Embed Size (px)
Citation preview
14. Kasseler SymposiumEnergie-Systemtechnik
Windenergiesysteme
14th Kassel SymposiumEnergy Systems Technology
Wind Energy Systems
Tagungsband / Proceedings24. – 25. September 2009

Mitveranstalter:
Bezirksverein Kassel e.V.
ForschungsVerbund erneuerbare Energien
Universität Kassel
Kompetenznetzwerk dezentrale Energietechnologien e.V.
VDE
14. Kasseler SymposiumEnergie-Systemtechnik
Windenergiesysteme
14th Kassel SymposiumEnergy Systems Technology
Wind Energy Systems
KASSELER SYMPOSIUM ENERGIE-SYSTEMTECHNIK 2009
2 Fraunhofer IWES 2009
Impressum / Imprint
Herausgeber
Fraunhofer Institutfür Windenergie und Energiesystemtechnik IWES
Der Institutsteil Kassel des am 01.01.2009 gegründeten neuen Fraunhofer IWES ist aus dem ehemaligen Institut für Solare Energieversorgungstechnik – Verein an der Universität Kassel e. V. (ISET) hervorgegangen.
Anschrift
Königstor 5934119 KASSEL / GermanyTelefon: +49 (0) 561 7294-0Telefax: +49 (0) 561 7294-100E-Mail: [email protected]
Rodenbacher Chaussee 663457 HANAU / GermanyTelefon: +49 (0) 6181 58-2701Telefax: +49 (0) 6181 58-2702E-Mail: [email protected]
Am Seedeich 4527572 BREMERHAVEN / GermanyTelefon: +49 (0) 471 902629-0Telefax: +49 (0) 471 902629-10
Internet: www.iset.uni-kassel.de www.iwes.fraunhofer.de
Wissenschaftlicher Tagungsleiter
Dr. Kurt Rohrig, Fraunhofer Institut für Windenergie und Energiesystemtechnik IWES
Kassel 2009
Verantwortlichkeit für den Inhalt:
Die Verantwortung liegt bei den Autoren
Responsibility for Content:
The authors are responsible for the content of the articles. Statements and opinions are expressions of the authors.
KASSELER SYMPOSIUM ENERGIE-SYSTEMTECHNIK 2009
Fraunhofer IWES 2009 3
Inhalt
Vorwort / Forword ........................................................................................ 5
Impacts of large amounts of wind power on design and operation of power on design and operation of power systems, results of IEA collaboration ......................................... 7
Hannele Holttinen, Peter Meibom, Antje Orths, Bernhard Lange, Mark O’Malley, John Olav Tande, Ana Estanqueiro, Emilio Gomez, Lennart Söder, Goran Strbac, J. Charles Smith, Frans van Hulle
European Wind Integration Study (EWIS) ............................................................ 25
Dr. Wilhelm Winter
Developing Europe‘s power market for large-scale integration of wind power – Results from TradeWind ................................................................................. 28
Frans Van Hulle
Storage and transport capacities in Europe for a full renewable power supply system ... 36
Clemens Hoffmann
Integration Erneuerbarer Energien und sicherer Systembetrieb aus Sicht des Übertragungsnetzbetreibers Vattenfall Europe Transmission GmbH ........................... 45
Hans-Peter Erbring
Netzbetrieb mit Perioden von mehr als 100 % Windenergieanteil .............................. 57
Uwe Urban
Grid Operation Supported by Wind Farms – The Danish Experience ........................... 63
Michal Powalko, Antje Gesa Orths, Peter Børre Eriksen
Verfügbarkeit von Windenergieanlagen – ein Beitrag zur Versorgungssicherheit ........... 72
Dr. Uwe Patzke, Dr. Jürgen Hentzschel
Ancillary Services by VPP ............................................................................... 80
Zbigniew A. Styczynski, Krzysztof Rudion
System Support by WT ClustersSystemdienstleistungen von WEA durch Clustering ............................................... 97
Alejandro J. Gesino, Reinhard Mackensen, Cesar A. Quintero Marrone, Bernhard Lange, Kurt Rohrig

KASSELER SYMPOSIUM ENERGIE-SYSTEMTECHNIK 2009
4 Fraunhofer IWES 2009
Wind Farms with power plant capabilities ......................................................... 102
Eckard Quitmann, Stephan Wachtel, Alfred Beekmann
Aktiver Beitrag zur Systemsicherheit durch Windenergie ...................................... 105
Jörg Müller
Spannungsregelung mit moderner WEA-Technik ................................................. 108
Istvan Erlich, Jens Fortmann, Stephan Engelhardt, Jörg Kretschmann
Role of Wind Power Forecasts in Grid Integration ............................................... 118
Bernhard Lange, Arne Wessel, Jan Dobschinski, Kurt Rohrig

KASSELER SYMPOSIUM ENERGIE-SYSTEMTECHNIK 2009
Fraunhofer IWES 2009 5
Vorwort
Der drohende Klimawandel kann nur durch eine drastische Reduktion der Treibhausgasemissionen verhindert werden. Eine der erforderlichen Maßnahmen ist die Vermeidung des CO2 Ausstoßes bei der Stromversorgung. Die vollständige Umstellung der elektrischen Energieversorgung von der konventionellen Erzeugung zur Nutzung der Erneuerbaren Energien ist dabei eine der wichtigsten Maßnahmen. Die Windenergienutzung ist heute nicht nur die kostengünstigste Technologie unter den Erneuerbaren sondern verzeichnet auch das schnellste Wachstum. Darum ist der weitere Aus-bau für die Vermeidung des Klimawandels unabdingbar.
Eines der größten Hindernisse für einen großskaligen Einsatz der Windenergie ist die begrenzte Kapazität der Übertragungsnetze. Ertragreiche Windstandorte sind meist weit entfernt von Last-zentren (z.B. Offshore) und können nur erschlossen werden, wenn ausreichende Übertragungska-pazitäten ermöglicht werden. Ein nachhaltiger, länderübergreifender Netzausbau und die bessere Ausnutzung vorhandener Übertragungskapazitäten sind ebenso erforderlich wie der aktive Beitrag der Anlagen zur Netz- und Systemsicherheit.
Um einen sehr hohen Anteil an Windenergie in elektrischen Energieversorgungssystemen zu er-möglichen, ist es erforderlich, die elektrischen Eigenschaften der Anlagen so zu gestalten, dass sie sich, einzeln oder in Gruppen wie konventionelle Kraftwerke bezüglich Planbarkeit, Beitrag zur Frequenzhaltung- und Spannungshaltung und dem Betrieb im Fehlerfall verhalten.
Das diesjährige Kasseler Symposium mit dem Titel „Windenergiesysteme“ soll die besonderen Anforderungen an Planung und Betrieb von Energieversorgungssystemen mit sehr hohem Wind-energieanteil aufzeigen und praktische Lösungen sowie innovative Konzepte aus Forschung und Entwicklung präsentieren. Nationale und internationale Experten berichten über die neusten Ent-wicklungen und Forschungsergebnisse auf dem Gebiet der Netzintegration der Windenergie. Zu Beginn der Veranstaltung stellen Experten die (vorläufi gen) Ergebnisse europäischer Studien zur Netzintegration (EWIS, TradeWind) und aus international besetzten Arbeitsgruppen (IEA Task 25) vor. Danach berichten Netzbetreiber und Energieversorger aus der täglichen Praxis des Netzbe-triebs mit sehr hohem Windenergieanteil, gefolgt von der Präsentation aktueller Forschungsergeb-nisse auf dem Gebiet der Netzeinbindung von Windenergieanlagen.
Dr. habil Hans-Gerd Busmann Prof. Dr. Jürgen Schmid Dr. Kurt RohrigInstitutsleiter IWES, Bremerhaven Institutsleiter IWES, Kassel Wissenschaftlicher Tagungsleiter
Am 1. Januar 2009 hat die Fraunhofer-Gesellschaft das neue Fraunhofer-Institut für Windenergie und Energie-systemtechnik IWES gegründet. Das neue Fraunhofer IWES besteht aus dem ehemaligen Fraunhofer-Center für Windenergie und Meerestechnik CWMT in Bremerhaven und wurde nach Abschluss des formalen Betriebsüber-gangs im Sommer 2009 noch um das Kasseler Institut für Solare Energieversorgungstechnik – ISET e.V. erweitert. Darüber hinaus wird das Fraunhofer IWES auch zwei Fraunhofer-Projektgruppen in Hannover und Oldenburg ein-richten. Nach einer Aufbauphase von 5 Jahren sollen im neuen Institut insgesamt mehr als 200 Mitarbeiterinnen und Mitarbeiter Forschung und Entwicklung für nationale und internationale Auftraggeber betreiben.

KASSELER SYMPOSIUM ENERGIE-SYSTEMTECHNIK 2009
6 Fraunhofer IWES 2009
Foreword
The threatening climate change can be prevented only by a drastic reduction of greenhouse gas emissions. One of the necessary measures is the avoidance of CO2 emissions created during electri-cal energy production. The complete conversion of the electrical power supply from conventional production to the use of renewable energies is one of the most important measures of doing so. Wind power utilization is today not only the most economical technology under the renewable energies, it also enjoys the fastest growth. The further development of wind energy is thus impera-tive in helping to prevent climate change.
One of today’s main barriers to large-scale wind technology deployment is the limited transmission capacity. Profi t-yielding wind spots are often far away from load centres (e.g. offshore) and can only be made accessible if suffi cient transmission capacity is affordable. Sustainable, transnational grid expansion together with the optimisation of existing transmission capacities are just as neces-sary for grid and system reliability as the active contribution of wind power plants.
One approach enabling a high penetration of wind power is for wind farms or wind farm groups to be operated as far as possible as conventional power plants (e.g. scheduling, contribution to both voltage and frequency control, fault-ride-through).
Under the title “Wind Energy Systems”, the 14th Kasseler symposium will point out special require-ments for the planning and operation of power supply systems with a very high share of wind ener-gy and will present practical solutions as well as innovative research and development concepts.
National and international experts will introduce latest developments and R&D results in the fi eld of grid integration. The symposium will commence with experts presenting the (preliminary) re-sults of European grid integration studies (EWIS, TradeWind) and internationally manned working groups (IEA Task 25). Grid operators and utility companies will then report on their day-to-day experiences in mains operation using a very high share of wind energy, followed by the presenta-tion of the latest R&D results.
Dr. habil Hans-Gerd Busmann Prof. Dr. Jürgen Schmid Dr. Kurt RohrigDirector Fraunhofer IWES, Bremerhaven Director Fraunhofer IWES, Kassel Scientifi c Chairman
In January 2009 the Fraunhofer-Gesellschaft founded the new Fraunhofer Institute for Wind Energy and Energy Systems Technology IWES. The new Fraunhofer IWES institute consists of the former Fraunhofer Center for Wind Energy and Maritime Technologies CWMT in Bremerhaven and was extended in summer 2009 by the Kassel Institut für Solare Energieversorgungstechnik – ISET e. V. Furthermore the Fraunhofer IWES will establish two Fraunhofer project groups in Hannover and Oldenburg. After a developmental phase of about fi ve years a total of more than 200 employees will pursue research and development for national and international partners.
KASSELER SYMPOSIUM ENERGIE-SYSTEMTECHNIK 2009
Fraunhofer IWES 2009 7
Impacts of large amounts of wind power on design and operation of power on design and operation of power systems, results of IEA collaboration
Hannele Holttinen1), Peter Meibom2), Antje Orths3), Bernhard Lange4), Mark O’Malley5), John Olav Tande6), Ana Estanqueiro7), Emilio Gomez8), Lennart Söder9), Goran Strbac10), J. Charles Smith11), Frans van Hulle12)
1) VTT, Finland, e-mail [email protected] 2) Risø DTU, Denmark; 3) Energinet.dk, Denmark; 4) ISET, Germany; 5) University College Dublin, Ireland; 6) SINTEF, Norway; 7) INETI, Portugal; 8) University Castilla la Mancha, Spain; 9) KTH, Sweden; 10) DG & SEE, UK; 11) UWIG, USA; 12) EWEA
Abstract
IEA WIND R&D Task 25 on “Design and Operation of Power Systems with Large Amounts of Wind Power” collects and shares information on wind power impacts on power systems, with analyses and guidelines on methodologies. There are dozens of studies made and ongoing related to wind integration, however, the results are not easy to compare. In the state-of-the-art report (October, 2007), and the fi nal report of the 3 years period (July, 2009) the most relevant wind power grid integration studies have been analysed especially regarding methodologies and input data. Several issues that impact on the amount of wind power that can be integrated have been identifi ed. Large balancing areas and aggregation benefi ts of large areas help in reducing the variability and forecast errors of wind power as well as help in pooling more cost effective balancing resources. System operation and functioning electricity markets at less than day-ahead time scales help reduce forecast errors of wind power. Transmission is the key to aggregation benefi ts, electricity markets and larger balancing areas. Best practices in wind integration studies are described. There is also benefi t when adding wind power to power systems: it reduces the total operating costs and emissions as wind replaces fossil fuels and this should be highlighted more in future studies.
Index Terms—wind integration, grid integration, balancing
Introduction1
Adding wind power will bring about a variable and only partly predictable source of power genera-tion to a power system that has to balance generation and varying demand at all times.
Power system impacts of wind power
Wind power has impacts on power system operational security, reliability and effi ciency. The stud-ies address different impacts, and the different time scales involved usually mean different models (and data) used in impact studies. The case studies for the system wide impacts have been divided
KASSELER SYMPOSIUM ENERGIE-SYSTEMTECHNIK 2009
8 Fraunhofer IWES 2009
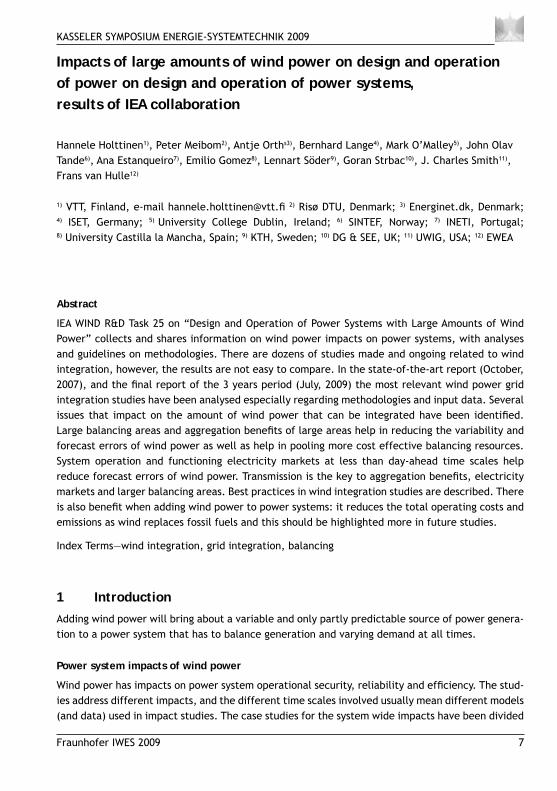
to three focus areas: Balancing, Adequacy of power and Grid (Fig 1). In this international col-laboration (IEA WIND Task 25; www.ieawind.org/AnnexXXV.html), more system related issues are addressed, as opposed to local issues of grid connection like power quality. Primary reserve is here denoted for reserves activated in seconds (frequency activated reserve; regulation) and secondary reserve for reserves activated in 10...15 minutes (minute reserve; load following reserve).
Figure 1: Impacts of wind power on power systems, divided in different time scales and width of area relevant fort the studies.
High penetration of wind power has impacts that have to be managed through proper wind power plant interconnection, integration of the generation, transmission planning, and system and mar-ket operations. The fi nal report of Task 25 fi rst term presents a summary of selected, recently concluded studies of wind integration impacts from participating countries [1]. The case studies summarized are compared, although this is not an easy task due to different methodology and data used, as well as different assumptions on the interconnection capacity available.
There are already several power systems and control areas coping with large amounts of wind power [2]. The experience from Denmark, Spain, Portugal and Ireland that have integrated 9-20 % of wind energy (of yearly electricity demand) show that wind power production will only have to be curtailed (regulated) at some rare instances, and that TSOs need on-line information of both the production and demand levels as well as respective forecasts in their control rooms. Spain and Portugal have launched centers for distributed energy that convey data to TSOs and even can re-
Power quality
Reducedemissions
Area relevant for impact studies
Time scale relevant for impact studies
ms…s s…min min…h years
Voltagemanagement
Local10-50 km
Regional100-1000 km
System wide1000-5000 km Secondary
reserve
Distributionefficiency
Adequacyof power
1…24 h
Hydro/thermal
efficiency
Adequacyof gr id
Gridstability
Primaryreserve
Task 25
Transmission efficiency
Congestionmanagement Grid
Balancing Adequacy

KASSELER SYMPOSIUM ENERGIE-SYSTEMTECHNIK 2009
Fraunhofer IWES 2009 9
act to control needs. Suitable grid codes help to further increase the penetration level: Germany, Denmark, Spain and Portugal have implemented fault-ride-through requirements for wind power plants in order to keep a certain level of security of supply.
1.2 Integration cost of wind power
Many studies assess impacts of wind power and some studies also estimate integration costs arising from the impacts. Integration cost is the extra investment and operational cost of the non-wind part of the power system when wind power is integrated.
Integration cost can be divided into different components arising from the increase in the opera-tional balancing cost and grid reinforcement cost. It is important to note whether a market cost has been estimated or the results refer to technical costs for the power system. A “market cost” include transfer of money from one actor to another actor, while “technical costs” implies a cost for the whole system.
Most studies so far have concentrated on the technical costs of integrating wind into the power system while also cost-benefi t analysis work is emerging. The benefi t when adding wind power to power systems is reducing the total operating costs and emissions as wind replaces fossil fuels. Integration costs of wind power need to be compared to something, like the production costs or market value of wind power, or integration cost of other production forms. A fair comparison between power systems with differing amounts of wind power, should in principle have systems with same CO2 emissions, reliability, etc. The value of the capacity credit of wind power can also be stated.
1.3 Defi ning wind penetration level
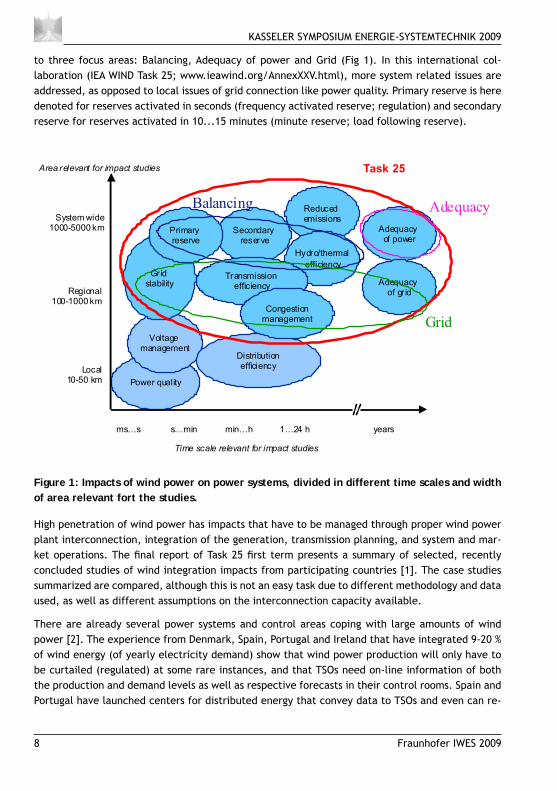
Determining what is “high” penetration of wind power is not straightforward. Often either energy or capacity metrics are used: wind power production as % of gross demand (energy) and wind power as % of peak load (capacity). The power systems and highest wind penetrations presented in the case studies are summarised in Fig. 2.
To determine high penetration for a power system also interconnecting capacity needs to be looked at. This is because critical moments of high wind and low load can be relieved by using interconnector capacity, assuming that the neighbour can cope with the additional import. In Fig 2 it can be seen that taking into account the limitations of interconnection capacity, the penetration levels of Ireland and UK are more challenging than for the other European countries.
KASSELER SYMPOSIUM ENERGIE-SYSTEMTECHNIK 2009
10 Fraunhofer IWES 2009
Figure 2: Comparison of the share of wind power in the power system (penetration levels) studied. For studies covering several countries, the aggregate penetration level has been cal-culated. Individual countries within the study cases can have signifi cantly higher wind power penetration levels.
Increase in short term reserve requirements due to wind power2 Wind generation may require system operators to carry additional operating reserves. From both the experience and results from studies performed, a signifi cant challenge is the variability of wind power within 1–6 hrs. Frequency control (time scale of seconds) and inertial response are not crucial problems when integrating wind power into large systems at the present time, but can be a challenge for small systems (like Ireland) and will become more of a challenge for systems with high penetration in the future.
Methodology2.1
The increase in short term reserve requirement is mostly estimated by statistical methods combin-ing the variability or forecast errors of wind power to that of load and investigating the increase in the largest variations seen by the system [2]. Usually margins for “possible” extreme situations are kept. The term “possible” then normally includes a certain percentage of what in reality could happen. A straightforward method to defi ne “possible” is the commonly used “N-1 criterion”, i.e., it is necessary to keep reserves for an outage of the largest production unit or interconnector,
KASSELER SYMPOSIUM ENERGIE-SYSTEMTECHNIK 2009
Fraunhofer IWES 2009 11
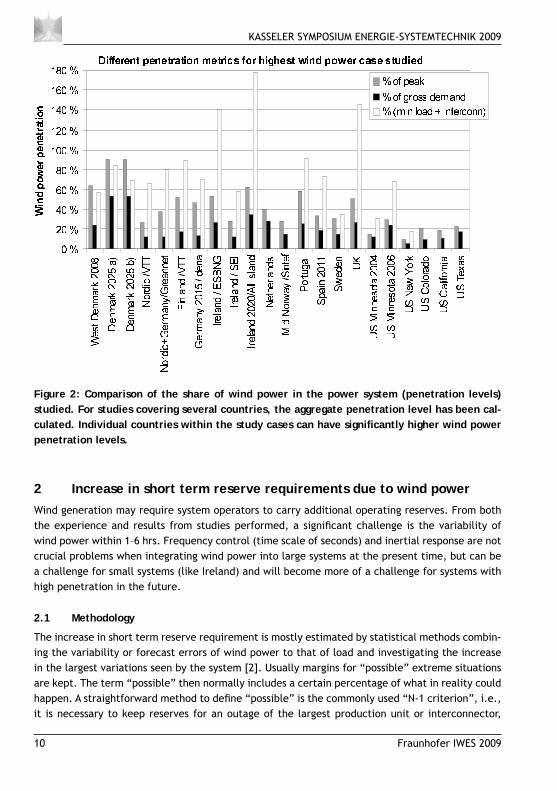
which could be a challenge during both, import and export situations. This is a common dimension-ing criteria for disturbance (contingency) reserve. In addition to that, some operational reserve is carried on top of that to cover variability and forecast errors, but there are no commonly used criteria to dimension this part of reserve. Some TSOs begin to use probabilistic approaches to defi ne a suitable level of reserves.
It is of central importance to separate need of fl exibility in longer time scales of several hours to a day (power plants that can follow net load variation) and need of reserves that can be activated in seconds or minutes time scale (power plants that can follow unforecasted net load variations). To illustrate the need of fl exibility, Fig. 3 shows the needed power increase divided in scheduled production and reserves.
0 1 2 3 4
MW
hours
Net load forecast
Real net load
Scheduled production
Updated net load forecast
Reserves
Flexibility
Figure 3: Flexibility in the power system to follow varying load and wind power production (the net load) consists of scheduled production and reserves.
The need of fl exibility is not the same as need of reserves, since a part of the net load variation can be forecasted.
Results from studies2.2
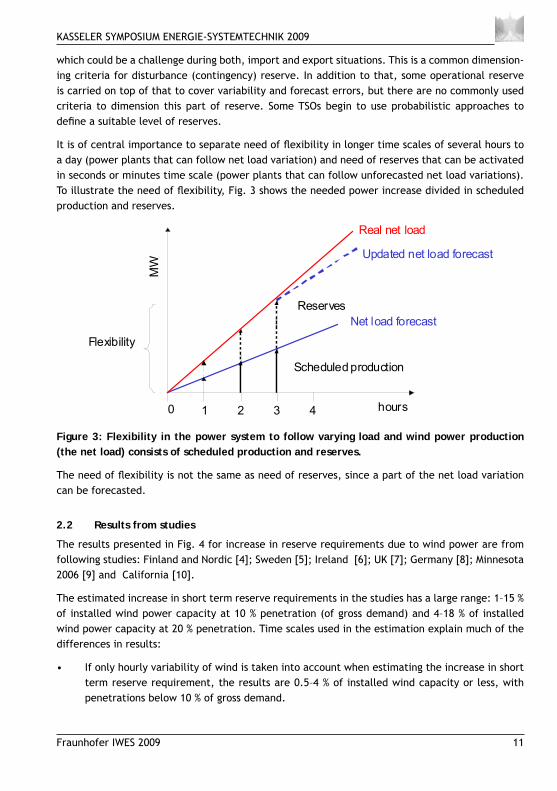
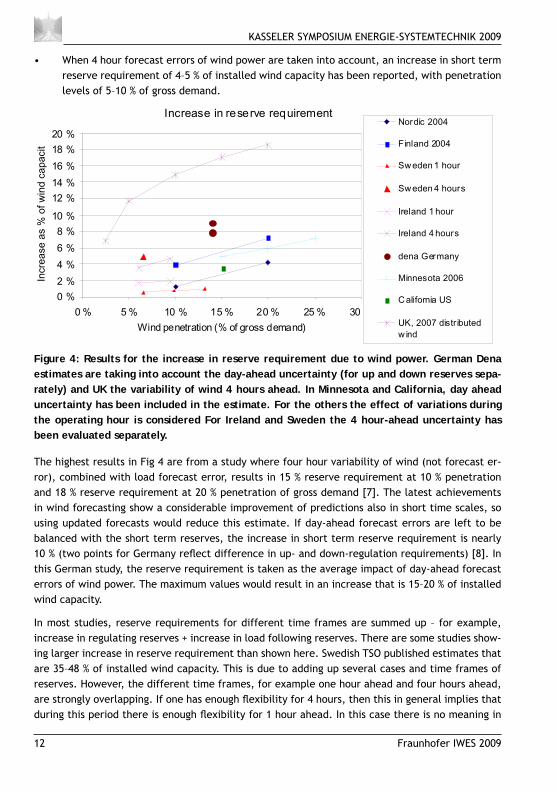
The results presented in Fig. 4 for increase in reserve requirements due to wind power are from following studies: Finland and Nordic [4]; Sweden [5]; Ireland [6]; UK [7]; Germany [8]; Minnesota 2006 [9] and California [10].
The estimated increase in short term reserve requirements in the studies has a large range: 1–15 % of installed wind power capacity at 10 % penetration (of gross demand) and 4–18 % of installed wind power capacity at 20 % penetration. Time scales used in the estimation explain much of the differences in results:
• If only hourly variability of wind is taken into account when estimating the increase in short term reserve requirement, the results are 0.5–4 % of installed wind capacity or less, with penetrations below 10 % of gross demand.
KASSELER SYMPOSIUM ENERGIE-SYSTEMTECHNIK 2009
12 Fraunhofer IWES 2009
• When 4 hour forecast errors of wind power are taken into account, an increase in short term reserve requirement of 4–5 % of installed wind capacity has been reported, with penetration levels of 5–10 % of gross demand.
Increase in reserve requirement
0 %
2 %
4 %
6 %
8 %
10 %
12 %
14 %
16 %
18 %
20 %
0 % 5 % 10 % 15 % 20 % 25 % 30 %
Wind penetration (% of gross demand)
Incre
ase a
s %
of w
ind c
apacity
Nordic 2004
Finland 2004
Sweden 1 hour
Sweden 4 hours
Ireland 1 hour
Ireland 4 hours
dena Germany
Minnesota 2006
California US
UK, 2007 distr ibuted
w ind
Figure 4: Results for the increase in reserve requirement due to wind power. German Dena estimates are taking into account the day-ahead uncertainty (for up and down reserves sepa-rately) and UK the variability of wind 4 hours ahead. In Minnesota and California, day ahead uncertainty has been included in the estimate. For the others the effect of variations during the operating hour is considered For Ireland and Sweden the 4 hour-ahead uncertainty has been evaluated separately.
The highest results in Fig 4 are from a study where four hour variability of wind (not forecast er-ror), combined with load forecast error, results in 15 % reserve requirement at 10 % penetration and 18 % reserve requirement at 20 % penetration of gross demand [7]. The latest achievements in wind forecasting show a considerable improvement of predictions also in short time scales, so using updated forecasts would reduce this estimate. If day-ahead forecast errors are left to be balanced with the short term reserves, the increase in short term reserve requirement is nearly 10 % (two points for Germany refl ect difference in up- and down-regulation requirements) [8]. In this German study, the reserve requirement is taken as the average impact of day-ahead forecast errors of wind power. The maximum values would result in an increase that is 15–20 % of installed wind capacity.
In most studies, reserve requirements for different time frames are summed up – for example, increase in regulating reserves + increase in load following reserves. There are some studies show-ing larger increase in reserve requirement than shown here. Swedish TSO published estimates that are 35–48 % of installed wind capacity. This is due to adding up several cases and time frames of reserves. However, the different time frames, for example one hour ahead and four hours ahead, are strongly overlapping. If one has enough fl exibility for 4 hours, then this in general implies that during this period there is enough fl exibility for 1 hour ahead. In this case there is no meaning in
KASSELER SYMPOSIUM ENERGIE-SYSTEMTECHNIK 2009
Fraunhofer IWES 2009 13
summing up these reserve requirements since they overlap signifi cantly. Such additions are only valid when they contain different units.
An important issue is that “increase in reserve requirements” does not necessarily mean need of new investments. The amount of wind-caused reserves is at highest when wind power is on a high production level. In these situations the other power stations are operated on a low level, which means that they can act as reserves and increase the generation if wind power decreases. This means that fl exibility and reserve keeping in a system with wind power is an issue of ramp rates and start-up times, together with a need of more capacity. More fast ramping and starting capacity can be needed, if the forecast errors are large enough that the slow units cannot follow. This must be considered when “increased reserve margins” are to be estimated.
Balancing cost3 Wind power impacts on power system balancing can be seen in several time scales, from minutes to hours, up to the day-ahead time scale. General conclusions on increase in balancing require-ment will depend on region size relevant for balancing, initial load variations and how distributed wind power is sited. Here also the operational routines of the power system are relevant – how often the forecasts of load and wind are updated, for example.
Methodology3.1
To arrive at estimates for balancing cost, the operating reserve impact is one issue (increase in re-serve requirement from statistical methods) and impact on effi ciency of conventional power plants for day-ahead operation is another issue (simulations). For the simulations most results are based on comparing costs of system operation without wind and adding different amounts of wind. The costs of variability are also addressed by comparing simulations with fl at wind energy to varying wind energy (for example in US Minnesota [9] and Greennet Nordic + Germany [12]).
It is important to pay attention to the representativeness of wind input data (how well does the wind data represent the geospread of the power system, how is wind power simulated, what time scale effects on variability and predictability have been taken into account) and also how the main set-up for the assessment or simulation is made (wind power replacing other production or capacity and to what extent is the power system operation optimised when wind power production is added). The level of detail of the simulation model (time resolution, level of detail in simulat-ing conventional generation and transmission, pricing) and how the uncertainty in the wind plant output forecast is handled with respect to the load forecast uncertainty are also important.
The matrix developed in [12] has been further processed to form a check-list for the national stud-ies that have used simulations [1]. The check-list can be used to fi nd out whether the approach has been conservative or whether some important aspects have been omitted, producing either high or low estimates for the impacts. The most general fi nding comparing the study set-ups is the use of interconnection capacity – this is crucial when estimating the impacts of wind power.
KASSELER SYMPOSIUM ENERGIE-SYSTEMTECHNIK 2009
14 Fraunhofer IWES 2009
Results from studies3.2
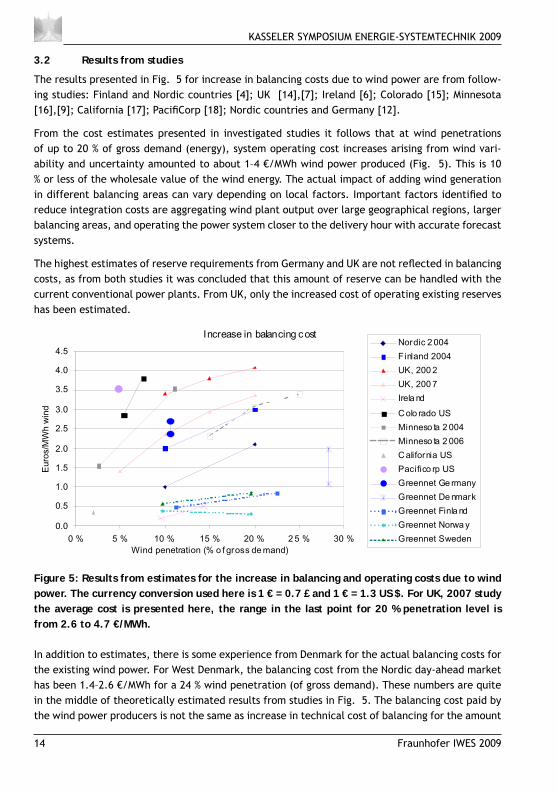
The results presented in Fig. 5 for increase in balancing costs due to wind power are from follow-ing studies: Finland and Nordic countries [4]; UK [14],[7]; Ireland [6]; Colorado [15]; Minnesota [16],[9]; California [17]; Pacifi Corp [18]; Nordic countries and Germany [12].
From the cost estimates presented in investigated studies it follows that at wind penetrations of up to 20 % of gross demand (energy), system operating cost increases arising from wind vari-ability and uncertainty amounted to about 1–4 €/MWh wind power produced (Fig. 5). This is 10 % or less of the wholesale value of the wind energy. The actual impact of adding wind generation in different balancing areas can vary depending on local factors. Important factors identifi ed to reduce integration costs are aggregating wind plant output over large geographical regions, larger balancing areas, and operating the power system closer to the delivery hour with accurate forecast systems.
The highest estimates of reserve requirements from Germany and UK are not refl ected in balancing costs, as from both studies it was concluded that this amount of reserve can be handled with the current conventional power plants. From UK, only the increased cost of operating existing reserves has been estimated.
Increase in balancing cost
0.0
0.5
1.0
1.5
2.0
2.5
3.0
3.5
4.0
4.5
0 % 5 % 10 % 15 % 20 % 2 5 % 30 %
Wind penetration (% o f gross de mand)
Euro
s/M
Wh w
ind
Nordic 2 004
Finland 2004
UK, 200 2
UK, 200 7
Irela nd
Colo rado US
Minneso ta 2 004
Minneso ta 2 006
California US
Pacifico rp US
Greennet Ge rmany
Greennet De nmark
Greennet Finla nd
Greennet Norwa y
Greennet Sweden
Figure 5: Results from estimates for the increase in balancing and operating costs due to wind power. The currency conversion used here is 1 € = 0.7 £ and 1 € = 1.3 US $. For UK, 2007 study the average cost is presented here, the range in the last point for 20 % penetration level is from 2.6 to 4.7 €/MWh.
In addition to estimates, there is some experience from Denmark for the actual balancing costs for the existing wind power. For West Denmark, the balancing cost from the Nordic day-ahead market has been 1.4–2.6 €/MWh for a 24 % wind penetration (of gross demand). These numbers are quite in the middle of theoretically estimated results from studies in Fig. 5. The balancing cost paid by the wind power producers is not the same as increase in technical cost of balancing for the amount
KASSELER SYMPOSIUM ENERGIE-SYSTEMTECHNIK 2009
Fraunhofer IWES 2009 15
of wind power. However the market costs from Denmark and Spain refl ect the cost incurred to the system. In Denmark the cost is low compared to the penetration level, as the cost comes from Nordic market where wind power penetration is still small.
The interconnection capacity to neighbouring systems is often signifi cant. For the balancing costs, it is then essential to note in the study setup whether the interconnection capacity can be used for balancing purposes or not. A general conclusion is that if interconnection capacity is allowed to be used also for balancing purposes, then the balancing costs are lower compared to the case where they are not allowed to be used.
Other balancing related results4 Not all case studies presented results quantifi ed as MW of increase in reserve requirements or monetary values for increase in balancing costs.
In Denmark the TSO has estimated the impacts of increasing the wind penetration level from 20 % to 50 % (of gross demand) and concluded that further large scale integration of wind power calls for exploiting both, domestic fl exibility and international power markets with measures on the market side, production side, transmission side and demand side ([19] and [20]).
For the Netherlands, the simulations show the benefi t of international trade of electricity and postponing market gate closure for wind integration. Wind power worsens the business case for thermal generation: CCGT during peak demand and base-load coal during low demand [21].
The Irish All Island Grid Study shows that going from 2 to 6 GW wind, the operational costs of the electricity system fall by €13/MWh when compared to the base case – due to cost benefi t approach in the study, the cost component was not published as such [22].
For New York, 10 % penetration of capacity, incremental regulation due to wind was found to be 36 MW. No additional spinning reserve was needed. Incremental intra-hour load following burden increased 1–2 MW / 5 min. Hourly ramp increased from 858 MW to 910 MW. All increased needs can be met by existing NY resources and market processes. System cost savings of $335–$455 million for assumed 2008 natural gas prices of $6.50–$6.80/MMBTU were found. Day-ahead unit-commitment forecast error σ increased from 700–800 MW to 859–950 MW. Total system variable cost savings increases from $335 million to $430 million when state of the art forecasting is considered in unit commitment ($10.70/MWh of wind) [23].
Balancing cost from electricity markets4.1
In Finland and Sweden, the balancing costs as payments for wind power producers have been estimated from the balancing market (Nordic Regulating market) prices to be 0.3–1.4 €/MWh de-pending on how distributed the wind power is and on the market price level for balancing ([24] and [25]). In Sweden, the use of 15 min operating reserves has been estimated to increase by 18–56 % of current amounts due to wind power forecast errors 1 or 4 hours ahead for 4000 MW wind power (8 % of gross demand) [26]. The increased cost of system imbalances of Finland due to future wind power prediction errors was estimated to be 0.2–1 €/MWh for penetration levels of 1–10 % of gross demand, assuming the Nordic balancing market was available (no bottlenecks) [27].
KASSELER SYMPOSIUM ENERGIE-SYSTEMTECHNIK 2009
16 Fraunhofer IWES 2009
The use of an intra-day market to help reduce the imbalance costs of wind power has been exam-ined in Germany [28] and for the Nordic market in Finland [18] and Sweden [25] have shown that for the current price assumptions there is not a straightforward benefi t to use an intra-day market. This is because trading at an intra-day market would mean correcting all imbalances, whereas the imbalance payments only apply to the imbalances that affect the power system net imbalances, thus not 100 % of time (at low wind penetrations only 50 % of time).
Storage4.2
The value of storage in the power system operation in UK was estimated to be 252–970 £/kW [7]. For Germany a 27 M€/year revenue could be foreseen for 400 MW CAES (250 M€ investment) [28]. In the NL international exchange was seen as a more promising alternative to storage in the system [21]. In Ireland adding storage did not bring additional value in the All Island Grid Study results [22].
For wind penetration levels of 10–20 % of gross demand in power systems, the cost effectiveness of building new electricity storage is still low (excluding hydro power with large reservoirs or pumped hydro). With higher wind penetration levels the extra fl exibility that also storages can provide will be benefi cial for the power system operation, provided they are economically competitive with other forms of fl exibility. It is important to notice, however, that any storage should be oper-ated according to the needs of aggregated system balancing. It is not cost effective to provide dedicated back-up for wind power in large power systems where the variability of all loads and generators are effectively reduced by aggregating, in the same way as it is not effective to have dedicated storage for outages in a certain thermal power plant, or having specifi c plants following the variation of a certain load.
Transmission planning and costs5 With current technology, new wind power plants are able to meet system operator expectations such as riding through voltage dips, supplying reactive power to the system, controlling terminal voltage, and participating in SCADA system operation with output and ramp rate control. Grid rein-forcement may be needed for handling larger power fl ows and maintaining a stable voltage, and is commonly needed if new generation is installed in weak or congested grids far from load centers, or where no grid exists, such as offshore.
Transmission cost is the extra cost in the transmission system when wind power is integrated. Either all extra costs are allocated to wind power, or only part of the extra costs are allocated to wind power – grid reinforcements and new transmission lines often benefi t also other consumers or producers and can be used for many purposes, such as increase of reliability and/or increased trading. The cost of grid reinforcements due to wind power is therefore very dependent on where the wind power plants are located relative to load and grid infrastructure, and one must expect numbers to vary from country to country. Grid reinforcement costs are by nature dependent of the existing grid. The costs vary with time and are dependent on the time instant the generator is connected. After building some lines, often several generators can be connected before new reinforcement needs occur. After a certain time instant, new lines, substations or something else is needed. The grid reinforcement costs are not continuous; there can be single very high cost rein-forcements. The same wind power plant, connected at different time instant, therefore may lead
KASSELER SYMPOSIUM ENERGIE-SYSTEMTECHNIK 2009
Fraunhofer IWES 2009 17
to different grid reinforcement costs. For transmission planning, the most cost effective solution in cases that demand considerable grid reinforcements would be to build transmission network for the fi nal amount of wind power in the network – instead of having to upgrade transmission lines in several phases.
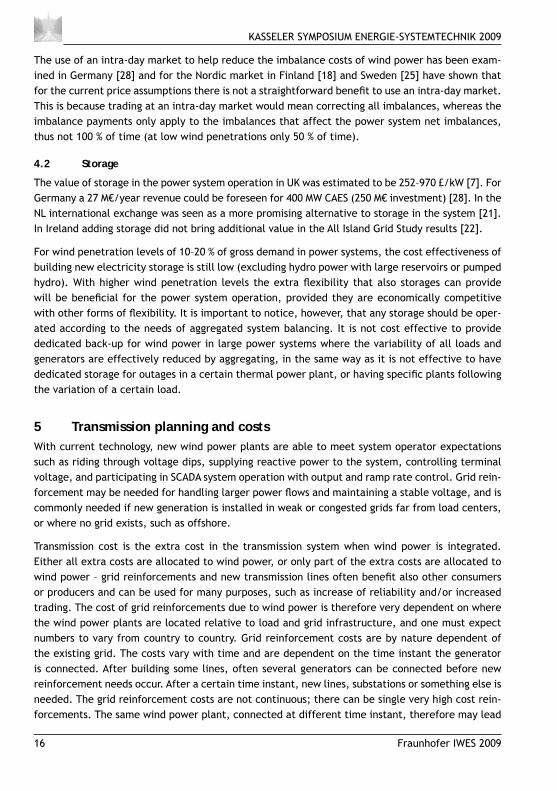
The reported results in the national case studies for grid reinforcements presented in Fig 6 are: UK [14]; Netherlands: [24]; Portugal: lower cost allocating only the proportion related to the wind program of total cost of each grid development or reinforcement [1]; Germany [8]; Ireland [22]; Denmark: [31] (allocating about 40 % of total grid reinforcement cost to wind power) and [32] for 2250 MW of additional off-shore wind power in 2025, excluding the costs of getting the offshore production on shore and no additional network reinforcement costs for increasing onshore wind power with 700 MW from 2007 to 2025.
0
50
100
150
200
250
300
0 % 10 % 20 % 30 % 40 % 50 % 60 %
Wind power penetration (% of gross demand)
Euro
s/k
W w
ind
Germany 2015 / dena
Ireland 2020/All island
Netherlands
Portugal
UK
D enmark EA
D enmark , 2008
Figure 6. Comparison of the estimated costs for grid reinforcement costs due to wind power. For Denmark, the cost of increasing wind penetration from 20 % to 50 % is allocated to added wind power. For Ireland the range comes from allocating the cost for all renewables from 0 % penetration and for allocating the cost for added renewables (from 2.25 GW to 6.6 GW).
The grid reinforcement costs from studies in this report vary from 0 €/kW to 270 €/kW. In the US, a recent study reviewed a sample of 40 detailed transmission studies from 2001–2008 that have included wind power [33]. The range of transmission costs for wind investigated in these studies ranged from $0/kW to over $1500/kW. The majority of studies, however, have a unit cost of trans-mission that is below $500/kW, and a median cost of $300/kW. One interesting fi nding in US is that unit transmission costs of wind do not appear to increase signifi cantly with higher levels of wind penetration. Economies of scale appear to come into play when accessing large resource areas.
It is also important to note that grid reinforcements should be held up against the option of controlling wind output or altering operation of other generation in cases where grid adequacy is insuffi cient during only part of the time or for only some production and load situations.
KASSELER SYMPOSIUM ENERGIE-SYSTEMTECHNIK 2009
18 Fraunhofer IWES 2009
The results from UK [34] suggest that at higher penetration levels, requiring suffi cient fault ride through capability for large wind power plants is economically effi cient compared with modifying the power system operation for ensuring power system security in case wind farms are not having fault ride through capability. In stability studies of the Iberian peninsula it is shown that to reach penetration levels of more than 10 %, fault ride through capability is required in majority of wind power plants. Also the German studies conclude that a passive fault ride through capability will not be suffi cient in the future. In addition, the turbines have to be able to provide reactive power to the grid. In a US study it was found that wind power plants with some dynamic reactive capability may reduce or eliminate the need for dynamic reactive devices on the transmission system [35].
Dynamic line ratings, taking into account the cooling effect of wind together with temperature in determining the transmission constraints, can increase transmission capacity from the North to the middle of Germany by 40 to 90 % at times when the German wind power generation is above 75 % of the installed capacity. In 99 % of the time the increase is above 15 % for all lines, except some very unfavourable cases, where only an increase of 5 % is calculated [36].
Norwegian study shows that the power smoothing effect of geographically dispersed wind power plants gives a signifi cant reduction of discarded wind energy in constrained networks, compared to a single up-scaled wind power plant site [37]. In both Norway and Sweden it has been shown that with comparatively high grid costs it can be economically preferable to spill wind power than to increase the transmission capability and that coordination of hydro power and wind power in a region with limited export capability can reduce the need for grid upgrade ([38],[39]).
6 Capacity value of wind powerWind generation will also provide some additional load carrying capability to meet forecasted in-creases in system demand. The analyses for system generation adequacy are made several weeks, months or years ahead and associated with static conditions of the system. This can be studied by a chronological generation-load model, that can include transmission and distribution capacities and constraints, or by probabilistic methods. The data required to make the required generation estimation includes the system demand and the availability data of generation units. There are several approaches used in literature. Calculating the effective load carrying capability (ELCC) by determining the Loss-of-Load-Probability (LOLP) of the power system for different load levels is the most rigorous methodology available. Although the use of alternative, simplifi ed methods appears to be somewhat popular, many of these have not been compared to the more robust ap-proaches based on reliability analysis. We strongly encourage this comparison so that the trade-offs of using simplifi ed approaches is transparent.
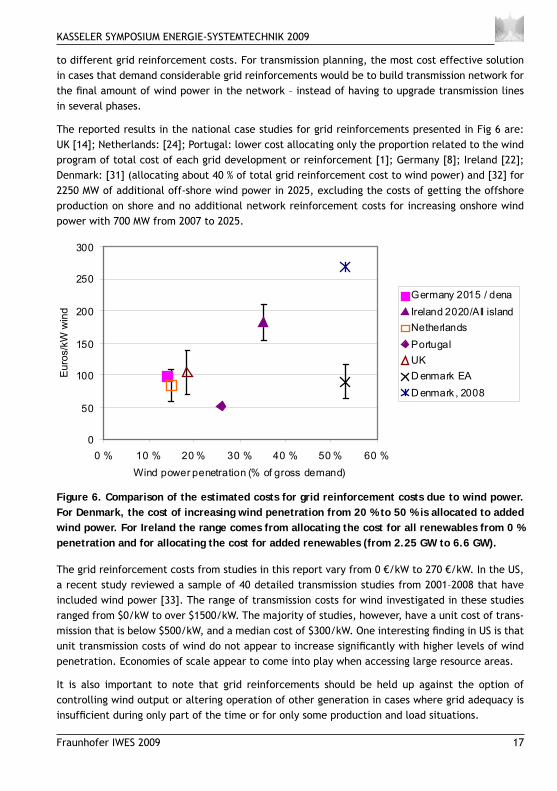
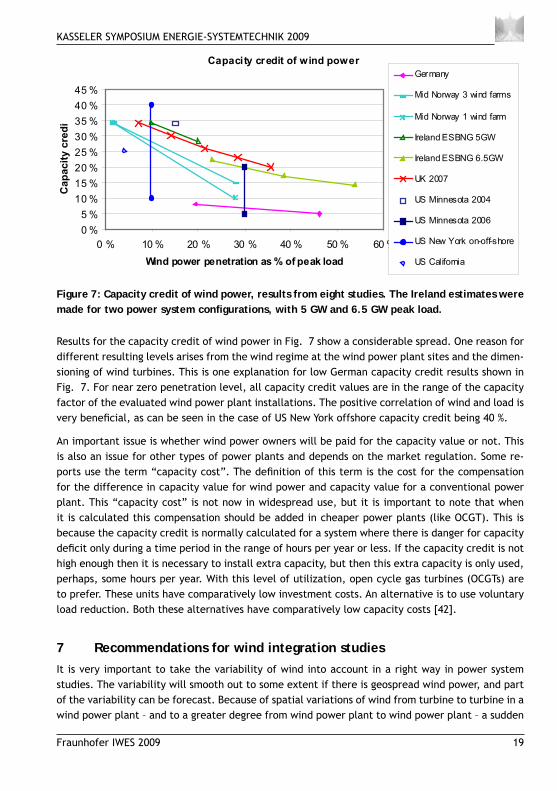
The results presented in Fig 7 for capacity value of wind power are from: Germany [8]; Ireland [40]; Norway [39]; UK [14]; US Minnesota [9],[16]; US New York [23]; US California [17].
The capacity value of wind power has been estimated to be up to 40 % of installed wind power capacity if wind power production at times of high load is high, and down to 5 % in higher penetra-tions or if local wind characteristics correlate negatively with the system load profi le. Aggregating larger areas benefi ts the capacity credit of wind power [41].
KASSELER SYMPOSIUM ENERGIE-SYSTEMTECHNIK 2009
Fraunhofer IWES 2009 19
Results for the capacity credit of wind power in Fig. 7 show a considerable spread. One reason for different resulting levels arises from the wind regime at the wind power plant sites and the dimen-sioning of wind turbines. This is one explanation for low German capacity credit results shown in Fig. 7. For near zero penetration level, all capacity credit values are in the range of the capacity factor of the evaluated wind power plant installations. The positive correlation of wind and load is very benefi cial, as can be seen in the case of US New York offshore capacity credit being 40 %.
An important issue is whether wind power owners will be paid for the capacity value or not. This is also an issue for other types of power plants and depends on the market regulation. Some re-ports use the term “capacity cost”. The defi nition of this term is the cost for the compensation for the difference in capacity value for wind power and capacity value for a conventional power plant. This “capacity cost” is not now in widespread use, but it is important to note that when it is calculated this compensation should be added in cheaper power plants (like OCGT). This is because the capacity credit is normally calculated for a system where there is danger for capacity defi cit only during a time period in the range of hours per year or less. If the capacity credit is not high enough then it is necessary to install extra capacity, but then this extra capacity is only used, perhaps, some hours per year. With this level of utilization, open cycle gas turbines (OCGTs) are to prefer. These units have comparatively low investment costs. An alternative is to use voluntary load reduction. Both these alternatives have comparatively low capacity costs [42].
7 Recommendations for wind integration studiesIt is very important to take the variability of wind into account in a right way in power system studies. The variability will smooth out to some extent if there is geospread wind power, and part of the variability can be forecast. Because of spatial variations of wind from turbine to turbine in a wind power plant – and to a greater degree from wind power plant to wind power plant – a sudden
Capacity credit of wind power
0 %
5 %
10 %
15 %
20 %
25 %
30 %
35 %
40 %
45 %
0 % 10 % 20 % 30 % 40 % 50 % 60 %
Wind power penetration as % of peak load
Cap
acit
y c
red
itGermany
Mid Norway 3 wind farms
Mid Norway 1 wind farm
Ireland ESBNG 5GW
Ireland ESBNG 6.5GW
UK 2007
US Minnesota 2004
US Minnesota 2006
US New York on-off-shore
US California
Figure 7: Capacity credit of wind power, results from eight studies. The Ireland estimates were made for two power system confi gurations, with 5 GW and 6.5 GW peak load.
KASSELER SYMPOSIUM ENERGIE-SYSTEMTECHNIK 2009
20 Fraunhofer IWES 2009
loss of all wind power on a system simultaneously due to a loss of wind is not a credible event. Sudden loss of large amounts of wind power due to voltage dips in the grid can be prevented by requiring fault-ride-through from the turbines.
Recommendations for wind integration studies include:
capturing the smoothed out variability of wind power production time series for the geo-• graphic diversity assumed and utilizing wind forecasting best practice for the uncertainty of wind power production;
examining wind variation in combination with load variations, coupled with actual historic • utility load and load forecasts;
capturing system characteristics and response through operational simulations and mod-• eling;
examining actual costs independent of tariff design structure and •
comparing the costs and benefi ts of wind power. •
In most cases the question is whether extra investments to power systems are economically profi t-able or not in the new system with larger amount of wind power – not only stating that a certain amount of extra reserve capacity and/or new transmission lines etc are a prerequisite in order to build any wind power.
For high penetration levels of wind power, the optimisation of the integrated system should be explored. Modifi cations to system confi guration and operation practices to accommodate high wind penetration may be required. Not all current system operation techniques are designed to correctly incorporate the characteristics of wind generation and surely were not developed with that objective in mind. Increasing power system fl exibility through such means as transmission to neighbouring areas, generation fl exibility, demand side management and optimal use of storage (e.g. pumping hydro or thermal) in combination with market aggregation and operation closer to real time will impact the amount of wind that can be integrated cost effectively.
Regarding capacity value of wind power, the recommendations are:
The availability of high quality chronological synchronized data that captures the correla-• tion with load data is of paramount importance and the robustness of the calculations is highly dependent on the volume of this data.
Approximations should be avoided and a full effective load carrying capability (ELCC) cal-• culation is the preferred method and great care and attention is needed when approxima-tions are used. It is challenging to compare capacity credits performed in different studies if different defi nitions are used ([42],[43]).
In some reports the term “capacity cost” is used. The meaning of this is the cost for the • difference between capacity credit for wind power and capacity credit for a conventional power plant. It is then important to consider the lowest possible cost compensation in order not to overestimate this cost [42].
KASSELER SYMPOSIUM ENERGIE-SYSTEMTECHNIK 2009
Fraunhofer IWES 2009 21
8 Summary and future workSeveral issues that impact on the amount of wind power that can be integrated have been iden-tifi ed. Aggregation benefi ts of large areas help in reducing the variability and forecast errors of wind power as well as help in pooling more cost effective balancing resources. An alternative to large balancing areas is to allow and promote intra-day and intra-hour trading between different balancing areas in order to obtain low-cost balancing services. System scheduling and operating electricity markets at less than day-ahead time scales help reduce the forecast errors of wind power that affect operating reserves. Transmission is the key to aggregation benefi ts, electricity markets and larger balancing areas.
Wind integration has mainly been studied to wind penetration levels of 10–20 % of gross demand (up to 50 % of peak load), with some fi rst efforts to study higher penetration levels of 40-50 % of gross demand ([19],[20] and [22]). What happens in larger penetration levels, where wind becomes a more dominating part of power system, is not completely clear. Studies will have to cover larger areas to take the cross border transmission into account properly [41]. The future power systems may also provide different options for fl exibility in demand side that do not exist today. Future integration studies should take into account the foreseen high penetration of PV or ocean power. This will help smoothing the variability of individual technologies.
9 References H. Holttinen, P. Meibom, A. Orths, F.van Hulle, B.Lange, M. O’Malley, J. Pierik, B. Um-[1] mels, J.O. Tande, A. Estanqueiro, M. Matos, E. Gomez, L. Söder, G. Strbac, A. Shakoor, J.Ricardo, J. C. Smith, M.Milligan, E. Ela. “Design and operation of power systems with large amounts of wind power” Final report, IEA WIND Task 25, Phase one 2006-2008. Espoo, VTT. 200 p. + app. 29 p. VTT Tiedotteita - Research Notes 2493. Available at http://www.vtt.fi /inf/pdf/tiedotteet/2009/T2493.pdf
Söder, L., Hofmann, L., Orths, A., Holttinen, H., Wan, Y.-H., Tuohy, A. 2007. Experience [2] from wind integration in some high penetration. IEEE Transactions on Energy Conversion, vol. 22, 2, pp. 4–12.
H. Holttinen, M. Milligan, B. Kirby, T. Acker, V. Neimane, T. Molinski, 2008. “Using standard [3] deviation as a measure of increased operational reserve requirement for wind power” Wind Engineering, vol. 32, 4, ss. 355 – 377.
H. Holttinen, 2004. “The impact of large scale wind power production on the Nordic elec-[4] tricity system” PhD dissertation. VTT Publications 554. Espoo, VTT Processes. 82 p. + app. 111 p. Available at: http://www.vtt.fi /inf/pdf/publications/2004/P554.pdf.
U.Axelsson, R.Murray and V.Neimane. “4000 MW wind power in Sweden – Impact on regu-[5] lation and reserve requirements”. Elforsk Report 05:19, Stockholm, 2005. Available at: http://www.elforsk.se.
Ilex, UMIST, UCD and QUB. “Operating reserve requirements as wind power penetration [6] increases in the Irish electricity system.” Sustainable Energy Ireland, 2004.
KASSELER SYMPOSIUM ENERGIE-SYSTEMTECHNIK 2009
22 Fraunhofer IWES 2009
Strbac, G., Shakoor, A., Black, M., Pudjianto, D. & Bopp, T. 2007. Impact of wind genera-[7] tion on the operation and development of the UK electricity systems. Electrical Power Systems Research, Vol. 77, Issue 9. Elsevier. Pp. 1143–1238.
Dena, 2005. Planning of the grid integration of wind energy in Germany onshore and off-[8] shore up to the year 2020 (Dena Grid study). Deutsche Energie-Agentur Dena, March 2005. English summary and full German version available at: http://www.dena.de/themen/thema-reg/projektarchiv/.
EnerNex/WindLogics 2006. Minnesota Wind Integration Study Final Report. Vol I, prepared [9] for Minnesota Public Utilities Commission, Nov. 2006. http://www.puc.state.mn.us/por-tal/groups/public/ documents/pdf_fi les/000664.pdf
Porter et al., July 2007. Intermittency analysis Final report. July, 2007. Available at: [10] http://www.uwig.org/CEC-500-2007-081.pdf.
Svenska Kraftnät. 2008. Large scale expansion of wind power – Consequences for the trans-[11] mission grid and need of regulation power. Available at: http://www.svk.se/Global/01_Om_oss/Pdf/Rapporter/ 080601_Bilaga_vindkraftrapport_2008.pdf (In Swedish.)
Meibom, P., Weber, C., Barth, R. & Brand, H. 2009. Operational costs induced by fl uctuat-[12] ing wind power production in Germany and Scandinavia. IET Renewable Energy Genera-tion, Volume 3, Issue 1, p. 75–83, March 2009.
Söder, L. and Holttinen, H. 2008. On methodology for modelling power system impact on [13] power systems. International Journal of Global Energy Issues, Vol. 29, 1–2, pp. 181–198.
Ilex Energy, Strbac, G. 2002. Quantifying the system costs of additional renewables in 2020. [14] DTI, 2002. Available at: http://www.dti.gov.uk/energy/developep/080scar_report_v2_0.pdf.
Zavadil, R. 2006. Wind Integration Study for Public Service Company of Colorado. May 22, [15] 2006. Available at http://www.xcelenergy.com/XLWEB/CDA/0,3080,1-1-1_1875_15056_15473-13518-2_171_258-0,00.html.
EnerNex/WindLogics, 2004. Xcel North study (Minnesota Department of Commerce). Avail-[16] able at: http://www.state.mn.us/cgi-bin/portal/mn/jsp/content.do?contentid=536904447&contenttype=EDITORIAL&hpage=true&agency=Commerce.
Shiu, H., Milligan, M., Kirby & B. Jackson, K. 2006. California Renewables Portfolio Stan-[17] dard Renewable Generation Integration Cost Analysis. California Energy Commission, PIER Public Interest Energy Research Programme. Available at: http://www. energy.ca.gov/pier/fi nal_project_reports/CEC-500-2006-064.html.
Pacifi Corp, 2005. Integrated Resource Planning. Available at: http://www.pacifi corp.com/[18] Navigation/Navigation23807.html .
Energinet.dk: System Plan 2007. available at: www.energinet.dk [19]
Eriksen, P. B.; Orths, A.: Challenges and Solutions of Increasing from 20 to 50 Percent of [20] Wind Energy Coverage in the Danish Power System until 2025; Invited Keynote Paper; Pro-
KASSELER SYMPOSIUM ENERGIE-SYSTEMTECHNIK 2009
Fraunhofer IWES 2009 23
ceedings of the 7th international Workshop on Large Scale Integration of Wind Power and on Transmission Networks for Offshore Wind Farms; 26-28 May 2008, Madrid, Spain.
Ummels, B. C. 2009. Power System Operation with Large-Scale Wind Power in Liberalised Environ-[21] ments. Ph.D. thesis, Delft University of Technology, the Netherlands. 192 p
All Island Grid Study. 2008. Available at: http://www.dcenr.gov.ie/Energy/North-South+Co-[22] operation +in+the+Energy+Sector/All+Island+Electricity+Grid+Study.htm.
GE Energy, 2005. The Effects of Integrating Wind Power on Transmission System Planning, [23] Reliability, and Operations. Report on Phase 2, Prepared for The New York State Energy Research and Development Authority, City, State, Mar. 2005. Available at: http://www.nyiso.com/public/services/planning/special_studies.jsp
Holttinen, H., Saarikivi, P., Repo, S., Ikäheimo, J. & Koreneff, G. 2006. Prediction Errors [24] and Balancing Costs for Wind Power Production in Finland. Proceedings of 6th workshop on Offshore and Large Scale Integration of Wind Power, 25–26th October, 2006, Delft, Nether-lands.
Neimane, V. & Carlsson, F. 2008. A massive introduction of wind power. Changed mar-[25] ket conditions? Elforsk report 08:41. Available at: http://www.vindenergi.org/Vindforskrapporter/v_132.pdf.
Brandberg & Broman. 2007. Future trading with regulating power, Magnus Brandberg and [26] Niclas Broman, Master’s Thesis, Uppsala Universitet. An updated version, together with Nils-son, in Minerals & Energy - Raw Materials Report, Volume 23, Issue 1 March 2008, pp. 1–11.
Helander, A., Holttinen, H. & Paatero, J. 2009. Impact of wind power on the power system [27] imbalances in Finland. Submitted to IET Renewable Power Generation journal.
FGE/FGH/ISET: Bewertung der Optimierungspotenziale zur Integration der Stromerzeu-[28] gung aus Windenergie in das Übertragungsnetz. 2007. Available at: http://www.erneuer-bare-energien.de/inhalt/42024/4591/.
Holttinen, H. & Koreneff, G. 2007. Imbalance costs of wind power for a hydro power pro-[29] ducer in Finland. Proceedings. European Wind Energy Conference EWEC2007. Milan, Italy, 7–10 May, 2007. European Wind Energy Association, EWEA
Jansen, C. P. J. & de Groot R. A. C. T. 2003. Connect 6000 MW: Aansluiting van 6000 MW [30] offshore windvermogen op het Nederlandse elektriciteitsnet. Deel 2: Net op land. Kema 40330050-TDC 03-37074B. Oktober 2003.
Electricity Infrastructure Committee. 2008. Technical Report on the future expansion and [31] undergrounding of the electricity transmission grid; published by the Electricity Infrastruc-ture Committee, April 2008. Available at: http://www.energinet.dk
EA Energianalyse A/S: 50 percent wind in 2025 (In Danish), June 2007. Available at: http://[32] www.ea-energianalyse.dk/publications.html.
Mills, A., Wiser, R. & Porter, K. 2009. The Cost of Transmission for Wind Energy: A Review [33] of Transmission Planning Studies. LBNL-1471E. February 2009.
KASSELER SYMPOSIUM ENERGIE-SYSTEMTECHNIK 2009
24 Fraunhofer IWES 2009
Strbac, G. & Bopp, T. 2007. Value of fault ride through capability for wind farms. Report to [34] Ofgem (http://www.sedg.ac.uk), July 2004
Loutan et al., November 2007. Available at: http://www.uwig.org/CAISOIntRenewables [35] Nov2007.pdf.
Lange, M. & Focken, U. 2008. Studie zur Abschätzung der Netzkapazität in Mittel¬deutschland [36] in Wetterlagen mit hoher Windeinspeisung. 2008. Available at: http://www.erneuerbare-energien.de/inhalt/42006/20049/.
Korpås, M., Tande J. O., Uhlen, K. & Gjengedal, T. 2006. [37] Planning and operation of large wind farms in areas with limited power transfer capacity. European Wind Energy Confer-ence (EWEC), Athens, Greece, 27 February – 2 March 2006.
Matevosyan, J. 2006. Wind power integration in power system with transmission bottle-[38] necks. PhD study, KTH, Sweden. Available at: http://www.diva-portal.org/kth/theses/ab-stract.xsql?dbid=4108 .
Tande, J. O., Korpås, M., 2006. Impact of large scale wind power on system adequacy in [39] a regional hydro-based power system with weak interconnections. Proceedings of Nordic Wind Power Conference NWPC 2006, 22–23 May, 2006, Espoo, Finland.
ESBNG, ESB National Grid. 2004. Impact of wind power generation in Ireland on the opera-[40] tion of conventional plant and the economic implications. February 2004.
Van Hulle, F., Tande, J. O., Uhlen, K., Warland, L., Korpås, M., Meibom, P., Sørensen, P., [41] Morthorst, P. E., Cutululis, N., Larsen, H., Woyte, A., Verheij, F., Kleinschmidt, C., Mol-dovan, N., Holttinen, H., Lemström, B., Uski-Joutsenvuo, S., Gardner, P., Purchala, K., Tiedemann, A. & Kreutzkamp, P. 2009. Final Report TradeWind. (Available at http://www.trade-wind.eu.)
Söder, L. & Amelin M., 2008. A review of different methodologies used for calculation of [42] wind power capacity credit Power and Energy Society General Meeting – Conversion and Delivery of Electrical Energy in the 21st Century, 2008 IEEE 20–24 July 2008, pp. 1–5.
Amelin, M. 2008. Comparison of Capacity Credit Calculation Methods for Conventional [43] Power Plants and Wind Power, accepted in December 2008 for publication in IEEE Transac-tions on Power Systems.
KASSELER SYMPOSIUM ENERGIE-SYSTEMTECHNIK 2009
Fraunhofer IWES 2009 25
European Wind Integration Study (EWIS)
Dr. Wilhelm Winter
European Wind Integration Study (EWIS)1 The EWIS was initiated by 15 European Transmission System Operators (TSOs) through the TSO trade organization (ENTSO-E) to study integration of large-scale wind power into Europe’s elec-trical power systems. This study covers the technical, operational, economical, regulatory, and market aspects of integrating wind into the power system, particularly the transmission network. EWIS seeks the best use of the pan-European transmission network and seeks common European solutions to wind integration challenges.
Wind is Europe’s fastest growing energy source and European TSOs are already actively • addressing the issues associated with wind integration:
Establishing direct connections to large onshore and offshore wind farms;•
Planning for interconnection with increasingly active distribution networks;•
Reinforcing network pinch-points within and between national networks;•
Developing balancing arrangements through enhanced control arrangements and market • mechanisms;
Developing appropriate, harmonized grid codes to facilitate large-scale wind entry.•
Earlier EWIS results include identifi cation of mitigation options to accommodate renewables while maintaining reliability in the existing European transmission network. Currently, EWIS is analyzing scenarios for the year 2015, investigating new investments, control systems, and market incen-tives. This analysis permits researchers to assess the implications of the renewables targets for 2020.
EWIS quantifi ed the potential implications of the current representation of network limits in the European market by comparing scheduled inter-hub exchanges and the resulting network physical fl ows. This has been assessed by examining fl ow volumes, the scale of potential market curtail-ments, additional operational costs that would result from fl ow adjustments by system operator counter-trading, and the cost of mitigating network reinforcements.
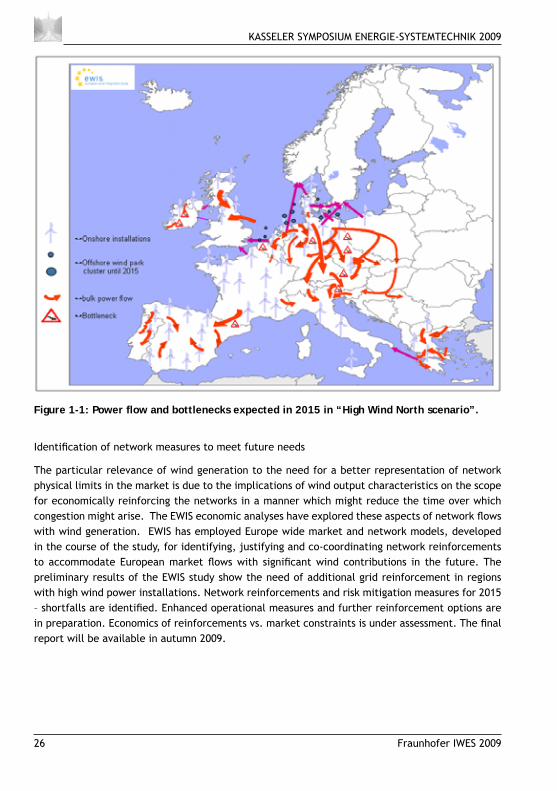
EWIS results from the scenarios show that high wind power production causes regional overloading of transmission lines (Figure 1-1). In this case, the regional surplus of wind generation results in large unscheduled fl ow through neighboring transmission systems.
In some regions, grid reinforcements are necessary, e.g., 850 km of new 380-kV overhead lines in Germany which are expected to be completed by 2015. To enhance the existing system fl exibility and increasing network capability measures such as corrective switching, phase shifters, and fl ex-ible line capacity management for relevant North-to-South transmission corridors are foreseen in addition to the national grid development plans.
KASSELER SYMPOSIUM ENERGIE-SYSTEMTECHNIK 2009
26 Fraunhofer IWES 2009
Identifi cation of network measures to meet future needs
The particular relevance of wind generation to the need for a better representation of network physical limits in the market is due to the implications of wind output characteristics on the scope for economically reinforcing the networks in a manner which might reduce the time over which congestion might arise. The EWIS economic analyses have explored these aspects of network fl ows with wind generation. EWIS has employed Europe wide market and network models, developed in the course of the study, for identifying, justifying and co-coordinating network reinforcements to accommodate European market fl ows with signifi cant wind contributions in the future. The preliminary results of the EWIS study show the need of additional grid reinforcement in regions with high wind power installations. Network reinforcements and risk mitigation measures for 2015 – shortfalls are identifi ed. Enhanced operational measures and further reinforcement options are in preparation. Economics of reinforcements vs. market constraints is under assessment. The fi nal report will be available in autumn 2009.
Figure 1-1: Power fl ow and bottlenecks expected in 2015 in “High Wind North scenario”.
KASSELER SYMPOSIUM ENERGIE-SYSTEMTECHNIK 2009
Fraunhofer IWES 2009 27
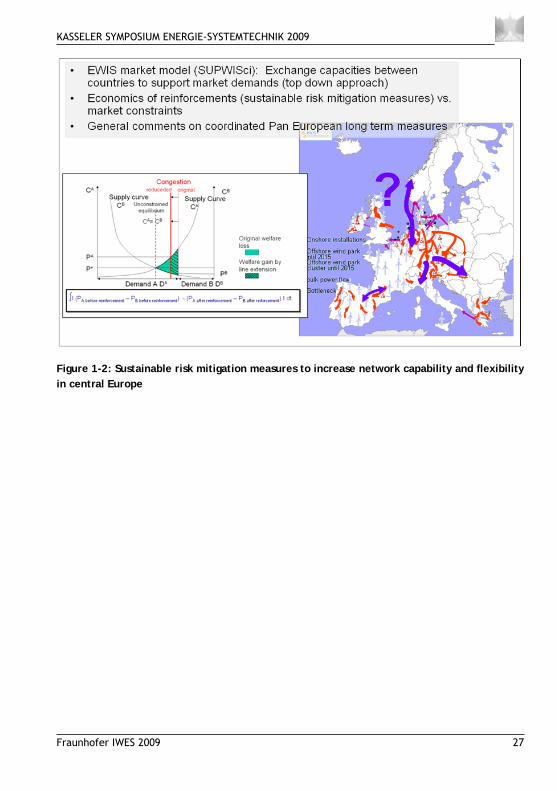
Figure 1-2: Sustainable risk mitigation measures to increase network capability and fl exibility in central Europe
KASSELER SYMPOSIUM ENERGIE-SYSTEMTECHNIK 2009
28 Fraunhofer IWES 2009
Developing Europe‘s power market for large-scale integration of wind power – Results from TradeWind
Frans Van Hulle (EWEA)
Introduction1 The paper discusses two issues of key importance for wind energy integration at European level, namely (a) the weak interconnectivity levels between European member states and (b) the infl ex-ibility and fragmented nature of the European power market. More specifi cally it focuses at the results of the recently completed TradeWind project [1], the fi rst study at European level of these issues in the context of ambitious wind power targets. Its objective was to make an assessment of the necessary interconnection upgrades and market design rules that enable to integrate ef-fi ciently the wind power capacities expected up to 2030 in Europe.
Interconnection and power market design is being addressed here in the perspective of the ‘conti-nental’ properties of wind as an energy source which does not see country borders. When looking Europe wide, wind speeds are not correlated, and the aggregated output of wind plants from dif-ferent geographical regions is smoothened (Figure 1), because ‘wind always blows somewhere’. The EU wide transmission grid can fulfi l the role of aggregating wind power from areas as large as possible. Additional benefi ts brought along include:
More accurate wind power forecast which allows a better management of the operation of • the system reserves for balancing, resulting in lower additional system operation costs;
Higher contribution of wind power to system adequacy and thus supply security, because • aggregation increases the availability of wind generation during peak demand and thus the capacity value of wind power in the overall generation mix.
TradeWind made an attempt at quantifying these effects, also in terms of reduction of electrical power generation costs at European level.
The TradeWind method and models2 The TradeWind project has based its conclusions on the outcomes of simulations of power fl ows in the transmission grid in Europe with stepwise increasing wind power capacity, up to 300 GW in 2030 (see Table 1). The dedicated market model used for this purpose idealized Europe to be just one large control zone, with a single grid and a perfectly functioning power market. The model calcu-lated for each hour of the year an optimal power fl ow in the European grid, dispatching the genera-tion units in such a way that the overall generation costs are minimized. TradeWind then specifi cally was interested in the power fl ows in the interconnectors. Full details of the model and assumptions can be accessed in [2]. Some important basic input data for the simulations are listed here:
Wind power capacity scenarios:• Scenarios (low, medium, high) of distributed wind power capacity for the years 2010, 2015, 2020 and 2030. The total capacities for the medium scenario correspond to recent EWEA scenarios [3].
KASSELER SYMPOSIUM ENERGIE-SYSTEMTECHNIK 2009
Fraunhofer IWES 2009 29
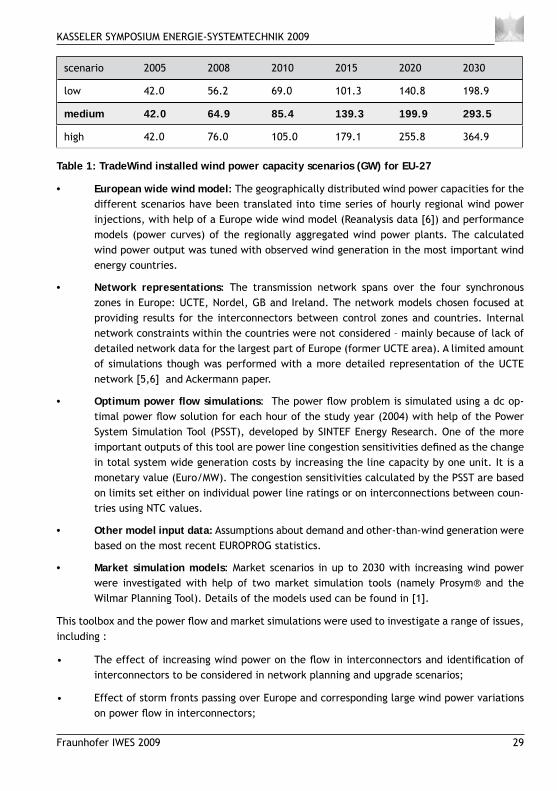
scenario 2005 2008 2010 2015 2020 2030
low 42.0 56.2 69.0 101.3 140.8 198.9
medium 42.0 64.9 85.4 139.3 199.9 293.5
high 42.0 76.0 105.0 179.1 255.8 364.9
Table 1: TradeWind installed wind power capacity scenarios (GW) for EU-27
European wide wind model:• The geographically distributed wind power capacities for the different scenarios have been translated into time series of hourly regional wind power injections, with help of a Europe wide wind model (Reanalysis data [6]) and performance models (power curves) of the regionally aggregated wind power plants. The calculated wind power output was tuned with observed wind generation in the most important wind energy countries.
Network representations:• The transmission network spans over the four synchronous zones in Europe: UCTE, Nordel, GB and Ireland. The network models chosen focused at providing results for the interconnectors between control zones and countries. Internal network constraints within the countries were not considered – mainly because of lack of detailed network data for the largest part of Europe (former UCTE area). A limited amount of simulations though was performed with a more detailed representation of the UCTE network [5,6] and Ackermann paper.
Optimum power fl ow simulations• : The power fl ow problem is simulated using a dc op-timal power fl ow solution for each hour of the study year (2004) with help of the Power System Simulation Tool (PSST), developed by SINTEF Energy Research. One of the more important outputs of this tool are power line congestion sensitivities defi ned as the change in total system wide generation costs by increasing the line capacity by one unit. It is a monetary value (Euro/MW). The congestion sensitivities calculated by the PSST are based on limits set either on individual power line ratings or on interconnections between coun-tries using NTC values.
Other model input data:• Assumptions about demand and other-than-wind generation were based on the most recent EUROPROG statistics.
Market simulation models• : Market scenarios in up to 2030 with increasing wind power were investigated with help of two market simulation tools (namely Prosym® and the Wilmar Planning Tool). Details of the models used can be found in [1].
This toolbox and the power fl ow and market simulations were used to investigate a range of issues, including :
The effect of increasing wind power on the fl ow in interconnectors and identifi cation of • interconnectors to be considered in network planning and upgrade scenarios;
Effect of storm fronts passing over Europe and corresponding large wind power variations • on power fl ow in interconnectors;
KASSELER SYMPOSIUM ENERGIE-SYSTEMTECHNIK 2009
30 Fraunhofer IWES 2009
Predictability of the power fl ows in interconnectors, given the forecast errors of wind • power;
Increases of the capacity value of wind power when aggregating the output from different • countries and zones;
Economic benefi ts of upgrading heavily congested connectors and order of magnitude for • allowable investments in transmission;
Transmission topology enabling an effective connection of the offshore wind power gen-• eration to the mainland transmission network;
Economic benefi ts/impacts of amount of interconnector capacity, the market gate closure • time (deadline for rescheduling of dispatch decisions) and with the extension of the overall market area, and consequentially:
Essential design characteristics for the power market, with increasing wind energy pen-• etration levels in Europe.
Findings of TradeWind3
The smoothing effect3.1
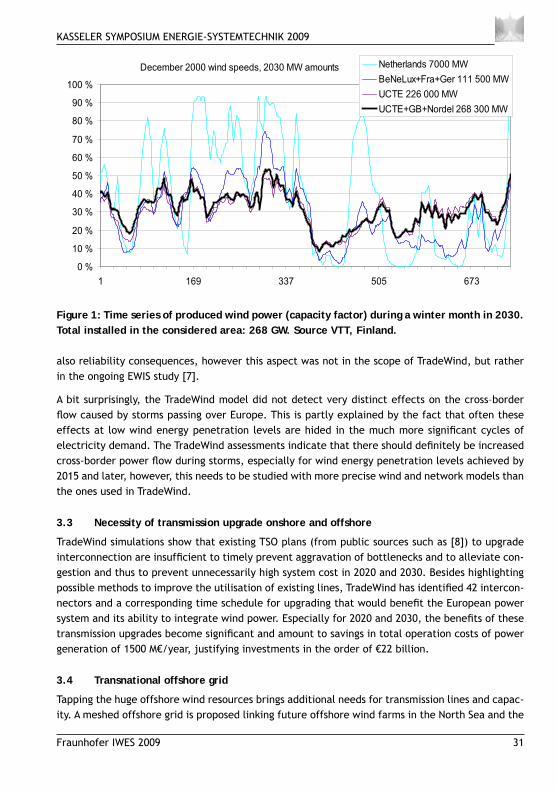
The smoothing effect of aggregating wind power from increasingly larger areas in Europe on the variations during a typical winter month is illustrated in Figure 2. This effect was simulated with wind power capacities as forecasted in 2030.
The average capacity factor for the period shown in the fi gure is around 30%. Approximately the same value was found for the capacity factor in 2020 during high load situations. The aggregated capacity factor of all wind power installed in Europe during high load in the year 2020 is found to be 20% higher than the annual average capacity factor (24% in 2020). This seemingly ‘load follow-ing behaviour’ of wind power is certainly benefi cial for fuel and CO2 saving. However, as shown by Figure 1, signifi cant variations of the aggregated wind power remain. How much conventional capacity in Europe effectively can be replaced by wind power is briefl y discussed below. The key-word for capturing these smoothing benefi ts is: interconnection.
Increased cross-border power fl ows3.2
Increasing wind power capacity in Europe will inevitably lead to increased cross border energy ex-changes, especially with installed capacities expected in 2020 and beyond. The TradeWind simula-tions show that the presently seen cross-border transmission bottlenecks will become more severe in the future. The fact that wind power cannot be perfectly predicted leads to higher uncertainty in cross border fl ows and thus will further exacerbate these congestions. The increased bottlenecks lead to restricted access to cheaper generation resources (such as wind power) and consequently to higher electricity prices. Simulations with a more detailed UCTE network, allowing to take into account internal network constraints, helped to identify regions needing transmission upgrade to avoid signifi cant wind power curtailment [5,6]. Diminishing transmission capacity margins have
KASSELER SYMPOSIUM ENERGIE-SYSTEMTECHNIK 2009
Fraunhofer IWES 2009 31
also reliability consequences, however this aspect was not in the scope of TradeWind, but rather in the ongoing EWIS study [7].
A bit surprisingly, the TradeWind model did not detect very distinct effects on the cross–border fl ow caused by storms passing over Europe. This is partly explained by the fact that often these effects at low wind energy penetration levels are hided in the much more signifi cant cycles of electricity demand. The TradeWind assessments indicate that there should defi nitely be increased cross-border power fl ow during storms, especially for wind energy penetration levels achieved by 2015 and later, however, this needs to be studied with more precise wind and network models than the ones used in TradeWind.
Necessity of transmission upgrade onshore and offshore3.3
TradeWind simulations show that existing TSO plans (from public sources such as [8]) to upgrade interconnection are insuffi cient to timely prevent aggravation of bottlenecks and to alleviate con-gestion and thus to prevent unnecessarily high system cost in 2020 and 2030. Besides highlighting possible methods to improve the utilisation of existing lines, TradeWind has identifi ed 42 intercon-nectors and a corresponding time schedule for upgrading that would benefi t the European power system and its ability to integrate wind power. Especially for 2020 and 2030, the benefi ts of these transmission upgrades become signifi cant and amount to savings in total operation costs of power generation of 1500 M€/year, justifying investments in the order of €22 billion.
Transnational offshore grid3.4
Tapping the huge offshore wind resources brings additional needs for transmission lines and capac-ity. A meshed offshore grid is proposed linking future offshore wind farms in the North Sea and the
December 2000 wind speeds, 2030 MW amounts
0 %
10 %
20 %
30 %
40 %
50 %
60 %
70 %
80 %
90 %
100 %
1 169 337 505 673
Netherlands 7000 MW
BeNeLux+Fra+Ger 111 500 MW
UCTE 226 000 MW
UCTE+GB+Nordel 268 300 MW
Figure 1: Time series of produced wind power (capacity factor) during a winter month in 2030. Total installed in the considered area: 268 GW. Source VTT, Finland.
KASSELER SYMPOSIUM ENERGIE-SYSTEMTECHNIK 2009
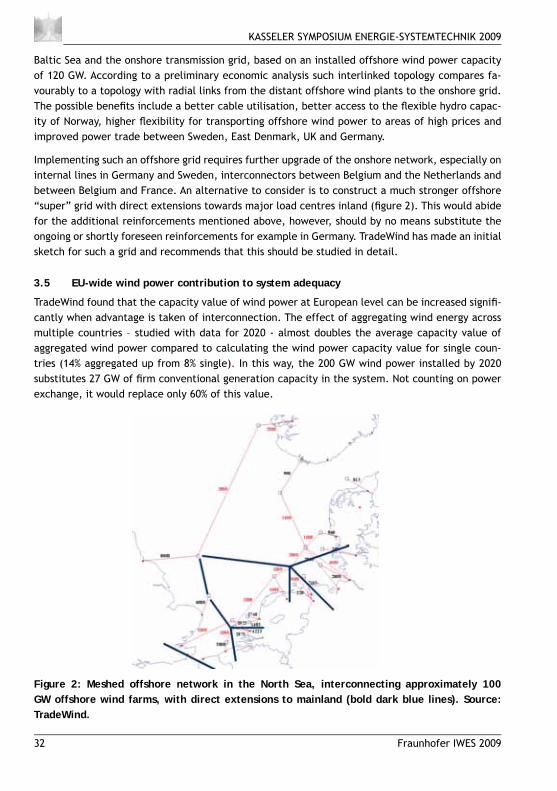
32 Fraunhofer IWES 2009
Baltic Sea and the onshore transmission grid, based on an installed offshore wind power capacity of 120 GW. According to a preliminary economic analysis such interlinked topology compares fa-vourably to a topology with radial links from the distant offshore wind plants to the onshore grid. The possible benefi ts include a better cable utilisation, better access to the fl exible hydro capac-ity of Norway, higher fl exibility for transporting offshore wind power to areas of high prices and improved power trade between Sweden, East Denmark, UK and Germany.
Implementing such an offshore grid requires further upgrade of the onshore network, especially on internal lines in Germany and Sweden, interconnectors between Belgium and the Netherlands and between Belgium and France. An alternative to consider is to construct a much stronger offshore “super” grid with direct extensions towards major load centres inland (fi gure 2). This would abide for the additional reinforcements mentioned above, however, should by no means substitute the ongoing or shortly foreseen reinforcements for example in Germany. TradeWind has made an initial sketch for such a grid and recommends that this should be studied in detail.
EU-wide wind power contribution to system adequacy3.5
TradeWind found that the capacity value of wind power at European level can be increased signifi -cantly when advantage is taken of interconnection. The effect of aggregating wind energy across multiple countries – studied with data for 2020 - almost doubles the average capacity value of aggregated wind power compared to calculating the wind power capacity value for single coun-tries (14% aggregated up from 8% single). In this way, the 200 GW wind power installed by 2020 substitutes 27 GW of fi rm conventional generation capacity in the system. Not counting on power exchange, it would replace only 60% of this value.
Figure 2: Meshed offshore network in the North Sea, interconnecting approximately 100 GW offshore wind farms, with direct extensions to mainland (bold dark blue lines). Source: TradeWind.
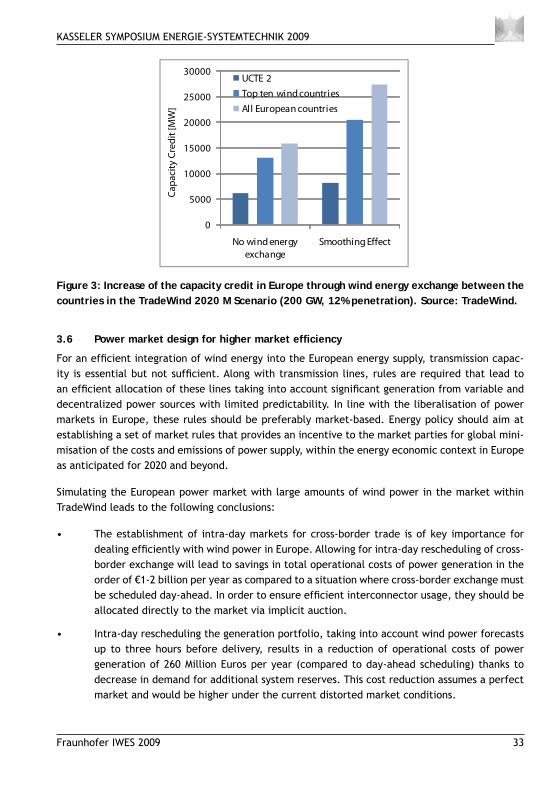
KASSELER SYMPOSIUM ENERGIE-SYSTEMTECHNIK 2009
Fraunhofer IWES 2009 33
0
5000
10000
15000
20000
25000
30000
No wind energy
exchange
Smoothing Effect
Ca
pa
city
Cre
dit
[M
W]
UCTE 2
Top ten wind countries
All European countries
Figure 3: Increase of the capacity credit in Europe through wind energy exchange between the countries in the TradeWind 2020 M Scenario (200 GW, 12% penetration). Source: TradeWind.
Power market design for higher market effi ciency3.6
For an effi cient integration of wind energy into the European energy supply, transmission capac-ity is essential but not suffi cient. Along with transmission lines, rules are required that lead to an effi cient allocation of these lines taking into account signifi cant generation from variable and decentralized power sources with limited predictability. In line with the liberalisation of power markets in Europe, these rules should be preferably market-based. Energy policy should aim at establishing a set of market rules that provides an incentive to the market parties for global mini-misation of the costs and emissions of power supply, within the energy economic context in Europe as anticipated for 2020 and beyond.
Simulating the European power market with large amounts of wind power in the market within TradeWind leads to the following conclusions:
The establishment of intra-day markets for cross-border trade is of key importance for • dealing effi ciently with wind power in Europe. Allowing for intra-day rescheduling of cross-border exchange will lead to savings in total operational costs of power generation in the order of €1-2 billion per year as compared to a situation where cross-border exchange must be scheduled day-ahead. In order to ensure effi cient interconnector usage, they should be allocated directly to the market via implicit auction.
Intra-day rescheduling the generation portfolio, taking into account wind power forecasts • up to three hours before delivery, results in a reduction of operational costs of power generation of 260 Million Euros per year (compared to day-ahead scheduling) thanks to decrease in demand for additional system reserves. This cost reduction assumes a perfect market and would be higher under the current distorted market conditions.
KASSELER SYMPOSIUM ENERGIE-SYSTEMTECHNIK 2009
34 Fraunhofer IWES 2009
Improving the interconnection in Europe is a prerequisite to improve the functioning of the • European internal electricity market. In order for the regional markets to function well, the power fl ow between the individual countries should be as little as possible hampered by physical constraints. Furthermore, implicit auctioning should be used on a wide scale for allocating cross-border capacity (i.e. market coupling, market splitting etc.).
SummaryIntegrating 300 GW of wind power and more in European power systems is feasible. As a gen-eral rule the power system needs to become more fl exible and better interconnected, and this – amongst other measures - supposes substantial efforts in upgrading of transmission and imple-menting of faster and more aggregated power markets. This is in line with the present policy agen-da of Europe, however there is a need for concrete implementation plans and proper incentives. The TradeWind project proposes concrete recommendations to be taken up by the stakeholders: investors, TSOs, regulators, authorities.
TradeWind was a fi rst attempt of study at European level, and for several aspects only made a fi rst order approach, an important simplifi cation being the assumption of unconstrained power fl ow within the countries. Further studies are recommended with more detailed network repre-sentations, to provide a sound basis for short and long term transmission upgrades enabling the economic large-scale integration of variable output renewables. Several other aspects should be entered in the equation, such as the role of other renewables, demand side management, and the interactions between transmission and more active and smart distribution grids.
References Van Hulle, F., Tande, J. O., Uhlen, K., Warland, L., Korpås, M., Meibom, P., Sørensen, 1.
P., Morthorst, P. E., Cutululis, N., Larsen, H., Woyte, A., Verheij, F., Kleinschmidt, C., Moldovan, N., Holttinen, H.,Lemström, B., Uski Joutsenvuo, S., Gardner, P., Purchala, K.,Tiedemann, A. & Kreutzkamp, P. 2009. Final Report TradeWind. (Available at http://www.trade-wind.eu.)
Website TradeWind: 2. www.trade-wind.eu
EWEA. Pure Power. Wind Energy Scenarios up to 2030. March 2008 3.
NCEP_Reanalysis 2 data provided by the NOAA/OAR/ESRL PSD, Boulder, Colorado, USA, 4. from their Web site at http://www.cdc.noaa.gov
Beharrysingh, S., Van Hulle, F., 2009: European electrical transmission system export 5. capability for increasing wind power penetration. 9th International Workshop on Wind Integration, Bremen October 2009 (to be published)

KASSELER SYMPOSIUM ENERGIE-SYSTEMTECHNIK 2009
Fraunhofer IWES 2009 35
Beharrysingh, S. Simulations of cross-border power fl ows in the European transmission net-6. work with the large scale integration of wind energy using a detailed UCTE network model. M.Sc. Thesis, CREST, Loughborough University, Leicestershire, 30 January 2009. available from www.trade-wind.eu
Website EWIS study: www.wind-integration.eu7.
UCTE. Transmission Development Plan 2008 http://www.ucte.org/_library/otherreports/8. tdp08_report_ucte.pdf
AcknowledgementsThe project partners of TradeWind (Sintef Energiforskning AS, Risø– DTU, 3E NV, Kema Nederland BV, Technical Research Centre of Finland (VTT), Garrad Hassan and Partners Ltd, Tractebel Engi-neering, Deutsche Energie-Agentur (dena)) are gratefully acknowledged for supplying the informa-tion which has been summarized in this paper. The TradeWind project was sponsored by the EACI in the programme Intelligent Energy Europe under grant number EIE/06/022/SI2.442659.
KASSELER SYMPOSIUM ENERGIE-SYSTEMTECHNIK 2009
36 Fraunhofer IWES 2009
Storage and transport capacities in Europe for a full renewable power supply system
Clemens Hoffmann, Siemens AG, GermanyCo-authors: Martin Greiner(1), Lueder Von Bremen(2), Kaspar Knorr(2), Stefan Bofi nger(2), Markus Speckmann(2), Kurt Rohrig (2) (1) Siemens AG, (2) ISET e.V.
Abstract
At a further increase of the share of renewable energy generation the power fl uctuations of these sources will become an important feature in the electrical networks and in all energy supply sys-tems. For the planning of a future energy system and particularly the layout of energy transport and energy storage an accurate, quantitative understanding of the dynamics of the power fl ows is a necessary prerequisite. Since balancing of mismatches of load and generation by transporting electricity is in most scenarios cheaper than balancing by storage the two aspects – local storage – and –long range transport – have to be analyzed in common. This has been exemplarily done for the European integrated network. Weather data with high spatial resolution and a time resolution of one hour spanning 8 years were convoluted with extension scenarios for wind and solar energy. The spatio-temporal patterns of generation and consumption in Europe constitute the basis for the calculation of important characteristic quantities such as the necessary total storage size, the maximum momentary storage power and the loading of the transport capacities. From these num-bers fi rst technological consequences of the future transport and storage system are inferred.
Introduction
In terms of electrical power it is expected that the major growth in renewable supply will be provided by wind and solar energy. Wind and solar energy are fl uctuating resources and can not be scheduled like conventional power plants. However, variability of wind and solar power decreases with increasing scale of the power supply system as many short-term fl uctuations are balanced by spatial smoothing effects. The combination of wind and solar exhibits potential to further reduce temporal variability on longer time-scales. Yet there will be a remaining probability that the re-sidual imbalance between demand and supply has to be compensated from energy storage. The probability distribution of the residual imbalances has to be evaluated as accurately as possible since imbalances even in the percent range constitute enormous absolute energy storage sizes. The planning of the infrastructure of the future power system can therefore only be done by simu-lation of weather related wind and solar energy generation over a long time in combination with the constraint to meet the demand at any time.
The baseline scenario in this study is the full-supply scenario with wind and solar power for Europe, i.e. the energy yield from wind turbines and solar (PV) plants totals the annual consumption in Europe.
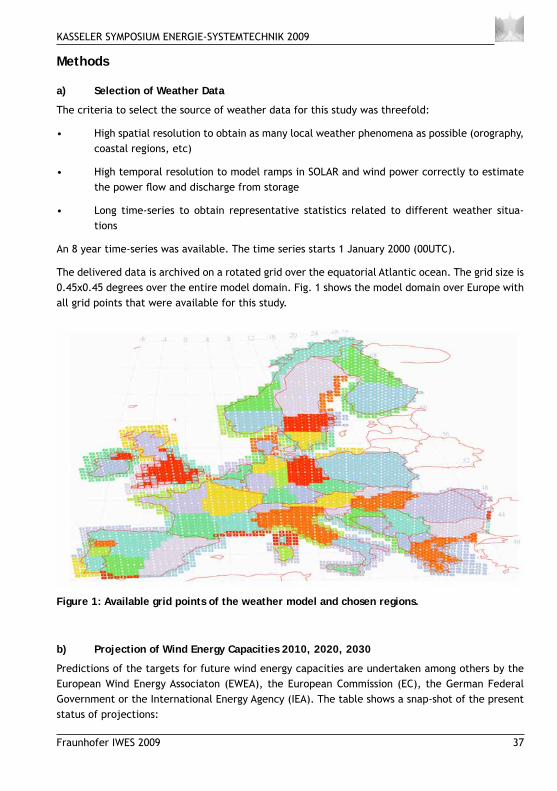
KASSELER SYMPOSIUM ENERGIE-SYSTEMTECHNIK 2009
Fraunhofer IWES 2009 37
Methods
a) Selection of Weather Data
The criteria to select the source of weather data for this study was threefold:
High spatial resolution to obtain as many local weather phenomena as possible (orography, • coastal regions, etc)
High temporal resolution to model ramps in SOLAR and wind power correctly to estimate • the power fl ow and discharge from storage
Long time-series to obtain representative statistics related to different weather situa-• tions
An 8 year time-series was available. The time series starts 1 January 2000 (00UTC).
The delivered data is archived on a rotated grid over the equatorial Atlantic ocean. The grid size is 0.45x0.45 degrees over the entire model domain. Fig. 1 shows the model domain over Europe with all grid points that were available for this study.
Figure 1: Available grid points of the weather model and chosen regions.
b) Projection of Wind Energy Capacities 2010, 2020, 2030
Predictions of the targets for future wind energy capacities are undertaken among others by the European Wind Energy Associaton (EWEA), the European Commission (EC), the German Federal Government or the International Energy Agency (IEA). The table shows a snap-shot of the present status of projections:
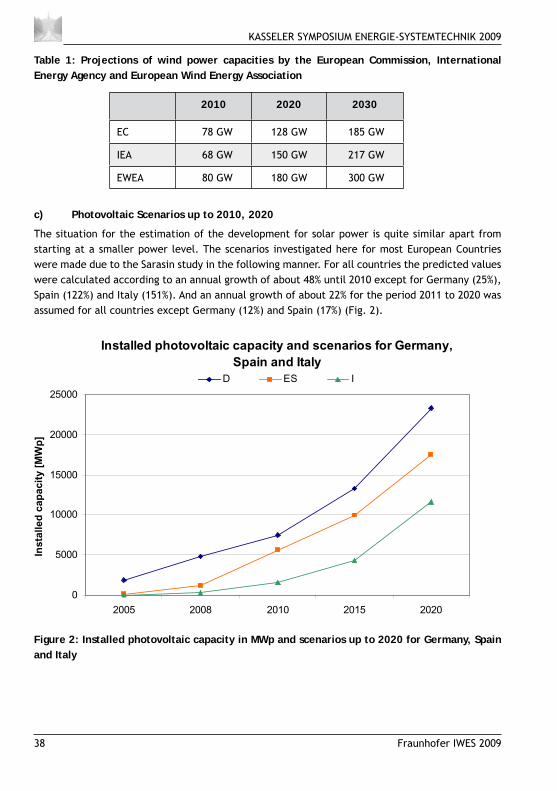
KASSELER SYMPOSIUM ENERGIE-SYSTEMTECHNIK 2009
38 Fraunhofer IWES 2009
Table 1: Projections of wind power capacities by the European Commission, International Energy Agency and European Wind Energy Association
2010 2020 2030
EC 78 GW 128 GW 185 GW
IEA 68 GW 150 GW 217 GW
EWEA 80 GW 180 GW 300 GW
c) Photovoltaic Scenarios up to 2010, 2020
The situation for the estimation of the development for solar power is quite similar apart from starting at a smaller power level. The scenarios investigated here for most European Countries were made due to the Sarasin study in the following manner. For all countries the predicted values were calculated according to an annual growth of about 48% until 2010 except for Germany (25%), Spain (122%) and Italy (151%). And an annual growth of about 22% for the period 2011 to 2020 was assumed for all countries except Germany (12%) and Spain (17%) (Fig. 2).
Installed photovoltaic capacity and scenarios for Germany,
Spain and Italy
0
5000
10000
15000
20000
25000
2005 2008 2010 2015 2020
Insta
lled
cap
acit
y [
MW
p]
D ES I
Figure 2: Installed photovoltaic capacity in MWp and scenarios up to 2020 for Germany, Spain and Italy
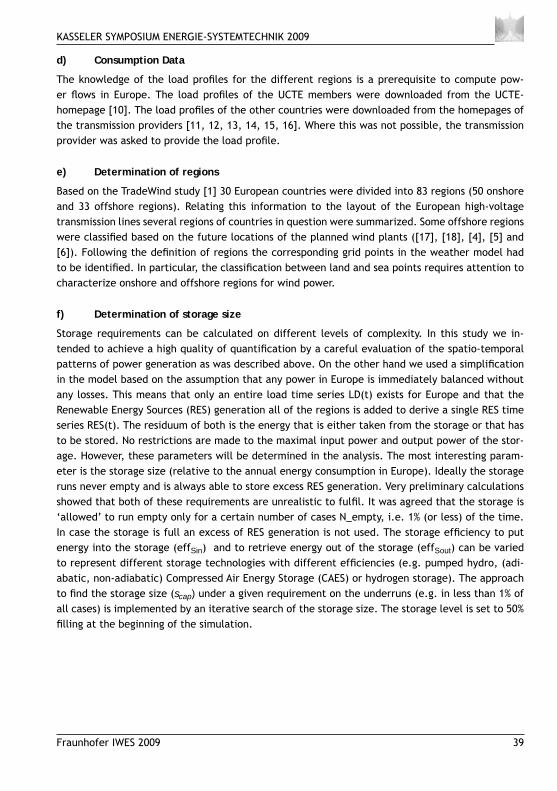
KASSELER SYMPOSIUM ENERGIE-SYSTEMTECHNIK 2009
Fraunhofer IWES 2009 39
d) Consumption Data
The knowledge of the load profi les for the different regions is a prerequisite to compute pow-er fl ows in Europe. The load profi les of the UCTE members were downloaded from the UCTE-homepage [10]. The load profi les of the other countries were downloaded from the homepages of the transmission providers [11, 12, 13, 14, 15, 16]. Where this was not possible, the transmission provider was asked to provide the load profi le.
e) Determination of regions
Based on the TradeWind study [1] 30 European countries were divided into 83 regions (50 onshore and 33 offshore regions). Relating this information to the layout of the European high-voltage transmission lines several regions of countries in question were summarized. Some offshore regions were classifi ed based on the future locations of the planned wind plants ([17], [18], [4], [5] and [6]). Following the defi nition of regions the corresponding grid points in the weather model had to be identifi ed. In particular, the classifi cation between land and sea points requires attention to characterize onshore and offshore regions for wind power.
f) Determination of storage size
Storage requirements can be calculated on different levels of complexity. In this study we in-tended to achieve a high quality of quantifi cation by a careful evaluation of the spatio-temporal patterns of power generation as was described above. On the other hand we used a simplifi cation in the model based on the assumption that any power in Europe is immediately balanced without any losses. This means that only an entire load time series LD(t) exists for Europe and that the Renewable Energy Sources (RES) generation all of the regions is added to derive a single RES time series RES(t). The residuum of both is the energy that is either taken from the storage or that has to be stored. No restrictions are made to the maximal input power and output power of the stor-age. However, these parameters will be determined in the analysis. The most interesting param-eter is the storage size (relative to the annual energy consumption in Europe). Ideally the storage runs never empty and is always able to store excess RES generation. Very preliminary calculations showed that both of these requirements are unrealistic to fulfi l. It was agreed that the storage is ‘allowed’ to run empty only for a certain number of cases N_empty, i.e. 1% (or less) of the time. In case the storage is full an excess of RES generation is not used. The storage effi ciency to put energy into the storage (effSin) and to retrieve energy out of the storage (effSout) can be varied to represent different storage technologies with different effi ciencies (e.g. pumped hydro, (adi-abatic, non-adiabatic) Compressed Air Energy Storage (CAES) or hydrogen storage). The approach to fi nd the storage size (scap) under a given requirement on the underruns (e.g. in less than 1% of all cases) is implemented by an iterative search of the storage size. The storage level is set to 50% fi lling at the beginning of the simulation.
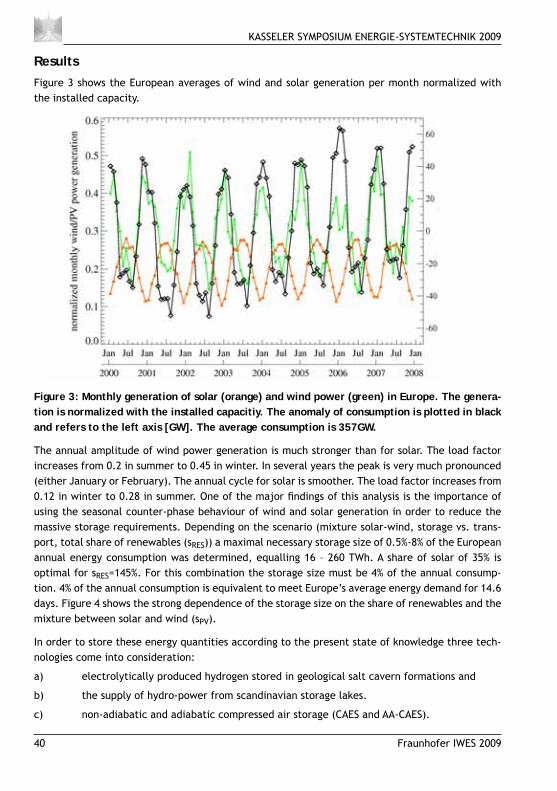
KASSELER SYMPOSIUM ENERGIE-SYSTEMTECHNIK 2009
40 Fraunhofer IWES 2009
ResultsFigure 3 shows the European averages of wind and solar generation per month normalized with the installed capacity.
Figure 3: Monthly generation of solar (orange) and wind power (green) in Europe. The genera-tion is normalized with the installed capacitiy. The anomaly of consumption is plotted in black and refers to the left axis [GW]. The average consumption is 357GW.
The annual amplitude of wind power generation is much stronger than for solar. The load factor increases from 0.2 in summer to 0.45 in winter. In several years the peak is very much pronounced (either January or February). The annual cycle for solar is smoother. The load factor increases from 0.12 in winter to 0.28 in summer. One of the major fi ndings of this analysis is the importance of using the seasonal counter-phase behaviour of wind and solar generation in order to reduce the massive storage requirements. Depending on the scenario (mixture solar-wind, storage vs. trans-port, total share of renewables (sRES)) a maximal necessary storage size of 0.5%-8% of the European annual energy consumption was determined, equalling 16 – 260 TWh. A share of solar of 35% is optimal for sRES=145%. For this combination the storage size must be 4% of the annual consump-tion. 4% of the annual consumption is equivalent to meet Europe’s average energy demand for 14.6 days. Figure 4 shows the strong dependence of the storage size on the share of renewables and the mixture between solar and wind (sPV).
In order to store these energy quantities according to the present state of knowledge three tech-nologies come into consideration:
a) electrolytically produced hydrogen stored in geological salt cavern formations and
b) the supply of hydro-power from scandinavian storage lakes.
c) non-adiabatic and adiabatic compressed air storage (CAES and AA-CAES).
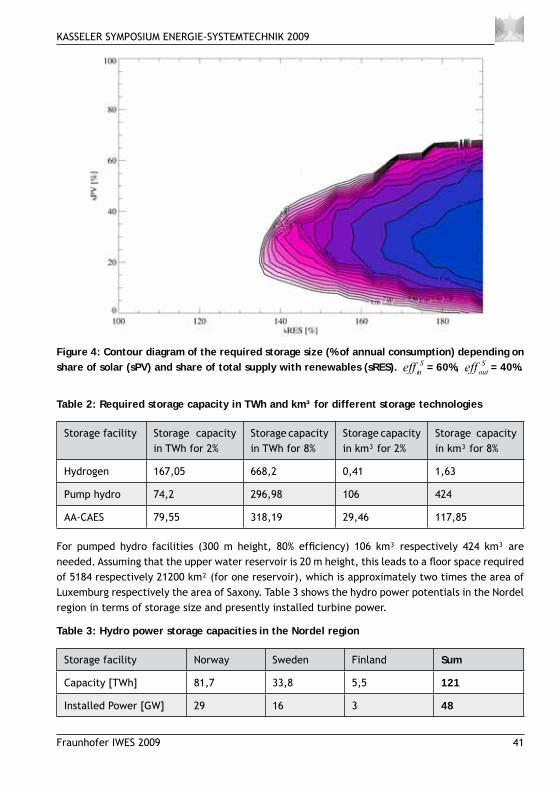
KASSELER SYMPOSIUM ENERGIE-SYSTEMTECHNIK 2009
Fraunhofer IWES 2009 41
Table 2: Required storage capacity in TWh and km³ for different storage technologies
Storage facility Storage capacity in TWh for 2%
Storage capacity in TWh for 8%
Storage capacity in km³ for 2%
Storage capacity in km³ for 8%
Hydrogen 167,05 668,2 0,41 1,63
Pump hydro 74,2 296,98 106 424
AA-CAES 79,55 318,19 29,46 117,85
For pumped hydro facilities (300 m height, 80% effi ciency) 106 km³ respectively 424 km³ are needed. Assuming that the upper water reservoir is 20 m height, this leads to a fl oor space required of 5184 respectively 21200 km² (for one reservoir), which is approximately two times the area of Luxemburg respectively the area of Saxony. Table 3 shows the hydro power potentials in the Nordel region in terms of storage size and presently installed turbine power.
Table 3: Hydro power storage capacities in the Nordel region
Storage facility Norway Sweden Finland Sum
Capacity [TWh] 81,7 33,8 5,5 121
Installed Power [GW] 29 16 3 48
Figure 4: Contour diagram of the required storage size (% of annual consumption) depending on share of solar (sPV) and share of total supply with renewables (sRES). S
ineff = 60%, Souteff = 40%.
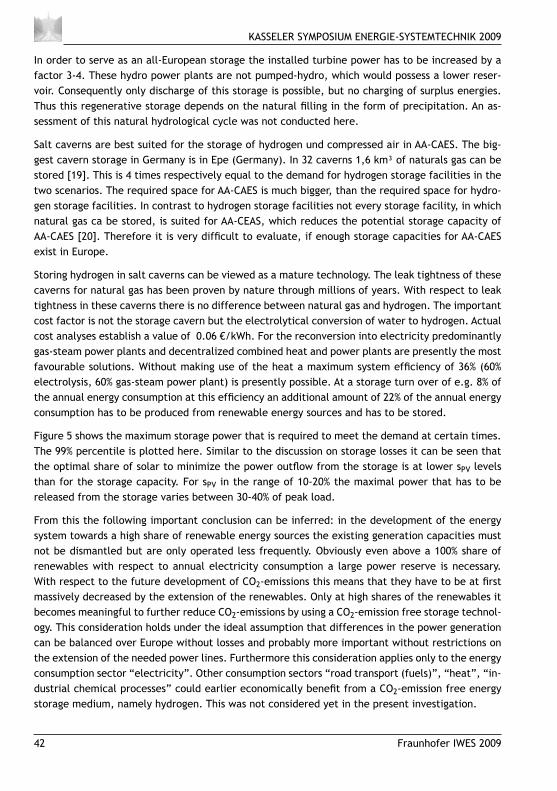
KASSELER SYMPOSIUM ENERGIE-SYSTEMTECHNIK 2009
42 Fraunhofer IWES 2009
In order to serve as an all-European storage the installed turbine power has to be increased by a factor 3-4. These hydro power plants are not pumped-hydro, which would possess a lower reser-voir. Consequently only discharge of this storage is possible, but no charging of surplus energies. Thus this regenerative storage depends on the natural fi lling in the form of precipitation. An as-sessment of this natural hydrological cycle was not conducted here.
Salt caverns are best suited for the storage of hydrogen und compressed air in AA-CAES. The big-gest cavern storage in Germany is in Epe (Germany). In 32 caverns 1,6 km³ of naturals gas can be stored [19]. This is 4 times respectively equal to the demand for hydrogen storage facilities in the two scenarios. The required space for AA-CAES is much bigger, than the required space for hydro-gen storage facilities. In contrast to hydrogen storage facilities not every storage facility, in which natural gas ca be stored, is suited for AA-CEAS, which reduces the potential storage capacity of AA-CAES [20]. Therefore it is very diffi cult to evaluate, if enough storage capacities for AA-CAES exist in Europe.
Storing hydrogen in salt caverns can be viewed as a mature technology. The leak tightness of these caverns for natural gas has been proven by nature through millions of years. With respect to leak tightness in these caverns there is no difference between natural gas and hydrogen. The important cost factor is not the storage cavern but the electrolytical conversion of water to hydrogen. Actual cost analyses establish a value of 0.06 €/kWh. For the reconversion into electricity predominantly gas-steam power plants and decentralized combined heat and power plants are presently the most favourable solutions. Without making use of the heat a maximum system effi ciency of 36% (60% electrolysis, 60% gas-steam power plant) is presently possible. At a storage turn over of e.g. 8% of the annual energy consumption at this effi ciency an additional amount of 22% of the annual energy consumption has to be produced from renewable energy sources and has to be stored.
Figure 5 shows the maximum storage power that is required to meet the demand at certain times. The 99% percentile is plotted here. Similar to the discussion on storage losses it can be seen that the optimal share of solar to minimize the power outfl ow from the storage is at lower sPV levels than for the storage capacity. For sPV in the range of 10-20% the maximal power that has to be released from the storage varies between 30-40% of peak load.
From this the following important conclusion can be inferred: in the development of the energy system towards a high share of renewable energy sources the existing generation capacities must not be dismantled but are only operated less frequently. Obviously even above a 100% share of renewables with respect to annual electricity consumption a large power reserve is necessary. With respect to the future development of CO2-emissions this means that they have to be at fi rst massively decreased by the extension of the renewables. Only at high shares of the renewables it becomes meaningful to further reduce CO2-emissions by using a CO2-emission free storage technol-ogy. This consideration holds under the ideal assumption that differences in the power generation can be balanced over Europe without losses and probably more important without restrictions on the extension of the needed power lines. Furthermore this consideration applies only to the energy consumption sector “electricity”. Other consumption sectors “road transport (fuels)”, “heat”, “in-dustrial chemical processes” could earlier economically benefi t from a CO2-emission free energy storage medium, namely hydrogen. This was not considered yet in the present investigation.
KASSELER SYMPOSIUM ENERGIE-SYSTEMTECHNIK 2009
Fraunhofer IWES 2009 43
Therefore in subsequent work this analysis has to be completed by taking into account the cross-sectoral and multi-utility aspects of the overall energy supply system and the regional restrictions on setting up network extensions and/or storage plants. By careful cost analyses an evolutionary path has to be constructed to pave an economically optimal path into the future.
Literature[1] G van der Toorn: EU Tradewind Work Package 2, Wind Power Scenarios, WP2.1: Wind Power
Capacity Data Collection, Contract N° :EIE/06/022/SI2.442659, 27.04.2007
[2] European Wind Energy Association: Pure Power - Wind Energy Scenarios up to 2030, March 2008
[3] EWEA: Wind directions, Focus on offshore - Projects Stack Up in Europe’s Seas, July/August 2003
[4] http://www.iwr.de/
[5] http://www.offshorecenter.dk/offshorewindfarms.asp
[6] http://www.thecrownestate.co.uk/offshore_wind_energy
[7] EPIA: Global Market Outlook for Photovoltaics until 2012, February 2008
Figure 5: As Fig. 4, but contour lines show the maximal power (99% percentile) that is required for balancing and must be provided by the storage in % of peak load.
KASSELER SYMPOSIUM ENERGIE-SYSTEMTECHNIK 2009
44 Fraunhofer IWES 2009
[8] EurObserv’ER: Photovoltaic Energy Barometer, April 2008
[9] Sarasin Nachhaltigkeitsstudie: Solarenergie 2007 – Der Höhenfl ug der Solarindustrie hält an, November 2007
[10] http://www.ucte.org/resources/dataportal/consumption/ (08.07.2008)
[11] http://www.nationalgrid.com/uk/Electricity/Data/Demand+Data/ (08.07.2008)
[12] http://www.statnett.no/default.aspx?ChannelID=1367 (08.07.2008)
[13] http://www.energinet.dk/en/menu/Market/Download+of+Market+Data/Download+of+Market+Data.htm (08.07.2008)
[14] http://emw.svk.se/docs/schablonweb/default.htm (08.07.2008)
[15] http://www.fingrid.fi/portal/in_english/electricity_market/load_and_generation/ (08.07.2008)
[16] http://www.soni.ltd.uk/ (08.07.2008)
[17] EWEA: Delivering Offshore Wind Power in Europe, 2007
[18] EWEA: European Wind Farms – La Tene Maps, March 2008
[19] Sedlacek, R., “Untertage-Gasspeicherung in Deutschland”, Erdöl Erdgas Kohle 123. Jg. 2007, Heft 11
[20] Private Communcation F. Crotogino, KBB-Underground-Technologies
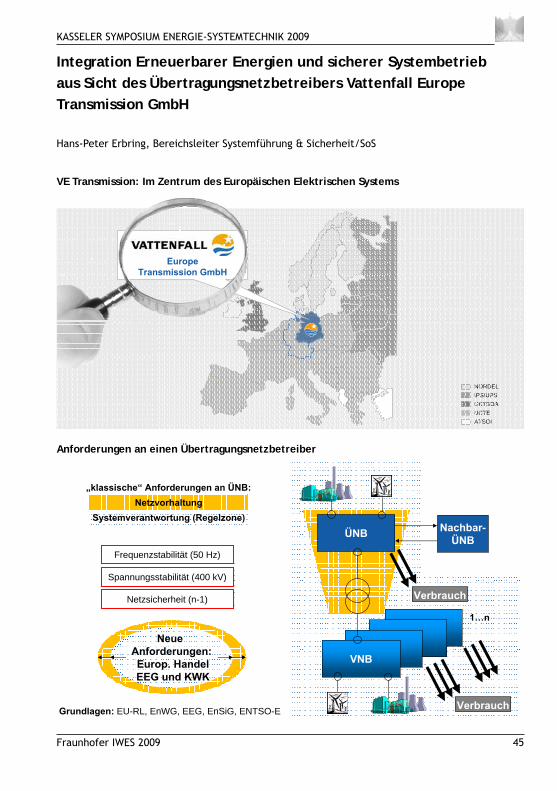
KASSELER SYMPOSIUM ENERGIE-SYSTEMTECHNIK 2009
Fraunhofer IWES 2009 45
Integration Erneuerbarer Energien und sicherer Systembetrieb aus Sicht des Übertragungsnetzbetreibers Vattenfall Europe Transmission GmbH
Hans-Peter Erbring, Bereichsleiter Systemführung & Sicherheit/SoS
VE Transmission: Im Zentrum des Europäischen Elektrischen Systems
Anforderungen an einen Übertragungsnetzbetreiber
NORDELIPS/UPSUKTSOAUCTEATSOI
Europe Transmission GmbH
ÜNB Nachbar-ÜNB
VNB
1…n
Verbrauch
Verbrauch
Systemverantwortung (Regelzone)Netzvorhaltung
„klassische“ Anforderungen an ÜNB:
Grundlagen: EU-RL, EnWG, EEG, EnSiG, ENTSO-E
Spannungsstabilität (400 kV)Spannungsstabilität (400 kV)
Frequenzstabilität (50 Hz)Frequenzstabilität (50 Hz)
Netzsicherheit (n-1)Netzsicherheit (n-1)
Neue Anforderungen:Europ. HandelEEG und KWK
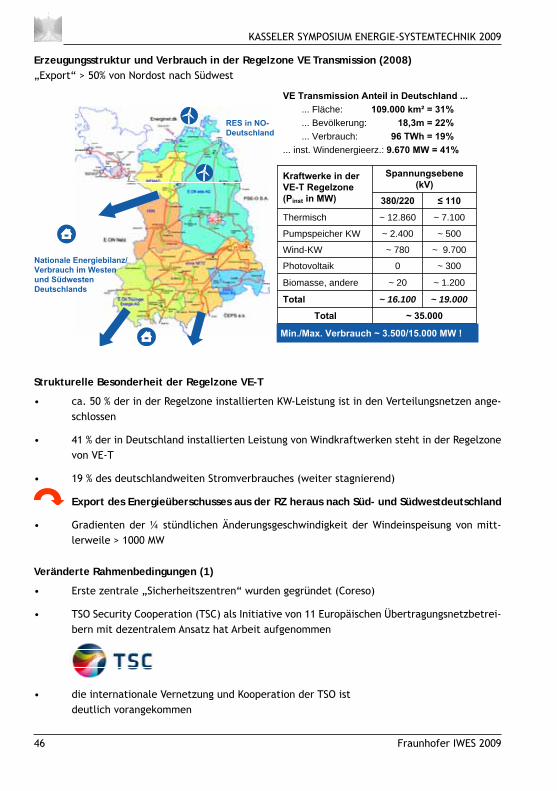
KASSELER SYMPOSIUM ENERGIE-SYSTEMTECHNIK 2009
46 Fraunhofer IWES 2009
Erzeugungsstruktur und Verbrauch in der Regelzone VE Transmission (2008) „Export“ > 50% von Nordost nach Südwest
Strukturelle Besonderheit der Regelzone VE-T
ca. 50 % der in der Regelzone installierten KW-Leistung ist in den Verteilungsnetzen ange-• schlossen
41 % der in Deutschland installierten Leistung von Windkraftwerken steht in der Regelzone • von VE-T
19 % des deutschlandweiten Stromverbrauches (weiter stagnierend) •
Export des Energieüberschusses aus der RZ heraus nach Süd- und Südwest deutsch land
Gradienten der ¼ stündlichen Änderungsgeschwindigkeit der Windeinspeisung von mitt-• lerweile > 1000 MW
Veränderte Rahmenbedingungen (1)
Erste zentrale „Sicherheitszentren“ wurden gegründet (Coreso)•
TSO Security Cooperation (TSC) als Initiative von 11 Europäischen Übertragungsnetzbetrei-• bern mit dezentralem Ansatz hat Arbeit aufgenommen
die internationale Vernetzung und Kooperation der TSO ist • deutlich vorangekommen
~ 500~ 2.400Pumpspeicher KW
~ 9.700~ 780Wind-KW
~ 3000Photovoltaik
110380/220
~ 35.000Total
~ 19.000~ 16.100Total
~ 20
~ 12.860
Spannungsebene(kV)
~ 1.200
~ 7.100
Biomasse, andere
Thermisch
Kraftwerke in derVE-T Regelzone(Pinst in MW)
VE Transmission Anteil in Deutschland ...... Fläche: 109.000 km² = 31%... Bevölkerung: 18,3m = 22%... Verbrauch: 96 TWh = 19%
... inst. Windenergieerz.: 9.670 MW = 41%
Min./Max. Verbrauch ~ 3.500/15.000 MW !
RES in NO-Deutschland
Nationale Energiebilanz/ Verbrauch im Westenund SüdwestenDeutschlands
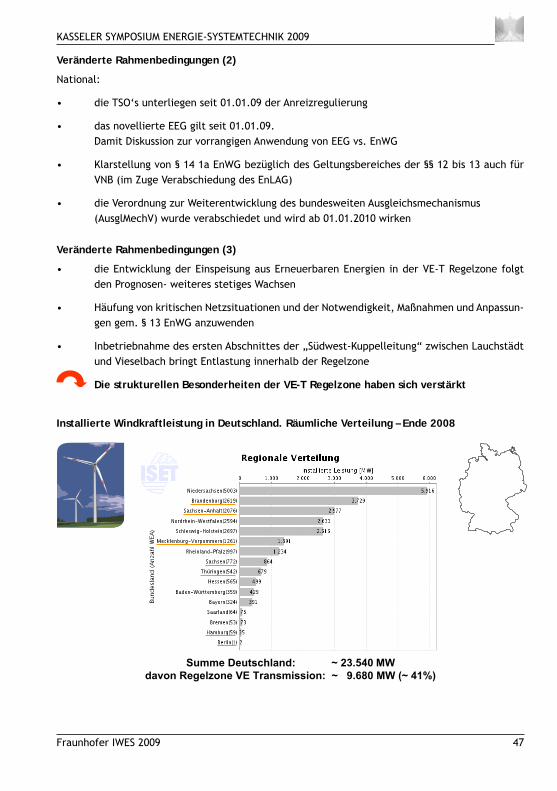
KASSELER SYMPOSIUM ENERGIE-SYSTEMTECHNIK 2009
Fraunhofer IWES 2009 47
Veränderte Rahmenbedingungen (2)
National:
die TSO‘s unterliegen seit 01.01.09 der Anreizregulierung •
das novellierte EEG gilt seit 01.01.09. • Damit Diskussion zur vorrangigen Anwendung von EEG vs. EnWG
Klarstellung von § 14 1a EnWG bezüglich des Geltungsbereiches der §§ 12 bis 13 auch für • VNB (im Zuge Verabschiedung des EnLAG)
die Verordnung zur Weiterentwicklung des bundesweiten Ausgleichsmechanismus • (AusglMechV) wurde verabschiedet und wird ab 01.01.2010 wirken
Veränderte Rahmenbedingungen (3)
die Entwicklung der Einspeisung aus Erneuerbaren Energien in der VE-T Regelzone folgt • den Prognosen- weiteres stetiges Wachsen
Häufung von kritischen Netzsituationen und der Notwendigkeit, Maßnahmen und Anpassun-• gen gem. § 13 EnWG anzuwenden
Inbetriebnahme des ersten Abschnittes der „Südwest-Kuppelleitung“ zwischen Lauchstädt • und Vieselbach bringt Entlastung innerhalb der Regelzone
Die strukturellen Besonderheiten der VE-T Regelzone haben sich verstärkt
Installierte Windkraftleistung in Deutschland. Räumliche Verteilung – Ende 2008
Summe Deutschland: ~ 23.540 MW davon Regelzone VE Transmission: ~ 9.680 MW (~ 41%)
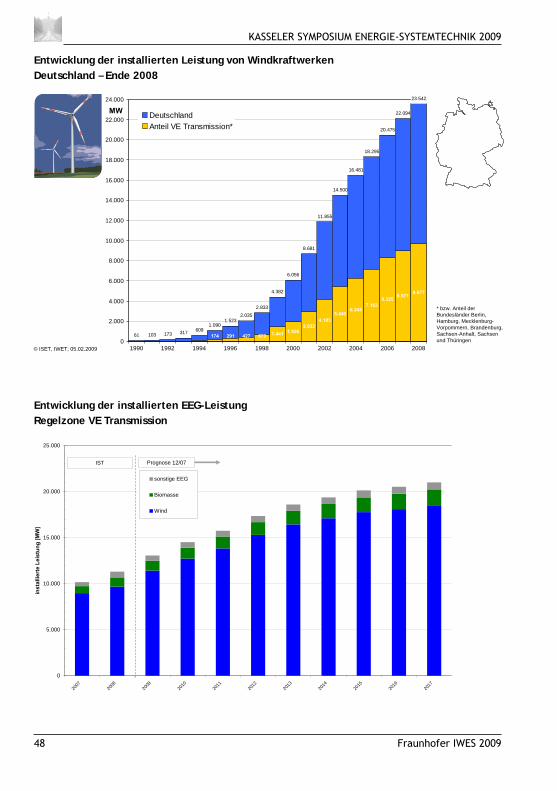
KASSELER SYMPOSIUM ENERGIE-SYSTEMTECHNIK 2009
48 Fraunhofer IWES 2009
Entwicklung der installierten Leistung von WindkraftwerkenDeutschland – Ende 2008
Entwicklung der installierten EEG-Leistung Regelzone VE Transmission
© ISET, IWET; 05.02.2009
* bzw. Anteil der Bundesländer Berlin, Hamburg, Mecklenburg-Vorpommern, Brandenburg, Sachsen-Anhalt, Sachsen und Thüringen
61 103 173 317 6091.090
2.833
4.382
6.056
8.681
11.855
14.500
16.481
18.295
20.475
22.094
174 291 427 673 1.441 1.9262.932
4.1835.449
6.2447.163
8.3258.971 9.677
23.542
2.0351.523
0
2.000
4.000
6.000
8.000
10.000
12.000
14.000
16.000
18.000
20.000
22.000
24.000
1990 1992 1994 1996 1998 2000 2002 2004 2006 2008
DeutschlandAnteil VE Transmission*
MW
0
5.000
10.000
15.000
20.000
25.000
2007
2008
2009
2010
2011
2012
2013
2014
2015
2016
2017
inst
allie
rte
Leis
tung
[MW
]
sonstige EEG
Biomasse
Wind
Prognose 12/07IST
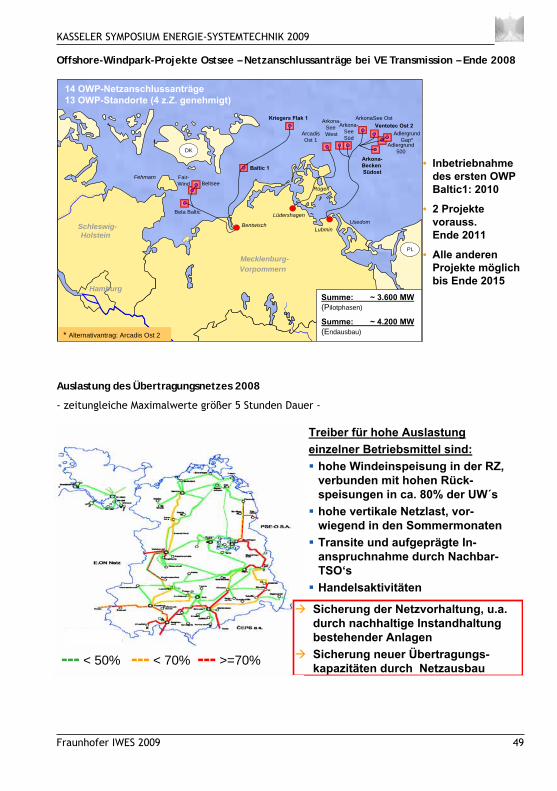
KASSELER SYMPOSIUM ENERGIE-SYSTEMTECHNIK 2009
Fraunhofer IWES 2009 49
Offshore-Windpark-Projekte Ostsee – Netzanschlussanträge bei VE Transmission – Ende 2008
Auslastung des Übertragungsnetzes 2008
- zeitungleiche Maximalwerte größer 5 Stunden Dauer -
BentwischLubmin
Mecklenburg-Vorpommern
Schleswig-Holstein
Rügen
Usedom
Fehmarn
PL
Beta Baltic
Arkona-Becken Südost
ArcadisOst 1
Hamburg
Baltic 1
Kriegers Flak 1Ventotec Ost 2
Lüdershagen
Adlergrund Gap*
* Alternativantrag: Arcadis Ost 2
BeltseeFair-Wind
Adlergrund 500
Summe: ~ 3.600 MW(Pilotphasen)
Summe: ~ 4.200 MW(Endausbau)
ArkonaSee OstArkona-
See Süd
Arkona-See West
14 OWP-Netzanschlussanträge13 OWP-Standorte (4 z.Z. genehmigt)
DK
• Inbetriebnahme des ersten OWP Baltic1: 2010
• 2 Projekte vorauss.Ende 2011
• Alle anderen Projekte möglich bis Ende 2015
Treiber für hohe Auslastung einzelner Betriebsmittel sind:
hohe Windeinspeisung in der RZ,verbunden mit hohen Rück-speisungen in ca. 80% der UW´shohe vertikale Netzlast, vor-wiegend in den SommermonatenTransite und aufgeprägte In-anspruchnahme durch Nachbar-TSO‘sHandelsaktivitäten
Sicherung der Netzvorhaltung, u.a. durch nachhaltige Instandhaltung bestehender AnlagenSicherung neuer Übertragungs-kapazitäten durch Netzausbau--- < 50% --- < 70% --- >=70%
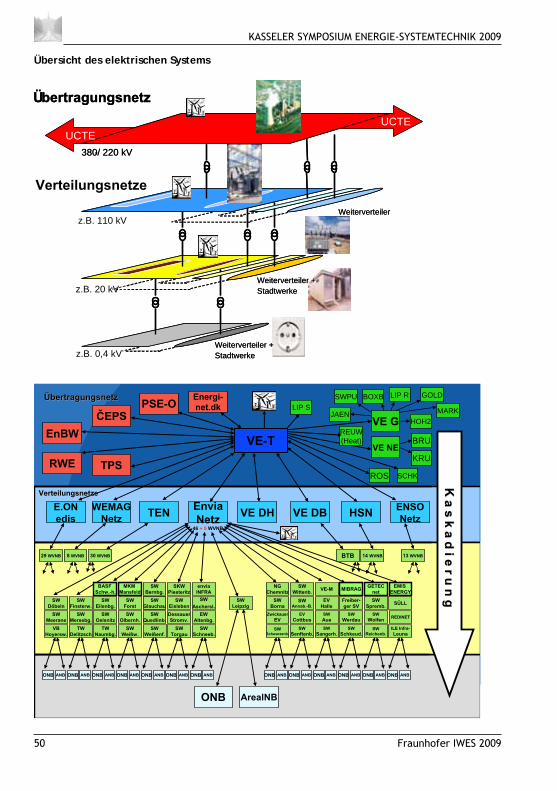
KASSELER SYMPOSIUM ENERGIE-SYSTEMTECHNIK 2009
50 Fraunhofer IWES 2009
Übersicht des elektrischen Systems
380-/ 220 kV
z.B. 20 kV
z.B. 110 kV
z.B. 0,4 kV
UCTE
Weiterverteiler
Weiterverteiler + Stadtwerke
Weiterverteiler + Stadtwerke
UCTE
Übertragungsnetz
380-/ 220 kV
z.B. 20 kV
z.B. 110 kV
z.B. 0,4 kV
UCTE
Weiterverteiler
Weiterverteiler + Stadtwerke
Weiterverteiler + Stadtwerke
UCTE
Übertragungsnetz
Verteilungsnetze
24.-25.09.2009 | | Kasseler Symposium Energie-Systemtechnik 15
VE-TVE G
LIP S
K a s k a d i e r u n g
K a s k a d i e r u n g
Energi-net.dk
RWE TPS
EnBW
PSE-OEPS
E.ONedis
WEMAGNetz TEN Envia
Netz VE DH VE DB HSN ENSONetz
ONB ArealNB
SWAschersl.
SWBernbg.
SWDöbeln
SWFinsterw.
SWEilenbg.
SWForst
SWGlauchau
SWEisleben
SWGlauchau
NGChemnitz
SWWittenb.
SWBorna
SWAnnab.-B.
EVHalle
Freiber-ger SV SÜLLSW
Spremb.SW
MeeraneSW
Mersebg.SW
OelsnitzSW
Olbernh.SW
Quedlinb.DessauerStromv.
EWAltenbg.
SWLeipzig
ZwickauerEV
EVCottbus
SWAue
SWWerdau
SWWolfen REDINET
VBHoyersw.
TWDelitzsch
TWNaumbg.
SWWeißw.
SWWeißenf.
SWTorgau
SWSchneeb.
SWSchwarzenb.
SWSenftenb.
SWSangerh.
SWSchkeud.
SWReichenb.
ILE Infra-Leuna
SKWPiesteritz
enviaINFRA VE-M
8 WVNB 30 WVNB29 WVNB BTB 14 WVNB 13 WVNB
ONB ANB ONB ANB ONB ANB ONB ANB ONB ANB ONB ANB ONB ANB ONB ANB ONB ANB ONB ANB ONB ANB ONB ANB ONB ANB
VerteilungsnetzeVerteilungsnetze
ÜÜbertragungsnetzbertragungsnetz
BRU
ROS SCHK
KRUVE NE
SWPU BOXB
HOH2MARK
GOLD
JAEN
REUW(Heat)
LIP R
46 + 5 WVNB
MKM Mansfeld
BASF Schw.-h.
EMIS ENERGY
GETECnetMIBRAG
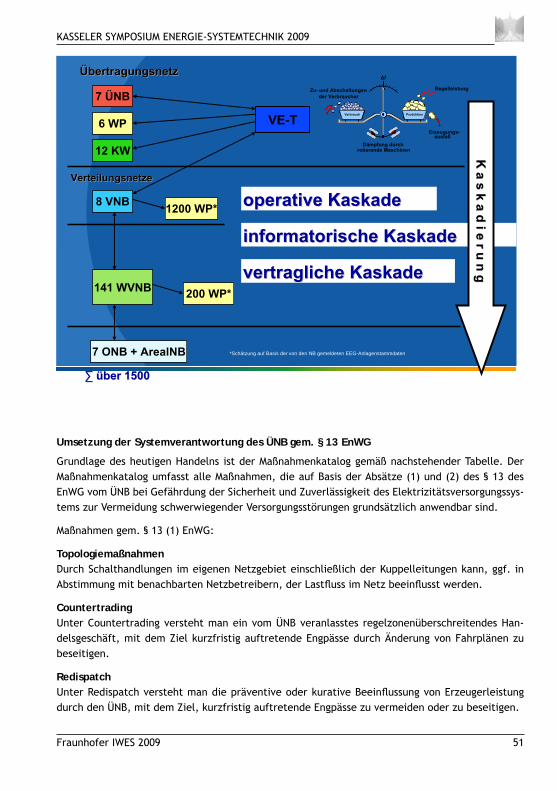
KASSELER SYMPOSIUM ENERGIE-SYSTEMTECHNIK 2009
Fraunhofer IWES 2009 51
Umsetzung der Systemverantwortung des ÜNB gem. § 13 EnWG
Grundlage des heutigen Handelns ist der Maßnahmenkatalog gemäß nachstehender Tabelle. Der Maßnahmenkatalog umfasst alle Maßnahmen, die auf Basis der Absätze (1) und (2) des § 13 des EnWG vom ÜNB bei Gefährdung der Sicherheit und Zuverlässigkeit des Elektrizitätsversorgungssys-tems zur Vermeidung schwerwiegender Versorgungsstörungen grundsätzlich anwendbar sind.
Maßnahmen gem. § 13 (1) EnWG:
TopologiemaßnahmenDurch Schalthandlungen im eigenen Netzgebiet einschließlich der Kuppelleitungen kann, ggf. in Abstimmung mit benachbarten Netzbetreibern, der Lastfl uss im Netz beeinfl usst werden.
CountertradingUnter Countertrading versteht man ein vom ÜNB veranlasstes regelzonenüberschreitendes Han-delsgeschäft, mit dem Ziel kurzfristig auftretende Engpässe durch Änderung von Fahrplänen zu beseitigen.
RedispatchUnter Redispatch versteht man die präventive oder kurative Beeinfl ussung von Erzeugerleistung durch den ÜNB, mit dem Ziel, kurzfristig auftretende Engpässe zu vermeiden oder zu beseitigen.
VE-T
7 ÜNB
8 VNB
7 ONB + ArealNB
VerteilungsnetzeVerteilungsnetze
ÜÜbertragungsnetzbertragungsnetz
6 WP
12 KW
141 WVNB
1200 WP*
200 WP*
informatorische Kaskadeinformatorische Kaskade
vertragliche Kaskadevertragliche Kaskade
operative Kaskadeoperative Kaskade
K a s k a d i e r u n g
K a s k a d i e r u n g
*Schätzung auf Basis der von den NB gemeldeten EEG-Anlagenstammdaten
üüber 1500ber 1500
Dämpfung durchrotierende Maschinen
Verbrauch Produktion
Zu- und Abschaltungender Verbraucher
Verbrauch Produktion
Regelleistung
Erzeugungs-ausfall
Verbrauch ProduktionVerbrauch Produktion
f
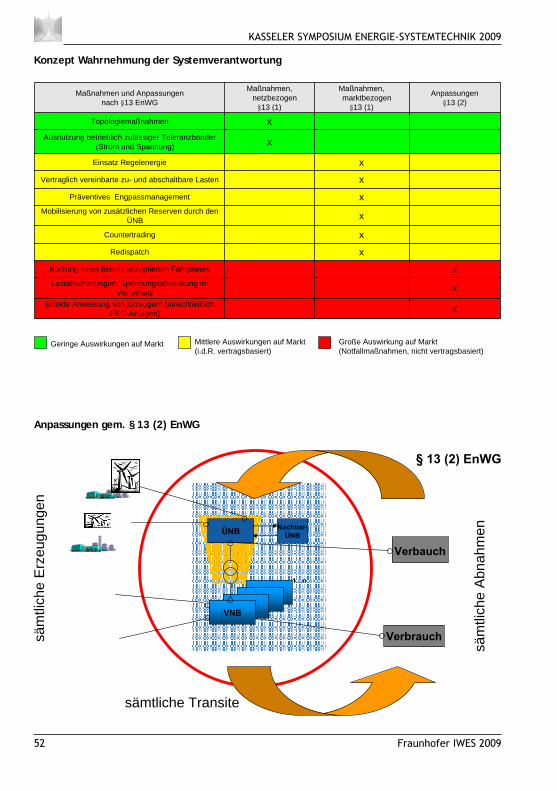
KASSELER SYMPOSIUM ENERGIE-SYSTEMTECHNIK 2009
52 Fraunhofer IWES 2009
Konzept Wahrnehmung der Systemverantwortung
Anpassungen gem. § 13 (2) EnWG
xDirekte Anweisung von Erzeugern (einschließlich EEG-Anlagen)
xLastabschaltungen, Spannungsabsenkung im Verteilnetz
xKürzung eines bereits akzeptierten Fahrplanes
xRedispatch
xCountertrading
xMobilisierung von zusätzlichen Reserven durch den ÜNB
xPräventives Engpassmanagement
xVertraglich vereinbarte zu- und abschaltbare Lasten
xEinsatz Regelenergie
xAusnutzung betrieblich zulässiger Toleranzbänder(Strom und Spannung)
xTopologiemaßnahmen
Anpassungen§13 (2)
Maßnahmen, marktbezogen§13 (1)
Maßnahmen, netzbezogen§13 (1)
Maßnahmen und Anpassungennach §13 EnWG
Geringe Auswirkungen auf Markt Mittlere Auswirkungen auf Markt (i.d.R. vertragsbasiert)
Große Auswirkung auf Markt(Notfallmaßnahmen, nicht vertragsbasiert)
ÜNB Nachbar-ÜNB
VNB
1…n
Verbrauch
Verbauch
säm
tlich
e E
rzeu
gung
en
säm
tlich
e A
bnah
men
sämtliche Transite
§ 13 (2) EnWG
KASSELER SYMPOSIUM ENERGIE-SYSTEMTECHNIK 2009
Fraunhofer IWES 2009 53
Vereinbarung über die Unterstützung von Maßnahmen gemäß §§ 13 Absatz 2, 14 Absatz 1 und 14 Absatz 1a EnWG
Basis: BDEW MustervertragGegenstand: Ausgestaltung des TransmissionCode 2007, Kap. 2 „Systemverantwortung durch die ÜNB unter Mitwirkung der VNB“
Ziff. 3 Kaskadierung
Ziff. 3.4.3 Stellung des VNB beschreibt eigene Verantwortung für am eigenen Netz angeschlossene Erzeugung und Mitwirkung/Unterstützung als Bote
Ziff. 5 Haftung
Abs. 7: Freistellung bei vereinbarungsgemäßer Umsetzung
VE Transmission hat diese Vereinbarung mit allen direkt an ihr Netz angeschlossenen Verteilungsnetzbetreibern abgeschlossen.
Verschärfte Problemstellung seit August 2008
Max. Windenergie- einspeisung
09.-11.11.2008 7341 MW
15.-16.11.2008 7274 MW
18.-21.11.2008 8752 MW lokale Anpassungen gem. § 13 (2)
02.12.2008 6069 MW lokale Anpassungen gem. § 13 (2)
03.-04.01.2009 5728 MW lokale Anpassungen gem. § 13 (2)
01.-02.02.2009 6187 MW
21.-23.03.2009 8225 MW Anpassungen gem. § 13 (2)
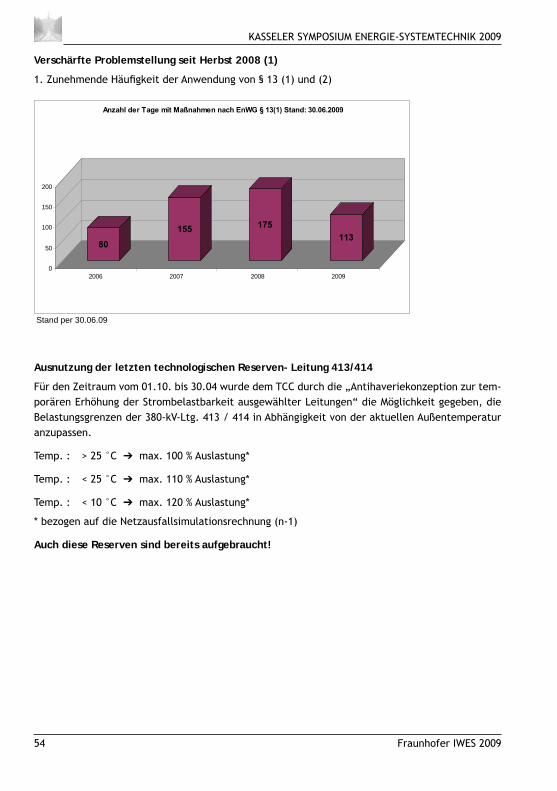
KASSELER SYMPOSIUM ENERGIE-SYSTEMTECHNIK 2009
54 Fraunhofer IWES 2009
Verschärfte Problemstellung seit Herbst 2008 (1)
1. Zunehmende Häufi gkeit der Anwendung von § 13 (1) und (2)
Ausnutzung der letzten technologischen Reserven- Leitung 413/414
Für den Zeitraum vom 01.10. bis 30.04 wurde dem TCC durch die „Antihaveriekonzeption zur tem-porären Erhöhung der Strombelastbarkeit ausgewählter Leitungen“ die Möglichkeit gegeben, die Belastungsgrenzen der 380-kV-Ltg. 413 / 414 in Abhängigkeit von der aktuellen Außentemperatur anzupassen.
Temp. : > 25 °C ➔ max. 100 % Auslastung*
Temp. : < 25 °C ➔ max. 110 % Auslastung*
Temp. : < 10 °C ➔ max. 120 % Auslastung*
* bezogen auf die Netzausfallsimulationsrechnung (n-1)
Auch diese Reserven sind bereits aufgebraucht!
80155 175
113
0
50
100
150
200
2006 2007 2008 2009
Anzahl der Tage mit Maßnahmen nach EnWG § 13(1) Stand: 30.06.2009
Stand per 30.06.09
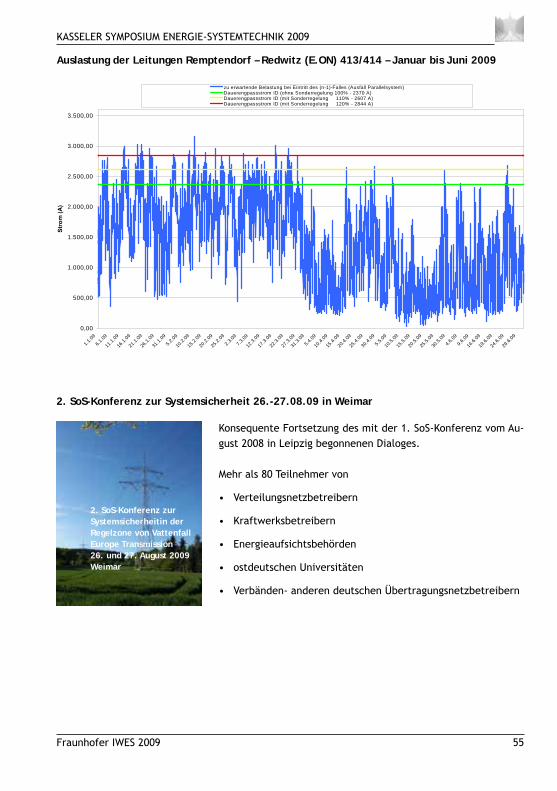
KASSELER SYMPOSIUM ENERGIE-SYSTEMTECHNIK 2009
Fraunhofer IWES 2009 55
Auslastung der Leitungen Remptendorf – Redwitz (E.ON) 413/414 – Januar bis Juni 2009
2. SoS-Konferenz zur Systemsicherheit 26.-27.08.09 in Weimar
Konsequente Fortsetzung des mit der 1. SoS-Konferenz vom Au-gust 2008 in Leipzig begonnenen Dialoges.
Mehr als 80 Teilnehmer von
Verteilungsnetzbetreibern•
Kraftwerksbetreibern•
Energieaufsichtsbehörden•
ostdeutschen Universitäten•
Verbänden- anderen deutschen Übertragungsnetzbetreibern•
0,00
500,00
1.000,00
1.500,00
2.000,00
2.500,00
3.000,00
3.500,00
1.1.09
6.1.09
11.1.
09
16.1.
09
21.1.
09
26.1.
09
31.1.
09
5.2.09
10.2.
09
15.2.
09
20.2.
09
25.2.
09
2.3.09
7.3.09
12.3.
09
17.3.
09
22.3.
09
27.3.
09
31.3.
09
5.4.09
10.4.
09
15.4.
09
20.4.
09
25.4.
09
30.4.
09
5.5.09
10.5.
09
15.5.
09
20.5.
09
25.5.
09
30.5.
09
4.6.09
9.6.09
14.6.
09
19.6.
09
24.6.
09
29.6.
09
Stro
m (A
)
zu erwartende Belastung bei Eintritt des (n-1)-Falles (Ausfall Parallelsystem)Dauerengpassstrom ID (ohne Sonderregelung 100% - 2370 A)Dauerengpassstrom ID (mit Sonderregelung 110% - 2607 A)Dauerengpassstrom ID (mit Sonderregelung 120% - 2844 A)
2. SoS-Konferenz zur Systemsicherheitin der Regelzone von Vattenfall Europe Transmission 26. und 27. August 2009 Weimar
KASSELER SYMPOSIUM ENERGIE-SYSTEMTECHNIK 2009
56 Fraunhofer IWES 2009
Ergebnisse der 2. SoS-Konferenz
Breites Committment zum koordinierten Handeln auf Basis der abgeschlossenen Verein-• barung
Bereitschaft der nachgelagerten VNB (Stadtwerke) zum Abschluss analoger Vereinbarungen • gestärkt
Dialog zur Weiterentwicklung der abgestimmten Vorgehensweise in kritischen Netzsituati-• onen weitergeführt
Anregungen und Kritiken aus den konkreten Vorgängen am 23.03.09 (Anpassungen gem. • § 13(2) EnWG) wurden aufgenommen und werden in den Verbesserungsprozess überführt
Committment zur zeitnahen Beschleunigung des Daten- und Informations austausches er-• zielt
erneute klare Herausarbeitung der dringenden Notwendigkeit, die Genehmigungsprozesse • für den erforderlichen Netzausbau zu beschleunigen („ die Netze sind verstopft …“)
Netztrainings- und Forschungszentrum in Cottbus wird am 10./11.09.09 einer breiten Öf-• fentlichkeit vorgestellt – erste Trainings Ende 2009 Bereitschaft der VNB, sich aktiv daran zu beteiligen erreicht.
FazitDie strukturellen Besonderheiten der Regelzone VE Transmission haben sich weiter verstärkt
Die als „Ausnahmeregel“ gedachten Maßnahmen gem. § 13 EnWG sind zum täglichen Instrument zur Gewährleistung der Systemsicherheit geworden
Das elektrische System läßt sich nur in enger Kooperation aller Akteure sicher betreiben. Die Vereinbarungen zwischen VE Transmission und den nachgelagerten VNB zur Unterstützung in kri-tischen Netzsituationen sind eine tragfähige Basis für die Sicherung der Handlungsfähigkeit des Operativpersonales. Deshalb ist die durchgängige Umsetzung des Kaskadierungs-Prinzips wesentlich
Online-Informationsaustausch und „Frühwarnsysteme“ sind forciert zu entwickeln
Schulung und insbesondere Training des Operativpersonales der Netz- und Kraftwerksbetreiber sind komplex und gemeinsam zu organisieren
Der massive Netzausbau ist unumgänglich und zu forcieren Die Entwicklung großtechnischer Energiespeicher ist voranzutreiben
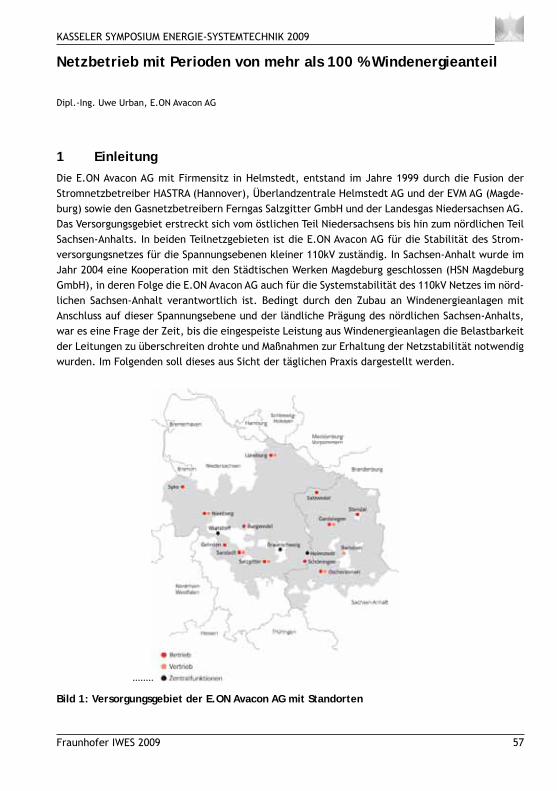
KASSELER SYMPOSIUM ENERGIE-SYSTEMTECHNIK 2009
Fraunhofer IWES 2009 57
Netzbetrieb mit Perioden von mehr als 100 % Windenergieanteil
Dipl.-Ing. Uwe Urban, E.ON Avacon AG
Einleitung 1 Die E.ON Avacon AG mit Firmensitz in Helmstedt, entstand im Jahre 1999 durch die Fusion der Stromnetzbetreiber HASTRA (Hannover), Überlandzentrale Helmstedt AG und der EVM AG (Magde-burg) sowie den Gasnetzbetreibern Ferngas Salzgitter GmbH und der Landesgas Niedersachsen AG. Das Versorgungsgebiet erstreckt sich vom östlichen Teil Niedersachsens bis hin zum nördlichen Teil Sachsen-Anhalts. In beiden Teilnetzgebieten ist die E.ON Avacon AG für die Stabilität des Strom-versorgungsnetzes für die Spannungsebenen kleiner 110kV zuständig. In Sachsen-Anhalt wurde im Jahr 2004 eine Kooperation mit den Städtischen Werken Magdeburg geschlossen (HSN Magdeburg GmbH), in deren Folge die E.ON Avacon AG auch für die Systemstabilität des 110kV Netzes im nörd-lichen Sachsen-Anhalt verantwortlich ist. Bedingt durch den Zubau an Windenergieanlagen mit Anschluss auf dieser Spannungsebene und der ländliche Prägung des nördlichen Sachsen-Anhalts, war es eine Frage der Zeit, bis die eingespeiste Leistung aus Windenergieanlagen die Belastbarkeit der Leitungen zu überschreiten drohte und Maßnahmen zur Erhaltung der Netzstabilität notwendig wurden. Im Folgenden soll dieses aus Sicht der täglichen Praxis dargestellt werden.
Bild 1: Versorgungsgebiet der E.ON Avacon AG mit Standorten
........

KASSELER SYMPOSIUM ENERGIE-SYSTEMTECHNIK 2009
58 Fraunhofer IWES 2009
2 Rechtlicher Ordnungsrahmen mit Bezug auf WindenergieMaßgeblich beeinfl usst hat den Zubau an Windkraftanlagen das Erneuerbare Energien Gesetz (EEG) vom April 2000. Dieses Gesetz wurde in den vergangenen Jahren mehrfach in Teilen novelliert, zuletzt im Rahmen der „großen EEG Novelle“ im Jahr 2008. Gemein haben alle Fassungen dieses Gesetzes, dass sie für einen defi nierten Zeitraum eine feste Vergütung je eingespeister Kilowatt-stunde Strom aus Erneuerbaren Energien (z.B. Wind, Wasser, Sonne oder Biomasse) festschreiben. Dieses hat in Bezug auf die Windenergie dazu geführt, dass auch an vermeintlich windschwachen Binnenstandorten für den Betreiber auskömmliche Renditen prognostisch zu erzielen waren bzw. sind.
Nicht zu letzt bedingt durch den in kurzer Zeit erfolgten Zubau von Windkraftanlagen wurde es er-forderlich, Regelungen für ein aus netztechnischer Sicht tragfähiges Miteinander von konventionel-ler und regenerativer Energieerzeugung zu erstellen. Aktuell wird dieses für Einspeisungen in die Mittelspannungsebene durch die Technische Richtlinie „Erzeugungsanlagen am Mittelspannungs-netz“ (Mittelspannungsrichtlinie 2008) bzw. für die Hochspannung durch den „TransmissionCode 2007 - Netz- und Systemregeln der deutschen Übertragungsnetzbetreiber“ (Transmission Code 2007) seitens des Bundesverbandes der Elektrizitäts- und Wasserwirtschaft (BDEW vormals VDN) erreicht. Im Rahmen der großen EEG Novelle des Jahres 2008 und der daraus abgeleiteten „Sy-stemdienstleistungsverordnung“, wurden beide als Basis für die Bestimmung der Rechtmäßigkeit auf Gewährung einer im EEG vorgesehen Bonuszahlung, dem sogenannten „Systemdienstleistungs-bonus“ verankert (§2 und §3 SDLWindV). Sinn dieser Regelung ist es, das sich die entsprechenden Anlagen in genau defi nierten Fällen netzstützend verhalten und nicht wie bisher gefordert sich abschalten.
Neben den vorstehenden Gesetzen und Verordnungen gibt es eine Vielzahl von weiteren Gesetzen (z.B. Bauplanung), Verordnungen (z.B.BImSchV) und Richtlinien (z.B. TAB, Berufsgenossenschaf-ten) die sich auf die Planung, Errichtung und den Betrieb einer Anlage beziehen, auf die jedoch im Folgenden nicht weiter eingegangen werden soll.
Aus Sicht des Netzbetreibers stellt sich viel mehr die Frage, wie der stetige Zuwachs an gesetzlich geförderter stark fl uktuierender Einspeiseleistung (z.B. aus Windkraftanlagen) in ein bestehendes Versorgungsnetz eingebunden und die Systemstabilität gewährleistet werden kann.
3 Entwicklung der installierten Leistung von Windenergieanlagen am Beispiel des Netzgebietes Sachsen-Anhalt „Hochspannung“
Mit Einführung des Erneuerbare Energien Gesetz (EEG) wurde die betriebswirtschaftliche Basis für die Erzeugung von Strom aus Erneuerbaren Energien, wie Wind, Wasser, Sonne oder Biomasse neu geregelt. In der Folge konnte ein stetiger Zuwachs an regenerativer Erzeugungskapazität im Netz festgestellt werden. In Bild 2 ist beispielsweise die Entwicklung der installierten Leistung an Wind-energieanlagen für das Hochspannungsnetz in Sachsen-Anhalt dargestellt. Für das laufende Jahr wurde ein Anlagenzubauszenario anhand von im ersten halben Jahr real in Betrieb genommener Anlagenleistung sowie bereits im bzw. kurz vor Baubeginn befi ndlicher Anlagen vorgenommen.
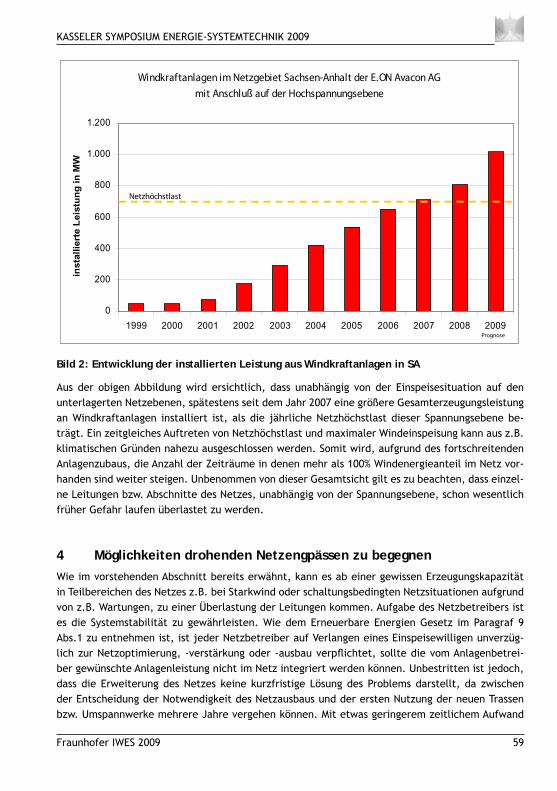
KASSELER SYMPOSIUM ENERGIE-SYSTEMTECHNIK 2009
Fraunhofer IWES 2009 59
Windkraftanlagen im Netzgebiet Sachsen-Anhalt der E.ON Avacon AG
mit Anschluß auf der Hochspannungsebene
0
200
400
600
800
1.000
1.200
1999 2000 2001 2002 2003 2004 2005 2006 2007 2008 2009
ins
tall
iert
e L
eis
tun
g i
n M
W
Netzhöchstlast
Prognose
Windkraftanlagen im Netzgebiet Sachsen-Anhalt der E.ON Avacon AG
mit Anschluß auf der Hochspannungsebene
0
200
400
600
800
1.000
1.200
1999 2000 2001 2002 2003 2004 2005 2006 2007 2008 2009
ins
tall
iert
e L
eis
tun
g i
n M
W
Netzhöchstlast
Prognose
Bild 2: Entwicklung der installierten Leistung aus Windkraftanlagen in SA
Aus der obigen Abbildung wird ersichtlich, dass unabhängig von der Einspeisesituation auf den unterlagerten Netzebenen, spätestens seit dem Jahr 2007 eine größere Gesamterzeugungsleistung an Windkraftanlagen installiert ist, als die jährliche Netzhöchstlast dieser Spannungsebene be-trägt. Ein zeitgleiches Auftreten von Netzhöchstlast und maximaler Windeinspeisung kann aus z.B. klimatischen Gründen nahezu ausgeschlossen werden. Somit wird, aufgrund des fortschreitenden Anlagenzubaus, die Anzahl der Zeiträume in denen mehr als 100% Windenergieanteil im Netz vor-handen sind weiter steigen. Unbenommen von dieser Gesamtsicht gilt es zu beachten, dass einzel-ne Leitungen bzw. Abschnitte des Netzes, unabhängig von der Spannungsebene, schon wesentlich früher Gefahr laufen überlastet zu werden.
4 Möglichkeiten drohenden Netzengpässen zu begegnenWie im vorstehenden Abschnitt bereits erwähnt, kann es ab einer gewissen Erzeugungskapazität in Teilbereichen des Netzes z.B. bei Starkwind oder schaltungsbedingten Netzsituationen aufgrund von z.B. Wartungen, zu einer Überlastung der Leitungen kommen. Aufgabe des Netzbetreibers ist es die Systemstabilität zu gewährleisten. Wie dem Erneuerbare Energien Gesetz im Paragraf 9 Abs.1 zu entnehmen ist, ist jeder Netzbetreiber auf Verlangen eines Einspeisewilligen unverzüg-lich zur Netzoptimierung, -verstärkung oder -ausbau verpfl ichtet, sollte die vom Anlagenbetrei-ber gewünschte Anlagenleistung nicht im Netz integriert werden können. Unbestritten ist jedoch, dass die Erweiterung des Netzes keine kurzfristige Lösung des Problems darstellt, da zwischen der Entscheidung der Notwendigkeit des Netzausbaus und der ersten Nutzung der neuen Trassen bzw. Umspannwerke mehrere Jahre vergehen können. Mit etwas geringerem zeitlichem Aufwand

KASSELER SYMPOSIUM ENERGIE-SYSTEMTECHNIK 2009
60 Fraunhofer IWES 2009
ließen sich Maßnahmen umsetzen, die die bestehende Netzinfrastruktur für höhere Ströme (Über-tragungskapazität) ertüchtigen. Beispielsweise sei hier das Erhöhen von Strommasten oder der Austausch der Leiterseile angeführt. Differenziert dagegen muss die Temperaturüberwachung der Leiterseile als Maßnahme zur Übertragskapazitätserhöhung betrachtet werden. Hintergrund ist, dass es in keinem des betroffenen Trassenabschnitts zu einer kritischen Längung der Leiterseile kommen darf (Mindestabstand Leiterseil zu Erde muss eingehalten werden). Dazu sind neben dem Verlauf der betroffenen Trasse auch Kenntnisse über den Anströmwinkel des Windes zur Leitung und der Umgebungstemperatur zu beachten. Da lokale Bedingungen innerhalb weniger 100m zu unterschiedlichen Leiterseiltemperaturen führen können (z.B. bei Richtungswechseln der Leitung), ist eine umfangreiche Messdatenerfassung und -auswertung erforderlich. Wesentlich schneller in der praktischen Umsetzung und bis zum erfolgten Netzausbau gesetzlich zulässig, ist gemäß §9 und §11 (EEG 2009) das sogenannte Einspeisemanagement. Bei diesem wird, wie im Folgenden dargestellt, bei einer drohenden Überlastung einzelner Leitungen die Einspeiseleistung einzelner oder aller Anlagen des betroffenen Leitungs- oder Netzabschnittes begrenzt. Die Entscheidung welche Einspeiser von der Reduzierung betroffen sind, erfolgt von zentraler Stelle z.B. aus einer Netzwarte.
5 Praxisbeispiel Erzeugungs- bzw. EinspeisemanagementAm 12.03.2008 zogen in der Nacht und am frühen Vormittag große Windböen in schneller Abfolge über das Sachsen-Anhaltinische Netzgebiet. Bedingt durch die Größe des hier betrachteten Netz-abschnittes kam es zu dieser Zeit zu keiner drohenden Grenzwertverletzung, da bedingt durch die Böendynamik einige Anlagen unter Volllast liefen, während sich andere schon wieder im Teillastbe-trieb befanden. Gegen 9 Uhr änderte sich jedoch die Wetterlage und der Wind blies mit konstant stärker werdender Intensität. Da sich gegen 12:45 Uhr die Lage zuspitzte wurde entschieden, einen Teil der Windkraftanlagen im Rahmen des Erzeugungsmanagements in der Einspeiseleistung zu begrenzen. In einem nahe gelegenen Umspannwerk (mit Wetterstation), konnte in Bodennähe eine mittlere Windgeschwindigkeit von 12,4 m/s bei einer Außentemperatur von 10,8°C festgestellt werden. Aus diesem Grund erging gegen 13 Uhr die Aufforderung per Fernwirksignal an ausgewähl-te Windkraftanlagen die eingespeiste Leistung am Netzverknüpfungspunkt auf 60% der installierten Nennleistung zu reduzieren. In der Folge sank die Belastung der Leiterseile unter die kritische Grenze und die Systemstabilität war für dieses Teilnetzgebiet wieder hergestellt. Aufgrund der lang anhaltenden Starkwindsituation, musste die Abregelungsmaßnahme bis gegen 17 Uhr des Fol-getages aufrechterhalten werden. Erst zu diesem Zeitpunkt war eine deutliche Reduzierung des Windangebotes zu verzeichnen.
In Abbildung 3 ist der vorstehende Sachverhalt anhand der Leiterströme, wie sie sich mit und ohne Erzeugungsmanagement ergeben haben bzw. hätten, beispielhaft grafi sch dargestellt. Der blaue Kurvenverlauf stellt die Leiterseilbelastung dar, wie sie sich aufgrund der Windeinspeisung ergeben hat bzw. ergeben hätte. Es wird deutlich, dass es ohne Abregelung der Leistung zu einer Grenzwertverletzung (Zeitpunkte mit einem Verlauf oberhalb der schwarzen Geraden) gekommen wäre. Die grüne Kurve zeigt den Stromverlauf wie er sich real auf den Leiterseilen aufgrund der ergriffenen Maßnahmen ergeben hat. Zu Zeiten ohne Leistungsbegrenzung sind beide Kurven dek-kungsgleich.
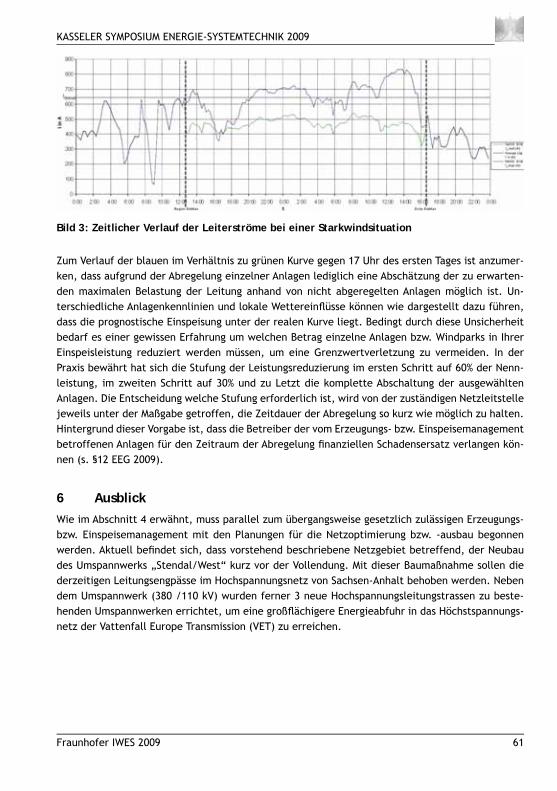
KASSELER SYMPOSIUM ENERGIE-SYSTEMTECHNIK 2009
Fraunhofer IWES 2009 61
Zum Verlauf der blauen im Verhältnis zu grünen Kurve gegen 17 Uhr des ersten Tages ist anzumer-ken, dass aufgrund der Abregelung einzelner Anlagen lediglich eine Abschätzung der zu erwarten-den maximalen Belastung der Leitung anhand von nicht abgeregelten Anlagen möglich ist. Un-terschiedliche Anlagenkennlinien und lokale Wettereinfl üsse können wie dargestellt dazu führen, dass die prognostische Einspeisung unter der realen Kurve liegt. Bedingt durch diese Unsicherheit bedarf es einer gewissen Erfahrung um welchen Betrag einzelne Anlagen bzw. Windparks in Ihrer Einspeisleistung reduziert werden müssen, um eine Grenzwertverletzung zu vermeiden. In der Praxis bewährt hat sich die Stufung der Leistungsreduzierung im ersten Schritt auf 60% der Nenn-leistung, im zweiten Schritt auf 30% und zu Letzt die komplette Abschaltung der ausgewählten Anlagen. Die Entscheidung welche Stufung erforderlich ist, wird von der zuständigen Netzleitstelle jeweils unter der Maßgabe getroffen, die Zeitdauer der Abregelung so kurz wie möglich zu halten. Hintergrund dieser Vorgabe ist, dass die Betreiber der vom Erzeugungs- bzw. Einspeisemanagement betroffenen Anlagen für den Zeitraum der Abregelung fi nanziellen Schadensersatz verlangen kön-nen (s. §12 EEG 2009).
6 AusblickWie im Abschnitt 4 erwähnt, muss parallel zum übergangsweise gesetzlich zulässigen Erzeugungs- bzw. Einspeisemanagement mit den Planungen für die Netzoptimierung bzw. -ausbau begonnen werden. Aktuell befi ndet sich, dass vorstehend beschriebene Netzgebiet betreffend, der Neubau des Umspannwerks „Stendal/West“ kurz vor der Vollendung. Mit dieser Baumaßnahme sollen die derzeitigen Leitungsengpässe im Hochspannungsnetz von Sachsen-Anhalt behoben werden. Neben dem Umspannwerk (380 /110 kV) wurden ferner 3 neue Hochspannungsleitungstrassen zu beste-henden Umspannwerken errichtet, um eine großfl ächigere Energieabfuhr in das Höchstspannungs-netz der Vattenfall Europe Transmission (VET) zu erreichen.
Bild 3: Zeitlicher Verlauf der Leiterströme bei einer Starkwindsituation
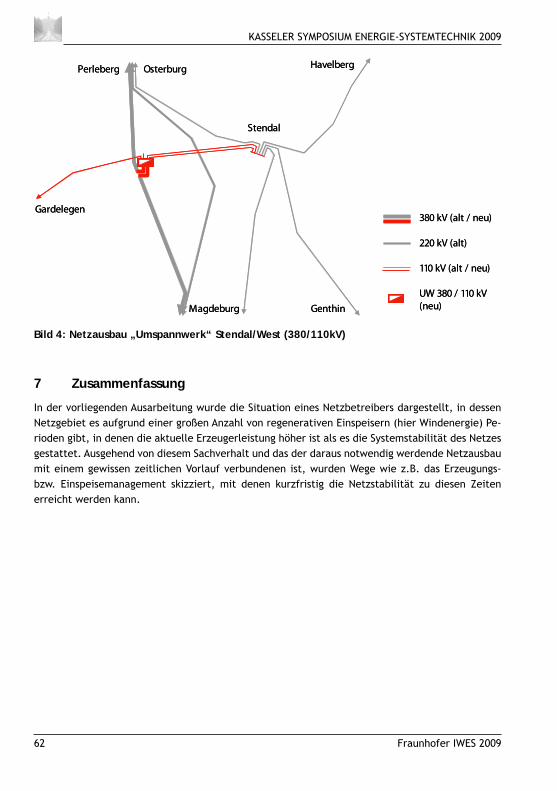
KASSELER SYMPOSIUM ENERGIE-SYSTEMTECHNIK 2009
62 Fraunhofer IWES 2009
Stendal
Osterburg
Gardelegen
Magdeburg Genthin
HavelbergPerleberg
380 kV (alt / neu)
220 kV (alt)
110 kV (alt / neu)
UW 380 / 110 kV(neu)
Stendal
Osterburg
Gardelegen
Magdeburg Genthin
HavelbergPerleberg
380 kV (alt / neu)
220 kV (alt)
110 kV (alt / neu)
UW 380 / 110 kV(neu)
Bild 4: Netzausbau „Umspannwerk“ Stendal/West (380/110kV)
7 Zusammenfassung
In der vorliegenden Ausarbeitung wurde die Situation eines Netzbetreibers dargestellt, in dessen Netzgebiet es aufgrund einer großen Anzahl von regenerativen Einspeisern (hier Windenergie) Pe-rioden gibt, in denen die aktuelle Erzeugerleistung höher ist als es die Systemstabilität des Netzes gestattet. Ausgehend von diesem Sachverhalt und das der daraus notwendig werdende Netzausbau mit einem gewissen zeitlichen Vorlauf verbundenen ist, wurden Wege wie z.B. das Erzeugungs- bzw. Einspeisemanagement skizziert, mit denen kurzfristig die Netzstabilität zu diesen Zeiten erreicht werden kann.
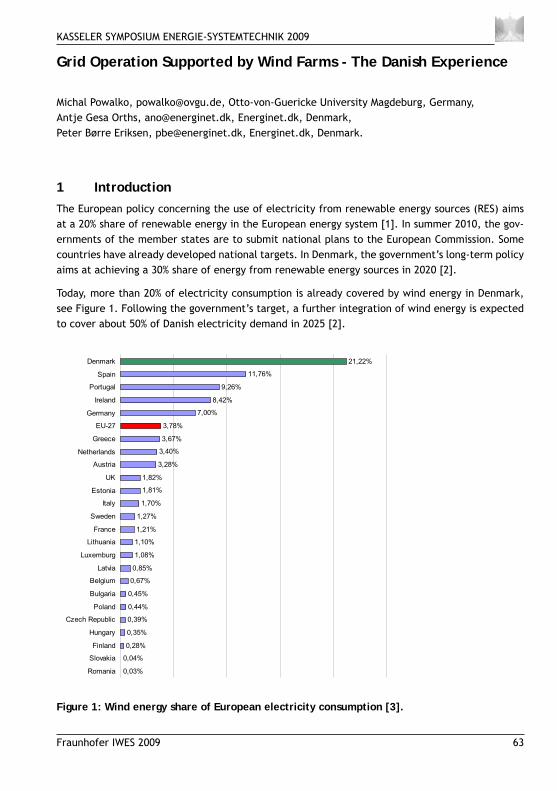
KASSELER SYMPOSIUM ENERGIE-SYSTEMTECHNIK 2009
Fraunhofer IWES 2009 63
Grid Operation Supported by Wind Farms - The Danish Experience
Michal Powalko, [email protected], Otto-von-Guericke University Magdeburg, Germany,Antje Gesa Orths, [email protected], Energinet.dk, Denmark,Peter Børre Eriksen, [email protected], Energinet.dk, Denmark.
Introduction1 The European policy concerning the use of electricity from renewable energy sources (RES) aims at a 20% share of renewable energy in the European energy system [1]. In summer 2010, the gov-ernments of the member states are to submit national plans to the European Commission. Some countries have already developed national targets. In Denmark, the government’s long-term policy aims at achieving a 30% share of energy from renewable energy sources in 2020 [2].
Today, more than 20% of electricity consumption is already covered by wind energy in Denmark, see Figure 1. Following the government’s target, a further integration of wind energy is expected to cover about 50% of Danish electricity demand in 2025 [2].
21,22%
11,76%
9,26%
8,42%
7,00%
3,78%
3,67%
3,40%
3,28%
1,82%
1,81%
1,70%
1,27%
1,21%
1,10%
1,08%
0,85%
0,67%
0,45%
0,44%
0,39%
0,35%
0,28%
0,04%
0,03%
Denmark
Spain
Portugal
Ireland
Germany
EU-27
Greece
Netherlands
Austria
UK
Estonia
Italy
Sweden
France
Lithuania
Luxemburg
Latvia
Belgium
Bulgaria
Poland
Czech Republic
Hungary
Finland
Slovakia
Romania
Figure 1: Wind energy share of European electricity consumption [3].
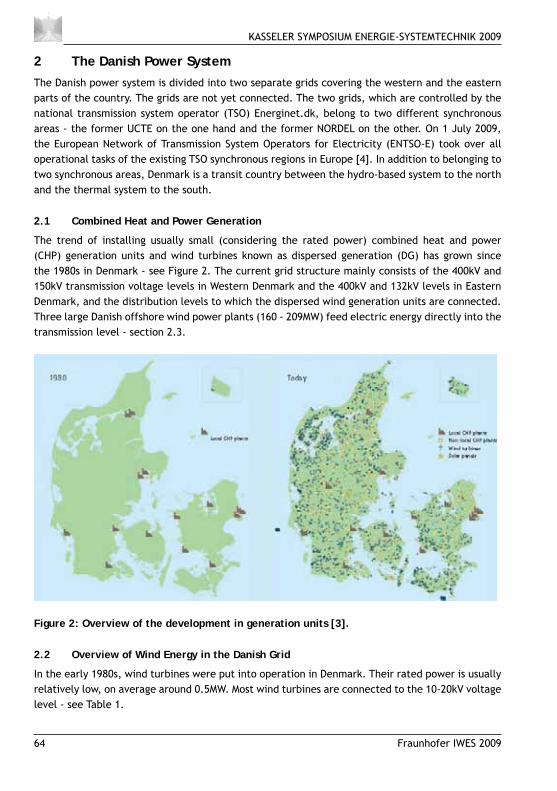
KASSELER SYMPOSIUM ENERGIE-SYSTEMTECHNIK 2009
64 Fraunhofer IWES 2009
The Danish Power System 2 The Danish power system is divided into two separate grids covering the western and the eastern parts of the country. The grids are not yet connected. The two grids, which are controlled by the national transmission system operator (TSO) Energinet.dk, belong to two different synchronous areas - the former UCTE on the one hand and the former NORDEL on the other. On 1 July 2009, the European Network of Transmission System Operators for Electricity (ENTSO-E) took over all operational tasks of the existing TSO synchronous regions in Europe [4]. In addition to belonging to two synchronous areas, Denmark is a transit country between the hydro-based system to the north and the thermal system to the south.
Combined Heat and Power Generation 2.1
The trend of installing usually small (considering the rated power) combined heat and power (CHP) generation units and wind turbines known as dispersed generation (DG) has grown since the 1980s in Denmark - see Figure 2. The current grid structure mainly consists of the 400kV and 150kV transmission voltage levels in Western Denmark and the 400kV and 132kV levels in Eastern Denmark, and the distribution levels to which the dispersed wind generation units are connected. Three large Danish offshore wind power plants (160 - 209MW) feed electric energy directly into the transmission level - section 2.3.
Figure 2: Overview of the development in generation units [3].
Overview of Wind Energy in the Danish Grid2.2
In the early 1980s, wind turbines were put into operation in Denmark. Their rated power is usually relatively low, on average around 0.5MW. Most wind turbines are connected to the 10-20kV voltage level - see Table 1.
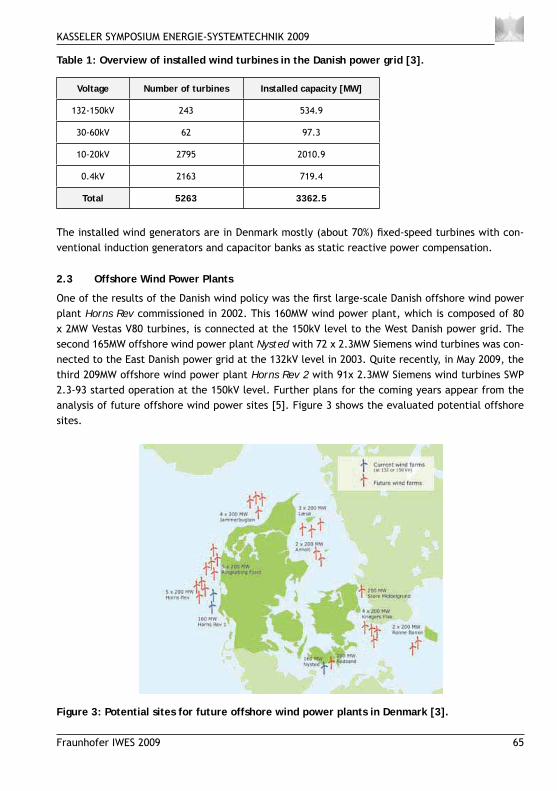
KASSELER SYMPOSIUM ENERGIE-SYSTEMTECHNIK 2009
Fraunhofer IWES 2009 65
Table 1: Overview of installed wind turbines in the Danish power grid [3].
Voltage Number of turbines Installed capacity [MW]
132-150kV 243 534.9
30-60kV 62 97.3
10-20kV 2795 2010.9
0.4kV 2163 719.4
Total 5263 3362.5
The installed wind generators are in Denmark mostly (about 70%) fi xed-speed turbines with con-ventional induction generators and capacitor banks as static reactive power compensation.
Offshore Wind Power Plants 2.3
One of the results of the Danish wind policy was the fi rst large-scale Danish offshore wind power plant Horns Rev commissioned in 2002. This 160MW wind power plant, which is composed of 80 x 2MW Vestas V80 turbines, is connected at the 150kV level to the West Danish power grid. The second 165MW offshore wind power plant Nysted with 72 x 2.3MW Siemens wind turbines was con-nected to the East Danish power grid at the 132kV level in 2003. Quite recently, in May 2009, the third 209MW offshore wind power plant Horns Rev 2 with 91x 2.3MW Siemens wind turbines SWP 2.3-93 started operation at the 150kV level. Further plans for the coming years appear from the analysis of future offshore wind power sites [5]. Figure 3 shows the evaluated potential offshore sites.
Figure 3: Potential sites for future offshore wind power plants in Denmark [3].
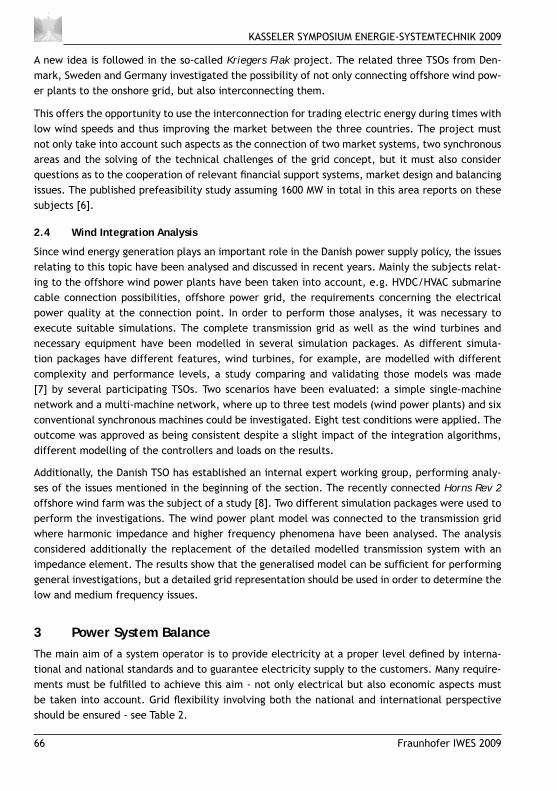
KASSELER SYMPOSIUM ENERGIE-SYSTEMTECHNIK 2009
66 Fraunhofer IWES 2009
A new idea is followed in the so-called Kriegers Flak project. The related three TSOs from Den-mark, Sweden and Germany investigated the possibility of not only connecting offshore wind pow-er plants to the onshore grid, but also interconnecting them.
This offers the opportunity to use the interconnection for trading electric energy during times with low wind speeds and thus improving the market between the three countries. The project must not only take into account such aspects as the connection of two market systems, two synchronous areas and the solving of the technical challenges of the grid concept, but it must also consider questions as to the cooperation of relevant fi nancial support systems, market design and balancing issues. The published prefeasibility study assuming 1600 MW in total in this area reports on these subjects [6].
Wind Integration Analysis2.4
Since wind energy generation plays an important role in the Danish power supply policy, the issues relating to this topic have been analysed and discussed in recent years. Mainly the subjects relat-ing to the offshore wind power plants have been taken into account, e.g. HVDC/HVAC submarine cable connection possibilities, offshore power grid, the requirements concerning the electrical power quality at the connection point. In order to perform those analyses, it was necessary to execute suitable simulations. The complete transmission grid as well as the wind turbines and necessary equipment have been modelled in several simulation packages. As different simula-tion packages have different features, wind turbines, for example, are modelled with different complexity and performance levels, a study comparing and validating those models was made [7] by several participating TSOs. Two scenarios have been evaluated: a simple single-machine network and a multi-machine network, where up to three test models (wind power plants) and six conventional synchronous machines could be investigated. Eight test conditions were applied. The outcome was approved as being consistent despite a slight impact of the integration algorithms, different modelling of the controllers and loads on the results.
Additionally, the Danish TSO has established an internal expert working group, performing analy-ses of the issues mentioned in the beginning of the section. The recently connected Horns Rev 2 offshore wind farm was the subject of a study [8]. Two different simulation packages were used to perform the investigations. The wind power plant model was connected to the transmission grid where harmonic impedance and higher frequency phenomena have been analysed. The analysis considered additionally the replacement of the detailed modelled transmission system with an impedance element. The results show that the generalised model can be suffi cient for performing general investigations, but a detailed grid representation should be used in order to determine the low and medium frequency issues.
Power System Balance 3 The main aim of a system operator is to provide electricity at a proper level defi ned by interna-tional and national standards and to guarantee electricity supply to the customers. Many require-ments must be fulfi lled to achieve this aim - not only electrical but also economic aspects must be taken into account. Grid fl exibility involving both the national and international perspective should be ensured - see Table 2.

KASSELER SYMPOSIUM ENERGIE-SYSTEMTECHNIK 2009
Fraunhofer IWES 2009 67
Providing balance between electricity consumption and generation in systems with a high pen-etration of dispersed generation is an extremely demanding task [9]. Wind power has an impact on power system operation, security of supply and reliability. Increased allocation and use of the short-term reserves is necessary in order to be able to balance the entire system.
Table 2: Technical and market issues incorporated in balancing tasks.
International fl exibility National fl exibility
Strong interconnections Strong transmission grid
Well-functioning spot market and real-time market Maximum fl exibility of thermal units
Implementation of new intraday market State-of-the-art wind power forecasts
Cross-border trade in ancillary services Work on new system architecture
Intense international cooperation on market grid issues Market design (e.g. CHP-to-market)
The Danish transmission system operator cooperates with several research institutions and consult-ing companies. The aim is to develop the tools and fi nd solutions which can help to manage the system today and in the future. Investigations included:
Forecasts / Scenarios / Principles for grid design,•
System analysis tools and models (both stationary and dynamic):•
Stability and power quality analysis,•
Detailed and aggregated models for the wind power plants [10],•
Visualisation of the system state.•
Tools for analysis of the market:•
Market power / Prices / Congestion / Power and energy exchange, etc.•
Meteorological forecast tools,•
New variants of system architecture and control:•
System expansions,•
Cell Project [11].•
Additionally, Energinet.dk participates in international studies and EU projects, as e.g. the “Euro-pean Wind Integration Study (EWIS)” and the “Decision Support for Large-Scale Integration of Wind Power (SUPWIND)”, where the detailed technical, operational, market and regulatory aspects currently are investigated.
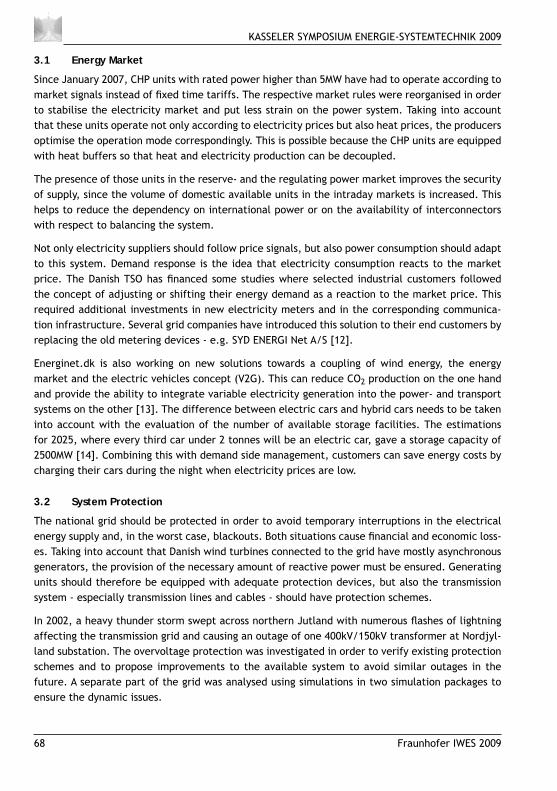
KASSELER SYMPOSIUM ENERGIE-SYSTEMTECHNIK 2009
68 Fraunhofer IWES 2009
Energy Market3.1
Since January 2007, CHP units with rated power higher than 5MW have had to operate according to market signals instead of fi xed time tariffs. The respective market rules were reorganised in order to stabilise the electricity market and put less strain on the power system. Taking into account that these units operate not only according to electricity prices but also heat prices, the producers optimise the operation mode correspondingly. This is possible because the CHP units are equipped with heat buffers so that heat and electricity production can be decoupled.
The presence of those units in the reserve- and the regulating power market improves the security of supply, since the volume of domestic available units in the intraday markets is increased. This helps to reduce the dependency on international power or on the availability of interconnectors with respect to balancing the system.
Not only electricity suppliers should follow price signals, but also power consumption should adapt to this system. Demand response is the idea that electricity consumption reacts to the market price. The Danish TSO has fi nanced some studies where selected industrial customers followed the concept of adjusting or shifting their energy demand as a reaction to the market price. This required additional investments in new electricity meters and in the corresponding communica-tion infrastructure. Several grid companies have introduced this solution to their end customers by replacing the old metering devices - e.g. SYD ENERGI Net A/S [12].
Energinet.dk is also working on new solutions towards a coupling of wind energy, the energy market and the electric vehicles concept (V2G). This can reduce CO2 production on the one hand and provide the ability to integrate variable electricity generation into the power- and transport systems on the other [13]. The difference between electric cars and hybrid cars needs to be taken into account with the evaluation of the number of available storage facilities. The estimations for 2025, where every third car under 2 tonnes will be an electric car, gave a storage capacity of 2500MW [14]. Combining this with demand side management, customers can save energy costs by charging their cars during the night when electricity prices are low.
System Protection3.2
The national grid should be protected in order to avoid temporary interruptions in the electrical energy supply and, in the worst case, blackouts. Both situations cause fi nancial and economic loss-es. Taking into account that Danish wind turbines connected to the grid have mostly asynchronous generators, the provision of the necessary amount of reactive power must be ensured. Generating units should therefore be equipped with adequate protection devices, but also the transmission system - especially transmission lines and cables - should have protection schemes.
In 2002, a heavy thunder storm swept across northern Jutland with numerous fl ashes of lightning affecting the transmission grid and causing an outage of one 400kV/150kV transformer at Nordjyl-land substation. The overvoltage protection was investigated in order to verify existing protection schemes and to propose improvements to the available system to avoid similar outages in the future. A separate part of the grid was analysed using simulations in two simulation packages to ensure the dynamic issues.
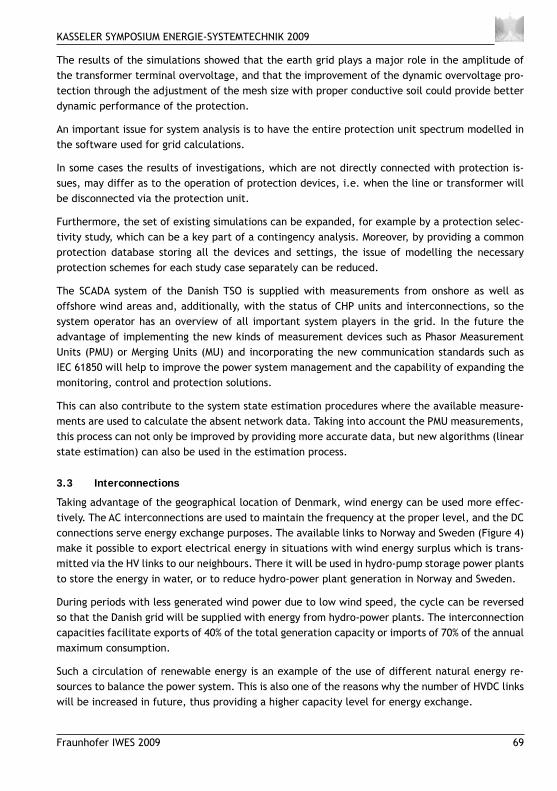
KASSELER SYMPOSIUM ENERGIE-SYSTEMTECHNIK 2009
Fraunhofer IWES 2009 69
The results of the simulations showed that the earth grid plays a major role in the amplitude of the transformer terminal overvoltage, and that the improvement of the dynamic overvoltage pro-tection through the adjustment of the mesh size with proper conductive soil could provide better dynamic performance of the protection.
An important issue for system analysis is to have the entire protection unit spectrum modelled in the software used for grid calculations.
In some cases the results of investigations, which are not directly connected with protection is-sues, may differ as to the operation of protection devices, i.e. when the line or transformer will be disconnected via the protection unit.
Furthermore, the set of existing simulations can be expanded, for example by a protection selec-tivity study, which can be a key part of a contingency analysis. Moreover, by providing a common protection database storing all the devices and settings, the issue of modelling the necessary protection schemes for each study case separately can be reduced.
The SCADA system of the Danish TSO is supplied with measurements from onshore as well as offshore wind areas and, additionally, with the status of CHP units and interconnections, so the system operator has an overview of all important system players in the grid. In the future the advantage of implementing the new kinds of measurement devices such as Phasor Measurement Units (PMU) or Merging Units (MU) and incorporating the new communication standards such as IEC 61850 will help to improve the power system management and the capability of expanding the monitoring, control and protection solutions.
This can also contribute to the system state estimation procedures where the available measure-ments are used to calculate the absent network data. Taking into account the PMU measurements, this process can not only be improved by providing more accurate data, but new algorithms (linear state estimation) can also be used in the estimation process.
Interconnections3.3
Taking advantage of the geographical location of Denmark, wind energy can be used more effec-tively. The AC interconnections are used to maintain the frequency at the proper level, and the DC connections serve energy exchange purposes. The available links to Norway and Sweden (Figure 4) make it possible to export electrical energy in situations with wind energy surplus which is trans-mitted via the HV links to our neighbours. There it will be used in hydro-pump storage power plants to store the energy in water, or to reduce hydro-power plant generation in Norway and Sweden.
During periods with less generated wind power due to low wind speed, the cycle can be reversed so that the Danish grid will be supplied with energy from hydro-power plants. The interconnection capacities facilitate exports of 40% of the total generation capacity or imports of 70% of the annual maximum consumption.
Such a circulation of renewable energy is an example of the use of different natural energy re-sources to balance the power system. This is also one of the reasons why the number of HVDC links will be increased in future, thus providing a higher capacity level for energy exchange.
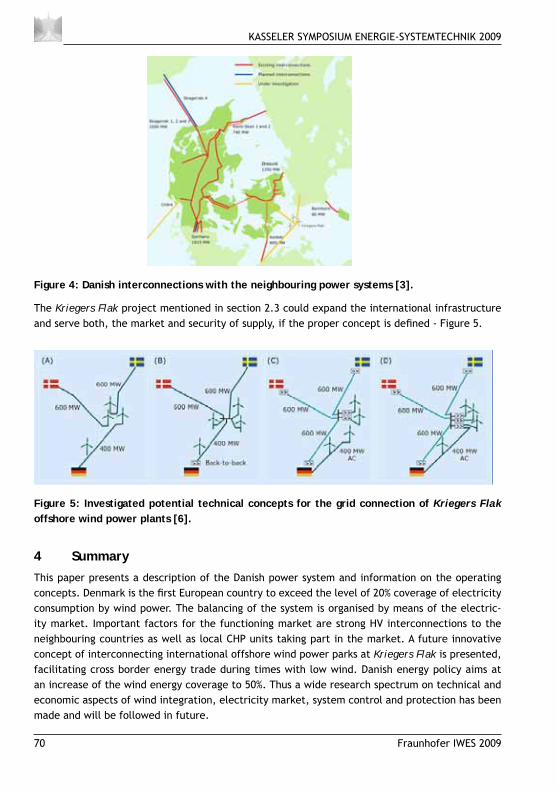
KASSELER SYMPOSIUM ENERGIE-SYSTEMTECHNIK 2009
70 Fraunhofer IWES 2009
Figure 4: Danish interconnections with the neighbouring power systems [3].
The Kriegers Flak project mentioned in section 2.3 could expand the international infrastructure and serve both, the market and security of supply, if the proper concept is defi ned - Figure 5.
Figure 5: Investigated potential technical concepts for the grid connection of Kriegers Flak offshore wind power plants [6].
Summary4 This paper presents a description of the Danish power system and information on the operating concepts. Denmark is the fi rst European country to exceed the level of 20% coverage of electricity consumption by wind power. The balancing of the system is organised by means of the electric-ity market. Important factors for the functioning market are strong HV interconnections to the neighbouring countries as well as local CHP units taking part in the market. A future innovative concept of interconnecting international offshore wind power parks at Kriegers Flak is presented, facilitating cross border energy trade during times with low wind. Danish energy policy aims at an increase of the wind energy coverage to 50%. Thus a wide research spectrum on technical and economic aspects of wind integration, electricity market, system control and protection has been made and will be followed in future.
KASSELER SYMPOSIUM ENERGIE-SYSTEMTECHNIK 2009
Fraunhofer IWES 2009 71
References5 Directive of the European Parliament and of the Council on the promotion of the use of en-[1]
ergy from renewable sources available at: http://ec.europa.eu/energy/climate_actions/doc/2008_res_directive_en.pdf
“A visionary Danish energy policy 2025”, January 2007, available at: [2] www.ens.dk
Transmission System Operator in Denmark Energinet.dk - Homepage: [3] www.energinet.dk
European Network of Transmission System Operators for Electricity - ENTSO-e, Homepage: [4] http://www.entsoe.eu
“Future Offshore Wind Power Sites - 2025”, April 2007, available at [5] www.ens.dk
“An Analysis of Offshore Grid Connection at Kriegers Flak in the Baltic Sea”, Joint Pre-fea-[6] sibility Study, May 2009, available at: http://www.energinet.dk/NR/rdonlyres/648CA739-6890-4E03-B18A-F21BB6A3FC5F/0/KriegersFlakPrefeasibilityReport.pdf
Toal, J.; Urdal, H.; Horne, J.; Coughlan, Y.; Brozio, C.; Punton, B.; Brown, A.; Wiechowski, [7] W.; “Building Confi dence in Computer Models of Wind Turbine Generators from a Utility Perspective”, Power System Integration and Electrical Systems of Wind Turbines and Wind Farms - Nordic Wind Power Conference, Roskilde, Denmark, 2008.
Wiechowski, W.; Hygebjerg, J. C.; Eriksen, P. B.; “Higher Frequency Performance of AC [8] Cable Connections of the Offshore Wind Farms - Studies of the Danish TSO”, 7th Interna-tional Workshop on Large-Scale Integration of Wind Power into Power Systems as well as on Transmission Networks for Offshore Wind Farms, Madrid, Spain, 2008.
Styczynski, Z. A.; Rudion, K.; Eriksen, P. B.; Orths, A. G.; Schafer, T.; Sattinger, W.; Rouco, [9] L.; Phadke, A.; “Operation and Control Strategies for Networks with a High Degree of Re-newable Generation”, Survey Paper at PSCC 2008 Conference, Glasgow, Scotland, 2008.
Rudion, K.; Styczynski, Z. A.; Orths, A. G.; Ruhle, O.; “MaWind - tool for the aggregation of [10] wind farm models”, Power and Energy Society General Meeting - Conversion and Delivery of Electrical Energy in the 21st Century, Pittsburgh, USA, 2008.
Lund, P.; “The Danish Cell Project - Part 1: Background and General Approach”, Power [11] Engineering Society General Meeting, Tampa, USA, 2007.
SYD ENERGI Net A/S Homepage: [12] http://www.sydenergi.dk
“Effi cient use of wind power-based electricity in Denmark – interaction between wind power, [13] heat pumps and electric vehicles”, March 2009, available at: http://www.energinet.dk/NR/rdonlyres/6E73AF6C-52C3-4080-B1F3-929FA1C13206/0/heat_pumps_and_electric_vehicles_Resume_UK.pdf
Eriksen, P. B.; Orths, A. G.; “The Challenges and Solutions of Increasing from 20 to 50 Per-[14] cent of Wind Energy Coverage in the Danish Power System until 2025”, 7th International Workshop on Large-Scale Integration of Wind Power into Power Systems, Madrid, Spain, 2008.
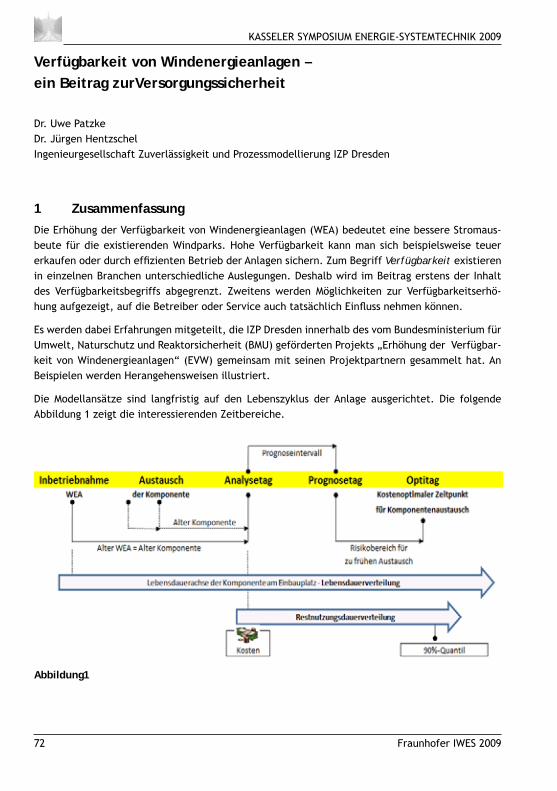
KASSELER SYMPOSIUM ENERGIE-SYSTEMTECHNIK 2009
72 Fraunhofer IWES 2009
Verfügbarkeit von Windenergieanlagen – ein Beitrag zurVersorgungssicherheit
Dr. Uwe PatzkeDr. Jürgen HentzschelIngenieurgesellschaft Zuverlässigkeit und Prozessmodellierung IZP Dresden
Zusammenfassung1 Die Erhöhung der Verfügbarkeit von Windenergieanlagen (WEA) bedeutet eine bessere Stromaus-beute für die existierenden Windparks. Hohe Verfügbarkeit kann man sich beispielsweise teuer erkaufen oder durch effi zienten Betrieb der Anlagen sichern. Zum Begriff Verfügbarkeit existieren in einzelnen Branchen unterschiedliche Auslegungen. Deshalb wird im Beitrag erstens der Inhalt des Verfügbarkeitsbegriffs abgegrenzt. Zweitens werden Möglichkeiten zur Verfügbarkeitserhö-hung aufgezeigt, auf die Betreiber oder Service auch tatsächlich Einfl uss nehmen können.
Es werden dabei Erfahrungen mitgeteilt, die IZP Dresden innerhalb des vom Bundesministerium für Umwelt, Naturschutz und Reaktorsicherheit (BMU) geförderten Projekts „Erhöhung der Verfügbar-keit von Windenergieanlagen“ (EVW) gemeinsam mit seinen Projektpartnern gesammelt hat. An Beispielen werden Herangehensweisen illustriert.
Die Modellansätze sind langfristig auf den Lebenszyklus der Anlage ausgerichtet. Die folgende Abbildung 1 zeigt die interessierenden Zeitbereiche.
Abbildung1

KASSELER SYMPOSIUM ENERGIE-SYSTEMTECHNIK 2009
Fraunhofer IWES 2009 73
EVW-Projekt „Erhöhung der Verfügbarkeit von Windenergieanlagen“ 2 Im Unterschied zu konventionellen Energieerzeugern weist die Windbranche neben dem Faktor Wind einige Besonderheiten auf, von denen vor allem die Vielzahl an Standorten mit unterschied-lichsten Größenordnungen und die nicht permanent möglichen Zugriffe auf die Anlagen charakte-ristisch sind. Aktuell spielen spezifi sche Marktbesonderheiten in punkto Preisgestaltung und Ersatz-teilbereitstellung eine besondere Rolle.
Im Rahmen des bereits genannten EVW-Projekts steht die Effi zienz von Betriebs- und Instandhal-tungsstrategien im Mittelpunkt.
Ein Schwerpunkt innerhalb des EVW-Projekts ist es, sich der Behebung von Informationsdefi ziten zu widmen. Die Aufgabengebiete reichen von der Standardisierung der Informations- und Manage-mentprozesse über die Verbesserung der Planungs- und Entscheidungssicherheit bis hin zur Erhö-hung der Verfügbarkeit. Eine zuverlässigkeitsorientierte Instandhaltung soll dazu beitragen, dass die Anlagen besonders in windstarken Zeiten in technisch einwandfreiem Zustand sind.
Der Begriff Verfügbarkeit3
Beschreibung in Standards wie DIN 400413.1
Verschiedene Standards widmen sich dem Begriff Verfügbarkeit: MIL-STD-721, DIN 40041, VDI 3423 usw.
In der branchenübergreifenden DIN 40041 werden die Begriffe Zuverlässigkeit und Verfügbarkeit von Maschinen und Anlagen in ihrem Zusammenhang vermittelt. Zuverlässigkeit ist defi niert als Wahrscheinlichkeit, mit der eine technische Einheit die an sie gestellten Anforderungen unter gewissen Randbedingungen mindestens eine vorgegebene Zeit erfüllt. Verfügbarkeit ist die Wahr-scheinlichkeit, mit der eine technische Einheit zu einem vorgegebenen Zeitpunkt arbeitet. Man spricht auch von Momentanverfügbarkeit. Ihr Mittelwert über ein Zeitintervall ist die Intervall-verfügbarkeit.
Die Berechnung von Verfügbarkeiten ist selten einfach. Im Vorfeld müssen qualifi zierte Zuverlässig-keitsauswertungen durchgeführt werden, damit speziell Lebensdauerverteilung und Erneuerungs-prozess modelliert werden können.
Unterstützende Softwaretools sind bei IZP Dresden und anderen Anbietern vorhanden. Für das Modell ist hilfreich, dass der übliche Betriebsrhythmus einer Betrachtungseinheit mit dem Wechsel von Arbeitsphase und Stillstandsphase (Reparatur, Wartung oder Ähnliches) als Erneuerungsprozess aufgefasst werden kann. Unter diesem Gesichtspunkt lassen sich sowohl die Momentan- als auch die Intervallverfügbarkeit als Quotient von Erwartungswerten
V = (1)
darstellen, falls nur die Betriebszeit der Betrachtungseinheit einigermaßen groß ist, was in prakti-schen Fällen regelmäßig erfüllt ist.
mittlere Dauer der Arbeitsphase
mittlere Dauer von (Arbeitsphase + Stillstandsphase)

KASSELER SYMPOSIUM ENERGIE-SYSTEMTECHNIK 2009
74 Fraunhofer IWES 2009
Quotient (1) heißt Dauer- oder stationäre Verfügbarkeit (auch: Verfügbarkeitskoeffi zient) einer Betrachtungseinheit (Komponente, System). Er gibt an, mit welcher Wahrscheinlichkeit eine Kom-ponente zu einem Zeitpunkt, der weit genug vom Anfangszeitpunkt des Prozesses entfernt ist, funktionsfähig ist.
Verfügbarkeitsbegriff und Windenergieerzeugung3.2
Verfügbarkeit wird im Allgemeinen nicht explizit erklärt und je nach Anliegen von Netz-betreiber, Anlagenhersteller, Service oder Betriebs führer unterschiedlich interpretiert, wie die aktuelle Dis-kussion zur Defi nition der Verfügbarkeit in der Fertigung nach IEC TS 61400-26-1 (Draft) „Time-based availability for wind turbines“ zeigt.
Grundsätzlich bleibt: Verfügbarkeit ist eine vergleichende statistische Kennzahl, die von einem Vergleichsziel abgeleitet wird. Unterschiedliche Verfügbarkeitsauffassungen sind denkbar, meist werden gewisse Effekte saldiert.
Wenn man für Windenergieanlagen versucht, Zeitabschnitte in einfacher und übersichtlicher Form aufzugliedern, stößt man schnell an Grenzen. Im folgenden Schema wurden dabei u.a. noch nicht einmal zeitliche Überlappungen von Abschaltungen und Schwachwindphasen berücksichtigt.
Weder einfach noch eindeutig ist es, die vorsorgliche Leistungsreduktion einer Anlage in einem Teilzeitraum abzubilden. Dieser Teilzeitraum trägt sowohl Merkmale der Arbeits- als auch der Still-standsphase.
Für eine Kennzahl, die die technische Verfügbarkeit entsprechend VDI 3423 abbilden soll, wird sich ein Hersteller wesentlich für Zeitbereich 5 interessieren, Serviceunternehmen vorrangig für Zeitbereich 4.
Der Betreiber wiederum muss Erträge sichern und benötigt deshalb neben der auf ihn zugeschnit-tenen operationalen Verfügbarkeit entsprechend VDI 3423 eine Verfügbarkeit mit kaufmännischer Sichtweise, d.h. mit Kostenpositionen. Die energetische Verfügbarkeit VE mit
VE= ErtragrentgangeneErtraghertatsächlic
Ertraghertatsächlic
+
bezieht Stillstand in Form von Referenzwerten für Ertragsverluste ein.

KASSELER SYMPOSIUM ENERGIE-SYSTEMTECHNIK 2009
Fraunhofer IWES 2009 75
Zuverlässigkeitsorientierte Instandhaltung3.3
Unabhängig von der jeweiligen Defi nition kann die Erhöhung der Verfügbarkeit für eine Komponen-te erzielt werden, wenn die Arbeitsphasen der Komponente verlängert und der tatsächliche Ertrag vergrößert und/oder Stillstandphasen verkürzt und der entgangene Ertrag verringert werden.
Eine Verlängerung der Arbeitsphase ist vor allem an eine Erhöhung der Zuverlässigkeit der Kompo-nente gebunden, was im Nachhinein nur bedingt zu steuern ist. Deshalb wird im Weiteren bei gege-bener Zuverlässigkeit nur die Stillstandsphase mit dem Bestandteil Instandhaltungs-management betrachtet.
Die Verkürzung der Stillstandsphase kann durch eine optimierende Organisation der Instand-hal-tung erreicht werden. Im Zusammenspiel mit Planungs- und Organisationsleistungen allgemeiner Art bieten sich hierfür Chancen an durch
Wartung/Instandsetzung während ohnehin geplanter Abschaltungen oder in wind-schwa-• chen Zeiten,
Ausnutzung der Anwesenheit von Servicepersonal auf der WEA für zusätzliche vorbeugende • Maßnahmen bei moderaten Zusatzkosten,
effektive Strategien zur Vermeidung von Havariesituationen mit hohen Folgekosten und • langen Wartezeiten.
In Ergänzung zu ordnungsgemäßer Wartung, Pfl ege und Betrieb bleibt zusammengefasst die Frage: Welche außerplanmäßigen Maßnahmen sollten wann in Auftrag gegeben werden?
Lösungsansätze für solche Problemstellungen verwenden den Zusammenhang von Zuverlässigkeit, Verfügbarkeit und Kosteninformationen der Komponenten und sind als zuverlässigkeitsorientierte Instandhaltung (ZOI) bekannt.
Voraussetzung für die praktische Arbeit sind fundierte Kenntnisse über die Zuverlässigkeit der Komponenten, zeitliche Rahmenbedingungen beim Service und Informationen über die Kosten der präventiven und der korrektiven Maßnahmen – die drei Säulen der ZOI. Eine der Zielstellungen des EVW-Projekts war die Schaffung einer branchenbezogenen Datenbasis für die Instandhaltung auf der Grundlage anerkannter Standards, in der auch die Belange der ZOI berücksichtigt sind.
Die zuverlässigkeitsorientierte Instandhaltung kennt nicht den Königsweg für Entscheidungen. Es kann aber mit der Unterstützung verlässlicher Informationen die ausreichende Bemessung der Wartungsintervalle, ein quantifi zierter Blick auf die kritischen Komponenten und eine vorausschau-ende Ersatzteilplanung vorgenommen werden.
Innerhalb des erwähnten EVW-Projekts wurde ein erster Schritt für eine statistisch validierte Ent-scheidungshilfe durch Schaffung RDS-PP-basierter Datenbankstrukturen und Kennwerte-Bibliothe-ken mit dem Decision-Tool SimuWind geschaffen.

KASSELER SYMPOSIUM ENERGIE-SYSTEMTECHNIK 2009
76 Fraunhofer IWES 2009
Verfügbarkeiten – am Beispiel eines Windparks3.4
Betrachtet sei ein Betriebsmonat an einer 1,65-MW-Anlage mit folgenden Koordinaten:
Stunden gesamt für einen Monat: 744 h
Betriebsstunden Generator: 242 h
Reparaturen: 62,72 h
Durchschnittliche Zeit unter Einschaltgeschwindigkeit: 191 h
Volllaststunden: 115 h (entspricht ca. 15% Auslastung)
Zumindest für diesen Monat liegt die Anlage also deutlich unter den branchenüblichen Referenzer-trägen. Das fi ndet sich in den Ergebnissen wieder:
Technische Verfügbarkeit: 91,57 %
Energetische Verfügbarkeit: 84,56 %
Das Auseinanderfallen von technischer und energetischer Verfügbarkeit zeigt, dass die Reparatu-ren an windstarken Tagen erfolgten. Diagnose und Wechsel einer Pumpe zuzüglich etwa zwei Tage Bestellzeit verursachten einen Ausfall von knapp 37.000 kWh.
Die genannten Verfügbarkeitsdefi nitionen sind nicht universell, jeweils allein nicht aussage-kräf-tig, nur über länger betrachtete Zeiträume sinnvoll und mit Saldierungseffekten belastet (z.B. zu viel/zu wenig Wind überdeckt Mängel).
Ginge es um ein Maß für den effi zienten Betrieb eines Windparks, wären normierte oder wind-bereinigte Vollaststunden geeigneter. Jedoch hätte dieser Wert keinen Bezug zum Begriff Verfüg-barkeit.
Beispiel für Zuverlässigkeit und Verfügbarkeit4
Aussagen im Prognosezeitraum4.1
Das nachfolgende Beispiel stützt sich auf Kostenangaben aus einer Studie des Deutschen Windener-gie-Instituts (DEWI) für das Jahr 2002 zur Komponente Getriebe, für das seither belastbare Werte nicht publiziert wurden.
Die Komponente habe aktuell ein Alter von 1.670 Tagen (4 Jahre, 7 Monate). Die Lebensdauer vergleichbarer Komponenten dieser Klasse wird durch eine validierte Weibull-Verteilung mit den Parametern [4,6; 3.200 Tage] beschrieben.
Der Prognosezeitraum erstreckt sich über zwei Jahre.
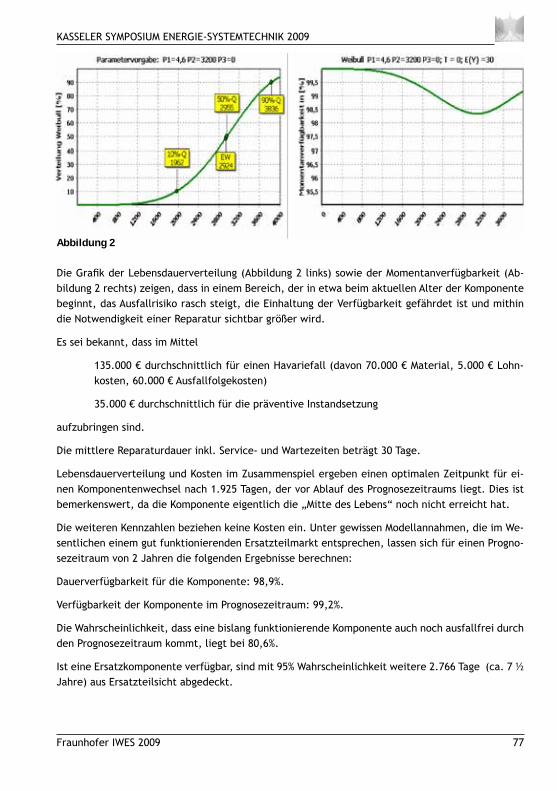
KASSELER SYMPOSIUM ENERGIE-SYSTEMTECHNIK 2009
Fraunhofer IWES 2009 77
Abbildung 2
Die Grafi k der Lebensdauerverteilung (Abbildung 2 links) sowie der Mome ntan verfügbarkeit (Ab-bildung 2 rechts) zeigen, dass in einem Bereich, der in etwa beim aktuellen Alter der Komponente beginnt, das Ausfallrisiko rasch steigt, die Einhaltung der Verfügbarkeit gefährdet ist und mithin die Notwendigkeit einer Reparatur sichtbar größer wird.
Es sei bekannt, dass im Mittel
135.000 € durchschnittlich für einen Havariefall (davon 70.000 € Material, 5.000 € Lohn-kosten, 60.000 € Ausfallfolgekosten)
35.000 € durchschnittlich für die präventive Instandsetzung
aufzubringen sind.
Die mittlere Reparaturdauer inkl. Service- und Wartezeiten beträgt 30 Tage.
Lebensdauerverteilung und Kosten im Zusammenspiel ergeben einen optimalen Zeitpunkt für ei-nen Komponentenwechsel nach 1.925 Tagen, der vor Ablauf des Prognosezeitraums liegt. Dies ist bemerkenswert, da die Komponente eigentlich die „Mitte des Lebens“ noch nicht erreicht hat.
Die weiteren Kennzahlen beziehen keine Kosten ein. Unter gewissen Modellannahmen, die im We-sentlichen einem gut funktionierenden Ersatzteilmarkt entsprechen, lassen sich für einen Progno-se zeitraum von 2 Jahren die folgenden Ergebnisse berechnen:
Dauerverfügbarkeit für die Komponente: 98,9%.
Verfügbarkeit der Komponente im Prognosezeitraum: 99,2%.
Die Wahrscheinlichkeit, dass eine bislang funktionierende Komponente auch noch ausfallfrei durch den Prognosezeitraum kommt, liegt bei 80,6%.
Ist eine Ersatzkomponente verfügbar, sind mit 95% Wahrscheinlichkeit weitere 2.766 Tage (ca. 7 ½ Jahre) aus Ersatzteilsicht abgedeckt.

KASSELER SYMPOSIUM ENERGIE-SYSTEMTECHNIK 2009
78 Fraunhofer IWES 2009
Aus Risikosicht wäre zu empfehlen, dass in nächster Zeit ein Komponentenaustausch bzw. eine komplette Instandsetzung einzuleiten ist. Aus Sicht der Zuverlässigkeit (technisch einwandfreier Zustand usw. vorausgesetzt) sind noch keine umfangreichen Instandhaltungsmaßnahmen zwingend notwendig.
Spezielle Szenarien4.2
Die Einfl ussgrößen für eine Kostenbetrachtung bei Instandhaltungsstrategien sind vielfältig und wei-sen zum Teil große Bandbreiten wegen der Komplexität an sich und der Datenqualität im Detail auf:
Zuverlässigkeit und Restnutzungsdauer•
Wiederbeschaffungs- und Wiederverkaufswerte•
Folgekosten•
Bestellzeit•
geplante und tatsächliche Nutzungsdauer•
Alter und Zustand•
Nutzeffekte von zusätzlichen Maßnahmen wie CMS usw.•
Material- und Lohnkostenentwicklungen, Zinssätze, Infl ation •
Zur praktischen Umsetzung gehört es vor allem, auch kurzfristig Entscheidungen zu unter-stützen. Grundsätzlich besteht aber die Gefahr, dass Berechnungen in einem Prognosefenster zu Fehlein-schätzungen führen. Es ist bei der Modellbildung stets darauf zu achten, dass bewertete Einheiten immer im Zusammenhang mit der geplanten oder tatsächlichen Nutzungsdauer der Gesamtanlage zu sehen sind. Das ist wichtig für die Kalkulation der Serviceanbieter, es ist wichtig für Hersteller oder Betreiber.
Die Fragestellung aus Abschnitt 3.1. kann z.B. mit einem Kostenvergleich bei folgenden Szenarien anders beleuchtet werden.
Szenario 1 - Korrektive Instandhaltung: Es werden außer der regelmäßigen Wartung keinerlei prä-ventive Maßnahmen ergriffen, die Komponente wird bis zum Totalausfall betrieben.
Szenario 2 - Geplante präventive Instandhaltung: Die Komponente wird sofort bestellt und nach einem halben Jahr Wartezeit bei Erhalt umgehend eingebaut.
Szenario 3 - Zustandsabhängige präventive Instandhaltung: Die Komponente wird wie in Szenario 2 sofort bestellt, aber erst bei Bedarf eingebaut. Zusätzliche Maßnahmen sichern ab, dass die Kom ponente „kurz vor“ Totalausfall ausgebaut werden kann und kostenintensive Folgeschäden ausbleiben.
Je länger die Komponente genutzt wird, umso kritischer wird Szenario 1, auch weil weder gegen Folgekosten noch gegen Ertragsverluste Maßnahmen enthalten sind. Szenario 2 ist dann zu emp-fehlen, wenn ein angemessener Verkaufserlös für die ausgetauschte Komponente erzielt werden kann.

KASSELER SYMPOSIUM ENERGIE-SYSTEMTECHNIK 2009
Fraunhofer IWES 2009 79
Szenario 3 als Kombination von Ersatzteilbevorratung und zusätzlichen Maßnahmen hat von allen drei Szenarien die höchste Verfügbarkeit und nutzt die Abnutzungsreserve. Auf der anderen Seite wird aber über eine zufällige Zeit Kapital für eine Komponente im Lagerbestand gebunden.
Welche Entscheidung sollte nun vom Betreiber eines Windparks getroffen werden, wenn als Ent-scheidungskriterium die Minimierung der mittleren Betriebskosten über die nächsten zwei Jahre dient? Wäre ein weiteres Szenario zu untersuchen, welches das Problem der Beschaffung einer neuen Komponente vertagt und zunächst preiswertere Alternativen verfolgt?
Unter Verzicht auf eine Diskussion der verschiedensten Einfl ussgrößen, Annahmen und sonstiger Randbedingungen für die Analyse ist in einem relativ frühen Lebensdauerabschnitt das Szenario 1 die erste Wahl, trotz Verfügbarkeit von nur knapp 96%. Aus Sicht der technischen Verfügbarkeit schneidet Szenario 3 mit 99,5% am besten ab.
Szenario 2 kann die beste Alternative sein, wenn an die Kosten des gesamten Lebenszyklus gedacht wird.
KASSELER SYMPOSIUM ENERGIE-SYSTEMTECHNIK 2009
80 Fraunhofer IWES 2009
Ancillary Services by VPP
Zbigniew A. Styczynski, [email protected], Otto-von-Guericke University Magdeburg, Germany.Krzysztof Rudion, [email protected], Otto-von-Guericke University Magdeburg, Germany.
Introduction1 The European Commission policies concerning climate and electricity have placed a high priority on the utilization of energy coming from renewable energy sources (RES). This should both con-tribute to a decrease in CO2 emission as well as reduce the dependency on fossil energy sources. The EU directives require that the European countries meet the aims of the renewable share in national power systems set in [1]. In Germany, in addition to the European law that ensures the incorporation of dispersed generation (DG), which includes both the combined heat and power (CHP) as well as RES, the national government is also supporting this directive by establishing the minimal profi t from 1kWh for the energy supply [2]. This additionally accelerates the interest in providing the “green energy”.
Achieving the level of 22% electricity production from RES by 2010, as defi ned in [3], will impact the structure of existing power systems. The wind, water, photovoltaic and other kinds of genera-tion units feed a respectable amount of electrical energy directly into the distribution level, unlike the centralized conventional power plants, where produced energy is injected into the system at the transmission level. Moreover, the stochastic character of the power generation from most of the RES units (heavy dependency on the weather conditions) needs to be taken into account, since it has a crucial infl uence on the operational behaviour of the overall power system. The change of the power system structure introduced by the DG units from a centralised to a decentralised one requires also changes in the monitoring, controlling and balancing concepts of the system, which allow for optimizing the interaction between conventional power plants and DG in order to guar-antee safety and security of supply at an economic level.
New concepts like virtual power plants (VPP) have been, therefore, introduced as a solution to handle the mix of conventional and DG energy sources. The VPP should act from the system opera-tor’s point of view taking into account operational characteristics like a conventional power plant, which keeps the power system balanced and guarantees the appropriate power quality level. For this purpose VPP should also take over other features of the common power plants like providing the ancillary services and contribute to ensuring system services.
The adoption of the new technologies considering the enhancement of the electrical power sys-tem will not only have an impact on the electric sector. In the development and integration of new concepts the information and communication technologies (ICT) play an important role. New challenges need to be faced in order to provide the infrastructure for proper operation of the VPP. Produced energy from even small scale generators will be utilized in energy markets and can extend the national power reserve capacity.
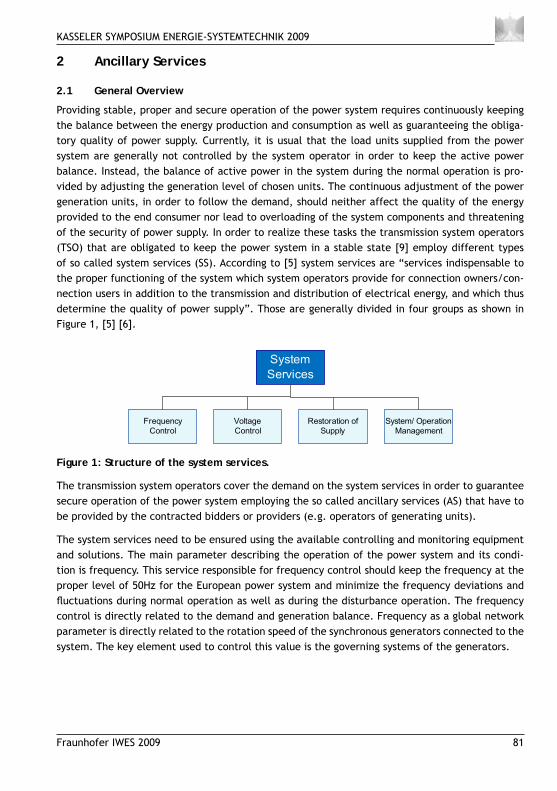
KASSELER SYMPOSIUM ENERGIE-SYSTEMTECHNIK 2009
Fraunhofer IWES 2009 81
Ancillary Services2
General Overview2.1
Providing stable, proper and secure operation of the power system requires continuously keeping the balance between the energy production and consumption as well as guaranteeing the obliga-tory quality of power supply. Currently, it is usual that the load units supplied from the power system are generally not controlled by the system operator in order to keep the active power balance. Instead, the balance of active power in the system during the normal operation is pro-vided by adjusting the generation level of chosen units. The continuous adjustment of the power generation units, in order to follow the demand, should neither affect the quality of the energy provided to the end consumer nor lead to overloading of the system components and threatening of the security of power supply. In order to realize these tasks the transmission system operators (TSO) that are obligated to keep the power system in a stable state [9] employ different types of so called system services (SS). According to [5] system services are “services indispensable to the proper functioning of the system which system operators provide for connection owners/con-nection users in addition to the transmission and distribution of electrical energy, and which thus determine the quality of power supply”. Those are generally divided in four groups as shown in Figure 1, [5] [6].
FrequencyControl
VoltageControl
Restoration ofSupply
System/ OperationManagement
System
Services
Figure 1: Structure of the system services.
The transmission system operators cover the demand on the system services in order to guarantee secure operation of the power system employing the so called ancillary services (AS) that have to be provided by the contracted bidders or providers (e.g. operators of generating units).
The system services need to be ensured using the available controlling and monitoring equipment and solutions. The main parameter describing the operation of the power system and its condi-tion is frequency. This service responsible for frequency control should keep the frequency at the proper level of 50Hz for the European power system and minimize the frequency deviations and fl uctuations during normal operation as well as during the disturbance operation. The frequency control is directly related to the demand and generation balance. Frequency as a global network parameter is directly related to the rotation speed of the synchronous generators connected to the system. The key element used to control this value is the governing systems of the generators.
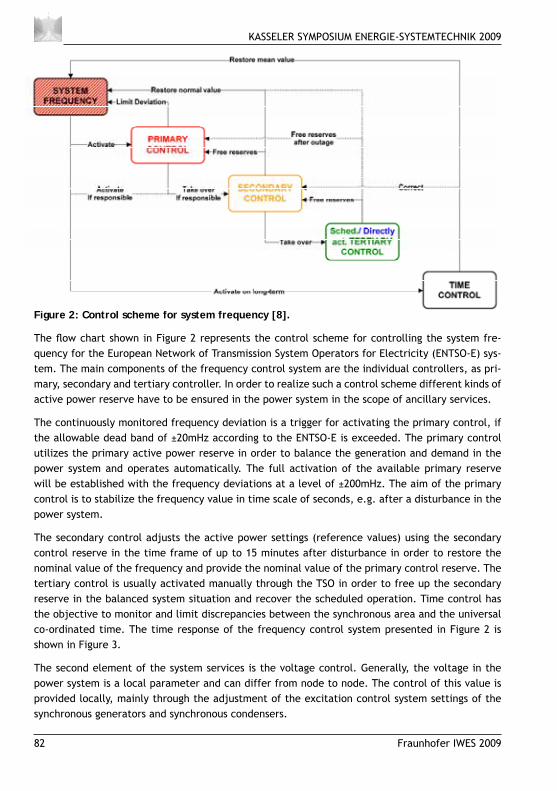
KASSELER SYMPOSIUM ENERGIE-SYSTEMTECHNIK 2009
82 Fraunhofer IWES 2009
Figure 2: Control scheme for system frequency [8].
The fl ow chart shown in Figure 2 represents the control scheme for controlling the system fre-quency for the European Network of Transmission System Operators for Electricity (ENTSO-E) sys-tem. The main components of the frequency control system are the individual controllers, as pri-mary, secondary and tertiary controller. In order to realize such a control scheme different kinds of active power reserve have to be ensured in the power system in the scope of ancillary services.
The continuously monitored frequency deviation is a trigger for activating the primary control, if the allowable dead band of ±20mHz according to the ENTSO-E is exceeded. The primary control utilizes the primary active power reserve in order to balance the generation and demand in the power system and operates automatically. The full activation of the available primary reserve will be established with the frequency deviations at a level of ±200mHz. The aim of the primary control is to stabilize the frequency value in time scale of seconds, e.g. after a disturbance in the power system.
The secondary control adjusts the active power settings (reference values) using the secondary control reserve in the time frame of up to 15 minutes after disturbance in order to restore the nominal value of the frequency and provide the nominal value of the primary control reserve. The tertiary control is usually activated manually through the TSO in order to free up the secondary reserve in the balanced system situation and recover the scheduled operation. Time control has the objective to monitor and limit discrepancies between the synchronous area and the universal co-ordinated time. The time response of the frequency control system presented in Figure 2 is shown in Figure 3.
The second element of the system services is the voltage control. Generally, the voltage in the power system is a local parameter and can differ from node to node. The control of this value is provided locally, mainly through the adjustment of the excitation control system settings of the synchronous generators and synchronous condensers.
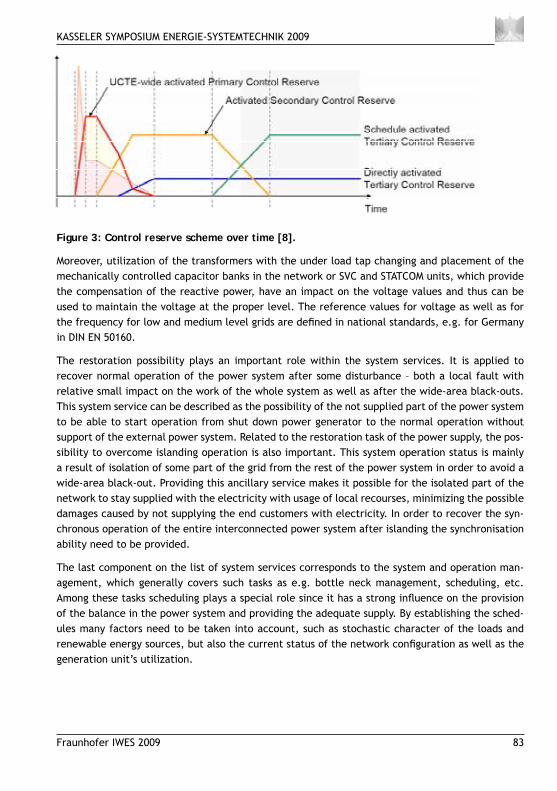
KASSELER SYMPOSIUM ENERGIE-SYSTEMTECHNIK 2009
Fraunhofer IWES 2009 83
Figure 3: Control reserve scheme over time [8].
Moreover, utilization of the transformers with the under load tap changing and placement of the mechanically controlled capacitor banks in the network or SVC and STATCOM units, which provide the compensation of the reactive power, have an impact on the voltage values and thus can be used to maintain the voltage at the proper level. The reference values for voltage as well as for the frequency for low and medium level grids are defi ned in national standards, e.g. for Germany in DIN EN 50160.
The restoration possibility plays an important role within the system services. It is applied to recover normal operation of the power system after some disturbance – both a local fault with relative small impact on the work of the whole system as well as after the wide-area black-outs. This system service can be described as the possibility of the not supplied part of the power system to be able to start operation from shut down power generator to the normal operation without support of the external power system. Related to the restoration task of the power supply, the pos-sibility to overcome islanding operation is also important. This system operation status is mainly a result of isolation of some part of the grid from the rest of the power system in order to avoid a wide-area black-out. Providing this ancillary service makes it possible for the isolated part of the network to stay supplied with the electricity with usage of local recourses, minimizing the possible damages caused by not supplying the end customers with electricity. In order to recover the syn-chronous operation of the entire interconnected power system after islanding the synchronisation ability need to be provided.
The last component on the list of system services corresponds to the system and operation man-agement, which generally covers such tasks as e.g. bottle neck management, scheduling, etc. Among these tasks scheduling plays a special role since it has a strong infl uence on the provision of the balance in the power system and providing the adequate supply. By establishing the sched-ules many factors need to be taken into account, such as stochastic character of the loads and renewable energy sources, but also the current status of the network confi guration as well as the generation unit’s utilization.
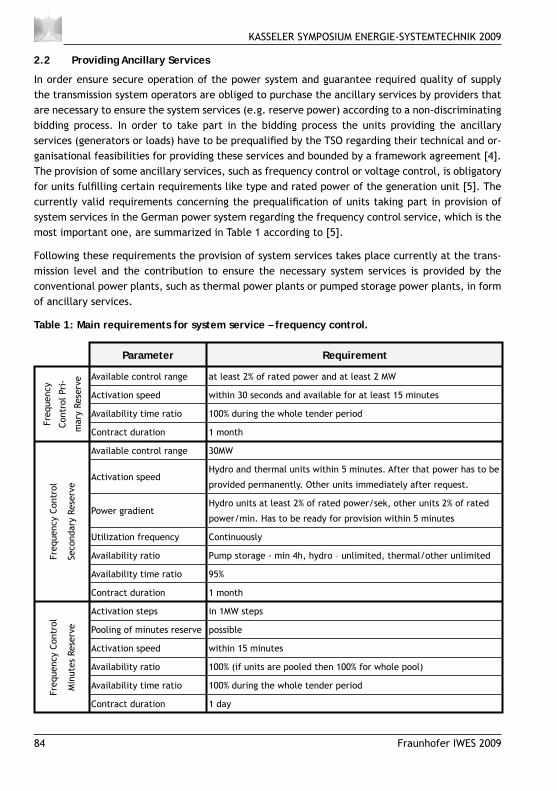
KASSELER SYMPOSIUM ENERGIE-SYSTEMTECHNIK 2009
84 Fraunhofer IWES 2009
Providing Ancillary Services2.2
In order ensure secure operation of the power system and guarantee required quality of supply the transmission system operators are obliged to purchase the ancillary services by providers that are necessary to ensure the system services (e.g. reserve power) according to a non-discriminating bidding process. In order to take part in the bidding process the units providing the ancillary services (generators or loads) have to be prequalifi ed by the TSO regarding their technical and or-ganisational feasibilities for providing these services and bounded by a framework agreement [4]. The provision of some ancillary services, such as frequency control or voltage control, is obligatory for units fulfi lling certain requirements like type and rated power of the generation unit [5]. The currently valid requirements concerning the prequalifi cation of units taking part in provision of system services in the German power system regarding the frequency control service, which is the most important one, are summarized in Table 1 according to [5].
Following these requirements the provision of system services takes place currently at the trans-mission level and the contribution to ensure the necessary system services is provided by the conventional power plants, such as thermal power plants or pumped storage power plants, in form of ancillary services.
Table 1: Main requirements for system service – frequency control.
Parameter Requirement
Freq
uenc
y
Cont
rol P
ri-
mar
y Re
serv
e Available control range at least 2% of rated power and at least 2 MW
Activation speed within 30 seconds and available for at least 15 minutes
Availability time ratio 100% during the whole tender period
Contract duration 1 month
Freq
uenc
y Co
ntro
l
Seco
ndar
y Re
serv
e
Available control range 30MW
Activation speedHydro and thermal units within 5 minutes. After that power has to be
provided permanently. Other units immediately after request.
Power gradientHydro units at least 2% of rated power/sek, other units 2% of rated
power/min. Has to be ready for provision within 5 minutes
Utilization frequency Continuously
Availability ratio Pump storage - min 4h, hydro – unlimited, thermal/other unlimited
Availability time ratio 95%
Contract duration 1 month
Freq
uenc
y Co
ntro
l
Min
utes
Res
erve
Activation steps in 1MW steps
Pooling of minutes reserve possible
Activation speed within 15 minutes
Availability ratio 100% (if units are pooled then 100% for whole pool)
Availability time ratio 100% during the whole tender period
Contract duration 1 day
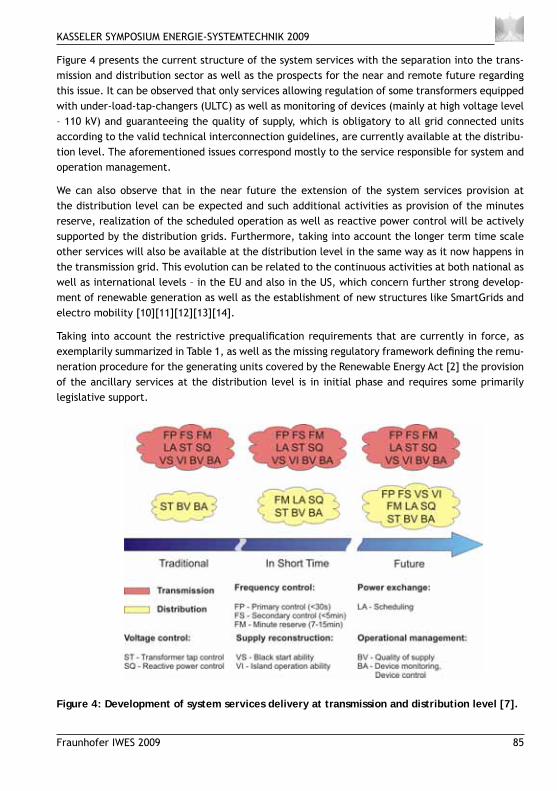
KASSELER SYMPOSIUM ENERGIE-SYSTEMTECHNIK 2009
Fraunhofer IWES 2009 85
Figure 4 presents the current structure of the system services with the separation into the trans-mission and distribution sector as well as the prospects for the near and remote future regarding this issue. It can be observed that only services allowing regulation of some transformers equipped with under-load-tap-changers (ULTC) as well as monitoring of devices (mainly at high voltage level – 110 kV) and guaranteeing the quality of supply, which is obligatory to all grid connected units according to the valid technical interconnection guidelines, are currently available at the distribu-tion level. The aforementioned issues correspond mostly to the service responsible for system and operation management.
We can also observe that in the near future the extension of the system services provision at the distribution level can be expected and such additional activities as provision of the minutes reserve, realization of the scheduled operation as well as reactive power control will be actively supported by the distribution grids. Furthermore, taking into account the longer term time scale other services will also be available at the distribution level in the same way as it now happens in the transmission grid. This evolution can be related to the continuous activities at both national as well as international levels – in the EU and also in the US, which concern further strong develop-ment of renewable generation as well as the establishment of new structures like SmartGrids and electro mobility [10][11][12][13][14].
Taking into account the restrictive prequalifi cation requirements that are currently in force, as exemplarily summarized in Table 1, as well as the missing regulatory framework defi ning the remu-neration procedure for the generating units covered by the Renewable Energy Act [2] the provision of the ancillary services at the distribution level is in initial phase and requires some primarily legislative support.
Figure 4: Development of system services delivery at transmission and distribution level [7].
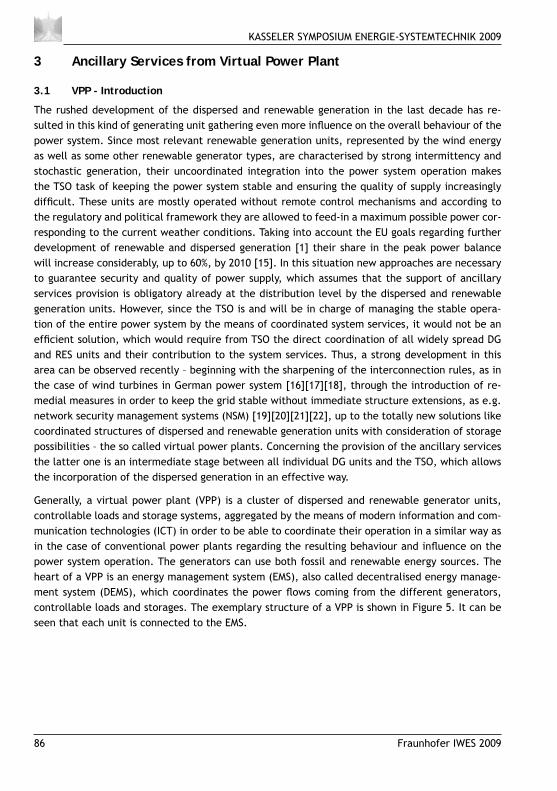
KASSELER SYMPOSIUM ENERGIE-SYSTEMTECHNIK 2009
86 Fraunhofer IWES 2009
Ancillary Services from Virtual Power Plant3
VPP - Introduction3.1
The rushed development of the dispersed and renewable generation in the last decade has re-sulted in this kind of generating unit gathering even more infl uence on the overall behaviour of the power system. Since most relevant renewable generation units, represented by the wind energy as well as some other renewable generator types, are characterised by strong intermittency and stochastic generation, their uncoordinated integration into the power system operation makes the TSO task of keeping the power system stable and ensuring the quality of supply increasingly diffi cult. These units are mostly operated without remote control mechanisms and according to the regulatory and political framework they are allowed to feed-in a maximum possible power cor-responding to the current weather conditions. Taking into account the EU goals regarding further development of renewable and dispersed generation [1] their share in the peak power balance will increase considerably, up to 60%, by 2010 [15]. In this situation new approaches are necessary to guarantee security and quality of power supply, which assumes that the support of ancillary services provision is obligatory already at the distribution level by the dispersed and renewable generation units. However, since the TSO is and will be in charge of managing the stable opera-tion of the entire power system by the means of coordinated system services, it would not be an effi cient solution, which would require from TSO the direct coordination of all widely spread DG and RES units and their contribution to the system services. Thus, a strong development in this area can be observed recently – beginning with the sharpening of the interconnection rules, as in the case of wind turbines in German power system [16][17][18], through the introduction of re-medial measures in order to keep the grid stable without immediate structure extensions, as e.g. network security management systems (NSM) [19][20][21][22], up to the totally new solutions like coordinated structures of dispersed and renewable generation units with consideration of storage possibilities – the so called virtual power plants. Concerning the provision of the ancillary services the latter one is an intermediate stage between all individual DG units and the TSO, which allows the incorporation of the dispersed generation in an effective way.
Generally, a virtual power plant (VPP) is a cluster of dispersed and renewable generator units, controllable loads and storage systems, aggregated by the means of modern information and com-munication technologies (ICT) in order to be able to coordinate their operation in a similar way as in the case of conventional power plants regarding the resulting behaviour and infl uence on the power system operation. The generators can use both fossil and renewable energy sources. The heart of a VPP is an energy management system (EMS), also called decentralised energy manage-ment system (DEMS), which coordinates the power fl ows coming from the different generators, controllable loads and storages. The exemplary structure of a VPP is shown in Figure 5. It can be seen that each unit is connected to the EMS.
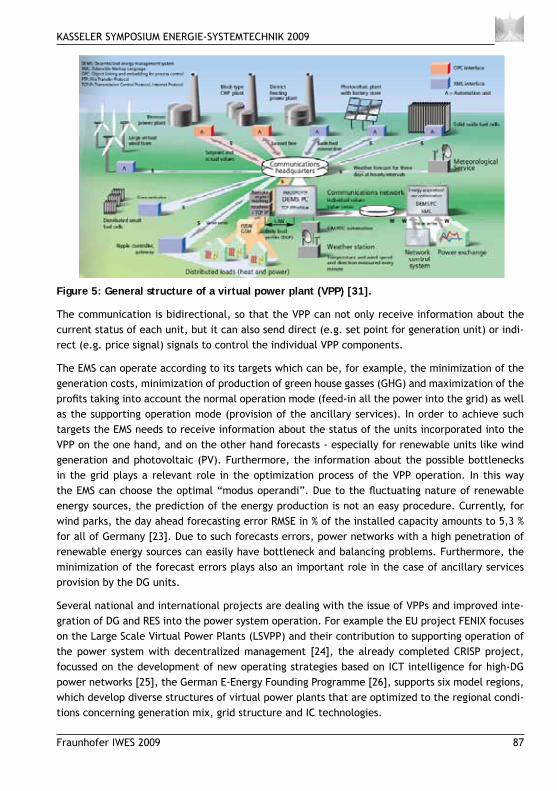
KASSELER SYMPOSIUM ENERGIE-SYSTEMTECHNIK 2009
Fraunhofer IWES 2009 87
Figure 5: General structure of a virtual power plant (VPP) [31].
The communication is bidirectional, so that the VPP can not only receive information about the current status of each unit, but it can also send direct (e.g. set point for generation unit) or indi-rect (e.g. price signal) signals to control the individual VPP components.
The EMS can operate according to its targets which can be, for example, the minimization of the generation costs, minimization of production of green house gasses (GHG) and maximization of the profi ts taking into account the normal operation mode (feed-in all the power into the grid) as well as the supporting operation mode (provision of the ancillary services). In order to achieve such targets the EMS needs to receive information about the status of the units incorporated into the VPP on the one hand, and on the other hand forecasts - especially for renewable units like wind generation and photovoltaic (PV). Furthermore, the information about the possible bottlenecks in the grid plays a relevant role in the optimization process of the VPP operation. In this way the EMS can choose the optimal “modus operandi”. Due to the fl uctuating nature of renewable energy sources, the prediction of the energy production is not an easy procedure. Currently, for wind parks, the day ahead forecasting error RMSE in % of the installed capacity amounts to 5,3 % for all of Germany [23]. Due to such forecasts errors, power networks with a high penetration of renewable energy sources can easily have bottleneck and balancing problems. Furthermore, the minimization of the forecast errors plays also an important role in the case of ancillary services provision by the DG units.
Several national and international projects are dealing with the issue of VPPs and improved inte-gration of DG and RES into the power system operation. For example the EU project FENIX focuses on the Large Scale Virtual Power Plants (LSVPP) and their contribution to supporting operation of the power system with decentralized management [24], the already completed CRISP project, focussed on the development of new operating strategies based on ICT intelligence for high-DG power networks [25], the German E-Energy Founding Programme [26], supports six model regions, which develop diverse structures of virtual power plants that are optimized to the regional condi-tions concerning generation mix, grid structure and IC technologies.
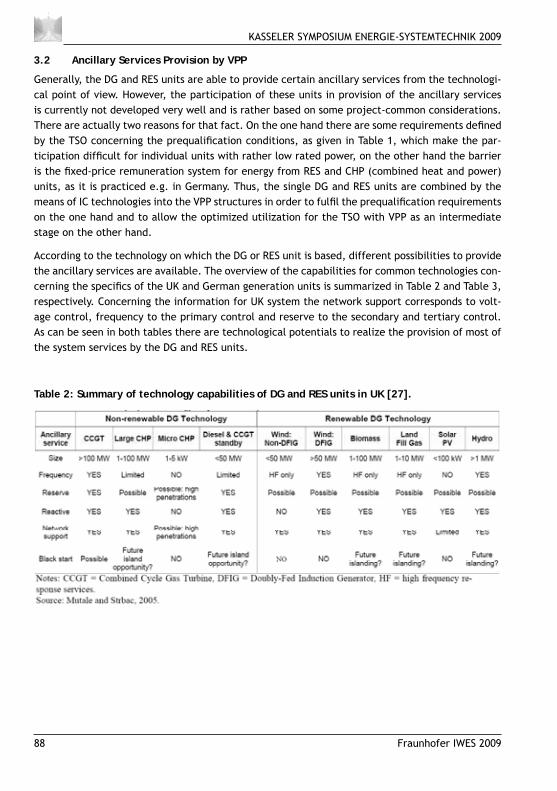
KASSELER SYMPOSIUM ENERGIE-SYSTEMTECHNIK 2009
88 Fraunhofer IWES 2009
Ancillary Services Provision by VPP3.2
Generally, the DG and RES units are able to provide certain ancillary services from the technologi-cal point of view. However, the participation of these units in provision of the ancillary services is currently not developed very well and is rather based on some project-common considerations. There are actually two reasons for that fact. On the one hand there are some requirements defi ned by the TSO concerning the prequalifi cation conditions, as given in Table 1, which make the par-ticipation diffi cult for individual units with rather low rated power, on the other hand the barrier is the fi xed-price remuneration system for energy from RES and CHP (combined heat and power) units, as it is practiced e.g. in Germany. Thus, the single DG and RES units are combined by the means of IC technologies into the VPP structures in order to fulfi l the prequalifi cation requirements on the one hand and to allow the optimized utilization for the TSO with VPP as an intermediate stage on the other hand.
According to the technology on which the DG or RES unit is based, different possibilities to provide the ancillary services are available. The overview of the capabilities for common technologies con-cerning the specifi cs of the UK and German generation units is summarized in Table 2 and Table 3, respectively. Concerning the information for UK system the network support corresponds to volt-age control, frequency to the primary control and reserve to the secondary and tertiary control. As can be seen in both tables there are technological potentials to realize the provision of most of the system services by the DG and RES units.
Table 2: Summary of technology capabilities of DG and RES units in UK [27].
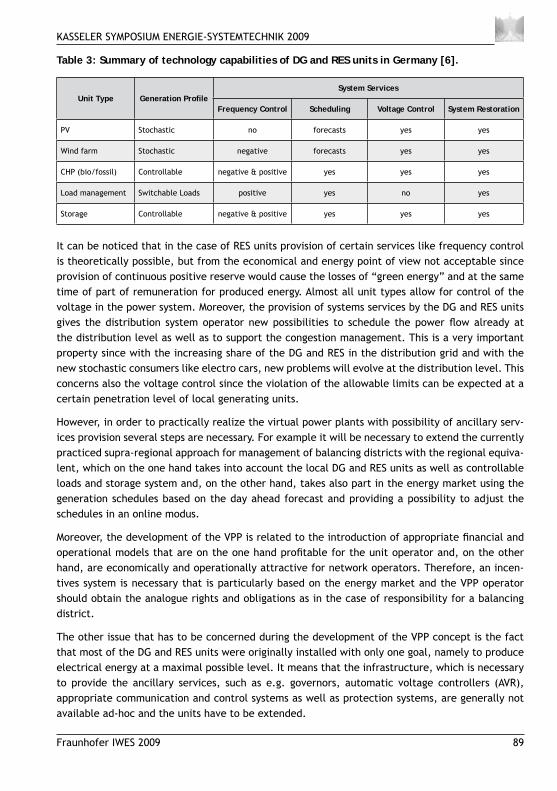
KASSELER SYMPOSIUM ENERGIE-SYSTEMTECHNIK 2009
Fraunhofer IWES 2009 89
Table 3: Summary of technology capabilities of DG and RES units in Germany [6].
Unit Type Generation Profi leSystem Services
Frequency Control Scheduling Voltage Control System Restoration
PV Stochastic no forecasts yes yes
Wind farm Stochastic negative forecasts yes yes
CHP (bio/fossil) Controllable negative & positive yes yes yes
Load management Switchable Loads positive yes no yes
Storage Controllable negative & positive yes yes yes
It can be noticed that in the case of RES units provision of certain services like frequency control is theoretically possible, but from the economical and energy point of view not acceptable since provision of continuous positive reserve would cause the losses of “green energy” and at the same time of part of remuneration for produced energy. Almost all unit types allow for control of the voltage in the power system. Moreover, the provision of systems services by the DG and RES units gives the distribution system operator new possibilities to schedule the power fl ow already at the distribution level as well as to support the congestion management. This is a very important property since with the increasing share of the DG and RES in the distribution grid and with the new stochastic consumers like electro cars, new problems will evolve at the distribution level. This concerns also the voltage control since the violation of the allowable limits can be expected at a certain penetration level of local generating units.
However, in order to practically realize the virtual power plants with possibility of ancillary serv-ices provision several steps are necessary. For example it will be necessary to extend the currently practiced supra-regional approach for management of balancing districts with the regional equiva-lent, which on the one hand takes into account the local DG and RES units as well as controllable loads and storage system and, on the other hand, takes also part in the energy market using the generation schedules based on the day ahead forecast and providing a possibility to adjust the schedules in an online modus.
Moreover, the development of the VPP is related to the introduction of appropriate fi nancial and operational models that are on the one hand profi table for the unit operator and, on the other hand, are economically and operationally attractive for network operators. Therefore, an incen-tives system is necessary that is particularly based on the energy market and the VPP operator should obtain the analogue rights and obligations as in the case of responsibility for a balancing district.
The other issue that has to be concerned during the development of the VPP concept is the fact that most of the DG and RES units were originally installed with only one goal, namely to produce electrical energy at a maximal possible level. It means that the infrastructure, which is necessary to provide the ancillary services, such as e.g. governors, automatic voltage controllers (AVR), appropriate communication and control systems as well as protection systems, are generally not available ad-hoc and the units have to be extended.
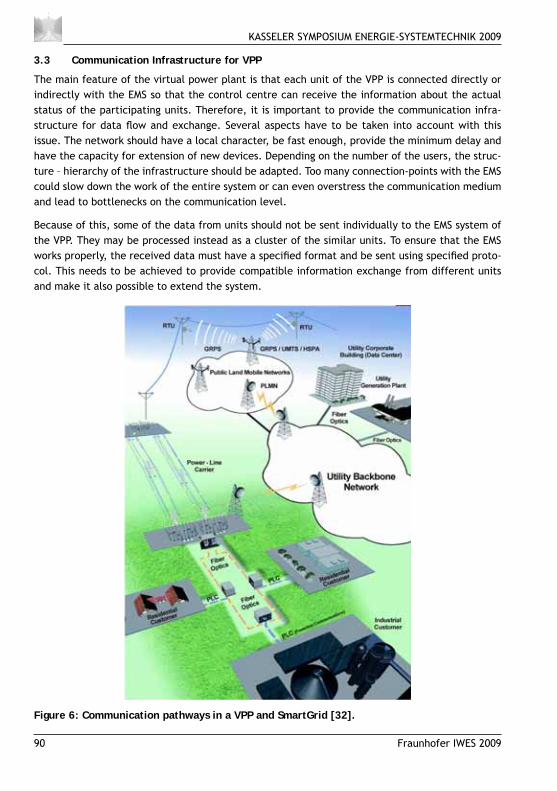
KASSELER SYMPOSIUM ENERGIE-SYSTEMTECHNIK 2009
90 Fraunhofer IWES 2009
Communication Infrastructure for VPP3.3
The main feature of the virtual power plant is that each unit of the VPP is connected directly or indirectly with the EMS so that the control centre can receive the information about the actual status of the participating units. Therefore, it is important to provide the communication infra-structure for data fl ow and exchange. Several aspects have to be taken into account with this issue. The network should have a local character, be fast enough, provide the minimum delay and have the capacity for extension of new devices. Depending on the number of the users, the struc-ture – hierarchy of the infrastructure should be adapted. Too many connection-points with the EMS could slow down the work of the entire system or can even overstress the communication medium and lead to bottlenecks on the communication level.
Because of this, some of the data from units should not be sent individually to the EMS system of the VPP. They may be processed instead as a cluster of the similar units. To ensure that the EMS works properly, the received data must have a specifi ed format and be sent using specifi ed proto-col. This needs to be achieved to provide compatible information exchange from different units and make it also possible to extend the system.
Figure 6: Communication pathways in a VPP and SmartGrid [32].
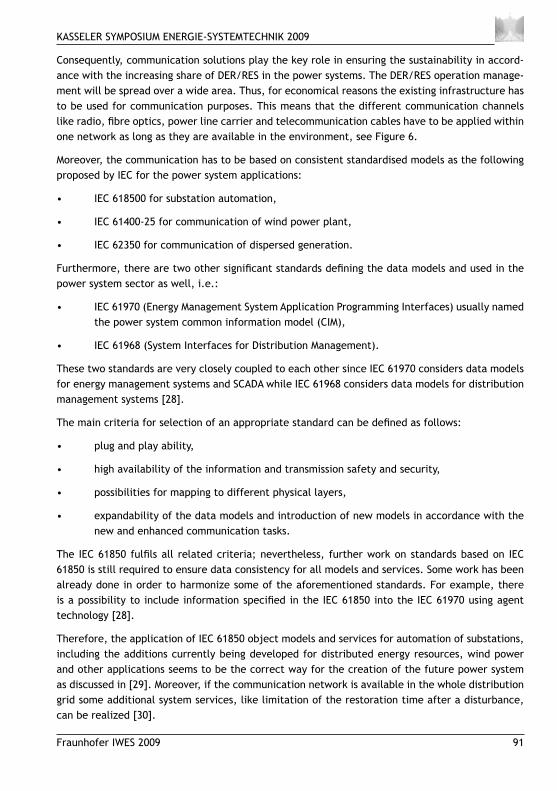
KASSELER SYMPOSIUM ENERGIE-SYSTEMTECHNIK 2009
Fraunhofer IWES 2009 91
Consequently, communication solutions play the key role in ensuring the sustainability in accord-ance with the increasing share of DER/RES in the power systems. The DER/RES operation manage-ment will be spread over a wide area. Thus, for economical reasons the existing infrastructure has to be used for communication purposes. This means that the different communication channels like radio, fi bre optics, power line carrier and telecommunication cables have to be applied within one network as long as they are available in the environment, see Figure 6.
Moreover, the communication has to be based on consistent standardised models as the following proposed by IEC for the power system applications:
IEC 618500 for substation automation,•
IEC 61400-25 for communication of wind power plant,•
IEC 62350 for communication of dispersed generation. •
Furthermore, there are two other signifi cant standards defi ning the data models and used in the power system sector as well, i.e.:
IEC 61970 (Energy Management System Application Programming Interfaces) usually named • the power system common information model (CIM),
IEC 61968 (System Interfaces for Distribution Management).•
These two standards are very closely coupled to each other since IEC 61970 considers data models for energy management systems and SCADA while IEC 61968 considers data models for distribution management systems [28].
The main criteria for selection of an appropriate standard can be defi ned as follows:
plug and play ability,•
high availability of the information and transmission safety and security,•
possibilities for mapping to different physical layers,•
expandability of the data models and introduction of new models in accordance with the • new and enhanced communication tasks.
The IEC 61850 fulfi ls all related criteria; nevertheless, further work on standards based on IEC 61850 is still required to ensure data consistency for all models and services. Some work has been already done in order to harmonize some of the aforementioned standards. For example, there is a possibility to include information specifi ed in the IEC 61850 into the IEC 61970 using agent technology [28].
Therefore, the application of IEC 61850 object models and services for automation of substations, including the additions currently being developed for distributed energy resources, wind power and other applications seems to be the correct way for the creation of the future power system as discussed in [29]. Moreover, if the communication network is available in the whole distribution grid some additional system services, like limitation of the restoration time after a disturbance, can be realized [30].
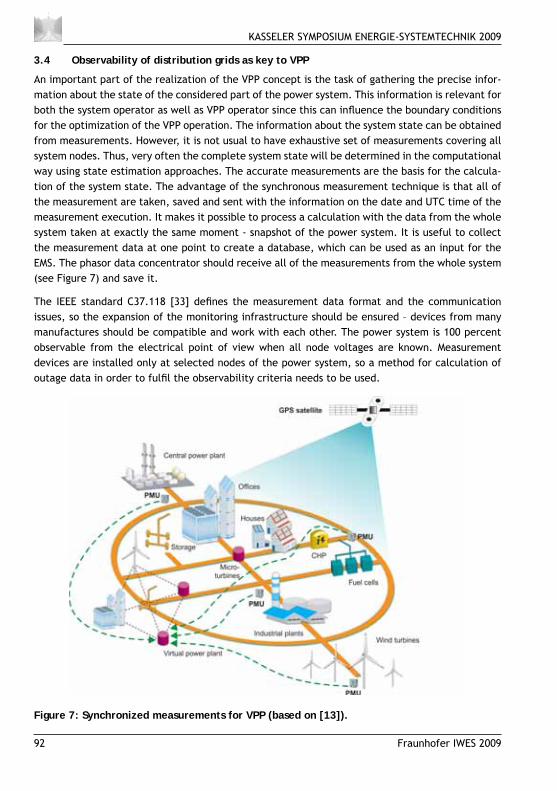
KASSELER SYMPOSIUM ENERGIE-SYSTEMTECHNIK 2009
92 Fraunhofer IWES 2009
Observability of distribution grids as key to VPP3.4
An important part of the realization of the VPP concept is the task of gathering the precise infor-mation about the state of the considered part of the power system. This information is relevant for both the system operator as well as VPP operator since this can infl uence the boundary conditions for the optimization of the VPP operation. The information about the system state can be obtained from measurements. However, it is not usual to have exhaustive set of measurements covering all system nodes. Thus, very often the complete system state will be determined in the computational way using state estimation approaches. The accurate measurements are the basis for the calcula-tion of the system state. The advantage of the synchronous measurement technique is that all of the measurement are taken, saved and sent with the information on the date and UTC time of the measurement execution. It makes it possible to process a calculation with the data from the whole system taken at exactly the same moment - snapshot of the power system. It is useful to collect the measurement data at one point to create a database, which can be used as an input for the EMS. The phasor data concentrator should receive all of the measurements from the whole system (see Figure 7) and save it.
The IEEE standard C37.118 [33] defi nes the measurement data format and the communication issues, so the expansion of the monitoring infrastructure should be ensured – devices from many manufactures should be compatible and work with each other. The power system is 100 percent observable from the electrical point of view when all node voltages are known. Measurement devices are installed only at selected nodes of the power system, so a method for calculation of outage data in order to fulfi l the observability criteria needs to be used.
Figure 7: Synchronized measurements for VPP (based on [13]).
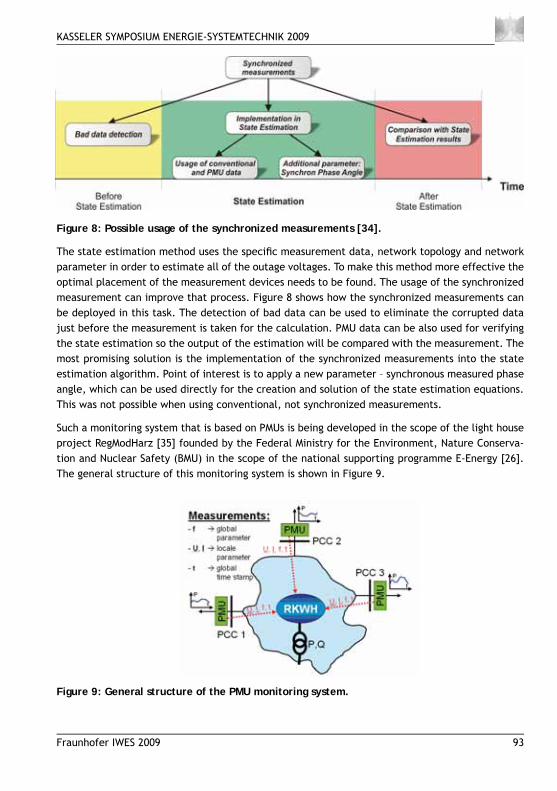
KASSELER SYMPOSIUM ENERGIE-SYSTEMTECHNIK 2009
Fraunhofer IWES 2009 93
Figure 8: Possible usage of the synchronized measurements [34].
The state estimation method uses the specifi c measurement data, network topology and network parameter in order to estimate all of the outage voltages. To make this method more effective the optimal placement of the measurement devices needs to be found. The usage of the synchronized measurement can improve that process. Figure 8 shows how the synchronized measurements can be deployed in this task. The detection of bad data can be used to eliminate the corrupted data just before the measurement is taken for the calculation. PMU data can be also used for verifying the state estimation so the output of the estimation will be compared with the measurement. The most promising solution is the implementation of the synchronized measurements into the state estimation algorithm. Point of interest is to apply a new parameter – synchronous measured phase angle, which can be used directly for the creation and solution of the state estimation equations. This was not possible when using conventional, not synchronized measurements.
Such a monitoring system that is based on PMUs is being developed in the scope of the light house project RegModHarz [35] founded by the Federal Ministry for the Environment, Nature Conserva-tion and Nuclear Safety (BMU) in the scope of the national supporting programme E-Energy [26]. The general structure of this monitoring system is shown in Figure 9.
Figure 9: General structure of the PMU monitoring system.
KASSELER SYMPOSIUM ENERGIE-SYSTEMTECHNIK 2009
94 Fraunhofer IWES 2009
Summary4
This paper deals with the provision of ancillary services by the virtual power plant. The level of development, requirements, challenges and possibilities in this fi eld have been discussed. The analysis of all facts shows that it is essential that with an increasing share of DG and RES they sup-port the power system operation by the provision of ancillary services, since the substitution of only energy produced by the conventional power plants by DG and RES without guaranteeing the same fl exibility and security of supply will considerably increase the overall system costs.
The modern DG and RES units are technically mature to support power system operation. However, some regulatory frameworks in some countries like Germany are missing. First experiences from different projects showed that DG and RES can have a signifi cant contribution to the support of power system operation, especially by creation of VPPs. A very good example in this fi eld is the Danish TSO Energinet.dk that uses the Offshore Wind Farm Horns Rev to support balancing of its sys-tem [36]. Furthermore, Energinet.dk is working on a cell project, where the possibility of islanding the MV-grid parts in case of system stability problems is being examined [37]. The resulting islands are operated autonomously and can be treated as VPPs. Moreover, there are also some other practi-cal experiences at the international level that were gathered in the scope of FENIX projects.
In order to speed-up the wide-area realization of this concept even more research activities at the national as well as international level is necessary. A very good way to reach the future goals is provided by the German national research programme E-Energy. This programme supports six model-regions that are working on developing optimal VPP structures, which are adapted to the regional characteristics.
References5
EU Directive on the promotion of the use of energy from renewable sources available at: [1] http://ec.europa.eu/energy/climate_actions/doc/2008_res_directive_en.pdf
“Erneuerbare-Energien-Gesetz (EEG) 2009”, available at: www.erneuerbare-energien.de[2]
„Towards a European strategy for security of energy supply“, Green Paper European Com-[3] munities 2001.
VDN – Verband der Netzbetreiber e.V.: TransmissionCode 2003 – Anhang D: Unterlagen zur [4] Präqualifi kation für die Erbringung von Regelleistung für die ÜNB, August 2003.
VDN – Verband der Netzbetreiber e.V.: TransmissionCode 2007 – Network and System Rules [5] of the German Transmission System Operators, August 2007. www.bdew.de.
“Smart Distribution 2020 Virtuelle Kraftwerke in Verteilungsnetzen - Technische, regulato-[6] rische und kommerzielle Rahmenbedingungen“, VDE /ETG – Studie 2008.
Styczynski, Z. A.; Rudion, K.; Eriksen, P. B.; Orths, A. G.; Schafer, T.; Sattinger, W.; Rouco, [7] L.; Phadke, A.; „Operation and Control Strategies for Networks with a High Degree of Re-newable Generation“; PSCC 2008 Conference, Glasgow, Scotland, 14.-18.07.2008.

KASSELER SYMPOSIUM ENERGIE-SYSTEMTECHNIK 2009
Fraunhofer IWES 2009 95
European Network of Transmission System Operators for Electricity - ENTSO-e, Homepage: [8] http://www.entsoe.eu.
Law on the Energy Industry (Orig.: EnWG) from 13.07.2005. [9]
IEEE P2030 Draft Guide for Smart Grid Interoperability of Energy Technology and Informa-[10] tion Technology Operation with the Electric Power System (EPS), and End-Use Applications and Loads. http://grouper.ieee.org/groups/scc21/2030/2030_index.html
http://www.rwe-mobility.com/web/cms/de/236726/rwemobility.[11]
www.bmwi.de/BMWi/Navigation/Technologie-und-Innovation/Informationsgesellschaft/[12] multimedia,did=303492.html.
http://www.smartgrids.eu/.[13]
http://www.oe.energy.gov/smartgrid.htm.[14]
Kapetanovic, T.; Buchholz, B. M.; Buchholz, B.; Buehner, V.: Provision of ancillary services [15] by dispersed generation and demand side response – needs, barriers and solutions. Elektro-technik & Informationstechnik 2008, Heft 12.2008.
E.ON Netz – Grid Code – High and extra high voltage, April 2006.[16]
Anforderungnen an seeseitige Netzanschlüsse an das Netz der E.ON Netz, April 2008.[17]
VDN – Verband der Netzbetreiber e.V.: REA generating plants connected to the high- and [18] extra-high voltage network. August 2004.
Styczynski Z. A., Heyde C.O., Buchholz B. M., Ruhle O.: Network Security Management Tool [19] for Distribution Systems. Proceedings of IEEE PES GM 2008 Pittsburgh, USA.
Netzsicherheitsmanagement in EON Grid: www.eon-edis.com/html/20373.htm.[20]
Netzsicherheitsmanagement in Envia Grid: www.envia-netz.de/ebene_b/753.html.[21]
Funktionsbeschreibung zum Netzsicherheitsmanagement (NSM) der envia Verteilnetz [22] GmbH, Mai 2006, www.envia-netz.de/data/04_funktionsbeschreibung_nsm.pdf.
K. Rohrig, B. Lange: Improving Security of Power System Operation applying DG Production [23] Forecasting Tools. IEEE PES General Meeting 2008 in Pittsburgh, USA.
FENIX Project home page, www.fenix-project.org/.[24]
CRISP Project home page, www.ecn.nl/crisp/participants.html.[25]
E-Energy Programme home page, http://www.e-energie.info/.[26]
Jansen, J. J.; van der Welle, A. J.; de Joode, J.: The evolving role of the DSO in effi ciently [27] accommodating distributed generation. Project Report ECN-E—07-063.
Nordström, L.; Nordman, M.: Common Information Models for Data Communication in In-[28] tegrated Power Systems. Proceedings of Nordic Distribution and Asset Management Confer-ence NORDAC 2006, Stockholm, Sweden.
KASSELER SYMPOSIUM ENERGIE-SYSTEMTECHNIK 2009
96 Fraunhofer IWES 2009
Buchholz, B.; Malcher, S.; Rohrig, K.: Communication as the Key for a Sustainable Network [29] Integration of Dispersed and Renewable Generation. CIGRE 2006, C6-104, Paris.
Buchholz, B. M.; Styczynski, Z. A.: New Tasks Create New Solutions for Communication in [30] Distribution Systems. Proceedings of IEEE PES General Meeting 2006, Montreal, Canada.
http://w1.siemens.com/innovation/pool/en/publikationen/publications_pof/pof_[31] spring_2002/energy_articles/virtual_power_plants/virtkraft1_d_1206508.jpg.
www.usyscom.com/Soluciones/RedesInteligentes/tabid/95/language/es-ES/Default.aspx.[32]
IEEE Standard for Synchrophasors for Power System (IEEE C37.118™ -2005, revision of IEEE [33] Std 1344™ -1995), Approved 1 February 2006 American Nation Standards Institute Approved 21 October IEEE-SA Standards Board.
A. G. Phadke, J. S. Thorp.: Synchronized Phasor Measurements and Their Aplications. [34] Springer Science+Business Media, LCC, 2008.
RegModHarz Project home page, www.regmodharz.de.[35]
Akhmatov, V.; Orths, A.; Eriksen, P. B.: Experience with Voltage Control from Large Off-[36] shore Wind Farms for Transmission Systems; EWEC May 2007, Milano, Italy.
Lund, P.; The Danish Cell Project - Part One - Background and General Approach; IEEE PES [37] General Meeting, 24-28 June 2007, Tampa, Florida, USA.
KASSELER SYMPOSIUM ENERGIE-SYSTEMTECHNIK 2009
Fraunhofer IWES 2009 97
System Support by WT ClustersSystemdienstleistungen von WEA durch Clustering
Authors:Alejandro J. Gesino ([email protected])Reinhard Mackensen ([email protected])Cesar A. Quintero Marrone ([email protected])Bernhard Lange ([email protected])Kurt Rohrig ([email protected])
Abstract1 Due to the constant increase of wind energy penetration into the power grids, system operators are starting to demand similar grid connections, operation conditions and services for wind energy, as for the existing for the conventional power generation. This is done in order to assure the se-curity of the electrical systems and to allow the secure penetration of larger scales of wind power into the energy matrixes.
Based on this scenario and with more than 20 years of experience in the wind energy R&D sec-tor, ISET e.V. has being working in a new concept for wind energy large scale integration: the “Wind Farm Cluster Management System” (WCMS). The objective of this approach is to develop the needed control strategies for managing wind power at large scale like a conventional power source, contributing to system stability issues like frequency and voltage control.
Introduction2 In 2030, wind energy should provide 25% of the EU electricity [1]. Such a high share of wind gen-eration represents an important challenge for the reliable and secure integration of wind power in the grids. Therefore, there are increasing needs to operate wind generation as conventional power plants to ensure a reliable and secure integration of wind power into the electrical system. Further development of wind power plant capabilities imply that wind power has to be controlled and operated according to system requirements and has to support the grid during disturbances and faults. These capabilities are based on active and reactive power control of wind farms as well as the supporting schemes during grid faults such as Fault-Ride-Through capabilities.
This paper focuses on how wind farms could support the system based on the Wind Farm Cluster concept developed at ISET e.V. [2]
KASSELER SYMPOSIUM ENERGIE-SYSTEMTECHNIK 2009
98 Fraunhofer IWES 2009
Active power control, reserve power and frecuency control with 3 Wind Farm Clusters
Transmission and distribution system frequency deviations are caused by unexpected unbalances between generation and demand, and are of particular concern in systems where the ratio of potential variation caused by fl uctuating wind in relation to the amount of generated energy in total is high. These deviations could activate a signifi cant share of primary power reserves. A further increase of these phenomena, for example due to high wind power penetration into the grids, could create frequency deviations large enough to activate the complete available primary power reserves reducing the security margins for frequency control and putting into question the adequacy of primary reserves to limit frequency variations, and secondary reserves to restore fre-quency variations. Currently an adequate frequency control1 depends on conventional generation resources made available by generation companies to TSOs for this specifi c porpoise [4].
Due to any unbalance issue, system frequency could increase above or below its nominal value (Fn = 50 Hz in Europe). In case of an upper frequency disturbance, active power should be reduced according to the frequency deviation; in case of an under frequency event additional active power should be produced in order to balance the system.
Wind Farm Clusters could for contribute to solve both situations. It should be considered the par-ticular characteristics of this renewable energy source, in order to determine the how and under which conditions frequency control could be addressed by wind power.
Reactive power control and voltage stability4 Wind power is also being requested to contribute with voltage control. Therefore it is important to develop control strategies oriented to wind farms that allow an optimal management of reactive power supply (capacitive and inductive) considering the P/Q characteristic of wind farms and the existing electrical grids that interconnect them with their grid nodes, among other factors [3].
Until now, several wind turbine manufacturers have provided solutions at wind farm level in which reactive power supply and voltage level at the connection point are constantly monitored and regulated to keep them within the allowed operational band. However, for an optimal utilization of reactive power control capabilities of modern wind farms, it is necessary to enable the grid operators to control these capabilities in a more fl exible way.
1 Control actions are performed in different successive steps, each with different characteristics and qualities and all depending on each other:Primary control: starts within seconds as a joint action of all undertakings involved.Secondary control: replaces primary control after minutes and is put into action by the responsible undertak-ings/TSO only.Tertiary control: frees secondary control by re-scheduling generation and is put into action by the responsible undertakings/TSOs.
KASSELER SYMPOSIUM ENERGIE-SYSTEMTECHNIK 2009
Fraunhofer IWES 2009 99
Wind Farm Cluster Management System5 The WCMS concept was created and developed as a natural evolution for wind energy. In the past, Wind Turbines were grouped into Wind Farms, and nowadays Wind Farms are being grouped into Wind Farm Clusters. The aim of the Wind Farm Cluster defi nition is to allow the TSOs to adminis-trate wind energy as a conventional power source, avoiding some natural aspects of wind energy as the fl uctuating nature of the wind, the distributed location of the wind farms and the existence of different generator technologies, among other issues.
For the WCMS implementation, advanced techniques and control strategies combined with high-tech wind energy forecast technologies were developed. These technologies allow Wind Farm Clusters to provide grid operators with active and reactive power control, wind power reserve, congestion management, gradient control, voltage changes control and power factor control, among other issues, in order to fulfi l the requirements of operational fl exibility and security issued by grid operators.
Conclusions6 Due to the expected increase of wind power into the grids, it is necessary the development of ad-vanced control strategies. The already presented concepts of the WCMS and its control strategies will strongly support wind energy further development.
The fi rst WCMS version has being already tested in a fi eld test in Germany. Measurements at the wind farm level as well as at high voltage grid nodes showed the capability of a wind farm cluster to control very quickly and accurately active and reactive power.
Due to these results the “Wind Farm Cluster” structure starts being a fundamental element of the solutions for all previously mentioned issues. Such a structure allows TSOs to control several distributed wind farms operating under a given node as a large power plant.
The implementation of such a control system, would lead to the introduction of new market rules and grid connection requirements for the operation and commercialization of wind energy in power grids.
The implementation of the cluster structure for wind energy control provides the following ad-vantages:
The cluster control of wind farms allows wind energy to better fulfi l all TSO requirements and increases its grid integration capabilities. As a logical consequence more wind energy can be ad-mitted into the grid.
Through the aggregation of wind farms by means of a cluster, the capacity to maintain the ac-curacy of a wind power feed-in schedule (forecast) is increased. Moreover, the forecast errors and its respective deviations can be balanced within the cluster. For grid planning purposes, there are better possibilities for the management of grid contingencies such as transmission bottlenecks and provision of power reserve.
KASSELER SYMPOSIUM ENERGIE-SYSTEMTECHNIK 2009
100 Fraunhofer IWES 2009
References7
European Union, “[1] A European Strategy for Sustainable, Competitive and Secure Energy”, Brussels, Belgium, 8th March 2006. Internet reference: http://europa.eu/scadplus/leg/en/lvb/l27062.htm
K. Rohrig, B. Lange, A. Gesino, M. Wolff, R. Mackensen, J. Dobschinski, A. Wessel, M. [2] Braun, C. Quintero, J. L.. Mata, R. Pestana, “Wind Power Plant Capabilities – Operate Wind Farms like Conventional Power Plants”, European Wind Energy Conference 2009, Marseille, France, 16 – 19 March 2009.
K. Rohrig; B. Lange; C. A. Quintero Marrone; A. J. Gesino; R. Mackensen; M Wolff; “[3] Reac-tive Power Management and Voltage Control with the Wind Farm Cluster Management System”; 7th International Workshop on Large Scale Integration of Wind Power and on Transmission Networks for Offshore Wind Farms; 26-27 May, 2008; Madrid, Spain.
UCTE AD-HOC Group, “Frequency quality investigation”, Final report, 30[4] th August 2008.
Biographies8
Alejandro J. Gesino is working at ISET since May 2007 in the area Energy Me-teorology and Wind Power Management of the R&D Division Energy Economy and Grid Operation. Born in Mar del Plata, Argentina in 1977, graduated as Informat-ics Engineer and specialized in Germany in Wind Energy technologies, Eng. Ges-ino’s main R&D interest are related with wind power integration into electrical grids, grid stability with wind power, Wind Farm Cluster concept and control strategies for active and reactive power control with Wind Farm Clusters. Mr.
Gesino is also PhD Student at the University of Kassel researching about “Primary and Secondary Frequency Control with Wind Farms”.
Reinhard Mackensen fi nished his studies of civil engineer with the focus of infor-matics in the year 2001. During his studies he collected valuable experiences as a software developer. Since April 2005 he is working for the R&D division informa-tion and energy economy. He is responsible for development of different applica-tions, database structures and information technologies focusing forecast and control of power feed in by wind energy and integration into the power supply
systems. Mr. Mackensen covers fi elds of application in object oriented languages like Java and C++. Furthermore he is responsible for database administration and development with SQL and PLSQL.
Cesar A. Quintero Marrone works at ISET since 2006 in the department of Infor-mation and Energy Economy. He completed a Master Degree in Electrical Power Engineering at the RWTH-Aachen University (2006). At ISET, Mr. Quintero works with projects that deal with requirements for wind energy integration in electri-cal grids and energy management system for wind energy.

KASSELER SYMPOSIUM ENERGIE-SYSTEMTECHNIK 2009
Fraunhofer IWES 2009 101
Bernhard Lange is head of Energy Meteorology and Wind Power Management of the R&D Division Energy Economy and Grid Operation at ISET. He is a physicist with MSc from the University of Oldenburg. After graduating he worked in Den-mark with Risø National Laboratory and Wind World A/S. 1998 to 2002 he pre-pared his PhD about offshore wind power meteorology at Risø National Labora-tory and University of Oldenburg. His main research interests for the last 10 years are wind power meteorology, wind farm modelling and wind power forecasting.
Kurt Rohrig has worked with ISET since 1991 and is head of the department of Information and Energy Economy. Mr. Rohrig has more than 10 years experience in wind power projects. He is the scientist-in-charge for projects handling the on-line monitoring and prediction of wind power for large supply areas – operated in co-operation with large power transmission utilities. Mr. Rohrig has contributed to numerous publications in the fi eld of wind energy integration in the electrical energy supply and completed his PhD at the end of 2003.

KASSELER SYMPOSIUM ENERGIE-SYSTEMTECHNIK 2009
102 Fraunhofer IWES 2009
Wind Farms with power plant capabilities
Eckard Quitmann, Stephan Wachtel, Alfred Beekmann ENERCON GmbH
Wind power and power system services1 With increasing penetration of wind power in electrical networks, the wind power plants will need to provide system services that used to come in the past only from conventional power plants. The load fl ow and system stability depends in an increasing manner on the more sophisticated electri-cal performance of wind power plants. Hence wind power plants should not be regarded any longer as a simple source of active power, but shall and can contribute in future more regarding, regional reactive power balance, voltage control at the wind power plant interconnection point, Fault Ride Through capability and adequate grid support during the fault etc.
These issues are one decisive factor for the total amount of wind power that can be locally con-nected and integrated into the entire power system. From the point of view of a manufacturer the already existing electrical capabilities of ENERCON WECs are not being used as they could in most wind power plants.
Past and future electrical issues2 The electrical issues, and in particular the system services mentioned above, can be divided into a group that is basically resolved and could be applied as standard, and another group that needs to be addressed more in future.
electrical issue Point of view of ENERCON
Mai
n is
sues
up
to n
ow
Power Qualitya.
Voltage Controlb.
Fault-Ride-Throughc.
Communicationd.
Resolved, thanks to advanced controls, use of IGBTs and ac-a. tive as well as passive fi lters on WEC level.
Wide reactive power-capability and control structures with b. fl exible dynamics are available from today’s wind power plants. Unfortunately they are not used frequently in prac-tice. Dynamic requirements are usually not defi ned with suf-fi cient detail in grid codes.
Resolved for all kinds of faults, even with residual voltage c. zero. Different modes how to support the grid during the fault are available. Dynamic requirements are usually not defi ned with suffi cient detail in grid codes.
Online communication between the wind power plant and d. the grid operator can be made available. Unfortunately it is not used in practice as wide as it could.
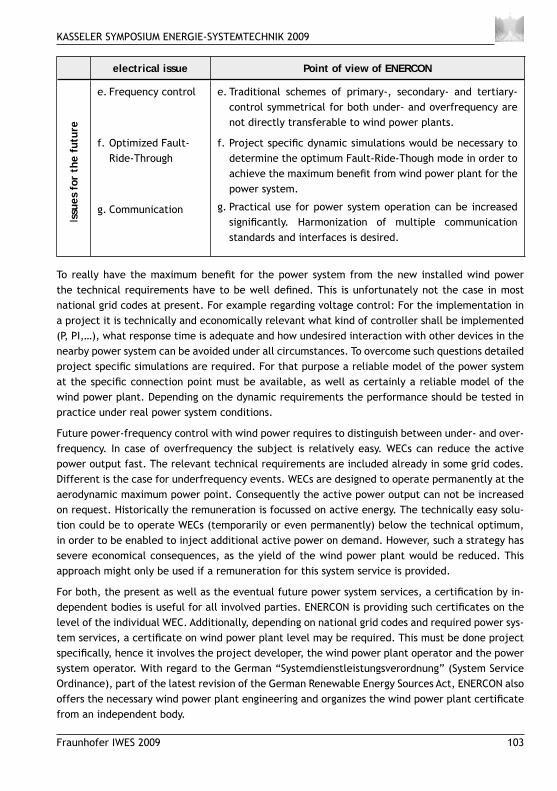
KASSELER SYMPOSIUM ENERGIE-SYSTEMTECHNIK 2009
Fraunhofer IWES 2009 103
electrical issue Point of view of ENERCONIs
sues
for
the
fut
ure
Frequency controle.
Optimized Fault-f. Ride-Through
Communicationg.
Traditional schemes of primary-, secondary- and tertiary-e. control symmetrical for both under- and overfrequency are not directly transferable to wind power plants.
Project specifi c dynamic simulations would be necessary to f. determine the optimum Fault-Ride-Though mode in order to achieve the maximum benefi t from wind power plant for the power system.
Practical use for power system operation can be increased g. signifi cantly. Harmonization of multiple communication standards and interfaces is desired.
To really have the maximum benefi t for the power system from the new installed wind power the technical requirements have to be well defi ned. This is unfortunately not the case in most national grid codes at present. For example regarding voltage control: For the implementation in a project it is technically and economically relevant what kind of controller shall be implemented (P, PI,…), what response time is adequate and how undesired interaction with other devices in the nearby power system can be avoided under all circumstances. To overcome such questions detailed project specifi c simulations are required. For that purpose a reliable model of the power system at the specifi c connection point must be available, as well as certainly a reliable model of the wind power plant. Depending on the dynamic requirements the performance should be tested in practice under real power system conditions.
Future power-frequency control with wind power requires to distinguish between under- and over-frequency. In case of overfrequency the subject is relatively easy. WECs can reduce the active power output fast. The relevant technical requirements are included already in some grid codes. Different is the case for underfrequency events. WECs are designed to operate permanently at the aerodynamic maximum power point. Consequently the active power output can not be increased on request. Historically the remuneration is focussed on active energy. The technically easy solu-tion could be to operate WECs (temporarily or even permanently) below the technical optimum, in order to be enabled to inject additional active power on demand. However, such a strategy has severe economical consequences, as the yield of the wind power plant would be reduced. This approach might only be used if a remuneration for this system service is provided.
For both, the present as well as the eventual future power system services, a certifi cation by in-dependent bodies is useful for all involved parties. ENERCON is providing such certifi cates on the level of the individual WEC. Additionally, depending on national grid codes and required power sys-tem services, a certifi cate on wind power plant level may be required. This must be done project specifi cally, hence it involves the project developer, the wind power plant operator and the power system operator. With regard to the German “Systemdienstleistungsverordnung” (System Service Ordinance), part of the latest revision of the German Renewable Energy Sources Act, ENERCON also offers the necessary wind power plant engineering and organizes the wind power plant certifi cate from an independent body.

KASSELER SYMPOSIUM ENERGIE-SYSTEMTECHNIK 2009
104 Fraunhofer IWES 2009
Economical value of system services3 New technical properties are being developed as soon as there is a market for them. The German “Systemdienstleistungs-Bonus” is the fi rst step in the right direction, linking advanced technical requirements with economical aspects.
If further contribution of wind power to power system services is desired, their economical values for the power system have to be evaluated and a price scheme must be determined. For those system services that can be integrated in a market mechanism a market oriented approach is clearly preferable, compared to an undifferentiated, equal requirement to all generators. Some of the services may be linked to regional needs of the power system (e.g. voltage control, optimized Fault-Ride-Through), other services are more of a global nature (e.g. frequency control).
To improve the power system integration of wind power, a discussion between wind industry and the power system operators is necessary. Both together have to evaluate system needs, technical possibilities and economical values for the future.

KASSELER SYMPOSIUM ENERGIE-SYSTEMTECHNIK 2009
Fraunhofer IWES 2009 105
Aktiver Beitrag zur Systemsicherheit durch Windenergie
Sichere und klimafreundliche Stromversorgung mit Windenenergievon Dipl.-Ing. Jörg Müller, GENI e.V.
Jahrgang 1964, Kraftwerksingenieur, seit 1992 selbständiger Windenergieunternehmer, Vorstandsvorsitzender der ENERTRAG AG, mit 600 MW Windenergieleistung und 390 Beschäftigten eines der größten unabhängigen Windenergieunternehmen Europas.Vorsitzender der Gesellschaft für Netzintegration (GENI) e.V., einem Zusammenschluss großer Windstromerzeuger im Nordosten Deutschlands. GENI entwickelt Konzepte für eine bessere Netzintegration erneuerbarer Energien und fördert die wirtschaftliche Zusammenarbeit der Mitgliedsunternehmen.
Die Ausgangslage1 Eine sichere und klimafreundliche Stromversorgung mit Windenergie ist machbar. Es wird heute nicht mehr in Frage gestellt, ob die technischen und natürlichen Potenziale der Windenergie in Deutschland ausreichen, um ihren bedeutenden Beitrag zu einer vollständigen Energieversorgung aus erneuerbaren Energien zu leisten. Die installierte Leistung übertrifft 2009 die Erwartungen der Bundesregierung1 mit über 25.000 Megawatt, neue Anlagen erreichen onshore bis 3000 Volllast-stunden. Dies weist darauf hin, dass die Branchenprognose2 realistisch ist, nach der die sich die Stromerzeugung aus Windenergie bis 2020 von 45 auf 150 Terrawattstunden verdreifacht. Damit liegt sie bei mehr als 27% des heutigen Nettostromverbrauchs; wenn dieser sinkt wie vorhergesagt wird der Anteil sogar noch größer. Das heißt im Ergebnis: Die Windenergie wird in zehn Jahren der bedeutendste Stromlieferant sein.
Der 14. Kasseler Symposium trifft mit dem Titel dieser Session daher den Nagel auf den Kopf: Ein aktiver Beitrag zu Systemsicherheit durch Windenergie erscheint vor diesem Hintergrund zwingend erforderlich, wenngleich nicht hinreichend. Ja, die wichtigste Energiequelle muss darüber hinaus viel mehr als bisher als integraler Kern des Energiesystems verstanden werden.
Die Herausforderungen2 Neben der weiteren erfolgreichen Ausweitung der Erzeugung muss für diese integrale Sicht die preisgünstige und sozialverträgliche Bereitstellung dieser klimafreundlichen Energie für die Ver-braucher in den Fokus rücken.
Die Herausforderungen lauten:
Netzintegration. Die Netzinfrastruktur ist nicht in der Lage, die Windenergieerzeugung • 2020 aufzunehmen. Die Volatilität und die Entfernung zu den Verbrauchsschwerpunkten erfordern Anpassungen. Transparente Kommunikationsstrukturen zwischen Netzbetreibern und Erzeugern erneuerbarer Energien („virtuelle Kraftwerke“) existieren erst in Ansätzen.
1 BMU: Leitstudie 2008, Stuttgart, Oktober 2008
2 BEE: Stromversorgung 2020, Berlin, Januar 2009

KASSELER SYMPOSIUM ENERGIE-SYSTEMTECHNIK 2009
106 Fraunhofer IWES 2009
Lastmanagement. Verbraucher können aufgrund fehlender untertägiger Preissignale nicht • auf das natürliche Energieangebot reagieren. Der Wettbewerb am Strommarkt funktioniert nur eingeschränkt.
Speicher. Strom aus Windenergie kann noch nicht kosteneffi zient zwischengespeichert • werden. Umwandlungsprodukte können am Kraftstoff- und Wärmemarkt aufgrund hoher Markteintrittsbarrieren noch nicht konkurrieren. Technisch gibt es eine ganze Bandbreite von vorhandenen Speichertechnologien, von denen einige bereits seit Jahren im Einsatz sind (z.B. Pumpspeicher), andere gerade in den letzten Jahren intensiv weiterentwickelt wurden (z.B. Batterien).
Die Antworten3 Lastmanagement, Netzausbau bzw. Netzoptimierung sind wichtige Bausteine, die umfängliche Nutzung erneuerbarer Energien in Deutschland sicherzustellen. Allerdings können sie die dyna-mischen Entwicklung des Ausbaus der Windenergie bis 2020 alleine nicht bewältigen. Ohne Ver-änderung der Einspeisung ist eine vollständige Systemintegration der großen Windstrommengen nicht möglich. Gleichzeitig muss die vollständige Nutzung dieser wertvollen erneuerbarer Energie garantiert bleiben.
Effi ziente Speichertechnologien bieten eine Lösung. Während klassische Stromspeicher bisher nur für den Tag-Nacht-Ausgleich zwischen Erzeugung und Verbrauch eingesetzt wurden, sind nun gro-ße Energiemengen aus windstarken Zeiten über längerfristige Zeit zu vorzuhalten, um spätere windarme Zeiten zu überbrücken. Für ihre Markteinführung steht die Frage nach der Effi zienz der Speichertechnologien an erster Stelle. Die Kosten der Speicherung setzen sich zusammen aus den zu verzinsenden Anschaffungskosten, den Betriebskosten und den Energieverlusten. Sie hängen sehr stark von der Benutzungshäufi gkeit ab, deren Kehrwert die Speicherdauer ist. Die für die Windenergie benötigten Langzeitspeicher müssen also wesentlich preiswerter in der Anschaffung sein als Kurzzeitspeicher, die mehrmals täglich be- und entladen werden.
Bei Betrachtung der einzelnen Speichertechnologien ergibt sich folgendes Bild:
Die längerfristige Speicherung von Energie ist am wirtschaftlichsten mit Hilfe von durch • Elektrolyse erzeugten Wasserstoff möglich. Deutschland verfügt bereits über Erdgasspei-cher mit einer Kapazität, die ausreichen würde, um mehr als das Doppelte der aktuellen Windstromerzeugung aufzunehmen. Der Wirkungsgrad der Energieumwandlung von Wind-strom in Wasserstoff beträgt dabei heute 70 Prozent und kann technisch noch auf bis zu 85 Prozent gesteigert werden. Für die Anpassung der Speicher entstehen kaum zusätzliche Kosten. Kurzzeitiges Speichern auf diesem Wege ist jedoch unrentabel, da die höheren Energieverluste schwerer zu Buche schlagen als die erzielbaren Einsparungen.
Im täglichen Einsatz sind Pumpspeicher, Akkumulatoren in Elektrofahrzeugen oder teilwei-• se auch Druckluftspeicher etwa gleichwertige Alternativen. Für die tägliche Speicherung sind Akkumulatoren in Fahrzeugen am besten geeignet, denn die Batterien werden mit den Fahrzeugen ohnehin angeschafft, während für den Neubau eines Pumpspeicherwerkes zusätzliche Investitionen anfallen. Druckluftspeicher sind aufgrund ihrer geringen Energie-dichte höchstens im Stundenbereich zur Netzstützung sinnvoll.
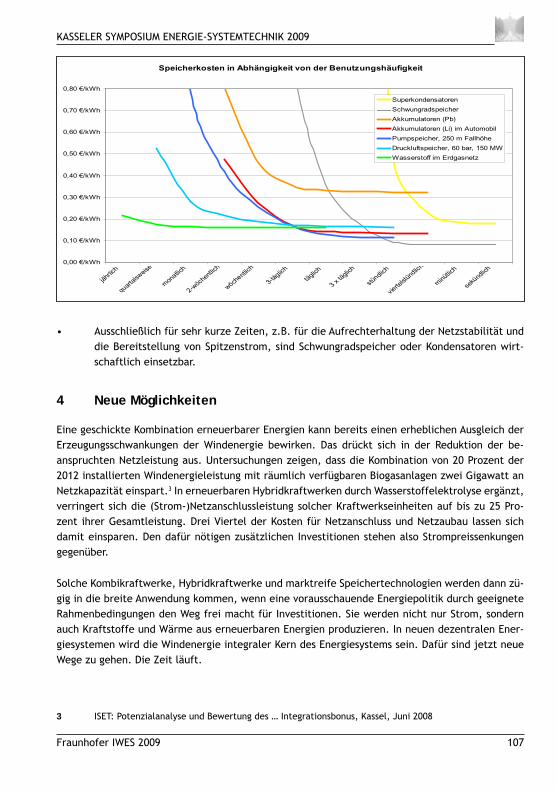
KASSELER SYMPOSIUM ENERGIE-SYSTEMTECHNIK 2009
Fraunhofer IWES 2009 107
Ausschließlich für sehr kurze Zeiten, z.B. für die Aufrechterhaltung der Netzstabilität und • die Bereitstellung von Spitzenstrom, sind Schwungradspeicher oder Kondensatoren wirt-schaftlich einsetzbar.
Neue Möglichkeiten4
Eine geschickte Kombination erneuerbarer Energien kann bereits einen erheblichen Ausgleich der Erzeugungsschwankungen der Windenergie bewirken. Das drückt sich in der Reduktion der be-anspruchten Netzleistung aus. Untersuchungen zeigen, dass die Kombination von 20 Prozent der 2012 installierten Windenergieleistung mit räumlich verfügbaren Biogasanlagen zwei Gigawatt an Netzkapazität einspart.3 In erneuerbaren Hybridkraftwerken durch Wasserstoffelektrolyse ergänzt, verringert sich die (Strom-)Netzanschlussleistung solcher Kraftwerkseinheiten auf bis zu 25 Pro-zent ihrer Gesamtleistung. Drei Viertel der Kosten für Netzanschluss und Netzaubau lassen sich damit einsparen. Den dafür nötigen zusätzlichen Investitionen stehen also Strompreissenkungen gegenüber.
Solche Kombikraftwerke, Hybridkraftwerke und marktreife Speichertechnologien werden dann zü-gig in die breite Anwendung kommen, wenn eine vorausschauende Energiepolitik durch geeignete Rahmenbedingungen den Weg frei macht für Investitionen. Sie werden nicht nur Strom, sondern auch Kraftstoffe und Wärme aus erneuerbaren Energien produzieren. In neuen dezentralen Ener-giesystemen wird die Windenergie integraler Kern des Energiesystems sein. Dafür sind jetzt neue Wege zu gehen. Die Zeit läuft.
3 ISET: Potenzialanalyse und Bewertung des … Integrationsbonus, Kassel, Juni 2008
Speicherkosten in Abhängigkeit von der Benutzungshäufigkeit
0,00 €/kWh
0,10 €/kWh
0,20 €/kWh
0,30 €/kWh
0,40 €/kWh
0,50 €/kWh
0,60 €/kWh
0,70 €/kWh
0,80 €/kWh
jähr
lich
quar
talsw
eise
mon
atlich
2-wöc
hent
lich
wöchent
lich
3-tä
glich
tägl
ich
3 x
tägl
ich
stün
dlich
vierte
lstün
dlich
min
ütlic
h
sekü
ndlic
h
Superkondensatoren
Schwungradspeicher
Akkumulatoren (Pb)
Akkumulatoren (Li) im Automobil
Pumpspeicher, 250 m Fallhöhe
Druckluftspeicher, 60 bar, 150 MW
Wasserstoff im Erdgasnetz

KASSELER SYMPOSIUM ENERGIE-SYSTEMTECHNIK 2009
108 Fraunhofer IWES 2009
Spannungsregelung mit moderner WEA-Technik
Istvan Erlich, Universität Duisburg-Essen, DuisburgJens Fortmann, REpower Systems AG, RendsburgStephan Engelhardt, Woodward SEG GmbH & Co. KG, KempenJörg Kretschmann, Woodward SEG GmbH & Co. KG, Kempen
Einleitung1 Lange Zeit hat man von Windenergieanlagen (WEA) Einspeisung mit einem festen vorgegebenen cosinus_fi gefordert. Auch während eines tieferen Spannungseinbruchs, verursacht durch einen Netzfehler, sollten WEA vom Netz getrennt werden, um negative Auswirkungen sowohl auf die WEA als auch auf das Netz zu vermeiden. Untersuchungen im Übertragungsnetz haben aber später gezeigt, dass die fehlende Stützung der Spannung durch die WEA während eines Kurzschlusses zur Ausweitung des Spannungstrichters führt und somit die Folgen des Fehlers noch größer wer-den lässt [1]. Insbesondere die Abschaltung einer großen Anzahl von WEA führt zum Verlust einer beträchtlichen Erzeugerleistung mit möglichen ernsten Folgen für die Systemstabilität. Deshalb wird heute in fast allen Grid Codes der Welt das Durchfahren von Spannungseinbrüchen (Fault Ride-Through, FRT) gefordert. Außerdem sollen die WEA bevorzugt einen Blindstrom zur Stützung der Netzspannung einspeisen. Trotz dieser Maßnahmen kann man bei WEA noch nicht über Span-nungsregelung, wie sie bei kleinen und großen konventionellen Synchrongeneratoren allgemein üblich ist, sprechen. Die deutschen Grid Codes [2], [3] haben aber schon für den Fall vorgesorgt, dass eine direkte kontinuierliche Spannungsregelung aus Netzsicht zu bevorzugen ist, indem die-se Option nach Ermessen des Netzbetreibers gefordert werden kann. Für die WEA bedeutet die Spannungsregelung und die Erweiterung der Blindleistungseinspeisung nicht nur eine veränderte Reglerstruktur, sondern u. U. eine erhöhte Umrichterleistung, was höhere Kosten nach sich zieht und somit die Anlagen teurer macht.
Im vorliegenden Beitrag werden die Autoren folgende Fragen diskutieren:
Welche Netzanforderungen bestehen bezüglich Spannungsregelung und Spannungsstützung?•
Wie kann man diese Anforderungen mit den heutigen modernen WEA erfüllen?•
Welche Auswirkungen hat die Spannungsstützung durch WEA auf das Netz?•
Netzanforderungen2 Die Netzanforderungen für WEA sind in Deutschland im Transmission Code [3] und der Mittel-spannungsrichtlinie [4] niedergelegt. Hinzu kommen noch Spezifi kationen für die Gewährung des sogenannten System-Dienstleistungsbonus [5]. Man kann die Anforderungen in Bezug auf das hier diskutierte Thema in zwei Gruppen unterteilen:
Anforderungen bezüglich des statischen (quasistationären) Verhaltens der WEA hinsichtlich • Spannungsregelung und Blindleistungseinspeisung.
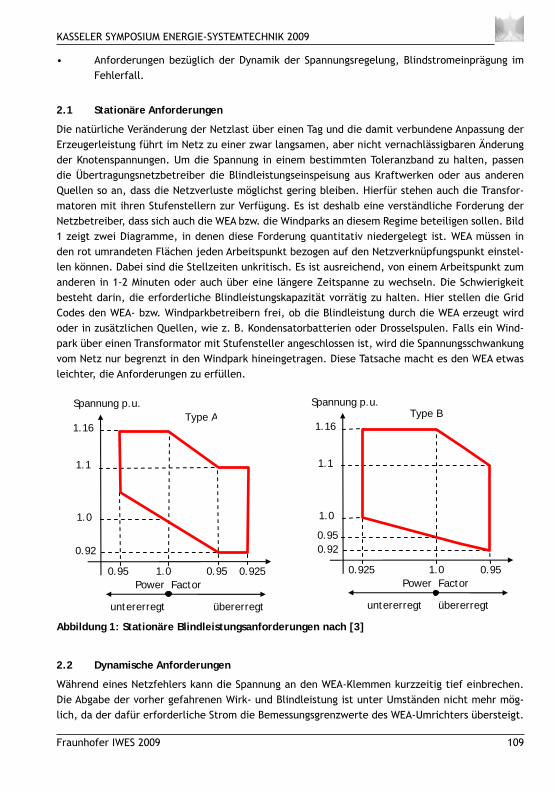
KASSELER SYMPOSIUM ENERGIE-SYSTEMTECHNIK 2009
Fraunhofer IWES 2009 109
Anforderungen bezüglich der Dynamik der Spannungsregelung, Blindstromeinprägung im • Fehlerfall.
Stationäre Anforderungen2.1
Die natürliche Veränderung der Netzlast über einen Tag und die damit verbundene Anpassung der Erzeugerleistung führt im Netz zu einer zwar langsamen, aber nicht vernachlässigbaren Änderung der Knotenspannungen. Um die Spannung in einem bestimmten Toleranzband zu halten, passen die Übertragungsnetzbetreiber die Blindleistungseinspeisung aus Kraftwerken oder aus anderen Quellen so an, dass die Netzverluste möglichst gering bleiben. Hierfür stehen auch die Transfor-matoren mit ihren Stufenstellern zur Verfügung. Es ist deshalb eine verständliche Forderung der Netzbetreiber, dass sich auch die WEA bzw. die Windparks an diesem Regime beteiligen sollen. Bild 1 zeigt zwei Diagramme, in denen diese Forderung quantitativ niedergelegt ist. WEA müssen in den rot umrandeten Flächen jeden Arbeitspunkt bezogen auf den Netzverknüpfungspunkt einstel-len können. Dabei sind die Stellzeiten unkritisch. Es ist ausreichend, von einem Arbeitspunkt zum anderen in 1-2 Minuten oder auch über eine längere Zeitspanne zu wechseln. Die Schwierigkeit besteht darin, die erforderliche Blindleistungskapazität vorrätig zu halten. Hier stellen die Grid Codes den WEA- bzw. Windparkbetreibern frei, ob die Blindleistung durch die WEA erzeugt wird oder in zusätzlichen Quellen, wie z. B. Kondensatorbatterien oder Drosselspulen. Falls ein Wind-park über einen Transformator mit Stufensteller angeschlossen ist, wird die Spannungsschwankung vom Netz nur begrenzt in den Windpark hineingetragen. Diese Tatsache macht es den WEA etwas leichter, die Anforderungen zu erfüllen.
Abbildung 1: Stationäre Blindleistungsanforderungen nach [3]
Dynamische Anforderungen2.2
Während eines Netzfehlers kann die Spannung an den WEA-Klemmen kurzzeitig tief einbrechen. Die Abgabe der vorher gefahrenen Wirk- und Blindleistung ist unter Umständen nicht mehr mög-lich, da der dafür erforderliche Strom die Bemessungsgrenzwerte des WEA-Umrichters übersteigt.
Spannung p.u.
1.16
1.1
1.0
0.92
0.95 1.0 0.95 0.925Power Factor
untererregt übererregt
Spannung p.u.
1.16
1.1
1.0
0.92
0.925 1.0 0.95 Power Factor
untererregt übererregt
Type A Type B
0.95
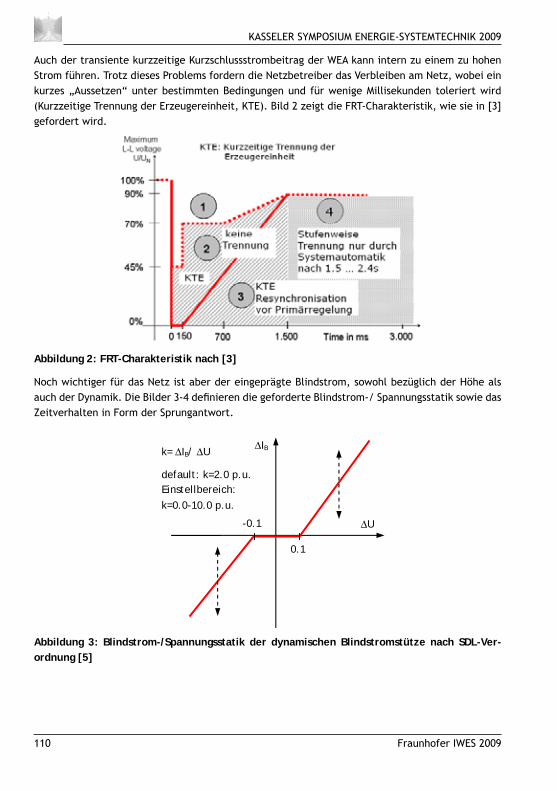
KASSELER SYMPOSIUM ENERGIE-SYSTEMTECHNIK 2009
110 Fraunhofer IWES 2009
Auch der transiente kurzzeitige Kurzschlussstrombeitrag der WEA kann intern zu einem zu hohen Strom führen. Trotz dieses Problems fordern die Netzbetreiber das Verbleiben am Netz, wobei ein kurzes „Aussetzen“ unter bestimmten Bedingungen und für wenige Millisekunden toleriert wird (Kurzzeitige Trennung der Erzeugereinheit, KTE). Bild 2 zeigt die FRT-Charakteristik, wie sie in [3] gefordert wird.
Abbildung 2: FRT-Charakteristik nach [3]
Noch wichtiger für das Netz ist aber der eingeprägte Blindstrom, sowohl bezüglich der Höhe als auch der Dynamik. Die Bilder 3-4 defi nieren die geforderte Blindstrom-/ Spannungsstatik sowie das Zeitverhalten in Form der Sprungantwort.
Abbildung 3: Blindstrom-/Spannungsstatik der dynamischen Blindstromstütze nach SDL-Ver-ordnung [5]
ΔIB
ΔU
0.1
-0.1
k= ΔIB/ ΔU
default: k=2.0 p.u. Einstellbereich: k=0.0-10.0 p.u.
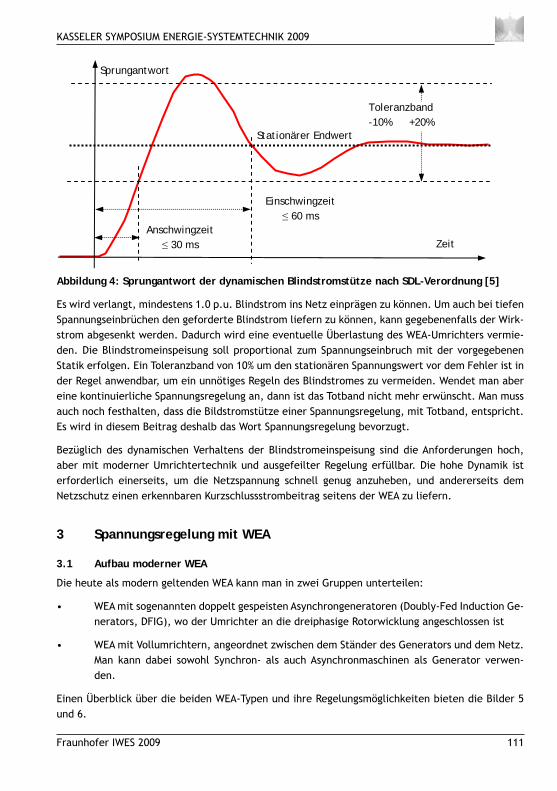
KASSELER SYMPOSIUM ENERGIE-SYSTEMTECHNIK 2009
Fraunhofer IWES 2009 111
Abbildung 4: Sprungantwort der dynamischen Blindstromstütze nach SDL-Verordnung [5]
Es wird verlangt, mindestens 1.0 p.u. Blindstrom ins Netz einprägen zu können. Um auch bei tiefen Spannungseinbrüchen den geforderte Blindstrom liefern zu können, kann gegebenenfalls der Wirk-strom abgesenkt werden. Dadurch wird eine eventuelle Überlastung des WEA-Umrichters vermie-den. Die Blindstromeinspeisung soll proportional zum Spannungseinbruch mit der vorgegebenen Statik erfolgen. Ein Toleranzband von 10% um den stationären Spannungswert vor dem Fehler ist in der Regel anwendbar, um ein unnötiges Regeln des Blindstromes zu vermeiden. Wendet man aber eine kontinuierliche Spannungsregelung an, dann ist das Totband nicht mehr erwünscht. Man muss auch noch festhalten, dass die Bildstromstütze einer Spannungsregelung, mit Totband, entspricht. Es wird in diesem Beitrag deshalb das Wort Spannungsregelung bevorzugt.
Bezüglich des dynamischen Verhaltens der Blindstromeinspeisung sind die Anforderungen hoch, aber mit moderner Umrichtertechnik und ausgefeilter Regelung erfüllbar. Die hohe Dynamik ist erforderlich einerseits, um die Netzspannung schnell genug anzuheben, und andererseits dem Netzschutz einen erkennbaren Kurzschlussstrombeitrag seitens der WEA zu liefern.
Spannungsregelung mit WEA3
Aufbau moderner WEA3.1
Die heute als modern geltenden WEA kann man in zwei Gruppen unterteilen:
WEA mit sogenannten doppelt gespeisten Asynchrongeneratoren (Doubly-Fed Induction Ge-• nerators, DFIG), wo der Umrichter an die dreiphasige Rotorwicklung angeschlossen ist
WEA mit Vollumrichtern, angeordnet zwischen dem Ständer des Generators und dem Netz. • Man kann dabei sowohl Synchron- als auch Asynchronmaschinen als Generator verwen-den.
Einen Überblick über die beiden WEA-Typen und ihre Regelungsmöglichkeiten bieten die Bilder 5 und 6.
Toleranzband-10% +20%
Zeit
Stationärer Endwert
Anschwingzeit 30 ms
Einschwingzeit 60 ms
Sprungantwort
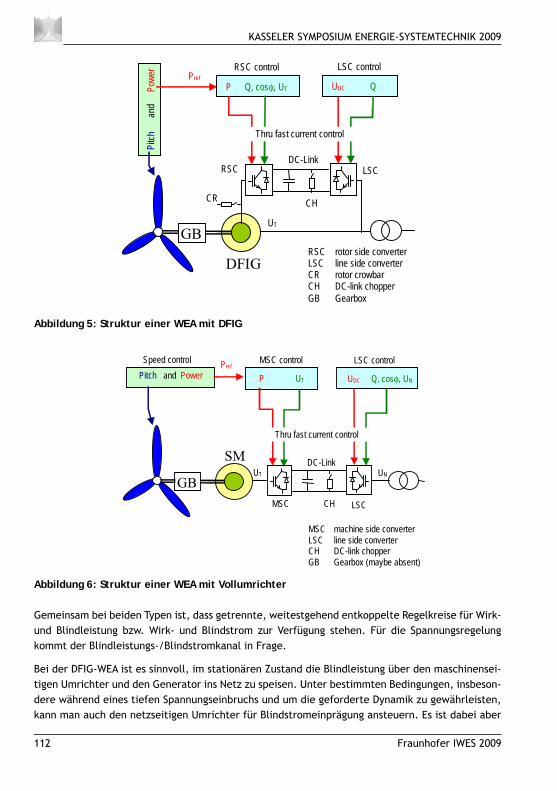
KASSELER SYMPOSIUM ENERGIE-SYSTEMTECHNIK 2009
112 Fraunhofer IWES 2009
GB
DC-Link Pi
tch
and
P
ower
DFIG
P Q, cosφ, UT UDC Q
Thru fast current control
Pref RSC control LSC control
RSC LSC
CR CH
RSC rotor side converter LSC line side converter CR rotor crowbar CH DC-link chopper GB Gearbox
UT
Abbildung 5: Struktur einer WEA mit DFIG
MSC control
GB
Pitch and Power
SM
P UT UDC Q, cosφ, UN
Thru fast current control
Pref
LSC
DC-Link
MSC CH
Speed control
MSC machine side converter LSC line side converter CH DC-link chopper GB Gearbox (maybe absent)
UT UN
LSC control
Abbildung 6: Struktur einer WEA mit Vollumrichter
Gemeinsam bei beiden Typen ist, dass getrennte, weitestgehend entkoppelte Regelkreise für Wirk- und Blindleistung bzw. Wirk- und Blindstrom zur Verfügung stehen. Für die Spannungsregelung kommt der Blindleistungs-/Blindstromkanal in Frage.
Bei der DFIG-WEA ist es sinnvoll, im stationären Zustand die Blindleistung über den maschinensei-tigen Umrichter und den Generator ins Netz zu speisen. Unter bestimmten Bedingungen, insbeson-dere während eines tiefen Spannungseinbruchs und um die geforderte Dynamik zu gewährleisten, kann man auch den netzseitigen Umrichter für Blindstromeinprägung ansteuern. Es ist dabei aber

KASSELER SYMPOSIUM ENERGIE-SYSTEMTECHNIK 2009
Fraunhofer IWES 2009 113
zu beachten, dass die vorrangige Aufgabe des netzseitigen Umrichters die Regelung der Zwischen-kreisspannung ist und nur, wenn die Stromkapazität des Umrichters nicht voll ausgenutzt ist, kann diese für Blindstromerzeugung genutzt werden.
Bei Anlagen mit Vollumrichtern steht nur der netzseitige Umrichter für Spannungsregelung bzw. Blindstromeinprägung zur Verfügung. Da bei dieser Konfi guration keine elektrische Maschine zwi-schen Umrichter und Netz liegt, verhält sich diese Anlage dynamisch schneller. Andererseits kann sie, aus dem gleichen Grund, nicht von der Stromausspeisung aus der Maschine unmittelbar nach dem Spannungseinbruch, wie es bei DFIG-Anlagen der Fall ist, profi tieren.
Während eines zweipoligen Netzfehlers im Netz kann bei DFIG-WEA über die Maschine und somit auch über den maschinenseitigen Umrichter ein Gegenstrom fl ießen. Dieser schränkt u. U. den zur Verfügung stehenden Blindstrombereich für Spannungsstütze ein. Es bedarf ausgefeilter regelungs-technischer Maßnahmen, um diesem Effekt entgegen zu wirken und trotzdem einen ausreichenden Blindstrom ins Netz speisen zu können. Diesem Problem trägt auch die SDL-Verordnung [5] Rech-nung, indem beim Vorhandensein eines Gegenstromes nur noch 0.4 p.u. Mitsystem-Blindstrom ge-fordert wird. Anlagen mit Vollumrichter betrifft dieses Problem nicht, da dort durch die Regelung ein Gegenstrom über den Umrichter komplett unterdrückt werden kann.
Bei älteren DFIG-WEA wurde für den Schutz des Umrichters während der Kurzschlussphase ein so-genannter Crowbar, ein Schutzwiderstand an die dreiphasige Rotorwicklung geschaltet und gleich-zeitig der Umrichter gestoppt. Dadurch ging die Erregung verloren und die Maschine wurde zu einem Schleifrigläufer-Asynchrongenerator. Diese Phase kann, abhängig von der Auslegung, 50-100 ms, d. h. nahezu die gesamte Kurzschlussphase dauern. Während dieser Zeit bezieht die Maschine Blindstrom aus dem Netz, statt, wie im Grid Code gefordert, einzuspeisen. Aus diesem Grund ist die traditionelle Crowbarlösung für das Netz nicht akzeptabel. Eine Alternative ist, den Chopper im Gleichstrom-Zwischenkreis so auszulegen, dass damit die Gleichspannung in fast allen Betriebszu-ständen stabilisiert werden kann und das Einschalten der Crowbar dadurch überfl üssig wird.
WEA-Reglerstrukturen für Spannungsregelung3.2
In Bild 7 ist eine mögliche Reglerstruktur, alternativ für Blindleistungs-, cos_fi - oder langsame Spannungsregelung, mit unterlagerter Blindstromstütze dargestellt. Der Ausgang des Reglers ist der Blindstrom-Sollwert für den Umrichter. Die drei Möglichkeiten Blindleistungs-, cos_fi - oder langsame Spannungsregelung können von den Netzbetreibern wahlweise gefordert werden. Die Blindstromstütze besitzt ein Totband und liefert ein zusätzliches Delta zum Blindstromsollwert. Der quasistationäre Blindleistungspfad muss während der aktiven Spannungsstütze entweder blok-kiert werden (Werte festgehalten) oder von vornherein ein sehr langsames Verhalten aufweisen. In einigen Anwendungen wurde statt des Aufsummierens des quasistationären und des dynamischen Blindstromanteils ein Umschalten implementiert. Dies kann zu Unstetigkeiten (Sprüngen) bei der Regelung führen und ist deshalb nicht zu empfehlen.
Eine separate Begrenzung des dynamischen Anteils des Blindstromes z. B. auf 1.0 p.u., wie manch-mal der Grid Code falsch ausgelegt wurde, führt dazu, dass die Blindstromkapazität der WEA u. U. nicht voll für die Stützung der Netzspannung ausgenutzt wird.
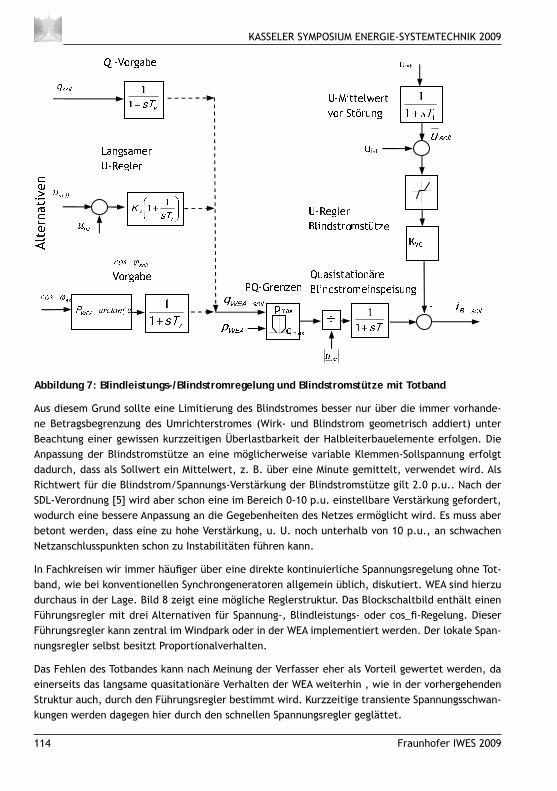
KASSELER SYMPOSIUM ENERGIE-SYSTEMTECHNIK 2009
114 Fraunhofer IWES 2009
Abbildung 7: Blindleistungs-/Blindstromregelung und Blindstromstütze mit Totband
Aus diesem Grund sollte eine Limitierung des Blindstromes besser nur über die immer vorhande-ne Betragsbegrenzung des Umrichterstromes (Wirk- und Blindstrom geometrisch addiert) unter Beachtung einer gewissen kurzzeitigen Überlastbarkeit der Halbleiterbauelemente erfolgen. Die Anpassung der Blindstromstütze an eine möglicherweise variable Klemmen-Sollspannung erfolgt dadurch, dass als Sollwert ein Mittelwert, z. B. über eine Minute gemittelt, verwendet wird. Als Richtwert für die Blindstrom/Spannungs-Verstärkung der Blindstromstütze gilt 2.0 p.u.. Nach der SDL-Verordnung [5] wird aber schon eine im Bereich 0-10 p.u. einstellbare Verstärkung gefordert, wodurch eine bessere Anpassung an die Gegebenheiten des Netzes ermöglicht wird. Es muss aber betont werden, dass eine zu hohe Verstärkung, u. U. noch unterhalb von 10 p.u., an schwachen Netzanschlusspunkten schon zu Instabilitäten führen kann.
In Fachkreisen wir immer häufi ger über eine direkte kontinuierliche Spannungsregelung ohne Tot-band, wie bei konventionellen Synchrongeneratoren allgemein üblich, diskutiert. WEA sind hierzu durchaus in der Lage. Bild 8 zeigt eine mögliche Reglerstruktur. Das Blockschaltbild enthält einen Führungsregler mit drei Alternativen für Spannung-, Blindleistungs- oder cos_fi -Regelung. Dieser Führungsregler kann zentral im Windpark oder in der WEA implementiert werden. Der lokale Span-nungsregler selbst besitzt Proportionalverhalten.
Das Fehlen des Totbandes kann nach Meinung der Verfasser eher als Vorteil gewertet werden, da einerseits das langsame quasitationäre Verhalten der WEA weiterhin , wie in der vorhergehenden Struktur auch, durch den Führungsregler bestimmt wird. Kurzzeitige transiente Spannungsschwan-kungen werden dagegen hier durch den schnellen Spannungsregler geglättet.
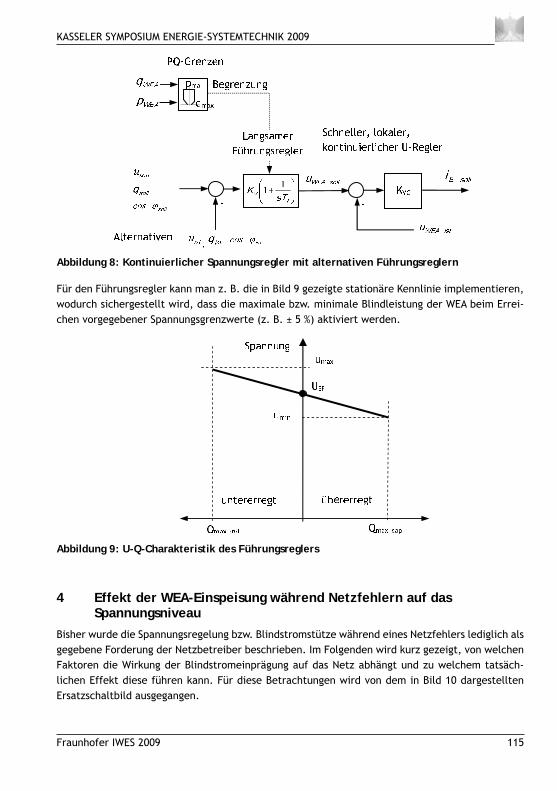
KASSELER SYMPOSIUM ENERGIE-SYSTEMTECHNIK 2009
Fraunhofer IWES 2009 115
Abbildung 8: Kontinuierlicher Spannungsregler mit alternativen Führungsreglern
Für den Führungsregler kann man z. B. die in Bild 9 gezeigte stationäre Kennlinie implementieren, wodurch sichergestellt wird, dass die maximale bzw. minimale Blindleistung der WEA beim Errei-chen vorgegebener Spannungsgrenzwerte (z. B. ± 5 %) aktiviert werden.
Abbildung 9: U-Q-Charakteristik des Führungsreglers
Effekt der WEA-Einspeisung während Netzfehlern auf das 4 Spannungsniveau
Bisher wurde die Spannungsregelung bzw. Blindstromstütze während eines Netzfehlers lediglich als gegebene Forderung der Netzbetreiber beschrieben. Im Folgenden wird kurz gezeigt, von welchen Faktoren die Wirkung der Blindstromeinprägung auf das Netz abhängt und zu welchem tatsäch-lichen Effekt diese führen kann. Für diese Betrachtungen wird von dem in Bild 10 dargestellten Ersatzschaltbild ausgegangen.
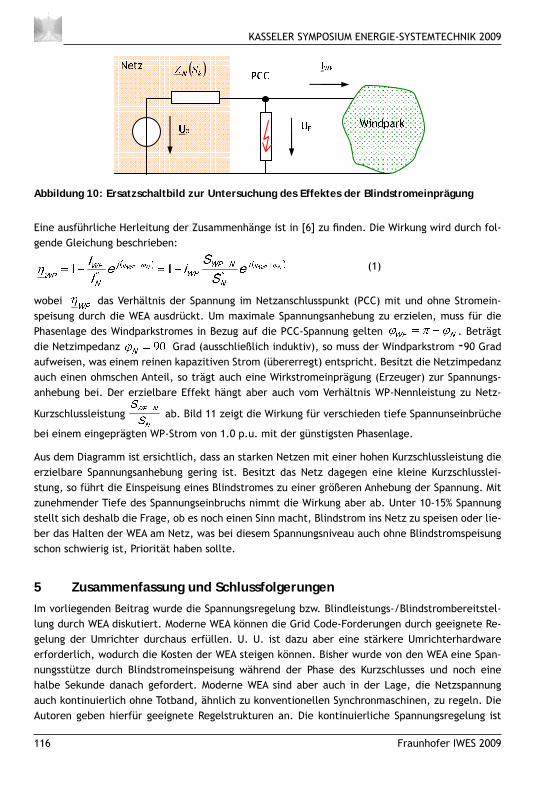
KASSELER SYMPOSIUM ENERGIE-SYSTEMTECHNIK 2009
116 Fraunhofer IWES 2009
Abbildung 10: Ersatzschaltbild zur Untersuchung des Effektes der Blindstromeinprägung
Eine ausführliche Herleitung der Zusammenhänge ist in [6] zu fi nden. Die Wirkung wird durch fol-gende Gleichung beschrieben:
(1)
wobei das Verhältnis der Spannung im Netzanschlusspunkt (PCC) mit und ohne Stromein-speisung durch die WEA ausdrückt. Um maximale Spannungsanhebung zu erzielen, muss für die Phasenlage des Windparkstromes in Bezug auf die PCC-Spannung gelten . Beträgt die Netzimpedanz
Grad (ausschließlich induktiv), so muss der Windparkstrom -90 Grad
aufweisen, was einem reinen kapazitiven Strom (übererregt) entspricht. Besitzt die Netzimpedanz auch einen ohmschen Anteil, so trägt auch eine Wirkstromeinprägung (Erzeuger) zur Spannungs-anhebung bei. Der erzielbare Effekt hängt aber auch vom Verhältnis WP-Nennleistung zu Netz-
Kurzschlussleistung ab. Bild 11 zeigt die Wirkung für verschieden tiefe Spannunseinbrüche
bei einem eingeprägten WP-Strom von 1.0 p.u. mit der günstigsten Phasenlage.
Aus dem Diagramm ist ersichtlich, dass an starken Netzen mit einer hohen Kurzschlussleistung die erzielbare Spannungsanhebung gering ist. Besitzt das Netz dagegen eine kleine Kurzschlusslei-stung, so führt die Einspeisung eines Blindstromes zu einer größeren Anhebung der Spannung. Mit zunehmender Tiefe des Spannungseinbruchs nimmt die Wirkung aber ab. Unter 10-15% Spannung stellt sich deshalb die Frage, ob es noch einen Sinn macht, Blindstrom ins Netz zu speisen oder lie-ber das Halten der WEA am Netz, was bei diesem Spannungsniveau auch ohne Blindstromspeisung schon schwierig ist, Priorität haben sollte.
Zusammenfassung und Schlussfolgerungen5 Im vorliegenden Beitrag wurde die Spannungsregelung bzw. Blindleistungs-/Blindstrombereitstel-lung durch WEA diskutiert. Moderne WEA können die Grid Code-Forderungen durch geeignete Re-gelung der Umrichter durchaus erfüllen. U. U. ist dazu aber eine stärkere Umrichterhardware erforderlich, wodurch die Kosten der WEA steigen können. Bisher wurde von den WEA eine Span-nungsstütze durch Blindstromeinspeisung während der Phase des Kurzschlusses und noch eine halbe Sekunde danach gefordert. Moderne WEA sind aber auch in der Lage, die Netzspannung auch kontinuierlich ohne Totband, ähnlich zu konventionellen Synchronmaschinen, zu regeln. Die Autoren geben hierfür geeignete Regelstrukturen an. Die kontinuierliche Spannungsregelung ist
( )
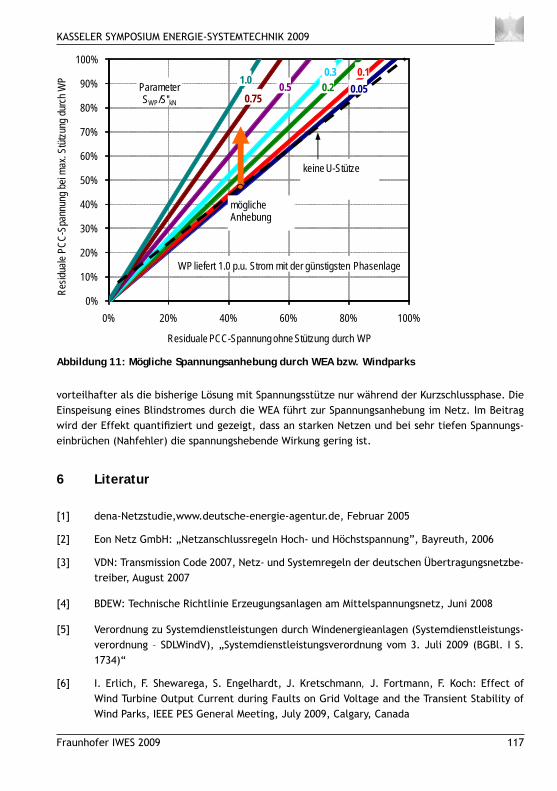
KASSELER SYMPOSIUM ENERGIE-SYSTEMTECHNIK 2009
Fraunhofer IWES 2009 117
vorteilhafter als die bisherige Lösung mit Spannungsstütze nur während der Kurzschlussphase. Die Einspeisung eines Blindstromes durch die WEA führt zur Spannungsanhebung im Netz. Im Beitrag wird der Effekt quantifi ziert und gezeigt, dass an starken Netzen und bei sehr tiefen Spannungs-einbrüchen (Nahfehler) die spannungshebende Wirkung gering ist.
Literatur6
[1] dena-Netzstudie,www.deutsche-energie-agentur.de, Februar 2005
[2] Eon Netz GmbH: „Netzanschlussregeln Hoch- und Höchstspannung”, Bayreuth, 2006
[3] VDN: Transmission Code 2007, Netz- und Systemregeln der deutschen Übertragungsnetzbe-treiber, August 2007
[4] BDEW: Technische Richtlinie Erzeugungsanlagen am Mittelspannungsnetz, Juni 2008
[5] Verordnung zu Systemdienstleistungen durch Windenergieanlagen (Systemdienstleistungs-verordnung – SDLWindV), „Systemdienstleistungsverordnung vom 3. Juli 2009 (BGBl. I S. 1734)“
[6] I. Erlich, F. Shewarega, S. Engelhardt, J. Kretschmann, J. Fortmann, F. Koch: Effect of Wind Turbine Output Current during Faults on Grid Voltage and the Transient Stability of Wind Parks, IEEE PES General Meeting, July 2009, Calgary, Canada
0%
10%
20%
30%
40%
50%
60%
70%
80%
90%
100%
0% 20% 40% 60% 80% 100%
Resid
uale
PCC-
Span
nung
bei m
ax. S
tützu
ng du
rch W
P
Residuale PCC-Spannung ohne Stützung durch WP
keine U-Stütze
ParameterSWP/S''kN
0.10.050.2
0.30.5
mögliche Anhebung
WP liefert 1.0 p.u. Strom mit der günstigsten Phasenlage
0.751.0
Abbildung 11: Mögliche Spannungsanhebung durch WEA bzw. Windparks
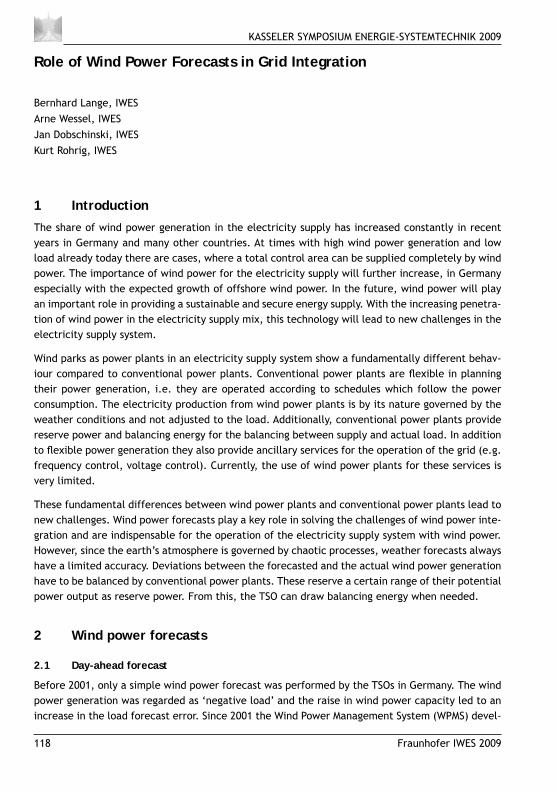
KASSELER SYMPOSIUM ENERGIE-SYSTEMTECHNIK 2009
118 Fraunhofer IWES 2009
Role of Wind Power Forecasts in Grid Integration
Bernhard Lange, IWESArne Wessel, IWESJan Dobschinski, IWESKurt Rohrig, IWES
Introduction1
The share of wind power generation in the electricity supply has increased constantly in recent years in Germany and many other countries. At times with high wind power generation and low load already today there are cases, where a total control area can be supplied completely by wind power. The importance of wind power for the electricity supply will further increase, in Germany especially with the expected growth of offshore wind power. In the future, wind power will play an important role in providing a sustainable and secure energy supply. With the increasing penetra-tion of wind power in the electricity supply mix, this technology will lead to new challenges in the electricity supply system.
Wind parks as power plants in an electricity supply system show a fundamentally different behav-iour compared to conventional power plants. Conventional power plants are fl exible in planning their power generation, i.e. they are operated according to schedules which follow the power consumption. The electricity production from wind power plants is by its nature governed by the weather conditions and not adjusted to the load. Additionally, conventional power plants provide reserve power and balancing energy for the balancing between supply and actual load. In addition to fl exible power generation they also provide ancillary services for the operation of the grid (e.g. frequency control, voltage control). Currently, the use of wind power plants for these services is very limited.
These fundamental differences between wind power plants and conventional power plants lead to new challenges. Wind power forecasts play a key role in solving the challenges of wind power inte-gration and are indispensable for the operation of the electricity supply system with wind power. However, since the earth’s atmosphere is governed by chaotic processes, weather forecasts always have a limited accuracy. Deviations between the forecasted and the actual wind power generation have to be balanced by conventional power plants. These reserve a certain range of their potential power output as reserve power. From this, the TSO can draw balancing energy when needed.
Wind power forecasts2
Day-ahead forecast2.1
Before 2001, only a simple wind power forecast was performed by the TSOs in Germany. The wind power generation was regarded as ‘negative load’ and the raise in wind power capacity led to an increase in the load forecast error. Since 2001 the Wind Power Management System (WPMS) devel-
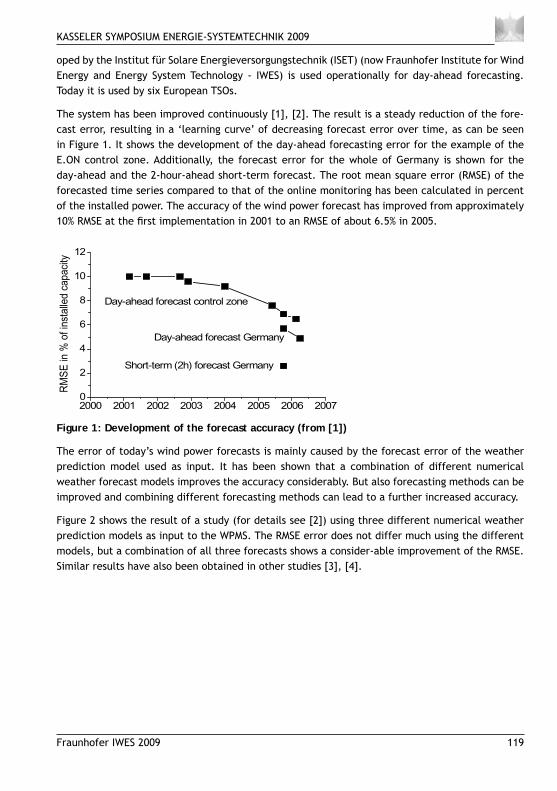
KASSELER SYMPOSIUM ENERGIE-SYSTEMTECHNIK 2009
Fraunhofer IWES 2009 119
oped by the Institut für Solare Energieversorgungstechnik (ISET) (now Fraunhofer Institute for Wind Energy and Energy System Technology - IWES) is used operationally for day-ahead forecasting. Today it is used by six European TSOs.
The system has been improved continuously [1], [2]. The result is a steady reduction of the fore-cast error, resulting in a ‘learning curve’ of decreasing forecast error over time, as can be seen in Figure 1. It shows the development of the day-ahead forecasting error for the example of the E.ON control zone. Additionally, the forecast error for the whole of Germany is shown for the day-ahead and the 2-hour-ahead short-term forecast. The root mean square error (RMSE) of the forecasted time series compared to that of the online monitoring has been calculated in percent of the installed power. The accuracy of the wind power forecast has improved from approximately 10% RMSE at the fi rst implementation in 2001 to an RMSE of about 6.5% in 2005.
Figure 1: Development of the forecast accuracy (from [1])
The error of today’s wind power forecasts is mainly caused by the forecast error of the weather prediction model used as input. It has been shown that a combination of different numerical weather forecast models improves the accuracy considerably. But also forecasting methods can be improved and combining different forecasting methods can lead to a further increased accuracy.
Figure 2 shows the result of a study (for details see [2]) using three different numerical weather prediction models as input to the WPMS. The RMSE error does not differ much using the different models, but a combination of all three forecasts shows a consider-able improvement of the RMSE. Similar results have also been obtained in other studies [3], [4].
2000 2001 2002 2003 2004 2005 2006 20070
2
4
6
8
10
12
Short-term (2h) forecast Germany
Day-ahead forecast Germany
Day-ahead forecast control zone
RM
SE
in %
of in
stalle
d c
apaci
ty
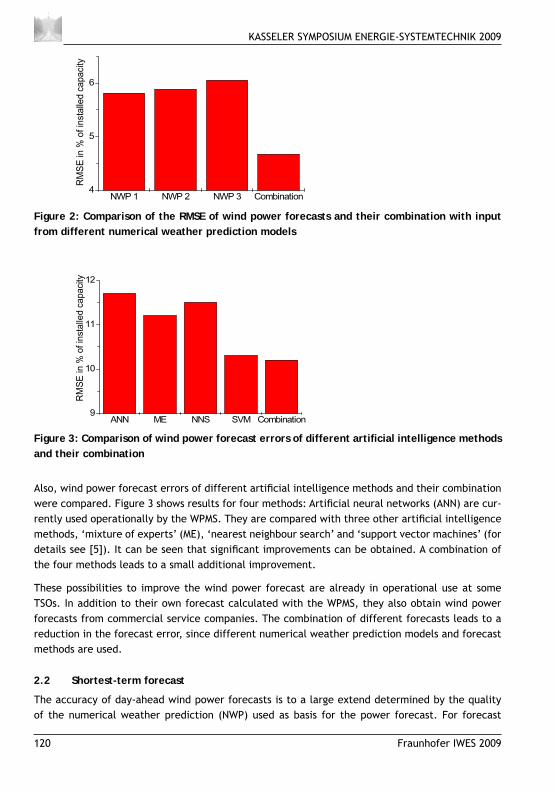
KASSELER SYMPOSIUM ENERGIE-SYSTEMTECHNIK 2009
120 Fraunhofer IWES 2009
Figure 2: Comparison of the RMSE of wind power forecasts and their combination with input from different numerical weather prediction models
Figure 3: Comparison of wind power forecast errors of different artifi cial intelligence methods and their combination
Also, wind power forecast errors of different artifi cial intelligence methods and their combination were compared. Figure 3 shows results for four methods: Artifi cial neural networks (ANN) are cur-rently used operationally by the WPMS. They are compared with three other artifi cial intelligence methods, ‘mixture of experts’ (ME), ‘nearest neighbour search’ and ‘support vector machines’ (for details see [5]). It can be seen that signifi cant improvements can be obtained. A combination of the four methods leads to a small additional improvement.
These possibilities to improve the wind power forecast are already in operational use at some TSOs. In addition to their own forecast calculated with the WPMS, they also obtain wind power forecasts from commercial service companies. The combination of different forecasts leads to a reduction in the forecast error, since different numerical weather prediction models and forecast methods are used.
Shortest-term forecast2.2
The accuracy of day-ahead wind power forecasts is to a large extend determined by the quality of the numerical weather prediction (NWP) used as basis for the power forecast. For forecast
NWP 1 NWP 2 NWP 3 Combination4
5
6R
MS
E in
% o
f in
sta
lled
ca
pa
city
ANN ME NNS SVM Combination9
10
11
12
RM
SE
in %
of
inst
alle
d c
ap
aci
ty
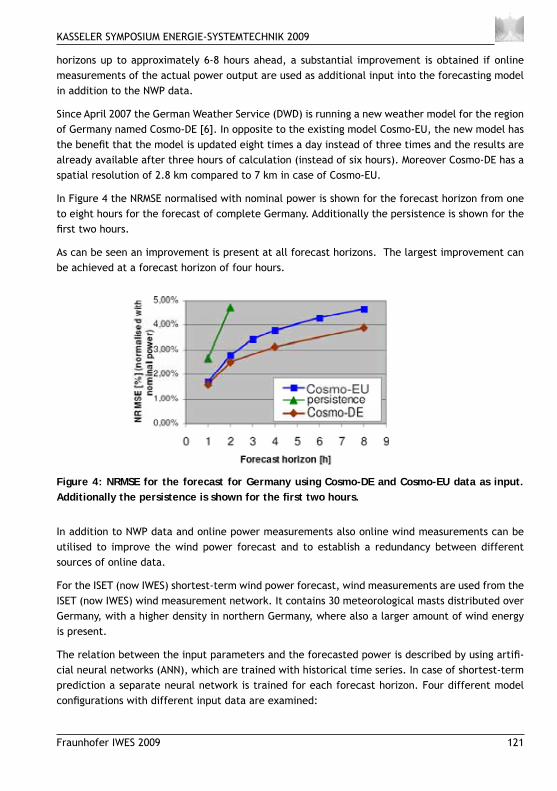
KASSELER SYMPOSIUM ENERGIE-SYSTEMTECHNIK 2009
Fraunhofer IWES 2009 121
horizons up to approximately 6-8 hours ahead, a substantial improvement is obtained if online measurements of the actual power output are used as additional input into the forecasting model in addition to the NWP data.
Since April 2007 the German Weather Service (DWD) is running a new weather model for the region of Germany named Cosmo-DE [6]. In opposite to the existing model Cosmo-EU, the new model has the benefi t that the model is updated eight times a day instead of three times and the results are already available after three hours of calculation (instead of six hours). Moreover Cosmo-DE has a spatial resolution of 2.8 km compared to 7 km in case of Cosmo-EU.
In Figure 4 the NRMSE normalised with nominal power is shown for the forecast horizon from one to eight hours for the forecast of complete Germany. Additionally the persistence is shown for the fi rst two hours.
As can be seen an improvement is present at all forecast horizons. The largest improvement can be achieved at a forecast horizon of four hours.
Figure 4: NRMSE for the forecast for Germany using Cosmo-DE and Cosmo-EU data as input. Additionally the persistence is shown for the fi rst two hours.
In addition to NWP data and online power measurements also online wind measurements can be utilised to improve the wind power forecast and to establish a redundancy between different sources of online data.
For the ISET (now IWES) shortest-term wind power forecast, wind measurements are used from the ISET (now IWES) wind measurement network. It contains 30 meteorological masts distributed over Germany, with a higher density in northern Germany, where also a larger amount of wind energy is present.
The relation between the input parameters and the forecasted power is described by using artifi -cial neural networks (ANN), which are trained with historical time series. In case of shortest-term prediction a separate neural network is trained for each forecast horizon. Four different model confi gurations with different input data are examined:
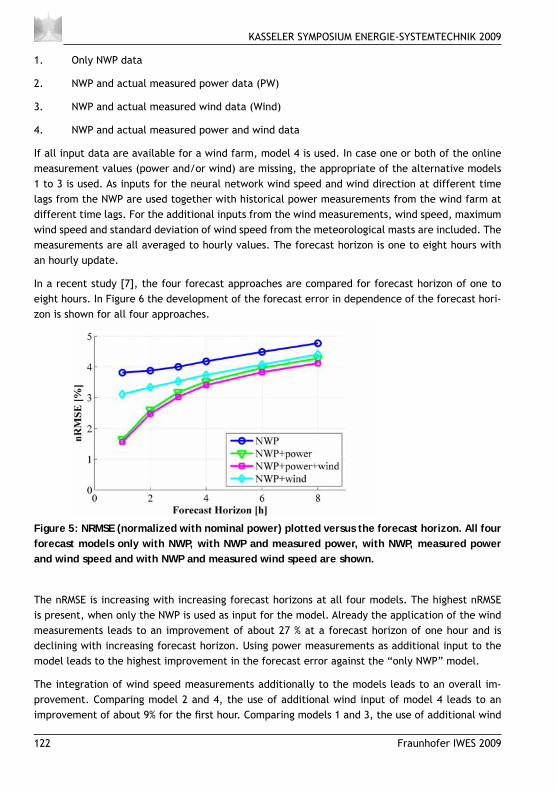
KASSELER SYMPOSIUM ENERGIE-SYSTEMTECHNIK 2009
122 Fraunhofer IWES 2009
1. Only NWP data
2. NWP and actual measured power data (PW)
3. NWP and actual measured wind data (Wind)
4. NWP and actual measured power and wind data
If all input data are available for a wind farm, model 4 is used. In case one or both of the online measurement values (power and/or wind) are missing, the appropriate of the alternative models 1 to 3 is used. As inputs for the neural network wind speed and wind direction at different time lags from the NWP are used together with historical power measurements from the wind farm at different time lags. For the additional inputs from the wind measurements, wind speed, maximum wind speed and standard deviation of wind speed from the meteorological masts are included. The measurements are all averaged to hourly values. The forecast horizon is one to eight hours with an hourly update.
In a recent study [7], the four forecast approaches are compared for forecast horizon of one to eight hours. In Figure 6 the development of the forecast error in dependence of the forecast hori-zon is shown for all four approaches.
Figure 5: NRMSE (normalized with nominal power) plotted versus the forecast horizon. All four forecast models only with NWP, with NWP and measured power, with NWP, measured power and wind speed and with NWP and measured wind speed are shown.
The nRMSE is increasing with increasing forecast horizons at all four models. The highest nRMSE is present, when only the NWP is used as input for the model. Already the application of the wind measurements leads to an improvement of about 27 % at a forecast horizon of one hour and is declining with increasing forecast horizon. Using power measurements as additional input to the model leads to the highest improvement in the forecast error against the “only NWP” model.
The integration of wind speed measurements additionally to the models leads to an overall im-provement. Comparing model 2 and 4, the use of additional wind input of model 4 leads to an improvement of about 9% for the fi rst hour. Comparing models 1 and 3, the use of additional wind
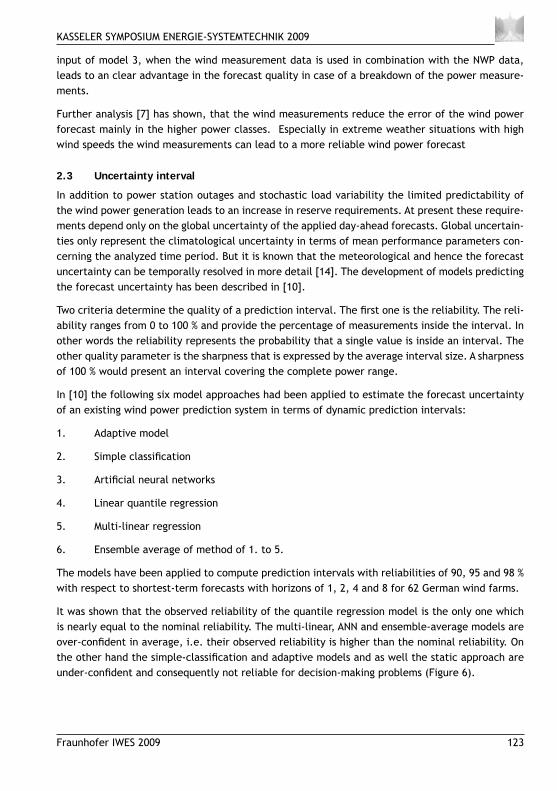
KASSELER SYMPOSIUM ENERGIE-SYSTEMTECHNIK 2009
Fraunhofer IWES 2009 123
input of model 3, when the wind measurement data is used in combination with the NWP data, leads to an clear advantage in the forecast quality in case of a breakdown of the power measure-ments.
Further analysis [7] has shown, that the wind measurements reduce the error of the wind power forecast mainly in the higher power classes. Especially in extreme weather situations with high wind speeds the wind measurements can lead to a more reliable wind power forecast
Uncertainty interval2.3
In addition to power station outages and stochastic load variability the limited predictability of the wind power generation leads to an increase in reserve requirements. At present these require-ments depend only on the global uncertainty of the applied day-ahead forecasts. Global uncertain-ties only represent the climatological uncertainty in terms of mean performance parameters con-cerning the analyzed time period. But it is known that the meteorological and hence the forecast uncertainty can be temporally resolved in more detail [14]. The development of models predicting the forecast uncertainty has been described in [10].
Two criteria determine the quality of a prediction interval. The fi rst one is the reliability. The reli-ability ranges from 0 to 100 % and provide the percentage of measurements inside the interval. In other words the reliability represents the probability that a single value is inside an interval. The other quality parameter is the sharpness that is expressed by the average interval size. A sharpness of 100 % would present an interval covering the complete power range.
In [10] the following six model approaches had been applied to estimate the forecast uncertainty of an existing wind power prediction system in terms of dynamic prediction intervals:
1. Adaptive model
2. Simple classifi cation
3. Artifi cial neural networks
4. Linear quantile regression
5. Multi-linear regression
6. Ensemble average of method of 1. to 5.
The models have been applied to compute prediction intervals with reliabilities of 90, 95 and 98 % with respect to shortest-term forecasts with horizons of 1, 2, 4 and 8 for 62 German wind farms.
It was shown that the observed reliability of the quantile regression model is the only one which is nearly equal to the nominal reliability. The multi-linear, ANN and ensemble-average models are over-confi dent in average, i.e. their observed reliability is higher than the nominal reliability. On the other hand the simple-classifi cation and adaptive models and as well the static approach are under-confi dent and consequently not reliable for decision-making problems (Figure 6).
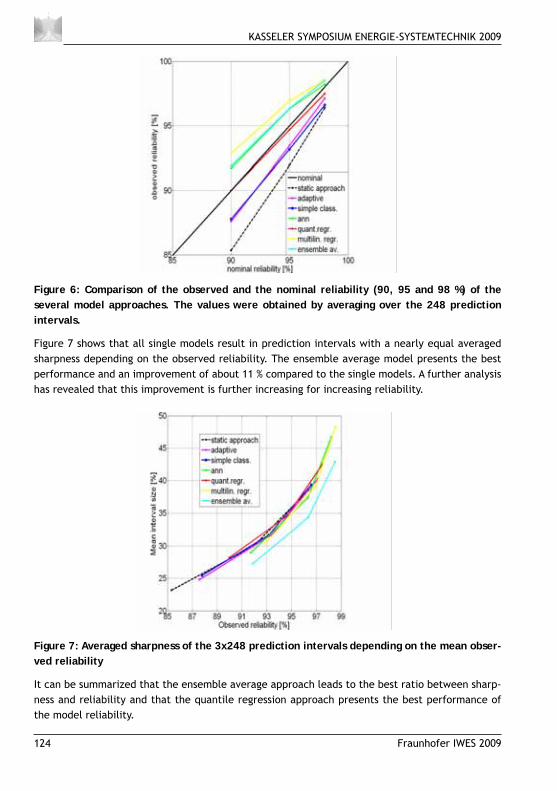
KASSELER SYMPOSIUM ENERGIE-SYSTEMTECHNIK 2009
124 Fraunhofer IWES 2009
Figure 6: Comparison of the observed and the nominal reliability (90, 95 and 98 %) of the several model approaches. The values were obtained by averaging over the 248 prediction intervals.
Figure 7 shows that all single models result in prediction intervals with a nearly equal averaged sharpness depending on the observed reliability. The ensemble average model presents the best performance and an improvement of about 11 % compared to the single models. A further analysis has revealed that this improvement is further increasing for increasing reliability.
Figure 7: Averaged sharpness of the 3x248 prediction intervals depending on the mean obser-ved reliability
It can be summarized that the ensemble average approach leads to the best ratio between sharp-ness and reliability and that the quantile regression approach presents the best performance of the model reliability.
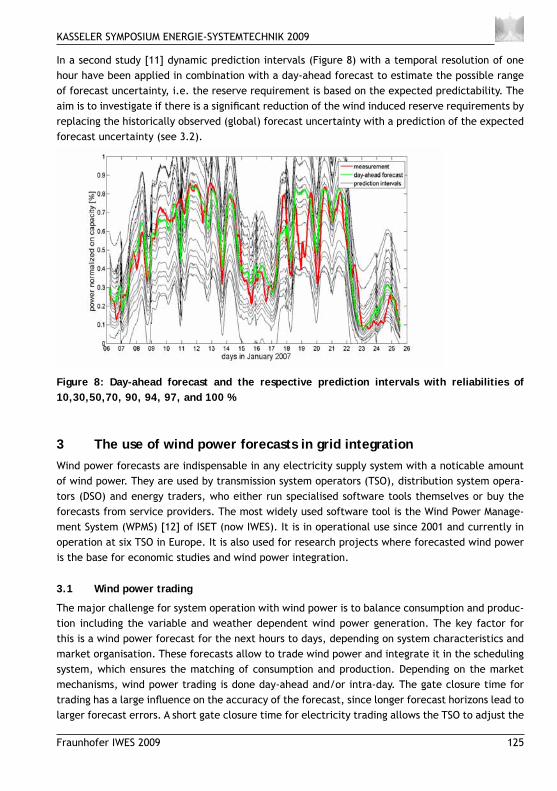
KASSELER SYMPOSIUM ENERGIE-SYSTEMTECHNIK 2009
Fraunhofer IWES 2009 125
In a second study [11] dynamic prediction intervals (Figure 8) with a temporal resolution of one hour have been applied in combination with a day-ahead forecast to estimate the possible range of forecast uncertainty, i.e. the reserve requirement is based on the expected predictability. The aim is to investigate if there is a signifi cant reduction of the wind induced reserve requirements by replacing the historically observed (global) forecast uncertainty with a prediction of the expected forecast uncertainty (see 3.2).
Figure 8: Day-ahead forecast and the respective prediction intervals with reliabilities of 10,30,50,70, 90, 94, 97, and 100 %
The use of wind power forecasts in grid integration3 Wind power forecasts are indispensable in any electricity supply system with a noticable amount of wind power. They are used by transmission system operators (TSO), distribution system opera-tors (DSO) and energy traders, who either run specialised software tools themselves or buy the forecasts from service providers. The most widely used software tool is the Wind Power Manage-ment System (WPMS) [12] of ISET (now IWES). It is in operational use since 2001 and currently in operation at six TSO in Europe. It is also used for research projects where forecasted wind power is the base for economic studies and wind power integration.
Wind power trading3.1
The major challenge for system operation with wind power is to balance consumption and produc-tion including the variable and weather dependent wind power generation. The key factor for this is a wind power forecast for the next hours to days, depending on system characteristics and market organisation. These forecasts allow to trade wind power and integrate it in the scheduling system, which ensures the matching of consumption and production. Depending on the market mechanisms, wind power trading is done day-ahead and/or intra-day. The gate closure time for trading has a large infl uence on the accuracy of the forecast, since longer forecast horizons lead to larger forecast errors. A short gate closure time for electricity trading allows the TSO to adjust the
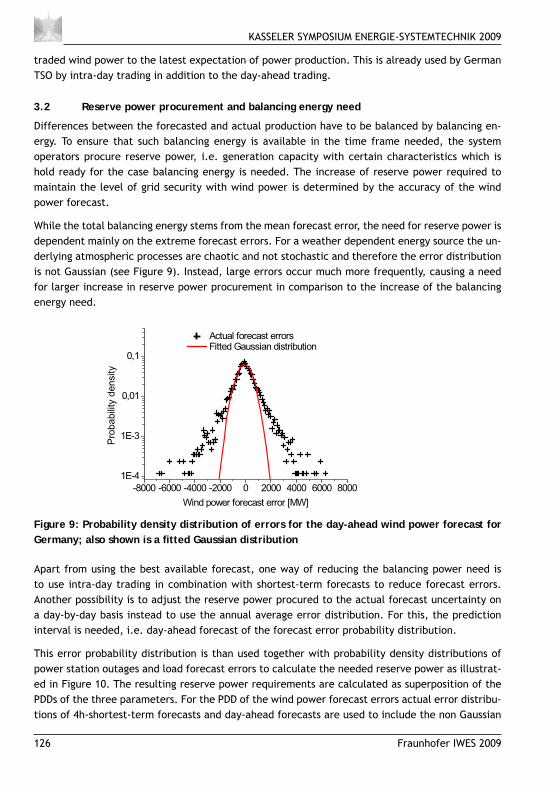
KASSELER SYMPOSIUM ENERGIE-SYSTEMTECHNIK 2009
126 Fraunhofer IWES 2009
traded wind power to the latest expectation of power production. This is already used by German TSO by intra-day trading in addition to the day-ahead trading.
Reserve power procurement and balancing energy need3.2
Differences between the forecasted and actual production have to be balanced by balancing en-ergy. To ensure that such balancing energy is available in the time frame needed, the system operators procure reserve power, i.e. generation capacity with certain characteristics which is hold ready for the case balancing energy is needed. The increase of reserve power required to maintain the level of grid security with wind power is determined by the accuracy of the wind power forecast.
While the total balancing energy stems from the mean forecast error, the need for reserve power is dependent mainly on the extreme forecast errors. For a weather dependent energy source the un-derlying atmospheric processes are chaotic and not stochastic and therefore the error distribution is not Gaussian (see Figure 9). Instead, large errors occur much more frequently, causing a need for larger increase in reserve power procurement in comparison to the increase of the balancing energy need.
-8000 -6000 -4000 -2000 0 2000 4000 6000 8000
1E-4
1E-3
0,01
0,1
Actual forecast errors Fitted Gaussian distribution
Pro
babili
ty d
ensity
Wind power forecast error [MW]
Figure 9: Probability density distribution of errors for the day-ahead wind power forecast for Germany; also shown is a fi tted Gaussian distribution
Apart from using the best available forecast, one way of reducing the balancing power need is to use intra-day trading in combination with shortest-term forecasts to reduce forecast errors. Another possibility is to adjust the reserve power procured to the actual forecast uncertainty on a day-by-day basis instead to use the annual average error distribution. For this, the prediction interval is needed, i.e. day-ahead forecast of the forecast error probability distribution.
This error probability distribution is than used together with probability density distributions of power station outages and load forecast errors to calculate the needed reserve power as illustrat-ed in Figure 10. The resulting reserve power requirements are calculated as superposition of the PDDs of the three parameters. For the PDD of the wind power forecast errors actual error distribu-tions of 4h-shortest-term forecasts and day-ahead forecasts are used to include the non Gaussian
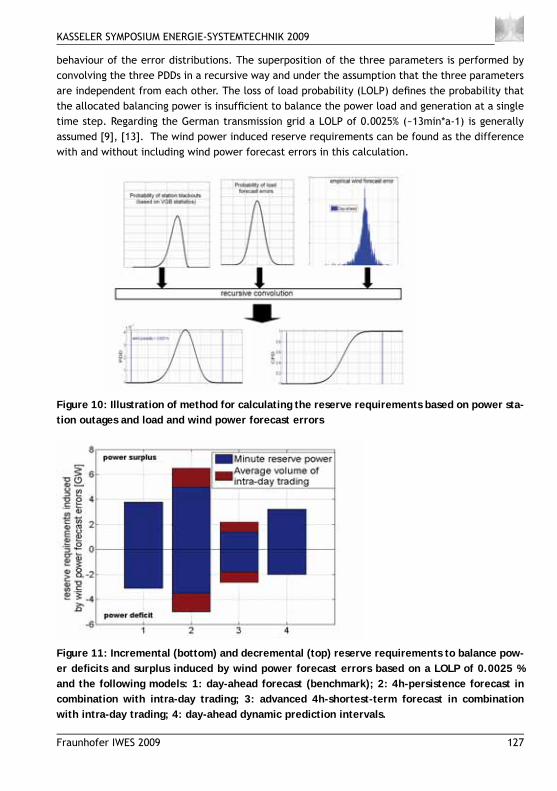
KASSELER SYMPOSIUM ENERGIE-SYSTEMTECHNIK 2009
Fraunhofer IWES 2009 127
behaviour of the error distributions. The superposition of the three parameters is performed by convolving the three PDDs in a recursive way and under the assumption that the three parameters are independent from each other. The loss of load probability (LOLP) defi nes the probability that the allocated balancing power is insuffi cient to balance the power load and generation at a single time step. Regarding the German transmission grid a LOLP of 0.0025% (~13min*a-1) is generally assumed [9], [13]. The wind power induced reserve requirements can be found as the difference with and without including wind power forecast errors in this calculation.
Figure 10: Illustration of method for calculating the reserve requirements based on power sta-tion outages and load and wind power forecast errors
Figure 11: Incremental (bottom) and decremental (top) reserve requirements to balance pow-er defi cits and surplus induced by wind power forecast errors based on a LOLP of 0.0025 % and the following models: 1: day-ahead forecast (benchmark); 2: 4h-persistence forecast in combination with intra-day trading; 3: advanced 4h-shortest-term forecast in combination with intra-day trading; 4: day-ahead dynamic prediction intervals.
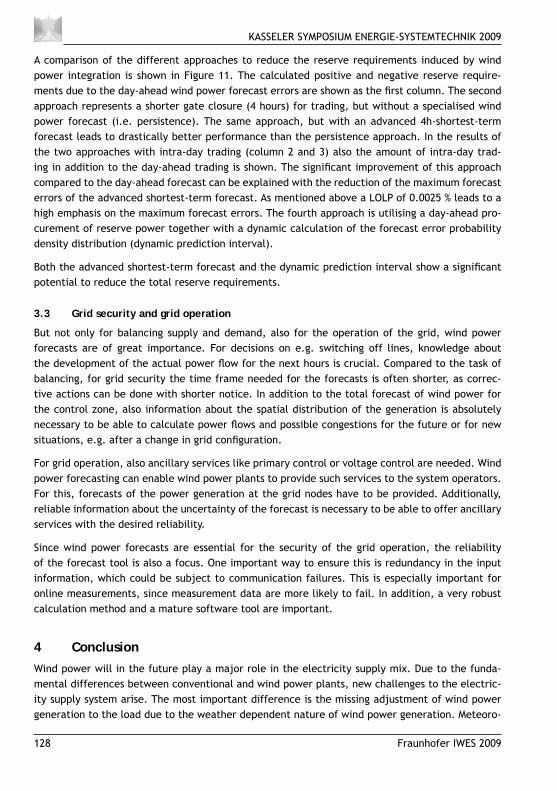
KASSELER SYMPOSIUM ENERGIE-SYSTEMTECHNIK 2009
128 Fraunhofer IWES 2009
A comparison of the different approaches to reduce the reserve requirements induced by wind power integration is shown in Figure 11. The calculated positive and negative reserve require-ments due to the day-ahead wind power forecast errors are shown as the fi rst column. The second approach represents a shorter gate closure (4 hours) for trading, but without a specialised wind power forecast (i.e. persistence). The same approach, but with an advanced 4h-shortest-term forecast leads to drastically better performance than the persistence approach. In the results of the two approaches with intra-day trading (column 2 and 3) also the amount of intra-day trad-ing in addition to the day-ahead trading is shown. The signifi cant improvement of this approach compared to the day-ahead forecast can be explained with the reduction of the maximum forecast errors of the advanced shortest-term forecast. As mentioned above a LOLP of 0.0025 % leads to a high emphasis on the maximum forecast errors. The fourth approach is utilising a day-ahead pro-curement of reserve power together with a dynamic calculation of the forecast error probability density distribution (dynamic prediction interval).
Both the advanced shortest-term forecast and the dynamic prediction interval show a signifi cant potential to reduce the total reserve requirements.
Grid security and grid operation3.3
But not only for balancing supply and demand, also for the operation of the grid, wind power forecasts are of great importance. For decisions on e.g. switching off lines, knowledge about the development of the actual power fl ow for the next hours is crucial. Compared to the task of balancing, for grid security the time frame needed for the forecasts is often shorter, as correc-tive actions can be done with shorter notice. In addition to the total forecast of wind power for the control zone, also information about the spatial distribution of the generation is absolutely necessary to be able to calculate power fl ows and possible congestions for the future or for new situations, e.g. after a change in grid confi guration.
For grid operation, also ancillary services like primary control or voltage control are needed. Wind power forecasting can enable wind power plants to provide such services to the system operators. For this, forecasts of the power generation at the grid nodes have to be provided. Additionally, reliable information about the uncertainty of the forecast is necessary to be able to offer ancillary services with the desired reliability.
Since wind power forecasts are essential for the security of the grid operation, the reliability of the forecast tool is also a focus. One important way to ensure this is redundancy in the input information, which could be subject to communication failures. This is especially important for online measurements, since measurement data are more likely to fail. In addition, a very robust calculation method and a mature software tool are important.
Conclusion4 Wind power will in the future play a major role in the electricity supply mix. Due to the funda-mental differences between conventional and wind power plants, new challenges to the electric-ity supply system arise. The most important difference is the missing adjustment of wind power generation to the load due to the weather dependent nature of wind power generation. Meteoro-
KASSELER SYMPOSIUM ENERGIE-SYSTEMTECHNIK 2009
Fraunhofer IWES 2009 129
logical aspects are therefore crucially important for a successful integration of wind power in the power supply system. Wind power meteorology has to provide the methods and tools which allow new concepts in energy system technology. Most important is the development of accurate and reliable wind power forecast systems, which provide the information necessary for the system and wind power plant operators.
Tools for wind power forecasts are today an integral part of the German electricity supply system. This development started in Germany with the WPMS as the fi rst operational forecast system in 2001 for a day-ahead wind power forecast. This system has constantly been improved and is today used by six TSO in Europe. The combination of the results of different weather prediction models and forecast methods leads to improved forecast accuracy and reliability. In Germany such a de-velopment is currently ongoing. Additionally, ensemble forecasts will be able to improve forecast accuracy in the future.
The next step in operational forecast will be the use of a shortest-term forecasting system by the German TSO. ISET (now IWES) is currently implementing its advanced shortest-term forecast system, which uses weather forecast data, online power data and data from the ISET (now IWES) wind measurement network.
Due to the constant development of the forecasting tools, the TSO were able to limit the needed balancing energy for wind integration in the past despite an increasing wind power capacity.
In the future, also the limitation of the reserve power requirement will become important. Intra-day trading with an advanced shortest-term forecast is one possible way to achieve this, the other is a dynamic uncertainty forecasts in the form of uncertainty intervals of error probability func-tions. This is clearly a topic which needs more research and the development of operational tools in the future.
Acknowledgement5 The work presented in this paper has partially been funded by the German Federal Ministry of En-vironment, Nature Conservation and Nuclear Safety in the projects “Deutscher Windmonitor” (BMU FKZ 0327584) and “Netzintegration von Offshore-Windparks” (BMU FKZ 0325002).
References6 [1] Lange, B., Ü. Cali, R. Jursa, R. Mackensen, K. Rohrig, F. Schlögl: Strategies for Balancing
Wind Power in Germany. DEWEK 2006, Bremen, November 2006
[2] Lange, B., K. Rohrig, B. Ernst, F. Schlögl, Ü. Cali, R. Jursa, J. Moradi: Wind power forecast-ing in Germany – Recent advances and future challenges. Zeitschrift für Energiewirtschaft. Vol. 30 no. 2 (2006), pp. 115-120
[3] Focken, U., M. Lange: Optimal combination of different numerical weather predictions for improved wind power predictions. Proceedings of the EWEC 2006, Athens (published on webside)
KASSELER SYMPOSIUM ENERGIE-SYSTEMTECHNIK 2009
130 Fraunhofer IWES 2009
[4] Lang, S., C. Möhrlen, J. Jørgensen, B.Ó. Gallachóir, E. McKeogh: Application of a multi-scheme ensemble prediction system for wind power forecasting in Ireland and comparison with validation results from Denmark and Germany. Proceedings of the EWEC 2006, Athens (published on webside)
[5] R. Jursa, B. Lange and K. Rohrig: Advanced Wind Power Prediction with Artifi cial Intel-ligence Methods, First International ICSC Symposium on Artifi cial Intelligence in Energy Systems and Power, Island of Madeira, Portugal, Feb. 7 – Feb. 10, 2006.
[6] G. Doms, J. Förstner. Development of a kilometer-scale NWP-system: LMK. COSMO News-letter 2004, vol. 4, pp. 159–167, 2004.
[7] Wessel, A., J. Dobschinski, B. Lange: Integration of offsite wind speed measurements in shortest-term wind power prediction systems. Proceedings of the 8th International Work-shop on Large-Scale Integration of Wind Power into Power Systems, Bremen, 2009
[8] Bofi nger S., Glotzbach, T., Saint-Drenan,Y-M., Braun, M. und Erge.T: „Abschlussbericht Stu-die: Rolle der Solarstromerzeugung in zukünftigen Energieversorgungsstrukturen - Welche Wertigkeit hat Solarstrom?“, ISET e.V., Kassel, 2008
[9] Haubrich, H.J.: “Gutachten zur Höhe des Regelenergiebedarfs” im Auftrag der Bundesnet-zagentur für Elektrizität, Gas, Telekommunikation, Post und Eisenbahnen, Bonn, 2008
[10] Dobschinski et al.: „Estimation of wind power prediction intervals using stochastic meth-ods and artifi cial intelligence model ensembles“, Proceeding, DEWEK, Bremen, 2008
[11 Jan Dobschinski, Arne Wessel, Bernhard Lange, Lüder von Bremen: Reduction of wind pow-er induced reserve requirements by advanced shortest-term forecasts and prediction in-tervals. Proceedings of the 8th International Workshop on Large-Scale Integration of Wind Power into Power Systems, Bremen, 2009
[12] Biermann et al. : ”Entwicklung eines Rechenmodells zur Windleistungsprognose für das Gebiet des deutschen Verbundnetzes”, BMU Forschungsvorhaben, ISET, 2005
[13] Dena Netzstudie I: „Energiewirtschaftliche Planung für die Netzintegration von Windener-gie in Deutschland an Land und Offshore bis zum Jahr 2020“, Köln, 2005
[14] Lange,M.: “Analysis of the Uncertainty of Wind Power Predictions”, PhD dissertation, Carl von Ossietzky University, Oldenburg, 2003

Institut für Windenergie und Energiesystemtechnik
Königstor 5934119 KASSEL / GERMANYTel: +49 (0) 561 7294-0Fax: +49 (0) 561 7294-100E-Mail: [email protected]
www.iset.uni-kassel.dewww.iwes.fraunhofer.de