Embed Size (px)
Citation preview
Wirtschaftswissenschaftliche Fakultät Faculty of Economics and Management Science
Working Paper, No. 166
Gunther Schnabl / Nils Sonnenberg
Monetary Policy, Financial Regulation and Financial Stability: A Comparison
between the Fed and the ECB
April 2020
ISSN 1437-9384
1
Monetary Policy, Financial Regulation and Financial Stability: A Comparison between the Fed and the ECB
Gunther Schnabl
Universität Leipzig Grimmaische Straße 12
D-04109 Leipzig [email protected]
Nils Sonnenberg Universität Leipzig
Grimmaische Straße 12 D-04109 Leipzig
6 April 2020
Abstract:
The paper analyses in light of Austrian and Keynesian economic theory the impact of conventional and unconventional monetary policies as therapies for financial crises. It compares the financial market stabilization measures of the Federal Reserve System and the European System of Central Banks in response to the US subprime crisis and the European financial and debt crisis. It is shown that the Federal Reserve System’s crisis measures were more directed towards stabilizing the banking system, whereas the European Central Bank had a stronger focus on the stabilization of the debt affordability of euro area crisis countries. In both cases, household credit growth remained under control despite renewed monetary expansion, while new imbalances emerged in the corporate sector. In the euro area, loose monetary policy had a destabilizing impact on the financial sector.
Keywords: Financial cycles, financial crisis, financial stability, Hayek, Keynes, monetary policy.
JEL-Codes: B53, E12, E14, E30, E44, E58, G10, G20, H30, H50.
2
1. Introduction
Since the second half of the 1980s the world has experienced several booms in financial
markets, which were followed by severe crises. Major crisis events were the bursting of the
Japanese bubble economy (1989), the Asian crisis (1997/98), the bursting of the dotcom bubble
(2000), the US subprime crisis (from 2007) as well as the European financial and debt crisis
(from 2007). A common feature of many of these crises was that the pre-crisis upswings were
driven by fast credit growth, with exuberance emerging in stock and real estate markets as well
as in other segments of financial markets.
The third generation of crisis models (e.g. Krugman 1998, Corsetti, Pesenti and Roubini 1999)
has stressed the role of over-lending and over-borrowing for non-sustainable investment, stock
and real estate booms in Southeast Asia. Since then, there has been a growing focus on the role
of credit growth for unsustainable booms, which tend to lead into banking and financial crisis.
For instance, Kraft and Jankov (2005) linked rapid credit growth in Croatia to an increased
probability of credit deterioration, current account deficits and increasing foreign debt.
Also the role of monetary policy and interest rates for unsustainable credit cycles has been
scrutinized. Jiminéz et al. (2014) show for pre-crisis Spanish banks that low overnight interest
rates induced lowly capitalized banks to grant more loans to risky firms. Paligorova and Santos
(2017) argue for the United States that loan spreads for riskier firms became relatively lower
during periods of monetary easing, accompanied by increased risk taking. Dell’Ariccia and
Marquez (2006) show that during upswings the demand for loans increases and the lending
standards decrease. According to Bonfim and Soares (2018) riskier borrowers have better
access to credit, when interest rates are lower.
This implies that – in particular in a persistent low interest rate environment – the probability
of risk-taking is larger and the regulation of credit growth is crucial to maintain financial
stability (Dell’Arricia et al. 2012). Therefore, after the outbreak of the US subprime and
European financial and debt crisis, both authorities in the US and the European Union have
taken broad measures to ensure financial stability. In the paper we analyze the success of these
attempts in a comparative approach between the United States and the euro area, based on the
theoretical frameworks of Mises (1912), Hayek (1929), Keynes (1936) and Minsky (1977).
3
2. Monetary Expansion as a Cause and Remedy for Financial Crisis
In the view of the Austrian overinvestment theory as formulated by Mises (1912) and Hayek
(1929) low interest rates can be a source of financial instability, whereas in the view of Keynes
(1936) and Minsky (1977) interest rate cuts in the face of crisis are an important instrument of
financial stabilization.
2.1. Monetary Expansion as a Source of Financial Instability
Mises (1912) and Hayek (1929) distinguish four types of interest rates to model the role of
interest rates for an unsustainable credit boom.1 First, the internal interest rate reflects the
(expected) returns of (planned) investment projects. Second, the natural interest rate is the
interest rate that equilibrates the supply of capital (saving S) and the demand for capital
(investment I) with no distortions in the capital stock (S=I).2 Third, the central bank interest
rate is the policy interest rate set by the central bank. It is assumed to guide the capital market
interest rate, which – forth – commercial banks charge for their credits to the enterprises.
In Mises (1912) and Hayek (1929) an economy is in equilibrium when the natural rate of
interest equals the central bank interest rate, i.e. planned savings are equal to investment. An
upswing starts when positive expectations – for instance due to an important innovation – raise
the internal interest rate of investment. Alternatively, the central bank may cut the central bank
rate exogenously. This brings about a rise in investment, which is financed by commercial
banks by creating additional loans and deposits.
To market participants a rise in credit to the private sector at a constant or lower interest rate
signals that saving activity of households increased and future consumption will rise. This
1 For details on the Austrian overinvestment theory see Schnabl (2019). 2 The natural interest rate is a theoretical concept and not observable. Hayek (1929, 1931) emphasized the
importance of the intertemporal misalignments of plans of producers and consumers to derive mal- or overinvestment as mismatch between the production structure and consumer preferences. The natural interest rate is the interest rate that aligns savings and consumption preferences with the production structure over time. A fall in the central bank interest rate and capital market interest rate below the natural interest rate causes a cumulative inflationary process, creating distortions in the production structure that later make an adjustment necessary (unless the central bank keeps on inflating credit at an ever-increasing pace and artificially prolongs the credit boom). In contrast, Wicksell (1898) saw the natural interest rate as an inflation-neutral interest rate, which is a concept on which Woodford (2003) build upon.
4
justifies the buildup of additional production capacities to satisfy the expected rise in future
consumption. As planned household saving does not increase, an unsustainable disequilibrium
between ex-ante saving and investment arises. A higher investment activity of some enterprises
trigger additional investments of other enterprises, which accelerates the upswing (cumulative
upward process). As soon as capacity limits are reached and unemployment is low, the bidding
for workers intensifies, hence wages and prices rise.
Rising prices signal higher profit margins and therefore trigger additional investments.
Growing profits for enterprises and banks may also lead to an increase of stock prices. Given
relatively low interest rates on bank deposits, shares are an attractive investment class. When
stock prices move upward, more agents will swim with the tide, which will drive stock prices
further up such that “the symptoms of prosperity themselves finally become […] a factor of
prosperity” (Schumpeter 1912, 226). Consumption is boosted as wages rise and elevated stock
prices make people feel wealthier.
The boom ends, when the central bank lifts the interest rate to slow down the accelerating
inflation (Mises 1912, Hayek 1929, 1931, 1937). Past and future investment projects with
internal interest rates below the now higher central bank and commercial bank interest rates
turn out to be unprofitable. As first investment projects have to be dismantled, more investment
projects become unprofitable. When stock (and other asset prices) burst, balance sheets of firms
and banks deteriorate, causing further disinvestment (cumulative downward process). Because
investments decrease, the natural interest rate falls.
In this situation, the central bank can cut the central bank interest rate to contain the downward-
spiral. Yet, when the central bank interest rate is kept too high, the downturn is aggravated
beyond what would be necessary to remove the structural distortions. Mises (1912), Hayek
(1931) and Schumpeter (1912) see the dismantling of low-return investment projects as a
necessary “cleansing process” of structural distortions in the economy. Resources which were
moved to investment projects with comparatively low marginal efficiency during the upswing
are freed up and unemployment rises. Exuberance on stock and real estate markets is corrected.
As prices and wages fall, the basis for a sustainable economic recovery is created. Labor and
capital can be shifted to new investment projects with a higher marginal efficiency.
In line with the overinvestment theory of Mises (1912) and Hayek (1929), a credit boom in the
5
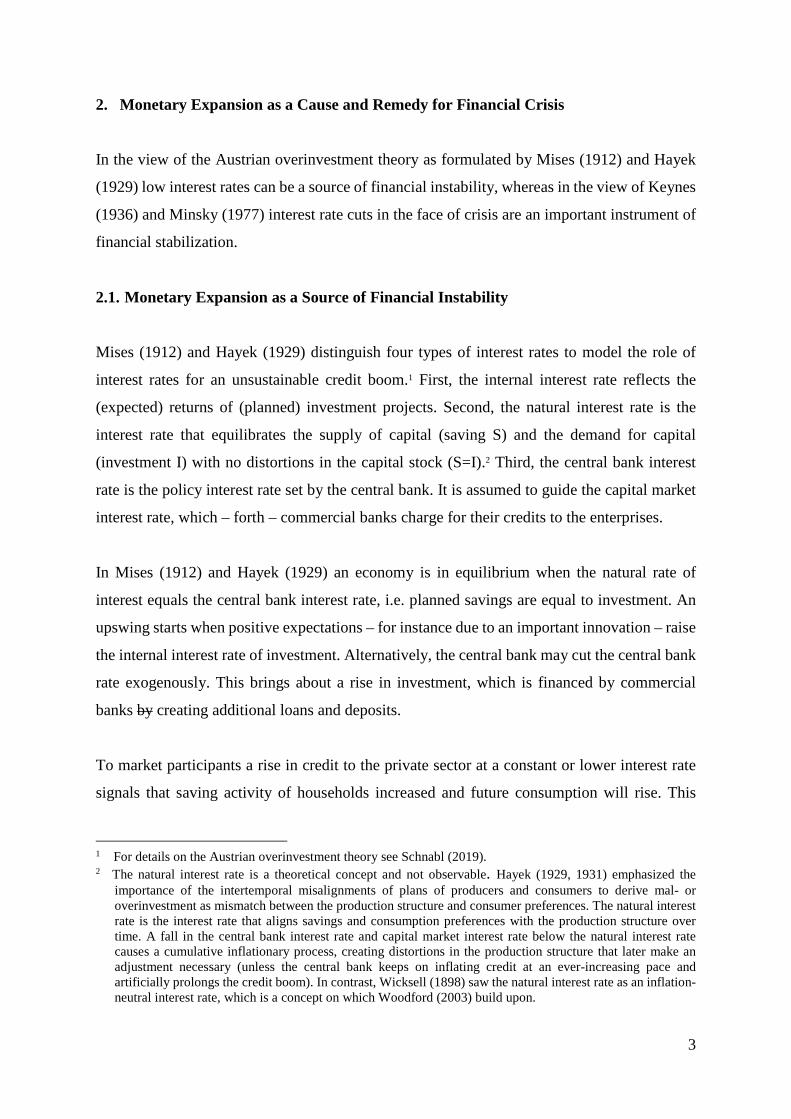
US housing market evolved, after the Fed had cut the federal funds rate in response to the
bursting of the dotcom bubble from 6.5% in May 2000 to 1.0% by June 2003 (Figure 2).3 Real
estate prices started to rise, also encouraged by deregulation and financial innovations. The real
estate index for residential property in the whole country increased between May 2000 and
June 2007 by roughly 60% (upper panel of Figure 1). At the same time, a stock market boom
evolved, with the DOW rising from 7692 points in 2003 to 13920 points by 2007. The real
estate boom encouraged a consumption boom, as increasing valuations of real estate served as
collateral for additional consumer credit, with the boom being transmitted via buoyant credit
growth (Figure 1).
Figure 1: Residential Property Prices and Credit to the Private Sector in the United States, Spain and Germany
United States
Spain
Germany
Source: BIS. 3 Borio (2014) refers to the concept of unfinished recessions. Policy responses contain recessions in the short- term, but at the cost of a build-up of larger financial imbalances and economic dislocations in the medium-term.
110
130
150
170
190
100
150
200
250
300
1990 1995 2000 2005 2010 2015 2020
Per
cent
of G
DP
Inde
x (1
990
= 1
00) Residential Propterty Prices (l.h.s.)
Credit (r.h.s.)
70
120
170
220
270
100
200
300
400
1990 1995 2000 2005 2010 2015 2020
Per
cent
of G
DP
Inde
x (1
990
= 1
00) Residential Propterty Prices (l.h.s.)
Credit (r.h.s.)
100
110
120
130
140
100
120
140
160
180
200
1990 1995 2000 2005 2010 2015 2020
Per
cent
of G
DP
Inde
x (1
990
= 1
00) Residential Propterty Prices (l.h.s.)
Credit (r.h.s.)
6
In Europe, the European Central Bank cut the interest rate in response to the bursting of the
dotcom bubble from 4.75% in May 2000 to 2.00% in June 2003. The interest rate cuts followed
a substantial decline of interest rates in the southern euro area countries linked to their euro
accession. This triggered inter alia real estate booms in Spain, Ireland and Greece, as shown in
Figure 1 for Spain. The real estate boom did not evolve in the whole euro area, possibly due to
the fact that fiscal policies within the euro area were uncoordinated. Whereas in the north
Germany pursued a reform program and tight fiscal policies, in the southern boom countries a
credit boom inflated tax revenues, thereby further encouraging more government spending.4
As in the US subprime boom, credit growth in the southern euro area played an important role
for the transmission of the boom as shown in Figure 1 for Spain.
2.2. Monetary Policy as a Stabilizer for Financial Markets
In the view of Keynes (1936) the exuberant boom prior to the world economic crisis in the
1930s was driven by too optimistic expectations (animal spirits5) regarding the future yield of
capital goods. According to Keynes (1936: 281) speculators are more concerned with
forecasting market sentiments rather than the future yield of capital assets. When the market is
over-optimistic and over-bought, “it should fall with sudden and even catastrophic force”
(Keynes 1936:281). Based on Keynes (1936), Hansen (1939) explained the stagnation in the
1930s by structural factors such as a declining marginal efficiency of investment, declining
population growth and a structurally increasing (declining) savings (consumption) rate due to
an increase of income levels.
The policy proposition of Keynes (1936) was to keep the interest rate low6 and to stimulate the
economy by increasing government demand and the redistribution of income to lower income
4 For details see Schnabl (2019). 5 “Even apart from the instability due to speculation, there is the instability due to the characteristic of human
nature that a large proportion of our positive activities depend on spontaneous optimism rather than mathematical expectations, whether moral or hedonistic or economic. Most, probably, of our decisions to do something positive, the full consequences of which will be drawn out over many days to come, can only be taken as the result of animal spirits - a spontaneous urge to action rather than inaction, and not as the outcome of a weighted average of quantitative benefits multiplied by quantitative probabilities.” (Keynes 1936: 141)
6 “Moreover, even if over-investment in this sense was a normal characteristic of the boom, the remedy would not lie in clapping on a high rate of interest which would probably deter some useful investments and might further diminish the propensity to consume, but in taking drastic steps, by redistributing incomes or otherwise, to stimulate the propensity to consume.” (Keynes 1936: 285-286).
7
classes with a higher propensity to consume. Lower and persistently low interest rates should
enable the boom to last. “The right remedy for the trade cycle is not to be found in abolishing
booms and thus keeping us permanently in a semi-slump; but in abolishing slumps and thus
keeping us permanently in a quasi-boom.” (Keynes 1936, 286).
Minsky (1977) built upon Keynes (1936) adjusting the policy strategy to a higher degree of
development of capital markets in the 1970s, viewing the economy “from the board room of a
Wall Street investment bank” (Minsky 1977: 7). He acknowledged that the economy has
sophisticated financial institutions, with credit creation and investment activity determining the
behavior of the economy. In his view, an unsustainable boom is triggered by economic stability
and optimistic expectations, as the expectations about “the appropriate liability structure for
the financing positions are subjective” (Minsky 1977: 12). During a financial market boom the
credit quality deteriorates, which finally leads into crisis.7
Minsky (1977) recommended expansionary fiscal and monetary policies to forestall a
recession. A tighter regulation of financial markets is recommended to prevent a revival of
financial market exuberance on the back of low interest rates. “(…) [I]n order to do better than
hitherto, we have to establish and enforce a “good financial society” in which the tendency by
business and bankers to engage in speculative finance is constrained” (Minsky 1977: 16).
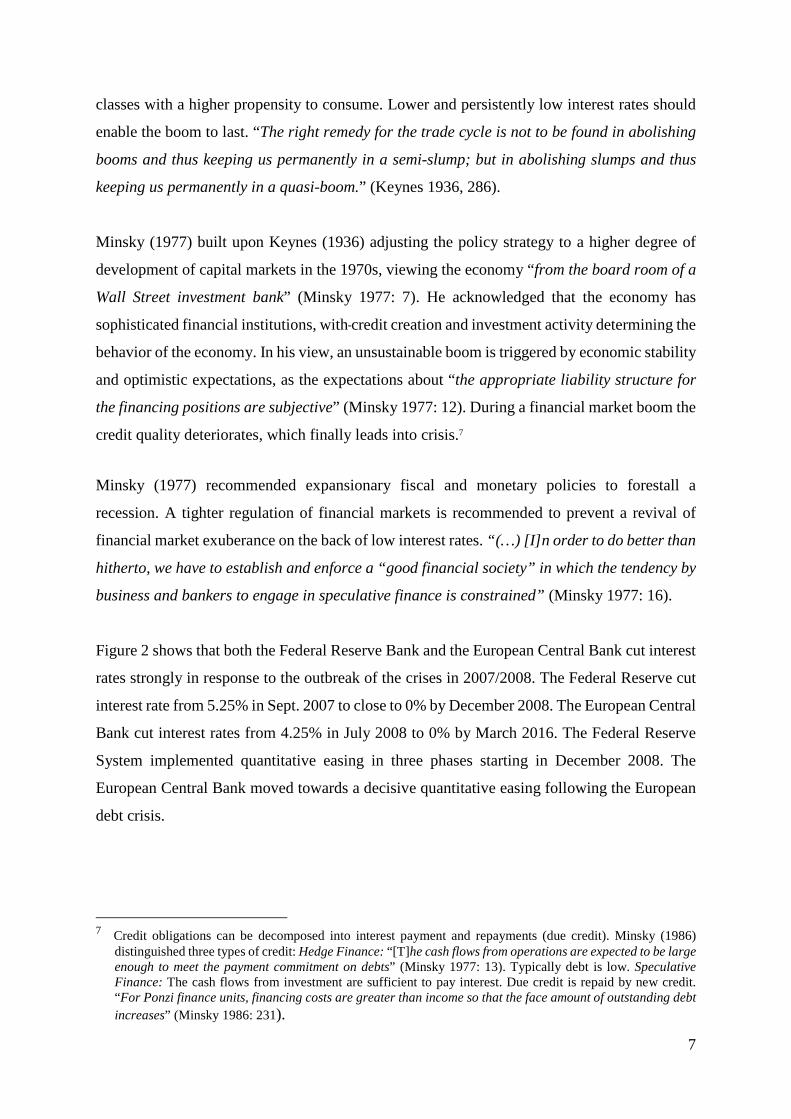
Figure 2 shows that both the Federal Reserve Bank and the European Central Bank cut interest
rates strongly in response to the outbreak of the crises in 2007/2008. The Federal Reserve cut
interest rate from 5.25% in Sept. 2007 to close to 0% by December 2008. The European Central
Bank cut interest rates from 4.25% in July 2008 to 0% by March 2016. The Federal Reserve
System implemented quantitative easing in three phases starting in December 2008. The
European Central Bank moved towards a decisive quantitative easing following the European
debt crisis.
7 Credit obligations can be decomposed into interest payment and repayments (due credit). Minsky (1986)
distinguished three types of credit: Hedge Finance: “[T] he cash flows from operations are expected to be large enough to meet the payment commitment on debts” (Minsky 1977: 13). Typically debt is low. Speculative Finance: The cash flows from investment are sufficient to pay interest. Due credit is repaid by new credit. “For Ponzi finance units, financing costs are greater than income so that the face amount of outstanding debt increases” (Minsky 1986: 231).
8
Figure 2: Conventional and Unconventional Monetary Policy Tools of Fed and ECB
Fed: Key interest rates ECB: Key interest rates
Fed: Size of Balance Sheet ECB: Size of Balance Sheet Source: FED, ECB, IMF, OECD.
3. Financial Crisis and Monetary Stabilization
The policy responses to the subprime crisis and the European financial and debt crisis mainly
correspond to the policy recommendation of Minsky (1977). Interest rates were reduced to
zero8, government expenditure was extended and financial regulation was tightened. With the
8 In response to the 1929 New York stock market crash, the Federal Reserve had kept the interest rate high to
deflate the bubble. This was later criticised by Friedman and Schwarz (1963) in their monetary history of the United States a severe policy mistake. Therefore, Bernanke (1995) argued: “In their classic study of U.S. monetary history, Friedman and Schwartz (1963) … arguing that the main lines of causation ran from
-2
0
2
4
6
8
10
1990 1995 2000 2005 2010 2015 2020
Per
cent
Fed Funds Effective Rate
Fed Funds Target Rate
Interest on Excess Reserves (IOER)
-2
0
2
4
6
8
10
1990 1995 2000 2005 2010 2015 2020
Per
cent
Deposit Facility Rate
Marginal Lending Facility Rate
Main Refinancing Rate
0
5
10
15
20
25
30
35
40
45
1990 1995 2000 2005 2010 2015 2020
Per
cen
t of G
DP
0
5
10
15
20
25
30
35
40
45
1990 1995 2000 2005 2010 2015 2020
Per
cen
t of G
DP
9
advent of quantitative easing, the traditional form of “market-neutral” monetary policy making
was abandoned, as the quantitative nature allowed for sector-specific monetary policies, in
particular in the case of the European Central Bank.
3.1. Financial Market Stabilization Measures in the US
The US subprime crisis started with money market funds stopping overnight lending. As the
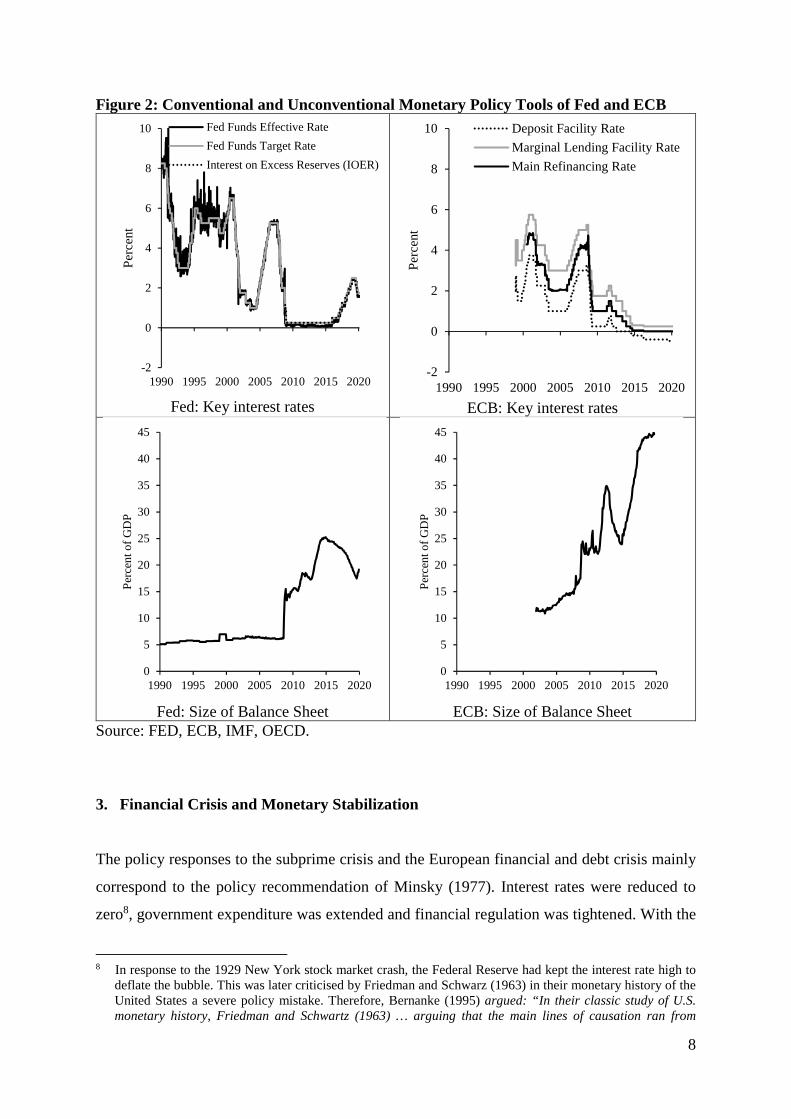
money market dried out, the Federal Reserve felt forced to maintain liquidity conditions. Figure
3 shows the short-term measures of the Federal Reserve System, which maintained liquidity to
banks, other depository institutions and other financial institutions.
Figure 3: Short-term Liquidity Measures of the Federal Reserve System
Source: Board of Governors of the Federal Reserve System.
Inter alia, the Fed provided credit via the Term Auction Facility to banks at a maturity of one
to three months, while all credits had to be fully collateralized. The program ensured the
liquidity of short-term funding markets. The Commercial Paper Funding Facility enhanced the
liquidity in the commercial paper markets. Via a limited liability company three-month
unsecured and asset-backed commercial paper was bought from October 2008 to February
2010. The credit remained outstanding until all commercial paper had matured.
monetary contraction—the result of poor policy—making and continuing crisis in the banking system—to declining prices and output."
0
200
400
600
800
1000
1200
1400
1600
1800
2007 2008 2009 2010 2011 2012 2013 2014 2015 2016 2017 2018 2019
Bill
ions
of d
olla
rs
Central Bank Liquidity SwapsSupport to Specific InstitutionsOther Liquidity FacilitiesTerm Asset-Backed Securities Loan FacilityCommercial Paper Funding FacilityTerm Auction Credit
10
Under the Term Asset-Backed Securities Loan Facility, the Federal Reserve Bank of New York
provided loans with terms up to five years to holders of eligible asset-backed securities. This
accommodated the credit needs of consumers and enterprises by facilitating the issuance of
asset-backed securities collateralized with consumer and business loans.9 Central Bank
Liquidity Swaps provided dollar liquidity to other central banks, inter alia to the European
Central Bank and the Swiss National Bank. The swaps were designed to improve liquidity
conditions in dollar funding markets in the United States and abroad and enabled foreign
central banks to provide dollar funding to financial institutions in their jurisdictions.
The short-term liquidity measures had mainly matured by 2010 and were followed by more
long-term monetary policy operations labelled quantitative easing (QE). Through three
quantitative easing programs, which went beyond the traditional tools of open market
operations, the Federal Reserve System de facto transformed the short-term liquidity measures
into longer term operations, while further extending the scale until the end of the year 2014.10
The goal was to maintain the functioning of the credit markets. Through the purchase of longer-
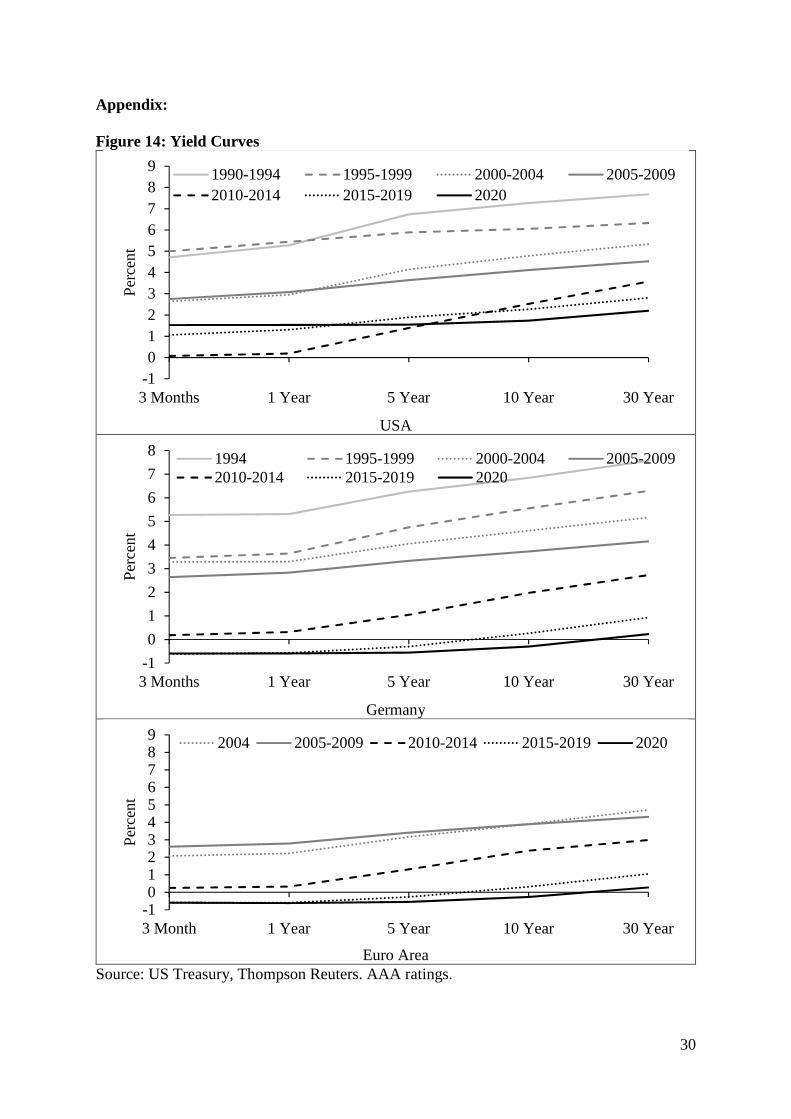
term securities, long-term interest rates were reduced and the yield curve was flattened (see
Figure 14 in the appendix).
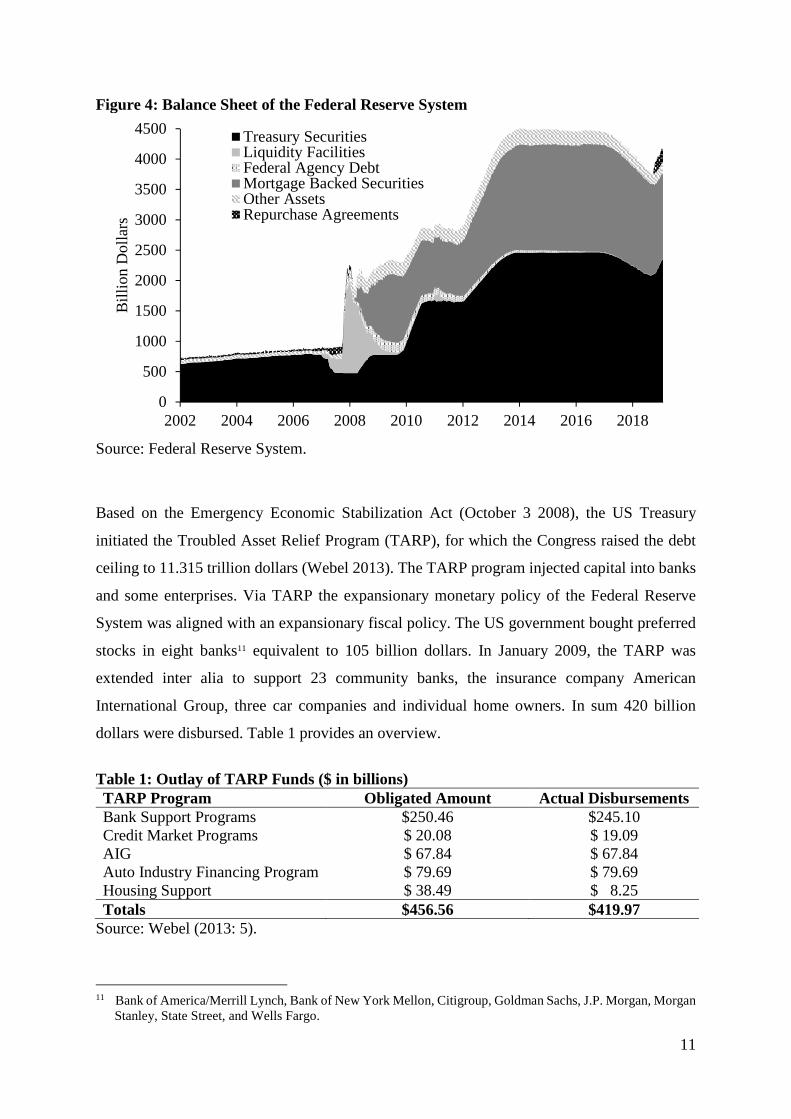
QE1 was performed from November 2008 by buying mortgage-backed securities and treasuries
(see Figure 4). By November 2009, the Federal Reserve System had accumulated 1400 billion
dollars of mortgage-backed securities and treasuries. The Fed announced QE2 in November
2010. Until June 2011 treasuries equivalent to 1500 billion dollar and mortgage-backed
securities equivalent to 900 billion were bought (QE2). QE3 was announced in September 2012
as an open-ended bond purchase program (also called QE-Infinity), with a volume of 40 billion
dollars per month. In addition, the Federal Open Market Committee announced to maintain the
federal funds rate to be kept near zero at least through 2015. In December 2012, the monthly
purchases of treasuries were increased to 85 billion dollars per month. Purchases were halted
in October 2014 after having accumulated assets equivalent to roughly 4.500 billion dollars.
9 For instance student loans, auto loans, credit card loans, loans guaranteed by the Small Business Administration. 10 For a survey see: https://www.federalreserve.gov/monetarypolicy/bst_crisisresponse.htm.
11
Figure 4: Balance Sheet of the Federal Reserve System
Source: Federal Reserve System.
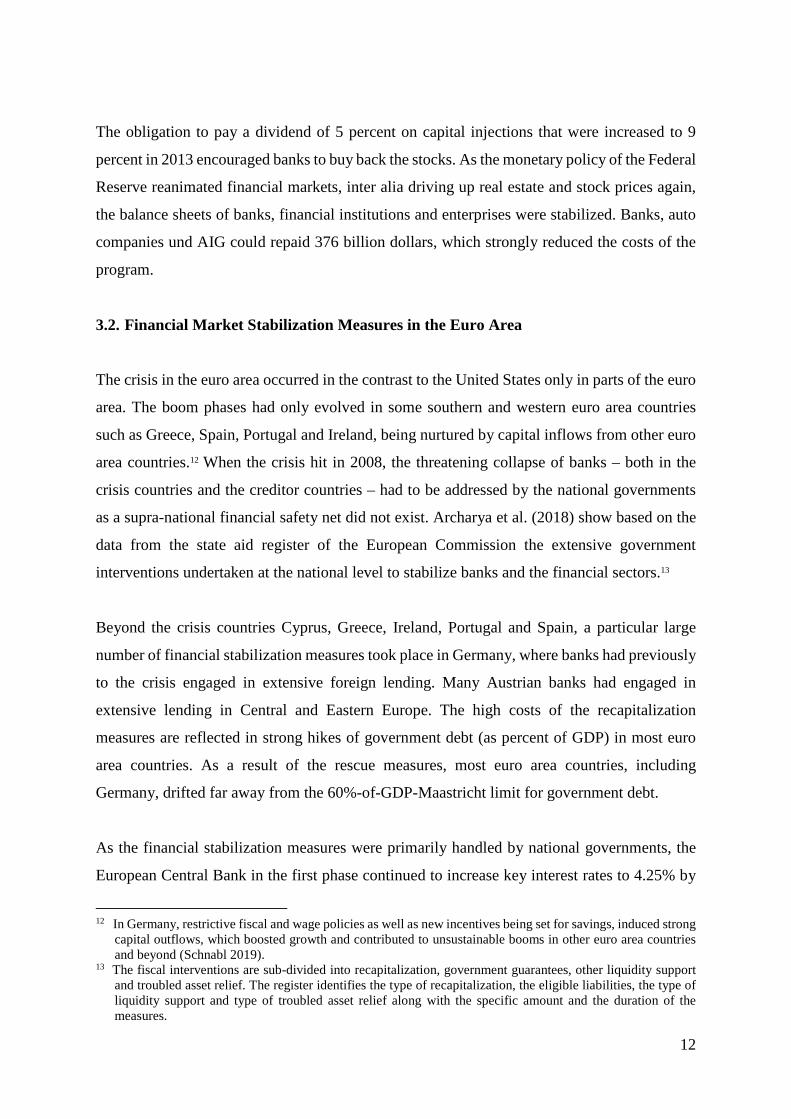
Based on the Emergency Economic Stabilization Act (October 3 2008), the US Treasury
initiated the Troubled Asset Relief Program (TARP), for which the Congress raised the debt
ceiling to 11.315 trillion dollars (Webel 2013). The TARP program injected capital into banks
and some enterprises. Via TARP the expansionary monetary policy of the Federal Reserve
System was aligned with an expansionary fiscal policy. The US government bought preferred
stocks in eight banks11 equivalent to 105 billion dollars. In January 2009, the TARP was
extended inter alia to support 23 community banks, the insurance company American
International Group, three car companies and individual home owners. In sum 420 billion
dollars were disbursed. Table 1 provides an overview.
Table 1: Outlay of TARP Funds ($ in billions) TARP Program Obligated Amount Actual Disbursements Bank Support Programs $250.46 $245.10 Credit Market Programs $ 20.08 $ 19.09 AIG $ 67.84 $ 67.84 Auto Industry Financing Program $ 79.69 $ 79.69 Housing Support $ 38.49 $ 8.25 Totals $456.56 $419.97
Source: Webel (2013: 5).
11 Bank of America/Merrill Lynch, Bank of New York Mellon, Citigroup, Goldman Sachs, J.P. Morgan, Morgan
Stanley, State Street, and Wells Fargo.
0
500
1000
1500
2000
2500
3000
3500
4000
4500
2002 2004 2006 2008 2010 2012 2014 2016 2018
Bill
ion
Dol
lars
Treasury SecuritiesLiquidity FacilitiesFederal Agency DebtMortgage Backed SecuritiesOther AssetsRepurchase Agreements
12
The obligation to pay a dividend of 5 percent on capital injections that were increased to 9
percent in 2013 encouraged banks to buy back the stocks. As the monetary policy of the Federal
Reserve reanimated financial markets, inter alia driving up real estate and stock prices again,
the balance sheets of banks, financial institutions and enterprises were stabilized. Banks, auto
companies und AIG could repaid 376 billion dollars, which strongly reduced the costs of the
program.
3.2. Financial Market Stabilization Measures in the Euro Area
The crisis in the euro area occurred in the contrast to the United States only in parts of the euro
area. The boom phases had only evolved in some southern and western euro area countries
such as Greece, Spain, Portugal and Ireland, being nurtured by capital inflows from other euro
area countries.12 When the crisis hit in 2008, the threatening collapse of banks – both in the
crisis countries and the creditor countries – had to be addressed by the national governments
as a supra-national financial safety net did not exist. Archarya et al. (2018) show based on the
data from the state aid register of the European Commission the extensive government
interventions undertaken at the national level to stabilize banks and the financial sectors.13
Beyond the crisis countries Cyprus, Greece, Ireland, Portugal and Spain, a particular large
number of financial stabilization measures took place in Germany, where banks had previously
to the crisis engaged in extensive foreign lending. Many Austrian banks had engaged in
extensive lending in Central and Eastern Europe. The high costs of the recapitalization
measures are reflected in strong hikes of government debt (as percent of GDP) in most euro
area countries. As a result of the rescue measures, most euro area countries, including
Germany, drifted far away from the 60%-of-GDP-Maastricht limit for government debt.
As the financial stabilization measures were primarily handled by national governments, the
European Central Bank in the first phase continued to increase key interest rates to 4.25% by
12 In Germany, restrictive fiscal and wage policies as well as new incentives being set for savings, induced strong
capital outflows, which boosted growth and contributed to unsustainable booms in other euro area countries and beyond (Schnabl 2019).
13 The fiscal interventions are sub-divided into recapitalization, government guarantees, other liquidity support and troubled asset relief. The register identifies the type of recapitalization, the eligible liabilities, the type of liquidity support and type of troubled asset relief along with the specific amount and the duration of the measures.
13
July 2008 in response to an above target inflation rate. The ECB cut interest rates only from
November 2008 and more hesitantly than the Federal Reserve (Figure 2). The policy of the
European Central Bank changed fundamentally when strongly diverging interest rates on euro
area government bonds – now including the highly indebted Italy – threatened to break up the
euro area. The reversal is marked by the statement of ECB president Mario Draghi that the
European Central Bank would do “whatever it takes” to preserve the euro area.14
Like the Fed, the European Central Bank took several unconventional measures to stabilize the
financial sector in the euro area. Starting from March 2008, the ECB launched several rounds
of Long-term Refinancing Operations (LTRO) to inject low-interest rate funding to euro area
banks with sovereign debt as a collateral. The banks could use the low-cost funds to invest in
higher-yield assets (such as government bonds) to stabilize their balance sheets. The resulting
increasing demand for government bonds reduced long-term interest rates. The Targeted Long-
term Refinancing Operations (TLTROs), which were implemented since 2014, tied low interest
rates to the credit provision to enterprises. In September 2019 the ECB decided to renew the
Targeted Long-term Refinancing Operations with an estimated volume of about 800 billion
euros.15 Today, Main Refinancing Operations (MROs) and LTROs only play a minor role in
the ECB monetary policy operations.
The scale of bond purchase programs gradually expanded. Between 2010 and 2012 the ECB
bought bonds equivalent to 211 billion euros in the Securities Market Programme (SMP). The
Covered Bond Purchase Programs (CBPP1, 2, 3) incorporated purchases of covered bonds of
76.4 billion euros between 2009 and 2012. As the program expired, the Outright Monetary
Transactions Programme (OMT) of July 2012 announced to buy up any amount of government
bonds necessary to maintain the euro area, but the program was never activated. The originally
secret Agreement on Net Financial Assets (ANFA) allowed the national central banks to
purchase financial assets related to national government debt of up to a total volume of 500
billion euros since October 2014.
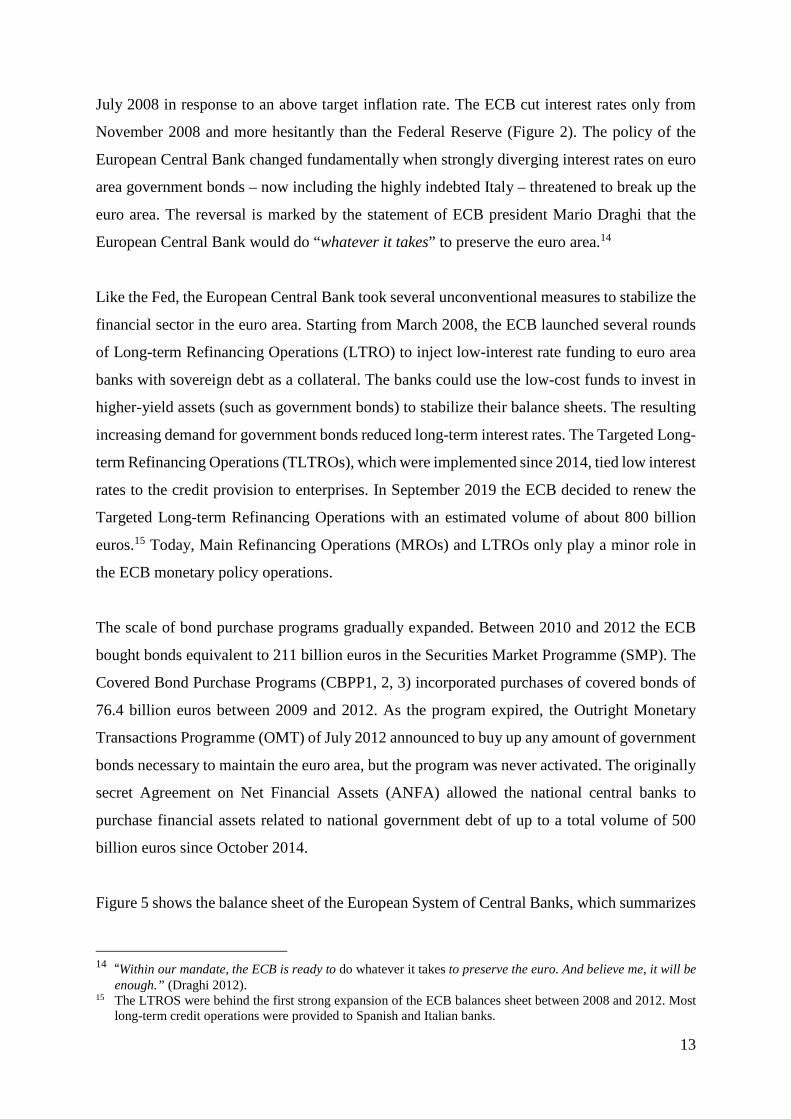
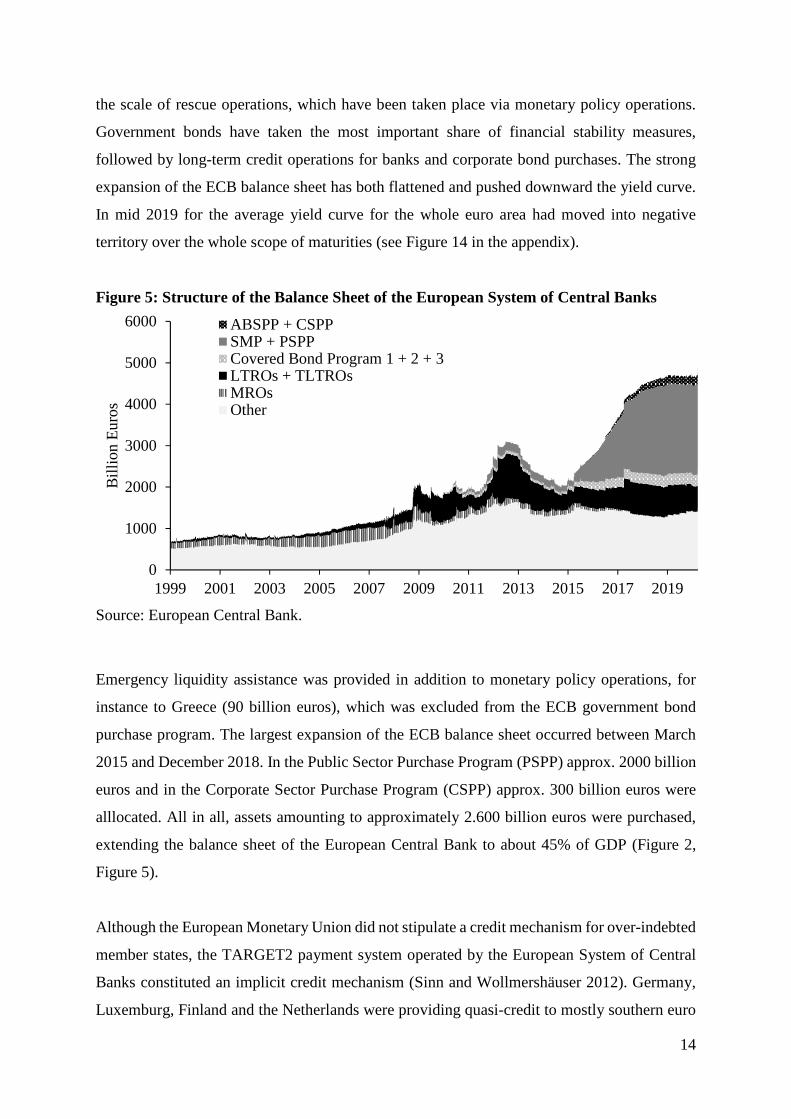
Figure 5 shows the balance sheet of the European System of Central Banks, which summarizes
14 “Within our mandate, the ECB is ready to do whatever it takes to preserve the euro. And believe me, it will be
enough.” (Draghi 2012). 15 The LTROS were behind the first strong expansion of the ECB balances sheet between 2008 and 2012. Most
long-term credit operations were provided to Spanish and Italian banks.
14
the scale of rescue operations, which have been taken place via monetary policy operations.
Government bonds have taken the most important share of financial stability measures,
followed by long-term credit operations for banks and corporate bond purchases. The strong
expansion of the ECB balance sheet has both flattened and pushed downward the yield curve.
In mid 2019 for the average yield curve for the whole euro area had moved into negative
territory over the whole scope of maturities (see Figure 14 in the appendix).
Figure 5: Structure of the Balance Sheet of the European System of Central Banks
Source: European Central Bank.
Emergency liquidity assistance was provided in addition to monetary policy operations, for
instance to Greece (90 billion euros), which was excluded from the ECB government bond
purchase program. The largest expansion of the ECB balance sheet occurred between March
2015 and December 2018. In the Public Sector Purchase Program (PSPP) approx. 2000 billion
euros and in the Corporate Sector Purchase Program (CSPP) approx. 300 billion euros were
alllocated. All in all, assets amounting to approximately 2.600 billion euros were purchased,
extending the balance sheet of the European Central Bank to about 45% of GDP (Figure 2,
Figure 5).
Although the European Monetary Union did not stipulate a credit mechanism for over-indebted
member states, the TARGET2 payment system operated by the European System of Central
Banks constituted an implicit credit mechanism (Sinn and Wollmershäuser 2012). Germany,
Luxemburg, Finland and the Netherlands were providing quasi-credit to mostly southern euro
0
1000
2000
3000
4000
5000
6000
1999 2001 2003 2005 2007 2009 2011 2013 2015 2017 2019
Bill
ion
Eur
os
ABSPP + CSPPSMP + PSPPCovered Bond Program 1 + 2 + 3LTROs + TLTROsMROsOther
15
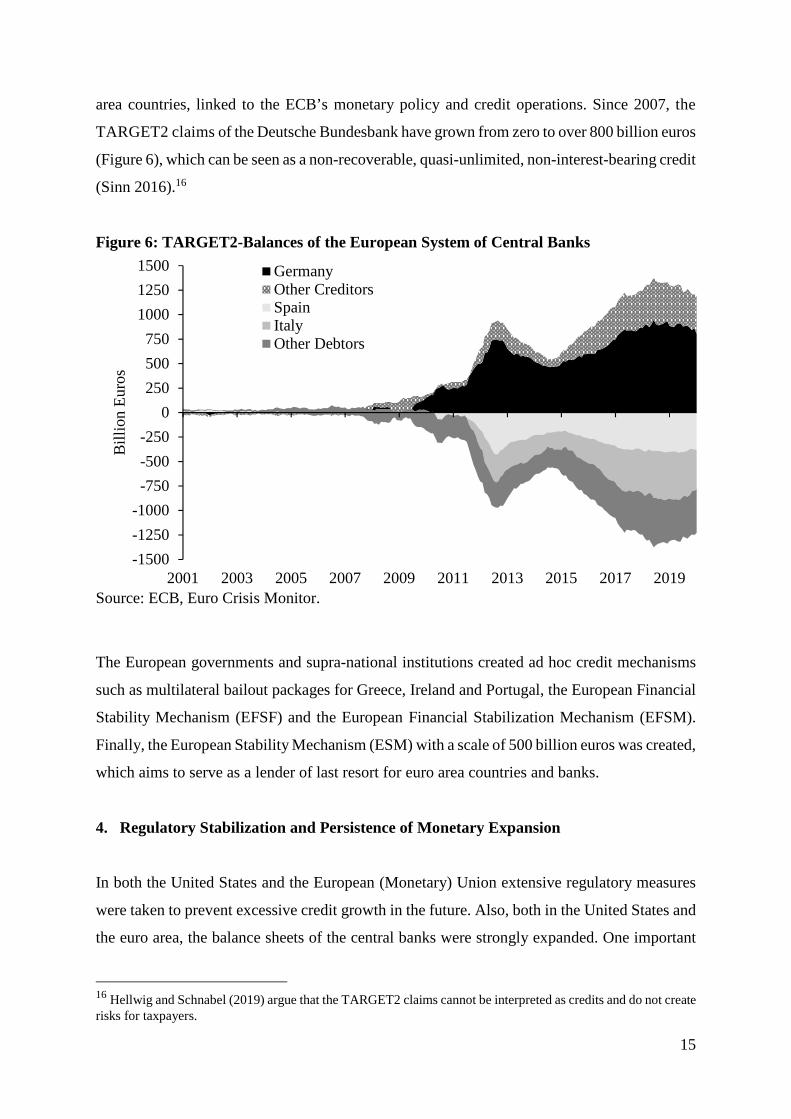
area countries, linked to the ECB’s monetary policy and credit operations. Since 2007, the
TARGET2 claims of the Deutsche Bundesbank have grown from zero to over 800 billion euros
(Figure 6), which can be seen as a non-recoverable, quasi-unlimited, non-interest-bearing credit
(Sinn 2016).16
Figure 6: TARGET2-Balances of the European System of Central Banks
Source: ECB, Euro Crisis Monitor.
The European governments and supra-national institutions created ad hoc credit mechanisms
such as multilateral bailout packages for Greece, Ireland and Portugal, the European Financial
Stability Mechanism (EFSF) and the European Financial Stabilization Mechanism (EFSM).
Finally, the European Stability Mechanism (ESM) with a scale of 500 billion euros was created,
which aims to serve as a lender of last resort for euro area countries and banks.
4. Regulatory Stabilization and Persistence of Monetary Expansion
In both the United States and the European (Monetary) Union extensive regulatory measures
were taken to prevent excessive credit growth in the future. Also, both in the United States and
the euro area, the balance sheets of the central banks were strongly expanded. One important
16 Hellwig and Schnabel (2019) argue that the TARGET2 claims cannot be interpreted as credits and do not create risks for taxpayers.
-1500
-1000
-500
0
500
1000
1500
-1500
-1250
-1000
-750
-500
-250
0
250
500
750
1000
1250
1500
2001 2003 2005 2007 2009 2011 2013 2015 2017 2019
Bill
ion
Eur
os
GermanyOther CreditorsSpainItalyOther Debtors
16
difference between the financial stabilization measures of the United States and the euro area
is the time dimension. Whereas the crisis broke out both in the United States and Europe in the
years 2007/2008, the Federal Reserve System responded faster by interest rate cuts and
quantitative easing and also left earlier the low interest rate environment (albeit at a limited
extend).
The ECB acted more hesitantly and did not tighten monetary policy during the post-crisis
recovery. After unconventional monetary policy measures had created large excess reserves of
commercial banks at the central bank, the Federal Reserve Board decided to pay positive
interest rates on excess reserves, whereas the European Central Bank charges negative interest
rates since 2014. The different policy approaches had different implications for the recovery of
the banking sectors.
4.1. Interest Margins
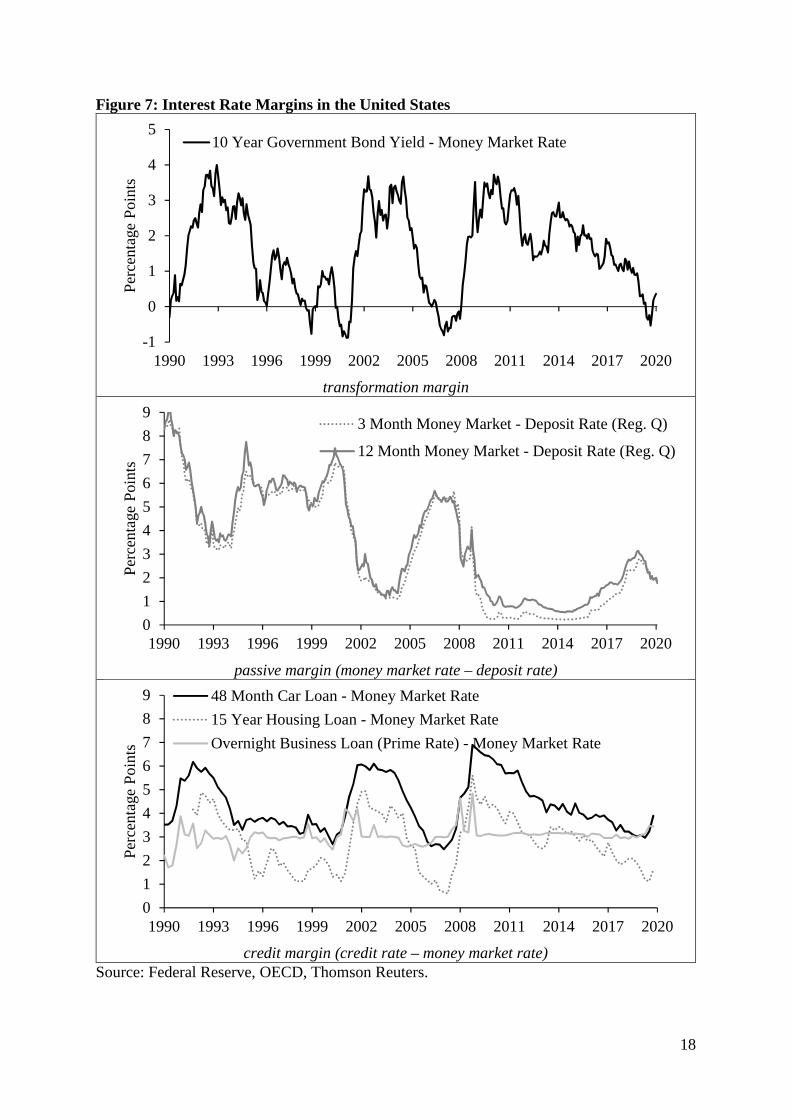
The persistent low interest environment had implications on the interest rate margins in the
banking business.17 Traditionally the main sources of income of banks have been the
transformation margin (defined as long-term interest rate minus short-term interest rate), the
passive margin (defined as money market rate minus deposit rate) and the credit margin
(defined as credit rate minus deposit rate or money market rate).
The central banks first pushed money market rates towards zero and then depressed interest
rates at the longer end of the yield curve, inter alia via quantitative easing. This gradually
eliminated the transformation margin in both the United States and the euro area (see upper
panels of Figure 7 and Figure 8). Previously to the global financial crisis, the transformation
margins in the United States and Europe had been mainly positive, except in phases of interest
rate increases when short-term interest rates increased faster than long-term interest rates. From
2010 onwards, both short-term and long-term interest rates were nudged towards (and even
below) zero. This deprived the commercial banks of the transformation margin as an important
source of income.
17 With Japan running ahead of the United States and Europe in zero-interest rate policies and quantitative easing,
the negative impact on credit margins and respective implications on the banking sector became visible earlier (Gerstenberger und Schnabl 2017).
17
The passive margins, i.e. the margin earned when idle deposits are invested in the money
markets, in both the United States and Europe converged towards zero, as money market rates
were pushed to zero and commercial banks felt constraints in setting deposit rates below zero.18
As shown in the center panels of Figure 7 and Figure 8 in both the United States and the euro
area the passive margins approached the zero-bound after the outbreak of the global financial
crisis. The passive margins diverged from the December 2015 onwards, when the Federal
Reserve started to lift the federal funds rate from 0 - 0.25% to 2.25% - 2.5% by December
2019, which increased the passive margin for US banks to about three percentage points, while
it remained zero for euro area banks.
Furthermore, as both US and euro area banks have accumulated large amounts of excess
reserves at the central bank in the course of the unconventional monetary policy measures, the
interest rate on deposits of commercial banks at the central bank matters strongly for the
profitability of banks. The Federal Reserve decided to increase the interest on excess reserves
(IOER) from 0.25% in December 2015 to 2.4% in December 2018. In contrast, the European
Central Bank opted, like the Bank of Japan, for a negative interest rate on deposits of
commercial banks at the ECB. The interest rate cut on the deposit facility in June 2014 to -
0,1% was followed by further cuts to -0.5% by September 2019.19 This also brought the money
market rate into negative territory (Figure 2).
18 Note that until 2011, in the United States the so-called Regulation Q prohibited US banks from paying interest
on demand deposits, which made money market funds attractive for depositors. Until 1986, there were also ceilings on savings and time deposits etc. The Regulation Q was abolished by the Dodd-Frank Act in 2010. In Germany, recently, an increasing number of banks is charging negative interest rates on deposits, in particular for new customers and customers with large deposits.
19 From Sept. 2019 like in Japan, a tier system was introduced, which created exemptions for negative interest rates on excess reserves for banks. The negative deposit facility rate is not applied up to a multiple of 6 of required reserves. Everything beyond this threshold is charged with a negative interest rate of -0.5%.
18
Figure 7: Interest Rate Margins in the United States
transformation margin
passive margin (money market rate – deposit rate)
credit margin (credit rate – money market rate)
Source: Federal Reserve, OECD, Thomson Reuters.
-1
0
1
2
3
4
5
1990 1993 1996 1999 2002 2005 2008 2011 2014 2017 2020
Per
cent
age
Poi
nts
10 Year Government Bond Yield - Money Market Rate
0
1
2
3
4
5
6
7
8
9
1990 1993 1996 1999 2002 2005 2008 2011 2014 2017 2020
Per
cent
age
Poi
nts
3 Month Money Market - Deposit Rate (Reg. Q)
12 Month Money Market - Deposit Rate (Reg. Q)
0
1
2
3
4
5
6
7
8
9
1990 1993 1996 1999 2002 2005 2008 2011 2014 2017 2020
Per
cent
age
Poi
nts
48 Month Car Loan - Money Market Rate
15 Year Housing Loan - Money Market Rate
Overnight Business Loan (Prime Rate) - Money Market Rate
19
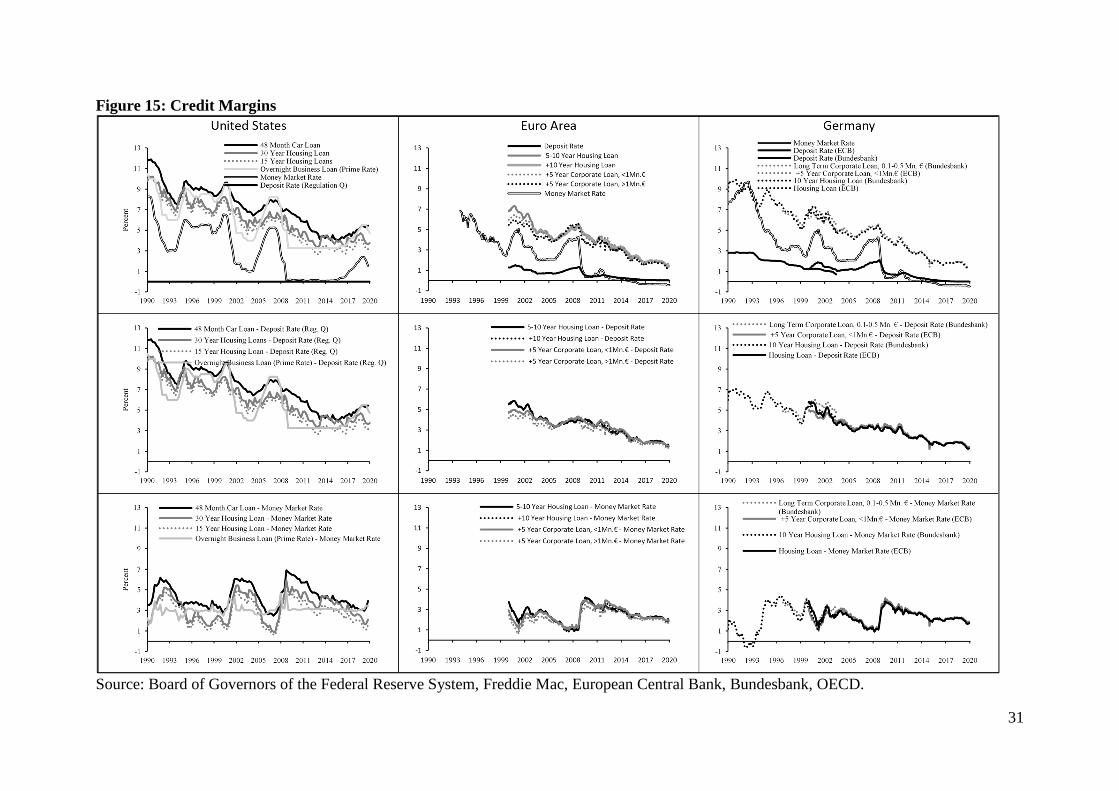
In both the United States and the euro area, the persistent low interest rate environment
continued to depress the credit margins of banks. In the United States between 2000 and 2019,
the credit margin, calculated as the difference between the interest rate for corporate and
housing loans minus the deposit rate declined from a range from 8.5% to 9.5% in 2000 to
around 3.2% to 5% by 2020 (Figure 15 in the appendix).20 The increase of the federal funds
rate between 2015 and 2019 by 2.25 percentage points had only a limited positive impact on
the credit margins. However, assuming that financing of US banks also occurs in the money
market, the credit margin calculated as credit rate minus money market rate remained widely
constant around 3 percentage points as shown in the lower panel of Figure 7.
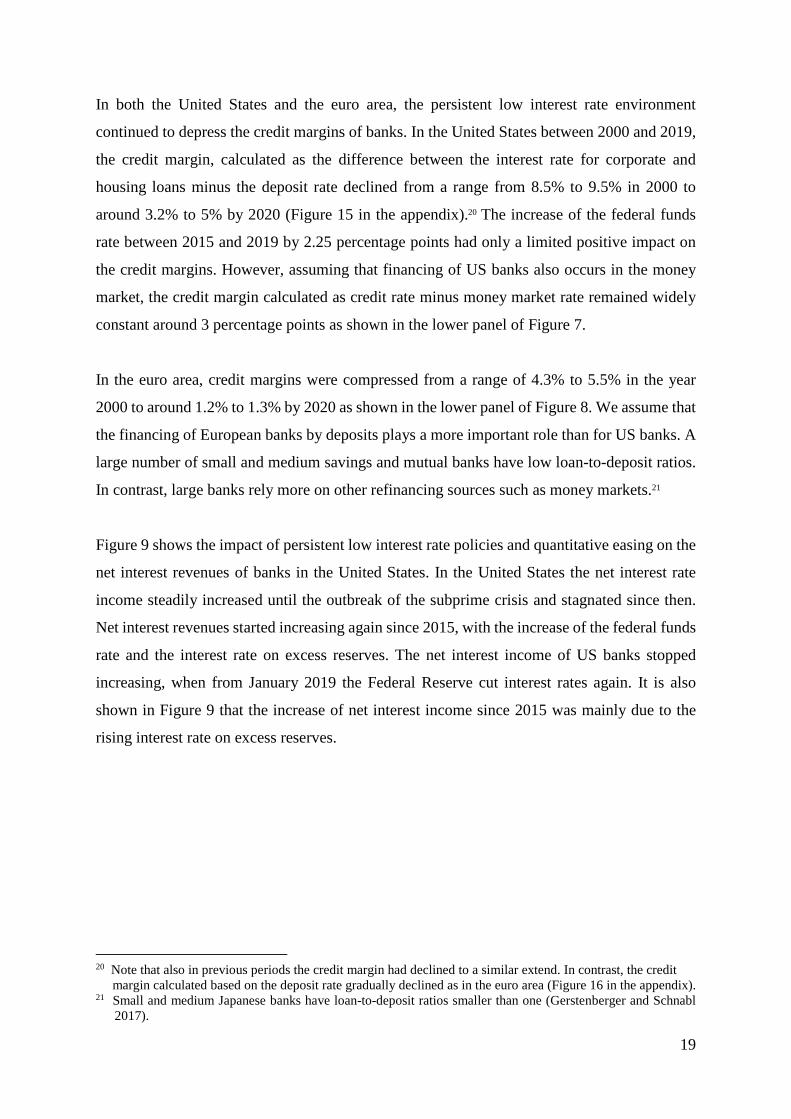
In the euro area, credit margins were compressed from a range of 4.3% to 5.5% in the year
2000 to around 1.2% to 1.3% by 2020 as shown in the lower panel of Figure 8. We assume that
the financing of European banks by deposits plays a more important role than for US banks. A
large number of small and medium savings and mutual banks have low loan-to-deposit ratios.
In contrast, large banks rely more on other refinancing sources such as money markets.21
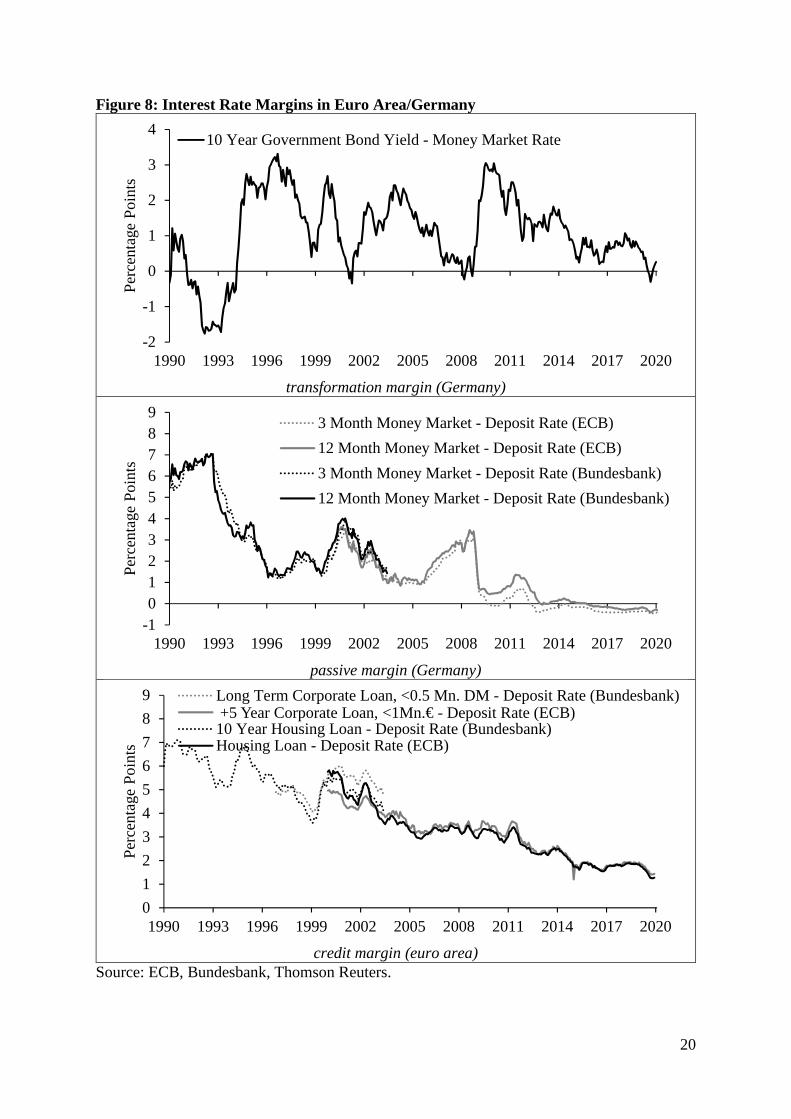
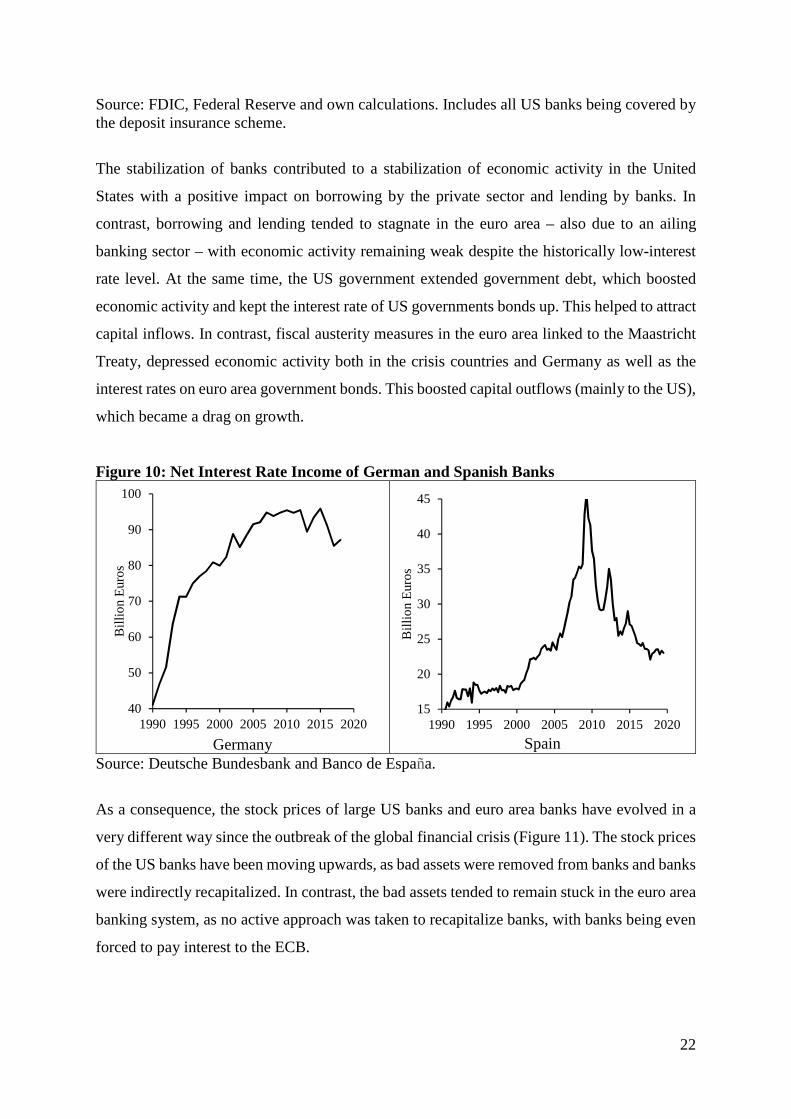
Figure 9 shows the impact of persistent low interest rate policies and quantitative easing on the
net interest revenues of banks in the United States. In the United States the net interest rate
income steadily increased until the outbreak of the subprime crisis and stagnated since then.
Net interest revenues started increasing again since 2015, with the increase of the federal funds
rate and the interest rate on excess reserves. The net interest income of US banks stopped
increasing, when from January 2019 the Federal Reserve cut interest rates again. It is also
shown in Figure 9 that the increase of net interest income since 2015 was mainly due to the
rising interest rate on excess reserves.
20 Note that also in previous periods the credit margin had declined to a similar extend. In contrast, the credit margin calculated based on the deposit rate gradually declined as in the euro area (Figure 16 in the appendix). 21 Small and medium Japanese banks have loan-to-deposit ratios smaller than one (Gerstenberger and Schnabl
2017).
20
Figure 8: Interest Rate Margins in Euro Area/Germany
transformation margin (Germany)
passive margin (Germany)
credit margin (euro area)
Source: ECB, Bundesbank, Thomson Reuters.
-2
-1
0
1
2
3
4
1990 1993 1996 1999 2002 2005 2008 2011 2014 2017 2020
Per
cent
age
Poi
nts
10 Year Government Bond Yield - Money Market Rate
-10123456789
1990 1993 1996 1999 2002 2005 2008 2011 2014 2017 2020
Per
cent
age
Poi
nts
3 Month Money Market - Deposit Rate (ECB)
12 Month Money Market - Deposit Rate (ECB)
3 Month Money Market - Deposit Rate (Bundesbank)
12 Month Money Market - Deposit Rate (Bundesbank)
0
1
2
3
4
5
6
7
8
9
1990 1993 1996 1999 2002 2005 2008 2011 2014 2017 2020
Per
cent
age
Poi
nts
Long Term Corporate Loan, <0.5 Mn. DM - Deposit Rate (Bundesbank)+5 Year Corporate Loan, <1Mn.€ - Deposit Rate (ECB)10 Year Housing Loan - Deposit Rate (Bundesbank)Housing Loan - Deposit Rate (ECB)
21
In contrast, the ECB charged an interest rate on deposits of commercial banks at the ECB,
which further weakened the net interest rate income of commercial banks. From 2014 to 2019,
euro area banks payed an equivalent of 34 billion dollars to the ECB, whereas US banks
received around 120 billion dollars from the Fed. From this perspective, the increase of the
interest on excess reserves in the US can be regarded as an implicit recapitalization of US
banks, which did not take place in the euro area.22
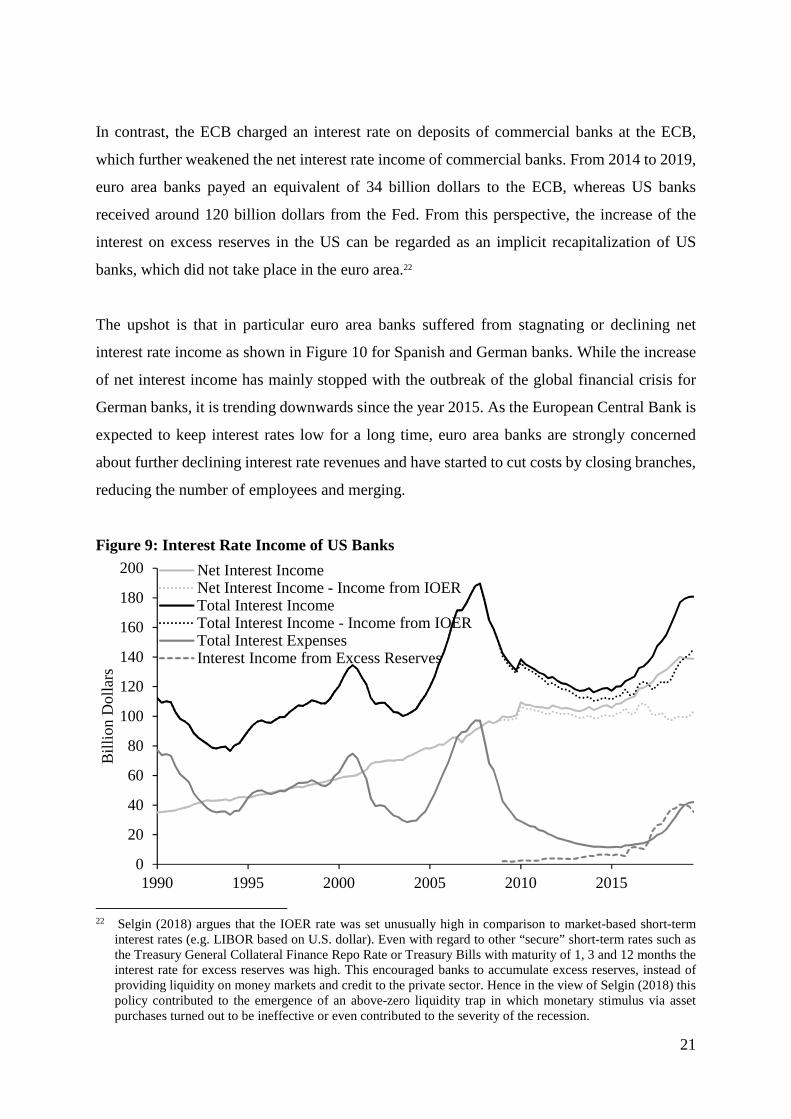
The upshot is that in particular euro area banks suffered from stagnating or declining net
interest rate income as shown in Figure 10 for Spanish and German banks. While the increase
of net interest income has mainly stopped with the outbreak of the global financial crisis for
German banks, it is trending downwards since the year 2015. As the European Central Bank is
expected to keep interest rates low for a long time, euro area banks are strongly concerned
about further declining interest rate revenues and have started to cut costs by closing branches,
reducing the number of employees and merging.
Figure 9: Interest Rate Income of US Banks
22 Selgin (2018) argues that the IOER rate was set unusually high in comparison to market-based short-term
interest rates (e.g. LIBOR based on U.S. dollar). Even with regard to other “secure” short-term rates such as the Treasury General Collateral Finance Repo Rate or Treasury Bills with maturity of 1, 3 and 12 months the interest rate for excess reserves was high. This encouraged banks to accumulate excess reserves, instead of providing liquidity on money markets and credit to the private sector. Hence in the view of Selgin (2018) this policy contributed to the emergence of an above-zero liquidity trap in which monetary stimulus via asset purchases turned out to be ineffective or even contributed to the severity of the recession.
0
20
40
60
80
100
120
140
160
180
200
1990 1995 2000 2005 2010 2015
Bill
ion
Dol
lars
Net Interest IncomeNet Interest Income - Income from IOERTotal Interest IncomeTotal Interest Income - Income from IOERTotal Interest ExpensesInterest Income from Excess Reserves
22
Source: FDIC, Federal Reserve and own calculations. Includes all US banks being covered by the deposit insurance scheme.
The stabilization of banks contributed to a stabilization of economic activity in the United
States with a positive impact on borrowing by the private sector and lending by banks. In
contrast, borrowing and lending tended to stagnate in the euro area – also due to an ailing
banking sector – with economic activity remaining weak despite the historically low-interest
rate level. At the same time, the US government extended government debt, which boosted
economic activity and kept the interest rate of US governments bonds up. This helped to attract
capital inflows. In contrast, fiscal austerity measures in the euro area linked to the Maastricht
Treaty, depressed economic activity both in the crisis countries and Germany as well as the
interest rates on euro area government bonds. This boosted capital outflows (mainly to the US),
which became a drag on growth.
Figure 10: Net Interest Rate Income of German and Spanish Banks
Germany
Spain
Source: Deutsche Bundesbank and Banco de España.
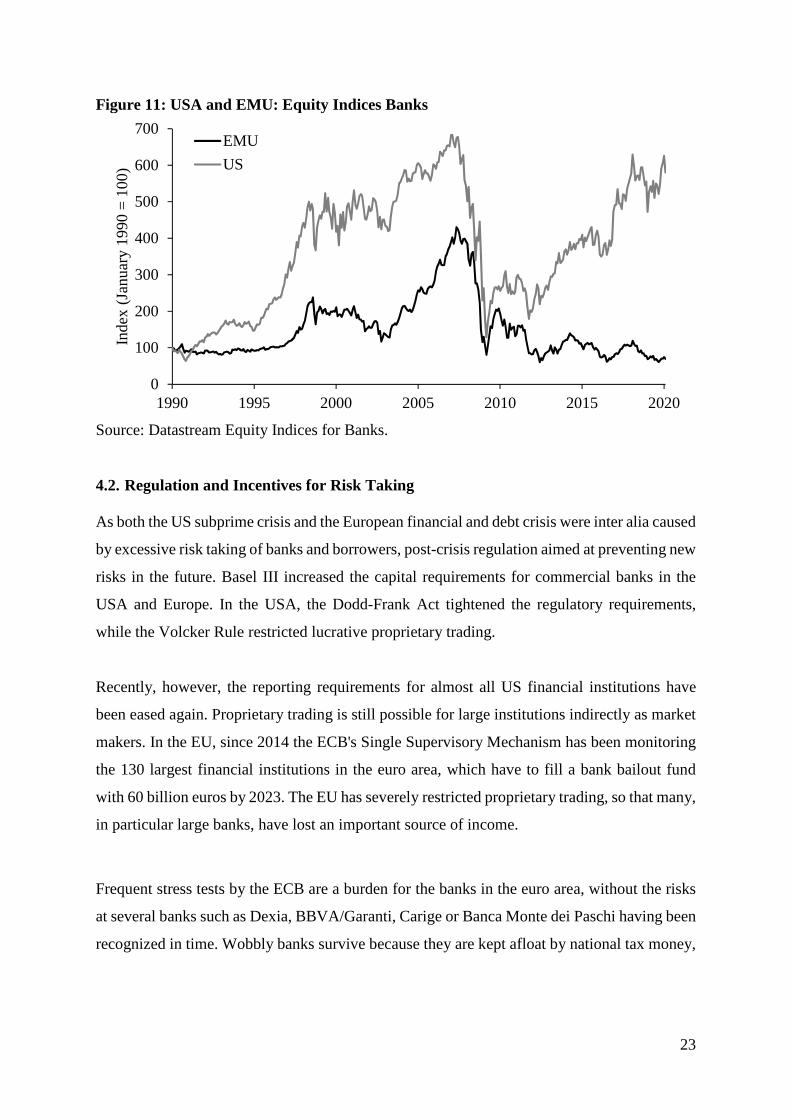
As a consequence, the stock prices of large US banks and euro area banks have evolved in a
very different way since the outbreak of the global financial crisis (Figure 11). The stock prices
of the US banks have been moving upwards, as bad assets were removed from banks and banks
were indirectly recapitalized. In contrast, the bad assets tended to remain stuck in the euro area
banking system, as no active approach was taken to recapitalize banks, with banks being even
forced to pay interest to the ECB.
40
50
60
70
80
90
100
1990 1995 2000 2005 2010 2015 2020
Bill
ion
Eur
os
15
20
25
30
35
40
45
1990 1995 2000 2005 2010 2015 2020
Bill
ion
Eur
os
23
Figure 11: USA and EMU: Equity Indices Banks
Source: Datastream Equity Indices for Banks.
4.2. Regulation and Incentives for Risk Taking
As both the US subprime crisis and the European financial and debt crisis were inter alia caused
by excessive risk taking of banks and borrowers, post-crisis regulation aimed at preventing new
risks in the future. Basel III increased the capital requirements for commercial banks in the
USA and Europe. In the USA, the Dodd-Frank Act tightened the regulatory requirements,
while the Volcker Rule restricted lucrative proprietary trading.
Recently, however, the reporting requirements for almost all US financial institutions have
been eased again. Proprietary trading is still possible for large institutions indirectly as market
makers. In the EU, since 2014 the ECB's Single Supervisory Mechanism has been monitoring
the 130 largest financial institutions in the euro area, which have to fill a bank bailout fund
with 60 billion euros by 2023. The EU has severely restricted proprietary trading, so that many,
in particular large banks, have lost an important source of income.
Frequent stress tests by the ECB are a burden for the banks in the euro area, without the risks
at several banks such as Dexia, BBVA/Garanti, Carige or Banca Monte dei Paschi having been
recognized in time. Wobbly banks survive because they are kept afloat by national tax money,
0
100
200
300
400
500
600
700
1990 1995 2000 2005 2010 2015 2020
Inde
x (J
anua
ry 1
990
= 1
00)
EMU
US
24
European rescue programs and credit provision by the ECB (see section 3.2.).23 An opaque
network of rescue mechanisms (ESM, ELA, ANFA, etc.) has emerged. The ECB's TARGET2
payment system has turned out to be a quasi-unconditional, interest-free credit system: around
900 billion euros have accumulated in southern European central banks, with collateral
requirements being gradually reduced (see Figure 6).
Nevertheless, the central banks induced more risk taking. After low interest rates had inflated
real estate prices in the southern euro area and in Ireland between 2003 and 2008, since the
year 2010 real estate prices in Germany started to increase fast (Figure 1).24 On average,
German real estate prices have increased since then by more than 50%, in growth regions close
to 70%. The real estate boom was not accompanied by excessive credit growth as growing
credit in the real estate sector came along with a stagnating credit provision to small and
medium enterprises. Also, in the former euro area crisis countries and the United States the real
estate prices recovered (see Figure 1 for USA and Spain).
With banks being constrained in credit provision by regulation, the pre-crisis unsound credit
growth was not repeated in the post-crisis ultra-low interest rate environment. This came along
with a restraint on investment by small and medium enterprises, which are not able to issue
own bonds. In contrast, the growth of bond issuance of large enterprises flourished, in particular
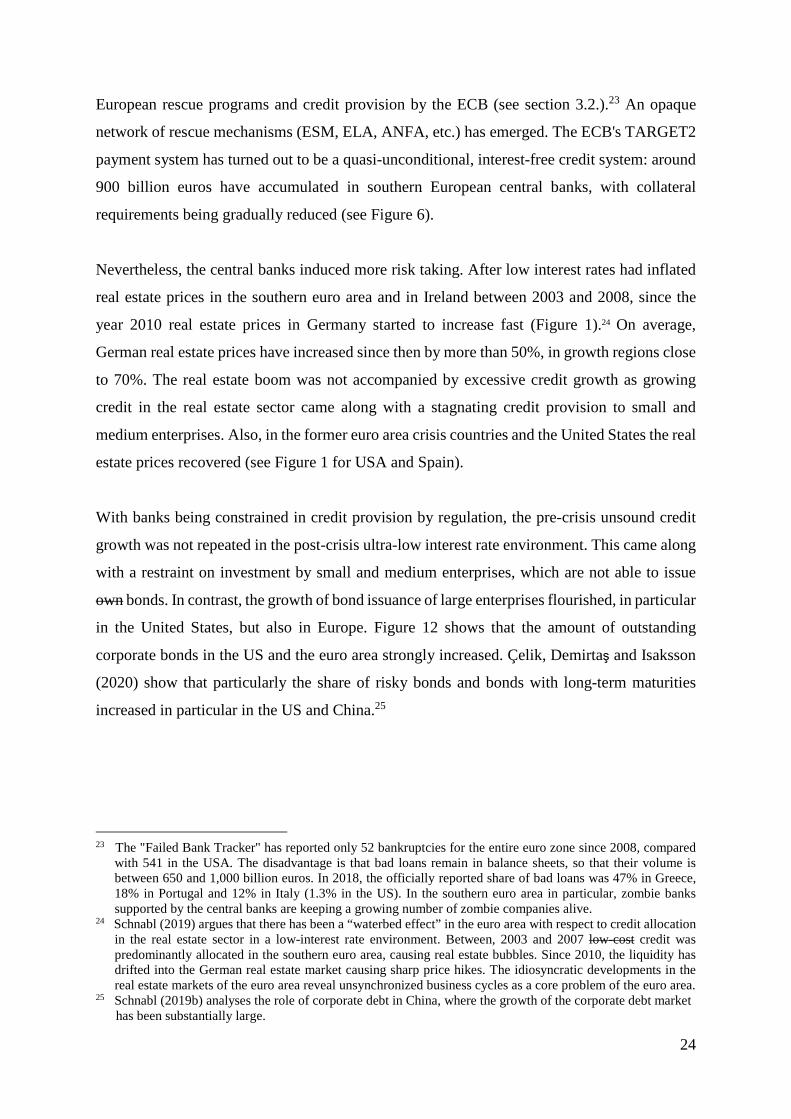
in the United States, but also in Europe. Figure 12 shows that the amount of outstanding
corporate bonds in the US and the euro area strongly increased. Çelik, Demirtaş and Isaksson
(2020) show that particularly the share of risky bonds and bonds with long-term maturities
increased in particular in the US and China.25
23 The "Failed Bank Tracker" has reported only 52 bankruptcies for the entire euro zone since 2008, compared
with 541 in the USA. The disadvantage is that bad loans remain in balance sheets, so that their volume is between 650 and 1,000 billion euros. In 2018, the officially reported share of bad loans was 47% in Greece, 18% in Portugal and 12% in Italy (1.3% in the US). In the southern euro area in particular, zombie banks supported by the central banks are keeping a growing number of zombie companies alive.
24 Schnabl (2019) argues that there has been a “waterbed effect” in the euro area with respect to credit allocation in the real estate sector in a low-interest rate environment. Between, 2003 and 2007 low-cost credit was predominantly allocated in the southern euro area, causing real estate bubbles. Since 2010, the liquidity has drifted into the German real estate market causing sharp price hikes. The idiosyncratic developments in the real estate markets of the euro area reveal unsynchronized business cycles as a core problem of the euro area.
25 Schnabl (2019b) analyses the role of corporate debt in China, where the growth of the corporate debt market has been substantially large.
25
Figure 12: Debt Outstanding from Non-Financial Corporations in US and Germany
United States: credit from all sources
Euro area: credit from all sources
United States: total debt securities
Euro area: total debt securities
Source: BIS.
Additional funds for large corporations generated by both an increased activity in corporate
bond issuance and declining interest rate expenses were used in the United States inter alia for
leveraged buy-outs and stock buy-backs, which have been strongly driving up stock prices. In
Europe, capital outflows to the United States accelerated, inter alia in the form of the build-up
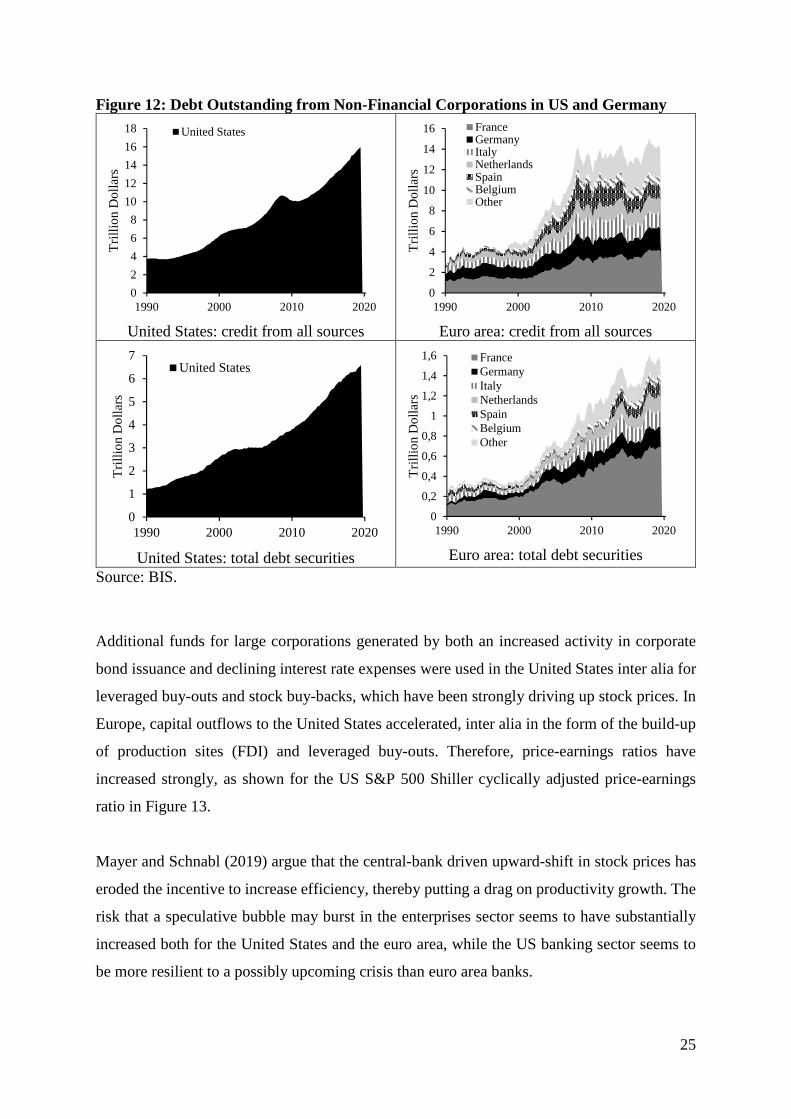
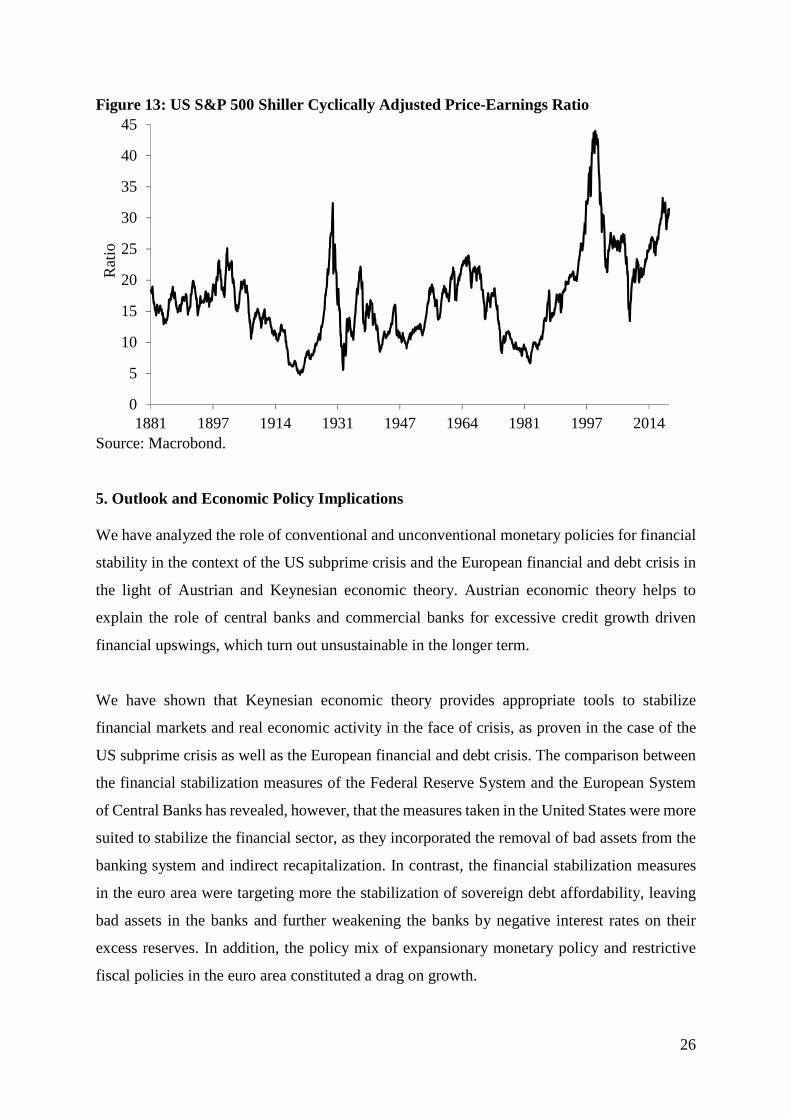
of production sites (FDI) and leveraged buy-outs. Therefore, price-earnings ratios have
increased strongly, as shown for the US S&P 500 Shiller cyclically adjusted price-earnings
ratio in Figure 13.
Mayer and Schnabl (2019) argue that the central-bank driven upward-shift in stock prices has
eroded the incentive to increase efficiency, thereby putting a drag on productivity growth. The
risk that a speculative bubble may burst in the enterprises sector seems to have substantially
increased both for the United States and the euro area, while the US banking sector seems to
be more resilient to a possibly upcoming crisis than euro area banks.
0
2
4
6
8
10
12
14
16
18
1990 2000 2010 2020
Tri
llio
n D
olla
rs
United States
0
2
4
6
8
10
12
14
16
1990 2000 2010 2020
Tri
llio
n D
olla
rs
FranceGermanyItalyNetherlandsSpainBelgiumOther
0
1
2
3
4
5
6
7
1990 2000 2010 2020
Tri
llio
n D
olla
rs
United States
0
0,2
0,4
0,6
0,8
1
1,2
1,4
1,6
1990 2000 2010 2020
Tri
llio
n D
olla
rs
FranceGermanyItalyNetherlandsSpainBelgiumOther
26
Figure 13: US S&P 500 Shiller Cyclically Adjusted Price-Earnings Ratio
Source: Macrobond.
5. Outlook and Economic Policy Implications
We have analyzed the role of conventional and unconventional monetary policies for financial
stability in the context of the US subprime crisis and the European financial and debt crisis in
the light of Austrian and Keynesian economic theory. Austrian economic theory helps to
explain the role of central banks and commercial banks for excessive credit growth driven
financial upswings, which turn out unsustainable in the longer term.
We have shown that Keynesian economic theory provides appropriate tools to stabilize
financial markets and real economic activity in the face of crisis, as proven in the case of the
US subprime crisis as well as the European financial and debt crisis. The comparison between
the financial stabilization measures of the Federal Reserve System and the European System
of Central Banks has revealed, however, that the measures taken in the United States were more
suited to stabilize the financial sector, as they incorporated the removal of bad assets from the
banking system and indirect recapitalization. In contrast, the financial stabilization measures
in the euro area were targeting more the stabilization of sovereign debt affordability, leaving
bad assets in the banks and further weakening the banks by negative interest rates on their
excess reserves. In addition, the policy mix of expansionary monetary policy and restrictive
fiscal policies in the euro area constituted a drag on growth.
0
5
10
15
20
25
30
35
40
45
1881 1897 1914 1931 1947 1964 1981 1997 2014
Rat
io
27
It was further shown, that the financial regulation linked to the monetary expansion has on one
side prevented banks from new risk taking. On the other side, persistently low interest rates
have destabilized banks in the euro area and have encouraged risk taking in the enterprise
sectors of the US and euro area, inter alia in form of costly leveraged buy-outs and stock buy-
back programs. The strong growth of corporate debt can be seen as a kind of shadow banking
sector, which has created new risks for economic stability.
The economic policy implication is that monetary expansion as an instrument for financial
stabilization has only limited effectiveness, as it helps to stabilize financial markets in the short-
term, but contributes to the emergence of new risks in the longer-term for two reasons. First,
during the upswing most financial indicators look sound, thereby providing incentives for
financial supervisors not to lean against the wind. Second, the regulation of one sector of the
economy leads to regulatory arbitrage and the emergence of new risks in other non-regulated
sectors of the economy. Therefore, in the long-term a gradual monetary tightening is inevitable
to ensure a sustainable degree of financial stability.
References:
Acharya, Viral / Steffen, Sascha / Steinruecke, Lea 2018. Kicking the Can Down the Road: Government Interventions in the European Banking Sector. Working Paper, Frankfurt School of Management and Finance.
Bernanke, Ben 1995. The Macroeconomics of the Great Depression: A Comparative Approach.
Journal of Money, Credit, and Banking 27, 1, 1-28. Bonfim, Diana / Soares, Carla 2018. The Risk‐Taking Channel of Monetary Policy: Exploring
All Avenues. Journal of Money, Credit and Banking 50, 7, 1507-1541. Borio, Claudio 2014. The Financial Cycle and Macroeconomics: What have we learnt?.
Journal of Banking and Finance 45, 182-198. Çelik, Serdar / Demirtaş, Gül / Isaksson, Mats 2020. Corporate Bond Market Trends, Emerging
Risks and Monetary Policy. OECD Capital Market Series. Corsetti, Giancarlo / Pesenti, Paolo / Roubini, Nouriel 1999. Paper Tigers? A Model of the
Asian Crisis. European Economic Review 43, 7, 1211-1236. Dell'Ariccia, Giovanni / Marquez, Robert 2006. Lending booms and lending standards. The
Journal of Finance 61, 5, 2511-2546.
28
Dell’Arricia, Giovanni / Igan, Deniz / Laeven, Luc / Tong, Hui / Bakker, Bas / Vandenbussche, Jérôme 2012. Policies for Macrofinancial Stability: How to Deal with Credit Booms. IMF Staff Discussion Note 12, 06.
Friedman, Milton / Schwartz, Anna 1963. A Monetary History of the United States, 1867–1960.
Princeton University Press, Princeton. Gerstenberger, Juliane / Schnabl, Gunther 2017. The Impact of Japanese Monetary Policy
Crisis Management on the Japanese Banking Sector. CESifo Working Paper 6440. Hellwig, Martin / Schnabel, Isabel 2019. Target-Salden, Leistungsbilanzsalden,
Geldschöpfung, Banken und Kapitalmärkte. Wirtschaftsdienst 99, 632–640 Hansen, Alvin 1939. Economic Stagnation and Population Growth. American Economic
Review 29, 1, 1-15. Hayek, Friedrich August von 1929. Geldtheorie und Konjunkturtheorie. Philosophia Verlag,
Salzburg. Hayek, Friedrich August von 1931 [1967]. Prices and Production. Reprint. Augustus M.
Kelley Publishers, New York. Hayek, Friedrich August von 1937 [1989]. Monetary Nationalism and International Stability.
Reprint. Augustus M. Kelley Publishers, New York. Jiménez, Gabriel / Ongena, Steven / Peydró, José-Luis / Saurina, Jesús 2014. Hazardous times
for monetary policy: What do twenty‐three million bank loans say about the effects of monetary policy on credit risk‐taking? Econometrica 82, 2, 463-505.
Keynes, John Maynard 1936 [2018]. The General Theory of Employment, Interest, and Money.
Reprint. Palgrave Macmillan, London. Kraft, Ivan / Ljubinko, Jankov 2005: Does Speed Kill? Lending Booms and their Consequences
in Croatia. Journal of Banking and Finance 29, 1, 105-121. Krugman, Paul 1998. What Happened to Asia? web.mit.edu/krugman/www/DISINTER.html. Paligorova, Teodora / Santos, João A.C. 2017: Monetary Policy and Bank Risk-Taking:
Evidence from the Corporate Loan Market, Journal of Financial Intermediation 30, 35-49. Mayer, Thomas / Schnabl Gunther 2019: Reasons for the Demise of Interest: Savings Glut and
Secular Stagnation or Central Bank Policy? CESifo Working Paper 7954.
Mises, Ludwig von 1912. Die Theorie des Geldes und der Umlaufmittel. Duncker und Humblot, Leipzig.
Minsky, Hyman Philip 1977. The Financial Instability Hypothesis: An Interpretation of Keynes
and an Alternative to "Standard" Theory. Nebraska Journal of Economics and Business 16, 1, 5-16.
29
Minsky, Hyman Philip 1986. Stabilizing and Unstable Economy. Yale University Press, New Haven.
Schnabl, Gunther 2019. Central Banking and Crisis Management from the Perspective of
Austrian Business Cycle Theory. The Oxford Handbook of the Economics of Central Banking. In Mayes, David / Siklos, Pierre / Sturm, Jan-Egbert (Eds.), Handbook The Economics of Central Banking 2019, Oxford University Press, Oxford, 551-584.
Schnabl, Gunther 2019. China’s Overinvestment and International Trade Conflict. China &
World Economy 27, 4, 37-62.
Schumpeter, Joseph 1912. The Theory of Economic Development. Cambridge, Massachusetts. Selgin, George 2018. Floored! How a Misguided Fed Experiment Deepened and Prolonged
the Great Recession. Cato Institute, Washington D.C. Sinn, Hans-Werner / Wollmershäuser, Timo 2012. Target Loans, Current Account Balances
and Capital Flows: The ECB’s Rescue Facility. International Tax and Public Finance 19, 4, 468-508.
Sinn, Hans-Werner 2016. Der Schwarze Juni. Verlag Herder, München. Webel, Baird 2013. Troubled Asset Relief Program (TARP): Implementation and Status.
Congressional Research Service, 7-5700. Wicksell, Knut 1898 [2005]. Geldzins und Güterpreise. Reprint. FinanzBuch Verlag,
München. Woodford, Michael 2003. Interest and Prices. Foundations of a Theory of Monetary Policy.
Princeton University Press, Princeton.
30
Appendix:
Figure 14: Yield Curves
USA
Germany
Euro Area
Source: US Treasury, Thompson Reuters. AAA ratings.
-10123456789
3 Months 1 Year 5 Year 10 Year 30 Year
Per
cent
1990-1994 1995-1999 2000-2004 2005-20092010-2014 2015-2019 2020
-1
0
1
2
3
4
5
6
7
8
3 Months 1 Year 5 Year 10 Year 30 Year
Per
cent
1994 1995-1999 2000-2004 2005-20092010-2014 2015-2019 2020
-10123456789
3 Month 1 Year 5 Year 10 Year 30 Year
Per
cent
2004 2005-2009 2010-2014 2015-2019 2020
31
Figure 15: Credit Margins
Source: Board of Governors of the Federal Reserve System, Freddie Mac, European Central Bank, Bundesbank, OECD.
Universität Leipzig Wirtschaftswissenschaftliche Fakultät
Nr. 1 Wolfgang Bernhardt Stock Options wegen oder gegen Shareholder Value? Vergütungsmodelle für Vorstände und Führungskräfte 04/1998
Nr. 2 Thomas Lenk / Volkmar Teichmann Bei der Reform der Finanzverfassung die neuen Bundesländer nicht vergessen! 10/1998
Nr. 3 Wolfgang Bernhardt Gedanken über Führen – Dienen – Verantworten 11/1998
Nr. 4 Kristin Wellner Möglichkeiten und Grenzen kooperativer Standortgestaltung zur Revitalisierung von Innenstädten 12/1998
Nr. 5 Gerhardt Wolff Brauchen wir eine weitere Internationalisierung der Betriebswirtschaftslehre? 01/1999
Nr. 6 Thomas Lenk / Friedrich Schneider Zurück zu mehr Föderalismus: Ein Vorschlag zur Neugestaltung des Finanzausgleichs in der Bundesrepublik Deutschland unter besonderer Berücksichtigung der neuen Bundesländer 12/1998
Nr: 7 Thomas Lenk Kooperativer Förderalismus – Wettbewerbsorientierter Förderalismus 03/1999
Nr. 8 Thomas Lenk / Andreas Mathes EU – Osterweiterung – Finanzierbar? 03/1999
Nr. 9 Thomas Lenk / Volkmar Teichmann Die fisikalischen Wirkungen verschiedener Forderungen zur Neugestaltung des Länderfinanz-ausgleichs in der Bundesrepublik Deutschland: Eine empirische Analyse unter Einbeziehung der Normenkontrollanträge der Länder Baden-Würtemberg, Bayern und Hessen sowie der Stellungnahmen verschiedener Bundesländer 09/1999
Nr. 10 Kai-Uwe Graw Gedanken zur Entwicklung der Strukturen im Bereich der Wasserversorgung unter besonderer Berücksichtigung kleiner und mittlerer Unternehmen 10/1999
Nr. 11 Adolf Wagner Materialien zur Konjunkturforschung 12/1999
Nr. 12 Anja Birke Die Übertragung westdeutscher Institutionen auf die ostdeutsche Wirklichkeit – ein erfolg-versprechendes Zusammenspiel oder Aufdeckung systematischer Mängel? Ein empirischer Bericht für den kommunalen Finanzausgleich am Beispiel Sachsen 02/2000
Nr. 13 Rolf H. Hasse Internationaler Kapitalverkehr in den letzten 40 Jahren – Wohlstandsmotor oder Krisenursache? 03/2000
Nr. 14 Wolfgang Bernhardt Unternehmensführung (Corporate Governance) und Hauptversammlung 04/2000
Nr. 15 Adolf Wagner Materialien zur Wachstumsforschung 03/2000
Nr. 16 Thomas Lenk / Anja Birke Determinanten des kommunalen Gebührenaufkommens unter besonderer Berücksichtigung der neuen Bundesländer 04/2000
Nr. 17 Thomas Lenk Finanzwirtschaftliche Auswirkungen des Bundesverfassungsgerichtsurteils zum Länderfinanzausgleich vom 11.11.1999 04/2000
Nr. 18 Dirk Bültel Continous linear utility for preferences on convex sets in normal real vector spaces 05/2000
Nr. 19 Stefan Dierkes / Stephanie Hanrath Steuerung dezentraler Investitionsentscheidungen bei nutzungsabhängigem und nutzungsunabhängigem Verschleiß des Anlagenvermögens 06/2000
Nr. 20 Thomas Lenk / Andreas Mathes / Olaf Hirschefeld Zur Trennung von Bundes- und Landeskompetenzen in der Finanzverfassung Deutschlands 07/2000
Nr. 21 Stefan Dierkes Marktwerte, Kapitalkosten und Betafaktoren bei wertabhängiger Finanzierung 10/2000
Nr. 22 Thomas Lenk Intergovernmental Fiscal Relationships in Germany: Requirement for New Regulations? 03/2001
Nr. 23 Wolfgang Bernhardt Stock Options – Aktuelle Fragen Besteuerung, Bewertung, Offenlegung 03/2001
Nr. 24 Thomas Lenk Die „kleine Reform“ des Länderfinanzausgleichs als Nukleus für die „große Finanzverfassungs-reform“? 10/2001
Nr. 25 Wolfgang Bernhardt Biotechnologie im Spannungsfeld von Menschenwürde, Forschung, Markt und Moral Wirtschaftsethik zwischen Beredsamkeit und Schweigen 11/2001
Nr. 26 Thomas Lenk Finanzwirtschaftliche Bedeutung der Neuregelung des bundestaatlichen Finanzausgleichs – Eine allkoative und distributive Wirkungsanalyse für das Jahr 2005 11/2001
Nr. 27 Sören Bär Grundzüge eines Tourismusmarketing, untersucht für den Südraum Leipzig 05/2002
Nr. 28 Wolfgang Bernhardt Der Deutsche Corporate Governance Kodex: Zuwahl (comply) oder Abwahl (explain)? 06/2002
Nr. 29 Adolf Wagner Konjunkturtheorie, Globalisierung und Evolutionsökonomik 08/2002
Nr. 30 Adolf Wagner Zur Profilbildung der Universitäten 08/2002
Nr. 31 Sabine Klinger / Jens Ulrich / Hans-Joachim Rudolph
Konjunktur als Determinante des Erdgasverbrauchs in der ostdeutschen Industrie? 10/2002
Nr. 32 Thomas Lenk / Anja Birke The Measurement of Expenditure Needs in the Fiscal Equalization at the Local Level Empirical Evidence from German Municipalities 10/2002
Nr. 33 Wolfgang Bernhardt Die Lust am Fliegen Eine Parabel auf viel Corporate Governance und wenig Unternehmensführung 11/2002
Nr. 34 Udo Hielscher Wie reich waren die reichsten Amerikaner wirklich? (US-Vermögensbewertungsindex 1800 – 2000) 12/2002
Nr. 35 Uwe Haubold / Michael Nowak Risikoanalyse für Langfrist-Investments Eine simulationsbasierte Studie 12/2002
Nr. 36 Thomas Lenk Die Neuregelung des bundesstaatlichen Finanzausgleichs auf Basis der Steuerschätzung Mai 2002 und einer aktualisierten Bevölkerungsstatistik 12/2002
Nr. 37 Uwe Haubold / Michael Nowak Auswirkungen der Renditeverteilungsannahme auf Anlageentscheidungen Eine simulationsbasierte Studie 02/2003
Nr. 38 Wolfgang Bernhard Corporate Governance Kondex für den Mittel-Stand? 06/2003
Nr. 39 Hermut Kormann Familienunternehmen: Grundfragen mit finanzwirtschaftlichen Bezug 10/2003
Nr. 40 Matthias Folk Launhardtsche Trichter 11/2003
Nr. 41 Wolfgang Bernhardt Corporate Governance statt Unternehmensführung 11/2003
Nr. 42 Thomas Lenk / Karolina Kaiser Das Prämienmodell im Länderfinanzausgleich – Anreiz- und Verteilungsmitwirkungen 11/2003
Nr. 43 Sabine Klinger Die Volkswirtschaftliche Gesamtrechnung des Haushaltsektors in einer Matrix 03/2004
Nr. 44 Thomas Lenk / Heide Köpping Strategien zur Armutsbekämpfung und –vermeidung in Ostdeutschland: 05/2004
Nr. 45 Wolfgang Bernhardt Sommernachtsfantasien Corporate Governance im Land der Träume. 07/2004
Nr. 46 Thomas Lenk / Karolina Kaiser The Premium Model in the German Fiscal Equalization System 12/2004
Nr. 47 Thomas Lenk / Christine Falken Komparative Analyse ausgewählter Indikatoren des Kommunalwirtschaftlichen Gesamt-ergebnisses 05/2005
Nr. 48 Michael Nowak / Stephan Barth Immobilienanlagen im Portfolio institutioneller Investoren am Beispiel von Versicherungsunternehmen Auswirkungen auf die Risikosituation 08/2005
Nr. 49 Wolfgang Bernhardt Familiengesellschaften – Quo Vadis? Vorsicht vor zu viel „Professionalisierung“ und Ver-Fremdung 11/2005
Nr. 50 Christian Milow Der Griff des Staates nach dem Währungsgold 12/2005
Nr. 51 Anja Eichhorst / Karolina Kaiser The Instiutional Design of Bailouts and Its Role in Hardening Budget Constraints in Federations 03/2006
Nr. 52 Ullrich Heilemann / Nancy Beck Die Mühen der Ebene – Regionale Wirtschaftsförderung in Leipzig 1991 bis 2004 08/2006
Nr. 53 Gunther Schnabl Die Grenzen der monetären Integration in Europa 08/2006
Nr. 54 Hermut Kormann Gibt es so etwas wie typisch mittelständige Strategien? 11/2006
Nr. 55 Wolfgang Bernhardt (Miss-)Stimmung, Bestimmung und Mitbestimmung Zwischen Juristentag und Biedenkopf-Kommission 11/2006
Nr. 56 Ullrich Heilemann / Annika Blaschzik Indicators and the German Business Cycle A Multivariate Perspective on Indicators of lfo, OECD, and ZEW 01/2007
Nr. 57 Ullrich Heilemann “The Suol of a new Machine” zu den Anfängen des RWI-Konjunkturmodells 12/2006
Nr. 58 Ullrich Heilemann / Roland Schuhr / Annika Blaschzik
Zur Evolution des deutschen Konjunkturzyklus 1958 bis 2004 Ergebnisse einer dynamischen Diskriminanzanalyse 01/2007
Nr. 59 Christine Falken / Mario Schmidt Kameralistik versus Doppik Zur Informationsfunktion des alten und neuen Rechnungswesens der Kommunen Teil I: Einführende und Erläuternde Betrachtungen zum Systemwechsel im kommunalen Rechnungswesen 01/2007
Nr. 60 Christine Falken / Mario Schmidt Kameralistik versus Doppik Zur Informationsfunktion des alten und neuen Rechnungswesens der Kommunen Teil II Bewertung der Informationsfunktion im Vergleich 01/2007
Nr. 61 Udo Hielscher Monti della citta di firenze Innovative Finanzierungen im Zeitalter Der Medici. Wurzeln der modernen Finanzmärkte 03/2007
Nr. 62 Ullrich Heilemann / Stefan Wappler Sachsen wächst anders Konjunkturelle, sektorale und regionale Bestimmungsgründe der Entwicklung der Bruttowertschöpfung 1992 bis 2006 07/2007
Nr. 63 Adolf Wagner Regionalökonomik: Konvergierende oder divergierende Regionalentwicklungen 08/2007
Nr. 64 Ullrich Heilemann / Jens Ulrich Good bye, Professir Phillips? Zum Wandel der Tariflohndeterminanten in der Bundesrepublik 1952 – 2004 08/2007
Nr. 65 Gunther Schnabl / Franziska Schobert Monetary Policy Operations of Debtor Central Banks in MENA Countries 10/2007
Nr. 66 Andreas Schäfer / Simone Valente Habit Formation, Dynastic Altruism, and Population Dynamics 11/2007
Nr. 67 Wolfgang Bernhardt 5 Jahre Deutscher Corporate Governance Kondex Eine Erfolgsgeschichte? 01/2008
Nr. 68 Ullrich Heilemann / Jens Ulrich Viel Lärm um wenig? Zur Empirie von Lohnformeln in der Bundesrepublik 01/2008
Nr. 69 Christian Groth / Karl-Josef Koch / Thomas M. Steger When economic growth is less than exponential 02/2008
Nr. 70 Andreas Bohne / Linda Kochmann Ökonomische Umweltbewertung und endogene Entwicklung peripherer Regionen Synthese einer Methodik und einer Theorie 02/2008
Nr. 71 Andreas Bohne / Linda Kochmann / Jan Slavík / Lenka Slavíková
Deutsch-tschechische Bibliographie Studien der kontingenten Bewertung in Mittel- und Osteuropa 06/2008
Nr. 72 Paul Lehmann / Christoph Schröter-Schlaack Regulating Land Development with Tradable Permits: What Can We Learn from Air Pollution Control? 08/2008
Nr. 73 Ronald McKinnon / Gunther Schnabl China’s Exchange Rate Impasse and the Weak U.S. Dollar 10/2008
Nr: 74 Wolfgang Bernhardt Managervergütungen in der Finanz- und Wirtschaftskrise Rückkehr zu (guter) Ordnung, (klugem) Maß und (vernünftigem) Ziel? 12/2008
Nr. 75 Moritz Schularick / Thomas M. Steger Financial Integration, Investment, and Economic Growth: Evidence From Two Eras of Financial Globalization 12/2008
Nr. 76 Gunther Schnabl / Stephan Freitag An Asymmetry Matrix in Global Current Accounts 01/2009
Nr. 77 Christina Ziegler Testing Predictive Ability of Business Cycle Indicators for the Euro Area 01/2009
Nr. 78 Thomas Lenk / Oliver Rottmann / Florian F. Woitek Public Corporate Governance in Public Enterprises Transparency in the Face of Divergent Positions of Interest 02/2009
Nr. 79 Thomas Steger / Lucas Bretschger Globalization, the Volatility of Intermediate Goods Prices, and Economic Growth 02/2009
Nr. 80 Marcela Munoz Escobar / Robert Holländer Institutional Sustainability of Payment for Watershed Ecosystem Services. Enabling conditions of institutional arrangement in watersheds 04/2009
Nr. 81 Robert Holländer / WU Chunyou / DUAN Ning Sustainable Development of Industrial Parks 07/2009
Nr. 82 Georg Quaas Realgrößen und Preisindizes im alten und im neuen VGR-System 10/2009
Nr. 83 Ullrich Heilemann / Hagen Findeis Empirical Determination of Aggregate Demand and Supply Curves: The Example of the RWI Business Cycle Model 12/2009
Nr. 84 Gunther Schnabl / Andreas Hoffmann The Theory of Optimum Currency Areas and Growth in Emerging Markets 03/2010
Nr. 85 Georg Quaas Does the macroeconomic policy of the global economy’s leader cause the worldwide asymmetry in current accounts? 03/2010
Nr. 86 Volker Grossmann / Thomas M. Steger / Timo Trimborn Quantifying Optimal Growth Policy 06/2010
Nr. 87 Wolfgang Bernhardt Corporate Governance Kodex für Familienunternehmen? Eine Widerrede 06/2010
Nr. 88 Philipp Mandel / Bernd Süssmuth A Re-Examination of the Role of Gender in Determining Digital Piracy Behavior 07/2010
Nr. 89 Philipp Mandel / Bernd Süssmuth Size Matters. The Relevance and Hicksian Surplus of Agreeable College Class Size 07/2010
Nr. 90 Thomas Kohstall / Bernd Süssmuth Cyclic Dynamics of Prevention Spending and Occupational Injuries in Germany: 1886-2009 07/2010
Nr. 91 Martina Padmanabhan Gender and Institutional Analysis. A Feminist Approach to Economic and Social Norms 08/2010
Nr. 92 Gunther Schnabl /Ansgar Belke Finanzkrise, globale Liquidität und makroökonomischer Exit 09/2010
Nr. 93 Ullrich Heilemann / Roland Schuhr / Heinz Josef Münch A “perfect storm”? The present crisis and German crisis patterns 12/2010
Nr. 94 Gunther Schnabl / Holger Zemanek Die Deutsche Wiedervereinigung und die europäische Schuldenkrise im Lichte der Theorie optimaler Währungsräume 06/2011
Nr. 95 Andreas Hoffmann / Gunther Schnabl Symmetrische Regeln und asymmetrisches Handeln in der Geld- und Finanzpolitik 07/2011
Nr. 96 Andreas Schäfer / Maik T. Schneider Endogenous Enforcement of Intellectual Property, North-South Trade, and Growth 08/2011
Nr. 97 Volker Grossmann / Thomas M. Steger / Timo Trimborn Dynamically Optimal R&D Subsidization 08/2011
Nr. 98 Erik Gawel Political drivers of and barriers to Public-Private Partnerships: The role of political involvement 09/2011
Nr. 99 André Casajus Collusion, symmetry, and the Banzhaf value 09/2011
Nr. 100 Frank Hüttner / Marco Sunder Decomposing R2 with the Owen value 10/2011
Nr. 101 Volker Grossmann / Thomas M. Steger / Timo Trimborn The Macroeconomics of TANSTAAFL 11/2011
Nr. 102 Andreas Hoffmann Determinants of Carry Trades in Central and Eastern Europe 11/2011
Nr. 103 Andreas Hoffmann Did the Fed and ECB react asymmetrically with respect to asset market developments? 01/2012
Nr. 104 Christina Ziegler Monetary Policy under Alternative Exchange Rate Regimes in Central and Eastern Europe 02/2012
Nr. 105 José Abad / Axel Löffler / Gunther Schnabl / Holger Zemanek
Fiscal Divergence, Current Account and TARGET2 Imbalances in the EMU 03/2012
Nr. 106 Georg Quaas / Robert Köster Ein Modell für die Wirtschaftszweige der deutschen Volkswirtschaft: Das “MOGBOT” (Model of Germany’s Branches of Trade)
Nr. 107 Andreas Schäfer / Thomas Steger Journey into the Unknown? Economic Consequences of Factor Market Integration under Increasing Returns to Scale 04/2012
Nr. 108 Andreas Hoffmann / Björn Urbansky Order, Displacements and Recurring Financial Crises 06/2012
Nr. 109 Finn Marten Körner / Holger Zemanek On the Brink? Intra-euro area imbalances and the sustainability of foreign debt 07/2012
Nr. 110 André Casajus / Frank Hüttner Nullifying vs. dummifying players or nullified vs. dummified players: The difference between the equal division value and the equal surplus division value 07/2012
Nr. 111 André Casajus Solidarity and fair taxation in TU games 07/2012
Nr. 112 Georg Quaas Ein Nelson-Winter-Modell der deutschen Volkswirtschaft 08/2012
Nr. 113 André Casajus / Frank Hüttner Null players, solidarity, and the egalitarian Shapley values 08/2012
Nr. 114 André Casajus The Shapley value without efficiency and additivity 11/2012
Nr. 115 Erik Gawel Neuordnung der W-Besoldung: Ausgestaltung und verfassungsrechtliche Probleme der Konsumtionsregeln zur Anrechnung von Leistungsbezügen 02/2013
Nr. 116 Volker Grossmann / Andreas Schäfer / Thomas M. Steger Migration, Capital Formation, and House Prices 02/2013
Nr. 117 Volker Grossmann / Thomas M. Steger Optimal Growth Policy: the Role of Skill Heterogeneity 03/2013
Nr. 118 Guido Heineck / Bernd Süssmuth A Different Look at Lenin's Legacy: Social Capital and Risk Taking in the Two Germanies 03/2013
Nr. 119 Andreas Hoffmann The Euro as a Proxy for the Classical Gold Standard? Government Debt Financing and Political Commitment in Historical Perspective 05/2013
Nr. 120 Andreas Hoffmann / Axel Loeffler Low Interest Rate Policy and the Use of Reserve Requirements in Emerging Markets 05/2013
Nr. 121 Gunther Schnabl The Global Move into the Zero Interest Rate and High Dept Trap 07/2013
Nr. 122 Axel Loeffler / Gunther Schnabl / Franziska Schobert Limits of Monetary Policy Autonomy and Exchange Rate Flexibility by East Asian Central Banks 08/2013
Nr. 123 Burkhard Heer / Bernd Süßmuth Tax Bracket Creep and its Effects on Income Distribution 08/2013
Nr. 124 Hans Fricke / Bernd Süßmuth Growth and Volatility of Tax Revenues in Latin America 08/2013
Nr. 125 Ulrich Volz RMB Internationalisation and Currency Co-operation in East Asia 09/2013
Nr. 126 André Casajus / Helfried Labrenz A property rights based consolidation approach 02/2014
Nr. 127 Pablo Duarte The Relationship between GDP and the Size of the Informal Economy: Empirical Evidence for Spain 02/2014
Nr. 128 Erik Gawel Neuordnung der Professorenbesoldung in Sachsen 03/2014
Nr. 129 Friedrun Quaas Orthodoxer Mainstream und Heterodoxe Alternativen Eine Analyse der ökonomischen Wissenschaftslandschaft 04/2014
Nr. 130 Gene Callahan / Andreas Hoffmann The Idea of a Social Cycle 05/2014
Nr. 131 Karl Trela Klimaanpassung als wirtschaftspolitisches Handlungsfeld 06/2014
Nr. 132 Erik Gawel / Miquel Aguado Neuregelungen der W-Besoldung auf dem verfassungsrechtlichen Prüfstand 08/2014
Nr. 133 Ulf Papenfuß / Matthias Redlich / Lars Steinhauer Forschend und engagiert lernen im Public Management: Befunde und Gestaltungsanregungen eines Service Learning Lehrforschungsprojektes 10/2014
Nr. 134 Karl Trela Political climate adaptation decisions in Germany - shortcomings and applications for decision support systems 11/2014
Nr. 135 Ulf Papenfuß / Lars Steinhauer / Benjamin Friedländer Beteiligungsberichterstattung der öffentlichen Hand im 13-Länder-Vergleich: Erfordernisse für mehr Transparenz über die Governance und Performance öffentlicher Unternehmen 02/2015
Nr. 136 Gunther Schnabl Japans Lehren für das Schweizer Wechselkursdilemma 02/2015
Nr. 137 Ulf Papenfuß / Christian Schmidt Determinants of Manager Pay in German State-Owned Enterprises and International Public Policy Implications: 3-Year Study for Sectors, Performance and Gender 02/2015
Nr. 138 Philipp Mandel / Bernd Süßmuth Public education, accountability, and yardstick competition in a federal system 05/2015
Nr. 139 Gunther Schnabl Wege zu einer stabilitäts- und wachstumsorientierten Geldpolitik aus österreichischer Perspektive 06/2015
Nr. 140 Ulf Papenfuß / Matthias Redlich / Lars Steinhauer / Benjamin Friedländer
Forschend und engagiert lernen im Public Management: Befunde und Gestaltungsanregungen eines Service Learning Lehrforschungsprojektes – 2. aktualisierte Auflage 08/2015
Nr. 141 Friedrun Quaas / Georg Quaas Hayeks Überinvestitionstheorie 10/2015
Nr. 142 Bastian Gawellek / Marco Sunder The German Excellence Initiative and Efficiency Change among Universities, 2001-2011 01/2016
Nr. 143 Benjamin Larin Bubble-Driven Business Cycles 02/2016
Nr. 144 Friedrun Quaas / Georg Quaas Effekte des Kapitalmarktzinses auf die Preis- und Produktivitätsentwicklung Eine Analyse der deutschen Volkswirtschaft 1970-2014 02/2016
Nr. 145 Thomas Lenk / Matthias Redlich / Philipp Glinka Nachhaltige Stadtfinanzen -Akzeptanzsteigerung der bürgerschaftlichen Beteiligung an der Haushaltsplanung 02/2016
Nr. 146 Michael von Prollius / Gunther Schnabl Geldpolitik, Arabellion, Flüchtlingskrise 10/2016
Nr. 147 David Leuwer / Bernd Süßmuth The Exchange Rate Susceptibility of European Core Industries, 1995-2010 05/2017
Nr. 148 Gunther Schnabl Monetary Policy and Wandering Overinvestment Cycles in East Asia and Europe 05/2017
Nr. 149 Ullrich Heilemann / Karsten Müller Wenig Unterschiede – Zur Treffsicherheit internationaler Prognosen und Prognostiker 07/2017
Nr. 150 Gunther Schnabl / Sebastian Müller Zur Zukunft der Europäischen Union aus ordnungspolitischer Perspektive 10/2017
Nr. 151 Gunther Schnabl Ultra-lockere Geldpolitiken, Finanzmarktblasen und marktwirtschaftliche Ordnung 10/2017
Nr. 152 Pablo Duarte / Bernd Süßmuth Implementing an approximate dynamic factor model to nowcast GDP using sensitivity analysis 02/2018
Nr. 153 Sophia Latsos Real Wage Effects of Japan’s Monetary Policy 03/2018
Nr. 154 Gunther Schnabl / Klaus Siemon Die EU-Insolvenzrichtlinie zu vorinsolvenzlichen Verfahren aus ordnungspolitischer Perspektive The EU Directive on Preventive Restructuring Frameworks from a Ordoliberal Perspective 07/2018
Nr. 155 Marika Behnert / Thomas Bruckner Cost effects of energy system stability and flexibility options – an integrated optimal power flow modeling approach 09/2018
Nr. 156 Gunther Schnabl 70 Years after the German Currency and Economic Reform: The Monetary, Economic and Political Order in Europe is Disturbed 10/2018
Nr. 157 Wolfgang Bernhardt Corporate Governance und Compliance Bunte Streiflichter 2018 11/2018
Nr. 158 Friedrun Quaas Der spezifische Liberalismus von Hayek im Spektrum des Neoliberalismus 01/2019
Nr. 159 Sophia Latsos The Low Interest Policy and the Household Saving Behavior in Japan 03/2019
Nr. 160 Gunther Schnabl Die Verteilungseffekte der Geldpolitik der Europäischen Zentralbank und deren Einfluss auf die politische Stabilität 06/2019
Nr. 161 Wolfgang Bernhardt 30 Jahre nach dem Fall der Mauer Einheit in Zweiheit? 07/2019
Nr. 162 Gunther Schnabl / Tim Sepp 30 Jahre nach dem Mauerfall Ursachen für Konvergenz und Divergenz zwischen Ost- und Westdeutschland 09/2019
Nr. 163 Karl-Friedrich Israel / Sophia Latsos The Impact of (Un)Conventional Expansionary Monetary Policy on Income Inequality – Lessons from Japan 11/2019
Nr. 164 Wolfgang Bernhardt 30 Jahre nach dem Fall der Mauer am 9. November 1989 Einheit in Zweiheit – Teil II 11/2019
Nr. 165 Friedrun Quaas Pluralismus in der Ökonomik – verpasste Chance, überfälliges Programm oder normalwissenschaftliche Realität? 03/2020
Nr. 166 Gunther Schnabl / Nils Sonnenberg Monetary Policy, Financial Regulation and Financial Stability: A Comparison between the Fed and the ECB 04/2020