Embed Size (px)
Citation preview
WORLD-MINING-DATA
WELT-BERGBAU-DATEN
C. Reichl, M. Schatz, G. Zsak
Volume / Heft 30
Minerals Production / Rohstoffproduktion
Vienna / Wien 2015
International Organizing Committee for the World Mining Congresses
Bundesministerium für Wissenschaft, Forschung und Wirtschaft 1010 WienStubenring 1www.bmwfw.gv.at

Vorwort
Eine wesentliche Grundlage für eine funktionierende Wirtschaft ist eine ausreichende und zu fairen Marktbedingungen ablaufende Versorgung mit mineralischen Rohstoffen. Die umfassende und objektive Analyse regionaler und sektoraler Trends der globalen
Bergbauproduktion ist die Basis für eine vorausschauende Rohstoffpolitik. Damit können eventuelle kurz- bzw. mittelfristige Versorgungsrisiken erkannt werden.
Obwohl die geologische Verfügbarkeit von mineralischen Rohstoffen derzeit unproblematisch scheint, können insbesondere handels- und geopolitische Faktoren zu deren Verknappung führen. Im Rahmen der Europäischen Innovationspartnerschaft für Rohstoffe, in deren Lenkungsgruppe Österreich vertreten ist, werden innovative Lösungen entlang der gesamten Rohstoffwertschöpfungskette erarbeitet. Dadurch soll die Importabhängigkeit Europas reduziert und die Versorgung mit leistbaren Rohstoffen langfristig sichergestellt werden, um die Wettbewerbsfähigkeit der Europäischen Industrie zu stärken.
Die Frage, welche mineralischen Rohstoffe im Hinblick auf ihre Versorgungssicherheit und wirtschaftliche Bedeutung als kritisch anzusehen sind, wurde von der Europäischen Kommission im letzten Jahr neu bewertet. Die Kenntnis über Produktionsmengen und mögliche Marktkonzentrationen sind für Fragen der Rohstoffsicherung von größter Bedeutung. Umso mehr freut mich, dass die Europäische Kommission dabei auf die vorliegenden World Mining Data zurückgegriffen hat und Österreich somit einen wichtigen Beitrag zur europäischen Rohstoffsicherungspolitik geleistet hat.
Die jährlich neu aufgelegten World Mining Data werden von namhaften nationalen und internationalen Institutionen als Grundlage wirtschaftlicher Auswertungen und rohstoffpolitischer Entscheidungen herangezogen. Damit nimmt das Wirtschaftsministerium eine internationale Vorreiterrolle auf diesem Sektor wahr.
Mein Dank gilt den österreichischen Vertretungsbehörden im Ausland sowie den zahlreichen internationalen Institutionen, die durch ihre aktive Mitarbeit wichtige Beiträge für das Zustandekommen der World Mining Data 2015 geleistet haben.
Glück Auf!
Dr. Reinhold Mitterlehner Vizekanzler und Bundesminister für Wissenschaft, Forschung und Wirtschaft Vice-Chancellor and Federal Minister of Science, Research and Economy

Content Inhalt
Explanation / Erläuterungen 1
1. Mineral Raw Materials / Mineralische Rohstoffe 1
2. Definitions / Definitionen 2
3. Details on Contents, Weights, Measures and Values / Angaben über Wertstoff, Dimensionen und Wert 5
4. Regional and Sectoral Groups / Regionale und sektorale Untergliederung 8
4.1 Development Status of Producer Countries / Entwicklungsstatus der Produzentenländer 8
4.2 Regional Groups of Producer Countries / Regionale Gruppierungen der Produzentenländer 10
4.3 Economic Blocks or Cartel-like Associations / Wirtschaftsblöcke oder kartellartige Zusammenschlüsse 11
4.4 Political Stability of Producer Countries / Politische Stabilität der Produzentenländer 13
4.5 Minerals Production by GNI (Gross National Income) of Producer Countries / Rohstoffproduktion nach BNE (Brutto National Einkommen) der Produzentenländer 14
4.6 Concentration of Producer Countries / Marktkonzentration der Produzentenländer 15
5. Data Capture / Erfassungsmodalität 16
Data / Daten 23
6. World Production of Mineral Raw Materials Weltproduktion mineralischer Rohstoffe 23
6.1 Total World Production Weltproduktion - gesamt 23
6.1.1 Total Minerals Production, by Continents Gesamtproduktion, nach Kontinenten 23
6.1.2 Total Minerals Production, by World Regions (according to IIASA) Gesamtproduktion, nach Welt-Regionen (gemäß IIASA) 24
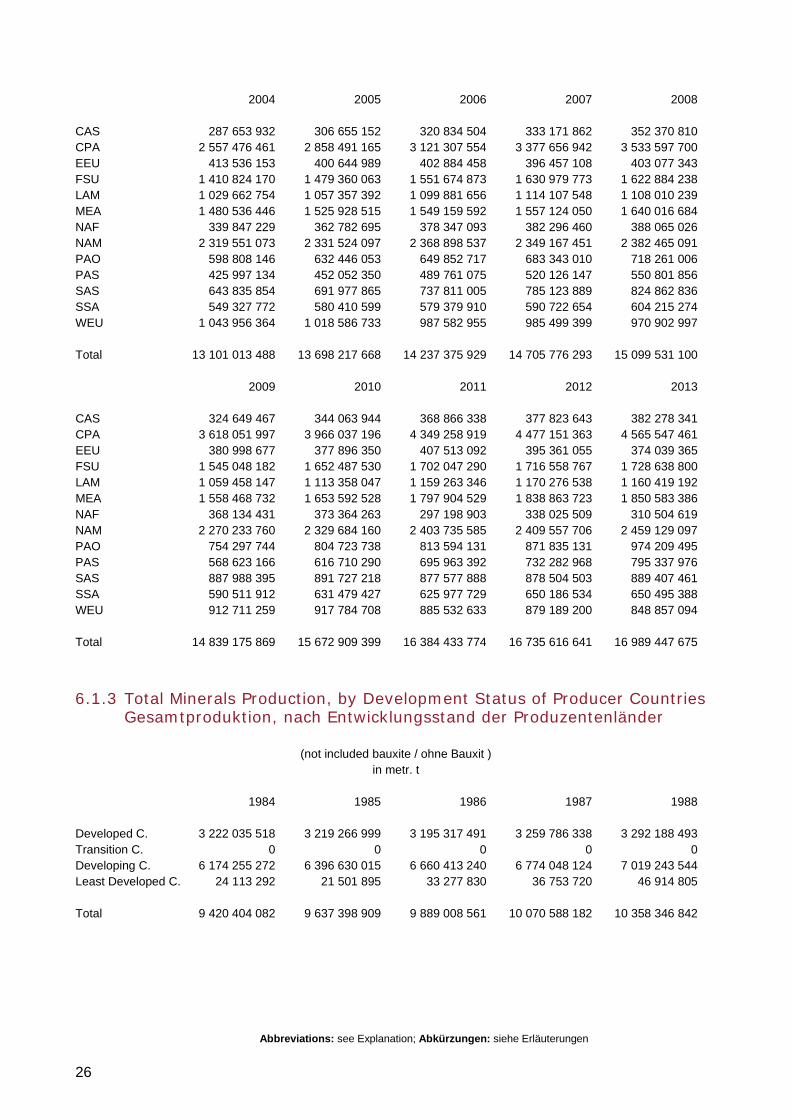
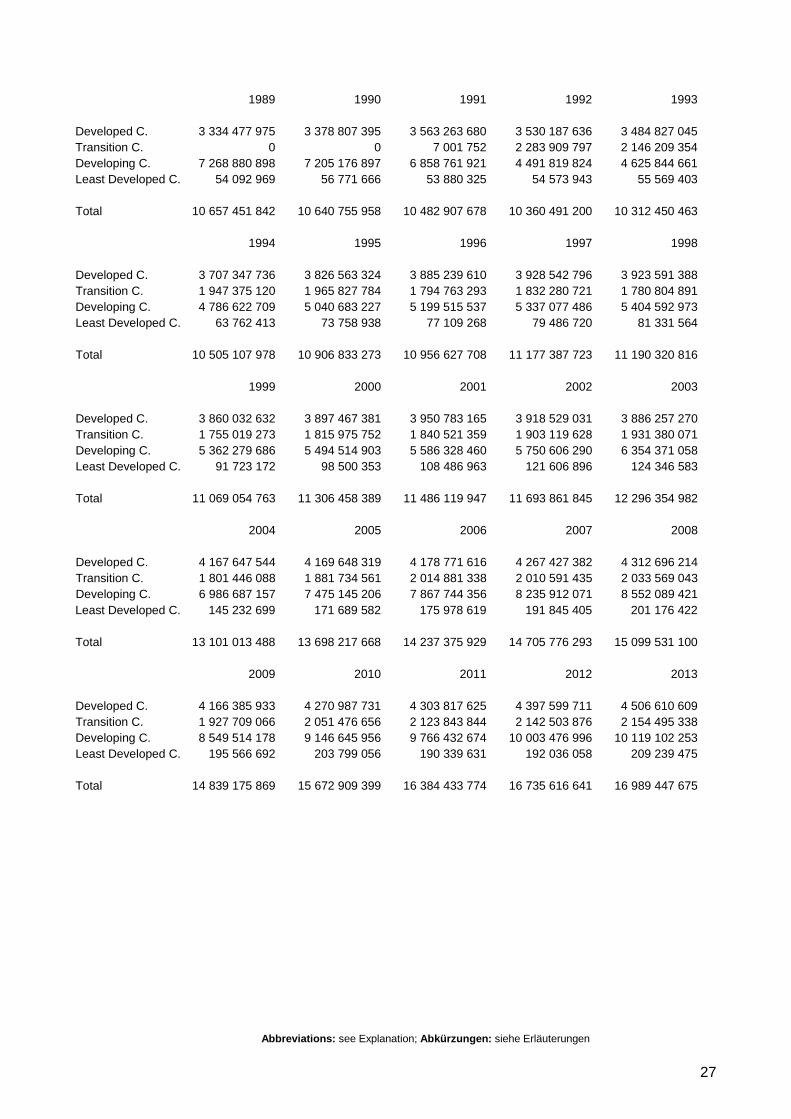
6.1.3 Total Minerals Production, by Development Status of Producer Countries Gesamtproduktion, nach Entwicklungsstand der Produzentenländer 26
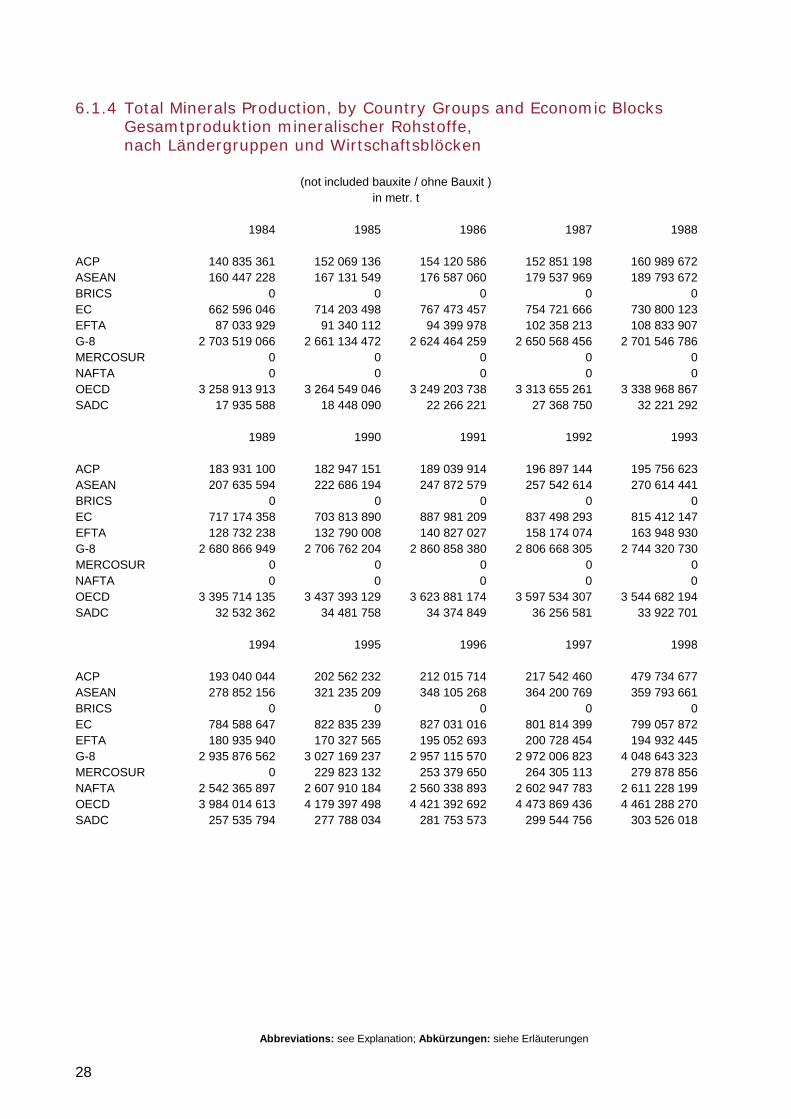
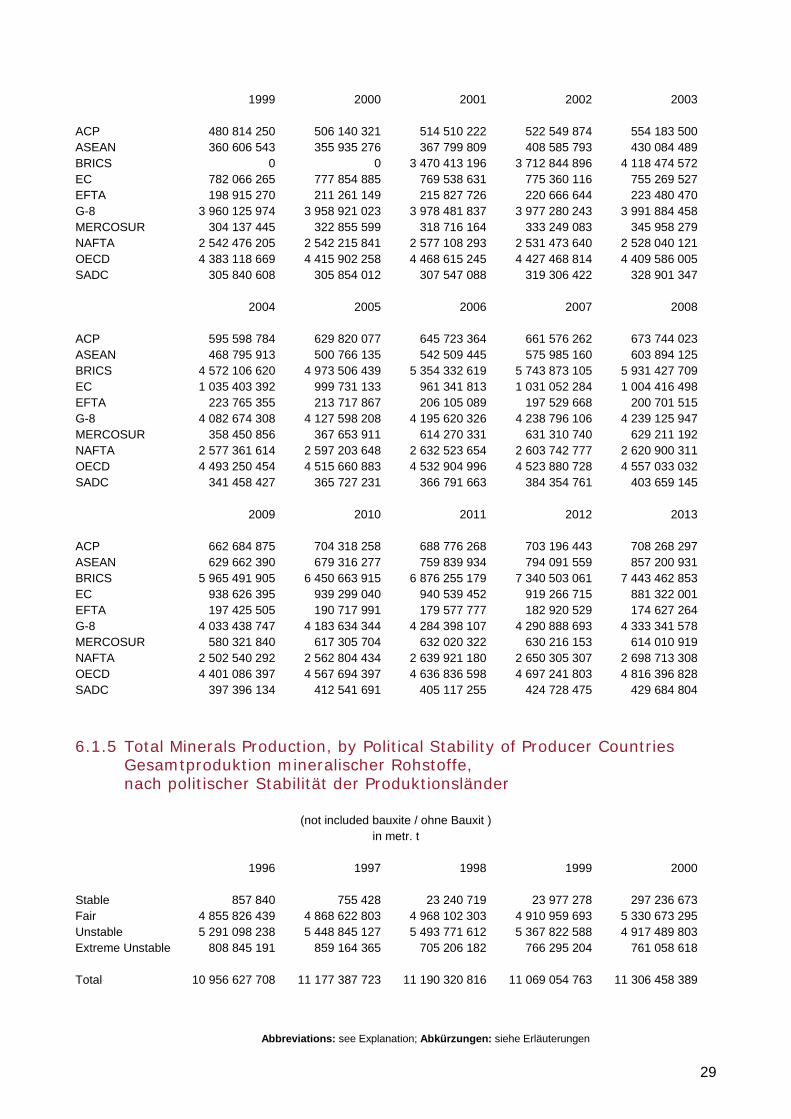
6.1.4 Total Minerals Production, by Country Groups and Economic Blocks Gesamtproduktion mineralischer Rohstoffe, nach Ländergruppen und Wirtschaftsblöcken 28
6.1.5 Total Minerals Production, by Political Stability of Producer Countries Gesamtproduktion mineralischer Rohstoffe, nach politischer Stabilität der Produktionsländer 29
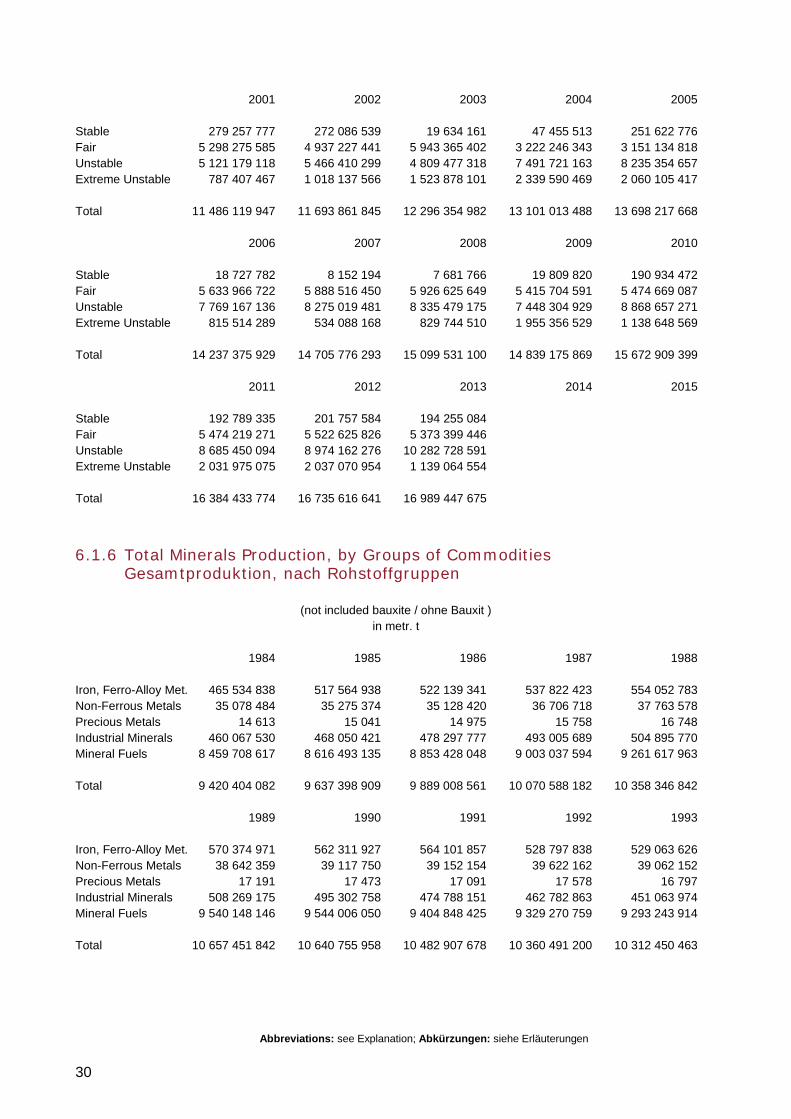
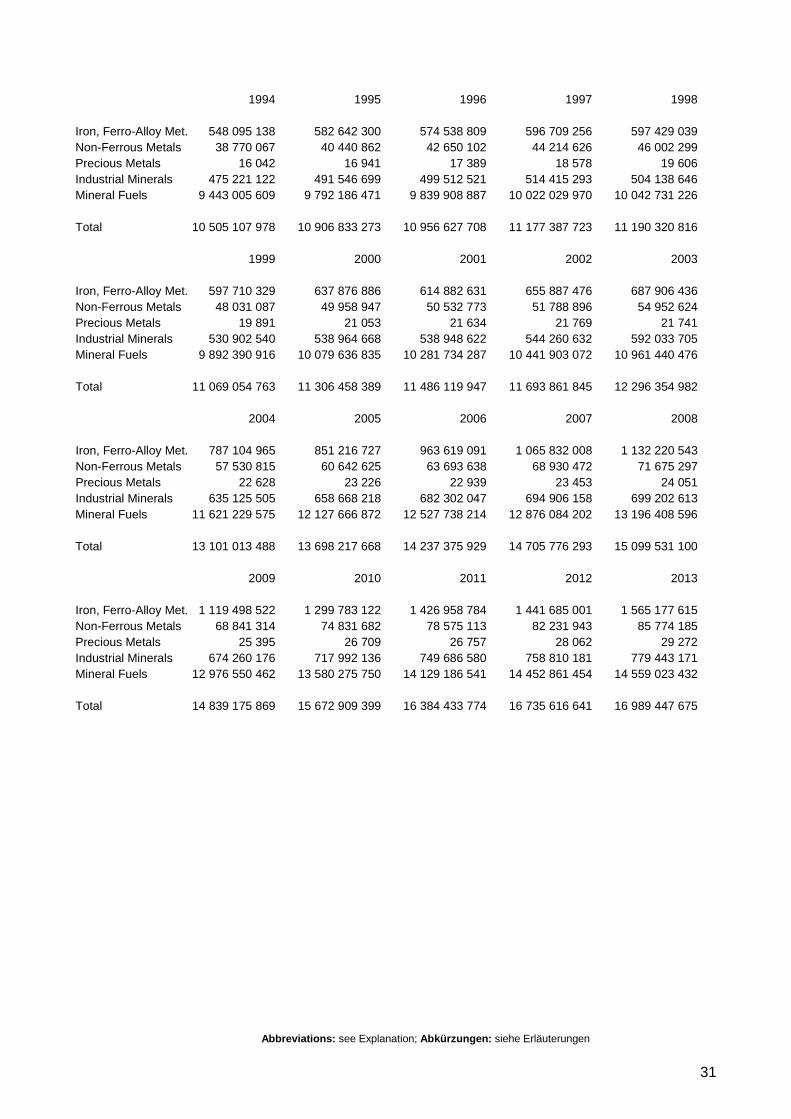
6.1.6 Total Minerals Production, by Groups of Commodities Gesamtproduktion, nach Rohstoffgruppen 30
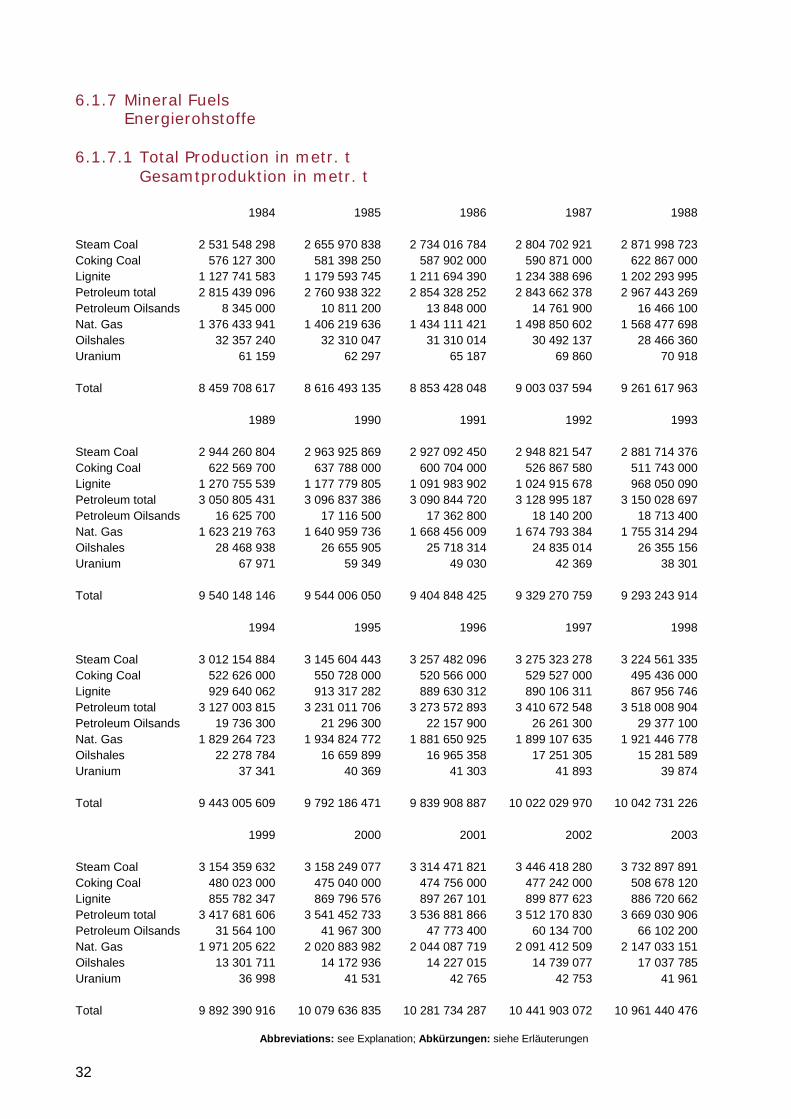
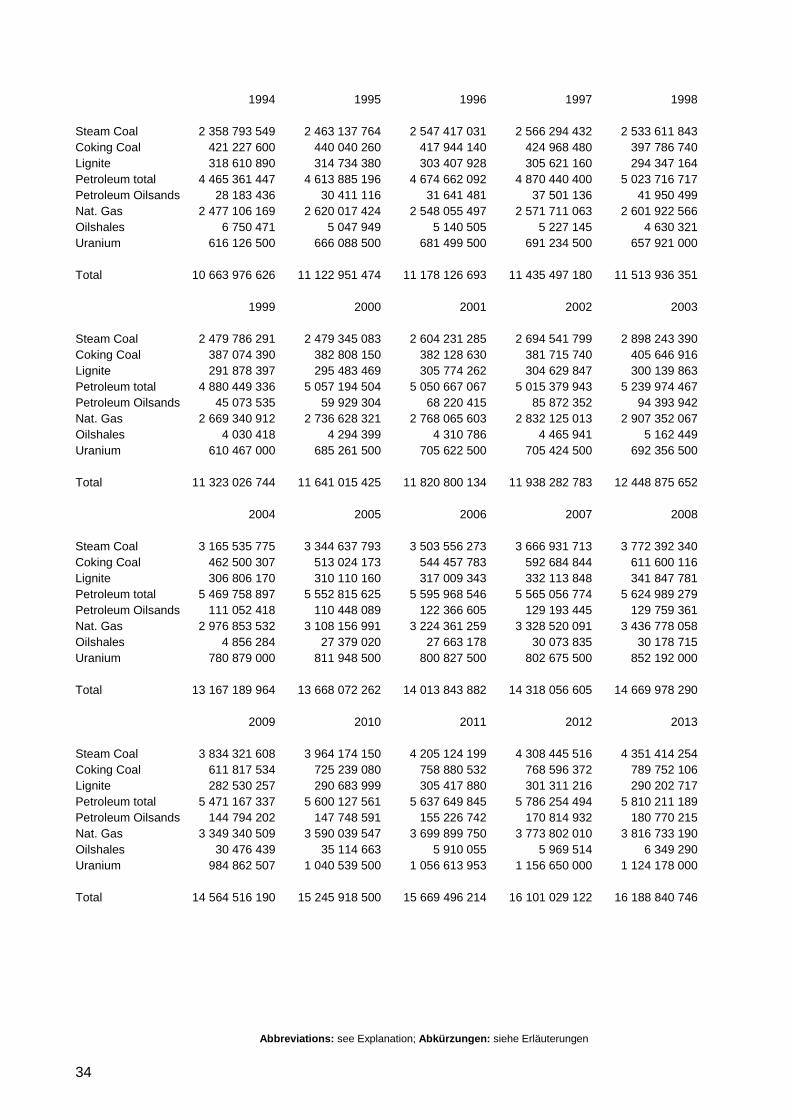
6.1.7 Mineral Fuels Energierohstoffe 32
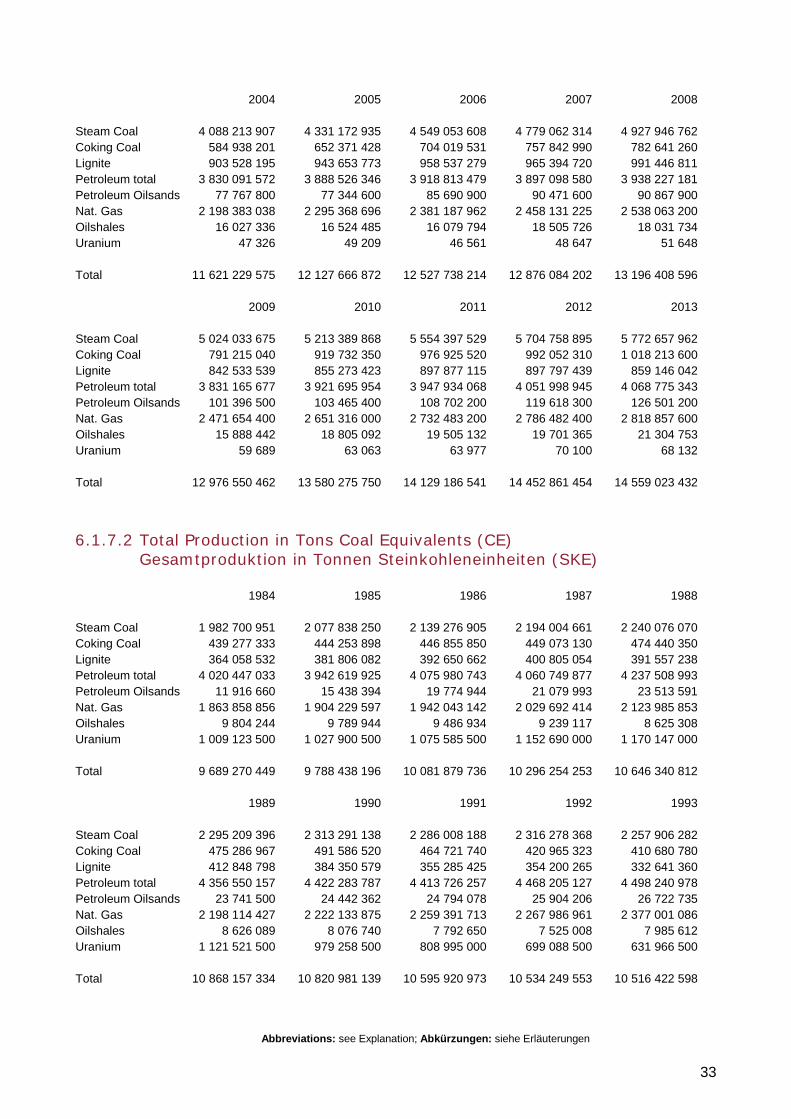
6.1.7.1 Total Production in metr. t Gesamtproduktion in metr. t 32
6.1.7.2 Total Production in Tons Coal Equivalents (CE) Gesamtproduktion in Tonnen Steinkohleneinheiten (SKE) 33
6.1.8 Total Minerals Production 2013, by Country Gesamt-Rohstoffproduktion 2013, nach Ländern 35
6.1.8.1 by Production in metr. t nach Mengen in metr. t 35
6.1.8.2 by Value in Million US$ (not included Diamonds) nach Wert in Mio. US$ (ohne Diamanten) 38
6.2 World Production of Mineral Raw Materials, by Mineral Raw Materials Weltproduktion mineralischer Rohstoffe, nach Rohstoffen 43
6.2.1 Iron and Ferro-Alloy Metals / Eisen und Stahlveredler 43
6.2.2 Non-Ferrous Metals / Nichteisenmetalle 43
6.2.3 Precious Metals / Edelmetalle 44
6.2.4 Industrial Minerals / Industrieminerale 44
6.2.5 Mineral Fuels / Energierohstoffe 45
6.3 World Production of Mineral Raw Materials, by Development Status, Income, Political Stability of the Producer Countries (according World Bank), Country Groups and Economic Blocks Weltproduktion mineralischer Rohstoffe, nach Entwicklungsstand, Einkommen, politischer Stabilität der Produzentenländer (gemäß Weltbank), Ländergruppen und Wirtschaftsblöcken 47
6.3.1 Iron and Ferro-Alloy Metals / Eisen und Stahlveredler 47
6.3.2 Non-Ferrous Metals / Nichteisenmetalle 55
6.3.3 Precious Metals / Edelmetalle 69
6.3.4 Industrial Minerals / Industrieminerale 73
6.3.5 Mineral Fuels / Energierohstoffe 88
6.4 Production of Mineral Raw Materials of individual Countries, by Minerals Produktion mineralischer Rohstoffe der einzelnen Länder, nach Rohstoffen 95
6.4.1 Iron and Ferro-Alloy Metals / Eisen und Stahlveredler 95
6.4.2 Non-Ferrous Metals / Nichteisenmetalle 101
6.4.3 Precious Metals / Edelmetalle 111
6.4.4 Industrial Minerals / Industrieminerale 115
6.4.5 Mineral Fuels / Energierohstoffe 132
6.5 Share of World Mineral Production 2013 by Countries Anteile der Länder an der Weltproduktion 2013 139
6.5.1 Iron and Ferro-Alloy Metals / Eisen und Stahlveredler 139
6.5.2 Non-Ferrous Metals / Nichteisenmetalle 145
6.5.3 Precious Metals / Edelmetalle 155
6.5.4 Industrial Minerals / Industrieminerale 159
6.5.5 Mineral Fuels / Energierohstoffe 175
6.6 Production of Mineral Raw Materials of individual Countries, by Countries Produktion mineralischer Rohstoffe der einzelnen Länder, nach Ländern 183

1
Explanation / Erläuterungen
1. Mineral Raw Materials / Mineralische Rohstoffe
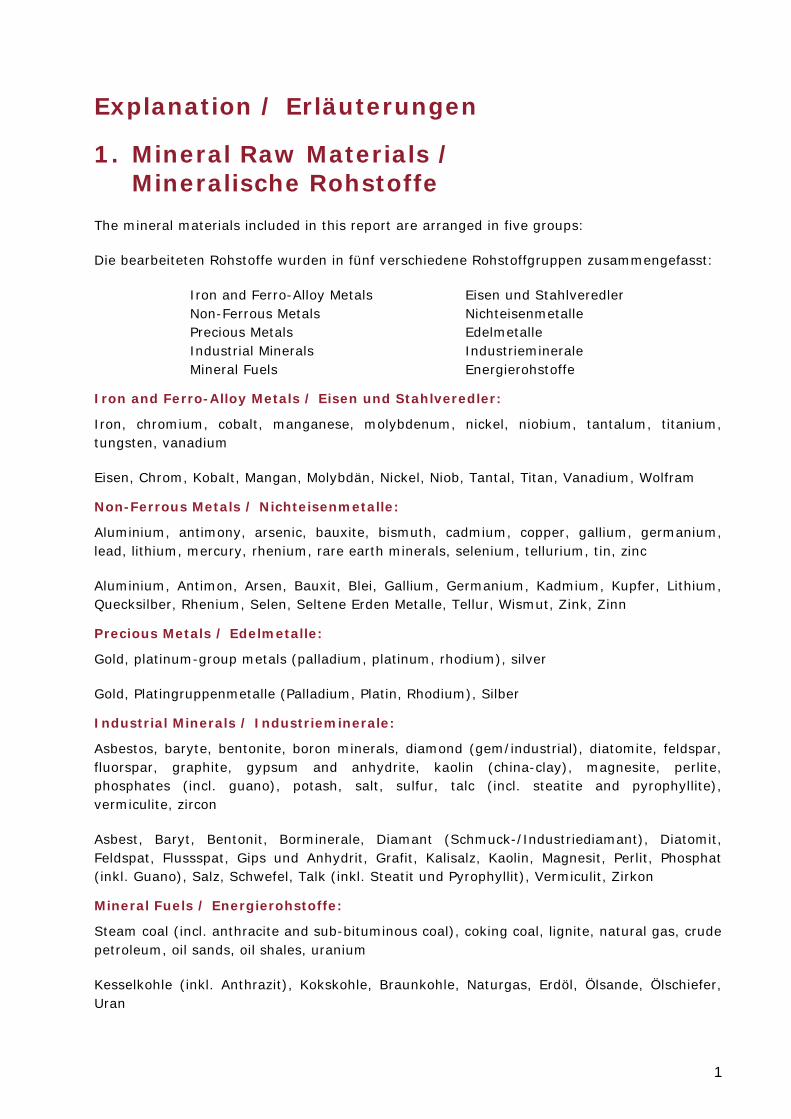
The mineral materials included in this report are arranged in five groups: Die bearbeiteten Rohstoffe wurden in fünf verschiedene Rohstoffgruppen zusammengefasst: Iron and Ferro-Alloy Metals Eisen und Stahlveredler Non-Ferrous Metals Nichteisenmetalle Precious Metals Edelmetalle Industrial Minerals Industrieminerale Mineral Fuels Energierohstoffe
Iron and Ferro-Alloy Metals / Eisen und Stahlveredler:
Iron, chromium, cobalt, manganese, molybdenum, nickel, niobium, tantalum, titanium, tungsten, vanadium Eisen, Chrom, Kobalt, Mangan, Molybdän, Nickel, Niob, Tantal, Titan, Vanadium, Wolfram
Non-Ferrous Metals / Nichteisenmetalle:
Aluminium, antimony, arsenic, bauxite, bismuth, cadmium, copper, gallium, germanium, lead, lithium, mercury, rhenium, rare earth minerals, selenium, tellurium, tin, zinc Aluminium, Antimon, Arsen, Bauxit, Blei, Gallium, Germanium, Kadmium, Kupfer, Lithium, Quecksilber, Rhenium, Selen, Seltene Erden Metalle, Tellur, Wismut, Zink, Zinn
Precious Metals / Edelmetalle:
Gold, platinum-group metals (palladium, platinum, rhodium), silver Gold, Platingruppenmetalle (Palladium, Platin, Rhodium), Silber
Industrial Minerals / Industrieminerale:
Asbestos, baryte, bentonite, boron minerals, diamond (gem/industrial), diatomite, feldspar, fluorspar, graphite, gypsum and anhydrite, kaolin (china-clay), magnesite, perlite, phosphates (incl. guano), potash, salt, sulfur, talc (incl. steatite and pyrophyllite), vermiculite, zircon Asbest, Baryt, Bentonit, Borminerale, Diamant (Schmuck-/Industriediamant), Diatomit, Feldspat, Flussspat, Gips und Anhydrit, Grafit, Kalisalz, Kaolin, Magnesit, Perlit, Phosphat (inkl. Guano), Salz, Schwefel, Talk (inkl. Steatit und Pyrophyllit), Vermiculit, Zirkon
Mineral Fuels / Energierohstoffe:
Steam coal (incl. anthracite and sub-bituminous coal), coking coal, lignite, natural gas, crude petroleum, oil sands, oil shales, uranium Kesselkohle (inkl. Anthrazit), Kokskohle, Braunkohle, Naturgas, Erdöl, Ölsande, Ölschiefer, Uran
2
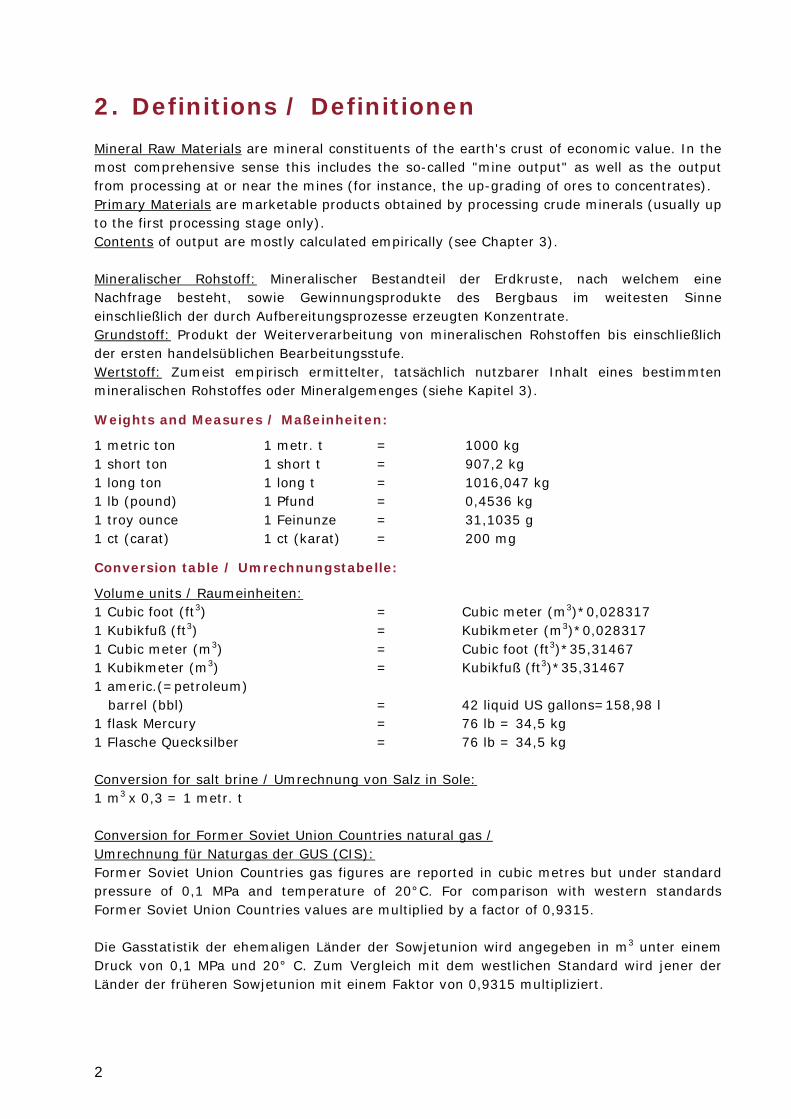
2. Definitions / Definitionen Mineral Raw Materials are mineral constituents of the earth's crust of economic value. In the most comprehensive sense this includes the so-called "mine output" as well as the output from processing at or near the mines (for instance, the up-grading of ores to concentrates). Primary Materials are marketable products obtained by processing crude minerals (usually up to the first processing stage only). Contents of output are mostly calculated empirically (see Chapter 3). Mineralischer Rohstoff: Mineralischer Bestandteil der Erdkruste, nach welchem eine Nachfrage besteht, sowie Gewinnungsprodukte des Bergbaus im weitesten Sinne einschließlich der durch Aufbereitungsprozesse erzeugten Konzentrate. Grundstoff: Produkt der Weiterverarbeitung von mineralischen Rohstoffen bis einschließlich der ersten handelsüblichen Bearbeitungsstufe. Wertstoff: Zumeist empirisch ermittelter, tatsächlich nutzbarer Inhalt eines bestimmten mineralischen Rohstoffes oder Mineralgemenges (siehe Kapitel 3).
Weights and Measures / Maßeinheiten:
1 metric ton 1 metr. t = 1000 kg 1 short ton 1 short t = 907,2 kg 1 long ton 1 long t = 1016,047 kg 1 lb (pound) 1 Pfund = 0,4536 kg 1 troy ounce 1 Feinunze = 31,1035 g 1 ct (carat) 1 ct (karat) = 200 mg
Conversion table / Umrechnungstabelle:
Volume units / Raumeinheiten: 1 Cubic foot (ft3) = Cubic meter (m3)*0,028317 1 Kubikfuß (ft3) = Kubikmeter (m3)*0,028317 1 Cubic meter (m3) = Cubic foot (ft3)*35,31467 1 Kubikmeter (m3) = Kubikfuß (ft3)*35,31467 1 americ.(=petroleum) barrel (bbl) = 42 liquid US gallons=158,98 l 1 flask Mercury = 76 lb = 34,5 kg 1 Flasche Quecksilber = 76 lb = 34,5 kg Conversion for salt brine / Umrechnung von Salz in Sole: 1 m3 x 0,3 = 1 metr. t Conversion for Former Soviet Union Countries natural gas / Umrechnung für Naturgas der GUS (CIS): Former Soviet Union Countries gas figures are reported in cubic metres but under standard pressure of 0,1 MPa and temperature of 20°C. For comparison with western standards Former Soviet Union Countries values are multiplied by a factor of 0,9315. Die Gasstatistik der ehemaligen Länder der Sowjetunion wird angegeben in m3 unter einem Druck von 0,1 MPa und 20° C. Zum Vergleich mit dem westlichen Standard wird jener der Länder der früheren Sowjetunion mit einem Faktor von 0,9315 multipliziert.
3
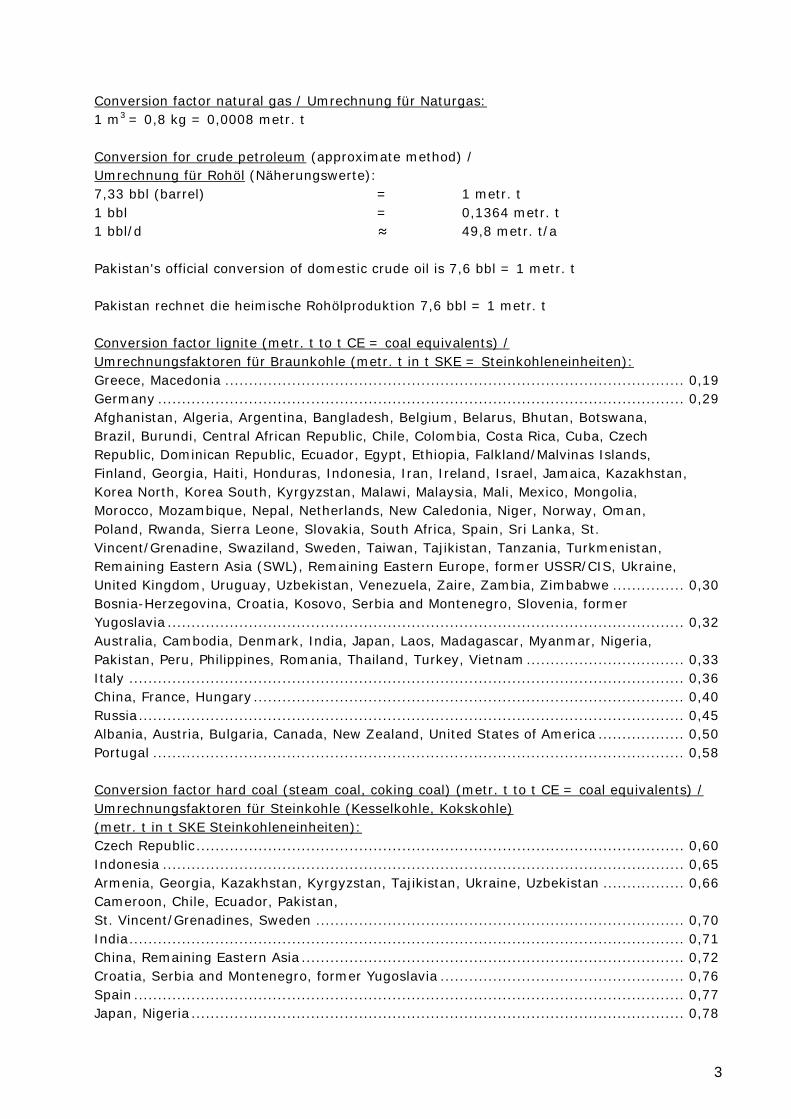
Conversion factor natural gas / Umrechnung für Naturgas: 1 m3 = 0,8 kg = 0,0008 metr. t Conversion for crude petroleum (approximate method) / Umrechnung für Rohöl (Näherungswerte): 7,33 bbl (barrel) = 1 metr. t 1 bbl = 0,1364 metr. t 1 bbl/d ≈ 49,8 metr. t/a Pakistan's official conversion of domestic crude oil is 7,6 bbl = 1 metr. t Pakistan rechnet die heimische Rohölproduktion 7,6 bbl = 1 metr. t Conversion factor lignite (metr. t to t CE = coal equivalents) / Umrechnungsfaktoren für Braunkohle (metr. t in t SKE = Steinkohleneinheiten): Greece, Macedonia ................................................................................................ 0,19 Germany .............................................................................................................. 0,29 Afghanistan, Algeria, Argentina, Bangladesh, Belgium, Belarus, Bhutan, Botswana, Brazil, Burundi, Central African Republic, Chile, Colombia, Costa Rica, Cuba, Czech Republic, Dominican Republic, Ecuador, Egypt, Ethiopia, Falkland/Malvinas Islands, Finland, Georgia, Haiti, Honduras, Indonesia, Iran, Ireland, Israel, Jamaica, Kazakhstan, Korea North, Korea South, Kyrgyzstan, Malawi, Malaysia, Mali, Mexico, Mongolia, Morocco, Mozambique, Nepal, Netherlands, New Caledonia, Niger, Norway, Oman, Poland, Rwanda, Sierra Leone, Slovakia, South Africa, Spain, Sri Lanka, St. Vincent/Grenadine, Swaziland, Sweden, Taiwan, Tajikistan, Tanzania, Turkmenistan, Remaining Eastern Asia (SWL), Remaining Eastern Europe, former USSR/CIS, Ukraine, United Kingdom, Uruguay, Uzbekistan, Venezuela, Zaire, Zambia, Zimbabwe ............... 0,30 Bosnia-Herzegovina, Croatia, Kosovo, Serbia and Montenegro, Slovenia, former Yugoslavia ............................................................................................................ 0,32 Australia, Cambodia, Denmark, India, Japan, Laos, Madagascar, Myanmar, Nigeria, Pakistan, Peru, Philippines, Romania, Thailand, Turkey, Vietnam ................................. 0,33 Italy .................................................................................................................... 0,36 China, France, Hungary .......................................................................................... 0,40 Russia .................................................................................................................. 0,45 Albania, Austria, Bulgaria, Canada, New Zealand, United States of America .................. 0,50 Portugal ............................................................................................................... 0,58 Conversion factor hard coal (steam coal, coking coal) (metr. t to t CE = coal equivalents) / Umrechnungsfaktoren für Steinkohle (Kesselkohle, Kokskohle) (metr. t in t SKE Steinkohleneinheiten): Czech Republic ...................................................................................................... 0,60 Indonesia ............................................................................................................. 0,65 Armenia, Georgia, Kazakhstan, Kyrgyzstan, Tajikistan, Ukraine, Uzbekistan ................. 0,66 Cameroon, Chile, Ecuador, Pakistan, St. Vincent/Grenadines, Sweden ............................................................................. 0,70 India .................................................................................................................... 0,71 China, Remaining Eastern Asia ................................................................................ 0,72 Croatia, Serbia and Montenegro, former Yugoslavia ................................................... 0,76 Spain ................................................................................................................... 0,77 Japan, Nigeria ....................................................................................................... 0,78
4
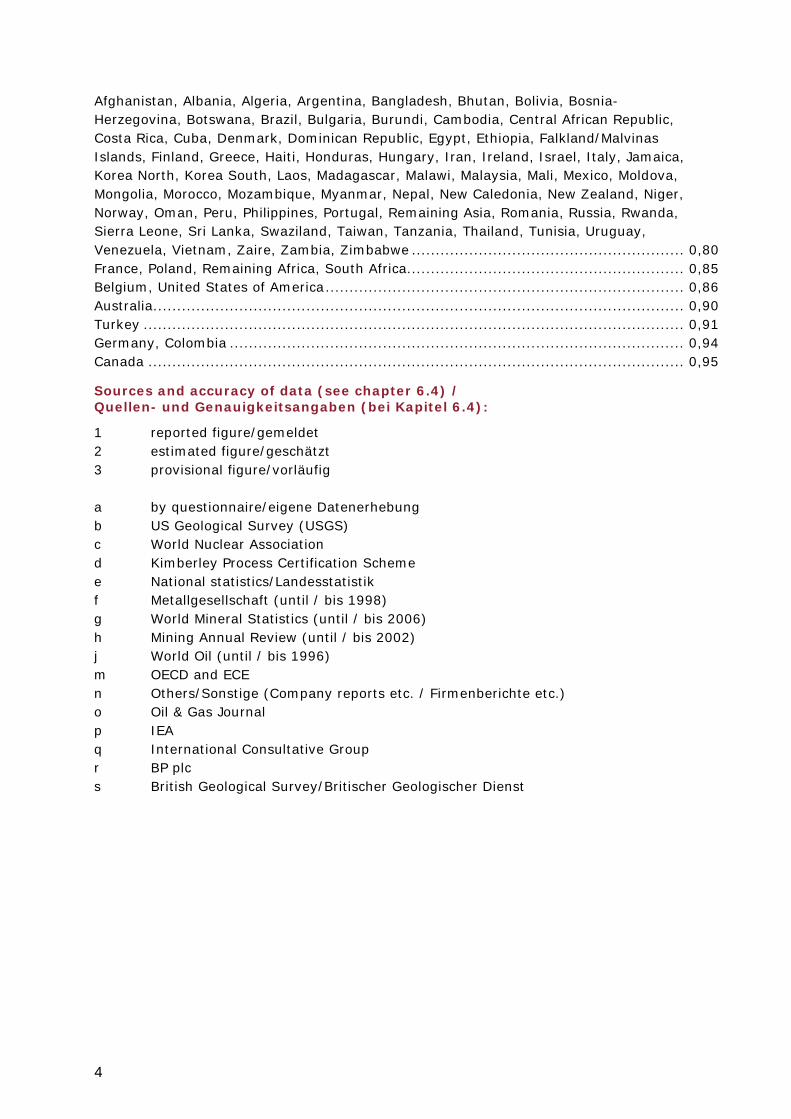
Afghanistan, Albania, Algeria, Argentina, Bangladesh, Bhutan, Bolivia, Bosnia-Herzegovina, Botswana, Brazil, Bulgaria, Burundi, Cambodia, Central African Republic, Costa Rica, Cuba, Denmark, Dominican Republic, Egypt, Ethiopia, Falkland/Malvinas Islands, Finland, Greece, Haiti, Honduras, Hungary, Iran, Ireland, Israel, Italy, Jamaica, Korea North, Korea South, Laos, Madagascar, Malawi, Malaysia, Mali, Mexico, Moldova, Mongolia, Morocco, Mozambique, Myanmar, Nepal, New Caledonia, New Zealand, Niger, Norway, Oman, Peru, Philippines, Portugal, Remaining Asia, Romania, Russia, Rwanda, Sierra Leone, Sri Lanka, Swaziland, Taiwan, Tanzania, Thailand, Tunisia, Uruguay, Venezuela, Vietnam, Zaire, Zambia, Zimbabwe ......................................................... 0,80 France, Poland, Remaining Africa, South Africa.......................................................... 0,85 Belgium, United States of America ........................................................................... 0,86 Australia ............................................................................................................... 0,90 Turkey ................................................................................................................. 0,91 Germany, Colombia ............................................................................................... 0,94 Canada ................................................................................................................ 0,95
Sources and accuracy of data (see chapter 6.4) / Quellen- und Genauigkeitsangaben (bei Kapitel 6.4):
1 reported figure/gemeldet 2 estimated figure/geschätzt 3 provisional figure/vorläufig a by questionnaire/eigene Datenerhebung b US Geological Survey (USGS) c World Nuclear Association d Kimberley Process Certification Scheme e National statistics/Landesstatistik f Metallgesellschaft (until / bis 1998) g World Mineral Statistics (until / bis 2006) h Mining Annual Review (until / bis 2002) j World Oil (until / bis 1996) m OECD and ECE n Others/Sonstige (Company reports etc. / Firmenberichte etc.) o Oil & Gas Journal p IEA q International Consultative Group r BP plc s British Geological Survey/Britischer Geologischer Dienst
5
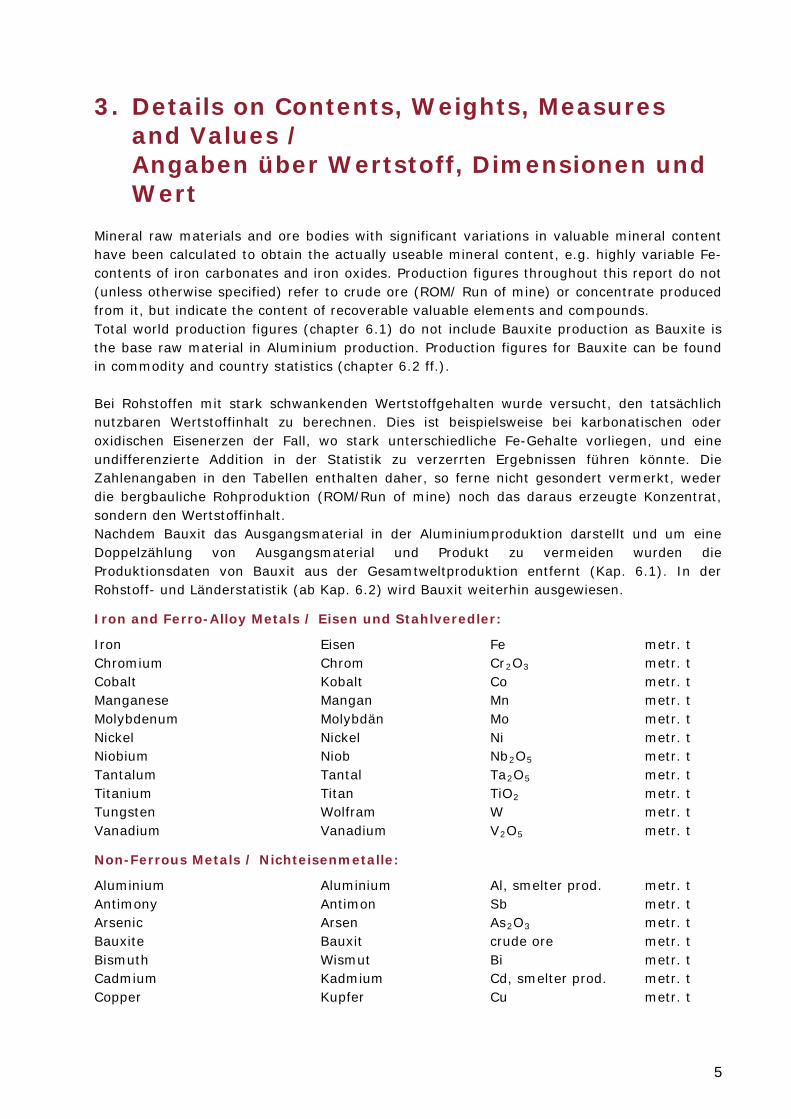
3. Details on Contents, Weights, Measures and Values / Angaben über Wertstoff, Dimensionen und Wert
Mineral raw materials and ore bodies with significant variations in valuable mineral content have been calculated to obtain the actually useable mineral content, e.g. highly variable Fe-contents of iron carbonates and iron oxides. Production figures throughout this report do not (unless otherwise specified) refer to crude ore (ROM/ Run of mine) or concentrate produced from it, but indicate the content of recoverable valuable elements and compounds. Total world production figures (chapter 6.1) do not include Bauxite production as Bauxite is the base raw material in Aluminium production. Production figures for Bauxite can be found in commodity and country statistics (chapter 6.2 ff.). Bei Rohstoffen mit stark schwankenden Wertstoffgehalten wurde versucht, den tatsächlich nutzbaren Wertstoffinhalt zu berechnen. Dies ist beispielsweise bei karbonatischen oder oxidischen Eisenerzen der Fall, wo stark unterschiedliche Fe-Gehalte vorliegen, und eine undifferenzierte Addition in der Statistik zu verzerrten Ergebnissen führen könnte. Die Zahlenangaben in den Tabellen enthalten daher, so ferne nicht gesondert vermerkt, weder die bergbauliche Rohproduktion (ROM/Run of mine) noch das daraus erzeugte Konzentrat, sondern den Wertstoffinhalt. Nachdem Bauxit das Ausgangsmaterial in der Aluminiumproduktion darstellt und um eine Doppelzählung von Ausgangsmaterial und Produkt zu vermeiden wurden die Produktionsdaten von Bauxit aus der Gesamtweltproduktion entfernt (Kap. 6.1). In der Rohstoff- und Länderstatistik (ab Kap. 6.2) wird Bauxit weiterhin ausgewiesen.
Iron and Ferro-Alloy Metals / Eisen und Stahlveredler:
Iron Eisen Fe metr. t Chromium Chrom Cr2O3 metr. t Cobalt Kobalt Co metr. t Manganese Mangan Mn metr. t Molybdenum Molybdän Mo metr. t Nickel Nickel Ni metr. t Niobium Niob Nb2O5 metr. t Tantalum Tantal Ta2O5 metr. t Titanium Titan TiO2 metr. t Tungsten Wolfram W metr. t Vanadium Vanadium V2O5 metr. t
Non-Ferrous Metals / Nichteisenmetalle:
Aluminium Aluminium Al, smelter prod. metr. t Antimony Antimon Sb metr. t Arsenic Arsen As2O3 metr. t Bauxite Bauxit crude ore metr. t Bismuth Wismut Bi metr. t Cadmium Kadmium Cd, smelter prod. metr. t Copper Kupfer Cu metr. t
6
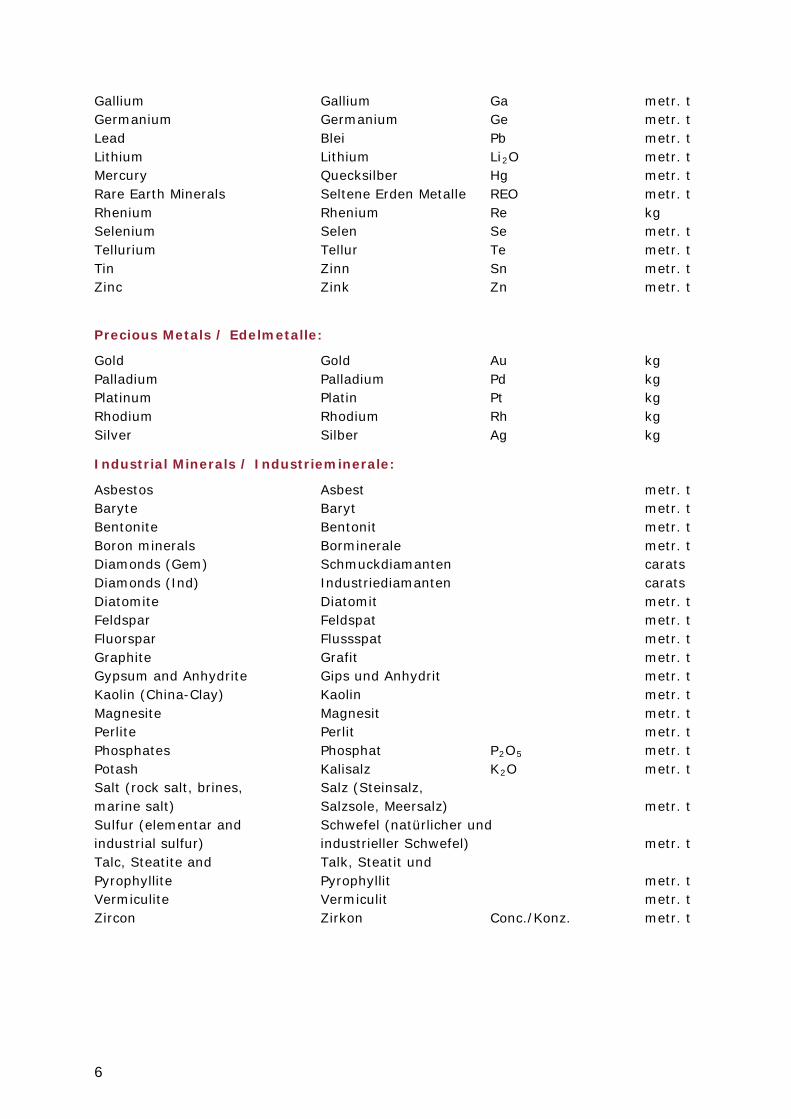
Gallium Gallium Ga metr. t Germanium Germanium Ge metr. t Lead Blei Pb metr. t Lithium Lithium Li2O metr. t Mercury Quecksilber Hg metr. t Rare Earth Minerals Seltene Erden Metalle REO metr. t Rhenium Rhenium Re kg Selenium Selen Se metr. t Tellurium Tellur Te metr. t Tin Zinn Sn metr. t Zinc Zink Zn metr. t
Precious Metals / Edelmetalle:
Gold Gold Au kg Palladium Palladium Pd kg Platinum Platin Pt kg Rhodium Rhodium Rh kg Silver Silber Ag kg
Industrial Minerals / Industrieminerale:
Asbestos Asbest metr. t Baryte Baryt metr. t Bentonite Bentonit metr. t Boron minerals Borminerale metr. t Diamonds (Gem) Schmuckdiamanten carats Diamonds (Ind) Industriediamanten carats Diatomite Diatomit metr. t Feldspar Feldspat metr. t Fluorspar Flussspat metr. t Graphite Grafit metr. t Gypsum and Anhydrite Gips und Anhydrit metr. t Kaolin (China-Clay) Kaolin metr. t Magnesite Magnesit metr. t Perlite Perlit metr. t Phosphates Phosphat P2O5 metr. t Potash Kalisalz K2O metr. t Salt (rock salt, brines, Salz (Steinsalz, marine salt) Salzsole, Meersalz) metr. t Sulfur (elementar and Schwefel (natürlicher und industrial sulfur) industrieller Schwefel) metr. t Talc, Steatite and Talk, Steatit und Pyrophyllite Pyrophyllit metr. t Vermiculite Vermiculit metr. t Zircon Zirkon Conc./Konz. metr. t
7
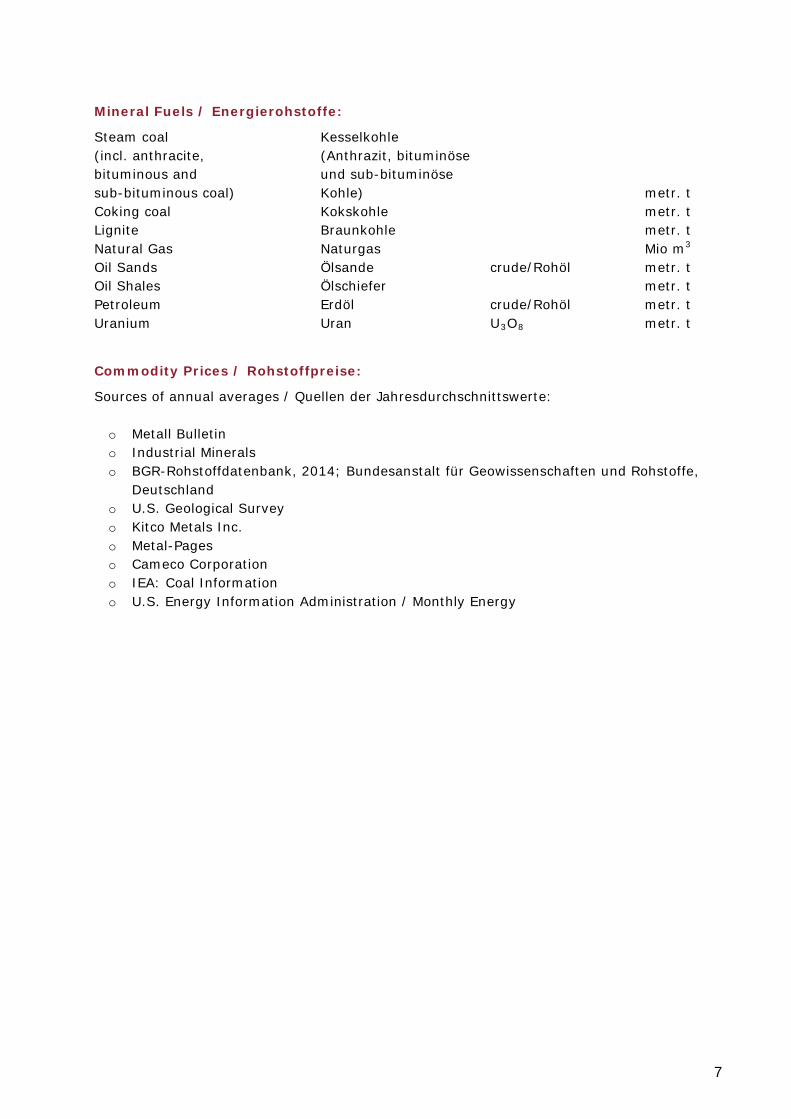
Mineral Fuels / Energierohstoffe:
Steam coal Kesselkohle (incl. anthracite, (Anthrazit, bituminöse bituminous and und sub-bituminöse sub-bituminous coal) Kohle) metr. t Coking coal Kokskohle metr. t Lignite Braunkohle metr. t Natural Gas Naturgas Mio m3
Oil Sands Ölsande crude/Rohöl metr. t Oil Shales Ölschiefer metr. t Petroleum Erdöl crude/Rohöl metr. t Uranium Uran U3O8 metr. t
Commodity Prices / Rohstoffpreise:
Sources of annual averages / Quellen der Jahresdurchschnittswerte: o Metall Bulletin o Industrial Minerals o BGR-Rohstoffdatenbank, 2014; Bundesanstalt für Geowissenschaften und Rohstoffe,
Deutschland o U.S. Geological Survey o Kitco Metals Inc. o Metal-Pages o Cameco Corporation o IEA: Coal Information o U.S. Energy Information Administration / Monthly Energy
8
4. Regional and Sectoral Groups / Regionale und sektorale Untergliederung
4.1 Development Status of Producer Countries / Entwicklungsstatus der Produzentenländer
An attempt was made to identify the development status of all countries that produce mineral raw materials. The different producer countries were classified according to international standards taking into consideration in particular UNCTAD and IIASA classifications. The classification has been adopted for statistical convenience only (see fig. 5). Important note: The designations "developed", "in transition" and "developing" are intended for statistical convenience and do not necessarily express a judgement about the stage reached by a particular country or area in the development process. Where the designations "economy" or "country or area" appear in tables, they cover countries, territories, cities and areas. Grundsätzlich wurde versucht, den Entwicklungsstatus sämtlicher rohstoffproduzierender Länder zu erfassen. Die einzelnen Produzentenländer wurden dabei nach international gültigen Kriterien unter Beachtung der UNCTAD- bzw. IIASA-Klassifikation geordnet. Die nachstehende Klassifikation dient lediglich zur statistischen Berechnung (siehe Fig. 5). Wichtiger Hinweis: Die Bezeichnungen "Entwickelte Länder", "Übergangsländer" und "Entwicklungsländer" sind lediglich für den statistischen Gebrauch bestimmt und geben nicht zwingend die Meinung über das erreichte Entwicklungsstadium eines bestimmten Landes oder einer Region wieder. Die Begriffe "Wirtschaft" oder "Land oder Region" umfassen Länder, Territorien, Städte und Gebiete.
Developed, developing countries / Entwickelte Länder, Entwicklungsländer:
According / nach OECD GLOSSARY OF STATISTICAL TERMS There is no established convention for the designation of "developed" and "developing" countries or areas in the United Nations system. In common practice, Japan in Asia, Canada and the United States in northern America, Australia and New Zealand in Oceania and Europe are considered "developed" regions or areas. In international trade statistics, the Southern African Customs Union is also treated as developed region and Israel as a developed country; countries emerging from the former Yugoslavia are treated as developing countries; and countries of Eastern Europe and the former USSR countries in Europe are not included under either developed or developing regions (see economies in transition). For detailed list of developing countries see http://unstats.un.org/unsd/methods/m49/m49regin.htm. Es besteht nach dem Einteilungssystem der Vereinten Nationen keine allgemein gültige Grundlage für die Bezeichnung als "Entwickeltes Land" oder "Entwicklungsland". Allgemein werden Japan in Asien, Kanada und die Vereinigten Staaten von Amerika in Nordamerika, Australien und Neuseeland in Oceanien und Europa als entwickelte Regionen angesehen. In den internationalen Handelsstatistiken werden die Südafrikanische Zollunion ebenso als entwickelte Region und auch Israel als entwickeltes Land geführt. Die osteuropäischen Länder und die Länder der ehemaligen USSR in Europa werden weder in der Gruppe der
9
entwickelten Länder, noch der Entwicklungsländer geführt (siehe Übergangsländer). Eine detaillierte Auflistung der Entwicklungsländer findet sich unter http://unstats.un.org/unsd/methods/m49/m49regin.htm. Source (Quelle): United Nations. Standard country or Area Codes for Statistical Use. Series M, No. 49, Rev. 4 (United Nations publication, Sales No. M.98.XVII.9).
Least Developed Countries / Geringst entwickelte Länder:
According / nach OECD GLOSSARY OF STATISTICAL TERMS According to the General Assembly, on the recommendation of the Committee for Development Policy, countries listed below are included in the list of the least developed countries (year in brackets indicates the inclusion in the group): Entsprechend der Generalversammlung der Vereinten Nationen wurden auf Empfehlung des Komittees für Entwicklungspolitik die unten angeführten Länder als geringst entwickelte Länder geführt (das Jahr in der Klammer entspricht der Aufnahme in die Gruppe): Africa: Angola (1994), Benin (1971), Burkina Faso (1971), Burundi (1971), Central African Republic (1975), Chad (1971), Comoros (1977), Congo, D.R. (1991), Djibouti (1982), Equatorial Guinea (1982), Eritrea (1994), Ethiopia (1971), Gambia (1975), Guinea (1971), Guinea-Bissau (1981), Lesotho (1971), Liberia (1990), Madagascar (1991), Malawi (1971), Mali (1971), Mauritania (1986), Mozambique (1988), Niger (1971), Rwanda (1971), Sao Tome and Principe (1982), Senegal (2001), Sierra Leone (1982), Somalia (1971), South Sudan (2011), Sudan (1971), Tanzania (1971), Togo (1982), Uganda (1971), Zambia (1991) Asia and the Pacific: Afghanistan (1971), Bangladesh (1975), Bhutan (1971), Cambodia (1991), Kiribati (1986), Laos P.D.R. (1971), Myanmar (1987), Nepal (1971), Solomon Islands (1991), East Timor (1982), Tuvalu (1986), Vanuatu (1985), Yemen (1971) Latin America and the Caribbean: Haiti (1971) Source / Quelle: United Nations. Office of the High Representative for the Least Developed Countries, Landlocked Developing Countries and Small Island Developing States (OHRLLS). United Nations Internet site www.un.org
Economies in Transition / Übergangsländer:
According / nach UNCTAD HANDBOOK OF STATISTICS (2014) Asia: Armenia, Azerbaijan, Georgia, Kazakhstan, Kyrgyzstan, Tajikistan, Turkmenistan, Uzbekistan Europe: Albania, Belarus, Bosnia-Herzegovina, Moldova, Montenegro, Russia, Serbia, Macedonia, Ukraine
10
4.2 Regional Groups of Producer Countries / Regionale Gruppierungen der Produzentenländer
CPE: (Centrally Planned Economies / Staatshandelsländer)
China, Cuba, Korea North, Mongolia, Vietnam
World Regions: (according to IIASA) / Welt-Regionen: (gem. IIASA)
see fig. 3; siehe Fig. 3 CAS - Central Asia: Kazakhstan, Kyrgyzstan, Tajikistan, Turkmenistan, Uzbekistan CPA - China & CPA: Cambodia, China, Hong Kong, Korea North, Laos, Mongolia, Taiwan, Vietnam EEU - Eastern Europe: Albania, Bosnia-Herzegovina, Bulgaria, Croatia, Czech Republic, Hungary, Kosovo, Macedonia, Montenegro, Poland, Romania, Slovakia, Slovenia, former Yugoslavia FSU - Former Soviet Union: Armenia, Azerbaijan, Belarus, Estonia, Georgia, Latvia, Lithuania, Moldova, Russian Federation, Ukraine LAM - Latin America: Antigua & Barbuda, Argentina, Bahamas, Barbados, Belize, Bermuda, Bolivia, Brazil, Chile, Colombia, Costa Rica, Cuba, Dominica, Dominican Republic, Ecuador, El Salvador, French Guyana, Grenada, Guadeloupe, Guatemala, Guyana, Haiti, Honduras, Jamaica, Martinique, Mexico, Netherlands Antilles, Nicaragua, Panama, Paraguay, Peru, St. Kitts & Nevis, St. Lucia, St. Vincent, Suriname, Trinidad & Tobago, Uruguay, Venezuela MEA - Middle East: Bahrain, Iran, Iraq, Israel, Jordan, Kuwait, Lebanon, Oman, Qatar, Saudi Arabia, Syria, United Arab Emirates, Yemen NAF - North Africa: Algeria, Egypt, Libya, Morocco, South Sudan, Sudan, Tunisia NAM - North America: Canada, Guam, Puerto Rico, Virgin Islands, Unites States of America PAO - Pacific OECD: Australia, Japan, New Zealand PAS - Pacific Asia: American Samoa, Brunei, East Timor, Fiji, French Polynesia, Indonesia, Kiribati, Korea South, Malaysia, Myanmar, New Caledonia, Papua New Guinea, Phillippines, Singapore, Solomon Islands, Thailand, Tonga, Vanuatu, Western Samoa SAS - South Asia: Afghanistan, Bangladesh, Bhutan, India, Maldives, Nepal, Pakistan, Sri Lanka SSA - Sub-Saharan Africa: Angola, Benin, Botswana, British Indian Ocean Territory, Burkina Faso, Burundi, Cameroon, Cape Verde, Central African Republic, Chad, Comoros, Congo D.R., Congo Rep., Cote d'Ivoire, Djibouti, Equatorial Guinea, Eritrea, Ethiopa, Gabon, Gambia, Ghana, Guinea, Guinea-Bissau, Kenya, Lesotho, Liberia, Madagascar, Malawi, Mali, Mauritania, Mauritius, Mozambique, Namibia, Niger, Nigeria, Réunion, Rwanda, St. Helena, Sao Tomé and Principe, Senegal, Sierra Leone, Seychelles, Somalia, South Africa, Swaziland, Tanzania, Togo, Uganda, Zambia, Zimbabwe WEU - Western Europe: Andorra, Austria, Azores, Belgium, Canary Islands, Cyprus, Denmark, Faroe Islands, Finland, France, Germany, Gibraltar, Greece, Greenland, Iceland, Ireland, Isle of Man, Italy, Liechtenstein, Luxembourg, Madeira, Malta, Monaco, Netherlands, Norway, Portugal, Spain, Sweden, Switzerland, Turkey, United Kingdom Apart from these, the membership of various countries in different economic blocks or other cartel-like associations was taken into consideration. Darüber hinaus wurde die Zugehörigkeit der einzelnen Länder zu verschiedenen Wirtschaftblöcken oder anderen kartellartigen Zusammenschlüssen berücksichtigt.
11
4.3 Economic Blocks or Cartel-like Associations / Wirtschaftsblöcke oder kartellartige Zusammenschlüsse
Economic blocks or cartel-like associations were included as follows (in alphabetical order, in brackets year of entry): Folgende Wirtschaftsblöcke oder kartellartige Zusammenschlüsse wurden unterschieden (Reihung alphabetisch, in Klammer Beitrittsjahr):
ACP Countries: African, Caribbean and Pacific group of states linked to the European Communities as signatory to the Georgetown Agreement and the Lomé Conventions.
AKP Länder: Länder des afrikanischen, karibischen und pazifischen Raumes, die mit der Europäischen Gemeinschaft nach dem Georgetown-Vertrag bzw. dem Abkommen von Lomé zusammengefasst sind.
Africa: Angola, Benin, Botswana, Burkina Faso, Burundi, Cameroon, Cape Verde, Central African Republic, Chad, Comoros, Congo D.R., Congo Rep., Côte d'Ivoire, Djibuti, Equatorial Guinea, Eritrea, Ethiopia, Gabon, Gambia, Ghana, Guinea, Guinea-Bissau, Kenya, Lesotho, Liberia, Madagascar, Malawi, Mali, Mauretania, Mauritius, Mozambique, Namibia, Niger, Nigeria, Rwanda, Sao Tome and Principe, Senegal, Seychelles, Sierra Leone, Somalia, South Africa, Sudan, Swaziland, Tanzania, Togo, Uganda, Zambia, Zimbabwe Caribbean: Antigua-Barbuda, Bahamas, Barbados, Belize, Cuba, Dominica, Dominican Republic, Grenada, Guyana, Haiti, Jamaica, St. Kitts-Nevis, St. Lucia, St. Vincent-Grenadines, Suriname, Trinidad and Tobago Pacific: Cook Islands, Fiji, Kiribati, Marshall Islands, Micronesia, Nauru, Niue, East Timor, Palau, Papua New Guinea, Samoa, Solomon Islands, Tonga, Tuvalu, Vanuatu
ASEAN Countries (ASEAN-Staaten): Ass. of South East Asian Nations
Brunei (1984), Cambodia (1999), Indonesia, Laos (1997), Malaysia, Myanmar (1997), Philippines, Singapore, Thailand, Vietnam (1995)
BRICS Countries (BRICS Staaten):
A 2003 from Goldman Sachs chief economist O'Neill created modern term of primary four major emerging economies with annual growth rates of economic performance by 5 to 10%. BRICS stands for the initials of the countries of Brazil, Russia, India and China. South Africa joined in 2011. Eine 2003 vom Goldman-Sachs-Chefvolkswirt O'Neill geschaffene und heute übliche Bezeichnung von ursprünglich vier wichtigen Schwellenländern mit jährlichen Zuwachsraten der Wirtschaftsleistung von 5 bis 10 %. BRICS steht hierbei für die Anfangsbuchstaben der Länder Brasilien, Russland, Indien und China. 2011 trat Südafrika bei.
EC (EU): European Community (Europäische Gemeinschaft)
Austria (1995), Belgium (1952/58), Bulgaria (2007), Croatia (2013), Cyprus (2004), Czech Republic (2004), Denmark (1973), Estonia (2004), Finland (1995), France (1952/58), Germany (1952/58), Greece (1981), Hungary (2004), Ireland (1973), Italy (1952/58), Latvia (2004), Lithuania (2004), Luxemburg (1952/58), Malta (2004), Netherlands (1952/58), Poland (2004), Portugal (1986), Romania (2007), Slovakia (2004), Slovenia (2004), Spain (1986), Sweden (1995), United Kingdom and North Ireland (1973)
12
EFTA (EFTA-Länder): European Free Trade Association
Austria (until 1994), Denmark (until 1973), Finland (until 1994), Iceland, Liechtenstein, Norway, Portugal (until 1986), Sweden (until 1994), Switzerland, United Kingdom (until 1973)
G8: Group of the Most Important Industrialized Countries (Gruppe der bedeutendsten Industriestaaten)
[G7 (1976): Canada, Germany, France, Italy, Japan, United Kingdom, United States of America] including Russia (1998)
MERCOSUR (Mercado Comun del Sur): Common Market of the South (Gemeinsamer Markt des Südens)
Treaty since January 1, 1995 between Argentina, Brazil, Paraguay and Uruguay establishing a common market; Venezuela joined MERCOSUR in July 2006; associated members: Bolivia, Chile, Colombia, Ecuador, Peru Wirtschaftsverbund Argentiniens, Brasiliens, Paraguays und Uruguays; Gründung: 1. Jänner 1995; Venezuela trat im Juli 2006 bei. Partnerländer: Bolivien, Chile, Ecuador, Kolumbien, Peru
NAFTA: North American Free Trade Agreement (Nordamerikanisches Freihandelsabkommen)
Canada, Mexico, United States of America This association was established on January 1, 1994. Dieser Wirtschaftsblock trat am 1.1.1994 in Kraft.
OECD: Organization for Economic Cooperation and Development
Australia (1971), Austria (1961), Belgium (1961), Canada (1961), Chile (2010), Czech Republic (1995), Denmark (1961), Estonia (2010), Finland (1969), France (1961), Germany (1961), Greece (1961), Hungary (1996), Iceland (1961), Ireland (1961), Israel (2010), Italy (1961), Japan (1964), Korea Republic (1996), Luxemburg (1961), Mexico (1994), Netherlands (1961), New Zealand (1973), Norway (1961), Poland (1996), Portugal (1961), Slovakia (2000), Slovenia (2010), Spain (1961), Sweden (1961), Switzerland (1961), Turkey (1961), United Kingdom (1961), United States of America (1961)
SADC: Southern African Development Community (Entwicklungsgemeinschaft des südlichen Afrika)
Angola, Botswana, Congo D.R. (1997), Lesotho, Madagascar (2005-2009, 2014), Malawi, Mauritius (1995), Mozambique, Namibia (1990), Seychelles (1997-2004, 2008) South Africa (1994), Swaziland, Tanzania, Zambia, Zimbabwe
13
4.4 Political Stability of Producer Countries / Politische Stabilität der Produzentenländer
The worldwide Governance Indicators rely on 31 data sources, including surveys of enterprises and citizens, and expert polls, gathered from 25 different organizations around the world (D. KAUFMANN, A. KRAAY & M. MASTRUZZI 2010). These provide data derived from hundreds of questions about governance. Before aggregation is carried out each question is mapped to one of six dimensions of governance: (1) Voice and Accountability; (2) Political Stability and Absence of Violence; (3) Government Effectiveness; (4) Regulatory Quality; (5) Rule of Law; (6) Control of Corruption, before the aggregation is carried out: Definition of political stability and absence of violence: A measure of the perception of the likelihood that the government will be destabilized or overthrown by unconstitutional or violent means, including political violence and terrorism. The values of measurement are indexed with a mean of zero and a standard deviation of one in each period. Virtually all scores lie between -2,5 and +2,5, with higher scores corresponding to better outcomes. The aggregate estimates convey no information about trends in global averages of governance but they are, of course, informative about changes in individual countries over time. Classes of political stability used in WMD: Estimates < -1,25: extremely unstable; < 0 to -1,25: unstable; > 0 to +1,25: fair; > +1,25: stable; (see fig. 6) Die weltweit erhobenen Kontroll-Indikatoren beruhen auf 31 verschiedenen Quellen einschließlich Befragungen von Unternehmen, Bürgern und Experten, die von 25 unterschiedlichen Organisationen weltweit durchgeführt wurden (D. KAUFMANN, A. KRAAY & M. MASTRUZZI, 2010). Dabei wurden hunderte von Fragen betreffend die Steuerungs- oder Regelungssysteme der einzelnen Staaten ausgewertet. Jede Frage kann einem von 6 Schwerpunkten zugeordnet warden: (1) Voice and Accountability; (2) Political Stability and Absence of Violence; (3) Government Effectiveness; (4) Regulatory Quality; (5) Rule of Law; (6) Control of Corruption. Definition der Politischen Stabilität und Gewaltfreiheit: Begriff der Wahrscheinlichkeit, dass eine Regierung destabilisiert oder durch verfassungswidrige Umstände gestürzt wird, einschließlich politischer Verfolgung und Terrorismus. Die Einheit, in der die erhobenen gesetzlichen und normativen Kontroll-Indikatoren für jeden Beobachtungszeitraum gemessen werden, folgt einer Normalverteilung mit einem Mittelwert 0 und einer Standardabweichung von 1. Konkret kommen alle Ergebniszahlen zwischen -2,5 und +2,5 zu liegen. Die jeweiligen Ergebnisse geben zwar keine Information über globale Entwicklungen, wohl aber zeitliche Veränderungen in den jeweiligen Ländern in den Beobachtungsperioden wieder. Einteilung der Klassen der politischen Stabilität, wie sie in den WMD verwendet werden: Werte < -1,25: extrem instabil; < 0 bis -1,25: instabil; > 0 bis +1,25: unauffällig; > +1,25: stabil; (siehe Fig. 6) More information / Weiterführende Information: Kaufmann, Daniel, Kraay, Aart and Mastruzzi, Massimo, The Worldwide Governance Indicators: Methodology and Analytical Issues (September 2010). World Bank Policy Research Working Paper No. 5430. Available at SSRN: http://ssrn.com/abstract=1682130
14
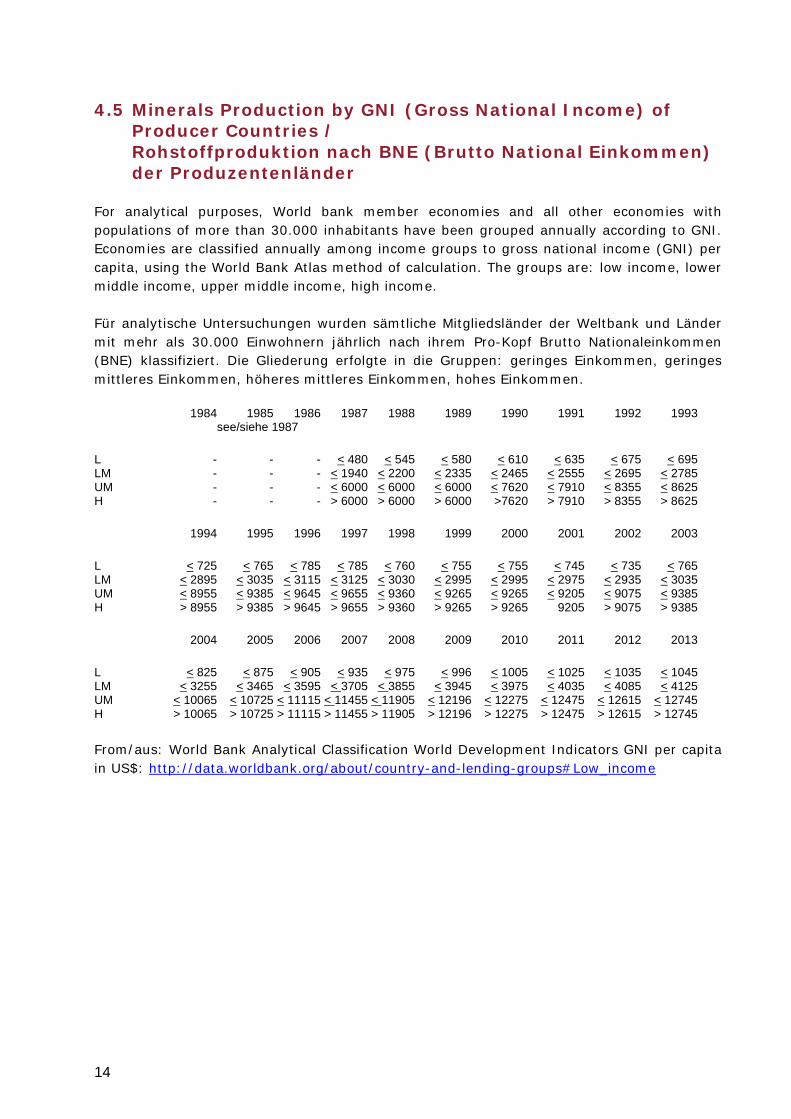
4.5 Minerals Production by GNI (Gross National Income) of Producer Countries / Rohstoffproduktion nach BNE (Brutto National Einkommen) der Produzentenländer
For analytical purposes, World bank member economies and all other economies with populations of more than 30.000 inhabitants have been grouped annually according to GNI. Economies are classified annually among income groups to gross national income (GNI) per capita, using the World Bank Atlas method of calculation. The groups are: low income, lower middle income, upper middle income, high income. Für analytische Untersuchungen wurden sämtliche Mitgliedsländer der Weltbank und Länder mit mehr als 30.000 Einwohnern jährlich nach ihrem Pro-Kopf Brutto Nationaleinkommen (BNE) klassifiziert. Die Gliederung erfolgte in die Gruppen: geringes Einkommen, geringes mittleres Einkommen, höheres mittleres Einkommen, hohes Einkommen.
1984 1985 1986 1987 1988 1989 1990 1991 1992 1993 see/siehe 1987
L - - - < 480 < 545 < 580 < 610 < 635 < 675 < 695 LM - - - < 1940 < 2200 < 2335 < 2465 < 2555 < 2695 < 2785 UM - - - < 6000 < 6000 < 6000 < 7620 < 7910 < 8355 < 8625 H - - - > 6000 > 6000 > 6000 >7620 > 7910 > 8355 > 8625
1994 1995 1996 1997 1998 1999 2000 2001 2002 2003
L < 725 < 765 < 785 < 785 < 760 < 755 < 755 < 745 < 735 < 765 LM < 2895 < 3035 < 3115 < 3125 < 3030 < 2995 < 2995 < 2975 < 2935 < 3035 UM < 8955 < 9385 < 9645 < 9655 < 9360 < 9265 < 9265 < 9205 < 9075 < 9385 H > 8955 > 9385 > 9645 > 9655 > 9360 > 9265 > 9265 9205 > 9075 > 9385
2004 2005 2006 2007 2008 2009 2010 2011 2012 2013
L < 825 < 875 < 905 < 935 < 975 < 996 < 1005 < 1025 < 1035 < 1045 LM < 3255 < 3465 < 3595 < 3705 < 3855 < 3945 < 3975 < 4035 < 4085 < 4125 UM < 10065 < 10725 < 11115 < 11455 < 11905 < 12196 < 12275 < 12475 < 12615 < 12745 H > 10065 > 10725 > 11115 > 11455 > 11905 > 12196 > 12275 > 12475 > 12615 > 12745
From/aus: World Bank Analytical Classification World Development Indicators GNI per capita in US$: http://data.worldbank.org/about/country-and-lending-groups#Low_income
15
4.6 Concentration of Producer Countries / Marktkonzentration der Produzentenländer
The Herfindahl-Hirschman Index (HHI) is a commonly accepted and used measure of market concentration. It is calculated by squaring the market share of each firm competing in the market and then summing the resulting numbers. Only one firm means 100% market share. In this case the HHI would equal 10.000 (1002), indicating a monopoly. A market consisting of 4 companies with shares of 50%, 30%, 15% and 5%, results in a HHI of (502 + 302+152+52)= 3.650. The HHI takes into account the relative size and distribution of the firms in a market and approaches zero when a market consists of a large number of firms of relatively equal size. The HHI increases both as the number of firms in the market decreases and as the disparity in size between those firms increases. In the United States markets in which the HHI is between 1.000 and 1.800 points are considered to be moderately concentrated, and those in which the HHI is in excess of 1.800 points are considered to be concentrated. In the EU the threshold to concentrated markets is 2.000. In chapter 6.5 the concentration of producer countries is calculated by the HHI similarly to the firms index. To avoid misunderstandings with the “classical” HHI, the countries concentration index is named as (mod)HHI(ct). Der Herfindahl-Hirschmann Index (HHI) ist eine allgemein anerkannte Maßzahl für Marktkonzentrationen. Er errechnet sich durch die Summe der Quadrate der Anteile von Unternehmen am (Welt-)markt. Besteht lediglich ein einziges Unternehmen (100 % Marktanteil), erreicht der HHI seinen Maximalwert von 10.000 (1002), was einem Monopol gleichkommt. Bei einem Markt, bestehend aus 4 Unternehmen mit Marktanteilen von 50%, 30%, 15% und 5% erreicht der HHI einen Wert von (502+ 302+152+52)=3.650. Der HHI berücksichtigt die relative Größe und die Verteilung von Produzenten in einem Markt und erreicht einen Wert von 0, wenn der Markt aus einer Vielzahl von Unternehmen mit relativ gleicher Größe besteht. Der HHI steigt aber ebenso an, wenn die Anzahl der Unternehmen sinkt, oder die Größen der einzelnen Unternehmen stark unterschiedlich sind. In den Vereinigten Staaten gilt ein Markt als mäßig konzentriert, wenn der HHI zwischen 1.000 und 1.800 liegt. Liegt der HHI über 1.800, gilt der Markt als konzentriert. In der EU liegt die Schwelle von mäßig konzentriert zu konzentriert bei 2.000. Im Kapitel 6.5 wird die Konzentration von Produzentenländern ausgewiesen, analog wie dies bei Unternehmenskonzentrationen angegeben werden kann. Um Missverständnisse zum „klassischen“ HHI zu vermeiden, wird die Maßzahl der Länderkonzentration als (mod)HHI(ct) bezeichnet.
16
5. Data Capture / Erfassungsmodalität Collection of data relating to mineral raw materials has been carried out by evaluation of questionnaires sent to the National Committees of member countries of the World Mining Congress as well as to other bodies such as Embassies, Foreign Trade Representatives etc. Use has been made of other official mining statistics in cases where they are publically available; for example, data produced by the British Geological Survey (World Mineral Statistics), also the USGS data sets have been very useful. For the present publication the complete data set has been reviewed carefully. Despite a diligent search of all sources, there are some producing areas where data are unavailable. In such instances, careful estimates of production have been made. Although data processing has been done automatically, the possibility exists of human error at the data entry stage. Since the data base is being continuously updated the compilers would be grateful to learn of any corrections and additions that can be made.
Deadline: February 28, 2015
Data received later than February 28, 2015 will be implemented in the next edition of this report. Please send any remarks to
[email protected] [email protected]
Die Erfassung der Rohstoffe erfolgte durch Auswertung von Fragebögen, die an die Nationalkomitees der Weltbergbaukongressmitgliedsländer sowie an andere Institutionen, wie Botschaften, Außenhandelsstellen usw. ausgesendet wurden. Wo darüber hinaus offizielle Bergbaustatistiken verfügbar waren, wurden diese Angaben mitverwertet. Wertvolle Hilfestellungen leisteten dabei Datensammlungen wie jene des British Geological Surveys (World Mineral Statistics) bzw. die Datensammlungen des USGS. Für die vorliegende Publikation wurde der gesamte Datenbestand sorgfältig revidiert. Wo trotz sorgfältigsten Quellenstudiums, trotz vermuteter Rohstoffproduktion, keine Zahlenangaben erhältlich waren, wurden diese Daten geschätzt. Abschließend sei bemerkt, dass die Rechenarbeit zwar automationsunterstützt erfolgte, hinter dem Rechner jedoch Menschen arbeiteten. Für deren Fehler ersuchen wir um Nachsicht. Da die Datenbank laufend aktualisiert wird, sind Korrekturen jederzeit möglich. Für jeden Hinweis sind wir wie immer dankbar.
Redaktionsschluss: 28. Februar 2015
Später einlangende Daten werden im nachfolgenden Band berücksichtigt. Vorschläge können unter
[email protected] [email protected]
eingebracht werden.
17
Disclaimer / Haftungsausschluss: World Mining Data is provided as a public service by the Federal Ministry of Sience, Research and Economy (BMWFW). The information presented does not necessarily reflect the views of the BMWFW and as such is not an official record. The BMWFW makes no warranties, either express or implied, concerning the accuracy, completeness, or reliability of the information. World Mining Data ist als Service des Bundesministeriums für Wissenschaft, Forschung und Wirtschaft (BMWFW) für die Öffentlichkeit zu verstehen. Die in der Publikation enthaltenen Informationen geben nicht zwingend die Meinung des BMWFW wieder und sind nicht als offizieller Bericht zu verstehen. Das BMWFW übernimmt keinerlei Garantie und Haftung bezüglich der Genauigkeit, der Vollständigkeit oder der Vertrauenswürdigkeit des jeweiligen Zahlenmaterials.

19
Charts / grafische Darstellungen
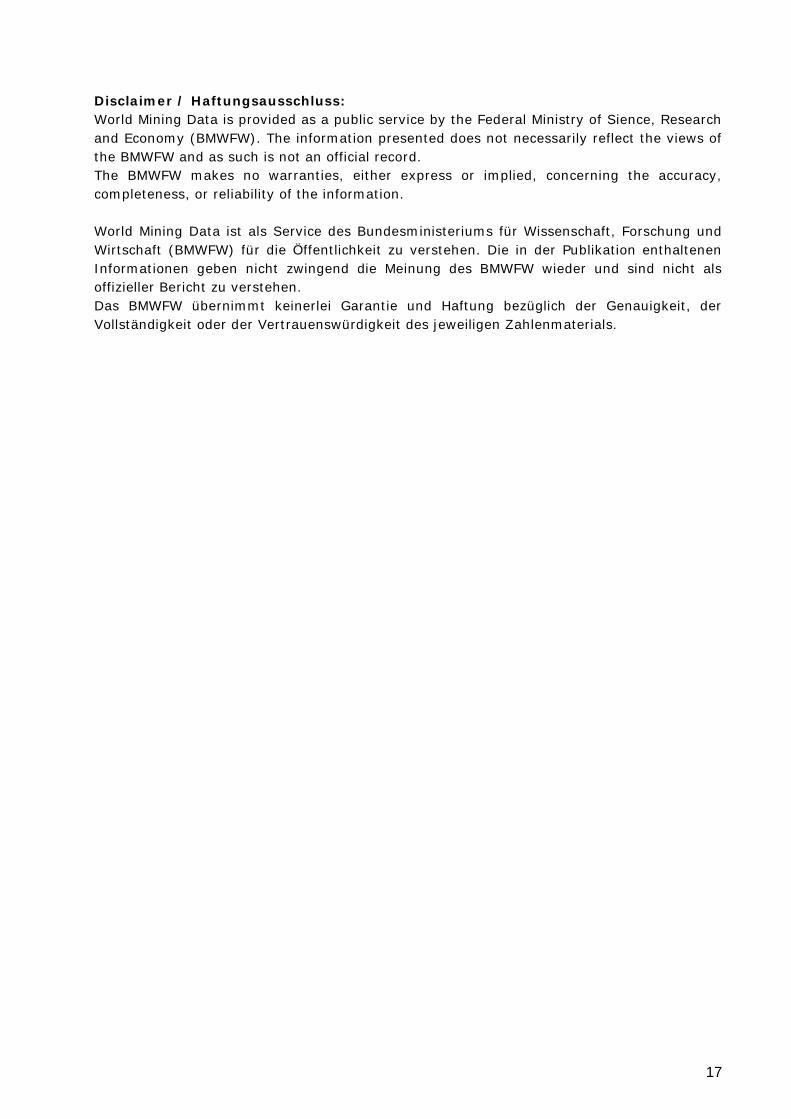
Fig. 1: World mining production 1984 - 2013 by groups of minerals
(without construction minerals, in Million metr. t) Weltbergbauproduktion 1984 - 2013 nach Rohstoffgruppen
(ohne Baurohstoffe, in Mio metr. t)
Fig. 2: World mining production 1984 - 2013 by continents
(without construction minerals, in Million metr. t) Weltbergbauproduktion 1984 - 2013 nach Kontinenten
(ohne Baurohstoffe, in Mio metr. t)
20
Charts / grafische Darstellungen
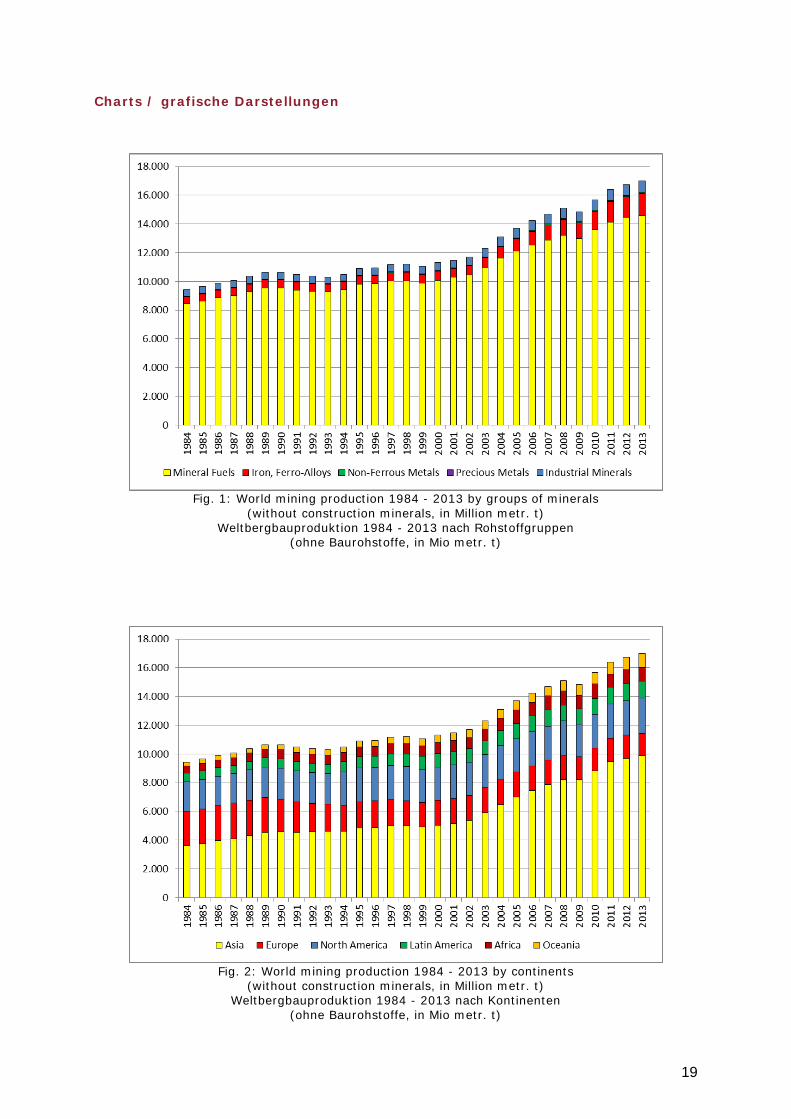
Fig. 3: World mining production 1984 - 2013 by word regions (acc. IIASA)
(without construction minerals, in Million metr. t) Weltbergbauproduktion 1984 - 2013 nach Weltregionen (gem. IIASA)
(ohne Baurohstoffe, in Mio metr. t)
CAS - Central Asia; CPA - China & CPA; EEU - Eastern Europe; FSU - Former Soviet Union; LAM - Latin America; MEA - Middle East; NAF - North Africa; NAM - North America; PAO - Pacific OECD;
PAS - Pacific Asia; SAS - South Asia; SSA - Sub-Saharan Africa; WEU - Western Europe
Fig. 4: World mining production 1984 - 2013 by economic blocks or cartel-like associations:
European Union, BRICS Countries (without construction minerals, in Million metr. t) Weltbergbauproduktion 1984 - 2013 nach Wirtschaftsblöcken oder kartellartigen
Zusammenschlüssen: Europäische Union, BRICS-Staaten (ohne Baurohstoffe, in Mio metr. t)
21
Charts / grafische Darstellungen
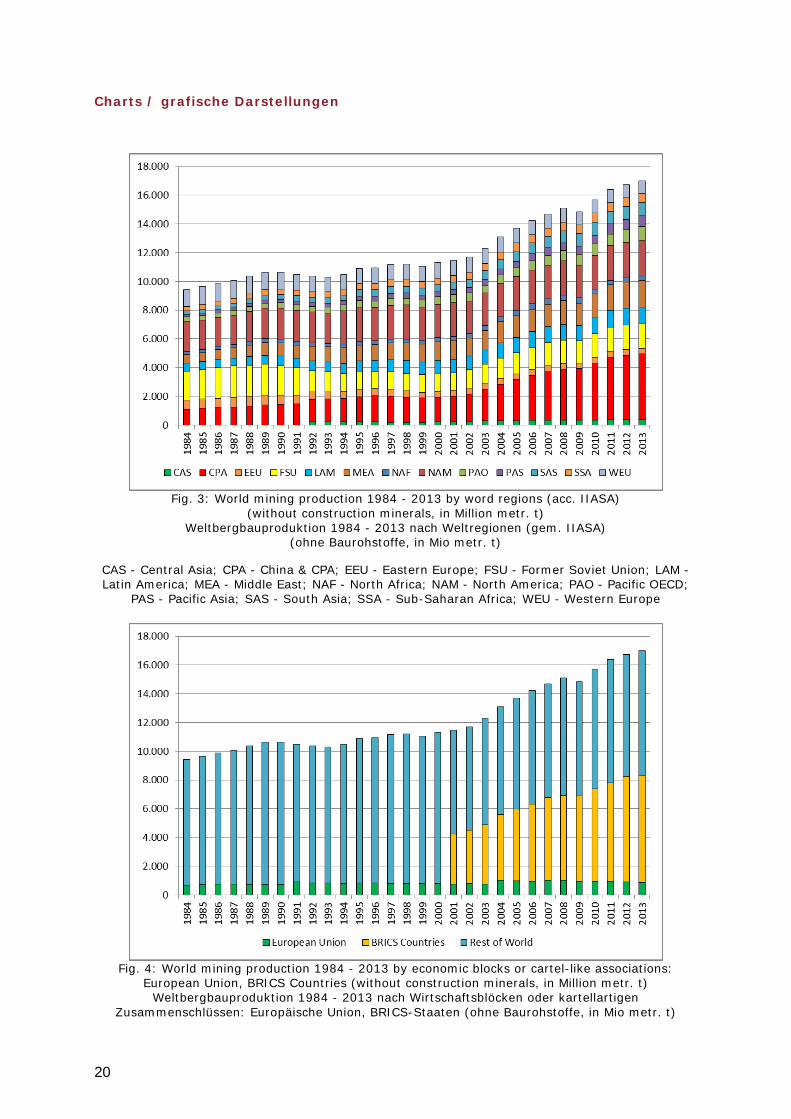
Fig. 5: World mining production 1984 - 2013 by development status of the producer countries
(without construction minerals, in Million metr. t) Weltbergbauproduktion 1984 - 2013 nach Entwicklungsstand der Produzentenländer
(ohne Baurohstoffe, in Mio metr. t)
Fig. 6: World mining production 1984 - 2013 by political stability of the producer countries
(without construction minerals, in Million metr. t) Weltbergbauproduktion 1984 - 2013 nach politischer Stabilität der Produzentenländer
(ohne Baurohstoffe, in Mio metr. t) Estimates conc. political stability of producer countries: WORLD BANK, Governance matters IX
Einschätzungen der pol. Stabilität der Produzentenländer: WORLD BANK, Governance matters IX
22
Charts / grafische Darstellungen
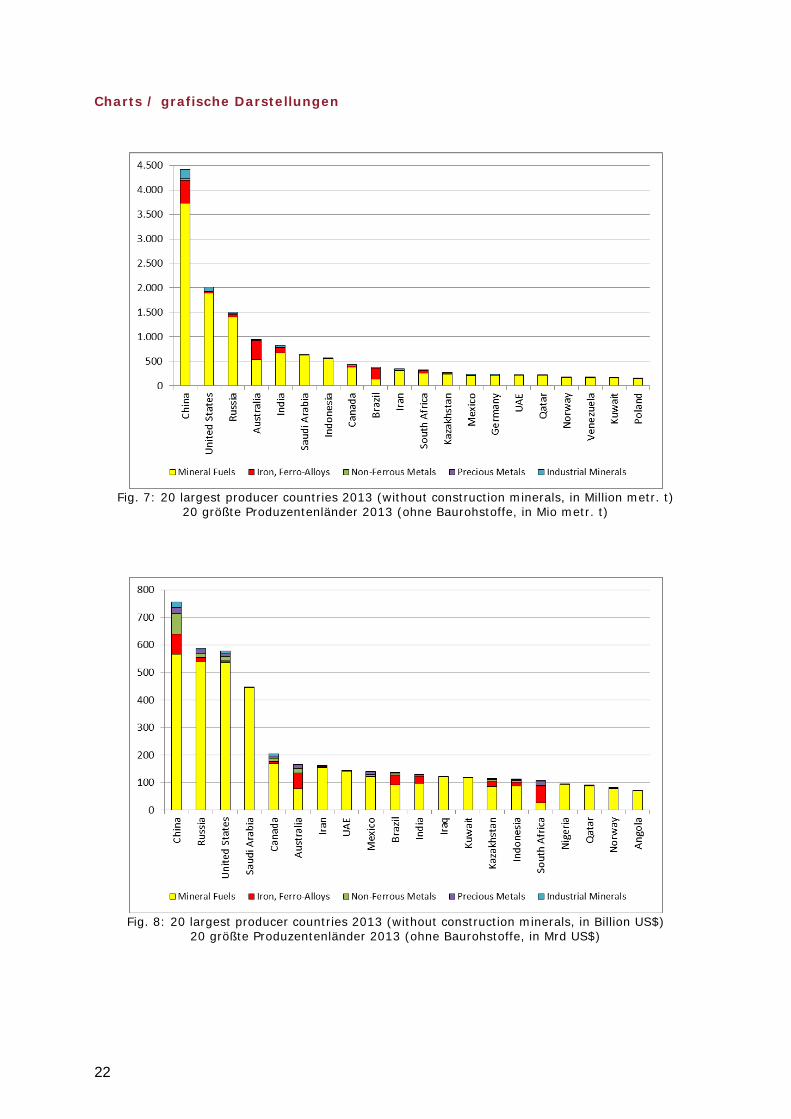
Fig. 7: 20 largest producer countries 2013 (without construction minerals, in Million metr. t)
20 größte Produzentenländer 2013 (ohne Baurohstoffe, in Mio metr. t)
Fig. 8: 20 largest producer countries 2013 (without construction minerals, in Billion US$)
20 größte Produzentenländer 2013 (ohne Baurohstoffe, in Mrd US$)
Abbreviations: see Explanation; Abkürzungen: siehe Erläuterungen
23
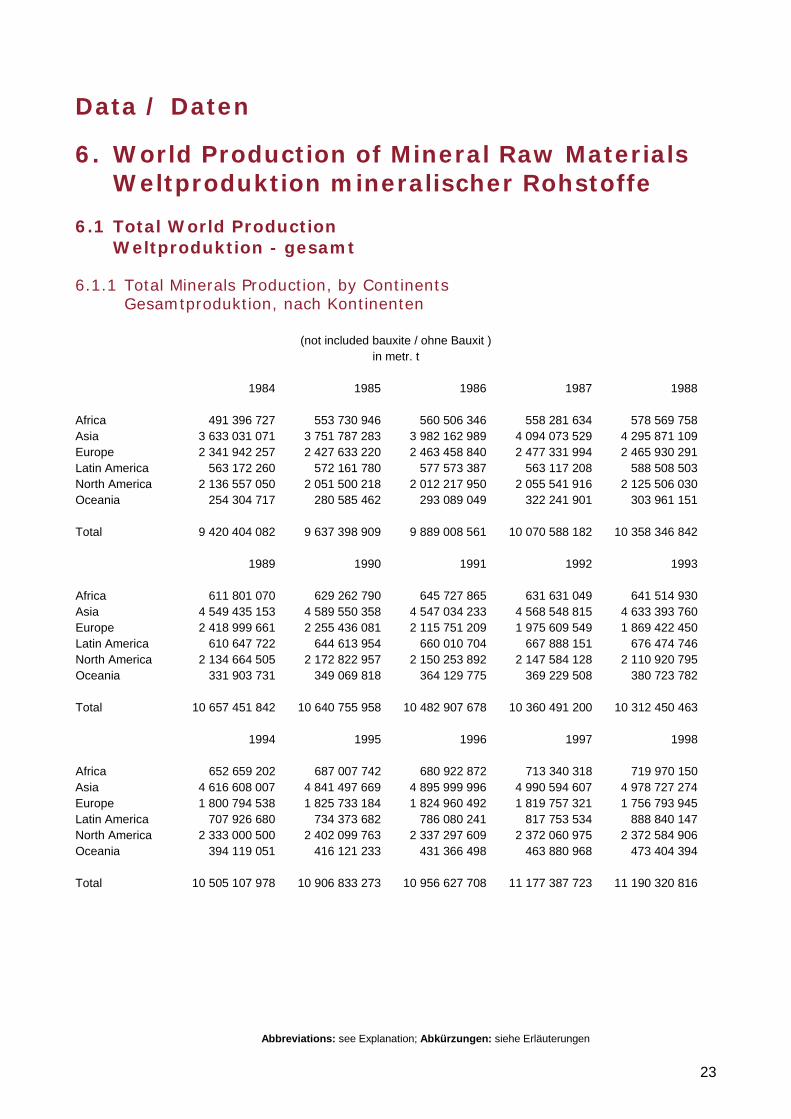
Data / Daten
6. World Production of Mineral Raw Materials Weltproduktion mineralischer Rohstoffe
6.1 Total World Production Weltproduktion - gesamt
6.1.1 Total Minerals Production, by Continents Gesamtproduktion, nach Kontinenten
(not included bauxite / ohne Bauxit ) in metr. t
1984 1985 1986 1987 1988 Africa 491 396 727 553 730 946 560 506 346 558 281 634 578 569 758 Asia 3 633 031 071 3 751 787 283 3 982 162 989 4 094 073 529 4 295 871 109 Europe 2 341 942 257 2 427 633 220 2 463 458 840 2 477 331 994 2 465 930 291 Latin America 563 172 260 572 161 780 577 573 387 563 117 208 588 508 503 North America 2 136 557 050 2 051 500 218 2 012 217 950 2 055 541 916 2 125 506 030 Oceania 254 304 717 280 585 462 293 089 049 322 241 901 303 961 151 Total 9 420 404 082 9 637 398 909 9 889 008 561 10 070 588 182 10 358 346 842 1989 1990 1991 1992 1993 Africa 611 801 070 629 262 790 645 727 865 631 631 049 641 514 930 Asia 4 549 435 153 4 589 550 358 4 547 034 233 4 568 548 815 4 633 393 760 Europe 2 418 999 661 2 255 436 081 2 115 751 209 1 975 609 549 1 869 422 450 Latin America 610 647 722 644 613 954 660 010 704 667 888 151 676 474 746 North America 2 134 664 505 2 172 822 957 2 150 253 892 2 147 584 128 2 110 920 795 Oceania 331 903 731 349 069 818 364 129 775 369 229 508 380 723 782 Total 10 657 451 842 10 640 755 958 10 482 907 678 10 360 491 200 10 312 450 463 1994 1995 1996 1997 1998 Africa 652 659 202 687 007 742 680 922 872 713 340 318 719 970 150 Asia 4 616 608 007 4 841 497 669 4 895 999 996 4 990 594 607 4 978 727 274 Europe 1 800 794 538 1 825 733 184 1 824 960 492 1 819 757 321 1 756 793 945 Latin America 707 926 680 734 373 682 786 080 241 817 753 534 888 840 147 North America 2 333 000 500 2 402 099 763 2 337 297 609 2 372 060 975 2 372 584 906 Oceania 394 119 051 416 121 233 431 366 498 463 880 968 473 404 394 Total 10 505 107 978 10 906 833 273 10 956 627 708 11 177 387 723 11 190 320 816
Abbreviations: see Explanation; Abkürzungen: siehe Erläuterungen
24
1999 2000 2001 2002 2003 Africa 732 231 529 765 797 537 773 522 555 781 720 536 833 953 206 Asia 4 925 827 664 5 043 878 907 5 152 221 063 5 362 023 432 5 895 402 657 Europe 1 712 098 167 1 749 364 435 1 748 130 220 1 770 494 605 1 771 221 249 Latin America 897 368 644 923 406 676 933 210 827 935 525 034 968 272 521 North America 2 310 657 714 2 307 491 774 2 339 218 079 2 291 780 280 2 275 054 195 Oceania 490 871 045 516 519 060 539 817 203 552 317 958 552 451 154 Total 11 069 054 763 11 306 458 389 11 486 119 947 11 693 861 845 12 296 354 982 2004 2005 2006 2007 2008 Africa 889 175 001 943 193 294 957 727 003 973 019 114 992 280 300 Asia 6 490 714 893 6 998 350 414 7 449 840 060 7 881 091 147 8 215 874 551 Europe 1 779 622 974 1 741 780 413 1 717 452 818 1 712 233 072 1 689 878 610 Latin America 1 029 662 754 1 057 357 392 1 099 881 656 1 114 107 548 1 108 010 239 North America 2 319 551 073 2 331 524 097 2 368 898 537 2 349 167 451 2 382 465 091 Oceania 592 286 793 626 012 058 643 575 855 676 157 961 711 022 309 Total 13 101 013 488 13 698 217 668 14 237 375 929 14 705 776 293 15 099 531 100 2009 2010 2011 2012 2013 Africa 958 646 343 1 004 843 690 923 176 632 988 212 043 961 000 007 Asia 8 205 052 865 8 811 959 716 9 459 255 826 9 689 734 999 9 875 484 134 Europe 1 598 540 139 1 615 513 824 1 632 151 060 1 612 737 453 1 565 533 657 Latin America 1 059 458 147 1 113 358 047 1 159 263 346 1 170 276 538 1 160 419 192 North America 2 270 233 760 2 329 684 160 2 403 735 585 2 409 557 706 2 459 129 097 Oceania 747 244 615 797 549 962 806 851 326 865 097 902 967 881 588 Total 14 839 175 869 15 672 909 399 16 384 433 774 16 735 616 641 16 989 447 675
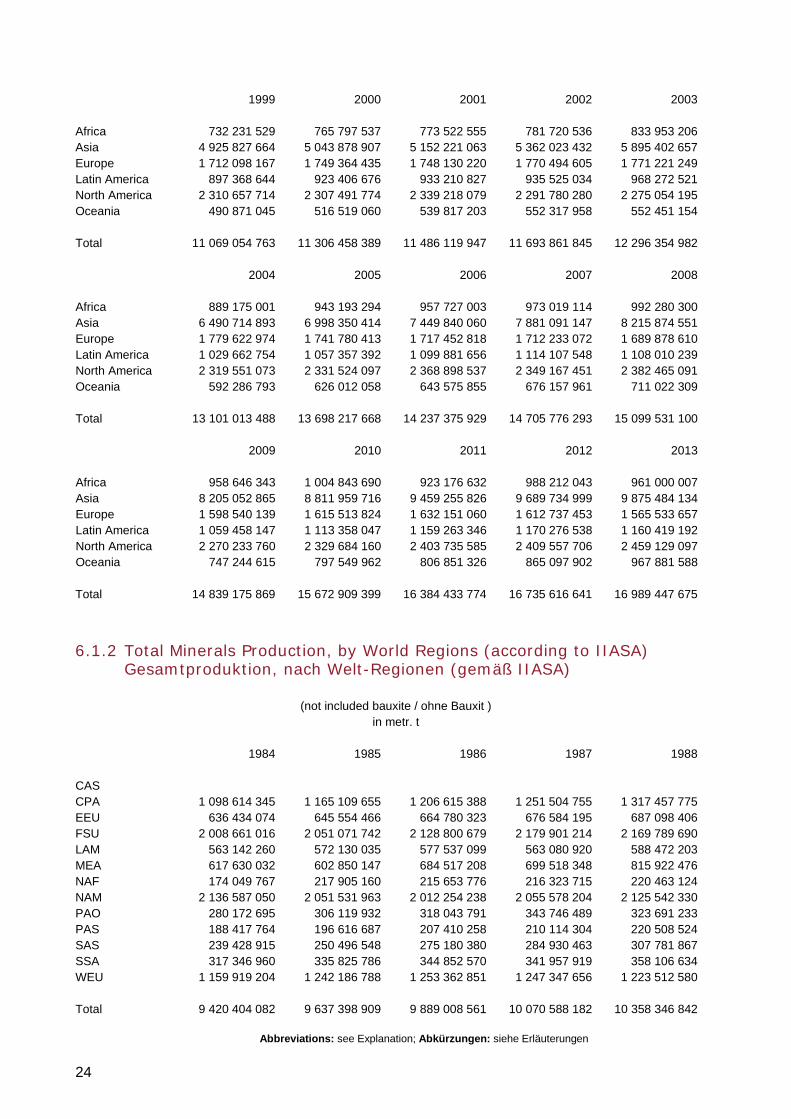
6.1.2 Total Minerals Production, by World Regions (according to IIASA) Gesamtproduktion, nach Welt-Regionen (gemäß IIASA)
(not included bauxite / ohne Bauxit ) in metr. t
1984 1985 1986 1987 1988 CAS CPA 1 098 614 345 1 165 109 655 1 206 615 388 1 251 504 755 1 317 457 775 EEU 636 434 074 645 554 466 664 780 323 676 584 195 687 098 406 FSU 2 008 661 016 2 051 071 742 2 128 800 679 2 179 901 214 2 169 789 690 LAM 563 142 260 572 130 035 577 537 099 563 080 920 588 472 203 MEA 617 630 032 602 850 147 684 517 208 699 518 348 815 922 476 NAF 174 049 767 217 905 160 215 653 776 216 323 715 220 463 124 NAM 2 136 587 050 2 051 531 963 2 012 254 238 2 055 578 204 2 125 542 330 PAO 280 172 695 306 119 932 318 043 791 343 746 489 323 691 233 PAS 188 417 764 196 616 687 207 410 258 210 114 304 220 508 524 SAS 239 428 915 250 496 548 275 180 380 284 930 463 307 781 867 SSA 317 346 960 335 825 786 344 852 570 341 957 919 358 106 634 WEU 1 159 919 204 1 242 186 788 1 253 362 851 1 247 347 656 1 223 512 580 Total 9 420 404 082 9 637 398 909 9 889 008 561 10 070 588 182 10 358 346 842
Abbreviations: see Explanation; Abkürzungen: siehe Erläuterungen
25
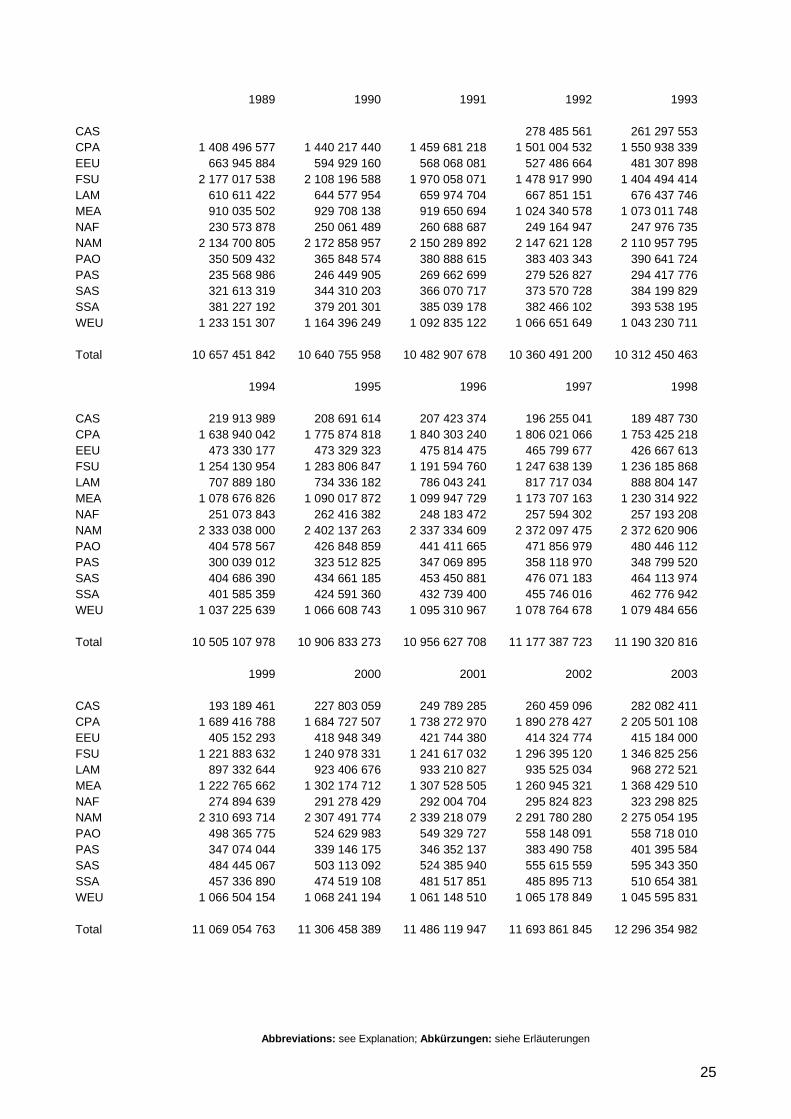
1989 1990 1991 1992 1993 CAS 278 485 561 261 297 553 CPA 1 408 496 577 1 440 217 440 1 459 681 218 1 501 004 532 1 550 938 339 EEU 663 945 884 594 929 160 568 068 081 527 486 664 481 307 898 FSU 2 177 017 538 2 108 196 588 1 970 058 071 1 478 917 990 1 404 494 414 LAM 610 611 422 644 577 954 659 974 704 667 851 151 676 437 746 MEA 910 035 502 929 708 138 919 650 694 1 024 340 578 1 073 011 748 NAF 230 573 878 250 061 489 260 688 687 249 164 947 247 976 735 NAM 2 134 700 805 2 172 858 957 2 150 289 892 2 147 621 128 2 110 957 795 PAO 350 509 432 365 848 574 380 888 615 383 403 343 390 641 724 PAS 235 568 986 246 449 905 269 662 699 279 526 827 294 417 776 SAS 321 613 319 344 310 203 366 070 717 373 570 728 384 199 829 SSA 381 227 192 379 201 301 385 039 178 382 466 102 393 538 195 WEU 1 233 151 307 1 164 396 249 1 092 835 122 1 066 651 649 1 043 230 711 Total 10 657 451 842 10 640 755 958 10 482 907 678 10 360 491 200 10 312 450 463 1994 1995 1996 1997 1998 CAS 219 913 989 208 691 614 207 423 374 196 255 041 189 487 730 CPA 1 638 940 042 1 775 874 818 1 840 303 240 1 806 021 066 1 753 425 218 EEU 473 330 177 473 329 323 475 814 475 465 799 677 426 667 613 FSU 1 254 130 954 1 283 806 847 1 191 594 760 1 247 638 139 1 236 185 868 LAM 707 889 180 734 336 182 786 043 241 817 717 034 888 804 147 MEA 1 078 676 826 1 090 017 872 1 099 947 729 1 173 707 163 1 230 314 922 NAF 251 073 843 262 416 382 248 183 472 257 594 302 257 193 208 NAM 2 333 038 000 2 402 137 263 2 337 334 609 2 372 097 475 2 372 620 906 PAO 404 578 567 426 848 859 441 411 665 471 856 979 480 446 112 PAS 300 039 012 323 512 825 347 069 895 358 118 970 348 799 520 SAS 404 686 390 434 661 185 453 450 881 476 071 183 464 113 974 SSA 401 585 359 424 591 360 432 739 400 455 746 016 462 776 942 WEU 1 037 225 639 1 066 608 743 1 095 310 967 1 078 764 678 1 079 484 656 Total 10 505 107 978 10 906 833 273 10 956 627 708 11 177 387 723 11 190 320 816 1999 2000 2001 2002 2003 CAS 193 189 461 227 803 059 249 789 285 260 459 096 282 082 411 CPA 1 689 416 788 1 684 727 507 1 738 272 970 1 890 278 427 2 205 501 108 EEU 405 152 293 418 948 349 421 744 380 414 324 774 415 184 000 FSU 1 221 883 632 1 240 978 331 1 241 617 032 1 296 395 120 1 346 825 256 LAM 897 332 644 923 406 676 933 210 827 935 525 034 968 272 521 MEA 1 222 765 662 1 302 174 712 1 307 528 505 1 260 945 321 1 368 429 510 NAF 274 894 639 291 278 429 292 004 704 295 824 823 323 298 825 NAM 2 310 693 714 2 307 491 774 2 339 218 079 2 291 780 280 2 275 054 195 PAO 498 365 775 524 629 983 549 329 727 558 148 091 558 718 010 PAS 347 074 044 339 146 175 346 352 137 383 490 758 401 395 584 SAS 484 445 067 503 113 092 524 385 940 555 615 559 595 343 350 SSA 457 336 890 474 519 108 481 517 851 485 895 713 510 654 381 WEU 1 066 504 154 1 068 241 194 1 061 148 510 1 065 178 849 1 045 595 831 Total 11 069 054 763 11 306 458 389 11 486 119 947 11 693 861 845 12 296 354 982
Abbreviations: see Explanation; Abkürzungen: siehe Erläuterungen
26
2004 2005 2006 2007 2008 CAS 287 653 932 306 655 152 320 834 504 333 171 862 352 370 810 CPA 2 557 476 461 2 858 491 165 3 121 307 554 3 377 656 942 3 533 597 700 EEU 413 536 153 400 644 989 402 884 458 396 457 108 403 077 343 FSU 1 410 824 170 1 479 360 063 1 551 674 873 1 630 979 773 1 622 884 238 LAM 1 029 662 754 1 057 357 392 1 099 881 656 1 114 107 548 1 108 010 239 MEA 1 480 536 446 1 525 928 515 1 549 159 592 1 557 124 050 1 640 016 684 NAF 339 847 229 362 782 695 378 347 093 382 296 460 388 065 026 NAM 2 319 551 073 2 331 524 097 2 368 898 537 2 349 167 451 2 382 465 091 PAO 598 808 146 632 446 053 649 852 717 683 343 010 718 261 006 PAS 425 997 134 452 052 350 489 761 075 520 126 147 550 801 856 SAS 643 835 854 691 977 865 737 811 005 785 123 889 824 862 836 SSA 549 327 772 580 410 599 579 379 910 590 722 654 604 215 274 WEU 1 043 956 364 1 018 586 733 987 582 955 985 499 399 970 902 997 Total 13 101 013 488 13 698 217 668 14 237 375 929 14 705 776 293 15 099 531 100 2009 2010 2011 2012 2013 CAS 324 649 467 344 063 944 368 866 338 377 823 643 382 278 341 CPA 3 618 051 997 3 966 037 196 4 349 258 919 4 477 151 363 4 565 547 461 EEU 380 998 677 377 896 350 407 513 092 395 361 055 374 039 365 FSU 1 545 048 182 1 652 487 530 1 702 047 290 1 716 558 767 1 728 638 800 LAM 1 059 458 147 1 113 358 047 1 159 263 346 1 170 276 538 1 160 419 192 MEA 1 558 468 732 1 653 592 528 1 797 904 529 1 838 863 723 1 850 583 386 NAF 368 134 431 373 364 263 297 198 903 338 025 509 310 504 619 NAM 2 270 233 760 2 329 684 160 2 403 735 585 2 409 557 706 2 459 129 097 PAO 754 297 744 804 723 738 813 594 131 871 835 131 974 209 495 PAS 568 623 166 616 710 290 695 963 392 732 282 968 795 337 976 SAS 887 988 395 891 727 218 877 577 888 878 504 503 889 407 461 SSA 590 511 912 631 479 427 625 977 729 650 186 534 650 495 388 WEU 912 711 259 917 784 708 885 532 633 879 189 200 848 857 094 Total 14 839 175 869 15 672 909 399 16 384 433 774 16 735 616 641 16 989 447 675
6.1.3 Total Minerals Production, by Development Status of Producer Countries Gesamtproduktion, nach Entwicklungsstand der Produzentenländer
(not included bauxite / ohne Bauxit ) in metr. t
1984 1985 1986 1987 1988 Developed C. 3 222 035 518 3 219 266 999 3 195 317 491 3 259 786 338 3 292 188 493 Transition C. 0 0 0 0 0 Developing C. 6 174 255 272 6 396 630 015 6 660 413 240 6 774 048 124 7 019 243 544 Least Developed C. 24 113 292 21 501 895 33 277 830 36 753 720 46 914 805 Total 9 420 404 082 9 637 398 909 9 889 008 561 10 070 588 182 10 358 346 842
Abbreviations: see Explanation; Abkürzungen: siehe Erläuterungen
27
1989 1990 1991 1992 1993 Developed C. 3 334 477 975 3 378 807 395 3 563 263 680 3 530 187 636 3 484 827 045 Transition C. 0 0 7 001 752 2 283 909 797 2 146 209 354 Developing C. 7 268 880 898 7 205 176 897 6 858 761 921 4 491 819 824 4 625 844 661 Least Developed C. 54 092 969 56 771 666 53 880 325 54 573 943 55 569 403 Total 10 657 451 842 10 640 755 958 10 482 907 678 10 360 491 200 10 312 450 463 1994 1995 1996 1997 1998 Developed C. 3 707 347 736 3 826 563 324 3 885 239 610 3 928 542 796 3 923 591 388 Transition C. 1 947 375 120 1 965 827 784 1 794 763 293 1 832 280 721 1 780 804 891 Developing C. 4 786 622 709 5 040 683 227 5 199 515 537 5 337 077 486 5 404 592 973 Least Developed C. 63 762 413 73 758 938 77 109 268 79 486 720 81 331 564 Total 10 505 107 978 10 906 833 273 10 956 627 708 11 177 387 723 11 190 320 816 1999 2000 2001 2002 2003 Developed C. 3 860 032 632 3 897 467 381 3 950 783 165 3 918 529 031 3 886 257 270 Transition C. 1 755 019 273 1 815 975 752 1 840 521 359 1 903 119 628 1 931 380 071 Developing C. 5 362 279 686 5 494 514 903 5 586 328 460 5 750 606 290 6 354 371 058 Least Developed C. 91 723 172 98 500 353 108 486 963 121 606 896 124 346 583 Total 11 069 054 763 11 306 458 389 11 486 119 947 11 693 861 845 12 296 354 982 2004 2005 2006 2007 2008 Developed C. 4 167 647 544 4 169 648 319 4 178 771 616 4 267 427 382 4 312 696 214 Transition C. 1 801 446 088 1 881 734 561 2 014 881 338 2 010 591 435 2 033 569 043 Developing C. 6 986 687 157 7 475 145 206 7 867 744 356 8 235 912 071 8 552 089 421 Least Developed C. 145 232 699 171 689 582 175 978 619 191 845 405 201 176 422 Total 13 101 013 488 13 698 217 668 14 237 375 929 14 705 776 293 15 099 531 100 2009 2010 2011 2012 2013 Developed C. 4 166 385 933 4 270 987 731 4 303 817 625 4 397 599 711 4 506 610 609 Transition C. 1 927 709 066 2 051 476 656 2 123 843 844 2 142 503 876 2 154 495 338 Developing C. 8 549 514 178 9 146 645 956 9 766 432 674 10 003 476 996 10 119 102 253 Least Developed C. 195 566 692 203 799 056 190 339 631 192 036 058 209 239 475 Total 14 839 175 869 15 672 909 399 16 384 433 774 16 735 616 641 16 989 447 675
Abbreviations: see Explanation; Abkürzungen: siehe Erläuterungen
28
6.1.4 Total Minerals Production, by Country Groups and Economic Blocks Gesamtproduktion mineralischer Rohstoffe, nach Ländergruppen und Wirtschaftsblöcken
(not included bauxite / ohne Bauxit ) in metr. t
1984 1985 1986 1987 1988 ACP 140 835 361 152 069 136 154 120 586 152 851 198 160 989 672 ASEAN 160 447 228 167 131 549 176 587 060 179 537 969 189 793 672 BRICS 0 0 0 0 0 EC 662 596 046 714 203 498 767 473 457 754 721 666 730 800 123 EFTA 87 033 929 91 340 112 94 399 978 102 358 213 108 833 907 G-8 2 703 519 066 2 661 134 472 2 624 464 259 2 650 568 456 2 701 546 786 MERCOSUR 0 0 0 0 0 NAFTA 0 0 0 0 0 OECD 3 258 913 913 3 264 549 046 3 249 203 738 3 313 655 261 3 338 968 867 SADC 17 935 588 18 448 090 22 266 221 27 368 750 32 221 292 1989 1990 1991 1992 1993 ACP 183 931 100 182 947 151 189 039 914 196 897 144 195 756 623 ASEAN 207 635 594 222 686 194 247 872 579 257 542 614 270 614 441 BRICS 0 0 0 0 0 EC 717 174 358 703 813 890 887 981 209 837 498 293 815 412 147 EFTA 128 732 238 132 790 008 140 827 027 158 174 074 163 948 930 G-8 2 680 866 949 2 706 762 204 2 860 858 380 2 806 668 305 2 744 320 730 MERCOSUR 0 0 0 0 0 NAFTA 0 0 0 0 0 OECD 3 395 714 135 3 437 393 129 3 623 881 174 3 597 534 307 3 544 682 194 SADC 32 532 362 34 481 758 34 374 849 36 256 581 33 922 701 1994 1995 1996 1997 1998 ACP 193 040 044 202 562 232 212 015 714 217 542 460 479 734 677 ASEAN 278 852 156 321 235 209 348 105 268 364 200 769 359 793 661 BRICS 0 0 0 0 0 EC 784 588 647 822 835 239 827 031 016 801 814 399 799 057 872 EFTA 180 935 940 170 327 565 195 052 693 200 728 454 194 932 445 G-8 2 935 876 562 3 027 169 237 2 957 115 570 2 972 006 823 4 048 643 323 MERCOSUR 0 229 823 132 253 379 650 264 305 113 279 878 856 NAFTA 2 542 365 897 2 607 910 184 2 560 338 893 2 602 947 783 2 611 228 199 OECD 3 984 014 613 4 179 397 498 4 421 392 692 4 473 869 436 4 461 288 270 SADC 257 535 794 277 788 034 281 753 573 299 544 756 303 526 018
Abbreviations: see Explanation; Abkürzungen: siehe Erläuterungen
29
1999 2000 2001 2002 2003 ACP 480 814 250 506 140 321 514 510 222 522 549 874 554 183 500 ASEAN 360 606 543 355 935 276 367 799 809 408 585 793 430 084 489 BRICS 0 0 3 470 413 196 3 712 844 896 4 118 474 572 EC 782 066 265 777 854 885 769 538 631 775 360 116 755 269 527 EFTA 198 915 270 211 261 149 215 827 726 220 666 644 223 480 470 G-8 3 960 125 974 3 958 921 023 3 978 481 837 3 977 280 243 3 991 884 458 MERCOSUR 304 137 445 322 855 599 318 716 164 333 249 083 345 958 279 NAFTA 2 542 476 205 2 542 215 841 2 577 108 293 2 531 473 640 2 528 040 121 OECD 4 383 118 669 4 415 902 258 4 468 615 245 4 427 468 814 4 409 586 005 SADC 305 840 608 305 854 012 307 547 088 319 306 422 328 901 347 2004 2005 2006 2007 2008 ACP 595 598 784 629 820 077 645 723 364 661 576 262 673 744 023 ASEAN 468 795 913 500 766 135 542 509 445 575 985 160 603 894 125 BRICS 4 572 106 620 4 973 506 439 5 354 332 619 5 743 873 105 5 931 427 709 EC 1 035 403 392 999 731 133 961 341 813 1 031 052 284 1 004 416 498 EFTA 223 765 355 213 717 867 206 105 089 197 529 668 200 701 515 G-8 4 082 674 308 4 127 598 208 4 195 620 326 4 238 796 106 4 239 125 947 MERCOSUR 358 450 856 367 653 911 614 270 331 631 310 740 629 211 192 NAFTA 2 577 361 614 2 597 203 648 2 632 523 654 2 603 742 777 2 620 900 311 OECD 4 493 250 454 4 515 660 883 4 532 904 996 4 523 880 728 4 557 033 032 SADC 341 458 427 365 727 231 366 791 663 384 354 761 403 659 145 2009 2010 2011 2012 2013 ACP 662 684 875 704 318 258 688 776 268 703 196 443 708 268 297 ASEAN 629 662 390 679 316 277 759 839 934 794 091 559 857 200 931 BRICS 5 965 491 905 6 450 663 915 6 876 255 179 7 340 503 061 7 443 462 853 EC 938 626 395 939 299 040 940 539 452 919 266 715 881 322 001 EFTA 197 425 505 190 717 991 179 577 777 182 920 529 174 627 264 G-8 4 033 438 747 4 183 634 344 4 284 398 107 4 290 888 693 4 333 341 578 MERCOSUR 580 321 840 617 305 704 632 020 322 630 216 153 614 010 919 NAFTA 2 502 540 292 2 562 804 434 2 639 921 180 2 650 305 307 2 698 713 308 OECD 4 401 086 397 4 567 694 397 4 636 836 598 4 697 241 803 4 816 396 828 SADC 397 396 134 412 541 691 405 117 255 424 728 475 429 684 804
6.1.5 Total Minerals Production, by Political Stability of Producer Countries Gesamtproduktion mineralischer Rohstoffe, nach politischer Stabilität der Produktionsländer
(not included bauxite / ohne Bauxit ) in metr. t
1996 1997 1998 1999 2000 Stable 857 840 755 428 23 240 719 23 977 278 297 236 673 Fair 4 855 826 439 4 868 622 803 4 968 102 303 4 910 959 693 5 330 673 295 Unstable 5 291 098 238 5 448 845 127 5 493 771 612 5 367 822 588 4 917 489 803 Extreme Unstable 808 845 191 859 164 365 705 206 182 766 295 204 761 058 618 Total 10 956 627 708 11 177 387 723 11 190 320 816 11 069 054 763 11 306 458 389
Abbreviations: see Explanation; Abkürzungen: siehe Erläuterungen
30
2001 2002 2003 2004 2005 Stable 279 257 777 272 086 539 19 634 161 47 455 513 251 622 776 Fair 5 298 275 585 4 937 227 441 5 943 365 402 3 222 246 343 3 151 134 818 Unstable 5 121 179 118 5 466 410 299 4 809 477 318 7 491 721 163 8 235 354 657 Extreme Unstable 787 407 467 1 018 137 566 1 523 878 101 2 339 590 469 2 060 105 417 Total 11 486 119 947 11 693 861 845 12 296 354 982 13 101 013 488 13 698 217 668 2006 2007 2008 2009 2010 Stable 18 727 782 8 152 194 7 681 766 19 809 820 190 934 472 Fair 5 633 966 722 5 888 516 450 5 926 625 649 5 415 704 591 5 474 669 087 Unstable 7 769 167 136 8 275 019 481 8 335 479 175 7 448 304 929 8 868 657 271 Extreme Unstable 815 514 289 534 088 168 829 744 510 1 955 356 529 1 138 648 569 Total 14 237 375 929 14 705 776 293 15 099 531 100 14 839 175 869 15 672 909 399 2011 2012 2013 2014 2015 Stable 192 789 335 201 757 584 194 255 084 Fair 5 474 219 271 5 522 625 826 5 373 399 446 Unstable 8 685 450 094 8 974 162 276 10 282 728 591 Extreme Unstable 2 031 975 075 2 037 070 954 1 139 064 554 Total 16 384 433 774 16 735 616 641 16 989 447 675
6.1.6 Total Minerals Production, by Groups of Commodities Gesamtproduktion, nach Rohstoffgruppen
(not included bauxite / ohne Bauxit ) in metr. t
1984 1985 1986 1987 1988 Iron, Ferro-Alloy Met. 465 534 838 517 564 938 522 139 341 537 822 423 554 052 783 Non-Ferrous Metals 35 078 484 35 275 374 35 128 420 36 706 718 37 763 578 Precious Metals 14 613 15 041 14 975 15 758 16 748 Industrial Minerals 460 067 530 468 050 421 478 297 777 493 005 689 504 895 770 Mineral Fuels 8 459 708 617 8 616 493 135 8 853 428 048 9 003 037 594 9 261 617 963 Total 9 420 404 082 9 637 398 909 9 889 008 561 10 070 588 182 10 358 346 842 1989 1990 1991 1992 1993 Iron, Ferro-Alloy Met. 570 374 971 562 311 927 564 101 857 528 797 838 529 063 626 Non-Ferrous Metals 38 642 359 39 117 750 39 152 154 39 622 162 39 062 152 Precious Metals 17 191 17 473 17 091 17 578 16 797 Industrial Minerals 508 269 175 495 302 758 474 788 151 462 782 863 451 063 974 Mineral Fuels 9 540 148 146 9 544 006 050 9 404 848 425 9 329 270 759 9 293 243 914 Total 10 657 451 842 10 640 755 958 10 482 907 678 10 360 491 200 10 312 450 463
Abbreviations: see Explanation; Abkürzungen: siehe Erläuterungen
31
1994 1995 1996 1997 1998 Iron, Ferro-Alloy Met. 548 095 138 582 642 300 574 538 809 596 709 256 597 429 039 Non-Ferrous Metals 38 770 067 40 440 862 42 650 102 44 214 626 46 002 299 Precious Metals 16 042 16 941 17 389 18 578 19 606 Industrial Minerals 475 221 122 491 546 699 499 512 521 514 415 293 504 138 646 Mineral Fuels 9 443 005 609 9 792 186 471 9 839 908 887 10 022 029 970 10 042 731 226 Total 10 505 107 978 10 906 833 273 10 956 627 708 11 177 387 723 11 190 320 816 1999 2000 2001 2002 2003 Iron, Ferro-Alloy Met. 597 710 329 637 876 886 614 882 631 655 887 476 687 906 436 Non-Ferrous Metals 48 031 087 49 958 947 50 532 773 51 788 896 54 952 624 Precious Metals 19 891 21 053 21 634 21 769 21 741 Industrial Minerals 530 902 540 538 964 668 538 948 622 544 260 632 592 033 705 Mineral Fuels 9 892 390 916 10 079 636 835 10 281 734 287 10 441 903 072 10 961 440 476 Total 11 069 054 763 11 306 458 389 11 486 119 947 11 693 861 845 12 296 354 982 2004 2005 2006 2007 2008 Iron, Ferro-Alloy Met. 787 104 965 851 216 727 963 619 091 1 065 832 008 1 132 220 543 Non-Ferrous Metals 57 530 815 60 642 625 63 693 638 68 930 472 71 675 297 Precious Metals 22 628 23 226 22 939 23 453 24 051 Industrial Minerals 635 125 505 658 668 218 682 302 047 694 906 158 699 202 613 Mineral Fuels 11 621 229 575 12 127 666 872 12 527 738 214 12 876 084 202 13 196 408 596 Total 13 101 013 488 13 698 217 668 14 237 375 929 14 705 776 293 15 099 531 100 2009 2010 2011 2012 2013 Iron, Ferro-Alloy Met. 1 119 498 522 1 299 783 122 1 426 958 784 1 441 685 001 1 565 177 615 Non-Ferrous Metals 68 841 314 74 831 682 78 575 113 82 231 943 85 774 185 Precious Metals 25 395 26 709 26 757 28 062 29 272 Industrial Minerals 674 260 176 717 992 136 749 686 580 758 810 181 779 443 171 Mineral Fuels 12 976 550 462 13 580 275 750 14 129 186 541 14 452 861 454 14 559 023 432 Total 14 839 175 869 15 672 909 399 16 384 433 774 16 735 616 641 16 989 447 675
Abbreviations: see Explanation; Abkürzungen: siehe Erläuterungen
32
6.1.7 Mineral Fuels Energierohstoffe
6.1.7.1 Total Production in metr. t Gesamtproduktion in metr. t
1984 1985 1986 1987 1988 Steam Coal 2 531 548 298 2 655 970 838 2 734 016 784 2 804 702 921 2 871 998 723 Coking Coal 576 127 300 581 398 250 587 902 000 590 871 000 622 867 000 Lignite 1 127 741 583 1 179 593 745 1 211 694 390 1 234 388 696 1 202 293 995 Petroleum total 2 815 439 096 2 760 938 322 2 854 328 252 2 843 662 378 2 967 443 269 Petroleum Oilsands 8 345 000 10 811 200 13 848 000 14 761 900 16 466 100 Nat. Gas 1 376 433 941 1 406 219 636 1 434 111 421 1 498 850 602 1 568 477 698 Oilshales 32 357 240 32 310 047 31 310 014 30 492 137 28 466 360 Uranium 61 159 62 297 65 187 69 860 70 918 Total 8 459 708 617 8 616 493 135 8 853 428 048 9 003 037 594 9 261 617 963 1989 1990 1991 1992 1993 Steam Coal 2 944 260 804 2 963 925 869 2 927 092 450 2 948 821 547 2 881 714 376 Coking Coal 622 569 700 637 788 000 600 704 000 526 867 580 511 743 000 Lignite 1 270 755 539 1 177 779 805 1 091 983 902 1 024 915 678 968 050 090 Petroleum total 3 050 805 431 3 096 837 386 3 090 844 720 3 128 995 187 3 150 028 697 Petroleum Oilsands 16 625 700 17 116 500 17 362 800 18 140 200 18 713 400 Nat. Gas 1 623 219 763 1 640 959 736 1 668 456 009 1 674 793 384 1 755 314 294 Oilshales 28 468 938 26 655 905 25 718 314 24 835 014 26 355 156 Uranium 67 971 59 349 49 030 42 369 38 301 Total 9 540 148 146 9 544 006 050 9 404 848 425 9 329 270 759 9 293 243 914 1994 1995 1996 1997 1998 Steam Coal 3 012 154 884 3 145 604 443 3 257 482 096 3 275 323 278 3 224 561 335 Coking Coal 522 626 000 550 728 000 520 566 000 529 527 000 495 436 000 Lignite 929 640 062 913 317 282 889 630 312 890 106 311 867 956 746 Petroleum total 3 127 003 815 3 231 011 706 3 273 572 893 3 410 672 548 3 518 008 904 Petroleum Oilsands 19 736 300 21 296 300 22 157 900 26 261 300 29 377 100 Nat. Gas 1 829 264 723 1 934 824 772 1 881 650 925 1 899 107 635 1 921 446 778 Oilshales 22 278 784 16 659 899 16 965 358 17 251 305 15 281 589 Uranium 37 341 40 369 41 303 41 893 39 874 Total 9 443 005 609 9 792 186 471 9 839 908 887 10 022 029 970 10 042 731 226 1999 2000 2001 2002 2003 Steam Coal 3 154 359 632 3 158 249 077 3 314 471 821 3 446 418 280 3 732 897 891 Coking Coal 480 023 000 475 040 000 474 756 000 477 242 000 508 678 120 Lignite 855 782 347 869 796 576 897 267 101 899 877 623 886 720 662 Petroleum total 3 417 681 606 3 541 452 733 3 536 881 866 3 512 170 830 3 669 030 906 Petroleum Oilsands 31 564 100 41 967 300 47 773 400 60 134 700 66 102 200 Nat. Gas 1 971 205 622 2 020 883 982 2 044 087 719 2 091 412 509 2 147 033 151 Oilshales 13 301 711 14 172 936 14 227 015 14 739 077 17 037 785 Uranium 36 998 41 531 42 765 42 753 41 961 Total 9 892 390 916 10 079 636 835 10 281 734 287 10 441 903 072 10 961 440 476
Abbreviations: see Explanation; Abkürzungen: siehe Erläuterungen
33
2004 2005 2006 2007 2008 Steam Coal 4 088 213 907 4 331 172 935 4 549 053 608 4 779 062 314 4 927 946 762 Coking Coal 584 938 201 652 371 428 704 019 531 757 842 990 782 641 260 Lignite 903 528 195 943 653 773 958 537 279 965 394 720 991 446 811 Petroleum total 3 830 091 572 3 888 526 346 3 918 813 479 3 897 098 580 3 938 227 181 Petroleum Oilsands 77 767 800 77 344 600 85 690 900 90 471 600 90 867 900 Nat. Gas 2 198 383 038 2 295 368 696 2 381 187 962 2 458 131 225 2 538 063 200 Oilshales 16 027 336 16 524 485 16 079 794 18 505 726 18 031 734 Uranium 47 326 49 209 46 561 48 647 51 648 Total 11 621 229 575 12 127 666 872 12 527 738 214 12 876 084 202 13 196 408 596 2009 2010 2011 2012 2013 Steam Coal 5 024 033 675 5 213 389 868 5 554 397 529 5 704 758 895 5 772 657 962 Coking Coal 791 215 040 919 732 350 976 925 520 992 052 310 1 018 213 600 Lignite 842 533 539 855 273 423 897 877 115 897 797 439 859 146 042 Petroleum total 3 831 165 677 3 921 695 954 3 947 934 068 4 051 998 945 4 068 775 343 Petroleum Oilsands 101 396 500 103 465 400 108 702 200 119 618 300 126 501 200 Nat. Gas 2 471 654 400 2 651 316 000 2 732 483 200 2 786 482 400 2 818 857 600 Oilshales 15 888 442 18 805 092 19 505 132 19 701 365 21 304 753 Uranium 59 689 63 063 63 977 70 100 68 132 Total 12 976 550 462 13 580 275 750 14 129 186 541 14 452 861 454 14 559 023 432
6.1.7.2 Total Production in Tons Coal Equivalents (CE) Gesamtproduktion in Tonnen Steinkohleneinheiten (SKE)
1984 1985 1986 1987 1988 Steam Coal 1 982 700 951 2 077 838 250 2 139 276 905 2 194 004 661 2 240 076 070 Coking Coal 439 277 333 444 253 898 446 855 850 449 073 130 474 440 350 Lignite 364 058 532 381 806 082 392 650 662 400 805 054 391 557 238 Petroleum total 4 020 447 033 3 942 619 925 4 075 980 743 4 060 749 877 4 237 508 993 Petroleum Oilsands 11 916 660 15 438 394 19 774 944 21 079 993 23 513 591 Nat. Gas 1 863 858 856 1 904 229 597 1 942 043 142 2 029 692 414 2 123 985 853 Oilshales 9 804 244 9 789 944 9 486 934 9 239 117 8 625 308 Uranium 1 009 123 500 1 027 900 500 1 075 585 500 1 152 690 000 1 170 147 000 Total 9 689 270 449 9 788 438 196 10 081 879 736 10 296 254 253 10 646 340 812 1989 1990 1991 1992 1993 Steam Coal 2 295 209 396 2 313 291 138 2 286 008 188 2 316 278 368 2 257 906 282 Coking Coal 475 286 967 491 586 520 464 721 740 420 965 323 410 680 780 Lignite 412 848 798 384 350 579 355 285 425 354 200 265 332 641 360 Petroleum total 4 356 550 157 4 422 283 787 4 413 726 257 4 468 205 127 4 498 240 978 Petroleum Oilsands 23 741 500 24 442 362 24 794 078 25 904 206 26 722 735 Nat. Gas 2 198 114 427 2 222 133 875 2 259 391 713 2 267 986 961 2 377 001 086 Oilshales 8 626 089 8 076 740 7 792 650 7 525 008 7 985 612 Uranium 1 121 521 500 979 258 500 808 995 000 699 088 500 631 966 500 Total 10 868 157 334 10 820 981 139 10 595 920 973 10 534 249 553 10 516 422 598
Abbreviations: see Explanation; Abkürzungen: siehe Erläuterungen
34
1994 1995 1996 1997 1998 Steam Coal 2 358 793 549 2 463 137 764 2 547 417 031 2 566 294 432 2 533 611 843 Coking Coal 421 227 600 440 040 260 417 944 140 424 968 480 397 786 740 Lignite 318 610 890 314 734 380 303 407 928 305 621 160 294 347 164 Petroleum total 4 465 361 447 4 613 885 196 4 674 662 092 4 870 440 400 5 023 716 717 Petroleum Oilsands 28 183 436 30 411 116 31 641 481 37 501 136 41 950 499 Nat. Gas 2 477 106 169 2 620 017 424 2 548 055 497 2 571 711 063 2 601 922 566 Oilshales 6 750 471 5 047 949 5 140 505 5 227 145 4 630 321 Uranium 616 126 500 666 088 500 681 499 500 691 234 500 657 921 000 Total 10 663 976 626 11 122 951 474 11 178 126 693 11 435 497 180 11 513 936 351 1999 2000 2001 2002 2003 Steam Coal 2 479 786 291 2 479 345 083 2 604 231 285 2 694 541 799 2 898 243 390 Coking Coal 387 074 390 382 808 150 382 128 630 381 715 740 405 646 916 Lignite 291 878 397 295 483 469 305 774 262 304 629 847 300 139 863 Petroleum total 4 880 449 336 5 057 194 504 5 050 667 067 5 015 379 943 5 239 974 467 Petroleum Oilsands 45 073 535 59 929 304 68 220 415 85 872 352 94 393 942 Nat. Gas 2 669 340 912 2 736 628 321 2 768 065 603 2 832 125 013 2 907 352 067 Oilshales 4 030 418 4 294 399 4 310 786 4 465 941 5 162 449 Uranium 610 467 000 685 261 500 705 622 500 705 424 500 692 356 500 Total 11 323 026 744 11 641 015 425 11 820 800 134 11 938 282 783 12 448 875 652 2004 2005 2006 2007 2008 Steam Coal 3 165 535 775 3 344 637 793 3 503 556 273 3 666 931 713 3 772 392 340 Coking Coal 462 500 307 513 024 173 544 457 783 592 684 844 611 600 116 Lignite 306 806 170 310 110 160 317 009 343 332 113 848 341 847 781 Petroleum total 5 469 758 897 5 552 815 625 5 595 968 546 5 565 056 774 5 624 989 279 Petroleum Oilsands 111 052 418 110 448 089 122 366 605 129 193 445 129 759 361 Nat. Gas 2 976 853 532 3 108 156 991 3 224 361 259 3 328 520 091 3 436 778 058 Oilshales 4 856 284 27 379 020 27 663 178 30 073 835 30 178 715 Uranium 780 879 000 811 948 500 800 827 500 802 675 500 852 192 000 Total 13 167 189 964 13 668 072 262 14 013 843 882 14 318 056 605 14 669 978 290 2009 2010 2011 2012 2013 Steam Coal 3 834 321 608 3 964 174 150 4 205 124 199 4 308 445 516 4 351 414 254 Coking Coal 611 817 534 725 239 080 758 880 532 768 596 372 789 752 106 Lignite 282 530 257 290 683 999 305 417 880 301 311 216 290 202 717 Petroleum total 5 471 167 337 5 600 127 561 5 637 649 845 5 786 254 494 5 810 211 189 Petroleum Oilsands 144 794 202 147 748 591 155 226 742 170 814 932 180 770 215 Nat. Gas 3 349 340 509 3 590 039 547 3 699 899 750 3 773 802 010 3 816 733 190 Oilshales 30 476 439 35 114 663 5 910 055 5 969 514 6 349 290 Uranium 984 862 507 1 040 539 500 1 056 613 953 1 156 650 000 1 124 178 000 Total 14 564 516 190 15 245 918 500 15 669 496 214 16 101 029 122 16 188 840 746
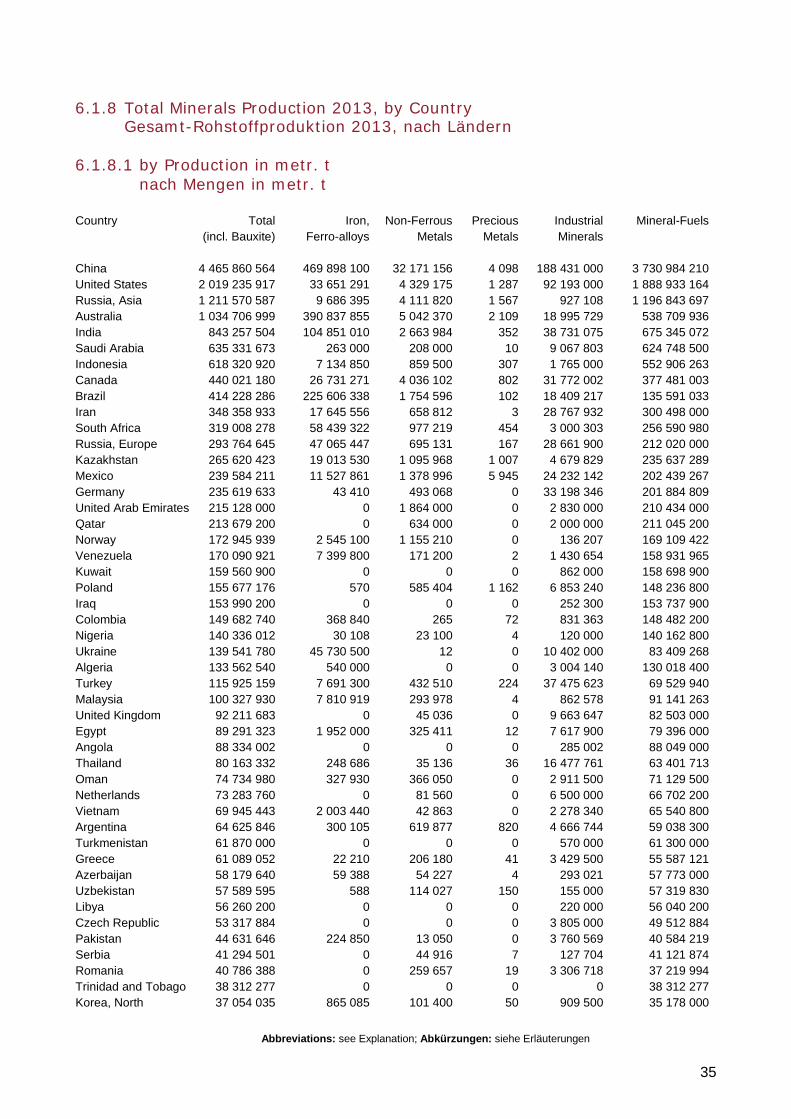
Abbreviations: see Explanation; Abkürzungen: siehe Erläuterungen
35
6.1.8 Total Minerals Production 2013, by Country Gesamt-Rohstoffproduktion 2013, nach Ländern
6.1.8.1 by Production in metr. t nach Mengen in metr. t
Country Total Iron, Non-Ferrous Precious Industrial Mineral-Fuels (incl. Bauxite) Ferro-alloys Metals Metals Minerals China 4 465 860 564 469 898 100 32 171 156 4 098 188 431 000 3 730 984 210 United States 2 019 235 917 33 651 291 4 329 175 1 287 92 193 000 1 888 933 164 Russia, Asia 1 211 570 587 9 686 395 4 111 820 1 567 927 108 1 196 843 697 Australia 1 034 706 999 390 837 855 5 042 370 2 109 18 995 729 538 709 936 India 843 257 504 104 851 010 2 663 984 352 38 731 075 675 345 072 Saudi Arabia 635 331 673 263 000 208 000 10 9 067 803 624 748 500 Indonesia 618 320 920 7 134 850 859 500 307 1 765 000 552 906 263 Canada 440 021 180 26 731 271 4 036 102 802 31 772 002 377 481 003 Brazil 414 228 286 225 606 338 1 754 596 102 18 409 217 135 591 033 Iran 348 358 933 17 645 556 658 812 3 28 767 932 300 498 000 South Africa 319 008 278 58 439 322 977 219 454 3 000 303 256 590 980 Russia, Europe 293 764 645 47 065 447 695 131 167 28 661 900 212 020 000 Kazakhstan 265 620 423 19 013 530 1 095 968 1 007 4 679 829 235 637 289 Mexico 239 584 211 11 527 861 1 378 996 5 945 24 232 142 202 439 267 Germany 235 619 633 43 410 493 068 0 33 198 346 201 884 809 United Arab Emirates 215 128 000 0 1 864 000 0 2 830 000 210 434 000 Qatar 213 679 200 0 634 000 0 2 000 000 211 045 200 Norway 172 945 939 2 545 100 1 155 210 0 136 207 169 109 422 Venezuela 170 090 921 7 399 800 171 200 2 1 430 654 158 931 965 Kuwait 159 560 900 0 0 0 862 000 158 698 900 Poland 155 677 176 570 585 404 1 162 6 853 240 148 236 800 Iraq 153 990 200 0 0 0 252 300 153 737 900 Colombia 149 682 740 368 840 265 72 831 363 148 482 200 Nigeria 140 336 012 30 108 23 100 4 120 000 140 162 800 Ukraine 139 541 780 45 730 500 12 0 10 402 000 83 409 268 Algeria 133 562 540 540 000 0 0 3 004 140 130 018 400 Turkey 115 925 159 7 691 300 432 510 224 37 475 623 69 529 940 Malaysia 100 327 930 7 810 919 293 978 4 862 578 91 141 263 United Kingdom 92 211 683 0 45 036 0 9 663 647 82 503 000 Egypt 89 291 323 1 952 000 325 411 12 7 617 900 79 396 000 Angola 88 334 002 0 0 0 285 002 88 049 000 Thailand 80 163 332 248 686 35 136 36 16 477 761 63 401 713 Oman 74 734 980 327 930 366 050 0 2 911 500 71 129 500 Netherlands 73 283 760 0 81 560 0 6 500 000 66 702 200 Vietnam 69 945 443 2 003 440 42 863 0 2 278 340 65 540 800 Argentina 64 625 846 300 105 619 877 820 4 666 744 59 038 300 Turkmenistan 61 870 000 0 0 0 570 000 61 300 000 Greece 61 089 052 22 210 206 180 41 3 429 500 55 587 121 Azerbaijan 58 179 640 59 388 54 227 4 293 021 57 773 000 Uzbekistan 57 589 595 588 114 027 150 155 000 57 319 830 Libya 56 260 200 0 0 0 220 000 56 040 200 Czech Republic 53 317 884 0 0 0 3 805 000 49 512 884 Pakistan 44 631 646 224 850 13 050 0 3 760 569 40 584 219 Serbia 41 294 501 0 44 916 7 127 704 41 121 874 Romania 40 786 388 0 259 657 19 3 306 718 37 219 994 Trinidad and Tobago 38 312 277 0 0 0 0 38 312 277 Korea, North 37 054 035 865 085 101 400 50 909 500 35 178 000
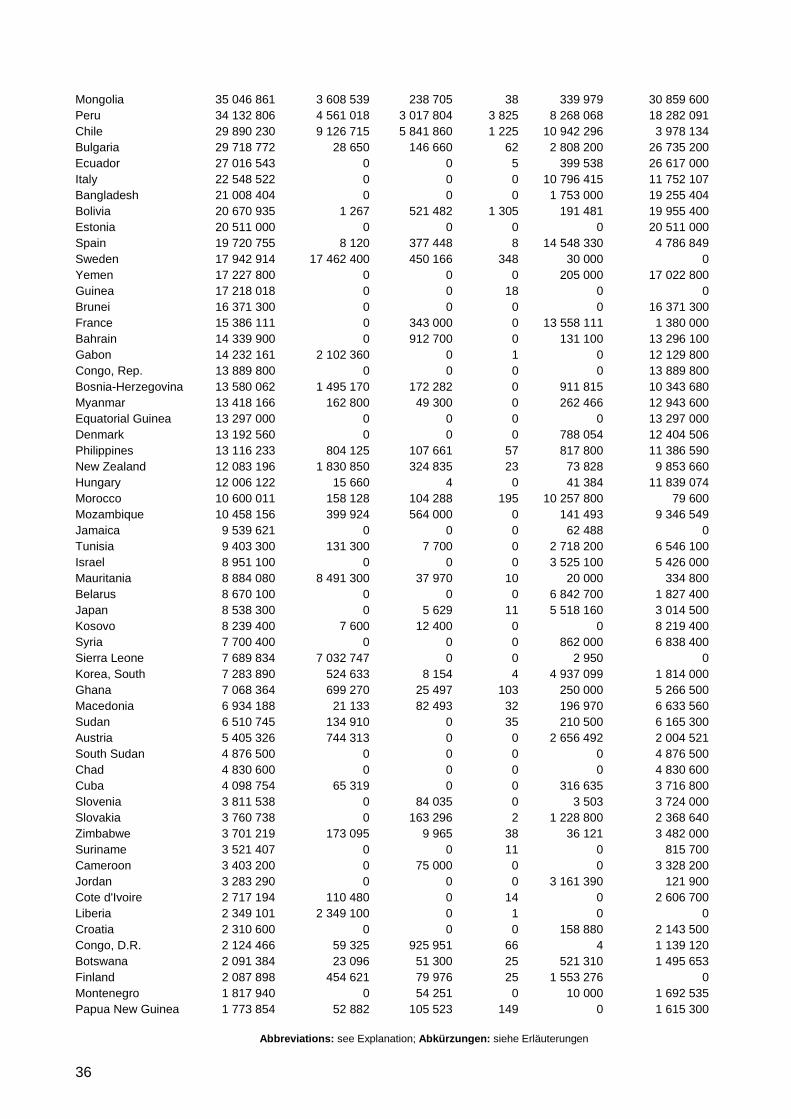
Abbreviations: see Explanation; Abkürzungen: siehe Erläuterungen
36
Mongolia 35 046 861 3 608 539 238 705 38 339 979 30 859 600 Peru 34 132 806 4 561 018 3 017 804 3 825 8 268 068 18 282 091 Chile 29 890 230 9 126 715 5 841 860 1 225 10 942 296 3 978 134 Bulgaria 29 718 772 28 650 146 660 62 2 808 200 26 735 200 Ecuador 27 016 543 0 0 5 399 538 26 617 000 Italy 22 548 522 0 0 0 10 796 415 11 752 107 Bangladesh 21 008 404 0 0 0 1 753 000 19 255 404 Bolivia 20 670 935 1 267 521 482 1 305 191 481 19 955 400 Estonia 20 511 000 0 0 0 0 20 511 000 Spain 19 720 755 8 120 377 448 8 14 548 330 4 786 849 Sweden 17 942 914 17 462 400 450 166 348 30 000 0 Yemen 17 227 800 0 0 0 205 000 17 022 800 Guinea 17 218 018 0 0 18 0 0 Brunei 16 371 300 0 0 0 0 16 371 300 France 15 386 111 0 343 000 0 13 558 111 1 380 000 Bahrain 14 339 900 0 912 700 0 131 100 13 296 100 Gabon 14 232 161 2 102 360 0 1 0 12 129 800 Congo, Rep. 13 889 800 0 0 0 0 13 889 800 Bosnia-Herzegovina 13 580 062 1 495 170 172 282 0 911 815 10 343 680 Myanmar 13 418 166 162 800 49 300 0 262 466 12 943 600 Equatorial Guinea 13 297 000 0 0 0 0 13 297 000 Denmark 13 192 560 0 0 0 788 054 12 404 506 Philippines 13 116 233 804 125 107 661 57 817 800 11 386 590 New Zealand 12 083 196 1 830 850 324 835 23 73 828 9 853 660 Hungary 12 006 122 15 660 4 0 41 384 11 839 074 Morocco 10 600 011 158 128 104 288 195 10 257 800 79 600 Mozambique 10 458 156 399 924 564 000 0 141 493 9 346 549 Jamaica 9 539 621 0 0 0 62 488 0 Tunisia 9 403 300 131 300 7 700 0 2 718 200 6 546 100 Israel 8 951 100 0 0 0 3 525 100 5 426 000 Mauritania 8 884 080 8 491 300 37 970 10 20 000 334 800 Belarus 8 670 100 0 0 0 6 842 700 1 827 400 Japan 8 538 300 0 5 629 11 5 518 160 3 014 500 Kosovo 8 239 400 7 600 12 400 0 0 8 219 400 Syria 7 700 400 0 0 0 862 000 6 838 400 Sierra Leone 7 689 834 7 032 747 0 0 2 950 0 Korea, South 7 283 890 524 633 8 154 4 4 937 099 1 814 000 Ghana 7 068 364 699 270 25 497 103 250 000 5 266 500 Macedonia 6 934 188 21 133 82 493 32 196 970 6 633 560 Sudan 6 510 745 134 910 0 35 210 500 6 165 300 Austria 5 405 326 744 313 0 0 2 656 492 2 004 521 South Sudan 4 876 500 0 0 0 0 4 876 500 Chad 4 830 600 0 0 0 0 4 830 600 Cuba 4 098 754 65 319 0 0 316 635 3 716 800 Slovenia 3 811 538 0 84 035 0 3 503 3 724 000 Slovakia 3 760 738 0 163 296 2 1 228 800 2 368 640 Zimbabwe 3 701 219 173 095 9 965 38 36 121 3 482 000 Suriname 3 521 407 0 0 11 0 815 700 Cameroon 3 403 200 0 75 000 0 0 3 328 200 Jordan 3 283 290 0 0 0 3 161 390 121 900 Cote d'Ivoire 2 717 194 110 480 0 14 0 2 606 700 Liberia 2 349 101 2 349 100 0 1 0 0 Croatia 2 310 600 0 0 0 158 880 2 143 500 Congo, D.R. 2 124 466 59 325 925 951 66 4 1 139 120 Botswana 2 091 384 23 096 51 300 25 521 310 1 495 653 Finland 2 087 898 454 621 79 976 25 1 553 276 0 Montenegro 1 817 940 0 54 251 0 10 000 1 692 535 Papua New Guinea 1 773 854 52 882 105 523 149 0 1 615 300
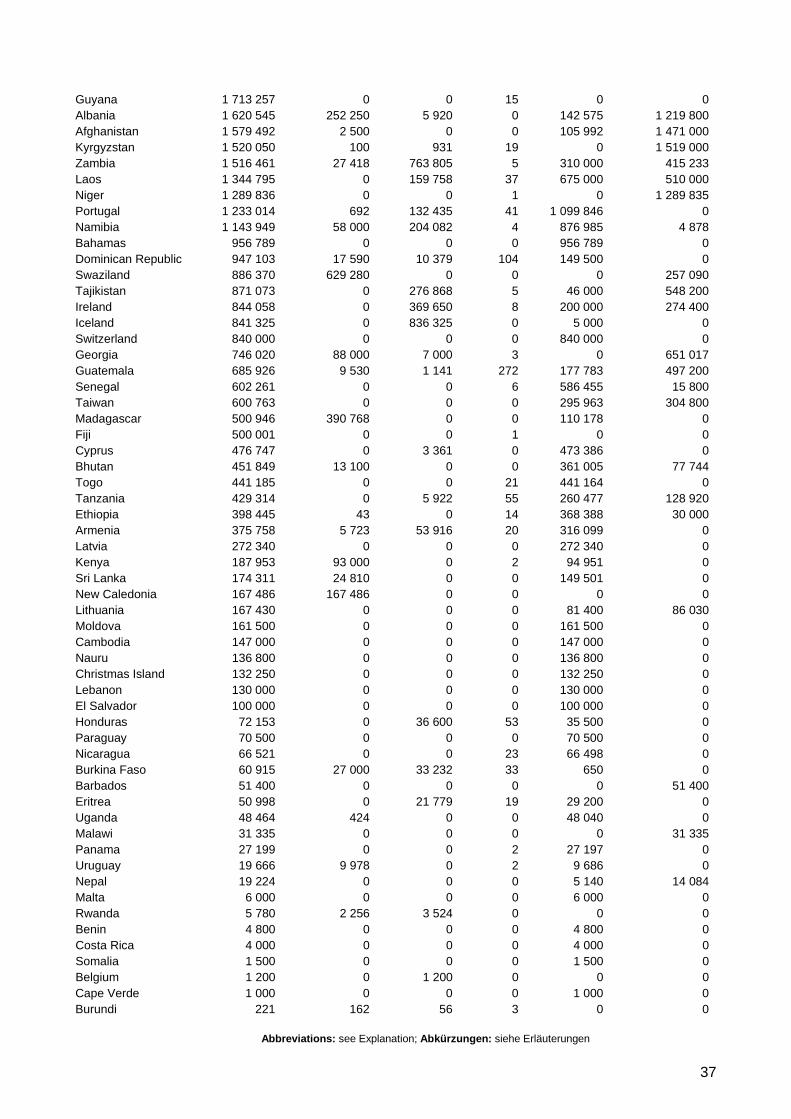
Abbreviations: see Explanation; Abkürzungen: siehe Erläuterungen
37
Guyana 1 713 257 0 0 15 0 0 Albania 1 620 545 252 250 5 920 0 142 575 1 219 800 Afghanistan 1 579 492 2 500 0 0 105 992 1 471 000 Kyrgyzstan 1 520 050 100 931 19 0 1 519 000 Zambia 1 516 461 27 418 763 805 5 310 000 415 233 Laos 1 344 795 0 159 758 37 675 000 510 000 Niger 1 289 836 0 0 1 0 1 289 835 Portugal 1 233 014 692 132 435 41 1 099 846 0 Namibia 1 143 949 58 000 204 082 4 876 985 4 878 Bahamas 956 789 0 0 0 956 789 0 Dominican Republic 947 103 17 590 10 379 104 149 500 0 Swaziland 886 370 629 280 0 0 0 257 090 Tajikistan 871 073 0 276 868 5 46 000 548 200 Ireland 844 058 0 369 650 8 200 000 274 400 Iceland 841 325 0 836 325 0 5 000 0 Switzerland 840 000 0 0 0 840 000 0 Georgia 746 020 88 000 7 000 3 0 651 017 Guatemala 685 926 9 530 1 141 272 177 783 497 200 Senegal 602 261 0 0 6 586 455 15 800 Taiwan 600 763 0 0 0 295 963 304 800 Madagascar 500 946 390 768 0 0 110 178 0 Fiji 500 001 0 0 1 0 0 Cyprus 476 747 0 3 361 0 473 386 0 Bhutan 451 849 13 100 0 0 361 005 77 744 Togo 441 185 0 0 21 441 164 0 Tanzania 429 314 0 5 922 55 260 477 128 920 Ethiopia 398 445 43 0 14 368 388 30 000 Armenia 375 758 5 723 53 916 20 316 099 0 Latvia 272 340 0 0 0 272 340 0 Kenya 187 953 93 000 0 2 94 951 0 Sri Lanka 174 311 24 810 0 0 149 501 0 New Caledonia 167 486 167 486 0 0 0 0 Lithuania 167 430 0 0 0 81 400 86 030 Moldova 161 500 0 0 0 161 500 0 Cambodia 147 000 0 0 0 147 000 0 Nauru 136 800 0 0 0 136 800 0 Christmas Island 132 250 0 0 0 132 250 0 Lebanon 130 000 0 0 0 130 000 0 El Salvador 100 000 0 0 0 100 000 0 Honduras 72 153 0 36 600 53 35 500 0 Paraguay 70 500 0 0 0 70 500 0 Nicaragua 66 521 0 0 23 66 498 0 Burkina Faso 60 915 27 000 33 232 33 650 0 Barbados 51 400 0 0 0 0 51 400 Eritrea 50 998 0 21 779 19 29 200 0 Uganda 48 464 424 0 0 48 040 0 Malawi 31 335 0 0 0 0 31 335 Panama 27 199 0 0 2 27 197 0 Uruguay 19 666 9 978 0 2 9 686 0 Nepal 19 224 0 0 0 5 140 14 084 Malta 6 000 0 0 0 6 000 0 Rwanda 5 780 2 256 3 524 0 0 0 Benin 4 800 0 0 0 4 800 0 Costa Rica 4 000 0 0 0 4 000 0 Somalia 1 500 0 0 0 1 500 0 Belgium 1 200 0 1 200 0 0 0 Cape Verde 1 000 0 0 0 1 000 0 Burundi 221 162 56 3 0 0
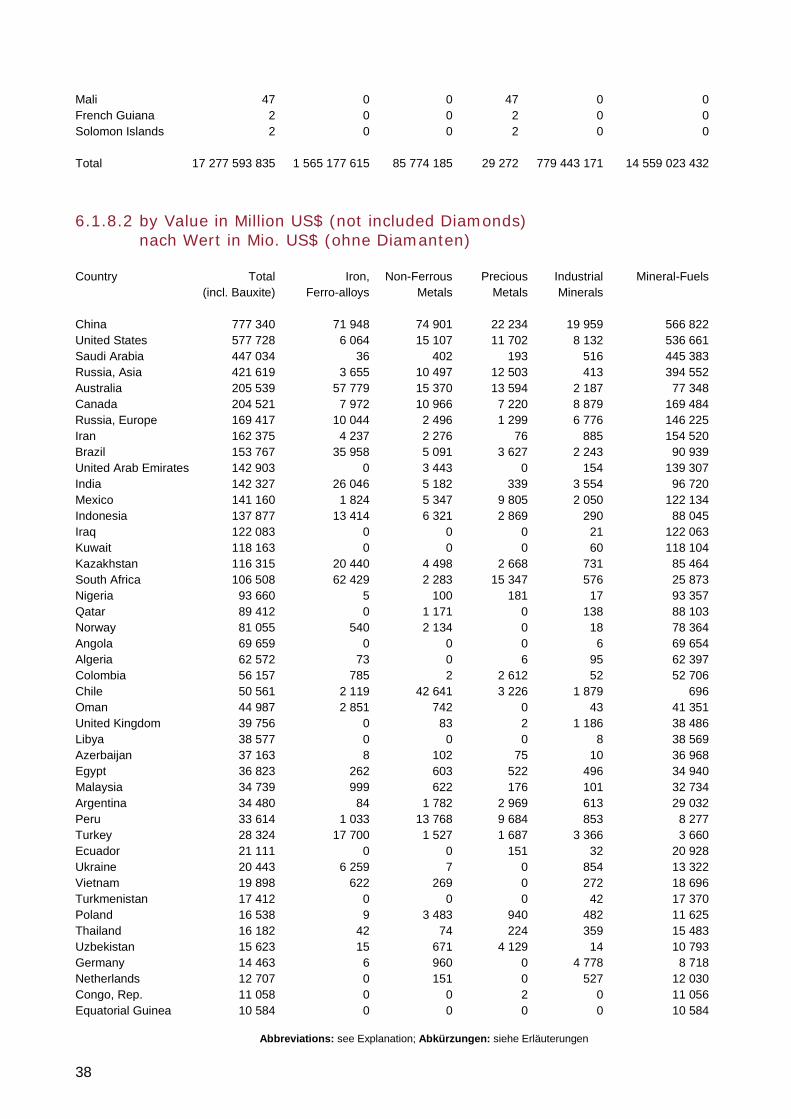
Abbreviations: see Explanation; Abkürzungen: siehe Erläuterungen
38
Mali 47 0 0 47 0 0 French Guiana 2 0 0 2 0 0 Solomon Islands 2 0 0 2 0 0 Total 17 277 593 835 1 565 177 615 85 774 185 29 272 779 443 171 14 559 023 432
6.1.8.2 by Value in Million US$ (not included Diamonds) nach Wert in Mio. US$ (ohne Diamanten)
Country Total Iron, Non-Ferrous Precious Industrial Mineral-Fuels (incl. Bauxite) Ferro-alloys Metals Metals Minerals China 777 340 71 948 74 901 22 234 19 959 566 822 United States 577 728 6 064 15 107 11 702 8 132 536 661 Saudi Arabia 447 034 36 402 193 516 445 383 Russia, Asia 421 619 3 655 10 497 12 503 413 394 552 Australia 205 539 57 779 15 370 13 594 2 187 77 348 Canada 204 521 7 972 10 966 7 220 8 879 169 484 Russia, Europe 169 417 10 044 2 496 1 299 6 776 146 225 Iran 162 375 4 237 2 276 76 885 154 520 Brazil 153 767 35 958 5 091 3 627 2 243 90 939 United Arab Emirates 142 903 0 3 443 0 154 139 307 India 142 327 26 046 5 182 339 3 554 96 720 Mexico 141 160 1 824 5 347 9 805 2 050 122 134 Indonesia 137 877 13 414 6 321 2 869 290 88 045 Iraq 122 083 0 0 0 21 122 063 Kuwait 118 163 0 0 0 60 118 104 Kazakhstan 116 315 20 440 4 498 2 668 731 85 464 South Africa 106 508 62 429 2 283 15 347 576 25 873 Nigeria 93 660 5 100 181 17 93 357 Qatar 89 412 0 1 171 0 138 88 103 Norway 81 055 540 2 134 0 18 78 364 Angola 69 659 0 0 0 6 69 654 Algeria 62 572 73 0 6 95 62 397 Colombia 56 157 785 2 2 612 52 52 706 Chile 50 561 2 119 42 641 3 226 1 879 696 Oman 44 987 2 851 742 0 43 41 351 United Kingdom 39 756 0 83 2 1 186 38 486 Libya 38 577 0 0 0 8 38 569 Azerbaijan 37 163 8 102 75 10 36 968 Egypt 36 823 262 603 522 496 34 940 Malaysia 34 739 999 622 176 101 32 734 Argentina 34 480 84 1 782 2 969 613 29 032 Peru 33 614 1 033 13 768 9 684 853 8 277 Turkey 28 324 17 700 1 527 1 687 3 366 3 660 Ecuador 21 111 0 0 151 32 20 928 Ukraine 20 443 6 259 7 0 854 13 322 Vietnam 19 898 622 269 0 272 18 696 Turkmenistan 17 412 0 0 0 42 17 370 Poland 16 538 9 3 483 940 482 11 625 Thailand 16 182 42 74 224 359 15 483 Uzbekistan 15 623 15 671 4 129 14 10 793 Germany 14 463 6 960 0 4 778 8 718 Netherlands 12 707 0 151 0 527 12 030 Congo, Rep. 11 058 0 0 2 0 11 056 Equatorial Guinea 10 584 0 0 0 0 10 584
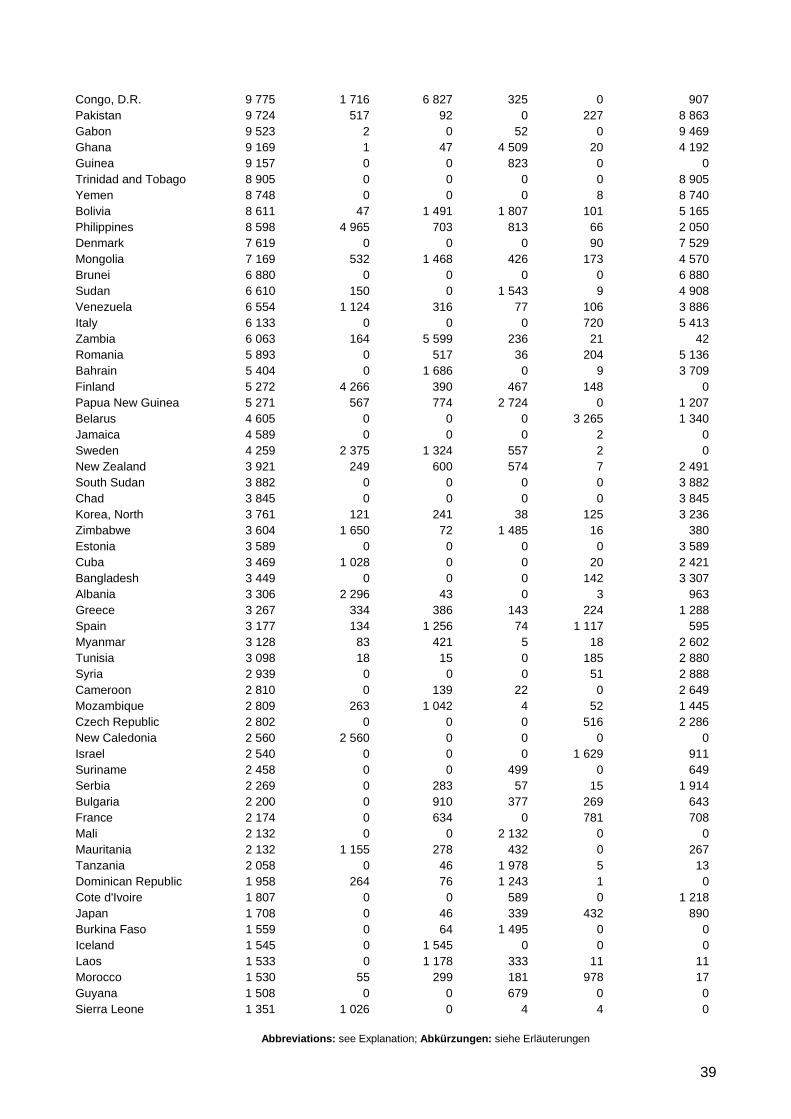
Abbreviations: see Explanation; Abkürzungen: siehe Erläuterungen
39
Congo, D.R. 9 775 1 716 6 827 325 0 907 Pakistan 9 724 517 92 0 227 8 863 Gabon 9 523 2 0 52 0 9 469 Ghana 9 169 1 47 4 509 20 4 192 Guinea 9 157 0 0 823 0 0 Trinidad and Tobago 8 905 0 0 0 0 8 905 Yemen 8 748 0 0 0 8 8 740 Bolivia 8 611 47 1 491 1 807 101 5 165 Philippines 8 598 4 965 703 813 66 2 050 Denmark 7 619 0 0 0 90 7 529 Mongolia 7 169 532 1 468 426 173 4 570 Brunei 6 880 0 0 0 0 6 880 Sudan 6 610 150 0 1 543 9 4 908 Venezuela 6 554 1 124 316 77 106 3 886 Italy 6 133 0 0 0 720 5 413 Zambia 6 063 164 5 599 236 21 42 Romania 5 893 0 517 36 204 5 136 Bahrain 5 404 0 1 686 0 9 3 709 Finland 5 272 4 266 390 467 148 0 Papua New Guinea 5 271 567 774 2 724 0 1 207 Belarus 4 605 0 0 0 3 265 1 340 Jamaica 4 589 0 0 0 2 0 Sweden 4 259 2 375 1 324 557 2 0 New Zealand 3 921 249 600 574 7 2 491 South Sudan 3 882 0 0 0 0 3 882 Chad 3 845 0 0 0 0 3 845 Korea, North 3 761 121 241 38 125 3 236 Zimbabwe 3 604 1 650 72 1 485 16 380 Estonia 3 589 0 0 0 0 3 589 Cuba 3 469 1 028 0 0 20 2 421 Bangladesh 3 449 0 0 0 142 3 307 Albania 3 306 2 296 43 0 3 963 Greece 3 267 334 386 143 224 1 288 Spain 3 177 134 1 256 74 1 117 595 Myanmar 3 128 83 421 5 18 2 602 Tunisia 3 098 18 15 0 185 2 880 Syria 2 939 0 0 0 51 2 888 Cameroon 2 810 0 139 22 0 2 649 Mozambique 2 809 263 1 042 4 52 1 445 Czech Republic 2 802 0 0 0 516 2 286 New Caledonia 2 560 2 560 0 0 0 0 Israel 2 540 0 0 0 1 629 911 Suriname 2 458 0 0 499 0 649 Serbia 2 269 0 283 57 15 1 914 Bulgaria 2 200 0 910 377 269 643 France 2 174 0 634 0 781 708 Mali 2 132 0 0 2 132 0 0 Mauritania 2 132 1 155 278 432 0 267 Tanzania 2 058 0 46 1 978 5 13 Dominican Republic 1 958 264 76 1 243 1 0 Cote d'Ivoire 1 807 0 0 589 0 1 218 Japan 1 708 0 46 339 432 890 Burkina Faso 1 559 0 64 1 495 0 0 Iceland 1 545 0 1 545 0 0 0 Laos 1 533 0 1 178 333 11 11 Morocco 1 530 55 299 181 978 17 Guyana 1 508 0 0 679 0 0 Sierra Leone 1 351 1 026 0 4 4 0
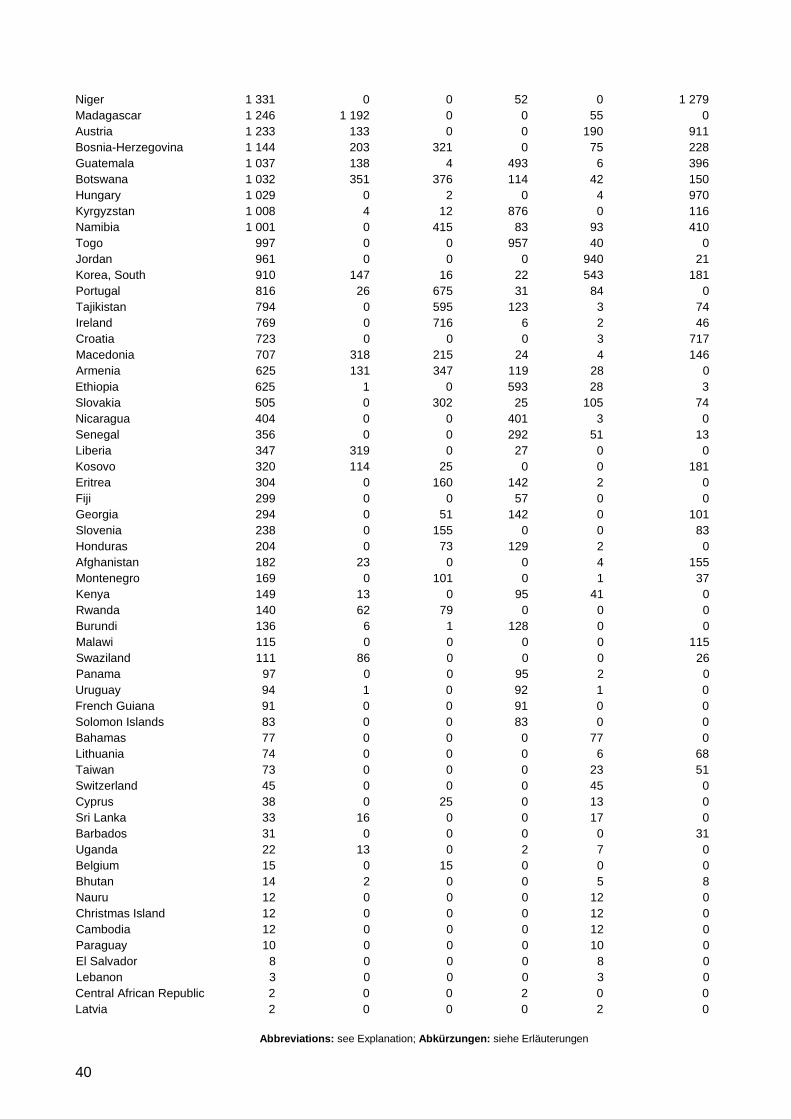
Abbreviations: see Explanation; Abkürzungen: siehe Erläuterungen
40
Niger 1 331 0 0 52 0 1 279 Madagascar 1 246 1 192 0 0 55 0 Austria 1 233 133 0 0 190 911 Bosnia-Herzegovina 1 144 203 321 0 75 228 Guatemala 1 037 138 4 493 6 396 Botswana 1 032 351 376 114 42 150 Hungary 1 029 0 2 0 4 970 Kyrgyzstan 1 008 4 12 876 0 116 Namibia 1 001 0 415 83 93 410 Togo 997 0 0 957 40 0 Jordan 961 0 0 0 940 21 Korea, South 910 147 16 22 543 181 Portugal 816 26 675 31 84 0 Tajikistan 794 0 595 123 3 74 Ireland 769 0 716 6 2 46 Croatia 723 0 0 0 3 717 Macedonia 707 318 215 24 4 146 Armenia 625 131 347 119 28 0 Ethiopia 625 1 0 593 28 3 Slovakia 505 0 302 25 105 74 Nicaragua 404 0 0 401 3 0 Senegal 356 0 0 292 51 13 Liberia 347 319 0 27 0 0 Kosovo 320 114 25 0 0 181 Eritrea 304 0 160 142 2 0 Fiji 299 0 0 57 0 0 Georgia 294 0 51 142 0 101 Slovenia 238 0 155 0 0 83 Honduras 204 0 73 129 2 0 Afghanistan 182 23 0 0 4 155 Montenegro 169 0 101 0 1 37 Kenya 149 13 0 95 41 0 Rwanda 140 62 79 0 0 0 Burundi 136 6 1 128 0 0 Malawi 115 0 0 0 0 115 Swaziland 111 86 0 0 0 26 Panama 97 0 0 95 2 0 Uruguay 94 1 0 92 1 0 French Guiana 91 0 0 91 0 0 Solomon Islands 83 0 0 83 0 0 Bahamas 77 0 0 0 77 0 Lithuania 74 0 0 0 6 68 Taiwan 73 0 0 0 23 51 Switzerland 45 0 0 0 45 0 Cyprus 38 0 25 0 13 0 Sri Lanka 33 16 0 0 17 0 Barbados 31 0 0 0 0 31 Uganda 22 13 0 2 7 0 Belgium 15 0 15 0 0 0 Bhutan 14 2 0 0 5 8 Nauru 12 0 0 0 12 0 Christmas Island 12 0 0 0 12 0 Cambodia 12 0 0 0 12 0 Paraguay 10 0 0 0 10 0 El Salvador 8 0 0 0 8 0 Lebanon 3 0 0 0 3 0 Central African Republic 2 0 0 2 0 0 Latvia 2 0 0 0 2 0
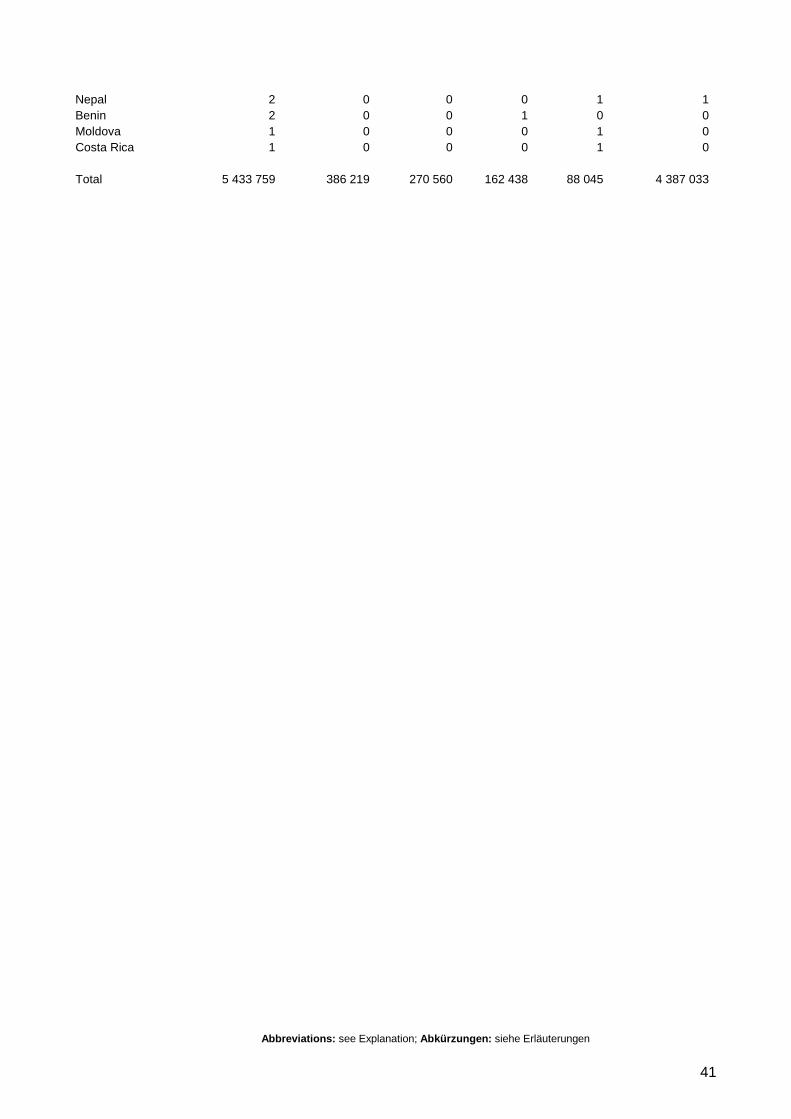
Abbreviations: see Explanation; Abkürzungen: siehe Erläuterungen
41
Nepal 2 0 0 0 1 1 Benin 2 0 0 1 0 0 Moldova 1 0 0 0 1 0 Costa Rica 1 0 0 0 1 0 Total 5 433 759 386 219 270 560 162 438 88 045 4 387 033

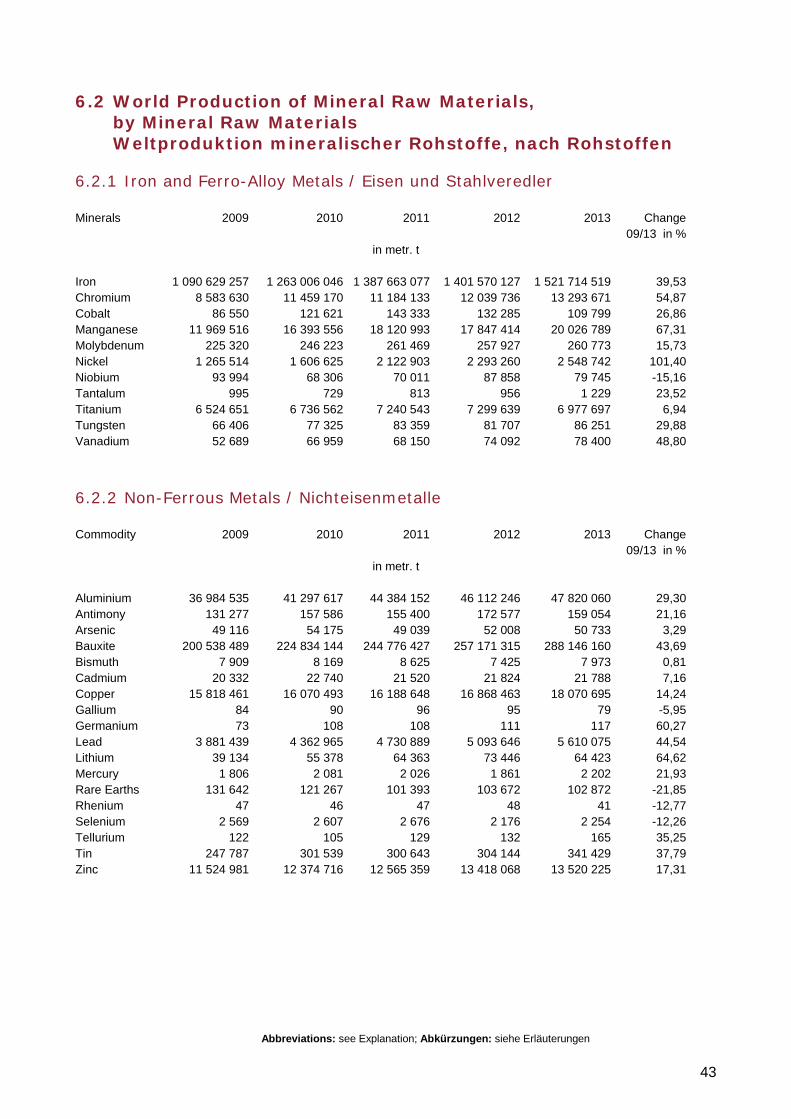
Abbreviations: see Explanation; Abkürzungen: siehe Erläuterungen
43
6.2 World Production of Mineral Raw Materials, by Mineral Raw Materials Weltproduktion mineralischer Rohstoffe, nach Rohstoffen
6.2.1 Iron and Ferro-Alloy Metals / Eisen und Stahlveredler
Minerals 2009 2010 2011 2012 2013 Change 09/13 in %
in metr. t Iron 1 090 629 257 1 263 006 046 1 387 663 077 1 401 570 127 1 521 714 519 39,53 Chromium 8 583 630 11 459 170 11 184 133 12 039 736 13 293 671 54,87 Cobalt 86 550 121 621 143 333 132 285 109 799 26,86 Manganese 11 969 516 16 393 556 18 120 993 17 847 414 20 026 789 67,31 Molybdenum 225 320 246 223 261 469 257 927 260 773 15,73 Nickel 1 265 514 1 606 625 2 122 903 2 293 260 2 548 742 101,40 Niobium 93 994 68 306 70 011 87 858 79 745 -15,16 Tantalum 995 729 813 956 1 229 23,52 Titanium 6 524 651 6 736 562 7 240 543 7 299 639 6 977 697 6,94 Tungsten 66 406 77 325 83 359 81 707 86 251 29,88 Vanadium 52 689 66 959 68 150 74 092 78 400 48,80
6.2.2 Non-Ferrous Metals / Nichteisenmetalle
Commodity 2009 2010 2011 2012 2013 Change 09/13 in %
in metr. t Aluminium 36 984 535 41 297 617 44 384 152 46 112 246 47 820 060 29,30 Antimony 131 277 157 586 155 400 172 577 159 054 21,16 Arsenic 49 116 54 175 49 039 52 008 50 733 3,29 Bauxite 200 538 489 224 834 144 244 776 427 257 171 315 288 146 160 43,69 Bismuth 7 909 8 169 8 625 7 425 7 973 0,81 Cadmium 20 332 22 740 21 520 21 824 21 788 7,16 Copper 15 818 461 16 070 493 16 188 648 16 868 463 18 070 695 14,24 Gallium 84 90 96 95 79 -5,95 Germanium 73 108 108 111 117 60,27 Lead 3 881 439 4 362 965 4 730 889 5 093 646 5 610 075 44,54 Lithium 39 134 55 378 64 363 73 446 64 423 64,62 Mercury 1 806 2 081 2 026 1 861 2 202 21,93 Rare Earths 131 642 121 267 101 393 103 672 102 872 -21,85 Rhenium 47 46 47 48 41 -12,77 Selenium 2 569 2 607 2 676 2 176 2 254 -12,26 Tellurium 122 105 129 132 165 35,25 Tin 247 787 301 539 300 643 304 144 341 429 37,79 Zinc 11 524 981 12 374 716 12 565 359 13 418 068 13 520 225 17,31
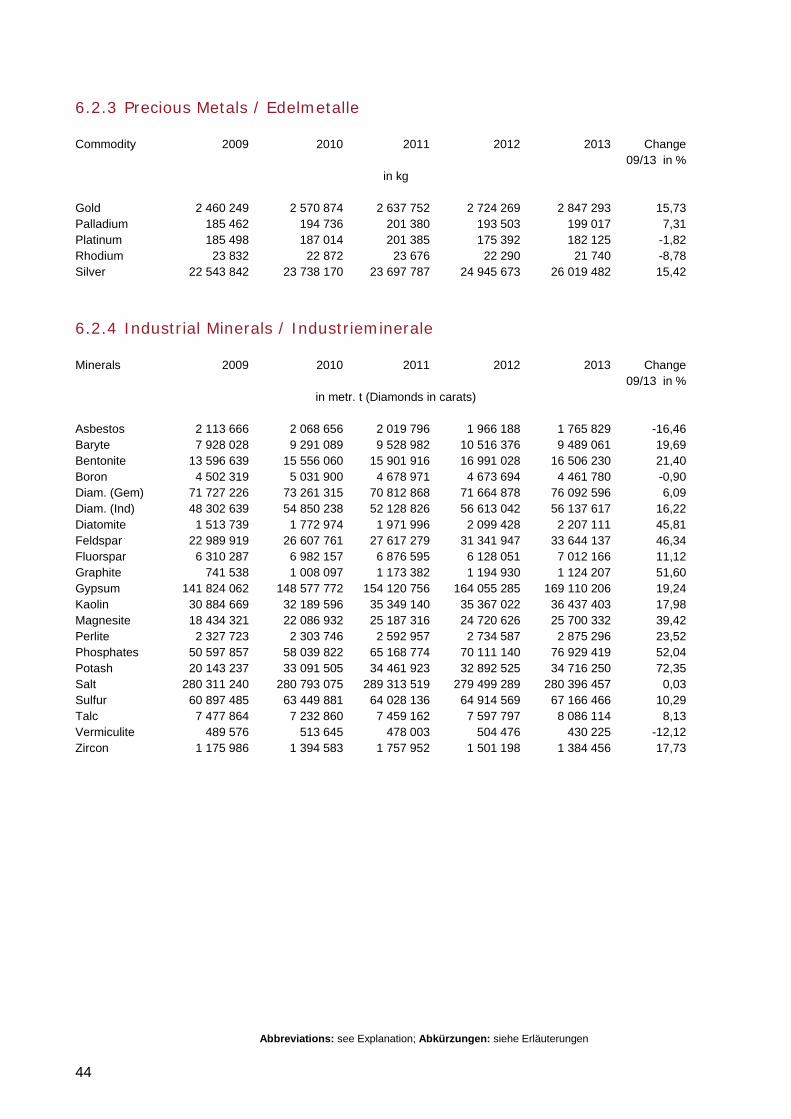
Abbreviations: see Explanation; Abkürzungen: siehe Erläuterungen
44
6.2.3 Precious Metals / Edelmetalle
Commodity 2009 2010 2011 2012 2013 Change 09/13 in %
in kg Gold 2 460 249 2 570 874 2 637 752 2 724 269 2 847 293 15,73 Palladium 185 462 194 736 201 380 193 503 199 017 7,31 Platinum 185 498 187 014 201 385 175 392 182 125 -1,82 Rhodium 23 832 22 872 23 676 22 290 21 740 -8,78 Silver 22 543 842 23 738 170 23 697 787 24 945 673 26 019 482 15,42
6.2.4 Industrial Minerals / Industrieminerale
Minerals 2009 2010 2011 2012 2013 Change 09/13 in %
in metr. t (Diamonds in carats) Asbestos 2 113 666 2 068 656 2 019 796 1 966 188 1 765 829 -16,46 Baryte 7 928 028 9 291 089 9 528 982 10 516 376 9 489 061 19,69 Bentonite 13 596 639 15 556 060 15 901 916 16 991 028 16 506 230 21,40 Boron 4 502 319 5 031 900 4 678 971 4 673 694 4 461 780 -0,90 Diam. (Gem) 71 727 226 73 261 315 70 812 868 71 664 878 76 092 596 6,09 Diam. (Ind) 48 302 639 54 850 238 52 128 826 56 613 042 56 137 617 16,22 Diatomite 1 513 739 1 772 974 1 971 996 2 099 428 2 207 111 45,81 Feldspar 22 989 919 26 607 761 27 617 279 31 341 947 33 644 137 46,34 Fluorspar 6 310 287 6 982 157 6 876 595 6 128 051 7 012 166 11,12 Graphite 741 538 1 008 097 1 173 382 1 194 930 1 124 207 51,60 Gypsum 141 824 062 148 577 772 154 120 756 164 055 285 169 110 206 19,24 Kaolin 30 884 669 32 189 596 35 349 140 35 367 022 36 437 403 17,98 Magnesite 18 434 321 22 086 932 25 187 316 24 720 626 25 700 332 39,42 Perlite 2 327 723 2 303 746 2 592 957 2 734 587 2 875 296 23,52 Phosphates 50 597 857 58 039 822 65 168 774 70 111 140 76 929 419 52,04 Potash 20 143 237 33 091 505 34 461 923 32 892 525 34 716 250 72,35 Salt 280 311 240 280 793 075 289 313 519 279 499 289 280 396 457 0,03 Sulfur 60 897 485 63 449 881 64 028 136 64 914 569 67 166 466 10,29 Talc 7 477 864 7 232 860 7 459 162 7 597 797 8 086 114 8,13 Vermiculite 489 576 513 645 478 003 504 476 430 225 -12,12 Zircon 1 175 986 1 394 583 1 757 952 1 501 198 1 384 456 17,73
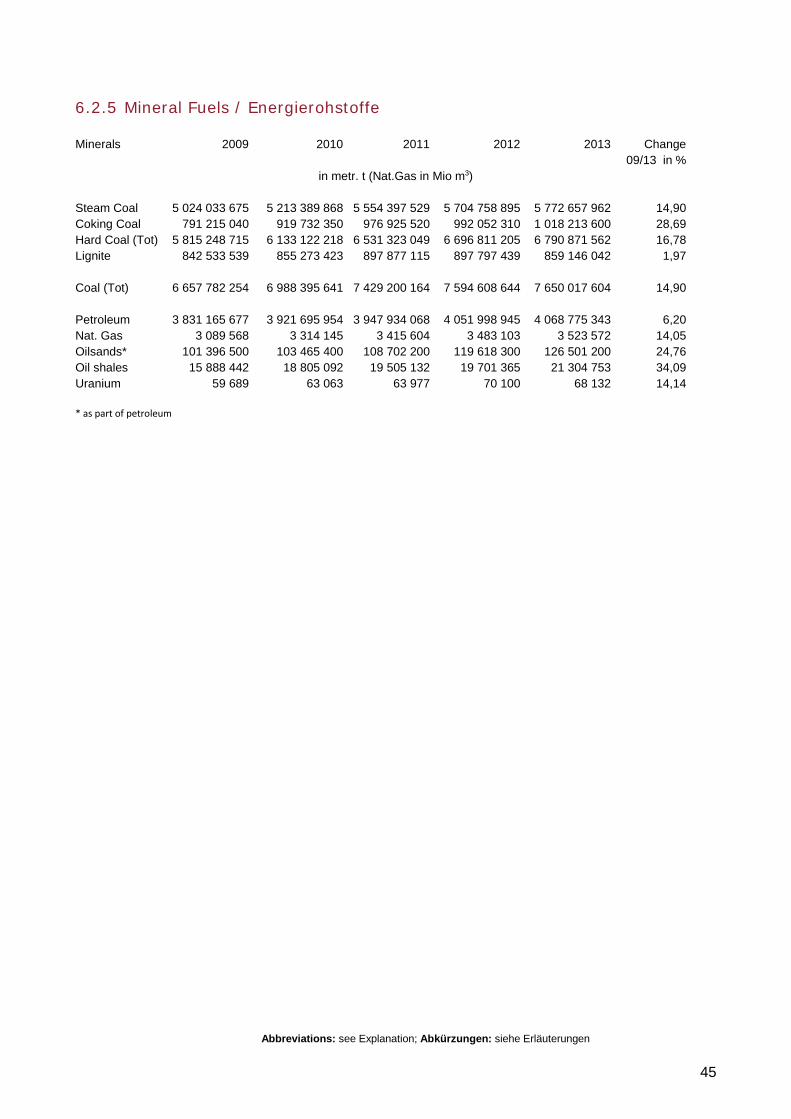
Abbreviations: see Explanation; Abkürzungen: siehe Erläuterungen
45
6.2.5 Mineral Fuels / Energierohstoffe
Minerals 2009 2010 2011 2012 2013 Change 09/13 in %
in metr. t (Nat.Gas in Mio m3) Steam Coal 5 024 033 675 5 213 389 868 5 554 397 529 5 704 758 895 5 772 657 962 14,90 Coking Coal 791 215 040 919 732 350 976 925 520 992 052 310 1 018 213 600 28,69 Hard Coal (Tot) 5 815 248 715 6 133 122 218 6 531 323 049 6 696 811 205 6 790 871 562 16,78 Lignite 842 533 539 855 273 423 897 877 115 897 797 439 859 146 042 1,97 Coal (Tot) 6 657 782 254 6 988 395 641 7 429 200 164 7 594 608 644 7 650 017 604 14,90 Petroleum 3 831 165 677 3 921 695 954 3 947 934 068 4 051 998 945 4 068 775 343 6,20 Nat. Gas 3 089 568 3 314 145 3 415 604 3 483 103 3 523 572 14,05 Oilsands* 101 396 500 103 465 400 108 702 200 119 618 300 126 501 200 24,76 Oil shales 15 888 442 18 805 092 19 505 132 19 701 365 21 304 753 34,09 Uranium 59 689 63 063 63 977 70 100 68 132 14,14 * as part of petroleum

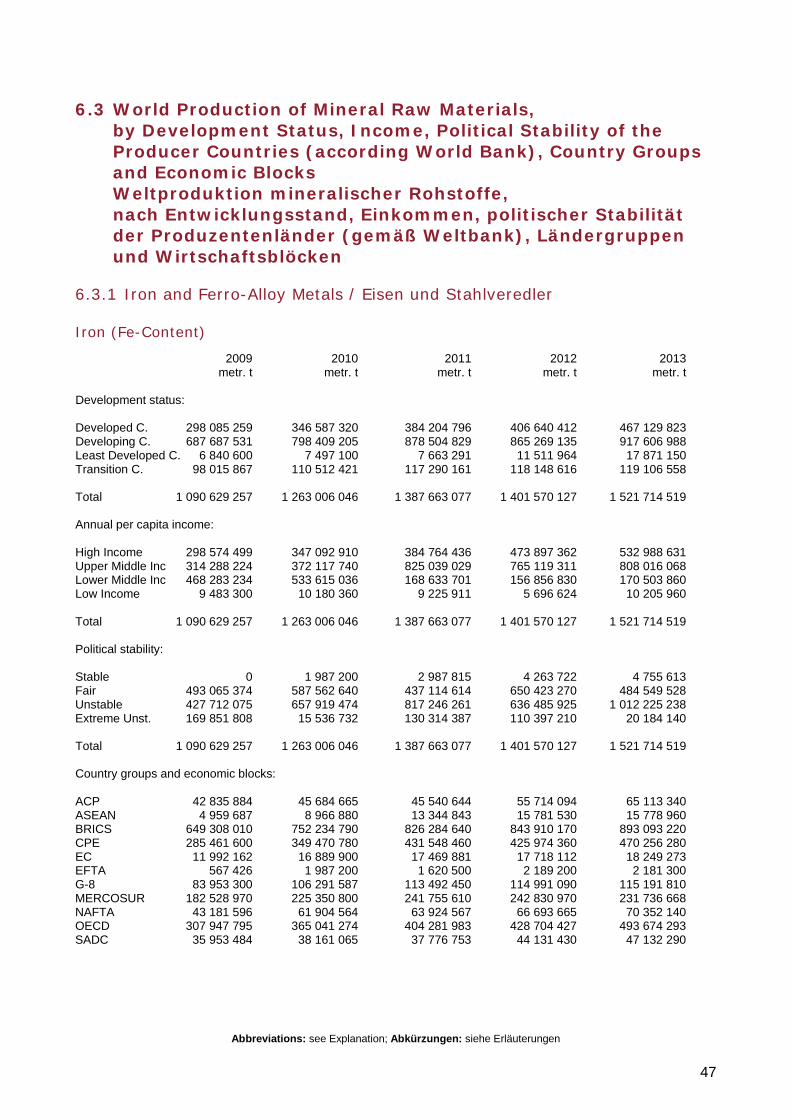
Abbreviations: see Explanation; Abkürzungen: siehe Erläuterungen
47
6.3 World Production of Mineral Raw Materials, by Development Status, Income, Political Stability of the Producer Countries (according World Bank), Country Groups and Economic Blocks Weltproduktion mineralischer Rohstoffe, nach Entwicklungsstand, Einkommen, politischer Stabilität der Produzentenländer (gemäß Weltbank), Ländergruppen und Wirtschaftsblöcken
6.3.1 Iron and Ferro-Alloy Metals / Eisen und Stahlveredler
Iron (Fe-Content)
2009 2010 2011 2012 2013 metr. t metr. t metr. t metr. t metr. t Development status: Developed C. 298 085 259 346 587 320 384 204 796 406 640 412 467 129 823 Developing C. 687 687 531 798 409 205 878 504 829 865 269 135 917 606 988 Least Developed C. 6 840 600 7 497 100 7 663 291 11 511 964 17 871 150 Transition C. 98 015 867 110 512 421 117 290 161 118 148 616 119 106 558 Total 1 090 629 257 1 263 006 046 1 387 663 077 1 401 570 127 1 521 714 519 Annual per capita income: High Income 298 574 499 347 092 910 384 764 436 473 897 362 532 988 631 Upper Middle Inc 314 288 224 372 117 740 825 039 029 765 119 311 808 016 068 Lower Middle Inc 468 283 234 533 615 036 168 633 701 156 856 830 170 503 860 Low Income 9 483 300 10 180 360 9 225 911 5 696 624 10 205 960 Total 1 090 629 257 1 263 006 046 1 387 663 077 1 401 570 127 1 521 714 519 Political stability: Stable 0 1 987 200 2 987 815 4 263 722 4 755 613 Fair 493 065 374 587 562 640 437 114 614 650 423 270 484 549 528 Unstable 427 712 075 657 919 474 817 246 261 636 485 925 1 012 225 238 Extreme Unst. 169 851 808 15 536 732 130 314 387 110 397 210 20 184 140 Total 1 090 629 257 1 263 006 046 1 387 663 077 1 401 570 127 1 521 714 519 Country groups and economic blocks: ACP 42 835 884 45 684 665 45 540 644 55 714 094 65 113 340 ASEAN 4 959 687 8 966 880 13 344 843 15 781 530 15 778 960 BRICS 649 308 010 752 234 790 826 284 640 843 910 170 893 093 220 CPE 285 461 600 349 470 780 431 548 460 425 974 360 470 256 280 EC 11 992 162 16 889 900 17 469 881 17 718 112 18 249 273 EFTA 567 426 1 987 200 1 620 500 2 189 200 2 181 300 G-8 83 953 300 106 291 587 113 492 450 114 991 090 115 191 810 MERCOSUR 182 528 970 225 350 800 241 755 610 242 830 970 231 736 668 NAFTA 43 181 596 61 904 564 63 924 567 66 693 665 70 352 140 OECD 307 947 795 365 041 274 404 281 983 428 704 427 493 674 293 SADC 35 953 484 38 161 065 37 776 753 44 131 430 47 132 290
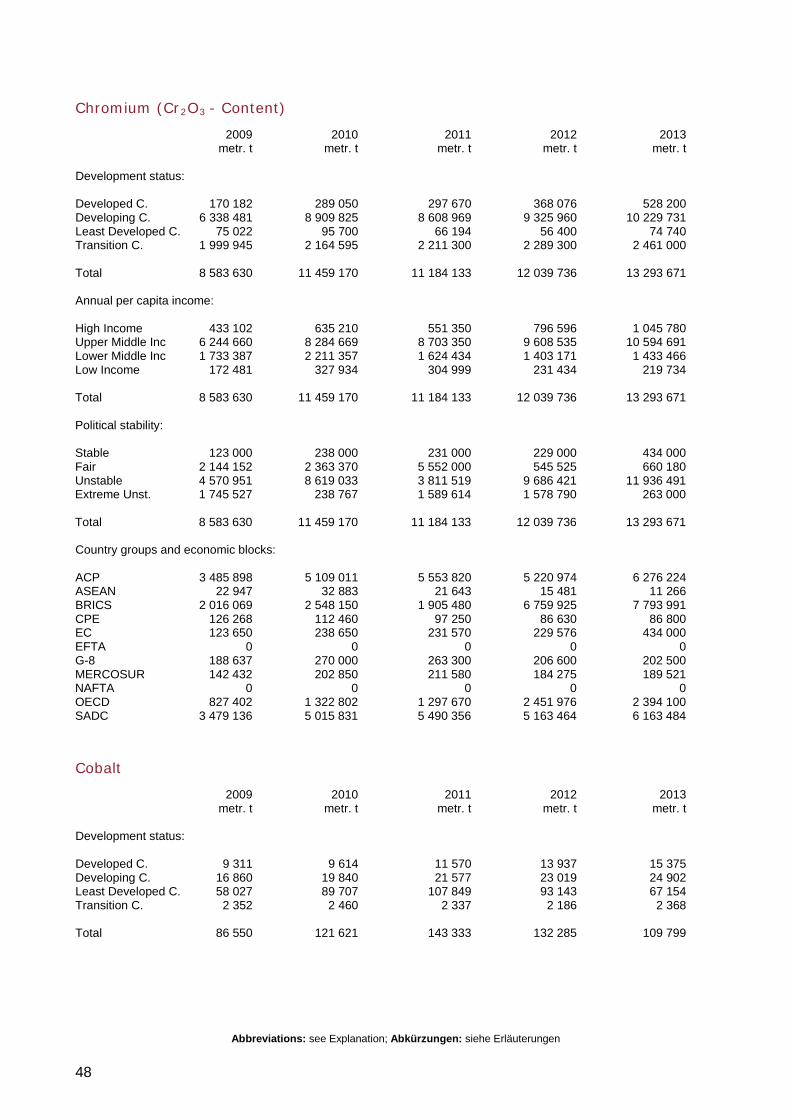
Abbreviations: see Explanation; Abkürzungen: siehe Erläuterungen
48
Chromium (Cr2O3 - Content)
2009 2010 2011 2012 2013 metr. t metr. t metr. t metr. t metr. t Development status: Developed C. 170 182 289 050 297 670 368 076 528 200 Developing C. 6 338 481 8 909 825 8 608 969 9 325 960 10 229 731 Least Developed C. 75 022 95 700 66 194 56 400 74 740 Transition C. 1 999 945 2 164 595 2 211 300 2 289 300 2 461 000 Total 8 583 630 11 459 170 11 184 133 12 039 736 13 293 671 Annual per capita income: High Income 433 102 635 210 551 350 796 596 1 045 780 Upper Middle Inc 6 244 660 8 284 669 8 703 350 9 608 535 10 594 691 Lower Middle Inc 1 733 387 2 211 357 1 624 434 1 403 171 1 433 466 Low Income 172 481 327 934 304 999 231 434 219 734 Total 8 583 630 11 459 170 11 184 133 12 039 736 13 293 671 Political stability: Stable 123 000 238 000 231 000 229 000 434 000 Fair 2 144 152 2 363 370 5 552 000 545 525 660 180 Unstable 4 570 951 8 619 033 3 811 519 9 686 421 11 936 491 Extreme Unst. 1 745 527 238 767 1 589 614 1 578 790 263 000 Total 8 583 630 11 459 170 11 184 133 12 039 736 13 293 671 Country groups and economic blocks: ACP 3 485 898 5 109 011 5 553 820 5 220 974 6 276 224 ASEAN 22 947 32 883 21 643 15 481 11 266 BRICS 2 016 069 2 548 150 1 905 480 6 759 925 7 793 991 CPE 126 268 112 460 97 250 86 630 86 800 EC 123 650 238 650 231 570 229 576 434 000 EFTA 0 0 0 0 0 G-8 188 637 270 000 263 300 206 600 202 500 MERCOSUR 142 432 202 850 211 580 184 275 189 521 NAFTA 0 0 0 0 0 OECD 827 402 1 322 802 1 297 670 2 451 976 2 394 100 SADC 3 479 136 5 015 831 5 490 356 5 163 464 6 163 484
Cobalt
2009 2010 2011 2012 2013 metr. t metr. t metr. t metr. t metr. t Development status: Developed C. 9 311 9 614 11 570 13 937 15 375 Developing C. 16 860 19 840 21 577 23 019 24 902 Least Developed C. 58 027 89 707 107 849 93 143 67 154 Transition C. 2 352 2 460 2 337 2 186 2 368 Total 86 550 121 621 143 333 132 285 109 799
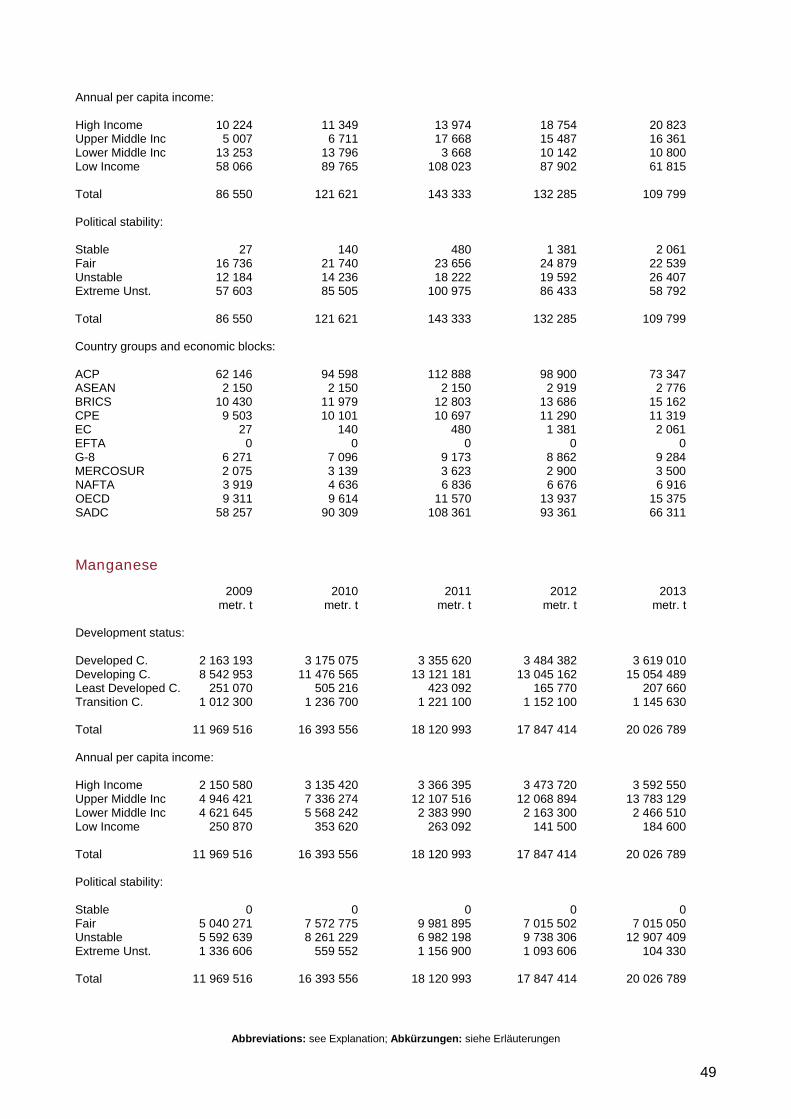
Abbreviations: see Explanation; Abkürzungen: siehe Erläuterungen
49
Annual per capita income: High Income 10 224 11 349 13 974 18 754 20 823 Upper Middle Inc 5 007 6 711 17 668 15 487 16 361 Lower Middle Inc 13 253 13 796 3 668 10 142 10 800 Low Income 58 066 89 765 108 023 87 902 61 815 Total 86 550 121 621 143 333 132 285 109 799 Political stability: Stable 27 140 480 1 381 2 061 Fair 16 736 21 740 23 656 24 879 22 539 Unstable 12 184 14 236 18 222 19 592 26 407 Extreme Unst. 57 603 85 505 100 975 86 433 58 792 Total 86 550 121 621 143 333 132 285 109 799 Country groups and economic blocks: ACP 62 146 94 598 112 888 98 900 73 347 ASEAN 2 150 2 150 2 150 2 919 2 776 BRICS 10 430 11 979 12 803 13 686 15 162 CPE 9 503 10 101 10 697 11 290 11 319 EC 27 140 480 1 381 2 061 EFTA 0 0 0 0 0 G-8 6 271 7 096 9 173 8 862 9 284 MERCOSUR 2 075 3 139 3 623 2 900 3 500 NAFTA 3 919 4 636 6 836 6 676 6 916 OECD 9 311 9 614 11 570 13 937 15 375 SADC 58 257 90 309 108 361 93 361 66 311
Manganese
2009 2010 2011 2012 2013 metr. t metr. t metr. t metr. t metr. t Development status: Developed C. 2 163 193 3 175 075 3 355 620 3 484 382 3 619 010 Developing C. 8 542 953 11 476 565 13 121 181 13 045 162 15 054 489 Least Developed C. 251 070 505 216 423 092 165 770 207 660 Transition C. 1 012 300 1 236 700 1 221 100 1 152 100 1 145 630 Total 11 969 516 16 393 556 18 120 993 17 847 414 20 026 789 Annual per capita income: High Income 2 150 580 3 135 420 3 366 395 3 473 720 3 592 550 Upper Middle Inc 4 946 421 7 336 274 12 107 516 12 068 894 13 783 129 Lower Middle Inc 4 621 645 5 568 242 2 383 990 2 163 300 2 466 510 Low Income 250 870 353 620 263 092 141 500 184 600 Total 11 969 516 16 393 556 18 120 993 17 847 414 20 026 789 Political stability: Stable 0 0 0 0 0 Fair 5 040 271 7 572 775 9 981 895 7 015 502 7 015 050 Unstable 5 592 639 8 261 229 6 982 198 9 738 306 12 907 409 Extreme Unst. 1 336 606 559 552 1 156 900 1 093 606 104 330 Total 11 969 516 16 393 556 18 120 993 17 847 414 20 026 789
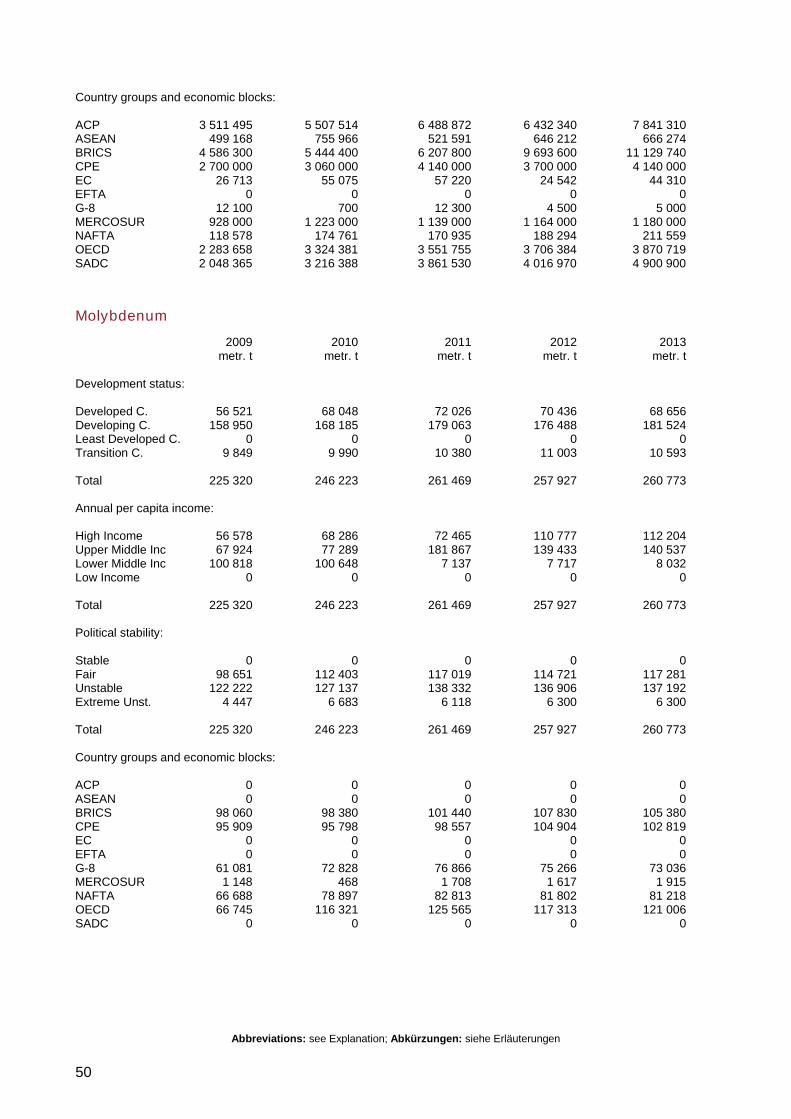
Abbreviations: see Explanation; Abkürzungen: siehe Erläuterungen
50
Country groups and economic blocks: ACP 3 511 495 5 507 514 6 488 872 6 432 340 7 841 310 ASEAN 499 168 755 966 521 591 646 212 666 274 BRICS 4 586 300 5 444 400 6 207 800 9 693 600 11 129 740 CPE 2 700 000 3 060 000 4 140 000 3 700 000 4 140 000 EC 26 713 55 075 57 220 24 542 44 310 EFTA 0 0 0 0 0 G-8 12 100 700 12 300 4 500 5 000 MERCOSUR 928 000 1 223 000 1 139 000 1 164 000 1 180 000 NAFTA 118 578 174 761 170 935 188 294 211 559 OECD 2 283 658 3 324 381 3 551 755 3 706 384 3 870 719 SADC 2 048 365 3 216 388 3 861 530 4 016 970 4 900 900
Molybdenum
2009 2010 2011 2012 2013 metr. t metr. t metr. t metr. t metr. t Development status: Developed C. 56 521 68 048 72 026 70 436 68 656 Developing C. 158 950 168 185 179 063 176 488 181 524 Least Developed C. 0 0 0 0 0 Transition C. 9 849 9 990 10 380 11 003 10 593 Total 225 320 246 223 261 469 257 927 260 773 Annual per capita income: High Income 56 578 68 286 72 465 110 777 112 204 Upper Middle Inc 67 924 77 289 181 867 139 433 140 537 Lower Middle Inc 100 818 100 648 7 137 7 717 8 032 Low Income 0 0 0 0 0 Total 225 320 246 223 261 469 257 927 260 773 Political stability: Stable 0 0 0 0 0 Fair 98 651 112 403 117 019 114 721 117 281 Unstable 122 222 127 137 138 332 136 906 137 192 Extreme Unst. 4 447 6 683 6 118 6 300 6 300 Total 225 320 246 223 261 469 257 927 260 773 Country groups and economic blocks: ACP 0 0 0 0 0 ASEAN 0 0 0 0 0 BRICS 98 060 98 380 101 440 107 830 105 380 CPE 95 909 95 798 98 557 104 904 102 819 EC 0 0 0 0 0 EFTA 0 0 0 0 0 G-8 61 081 72 828 76 866 75 266 73 036 MERCOSUR 1 148 468 1 708 1 617 1 915 NAFTA 66 688 78 897 82 813 81 802 81 218 OECD 66 745 116 321 125 565 117 313 121 006 SADC 0 0 0 0 0
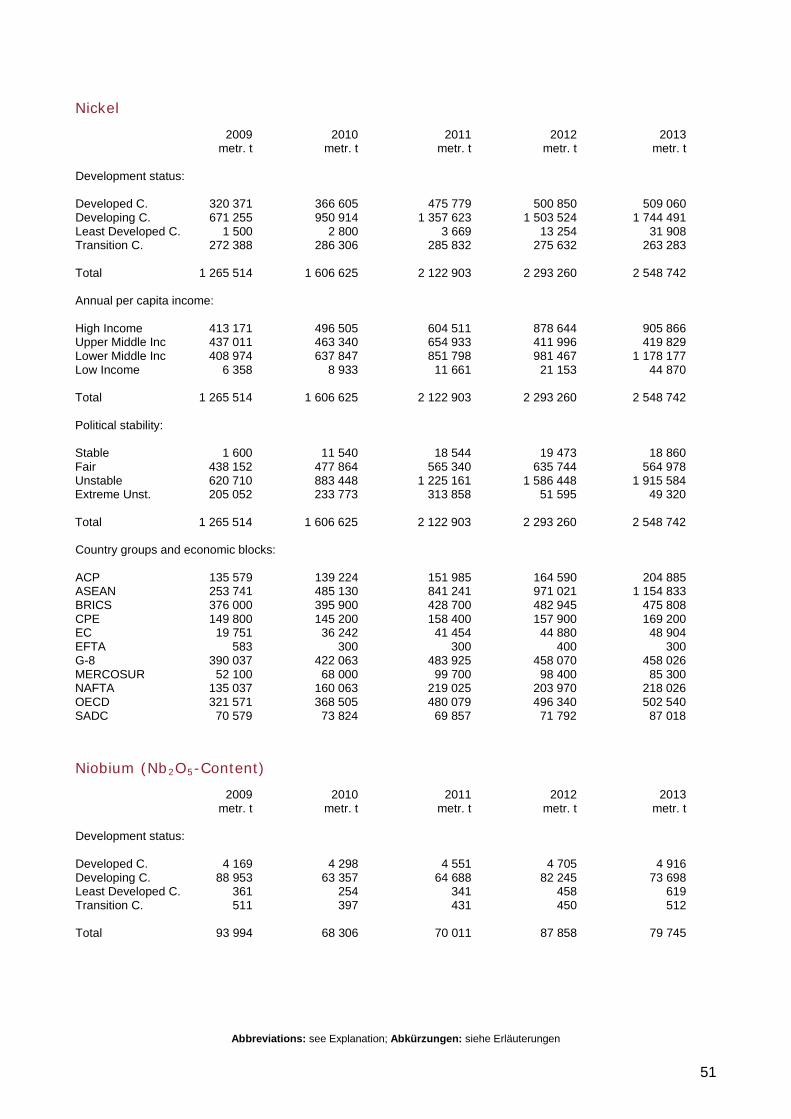
Abbreviations: see Explanation; Abkürzungen: siehe Erläuterungen
51
Nickel
2009 2010 2011 2012 2013 metr. t metr. t metr. t metr. t metr. t Development status: Developed C. 320 371 366 605 475 779 500 850 509 060 Developing C. 671 255 950 914 1 357 623 1 503 524 1 744 491 Least Developed C. 1 500 2 800 3 669 13 254 31 908 Transition C. 272 388 286 306 285 832 275 632 263 283 Total 1 265 514 1 606 625 2 122 903 2 293 260 2 548 742 Annual per capita income: High Income 413 171 496 505 604 511 878 644 905 866 Upper Middle Inc 437 011 463 340 654 933 411 996 419 829 Lower Middle Inc 408 974 637 847 851 798 981 467 1 178 177 Low Income 6 358 8 933 11 661 21 153 44 870 Total 1 265 514 1 606 625 2 122 903 2 293 260 2 548 742 Political stability: Stable 1 600 11 540 18 544 19 473 18 860 Fair 438 152 477 864 565 340 635 744 564 978 Unstable 620 710 883 448 1 225 161 1 586 448 1 915 584 Extreme Unst. 205 052 233 773 313 858 51 595 49 320 Total 1 265 514 1 606 625 2 122 903 2 293 260 2 548 742 Country groups and economic blocks: ACP 135 579 139 224 151 985 164 590 204 885 ASEAN 253 741 485 130 841 241 971 021 1 154 833 BRICS 376 000 395 900 428 700 482 945 475 808 CPE 149 800 145 200 158 400 157 900 169 200 EC 19 751 36 242 41 454 44 880 48 904 EFTA 583 300 300 400 300 G-8 390 037 422 063 483 925 458 070 458 026 MERCOSUR 52 100 68 000 99 700 98 400 85 300 NAFTA 135 037 160 063 219 025 203 970 218 026 OECD 321 571 368 505 480 079 496 340 502 540 SADC 70 579 73 824 69 857 71 792 87 018
Niobium (Nb2O5-Content)
2009 2010 2011 2012 2013 metr. t metr. t metr. t metr. t metr. t Development status: Developed C. 4 169 4 298 4 551 4 705 4 916 Developing C. 88 953 63 357 64 688 82 245 73 698 Least Developed C. 361 254 341 458 619 Transition C. 511 397 431 450 512 Total 93 994 68 306 70 011 87 858 79 745
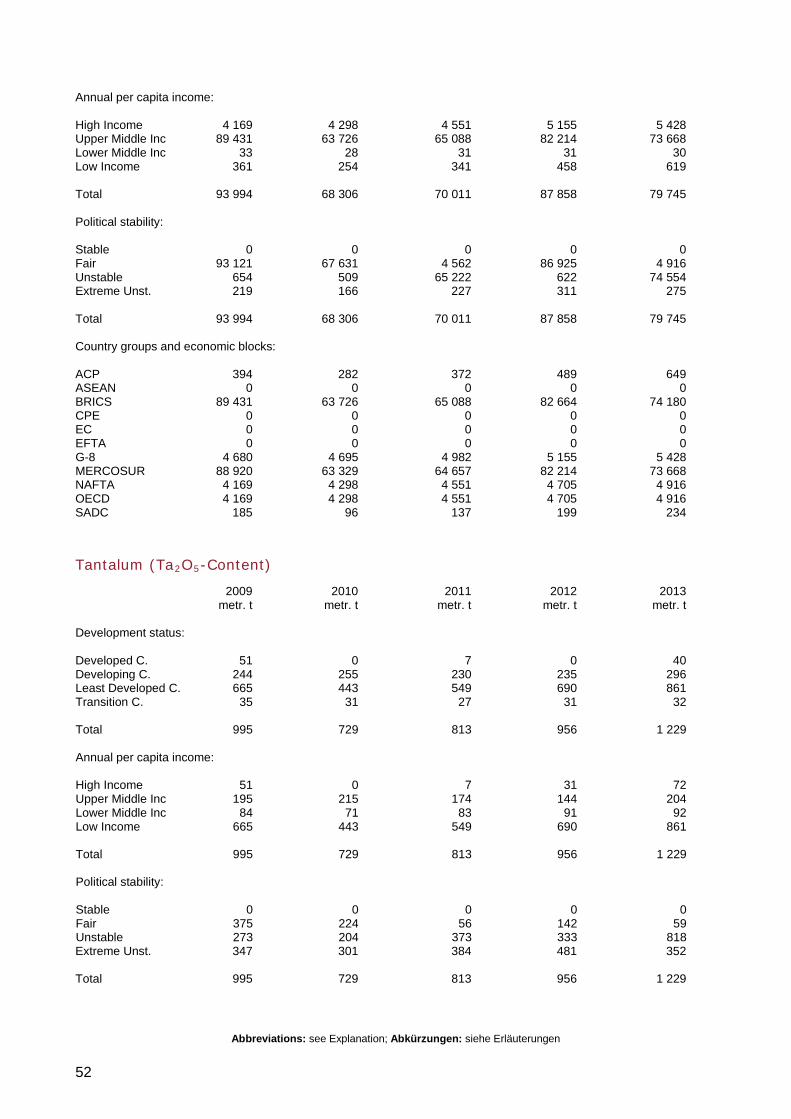
Abbreviations: see Explanation; Abkürzungen: siehe Erläuterungen
52
Annual per capita income: High Income 4 169 4 298 4 551 5 155 5 428 Upper Middle Inc 89 431 63 726 65 088 82 214 73 668 Lower Middle Inc 33 28 31 31 30 Low Income 361 254 341 458 619 Total 93 994 68 306 70 011 87 858 79 745 Political stability: Stable 0 0 0 0 0 Fair 93 121 67 631 4 562 86 925 4 916 Unstable 654 509 65 222 622 74 554 Extreme Unst. 219 166 227 311 275 Total 93 994 68 306 70 011 87 858 79 745 Country groups and economic blocks: ACP 394 282 372 489 649 ASEAN 0 0 0 0 0 BRICS 89 431 63 726 65 088 82 664 74 180 CPE 0 0 0 0 0 EC 0 0 0 0 0 EFTA 0 0 0 0 0 G-8 4 680 4 695 4 982 5 155 5 428 MERCOSUR 88 920 63 329 64 657 82 214 73 668 NAFTA 4 169 4 298 4 551 4 705 4 916 OECD 4 169 4 298 4 551 4 705 4 916 SADC 185 96 137 199 234
Tantalum (Ta2O5-Content)
2009 2010 2011 2012 2013 metr. t metr. t metr. t metr. t metr. t Development status: Developed C. 51 0 7 0 40 Developing C. 244 255 230 235 296 Least Developed C. 665 443 549 690 861 Transition C. 35 31 27 31 32 Total 995 729 813 956 1 229 Annual per capita income: High Income 51 0 7 31 72 Upper Middle Inc 195 215 174 144 204 Lower Middle Inc 84 71 83 91 92 Low Income 665 443 549 690 861 Total 995 729 813 956 1 229 Political stability: Stable 0 0 0 0 0 Fair 375 224 56 142 59 Unstable 273 204 373 333 818 Extreme Unst. 347 301 384 481 352 Total 995 729 813 956 1 229
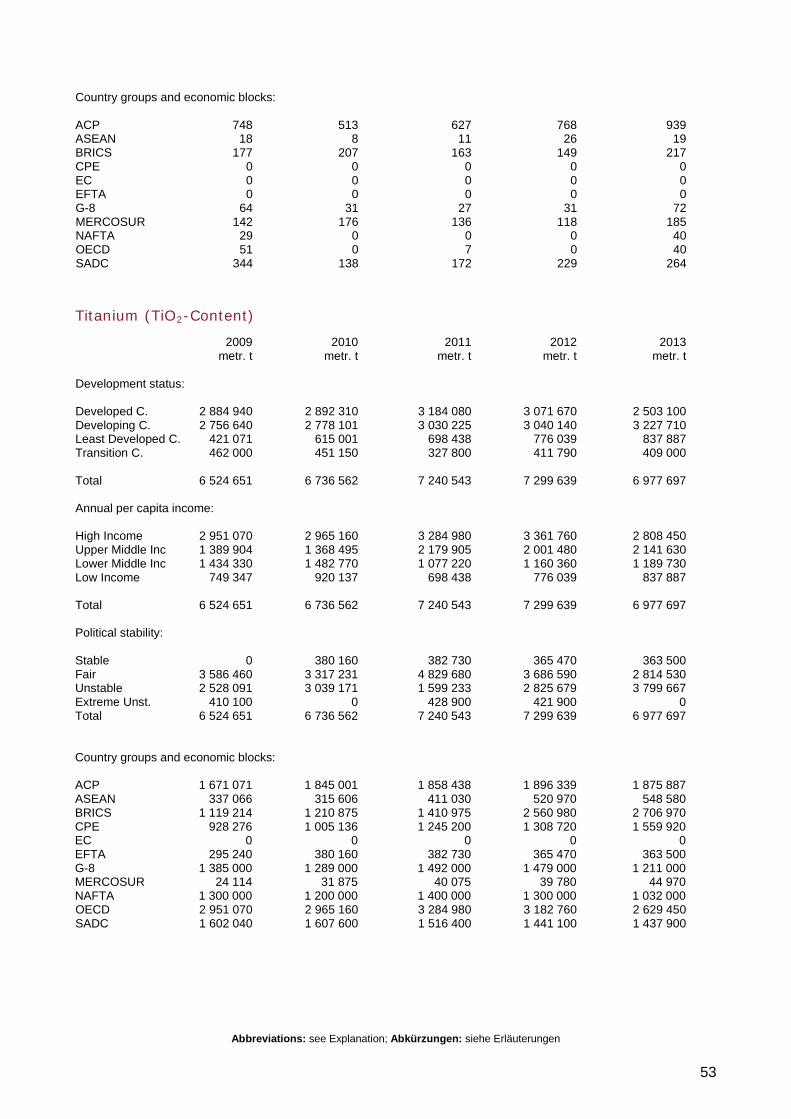
Abbreviations: see Explanation; Abkürzungen: siehe Erläuterungen
53
Country groups and economic blocks: ACP 748 513 627 768 939 ASEAN 18 8 11 26 19 BRICS 177 207 163 149 217 CPE 0 0 0 0 0 EC 0 0 0 0 0 EFTA 0 0 0 0 0 G-8 64 31 27 31 72 MERCOSUR 142 176 136 118 185 NAFTA 29 0 0 0 40 OECD 51 0 7 0 40 SADC 344 138 172 229 264
Titanium (TiO2-Content)
2009 2010 2011 2012 2013 metr. t metr. t metr. t metr. t metr. t Development status: Developed C. 2 884 940 2 892 310 3 184 080 3 071 670 2 503 100 Developing C. 2 756 640 2 778 101 3 030 225 3 040 140 3 227 710 Least Developed C. 421 071 615 001 698 438 776 039 837 887 Transition C. 462 000 451 150 327 800 411 790 409 000 Total 6 524 651 6 736 562 7 240 543 7 299 639 6 977 697 Annual per capita income: High Income 2 951 070 2 965 160 3 284 980 3 361 760 2 808 450 Upper Middle Inc 1 389 904 1 368 495 2 179 905 2 001 480 2 141 630 Lower Middle Inc 1 434 330 1 482 770 1 077 220 1 160 360 1 189 730 Low Income 749 347 920 137 698 438 776 039 837 887 Total 6 524 651 6 736 562 7 240 543 7 299 639 6 977 697 Political stability: Stable 0 380 160 382 730 365 470 363 500 Fair 3 586 460 3 317 231 4 829 680 3 686 590 2 814 530 Unstable 2 528 091 3 039 171 1 599 233 2 825 679 3 799 667 Extreme Unst. 410 100 0 428 900 421 900 0 Total 6 524 651 6 736 562 7 240 543 7 299 639 6 977 697 Country groups and economic blocks: ACP 1 671 071 1 845 001 1 858 438 1 896 339 1 875 887 ASEAN 337 066 315 606 411 030 520 970 548 580 BRICS 1 119 214 1 210 875 1 410 975 2 560 980 2 706 970 CPE 928 276 1 005 136 1 245 200 1 308 720 1 559 920 EC 0 0 0 0 0 EFTA 295 240 380 160 382 730 365 470 363 500 G-8 1 385 000 1 289 000 1 492 000 1 479 000 1 211 000 MERCOSUR 24 114 31 875 40 075 39 780 44 970 NAFTA 1 300 000 1 200 000 1 400 000 1 300 000 1 032 000 OECD 2 951 070 2 965 160 3 284 980 3 182 760 2 629 450 SADC 1 602 040 1 607 600 1 516 400 1 441 100 1 437 900
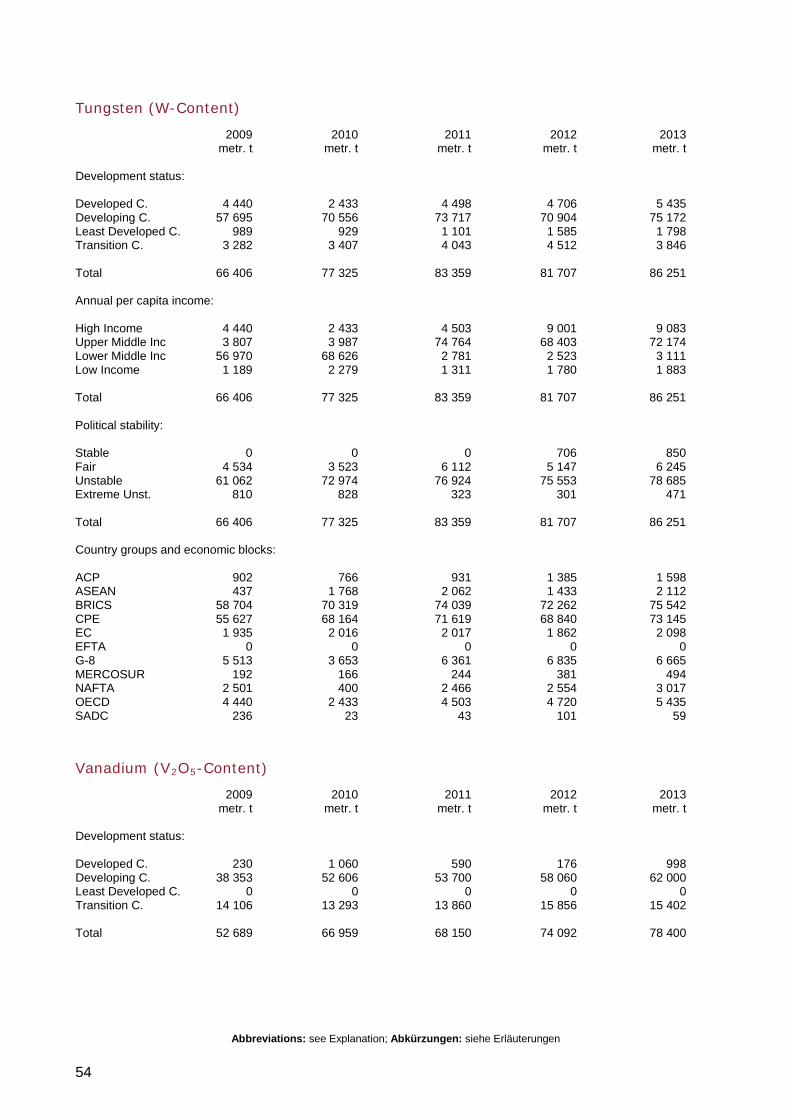
Abbreviations: see Explanation; Abkürzungen: siehe Erläuterungen
54
Tungsten (W-Content)
2009 2010 2011 2012 2013 metr. t metr. t metr. t metr. t metr. t Development status: Developed C. 4 440 2 433 4 498 4 706 5 435 Developing C. 57 695 70 556 73 717 70 904 75 172 Least Developed C. 989 929 1 101 1 585 1 798 Transition C. 3 282 3 407 4 043 4 512 3 846 Total 66 406 77 325 83 359 81 707 86 251 Annual per capita income: High Income 4 440 2 433 4 503 9 001 9 083 Upper Middle Inc 3 807 3 987 74 764 68 403 72 174 Lower Middle Inc 56 970 68 626 2 781 2 523 3 111 Low Income 1 189 2 279 1 311 1 780 1 883 Total 66 406 77 325 83 359 81 707 86 251 Political stability: Stable 0 0 0 706 850 Fair 4 534 3 523 6 112 5 147 6 245 Unstable 61 062 72 974 76 924 75 553 78 685 Extreme Unst. 810 828 323 301 471 Total 66 406 77 325 83 359 81 707 86 251 Country groups and economic blocks: ACP 902 766 931 1 385 1 598 ASEAN 437 1 768 2 062 1 433 2 112 BRICS 58 704 70 319 74 039 72 262 75 542 CPE 55 627 68 164 71 619 68 840 73 145 EC 1 935 2 016 2 017 1 862 2 098 EFTA 0 0 0 0 0 G-8 5 513 3 653 6 361 6 835 6 665 MERCOSUR 192 166 244 381 494 NAFTA 2 501 400 2 466 2 554 3 017 OECD 4 440 2 433 4 503 4 720 5 435 SADC 236 23 43 101 59
Vanadium (V2O5-Content)
2009 2010 2011 2012 2013 metr. t metr. t metr. t metr. t metr. t Development status: Developed C. 230 1 060 590 176 998 Developing C. 38 353 52 606 53 700 58 060 62 000 Least Developed C. 0 0 0 0 0 Transition C. 14 106 13 293 13 860 15 856 15 402 Total 52 689 66 959 68 150 74 092 78 400
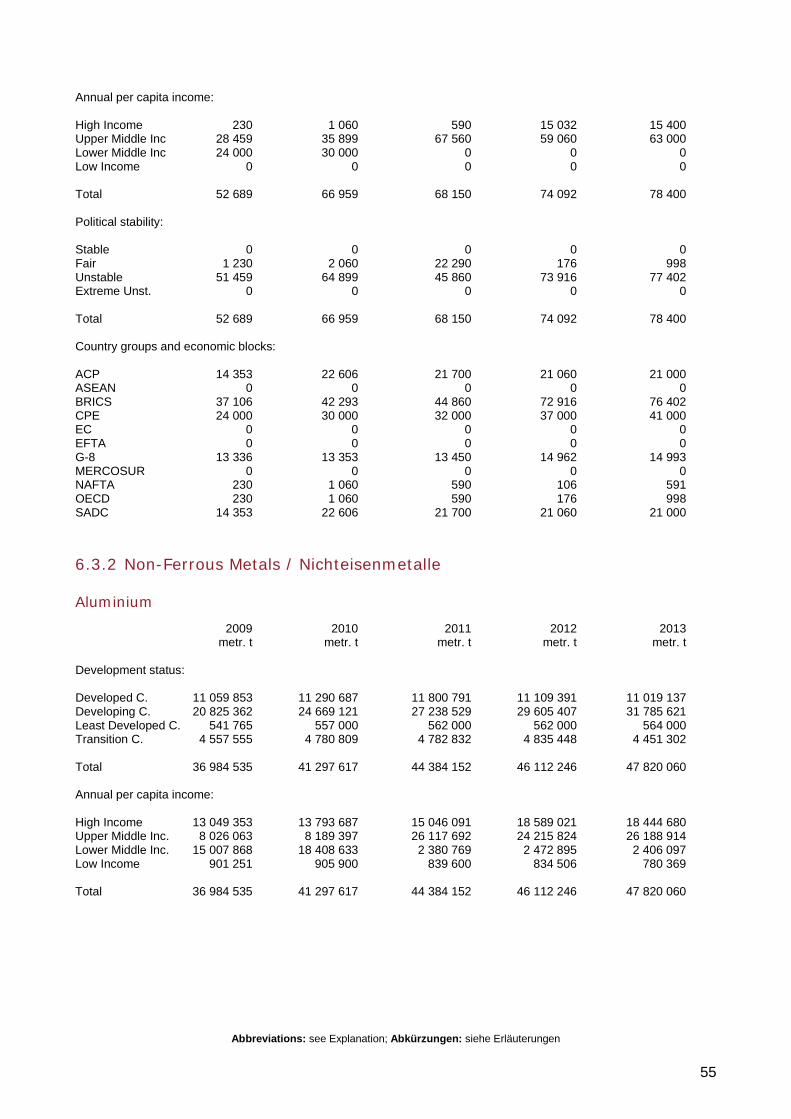
Abbreviations: see Explanation; Abkürzungen: siehe Erläuterungen
55
Annual per capita income: High Income 230 1 060 590 15 032 15 400 Upper Middle Inc 28 459 35 899 67 560 59 060 63 000 Lower Middle Inc 24 000 30 000 0 0 0 Low Income 0 0 0 0 0 Total 52 689 66 959 68 150 74 092 78 400 Political stability: Stable 0 0 0 0 0 Fair 1 230 2 060 22 290 176 998 Unstable 51 459 64 899 45 860 73 916 77 402 Extreme Unst. 0 0 0 0 0 Total 52 689 66 959 68 150 74 092 78 400 Country groups and economic blocks: ACP 14 353 22 606 21 700 21 060 21 000 ASEAN 0 0 0 0 0 BRICS 37 106 42 293 44 860 72 916 76 402 CPE 24 000 30 000 32 000 37 000 41 000 EC 0 0 0 0 0 EFTA 0 0 0 0 0 G-8 13 336 13 353 13 450 14 962 14 993 MERCOSUR 0 0 0 0 0 NAFTA 230 1 060 590 106 591 OECD 230 1 060 590 176 998 SADC 14 353 22 606 21 700 21 060 21 000
6.3.2 Non-Ferrous Metals / Nichteisenmetalle
Aluminium
2009 2010 2011 2012 2013 metr. t metr. t metr. t metr. t metr. t Development status: Developed C. 11 059 853 11 290 687 11 800 791 11 109 391 11 019 137 Developing C. 20 825 362 24 669 121 27 238 529 29 605 407 31 785 621 Least Developed C. 541 765 557 000 562 000 562 000 564 000 Transition C. 4 557 555 4 780 809 4 782 832 4 835 448 4 451 302 Total 36 984 535 41 297 617 44 384 152 46 112 246 47 820 060 Annual per capita income: High Income 13 049 353 13 793 687 15 046 091 18 589 021 18 444 680 Upper Middle Inc. 8 026 063 8 189 397 26 117 692 24 215 824 26 188 914 Lower Middle Inc. 15 007 868 18 408 633 2 380 769 2 472 895 2 406 097 Low Income 901 251 905 900 839 600 834 506 780 369 Total 36 984 535 41 297 617 44 384 152 46 112 246 47 820 060
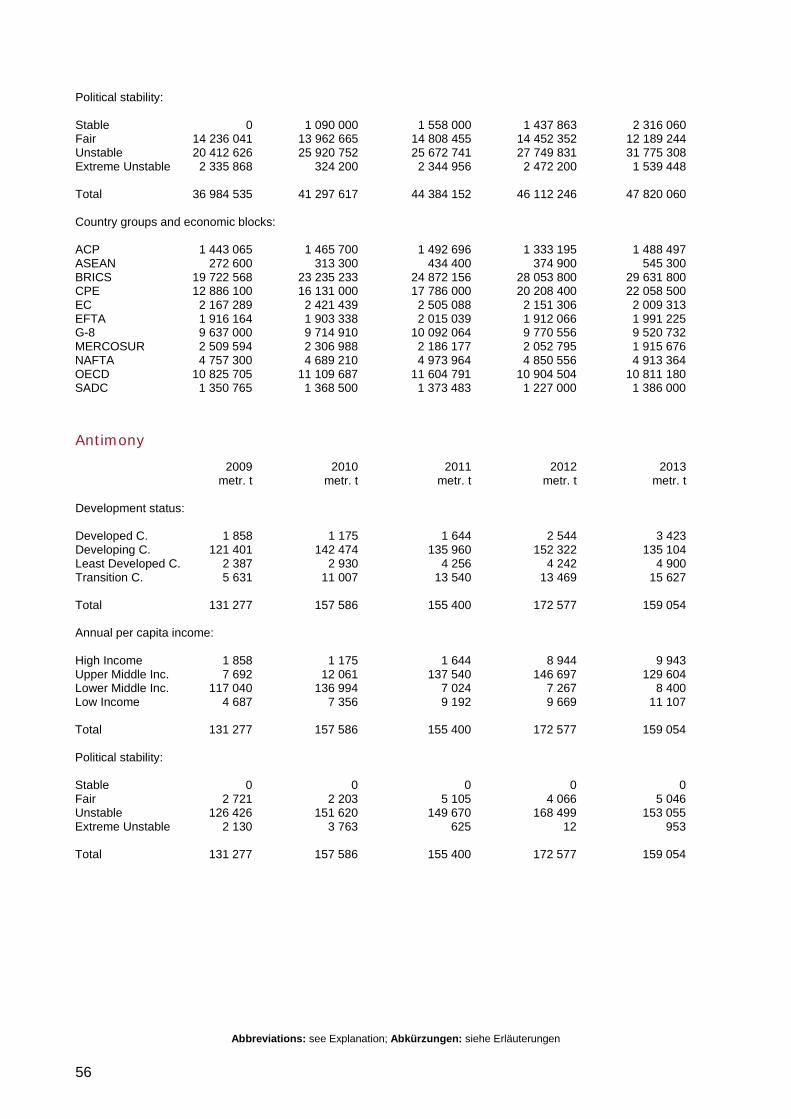
Abbreviations: see Explanation; Abkürzungen: siehe Erläuterungen
56
Political stability: Stable 0 1 090 000 1 558 000 1 437 863 2 316 060 Fair 14 236 041 13 962 665 14 808 455 14 452 352 12 189 244 Unstable 20 412 626 25 920 752 25 672 741 27 749 831 31 775 308 Extreme Unstable 2 335 868 324 200 2 344 956 2 472 200 1 539 448 Total 36 984 535 41 297 617 44 384 152 46 112 246 47 820 060 Country groups and economic blocks: ACP 1 443 065 1 465 700 1 492 696 1 333 195 1 488 497 ASEAN 272 600 313 300 434 400 374 900 545 300 BRICS 19 722 568 23 235 233 24 872 156 28 053 800 29 631 800 CPE 12 886 100 16 131 000 17 786 000 20 208 400 22 058 500 EC 2 167 289 2 421 439 2 505 088 2 151 306 2 009 313 EFTA 1 916 164 1 903 338 2 015 039 1 912 066 1 991 225 G-8 9 637 000 9 714 910 10 092 064 9 770 556 9 520 732 MERCOSUR 2 509 594 2 306 988 2 186 177 2 052 795 1 915 676 NAFTA 4 757 300 4 689 210 4 973 964 4 850 556 4 913 364 OECD 10 825 705 11 109 687 11 604 791 10 904 504 10 811 180 SADC 1 350 765 1 368 500 1 373 483 1 227 000 1 386 000
Antimony
2009 2010 2011 2012 2013 metr. t metr. t metr. t metr. t metr. t Development status: Developed C. 1 858 1 175 1 644 2 544 3 423 Developing C. 121 401 142 474 135 960 152 322 135 104 Least Developed C. 2 387 2 930 4 256 4 242 4 900 Transition C. 5 631 11 007 13 540 13 469 15 627 Total 131 277 157 586 155 400 172 577 159 054 Annual per capita income: High Income 1 858 1 175 1 644 8 944 9 943 Upper Middle Inc. 7 692 12 061 137 540 146 697 129 604 Lower Middle Inc. 117 040 136 994 7 024 7 267 8 400 Low Income 4 687 7 356 9 192 9 669 11 107 Total 131 277 157 586 155 400 172 577 159 054 Political stability: Stable 0 0 0 0 0 Fair 2 721 2 203 5 105 4 066 5 046 Unstable 126 426 151 620 149 670 168 499 153 055 Extreme Unstable 2 130 3 763 625 12 953 Total 131 277 157 586 155 400 172 577 159 054
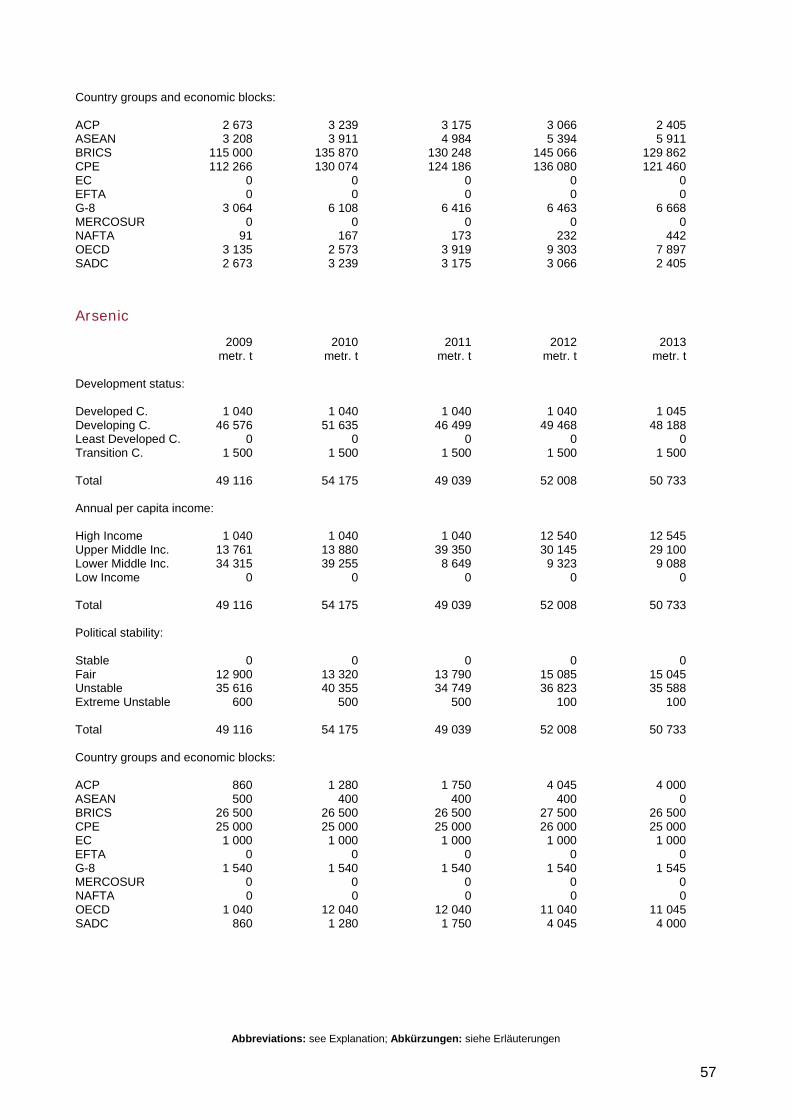
Abbreviations: see Explanation; Abkürzungen: siehe Erläuterungen
57
Country groups and economic blocks: ACP 2 673 3 239 3 175 3 066 2 405 ASEAN 3 208 3 911 4 984 5 394 5 911 BRICS 115 000 135 870 130 248 145 066 129 862 CPE 112 266 130 074 124 186 136 080 121 460 EC 0 0 0 0 0 EFTA 0 0 0 0 0 G-8 3 064 6 108 6 416 6 463 6 668 MERCOSUR 0 0 0 0 0 NAFTA 91 167 173 232 442 OECD 3 135 2 573 3 919 9 303 7 897 SADC 2 673 3 239 3 175 3 066 2 405
Arsenic
2009 2010 2011 2012 2013 metr. t metr. t metr. t metr. t metr. t Development status: Developed C. 1 040 1 040 1 040 1 040 1 045 Developing C. 46 576 51 635 46 499 49 468 48 188 Least Developed C. 0 0 0 0 0 Transition C. 1 500 1 500 1 500 1 500 1 500 Total 49 116 54 175 49 039 52 008 50 733 Annual per capita income: High Income 1 040 1 040 1 040 12 540 12 545 Upper Middle Inc. 13 761 13 880 39 350 30 145 29 100 Lower Middle Inc. 34 315 39 255 8 649 9 323 9 088 Low Income 0 0 0 0 0 Total 49 116 54 175 49 039 52 008 50 733 Political stability: Stable 0 0 0 0 0 Fair 12 900 13 320 13 790 15 085 15 045 Unstable 35 616 40 355 34 749 36 823 35 588 Extreme Unstable 600 500 500 100 100 Total 49 116 54 175 49 039 52 008 50 733 Country groups and economic blocks: ACP 860 1 280 1 750 4 045 4 000 ASEAN 500 400 400 400 0 BRICS 26 500 26 500 26 500 27 500 26 500 CPE 25 000 25 000 25 000 26 000 25 000 EC 1 000 1 000 1 000 1 000 1 000 EFTA 0 0 0 0 0 G-8 1 540 1 540 1 540 1 540 1 545 MERCOSUR 0 0 0 0 0 NAFTA 0 0 0 0 0 OECD 1 040 12 040 12 040 11 040 11 045 SADC 860 1 280 1 750 4 045 4 000
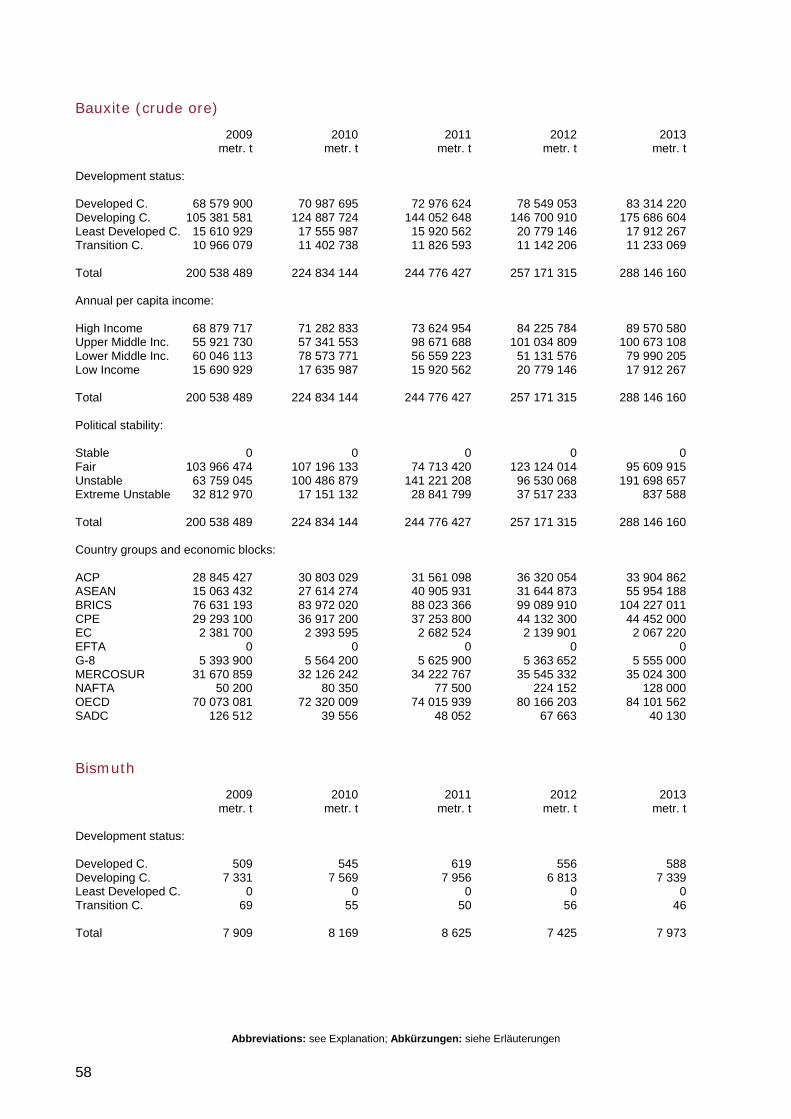
Abbreviations: see Explanation; Abkürzungen: siehe Erläuterungen
58
Bauxite (crude ore)
2009 2010 2011 2012 2013 metr. t metr. t metr. t metr. t metr. t Development status: Developed C. 68 579 900 70 987 695 72 976 624 78 549 053 83 314 220 Developing C. 105 381 581 124 887 724 144 052 648 146 700 910 175 686 604 Least Developed C. 15 610 929 17 555 987 15 920 562 20 779 146 17 912 267 Transition C. 10 966 079 11 402 738 11 826 593 11 142 206 11 233 069 Total 200 538 489 224 834 144 244 776 427 257 171 315 288 146 160 Annual per capita income: High Income 68 879 717 71 282 833 73 624 954 84 225 784 89 570 580 Upper Middle Inc. 55 921 730 57 341 553 98 671 688 101 034 809 100 673 108 Lower Middle Inc. 60 046 113 78 573 771 56 559 223 51 131 576 79 990 205 Low Income 15 690 929 17 635 987 15 920 562 20 779 146 17 912 267 Total 200 538 489 224 834 144 244 776 427 257 171 315 288 146 160 Political stability: Stable 0 0 0 0 0 Fair 103 966 474 107 196 133 74 713 420 123 124 014 95 609 915 Unstable 63 759 045 100 486 879 141 221 208 96 530 068 191 698 657 Extreme Unstable 32 812 970 17 151 132 28 841 799 37 517 233 837 588 Total 200 538 489 224 834 144 244 776 427 257 171 315 288 146 160 Country groups and economic blocks: ACP 28 845 427 30 803 029 31 561 098 36 320 054 33 904 862 ASEAN 15 063 432 27 614 274 40 905 931 31 644 873 55 954 188 BRICS 76 631 193 83 972 020 88 023 366 99 089 910 104 227 011 CPE 29 293 100 36 917 200 37 253 800 44 132 300 44 452 000 EC 2 381 700 2 393 595 2 682 524 2 139 901 2 067 220 EFTA 0 0 0 0 0 G-8 5 393 900 5 564 200 5 625 900 5 363 652 5 555 000 MERCOSUR 31 670 859 32 126 242 34 222 767 35 545 332 35 024 300 NAFTA 50 200 80 350 77 500 224 152 128 000 OECD 70 073 081 72 320 009 74 015 939 80 166 203 84 101 562 SADC 126 512 39 556 48 052 67 663 40 130
Bismuth
2009 2010 2011 2012 2013 metr. t metr. t metr. t metr. t metr. t Development status: Developed C. 509 545 619 556 588 Developing C. 7 331 7 569 7 956 6 813 7 339 Least Developed C. 0 0 0 0 0 Transition C. 69 55 50 56 46 Total 7 909 8 169 8 625 7 425 7 973
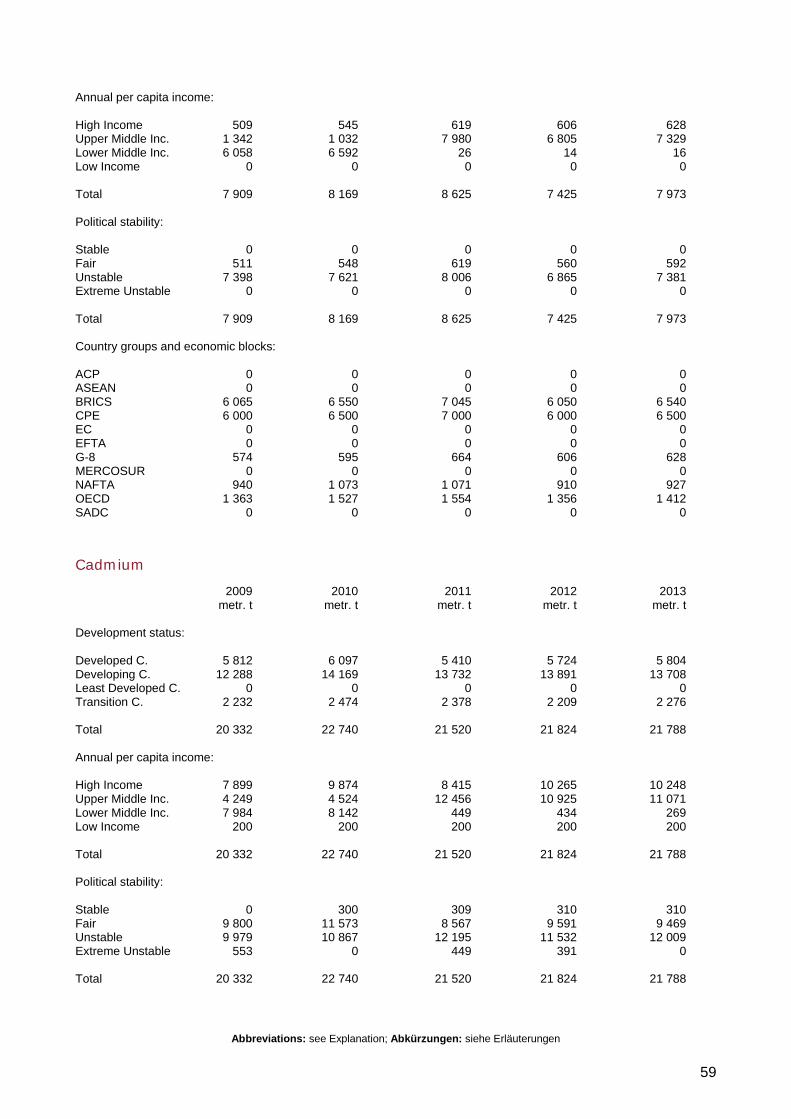
Abbreviations: see Explanation; Abkürzungen: siehe Erläuterungen
59
Annual per capita income: High Income 509 545 619 606 628 Upper Middle Inc. 1 342 1 032 7 980 6 805 7 329 Lower Middle Inc. 6 058 6 592 26 14 16 Low Income 0 0 0 0 0 Total 7 909 8 169 8 625 7 425 7 973 Political stability: Stable 0 0 0 0 0 Fair 511 548 619 560 592 Unstable 7 398 7 621 8 006 6 865 7 381 Extreme Unstable 0 0 0 0 0 Total 7 909 8 169 8 625 7 425 7 973 Country groups and economic blocks: ACP 0 0 0 0 0 ASEAN 0 0 0 0 0 BRICS 6 065 6 550 7 045 6 050 6 540 CPE 6 000 6 500 7 000 6 000 6 500 EC 0 0 0 0 0 EFTA 0 0 0 0 0 G-8 574 595 664 606 628 MERCOSUR 0 0 0 0 0 NAFTA 940 1 073 1 071 910 927 OECD 1 363 1 527 1 554 1 356 1 412 SADC 0 0 0 0 0
Cadmium
2009 2010 2011 2012 2013 metr. t metr. t metr. t metr. t metr. t Development status: Developed C. 5 812 6 097 5 410 5 724 5 804 Developing C. 12 288 14 169 13 732 13 891 13 708 Least Developed C. 0 0 0 0 0 Transition C. 2 232 2 474 2 378 2 209 2 276 Total 20 332 22 740 21 520 21 824 21 788 Annual per capita income: High Income 7 899 9 874 8 415 10 265 10 248 Upper Middle Inc. 4 249 4 524 12 456 10 925 11 071 Lower Middle Inc. 7 984 8 142 449 434 269 Low Income 200 200 200 200 200 Total 20 332 22 740 21 520 21 824 21 788 Political stability: Stable 0 300 309 310 310 Fair 9 800 11 573 8 567 9 591 9 469 Unstable 9 979 10 867 12 195 11 532 12 009 Extreme Unstable 553 0 449 391 0 Total 20 332 22 740 21 520 21 824 21 788
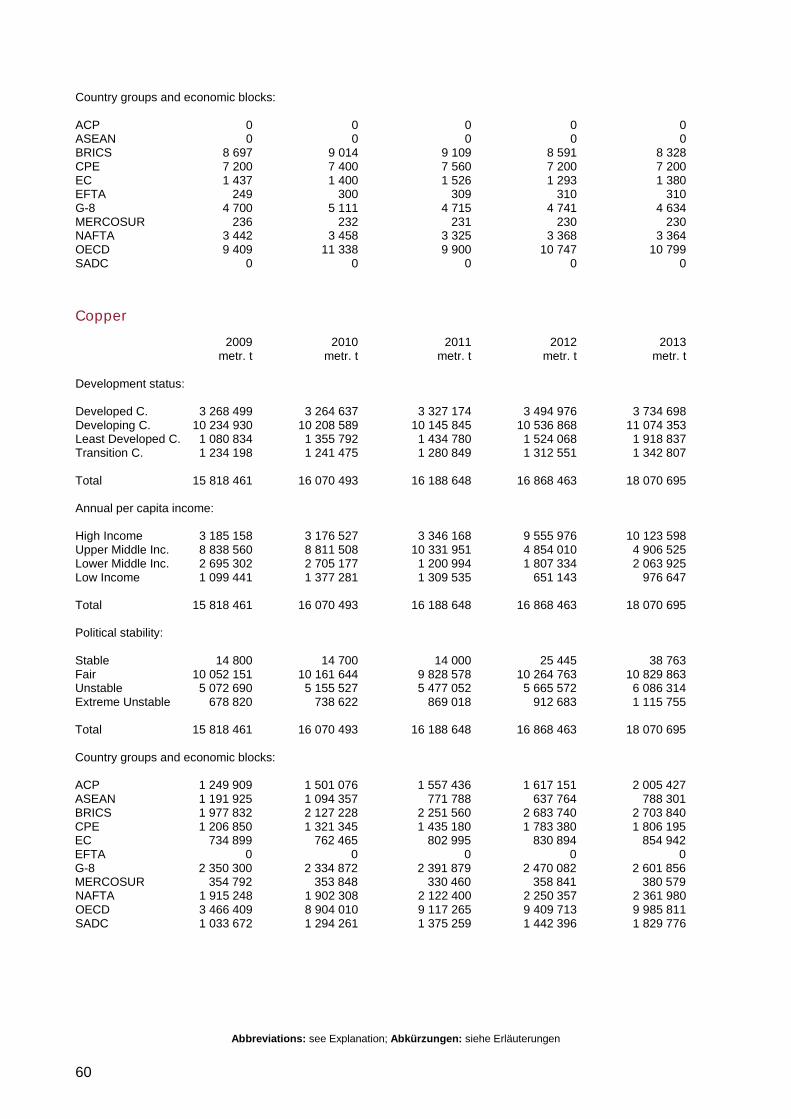
Abbreviations: see Explanation; Abkürzungen: siehe Erläuterungen
60
Country groups and economic blocks: ACP 0 0 0 0 0 ASEAN 0 0 0 0 0 BRICS 8 697 9 014 9 109 8 591 8 328 CPE 7 200 7 400 7 560 7 200 7 200 EC 1 437 1 400 1 526 1 293 1 380 EFTA 249 300 309 310 310 G-8 4 700 5 111 4 715 4 741 4 634 MERCOSUR 236 232 231 230 230 NAFTA 3 442 3 458 3 325 3 368 3 364 OECD 9 409 11 338 9 900 10 747 10 799 SADC 0 0 0 0 0
Copper
2009 2010 2011 2012 2013 metr. t metr. t metr. t metr. t metr. t Development status: Developed C. 3 268 499 3 264 637 3 327 174 3 494 976 3 734 698 Developing C. 10 234 930 10 208 589 10 145 845 10 536 868 11 074 353 Least Developed C. 1 080 834 1 355 792 1 434 780 1 524 068 1 918 837 Transition C. 1 234 198 1 241 475 1 280 849 1 312 551 1 342 807 Total 15 818 461 16 070 493 16 188 648 16 868 463 18 070 695 Annual per capita income: High Income 3 185 158 3 176 527 3 346 168 9 555 976 10 123 598 Upper Middle Inc. 8 838 560 8 811 508 10 331 951 4 854 010 4 906 525 Lower Middle Inc. 2 695 302 2 705 177 1 200 994 1 807 334 2 063 925 Low Income 1 099 441 1 377 281 1 309 535 651 143 976 647 Total 15 818 461 16 070 493 16 188 648 16 868 463 18 070 695 Political stability: Stable 14 800 14 700 14 000 25 445 38 763 Fair 10 052 151 10 161 644 9 828 578 10 264 763 10 829 863 Unstable 5 072 690 5 155 527 5 477 052 5 665 572 6 086 314 Extreme Unstable 678 820 738 622 869 018 912 683 1 115 755 Total 15 818 461 16 070 493 16 188 648 16 868 463 18 070 695 Country groups and economic blocks: ACP 1 249 909 1 501 076 1 557 436 1 617 151 2 005 427 ASEAN 1 191 925 1 094 357 771 788 637 764 788 301 BRICS 1 977 832 2 127 228 2 251 560 2 683 740 2 703 840 CPE 1 206 850 1 321 345 1 435 180 1 783 380 1 806 195 EC 734 899 762 465 802 995 830 894 854 942 EFTA 0 0 0 0 0 G-8 2 350 300 2 334 872 2 391 879 2 470 082 2 601 856 MERCOSUR 354 792 353 848 330 460 358 841 380 579 NAFTA 1 915 248 1 902 308 2 122 400 2 250 357 2 361 980 OECD 3 466 409 8 904 010 9 117 265 9 409 713 9 985 811 SADC 1 033 672 1 294 261 1 375 259 1 442 396 1 829 776
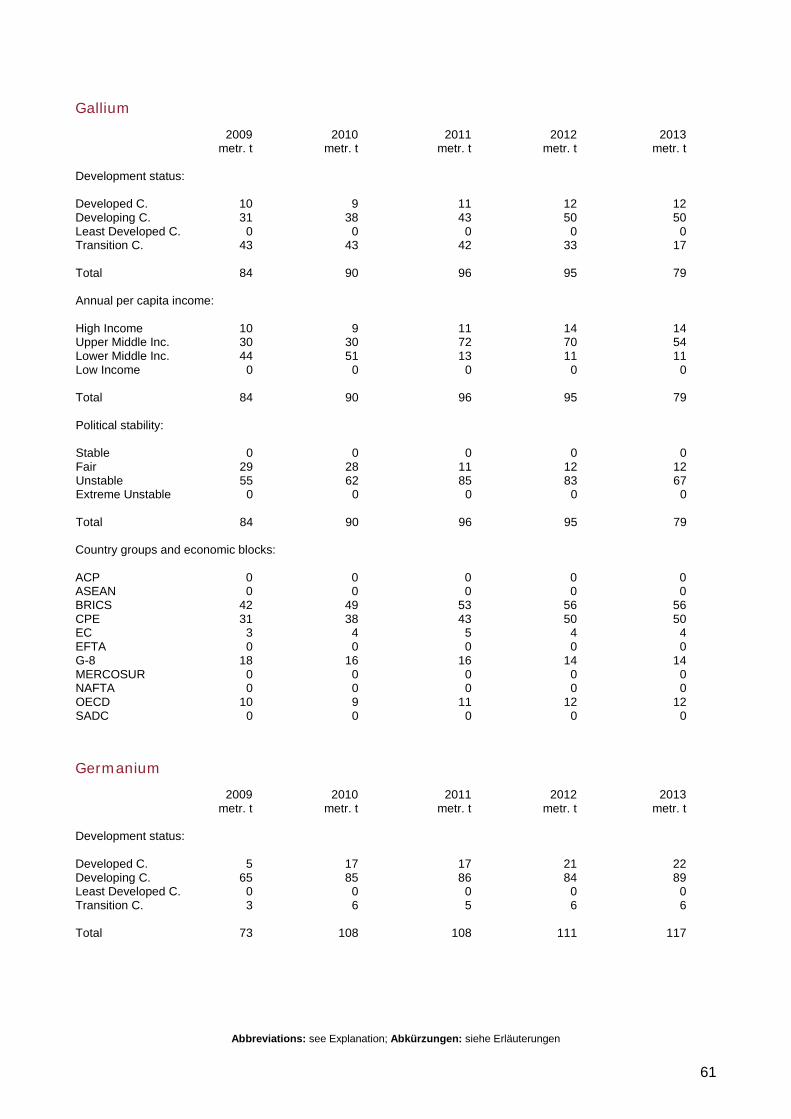
Abbreviations: see Explanation; Abkürzungen: siehe Erläuterungen
61
Gallium
2009 2010 2011 2012 2013 metr. t metr. t metr. t metr. t metr. t Development status: Developed C. 10 9 11 12 12 Developing C. 31 38 43 50 50 Least Developed C. 0 0 0 0 0 Transition C. 43 43 42 33 17 Total 84 90 96 95 79 Annual per capita income: High Income 10 9 11 14 14 Upper Middle Inc. 30 30 72 70 54 Lower Middle Inc. 44 51 13 11 11 Low Income 0 0 0 0 0 Total 84 90 96 95 79 Political stability: Stable 0 0 0 0 0 Fair 29 28 11 12 12 Unstable 55 62 85 83 67 Extreme Unstable 0 0 0 0 0 Total 84 90 96 95 79 Country groups and economic blocks: ACP 0 0 0 0 0 ASEAN 0 0 0 0 0 BRICS 42 49 53 56 56 CPE 31 38 43 50 50 EC 3 4 5 4 4 EFTA 0 0 0 0 0 G-8 18 16 16 14 14 MERCOSUR 0 0 0 0 0 NAFTA 0 0 0 0 0 OECD 10 9 11 12 12 SADC 0 0 0 0 0
Germanium
2009 2010 2011 2012 2013 metr. t metr. t metr. t metr. t metr. t Development status: Developed C. 5 17 17 21 22 Developing C. 65 85 86 84 89 Least Developed C. 0 0 0 0 0 Transition C. 3 6 5 6 6 Total 73 108 108 111 117
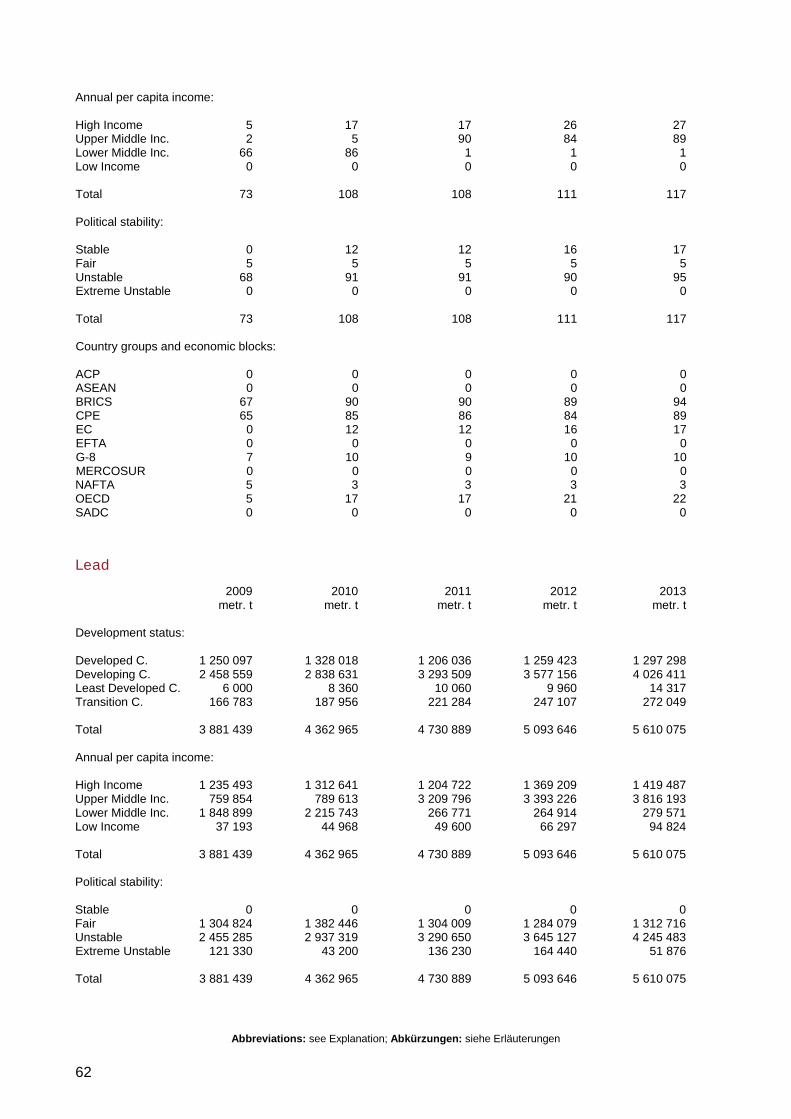
Abbreviations: see Explanation; Abkürzungen: siehe Erläuterungen
62
Annual per capita income: High Income 5 17 17 26 27 Upper Middle Inc. 2 5 90 84 89 Lower Middle Inc. 66 86 1 1 1 Low Income 0 0 0 0 0 Total 73 108 108 111 117 Political stability: Stable 0 12 12 16 17 Fair 5 5 5 5 5 Unstable 68 91 91 90 95 Extreme Unstable 0 0 0 0 0 Total 73 108 108 111 117 Country groups and economic blocks: ACP 0 0 0 0 0 ASEAN 0 0 0 0 0 BRICS 67 90 90 89 94 CPE 65 85 86 84 89 EC 0 12 12 16 17 EFTA 0 0 0 0 0 G-8 7 10 9 10 10 MERCOSUR 0 0 0 0 0 NAFTA 5 3 3 3 3 OECD 5 17 17 21 22 SADC 0 0 0 0 0
Lead
2009 2010 2011 2012 2013 metr. t metr. t metr. t metr. t metr. t Development status: Developed C. 1 250 097 1 328 018 1 206 036 1 259 423 1 297 298 Developing C. 2 458 559 2 838 631 3 293 509 3 577 156 4 026 411 Least Developed C. 6 000 8 360 10 060 9 960 14 317 Transition C. 166 783 187 956 221 284 247 107 272 049 Total 3 881 439 4 362 965 4 730 889 5 093 646 5 610 075 Annual per capita income: High Income 1 235 493 1 312 641 1 204 722 1 369 209 1 419 487 Upper Middle Inc. 759 854 789 613 3 209 796 3 393 226 3 816 193 Lower Middle Inc. 1 848 899 2 215 743 266 771 264 914 279 571 Low Income 37 193 44 968 49 600 66 297 94 824 Total 3 881 439 4 362 965 4 730 889 5 093 646 5 610 075 Political stability: Stable 0 0 0 0 0 Fair 1 304 824 1 382 446 1 304 009 1 284 079 1 312 716 Unstable 2 455 285 2 937 319 3 290 650 3 645 127 4 245 483 Extreme Unstable 121 330 43 200 136 230 164 440 51 876 Total 3 881 439 4 362 965 4 730 889 5 093 646 5 610 075
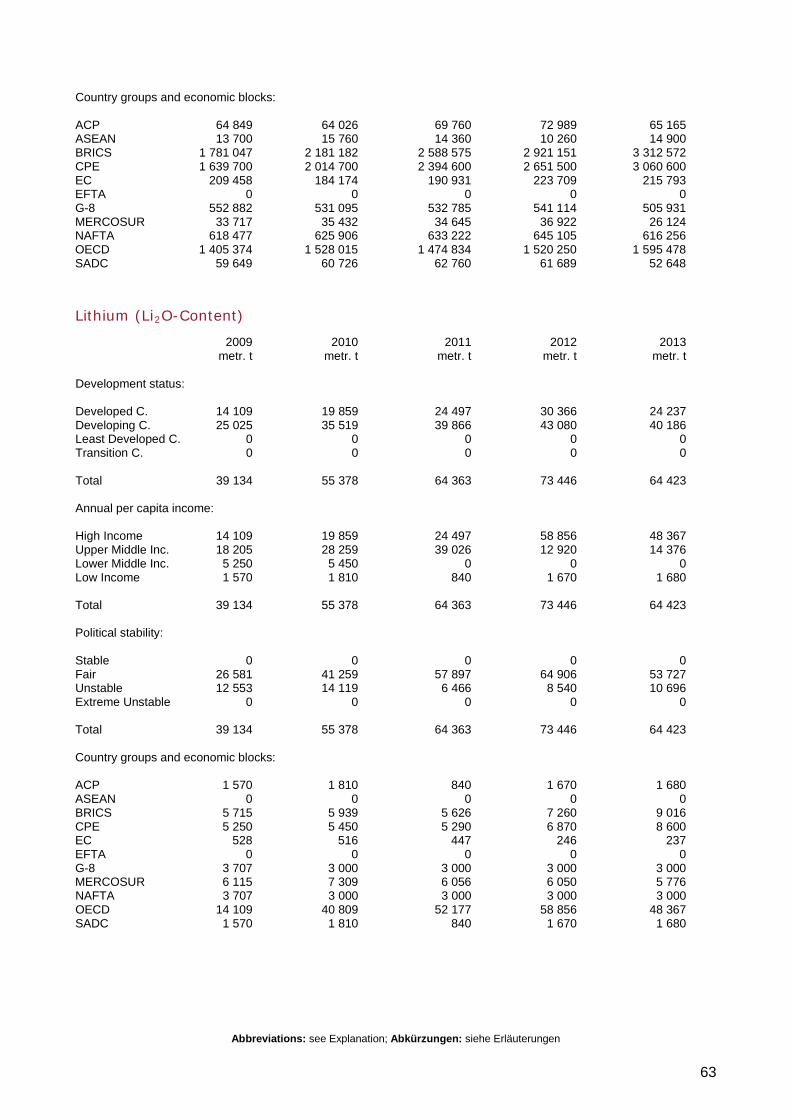
Abbreviations: see Explanation; Abkürzungen: siehe Erläuterungen
63
Country groups and economic blocks: ACP 64 849 64 026 69 760 72 989 65 165 ASEAN 13 700 15 760 14 360 10 260 14 900 BRICS 1 781 047 2 181 182 2 588 575 2 921 151 3 312 572 CPE 1 639 700 2 014 700 2 394 600 2 651 500 3 060 600 EC 209 458 184 174 190 931 223 709 215 793 EFTA 0 0 0 0 0 G-8 552 882 531 095 532 785 541 114 505 931 MERCOSUR 33 717 35 432 34 645 36 922 26 124 NAFTA 618 477 625 906 633 222 645 105 616 256 OECD 1 405 374 1 528 015 1 474 834 1 520 250 1 595 478 SADC 59 649 60 726 62 760 61 689 52 648
Lithium (Li2O-Content)
2009 2010 2011 2012 2013 metr. t metr. t metr. t metr. t metr. t Development status: Developed C. 14 109 19 859 24 497 30 366 24 237 Developing C. 25 025 35 519 39 866 43 080 40 186 Least Developed C. 0 0 0 0 0 Transition C. 0 0 0 0 0 Total 39 134 55 378 64 363 73 446 64 423 Annual per capita income: High Income 14 109 19 859 24 497 58 856 48 367 Upper Middle Inc. 18 205 28 259 39 026 12 920 14 376 Lower Middle Inc. 5 250 5 450 0 0 0 Low Income 1 570 1 810 840 1 670 1 680 Total 39 134 55 378 64 363 73 446 64 423 Political stability: Stable 0 0 0 0 0 Fair 26 581 41 259 57 897 64 906 53 727 Unstable 12 553 14 119 6 466 8 540 10 696 Extreme Unstable 0 0 0 0 0 Total 39 134 55 378 64 363 73 446 64 423 Country groups and economic blocks: ACP 1 570 1 810 840 1 670 1 680 ASEAN 0 0 0 0 0 BRICS 5 715 5 939 5 626 7 260 9 016 CPE 5 250 5 450 5 290 6 870 8 600 EC 528 516 447 246 237 EFTA 0 0 0 0 0 G-8 3 707 3 000 3 000 3 000 3 000 MERCOSUR 6 115 7 309 6 056 6 050 5 776 NAFTA 3 707 3 000 3 000 3 000 3 000 OECD 14 109 40 809 52 177 58 856 48 367 SADC 1 570 1 810 840 1 670 1 680
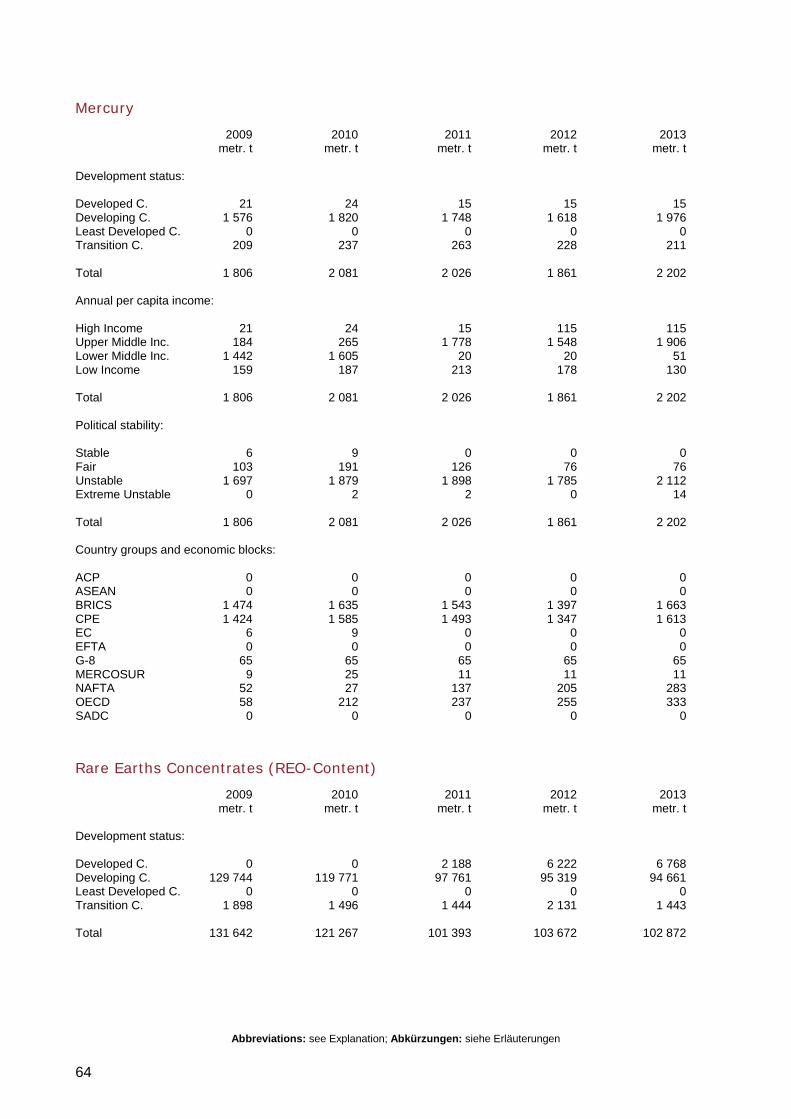
Abbreviations: see Explanation; Abkürzungen: siehe Erläuterungen
64
Mercury
2009 2010 2011 2012 2013 metr. t metr. t metr. t metr. t metr. t Development status: Developed C. 21 24 15 15 15 Developing C. 1 576 1 820 1 748 1 618 1 976 Least Developed C. 0 0 0 0 0 Transition C. 209 237 263 228 211 Total 1 806 2 081 2 026 1 861 2 202 Annual per capita income: High Income 21 24 15 115 115 Upper Middle Inc. 184 265 1 778 1 548 1 906 Lower Middle Inc. 1 442 1 605 20 20 51 Low Income 159 187 213 178 130 Total 1 806 2 081 2 026 1 861 2 202 Political stability: Stable 6 9 0 0 0 Fair 103 191 126 76 76 Unstable 1 697 1 879 1 898 1 785 2 112 Extreme Unstable 0 2 2 0 14 Total 1 806 2 081 2 026 1 861 2 202 Country groups and economic blocks: ACP 0 0 0 0 0 ASEAN 0 0 0 0 0 BRICS 1 474 1 635 1 543 1 397 1 663 CPE 1 424 1 585 1 493 1 347 1 613 EC 6 9 0 0 0 EFTA 0 0 0 0 0 G-8 65 65 65 65 65 MERCOSUR 9 25 11 11 11 NAFTA 52 27 137 205 283 OECD 58 212 237 255 333 SADC 0 0 0 0 0
Rare Earths Concentrates (REO-Content)
2009 2010 2011 2012 2013 metr. t metr. t metr. t metr. t metr. t Development status: Developed C. 0 0 2 188 6 222 6 768 Developing C. 129 744 119 771 97 761 95 319 94 661 Least Developed C. 0 0 0 0 0 Transition C. 1 898 1 496 1 444 2 131 1 443 Total 131 642 121 267 101 393 103 672 102 872
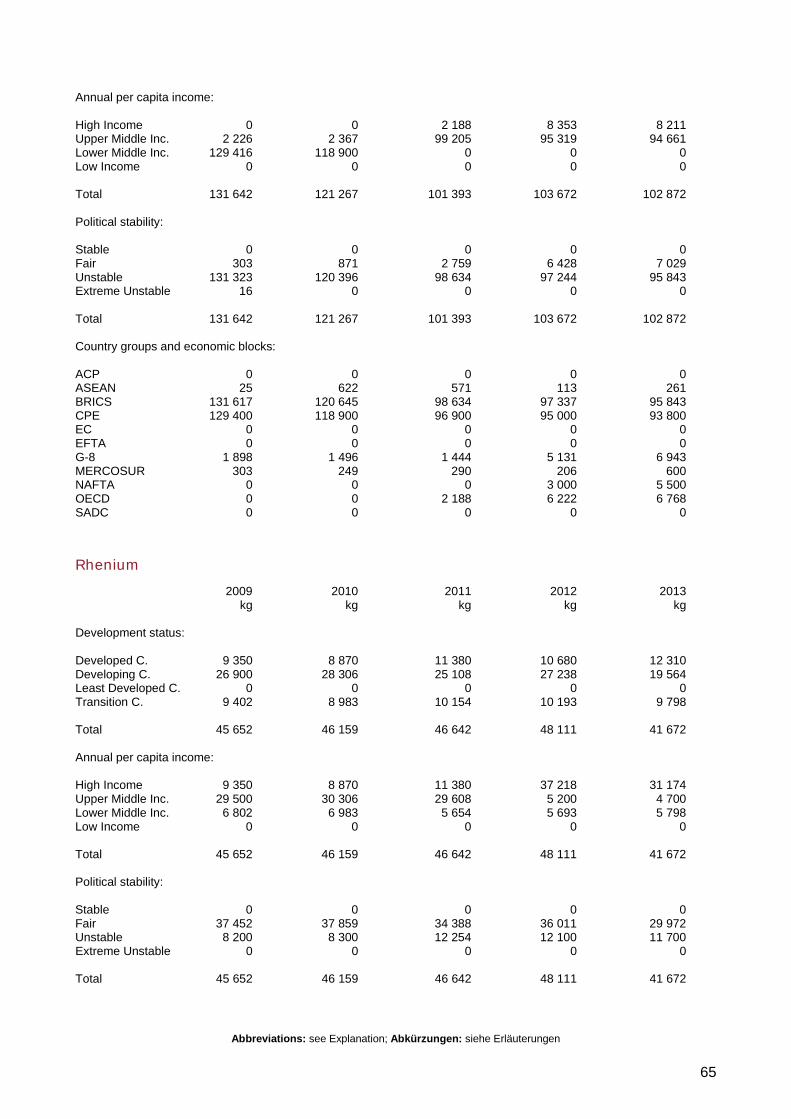
Abbreviations: see Explanation; Abkürzungen: siehe Erläuterungen
65
Annual per capita income: High Income 0 0 2 188 8 353 8 211 Upper Middle Inc. 2 226 2 367 99 205 95 319 94 661 Lower Middle Inc. 129 416 118 900 0 0 0 Low Income 0 0 0 0 0 Total 131 642 121 267 101 393 103 672 102 872 Political stability: Stable 0 0 0 0 0 Fair 303 871 2 759 6 428 7 029 Unstable 131 323 120 396 98 634 97 244 95 843 Extreme Unstable 16 0 0 0 0 Total 131 642 121 267 101 393 103 672 102 872 Country groups and economic blocks: ACP 0 0 0 0 0 ASEAN 25 622 571 113 261 BRICS 131 617 120 645 98 634 97 337 95 843 CPE 129 400 118 900 96 900 95 000 93 800 EC 0 0 0 0 0 EFTA 0 0 0 0 0 G-8 1 898 1 496 1 444 5 131 6 943 MERCOSUR 303 249 290 206 600 NAFTA 0 0 0 3 000 5 500 OECD 0 0 2 188 6 222 6 768 SADC 0 0 0 0 0
Rhenium
2009 2010 2011 2012 2013 kg kg kg kg kg Development status: Developed C. 9 350 8 870 11 380 10 680 12 310 Developing C. 26 900 28 306 25 108 27 238 19 564 Least Developed C. 0 0 0 0 0 Transition C. 9 402 8 983 10 154 10 193 9 798 Total 45 652 46 159 46 642 48 111 41 672 Annual per capita income: High Income 9 350 8 870 11 380 37 218 31 174 Upper Middle Inc. 29 500 30 306 29 608 5 200 4 700 Lower Middle Inc. 6 802 6 983 5 654 5 693 5 798 Low Income 0 0 0 0 0 Total 45 652 46 159 46 642 48 111 41 672 Political stability: Stable 0 0 0 0 0 Fair 37 452 37 859 34 388 36 011 29 972 Unstable 8 200 8 300 12 254 12 100 11 700 Extreme Unstable 0 0 0 0 0 Total 45 652 46 159 46 642 48 111 41 672
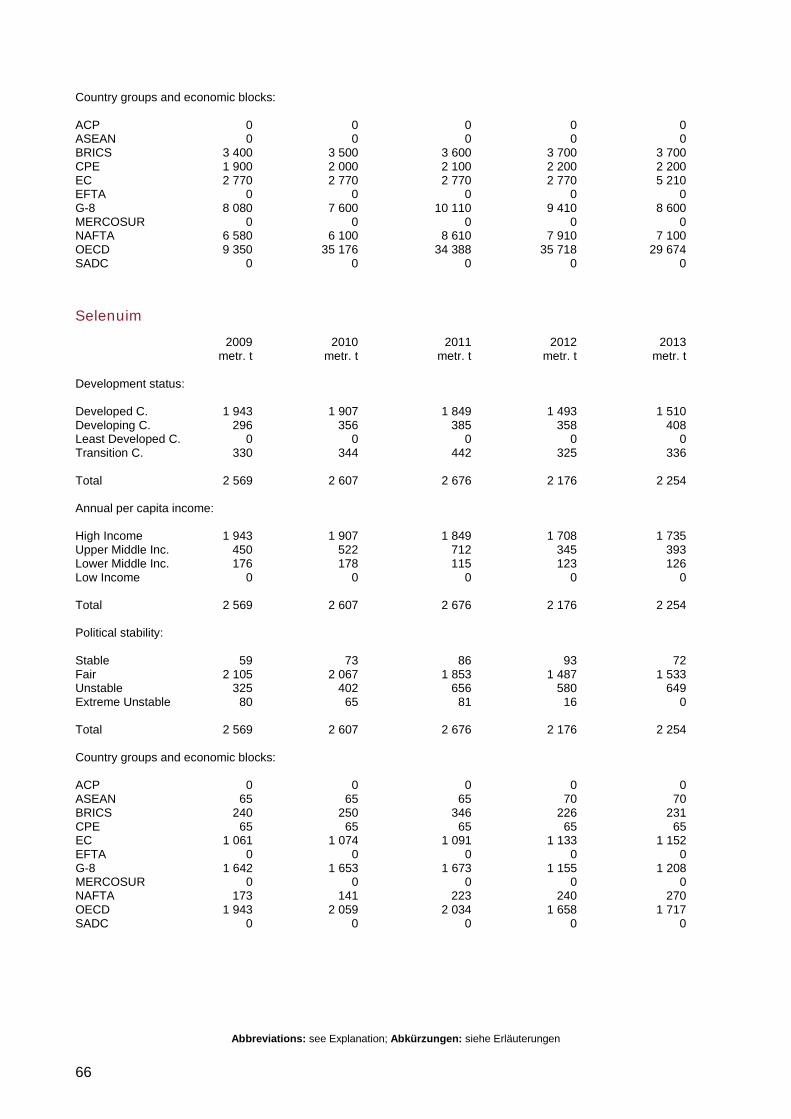
Abbreviations: see Explanation; Abkürzungen: siehe Erläuterungen
66
Country groups and economic blocks: ACP 0 0 0 0 0 ASEAN 0 0 0 0 0 BRICS 3 400 3 500 3 600 3 700 3 700 CPE 1 900 2 000 2 100 2 200 2 200 EC 2 770 2 770 2 770 2 770 5 210 EFTA 0 0 0 0 0 G-8 8 080 7 600 10 110 9 410 8 600 MERCOSUR 0 0 0 0 0 NAFTA 6 580 6 100 8 610 7 910 7 100 OECD 9 350 35 176 34 388 35 718 29 674 SADC 0 0 0 0 0
Selenuim
2009 2010 2011 2012 2013 metr. t metr. t metr. t metr. t metr. t Development status: Developed C. 1 943 1 907 1 849 1 493 1 510 Developing C. 296 356 385 358 408 Least Developed C. 0 0 0 0 0 Transition C. 330 344 442 325 336 Total 2 569 2 607 2 676 2 176 2 254 Annual per capita income: High Income 1 943 1 907 1 849 1 708 1 735 Upper Middle Inc. 450 522 712 345 393 Lower Middle Inc. 176 178 115 123 126 Low Income 0 0 0 0 0 Total 2 569 2 607 2 676 2 176 2 254 Political stability: Stable 59 73 86 93 72 Fair 2 105 2 067 1 853 1 487 1 533 Unstable 325 402 656 580 649 Extreme Unstable 80 65 81 16 0 Total 2 569 2 607 2 676 2 176 2 254 Country groups and economic blocks: ACP 0 0 0 0 0 ASEAN 65 65 65 70 70 BRICS 240 250 346 226 231 CPE 65 65 65 65 65 EC 1 061 1 074 1 091 1 133 1 152 EFTA 0 0 0 0 0 G-8 1 642 1 653 1 673 1 155 1 208 MERCOSUR 0 0 0 0 0 NAFTA 173 141 223 240 270 OECD 1 943 2 059 2 034 1 658 1 717 SADC 0 0 0 0 0
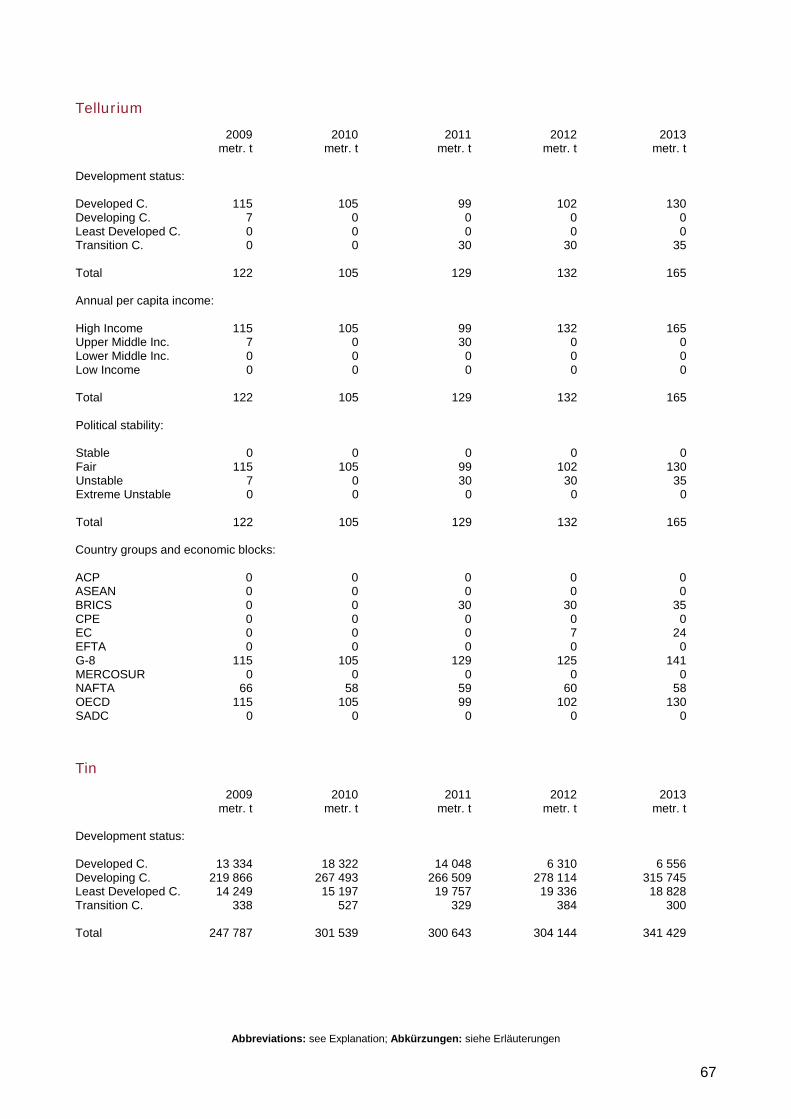
Abbreviations: see Explanation; Abkürzungen: siehe Erläuterungen
67
Tellurium
2009 2010 2011 2012 2013 metr. t metr. t metr. t metr. t metr. t Development status: Developed C. 115 105 99 102 130 Developing C. 7 0 0 0 0 Least Developed C. 0 0 0 0 0 Transition C. 0 0 30 30 35 Total 122 105 129 132 165 Annual per capita income: High Income 115 105 99 132 165 Upper Middle Inc. 7 0 30 0 0 Lower Middle Inc. 0 0 0 0 0 Low Income 0 0 0 0 0 Total 122 105 129 132 165 Political stability: Stable 0 0 0 0 0 Fair 115 105 99 102 130 Unstable 7 0 30 30 35 Extreme Unstable 0 0 0 0 0 Total 122 105 129 132 165 Country groups and economic blocks: ACP 0 0 0 0 0 ASEAN 0 0 0 0 0 BRICS 0 0 30 30 35 CPE 0 0 0 0 0 EC 0 0 0 7 24 EFTA 0 0 0 0 0 G-8 115 105 129 125 141 MERCOSUR 0 0 0 0 0 NAFTA 66 58 59 60 58 OECD 115 105 99 102 130 SADC 0 0 0 0 0
Tin
2009 2010 2011 2012 2013 metr. t metr. t metr. t metr. t metr. t Development status: Developed C. 13 334 18 322 14 048 6 310 6 556 Developing C. 219 866 267 493 266 509 278 114 315 745 Least Developed C. 14 249 15 197 19 757 19 336 18 828 Transition C. 338 527 329 384 300 Total 247 787 301 539 300 643 304 144 341 429
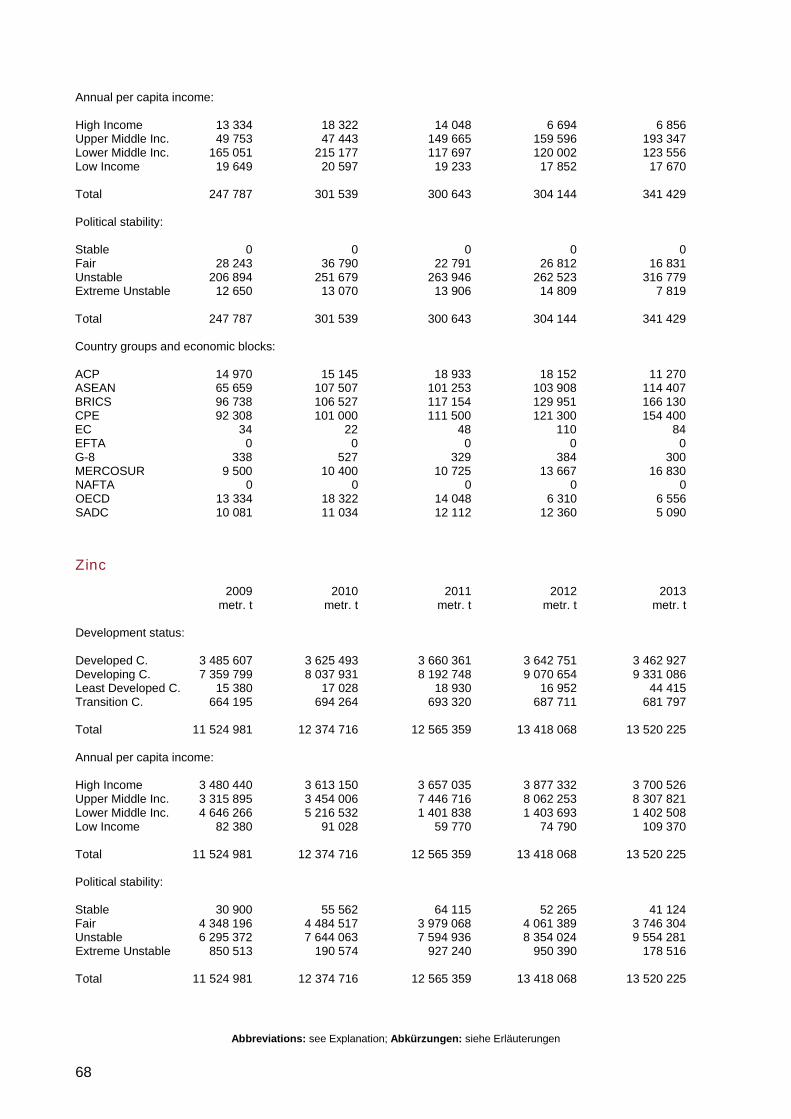
Abbreviations: see Explanation; Abkürzungen: siehe Erläuterungen
68
Annual per capita income: High Income 13 334 18 322 14 048 6 694 6 856 Upper Middle Inc. 49 753 47 443 149 665 159 596 193 347 Lower Middle Inc. 165 051 215 177 117 697 120 002 123 556 Low Income 19 649 20 597 19 233 17 852 17 670 Total 247 787 301 539 300 643 304 144 341 429 Political stability: Stable 0 0 0 0 0 Fair 28 243 36 790 22 791 26 812 16 831 Unstable 206 894 251 679 263 946 262 523 316 779 Extreme Unstable 12 650 13 070 13 906 14 809 7 819 Total 247 787 301 539 300 643 304 144 341 429 Country groups and economic blocks: ACP 14 970 15 145 18 933 18 152 11 270 ASEAN 65 659 107 507 101 253 103 908 114 407 BRICS 96 738 106 527 117 154 129 951 166 130 CPE 92 308 101 000 111 500 121 300 154 400 EC 34 22 48 110 84 EFTA 0 0 0 0 0 G-8 338 527 329 384 300 MERCOSUR 9 500 10 400 10 725 13 667 16 830 NAFTA 0 0 0 0 0 OECD 13 334 18 322 14 048 6 310 6 556 SADC 10 081 11 034 12 112 12 360 5 090
Zinc
2009 2010 2011 2012 2013 metr. t metr. t metr. t metr. t metr. t Development status: Developed C. 3 485 607 3 625 493 3 660 361 3 642 751 3 462 927 Developing C. 7 359 799 8 037 931 8 192 748 9 070 654 9 331 086 Least Developed C. 15 380 17 028 18 930 16 952 44 415 Transition C. 664 195 694 264 693 320 687 711 681 797 Total 11 524 981 12 374 716 12 565 359 13 418 068 13 520 225 Annual per capita income: High Income 3 480 440 3 613 150 3 657 035 3 877 332 3 700 526 Upper Middle Inc. 3 315 895 3 454 006 7 446 716 8 062 253 8 307 821 Lower Middle Inc. 4 646 266 5 216 532 1 401 838 1 403 693 1 402 508 Low Income 82 380 91 028 59 770 74 790 109 370 Total 11 524 981 12 374 716 12 565 359 13 418 068 13 520 225 Political stability: Stable 30 900 55 562 64 115 52 265 41 124 Fair 4 348 196 4 484 517 3 979 068 4 061 389 3 746 304 Unstable 6 295 372 7 644 063 7 594 936 8 354 024 9 554 281 Extreme Unstable 850 513 190 574 927 240 950 390 178 516 Total 11 524 981 12 374 716 12 565 359 13 418 068 13 520 225
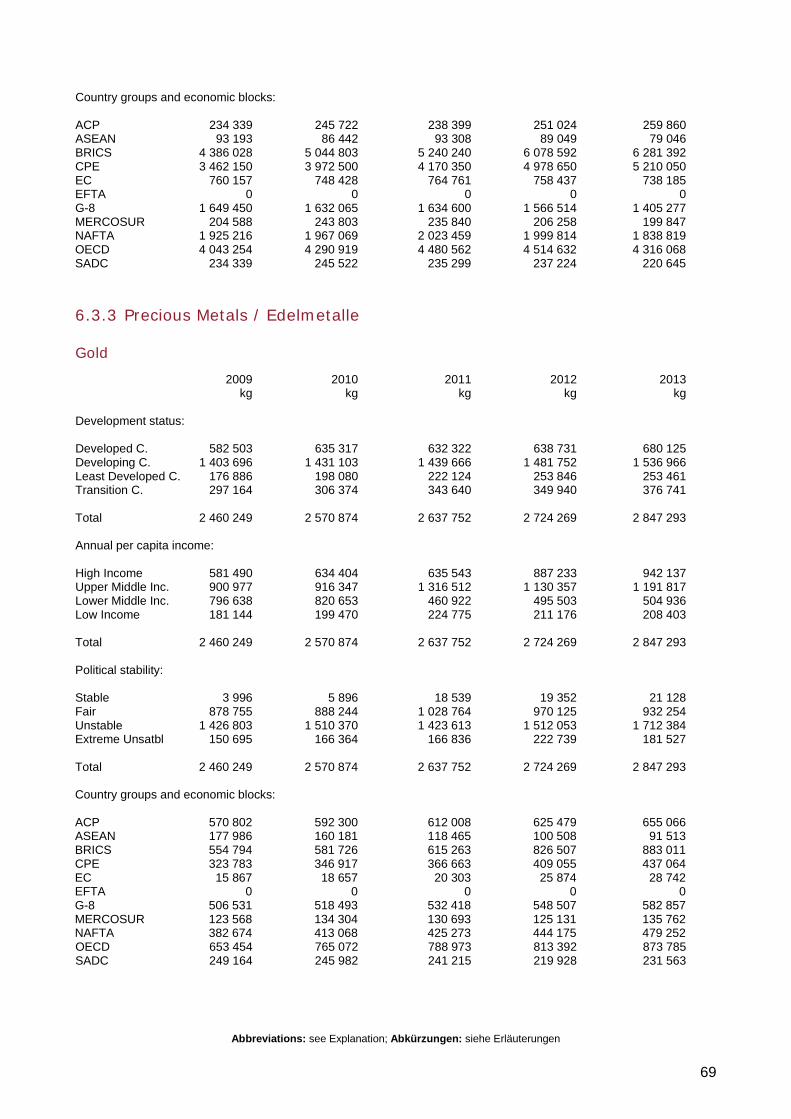
Abbreviations: see Explanation; Abkürzungen: siehe Erläuterungen
69
Country groups and economic blocks: ACP 234 339 245 722 238 399 251 024 259 860 ASEAN 93 193 86 442 93 308 89 049 79 046 BRICS 4 386 028 5 044 803 5 240 240 6 078 592 6 281 392 CPE 3 462 150 3 972 500 4 170 350 4 978 650 5 210 050 EC 760 157 748 428 764 761 758 437 738 185 EFTA 0 0 0 0 0 G-8 1 649 450 1 632 065 1 634 600 1 566 514 1 405 277 MERCOSUR 204 588 243 803 235 840 206 258 199 847 NAFTA 1 925 216 1 967 069 2 023 459 1 999 814 1 838 819 OECD 4 043 254 4 290 919 4 480 562 4 514 632 4 316 068 SADC 234 339 245 522 235 299 237 224 220 645
6.3.3 Precious Metals / Edelmetalle
Gold
2009 2010 2011 2012 2013 kg kg kg kg kg Development status: Developed C. 582 503 635 317 632 322 638 731 680 125 Developing C. 1 403 696 1 431 103 1 439 666 1 481 752 1 536 966 Least Developed C. 176 886 198 080 222 124 253 846 253 461 Transition C. 297 164 306 374 343 640 349 940 376 741 Total 2 460 249 2 570 874 2 637 752 2 724 269 2 847 293 Annual per capita income: High Income 581 490 634 404 635 543 887 233 942 137 Upper Middle Inc. 900 977 916 347 1 316 512 1 130 357 1 191 817 Lower Middle Inc. 796 638 820 653 460 922 495 503 504 936 Low Income 181 144 199 470 224 775 211 176 208 403 Total 2 460 249 2 570 874 2 637 752 2 724 269 2 847 293 Political stability: Stable 3 996 5 896 18 539 19 352 21 128 Fair 878 755 888 244 1 028 764 970 125 932 254 Unstable 1 426 803 1 510 370 1 423 613 1 512 053 1 712 384 Extreme Unsatbl 150 695 166 364 166 836 222 739 181 527 Total 2 460 249 2 570 874 2 637 752 2 724 269 2 847 293 Country groups and economic blocks: ACP 570 802 592 300 612 008 625 479 655 066 ASEAN 177 986 160 181 118 465 100 508 91 513 BRICS 554 794 581 726 615 263 826 507 883 011 CPE 323 783 346 917 366 663 409 055 437 064 EC 15 867 18 657 20 303 25 874 28 742 EFTA 0 0 0 0 0 G-8 506 531 518 493 532 418 548 507 582 857 MERCOSUR 123 568 134 304 130 693 125 131 135 762 NAFTA 382 674 413 068 425 273 444 175 479 252 OECD 653 454 765 072 788 973 813 392 873 785 SADC 249 164 245 982 241 215 219 928 231 563
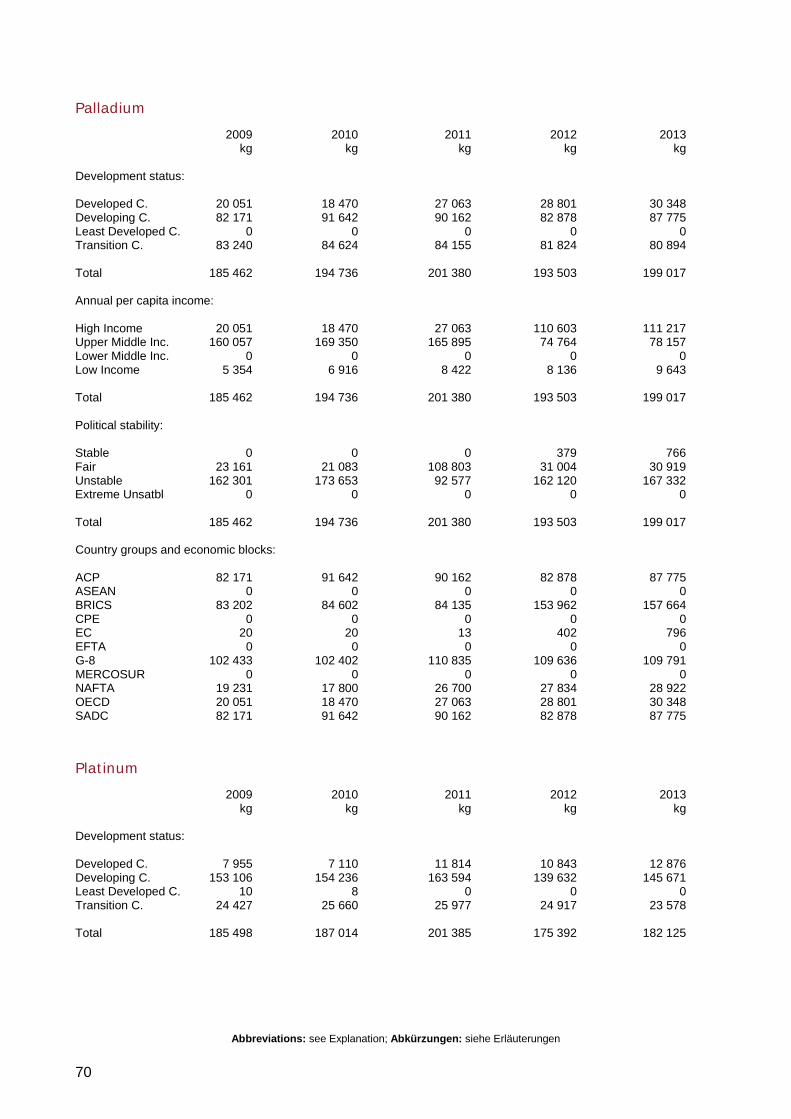
Abbreviations: see Explanation; Abkürzungen: siehe Erläuterungen
70
Palladium
2009 2010 2011 2012 2013 kg kg kg kg kg Development status: Developed C. 20 051 18 470 27 063 28 801 30 348 Developing C. 82 171 91 642 90 162 82 878 87 775 Least Developed C. 0 0 0 0 0 Transition C. 83 240 84 624 84 155 81 824 80 894 Total 185 462 194 736 201 380 193 503 199 017 Annual per capita income: High Income 20 051 18 470 27 063 110 603 111 217 Upper Middle Inc. 160 057 169 350 165 895 74 764 78 157 Lower Middle Inc. 0 0 0 0 0 Low Income 5 354 6 916 8 422 8 136 9 643 Total 185 462 194 736 201 380 193 503 199 017 Political stability: Stable 0 0 0 379 766 Fair 23 161 21 083 108 803 31 004 30 919 Unstable 162 301 173 653 92 577 162 120 167 332 Extreme Unsatbl 0 0 0 0 0 Total 185 462 194 736 201 380 193 503 199 017 Country groups and economic blocks: ACP 82 171 91 642 90 162 82 878 87 775 ASEAN 0 0 0 0 0 BRICS 83 202 84 602 84 135 153 962 157 664 CPE 0 0 0 0 0 EC 20 20 13 402 796 EFTA 0 0 0 0 0 G-8 102 433 102 402 110 835 109 636 109 791 MERCOSUR 0 0 0 0 0 NAFTA 19 231 17 800 26 700 27 834 28 922 OECD 20 051 18 470 27 063 28 801 30 348 SADC 82 171 91 642 90 162 82 878 87 775
Platinum
2009 2010 2011 2012 2013 kg kg kg kg kg Development status: Developed C. 7 955 7 110 11 814 10 843 12 876 Developing C. 153 106 154 236 163 594 139 632 145 671 Least Developed C. 10 8 0 0 0 Transition C. 24 427 25 660 25 977 24 917 23 578 Total 185 498 187 014 201 385 175 392 182 125
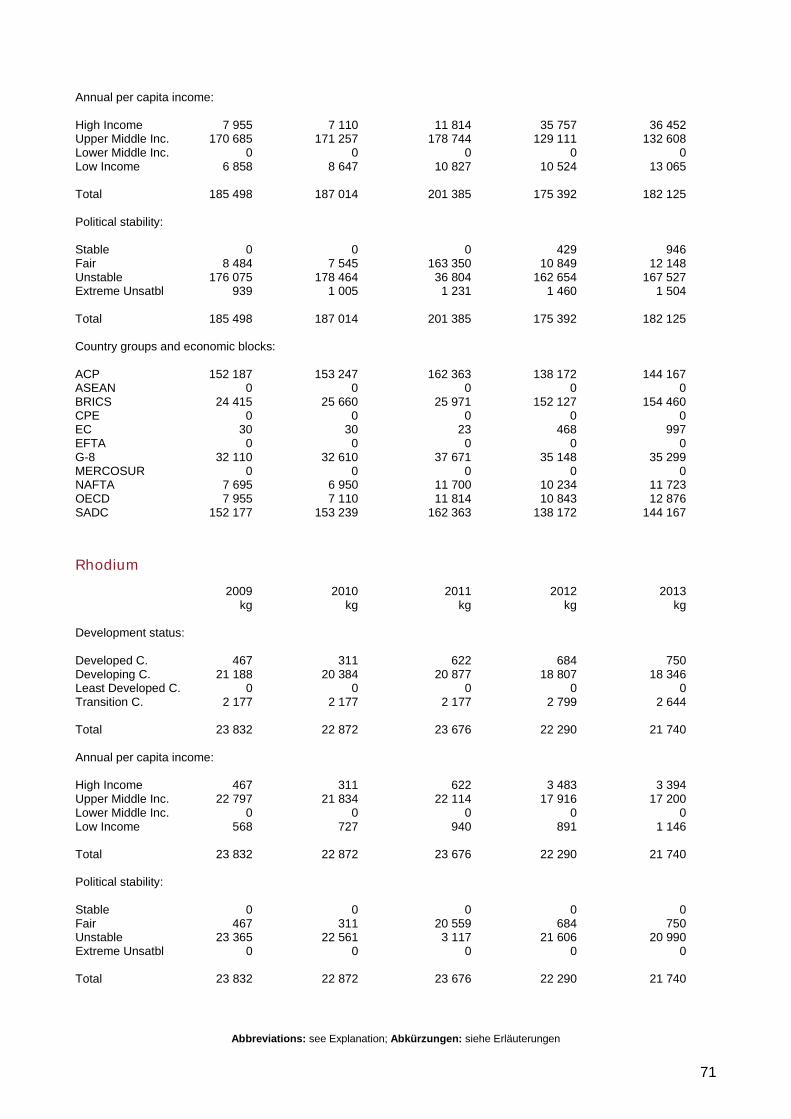
Abbreviations: see Explanation; Abkürzungen: siehe Erläuterungen
71
Annual per capita income: High Income 7 955 7 110 11 814 35 757 36 452 Upper Middle Inc. 170 685 171 257 178 744 129 111 132 608 Lower Middle Inc. 0 0 0 0 0 Low Income 6 858 8 647 10 827 10 524 13 065 Total 185 498 187 014 201 385 175 392 182 125 Political stability: Stable 0 0 0 429 946 Fair 8 484 7 545 163 350 10 849 12 148 Unstable 176 075 178 464 36 804 162 654 167 527 Extreme Unsatbl 939 1 005 1 231 1 460 1 504 Total 185 498 187 014 201 385 175 392 182 125 Country groups and economic blocks: ACP 152 187 153 247 162 363 138 172 144 167 ASEAN 0 0 0 0 0 BRICS 24 415 25 660 25 971 152 127 154 460 CPE 0 0 0 0 0 EC 30 30 23 468 997 EFTA 0 0 0 0 0 G-8 32 110 32 610 37 671 35 148 35 299 MERCOSUR 0 0 0 0 0 NAFTA 7 695 6 950 11 700 10 234 11 723 OECD 7 955 7 110 11 814 10 843 12 876 SADC 152 177 153 239 162 363 138 172 144 167
Rhodium
2009 2010 2011 2012 2013 kg kg kg kg kg Development status: Developed C. 467 311 622 684 750 Developing C. 21 188 20 384 20 877 18 807 18 346 Least Developed C. 0 0 0 0 0 Transition C. 2 177 2 177 2 177 2 799 2 644 Total 23 832 22 872 23 676 22 290 21 740 Annual per capita income: High Income 467 311 622 3 483 3 394 Upper Middle Inc. 22 797 21 834 22 114 17 916 17 200 Lower Middle Inc. 0 0 0 0 0 Low Income 568 727 940 891 1 146 Total 23 832 22 872 23 676 22 290 21 740 Political stability: Stable 0 0 0 0 0 Fair 467 311 20 559 684 750 Unstable 23 365 22 561 3 117 21 606 20 990 Extreme Unsatbl 0 0 0 0 0 Total 23 832 22 872 23 676 22 290 21 740
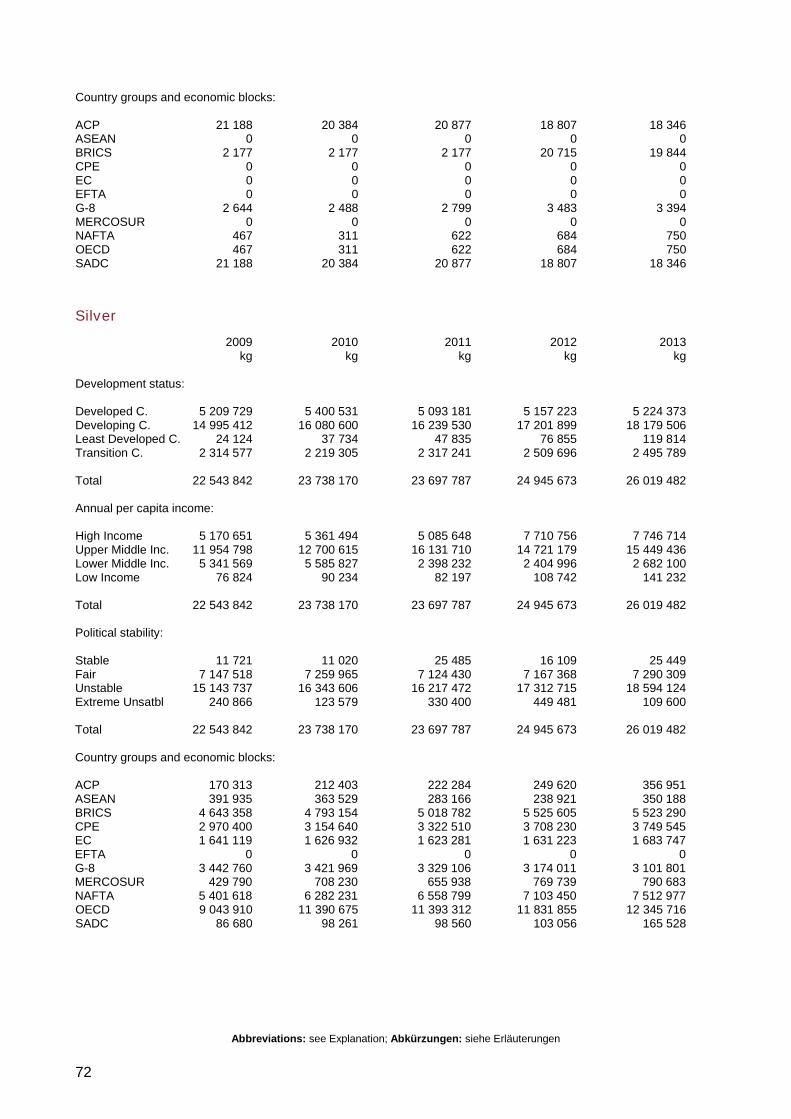
Abbreviations: see Explanation; Abkürzungen: siehe Erläuterungen
72
Country groups and economic blocks: ACP 21 188 20 384 20 877 18 807 18 346 ASEAN 0 0 0 0 0 BRICS 2 177 2 177 2 177 20 715 19 844 CPE 0 0 0 0 0 EC 0 0 0 0 0 EFTA 0 0 0 0 0 G-8 2 644 2 488 2 799 3 483 3 394 MERCOSUR 0 0 0 0 0 NAFTA 467 311 622 684 750 OECD 467 311 622 684 750 SADC 21 188 20 384 20 877 18 807 18 346
Silver
2009 2010 2011 2012 2013 kg kg kg kg kg Development status: Developed C. 5 209 729 5 400 531 5 093 181 5 157 223 5 224 373 Developing C. 14 995 412 16 080 600 16 239 530 17 201 899 18 179 506 Least Developed C. 24 124 37 734 47 835 76 855 119 814 Transition C. 2 314 577 2 219 305 2 317 241 2 509 696 2 495 789 Total 22 543 842 23 738 170 23 697 787 24 945 673 26 019 482 Annual per capita income: High Income 5 170 651 5 361 494 5 085 648 7 710 756 7 746 714 Upper Middle Inc. 11 954 798 12 700 615 16 131 710 14 721 179 15 449 436 Lower Middle Inc. 5 341 569 5 585 827 2 398 232 2 404 996 2 682 100 Low Income 76 824 90 234 82 197 108 742 141 232 Total 22 543 842 23 738 170 23 697 787 24 945 673 26 019 482 Political stability: Stable 11 721 11 020 25 485 16 109 25 449 Fair 7 147 518 7 259 965 7 124 430 7 167 368 7 290 309 Unstable 15 143 737 16 343 606 16 217 472 17 312 715 18 594 124 Extreme Unsatbl 240 866 123 579 330 400 449 481 109 600 Total 22 543 842 23 738 170 23 697 787 24 945 673 26 019 482 Country groups and economic blocks: ACP 170 313 212 403 222 284 249 620 356 951 ASEAN 391 935 363 529 283 166 238 921 350 188 BRICS 4 643 358 4 793 154 5 018 782 5 525 605 5 523 290 CPE 2 970 400 3 154 640 3 322 510 3 708 230 3 749 545 EC 1 641 119 1 626 932 1 623 281 1 631 223 1 683 747 EFTA 0 0 0 0 0 G-8 3 442 760 3 421 969 3 329 106 3 174 011 3 101 801 MERCOSUR 429 790 708 230 655 938 769 739 790 683 NAFTA 5 401 618 6 282 231 6 558 799 7 103 450 7 512 977 OECD 9 043 910 11 390 675 11 393 312 11 831 855 12 345 716 SADC 86 680 98 261 98 560 103 056 165 528
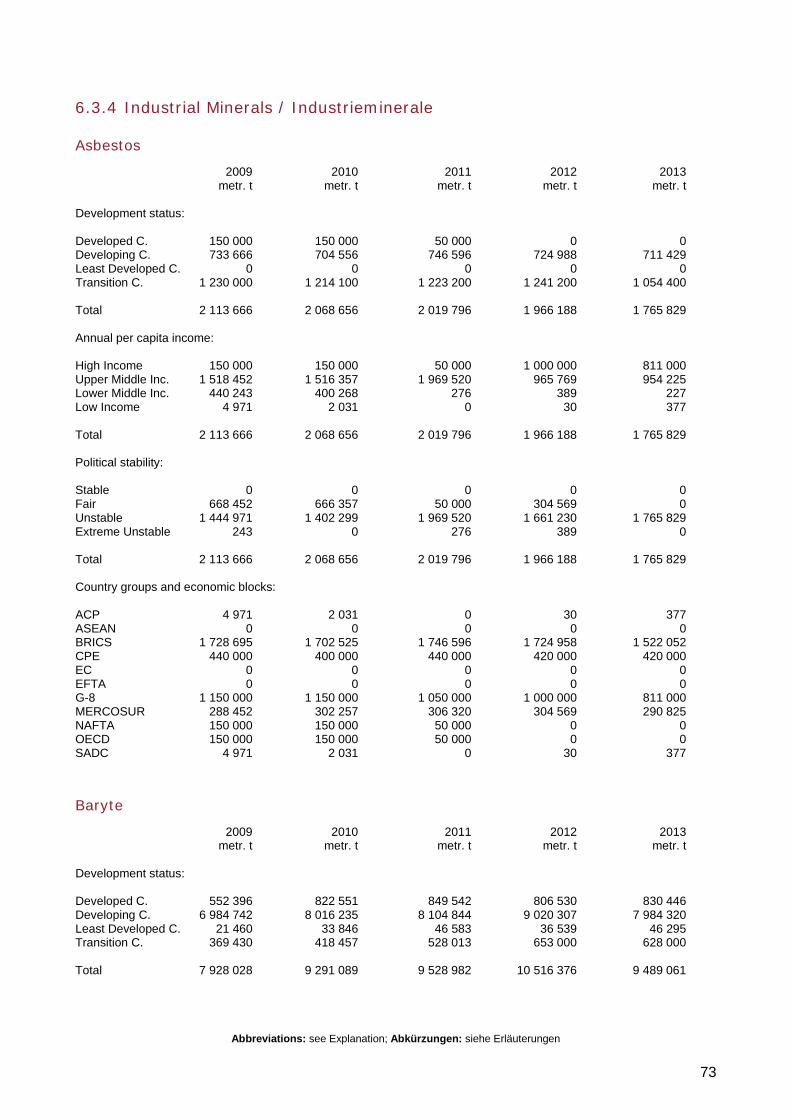
Abbreviations: see Explanation; Abkürzungen: siehe Erläuterungen
73
6.3.4 Industrial Minerals / Industrieminerale
Asbestos
2009 2010 2011 2012 2013 metr. t metr. t metr. t metr. t metr. t Development status: Developed C. 150 000 150 000 50 000 0 0 Developing C. 733 666 704 556 746 596 724 988 711 429 Least Developed C. 0 0 0 0 0 Transition C. 1 230 000 1 214 100 1 223 200 1 241 200 1 054 400 Total 2 113 666 2 068 656 2 019 796 1 966 188 1 765 829 Annual per capita income: High Income 150 000 150 000 50 000 1 000 000 811 000 Upper Middle Inc. 1 518 452 1 516 357 1 969 520 965 769 954 225 Lower Middle Inc. 440 243 400 268 276 389 227 Low Income 4 971 2 031 0 30 377 Total 2 113 666 2 068 656 2 019 796 1 966 188 1 765 829 Political stability: Stable 0 0 0 0 0 Fair 668 452 666 357 50 000 304 569 0 Unstable 1 444 971 1 402 299 1 969 520 1 661 230 1 765 829 Extreme Unstable 243 0 276 389 0 Total 2 113 666 2 068 656 2 019 796 1 966 188 1 765 829 Country groups and economic blocks: ACP 4 971 2 031 0 30 377 ASEAN 0 0 0 0 0 BRICS 1 728 695 1 702 525 1 746 596 1 724 958 1 522 052 CPE 440 000 400 000 440 000 420 000 420 000 EC 0 0 0 0 0 EFTA 0 0 0 0 0 G-8 1 150 000 1 150 000 1 050 000 1 000 000 811 000 MERCOSUR 288 452 302 257 306 320 304 569 290 825 NAFTA 150 000 150 000 50 000 0 0 OECD 150 000 150 000 50 000 0 0 SADC 4 971 2 031 0 30 377
Baryte
2009 2010 2011 2012 2013 metr. t metr. t metr. t metr. t metr. t Development status: Developed C. 552 396 822 551 849 542 806 530 830 446 Developing C. 6 984 742 8 016 235 8 104 844 9 020 307 7 984 320 Least Developed C. 21 460 33 846 46 583 36 539 46 295 Transition C. 369 430 418 457 528 013 653 000 628 000 Total 7 928 028 9 291 089 9 528 982 10 516 376 9 489 061
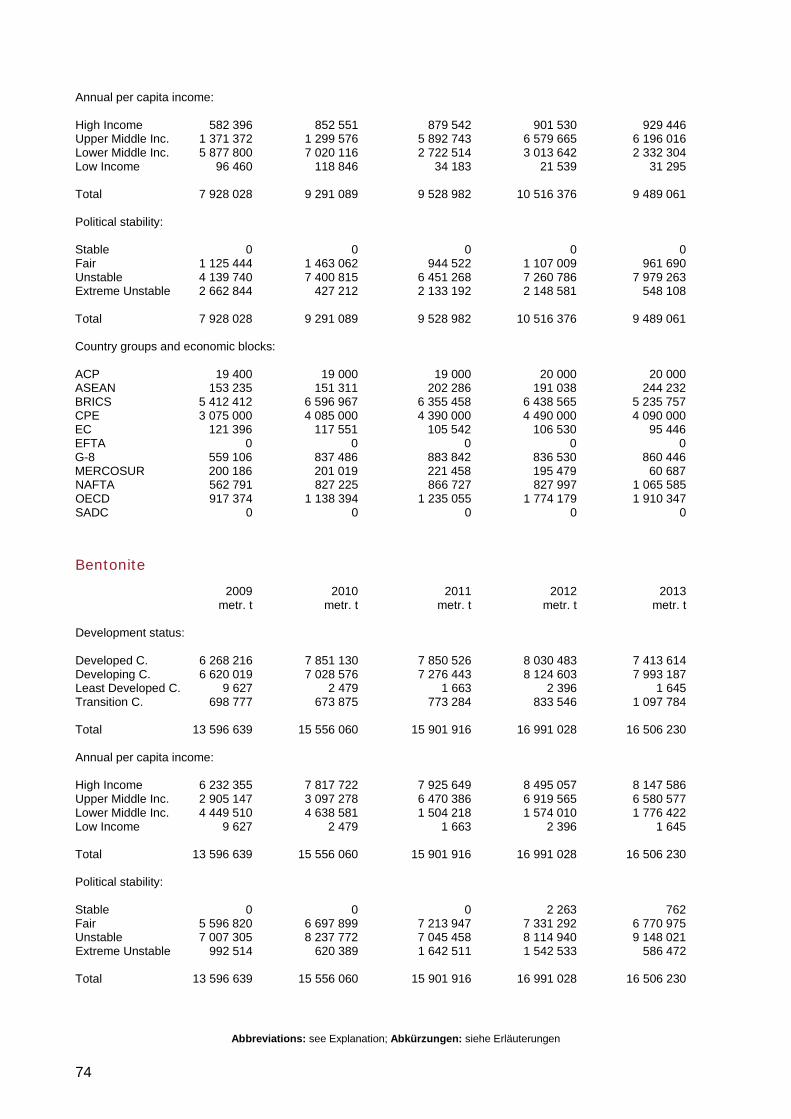
Abbreviations: see Explanation; Abkürzungen: siehe Erläuterungen
74
Annual per capita income: High Income 582 396 852 551 879 542 901 530 929 446 Upper Middle Inc. 1 371 372 1 299 576 5 892 743 6 579 665 6 196 016 Lower Middle Inc. 5 877 800 7 020 116 2 722 514 3 013 642 2 332 304 Low Income 96 460 118 846 34 183 21 539 31 295 Total 7 928 028 9 291 089 9 528 982 10 516 376 9 489 061 Political stability: Stable 0 0 0 0 0 Fair 1 125 444 1 463 062 944 522 1 107 009 961 690 Unstable 4 139 740 7 400 815 6 451 268 7 260 786 7 979 263 Extreme Unstable 2 662 844 427 212 2 133 192 2 148 581 548 108 Total 7 928 028 9 291 089 9 528 982 10 516 376 9 489 061 Country groups and economic blocks: ACP 19 400 19 000 19 000 20 000 20 000 ASEAN 153 235 151 311 202 286 191 038 244 232 BRICS 5 412 412 6 596 967 6 355 458 6 438 565 5 235 757 CPE 3 075 000 4 085 000 4 390 000 4 490 000 4 090 000 EC 121 396 117 551 105 542 106 530 95 446 EFTA 0 0 0 0 0 G-8 559 106 837 486 883 842 836 530 860 446 MERCOSUR 200 186 201 019 221 458 195 479 60 687 NAFTA 562 791 827 225 866 727 827 997 1 065 585 OECD 917 374 1 138 394 1 235 055 1 774 179 1 910 347 SADC 0 0 0 0 0
Bentonite
2009 2010 2011 2012 2013 metr. t metr. t metr. t metr. t metr. t Development status: Developed C. 6 268 216 7 851 130 7 850 526 8 030 483 7 413 614 Developing C. 6 620 019 7 028 576 7 276 443 8 124 603 7 993 187 Least Developed C. 9 627 2 479 1 663 2 396 1 645 Transition C. 698 777 673 875 773 284 833 546 1 097 784 Total 13 596 639 15 556 060 15 901 916 16 991 028 16 506 230 Annual per capita income: High Income 6 232 355 7 817 722 7 925 649 8 495 057 8 147 586 Upper Middle Inc. 2 905 147 3 097 278 6 470 386 6 919 565 6 580 577 Lower Middle Inc. 4 449 510 4 638 581 1 504 218 1 574 010 1 776 422 Low Income 9 627 2 479 1 663 2 396 1 645 Total 13 596 639 15 556 060 15 901 916 16 991 028 16 506 230 Political stability: Stable 0 0 0 2 263 762 Fair 5 596 820 6 697 899 7 213 947 7 331 292 6 770 975 Unstable 7 007 305 8 237 772 7 045 458 8 114 940 9 148 021 Extreme Unstable 992 514 620 389 1 642 511 1 542 533 586 472 Total 13 596 639 15 556 060 15 901 916 16 991 028 16 506 230
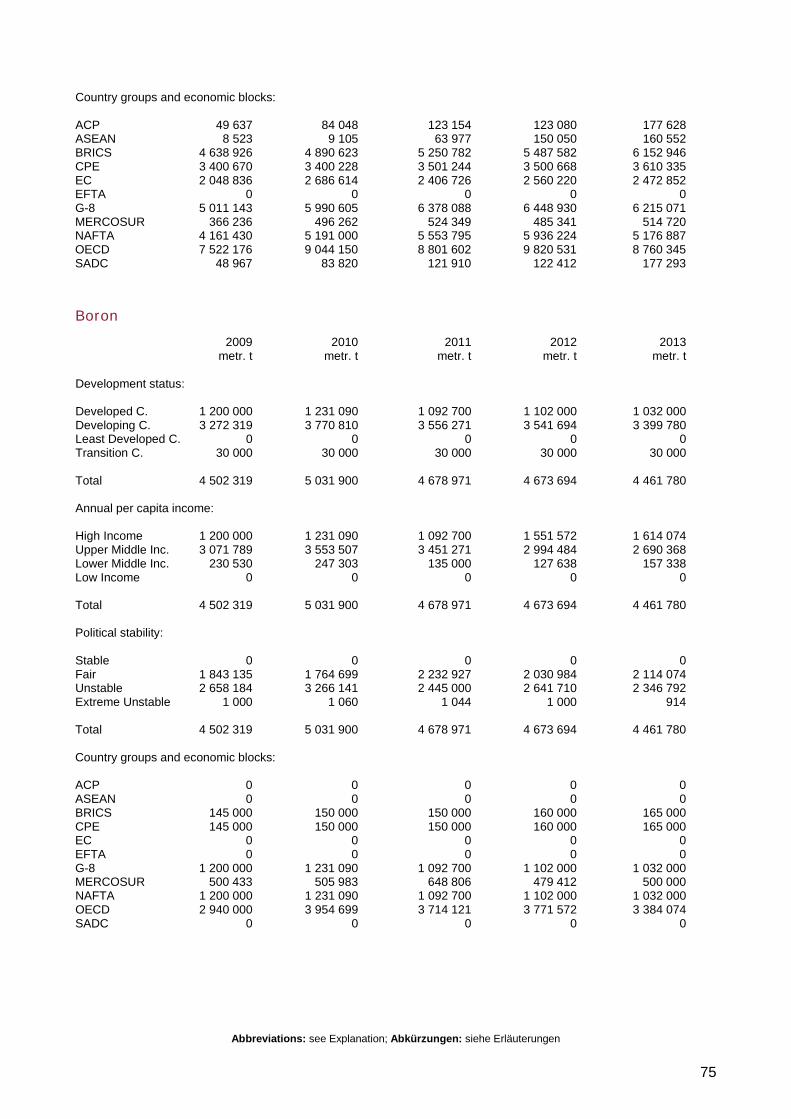
Abbreviations: see Explanation; Abkürzungen: siehe Erläuterungen
75
Country groups and economic blocks: ACP 49 637 84 048 123 154 123 080 177 628 ASEAN 8 523 9 105 63 977 150 050 160 552 BRICS 4 638 926 4 890 623 5 250 782 5 487 582 6 152 946 CPE 3 400 670 3 400 228 3 501 244 3 500 668 3 610 335 EC 2 048 836 2 686 614 2 406 726 2 560 220 2 472 852 EFTA 0 0 0 0 0 G-8 5 011 143 5 990 605 6 378 088 6 448 930 6 215 071 MERCOSUR 366 236 496 262 524 349 485 341 514 720 NAFTA 4 161 430 5 191 000 5 553 795 5 936 224 5 176 887 OECD 7 522 176 9 044 150 8 801 602 9 820 531 8 760 345 SADC 48 967 83 820 121 910 122 412 177 293
Boron
2009 2010 2011 2012 2013 metr. t metr. t metr. t metr. t metr. t Development status: Developed C. 1 200 000 1 231 090 1 092 700 1 102 000 1 032 000 Developing C. 3 272 319 3 770 810 3 556 271 3 541 694 3 399 780 Least Developed C. 0 0 0 0 0 Transition C. 30 000 30 000 30 000 30 000 30 000 Total 4 502 319 5 031 900 4 678 971 4 673 694 4 461 780 Annual per capita income: High Income 1 200 000 1 231 090 1 092 700 1 551 572 1 614 074 Upper Middle Inc. 3 071 789 3 553 507 3 451 271 2 994 484 2 690 368 Lower Middle Inc. 230 530 247 303 135 000 127 638 157 338 Low Income 0 0 0 0 0 Total 4 502 319 5 031 900 4 678 971 4 673 694 4 461 780 Political stability: Stable 0 0 0 0 0 Fair 1 843 135 1 764 699 2 232 927 2 030 984 2 114 074 Unstable 2 658 184 3 266 141 2 445 000 2 641 710 2 346 792 Extreme Unstable 1 000 1 060 1 044 1 000 914 Total 4 502 319 5 031 900 4 678 971 4 673 694 4 461 780 Country groups and economic blocks: ACP 0 0 0 0 0 ASEAN 0 0 0 0 0 BRICS 145 000 150 000 150 000 160 000 165 000 CPE 145 000 150 000 150 000 160 000 165 000 EC 0 0 0 0 0 EFTA 0 0 0 0 0 G-8 1 200 000 1 231 090 1 092 700 1 102 000 1 032 000 MERCOSUR 500 433 505 983 648 806 479 412 500 000 NAFTA 1 200 000 1 231 090 1 092 700 1 102 000 1 032 000 OECD 2 940 000 3 954 699 3 714 121 3 771 572 3 384 074 SADC 0 0 0 0 0
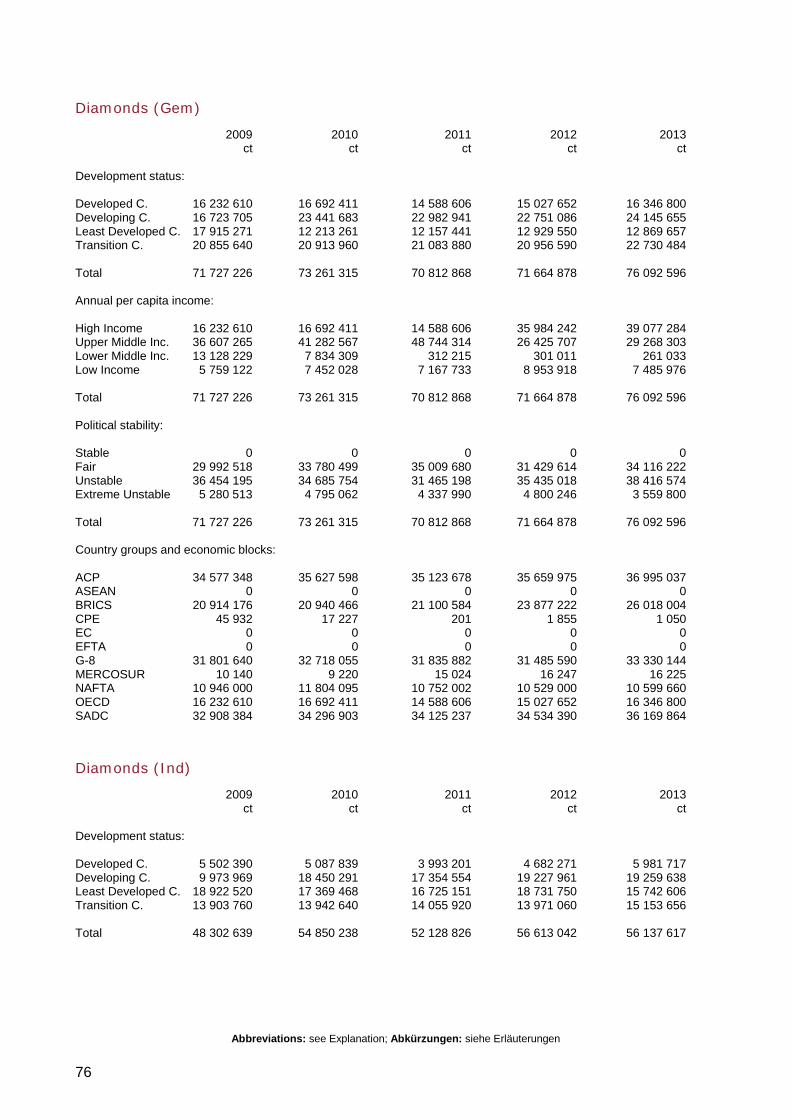
Abbreviations: see Explanation; Abkürzungen: siehe Erläuterungen
76
Diamonds (Gem)
2009 2010 2011 2012 2013 ct ct ct ct ct Development status: Developed C. 16 232 610 16 692 411 14 588 606 15 027 652 16 346 800 Developing C. 16 723 705 23 441 683 22 982 941 22 751 086 24 145 655 Least Developed C. 17 915 271 12 213 261 12 157 441 12 929 550 12 869 657 Transition C. 20 855 640 20 913 960 21 083 880 20 956 590 22 730 484 Total 71 727 226 73 261 315 70 812 868 71 664 878 76 092 596 Annual per capita income: High Income 16 232 610 16 692 411 14 588 606 35 984 242 39 077 284 Upper Middle Inc. 36 607 265 41 282 567 48 744 314 26 425 707 29 268 303 Lower Middle Inc. 13 128 229 7 834 309 312 215 301 011 261 033 Low Income 5 759 122 7 452 028 7 167 733 8 953 918 7 485 976 Total 71 727 226 73 261 315 70 812 868 71 664 878 76 092 596 Political stability: Stable 0 0 0 0 0 Fair 29 992 518 33 780 499 35 009 680 31 429 614 34 116 222 Unstable 36 454 195 34 685 754 31 465 198 35 435 018 38 416 574 Extreme Unstable 5 280 513 4 795 062 4 337 990 4 800 246 3 559 800 Total 71 727 226 73 261 315 70 812 868 71 664 878 76 092 596 Country groups and economic blocks: ACP 34 577 348 35 627 598 35 123 678 35 659 975 36 995 037 ASEAN 0 0 0 0 0 BRICS 20 914 176 20 940 466 21 100 584 23 877 222 26 018 004 CPE 45 932 17 227 201 1 855 1 050 EC 0 0 0 0 0 EFTA 0 0 0 0 0 G-8 31 801 640 32 718 055 31 835 882 31 485 590 33 330 144 MERCOSUR 10 140 9 220 15 024 16 247 16 225 NAFTA 10 946 000 11 804 095 10 752 002 10 529 000 10 599 660 OECD 16 232 610 16 692 411 14 588 606 15 027 652 16 346 800 SADC 32 908 384 34 296 903 34 125 237 34 534 390 36 169 864
Diamonds (Ind)
2009 2010 2011 2012 2013 ct ct ct ct ct Development status: Developed C. 5 502 390 5 087 839 3 993 201 4 682 271 5 981 717 Developing C. 9 973 969 18 450 291 17 354 554 19 227 961 19 259 638 Least Developed C. 18 922 520 17 369 468 16 725 151 18 731 750 15 742 606 Transition C. 13 903 760 13 942 640 14 055 920 13 971 060 15 153 656 Total 48 302 639 54 850 238 52 128 826 56 613 042 56 137 617
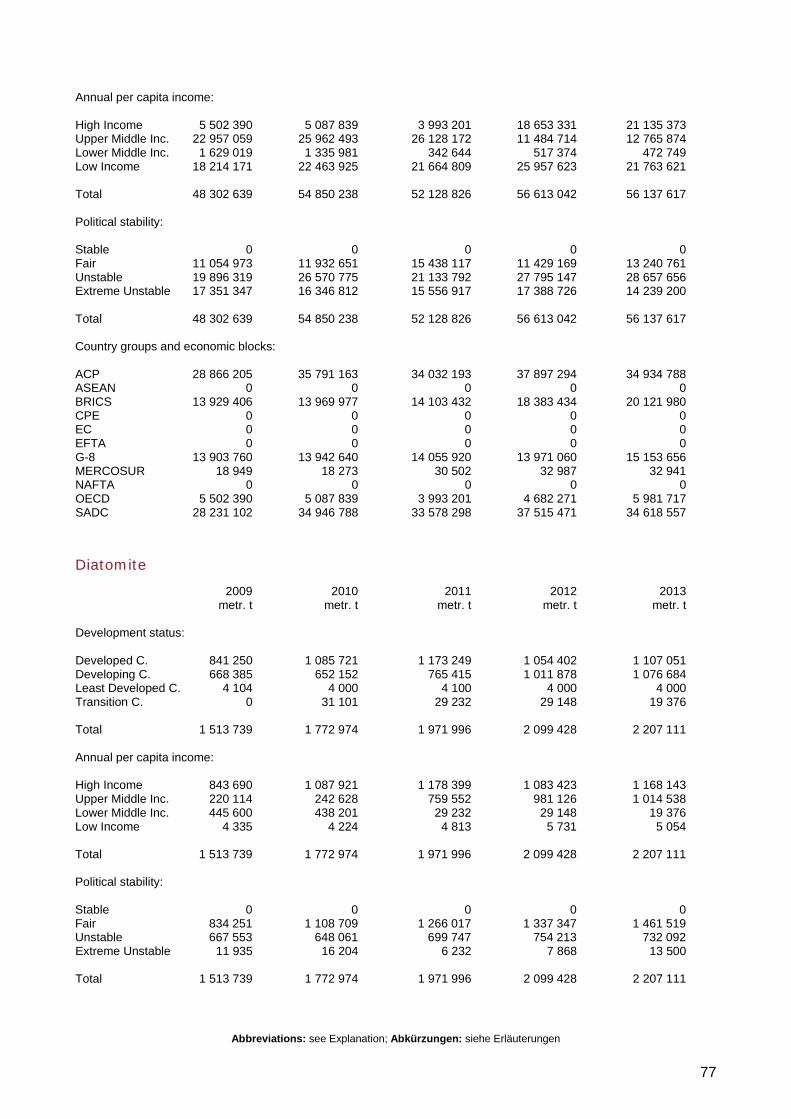
Abbreviations: see Explanation; Abkürzungen: siehe Erläuterungen
77
Annual per capita income: High Income 5 502 390 5 087 839 3 993 201 18 653 331 21 135 373 Upper Middle Inc. 22 957 059 25 962 493 26 128 172 11 484 714 12 765 874 Lower Middle Inc. 1 629 019 1 335 981 342 644 517 374 472 749 Low Income 18 214 171 22 463 925 21 664 809 25 957 623 21 763 621 Total 48 302 639 54 850 238 52 128 826 56 613 042 56 137 617 Political stability: Stable 0 0 0 0 0 Fair 11 054 973 11 932 651 15 438 117 11 429 169 13 240 761 Unstable 19 896 319 26 570 775 21 133 792 27 795 147 28 657 656 Extreme Unstable 17 351 347 16 346 812 15 556 917 17 388 726 14 239 200 Total 48 302 639 54 850 238 52 128 826 56 613 042 56 137 617 Country groups and economic blocks: ACP 28 866 205 35 791 163 34 032 193 37 897 294 34 934 788 ASEAN 0 0 0 0 0 BRICS 13 929 406 13 969 977 14 103 432 18 383 434 20 121 980 CPE 0 0 0 0 0 EC 0 0 0 0 0 EFTA 0 0 0 0 0 G-8 13 903 760 13 942 640 14 055 920 13 971 060 15 153 656 MERCOSUR 18 949 18 273 30 502 32 987 32 941 NAFTA 0 0 0 0 0 OECD 5 502 390 5 087 839 3 993 201 4 682 271 5 981 717 SADC 28 231 102 34 946 788 33 578 298 37 515 471 34 618 557
Diatomite
2009 2010 2011 2012 2013 metr. t metr. t metr. t metr. t metr. t Development status: Developed C. 841 250 1 085 721 1 173 249 1 054 402 1 107 051 Developing C. 668 385 652 152 765 415 1 011 878 1 076 684 Least Developed C. 4 104 4 000 4 100 4 000 4 000 Transition C. 0 31 101 29 232 29 148 19 376 Total 1 513 739 1 772 974 1 971 996 2 099 428 2 207 111 Annual per capita income: High Income 843 690 1 087 921 1 178 399 1 083 423 1 168 143 Upper Middle Inc. 220 114 242 628 759 552 981 126 1 014 538 Lower Middle Inc. 445 600 438 201 29 232 29 148 19 376 Low Income 4 335 4 224 4 813 5 731 5 054 Total 1 513 739 1 772 974 1 971 996 2 099 428 2 207 111 Political stability: Stable 0 0 0 0 0 Fair 834 251 1 108 709 1 266 017 1 337 347 1 461 519 Unstable 667 553 648 061 699 747 754 213 732 092 Extreme Unstable 11 935 16 204 6 232 7 868 13 500 Total 1 513 739 1 772 974 1 971 996 2 099 428 2 207 111
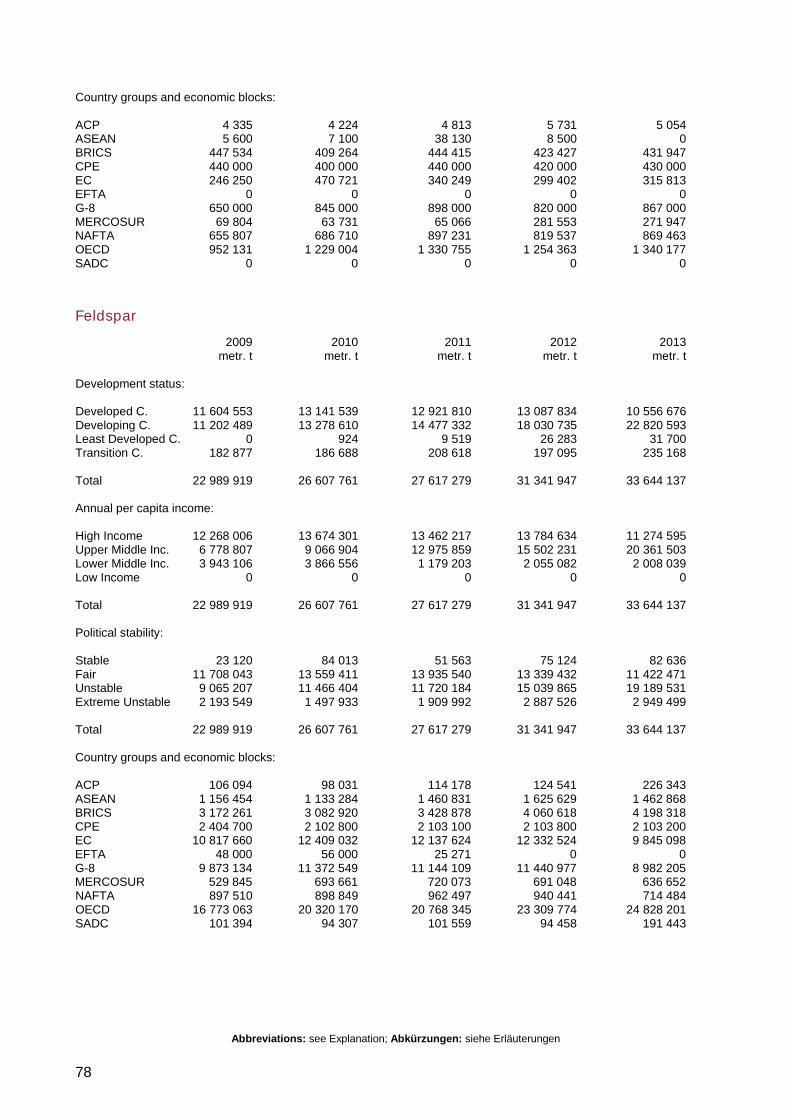
Abbreviations: see Explanation; Abkürzungen: siehe Erläuterungen
78
Country groups and economic blocks: ACP 4 335 4 224 4 813 5 731 5 054 ASEAN 5 600 7 100 38 130 8 500 0 BRICS 447 534 409 264 444 415 423 427 431 947 CPE 440 000 400 000 440 000 420 000 430 000 EC 246 250 470 721 340 249 299 402 315 813 EFTA 0 0 0 0 0 G-8 650 000 845 000 898 000 820 000 867 000 MERCOSUR 69 804 63 731 65 066 281 553 271 947 NAFTA 655 807 686 710 897 231 819 537 869 463 OECD 952 131 1 229 004 1 330 755 1 254 363 1 340 177 SADC 0 0 0 0 0
Feldspar
2009 2010 2011 2012 2013 metr. t metr. t metr. t metr. t metr. t Development status: Developed C. 11 604 553 13 141 539 12 921 810 13 087 834 10 556 676 Developing C. 11 202 489 13 278 610 14 477 332 18 030 735 22 820 593 Least Developed C. 0 924 9 519 26 283 31 700 Transition C. 182 877 186 688 208 618 197 095 235 168 Total 22 989 919 26 607 761 27 617 279 31 341 947 33 644 137 Annual per capita income: High Income 12 268 006 13 674 301 13 462 217 13 784 634 11 274 595 Upper Middle Inc. 6 778 807 9 066 904 12 975 859 15 502 231 20 361 503 Lower Middle Inc. 3 943 106 3 866 556 1 179 203 2 055 082 2 008 039 Low Income 0 0 0 0 0 Total 22 989 919 26 607 761 27 617 279 31 341 947 33 644 137 Political stability: Stable 23 120 84 013 51 563 75 124 82 636 Fair 11 708 043 13 559 411 13 935 540 13 339 432 11 422 471 Unstable 9 065 207 11 466 404 11 720 184 15 039 865 19 189 531 Extreme Unstable 2 193 549 1 497 933 1 909 992 2 887 526 2 949 499 Total 22 989 919 26 607 761 27 617 279 31 341 947 33 644 137 Country groups and economic blocks: ACP 106 094 98 031 114 178 124 541 226 343 ASEAN 1 156 454 1 133 284 1 460 831 1 625 629 1 462 868 BRICS 3 172 261 3 082 920 3 428 878 4 060 618 4 198 318 CPE 2 404 700 2 102 800 2 103 100 2 103 800 2 103 200 EC 10 817 660 12 409 032 12 137 624 12 332 524 9 845 098 EFTA 48 000 56 000 25 271 0 0 G-8 9 873 134 11 372 549 11 144 109 11 440 977 8 982 205 MERCOSUR 529 845 693 661 720 073 691 048 636 652 NAFTA 897 510 898 849 962 497 940 441 714 484 OECD 16 773 063 20 320 170 20 768 345 23 309 774 24 828 201 SADC 101 394 94 307 101 559 94 458 191 443
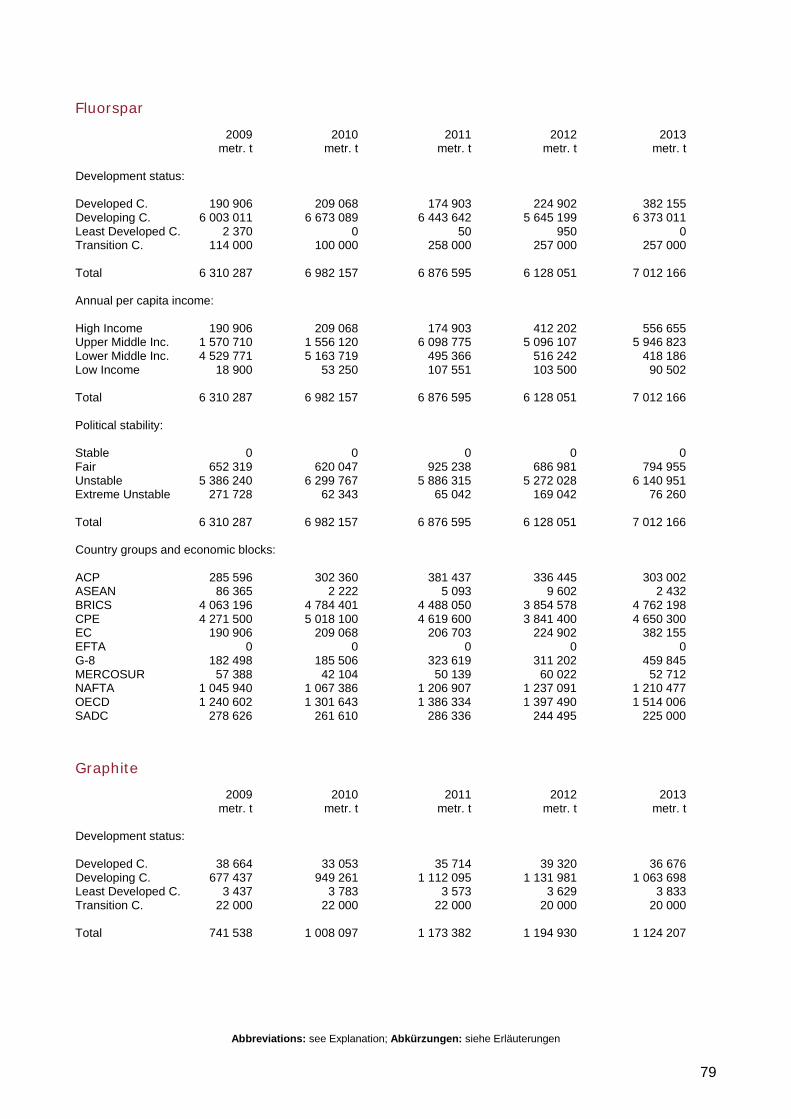
Abbreviations: see Explanation; Abkürzungen: siehe Erläuterungen
79
Fluorspar
2009 2010 2011 2012 2013 metr. t metr. t metr. t metr. t metr. t Development status: Developed C. 190 906 209 068 174 903 224 902 382 155 Developing C. 6 003 011 6 673 089 6 443 642 5 645 199 6 373 011 Least Developed C. 2 370 0 50 950 0 Transition C. 114 000 100 000 258 000 257 000 257 000 Total 6 310 287 6 982 157 6 876 595 6 128 051 7 012 166 Annual per capita income: High Income 190 906 209 068 174 903 412 202 556 655 Upper Middle Inc. 1 570 710 1 556 120 6 098 775 5 096 107 5 946 823 Lower Middle Inc. 4 529 771 5 163 719 495 366 516 242 418 186 Low Income 18 900 53 250 107 551 103 500 90 502 Total 6 310 287 6 982 157 6 876 595 6 128 051 7 012 166 Political stability: Stable 0 0 0 0 0 Fair 652 319 620 047 925 238 686 981 794 955 Unstable 5 386 240 6 299 767 5 886 315 5 272 028 6 140 951 Extreme Unstable 271 728 62 343 65 042 169 042 76 260 Total 6 310 287 6 982 157 6 876 595 6 128 051 7 012 166 Country groups and economic blocks: ACP 285 596 302 360 381 437 336 445 303 002 ASEAN 86 365 2 222 5 093 9 602 2 432 BRICS 4 063 196 4 784 401 4 488 050 3 854 578 4 762 198 CPE 4 271 500 5 018 100 4 619 600 3 841 400 4 650 300 EC 190 906 209 068 206 703 224 902 382 155 EFTA 0 0 0 0 0 G-8 182 498 185 506 323 619 311 202 459 845 MERCOSUR 57 388 42 104 50 139 60 022 52 712 NAFTA 1 045 940 1 067 386 1 206 907 1 237 091 1 210 477 OECD 1 240 602 1 301 643 1 386 334 1 397 490 1 514 006 SADC 278 626 261 610 286 336 244 495 225 000
Graphite
2009 2010 2011 2012 2013 metr. t metr. t metr. t metr. t metr. t Development status: Developed C. 38 664 33 053 35 714 39 320 36 676 Developing C. 677 437 949 261 1 112 095 1 131 981 1 063 698 Least Developed C. 3 437 3 783 3 573 3 629 3 833 Transition C. 22 000 22 000 22 000 20 000 20 000 Total 741 538 1 008 097 1 173 382 1 194 930 1 124 207
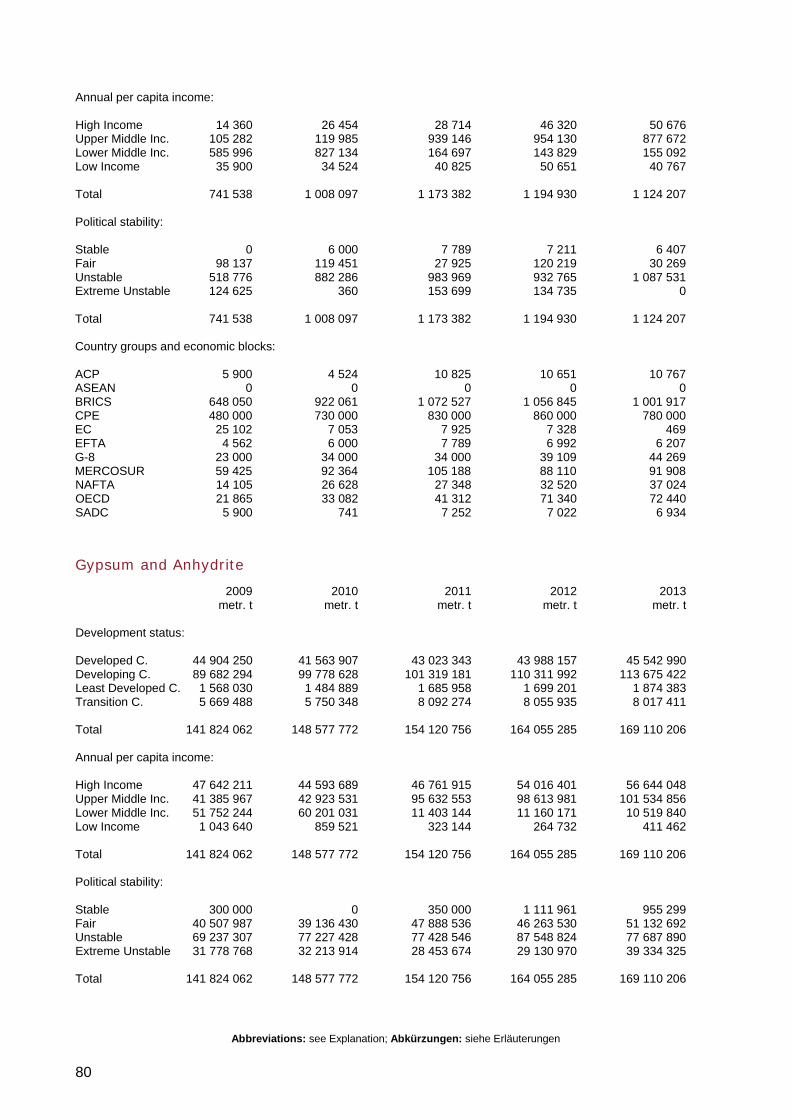
Abbreviations: see Explanation; Abkürzungen: siehe Erläuterungen
80
Annual per capita income: High Income 14 360 26 454 28 714 46 320 50 676 Upper Middle Inc. 105 282 119 985 939 146 954 130 877 672 Lower Middle Inc. 585 996 827 134 164 697 143 829 155 092 Low Income 35 900 34 524 40 825 50 651 40 767 Total 741 538 1 008 097 1 173 382 1 194 930 1 124 207 Political stability: Stable 0 6 000 7 789 7 211 6 407 Fair 98 137 119 451 27 925 120 219 30 269 Unstable 518 776 882 286 983 969 932 765 1 087 531 Extreme Unstable 124 625 360 153 699 134 735 0 Total 741 538 1 008 097 1 173 382 1 194 930 1 124 207 Country groups and economic blocks: ACP 5 900 4 524 10 825 10 651 10 767 ASEAN 0 0 0 0 0 BRICS 648 050 922 061 1 072 527 1 056 845 1 001 917 CPE 480 000 730 000 830 000 860 000 780 000 EC 25 102 7 053 7 925 7 328 469 EFTA 4 562 6 000 7 789 6 992 6 207 G-8 23 000 34 000 34 000 39 109 44 269 MERCOSUR 59 425 92 364 105 188 88 110 91 908 NAFTA 14 105 26 628 27 348 32 520 37 024 OECD 21 865 33 082 41 312 71 340 72 440 SADC 5 900 741 7 252 7 022 6 934
Gypsum and Anhydrite
2009 2010 2011 2012 2013 metr. t metr. t metr. t metr. t metr. t Development status: Developed C. 44 904 250 41 563 907 43 023 343 43 988 157 45 542 990 Developing C. 89 682 294 99 778 628 101 319 181 110 311 992 113 675 422 Least Developed C. 1 568 030 1 484 889 1 685 958 1 699 201 1 874 383 Transition C. 5 669 488 5 750 348 8 092 274 8 055 935 8 017 411 Total 141 824 062 148 577 772 154 120 756 164 055 285 169 110 206 Annual per capita income: High Income 47 642 211 44 593 689 46 761 915 54 016 401 56 644 048 Upper Middle Inc. 41 385 967 42 923 531 95 632 553 98 613 981 101 534 856 Lower Middle Inc. 51 752 244 60 201 031 11 403 144 11 160 171 10 519 840 Low Income 1 043 640 859 521 323 144 264 732 411 462 Total 141 824 062 148 577 772 154 120 756 164 055 285 169 110 206 Political stability: Stable 300 000 0 350 000 1 111 961 955 299 Fair 40 507 987 39 136 430 47 888 536 46 263 530 51 132 692 Unstable 69 237 307 77 227 428 77 428 546 87 548 824 77 687 890 Extreme Unstable 31 778 768 32 213 914 28 453 674 29 130 970 39 334 325 Total 141 824 062 148 577 772 154 120 756 164 055 285 169 110 206
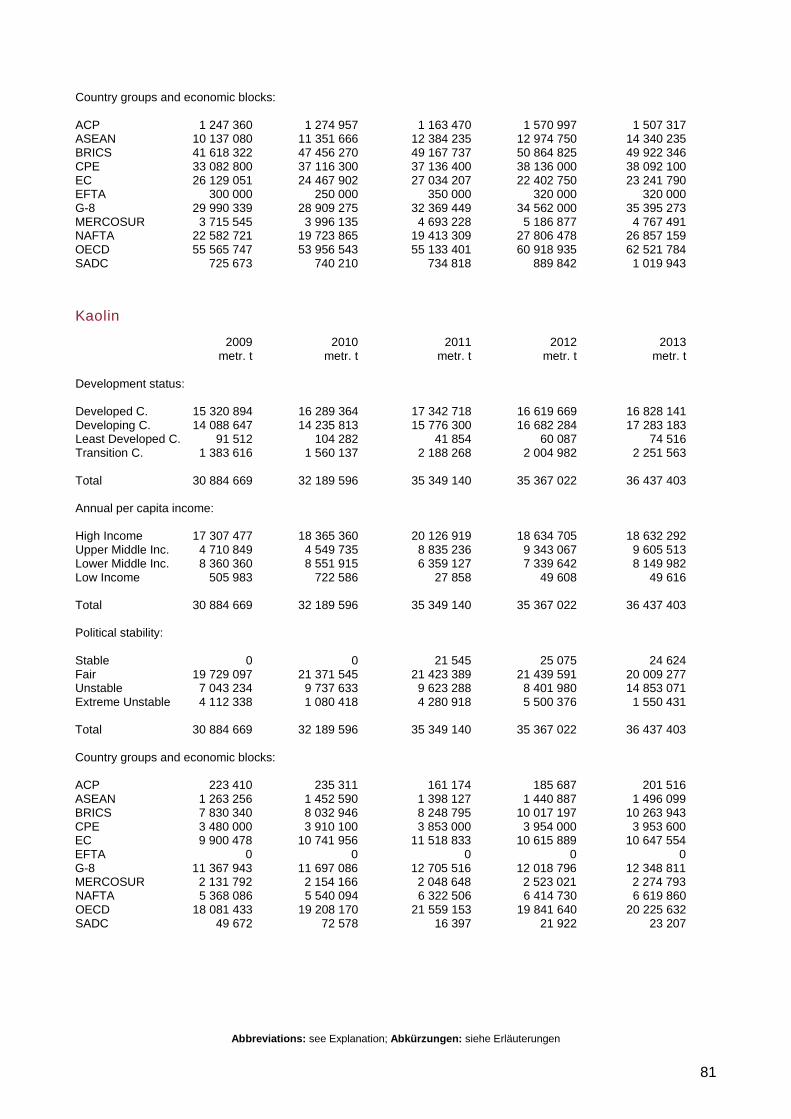
Abbreviations: see Explanation; Abkürzungen: siehe Erläuterungen
81
Country groups and economic blocks: ACP 1 247 360 1 274 957 1 163 470 1 570 997 1 507 317 ASEAN 10 137 080 11 351 666 12 384 235 12 974 750 14 340 235 BRICS 41 618 322 47 456 270 49 167 737 50 864 825 49 922 346 CPE 33 082 800 37 116 300 37 136 400 38 136 000 38 092 100 EC 26 129 051 24 467 902 27 034 207 22 402 750 23 241 790 EFTA 300 000 250 000 350 000 320 000 320 000 G-8 29 990 339 28 909 275 32 369 449 34 562 000 35 395 273 MERCOSUR 3 715 545 3 996 135 4 693 228 5 186 877 4 767 491 NAFTA 22 582 721 19 723 865 19 413 309 27 806 478 26 857 159 OECD 55 565 747 53 956 543 55 133 401 60 918 935 62 521 784 SADC 725 673 740 210 734 818 889 842 1 019 943
Kaolin
2009 2010 2011 2012 2013 metr. t metr. t metr. t metr. t metr. t Development status: Developed C. 15 320 894 16 289 364 17 342 718 16 619 669 16 828 141 Developing C. 14 088 647 14 235 813 15 776 300 16 682 284 17 283 183 Least Developed C. 91 512 104 282 41 854 60 087 74 516 Transition C. 1 383 616 1 560 137 2 188 268 2 004 982 2 251 563 Total 30 884 669 32 189 596 35 349 140 35 367 022 36 437 403 Annual per capita income: High Income 17 307 477 18 365 360 20 126 919 18 634 705 18 632 292 Upper Middle Inc. 4 710 849 4 549 735 8 835 236 9 343 067 9 605 513 Lower Middle Inc. 8 360 360 8 551 915 6 359 127 7 339 642 8 149 982 Low Income 505 983 722 586 27 858 49 608 49 616 Total 30 884 669 32 189 596 35 349 140 35 367 022 36 437 403 Political stability: Stable 0 0 21 545 25 075 24 624 Fair 19 729 097 21 371 545 21 423 389 21 439 591 20 009 277 Unstable 7 043 234 9 737 633 9 623 288 8 401 980 14 853 071 Extreme Unstable 4 112 338 1 080 418 4 280 918 5 500 376 1 550 431 Total 30 884 669 32 189 596 35 349 140 35 367 022 36 437 403 Country groups and economic blocks: ACP 223 410 235 311 161 174 185 687 201 516 ASEAN 1 263 256 1 452 590 1 398 127 1 440 887 1 496 099 BRICS 7 830 340 8 032 946 8 248 795 10 017 197 10 263 943 CPE 3 480 000 3 910 100 3 853 000 3 954 000 3 953 600 EC 9 900 478 10 741 956 11 518 833 10 615 889 10 647 554 EFTA 0 0 0 0 0 G-8 11 367 943 11 697 086 12 705 516 12 018 796 12 348 811 MERCOSUR 2 131 792 2 154 166 2 048 648 2 523 021 2 274 793 NAFTA 5 368 086 5 540 094 6 322 506 6 414 730 6 619 860 OECD 18 081 433 19 208 170 21 559 153 19 841 640 20 225 632 SADC 49 672 72 578 16 397 21 922 23 207

Abbreviations: see Explanation; Abkürzungen: siehe Erläuterungen
82
Magnesite
2009 2010 2011 2012 2013 metr. t metr. t metr. t metr. t metr. t Development status: Developed C. 2 488 261 3 444 009 4 053 375 3 610 201 3 402 184 Developing C. 14 935 060 17 422 023 19 813 041 19 689 525 20 874 148 Least Developed C. 0 0 0 0 0 Transition C. 1 011 000 1 220 900 1 320 900 1 420 900 1 424 000 Total 18 434 321 22 086 932 25 187 316 24 720 626 25 700 332 Annual per capita income: High Income 2 488 261 3 469 002 4 212 375 5 049 201 4 831 689 Upper Middle Inc. 2 470 783 4 222 823 20 590 665 19 259 634 20 463 637 Lower Middle Inc. 13 324 828 14 245 107 234 107 261 791 225 006 Low Income 150 449 150 000 150 169 150 000 180 000 Total 18 434 321 22 086 932 25 187 316 24 720 626 25 700 332 Political stability: Stable 0 0 0 778 810 714 422 Fair 2 257 625 2 951 445 3 543 549 2 309 452 2 327 762 Unstable 15 728 040 18 952 612 21 237 274 21 232 505 22 480 702 Extreme Unstable 448 656 182 875 406 493 399 859 177 446 Total 18 434 321 22 086 932 25 187 316 24 720 626 25 700 332 Country groups and economic blocks: ACP 48 068 27 748 32 156 12 878 13 000 ASEAN 3 872 4 186 4 784 4 800 6 000 BRICS 14 710 979 15 919 644 18 000 909 18 116 497 19 165 536 CPE 13 150 000 14 150 000 16 150 000 16 150 000 17 180 000 EC 2 003 261 3 018 009 3 259 050 2 872 513 2 748 449 EFTA 0 0 0 0 0 G-8 1 140 000 1 350 000 1 450 000 1 550 000 1 550 000 MERCOSUR 409 909 483 882 476 805 479 304 557 431 NAFTA 140 000 150 000 150 000 250 724 251 000 OECD 3 349 441 5 760 772 6 641 651 6 186 753 6 100 649 SADC 48 068 27 748 32 156 12 878 13 000
Perlite
2009 2010 2011 2012 2013 metr. t metr. t metr. t metr. t metr. t Development status: Developed C. 1 536 832 1 540 577 1 658 340 1 667 934 1 557 324 Developing C. 661 749 643 969 814 990 1 021 653 1 210 343 Least Developed C. 0 0 0 0 0 Transition C. 129 142 119 200 119 627 45 000 107 629 Total 2 327 723 2 303 746 2 592 957 2 734 587 2 875 296
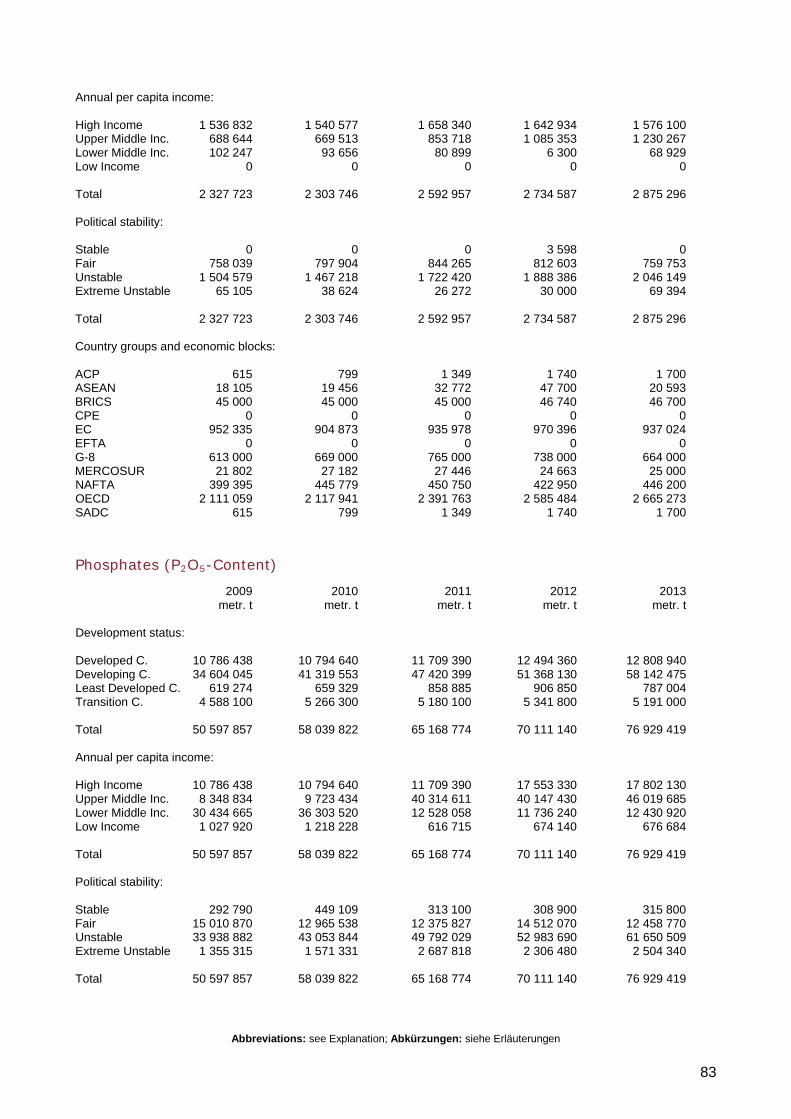
Abbreviations: see Explanation; Abkürzungen: siehe Erläuterungen
83
Annual per capita income: High Income 1 536 832 1 540 577 1 658 340 1 642 934 1 576 100 Upper Middle Inc. 688 644 669 513 853 718 1 085 353 1 230 267 Lower Middle Inc. 102 247 93 656 80 899 6 300 68 929 Low Income 0 0 0 0 0 Total 2 327 723 2 303 746 2 592 957 2 734 587 2 875 296 Political stability: Stable 0 0 0 3 598 0 Fair 758 039 797 904 844 265 812 603 759 753 Unstable 1 504 579 1 467 218 1 722 420 1 888 386 2 046 149 Extreme Unstable 65 105 38 624 26 272 30 000 69 394 Total 2 327 723 2 303 746 2 592 957 2 734 587 2 875 296 Country groups and economic blocks: ACP 615 799 1 349 1 740 1 700 ASEAN 18 105 19 456 32 772 47 700 20 593 BRICS 45 000 45 000 45 000 46 740 46 700 CPE 0 0 0 0 0 EC 952 335 904 873 935 978 970 396 937 024 EFTA 0 0 0 0 0 G-8 613 000 669 000 765 000 738 000 664 000 MERCOSUR 21 802 27 182 27 446 24 663 25 000 NAFTA 399 395 445 779 450 750 422 950 446 200 OECD 2 111 059 2 117 941 2 391 763 2 585 484 2 665 273 SADC 615 799 1 349 1 740 1 700
Phosphates (P2O5-Content)
2009 2010 2011 2012 2013 metr. t metr. t metr. t metr. t metr. t Development status: Developed C. 10 786 438 10 794 640 11 709 390 12 494 360 12 808 940 Developing C. 34 604 045 41 319 553 47 420 399 51 368 130 58 142 475 Least Developed C. 619 274 659 329 858 885 906 850 787 004 Transition C. 4 588 100 5 266 300 5 180 100 5 341 800 5 191 000 Total 50 597 857 58 039 822 65 168 774 70 111 140 76 929 419 Annual per capita income: High Income 10 786 438 10 794 640 11 709 390 17 553 330 17 802 130 Upper Middle Inc. 8 348 834 9 723 434 40 314 611 40 147 430 46 019 685 Lower Middle Inc. 30 434 665 36 303 520 12 528 058 11 736 240 12 430 920 Low Income 1 027 920 1 218 228 616 715 674 140 676 684 Total 50 597 857 58 039 822 65 168 774 70 111 140 76 929 419 Political stability: Stable 292 790 449 109 313 100 308 900 315 800 Fair 15 010 870 12 965 538 12 375 827 14 512 070 12 458 770 Unstable 33 938 882 43 053 844 49 792 029 52 983 690 61 650 509 Extreme Unstable 1 355 315 1 571 331 2 687 818 2 306 480 2 504 340 Total 50 597 857 58 039 822 65 168 774 70 111 140 76 929 419
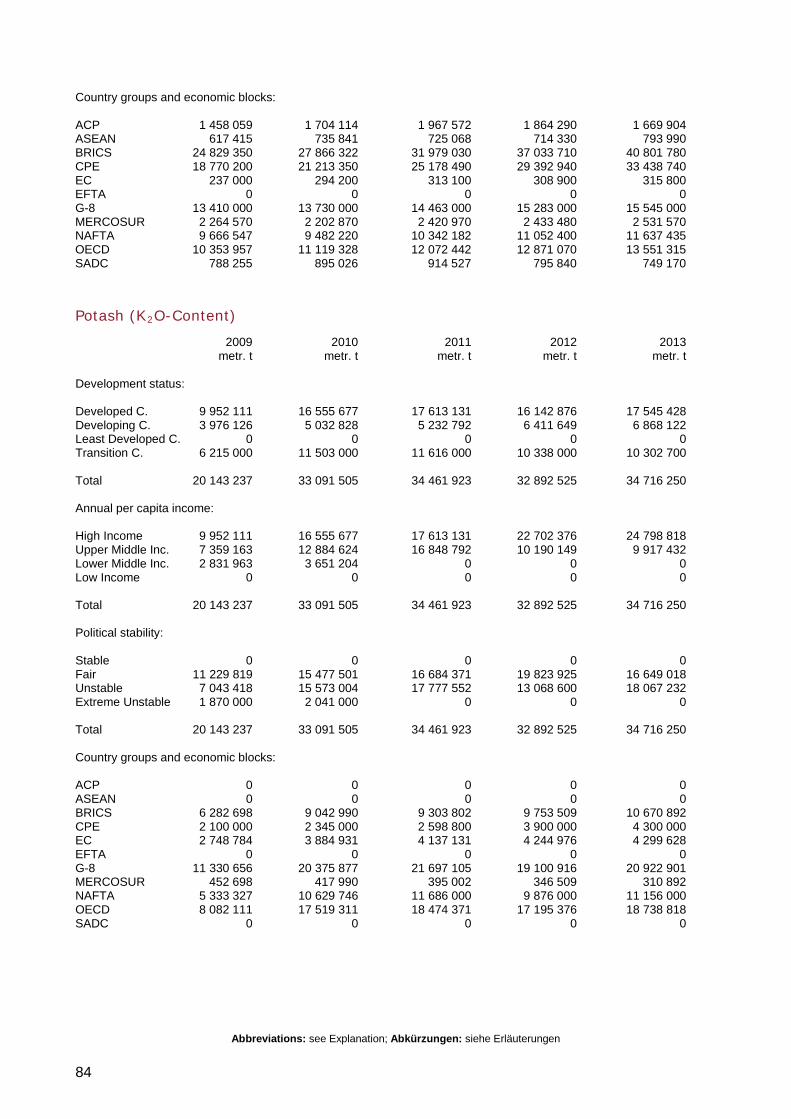
Abbreviations: see Explanation; Abkürzungen: siehe Erläuterungen
84
Country groups and economic blocks: ACP 1 458 059 1 704 114 1 967 572 1 864 290 1 669 904 ASEAN 617 415 735 841 725 068 714 330 793 990 BRICS 24 829 350 27 866 322 31 979 030 37 033 710 40 801 780 CPE 18 770 200 21 213 350 25 178 490 29 392 940 33 438 740 EC 237 000 294 200 313 100 308 900 315 800 EFTA 0 0 0 0 0 G-8 13 410 000 13 730 000 14 463 000 15 283 000 15 545 000 MERCOSUR 2 264 570 2 202 870 2 420 970 2 433 480 2 531 570 NAFTA 9 666 547 9 482 220 10 342 182 11 052 400 11 637 435 OECD 10 353 957 11 119 328 12 072 442 12 871 070 13 551 315 SADC 788 255 895 026 914 527 795 840 749 170
Potash (K2O-Content)
2009 2010 2011 2012 2013 metr. t metr. t metr. t metr. t metr. t Development status: Developed C. 9 952 111 16 555 677 17 613 131 16 142 876 17 545 428 Developing C. 3 976 126 5 032 828 5 232 792 6 411 649 6 868 122 Least Developed C. 0 0 0 0 0 Transition C. 6 215 000 11 503 000 11 616 000 10 338 000 10 302 700 Total 20 143 237 33 091 505 34 461 923 32 892 525 34 716 250 Annual per capita income: High Income 9 952 111 16 555 677 17 613 131 22 702 376 24 798 818 Upper Middle Inc. 7 359 163 12 884 624 16 848 792 10 190 149 9 917 432 Lower Middle Inc. 2 831 963 3 651 204 0 0 0 Low Income 0 0 0 0 0 Total 20 143 237 33 091 505 34 461 923 32 892 525 34 716 250 Political stability: Stable 0 0 0 0 0 Fair 11 229 819 15 477 501 16 684 371 19 823 925 16 649 018 Unstable 7 043 418 15 573 004 17 777 552 13 068 600 18 067 232 Extreme Unstable 1 870 000 2 041 000 0 0 0 Total 20 143 237 33 091 505 34 461 923 32 892 525 34 716 250 Country groups and economic blocks: ACP 0 0 0 0 0 ASEAN 0 0 0 0 0 BRICS 6 282 698 9 042 990 9 303 802 9 753 509 10 670 892 CPE 2 100 000 2 345 000 2 598 800 3 900 000 4 300 000 EC 2 748 784 3 884 931 4 137 131 4 244 976 4 299 628 EFTA 0 0 0 0 0 G-8 11 330 656 20 375 877 21 697 105 19 100 916 20 922 901 MERCOSUR 452 698 417 990 395 002 346 509 310 892 NAFTA 5 333 327 10 629 746 11 686 000 9 876 000 11 156 000 OECD 8 082 111 17 519 311 18 474 371 17 195 376 18 738 818 SADC 0 0 0 0 0
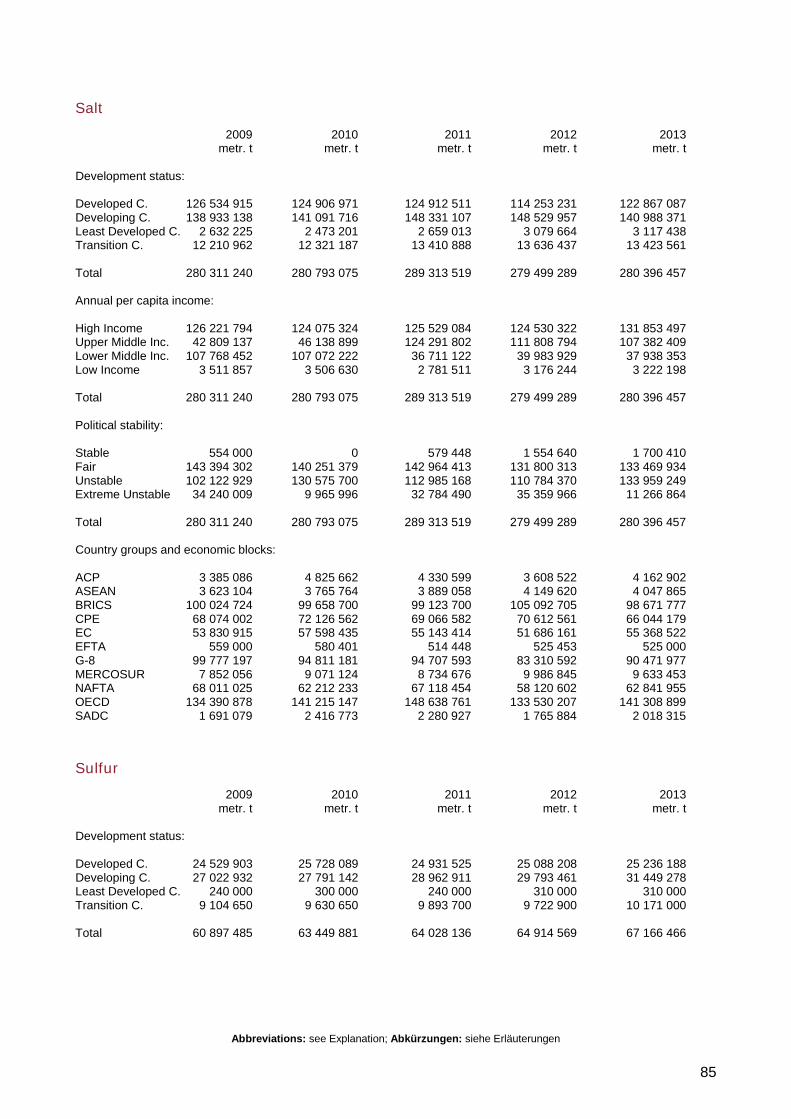
Abbreviations: see Explanation; Abkürzungen: siehe Erläuterungen
85
Salt
2009 2010 2011 2012 2013 metr. t metr. t metr. t metr. t metr. t Development status: Developed C. 126 534 915 124 906 971 124 912 511 114 253 231 122 867 087 Developing C. 138 933 138 141 091 716 148 331 107 148 529 957 140 988 371 Least Developed C. 2 632 225 2 473 201 2 659 013 3 079 664 3 117 438 Transition C. 12 210 962 12 321 187 13 410 888 13 636 437 13 423 561 Total 280 311 240 280 793 075 289 313 519 279 499 289 280 396 457 Annual per capita income: High Income 126 221 794 124 075 324 125 529 084 124 530 322 131 853 497 Upper Middle Inc. 42 809 137 46 138 899 124 291 802 111 808 794 107 382 409 Lower Middle Inc. 107 768 452 107 072 222 36 711 122 39 983 929 37 938 353 Low Income 3 511 857 3 506 630 2 781 511 3 176 244 3 222 198 Total 280 311 240 280 793 075 289 313 519 279 499 289 280 396 457 Political stability: Stable 554 000 0 579 448 1 554 640 1 700 410 Fair 143 394 302 140 251 379 142 964 413 131 800 313 133 469 934 Unstable 102 122 929 130 575 700 112 985 168 110 784 370 133 959 249 Extreme Unstable 34 240 009 9 965 996 32 784 490 35 359 966 11 266 864 Total 280 311 240 280 793 075 289 313 519 279 499 289 280 396 457 Country groups and economic blocks: ACP 3 385 086 4 825 662 4 330 599 3 608 522 4 162 902 ASEAN 3 623 104 3 765 764 3 889 058 4 149 620 4 047 865 BRICS 100 024 724 99 658 700 99 123 700 105 092 705 98 671 777 CPE 68 074 002 72 126 562 69 066 582 70 612 561 66 044 179 EC 53 830 915 57 598 435 55 143 414 51 686 161 55 368 522 EFTA 559 000 580 401 514 448 525 453 525 000 G-8 99 777 197 94 811 181 94 707 593 83 310 592 90 471 977 MERCOSUR 7 852 056 9 071 124 8 734 676 9 986 845 9 633 453 NAFTA 68 011 025 62 212 233 67 118 454 58 120 602 62 841 955 OECD 134 390 878 141 215 147 148 638 761 133 530 207 141 308 899 SADC 1 691 079 2 416 773 2 280 927 1 765 884 2 018 315
Sulfur
2009 2010 2011 2012 2013 metr. t metr. t metr. t metr. t metr. t Development status: Developed C. 24 529 903 25 728 089 24 931 525 25 088 208 25 236 188 Developing C. 27 022 932 27 791 142 28 962 911 29 793 461 31 449 278 Least Developed C. 240 000 300 000 240 000 310 000 310 000 Transition C. 9 104 650 9 630 650 9 893 700 9 722 900 10 171 000 Total 60 897 485 63 449 881 64 028 136 64 914 569 67 166 466
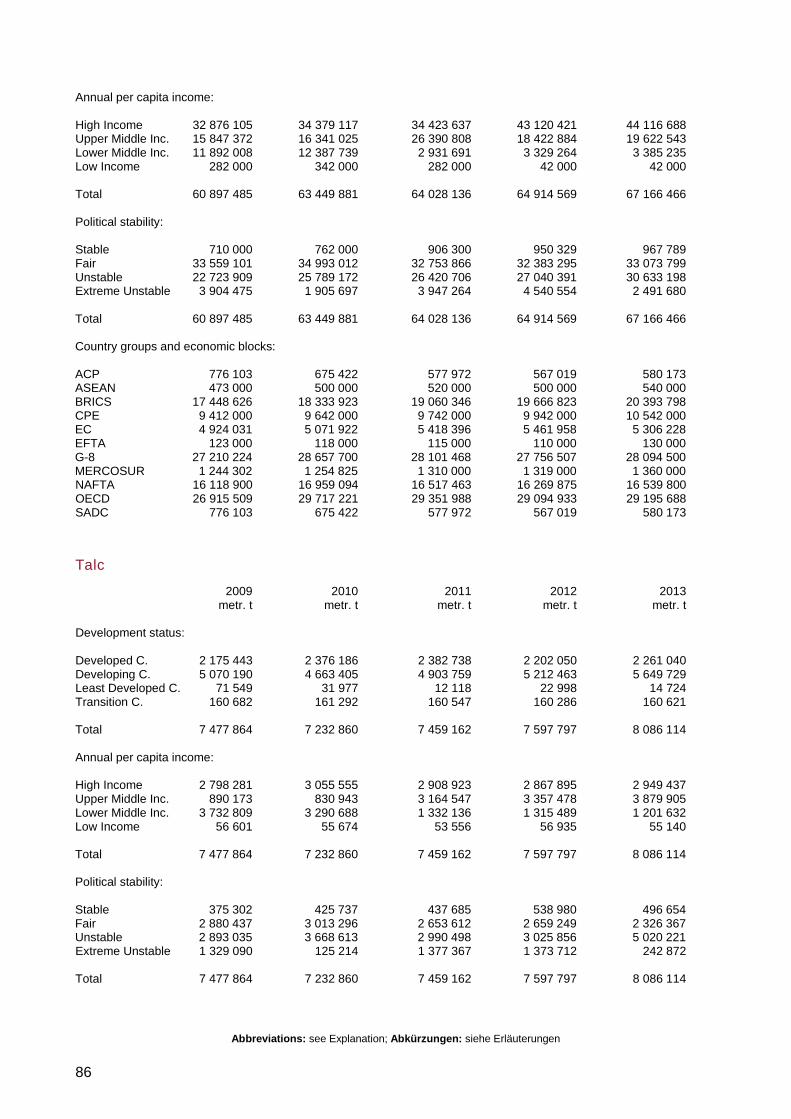
Abbreviations: see Explanation; Abkürzungen: siehe Erläuterungen
86
Annual per capita income: High Income 32 876 105 34 379 117 34 423 637 43 120 421 44 116 688 Upper Middle Inc. 15 847 372 16 341 025 26 390 808 18 422 884 19 622 543 Lower Middle Inc. 11 892 008 12 387 739 2 931 691 3 329 264 3 385 235 Low Income 282 000 342 000 282 000 42 000 42 000 Total 60 897 485 63 449 881 64 028 136 64 914 569 67 166 466 Political stability: Stable 710 000 762 000 906 300 950 329 967 789 Fair 33 559 101 34 993 012 32 753 866 32 383 295 33 073 799 Unstable 22 723 909 25 789 172 26 420 706 27 040 391 30 633 198 Extreme Unstable 3 904 475 1 905 697 3 947 264 4 540 554 2 491 680 Total 60 897 485 63 449 881 64 028 136 64 914 569 67 166 466 Country groups and economic blocks: ACP 776 103 675 422 577 972 567 019 580 173 ASEAN 473 000 500 000 520 000 500 000 540 000 BRICS 17 448 626 18 333 923 19 060 346 19 666 823 20 393 798 CPE 9 412 000 9 642 000 9 742 000 9 942 000 10 542 000 EC 4 924 031 5 071 922 5 418 396 5 461 958 5 306 228 EFTA 123 000 118 000 115 000 110 000 130 000 G-8 27 210 224 28 657 700 28 101 468 27 756 507 28 094 500 MERCOSUR 1 244 302 1 254 825 1 310 000 1 319 000 1 360 000 NAFTA 16 118 900 16 959 094 16 517 463 16 269 875 16 539 800 OECD 26 915 509 29 717 221 29 351 988 29 094 933 29 195 688 SADC 776 103 675 422 577 972 567 019 580 173
Talc
2009 2010 2011 2012 2013 metr. t metr. t metr. t metr. t metr. t Development status: Developed C. 2 175 443 2 376 186 2 382 738 2 202 050 2 261 040 Developing C. 5 070 190 4 663 405 4 903 759 5 212 463 5 649 729 Least Developed C. 71 549 31 977 12 118 22 998 14 724 Transition C. 160 682 161 292 160 547 160 286 160 621 Total 7 477 864 7 232 860 7 459 162 7 597 797 8 086 114 Annual per capita income: High Income 2 798 281 3 055 555 2 908 923 2 867 895 2 949 437 Upper Middle Inc. 890 173 830 943 3 164 547 3 357 478 3 879 905 Lower Middle Inc. 3 732 809 3 290 688 1 332 136 1 315 489 1 201 632 Low Income 56 601 55 674 53 556 56 935 55 140 Total 7 477 864 7 232 860 7 459 162 7 597 797 8 086 114 Political stability: Stable 375 302 425 737 437 685 538 980 496 654 Fair 2 880 437 3 013 296 2 653 612 2 659 249 2 326 367 Unstable 2 893 035 3 668 613 2 990 498 3 025 856 5 020 221 Extreme Unstable 1 329 090 125 214 1 377 367 1 373 712 242 872 Total 7 477 864 7 232 860 7 459 162 7 597 797 8 086 114
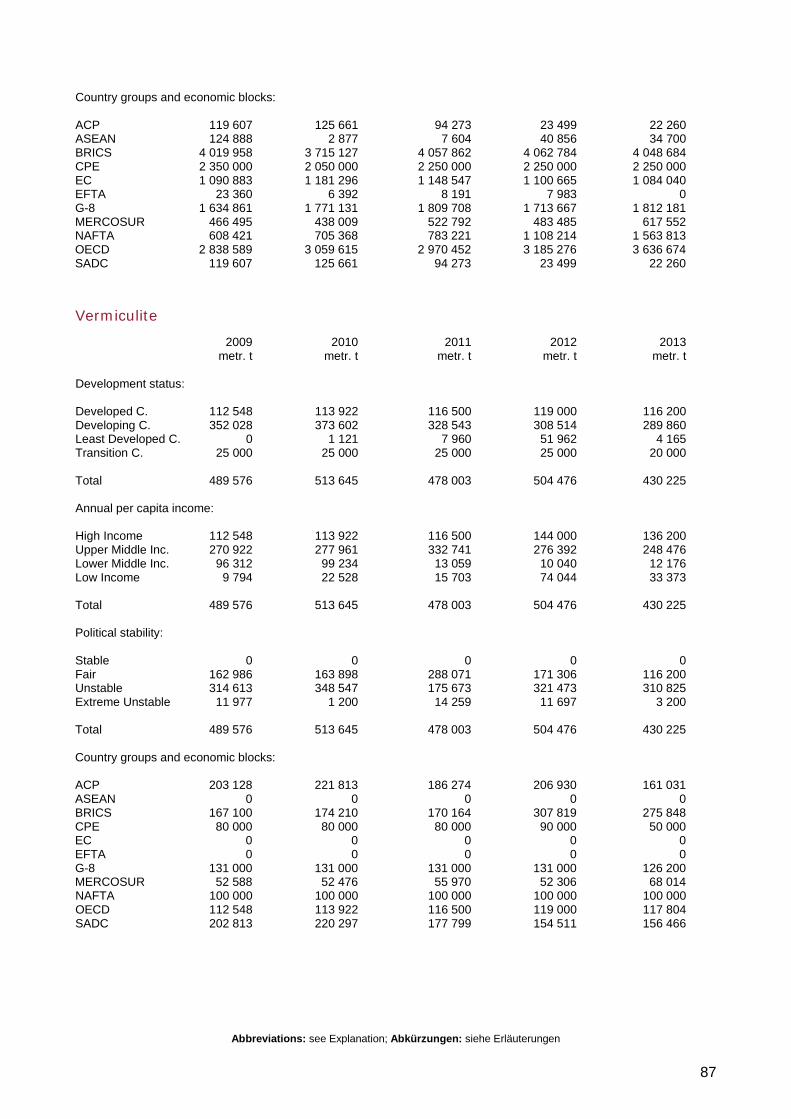
Abbreviations: see Explanation; Abkürzungen: siehe Erläuterungen
87
Country groups and economic blocks: ACP 119 607 125 661 94 273 23 499 22 260 ASEAN 124 888 2 877 7 604 40 856 34 700 BRICS 4 019 958 3 715 127 4 057 862 4 062 784 4 048 684 CPE 2 350 000 2 050 000 2 250 000 2 250 000 2 250 000 EC 1 090 883 1 181 296 1 148 547 1 100 665 1 084 040 EFTA 23 360 6 392 8 191 7 983 0 G-8 1 634 861 1 771 131 1 809 708 1 713 667 1 812 181 MERCOSUR 466 495 438 009 522 792 483 485 617 552 NAFTA 608 421 705 368 783 221 1 108 214 1 563 813 OECD 2 838 589 3 059 615 2 970 452 3 185 276 3 636 674 SADC 119 607 125 661 94 273 23 499 22 260
Vermiculite
2009 2010 2011 2012 2013 metr. t metr. t metr. t metr. t metr. t Development status: Developed C. 112 548 113 922 116 500 119 000 116 200 Developing C. 352 028 373 602 328 543 308 514 289 860 Least Developed C. 0 1 121 7 960 51 962 4 165 Transition C. 25 000 25 000 25 000 25 000 20 000 Total 489 576 513 645 478 003 504 476 430 225 Annual per capita income: High Income 112 548 113 922 116 500 144 000 136 200 Upper Middle Inc. 270 922 277 961 332 741 276 392 248 476 Lower Middle Inc. 96 312 99 234 13 059 10 040 12 176 Low Income 9 794 22 528 15 703 74 044 33 373 Total 489 576 513 645 478 003 504 476 430 225 Political stability: Stable 0 0 0 0 0 Fair 162 986 163 898 288 071 171 306 116 200 Unstable 314 613 348 547 175 673 321 473 310 825 Extreme Unstable 11 977 1 200 14 259 11 697 3 200 Total 489 576 513 645 478 003 504 476 430 225 Country groups and economic blocks: ACP 203 128 221 813 186 274 206 930 161 031 ASEAN 0 0 0 0 0 BRICS 167 100 174 210 170 164 307 819 275 848 CPE 80 000 80 000 80 000 90 000 50 000 EC 0 0 0 0 0 EFTA 0 0 0 0 0 G-8 131 000 131 000 131 000 131 000 126 200 MERCOSUR 52 588 52 476 55 970 52 306 68 014 NAFTA 100 000 100 000 100 000 100 000 100 000 OECD 112 548 113 922 116 500 119 000 117 804 SADC 202 813 220 297 177 799 154 511 156 466
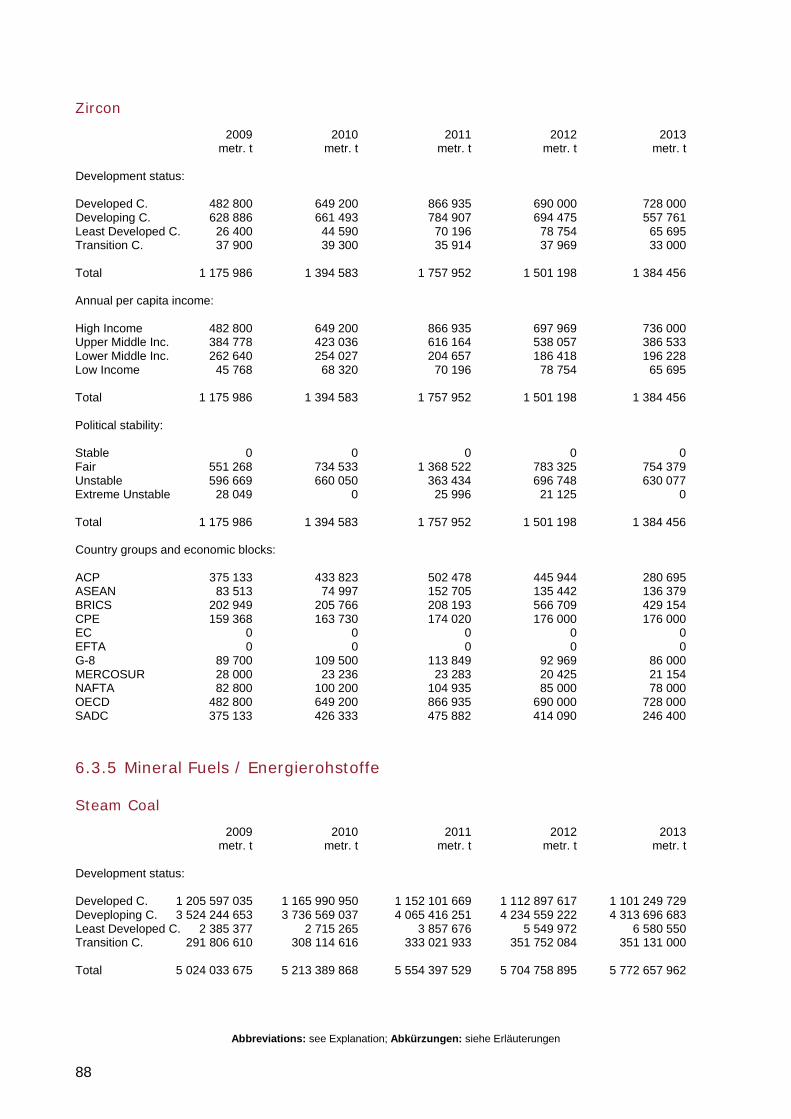
Abbreviations: see Explanation; Abkürzungen: siehe Erläuterungen
88
Zircon
2009 2010 2011 2012 2013 metr. t metr. t metr. t metr. t metr. t Development status: Developed C. 482 800 649 200 866 935 690 000 728 000 Developing C. 628 886 661 493 784 907 694 475 557 761 Least Developed C. 26 400 44 590 70 196 78 754 65 695 Transition C. 37 900 39 300 35 914 37 969 33 000 Total 1 175 986 1 394 583 1 757 952 1 501 198 1 384 456 Annual per capita income: High Income 482 800 649 200 866 935 697 969 736 000 Upper Middle Inc. 384 778 423 036 616 164 538 057 386 533 Lower Middle Inc. 262 640 254 027 204 657 186 418 196 228 Low Income 45 768 68 320 70 196 78 754 65 695 Total 1 175 986 1 394 583 1 757 952 1 501 198 1 384 456 Political stability: Stable 0 0 0 0 0 Fair 551 268 734 533 1 368 522 783 325 754 379 Unstable 596 669 660 050 363 434 696 748 630 077 Extreme Unstable 28 049 0 25 996 21 125 0 Total 1 175 986 1 394 583 1 757 952 1 501 198 1 384 456 Country groups and economic blocks: ACP 375 133 433 823 502 478 445 944 280 695 ASEAN 83 513 74 997 152 705 135 442 136 379 BRICS 202 949 205 766 208 193 566 709 429 154 CPE 159 368 163 730 174 020 176 000 176 000 EC 0 0 0 0 0 EFTA 0 0 0 0 0 G-8 89 700 109 500 113 849 92 969 86 000 MERCOSUR 28 000 23 236 23 283 20 425 21 154 NAFTA 82 800 100 200 104 935 85 000 78 000 OECD 482 800 649 200 866 935 690 000 728 000 SADC 375 133 426 333 475 882 414 090 246 400
6.3.5 Mineral Fuels / Energierohstoffe
Steam Coal
2009 2010 2011 2012 2013 metr. t metr. t metr. t metr. t metr. t Development status: Developed C. 1 205 597 035 1 165 990 950 1 152 101 669 1 112 897 617 1 101 249 729 Deveploping C. 3 524 244 653 3 736 569 037 4 065 416 251 4 234 559 222 4 313 696 683 Least Developed C. 2 385 377 2 715 265 3 857 676 5 549 972 6 580 550 Transition C. 291 806 610 308 114 616 333 021 933 351 752 084 351 131 000 Total 5 024 033 675 5 213 389 868 5 554 397 529 5 704 758 895 5 772 657 962
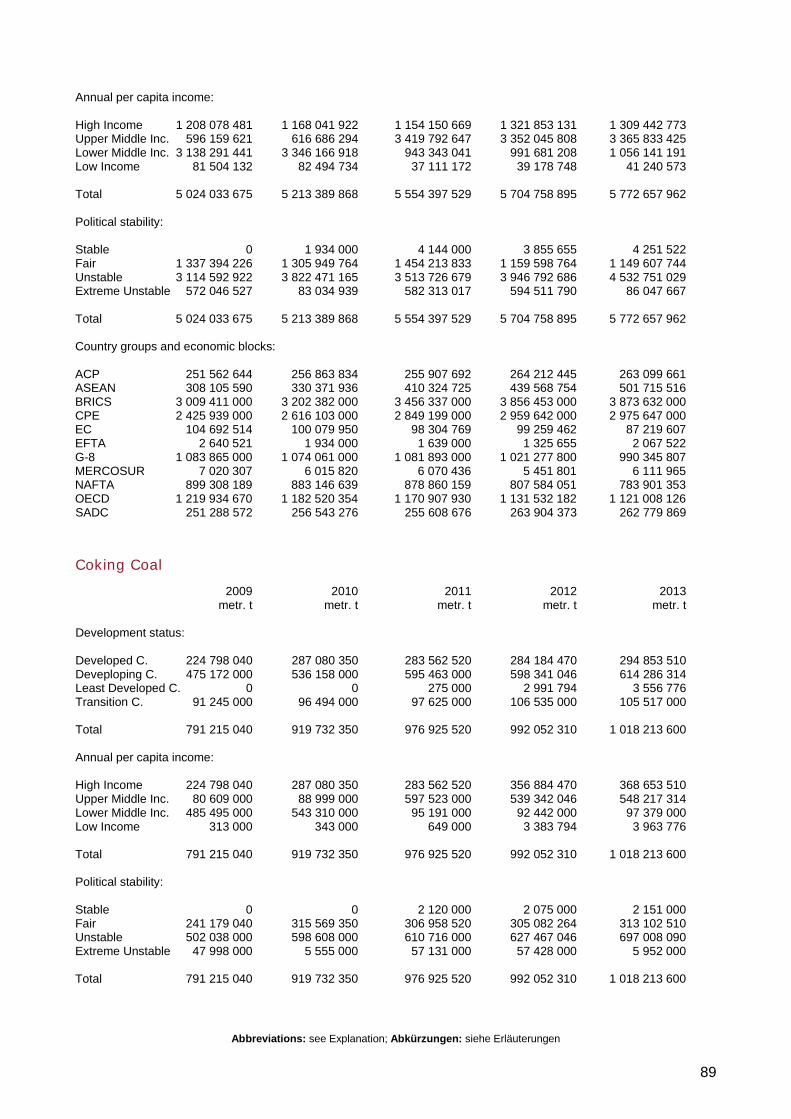
Abbreviations: see Explanation; Abkürzungen: siehe Erläuterungen
89
Annual per capita income: High Income 1 208 078 481 1 168 041 922 1 154 150 669 1 321 853 131 1 309 442 773 Upper Middle Inc. 596 159 621 616 686 294 3 419 792 647 3 352 045 808 3 365 833 425 Lower Middle Inc. 3 138 291 441 3 346 166 918 943 343 041 991 681 208 1 056 141 191 Low Income 81 504 132 82 494 734 37 111 172 39 178 748 41 240 573 Total 5 024 033 675 5 213 389 868 5 554 397 529 5 704 758 895 5 772 657 962 Political stability: Stable 0 1 934 000 4 144 000 3 855 655 4 251 522 Fair 1 337 394 226 1 305 949 764 1 454 213 833 1 159 598 764 1 149 607 744 Unstable 3 114 592 922 3 822 471 165 3 513 726 679 3 946 792 686 4 532 751 029 Extreme Unstable 572 046 527 83 034 939 582 313 017 594 511 790 86 047 667 Total 5 024 033 675 5 213 389 868 5 554 397 529 5 704 758 895 5 772 657 962 Country groups and economic blocks: ACP 251 562 644 256 863 834 255 907 692 264 212 445 263 099 661 ASEAN 308 105 590 330 371 936 410 324 725 439 568 754 501 715 516 BRICS 3 009 411 000 3 202 382 000 3 456 337 000 3 856 453 000 3 873 632 000 CPE 2 425 939 000 2 616 103 000 2 849 199 000 2 959 642 000 2 975 647 000 EC 104 692 514 100 079 950 98 304 769 99 259 462 87 219 607 EFTA 2 640 521 1 934 000 1 639 000 1 325 655 2 067 522 G-8 1 083 865 000 1 074 061 000 1 081 893 000 1 021 277 800 990 345 807 MERCOSUR 7 020 307 6 015 820 6 070 436 5 451 801 6 111 965 NAFTA 899 308 189 883 146 639 878 860 159 807 584 051 783 901 353 OECD 1 219 934 670 1 182 520 354 1 170 907 930 1 131 532 182 1 121 008 126 SADC 251 288 572 256 543 276 255 608 676 263 904 373 262 779 869
Coking Coal
2009 2010 2011 2012 2013 metr. t metr. t metr. t metr. t metr. t Development status: Developed C. 224 798 040 287 080 350 283 562 520 284 184 470 294 853 510 Deveploping C. 475 172 000 536 158 000 595 463 000 598 341 046 614 286 314 Least Developed C. 0 0 275 000 2 991 794 3 556 776 Transition C. 91 245 000 96 494 000 97 625 000 106 535 000 105 517 000 Total 791 215 040 919 732 350 976 925 520 992 052 310 1 018 213 600 Annual per capita income: High Income 224 798 040 287 080 350 283 562 520 356 884 470 368 653 510 Upper Middle Inc. 80 609 000 88 999 000 597 523 000 539 342 046 548 217 314 Lower Middle Inc. 485 495 000 543 310 000 95 191 000 92 442 000 97 379 000 Low Income 313 000 343 000 649 000 3 383 794 3 963 776 Total 791 215 040 919 732 350 976 925 520 992 052 310 1 018 213 600 Political stability: Stable 0 0 2 120 000 2 075 000 2 151 000 Fair 241 179 040 315 569 350 306 958 520 305 082 264 313 102 510 Unstable 502 038 000 598 608 000 610 716 000 627 467 046 697 008 090 Extreme Unstable 47 998 000 5 555 000 57 131 000 57 428 000 5 952 000 Total 791 215 040 919 732 350 976 925 520 992 052 310 1 018 213 600
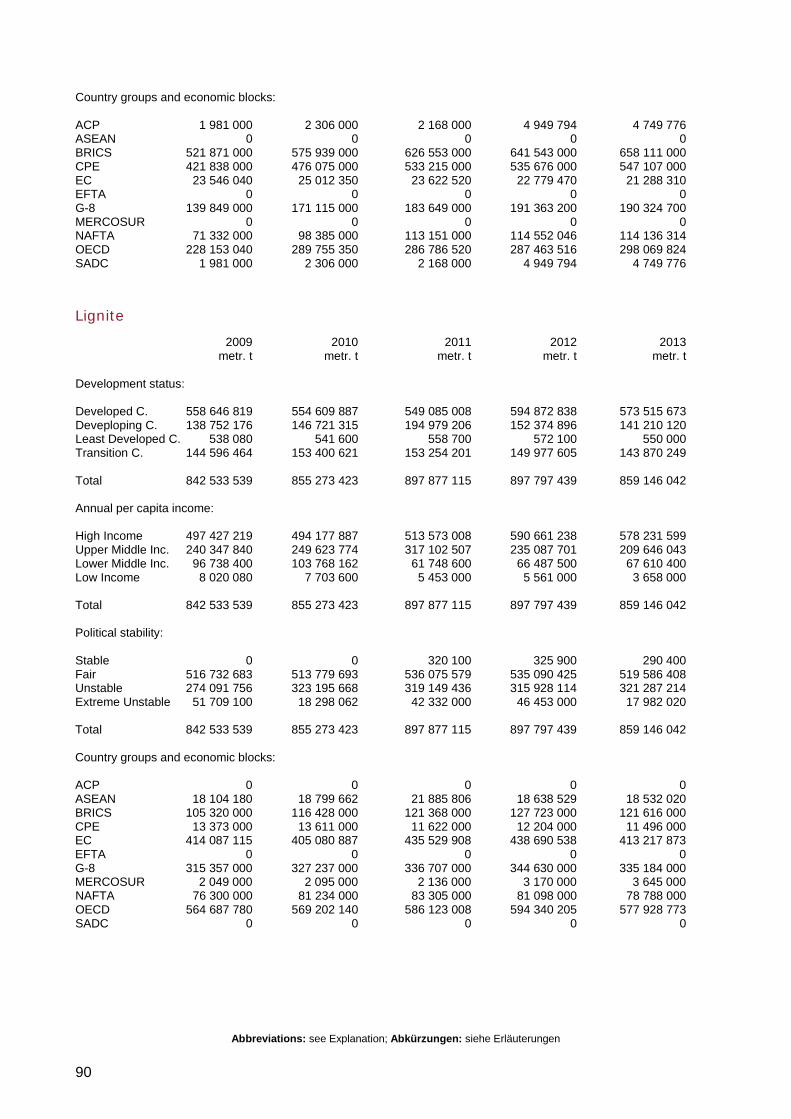
Abbreviations: see Explanation; Abkürzungen: siehe Erläuterungen
90
Country groups and economic blocks: ACP 1 981 000 2 306 000 2 168 000 4 949 794 4 749 776 ASEAN 0 0 0 0 0 BRICS 521 871 000 575 939 000 626 553 000 641 543 000 658 111 000 CPE 421 838 000 476 075 000 533 215 000 535 676 000 547 107 000 EC 23 546 040 25 012 350 23 622 520 22 779 470 21 288 310 EFTA 0 0 0 0 0 G-8 139 849 000 171 115 000 183 649 000 191 363 200 190 324 700 MERCOSUR 0 0 0 0 0 NAFTA 71 332 000 98 385 000 113 151 000 114 552 046 114 136 314 OECD 228 153 040 289 755 350 286 786 520 287 463 516 298 069 824 SADC 1 981 000 2 306 000 2 168 000 4 949 794 4 749 776
Lignite
2009 2010 2011 2012 2013 metr. t metr. t metr. t metr. t metr. t Development status: Developed C. 558 646 819 554 609 887 549 085 008 594 872 838 573 515 673 Deveploping C. 138 752 176 146 721 315 194 979 206 152 374 896 141 210 120 Least Developed C. 538 080 541 600 558 700 572 100 550 000 Transition C. 144 596 464 153 400 621 153 254 201 149 977 605 143 870 249 Total 842 533 539 855 273 423 897 877 115 897 797 439 859 146 042 Annual per capita income: High Income 497 427 219 494 177 887 513 573 008 590 661 238 578 231 599 Upper Middle Inc. 240 347 840 249 623 774 317 102 507 235 087 701 209 646 043 Lower Middle Inc. 96 738 400 103 768 162 61 748 600 66 487 500 67 610 400 Low Income 8 020 080 7 703 600 5 453 000 5 561 000 3 658 000 Total 842 533 539 855 273 423 897 877 115 897 797 439 859 146 042 Political stability: Stable 0 0 320 100 325 900 290 400 Fair 516 732 683 513 779 693 536 075 579 535 090 425 519 586 408 Unstable 274 091 756 323 195 668 319 149 436 315 928 114 321 287 214 Extreme Unstable 51 709 100 18 298 062 42 332 000 46 453 000 17 982 020 Total 842 533 539 855 273 423 897 877 115 897 797 439 859 146 042 Country groups and economic blocks: ACP 0 0 0 0 0 ASEAN 18 104 180 18 799 662 21 885 806 18 638 529 18 532 020 BRICS 105 320 000 116 428 000 121 368 000 127 723 000 121 616 000 CPE 13 373 000 13 611 000 11 622 000 12 204 000 11 496 000 EC 414 087 115 405 080 887 435 529 908 438 690 538 413 217 873 EFTA 0 0 0 0 0 G-8 315 357 000 327 237 000 336 707 000 344 630 000 335 184 000 MERCOSUR 2 049 000 2 095 000 2 136 000 3 170 000 3 645 000 NAFTA 76 300 000 81 234 000 83 305 000 81 098 000 78 788 000 OECD 564 687 780 569 202 140 586 123 008 594 340 205 577 928 773 SADC 0 0 0 0 0
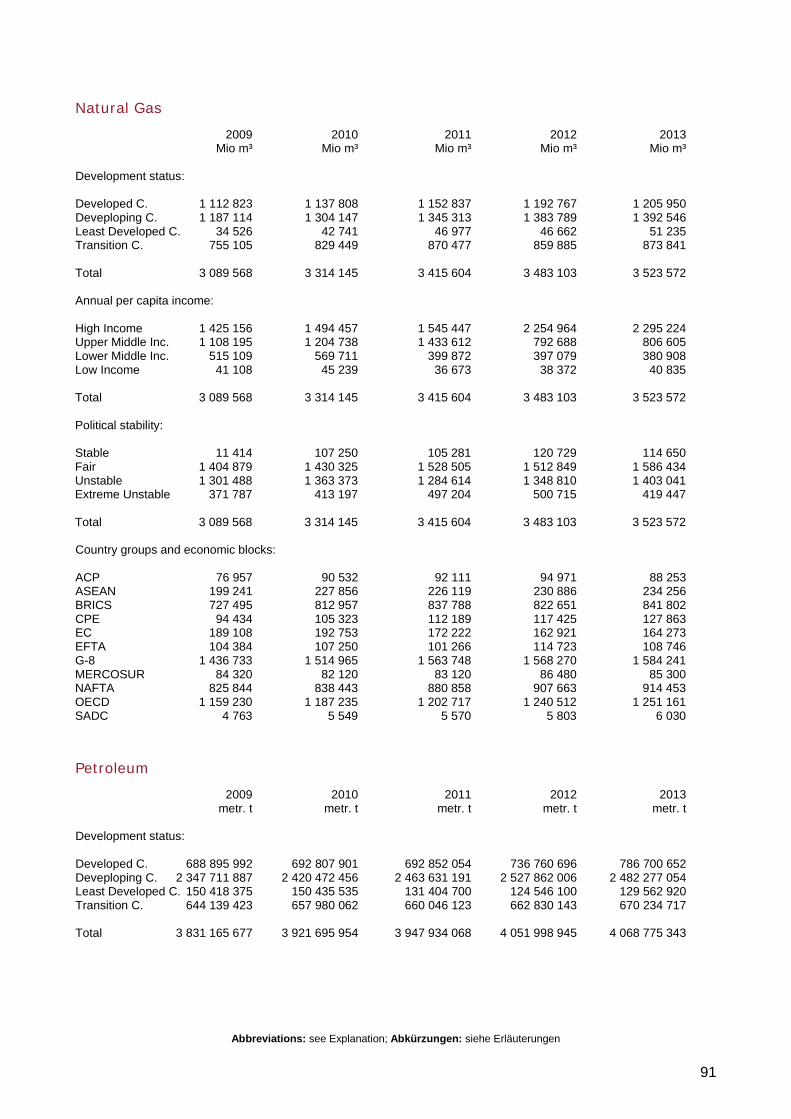
Abbreviations: see Explanation; Abkürzungen: siehe Erläuterungen
91
Natural Gas
2009 2010 2011 2012 2013 Mio m³ Mio m³ Mio m³ Mio m³ Mio m³ Development status: Developed C. 1 112 823 1 137 808 1 152 837 1 192 767 1 205 950 Deveploping C. 1 187 114 1 304 147 1 345 313 1 383 789 1 392 546 Least Developed C. 34 526 42 741 46 977 46 662 51 235 Transition C. 755 105 829 449 870 477 859 885 873 841 Total 3 089 568 3 314 145 3 415 604 3 483 103 3 523 572 Annual per capita income: High Income 1 425 156 1 494 457 1 545 447 2 254 964 2 295 224 Upper Middle Inc. 1 108 195 1 204 738 1 433 612 792 688 806 605 Lower Middle Inc. 515 109 569 711 399 872 397 079 380 908 Low Income 41 108 45 239 36 673 38 372 40 835 Total 3 089 568 3 314 145 3 415 604 3 483 103 3 523 572 Political stability: Stable 11 414 107 250 105 281 120 729 114 650 Fair 1 404 879 1 430 325 1 528 505 1 512 849 1 586 434 Unstable 1 301 488 1 363 373 1 284 614 1 348 810 1 403 041 Extreme Unstable 371 787 413 197 497 204 500 715 419 447 Total 3 089 568 3 314 145 3 415 604 3 483 103 3 523 572 Country groups and economic blocks: ACP 76 957 90 532 92 111 94 971 88 253 ASEAN 199 241 227 856 226 119 230 886 234 256 BRICS 727 495 812 957 837 788 822 651 841 802 CPE 94 434 105 323 112 189 117 425 127 863 EC 189 108 192 753 172 222 162 921 164 273 EFTA 104 384 107 250 101 266 114 723 108 746 G-8 1 436 733 1 514 965 1 563 748 1 568 270 1 584 241 MERCOSUR 84 320 82 120 83 120 86 480 85 300 NAFTA 825 844 838 443 880 858 907 663 914 453 OECD 1 159 230 1 187 235 1 202 717 1 240 512 1 251 161 SADC 4 763 5 549 5 570 5 803 6 030
Petroleum
2009 2010 2011 2012 2013 metr. t metr. t metr. t metr. t metr. t Development status: Developed C. 688 895 992 692 807 901 692 852 054 736 760 696 786 700 652 Deveploping C. 2 347 711 887 2 420 472 456 2 463 631 191 2 527 862 006 2 482 277 054 Least Developed C. 150 418 375 150 435 535 131 404 700 124 546 100 129 562 920 Transition C. 644 139 423 657 980 062 660 046 123 662 830 143 670 234 717 Total 3 831 165 677 3 921 695 954 3 947 934 068 4 051 998 945 4 068 775 343
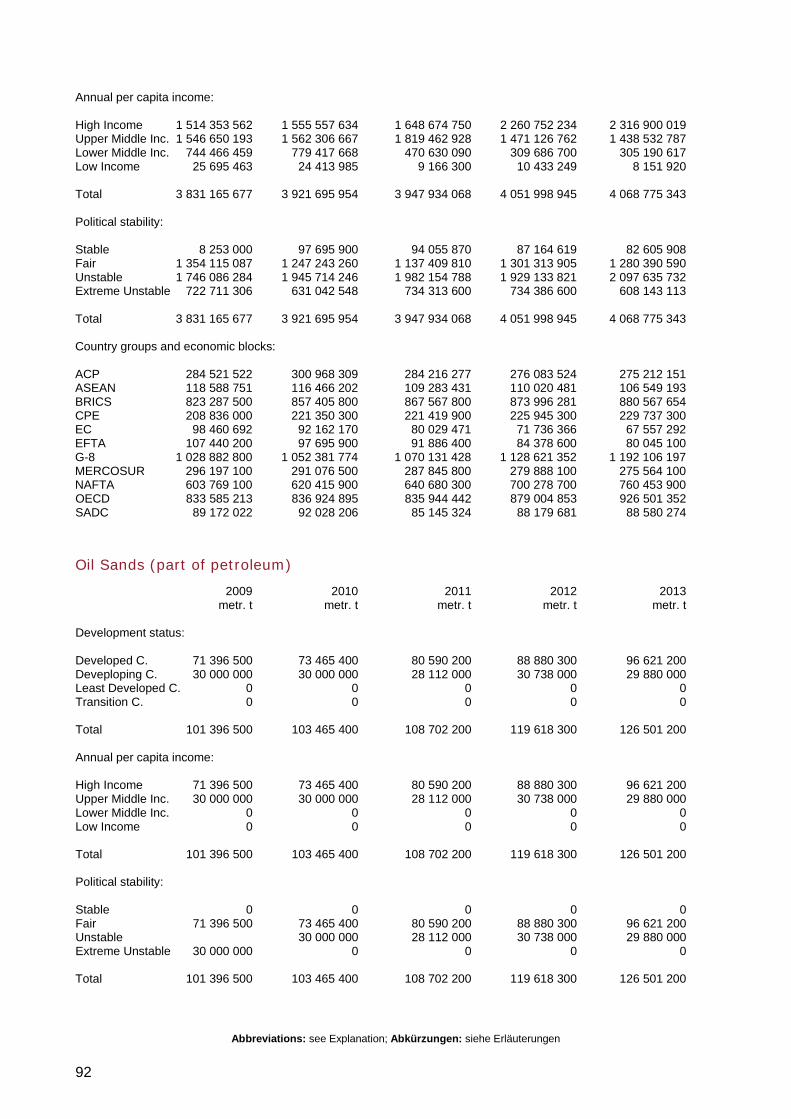
Abbreviations: see Explanation; Abkürzungen: siehe Erläuterungen
92
Annual per capita income: High Income 1 514 353 562 1 555 557 634 1 648 674 750 2 260 752 234 2 316 900 019 Upper Middle Inc. 1 546 650 193 1 562 306 667 1 819 462 928 1 471 126 762 1 438 532 787 Lower Middle Inc. 744 466 459 779 417 668 470 630 090 309 686 700 305 190 617 Low Income 25 695 463 24 413 985 9 166 300 10 433 249 8 151 920 Total 3 831 165 677 3 921 695 954 3 947 934 068 4 051 998 945 4 068 775 343 Political stability: Stable 8 253 000 97 695 900 94 055 870 87 164 619 82 605 908 Fair 1 354 115 087 1 247 243 260 1 137 409 810 1 301 313 905 1 280 390 590 Unstable 1 746 086 284 1 945 714 246 1 982 154 788 1 929 133 821 2 097 635 732 Extreme Unstable 722 711 306 631 042 548 734 313 600 734 386 600 608 143 113 Total 3 831 165 677 3 921 695 954 3 947 934 068 4 051 998 945 4 068 775 343 Country groups and economic blocks: ACP 284 521 522 300 968 309 284 216 277 276 083 524 275 212 151 ASEAN 118 588 751 116 466 202 109 283 431 110 020 481 106 549 193 BRICS 823 287 500 857 405 800 867 567 800 873 996 281 880 567 654 CPE 208 836 000 221 350 300 221 419 900 225 945 300 229 737 300 EC 98 460 692 92 162 170 80 029 471 71 736 366 67 557 292 EFTA 107 440 200 97 695 900 91 886 400 84 378 600 80 045 100 G-8 1 028 882 800 1 052 381 774 1 070 131 428 1 128 621 352 1 192 106 197 MERCOSUR 296 197 100 291 076 500 287 845 800 279 888 100 275 564 100 NAFTA 603 769 100 620 415 900 640 680 300 700 278 700 760 453 900 OECD 833 585 213 836 924 895 835 944 442 879 004 853 926 501 352 SADC 89 172 022 92 028 206 85 145 324 88 179 681 88 580 274
Oil Sands (part of petroleum)
2009 2010 2011 2012 2013 metr. t metr. t metr. t metr. t metr. t Development status: Developed C. 71 396 500 73 465 400 80 590 200 88 880 300 96 621 200 Deveploping C. 30 000 000 30 000 000 28 112 000 30 738 000 29 880 000 Least Developed C. 0 0 0 0 0 Transition C. 0 0 0 0 0 Total 101 396 500 103 465 400 108 702 200 119 618 300 126 501 200 Annual per capita income: High Income 71 396 500 73 465 400 80 590 200 88 880 300 96 621 200 Upper Middle Inc. 30 000 000 30 000 000 28 112 000 30 738 000 29 880 000 Lower Middle Inc. 0 0 0 0 0 Low Income 0 0 0 0 0 Total 101 396 500 103 465 400 108 702 200 119 618 300 126 501 200 Political stability: Stable 0 0 0 0 0 Fair 71 396 500 73 465 400 80 590 200 88 880 300 96 621 200 Unstable 30 000 000 28 112 000 30 738 000 29 880 000 Extreme Unstable 30 000 000 0 0 0 0 Total 101 396 500 103 465 400 108 702 200 119 618 300 126 501 200
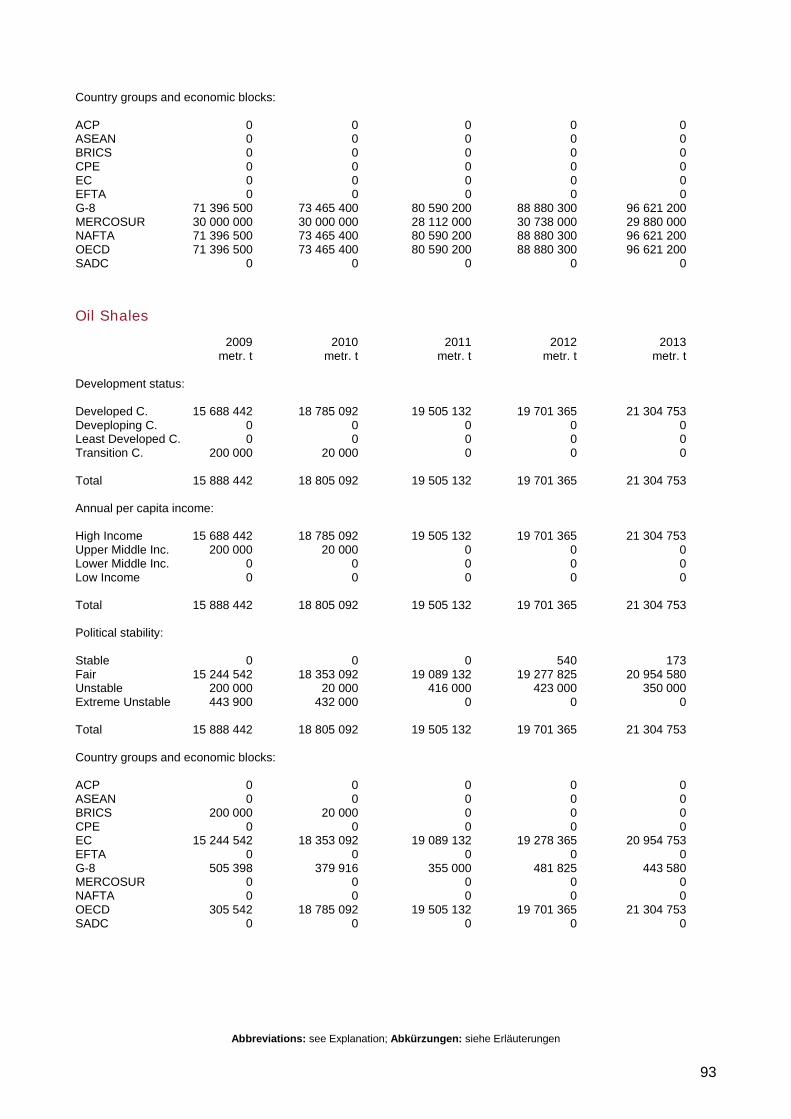
Abbreviations: see Explanation; Abkürzungen: siehe Erläuterungen
93
Country groups and economic blocks: ACP 0 0 0 0 0 ASEAN 0 0 0 0 0 BRICS 0 0 0 0 0 CPE 0 0 0 0 0 EC 0 0 0 0 0 EFTA 0 0 0 0 0 G-8 71 396 500 73 465 400 80 590 200 88 880 300 96 621 200 MERCOSUR 30 000 000 30 000 000 28 112 000 30 738 000 29 880 000 NAFTA 71 396 500 73 465 400 80 590 200 88 880 300 96 621 200 OECD 71 396 500 73 465 400 80 590 200 88 880 300 96 621 200 SADC 0 0 0 0 0
Oil Shales
2009 2010 2011 2012 2013 metr. t metr. t metr. t metr. t metr. t Development status: Developed C. 15 688 442 18 785 092 19 505 132 19 701 365 21 304 753 Deveploping C. 0 0 0 0 0 Least Developed C. 0 0 0 0 0 Transition C. 200 000 20 000 0 0 0 Total 15 888 442 18 805 092 19 505 132 19 701 365 21 304 753 Annual per capita income: High Income 15 688 442 18 785 092 19 505 132 19 701 365 21 304 753 Upper Middle Inc. 200 000 20 000 0 0 0 Lower Middle Inc. 0 0 0 0 0 Low Income 0 0 0 0 0 Total 15 888 442 18 805 092 19 505 132 19 701 365 21 304 753 Political stability: Stable 0 0 0 540 173 Fair 15 244 542 18 353 092 19 089 132 19 277 825 20 954 580 Unstable 200 000 20 000 416 000 423 000 350 000 Extreme Unstable 443 900 432 000 0 0 0 Total 15 888 442 18 805 092 19 505 132 19 701 365 21 304 753 Country groups and economic blocks: ACP 0 0 0 0 0 ASEAN 0 0 0 0 0 BRICS 200 000 20 000 0 0 0 CPE 0 0 0 0 0 EC 15 244 542 18 353 092 19 089 132 19 278 365 20 954 753 EFTA 0 0 0 0 0 G-8 505 398 379 916 355 000 481 825 443 580 MERCOSUR 0 0 0 0 0 NAFTA 0 0 0 0 0 OECD 305 542 18 785 092 19 505 132 19 701 365 21 304 753 SADC 0 0 0 0 0
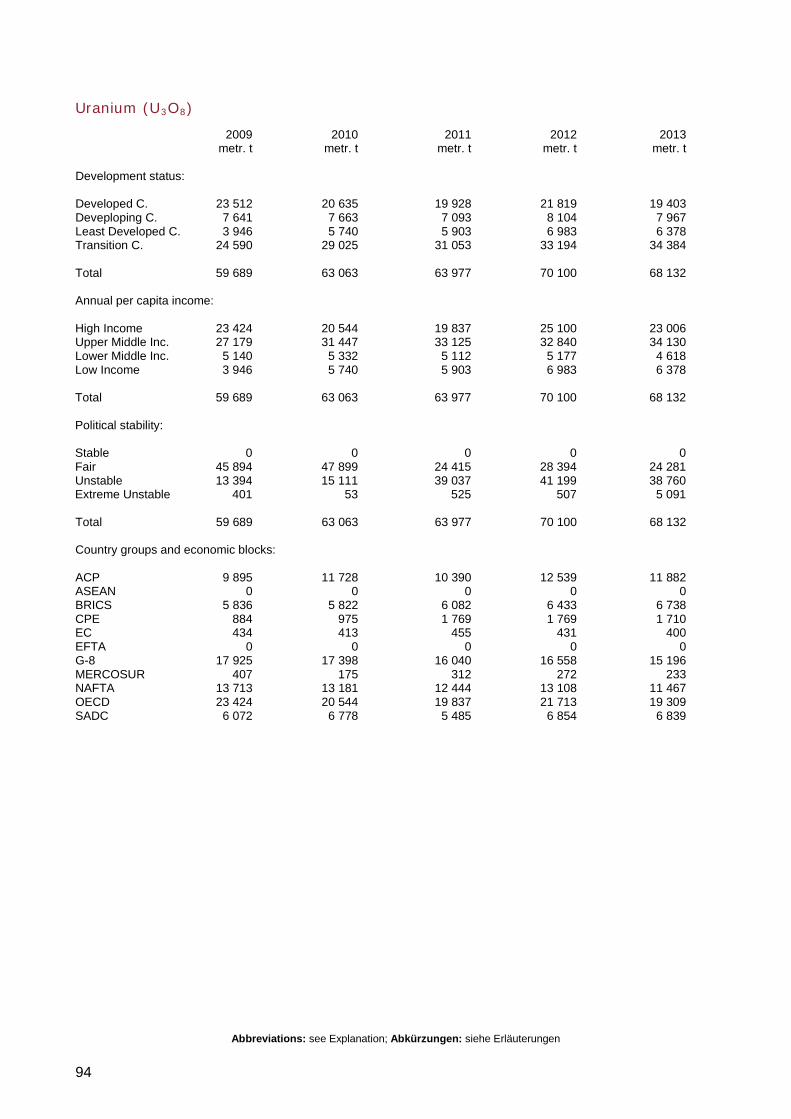
Abbreviations: see Explanation; Abkürzungen: siehe Erläuterungen
94
Uranium (U3O8)
2009 2010 2011 2012 2013 metr. t metr. t metr. t metr. t metr. t Development status: Developed C. 23 512 20 635 19 928 21 819 19 403 Deveploping C. 7 641 7 663 7 093 8 104 7 967 Least Developed C. 3 946 5 740 5 903 6 983 6 378 Transition C. 24 590 29 025 31 053 33 194 34 384 Total 59 689 63 063 63 977 70 100 68 132 Annual per capita income: High Income 23 424 20 544 19 837 25 100 23 006 Upper Middle Inc. 27 179 31 447 33 125 32 840 34 130 Lower Middle Inc. 5 140 5 332 5 112 5 177 4 618 Low Income 3 946 5 740 5 903 6 983 6 378 Total 59 689 63 063 63 977 70 100 68 132 Political stability: Stable 0 0 0 0 0 Fair 45 894 47 899 24 415 28 394 24 281 Unstable 13 394 15 111 39 037 41 199 38 760 Extreme Unstable 401 53 525 507 5 091 Total 59 689 63 063 63 977 70 100 68 132 Country groups and economic blocks: ACP 9 895 11 728 10 390 12 539 11 882 ASEAN 0 0 0 0 0 BRICS 5 836 5 822 6 082 6 433 6 738 CPE 884 975 1 769 1 769 1 710 EC 434 413 455 431 400 EFTA 0 0 0 0 0 G-8 17 925 17 398 16 040 16 558 15 196 MERCOSUR 407 175 312 272 233 NAFTA 13 713 13 181 12 444 13 108 11 467 OECD 23 424 20 544 19 837 21 713 19 309 SADC 6 072 6 778 5 485 6 854 6 839
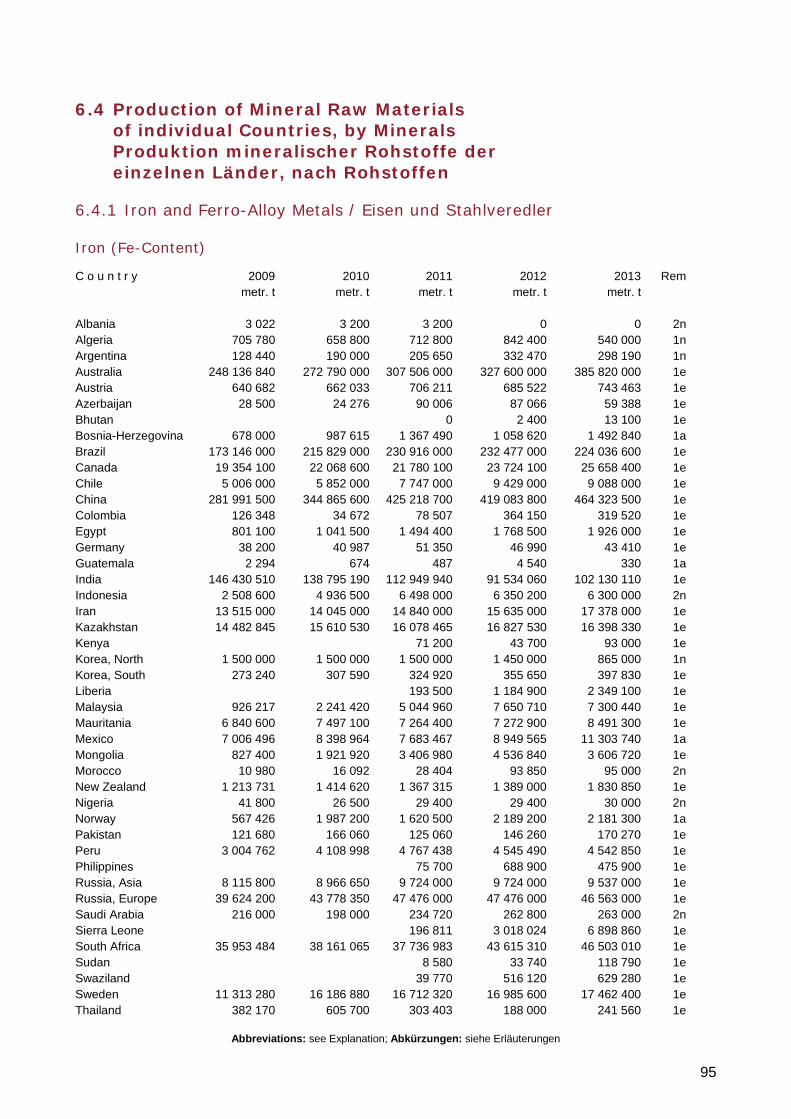
Abbreviations: see Explanation; Abkürzungen: siehe Erläuterungen
95
6.4 Production of Mineral Raw Materials of individual Countries, by Minerals Produktion mineralischer Rohstoffe der einzelnen Länder, nach Rohstoffen
6.4.1 Iron and Ferro-Alloy Metals / Eisen und Stahlveredler
Iron (Fe-Content)
C o u n t r y 2009 2010 2011 2012 2013 Rem metr. t metr. t metr. t metr. t metr. t Albania 3 022 3 200 3 200 0 0 2n Algeria 705 780 658 800 712 800 842 400 540 000 1n Argentina 128 440 190 000 205 650 332 470 298 190 1n Australia 248 136 840 272 790 000 307 506 000 327 600 000 385 820 000 1e Austria 640 682 662 033 706 211 685 522 743 463 1e Azerbaijan 28 500 24 276 90 006 87 066 59 388 1e Bhutan 0 2 400 13 100 1e Bosnia-Herzegovina 678 000 987 615 1 367 490 1 058 620 1 492 840 1a Brazil 173 146 000 215 829 000 230 916 000 232 477 000 224 036 600 1e Canada 19 354 100 22 068 600 21 780 100 23 724 100 25 658 400 1e Chile 5 006 000 5 852 000 7 747 000 9 429 000 9 088 000 1e China 281 991 500 344 865 600 425 218 700 419 083 800 464 323 500 1e Colombia 126 348 34 672 78 507 364 150 319 520 1e Egypt 801 100 1 041 500 1 494 400 1 768 500 1 926 000 1e Germany 38 200 40 987 51 350 46 990 43 410 1e Guatemala 2 294 674 487 4 540 330 1a India 146 430 510 138 795 190 112 949 940 91 534 060 102 130 110 1e Indonesia 2 508 600 4 936 500 6 498 000 6 350 200 6 300 000 2n Iran 13 515 000 14 045 000 14 840 000 15 635 000 17 378 000 1e Kazakhstan 14 482 845 15 610 530 16 078 465 16 827 530 16 398 330 1e Kenya 71 200 43 700 93 000 1e Korea, North 1 500 000 1 500 000 1 500 000 1 450 000 865 000 1n Korea, South 273 240 307 590 324 920 355 650 397 830 1e Liberia 193 500 1 184 900 2 349 100 1e Malaysia 926 217 2 241 420 5 044 960 7 650 710 7 300 440 1e Mauritania 6 840 600 7 497 100 7 264 400 7 272 900 8 491 300 1e Mexico 7 006 496 8 398 964 7 683 467 8 949 565 11 303 740 1a Mongolia 827 400 1 921 920 3 406 980 4 536 840 3 606 720 1e Morocco 10 980 16 092 28 404 93 850 95 000 2n New Zealand 1 213 731 1 414 620 1 367 315 1 389 000 1 830 850 1e Nigeria 41 800 26 500 29 400 29 400 30 000 2n Norway 567 426 1 987 200 1 620 500 2 189 200 2 181 300 1a Pakistan 121 680 166 060 125 060 146 260 170 270 1e Peru 3 004 762 4 108 998 4 767 438 4 545 490 4 542 850 1e Philippines 75 700 688 900 475 900 1e Russia, Asia 8 115 800 8 966 650 9 724 000 9 724 000 9 537 000 1e Russia, Europe 39 624 200 43 778 350 47 476 000 47 476 000 46 563 000 1e Saudi Arabia 216 000 198 000 234 720 262 800 263 000 2n Sierra Leone 196 811 3 018 024 6 898 860 1e South Africa 35 953 484 38 161 065 37 736 983 43 615 310 46 503 010 1e Sudan 8 580 33 740 118 790 1e Swaziland 39 770 516 120 629 280 1e Sweden 11 313 280 16 186 880 16 712 320 16 985 600 17 462 400 1e Thailand 382 170 605 700 303 403 188 000 241 560 1e
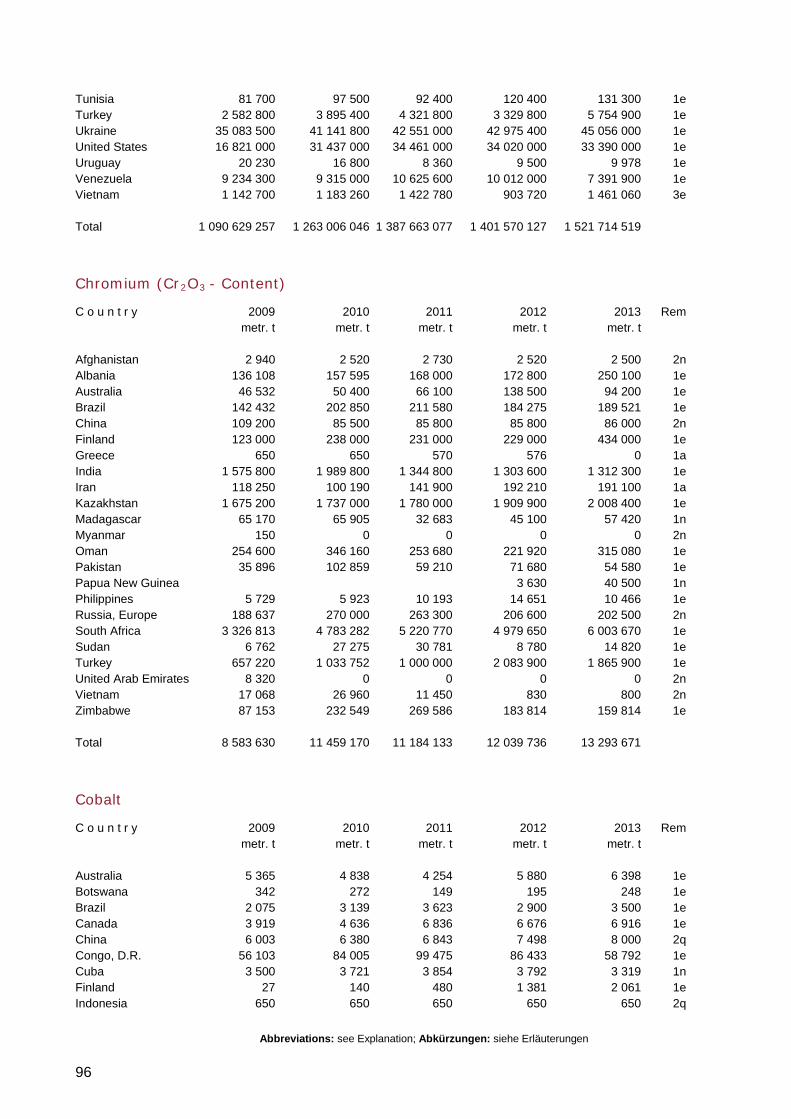
Abbreviations: see Explanation; Abkürzungen: siehe Erläuterungen
96
Tunisia 81 700 97 500 92 400 120 400 131 300 1e Turkey 2 582 800 3 895 400 4 321 800 3 329 800 5 754 900 1e Ukraine 35 083 500 41 141 800 42 551 000 42 975 400 45 056 000 1e United States 16 821 000 31 437 000 34 461 000 34 020 000 33 390 000 1e Uruguay 20 230 16 800 8 360 9 500 9 978 1e Venezuela 9 234 300 9 315 000 10 625 600 10 012 000 7 391 900 1e Vietnam 1 142 700 1 183 260 1 422 780 903 720 1 461 060 3e Total 1 090 629 257 1 263 006 046 1 387 663 077 1 401 570 127 1 521 714 519
Chromium (Cr2O3 - Content)
C o u n t r y 2009 2010 2011 2012 2013 Rem metr. t metr. t metr. t metr. t metr. t Afghanistan 2 940 2 520 2 730 2 520 2 500 2n Albania 136 108 157 595 168 000 172 800 250 100 1e Australia 46 532 50 400 66 100 138 500 94 200 1e Brazil 142 432 202 850 211 580 184 275 189 521 1e China 109 200 85 500 85 800 85 800 86 000 2n Finland 123 000 238 000 231 000 229 000 434 000 1e Greece 650 650 570 576 0 1a India 1 575 800 1 989 800 1 344 800 1 303 600 1 312 300 1e Iran 118 250 100 190 141 900 192 210 191 100 1a Kazakhstan 1 675 200 1 737 000 1 780 000 1 909 900 2 008 400 1e Madagascar 65 170 65 905 32 683 45 100 57 420 1n Myanmar 150 0 0 0 0 2n Oman 254 600 346 160 253 680 221 920 315 080 1e Pakistan 35 896 102 859 59 210 71 680 54 580 1e Papua New Guinea 3 630 40 500 1n Philippines 5 729 5 923 10 193 14 651 10 466 1e Russia, Europe 188 637 270 000 263 300 206 600 202 500 2n South Africa 3 326 813 4 783 282 5 220 770 4 979 650 6 003 670 1e Sudan 6 762 27 275 30 781 8 780 14 820 1e Turkey 657 220 1 033 752 1 000 000 2 083 900 1 865 900 1e United Arab Emirates 8 320 0 0 0 0 2n Vietnam 17 068 26 960 11 450 830 800 2n Zimbabwe 87 153 232 549 269 586 183 814 159 814 1e Total 8 583 630 11 459 170 11 184 133 12 039 736 13 293 671
Cobalt
C o u n t r y 2009 2010 2011 2012 2013 Rem metr. t metr. t metr. t metr. t metr. t Australia 5 365 4 838 4 254 5 880 6 398 1e Botswana 342 272 149 195 248 1e Brazil 2 075 3 139 3 623 2 900 3 500 1e Canada 3 919 4 636 6 836 6 676 6 916 1e China 6 003 6 380 6 843 7 498 8 000 2q Congo, D.R. 56 103 84 005 99 475 86 433 58 792 1e Cuba 3 500 3 721 3 854 3 792 3 319 1n Finland 27 140 480 1 381 2 061 1e Indonesia 650 650 650 650 650 2q
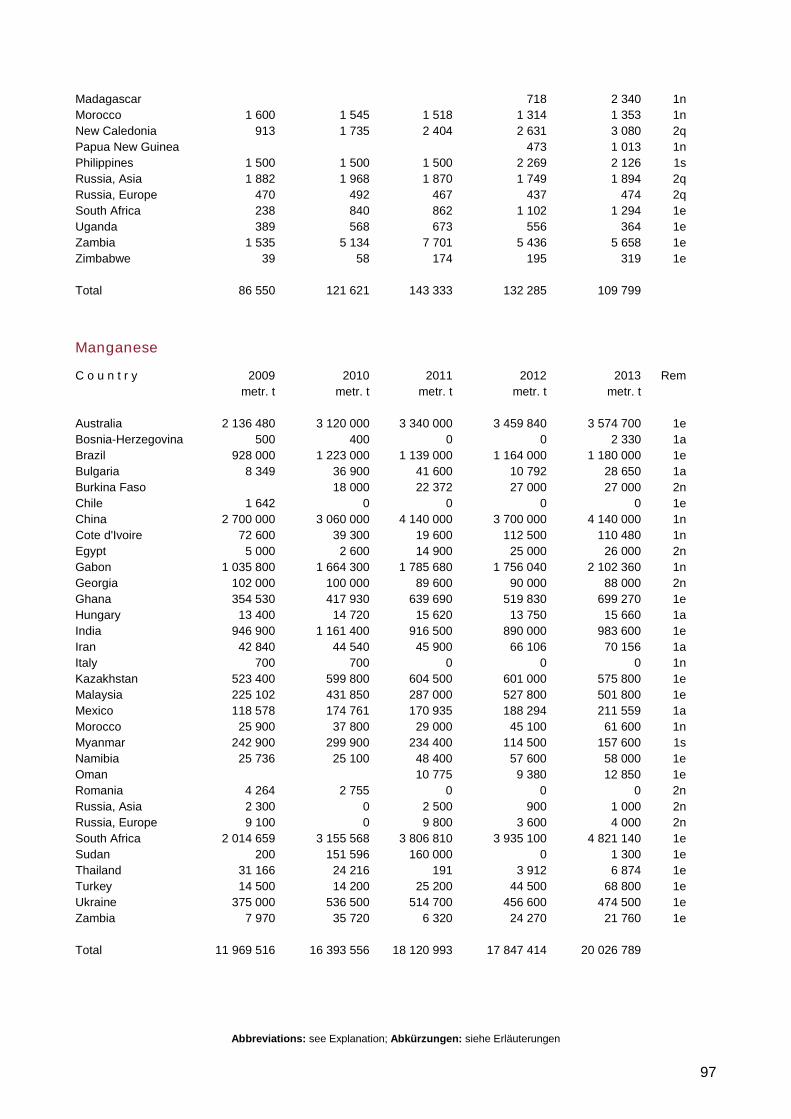
Abbreviations: see Explanation; Abkürzungen: siehe Erläuterungen
97
Madagascar 718 2 340 1n Morocco 1 600 1 545 1 518 1 314 1 353 1n New Caledonia 913 1 735 2 404 2 631 3 080 2q Papua New Guinea 473 1 013 1n Philippines 1 500 1 500 1 500 2 269 2 126 1s Russia, Asia 1 882 1 968 1 870 1 749 1 894 2q Russia, Europe 470 492 467 437 474 2q South Africa 238 840 862 1 102 1 294 1e Uganda 389 568 673 556 364 1e Zambia 1 535 5 134 7 701 5 436 5 658 1e Zimbabwe 39 58 174 195 319 1e Total 86 550 121 621 143 333 132 285 109 799
Manganese
C o u n t r y 2009 2010 2011 2012 2013 Rem metr. t metr. t metr. t metr. t metr. t Australia 2 136 480 3 120 000 3 340 000 3 459 840 3 574 700 1e Bosnia-Herzegovina 500 400 0 0 2 330 1a Brazil 928 000 1 223 000 1 139 000 1 164 000 1 180 000 1e Bulgaria 8 349 36 900 41 600 10 792 28 650 1a Burkina Faso 18 000 22 372 27 000 27 000 2n Chile 1 642 0 0 0 0 1e China 2 700 000 3 060 000 4 140 000 3 700 000 4 140 000 1n Cote d'Ivoire 72 600 39 300 19 600 112 500 110 480 1n Egypt 5 000 2 600 14 900 25 000 26 000 2n Gabon 1 035 800 1 664 300 1 785 680 1 756 040 2 102 360 1n Georgia 102 000 100 000 89 600 90 000 88 000 2n Ghana 354 530 417 930 639 690 519 830 699 270 1e Hungary 13 400 14 720 15 620 13 750 15 660 1a India 946 900 1 161 400 916 500 890 000 983 600 1e Iran 42 840 44 540 45 900 66 106 70 156 1a Italy 700 700 0 0 0 1n Kazakhstan 523 400 599 800 604 500 601 000 575 800 1e Malaysia 225 102 431 850 287 000 527 800 501 800 1e Mexico 118 578 174 761 170 935 188 294 211 559 1a Morocco 25 900 37 800 29 000 45 100 61 600 1n Myanmar 242 900 299 900 234 400 114 500 157 600 1s Namibia 25 736 25 100 48 400 57 600 58 000 1e Oman 10 775 9 380 12 850 1e Romania 4 264 2 755 0 0 0 2n Russia, Asia 2 300 0 2 500 900 1 000 2n Russia, Europe 9 100 0 9 800 3 600 4 000 2n South Africa 2 014 659 3 155 568 3 806 810 3 935 100 4 821 140 1e Sudan 200 151 596 160 000 0 1 300 1e Thailand 31 166 24 216 191 3 912 6 874 1e Turkey 14 500 14 200 25 200 44 500 68 800 1e Ukraine 375 000 536 500 514 700 456 600 474 500 1e Zambia 7 970 35 720 6 320 24 270 21 760 1e Total 11 969 516 16 393 556 18 120 993 17 847 414 20 026 789
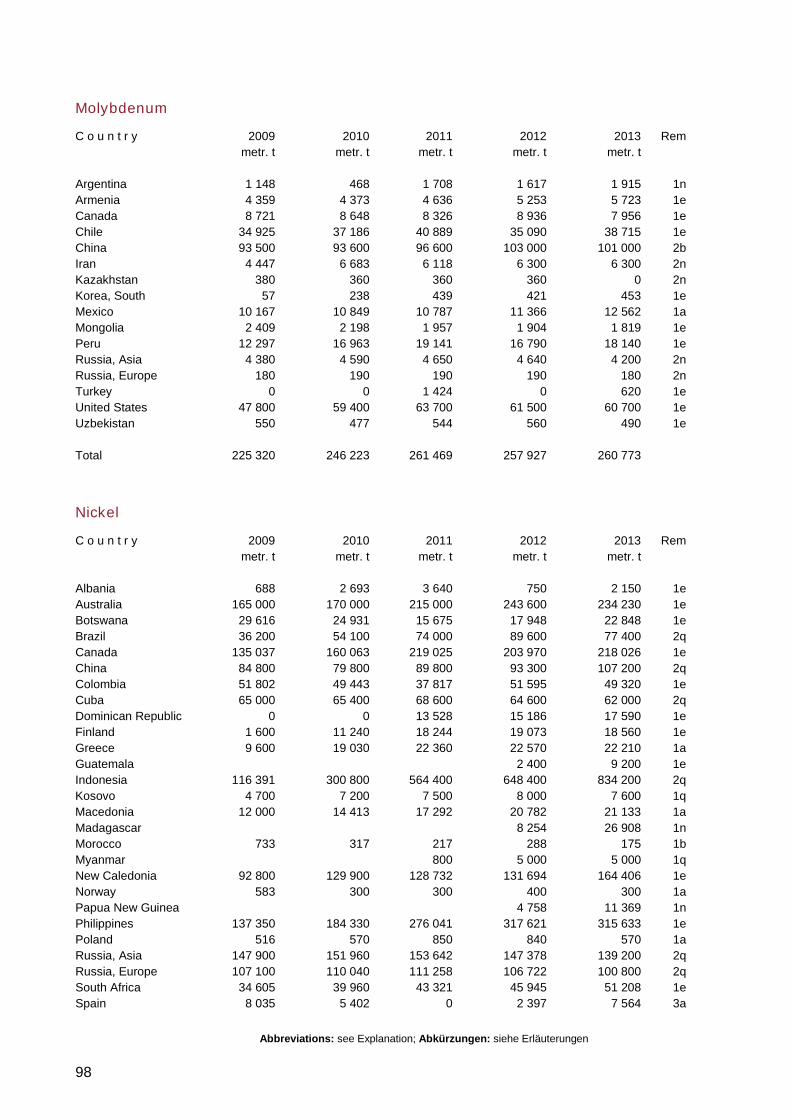
Abbreviations: see Explanation; Abkürzungen: siehe Erläuterungen
98
Molybdenum
C o u n t r y 2009 2010 2011 2012 2013 Rem metr. t metr. t metr. t metr. t metr. t Argentina 1 148 468 1 708 1 617 1 915 1n Armenia 4 359 4 373 4 636 5 253 5 723 1e Canada 8 721 8 648 8 326 8 936 7 956 1e Chile 34 925 37 186 40 889 35 090 38 715 1e China 93 500 93 600 96 600 103 000 101 000 2b Iran 4 447 6 683 6 118 6 300 6 300 2n Kazakhstan 380 360 360 360 0 2n Korea, South 57 238 439 421 453 1e Mexico 10 167 10 849 10 787 11 366 12 562 1a Mongolia 2 409 2 198 1 957 1 904 1 819 1e Peru 12 297 16 963 19 141 16 790 18 140 1e Russia, Asia 4 380 4 590 4 650 4 640 4 200 2n Russia, Europe 180 190 190 190 180 2n Turkey 0 0 1 424 0 620 1e United States 47 800 59 400 63 700 61 500 60 700 1e Uzbekistan 550 477 544 560 490 1e Total 225 320 246 223 261 469 257 927 260 773
Nickel
C o u n t r y 2009 2010 2011 2012 2013 Rem metr. t metr. t metr. t metr. t metr. t Albania 688 2 693 3 640 750 2 150 1e Australia 165 000 170 000 215 000 243 600 234 230 1e Botswana 29 616 24 931 15 675 17 948 22 848 1e Brazil 36 200 54 100 74 000 89 600 77 400 2q Canada 135 037 160 063 219 025 203 970 218 026 1e China 84 800 79 800 89 800 93 300 107 200 2q Colombia 51 802 49 443 37 817 51 595 49 320 1e Cuba 65 000 65 400 68 600 64 600 62 000 2q Dominican Republic 0 0 13 528 15 186 17 590 1e Finland 1 600 11 240 18 244 19 073 18 560 1e Greece 9 600 19 030 22 360 22 570 22 210 1a Guatemala 2 400 9 200 1e Indonesia 116 391 300 800 564 400 648 400 834 200 2q Kosovo 4 700 7 200 7 500 8 000 7 600 1q Macedonia 12 000 14 413 17 292 20 782 21 133 1a Madagascar 8 254 26 908 1n Morocco 733 317 217 288 175 1b Myanmar 800 5 000 5 000 1q New Caledonia 92 800 129 900 128 732 131 694 164 406 1e Norway 583 300 300 400 300 1a Papua New Guinea 4 758 11 369 1n Philippines 137 350 184 330 276 041 317 621 315 633 1e Poland 516 570 850 840 570 1a Russia, Asia 147 900 151 960 153 642 147 378 139 200 2q Russia, Europe 107 100 110 040 111 258 106 722 100 800 2q South Africa 34 605 39 960 43 321 45 945 51 208 1e Spain 8 035 5 402 0 2 397 7 564 3a
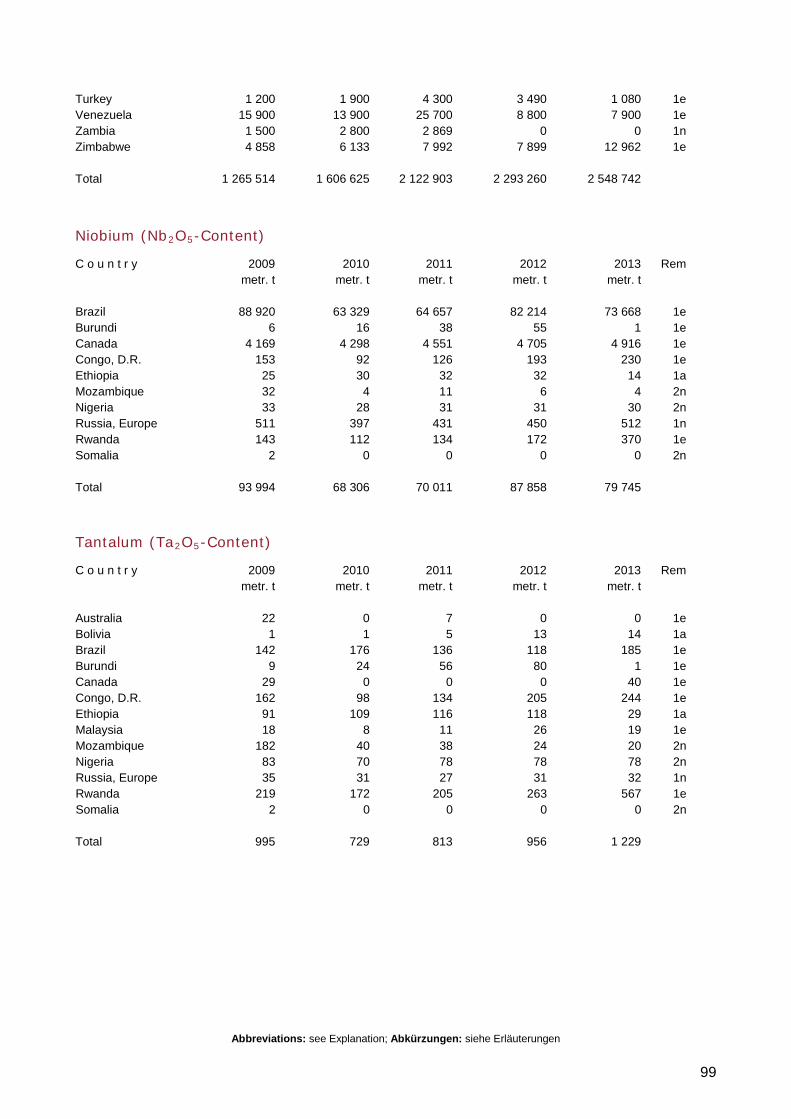
Abbreviations: see Explanation; Abkürzungen: siehe Erläuterungen
99
Turkey 1 200 1 900 4 300 3 490 1 080 1e Venezuela 15 900 13 900 25 700 8 800 7 900 1e Zambia 1 500 2 800 2 869 0 0 1n Zimbabwe 4 858 6 133 7 992 7 899 12 962 1e Total 1 265 514 1 606 625 2 122 903 2 293 260 2 548 742
Niobium (Nb2O5-Content)
C o u n t r y 2009 2010 2011 2012 2013 Rem metr. t metr. t metr. t metr. t metr. t Brazil 88 920 63 329 64 657 82 214 73 668 1e Burundi 6 16 38 55 1 1e Canada 4 169 4 298 4 551 4 705 4 916 1e Congo, D.R. 153 92 126 193 230 1e Ethiopia 25 30 32 32 14 1a Mozambique 32 4 11 6 4 2n Nigeria 33 28 31 31 30 2n Russia, Europe 511 397 431 450 512 1n Rwanda 143 112 134 172 370 1e Somalia 2 0 0 0 0 2n Total 93 994 68 306 70 011 87 858 79 745
Tantalum (Ta2O5-Content)
C o u n t r y 2009 2010 2011 2012 2013 Rem metr. t metr. t metr. t metr. t metr. t Australia 22 0 7 0 0 1e Bolivia 1 1 5 13 14 1a Brazil 142 176 136 118 185 1e Burundi 9 24 56 80 1 1e Canada 29 0 0 0 40 1e Congo, D.R. 162 98 134 205 244 1e Ethiopia 91 109 116 118 29 1a Malaysia 18 8 11 26 19 1e Mozambique 182 40 38 24 20 2n Nigeria 83 70 78 78 78 2n Russia, Europe 35 31 27 31 32 1n Rwanda 219 172 205 263 567 1e Somalia 2 0 0 0 0 2n Total 995 729 813 956 1 229
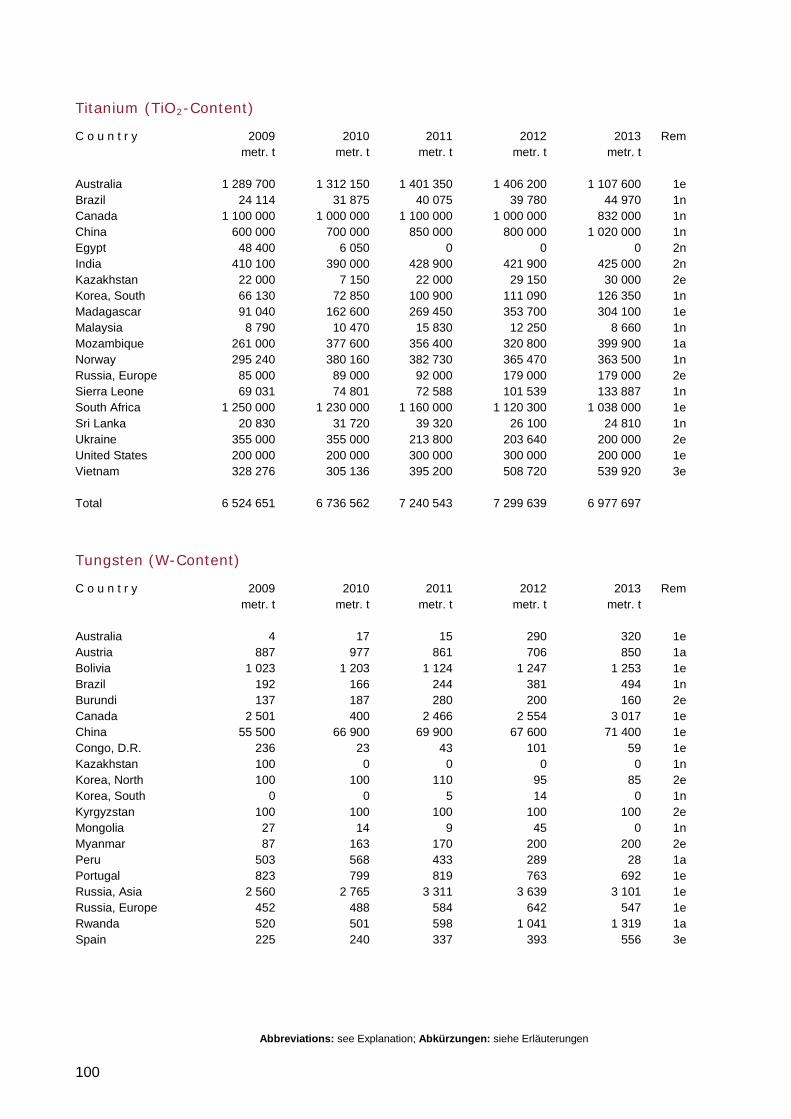
Abbreviations: see Explanation; Abkürzungen: siehe Erläuterungen
100
Titanium (TiO2-Content)
C o u n t r y 2009 2010 2011 2012 2013 Rem metr. t metr. t metr. t metr. t metr. t Australia 1 289 700 1 312 150 1 401 350 1 406 200 1 107 600 1e Brazil 24 114 31 875 40 075 39 780 44 970 1n Canada 1 100 000 1 000 000 1 100 000 1 000 000 832 000 1n China 600 000 700 000 850 000 800 000 1 020 000 1n Egypt 48 400 6 050 0 0 0 2n India 410 100 390 000 428 900 421 900 425 000 2n Kazakhstan 22 000 7 150 22 000 29 150 30 000 2e Korea, South 66 130 72 850 100 900 111 090 126 350 1n Madagascar 91 040 162 600 269 450 353 700 304 100 1e Malaysia 8 790 10 470 15 830 12 250 8 660 1n Mozambique 261 000 377 600 356 400 320 800 399 900 1a Norway 295 240 380 160 382 730 365 470 363 500 1n Russia, Europe 85 000 89 000 92 000 179 000 179 000 2e Sierra Leone 69 031 74 801 72 588 101 539 133 887 1n South Africa 1 250 000 1 230 000 1 160 000 1 120 300 1 038 000 1e Sri Lanka 20 830 31 720 39 320 26 100 24 810 1n Ukraine 355 000 355 000 213 800 203 640 200 000 2e United States 200 000 200 000 300 000 300 000 200 000 1e Vietnam 328 276 305 136 395 200 508 720 539 920 3e Total 6 524 651 6 736 562 7 240 543 7 299 639 6 977 697
Tungsten (W-Content)
C o u n t r y 2009 2010 2011 2012 2013 Rem metr. t metr. t metr. t metr. t metr. t Australia 4 17 15 290 320 1e Austria 887 977 861 706 850 1a Bolivia 1 023 1 203 1 124 1 247 1 253 1e Brazil 192 166 244 381 494 1n Burundi 137 187 280 200 160 2e Canada 2 501 400 2 466 2 554 3 017 1e China 55 500 66 900 69 900 67 600 71 400 1e Congo, D.R. 236 23 43 101 59 1e Kazakhstan 100 0 0 0 0 1n Korea, North 100 100 110 95 85 2e Korea, South 0 0 5 14 0 1n Kyrgyzstan 100 100 100 100 100 2e Mongolia 27 14 9 45 0 1n Myanmar 87 163 170 200 200 2e Peru 503 568 433 289 28 1a Portugal 823 799 819 763 692 1e Russia, Asia 2 560 2 765 3 311 3 639 3 101 1e Russia, Europe 452 488 584 642 547 1e Rwanda 520 501 598 1 041 1 319 1a Spain 225 240 337 393 556 3e
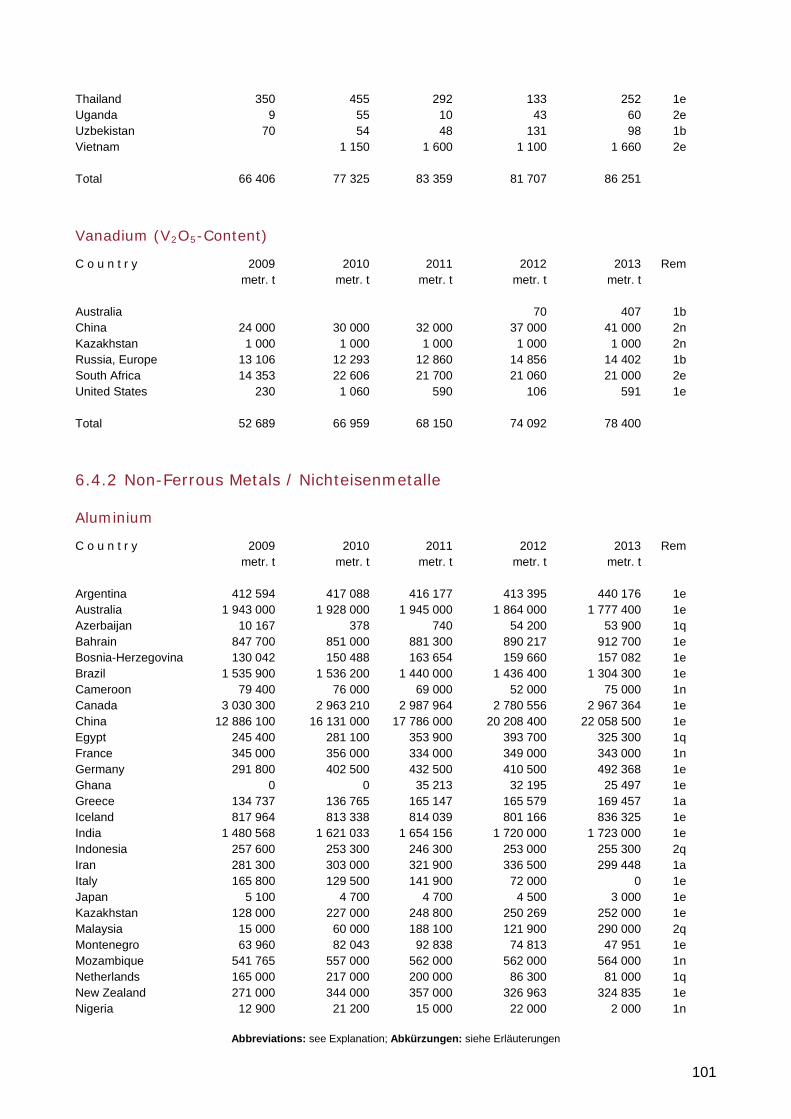
Abbreviations: see Explanation; Abkürzungen: siehe Erläuterungen
101
Thailand 350 455 292 133 252 1e Uganda 9 55 10 43 60 2e Uzbekistan 70 54 48 131 98 1b Vietnam 1 150 1 600 1 100 1 660 2e Total 66 406 77 325 83 359 81 707 86 251
Vanadium (V2O5-Content)
C o u n t r y 2009 2010 2011 2012 2013 Rem metr. t metr. t metr. t metr. t metr. t Australia 70 407 1b China 24 000 30 000 32 000 37 000 41 000 2n Kazakhstan 1 000 1 000 1 000 1 000 1 000 2n Russia, Europe 13 106 12 293 12 860 14 856 14 402 1b South Africa 14 353 22 606 21 700 21 060 21 000 2e United States 230 1 060 590 106 591 1e Total 52 689 66 959 68 150 74 092 78 400
6.4.2 Non-Ferrous Metals / Nichteisenmetalle
Aluminium
C o u n t r y 2009 2010 2011 2012 2013 Rem metr. t metr. t metr. t metr. t metr. t Argentina 412 594 417 088 416 177 413 395 440 176 1e Australia 1 943 000 1 928 000 1 945 000 1 864 000 1 777 400 1e Azerbaijan 10 167 378 740 54 200 53 900 1q Bahrain 847 700 851 000 881 300 890 217 912 700 1e Bosnia-Herzegovina 130 042 150 488 163 654 159 660 157 082 1e Brazil 1 535 900 1 536 200 1 440 000 1 436 400 1 304 300 1e Cameroon 79 400 76 000 69 000 52 000 75 000 1n Canada 3 030 300 2 963 210 2 987 964 2 780 556 2 967 364 1e China 12 886 100 16 131 000 17 786 000 20 208 400 22 058 500 1e Egypt 245 400 281 100 353 900 393 700 325 300 1q France 345 000 356 000 334 000 349 000 343 000 1n Germany 291 800 402 500 432 500 410 500 492 368 1e Ghana 0 0 35 213 32 195 25 497 1e Greece 134 737 136 765 165 147 165 579 169 457 1a Iceland 817 964 813 338 814 039 801 166 836 325 1e India 1 480 568 1 621 033 1 654 156 1 720 000 1 723 000 1e Indonesia 257 600 253 300 246 300 253 000 255 300 2q Iran 281 300 303 000 321 900 336 500 299 448 1a Italy 165 800 129 500 141 900 72 000 0 1e Japan 5 100 4 700 4 700 4 500 3 000 1e Kazakhstan 128 000 227 000 248 800 250 269 252 000 1e Malaysia 15 000 60 000 188 100 121 900 290 000 2q Montenegro 63 960 82 043 92 838 74 813 47 951 1e Mozambique 541 765 557 000 562 000 562 000 564 000 1n Netherlands 165 000 217 000 200 000 86 300 81 000 1q New Zealand 271 000 344 000 357 000 326 963 324 835 1e Nigeria 12 900 21 200 15 000 22 000 2 000 1n
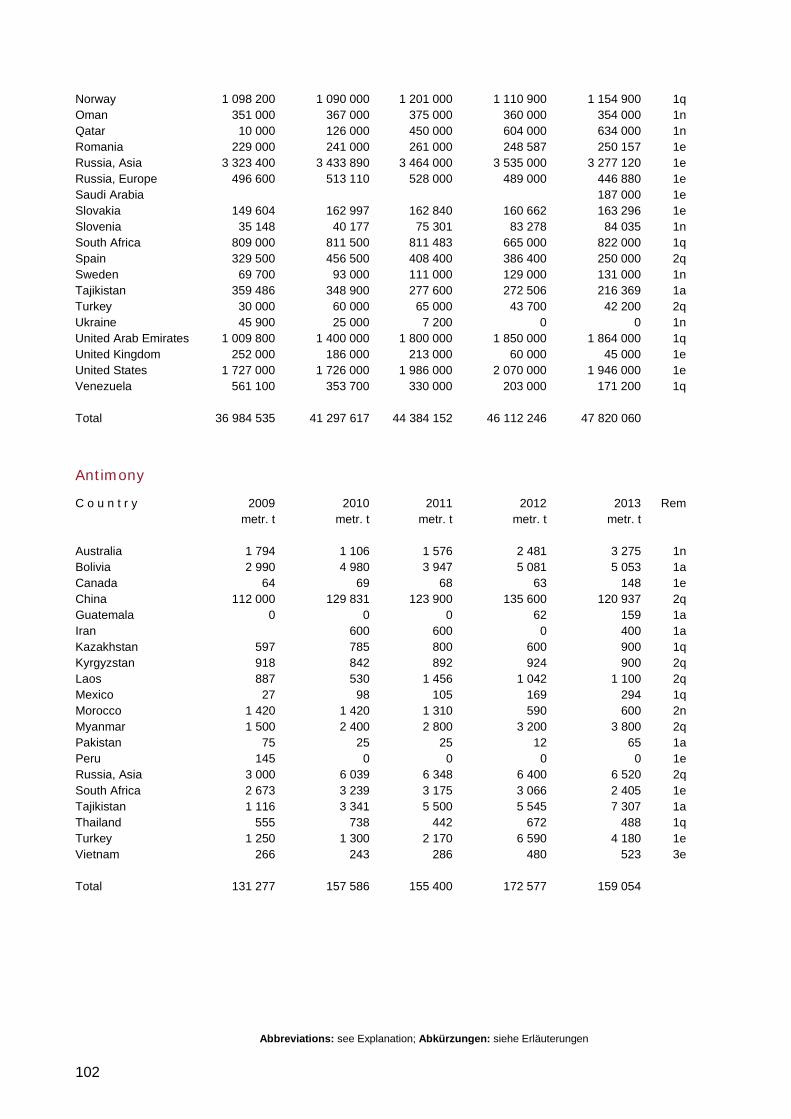
Abbreviations: see Explanation; Abkürzungen: siehe Erläuterungen
102
Norway 1 098 200 1 090 000 1 201 000 1 110 900 1 154 900 1q Oman 351 000 367 000 375 000 360 000 354 000 1n Qatar 10 000 126 000 450 000 604 000 634 000 1n Romania 229 000 241 000 261 000 248 587 250 157 1e Russia, Asia 3 323 400 3 433 890 3 464 000 3 535 000 3 277 120 1e Russia, Europe 496 600 513 110 528 000 489 000 446 880 1e Saudi Arabia 187 000 1e Slovakia 149 604 162 997 162 840 160 662 163 296 1e Slovenia 35 148 40 177 75 301 83 278 84 035 1n South Africa 809 000 811 500 811 483 665 000 822 000 1q Spain 329 500 456 500 408 400 386 400 250 000 2q Sweden 69 700 93 000 111 000 129 000 131 000 1n Tajikistan 359 486 348 900 277 600 272 506 216 369 1a Turkey 30 000 60 000 65 000 43 700 42 200 2q Ukraine 45 900 25 000 7 200 0 0 1n United Arab Emirates 1 009 800 1 400 000 1 800 000 1 850 000 1 864 000 1q United Kingdom 252 000 186 000 213 000 60 000 45 000 1e United States 1 727 000 1 726 000 1 986 000 2 070 000 1 946 000 1e Venezuela 561 100 353 700 330 000 203 000 171 200 1q Total 36 984 535 41 297 617 44 384 152 46 112 246 47 820 060
Antimony
C o u n t r y 2009 2010 2011 2012 2013 Rem metr. t metr. t metr. t metr. t metr. t Australia 1 794 1 106 1 576 2 481 3 275 1n Bolivia 2 990 4 980 3 947 5 081 5 053 1a Canada 64 69 68 63 148 1e China 112 000 129 831 123 900 135 600 120 937 2q Guatemala 0 0 0 62 159 1a Iran 600 600 0 400 1a Kazakhstan 597 785 800 600 900 1q Kyrgyzstan 918 842 892 924 900 2q Laos 887 530 1 456 1 042 1 100 2q Mexico 27 98 105 169 294 1q Morocco 1 420 1 420 1 310 590 600 2n Myanmar 1 500 2 400 2 800 3 200 3 800 2q Pakistan 75 25 25 12 65 1a Peru 145 0 0 0 0 1e Russia, Asia 3 000 6 039 6 348 6 400 6 520 2q South Africa 2 673 3 239 3 175 3 066 2 405 1e Tajikistan 1 116 3 341 5 500 5 545 7 307 1a Thailand 555 738 442 672 488 1q Turkey 1 250 1 300 2 170 6 590 4 180 1e Vietnam 266 243 286 480 523 3e Total 131 277 157 586 155 400 172 577 159 054
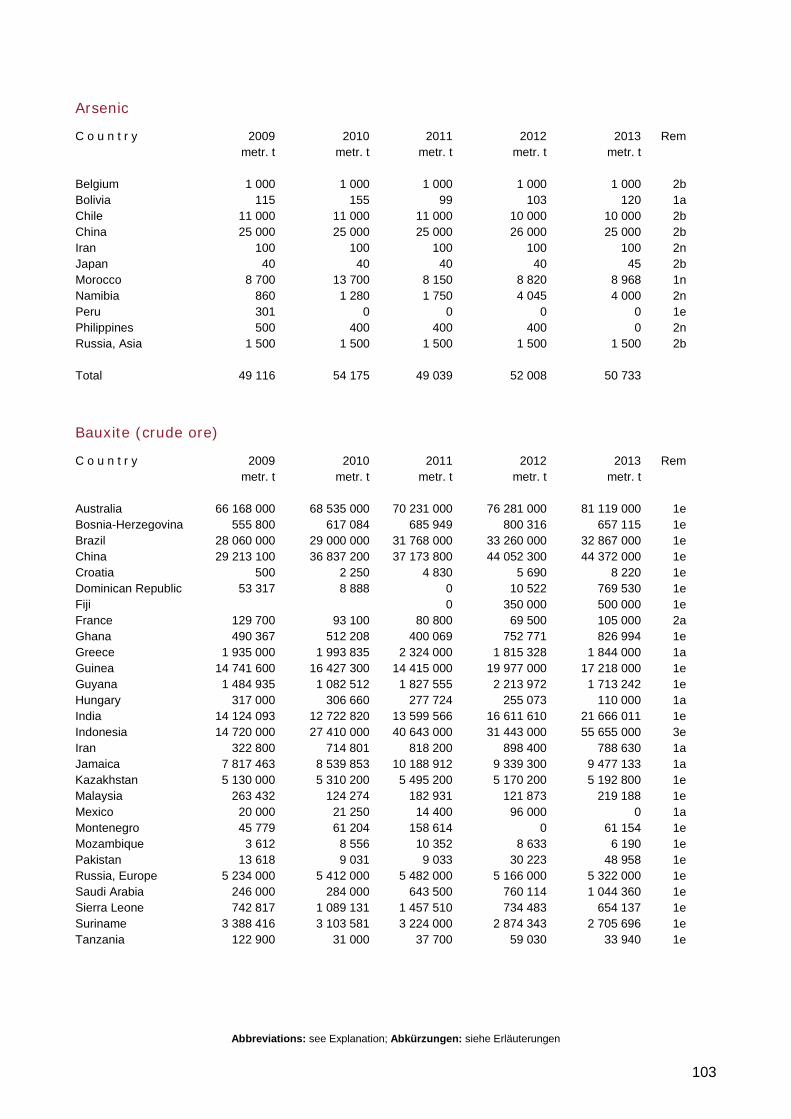
Abbreviations: see Explanation; Abkürzungen: siehe Erläuterungen
103
Arsenic
C o u n t r y 2009 2010 2011 2012 2013 Rem metr. t metr. t metr. t metr. t metr. t Belgium 1 000 1 000 1 000 1 000 1 000 2b Bolivia 115 155 99 103 120 1a Chile 11 000 11 000 11 000 10 000 10 000 2b China 25 000 25 000 25 000 26 000 25 000 2b Iran 100 100 100 100 100 2n Japan 40 40 40 40 45 2b Morocco 8 700 13 700 8 150 8 820 8 968 1n Namibia 860 1 280 1 750 4 045 4 000 2n Peru 301 0 0 0 0 1e Philippines 500 400 400 400 0 2n Russia, Asia 1 500 1 500 1 500 1 500 1 500 2b Total 49 116 54 175 49 039 52 008 50 733
Bauxite (crude ore)
C o u n t r y 2009 2010 2011 2012 2013 Rem metr. t metr. t metr. t metr. t metr. t Australia 66 168 000 68 535 000 70 231 000 76 281 000 81 119 000 1e Bosnia-Herzegovina 555 800 617 084 685 949 800 316 657 115 1e Brazil 28 060 000 29 000 000 31 768 000 33 260 000 32 867 000 1e China 29 213 100 36 837 200 37 173 800 44 052 300 44 372 000 1e Croatia 500 2 250 4 830 5 690 8 220 1e Dominican Republic 53 317 8 888 0 10 522 769 530 1e Fiji 0 350 000 500 000 1e France 129 700 93 100 80 800 69 500 105 000 2a Ghana 490 367 512 208 400 069 752 771 826 994 1e Greece 1 935 000 1 993 835 2 324 000 1 815 328 1 844 000 1a Guinea 14 741 600 16 427 300 14 415 000 19 977 000 17 218 000 1e Guyana 1 484 935 1 082 512 1 827 555 2 213 972 1 713 242 1e Hungary 317 000 306 660 277 724 255 073 110 000 1a India 14 124 093 12 722 820 13 599 566 16 611 610 21 666 011 1e Indonesia 14 720 000 27 410 000 40 643 000 31 443 000 55 655 000 3e Iran 322 800 714 801 818 200 898 400 788 630 1a Jamaica 7 817 463 8 539 853 10 188 912 9 339 300 9 477 133 1a Kazakhstan 5 130 000 5 310 200 5 495 200 5 170 200 5 192 800 1e Malaysia 263 432 124 274 182 931 121 873 219 188 1e Mexico 20 000 21 250 14 400 96 000 0 1a Montenegro 45 779 61 204 158 614 0 61 154 1e Mozambique 3 612 8 556 10 352 8 633 6 190 1e Pakistan 13 618 9 031 9 033 30 223 48 958 1e Russia, Europe 5 234 000 5 412 000 5 482 000 5 166 000 5 322 000 1e Saudi Arabia 246 000 284 000 643 500 760 114 1 044 360 1e Sierra Leone 742 817 1 089 131 1 457 510 734 483 654 137 1e Suriname 3 388 416 3 103 581 3 224 000 2 874 343 2 705 696 1e Tanzania 122 900 31 000 37 700 59 030 33 940 1e
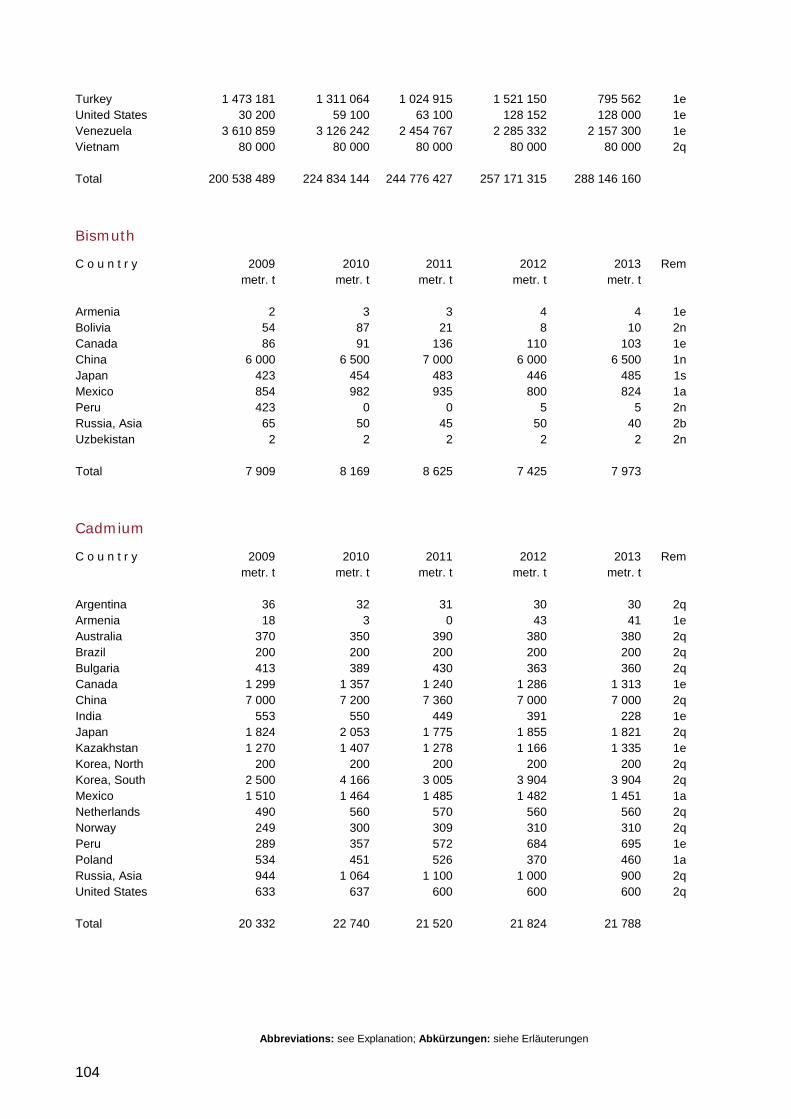
Abbreviations: see Explanation; Abkürzungen: siehe Erläuterungen
104
Turkey 1 473 181 1 311 064 1 024 915 1 521 150 795 562 1e United States 30 200 59 100 63 100 128 152 128 000 1e Venezuela 3 610 859 3 126 242 2 454 767 2 285 332 2 157 300 1e Vietnam 80 000 80 000 80 000 80 000 80 000 2q Total 200 538 489 224 834 144 244 776 427 257 171 315 288 146 160
Bismuth
C o u n t r y 2009 2010 2011 2012 2013 Rem metr. t metr. t metr. t metr. t metr. t Armenia 2 3 3 4 4 1e Bolivia 54 87 21 8 10 2n Canada 86 91 136 110 103 1e China 6 000 6 500 7 000 6 000 6 500 1n Japan 423 454 483 446 485 1s Mexico 854 982 935 800 824 1a Peru 423 0 0 5 5 2n Russia, Asia 65 50 45 50 40 2b Uzbekistan 2 2 2 2 2 2n Total 7 909 8 169 8 625 7 425 7 973
Cadmium
C o u n t r y 2009 2010 2011 2012 2013 Rem metr. t metr. t metr. t metr. t metr. t Argentina 36 32 31 30 30 2q Armenia 18 3 0 43 41 1e Australia 370 350 390 380 380 2q Brazil 200 200 200 200 200 2q Bulgaria 413 389 430 363 360 2q Canada 1 299 1 357 1 240 1 286 1 313 1e China 7 000 7 200 7 360 7 000 7 000 2q India 553 550 449 391 228 1e Japan 1 824 2 053 1 775 1 855 1 821 2q Kazakhstan 1 270 1 407 1 278 1 166 1 335 1e Korea, North 200 200 200 200 200 2q Korea, South 2 500 4 166 3 005 3 904 3 904 2q Mexico 1 510 1 464 1 485 1 482 1 451 1a Netherlands 490 560 570 560 560 2q Norway 249 300 309 310 310 2q Peru 289 357 572 684 695 1e Poland 534 451 526 370 460 1a Russia, Asia 944 1 064 1 100 1 000 900 2q United States 633 637 600 600 600 2q Total 20 332 22 740 21 520 21 824 21 788
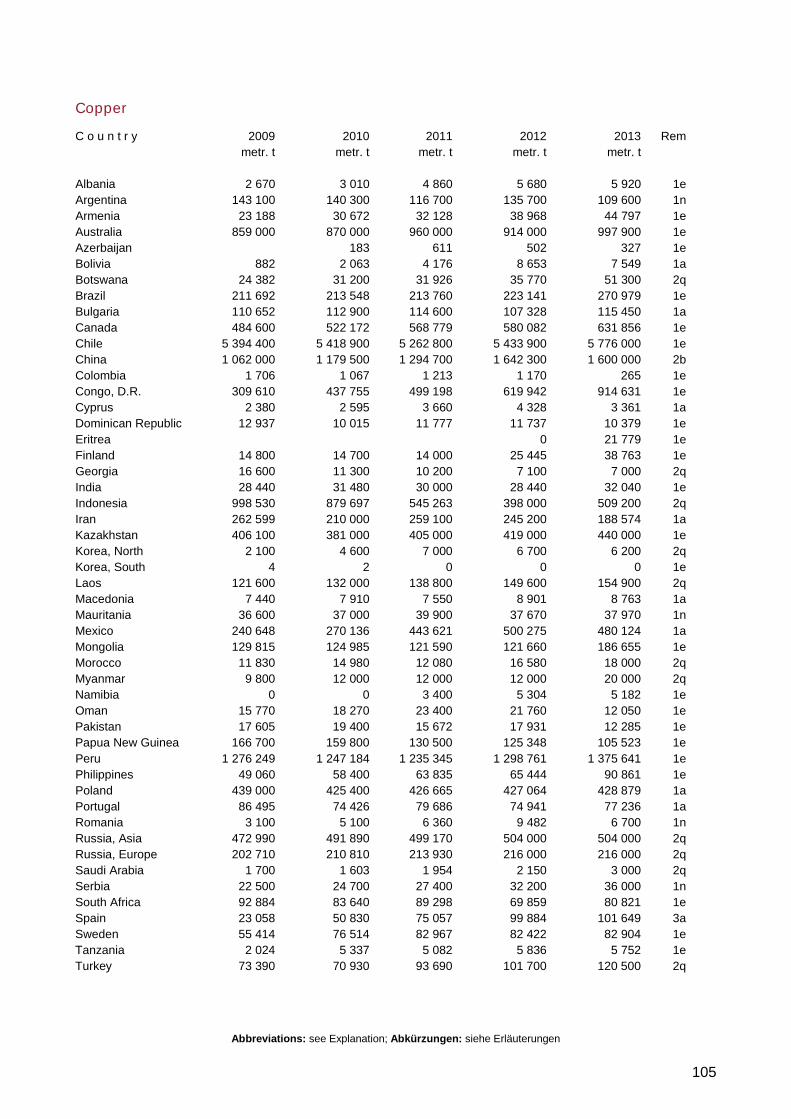
Abbreviations: see Explanation; Abkürzungen: siehe Erläuterungen
105
Copper
C o u n t r y 2009 2010 2011 2012 2013 Rem metr. t metr. t metr. t metr. t metr. t Albania 2 670 3 010 4 860 5 680 5 920 1e Argentina 143 100 140 300 116 700 135 700 109 600 1n Armenia 23 188 30 672 32 128 38 968 44 797 1e Australia 859 000 870 000 960 000 914 000 997 900 1e Azerbaijan 183 611 502 327 1e Bolivia 882 2 063 4 176 8 653 7 549 1a Botswana 24 382 31 200 31 926 35 770 51 300 2q Brazil 211 692 213 548 213 760 223 141 270 979 1e Bulgaria 110 652 112 900 114 600 107 328 115 450 1a Canada 484 600 522 172 568 779 580 082 631 856 1e Chile 5 394 400 5 418 900 5 262 800 5 433 900 5 776 000 1e China 1 062 000 1 179 500 1 294 700 1 642 300 1 600 000 2b Colombia 1 706 1 067 1 213 1 170 265 1e Congo, D.R. 309 610 437 755 499 198 619 942 914 631 1e Cyprus 2 380 2 595 3 660 4 328 3 361 1a Dominican Republic 12 937 10 015 11 777 11 737 10 379 1e Eritrea 0 21 779 1e Finland 14 800 14 700 14 000 25 445 38 763 1e Georgia 16 600 11 300 10 200 7 100 7 000 2q India 28 440 31 480 30 000 28 440 32 040 1e Indonesia 998 530 879 697 545 263 398 000 509 200 2q Iran 262 599 210 000 259 100 245 200 188 574 1a Kazakhstan 406 100 381 000 405 000 419 000 440 000 1e Korea, North 2 100 4 600 7 000 6 700 6 200 2q Korea, South 4 2 0 0 0 1e Laos 121 600 132 000 138 800 149 600 154 900 2q Macedonia 7 440 7 910 7 550 8 901 8 763 1a Mauritania 36 600 37 000 39 900 37 670 37 970 1n Mexico 240 648 270 136 443 621 500 275 480 124 1a Mongolia 129 815 124 985 121 590 121 660 186 655 1e Morocco 11 830 14 980 12 080 16 580 18 000 2q Myanmar 9 800 12 000 12 000 12 000 20 000 2q Namibia 0 0 3 400 5 304 5 182 1e Oman 15 770 18 270 23 400 21 760 12 050 1e Pakistan 17 605 19 400 15 672 17 931 12 285 1e Papua New Guinea 166 700 159 800 130 500 125 348 105 523 1e Peru 1 276 249 1 247 184 1 235 345 1 298 761 1 375 641 1e Philippines 49 060 58 400 63 835 65 444 90 861 1e Poland 439 000 425 400 426 665 427 064 428 879 1a Portugal 86 495 74 426 79 686 74 941 77 236 1a Romania 3 100 5 100 6 360 9 482 6 700 1n Russia, Asia 472 990 491 890 499 170 504 000 504 000 2q Russia, Europe 202 710 210 810 213 930 216 000 216 000 2q Saudi Arabia 1 700 1 603 1 954 2 150 3 000 2q Serbia 22 500 24 700 27 400 32 200 36 000 1n South Africa 92 884 83 640 89 298 69 859 80 821 1e Spain 23 058 50 830 75 057 99 884 101 649 3a Sweden 55 414 76 514 82 967 82 422 82 904 1e Tanzania 2 024 5 337 5 082 5 836 5 752 1e Turkey 73 390 70 930 93 690 101 700 120 500 2q
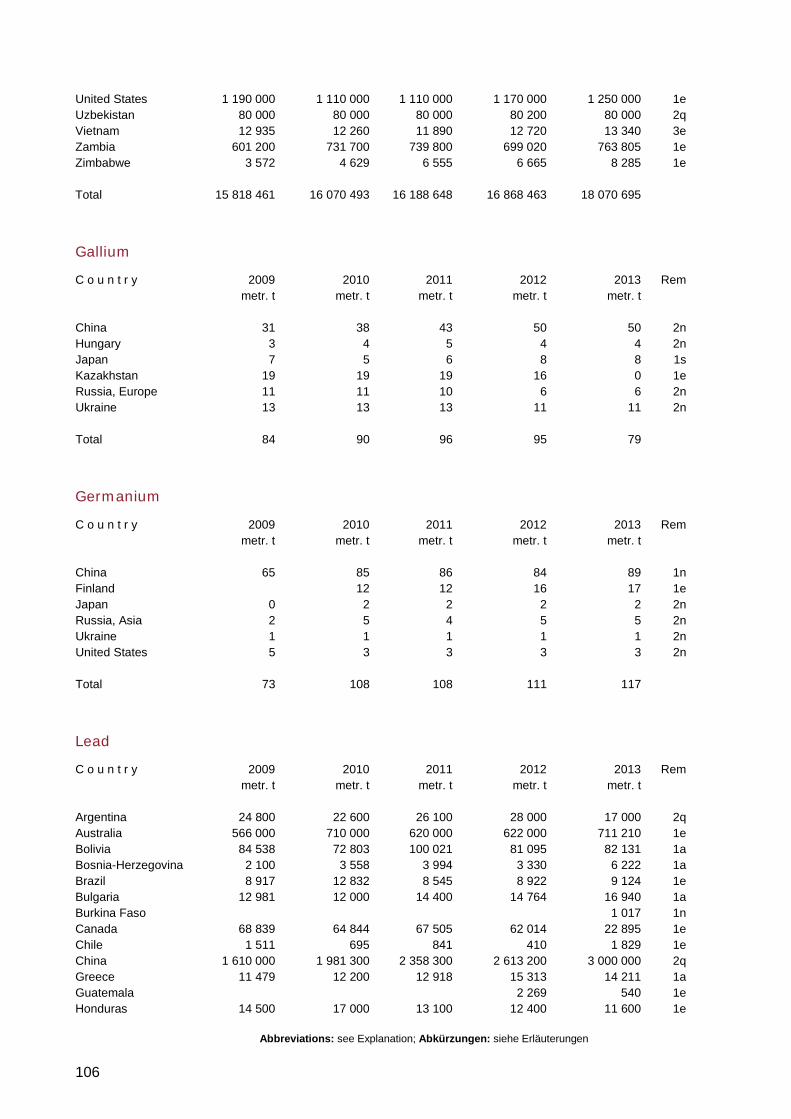
Abbreviations: see Explanation; Abkürzungen: siehe Erläuterungen
106
United States 1 190 000 1 110 000 1 110 000 1 170 000 1 250 000 1e Uzbekistan 80 000 80 000 80 000 80 200 80 000 2q Vietnam 12 935 12 260 11 890 12 720 13 340 3e Zambia 601 200 731 700 739 800 699 020 763 805 1e Zimbabwe 3 572 4 629 6 555 6 665 8 285 1e Total 15 818 461 16 070 493 16 188 648 16 868 463 18 070 695
Gallium
C o u n t r y 2009 2010 2011 2012 2013 Rem metr. t metr. t metr. t metr. t metr. t China 31 38 43 50 50 2n Hungary 3 4 5 4 4 2n Japan 7 5 6 8 8 1s Kazakhstan 19 19 19 16 0 1e Russia, Europe 11 11 10 6 6 2n Ukraine 13 13 13 11 11 2n Total 84 90 96 95 79
Germanium
C o u n t r y 2009 2010 2011 2012 2013 Rem metr. t metr. t metr. t metr. t metr. t China 65 85 86 84 89 1n Finland 12 12 16 17 1e Japan 0 2 2 2 2 2n Russia, Asia 2 5 4 5 5 2n Ukraine 1 1 1 1 1 2n United States 5 3 3 3 3 2n Total 73 108 108 111 117
Lead
C o u n t r y 2009 2010 2011 2012 2013 Rem metr. t metr. t metr. t metr. t metr. t Argentina 24 800 22 600 26 100 28 000 17 000 2q Australia 566 000 710 000 620 000 622 000 711 210 1e Bolivia 84 538 72 803 100 021 81 095 82 131 1a Bosnia-Herzegovina 2 100 3 558 3 994 3 330 6 222 1a Brazil 8 917 12 832 8 545 8 922 9 124 1e Bulgaria 12 981 12 000 14 400 14 764 16 940 1a Burkina Faso 1 017 1n Canada 68 839 64 844 67 505 62 014 22 895 1e Chile 1 511 695 841 410 1 829 1e China 1 610 000 1 981 300 2 358 300 2 613 200 3 000 000 2q Greece 11 479 12 200 12 918 15 313 14 211 1a Guatemala 2 269 540 1e Honduras 14 500 17 000 13 100 12 400 11 600 1e
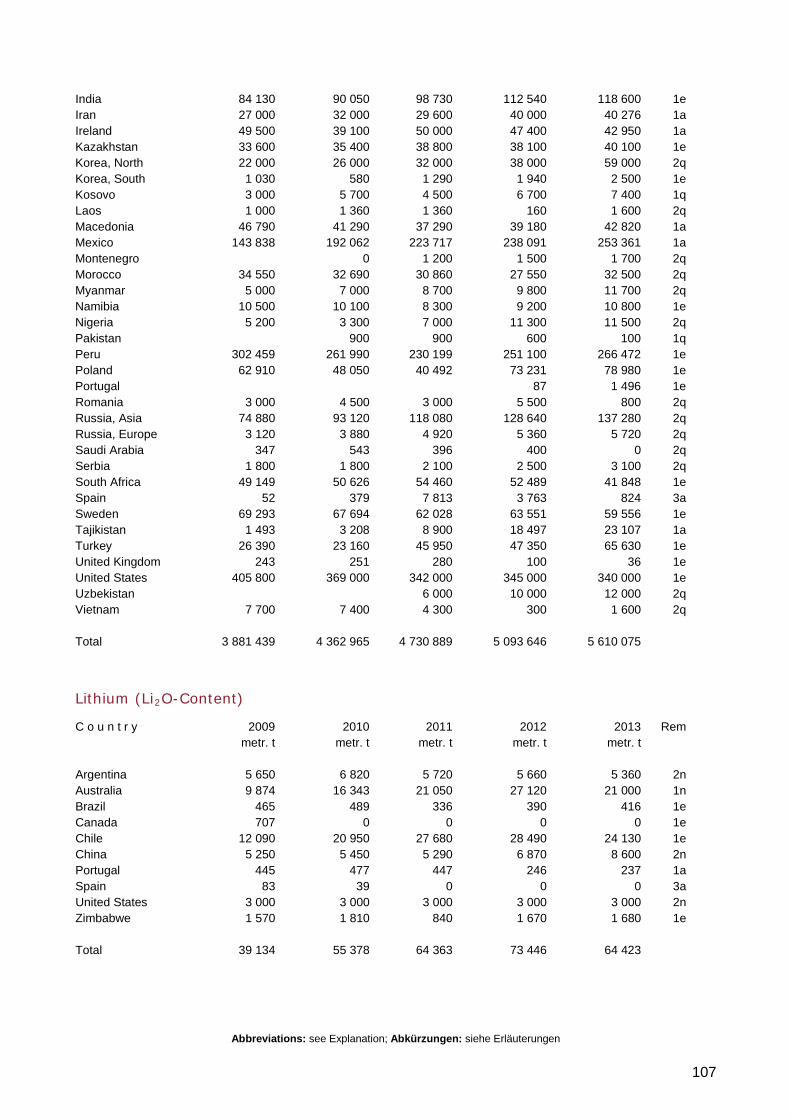
Abbreviations: see Explanation; Abkürzungen: siehe Erläuterungen
107
India 84 130 90 050 98 730 112 540 118 600 1e Iran 27 000 32 000 29 600 40 000 40 276 1a Ireland 49 500 39 100 50 000 47 400 42 950 1a Kazakhstan 33 600 35 400 38 800 38 100 40 100 1e Korea, North 22 000 26 000 32 000 38 000 59 000 2q Korea, South 1 030 580 1 290 1 940 2 500 1e Kosovo 3 000 5 700 4 500 6 700 7 400 1q Laos 1 000 1 360 1 360 160 1 600 2q Macedonia 46 790 41 290 37 290 39 180 42 820 1a Mexico 143 838 192 062 223 717 238 091 253 361 1a Montenegro 0 1 200 1 500 1 700 2q Morocco 34 550 32 690 30 860 27 550 32 500 2q Myanmar 5 000 7 000 8 700 9 800 11 700 2q Namibia 10 500 10 100 8 300 9 200 10 800 1e Nigeria 5 200 3 300 7 000 11 300 11 500 2q Pakistan 900 900 600 100 1q Peru 302 459 261 990 230 199 251 100 266 472 1e Poland 62 910 48 050 40 492 73 231 78 980 1e Portugal 87 1 496 1e Romania 3 000 4 500 3 000 5 500 800 2q Russia, Asia 74 880 93 120 118 080 128 640 137 280 2q Russia, Europe 3 120 3 880 4 920 5 360 5 720 2q Saudi Arabia 347 543 396 400 0 2q Serbia 1 800 1 800 2 100 2 500 3 100 2q South Africa 49 149 50 626 54 460 52 489 41 848 1e Spain 52 379 7 813 3 763 824 3a Sweden 69 293 67 694 62 028 63 551 59 556 1e Tajikistan 1 493 3 208 8 900 18 497 23 107 1a Turkey 26 390 23 160 45 950 47 350 65 630 1e United Kingdom 243 251 280 100 36 1e United States 405 800 369 000 342 000 345 000 340 000 1e Uzbekistan 6 000 10 000 12 000 2q Vietnam 7 700 7 400 4 300 300 1 600 2q Total 3 881 439 4 362 965 4 730 889 5 093 646 5 610 075
Lithium (Li2O-Content)
C o u n t r y 2009 2010 2011 2012 2013 Rem metr. t metr. t metr. t metr. t metr. t Argentina 5 650 6 820 5 720 5 660 5 360 2n Australia 9 874 16 343 21 050 27 120 21 000 1n Brazil 465 489 336 390 416 1e Canada 707 0 0 0 0 1e Chile 12 090 20 950 27 680 28 490 24 130 1e China 5 250 5 450 5 290 6 870 8 600 2n Portugal 445 477 447 246 237 1a Spain 83 39 0 0 0 3a United States 3 000 3 000 3 000 3 000 3 000 2n Zimbabwe 1 570 1 810 840 1 670 1 680 1e Total 39 134 55 378 64 363 73 446 64 423
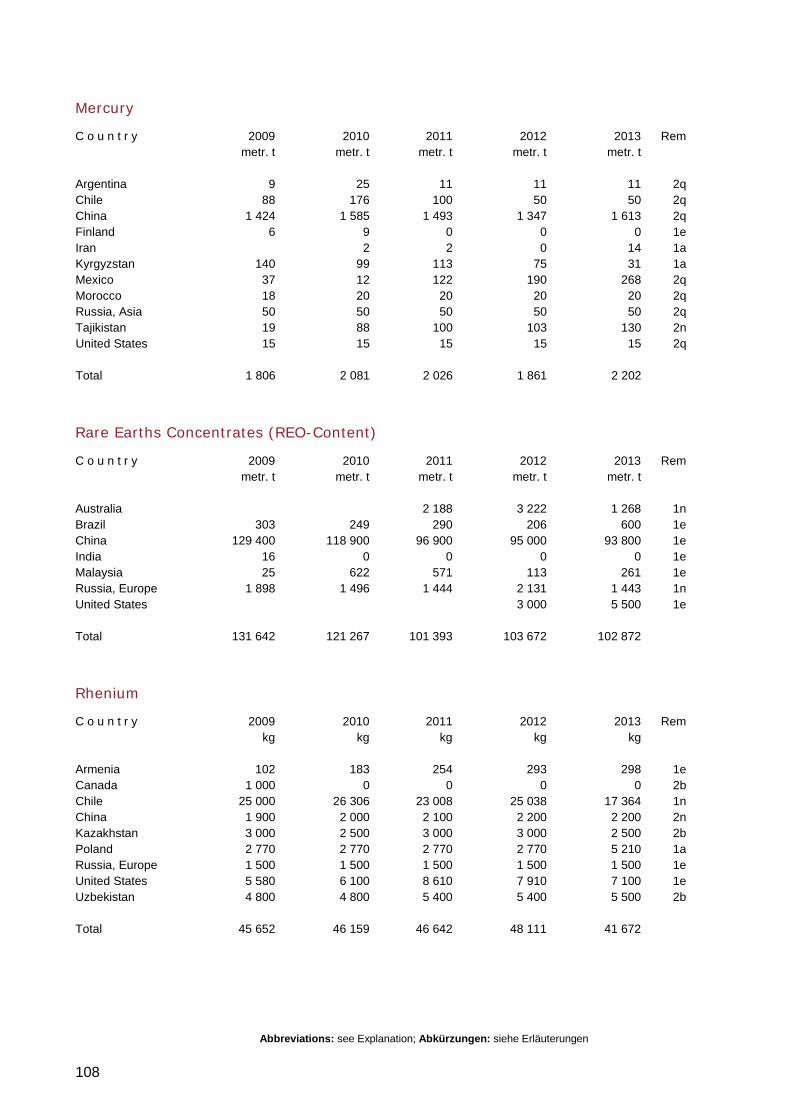
Abbreviations: see Explanation; Abkürzungen: siehe Erläuterungen
108
Mercury
C o u n t r y 2009 2010 2011 2012 2013 Rem metr. t metr. t metr. t metr. t metr. t Argentina 9 25 11 11 11 2q Chile 88 176 100 50 50 2q China 1 424 1 585 1 493 1 347 1 613 2q Finland 6 9 0 0 0 1e Iran 2 2 0 14 1a Kyrgyzstan 140 99 113 75 31 1a Mexico 37 12 122 190 268 2q Morocco 18 20 20 20 20 2q Russia, Asia 50 50 50 50 50 2q Tajikistan 19 88 100 103 130 2n United States 15 15 15 15 15 2q Total 1 806 2 081 2 026 1 861 2 202
Rare Earths Concentrates (REO-Content)
C o u n t r y 2009 2010 2011 2012 2013 Rem metr. t metr. t metr. t metr. t metr. t Australia 2 188 3 222 1 268 1n Brazil 303 249 290 206 600 1e China 129 400 118 900 96 900 95 000 93 800 1e India 16 0 0 0 0 1e Malaysia 25 622 571 113 261 1e Russia, Europe 1 898 1 496 1 444 2 131 1 443 1n United States 3 000 5 500 1e Total 131 642 121 267 101 393 103 672 102 872
Rhenium
C o u n t r y 2009 2010 2011 2012 2013 Rem kg kg kg kg kg Armenia 102 183 254 293 298 1e Canada 1 000 0 0 0 0 2b Chile 25 000 26 306 23 008 25 038 17 364 1n China 1 900 2 000 2 100 2 200 2 200 2n Kazakhstan 3 000 2 500 3 000 3 000 2 500 2b Poland 2 770 2 770 2 770 2 770 5 210 1a Russia, Europe 1 500 1 500 1 500 1 500 1 500 1e United States 5 580 6 100 8 610 7 910 7 100 1e Uzbekistan 4 800 4 800 5 400 5 400 5 500 2b Total 45 652 46 159 46 642 48 111 41 672
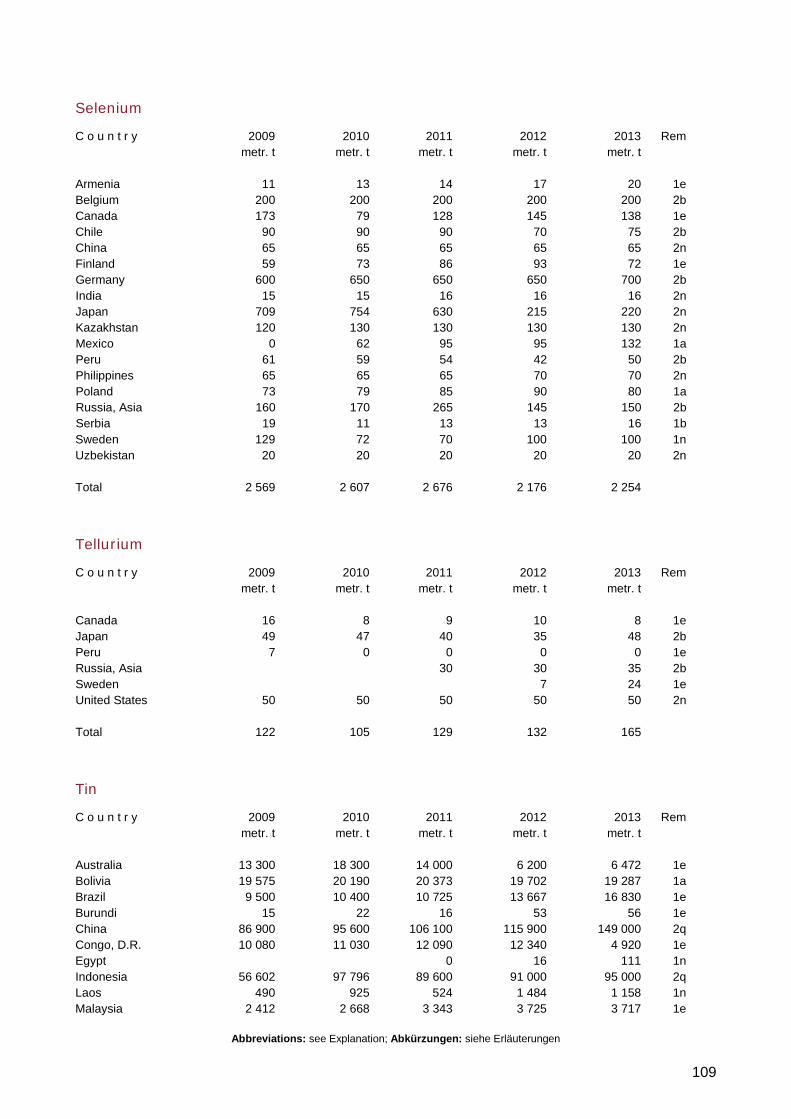
Abbreviations: see Explanation; Abkürzungen: siehe Erläuterungen
109
Selenium
C o u n t r y 2009 2010 2011 2012 2013 Rem metr. t metr. t metr. t metr. t metr. t Armenia 11 13 14 17 20 1e Belgium 200 200 200 200 200 2b Canada 173 79 128 145 138 1e Chile 90 90 90 70 75 2b China 65 65 65 65 65 2n Finland 59 73 86 93 72 1e Germany 600 650 650 650 700 2b India 15 15 16 16 16 2n Japan 709 754 630 215 220 2n Kazakhstan 120 130 130 130 130 2n Mexico 0 62 95 95 132 1a Peru 61 59 54 42 50 2b Philippines 65 65 65 70 70 2n Poland 73 79 85 90 80 1a Russia, Asia 160 170 265 145 150 2b Serbia 19 11 13 13 16 1b Sweden 129 72 70 100 100 1n Uzbekistan 20 20 20 20 20 2n Total 2 569 2 607 2 676 2 176 2 254
Tellurium
C o u n t r y 2009 2010 2011 2012 2013 Rem metr. t metr. t metr. t metr. t metr. t Canada 16 8 9 10 8 1e Japan 49 47 40 35 48 2b Peru 7 0 0 0 0 1e Russia, Asia 30 30 35 2b Sweden 7 24 1e United States 50 50 50 50 50 2n Total 122 105 129 132 165
Tin
C o u n t r y 2009 2010 2011 2012 2013 Rem metr. t metr. t metr. t metr. t metr. t Australia 13 300 18 300 14 000 6 200 6 472 1e Bolivia 19 575 20 190 20 373 19 702 19 287 1a Brazil 9 500 10 400 10 725 13 667 16 830 1e Burundi 15 22 16 53 56 1e China 86 900 95 600 106 100 115 900 149 000 2q Congo, D.R. 10 080 11 030 12 090 12 340 4 920 1e Egypt 0 16 111 1n Indonesia 56 602 97 796 89 600 91 000 95 000 2q Laos 490 925 524 1 484 1 158 1n Malaysia 2 412 2 668 3 343 3 725 3 717 1e
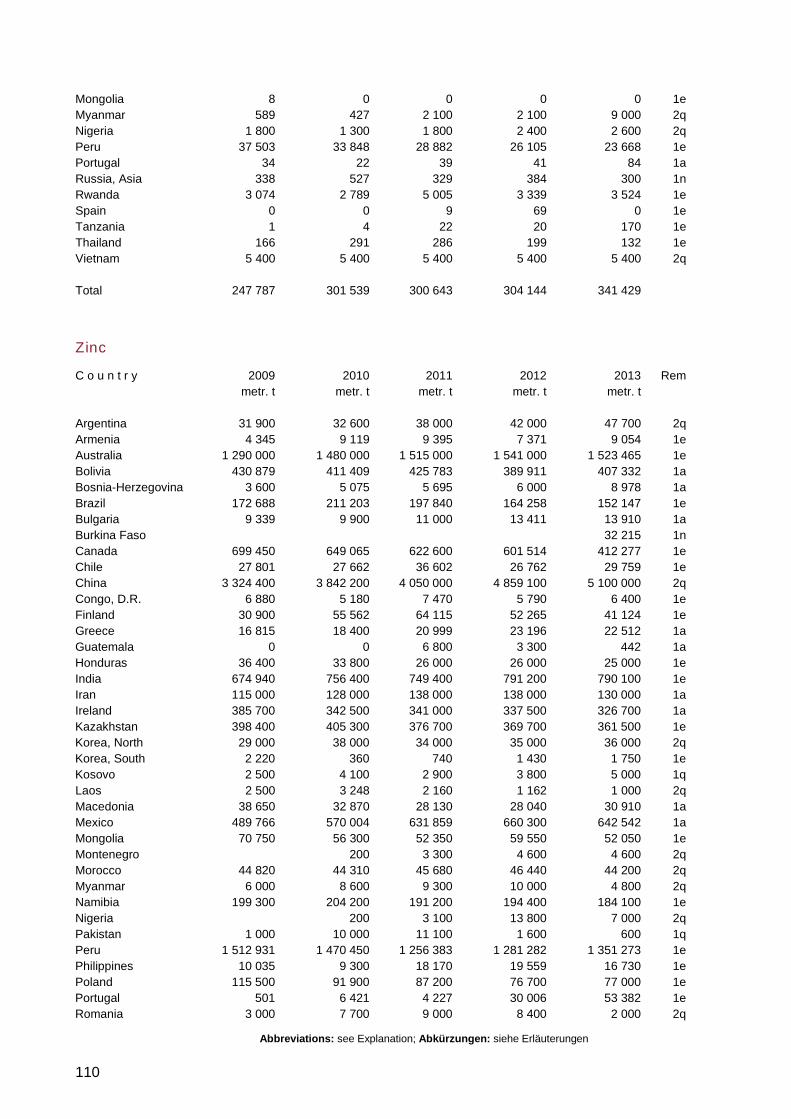
Abbreviations: see Explanation; Abkürzungen: siehe Erläuterungen
110
Mongolia 8 0 0 0 0 1e Myanmar 589 427 2 100 2 100 9 000 2q Nigeria 1 800 1 300 1 800 2 400 2 600 2q Peru 37 503 33 848 28 882 26 105 23 668 1e Portugal 34 22 39 41 84 1a Russia, Asia 338 527 329 384 300 1n Rwanda 3 074 2 789 5 005 3 339 3 524 1e Spain 0 0 9 69 0 1e Tanzania 1 4 22 20 170 1e Thailand 166 291 286 199 132 1e Vietnam 5 400 5 400 5 400 5 400 5 400 2q Total 247 787 301 539 300 643 304 144 341 429
Zinc
C o u n t r y 2009 2010 2011 2012 2013 Rem metr. t metr. t metr. t metr. t metr. t Argentina 31 900 32 600 38 000 42 000 47 700 2q Armenia 4 345 9 119 9 395 7 371 9 054 1e Australia 1 290 000 1 480 000 1 515 000 1 541 000 1 523 465 1e Bolivia 430 879 411 409 425 783 389 911 407 332 1a Bosnia-Herzegovina 3 600 5 075 5 695 6 000 8 978 1a Brazil 172 688 211 203 197 840 164 258 152 147 1e Bulgaria 9 339 9 900 11 000 13 411 13 910 1a Burkina Faso 32 215 1n Canada 699 450 649 065 622 600 601 514 412 277 1e Chile 27 801 27 662 36 602 26 762 29 759 1e China 3 324 400 3 842 200 4 050 000 4 859 100 5 100 000 2q Congo, D.R. 6 880 5 180 7 470 5 790 6 400 1e Finland 30 900 55 562 64 115 52 265 41 124 1e Greece 16 815 18 400 20 999 23 196 22 512 1a Guatemala 0 0 6 800 3 300 442 1a Honduras 36 400 33 800 26 000 26 000 25 000 1e India 674 940 756 400 749 400 791 200 790 100 1e Iran 115 000 128 000 138 000 138 000 130 000 1a Ireland 385 700 342 500 341 000 337 500 326 700 1a Kazakhstan 398 400 405 300 376 700 369 700 361 500 1e Korea, North 29 000 38 000 34 000 35 000 36 000 2q Korea, South 2 220 360 740 1 430 1 750 1e Kosovo 2 500 4 100 2 900 3 800 5 000 1q Laos 2 500 3 248 2 160 1 162 1 000 2q Macedonia 38 650 32 870 28 130 28 040 30 910 1a Mexico 489 766 570 004 631 859 660 300 642 542 1a Mongolia 70 750 56 300 52 350 59 550 52 050 1e Montenegro 200 3 300 4 600 4 600 2q Morocco 44 820 44 310 45 680 46 440 44 200 2q Myanmar 6 000 8 600 9 300 10 000 4 800 2q Namibia 199 300 204 200 191 200 194 400 184 100 1e Nigeria 200 3 100 13 800 7 000 2q Pakistan 1 000 10 000 11 100 1 600 600 1q Peru 1 512 931 1 470 450 1 256 383 1 281 282 1 351 273 1e Philippines 10 035 9 300 18 170 19 559 16 730 1e Poland 115 500 91 900 87 200 76 700 77 000 1e Portugal 501 6 421 4 227 30 006 53 382 1e Romania 3 000 7 700 9 000 8 400 2 000 2q
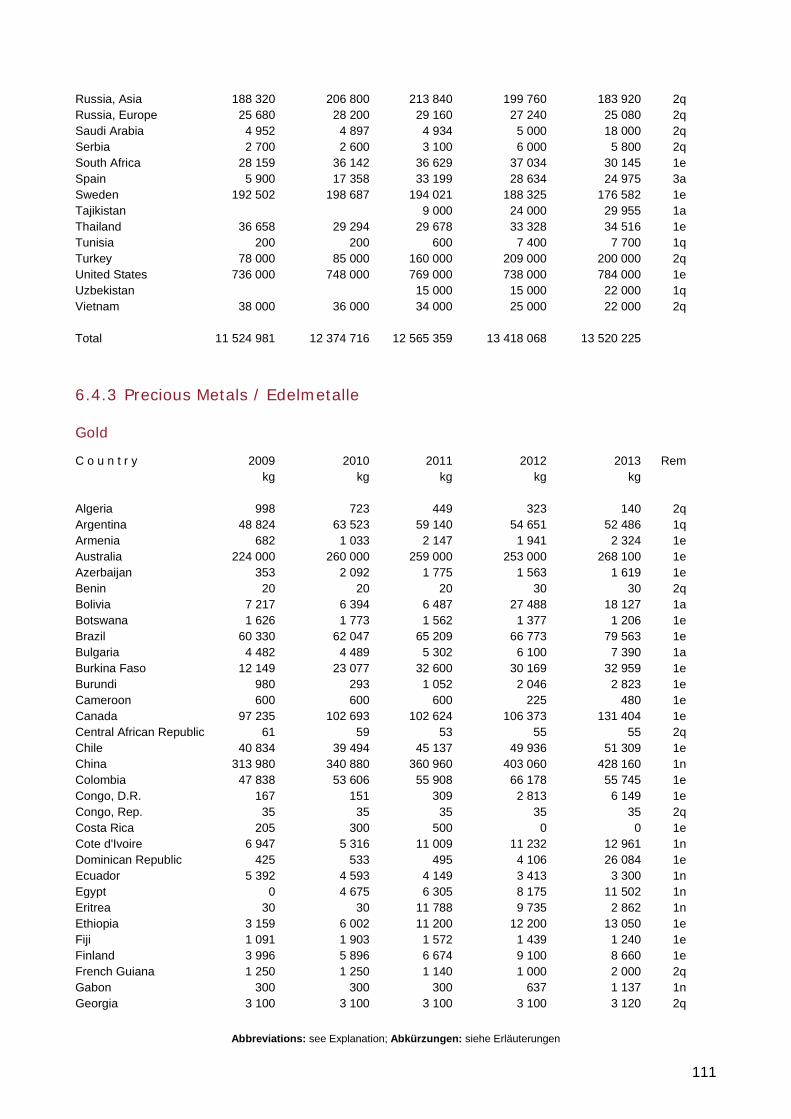
Abbreviations: see Explanation; Abkürzungen: siehe Erläuterungen
111
Russia, Asia 188 320 206 800 213 840 199 760 183 920 2q Russia, Europe 25 680 28 200 29 160 27 240 25 080 2q Saudi Arabia 4 952 4 897 4 934 5 000 18 000 2q Serbia 2 700 2 600 3 100 6 000 5 800 2q South Africa 28 159 36 142 36 629 37 034 30 145 1e Spain 5 900 17 358 33 199 28 634 24 975 3a Sweden 192 502 198 687 194 021 188 325 176 582 1e Tajikistan 9 000 24 000 29 955 1a Thailand 36 658 29 294 29 678 33 328 34 516 1e Tunisia 200 200 600 7 400 7 700 1q Turkey 78 000 85 000 160 000 209 000 200 000 2q United States 736 000 748 000 769 000 738 000 784 000 1e Uzbekistan 15 000 15 000 22 000 1q Vietnam 38 000 36 000 34 000 25 000 22 000 2q Total 11 524 981 12 374 716 12 565 359 13 418 068 13 520 225
6.4.3 Precious Metals / Edelmetalle
Gold
C o u n t r y 2009 2010 2011 2012 2013 Rem kg kg kg kg kg Algeria 998 723 449 323 140 2q Argentina 48 824 63 523 59 140 54 651 52 486 1q Armenia 682 1 033 2 147 1 941 2 324 1e Australia 224 000 260 000 259 000 253 000 268 100 1e Azerbaijan 353 2 092 1 775 1 563 1 619 1e Benin 20 20 20 30 30 2q Bolivia 7 217 6 394 6 487 27 488 18 127 1a Botswana 1 626 1 773 1 562 1 377 1 206 1e Brazil 60 330 62 047 65 209 66 773 79 563 1e Bulgaria 4 482 4 489 5 302 6 100 7 390 1a Burkina Faso 12 149 23 077 32 600 30 169 32 959 1e Burundi 980 293 1 052 2 046 2 823 1e Cameroon 600 600 600 225 480 1e Canada 97 235 102 693 102 624 106 373 131 404 1e Central African Republic 61 59 53 55 55 2q Chile 40 834 39 494 45 137 49 936 51 309 1e China 313 980 340 880 360 960 403 060 428 160 1n Colombia 47 838 53 606 55 908 66 178 55 745 1e Congo, D.R. 167 151 309 2 813 6 149 1e Congo, Rep. 35 35 35 35 35 2q Costa Rica 205 300 500 0 0 1e Cote d'Ivoire 6 947 5 316 11 009 11 232 12 961 1n Dominican Republic 425 533 495 4 106 26 084 1e Ecuador 5 392 4 593 4 149 3 413 3 300 1n Egypt 0 4 675 6 305 8 175 11 502 1n Eritrea 30 30 11 788 9 735 2 862 1n Ethiopia 3 159 6 002 11 200 12 200 13 050 1e Fiji 1 091 1 903 1 572 1 439 1 240 1e Finland 3 996 5 896 6 674 9 100 8 660 1e French Guiana 1 250 1 250 1 140 1 000 2 000 2q Gabon 300 300 300 637 1 137 1n Georgia 3 100 3 100 3 100 3 100 3 120 2q
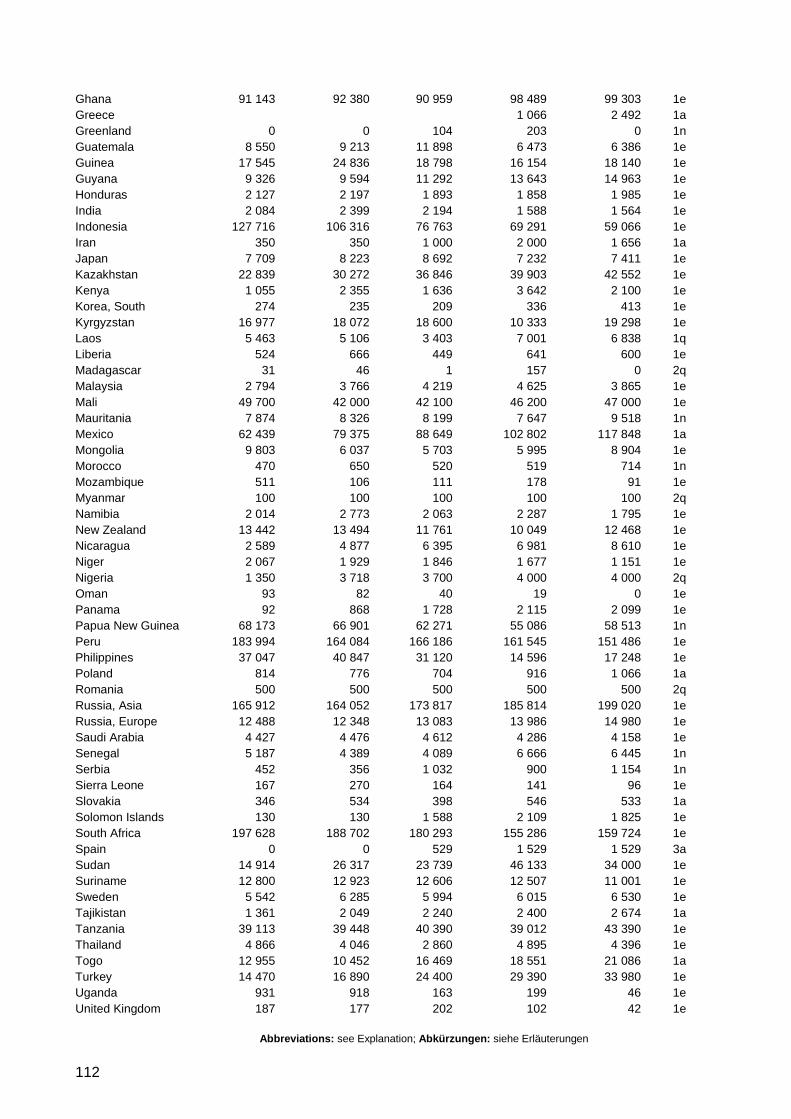
Abbreviations: see Explanation; Abkürzungen: siehe Erläuterungen
112
Ghana 91 143 92 380 90 959 98 489 99 303 1e Greece 1 066 2 492 1a Greenland 0 0 104 203 0 1n Guatemala 8 550 9 213 11 898 6 473 6 386 1e Guinea 17 545 24 836 18 798 16 154 18 140 1e Guyana 9 326 9 594 11 292 13 643 14 963 1e Honduras 2 127 2 197 1 893 1 858 1 985 1e India 2 084 2 399 2 194 1 588 1 564 1e Indonesia 127 716 106 316 76 763 69 291 59 066 1e Iran 350 350 1 000 2 000 1 656 1a Japan 7 709 8 223 8 692 7 232 7 411 1e Kazakhstan 22 839 30 272 36 846 39 903 42 552 1e Kenya 1 055 2 355 1 636 3 642 2 100 1e Korea, South 274 235 209 336 413 1e Kyrgyzstan 16 977 18 072 18 600 10 333 19 298 1e Laos 5 463 5 106 3 403 7 001 6 838 1q Liberia 524 666 449 641 600 1e Madagascar 31 46 1 157 0 2q Malaysia 2 794 3 766 4 219 4 625 3 865 1e Mali 49 700 42 000 42 100 46 200 47 000 1e Mauritania 7 874 8 326 8 199 7 647 9 518 1n Mexico 62 439 79 375 88 649 102 802 117 848 1a Mongolia 9 803 6 037 5 703 5 995 8 904 1e Morocco 470 650 520 519 714 1n Mozambique 511 106 111 178 91 1e Myanmar 100 100 100 100 100 2q Namibia 2 014 2 773 2 063 2 287 1 795 1e New Zealand 13 442 13 494 11 761 10 049 12 468 1e Nicaragua 2 589 4 877 6 395 6 981 8 610 1e Niger 2 067 1 929 1 846 1 677 1 151 1e Nigeria 1 350 3 718 3 700 4 000 4 000 2q Oman 93 82 40 19 0 1e Panama 92 868 1 728 2 115 2 099 1e Papua New Guinea 68 173 66 901 62 271 55 086 58 513 1n Peru 183 994 164 084 166 186 161 545 151 486 1e Philippines 37 047 40 847 31 120 14 596 17 248 1e Poland 814 776 704 916 1 066 1a Romania 500 500 500 500 500 2q Russia, Asia 165 912 164 052 173 817 185 814 199 020 1e Russia, Europe 12 488 12 348 13 083 13 986 14 980 1e Saudi Arabia 4 427 4 476 4 612 4 286 4 158 1e Senegal 5 187 4 389 4 089 6 666 6 445 1n Serbia 452 356 1 032 900 1 154 1n Sierra Leone 167 270 164 141 96 1e Slovakia 346 534 398 546 533 1a Solomon Islands 130 130 1 588 2 109 1 825 1e South Africa 197 628 188 702 180 293 155 286 159 724 1e Spain 0 0 529 1 529 1 529 3a Sudan 14 914 26 317 23 739 46 133 34 000 1e Suriname 12 800 12 923 12 606 12 507 11 001 1e Sweden 5 542 6 285 5 994 6 015 6 530 1e Tajikistan 1 361 2 049 2 240 2 400 2 674 1a Tanzania 39 113 39 448 40 390 39 012 43 390 1e Thailand 4 866 4 046 2 860 4 895 4 396 1e Togo 12 955 10 452 16 469 18 551 21 086 1a Turkey 14 470 16 890 24 400 29 390 33 980 1e Uganda 931 918 163 199 46 1e United Kingdom 187 177 202 102 42 1e
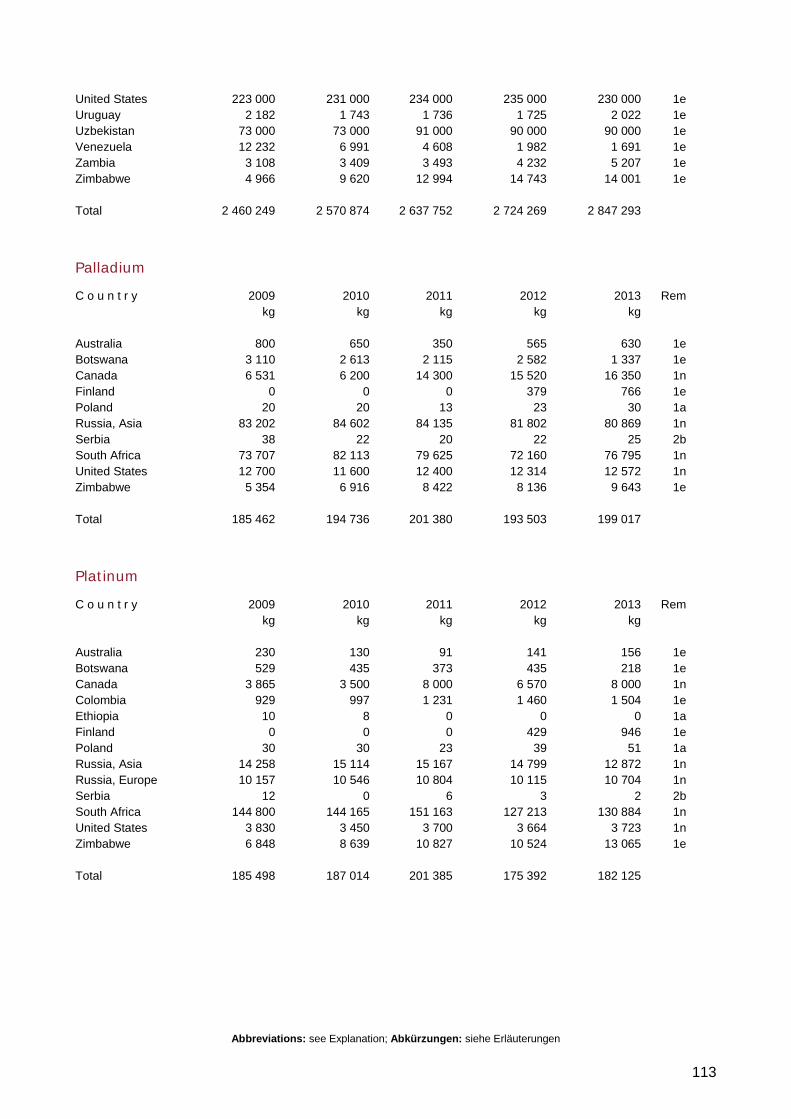
Abbreviations: see Explanation; Abkürzungen: siehe Erläuterungen
113
United States 223 000 231 000 234 000 235 000 230 000 1e Uruguay 2 182 1 743 1 736 1 725 2 022 1e Uzbekistan 73 000 73 000 91 000 90 000 90 000 1e Venezuela 12 232 6 991 4 608 1 982 1 691 1e Zambia 3 108 3 409 3 493 4 232 5 207 1e Zimbabwe 4 966 9 620 12 994 14 743 14 001 1e Total 2 460 249 2 570 874 2 637 752 2 724 269 2 847 293
Palladium
C o u n t r y 2009 2010 2011 2012 2013 Rem kg kg kg kg kg Australia 800 650 350 565 630 1e Botswana 3 110 2 613 2 115 2 582 1 337 1e Canada 6 531 6 200 14 300 15 520 16 350 1n Finland 0 0 0 379 766 1e Poland 20 20 13 23 30 1a Russia, Asia 83 202 84 602 84 135 81 802 80 869 1n Serbia 38 22 20 22 25 2b South Africa 73 707 82 113 79 625 72 160 76 795 1n United States 12 700 11 600 12 400 12 314 12 572 1n Zimbabwe 5 354 6 916 8 422 8 136 9 643 1e Total 185 462 194 736 201 380 193 503 199 017
Platinum
C o u n t r y 2009 2010 2011 2012 2013 Rem kg kg kg kg kg Australia 230 130 91 141 156 1e Botswana 529 435 373 435 218 1e Canada 3 865 3 500 8 000 6 570 8 000 1n Colombia 929 997 1 231 1 460 1 504 1e Ethiopia 10 8 0 0 0 1a Finland 0 0 0 429 946 1e Poland 30 30 23 39 51 1a Russia, Asia 14 258 15 114 15 167 14 799 12 872 1n Russia, Europe 10 157 10 546 10 804 10 115 10 704 1n Serbia 12 0 6 3 2 2b South Africa 144 800 144 165 151 163 127 213 130 884 1n United States 3 830 3 450 3 700 3 664 3 723 1n Zimbabwe 6 848 8 639 10 827 10 524 13 065 1e Total 185 498 187 014 201 385 175 392 182 125
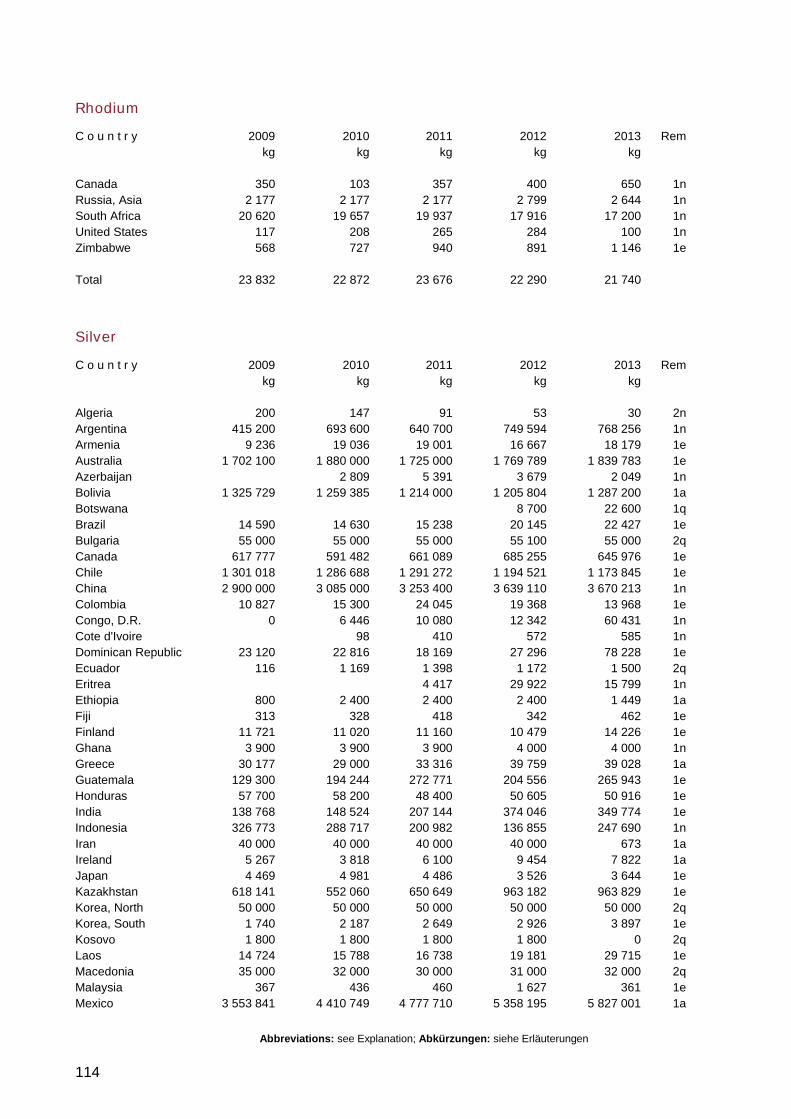
Abbreviations: see Explanation; Abkürzungen: siehe Erläuterungen
114
Rhodium
C o u n t r y 2009 2010 2011 2012 2013 Rem kg kg kg kg kg Canada 350 103 357 400 650 1n Russia, Asia 2 177 2 177 2 177 2 799 2 644 1n South Africa 20 620 19 657 19 937 17 916 17 200 1n United States 117 208 265 284 100 1n Zimbabwe 568 727 940 891 1 146 1e Total 23 832 22 872 23 676 22 290 21 740
Silver
C o u n t r y 2009 2010 2011 2012 2013 Rem kg kg kg kg kg Algeria 200 147 91 53 30 2n Argentina 415 200 693 600 640 700 749 594 768 256 1n Armenia 9 236 19 036 19 001 16 667 18 179 1e Australia 1 702 100 1 880 000 1 725 000 1 769 789 1 839 783 1e Azerbaijan 2 809 5 391 3 679 2 049 1n Bolivia 1 325 729 1 259 385 1 214 000 1 205 804 1 287 200 1a Botswana 8 700 22 600 1q Brazil 14 590 14 630 15 238 20 145 22 427 1e Bulgaria 55 000 55 000 55 000 55 100 55 000 2q Canada 617 777 591 482 661 089 685 255 645 976 1e Chile 1 301 018 1 286 688 1 291 272 1 194 521 1 173 845 1e China 2 900 000 3 085 000 3 253 400 3 639 110 3 670 213 1n Colombia 10 827 15 300 24 045 19 368 13 968 1e Congo, D.R. 0 6 446 10 080 12 342 60 431 1n Cote d'Ivoire 98 410 572 585 1n Dominican Republic 23 120 22 816 18 169 27 296 78 228 1e Ecuador 116 1 169 1 398 1 172 1 500 2q Eritrea 4 417 29 922 15 799 1n Ethiopia 800 2 400 2 400 2 400 1 449 1a Fiji 313 328 418 342 462 1e Finland 11 721 11 020 11 160 10 479 14 226 1e Ghana 3 900 3 900 3 900 4 000 4 000 1n Greece 30 177 29 000 33 316 39 759 39 028 1a Guatemala 129 300 194 244 272 771 204 556 265 943 1e Honduras 57 700 58 200 48 400 50 605 50 916 1e India 138 768 148 524 207 144 374 046 349 774 1e Indonesia 326 773 288 717 200 982 136 855 247 690 1n Iran 40 000 40 000 40 000 40 000 673 1a Ireland 5 267 3 818 6 100 9 454 7 822 1a Japan 4 469 4 981 4 486 3 526 3 644 1e Kazakhstan 618 141 552 060 650 649 963 182 963 829 1e Korea, North 50 000 50 000 50 000 50 000 50 000 2q Korea, South 1 740 2 187 2 649 2 926 3 897 1e Kosovo 1 800 1 800 1 800 1 800 0 2q Laos 14 724 15 788 16 738 19 181 29 715 1e Macedonia 35 000 32 000 30 000 31 000 32 000 2q Malaysia 367 436 460 1 627 361 1e Mexico 3 553 841 4 410 749 4 777 710 5 358 195 5 827 001 1a
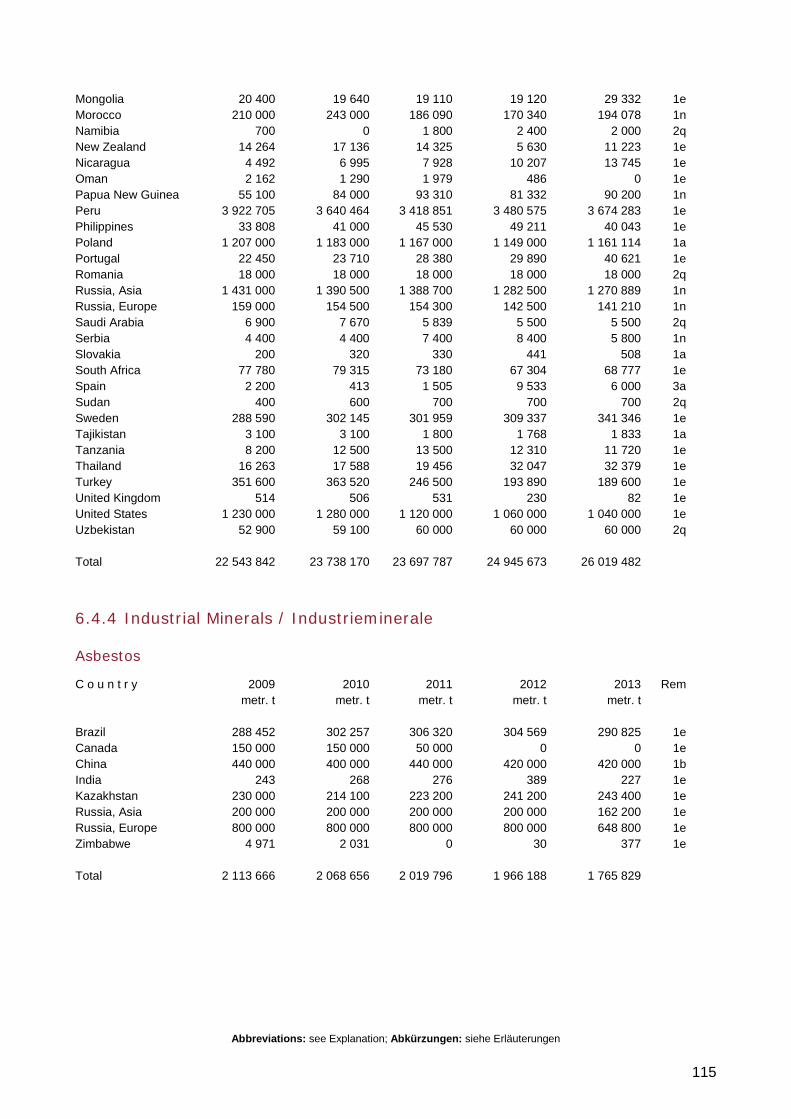
Abbreviations: see Explanation; Abkürzungen: siehe Erläuterungen
115
Mongolia 20 400 19 640 19 110 19 120 29 332 1e Morocco 210 000 243 000 186 090 170 340 194 078 1n Namibia 700 0 1 800 2 400 2 000 2q New Zealand 14 264 17 136 14 325 5 630 11 223 1e Nicaragua 4 492 6 995 7 928 10 207 13 745 1e Oman 2 162 1 290 1 979 486 0 1e Papua New Guinea 55 100 84 000 93 310 81 332 90 200 1n Peru 3 922 705 3 640 464 3 418 851 3 480 575 3 674 283 1e Philippines 33 808 41 000 45 530 49 211 40 043 1e Poland 1 207 000 1 183 000 1 167 000 1 149 000 1 161 114 1a Portugal 22 450 23 710 28 380 29 890 40 621 1e Romania 18 000 18 000 18 000 18 000 18 000 2q Russia, Asia 1 431 000 1 390 500 1 388 700 1 282 500 1 270 889 1n Russia, Europe 159 000 154 500 154 300 142 500 141 210 1n Saudi Arabia 6 900 7 670 5 839 5 500 5 500 2q Serbia 4 400 4 400 7 400 8 400 5 800 1n Slovakia 200 320 330 441 508 1a South Africa 77 780 79 315 73 180 67 304 68 777 1e Spain 2 200 413 1 505 9 533 6 000 3a Sudan 400 600 700 700 700 2q Sweden 288 590 302 145 301 959 309 337 341 346 1e Tajikistan 3 100 3 100 1 800 1 768 1 833 1a Tanzania 8 200 12 500 13 500 12 310 11 720 1e Thailand 16 263 17 588 19 456 32 047 32 379 1e Turkey 351 600 363 520 246 500 193 890 189 600 1e United Kingdom 514 506 531 230 82 1e United States 1 230 000 1 280 000 1 120 000 1 060 000 1 040 000 1e Uzbekistan 52 900 59 100 60 000 60 000 60 000 2q Total 22 543 842 23 738 170 23 697 787 24 945 673 26 019 482
6.4.4 Industrial Minerals / Industrieminerale
Asbestos
C o u n t r y 2009 2010 2011 2012 2013 Rem metr. t metr. t metr. t metr. t metr. t Brazil 288 452 302 257 306 320 304 569 290 825 1e Canada 150 000 150 000 50 000 0 0 1e China 440 000 400 000 440 000 420 000 420 000 1b India 243 268 276 389 227 1e Kazakhstan 230 000 214 100 223 200 241 200 243 400 1e Russia, Asia 200 000 200 000 200 000 200 000 162 200 1e Russia, Europe 800 000 800 000 800 000 800 000 648 800 1e Zimbabwe 4 971 2 031 0 30 377 1e Total 2 113 666 2 068 656 2 019 796 1 966 188 1 765 829
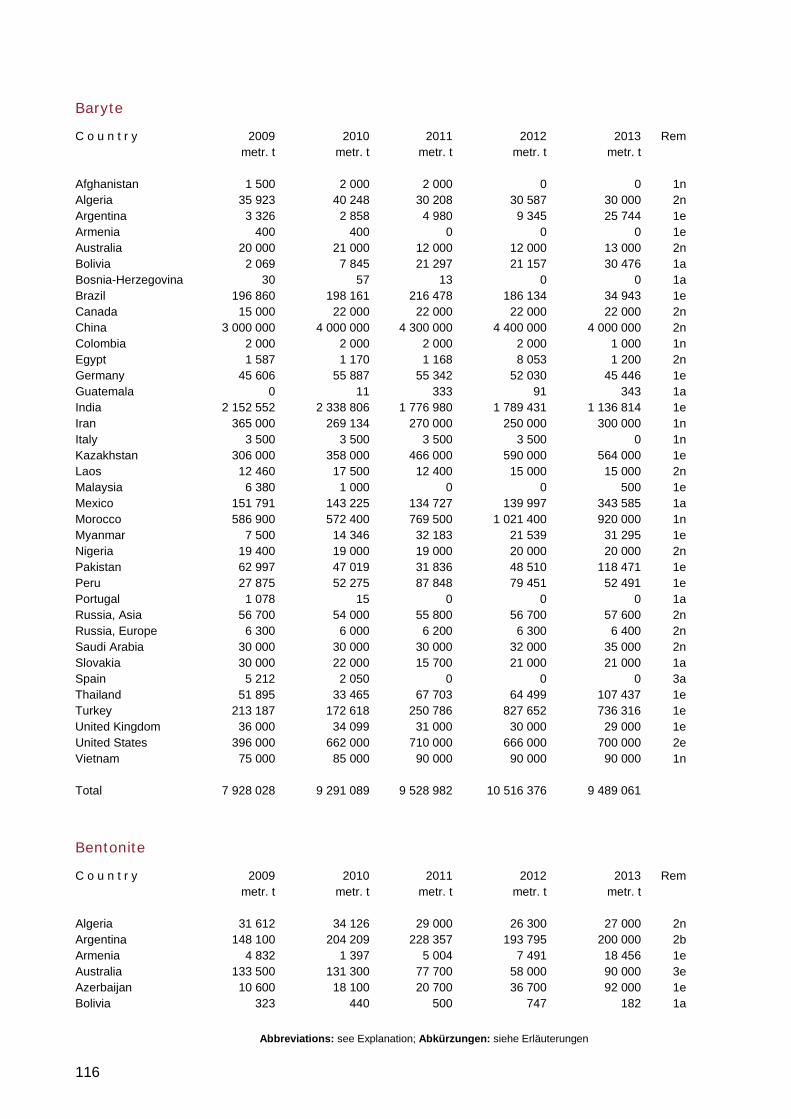
Abbreviations: see Explanation; Abkürzungen: siehe Erläuterungen
116
Baryte
C o u n t r y 2009 2010 2011 2012 2013 Rem metr. t metr. t metr. t metr. t metr. t Afghanistan 1 500 2 000 2 000 0 0 1n Algeria 35 923 40 248 30 208 30 587 30 000 2n Argentina 3 326 2 858 4 980 9 345 25 744 1e Armenia 400 400 0 0 0 1e Australia 20 000 21 000 12 000 12 000 13 000 2n Bolivia 2 069 7 845 21 297 21 157 30 476 1a Bosnia-Herzegovina 30 57 13 0 0 1a Brazil 196 860 198 161 216 478 186 134 34 943 1e Canada 15 000 22 000 22 000 22 000 22 000 2n China 3 000 000 4 000 000 4 300 000 4 400 000 4 000 000 2n Colombia 2 000 2 000 2 000 2 000 1 000 1n Egypt 1 587 1 170 1 168 8 053 1 200 2n Germany 45 606 55 887 55 342 52 030 45 446 1e Guatemala 0 11 333 91 343 1a India 2 152 552 2 338 806 1 776 980 1 789 431 1 136 814 1e Iran 365 000 269 134 270 000 250 000 300 000 1n Italy 3 500 3 500 3 500 3 500 0 1n Kazakhstan 306 000 358 000 466 000 590 000 564 000 1e Laos 12 460 17 500 12 400 15 000 15 000 2n Malaysia 6 380 1 000 0 0 500 1e Mexico 151 791 143 225 134 727 139 997 343 585 1a Morocco 586 900 572 400 769 500 1 021 400 920 000 1n Myanmar 7 500 14 346 32 183 21 539 31 295 1e Nigeria 19 400 19 000 19 000 20 000 20 000 2n Pakistan 62 997 47 019 31 836 48 510 118 471 1e Peru 27 875 52 275 87 848 79 451 52 491 1e Portugal 1 078 15 0 0 0 1a Russia, Asia 56 700 54 000 55 800 56 700 57 600 2n Russia, Europe 6 300 6 000 6 200 6 300 6 400 2n Saudi Arabia 30 000 30 000 30 000 32 000 35 000 2n Slovakia 30 000 22 000 15 700 21 000 21 000 1a Spain 5 212 2 050 0 0 0 3a Thailand 51 895 33 465 67 703 64 499 107 437 1e Turkey 213 187 172 618 250 786 827 652 736 316 1e United Kingdom 36 000 34 099 31 000 30 000 29 000 1e United States 396 000 662 000 710 000 666 000 700 000 2e Vietnam 75 000 85 000 90 000 90 000 90 000 1n Total 7 928 028 9 291 089 9 528 982 10 516 376 9 489 061
Bentonite
C o u n t r y 2009 2010 2011 2012 2013 Rem metr. t metr. t metr. t metr. t metr. t Algeria 31 612 34 126 29 000 26 300 27 000 2n Argentina 148 100 204 209 228 357 193 795 200 000 2b Armenia 4 832 1 397 5 004 7 491 18 456 1e Australia 133 500 131 300 77 700 58 000 90 000 3e Azerbaijan 10 600 18 100 20 700 36 700 92 000 1e Bolivia 323 440 500 747 182 1a
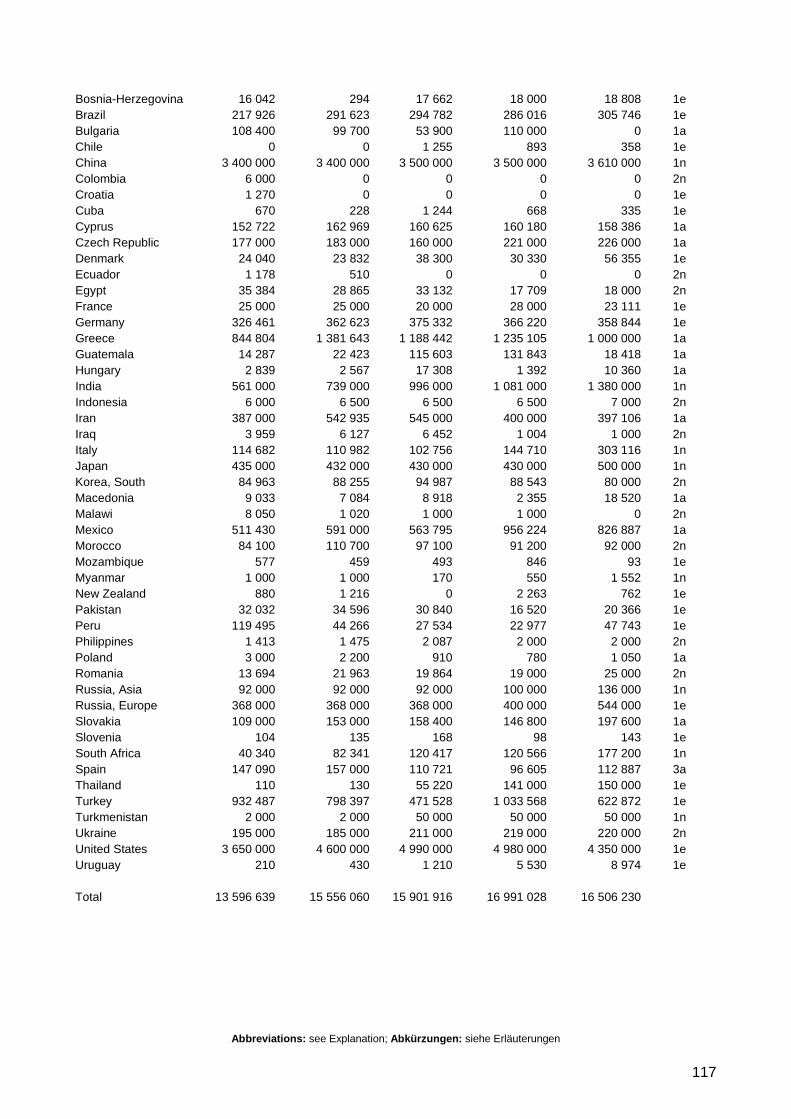
Abbreviations: see Explanation; Abkürzungen: siehe Erläuterungen
117
Bosnia-Herzegovina 16 042 294 17 662 18 000 18 808 1e Brazil 217 926 291 623 294 782 286 016 305 746 1e Bulgaria 108 400 99 700 53 900 110 000 0 1a Chile 0 0 1 255 893 358 1e China 3 400 000 3 400 000 3 500 000 3 500 000 3 610 000 1n Colombia 6 000 0 0 0 0 2n Croatia 1 270 0 0 0 0 1e Cuba 670 228 1 244 668 335 1e Cyprus 152 722 162 969 160 625 160 180 158 386 1a Czech Republic 177 000 183 000 160 000 221 000 226 000 1a Denmark 24 040 23 832 38 300 30 330 56 355 1e Ecuador 1 178 510 0 0 0 2n Egypt 35 384 28 865 33 132 17 709 18 000 2n France 25 000 25 000 20 000 28 000 23 111 1e Germany 326 461 362 623 375 332 366 220 358 844 1e Greece 844 804 1 381 643 1 188 442 1 235 105 1 000 000 1a Guatemala 14 287 22 423 115 603 131 843 18 418 1a Hungary 2 839 2 567 17 308 1 392 10 360 1a India 561 000 739 000 996 000 1 081 000 1 380 000 1n Indonesia 6 000 6 500 6 500 6 500 7 000 2n Iran 387 000 542 935 545 000 400 000 397 106 1a Iraq 3 959 6 127 6 452 1 004 1 000 2n Italy 114 682 110 982 102 756 144 710 303 116 1n Japan 435 000 432 000 430 000 430 000 500 000 1n Korea, South 84 963 88 255 94 987 88 543 80 000 2n Macedonia 9 033 7 084 8 918 2 355 18 520 1a Malawi 8 050 1 020 1 000 1 000 0 2n Mexico 511 430 591 000 563 795 956 224 826 887 1a Morocco 84 100 110 700 97 100 91 200 92 000 2n Mozambique 577 459 493 846 93 1e Myanmar 1 000 1 000 170 550 1 552 1n New Zealand 880 1 216 0 2 263 762 1e Pakistan 32 032 34 596 30 840 16 520 20 366 1e Peru 119 495 44 266 27 534 22 977 47 743 1e Philippines 1 413 1 475 2 087 2 000 2 000 2n Poland 3 000 2 200 910 780 1 050 1a Romania 13 694 21 963 19 864 19 000 25 000 2n Russia, Asia 92 000 92 000 92 000 100 000 136 000 1n Russia, Europe 368 000 368 000 368 000 400 000 544 000 1e Slovakia 109 000 153 000 158 400 146 800 197 600 1a Slovenia 104 135 168 98 143 1e South Africa 40 340 82 341 120 417 120 566 177 200 1n Spain 147 090 157 000 110 721 96 605 112 887 3a Thailand 110 130 55 220 141 000 150 000 1e Turkey 932 487 798 397 471 528 1 033 568 622 872 1e Turkmenistan 2 000 2 000 50 000 50 000 50 000 1n Ukraine 195 000 185 000 211 000 219 000 220 000 2n United States 3 650 000 4 600 000 4 990 000 4 980 000 4 350 000 1e Uruguay 210 430 1 210 5 530 8 974 1e Total 13 596 639 15 556 060 15 901 916 16 991 028 16 506 230
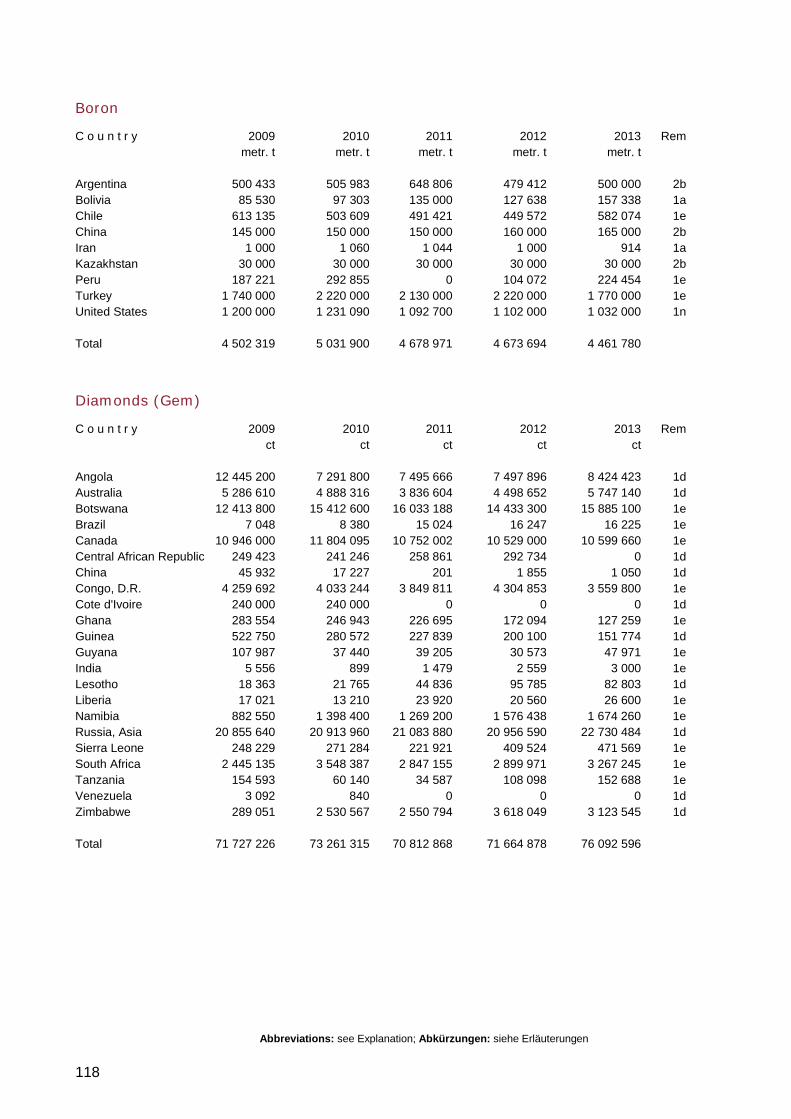
Abbreviations: see Explanation; Abkürzungen: siehe Erläuterungen
118
Boron
C o u n t r y 2009 2010 2011 2012 2013 Rem metr. t metr. t metr. t metr. t metr. t Argentina 500 433 505 983 648 806 479 412 500 000 2b Bolivia 85 530 97 303 135 000 127 638 157 338 1a Chile 613 135 503 609 491 421 449 572 582 074 1e China 145 000 150 000 150 000 160 000 165 000 2b Iran 1 000 1 060 1 044 1 000 914 1a Kazakhstan 30 000 30 000 30 000 30 000 30 000 2b Peru 187 221 292 855 0 104 072 224 454 1e Turkey 1 740 000 2 220 000 2 130 000 2 220 000 1 770 000 1e United States 1 200 000 1 231 090 1 092 700 1 102 000 1 032 000 1n Total 4 502 319 5 031 900 4 678 971 4 673 694 4 461 780
Diamonds (Gem)
C o u n t r y 2009 2010 2011 2012 2013 Rem ct ct ct ct ct Angola 12 445 200 7 291 800 7 495 666 7 497 896 8 424 423 1d Australia 5 286 610 4 888 316 3 836 604 4 498 652 5 747 140 1d Botswana 12 413 800 15 412 600 16 033 188 14 433 300 15 885 100 1e Brazil 7 048 8 380 15 024 16 247 16 225 1e Canada 10 946 000 11 804 095 10 752 002 10 529 000 10 599 660 1e Central African Republic 249 423 241 246 258 861 292 734 0 1d China 45 932 17 227 201 1 855 1 050 1d Congo, D.R. 4 259 692 4 033 244 3 849 811 4 304 853 3 559 800 1e Cote d'Ivoire 240 000 240 000 0 0 0 1d Ghana 283 554 246 943 226 695 172 094 127 259 1e Guinea 522 750 280 572 227 839 200 100 151 774 1d Guyana 107 987 37 440 39 205 30 573 47 971 1e India 5 556 899 1 479 2 559 3 000 1e Lesotho 18 363 21 765 44 836 95 785 82 803 1d Liberia 17 021 13 210 23 920 20 560 26 600 1e Namibia 882 550 1 398 400 1 269 200 1 576 438 1 674 260 1e Russia, Asia 20 855 640 20 913 960 21 083 880 20 956 590 22 730 484 1d Sierra Leone 248 229 271 284 221 921 409 524 471 569 1e South Africa 2 445 135 3 548 387 2 847 155 2 899 971 3 267 245 1e Tanzania 154 593 60 140 34 587 108 098 152 688 1e Venezuela 3 092 840 0 0 0 1d Zimbabwe 289 051 2 530 567 2 550 794 3 618 049 3 123 545 1d Total 71 727 226 73 261 315 70 812 868 71 664 878 76 092 596
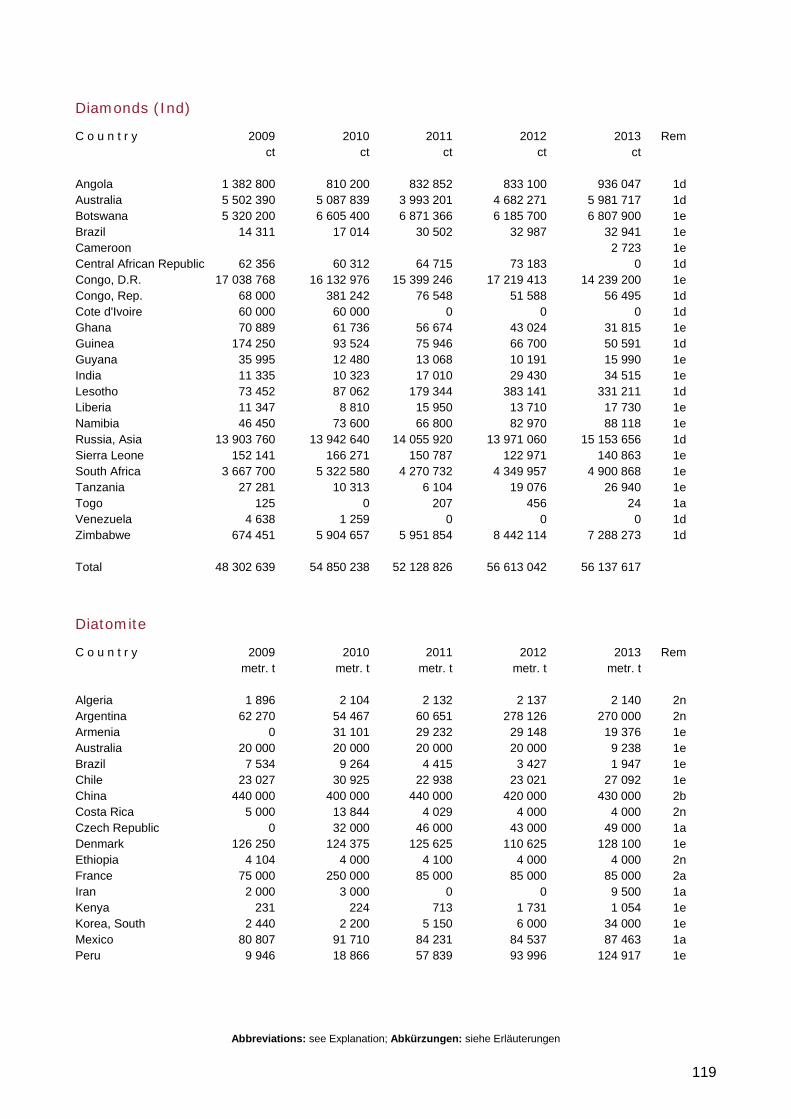
Abbreviations: see Explanation; Abkürzungen: siehe Erläuterungen
119
Diamonds (Ind)
C o u n t r y 2009 2010 2011 2012 2013 Rem ct ct ct ct ct Angola 1 382 800 810 200 832 852 833 100 936 047 1d Australia 5 502 390 5 087 839 3 993 201 4 682 271 5 981 717 1d Botswana 5 320 200 6 605 400 6 871 366 6 185 700 6 807 900 1e Brazil 14 311 17 014 30 502 32 987 32 941 1e Cameroon 2 723 1e Central African Republic 62 356 60 312 64 715 73 183 0 1d Congo, D.R. 17 038 768 16 132 976 15 399 246 17 219 413 14 239 200 1e Congo, Rep. 68 000 381 242 76 548 51 588 56 495 1d Cote d'Ivoire 60 000 60 000 0 0 0 1d Ghana 70 889 61 736 56 674 43 024 31 815 1e Guinea 174 250 93 524 75 946 66 700 50 591 1d Guyana 35 995 12 480 13 068 10 191 15 990 1e India 11 335 10 323 17 010 29 430 34 515 1e Lesotho 73 452 87 062 179 344 383 141 331 211 1d Liberia 11 347 8 810 15 950 13 710 17 730 1e Namibia 46 450 73 600 66 800 82 970 88 118 1e Russia, Asia 13 903 760 13 942 640 14 055 920 13 971 060 15 153 656 1d Sierra Leone 152 141 166 271 150 787 122 971 140 863 1e South Africa 3 667 700 5 322 580 4 270 732 4 349 957 4 900 868 1e Tanzania 27 281 10 313 6 104 19 076 26 940 1e Togo 125 0 207 456 24 1a Venezuela 4 638 1 259 0 0 0 1d Zimbabwe 674 451 5 904 657 5 951 854 8 442 114 7 288 273 1d Total 48 302 639 54 850 238 52 128 826 56 613 042 56 137 617
Diatomite
C o u n t r y 2009 2010 2011 2012 2013 Rem metr. t metr. t metr. t metr. t metr. t Algeria 1 896 2 104 2 132 2 137 2 140 2n Argentina 62 270 54 467 60 651 278 126 270 000 2n Armenia 0 31 101 29 232 29 148 19 376 1e Australia 20 000 20 000 20 000 20 000 9 238 1e Brazil 7 534 9 264 4 415 3 427 1 947 1e Chile 23 027 30 925 22 938 23 021 27 092 1e China 440 000 400 000 440 000 420 000 430 000 2b Costa Rica 5 000 13 844 4 029 4 000 4 000 2n Czech Republic 0 32 000 46 000 43 000 49 000 1a Denmark 126 250 124 375 125 625 110 625 128 100 1e Ethiopia 4 104 4 000 4 100 4 000 4 000 2n France 75 000 250 000 85 000 85 000 85 000 2a Iran 2 000 3 000 0 0 9 500 1a Kenya 231 224 713 1 731 1 054 1e Korea, South 2 440 2 200 5 150 6 000 34 000 1e Mexico 80 807 91 710 84 231 84 537 87 463 1a Peru 9 946 18 866 57 839 93 996 124 917 1e
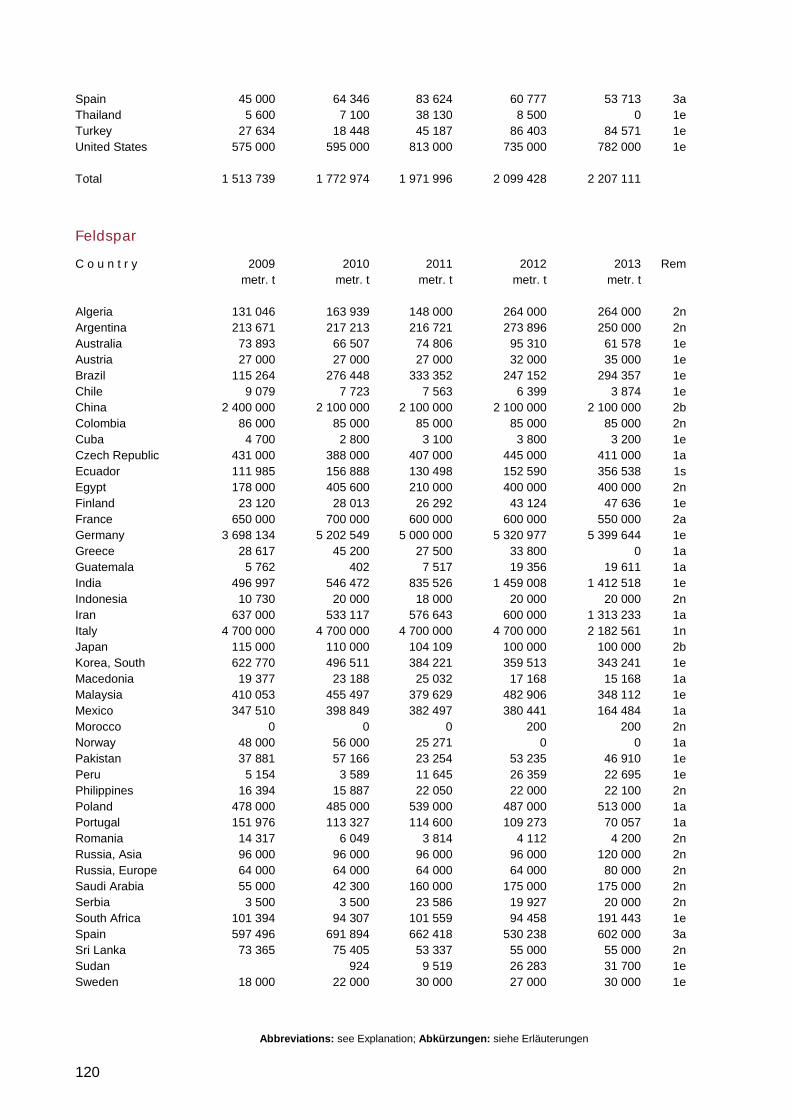
Abbreviations: see Explanation; Abkürzungen: siehe Erläuterungen
120
Spain 45 000 64 346 83 624 60 777 53 713 3a Thailand 5 600 7 100 38 130 8 500 0 1e Turkey 27 634 18 448 45 187 86 403 84 571 1e United States 575 000 595 000 813 000 735 000 782 000 1e Total 1 513 739 1 772 974 1 971 996 2 099 428 2 207 111
Feldspar
C o u n t r y 2009 2010 2011 2012 2013 Rem metr. t metr. t metr. t metr. t metr. t Algeria 131 046 163 939 148 000 264 000 264 000 2n Argentina 213 671 217 213 216 721 273 896 250 000 2n Australia 73 893 66 507 74 806 95 310 61 578 1e Austria 27 000 27 000 27 000 32 000 35 000 1e Brazil 115 264 276 448 333 352 247 152 294 357 1e Chile 9 079 7 723 7 563 6 399 3 874 1e China 2 400 000 2 100 000 2 100 000 2 100 000 2 100 000 2b Colombia 86 000 85 000 85 000 85 000 85 000 2n Cuba 4 700 2 800 3 100 3 800 3 200 1e Czech Republic 431 000 388 000 407 000 445 000 411 000 1a Ecuador 111 985 156 888 130 498 152 590 356 538 1s Egypt 178 000 405 600 210 000 400 000 400 000 2n Finland 23 120 28 013 26 292 43 124 47 636 1e France 650 000 700 000 600 000 600 000 550 000 2a Germany 3 698 134 5 202 549 5 000 000 5 320 977 5 399 644 1e Greece 28 617 45 200 27 500 33 800 0 1a Guatemala 5 762 402 7 517 19 356 19 611 1a India 496 997 546 472 835 526 1 459 008 1 412 518 1e Indonesia 10 730 20 000 18 000 20 000 20 000 2n Iran 637 000 533 117 576 643 600 000 1 313 233 1a Italy 4 700 000 4 700 000 4 700 000 4 700 000 2 182 561 1n Japan 115 000 110 000 104 109 100 000 100 000 2b Korea, South 622 770 496 511 384 221 359 513 343 241 1e Macedonia 19 377 23 188 25 032 17 168 15 168 1a Malaysia 410 053 455 497 379 629 482 906 348 112 1e Mexico 347 510 398 849 382 497 380 441 164 484 1a Morocco 0 0 0 200 200 2n Norway 48 000 56 000 25 271 0 0 1a Pakistan 37 881 57 166 23 254 53 235 46 910 1e Peru 5 154 3 589 11 645 26 359 22 695 1e Philippines 16 394 15 887 22 050 22 000 22 100 2n Poland 478 000 485 000 539 000 487 000 513 000 1a Portugal 151 976 113 327 114 600 109 273 70 057 1a Romania 14 317 6 049 3 814 4 112 4 200 2n Russia, Asia 96 000 96 000 96 000 96 000 120 000 2n Russia, Europe 64 000 64 000 64 000 64 000 80 000 2n Saudi Arabia 55 000 42 300 160 000 175 000 175 000 2n Serbia 3 500 3 500 23 586 19 927 20 000 2n South Africa 101 394 94 307 101 559 94 458 191 443 1e Spain 597 496 691 894 662 418 530 238 602 000 3a Sri Lanka 73 365 75 405 53 337 55 000 55 000 2n Sudan 924 9 519 26 283 31 700 1e Sweden 18 000 22 000 30 000 27 000 30 000 1e
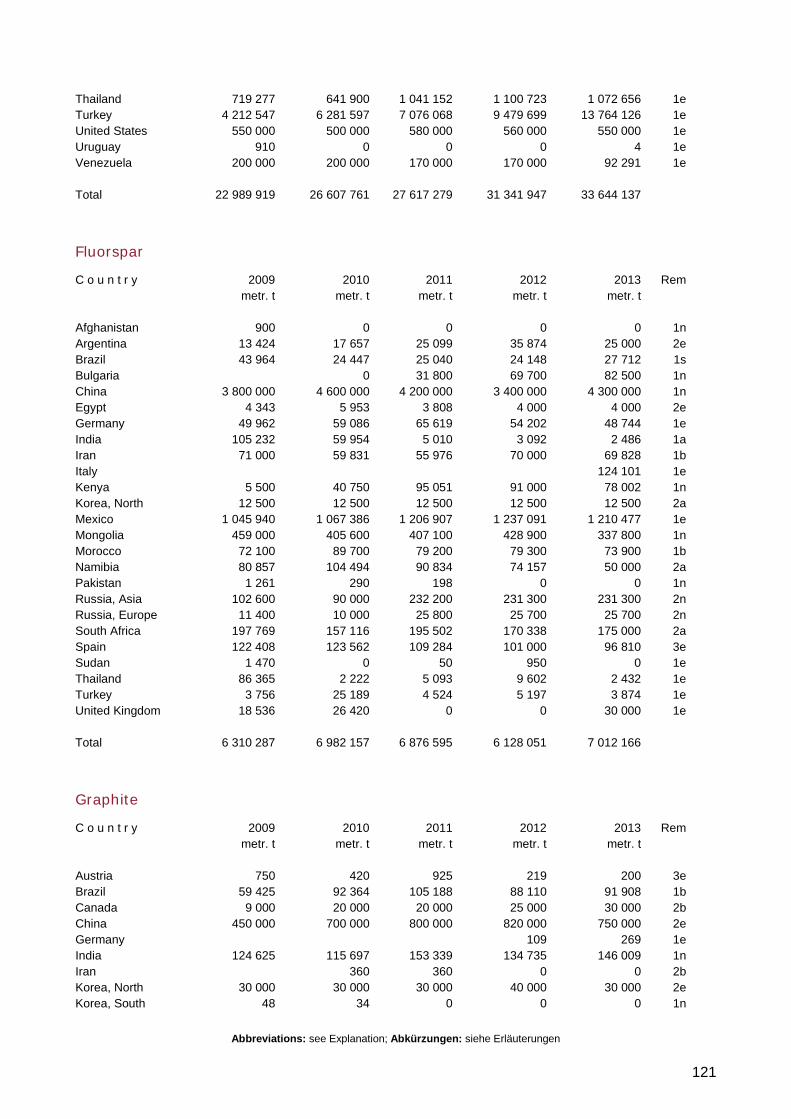
Abbreviations: see Explanation; Abkürzungen: siehe Erläuterungen
121
Thailand 719 277 641 900 1 041 152 1 100 723 1 072 656 1e Turkey 4 212 547 6 281 597 7 076 068 9 479 699 13 764 126 1e United States 550 000 500 000 580 000 560 000 550 000 1e Uruguay 910 0 0 0 4 1e Venezuela 200 000 200 000 170 000 170 000 92 291 1e Total 22 989 919 26 607 761 27 617 279 31 341 947 33 644 137
Fluorspar
C o u n t r y 2009 2010 2011 2012 2013 Rem metr. t metr. t metr. t metr. t metr. t Afghanistan 900 0 0 0 0 1n Argentina 13 424 17 657 25 099 35 874 25 000 2e Brazil 43 964 24 447 25 040 24 148 27 712 1s Bulgaria 0 31 800 69 700 82 500 1n China 3 800 000 4 600 000 4 200 000 3 400 000 4 300 000 1n Egypt 4 343 5 953 3 808 4 000 4 000 2e Germany 49 962 59 086 65 619 54 202 48 744 1e India 105 232 59 954 5 010 3 092 2 486 1a Iran 71 000 59 831 55 976 70 000 69 828 1b Italy 124 101 1e Kenya 5 500 40 750 95 051 91 000 78 002 1n Korea, North 12 500 12 500 12 500 12 500 12 500 2a Mexico 1 045 940 1 067 386 1 206 907 1 237 091 1 210 477 1e Mongolia 459 000 405 600 407 100 428 900 337 800 1n Morocco 72 100 89 700 79 200 79 300 73 900 1b Namibia 80 857 104 494 90 834 74 157 50 000 2a Pakistan 1 261 290 198 0 0 1n Russia, Asia 102 600 90 000 232 200 231 300 231 300 2n Russia, Europe 11 400 10 000 25 800 25 700 25 700 2n South Africa 197 769 157 116 195 502 170 338 175 000 2a Spain 122 408 123 562 109 284 101 000 96 810 3e Sudan 1 470 0 50 950 0 1e Thailand 86 365 2 222 5 093 9 602 2 432 1e Turkey 3 756 25 189 4 524 5 197 3 874 1e United Kingdom 18 536 26 420 0 0 30 000 1e Total 6 310 287 6 982 157 6 876 595 6 128 051 7 012 166
Graphite
C o u n t r y 2009 2010 2011 2012 2013 Rem metr. t metr. t metr. t metr. t metr. t Austria 750 420 925 219 200 3e Brazil 59 425 92 364 105 188 88 110 91 908 1b Canada 9 000 20 000 20 000 25 000 30 000 2b China 450 000 700 000 800 000 820 000 750 000 2e Germany 109 269 1e India 124 625 115 697 153 339 134 735 146 009 1n Iran 360 360 0 0 2b Korea, North 30 000 30 000 30 000 40 000 30 000 2e Korea, South 48 34 0 0 0 1n
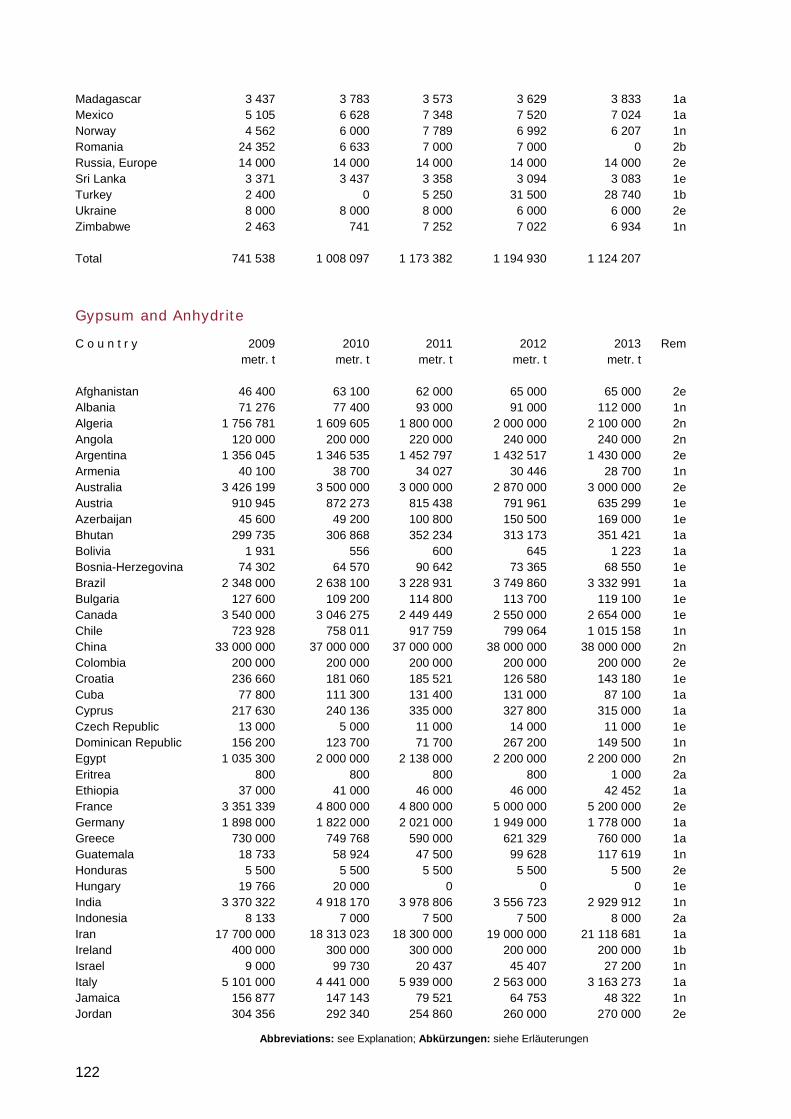
Abbreviations: see Explanation; Abkürzungen: siehe Erläuterungen
122
Madagascar 3 437 3 783 3 573 3 629 3 833 1a Mexico 5 105 6 628 7 348 7 520 7 024 1a Norway 4 562 6 000 7 789 6 992 6 207 1n Romania 24 352 6 633 7 000 7 000 0 2b Russia, Europe 14 000 14 000 14 000 14 000 14 000 2e Sri Lanka 3 371 3 437 3 358 3 094 3 083 1e Turkey 2 400 0 5 250 31 500 28 740 1b Ukraine 8 000 8 000 8 000 6 000 6 000 2e Zimbabwe 2 463 741 7 252 7 022 6 934 1n Total 741 538 1 008 097 1 173 382 1 194 930 1 124 207
Gypsum and Anhydrite
C o u n t r y 2009 2010 2011 2012 2013 Rem metr. t metr. t metr. t metr. t metr. t Afghanistan 46 400 63 100 62 000 65 000 65 000 2e Albania 71 276 77 400 93 000 91 000 112 000 1n Algeria 1 756 781 1 609 605 1 800 000 2 000 000 2 100 000 2n Angola 120 000 200 000 220 000 240 000 240 000 2n Argentina 1 356 045 1 346 535 1 452 797 1 432 517 1 430 000 2e Armenia 40 100 38 700 34 027 30 446 28 700 1n Australia 3 426 199 3 500 000 3 000 000 2 870 000 3 000 000 2e Austria 910 945 872 273 815 438 791 961 635 299 1e Azerbaijan 45 600 49 200 100 800 150 500 169 000 1e Bhutan 299 735 306 868 352 234 313 173 351 421 1a Bolivia 1 931 556 600 645 1 223 1a Bosnia-Herzegovina 74 302 64 570 90 642 73 365 68 550 1e Brazil 2 348 000 2 638 100 3 228 931 3 749 860 3 332 991 1a Bulgaria 127 600 109 200 114 800 113 700 119 100 1e Canada 3 540 000 3 046 275 2 449 449 2 550 000 2 654 000 1e Chile 723 928 758 011 917 759 799 064 1 015 158 1n China 33 000 000 37 000 000 37 000 000 38 000 000 38 000 000 2n Colombia 200 000 200 000 200 000 200 000 200 000 2e Croatia 236 660 181 060 185 521 126 580 143 180 1e Cuba 77 800 111 300 131 400 131 000 87 100 1a Cyprus 217 630 240 136 335 000 327 800 315 000 1a Czech Republic 13 000 5 000 11 000 14 000 11 000 1e Dominican Republic 156 200 123 700 71 700 267 200 149 500 1n Egypt 1 035 300 2 000 000 2 138 000 2 200 000 2 200 000 2n Eritrea 800 800 800 800 1 000 2a Ethiopia 37 000 41 000 46 000 46 000 42 452 1a France 3 351 339 4 800 000 4 800 000 5 000 000 5 200 000 2e Germany 1 898 000 1 822 000 2 021 000 1 949 000 1 778 000 1a Greece 730 000 749 768 590 000 621 329 760 000 1a Guatemala 18 733 58 924 47 500 99 628 117 619 1n Honduras 5 500 5 500 5 500 5 500 5 500 2e Hungary 19 766 20 000 0 0 0 1e India 3 370 322 4 918 170 3 978 806 3 556 723 2 929 912 1n Indonesia 8 133 7 000 7 500 7 500 8 000 2a Iran 17 700 000 18 313 023 18 300 000 19 000 000 21 118 681 1a Ireland 400 000 300 000 300 000 200 000 200 000 1b Israel 9 000 99 730 20 437 45 407 27 200 1n Italy 5 101 000 4 441 000 5 939 000 2 563 000 3 163 273 1a Jamaica 156 877 147 143 79 521 64 753 48 322 1n Jordan 304 356 292 340 254 860 260 000 270 000 2e
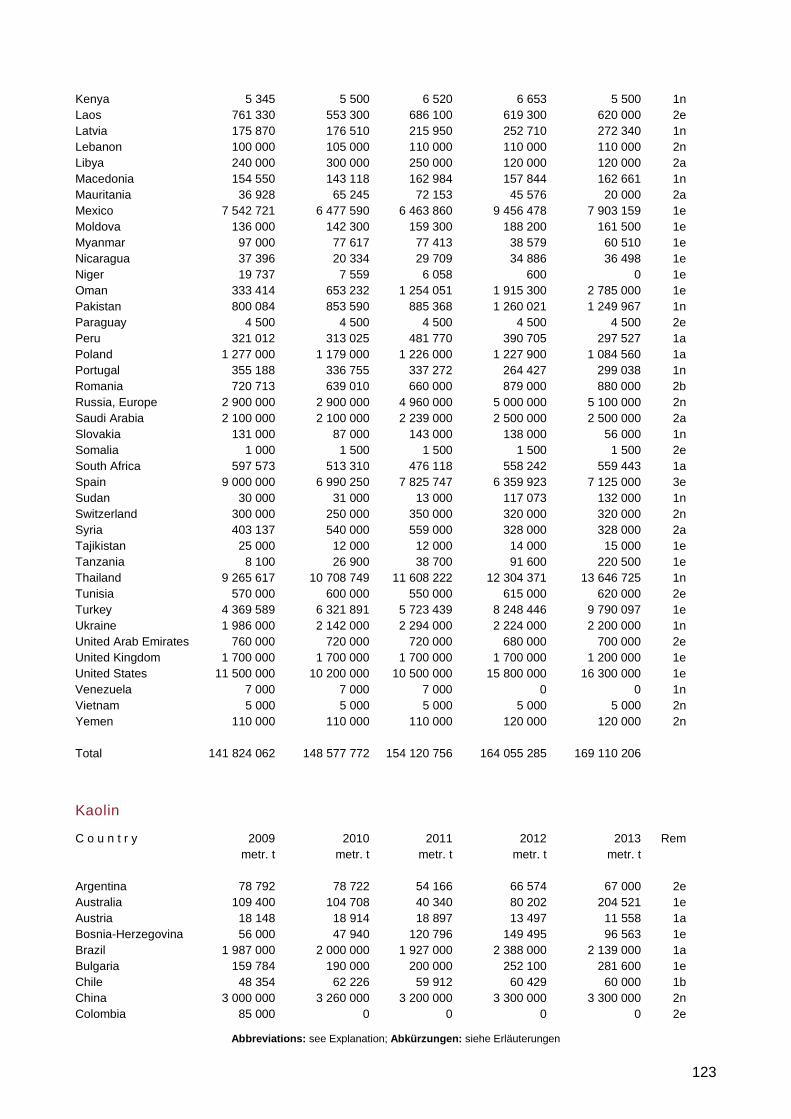
Abbreviations: see Explanation; Abkürzungen: siehe Erläuterungen
123
Kenya 5 345 5 500 6 520 6 653 5 500 1n Laos 761 330 553 300 686 100 619 300 620 000 2e Latvia 175 870 176 510 215 950 252 710 272 340 1n Lebanon 100 000 105 000 110 000 110 000 110 000 2n Libya 240 000 300 000 250 000 120 000 120 000 2a Macedonia 154 550 143 118 162 984 157 844 162 661 1n Mauritania 36 928 65 245 72 153 45 576 20 000 2a Mexico 7 542 721 6 477 590 6 463 860 9 456 478 7 903 159 1e Moldova 136 000 142 300 159 300 188 200 161 500 1e Myanmar 97 000 77 617 77 413 38 579 60 510 1e Nicaragua 37 396 20 334 29 709 34 886 36 498 1e Niger 19 737 7 559 6 058 600 0 1e Oman 333 414 653 232 1 254 051 1 915 300 2 785 000 1e Pakistan 800 084 853 590 885 368 1 260 021 1 249 967 1n Paraguay 4 500 4 500 4 500 4 500 4 500 2e Peru 321 012 313 025 481 770 390 705 297 527 1a Poland 1 277 000 1 179 000 1 226 000 1 227 900 1 084 560 1a Portugal 355 188 336 755 337 272 264 427 299 038 1n Romania 720 713 639 010 660 000 879 000 880 000 2b Russia, Europe 2 900 000 2 900 000 4 960 000 5 000 000 5 100 000 2n Saudi Arabia 2 100 000 2 100 000 2 239 000 2 500 000 2 500 000 2a Slovakia 131 000 87 000 143 000 138 000 56 000 1n Somalia 1 000 1 500 1 500 1 500 1 500 2e South Africa 597 573 513 310 476 118 558 242 559 443 1a Spain 9 000 000 6 990 250 7 825 747 6 359 923 7 125 000 3e Sudan 30 000 31 000 13 000 117 073 132 000 1n Switzerland 300 000 250 000 350 000 320 000 320 000 2n Syria 403 137 540 000 559 000 328 000 328 000 2a Tajikistan 25 000 12 000 12 000 14 000 15 000 1e Tanzania 8 100 26 900 38 700 91 600 220 500 1e Thailand 9 265 617 10 708 749 11 608 222 12 304 371 13 646 725 1n Tunisia 570 000 600 000 550 000 615 000 620 000 2e Turkey 4 369 589 6 321 891 5 723 439 8 248 446 9 790 097 1e Ukraine 1 986 000 2 142 000 2 294 000 2 224 000 2 200 000 1n United Arab Emirates 760 000 720 000 720 000 680 000 700 000 2e United Kingdom 1 700 000 1 700 000 1 700 000 1 700 000 1 200 000 1e United States 11 500 000 10 200 000 10 500 000 15 800 000 16 300 000 1e Venezuela 7 000 7 000 7 000 0 0 1n Vietnam 5 000 5 000 5 000 5 000 5 000 2n Yemen 110 000 110 000 110 000 120 000 120 000 2n Total 141 824 062 148 577 772 154 120 756 164 055 285 169 110 206
Kaolin
C o u n t r y 2009 2010 2011 2012 2013 Rem metr. t metr. t metr. t metr. t metr. t Argentina 78 792 78 722 54 166 66 574 67 000 2e Australia 109 400 104 708 40 340 80 202 204 521 1e Austria 18 148 18 914 18 897 13 497 11 558 1a Bosnia-Herzegovina 56 000 47 940 120 796 149 495 96 563 1e Brazil 1 987 000 2 000 000 1 927 000 2 388 000 2 139 000 1a Bulgaria 159 784 190 000 200 000 252 100 281 600 1e Chile 48 354 62 226 59 912 60 429 60 000 1b China 3 000 000 3 260 000 3 200 000 3 300 000 3 300 000 2n Colombia 85 000 0 0 0 0 2e
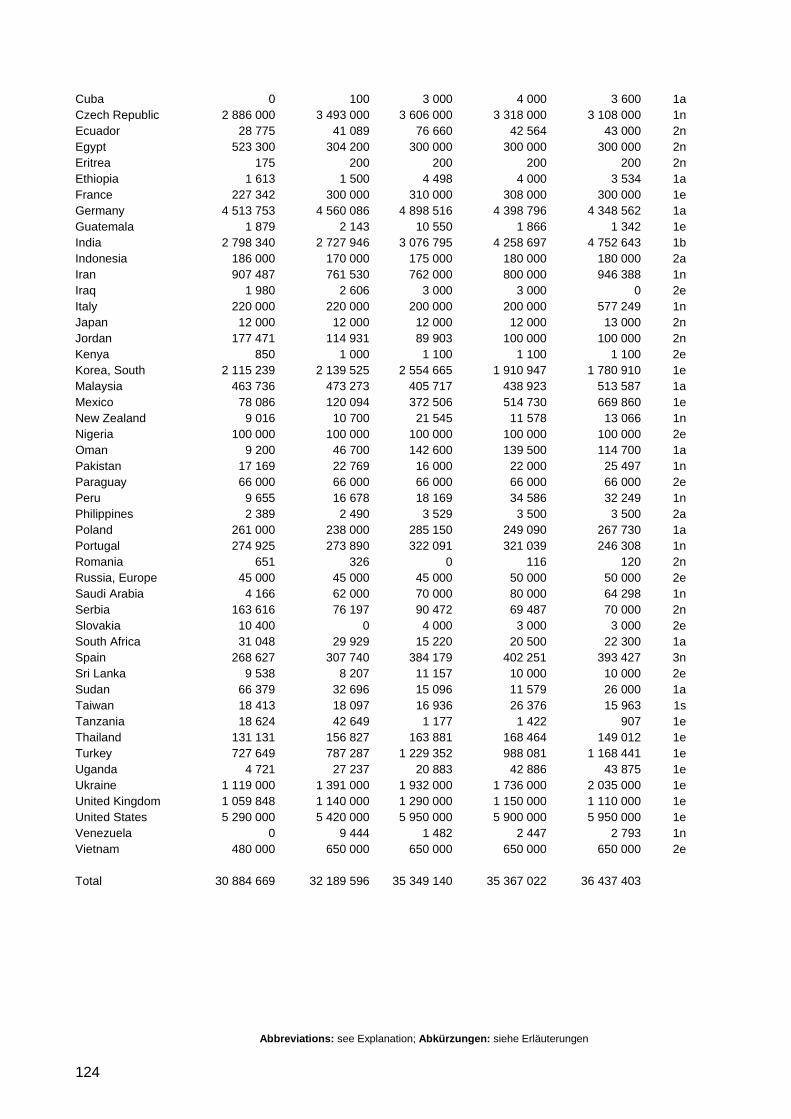
Abbreviations: see Explanation; Abkürzungen: siehe Erläuterungen
124
Cuba 0 100 3 000 4 000 3 600 1a Czech Republic 2 886 000 3 493 000 3 606 000 3 318 000 3 108 000 1n Ecuador 28 775 41 089 76 660 42 564 43 000 2n Egypt 523 300 304 200 300 000 300 000 300 000 2n Eritrea 175 200 200 200 200 2n Ethiopia 1 613 1 500 4 498 4 000 3 534 1a France 227 342 300 000 310 000 308 000 300 000 1e Germany 4 513 753 4 560 086 4 898 516 4 398 796 4 348 562 1a Guatemala 1 879 2 143 10 550 1 866 1 342 1e India 2 798 340 2 727 946 3 076 795 4 258 697 4 752 643 1b Indonesia 186 000 170 000 175 000 180 000 180 000 2a Iran 907 487 761 530 762 000 800 000 946 388 1n Iraq 1 980 2 606 3 000 3 000 0 2e Italy 220 000 220 000 200 000 200 000 577 249 1n Japan 12 000 12 000 12 000 12 000 13 000 2n Jordan 177 471 114 931 89 903 100 000 100 000 2n Kenya 850 1 000 1 100 1 100 1 100 2e Korea, South 2 115 239 2 139 525 2 554 665 1 910 947 1 780 910 1e Malaysia 463 736 473 273 405 717 438 923 513 587 1a Mexico 78 086 120 094 372 506 514 730 669 860 1e New Zealand 9 016 10 700 21 545 11 578 13 066 1n Nigeria 100 000 100 000 100 000 100 000 100 000 2e Oman 9 200 46 700 142 600 139 500 114 700 1a Pakistan 17 169 22 769 16 000 22 000 25 497 1n Paraguay 66 000 66 000 66 000 66 000 66 000 2e Peru 9 655 16 678 18 169 34 586 32 249 1n Philippines 2 389 2 490 3 529 3 500 3 500 2a Poland 261 000 238 000 285 150 249 090 267 730 1a Portugal 274 925 273 890 322 091 321 039 246 308 1n Romania 651 326 0 116 120 2n Russia, Europe 45 000 45 000 45 000 50 000 50 000 2e Saudi Arabia 4 166 62 000 70 000 80 000 64 298 1n Serbia 163 616 76 197 90 472 69 487 70 000 2n Slovakia 10 400 0 4 000 3 000 3 000 2e South Africa 31 048 29 929 15 220 20 500 22 300 1a Spain 268 627 307 740 384 179 402 251 393 427 3n Sri Lanka 9 538 8 207 11 157 10 000 10 000 2e Sudan 66 379 32 696 15 096 11 579 26 000 1a Taiwan 18 413 18 097 16 936 26 376 15 963 1s Tanzania 18 624 42 649 1 177 1 422 907 1e Thailand 131 131 156 827 163 881 168 464 149 012 1e Turkey 727 649 787 287 1 229 352 988 081 1 168 441 1e Uganda 4 721 27 237 20 883 42 886 43 875 1e Ukraine 1 119 000 1 391 000 1 932 000 1 736 000 2 035 000 1e United Kingdom 1 059 848 1 140 000 1 290 000 1 150 000 1 110 000 1e United States 5 290 000 5 420 000 5 950 000 5 900 000 5 950 000 1e Venezuela 0 9 444 1 482 2 447 2 793 1n Vietnam 480 000 650 000 650 000 650 000 650 000 2e Total 30 884 669 32 189 596 35 349 140 35 367 022 36 437 403
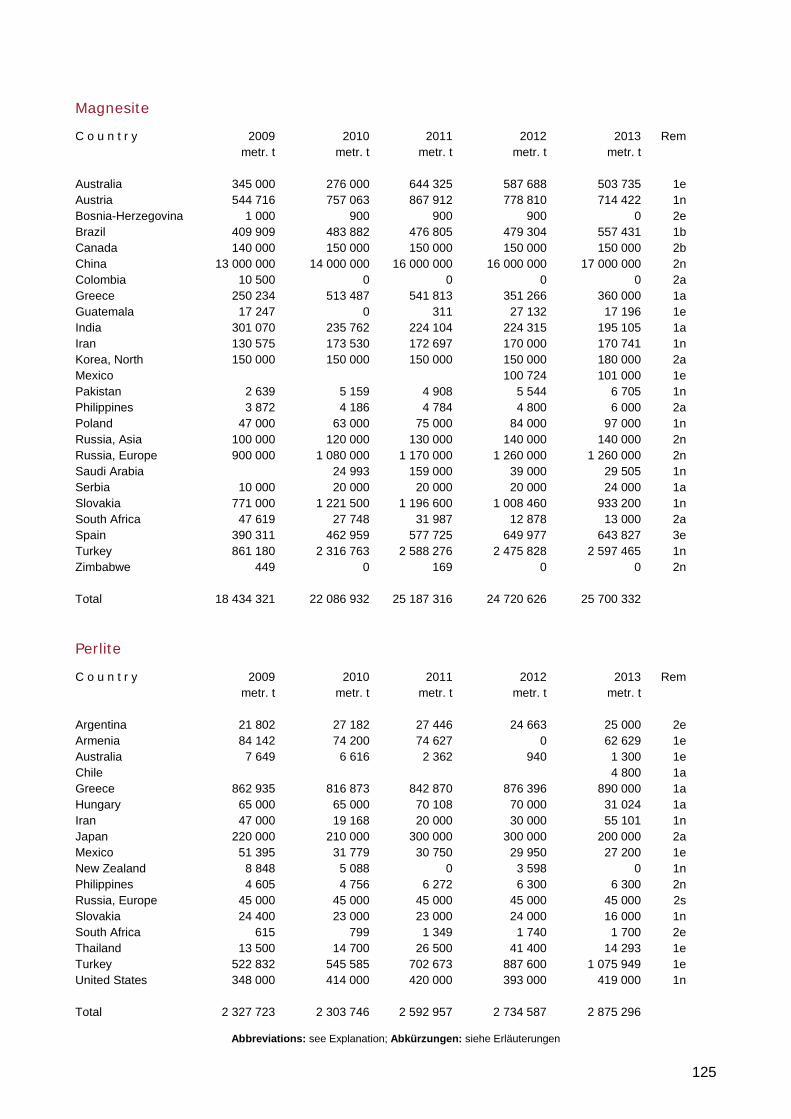
Abbreviations: see Explanation; Abkürzungen: siehe Erläuterungen
125
Magnesite
C o u n t r y 2009 2010 2011 2012 2013 Rem metr. t metr. t metr. t metr. t metr. t Australia 345 000 276 000 644 325 587 688 503 735 1e Austria 544 716 757 063 867 912 778 810 714 422 1n Bosnia-Herzegovina 1 000 900 900 900 0 2e Brazil 409 909 483 882 476 805 479 304 557 431 1b Canada 140 000 150 000 150 000 150 000 150 000 2b China 13 000 000 14 000 000 16 000 000 16 000 000 17 000 000 2n Colombia 10 500 0 0 0 0 2a Greece 250 234 513 487 541 813 351 266 360 000 1a Guatemala 17 247 0 311 27 132 17 196 1e India 301 070 235 762 224 104 224 315 195 105 1a Iran 130 575 173 530 172 697 170 000 170 741 1n Korea, North 150 000 150 000 150 000 150 000 180 000 2a Mexico 100 724 101 000 1e Pakistan 2 639 5 159 4 908 5 544 6 705 1n Philippines 3 872 4 186 4 784 4 800 6 000 2a Poland 47 000 63 000 75 000 84 000 97 000 1n Russia, Asia 100 000 120 000 130 000 140 000 140 000 2n Russia, Europe 900 000 1 080 000 1 170 000 1 260 000 1 260 000 2n Saudi Arabia 24 993 159 000 39 000 29 505 1n Serbia 10 000 20 000 20 000 20 000 24 000 1a Slovakia 771 000 1 221 500 1 196 600 1 008 460 933 200 1n South Africa 47 619 27 748 31 987 12 878 13 000 2a Spain 390 311 462 959 577 725 649 977 643 827 3e Turkey 861 180 2 316 763 2 588 276 2 475 828 2 597 465 1n Zimbabwe 449 0 169 0 0 2n Total 18 434 321 22 086 932 25 187 316 24 720 626 25 700 332
Perlite
C o u n t r y 2009 2010 2011 2012 2013 Rem metr. t metr. t metr. t metr. t metr. t Argentina 21 802 27 182 27 446 24 663 25 000 2e Armenia 84 142 74 200 74 627 0 62 629 1e Australia 7 649 6 616 2 362 940 1 300 1e Chile 4 800 1a Greece 862 935 816 873 842 870 876 396 890 000 1a Hungary 65 000 65 000 70 108 70 000 31 024 1a Iran 47 000 19 168 20 000 30 000 55 101 1n Japan 220 000 210 000 300 000 300 000 200 000 2a Mexico 51 395 31 779 30 750 29 950 27 200 1e New Zealand 8 848 5 088 0 3 598 0 1n Philippines 4 605 4 756 6 272 6 300 6 300 2n Russia, Europe 45 000 45 000 45 000 45 000 45 000 2s Slovakia 24 400 23 000 23 000 24 000 16 000 1n South Africa 615 799 1 349 1 740 1 700 2e Thailand 13 500 14 700 26 500 41 400 14 293 1e Turkey 522 832 545 585 702 673 887 600 1 075 949 1e United States 348 000 414 000 420 000 393 000 419 000 1n Total 2 327 723 2 303 746 2 592 957 2 734 587 2 875 296
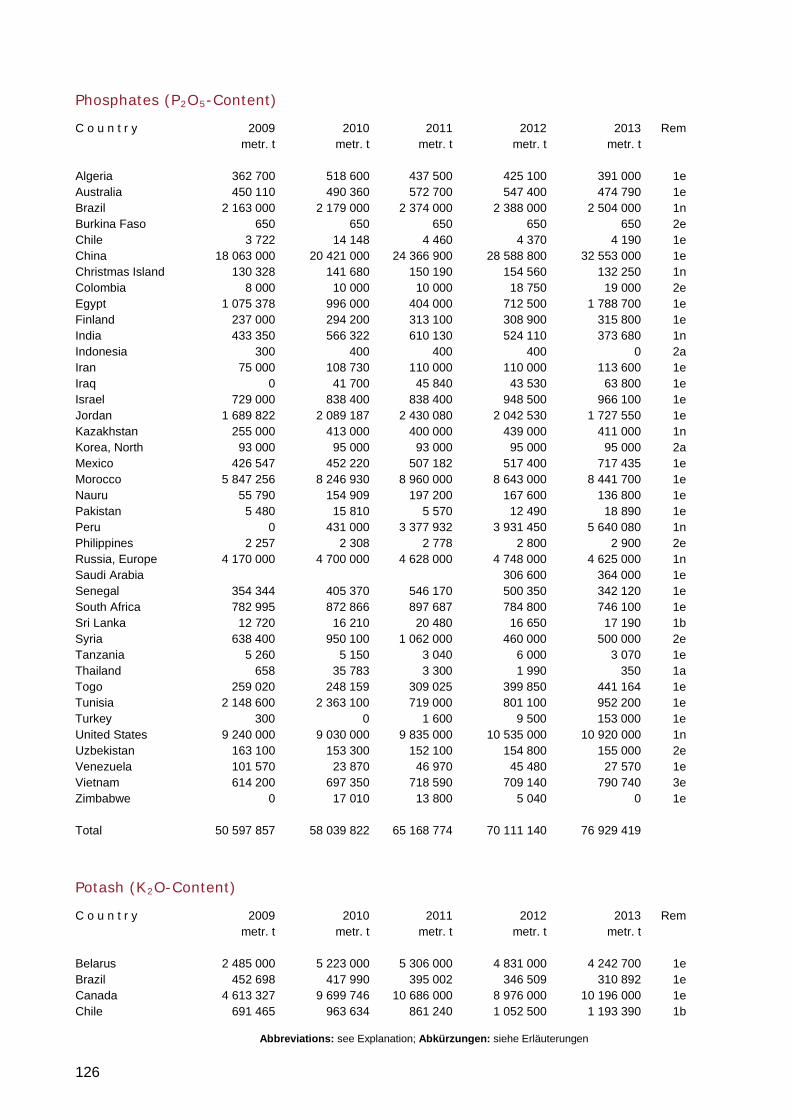
Abbreviations: see Explanation; Abkürzungen: siehe Erläuterungen
126
Phosphates (P2O5-Content)
C o u n t r y 2009 2010 2011 2012 2013 Rem metr. t metr. t metr. t metr. t metr. t Algeria 362 700 518 600 437 500 425 100 391 000 1e Australia 450 110 490 360 572 700 547 400 474 790 1e Brazil 2 163 000 2 179 000 2 374 000 2 388 000 2 504 000 1n Burkina Faso 650 650 650 650 650 2e Chile 3 722 14 148 4 460 4 370 4 190 1e China 18 063 000 20 421 000 24 366 900 28 588 800 32 553 000 1e Christmas Island 130 328 141 680 150 190 154 560 132 250 1n Colombia 8 000 10 000 10 000 18 750 19 000 2e Egypt 1 075 378 996 000 404 000 712 500 1 788 700 1e Finland 237 000 294 200 313 100 308 900 315 800 1e India 433 350 566 322 610 130 524 110 373 680 1n Indonesia 300 400 400 400 0 2a Iran 75 000 108 730 110 000 110 000 113 600 1e Iraq 0 41 700 45 840 43 530 63 800 1e Israel 729 000 838 400 838 400 948 500 966 100 1e Jordan 1 689 822 2 089 187 2 430 080 2 042 530 1 727 550 1e Kazakhstan 255 000 413 000 400 000 439 000 411 000 1n Korea, North 93 000 95 000 93 000 95 000 95 000 2a Mexico 426 547 452 220 507 182 517 400 717 435 1e Morocco 5 847 256 8 246 930 8 960 000 8 643 000 8 441 700 1e Nauru 55 790 154 909 197 200 167 600 136 800 1e Pakistan 5 480 15 810 5 570 12 490 18 890 1e Peru 0 431 000 3 377 932 3 931 450 5 640 080 1n Philippines 2 257 2 308 2 778 2 800 2 900 2e Russia, Europe 4 170 000 4 700 000 4 628 000 4 748 000 4 625 000 1n Saudi Arabia 306 600 364 000 1e Senegal 354 344 405 370 546 170 500 350 342 120 1e South Africa 782 995 872 866 897 687 784 800 746 100 1e Sri Lanka 12 720 16 210 20 480 16 650 17 190 1b Syria 638 400 950 100 1 062 000 460 000 500 000 2e Tanzania 5 260 5 150 3 040 6 000 3 070 1e Thailand 658 35 783 3 300 1 990 350 1a Togo 259 020 248 159 309 025 399 850 441 164 1e Tunisia 2 148 600 2 363 100 719 000 801 100 952 200 1e Turkey 300 0 1 600 9 500 153 000 1e United States 9 240 000 9 030 000 9 835 000 10 535 000 10 920 000 1n Uzbekistan 163 100 153 300 152 100 154 800 155 000 2e Venezuela 101 570 23 870 46 970 45 480 27 570 1e Vietnam 614 200 697 350 718 590 709 140 790 740 3e Zimbabwe 0 17 010 13 800 5 040 0 1e Total 50 597 857 58 039 822 65 168 774 70 111 140 76 929 419
Potash (K2O-Content)
C o u n t r y 2009 2010 2011 2012 2013 Rem metr. t metr. t metr. t metr. t metr. t Belarus 2 485 000 5 223 000 5 306 000 4 831 000 4 242 700 1e Brazil 452 698 417 990 395 002 346 509 310 892 1e Canada 4 613 327 9 699 746 10 686 000 8 976 000 10 196 000 1e Chile 691 465 963 634 861 240 1 052 500 1 193 390 1b
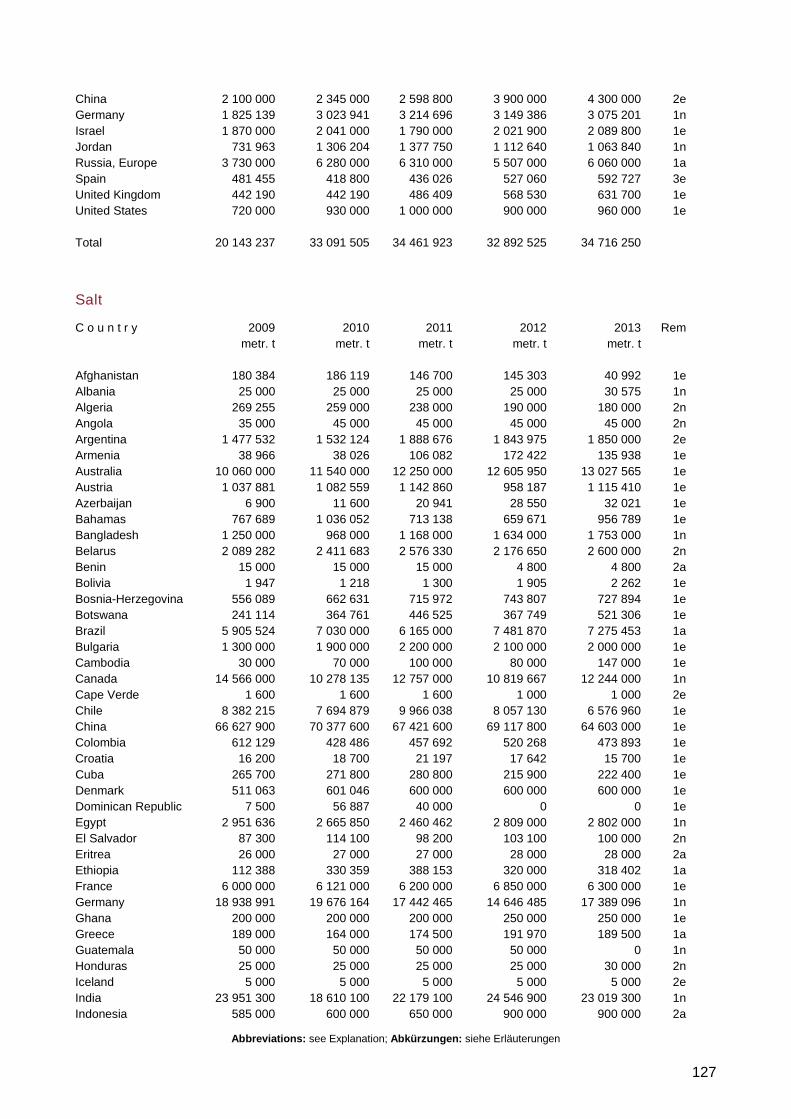
Abbreviations: see Explanation; Abkürzungen: siehe Erläuterungen
127
China 2 100 000 2 345 000 2 598 800 3 900 000 4 300 000 2e Germany 1 825 139 3 023 941 3 214 696 3 149 386 3 075 201 1n Israel 1 870 000 2 041 000 1 790 000 2 021 900 2 089 800 1e Jordan 731 963 1 306 204 1 377 750 1 112 640 1 063 840 1n Russia, Europe 3 730 000 6 280 000 6 310 000 5 507 000 6 060 000 1a Spain 481 455 418 800 436 026 527 060 592 727 3e United Kingdom 442 190 442 190 486 409 568 530 631 700 1e United States 720 000 930 000 1 000 000 900 000 960 000 1e Total 20 143 237 33 091 505 34 461 923 32 892 525 34 716 250
Salt
C o u n t r y 2009 2010 2011 2012 2013 Rem metr. t metr. t metr. t metr. t metr. t Afghanistan 180 384 186 119 146 700 145 303 40 992 1e Albania 25 000 25 000 25 000 25 000 30 575 1n Algeria 269 255 259 000 238 000 190 000 180 000 2n Angola 35 000 45 000 45 000 45 000 45 000 2n Argentina 1 477 532 1 532 124 1 888 676 1 843 975 1 850 000 2e Armenia 38 966 38 026 106 082 172 422 135 938 1e Australia 10 060 000 11 540 000 12 250 000 12 605 950 13 027 565 1e Austria 1 037 881 1 082 559 1 142 860 958 187 1 115 410 1e Azerbaijan 6 900 11 600 20 941 28 550 32 021 1e Bahamas 767 689 1 036 052 713 138 659 671 956 789 1e Bangladesh 1 250 000 968 000 1 168 000 1 634 000 1 753 000 1n Belarus 2 089 282 2 411 683 2 576 330 2 176 650 2 600 000 2n Benin 15 000 15 000 15 000 4 800 4 800 2a Bolivia 1 947 1 218 1 300 1 905 2 262 1e Bosnia-Herzegovina 556 089 662 631 715 972 743 807 727 894 1e Botswana 241 114 364 761 446 525 367 749 521 306 1e Brazil 5 905 524 7 030 000 6 165 000 7 481 870 7 275 453 1a Bulgaria 1 300 000 1 900 000 2 200 000 2 100 000 2 000 000 1e Cambodia 30 000 70 000 100 000 80 000 147 000 1e Canada 14 566 000 10 278 135 12 757 000 10 819 667 12 244 000 1n Cape Verde 1 600 1 600 1 600 1 000 1 000 2e Chile 8 382 215 7 694 879 9 966 038 8 057 130 6 576 960 1e China 66 627 900 70 377 600 67 421 600 69 117 800 64 603 000 1e Colombia 612 129 428 486 457 692 520 268 473 893 1e Croatia 16 200 18 700 21 197 17 642 15 700 1e Cuba 265 700 271 800 280 800 215 900 222 400 1e Denmark 511 063 601 046 600 000 600 000 600 000 1e Dominican Republic 7 500 56 887 40 000 0 0 1e Egypt 2 951 636 2 665 850 2 460 462 2 809 000 2 802 000 1n El Salvador 87 300 114 100 98 200 103 100 100 000 2n Eritrea 26 000 27 000 27 000 28 000 28 000 2a Ethiopia 112 388 330 359 388 153 320 000 318 402 1a France 6 000 000 6 121 000 6 200 000 6 850 000 6 300 000 1e Germany 18 938 991 19 676 164 17 442 465 14 646 485 17 389 096 1n Ghana 200 000 200 000 200 000 250 000 250 000 1e Greece 189 000 164 000 174 500 191 970 189 500 1a Guatemala 50 000 50 000 50 000 50 000 0 1n Honduras 25 000 25 000 25 000 25 000 30 000 2n Iceland 5 000 5 000 5 000 5 000 5 000 2e India 23 951 300 18 610 100 22 179 100 24 546 900 23 019 300 1n Indonesia 585 000 600 000 650 000 900 000 900 000 2a
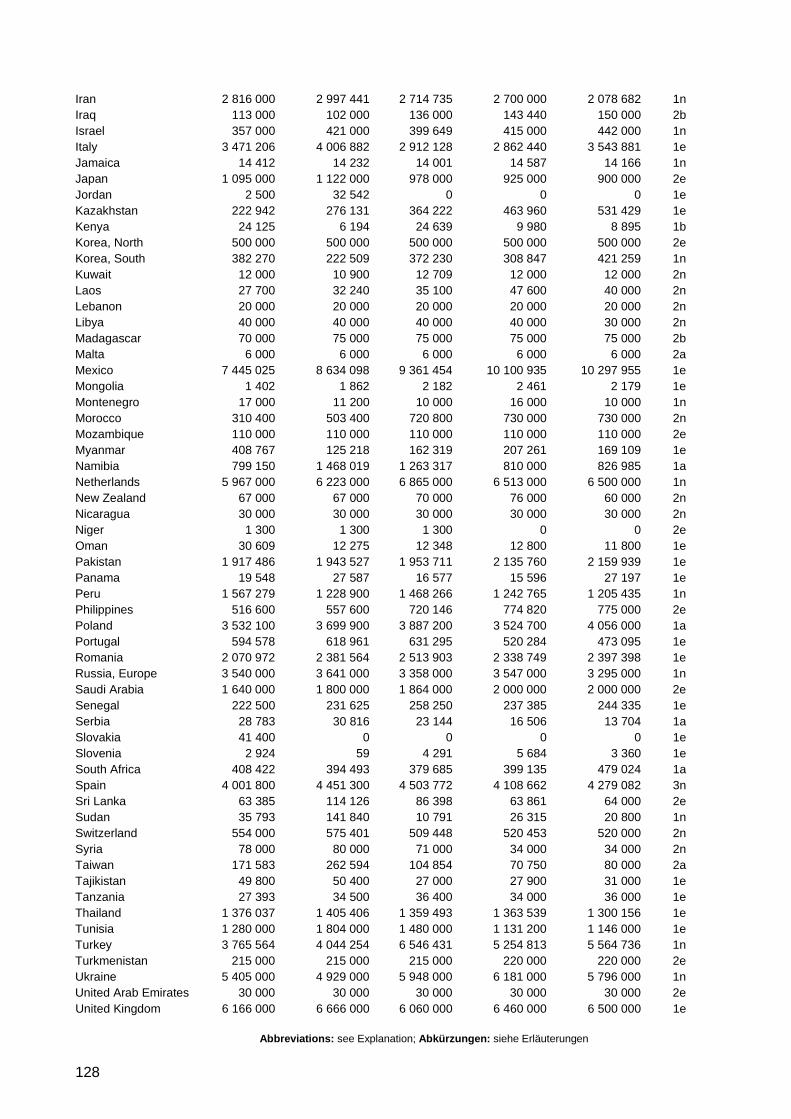
Abbreviations: see Explanation; Abkürzungen: siehe Erläuterungen
128
Iran 2 816 000 2 997 441 2 714 735 2 700 000 2 078 682 1n Iraq 113 000 102 000 136 000 143 440 150 000 2b Israel 357 000 421 000 399 649 415 000 442 000 1n Italy 3 471 206 4 006 882 2 912 128 2 862 440 3 543 881 1e Jamaica 14 412 14 232 14 001 14 587 14 166 1n Japan 1 095 000 1 122 000 978 000 925 000 900 000 2e Jordan 2 500 32 542 0 0 0 1e Kazakhstan 222 942 276 131 364 222 463 960 531 429 1e Kenya 24 125 6 194 24 639 9 980 8 895 1b Korea, North 500 000 500 000 500 000 500 000 500 000 2e Korea, South 382 270 222 509 372 230 308 847 421 259 1n Kuwait 12 000 10 900 12 709 12 000 12 000 2n Laos 27 700 32 240 35 100 47 600 40 000 2n Lebanon 20 000 20 000 20 000 20 000 20 000 2n Libya 40 000 40 000 40 000 40 000 30 000 2n Madagascar 70 000 75 000 75 000 75 000 75 000 2b Malta 6 000 6 000 6 000 6 000 6 000 2a Mexico 7 445 025 8 634 098 9 361 454 10 100 935 10 297 955 1e Mongolia 1 402 1 862 2 182 2 461 2 179 1e Montenegro 17 000 11 200 10 000 16 000 10 000 1n Morocco 310 400 503 400 720 800 730 000 730 000 2n Mozambique 110 000 110 000 110 000 110 000 110 000 2e Myanmar 408 767 125 218 162 319 207 261 169 109 1e Namibia 799 150 1 468 019 1 263 317 810 000 826 985 1a Netherlands 5 967 000 6 223 000 6 865 000 6 513 000 6 500 000 1n New Zealand 67 000 67 000 70 000 76 000 60 000 2n Nicaragua 30 000 30 000 30 000 30 000 30 000 2n Niger 1 300 1 300 1 300 0 0 2e Oman 30 609 12 275 12 348 12 800 11 800 1e Pakistan 1 917 486 1 943 527 1 953 711 2 135 760 2 159 939 1e Panama 19 548 27 587 16 577 15 596 27 197 1e Peru 1 567 279 1 228 900 1 468 266 1 242 765 1 205 435 1n Philippines 516 600 557 600 720 146 774 820 775 000 2e Poland 3 532 100 3 699 900 3 887 200 3 524 700 4 056 000 1a Portugal 594 578 618 961 631 295 520 284 473 095 1e Romania 2 070 972 2 381 564 2 513 903 2 338 749 2 397 398 1e Russia, Europe 3 540 000 3 641 000 3 358 000 3 547 000 3 295 000 1n Saudi Arabia 1 640 000 1 800 000 1 864 000 2 000 000 2 000 000 2e Senegal 222 500 231 625 258 250 237 385 244 335 1e Serbia 28 783 30 816 23 144 16 506 13 704 1a Slovakia 41 400 0 0 0 0 1e Slovenia 2 924 59 4 291 5 684 3 360 1e South Africa 408 422 394 493 379 685 399 135 479 024 1a Spain 4 001 800 4 451 300 4 503 772 4 108 662 4 279 082 3n Sri Lanka 63 385 114 126 86 398 63 861 64 000 2e Sudan 35 793 141 840 10 791 26 315 20 800 1n Switzerland 554 000 575 401 509 448 520 453 520 000 2n Syria 78 000 80 000 71 000 34 000 34 000 2n Taiwan 171 583 262 594 104 854 70 750 80 000 2a Tajikistan 49 800 50 400 27 000 27 900 31 000 1e Tanzania 27 393 34 500 36 400 34 000 36 000 1e Thailand 1 376 037 1 405 406 1 359 493 1 363 539 1 300 156 1e Tunisia 1 280 000 1 804 000 1 480 000 1 131 200 1 146 000 1e Turkey 3 765 564 4 044 254 6 546 431 5 254 813 5 564 736 1n Turkmenistan 215 000 215 000 215 000 220 000 220 000 2e Ukraine 5 405 000 4 929 000 5 948 000 6 181 000 5 796 000 1n United Arab Emirates 30 000 30 000 30 000 30 000 30 000 2e United Kingdom 6 166 000 6 666 000 6 060 000 6 460 000 6 500 000 1e
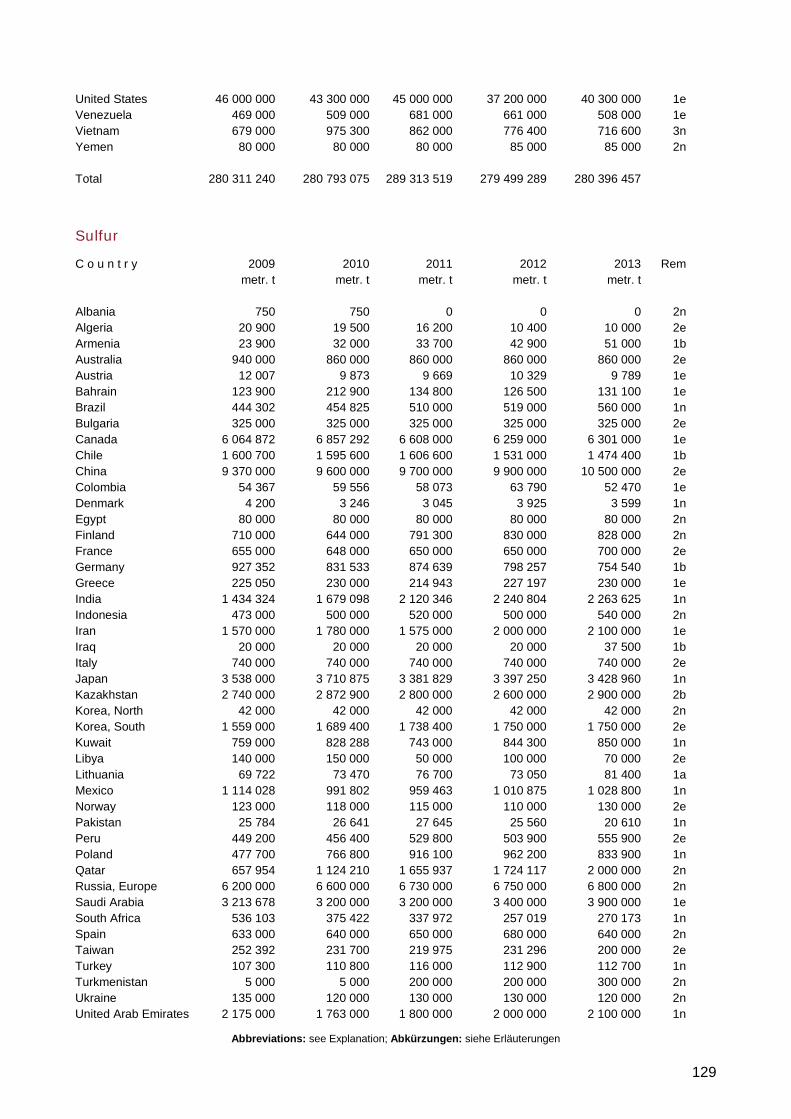
Abbreviations: see Explanation; Abkürzungen: siehe Erläuterungen
129
United States 46 000 000 43 300 000 45 000 000 37 200 000 40 300 000 1e Venezuela 469 000 509 000 681 000 661 000 508 000 1e Vietnam 679 000 975 300 862 000 776 400 716 600 3n Yemen 80 000 80 000 80 000 85 000 85 000 2n Total 280 311 240 280 793 075 289 313 519 279 499 289 280 396 457
Sulfur
C o u n t r y 2009 2010 2011 2012 2013 Rem metr. t metr. t metr. t metr. t metr. t Albania 750 750 0 0 0 2n Algeria 20 900 19 500 16 200 10 400 10 000 2e Armenia 23 900 32 000 33 700 42 900 51 000 1b Australia 940 000 860 000 860 000 860 000 860 000 2e Austria 12 007 9 873 9 669 10 329 9 789 1e Bahrain 123 900 212 900 134 800 126 500 131 100 1e Brazil 444 302 454 825 510 000 519 000 560 000 1n Bulgaria 325 000 325 000 325 000 325 000 325 000 2e Canada 6 064 872 6 857 292 6 608 000 6 259 000 6 301 000 1e Chile 1 600 700 1 595 600 1 606 600 1 531 000 1 474 400 1b China 9 370 000 9 600 000 9 700 000 9 900 000 10 500 000 2e Colombia 54 367 59 556 58 073 63 790 52 470 1e Denmark 4 200 3 246 3 045 3 925 3 599 1n Egypt 80 000 80 000 80 000 80 000 80 000 2n Finland 710 000 644 000 791 300 830 000 828 000 2n France 655 000 648 000 650 000 650 000 700 000 2e Germany 927 352 831 533 874 639 798 257 754 540 1b Greece 225 050 230 000 214 943 227 197 230 000 1e India 1 434 324 1 679 098 2 120 346 2 240 804 2 263 625 1n Indonesia 473 000 500 000 520 000 500 000 540 000 2n Iran 1 570 000 1 780 000 1 575 000 2 000 000 2 100 000 1e Iraq 20 000 20 000 20 000 20 000 37 500 1b Italy 740 000 740 000 740 000 740 000 740 000 2e Japan 3 538 000 3 710 875 3 381 829 3 397 250 3 428 960 1n Kazakhstan 2 740 000 2 872 900 2 800 000 2 600 000 2 900 000 2b Korea, North 42 000 42 000 42 000 42 000 42 000 2n Korea, South 1 559 000 1 689 400 1 738 400 1 750 000 1 750 000 2e Kuwait 759 000 828 288 743 000 844 300 850 000 1n Libya 140 000 150 000 50 000 100 000 70 000 2e Lithuania 69 722 73 470 76 700 73 050 81 400 1a Mexico 1 114 028 991 802 959 463 1 010 875 1 028 800 1n Norway 123 000 118 000 115 000 110 000 130 000 2e Pakistan 25 784 26 641 27 645 25 560 20 610 1n Peru 449 200 456 400 529 800 503 900 555 900 2e Poland 477 700 766 800 916 100 962 200 833 900 1n Qatar 657 954 1 124 210 1 655 937 1 724 117 2 000 000 2n Russia, Europe 6 200 000 6 600 000 6 730 000 6 750 000 6 800 000 2n Saudi Arabia 3 213 678 3 200 000 3 200 000 3 400 000 3 900 000 1e South Africa 536 103 375 422 337 972 257 019 270 173 1n Spain 633 000 640 000 650 000 680 000 640 000 2n Taiwan 252 392 231 700 219 975 231 296 200 000 2e Turkey 107 300 110 800 116 000 112 900 112 700 1n Turkmenistan 5 000 5 000 200 000 200 000 300 000 2n Ukraine 135 000 120 000 130 000 130 000 120 000 2n United Arab Emirates 2 175 000 1 763 000 1 800 000 2 000 000 2 100 000 1n
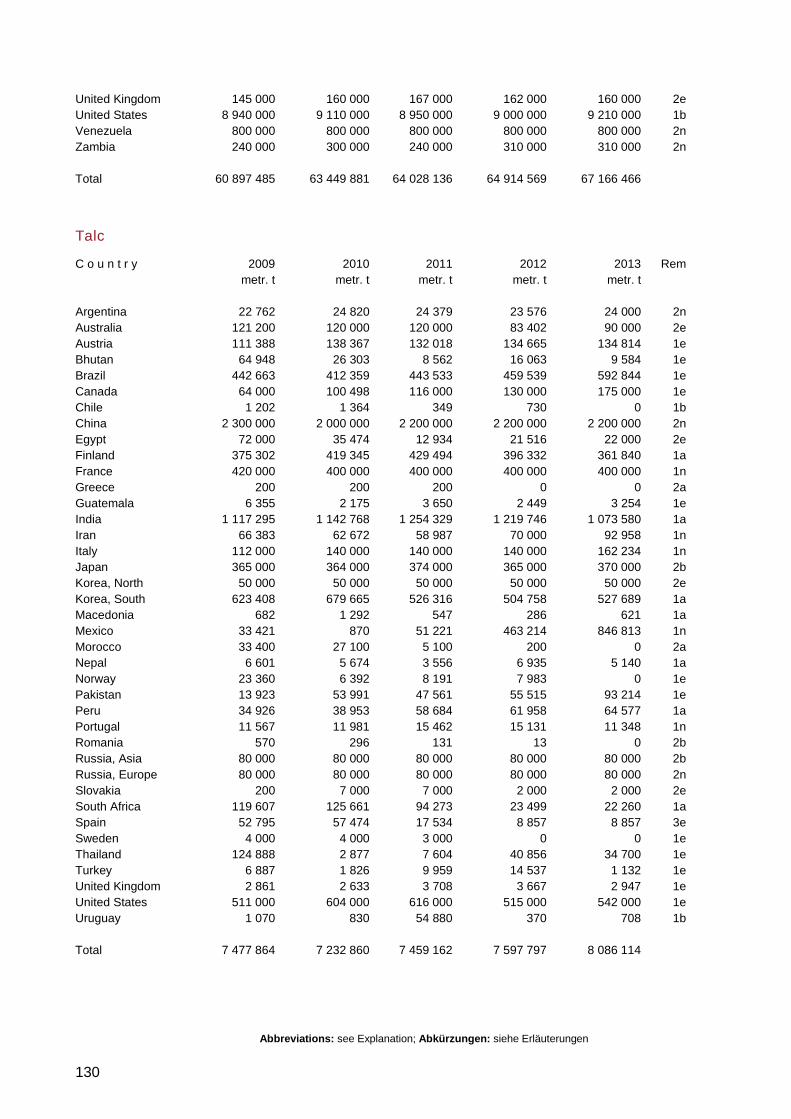
Abbreviations: see Explanation; Abkürzungen: siehe Erläuterungen
130
United Kingdom 145 000 160 000 167 000 162 000 160 000 2e United States 8 940 000 9 110 000 8 950 000 9 000 000 9 210 000 1b Venezuela 800 000 800 000 800 000 800 000 800 000 2n Zambia 240 000 300 000 240 000 310 000 310 000 2n Total 60 897 485 63 449 881 64 028 136 64 914 569 67 166 466
Talc
C o u n t r y 2009 2010 2011 2012 2013 Rem metr. t metr. t metr. t metr. t metr. t Argentina 22 762 24 820 24 379 23 576 24 000 2n Australia 121 200 120 000 120 000 83 402 90 000 2e Austria 111 388 138 367 132 018 134 665 134 814 1e Bhutan 64 948 26 303 8 562 16 063 9 584 1e Brazil 442 663 412 359 443 533 459 539 592 844 1e Canada 64 000 100 498 116 000 130 000 175 000 1e Chile 1 202 1 364 349 730 0 1b China 2 300 000 2 000 000 2 200 000 2 200 000 2 200 000 2n Egypt 72 000 35 474 12 934 21 516 22 000 2e Finland 375 302 419 345 429 494 396 332 361 840 1a France 420 000 400 000 400 000 400 000 400 000 1n Greece 200 200 200 0 0 2a Guatemala 6 355 2 175 3 650 2 449 3 254 1e India 1 117 295 1 142 768 1 254 329 1 219 746 1 073 580 1a Iran 66 383 62 672 58 987 70 000 92 958 1n Italy 112 000 140 000 140 000 140 000 162 234 1n Japan 365 000 364 000 374 000 365 000 370 000 2b Korea, North 50 000 50 000 50 000 50 000 50 000 2e Korea, South 623 408 679 665 526 316 504 758 527 689 1a Macedonia 682 1 292 547 286 621 1a Mexico 33 421 870 51 221 463 214 846 813 1n Morocco 33 400 27 100 5 100 200 0 2a Nepal 6 601 5 674 3 556 6 935 5 140 1a Norway 23 360 6 392 8 191 7 983 0 1e Pakistan 13 923 53 991 47 561 55 515 93 214 1e Peru 34 926 38 953 58 684 61 958 64 577 1a Portugal 11 567 11 981 15 462 15 131 11 348 1n Romania 570 296 131 13 0 2b Russia, Asia 80 000 80 000 80 000 80 000 80 000 2b Russia, Europe 80 000 80 000 80 000 80 000 80 000 2n Slovakia 200 7 000 7 000 2 000 2 000 2e South Africa 119 607 125 661 94 273 23 499 22 260 1a Spain 52 795 57 474 17 534 8 857 8 857 3e Sweden 4 000 4 000 3 000 0 0 1e Thailand 124 888 2 877 7 604 40 856 34 700 1e Turkey 6 887 1 826 9 959 14 537 1 132 1e United Kingdom 2 861 2 633 3 708 3 667 2 947 1e United States 511 000 604 000 616 000 515 000 542 000 1e Uruguay 1 070 830 54 880 370 708 1b Total 7 477 864 7 232 860 7 459 162 7 597 797 8 086 114
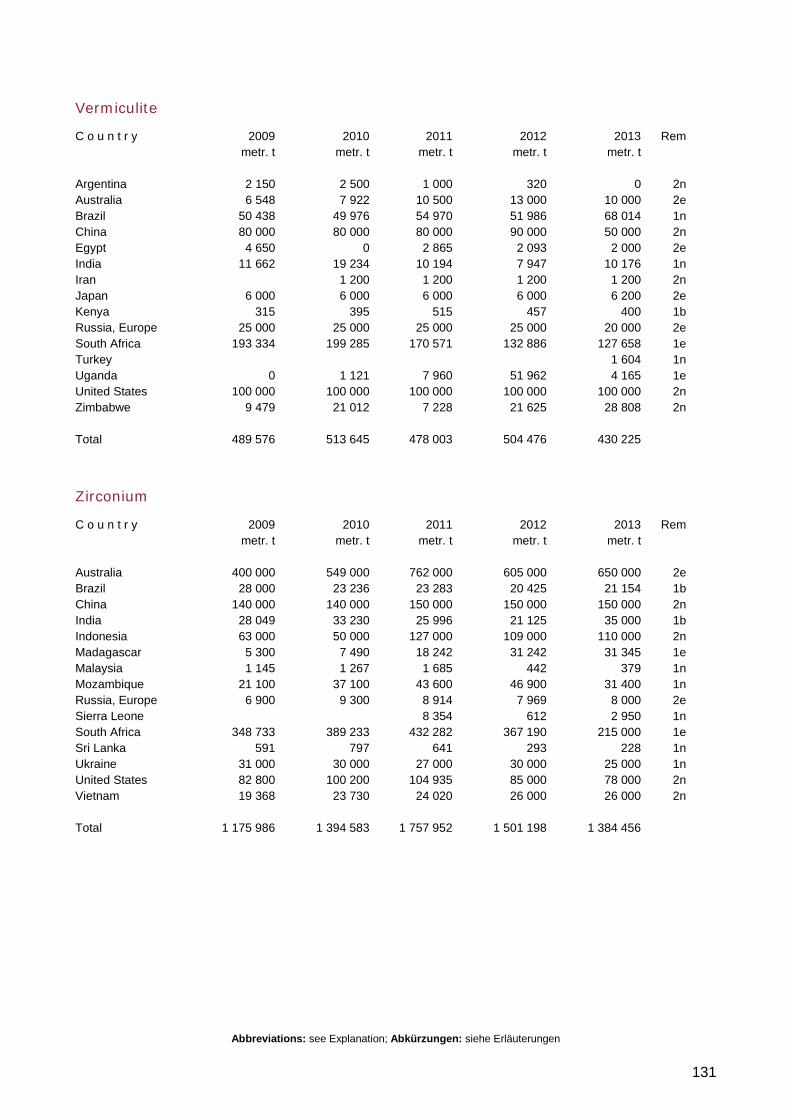
Abbreviations: see Explanation; Abkürzungen: siehe Erläuterungen
131
Vermiculite
C o u n t r y 2009 2010 2011 2012 2013 Rem metr. t metr. t metr. t metr. t metr. t Argentina 2 150 2 500 1 000 320 0 2n Australia 6 548 7 922 10 500 13 000 10 000 2e Brazil 50 438 49 976 54 970 51 986 68 014 1n China 80 000 80 000 80 000 90 000 50 000 2n Egypt 4 650 0 2 865 2 093 2 000 2e India 11 662 19 234 10 194 7 947 10 176 1n Iran 1 200 1 200 1 200 1 200 2n Japan 6 000 6 000 6 000 6 000 6 200 2e Kenya 315 395 515 457 400 1b Russia, Europe 25 000 25 000 25 000 25 000 20 000 2e South Africa 193 334 199 285 170 571 132 886 127 658 1e Turkey 1 604 1n Uganda 0 1 121 7 960 51 962 4 165 1e United States 100 000 100 000 100 000 100 000 100 000 2n Zimbabwe 9 479 21 012 7 228 21 625 28 808 2n Total 489 576 513 645 478 003 504 476 430 225
Zirconium
C o u n t r y 2009 2010 2011 2012 2013 Rem metr. t metr. t metr. t metr. t metr. t Australia 400 000 549 000 762 000 605 000 650 000 2e Brazil 28 000 23 236 23 283 20 425 21 154 1b China 140 000 140 000 150 000 150 000 150 000 2n India 28 049 33 230 25 996 21 125 35 000 1b Indonesia 63 000 50 000 127 000 109 000 110 000 2n Madagascar 5 300 7 490 18 242 31 242 31 345 1e Malaysia 1 145 1 267 1 685 442 379 1n Mozambique 21 100 37 100 43 600 46 900 31 400 1n Russia, Europe 6 900 9 300 8 914 7 969 8 000 2e Sierra Leone 8 354 612 2 950 1n South Africa 348 733 389 233 432 282 367 190 215 000 1e Sri Lanka 591 797 641 293 228 1n Ukraine 31 000 30 000 27 000 30 000 25 000 1n United States 82 800 100 200 104 935 85 000 78 000 2n Vietnam 19 368 23 730 24 020 26 000 26 000 2n Total 1 175 986 1 394 583 1 757 952 1 501 198 1 384 456
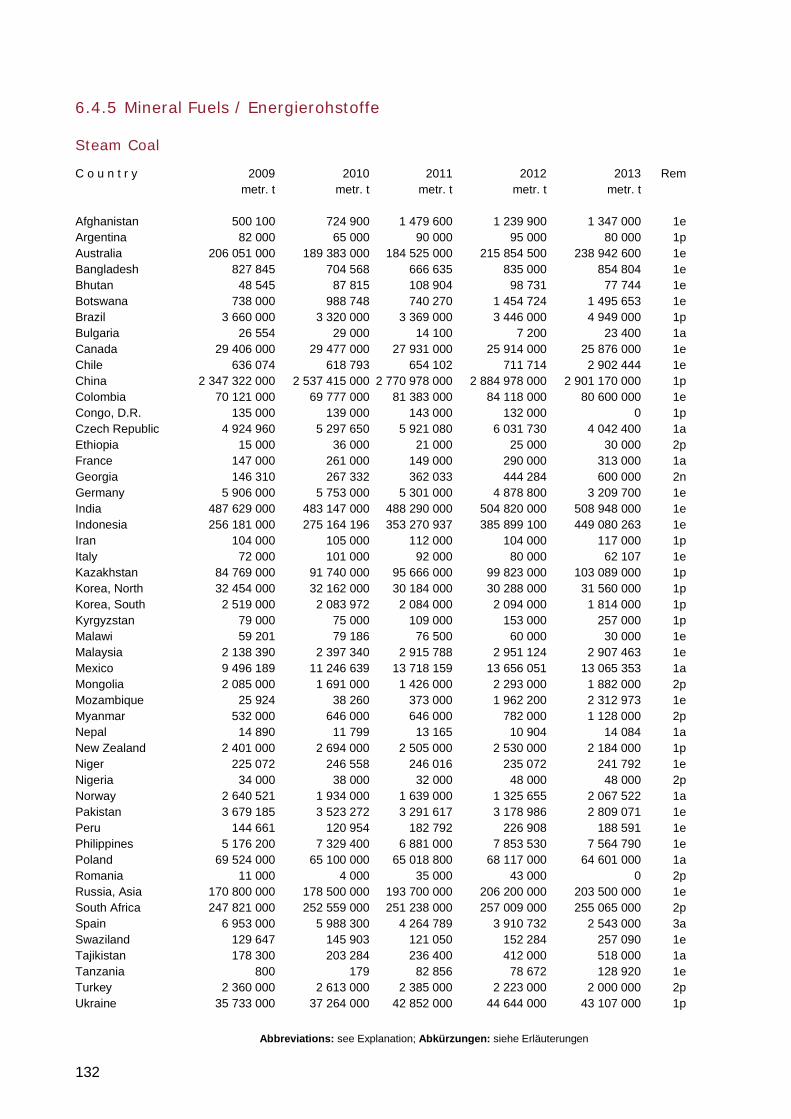
Abbreviations: see Explanation; Abkürzungen: siehe Erläuterungen
132
6.4.5 Mineral Fuels / Energierohstoffe
Steam Coal
C o u n t r y 2009 2010 2011 2012 2013 Rem metr. t metr. t metr. t metr. t metr. t Afghanistan 500 100 724 900 1 479 600 1 239 900 1 347 000 1e Argentina 82 000 65 000 90 000 95 000 80 000 1p Australia 206 051 000 189 383 000 184 525 000 215 854 500 238 942 600 1e Bangladesh 827 845 704 568 666 635 835 000 854 804 1e Bhutan 48 545 87 815 108 904 98 731 77 744 1e Botswana 738 000 988 748 740 270 1 454 724 1 495 653 1e Brazil 3 660 000 3 320 000 3 369 000 3 446 000 4 949 000 1p Bulgaria 26 554 29 000 14 100 7 200 23 400 1a Canada 29 406 000 29 477 000 27 931 000 25 914 000 25 876 000 1e Chile 636 074 618 793 654 102 711 714 2 902 444 1e China 2 347 322 000 2 537 415 000 2 770 978 000 2 884 978 000 2 901 170 000 1p Colombia 70 121 000 69 777 000 81 383 000 84 118 000 80 600 000 1e Congo, D.R. 135 000 139 000 143 000 132 000 0 1p Czech Republic 4 924 960 5 297 650 5 921 080 6 031 730 4 042 400 1a Ethiopia 15 000 36 000 21 000 25 000 30 000 2p France 147 000 261 000 149 000 290 000 313 000 1a Georgia 146 310 267 332 362 033 444 284 600 000 2n Germany 5 906 000 5 753 000 5 301 000 4 878 800 3 209 700 1e India 487 629 000 483 147 000 488 290 000 504 820 000 508 948 000 1e Indonesia 256 181 000 275 164 196 353 270 937 385 899 100 449 080 263 1e Iran 104 000 105 000 112 000 104 000 117 000 1p Italy 72 000 101 000 92 000 80 000 62 107 1e Kazakhstan 84 769 000 91 740 000 95 666 000 99 823 000 103 089 000 1p Korea, North 32 454 000 32 162 000 30 184 000 30 288 000 31 560 000 1p Korea, South 2 519 000 2 083 972 2 084 000 2 094 000 1 814 000 1p Kyrgyzstan 79 000 75 000 109 000 153 000 257 000 1p Malawi 59 201 79 186 76 500 60 000 30 000 1e Malaysia 2 138 390 2 397 340 2 915 788 2 951 124 2 907 463 1e Mexico 9 496 189 11 246 639 13 718 159 13 656 051 13 065 353 1a Mongolia 2 085 000 1 691 000 1 426 000 2 293 000 1 882 000 2p Mozambique 25 924 38 260 373 000 1 962 200 2 312 973 1e Myanmar 532 000 646 000 646 000 782 000 1 128 000 2p Nepal 14 890 11 799 13 165 10 904 14 084 1a New Zealand 2 401 000 2 694 000 2 505 000 2 530 000 2 184 000 1p Niger 225 072 246 558 246 016 235 072 241 792 1e Nigeria 34 000 38 000 32 000 48 000 48 000 2p Norway 2 640 521 1 934 000 1 639 000 1 325 655 2 067 522 1a Pakistan 3 679 185 3 523 272 3 291 617 3 178 986 2 809 071 1e Peru 144 661 120 954 182 792 226 908 188 591 1e Philippines 5 176 200 7 329 400 6 881 000 7 853 530 7 564 790 1e Poland 69 524 000 65 100 000 65 018 800 68 117 000 64 601 000 1a Romania 11 000 4 000 35 000 43 000 0 2p Russia, Asia 170 800 000 178 500 000 193 700 000 206 200 000 203 500 000 1e South Africa 247 821 000 252 559 000 251 238 000 257 009 000 255 065 000 2p Spain 6 953 000 5 988 300 4 264 789 3 910 732 2 543 000 3a Swaziland 129 647 145 903 121 050 152 284 257 090 1e Tajikistan 178 300 203 284 236 400 412 000 518 000 1a Tanzania 800 179 82 856 78 672 128 920 1e Turkey 2 360 000 2 613 000 2 385 000 2 223 000 2 000 000 2p Ukraine 35 733 000 37 264 000 42 852 000 44 644 000 43 107 000 1p
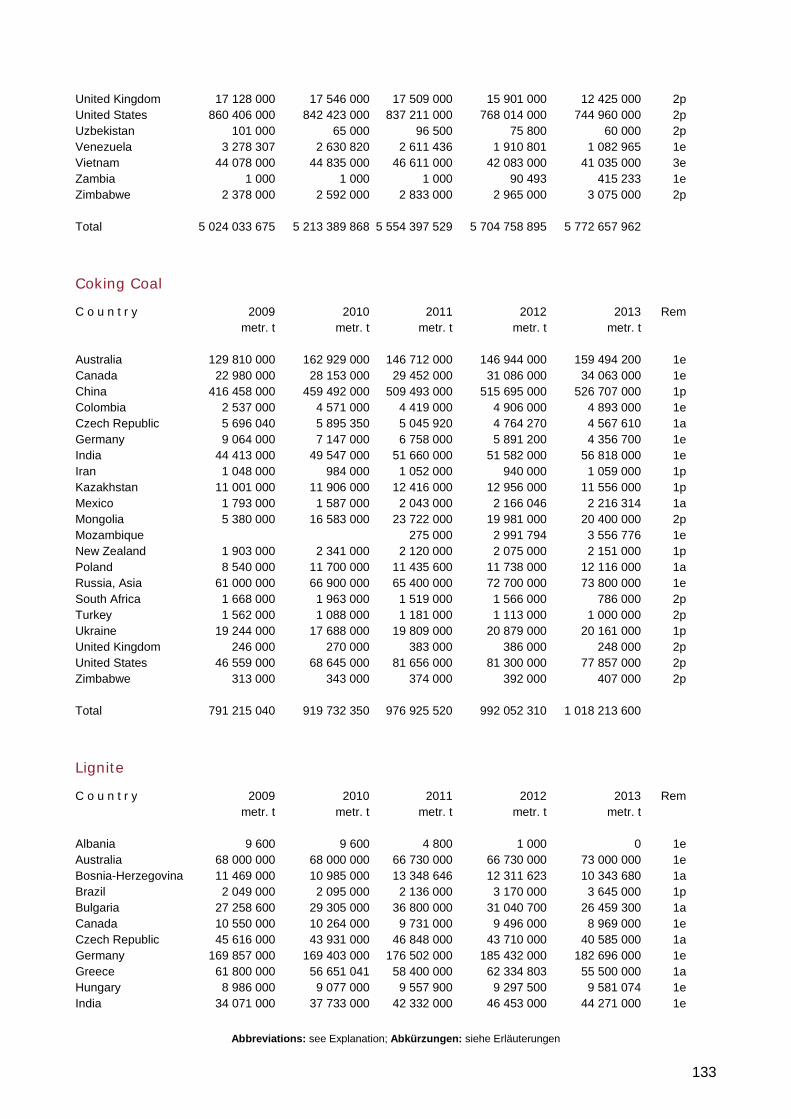
Abbreviations: see Explanation; Abkürzungen: siehe Erläuterungen
133
United Kingdom 17 128 000 17 546 000 17 509 000 15 901 000 12 425 000 2p United States 860 406 000 842 423 000 837 211 000 768 014 000 744 960 000 2p Uzbekistan 101 000 65 000 96 500 75 800 60 000 2p Venezuela 3 278 307 2 630 820 2 611 436 1 910 801 1 082 965 1e Vietnam 44 078 000 44 835 000 46 611 000 42 083 000 41 035 000 3e Zambia 1 000 1 000 1 000 90 493 415 233 1e Zimbabwe 2 378 000 2 592 000 2 833 000 2 965 000 3 075 000 2p Total 5 024 033 675 5 213 389 868 5 554 397 529 5 704 758 895 5 772 657 962
Coking Coal
C o u n t r y 2009 2010 2011 2012 2013 Rem metr. t metr. t metr. t metr. t metr. t Australia 129 810 000 162 929 000 146 712 000 146 944 000 159 494 200 1e Canada 22 980 000 28 153 000 29 452 000 31 086 000 34 063 000 1e China 416 458 000 459 492 000 509 493 000 515 695 000 526 707 000 1p Colombia 2 537 000 4 571 000 4 419 000 4 906 000 4 893 000 1e Czech Republic 5 696 040 5 895 350 5 045 920 4 764 270 4 567 610 1a Germany 9 064 000 7 147 000 6 758 000 5 891 200 4 356 700 1e India 44 413 000 49 547 000 51 660 000 51 582 000 56 818 000 1e Iran 1 048 000 984 000 1 052 000 940 000 1 059 000 1p Kazakhstan 11 001 000 11 906 000 12 416 000 12 956 000 11 556 000 1p Mexico 1 793 000 1 587 000 2 043 000 2 166 046 2 216 314 1a Mongolia 5 380 000 16 583 000 23 722 000 19 981 000 20 400 000 2p Mozambique 275 000 2 991 794 3 556 776 1e New Zealand 1 903 000 2 341 000 2 120 000 2 075 000 2 151 000 1p Poland 8 540 000 11 700 000 11 435 600 11 738 000 12 116 000 1a Russia, Asia 61 000 000 66 900 000 65 400 000 72 700 000 73 800 000 1e South Africa 1 668 000 1 963 000 1 519 000 1 566 000 786 000 2p Turkey 1 562 000 1 088 000 1 181 000 1 113 000 1 000 000 2p Ukraine 19 244 000 17 688 000 19 809 000 20 879 000 20 161 000 1p United Kingdom 246 000 270 000 383 000 386 000 248 000 2p United States 46 559 000 68 645 000 81 656 000 81 300 000 77 857 000 2p Zimbabwe 313 000 343 000 374 000 392 000 407 000 2p Total 791 215 040 919 732 350 976 925 520 992 052 310 1 018 213 600
Lignite
C o u n t r y 2009 2010 2011 2012 2013 Rem metr. t metr. t metr. t metr. t metr. t Albania 9 600 9 600 4 800 1 000 0 1e Australia 68 000 000 68 000 000 66 730 000 66 730 000 73 000 000 1e Bosnia-Herzegovina 11 469 000 10 985 000 13 348 646 12 311 623 10 343 680 1a Brazil 2 049 000 2 095 000 2 136 000 3 170 000 3 645 000 1p Bulgaria 27 258 600 29 305 000 36 800 000 31 040 700 26 459 300 1a Canada 10 550 000 10 264 000 9 731 000 9 496 000 8 969 000 1e Czech Republic 45 616 000 43 931 000 46 848 000 43 710 000 40 585 000 1a Germany 169 857 000 169 403 000 176 502 000 185 432 000 182 696 000 1e Greece 61 800 000 56 651 041 58 400 000 62 334 803 55 500 000 1a Hungary 8 986 000 9 077 000 9 557 900 9 297 500 9 581 074 1e India 34 071 000 37 733 000 42 332 000 46 453 000 44 271 000 1e
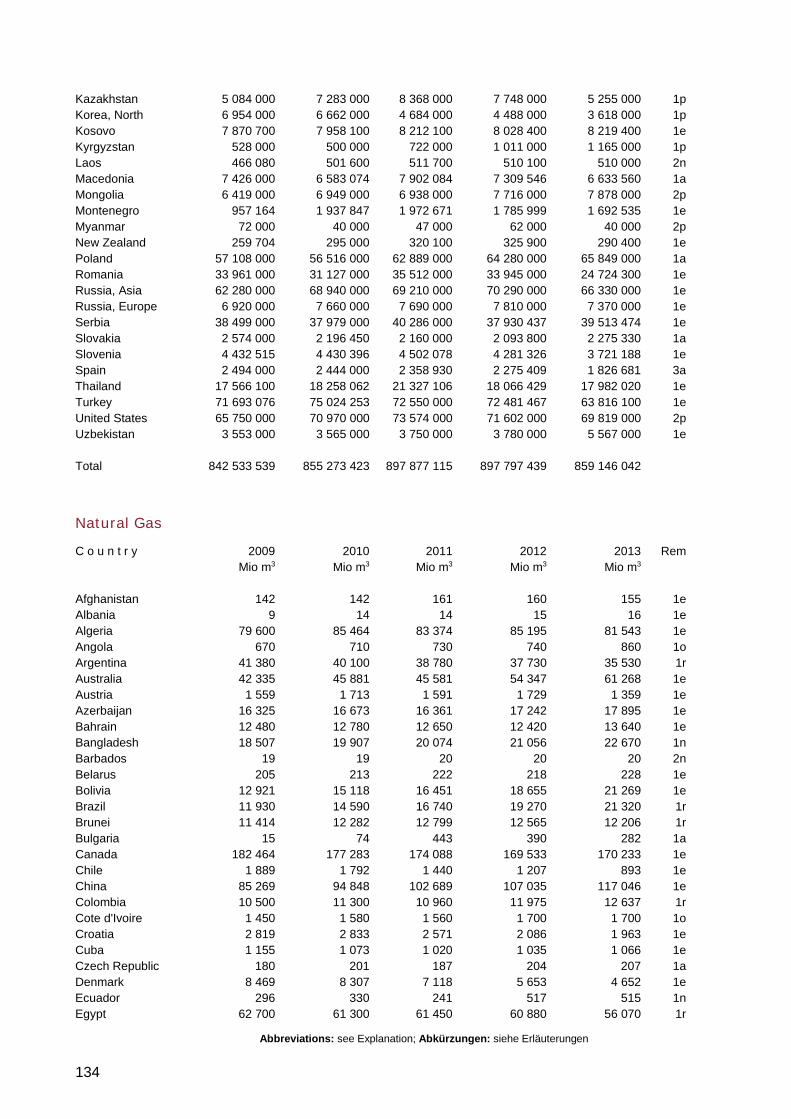
Abbreviations: see Explanation; Abkürzungen: siehe Erläuterungen
134
Kazakhstan 5 084 000 7 283 000 8 368 000 7 748 000 5 255 000 1p Korea, North 6 954 000 6 662 000 4 684 000 4 488 000 3 618 000 1p Kosovo 7 870 700 7 958 100 8 212 100 8 028 400 8 219 400 1e Kyrgyzstan 528 000 500 000 722 000 1 011 000 1 165 000 1p Laos 466 080 501 600 511 700 510 100 510 000 2n Macedonia 7 426 000 6 583 074 7 902 084 7 309 546 6 633 560 1a Mongolia 6 419 000 6 949 000 6 938 000 7 716 000 7 878 000 2p Montenegro 957 164 1 937 847 1 972 671 1 785 999 1 692 535 1e Myanmar 72 000 40 000 47 000 62 000 40 000 2p New Zealand 259 704 295 000 320 100 325 900 290 400 1e Poland 57 108 000 56 516 000 62 889 000 64 280 000 65 849 000 1a Romania 33 961 000 31 127 000 35 512 000 33 945 000 24 724 300 1e Russia, Asia 62 280 000 68 940 000 69 210 000 70 290 000 66 330 000 1e Russia, Europe 6 920 000 7 660 000 7 690 000 7 810 000 7 370 000 1e Serbia 38 499 000 37 979 000 40 286 000 37 930 437 39 513 474 1e Slovakia 2 574 000 2 196 450 2 160 000 2 093 800 2 275 330 1a Slovenia 4 432 515 4 430 396 4 502 078 4 281 326 3 721 188 1e Spain 2 494 000 2 444 000 2 358 930 2 275 409 1 826 681 3a Thailand 17 566 100 18 258 062 21 327 106 18 066 429 17 982 020 1e Turkey 71 693 076 75 024 253 72 550 000 72 481 467 63 816 100 1e United States 65 750 000 70 970 000 73 574 000 71 602 000 69 819 000 2p Uzbekistan 3 553 000 3 565 000 3 750 000 3 780 000 5 567 000 1e Total 842 533 539 855 273 423 897 877 115 897 797 439 859 146 042
Natural Gas
C o u n t r y 2009 2010 2011 2012 2013 Rem Mio m3 Mio m3 Mio m3 Mio m3 Mio m3 Afghanistan 142 142 161 160 155 1e Albania 9 14 14 15 16 1e Algeria 79 600 85 464 83 374 85 195 81 543 1e Angola 670 710 730 740 860 1o Argentina 41 380 40 100 38 780 37 730 35 530 1r Australia 42 335 45 881 45 581 54 347 61 268 1e Austria 1 559 1 713 1 591 1 729 1 359 1e Azerbaijan 16 325 16 673 16 361 17 242 17 895 1e Bahrain 12 480 12 780 12 650 12 420 13 640 1e Bangladesh 18 507 19 907 20 074 21 056 22 670 1n Barbados 19 19 20 20 20 2n Belarus 205 213 222 218 228 1e Bolivia 12 921 15 118 16 451 18 655 21 269 1e Brazil 11 930 14 590 16 740 19 270 21 320 1r Brunei 11 414 12 282 12 799 12 565 12 206 1r Bulgaria 15 74 443 390 282 1a Canada 182 464 177 283 174 088 169 533 170 233 1e Chile 1 889 1 792 1 440 1 207 893 1e China 85 269 94 848 102 689 107 035 117 046 1e Colombia 10 500 11 300 10 960 11 975 12 637 1r Cote d'Ivoire 1 450 1 580 1 560 1 700 1 700 1o Croatia 2 819 2 833 2 571 2 086 1 963 1e Cuba 1 155 1 073 1 020 1 035 1 066 1e Czech Republic 180 201 187 204 207 1a Denmark 8 469 8 307 7 118 5 653 4 652 1e Ecuador 296 330 241 517 515 1n Egypt 62 700 61 300 61 450 60 880 56 070 1r
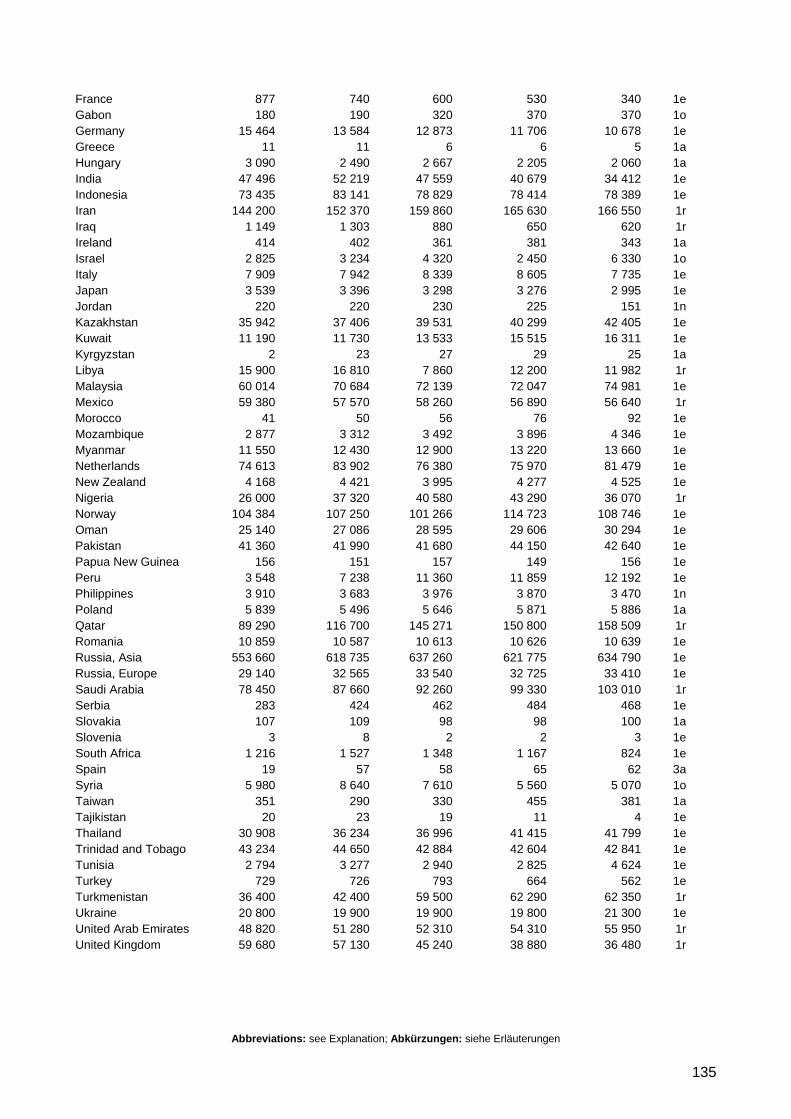
Abbreviations: see Explanation; Abkürzungen: siehe Erläuterungen
135
France 877 740 600 530 340 1e Gabon 180 190 320 370 370 1o Germany 15 464 13 584 12 873 11 706 10 678 1e Greece 11 11 6 6 5 1a Hungary 3 090 2 490 2 667 2 205 2 060 1a India 47 496 52 219 47 559 40 679 34 412 1e Indonesia 73 435 83 141 78 829 78 414 78 389 1e Iran 144 200 152 370 159 860 165 630 166 550 1r Iraq 1 149 1 303 880 650 620 1r Ireland 414 402 361 381 343 1a Israel 2 825 3 234 4 320 2 450 6 330 1o Italy 7 909 7 942 8 339 8 605 7 735 1e Japan 3 539 3 396 3 298 3 276 2 995 1e Jordan 220 220 230 225 151 1n Kazakhstan 35 942 37 406 39 531 40 299 42 405 1e Kuwait 11 190 11 730 13 533 15 515 16 311 1e Kyrgyzstan 2 23 27 29 25 1a Libya 15 900 16 810 7 860 12 200 11 982 1r Malaysia 60 014 70 684 72 139 72 047 74 981 1e Mexico 59 380 57 570 58 260 56 890 56 640 1r Morocco 41 50 56 76 92 1e Mozambique 2 877 3 312 3 492 3 896 4 346 1e Myanmar 11 550 12 430 12 900 13 220 13 660 1e Netherlands 74 613 83 902 76 380 75 970 81 479 1e New Zealand 4 168 4 421 3 995 4 277 4 525 1e Nigeria 26 000 37 320 40 580 43 290 36 070 1r Norway 104 384 107 250 101 266 114 723 108 746 1e Oman 25 140 27 086 28 595 29 606 30 294 1e Pakistan 41 360 41 990 41 680 44 150 42 640 1e Papua New Guinea 156 151 157 149 156 1e Peru 3 548 7 238 11 360 11 859 12 192 1e Philippines 3 910 3 683 3 976 3 870 3 470 1n Poland 5 839 5 496 5 646 5 871 5 886 1a Qatar 89 290 116 700 145 271 150 800 158 509 1r Romania 10 859 10 587 10 613 10 626 10 639 1e Russia, Asia 553 660 618 735 637 260 621 775 634 790 1e Russia, Europe 29 140 32 565 33 540 32 725 33 410 1e Saudi Arabia 78 450 87 660 92 260 99 330 103 010 1r Serbia 283 424 462 484 468 1e Slovakia 107 109 98 98 100 1a Slovenia 3 8 2 2 3 1e South Africa 1 216 1 527 1 348 1 167 824 1e Spain 19 57 58 65 62 3a Syria 5 980 8 640 7 610 5 560 5 070 1o Taiwan 351 290 330 455 381 1a Tajikistan 20 23 19 11 4 1e Thailand 30 908 36 234 36 996 41 415 41 799 1e Trinidad and Tobago 43 234 44 650 42 884 42 604 42 841 1e Tunisia 2 794 3 277 2 940 2 825 4 624 1e Turkey 729 726 793 664 562 1e Turkmenistan 36 400 42 400 59 500 62 290 62 350 1r Ukraine 20 800 19 900 19 900 19 800 21 300 1e United Arab Emirates 48 820 51 280 52 310 54 310 55 950 1r United Kingdom 59 680 57 130 45 240 38 880 36 480 1r
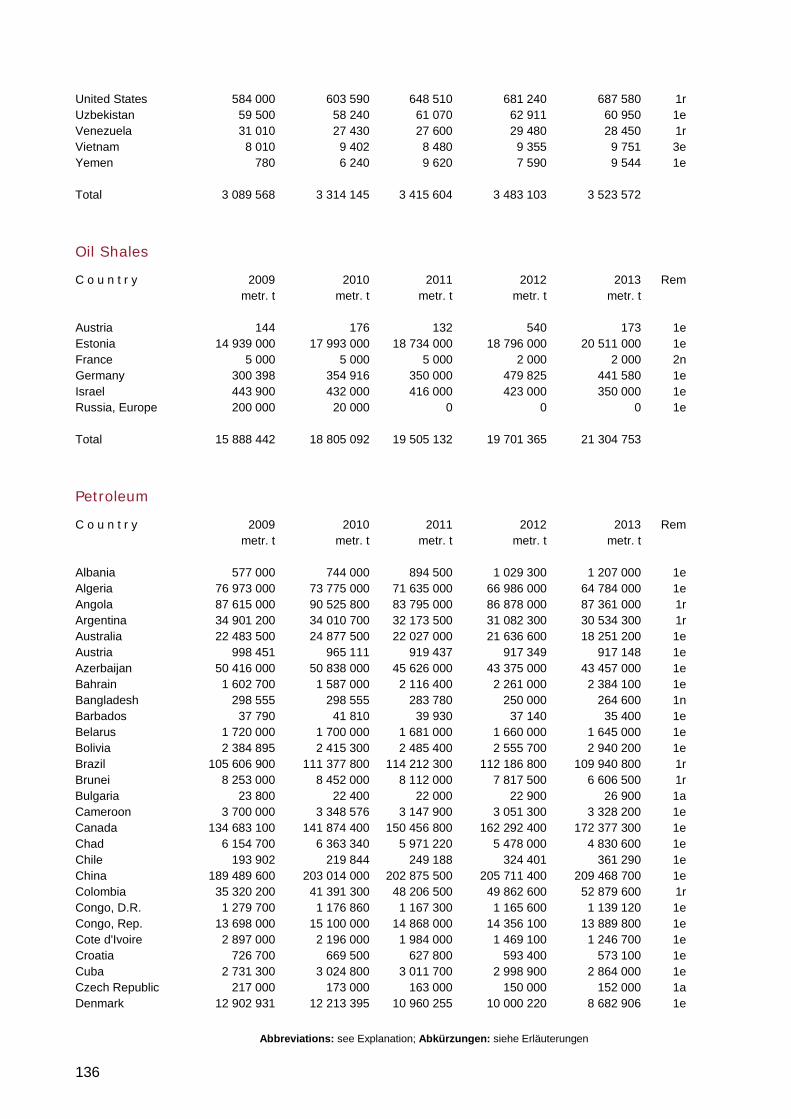
Abbreviations: see Explanation; Abkürzungen: siehe Erläuterungen
136
United States 584 000 603 590 648 510 681 240 687 580 1r Uzbekistan 59 500 58 240 61 070 62 911 60 950 1e Venezuela 31 010 27 430 27 600 29 480 28 450 1r Vietnam 8 010 9 402 8 480 9 355 9 751 3e Yemen 780 6 240 9 620 7 590 9 544 1e Total 3 089 568 3 314 145 3 415 604 3 483 103 3 523 572
Oil Shales
C o u n t r y 2009 2010 2011 2012 2013 Rem metr. t metr. t metr. t metr. t metr. t Austria 144 176 132 540 173 1e Estonia 14 939 000 17 993 000 18 734 000 18 796 000 20 511 000 1e France 5 000 5 000 5 000 2 000 2 000 2n Germany 300 398 354 916 350 000 479 825 441 580 1e Israel 443 900 432 000 416 000 423 000 350 000 1e Russia, Europe 200 000 20 000 0 0 0 1e Total 15 888 442 18 805 092 19 505 132 19 701 365 21 304 753
Petroleum
C o u n t r y 2009 2010 2011 2012 2013 Rem metr. t metr. t metr. t metr. t metr. t Albania 577 000 744 000 894 500 1 029 300 1 207 000 1e Algeria 76 973 000 73 775 000 71 635 000 66 986 000 64 784 000 1e Angola 87 615 000 90 525 800 83 795 000 86 878 000 87 361 000 1r Argentina 34 901 200 34 010 700 32 173 500 31 082 300 30 534 300 1r Australia 22 483 500 24 877 500 22 027 000 21 636 600 18 251 200 1e Austria 998 451 965 111 919 437 917 349 917 148 1e Azerbaijan 50 416 000 50 838 000 45 626 000 43 375 000 43 457 000 1e Bahrain 1 602 700 1 587 000 2 116 400 2 261 000 2 384 100 1e Bangladesh 298 555 298 555 283 780 250 000 264 600 1n Barbados 37 790 41 810 39 930 37 140 35 400 1e Belarus 1 720 000 1 700 000 1 681 000 1 660 000 1 645 000 1e Bolivia 2 384 895 2 415 300 2 485 400 2 555 700 2 940 200 1e Brazil 105 606 900 111 377 800 114 212 300 112 186 800 109 940 800 1r Brunei 8 253 000 8 452 000 8 112 000 7 817 500 6 606 500 1r Bulgaria 23 800 22 400 22 000 22 900 26 900 1a Cameroon 3 700 000 3 348 576 3 147 900 3 051 300 3 328 200 1e Canada 134 683 100 141 874 400 150 456 800 162 292 400 172 377 300 1e Chad 6 154 700 6 363 340 5 971 220 5 478 000 4 830 600 1e Chile 193 902 219 844 249 188 324 401 361 290 1e China 189 489 600 203 014 000 202 875 500 205 711 400 209 468 700 1e Colombia 35 320 200 41 391 300 48 206 500 49 862 600 52 879 600 1r Congo, D.R. 1 279 700 1 176 860 1 167 300 1 165 600 1 139 120 1e Congo, Rep. 13 698 000 15 100 000 14 868 000 14 356 100 13 889 800 1e Cote d'Ivoire 2 897 000 2 196 000 1 984 000 1 469 100 1 246 700 1e Croatia 726 700 669 500 627 800 593 400 573 100 1e Cuba 2 731 300 3 024 800 3 011 700 2 998 900 2 864 000 1e Czech Republic 217 000 173 000 163 000 150 000 152 000 1a Denmark 12 902 931 12 213 395 10 960 255 10 000 220 8 682 906 1e
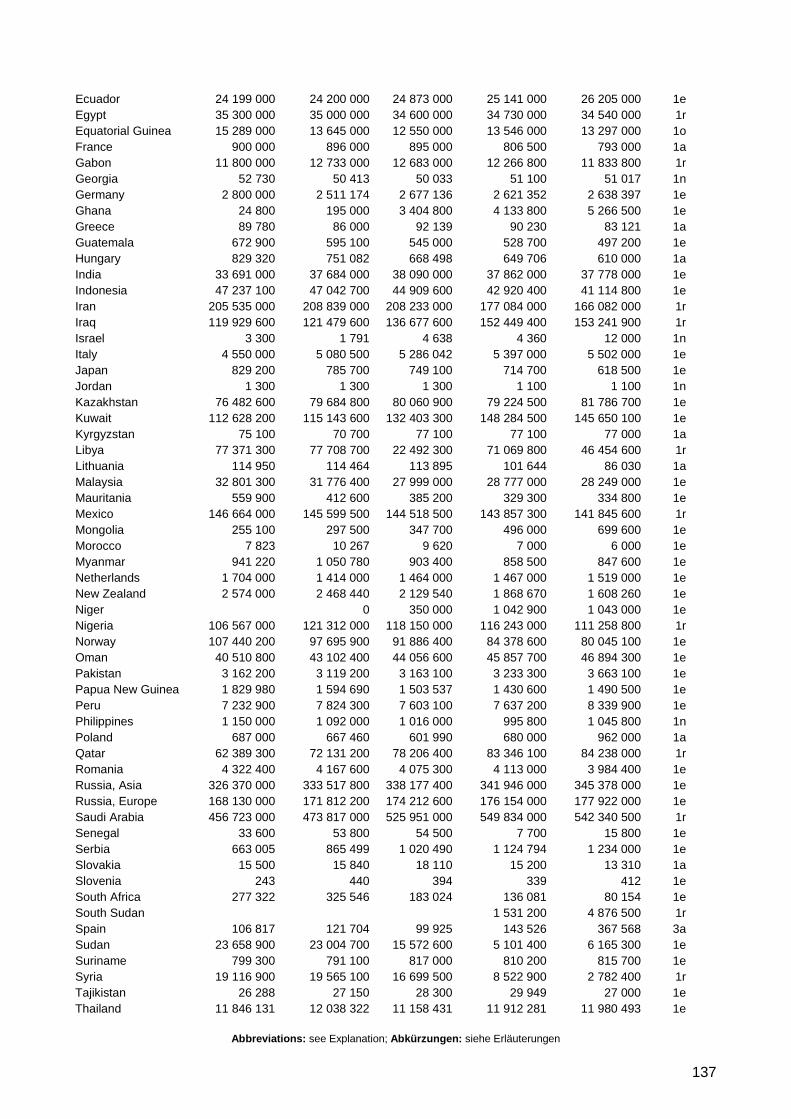
Abbreviations: see Explanation; Abkürzungen: siehe Erläuterungen
137
Ecuador 24 199 000 24 200 000 24 873 000 25 141 000 26 205 000 1e Egypt 35 300 000 35 000 000 34 600 000 34 730 000 34 540 000 1r Equatorial Guinea 15 289 000 13 645 000 12 550 000 13 546 000 13 297 000 1o France 900 000 896 000 895 000 806 500 793 000 1a Gabon 11 800 000 12 733 000 12 683 000 12 266 800 11 833 800 1r Georgia 52 730 50 413 50 033 51 100 51 017 1n Germany 2 800 000 2 511 174 2 677 136 2 621 352 2 638 397 1e Ghana 24 800 195 000 3 404 800 4 133 800 5 266 500 1e Greece 89 780 86 000 92 139 90 230 83 121 1a Guatemala 672 900 595 100 545 000 528 700 497 200 1e Hungary 829 320 751 082 668 498 649 706 610 000 1a India 33 691 000 37 684 000 38 090 000 37 862 000 37 778 000 1e Indonesia 47 237 100 47 042 700 44 909 600 42 920 400 41 114 800 1e Iran 205 535 000 208 839 000 208 233 000 177 084 000 166 082 000 1r Iraq 119 929 600 121 479 600 136 677 600 152 449 400 153 241 900 1r Israel 3 300 1 791 4 638 4 360 12 000 1n Italy 4 550 000 5 080 500 5 286 042 5 397 000 5 502 000 1e Japan 829 200 785 700 749 100 714 700 618 500 1e Jordan 1 300 1 300 1 300 1 100 1 100 1n Kazakhstan 76 482 600 79 684 800 80 060 900 79 224 500 81 786 700 1e Kuwait 112 628 200 115 143 600 132 403 300 148 284 500 145 650 100 1e Kyrgyzstan 75 100 70 700 77 100 77 100 77 000 1a Libya 77 371 300 77 708 700 22 492 300 71 069 800 46 454 600 1r Lithuania 114 950 114 464 113 895 101 644 86 030 1a Malaysia 32 801 300 31 776 400 27 999 000 28 777 000 28 249 000 1e Mauritania 559 900 412 600 385 200 329 300 334 800 1e Mexico 146 664 000 145 599 500 144 518 500 143 857 300 141 845 600 1r Mongolia 255 100 297 500 347 700 496 000 699 600 1e Morocco 7 823 10 267 9 620 7 000 6 000 1e Myanmar 941 220 1 050 780 903 400 858 500 847 600 1e Netherlands 1 704 000 1 414 000 1 464 000 1 467 000 1 519 000 1e New Zealand 2 574 000 2 468 440 2 129 540 1 868 670 1 608 260 1e Niger 0 350 000 1 042 900 1 043 000 1e Nigeria 106 567 000 121 312 000 118 150 000 116 243 000 111 258 800 1r Norway 107 440 200 97 695 900 91 886 400 84 378 600 80 045 100 1e Oman 40 510 800 43 102 400 44 056 600 45 857 700 46 894 300 1e Pakistan 3 162 200 3 119 200 3 163 100 3 233 300 3 663 100 1e Papua New Guinea 1 829 980 1 594 690 1 503 537 1 430 600 1 490 500 1e Peru 7 232 900 7 824 300 7 603 100 7 637 200 8 339 900 1e Philippines 1 150 000 1 092 000 1 016 000 995 800 1 045 800 1n Poland 687 000 667 460 601 990 680 000 962 000 1a Qatar 62 389 300 72 131 200 78 206 400 83 346 100 84 238 000 1r Romania 4 322 400 4 167 600 4 075 300 4 113 000 3 984 400 1e Russia, Asia 326 370 000 333 517 800 338 177 400 341 946 000 345 378 000 1e Russia, Europe 168 130 000 171 812 200 174 212 600 176 154 000 177 922 000 1e Saudi Arabia 456 723 000 473 817 000 525 951 000 549 834 000 542 340 500 1r Senegal 33 600 53 800 54 500 7 700 15 800 1e Serbia 663 005 865 499 1 020 490 1 124 794 1 234 000 1e Slovakia 15 500 15 840 18 110 15 200 13 310 1a Slovenia 243 440 394 339 412 1e South Africa 277 322 325 546 183 024 136 081 80 154 1e South Sudan 1 531 200 4 876 500 1r Spain 106 817 121 704 99 925 143 526 367 568 3a Sudan 23 658 900 23 004 700 15 572 600 5 101 400 6 165 300 1e Suriname 799 300 791 100 817 000 810 200 815 700 1e Syria 19 116 900 19 565 100 16 699 500 8 522 900 2 782 400 1r Tajikistan 26 288 27 150 28 300 29 949 27 000 1e Thailand 11 846 131 12 038 322 11 158 431 11 912 281 11 980 493 1e
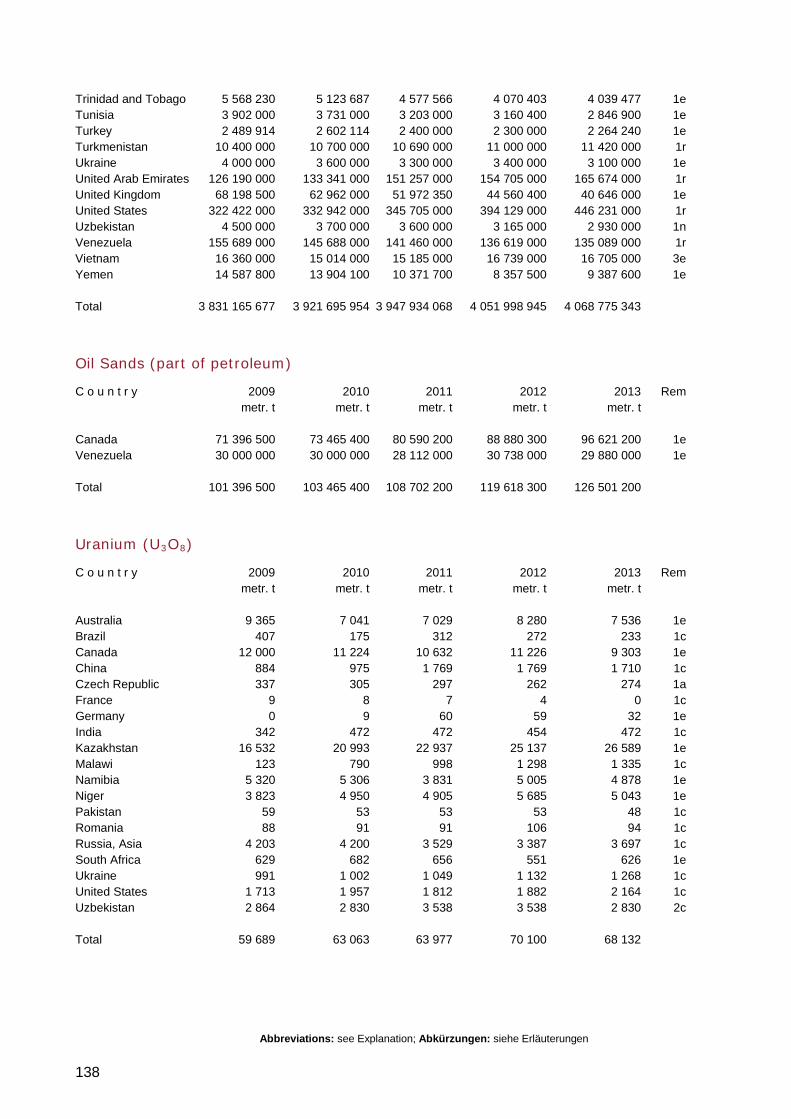
Abbreviations: see Explanation; Abkürzungen: siehe Erläuterungen
138
Trinidad and Tobago 5 568 230 5 123 687 4 577 566 4 070 403 4 039 477 1e Tunisia 3 902 000 3 731 000 3 203 000 3 160 400 2 846 900 1e Turkey 2 489 914 2 602 114 2 400 000 2 300 000 2 264 240 1e Turkmenistan 10 400 000 10 700 000 10 690 000 11 000 000 11 420 000 1r Ukraine 4 000 000 3 600 000 3 300 000 3 400 000 3 100 000 1e United Arab Emirates 126 190 000 133 341 000 151 257 000 154 705 000 165 674 000 1r United Kingdom 68 198 500 62 962 000 51 972 350 44 560 400 40 646 000 1e United States 322 422 000 332 942 000 345 705 000 394 129 000 446 231 000 1r Uzbekistan 4 500 000 3 700 000 3 600 000 3 165 000 2 930 000 1n Venezuela 155 689 000 145 688 000 141 460 000 136 619 000 135 089 000 1r Vietnam 16 360 000 15 014 000 15 185 000 16 739 000 16 705 000 3e Yemen 14 587 800 13 904 100 10 371 700 8 357 500 9 387 600 1e Total 3 831 165 677 3 921 695 954 3 947 934 068 4 051 998 945 4 068 775 343
Oil Sands (part of petroleum)
C o u n t r y 2009 2010 2011 2012 2013 Rem metr. t metr. t metr. t metr. t metr. t Canada 71 396 500 73 465 400 80 590 200 88 880 300 96 621 200 1e Venezuela 30 000 000 30 000 000 28 112 000 30 738 000 29 880 000 1e Total 101 396 500 103 465 400 108 702 200 119 618 300 126 501 200
Uranium (U3O8)
C o u n t r y 2009 2010 2011 2012 2013 Rem metr. t metr. t metr. t metr. t metr. t Australia 9 365 7 041 7 029 8 280 7 536 1e Brazil 407 175 312 272 233 1c Canada 12 000 11 224 10 632 11 226 9 303 1e China 884 975 1 769 1 769 1 710 1c Czech Republic 337 305 297 262 274 1a France 9 8 7 4 0 1c Germany 0 9 60 59 32 1e India 342 472 472 454 472 1c Kazakhstan 16 532 20 993 22 937 25 137 26 589 1e Malawi 123 790 998 1 298 1 335 1c Namibia 5 320 5 306 3 831 5 005 4 878 1e Niger 3 823 4 950 4 905 5 685 5 043 1e Pakistan 59 53 53 53 48 1c Romania 88 91 91 106 94 1c Russia, Asia 4 203 4 200 3 529 3 387 3 697 1c South Africa 629 682 656 551 626 1e Ukraine 991 1 002 1 049 1 132 1 268 1c United States 1 713 1 957 1 812 1 882 2 164 1c Uzbekistan 2 864 2 830 3 538 3 538 2 830 2c Total 59 689 63 063 63 977 70 100 68 132
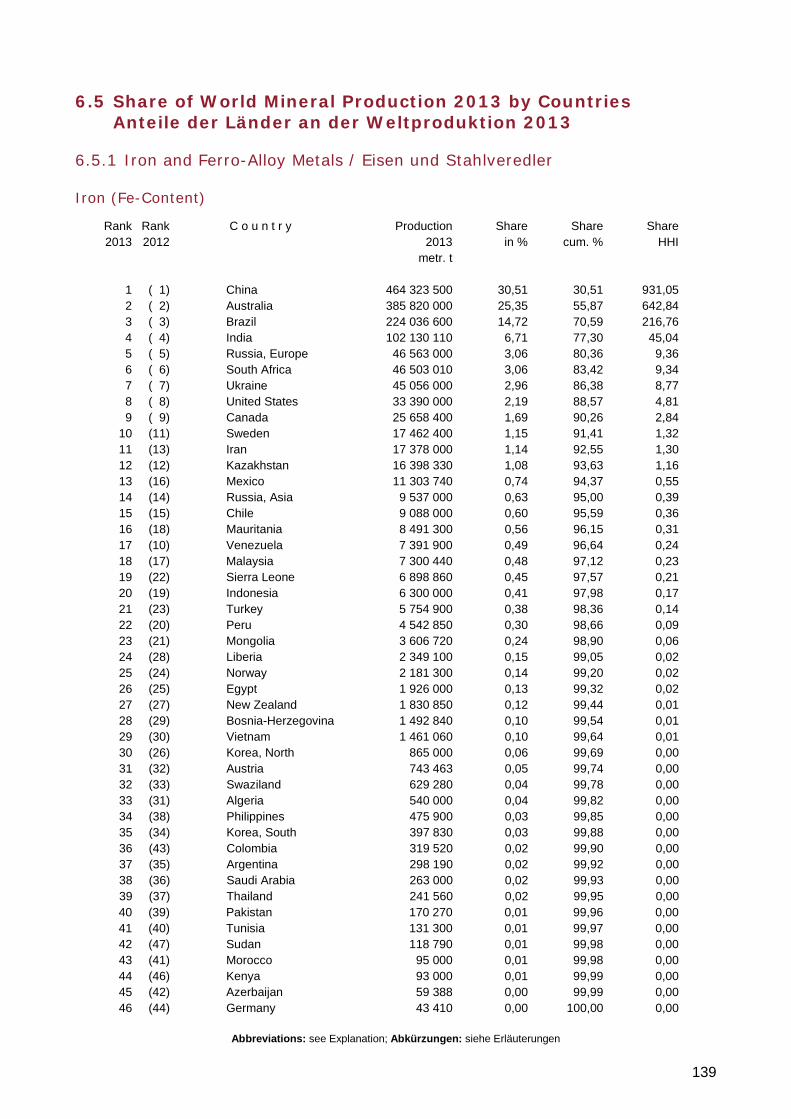
Abbreviations: see Explanation; Abkürzungen: siehe Erläuterungen
139
6.5 Share of World Mineral Production 2013 by Countries Anteile der Länder an der Weltproduktion 2013
6.5.1 Iron and Ferro-Alloy Metals / Eisen und Stahlveredler
Iron (Fe-Content)
Rank Rank C o u n t r y Production Share Share Share 2013 2012 2013 in % cum. % HHI metr. t 1 ( 1) China 464 323 500 30,51 30,51 931,05 2 ( 2) Australia 385 820 000 25,35 55,87 642,84 3 ( 3) Brazil 224 036 600 14,72 70,59 216,76 4 ( 4) India 102 130 110 6,71 77,30 45,04 5 ( 5) Russia, Europe 46 563 000 3,06 80,36 9,36 6 ( 6) South Africa 46 503 010 3,06 83,42 9,34 7 ( 7) Ukraine 45 056 000 2,96 86,38 8,77 8 ( 8) United States 33 390 000 2,19 88,57 4,81 9 ( 9) Canada 25 658 400 1,69 90,26 2,84 10 (11) Sweden 17 462 400 1,15 91,41 1,32 11 (13) Iran 17 378 000 1,14 92,55 1,30 12 (12) Kazakhstan 16 398 330 1,08 93,63 1,16 13 (16) Mexico 11 303 740 0,74 94,37 0,55 14 (14) Russia, Asia 9 537 000 0,63 95,00 0,39 15 (15) Chile 9 088 000 0,60 95,59 0,36 16 (18) Mauritania 8 491 300 0,56 96,15 0,31 17 (10) Venezuela 7 391 900 0,49 96,64 0,24 18 (17) Malaysia 7 300 440 0,48 97,12 0,23 19 (22) Sierra Leone 6 898 860 0,45 97,57 0,21 20 (19) Indonesia 6 300 000 0,41 97,98 0,17 21 (23) Turkey 5 754 900 0,38 98,36 0,14 22 (20) Peru 4 542 850 0,30 98,66 0,09 23 (21) Mongolia 3 606 720 0,24 98,90 0,06 24 (28) Liberia 2 349 100 0,15 99,05 0,02 25 (24) Norway 2 181 300 0,14 99,20 0,02 26 (25) Egypt 1 926 000 0,13 99,32 0,02 27 (27) New Zealand 1 830 850 0,12 99,44 0,01 28 (29) Bosnia-Herzegovina 1 492 840 0,10 99,54 0,01 29 (30) Vietnam 1 461 060 0,10 99,64 0,01 30 (26) Korea, North 865 000 0,06 99,69 0,00 31 (32) Austria 743 463 0,05 99,74 0,00 32 (33) Swaziland 629 280 0,04 99,78 0,00 33 (31) Algeria 540 000 0,04 99,82 0,00 34 (38) Philippines 475 900 0,03 99,85 0,00 35 (34) Korea, South 397 830 0,03 99,88 0,00 36 (43) Colombia 319 520 0,02 99,90 0,00 37 (35) Argentina 298 190 0,02 99,92 0,00 38 (36) Saudi Arabia 263 000 0,02 99,93 0,00 39 (37) Thailand 241 560 0,02 99,95 0,00 40 (39) Pakistan 170 270 0,01 99,96 0,00 41 (40) Tunisia 131 300 0,01 99,97 0,00 42 (47) Sudan 118 790 0,01 99,98 0,00 43 (41) Morocco 95 000 0,01 99,98 0,00 44 (46) Kenya 93 000 0,01 99,99 0,00 45 (42) Azerbaijan 59 388 0,00 99,99 0,00 46 (44) Germany 43 410 0,00 100,00 0,00
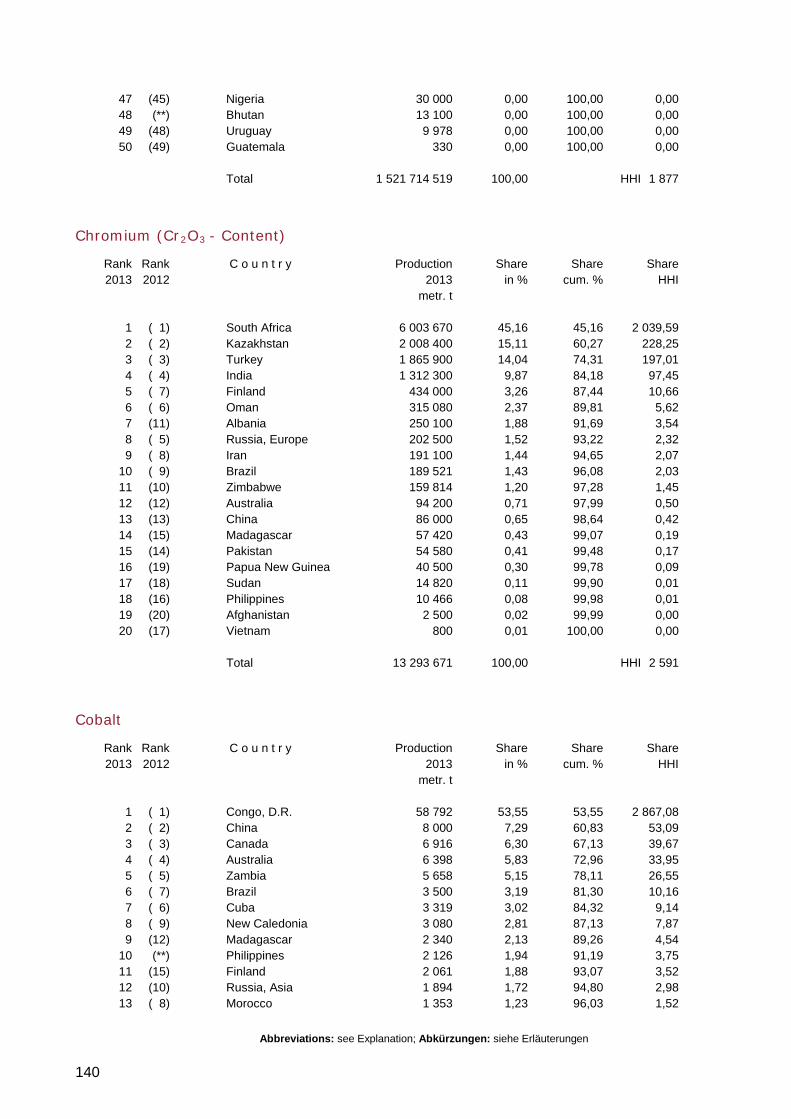
Abbreviations: see Explanation; Abkürzungen: siehe Erläuterungen
140
47 (45) Nigeria 30 000 0,00 100,00 0,00 48 (**) Bhutan 13 100 0,00 100,00 0,00 49 (48) Uruguay 9 978 0,00 100,00 0,00 50 (49) Guatemala 330 0,00 100,00 0,00 Total 1 521 714 519 100,00 HHI 1 877
Chromium (Cr2O3 - Content)
Rank Rank C o u n t r y Production Share Share Share 2013 2012 2013 in % cum. % HHI metr. t 1 ( 1) South Africa 6 003 670 45,16 45,16 2 039,59 2 ( 2) Kazakhstan 2 008 400 15,11 60,27 228,25 3 ( 3) Turkey 1 865 900 14,04 74,31 197,01 4 ( 4) India 1 312 300 9,87 84,18 97,45 5 ( 7) Finland 434 000 3,26 87,44 10,66 6 ( 6) Oman 315 080 2,37 89,81 5,62 7 (11) Albania 250 100 1,88 91,69 3,54 8 ( 5) Russia, Europe 202 500 1,52 93,22 2,32 9 ( 8) Iran 191 100 1,44 94,65 2,07 10 ( 9) Brazil 189 521 1,43 96,08 2,03 11 (10) Zimbabwe 159 814 1,20 97,28 1,45 12 (12) Australia 94 200 0,71 97,99 0,50 13 (13) China 86 000 0,65 98,64 0,42 14 (15) Madagascar 57 420 0,43 99,07 0,19 15 (14) Pakistan 54 580 0,41 99,48 0,17 16 (19) Papua New Guinea 40 500 0,30 99,78 0,09 17 (18) Sudan 14 820 0,11 99,90 0,01 18 (16) Philippines 10 466 0,08 99,98 0,01 19 (20) Afghanistan 2 500 0,02 99,99 0,00 20 (17) Vietnam 800 0,01 100,00 0,00 Total 13 293 671 100,00 HHI 2 591
Cobalt
Rank Rank C o u n t r y Production Share Share Share 2013 2012 2013 in % cum. % HHI metr. t 1 ( 1) Congo, D.R. 58 792 53,55 53,55 2 867,08 2 ( 2) China 8 000 7,29 60,83 53,09 3 ( 3) Canada 6 916 6,30 67,13 39,67 4 ( 4) Australia 6 398 5,83 72,96 33,95 5 ( 5) Zambia 5 658 5,15 78,11 26,55 6 ( 7) Brazil 3 500 3,19 81,30 10,16 7 ( 6) Cuba 3 319 3,02 84,32 9,14 8 ( 9) New Caledonia 3 080 2,81 87,13 7,87 9 (12) Madagascar 2 340 2,13 89,26 4,54 10 (**) Philippines 2 126 1,94 91,19 3,75 11 (15) Finland 2 061 1,88 93,07 3,52 12 (10) Russia, Asia 1 894 1,72 94,80 2,98 13 ( 8) Morocco 1 353 1,23 96,03 1,52
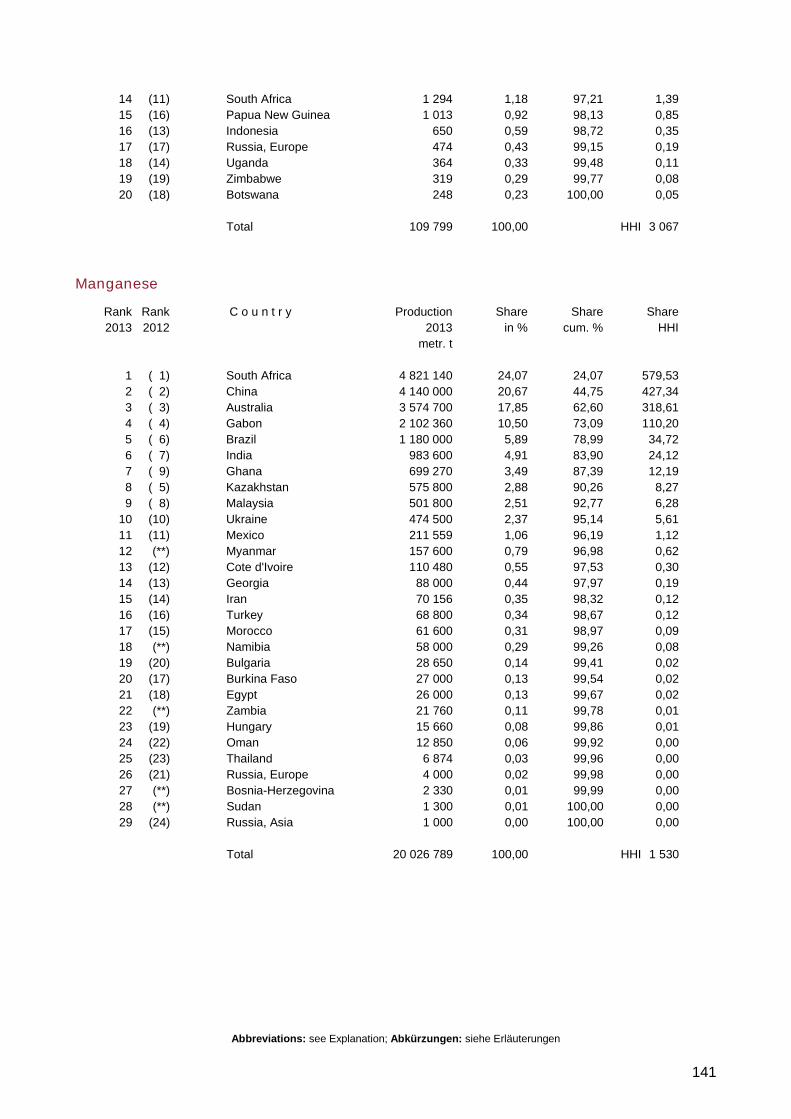
Abbreviations: see Explanation; Abkürzungen: siehe Erläuterungen
141
14 (11) South Africa 1 294 1,18 97,21 1,39 15 (16) Papua New Guinea 1 013 0,92 98,13 0,85 16 (13) Indonesia 650 0,59 98,72 0,35 17 (17) Russia, Europe 474 0,43 99,15 0,19 18 (14) Uganda 364 0,33 99,48 0,11 19 (19) Zimbabwe 319 0,29 99,77 0,08 20 (18) Botswana 248 0,23 100,00 0,05 Total 109 799 100,00 HHI 3 067
Manganese
Rank Rank C o u n t r y Production Share Share Share 2013 2012 2013 in % cum. % HHI metr. t 1 ( 1) South Africa 4 821 140 24,07 24,07 579,53 2 ( 2) China 4 140 000 20,67 44,75 427,34 3 ( 3) Australia 3 574 700 17,85 62,60 318,61 4 ( 4) Gabon 2 102 360 10,50 73,09 110,20 5 ( 6) Brazil 1 180 000 5,89 78,99 34,72 6 ( 7) India 983 600 4,91 83,90 24,12 7 ( 9) Ghana 699 270 3,49 87,39 12,19 8 ( 5) Kazakhstan 575 800 2,88 90,26 8,27 9 ( 8) Malaysia 501 800 2,51 92,77 6,28 10 (10) Ukraine 474 500 2,37 95,14 5,61 11 (11) Mexico 211 559 1,06 96,19 1,12 12 (**) Myanmar 157 600 0,79 96,98 0,62 13 (12) Cote d'Ivoire 110 480 0,55 97,53 0,30 14 (13) Georgia 88 000 0,44 97,97 0,19 15 (14) Iran 70 156 0,35 98,32 0,12 16 (16) Turkey 68 800 0,34 98,67 0,12 17 (15) Morocco 61 600 0,31 98,97 0,09 18 (**) Namibia 58 000 0,29 99,26 0,08 19 (20) Bulgaria 28 650 0,14 99,41 0,02 20 (17) Burkina Faso 27 000 0,13 99,54 0,02 21 (18) Egypt 26 000 0,13 99,67 0,02 22 (**) Zambia 21 760 0,11 99,78 0,01 23 (19) Hungary 15 660 0,08 99,86 0,01 24 (22) Oman 12 850 0,06 99,92 0,00 25 (23) Thailand 6 874 0,03 99,96 0,00 26 (21) Russia, Europe 4 000 0,02 99,98 0,00 27 (**) Bosnia-Herzegovina 2 330 0,01 99,99 0,00 28 (**) Sudan 1 300 0,01 100,00 0,00 29 (24) Russia, Asia 1 000 0,00 100,00 0,00 Total 20 026 789 100,00 HHI 1 530
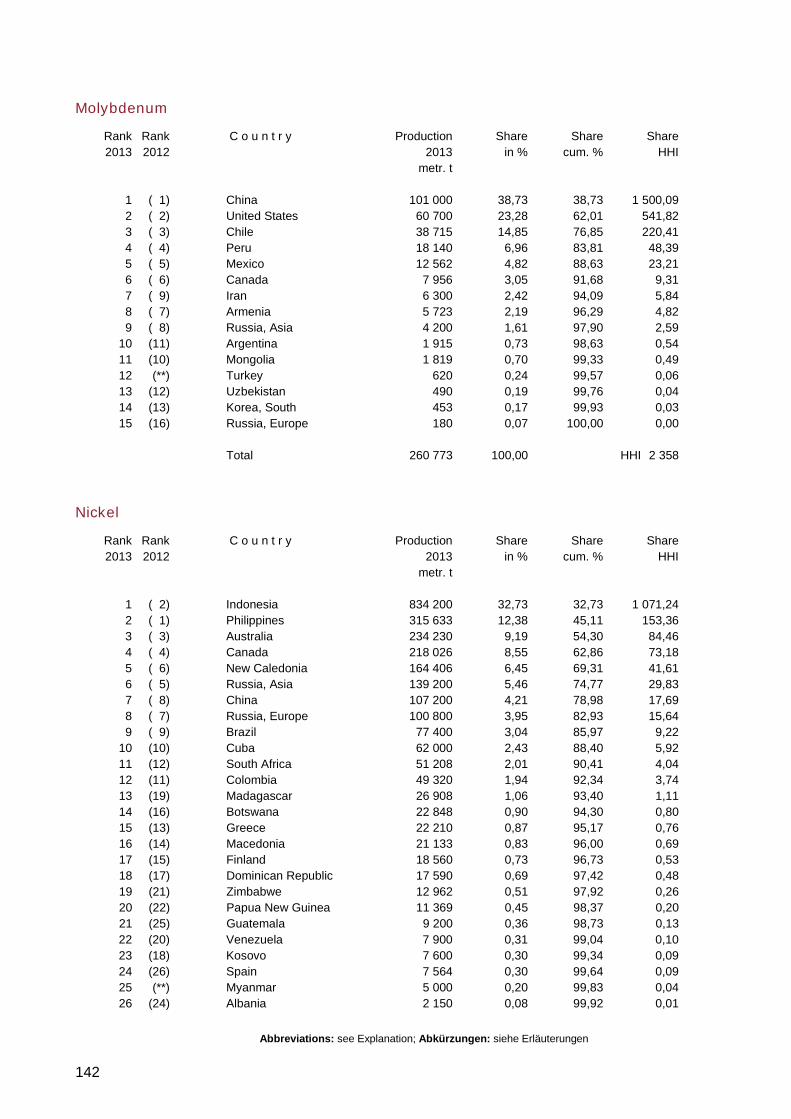
Abbreviations: see Explanation; Abkürzungen: siehe Erläuterungen
142
Molybdenum
Rank Rank C o u n t r y Production Share Share Share 2013 2012 2013 in % cum. % HHI metr. t 1 ( 1) China 101 000 38,73 38,73 1 500,09 2 ( 2) United States 60 700 23,28 62,01 541,82 3 ( 3) Chile 38 715 14,85 76,85 220,41 4 ( 4) Peru 18 140 6,96 83,81 48,39 5 ( 5) Mexico 12 562 4,82 88,63 23,21 6 ( 6) Canada 7 956 3,05 91,68 9,31 7 ( 9) Iran 6 300 2,42 94,09 5,84 8 ( 7) Armenia 5 723 2,19 96,29 4,82 9 ( 8) Russia, Asia 4 200 1,61 97,90 2,59 10 (11) Argentina 1 915 0,73 98,63 0,54 11 (10) Mongolia 1 819 0,70 99,33 0,49 12 (**) Turkey 620 0,24 99,57 0,06 13 (12) Uzbekistan 490 0,19 99,76 0,04 14 (13) Korea, South 453 0,17 99,93 0,03 15 (16) Russia, Europe 180 0,07 100,00 0,00 Total 260 773 100,00 HHI 2 358
Nickel
Rank Rank C o u n t r y Production Share Share Share 2013 2012 2013 in % cum. % HHI metr. t 1 ( 2) Indonesia 834 200 32,73 32,73 1 071,24 2 ( 1) Philippines 315 633 12,38 45,11 153,36 3 ( 3) Australia 234 230 9,19 54,30 84,46 4 ( 4) Canada 218 026 8,55 62,86 73,18 5 ( 6) New Caledonia 164 406 6,45 69,31 41,61 6 ( 5) Russia, Asia 139 200 5,46 74,77 29,83 7 ( 8) China 107 200 4,21 78,98 17,69 8 ( 7) Russia, Europe 100 800 3,95 82,93 15,64 9 ( 9) Brazil 77 400 3,04 85,97 9,22 10 (10) Cuba 62 000 2,43 88,40 5,92 11 (12) South Africa 51 208 2,01 90,41 4,04 12 (11) Colombia 49 320 1,94 92,34 3,74 13 (19) Madagascar 26 908 1,06 93,40 1,11 14 (16) Botswana 22 848 0,90 94,30 0,80 15 (13) Greece 22 210 0,87 95,17 0,76 16 (14) Macedonia 21 133 0,83 96,00 0,69 17 (15) Finland 18 560 0,73 96,73 0,53 18 (17) Dominican Republic 17 590 0,69 97,42 0,48 19 (21) Zimbabwe 12 962 0,51 97,92 0,26 20 (22) Papua New Guinea 11 369 0,45 98,37 0,20 21 (25) Guatemala 9 200 0,36 98,73 0,13 22 (20) Venezuela 7 900 0,31 99,04 0,10 23 (18) Kosovo 7 600 0,30 99,34 0,09 24 (26) Spain 7 564 0,30 99,64 0,09 25 (**) Myanmar 5 000 0,20 99,83 0,04 26 (24) Albania 2 150 0,08 99,92 0,01
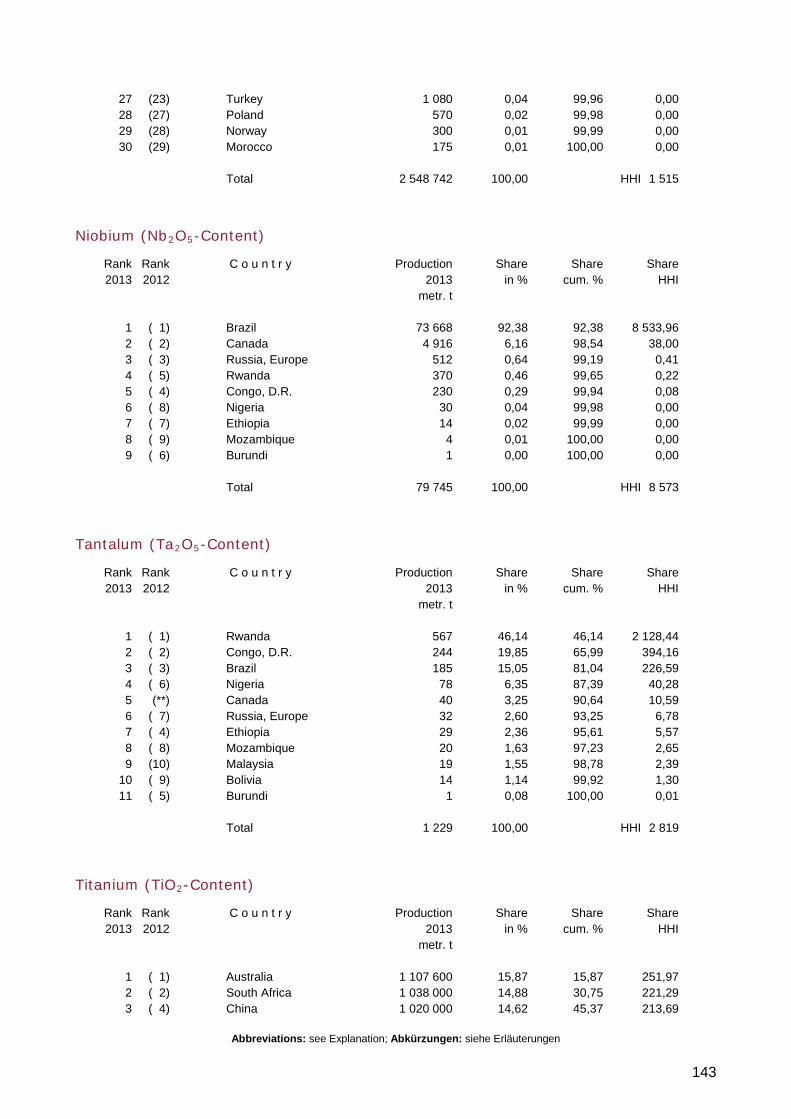
Abbreviations: see Explanation; Abkürzungen: siehe Erläuterungen
143
27 (23) Turkey 1 080 0,04 99,96 0,00 28 (27) Poland 570 0,02 99,98 0,00 29 (28) Norway 300 0,01 99,99 0,00 30 (29) Morocco 175 0,01 100,00 0,00 Total 2 548 742 100,00 HHI 1 515
Niobium (Nb2O5-Content)
Rank Rank C o u n t r y Production Share Share Share 2013 2012 2013 in % cum. % HHI metr. t 1 ( 1) Brazil 73 668 92,38 92,38 8 533,96 2 ( 2) Canada 4 916 6,16 98,54 38,00 3 ( 3) Russia, Europe 512 0,64 99,19 0,41 4 ( 5) Rwanda 370 0,46 99,65 0,22 5 ( 4) Congo, D.R. 230 0,29 99,94 0,08 6 ( 8) Nigeria 30 0,04 99,98 0,00 7 ( 7) Ethiopia 14 0,02 99,99 0,00 8 ( 9) Mozambique 4 0,01 100,00 0,00 9 ( 6) Burundi 1 0,00 100,00 0,00 Total 79 745 100,00 HHI 8 573
Tantalum (Ta2O5-Content)
Rank Rank C o u n t r y Production Share Share Share 2013 2012 2013 in % cum. % HHI metr. t 1 ( 1) Rwanda 567 46,14 46,14 2 128,44 2 ( 2) Congo, D.R. 244 19,85 65,99 394,16 3 ( 3) Brazil 185 15,05 81,04 226,59 4 ( 6) Nigeria 78 6,35 87,39 40,28 5 (**) Canada 40 3,25 90,64 10,59 6 ( 7) Russia, Europe 32 2,60 93,25 6,78 7 ( 4) Ethiopia 29 2,36 95,61 5,57 8 ( 8) Mozambique 20 1,63 97,23 2,65 9 (10) Malaysia 19 1,55 98,78 2,39 10 ( 9) Bolivia 14 1,14 99,92 1,30 11 ( 5) Burundi 1 0,08 100,00 0,01 Total 1 229 100,00 HHI 2 819
Titanium (TiO2-Content)
Rank Rank C o u n t r y Production Share Share Share 2013 2012 2013 in % cum. % HHI metr. t 1 ( 1) Australia 1 107 600 15,87 15,87 251,97 2 ( 2) South Africa 1 038 000 14,88 30,75 221,29 3 ( 4) China 1 020 000 14,62 45,37 213,69
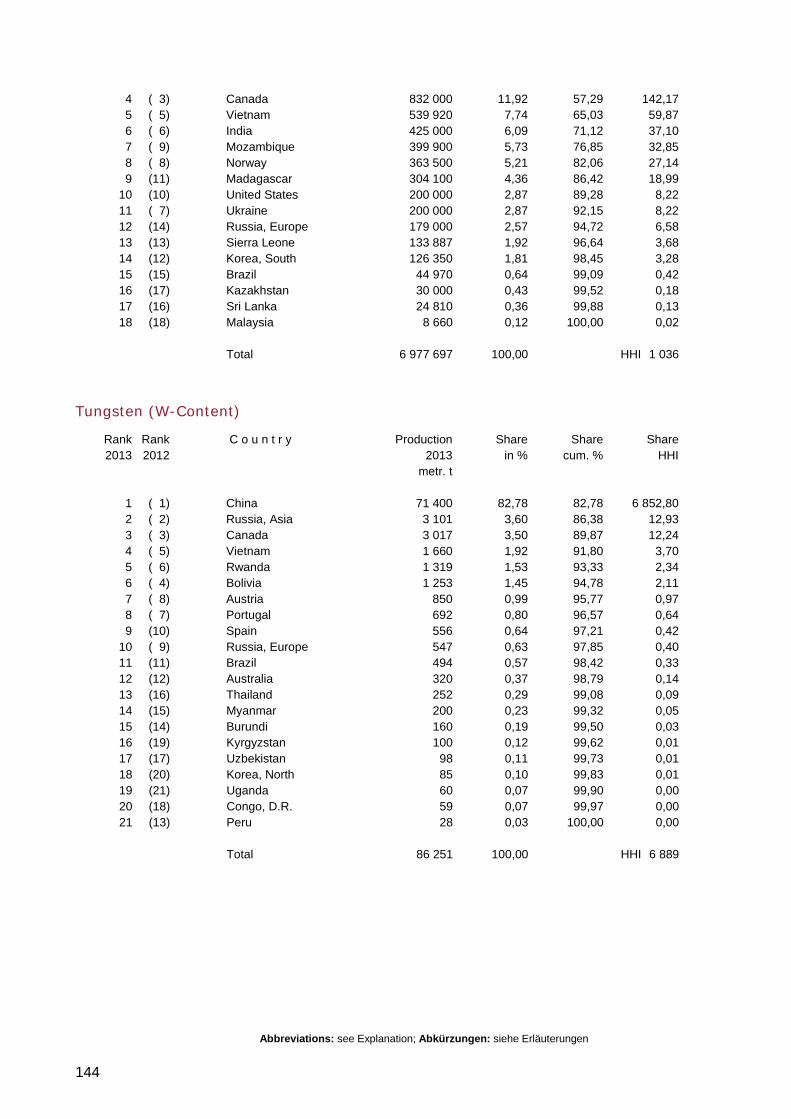
Abbreviations: see Explanation; Abkürzungen: siehe Erläuterungen
144
4 ( 3) Canada 832 000 11,92 57,29 142,17 5 ( 5) Vietnam 539 920 7,74 65,03 59,87 6 ( 6) India 425 000 6,09 71,12 37,10 7 ( 9) Mozambique 399 900 5,73 76,85 32,85 8 ( 8) Norway 363 500 5,21 82,06 27,14 9 (11) Madagascar 304 100 4,36 86,42 18,99 10 (10) United States 200 000 2,87 89,28 8,22 11 ( 7) Ukraine 200 000 2,87 92,15 8,22 12 (14) Russia, Europe 179 000 2,57 94,72 6,58 13 (13) Sierra Leone 133 887 1,92 96,64 3,68 14 (12) Korea, South 126 350 1,81 98,45 3,28 15 (15) Brazil 44 970 0,64 99,09 0,42 16 (17) Kazakhstan 30 000 0,43 99,52 0,18 17 (16) Sri Lanka 24 810 0,36 99,88 0,13 18 (18) Malaysia 8 660 0,12 100,00 0,02 Total 6 977 697 100,00 HHI 1 036
Tungsten (W-Content)
Rank Rank C o u n t r y Production Share Share Share 2013 2012 2013 in % cum. % HHI metr. t 1 ( 1) China 71 400 82,78 82,78 6 852,80 2 ( 2) Russia, Asia 3 101 3,60 86,38 12,93 3 ( 3) Canada 3 017 3,50 89,87 12,24 4 ( 5) Vietnam 1 660 1,92 91,80 3,70 5 ( 6) Rwanda 1 319 1,53 93,33 2,34 6 ( 4) Bolivia 1 253 1,45 94,78 2,11 7 ( 8) Austria 850 0,99 95,77 0,97 8 ( 7) Portugal 692 0,80 96,57 0,64 9 (10) Spain 556 0,64 97,21 0,42 10 ( 9) Russia, Europe 547 0,63 97,85 0,40 11 (11) Brazil 494 0,57 98,42 0,33 12 (12) Australia 320 0,37 98,79 0,14 13 (16) Thailand 252 0,29 99,08 0,09 14 (15) Myanmar 200 0,23 99,32 0,05 15 (14) Burundi 160 0,19 99,50 0,03 16 (19) Kyrgyzstan 100 0,12 99,62 0,01 17 (17) Uzbekistan 98 0,11 99,73 0,01 18 (20) Korea, North 85 0,10 99,83 0,01 19 (21) Uganda 60 0,07 99,90 0,00 20 (18) Congo, D.R. 59 0,07 99,97 0,00 21 (13) Peru 28 0,03 100,00 0,00 Total 86 251 100,00 HHI 6 889
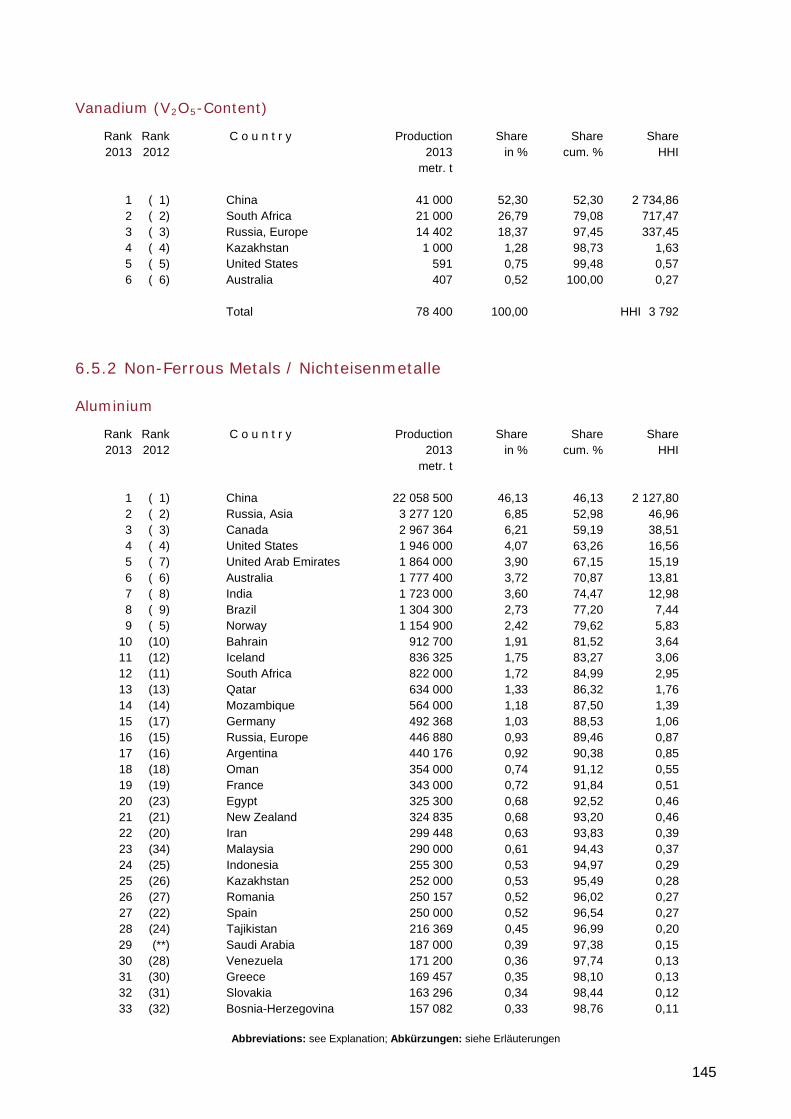
Abbreviations: see Explanation; Abkürzungen: siehe Erläuterungen
145
Vanadium (V2O5-Content)
Rank Rank C o u n t r y Production Share Share Share 2013 2012 2013 in % cum. % HHI metr. t 1 ( 1) China 41 000 52,30 52,30 2 734,86 2 ( 2) South Africa 21 000 26,79 79,08 717,47 3 ( 3) Russia, Europe 14 402 18,37 97,45 337,45 4 ( 4) Kazakhstan 1 000 1,28 98,73 1,63 5 ( 5) United States 591 0,75 99,48 0,57 6 ( 6) Australia 407 0,52 100,00 0,27 Total 78 400 100,00 HHI 3 792
6.5.2 Non-Ferrous Metals / Nichteisenmetalle
Aluminium
Rank Rank C o u n t r y Production Share Share Share 2013 2012 2013 in % cum. % HHI metr. t 1 ( 1) China 22 058 500 46,13 46,13 2 127,80 2 ( 2) Russia, Asia 3 277 120 6,85 52,98 46,96 3 ( 3) Canada 2 967 364 6,21 59,19 38,51 4 ( 4) United States 1 946 000 4,07 63,26 16,56 5 ( 7) United Arab Emirates 1 864 000 3,90 67,15 15,19 6 ( 6) Australia 1 777 400 3,72 70,87 13,81 7 ( 8) India 1 723 000 3,60 74,47 12,98 8 ( 9) Brazil 1 304 300 2,73 77,20 7,44 9 ( 5) Norway 1 154 900 2,42 79,62 5,83 10 (10) Bahrain 912 700 1,91 81,52 3,64 11 (12) Iceland 836 325 1,75 83,27 3,06 12 (11) South Africa 822 000 1,72 84,99 2,95 13 (13) Qatar 634 000 1,33 86,32 1,76 14 (14) Mozambique 564 000 1,18 87,50 1,39 15 (17) Germany 492 368 1,03 88,53 1,06 16 (15) Russia, Europe 446 880 0,93 89,46 0,87 17 (16) Argentina 440 176 0,92 90,38 0,85 18 (18) Oman 354 000 0,74 91,12 0,55 19 (19) France 343 000 0,72 91,84 0,51 20 (23) Egypt 325 300 0,68 92,52 0,46 21 (21) New Zealand 324 835 0,68 93,20 0,46 22 (20) Iran 299 448 0,63 93,83 0,39 23 (34) Malaysia 290 000 0,61 94,43 0,37 24 (25) Indonesia 255 300 0,53 94,97 0,29 25 (26) Kazakhstan 252 000 0,53 95,49 0,28 26 (27) Romania 250 157 0,52 96,02 0,27 27 (22) Spain 250 000 0,52 96,54 0,27 28 (24) Tajikistan 216 369 0,45 96,99 0,20 29 (**) Saudi Arabia 187 000 0,39 97,38 0,15 30 (28) Venezuela 171 200 0,36 97,74 0,13 31 (30) Greece 169 457 0,35 98,10 0,13 32 (31) Slovakia 163 296 0,34 98,44 0,12 33 (32) Bosnia-Herzegovina 157 082 0,33 98,76 0,11
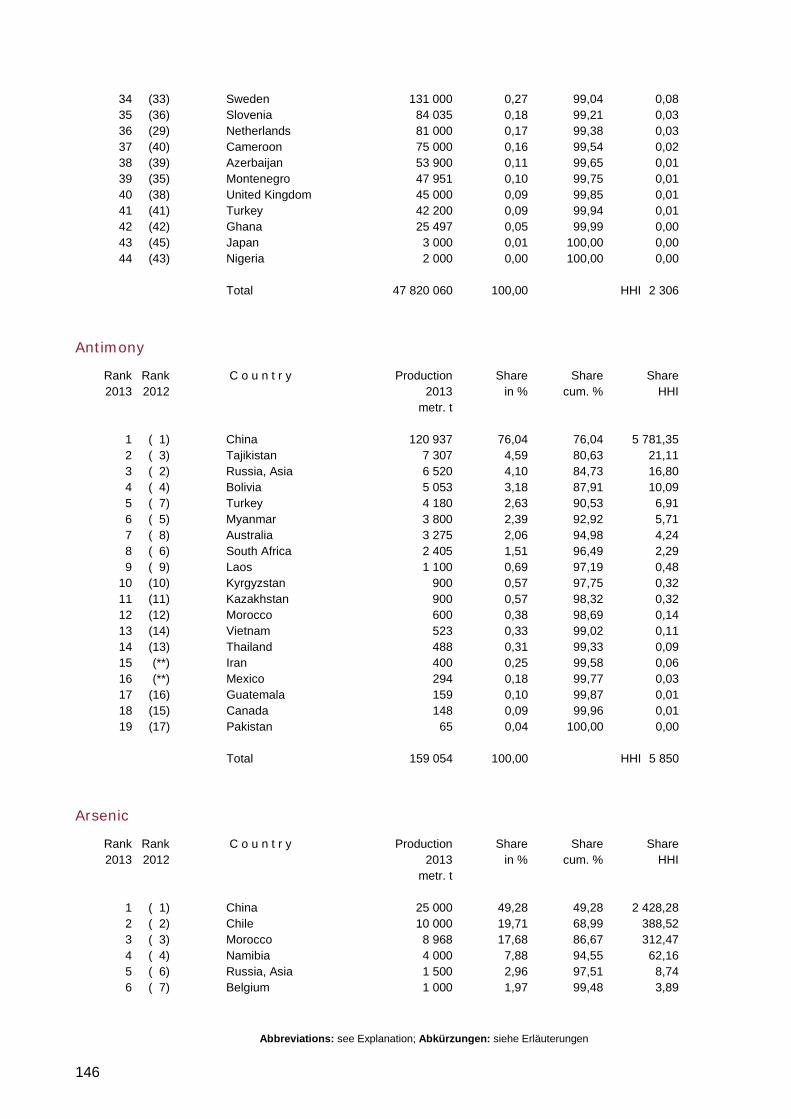
Abbreviations: see Explanation; Abkürzungen: siehe Erläuterungen
146
34 (33) Sweden 131 000 0,27 99,04 0,08 35 (36) Slovenia 84 035 0,18 99,21 0,03 36 (29) Netherlands 81 000 0,17 99,38 0,03 37 (40) Cameroon 75 000 0,16 99,54 0,02 38 (39) Azerbaijan 53 900 0,11 99,65 0,01 39 (35) Montenegro 47 951 0,10 99,75 0,01 40 (38) United Kingdom 45 000 0,09 99,85 0,01 41 (41) Turkey 42 200 0,09 99,94 0,01 42 (42) Ghana 25 497 0,05 99,99 0,00 43 (45) Japan 3 000 0,01 100,00 0,00 44 (43) Nigeria 2 000 0,00 100,00 0,00 Total 47 820 060 100,00 HHI 2 306
Antimony
Rank Rank C o u n t r y Production Share Share Share 2013 2012 2013 in % cum. % HHI metr. t 1 ( 1) China 120 937 76,04 76,04 5 781,35 2 ( 3) Tajikistan 7 307 4,59 80,63 21,11 3 ( 2) Russia, Asia 6 520 4,10 84,73 16,80 4 ( 4) Bolivia 5 053 3,18 87,91 10,09 5 ( 7) Turkey 4 180 2,63 90,53 6,91 6 ( 5) Myanmar 3 800 2,39 92,92 5,71 7 ( 8) Australia 3 275 2,06 94,98 4,24 8 ( 6) South Africa 2 405 1,51 96,49 2,29 9 ( 9) Laos 1 100 0,69 97,19 0,48 10 (10) Kyrgyzstan 900 0,57 97,75 0,32 11 (11) Kazakhstan 900 0,57 98,32 0,32 12 (12) Morocco 600 0,38 98,69 0,14 13 (14) Vietnam 523 0,33 99,02 0,11 14 (13) Thailand 488 0,31 99,33 0,09 15 (**) Iran 400 0,25 99,58 0,06 16 (**) Mexico 294 0,18 99,77 0,03 17 (16) Guatemala 159 0,10 99,87 0,01 18 (15) Canada 148 0,09 99,96 0,01 19 (17) Pakistan 65 0,04 100,00 0,00 Total 159 054 100,00 HHI 5 850
Arsenic
Rank Rank C o u n t r y Production Share Share Share 2013 2012 2013 in % cum. % HHI metr. t 1 ( 1) China 25 000 49,28 49,28 2 428,28 2 ( 2) Chile 10 000 19,71 68,99 388,52 3 ( 3) Morocco 8 968 17,68 86,67 312,47 4 ( 4) Namibia 4 000 7,88 94,55 62,16 5 ( 6) Russia, Asia 1 500 2,96 97,51 8,74 6 ( 7) Belgium 1 000 1,97 99,48 3,89
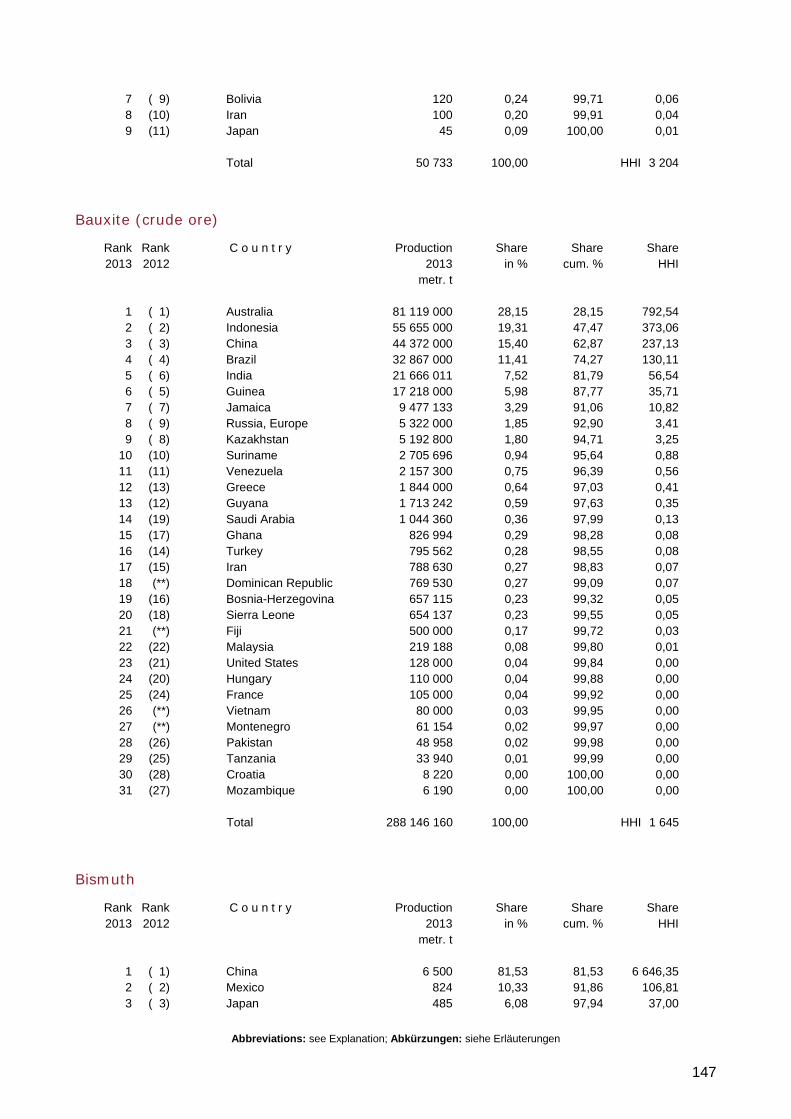
Abbreviations: see Explanation; Abkürzungen: siehe Erläuterungen
147
7 ( 9) Bolivia 120 0,24 99,71 0,06 8 (10) Iran 100 0,20 99,91 0,04 9 (11) Japan 45 0,09 100,00 0,01 Total 50 733 100,00 HHI 3 204
Bauxite (crude ore)
Rank Rank C o u n t r y Production Share Share Share 2013 2012 2013 in % cum. % HHI metr. t 1 ( 1) Australia 81 119 000 28,15 28,15 792,54 2 ( 2) Indonesia 55 655 000 19,31 47,47 373,06 3 ( 3) China 44 372 000 15,40 62,87 237,13 4 ( 4) Brazil 32 867 000 11,41 74,27 130,11 5 ( 6) India 21 666 011 7,52 81,79 56,54 6 ( 5) Guinea 17 218 000 5,98 87,77 35,71 7 ( 7) Jamaica 9 477 133 3,29 91,06 10,82 8 ( 9) Russia, Europe 5 322 000 1,85 92,90 3,41 9 ( 8) Kazakhstan 5 192 800 1,80 94,71 3,25 10 (10) Suriname 2 705 696 0,94 95,64 0,88 11 (11) Venezuela 2 157 300 0,75 96,39 0,56 12 (13) Greece 1 844 000 0,64 97,03 0,41 13 (12) Guyana 1 713 242 0,59 97,63 0,35 14 (19) Saudi Arabia 1 044 360 0,36 97,99 0,13 15 (17) Ghana 826 994 0,29 98,28 0,08 16 (14) Turkey 795 562 0,28 98,55 0,08 17 (15) Iran 788 630 0,27 98,83 0,07 18 (**) Dominican Republic 769 530 0,27 99,09 0,07 19 (16) Bosnia-Herzegovina 657 115 0,23 99,32 0,05 20 (18) Sierra Leone 654 137 0,23 99,55 0,05 21 (**) Fiji 500 000 0,17 99,72 0,03 22 (22) Malaysia 219 188 0,08 99,80 0,01 23 (21) United States 128 000 0,04 99,84 0,00 24 (20) Hungary 110 000 0,04 99,88 0,00 25 (24) France 105 000 0,04 99,92 0,00 26 (**) Vietnam 80 000 0,03 99,95 0,00 27 (**) Montenegro 61 154 0,02 99,97 0,00 28 (26) Pakistan 48 958 0,02 99,98 0,00 29 (25) Tanzania 33 940 0,01 99,99 0,00 30 (28) Croatia 8 220 0,00 100,00 0,00 31 (27) Mozambique 6 190 0,00 100,00 0,00 Total 288 146 160 100,00 HHI 1 645
Bismuth
Rank Rank C o u n t r y Production Share Share Share 2013 2012 2013 in % cum. % HHI metr. t 1 ( 1) China 6 500 81,53 81,53 6 646,35 2 ( 2) Mexico 824 10,33 91,86 106,81 3 ( 3) Japan 485 6,08 97,94 37,00
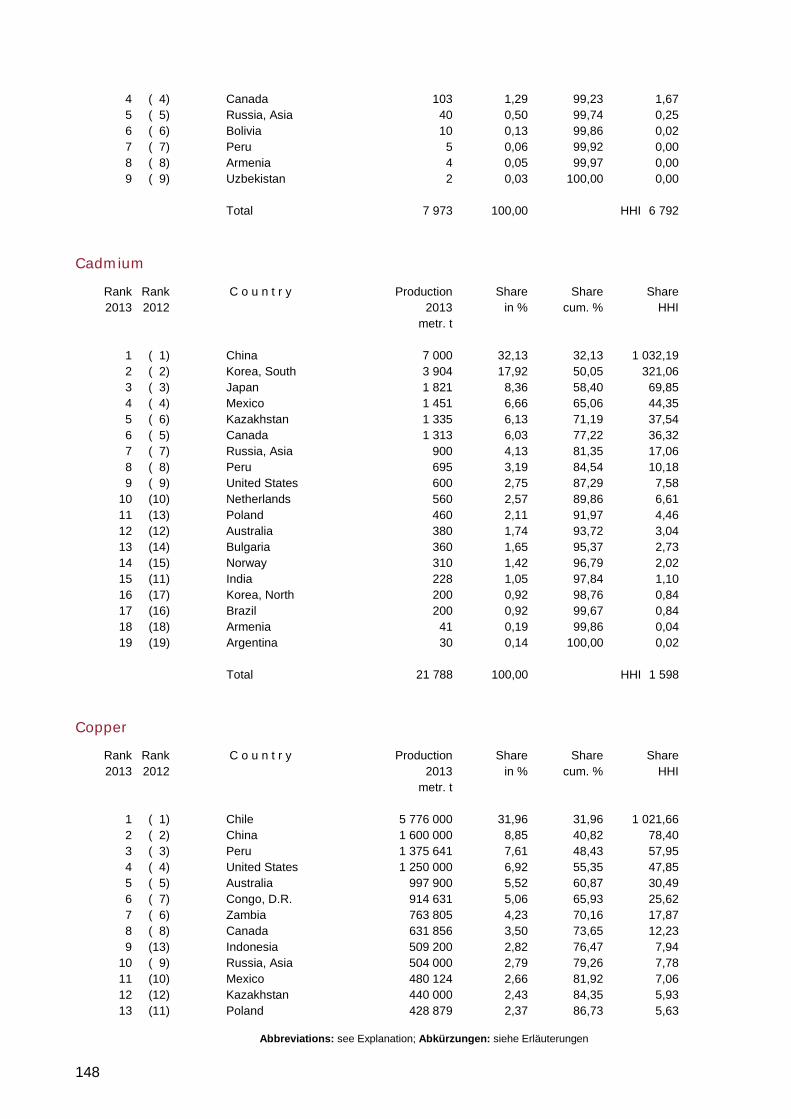
Abbreviations: see Explanation; Abkürzungen: siehe Erläuterungen
148
4 ( 4) Canada 103 1,29 99,23 1,67 5 ( 5) Russia, Asia 40 0,50 99,74 0,25 6 ( 6) Bolivia 10 0,13 99,86 0,02 7 ( 7) Peru 5 0,06 99,92 0,00 8 ( 8) Armenia 4 0,05 99,97 0,00 9 ( 9) Uzbekistan 2 0,03 100,00 0,00 Total 7 973 100,00 HHI 6 792
Cadmium
Rank Rank C o u n t r y Production Share Share Share 2013 2012 2013 in % cum. % HHI metr. t 1 ( 1) China 7 000 32,13 32,13 1 032,19 2 ( 2) Korea, South 3 904 17,92 50,05 321,06 3 ( 3) Japan 1 821 8,36 58,40 69,85 4 ( 4) Mexico 1 451 6,66 65,06 44,35 5 ( 6) Kazakhstan 1 335 6,13 71,19 37,54 6 ( 5) Canada 1 313 6,03 77,22 36,32 7 ( 7) Russia, Asia 900 4,13 81,35 17,06 8 ( 8) Peru 695 3,19 84,54 10,18 9 ( 9) United States 600 2,75 87,29 7,58 10 (10) Netherlands 560 2,57 89,86 6,61 11 (13) Poland 460 2,11 91,97 4,46 12 (12) Australia 380 1,74 93,72 3,04 13 (14) Bulgaria 360 1,65 95,37 2,73 14 (15) Norway 310 1,42 96,79 2,02 15 (11) India 228 1,05 97,84 1,10 16 (17) Korea, North 200 0,92 98,76 0,84 17 (16) Brazil 200 0,92 99,67 0,84 18 (18) Armenia 41 0,19 99,86 0,04 19 (19) Argentina 30 0,14 100,00 0,02 Total 21 788 100,00 HHI 1 598
Copper
Rank Rank C o u n t r y Production Share Share Share 2013 2012 2013 in % cum. % HHI metr. t 1 ( 1) Chile 5 776 000 31,96 31,96 1 021,66 2 ( 2) China 1 600 000 8,85 40,82 78,40 3 ( 3) Peru 1 375 641 7,61 48,43 57,95 4 ( 4) United States 1 250 000 6,92 55,35 47,85 5 ( 5) Australia 997 900 5,52 60,87 30,49 6 ( 7) Congo, D.R. 914 631 5,06 65,93 25,62 7 ( 6) Zambia 763 805 4,23 70,16 17,87 8 ( 8) Canada 631 856 3,50 73,65 12,23 9 (13) Indonesia 509 200 2,82 76,47 7,94 10 ( 9) Russia, Asia 504 000 2,79 79,26 7,78 11 (10) Mexico 480 124 2,66 81,92 7,06 12 (12) Kazakhstan 440 000 2,43 84,35 5,93 13 (11) Poland 428 879 2,37 86,73 5,63
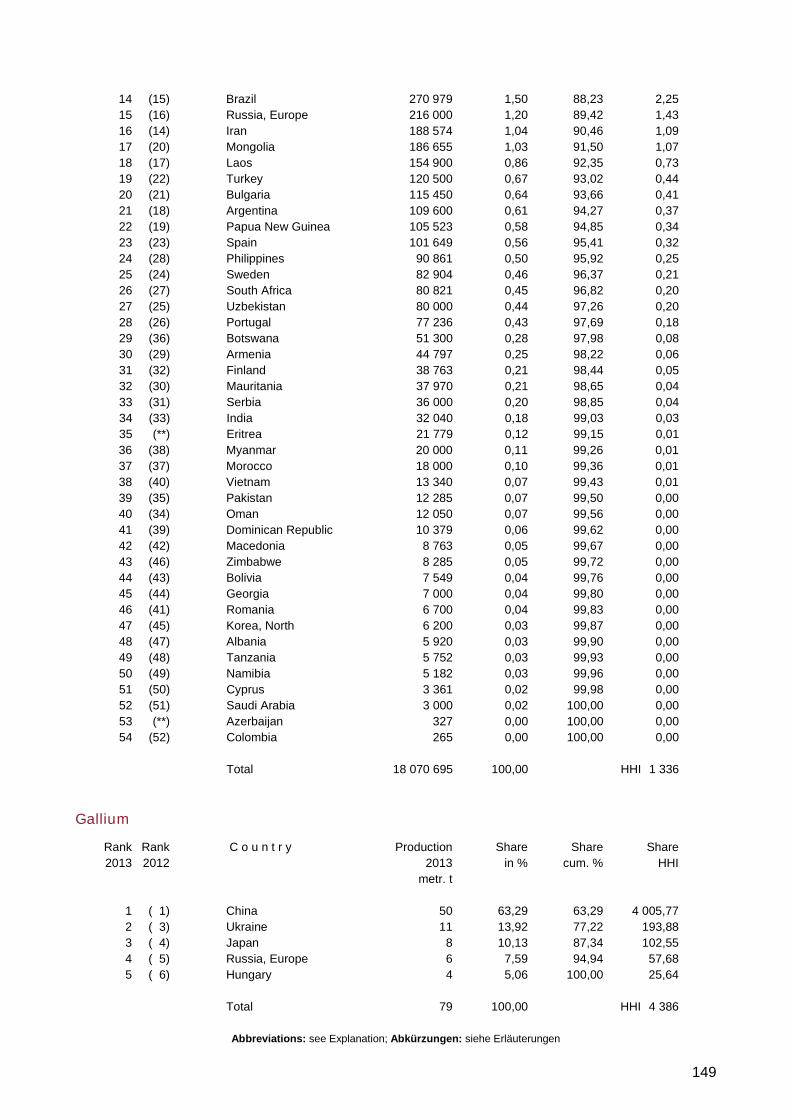
Abbreviations: see Explanation; Abkürzungen: siehe Erläuterungen
149
14 (15) Brazil 270 979 1,50 88,23 2,25 15 (16) Russia, Europe 216 000 1,20 89,42 1,43 16 (14) Iran 188 574 1,04 90,46 1,09 17 (20) Mongolia 186 655 1,03 91,50 1,07 18 (17) Laos 154 900 0,86 92,35 0,73 19 (22) Turkey 120 500 0,67 93,02 0,44 20 (21) Bulgaria 115 450 0,64 93,66 0,41 21 (18) Argentina 109 600 0,61 94,27 0,37 22 (19) Papua New Guinea 105 523 0,58 94,85 0,34 23 (23) Spain 101 649 0,56 95,41 0,32 24 (28) Philippines 90 861 0,50 95,92 0,25 25 (24) Sweden 82 904 0,46 96,37 0,21 26 (27) South Africa 80 821 0,45 96,82 0,20 27 (25) Uzbekistan 80 000 0,44 97,26 0,20 28 (26) Portugal 77 236 0,43 97,69 0,18 29 (36) Botswana 51 300 0,28 97,98 0,08 30 (29) Armenia 44 797 0,25 98,22 0,06 31 (32) Finland 38 763 0,21 98,44 0,05 32 (30) Mauritania 37 970 0,21 98,65 0,04 33 (31) Serbia 36 000 0,20 98,85 0,04 34 (33) India 32 040 0,18 99,03 0,03 35 (**) Eritrea 21 779 0,12 99,15 0,01 36 (38) Myanmar 20 000 0,11 99,26 0,01 37 (37) Morocco 18 000 0,10 99,36 0,01 38 (40) Vietnam 13 340 0,07 99,43 0,01 39 (35) Pakistan 12 285 0,07 99,50 0,00 40 (34) Oman 12 050 0,07 99,56 0,00 41 (39) Dominican Republic 10 379 0,06 99,62 0,00 42 (42) Macedonia 8 763 0,05 99,67 0,00 43 (46) Zimbabwe 8 285 0,05 99,72 0,00 44 (43) Bolivia 7 549 0,04 99,76 0,00 45 (44) Georgia 7 000 0,04 99,80 0,00 46 (41) Romania 6 700 0,04 99,83 0,00 47 (45) Korea, North 6 200 0,03 99,87 0,00 48 (47) Albania 5 920 0,03 99,90 0,00 49 (48) Tanzania 5 752 0,03 99,93 0,00 50 (49) Namibia 5 182 0,03 99,96 0,00 51 (50) Cyprus 3 361 0,02 99,98 0,00 52 (51) Saudi Arabia 3 000 0,02 100,00 0,00 53 (**) Azerbaijan 327 0,00 100,00 0,00 54 (52) Colombia 265 0,00 100,00 0,00 Total 18 070 695 100,00 HHI 1 336
Gallium
Rank Rank C o u n t r y Production Share Share Share 2013 2012 2013 in % cum. % HHI metr. t 1 ( 1) China 50 63,29 63,29 4 005,77 2 ( 3) Ukraine 11 13,92 77,22 193,88 3 ( 4) Japan 8 10,13 87,34 102,55 4 ( 5) Russia, Europe 6 7,59 94,94 57,68 5 ( 6) Hungary 4 5,06 100,00 25,64 Total 79 100,00 HHI 4 386
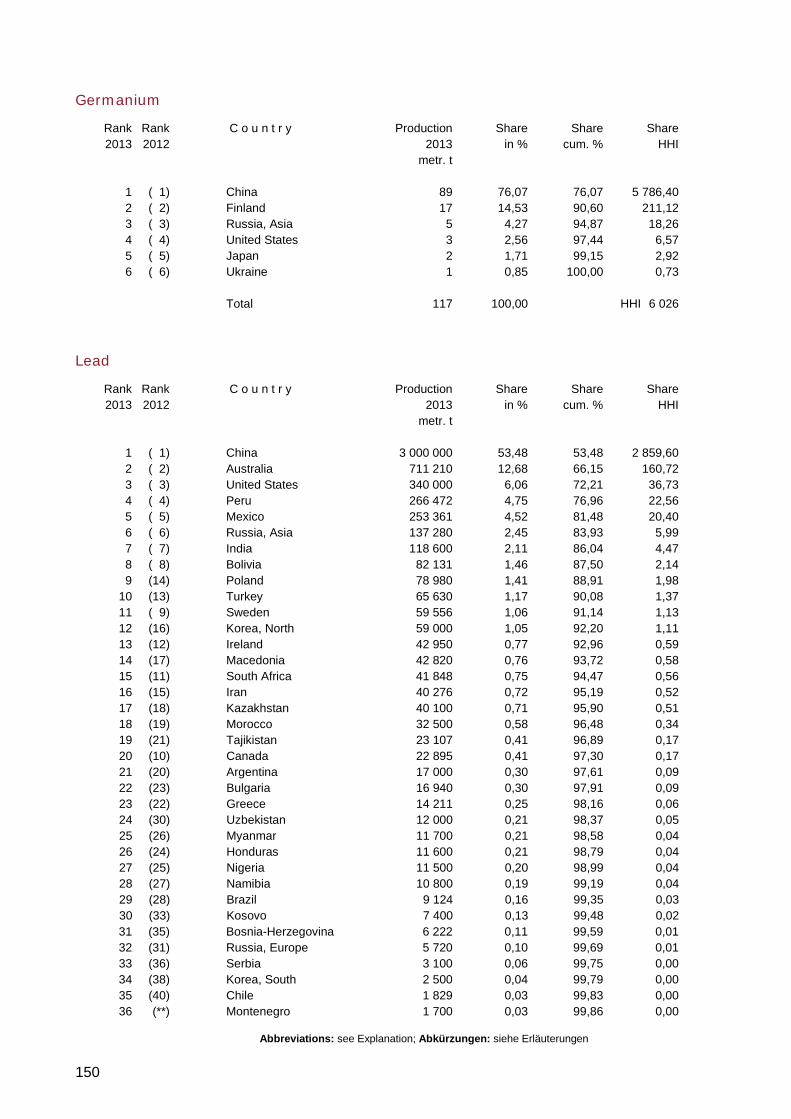
Abbreviations: see Explanation; Abkürzungen: siehe Erläuterungen
150
Germanium
Rank Rank C o u n t r y Production Share Share Share 2013 2012 2013 in % cum. % HHI metr. t 1 ( 1) China 89 76,07 76,07 5 786,40 2 ( 2) Finland 17 14,53 90,60 211,12 3 ( 3) Russia, Asia 5 4,27 94,87 18,26 4 ( 4) United States 3 2,56 97,44 6,57 5 ( 5) Japan 2 1,71 99,15 2,92 6 ( 6) Ukraine 1 0,85 100,00 0,73 Total 117 100,00 HHI 6 026
Lead
Rank Rank C o u n t r y Production Share Share Share 2013 2012 2013 in % cum. % HHI metr. t 1 ( 1) China 3 000 000 53,48 53,48 2 859,60 2 ( 2) Australia 711 210 12,68 66,15 160,72 3 ( 3) United States 340 000 6,06 72,21 36,73 4 ( 4) Peru 266 472 4,75 76,96 22,56 5 ( 5) Mexico 253 361 4,52 81,48 20,40 6 ( 6) Russia, Asia 137 280 2,45 83,93 5,99 7 ( 7) India 118 600 2,11 86,04 4,47 8 ( 8) Bolivia 82 131 1,46 87,50 2,14 9 (14) Poland 78 980 1,41 88,91 1,98 10 (13) Turkey 65 630 1,17 90,08 1,37 11 ( 9) Sweden 59 556 1,06 91,14 1,13 12 (16) Korea, North 59 000 1,05 92,20 1,11 13 (12) Ireland 42 950 0,77 92,96 0,59 14 (17) Macedonia 42 820 0,76 93,72 0,58 15 (11) South Africa 41 848 0,75 94,47 0,56 16 (15) Iran 40 276 0,72 95,19 0,52 17 (18) Kazakhstan 40 100 0,71 95,90 0,51 18 (19) Morocco 32 500 0,58 96,48 0,34 19 (21) Tajikistan 23 107 0,41 96,89 0,17 20 (10) Canada 22 895 0,41 97,30 0,17 21 (20) Argentina 17 000 0,30 97,61 0,09 22 (23) Bulgaria 16 940 0,30 97,91 0,09 23 (22) Greece 14 211 0,25 98,16 0,06 24 (30) Uzbekistan 12 000 0,21 98,37 0,05 25 (26) Myanmar 11 700 0,21 98,58 0,04 26 (24) Honduras 11 600 0,21 98,79 0,04 27 (25) Nigeria 11 500 0,20 98,99 0,04 28 (27) Namibia 10 800 0,19 99,19 0,04 29 (28) Brazil 9 124 0,16 99,35 0,03 30 (33) Kosovo 7 400 0,13 99,48 0,02 31 (35) Bosnia-Herzegovina 6 222 0,11 99,59 0,01 32 (31) Russia, Europe 5 720 0,10 99,69 0,01 33 (36) Serbia 3 100 0,06 99,75 0,00 34 (38) Korea, South 2 500 0,04 99,79 0,00 35 (40) Chile 1 829 0,03 99,83 0,00 36 (**) Montenegro 1 700 0,03 99,86 0,00
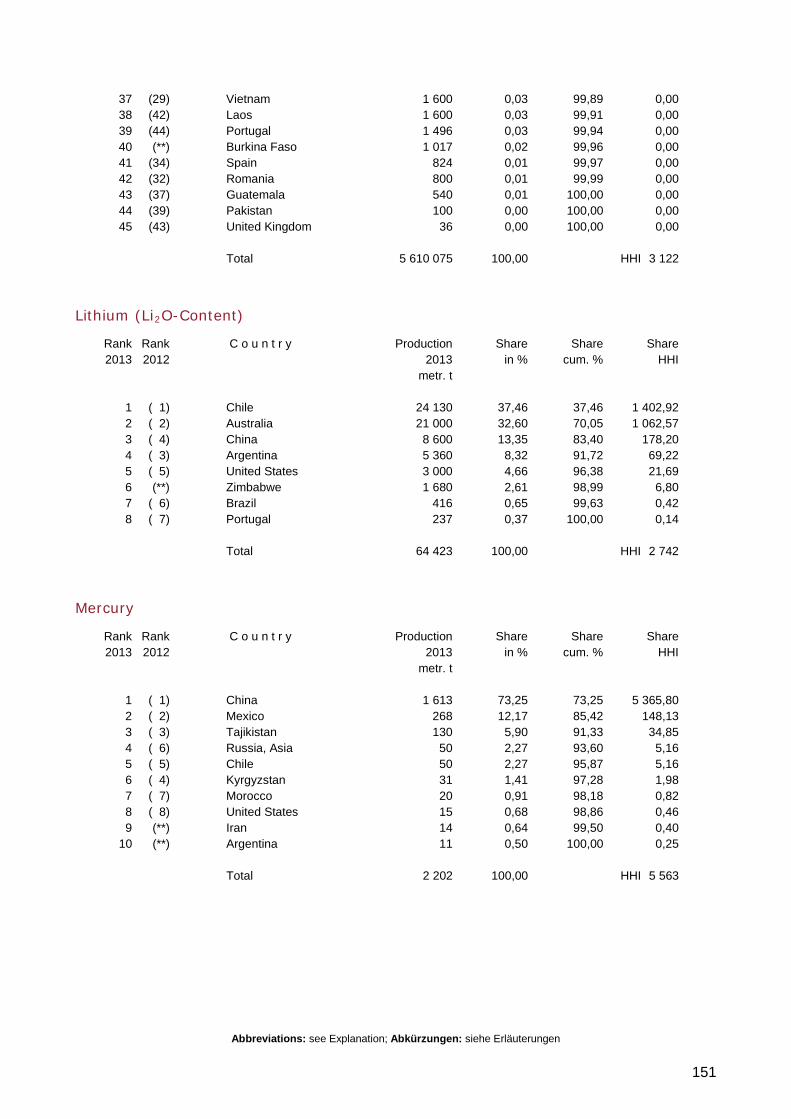
Abbreviations: see Explanation; Abkürzungen: siehe Erläuterungen
151
37 (29) Vietnam 1 600 0,03 99,89 0,00 38 (42) Laos 1 600 0,03 99,91 0,00 39 (44) Portugal 1 496 0,03 99,94 0,00 40 (**) Burkina Faso 1 017 0,02 99,96 0,00 41 (34) Spain 824 0,01 99,97 0,00 42 (32) Romania 800 0,01 99,99 0,00 43 (37) Guatemala 540 0,01 100,00 0,00 44 (39) Pakistan 100 0,00 100,00 0,00 45 (43) United Kingdom 36 0,00 100,00 0,00 Total 5 610 075 100,00 HHI 3 122
Lithium (Li2O-Content)
Rank Rank C o u n t r y Production Share Share Share 2013 2012 2013 in % cum. % HHI metr. t 1 ( 1) Chile 24 130 37,46 37,46 1 402,92 2 ( 2) Australia 21 000 32,60 70,05 1 062,57 3 ( 4) China 8 600 13,35 83,40 178,20 4 ( 3) Argentina 5 360 8,32 91,72 69,22 5 ( 5) United States 3 000 4,66 96,38 21,69 6 (**) Zimbabwe 1 680 2,61 98,99 6,80 7 ( 6) Brazil 416 0,65 99,63 0,42 8 ( 7) Portugal 237 0,37 100,00 0,14 Total 64 423 100,00 HHI 2 742
Mercury
Rank Rank C o u n t r y Production Share Share Share 2013 2012 2013 in % cum. % HHI metr. t 1 ( 1) China 1 613 73,25 73,25 5 365,80 2 ( 2) Mexico 268 12,17 85,42 148,13 3 ( 3) Tajikistan 130 5,90 91,33 34,85 4 ( 6) Russia, Asia 50 2,27 93,60 5,16 5 ( 5) Chile 50 2,27 95,87 5,16 6 ( 4) Kyrgyzstan 31 1,41 97,28 1,98 7 ( 7) Morocco 20 0,91 98,18 0,82 8 ( 8) United States 15 0,68 98,86 0,46 9 (**) Iran 14 0,64 99,50 0,40 10 (**) Argentina 11 0,50 100,00 0,25 Total 2 202 100,00 HHI 5 563
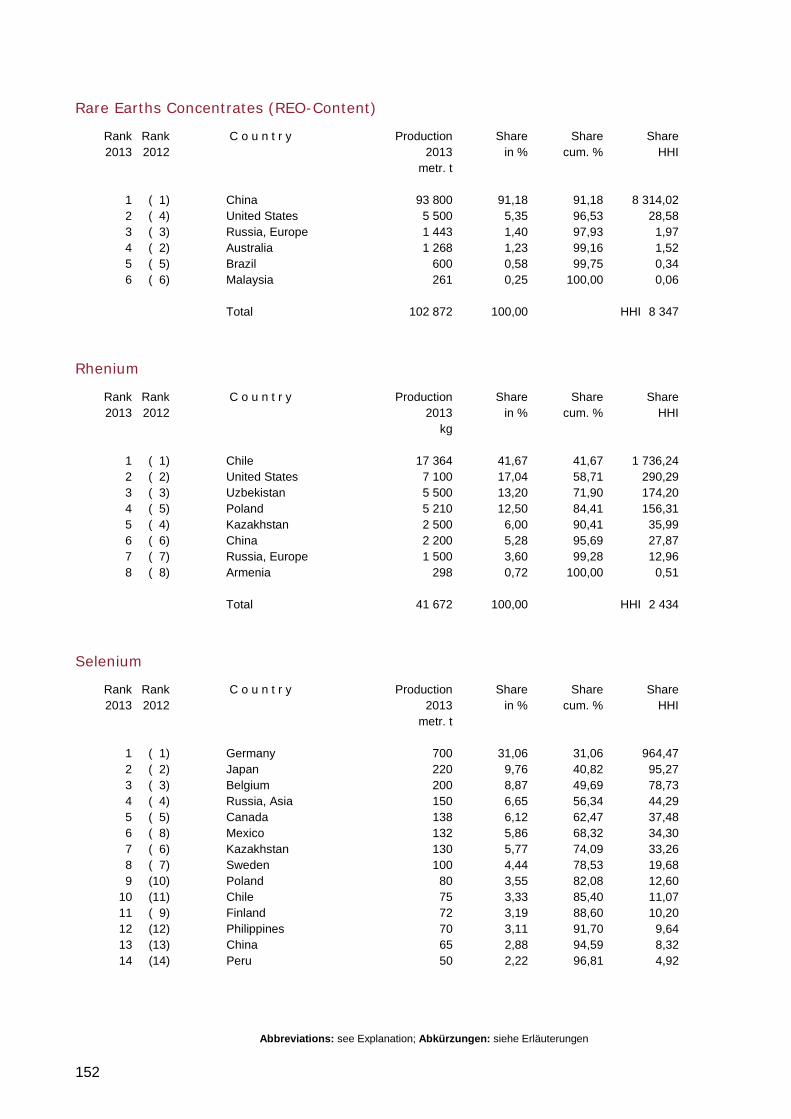
Abbreviations: see Explanation; Abkürzungen: siehe Erläuterungen
152
Rare Earths Concentrates (REO-Content)
Rank Rank C o u n t r y Production Share Share Share 2013 2012 2013 in % cum. % HHI metr. t 1 ( 1) China 93 800 91,18 91,18 8 314,02 2 ( 4) United States 5 500 5,35 96,53 28,58 3 ( 3) Russia, Europe 1 443 1,40 97,93 1,97 4 ( 2) Australia 1 268 1,23 99,16 1,52 5 ( 5) Brazil 600 0,58 99,75 0,34 6 ( 6) Malaysia 261 0,25 100,00 0,06 Total 102 872 100,00 HHI 8 347
Rhenium
Rank Rank C o u n t r y Production Share Share Share 2013 2012 2013 in % cum. % HHI kg 1 ( 1) Chile 17 364 41,67 41,67 1 736,24 2 ( 2) United States 7 100 17,04 58,71 290,29 3 ( 3) Uzbekistan 5 500 13,20 71,90 174,20 4 ( 5) Poland 5 210 12,50 84,41 156,31 5 ( 4) Kazakhstan 2 500 6,00 90,41 35,99 6 ( 6) China 2 200 5,28 95,69 27,87 7 ( 7) Russia, Europe 1 500 3,60 99,28 12,96 8 ( 8) Armenia 298 0,72 100,00 0,51 Total 41 672 100,00 HHI 2 434
Selenium
Rank Rank C o u n t r y Production Share Share Share 2013 2012 2013 in % cum. % HHI metr. t 1 ( 1) Germany 700 31,06 31,06 964,47 2 ( 2) Japan 220 9,76 40,82 95,27 3 ( 3) Belgium 200 8,87 49,69 78,73 4 ( 4) Russia, Asia 150 6,65 56,34 44,29 5 ( 5) Canada 138 6,12 62,47 37,48 6 ( 8) Mexico 132 5,86 68,32 34,30 7 ( 6) Kazakhstan 130 5,77 74,09 33,26 8 ( 7) Sweden 100 4,44 78,53 19,68 9 (10) Poland 80 3,55 82,08 12,60 10 (11) Chile 75 3,33 85,40 11,07 11 ( 9) Finland 72 3,19 88,60 10,20 12 (12) Philippines 70 3,11 91,70 9,64 13 (13) China 65 2,88 94,59 8,32 14 (14) Peru 50 2,22 96,81 4,92
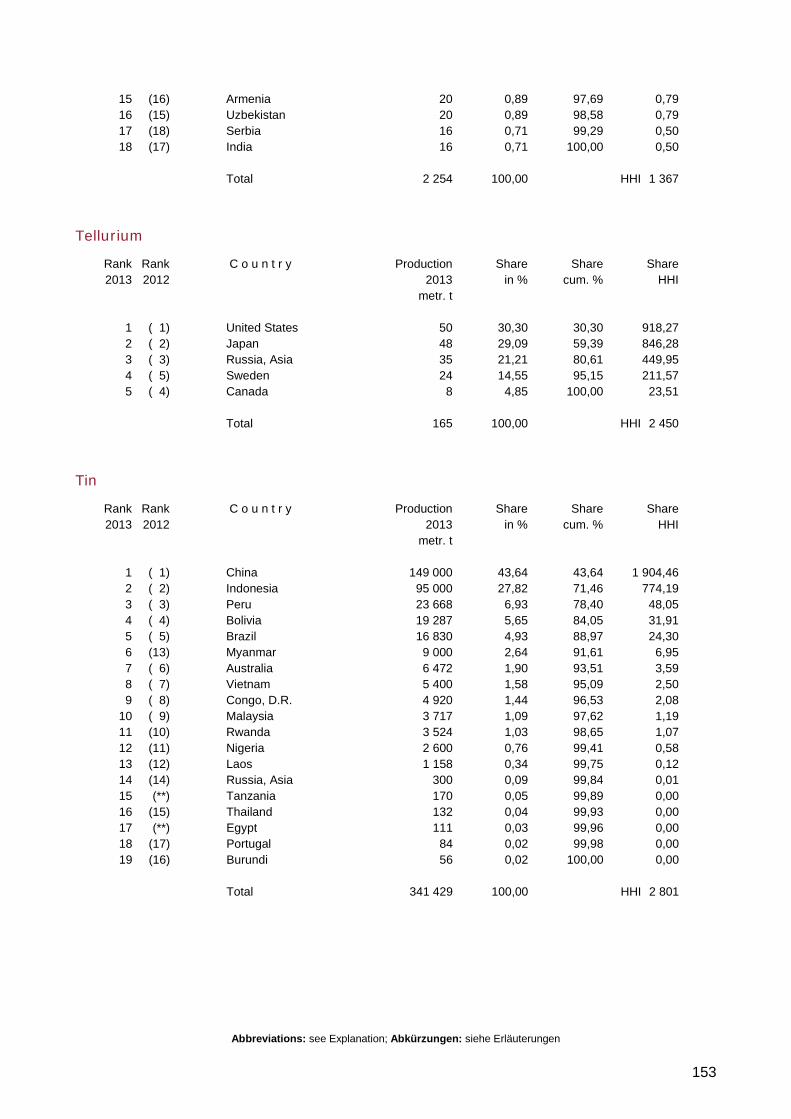
Abbreviations: see Explanation; Abkürzungen: siehe Erläuterungen
153
15 (16) Armenia 20 0,89 97,69 0,79 16 (15) Uzbekistan 20 0,89 98,58 0,79 17 (18) Serbia 16 0,71 99,29 0,50 18 (17) India 16 0,71 100,00 0,50 Total 2 254 100,00 HHI 1 367
Tellurium
Rank Rank C o u n t r y Production Share Share Share 2013 2012 2013 in % cum. % HHI metr. t 1 ( 1) United States 50 30,30 30,30 918,27 2 ( 2) Japan 48 29,09 59,39 846,28 3 ( 3) Russia, Asia 35 21,21 80,61 449,95 4 ( 5) Sweden 24 14,55 95,15 211,57 5 ( 4) Canada 8 4,85 100,00 23,51 Total 165 100,00 HHI 2 450
Tin
Rank Rank C o u n t r y Production Share Share Share 2013 2012 2013 in % cum. % HHI metr. t 1 ( 1) China 149 000 43,64 43,64 1 904,46 2 ( 2) Indonesia 95 000 27,82 71,46 774,19 3 ( 3) Peru 23 668 6,93 78,40 48,05 4 ( 4) Bolivia 19 287 5,65 84,05 31,91 5 ( 5) Brazil 16 830 4,93 88,97 24,30 6 (13) Myanmar 9 000 2,64 91,61 6,95 7 ( 6) Australia 6 472 1,90 93,51 3,59 8 ( 7) Vietnam 5 400 1,58 95,09 2,50 9 ( 8) Congo, D.R. 4 920 1,44 96,53 2,08 10 ( 9) Malaysia 3 717 1,09 97,62 1,19 11 (10) Rwanda 3 524 1,03 98,65 1,07 12 (11) Nigeria 2 600 0,76 99,41 0,58 13 (12) Laos 1 158 0,34 99,75 0,12 14 (14) Russia, Asia 300 0,09 99,84 0,01 15 (**) Tanzania 170 0,05 99,89 0,00 16 (15) Thailand 132 0,04 99,93 0,00 17 (**) Egypt 111 0,03 99,96 0,00 18 (17) Portugal 84 0,02 99,98 0,00 19 (16) Burundi 56 0,02 100,00 0,00 Total 341 429 100,00 HHI 2 801
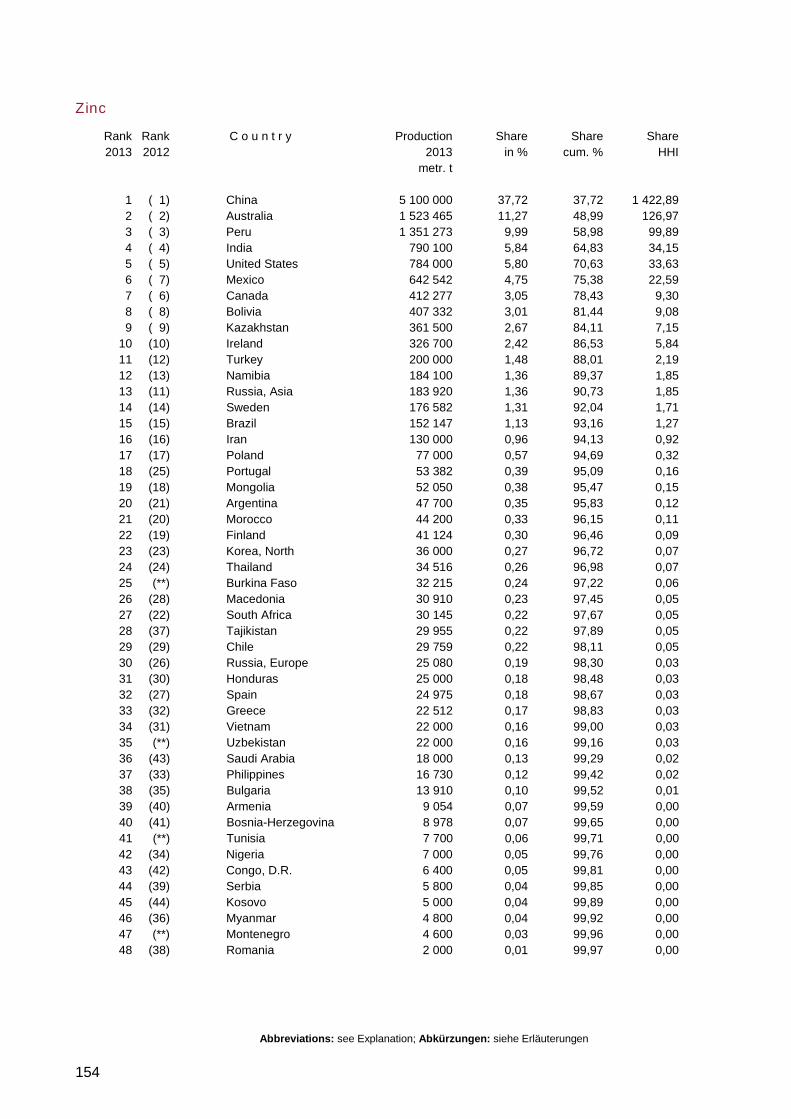
Abbreviations: see Explanation; Abkürzungen: siehe Erläuterungen
154
Zinc
Rank Rank C o u n t r y Production Share Share Share 2013 2012 2013 in % cum. % HHI metr. t 1 ( 1) China 5 100 000 37,72 37,72 1 422,89 2 ( 2) Australia 1 523 465 11,27 48,99 126,97 3 ( 3) Peru 1 351 273 9,99 58,98 99,89 4 ( 4) India 790 100 5,84 64,83 34,15 5 ( 5) United States 784 000 5,80 70,63 33,63 6 ( 7) Mexico 642 542 4,75 75,38 22,59 7 ( 6) Canada 412 277 3,05 78,43 9,30 8 ( 8) Bolivia 407 332 3,01 81,44 9,08 9 ( 9) Kazakhstan 361 500 2,67 84,11 7,15 10 (10) Ireland 326 700 2,42 86,53 5,84 11 (12) Turkey 200 000 1,48 88,01 2,19 12 (13) Namibia 184 100 1,36 89,37 1,85 13 (11) Russia, Asia 183 920 1,36 90,73 1,85 14 (14) Sweden 176 582 1,31 92,04 1,71 15 (15) Brazil 152 147 1,13 93,16 1,27 16 (16) Iran 130 000 0,96 94,13 0,92 17 (17) Poland 77 000 0,57 94,69 0,32 18 (25) Portugal 53 382 0,39 95,09 0,16 19 (18) Mongolia 52 050 0,38 95,47 0,15 20 (21) Argentina 47 700 0,35 95,83 0,12 21 (20) Morocco 44 200 0,33 96,15 0,11 22 (19) Finland 41 124 0,30 96,46 0,09 23 (23) Korea, North 36 000 0,27 96,72 0,07 24 (24) Thailand 34 516 0,26 96,98 0,07 25 (**) Burkina Faso 32 215 0,24 97,22 0,06 26 (28) Macedonia 30 910 0,23 97,45 0,05 27 (22) South Africa 30 145 0,22 97,67 0,05 28 (37) Tajikistan 29 955 0,22 97,89 0,05 29 (29) Chile 29 759 0,22 98,11 0,05 30 (26) Russia, Europe 25 080 0,19 98,30 0,03 31 (30) Honduras 25 000 0,18 98,48 0,03 32 (27) Spain 24 975 0,18 98,67 0,03 33 (32) Greece 22 512 0,17 98,83 0,03 34 (31) Vietnam 22 000 0,16 99,00 0,03 35 (**) Uzbekistan 22 000 0,16 99,16 0,03 36 (43) Saudi Arabia 18 000 0,13 99,29 0,02 37 (33) Philippines 16 730 0,12 99,42 0,02 38 (35) Bulgaria 13 910 0,10 99,52 0,01 39 (40) Armenia 9 054 0,07 99,59 0,00 40 (41) Bosnia-Herzegovina 8 978 0,07 99,65 0,00 41 (**) Tunisia 7 700 0,06 99,71 0,00 42 (34) Nigeria 7 000 0,05 99,76 0,00 43 (42) Congo, D.R. 6 400 0,05 99,81 0,00 44 (39) Serbia 5 800 0,04 99,85 0,00 45 (44) Kosovo 5 000 0,04 99,89 0,00 46 (36) Myanmar 4 800 0,04 99,92 0,00 47 (**) Montenegro 4 600 0,03 99,96 0,00 48 (38) Romania 2 000 0,01 99,97 0,00
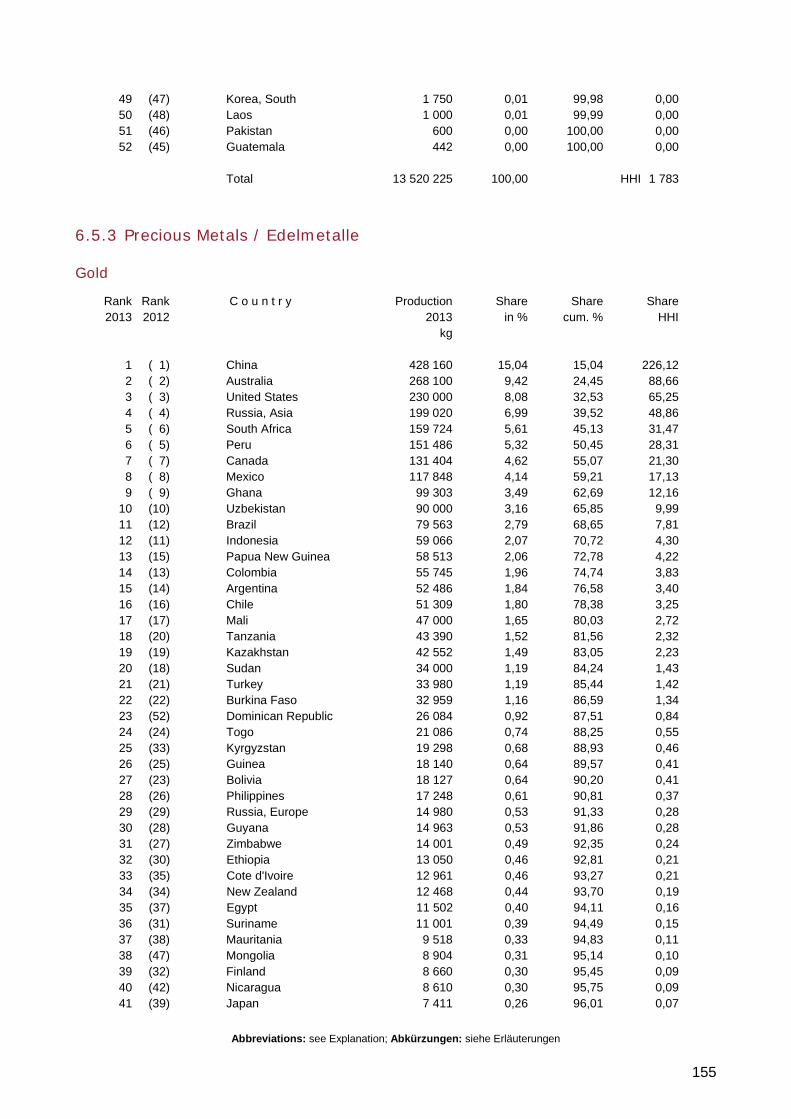
Abbreviations: see Explanation; Abkürzungen: siehe Erläuterungen
155
49 (47) Korea, South 1 750 0,01 99,98 0,00 50 (48) Laos 1 000 0,01 99,99 0,00 51 (46) Pakistan 600 0,00 100,00 0,00 52 (45) Guatemala 442 0,00 100,00 0,00 Total 13 520 225 100,00 HHI 1 783
6.5.3 Precious Metals / Edelmetalle
Gold
Rank Rank C o u n t r y Production Share Share Share 2013 2012 2013 in % cum. % HHI kg 1 ( 1) China 428 160 15,04 15,04 226,12 2 ( 2) Australia 268 100 9,42 24,45 88,66 3 ( 3) United States 230 000 8,08 32,53 65,25 4 ( 4) Russia, Asia 199 020 6,99 39,52 48,86 5 ( 6) South Africa 159 724 5,61 45,13 31,47 6 ( 5) Peru 151 486 5,32 50,45 28,31 7 ( 7) Canada 131 404 4,62 55,07 21,30 8 ( 8) Mexico 117 848 4,14 59,21 17,13 9 ( 9) Ghana 99 303 3,49 62,69 12,16 10 (10) Uzbekistan 90 000 3,16 65,85 9,99 11 (12) Brazil 79 563 2,79 68,65 7,81 12 (11) Indonesia 59 066 2,07 70,72 4,30 13 (15) Papua New Guinea 58 513 2,06 72,78 4,22 14 (13) Colombia 55 745 1,96 74,74 3,83 15 (14) Argentina 52 486 1,84 76,58 3,40 16 (16) Chile 51 309 1,80 78,38 3,25 17 (17) Mali 47 000 1,65 80,03 2,72 18 (20) Tanzania 43 390 1,52 81,56 2,32 19 (19) Kazakhstan 42 552 1,49 83,05 2,23 20 (18) Sudan 34 000 1,19 84,24 1,43 21 (21) Turkey 33 980 1,19 85,44 1,42 22 (22) Burkina Faso 32 959 1,16 86,59 1,34 23 (52) Dominican Republic 26 084 0,92 87,51 0,84 24 (24) Togo 21 086 0,74 88,25 0,55 25 (33) Kyrgyzstan 19 298 0,68 88,93 0,46 26 (25) Guinea 18 140 0,64 89,57 0,41 27 (23) Bolivia 18 127 0,64 90,20 0,41 28 (26) Philippines 17 248 0,61 90,81 0,37 29 (29) Russia, Europe 14 980 0,53 91,33 0,28 30 (28) Guyana 14 963 0,53 91,86 0,28 31 (27) Zimbabwe 14 001 0,49 92,35 0,24 32 (30) Ethiopia 13 050 0,46 92,81 0,21 33 (35) Cote d'Ivoire 12 961 0,46 93,27 0,21 34 (34) New Zealand 12 468 0,44 93,70 0,19 35 (37) Egypt 11 502 0,40 94,11 0,16 36 (31) Suriname 11 001 0,39 94,49 0,15 37 (38) Mauritania 9 518 0,33 94,83 0,11 38 (47) Mongolia 8 904 0,31 95,14 0,10 39 (32) Finland 8 660 0,30 95,45 0,09 40 (42) Nicaragua 8 610 0,30 95,75 0,09 41 (39) Japan 7 411 0,26 96,01 0,07
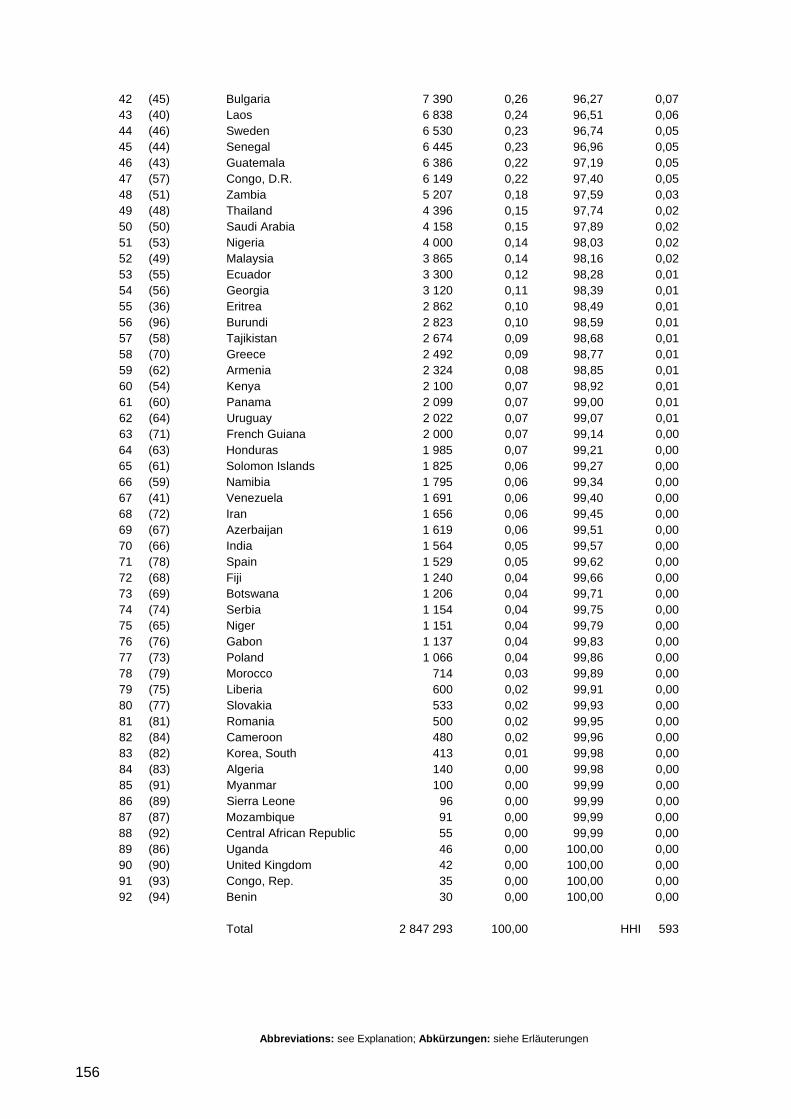
Abbreviations: see Explanation; Abkürzungen: siehe Erläuterungen
156
42 (45) Bulgaria 7 390 0,26 96,27 0,07 43 (40) Laos 6 838 0,24 96,51 0,06 44 (46) Sweden 6 530 0,23 96,74 0,05 45 (44) Senegal 6 445 0,23 96,96 0,05 46 (43) Guatemala 6 386 0,22 97,19 0,05 47 (57) Congo, D.R. 6 149 0,22 97,40 0,05 48 (51) Zambia 5 207 0,18 97,59 0,03 49 (48) Thailand 4 396 0,15 97,74 0,02 50 (50) Saudi Arabia 4 158 0,15 97,89 0,02 51 (53) Nigeria 4 000 0,14 98,03 0,02 52 (49) Malaysia 3 865 0,14 98,16 0,02 53 (55) Ecuador 3 300 0,12 98,28 0,01 54 (56) Georgia 3 120 0,11 98,39 0,01 55 (36) Eritrea 2 862 0,10 98,49 0,01 56 (96) Burundi 2 823 0,10 98,59 0,01 57 (58) Tajikistan 2 674 0,09 98,68 0,01 58 (70) Greece 2 492 0,09 98,77 0,01 59 (62) Armenia 2 324 0,08 98,85 0,01 60 (54) Kenya 2 100 0,07 98,92 0,01 61 (60) Panama 2 099 0,07 99,00 0,01 62 (64) Uruguay 2 022 0,07 99,07 0,01 63 (71) French Guiana 2 000 0,07 99,14 0,00 64 (63) Honduras 1 985 0,07 99,21 0,00 65 (61) Solomon Islands 1 825 0,06 99,27 0,00 66 (59) Namibia 1 795 0,06 99,34 0,00 67 (41) Venezuela 1 691 0,06 99,40 0,00 68 (72) Iran 1 656 0,06 99,45 0,00 69 (67) Azerbaijan 1 619 0,06 99,51 0,00 70 (66) India 1 564 0,05 99,57 0,00 71 (78) Spain 1 529 0,05 99,62 0,00 72 (68) Fiji 1 240 0,04 99,66 0,00 73 (69) Botswana 1 206 0,04 99,71 0,00 74 (74) Serbia 1 154 0,04 99,75 0,00 75 (65) Niger 1 151 0,04 99,79 0,00 76 (76) Gabon 1 137 0,04 99,83 0,00 77 (73) Poland 1 066 0,04 99,86 0,00 78 (79) Morocco 714 0,03 99,89 0,00 79 (75) Liberia 600 0,02 99,91 0,00 80 (77) Slovakia 533 0,02 99,93 0,00 81 (81) Romania 500 0,02 99,95 0,00 82 (84) Cameroon 480 0,02 99,96 0,00 83 (82) Korea, South 413 0,01 99,98 0,00 84 (83) Algeria 140 0,00 99,98 0,00 85 (91) Myanmar 100 0,00 99,99 0,00 86 (89) Sierra Leone 96 0,00 99,99 0,00 87 (87) Mozambique 91 0,00 99,99 0,00 88 (92) Central African Republic 55 0,00 99,99 0,00 89 (86) Uganda 46 0,00 100,00 0,00 90 (90) United Kingdom 42 0,00 100,00 0,00 91 (93) Congo, Rep. 35 0,00 100,00 0,00 92 (94) Benin 30 0,00 100,00 0,00 Total 2 847 293 100,00 HHI 593
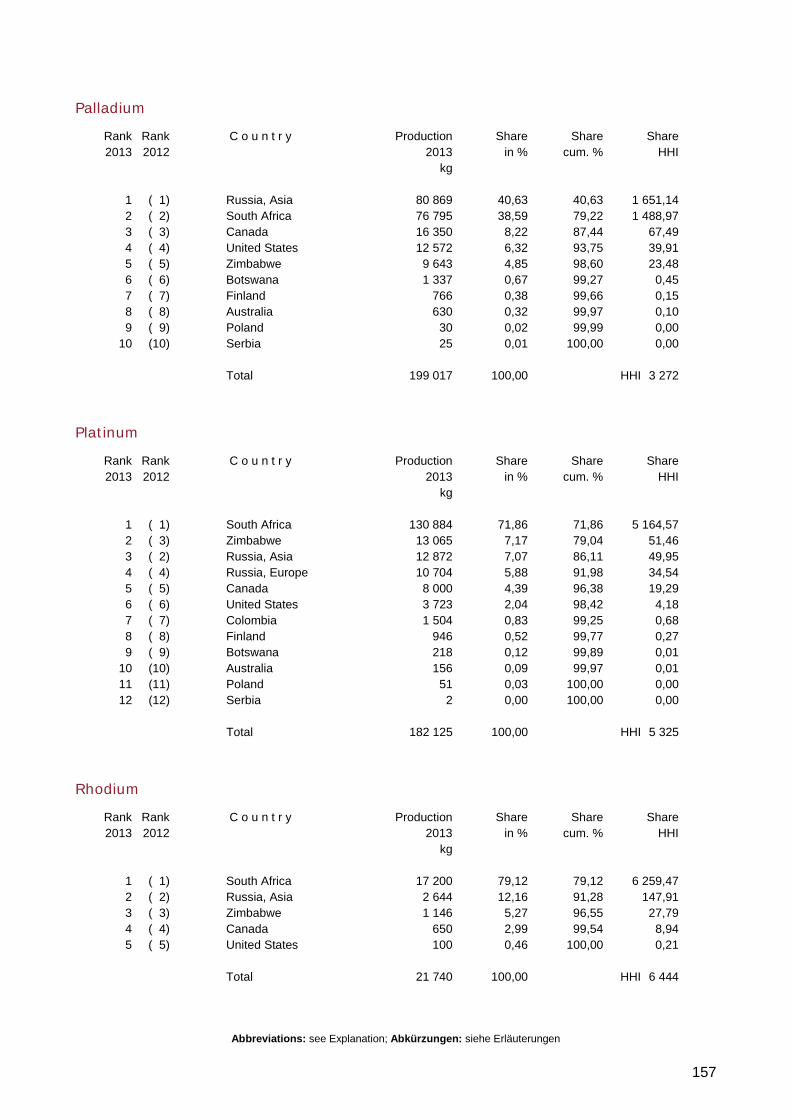
Abbreviations: see Explanation; Abkürzungen: siehe Erläuterungen
157
Palladium
Rank Rank C o u n t r y Production Share Share Share 2013 2012 2013 in % cum. % HHI kg 1 ( 1) Russia, Asia 80 869 40,63 40,63 1 651,14 2 ( 2) South Africa 76 795 38,59 79,22 1 488,97 3 ( 3) Canada 16 350 8,22 87,44 67,49 4 ( 4) United States 12 572 6,32 93,75 39,91 5 ( 5) Zimbabwe 9 643 4,85 98,60 23,48 6 ( 6) Botswana 1 337 0,67 99,27 0,45 7 ( 7) Finland 766 0,38 99,66 0,15 8 ( 8) Australia 630 0,32 99,97 0,10 9 ( 9) Poland 30 0,02 99,99 0,00 10 (10) Serbia 25 0,01 100,00 0,00 Total 199 017 100,00 HHI 3 272
Platinum
Rank Rank C o u n t r y Production Share Share Share 2013 2012 2013 in % cum. % HHI kg 1 ( 1) South Africa 130 884 71,86 71,86 5 164,57 2 ( 3) Zimbabwe 13 065 7,17 79,04 51,46 3 ( 2) Russia, Asia 12 872 7,07 86,11 49,95 4 ( 4) Russia, Europe 10 704 5,88 91,98 34,54 5 ( 5) Canada 8 000 4,39 96,38 19,29 6 ( 6) United States 3 723 2,04 98,42 4,18 7 ( 7) Colombia 1 504 0,83 99,25 0,68 8 ( 8) Finland 946 0,52 99,77 0,27 9 ( 9) Botswana 218 0,12 99,89 0,01 10 (10) Australia 156 0,09 99,97 0,01 11 (11) Poland 51 0,03 100,00 0,00 12 (12) Serbia 2 0,00 100,00 0,00 Total 182 125 100,00 HHI 5 325
Rhodium
Rank Rank C o u n t r y Production Share Share Share 2013 2012 2013 in % cum. % HHI kg 1 ( 1) South Africa 17 200 79,12 79,12 6 259,47 2 ( 2) Russia, Asia 2 644 12,16 91,28 147,91 3 ( 3) Zimbabwe 1 146 5,27 96,55 27,79 4 ( 4) Canada 650 2,99 99,54 8,94 5 ( 5) United States 100 0,46 100,00 0,21 Total 21 740 100,00 HHI 6 444
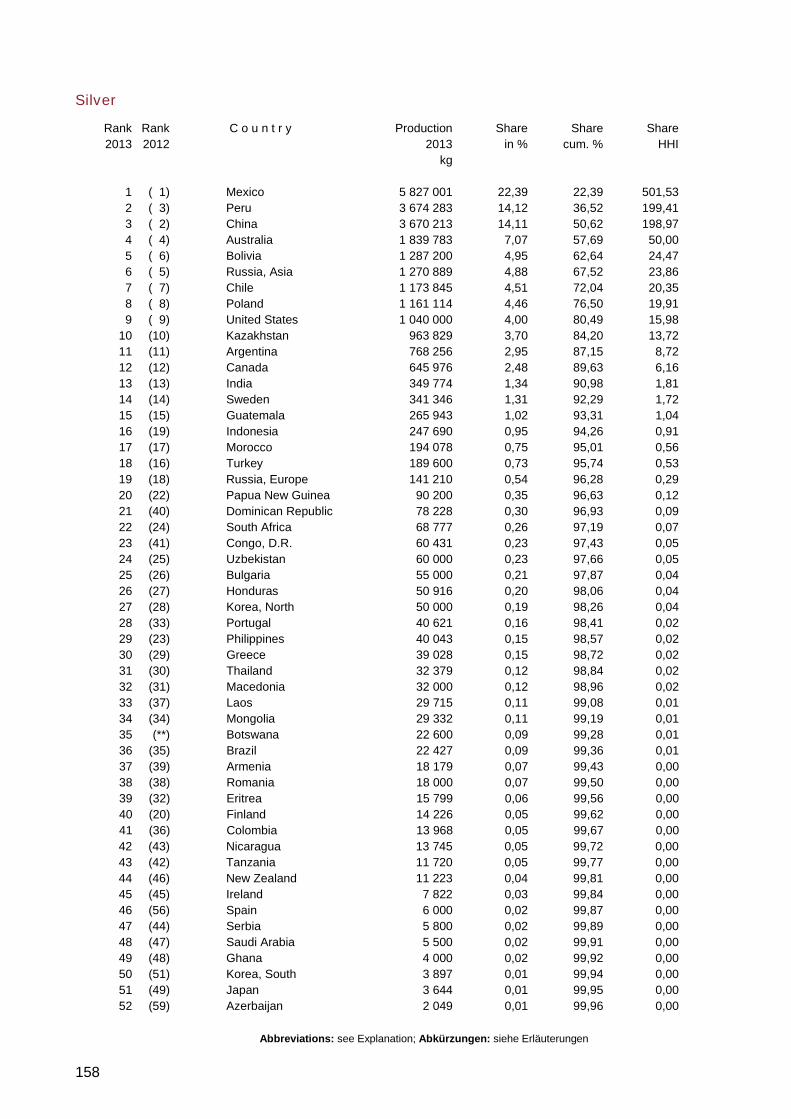
Abbreviations: see Explanation; Abkürzungen: siehe Erläuterungen
158
Silver
Rank Rank C o u n t r y Production Share Share Share 2013 2012 2013 in % cum. % HHI kg 1 ( 1) Mexico 5 827 001 22,39 22,39 501,53 2 ( 3) Peru 3 674 283 14,12 36,52 199,41 3 ( 2) China 3 670 213 14,11 50,62 198,97 4 ( 4) Australia 1 839 783 7,07 57,69 50,00 5 ( 6) Bolivia 1 287 200 4,95 62,64 24,47 6 ( 5) Russia, Asia 1 270 889 4,88 67,52 23,86 7 ( 7) Chile 1 173 845 4,51 72,04 20,35 8 ( 8) Poland 1 161 114 4,46 76,50 19,91 9 ( 9) United States 1 040 000 4,00 80,49 15,98 10 (10) Kazakhstan 963 829 3,70 84,20 13,72 11 (11) Argentina 768 256 2,95 87,15 8,72 12 (12) Canada 645 976 2,48 89,63 6,16 13 (13) India 349 774 1,34 90,98 1,81 14 (14) Sweden 341 346 1,31 92,29 1,72 15 (15) Guatemala 265 943 1,02 93,31 1,04 16 (19) Indonesia 247 690 0,95 94,26 0,91 17 (17) Morocco 194 078 0,75 95,01 0,56 18 (16) Turkey 189 600 0,73 95,74 0,53 19 (18) Russia, Europe 141 210 0,54 96,28 0,29 20 (22) Papua New Guinea 90 200 0,35 96,63 0,12 21 (40) Dominican Republic 78 228 0,30 96,93 0,09 22 (24) South Africa 68 777 0,26 97,19 0,07 23 (41) Congo, D.R. 60 431 0,23 97,43 0,05 24 (25) Uzbekistan 60 000 0,23 97,66 0,05 25 (26) Bulgaria 55 000 0,21 97,87 0,04 26 (27) Honduras 50 916 0,20 98,06 0,04 27 (28) Korea, North 50 000 0,19 98,26 0,04 28 (33) Portugal 40 621 0,16 98,41 0,02 29 (23) Philippines 40 043 0,15 98,57 0,02 30 (29) Greece 39 028 0,15 98,72 0,02 31 (30) Thailand 32 379 0,12 98,84 0,02 32 (31) Macedonia 32 000 0,12 98,96 0,02 33 (37) Laos 29 715 0,11 99,08 0,01 34 (34) Mongolia 29 332 0,11 99,19 0,01 35 (**) Botswana 22 600 0,09 99,28 0,01 36 (35) Brazil 22 427 0,09 99,36 0,01 37 (39) Armenia 18 179 0,07 99,43 0,00 38 (38) Romania 18 000 0,07 99,50 0,00 39 (32) Eritrea 15 799 0,06 99,56 0,00 40 (20) Finland 14 226 0,05 99,62 0,00 41 (36) Colombia 13 968 0,05 99,67 0,00 42 (43) Nicaragua 13 745 0,05 99,72 0,00 43 (42) Tanzania 11 720 0,05 99,77 0,00 44 (46) New Zealand 11 223 0,04 99,81 0,00 45 (45) Ireland 7 822 0,03 99,84 0,00 46 (56) Spain 6 000 0,02 99,87 0,00 47 (44) Serbia 5 800 0,02 99,89 0,00 48 (47) Saudi Arabia 5 500 0,02 99,91 0,00 49 (48) Ghana 4 000 0,02 99,92 0,00 50 (51) Korea, South 3 897 0,01 99,94 0,00 51 (49) Japan 3 644 0,01 99,95 0,00 52 (59) Azerbaijan 2 049 0,01 99,96 0,00
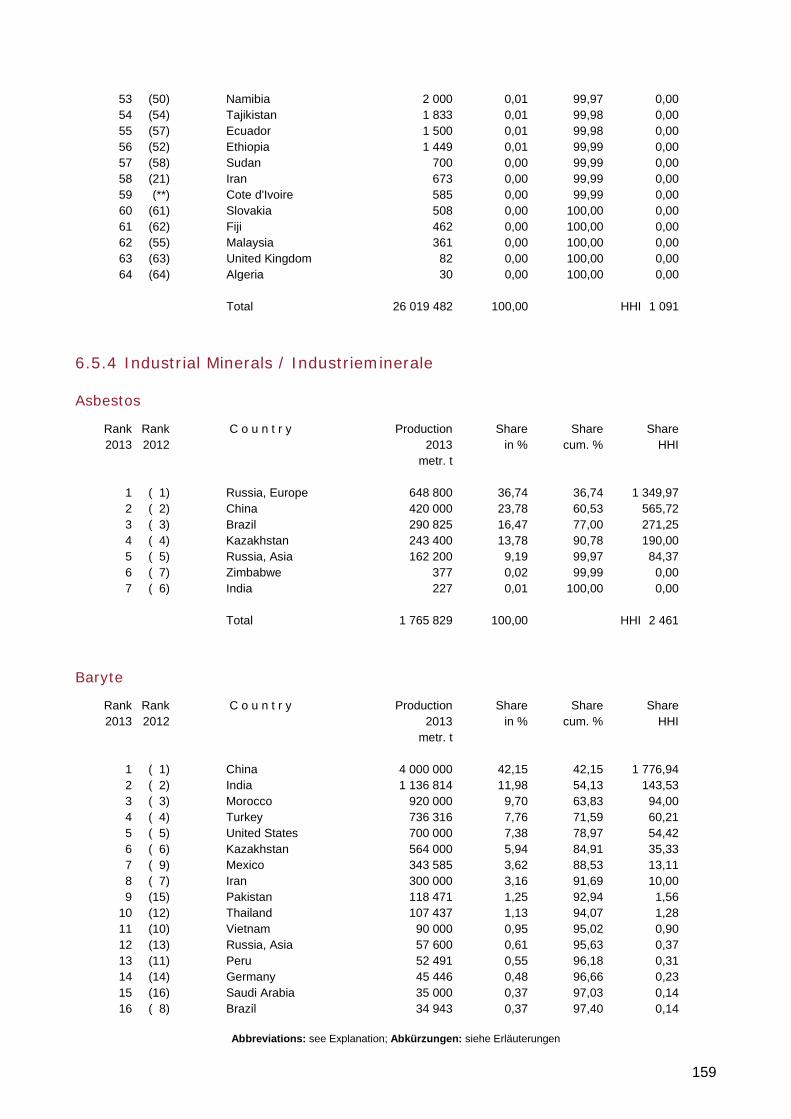
Abbreviations: see Explanation; Abkürzungen: siehe Erläuterungen
159
53 (50) Namibia 2 000 0,01 99,97 0,00 54 (54) Tajikistan 1 833 0,01 99,98 0,00 55 (57) Ecuador 1 500 0,01 99,98 0,00 56 (52) Ethiopia 1 449 0,01 99,99 0,00 57 (58) Sudan 700 0,00 99,99 0,00 58 (21) Iran 673 0,00 99,99 0,00 59 (**) Cote d'Ivoire 585 0,00 99,99 0,00 60 (61) Slovakia 508 0,00 100,00 0,00 61 (62) Fiji 462 0,00 100,00 0,00 62 (55) Malaysia 361 0,00 100,00 0,00 63 (63) United Kingdom 82 0,00 100,00 0,00 64 (64) Algeria 30 0,00 100,00 0,00 Total 26 019 482 100,00 HHI 1 091
6.5.4 Industrial Minerals / Industrieminerale
Asbestos
Rank Rank C o u n t r y Production Share Share Share 2013 2012 2013 in % cum. % HHI metr. t 1 ( 1) Russia, Europe 648 800 36,74 36,74 1 349,97 2 ( 2) China 420 000 23,78 60,53 565,72 3 ( 3) Brazil 290 825 16,47 77,00 271,25 4 ( 4) Kazakhstan 243 400 13,78 90,78 190,00 5 ( 5) Russia, Asia 162 200 9,19 99,97 84,37 6 ( 7) Zimbabwe 377 0,02 99,99 0,00 7 ( 6) India 227 0,01 100,00 0,00 Total 1 765 829 100,00 HHI 2 461
Baryte
Rank Rank C o u n t r y Production Share Share Share 2013 2012 2013 in % cum. % HHI metr. t 1 ( 1) China 4 000 000 42,15 42,15 1 776,94 2 ( 2) India 1 136 814 11,98 54,13 143,53 3 ( 3) Morocco 920 000 9,70 63,83 94,00 4 ( 4) Turkey 736 316 7,76 71,59 60,21 5 ( 5) United States 700 000 7,38 78,97 54,42 6 ( 6) Kazakhstan 564 000 5,94 84,91 35,33 7 ( 9) Mexico 343 585 3,62 88,53 13,11 8 ( 7) Iran 300 000 3,16 91,69 10,00 9 (15) Pakistan 118 471 1,25 92,94 1,56 10 (12) Thailand 107 437 1,13 94,07 1,28 11 (10) Vietnam 90 000 0,95 95,02 0,90 12 (13) Russia, Asia 57 600 0,61 95,63 0,37 13 (11) Peru 52 491 0,55 96,18 0,31 14 (14) Germany 45 446 0,48 96,66 0,23 15 (16) Saudi Arabia 35 000 0,37 97,03 0,14 16 ( 8) Brazil 34 943 0,37 97,40 0,14
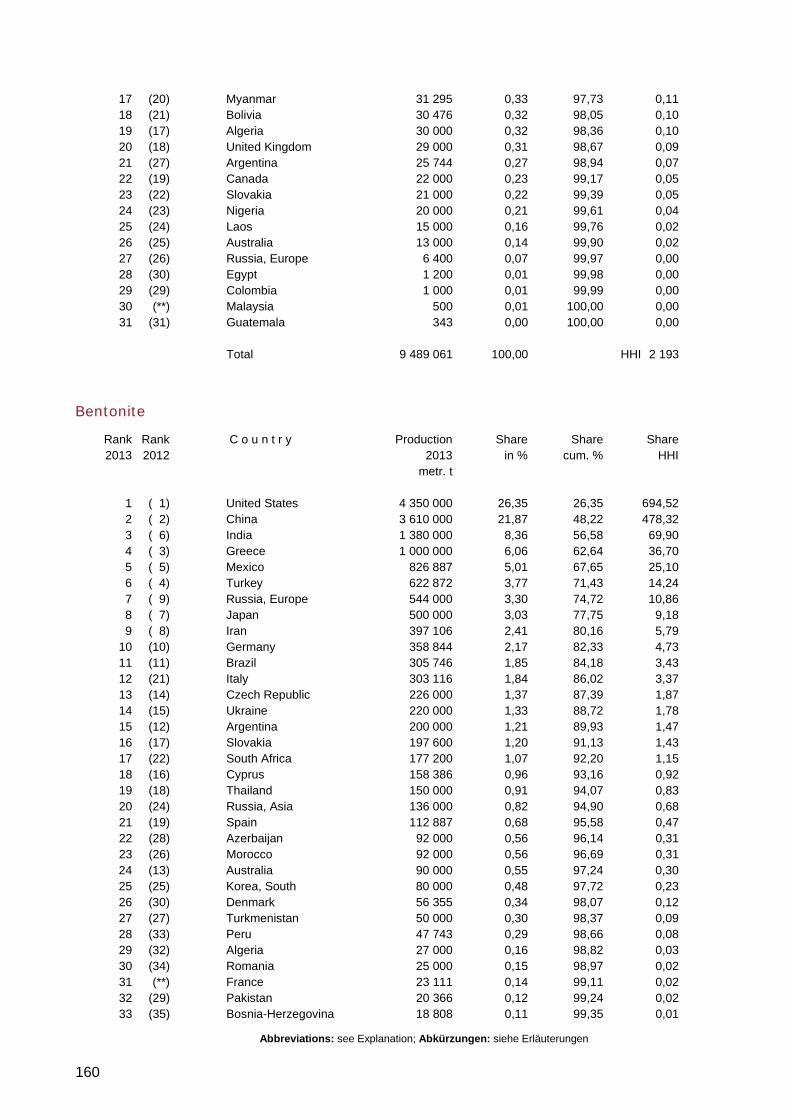
Abbreviations: see Explanation; Abkürzungen: siehe Erläuterungen
160
17 (20) Myanmar 31 295 0,33 97,73 0,11 18 (21) Bolivia 30 476 0,32 98,05 0,10 19 (17) Algeria 30 000 0,32 98,36 0,10 20 (18) United Kingdom 29 000 0,31 98,67 0,09 21 (27) Argentina 25 744 0,27 98,94 0,07 22 (19) Canada 22 000 0,23 99,17 0,05 23 (22) Slovakia 21 000 0,22 99,39 0,05 24 (23) Nigeria 20 000 0,21 99,61 0,04 25 (24) Laos 15 000 0,16 99,76 0,02 26 (25) Australia 13 000 0,14 99,90 0,02 27 (26) Russia, Europe 6 400 0,07 99,97 0,00 28 (30) Egypt 1 200 0,01 99,98 0,00 29 (29) Colombia 1 000 0,01 99,99 0,00 30 (**) Malaysia 500 0,01 100,00 0,00 31 (31) Guatemala 343 0,00 100,00 0,00 Total 9 489 061 100,00 HHI 2 193
Bentonite
Rank Rank C o u n t r y Production Share Share Share 2013 2012 2013 in % cum. % HHI metr. t 1 ( 1) United States 4 350 000 26,35 26,35 694,52 2 ( 2) China 3 610 000 21,87 48,22 478,32 3 ( 6) India 1 380 000 8,36 56,58 69,90 4 ( 3) Greece 1 000 000 6,06 62,64 36,70 5 ( 5) Mexico 826 887 5,01 67,65 25,10 6 ( 4) Turkey 622 872 3,77 71,43 14,24 7 ( 9) Russia, Europe 544 000 3,30 74,72 10,86 8 ( 7) Japan 500 000 3,03 77,75 9,18 9 ( 8) Iran 397 106 2,41 80,16 5,79 10 (10) Germany 358 844 2,17 82,33 4,73 11 (11) Brazil 305 746 1,85 84,18 3,43 12 (21) Italy 303 116 1,84 86,02 3,37 13 (14) Czech Republic 226 000 1,37 87,39 1,87 14 (15) Ukraine 220 000 1,33 88,72 1,78 15 (12) Argentina 200 000 1,21 89,93 1,47 16 (17) Slovakia 197 600 1,20 91,13 1,43 17 (22) South Africa 177 200 1,07 92,20 1,15 18 (16) Cyprus 158 386 0,96 93,16 0,92 19 (18) Thailand 150 000 0,91 94,07 0,83 20 (24) Russia, Asia 136 000 0,82 94,90 0,68 21 (19) Spain 112 887 0,68 95,58 0,47 22 (28) Azerbaijan 92 000 0,56 96,14 0,31 23 (26) Morocco 92 000 0,56 96,69 0,31 24 (13) Australia 90 000 0,55 97,24 0,30 25 (25) Korea, South 80 000 0,48 97,72 0,23 26 (30) Denmark 56 355 0,34 98,07 0,12 27 (27) Turkmenistan 50 000 0,30 98,37 0,09 28 (33) Peru 47 743 0,29 98,66 0,08 29 (32) Algeria 27 000 0,16 98,82 0,03 30 (34) Romania 25 000 0,15 98,97 0,02 31 (**) France 23 111 0,14 99,11 0,02 32 (29) Pakistan 20 366 0,12 99,24 0,02 33 (35) Bosnia-Herzegovina 18 808 0,11 99,35 0,01
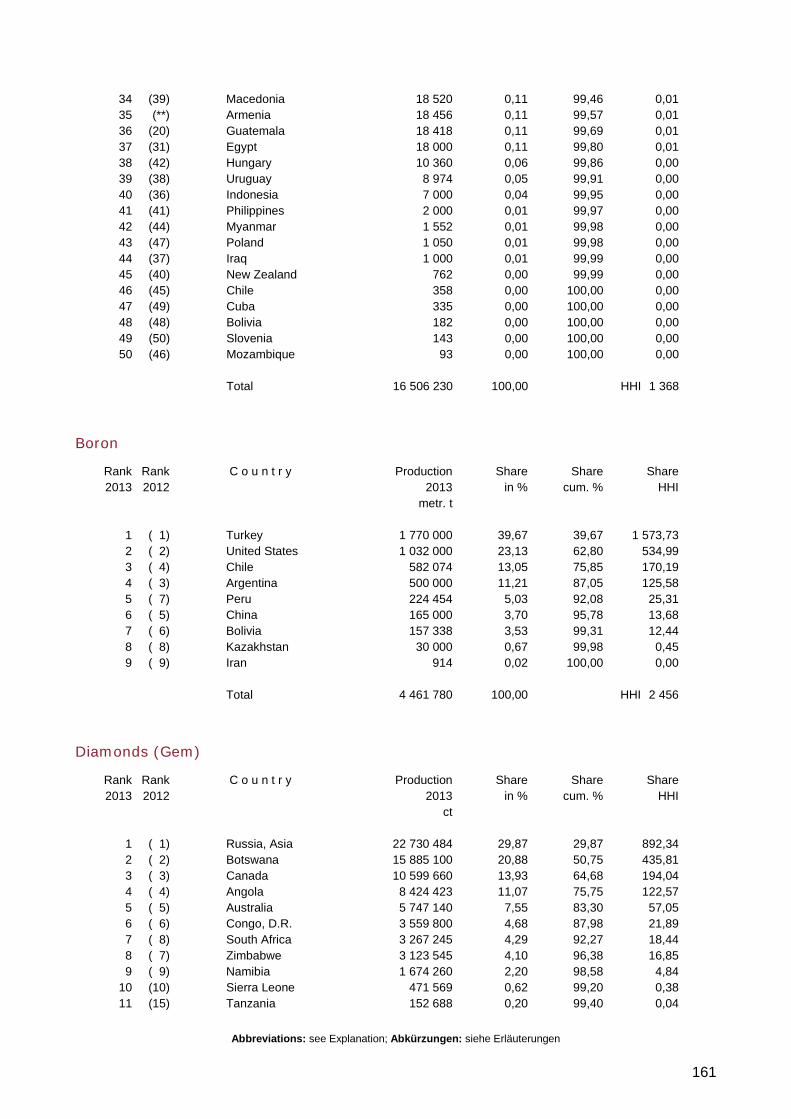
Abbreviations: see Explanation; Abkürzungen: siehe Erläuterungen
161
34 (39) Macedonia 18 520 0,11 99,46 0,01 35 (**) Armenia 18 456 0,11 99,57 0,01 36 (20) Guatemala 18 418 0,11 99,69 0,01 37 (31) Egypt 18 000 0,11 99,80 0,01 38 (42) Hungary 10 360 0,06 99,86 0,00 39 (38) Uruguay 8 974 0,05 99,91 0,00 40 (36) Indonesia 7 000 0,04 99,95 0,00 41 (41) Philippines 2 000 0,01 99,97 0,00 42 (44) Myanmar 1 552 0,01 99,98 0,00 43 (47) Poland 1 050 0,01 99,98 0,00 44 (37) Iraq 1 000 0,01 99,99 0,00 45 (40) New Zealand 762 0,00 99,99 0,00 46 (45) Chile 358 0,00 100,00 0,00 47 (49) Cuba 335 0,00 100,00 0,00 48 (48) Bolivia 182 0,00 100,00 0,00 49 (50) Slovenia 143 0,00 100,00 0,00 50 (46) Mozambique 93 0,00 100,00 0,00 Total 16 506 230 100,00 HHI 1 368
Boron
Rank Rank C o u n t r y Production Share Share Share 2013 2012 2013 in % cum. % HHI metr. t 1 ( 1) Turkey 1 770 000 39,67 39,67 1 573,73 2 ( 2) United States 1 032 000 23,13 62,80 534,99 3 ( 4) Chile 582 074 13,05 75,85 170,19 4 ( 3) Argentina 500 000 11,21 87,05 125,58 5 ( 7) Peru 224 454 5,03 92,08 25,31 6 ( 5) China 165 000 3,70 95,78 13,68 7 ( 6) Bolivia 157 338 3,53 99,31 12,44 8 ( 8) Kazakhstan 30 000 0,67 99,98 0,45 9 ( 9) Iran 914 0,02 100,00 0,00 Total 4 461 780 100,00 HHI 2 456
Diamonds (Gem)
Rank Rank C o u n t r y Production Share Share Share 2013 2012 2013 in % cum. % HHI ct 1 ( 1) Russia, Asia 22 730 484 29,87 29,87 892,34 2 ( 2) Botswana 15 885 100 20,88 50,75 435,81 3 ( 3) Canada 10 599 660 13,93 64,68 194,04 4 ( 4) Angola 8 424 423 11,07 75,75 122,57 5 ( 5) Australia 5 747 140 7,55 83,30 57,05 6 ( 6) Congo, D.R. 3 559 800 4,68 87,98 21,89 7 ( 8) South Africa 3 267 245 4,29 92,27 18,44 8 ( 7) Zimbabwe 3 123 545 4,10 96,38 16,85 9 ( 9) Namibia 1 674 260 2,20 98,58 4,84 10 (10) Sierra Leone 471 569 0,62 99,20 0,38 11 (15) Tanzania 152 688 0,20 99,40 0,04
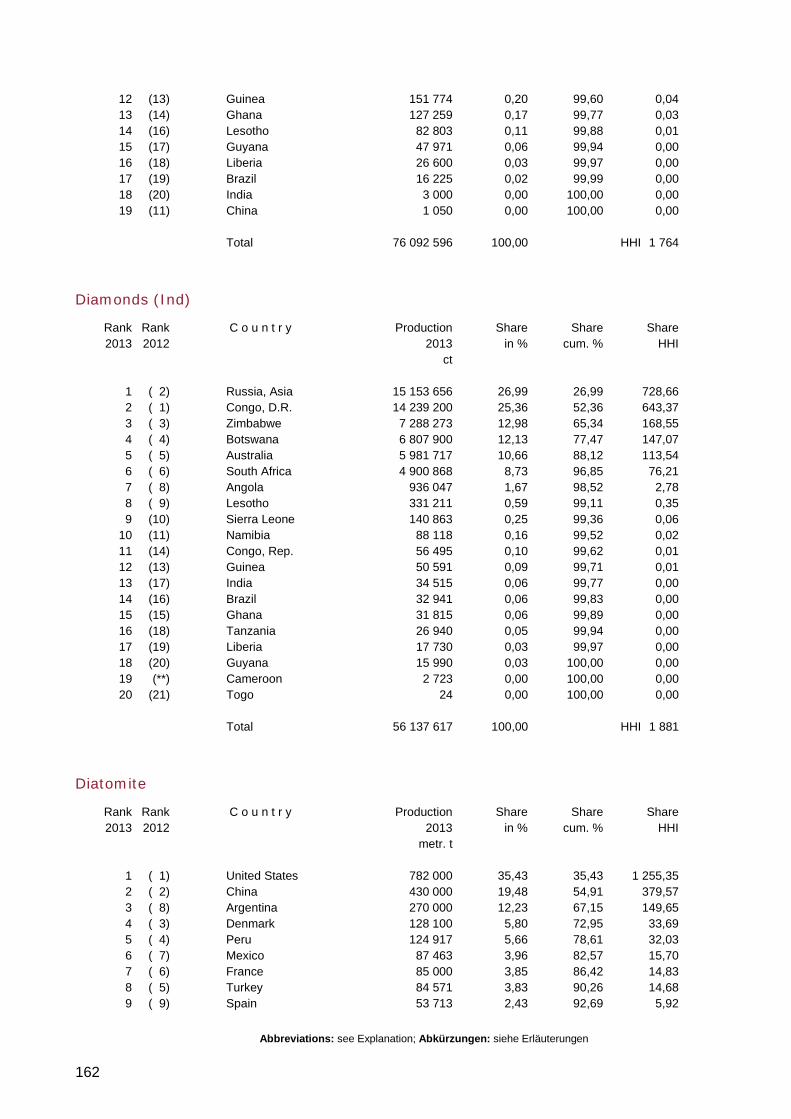
Abbreviations: see Explanation; Abkürzungen: siehe Erläuterungen
162
12 (13) Guinea 151 774 0,20 99,60 0,04 13 (14) Ghana 127 259 0,17 99,77 0,03 14 (16) Lesotho 82 803 0,11 99,88 0,01 15 (17) Guyana 47 971 0,06 99,94 0,00 16 (18) Liberia 26 600 0,03 99,97 0,00 17 (19) Brazil 16 225 0,02 99,99 0,00 18 (20) India 3 000 0,00 100,00 0,00 19 (11) China 1 050 0,00 100,00 0,00 Total 76 092 596 100,00 HHI 1 764
Diamonds (Ind)
Rank Rank C o u n t r y Production Share Share Share 2013 2012 2013 in % cum. % HHI ct 1 ( 2) Russia, Asia 15 153 656 26,99 26,99 728,66 2 ( 1) Congo, D.R. 14 239 200 25,36 52,36 643,37 3 ( 3) Zimbabwe 7 288 273 12,98 65,34 168,55 4 ( 4) Botswana 6 807 900 12,13 77,47 147,07 5 ( 5) Australia 5 981 717 10,66 88,12 113,54 6 ( 6) South Africa 4 900 868 8,73 96,85 76,21 7 ( 8) Angola 936 047 1,67 98,52 2,78 8 ( 9) Lesotho 331 211 0,59 99,11 0,35 9 (10) Sierra Leone 140 863 0,25 99,36 0,06 10 (11) Namibia 88 118 0,16 99,52 0,02 11 (14) Congo, Rep. 56 495 0,10 99,62 0,01 12 (13) Guinea 50 591 0,09 99,71 0,01 13 (17) India 34 515 0,06 99,77 0,00 14 (16) Brazil 32 941 0,06 99,83 0,00 15 (15) Ghana 31 815 0,06 99,89 0,00 16 (18) Tanzania 26 940 0,05 99,94 0,00 17 (19) Liberia 17 730 0,03 99,97 0,00 18 (20) Guyana 15 990 0,03 100,00 0,00 19 (**) Cameroon 2 723 0,00 100,00 0,00 20 (21) Togo 24 0,00 100,00 0,00 Total 56 137 617 100,00 HHI 1 881
Diatomite
Rank Rank C o u n t r y Production Share Share Share 2013 2012 2013 in % cum. % HHI metr. t 1 ( 1) United States 782 000 35,43 35,43 1 255,35 2 ( 2) China 430 000 19,48 54,91 379,57 3 ( 8) Argentina 270 000 12,23 67,15 149,65 4 ( 3) Denmark 128 100 5,80 72,95 33,69 5 ( 4) Peru 124 917 5,66 78,61 32,03 6 ( 7) Mexico 87 463 3,96 82,57 15,70 7 ( 6) France 85 000 3,85 86,42 14,83 8 ( 5) Turkey 84 571 3,83 90,26 14,68 9 ( 9) Spain 53 713 2,43 92,69 5,92
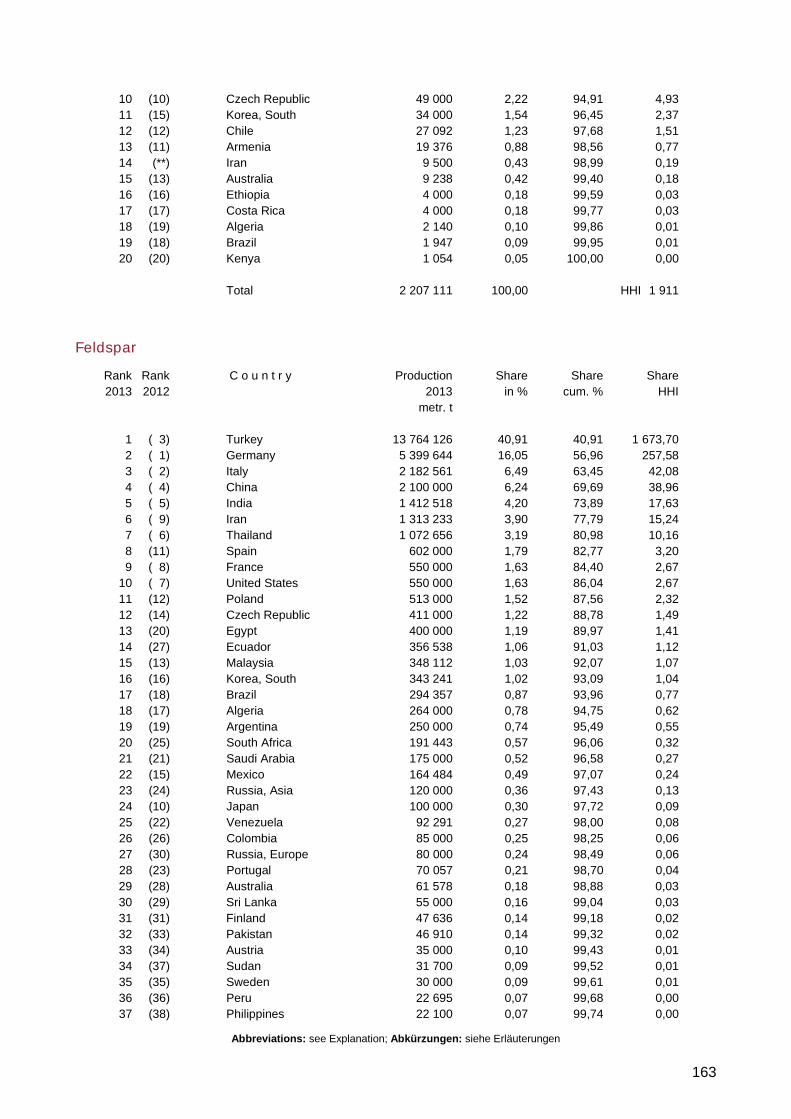
Abbreviations: see Explanation; Abkürzungen: siehe Erläuterungen
163
10 (10) Czech Republic 49 000 2,22 94,91 4,93 11 (15) Korea, South 34 000 1,54 96,45 2,37 12 (12) Chile 27 092 1,23 97,68 1,51 13 (11) Armenia 19 376 0,88 98,56 0,77 14 (**) Iran 9 500 0,43 98,99 0,19 15 (13) Australia 9 238 0,42 99,40 0,18 16 (16) Ethiopia 4 000 0,18 99,59 0,03 17 (17) Costa Rica 4 000 0,18 99,77 0,03 18 (19) Algeria 2 140 0,10 99,86 0,01 19 (18) Brazil 1 947 0,09 99,95 0,01 20 (20) Kenya 1 054 0,05 100,00 0,00 Total 2 207 111 100,00 HHI 1 911
Feldspar
Rank Rank C o u n t r y Production Share Share Share 2013 2012 2013 in % cum. % HHI metr. t 1 ( 3) Turkey 13 764 126 40,91 40,91 1 673,70 2 ( 1) Germany 5 399 644 16,05 56,96 257,58 3 ( 2) Italy 2 182 561 6,49 63,45 42,08 4 ( 4) China 2 100 000 6,24 69,69 38,96 5 ( 5) India 1 412 518 4,20 73,89 17,63 6 ( 9) Iran 1 313 233 3,90 77,79 15,24 7 ( 6) Thailand 1 072 656 3,19 80,98 10,16 8 (11) Spain 602 000 1,79 82,77 3,20 9 ( 8) France 550 000 1,63 84,40 2,67 10 ( 7) United States 550 000 1,63 86,04 2,67 11 (12) Poland 513 000 1,52 87,56 2,32 12 (14) Czech Republic 411 000 1,22 88,78 1,49 13 (20) Egypt 400 000 1,19 89,97 1,41 14 (27) Ecuador 356 538 1,06 91,03 1,12 15 (13) Malaysia 348 112 1,03 92,07 1,07 16 (16) Korea, South 343 241 1,02 93,09 1,04 17 (18) Brazil 294 357 0,87 93,96 0,77 18 (17) Algeria 264 000 0,78 94,75 0,62 19 (19) Argentina 250 000 0,74 95,49 0,55 20 (25) South Africa 191 443 0,57 96,06 0,32 21 (21) Saudi Arabia 175 000 0,52 96,58 0,27 22 (15) Mexico 164 484 0,49 97,07 0,24 23 (24) Russia, Asia 120 000 0,36 97,43 0,13 24 (10) Japan 100 000 0,30 97,72 0,09 25 (22) Venezuela 92 291 0,27 98,00 0,08 26 (26) Colombia 85 000 0,25 98,25 0,06 27 (30) Russia, Europe 80 000 0,24 98,49 0,06 28 (23) Portugal 70 057 0,21 98,70 0,04 29 (28) Australia 61 578 0,18 98,88 0,03 30 (29) Sri Lanka 55 000 0,16 99,04 0,03 31 (31) Finland 47 636 0,14 99,18 0,02 32 (33) Pakistan 46 910 0,14 99,32 0,02 33 (34) Austria 35 000 0,10 99,43 0,01 34 (37) Sudan 31 700 0,09 99,52 0,01 35 (35) Sweden 30 000 0,09 99,61 0,01 36 (36) Peru 22 695 0,07 99,68 0,00 37 (38) Philippines 22 100 0,07 99,74 0,00
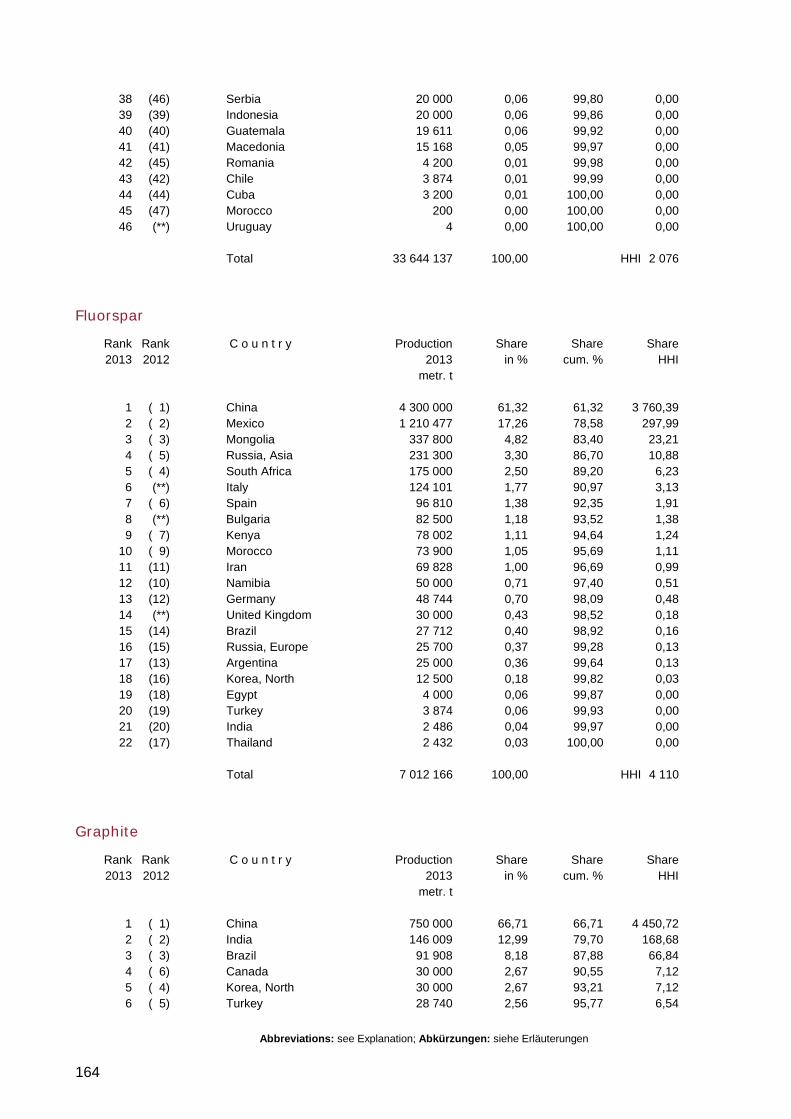
Abbreviations: see Explanation; Abkürzungen: siehe Erläuterungen
164
38 (46) Serbia 20 000 0,06 99,80 0,00 39 (39) Indonesia 20 000 0,06 99,86 0,00 40 (40) Guatemala 19 611 0,06 99,92 0,00 41 (41) Macedonia 15 168 0,05 99,97 0,00 42 (45) Romania 4 200 0,01 99,98 0,00 43 (42) Chile 3 874 0,01 99,99 0,00 44 (44) Cuba 3 200 0,01 100,00 0,00 45 (47) Morocco 200 0,00 100,00 0,00 46 (**) Uruguay 4 0,00 100,00 0,00 Total 33 644 137 100,00 HHI 2 076
Fluorspar
Rank Rank C o u n t r y Production Share Share Share 2013 2012 2013 in % cum. % HHI metr. t 1 ( 1) China 4 300 000 61,32 61,32 3 760,39 2 ( 2) Mexico 1 210 477 17,26 78,58 297,99 3 ( 3) Mongolia 337 800 4,82 83,40 23,21 4 ( 5) Russia, Asia 231 300 3,30 86,70 10,88 5 ( 4) South Africa 175 000 2,50 89,20 6,23 6 (**) Italy 124 101 1,77 90,97 3,13 7 ( 6) Spain 96 810 1,38 92,35 1,91 8 (**) Bulgaria 82 500 1,18 93,52 1,38 9 ( 7) Kenya 78 002 1,11 94,64 1,24 10 ( 9) Morocco 73 900 1,05 95,69 1,11 11 (11) Iran 69 828 1,00 96,69 0,99 12 (10) Namibia 50 000 0,71 97,40 0,51 13 (12) Germany 48 744 0,70 98,09 0,48 14 (**) United Kingdom 30 000 0,43 98,52 0,18 15 (14) Brazil 27 712 0,40 98,92 0,16 16 (15) Russia, Europe 25 700 0,37 99,28 0,13 17 (13) Argentina 25 000 0,36 99,64 0,13 18 (16) Korea, North 12 500 0,18 99,82 0,03 19 (18) Egypt 4 000 0,06 99,87 0,00 20 (19) Turkey 3 874 0,06 99,93 0,00 21 (20) India 2 486 0,04 99,97 0,00 22 (17) Thailand 2 432 0,03 100,00 0,00 Total 7 012 166 100,00 HHI 4 110
Graphite
Rank Rank C o u n t r y Production Share Share Share 2013 2012 2013 in % cum. % HHI metr. t 1 ( 1) China 750 000 66,71 66,71 4 450,72 2 ( 2) India 146 009 12,99 79,70 168,68 3 ( 3) Brazil 91 908 8,18 87,88 66,84 4 ( 6) Canada 30 000 2,67 90,55 7,12 5 ( 4) Korea, North 30 000 2,67 93,21 7,12 6 ( 5) Turkey 28 740 2,56 95,77 6,54
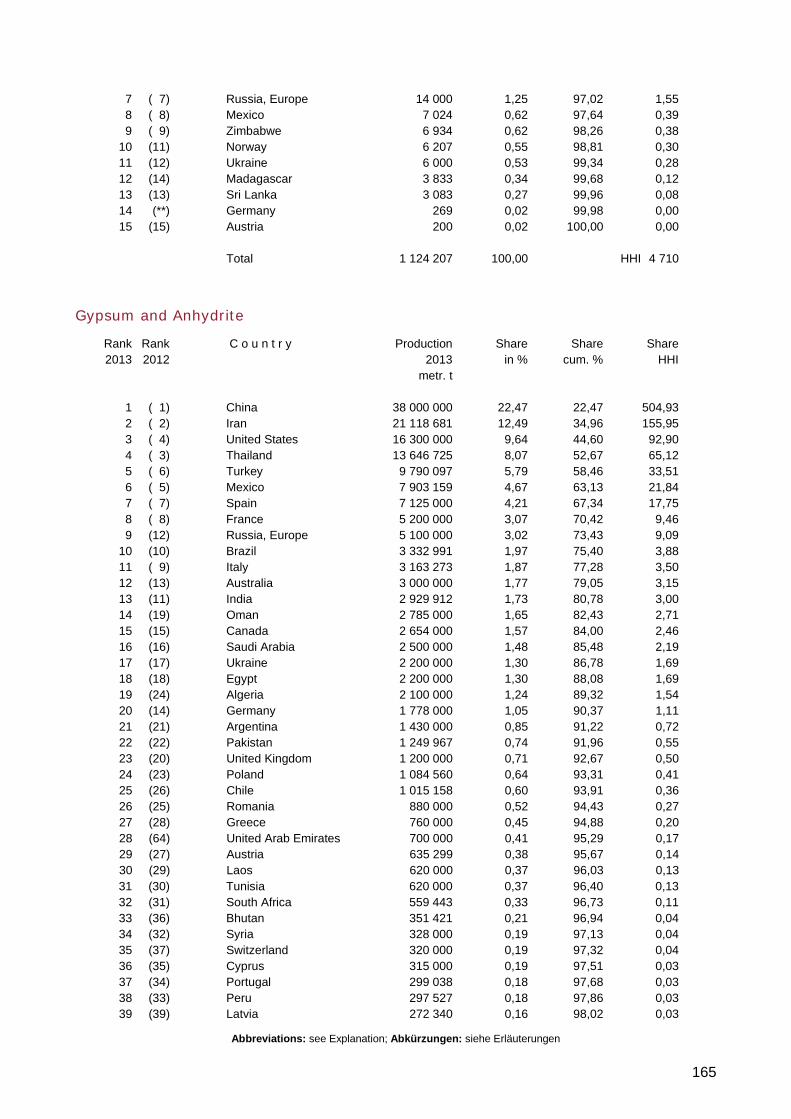
Abbreviations: see Explanation; Abkürzungen: siehe Erläuterungen
165
7 ( 7) Russia, Europe 14 000 1,25 97,02 1,55 8 ( 8) Mexico 7 024 0,62 97,64 0,39 9 ( 9) Zimbabwe 6 934 0,62 98,26 0,38 10 (11) Norway 6 207 0,55 98,81 0,30 11 (12) Ukraine 6 000 0,53 99,34 0,28 12 (14) Madagascar 3 833 0,34 99,68 0,12 13 (13) Sri Lanka 3 083 0,27 99,96 0,08 14 (**) Germany 269 0,02 99,98 0,00 15 (15) Austria 200 0,02 100,00 0,00 Total 1 124 207 100,00 HHI 4 710
Gypsum and Anhydrite
Rank Rank C o u n t r y Production Share Share Share 2013 2012 2013 in % cum. % HHI metr. t 1 ( 1) China 38 000 000 22,47 22,47 504,93 2 ( 2) Iran 21 118 681 12,49 34,96 155,95 3 ( 4) United States 16 300 000 9,64 44,60 92,90 4 ( 3) Thailand 13 646 725 8,07 52,67 65,12 5 ( 6) Turkey 9 790 097 5,79 58,46 33,51 6 ( 5) Mexico 7 903 159 4,67 63,13 21,84 7 ( 7) Spain 7 125 000 4,21 67,34 17,75 8 ( 8) France 5 200 000 3,07 70,42 9,46 9 (12) Russia, Europe 5 100 000 3,02 73,43 9,09 10 (10) Brazil 3 332 991 1,97 75,40 3,88 11 ( 9) Italy 3 163 273 1,87 77,28 3,50 12 (13) Australia 3 000 000 1,77 79,05 3,15 13 (11) India 2 929 912 1,73 80,78 3,00 14 (19) Oman 2 785 000 1,65 82,43 2,71 15 (15) Canada 2 654 000 1,57 84,00 2,46 16 (16) Saudi Arabia 2 500 000 1,48 85,48 2,19 17 (17) Ukraine 2 200 000 1,30 86,78 1,69 18 (18) Egypt 2 200 000 1,30 88,08 1,69 19 (24) Algeria 2 100 000 1,24 89,32 1,54 20 (14) Germany 1 778 000 1,05 90,37 1,11 21 (21) Argentina 1 430 000 0,85 91,22 0,72 22 (22) Pakistan 1 249 967 0,74 91,96 0,55 23 (20) United Kingdom 1 200 000 0,71 92,67 0,50 24 (23) Poland 1 084 560 0,64 93,31 0,41 25 (26) Chile 1 015 158 0,60 93,91 0,36 26 (25) Romania 880 000 0,52 94,43 0,27 27 (28) Greece 760 000 0,45 94,88 0,20 28 (64) United Arab Emirates 700 000 0,41 95,29 0,17 29 (27) Austria 635 299 0,38 95,67 0,14 30 (29) Laos 620 000 0,37 96,03 0,13 31 (30) Tunisia 620 000 0,37 96,40 0,13 32 (31) South Africa 559 443 0,33 96,73 0,11 33 (36) Bhutan 351 421 0,21 96,94 0,04 34 (32) Syria 328 000 0,19 97,13 0,04 35 (37) Switzerland 320 000 0,19 97,32 0,04 36 (35) Cyprus 315 000 0,19 97,51 0,03 37 (34) Portugal 299 038 0,18 97,68 0,03 38 (33) Peru 297 527 0,18 97,86 0,03 39 (39) Latvia 272 340 0,16 98,02 0,03
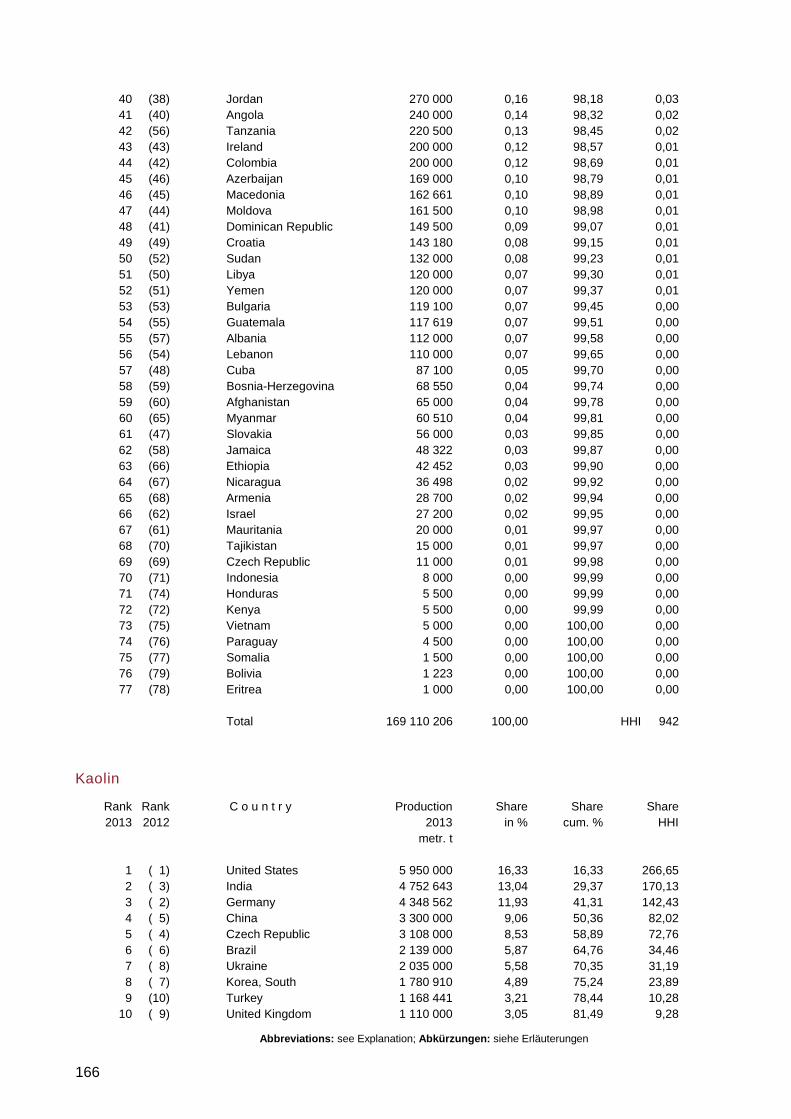
Abbreviations: see Explanation; Abkürzungen: siehe Erläuterungen
166
40 (38) Jordan 270 000 0,16 98,18 0,03 41 (40) Angola 240 000 0,14 98,32 0,02 42 (56) Tanzania 220 500 0,13 98,45 0,02 43 (43) Ireland 200 000 0,12 98,57 0,01 44 (42) Colombia 200 000 0,12 98,69 0,01 45 (46) Azerbaijan 169 000 0,10 98,79 0,01 46 (45) Macedonia 162 661 0,10 98,89 0,01 47 (44) Moldova 161 500 0,10 98,98 0,01 48 (41) Dominican Republic 149 500 0,09 99,07 0,01 49 (49) Croatia 143 180 0,08 99,15 0,01 50 (52) Sudan 132 000 0,08 99,23 0,01 51 (50) Libya 120 000 0,07 99,30 0,01 52 (51) Yemen 120 000 0,07 99,37 0,01 53 (53) Bulgaria 119 100 0,07 99,45 0,00 54 (55) Guatemala 117 619 0,07 99,51 0,00 55 (57) Albania 112 000 0,07 99,58 0,00 56 (54) Lebanon 110 000 0,07 99,65 0,00 57 (48) Cuba 87 100 0,05 99,70 0,00 58 (59) Bosnia-Herzegovina 68 550 0,04 99,74 0,00 59 (60) Afghanistan 65 000 0,04 99,78 0,00 60 (65) Myanmar 60 510 0,04 99,81 0,00 61 (47) Slovakia 56 000 0,03 99,85 0,00 62 (58) Jamaica 48 322 0,03 99,87 0,00 63 (66) Ethiopia 42 452 0,03 99,90 0,00 64 (67) Nicaragua 36 498 0,02 99,92 0,00 65 (68) Armenia 28 700 0,02 99,94 0,00 66 (62) Israel 27 200 0,02 99,95 0,00 67 (61) Mauritania 20 000 0,01 99,97 0,00 68 (70) Tajikistan 15 000 0,01 99,97 0,00 69 (69) Czech Republic 11 000 0,01 99,98 0,00 70 (71) Indonesia 8 000 0,00 99,99 0,00 71 (74) Honduras 5 500 0,00 99,99 0,00 72 (72) Kenya 5 500 0,00 99,99 0,00 73 (75) Vietnam 5 000 0,00 100,00 0,00 74 (76) Paraguay 4 500 0,00 100,00 0,00 75 (77) Somalia 1 500 0,00 100,00 0,00 76 (79) Bolivia 1 223 0,00 100,00 0,00 77 (78) Eritrea 1 000 0,00 100,00 0,00 Total 169 110 206 100,00 HHI 942
Kaolin
Rank Rank C o u n t r y Production Share Share Share 2013 2012 2013 in % cum. % HHI metr. t 1 ( 1) United States 5 950 000 16,33 16,33 266,65 2 ( 3) India 4 752 643 13,04 29,37 170,13 3 ( 2) Germany 4 348 562 11,93 41,31 142,43 4 ( 5) China 3 300 000 9,06 50,36 82,02 5 ( 4) Czech Republic 3 108 000 8,53 58,89 72,76 6 ( 6) Brazil 2 139 000 5,87 64,76 34,46 7 ( 8) Ukraine 2 035 000 5,58 70,35 31,19 8 ( 7) Korea, South 1 780 910 4,89 75,24 23,89 9 (10) Turkey 1 168 441 3,21 78,44 10,28 10 ( 9) United Kingdom 1 110 000 3,05 81,49 9,28
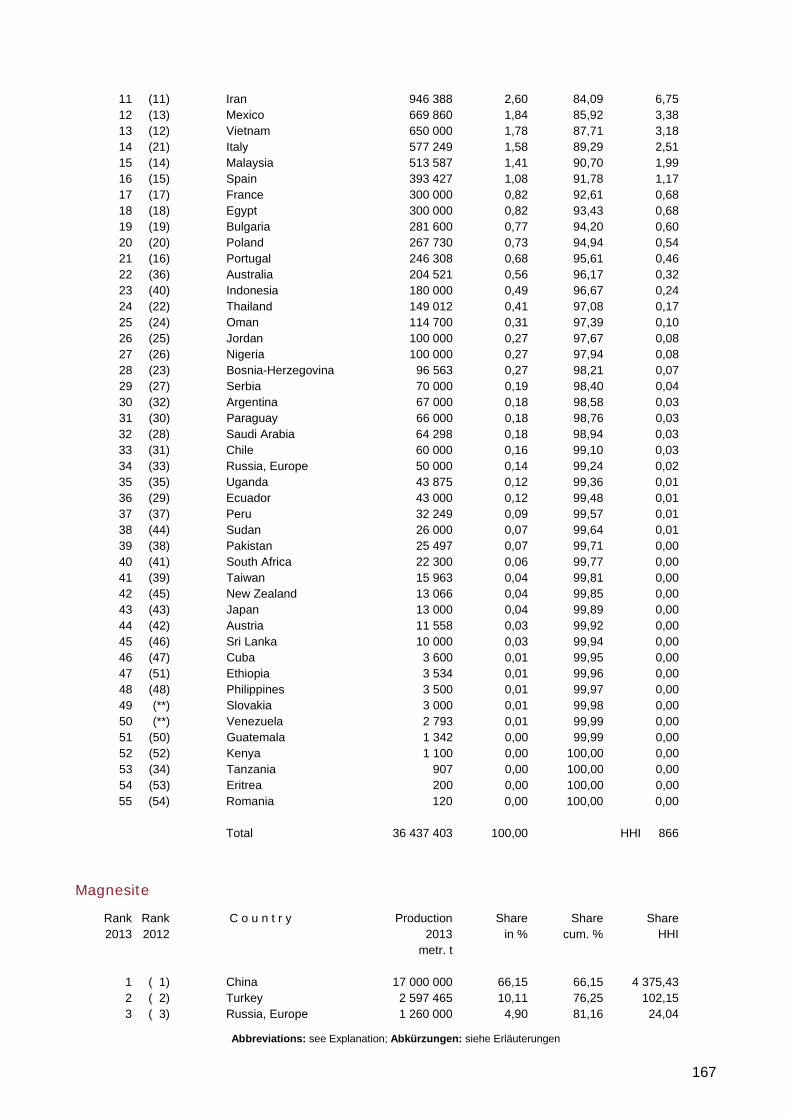
Abbreviations: see Explanation; Abkürzungen: siehe Erläuterungen
167
11 (11) Iran 946 388 2,60 84,09 6,75 12 (13) Mexico 669 860 1,84 85,92 3,38 13 (12) Vietnam 650 000 1,78 87,71 3,18 14 (21) Italy 577 249 1,58 89,29 2,51 15 (14) Malaysia 513 587 1,41 90,70 1,99 16 (15) Spain 393 427 1,08 91,78 1,17 17 (17) France 300 000 0,82 92,61 0,68 18 (18) Egypt 300 000 0,82 93,43 0,68 19 (19) Bulgaria 281 600 0,77 94,20 0,60 20 (20) Poland 267 730 0,73 94,94 0,54 21 (16) Portugal 246 308 0,68 95,61 0,46 22 (36) Australia 204 521 0,56 96,17 0,32 23 (40) Indonesia 180 000 0,49 96,67 0,24 24 (22) Thailand 149 012 0,41 97,08 0,17 25 (24) Oman 114 700 0,31 97,39 0,10 26 (25) Jordan 100 000 0,27 97,67 0,08 27 (26) Nigeria 100 000 0,27 97,94 0,08 28 (23) Bosnia-Herzegovina 96 563 0,27 98,21 0,07 29 (27) Serbia 70 000 0,19 98,40 0,04 30 (32) Argentina 67 000 0,18 98,58 0,03 31 (30) Paraguay 66 000 0,18 98,76 0,03 32 (28) Saudi Arabia 64 298 0,18 98,94 0,03 33 (31) Chile 60 000 0,16 99,10 0,03 34 (33) Russia, Europe 50 000 0,14 99,24 0,02 35 (35) Uganda 43 875 0,12 99,36 0,01 36 (29) Ecuador 43 000 0,12 99,48 0,01 37 (37) Peru 32 249 0,09 99,57 0,01 38 (44) Sudan 26 000 0,07 99,64 0,01 39 (38) Pakistan 25 497 0,07 99,71 0,00 40 (41) South Africa 22 300 0,06 99,77 0,00 41 (39) Taiwan 15 963 0,04 99,81 0,00 42 (45) New Zealand 13 066 0,04 99,85 0,00 43 (43) Japan 13 000 0,04 99,89 0,00 44 (42) Austria 11 558 0,03 99,92 0,00 45 (46) Sri Lanka 10 000 0,03 99,94 0,00 46 (47) Cuba 3 600 0,01 99,95 0,00 47 (51) Ethiopia 3 534 0,01 99,96 0,00 48 (48) Philippines 3 500 0,01 99,97 0,00 49 (**) Slovakia 3 000 0,01 99,98 0,00 50 (**) Venezuela 2 793 0,01 99,99 0,00 51 (50) Guatemala 1 342 0,00 99,99 0,00 52 (52) Kenya 1 100 0,00 100,00 0,00 53 (34) Tanzania 907 0,00 100,00 0,00 54 (53) Eritrea 200 0,00 100,00 0,00 55 (54) Romania 120 0,00 100,00 0,00 Total 36 437 403 100,00 HHI 866
Magnesite
Rank Rank C o u n t r y Production Share Share Share 2013 2012 2013 in % cum. % HHI metr. t 1 ( 1) China 17 000 000 66,15 66,15 4 375,43 2 ( 2) Turkey 2 597 465 10,11 76,25 102,15 3 ( 3) Russia, Europe 1 260 000 4,90 81,16 24,04
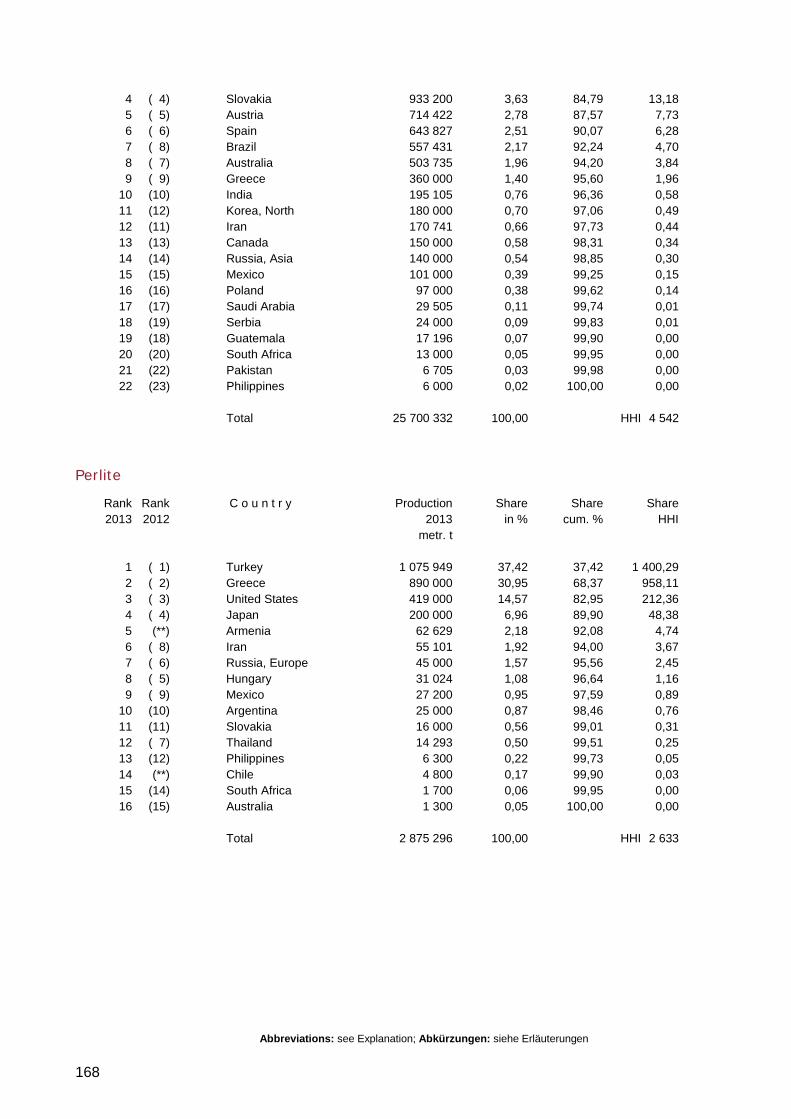
Abbreviations: see Explanation; Abkürzungen: siehe Erläuterungen
168
4 ( 4) Slovakia 933 200 3,63 84,79 13,18 5 ( 5) Austria 714 422 2,78 87,57 7,73 6 ( 6) Spain 643 827 2,51 90,07 6,28 7 ( 8) Brazil 557 431 2,17 92,24 4,70 8 ( 7) Australia 503 735 1,96 94,20 3,84 9 ( 9) Greece 360 000 1,40 95,60 1,96 10 (10) India 195 105 0,76 96,36 0,58 11 (12) Korea, North 180 000 0,70 97,06 0,49 12 (11) Iran 170 741 0,66 97,73 0,44 13 (13) Canada 150 000 0,58 98,31 0,34 14 (14) Russia, Asia 140 000 0,54 98,85 0,30 15 (15) Mexico 101 000 0,39 99,25 0,15 16 (16) Poland 97 000 0,38 99,62 0,14 17 (17) Saudi Arabia 29 505 0,11 99,74 0,01 18 (19) Serbia 24 000 0,09 99,83 0,01 19 (18) Guatemala 17 196 0,07 99,90 0,00 20 (20) South Africa 13 000 0,05 99,95 0,00 21 (22) Pakistan 6 705 0,03 99,98 0,00 22 (23) Philippines 6 000 0,02 100,00 0,00 Total 25 700 332 100,00 HHI 4 542
Perlite
Rank Rank C o u n t r y Production Share Share Share 2013 2012 2013 in % cum. % HHI metr. t 1 ( 1) Turkey 1 075 949 37,42 37,42 1 400,29 2 ( 2) Greece 890 000 30,95 68,37 958,11 3 ( 3) United States 419 000 14,57 82,95 212,36 4 ( 4) Japan 200 000 6,96 89,90 48,38 5 (**) Armenia 62 629 2,18 92,08 4,74 6 ( 8) Iran 55 101 1,92 94,00 3,67 7 ( 6) Russia, Europe 45 000 1,57 95,56 2,45 8 ( 5) Hungary 31 024 1,08 96,64 1,16 9 ( 9) Mexico 27 200 0,95 97,59 0,89 10 (10) Argentina 25 000 0,87 98,46 0,76 11 (11) Slovakia 16 000 0,56 99,01 0,31 12 ( 7) Thailand 14 293 0,50 99,51 0,25 13 (12) Philippines 6 300 0,22 99,73 0,05 14 (**) Chile 4 800 0,17 99,90 0,03 15 (14) South Africa 1 700 0,06 99,95 0,00 16 (15) Australia 1 300 0,05 100,00 0,00 Total 2 875 296 100,00 HHI 2 633
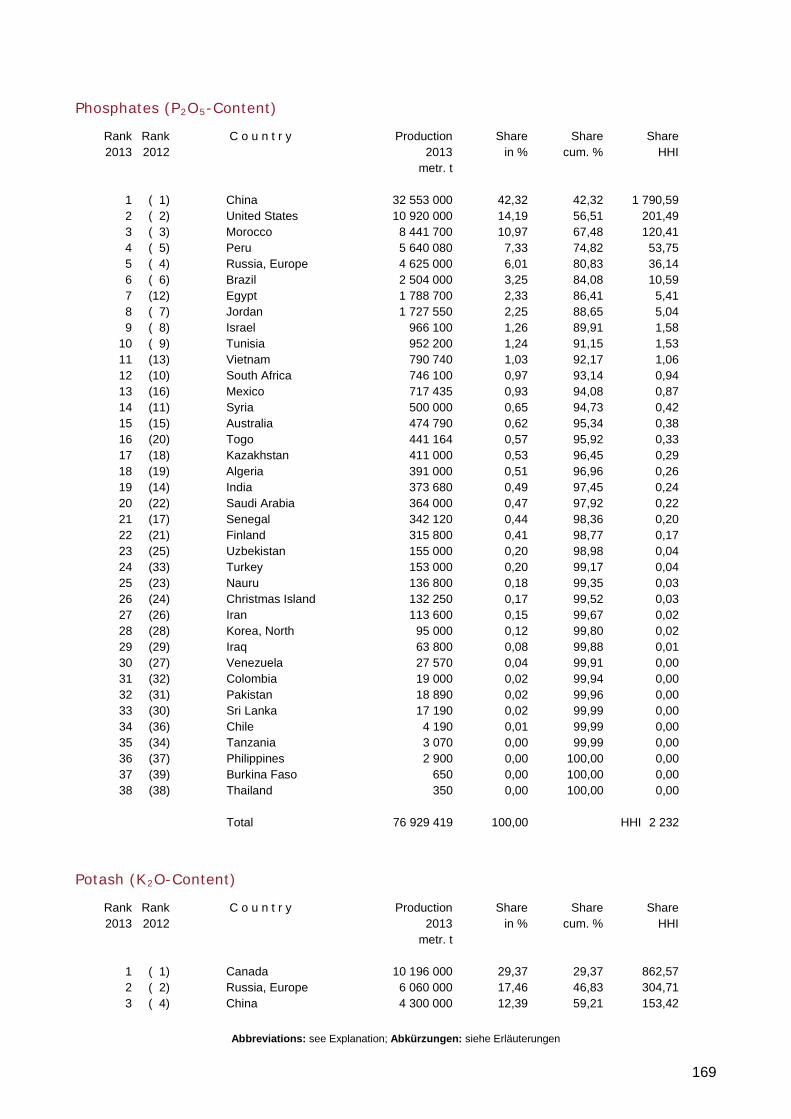
Abbreviations: see Explanation; Abkürzungen: siehe Erläuterungen
169
Phosphates (P2O5-Content)
Rank Rank C o u n t r y Production Share Share Share 2013 2012 2013 in % cum. % HHI metr. t 1 ( 1) China 32 553 000 42,32 42,32 1 790,59 2 ( 2) United States 10 920 000 14,19 56,51 201,49 3 ( 3) Morocco 8 441 700 10,97 67,48 120,41 4 ( 5) Peru 5 640 080 7,33 74,82 53,75 5 ( 4) Russia, Europe 4 625 000 6,01 80,83 36,14 6 ( 6) Brazil 2 504 000 3,25 84,08 10,59 7 (12) Egypt 1 788 700 2,33 86,41 5,41 8 ( 7) Jordan 1 727 550 2,25 88,65 5,04 9 ( 8) Israel 966 100 1,26 89,91 1,58 10 ( 9) Tunisia 952 200 1,24 91,15 1,53 11 (13) Vietnam 790 740 1,03 92,17 1,06 12 (10) South Africa 746 100 0,97 93,14 0,94 13 (16) Mexico 717 435 0,93 94,08 0,87 14 (11) Syria 500 000 0,65 94,73 0,42 15 (15) Australia 474 790 0,62 95,34 0,38 16 (20) Togo 441 164 0,57 95,92 0,33 17 (18) Kazakhstan 411 000 0,53 96,45 0,29 18 (19) Algeria 391 000 0,51 96,96 0,26 19 (14) India 373 680 0,49 97,45 0,24 20 (22) Saudi Arabia 364 000 0,47 97,92 0,22 21 (17) Senegal 342 120 0,44 98,36 0,20 22 (21) Finland 315 800 0,41 98,77 0,17 23 (25) Uzbekistan 155 000 0,20 98,98 0,04 24 (33) Turkey 153 000 0,20 99,17 0,04 25 (23) Nauru 136 800 0,18 99,35 0,03 26 (24) Christmas Island 132 250 0,17 99,52 0,03 27 (26) Iran 113 600 0,15 99,67 0,02 28 (28) Korea, North 95 000 0,12 99,80 0,02 29 (29) Iraq 63 800 0,08 99,88 0,01 30 (27) Venezuela 27 570 0,04 99,91 0,00 31 (32) Colombia 19 000 0,02 99,94 0,00 32 (31) Pakistan 18 890 0,02 99,96 0,00 33 (30) Sri Lanka 17 190 0,02 99,99 0,00 34 (36) Chile 4 190 0,01 99,99 0,00 35 (34) Tanzania 3 070 0,00 99,99 0,00 36 (37) Philippines 2 900 0,00 100,00 0,00 37 (39) Burkina Faso 650 0,00 100,00 0,00 38 (38) Thailand 350 0,00 100,00 0,00 Total 76 929 419 100,00 HHI 2 232
Potash (K2O-Content)
Rank Rank C o u n t r y Production Share Share Share 2013 2012 2013 in % cum. % HHI metr. t 1 ( 1) Canada 10 196 000 29,37 29,37 862,57 2 ( 2) Russia, Europe 6 060 000 17,46 46,83 304,71 3 ( 4) China 4 300 000 12,39 59,21 153,42
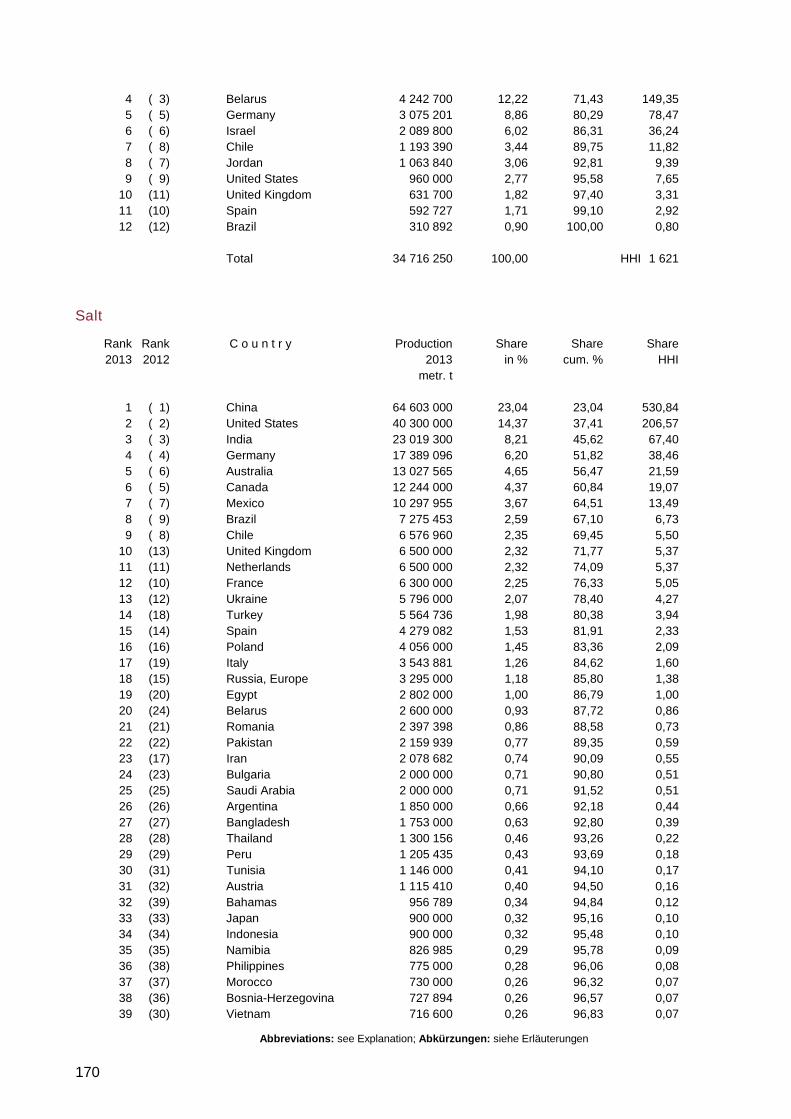
Abbreviations: see Explanation; Abkürzungen: siehe Erläuterungen
170
4 ( 3) Belarus 4 242 700 12,22 71,43 149,35 5 ( 5) Germany 3 075 201 8,86 80,29 78,47 6 ( 6) Israel 2 089 800 6,02 86,31 36,24 7 ( 8) Chile 1 193 390 3,44 89,75 11,82 8 ( 7) Jordan 1 063 840 3,06 92,81 9,39 9 ( 9) United States 960 000 2,77 95,58 7,65 10 (11) United Kingdom 631 700 1,82 97,40 3,31 11 (10) Spain 592 727 1,71 99,10 2,92 12 (12) Brazil 310 892 0,90 100,00 0,80 Total 34 716 250 100,00 HHI 1 621
Salt
Rank Rank C o u n t r y Production Share Share Share 2013 2012 2013 in % cum. % HHI metr. t 1 ( 1) China 64 603 000 23,04 23,04 530,84 2 ( 2) United States 40 300 000 14,37 37,41 206,57 3 ( 3) India 23 019 300 8,21 45,62 67,40 4 ( 4) Germany 17 389 096 6,20 51,82 38,46 5 ( 6) Australia 13 027 565 4,65 56,47 21,59 6 ( 5) Canada 12 244 000 4,37 60,84 19,07 7 ( 7) Mexico 10 297 955 3,67 64,51 13,49 8 ( 9) Brazil 7 275 453 2,59 67,10 6,73 9 ( 8) Chile 6 576 960 2,35 69,45 5,50 10 (13) United Kingdom 6 500 000 2,32 71,77 5,37 11 (11) Netherlands 6 500 000 2,32 74,09 5,37 12 (10) France 6 300 000 2,25 76,33 5,05 13 (12) Ukraine 5 796 000 2,07 78,40 4,27 14 (18) Turkey 5 564 736 1,98 80,38 3,94 15 (14) Spain 4 279 082 1,53 81,91 2,33 16 (16) Poland 4 056 000 1,45 83,36 2,09 17 (19) Italy 3 543 881 1,26 84,62 1,60 18 (15) Russia, Europe 3 295 000 1,18 85,80 1,38 19 (20) Egypt 2 802 000 1,00 86,79 1,00 20 (24) Belarus 2 600 000 0,93 87,72 0,86 21 (21) Romania 2 397 398 0,86 88,58 0,73 22 (22) Pakistan 2 159 939 0,77 89,35 0,59 23 (17) Iran 2 078 682 0,74 90,09 0,55 24 (23) Bulgaria 2 000 000 0,71 90,80 0,51 25 (25) Saudi Arabia 2 000 000 0,71 91,52 0,51 26 (26) Argentina 1 850 000 0,66 92,18 0,44 27 (27) Bangladesh 1 753 000 0,63 92,80 0,39 28 (28) Thailand 1 300 156 0,46 93,26 0,22 29 (29) Peru 1 205 435 0,43 93,69 0,18 30 (31) Tunisia 1 146 000 0,41 94,10 0,17 31 (32) Austria 1 115 410 0,40 94,50 0,16 32 (39) Bahamas 956 789 0,34 94,84 0,12 33 (33) Japan 900 000 0,32 95,16 0,10 34 (34) Indonesia 900 000 0,32 95,48 0,10 35 (35) Namibia 826 985 0,29 95,78 0,09 36 (38) Philippines 775 000 0,28 96,06 0,08 37 (37) Morocco 730 000 0,26 96,32 0,07 38 (36) Bosnia-Herzegovina 727 894 0,26 96,57 0,07 39 (30) Vietnam 716 600 0,26 96,83 0,07
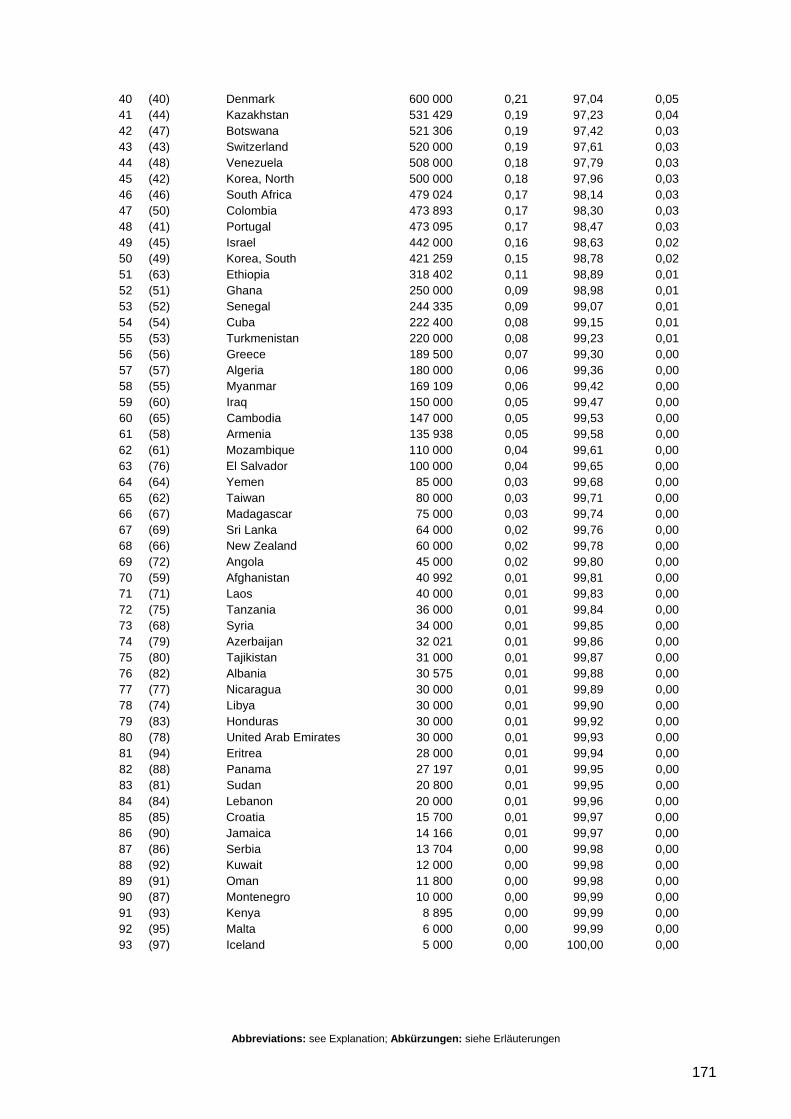
Abbreviations: see Explanation; Abkürzungen: siehe Erläuterungen
171
40 (40) Denmark 600 000 0,21 97,04 0,05 41 (44) Kazakhstan 531 429 0,19 97,23 0,04 42 (47) Botswana 521 306 0,19 97,42 0,03 43 (43) Switzerland 520 000 0,19 97,61 0,03 44 (48) Venezuela 508 000 0,18 97,79 0,03 45 (42) Korea, North 500 000 0,18 97,96 0,03 46 (46) South Africa 479 024 0,17 98,14 0,03 47 (50) Colombia 473 893 0,17 98,30 0,03 48 (41) Portugal 473 095 0,17 98,47 0,03 49 (45) Israel 442 000 0,16 98,63 0,02 50 (49) Korea, South 421 259 0,15 98,78 0,02 51 (63) Ethiopia 318 402 0,11 98,89 0,01 52 (51) Ghana 250 000 0,09 98,98 0,01 53 (52) Senegal 244 335 0,09 99,07 0,01 54 (54) Cuba 222 400 0,08 99,15 0,01 55 (53) Turkmenistan 220 000 0,08 99,23 0,01 56 (56) Greece 189 500 0,07 99,30 0,00 57 (57) Algeria 180 000 0,06 99,36 0,00 58 (55) Myanmar 169 109 0,06 99,42 0,00 59 (60) Iraq 150 000 0,05 99,47 0,00 60 (65) Cambodia 147 000 0,05 99,53 0,00 61 (58) Armenia 135 938 0,05 99,58 0,00 62 (61) Mozambique 110 000 0,04 99,61 0,00 63 (76) El Salvador 100 000 0,04 99,65 0,00 64 (64) Yemen 85 000 0,03 99,68 0,00 65 (62) Taiwan 80 000 0,03 99,71 0,00 66 (67) Madagascar 75 000 0,03 99,74 0,00 67 (69) Sri Lanka 64 000 0,02 99,76 0,00 68 (66) New Zealand 60 000 0,02 99,78 0,00 69 (72) Angola 45 000 0,02 99,80 0,00 70 (59) Afghanistan 40 992 0,01 99,81 0,00 71 (71) Laos 40 000 0,01 99,83 0,00 72 (75) Tanzania 36 000 0,01 99,84 0,00 73 (68) Syria 34 000 0,01 99,85 0,00 74 (79) Azerbaijan 32 021 0,01 99,86 0,00 75 (80) Tajikistan 31 000 0,01 99,87 0,00 76 (82) Albania 30 575 0,01 99,88 0,00 77 (77) Nicaragua 30 000 0,01 99,89 0,00 78 (74) Libya 30 000 0,01 99,90 0,00 79 (83) Honduras 30 000 0,01 99,92 0,00 80 (78) United Arab Emirates 30 000 0,01 99,93 0,00 81 (94) Eritrea 28 000 0,01 99,94 0,00 82 (88) Panama 27 197 0,01 99,95 0,00 83 (81) Sudan 20 800 0,01 99,95 0,00 84 (84) Lebanon 20 000 0,01 99,96 0,00 85 (85) Croatia 15 700 0,01 99,97 0,00 86 (90) Jamaica 14 166 0,01 99,97 0,00 87 (86) Serbia 13 704 0,00 99,98 0,00 88 (92) Kuwait 12 000 0,00 99,98 0,00 89 (91) Oman 11 800 0,00 99,98 0,00 90 (87) Montenegro 10 000 0,00 99,99 0,00 91 (93) Kenya 8 895 0,00 99,99 0,00 92 (95) Malta 6 000 0,00 99,99 0,00 93 (97) Iceland 5 000 0,00 100,00 0,00
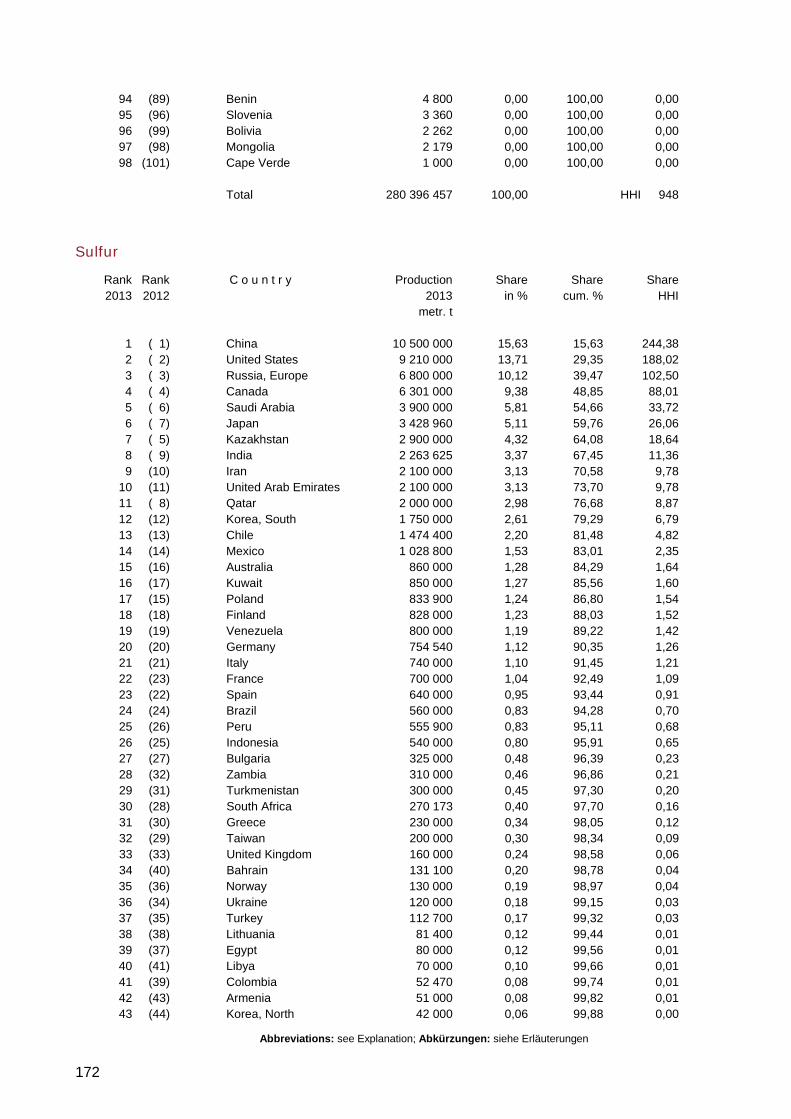
Abbreviations: see Explanation; Abkürzungen: siehe Erläuterungen
172
94 (89) Benin 4 800 0,00 100,00 0,00 95 (96) Slovenia 3 360 0,00 100,00 0,00 96 (99) Bolivia 2 262 0,00 100,00 0,00 97 (98) Mongolia 2 179 0,00 100,00 0,00 98 (101) Cape Verde 1 000 0,00 100,00 0,00 Total 280 396 457 100,00 HHI 948
Sulfur
Rank Rank C o u n t r y Production Share Share Share 2013 2012 2013 in % cum. % HHI metr. t 1 ( 1) China 10 500 000 15,63 15,63 244,38 2 ( 2) United States 9 210 000 13,71 29,35 188,02 3 ( 3) Russia, Europe 6 800 000 10,12 39,47 102,50 4 ( 4) Canada 6 301 000 9,38 48,85 88,01 5 ( 6) Saudi Arabia 3 900 000 5,81 54,66 33,72 6 ( 7) Japan 3 428 960 5,11 59,76 26,06 7 ( 5) Kazakhstan 2 900 000 4,32 64,08 18,64 8 ( 9) India 2 263 625 3,37 67,45 11,36 9 (10) Iran 2 100 000 3,13 70,58 9,78 10 (11) United Arab Emirates 2 100 000 3,13 73,70 9,78 11 ( 8) Qatar 2 000 000 2,98 76,68 8,87 12 (12) Korea, South 1 750 000 2,61 79,29 6,79 13 (13) Chile 1 474 400 2,20 81,48 4,82 14 (14) Mexico 1 028 800 1,53 83,01 2,35 15 (16) Australia 860 000 1,28 84,29 1,64 16 (17) Kuwait 850 000 1,27 85,56 1,60 17 (15) Poland 833 900 1,24 86,80 1,54 18 (18) Finland 828 000 1,23 88,03 1,52 19 (19) Venezuela 800 000 1,19 89,22 1,42 20 (20) Germany 754 540 1,12 90,35 1,26 21 (21) Italy 740 000 1,10 91,45 1,21 22 (23) France 700 000 1,04 92,49 1,09 23 (22) Spain 640 000 0,95 93,44 0,91 24 (24) Brazil 560 000 0,83 94,28 0,70 25 (26) Peru 555 900 0,83 95,11 0,68 26 (25) Indonesia 540 000 0,80 95,91 0,65 27 (27) Bulgaria 325 000 0,48 96,39 0,23 28 (32) Zambia 310 000 0,46 96,86 0,21 29 (31) Turkmenistan 300 000 0,45 97,30 0,20 30 (28) South Africa 270 173 0,40 97,70 0,16 31 (30) Greece 230 000 0,34 98,05 0,12 32 (29) Taiwan 200 000 0,30 98,34 0,09 33 (33) United Kingdom 160 000 0,24 98,58 0,06 34 (40) Bahrain 131 100 0,20 98,78 0,04 35 (36) Norway 130 000 0,19 98,97 0,04 36 (34) Ukraine 120 000 0,18 99,15 0,03 37 (35) Turkey 112 700 0,17 99,32 0,03 38 (38) Lithuania 81 400 0,12 99,44 0,01 39 (37) Egypt 80 000 0,12 99,56 0,01 40 (41) Libya 70 000 0,10 99,66 0,01 41 (39) Colombia 52 470 0,08 99,74 0,01 42 (43) Armenia 51 000 0,08 99,82 0,01 43 (44) Korea, North 42 000 0,06 99,88 0,00
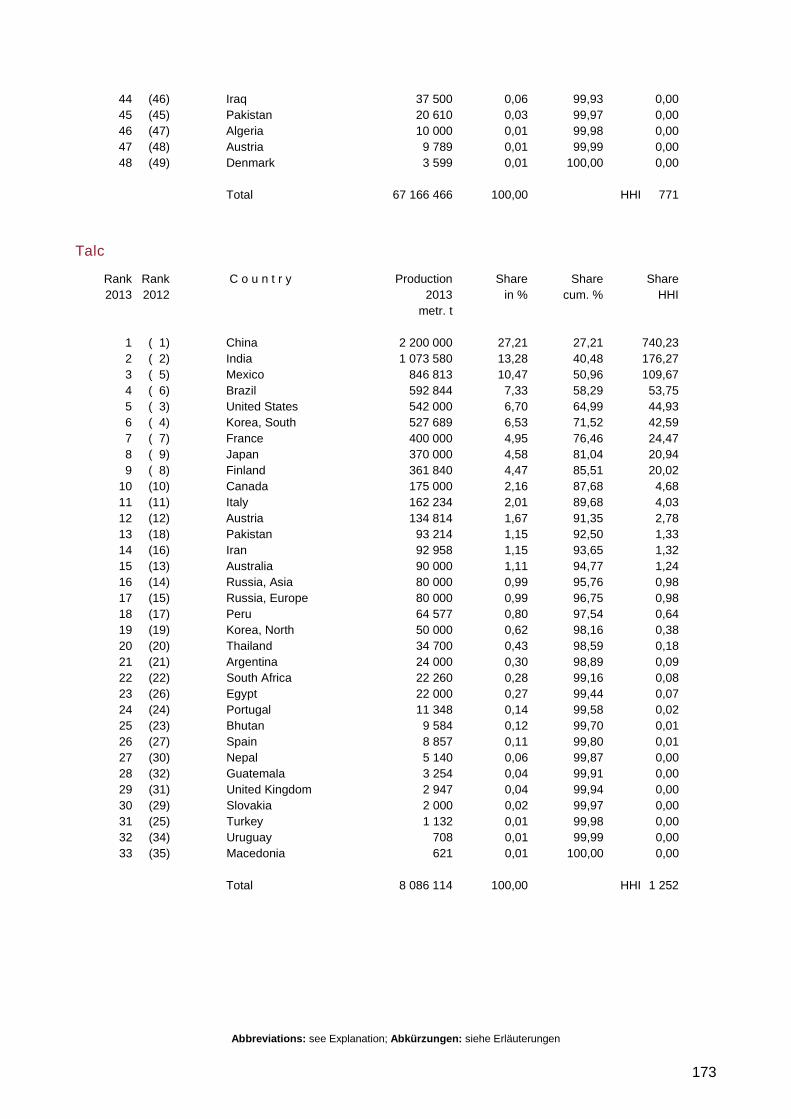
Abbreviations: see Explanation; Abkürzungen: siehe Erläuterungen
173
44 (46) Iraq 37 500 0,06 99,93 0,00 45 (45) Pakistan 20 610 0,03 99,97 0,00 46 (47) Algeria 10 000 0,01 99,98 0,00 47 (48) Austria 9 789 0,01 99,99 0,00 48 (49) Denmark 3 599 0,01 100,00 0,00 Total 67 166 466 100,00 HHI 771
Talc
Rank Rank C o u n t r y Production Share Share Share 2013 2012 2013 in % cum. % HHI metr. t 1 ( 1) China 2 200 000 27,21 27,21 740,23 2 ( 2) India 1 073 580 13,28 40,48 176,27 3 ( 5) Mexico 846 813 10,47 50,96 109,67 4 ( 6) Brazil 592 844 7,33 58,29 53,75 5 ( 3) United States 542 000 6,70 64,99 44,93 6 ( 4) Korea, South 527 689 6,53 71,52 42,59 7 ( 7) France 400 000 4,95 76,46 24,47 8 ( 9) Japan 370 000 4,58 81,04 20,94 9 ( 8) Finland 361 840 4,47 85,51 20,02 10 (10) Canada 175 000 2,16 87,68 4,68 11 (11) Italy 162 234 2,01 89,68 4,03 12 (12) Austria 134 814 1,67 91,35 2,78 13 (18) Pakistan 93 214 1,15 92,50 1,33 14 (16) Iran 92 958 1,15 93,65 1,32 15 (13) Australia 90 000 1,11 94,77 1,24 16 (14) Russia, Asia 80 000 0,99 95,76 0,98 17 (15) Russia, Europe 80 000 0,99 96,75 0,98 18 (17) Peru 64 577 0,80 97,54 0,64 19 (19) Korea, North 50 000 0,62 98,16 0,38 20 (20) Thailand 34 700 0,43 98,59 0,18 21 (21) Argentina 24 000 0,30 98,89 0,09 22 (22) South Africa 22 260 0,28 99,16 0,08 23 (26) Egypt 22 000 0,27 99,44 0,07 24 (24) Portugal 11 348 0,14 99,58 0,02 25 (23) Bhutan 9 584 0,12 99,70 0,01 26 (27) Spain 8 857 0,11 99,80 0,01 27 (30) Nepal 5 140 0,06 99,87 0,00 28 (32) Guatemala 3 254 0,04 99,91 0,00 29 (31) United Kingdom 2 947 0,04 99,94 0,00 30 (29) Slovakia 2 000 0,02 99,97 0,00 31 (25) Turkey 1 132 0,01 99,98 0,00 32 (34) Uruguay 708 0,01 99,99 0,00 33 (35) Macedonia 621 0,01 100,00 0,00 Total 8 086 114 100,00 HHI 1 252
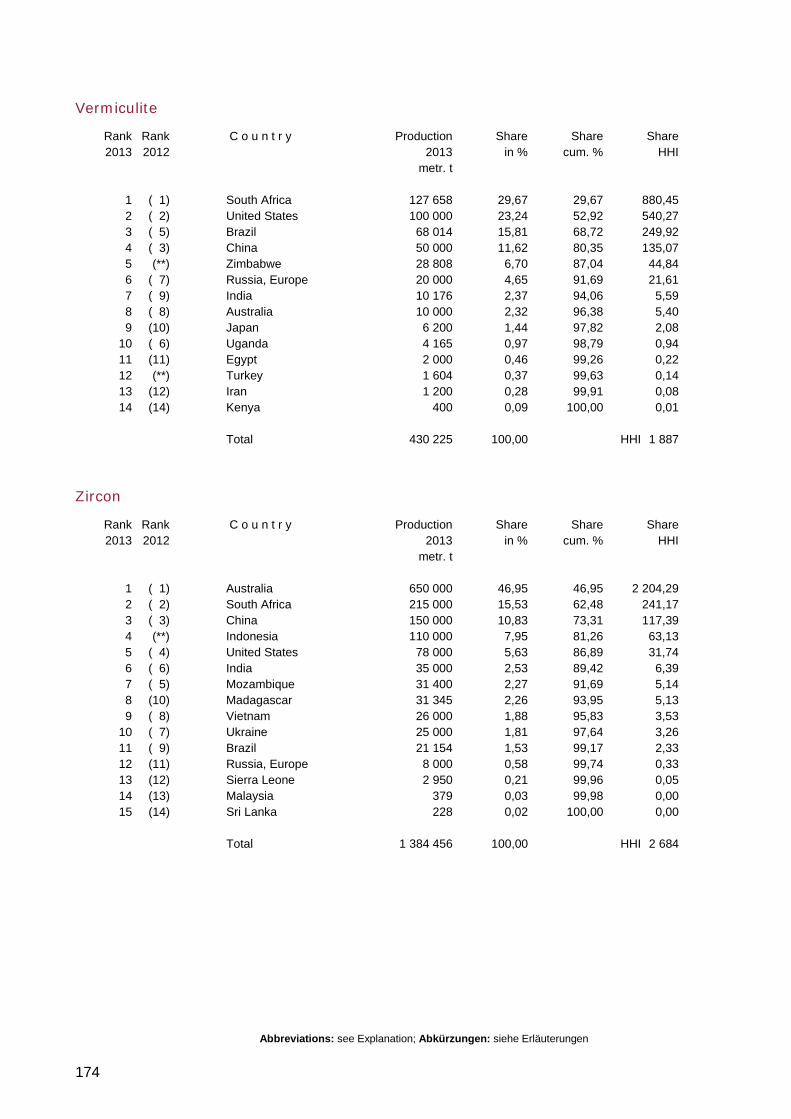
Abbreviations: see Explanation; Abkürzungen: siehe Erläuterungen
174
Vermiculite
Rank Rank C o u n t r y Production Share Share Share 2013 2012 2013 in % cum. % HHI metr. t 1 ( 1) South Africa 127 658 29,67 29,67 880,45 2 ( 2) United States 100 000 23,24 52,92 540,27 3 ( 5) Brazil 68 014 15,81 68,72 249,92 4 ( 3) China 50 000 11,62 80,35 135,07 5 (**) Zimbabwe 28 808 6,70 87,04 44,84 6 ( 7) Russia, Europe 20 000 4,65 91,69 21,61 7 ( 9) India 10 176 2,37 94,06 5,59 8 ( 8) Australia 10 000 2,32 96,38 5,40 9 (10) Japan 6 200 1,44 97,82 2,08 10 ( 6) Uganda 4 165 0,97 98,79 0,94 11 (11) Egypt 2 000 0,46 99,26 0,22 12 (**) Turkey 1 604 0,37 99,63 0,14 13 (12) Iran 1 200 0,28 99,91 0,08 14 (14) Kenya 400 0,09 100,00 0,01 Total 430 225 100,00 HHI 1 887
Zircon
Rank Rank C o u n t r y Production Share Share Share 2013 2012 2013 in % cum. % HHI metr. t 1 ( 1) Australia 650 000 46,95 46,95 2 204,29 2 ( 2) South Africa 215 000 15,53 62,48 241,17 3 ( 3) China 150 000 10,83 73,31 117,39 4 (**) Indonesia 110 000 7,95 81,26 63,13 5 ( 4) United States 78 000 5,63 86,89 31,74 6 ( 6) India 35 000 2,53 89,42 6,39 7 ( 5) Mozambique 31 400 2,27 91,69 5,14 8 (10) Madagascar 31 345 2,26 93,95 5,13 9 ( 8) Vietnam 26 000 1,88 95,83 3,53 10 ( 7) Ukraine 25 000 1,81 97,64 3,26 11 ( 9) Brazil 21 154 1,53 99,17 2,33 12 (11) Russia, Europe 8 000 0,58 99,74 0,33 13 (12) Sierra Leone 2 950 0,21 99,96 0,05 14 (13) Malaysia 379 0,03 99,98 0,00 15 (14) Sri Lanka 228 0,02 100,00 0,00 Total 1 384 456 100,00 HHI 2 684
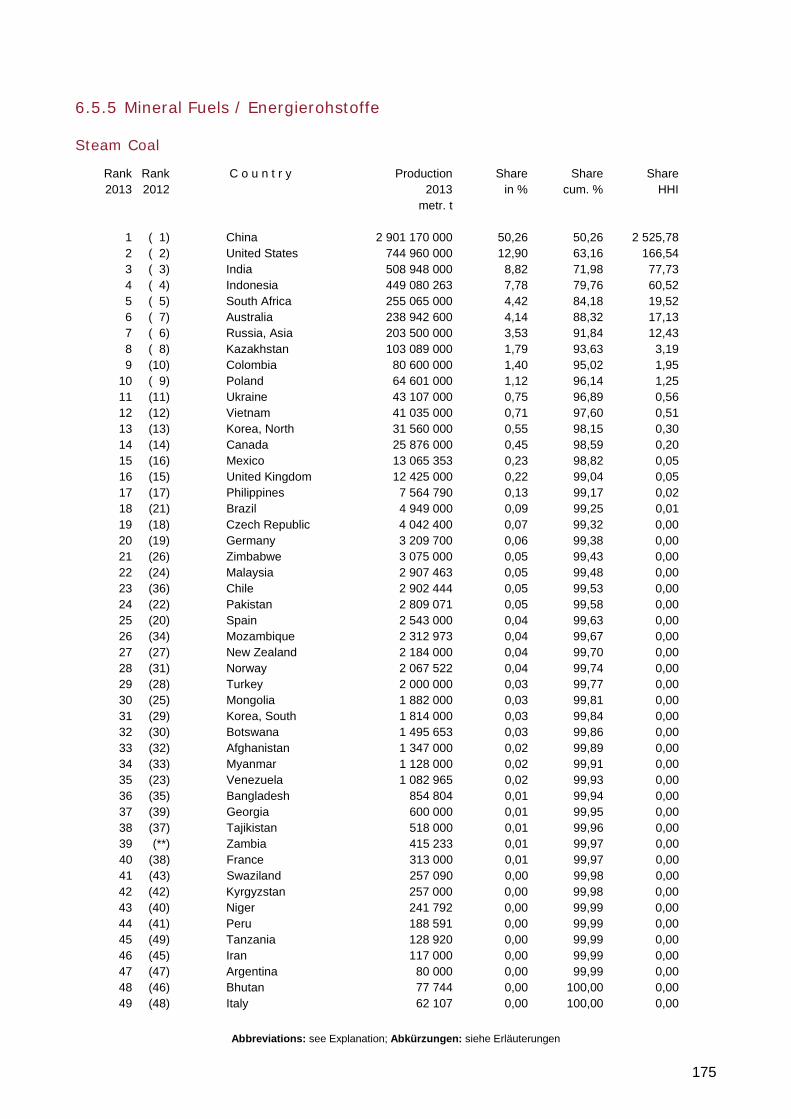
Abbreviations: see Explanation; Abkürzungen: siehe Erläuterungen
175
6.5.5 Mineral Fuels / Energierohstoffe
Steam Coal
Rank Rank C o u n t r y Production Share Share Share 2013 2012 2013 in % cum. % HHI metr. t 1 ( 1) China 2 901 170 000 50,26 50,26 2 525,78 2 ( 2) United States 744 960 000 12,90 63,16 166,54 3 ( 3) India 508 948 000 8,82 71,98 77,73 4 ( 4) Indonesia 449 080 263 7,78 79,76 60,52 5 ( 5) South Africa 255 065 000 4,42 84,18 19,52 6 ( 7) Australia 238 942 600 4,14 88,32 17,13 7 ( 6) Russia, Asia 203 500 000 3,53 91,84 12,43 8 ( 8) Kazakhstan 103 089 000 1,79 93,63 3,19 9 (10) Colombia 80 600 000 1,40 95,02 1,95 10 ( 9) Poland 64 601 000 1,12 96,14 1,25 11 (11) Ukraine 43 107 000 0,75 96,89 0,56 12 (12) Vietnam 41 035 000 0,71 97,60 0,51 13 (13) Korea, North 31 560 000 0,55 98,15 0,30 14 (14) Canada 25 876 000 0,45 98,59 0,20 15 (16) Mexico 13 065 353 0,23 98,82 0,05 16 (15) United Kingdom 12 425 000 0,22 99,04 0,05 17 (17) Philippines 7 564 790 0,13 99,17 0,02 18 (21) Brazil 4 949 000 0,09 99,25 0,01 19 (18) Czech Republic 4 042 400 0,07 99,32 0,00 20 (19) Germany 3 209 700 0,06 99,38 0,00 21 (26) Zimbabwe 3 075 000 0,05 99,43 0,00 22 (24) Malaysia 2 907 463 0,05 99,48 0,00 23 (36) Chile 2 902 444 0,05 99,53 0,00 24 (22) Pakistan 2 809 071 0,05 99,58 0,00 25 (20) Spain 2 543 000 0,04 99,63 0,00 26 (34) Mozambique 2 312 973 0,04 99,67 0,00 27 (27) New Zealand 2 184 000 0,04 99,70 0,00 28 (31) Norway 2 067 522 0,04 99,74 0,00 29 (28) Turkey 2 000 000 0,03 99,77 0,00 30 (25) Mongolia 1 882 000 0,03 99,81 0,00 31 (29) Korea, South 1 814 000 0,03 99,84 0,00 32 (30) Botswana 1 495 653 0,03 99,86 0,00 33 (32) Afghanistan 1 347 000 0,02 99,89 0,00 34 (33) Myanmar 1 128 000 0,02 99,91 0,00 35 (23) Venezuela 1 082 965 0,02 99,93 0,00 36 (35) Bangladesh 854 804 0,01 99,94 0,00 37 (39) Georgia 600 000 0,01 99,95 0,00 38 (37) Tajikistan 518 000 0,01 99,96 0,00 39 (**) Zambia 415 233 0,01 99,97 0,00 40 (38) France 313 000 0,01 99,97 0,00 41 (43) Swaziland 257 090 0,00 99,98 0,00 42 (42) Kyrgyzstan 257 000 0,00 99,98 0,00 43 (40) Niger 241 792 0,00 99,99 0,00 44 (41) Peru 188 591 0,00 99,99 0,00 45 (49) Tanzania 128 920 0,00 99,99 0,00 46 (45) Iran 117 000 0,00 99,99 0,00 47 (47) Argentina 80 000 0,00 99,99 0,00 48 (46) Bhutan 77 744 0,00 100,00 0,00 49 (48) Italy 62 107 0,00 100,00 0,00
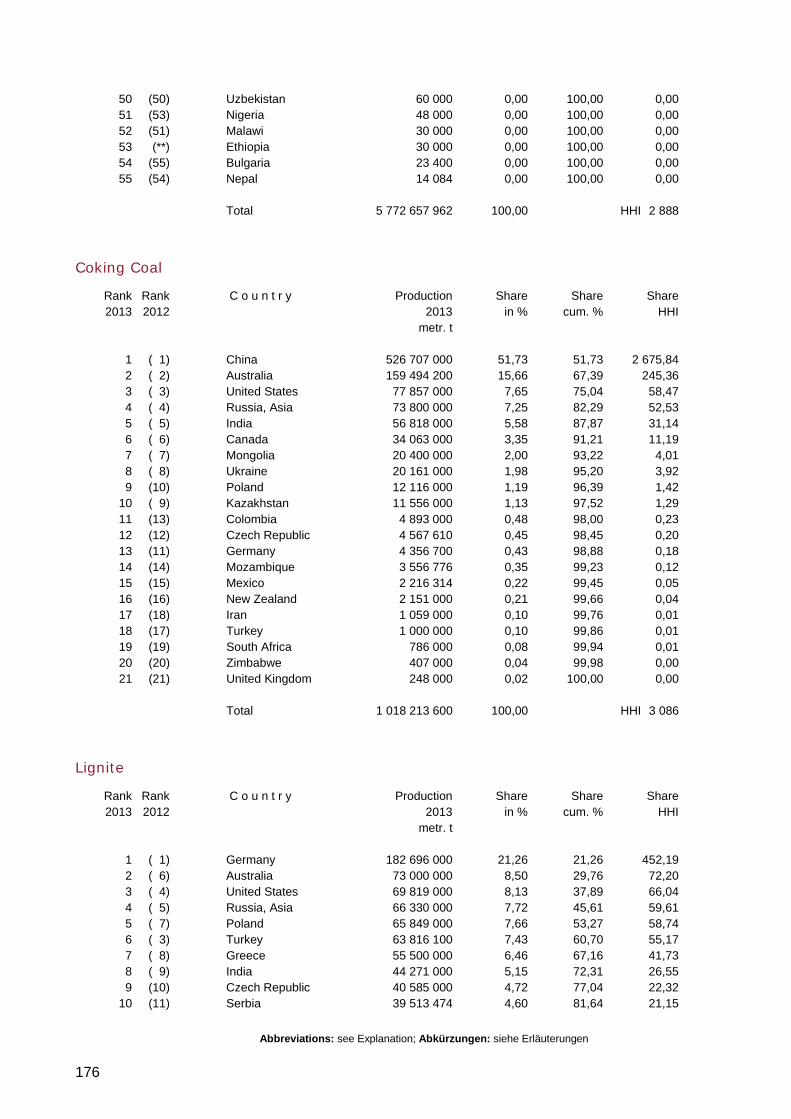
Abbreviations: see Explanation; Abkürzungen: siehe Erläuterungen
176
50 (50) Uzbekistan 60 000 0,00 100,00 0,00 51 (53) Nigeria 48 000 0,00 100,00 0,00 52 (51) Malawi 30 000 0,00 100,00 0,00 53 (**) Ethiopia 30 000 0,00 100,00 0,00 54 (55) Bulgaria 23 400 0,00 100,00 0,00 55 (54) Nepal 14 084 0,00 100,00 0,00 Total 5 772 657 962 100,00 HHI 2 888
Coking Coal
Rank Rank C o u n t r y Production Share Share Share 2013 2012 2013 in % cum. % HHI metr. t 1 ( 1) China 526 707 000 51,73 51,73 2 675,84 2 ( 2) Australia 159 494 200 15,66 67,39 245,36 3 ( 3) United States 77 857 000 7,65 75,04 58,47 4 ( 4) Russia, Asia 73 800 000 7,25 82,29 52,53 5 ( 5) India 56 818 000 5,58 87,87 31,14 6 ( 6) Canada 34 063 000 3,35 91,21 11,19 7 ( 7) Mongolia 20 400 000 2,00 93,22 4,01 8 ( 8) Ukraine 20 161 000 1,98 95,20 3,92 9 (10) Poland 12 116 000 1,19 96,39 1,42 10 ( 9) Kazakhstan 11 556 000 1,13 97,52 1,29 11 (13) Colombia 4 893 000 0,48 98,00 0,23 12 (12) Czech Republic 4 567 610 0,45 98,45 0,20 13 (11) Germany 4 356 700 0,43 98,88 0,18 14 (14) Mozambique 3 556 776 0,35 99,23 0,12 15 (15) Mexico 2 216 314 0,22 99,45 0,05 16 (16) New Zealand 2 151 000 0,21 99,66 0,04 17 (18) Iran 1 059 000 0,10 99,76 0,01 18 (17) Turkey 1 000 000 0,10 99,86 0,01 19 (19) South Africa 786 000 0,08 99,94 0,01 20 (20) Zimbabwe 407 000 0,04 99,98 0,00 21 (21) United Kingdom 248 000 0,02 100,00 0,00 Total 1 018 213 600 100,00 HHI 3 086
Lignite
Rank Rank C o u n t r y Production Share Share Share 2013 2012 2013 in % cum. % HHI metr. t 1 ( 1) Germany 182 696 000 21,26 21,26 452,19 2 ( 6) Australia 73 000 000 8,50 29,76 72,20 3 ( 4) United States 69 819 000 8,13 37,89 66,04 4 ( 5) Russia, Asia 66 330 000 7,72 45,61 59,61 5 ( 7) Poland 65 849 000 7,66 53,27 58,74 6 ( 3) Turkey 63 816 100 7,43 60,70 55,17 7 ( 8) Greece 55 500 000 6,46 67,16 41,73 8 ( 9) India 44 271 000 5,15 72,31 26,55 9 (10) Czech Republic 40 585 000 4,72 77,04 22,32 10 (11) Serbia 39 513 474 4,60 81,64 21,15
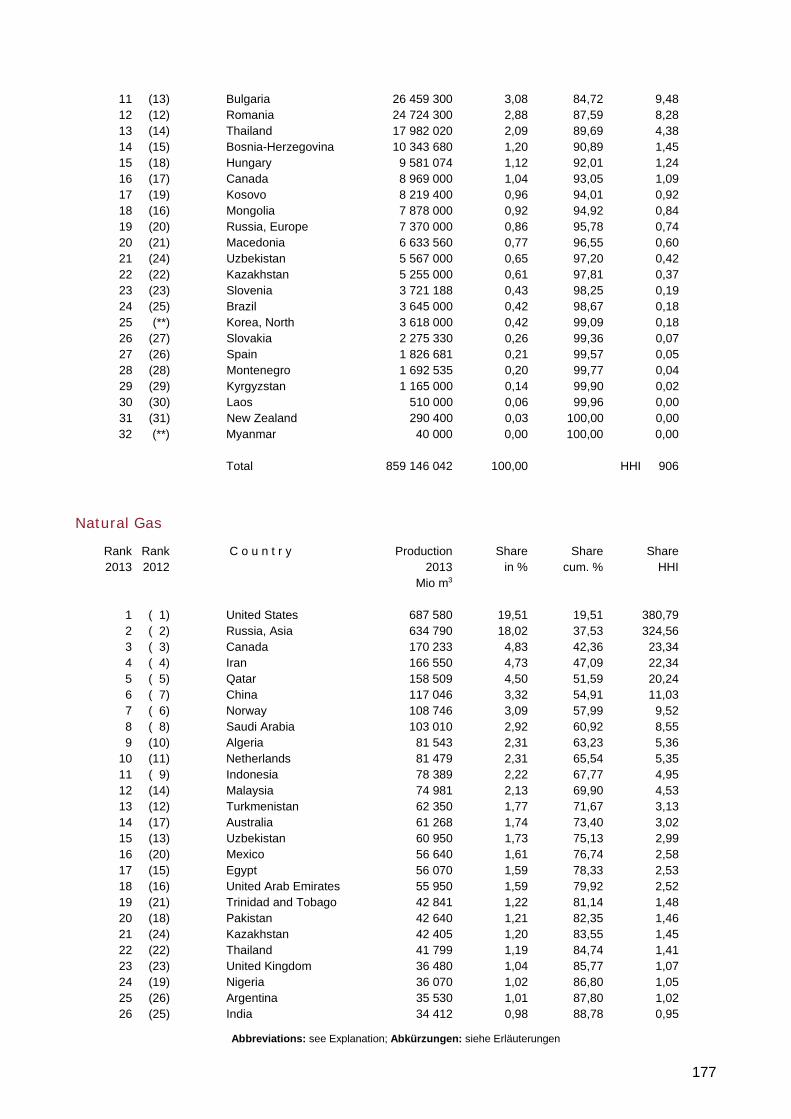
Abbreviations: see Explanation; Abkürzungen: siehe Erläuterungen
177
11 (13) Bulgaria 26 459 300 3,08 84,72 9,48 12 (12) Romania 24 724 300 2,88 87,59 8,28 13 (14) Thailand 17 982 020 2,09 89,69 4,38 14 (15) Bosnia-Herzegovina 10 343 680 1,20 90,89 1,45 15 (18) Hungary 9 581 074 1,12 92,01 1,24 16 (17) Canada 8 969 000 1,04 93,05 1,09 17 (19) Kosovo 8 219 400 0,96 94,01 0,92 18 (16) Mongolia 7 878 000 0,92 94,92 0,84 19 (20) Russia, Europe 7 370 000 0,86 95,78 0,74 20 (21) Macedonia 6 633 560 0,77 96,55 0,60 21 (24) Uzbekistan 5 567 000 0,65 97,20 0,42 22 (22) Kazakhstan 5 255 000 0,61 97,81 0,37 23 (23) Slovenia 3 721 188 0,43 98,25 0,19 24 (25) Brazil 3 645 000 0,42 98,67 0,18 25 (**) Korea, North 3 618 000 0,42 99,09 0,18 26 (27) Slovakia 2 275 330 0,26 99,36 0,07 27 (26) Spain 1 826 681 0,21 99,57 0,05 28 (28) Montenegro 1 692 535 0,20 99,77 0,04 29 (29) Kyrgyzstan 1 165 000 0,14 99,90 0,02 30 (30) Laos 510 000 0,06 99,96 0,00 31 (31) New Zealand 290 400 0,03 100,00 0,00 32 (**) Myanmar 40 000 0,00 100,00 0,00 Total 859 146 042 100,00 HHI 906
Natural Gas
Rank Rank C o u n t r y Production Share Share Share 2013 2012 2013 in % cum. % HHI Mio m3 1 ( 1) United States 687 580 19,51 19,51 380,79 2 ( 2) Russia, Asia 634 790 18,02 37,53 324,56 3 ( 3) Canada 170 233 4,83 42,36 23,34 4 ( 4) Iran 166 550 4,73 47,09 22,34 5 ( 5) Qatar 158 509 4,50 51,59 20,24 6 ( 7) China 117 046 3,32 54,91 11,03 7 ( 6) Norway 108 746 3,09 57,99 9,52 8 ( 8) Saudi Arabia 103 010 2,92 60,92 8,55 9 (10) Algeria 81 543 2,31 63,23 5,36 10 (11) Netherlands 81 479 2,31 65,54 5,35 11 ( 9) Indonesia 78 389 2,22 67,77 4,95 12 (14) Malaysia 74 981 2,13 69,90 4,53 13 (12) Turkmenistan 62 350 1,77 71,67 3,13 14 (17) Australia 61 268 1,74 73,40 3,02 15 (13) Uzbekistan 60 950 1,73 75,13 2,99 16 (20) Mexico 56 640 1,61 76,74 2,58 17 (15) Egypt 56 070 1,59 78,33 2,53 18 (16) United Arab Emirates 55 950 1,59 79,92 2,52 19 (21) Trinidad and Tobago 42 841 1,22 81,14 1,48 20 (18) Pakistan 42 640 1,21 82,35 1,46 21 (24) Kazakhstan 42 405 1,20 83,55 1,45 22 (22) Thailand 41 799 1,19 84,74 1,41 23 (23) United Kingdom 36 480 1,04 85,77 1,07 24 (19) Nigeria 36 070 1,02 86,80 1,05 25 (26) Argentina 35 530 1,01 87,80 1,02 26 (25) India 34 412 0,98 88,78 0,95
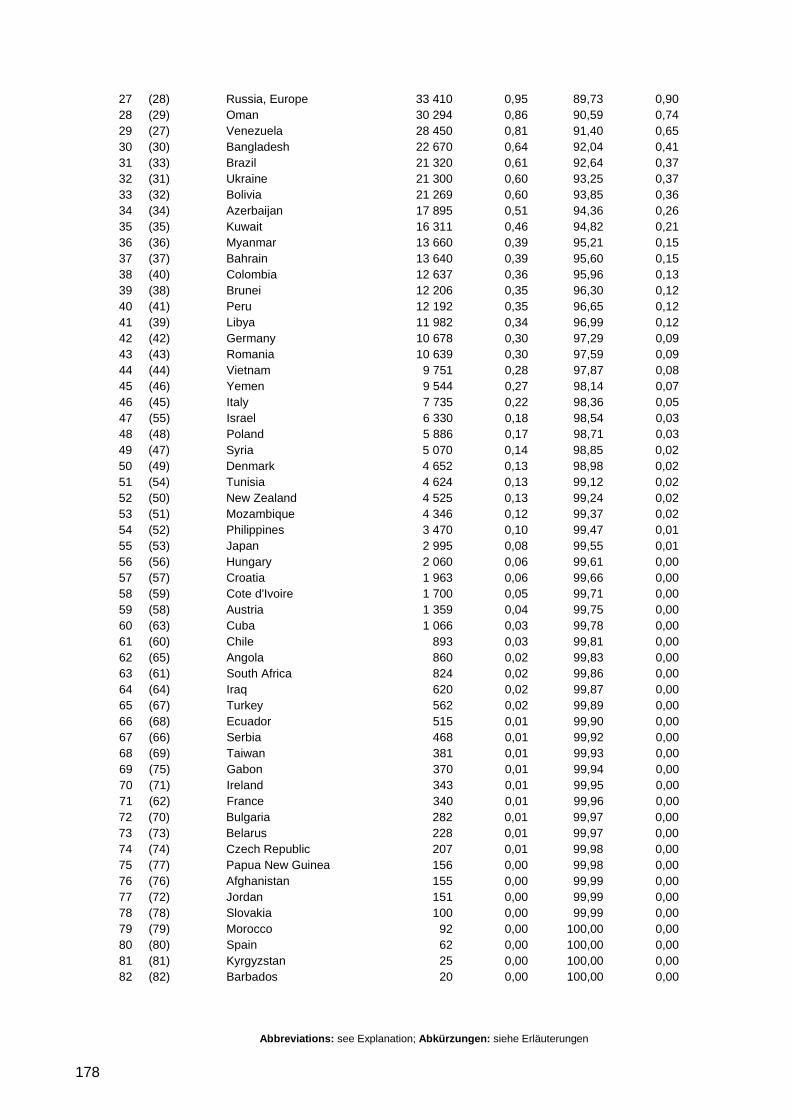
Abbreviations: see Explanation; Abkürzungen: siehe Erläuterungen
178
27 (28) Russia, Europe 33 410 0,95 89,73 0,90 28 (29) Oman 30 294 0,86 90,59 0,74 29 (27) Venezuela 28 450 0,81 91,40 0,65 30 (30) Bangladesh 22 670 0,64 92,04 0,41 31 (33) Brazil 21 320 0,61 92,64 0,37 32 (31) Ukraine 21 300 0,60 93,25 0,37 33 (32) Bolivia 21 269 0,60 93,85 0,36 34 (34) Azerbaijan 17 895 0,51 94,36 0,26 35 (35) Kuwait 16 311 0,46 94,82 0,21 36 (36) Myanmar 13 660 0,39 95,21 0,15 37 (37) Bahrain 13 640 0,39 95,60 0,15 38 (40) Colombia 12 637 0,36 95,96 0,13 39 (38) Brunei 12 206 0,35 96,30 0,12 40 (41) Peru 12 192 0,35 96,65 0,12 41 (39) Libya 11 982 0,34 96,99 0,12 42 (42) Germany 10 678 0,30 97,29 0,09 43 (43) Romania 10 639 0,30 97,59 0,09 44 (44) Vietnam 9 751 0,28 97,87 0,08 45 (46) Yemen 9 544 0,27 98,14 0,07 46 (45) Italy 7 735 0,22 98,36 0,05 47 (55) Israel 6 330 0,18 98,54 0,03 48 (48) Poland 5 886 0,17 98,71 0,03 49 (47) Syria 5 070 0,14 98,85 0,02 50 (49) Denmark 4 652 0,13 98,98 0,02 51 (54) Tunisia 4 624 0,13 99,12 0,02 52 (50) New Zealand 4 525 0,13 99,24 0,02 53 (51) Mozambique 4 346 0,12 99,37 0,02 54 (52) Philippines 3 470 0,10 99,47 0,01 55 (53) Japan 2 995 0,08 99,55 0,01 56 (56) Hungary 2 060 0,06 99,61 0,00 57 (57) Croatia 1 963 0,06 99,66 0,00 58 (59) Cote d'Ivoire 1 700 0,05 99,71 0,00 59 (58) Austria 1 359 0,04 99,75 0,00 60 (63) Cuba 1 066 0,03 99,78 0,00 61 (60) Chile 893 0,03 99,81 0,00 62 (65) Angola 860 0,02 99,83 0,00 63 (61) South Africa 824 0,02 99,86 0,00 64 (64) Iraq 620 0,02 99,87 0,00 65 (67) Turkey 562 0,02 99,89 0,00 66 (68) Ecuador 515 0,01 99,90 0,00 67 (66) Serbia 468 0,01 99,92 0,00 68 (69) Taiwan 381 0,01 99,93 0,00 69 (75) Gabon 370 0,01 99,94 0,00 70 (71) Ireland 343 0,01 99,95 0,00 71 (62) France 340 0,01 99,96 0,00 72 (70) Bulgaria 282 0,01 99,97 0,00 73 (73) Belarus 228 0,01 99,97 0,00 74 (74) Czech Republic 207 0,01 99,98 0,00 75 (77) Papua New Guinea 156 0,00 99,98 0,00 76 (76) Afghanistan 155 0,00 99,99 0,00 77 (72) Jordan 151 0,00 99,99 0,00 78 (78) Slovakia 100 0,00 99,99 0,00 79 (79) Morocco 92 0,00 100,00 0,00 80 (80) Spain 62 0,00 100,00 0,00 81 (81) Kyrgyzstan 25 0,00 100,00 0,00 82 (82) Barbados 20 0,00 100,00 0,00
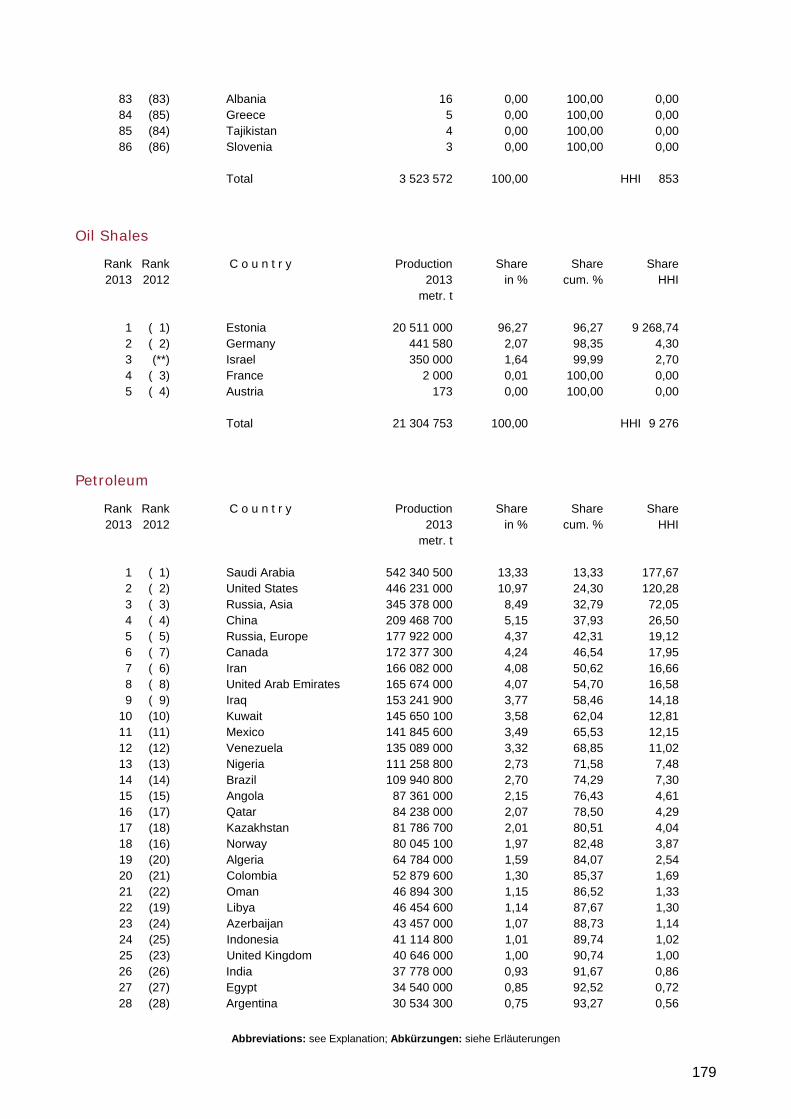
Abbreviations: see Explanation; Abkürzungen: siehe Erläuterungen
179
83 (83) Albania 16 0,00 100,00 0,00 84 (85) Greece 5 0,00 100,00 0,00 85 (84) Tajikistan 4 0,00 100,00 0,00 86 (86) Slovenia 3 0,00 100,00 0,00 Total 3 523 572 100,00 HHI 853
Oil Shales
Rank Rank C o u n t r y Production Share Share Share 2013 2012 2013 in % cum. % HHI metr. t 1 ( 1) Estonia 20 511 000 96,27 96,27 9 268,74 2 ( 2) Germany 441 580 2,07 98,35 4,30 3 (**) Israel 350 000 1,64 99,99 2,70 4 ( 3) France 2 000 0,01 100,00 0,00 5 ( 4) Austria 173 0,00 100,00 0,00 Total 21 304 753 100,00 HHI 9 276
Petroleum
Rank Rank C o u n t r y Production Share Share Share 2013 2012 2013 in % cum. % HHI metr. t 1 ( 1) Saudi Arabia 542 340 500 13,33 13,33 177,67 2 ( 2) United States 446 231 000 10,97 24,30 120,28 3 ( 3) Russia, Asia 345 378 000 8,49 32,79 72,05 4 ( 4) China 209 468 700 5,15 37,93 26,50 5 ( 5) Russia, Europe 177 922 000 4,37 42,31 19,12 6 ( 7) Canada 172 377 300 4,24 46,54 17,95 7 ( 6) Iran 166 082 000 4,08 50,62 16,66 8 ( 8) United Arab Emirates 165 674 000 4,07 54,70 16,58 9 ( 9) Iraq 153 241 900 3,77 58,46 14,18 10 (10) Kuwait 145 650 100 3,58 62,04 12,81 11 (11) Mexico 141 845 600 3,49 65,53 12,15 12 (12) Venezuela 135 089 000 3,32 68,85 11,02 13 (13) Nigeria 111 258 800 2,73 71,58 7,48 14 (14) Brazil 109 940 800 2,70 74,29 7,30 15 (15) Angola 87 361 000 2,15 76,43 4,61 16 (17) Qatar 84 238 000 2,07 78,50 4,29 17 (18) Kazakhstan 81 786 700 2,01 80,51 4,04 18 (16) Norway 80 045 100 1,97 82,48 3,87 19 (20) Algeria 64 784 000 1,59 84,07 2,54 20 (21) Colombia 52 879 600 1,30 85,37 1,69 21 (22) Oman 46 894 300 1,15 86,52 1,33 22 (19) Libya 46 454 600 1,14 87,67 1,30 23 (24) Azerbaijan 43 457 000 1,07 88,73 1,14 24 (25) Indonesia 41 114 800 1,01 89,74 1,02 25 (23) United Kingdom 40 646 000 1,00 90,74 1,00 26 (26) India 37 778 000 0,93 91,67 0,86 27 (27) Egypt 34 540 000 0,85 92,52 0,72 28 (28) Argentina 30 534 300 0,75 93,27 0,56
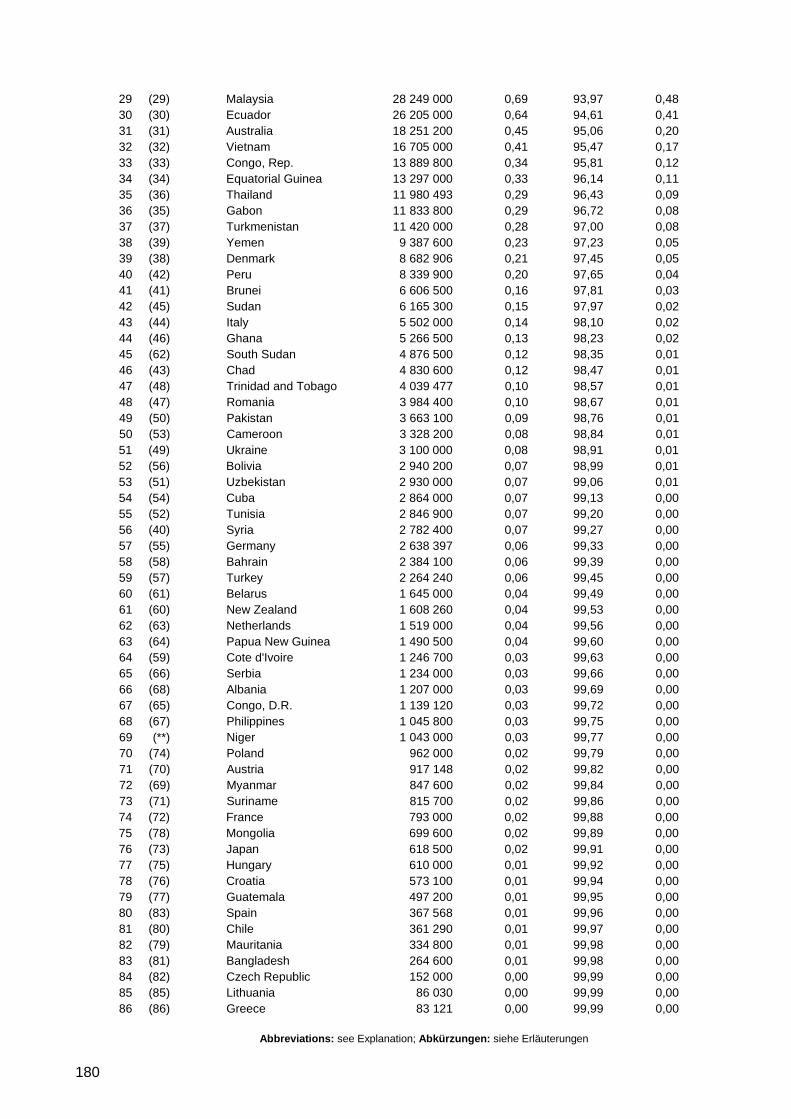
Abbreviations: see Explanation; Abkürzungen: siehe Erläuterungen
180
29 (29) Malaysia 28 249 000 0,69 93,97 0,48 30 (30) Ecuador 26 205 000 0,64 94,61 0,41 31 (31) Australia 18 251 200 0,45 95,06 0,20 32 (32) Vietnam 16 705 000 0,41 95,47 0,17 33 (33) Congo, Rep. 13 889 800 0,34 95,81 0,12 34 (34) Equatorial Guinea 13 297 000 0,33 96,14 0,11 35 (36) Thailand 11 980 493 0,29 96,43 0,09 36 (35) Gabon 11 833 800 0,29 96,72 0,08 37 (37) Turkmenistan 11 420 000 0,28 97,00 0,08 38 (39) Yemen 9 387 600 0,23 97,23 0,05 39 (38) Denmark 8 682 906 0,21 97,45 0,05 40 (42) Peru 8 339 900 0,20 97,65 0,04 41 (41) Brunei 6 606 500 0,16 97,81 0,03 42 (45) Sudan 6 165 300 0,15 97,97 0,02 43 (44) Italy 5 502 000 0,14 98,10 0,02 44 (46) Ghana 5 266 500 0,13 98,23 0,02 45 (62) South Sudan 4 876 500 0,12 98,35 0,01 46 (43) Chad 4 830 600 0,12 98,47 0,01 47 (48) Trinidad and Tobago 4 039 477 0,10 98,57 0,01 48 (47) Romania 3 984 400 0,10 98,67 0,01 49 (50) Pakistan 3 663 100 0,09 98,76 0,01 50 (53) Cameroon 3 328 200 0,08 98,84 0,01 51 (49) Ukraine 3 100 000 0,08 98,91 0,01 52 (56) Bolivia 2 940 200 0,07 98,99 0,01 53 (51) Uzbekistan 2 930 000 0,07 99,06 0,01 54 (54) Cuba 2 864 000 0,07 99,13 0,00 55 (52) Tunisia 2 846 900 0,07 99,20 0,00 56 (40) Syria 2 782 400 0,07 99,27 0,00 57 (55) Germany 2 638 397 0,06 99,33 0,00 58 (58) Bahrain 2 384 100 0,06 99,39 0,00 59 (57) Turkey 2 264 240 0,06 99,45 0,00 60 (61) Belarus 1 645 000 0,04 99,49 0,00 61 (60) New Zealand 1 608 260 0,04 99,53 0,00 62 (63) Netherlands 1 519 000 0,04 99,56 0,00 63 (64) Papua New Guinea 1 490 500 0,04 99,60 0,00 64 (59) Cote d'Ivoire 1 246 700 0,03 99,63 0,00 65 (66) Serbia 1 234 000 0,03 99,66 0,00 66 (68) Albania 1 207 000 0,03 99,69 0,00 67 (65) Congo, D.R. 1 139 120 0,03 99,72 0,00 68 (67) Philippines 1 045 800 0,03 99,75 0,00 69 (**) Niger 1 043 000 0,03 99,77 0,00 70 (74) Poland 962 000 0,02 99,79 0,00 71 (70) Austria 917 148 0,02 99,82 0,00 72 (69) Myanmar 847 600 0,02 99,84 0,00 73 (71) Suriname 815 700 0,02 99,86 0,00 74 (72) France 793 000 0,02 99,88 0,00 75 (78) Mongolia 699 600 0,02 99,89 0,00 76 (73) Japan 618 500 0,02 99,91 0,00 77 (75) Hungary 610 000 0,01 99,92 0,00 78 (76) Croatia 573 100 0,01 99,94 0,00 79 (77) Guatemala 497 200 0,01 99,95 0,00 80 (83) Spain 367 568 0,01 99,96 0,00 81 (80) Chile 361 290 0,01 99,97 0,00 82 (79) Mauritania 334 800 0,01 99,98 0,00 83 (81) Bangladesh 264 600 0,01 99,98 0,00 84 (82) Czech Republic 152 000 0,00 99,99 0,00 85 (85) Lithuania 86 030 0,00 99,99 0,00 86 (86) Greece 83 121 0,00 99,99 0,00
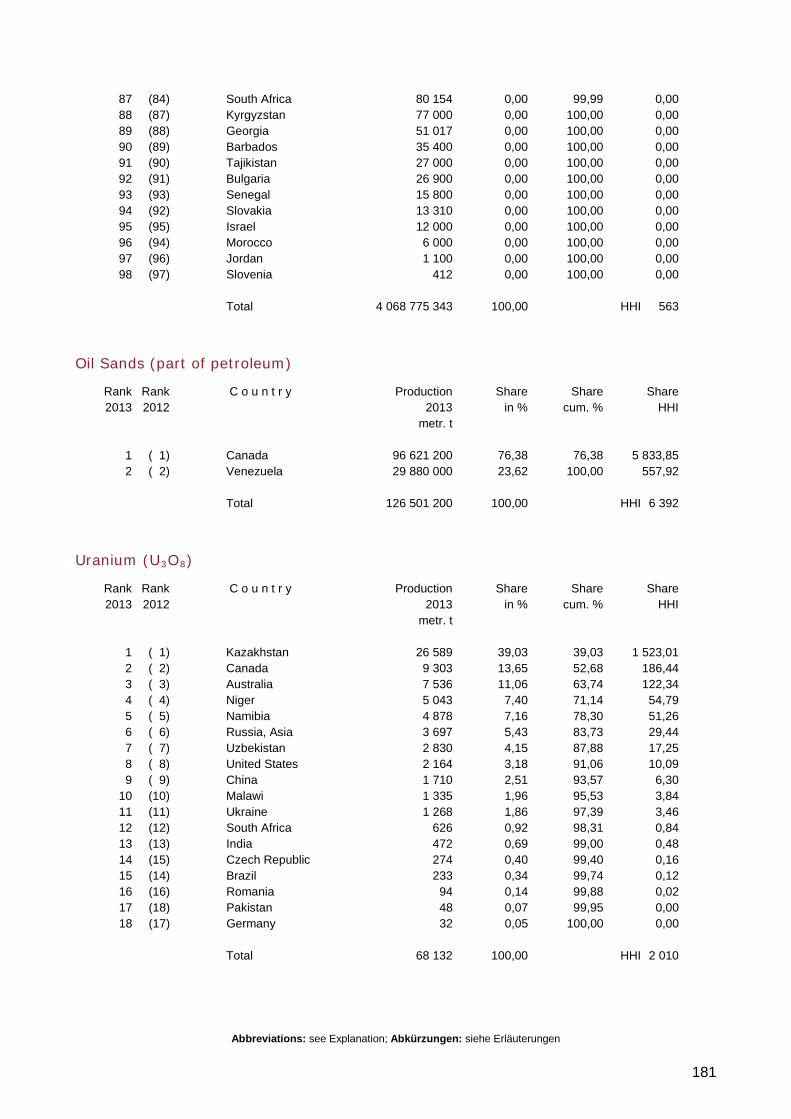
Abbreviations: see Explanation; Abkürzungen: siehe Erläuterungen
181
87 (84) South Africa 80 154 0,00 99,99 0,00 88 (87) Kyrgyzstan 77 000 0,00 100,00 0,00 89 (88) Georgia 51 017 0,00 100,00 0,00 90 (89) Barbados 35 400 0,00 100,00 0,00 91 (90) Tajikistan 27 000 0,00 100,00 0,00 92 (91) Bulgaria 26 900 0,00 100,00 0,00 93 (93) Senegal 15 800 0,00 100,00 0,00 94 (92) Slovakia 13 310 0,00 100,00 0,00 95 (95) Israel 12 000 0,00 100,00 0,00 96 (94) Morocco 6 000 0,00 100,00 0,00 97 (96) Jordan 1 100 0,00 100,00 0,00 98 (97) Slovenia 412 0,00 100,00 0,00 Total 4 068 775 343 100,00 HHI 563
Oil Sands (part of petroleum)
Rank Rank C o u n t r y Production Share Share Share 2013 2012 2013 in % cum. % HHI metr. t 1 ( 1) Canada 96 621 200 76,38 76,38 5 833,85 2 ( 2) Venezuela 29 880 000 23,62 100,00 557,92 Total 126 501 200 100,00 HHI 6 392
Uranium (U3O8)
Rank Rank C o u n t r y Production Share Share Share 2013 2012 2013 in % cum. % HHI metr. t 1 ( 1) Kazakhstan 26 589 39,03 39,03 1 523,01 2 ( 2) Canada 9 303 13,65 52,68 186,44 3 ( 3) Australia 7 536 11,06 63,74 122,34 4 ( 4) Niger 5 043 7,40 71,14 54,79 5 ( 5) Namibia 4 878 7,16 78,30 51,26 6 ( 6) Russia, Asia 3 697 5,43 83,73 29,44 7 ( 7) Uzbekistan 2 830 4,15 87,88 17,25 8 ( 8) United States 2 164 3,18 91,06 10,09 9 ( 9) China 1 710 2,51 93,57 6,30 10 (10) Malawi 1 335 1,96 95,53 3,84 11 (11) Ukraine 1 268 1,86 97,39 3,46 12 (12) South Africa 626 0,92 98,31 0,84 13 (13) India 472 0,69 99,00 0,48 14 (15) Czech Republic 274 0,40 99,40 0,16 15 (14) Brazil 233 0,34 99,74 0,12 16 (16) Romania 94 0,14 99,88 0,02 17 (18) Pakistan 48 0,07 99,95 0,00 18 (17) Germany 32 0,05 100,00 0,00 Total 68 132 100,00 HHI 2 010

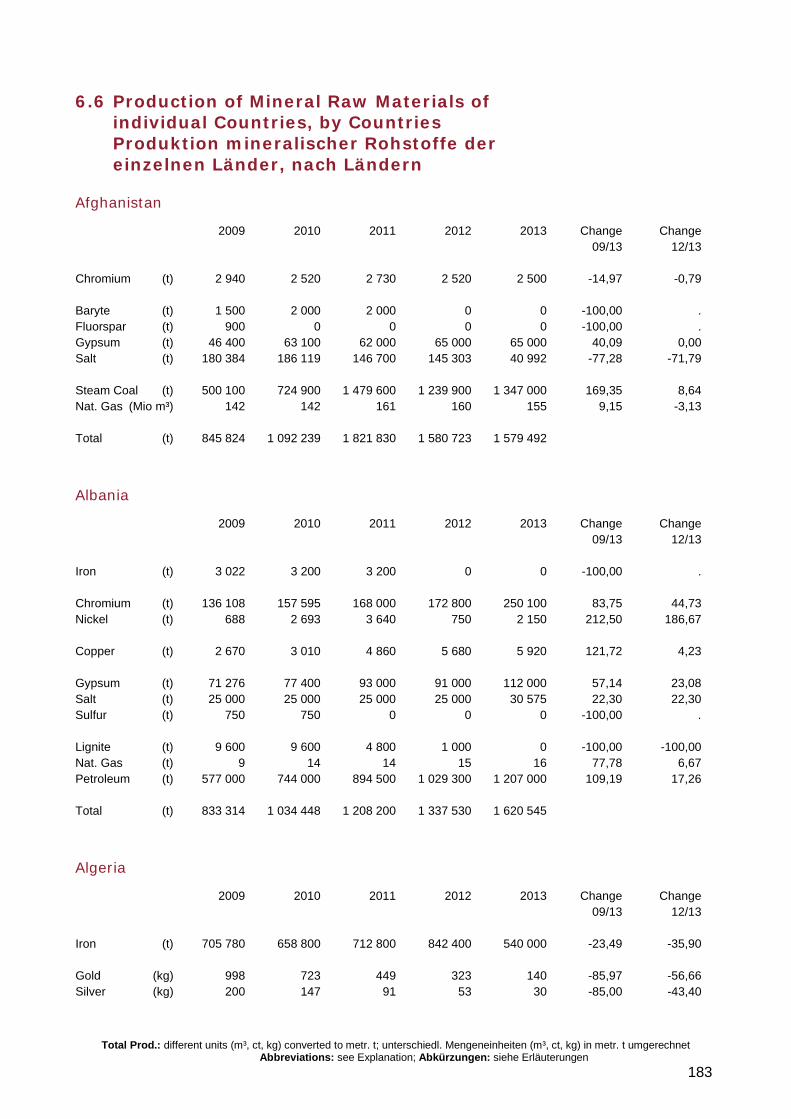
Total Prod.: different units (m³, ct, kg) converted to metr. t; unterschiedl. Mengeneinheiten (m³, ct, kg) in metr. t umgerechnet Abbreviations: see Explanation; Abkürzungen: siehe Erläuterungen
183
6.6 Production of Mineral Raw Materials of individual Countries, by Countries Produktion mineralischer Rohstoffe der einzelnen Länder, nach Ländern
Afghanistan
2009 2010 2011 2012 2013 Change Change 09/13 12/13 Chromium (t) 2 940 2 520 2 730 2 520 2 500 -14,97 -0,79 Baryte (t) 1 500 2 000 2 000 0 0 -100,00 . Fluorspar (t) 900 0 0 0 0 -100,00 . Gypsum (t) 46 400 63 100 62 000 65 000 65 000 40,09 0,00 Salt (t) 180 384 186 119 146 700 145 303 40 992 -77,28 -71,79 Steam Coal (t) 500 100 724 900 1 479 600 1 239 900 1 347 000 169,35 8,64 Nat. Gas (Mio m³) 142 142 161 160 155 9,15 -3,13 Total (t) 845 824 1 092 239 1 821 830 1 580 723 1 579 492
Albania
2009 2010 2011 2012 2013 Change Change 09/13 12/13 Iron (t) 3 022 3 200 3 200 0 0 -100,00 . Chromium (t) 136 108 157 595 168 000 172 800 250 100 83,75 44,73 Nickel (t) 688 2 693 3 640 750 2 150 212,50 186,67 Copper (t) 2 670 3 010 4 860 5 680 5 920 121,72 4,23 Gypsum (t) 71 276 77 400 93 000 91 000 112 000 57,14 23,08 Salt (t) 25 000 25 000 25 000 25 000 30 575 22,30 22,30 Sulfur (t) 750 750 0 0 0 -100,00 . Lignite (t) 9 600 9 600 4 800 1 000 0 -100,00 -100,00 Nat. Gas (t) 9 14 14 15 16 77,78 6,67 Petroleum (t) 577 000 744 000 894 500 1 029 300 1 207 000 109,19 17,26 Total (t) 833 314 1 034 448 1 208 200 1 337 530 1 620 545
Algeria
2009 2010 2011 2012 2013 Change Change 09/13 12/13 Iron (t) 705 780 658 800 712 800 842 400 540 000 -23,49 -35,90 Gold (kg) 998 723 449 323 140 -85,97 -56,66 Silver (kg) 200 147 91 53 30 -85,00 -43,40
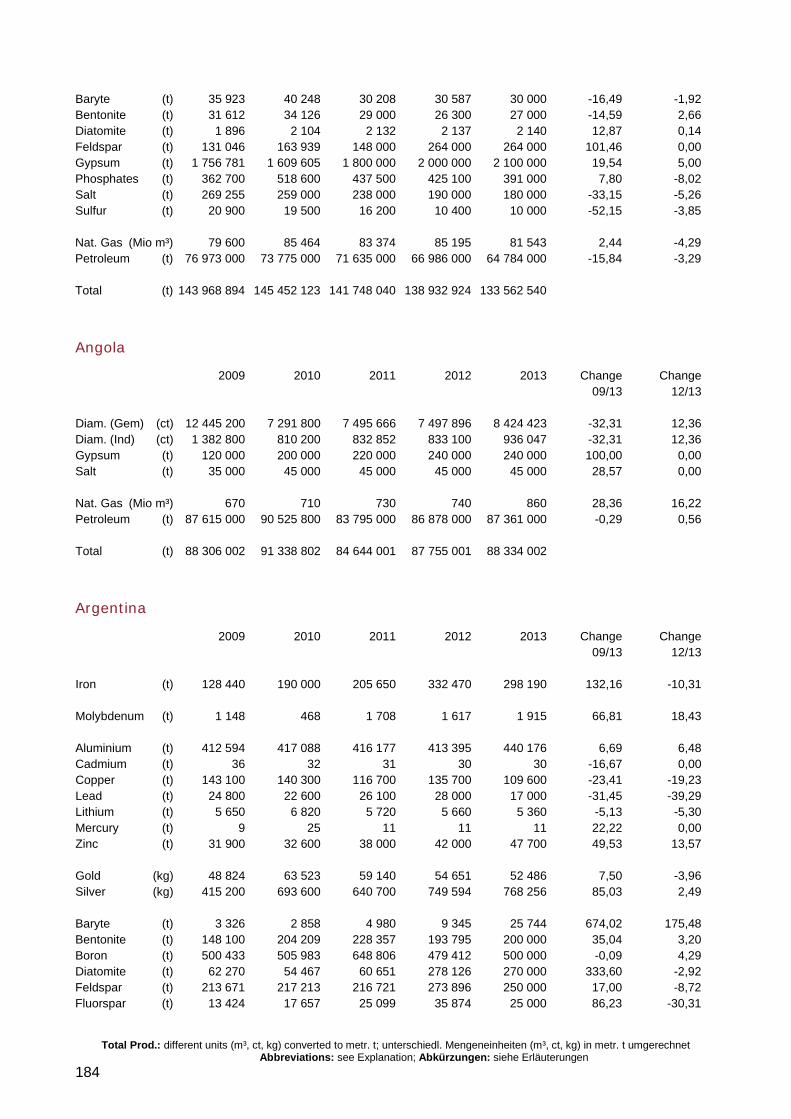
Total Prod.: different units (m³, ct, kg) converted to metr. t; unterschiedl. Mengeneinheiten (m³, ct, kg) in metr. t umgerechnet Abbreviations: see Explanation; Abkürzungen: siehe Erläuterungen
184
Baryte (t) 35 923 40 248 30 208 30 587 30 000 -16,49 -1,92 Bentonite (t) 31 612 34 126 29 000 26 300 27 000 -14,59 2,66 Diatomite (t) 1 896 2 104 2 132 2 137 2 140 12,87 0,14 Feldspar (t) 131 046 163 939 148 000 264 000 264 000 101,46 0,00 Gypsum (t) 1 756 781 1 609 605 1 800 000 2 000 000 2 100 000 19,54 5,00 Phosphates (t) 362 700 518 600 437 500 425 100 391 000 7,80 -8,02 Salt (t) 269 255 259 000 238 000 190 000 180 000 -33,15 -5,26 Sulfur (t) 20 900 19 500 16 200 10 400 10 000 -52,15 -3,85 Nat. Gas (Mio m³) 79 600 85 464 83 374 85 195 81 543 2,44 -4,29 Petroleum (t) 76 973 000 73 775 000 71 635 000 66 986 000 64 784 000 -15,84 -3,29 Total (t) 143 968 894 145 452 123 141 748 040 138 932 924 133 562 540
Angola
2009 2010 2011 2012 2013 Change Change 09/13 12/13 Diam. (Gem) (ct) 12 445 200 7 291 800 7 495 666 7 497 896 8 424 423 -32,31 12,36 Diam. (Ind) (ct) 1 382 800 810 200 832 852 833 100 936 047 -32,31 12,36 Gypsum (t) 120 000 200 000 220 000 240 000 240 000 100,00 0,00 Salt (t) 35 000 45 000 45 000 45 000 45 000 28,57 0,00 Nat. Gas (Mio m³) 670 710 730 740 860 28,36 16,22 Petroleum (t) 87 615 000 90 525 800 83 795 000 86 878 000 87 361 000 -0,29 0,56 Total (t) 88 306 002 91 338 802 84 644 001 87 755 001 88 334 002
Argentina
2009 2010 2011 2012 2013 Change Change 09/13 12/13 Iron (t) 128 440 190 000 205 650 332 470 298 190 132,16 -10,31 Molybdenum (t) 1 148 468 1 708 1 617 1 915 66,81 18,43 Aluminium (t) 412 594 417 088 416 177 413 395 440 176 6,69 6,48 Cadmium (t) 36 32 31 30 30 -16,67 0,00 Copper (t) 143 100 140 300 116 700 135 700 109 600 -23,41 -19,23 Lead (t) 24 800 22 600 26 100 28 000 17 000 -31,45 -39,29 Lithium (t) 5 650 6 820 5 720 5 660 5 360 -5,13 -5,30 Mercury (t) 9 25 11 11 11 22,22 0,00 Zinc (t) 31 900 32 600 38 000 42 000 47 700 49,53 13,57 Gold (kg) 48 824 63 523 59 140 54 651 52 486 7,50 -3,96 Silver (kg) 415 200 693 600 640 700 749 594 768 256 85,03 2,49 Baryte (t) 3 326 2 858 4 980 9 345 25 744 674,02 175,48 Bentonite (t) 148 100 204 209 228 357 193 795 200 000 35,04 3,20 Boron (t) 500 433 505 983 648 806 479 412 500 000 -0,09 4,29 Diatomite (t) 62 270 54 467 60 651 278 126 270 000 333,60 -2,92 Feldspar (t) 213 671 217 213 216 721 273 896 250 000 17,00 -8,72 Fluorspar (t) 13 424 17 657 25 099 35 874 25 000 86,23 -30,31
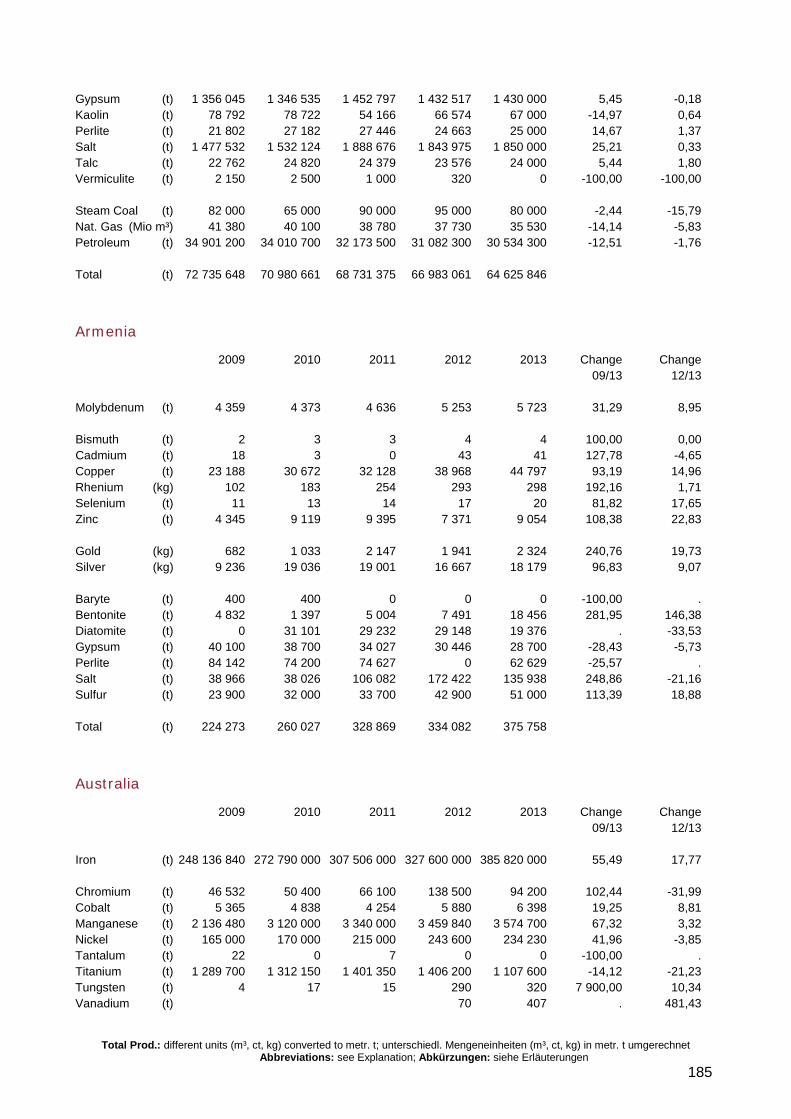
Total Prod.: different units (m³, ct, kg) converted to metr. t; unterschiedl. Mengeneinheiten (m³, ct, kg) in metr. t umgerechnet Abbreviations: see Explanation; Abkürzungen: siehe Erläuterungen
185
Gypsum (t) 1 356 045 1 346 535 1 452 797 1 432 517 1 430 000 5,45 -0,18 Kaolin (t) 78 792 78 722 54 166 66 574 67 000 -14,97 0,64 Perlite (t) 21 802 27 182 27 446 24 663 25 000 14,67 1,37 Salt (t) 1 477 532 1 532 124 1 888 676 1 843 975 1 850 000 25,21 0,33 Talc (t) 22 762 24 820 24 379 23 576 24 000 5,44 1,80 Vermiculite (t) 2 150 2 500 1 000 320 0 -100,00 -100,00 Steam Coal (t) 82 000 65 000 90 000 95 000 80 000 -2,44 -15,79 Nat. Gas (Mio m³) 41 380 40 100 38 780 37 730 35 530 -14,14 -5,83 Petroleum (t) 34 901 200 34 010 700 32 173 500 31 082 300 30 534 300 -12,51 -1,76 Total (t) 72 735 648 70 980 661 68 731 375 66 983 061 64 625 846
Armenia
2009 2010 2011 2012 2013 Change Change 09/13 12/13 Molybdenum (t) 4 359 4 373 4 636 5 253 5 723 31,29 8,95 Bismuth (t) 2 3 3 4 4 100,00 0,00 Cadmium (t) 18 3 0 43 41 127,78 -4,65 Copper (t) 23 188 30 672 32 128 38 968 44 797 93,19 14,96 Rhenium (kg) 102 183 254 293 298 192,16 1,71 Selenium (t) 11 13 14 17 20 81,82 17,65 Zinc (t) 4 345 9 119 9 395 7 371 9 054 108,38 22,83 Gold (kg) 682 1 033 2 147 1 941 2 324 240,76 19,73 Silver (kg) 9 236 19 036 19 001 16 667 18 179 96,83 9,07 Baryte (t) 400 400 0 0 0 -100,00 . Bentonite (t) 4 832 1 397 5 004 7 491 18 456 281,95 146,38 Diatomite (t) 0 31 101 29 232 29 148 19 376 . -33,53 Gypsum (t) 40 100 38 700 34 027 30 446 28 700 -28,43 -5,73 Perlite (t) 84 142 74 200 74 627 0 62 629 -25,57 . Salt (t) 38 966 38 026 106 082 172 422 135 938 248,86 -21,16 Sulfur (t) 23 900 32 000 33 700 42 900 51 000 113,39 18,88 Total (t) 224 273 260 027 328 869 334 082 375 758
Australia
2009 2010 2011 2012 2013 Change Change 09/13 12/13 Iron (t) 248 136 840 272 790 000 307 506 000 327 600 000 385 820 000 55,49 17,77 Chromium (t) 46 532 50 400 66 100 138 500 94 200 102,44 -31,99 Cobalt (t) 5 365 4 838 4 254 5 880 6 398 19,25 8,81 Manganese (t) 2 136 480 3 120 000 3 340 000 3 459 840 3 574 700 67,32 3,32 Nickel (t) 165 000 170 000 215 000 243 600 234 230 41,96 -3,85 Tantalum (t) 22 0 7 0 0 -100,00 . Titanium (t) 1 289 700 1 312 150 1 401 350 1 406 200 1 107 600 -14,12 -21,23 Tungsten (t) 4 17 15 290 320 7 900,00 10,34 Vanadium (t) 70 407 . 481,43
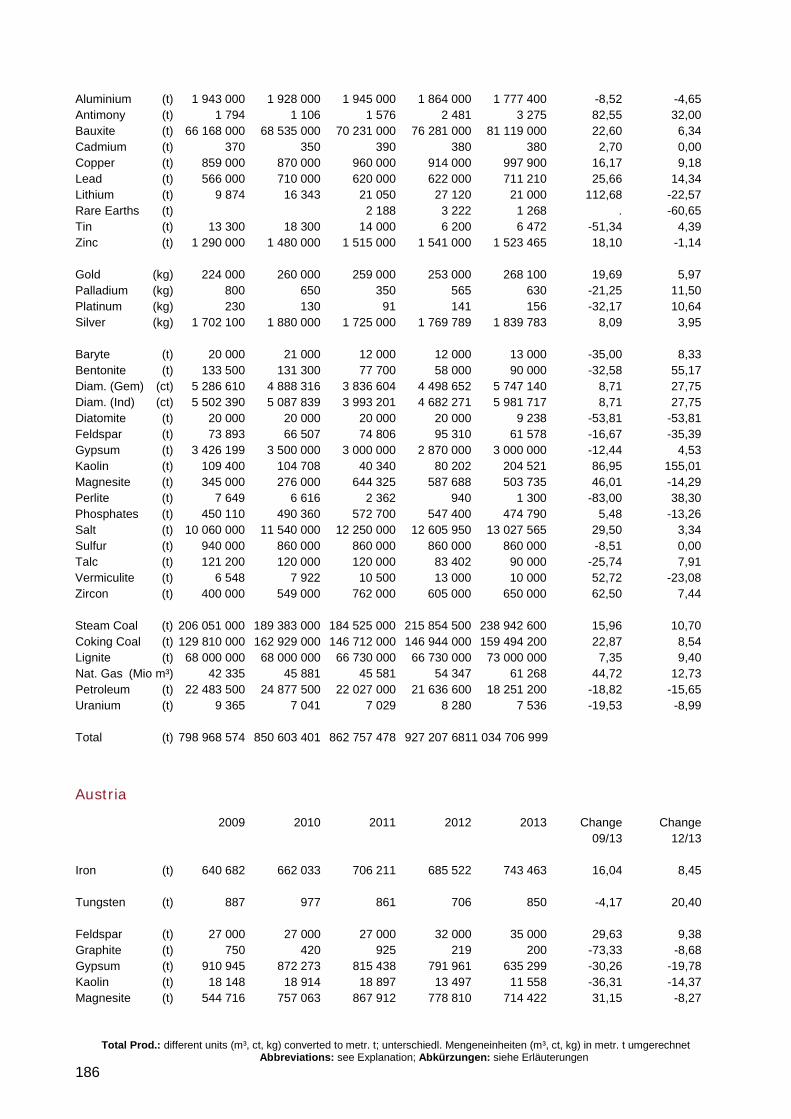
Total Prod.: different units (m³, ct, kg) converted to metr. t; unterschiedl. Mengeneinheiten (m³, ct, kg) in metr. t umgerechnet Abbreviations: see Explanation; Abkürzungen: siehe Erläuterungen
186
Aluminium (t) 1 943 000 1 928 000 1 945 000 1 864 000 1 777 400 -8,52 -4,65 Antimony (t) 1 794 1 106 1 576 2 481 3 275 82,55 32,00 Bauxite (t) 66 168 000 68 535 000 70 231 000 76 281 000 81 119 000 22,60 6,34 Cadmium (t) 370 350 390 380 380 2,70 0,00 Copper (t) 859 000 870 000 960 000 914 000 997 900 16,17 9,18 Lead (t) 566 000 710 000 620 000 622 000 711 210 25,66 14,34 Lithium (t) 9 874 16 343 21 050 27 120 21 000 112,68 -22,57 Rare Earths (t) 2 188 3 222 1 268 . -60,65 Tin (t) 13 300 18 300 14 000 6 200 6 472 -51,34 4,39 Zinc (t) 1 290 000 1 480 000 1 515 000 1 541 000 1 523 465 18,10 -1,14 Gold (kg) 224 000 260 000 259 000 253 000 268 100 19,69 5,97 Palladium (kg) 800 650 350 565 630 -21,25 11,50 Platinum (kg) 230 130 91 141 156 -32,17 10,64 Silver (kg) 1 702 100 1 880 000 1 725 000 1 769 789 1 839 783 8,09 3,95 Baryte (t) 20 000 21 000 12 000 12 000 13 000 -35,00 8,33 Bentonite (t) 133 500 131 300 77 700 58 000 90 000 -32,58 55,17 Diam. (Gem) (ct) 5 286 610 4 888 316 3 836 604 4 498 652 5 747 140 8,71 27,75 Diam. (Ind) (ct) 5 502 390 5 087 839 3 993 201 4 682 271 5 981 717 8,71 27,75 Diatomite (t) 20 000 20 000 20 000 20 000 9 238 -53,81 -53,81 Feldspar (t) 73 893 66 507 74 806 95 310 61 578 -16,67 -35,39 Gypsum (t) 3 426 199 3 500 000 3 000 000 2 870 000 3 000 000 -12,44 4,53 Kaolin (t) 109 400 104 708 40 340 80 202 204 521 86,95 155,01 Magnesite (t) 345 000 276 000 644 325 587 688 503 735 46,01 -14,29 Perlite (t) 7 649 6 616 2 362 940 1 300 -83,00 38,30 Phosphates (t) 450 110 490 360 572 700 547 400 474 790 5,48 -13,26 Salt (t) 10 060 000 11 540 000 12 250 000 12 605 950 13 027 565 29,50 3,34 Sulfur (t) 940 000 860 000 860 000 860 000 860 000 -8,51 0,00 Talc (t) 121 200 120 000 120 000 83 402 90 000 -25,74 7,91 Vermiculite (t) 6 548 7 922 10 500 13 000 10 000 52,72 -23,08 Zircon (t) 400 000 549 000 762 000 605 000 650 000 62,50 7,44 Steam Coal (t) 206 051 000 189 383 000 184 525 000 215 854 500 238 942 600 15,96 10,70 Coking Coal (t) 129 810 000 162 929 000 146 712 000 146 944 000 159 494 200 22,87 8,54 Lignite (t) 68 000 000 68 000 000 66 730 000 66 730 000 73 000 000 7,35 9,40 Nat. Gas (Mio m³) 42 335 45 881 45 581 54 347 61 268 44,72 12,73 Petroleum (t) 22 483 500 24 877 500 22 027 000 21 636 600 18 251 200 -18,82 -15,65 Uranium (t) 9 365 7 041 7 029 8 280 7 536 -19,53 -8,99 Total (t) 798 968 574 850 603 401 862 757 478 927 207 6811 034 706 999
Austria
2009 2010 2011 2012 2013 Change Change 09/13 12/13 Iron (t) 640 682 662 033 706 211 685 522 743 463 16,04 8,45 Tungsten (t) 887 977 861 706 850 -4,17 20,40 Feldspar (t) 27 000 27 000 27 000 32 000 35 000 29,63 9,38 Graphite (t) 750 420 925 219 200 -73,33 -8,68 Gypsum (t) 910 945 872 273 815 438 791 961 635 299 -30,26 -19,78 Kaolin (t) 18 148 18 914 18 897 13 497 11 558 -36,31 -14,37 Magnesite (t) 544 716 757 063 867 912 778 810 714 422 31,15 -8,27
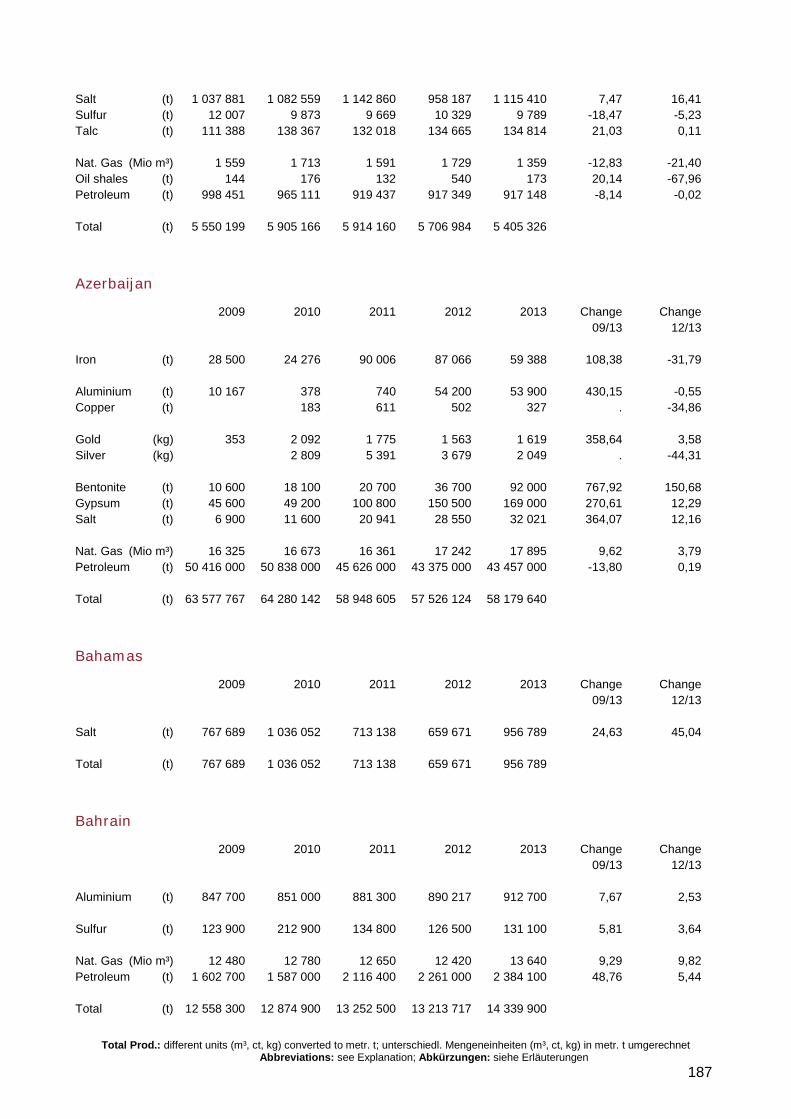
Total Prod.: different units (m³, ct, kg) converted to metr. t; unterschiedl. Mengeneinheiten (m³, ct, kg) in metr. t umgerechnet Abbreviations: see Explanation; Abkürzungen: siehe Erläuterungen
187
Salt (t) 1 037 881 1 082 559 1 142 860 958 187 1 115 410 7,47 16,41 Sulfur (t) 12 007 9 873 9 669 10 329 9 789 -18,47 -5,23 Talc (t) 111 388 138 367 132 018 134 665 134 814 21,03 0,11 Nat. Gas (Mio m³) 1 559 1 713 1 591 1 729 1 359 -12,83 -21,40 Oil shales (t) 144 176 132 540 173 20,14 -67,96 Petroleum (t) 998 451 965 111 919 437 917 349 917 148 -8,14 -0,02 Total (t) 5 550 199 5 905 166 5 914 160 5 706 984 5 405 326
Azerbaijan
2009 2010 2011 2012 2013 Change Change 09/13 12/13 Iron (t) 28 500 24 276 90 006 87 066 59 388 108,38 -31,79 Aluminium (t) 10 167 378 740 54 200 53 900 430,15 -0,55 Copper (t) 183 611 502 327 . -34,86 Gold (kg) 353 2 092 1 775 1 563 1 619 358,64 3,58 Silver (kg) 2 809 5 391 3 679 2 049 . -44,31 Bentonite (t) 10 600 18 100 20 700 36 700 92 000 767,92 150,68 Gypsum (t) 45 600 49 200 100 800 150 500 169 000 270,61 12,29 Salt (t) 6 900 11 600 20 941 28 550 32 021 364,07 12,16 Nat. Gas (Mio m³) 16 325 16 673 16 361 17 242 17 895 9,62 3,79 Petroleum (t) 50 416 000 50 838 000 45 626 000 43 375 000 43 457 000 -13,80 0,19 Total (t) 63 577 767 64 280 142 58 948 605 57 526 124 58 179 640
Bahamas
2009 2010 2011 2012 2013 Change Change 09/13 12/13 Salt (t) 767 689 1 036 052 713 138 659 671 956 789 24,63 45,04 Total (t) 767 689 1 036 052 713 138 659 671 956 789
Bahrain
2009 2010 2011 2012 2013 Change Change 09/13 12/13 Aluminium (t) 847 700 851 000 881 300 890 217 912 700 7,67 2,53 Sulfur (t) 123 900 212 900 134 800 126 500 131 100 5,81 3,64 Nat. Gas (Mio m³) 12 480 12 780 12 650 12 420 13 640 9,29 9,82 Petroleum (t) 1 602 700 1 587 000 2 116 400 2 261 000 2 384 100 48,76 5,44 Total (t) 12 558 300 12 874 900 13 252 500 13 213 717 14 339 900
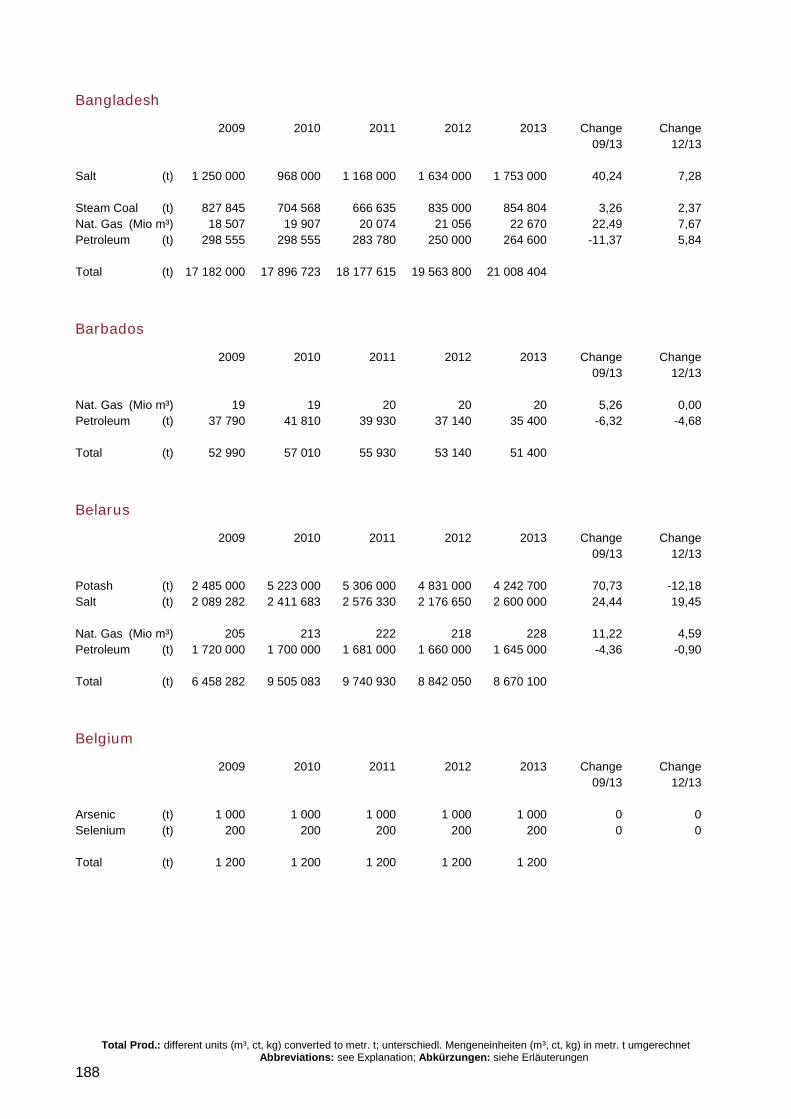
Total Prod.: different units (m³, ct, kg) converted to metr. t; unterschiedl. Mengeneinheiten (m³, ct, kg) in metr. t umgerechnet Abbreviations: see Explanation; Abkürzungen: siehe Erläuterungen
188
Bangladesh
2009 2010 2011 2012 2013 Change Change 09/13 12/13 Salt (t) 1 250 000 968 000 1 168 000 1 634 000 1 753 000 40,24 7,28 Steam Coal (t) 827 845 704 568 666 635 835 000 854 804 3,26 2,37 Nat. Gas (Mio m³) 18 507 19 907 20 074 21 056 22 670 22,49 7,67 Petroleum (t) 298 555 298 555 283 780 250 000 264 600 -11,37 5,84 Total (t) 17 182 000 17 896 723 18 177 615 19 563 800 21 008 404
Barbados
2009 2010 2011 2012 2013 Change Change 09/13 12/13 Nat. Gas (Mio m³) 19 19 20 20 20 5,26 0,00 Petroleum (t) 37 790 41 810 39 930 37 140 35 400 -6,32 -4,68 Total (t) 52 990 57 010 55 930 53 140 51 400
Belarus
2009 2010 2011 2012 2013 Change Change 09/13 12/13 Potash (t) 2 485 000 5 223 000 5 306 000 4 831 000 4 242 700 70,73 -12,18 Salt (t) 2 089 282 2 411 683 2 576 330 2 176 650 2 600 000 24,44 19,45 Nat. Gas (Mio m³) 205 213 222 218 228 11,22 4,59 Petroleum (t) 1 720 000 1 700 000 1 681 000 1 660 000 1 645 000 -4,36 -0,90 Total (t) 6 458 282 9 505 083 9 740 930 8 842 050 8 670 100
Belgium
2009 2010 2011 2012 2013 Change Change 09/13 12/13 Arsenic (t) 1 000 1 000 1 000 1 000 1 000 0 0 Selenium (t) 200 200 200 200 200 0 0 Total (t) 1 200 1 200 1 200 1 200 1 200
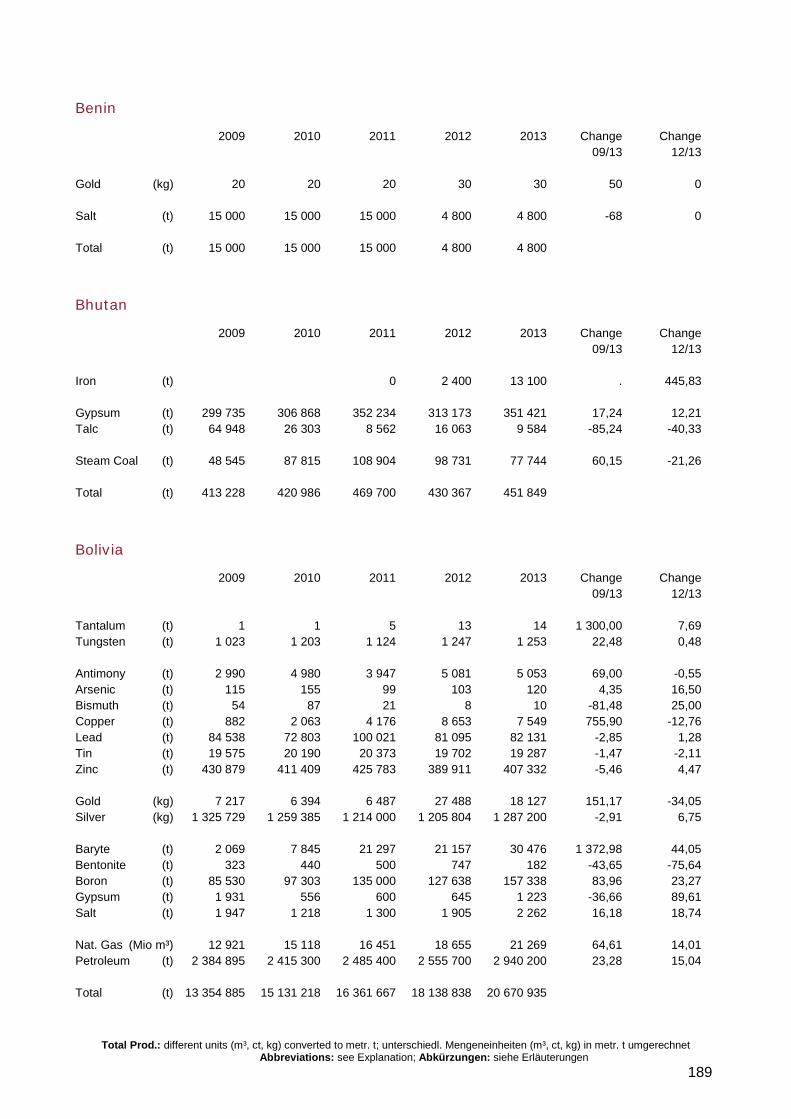
Total Prod.: different units (m³, ct, kg) converted to metr. t; unterschiedl. Mengeneinheiten (m³, ct, kg) in metr. t umgerechnet Abbreviations: see Explanation; Abkürzungen: siehe Erläuterungen
189
Benin
2009 2010 2011 2012 2013 Change Change 09/13 12/13 Gold (kg) 20 20 20 30 30 50 0 Salt (t) 15 000 15 000 15 000 4 800 4 800 -68 0 Total (t) 15 000 15 000 15 000 4 800 4 800
Bhutan
2009 2010 2011 2012 2013 Change Change 09/13 12/13 Iron (t) 0 2 400 13 100 . 445,83 Gypsum (t) 299 735 306 868 352 234 313 173 351 421 17,24 12,21 Talc (t) 64 948 26 303 8 562 16 063 9 584 -85,24 -40,33 Steam Coal (t) 48 545 87 815 108 904 98 731 77 744 60,15 -21,26 Total (t) 413 228 420 986 469 700 430 367 451 849
Bolivia
2009 2010 2011 2012 2013 Change Change 09/13 12/13 Tantalum (t) 1 1 5 13 14 1 300,00 7,69 Tungsten (t) 1 023 1 203 1 124 1 247 1 253 22,48 0,48 Antimony (t) 2 990 4 980 3 947 5 081 5 053 69,00 -0,55 Arsenic (t) 115 155 99 103 120 4,35 16,50 Bismuth (t) 54 87 21 8 10 -81,48 25,00 Copper (t) 882 2 063 4 176 8 653 7 549 755,90 -12,76 Lead (t) 84 538 72 803 100 021 81 095 82 131 -2,85 1,28 Tin (t) 19 575 20 190 20 373 19 702 19 287 -1,47 -2,11 Zinc (t) 430 879 411 409 425 783 389 911 407 332 -5,46 4,47 Gold (kg) 7 217 6 394 6 487 27 488 18 127 151,17 -34,05 Silver (kg) 1 325 729 1 259 385 1 214 000 1 205 804 1 287 200 -2,91 6,75 Baryte (t) 2 069 7 845 21 297 21 157 30 476 1 372,98 44,05 Bentonite (t) 323 440 500 747 182 -43,65 -75,64 Boron (t) 85 530 97 303 135 000 127 638 157 338 83,96 23,27 Gypsum (t) 1 931 556 600 645 1 223 -36,66 89,61 Salt (t) 1 947 1 218 1 300 1 905 2 262 16,18 18,74 Nat. Gas (Mio m³) 12 921 15 118 16 451 18 655 21 269 64,61 14,01 Petroleum (t) 2 384 895 2 415 300 2 485 400 2 555 700 2 940 200 23,28 15,04 Total (t) 13 354 885 15 131 218 16 361 667 18 138 838 20 670 935
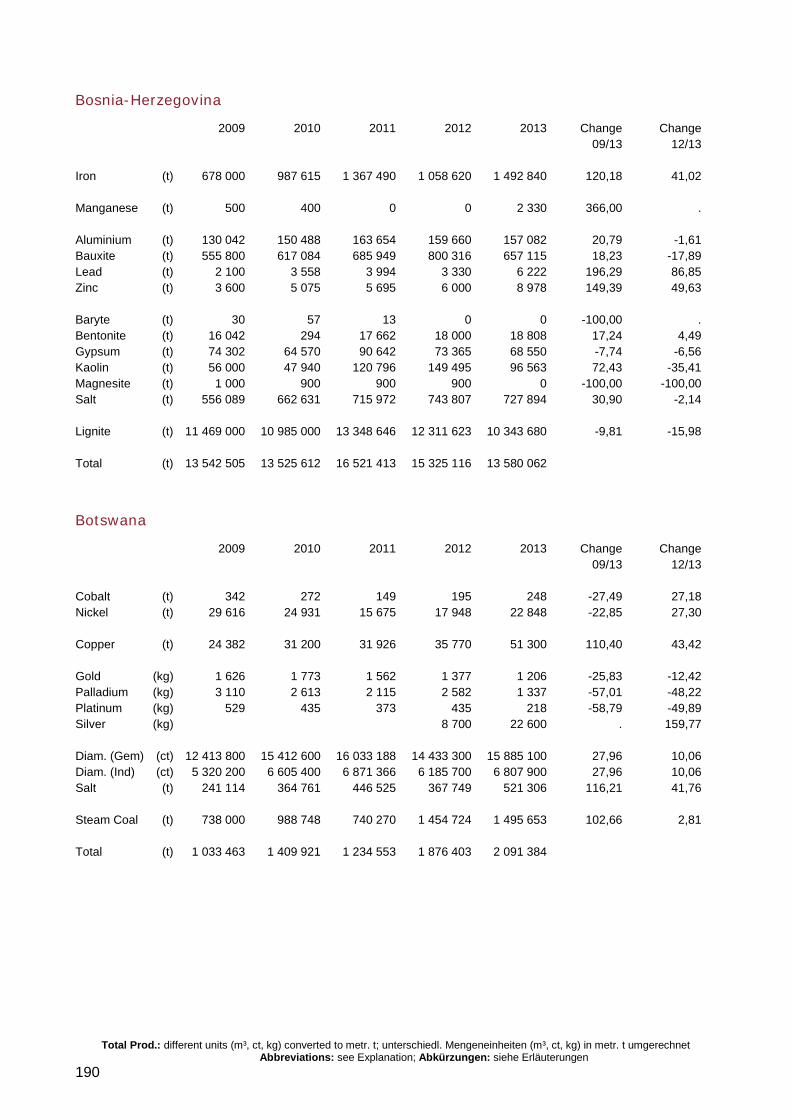
Total Prod.: different units (m³, ct, kg) converted to metr. t; unterschiedl. Mengeneinheiten (m³, ct, kg) in metr. t umgerechnet Abbreviations: see Explanation; Abkürzungen: siehe Erläuterungen
190
Bosnia-Herzegovina
2009 2010 2011 2012 2013 Change Change 09/13 12/13 Iron (t) 678 000 987 615 1 367 490 1 058 620 1 492 840 120,18 41,02 Manganese (t) 500 400 0 0 2 330 366,00 . Aluminium (t) 130 042 150 488 163 654 159 660 157 082 20,79 -1,61 Bauxite (t) 555 800 617 084 685 949 800 316 657 115 18,23 -17,89 Lead (t) 2 100 3 558 3 994 3 330 6 222 196,29 86,85 Zinc (t) 3 600 5 075 5 695 6 000 8 978 149,39 49,63 Baryte (t) 30 57 13 0 0 -100,00 . Bentonite (t) 16 042 294 17 662 18 000 18 808 17,24 4,49 Gypsum (t) 74 302 64 570 90 642 73 365 68 550 -7,74 -6,56 Kaolin (t) 56 000 47 940 120 796 149 495 96 563 72,43 -35,41 Magnesite (t) 1 000 900 900 900 0 -100,00 -100,00 Salt (t) 556 089 662 631 715 972 743 807 727 894 30,90 -2,14 Lignite (t) 11 469 000 10 985 000 13 348 646 12 311 623 10 343 680 -9,81 -15,98 Total (t) 13 542 505 13 525 612 16 521 413 15 325 116 13 580 062
Botswana
2009 2010 2011 2012 2013 Change Change 09/13 12/13 Cobalt (t) 342 272 149 195 248 -27,49 27,18 Nickel (t) 29 616 24 931 15 675 17 948 22 848 -22,85 27,30 Copper (t) 24 382 31 200 31 926 35 770 51 300 110,40 43,42 Gold (kg) 1 626 1 773 1 562 1 377 1 206 -25,83 -12,42 Palladium (kg) 3 110 2 613 2 115 2 582 1 337 -57,01 -48,22 Platinum (kg) 529 435 373 435 218 -58,79 -49,89 Silver (kg) 8 700 22 600 . 159,77 Diam. (Gem) (ct) 12 413 800 15 412 600 16 033 188 14 433 300 15 885 100 27,96 10,06 Diam. (Ind) (ct) 5 320 200 6 605 400 6 871 366 6 185 700 6 807 900 27,96 10,06 Salt (t) 241 114 364 761 446 525 367 749 521 306 116,21 41,76 Steam Coal (t) 738 000 988 748 740 270 1 454 724 1 495 653 102,66 2,81 Total (t) 1 033 463 1 409 921 1 234 553 1 876 403 2 091 384
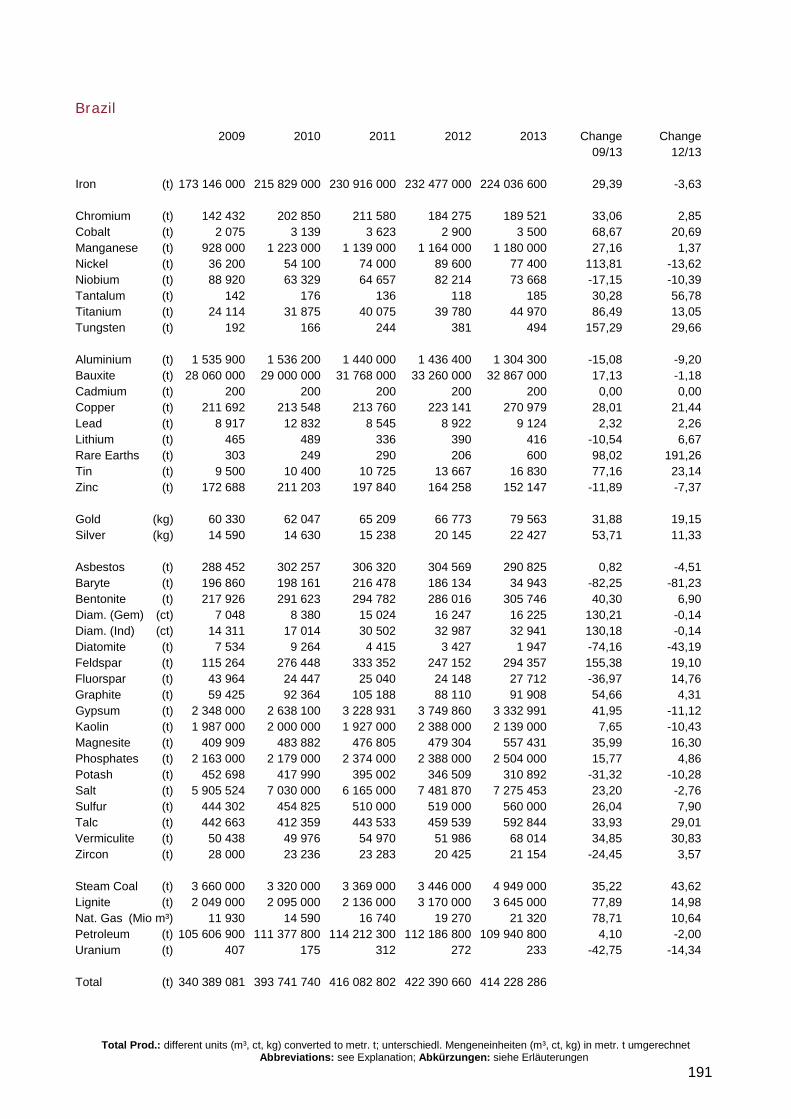
Total Prod.: different units (m³, ct, kg) converted to metr. t; unterschiedl. Mengeneinheiten (m³, ct, kg) in metr. t umgerechnet Abbreviations: see Explanation; Abkürzungen: siehe Erläuterungen
191
Brazil
2009 2010 2011 2012 2013 Change Change 09/13 12/13 Iron (t) 173 146 000 215 829 000 230 916 000 232 477 000 224 036 600 29,39 -3,63 Chromium (t) 142 432 202 850 211 580 184 275 189 521 33,06 2,85 Cobalt (t) 2 075 3 139 3 623 2 900 3 500 68,67 20,69 Manganese (t) 928 000 1 223 000 1 139 000 1 164 000 1 180 000 27,16 1,37 Nickel (t) 36 200 54 100 74 000 89 600 77 400 113,81 -13,62 Niobium (t) 88 920 63 329 64 657 82 214 73 668 -17,15 -10,39 Tantalum (t) 142 176 136 118 185 30,28 56,78 Titanium (t) 24 114 31 875 40 075 39 780 44 970 86,49 13,05 Tungsten (t) 192 166 244 381 494 157,29 29,66 Aluminium (t) 1 535 900 1 536 200 1 440 000 1 436 400 1 304 300 -15,08 -9,20 Bauxite (t) 28 060 000 29 000 000 31 768 000 33 260 000 32 867 000 17,13 -1,18 Cadmium (t) 200 200 200 200 200 0,00 0,00 Copper (t) 211 692 213 548 213 760 223 141 270 979 28,01 21,44 Lead (t) 8 917 12 832 8 545 8 922 9 124 2,32 2,26 Lithium (t) 465 489 336 390 416 -10,54 6,67 Rare Earths (t) 303 249 290 206 600 98,02 191,26 Tin (t) 9 500 10 400 10 725 13 667 16 830 77,16 23,14 Zinc (t) 172 688 211 203 197 840 164 258 152 147 -11,89 -7,37 Gold (kg) 60 330 62 047 65 209 66 773 79 563 31,88 19,15 Silver (kg) 14 590 14 630 15 238 20 145 22 427 53,71 11,33 Asbestos (t) 288 452 302 257 306 320 304 569 290 825 0,82 -4,51 Baryte (t) 196 860 198 161 216 478 186 134 34 943 -82,25 -81,23 Bentonite (t) 217 926 291 623 294 782 286 016 305 746 40,30 6,90 Diam. (Gem) (ct) 7 048 8 380 15 024 16 247 16 225 130,21 -0,14 Diam. (Ind) (ct) 14 311 17 014 30 502 32 987 32 941 130,18 -0,14 Diatomite (t) 7 534 9 264 4 415 3 427 1 947 -74,16 -43,19 Feldspar (t) 115 264 276 448 333 352 247 152 294 357 155,38 19,10 Fluorspar (t) 43 964 24 447 25 040 24 148 27 712 -36,97 14,76 Graphite (t) 59 425 92 364 105 188 88 110 91 908 54,66 4,31 Gypsum (t) 2 348 000 2 638 100 3 228 931 3 749 860 3 332 991 41,95 -11,12 Kaolin (t) 1 987 000 2 000 000 1 927 000 2 388 000 2 139 000 7,65 -10,43 Magnesite (t) 409 909 483 882 476 805 479 304 557 431 35,99 16,30 Phosphates (t) 2 163 000 2 179 000 2 374 000 2 388 000 2 504 000 15,77 4,86 Potash (t) 452 698 417 990 395 002 346 509 310 892 -31,32 -10,28 Salt (t) 5 905 524 7 030 000 6 165 000 7 481 870 7 275 453 23,20 -2,76 Sulfur (t) 444 302 454 825 510 000 519 000 560 000 26,04 7,90 Talc (t) 442 663 412 359 443 533 459 539 592 844 33,93 29,01 Vermiculite (t) 50 438 49 976 54 970 51 986 68 014 34,85 30,83 Zircon (t) 28 000 23 236 23 283 20 425 21 154 -24,45 3,57 Steam Coal (t) 3 660 000 3 320 000 3 369 000 3 446 000 4 949 000 35,22 43,62 Lignite (t) 2 049 000 2 095 000 2 136 000 3 170 000 3 645 000 77,89 14,98 Nat. Gas (Mio m³) 11 930 14 590 16 740 19 270 21 320 78,71 10,64 Petroleum (t) 105 606 900 111 377 800 114 212 300 112 186 800 109 940 800 4,10 -2,00 Uranium (t) 407 175 312 272 233 -42,75 -14,34 Total (t) 340 389 081 393 741 740 416 082 802 422 390 660 414 228 286
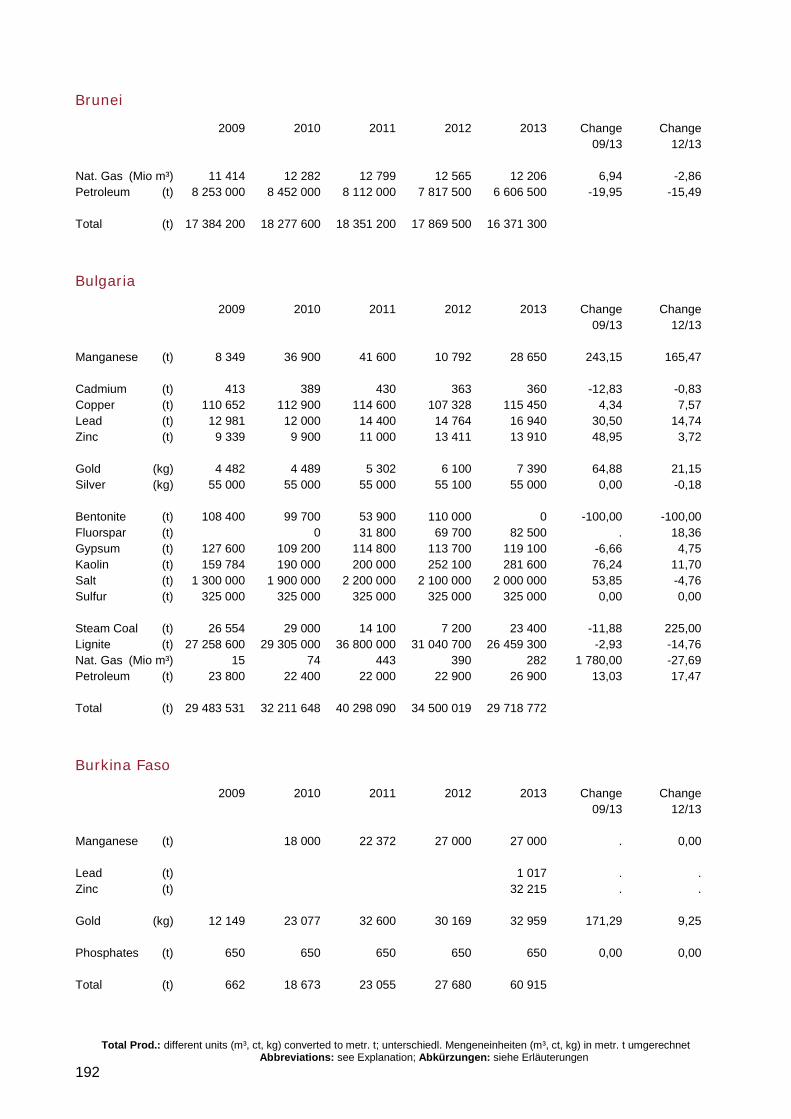
Total Prod.: different units (m³, ct, kg) converted to metr. t; unterschiedl. Mengeneinheiten (m³, ct, kg) in metr. t umgerechnet Abbreviations: see Explanation; Abkürzungen: siehe Erläuterungen
192
Brunei
2009 2010 2011 2012 2013 Change Change 09/13 12/13 Nat. Gas (Mio m³) 11 414 12 282 12 799 12 565 12 206 6,94 -2,86 Petroleum (t) 8 253 000 8 452 000 8 112 000 7 817 500 6 606 500 -19,95 -15,49 Total (t) 17 384 200 18 277 600 18 351 200 17 869 500 16 371 300
Bulgaria
2009 2010 2011 2012 2013 Change Change 09/13 12/13 Manganese (t) 8 349 36 900 41 600 10 792 28 650 243,15 165,47 Cadmium (t) 413 389 430 363 360 -12,83 -0,83 Copper (t) 110 652 112 900 114 600 107 328 115 450 4,34 7,57 Lead (t) 12 981 12 000 14 400 14 764 16 940 30,50 14,74 Zinc (t) 9 339 9 900 11 000 13 411 13 910 48,95 3,72 Gold (kg) 4 482 4 489 5 302 6 100 7 390 64,88 21,15 Silver (kg) 55 000 55 000 55 000 55 100 55 000 0,00 -0,18 Bentonite (t) 108 400 99 700 53 900 110 000 0 -100,00 -100,00 Fluorspar (t) 0 31 800 69 700 82 500 . 18,36 Gypsum (t) 127 600 109 200 114 800 113 700 119 100 -6,66 4,75 Kaolin (t) 159 784 190 000 200 000 252 100 281 600 76,24 11,70 Salt (t) 1 300 000 1 900 000 2 200 000 2 100 000 2 000 000 53,85 -4,76 Sulfur (t) 325 000 325 000 325 000 325 000 325 000 0,00 0,00 Steam Coal (t) 26 554 29 000 14 100 7 200 23 400 -11,88 225,00 Lignite (t) 27 258 600 29 305 000 36 800 000 31 040 700 26 459 300 -2,93 -14,76 Nat. Gas (Mio m³) 15 74 443 390 282 1 780,00 -27,69 Petroleum (t) 23 800 22 400 22 000 22 900 26 900 13,03 17,47 Total (t) 29 483 531 32 211 648 40 298 090 34 500 019 29 718 772
Burkina Faso
2009 2010 2011 2012 2013 Change Change 09/13 12/13 Manganese (t) 18 000 22 372 27 000 27 000 . 0,00 Lead (t) 1 017 . . Zinc (t) 32 215 . . Gold (kg) 12 149 23 077 32 600 30 169 32 959 171,29 9,25 Phosphates (t) 650 650 650 650 650 0,00 0,00 Total (t) 662 18 673 23 055 27 680 60 915
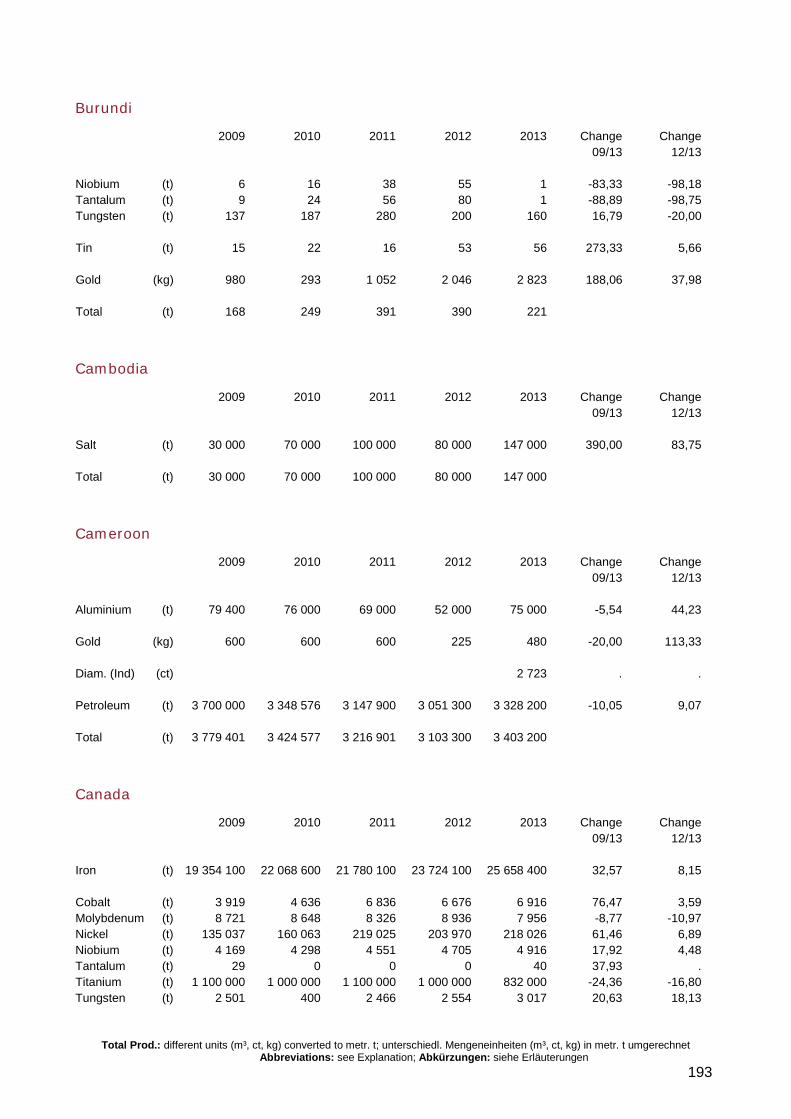
Total Prod.: different units (m³, ct, kg) converted to metr. t; unterschiedl. Mengeneinheiten (m³, ct, kg) in metr. t umgerechnet Abbreviations: see Explanation; Abkürzungen: siehe Erläuterungen
193
Burundi
2009 2010 2011 2012 2013 Change Change 09/13 12/13 Niobium (t) 6 16 38 55 1 -83,33 -98,18 Tantalum (t) 9 24 56 80 1 -88,89 -98,75 Tungsten (t) 137 187 280 200 160 16,79 -20,00 Tin (t) 15 22 16 53 56 273,33 5,66 Gold (kg) 980 293 1 052 2 046 2 823 188,06 37,98 Total (t) 168 249 391 390 221
Cambodia
2009 2010 2011 2012 2013 Change Change 09/13 12/13 Salt (t) 30 000 70 000 100 000 80 000 147 000 390,00 83,75 Total (t) 30 000 70 000 100 000 80 000 147 000
Cameroon
2009 2010 2011 2012 2013 Change Change 09/13 12/13 Aluminium (t) 79 400 76 000 69 000 52 000 75 000 -5,54 44,23 Gold (kg) 600 600 600 225 480 -20,00 113,33 Diam. (Ind) (ct) 2 723 . . Petroleum (t) 3 700 000 3 348 576 3 147 900 3 051 300 3 328 200 -10,05 9,07 Total (t) 3 779 401 3 424 577 3 216 901 3 103 300 3 403 200
Canada
2009 2010 2011 2012 2013 Change Change 09/13 12/13 Iron (t) 19 354 100 22 068 600 21 780 100 23 724 100 25 658 400 32,57 8,15 Cobalt (t) 3 919 4 636 6 836 6 676 6 916 76,47 3,59 Molybdenum (t) 8 721 8 648 8 326 8 936 7 956 -8,77 -10,97 Nickel (t) 135 037 160 063 219 025 203 970 218 026 61,46 6,89 Niobium (t) 4 169 4 298 4 551 4 705 4 916 17,92 4,48 Tantalum (t) 29 0 0 0 40 37,93 . Titanium (t) 1 100 000 1 000 000 1 100 000 1 000 000 832 000 -24,36 -16,80 Tungsten (t) 2 501 400 2 466 2 554 3 017 20,63 18,13
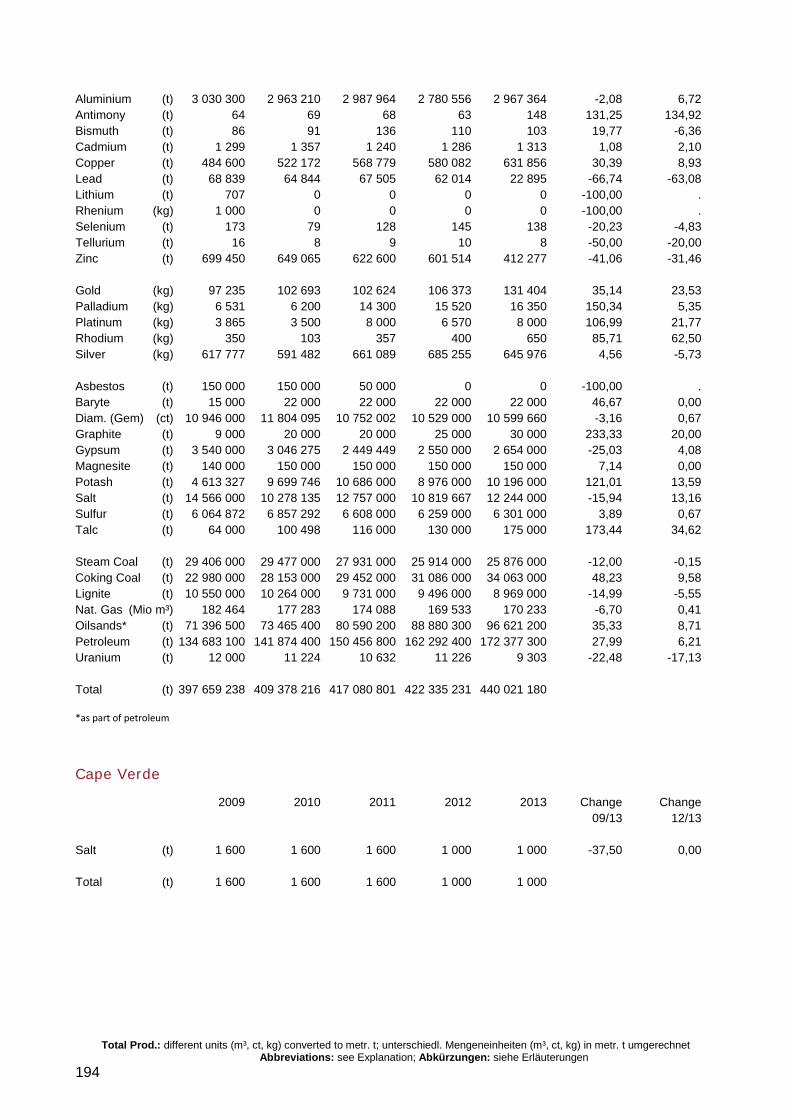
Total Prod.: different units (m³, ct, kg) converted to metr. t; unterschiedl. Mengeneinheiten (m³, ct, kg) in metr. t umgerechnet Abbreviations: see Explanation; Abkürzungen: siehe Erläuterungen
194
Aluminium (t) 3 030 300 2 963 210 2 987 964 2 780 556 2 967 364 -2,08 6,72 Antimony (t) 64 69 68 63 148 131,25 134,92 Bismuth (t) 86 91 136 110 103 19,77 -6,36 Cadmium (t) 1 299 1 357 1 240 1 286 1 313 1,08 2,10 Copper (t) 484 600 522 172 568 779 580 082 631 856 30,39 8,93 Lead (t) 68 839 64 844 67 505 62 014 22 895 -66,74 -63,08 Lithium (t) 707 0 0 0 0 -100,00 . Rhenium (kg) 1 000 0 0 0 0 -100,00 . Selenium (t) 173 79 128 145 138 -20,23 -4,83 Tellurium (t) 16 8 9 10 8 -50,00 -20,00 Zinc (t) 699 450 649 065 622 600 601 514 412 277 -41,06 -31,46 Gold (kg) 97 235 102 693 102 624 106 373 131 404 35,14 23,53 Palladium (kg) 6 531 6 200 14 300 15 520 16 350 150,34 5,35 Platinum (kg) 3 865 3 500 8 000 6 570 8 000 106,99 21,77 Rhodium (kg) 350 103 357 400 650 85,71 62,50 Silver (kg) 617 777 591 482 661 089 685 255 645 976 4,56 -5,73 Asbestos (t) 150 000 150 000 50 000 0 0 -100,00 . Baryte (t) 15 000 22 000 22 000 22 000 22 000 46,67 0,00 Diam. (Gem) (ct) 10 946 000 11 804 095 10 752 002 10 529 000 10 599 660 -3,16 0,67 Graphite (t) 9 000 20 000 20 000 25 000 30 000 233,33 20,00 Gypsum (t) 3 540 000 3 046 275 2 449 449 2 550 000 2 654 000 -25,03 4,08 Magnesite (t) 140 000 150 000 150 000 150 000 150 000 7,14 0,00 Potash (t) 4 613 327 9 699 746 10 686 000 8 976 000 10 196 000 121,01 13,59 Salt (t) 14 566 000 10 278 135 12 757 000 10 819 667 12 244 000 -15,94 13,16 Sulfur (t) 6 064 872 6 857 292 6 608 000 6 259 000 6 301 000 3,89 0,67 Talc (t) 64 000 100 498 116 000 130 000 175 000 173,44 34,62 Steam Coal (t) 29 406 000 29 477 000 27 931 000 25 914 000 25 876 000 -12,00 -0,15 Coking Coal (t) 22 980 000 28 153 000 29 452 000 31 086 000 34 063 000 48,23 9,58 Lignite (t) 10 550 000 10 264 000 9 731 000 9 496 000 8 969 000 -14,99 -5,55 Nat. Gas (Mio m³) 182 464 177 283 174 088 169 533 170 233 -6,70 0,41 Oilsands* (t) 71 396 500 73 465 400 80 590 200 88 880 300 96 621 200 35,33 8,71 Petroleum (t) 134 683 100 141 874 400 150 456 800 162 292 400 172 377 300 27,99 6,21 Uranium (t) 12 000 11 224 10 632 11 226 9 303 -22,48 -17,13 Total (t) 397 659 238 409 378 216 417 080 801 422 335 231 440 021 180 *as part of petroleum
Cape Verde
2009 2010 2011 2012 2013 Change Change 09/13 12/13 Salt (t) 1 600 1 600 1 600 1 000 1 000 -37,50 0,00 Total (t) 1 600 1 600 1 600 1 000 1 000
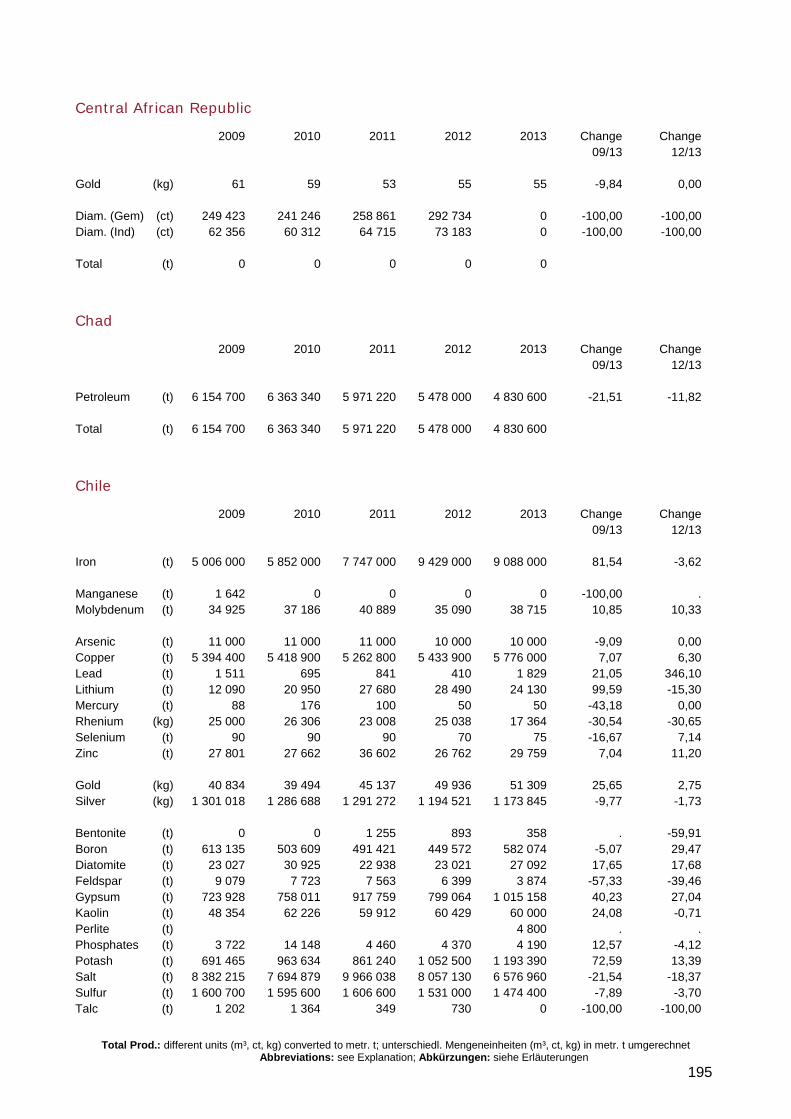
Total Prod.: different units (m³, ct, kg) converted to metr. t; unterschiedl. Mengeneinheiten (m³, ct, kg) in metr. t umgerechnet Abbreviations: see Explanation; Abkürzungen: siehe Erläuterungen
195
Central African Republic
2009 2010 2011 2012 2013 Change Change 09/13 12/13 Gold (kg) 61 59 53 55 55 -9,84 0,00 Diam. (Gem) (ct) 249 423 241 246 258 861 292 734 0 -100,00 -100,00 Diam. (Ind) (ct) 62 356 60 312 64 715 73 183 0 -100,00 -100,00 Total (t) 0 0 0 0 0
Chad
2009 2010 2011 2012 2013 Change Change 09/13 12/13 Petroleum (t) 6 154 700 6 363 340 5 971 220 5 478 000 4 830 600 -21,51 -11,82 Total (t) 6 154 700 6 363 340 5 971 220 5 478 000 4 830 600
Chile
2009 2010 2011 2012 2013 Change Change 09/13 12/13 Iron (t) 5 006 000 5 852 000 7 747 000 9 429 000 9 088 000 81,54 -3,62 Manganese (t) 1 642 0 0 0 0 -100,00 . Molybdenum (t) 34 925 37 186 40 889 35 090 38 715 10,85 10,33 Arsenic (t) 11 000 11 000 11 000 10 000 10 000 -9,09 0,00 Copper (t) 5 394 400 5 418 900 5 262 800 5 433 900 5 776 000 7,07 6,30 Lead (t) 1 511 695 841 410 1 829 21,05 346,10 Lithium (t) 12 090 20 950 27 680 28 490 24 130 99,59 -15,30 Mercury (t) 88 176 100 50 50 -43,18 0,00 Rhenium (kg) 25 000 26 306 23 008 25 038 17 364 -30,54 -30,65 Selenium (t) 90 90 90 70 75 -16,67 7,14 Zinc (t) 27 801 27 662 36 602 26 762 29 759 7,04 11,20 Gold (kg) 40 834 39 494 45 137 49 936 51 309 25,65 2,75 Silver (kg) 1 301 018 1 286 688 1 291 272 1 194 521 1 173 845 -9,77 -1,73 Bentonite (t) 0 0 1 255 893 358 . -59,91 Boron (t) 613 135 503 609 491 421 449 572 582 074 -5,07 29,47 Diatomite (t) 23 027 30 925 22 938 23 021 27 092 17,65 17,68 Feldspar (t) 9 079 7 723 7 563 6 399 3 874 -57,33 -39,46 Gypsum (t) 723 928 758 011 917 759 799 064 1 015 158 40,23 27,04 Kaolin (t) 48 354 62 226 59 912 60 429 60 000 24,08 -0,71 Perlite (t) 4 800 . . Phosphates (t) 3 722 14 148 4 460 4 370 4 190 12,57 -4,12 Potash (t) 691 465 963 634 861 240 1 052 500 1 193 390 72,59 13,39 Salt (t) 8 382 215 7 694 879 9 966 038 8 057 130 6 576 960 -21,54 -18,37 Sulfur (t) 1 600 700 1 595 600 1 606 600 1 531 000 1 474 400 -7,89 -3,70 Talc (t) 1 202 1 364 349 730 0 -100,00 -100,00
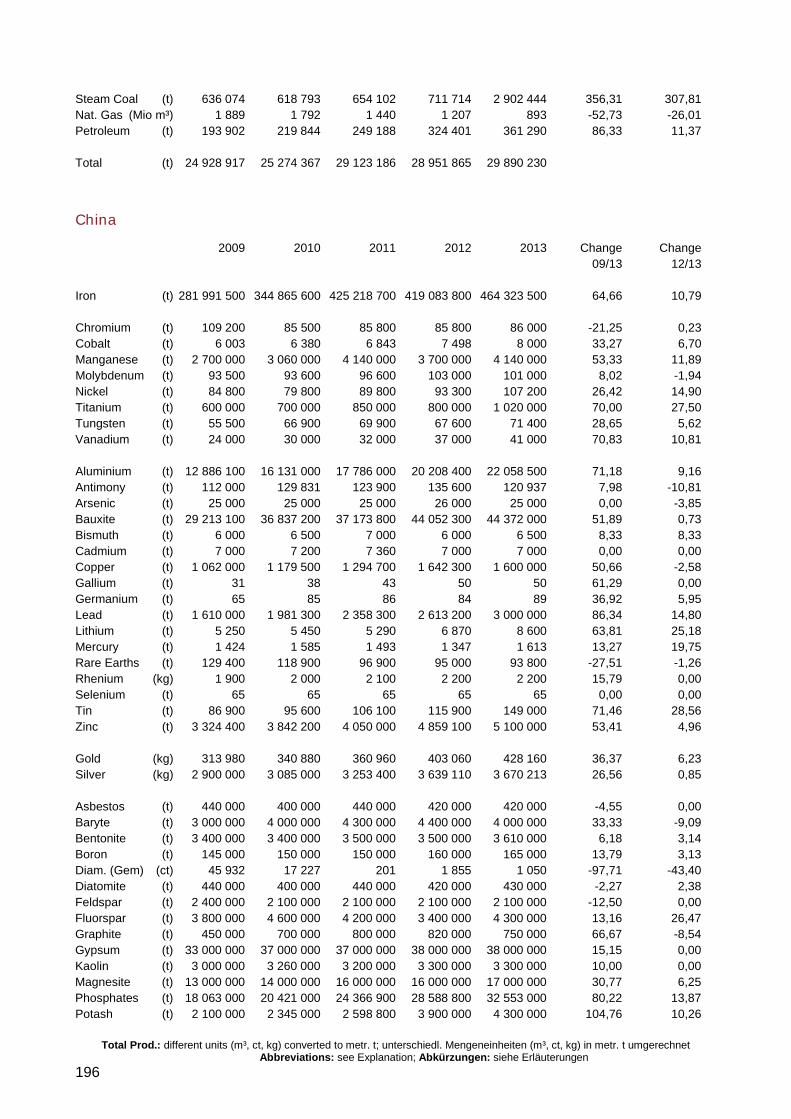
Total Prod.: different units (m³, ct, kg) converted to metr. t; unterschiedl. Mengeneinheiten (m³, ct, kg) in metr. t umgerechnet Abbreviations: see Explanation; Abkürzungen: siehe Erläuterungen
196
Steam Coal (t) 636 074 618 793 654 102 711 714 2 902 444 356,31 307,81 Nat. Gas (Mio m³) 1 889 1 792 1 440 1 207 893 -52,73 -26,01 Petroleum (t) 193 902 219 844 249 188 324 401 361 290 86,33 11,37 Total (t) 24 928 917 25 274 367 29 123 186 28 951 865 29 890 230
China
2009 2010 2011 2012 2013 Change Change 09/13 12/13 Iron (t) 281 991 500 344 865 600 425 218 700 419 083 800 464 323 500 64,66 10,79 Chromium (t) 109 200 85 500 85 800 85 800 86 000 -21,25 0,23 Cobalt (t) 6 003 6 380 6 843 7 498 8 000 33,27 6,70 Manganese (t) 2 700 000 3 060 000 4 140 000 3 700 000 4 140 000 53,33 11,89 Molybdenum (t) 93 500 93 600 96 600 103 000 101 000 8,02 -1,94 Nickel (t) 84 800 79 800 89 800 93 300 107 200 26,42 14,90 Titanium (t) 600 000 700 000 850 000 800 000 1 020 000 70,00 27,50 Tungsten (t) 55 500 66 900 69 900 67 600 71 400 28,65 5,62 Vanadium (t) 24 000 30 000 32 000 37 000 41 000 70,83 10,81 Aluminium (t) 12 886 100 16 131 000 17 786 000 20 208 400 22 058 500 71,18 9,16 Antimony (t) 112 000 129 831 123 900 135 600 120 937 7,98 -10,81 Arsenic (t) 25 000 25 000 25 000 26 000 25 000 0,00 -3,85 Bauxite (t) 29 213 100 36 837 200 37 173 800 44 052 300 44 372 000 51,89 0,73 Bismuth (t) 6 000 6 500 7 000 6 000 6 500 8,33 8,33 Cadmium (t) 7 000 7 200 7 360 7 000 7 000 0,00 0,00 Copper (t) 1 062 000 1 179 500 1 294 700 1 642 300 1 600 000 50,66 -2,58 Gallium (t) 31 38 43 50 50 61,29 0,00 Germanium (t) 65 85 86 84 89 36,92 5,95 Lead (t) 1 610 000 1 981 300 2 358 300 2 613 200 3 000 000 86,34 14,80 Lithium (t) 5 250 5 450 5 290 6 870 8 600 63,81 25,18 Mercury (t) 1 424 1 585 1 493 1 347 1 613 13,27 19,75 Rare Earths (t) 129 400 118 900 96 900 95 000 93 800 -27,51 -1,26 Rhenium (kg) 1 900 2 000 2 100 2 200 2 200 15,79 0,00 Selenium (t) 65 65 65 65 65 0,00 0,00 Tin (t) 86 900 95 600 106 100 115 900 149 000 71,46 28,56 Zinc (t) 3 324 400 3 842 200 4 050 000 4 859 100 5 100 000 53,41 4,96 Gold (kg) 313 980 340 880 360 960 403 060 428 160 36,37 6,23 Silver (kg) 2 900 000 3 085 000 3 253 400 3 639 110 3 670 213 26,56 0,85 Asbestos (t) 440 000 400 000 440 000 420 000 420 000 -4,55 0,00 Baryte (t) 3 000 000 4 000 000 4 300 000 4 400 000 4 000 000 33,33 -9,09 Bentonite (t) 3 400 000 3 400 000 3 500 000 3 500 000 3 610 000 6,18 3,14 Boron (t) 145 000 150 000 150 000 160 000 165 000 13,79 3,13 Diam. (Gem) (ct) 45 932 17 227 201 1 855 1 050 -97,71 -43,40 Diatomite (t) 440 000 400 000 440 000 420 000 430 000 -2,27 2,38 Feldspar (t) 2 400 000 2 100 000 2 100 000 2 100 000 2 100 000 -12,50 0,00 Fluorspar (t) 3 800 000 4 600 000 4 200 000 3 400 000 4 300 000 13,16 26,47 Graphite (t) 450 000 700 000 800 000 820 000 750 000 66,67 -8,54 Gypsum (t) 33 000 000 37 000 000 37 000 000 38 000 000 38 000 000 15,15 0,00 Kaolin (t) 3 000 000 3 260 000 3 200 000 3 300 000 3 300 000 10,00 0,00 Magnesite (t) 13 000 000 14 000 000 16 000 000 16 000 000 17 000 000 30,77 6,25 Phosphates (t) 18 063 000 20 421 000 24 366 900 28 588 800 32 553 000 80,22 13,87 Potash (t) 2 100 000 2 345 000 2 598 800 3 900 000 4 300 000 104,76 10,26
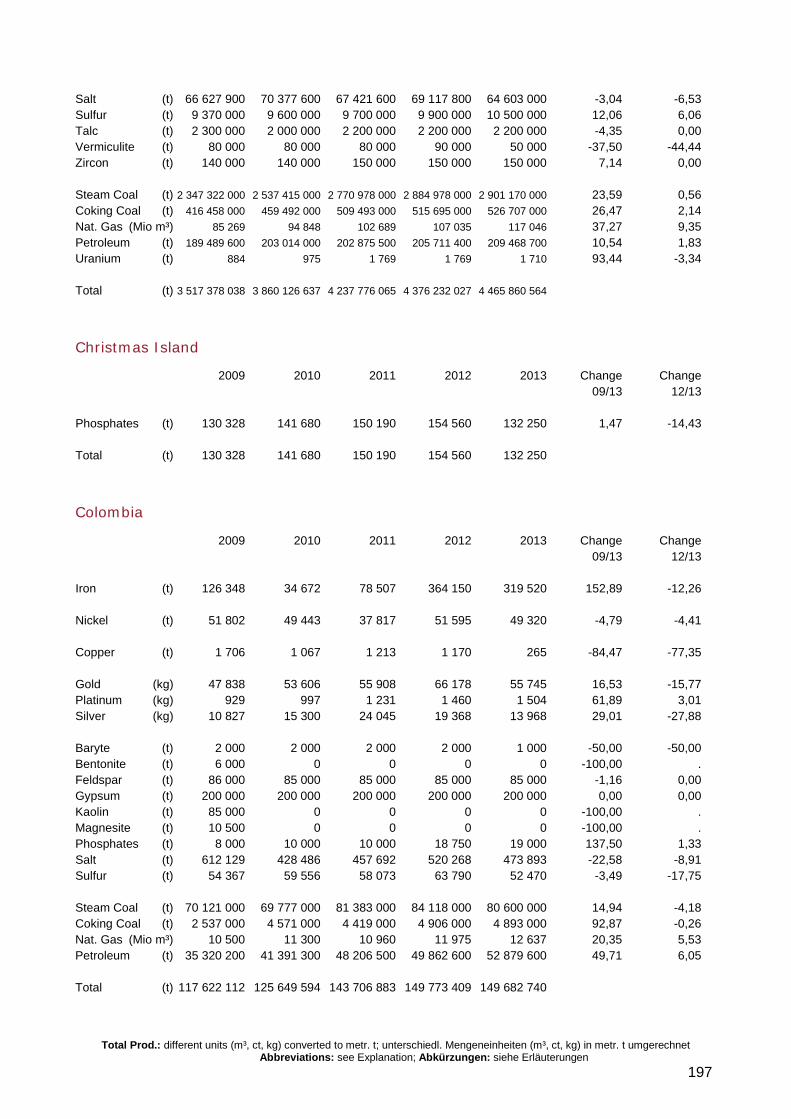
Total Prod.: different units (m³, ct, kg) converted to metr. t; unterschiedl. Mengeneinheiten (m³, ct, kg) in metr. t umgerechnet Abbreviations: see Explanation; Abkürzungen: siehe Erläuterungen
197
Salt (t) 66 627 900 70 377 600 67 421 600 69 117 800 64 603 000 -3,04 -6,53 Sulfur (t) 9 370 000 9 600 000 9 700 000 9 900 000 10 500 000 12,06 6,06 Talc (t) 2 300 000 2 000 000 2 200 000 2 200 000 2 200 000 -4,35 0,00 Vermiculite (t) 80 000 80 000 80 000 90 000 50 000 -37,50 -44,44 Zircon (t) 140 000 140 000 150 000 150 000 150 000 7,14 0,00 Steam Coal (t) 2 347 322 000 2 537 415 000 2 770 978 000 2 884 978 000 2 901 170 000 23,59 0,56 Coking Coal (t) 416 458 000 459 492 000 509 493 000 515 695 000 526 707 000 26,47 2,14 Nat. Gas (Mio m³) 85 269 94 848 102 689 107 035 117 046 37,27 9,35 Petroleum (t) 189 489 600 203 014 000 202 875 500 205 711 400 209 468 700 10,54 1,83 Uranium (t) 884 975 1 769 1 769 1 710 93,44 -3,34 Total (t) 3 517 378 038 3 860 126 637 4 237 776 065 4 376 232 027 4 465 860 564
Christmas Island
2009 2010 2011 2012 2013 Change Change 09/13 12/13 Phosphates (t) 130 328 141 680 150 190 154 560 132 250 1,47 -14,43 Total (t) 130 328 141 680 150 190 154 560 132 250
Colombia
2009 2010 2011 2012 2013 Change Change 09/13 12/13 Iron (t) 126 348 34 672 78 507 364 150 319 520 152,89 -12,26 Nickel (t) 51 802 49 443 37 817 51 595 49 320 -4,79 -4,41 Copper (t) 1 706 1 067 1 213 1 170 265 -84,47 -77,35 Gold (kg) 47 838 53 606 55 908 66 178 55 745 16,53 -15,77 Platinum (kg) 929 997 1 231 1 460 1 504 61,89 3,01 Silver (kg) 10 827 15 300 24 045 19 368 13 968 29,01 -27,88 Baryte (t) 2 000 2 000 2 000 2 000 1 000 -50,00 -50,00 Bentonite (t) 6 000 0 0 0 0 -100,00 . Feldspar (t) 86 000 85 000 85 000 85 000 85 000 -1,16 0,00 Gypsum (t) 200 000 200 000 200 000 200 000 200 000 0,00 0,00 Kaolin (t) 85 000 0 0 0 0 -100,00 . Magnesite (t) 10 500 0 0 0 0 -100,00 . Phosphates (t) 8 000 10 000 10 000 18 750 19 000 137,50 1,33 Salt (t) 612 129 428 486 457 692 520 268 473 893 -22,58 -8,91 Sulfur (t) 54 367 59 556 58 073 63 790 52 470 -3,49 -17,75 Steam Coal (t) 70 121 000 69 777 000 81 383 000 84 118 000 80 600 000 14,94 -4,18 Coking Coal (t) 2 537 000 4 571 000 4 419 000 4 906 000 4 893 000 92,87 -0,26 Nat. Gas (Mio m³) 10 500 11 300 10 960 11 975 12 637 20,35 5,53 Petroleum (t) 35 320 200 41 391 300 48 206 500 49 862 600 52 879 600 49,71 6,05 Total (t) 117 622 112 125 649 594 143 706 883 149 773 409 149 682 740
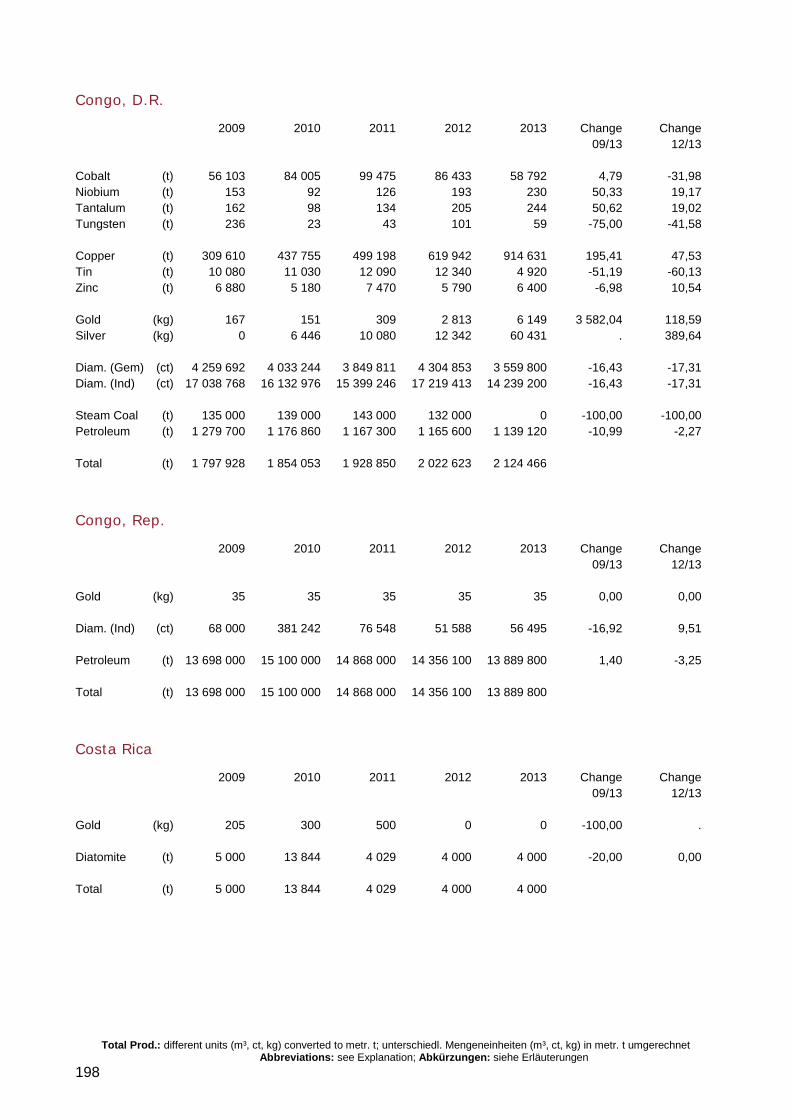
Total Prod.: different units (m³, ct, kg) converted to metr. t; unterschiedl. Mengeneinheiten (m³, ct, kg) in metr. t umgerechnet Abbreviations: see Explanation; Abkürzungen: siehe Erläuterungen
198
Congo, D.R.
2009 2010 2011 2012 2013 Change Change 09/13 12/13 Cobalt (t) 56 103 84 005 99 475 86 433 58 792 4,79 -31,98 Niobium (t) 153 92 126 193 230 50,33 19,17 Tantalum (t) 162 98 134 205 244 50,62 19,02 Tungsten (t) 236 23 43 101 59 -75,00 -41,58 Copper (t) 309 610 437 755 499 198 619 942 914 631 195,41 47,53 Tin (t) 10 080 11 030 12 090 12 340 4 920 -51,19 -60,13 Zinc (t) 6 880 5 180 7 470 5 790 6 400 -6,98 10,54 Gold (kg) 167 151 309 2 813 6 149 3 582,04 118,59 Silver (kg) 0 6 446 10 080 12 342 60 431 . 389,64 Diam. (Gem) (ct) 4 259 692 4 033 244 3 849 811 4 304 853 3 559 800 -16,43 -17,31 Diam. (Ind) (ct) 17 038 768 16 132 976 15 399 246 17 219 413 14 239 200 -16,43 -17,31 Steam Coal (t) 135 000 139 000 143 000 132 000 0 -100,00 -100,00 Petroleum (t) 1 279 700 1 176 860 1 167 300 1 165 600 1 139 120 -10,99 -2,27 Total (t) 1 797 928 1 854 053 1 928 850 2 022 623 2 124 466
Congo, Rep.
2009 2010 2011 2012 2013 Change Change 09/13 12/13 Gold (kg) 35 35 35 35 35 0,00 0,00 Diam. (Ind) (ct) 68 000 381 242 76 548 51 588 56 495 -16,92 9,51 Petroleum (t) 13 698 000 15 100 000 14 868 000 14 356 100 13 889 800 1,40 -3,25 Total (t) 13 698 000 15 100 000 14 868 000 14 356 100 13 889 800
Costa Rica
2009 2010 2011 2012 2013 Change Change 09/13 12/13 Gold (kg) 205 300 500 0 0 -100,00 . Diatomite (t) 5 000 13 844 4 029 4 000 4 000 -20,00 0,00 Total (t) 5 000 13 844 4 029 4 000 4 000
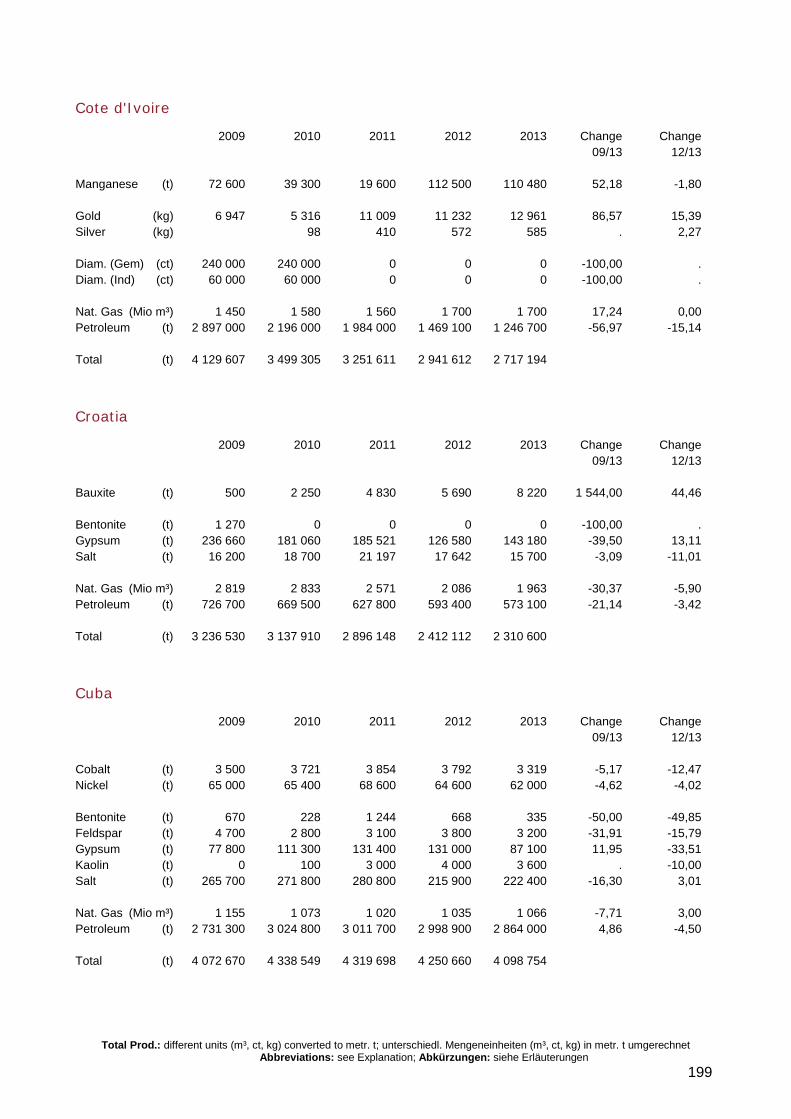
Total Prod.: different units (m³, ct, kg) converted to metr. t; unterschiedl. Mengeneinheiten (m³, ct, kg) in metr. t umgerechnet Abbreviations: see Explanation; Abkürzungen: siehe Erläuterungen
199
Cote d'Ivoire
2009 2010 2011 2012 2013 Change Change 09/13 12/13 Manganese (t) 72 600 39 300 19 600 112 500 110 480 52,18 -1,80 Gold (kg) 6 947 5 316 11 009 11 232 12 961 86,57 15,39 Silver (kg) 98 410 572 585 . 2,27 Diam. (Gem) (ct) 240 000 240 000 0 0 0 -100,00 . Diam. (Ind) (ct) 60 000 60 000 0 0 0 -100,00 . Nat. Gas (Mio m³) 1 450 1 580 1 560 1 700 1 700 17,24 0,00 Petroleum (t) 2 897 000 2 196 000 1 984 000 1 469 100 1 246 700 -56,97 -15,14 Total (t) 4 129 607 3 499 305 3 251 611 2 941 612 2 717 194
Croatia
2009 2010 2011 2012 2013 Change Change 09/13 12/13 Bauxite (t) 500 2 250 4 830 5 690 8 220 1 544,00 44,46 Bentonite (t) 1 270 0 0 0 0 -100,00 . Gypsum (t) 236 660 181 060 185 521 126 580 143 180 -39,50 13,11 Salt (t) 16 200 18 700 21 197 17 642 15 700 -3,09 -11,01 Nat. Gas (Mio m³) 2 819 2 833 2 571 2 086 1 963 -30,37 -5,90 Petroleum (t) 726 700 669 500 627 800 593 400 573 100 -21,14 -3,42 Total (t) 3 236 530 3 137 910 2 896 148 2 412 112 2 310 600
Cuba
2009 2010 2011 2012 2013 Change Change 09/13 12/13 Cobalt (t) 3 500 3 721 3 854 3 792 3 319 -5,17 -12,47 Nickel (t) 65 000 65 400 68 600 64 600 62 000 -4,62 -4,02 Bentonite (t) 670 228 1 244 668 335 -50,00 -49,85 Feldspar (t) 4 700 2 800 3 100 3 800 3 200 -31,91 -15,79 Gypsum (t) 77 800 111 300 131 400 131 000 87 100 11,95 -33,51 Kaolin (t) 0 100 3 000 4 000 3 600 . -10,00 Salt (t) 265 700 271 800 280 800 215 900 222 400 -16,30 3,01 Nat. Gas (Mio m³) 1 155 1 073 1 020 1 035 1 066 -7,71 3,00 Petroleum (t) 2 731 300 3 024 800 3 011 700 2 998 900 2 864 000 4,86 -4,50 Total (t) 4 072 670 4 338 549 4 319 698 4 250 660 4 098 754
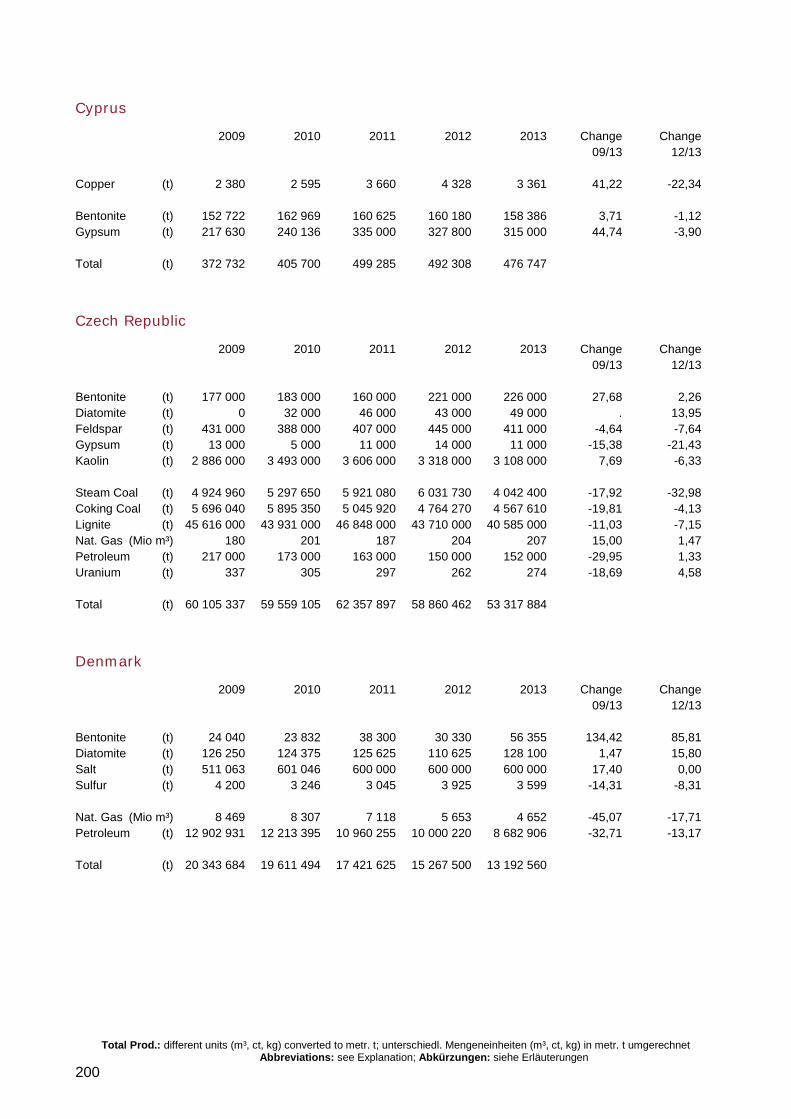
Total Prod.: different units (m³, ct, kg) converted to metr. t; unterschiedl. Mengeneinheiten (m³, ct, kg) in metr. t umgerechnet Abbreviations: see Explanation; Abkürzungen: siehe Erläuterungen
200
Cyprus
2009 2010 2011 2012 2013 Change Change 09/13 12/13 Copper (t) 2 380 2 595 3 660 4 328 3 361 41,22 -22,34 Bentonite (t) 152 722 162 969 160 625 160 180 158 386 3,71 -1,12 Gypsum (t) 217 630 240 136 335 000 327 800 315 000 44,74 -3,90 Total (t) 372 732 405 700 499 285 492 308 476 747
Czech Republic
2009 2010 2011 2012 2013 Change Change 09/13 12/13 Bentonite (t) 177 000 183 000 160 000 221 000 226 000 27,68 2,26 Diatomite (t) 0 32 000 46 000 43 000 49 000 . 13,95 Feldspar (t) 431 000 388 000 407 000 445 000 411 000 -4,64 -7,64 Gypsum (t) 13 000 5 000 11 000 14 000 11 000 -15,38 -21,43 Kaolin (t) 2 886 000 3 493 000 3 606 000 3 318 000 3 108 000 7,69 -6,33 Steam Coal (t) 4 924 960 5 297 650 5 921 080 6 031 730 4 042 400 -17,92 -32,98 Coking Coal (t) 5 696 040 5 895 350 5 045 920 4 764 270 4 567 610 -19,81 -4,13 Lignite (t) 45 616 000 43 931 000 46 848 000 43 710 000 40 585 000 -11,03 -7,15 Nat. Gas (Mio m³) 180 201 187 204 207 15,00 1,47 Petroleum (t) 217 000 173 000 163 000 150 000 152 000 -29,95 1,33 Uranium (t) 337 305 297 262 274 -18,69 4,58 Total (t) 60 105 337 59 559 105 62 357 897 58 860 462 53 317 884
Denmark
2009 2010 2011 2012 2013 Change Change 09/13 12/13 Bentonite (t) 24 040 23 832 38 300 30 330 56 355 134,42 85,81 Diatomite (t) 126 250 124 375 125 625 110 625 128 100 1,47 15,80 Salt (t) 511 063 601 046 600 000 600 000 600 000 17,40 0,00 Sulfur (t) 4 200 3 246 3 045 3 925 3 599 -14,31 -8,31 Nat. Gas (Mio m³) 8 469 8 307 7 118 5 653 4 652 -45,07 -17,71 Petroleum (t) 12 902 931 12 213 395 10 960 255 10 000 220 8 682 906 -32,71 -13,17 Total (t) 20 343 684 19 611 494 17 421 625 15 267 500 13 192 560
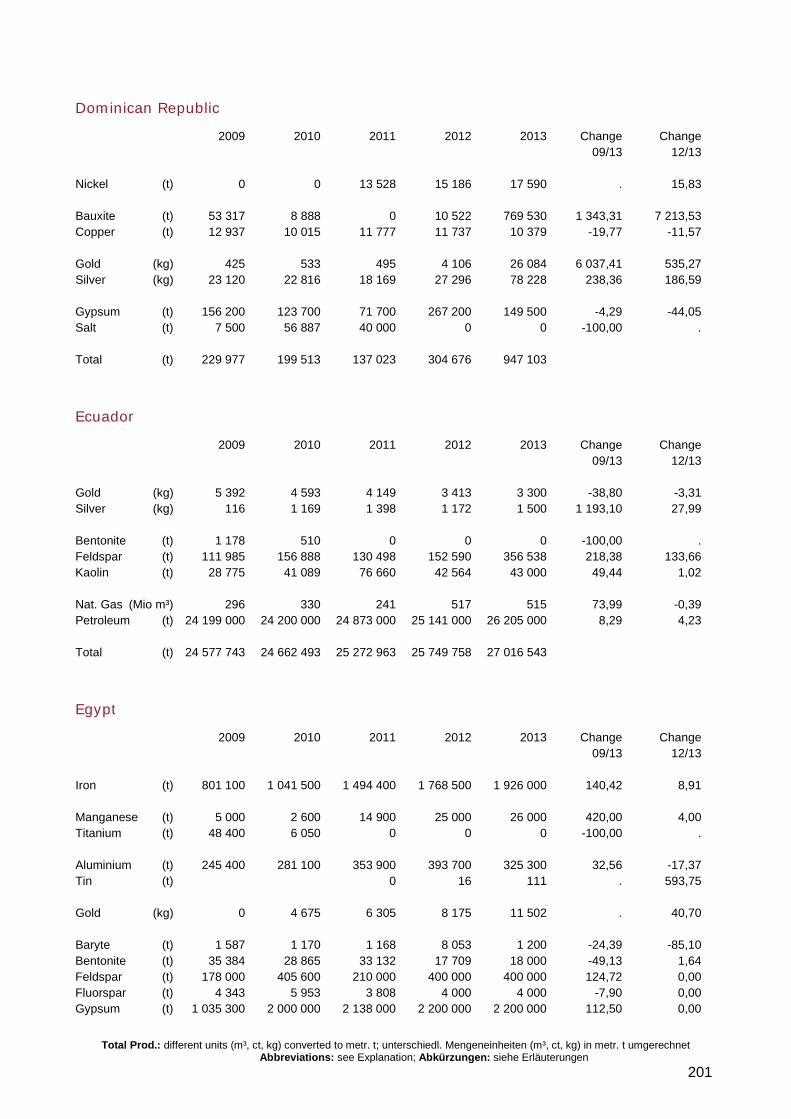
Total Prod.: different units (m³, ct, kg) converted to metr. t; unterschiedl. Mengeneinheiten (m³, ct, kg) in metr. t umgerechnet Abbreviations: see Explanation; Abkürzungen: siehe Erläuterungen
201
Dominican Republic
2009 2010 2011 2012 2013 Change Change 09/13 12/13 Nickel (t) 0 0 13 528 15 186 17 590 . 15,83 Bauxite (t) 53 317 8 888 0 10 522 769 530 1 343,31 7 213,53 Copper (t) 12 937 10 015 11 777 11 737 10 379 -19,77 -11,57 Gold (kg) 425 533 495 4 106 26 084 6 037,41 535,27 Silver (kg) 23 120 22 816 18 169 27 296 78 228 238,36 186,59 Gypsum (t) 156 200 123 700 71 700 267 200 149 500 -4,29 -44,05 Salt (t) 7 500 56 887 40 000 0 0 -100,00 . Total (t) 229 977 199 513 137 023 304 676 947 103
Ecuador
2009 2010 2011 2012 2013 Change Change 09/13 12/13 Gold (kg) 5 392 4 593 4 149 3 413 3 300 -38,80 -3,31 Silver (kg) 116 1 169 1 398 1 172 1 500 1 193,10 27,99 Bentonite (t) 1 178 510 0 0 0 -100,00 . Feldspar (t) 111 985 156 888 130 498 152 590 356 538 218,38 133,66 Kaolin (t) 28 775 41 089 76 660 42 564 43 000 49,44 1,02 Nat. Gas (Mio m³) 296 330 241 517 515 73,99 -0,39 Petroleum (t) 24 199 000 24 200 000 24 873 000 25 141 000 26 205 000 8,29 4,23 Total (t) 24 577 743 24 662 493 25 272 963 25 749 758 27 016 543
Egypt
2009 2010 2011 2012 2013 Change Change 09/13 12/13 Iron (t) 801 100 1 041 500 1 494 400 1 768 500 1 926 000 140,42 8,91 Manganese (t) 5 000 2 600 14 900 25 000 26 000 420,00 4,00 Titanium (t) 48 400 6 050 0 0 0 -100,00 . Aluminium (t) 245 400 281 100 353 900 393 700 325 300 32,56 -17,37 Tin (t) 0 16 111 . 593,75 Gold (kg) 0 4 675 6 305 8 175 11 502 . 40,70 Baryte (t) 1 587 1 170 1 168 8 053 1 200 -24,39 -85,10 Bentonite (t) 35 384 28 865 33 132 17 709 18 000 -49,13 1,64 Feldspar (t) 178 000 405 600 210 000 400 000 400 000 124,72 0,00 Fluorspar (t) 4 343 5 953 3 808 4 000 4 000 -7,90 0,00 Gypsum (t) 1 035 300 2 000 000 2 138 000 2 200 000 2 200 000 112,50 0,00
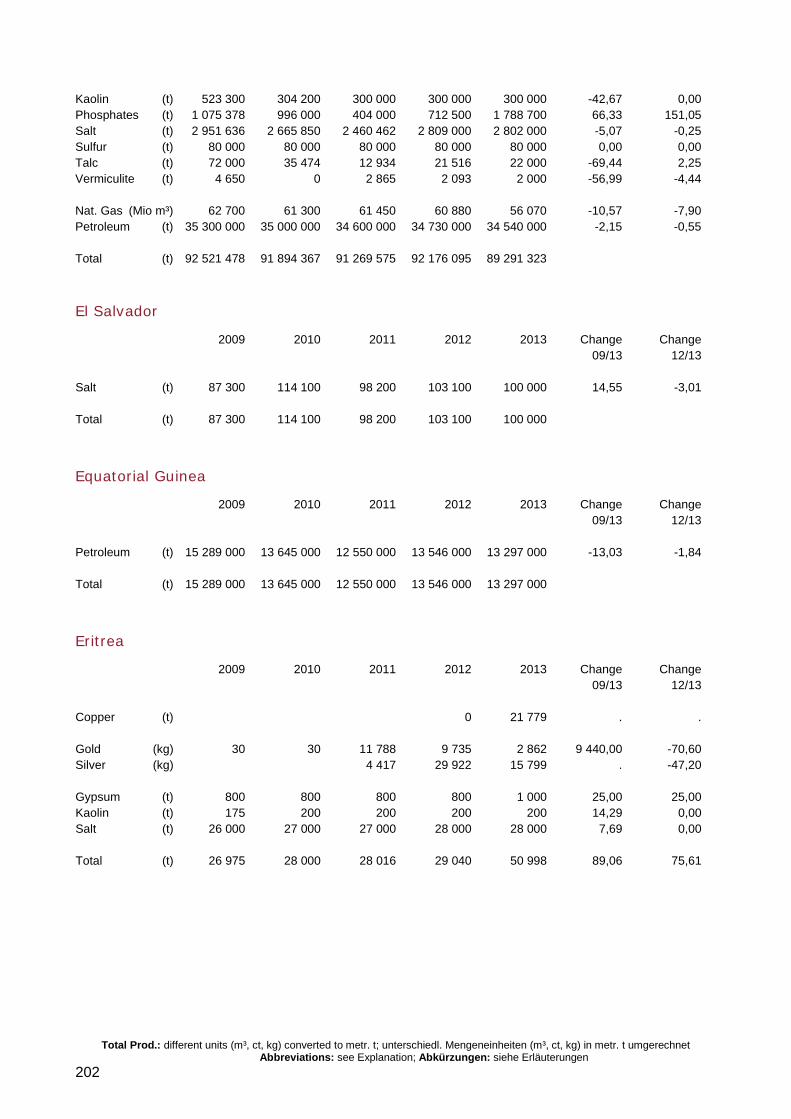
Total Prod.: different units (m³, ct, kg) converted to metr. t; unterschiedl. Mengeneinheiten (m³, ct, kg) in metr. t umgerechnet Abbreviations: see Explanation; Abkürzungen: siehe Erläuterungen
202
Kaolin (t) 523 300 304 200 300 000 300 000 300 000 -42,67 0,00 Phosphates (t) 1 075 378 996 000 404 000 712 500 1 788 700 66,33 151,05 Salt (t) 2 951 636 2 665 850 2 460 462 2 809 000 2 802 000 -5,07 -0,25 Sulfur (t) 80 000 80 000 80 000 80 000 80 000 0,00 0,00 Talc (t) 72 000 35 474 12 934 21 516 22 000 -69,44 2,25 Vermiculite (t) 4 650 0 2 865 2 093 2 000 -56,99 -4,44 Nat. Gas (Mio m³) 62 700 61 300 61 450 60 880 56 070 -10,57 -7,90 Petroleum (t) 35 300 000 35 000 000 34 600 000 34 730 000 34 540 000 -2,15 -0,55 Total (t) 92 521 478 91 894 367 91 269 575 92 176 095 89 291 323
El Salvador
2009 2010 2011 2012 2013 Change Change 09/13 12/13 Salt (t) 87 300 114 100 98 200 103 100 100 000 14,55 -3,01 Total (t) 87 300 114 100 98 200 103 100 100 000
Equatorial Guinea
2009 2010 2011 2012 2013 Change Change 09/13 12/13 Petroleum (t) 15 289 000 13 645 000 12 550 000 13 546 000 13 297 000 -13,03 -1,84 Total (t) 15 289 000 13 645 000 12 550 000 13 546 000 13 297 000
Eritrea
2009 2010 2011 2012 2013 Change Change 09/13 12/13 Copper (t) 0 21 779 . . Gold (kg) 30 30 11 788 9 735 2 862 9 440,00 -70,60 Silver (kg) 4 417 29 922 15 799 . -47,20 Gypsum (t) 800 800 800 800 1 000 25,00 25,00 Kaolin (t) 175 200 200 200 200 14,29 0,00 Salt (t) 26 000 27 000 27 000 28 000 28 000 7,69 0,00 Total (t) 26 975 28 000 28 016 29 040 50 998 89,06 75,61
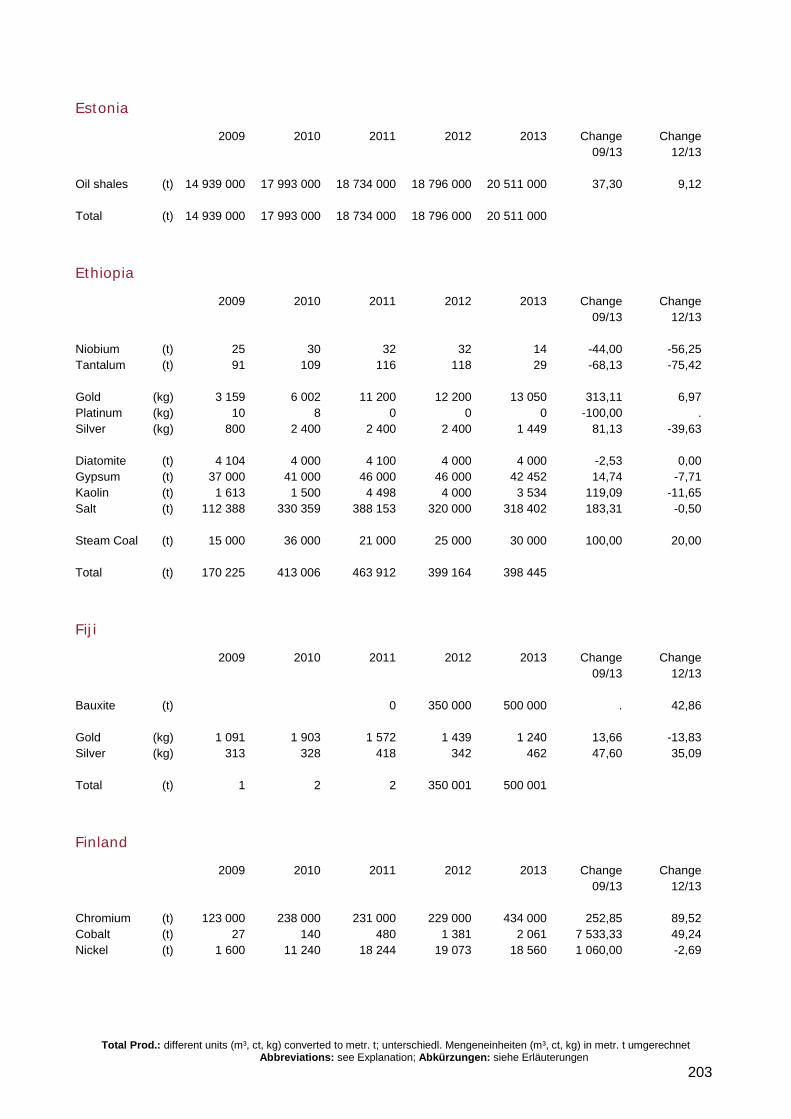
Total Prod.: different units (m³, ct, kg) converted to metr. t; unterschiedl. Mengeneinheiten (m³, ct, kg) in metr. t umgerechnet Abbreviations: see Explanation; Abkürzungen: siehe Erläuterungen
203
Estonia
2009 2010 2011 2012 2013 Change Change 09/13 12/13 Oil shales (t) 14 939 000 17 993 000 18 734 000 18 796 000 20 511 000 37,30 9,12 Total (t) 14 939 000 17 993 000 18 734 000 18 796 000 20 511 000
Ethiopia
2009 2010 2011 2012 2013 Change Change 09/13 12/13 Niobium (t) 25 30 32 32 14 -44,00 -56,25 Tantalum (t) 91 109 116 118 29 -68,13 -75,42 Gold (kg) 3 159 6 002 11 200 12 200 13 050 313,11 6,97 Platinum (kg) 10 8 0 0 0 -100,00 . Silver (kg) 800 2 400 2 400 2 400 1 449 81,13 -39,63 Diatomite (t) 4 104 4 000 4 100 4 000 4 000 -2,53 0,00 Gypsum (t) 37 000 41 000 46 000 46 000 42 452 14,74 -7,71 Kaolin (t) 1 613 1 500 4 498 4 000 3 534 119,09 -11,65 Salt (t) 112 388 330 359 388 153 320 000 318 402 183,31 -0,50 Steam Coal (t) 15 000 36 000 21 000 25 000 30 000 100,00 20,00 Total (t) 170 225 413 006 463 912 399 164 398 445
Fiji
2009 2010 2011 2012 2013 Change Change 09/13 12/13 Bauxite (t) 0 350 000 500 000 . 42,86 Gold (kg) 1 091 1 903 1 572 1 439 1 240 13,66 -13,83 Silver (kg) 313 328 418 342 462 47,60 35,09 Total (t) 1 2 2 350 001 500 001
Finland
2009 2010 2011 2012 2013 Change Change 09/13 12/13 Chromium (t) 123 000 238 000 231 000 229 000 434 000 252,85 89,52 Cobalt (t) 27 140 480 1 381 2 061 7 533,33 49,24 Nickel (t) 1 600 11 240 18 244 19 073 18 560 1 060,00 -2,69
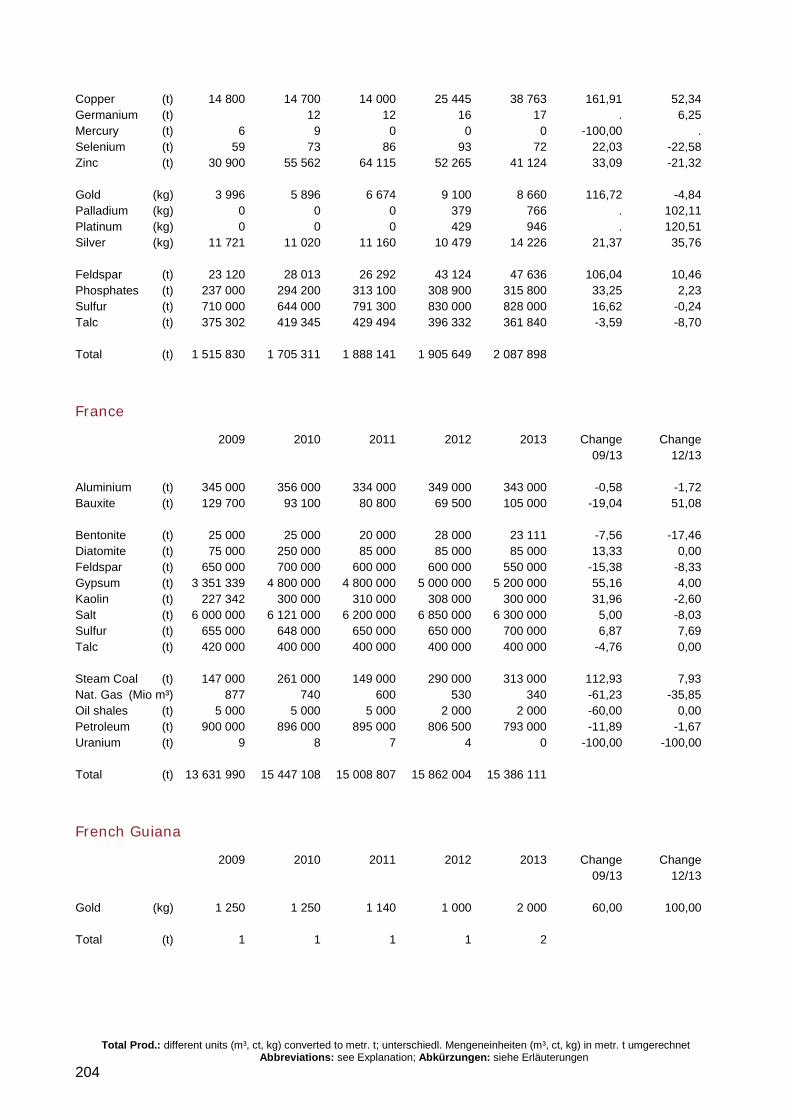
Total Prod.: different units (m³, ct, kg) converted to metr. t; unterschiedl. Mengeneinheiten (m³, ct, kg) in metr. t umgerechnet Abbreviations: see Explanation; Abkürzungen: siehe Erläuterungen
204
Copper (t) 14 800 14 700 14 000 25 445 38 763 161,91 52,34 Germanium (t) 12 12 16 17 . 6,25 Mercury (t) 6 9 0 0 0 -100,00 . Selenium (t) 59 73 86 93 72 22,03 -22,58 Zinc (t) 30 900 55 562 64 115 52 265 41 124 33,09 -21,32 Gold (kg) 3 996 5 896 6 674 9 100 8 660 116,72 -4,84 Palladium (kg) 0 0 0 379 766 . 102,11 Platinum (kg) 0 0 0 429 946 . 120,51 Silver (kg) 11 721 11 020 11 160 10 479 14 226 21,37 35,76 Feldspar (t) 23 120 28 013 26 292 43 124 47 636 106,04 10,46 Phosphates (t) 237 000 294 200 313 100 308 900 315 800 33,25 2,23 Sulfur (t) 710 000 644 000 791 300 830 000 828 000 16,62 -0,24 Talc (t) 375 302 419 345 429 494 396 332 361 840 -3,59 -8,70 Total (t) 1 515 830 1 705 311 1 888 141 1 905 649 2 087 898
France
2009 2010 2011 2012 2013 Change Change 09/13 12/13 Aluminium (t) 345 000 356 000 334 000 349 000 343 000 -0,58 -1,72 Bauxite (t) 129 700 93 100 80 800 69 500 105 000 -19,04 51,08 Bentonite (t) 25 000 25 000 20 000 28 000 23 111 -7,56 -17,46 Diatomite (t) 75 000 250 000 85 000 85 000 85 000 13,33 0,00 Feldspar (t) 650 000 700 000 600 000 600 000 550 000 -15,38 -8,33 Gypsum (t) 3 351 339 4 800 000 4 800 000 5 000 000 5 200 000 55,16 4,00 Kaolin (t) 227 342 300 000 310 000 308 000 300 000 31,96 -2,60 Salt (t) 6 000 000 6 121 000 6 200 000 6 850 000 6 300 000 5,00 -8,03 Sulfur (t) 655 000 648 000 650 000 650 000 700 000 6,87 7,69 Talc (t) 420 000 400 000 400 000 400 000 400 000 -4,76 0,00 Steam Coal (t) 147 000 261 000 149 000 290 000 313 000 112,93 7,93 Nat. Gas (Mio m³) 877 740 600 530 340 -61,23 -35,85 Oil shales (t) 5 000 5 000 5 000 2 000 2 000 -60,00 0,00 Petroleum (t) 900 000 896 000 895 000 806 500 793 000 -11,89 -1,67 Uranium (t) 9 8 7 4 0 -100,00 -100,00 Total (t) 13 631 990 15 447 108 15 008 807 15 862 004 15 386 111
French Guiana
2009 2010 2011 2012 2013 Change Change 09/13 12/13 Gold (kg) 1 250 1 250 1 140 1 000 2 000 60,00 100,00 Total (t) 1 1 1 1 2
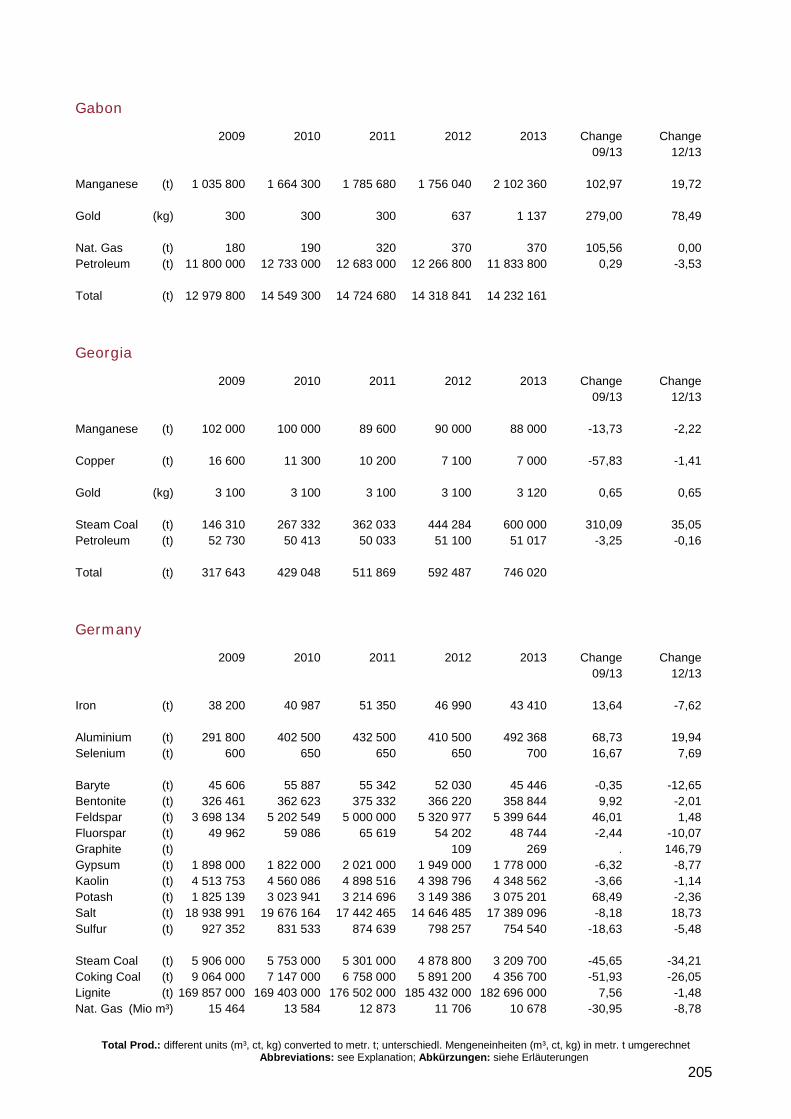
Total Prod.: different units (m³, ct, kg) converted to metr. t; unterschiedl. Mengeneinheiten (m³, ct, kg) in metr. t umgerechnet Abbreviations: see Explanation; Abkürzungen: siehe Erläuterungen
205
Gabon
2009 2010 2011 2012 2013 Change Change 09/13 12/13 Manganese (t) 1 035 800 1 664 300 1 785 680 1 756 040 2 102 360 102,97 19,72 Gold (kg) 300 300 300 637 1 137 279,00 78,49 Nat. Gas (t) 180 190 320 370 370 105,56 0,00 Petroleum (t) 11 800 000 12 733 000 12 683 000 12 266 800 11 833 800 0,29 -3,53 Total (t) 12 979 800 14 549 300 14 724 680 14 318 841 14 232 161
Georgia
2009 2010 2011 2012 2013 Change Change 09/13 12/13 Manganese (t) 102 000 100 000 89 600 90 000 88 000 -13,73 -2,22 Copper (t) 16 600 11 300 10 200 7 100 7 000 -57,83 -1,41 Gold (kg) 3 100 3 100 3 100 3 100 3 120 0,65 0,65 Steam Coal (t) 146 310 267 332 362 033 444 284 600 000 310,09 35,05 Petroleum (t) 52 730 50 413 50 033 51 100 51 017 -3,25 -0,16 Total (t) 317 643 429 048 511 869 592 487 746 020
Germany
2009 2010 2011 2012 2013 Change Change 09/13 12/13 Iron (t) 38 200 40 987 51 350 46 990 43 410 13,64 -7,62 Aluminium (t) 291 800 402 500 432 500 410 500 492 368 68,73 19,94 Selenium (t) 600 650 650 650 700 16,67 7,69 Baryte (t) 45 606 55 887 55 342 52 030 45 446 -0,35 -12,65 Bentonite (t) 326 461 362 623 375 332 366 220 358 844 9,92 -2,01 Feldspar (t) 3 698 134 5 202 549 5 000 000 5 320 977 5 399 644 46,01 1,48 Fluorspar (t) 49 962 59 086 65 619 54 202 48 744 -2,44 -10,07 Graphite (t) 109 269 . 146,79 Gypsum (t) 1 898 000 1 822 000 2 021 000 1 949 000 1 778 000 -6,32 -8,77 Kaolin (t) 4 513 753 4 560 086 4 898 516 4 398 796 4 348 562 -3,66 -1,14 Potash (t) 1 825 139 3 023 941 3 214 696 3 149 386 3 075 201 68,49 -2,36 Salt (t) 18 938 991 19 676 164 17 442 465 14 646 485 17 389 096 -8,18 18,73 Sulfur (t) 927 352 831 533 874 639 798 257 754 540 -18,63 -5,48 Steam Coal (t) 5 906 000 5 753 000 5 301 000 4 878 800 3 209 700 -45,65 -34,21 Coking Coal (t) 9 064 000 7 147 000 6 758 000 5 891 200 4 356 700 -51,93 -26,05 Lignite (t) 169 857 000 169 403 000 176 502 000 185 432 000 182 696 000 7,56 -1,48 Nat. Gas (Mio m³) 15 464 13 584 12 873 11 706 10 678 -30,95 -8,78
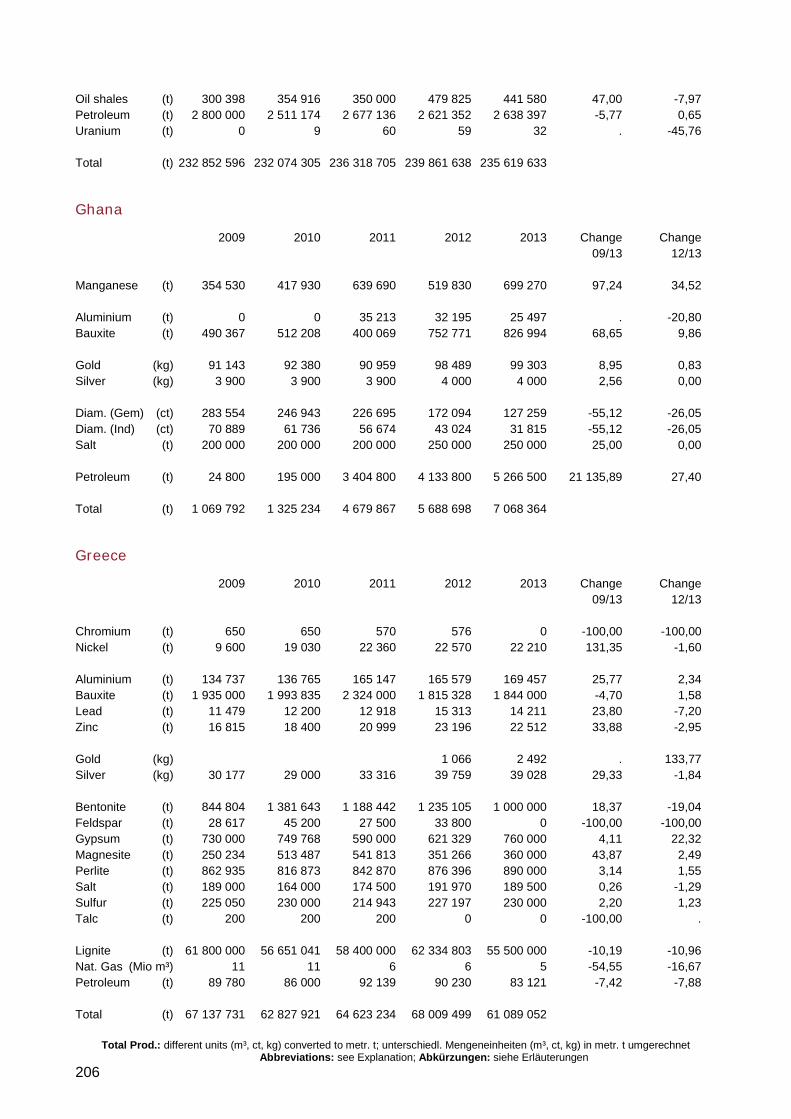
Total Prod.: different units (m³, ct, kg) converted to metr. t; unterschiedl. Mengeneinheiten (m³, ct, kg) in metr. t umgerechnet Abbreviations: see Explanation; Abkürzungen: siehe Erläuterungen
206
Oil shales (t) 300 398 354 916 350 000 479 825 441 580 47,00 -7,97 Petroleum (t) 2 800 000 2 511 174 2 677 136 2 621 352 2 638 397 -5,77 0,65 Uranium (t) 0 9 60 59 32 . -45,76 Total (t) 232 852 596 232 074 305 236 318 705 239 861 638 235 619 633
Ghana
2009 2010 2011 2012 2013 Change Change 09/13 12/13 Manganese (t) 354 530 417 930 639 690 519 830 699 270 97,24 34,52 Aluminium (t) 0 0 35 213 32 195 25 497 . -20,80 Bauxite (t) 490 367 512 208 400 069 752 771 826 994 68,65 9,86 Gold (kg) 91 143 92 380 90 959 98 489 99 303 8,95 0,83 Silver (kg) 3 900 3 900 3 900 4 000 4 000 2,56 0,00 Diam. (Gem) (ct) 283 554 246 943 226 695 172 094 127 259 -55,12 -26,05 Diam. (Ind) (ct) 70 889 61 736 56 674 43 024 31 815 -55,12 -26,05 Salt (t) 200 000 200 000 200 000 250 000 250 000 25,00 0,00 Petroleum (t) 24 800 195 000 3 404 800 4 133 800 5 266 500 21 135,89 27,40 Total (t) 1 069 792 1 325 234 4 679 867 5 688 698 7 068 364
Greece
2009 2010 2011 2012 2013 Change Change 09/13 12/13 Chromium (t) 650 650 570 576 0 -100,00 -100,00 Nickel (t) 9 600 19 030 22 360 22 570 22 210 131,35 -1,60 Aluminium (t) 134 737 136 765 165 147 165 579 169 457 25,77 2,34 Bauxite (t) 1 935 000 1 993 835 2 324 000 1 815 328 1 844 000 -4,70 1,58 Lead (t) 11 479 12 200 12 918 15 313 14 211 23,80 -7,20 Zinc (t) 16 815 18 400 20 999 23 196 22 512 33,88 -2,95 Gold (kg) 1 066 2 492 . 133,77 Silver (kg) 30 177 29 000 33 316 39 759 39 028 29,33 -1,84 Bentonite (t) 844 804 1 381 643 1 188 442 1 235 105 1 000 000 18,37 -19,04 Feldspar (t) 28 617 45 200 27 500 33 800 0 -100,00 -100,00 Gypsum (t) 730 000 749 768 590 000 621 329 760 000 4,11 22,32 Magnesite (t) 250 234 513 487 541 813 351 266 360 000 43,87 2,49 Perlite (t) 862 935 816 873 842 870 876 396 890 000 3,14 1,55 Salt (t) 189 000 164 000 174 500 191 970 189 500 0,26 -1,29 Sulfur (t) 225 050 230 000 214 943 227 197 230 000 2,20 1,23 Talc (t) 200 200 200 0 0 -100,00 . Lignite (t) 61 800 000 56 651 041 58 400 000 62 334 803 55 500 000 -10,19 -10,96 Nat. Gas (Mio m³) 11 11 6 6 5 -54,55 -16,67 Petroleum (t) 89 780 86 000 92 139 90 230 83 121 -7,42 -7,88 Total (t) 67 137 731 62 827 921 64 623 234 68 009 499 61 089 052
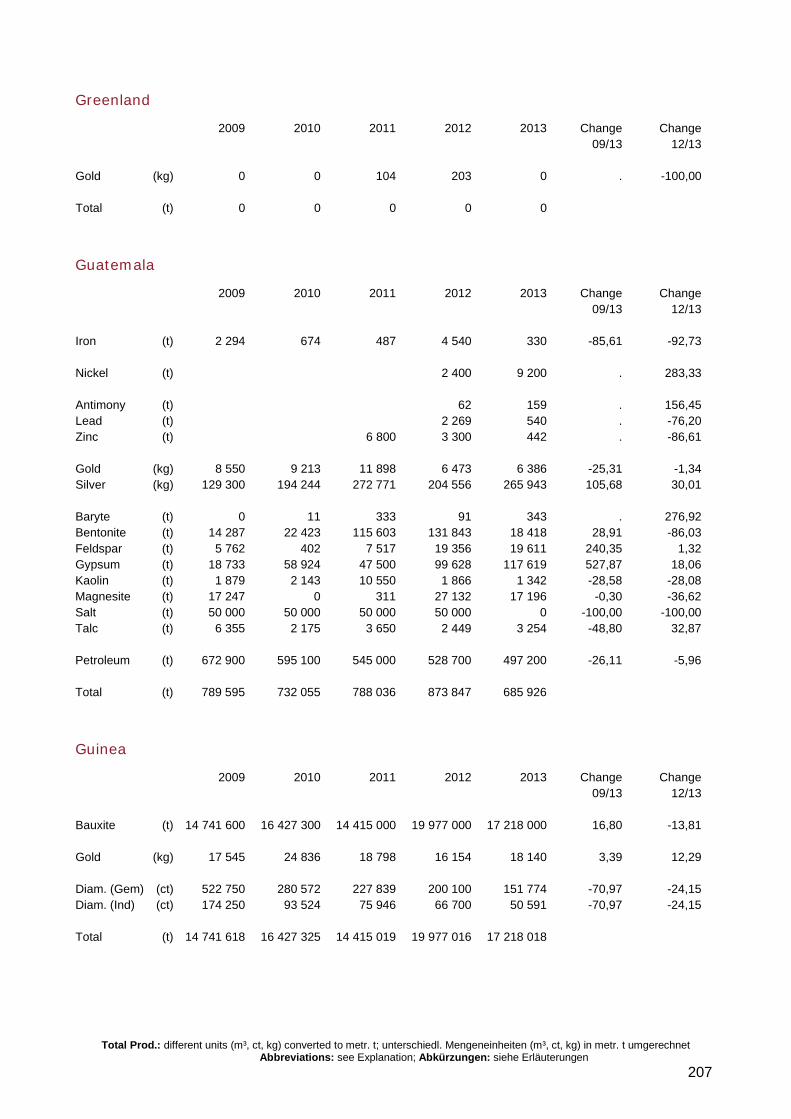
Total Prod.: different units (m³, ct, kg) converted to metr. t; unterschiedl. Mengeneinheiten (m³, ct, kg) in metr. t umgerechnet Abbreviations: see Explanation; Abkürzungen: siehe Erläuterungen
207
Greenland
2009 2010 2011 2012 2013 Change Change 09/13 12/13 Gold (kg) 0 0 104 203 0 . -100,00 Total (t) 0 0 0 0 0
Guatemala
2009 2010 2011 2012 2013 Change Change 09/13 12/13 Iron (t) 2 294 674 487 4 540 330 -85,61 -92,73 Nickel (t) 2 400 9 200 . 283,33 Antimony (t) 62 159 . 156,45 Lead (t) 2 269 540 . -76,20 Zinc (t) 6 800 3 300 442 . -86,61 Gold (kg) 8 550 9 213 11 898 6 473 6 386 -25,31 -1,34 Silver (kg) 129 300 194 244 272 771 204 556 265 943 105,68 30,01 Baryte (t) 0 11 333 91 343 . 276,92 Bentonite (t) 14 287 22 423 115 603 131 843 18 418 28,91 -86,03 Feldspar (t) 5 762 402 7 517 19 356 19 611 240,35 1,32 Gypsum (t) 18 733 58 924 47 500 99 628 117 619 527,87 18,06 Kaolin (t) 1 879 2 143 10 550 1 866 1 342 -28,58 -28,08 Magnesite (t) 17 247 0 311 27 132 17 196 -0,30 -36,62 Salt (t) 50 000 50 000 50 000 50 000 0 -100,00 -100,00 Talc (t) 6 355 2 175 3 650 2 449 3 254 -48,80 32,87 Petroleum (t) 672 900 595 100 545 000 528 700 497 200 -26,11 -5,96 Total (t) 789 595 732 055 788 036 873 847 685 926
Guinea
2009 2010 2011 2012 2013 Change Change 09/13 12/13 Bauxite (t) 14 741 600 16 427 300 14 415 000 19 977 000 17 218 000 16,80 -13,81 Gold (kg) 17 545 24 836 18 798 16 154 18 140 3,39 12,29 Diam. (Gem) (ct) 522 750 280 572 227 839 200 100 151 774 -70,97 -24,15 Diam. (Ind) (ct) 174 250 93 524 75 946 66 700 50 591 -70,97 -24,15 Total (t) 14 741 618 16 427 325 14 415 019 19 977 016 17 218 018
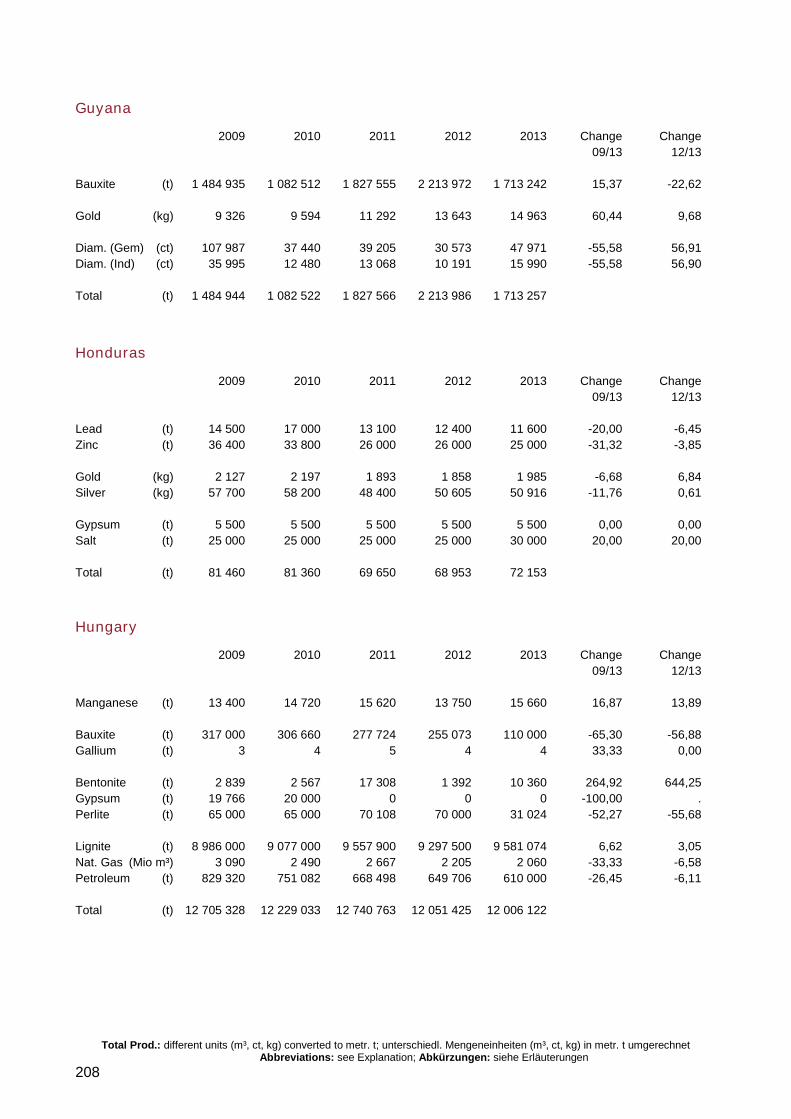
Total Prod.: different units (m³, ct, kg) converted to metr. t; unterschiedl. Mengeneinheiten (m³, ct, kg) in metr. t umgerechnet Abbreviations: see Explanation; Abkürzungen: siehe Erläuterungen
208
Guyana
2009 2010 2011 2012 2013 Change Change 09/13 12/13 Bauxite (t) 1 484 935 1 082 512 1 827 555 2 213 972 1 713 242 15,37 -22,62 Gold (kg) 9 326 9 594 11 292 13 643 14 963 60,44 9,68 Diam. (Gem) (ct) 107 987 37 440 39 205 30 573 47 971 -55,58 56,91 Diam. (Ind) (ct) 35 995 12 480 13 068 10 191 15 990 -55,58 56,90 Total (t) 1 484 944 1 082 522 1 827 566 2 213 986 1 713 257
Honduras
2009 2010 2011 2012 2013 Change Change 09/13 12/13 Lead (t) 14 500 17 000 13 100 12 400 11 600 -20,00 -6,45 Zinc (t) 36 400 33 800 26 000 26 000 25 000 -31,32 -3,85 Gold (kg) 2 127 2 197 1 893 1 858 1 985 -6,68 6,84 Silver (kg) 57 700 58 200 48 400 50 605 50 916 -11,76 0,61 Gypsum (t) 5 500 5 500 5 500 5 500 5 500 0,00 0,00 Salt (t) 25 000 25 000 25 000 25 000 30 000 20,00 20,00 Total (t) 81 460 81 360 69 650 68 953 72 153
Hungary
2009 2010 2011 2012 2013 Change Change 09/13 12/13 Manganese (t) 13 400 14 720 15 620 13 750 15 660 16,87 13,89 Bauxite (t) 317 000 306 660 277 724 255 073 110 000 -65,30 -56,88 Gallium (t) 3 4 5 4 4 33,33 0,00 Bentonite (t) 2 839 2 567 17 308 1 392 10 360 264,92 644,25 Gypsum (t) 19 766 20 000 0 0 0 -100,00 . Perlite (t) 65 000 65 000 70 108 70 000 31 024 -52,27 -55,68 Lignite (t) 8 986 000 9 077 000 9 557 900 9 297 500 9 581 074 6,62 3,05 Nat. Gas (Mio m³) 3 090 2 490 2 667 2 205 2 060 -33,33 -6,58 Petroleum (t) 829 320 751 082 668 498 649 706 610 000 -26,45 -6,11 Total (t) 12 705 328 12 229 033 12 740 763 12 051 425 12 006 122
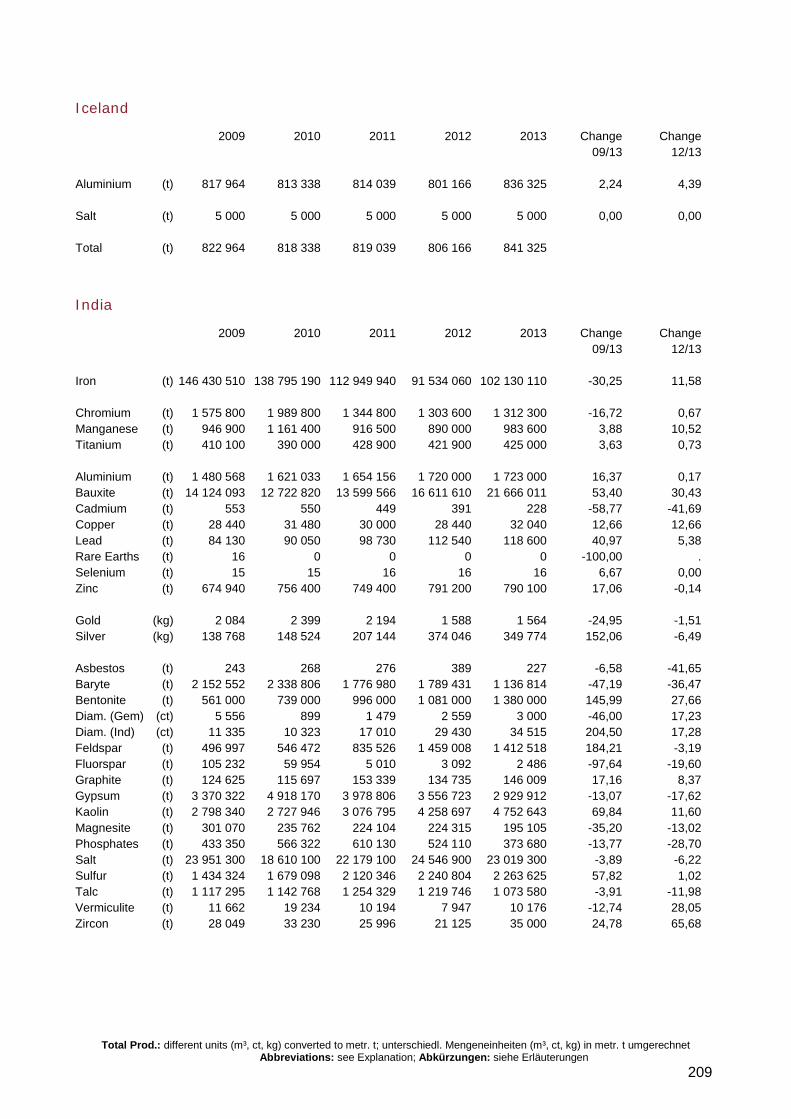
Total Prod.: different units (m³, ct, kg) converted to metr. t; unterschiedl. Mengeneinheiten (m³, ct, kg) in metr. t umgerechnet Abbreviations: see Explanation; Abkürzungen: siehe Erläuterungen
209
Iceland
2009 2010 2011 2012 2013 Change Change 09/13 12/13 Aluminium (t) 817 964 813 338 814 039 801 166 836 325 2,24 4,39 Salt (t) 5 000 5 000 5 000 5 000 5 000 0,00 0,00 Total (t) 822 964 818 338 819 039 806 166 841 325
India
2009 2010 2011 2012 2013 Change Change 09/13 12/13 Iron (t) 146 430 510 138 795 190 112 949 940 91 534 060 102 130 110 -30,25 11,58 Chromium (t) 1 575 800 1 989 800 1 344 800 1 303 600 1 312 300 -16,72 0,67 Manganese (t) 946 900 1 161 400 916 500 890 000 983 600 3,88 10,52 Titanium (t) 410 100 390 000 428 900 421 900 425 000 3,63 0,73 Aluminium (t) 1 480 568 1 621 033 1 654 156 1 720 000 1 723 000 16,37 0,17 Bauxite (t) 14 124 093 12 722 820 13 599 566 16 611 610 21 666 011 53,40 30,43 Cadmium (t) 553 550 449 391 228 -58,77 -41,69 Copper (t) 28 440 31 480 30 000 28 440 32 040 12,66 12,66 Lead (t) 84 130 90 050 98 730 112 540 118 600 40,97 5,38 Rare Earths (t) 16 0 0 0 0 -100,00 . Selenium (t) 15 15 16 16 16 6,67 0,00 Zinc (t) 674 940 756 400 749 400 791 200 790 100 17,06 -0,14 Gold (kg) 2 084 2 399 2 194 1 588 1 564 -24,95 -1,51 Silver (kg) 138 768 148 524 207 144 374 046 349 774 152,06 -6,49 Asbestos (t) 243 268 276 389 227 -6,58 -41,65 Baryte (t) 2 152 552 2 338 806 1 776 980 1 789 431 1 136 814 -47,19 -36,47 Bentonite (t) 561 000 739 000 996 000 1 081 000 1 380 000 145,99 27,66 Diam. (Gem) (ct) 5 556 899 1 479 2 559 3 000 -46,00 17,23 Diam. (Ind) (ct) 11 335 10 323 17 010 29 430 34 515 204,50 17,28 Feldspar (t) 496 997 546 472 835 526 1 459 008 1 412 518 184,21 -3,19 Fluorspar (t) 105 232 59 954 5 010 3 092 2 486 -97,64 -19,60 Graphite (t) 124 625 115 697 153 339 134 735 146 009 17,16 8,37 Gypsum (t) 3 370 322 4 918 170 3 978 806 3 556 723 2 929 912 -13,07 -17,62 Kaolin (t) 2 798 340 2 727 946 3 076 795 4 258 697 4 752 643 69,84 11,60 Magnesite (t) 301 070 235 762 224 104 224 315 195 105 -35,20 -13,02 Phosphates (t) 433 350 566 322 610 130 524 110 373 680 -13,77 -28,70 Salt (t) 23 951 300 18 610 100 22 179 100 24 546 900 23 019 300 -3,89 -6,22 Sulfur (t) 1 434 324 1 679 098 2 120 346 2 240 804 2 263 625 57,82 1,02 Talc (t) 1 117 295 1 142 768 1 254 329 1 219 746 1 073 580 -3,91 -11,98 Vermiculite (t) 11 662 19 234 10 194 7 947 10 176 -12,74 28,05 Zircon (t) 28 049 33 230 25 996 21 125 35 000 24,78 65,68
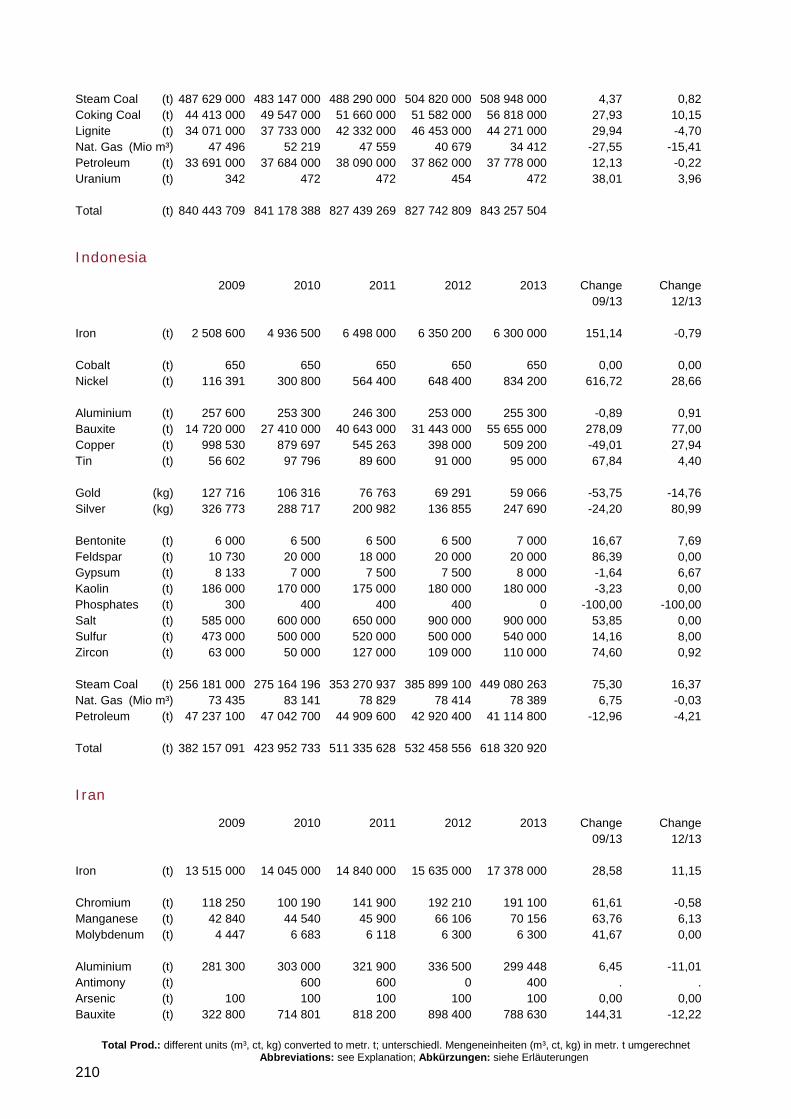
Total Prod.: different units (m³, ct, kg) converted to metr. t; unterschiedl. Mengeneinheiten (m³, ct, kg) in metr. t umgerechnet Abbreviations: see Explanation; Abkürzungen: siehe Erläuterungen
210
Steam Coal (t) 487 629 000 483 147 000 488 290 000 504 820 000 508 948 000 4,37 0,82 Coking Coal (t) 44 413 000 49 547 000 51 660 000 51 582 000 56 818 000 27,93 10,15 Lignite (t) 34 071 000 37 733 000 42 332 000 46 453 000 44 271 000 29,94 -4,70 Nat. Gas (Mio m³) 47 496 52 219 47 559 40 679 34 412 -27,55 -15,41 Petroleum (t) 33 691 000 37 684 000 38 090 000 37 862 000 37 778 000 12,13 -0,22 Uranium (t) 342 472 472 454 472 38,01 3,96 Total (t) 840 443 709 841 178 388 827 439 269 827 742 809 843 257 504
Indonesia
2009 2010 2011 2012 2013 Change Change 09/13 12/13 Iron (t) 2 508 600 4 936 500 6 498 000 6 350 200 6 300 000 151,14 -0,79 Cobalt (t) 650 650 650 650 650 0,00 0,00 Nickel (t) 116 391 300 800 564 400 648 400 834 200 616,72 28,66 Aluminium (t) 257 600 253 300 246 300 253 000 255 300 -0,89 0,91 Bauxite (t) 14 720 000 27 410 000 40 643 000 31 443 000 55 655 000 278,09 77,00 Copper (t) 998 530 879 697 545 263 398 000 509 200 -49,01 27,94 Tin (t) 56 602 97 796 89 600 91 000 95 000 67,84 4,40 Gold (kg) 127 716 106 316 76 763 69 291 59 066 -53,75 -14,76 Silver (kg) 326 773 288 717 200 982 136 855 247 690 -24,20 80,99 Bentonite (t) 6 000 6 500 6 500 6 500 7 000 16,67 7,69 Feldspar (t) 10 730 20 000 18 000 20 000 20 000 86,39 0,00 Gypsum (t) 8 133 7 000 7 500 7 500 8 000 -1,64 6,67 Kaolin (t) 186 000 170 000 175 000 180 000 180 000 -3,23 0,00 Phosphates (t) 300 400 400 400 0 -100,00 -100,00 Salt (t) 585 000 600 000 650 000 900 000 900 000 53,85 0,00 Sulfur (t) 473 000 500 000 520 000 500 000 540 000 14,16 8,00 Zircon (t) 63 000 50 000 127 000 109 000 110 000 74,60 0,92 Steam Coal (t) 256 181 000 275 164 196 353 270 937 385 899 100 449 080 263 75,30 16,37 Nat. Gas (Mio m³) 73 435 83 141 78 829 78 414 78 389 6,75 -0,03 Petroleum (t) 47 237 100 47 042 700 44 909 600 42 920 400 41 114 800 -12,96 -4,21 Total (t) 382 157 091 423 952 733 511 335 628 532 458 556 618 320 920
Iran
2009 2010 2011 2012 2013 Change Change 09/13 12/13 Iron (t) 13 515 000 14 045 000 14 840 000 15 635 000 17 378 000 28,58 11,15 Chromium (t) 118 250 100 190 141 900 192 210 191 100 61,61 -0,58 Manganese (t) 42 840 44 540 45 900 66 106 70 156 63,76 6,13 Molybdenum (t) 4 447 6 683 6 118 6 300 6 300 41,67 0,00 Aluminium (t) 281 300 303 000 321 900 336 500 299 448 6,45 -11,01 Antimony (t) 600 600 0 400 . . Arsenic (t) 100 100 100 100 100 0,00 0,00 Bauxite (t) 322 800 714 801 818 200 898 400 788 630 144,31 -12,22
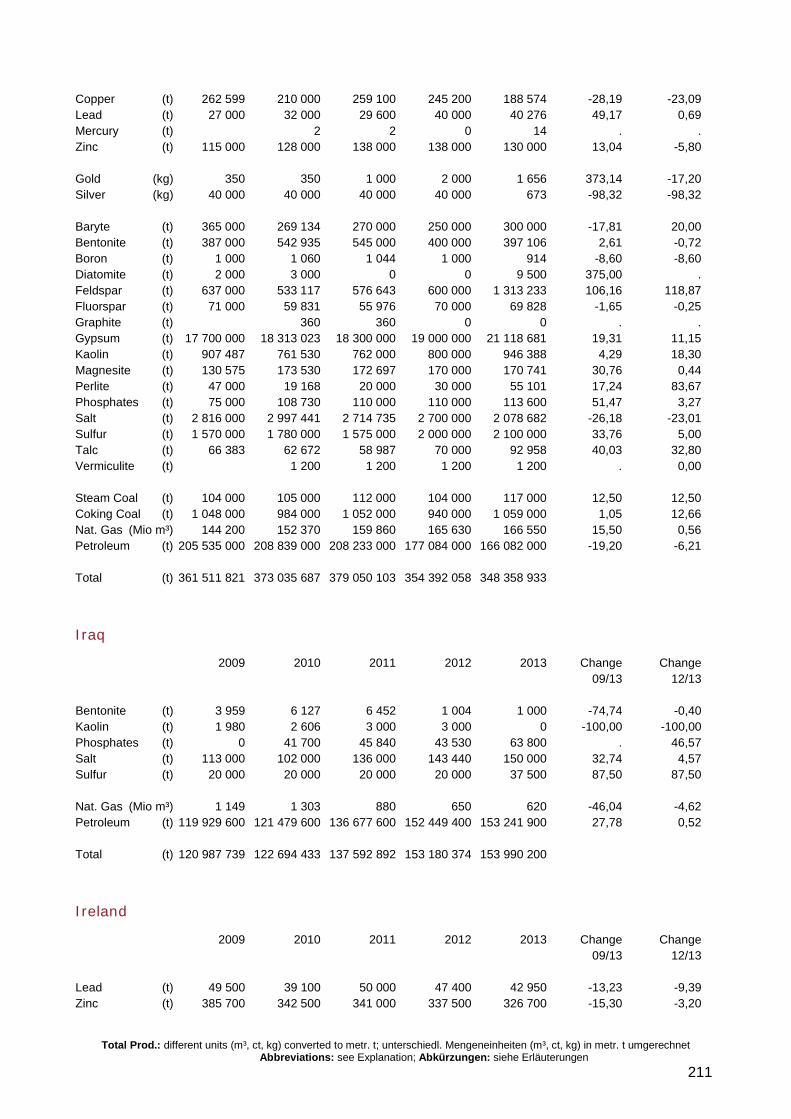
Total Prod.: different units (m³, ct, kg) converted to metr. t; unterschiedl. Mengeneinheiten (m³, ct, kg) in metr. t umgerechnet Abbreviations: see Explanation; Abkürzungen: siehe Erläuterungen
211
Copper (t) 262 599 210 000 259 100 245 200 188 574 -28,19 -23,09 Lead (t) 27 000 32 000 29 600 40 000 40 276 49,17 0,69 Mercury (t) 2 2 0 14 . . Zinc (t) 115 000 128 000 138 000 138 000 130 000 13,04 -5,80 Gold (kg) 350 350 1 000 2 000 1 656 373,14 -17,20 Silver (kg) 40 000 40 000 40 000 40 000 673 -98,32 -98,32 Baryte (t) 365 000 269 134 270 000 250 000 300 000 -17,81 20,00 Bentonite (t) 387 000 542 935 545 000 400 000 397 106 2,61 -0,72 Boron (t) 1 000 1 060 1 044 1 000 914 -8,60 -8,60 Diatomite (t) 2 000 3 000 0 0 9 500 375,00 . Feldspar (t) 637 000 533 117 576 643 600 000 1 313 233 106,16 118,87 Fluorspar (t) 71 000 59 831 55 976 70 000 69 828 -1,65 -0,25 Graphite (t) 360 360 0 0 . . Gypsum (t) 17 700 000 18 313 023 18 300 000 19 000 000 21 118 681 19,31 11,15 Kaolin (t) 907 487 761 530 762 000 800 000 946 388 4,29 18,30 Magnesite (t) 130 575 173 530 172 697 170 000 170 741 30,76 0,44 Perlite (t) 47 000 19 168 20 000 30 000 55 101 17,24 83,67 Phosphates (t) 75 000 108 730 110 000 110 000 113 600 51,47 3,27 Salt (t) 2 816 000 2 997 441 2 714 735 2 700 000 2 078 682 -26,18 -23,01 Sulfur (t) 1 570 000 1 780 000 1 575 000 2 000 000 2 100 000 33,76 5,00 Talc (t) 66 383 62 672 58 987 70 000 92 958 40,03 32,80 Vermiculite (t) 1 200 1 200 1 200 1 200 . 0,00 Steam Coal (t) 104 000 105 000 112 000 104 000 117 000 12,50 12,50 Coking Coal (t) 1 048 000 984 000 1 052 000 940 000 1 059 000 1,05 12,66 Nat. Gas (Mio m³) 144 200 152 370 159 860 165 630 166 550 15,50 0,56 Petroleum (t) 205 535 000 208 839 000 208 233 000 177 084 000 166 082 000 -19,20 -6,21 Total (t) 361 511 821 373 035 687 379 050 103 354 392 058 348 358 933
Iraq
2009 2010 2011 2012 2013 Change Change 09/13 12/13 Bentonite (t) 3 959 6 127 6 452 1 004 1 000 -74,74 -0,40 Kaolin (t) 1 980 2 606 3 000 3 000 0 -100,00 -100,00 Phosphates (t) 0 41 700 45 840 43 530 63 800 . 46,57 Salt (t) 113 000 102 000 136 000 143 440 150 000 32,74 4,57 Sulfur (t) 20 000 20 000 20 000 20 000 37 500 87,50 87,50 Nat. Gas (Mio m³) 1 149 1 303 880 650 620 -46,04 -4,62 Petroleum (t) 119 929 600 121 479 600 136 677 600 152 449 400 153 241 900 27,78 0,52 Total (t) 120 987 739 122 694 433 137 592 892 153 180 374 153 990 200
Ireland
2009 2010 2011 2012 2013 Change Change 09/13 12/13 Lead (t) 49 500 39 100 50 000 47 400 42 950 -13,23 -9,39 Zinc (t) 385 700 342 500 341 000 337 500 326 700 -15,30 -3,20
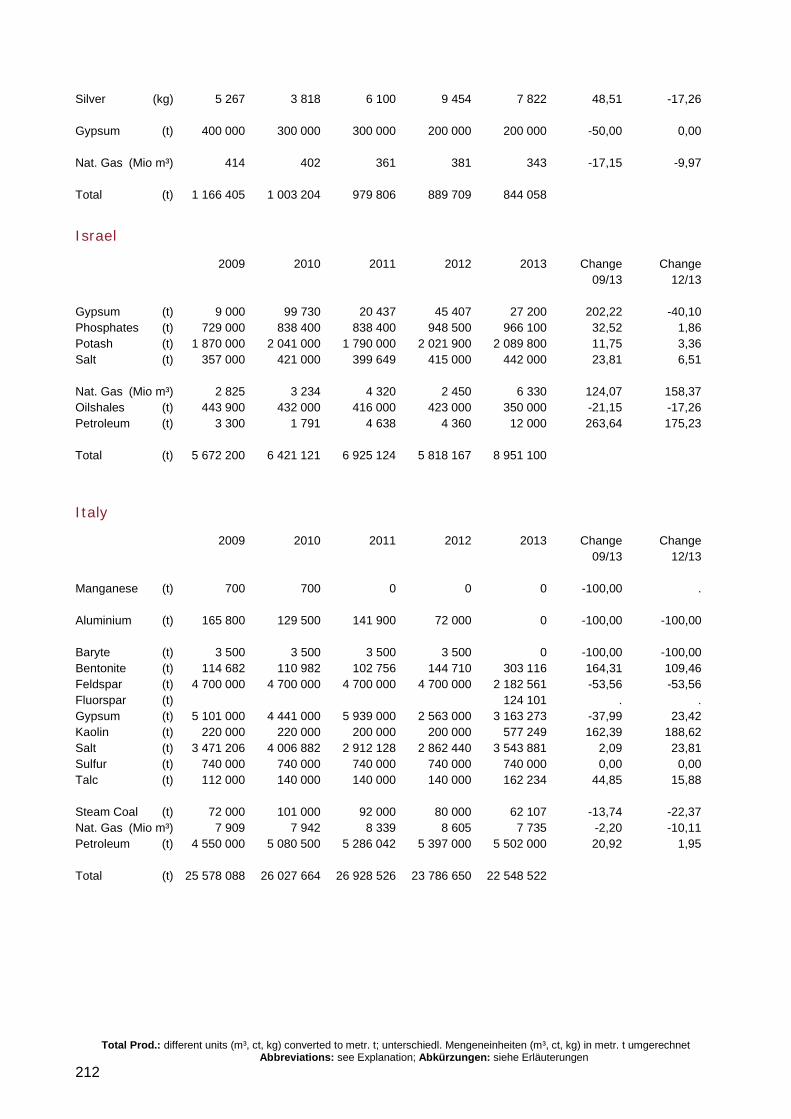
Total Prod.: different units (m³, ct, kg) converted to metr. t; unterschiedl. Mengeneinheiten (m³, ct, kg) in metr. t umgerechnet Abbreviations: see Explanation; Abkürzungen: siehe Erläuterungen
212
Silver (kg) 5 267 3 818 6 100 9 454 7 822 48,51 -17,26 Gypsum (t) 400 000 300 000 300 000 200 000 200 000 -50,00 0,00 Nat. Gas (Mio m³) 414 402 361 381 343 -17,15 -9,97 Total (t) 1 166 405 1 003 204 979 806 889 709 844 058
Israel
2009 2010 2011 2012 2013 Change Change 09/13 12/13 Gypsum (t) 9 000 99 730 20 437 45 407 27 200 202,22 -40,10 Phosphates (t) 729 000 838 400 838 400 948 500 966 100 32,52 1,86 Potash (t) 1 870 000 2 041 000 1 790 000 2 021 900 2 089 800 11,75 3,36 Salt (t) 357 000 421 000 399 649 415 000 442 000 23,81 6,51 Nat. Gas (Mio m³) 2 825 3 234 4 320 2 450 6 330 124,07 158,37 Oilshales (t) 443 900 432 000 416 000 423 000 350 000 -21,15 -17,26 Petroleum (t) 3 300 1 791 4 638 4 360 12 000 263,64 175,23 Total (t) 5 672 200 6 421 121 6 925 124 5 818 167 8 951 100
Italy
2009 2010 2011 2012 2013 Change Change 09/13 12/13 Manganese (t) 700 700 0 0 0 -100,00 . Aluminium (t) 165 800 129 500 141 900 72 000 0 -100,00 -100,00 Baryte (t) 3 500 3 500 3 500 3 500 0 -100,00 -100,00 Bentonite (t) 114 682 110 982 102 756 144 710 303 116 164,31 109,46 Feldspar (t) 4 700 000 4 700 000 4 700 000 4 700 000 2 182 561 -53,56 -53,56 Fluorspar (t) 124 101 . . Gypsum (t) 5 101 000 4 441 000 5 939 000 2 563 000 3 163 273 -37,99 23,42 Kaolin (t) 220 000 220 000 200 000 200 000 577 249 162,39 188,62 Salt (t) 3 471 206 4 006 882 2 912 128 2 862 440 3 543 881 2,09 23,81 Sulfur (t) 740 000 740 000 740 000 740 000 740 000 0,00 0,00 Talc (t) 112 000 140 000 140 000 140 000 162 234 44,85 15,88 Steam Coal (t) 72 000 101 000 92 000 80 000 62 107 -13,74 -22,37 Nat. Gas (Mio m³) 7 909 7 942 8 339 8 605 7 735 -2,20 -10,11 Petroleum (t) 4 550 000 5 080 500 5 286 042 5 397 000 5 502 000 20,92 1,95 Total (t) 25 578 088 26 027 664 26 928 526 23 786 650 22 548 522
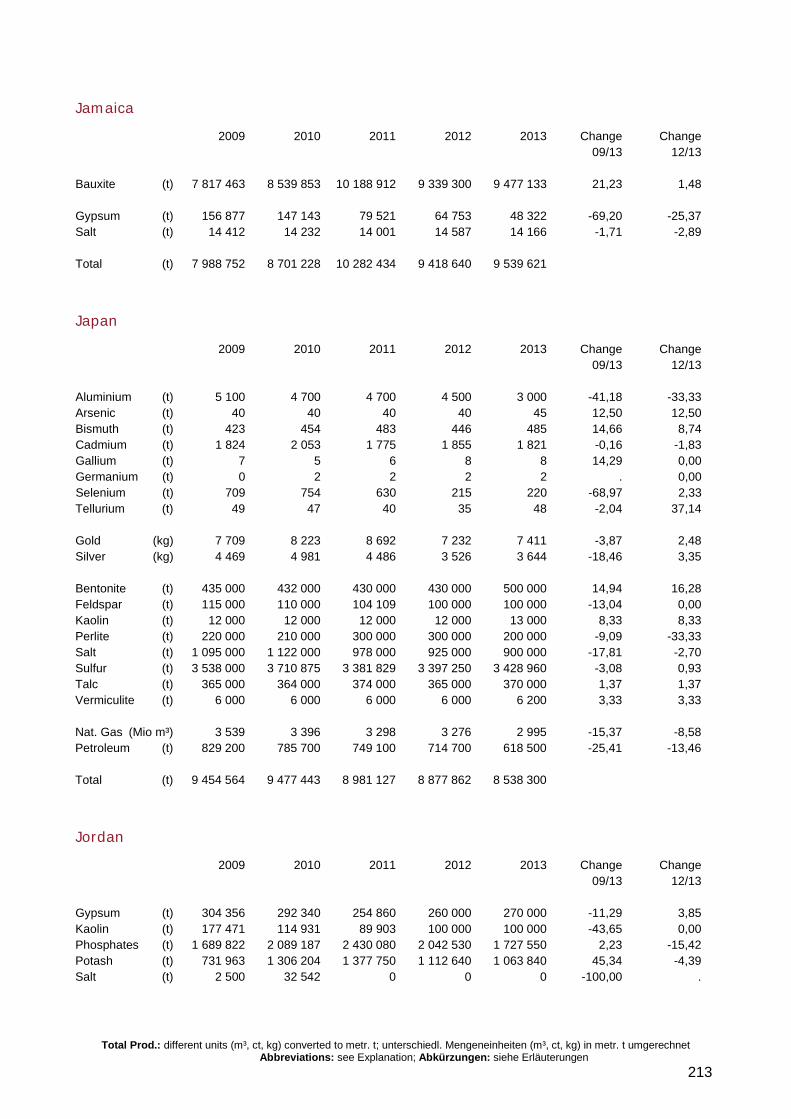
Total Prod.: different units (m³, ct, kg) converted to metr. t; unterschiedl. Mengeneinheiten (m³, ct, kg) in metr. t umgerechnet Abbreviations: see Explanation; Abkürzungen: siehe Erläuterungen
213
Jamaica
2009 2010 2011 2012 2013 Change Change 09/13 12/13 Bauxite (t) 7 817 463 8 539 853 10 188 912 9 339 300 9 477 133 21,23 1,48 Gypsum (t) 156 877 147 143 79 521 64 753 48 322 -69,20 -25,37 Salt (t) 14 412 14 232 14 001 14 587 14 166 -1,71 -2,89 Total (t) 7 988 752 8 701 228 10 282 434 9 418 640 9 539 621
Japan
2009 2010 2011 2012 2013 Change Change 09/13 12/13 Aluminium (t) 5 100 4 700 4 700 4 500 3 000 -41,18 -33,33 Arsenic (t) 40 40 40 40 45 12,50 12,50 Bismuth (t) 423 454 483 446 485 14,66 8,74 Cadmium (t) 1 824 2 053 1 775 1 855 1 821 -0,16 -1,83 Gallium (t) 7 5 6 8 8 14,29 0,00 Germanium (t) 0 2 2 2 2 . 0,00 Selenium (t) 709 754 630 215 220 -68,97 2,33 Tellurium (t) 49 47 40 35 48 -2,04 37,14 Gold (kg) 7 709 8 223 8 692 7 232 7 411 -3,87 2,48 Silver (kg) 4 469 4 981 4 486 3 526 3 644 -18,46 3,35 Bentonite (t) 435 000 432 000 430 000 430 000 500 000 14,94 16,28 Feldspar (t) 115 000 110 000 104 109 100 000 100 000 -13,04 0,00 Kaolin (t) 12 000 12 000 12 000 12 000 13 000 8,33 8,33 Perlite (t) 220 000 210 000 300 000 300 000 200 000 -9,09 -33,33 Salt (t) 1 095 000 1 122 000 978 000 925 000 900 000 -17,81 -2,70 Sulfur (t) 3 538 000 3 710 875 3 381 829 3 397 250 3 428 960 -3,08 0,93 Talc (t) 365 000 364 000 374 000 365 000 370 000 1,37 1,37 Vermiculite (t) 6 000 6 000 6 000 6 000 6 200 3,33 3,33 Nat. Gas (Mio m³) 3 539 3 396 3 298 3 276 2 995 -15,37 -8,58 Petroleum (t) 829 200 785 700 749 100 714 700 618 500 -25,41 -13,46 Total (t) 9 454 564 9 477 443 8 981 127 8 877 862 8 538 300
Jordan
2009 2010 2011 2012 2013 Change Change 09/13 12/13 Gypsum (t) 304 356 292 340 254 860 260 000 270 000 -11,29 3,85 Kaolin (t) 177 471 114 931 89 903 100 000 100 000 -43,65 0,00 Phosphates (t) 1 689 822 2 089 187 2 430 080 2 042 530 1 727 550 2,23 -15,42 Potash (t) 731 963 1 306 204 1 377 750 1 112 640 1 063 840 45,34 -4,39 Salt (t) 2 500 32 542 0 0 0 -100,00 .
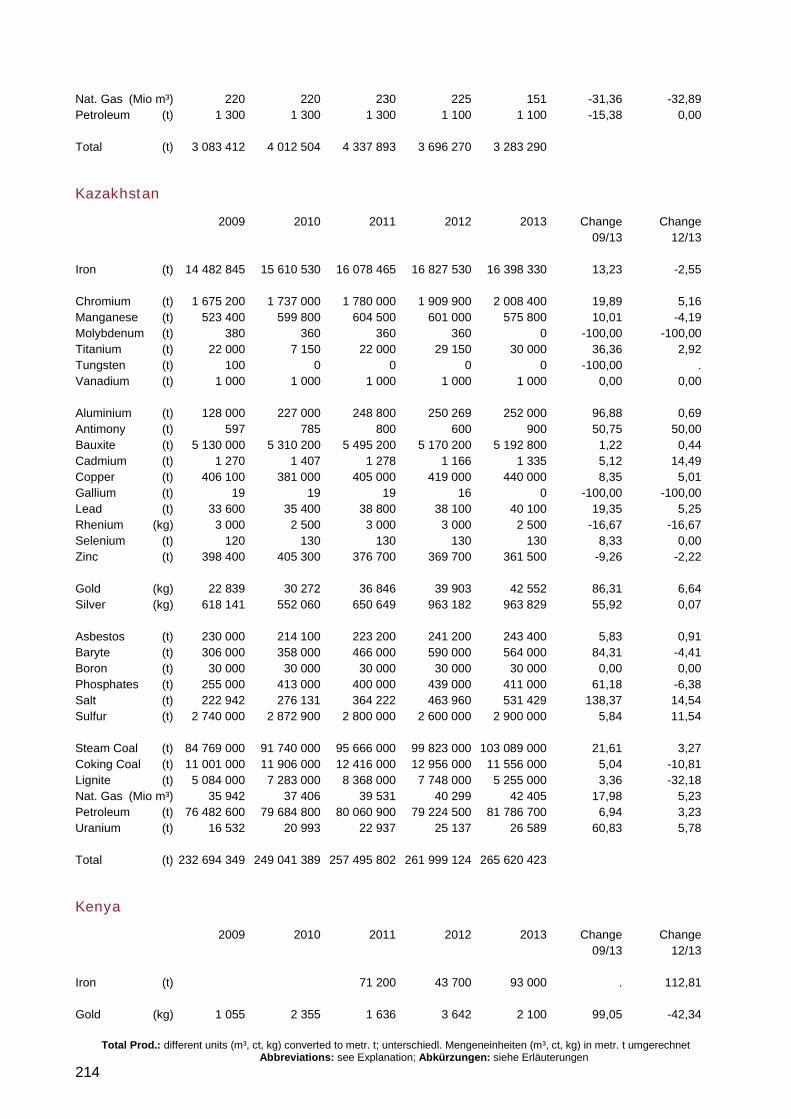
Total Prod.: different units (m³, ct, kg) converted to metr. t; unterschiedl. Mengeneinheiten (m³, ct, kg) in metr. t umgerechnet Abbreviations: see Explanation; Abkürzungen: siehe Erläuterungen
214
Nat. Gas (Mio m³) 220 220 230 225 151 -31,36 -32,89 Petroleum (t) 1 300 1 300 1 300 1 100 1 100 -15,38 0,00 Total (t) 3 083 412 4 012 504 4 337 893 3 696 270 3 283 290
Kazakhstan
2009 2010 2011 2012 2013 Change Change 09/13 12/13 Iron (t) 14 482 845 15 610 530 16 078 465 16 827 530 16 398 330 13,23 -2,55 Chromium (t) 1 675 200 1 737 000 1 780 000 1 909 900 2 008 400 19,89 5,16 Manganese (t) 523 400 599 800 604 500 601 000 575 800 10,01 -4,19 Molybdenum (t) 380 360 360 360 0 -100,00 -100,00 Titanium (t) 22 000 7 150 22 000 29 150 30 000 36,36 2,92 Tungsten (t) 100 0 0 0 0 -100,00 . Vanadium (t) 1 000 1 000 1 000 1 000 1 000 0,00 0,00 Aluminium (t) 128 000 227 000 248 800 250 269 252 000 96,88 0,69 Antimony (t) 597 785 800 600 900 50,75 50,00 Bauxite (t) 5 130 000 5 310 200 5 495 200 5 170 200 5 192 800 1,22 0,44 Cadmium (t) 1 270 1 407 1 278 1 166 1 335 5,12 14,49 Copper (t) 406 100 381 000 405 000 419 000 440 000 8,35 5,01 Gallium (t) 19 19 19 16 0 -100,00 -100,00 Lead (t) 33 600 35 400 38 800 38 100 40 100 19,35 5,25 Rhenium (kg) 3 000 2 500 3 000 3 000 2 500 -16,67 -16,67 Selenium (t) 120 130 130 130 130 8,33 0,00 Zinc (t) 398 400 405 300 376 700 369 700 361 500 -9,26 -2,22 Gold (kg) 22 839 30 272 36 846 39 903 42 552 86,31 6,64 Silver (kg) 618 141 552 060 650 649 963 182 963 829 55,92 0,07 Asbestos (t) 230 000 214 100 223 200 241 200 243 400 5,83 0,91 Baryte (t) 306 000 358 000 466 000 590 000 564 000 84,31 -4,41 Boron (t) 30 000 30 000 30 000 30 000 30 000 0,00 0,00 Phosphates (t) 255 000 413 000 400 000 439 000 411 000 61,18 -6,38 Salt (t) 222 942 276 131 364 222 463 960 531 429 138,37 14,54 Sulfur (t) 2 740 000 2 872 900 2 800 000 2 600 000 2 900 000 5,84 11,54 Steam Coal (t) 84 769 000 91 740 000 95 666 000 99 823 000 103 089 000 21,61 3,27 Coking Coal (t) 11 001 000 11 906 000 12 416 000 12 956 000 11 556 000 5,04 -10,81 Lignite (t) 5 084 000 7 283 000 8 368 000 7 748 000 5 255 000 3,36 -32,18 Nat. Gas (Mio m³) 35 942 37 406 39 531 40 299 42 405 17,98 5,23 Petroleum (t) 76 482 600 79 684 800 80 060 900 79 224 500 81 786 700 6,94 3,23 Uranium (t) 16 532 20 993 22 937 25 137 26 589 60,83 5,78 Total (t) 232 694 349 249 041 389 257 495 802 261 999 124 265 620 423
Kenya
2009 2010 2011 2012 2013 Change Change 09/13 12/13 Iron (t) 71 200 43 700 93 000 . 112,81 Gold (kg) 1 055 2 355 1 636 3 642 2 100 99,05 -42,34
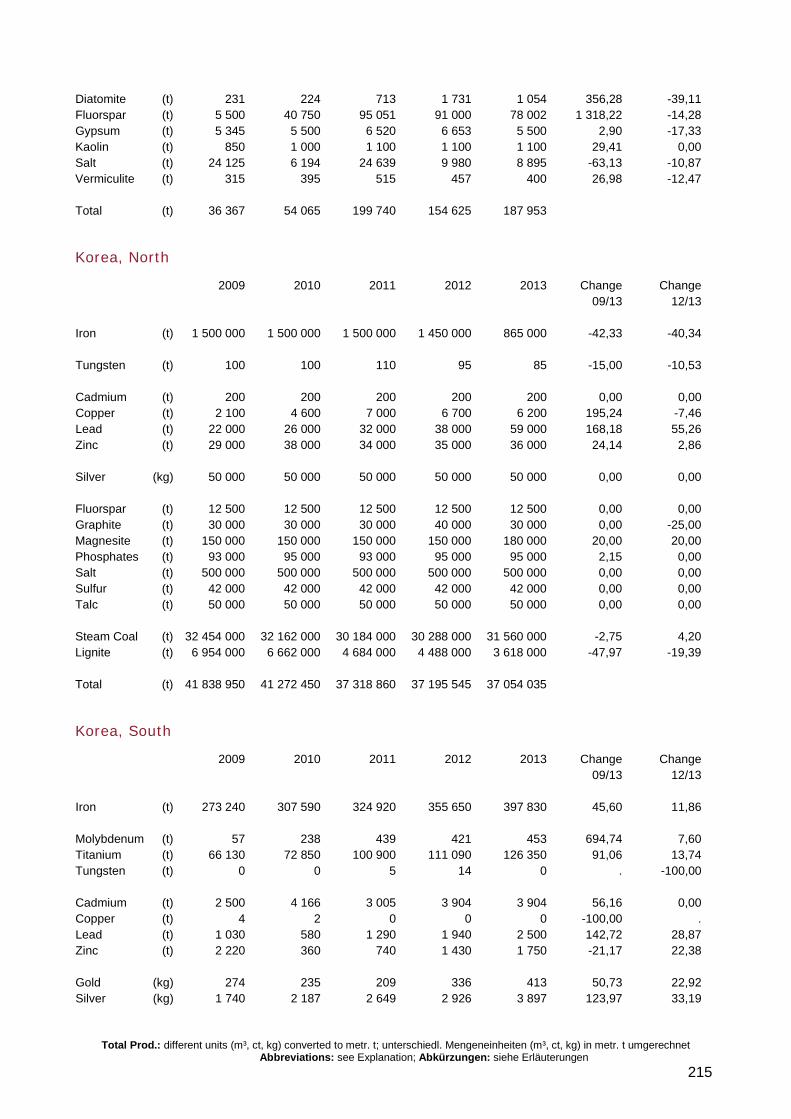
Total Prod.: different units (m³, ct, kg) converted to metr. t; unterschiedl. Mengeneinheiten (m³, ct, kg) in metr. t umgerechnet Abbreviations: see Explanation; Abkürzungen: siehe Erläuterungen
215
Diatomite (t) 231 224 713 1 731 1 054 356,28 -39,11 Fluorspar (t) 5 500 40 750 95 051 91 000 78 002 1 318,22 -14,28 Gypsum (t) 5 345 5 500 6 520 6 653 5 500 2,90 -17,33 Kaolin (t) 850 1 000 1 100 1 100 1 100 29,41 0,00 Salt (t) 24 125 6 194 24 639 9 980 8 895 -63,13 -10,87 Vermiculite (t) 315 395 515 457 400 26,98 -12,47 Total (t) 36 367 54 065 199 740 154 625 187 953
Korea, North
2009 2010 2011 2012 2013 Change Change 09/13 12/13 Iron (t) 1 500 000 1 500 000 1 500 000 1 450 000 865 000 -42,33 -40,34 Tungsten (t) 100 100 110 95 85 -15,00 -10,53 Cadmium (t) 200 200 200 200 200 0,00 0,00 Copper (t) 2 100 4 600 7 000 6 700 6 200 195,24 -7,46 Lead (t) 22 000 26 000 32 000 38 000 59 000 168,18 55,26 Zinc (t) 29 000 38 000 34 000 35 000 36 000 24,14 2,86 Silver (kg) 50 000 50 000 50 000 50 000 50 000 0,00 0,00 Fluorspar (t) 12 500 12 500 12 500 12 500 12 500 0,00 0,00 Graphite (t) 30 000 30 000 30 000 40 000 30 000 0,00 -25,00 Magnesite (t) 150 000 150 000 150 000 150 000 180 000 20,00 20,00 Phosphates (t) 93 000 95 000 93 000 95 000 95 000 2,15 0,00 Salt (t) 500 000 500 000 500 000 500 000 500 000 0,00 0,00 Sulfur (t) 42 000 42 000 42 000 42 000 42 000 0,00 0,00 Talc (t) 50 000 50 000 50 000 50 000 50 000 0,00 0,00 Steam Coal (t) 32 454 000 32 162 000 30 184 000 30 288 000 31 560 000 -2,75 4,20 Lignite (t) 6 954 000 6 662 000 4 684 000 4 488 000 3 618 000 -47,97 -19,39 Total (t) 41 838 950 41 272 450 37 318 860 37 195 545 37 054 035
Korea, South
2009 2010 2011 2012 2013 Change Change 09/13 12/13 Iron (t) 273 240 307 590 324 920 355 650 397 830 45,60 11,86 Molybdenum (t) 57 238 439 421 453 694,74 7,60 Titanium (t) 66 130 72 850 100 900 111 090 126 350 91,06 13,74 Tungsten (t) 0 0 5 14 0 . -100,00 Cadmium (t) 2 500 4 166 3 005 3 904 3 904 56,16 0,00 Copper (t) 4 2 0 0 0 -100,00 . Lead (t) 1 030 580 1 290 1 940 2 500 142,72 28,87 Zinc (t) 2 220 360 740 1 430 1 750 -21,17 22,38 Gold (kg) 274 235 209 336 413 50,73 22,92 Silver (kg) 1 740 2 187 2 649 2 926 3 897 123,97 33,19
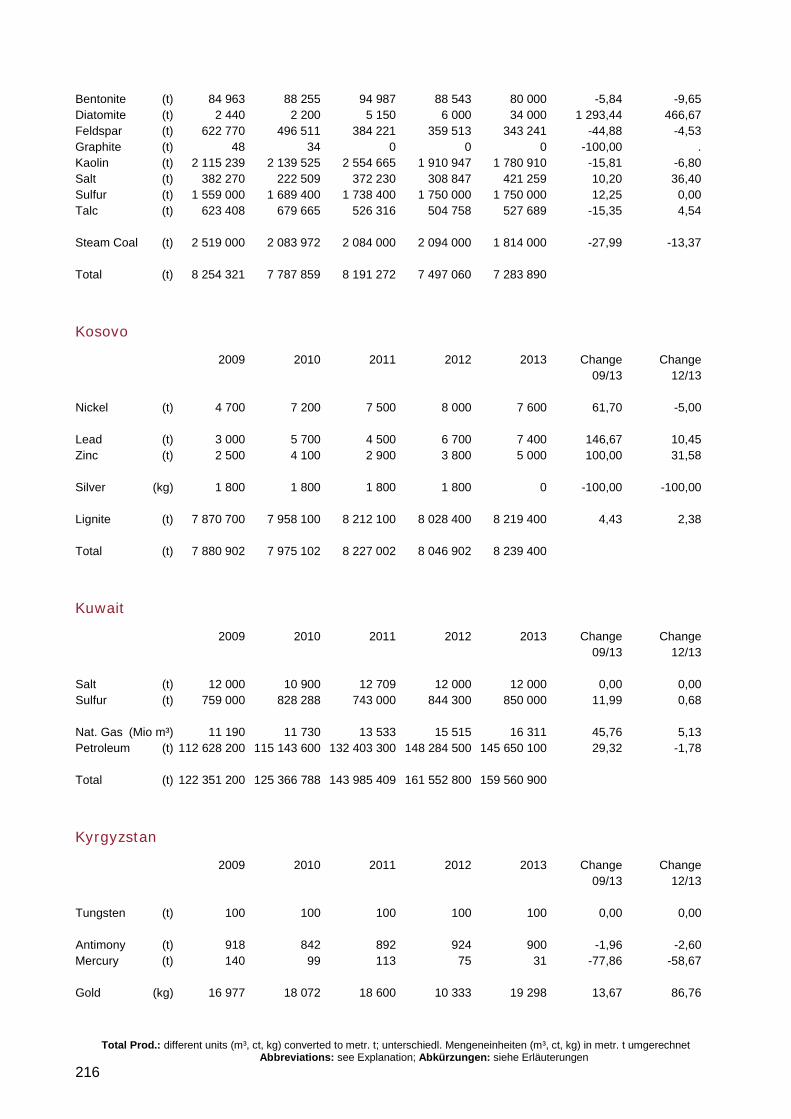
Total Prod.: different units (m³, ct, kg) converted to metr. t; unterschiedl. Mengeneinheiten (m³, ct, kg) in metr. t umgerechnet Abbreviations: see Explanation; Abkürzungen: siehe Erläuterungen
216
Bentonite (t) 84 963 88 255 94 987 88 543 80 000 -5,84 -9,65 Diatomite (t) 2 440 2 200 5 150 6 000 34 000 1 293,44 466,67 Feldspar (t) 622 770 496 511 384 221 359 513 343 241 -44,88 -4,53 Graphite (t) 48 34 0 0 0 -100,00 . Kaolin (t) 2 115 239 2 139 525 2 554 665 1 910 947 1 780 910 -15,81 -6,80 Salt (t) 382 270 222 509 372 230 308 847 421 259 10,20 36,40 Sulfur (t) 1 559 000 1 689 400 1 738 400 1 750 000 1 750 000 12,25 0,00 Talc (t) 623 408 679 665 526 316 504 758 527 689 -15,35 4,54 Steam Coal (t) 2 519 000 2 083 972 2 084 000 2 094 000 1 814 000 -27,99 -13,37 Total (t) 8 254 321 7 787 859 8 191 272 7 497 060 7 283 890
Kosovo
2009 2010 2011 2012 2013 Change Change 09/13 12/13 Nickel (t) 4 700 7 200 7 500 8 000 7 600 61,70 -5,00 Lead (t) 3 000 5 700 4 500 6 700 7 400 146,67 10,45 Zinc (t) 2 500 4 100 2 900 3 800 5 000 100,00 31,58 Silver (kg) 1 800 1 800 1 800 1 800 0 -100,00 -100,00 Lignite (t) 7 870 700 7 958 100 8 212 100 8 028 400 8 219 400 4,43 2,38 Total (t) 7 880 902 7 975 102 8 227 002 8 046 902 8 239 400
Kuwait
2009 2010 2011 2012 2013 Change Change 09/13 12/13 Salt (t) 12 000 10 900 12 709 12 000 12 000 0,00 0,00 Sulfur (t) 759 000 828 288 743 000 844 300 850 000 11,99 0,68 Nat. Gas (Mio m³) 11 190 11 730 13 533 15 515 16 311 45,76 5,13 Petroleum (t) 112 628 200 115 143 600 132 403 300 148 284 500 145 650 100 29,32 -1,78 Total (t) 122 351 200 125 366 788 143 985 409 161 552 800 159 560 900
Kyrgyzstan
2009 2010 2011 2012 2013 Change Change 09/13 12/13 Tungsten (t) 100 100 100 100 100 0,00 0,00 Antimony (t) 918 842 892 924 900 -1,96 -2,60 Mercury (t) 140 99 113 75 31 -77,86 -58,67 Gold (kg) 16 977 18 072 18 600 10 333 19 298 13,67 86,76
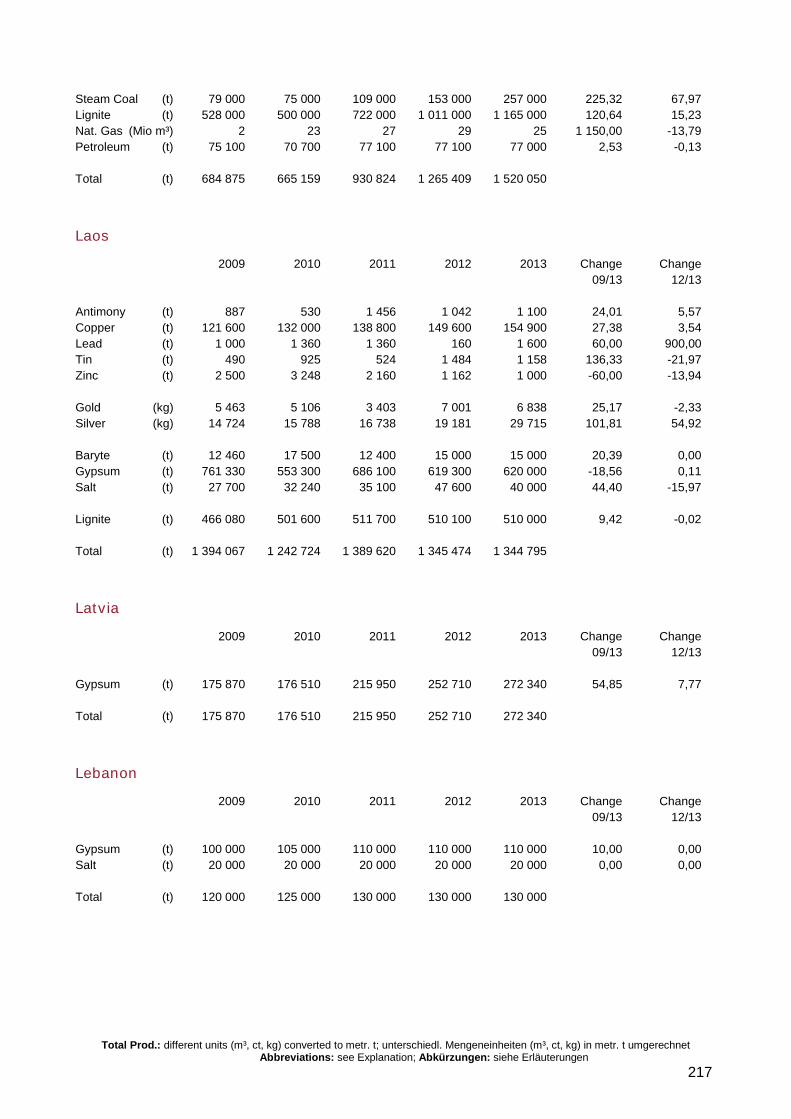
Total Prod.: different units (m³, ct, kg) converted to metr. t; unterschiedl. Mengeneinheiten (m³, ct, kg) in metr. t umgerechnet Abbreviations: see Explanation; Abkürzungen: siehe Erläuterungen
217
Steam Coal (t) 79 000 75 000 109 000 153 000 257 000 225,32 67,97 Lignite (t) 528 000 500 000 722 000 1 011 000 1 165 000 120,64 15,23 Nat. Gas (Mio m³) 2 23 27 29 25 1 150,00 -13,79 Petroleum (t) 75 100 70 700 77 100 77 100 77 000 2,53 -0,13 Total (t) 684 875 665 159 930 824 1 265 409 1 520 050
Laos
2009 2010 2011 2012 2013 Change Change 09/13 12/13 Antimony (t) 887 530 1 456 1 042 1 100 24,01 5,57 Copper (t) 121 600 132 000 138 800 149 600 154 900 27,38 3,54 Lead (t) 1 000 1 360 1 360 160 1 600 60,00 900,00 Tin (t) 490 925 524 1 484 1 158 136,33 -21,97 Zinc (t) 2 500 3 248 2 160 1 162 1 000 -60,00 -13,94 Gold (kg) 5 463 5 106 3 403 7 001 6 838 25,17 -2,33 Silver (kg) 14 724 15 788 16 738 19 181 29 715 101,81 54,92 Baryte (t) 12 460 17 500 12 400 15 000 15 000 20,39 0,00 Gypsum (t) 761 330 553 300 686 100 619 300 620 000 -18,56 0,11 Salt (t) 27 700 32 240 35 100 47 600 40 000 44,40 -15,97 Lignite (t) 466 080 501 600 511 700 510 100 510 000 9,42 -0,02 Total (t) 1 394 067 1 242 724 1 389 620 1 345 474 1 344 795
Latvia
2009 2010 2011 2012 2013 Change Change 09/13 12/13 Gypsum (t) 175 870 176 510 215 950 252 710 272 340 54,85 7,77 Total (t) 175 870 176 510 215 950 252 710 272 340
Lebanon
2009 2010 2011 2012 2013 Change Change 09/13 12/13 Gypsum (t) 100 000 105 000 110 000 110 000 110 000 10,00 0,00 Salt (t) 20 000 20 000 20 000 20 000 20 000 0,00 0,00 Total (t) 120 000 125 000 130 000 130 000 130 000
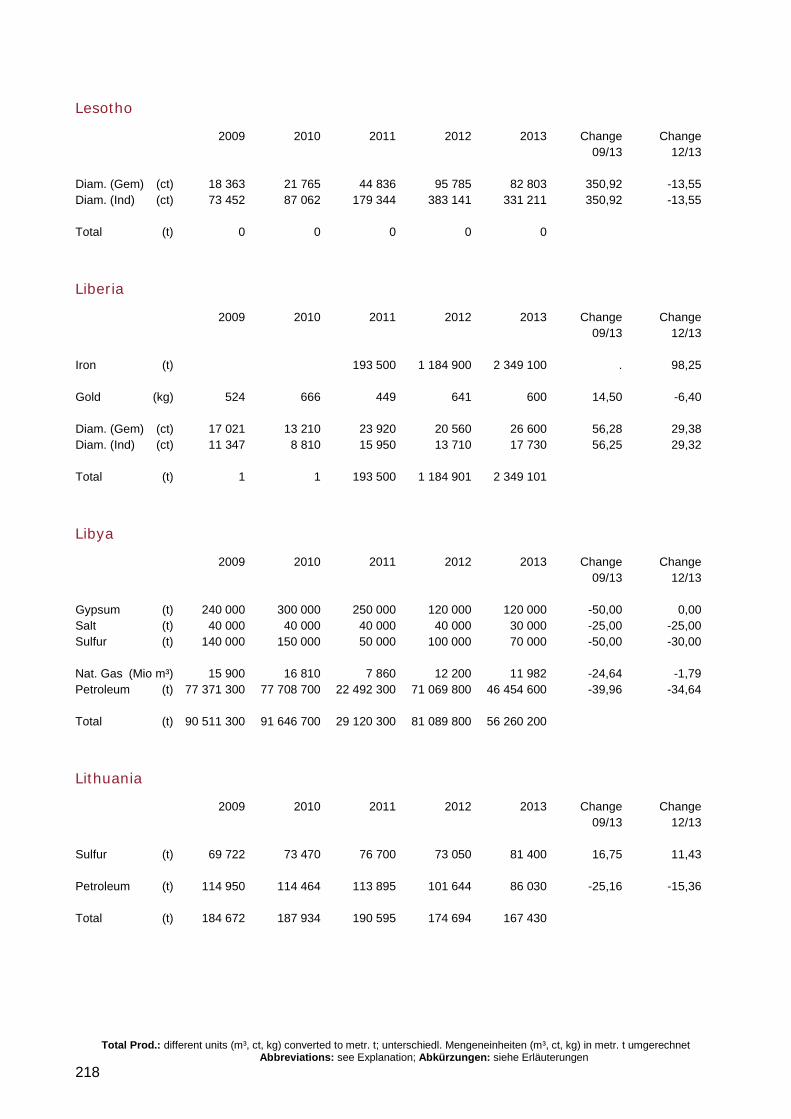
Total Prod.: different units (m³, ct, kg) converted to metr. t; unterschiedl. Mengeneinheiten (m³, ct, kg) in metr. t umgerechnet Abbreviations: see Explanation; Abkürzungen: siehe Erläuterungen
218
Lesotho
2009 2010 2011 2012 2013 Change Change 09/13 12/13 Diam. (Gem) (ct) 18 363 21 765 44 836 95 785 82 803 350,92 -13,55 Diam. (Ind) (ct) 73 452 87 062 179 344 383 141 331 211 350,92 -13,55 Total (t) 0 0 0 0 0
Liberia
2009 2010 2011 2012 2013 Change Change 09/13 12/13 Iron (t) 193 500 1 184 900 2 349 100 . 98,25 Gold (kg) 524 666 449 641 600 14,50 -6,40 Diam. (Gem) (ct) 17 021 13 210 23 920 20 560 26 600 56,28 29,38 Diam. (Ind) (ct) 11 347 8 810 15 950 13 710 17 730 56,25 29,32 Total (t) 1 1 193 500 1 184 901 2 349 101
Libya
2009 2010 2011 2012 2013 Change Change 09/13 12/13 Gypsum (t) 240 000 300 000 250 000 120 000 120 000 -50,00 0,00 Salt (t) 40 000 40 000 40 000 40 000 30 000 -25,00 -25,00 Sulfur (t) 140 000 150 000 50 000 100 000 70 000 -50,00 -30,00 Nat. Gas (Mio m³) 15 900 16 810 7 860 12 200 11 982 -24,64 -1,79 Petroleum (t) 77 371 300 77 708 700 22 492 300 71 069 800 46 454 600 -39,96 -34,64 Total (t) 90 511 300 91 646 700 29 120 300 81 089 800 56 260 200
Lithuania
2009 2010 2011 2012 2013 Change Change 09/13 12/13 Sulfur (t) 69 722 73 470 76 700 73 050 81 400 16,75 11,43 Petroleum (t) 114 950 114 464 113 895 101 644 86 030 -25,16 -15,36 Total (t) 184 672 187 934 190 595 174 694 167 430
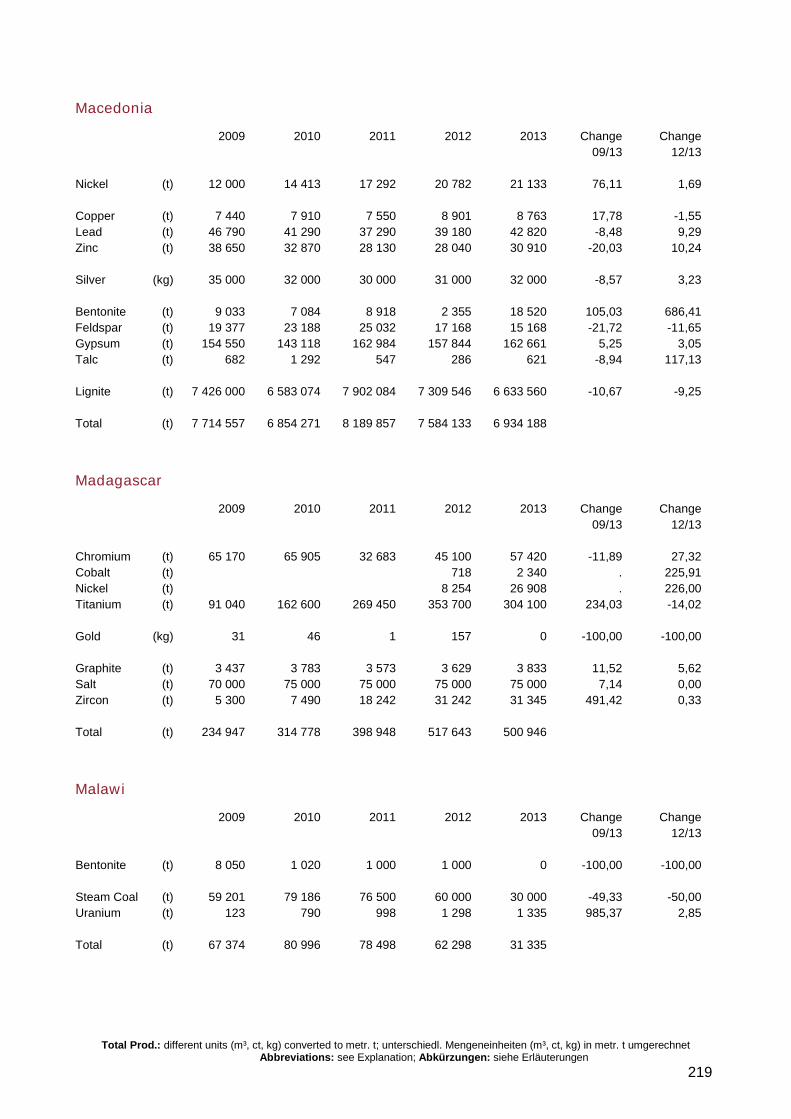
Total Prod.: different units (m³, ct, kg) converted to metr. t; unterschiedl. Mengeneinheiten (m³, ct, kg) in metr. t umgerechnet Abbreviations: see Explanation; Abkürzungen: siehe Erläuterungen
219
Macedonia
2009 2010 2011 2012 2013 Change Change 09/13 12/13 Nickel (t) 12 000 14 413 17 292 20 782 21 133 76,11 1,69 Copper (t) 7 440 7 910 7 550 8 901 8 763 17,78 -1,55 Lead (t) 46 790 41 290 37 290 39 180 42 820 -8,48 9,29 Zinc (t) 38 650 32 870 28 130 28 040 30 910 -20,03 10,24 Silver (kg) 35 000 32 000 30 000 31 000 32 000 -8,57 3,23 Bentonite (t) 9 033 7 084 8 918 2 355 18 520 105,03 686,41 Feldspar (t) 19 377 23 188 25 032 17 168 15 168 -21,72 -11,65 Gypsum (t) 154 550 143 118 162 984 157 844 162 661 5,25 3,05 Talc (t) 682 1 292 547 286 621 -8,94 117,13 Lignite (t) 7 426 000 6 583 074 7 902 084 7 309 546 6 633 560 -10,67 -9,25 Total (t) 7 714 557 6 854 271 8 189 857 7 584 133 6 934 188
Madagascar
2009 2010 2011 2012 2013 Change Change 09/13 12/13 Chromium (t) 65 170 65 905 32 683 45 100 57 420 -11,89 27,32 Cobalt (t) 718 2 340 . 225,91 Nickel (t) 8 254 26 908 . 226,00 Titanium (t) 91 040 162 600 269 450 353 700 304 100 234,03 -14,02 Gold (kg) 31 46 1 157 0 -100,00 -100,00 Graphite (t) 3 437 3 783 3 573 3 629 3 833 11,52 5,62 Salt (t) 70 000 75 000 75 000 75 000 75 000 7,14 0,00 Zircon (t) 5 300 7 490 18 242 31 242 31 345 491,42 0,33 Total (t) 234 947 314 778 398 948 517 643 500 946
Malawi
2009 2010 2011 2012 2013 Change Change 09/13 12/13 Bentonite (t) 8 050 1 020 1 000 1 000 0 -100,00 -100,00 Steam Coal (t) 59 201 79 186 76 500 60 000 30 000 -49,33 -50,00 Uranium (t) 123 790 998 1 298 1 335 985,37 2,85 Total (t) 67 374 80 996 78 498 62 298 31 335
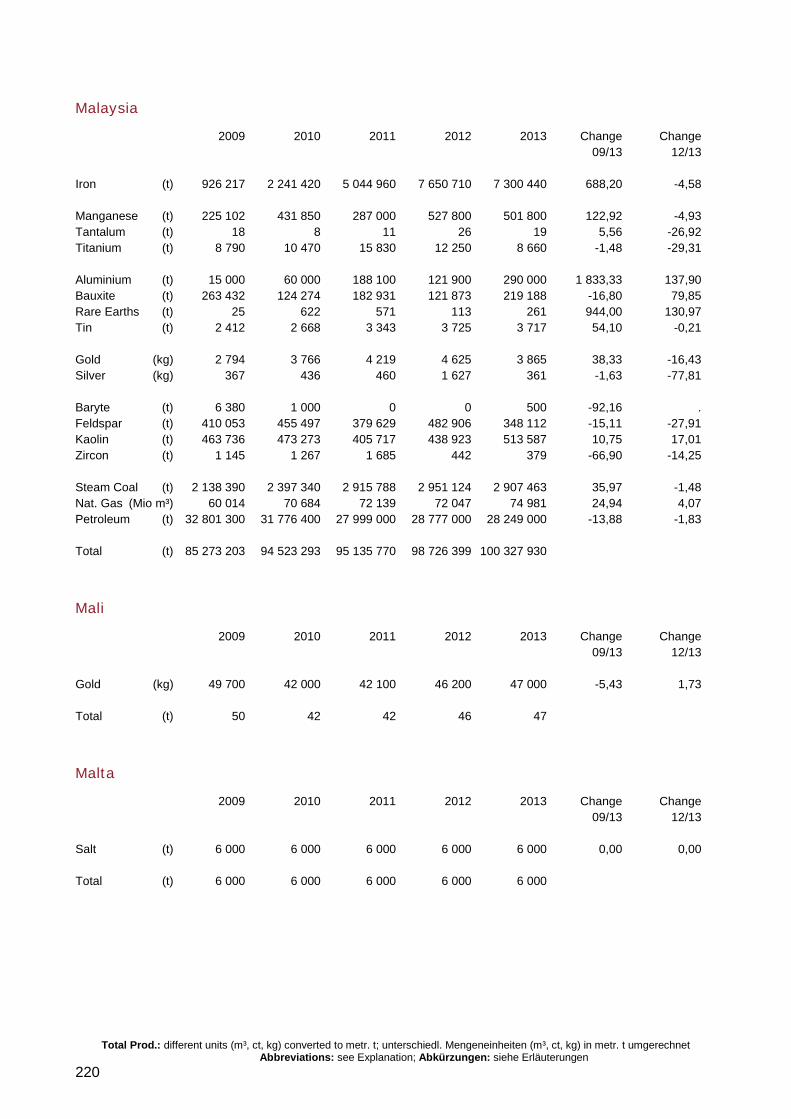
Total Prod.: different units (m³, ct, kg) converted to metr. t; unterschiedl. Mengeneinheiten (m³, ct, kg) in metr. t umgerechnet Abbreviations: see Explanation; Abkürzungen: siehe Erläuterungen
220
Malaysia
2009 2010 2011 2012 2013 Change Change 09/13 12/13 Iron (t) 926 217 2 241 420 5 044 960 7 650 710 7 300 440 688,20 -4,58 Manganese (t) 225 102 431 850 287 000 527 800 501 800 122,92 -4,93 Tantalum (t) 18 8 11 26 19 5,56 -26,92 Titanium (t) 8 790 10 470 15 830 12 250 8 660 -1,48 -29,31 Aluminium (t) 15 000 60 000 188 100 121 900 290 000 1 833,33 137,90 Bauxite (t) 263 432 124 274 182 931 121 873 219 188 -16,80 79,85 Rare Earths (t) 25 622 571 113 261 944,00 130,97 Tin (t) 2 412 2 668 3 343 3 725 3 717 54,10 -0,21 Gold (kg) 2 794 3 766 4 219 4 625 3 865 38,33 -16,43 Silver (kg) 367 436 460 1 627 361 -1,63 -77,81 Baryte (t) 6 380 1 000 0 0 500 -92,16 . Feldspar (t) 410 053 455 497 379 629 482 906 348 112 -15,11 -27,91 Kaolin (t) 463 736 473 273 405 717 438 923 513 587 10,75 17,01 Zircon (t) 1 145 1 267 1 685 442 379 -66,90 -14,25 Steam Coal (t) 2 138 390 2 397 340 2 915 788 2 951 124 2 907 463 35,97 -1,48 Nat. Gas (Mio m³) 60 014 70 684 72 139 72 047 74 981 24,94 4,07 Petroleum (t) 32 801 300 31 776 400 27 999 000 28 777 000 28 249 000 -13,88 -1,83 Total (t) 85 273 203 94 523 293 95 135 770 98 726 399 100 327 930
Mali
2009 2010 2011 2012 2013 Change Change 09/13 12/13 Gold (kg) 49 700 42 000 42 100 46 200 47 000 -5,43 1,73 Total (t) 50 42 42 46 47
Malta
2009 2010 2011 2012 2013 Change Change 09/13 12/13 Salt (t) 6 000 6 000 6 000 6 000 6 000 0,00 0,00 Total (t) 6 000 6 000 6 000 6 000 6 000
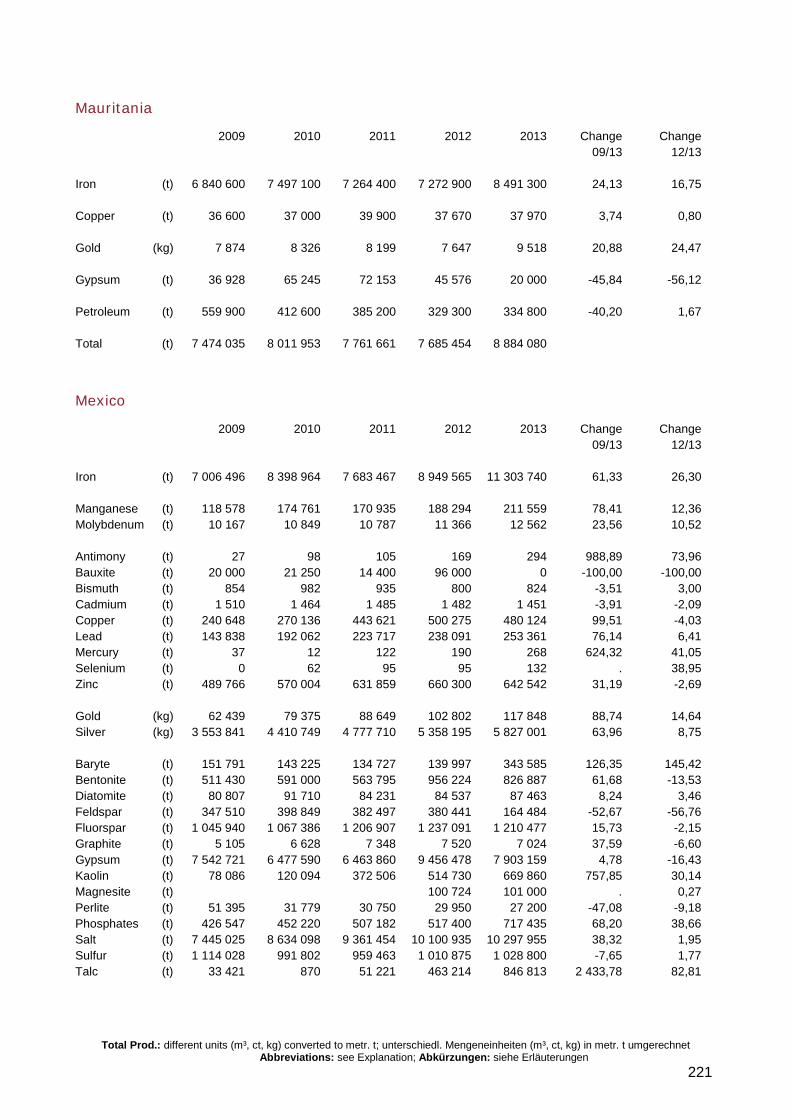
Total Prod.: different units (m³, ct, kg) converted to metr. t; unterschiedl. Mengeneinheiten (m³, ct, kg) in metr. t umgerechnet Abbreviations: see Explanation; Abkürzungen: siehe Erläuterungen
221
Mauritania
2009 2010 2011 2012 2013 Change Change 09/13 12/13 Iron (t) 6 840 600 7 497 100 7 264 400 7 272 900 8 491 300 24,13 16,75 Copper (t) 36 600 37 000 39 900 37 670 37 970 3,74 0,80 Gold (kg) 7 874 8 326 8 199 7 647 9 518 20,88 24,47 Gypsum (t) 36 928 65 245 72 153 45 576 20 000 -45,84 -56,12 Petroleum (t) 559 900 412 600 385 200 329 300 334 800 -40,20 1,67 Total (t) 7 474 035 8 011 953 7 761 661 7 685 454 8 884 080
Mexico
2009 2010 2011 2012 2013 Change Change 09/13 12/13 Iron (t) 7 006 496 8 398 964 7 683 467 8 949 565 11 303 740 61,33 26,30 Manganese (t) 118 578 174 761 170 935 188 294 211 559 78,41 12,36 Molybdenum (t) 10 167 10 849 10 787 11 366 12 562 23,56 10,52 Antimony (t) 27 98 105 169 294 988,89 73,96 Bauxite (t) 20 000 21 250 14 400 96 000 0 -100,00 -100,00 Bismuth (t) 854 982 935 800 824 -3,51 3,00 Cadmium (t) 1 510 1 464 1 485 1 482 1 451 -3,91 -2,09 Copper (t) 240 648 270 136 443 621 500 275 480 124 99,51 -4,03 Lead (t) 143 838 192 062 223 717 238 091 253 361 76,14 6,41 Mercury (t) 37 12 122 190 268 624,32 41,05 Selenium (t) 0 62 95 95 132 . 38,95 Zinc (t) 489 766 570 004 631 859 660 300 642 542 31,19 -2,69 Gold (kg) 62 439 79 375 88 649 102 802 117 848 88,74 14,64 Silver (kg) 3 553 841 4 410 749 4 777 710 5 358 195 5 827 001 63,96 8,75 Baryte (t) 151 791 143 225 134 727 139 997 343 585 126,35 145,42 Bentonite (t) 511 430 591 000 563 795 956 224 826 887 61,68 -13,53 Diatomite (t) 80 807 91 710 84 231 84 537 87 463 8,24 3,46 Feldspar (t) 347 510 398 849 382 497 380 441 164 484 -52,67 -56,76 Fluorspar (t) 1 045 940 1 067 386 1 206 907 1 237 091 1 210 477 15,73 -2,15 Graphite (t) 5 105 6 628 7 348 7 520 7 024 37,59 -6,60 Gypsum (t) 7 542 721 6 477 590 6 463 860 9 456 478 7 903 159 4,78 -16,43 Kaolin (t) 78 086 120 094 372 506 514 730 669 860 757,85 30,14 Magnesite (t) 100 724 101 000 . 0,27 Perlite (t) 51 395 31 779 30 750 29 950 27 200 -47,08 -9,18 Phosphates (t) 426 547 452 220 507 182 517 400 717 435 68,20 38,66 Salt (t) 7 445 025 8 634 098 9 361 454 10 100 935 10 297 955 38,32 1,95 Sulfur (t) 1 114 028 991 802 959 463 1 010 875 1 028 800 -7,65 1,77 Talc (t) 33 421 870 51 221 463 214 846 813 2 433,78 82,81
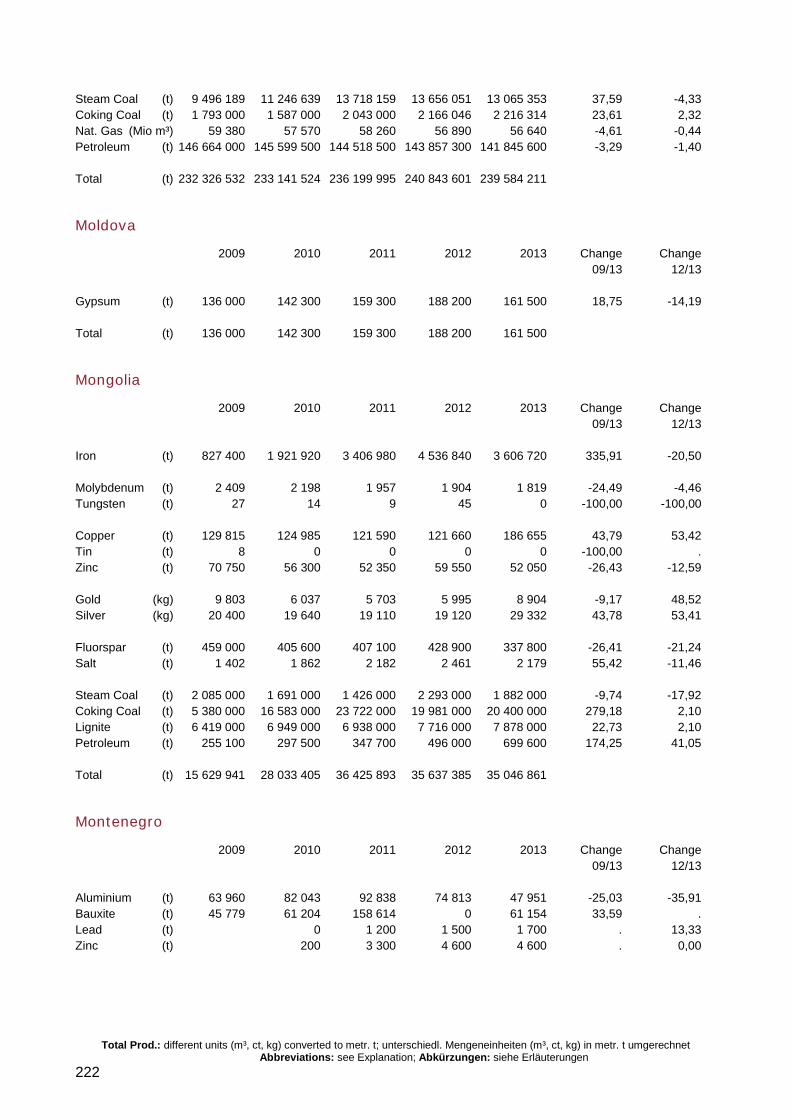
Total Prod.: different units (m³, ct, kg) converted to metr. t; unterschiedl. Mengeneinheiten (m³, ct, kg) in metr. t umgerechnet Abbreviations: see Explanation; Abkürzungen: siehe Erläuterungen
222
Steam Coal (t) 9 496 189 11 246 639 13 718 159 13 656 051 13 065 353 37,59 -4,33 Coking Coal (t) 1 793 000 1 587 000 2 043 000 2 166 046 2 216 314 23,61 2,32 Nat. Gas (Mio m³) 59 380 57 570 58 260 56 890 56 640 -4,61 -0,44 Petroleum (t) 146 664 000 145 599 500 144 518 500 143 857 300 141 845 600 -3,29 -1,40 Total (t) 232 326 532 233 141 524 236 199 995 240 843 601 239 584 211
Moldova
2009 2010 2011 2012 2013 Change Change 09/13 12/13 Gypsum (t) 136 000 142 300 159 300 188 200 161 500 18,75 -14,19 Total (t) 136 000 142 300 159 300 188 200 161 500
Mongolia
2009 2010 2011 2012 2013 Change Change 09/13 12/13 Iron (t) 827 400 1 921 920 3 406 980 4 536 840 3 606 720 335,91 -20,50 Molybdenum (t) 2 409 2 198 1 957 1 904 1 819 -24,49 -4,46 Tungsten (t) 27 14 9 45 0 -100,00 -100,00 Copper (t) 129 815 124 985 121 590 121 660 186 655 43,79 53,42 Tin (t) 8 0 0 0 0 -100,00 . Zinc (t) 70 750 56 300 52 350 59 550 52 050 -26,43 -12,59 Gold (kg) 9 803 6 037 5 703 5 995 8 904 -9,17 48,52 Silver (kg) 20 400 19 640 19 110 19 120 29 332 43,78 53,41 Fluorspar (t) 459 000 405 600 407 100 428 900 337 800 -26,41 -21,24 Salt (t) 1 402 1 862 2 182 2 461 2 179 55,42 -11,46 Steam Coal (t) 2 085 000 1 691 000 1 426 000 2 293 000 1 882 000 -9,74 -17,92 Coking Coal (t) 5 380 000 16 583 000 23 722 000 19 981 000 20 400 000 279,18 2,10 Lignite (t) 6 419 000 6 949 000 6 938 000 7 716 000 7 878 000 22,73 2,10 Petroleum (t) 255 100 297 500 347 700 496 000 699 600 174,25 41,05 Total (t) 15 629 941 28 033 405 36 425 893 35 637 385 35 046 861
Montenegro
2009 2010 2011 2012 2013 Change Change 09/13 12/13 Aluminium (t) 63 960 82 043 92 838 74 813 47 951 -25,03 -35,91 Bauxite (t) 45 779 61 204 158 614 0 61 154 33,59 . Lead (t) 0 1 200 1 500 1 700 . 13,33 Zinc (t) 200 3 300 4 600 4 600 . 0,00
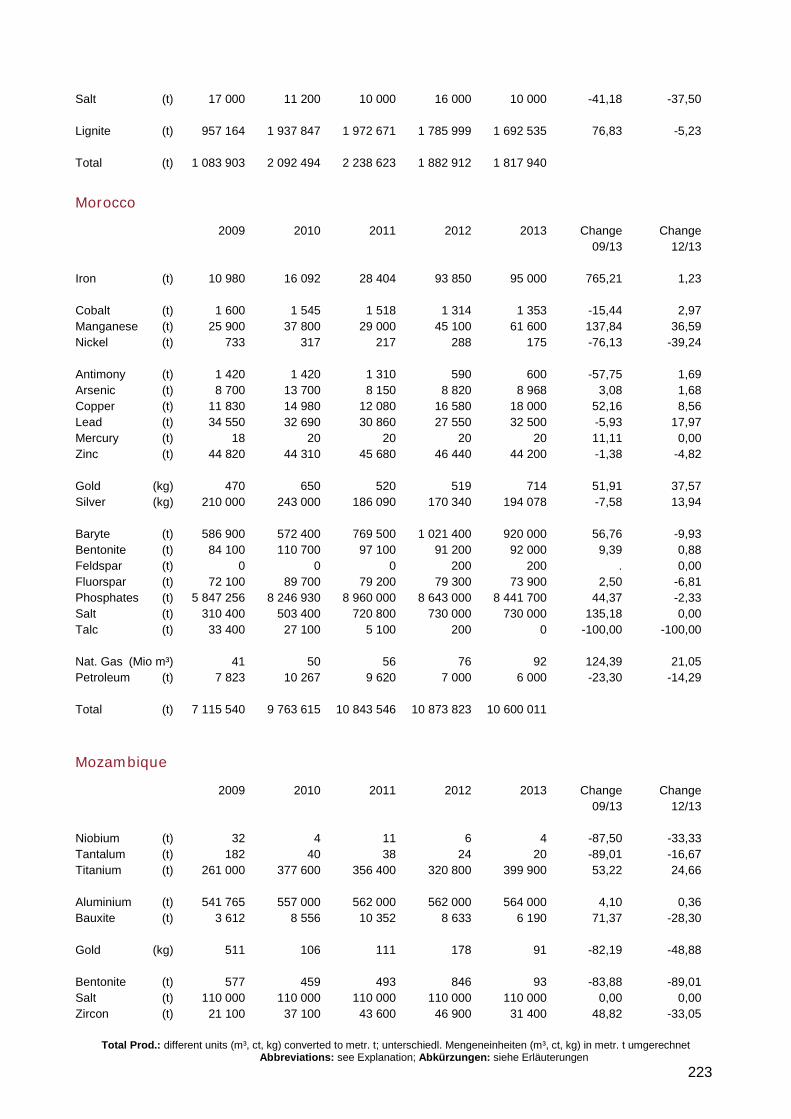
Total Prod.: different units (m³, ct, kg) converted to metr. t; unterschiedl. Mengeneinheiten (m³, ct, kg) in metr. t umgerechnet Abbreviations: see Explanation; Abkürzungen: siehe Erläuterungen
223
Salt (t) 17 000 11 200 10 000 16 000 10 000 -41,18 -37,50 Lignite (t) 957 164 1 937 847 1 972 671 1 785 999 1 692 535 76,83 -5,23 Total (t) 1 083 903 2 092 494 2 238 623 1 882 912 1 817 940
Morocco
2009 2010 2011 2012 2013 Change Change 09/13 12/13 Iron (t) 10 980 16 092 28 404 93 850 95 000 765,21 1,23 Cobalt (t) 1 600 1 545 1 518 1 314 1 353 -15,44 2,97 Manganese (t) 25 900 37 800 29 000 45 100 61 600 137,84 36,59 Nickel (t) 733 317 217 288 175 -76,13 -39,24 Antimony (t) 1 420 1 420 1 310 590 600 -57,75 1,69 Arsenic (t) 8 700 13 700 8 150 8 820 8 968 3,08 1,68 Copper (t) 11 830 14 980 12 080 16 580 18 000 52,16 8,56 Lead (t) 34 550 32 690 30 860 27 550 32 500 -5,93 17,97 Mercury (t) 18 20 20 20 20 11,11 0,00 Zinc (t) 44 820 44 310 45 680 46 440 44 200 -1,38 -4,82 Gold (kg) 470 650 520 519 714 51,91 37,57 Silver (kg) 210 000 243 000 186 090 170 340 194 078 -7,58 13,94 Baryte (t) 586 900 572 400 769 500 1 021 400 920 000 56,76 -9,93 Bentonite (t) 84 100 110 700 97 100 91 200 92 000 9,39 0,88 Feldspar (t) 0 0 0 200 200 . 0,00 Fluorspar (t) 72 100 89 700 79 200 79 300 73 900 2,50 -6,81 Phosphates (t) 5 847 256 8 246 930 8 960 000 8 643 000 8 441 700 44,37 -2,33 Salt (t) 310 400 503 400 720 800 730 000 730 000 135,18 0,00 Talc (t) 33 400 27 100 5 100 200 0 -100,00 -100,00 Nat. Gas (Mio m³) 41 50 56 76 92 124,39 21,05 Petroleum (t) 7 823 10 267 9 620 7 000 6 000 -23,30 -14,29 Total (t) 7 115 540 9 763 615 10 843 546 10 873 823 10 600 011
Mozambique
2009 2010 2011 2012 2013 Change Change 09/13 12/13 Niobium (t) 32 4 11 6 4 -87,50 -33,33 Tantalum (t) 182 40 38 24 20 -89,01 -16,67 Titanium (t) 261 000 377 600 356 400 320 800 399 900 53,22 24,66 Aluminium (t) 541 765 557 000 562 000 562 000 564 000 4,10 0,36 Bauxite (t) 3 612 8 556 10 352 8 633 6 190 71,37 -28,30 Gold (kg) 511 106 111 178 91 -82,19 -48,88 Bentonite (t) 577 459 493 846 93 -83,88 -89,01 Salt (t) 110 000 110 000 110 000 110 000 110 000 0,00 0,00 Zircon (t) 21 100 37 100 43 600 46 900 31 400 48,82 -33,05
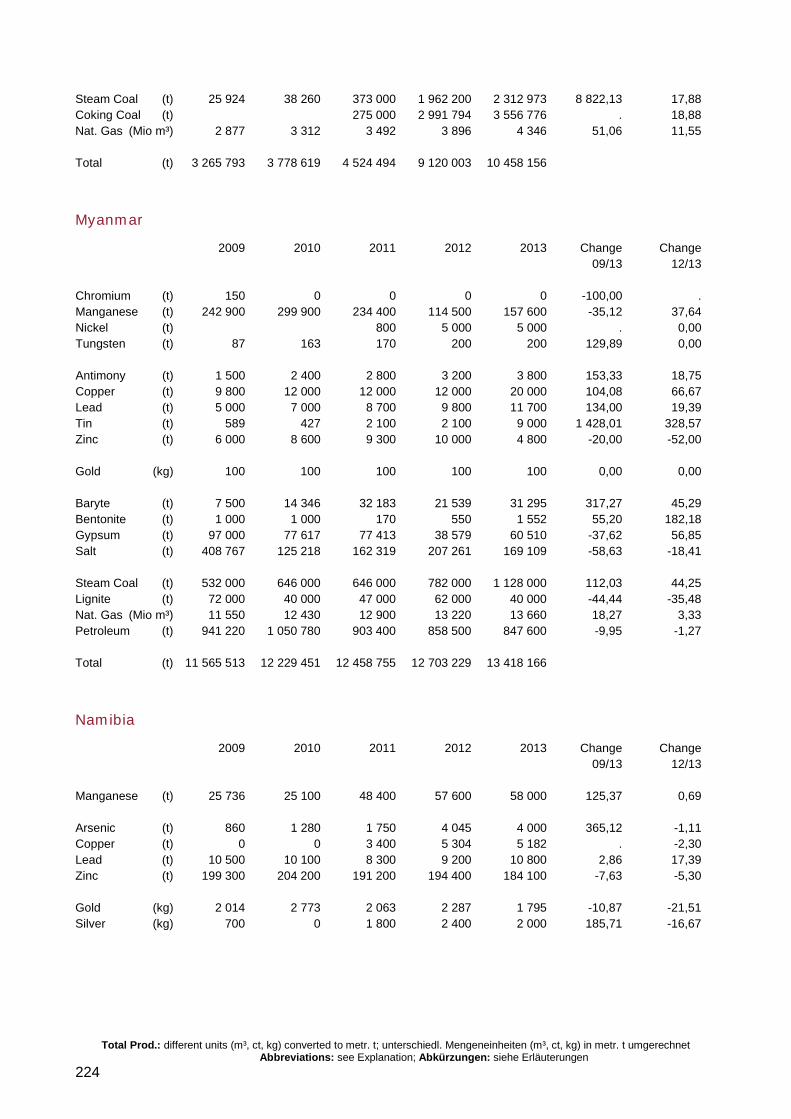
Total Prod.: different units (m³, ct, kg) converted to metr. t; unterschiedl. Mengeneinheiten (m³, ct, kg) in metr. t umgerechnet Abbreviations: see Explanation; Abkürzungen: siehe Erläuterungen
224
Steam Coal (t) 25 924 38 260 373 000 1 962 200 2 312 973 8 822,13 17,88 Coking Coal (t) 275 000 2 991 794 3 556 776 . 18,88 Nat. Gas (Mio m³) 2 877 3 312 3 492 3 896 4 346 51,06 11,55 Total (t) 3 265 793 3 778 619 4 524 494 9 120 003 10 458 156
Myanmar
2009 2010 2011 2012 2013 Change Change 09/13 12/13 Chromium (t) 150 0 0 0 0 -100,00 . Manganese (t) 242 900 299 900 234 400 114 500 157 600 -35,12 37,64 Nickel (t) 800 5 000 5 000 . 0,00 Tungsten (t) 87 163 170 200 200 129,89 0,00 Antimony (t) 1 500 2 400 2 800 3 200 3 800 153,33 18,75 Copper (t) 9 800 12 000 12 000 12 000 20 000 104,08 66,67 Lead (t) 5 000 7 000 8 700 9 800 11 700 134,00 19,39 Tin (t) 589 427 2 100 2 100 9 000 1 428,01 328,57 Zinc (t) 6 000 8 600 9 300 10 000 4 800 -20,00 -52,00 Gold (kg) 100 100 100 100 100 0,00 0,00 Baryte (t) 7 500 14 346 32 183 21 539 31 295 317,27 45,29 Bentonite (t) 1 000 1 000 170 550 1 552 55,20 182,18 Gypsum (t) 97 000 77 617 77 413 38 579 60 510 -37,62 56,85 Salt (t) 408 767 125 218 162 319 207 261 169 109 -58,63 -18,41 Steam Coal (t) 532 000 646 000 646 000 782 000 1 128 000 112,03 44,25 Lignite (t) 72 000 40 000 47 000 62 000 40 000 -44,44 -35,48 Nat. Gas (Mio m³) 11 550 12 430 12 900 13 220 13 660 18,27 3,33 Petroleum (t) 941 220 1 050 780 903 400 858 500 847 600 -9,95 -1,27 Total (t) 11 565 513 12 229 451 12 458 755 12 703 229 13 418 166
Namibia
2009 2010 2011 2012 2013 Change Change 09/13 12/13 Manganese (t) 25 736 25 100 48 400 57 600 58 000 125,37 0,69 Arsenic (t) 860 1 280 1 750 4 045 4 000 365,12 -1,11 Copper (t) 0 0 3 400 5 304 5 182 . -2,30 Lead (t) 10 500 10 100 8 300 9 200 10 800 2,86 17,39 Zinc (t) 199 300 204 200 191 200 194 400 184 100 -7,63 -5,30 Gold (kg) 2 014 2 773 2 063 2 287 1 795 -10,87 -21,51 Silver (kg) 700 0 1 800 2 400 2 000 185,71 -16,67
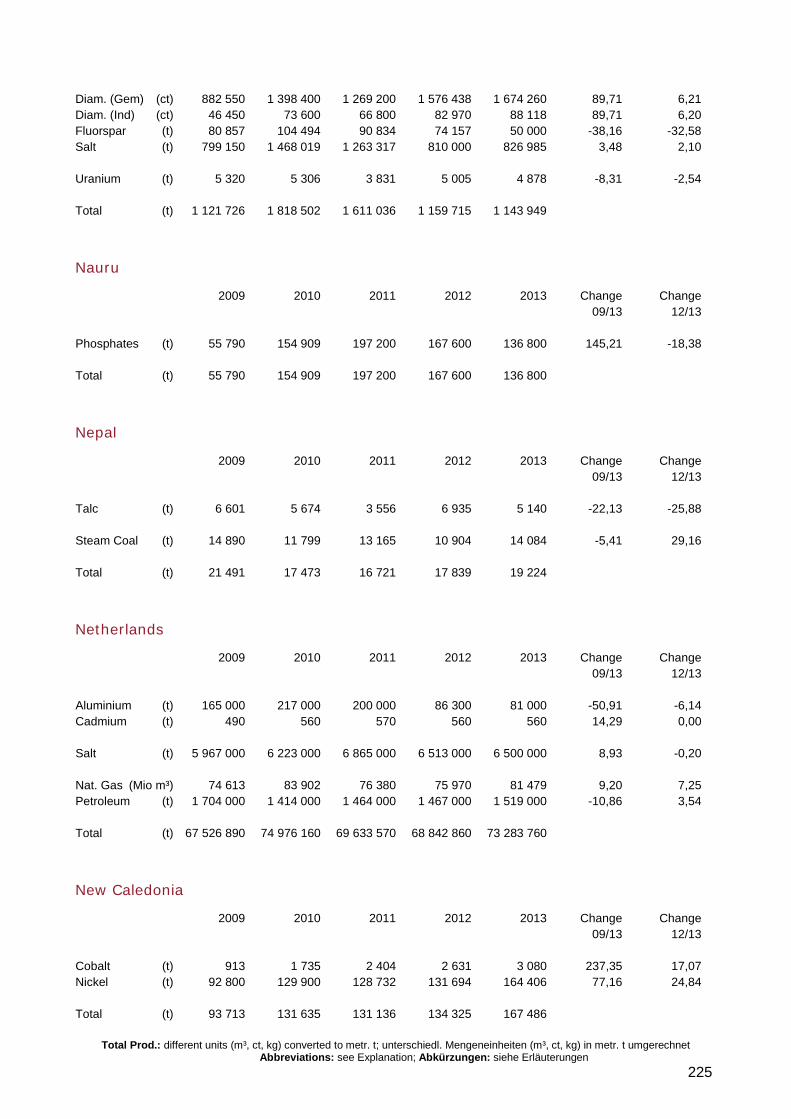
Total Prod.: different units (m³, ct, kg) converted to metr. t; unterschiedl. Mengeneinheiten (m³, ct, kg) in metr. t umgerechnet Abbreviations: see Explanation; Abkürzungen: siehe Erläuterungen
225
Diam. (Gem) (ct) 882 550 1 398 400 1 269 200 1 576 438 1 674 260 89,71 6,21 Diam. (Ind) (ct) 46 450 73 600 66 800 82 970 88 118 89,71 6,20 Fluorspar (t) 80 857 104 494 90 834 74 157 50 000 -38,16 -32,58 Salt (t) 799 150 1 468 019 1 263 317 810 000 826 985 3,48 2,10 Uranium (t) 5 320 5 306 3 831 5 005 4 878 -8,31 -2,54 Total (t) 1 121 726 1 818 502 1 611 036 1 159 715 1 143 949
Nauru
2009 2010 2011 2012 2013 Change Change 09/13 12/13 Phosphates (t) 55 790 154 909 197 200 167 600 136 800 145,21 -18,38 Total (t) 55 790 154 909 197 200 167 600 136 800
Nepal
2009 2010 2011 2012 2013 Change Change 09/13 12/13 Talc (t) 6 601 5 674 3 556 6 935 5 140 -22,13 -25,88 Steam Coal (t) 14 890 11 799 13 165 10 904 14 084 -5,41 29,16 Total (t) 21 491 17 473 16 721 17 839 19 224
Netherlands
2009 2010 2011 2012 2013 Change Change 09/13 12/13 Aluminium (t) 165 000 217 000 200 000 86 300 81 000 -50,91 -6,14 Cadmium (t) 490 560 570 560 560 14,29 0,00 Salt (t) 5 967 000 6 223 000 6 865 000 6 513 000 6 500 000 8,93 -0,20 Nat. Gas (Mio m³) 74 613 83 902 76 380 75 970 81 479 9,20 7,25 Petroleum (t) 1 704 000 1 414 000 1 464 000 1 467 000 1 519 000 -10,86 3,54 Total (t) 67 526 890 74 976 160 69 633 570 68 842 860 73 283 760
New Caledonia
2009 2010 2011 2012 2013 Change Change 09/13 12/13 Cobalt (t) 913 1 735 2 404 2 631 3 080 237,35 17,07 Nickel (t) 92 800 129 900 128 732 131 694 164 406 77,16 24,84 Total (t) 93 713 131 635 131 136 134 325 167 486
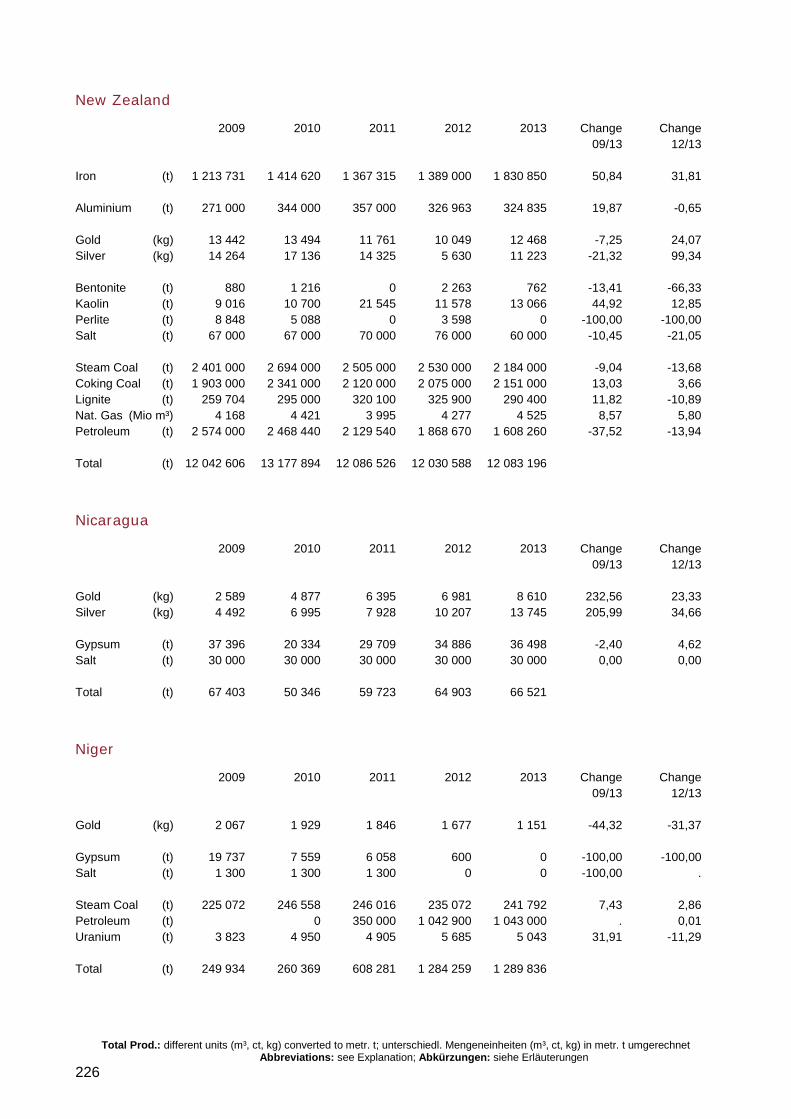
Total Prod.: different units (m³, ct, kg) converted to metr. t; unterschiedl. Mengeneinheiten (m³, ct, kg) in metr. t umgerechnet Abbreviations: see Explanation; Abkürzungen: siehe Erläuterungen
226
New Zealand
2009 2010 2011 2012 2013 Change Change 09/13 12/13 Iron (t) 1 213 731 1 414 620 1 367 315 1 389 000 1 830 850 50,84 31,81 Aluminium (t) 271 000 344 000 357 000 326 963 324 835 19,87 -0,65 Gold (kg) 13 442 13 494 11 761 10 049 12 468 -7,25 24,07 Silver (kg) 14 264 17 136 14 325 5 630 11 223 -21,32 99,34 Bentonite (t) 880 1 216 0 2 263 762 -13,41 -66,33 Kaolin (t) 9 016 10 700 21 545 11 578 13 066 44,92 12,85 Perlite (t) 8 848 5 088 0 3 598 0 -100,00 -100,00 Salt (t) 67 000 67 000 70 000 76 000 60 000 -10,45 -21,05 Steam Coal (t) 2 401 000 2 694 000 2 505 000 2 530 000 2 184 000 -9,04 -13,68 Coking Coal (t) 1 903 000 2 341 000 2 120 000 2 075 000 2 151 000 13,03 3,66 Lignite (t) 259 704 295 000 320 100 325 900 290 400 11,82 -10,89 Nat. Gas (Mio m³) 4 168 4 421 3 995 4 277 4 525 8,57 5,80 Petroleum (t) 2 574 000 2 468 440 2 129 540 1 868 670 1 608 260 -37,52 -13,94 Total (t) 12 042 606 13 177 894 12 086 526 12 030 588 12 083 196
Nicaragua
2009 2010 2011 2012 2013 Change Change 09/13 12/13 Gold (kg) 2 589 4 877 6 395 6 981 8 610 232,56 23,33 Silver (kg) 4 492 6 995 7 928 10 207 13 745 205,99 34,66 Gypsum (t) 37 396 20 334 29 709 34 886 36 498 -2,40 4,62 Salt (t) 30 000 30 000 30 000 30 000 30 000 0,00 0,00 Total (t) 67 403 50 346 59 723 64 903 66 521
Niger
2009 2010 2011 2012 2013 Change Change 09/13 12/13 Gold (kg) 2 067 1 929 1 846 1 677 1 151 -44,32 -31,37 Gypsum (t) 19 737 7 559 6 058 600 0 -100,00 -100,00 Salt (t) 1 300 1 300 1 300 0 0 -100,00 . Steam Coal (t) 225 072 246 558 246 016 235 072 241 792 7,43 2,86 Petroleum (t) 0 350 000 1 042 900 1 043 000 . 0,01 Uranium (t) 3 823 4 950 4 905 5 685 5 043 31,91 -11,29 Total (t) 249 934 260 369 608 281 1 284 259 1 289 836
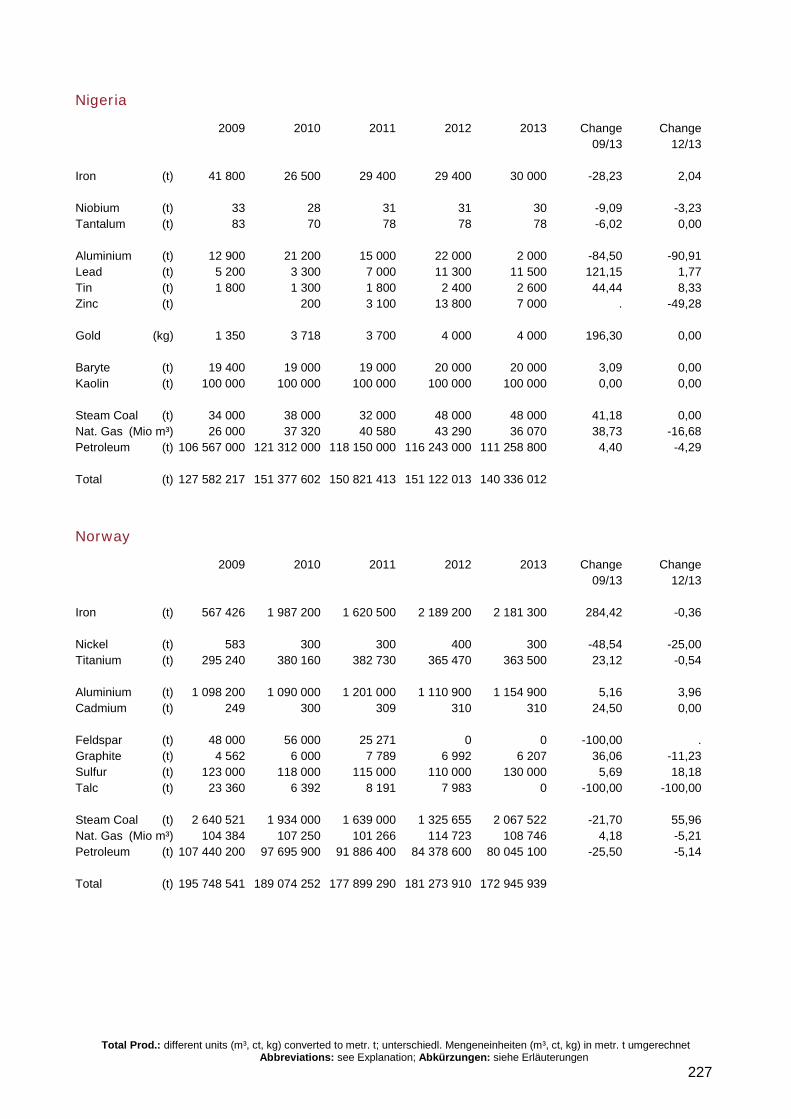
Total Prod.: different units (m³, ct, kg) converted to metr. t; unterschiedl. Mengeneinheiten (m³, ct, kg) in metr. t umgerechnet Abbreviations: see Explanation; Abkürzungen: siehe Erläuterungen
227
Nigeria
2009 2010 2011 2012 2013 Change Change 09/13 12/13 Iron (t) 41 800 26 500 29 400 29 400 30 000 -28,23 2,04 Niobium (t) 33 28 31 31 30 -9,09 -3,23 Tantalum (t) 83 70 78 78 78 -6,02 0,00 Aluminium (t) 12 900 21 200 15 000 22 000 2 000 -84,50 -90,91 Lead (t) 5 200 3 300 7 000 11 300 11 500 121,15 1,77 Tin (t) 1 800 1 300 1 800 2 400 2 600 44,44 8,33 Zinc (t) 200 3 100 13 800 7 000 . -49,28 Gold (kg) 1 350 3 718 3 700 4 000 4 000 196,30 0,00 Baryte (t) 19 400 19 000 19 000 20 000 20 000 3,09 0,00 Kaolin (t) 100 000 100 000 100 000 100 000 100 000 0,00 0,00 Steam Coal (t) 34 000 38 000 32 000 48 000 48 000 41,18 0,00 Nat. Gas (Mio m³) 26 000 37 320 40 580 43 290 36 070 38,73 -16,68 Petroleum (t) 106 567 000 121 312 000 118 150 000 116 243 000 111 258 800 4,40 -4,29 Total (t) 127 582 217 151 377 602 150 821 413 151 122 013 140 336 012
Norway
2009 2010 2011 2012 2013 Change Change 09/13 12/13 Iron (t) 567 426 1 987 200 1 620 500 2 189 200 2 181 300 284,42 -0,36 Nickel (t) 583 300 300 400 300 -48,54 -25,00 Titanium (t) 295 240 380 160 382 730 365 470 363 500 23,12 -0,54 Aluminium (t) 1 098 200 1 090 000 1 201 000 1 110 900 1 154 900 5,16 3,96 Cadmium (t) 249 300 309 310 310 24,50 0,00 Feldspar (t) 48 000 56 000 25 271 0 0 -100,00 . Graphite (t) 4 562 6 000 7 789 6 992 6 207 36,06 -11,23 Sulfur (t) 123 000 118 000 115 000 110 000 130 000 5,69 18,18 Talc (t) 23 360 6 392 8 191 7 983 0 -100,00 -100,00 Steam Coal (t) 2 640 521 1 934 000 1 639 000 1 325 655 2 067 522 -21,70 55,96 Nat. Gas (Mio m³) 104 384 107 250 101 266 114 723 108 746 4,18 -5,21 Petroleum (t) 107 440 200 97 695 900 91 886 400 84 378 600 80 045 100 -25,50 -5,14 Total (t) 195 748 541 189 074 252 177 899 290 181 273 910 172 945 939
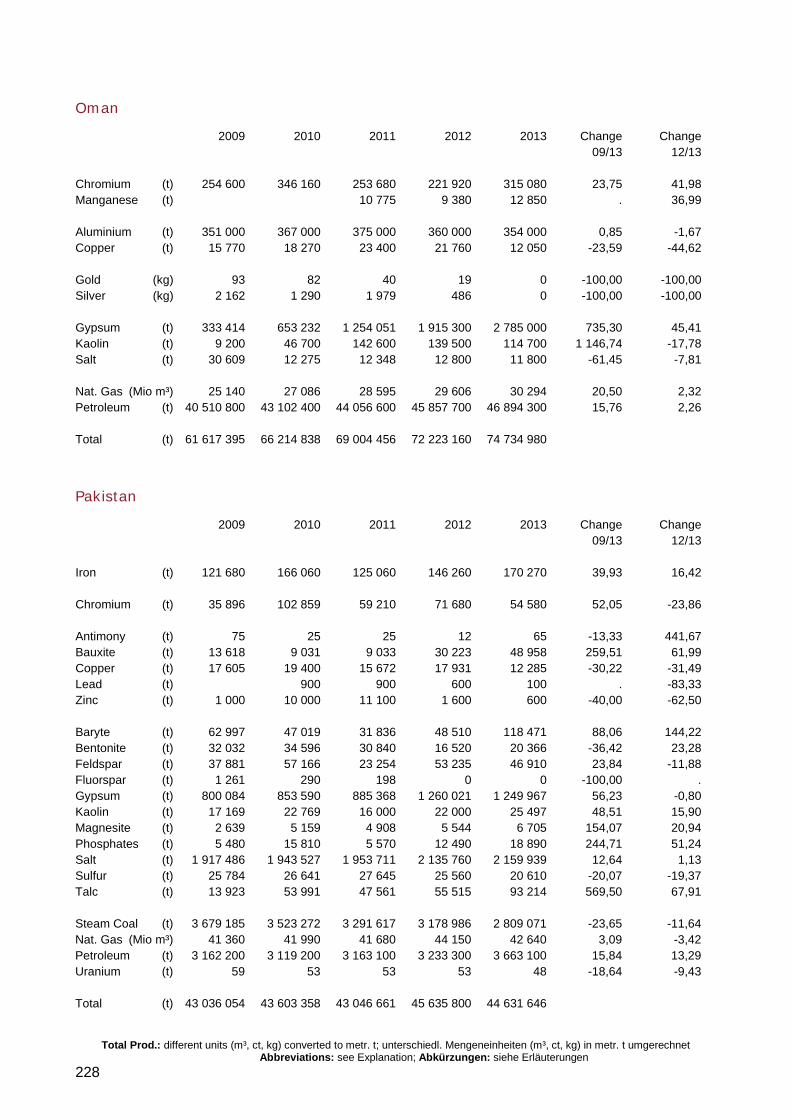
Total Prod.: different units (m³, ct, kg) converted to metr. t; unterschiedl. Mengeneinheiten (m³, ct, kg) in metr. t umgerechnet Abbreviations: see Explanation; Abkürzungen: siehe Erläuterungen
228
Oman
2009 2010 2011 2012 2013 Change Change 09/13 12/13 Chromium (t) 254 600 346 160 253 680 221 920 315 080 23,75 41,98 Manganese (t) 10 775 9 380 12 850 . 36,99 Aluminium (t) 351 000 367 000 375 000 360 000 354 000 0,85 -1,67 Copper (t) 15 770 18 270 23 400 21 760 12 050 -23,59 -44,62 Gold (kg) 93 82 40 19 0 -100,00 -100,00 Silver (kg) 2 162 1 290 1 979 486 0 -100,00 -100,00 Gypsum (t) 333 414 653 232 1 254 051 1 915 300 2 785 000 735,30 45,41 Kaolin (t) 9 200 46 700 142 600 139 500 114 700 1 146,74 -17,78 Salt (t) 30 609 12 275 12 348 12 800 11 800 -61,45 -7,81 Nat. Gas (Mio m³) 25 140 27 086 28 595 29 606 30 294 20,50 2,32 Petroleum (t) 40 510 800 43 102 400 44 056 600 45 857 700 46 894 300 15,76 2,26 Total (t) 61 617 395 66 214 838 69 004 456 72 223 160 74 734 980
Pakistan
2009 2010 2011 2012 2013 Change Change 09/13 12/13 Iron (t) 121 680 166 060 125 060 146 260 170 270 39,93 16,42 Chromium (t) 35 896 102 859 59 210 71 680 54 580 52,05 -23,86 Antimony (t) 75 25 25 12 65 -13,33 441,67 Bauxite (t) 13 618 9 031 9 033 30 223 48 958 259,51 61,99 Copper (t) 17 605 19 400 15 672 17 931 12 285 -30,22 -31,49 Lead (t) 900 900 600 100 . -83,33 Zinc (t) 1 000 10 000 11 100 1 600 600 -40,00 -62,50 Baryte (t) 62 997 47 019 31 836 48 510 118 471 88,06 144,22 Bentonite (t) 32 032 34 596 30 840 16 520 20 366 -36,42 23,28 Feldspar (t) 37 881 57 166 23 254 53 235 46 910 23,84 -11,88 Fluorspar (t) 1 261 290 198 0 0 -100,00 . Gypsum (t) 800 084 853 590 885 368 1 260 021 1 249 967 56,23 -0,80 Kaolin (t) 17 169 22 769 16 000 22 000 25 497 48,51 15,90 Magnesite (t) 2 639 5 159 4 908 5 544 6 705 154,07 20,94 Phosphates (t) 5 480 15 810 5 570 12 490 18 890 244,71 51,24 Salt (t) 1 917 486 1 943 527 1 953 711 2 135 760 2 159 939 12,64 1,13 Sulfur (t) 25 784 26 641 27 645 25 560 20 610 -20,07 -19,37 Talc (t) 13 923 53 991 47 561 55 515 93 214 569,50 67,91 Steam Coal (t) 3 679 185 3 523 272 3 291 617 3 178 986 2 809 071 -23,65 -11,64 Nat. Gas (Mio m³) 41 360 41 990 41 680 44 150 42 640 3,09 -3,42 Petroleum (t) 3 162 200 3 119 200 3 163 100 3 233 300 3 663 100 15,84 13,29 Uranium (t) 59 53 53 53 48 -18,64 -9,43 Total (t) 43 036 054 43 603 358 43 046 661 45 635 800 44 631 646
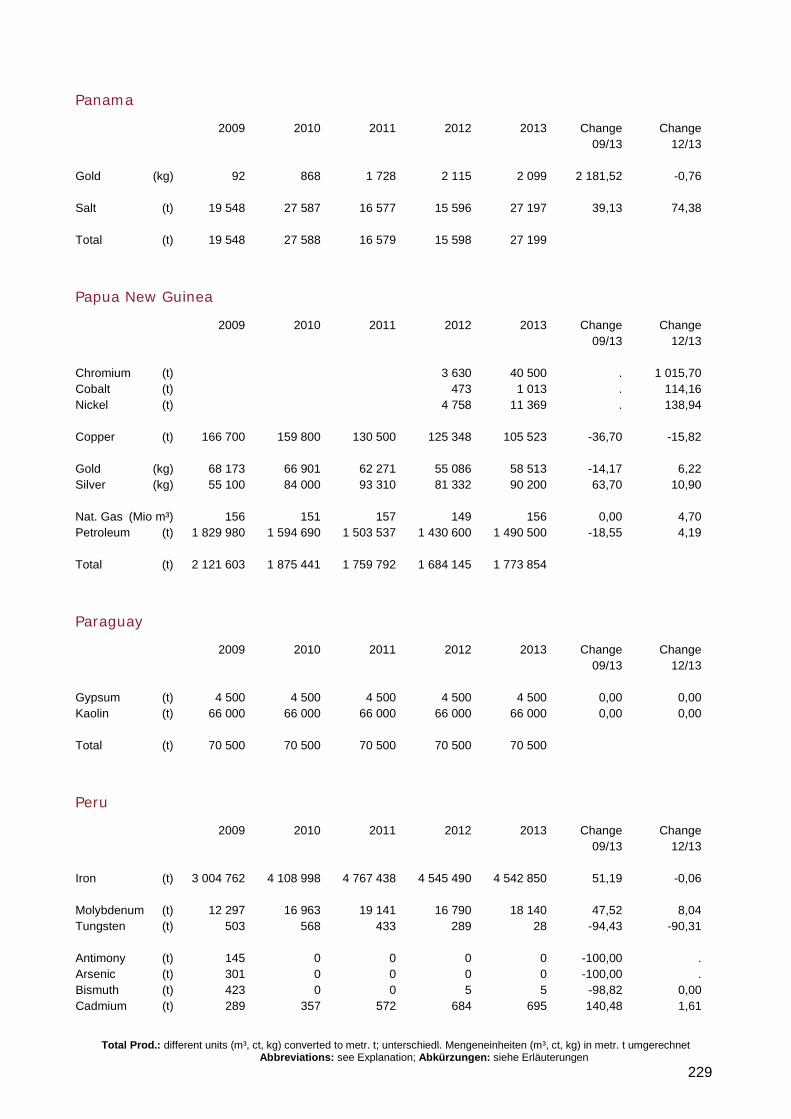
Total Prod.: different units (m³, ct, kg) converted to metr. t; unterschiedl. Mengeneinheiten (m³, ct, kg) in metr. t umgerechnet Abbreviations: see Explanation; Abkürzungen: siehe Erläuterungen
229
Panama
2009 2010 2011 2012 2013 Change Change 09/13 12/13 Gold (kg) 92 868 1 728 2 115 2 099 2 181,52 -0,76 Salt (t) 19 548 27 587 16 577 15 596 27 197 39,13 74,38 Total (t) 19 548 27 588 16 579 15 598 27 199
Papua New Guinea
2009 2010 2011 2012 2013 Change Change 09/13 12/13 Chromium (t) 3 630 40 500 . 1 015,70 Cobalt (t) 473 1 013 . 114,16 Nickel (t) 4 758 11 369 . 138,94 Copper (t) 166 700 159 800 130 500 125 348 105 523 -36,70 -15,82 Gold (kg) 68 173 66 901 62 271 55 086 58 513 -14,17 6,22 Silver (kg) 55 100 84 000 93 310 81 332 90 200 63,70 10,90 Nat. Gas (Mio m³) 156 151 157 149 156 0,00 4,70 Petroleum (t) 1 829 980 1 594 690 1 503 537 1 430 600 1 490 500 -18,55 4,19 Total (t) 2 121 603 1 875 441 1 759 792 1 684 145 1 773 854
Paraguay
2009 2010 2011 2012 2013 Change Change 09/13 12/13 Gypsum (t) 4 500 4 500 4 500 4 500 4 500 0,00 0,00 Kaolin (t) 66 000 66 000 66 000 66 000 66 000 0,00 0,00 Total (t) 70 500 70 500 70 500 70 500 70 500
Peru
2009 2010 2011 2012 2013 Change Change 09/13 12/13 Iron (t) 3 004 762 4 108 998 4 767 438 4 545 490 4 542 850 51,19 -0,06 Molybdenum (t) 12 297 16 963 19 141 16 790 18 140 47,52 8,04 Tungsten (t) 503 568 433 289 28 -94,43 -90,31 Antimony (t) 145 0 0 0 0 -100,00 . Arsenic (t) 301 0 0 0 0 -100,00 . Bismuth (t) 423 0 0 5 5 -98,82 0,00 Cadmium (t) 289 357 572 684 695 140,48 1,61
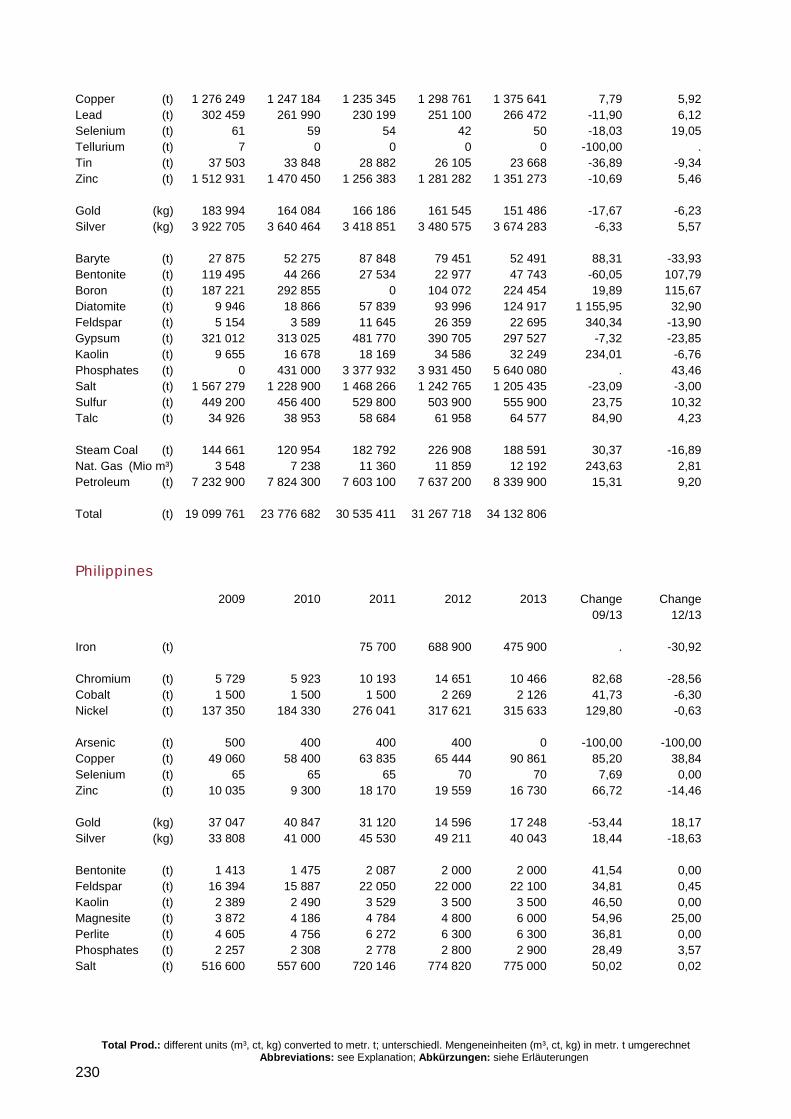
Total Prod.: different units (m³, ct, kg) converted to metr. t; unterschiedl. Mengeneinheiten (m³, ct, kg) in metr. t umgerechnet Abbreviations: see Explanation; Abkürzungen: siehe Erläuterungen
230
Copper (t) 1 276 249 1 247 184 1 235 345 1 298 761 1 375 641 7,79 5,92 Lead (t) 302 459 261 990 230 199 251 100 266 472 -11,90 6,12 Selenium (t) 61 59 54 42 50 -18,03 19,05 Tellurium (t) 7 0 0 0 0 -100,00 . Tin (t) 37 503 33 848 28 882 26 105 23 668 -36,89 -9,34 Zinc (t) 1 512 931 1 470 450 1 256 383 1 281 282 1 351 273 -10,69 5,46 Gold (kg) 183 994 164 084 166 186 161 545 151 486 -17,67 -6,23 Silver (kg) 3 922 705 3 640 464 3 418 851 3 480 575 3 674 283 -6,33 5,57 Baryte (t) 27 875 52 275 87 848 79 451 52 491 88,31 -33,93 Bentonite (t) 119 495 44 266 27 534 22 977 47 743 -60,05 107,79 Boron (t) 187 221 292 855 0 104 072 224 454 19,89 115,67 Diatomite (t) 9 946 18 866 57 839 93 996 124 917 1 155,95 32,90 Feldspar (t) 5 154 3 589 11 645 26 359 22 695 340,34 -13,90 Gypsum (t) 321 012 313 025 481 770 390 705 297 527 -7,32 -23,85 Kaolin (t) 9 655 16 678 18 169 34 586 32 249 234,01 -6,76 Phosphates (t) 0 431 000 3 377 932 3 931 450 5 640 080 . 43,46 Salt (t) 1 567 279 1 228 900 1 468 266 1 242 765 1 205 435 -23,09 -3,00 Sulfur (t) 449 200 456 400 529 800 503 900 555 900 23,75 10,32 Talc (t) 34 926 38 953 58 684 61 958 64 577 84,90 4,23 Steam Coal (t) 144 661 120 954 182 792 226 908 188 591 30,37 -16,89 Nat. Gas (Mio m³) 3 548 7 238 11 360 11 859 12 192 243,63 2,81 Petroleum (t) 7 232 900 7 824 300 7 603 100 7 637 200 8 339 900 15,31 9,20 Total (t) 19 099 761 23 776 682 30 535 411 31 267 718 34 132 806
Philippines
2009 2010 2011 2012 2013 Change Change 09/13 12/13 Iron (t) 75 700 688 900 475 900 . -30,92 Chromium (t) 5 729 5 923 10 193 14 651 10 466 82,68 -28,56 Cobalt (t) 1 500 1 500 1 500 2 269 2 126 41,73 -6,30 Nickel (t) 137 350 184 330 276 041 317 621 315 633 129,80 -0,63 Arsenic (t) 500 400 400 400 0 -100,00 -100,00 Copper (t) 49 060 58 400 63 835 65 444 90 861 85,20 38,84 Selenium (t) 65 65 65 70 70 7,69 0,00 Zinc (t) 10 035 9 300 18 170 19 559 16 730 66,72 -14,46 Gold (kg) 37 047 40 847 31 120 14 596 17 248 -53,44 18,17 Silver (kg) 33 808 41 000 45 530 49 211 40 043 18,44 -18,63 Bentonite (t) 1 413 1 475 2 087 2 000 2 000 41,54 0,00 Feldspar (t) 16 394 15 887 22 050 22 000 22 100 34,81 0,45 Kaolin (t) 2 389 2 490 3 529 3 500 3 500 46,50 0,00 Magnesite (t) 3 872 4 186 4 784 4 800 6 000 54,96 25,00 Perlite (t) 4 605 4 756 6 272 6 300 6 300 36,81 0,00 Phosphates (t) 2 257 2 308 2 778 2 800 2 900 28,49 3,57 Salt (t) 516 600 557 600 720 146 774 820 775 000 50,02 0,02
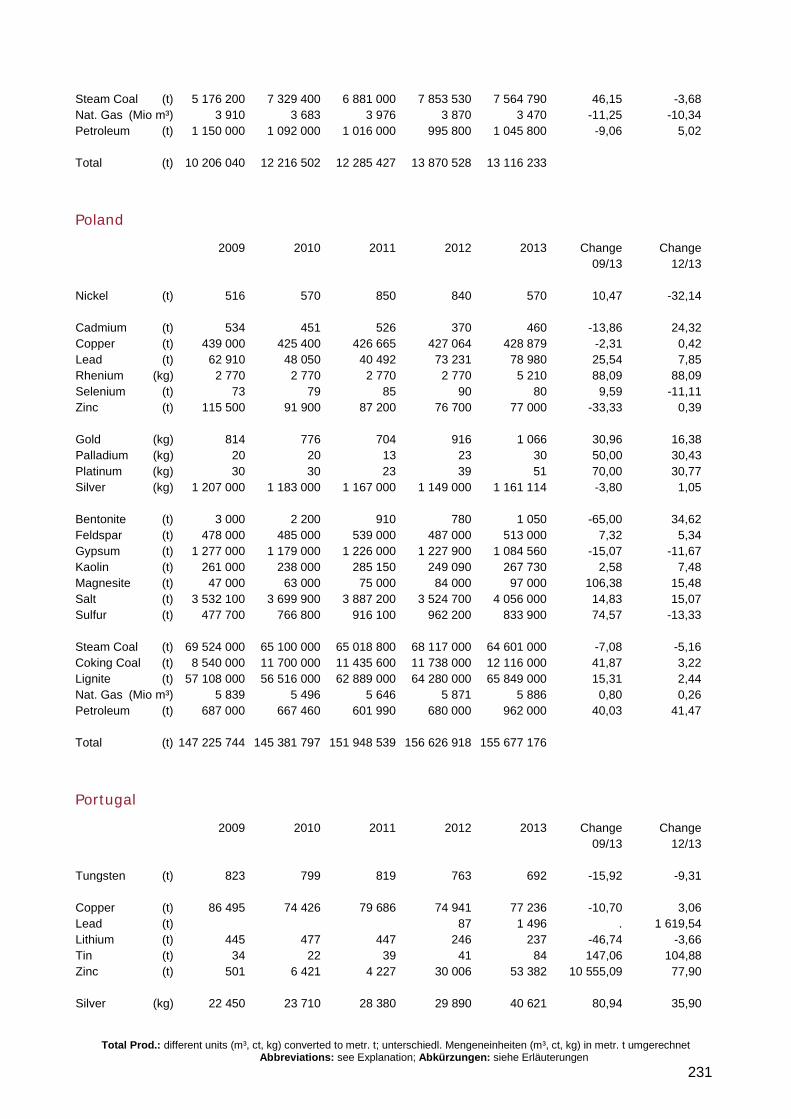
Total Prod.: different units (m³, ct, kg) converted to metr. t; unterschiedl. Mengeneinheiten (m³, ct, kg) in metr. t umgerechnet Abbreviations: see Explanation; Abkürzungen: siehe Erläuterungen
231
Steam Coal (t) 5 176 200 7 329 400 6 881 000 7 853 530 7 564 790 46,15 -3,68 Nat. Gas (Mio m³) 3 910 3 683 3 976 3 870 3 470 -11,25 -10,34 Petroleum (t) 1 150 000 1 092 000 1 016 000 995 800 1 045 800 -9,06 5,02 Total (t) 10 206 040 12 216 502 12 285 427 13 870 528 13 116 233
Poland
2009 2010 2011 2012 2013 Change Change 09/13 12/13 Nickel (t) 516 570 850 840 570 10,47 -32,14 Cadmium (t) 534 451 526 370 460 -13,86 24,32 Copper (t) 439 000 425 400 426 665 427 064 428 879 -2,31 0,42 Lead (t) 62 910 48 050 40 492 73 231 78 980 25,54 7,85 Rhenium (kg) 2 770 2 770 2 770 2 770 5 210 88,09 88,09 Selenium (t) 73 79 85 90 80 9,59 -11,11 Zinc (t) 115 500 91 900 87 200 76 700 77 000 -33,33 0,39 Gold (kg) 814 776 704 916 1 066 30,96 16,38 Palladium (kg) 20 20 13 23 30 50,00 30,43 Platinum (kg) 30 30 23 39 51 70,00 30,77 Silver (kg) 1 207 000 1 183 000 1 167 000 1 149 000 1 161 114 -3,80 1,05 Bentonite (t) 3 000 2 200 910 780 1 050 -65,00 34,62 Feldspar (t) 478 000 485 000 539 000 487 000 513 000 7,32 5,34 Gypsum (t) 1 277 000 1 179 000 1 226 000 1 227 900 1 084 560 -15,07 -11,67 Kaolin (t) 261 000 238 000 285 150 249 090 267 730 2,58 7,48 Magnesite (t) 47 000 63 000 75 000 84 000 97 000 106,38 15,48 Salt (t) 3 532 100 3 699 900 3 887 200 3 524 700 4 056 000 14,83 15,07 Sulfur (t) 477 700 766 800 916 100 962 200 833 900 74,57 -13,33 Steam Coal (t) 69 524 000 65 100 000 65 018 800 68 117 000 64 601 000 -7,08 -5,16 Coking Coal (t) 8 540 000 11 700 000 11 435 600 11 738 000 12 116 000 41,87 3,22 Lignite (t) 57 108 000 56 516 000 62 889 000 64 280 000 65 849 000 15,31 2,44 Nat. Gas (Mio m³) 5 839 5 496 5 646 5 871 5 886 0,80 0,26 Petroleum (t) 687 000 667 460 601 990 680 000 962 000 40,03 41,47 Total (t) 147 225 744 145 381 797 151 948 539 156 626 918 155 677 176
Portugal
2009 2010 2011 2012 2013 Change Change 09/13 12/13 Tungsten (t) 823 799 819 763 692 -15,92 -9,31 Copper (t) 86 495 74 426 79 686 74 941 77 236 -10,70 3,06 Lead (t) 87 1 496 . 1 619,54 Lithium (t) 445 477 447 246 237 -46,74 -3,66 Tin (t) 34 22 39 41 84 147,06 104,88 Zinc (t) 501 6 421 4 227 30 006 53 382 10 555,09 77,90 Silver (kg) 22 450 23 710 28 380 29 890 40 621 80,94 35,90
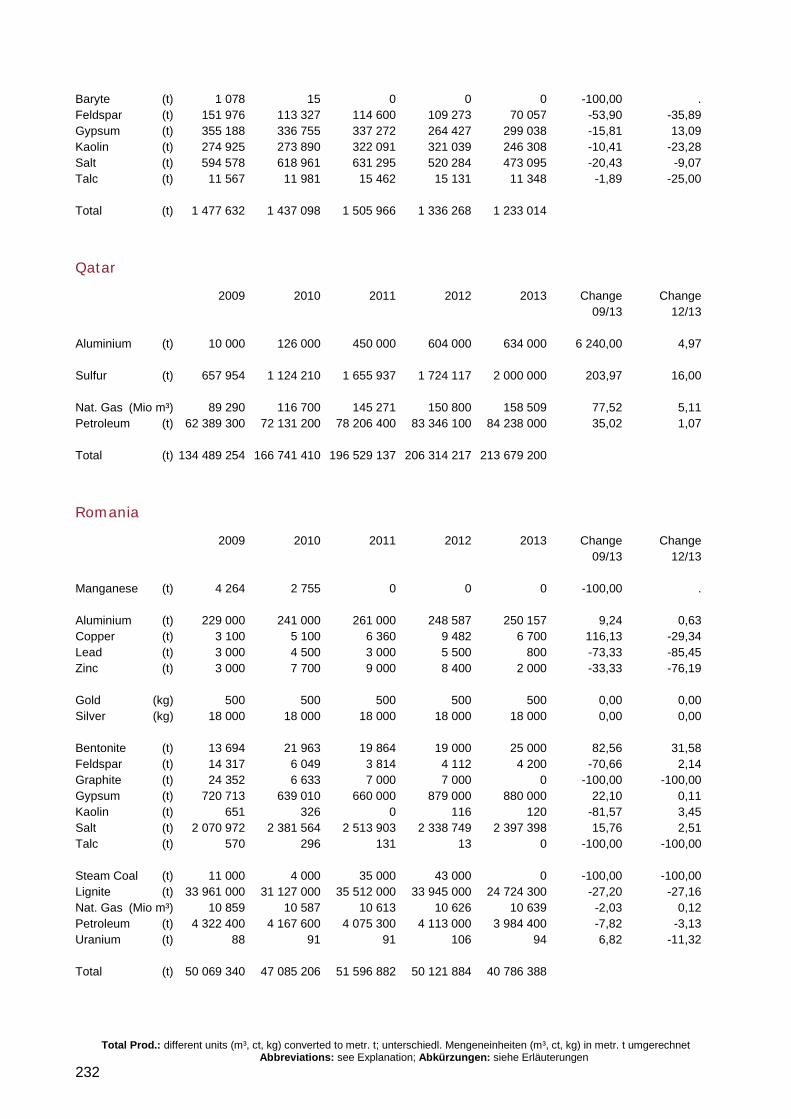
Total Prod.: different units (m³, ct, kg) converted to metr. t; unterschiedl. Mengeneinheiten (m³, ct, kg) in metr. t umgerechnet Abbreviations: see Explanation; Abkürzungen: siehe Erläuterungen
232
Baryte (t) 1 078 15 0 0 0 -100,00 . Feldspar (t) 151 976 113 327 114 600 109 273 70 057 -53,90 -35,89 Gypsum (t) 355 188 336 755 337 272 264 427 299 038 -15,81 13,09 Kaolin (t) 274 925 273 890 322 091 321 039 246 308 -10,41 -23,28 Salt (t) 594 578 618 961 631 295 520 284 473 095 -20,43 -9,07 Talc (t) 11 567 11 981 15 462 15 131 11 348 -1,89 -25,00 Total (t) 1 477 632 1 437 098 1 505 966 1 336 268 1 233 014
Qatar
2009 2010 2011 2012 2013 Change Change 09/13 12/13 Aluminium (t) 10 000 126 000 450 000 604 000 634 000 6 240,00 4,97 Sulfur (t) 657 954 1 124 210 1 655 937 1 724 117 2 000 000 203,97 16,00 Nat. Gas (Mio m³) 89 290 116 700 145 271 150 800 158 509 77,52 5,11 Petroleum (t) 62 389 300 72 131 200 78 206 400 83 346 100 84 238 000 35,02 1,07 Total (t) 134 489 254 166 741 410 196 529 137 206 314 217 213 679 200
Romania
2009 2010 2011 2012 2013 Change Change 09/13 12/13 Manganese (t) 4 264 2 755 0 0 0 -100,00 . Aluminium (t) 229 000 241 000 261 000 248 587 250 157 9,24 0,63 Copper (t) 3 100 5 100 6 360 9 482 6 700 116,13 -29,34 Lead (t) 3 000 4 500 3 000 5 500 800 -73,33 -85,45 Zinc (t) 3 000 7 700 9 000 8 400 2 000 -33,33 -76,19 Gold (kg) 500 500 500 500 500 0,00 0,00 Silver (kg) 18 000 18 000 18 000 18 000 18 000 0,00 0,00 Bentonite (t) 13 694 21 963 19 864 19 000 25 000 82,56 31,58 Feldspar (t) 14 317 6 049 3 814 4 112 4 200 -70,66 2,14 Graphite (t) 24 352 6 633 7 000 7 000 0 -100,00 -100,00 Gypsum (t) 720 713 639 010 660 000 879 000 880 000 22,10 0,11 Kaolin (t) 651 326 0 116 120 -81,57 3,45 Salt (t) 2 070 972 2 381 564 2 513 903 2 338 749 2 397 398 15,76 2,51 Talc (t) 570 296 131 13 0 -100,00 -100,00 Steam Coal (t) 11 000 4 000 35 000 43 000 0 -100,00 -100,00 Lignite (t) 33 961 000 31 127 000 35 512 000 33 945 000 24 724 300 -27,20 -27,16 Nat. Gas (Mio m³) 10 859 10 587 10 613 10 626 10 639 -2,03 0,12 Petroleum (t) 4 322 400 4 167 600 4 075 300 4 113 000 3 984 400 -7,82 -3,13 Uranium (t) 88 91 91 106 94 6,82 -11,32 Total (t) 50 069 340 47 085 206 51 596 882 50 121 884 40 786 388
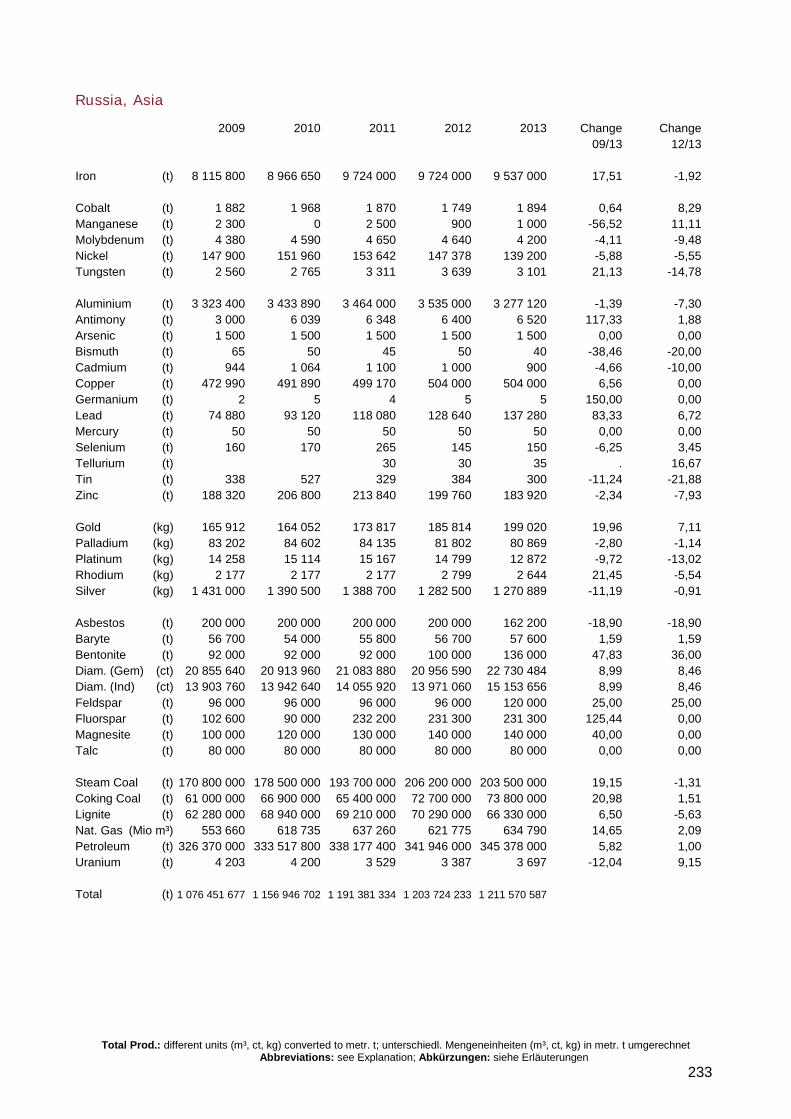
Total Prod.: different units (m³, ct, kg) converted to metr. t; unterschiedl. Mengeneinheiten (m³, ct, kg) in metr. t umgerechnet Abbreviations: see Explanation; Abkürzungen: siehe Erläuterungen
233
Russia, Asia
2009 2010 2011 2012 2013 Change Change 09/13 12/13 Iron (t) 8 115 800 8 966 650 9 724 000 9 724 000 9 537 000 17,51 -1,92 Cobalt (t) 1 882 1 968 1 870 1 749 1 894 0,64 8,29 Manganese (t) 2 300 0 2 500 900 1 000 -56,52 11,11 Molybdenum (t) 4 380 4 590 4 650 4 640 4 200 -4,11 -9,48 Nickel (t) 147 900 151 960 153 642 147 378 139 200 -5,88 -5,55 Tungsten (t) 2 560 2 765 3 311 3 639 3 101 21,13 -14,78 Aluminium (t) 3 323 400 3 433 890 3 464 000 3 535 000 3 277 120 -1,39 -7,30 Antimony (t) 3 000 6 039 6 348 6 400 6 520 117,33 1,88 Arsenic (t) 1 500 1 500 1 500 1 500 1 500 0,00 0,00 Bismuth (t) 65 50 45 50 40 -38,46 -20,00 Cadmium (t) 944 1 064 1 100 1 000 900 -4,66 -10,00 Copper (t) 472 990 491 890 499 170 504 000 504 000 6,56 0,00 Germanium (t) 2 5 4 5 5 150,00 0,00 Lead (t) 74 880 93 120 118 080 128 640 137 280 83,33 6,72 Mercury (t) 50 50 50 50 50 0,00 0,00 Selenium (t) 160 170 265 145 150 -6,25 3,45 Tellurium (t) 30 30 35 . 16,67 Tin (t) 338 527 329 384 300 -11,24 -21,88 Zinc (t) 188 320 206 800 213 840 199 760 183 920 -2,34 -7,93 Gold (kg) 165 912 164 052 173 817 185 814 199 020 19,96 7,11 Palladium (kg) 83 202 84 602 84 135 81 802 80 869 -2,80 -1,14 Platinum (kg) 14 258 15 114 15 167 14 799 12 872 -9,72 -13,02 Rhodium (kg) 2 177 2 177 2 177 2 799 2 644 21,45 -5,54 Silver (kg) 1 431 000 1 390 500 1 388 700 1 282 500 1 270 889 -11,19 -0,91 Asbestos (t) 200 000 200 000 200 000 200 000 162 200 -18,90 -18,90 Baryte (t) 56 700 54 000 55 800 56 700 57 600 1,59 1,59 Bentonite (t) 92 000 92 000 92 000 100 000 136 000 47,83 36,00 Diam. (Gem) (ct) 20 855 640 20 913 960 21 083 880 20 956 590 22 730 484 8,99 8,46 Diam. (Ind) (ct) 13 903 760 13 942 640 14 055 920 13 971 060 15 153 656 8,99 8,46 Feldspar (t) 96 000 96 000 96 000 96 000 120 000 25,00 25,00 Fluorspar (t) 102 600 90 000 232 200 231 300 231 300 125,44 0,00 Magnesite (t) 100 000 120 000 130 000 140 000 140 000 40,00 0,00 Talc (t) 80 000 80 000 80 000 80 000 80 000 0,00 0,00 Steam Coal (t) 170 800 000 178 500 000 193 700 000 206 200 000 203 500 000 19,15 -1,31 Coking Coal (t) 61 000 000 66 900 000 65 400 000 72 700 000 73 800 000 20,98 1,51 Lignite (t) 62 280 000 68 940 000 69 210 000 70 290 000 66 330 000 6,50 -5,63 Nat. Gas (Mio m³) 553 660 618 735 637 260 621 775 634 790 14,65 2,09 Petroleum (t) 326 370 000 333 517 800 338 177 400 341 946 000 345 378 000 5,82 1,00 Uranium (t) 4 203 4 200 3 529 3 387 3 697 -12,04 9,15 Total (t) 1 076 451 677 1 156 946 702 1 191 381 334 1 203 724 233 1 211 570 587
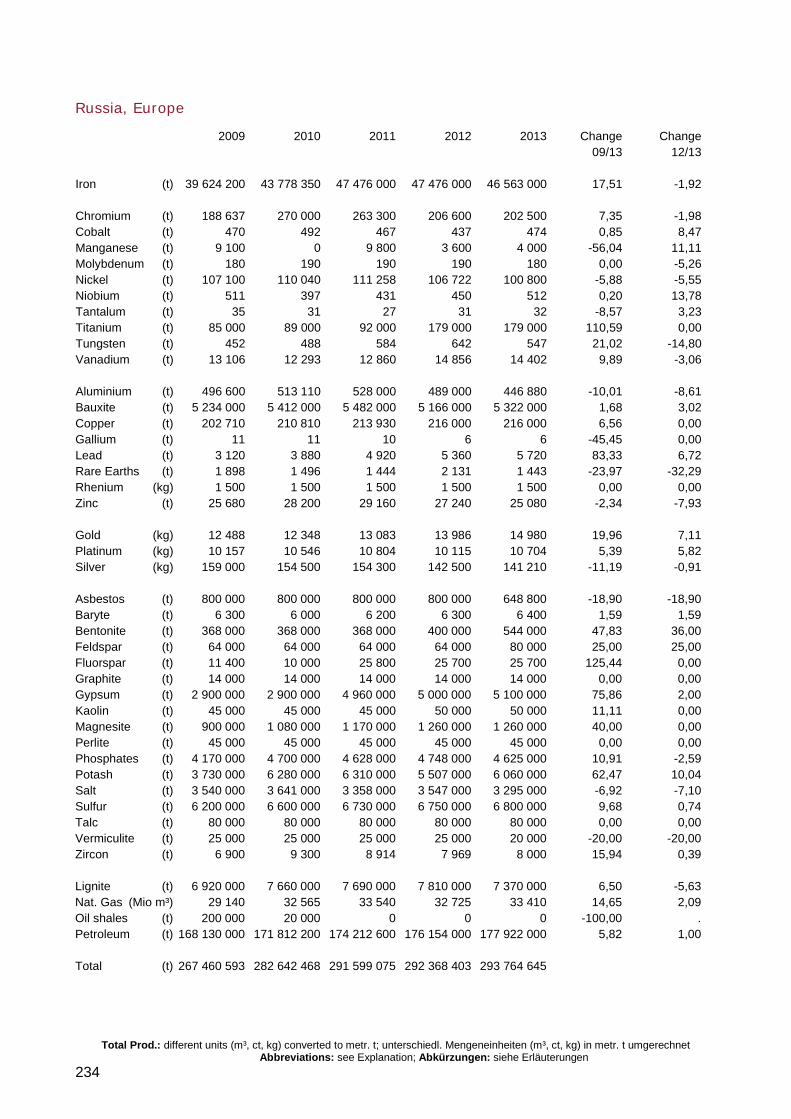
Total Prod.: different units (m³, ct, kg) converted to metr. t; unterschiedl. Mengeneinheiten (m³, ct, kg) in metr. t umgerechnet Abbreviations: see Explanation; Abkürzungen: siehe Erläuterungen
234
Russia, Europe
2009 2010 2011 2012 2013 Change Change 09/13 12/13 Iron (t) 39 624 200 43 778 350 47 476 000 47 476 000 46 563 000 17,51 -1,92 Chromium (t) 188 637 270 000 263 300 206 600 202 500 7,35 -1,98 Cobalt (t) 470 492 467 437 474 0,85 8,47 Manganese (t) 9 100 0 9 800 3 600 4 000 -56,04 11,11 Molybdenum (t) 180 190 190 190 180 0,00 -5,26 Nickel (t) 107 100 110 040 111 258 106 722 100 800 -5,88 -5,55 Niobium (t) 511 397 431 450 512 0,20 13,78 Tantalum (t) 35 31 27 31 32 -8,57 3,23 Titanium (t) 85 000 89 000 92 000 179 000 179 000 110,59 0,00 Tungsten (t) 452 488 584 642 547 21,02 -14,80 Vanadium (t) 13 106 12 293 12 860 14 856 14 402 9,89 -3,06 Aluminium (t) 496 600 513 110 528 000 489 000 446 880 -10,01 -8,61 Bauxite (t) 5 234 000 5 412 000 5 482 000 5 166 000 5 322 000 1,68 3,02 Copper (t) 202 710 210 810 213 930 216 000 216 000 6,56 0,00 Gallium (t) 11 11 10 6 6 -45,45 0,00 Lead (t) 3 120 3 880 4 920 5 360 5 720 83,33 6,72 Rare Earths (t) 1 898 1 496 1 444 2 131 1 443 -23,97 -32,29 Rhenium (kg) 1 500 1 500 1 500 1 500 1 500 0,00 0,00 Zinc (t) 25 680 28 200 29 160 27 240 25 080 -2,34 -7,93 Gold (kg) 12 488 12 348 13 083 13 986 14 980 19,96 7,11 Platinum (kg) 10 157 10 546 10 804 10 115 10 704 5,39 5,82 Silver (kg) 159 000 154 500 154 300 142 500 141 210 -11,19 -0,91 Asbestos (t) 800 000 800 000 800 000 800 000 648 800 -18,90 -18,90 Baryte (t) 6 300 6 000 6 200 6 300 6 400 1,59 1,59 Bentonite (t) 368 000 368 000 368 000 400 000 544 000 47,83 36,00 Feldspar (t) 64 000 64 000 64 000 64 000 80 000 25,00 25,00 Fluorspar (t) 11 400 10 000 25 800 25 700 25 700 125,44 0,00 Graphite (t) 14 000 14 000 14 000 14 000 14 000 0,00 0,00 Gypsum (t) 2 900 000 2 900 000 4 960 000 5 000 000 5 100 000 75,86 2,00 Kaolin (t) 45 000 45 000 45 000 50 000 50 000 11,11 0,00 Magnesite (t) 900 000 1 080 000 1 170 000 1 260 000 1 260 000 40,00 0,00 Perlite (t) 45 000 45 000 45 000 45 000 45 000 0,00 0,00 Phosphates (t) 4 170 000 4 700 000 4 628 000 4 748 000 4 625 000 10,91 -2,59 Potash (t) 3 730 000 6 280 000 6 310 000 5 507 000 6 060 000 62,47 10,04 Salt (t) 3 540 000 3 641 000 3 358 000 3 547 000 3 295 000 -6,92 -7,10 Sulfur (t) 6 200 000 6 600 000 6 730 000 6 750 000 6 800 000 9,68 0,74 Talc (t) 80 000 80 000 80 000 80 000 80 000 0,00 0,00 Vermiculite (t) 25 000 25 000 25 000 25 000 20 000 -20,00 -20,00 Zircon (t) 6 900 9 300 8 914 7 969 8 000 15,94 0,39 Lignite (t) 6 920 000 7 660 000 7 690 000 7 810 000 7 370 000 6,50 -5,63 Nat. Gas (Mio m³) 29 140 32 565 33 540 32 725 33 410 14,65 2,09 Oil shales (t) 200 000 20 000 0 0 0 -100,00 . Petroleum (t) 168 130 000 171 812 200 174 212 600 176 154 000 177 922 000 5,82 1,00 Total (t) 267 460 593 282 642 468 291 599 075 292 368 403 293 764 645
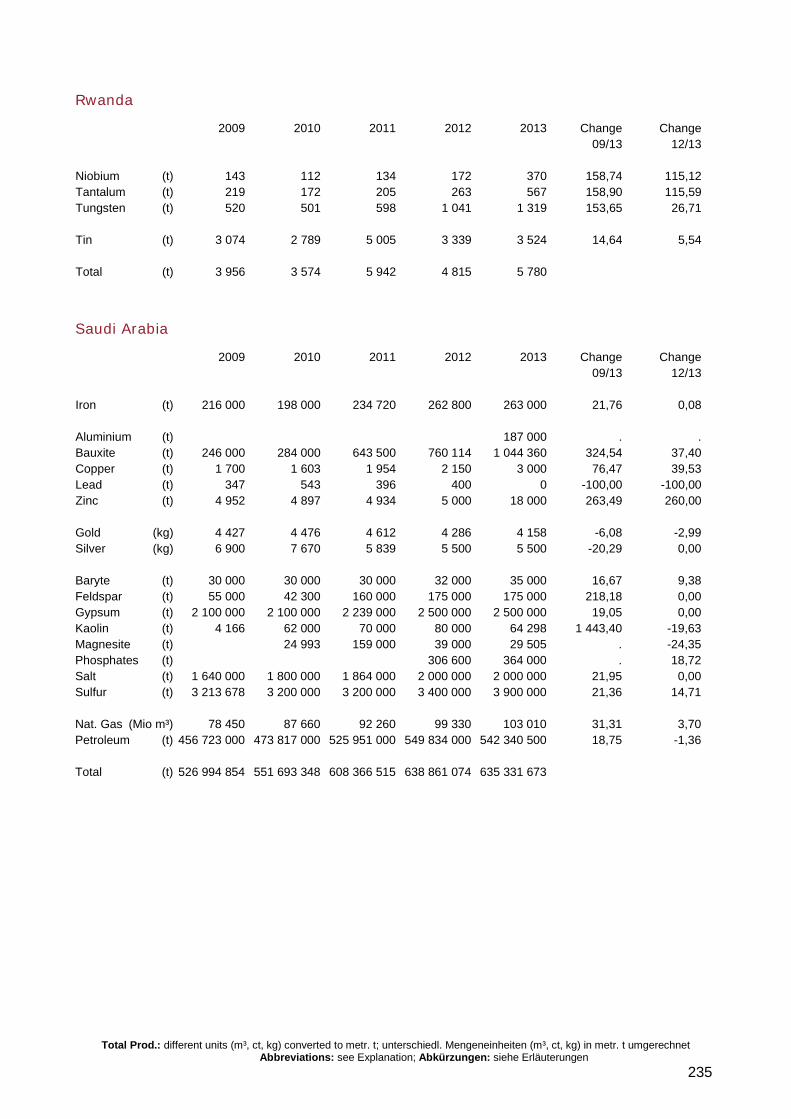
Total Prod.: different units (m³, ct, kg) converted to metr. t; unterschiedl. Mengeneinheiten (m³, ct, kg) in metr. t umgerechnet Abbreviations: see Explanation; Abkürzungen: siehe Erläuterungen
235
Rwanda
2009 2010 2011 2012 2013 Change Change 09/13 12/13 Niobium (t) 143 112 134 172 370 158,74 115,12 Tantalum (t) 219 172 205 263 567 158,90 115,59 Tungsten (t) 520 501 598 1 041 1 319 153,65 26,71 Tin (t) 3 074 2 789 5 005 3 339 3 524 14,64 5,54 Total (t) 3 956 3 574 5 942 4 815 5 780
Saudi Arabia
2009 2010 2011 2012 2013 Change Change 09/13 12/13 Iron (t) 216 000 198 000 234 720 262 800 263 000 21,76 0,08 Aluminium (t) 187 000 . . Bauxite (t) 246 000 284 000 643 500 760 114 1 044 360 324,54 37,40 Copper (t) 1 700 1 603 1 954 2 150 3 000 76,47 39,53 Lead (t) 347 543 396 400 0 -100,00 -100,00 Zinc (t) 4 952 4 897 4 934 5 000 18 000 263,49 260,00 Gold (kg) 4 427 4 476 4 612 4 286 4 158 -6,08 -2,99 Silver (kg) 6 900 7 670 5 839 5 500 5 500 -20,29 0,00 Baryte (t) 30 000 30 000 30 000 32 000 35 000 16,67 9,38 Feldspar (t) 55 000 42 300 160 000 175 000 175 000 218,18 0,00 Gypsum (t) 2 100 000 2 100 000 2 239 000 2 500 000 2 500 000 19,05 0,00 Kaolin (t) 4 166 62 000 70 000 80 000 64 298 1 443,40 -19,63 Magnesite (t) 24 993 159 000 39 000 29 505 . -24,35 Phosphates (t) 306 600 364 000 . 18,72 Salt (t) 1 640 000 1 800 000 1 864 000 2 000 000 2 000 000 21,95 0,00 Sulfur (t) 3 213 678 3 200 000 3 200 000 3 400 000 3 900 000 21,36 14,71 Nat. Gas (Mio m³) 78 450 87 660 92 260 99 330 103 010 31,31 3,70 Petroleum (t) 456 723 000 473 817 000 525 951 000 549 834 000 542 340 500 18,75 -1,36 Total (t) 526 994 854 551 693 348 608 366 515 638 861 074 635 331 673
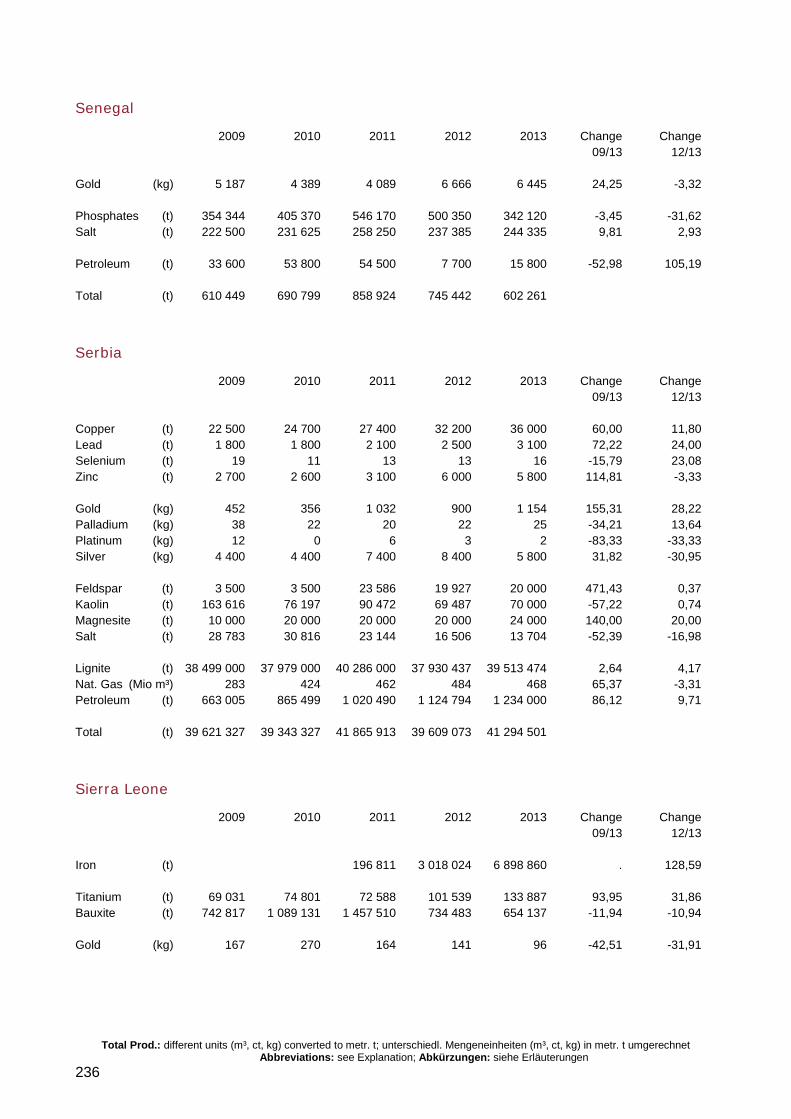
Total Prod.: different units (m³, ct, kg) converted to metr. t; unterschiedl. Mengeneinheiten (m³, ct, kg) in metr. t umgerechnet Abbreviations: see Explanation; Abkürzungen: siehe Erläuterungen
236
Senegal
2009 2010 2011 2012 2013 Change Change 09/13 12/13 Gold (kg) 5 187 4 389 4 089 6 666 6 445 24,25 -3,32 Phosphates (t) 354 344 405 370 546 170 500 350 342 120 -3,45 -31,62 Salt (t) 222 500 231 625 258 250 237 385 244 335 9,81 2,93 Petroleum (t) 33 600 53 800 54 500 7 700 15 800 -52,98 105,19 Total (t) 610 449 690 799 858 924 745 442 602 261
Serbia
2009 2010 2011 2012 2013 Change Change 09/13 12/13 Copper (t) 22 500 24 700 27 400 32 200 36 000 60,00 11,80 Lead (t) 1 800 1 800 2 100 2 500 3 100 72,22 24,00 Selenium (t) 19 11 13 13 16 -15,79 23,08 Zinc (t) 2 700 2 600 3 100 6 000 5 800 114,81 -3,33 Gold (kg) 452 356 1 032 900 1 154 155,31 28,22 Palladium (kg) 38 22 20 22 25 -34,21 13,64 Platinum (kg) 12 0 6 3 2 -83,33 -33,33 Silver (kg) 4 400 4 400 7 400 8 400 5 800 31,82 -30,95 Feldspar (t) 3 500 3 500 23 586 19 927 20 000 471,43 0,37 Kaolin (t) 163 616 76 197 90 472 69 487 70 000 -57,22 0,74 Magnesite (t) 10 000 20 000 20 000 20 000 24 000 140,00 20,00 Salt (t) 28 783 30 816 23 144 16 506 13 704 -52,39 -16,98 Lignite (t) 38 499 000 37 979 000 40 286 000 37 930 437 39 513 474 2,64 4,17 Nat. Gas (Mio m³) 283 424 462 484 468 65,37 -3,31 Petroleum (t) 663 005 865 499 1 020 490 1 124 794 1 234 000 86,12 9,71 Total (t) 39 621 327 39 343 327 41 865 913 39 609 073 41 294 501
Sierra Leone
2009 2010 2011 2012 2013 Change Change 09/13 12/13 Iron (t) 196 811 3 018 024 6 898 860 . 128,59 Titanium (t) 69 031 74 801 72 588 101 539 133 887 93,95 31,86 Bauxite (t) 742 817 1 089 131 1 457 510 734 483 654 137 -11,94 -10,94 Gold (kg) 167 270 164 141 96 -42,51 -31,91
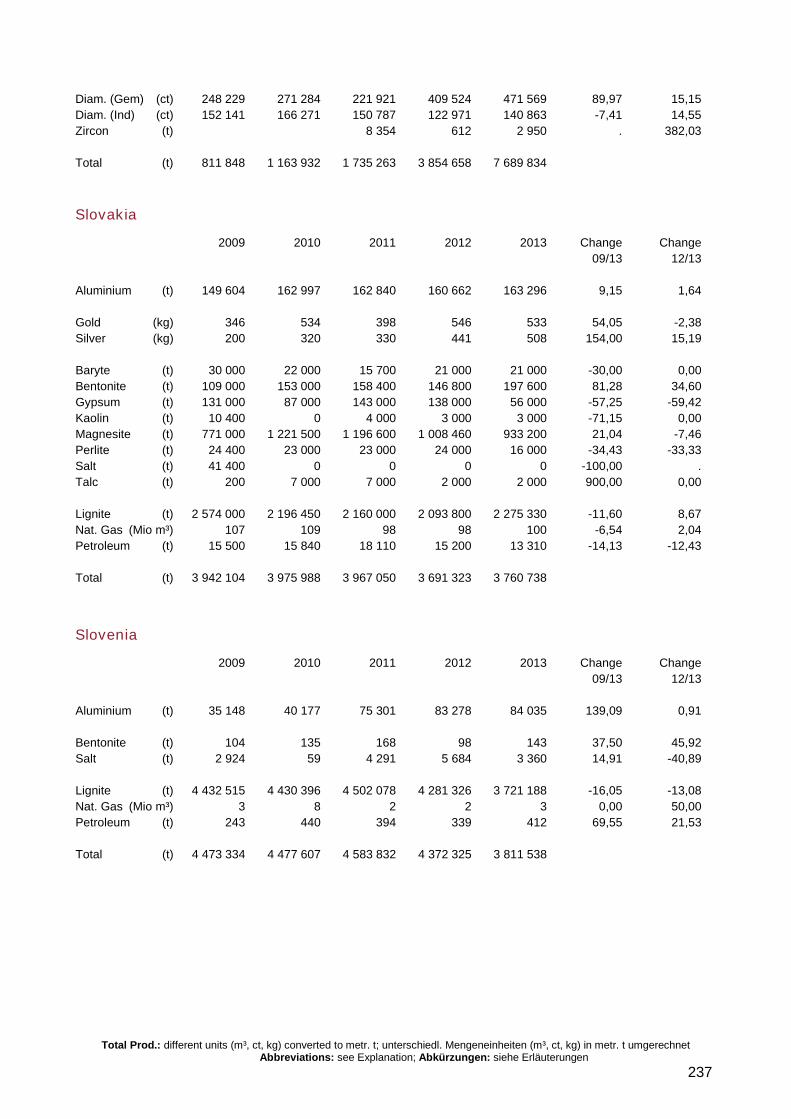
Total Prod.: different units (m³, ct, kg) converted to metr. t; unterschiedl. Mengeneinheiten (m³, ct, kg) in metr. t umgerechnet Abbreviations: see Explanation; Abkürzungen: siehe Erläuterungen
237
Diam. (Gem) (ct) 248 229 271 284 221 921 409 524 471 569 89,97 15,15 Diam. (Ind) (ct) 152 141 166 271 150 787 122 971 140 863 -7,41 14,55 Zircon (t) 8 354 612 2 950 . 382,03 Total (t) 811 848 1 163 932 1 735 263 3 854 658 7 689 834
Slovakia
2009 2010 2011 2012 2013 Change Change 09/13 12/13 Aluminium (t) 149 604 162 997 162 840 160 662 163 296 9,15 1,64 Gold (kg) 346 534 398 546 533 54,05 -2,38 Silver (kg) 200 320 330 441 508 154,00 15,19 Baryte (t) 30 000 22 000 15 700 21 000 21 000 -30,00 0,00 Bentonite (t) 109 000 153 000 158 400 146 800 197 600 81,28 34,60 Gypsum (t) 131 000 87 000 143 000 138 000 56 000 -57,25 -59,42 Kaolin (t) 10 400 0 4 000 3 000 3 000 -71,15 0,00 Magnesite (t) 771 000 1 221 500 1 196 600 1 008 460 933 200 21,04 -7,46 Perlite (t) 24 400 23 000 23 000 24 000 16 000 -34,43 -33,33 Salt (t) 41 400 0 0 0 0 -100,00 . Talc (t) 200 7 000 7 000 2 000 2 000 900,00 0,00 Lignite (t) 2 574 000 2 196 450 2 160 000 2 093 800 2 275 330 -11,60 8,67 Nat. Gas (Mio m³) 107 109 98 98 100 -6,54 2,04 Petroleum (t) 15 500 15 840 18 110 15 200 13 310 -14,13 -12,43 Total (t) 3 942 104 3 975 988 3 967 050 3 691 323 3 760 738
Slovenia
2009 2010 2011 2012 2013 Change Change 09/13 12/13 Aluminium (t) 35 148 40 177 75 301 83 278 84 035 139,09 0,91 Bentonite (t) 104 135 168 98 143 37,50 45,92 Salt (t) 2 924 59 4 291 5 684 3 360 14,91 -40,89 Lignite (t) 4 432 515 4 430 396 4 502 078 4 281 326 3 721 188 -16,05 -13,08 Nat. Gas (Mio m³) 3 8 2 2 3 0,00 50,00 Petroleum (t) 243 440 394 339 412 69,55 21,53 Total (t) 4 473 334 4 477 607 4 583 832 4 372 325 3 811 538
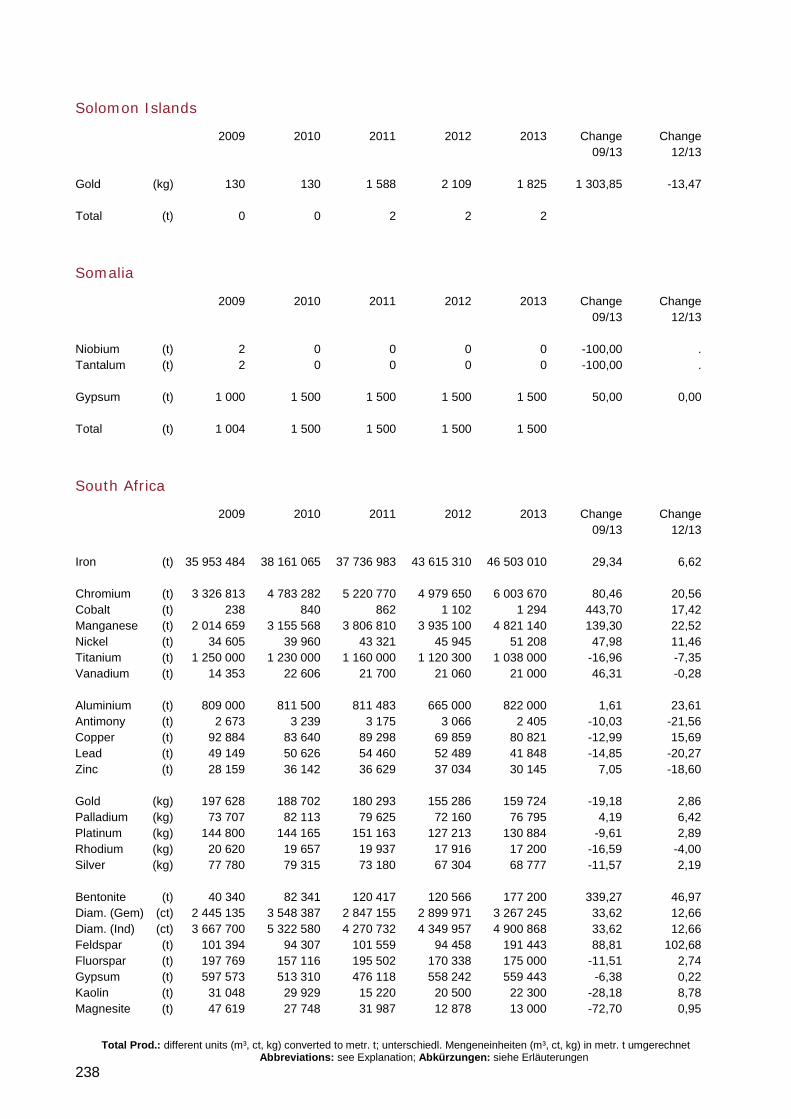
Total Prod.: different units (m³, ct, kg) converted to metr. t; unterschiedl. Mengeneinheiten (m³, ct, kg) in metr. t umgerechnet Abbreviations: see Explanation; Abkürzungen: siehe Erläuterungen
238
Solomon Islands
2009 2010 2011 2012 2013 Change Change 09/13 12/13 Gold (kg) 130 130 1 588 2 109 1 825 1 303,85 -13,47 Total (t) 0 0 2 2 2
Somalia
2009 2010 2011 2012 2013 Change Change 09/13 12/13 Niobium (t) 2 0 0 0 0 -100,00 . Tantalum (t) 2 0 0 0 0 -100,00 . Gypsum (t) 1 000 1 500 1 500 1 500 1 500 50,00 0,00 Total (t) 1 004 1 500 1 500 1 500 1 500
South Africa
2009 2010 2011 2012 2013 Change Change 09/13 12/13 Iron (t) 35 953 484 38 161 065 37 736 983 43 615 310 46 503 010 29,34 6,62 Chromium (t) 3 326 813 4 783 282 5 220 770 4 979 650 6 003 670 80,46 20,56 Cobalt (t) 238 840 862 1 102 1 294 443,70 17,42 Manganese (t) 2 014 659 3 155 568 3 806 810 3 935 100 4 821 140 139,30 22,52 Nickel (t) 34 605 39 960 43 321 45 945 51 208 47,98 11,46 Titanium (t) 1 250 000 1 230 000 1 160 000 1 120 300 1 038 000 -16,96 -7,35 Vanadium (t) 14 353 22 606 21 700 21 060 21 000 46,31 -0,28 Aluminium (t) 809 000 811 500 811 483 665 000 822 000 1,61 23,61 Antimony (t) 2 673 3 239 3 175 3 066 2 405 -10,03 -21,56 Copper (t) 92 884 83 640 89 298 69 859 80 821 -12,99 15,69 Lead (t) 49 149 50 626 54 460 52 489 41 848 -14,85 -20,27 Zinc (t) 28 159 36 142 36 629 37 034 30 145 7,05 -18,60 Gold (kg) 197 628 188 702 180 293 155 286 159 724 -19,18 2,86 Palladium (kg) 73 707 82 113 79 625 72 160 76 795 4,19 6,42 Platinum (kg) 144 800 144 165 151 163 127 213 130 884 -9,61 2,89 Rhodium (kg) 20 620 19 657 19 937 17 916 17 200 -16,59 -4,00 Silver (kg) 77 780 79 315 73 180 67 304 68 777 -11,57 2,19 Bentonite (t) 40 340 82 341 120 417 120 566 177 200 339,27 46,97 Diam. (Gem) (ct) 2 445 135 3 548 387 2 847 155 2 899 971 3 267 245 33,62 12,66 Diam. (Ind) (ct) 3 667 700 5 322 580 4 270 732 4 349 957 4 900 868 33,62 12,66 Feldspar (t) 101 394 94 307 101 559 94 458 191 443 88,81 102,68 Fluorspar (t) 197 769 157 116 195 502 170 338 175 000 -11,51 2,74 Gypsum (t) 597 573 513 310 476 118 558 242 559 443 -6,38 0,22 Kaolin (t) 31 048 29 929 15 220 20 500 22 300 -28,18 8,78 Magnesite (t) 47 619 27 748 31 987 12 878 13 000 -72,70 0,95
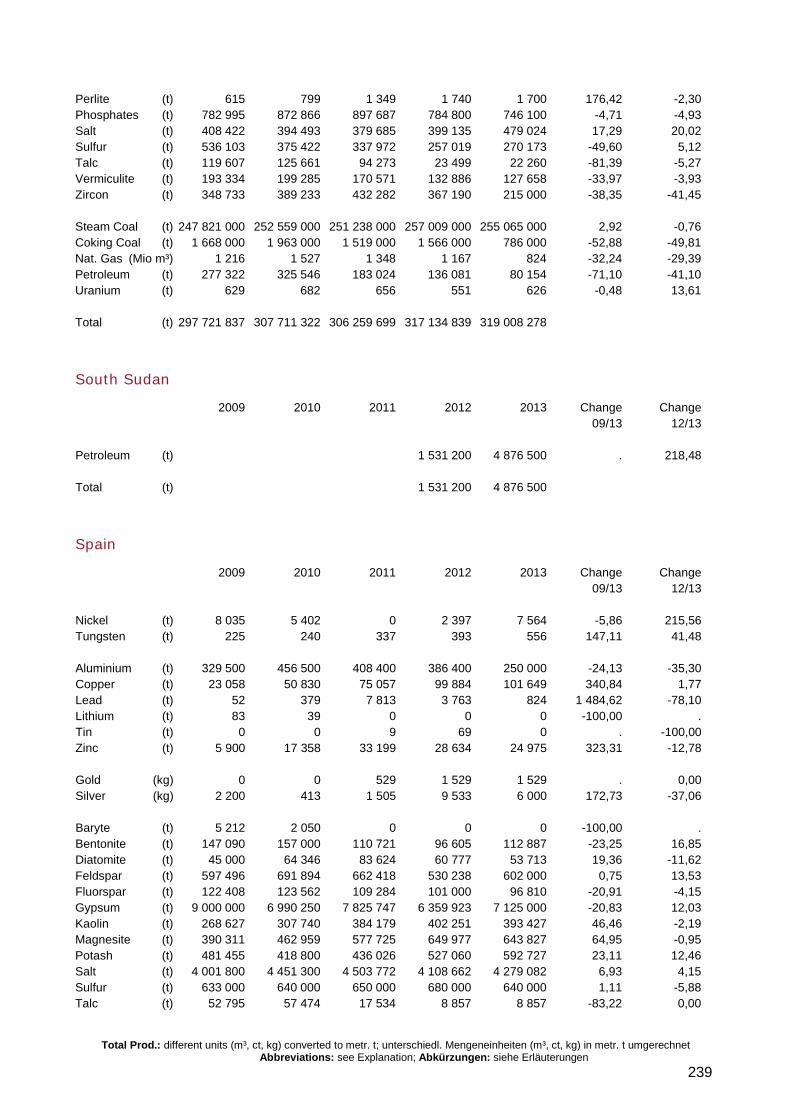
Total Prod.: different units (m³, ct, kg) converted to metr. t; unterschiedl. Mengeneinheiten (m³, ct, kg) in metr. t umgerechnet Abbreviations: see Explanation; Abkürzungen: siehe Erläuterungen
239
Perlite (t) 615 799 1 349 1 740 1 700 176,42 -2,30 Phosphates (t) 782 995 872 866 897 687 784 800 746 100 -4,71 -4,93 Salt (t) 408 422 394 493 379 685 399 135 479 024 17,29 20,02 Sulfur (t) 536 103 375 422 337 972 257 019 270 173 -49,60 5,12 Talc (t) 119 607 125 661 94 273 23 499 22 260 -81,39 -5,27 Vermiculite (t) 193 334 199 285 170 571 132 886 127 658 -33,97 -3,93 Zircon (t) 348 733 389 233 432 282 367 190 215 000 -38,35 -41,45 Steam Coal (t) 247 821 000 252 559 000 251 238 000 257 009 000 255 065 000 2,92 -0,76 Coking Coal (t) 1 668 000 1 963 000 1 519 000 1 566 000 786 000 -52,88 -49,81 Nat. Gas (Mio m³) 1 216 1 527 1 348 1 167 824 -32,24 -29,39 Petroleum (t) 277 322 325 546 183 024 136 081 80 154 -71,10 -41,10 Uranium (t) 629 682 656 551 626 -0,48 13,61 Total (t) 297 721 837 307 711 322 306 259 699 317 134 839 319 008 278
South Sudan
2009 2010 2011 2012 2013 Change Change 09/13 12/13 Petroleum (t) 1 531 200 4 876 500 . 218,48 Total (t) 1 531 200 4 876 500
Spain
2009 2010 2011 2012 2013 Change Change 09/13 12/13 Nickel (t) 8 035 5 402 0 2 397 7 564 -5,86 215,56 Tungsten (t) 225 240 337 393 556 147,11 41,48 Aluminium (t) 329 500 456 500 408 400 386 400 250 000 -24,13 -35,30 Copper (t) 23 058 50 830 75 057 99 884 101 649 340,84 1,77 Lead (t) 52 379 7 813 3 763 824 1 484,62 -78,10 Lithium (t) 83 39 0 0 0 -100,00 . Tin (t) 0 0 9 69 0 . -100,00 Zinc (t) 5 900 17 358 33 199 28 634 24 975 323,31 -12,78 Gold (kg) 0 0 529 1 529 1 529 . 0,00 Silver (kg) 2 200 413 1 505 9 533 6 000 172,73 -37,06 Baryte (t) 5 212 2 050 0 0 0 -100,00 . Bentonite (t) 147 090 157 000 110 721 96 605 112 887 -23,25 16,85 Diatomite (t) 45 000 64 346 83 624 60 777 53 713 19,36 -11,62 Feldspar (t) 597 496 691 894 662 418 530 238 602 000 0,75 13,53 Fluorspar (t) 122 408 123 562 109 284 101 000 96 810 -20,91 -4,15 Gypsum (t) 9 000 000 6 990 250 7 825 747 6 359 923 7 125 000 -20,83 12,03 Kaolin (t) 268 627 307 740 384 179 402 251 393 427 46,46 -2,19 Magnesite (t) 390 311 462 959 577 725 649 977 643 827 64,95 -0,95 Potash (t) 481 455 418 800 436 026 527 060 592 727 23,11 12,46 Salt (t) 4 001 800 4 451 300 4 503 772 4 108 662 4 279 082 6,93 4,15 Sulfur (t) 633 000 640 000 650 000 680 000 640 000 1,11 -5,88 Talc (t) 52 795 57 474 17 534 8 857 8 857 -83,22 0,00
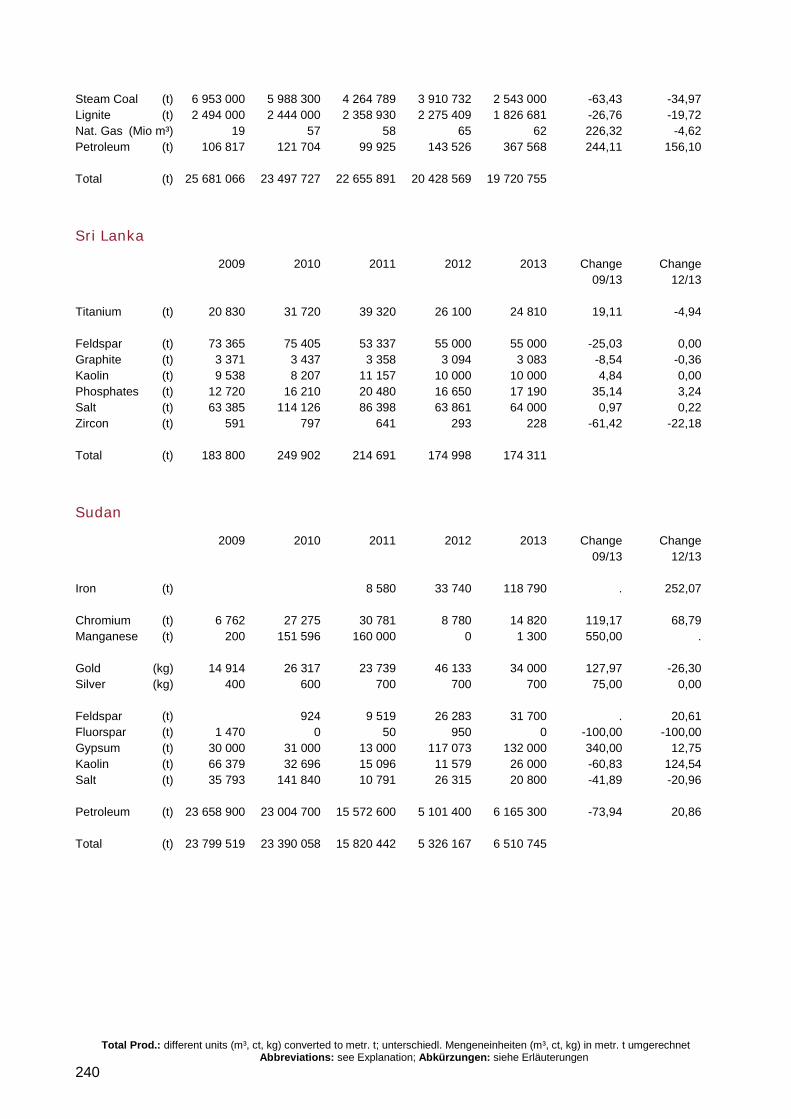
Total Prod.: different units (m³, ct, kg) converted to metr. t; unterschiedl. Mengeneinheiten (m³, ct, kg) in metr. t umgerechnet Abbreviations: see Explanation; Abkürzungen: siehe Erläuterungen
240
Steam Coal (t) 6 953 000 5 988 300 4 264 789 3 910 732 2 543 000 -63,43 -34,97 Lignite (t) 2 494 000 2 444 000 2 358 930 2 275 409 1 826 681 -26,76 -19,72 Nat. Gas (Mio m³) 19 57 58 65 62 226,32 -4,62 Petroleum (t) 106 817 121 704 99 925 143 526 367 568 244,11 156,10 Total (t) 25 681 066 23 497 727 22 655 891 20 428 569 19 720 755
Sri Lanka
2009 2010 2011 2012 2013 Change Change 09/13 12/13 Titanium (t) 20 830 31 720 39 320 26 100 24 810 19,11 -4,94 Feldspar (t) 73 365 75 405 53 337 55 000 55 000 -25,03 0,00 Graphite (t) 3 371 3 437 3 358 3 094 3 083 -8,54 -0,36 Kaolin (t) 9 538 8 207 11 157 10 000 10 000 4,84 0,00 Phosphates (t) 12 720 16 210 20 480 16 650 17 190 35,14 3,24 Salt (t) 63 385 114 126 86 398 63 861 64 000 0,97 0,22 Zircon (t) 591 797 641 293 228 -61,42 -22,18 Total (t) 183 800 249 902 214 691 174 998 174 311
Sudan
2009 2010 2011 2012 2013 Change Change 09/13 12/13 Iron (t) 8 580 33 740 118 790 . 252,07 Chromium (t) 6 762 27 275 30 781 8 780 14 820 119,17 68,79 Manganese (t) 200 151 596 160 000 0 1 300 550,00 . Gold (kg) 14 914 26 317 23 739 46 133 34 000 127,97 -26,30 Silver (kg) 400 600 700 700 700 75,00 0,00 Feldspar (t) 924 9 519 26 283 31 700 . 20,61 Fluorspar (t) 1 470 0 50 950 0 -100,00 -100,00 Gypsum (t) 30 000 31 000 13 000 117 073 132 000 340,00 12,75 Kaolin (t) 66 379 32 696 15 096 11 579 26 000 -60,83 124,54 Salt (t) 35 793 141 840 10 791 26 315 20 800 -41,89 -20,96 Petroleum (t) 23 658 900 23 004 700 15 572 600 5 101 400 6 165 300 -73,94 20,86 Total (t) 23 799 519 23 390 058 15 820 442 5 326 167 6 510 745
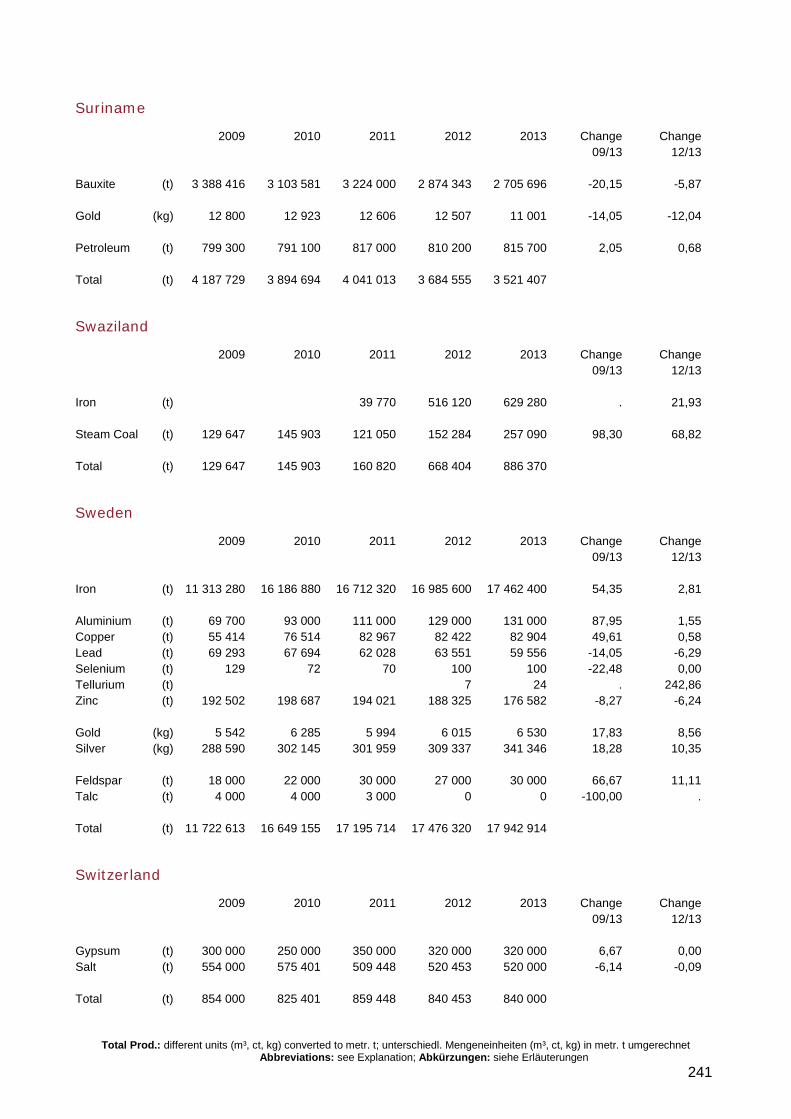
Total Prod.: different units (m³, ct, kg) converted to metr. t; unterschiedl. Mengeneinheiten (m³, ct, kg) in metr. t umgerechnet Abbreviations: see Explanation; Abkürzungen: siehe Erläuterungen
241
Suriname
2009 2010 2011 2012 2013 Change Change 09/13 12/13 Bauxite (t) 3 388 416 3 103 581 3 224 000 2 874 343 2 705 696 -20,15 -5,87 Gold (kg) 12 800 12 923 12 606 12 507 11 001 -14,05 -12,04 Petroleum (t) 799 300 791 100 817 000 810 200 815 700 2,05 0,68 Total (t) 4 187 729 3 894 694 4 041 013 3 684 555 3 521 407
Swaziland
2009 2010 2011 2012 2013 Change Change 09/13 12/13 Iron (t) 39 770 516 120 629 280 . 21,93 Steam Coal (t) 129 647 145 903 121 050 152 284 257 090 98,30 68,82 Total (t) 129 647 145 903 160 820 668 404 886 370
Sweden
2009 2010 2011 2012 2013 Change Change 09/13 12/13 Iron (t) 11 313 280 16 186 880 16 712 320 16 985 600 17 462 400 54,35 2,81 Aluminium (t) 69 700 93 000 111 000 129 000 131 000 87,95 1,55 Copper (t) 55 414 76 514 82 967 82 422 82 904 49,61 0,58 Lead (t) 69 293 67 694 62 028 63 551 59 556 -14,05 -6,29 Selenium (t) 129 72 70 100 100 -22,48 0,00 Tellurium (t) 7 24 . 242,86 Zinc (t) 192 502 198 687 194 021 188 325 176 582 -8,27 -6,24 Gold (kg) 5 542 6 285 5 994 6 015 6 530 17,83 8,56 Silver (kg) 288 590 302 145 301 959 309 337 341 346 18,28 10,35 Feldspar (t) 18 000 22 000 30 000 27 000 30 000 66,67 11,11 Talc (t) 4 000 4 000 3 000 0 0 -100,00 . Total (t) 11 722 613 16 649 155 17 195 714 17 476 320 17 942 914
Switzerland
2009 2010 2011 2012 2013 Change Change 09/13 12/13 Gypsum (t) 300 000 250 000 350 000 320 000 320 000 6,67 0,00 Salt (t) 554 000 575 401 509 448 520 453 520 000 -6,14 -0,09 Total (t) 854 000 825 401 859 448 840 453 840 000
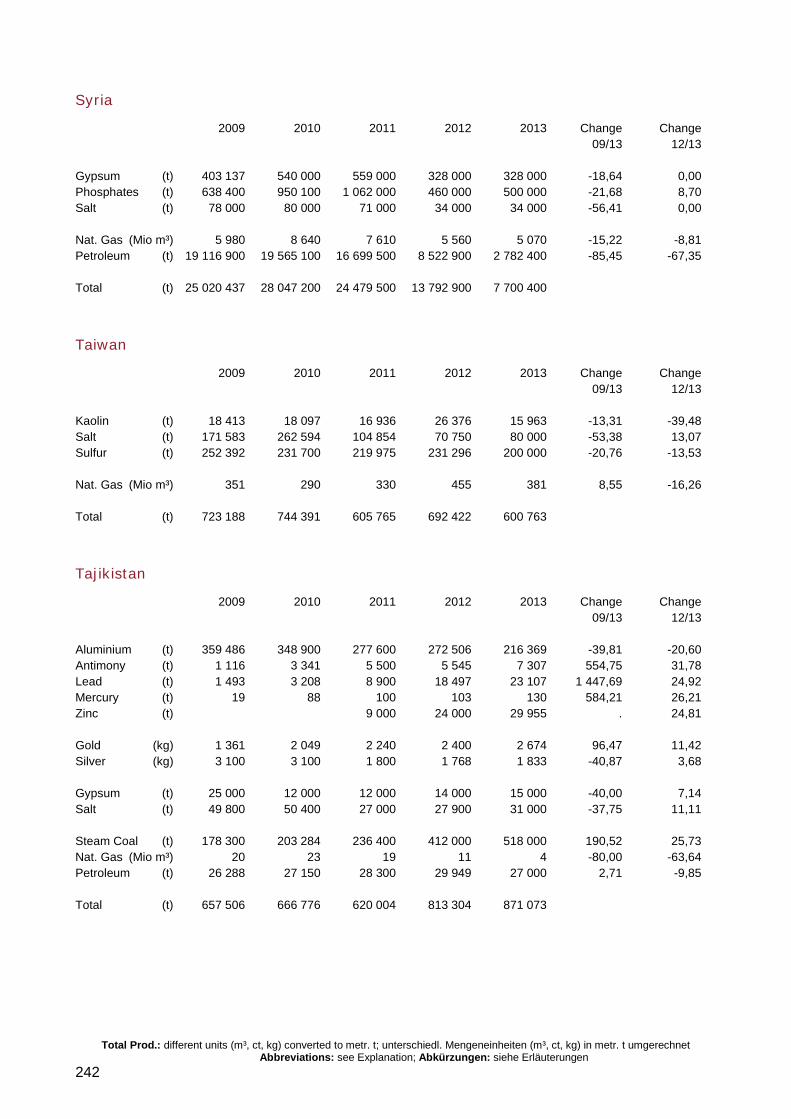
Total Prod.: different units (m³, ct, kg) converted to metr. t; unterschiedl. Mengeneinheiten (m³, ct, kg) in metr. t umgerechnet Abbreviations: see Explanation; Abkürzungen: siehe Erläuterungen
242
Syria
2009 2010 2011 2012 2013 Change Change 09/13 12/13 Gypsum (t) 403 137 540 000 559 000 328 000 328 000 -18,64 0,00 Phosphates (t) 638 400 950 100 1 062 000 460 000 500 000 -21,68 8,70 Salt (t) 78 000 80 000 71 000 34 000 34 000 -56,41 0,00 Nat. Gas (Mio m³) 5 980 8 640 7 610 5 560 5 070 -15,22 -8,81 Petroleum (t) 19 116 900 19 565 100 16 699 500 8 522 900 2 782 400 -85,45 -67,35 Total (t) 25 020 437 28 047 200 24 479 500 13 792 900 7 700 400
Taiwan
2009 2010 2011 2012 2013 Change Change 09/13 12/13 Kaolin (t) 18 413 18 097 16 936 26 376 15 963 -13,31 -39,48 Salt (t) 171 583 262 594 104 854 70 750 80 000 -53,38 13,07 Sulfur (t) 252 392 231 700 219 975 231 296 200 000 -20,76 -13,53 Nat. Gas (Mio m³) 351 290 330 455 381 8,55 -16,26 Total (t) 723 188 744 391 605 765 692 422 600 763
Tajikistan
2009 2010 2011 2012 2013 Change Change 09/13 12/13 Aluminium (t) 359 486 348 900 277 600 272 506 216 369 -39,81 -20,60 Antimony (t) 1 116 3 341 5 500 5 545 7 307 554,75 31,78 Lead (t) 1 493 3 208 8 900 18 497 23 107 1 447,69 24,92 Mercury (t) 19 88 100 103 130 584,21 26,21 Zinc (t) 9 000 24 000 29 955 . 24,81 Gold (kg) 1 361 2 049 2 240 2 400 2 674 96,47 11,42 Silver (kg) 3 100 3 100 1 800 1 768 1 833 -40,87 3,68 Gypsum (t) 25 000 12 000 12 000 14 000 15 000 -40,00 7,14 Salt (t) 49 800 50 400 27 000 27 900 31 000 -37,75 11,11 Steam Coal (t) 178 300 203 284 236 400 412 000 518 000 190,52 25,73 Nat. Gas (Mio m³) 20 23 19 11 4 -80,00 -63,64 Petroleum (t) 26 288 27 150 28 300 29 949 27 000 2,71 -9,85 Total (t) 657 506 666 776 620 004 813 304 871 073
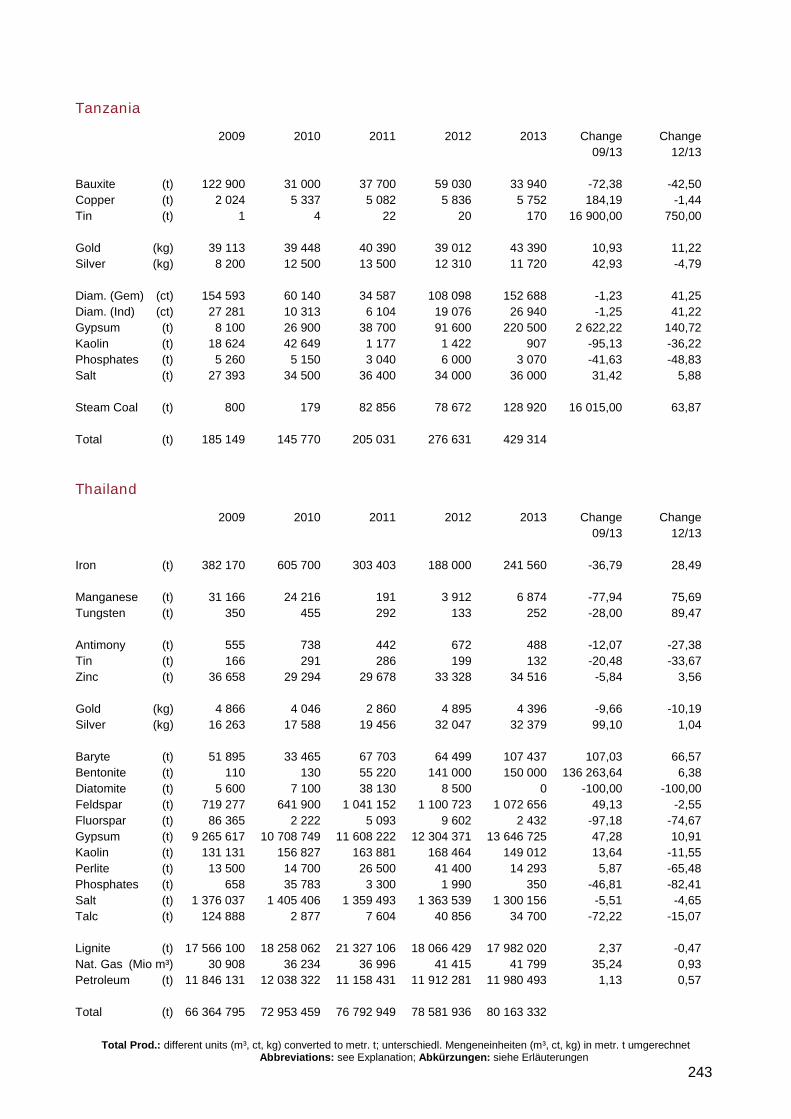
Total Prod.: different units (m³, ct, kg) converted to metr. t; unterschiedl. Mengeneinheiten (m³, ct, kg) in metr. t umgerechnet Abbreviations: see Explanation; Abkürzungen: siehe Erläuterungen
243
Tanzania
2009 2010 2011 2012 2013 Change Change 09/13 12/13 Bauxite (t) 122 900 31 000 37 700 59 030 33 940 -72,38 -42,50 Copper (t) 2 024 5 337 5 082 5 836 5 752 184,19 -1,44 Tin (t) 1 4 22 20 170 16 900,00 750,00 Gold (kg) 39 113 39 448 40 390 39 012 43 390 10,93 11,22 Silver (kg) 8 200 12 500 13 500 12 310 11 720 42,93 -4,79 Diam. (Gem) (ct) 154 593 60 140 34 587 108 098 152 688 -1,23 41,25 Diam. (Ind) (ct) 27 281 10 313 6 104 19 076 26 940 -1,25 41,22 Gypsum (t) 8 100 26 900 38 700 91 600 220 500 2 622,22 140,72 Kaolin (t) 18 624 42 649 1 177 1 422 907 -95,13 -36,22 Phosphates (t) 5 260 5 150 3 040 6 000 3 070 -41,63 -48,83 Salt (t) 27 393 34 500 36 400 34 000 36 000 31,42 5,88 Steam Coal (t) 800 179 82 856 78 672 128 920 16 015,00 63,87 Total (t) 185 149 145 770 205 031 276 631 429 314
Thailand
2009 2010 2011 2012 2013 Change Change 09/13 12/13 Iron (t) 382 170 605 700 303 403 188 000 241 560 -36,79 28,49 Manganese (t) 31 166 24 216 191 3 912 6 874 -77,94 75,69 Tungsten (t) 350 455 292 133 252 -28,00 89,47 Antimony (t) 555 738 442 672 488 -12,07 -27,38 Tin (t) 166 291 286 199 132 -20,48 -33,67 Zinc (t) 36 658 29 294 29 678 33 328 34 516 -5,84 3,56 Gold (kg) 4 866 4 046 2 860 4 895 4 396 -9,66 -10,19 Silver (kg) 16 263 17 588 19 456 32 047 32 379 99,10 1,04 Baryte (t) 51 895 33 465 67 703 64 499 107 437 107,03 66,57 Bentonite (t) 110 130 55 220 141 000 150 000 136 263,64 6,38 Diatomite (t) 5 600 7 100 38 130 8 500 0 -100,00 -100,00 Feldspar (t) 719 277 641 900 1 041 152 1 100 723 1 072 656 49,13 -2,55 Fluorspar (t) 86 365 2 222 5 093 9 602 2 432 -97,18 -74,67 Gypsum (t) 9 265 617 10 708 749 11 608 222 12 304 371 13 646 725 47,28 10,91 Kaolin (t) 131 131 156 827 163 881 168 464 149 012 13,64 -11,55 Perlite (t) 13 500 14 700 26 500 41 400 14 293 5,87 -65,48 Phosphates (t) 658 35 783 3 300 1 990 350 -46,81 -82,41 Salt (t) 1 376 037 1 405 406 1 359 493 1 363 539 1 300 156 -5,51 -4,65 Talc (t) 124 888 2 877 7 604 40 856 34 700 -72,22 -15,07 Lignite (t) 17 566 100 18 258 062 21 327 106 18 066 429 17 982 020 2,37 -0,47 Nat. Gas (Mio m³) 30 908 36 234 36 996 41 415 41 799 35,24 0,93 Petroleum (t) 11 846 131 12 038 322 11 158 431 11 912 281 11 980 493 1,13 0,57 Total (t) 66 364 795 72 953 459 76 792 949 78 581 936 80 163 332
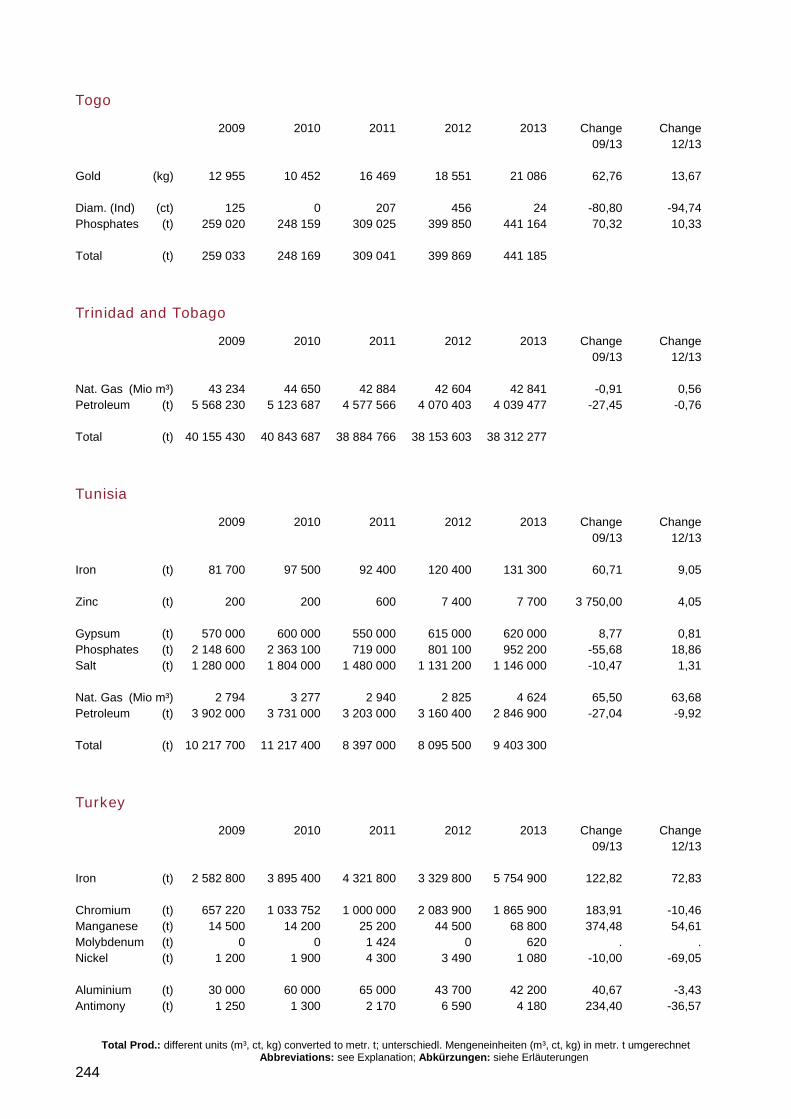
Total Prod.: different units (m³, ct, kg) converted to metr. t; unterschiedl. Mengeneinheiten (m³, ct, kg) in metr. t umgerechnet Abbreviations: see Explanation; Abkürzungen: siehe Erläuterungen
244
Togo
2009 2010 2011 2012 2013 Change Change 09/13 12/13 Gold (kg) 12 955 10 452 16 469 18 551 21 086 62,76 13,67 Diam. (Ind) (ct) 125 0 207 456 24 -80,80 -94,74 Phosphates (t) 259 020 248 159 309 025 399 850 441 164 70,32 10,33 Total (t) 259 033 248 169 309 041 399 869 441 185
Trinidad and Tobago
2009 2010 2011 2012 2013 Change Change 09/13 12/13 Nat. Gas (Mio m³) 43 234 44 650 42 884 42 604 42 841 -0,91 0,56 Petroleum (t) 5 568 230 5 123 687 4 577 566 4 070 403 4 039 477 -27,45 -0,76 Total (t) 40 155 430 40 843 687 38 884 766 38 153 603 38 312 277
Tunisia
2009 2010 2011 2012 2013 Change Change 09/13 12/13 Iron (t) 81 700 97 500 92 400 120 400 131 300 60,71 9,05 Zinc (t) 200 200 600 7 400 7 700 3 750,00 4,05 Gypsum (t) 570 000 600 000 550 000 615 000 620 000 8,77 0,81 Phosphates (t) 2 148 600 2 363 100 719 000 801 100 952 200 -55,68 18,86 Salt (t) 1 280 000 1 804 000 1 480 000 1 131 200 1 146 000 -10,47 1,31 Nat. Gas (Mio m³) 2 794 3 277 2 940 2 825 4 624 65,50 63,68 Petroleum (t) 3 902 000 3 731 000 3 203 000 3 160 400 2 846 900 -27,04 -9,92 Total (t) 10 217 700 11 217 400 8 397 000 8 095 500 9 403 300
Turkey
2009 2010 2011 2012 2013 Change Change 09/13 12/13 Iron (t) 2 582 800 3 895 400 4 321 800 3 329 800 5 754 900 122,82 72,83 Chromium (t) 657 220 1 033 752 1 000 000 2 083 900 1 865 900 183,91 -10,46 Manganese (t) 14 500 14 200 25 200 44 500 68 800 374,48 54,61 Molybdenum (t) 0 0 1 424 0 620 . . Nickel (t) 1 200 1 900 4 300 3 490 1 080 -10,00 -69,05 Aluminium (t) 30 000 60 000 65 000 43 700 42 200 40,67 -3,43 Antimony (t) 1 250 1 300 2 170 6 590 4 180 234,40 -36,57
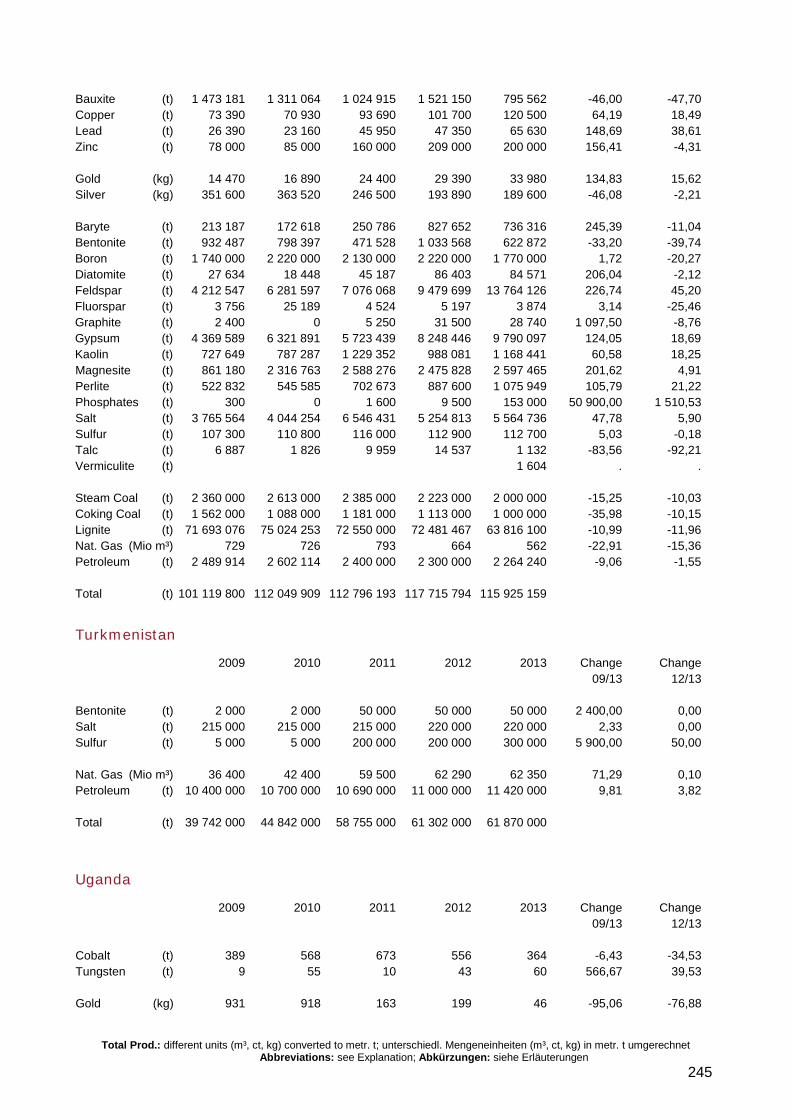
Total Prod.: different units (m³, ct, kg) converted to metr. t; unterschiedl. Mengeneinheiten (m³, ct, kg) in metr. t umgerechnet Abbreviations: see Explanation; Abkürzungen: siehe Erläuterungen
245
Bauxite (t) 1 473 181 1 311 064 1 024 915 1 521 150 795 562 -46,00 -47,70 Copper (t) 73 390 70 930 93 690 101 700 120 500 64,19 18,49 Lead (t) 26 390 23 160 45 950 47 350 65 630 148,69 38,61 Zinc (t) 78 000 85 000 160 000 209 000 200 000 156,41 -4,31 Gold (kg) 14 470 16 890 24 400 29 390 33 980 134,83 15,62 Silver (kg) 351 600 363 520 246 500 193 890 189 600 -46,08 -2,21 Baryte (t) 213 187 172 618 250 786 827 652 736 316 245,39 -11,04 Bentonite (t) 932 487 798 397 471 528 1 033 568 622 872 -33,20 -39,74 Boron (t) 1 740 000 2 220 000 2 130 000 2 220 000 1 770 000 1,72 -20,27 Diatomite (t) 27 634 18 448 45 187 86 403 84 571 206,04 -2,12 Feldspar (t) 4 212 547 6 281 597 7 076 068 9 479 699 13 764 126 226,74 45,20 Fluorspar (t) 3 756 25 189 4 524 5 197 3 874 3,14 -25,46 Graphite (t) 2 400 0 5 250 31 500 28 740 1 097,50 -8,76 Gypsum (t) 4 369 589 6 321 891 5 723 439 8 248 446 9 790 097 124,05 18,69 Kaolin (t) 727 649 787 287 1 229 352 988 081 1 168 441 60,58 18,25 Magnesite (t) 861 180 2 316 763 2 588 276 2 475 828 2 597 465 201,62 4,91 Perlite (t) 522 832 545 585 702 673 887 600 1 075 949 105,79 21,22 Phosphates (t) 300 0 1 600 9 500 153 000 50 900,00 1 510,53 Salt (t) 3 765 564 4 044 254 6 546 431 5 254 813 5 564 736 47,78 5,90 Sulfur (t) 107 300 110 800 116 000 112 900 112 700 5,03 -0,18 Talc (t) 6 887 1 826 9 959 14 537 1 132 -83,56 -92,21 Vermiculite (t) 1 604 . . Steam Coal (t) 2 360 000 2 613 000 2 385 000 2 223 000 2 000 000 -15,25 -10,03 Coking Coal (t) 1 562 000 1 088 000 1 181 000 1 113 000 1 000 000 -35,98 -10,15 Lignite (t) 71 693 076 75 024 253 72 550 000 72 481 467 63 816 100 -10,99 -11,96 Nat. Gas (Mio m³) 729 726 793 664 562 -22,91 -15,36 Petroleum (t) 2 489 914 2 602 114 2 400 000 2 300 000 2 264 240 -9,06 -1,55 Total (t) 101 119 800 112 049 909 112 796 193 117 715 794 115 925 159
Turkmenistan
2009 2010 2011 2012 2013 Change Change 09/13 12/13 Bentonite (t) 2 000 2 000 50 000 50 000 50 000 2 400,00 0,00 Salt (t) 215 000 215 000 215 000 220 000 220 000 2,33 0,00 Sulfur (t) 5 000 5 000 200 000 200 000 300 000 5 900,00 50,00 Nat. Gas (Mio m³) 36 400 42 400 59 500 62 290 62 350 71,29 0,10 Petroleum (t) 10 400 000 10 700 000 10 690 000 11 000 000 11 420 000 9,81 3,82 Total (t) 39 742 000 44 842 000 58 755 000 61 302 000 61 870 000
Uganda
2009 2010 2011 2012 2013 Change Change 09/13 12/13 Cobalt (t) 389 568 673 556 364 -6,43 -34,53 Tungsten (t) 9 55 10 43 60 566,67 39,53 Gold (kg) 931 918 163 199 46 -95,06 -76,88
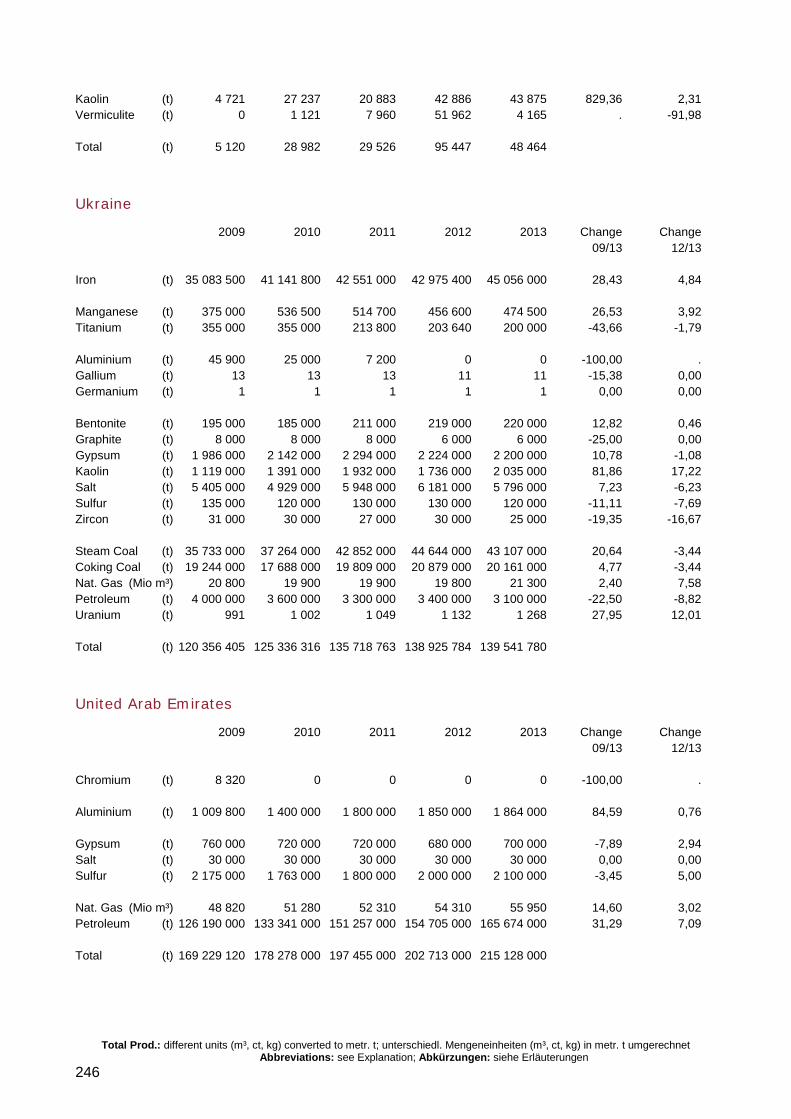
Total Prod.: different units (m³, ct, kg) converted to metr. t; unterschiedl. Mengeneinheiten (m³, ct, kg) in metr. t umgerechnet Abbreviations: see Explanation; Abkürzungen: siehe Erläuterungen
246
Kaolin (t) 4 721 27 237 20 883 42 886 43 875 829,36 2,31 Vermiculite (t) 0 1 121 7 960 51 962 4 165 . -91,98 Total (t) 5 120 28 982 29 526 95 447 48 464
Ukraine
2009 2010 2011 2012 2013 Change Change 09/13 12/13 Iron (t) 35 083 500 41 141 800 42 551 000 42 975 400 45 056 000 28,43 4,84 Manganese (t) 375 000 536 500 514 700 456 600 474 500 26,53 3,92 Titanium (t) 355 000 355 000 213 800 203 640 200 000 -43,66 -1,79 Aluminium (t) 45 900 25 000 7 200 0 0 -100,00 . Gallium (t) 13 13 13 11 11 -15,38 0,00 Germanium (t) 1 1 1 1 1 0,00 0,00 Bentonite (t) 195 000 185 000 211 000 219 000 220 000 12,82 0,46 Graphite (t) 8 000 8 000 8 000 6 000 6 000 -25,00 0,00 Gypsum (t) 1 986 000 2 142 000 2 294 000 2 224 000 2 200 000 10,78 -1,08 Kaolin (t) 1 119 000 1 391 000 1 932 000 1 736 000 2 035 000 81,86 17,22 Salt (t) 5 405 000 4 929 000 5 948 000 6 181 000 5 796 000 7,23 -6,23 Sulfur (t) 135 000 120 000 130 000 130 000 120 000 -11,11 -7,69 Zircon (t) 31 000 30 000 27 000 30 000 25 000 -19,35 -16,67 Steam Coal (t) 35 733 000 37 264 000 42 852 000 44 644 000 43 107 000 20,64 -3,44 Coking Coal (t) 19 244 000 17 688 000 19 809 000 20 879 000 20 161 000 4,77 -3,44 Nat. Gas (Mio m³) 20 800 19 900 19 900 19 800 21 300 2,40 7,58 Petroleum (t) 4 000 000 3 600 000 3 300 000 3 400 000 3 100 000 -22,50 -8,82 Uranium (t) 991 1 002 1 049 1 132 1 268 27,95 12,01 Total (t) 120 356 405 125 336 316 135 718 763 138 925 784 139 541 780
United Arab Emirates
2009 2010 2011 2012 2013 Change Change 09/13 12/13 Chromium (t) 8 320 0 0 0 0 -100,00 . Aluminium (t) 1 009 800 1 400 000 1 800 000 1 850 000 1 864 000 84,59 0,76 Gypsum (t) 760 000 720 000 720 000 680 000 700 000 -7,89 2,94 Salt (t) 30 000 30 000 30 000 30 000 30 000 0,00 0,00 Sulfur (t) 2 175 000 1 763 000 1 800 000 2 000 000 2 100 000 -3,45 5,00 Nat. Gas (Mio m³) 48 820 51 280 52 310 54 310 55 950 14,60 3,02 Petroleum (t) 126 190 000 133 341 000 151 257 000 154 705 000 165 674 000 31,29 7,09 Total (t) 169 229 120 178 278 000 197 455 000 202 713 000 215 128 000
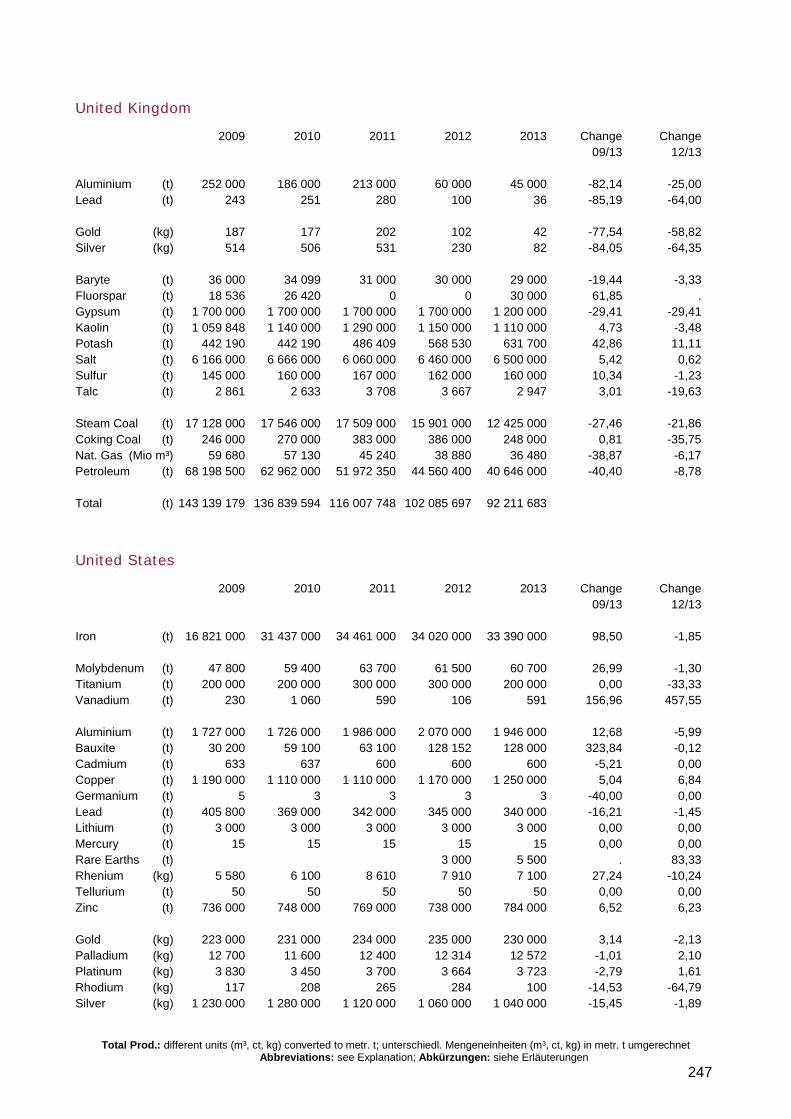
Total Prod.: different units (m³, ct, kg) converted to metr. t; unterschiedl. Mengeneinheiten (m³, ct, kg) in metr. t umgerechnet Abbreviations: see Explanation; Abkürzungen: siehe Erläuterungen
247
United Kingdom
2009 2010 2011 2012 2013 Change Change 09/13 12/13 Aluminium (t) 252 000 186 000 213 000 60 000 45 000 -82,14 -25,00 Lead (t) 243 251 280 100 36 -85,19 -64,00 Gold (kg) 187 177 202 102 42 -77,54 -58,82 Silver (kg) 514 506 531 230 82 -84,05 -64,35 Baryte (t) 36 000 34 099 31 000 30 000 29 000 -19,44 -3,33 Fluorspar (t) 18 536 26 420 0 0 30 000 61,85 . Gypsum (t) 1 700 000 1 700 000 1 700 000 1 700 000 1 200 000 -29,41 -29,41 Kaolin (t) 1 059 848 1 140 000 1 290 000 1 150 000 1 110 000 4,73 -3,48 Potash (t) 442 190 442 190 486 409 568 530 631 700 42,86 11,11 Salt (t) 6 166 000 6 666 000 6 060 000 6 460 000 6 500 000 5,42 0,62 Sulfur (t) 145 000 160 000 167 000 162 000 160 000 10,34 -1,23 Talc (t) 2 861 2 633 3 708 3 667 2 947 3,01 -19,63 Steam Coal (t) 17 128 000 17 546 000 17 509 000 15 901 000 12 425 000 -27,46 -21,86 Coking Coal (t) 246 000 270 000 383 000 386 000 248 000 0,81 -35,75 Nat. Gas (Mio m³) 59 680 57 130 45 240 38 880 36 480 -38,87 -6,17 Petroleum (t) 68 198 500 62 962 000 51 972 350 44 560 400 40 646 000 -40,40 -8,78 Total (t) 143 139 179 136 839 594 116 007 748 102 085 697 92 211 683
United States
2009 2010 2011 2012 2013 Change Change 09/13 12/13 Iron (t) 16 821 000 31 437 000 34 461 000 34 020 000 33 390 000 98,50 -1,85 Molybdenum (t) 47 800 59 400 63 700 61 500 60 700 26,99 -1,30 Titanium (t) 200 000 200 000 300 000 300 000 200 000 0,00 -33,33 Vanadium (t) 230 1 060 590 106 591 156,96 457,55 Aluminium (t) 1 727 000 1 726 000 1 986 000 2 070 000 1 946 000 12,68 -5,99 Bauxite (t) 30 200 59 100 63 100 128 152 128 000 323,84 -0,12 Cadmium (t) 633 637 600 600 600 -5,21 0,00 Copper (t) 1 190 000 1 110 000 1 110 000 1 170 000 1 250 000 5,04 6,84 Germanium (t) 5 3 3 3 3 -40,00 0,00 Lead (t) 405 800 369 000 342 000 345 000 340 000 -16,21 -1,45 Lithium (t) 3 000 3 000 3 000 3 000 3 000 0,00 0,00 Mercury (t) 15 15 15 15 15 0,00 0,00 Rare Earths (t) 3 000 5 500 . 83,33 Rhenium (kg) 5 580 6 100 8 610 7 910 7 100 27,24 -10,24 Tellurium (t) 50 50 50 50 50 0,00 0,00 Zinc (t) 736 000 748 000 769 000 738 000 784 000 6,52 6,23 Gold (kg) 223 000 231 000 234 000 235 000 230 000 3,14 -2,13 Palladium (kg) 12 700 11 600 12 400 12 314 12 572 -1,01 2,10 Platinum (kg) 3 830 3 450 3 700 3 664 3 723 -2,79 1,61 Rhodium (kg) 117 208 265 284 100 -14,53 -64,79 Silver (kg) 1 230 000 1 280 000 1 120 000 1 060 000 1 040 000 -15,45 -1,89
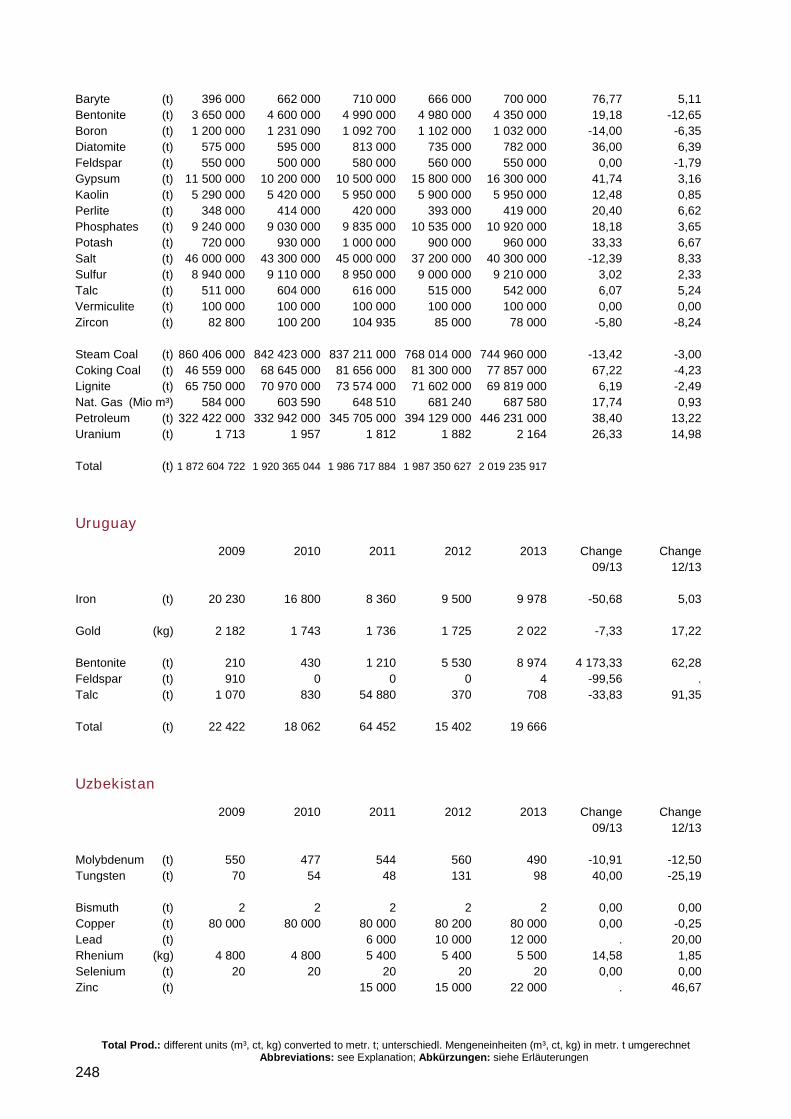
Total Prod.: different units (m³, ct, kg) converted to metr. t; unterschiedl. Mengeneinheiten (m³, ct, kg) in metr. t umgerechnet Abbreviations: see Explanation; Abkürzungen: siehe Erläuterungen
248
Baryte (t) 396 000 662 000 710 000 666 000 700 000 76,77 5,11 Bentonite (t) 3 650 000 4 600 000 4 990 000 4 980 000 4 350 000 19,18 -12,65 Boron (t) 1 200 000 1 231 090 1 092 700 1 102 000 1 032 000 -14,00 -6,35 Diatomite (t) 575 000 595 000 813 000 735 000 782 000 36,00 6,39 Feldspar (t) 550 000 500 000 580 000 560 000 550 000 0,00 -1,79 Gypsum (t) 11 500 000 10 200 000 10 500 000 15 800 000 16 300 000 41,74 3,16 Kaolin (t) 5 290 000 5 420 000 5 950 000 5 900 000 5 950 000 12,48 0,85 Perlite (t) 348 000 414 000 420 000 393 000 419 000 20,40 6,62 Phosphates (t) 9 240 000 9 030 000 9 835 000 10 535 000 10 920 000 18,18 3,65 Potash (t) 720 000 930 000 1 000 000 900 000 960 000 33,33 6,67 Salt (t) 46 000 000 43 300 000 45 000 000 37 200 000 40 300 000 -12,39 8,33 Sulfur (t) 8 940 000 9 110 000 8 950 000 9 000 000 9 210 000 3,02 2,33 Talc (t) 511 000 604 000 616 000 515 000 542 000 6,07 5,24 Vermiculite (t) 100 000 100 000 100 000 100 000 100 000 0,00 0,00 Zircon (t) 82 800 100 200 104 935 85 000 78 000 -5,80 -8,24 Steam Coal (t) 860 406 000 842 423 000 837 211 000 768 014 000 744 960 000 -13,42 -3,00 Coking Coal (t) 46 559 000 68 645 000 81 656 000 81 300 000 77 857 000 67,22 -4,23 Lignite (t) 65 750 000 70 970 000 73 574 000 71 602 000 69 819 000 6,19 -2,49 Nat. Gas (Mio m³) 584 000 603 590 648 510 681 240 687 580 17,74 0,93 Petroleum (t) 322 422 000 332 942 000 345 705 000 394 129 000 446 231 000 38,40 13,22 Uranium (t) 1 713 1 957 1 812 1 882 2 164 26,33 14,98 Total (t) 1 872 604 722 1 920 365 044 1 986 717 884 1 987 350 627 2 019 235 917
Uruguay
2009 2010 2011 2012 2013 Change Change 09/13 12/13 Iron (t) 20 230 16 800 8 360 9 500 9 978 -50,68 5,03 Gold (kg) 2 182 1 743 1 736 1 725 2 022 -7,33 17,22 Bentonite (t) 210 430 1 210 5 530 8 974 4 173,33 62,28 Feldspar (t) 910 0 0 0 4 -99,56 . Talc (t) 1 070 830 54 880 370 708 -33,83 91,35 Total (t) 22 422 18 062 64 452 15 402 19 666
Uzbekistan
2009 2010 2011 2012 2013 Change Change 09/13 12/13 Molybdenum (t) 550 477 544 560 490 -10,91 -12,50 Tungsten (t) 70 54 48 131 98 40,00 -25,19 Bismuth (t) 2 2 2 2 2 0,00 0,00 Copper (t) 80 000 80 000 80 000 80 200 80 000 0,00 -0,25 Lead (t) 6 000 10 000 12 000 . 20,00 Rhenium (kg) 4 800 4 800 5 400 5 400 5 500 14,58 1,85 Selenium (t) 20 20 20 20 20 0,00 0,00 Zinc (t) 15 000 15 000 22 000 . 46,67
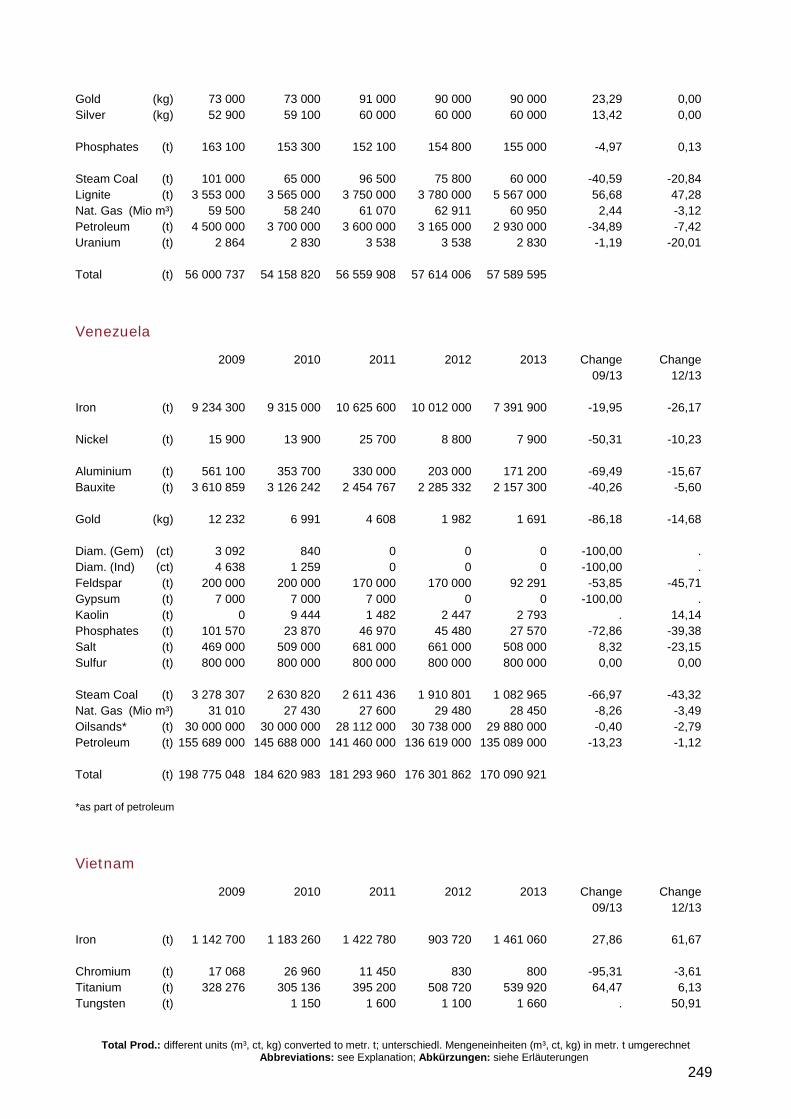
Total Prod.: different units (m³, ct, kg) converted to metr. t; unterschiedl. Mengeneinheiten (m³, ct, kg) in metr. t umgerechnet Abbreviations: see Explanation; Abkürzungen: siehe Erläuterungen
249
Gold (kg) 73 000 73 000 91 000 90 000 90 000 23,29 0,00 Silver (kg) 52 900 59 100 60 000 60 000 60 000 13,42 0,00 Phosphates (t) 163 100 153 300 152 100 154 800 155 000 -4,97 0,13 Steam Coal (t) 101 000 65 000 96 500 75 800 60 000 -40,59 -20,84 Lignite (t) 3 553 000 3 565 000 3 750 000 3 780 000 5 567 000 56,68 47,28 Nat. Gas (Mio m³) 59 500 58 240 61 070 62 911 60 950 2,44 -3,12 Petroleum (t) 4 500 000 3 700 000 3 600 000 3 165 000 2 930 000 -34,89 -7,42 Uranium (t) 2 864 2 830 3 538 3 538 2 830 -1,19 -20,01 Total (t) 56 000 737 54 158 820 56 559 908 57 614 006 57 589 595
Venezuela
2009 2010 2011 2012 2013 Change Change 09/13 12/13 Iron (t) 9 234 300 9 315 000 10 625 600 10 012 000 7 391 900 -19,95 -26,17 Nickel (t) 15 900 13 900 25 700 8 800 7 900 -50,31 -10,23 Aluminium (t) 561 100 353 700 330 000 203 000 171 200 -69,49 -15,67 Bauxite (t) 3 610 859 3 126 242 2 454 767 2 285 332 2 157 300 -40,26 -5,60 Gold (kg) 12 232 6 991 4 608 1 982 1 691 -86,18 -14,68 Diam. (Gem) (ct) 3 092 840 0 0 0 -100,00 . Diam. (Ind) (ct) 4 638 1 259 0 0 0 -100,00 . Feldspar (t) 200 000 200 000 170 000 170 000 92 291 -53,85 -45,71 Gypsum (t) 7 000 7 000 7 000 0 0 -100,00 . Kaolin (t) 0 9 444 1 482 2 447 2 793 . 14,14 Phosphates (t) 101 570 23 870 46 970 45 480 27 570 -72,86 -39,38 Salt (t) 469 000 509 000 681 000 661 000 508 000 8,32 -23,15 Sulfur (t) 800 000 800 000 800 000 800 000 800 000 0,00 0,00 Steam Coal (t) 3 278 307 2 630 820 2 611 436 1 910 801 1 082 965 -66,97 -43,32 Nat. Gas (Mio m³) 31 010 27 430 27 600 29 480 28 450 -8,26 -3,49 Oilsands* (t) 30 000 000 30 000 000 28 112 000 30 738 000 29 880 000 -0,40 -2,79 Petroleum (t) 155 689 000 145 688 000 141 460 000 136 619 000 135 089 000 -13,23 -1,12 Total (t) 198 775 048 184 620 983 181 293 960 176 301 862 170 090 921 *as part of petroleum
Vietnam
2009 2010 2011 2012 2013 Change Change 09/13 12/13 Iron (t) 1 142 700 1 183 260 1 422 780 903 720 1 461 060 27,86 61,67 Chromium (t) 17 068 26 960 11 450 830 800 -95,31 -3,61 Titanium (t) 328 276 305 136 395 200 508 720 539 920 64,47 6,13 Tungsten (t) 1 150 1 600 1 100 1 660 . 50,91
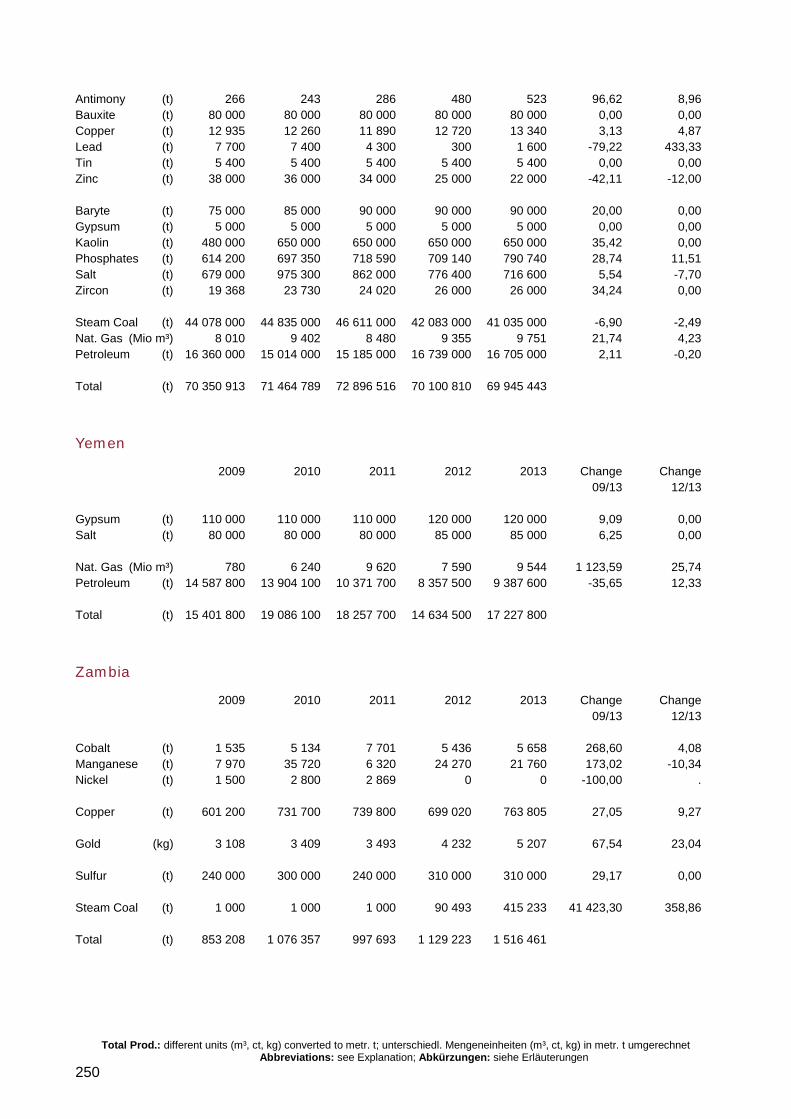
Total Prod.: different units (m³, ct, kg) converted to metr. t; unterschiedl. Mengeneinheiten (m³, ct, kg) in metr. t umgerechnet Abbreviations: see Explanation; Abkürzungen: siehe Erläuterungen
250
Antimony (t) 266 243 286 480 523 96,62 8,96 Bauxite (t) 80 000 80 000 80 000 80 000 80 000 0,00 0,00 Copper (t) 12 935 12 260 11 890 12 720 13 340 3,13 4,87 Lead (t) 7 700 7 400 4 300 300 1 600 -79,22 433,33 Tin (t) 5 400 5 400 5 400 5 400 5 400 0,00 0,00 Zinc (t) 38 000 36 000 34 000 25 000 22 000 -42,11 -12,00 Baryte (t) 75 000 85 000 90 000 90 000 90 000 20,00 0,00 Gypsum (t) 5 000 5 000 5 000 5 000 5 000 0,00 0,00 Kaolin (t) 480 000 650 000 650 000 650 000 650 000 35,42 0,00 Phosphates (t) 614 200 697 350 718 590 709 140 790 740 28,74 11,51 Salt (t) 679 000 975 300 862 000 776 400 716 600 5,54 -7,70 Zircon (t) 19 368 23 730 24 020 26 000 26 000 34,24 0,00 Steam Coal (t) 44 078 000 44 835 000 46 611 000 42 083 000 41 035 000 -6,90 -2,49 Nat. Gas (Mio m³) 8 010 9 402 8 480 9 355 9 751 21,74 4,23 Petroleum (t) 16 360 000 15 014 000 15 185 000 16 739 000 16 705 000 2,11 -0,20 Total (t) 70 350 913 71 464 789 72 896 516 70 100 810 69 945 443
Yemen
2009 2010 2011 2012 2013 Change Change 09/13 12/13 Gypsum (t) 110 000 110 000 110 000 120 000 120 000 9,09 0,00 Salt (t) 80 000 80 000 80 000 85 000 85 000 6,25 0,00 Nat. Gas (Mio m³) 780 6 240 9 620 7 590 9 544 1 123,59 25,74 Petroleum (t) 14 587 800 13 904 100 10 371 700 8 357 500 9 387 600 -35,65 12,33 Total (t) 15 401 800 19 086 100 18 257 700 14 634 500 17 227 800
Zambia
2009 2010 2011 2012 2013 Change Change 09/13 12/13 Cobalt (t) 1 535 5 134 7 701 5 436 5 658 268,60 4,08 Manganese (t) 7 970 35 720 6 320 24 270 21 760 173,02 -10,34 Nickel (t) 1 500 2 800 2 869 0 0 -100,00 . Copper (t) 601 200 731 700 739 800 699 020 763 805 27,05 9,27 Gold (kg) 3 108 3 409 3 493 4 232 5 207 67,54 23,04 Sulfur (t) 240 000 300 000 240 000 310 000 310 000 29,17 0,00 Steam Coal (t) 1 000 1 000 1 000 90 493 415 233 41 423,30 358,86 Total (t) 853 208 1 076 357 997 693 1 129 223 1 516 461
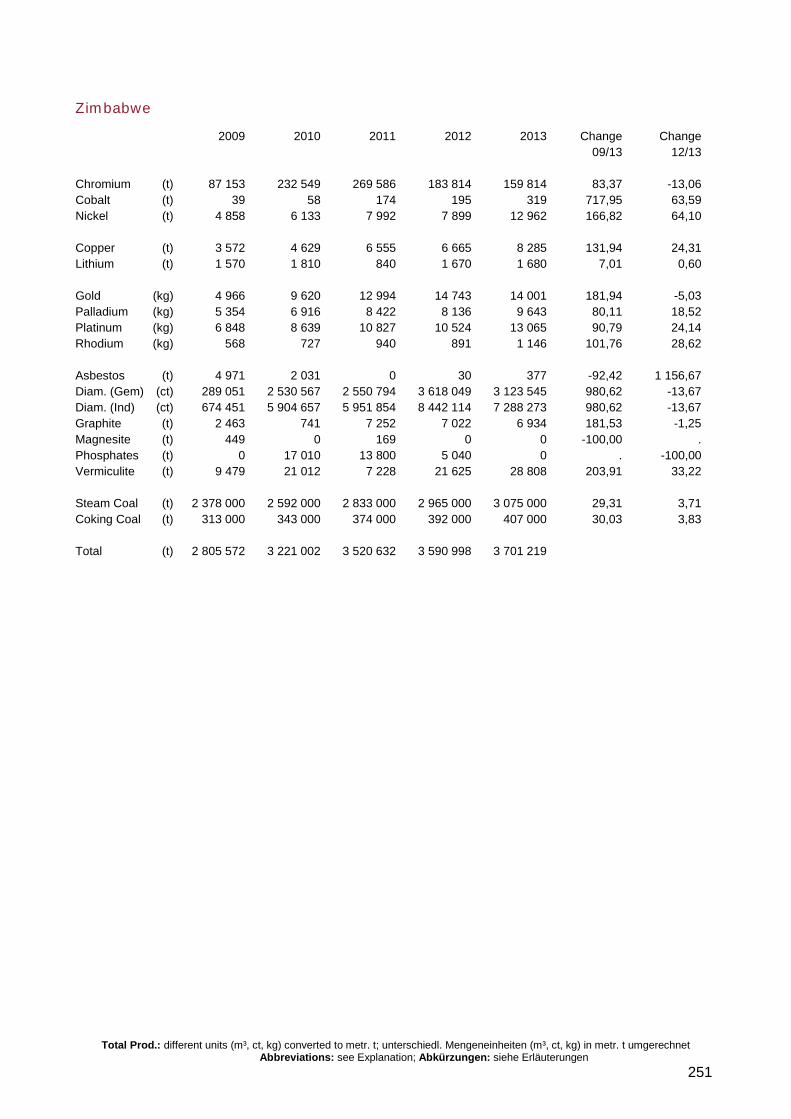
Total Prod.: different units (m³, ct, kg) converted to metr. t; unterschiedl. Mengeneinheiten (m³, ct, kg) in metr. t umgerechnet Abbreviations: see Explanation; Abkürzungen: siehe Erläuterungen
251
Zimbabwe
2009 2010 2011 2012 2013 Change Change 09/13 12/13 Chromium (t) 87 153 232 549 269 586 183 814 159 814 83,37 -13,06 Cobalt (t) 39 58 174 195 319 717,95 63,59 Nickel (t) 4 858 6 133 7 992 7 899 12 962 166,82 64,10 Copper (t) 3 572 4 629 6 555 6 665 8 285 131,94 24,31 Lithium (t) 1 570 1 810 840 1 670 1 680 7,01 0,60 Gold (kg) 4 966 9 620 12 994 14 743 14 001 181,94 -5,03 Palladium (kg) 5 354 6 916 8 422 8 136 9 643 80,11 18,52 Platinum (kg) 6 848 8 639 10 827 10 524 13 065 90,79 24,14 Rhodium (kg) 568 727 940 891 1 146 101,76 28,62 Asbestos (t) 4 971 2 031 0 30 377 -92,42 1 156,67 Diam. (Gem) (ct) 289 051 2 530 567 2 550 794 3 618 049 3 123 545 980,62 -13,67 Diam. (Ind) (ct) 674 451 5 904 657 5 951 854 8 442 114 7 288 273 980,62 -13,67 Graphite (t) 2 463 741 7 252 7 022 6 934 181,53 -1,25 Magnesite (t) 449 0 169 0 0 -100,00 . Phosphates (t) 0 17 010 13 800 5 040 0 . -100,00 Vermiculite (t) 9 479 21 012 7 228 21 625 28 808 203,91 33,22 Steam Coal (t) 2 378 000 2 592 000 2 833 000 2 965 000 3 075 000 29,31 3,71 Coking Coal (t) 313 000 343 000 374 000 392 000 407 000 30,03 3,83 Total (t) 2 805 572 3 221 002 3 520 632 3 590 998 3 701 219