Embed Size (px)
Citation preview


© Suruhanjaya Komunikasi dan Multimedia Malaysia 2007The information or material in this publication is protected under copyright and, save where otherwise stated,may be reproduced for non-commercial use provided it is reproduced accurately and not used in amisleading context. Where any material is reproduced, SKMM as the source of the material must be identifiedand the copyright status acknowledged.
The permission to reproduce does not extend to any information or material the copyright of which belongsto any other person, organisation or third party. Authorisation or permission to reproduce such information ormaterial must be obtained from the copyright holders concerned.
Suruhanjaya Komunikasi dan Multimedia MalaysiaOff Persiaran Multimedia, 63000 Cyberjaya, Selangor Darul Ehsan, Malaysia. Tel: (603) 8688 8000 Fax: (603) 8688 1000Freephone Number: 1-800-888-030 http://www.mcmc.gov.my
Cover RationaleThe cover symbolises the uniqueness of the magnificent Rafflesia, the world’slargest flower that can be found inMalaysia’s tropical forests. With adiameter reaching 100cm and weighing10kg, this cross-pollinated flora drawsmany forms of lives together – theinsects, human and flowers themselves.
Likewise, this publication draws togetherthe many developments toward theconvergence of communications,multimedia and content, and assists tobring Malaysian communicationsstakeholders to cross pollinate ideas andwork together.
IFC 1H 10/22/79 12:07 AM Page 1

1
CONTENTS
FOREWORD 2
SUMMARY HIGHLIGHTS 3
C&M MarketMalaysian Market Closed Near Half Year High 4C&M Market Capitalisation Up Double Digit 5Individual C&M Companies Contribution to Bursa Malaysia 5C&M Companies Share Price Movements 6C&M Amongst Other Heavyweights 7MESDAQ Performance 1H 2007 7Local C&M versus Overseas by Market Capitalisation in US Dollar 8
C&M EconomicsC&M Companies Revenue 1H 2007 9C&M Revenue Market Share 9Malaysian Economic Snapshot 1H 2007 11C&M Services Connection 13Budget 2008 from the C&M Perspective 14
Boosting the Knowledge Economy 15Broadband Incentives to Build a Knowledge-Based Society 16
C&M Adex TrendsMalaysian Adex 1H 2007 – 9% Growth 17Adex Comparison Quarterly and Monthly 17Adex Comparison by Medium 18Free-to-Air Television Advertising 19Radio Adex 20Top Adex Sectors; Top Advertisers and Brand 21Overseas Adex Trends and Comparatives 22
Worldwide Ad Growth and Forecasts 22Adex Forecasts by Region 23Global Adex Forecast by Medium 24Countries Adex as % of Total World Adex 24
C&M DevelopmentsStandardisation and Standards Development 25
Latest in Standards Development 25Standards/Alliance Bodies by Various Categories 26Regional Standards Bodies 28Challenges in Standards Development 29
Malware and its Spread 29Malware and What it is 30Malware Problems 31Mobile Malware 31Security Adoption to Curb Malware Spread 31Economic Impact 31Synergies of Regional and National Level 33
GLOSSARY 34
CONTACT US 35
CM1H101007 10/25/79 2:33 AM Page 1
2
FOREWORD
On behalf of the Suruhanjaya Komunikasi dan Multimedia Malaysia (SKMM),it is my pleasure to present to our readers the Communications andMultimedia Market and Financial Review for the first half of 2007. ThisBulletin discusses communications and multimedia (C&M) market trendsand performance over the first and second quarters of the year, includinginsight into relative market trends and company performances throughcomparatives over time and across countries.
This Bulletin also highlights various developments during this period suchas the Malaysian economic status; impact of the Malaysian Budget 2008 onthe C&M market; C&M service connections status; a perspective of size ofadvertising from a global angle including the Malaysian scenario; a featureon Malware; and an overview of the global C&M industry standardsdevelopment.
If you wish to refer to this and previous issues of the quarterly publication,these can be obtained from the SKMM’s website at:
http://www.mcmc.gov.my/what_we_do/Research/financial_review.asp
I trust the publication will be useful to all our stakeholders including theGovernment, Industry Players, Educators, Consumers and the Public.
To improve this publication in the future, we welcome any comments,enquiries, suggestions and feedback on the information presented in thisBulletin. Please send them to [email protected]
Thank you
YBhg. Datuk Dr. Halim Shafie Chairman Suruhanjaya Komunikasi dan Multimedia Malaysia
CM1H101007 10/25/79 2:33 AM Page 2

3
Market Closed Near Half Year High (pg 4)The local market barometer posted a gain of 21%in the 1H-07 to 1,354.38 on the KLCI end Jun-07.This is a steady climb from its low at 1,106.1 on 11Jan-07. The market faced some turbulencetowards end June 2007 due to more restriction incredit arising from higher defaults in the US sub-prime loans market.
C&M Market Capitalisation Up Double Digit (pg 5)C&M market capitalisation was RM107 billion or9.8% of Bursa Malaysia market capitalisation as at1H-07. The C&M market capitalisation in the 2Q-07and 1Q-07 saw double digit growth of 23% and14% respectively compared to full year 2006.
DiGi topped Share Price Gain (pg 6)DiGi topped the list with a share price gain of 51%or RM7.80 from RM15.20 per share at end 2006 toRM23 per share at end 1H-07. Maxis share price,on the other hand, gained 49% from RM10.20 pershare at end 2006 to RM15.20 at end 1H-07.
C&M Sector 1H-07 Revenue at RM17.4 Billion (pg 9)Overall, the C&M sector revenue grew 12.6% fromRM15.413 billion in 1H-06 to RM17.352 billion for1H-07. Telcos command lion’s share of 86%(RM15.04 billion); broadcasting 9% (RM1.5 billion);postal 3% (RM0.4 billion); others 2% (RM0.4 billion).
2006 GDP at 5.9%; 2007 expected at 6% (pg 11)Domestic economy saw 5.7% GDP growth in 2Q-07 due to more public spending and private sectoractivity. Outlook is for better performance in 2H-07 on stronger domestic demand with variousfactors supporting favourable growth such asemployment; consumer sentiments and businessconfidence; private investment and publicexpenditure.
Budget 2008 conducive for C&M industry (pg 14)A further corporate tax cut to 25% in 2009following the cut to 26% in 2008 is expected tobenefit all companies. Government is promotingmore usage of ICT to improve private sectorcompetitiveness and public sector processes.Broadband rollout takes centre stage in bid tonarrow digital divide; with last mile networkfacilities providers’ Investment Allowance of100% on broadband capex incurred up to Dec-2010; import duty and sales tax exemptionson broadband equipment and consumer accessdevices including tax exemptions for employersand employees buying and using such access.Target for 2010 is 50% household penetrationthrough private and public partnership efforts.
Malaysian Adex growth at 9.2% in 1H-07 (pg 17)Adex grew from RM2.187 billion in 2006 toRM2.390 billion in 1H-07 (up 9.2%). The month ofJune registered the highest adex at RM448.7million for the first half of the year. Nationwidepromotions such as Visit Malaysia Year 2007;domestic travel campaigns; and strongcompetition boosting the communications sectorad spend contributed to bulk of the growth.
Print has Highest Adex at RM1.494 billion; AMPRadio Stations Leads (pg 18)With a 65% market share, print achieved highestadex with a growth of 6.5% from 1H-06. This isfollowed by TV at RM690.9 million (11% growth),radio at RM111.3 million (25.9% growth) andother mediums at RM93.8 million (26.9% growth).Meanwhile, Era FM and My FM lead as top twohighest ad revenue stations at RM21.8 million andRM17 million respectively.
Overseas Adex 2007: More than 5% Growth (pg 22)Overseas adex growth is expected to grow morethan 5% in 2007 and above 6% in 2008. Chinaplays a key role in the Asia Pacific region growthdue to the run-up of the Beijing Olympic Games.Other events expected to boost adex are the USelections in 2008 and the European Football 2008(Euro 2008). As of 2006, world adex stands atUSD604.6 billion. Malaysia has 0.2% of this. The UScaptures most at 43% of global adex.
Standardisation & Standards DevelopmentWorldwide (pg 25)Rapid advance in technology has led to theexistence of new emerging standards such as 3G LTE and IEEE 802.20. Standard bodies, be it regional or worldwide, co-operate to solvecommon issues towards commercialisation goingforward.
Malware and its Spread (pg 29)Amidst many forms of security threats posed inthe information society today, malware ormalicious software can be considered as thegreatest threat to Internet security. Malware canaffect consumers, business, and government.Therefore, security adoption is taking place fromthe various dimensions that include political,economic, social and legal; let along individualuser vigilance.
SUMMARY HIGHLIGHTS
CM1H101007 11/13/79 12:35 AM Page 3
4
980
960
940
920
900
880
860
840
IndexLast Price 910.54High 09/05/06 966.88Average 925.55Low 15/06/06 886.48
Jan Feb Mar Apr May Jun
Ind
ex
Jan Feb Mar Apr May Jun
IndexLast Price 1,354.38High 22/06/07 1,391.57Average 1,267.81Low 11/01/07 1,106.06
1,450
1,400
1,350
1,300
1,250
1,200
1,150
1,100
1,050
1,000
Ind
exKLCI 1H – 06 KLCI 1H – 07
C&M MARKET
Source: SKMM, Bloomberg
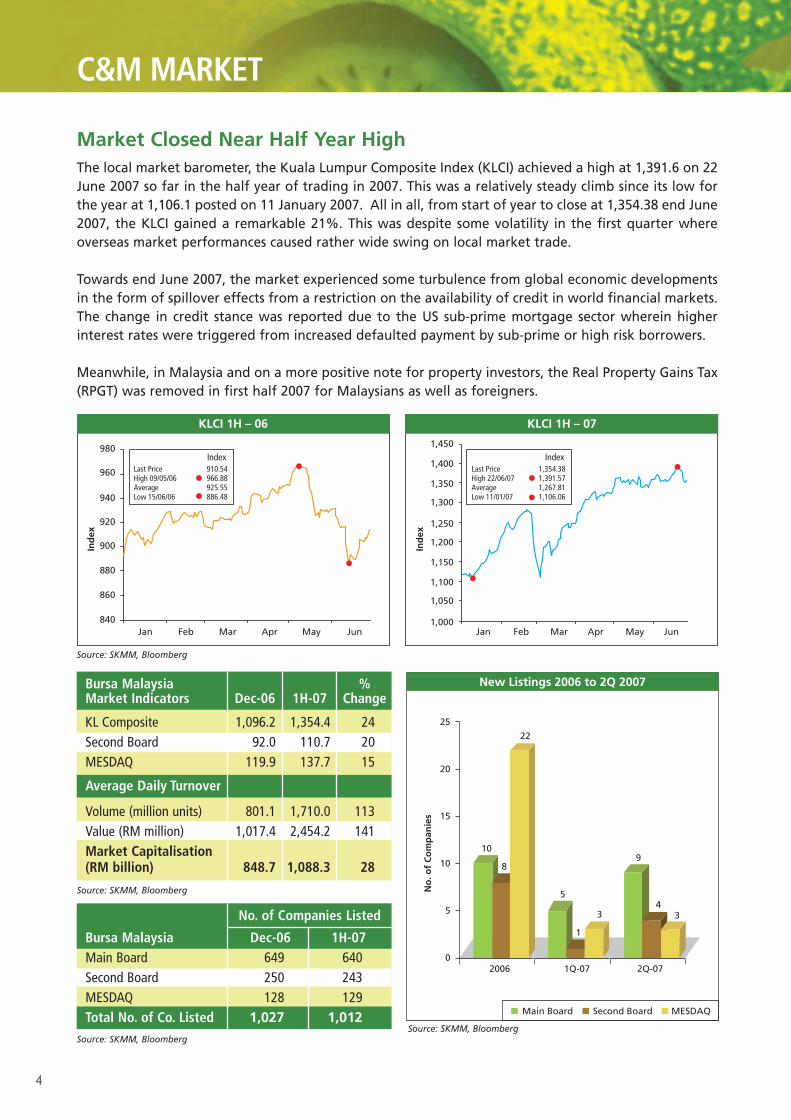
Bursa Malaysia %Market Indicators Dec-06 1H-07 Change
KL Composite 1,096.2 1,354.4 24Second Board 92.0 110.7 20MESDAQ 119.9 137.7 15
Average Daily Turnover
Volume (million units) 801.1 1,710.0 113Value (RM million) 1,017.4 2,454.2 141Market Capitalisation (RM billion) 848.7 1,088.3 28
Market Closed Near Half Year HighThe local market barometer, the Kuala Lumpur Composite Index (KLCI) achieved a high at 1,391.6 on 22June 2007 so far in the half year of trading in 2007. This was a relatively steady climb since its low forthe year at 1,106.1 posted on 11 January 2007. All in all, from start of year to close at 1,354.38 end June2007, the KLCI gained a remarkable 21%. This was despite some volatility in the first quarter whereoverseas market performances caused rather wide swing on local market trade.
Towards end June 2007, the market experienced some turbulence from global economic developmentsin the form of spillover effects from a restriction on the availability of credit in world financial markets.The change in credit stance was reported due to the US sub-prime mortgage sector wherein higherinterest rates were triggered from increased defaulted payment by sub-prime or high risk borrowers.
Meanwhile, in Malaysia and on a more positive note for property investors, the Real Property Gains Tax(RPGT) was removed in first half 2007 for Malaysians as well as foreigners.
Source: SKMM, Bloomberg
Source: SKMM, Bloomberg
25
20
15
10
5
02006 1Q-07 2Q-07
22
10
8
1
3
5
9
43
Main Board Second Board MESDAQ
No
. of
Co
mp
anie
s
New Listings 2006 to 2Q 2007
No. of Companies Listed
Bursa Malaysia Dec-06 1H-07Main Board 649 640Second Board 250 243MESDAQ 128 129Total No. of Co. Listed 1,027 1,012
Source: SKMM, Bloomberg
CM1H101007 10/25/79 2:33 AM Page 4
5
C&M MARKET
Source: SKMM, Bursa Malaysia, Bloomberg
Source: SKMM, Bursa Malaysia, Bloomberg
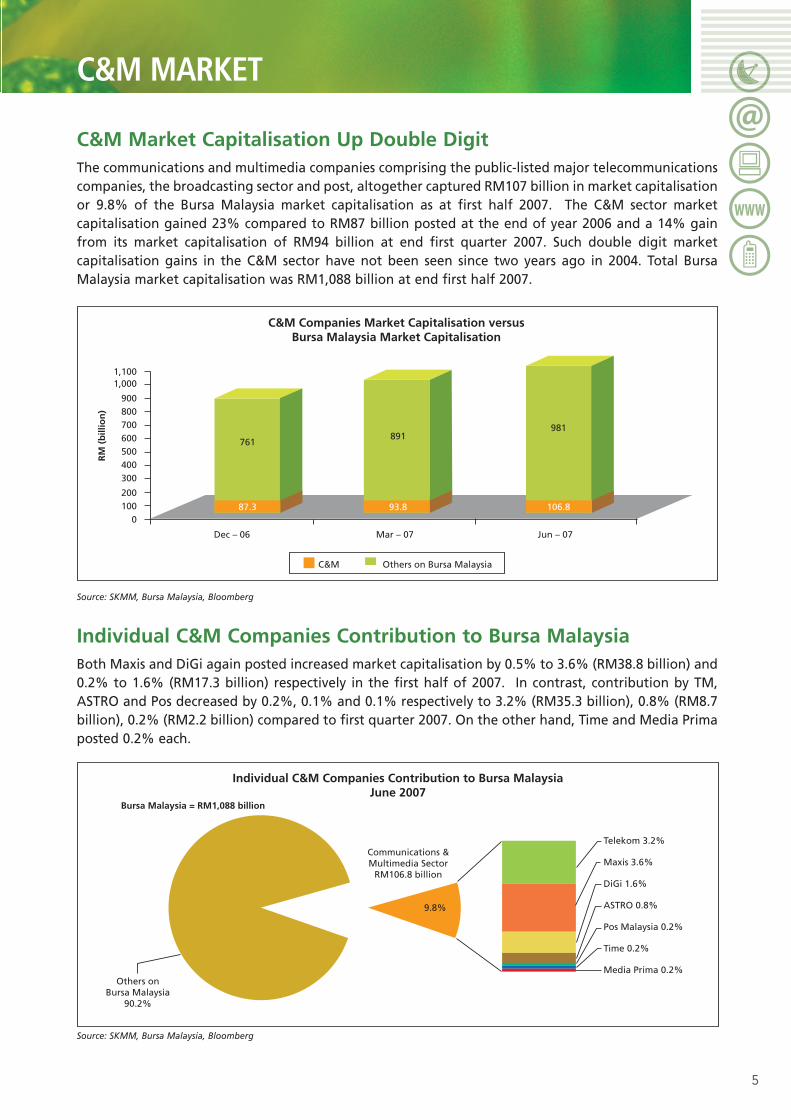
C&M Market Capitalisation Up Double Digit The communications and multimedia companies comprising the public-listed major telecommunicationscompanies, the broadcasting sector and post, altogether captured RM107 billion in market capitalisationor 9.8% of the Bursa Malaysia market capitalisation as at first half 2007. The C&M sector marketcapitalisation gained 23% compared to RM87 billion posted at the end of year 2006 and a 14% gainfrom its market capitalisation of RM94 billion at end first quarter 2007. Such double digit marketcapitalisation gains in the C&M sector have not been seen since two years ago in 2004. Total BursaMalaysia market capitalisation was RM1,088 billion at end first half 2007.
C&M Companies Market Capitalisation versusBursa Malaysia Market Capitalisation
1,1001,000
900800700600500400300
200100
0
Dec – 06 Mar – 07 Jun – 07
761
87.3
891981
93.8 106.8
C&M Others on Bursa Malaysia
RM
(b
illio
n)
Individual C&M Companies Contribution to Bursa MalaysiaBoth Maxis and DiGi again posted increased market capitalisation by 0.5% to 3.6% (RM38.8 billion) and0.2% to 1.6% (RM17.3 billion) respectively in the first half of 2007. In contrast, contribution by TM,ASTRO and Pos decreased by 0.2%, 0.1% and 0.1% respectively to 3.2% (RM35.3 billion), 0.8% (RM8.7billion), 0.2% (RM2.2 billion) compared to first quarter 2007. On the other hand, Time and Media Primaposted 0.2% each.
Individual C&M Companies Contribution to Bursa MalaysiaJune 2007
Bursa Malaysia = RM1,088 billion
Others onBursa Malaysia
90.2%
Communications &Multimedia Sector
RM106.8 billion
9.8%
Telekom 3.2%
Maxis 3.6%
DiGi 1.6%
ASTRO 0.8%
Pos Malaysia 0.2%
Time 0.2%
Media Prima 0.2%
CM1H101007 10/25/79 2:33 AM Page 5

6
C&M MARKET
C&M Companies Share Price Movements
DiGi topped the list with a share price gain of 51% or RM7.80 from RM15.20 per share at end 2006 toRM23 per share at first half 2007. Factors likely supporting this gain are the reported capital repaymentmove apart from expectations of higher revenue upon innovatively competitive pricing packages.
Maxis is still the second best performer amongst our list of C&M companies in terms of percentage gaincompared to first quarter 2007. Maxis share price gained 49% from RM10.20 per share at end 2006 toRM15.20 at first half 2007. Volume-wise, Time was traded most actively with 12.2 million units. Ringgit-wise, Media Prima, Time and TM posted gains with Media Prima share price up RM0.52 (20.8%) toRM3.02 per share; Time gained RM0.09 (12.2%) to RM0.83 per share while TM gained RM0.55 or 5.6%to RM10.30 per share.
Communications and Multimedia Companies PerformanceJan – Jun 2007
180
160
140
120
100
80
Jan Feb Mar Apr May Jun
Maxis
DiGi
ASTRO
Media Prima
Time
TM
Pos Malaysia
Pos Malaysia Maxis ASTRO Media Prima TM DiGi Time
% C
han
ge:
Bas
e 29
Dec
06
Source: SKMM, Bloomberg
* All data reported for Maxis Communications Berhad for 1H-07 is until 22/06/2007 Source: SKMM, Bloomberg
Companies
Share Price
29-Dec-06 29-Jun-07% Change (6 months)
(Dec-06 to Jun-07)
High(RM)
Low(RM)
Average Volume Traded(‘000)
DiGi 15.20 23.00 51.3 24.80 15.30 978Maxis* 10.20 15.20 49.0 15.40 10.00 4,596Media Prima 2.50 3.02 20.8 3.16 2.28 1,330Time 0.74 0.83 12.2 0.96 0.62 12,266TM 9.75 10.30 5.6 11.00 9.65 5,612Pos Malaysia 5.00 4.18 -16.4 5.05 4.08 1,241ASTRO 5.55 4.48 -19.3 5.70 4.46 2,082
CM1H101007 10/25/79 2:33 AM Page 6
7
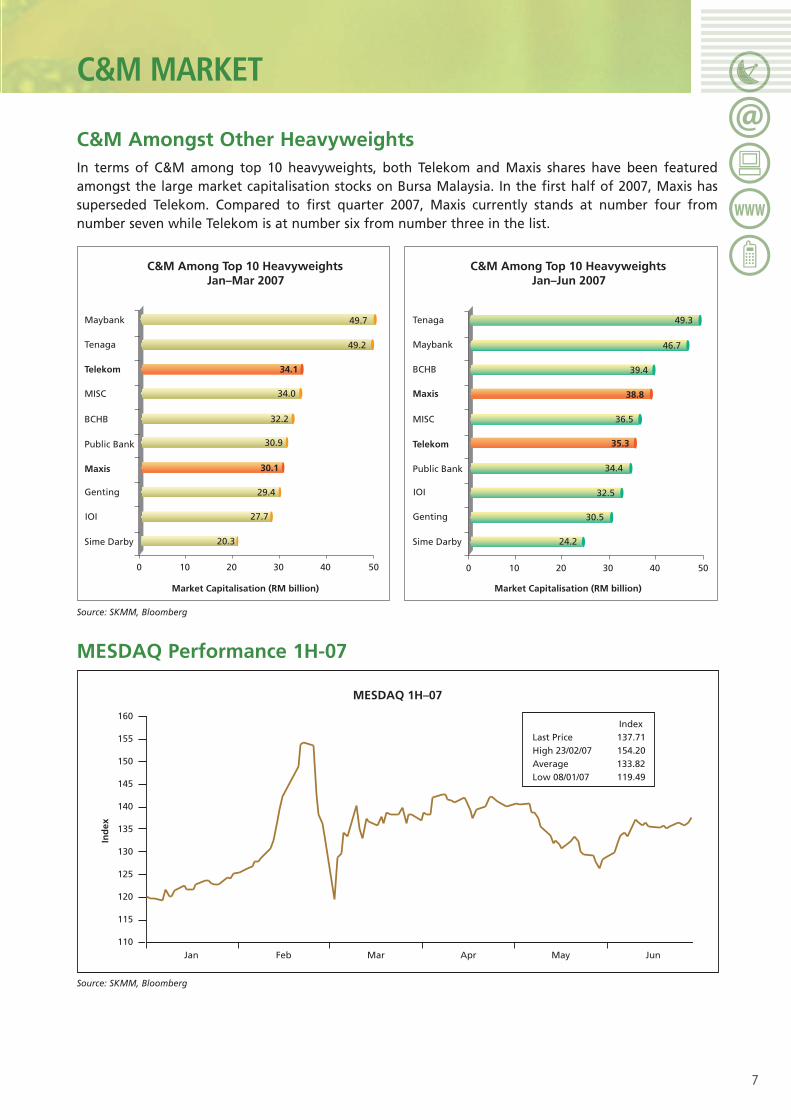
C&M Amongst Other HeavyweightsIn terms of C&M among top 10 heavyweights, both Telekom and Maxis shares have been featuredamongst the large market capitalisation stocks on Bursa Malaysia. In the first half of 2007, Maxis hassuperseded Telekom. Compared to first quarter 2007, Maxis currently stands at number four fromnumber seven while Telekom is at number six from number three in the list.
Source: SKMM, Bloomberg
Source: SKMM, Bloomberg
MESDAQ Performance 1H-07
C&M Among Top 10 HeavyweightsJan–Mar 2007
Maybank
Tenaga
Telekom
MISC
BCHB
Public Bank
Maxis
Genting
IOI
Sime Darby
Maybank
Tenaga
Telekom
MISC
BCHB
Public Bank
Maxis
Genting
IOI
Sime Darby
Market Capitalisation (RM billion) Market Capitalisation (RM billion)
0 10 20 30 40 50
C&M Among Top 10 HeavyweightsJan–Jun 2007
49.7
49.2
0 10 20 30 40 50
49.3
46.7
39.4
38.8
36.5
35.3
34.4
32.5
30.5
24.2
34.1
34.0
32.2
30.9
30.1
29.4
27.7
20.3
MESDAQ 1H–07
160
155
150
145
140
135
130
125
120
115
110Jan Feb Mar Apr May Jun
Ind
ex
IndexLast Price 137.71High 23/02/07 154.20Average 133.82Low 08/01/07 119.49
C&M MARKET
CM1H101007 10/25/79 2:33 AM Page 7

8
C&M MARKET
Local C&M versus Overseas by Market Capitalisation in US Dollar
Companies Country Main BusinessMarket Capitalisation (USD billion)
Dec-06 Jun-07 % Change (6 months)China Mobile Hong Kong Wireless 172.2 214.7 24.7NTT DoCoMo Japan Wireless 73.9 72.6 -1.8BT Britain Diversified Wireline 48.9 54.5 11.5Telstra Australia Diversified Wireline 40.6 48.6 19.7China Telecom China Wireline 44.3 47.6 7.4Sing Tel Singapore Diversified Wireline 34.0 35.3 3.8KDDI Japan Diversified Wireline 30.0 33.2 10.7Telekom TBK Indonesia Diversified Wireline 22.5 22.1 -1.8China Unicom Hong Kong Diversified Wireline 18.5 21.9 18.4SK Telecom Korea Wireless 19.4 18.7 -3.6Chunghwa Taiwan Diversified Wireline 18.0 18.5 2.8China United China Wireline 12.7 16.3 28.3KT Corp Korea Diversified Wireline 14.0 13.1 -6.4Maxis Malaysia Wireless 7.3 11.2 53.4PLDT Philippines Wireline 9.8 10.8 10.2Telekom Malaysia Diversified Wireline 9.4 10.2 8.5Telecom Corp New Zealand Diversified Wireline 6.8 7.2 5.9Taiwan Mobile Taiwan Wireless 5.1 6.1 19.6KT Freetel Korea Wireless 6.4 6.0 -6.3DiGi Malaysia Wireless 3.2 5.0 56.3Far Eastone Taiwan Wireless 4.4 4.8 9.1PCCW Hong Kong Diversified Wireline 4.1 4.2 2.4Indosat Indonesia Diversified Wireline 4.1 3.9 -4.9Globe Philippines Wireless 3.3 3.9 18.2VSNL India Wireline 2.7 3.3 22.2LG Telecom Korea Wireless 2.9 3.1 6.9ASTRO Malaysia Satelite Pay-TV 3.0 2.5 -16.7MTNL India Diversified Wireline 2.0 2.5 25.0Dacom Korea Wireline 1.71 2.24 31.0Excelcomindo Indonesia Wireless 1.82 1.70 -6.6MobileOne Singapore Wireless 1.40 1.30 -7.1True Corp Thailand Diversified Wireline 0.64 0.92 43.8Media Prima Malaysia Commercial Free-To-Air TV 0.54 0.72 33.3Smartone Hong Kong Wireless 0.60 0.67 11.7Pos Malaysia Malaysia Postal Services 0.73 0.63 -13.7Time Malaysia Wireless 0.53 0.61 15.1TT&T Thailand Diversified Wireline 0.09 0.11 22.2CSA Malaysia Diversified C&M 0.06 0.10 66.7GD Express Malaysia Courier 0.05 0.07 40.0Hutchison Australia Wireless 0.13 0.07 -46.2asiaEP Malaysia Internet Application Software 0.013 0.060 361.5REDtone Malaysia Discounted Call Services 0.041 0.043 4.9MoBif Malaysia Internet Telephony 0.034 0.033 -2.9Nationwide Malaysia Courier 0.020 0.020 No changeNasionCom Malaysia Web Portals / ISP 0.040 0.016 -60.0AKNM Tech Malaysia Internet Content/Entertainment 0.011 0.010 -9.1Palette Multimedia Malaysia Diversified C&M 0.006 0.009 50.0Intelligent Edge Malaysia Enterprise Software Services 0.004 0.007 75.0MNC Wireless Malaysia Diversified C&M 0.006 0.006 No changeEB Capital Malaysia Internet Connectivity Services 0.005 0.006 20.0Airocom Tech Malaysia Wireless 0.006 0.005 -16.7
Source: SKMM, Bloomberg
CM1H101007 10/25/79 2:33 AM Page 8

9
C&M Companies Revenue 1H 2007Good Performance from Revenue Perspective
The communications and multimedia (C&M) sector recorded a positive growth in the second half of theyear based on the aggregate revenue of listed C&M companies. The aggregate revenue recorded by thelisted C&M companies as at the end of June 2007 amounted to RM17.4 billion for the first six months ofthe year. On an annualised basis, the C&M sector revenue for 2007 is about RM34.7 billion. This is 9.5%more than the industry revenue for 2006 which amounted to RM 31.7 billion.
C&M ECONOMICS
1H-06 1H-07 1H-06 versus 1H-07
RM (billion) RM (billion) (% growth)
TM 7.764 8.500 9.5%Maxis 3.616 4.3141 19.3%DiGi 1.765 2.072 17.4%Time 0.177 0.156 -11.9%Major Telcos 13.322 15.042 12.9%ASTRO2 1.080 1.211 12.1%Media Prima 0.233 0.280 20.2%Broadcasting 1.313 1.491 13.6%Pos Malaysia 0.418 0.434 3.8%Others 0.360 0.385 6.9%C&M Total 15.413 17.352 12.6%
1 Maxis was de-listed on 13 July 2007. 1H-07 based on annualised figure.2 Adjusted year-end Source: SKMM, Industry
The telecommunications companies capturedlargest revenue market share of 86%,followed by the broadcasting sector at 9%,post with 3% and others at 2%.
TM achieved an operating profit margin of47.3% for the period under review. The fixedline and wireless cellular mobile servicesprovider maintain its lead in revenue marketshare registering a 9.5% growth in grouprevenue from the same period in 2006. TM hasbeen steadfastly driving growth in the fixedline broadband services segment. Its cellularmobile arm, Celcom, posted 14% growth toRM2.36 billion in revenue (1H-06: RM2.07billion).
Pos Malaysia 3%
C&M Revenue Market Share1H–07
Broadcasting 9%
Others 2%
Major Telcos 86%
Source: SKMM, Industry
C&M Revenue Market Share
CM1H101007 10/25/79 2:33 AM Page 9

10
C&M ECONOMICS
Source: SKMM, Industry Source: SKMM, Industry
* AnnualisedSource: SKMM, Industry
Source: SKMM, Industry
Source: SKMM, Industry * FYE 31 JanuarySource: SKMM, Industry
TM10,000
9,000
8,000
7,000
6,000
5,000
4,000
3,000
2,000
1,000
0
100
90
80
70
60
50
40
30
20
10
0
RM
(m
illio
n)
1H-03 1H-04 1H-05 1H-06 1H-07
5,289
6,501 6,737
7,764
8,500
16.3
45.1 43.446.6 47.3
Op
erat
ing
Pro
fit
Mar
gin
(%
)
Revenue Operating Profit margin
Pos Malaysia500
450
400
350
300
250
200
150
100
50
0
80
70
60
50
40
30
20
10
0
RM
(m
illio
n)
1H-03 1H-04 1H-05 1H-06 1H-07
323336
394416
434
Op
erat
ing
Pro
fit
Mar
gin
(%
)
Revenue Operating Profit margin
12.916.7 15.5
18.5
23.8
Maxis5,000
4,000
3,000
2,000
1,000
0
100
80
60
40
20
0
RM
(m
illio
n)
1H-03 1H-04 1H-05 1H-06 1H-07*
2,152
2,729
3,108
3,616
4,314
34.1
41.4 40.037.2 37.6
Op
erat
ing
Pro
fit
Mar
gin
(%
)
Media Prima300
250
200
150
100
50
0
50
40
30
20
10
0
RM
(m
illio
n)
1H-04 1H-05 1H-06 1H-07
139
172
233
280
Op
erat
ing
Pro
fit
Mar
gin
(%
)Revenue Operating Profit marginRevenue Operating Profit margin
9.9
17.517.3
12.0
DiGi2,200
2,000
1,800
1,600
1,400
1,200
800
600
1,000
400
200
0
100
80
60
40
20
0
RM
(m
illio
n)
1H-03 1H-04 1H-05 1H-06 1H-07
7931,051
1,312
1,765
2,073
40.644.3 44.0 46.4
48.9
Op
erat
ing
Pro
fit
Mar
gin
(%
)
ASTRO*1,400
1,200
1,000
800
600
400
200
0
40
20
35
30
25
15
10
5
0
RM
(m
illio
n)
1H-04 1H-05 1H-06 1H-07 1H-08
650
815
973
1,092
1,212
Op
erat
ing
Pro
fit
Mar
gin
(%
)
Revenue Operating Profit marginRevenue Operating Profit margin
7.9
21.5
10.512.8
18.4
CM1H101007 10/25/79 2:33 AM Page 10
11
The market leader in terms of subscribers and cellular mobile revenue, Maxis was de-listed from theMain Board of Bursa Malaysia as a result of a restructuring exercise involving its parent companyBinariang GSM Sdn Bhd. Having ventured into overseas markets in 2005, Maxis has repositioned itselfnow to meet greater investments and expansion requirements at home and abroad. In annualised terms,the operator’s half yearly revenue of RM4.3 billion is a 19.3% growth over the previous year’s half yearmark of RM3.6 billion.
DiGi posted a lower year-on-year growth in revenue of 17.4% for 1H-07 compared to the previous twoperiods, that is, 34.5% (Y-o-Y) in 1H-06 and 24.8% (Y-o-Y) in 1H-05. The celco recorded an encouragingoperating profit margin of 48.9% for the half year period ending 30 June 2007.
Time’s revenue continued to decline and was attributed to the lower voice and payphone revenue. Themigration of its current Time Division Multiplexing network to Internet Protocol Next GenerationNetworks will enable the Group to boost its financial performance through a new service and productplatform.
Pos Malaysia’s revenue rose marginally by 3.8% to RM434 million for the first six months of 2007 fromRM418 million for 1H-06. Operating profit margin also improved at 23.8% for 1H-07 compared to 18.5%for 1H-06.
The broadcasting sector enjoyed encouraging revenue growth in the first half of 2007. Media Primarecorded strong revenue growth driven in particular by advertising revenue from its Free-To-Airtelevision networks as well as its radio networks. Overall revenue grew 13.6% compared to the sameperiod in 2006. The media conglomerate recorded an operating profit margin of 17.5% for the sixmonth period.
ASTRO, the pay-TV services provider adjusted revenue grew by 12.1% to record RM1.21 billion inrevenue for the six months under review. Growth was contributed mainly by higher subscription revenueto its pay-TV segment.
Malaysian Economic Snapshot 1H 2007Business Conditions Optimistic
Growth momentum prevailed in the second quarter whereby economic expansion was 5.7% (1Q-07:5.3%) surpassing a median forecast GDP of 5.5% from a Bloomberg survey of 20 economists. Thesoftening of external demand was moderated by a stronger domestic demand. In the first half of 2007,civil servants received a salary boost whilst national carmakers enjoy increased sales from new models.With the services sector expected to cushion any moderation in the manufacturing sector, the secondhalf of the year is expected to record stronger growth (reference source: Bank Negara MalaysiaEconomic and Financial Developments in the Malaysian Economy in the Second Quarter of 2007).
The Malaysian Institute of Economic Research (MIER) has revised its forecast up marginally for GDPgrowth in 2007 to 5.7% (from 5.6%). The MIER Business Conditions and Consumer Sentiments Indiceswere more upbeat for the second quarter compared to the same quarters in 2006. Optimism amongrespondents of the Business Conditions survey was reported could be the impact of the implementationof the Ninth Malaysia Plan filtering through evidenced by higher local orders and pickup in outputactivities. Consumers indicated stable finances coupled with favourable employment outlook and
C&M ECONOMICS
CM1H101007 10/25/79 2:33 AM Page 11

12
C&M ECONOMICS
spending plans into higher gear. With a view that the second half of the year could yield even betterresults, MIER is optimistic for a 5.8% growth for 2008, barring any external shocks such as oil price hikesand the further softening of the US economy.
* 2Q-07 GDP taken from median value of Bloomberg’s survey of 12 economistsSource: MIER, Bloomberg
The country’s Consumer Price Index averaged 1.5% in the second quarter of 2007 (1Q: 2.6%). For 2007,Bank Negara expected inflation to be lower at the lower end in the range of 2% to 2.5%.
In the meantime, despite volatility in the global financial markets and possible consequentialmoderation in global demand, Bank Negara has held the overnight policy rate steady at 3.5% and is stillholding accommodative monetary policy, in favour of supporting strong domestic fundamentals toprovide a sound foundation for growth. The next monetary policy committee meeting will be in Octoberthis year.
f -forecast* Based on Bloomberg’s survey of economistsSource: Bloomberg, MIER, Bank Negara Malaysia Annual Report 2006, ADB Asia Development Outlook 2007 Update.
2006First Second
2007f 2008fQuarter Quarter2007 2007
5.9% 5.5% 5.7%
Bank Negara Malaysia 6.0% 6.0%
Malaysian Institute of Economic Research (MIER) 5.7% 5.8%
Bloomberg median* 5.8% 6.0%
Asian Development Bank 5.4% 5.7%
MIER: Business Conditions &Consumer Sentiments Indices 2005–1H 2007
130
120
110
100
90
80
70
60
50
Ind
ex P
oin
ts
7%
6%
5%
4%
3%
2%
1%
0%
BCI
CSI
GDP
1Q-05 2Q-05 3Q-05 4Q-05 1Q-06 2Q-06 1Q-07 2Q-073Q-06 4Q-06
CSI BCI GDP
GDP Growth Forecasts
CM1H101007 10/25/79 2:33 AM Page 12
13
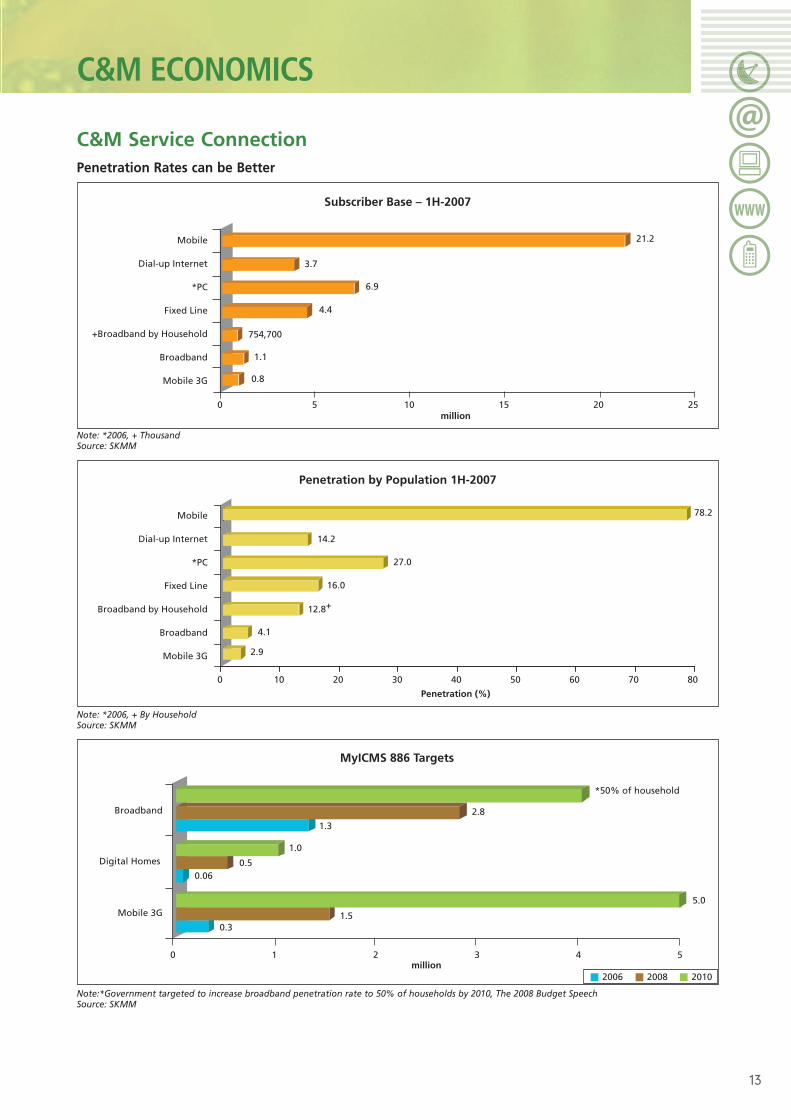
C&M Service ConnectionPenetration Rates can be Better
Note: *2006, + ThousandSource: SKMM
Note: *2006, + By HouseholdSource: SKMM
Note:*Government targeted to increase broadband penetration rate to 50% of households by 2010, The 2008 Budget Speech Source: SKMM
Subscriber Base – 1H-2007
Mobile
0 5 10 15 20 25million
3.7
6.9
4.4
754,700
1.1
0.8
Dial-up Internet
*PC
Fixed Line
+Broadband by Household
Broadband
Mobile 3G
21.2
Penetration by Population 1H-2007
Mobile
Penetration (%)
14.2
27.0
16.0
12.8+
4.1
2.9
Dial-up Internet
*PC
Fixed Line
Broadband by Household
Broadband
Mobile 3G
78.2
0 10 20 30 40 50 60 70 80
MyICMS 886 Targets
million
Digital Homes
Broadband
Mobile 3G
*50% of household
2.8
5.0
1.3
1.0
0.50.06
1.50.3
0 1 2 3 4 5
2006 2008 2010
C&M ECONOMICS
CM1H101007 10/25/79 2:33 AM Page 13

14
C&M ECONOMICS
Budget 2008 from the C&M Perspective
Budget Emphasises Propelling Broadband Services and Penetration
The 2008 National Budget carried the theme ‘Together Building the Nation and Sharing Prosperity’ inline with the spirit of celebrating and marking the first annual budget in the second 50-year phase ofthe country post independence.
With three more years remaining under the Ninth Malaysia Plan (2006 – 2010), the Budget is targetedat ensuring equitable benefits to all Malaysians. To achieve this, the Budget outlined three strategies forimplementation in 2008.
The first strategy focuses on enhancing the competitiveness of the country. The government’s resolve inthis area was reinforced by the emphases on improving the public delivery system; among them speedierprocesses, reducing lead time for activities as identified by the newly formed taskforce to enhance thepublic delivery system efficiency and national competitiveness. In their review, increasing greater usage
Source: The 2008 Budget Speech
Enhancing thenation’s
competitiveness
1
Strengtheninghuman capitaldevelopment
2
Ensuring thewell-being of all
Malaysians
3
Move the economy up the value chain
To raise the capacity for knowledgeand innovation and nurture
first class mentality
To address persistent socio-economic inequalities
constructively and productively
To improve the standard and sustainability of quality of life
To strengthen the institutional andimplementation capacity
BUDGET 2006
‘Strengtheringresilience, meeting
challenges’
BUDGET 2007
‘Implementing thenational mission
towards achievingthe national vision’
BUDGET 2008
‘Together buildingthe nation and
sharing prosperity’
CM1H101007 10/25/79 2:34 AM Page 14

15
of ICT was among the strategies of the taskforce to shorten and improve process efficiencies. Whilesome improvements came by way of review, new measures were also introduced together withincentives collectively aimed at elevating the country’s competitiveness.
Further measures were introduced to enhance further private sector competitiveness in the areas ofprivate investment. In addition to enhancements to the tax system, the 1% corporate tax cut whichbegan in 2007 and was to end in 2008 at 26%, is to continue until 2009 at 25%. This is overall conducivefor corporate earnings. The fact that the corporate tax cuts are announced ahead is said to facilitateinvestment and business planning for both local and foreign investors or businesses.
Boosting the Knowledge Economy
Measures for promoting the quality of human capital in the knowledge economy is the second Budget2008 strategy. Initiatives of this nature is in order to add value to the knowledge economy andultimately promote and attract investment. The entry of knowledge workers from overseas will be madesmoother beginning next year with processing time of documents for work permits halved to sevendays. In addition, a new category of business travellers has been created to enable a longer stay aimedat facilitating travelling requirements of skilled professionals working with companies with offices inthis region. The issuance of a multiple entry visa for Chinese and Indian nationals by Malaysianembassies and consulates in major cities such as London, New York, Hong Kong and Singapore will bemade possible from the start of 2008.
The Budget also outlines incentives to encourage the greater use of technology in various areas. In thecapital market, retail investors who trade using the Internet will enjoy negotiable commission rates andreduced clearing fees. To promote private sector participation, an amount of RM236 million has beenallocated for the provision of infrastructure and technological facilities to support the country’s biotechindustry.
MSC (Multimedia Super Corridor) companies stand to benefit from promotional efforts set to intensifyat the international level. These and other promotional efforts which include hosting notable ICT eventsand conferences next year in Kuala Lumpur such as the World ICT Week, World Congress on InformationTechnology and the United Nations Global Alliance on ICT for Development will open up further growthopportunities.
In a bid to create a more conducive environment for investors, Cyberjaya, one of the world’s firstintelligent cities located within the MSC will be made even more attractive with the planneddevelopment of an international school, affordable homes and heightened security measures. In respectof human capital development in ICT, a Knowledge Workers Development Institute will be set up inCyberjaya to ensure there is an adequate supply of high-skilled workers to meet the demand of the ICTindustry. On the content development front, the MSC Malaysia Digital Animation Centre will be set upin Cyberjaya to develop local expertise.
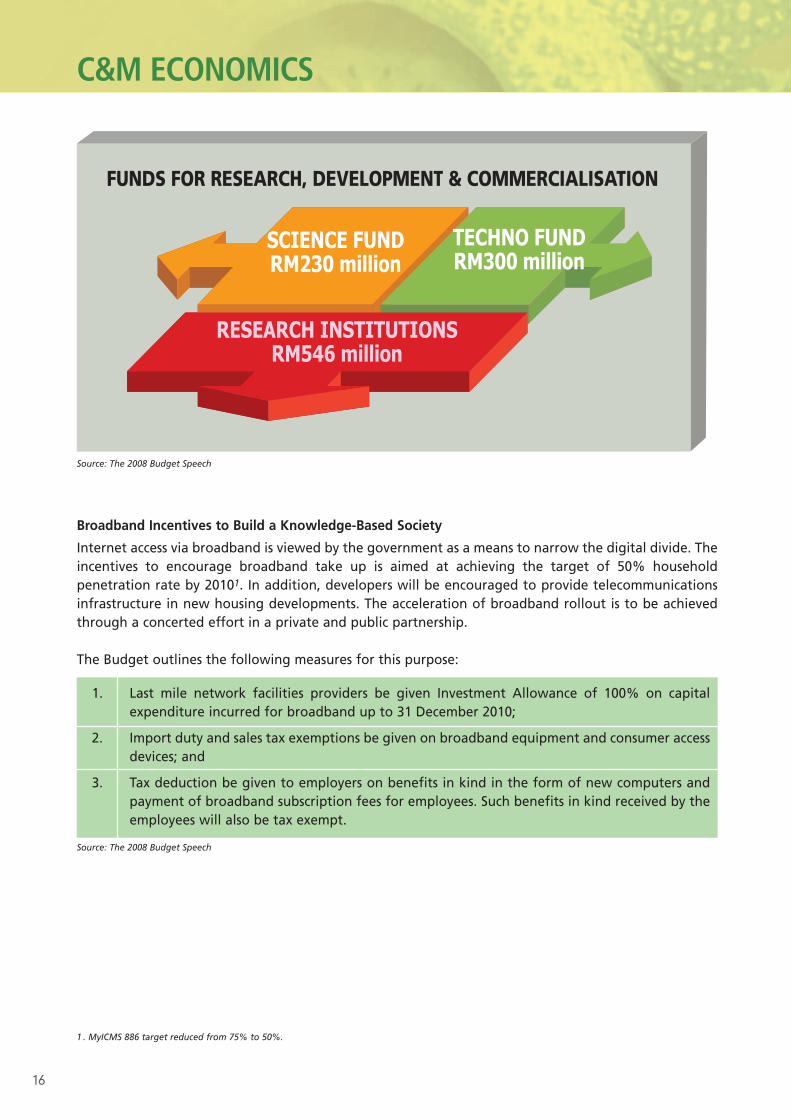
There is a continuing emphasis by the government on building the capacity in scientific andtechnological research. This is evidenced by the funds that will be made available to facilitate theresearch and development capabilities and thereafter the commercialisation of the results. To furtherpromote R&D and commercialisation activities, royalty payments to researchers will be increased to 80%.
C&M ECONOMICS
CM1H101007 10/25/79 2:34 AM Page 15
16
Source: The 2008 Budget Speech
Broadband Incentives to Build a Knowledge-Based Society
Internet access via broadband is viewed by the government as a means to narrow the digital divide. Theincentives to encourage broadband take up is aimed at achieving the target of 50% householdpenetration rate by 20101. In addition, developers will be encouraged to provide telecommunicationsinfrastructure in new housing developments. The acceleration of broadband rollout is to be achievedthrough a concerted effort in a private and public partnership.
The Budget outlines the following measures for this purpose:
1. Last mile network facilities providers be given Investment Allowance of 100% on capitalexpenditure incurred for broadband up to 31 December 2010;
2. Import duty and sales tax exemptions be given on broadband equipment and consumer accessdevices; and
3. Tax deduction be given to employers on benefits in kind in the form of new computers andpayment of broadband subscription fees for employees. Such benefits in kind received by theemployees will also be tax exempt.
Source: The 2008 Budget Speech
FUNDS FOR RESEARCH, DEVELOPMENT & COMMERCIALISATION
RESEARCH INSTITUTIONSRM546 million
TECHNO FUNDRM300 million
SCIENCE FUNDRM230 million
C&M ECONOMICS
1 . MyICMS 886 target reduced from 75% to 50%.
CM1H101007 10/25/79 2:34 AM Page 16

17
Malaysia Adex 1H 2007 – 9% Growth
For the first half of 2007, Malaysian adex jumped to a 9.2% growth from last year’s first half of RM2.188billion to RM2.390 billion. The widespread promotions of the Visit Malaysia Year 2007 (VMY 2007) anddomestic travel campaigns contributed to the growth. The adex scenario is encouraging this year, havingachieved the second highest growth on a half year period basis in the period of 2003 to 2007. Thehighest growth on a half year period basis was in 2004. On quarterly basis, growth was reflected in everysecond quarter of the years (in chart below) and this year adex contributed the highest second quarterat RM1.28 billion.
Adex Comparison Quarterly and Monthly
Source: Nielsen Media Research Service
Source: Nielsen Media Research Service
Malaysia Adex(1H 2003 – 1H 2007)
3,000
2,500
2,000
1,500
1,000
500
–
1H-03 1H-04 1H-05 1H-06 1H-07
30
25
20
15
10
5
0
%
RM
(m
illio
n)
1,646
2,046
2,184 2,1882,390
0.1
9.2
0.2
6.7
24.3
Quarter-to-Quarter Adex Comparison2003 – 2007
1,400
1,200
1,100
800
600
400
200
–2003 2004 2005 2006 2007
782.
3
863.
2 965.
2
1,08
0.6
1,05
7.7
1,12
5.8
1,02
5.0
1,16
2.5
1,10
8.1
1,28
0.4
1Q 2Q
RM
(m
illio
n)
C&M ADEX TRENDS
CM1H101007 10/25/79 2:34 AM Page 17

18
C&M ADEX TRENDS
For the first half of the year, the month of June collected the highest adex at RM448.7 million, a growthof 3% from May. Boosting the adex for the second half of the year were local and international eventsheld in Malaysia in conjunction with the VMY 2007 such as the Malaysia Mega Sale Carnival, Colours ofMalaysia parade, International Flora Festival and the Japan GT race.
Adex Comparison by Medium
Source: Nielsen Media Research Service
At a growth of 6.5% from last year’s first half, print still continue to be the most desired medium byadvertisers, garnering adex worth RM1.494 billion and holding the largest market share at 65%. TV,radio and other types of medium gained 11%, 25.9% and 26.9% respectively for the first half of thisyear from the same period last year. According to Nielsen Research, categories contributing to theoverall growth in ad spend include bank/finance, hair shampoo/conditioner, local governmentinstitutions, investment companies, automotive and tourism.
Source: Nielsen Media Research Service Source: Nielsen Media Research Service
Month-to-Month Adex 2007Jan – Jun
RM (million)
0 50 100 15 200 250 300 350 400 450
Jun
May
Apr
Mar
Feb
Jan
448.7
435.8
393.2
399.7
349.3
344.0
622.
4
88.4
73.9
1,49
3.8
690.
9
111.
3
93.8
1,40
2.9
Adex Market Share by Medium
1,600
1,400
1,200
1,000
800
600
400
200
–Print TV Radio Others
Jan–Jun 2006 Jan–Jun 2007
RM
(m
illio
n)
Adex Market Share(Jan – Jun 2007)
Print65%
Radio4%
Others3%
TV28%
CM1H101007 10/25/79 2:34 AM Page 18

19
Free-To-Air Television Advertising
Media Prima’s commencement of TV9fuelled the company to an 89% FTATV adex market share for the first halfof the year as compared to 83% in thelast year’s first half, and garnering atotal ad spend of RM618.9 million.Government channels total ad spendfor 1H 2007 arrived at RM72 million ascompared to RM108 million from thesame period last year. Meanwhile, TV3produced the highest number of adsfollowed by NTV7 and 8TV raking in atotal of RM762.97 million.
Source: Nielsen Media Research Service Source: Nielsen Media Research Service
Source: Nielsen Media Research Service
Media No. of Ads Ads in Seconds RM (million)
TV 1 33,950 1,038,612 25.53TV 2 59,312 1,564,465 69.93TV 3 123,416 3,011,446 429.90
NTV7 84,631 2,133,918 169.18TV9 57,368 1,542,498 86.918TV 79,012 2,016,875 163.89
Source: Nielsen Media Research Service
NTV 719%
8TV 16%
TV 14%
TV 213%
TV 348%
FTA TV Adex(Jan – Jun 2006)
NTV 718%
8TV 17%
TV9 9%
TV 13% TV 2
8%
TV 345%
FTA TV Adex(Jan – Jun 2007)
FTA TV Adex Comparison(Jan – Jun 2006/2007)
2006 2007
8TV
TV9
NTV7
TV3
TV2
TV1
0 50 100 150 200 250 300 350
RM (million)
119.8102.0
64.8
122.7117.5
311.6294.8
52.982.6
19.125.4
C&M ADEX TRENDS
CM1H101007 10/25/79 2:34 AM Page 19

20
C&M ADEX TRENDS
Radio Adex
Total radio ad revenue reached RM111.3 million for the first half of 2007 as opposed to last year’s totalof RM88.4 million. The growth of 25.9% is due to the introduction of two new stations owned by MediaPrima, which are Fly FM and Hot FM. Meanwhile, by individual stations Era FM leads in ad revenue,raking in more than RM20 million, followed closely by sister channel My FM at RM17 million. Redi 998,Hitz FM and Mix FM each garnered more than RM10 million while newcomer Hot FM falls in close atRM9 million.
Source: Nielsen Media Research Service
Source: Nielsen Media Research Service
Star RFMRM12.1 million
14%
Star RFMRM15.6 million
14%
RTMRM4.7 million
5%
AMPRM71.6 million
81%
Market Share Radio Adex(Jan – Jun 2006)
Media PrimaRM13.8 million
12%
RTMRM7.3 million
7%
AMPRM74.6 million
67%
Market Share Radio Adex(Jan – Jun 2007)
ERA
FM
MY
FM
RED
I 988
HIT
Z FM
MIX
FM
HO
T FM
LIG
HT
& E
ASY
FM
FLY
FM
SIN
AR
FM
THR
.FM
Oth
er R
egio
nal
(R
TM)
AI F
M (
RM
S 5)
MIN
NA
L FM
(R
MS
6)
Red
104
.9
KL
FM (
RM
S K
L)
XFR
ESH
FM
MU
ZIK
FM
(R
MS
MU
ZIK
)
SELA
NG
OR
FM
(R
MS
S'G
OR
)
KLA
SIK
NA
SIO
NA
L FM
TRA
XX
FM
(R
MS
4)
RM
(m
illio
n)
Radio Adex by Stations(Jan – Jun 2007)25
20
15
10
5
0
21.8
17.0
14.8
10.7 10.59.0
7.6
4.83.5 3.0 2.8
1.9 1.40.8 0.4 0.4 0.3 0.2 0.2 0.1
CM1H101007 11/13/79 12:35 AM Page 20

21
Top Adex Sectors; Top Advertiser and Brand
Top Five Advertising Sector (Jan–Jun 07)
RM (million) % Print TV Radio Others
Miscellaneous 182.0 14 16.7 4.0 0.6 0.8Communication 147.4 12 33.7 20.1 5.3 4.9Toiletries 119.4 9 7.7 0.8 0.05 1.4Retail 118.3 9 14.6 43.2 2.7 6.8Finance 76.3 6 77.9 48.1 12.6 8.8
Total 643.4 50 150.6 116.2 21.25 22.7Source: Nielsen Media Research Service
The communications sector is the second highest ad spend sector, spending RM147.4 million withhighest being spent on the print medium followed by TV. Toiletries and finance sector also chose printas their preferred medium with total spending close to RM120 million and RM76 million respectively.Meanwhile, retail sector prefers to spend more on TV medium rather than print.
Top Advertiser (Jan–Jun 07)
Advertiser Rank 1H 2006 1H 2007 Growth
RM (million) (%)DiGi 1 38.6 74.1 92.0Unilever Malaysia 2 36.5 54.5 49.3Procter & Gamble 3 49.8 54.3 9.0Maxis 4 100.7 52.4 -48.0Celcom 5 59.5 48.1 -19.2Nestle 6 36.7 38.4 4.6TM 7 23.7 27.7 16.9KFC Holdings 8 20.4 22.8 11.8Petronas 9 18.6 22.3 19.9Kementerian Pengangkutan 10 14.2 18.5 30.3
Source: Nielsen AIS
Top Brand (Jan–Jun 07)
Brand Rank 1H 2006 1H 2007 Growth
RM (million) (%)DiGi 1 38.6 74.1 92.0Maxis 2 100.7 52.4 -48.0Celcom 3 59.5 48.1 -19.2TM 4 23.3 26.8 15.0Petronas 5 18.0 21.5 19.4Kementerian Pengangkutan 6 14.2 18.5 30.3KFC 7 12.3 15.7 27.6Courts Mammoth Superstore 8 12.2 15.5 27.0Panasonic 9 10.7 15.1 41.1Tourism Malaysia 10 6.9 14.3 107.2
Source: Nielsen AIS
DiGi leads in both brand and advertiser for the 1H 2007, almost doubling their ad spend to RM74 million.The second largest advertiser, Unilever Malaysia also recorded a growth close to 50% to RM54.5 millionfollowed by Procter & Gamble at 9% (RM54.3 million). The top four brands are dominated by thecommunications sector with DiGi leading the pack followed by Maxis, Celcom and TM, with these takinga combined total of RM201.4 million or 67% amongst the top brands. However, Maxis and Celcom sawreduction in spending by 48% and 19% respectively. DiGi’s ad spend was almost doubled during theperiod concerned, reflecting aggressive marketing strategy.
C&M ADEX TRENDS
CM1H101007 10/25/79 2:34 AM Page 21
22
C&M ADEX TRENDS
Overseas Adex Trends and Comparatives
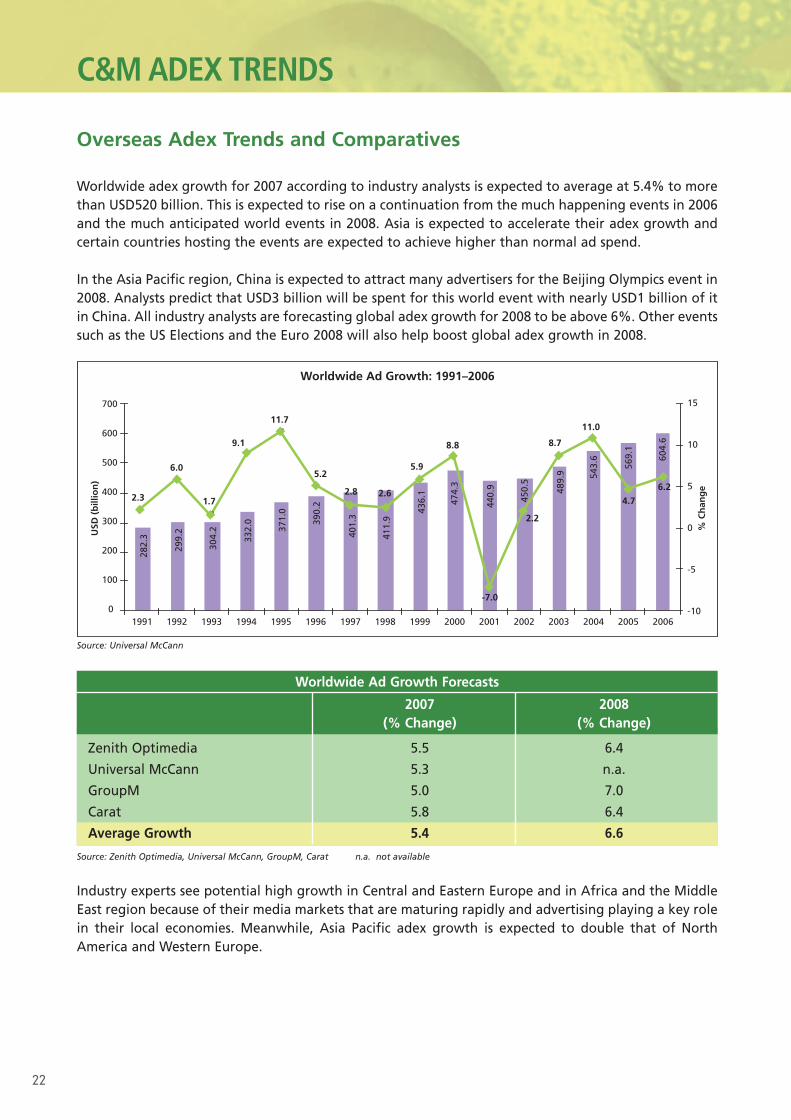
Worldwide adex growth for 2007 according to industry analysts is expected to average at 5.4% to morethan USD520 billion. This is expected to rise on a continuation from the much happening events in 2006and the much anticipated world events in 2008. Asia is expected to accelerate their adex growth andcertain countries hosting the events are expected to achieve higher than normal ad spend.
In the Asia Pacific region, China is expected to attract many advertisers for the Beijing Olympics event in2008. Analysts predict that USD3 billion will be spent for this world event with nearly USD1 billion of itin China. All industry analysts are forecasting global adex growth for 2008 to be above 6%. Other eventssuch as the US Elections and the Euro 2008 will also help boost global adex growth in 2008.
Source: Universal McCann
Worldwide Ad Growth Forecasts
2007 2008(% Change) (% Change)
Zenith Optimedia 5.5 6.4
Universal McCann 5.3 n.a.
GroupM 5.0 7.0
Carat 5.8 6.4
Average Growth 5.4 6.6
Source: Zenith Optimedia, Universal McCann, GroupM, Carat n.a. not available
Industry experts see potential high growth in Central and Eastern Europe and in Africa and the MiddleEast region because of their media markets that are maturing rapidly and advertising playing a key rolein their local economies. Meanwhile, Asia Pacific adex growth is expected to double that of NorthAmerica and Western Europe.
604.
6
569.
1
543.
6
489.
9
450.
5
440.
9
474.
3
436.
1
411.
9
401.
3390.
2
371.
0
332.
0
304.
2
299.
2
282.
3
Worldwide Ad Growth: 1991–2006
1991 1992 1993 1994 1995 1996 1997 1998 1999 2000 2001 2002 2003 2004 2005 2006
700
600
500
400
300
200
100
0-7.0
2.3
6.0
9.1
1.7
11.7
5.2
2.8 2.6
5.9
8.8 8.7
11.0
4.7
2.2
6.2
USD
(b
illio
n)
% C
han
ge
15
10
5
0
-5
-10
CM1H101007 10/25/79 2:34 AM Page 22
23
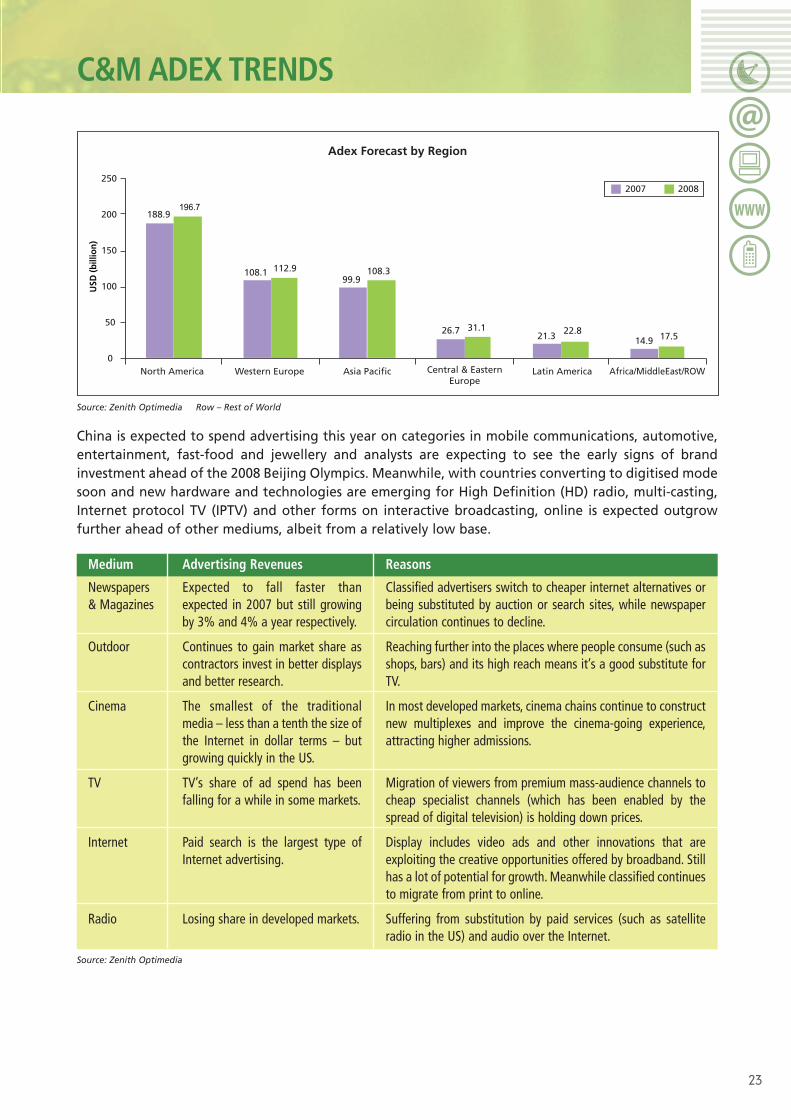
China is expected to spend advertising this year on categories in mobile communications, automotive,entertainment, fast-food and jewellery and analysts are expecting to see the early signs of brandinvestment ahead of the 2008 Beijing Olympics. Meanwhile, with countries converting to digitised modesoon and new hardware and technologies are emerging for High Definition (HD) radio, multi-casting,Internet protocol TV (IPTV) and other forms on interactive broadcasting, online is expected outgrowfurther ahead of other mediums, albeit from a relatively low base.
Source: Zenith Optimedia Row – Rest of World
Source: Zenith Optimedia
Medium
Newspapers & Magazines
Outdoor
Cinema
TV
Internet
Radio
Advertising Revenues
Expected to fall faster thanexpected in 2007 but still growingby 3% and 4% a year respectively.
Continues to gain market share ascontractors invest in better displaysand better research.
The smallest of the traditionalmedia – less than a tenth the size ofthe Internet in dollar terms – butgrowing quickly in the US.
TV’s share of ad spend has beenfalling for a while in some markets.
Paid search is the largest type ofInternet advertising.
Losing share in developed markets.
Reasons
Classified advertisers switch to cheaper internet alternatives orbeing substituted by auction or search sites, while newspapercirculation continues to decline.
Reaching further into the places where people consume (such asshops, bars) and its high reach means it’s a good substitute forTV.
In most developed markets, cinema chains continue to constructnew multiplexes and improve the cinema-going experience,attracting higher admissions.
Migration of viewers from premium mass-audience channels tocheap specialist channels (which has been enabled by thespread of digital television) is holding down prices.
Display includes video ads and other innovations that areexploiting the creative opportunities offered by broadband. Stillhas a lot of potential for growth. Meanwhile classified continuesto migrate from print to online.
Suffering from substitution by paid services (such as satelliteradio in the US) and audio over the Internet.
108.199.9
26.721.3 14.9
196.7
112.9 108.3
31.1 22.817.5
USD
(bill
ion)
Adex Forecast by Region
North America Western Europe Asia Pacific Central & EasternEurope
Latin America Africa/MiddleEast/ROW
188.9
250
200
150
100
50
0
2007 2008
C&M ADEX TRENDS
CM1H101007 10/25/79 2:34 AM Page 23
24
C&M ADEX TRENDS
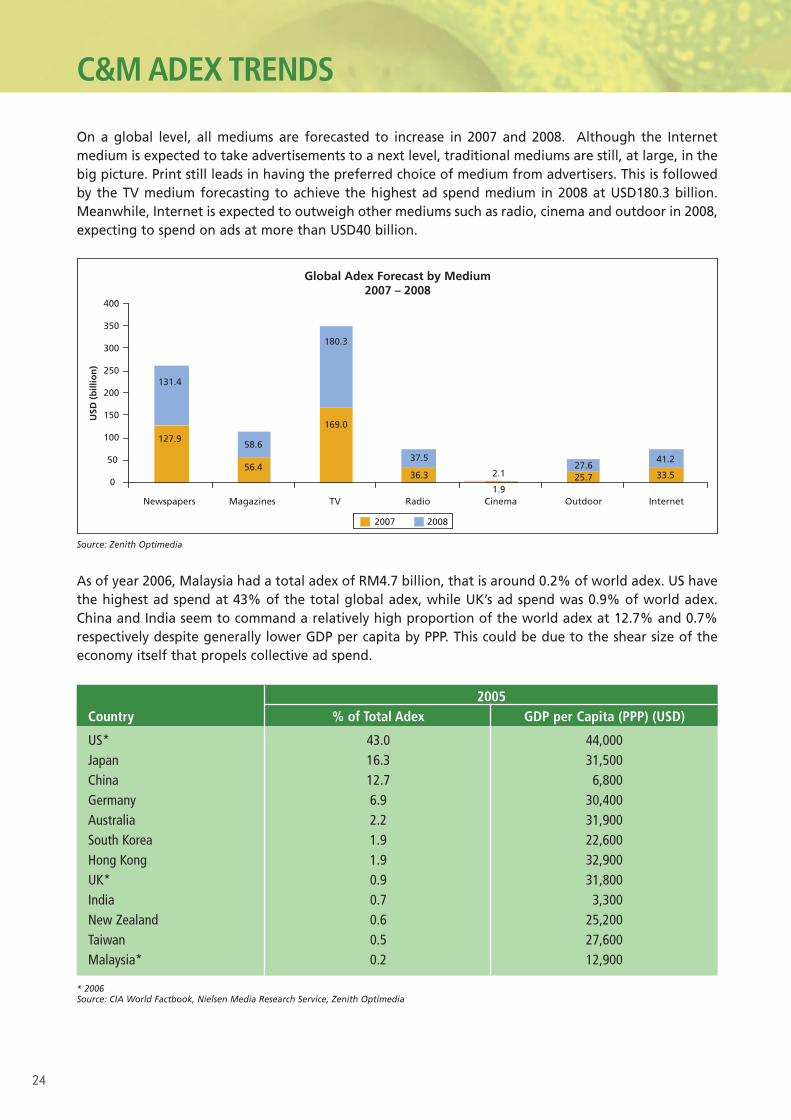
On a global level, all mediums are forecasted to increase in 2007 and 2008. Although the Internetmedium is expected to take advertisements to a next level, traditional mediums are still, at large, in thebig picture. Print still leads in having the preferred choice of medium from advertisers. This is followedby the TV medium forecasting to achieve the highest ad spend medium in 2008 at USD180.3 billion.Meanwhile, Internet is expected to outweigh other mediums such as radio, cinema and outdoor in 2008,expecting to spend on ads at more than USD40 billion.
Source: Zenith Optimedia
As of year 2006, Malaysia had a total adex of RM4.7 billion, that is around 0.2% of world adex. US havethe highest ad spend at 43% of the total global adex, while UK’s ad spend was 0.9% of world adex.China and India seem to command a relatively high proportion of the world adex at 12.7% and 0.7%respectively despite generally lower GDP per capita by PPP. This could be due to the shear size of theeconomy itself that propels collective ad spend.
2005Country % of Total Adex GDP per Capita (PPP) (USD)
US* 43.0 44,000Japan 16.3 31,500China 12.7 6,800Germany 6.9 30,400Australia 2.2 31,900South Korea 1.9 22,600Hong Kong 1.9 32,900UK* 0.9 31,800India 0.7 3,300New Zealand 0.6 25,200Taiwan 0.5 27,600Malaysia* 0.2 12,900
* 2006Source: CIA World Factbook, Nielsen Media Research Service, Zenith Optimedia
USD
(b
illio
n)
Global Adex Forecast by Medium2007 – 2008
400
350
300
250
200
150
100
50
0
Newspapers Magazines TV Radio Cinema Outdoor Internet
131.4
127.958.6
56.437.5
36.3 2.1
1.9
27.625.7
41.2
33.5
180.3
169.0
2007 2008
CM1H101007 10/25/79 2:34 AM Page 24

25
C&M DEVELOPMENTS
Standardisation & Standards Development WorldwideIn the last two decades or so as the telecommunications environment witnessed liberalisation andglobalization, and saw competitive pressures shape the economics of voice and now data, the need forco-operation and alliances invariably also increased. Just as the communications services eliminatedistance and time in video calls today, bringing users together more frequently and at lower cost, theproviders supporting such service platforms, be it fixed or mobile, have made unprecedented alliancesamongst themselves – bringing together operators who wish to solve common problems across theworld for mutual benefit or objectives. Thus, the importance of standardisation and standardsdevelopment – mostly viewed as a means to an end. Yet, standardisation as attested by the manystandards bodies in the world today, operating with common goals or diverse goals as the case may be,is only useful when the desired consensus meets the context or demand as users require it.
Latest in Standards Development
Area
Set-Top-Box – Overall lackof standard
Modems
Fixed wireless
Mobile
Standards/Emerging standard/Alliance
European MHP standard (Multimedia HomePlatform) is slowly catching on; MHP uses theDVB standard, and is fully compatible withterrestrial, cable, and satellite transmissions.
V-Series Standards are standardised by ITU-Tunder Data Communication over theTelephone Network. V.92 is the lateststandard in dial-up modem technology.
Enhance Wi-Fi network standard with thedevelopment of new IEEE 802.11n standards.
WiMAX – World Interoperability forMicrowave Access based on the IEEE 802.16estandard.
3G LTE (Long-Term Evolution) or Super 3G isexpected to be deployed in real-worldnetworks in 2010. Standardised by 3GPP, 3GLTE would enable new services and newmultimedia applications on 3G Networks.
Multimedia Broadcast and Multicast Service(MBMS) is part of the WCDMA evolutionstandardized by 3GPP. High Speed UplinkPacket Access (HSUPA) is expected to bestandardized by 3GPP in UMTS Release 6.HSUPA is expected to provide higher datathroughput up to 5.76 Mbps in W-CDMAuplink.
Status of Standard Development
In Germany, public and private broadcasters agreedto use MHP and looking forward to big sports eventslike Olympics, Tour de France, and European SoccerChampionship to serve as startup applications.
V.92 dial-up modem introduces three new featuresthat add convenience and performance for the user.The three features are Quick Connect, Modem-On-Hold and PCM Upstream.
The 802.11n stand offers higher speed at which dataapplications such as photos, video clips and manyother related images can be sent over a wirelessnetwork. The standard is expected to receive finalapproval in Sept 2008 by IEEE with range (Indoor) of35meters.
IEEE 802.16e standard continues its evolution as aplatform for the broadband wireless industry tobuild high-performance, cost-effective fixed, andnow mobile broadband access systems.
3G LTE aiming to achieve broadband-class data ratesover the cellular network and enable mobileoperator to compete with fixed broadband services.However, in order to obtain full benefits of 3G LTE,mobile operators need to use 20MHz frequencybands which means additional spectrum allocationsand investment.
MBMS and HSUPA bring important capabilityenhancements to W-CDMA. However, both do notmatch technologies such as DVB-H or WiMAX inaspects of mobile TV services and Internet access.MBMS delivers limited number of broadcastchannels and HSUPA.
CM1H101007 10/25/79 2:34 AM Page 25
26
Area
Copyright
IP
NFC
MPEG-4
Standards/Emerging standard/Alliance
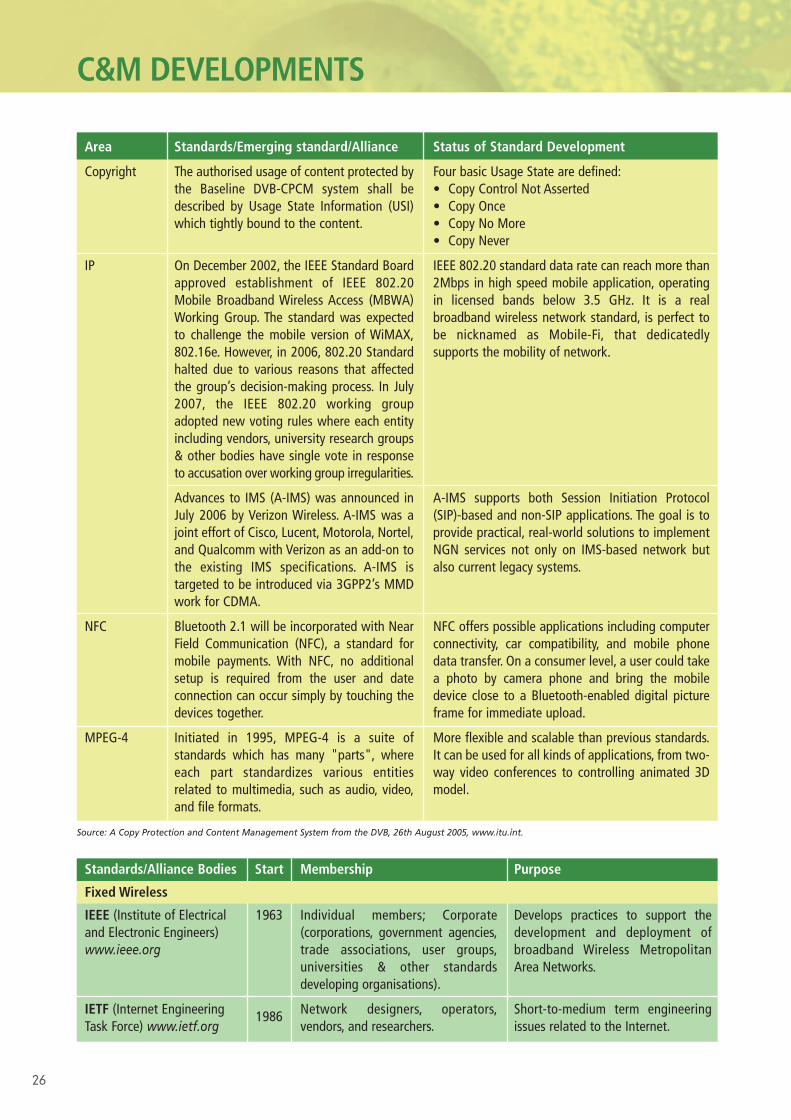
The authorised usage of content protected bythe Baseline DVB-CPCM system shall bedescribed by Usage State Information (USI)which tightly bound to the content.
On December 2002, the IEEE Standard Boardapproved establishment of IEEE 802.20Mobile Broadband Wireless Access (MBWA)Working Group. The standard was expectedto challenge the mobile version of WiMAX,802.16e. However, in 2006, 802.20 Standardhalted due to various reasons that affectedthe group’s decision-making process. In July2007, the IEEE 802.20 working groupadopted new voting rules where each entityincluding vendors, university research groups& other bodies have single vote in responseto accusation over working group irregularities.
Advances to IMS (A-IMS) was announced inJuly 2006 by Verizon Wireless. A-IMS was ajoint effort of Cisco, Lucent, Motorola, Nortel,and Qualcomm with Verizon as an add-on tothe existing IMS specifications. A-IMS istargeted to be introduced via 3GPP2’s MMDwork for CDMA.
Bluetooth 2.1 will be incorporated with NearField Communication (NFC), a standard formobile payments. With NFC, no additionalsetup is required from the user and dateconnection can occur simply by touching thedevices together.
Initiated in 1995, MPEG-4 is a suite ofstandards which has many "parts", whereeach part standardizes various entitiesrelated to multimedia, such as audio, video,and file formats.
Status of Standard Development
Four basic Usage State are defined:• Copy Control Not Asserted• Copy Once• Copy No More• Copy Never
IEEE 802.20 standard data rate can reach more than2Mbps in high speed mobile application, operatingin licensed bands below 3.5 GHz. It is a realbroadband wireless network standard, is perfect tobe nicknamed as Mobile-Fi, that dedicatedlysupports the mobility of network.
A-IMS supports both Session Initiation Protocol(SIP)-based and non-SIP applications. The goal is toprovide practical, real-world solutions to implementNGN services not only on IMS-based network butalso current legacy systems.
NFC offers possible applications including computerconnectivity, car compatibility, and mobile phonedata transfer. On a consumer level, a user could takea photo by camera phone and bring the mobiledevice close to a Bluetooth-enabled digital pictureframe for immediate upload.
More flexible and scalable than previous standards.It can be used for all kinds of applications, from two-way video conferences to controlling animated 3Dmodel.
Source: A Copy Protection and Content Management System from the DVB, 26th August 2005, www.itu.int.
Start
1963
1986
Standards/Alliance Bodies
Fixed Wireless
IEEE (Institute of Electricaland Electronic Engineers)www.ieee.org
IETF (Internet EngineeringTask Force) www.ietf.org
Membership
Individual members; Corporate(corporations, government agencies,trade associations, user groups,universities & other standardsdeveloping organisations).
Network designers, operators,vendors, and researchers.
Purpose
Develops practices to support thedevelopment and deployment ofbroadband Wireless MetropolitanArea Networks.
Short-to-medium term engineeringissues related to the Internet.
C&M DEVELOPMENTS
CM1H101007 10/25/79 2:34 AM Page 26

27
Standards/Alliance Bodies
Fixed Wireless
ATIS (Alliance forTelecommunications IndustrySolutions) www.atis.org
ETSI (EuropeanTelecommunicationsStandards Institute)www.etsi.org
Mobile
ITU (InternationalTelecommunication Union)www.itu.int
TIA (TelecommunicationIndustry Association)www.tiaonline.org
GSA (Global mobileSuppliers Association)www.gsacom.com
GSMA (Global System forMobile CommunicationsAssociation)www.gsmworld.com
3GPP (3G PartnershipProject)www.3gpp.org
SMIA (Standard MobileImaging Architecture)www.smia-forum.org
UMTS (Universal MobileTelecommunicationsSystems)www.umts-forum.org
Start
1986
1988
1865
1984
1987
1987
1998
2003
n.a.
Membership
63 members from leading industryorganisations: carriers, serviceproviders, content providers,hardware vendors & softwaredevelopers; 300+member cos; & over1,100 professionals in 22 industrystandards committees & forums.
700 Members (Full Membership,Associate Membership, Observership).
191 Member States.
446 members; across the world.
Suppliers of GSM/3G systems,terminal, and services.
718 GSM mobile phone operators,206 manufactures and suppliers asAssociate members.
Organisational Partners: ARIB, CCSA,ETSI, ATIS, TTA, TTC; 324 individualmembers; Market RepresentationPartners: UMTS-Forum, 3GAmericas,GSM Association, TD-SCDMA, GSA,IPv6 Forum, TDIA and UMTSTDD;Observers: TIA, ISACC, ACIF
500 Members.
77 Members.
Purpose
Developing and promoting technicaland operations standards for thecommunications and informationtechnologies industry worldwide.
Responsible for standardisation ofInformation and CommunicationTechnology (ICT) within Europe, includetelecoms, broadcasting and related areas.
Standardising emerging new systemsand fostering common global policies.
To promote the interest ofmanufacturers of fixed and mobile two-way communications equipment.
As a forum and represent to meet theneed of GSM/3G suppliers world-wide.
Ensure mobile phones and wirelessservices work globally and are easilyaccessible, enhancing value to individualcustomers and national economies,creating new business opportunities foroperators and suppliers.
Produce globally applicable TechnicalSpecifications and Technical Reports fora 3rd Generation Mobile System basedon evolved GSM core networks and theradio access technologies that theysupport.
An open standard for use by allcompanies making, buying or specifyingminiature integrated camera modules foruse in mobile applications – To be able toconnect any SMIA-compliant sensor toany SMIA-compliant host system withmatching capabilities and get a workingsystem with acceptable performance.
Promoting the global uptake of UMTSthird generation (3G) mobile systemsand services.
C&M DEVELOPMENTS
CM1H101007 10/25/79 2:34 AM Page 27

28
C&M DEVELOPMENTS
Start
1993
2005
2002
2000
n.a.
Standards/Alliance Bodies
CONTENT
DVB (Digital VideoBroadcast)www.dvb.org
HANA (High-DefinitionAudio-Video NetworkAlliance)www.hanaalliance.org
Standard DRM Bodies
OMA (Open Mobile Alliance)www.openmobilealliance.org
MEF (Mobile EntertainmentForum)www.m-e-f.org
WS-I (Web ServicesInteroperabilityOrganisation)www.ws-i.org
Membership
More than 270 members.
37 companies which comprise ofpromoter members, contributormembers, and adopter members.
Mobile operators, device andnetwork suppliers, informationtechnology companies and contentand service providers.
143 members from 5 regions(Americas, Europe, Middle East,Africa, Asia).
More than 14 countriesthroughout North America, SouthAmerica, Europe, Asia and thePacific Rim – 30% membershipare end-user companies orconsumers of Web services.
Purpose
Setting the standard for satellite,cable and terrestrial transmissions andequipment.
Facilitate commercial deployment ofconnected products and services.
Support creation of interoperable end-to-end mobile services; Drives serviceenabler architectures & open enablerinterfaces that are independent ofunderlying wireless networks &platforms; Relates interoperable mobiledata service enablers that work acrossdevices, service providers, operators,networks, & geographies; Develop testspecifications, encourage third party tooldevelopment, and conduct test activities.
Provides platform to meet, shareinformation, relay expertise and exchangenational experience.
Promote Web services interoperabilityacross platforms, operating systems andprogramming languages; Creates,promotes and supports generic protocolsfor interoperable exchange of messagesbetween Web services.
Source: Respective websites n.a. not available
Regional Standards BodiesThere are also standards development on regional basis. This may be in reference to one type ofnetwork in single or multiple frequency network digital TV broadcast where various standards areadopted across countries such as Japan, Korea and China using their own standards, e.g.,TSBD-T, T-DMBand DMB-T/H respectively.
Digital TV Broadcast Standards by Geographic Area
Country Standard Networks MobilityJapan ISBD-T SFN* and MFN** High – differential modulation and narrow bandwidths give good
mobile coverage for Quarter Video Graphics Array (QVGA)Korea T-DMB SFN High – same as ISDB-T one segmentChina DMB-T/H SFN and MFN Very high – special training waveform improves mobility/Doppler for
HD receptionNorth America ATSC MFN None – HD
*Single Frequency Network **Multiple Frequency Network Source: Digital Broadcasting in Japan, Ministry of Internal Affairs and Communications Japan, 28th Feb. – 1st Mar 07, Jakarta, Indonesia
CM1H101007 10/25/79 2:35 AM Page 28
29
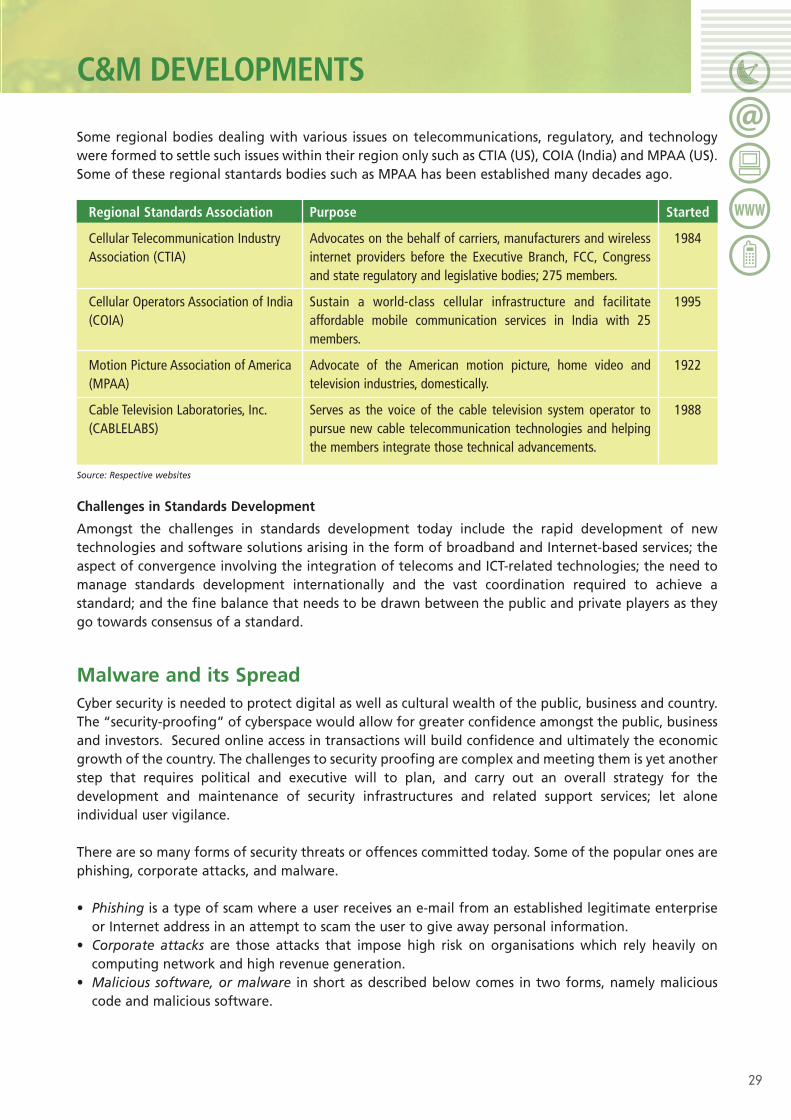
Some regional bodies dealing with various issues on telecommunications, regulatory, and technologywere formed to settle such issues within their region only such as CTIA (US), COIA (India) and MPAA (US).Some of these regional stantards bodies such as MPAA has been established many decades ago.
Regional Standards Association
Cellular Telecommunication IndustryAssociation (CTIA)
Cellular Operators Association of India(COIA)
Motion Picture Association of America(MPAA)
Cable Television Laboratories, Inc.(CABLELABS)
Purpose
Advocates on the behalf of carriers, manufacturers and wirelessinternet providers before the Executive Branch, FCC, Congressand state regulatory and legislative bodies; 275 members.
Sustain a world-class cellular infrastructure and facilitateaffordable mobile communication services in India with 25members.
Advocate of the American motion picture, home video andtelevision industries, domestically.
Serves as the voice of the cable television system operator topursue new cable telecommunication technologies and helpingthe members integrate those technical advancements.
Started
1984
1995
1922
1988
Source: Respective websites
Challenges in Standards Development
Amongst the challenges in standards development today include the rapid development of newtechnologies and software solutions arising in the form of broadband and Internet-based services; theaspect of convergence involving the integration of telecoms and ICT-related technologies; the need tomanage standards development internationally and the vast coordination required to achieve astandard; and the fine balance that needs to be drawn between the public and private players as theygo towards consensus of a standard.
Malware and its SpreadCyber security is needed to protect digital as well as cultural wealth of the public, business and country.The “security-proofing” of cyberspace would allow for greater confidence amongst the public, businessand investors. Secured online access in transactions will build confidence and ultimately the economicgrowth of the country. The challenges to security proofing are complex and meeting them is yet anotherstep that requires political and executive will to plan, and carry out an overall strategy for thedevelopment and maintenance of security infrastructures and related support services; let aloneindividual user vigilance.
There are so many forms of security threats or offences committed today. Some of the popular ones arephishing, corporate attacks, and malware.
• Phishing is a type of scam where a user receives an e-mail from an established legitimate enterpriseor Internet address in an attempt to scam the user to give away personal information.
• Corporate attacks are those attacks that impose high risk on organisations which rely heavily oncomputing network and high revenue generation.
• Malicious software, or malware in short as described below comes in two forms, namely maliciouscode and malicious software.
C&M DEVELOPMENTS
CM1H101007 10/25/79 2:35 AM Page 29

30
C&M DEVELOPMENTS
Malware And What it is
Malicious code This is a malware that is dependent on the paragraph of the program codeembedded in executable programs or .exe better known as virus.
Malicious software This is essentially an independent program which is usually invisible to the endusers and indeed developed for the purpose of doing harm to a computersystem.
Various forms of hostile, intrusive, annoying software or program code under malware are:• adware – advertising software.• keyloggers – monitors and records keystrokes users enter on the computer.• spyware – secretly monitors user behaviour to collect various types of user information• zombies or bots – short for Robot which can operate in large computing network without being
noticed.• downloaders – use to download data and programs remotely.
In addition, there are also viruses which consist of malware labelled as worms, Trojan horses, logicbombs being installed in the system without the users’ knowledge.
Source: International Telecommunication Union (ITU)
The threat of malicious software can be easily considered as the greatest threat to Internet security andany network that provides connection to devices and other software and hardware links in a web.Earlier, viruses were, more or less, the only form of malware. Nowadays, the threat has grown to includeTrojans, spyware, adware and others. Malware strongly relies on the intent of the creator rather thanthe features itself.
Years ago, malware could have been authored by for example, a delinquent employee with the solepurpose of causing havoc. It could also have been done as a joke to boost the self esteem of the author.In other words, the trouble caused previously is generally contained. Today, malware is being created bysomeone who is technology savvy, with the programming skills or an e-criminal connected to theInternet with self-propelled malware to not only impact business but government and consumers.Furthermore, there are Internet sites today with information on how to develop and propagatemalware, including downloadable toolkits. Instead of using the latter sites to enhance securityawareness, those with negative intent have used it for malicious purpose. Today therefore, damagecaused by malware is more destructive; impacting affected person, business, asset and society, and canbe potentially widespread fast if not controlled or curbed in time.
Some of the harm that malware causes are financial fraud, identity or trade secret theft, data theft,vandalism, Denial of Service (DoS) and Distributed Denial of Service (DDoS). DoS attack prevents a userfrom using computer resources efficiently while DDoS breaks into hundreds or thousands of machinesall over the Internet to control and coordinate attacks that typically exhaust network, bandwidth,processing capacity to the victims.
Exposure to cyber threats is greater these days. There is the Botnet or better known as software robotsor bots, which is a form of malware most destructive as it is an attacking platform that can be used as atool and ‘amplifier’ to release worm, launch DDoS, sending spam, stealing information and so on . Thismalware goes around, especially through the network of computers using distributed computingsoftware2. The strategy has been shifted from a central command-and-control model (the master of
2 Distributed computing software is a method of computer processing in which different parts of a program run simultaneously on two or morecomputers that are communicating with each other.
CM1H101007 10/25/79 2:35 AM Page 30
31
bots) for controlling botnets to a peer-to-peer model with a distributed command structure (neighbourswho are infected with bots), capable of spreading to compromised computers located in differentcountries. This practice makes it very difficult to pinpoint any single geographical location as the originof cyber attacks, and consequently makes it more difficult to identify and shut down.
Malware ProblemsMalware can affect consumers, business and government agencies in many ways such as security risk,advertisement bombardment, unauthorized access and state of the computer performing slowly.
Malware associated with risk in security are banks, investment companies, regulatory bodies which areequipped with data banks such as credit card information data, account balances, e-mail addresses,passwords which could be sold and shared for money. This activity is commonly performed by e-criminalswhereby the malicious code is used to steal sensitive information such as bank account details and creditcard numbers. The attacker would identify vulnerabilities in that particular system and upon gaugingthese, it infects the malicious code into the web pages. It is not difficult to get those codes as these arefound in packages of software ‘suites’ that are sold in the black market and ever updated frequently.
Advertisement bombarding through a type of malware called adware would produce a pop-up anytimethe user is on the computer such as when writing a document, playing games and so on. Unauthorizedaccess normally affects poorly written programs categorized as unstable which has a gap to allow forillegal access or known as unauthorized access to the users’ personal information. The slow performanceof computer is yet another sign that the computer has been affected with malware. This causesunproductive job whereby the computer tend to crawl.
Mobile MalwareBefore even thinking of having a break after combating computer malware, here is already anotherform of attack called mobile malware. Mobile malware is on the rise with more and more smart phonesbeing introduced in the market.
Carriers, enterprises and handset manufacturers are combating the malicious activities posed by mobileas they are becoming more aware of the needs for wireless security. Some of the malicious activitiesmobile malware can do are tracking individual movement, listening to conversation, photographing orvideotaping user activities without user being aware of this. What is even more surprising is that, theseactivities can be performed even while your hand phone is switched off. So the responsibility in termsof protecting mobile devices, on the other hand, lies with user as well. The user has to ever make surethat the battery is out from the phone to protect their mobile devices3.
Security Adoption to curb Malware spreadAs the saying goes, “prevention is better than cure”, some common steps taken to prevent malwareproblems are firewall enablement, updating Operating System (OS), using up-to-date Anti-virus (AV)and using up-to-date Anti-spyware (AS). These activities need to be updated on a constant basis tocombat the continuous update of malware generations in the market.
Economic ImpactSecurity is crucial to curb the growth of security breaks which could lead to political, economical, socialand legal loss such as stealing of sensitive information and money, abusing of computer network andresources, control computer and systems secretly, destroy important work and personal data and makingsystem unusable.
3 Source International Telecommunication Union (ITU)
C&M DEVELOPMENTS
CM1H101007 10/25/79 2:35 AM Page 31
32
C&M DEVELOPMENTS
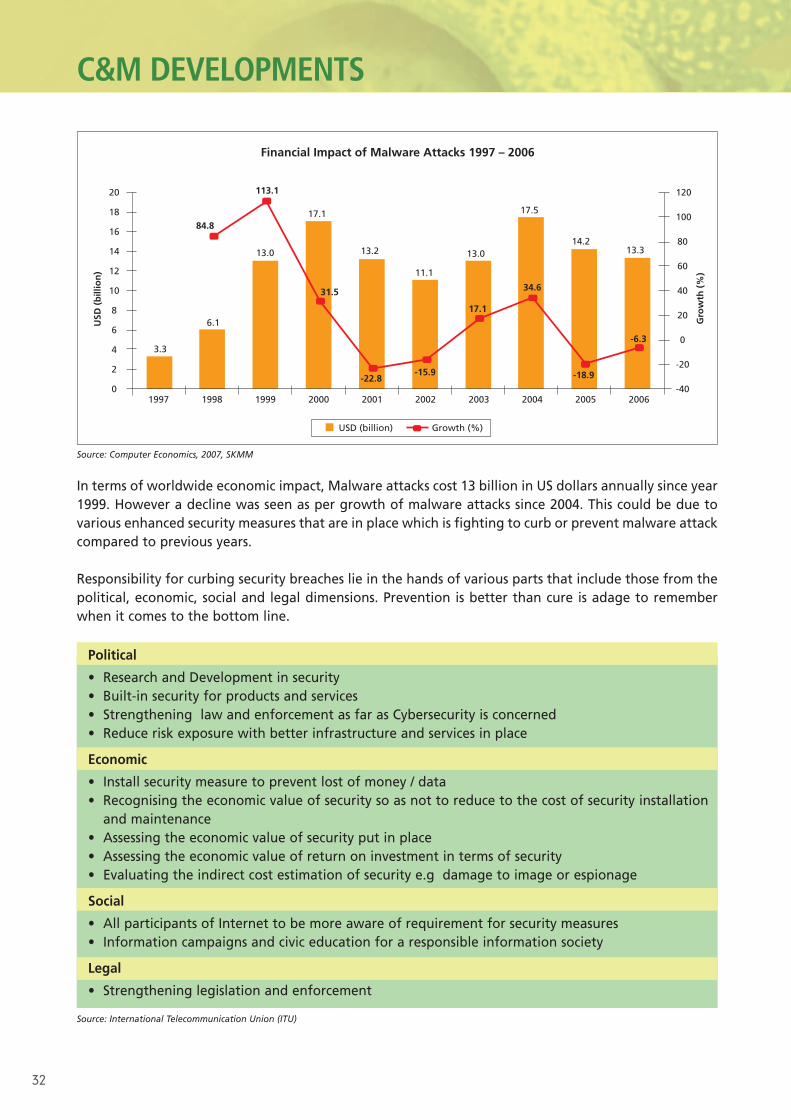
Source: Computer Economics, 2007, SKMM
In terms of worldwide economic impact, Malware attacks cost 13 billion in US dollars annually since year1999. However a decline was seen as per growth of malware attacks since 2004. This could be due tovarious enhanced security measures that are in place which is fighting to curb or prevent malware attackcompared to previous years.
Responsibility for curbing security breaches lie in the hands of various parts that include those from thepolitical, economic, social and legal dimensions. Prevention is better than cure is adage to rememberwhen it comes to the bottom line.
Political
• Research and Development in security• Built-in security for products and services• Strengthening law and enforcement as far as Cybersecurity is concerned• Reduce risk exposure with better infrastructure and services in place
Economic
• Install security measure to prevent lost of money / data• Recognising the economic value of security so as not to reduce to the cost of security installation
and maintenance• Assessing the economic value of security put in place• Assessing the economic value of return on investment in terms of security• Evaluating the indirect cost estimation of security e.g damage to image or espionage
Social
• All participants of Internet to be more aware of requirement for security measures• Information campaigns and civic education for a responsible information society
Legal
• Strengthening legislation and enforcement
Source: International Telecommunication Union (ITU)
Financial Impact of Malware Attacks 1997 – 2006
USD
(b
illio
n)
Gro
wth
(%
)
20
18
16
14
12
10
8
6
4
2
0
120
100
80
60
40
20
0
-20
-401997 1998 1999 2000 2001 2002 2003 2004 2005 2006
3.3
6.1
13.0
17.1
13.2
11.1
13.0
17.5
14.213.3
84.8
113.1
31.5
-22.8-15.9
17.1
34.6
-18.9
-6.3
USD (billion) Growth (%)
CM1H101007 10/25/79 2:35 AM Page 32

33
There are also attempts by vendors and operators to curb malware propagation. For example, Symanteccame up with anti-virus software for Windows Mobile. It is called as Mobile AntiVirus 4.0 for WindowsMobile. This anti-virus aims to protect data stored on smartphone running Microsoft OS. Another bestfeature of this software is that it allows users to wipe out data on devices that are lost or stolen. Theultimate motives of the vendors or operators are basically to capitalise on developing consumer needs.
Synergies of regional and national level to support International Coordination Cyber attacks or cyber crime needs to be curbed at the regional, national and international level as well.Today, time and geography are no longer barriers to e-criminals. On top of this, the laws andtechnological measures also cannot be bound to geographical locations either. Therefore, internationalcooperation is definitely needed as virtual attacks needs global solutions in a borderless world. In orderto facilitate this strategy amongst countries be it developed to the least developed in the world, a globalnature of the legal, technical, operational, organizational and policy challenges needs to be met withexisting initiatives at hand in their respective countries to come to a common understanding globally tobuild high-trust information in the society for all nations. This needs the co-operations across nationalsand nations and great information dissemination, discussion and the like.
Reference source: Cybersecurity guide for developing countries, International Telecommunication Union, 2006
C&M DEVELOPMENTS
CM1H101007 10/25/79 2:35 AM Page 33

34
GLOSSARY
ACIF Communication Alliance – Former ACIFARIB Association of Radio Industries and BusinessASP Applications Service ProvidersATSC Advanced Television Systems CommitteeATSC-M/H ATSC-Mobile/HandheldBNM Bank Negara Malaysia, the country’s Central BankBT BT Group PlcBursa Malaysia Stock exchange of Malaysia (previously KL Stock Exchange)C&M Sector Communications and Multimedia SectorCCSA China Communications Standards AssociationCDMA Code Division Multiple AccessChina Unicom China Unicom LtdChunghwa Chunghwa Telecom Co. LtdCMMB China Multimedia Mobile Broadcasting Deutsche Tel Deutsche Telekom AGDiGi DiGi.Com BerhadDMB-T/H Digital Multimedia Broadcast-Terrestrial/HandheldDVB Digital Video Broadcasting Far Eastone Far Eastone Telecom Co. LtdFCC Federal Communications Commission of USGlobe Globe Telecom Inc.GSM Global System for Mobile CommunicationsHD High DefinitionHutchison Hutchison Telecom (AUST)IEEE Institute of Electrical and Electronics EngineersIMT-2000 International Mobile Telecommunication 2000IndoSat Indonesian Satellite CorpISACC ICT Standards Advisory Council of CanadaISBD-T Integrated Services Digital Broadcast-TerrestrialITU International Telecommunication UnionKDDI KDDI CorporationKT Corp KT CorporationLG Telecom LG Telecom LtdMarket Capitalisation Market capitalisation is the result of multiplying the number of shares outstanding by
share price at the end of a periodMaxis Maxis Communications BerhadMESDAQ Malaysia Exchange of Securities Dealing & Automated QuotationMobileOne MobileOne LtdMPEG Motion Picture Experts Group MTNL Mahanagar Telephone NigamMyICMS 886 Malaysian Information, Communications & Multimedia Services 886New World New World Cyberbase LtdNTT DoCoMo NTT DoCoMo Inc.PCCW PCCW LimitedPLDT Philippine Long Distance Telephone CompanyPosM Pos Malaysia & Services Holdings BerhadSingTel Singapore Telecommunications LtdSmartone Smartone TelecommunicationsSTI Straits Times Index of the Singapore Stock ExchangeSunday Sunday Communications LtdT-DMB Terrestrial – Digital Multimedia BroadcastingTaiwan Mobile Taiwan Mobile Co. LtdTD-SCDMA Time Division-Synchronous Code Division Multiple AccessTelecom Corp. Telecom Corporation of New ZealandTelekom TBK Telekomunikasi TBK PTTelstra Telstra Corporation LtdTIA Telecommunications Industries AssociationTime Time dotcom BerhadTM or Telekom Telekom Malaysia BerhadTT&T TT&T Public Co. LtdTTC Telecommunication Technology CommitteeVSNL Videsh Sanchar Nigam LimitedWiFi Wireless Fidelity
CM1H101007 10/25/79 2:35 AM Page 34

Suruhanjaya Komunikasi dan Multimedia MalaysiaOff Persiaran Multimedia63000 Cyberjaya Selangor Darul EhsanTelephone: (603) 8688 8000 Facsimile: (603) 8688 1000 E-mail: [email protected] : www.mcmc.gov.myFreephone number: 1-800-888-030
Northern
PenangTel: (604) 227 1657Fax: (604) 227 1650
Eastern
KuantanTel: (609) 512 1100 / 1119Fax: (609) 515 7566
Southern
Johor BahruTel: (607) 226 6700Fax: (607) 227 8700
EnquiriesPlease contact the Market Research team ([email protected]):Yee Sye Chung (Head)Mooi Mee MeeSharmila ManoharanAzrita Abdul KadirNadzrah MazuriahSiti Na’ilah KamarudinNurul Izza Saaman
Sabah
Kota Kinabalu Tel: (088) 270550 Fax: (088) 253205
Sarawak
KuchingTel: (6082) 331 900 Fax: (6082) 331 901
Central
Shah AlamTel: (603) 5518 7701 Fax: (603) 5518 771
CONTACT US
REGIONAL OFFICES
IFC 1H 10/22/79 12:07 AM Page 2