Embed Size (px)
Citation preview
econstor www.econstor.eu
Der Open-Access-Publikationsserver der ZBW – Leibniz-Informationszentrum WirtschaftThe Open Access Publication Server of the ZBW – Leibniz Information Centre for Economics
Standard-Nutzungsbedingungen:
Die Dokumente auf EconStor dürfen zu eigenen wissenschaftlichenZwecken und zum Privatgebrauch gespeichert und kopiert werden.
Sie dürfen die Dokumente nicht für öffentliche oder kommerzielleZwecke vervielfältigen, öffentlich ausstellen, öffentlich zugänglichmachen, vertreiben oder anderweitig nutzen.
Sofern die Verfasser die Dokumente unter Open-Content-Lizenzen(insbesondere CC-Lizenzen) zur Verfügung gestellt haben sollten,gelten abweichend von diesen Nutzungsbedingungen die in der dortgenannten Lizenz gewährten Nutzungsrechte.
Terms of use:
Documents in EconStor may be saved and copied for yourpersonal and scholarly purposes.
You are not to copy documents for public or commercialpurposes, to exhibit the documents publicly, to make thempublicly available on the internet, or to distribute or otherwiseuse the documents in public.
If the documents have been made available under an OpenContent Licence (especially Creative Commons Licences), youmay exercise further usage rights as specified in the indicatedlicence.
zbw Leibniz-Informationszentrum WirtschaftLeibniz Information Centre for Economics
Umlauf, Florian
Working Paper
Network determinants of a collaborative fundingsystem: The case of the German innovation policy
Papers on Economics and Evolution, No. 1403
Provided in Cooperation with:Philipps University Marburg, Department of Geography
Suggested Citation: Umlauf, Florian (2014) : Network determinants of a collaborative fundingsystem: The case of the German innovation policy, Papers on Economics and Evolution, No.1403
This Version is available at:http://hdl.handle.net/10419/107201

Philipps-University, Marburg Department of Geography Economic Geography and Location Research Deutschhausstraße. 10 35032 Marburg, Germany Fax: + +49 6421/28-28950
The Papers on Economics and Evolution are edited by the Economic Geography and Location Research, Philipps-University, Marburg.
For editorial correspondence, please contact: [email protected]
ISSN 1430-4716
by the author
# 1403
Network Determinants of a Collaborative Funding System: The Case of the German Innovation Policy
by
Florian Umlauf
#1403
1
Network Determinants of a Collaborative Funding System: The Case of the German Innovation Policy
Florian Umlauf a
a University of Bremen, Faculty of Business Studies and Economics, Centre for Regional
and Innovation Economics (CRIE), Wilhelm-Herbts-Str. 12, 28359 Bremen, Germany
Abstract The granting of publicly subsidized joint projects has become a popular policy instrument
in Germany and other developed countries. However, little is known about how an
emerging subsidization network affects the overall allocation process of further project
grants. Employing a database that contains all funded R&D projects of the German
federal government, this paper analyzes the extent to which the funding network tends
to reproduce itself. The results of an empirical model show that participation within a
collaborative project does not raise, per se, the chance of an enterprise obtaining
another project grant. Rather, it is important to hold central positions within the network
or have access to a diverse external knowledge base to receive anew project grant.
Keywords: R&D subsidies, project allocation, network determinants, cooperation
JEL classification: H32 L53 L60 O38
#1403
1 Introduction
During recent decades, innovation policies of Germany and other developed countriesevolved towards an increased importance of collaborative research within government-funded R&D projects (Fier and Harhoff, 2002; Eickelpasch and Fritsch, 2005). Due to thegrowing awareness of the innovation-stimulating nature of collaborative research efforts– because of, for example, knowledge exchange, resource pooling or risk sharing – mostof the publicly sponsored R&D projects in Germany inherently integrate cooperativeelements. What is new about this policy is that only consortiums, rather than individualorganizations, can apply for such a joint project. In the case of a cooperative projectgrant, organizations have to collaborate within the scope of the project, as well as toshare their knowledge and the results at the end of the project (Broekel and Graf, 2012).Due to of the overall large number of joint projects and intertwined organizations, acomplex network evolves, that is determined by policy-driven rules and organizationalbehavior. There is a rich source of literature regarding the internal dynamics (Broekeland Graf, 2012; Balland, 2012) and external-policy influences (Aschhoff, 2009) that drivethe evolution of such a complex system, but interestingly less is known about the wayboth sources of change are related to one another.This is even more evident since the government has had to comply with regulatory
standards - preventing distortions to the market (such as reducing incentives to inno-vate), promoting existing market power or guaranteeing the survival of poorly performingenterprises. To some extent, the direct-funding system of the federal government antici-pates the possibility of failure, since financial support is only granted for a certain periodof time (BMBF, 2012) in order to prevent it giving an extraordinary amount of supportto private organizations. But the idea of clear regulation is misleading, since there are noupper bounds of projects an organization can have subsequently or in parallel. There isno doubt that governmental policy shapes the funding system to a high degree, but thereare some concerns that policies are highly affected by the self-reinforcing tendencies ofthe system, which could lead to unexpected feedbacks and distortions to the market.This paper is intended to analyze the extent to which the dynamic of the system is
influenced by its structural patterns. Therefore, the second section gives a systematicoverview of the allocation process of a project grant, complemented by some hypotheses,exploring the dependency of the funding system on some network-related effects. Thethird section presents the empirical background of the paper. The fourth section intro-duces the model and the employed data in order to check whether the hypotheses arevalid or not. Section five presents and discusses the results of the estimated model. Thefinal section summarizes the results and gives an outlook on further research questions.
2 Theory
2.1 Decision-making process of a project grant
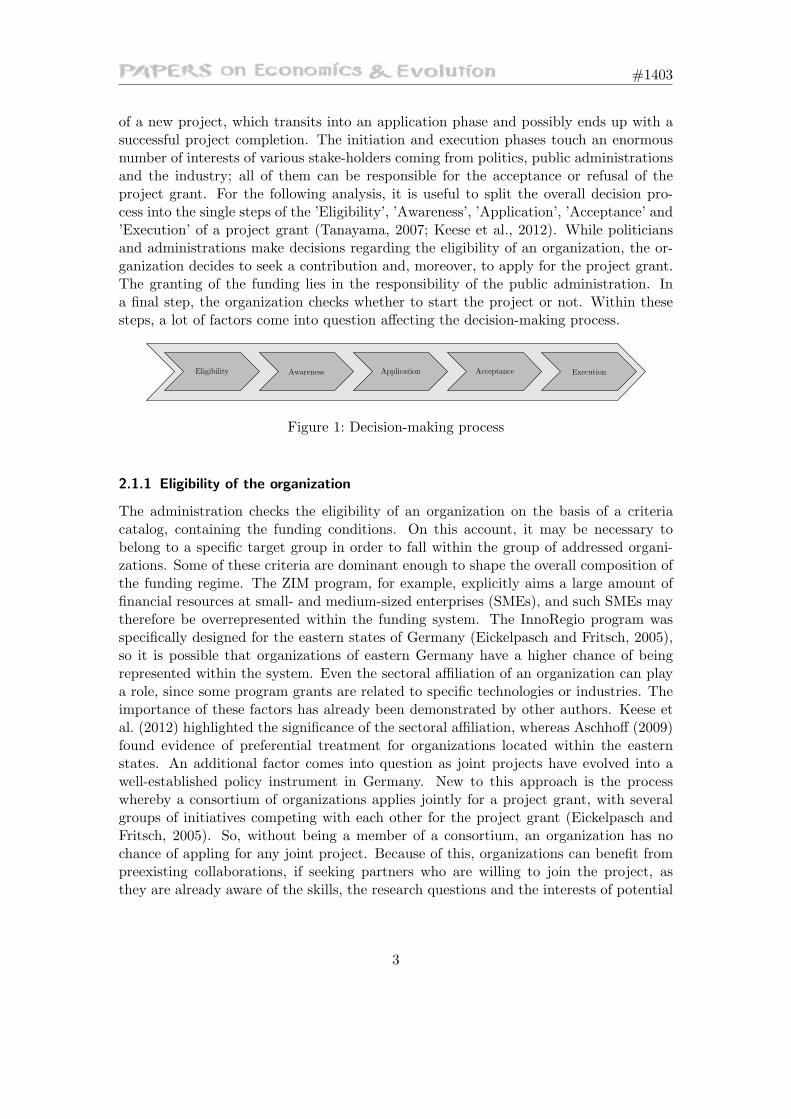
Since the allocation of project grants is a long-term process, it is necessary to analyze theoverall decision process in detail (Figure 1). The process starts with the initiation phases
2
#1403
of a new project, which transits into an application phase and possibly ends up with asuccessful project completion. The initiation and execution phases touch an enormousnumber of interests of various stake-holders coming from politics, public administrationsand the industry; all of them can be responsible for the acceptance or refusal of theproject grant. For the following analysis, it is useful to split the overall decision pro-cess into the single steps of the ’Eligibility’, ’Awareness’, ’Application’, ’Acceptance’ and’Execution’ of a project grant (Tanayama, 2007; Keese et al., 2012). While politiciansand administrations make decisions regarding the eligibility of an organization, the or-ganization decides to seek a contribution and, moreover, to apply for the project grant.The granting of the funding lies in the responsibility of the public administration. Ina final step, the organization checks whether to start the project or not. Within thesesteps, a lot of factors come into question affecting the decision-making process.
Eligibility Awareness Application Acceptance Execution
Figure 1: Decision-making process
2.1.1 Eligibility of the organization
The administration checks the eligibility of an organization on the basis of a criteriacatalog, containing the funding conditions. On this account, it may be necessary tobelong to a specific target group in order to fall within the group of addressed organi-zations. Some of these criteria are dominant enough to shape the overall composition ofthe funding regime. The ZIM program, for example, explicitly aims a large amount offinancial resources at small- and medium-sized enterprises (SMEs), and such SMEs maytherefore be overrepresented within the funding system. The InnoRegio program wasspecifically designed for the eastern states of Germany (Eickelpasch and Fritsch, 2005),so it is possible that organizations of eastern Germany have a higher chance of beingrepresented within the system. Even the sectoral affiliation of an organization can playa role, since some program grants are related to specific technologies or industries. Theimportance of these factors has already been demonstrated by other authors. Keese etal. (2012) highlighted the significance of the sectoral affiliation, whereas Aschhoff (2009)found evidence of preferential treatment for organizations located within the easternstates. An additional factor comes into question as joint projects have evolved into awell-established policy instrument in Germany. New to this approach is the processwhereby a consortium of organizations applies jointly for a project grant, with severalgroups of initiatives competing with each other for the project grant (Eickelpasch andFritsch, 2005). So, without being a member of a consortium, an organization has nochance of appling for any joint project. Because of this, organizations can benefit frompreexisting collaborations, if seeking partners who are willing to join the project, asthey are already aware of the skills, the research questions and the interests of potential
3
#1403
project partners.
2.1.2 Awareness of the funding programs
Without the awareness of a funding opportunity, not a single organization would applyfor a project grant. The decision to seek funding can only be taken by the organizationitself, but several additional factors play a role within this context. First of all, thegovernment could support this process by providing easily accessible communicationplatforms for organizations, informing them about current funding programs. Secondly,an organization can benefit from earlier project applications, since market monitoringis a costly process, which becomes more efficient if information channels between theapplicant, the administration or other applying organizations already exist. Additionally,former projects promote both the prominence of the organization within administrativecircles as well as familiarity with administrative processes. Prior collaborations withother particularly organizations support this process (Levinthal and Fichman, 1988;Mora-Valentin et al., 2004). Organizations connecting with each other, which entailsthe possibility of building up a recommendation network, leads to better informationchannels between the organizations and, thus, more opportunities to collaborate. Thegreater the quantity and quality of available information channels, the more central theorganization becomes within the network (Freeman, 1978; Gould and Fernandez, 1989;Burt, 2000). This is even more relevant as most of the subsidized projects are jointprojects.
2.1.3 Project application
Trust can be seen as the most important currency within the project, due to the prob-lem of incomplete contracts, which entails the opportunity of opportunistic behavior be-tween the project partners (Granovetter, 1985; Uzzi, 1996; Mora-Valentin et al., 2004).Scarcely anything is as valuable for cooperation as organizations that are known to betrustworthy partners. Previous collaboration experiences are manifested in networks(Ahuja et al., 2012), so the degree of embeddedness, or just being within the network,can enhance the credibility of a potential partner. The decision of the organization toapply for a project grant is made on the basis of a calculation, which takes into accountthe expected costs and benefits of the potential project. Therefore, the organization notonly has to consider the financial aspects of the project grant, but also the additionalvalue of collaborative projects increasing the likelihood to innovate (Czarnitzki and Fier,2003; Tanayama, 2007; Blanes and Busom, 2004; Keese et al., 2012) due to, for example,knowledge spillover, risk sharing or economies of scale. The more the expected profitsexceed the expected costs, the more likely the project application becomes, althoughthe profit, as well as the cost of the project, cannot be completely specified before theproject has ended. This is even more evident for joint projects, since incomplete con-tracts entail the possibility of opportunistic behavior of the partners (Eickelpasch andFritsch, 2005). The application requires the formulation of a proposal, for which thenecessary information must be compiled, and each organization has to justify whether
4
#1403
their expenditures are within the scope of the project (Tanayama, 2007; Eickelpasch andFritsch, 2005). Additionally, detailed reports have to be delivered during and at theend of, the funded project. Aschhoff (2009) has shown that earlier applications lead tothe development of routines for project applications. By utilizing the recovered projectknow-how, organizations can assess if the application could be promising. Such preexist-ing experiences and organizational processes ease organizational efforts and reduce thecosts of further applications (Aschhoff, 2009; Tanayama, 2007). For the risk assessmentof a project application, the organizational size has to be taken into account (Blanes andBusom, 2004; Aschhoff, 2009; Tanayama, 2007). Fixed costs diminish with the increas-ing size of the organization, thus potential sunk costs play only a tangential role. If asmaller organization cannot afford the expenses of a possibly unsuccessful application,the application will be canceled due to the limited resources of the organization. In caseof a cooperation project, additional factors must be taken into account. First of all, theorganization should be able to absorb circulating knowledge flows gained from internalR&D processes and external accessible knowledge gained from potential collaborationpartners. The less knowledge an organization has accumulated in the past, the less devel-oped is its absorptive capacity, thus the identification and enhancement of relevant newknowledge become more challenging (Cohen and Levinthal, 1990). Within a complexeconomy, knowledge is dispersed among different organizations (Brusoni et al., 2001),thus it becomes urgent to bring these different skills together, since innovations stronglydepend on the recombination of diverse and complementary capabilities (Boschma, 2005;Nooteboom, 2000). Therefore, a diversified knowledge base within the project should bean incentive for an organization to join the cooperative project, since knowledge hetero-geneity is known to be a promising driver of innovation (Mowery et al., 1998; Boschmaand Frenken, 2009; Fornahl, Broekel, et al., 2011). If the cognitive proximity betweenthe partners is too close, organizations may exchange too much redundant information,harming the initiation of the learning processes, whereas too little cognitive proxim-ity complicates the exchange of knowledge within the group (Nooteboom et al., 2007).Mowery et al. (1998) found evidence for an inverted U-shaped interrelation between thelikelihood to cooperate and the cognitive proximity, so that a pair of organizations ismore likely to cooperate due to their promising heterogeneous knowledge structure.
2.1.4 Project acceptance
A jury of experts, consisting of administrative members or other external professionals,has to confirm the project application of the organization, so additional effects come intoaccount within the decision-making process. The legitimacy of R&D subsidies is alwaysin question, since governmental interventions could lead to government failure. Thisentails a certain pressure to succeed, because if too many projects fail, the impressionof government failure could arise. Since projects always run the risk of failure, the ex-pert group could systematically tend to select an previously successful organizations ora group of organizations which is known as a productive group, aiming to minimize thelikelihood of an abandonment - known as the ’picking-the-winner’ strategy (Blanes andBusom, 2004; Cantner and Kosters, 2009; Aschhoff, 2009). Another positive attribute
5
#1403
of an organization can be an earlier investment in R&D processes, which demonstrates apending successful innovation process, if the organization has invested their own money.Further distortions could arise due to the attempt to minimize the market distortion byselecting previously successful companies, since subsidies to poorly performing organiza-tions may affect the market equilibrium. Aschhoff (2009) and Keese et al. (2012) foundthat prior R&D expenditures and corporate growth enhance the likelihood of a projectgrant. Moreover, Aschhoff (2009) found an increased likelihood of younger organiza-tions receiving a project grant. She attributes this to the fact that smaller organizationshave certain difficulties if, for example R&D investments have a long-term horizon, highbudget requirements or a high technical risk, when compared to other organizations.In addition, Blanes and Busom (2004) suggests that favoritism may exist for youngerorganizations in order to reduce the amount of free-riding by mature organizations.
2.1.5 Project execution
The beginning of the project execution phase marks the end of the decision-makingprocess. By the initiation of the project, the expectations of the organization becomeconcrete, while the portfolio of experiences continuously grows due to the research activ-ities within the organization and the spillover effects gained from collaborative researchprojects. The completion of a successful project, which ideally implies the genesis of aninnovation, helps to establish mutual trust between the project participants.
2.2 Hypotheses
The previous section has discussed the theory of how the allocation process is affectedby internal and external determinants. Due to this, several network-related effects havebeen identified, affecting most of the stages of the overall decision-making process. Basedon these preliminary considerations, some hypotheses are formulated to identify theparticular importance of network relationships within the direct-funding system.The first hypothesis is based on all stages of the decision-making process, except the
last one. It is the simplest of the hypotheses, asking if a new project grant if more likelyto be received due to the participation within a joint project.
H1: The participation of an organization in a joint project raises the prob-ability of the organization receiving a new project grant.
The second hypothesis is quite similar to the first, but it goes into a bit more in detailby asking if the position of the organization within the network positively affects thechance of obtaining an additional project grant.
H2: The better the position of an organization within the network, the morelikely an organization is to receive a new project grant.
The last hypothesis concentrates on the argument that the heterogeneity of knowl-edge within an organizational group stimulates the output of a research project, since
6

#1403
innovations depend greatly on the recombination of diverse and complementary capa-bilities (Boschma, 2005; Nooteboom, 2000). This should motivate the expert group, aswell as the application group, to initiate a project only if it includes a certain degree ofknowledge heterogeneity within the group of project participants. Therefore, the thirdhypothesis asks if an organization has a higher probability of obtaining another projectgrant when this organization has a certain degree of heterogeneity within their relations.
H3: The better the access to heterogeneous knowledge, the more likely anorganization is to receive a new project grant.
3 Empirical Background
3.1 Individual Approach
The empirical analysis of the German direct-funding system employes a publicly avail-able database which contains all funded projects of the federal government. Reportingministries are: the Federal Ministry of Education and Research (BMBF); the FederalMinistry of Economics and Technology (BMWi); the Federal Ministry of Transport,Building and Urban Development (BMVBS); and the Federal Ministry for the Environ-ment (BMU). The so called ’Foerderkatalog’ goes back to the late 1960s and includesmore than 152,000 projects until the end of 2012. Each entry reports which organiza-tion received the funding, co-funded organizations, the location of the organization, theamount of funding, the funding period, the project theme and a classification numberconcerning the technology. In line with Broekel and Graf (2012), we assume an intensiveknowledge exchange through the collaborative research effort between participants ofthose ’joint projects’. Those organizations that obtain a public grant accept the require-ment of allowing every partner unrestricted access to the project’s results and fee-freeusage of their know-how and intellectual property rights. The selected data are restrictedto those projects dealing with ’technology and innovations,’ ’research and development’and ’basic research,’ so that irrelevant projects such as ’non R&D related expenditureson education’ are excluded.Although there are no official regulations regarding the limit of the project durations
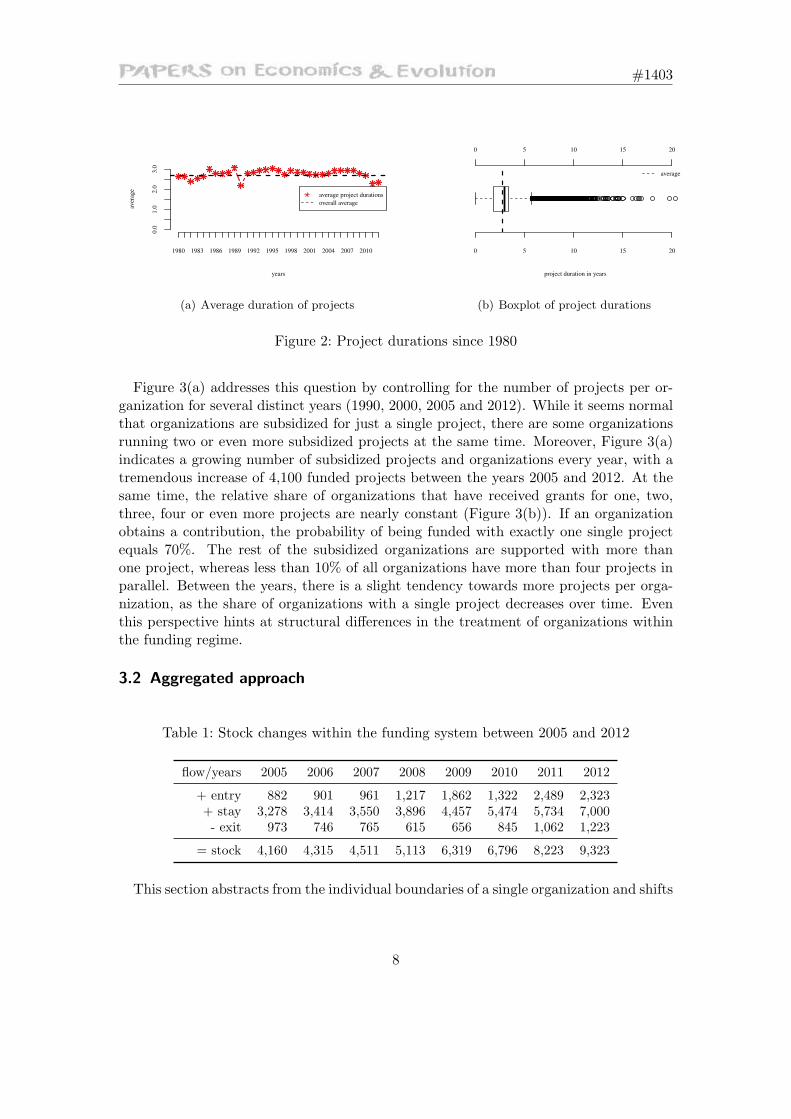
or how many projects are allowed in parallel, or subsequently, there are some informalpatterns within the governmental funding regime that can be identified. Therefore, weanalyzed the average timespan between the beginning and end of each project since1980 (Figure 2(a)). The time span varies around the overall mean value of 2.7 years.The relative constant level of variation over recent decades indicates the absence ofmajor structural shifts between the years, but the imagination of an approximatelyconstant project duration is misleading, as shown by Figure 2(b). The percentile valuesof p0.25 = 1, 838 and p0.75 = 3, 411 indicate some variance behind the mean value of2.7, which signals remarkable inequalities in the treatment of projects. Both the overallconstant average and the remarkable diversity of project durations us to consider if wecan also find differences between the treatment of organizations.
7
#1403
years
aver
age
1980 1983 1986 1989 1992 1995 1998 2001 2004 2007 2010
0.0
1.0
2.0
3.0
average project durations
overall average
(a) Average duration of projects
0 5 10 15 20
0 5 10 15 20
project duration in years
average
(b) Boxplot of project durations
Figure 2: Project durations since 1980
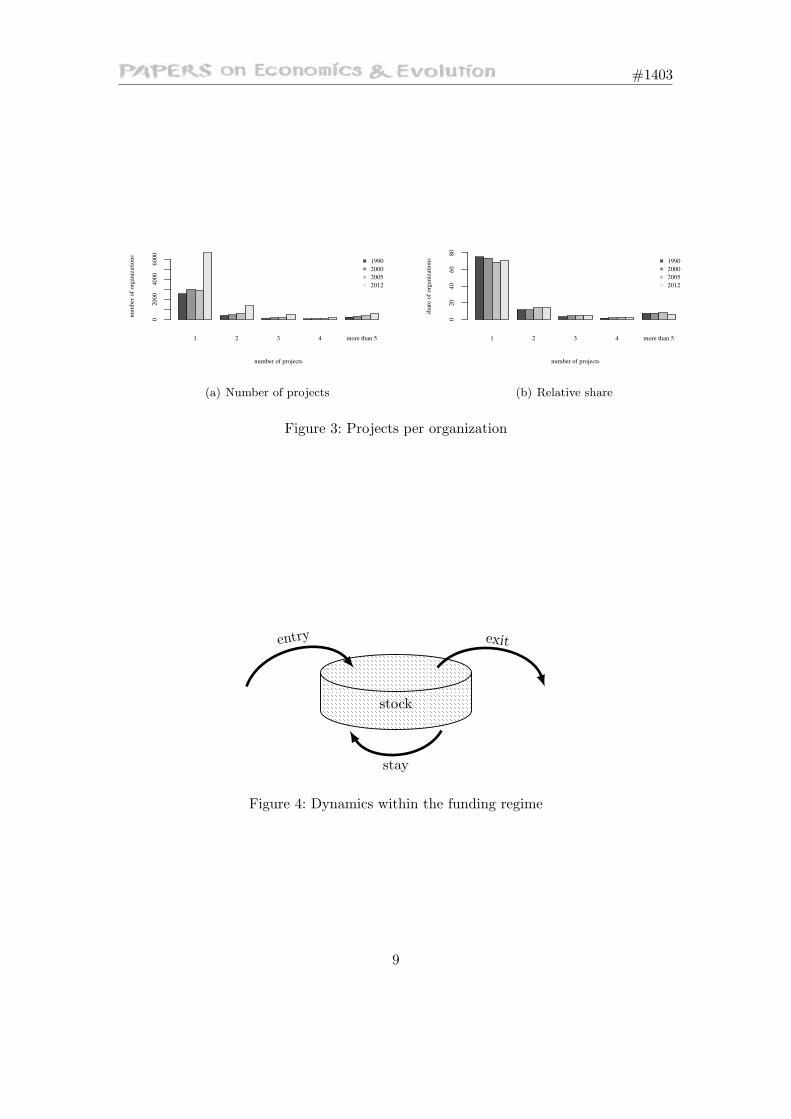
Figure 3(a) addresses this question by controlling for the number of projects per or-ganization for several distinct years (1990, 2000, 2005 and 2012). While it seems normalthat organizations are subsidized for just a single project, there are some organizationsrunning two or even more subsidized projects at the same time. Moreover, Figure 3(a)indicates a growing number of subsidized projects and organizations every year, with atremendous increase of 4,100 funded projects between the years 2005 and 2012. At thesame time, the relative share of organizations that have received grants for one, two,three, four or even more projects are nearly constant (Figure 3(b)). If an organizationobtains a contribution, the probability of being funded with exactly one single projectequals 70%. The rest of the subsidized organizations are supported with more thanone project, whereas less than 10% of all organizations have more than four projects inparallel. Between the years, there is a slight tendency towards more projects per orga-nization, as the share of organizations with a single project decreases over time. Eventhis perspective hints at structural differences in the treatment of organizations withinthe funding regime.
3.2 Aggregated approach
Table 1: Stock changes within the funding system between 2005 and 2012
flow/years 2005 2006 2007 2008 2009 2010 2011 2012
+ entry 882 901 961 1,217 1,862 1,322 2,489 2,323+ stay 3,278 3,414 3,550 3,896 4,457 5,474 5,734 7,000- exit 973 746 765 615 656 845 1,062 1,223
= stock 4,160 4,315 4,511 5,113 6,319 6,796 8,223 9,323
This section abstracts from the individual boundaries of a single organization and shifts
8
#1403
1 2 3 4 more than 5
number of projects
nu
mb
er o
f o
rgan
izat
ion
s
02
00
04
00
06
00
0
1990
2000
2005
2012
(a) Number of projects
1 2 3 4 more than 5
number of projects
shar
e o
f o
rgan
izat
ion
s
02
04
06
08
0
1990
2000
2005
2012
(b) Relative share
Figure 3: Projects per organization
entry exit
stay
stock
Figure 4: Dynamics within the funding regime
9
#1403
years
num
ber
of
org
aniz
atio
ns
1980 1984 1988 1992 1996 2000 2004 2008 2012
2000
4000
6000
8000 funded since 1 year
funded since 2 years
funded since 3 years
funded since 4 years
funded since 5 bis 10 years
funded since more than 10 years
(a) Length of stay
years
num
ber
of
org
aniz
atio
ns
1980 1984 1988 1992 1996 2000 2004 2008 2012
1000
2000
3000
4000
first time funded
funded last year
funded 2−5 years ago
last funding more than 5 years ago
(b) Duration since last funding
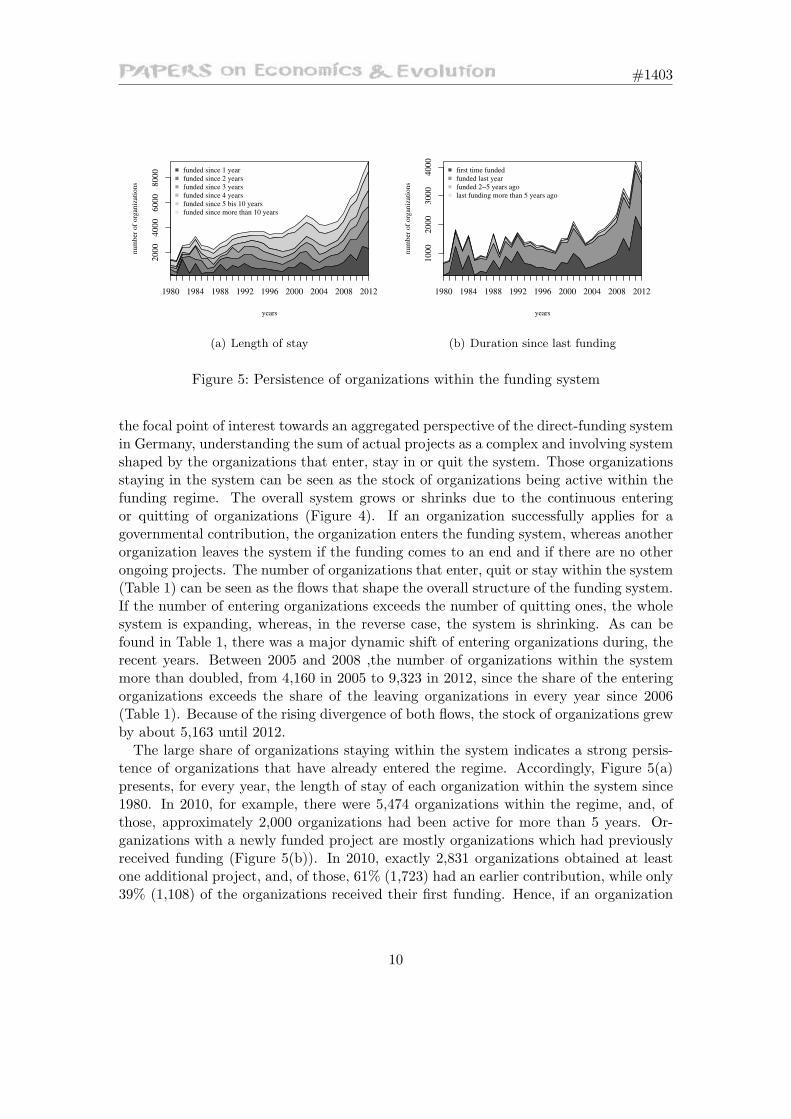
Figure 5: Persistence of organizations within the funding system
the focal point of interest towards an aggregated perspective of the direct-funding systemin Germany, understanding the sum of actual projects as a complex and involving systemshaped by the organizations that enter, stay in or quit the system. Those organizationsstaying in the system can be seen as the stock of organizations being active within thefunding regime. The overall system grows or shrinks due to the continuous enteringor quitting of organizations (Figure 4). If an organization successfully applies for agovernmental contribution, the organization enters the funding system, whereas anotherorganization leaves the system if the funding comes to an end and if there are no otherongoing projects. The number of organizations that enter, quit or stay within the system(Table 1) can be seen as the flows that shape the overall structure of the funding system.If the number of entering organizations exceeds the number of quitting ones, the wholesystem is expanding, whereas, in the reverse case, the system is shrinking. As can befound in Table 1, there was a major dynamic shift of entering organizations during, therecent years. Between 2005 and 2008 ,the number of organizations within the systemmore than doubled, from 4,160 in 2005 to 9,323 in 2012, since the share of the enteringorganizations exceeds the share of the leaving organizations in every year since 2006(Table 1). Because of the rising divergence of both flows, the stock of organizations grewby about 5,163 until 2012.The large share of organizations staying within the system indicates a strong persis-
tence of organizations that have already entered the regime. Accordingly, Figure 5(a)presents, for every year, the length of stay of each organization within the system since1980. In 2010, for example, there were 5,474 organizations within the regime, and, ofthose, approximately 2,000 organizations had been active for more than 5 years. Or-ganizations with a newly funded project are mostly organizations which had previouslyreceived funding (Figure 5(b)). In 2010, exactly 2,831 organizations obtained at leastone additional project, and, of those, 61% (1,723) had an earlier contribution, while only39% (1,108) of the organizations received their first funding. Hence, if an organization
10
#1403
is already present within the system, the probability of obtaining additional fundingincreases significantly.
4 Model
4.1 Methodology
The analysis employs a model which was published for the first time by Gourieroux(2000). Nguyen Van et al. (2004), Fryges (2007) and Aschhoff (2009) applied this kindof model under comparable circumstances, whereas this paper aims to estimate the effectof organizational characteristics influencing the dynamic of the overall funding system.The model describes the dynamic by a series of Markov chains, where each transitionprobability depends on organizational characteristics. Through the application of themaximum-likelihood method, it is possible to estimate the significance of organizationalcharacteristics changing the actual status of an organization.Some definitions have to be made for the model. An organization i = {1, .., N} at time
point t can have the status Yit = {0, 1}, whereas Yit = 1 describes the status in whichthe organization i receives a new project grant in t . Correspondingly, Yit = 0 describesthe situation in which the organization i remains without a newly funded project intime point t (Gourieroux, 2000; Aschhoff, 2009), thus the occurrence of Yit = 1 dependson how often an organization acquires a new project over time t = {0, ..., T}. Thereason to consider only the time point t is that the decision to grant a funded project istaken only once by the expert group and not continuously. From of the two states, fourpossible combinations of transitions can be derived. If an organization changes its actualstatus, the organization switches either from unsubsidized to subsidized (0 → 1) or fromsubsidized to unsubsidized (1 → 0). If the current status remains, the organizationpreserves its unsubsidized (0 → 0) status or receives a further promotion (1 → 1).Therefore, it is necessary to know the transition matrix Mi for each organization i,where each value reflects the likelihood of an organization changing its present statusinto the next state. The transition probability of an organization from the status j int into state j
′
in t + 1 is explained by the probability Pijj′ . Since the Markov process
has no memory of prior stages, actual change only depends on current time (Chiang andWainwright, 2005).
Mi =
[
Pi00 Pi01
Pi10 Pi11
]
(1)
The columns of a transition matrix add up to 1, so Pi00+Pi01 = 1 and Pi10+Pi11 = 1.By simple transformations these formulas can be written as shown in Equation 2.
Mi =
[
1− Pi01 Pi01
1− Pi11 Pi11
]
(2)
11
#1403
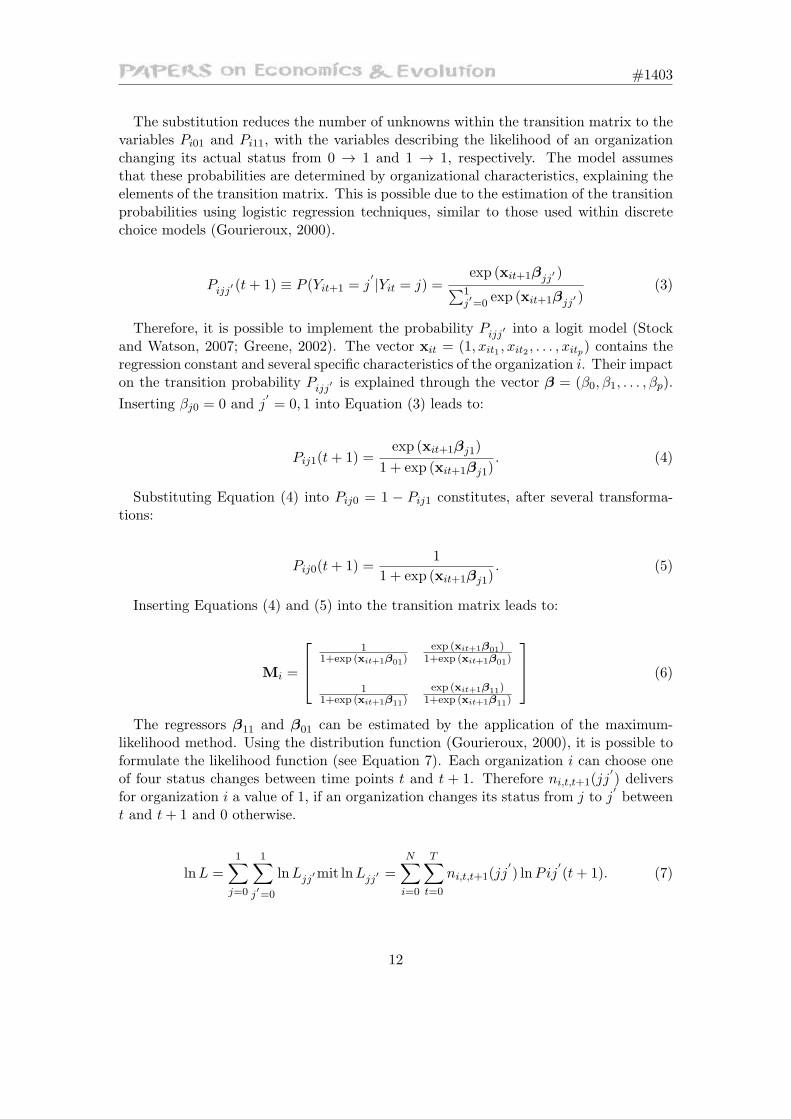
The substitution reduces the number of unknowns within the transition matrix to thevariables Pi01 and Pi11, with the variables describing the likelihood of an organizationchanging its actual status from 0 → 1 and 1 → 1, respectively. The model assumesthat these probabilities are determined by organizational characteristics, explaining theelements of the transition matrix. This is possible due to the estimation of the transitionprobabilities using logistic regression techniques, similar to those used within discretechoice models (Gourieroux, 2000).
Pijj′ (t+ 1) ≡ P (Yit+1 = j
′
|Yit = j) =exp (xit+1βjj
′ )∑1
j′=0
exp (xit+1βjj′ )
(3)
Therefore, it is possible to implement the probability Pijj′ into a logit model (Stock
and Watson, 2007; Greene, 2002). The vector xit = (1, xit1 , xit2 , . . . , xitp) contains theregression constant and several specific characteristics of the organization i. Their impacton the transition probability Pijj
′ is explained through the vector β = (β0, β1, . . . , βp).
Inserting βj0 = 0 and j′
= 0, 1 into Equation (3) leads to:
Pij1(t+ 1) =exp (xit+1βj1)
1 + exp (xit+1βj1). (4)
Substituting Equation (4) into Pij0 = 1 − Pij1 constitutes, after several transforma-tions:
Pij0(t+ 1) =1
1 + exp (xit+1βj1). (5)
Inserting Equations (4) and (5) into the transition matrix leads to:
Mi =
11+exp (xit+1β01)
exp (xit+1β01)1+exp (xit+1β01)
11+exp (xit+1β11)
exp (xit+1β11)1+exp (xit+1β11)
(6)
The regressors β11 and β01 can be estimated by the application of the maximum-likelihood method. Using the distribution function (Gourieroux, 2000), it is possible toformulate the likelihood function (see Equation 7). Each organization i can choose oneof four status changes between time points t and t + 1. Therefore ni,t,t+1(jj
′
) deliversfor organization i a value of 1, if an organization changes its status from j to j
′
betweent and t+ 1 and 0 otherwise.
lnL =1
∑
j=0
1∑
j′=0
lnLjj′mit lnLjj
′ =N∑
i=0
T∑
t=0
ni,t,t+1(jj′
) lnPij′
(t+ 1). (7)
12
#1403
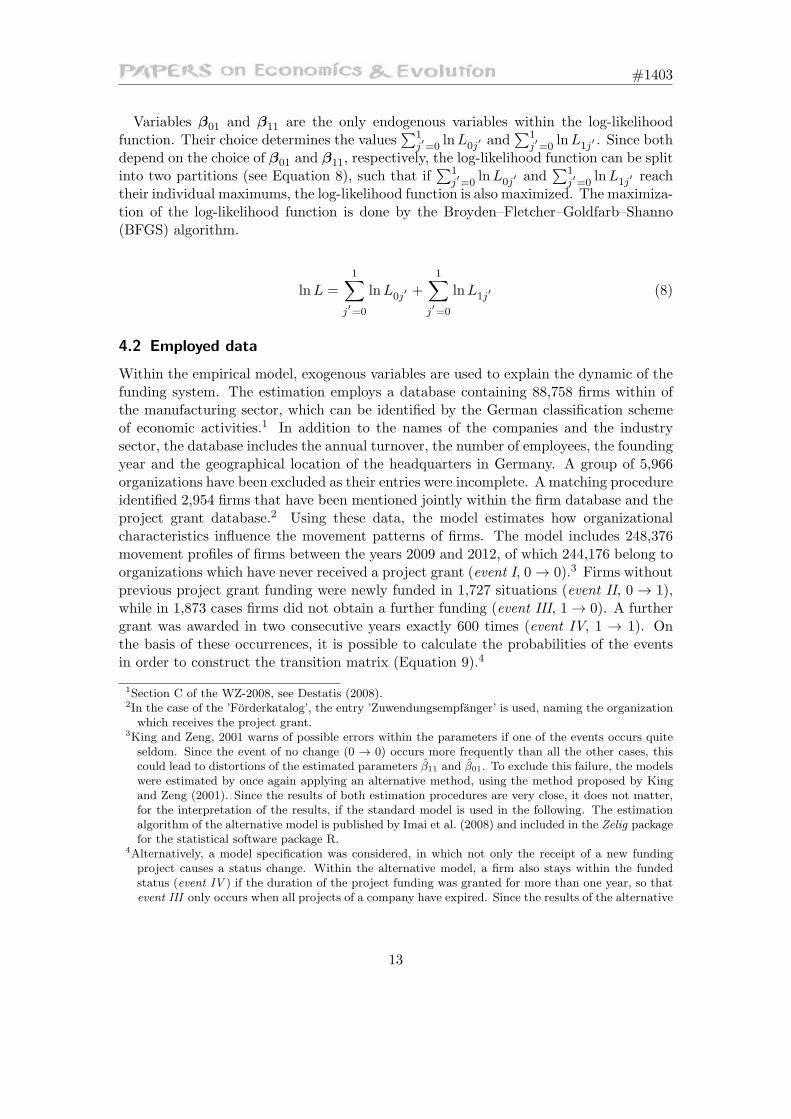
Variables β01 and β11 are the only endogenous variables within the log-likelihoodfunction. Their choice determines the values
∑1j′=0
lnL0j′ and∑1
j′=0
lnL1j′ . Since bothdepend on the choice of β01 and β11, respectively, the log-likelihood function can be splitinto two partitions (see Equation 8), such that if
∑1j′=0
lnL0j′ and
∑1j′=0
lnL1j′ reach
their individual maximums, the log-likelihood function is also maximized. The maximiza-tion of the log-likelihood function is done by the Broyden–Fletcher–Goldfarb–Shanno(BFGS) algorithm.
lnL =1
∑
j′=0
lnL0j′ +
1∑
j′=0
lnL1j′ (8)
4.2 Employed data
Within the empirical model, exogenous variables are used to explain the dynamic of thefunding system. The estimation employs a database containing 88,758 firms within ofthe manufacturing sector, which can be identified by the German classification schemeof economic activities.1 In addition to the names of the companies and the industrysector, the database includes the annual turnover, the number of employees, the foundingyear and the geographical location of the headquarters in Germany. A group of 5,966organizations have been excluded as their entries were incomplete. A matching procedureidentified 2,954 firms that have been mentioned jointly within the firm database and theproject grant database.2 Using these data, the model estimates how organizationalcharacteristics influence the movement patterns of firms. The model includes 248,376movement profiles of firms between the years 2009 and 2012, of which 244,176 belong toorganizations which have never received a project grant (event I, 0 → 0).3 Firms withoutprevious project grant funding were newly funded in 1,727 situations (event II, 0 → 1),while in 1,873 cases firms did not obtain a further funding (event III, 1 → 0). A furthergrant was awarded in two consecutive years exactly 600 times (event IV, 1 → 1). Onthe basis of these occurrences, it is possible to calculate the probabilities of the eventsin order to construct the transition matrix (Equation 9).4
1Section C of the WZ-2008, see Destatis (2008).2In the case of the ’Forderkatalog’, the entry ’Zuwendungsempfanger’ is used, naming the organizationwhich receives the project grant.
3King and Zeng, 2001 warns of possible errors within the parameters if one of the events occurs quiteseldom. Since the event of no change (0 → 0) occurs more frequently than all the other cases, thiscould lead to distortions of the estimated parameters β11 and β01. To exclude this failure, the modelswere estimated by once again applying an alternative method, using the method proposed by Kingand Zeng (2001). Since the results of both estimation procedures are very close, it does not matter,for the interpretation of the results, if the standard model is used in the following. The estimationalgorithm of the alternative model is published by Imai et al. (2008) and included in the Zelig packagefor the statistical software package R.
4Alternatively, a model specification was considered, in which not only the receipt of a new fundingproject causes a status change. Within the alternative model, a firm also stays within the fundedstatus (event IV ) if the duration of the project funding was granted for more than one year, so thatevent III only occurs when all projects of a company have expired. Since the results of the alternative
13
#1403
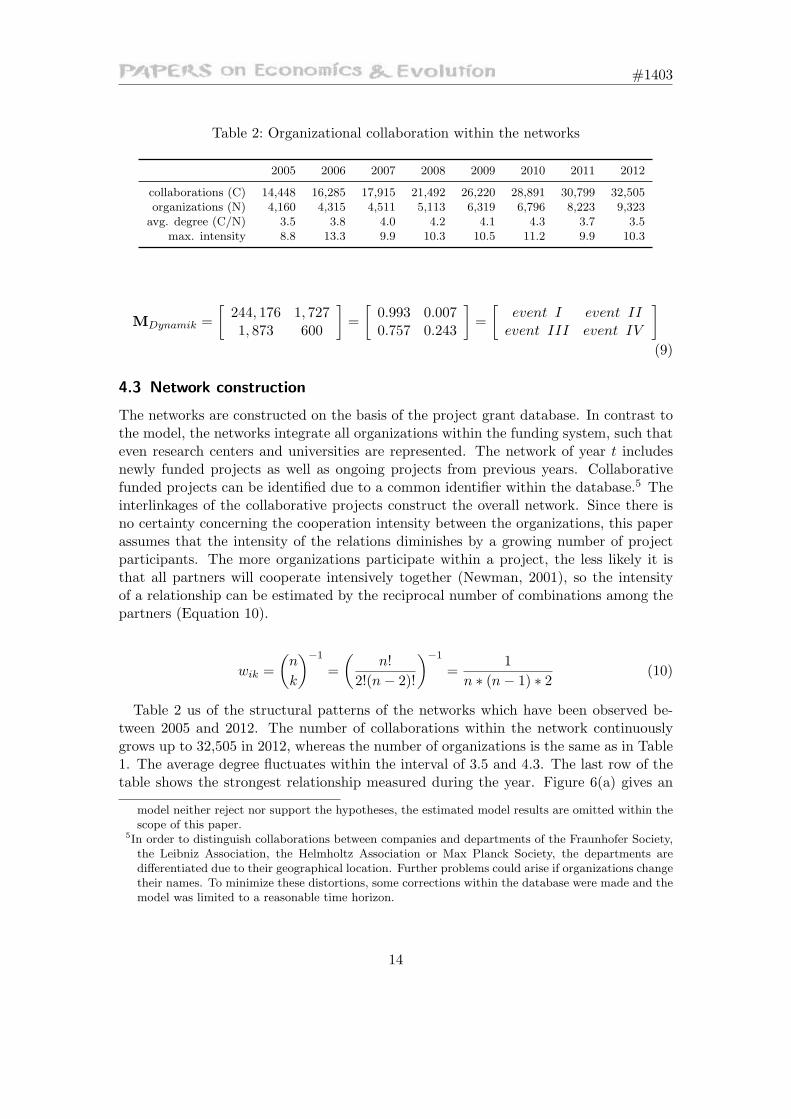
Table 2: Organizational collaboration within the networks
2005 2006 2007 2008 2009 2010 2011 2012
collaborations (C) 14,448 16,285 17,915 21,492 26,220 28,891 30,799 32,505organizations (N) 4,160 4,315 4,511 5,113 6,319 6,796 8,223 9,323avg. degree (C/N) 3.5 3.8 4.0 4.2 4.1 4.3 3.7 3.5
max. intensity 8.8 13.3 9.9 10.3 10.5 11.2 9.9 10.3
MDynamik =
[
244, 176 1, 7271, 873 600
]
=
[
0.993 0.0070.757 0.243
]
=
[
event I event II
event III event IV
]
(9)
4.3 Network construction
The networks are constructed on the basis of the project grant database. In contrast tothe model, the networks integrate all organizations within the funding system, such thateven research centers and universities are represented. The network of year t includesnewly funded projects as well as ongoing projects from previous years. Collaborativefunded projects can be identified due to a common identifier within the database.5 Theinterlinkages of the collaborative projects construct the overall network. Since there isno certainty concerning the cooperation intensity between the organizations, this paperassumes that the intensity of the relations diminishes by a growing number of projectparticipants. The more organizations participate within a project, the less likely it isthat all partners will cooperate intensively together (Newman, 2001), so the intensityof a relationship can be estimated by the reciprocal number of combinations among thepartners (Equation 10).
wik =
(
n
k
)
−1
=
(
n!
2!(n− 2)!
)
−1
=1
n ∗ (n− 1) ∗ 2(10)
Table 2 us of the structural patterns of the networks which have been observed be-tween 2005 and 2012. The number of collaborations within the network continuouslygrows up to 32,505 in 2012, whereas the number of organizations is the same as in Table1. The average degree fluctuates within the interval of 3.5 and 4.3. The last row of thetable shows the strongest relationship measured during the year. Figure 6(a) gives an
model neither reject nor support the hypotheses, the estimated model results are omitted within thescope of this paper.
5In order to distinguish collaborations between companies and departments of the Fraunhofer Society,the Leibniz Association, the Helmholtz Association or Max Planck Society, the departments aredifferentiated due to their geographical location. Further problems could arise if organizations changetheir names. To minimize these distortions, some corrections within the database were made and themodel was limited to a reasonable time horizon.
14
#1403
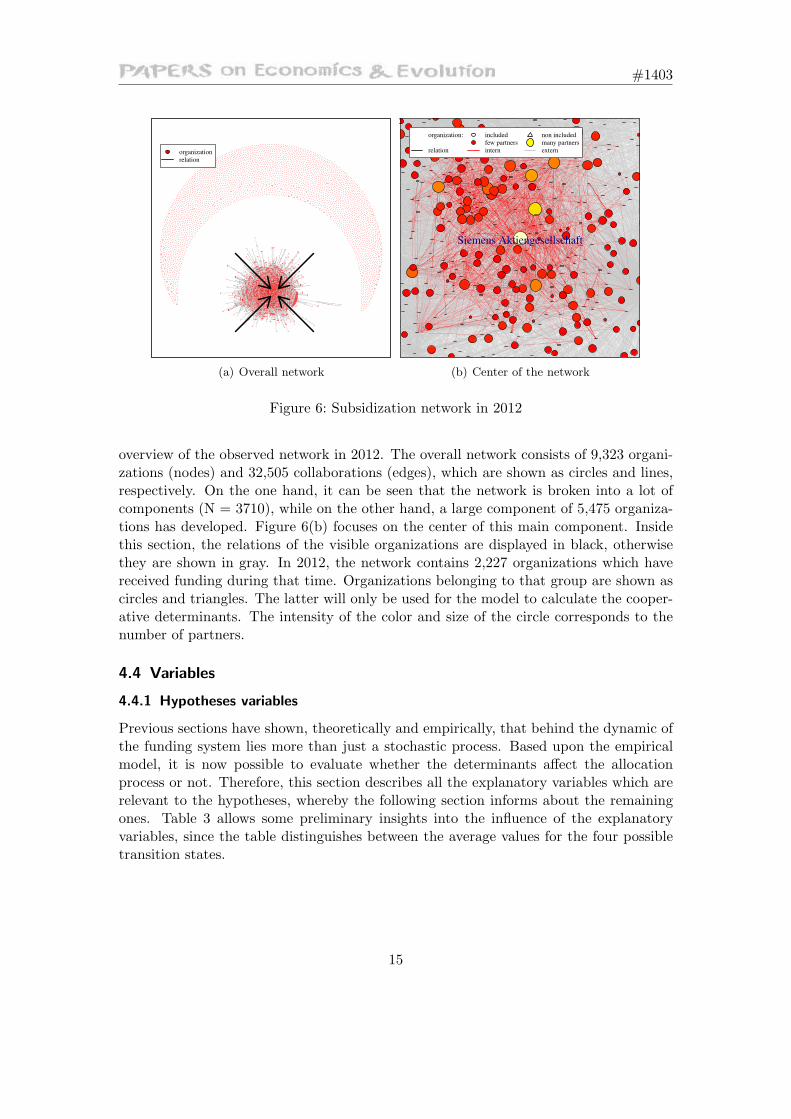
organization
relation
(a) Overall network
Siemens Aktiengesellschaft
organization:
relation
included
few partners
intern
non included
many partners
extern
(b) Center of the network
Figure 6: Subsidization network in 2012
overview of the observed network in 2012. The overall network consists of 9,323 organi-zations (nodes) and 32,505 collaborations (edges), which are shown as circles and lines,respectively. On the one hand, it can be seen that the network is broken into a lot ofcomponents (N = 3710), while on the other hand, a large component of 5,475 organiza-tions has developed. Figure 6(b) focuses on the center of this main component. Insidethis section, the relations of the visible organizations are displayed in black, otherwisethey are shown in gray. In 2012, the network contains 2,227 organizations which havereceived funding during that time. Organizations belonging to that group are shown ascircles and triangles. The latter will only be used for the model to calculate the cooper-ative determinants. The intensity of the color and size of the circle corresponds to thenumber of partners.
4.4 Variables
4.4.1 Hypotheses variables
Previous sections have shown, theoretically and empirically, that behind the dynamic ofthe funding system lies more than just a stochastic process. Based upon the empiricalmodel, it is now possible to evaluate whether the determinants affect the allocationprocess or not. Therefore, this section describes all the explanatory variables which arerelevant to the hypotheses, whereby the following section informs about the remainingones. Table 3 allows some preliminary insights into the influence of the explanatoryvariables, since the table distinguishes between the average values for the four possibletransition states.
15
#1403
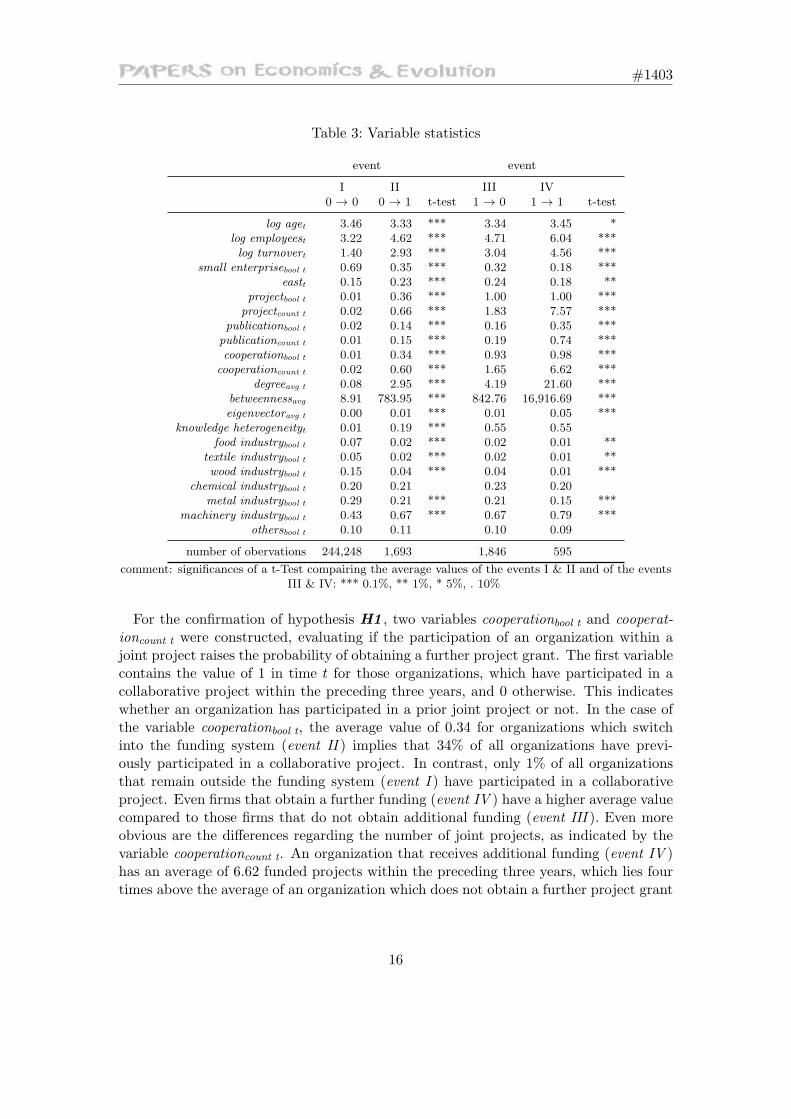
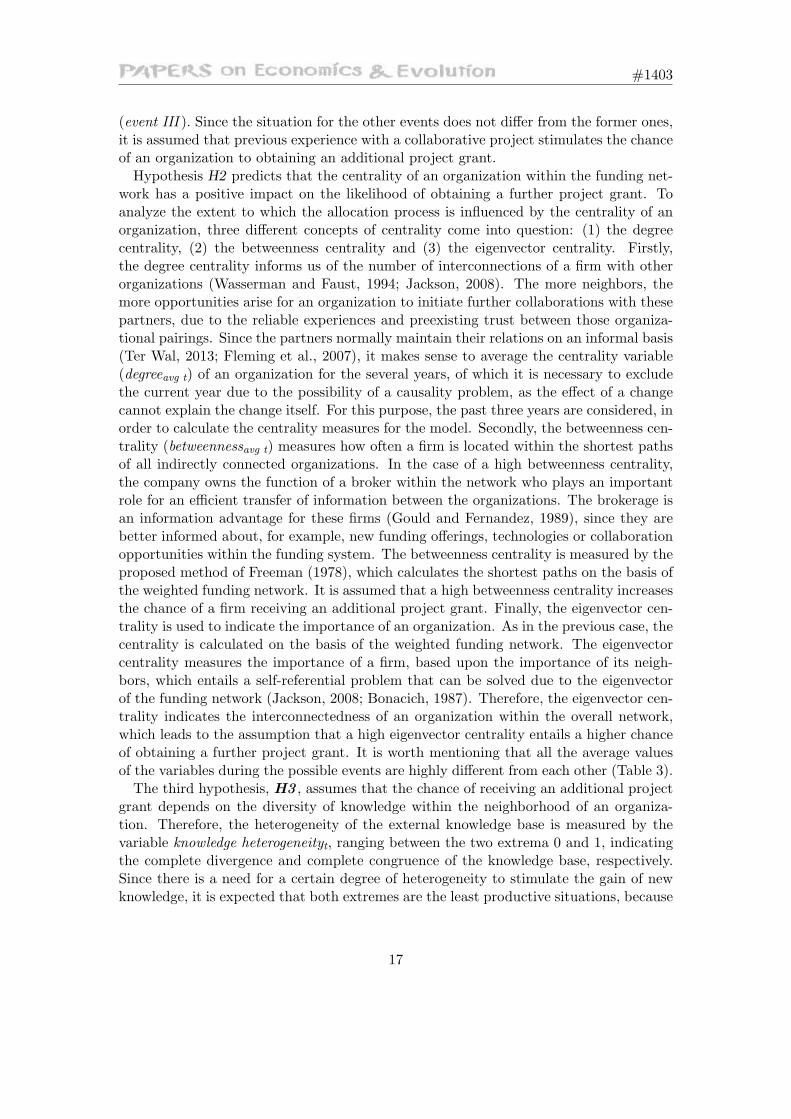
Table 3: Variable statistics
event event
I II III IV0 → 0 0 → 1 t-test 1 → 0 1 → 1 t-test
log aget 3.46 3.33 *** 3.34 3.45 *log employeest 3.22 4.62 *** 4.71 6.04 ***log turnovert 1.40 2.93 *** 3.04 4.56 ***
small enterprisebool t 0.69 0.35 *** 0.32 0.18 ***eastt 0.15 0.23 *** 0.24 0.18 **
projectbool t 0.01 0.36 *** 1.00 1.00 ***projectcount t 0.02 0.66 *** 1.83 7.57 ***
publicationbool t 0.02 0.14 *** 0.16 0.35 ***publicationcount t 0.01 0.15 *** 0.19 0.74 ***cooperationbool t 0.01 0.34 *** 0.93 0.98 ***
cooperationcount t 0.02 0.60 *** 1.65 6.62 ***degreeavg t 0.08 2.95 *** 4.19 21.60 ***
betweennessavg 8.91 783.95 *** 842.76 16,916.69 ***eigenvectoravg t 0.00 0.01 *** 0.01 0.05 ***
knowledge heterogeneityt 0.01 0.19 *** 0.55 0.55food industrybool t 0.07 0.02 *** 0.02 0.01 **
textile industrybool t 0.05 0.02 *** 0.02 0.01 **wood industrybool t 0.15 0.04 *** 0.04 0.01 ***
chemical industrybool t 0.20 0.21 0.23 0.20metal industrybool t 0.29 0.21 *** 0.21 0.15 ***
machinery industrybool t 0.43 0.67 *** 0.67 0.79 ***othersbool t 0.10 0.11 0.10 0.09
number of obervations 244,248 1,693 1,846 595
comment: significances of a t-Test compairing the average values of the events I & II and of the eventsIII & IV: *** 0.1%, ** 1%, * 5%, . 10%
For the confirmation of hypothesis H1 , two variables cooperationbool t and cooperat-
ioncount t were constructed, evaluating if the participation of an organization within ajoint project raises the probability of obtaining a further project grant. The first variablecontains the value of 1 in time t for those organizations, which have participated in acollaborative project within the preceding three years, and 0 otherwise. This indicateswhether an organization has participated in a prior joint project or not. In the case ofthe variable cooperationbool t, the average value of 0.34 for organizations which switchinto the funding system (event II ) implies that 34% of all organizations have previ-ously participated in a collaborative project. In contrast, only 1% of all organizationsthat remain outside the funding system (event I ) have participated in a collaborativeproject. Even firms that obtain a further funding (event IV ) have a higher average valuecompared to those firms that do not obtain additional funding (event III ). Even moreobvious are the differences regarding the number of joint projects, as indicated by thevariable cooperationcount t. An organization that receives additional funding (event IV )has an average of 6.62 funded projects within the preceding three years, which lies fourtimes above the average of an organization which does not obtain a further project grant
16
#1403
(event III ). Since the situation for the other events does not differ from the former ones,it is assumed that previous experience with a collaborative project stimulates the chanceof an organization to obtaining an additional project grant.Hypothesis H2 predicts that the centrality of an organization within the funding net-
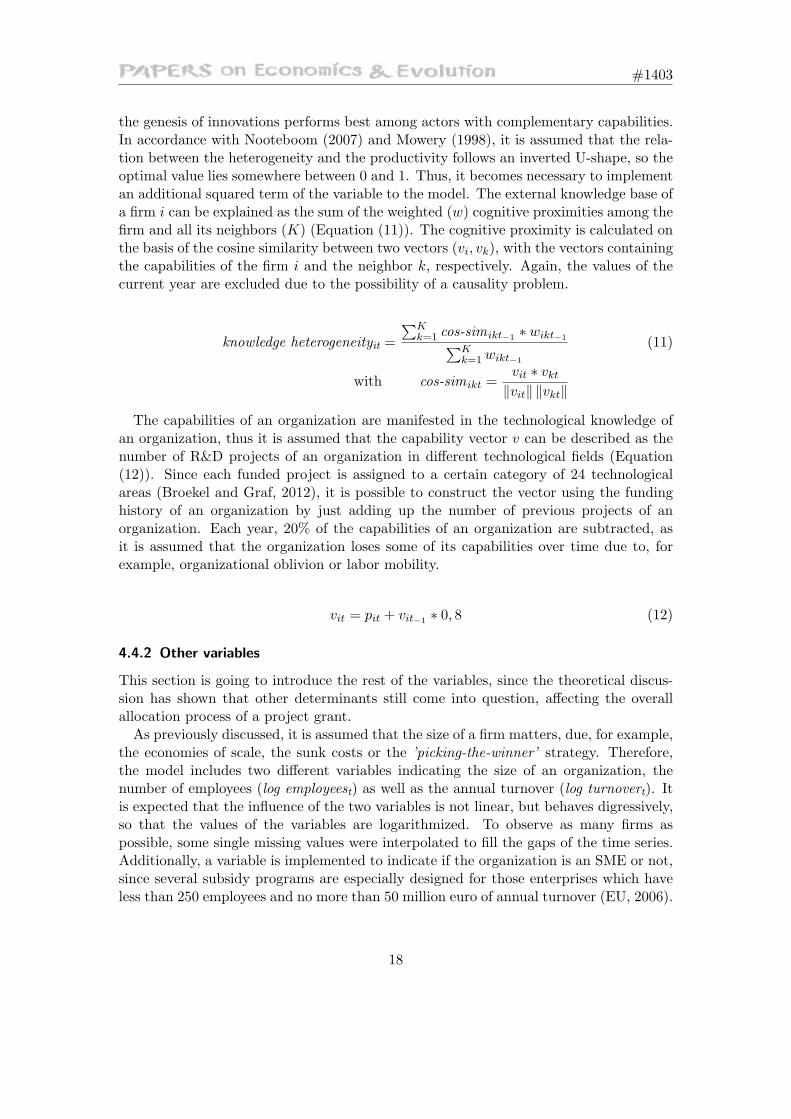
work has a positive impact on the likelihood of obtaining a further project grant. Toanalyze the extent to which the allocation process is influenced by the centrality of anorganization, three different concepts of centrality come into question: (1) the degreecentrality, (2) the betweenness centrality and (3) the eigenvector centrality. Firstly,the degree centrality informs us of the number of interconnections of a firm with otherorganizations (Wasserman and Faust, 1994; Jackson, 2008). The more neighbors, themore opportunities arise for an organization to initiate further collaborations with thesepartners, due to the reliable experiences and preexisting trust between those organiza-tional pairings. Since the partners normally maintain their relations on an informal basis(Ter Wal, 2013; Fleming et al., 2007), it makes sense to average the centrality variable(degreeavg t) of an organization for the several years, of which it is necessary to excludethe current year due to the possibility of a causality problem, as the effect of a changecannot explain the change itself. For this purpose, the past three years are considered, inorder to calculate the centrality measures for the model. Secondly, the betweenness cen-trality (betweennessavg t) measures how often a firm is located within the shortest pathsof all indirectly connected organizations. In the case of a high betweenness centrality,the company owns the function of a broker within the network who plays an importantrole for an efficient transfer of information between the organizations. The brokerage isan information advantage for these firms (Gould and Fernandez, 1989), since they arebetter informed about, for example, new funding offerings, technologies or collaborationopportunities within the funding system. The betweenness centrality is measured by theproposed method of Freeman (1978), which calculates the shortest paths on the basis ofthe weighted funding network. It is assumed that a high betweenness centrality increasesthe chance of a firm receiving an additional project grant. Finally, the eigenvector cen-trality is used to indicate the importance of an organization. As in the previous case, thecentrality is calculated on the basis of the weighted funding network. The eigenvectorcentrality measures the importance of a firm, based upon the importance of its neigh-bors, which entails a self-referential problem that can be solved due to the eigenvectorof the funding network (Jackson, 2008; Bonacich, 1987). Therefore, the eigenvector cen-trality indicates the interconnectedness of an organization within the overall network,which leads to the assumption that a high eigenvector centrality entails a higher chanceof obtaining a further project grant. It is worth mentioning that all the average valuesof the variables during the possible events are highly different from each other (Table 3).The third hypothesis, H3 , assumes that the chance of receiving an additional project
grant depends on the diversity of knowledge within the neighborhood of an organiza-tion. Therefore, the heterogeneity of the external knowledge base is measured by thevariable knowledge heterogeneityt, ranging between the two extrema 0 and 1, indicatingthe complete divergence and complete congruence of the knowledge base, respectively.Since there is a need for a certain degree of heterogeneity to stimulate the gain of newknowledge, it is expected that both extremes are the least productive situations, because
17
#1403
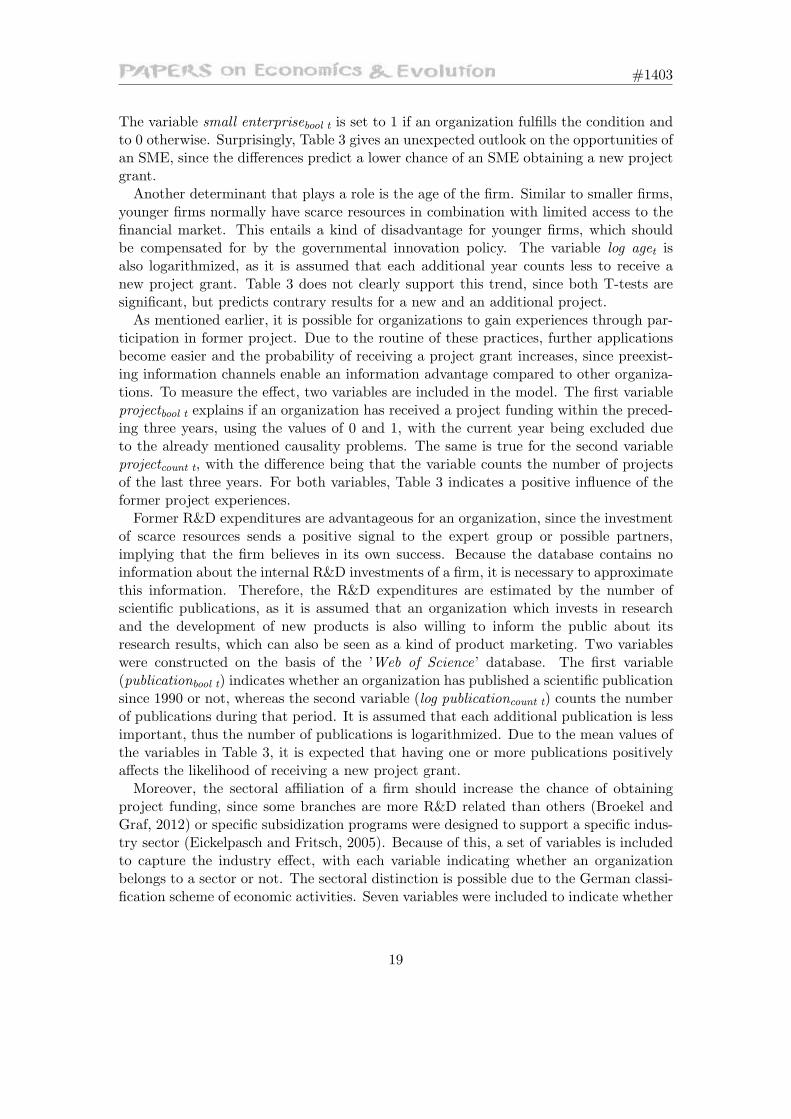
the genesis of innovations performs best among actors with complementary capabilities.In accordance with Nooteboom (2007) and Mowery (1998), it is assumed that the rela-tion between the heterogeneity and the productivity follows an inverted U-shape, so theoptimal value lies somewhere between 0 and 1. Thus, it becomes necessary to implementan additional squared term of the variable to the model. The external knowledge base ofa firm i can be explained as the sum of the weighted (w) cognitive proximities among thefirm and all its neighbors (K) (Equation (11)). The cognitive proximity is calculated onthe basis of the cosine similarity between two vectors (vi, vk), with the vectors containingthe capabilities of the firm i and the neighbor k, respectively. Again, the values of thecurrent year are excluded due to the possibility of a causality problem.
knowledge heterogeneityit =
∑Kk=1 cos-simikt−1
∗ wikt−1∑K
k=1wikt−1
(11)
with cos-simikt =vit ∗ vkt
‖vit‖ ‖vkt‖
The capabilities of an organization are manifested in the technological knowledge ofan organization, thus it is assumed that the capability vector v can be described as thenumber of R&D projects of an organization in different technological fields (Equation(12)). Since each funded project is assigned to a certain category of 24 technologicalareas (Broekel and Graf, 2012), it is possible to construct the vector using the fundinghistory of an organization by just adding up the number of previous projects of anorganization. Each year, 20% of the capabilities of an organization are subtracted, asit is assumed that the organization loses some of its capabilities over time due to, forexample, organizational oblivion or labor mobility.
vit = pit + vit−1 ∗ 0, 8 (12)
4.4.2 Other variables
This section is going to introduce the rest of the variables, since the theoretical discus-sion has shown that other determinants still come into question, affecting the overallallocation process of a project grant.As previously discussed, it is assumed that the size of a firm matters, due, for example,
the economies of scale, the sunk costs or the ’picking-the-winner’ strategy. Therefore,the model includes two different variables indicating the size of an organization, thenumber of employees (log employeest) as well as the annual turnover (log turnovert). Itis expected that the influence of the two variables is not linear, but behaves digressively,so that the values of the variables are logarithmized. To observe as many firms aspossible, some single missing values were interpolated to fill the gaps of the time series.Additionally, a variable is implemented to indicate if the organization is an SME or not,since several subsidy programs are especially designed for those enterprises which haveless than 250 employees and no more than 50 million euro of annual turnover (EU, 2006).
18
#1403
The variable small enterprisebool t is set to 1 if an organization fulfills the condition andto 0 otherwise. Surprisingly, Table 3 gives an unexpected outlook on the opportunities ofan SME, since the differences predict a lower chance of an SME obtaining a new projectgrant.Another determinant that plays a role is the age of the firm. Similar to smaller firms,
younger firms normally have scarce resources in combination with limited access to thefinancial market. This entails a kind of disadvantage for younger firms, which shouldbe compensated for by the governmental innovation policy. The variable log aget isalso logarithmized, as it is assumed that each additional year counts less to receive anew project grant. Table 3 does not clearly support this trend, since both T-tests aresignificant, but predicts contrary results for a new and an additional project.As mentioned earlier, it is possible for organizations to gain experiences through par-
ticipation in former project. Due to the routine of these practices, further applicationsbecome easier and the probability of receiving a project grant increases, since preexist-ing information channels enable an information advantage compared to other organiza-tions. To measure the effect, two variables are included in the model. The first variableprojectbool t explains if an organization has received a project funding within the preced-ing three years, using the values of 0 and 1, with the current year being excluded dueto the already mentioned causality problems. The same is true for the second variableprojectcount t, with the difference being that the variable counts the number of projectsof the last three years. For both variables, Table 3 indicates a positive influence of theformer project experiences.Former R&D expenditures are advantageous for an organization, since the investment
of scarce resources sends a positive signal to the expert group or possible partners,implying that the firm believes in its own success. Because the database contains noinformation about the internal R&D investments of a firm, it is necessary to approximatethis information. Therefore, the R&D expenditures are estimated by the number ofscientific publications, as it is assumed that an organization which invests in researchand the development of new products is also willing to inform the public about itsresearch results, which can also be seen as a kind of product marketing. Two variableswere constructed on the basis of the ’Web of Science’ database. The first variable(publicationbool t) indicates whether an organization has published a scientific publicationsince 1990 or not, whereas the second variable (log publicationcount t) counts the numberof publications during that period. It is assumed that each additional publication is lessimportant, thus the number of publications is logarithmized. Due to the mean values ofthe variables in Table 3, it is expected that having one or more publications positivelyaffects the likelihood of receiving a new project grant.Moreover, the sectoral affiliation of a firm should increase the chance of obtaining
project funding, since some branches are more R&D related than others (Broekel andGraf, 2012) or specific subsidization programs were designed to support a specific indus-try sector (Eickelpasch and Fritsch, 2005). Because of this, a set of variables is includedto capture the industry effect, with each variable indicating whether an organizationbelongs to a sector or not. The sectoral distinction is possible due to the German classi-fication scheme of economic activities. Seven variables were included to indicate whether
19
#1403
a firm belongs to the food, textile, wood, chemical, machinery industry or another cate-gory. Table 3 supports this, since sectors with a higher tendency to invest in R&D, suchas the machinery and chemical industries, are more likely obtain a new project fundingcompared to the rest.The intensity of public subsidies differs among the regions in Germany (Fornahl and
Umlauf, 2014), especially because funding programs are sometimes intended for thedevelopment of regions (Eickelpasch and Fritsch, 2005). One special event was theGerman reunification (Aschhoff, 2009), which led several promotion programs for easternstates of Germany, thus it is assumed that the location of the firm’s headquarters in oneof the new states of Germany increases the likelihood of a company receiving a newproject fund. To capture this effect, the variable eastbool t includes the value 1 if thefirm’s headquarters lie in the eastern states, or 0 otherwise.The Condition Index (CI) was calculated for all explanatory variables in order to
analyze whether the estimation process could be affected by collinearity problems ornot (Belsey et al., 1980; Greene, 2002). The index rejects the possibility of collinearitywithin the explanatory data, since the calculated CI-value 29.79 does not exceed theconservative upper bound of 30.
5 Results
For the verification of the hypotheses, three different models were estimated. Since novariables were deleted from each subsequent model, it is possible to observe which vari-ables lose their explanatory power due to the inclusion of network-related determinants.The model results of the maximum-likelihood estimation are presented in Tables 4, 5 and6, including the parameters, t-values and the significance of the exogenous determinants.Due to the Akaike information criterion (AIC), it is possible to compare the quality ofthe estimated models.The formulated hypotheses aim to prove the importance of network-related determi-
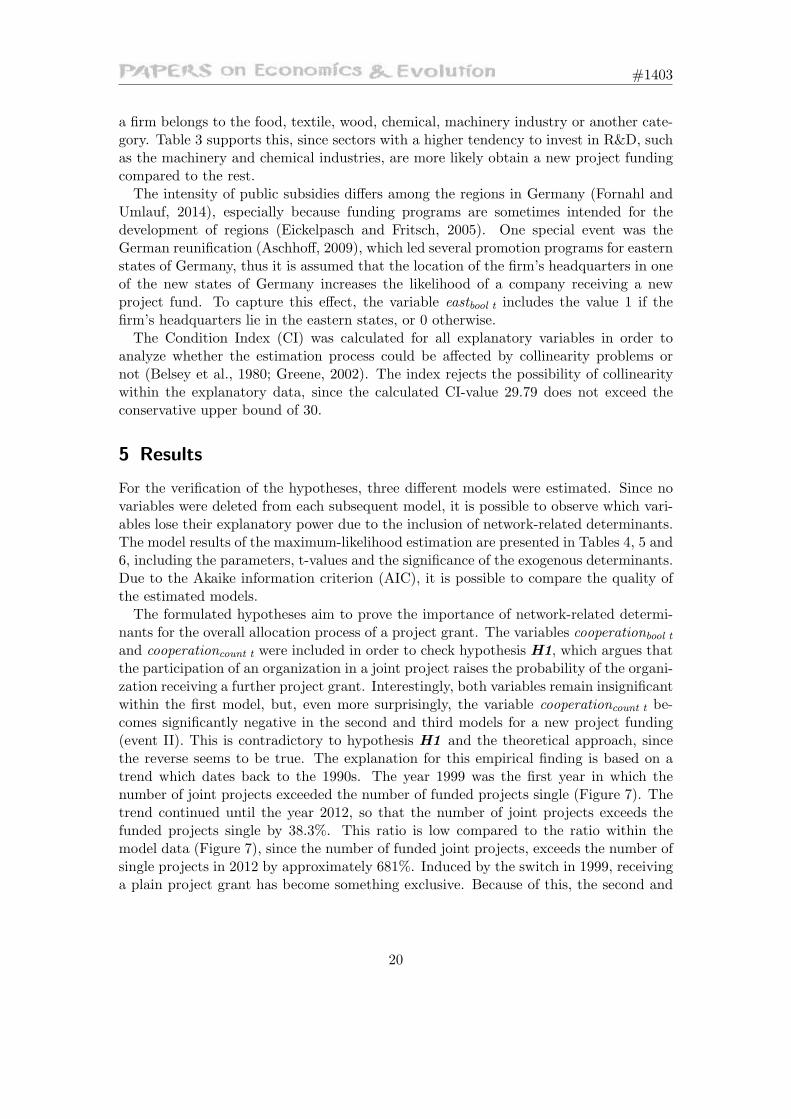
nants for the overall allocation process of a project grant. The variables cooperationbool tand cooperationcount t were included in order to check hypothesis H1, which argues thatthe participation of an organization in a joint project raises the probability of the organi-zation receiving a further project grant. Interestingly, both variables remain insignificantwithin the first model, but, even more surprisingly, the variable cooperationcount t be-comes significantly negative in the second and third models for a new project funding(event II). This is contradictory to hypothesis H1 and the theoretical approach, sincethe reverse seems to be true. The explanation for this empirical finding is based on atrend which dates back to the 1990s. The year 1999 was the first year in which thenumber of joint projects exceeded the number of funded projects single (Figure 7). Thetrend continued until the year 2012, so that the number of joint projects exceeds thefunded projects single by 38.3%. This ratio is low compared to the ratio within themodel data (Figure 7), since the number of funded joint projects, exceeds the number ofsingle projects in 2012 by approximately 681%. Induced by the switch in 1999, receivinga plain project grant has become something exclusive. Because of this, the second and
20
#1403
years
num
ber
of
pro
ject
s
1990 1995 2000 2005 2010 2012
01000
2000
3000
4000
5000
+ 3
8,3
per
cent
swit
ch 1
999
single projects − total
joint projects − total
single projects − model
joint projects − model
+ 6
86,1
per
cent
model
Figure 7: Number of projects per year
third models are right - if they indicate a higher chance of organizations with less coop-erative projects but therefore more single project grants - since the difference betweenthe estimated variables projectcount t and cooperationcount t is still positive.The second hypothesis, H2 , goes into more detail, asking whether the centrality of an
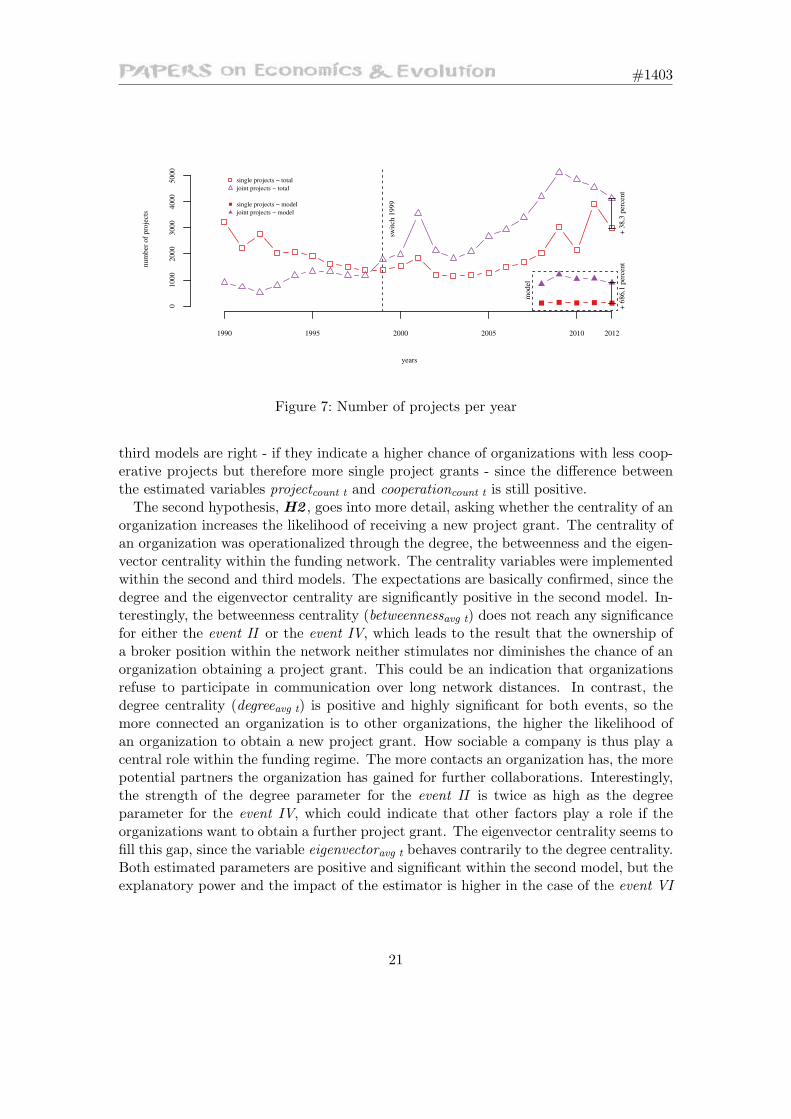
organization increases the likelihood of receiving a new project grant. The centrality ofan organization was operationalized through the degree, the betweenness and the eigen-vector centrality within the funding network. The centrality variables were implementedwithin the second and third models. The expectations are basically confirmed, since thedegree and the eigenvector centrality are significantly positive in the second model. In-terestingly, the betweenness centrality (betweennessavg t) does not reach any significancefor either the event II or the event IV, which leads to the result that the ownership ofa broker position within the network neither stimulates nor diminishes the chance of anorganization obtaining a project grant. This could be an indication that organizationsrefuse to participate in communication over long network distances. In contrast, thedegree centrality (degreeavg t) is positive and highly significant for both events, so themore connected an organization is to other organizations, the higher the likelihood ofan organization to obtain a new project grant. How sociable a company is thus play acentral role within the funding regime. The more contacts an organization has, the morepotential partners the organization has gained for further collaborations. Interestingly,the strength of the degree parameter for the event II is twice as high as the degreeparameter for the event IV, which could indicate that other factors play a role if theorganizations want to obtain a further project grant. The eigenvector centrality seems tofill this gap, since the variable eigenvectoravg t behaves contrarily to the degree centrality.Both estimated parameters are positive and significant within the second model, but theexplanatory power and the impact of the estimator is higher in the case of the event VI
21
#1403
heterogeneity of knowledge
impac
t
0.0 0.2 0.4 0.6 0.8 1.0−
1.0
−0.5
0.0
0.5
1.0
event II:3.19x − 3.99x2
event IV:2.28x − 3.08x2
Figure 8: Effect of knowledge heterogeneity
and thus more relevant in obtaining an additional project grant. To receive an addi-tional R&D project grant (event VI ) it is even more relevant to whom an organizationis connected, whereas it is more important to have a lot of connections within the net-work if an organization seeks a project grant without having ongoing funding (event II ).Therefore, the overall network position of an organization is the second-most importantnetwork determinant, which shapes the allocation process of a project grant. Hypothe-ses H3 assumes that a specific mixture of heterogeneity within the neighborhood ofan organization has a positive impact on the likelihood of an organization obtaining anew project grant. In contrast to the previous hypothesis, which concentrates on thecentrality of an organization, this hypothesis seeks a balance within the relationshipsof an organization. To estimate this effect, the variables knowledge heterogeneityt andknowledge heterogeneitysquare t were added to the third model, whereby the quadraticvariable is necessary to analyze whether the relation follows an inverted U-shape or not.The estimated model parameters support hypothesis H3 , even if the significance of theparameter for the event IV lies a bit below their counterparts. It is most satisfyingthat the value of the first variable is always positive and the squared variable is alwaysnegative, which supports the parabolic relationship between the variable and the chanceof a new project grant. This shows that organizations seek a certain ratio of familiar andnew knowledge, so that it is possible for a company to acquire new capabilities duringthe project duration. For a closer look Figure 8 presents the estimated curves for theinverted U-shaped relationships. Both curves reach their maximum close to 0.4. If thesimilarity of the knowledge within the neighborhood reaches an index value of 0.8, theeffect becomes negative, thus the likelihood obtaining a new project grant is deceased.The remaining variables are used to calibrate the model. All of them are in line
with the theory or previous studies so that they do not question the importance of thenetwork determinants. The results of the three models are almost identical concerningthe estimated parameters, since the observed small deviations do not affect the overall
22
#1403
significance of the results. Therefore, the variables will be presented on the basis of thefirst model.The constant defines, somewhat, the baseline probability of an organization obtaining
a new or further project grant. Irrespective of the other determinants, it depends on thepresent funding status of a firm as to whether the chance of a company receiving a newproject grant is 0.2% or 4.7%. Therefore, it seems to be the normal case that a companydoes not receive subsidization. Moreover, the model proved the preferential treatmentof younger companies (log aget) within the funding system, since older firms are lesslikely to get a further project grant, possibly is to mitigate the high risk of an R&Dinvestment or to reduce the free-rider effect. The size of the company is representedwithin the model by the number of employees (log employeest) and the annual turnover(log turnovert). The assumption that the size of the firm positively affects the likelihoodof an organization obtaining a new project grant is broadly supported, since only the logturnovert variable is insignificant in obtaining of a further project grant. All estimatedvalues are positive without exception. The size of the firm has a higher relevance tothose firms that have not received a previous project grant, as the overall significancesand parameter values are higher for the event II. Due to their size, larger firms are lessaffected by fixed costs or other risks in comparison to SMEs, since the variable small
enterprisebool t is insignificant. Not even special programs for SMEs seem to drasticallychange their chances of obtaining a project grant. Another possible explanation for thiscould be, that the expert group favors already established enterprises, in order to reducethe chance of a project aborted (’picking-the-winner’ ).It was assumed that the location of the firm’s headquarters within the eastern states
of Germany has a positive impact. Therefore, the variable eastbool t was constructed tocapture whether the location of the headquarters has an impact or not. The expectationis validated for the event II, since the estimated parameter is positive and stronglysignificant, but not for the event IV.There can be no doubt that previous project experiences stimulate the chances of an
organization obtaining a new project grant. Both variables projectbool t and projectcount twere found to be positive and highly significant. The publicationbool t variable was ex-cluded from the estimation process for the event IV, since the variable is identical to theregression constant. The findings proved that companies can benefit from their formerexperiences, which leads to a reduction of the information asymmetry between the firmand other stakeholders in the allocation process.The extent of former R&D investments was approximated by the scientific engage-
ment of a firm within the academic discussion. Two variables, publicationbool t andpublicationcount t, were included in the model to capture this effect. Interestingly, onlythe variable publicationbool t has a positive effect for the case of new funding. All theother cases remain insignificant. Maybe these variables are outperformed by the previousproject experiences, since both indicators refer to experiences in R&D investments.Interestingly, most of the sectoral parameters are negativly significant for those compa-
nies, that receive a new project without having a previous one. This can be observed forthe food, textile, wood and metal industries. Only firms within the machinery industry,and those firms who fall within the ’others’ category, have a higher chance of receiving
23
#1403
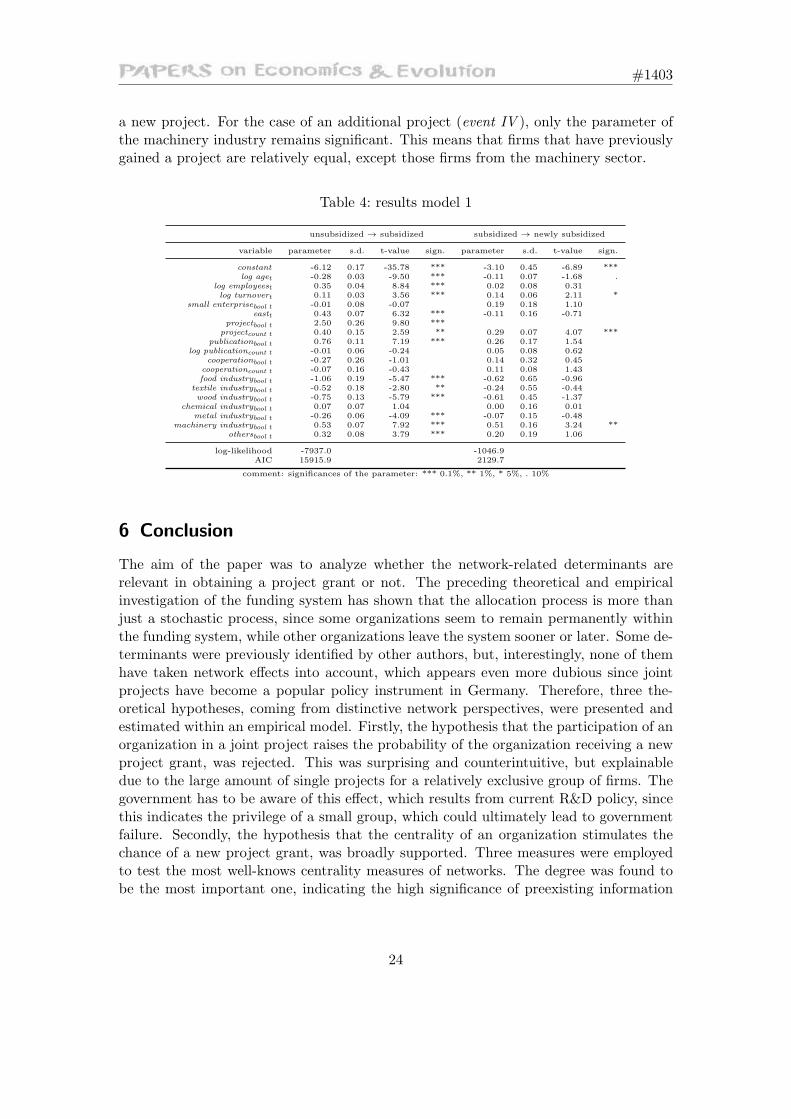
a new project. For the case of an additional project (event IV ), only the parameter ofthe machinery industry remains significant. This means that firms that have previouslygained a project are relatively equal, except those firms from the machinery sector.
Table 4: results model 1
unsubsidized → subsidized subsidized → newly subsidized
variable parameter s.d. t-value sign. parameter s.d. t-value sign.
constant -6.12 0.17 -35.78 *** -3.10 0.45 -6.89 ***log aget -0.28 0.03 -9.50 *** -0.11 0.07 -1.68 .
log employeest 0.35 0.04 8.84 *** 0.02 0.08 0.31log turnovert 0.11 0.03 3.56 *** 0.14 0.06 2.11 *
small enterprisebool t -0.01 0.08 -0.07 0.19 0.18 1.10eastt 0.43 0.07 6.32 *** -0.11 0.16 -0.71
projectbool t 2.50 0.26 9.80 ***projectcount t 0.40 0.15 2.59 ** 0.29 0.07 4.07 ***
publicationbool t 0.76 0.11 7.19 *** 0.26 0.17 1.54log publicationcount t -0.01 0.06 -0.24 0.05 0.08 0.62
cooperationbool t -0.27 0.26 -1.01 0.14 0.32 0.45cooperationcount t -0.07 0.16 -0.43 0.11 0.08 1.43food industrybool t -1.06 0.19 -5.47 *** -0.62 0.65 -0.96
textile industrybool t -0.52 0.18 -2.80 ** -0.24 0.55 -0.44wood industrybool t -0.75 0.13 -5.79 *** -0.61 0.45 -1.37
chemical industrybool t 0.07 0.07 1.04 0.00 0.16 0.01metal industrybool t -0.26 0.06 -4.09 *** -0.07 0.15 -0.48
machinery industrybool t 0.53 0.07 7.92 *** 0.51 0.16 3.24 **othersbool t 0.32 0.08 3.79 *** 0.20 0.19 1.06
log-likelihood -7937.0 -1046.9AIC 15915.9 2129.7
comment: significances of the parameter: *** 0.1%, ** 1%, * 5%, . 10%
6 Conclusion
The aim of the paper was to analyze whether the network-related determinants arerelevant in obtaining a project grant or not. The preceding theoretical and empiricalinvestigation of the funding system has shown that the allocation process is more thanjust a stochastic process, since some organizations seem to remain permanently withinthe funding system, while other organizations leave the system sooner or later. Some de-terminants were previously identified by other authors, but, interestingly, none of themhave taken network effects into account, which appears even more dubious since jointprojects have become a popular policy instrument in Germany. Therefore, three the-oretical hypotheses, coming from distinctive network perspectives, were presented andestimated within an empirical model. Firstly, the hypothesis that the participation of anorganization in a joint project raises the probability of the organization receiving a newproject grant, was rejected. This was surprising and counterintuitive, but explainabledue to the large amount of single projects for a relatively exclusive group of firms. Thegovernment has to be aware of this effect, which results from current R&D policy, sincethis indicates the privilege of a small group, which could ultimately lead to governmentfailure. Secondly, the hypothesis that the centrality of an organization stimulates thechance of a new project grant, was broadly supported. Three measures were employedto test the most well-knows centrality measures of networks. The degree was found tobe the most important one, indicating the high significance of preexisting information
24
#1403
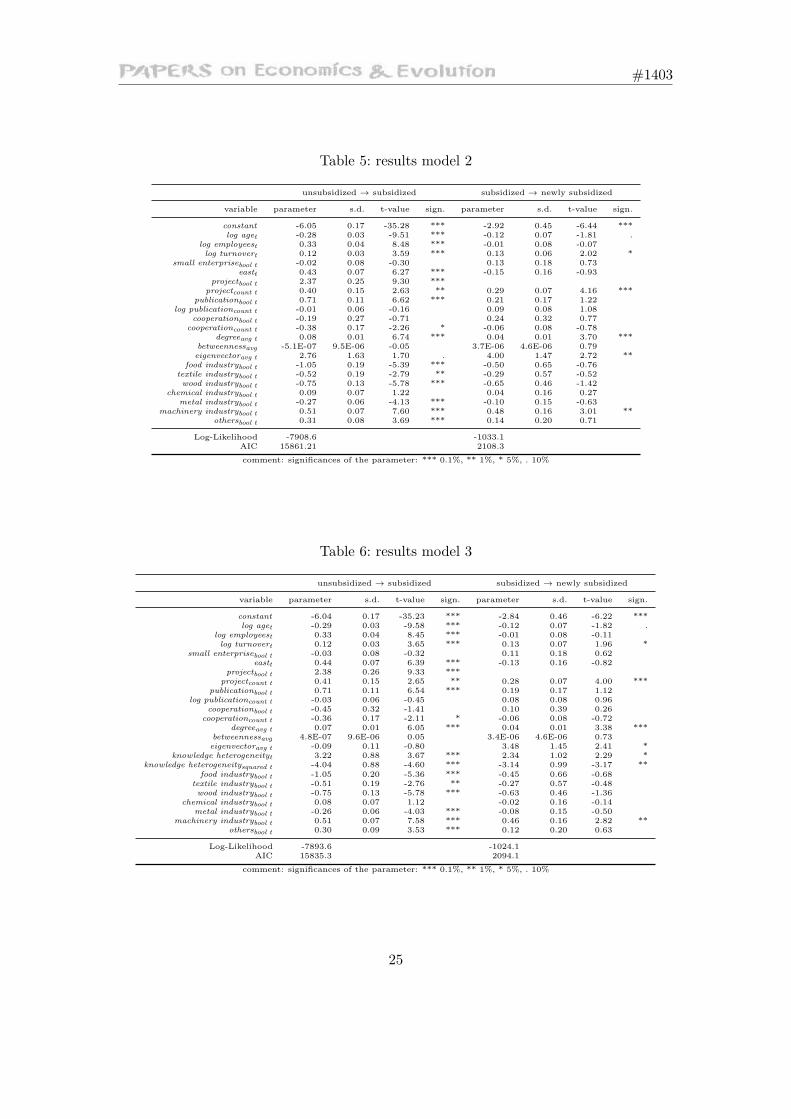
Table 5: results model 2
unsubsidized → subsidized subsidized → newly subsidized
variable parameter s.d. t-value sign. parameter s.d. t-value sign.
constant -6.05 0.17 -35.28 *** -2.92 0.45 -6.44 ***log aget -0.28 0.03 -9.51 *** -0.12 0.07 -1.81 .
log employeest 0.33 0.04 8.48 *** -0.01 0.08 -0.07log turnovert 0.12 0.03 3.59 *** 0.13 0.06 2.02 *
small enterprisebool t -0.02 0.08 -0.30 0.13 0.18 0.73eastt 0.43 0.07 6.27 *** -0.15 0.16 -0.93
projectbool t 2.37 0.25 9.30 ***projectcount t 0.40 0.15 2.63 ** 0.29 0.07 4.16 ***
publicationbool t 0.71 0.11 6.62 *** 0.21 0.17 1.22log publicationcount t -0.01 0.06 -0.16 0.09 0.08 1.08
cooperationbool t -0.19 0.27 -0.71 0.24 0.32 0.77cooperationcount t -0.38 0.17 -2.26 * -0.06 0.08 -0.78
degreeavg t 0.08 0.01 6.74 *** 0.04 0.01 3.70 ***betweennessavg -5.1E-07 9.5E-06 -0.05 3.7E-06 4.6E-06 0.79eigenvectoravg t 2.76 1.63 1.70 . 4.00 1.47 2.72 **
food industrybool t -1.05 0.19 -5.39 *** -0.50 0.65 -0.76textile industrybool t -0.52 0.19 -2.79 ** -0.29 0.57 -0.52wood industrybool t -0.75 0.13 -5.78 *** -0.65 0.46 -1.42
chemical industrybool t 0.09 0.07 1.22 0.04 0.16 0.27metal industrybool t -0.27 0.06 -4.13 *** -0.10 0.15 -0.63
machinery industrybool t 0.51 0.07 7.60 *** 0.48 0.16 3.01 **othersbool t 0.31 0.08 3.69 *** 0.14 0.20 0.71
Log-Likelihood -7908.6 -1033.1AIC 15861.21 2108.3
comment: significances of the parameter: *** 0.1%, ** 1%, * 5%, . 10%
Table 6: results model 3
unsubsidized → subsidized subsidized → newly subsidized
variable parameter s.d. t-value sign. parameter s.d. t-value sign.
constant -6.04 0.17 -35.23 *** -2.84 0.46 -6.22 ***log aget -0.29 0.03 -9.58 *** -0.12 0.07 -1.82 .
log employeest 0.33 0.04 8.45 *** -0.01 0.08 -0.11log turnovert 0.12 0.03 3.65 *** 0.13 0.07 1.96 *
small enterprisebool t -0.03 0.08 -0.32 0.11 0.18 0.62eastt 0.44 0.07 6.39 *** -0.13 0.16 -0.82
projectbool t 2.38 0.26 9.33 ***projectcount t 0.41 0.15 2.65 ** 0.28 0.07 4.00 ***
publicationbool t 0.71 0.11 6.54 *** 0.19 0.17 1.12log publicationcount t -0.03 0.06 -0.45 0.08 0.08 0.96
cooperationbool t -0.45 0.32 -1.41 0.10 0.39 0.26cooperationcount t -0.36 0.17 -2.11 * -0.06 0.08 -0.72
degreeavg t 0.07 0.01 6.05 *** 0.04 0.01 3.38 ***betweennessavg 4.8E-07 9.6E-06 0.05 3.4E-06 4.6E-06 0.73eigenvectoravg t -0.09 0.11 -0.80 3.48 1.45 2.41 *
knowledge heterogeneityt 3.22 0.88 3.67 *** 2.34 1.02 2.29 *knowledge heterogeneitysquared t -4.04 0.88 -4.60 *** -3.14 0.99 -3.17 **
food industrybool t -1.05 0.20 -5.36 *** -0.45 0.66 -0.68textile industrybool t -0.51 0.19 -2.76 ** -0.27 0.57 -0.48wood industrybool t -0.75 0.13 -5.78 *** -0.63 0.46 -1.36
chemical industrybool t 0.08 0.07 1.12 -0.02 0.16 -0.14metal industrybool t -0.26 0.06 -4.03 *** -0.08 0.15 -0.50
machinery industrybool t 0.51 0.07 7.58 *** 0.46 0.16 2.82 **othersbool t 0.30 0.09 3.53 *** 0.12 0.20 0.63
Log-Likelihood -7893.6 -1024.1AIC 15835.3 2094.1
comment: significances of the parameter: *** 0.1%, ** 1%, * 5%, . 10%
25
#1403
channels, and trustworthy relations with other organizations, for securing new fundingopportunities. No other network effect was similarly significant, but the variable losessome of its explanatory power if an organization obtains additional funding. This gapwas closed by the eigenvector centrality, so that both centrality parameters seem tocomplement one another. This entails that the obtaining of an additional project grantrequires a central position within the overall network, whereas an organization withouta prior funded project needs to have a high degree centrality. Surprisingly, brokers donot own a privileged position within the funding system, since the parameters of thebetweenness centrality were insignificant. Firms seem to prefer to communicate withintheir direct neighborhood, thus bridging links are less necessary for the communicationpatterns within the funding system. Overall, it seems necessary to keep a useful scopeof centrality on the one hand and enough openness for new competitors within the fund-ing system on the other hand, since the high impact of the network effects signals atendency of the funding regime to reproduce itself. Finally, a diverse external knowl-edge base is significant for an organization to obtain a new funding project. Since thisfinding was important for both situations, for a new as well as for an ongoing projectgrant, all involved stakeholders in the allocation process seem to acknowledge the highimportance of a certain extent of heterogeneous capabilities within an R&D project inorder to stimulate the innovational outcome. Further research questions arise, due to thelimitation of this paper, in that only successful project applications have been taken intoaccount. To conclude whether the funding regime is systematically reproducing itselfor not, it is necessary to also include the rejected project proposals within the analysis.Without these observations there can be no final certainty, as to whether the patternsevolve because of the strong network effects or due to a low number of applicants.
26
#1403
References
Ahuja, Gautam, Giuseppe Soda, and Akbar Zaheer (2012). ‘The Genesis and Dynamicsof Organizational Networks’. In: Organization Science 23.2, pp. 434–448.
Aschhoff, Birgit (2009). ‘Who gets the money? - The dynamics of R&D project subsidiesin Germany’. In: ZEW - Centre for European Economic Research Discussion Paper
08–018.Balland, Pierre-Alexandre (2012). ‘Proximity and the Evolution of Collaboration Net-works: Evidence from Research and Development Projects within the Global Naviga-tion Satellite System (GNSS) Industry’. In: Regional Studies 46.6, pp. 741–756.
Belsey, David A., Edwin Kuh, and Roy E. Welsch (1980). Regression diagnostics: Iden-
tifying influential data and sources of collinearity. New York: John Wiley.Blanes, J. Vicente and Isabel Busom (2004). ‘Who participates in R&D subsidy pro-grams?: The case of Spanish manufacturing firms’. In: Research Policy 33.10, pp. 1459–1476.
Bonacich, Phillip (1987). ‘Power and Centrality: A Family of Measures’. In: American
Journal of Sociology 92.5, pp. 1170–1182.Boschma, Ron (2005). ‘Proximity and Innovation: A Critical Assessment’. In: RegionalStudies 39.1, pp. 61–74.
Boschma, Ron and Koen Frenken (2009). The Spatial Evolution of Innovation Networks:
A Proximity Perspective. Papers in Evolutionary Economic Geography (PEEG) 0905.Utrecht University, Section of Economic Geography.
Broekel, Tom and Holger Graf (2012). ‘Public research intensity and the structure ofGerman R&D networks: a comparison of 10 technologies’. In: Economics of Innovation
and New Technology 21.4, pp. 345–372.Brusoni, Stefano, Andrea Prencipe, and Keith Pavitt (2001). ‘Knowledge Specialization,Organizational Coupling, and the Boundaries of the Firm: Why Do Firms Know MoreThan They Make?’ English. In: Administrative Science Quarterly 46.4, pp. 597–621.
Burt, Ronald S. (2000). ‘The network structure of social capital’. In: Research in Orga-
nizational Behavior 22, pp. 345–423.Cantner, Uwe and Sarah Kosters (2009). Picking the winner? Empirical evidence on
the targeting of R&D subsidies to start-ups. eng. Jena Economic Research Papers 93.Friedrich Schiller Universitat Jena.
Chiang, Alpha C. and Kevin Wainwright (2005). Fundamental methods of mathematical
economics. McGraw-Hill.Cohen, Wesley M. and Daniel A. Levinthal (1990). ‘Absorptive Capacity: A New Per-spective on Learning and Innovation’. English. In: Administrative Science Quarterly
35.1, pp. 128–152.Czarnitzki, Dirk and Andreas Fier (2003). ‘Publicly Funded R&D Collaborations andPatent Outcome in Germany’. In: ZEW - Centre for European Economic Research
Discussion Paper 03-24.Destatis (2008). Klassifikation der Wirtschaftszweige. Tech. rep. Statistisches Bunde-samt.
27
#1403
Eickelpasch, Alexander and Michael Fritsch (2005). ‘Contest for Cooperation - A NewApproach in German Innovation Policy’. In: DIW Discussion Papers 478.
EU (2006). The new SME definition – User guide and model declaration. Ed. by Kom-mission. Publications Office.
Federal Ministry of Education and Research (2012). Bundesbericht Forschung und Inno-
vation 2012.Fier, Andreas and Dietmar Harhoff (2002). ‘Die Evolution der bundesdeutschen Forschungs-und Technologiepolitik: Ruckblick und Bestandsaufnahme’. In: Perspektiven der Wirtschaft-
spolitik 3, pp. 279–301.Fleming, Lee, Charles King, and Adam I. Juda (2007). ‘Small Worlds and RegionalInnovation’. In: Organization Science 18.6, pp. 938–954.
Fornahl, Dirk, Tom Broekel, and Ron Boschma (2011). ‘What drives patent performanceof German biotech firms? The impact of R&D subsidies, knowledge networks and theirlocation’. In: Papers in Regional Science 90.2, pp. 395–418.
Fornahl, Dirk and Florian Umlauf (2014). ‘FuE-Forderung zur Entwicklung landlicherRaume: Empirische Bestandsaufnahmen und Entwicklungspotenziale’. In: Beck, R.and Heinze R. und Schmid J. Chap. 21, pp. 197–518.
Freeman, Linton C. (1978). ‘Centrality in social networks conceptual clarification’. In:Social Networks 1.3, pp. 215–239.
Fryges, Helmut (2007). ‘The Change of Sales Modes in International Markets: Empir-ical Results for German and British High-Tech Firms’. In: Progress in International
Business Research 1, pp. 139–185.Gould, Roger V. and Roberto M. Fernandez (1989). ‘Structures of Mediation: A FormalApproach to Brokerage in Transaction Networks’. English. In: Sociological Methodology
19, pp. 89–126.Gourieroux, Christian (2000). Econometrics of Qualitative Dependent Variables. Ed. byPeter C.B. Phillips. Cambridge University Press.
Granovetter, Mark (1985). ‘Economic Action and Social Structure: The Problem of Em-beddedness’. English. In: American Journal of Sociology 91.3, pp. 481–510.
Greene, William H. (2002). Econometric Analysis. Ed. by Rod Banister. Fifth Edition.Pearson Education.
Imai, Kosuke, Gary King, and Olivia Lau (2008). ‘Toward a Common Framework forStatistical Analysis and Development’. In: Journal of Computational and Graphical
Statistics 17.4, pp. 892–913.Jackson, Matthew O. (2008). Social and Economic Networks. Journal Article. PrincetonUniversity Press.
Keese, Detlef, Ralf Philipp, and Niclas Ruffer (2012). ‘Determinants for the ApplicationDecision for Innovation Subsidies’. In: Center for SME Research and Entrepreneurship
University of Mannheim.King, Gary and Langche Zeng (2001). ‘Logistic Regression in Rare Events Data’. In:Political Analysis 9.2, pp. 137–163.
Levinthal, Daniel A. and Mark Fichman (1988). ‘Dynamics of Interorganizational At-tachments: Auditor-Client Relationships’. English. In: Administrative Science Quar-
terly 33, pp. 345–369.
28
#1403
Mora-Valentin, Eva M., Angeles Montoro-Sanchez, and Luis A. Guerras-Martin (2004).‘Determining factors in the success of R&D cooperative agreements between firms andresearch organizations’. In: Research Policy 33.1, pp. 17–40.
Mowery, David C., Joanne E. Oxley, and Brian S. Silverman (1998). ‘Technologicaloverlap and interfirm cooperation: implications for the resource-based view of thefirm’. In: Research Policy 27.5, pp. 507–523.
Newman, M. E. J. (2001). ‘Scientific collaboration networks. II. Shortest paths, weightednetworks, and centrality’. In: Physical Review E 64, pp. 1–7.
Nguyen Van, Phu, Francois Laisney, and Ulrich Kaiser (2004). ‘The Performance ofGerman Firms in the Business-Related Service Sector’. In: Journal of Business &
Economic Statistics 22.3, pp. 274–295.Nooteboom, Bart (2000). Inter-firm Alliances: Analysis and Design. Reprinted. LondonnNew York: Routledge.
Nooteboom, Bart, Wim Van Haverbeke, Geert Duysters, Victor Gilsing, and Ad van denOord (2007). ‘Optimal cognitive distance and absorptive capacity’. In: Research Policy
36.7, pp. 1016–1034.Stock, James H. and Mark W. Watson (2007). Introduction to Econometrics. Ed. byDenise Clinton. Pearson.
Tanayama, Tanja (2007). Eligibility, awareness and the application decision: An empir-
ical study of firm participation in an R&D subsidy program. Helsinki Center of Eco-nomic Research - Discussion Papers 161. Helsinki School of Economics and HECER.
Ter Wal, Anne L. J. (2013). ‘The dynamics of the inventor network in German biotechnol-ogy: geographic proximity versus triadic closure’. In: Journal of Economic Geography.
Uzzi, Brian (1996). ‘The Sources and Consequences of Embeddedness for the EconomicPerformance of Organizations: The Network Effect’. English. In: American Sociological
Review 61.4, pp. 674–698.Wasserman, Stanley and Katherine Faust (1994). Socal Network Analysis. CambridgeUniversity Press.
29