Embed Size (px)
Citation preview
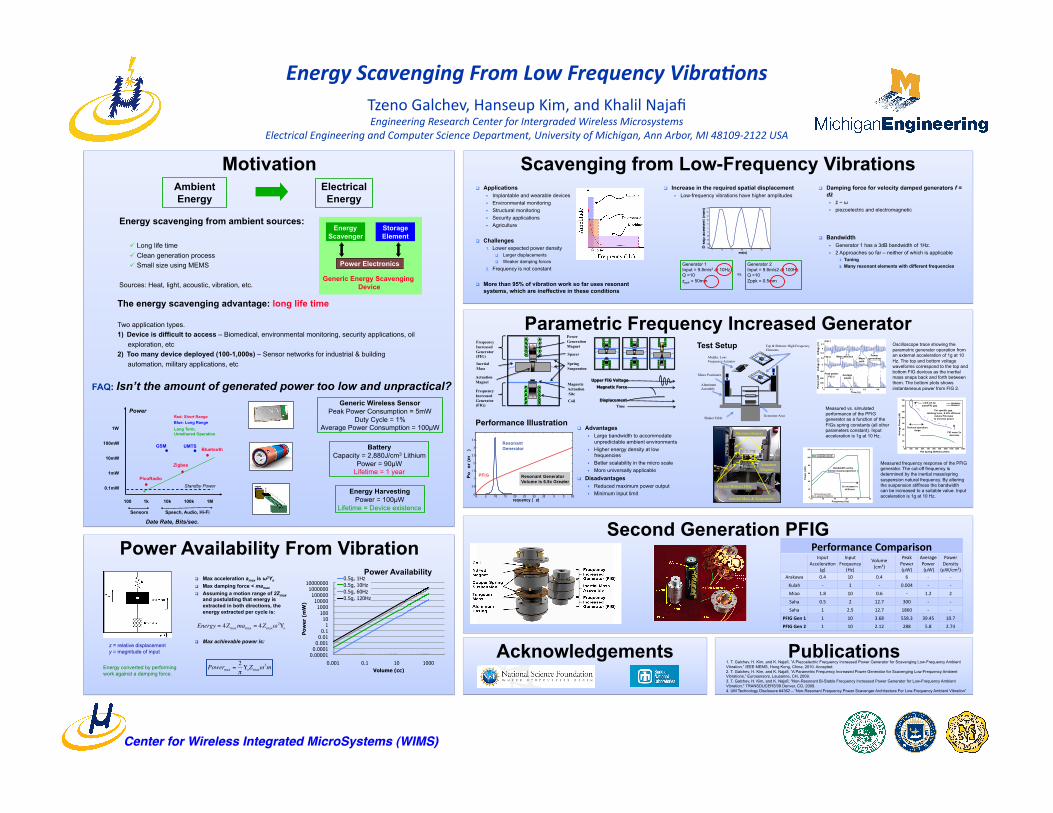
EnergyScavengingFromLowFrequencyVibra6onsTzenoGalchev,HanseupKim,andKhalilNajafiEngineeringResearchCenterforIntergradedWirelessMicrosystems
ElectricalEngineeringandComputerScienceDepartment,UniversityofMichigan,AnnArbor,MI48109‐2122USA
Power Availability From Vibration
Motivation Ambient Energy
Electrical Energy
Energy scavenging from ambient sources:
Long life time Clean generation process Small size using MEMS
Sources: Heat, light, acoustic, vibration, etc.
Storage Element
Power Electronics
Energy Scavenger
Generic Energy Scavenging Device
The energy scavenging advantage: long life time
Two application types. 1) Device is difficult to access – Biomedical, environmental monitoring, security applications, oil
exploration, etc 2) Too many device deployed (100-1,000s) – Sensor networks for industrial & building
automation, military applications, etc
FAQ: Isn’t the amount of generated power too low and unpractical? Generic Wireless Sensor
Peak Power Consumption = 5mW Duty Cycle = 1%
Average Power Consumption = 100µW
Battery Capacity = 2,880J/cm3 Lithium
Power = 90µW Lifetime = 1 year
Energy Harvesting Power = 100µW
Lifetime = Device existence
1W
100mW
10mW
1mW
0.1mW
100 1k 10k 100k 1M
Sensors Speech, Audio, Hi-Fi
GSM UMTS Bluetooth
Zigbee
PicoRadio
Red: Short Range Blue: Long Range
Power
Date Rate, Bits/sec.
Standby Power
Long Term, Untethered Operation
z = relative displacement y = magnitude of input
Energy converted by performing work against a damping force.
Max acceleration amax is ω2Yo
Max damping force < mamax
Assuming a motion range of 2Zmax and postulating that energy is extracted in both directions, the energy extracted per cycle is:
Max achievable power is:
€
Energy = 4Zmaxmamax = 4Zmaxω2Υo
€
Powermax =2πΥoZmaxω
3m
Scavenging from Low-Frequency Vibrations Applications
Implantable and wearable devices Environmental monitoring Structural monitoring Security applications Agriculture
Challenges 1. Lower expected power density
Larger displacements Weaker damping forces
2. Frequency is not constant
More than 95% of vibration work so far uses resonant systems, which are ineffective in these conditions
0.00001 0.0001 0.001 0.01 0.1
1 10
100 1000
10000 100000
1000000 10000000
0.001 0.1 10 1000
Pow
er (
mW
)
Volume (cc)
0.5g, 1Hz 0.5g, 10Hz 0.5g, 60Hz 0.5g, 120Hz
Power Availability
Increase in the required spatial displacement Low-frequency vibrations have higher amplitudes
vs.
Generator 2 Input = 9.8m/s2 at 100Hz Q =10 Zppk = 0.5mm
Generator 1 Input = 9.8m/s2 at 10Hz Q =10 zppk = 50mm
Damping force for velocity damped generators f = dż ż ~ ω piezoelectric and electromagnetic
Bandwidth Generator 1 has a 3dB bandwidth of 1Hz. 2 Approaches so far – neither of which is applicable
1. Tuning 2. Many resonant elements with different frequencies
Parametric Frequency Increased Generator
Advantages Large bandwidth to accommodate
unpredictable ambient environments Higher energy density at low
frequencies Better scalability in the micro scale More universally applicable
Disadvantages Reduced maximum power output Minimum input limit
Performance Illustration
Acknowledgements Publications 1. T. Galchev, H. Kim, and K. Najafi, ”A Piezoelectric Frequency Increased Power Generator for Scavenging Low-Frequency Ambient Vibration,” IEEE MEMS, Hong Kong, China, 2010. Accepted. 2. T. Galchev, H. Kim, and K. Najafi, ”A Parametric Frequency Increased Power Generator for Scavenging Low-Frequency Ambient Vibrations,” Eurosensors, Lausanne, CH, 2009. 3. T. Galchev, H. Kim, and K. Najafi, "Non-Resonant Bi-Stable Frequency Increased Power Generator for Low-Frequency Ambient Vibration," TRANSDUCERS'09 Denver, CO, 2009. 4. UM Technology Disclosure #4362 – “Non-Resonant Frequency Power Scavenger Architecture For Low-Frequency Ambient Vibration”
N
S
N
S
N
S
Inertial Mass
Frequency Increased Generator (FIG)
Actuation Magnet Magnetic
Actuation Site
Spring Suspension
Coil
Frequency Increased Generator (FIG)
Power Generation Magnet
Spacer
Time Displacement
Magnetic Force
Upper FIG Voltage
Top & Bottom: High Frequency Elements
Shaker Table
Aluminum Assembly
Micro Positioner
Generator Area
Middle: Low-Frequency Actuator
Top and Bottom FIGs
Micropositioners
Actuation Magnets
Inertial Mass & Suspension
Oscilloscope trace showing the parametric generator operation from an external acceleration of 1g at 10 Hz. The top and bottom voltage waveforms correspond to the top and bottom FIG devices as the inertial mass snaps back and forth between them. The bottom plots shows instantaneous power from FIG 2.
Measured vs. simulated performance of the PFIG generator as a function of the FIGs spring constants (all other parameters constant). Input acceleration is 1g at 10 Hz.
Measured frequency response of the PFIG generator. The cut-off frequency is determined by the inertial mass/spring suspension natural frequency. By altering the suspension stiffness the bandwidth can be increased to a suitable value. Input acceleration is 1g at 10 Hz.
Test Setup
Second Generation PFIG PerformanceComparison
InputAccelera=on
(g)
InputFrequency
(Hz)
Volume(cm3)
PeakPower(µW)
AveragePower(µW)
PowerDensity(µW/cm3)
Arakawa 0.4 10 0.4 6 ‐ ‐
Kulah ‐ 1 ‐ 0.004 ‐ ‐
Miao 1.8 10 0.6 ‐ 1.2 2
Saha 0.5 2 12.7 300 ‐ ‐
Saha 1 2.5 12.7 1860 ‐ ‐
PFIGGen1 1 10 3.68 558.3 39.45 10.7
PFIGGen2 1 10 2.12 288 5.8 2.74