Embed Size (px)
Citation preview
Im Fachbereich Physik der Freien Universitat Berlin eingereichte Dissertation.
Ultrafast hot carrier driven
magnetization dynamics
by
Alexandr Alekhin
2015

Die vorliegende Arbeit wurde im Zeitraum von Februar 2011 bis Oktober 2015, imFritz-Haber Institut der Max-Planck Gesellschaft unter der Betreuung von Prof. Dr.Martin Wolf, angefertigt.
Berlin, Oktober 2015
1. Gutachter: Prof. Dr. Martin Wolf
2. Gutachter: Prof. Dr. Martin Weinelt
Datum der Disputation: 04.02.2016

Abstract
This work investigates ultrafast magnetization dynamics driven by hot carrier (HC)transport in metallic multilayer (ML) structures using femtosecond time-resolved linearand nonlinear optical spectroscopy. The linear magneto-optical Kerr effect (MOKE)and magneto-induced second harmonic (SH) generation (mSHG) have been utilizedto study optically induced spin dynamics in highly excited state of matter with 20-femtosecond (fs) time resolution approaching the time scales of underlying elementaryprocesses in metals. The spin transfer from a ferromagnet to a noble metal or from oneferromagnet to another one through a non-magnetic spacer by means of HC transportis of particular interest in this thesis. Investigation of these effects is of great impor-tance for understanding of ultrafast spin dynamics and has a potentially high impacton future spintronic devices. Epitaxial Au/Fe/MgO(001) and Fe/Au/Fe/MgO(001)structures have been used as basic model systems, where in the latter case one Fe layerserves as a spin-emitter and another Fe layer serves as a spin-collector.
As a first step towards understanding of the spin transfer in metallic MLs, HCtransport has been investigated in simpler two-layer Au/Fe/MgO(001) structures. Ithas been shown that pumping the Fe film through a transparent MgO substrate leadsto the generation of a spin current (SC) flowing from the ferromagnetic film into thenon-magnetic layer. This phenomenon is an analog of the spin Seebeck effect, but inthis case the SC is dominated by non-equilibrium (NEQ) HCs propagating in Au in aquasi-ballistic regime. According to the first principle quantum transport calculation,the emission of majority electrons from the Fe film into the Au layer is much moreefficient than the emission of other HCs, which provides a net flux of the positive SPinto the bulk of Au. Quantitative analysis of the MOKE signals, measured from the Feside of Au/Fe/MgO(001) structures with different Fe thicknesses, reveals a considerablecontribution of the HC transport to ultrafast demagnetization of the Fe film, followedby a build-up of transient magnetization in the Au layer which also contributes to theMOKE signal.
Finally, magnetization dynamics induced in a ferromagnet by the injection of thespin-polarized HCs has been studied on three-layer Fe/Au/Fe/MgO(001) structures.Owing to different coercitivities of the Fe films, the magnetizations in the spin-emitterand the spin-collector can be aligned parallel, antiparallel or orthogonal to each other.For the orthogonal alignment, it has been demonstrated that the optically-driven SCpulse excites standing spin waves in the spin-collector via the spatially non-uniformspin transfer torque (STT) mechanism. Realization of different mutual orientationsof the external magnetic field and the magnetizations in the spin-emitter and thespin-collector makes it possible to disentangle STT from laser-induced heating of thesample. Moreover, in the analysis of the mSHG response measured in different mag-netic geometries it has been undoubtedly proven that the SC pulse gives rise to the SHfield originating in the bulk. All data are in a good agreement with the experimentalresults obtained on two-layer structures and sustains the model of spin-polarized HCtransport.
I

Deutsche Kurzfassung
Diese Arbeit umfasst die Untersuchung der ultraschnellen Magnetisierungsdynamikdurch Transport heißer Ladungtrager (HC) in metallischen Multilayer(ML)-Strukturenanhand zeitaufgeloster linearer und nichtlinearer optischer Femtosekundenspektroskopie.Der lineare magneto-optische Kerr-Effekt (MOKE) und die magnetisch induzierteErzeugung der zweiten Harmonischen (mSHG) wurden verwendet, um lichtinduzierteSpindynamik in hoch angeregten Zustanden der Materie mit 20 Femtosekunden (fs)Zeitauflosung zu untersuchen, was den Zeitskalen zugrundeliegender Elementarprozessein Metallen entspricht. Der Spintransfer von einem Ferromagneten zu einem Edelmet-all, oder von einem Ferromagneten zum anderen Ferromagneten mittels HC-Transportdurch eine nichtmagnetische Zwischenschicht hindurch ist von besonderem Interessein dieser Arbeit. Untersuchungen dieser Effekte sind von großer Bedeutung fur dasVerstandnis der ultraschnellen Spindynamik, und die gewonnenen Erkenntnisse habenmoglicherweise einen großen Einfluss auf zukunftige Spintronik-Gerate. Als Modell-systeme wurden epitaktische Au/Fe/MgO(001) und Fe/Au/Fe/MgO(001) Strukturenverwendet, wobei im letztgenannten Fall eine Fe-Schicht als Spinemitter und die andereFe-Schicht als Spinkollektor dient.
Als erster Schritt zum Verstandnis des Spin-Transfers in metallischen MLs, wurdeder HC Transport in einfachen Zweischicht-Au/Fe/MgO(001)-strukturen untersucht.Es wurde gezeigt, dass die optische Anregung von Fe zur Erzeugung eines Spin-Stromsfuhrt, der von der ferromagnetischen Schicht in die nicht-magnetische Schicht fließt.Dieses Phanomen ist ein Analogon zum Spin-Seebeck-Effekt, wobei in diesem Fallder Spin-Strom in Gold von nicht-gleichgewichts HCs dominiert wird, die sich imquasi-ballistichen Regime bewegen. Die quantitative Analyse der MOKE Signalen,die von der Fe-Seite der Au/Fe/MgO(001)-Strukturen mit unterschiedlichen Fe-Dickengemessen wurden, zeigt den bemerkbaren Beitrag des HC-Transports zur ultraschnellenEntmagnetisierung des Fe-Films, gefolgt von einer vorubergehenden Magnetisierungder Au-Schicht, die zusatzlich zum MOKE Signal beitragt.
Abschließend wurde Magnetisierungsdynamik, die in einem Ferromagneten mittelsder Injektion von spinpolarisierten HCs induziert wird, an Dreischicht-Fe/Au/Fe/MgO(001)-strukturen untersucht. Aufgrund unterschiedlicher Koerzitiv-krafte in den Fe-Filmen konnen die Magnetisierungen im Spinemitter und im Spinkollek-tor parallel, antiparallel oder orthogonal zueinander ausgerichtet werden. In der or-thogonalen Ausrichtung zeigt es sich, dass der optisch erzeugte Spinstrompuls stehendeSpinwellen im Spinkollektor erzeugt, die durch das raumlich inhomogen Spin-Transfer-Drehmoment (STT) induziert werden. Die Realisierung verschiedener gegenseitigenOrientierungen der außeren Magnetfeldes und der Magnetisierungen im Spin-emitterund im Spin-kollektor ermoglicht es, das Signal des STT unabhangig vom Signal derlaserinduzierter Erwarmung der Probe zu messen. Außerdem in der Analyse dermSHG-Antwort, die in verschiedenen magnetischen Geometrien gemessen wurde, kannes deutlich bewiesen werden, dass der Spinstrompuls resultiert im SH-Feld, das imVolum erzeugt wird. Alle Daten zeigen eine gute Ubereinstimmung mit den erhalte-nen Versuchsergebnissen der Zweischichtstrukturen und untermauern somit das Modelldes spinpolarisierten HC-Transports.
III

Contents
Abstract I
Deutsche Kurzfassung III
Contents V
1 Introduction and Motivation 11.1 Why study ultrafast spin dynamics . . . . . . . . . . . . . . . . . . . . 11.2 Experimental approach . . . . . . . . . . . . . . . . . . . . . . . . . . . 41.3 Scope of this thesis . . . . . . . . . . . . . . . . . . . . . . . . . . . . . 8
2 Magnetism and magnetization dynamics in metals 112.1 Itinerant ferromagnetism of 3d metals . . . . . . . . . . . . . . . . . . . 11
2.1.1 Magnetization and magnetic interactions . . . . . . . . . . . . . 122.1.2 Energy band structure . . . . . . . . . . . . . . . . . . . . . . . 16
2.2 Laser-induced dynamics in metals and metallic multilayers . . . . . . . 192.2.1 Absorption of light in metals . . . . . . . . . . . . . . . . . . . . 192.2.2 Hot carrier and magnetization dynamics in metals . . . . . . . . 222.2.3 Phenomenological description of magnetization dynamics . . . . 242.2.4 Microscopic models for the origin of ultrafast demagnetization . 26
2.3 Precessional magnetization dynamics . . . . . . . . . . . . . . . . . . . 282.3.1 Homogeneous precession . . . . . . . . . . . . . . . . . . . . . . 282.3.2 Spin waves . . . . . . . . . . . . . . . . . . . . . . . . . . . . . . 292.3.3 Laser-induced spin precession . . . . . . . . . . . . . . . . . . . 31
3 Time-resolved magneto-optical probe techniques 353.1 Light-matter interaction . . . . . . . . . . . . . . . . . . . . . . . . . . 353.2 Magneto-optical Kerr effect . . . . . . . . . . . . . . . . . . . . . . . . 37
3.2.1 Phenomenological description and macroscopic formalism . . . . 373.2.2 Microscopic formalism . . . . . . . . . . . . . . . . . . . . . . . 42
3.3 Magneto-induced Second Harmonic Generation . . . . . . . . . . . . . 423.3.1 Macroscopic formalism . . . . . . . . . . . . . . . . . . . . . . . 433.3.2 Microscopic formalism . . . . . . . . . . . . . . . . . . . . . . . 46
3.4 Hot carrier dynamics probed by the MOKE and the mSHG . . . . . . . 473.4.1 Variation of the magneto-optical constants . . . . . . . . . . . . 47
V
3.4.2 Current- and spin-current-induced contributions to the mSHG . 47
4 Experimental details 49
4.1 Ti:sapphire Oscillator with Cavity dumper . . . . . . . . . . . . . . . . 49
4.2 Temporal pulse compression . . . . . . . . . . . . . . . . . . . . . . . . 53
4.3 Data acquisition . . . . . . . . . . . . . . . . . . . . . . . . . . . . . . . 54
4.4 Calibration of the magnet . . . . . . . . . . . . . . . . . . . . . . . . . 57
4.5 Samples . . . . . . . . . . . . . . . . . . . . . . . . . . . . . . . . . . . 58
4.6 MOKE measurements . . . . . . . . . . . . . . . . . . . . . . . . . . . 60
4.7 mSHG measurements . . . . . . . . . . . . . . . . . . . . . . . . . . . . 61
4.7.1 Data analysis . . . . . . . . . . . . . . . . . . . . . . . . . . . . 62
4.7.2 SH cross-correlation and time resolution . . . . . . . . . . . . . 63
5 Ultrafast demagnetization of Fe in the absence of hot carrier transport 65
5.1 Separation of magnetism and optics . . . . . . . . . . . . . . . . . . . . 67
5.2 Phenomenological description . . . . . . . . . . . . . . . . . . . . . . . 68
5.3 Microscopic models . . . . . . . . . . . . . . . . . . . . . . . . . . . . . 72
5.3.1 Microscopic three-temperature model . . . . . . . . . . . . . . . 72
5.3.2 Model with the non-equilibrium hot carriers . . . . . . . . . . . 75
5.4 Nonlinear magneto-optical response . . . . . . . . . . . . . . . . . . . . 82
5.5 Conclusions . . . . . . . . . . . . . . . . . . . . . . . . . . . . . . . . . 85
6 Hot carrier injection from the Fe film into the Au layer 87
6.1 Static magneto-optical response of the Fe film . . . . . . . . . . . . . . 88
6.2 Laser-induced demagnetization of the Fe film . . . . . . . . . . . . . . . 92
6.3 Model of the ballistic hot carrier transport . . . . . . . . . . . . . . . . 94
6.3.1 Calculation of the ballistic hot carrier profile . . . . . . . . . . . 94
6.3.2 Analysis of the experimental data . . . . . . . . . . . . . . . . . 100
6.4 Conclusions . . . . . . . . . . . . . . . . . . . . . . . . . . . . . . . . . 103
7 Transport of spin-polarized hot carriers in Au 105
7.1 Transient magneto-optical response of Au . . . . . . . . . . . . . . . . . 106
7.1.1 Hot carrier transport: dependence on the Au thickness . . . . . 111
7.1.2 Hot carrier transport: dependence on the Fe thickness . . . . . . 117
7.1.3 Acoustic response as a tool to measure Au thickness . . . . . . . 119
7.2 Conclusions . . . . . . . . . . . . . . . . . . . . . . . . . . . . . . . . . 120
8 Spin dynamics induced in the Fe film by hot carrier injection 121
8.1 Magnetic configurations . . . . . . . . . . . . . . . . . . . . . . . . . . 122
8.2 Spin current . . . . . . . . . . . . . . . . . . . . . . . . . . . . . . . . . 124
8.3 Magnetization dynamics . . . . . . . . . . . . . . . . . . . . . . . . . . 130
8.3.1 Incoherent dynamics . . . . . . . . . . . . . . . . . . . . . . . . 130
8.3.2 Coherent dynamics . . . . . . . . . . . . . . . . . . . . . . . . . 134
8.4 Conclusions . . . . . . . . . . . . . . . . . . . . . . . . . . . . . . . . . 140
VI

9 Conclusions 1439.1 Summary and Conclusions . . . . . . . . . . . . . . . . . . . . . . . . . 1439.2 Outlook . . . . . . . . . . . . . . . . . . . . . . . . . . . . . . . . . . . 146
A Lists 149A.1 Abbreviations . . . . . . . . . . . . . . . . . . . . . . . . . . . . . . . . 149A.2 List of publications . . . . . . . . . . . . . . . . . . . . . . . . . . . . . 150A.3 Curriculum vitae . . . . . . . . . . . . . . . . . . . . . . . . . . . . . . 151
B Acknowledgements 153
Bibliography 155
VII

Chapter 1
Introduction and Motivation
1.1 Why study ultrafast spin dynamics
Since the invention of the integrated circuit in 1958 by Jack S. Kilby [1, 2] electronicdevice fabrication has come a long way from a feature size of the circuit elementsabove 10 microns to about few tens of nanometers in the most modern prototypes.In August 2014 Intel announced details of the 14-nm technology [3]. During the lastten years development of material processing and significant increase of the numberof transistors per chip made it possible to sustain 60% annual growth of the general-purpose computing capacity [4]. However, the smaller the device gets, the harder itbecomes to combine high performance, stability and power efficiency. The data storageis one of the variety of information technologies which have to deal with this problem.
Fast growth and development of cloud services, social networks, data bases andcomputational facilities have changed priorities of the companies specialized in theproduction of storage devices. Because of large power costs, huge amount of tran-sient data and demand for higher performance and instant access, for such applica-tions non-volatility, high reliability and low latency become the most important fac-tors. Nowadays there are three most perspective low latency memories: Phase ChangeMemory (PCM or PRAM), Magnetoresistive Random-Access Memory (MRAM) andSpin-Transfer-Torque Magnetic Random Access Memory (STT-MRAM). In Table 1.1general characteristics of these three storage devices are shown in comparison withother memory technologies: static RAM (SRAM), dynamic RAM (DRAM), flashmemory (NAND), ferroelectric RAM (FeRAM). PRAM is a very strong candidateto replace flash memory due to high density and low cost per bit. However, lim-ited endurance and long write/erase time make it unsuitable as a universal memory.MRAM devices are fast and non-volatile, but they use Oersted field to switch bitsfrom one state to another. It works well for large bit sizes, but when the bit size getssmaller, larger magnetic fields and consequently larger currents are required to switchmagnetization in one bit, resulting in higher power consumption.
1
CHAPTER 1. INTRODUCTION AND MOTIVATION
SRAM DRAMFlash(NAND)
FeRAM MRAM PRAMSTT-MRAM
Non-volatile No No Yes Yes Yes Yes Yes
Cell size (F 2) 50-120 6-10 5 15-34 16-40 6-12 6-20
Read time (ns) 1-100 30 50 20-80 3-20 20-50 2-20
Write/Erasetime (ns)
1-100 50/501 ms/0.1ms
50/50 3-20 50/120 2-20
Endurance 1016 1016 105 1012 > 1015 1010 > 1015
Write power Low LowVeryhigh
Low High Low Low
Other powerconsumption
Currentleakage
Refreshcurrent
None None None None None
High voltagerequired
No 2 V 16-20 V 2-3 V 3 V 1.5-3 V 0.15 V
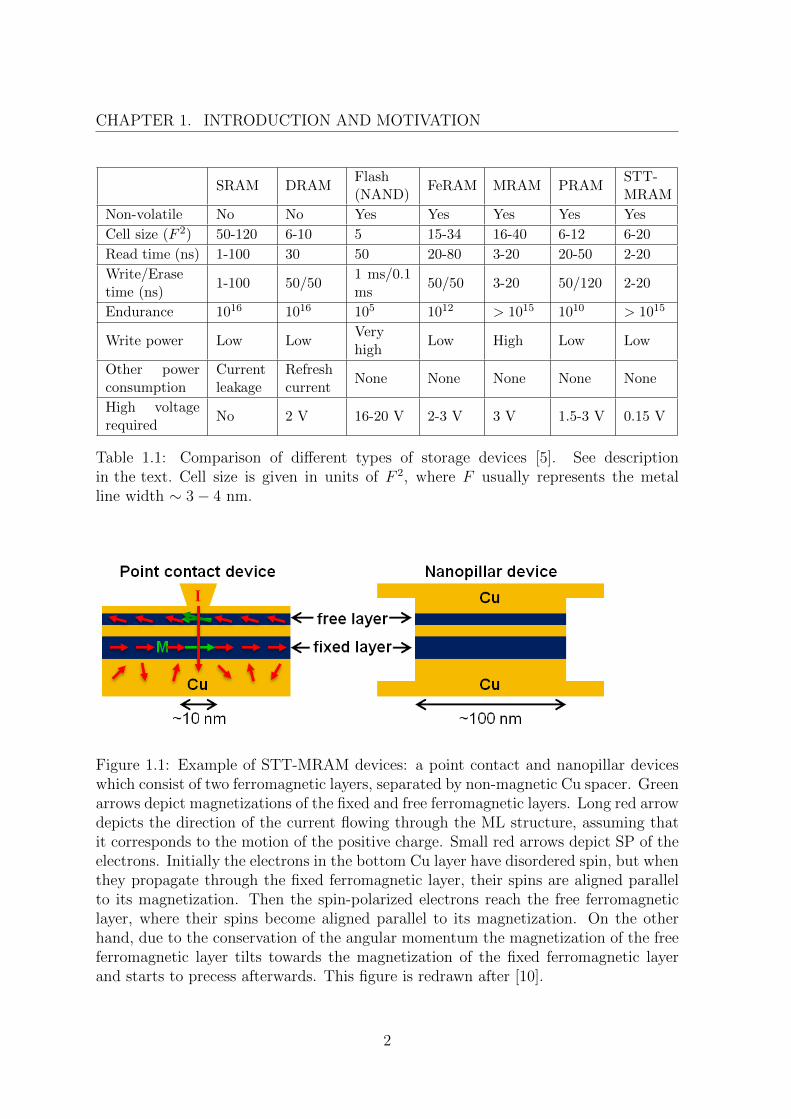
Table 1.1: Comparison of different types of storage devices [5]. See descriptionin the text. Cell size is given in units of F 2, where F usually represents the metalline width ∼ 3− 4 nm.
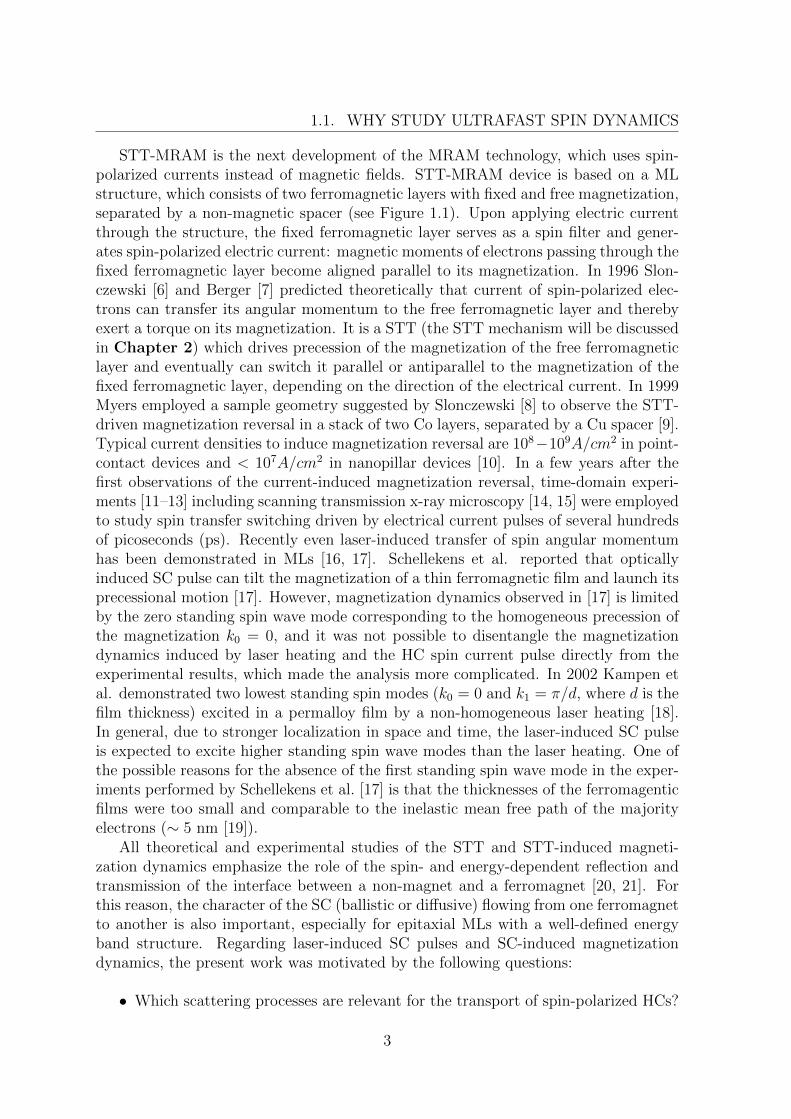
Figure 1.1: Example of STT-MRAM devices: a point contact and nanopillar deviceswhich consist of two ferromagnetic layers, separated by non-magnetic Cu spacer. Greenarrows depict magnetizations of the fixed and free ferromagnetic layers. Long red arrowdepicts the direction of the current flowing through the ML structure, assuming thatit corresponds to the motion of the positive charge. Small red arrows depict SP of theelectrons. Initially the electrons in the bottom Cu layer have disordered spin, but whenthey propagate through the fixed ferromagnetic layer, their spins are aligned parallelto its magnetization. Then the spin-polarized electrons reach the free ferromagneticlayer, where their spins become aligned parallel to its magnetization. On the otherhand, due to the conservation of the angular momentum the magnetization of the freeferromagnetic layer tilts towards the magnetization of the fixed ferromagnetic layerand starts to precess afterwards. This figure is redrawn after [10].
2
1.1. WHY STUDY ULTRAFAST SPIN DYNAMICS
STT-MRAM is the next development of the MRAM technology, which uses spin-polarized currents instead of magnetic fields. STT-MRAM device is based on a MLstructure, which consists of two ferromagnetic layers with fixed and free magnetization,separated by a non-magnetic spacer (see Figure 1.1). Upon applying electric currentthrough the structure, the fixed ferromagnetic layer serves as a spin filter and gener-ates spin-polarized electric current: magnetic moments of electrons passing through thefixed ferromagnetic layer become aligned parallel to its magnetization. In 1996 Slon-czewski [6] and Berger [7] predicted theoretically that current of spin-polarized elec-trons can transfer its angular momentum to the free ferromagnetic layer and therebyexert a torque on its magnetization. It is a STT (the STT mechanism will be discussedin Chapter 2) which drives precession of the magnetization of the free ferromagneticlayer and eventually can switch it parallel or antiparallel to the magnetization of thefixed ferromagnetic layer, depending on the direction of the electrical current. In 1999Myers employed a sample geometry suggested by Slonczewski [8] to observe the STT-driven magnetization reversal in a stack of two Co layers, separated by a Cu spacer [9].Typical current densities to induce magnetization reversal are 108−109A/cm2 in point-contact devices and < 107A/cm2 in nanopillar devices [10]. In a few years after thefirst observations of the current-induced magnetization reversal, time-domain experi-ments [11–13] including scanning transmission x-ray microscopy [14, 15] were employedto study spin transfer switching driven by electrical current pulses of several hundredsof picoseconds (ps). Recently even laser-induced transfer of spin angular momentumhas been demonstrated in MLs [16, 17]. Schellekens et al. reported that opticallyinduced SC pulse can tilt the magnetization of a thin ferromagnetic film and launch itsprecessional motion [17]. However, magnetization dynamics observed in [17] is limitedby the zero standing spin wave mode corresponding to the homogeneous precession ofthe magnetization k0 = 0, and it was not possible to disentangle the magnetizationdynamics induced by laser heating and the HC spin current pulse directly from theexperimental results, which made the analysis more complicated. In 2002 Kampen etal. demonstrated two lowest standing spin modes (k0 = 0 and k1 = π/d, where d is thefilm thickness) excited in a permalloy film by a non-homogeneous laser heating [18].In general, due to stronger localization in space and time, the laser-induced SC pulseis expected to excite higher standing spin wave modes than the laser heating. One ofthe possible reasons for the absence of the first standing spin wave mode in the exper-iments performed by Schellekens et al. [17] is that the thicknesses of the ferromagenticfilms were too small and comparable to the inelastic mean free path of the majorityelectrons (∼ 5 nm [19]).
All theoretical and experimental studies of the STT and STT-induced magneti-zation dynamics emphasize the role of the spin- and energy-dependent reflection andtransmission of the interface between a non-magnet and a ferromagnet [20, 21]. Forthis reason, the character of the SC (ballistic or diffusive) flowing from one ferromagnetto another is also important, especially for epitaxial MLs with a well-defined energyband structure. Regarding laser-induced SC pulses and SC-induced magnetizationdynamics, the present work was motivated by the following questions:
• Which scattering processes are relevant for the transport of spin-polarized HCs?
3
CHAPTER 1. INTRODUCTION AND MOTIVATION
• What kind of spin dynamics can be induced in the ferromagnetic film by theinjection of spin-polarized HCs?
• What are the mechanisms governing this spin dynamics?
• How important is the ballistic character of the HC transport?
In addition to already mentioned SC-induced spin dynamics, laser-induced trans-port of spin-polarized HCs is of particular interest as a candidate for the origin ofultrafast laser-induced demagnetization [22–24]. One of the main break-through inthis field of the magnetization dynamics is the discovery of subpicosecond demagneti-zation of a thin Ni film in 1996 [25]. These experiments performed by Beaurepaire etal. started a new quest which is troubling scientists even today:
• What is the origin of ultrafast laser-induced demagnetization?
Since then ultrafast laser-induced magnetization dynamics has been observed in ahuge variety of magnetic systems, but mechanisms of underlying processes are notwell-understood yet. Complexity of different theoretical models and interpretation ofthe experimental results is related to the fact that a femtosecond laser pulse bringsthe system in a highly excited state, where magnetic phenomena can not be describedin terms of thermodynamics and conventional approximations applied for systems inequilibrium [26]. Besides that, depending on a studied system, several mechanismsmay compete with each other. In order to disentangle their influence on the observedmagnetization dynamics, further systematic studies are required.
The present thesis addresses all mentioned fundamental challenges with the inves-tigation of the optically induced HC transport in epitaxial metallic MLs. Epitaxiallygrown sample ensures well-defined structure of the films and the interfaces betweenthem, which simplifies modelling and comparison of the experimental results with ab-initio calculations. The next section gives an overview of the experimental approach.
1.2 Experimental approach
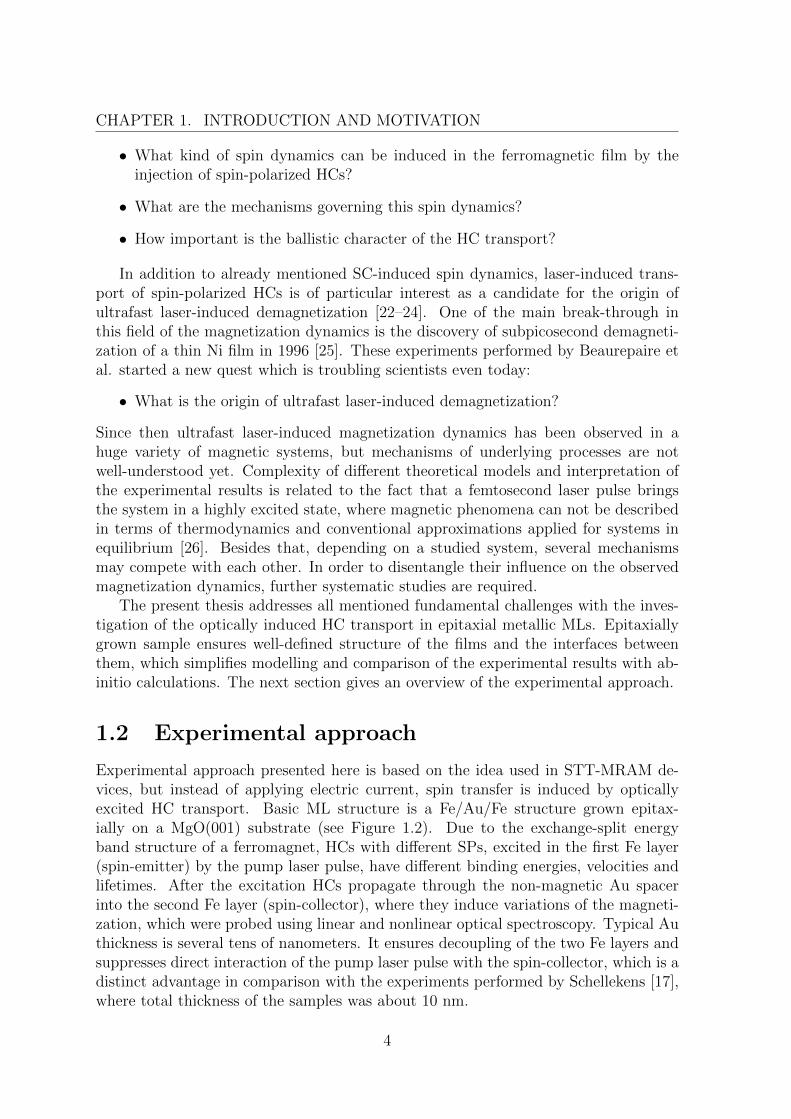
Experimental approach presented here is based on the idea used in STT-MRAM de-vices, but instead of applying electric current, spin transfer is induced by opticallyexcited HC transport. Basic ML structure is a Fe/Au/Fe structure grown epitax-ially on a MgO(001) substrate (see Figure 1.2). Due to the exchange-split energyband structure of a ferromagnet, HCs with different SPs, excited in the first Fe layer(spin-emitter) by the pump laser pulse, have different binding energies, velocities andlifetimes. After the excitation HCs propagate through the non-magnetic Au spacerinto the second Fe layer (spin-collector), where they induce variations of the magneti-zation, which were probed using linear and nonlinear optical spectroscopy. Typical Authickness is several tens of nanometers. It ensures decoupling of the two Fe layers andsuppresses direct interaction of the pump laser pulse with the spin-collector, which is adistinct advantage in comparison with the experiments performed by Schellekens [17],where total thickness of the samples was about 10 nm.
4
1.2. EXPERIMENTAL APPROACH
Figure 1.2: Experimental geometry. Optical pumping of the first ferromagnetic layer(spin-emitter) leads to the excitation of majority (non-transparent green balls) andminority (non-transparent red balls) electrons to the states with different binding en-ergies due to the exchange-split d-bands of Fe. Majority electrons and minority holes(transparent red balls) carry positive SP with respect to the magnetization ME of thespin-emitter, while minority electrons and majority holes (transparent green balls) areresponsible for the transport of the negative SP. After the excitation spin-polarizedHCs are injected into the non-magnetic Au spacer, where they form spin current pulse.Upon the arrival to the interface between the Au spacer and the second ferromagneticlayer (spin-collector), spin-polarized HCs induces variations of the magnetization MC ,monitored by the transient MOKE and mSHG signals.
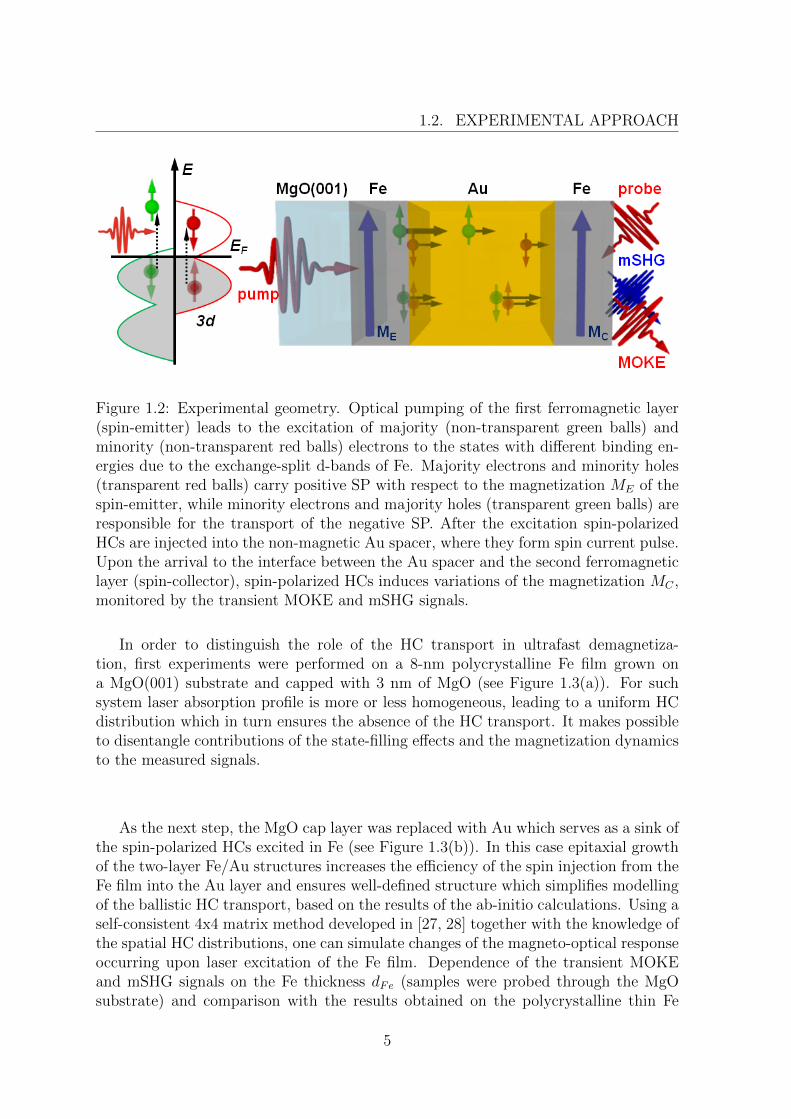
In order to distinguish the role of the HC transport in ultrafast demagnetiza-tion, first experiments were performed on a 8-nm polycrystalline Fe film grown ona MgO(001) substrate and capped with 3 nm of MgO (see Figure 1.3(a)). For suchsystem laser absorption profile is more or less homogeneous, leading to a uniform HCdistribution which in turn ensures the absence of the HC transport. It makes possibleto disentangle contributions of the state-filling effects and the magnetization dynamicsto the measured signals.
As the next step, the MgO cap layer was replaced with Au which serves as a sink ofthe spin-polarized HCs excited in Fe (see Figure 1.3(b)). In this case epitaxial growthof the two-layer Fe/Au structures increases the efficiency of the spin injection from theFe film into the Au layer and ensures well-defined structure which simplifies modellingof the ballistic HC transport, based on the results of the ab-initio calculations. Using aself-consistent 4x4 matrix method developed in [27, 28] together with the knowledge ofthe spatial HC distributions, one can simulate changes of the magneto-optical responseoccurring upon laser excitation of the Fe film. Dependence of the transient MOKEand mSHG signals on the Fe thickness dFe (samples were probed through the MgOsubstrate) and comparison with the results obtained on the polycrystalline thin Fe
5
CHAPTER 1. INTRODUCTION AND MOTIVATION
film revealed considerable role of the HC transport in ultrafast demagnetization andallowed us to estimate its efficiency. It has been concluded that the emission of themajority electrons is much more efficient than the emission of other HCs. This resultis in a good agreement with ab-initio calculations of the inelastic mean free path λHCFein Fe and the transmission THCFe→Au of the Fe/Au interface.
After the injection from the Fe film, spin-polarized HCs continue to propagate fur-ther into the bulk of the Au layer. Pumping the Fe film and probing the Au side of theAu/Fe/MgO(001) structures with different Au thicknesses, it can be observed that thelaser-induced SC pulse is formed predominantly by the majority electrons propagatingin Au in a quasi-ballistic regime. In the static regime the mSHG can be considered asa purely surface/interface-sensitive technique. After the optical excitation of Fe, trans-port of the spin-polarized HCs may give rise to HC-current- and SC-induced SH fieldsoriginating in the bulk of the Fe and Au films. Nevertheless, analysis of the mSHGdata allows us to monitor arrival of the spin-polarized HCs at the Au surface, therebyrealizing a time-of-flight-like experiment (see Figure 1.3(b)). The Fe thickness dFe alsoplays a very important role for the HC transport in Au: the ratio between the lightpenetration depth, the inelastic mean free path, and the Fe thickness dFe determinesthe ratio between the optically excited HCs, injected into the Au layer in the ballisticregime, and the secondary HCs.
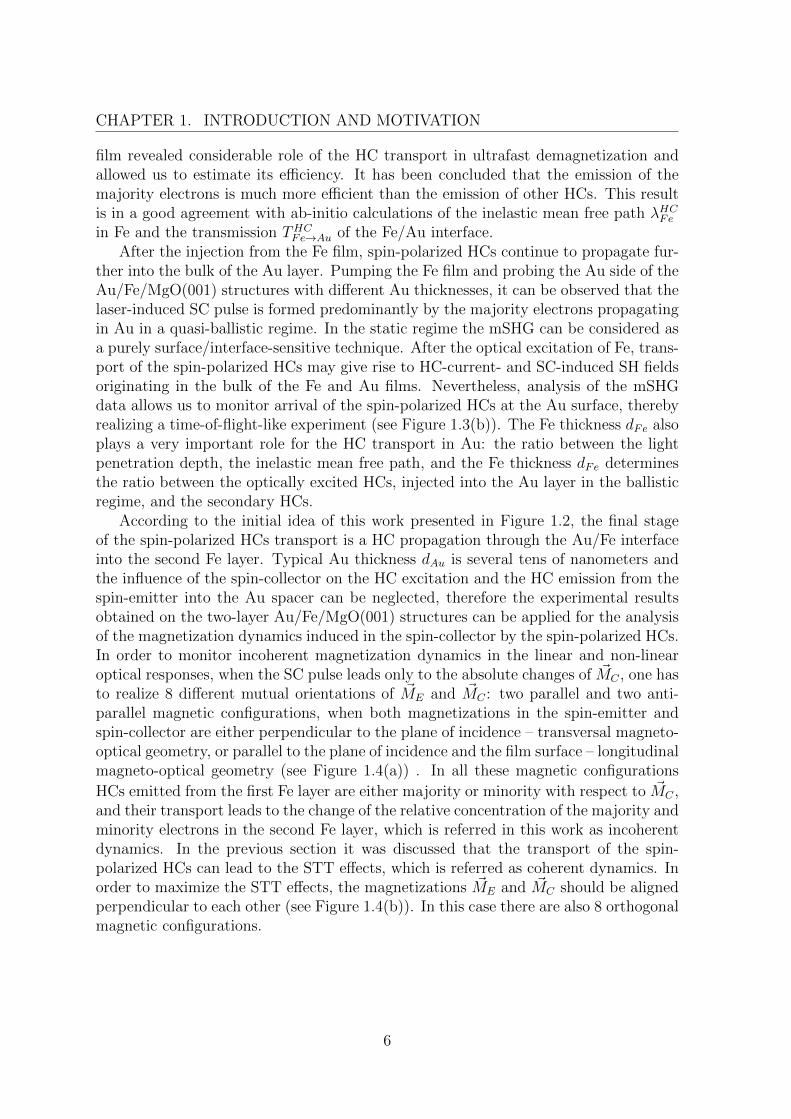
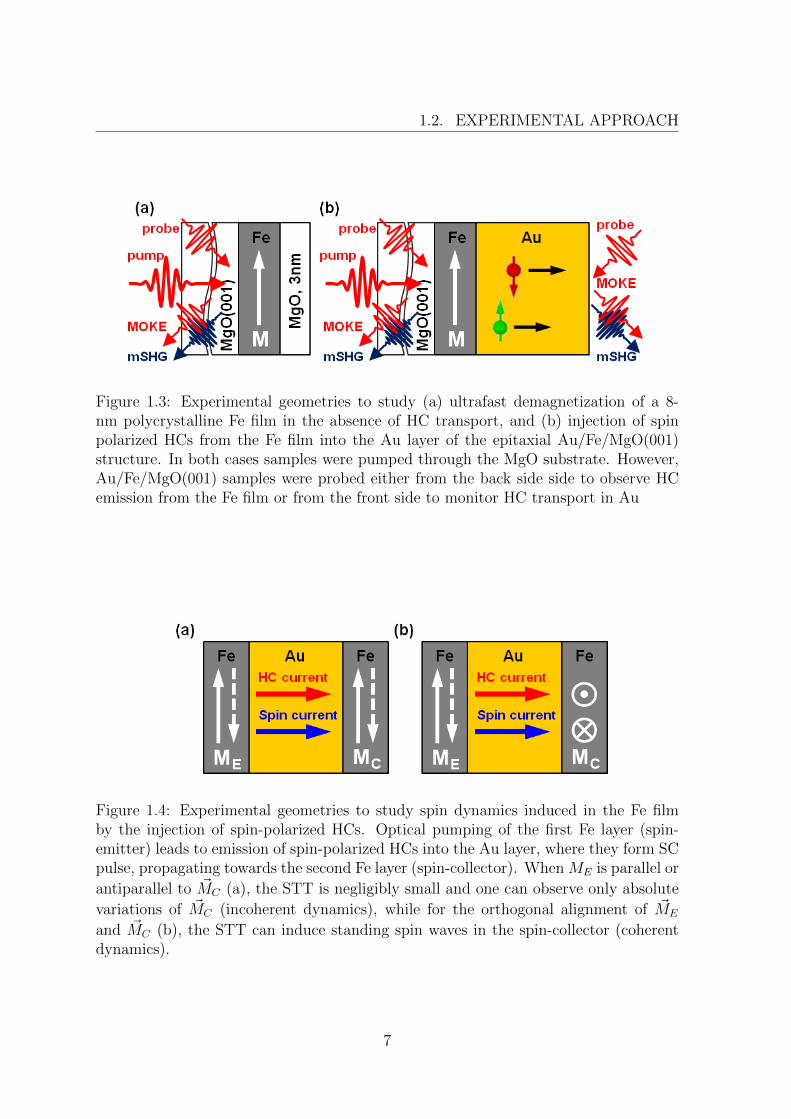
According to the initial idea of this work presented in Figure 1.2, the final stageof the spin-polarized HCs transport is a HC propagation through the Au/Fe interfaceinto the second Fe layer. Typical Au thickness dAu is several tens of nanometers andthe influence of the spin-collector on the HC excitation and the HC emission from thespin-emitter into the Au spacer can be neglected, therefore the experimental resultsobtained on the two-layer Au/Fe/MgO(001) structures can be applied for the analysisof the magnetization dynamics induced in the spin-collector by the spin-polarized HCs.In order to monitor incoherent magnetization dynamics in the linear and non-linearoptical responses, when the SC pulse leads only to the absolute changes of ~MC , one hasto realize 8 different mutual orientations of ~ME and ~MC : two parallel and two anti-parallel magnetic configurations, when both magnetizations in the spin-emitter andspin-collector are either perpendicular to the plane of incidence – transversal magneto-optical geometry, or parallel to the plane of incidence and the film surface – longitudinalmagneto-optical geometry (see Figure 1.4(a)) . In all these magnetic configurations
HCs emitted from the first Fe layer are either majority or minority with respect to ~MC ,and their transport leads to the change of the relative concentration of the majority andminority electrons in the second Fe layer, which is referred in this work as incoherentdynamics. In the previous section it was discussed that the transport of the spin-polarized HCs can lead to the STT effects, which is referred as coherent dynamics. Inorder to maximize the STT effects, the magnetizations ~ME and ~MC should be alignedperpendicular to each other (see Figure 1.4(b)). In this case there are also 8 orthogonalmagnetic configurations.
6
1.2. EXPERIMENTAL APPROACH
Figure 1.3: Experimental geometries to study (a) ultrafast demagnetization of a 8-nm polycrystalline Fe film in the absence of HC transport, and (b) injection of spinpolarized HCs from the Fe film into the Au layer of the epitaxial Au/Fe/MgO(001)structure. In both cases samples were pumped through the MgO substrate. However,Au/Fe/MgO(001) samples were probed either from the back side side to observe HCemission from the Fe film or from the front side to monitor HC transport in Au
Figure 1.4: Experimental geometries to study spin dynamics induced in the Fe filmby the injection of spin-polarized HCs. Optical pumping of the first Fe layer (spin-emitter) leads to emission of spin-polarized HCs into the Au layer, where they form SCpulse, propagating towards the second Fe layer (spin-collector). When ME is parallel or
antiparallel to ~MC (a), the STT is negligibly small and one can observe only absolute
variations of ~MC (incoherent dynamics), while for the orthogonal alignment of ~ME
and ~MC (b), the STT can induce standing spin waves in the spin-collector (coherentdynamics).
7
CHAPTER 1. INTRODUCTION AND MOTIVATION
1.3 Scope of this thesis
After general introduction, magnetism and magnetization dynamics in metals andmetallic MLs will be discussed in Chapter 2. It starts with properties of the itinerant3d ferromagnets (Fe, Co, Ni): the origin of ferromagnetism, itinerant behavior andelectron density of states. Then processes occurring in metals and metallic MLs uponlaser excitation are considered together with experimental works devoted to laser-induced ultrafast HC and magnetization dynamics. In this overview characteristic timeconstants obtained with different experimental techniques for Fe, Co and Ni, and theirdependence on experimental conditions are discussed together with microscopic andphenomenological models describing the observations. Special attention is devoted tosuperdiffusive spin transport. The last section of Chapter 2 is devoted to precessionalmagnetization dynamics and stimuli which can induce it.
In Chapter 3, magneto-optical pump-probe techniques for investigation of ultra-fast non-local spin dynamics are introduced. The MOKE and the mSHG are discussedin terms of phenomenological description and microscopic formalism. In the last sec-tion of Chapter 3 these two techniques are considered as a tool to probe HC andspin dynamics. In spite of apparent simplicity there are some challenges in correctinterpretation of the experimental data, related to the appearance of so-called ’opticalartefacts’, contributions from different parts of the ML structure to the linear andnon-linear magneto-optical signal.
Pump-probe experimental setup and details concerning samples and data analy-sis are presented in Chapter 4. It starts with a brief description of the CoherentMantis Laser system with cavity dumper as a source of 14-fs laser pulses with centralwavelength 820 nm. Then it proceeds with a description of the experimental setupand studied samples. Some special features of the experiments using ultrashort laserpulses are discussed. Further I provide experimental details for the MOKE and mSHGmeasurements: MOKE detectors with balanced photodiodes, different magneto-opticalgeometries.
Chapter 5 presents experimental results obtained on a 8-nm polycrystalline Fefilm. Owing to homogeneous laser absorption profile and nonconducting MgO substrateand cap layer, the HC spatial distribution is uniform, which allows us to neglect theHC transport. In this case it is possible to evaluate real transient magnetization anddisentangle its contribution to the MOKE rotation and ellipticity signals from thevariation of the magneto-optical constants. Observed demagnetization of the Fe filmoccurs on the time scale of approximately 200 fs only due to the spin-flip processes.This time appeared to be close to the characteristic time of the electron thermalization,meaning that ultrafast demagnetization is mostly dominated by the NEQ HCs.
Results presented in Chapter 5 have been used for the analysis of the HC injectionfrom the Fe film into Au, discussed in Chapter6. Pump-probe experiments have beenperformed on the Au/Fe/MgO(001) structures probing and pumping the Fe side ofthe samples. Static MOKE data are in a good agreement with theoretical calculationsaccording to the method described in Chapter 3. Simple model of the ballistic HCtransport has been developed to estimate demagnetization of the Fe film and evaluatethe magneto-optical constant of Au. Analysis of the transient MOKE signals reveals
8
1.3. SCOPE OF THIS THESIS
considerable role of the HC transport in the ultrafast demagnetization of the Fe film.In Chapter7 it is demonstrated that the HC injection from the Fe film into the Au
layer results in the SC pulse with a steep leading part, formed by the optically excitedHCs, leaving the ferromagnetic film in the ballistic regime, and a shallow trailing part,formed by the secondary HCs. Analyzing the MOKE and mSHG data, it can be seenthat the HC transport in Au has a quasi-ballistic character. Besides that, comparisonof the mSHG response measured in the transversal (p-in/p-out) and longitudinal (p-in/45 − out) magneto-optical geometries has brought us to the conclusion that theSC pulse gives rise to the SH field originating in the bulk of Au. At the same time inthe static regime the mSHG can be considered as a purely surface/interface sensitivetechnique.
Chapter8 is devoted to spin dynamics induced in the Fe film by the HC injection.At the beginning of Chapter8, it is demonstrated that if two Fe films in a three-layerFe/Au/Fe structure have different coercitivities, their magnetizations can be alignedparallel, antiparallel or orthogonal to each other. Using the MOKE and the mSHG,it is possible to identify the directions of the static magnetizations ~ME in the spin-emitter and ~MC in the spin-collector. Because of a larger variety of the magneticconfigurations in comparison with two-layer Au/Fe/MgO(001) structures, the mSHGdata obtained on three-layer Fe/Au/Fe structures provide an undoubtful evidence ofthe appearance of the SC-induced SH field. At the same time, the MOKE is exclusivelysensitive to the magnetization. Depending on the initial orientation of ~ME and ~MC , theinjection of the laser-induced SC pulse into the spin-collector can lead to the absolutechanges of ~MC (incoherent dynamics) or even drive its precessional motion (coherentdynamics). These results illuminate the role of spin-dependent HC scattering at theFe/Au interface.
9

Chapter 2
Magnetism and magnetizationdynamics in metals
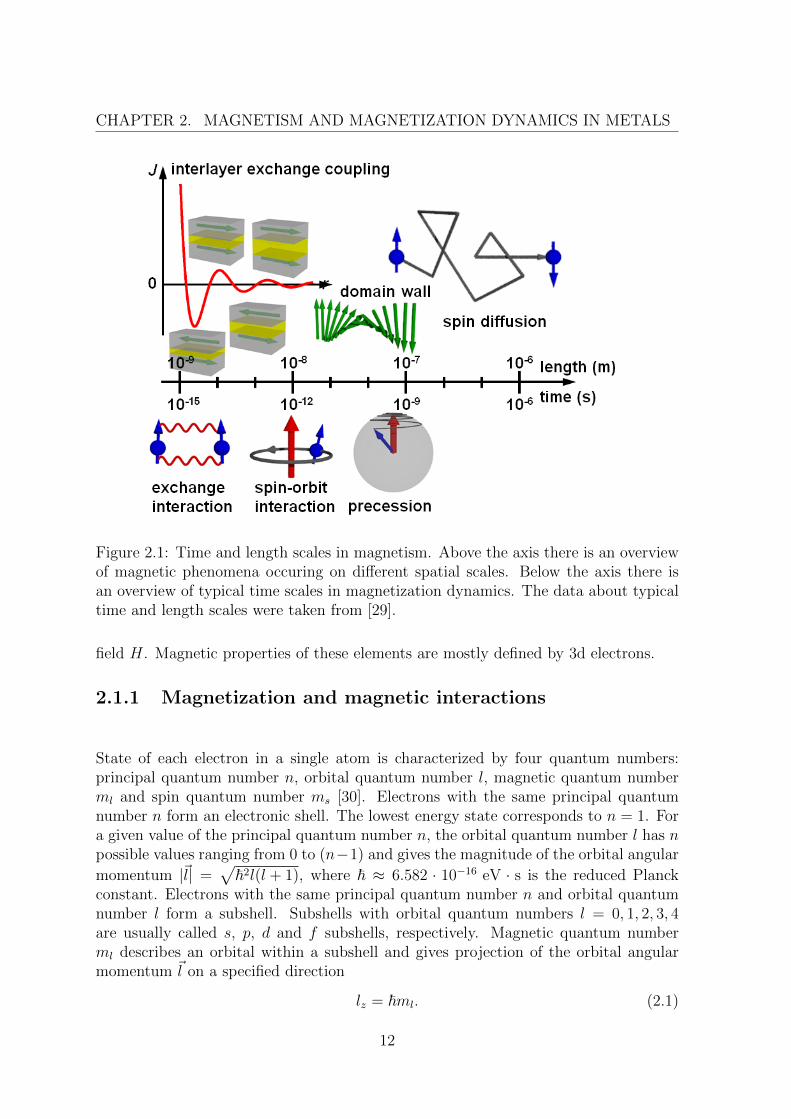
The field of magnetization dynamics includes a large variety of processes occurringon different spatial and time scales [29]: from few angstroms to microns, from fem-toseconds to picoseconds (see Figure 2.1). This chapter introduces the fundamentalconcepts for magnetic interactions and magnetization dynamics in metals, providingan overview of theoretical and experimental works.
In the first section the main attention is focused on itinerant ferromagnetism of3d metals iron (Fe), cobalt (Co) and nickel (Ni). These materials have been underinvestigation for years, but there is still no basic model which describes all magneticphenomena. Mostly this problem is related to the fact that such model should includeboth collective and local aspects of the interactions in the electronic subsystem andbetween the electronic and lattice subsystems.
Then an overview of laser-induced dynamics in metals and metallic MLs will begiven in the second section. In particular, possible mechanisms of ultrafast demagneti-zation of ferromagnetic films are considered. Typical time scales reported in literaturevary from several tens of femtoseconds to few picoseconds. In this case electronic,lattice and spin subsystems are far from equilibrium, and contributions of differentprocesses to the HC and magnetization dynamics can depend on the excitation condi-tions and vary with time.
Electron transport through an interface between a ferromagnet and a non-magneticmetal may lead to spin wave emission [7]. For this reason, the final section is devotedto precessional magnetization dynamics and mechanisms which can induce such dy-namics. Particular interest is related to the excitation of the standing spin waves inferromagnetic films by injection of spin-polarized HCs.
2.1 Itinerant ferromagnetism of 3d metals
The 3d metals Fe, Co, and Ni are known to be ferromagnets because of spontaneousmagnetization in the absense of the external magnetic field and large magnetic suscep-tibility χM which characterizes the ratio of magnetization M to the external magnetic
11
CHAPTER 2. MAGNETISM AND MAGNETIZATION DYNAMICS IN METALS
Figure 2.1: Time and length scales in magnetism. Above the axis there is an overviewof magnetic phenomena occuring on different spatial scales. Below the axis there isan overview of typical time scales in magnetization dynamics. The data about typicaltime and length scales were taken from [29].
field H. Magnetic properties of these elements are mostly defined by 3d electrons.
2.1.1 Magnetization and magnetic interactions
State of each electron in a single atom is characterized by four quantum numbers:principal quantum number n, orbital quantum number l, magnetic quantum numberml and spin quantum number ms [30]. Electrons with the same principal quantumnumber n form an electronic shell. The lowest energy state corresponds to n = 1. Fora given value of the principal quantum number n, the orbital quantum number l has npossible values ranging from 0 to (n−1) and gives the magnitude of the orbital angular
momentum |~l| =√~2l(l + 1), where ~ ≈ 6.582 · 10−16 eV · s is the reduced Planck
constant. Electrons with the same principal quantum number n and orbital quantumnumber l form a subshell. Subshells with orbital quantum numbers l = 0, 1, 2, 3, 4are usually called s, p, d and f subshells, respectively. Magnetic quantum numberml describes an orbital within a subshell and gives projection of the orbital angularmomentum ~l on a specified direction
lz = ~ml. (2.1)
12
2.1. ITINERANT FERROMAGNETISM OF 3D METALS
Possible values of ml range from −l to l with integer steps between them. Each electronin atom has a magnetic moment ~µorb. associated with its orbital motion around thenucleus. Projection of this magnetic moment on a specified direction is determined bymagnetic quantum number ml
µorb.z = −µBml
~, (2.2)
where µB = e~2mec
= 0.9274 · 10−20Erg ·G−1 is the Bohr magneton, e is the elementarycharge, me is the electron mass, and c is the speed of light. In addition to the orbitalangular momentum, each electron has an intrinsic angular momentum or spin ~s. Spinquantum number ms gives a projection of spin on a specified direction, which can beeither ~/2 or −~/2. Electrons are fermions and obey the Pauli exclusion principleformulated by Pauli in 1925. It forbids two identical fermions to occupy the samequantum state simultaneously. Thus electrons with the same values of n, l and ml
should have opposite spins, which means that only two electrons can sit on the sameatomic orbital. Electron spin ~s is associated with spin magnetic moment ~µs, and ms
gives a projection of ~µs on a specified direction
µsz = −gsµBms
~, (2.3)
where gs ≈ 2 is the spin g-factor. Protons and neutrons in the atomic nucleus also havemagnetic moments, but they are about 1000 times smaller than that of an electronand can be neglected in our consideration.
In the ground state of single Fe, Co and Ni atoms the first (n = 1) and second(n = 2) shells are completely filled as well as the 3s, 3p and 4s subshells 1, therefore
their resultant orbital ~L =∑
i~li and spin ~S =
∑i ~si angular momenta are equal to
zero. Occupation of the different orbitals in the 3d subshell follows the empirical rulessuggested by Hund in 1925. According to the first and second Hund’s rules, electronicconfiguration with the lowest energy has maximum resultant spin ~S and orbital ~Langular momenta. The third Hund’s rule is about spin-orbit interaction which couplesspin ~S and orbital ~L angular momenta to a total angular momenta ~J = ~L+ ~S, where|L − S| 6 J 6 L + S. Spin-orbit interaction is a pure relativistic effect. In the rest
frame of the nucleus a given electron moves in the Coulomb electric field ~E, but in the
rest frame of the electron there is a magnetic field ~H ∼[~v × ~E
]/c interacting with
the spin magnetic moment ~µs. In the self-consistent field approximation Hamiltonianoperator of the spin-orbit interaction HSL is
HSL = λso(S · L), (2.4)
where S, L are the operators of the resultant spin and orbital momenta, λso is aconstant depending on ~S and L, but not on the total angular momentum J . Theconstant λso can be either positive or negative. In the ground state of a single atomwith one incompletely filled shell, ~J = |~L − ~S| (λso > 0) if this shell contains not
more than half the greatest possible number of electrons for that shell or ~J = ~L + ~S
1The 3d subshell has higher energy than the 4s subshell due to the centrifugal potential ~2l(l +1)/(2mer
2), where r is the distance between the electron and the nucleus.
13
CHAPTER 2. MAGNETISM AND MAGNETIZATION DYNAMICS IN METALS
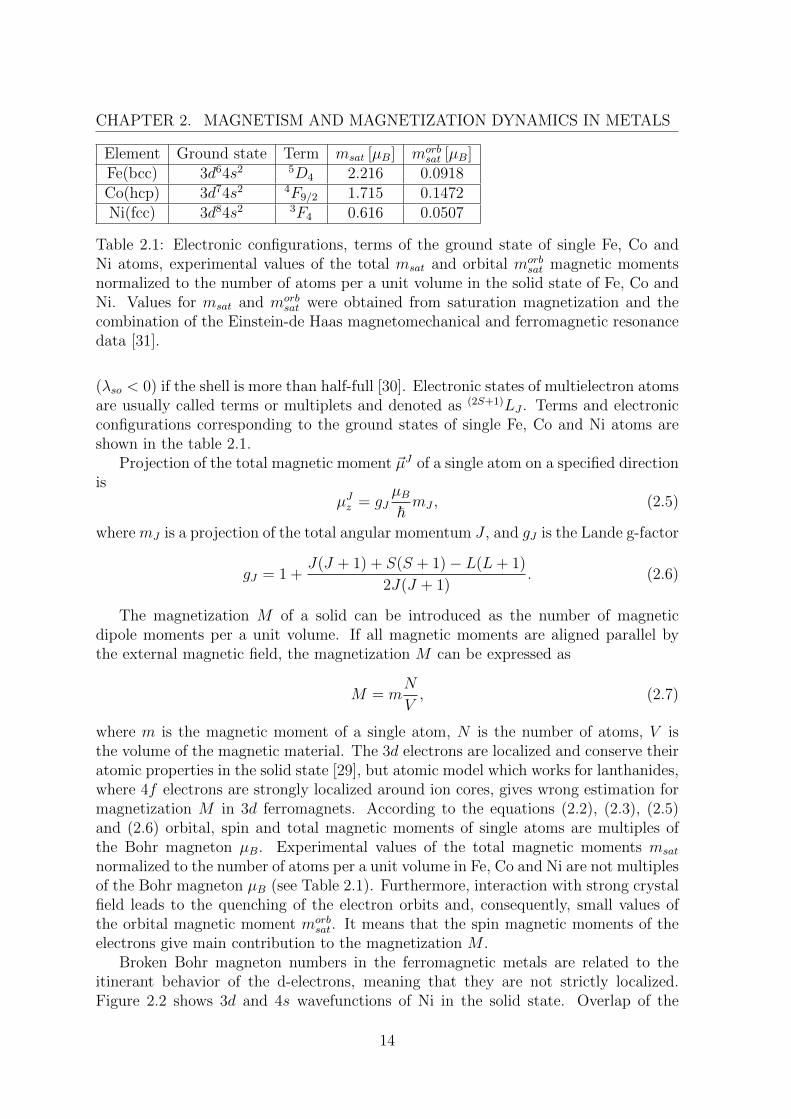
Element Ground state Term msat [µB] morbsat [µB]
Fe(bcc) 3d64s2 5D4 2.216 0.0918Co(hcp) 3d74s2 4F9/2 1.715 0.1472Ni(fcc) 3d84s2 3F4 0.616 0.0507
Table 2.1: Electronic configurations, terms of the ground state of single Fe, Co andNi atoms, experimental values of the total msat and orbital morb
sat magnetic momentsnormalized to the number of atoms per a unit volume in the solid state of Fe, Co andNi. Values for msat and morb
sat were obtained from saturation magnetization and thecombination of the Einstein-de Haas magnetomechanical and ferromagnetic resonancedata [31].
(λso < 0) if the shell is more than half-full [30]. Electronic states of multielectron atomsare usually called terms or multiplets and denoted as (2S+1)LJ . Terms and electronicconfigurations corresponding to the ground states of single Fe, Co and Ni atoms areshown in the table 2.1.
Projection of the total magnetic moment ~µJ of a single atom on a specified directionis
µJz = gJµB~mJ , (2.5)
where mJ is a projection of the total angular momentum J , and gJ is the Lande g-factor
gJ = 1 +J(J + 1) + S(S + 1)− L(L+ 1)
2J(J + 1). (2.6)
The magnetization M of a solid can be introduced as the number of magneticdipole moments per a unit volume. If all magnetic moments are aligned parallel bythe external magnetic field, the magnetization M can be expressed as
M = mN
V, (2.7)
where m is the magnetic moment of a single atom, N is the number of atoms, V isthe volume of the magnetic material. The 3d electrons are localized and conserve theiratomic properties in the solid state [29], but atomic model which works for lanthanides,where 4f electrons are strongly localized around ion cores, gives wrong estimation formagnetization M in 3d ferromagnets. According to the equations (2.2), (2.3), (2.5)and (2.6) orbital, spin and total magnetic moments of single atoms are multiples ofthe Bohr magneton µB. Experimental values of the total magnetic moments msat
normalized to the number of atoms per a unit volume in Fe, Co and Ni are not multiplesof the Bohr magneton µB (see Table 2.1). Furthermore, interaction with strong crystalfield leads to the quenching of the electron orbits and, consequently, small values ofthe orbital magnetic moment morb
sat. It means that the spin magnetic moments of theelectrons give main contribution to the magnetization M .
Broken Bohr magneton numbers in the ferromagnetic metals are related to theitinerant behavior of the d-electrons, meaning that they are not strictly localized.Figure 2.2 shows 3d and 4s wavefunctions of Ni in the solid state. Overlap of the
14
2.1. ITINERANT FERROMAGNETISM OF 3D METALS
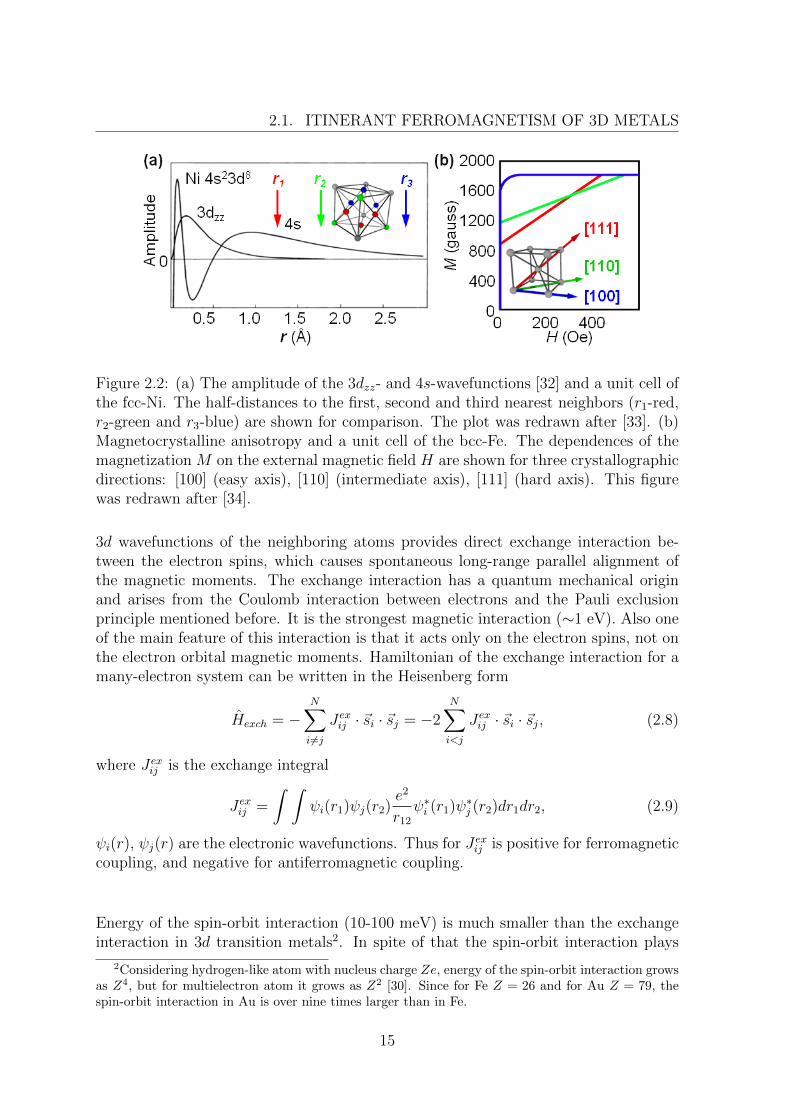
Figure 2.2: (a) The amplitude of the 3dzz- and 4s-wavefunctions [32] and a unit cell ofthe fcc-Ni. The half-distances to the first, second and third nearest neighbors (r1-red,r2-green and r3-blue) are shown for comparison. The plot was redrawn after [33]. (b)Magnetocrystalline anisotropy and a unit cell of the bcc-Fe. The dependences of themagnetization M on the external magnetic field H are shown for three crystallographicdirections: [100] (easy axis), [110] (intermediate axis), [111] (hard axis). This figurewas redrawn after [34].
3d wavefunctions of the neighboring atoms provides direct exchange interaction be-tween the electron spins, which causes spontaneous long-range parallel alignment ofthe magnetic moments. The exchange interaction has a quantum mechanical originand arises from the Coulomb interaction between electrons and the Pauli exclusionprinciple mentioned before. It is the strongest magnetic interaction (∼1 eV). Also oneof the main feature of this interaction is that it acts only on the electron spins, not onthe electron orbital magnetic moments. Hamiltonian of the exchange interaction for amany-electron system can be written in the Heisenberg form
Hexch = −N∑i 6=j
Jexij · ~si · ~sj = −2N∑i<j
Jexij · ~si · ~sj, (2.8)
where Jexij is the exchange integral
Jexij =
∫ ∫ψi(r1)ψj(r2)
e2
r12
ψ∗i (r1)ψ∗j (r2)dr1dr2, (2.9)
ψi(r), ψj(r) are the electronic wavefunctions. Thus for Jexij is positive for ferromagneticcoupling, and negative for antiferromagnetic coupling.
Energy of the spin-orbit interaction (10-100 meV) is much smaller than the exchangeinteraction in 3d transition metals2. In spite of that the spin-orbit interaction plays
2Considering hydrogen-like atom with nucleus charge Ze, energy of the spin-orbit interaction growsas Z4, but for multielectron atom it grows as Z2 [30]. Since for Fe Z = 26 and for Au Z = 79, thespin-orbit interaction in Au is over nine times larger than in Fe.
15
CHAPTER 2. MAGNETISM AND MAGNETIZATION DYNAMICS IN METALS
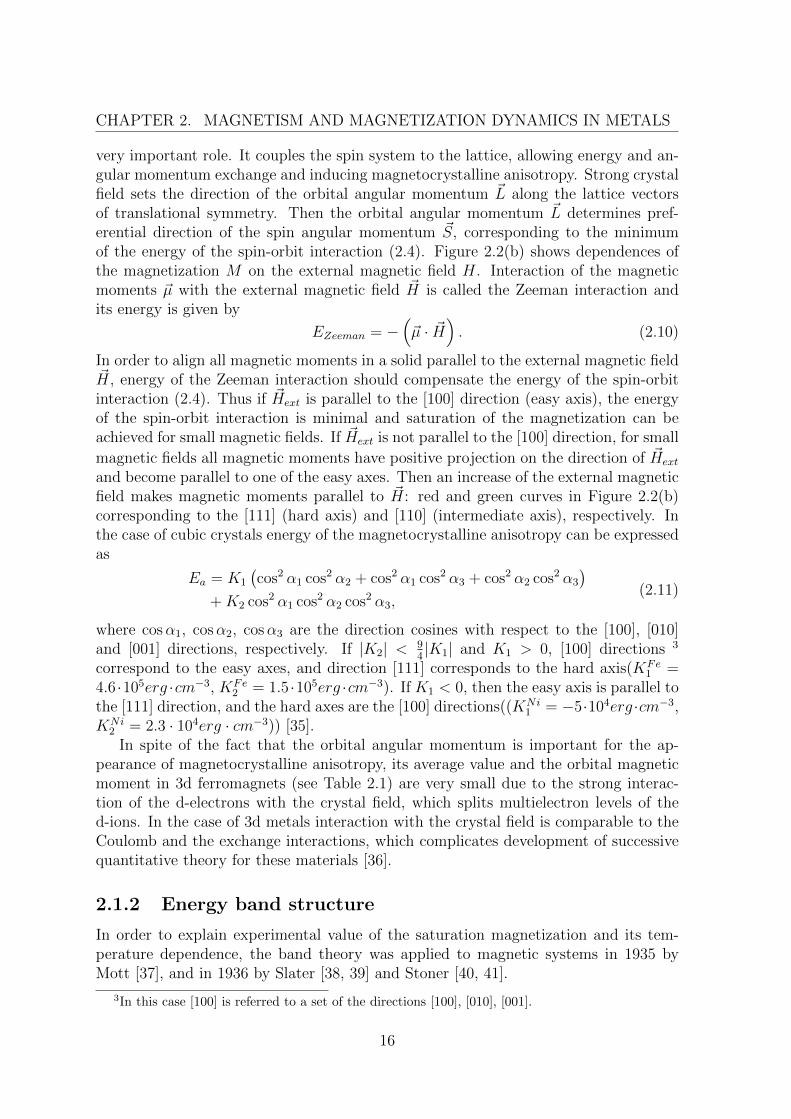
very important role. It couples the spin system to the lattice, allowing energy and an-gular momentum exchange and inducing magnetocrystalline anisotropy. Strong crystalfield sets the direction of the orbital angular momentum ~L along the lattice vectorsof translational symmetry. Then the orbital angular momentum ~L determines pref-erential direction of the spin angular momentum ~S, corresponding to the minimumof the energy of the spin-orbit interaction (2.4). Figure 2.2(b) shows dependences ofthe magnetization M on the external magnetic field H. Interaction of the magneticmoments ~µ with the external magnetic field ~H is called the Zeeman interaction andits energy is given by
EZeeman = −(~µ · ~H
). (2.10)
In order to align all magnetic moments in a solid parallel to the external magnetic field~H, energy of the Zeeman interaction should compensate the energy of the spin-orbitinteraction (2.4). Thus if ~Hext is parallel to the [100] direction (easy axis), the energyof the spin-orbit interaction is minimal and saturation of the magnetization can beachieved for small magnetic fields. If ~Hext is not parallel to the [100] direction, for small
magnetic fields all magnetic moments have positive projection on the direction of ~Hext
and become parallel to one of the easy axes. Then an increase of the external magneticfield makes magnetic moments parallel to ~H: red and green curves in Figure 2.2(b)corresponding to the [111] (hard axis) and [110] (intermediate axis), respectively. Inthe case of cubic crystals energy of the magnetocrystalline anisotropy can be expressedas
Ea = K1
(cos2 α1 cos2 α2 + cos2 α1 cos2 α3 + cos2 α2 cos2 α3
)+K2 cos2 α1 cos2 α2 cos2 α3,
(2.11)
where cosα1, cosα2, cosα3 are the direction cosines with respect to the [100], [010]and [001] directions, respectively. If |K2| < 9
4|K1| and K1 > 0, [100] directions 3
correspond to the easy axes, and direction [111] corresponds to the hard axis(KFe1 =
4.6 ·105erg ·cm−3, KFe2 = 1.5 ·105erg ·cm−3). If K1 < 0, then the easy axis is parallel to
the [111] direction, and the hard axes are the [100] directions((KNi1 = −5·104erg ·cm−3,
KNi2 = 2.3 · 104erg · cm−3)) [35].
In spite of the fact that the orbital angular momentum is important for the ap-pearance of magnetocrystalline anisotropy, its average value and the orbital magneticmoment in 3d ferromagnets (see Table 2.1) are very small due to the strong interac-tion of the d-electrons with the crystal field, which splits multielectron levels of thed-ions. In the case of 3d metals interaction with the crystal field is comparable to theCoulomb and the exchange interactions, which complicates development of successivequantitative theory for these materials [36].
2.1.2 Energy band structure
In order to explain experimental value of the saturation magnetization and its tem-perature dependence, the band theory was applied to magnetic systems in 1935 byMott [37], and in 1936 by Slater [38, 39] and Stoner [40, 41].
3In this case [100] is referred to a set of the directions [100], [010], [001].
16
2.1. ITINERANT FERROMAGNETISM OF 3D METALS
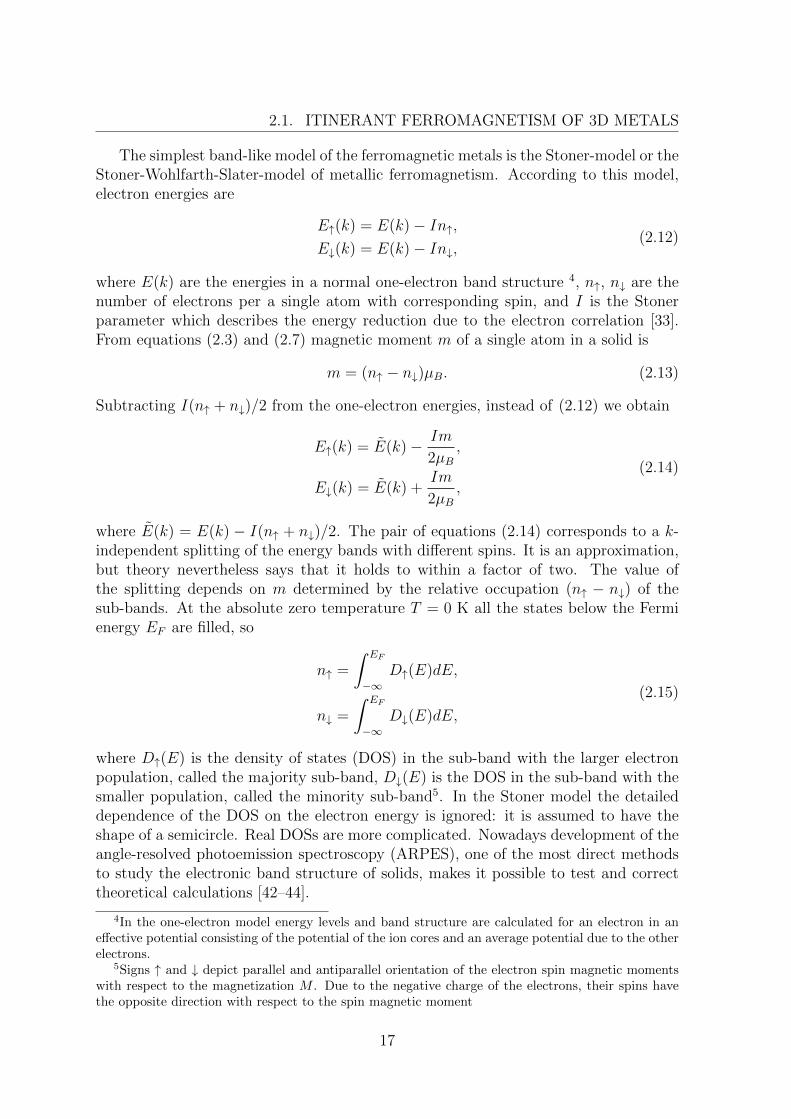
The simplest band-like model of the ferromagnetic metals is the Stoner-model or theStoner-Wohlfarth-Slater-model of metallic ferromagnetism. According to this model,electron energies are
E↑(k) = E(k)− In↑,E↓(k) = E(k)− In↓,
(2.12)
where E(k) are the energies in a normal one-electron band structure 4, n↑, n↓ are thenumber of electrons per a single atom with corresponding spin, and I is the Stonerparameter which describes the energy reduction due to the electron correlation [33].From equations (2.3) and (2.7) magnetic moment m of a single atom in a solid is
m = (n↑ − n↓)µB. (2.13)
Subtracting I(n↑ + n↓)/2 from the one-electron energies, instead of (2.12) we obtain
E↑(k) = E(k)− Im
2µB,
E↓(k) = E(k) +Im
2µB,
(2.14)
where E(k) = E(k) − I(n↑ + n↓)/2. The pair of equations (2.14) corresponds to a k-independent splitting of the energy bands with different spins. It is an approximation,but theory nevertheless says that it holds to within a factor of two. The value ofthe splitting depends on m determined by the relative occupation (n↑ − n↓) of thesub-bands. At the absolute zero temperature T = 0 K all the states below the Fermienergy EF are filled, so
n↑ =
∫ EF
−∞D↑(E)dE,
n↓ =
∫ EF
−∞D↓(E)dE,
(2.15)
where D↑(E) is the density of states (DOS) in the sub-band with the larger electronpopulation, called the majority sub-band, D↓(E) is the DOS in the sub-band with thesmaller population, called the minority sub-band5. In the Stoner model the detaileddependence of the DOS on the electron energy is ignored: it is assumed to have theshape of a semicircle. Real DOSs are more complicated. Nowadays development of theangle-resolved photoemission spectroscopy (ARPES), one of the most direct methodsto study the electronic band structure of solids, makes it possible to test and correcttheoretical calculations [42–44].
4In the one-electron model energy levels and band structure are calculated for an electron in aneffective potential consisting of the potential of the ion cores and an average potential due to the otherelectrons.
5Signs ↑ and ↓ depict parallel and antiparallel orientation of the electron spin magnetic momentswith respect to the magnetization M . Due to the negative charge of the electrons, their spins havethe opposite direction with respect to the spin magnetic moment
17
CHAPTER 2. MAGNETISM AND MAGNETIZATION DYNAMICS IN METALS
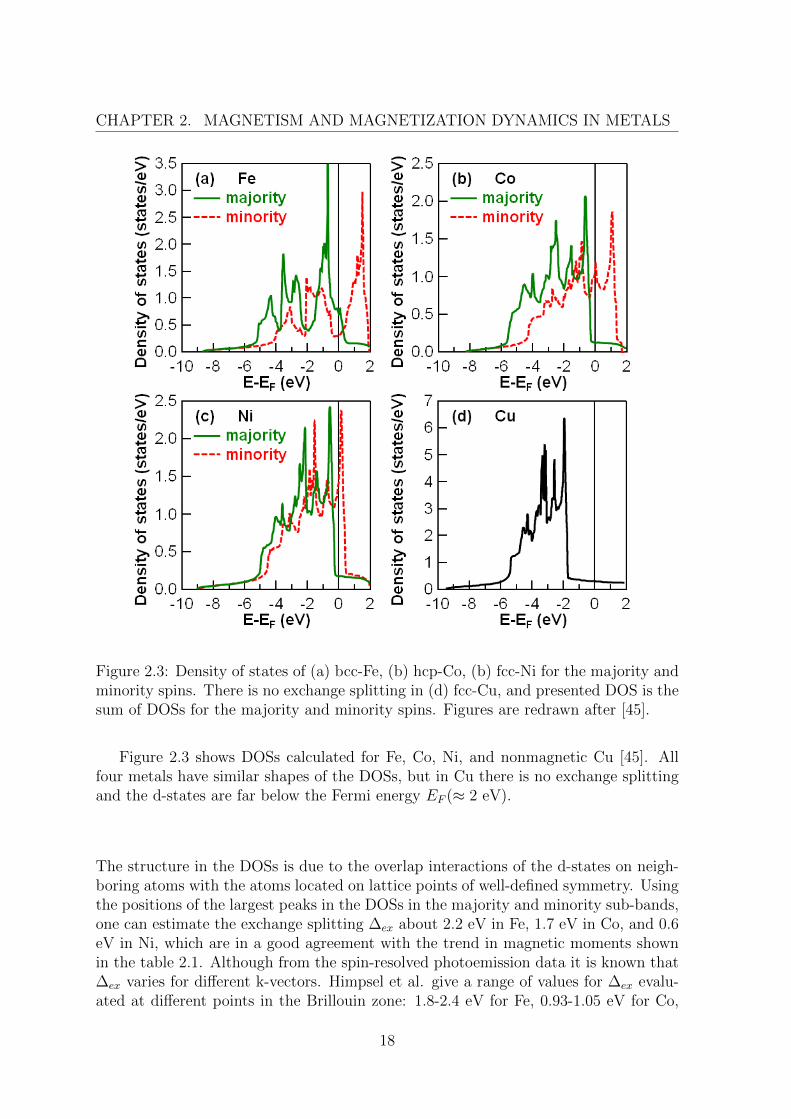
Figure 2.3: Density of states of (a) bcc-Fe, (b) hcp-Co, (b) fcc-Ni for the majority andminority spins. There is no exchange splitting in (d) fcc-Cu, and presented DOS is thesum of DOSs for the majority and minority spins. Figures are redrawn after [45].
Figure 2.3 shows DOSs calculated for Fe, Co, Ni, and nonmagnetic Cu [45]. Allfour metals have similar shapes of the DOSs, but in Cu there is no exchange splittingand the d-states are far below the Fermi energy EF (≈ 2 eV).
The structure in the DOSs is due to the overlap interactions of the d-states on neigh-boring atoms with the atoms located on lattice points of well-defined symmetry. Usingthe positions of the largest peaks in the DOSs in the majority and minority sub-bands,one can estimate the exchange splitting ∆ex about 2.2 eV in Fe, 1.7 eV in Co, and 0.6eV in Ni, which are in a good agreement with the trend in magnetic moments shownin the table 2.1. Although from the spin-resolved photoemission data it is known that∆ex varies for different k-vectors. Himpsel et al. give a range of values for ∆ex evalu-ated at different points in the Brillouin zone: 1.8-2.4 eV for Fe, 0.93-1.05 eV for Co,
18
2.2. LASER-INDUCED DYNAMICS IN METALS AND METALLICMULTILAYERS
and 0.17-0.33 eV for Ni [42, 43]. Typical band width of the d-electrons is comparableto ∆ex, about 3-5 eV. The band width of the s-p electrons is larger, about 10 eV.
One of the most important difference between 3d ferromagnets is the position of theFermi energy EF with respect to the d-states in the majority and minority sub-bands(see Figure 2.3). In static regime there are no spin-up d-holes in Ni and Co, thereforethey are called ‘strong‘ ferromagnets. Fe is called a ’weak’ ferromagnet (but with largermagnetic moment) because of the sizeable d-band contributions in the both sub-bands.Moreover, in bcc-Fe the degree of spin polarization
P (EF ) =D↑ (EF )−D↓ (EF )
D↑ (EF ) +D↓ (EF )(2.16)
at the Fermi energy EF is positive, while in Co and Ni it is negative. The sign of thespin polarization at EF is important for a number of experiments, where one measuresthe sign of the spin polarization of electrons emitted from states near EF . However,in the experiments with electric current, P (EF ) is not the only factor determining thesign of the spin polarization of the electric current, because conductivity σ is largelydetermined by the s-d scattering which is spin-dependent and also influences on thespin polarization [29].
In the next section it will be shown that the electronic band structure is veryimportant in terms of light-matter interaction and relaxation processes occuring afteroptical excitation.
2.2 Laser-induced dynamics in metals and metallic
multilayers
Since this work investigates optically excited HC dynamics in metallic MLs, it is worthto summarize typical processes that HCs undergo in metals after excitation by ultra-short laser pulses. Also this section provides an overview of the experimental andtheoretical works devoted to laser-induced HC and magnetization dynamics.
2.2.1 Absorption of light in metals
One-photon absorption in metals can be described by the refractive index n = n′(ω) +in′′(ω) and the dielectric function ε = ε′(ω) + iε′′(ω), where
ε = n2 ⇒ ε′ = (n′2 − n′′2) and ε′′ = 2n′n′′. (2.17)
In the general case the dielectric function is a tensor, but in cubic crystals transverseand logitudinal dielectric functions are identical6. Dependence of the diagonal compo-
6Considering linear absorption, rotation of the light polarization while propagating in a magneticmedium due to MOKE can be neglected.
19
CHAPTER 2. MAGNETISM AND MAGNETIZATION DYNAMICS IN METALS
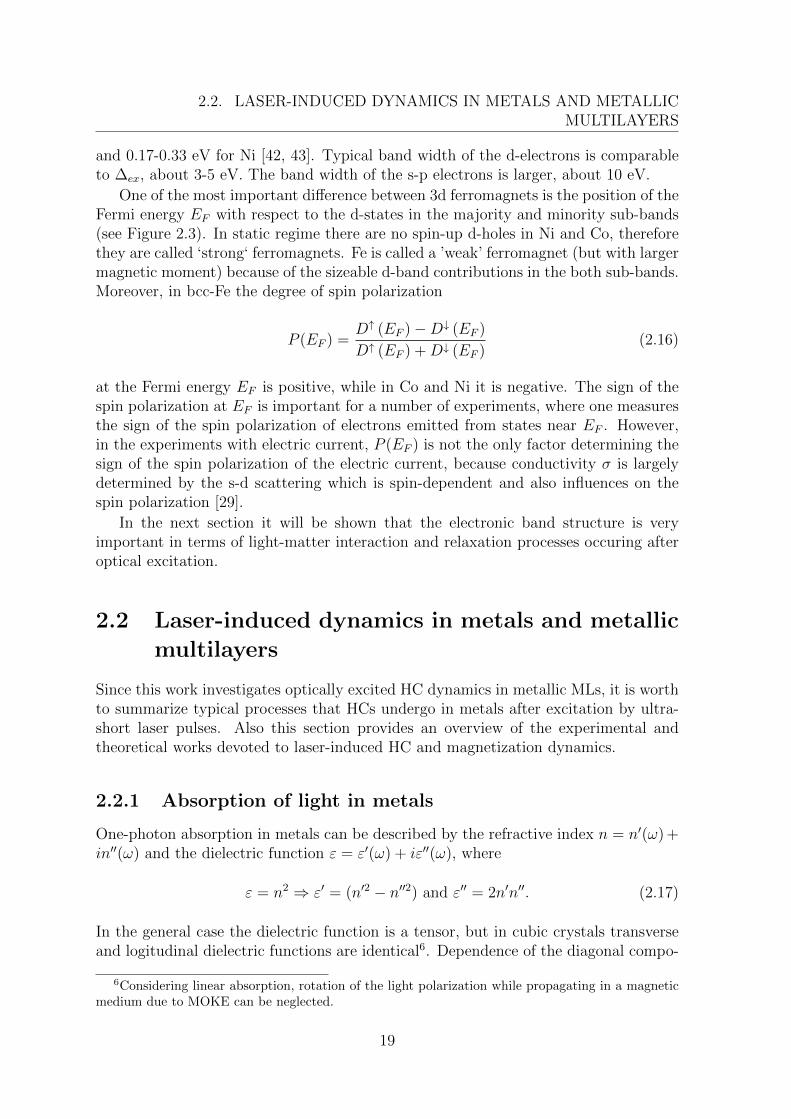
Figure 2.4: E(k) diagram of the majority (a) and minority (b) subbands in Fe. Greenarrows denote direct optical transitions. The energy band structure of Fe was calcu-lated by Dr. Tim Wehling and Prof. Dr. Alexander Lichtenstein.
nent of the dielectric tensor ε(ω) on the photon energy ~ω is described by this formula
εii(ω) = 1−ω2p
ω(ω + i/τc)
− 4πe2
m2ω2
∑kk′bb′
(~ω + i/τbb′) 〈bk|pi|b′k′〉〈b′k′|pi|bk〉(Eb′k′ − Ebk) (Eb′k′ − Ebk − ~ω − i/τbb′)
[f0 (Eb′k′)− f0 (Ebk)] , (2.18)
where i = x, y, z, ωp is the plasma frequency, τc = τ0 [EF/ (~ω − EF )]2 is the energy-dependent relaxation time of the conduction electrons, 〈bk|pi|b′k′〉 is the transitionmatrix element for bk → b′k′ transitions, τbb′ is the corresponding relaxation time, Ebkis the energy of the state |bk〉, and
f0 (Ebk) =1
exp[Ebk−EF (Te)
kTe
]+ 1
(2.19)
is the value of the Fermi function at this energy [46]. The electron temperature de-pendence of the Fermi energy is given by [47]:
EF (Te) = EF0
[1− π2
12
(kTeEF0
)2], (2.20)
where EF0 denotes the Fermi energy at Te = 0.
20
2.2. LASER-INDUCED DYNAMICS IN METALS AND METALLICMULTILAYERS
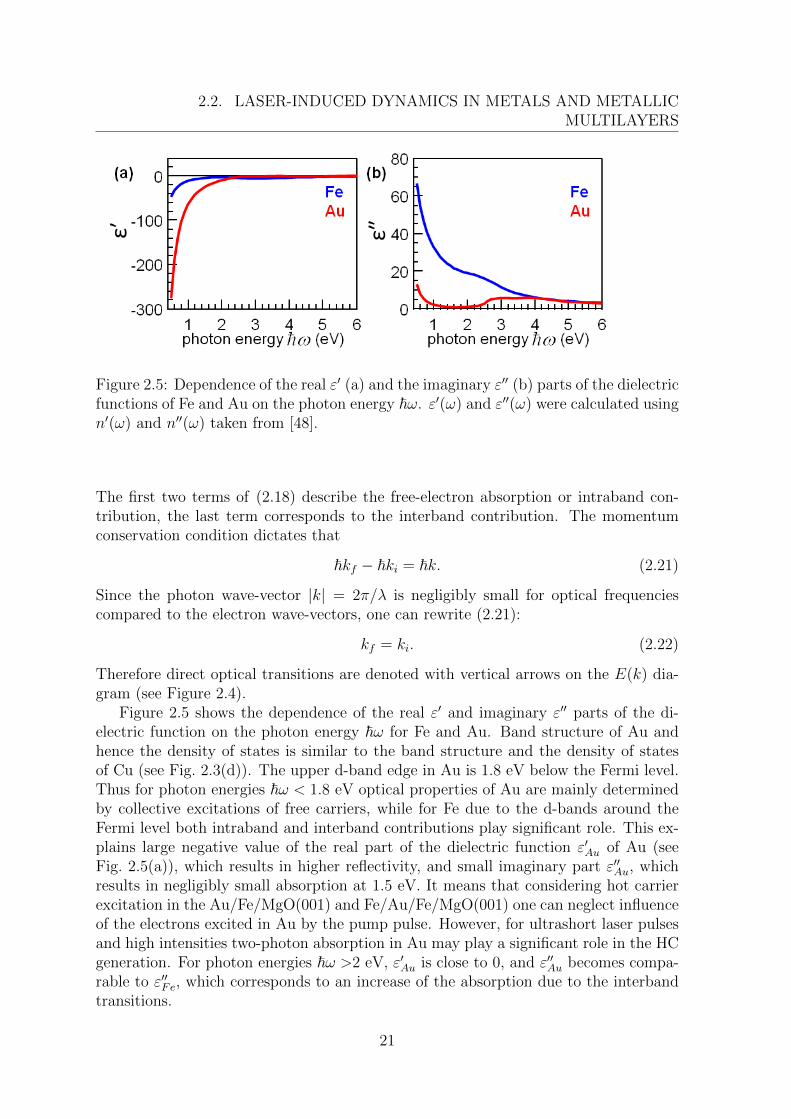
Figure 2.5: Dependence of the real ε′ (a) and the imaginary ε′′ (b) parts of the dielectricfunctions of Fe and Au on the photon energy ~ω. ε′(ω) and ε′′(ω) were calculated usingn′(ω) and n′′(ω) taken from [48].
The first two terms of (2.18) describe the free-electron absorption or intraband con-tribution, the last term corresponds to the interband contribution. The momentumconservation condition dictates that
~kf − ~ki = ~k. (2.21)
Since the photon wave-vector |k| = 2π/λ is negligibly small for optical frequenciescompared to the electron wave-vectors, one can rewrite (2.21):
kf = ki. (2.22)
Therefore direct optical transitions are denoted with vertical arrows on the E(k) dia-gram (see Figure 2.4).
Figure 2.5 shows the dependence of the real ε′ and imaginary ε′′ parts of the di-electric function on the photon energy ~ω for Fe and Au. Band structure of Au andhence the density of states is similar to the band structure and the density of statesof Cu (see Fig. 2.3(d)). The upper d-band edge in Au is 1.8 eV below the Fermi level.Thus for photon energies ~ω < 1.8 eV optical properties of Au are mainly determinedby collective excitations of free carriers, while for Fe due to the d-bands around theFermi level both intraband and interband contributions play significant role. This ex-plains large negative value of the real part of the dielectric function ε′Au of Au (seeFig. 2.5(a)), which results in higher reflectivity, and small imaginary part ε′′Au, whichresults in negligibly small absorption at 1.5 eV. It means that considering hot carrierexcitation in the Au/Fe/MgO(001) and Fe/Au/Fe/MgO(001) one can neglect influenceof the electrons excited in Au by the pump pulse. However, for ultrashort laser pulsesand high intensities two-photon absorption in Au may play a significant role in the HCgeneration. For photon energies ~ω >2 eV, ε′Au is close to 0, and ε′′Au becomes compa-rable to ε′′Fe, which corresponds to an increase of the absorption due to the interbandtransitions.
21
CHAPTER 2. MAGNETISM AND MAGNETIZATION DYNAMICS IN METALS
For plane monochromatic electromagnetic wave with cyclic frequency ω, propa-gating in a medium in the positive direction of the z axis, electric field is oscillatingaccording to the equation
E(z, t) = E0 · ei(kz−ωt+φ), (2.23)
where E0 and φ are the amplitude and phase of the electric field in the point z = 0at the time t = 0, respectively, and k = k′ + ik′′ = ω · (n′ + in′′)/c is the wave vectorinside the medium. Thus the amplitude of the electric field decreases as e−k
′′z and theintensity of the electromagnetic wave, which is proportional to |E0 ·e−k
′′z|2, is governedby the Lamber-Beer’s law
I(z) = I0 · e−αz, (2.24)
where I0 is the intensity of the electromagnetic wave in the point z = 0, α = 2 · k′′ =2ωn′′/c is the extinction coefficient.
In comparison to the monochromatic wave with a single frequency ω, femtosecondlaser pulse has a relatively wide spectrum, different parts of which can have differ-ent absorption coefficients α(ω). However, if α(ω) does not vary strongly within thespectrum of the short laser pulse, it can be replaced with the average value.
2.2.2 Hot carrier and magnetization dynamics in metals
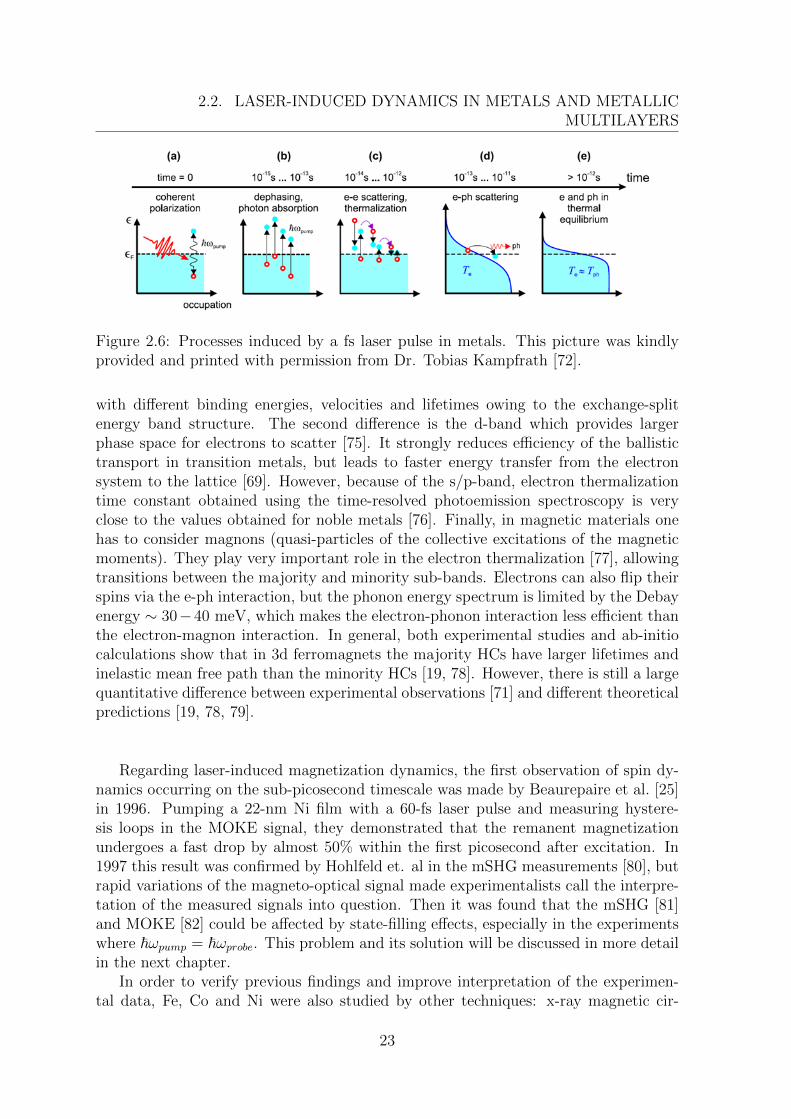
With the advent of pulsed femtosecond lasers, it has become possible to study a highlyexcited state of metals where the electron subsystem is far not only from the equilibriumwith the lattice, but also from its internal equilibrium. A great effort was done in theinvestigation of the HC dynamics in normal metals such as Au, Ag and Cu, employingreflectivity, SHG or photoemission spectroscopy [49–71]. Processes induced by a fslaser in normal metals are summarized in Figure 2.6. It was found that hot electronlifetime decreases with the electron energy in accordance with the prediction from theFermi-Liquid theory (FLT) [73, 74]:
τFLT ∼1
(E − EF )2. (2.25)
It may vary from several femtoseconds to hundreds of femtoseconds. In spite of thehigh electron-electron (e-e) collision rate for HCs with large energies, thermalizationof the electronic system is usually established within 300-500 fs. Then the electronenergy distribution can be described by the Fermi-Dirac function (2.19) with a certainelectron temperature Te. Subsequent thermalization between the electron subsystemand the lattice occurs on the timescale of several picoseconds via the electron-phonon(e-ph) interaction. In the experiments with metallic films of different thicknesses, itwas observed that the hot carrier transport plays significant role in the relaxationprocess, but its contribution vanishes for thin films (∼ 10nm) [69]. After the opticalexcitation, HCs move in the ballistic regime with velocities vbal. ∼ 106m/s. Then dueto e-e collisions, the HC transport becomes mostly diffusive with the diffusion velocityvdif. < 104m/s.
In terms of the HC dynamics, one major difference between noble metals and 3dferromagnets is that majority e↑ and minority e↓ electrons are excited to the states
22
2.2. LASER-INDUCED DYNAMICS IN METALS AND METALLICMULTILAYERS
Figure 2.6: Processes induced by a fs laser pulse in metals. This picture was kindlyprovided and printed with permission from Dr. Tobias Kampfrath [72].
with different binding energies, velocities and lifetimes owing to the exchange-splitenergy band structure. The second difference is the d-band which provides largerphase space for electrons to scatter [75]. It strongly reduces efficiency of the ballistictransport in transition metals, but leads to faster energy transfer from the electronsystem to the lattice [69]. However, because of the s/p-band, electron thermalizationtime constant obtained using the time-resolved photoemission spectroscopy is veryclose to the values obtained for noble metals [76]. Finally, in magnetic materials onehas to consider magnons (quasi-particles of the collective excitations of the magneticmoments). They play very important role in the electron thermalization [77], allowingtransitions between the majority and minority sub-bands. Electrons can also flip theirspins via the e-ph interaction, but the phonon energy spectrum is limited by the Debayenergy ∼ 30−40 meV, which makes the electron-phonon interaction less efficient thanthe electron-magnon interaction. In general, both experimental studies and ab-initiocalculations show that in 3d ferromagnets the majority HCs have larger lifetimes andinelastic mean free path than the minority HCs [19, 78]. However, there is still a largequantitative difference between experimental observations [71] and different theoreticalpredictions [19, 78, 79].
Regarding laser-induced magnetization dynamics, the first observation of spin dy-namics occurring on the sub-picosecond timescale was made by Beaurepaire et al. [25]in 1996. Pumping a 22-nm Ni film with a 60-fs laser pulse and measuring hystere-sis loops in the MOKE signal, they demonstrated that the remanent magnetizationundergoes a fast drop by almost 50% within the first picosecond after excitation. In1997 this result was confirmed by Hohlfeld et. al in the mSHG measurements [80], butrapid variations of the magneto-optical signal made experimentalists call the interpre-tation of the measured signals into question. Then it was found that the mSHG [81]and MOKE [82] could be affected by state-filling effects, especially in the experimentswhere ~ωpump = ~ωprobe. This problem and its solution will be discussed in more detailin the next chapter.
In order to verify previous findings and improve interpretation of the experimen-tal data, Fe, Co and Ni were also studied by other techniques: x-ray magnetic cir-
23
CHAPTER 2. MAGNETISM AND MAGNETIZATION DYNAMICS IN METALS
cular dichroism (XMCD) [83, 84] and spin-resolved two-photon-photoemission (SR-2PPE) [77, 85]. Demagnetization time constants obtained for 3d ferromagnets aresimilar and on the order of 200 fs. Systematic studies showed that the maximumquenching of magnetization is linearly proportional to the pump fluence for all three3d ferromagnets [80, 86–88]. Koopmans et al. reported about two demagnetizationtime scales in Ni [86], while in Fe and Co only one demagnetization time scale hasbeen observed. Two demagnetization time scales are attributed to the situation whencoupling between the electron and spin system is weak. Initially at low ambient tem-peratures and small pump fluence, thin Ni film exhibit only one demagnetization timescale. Appearance of the two demagnetization time scales occurs upon an increase ofthe pump fluence [86] or the sample termperature [89]. This effect has been observedin rare-earth metals such as Gd and Tb [90], in half-metals [91] and other materials.
2.2.3 Phenomenological description of magnetization dynamics
Together with further improvement of the experimental techniques, one of the maingoals in the field of laser-induced spin dynamics is the development of a microscopicmodel which can successfully describe ultrafast demagnetization. Phenomenologicalmodels presented in this subsection, are mostly intended to describe the experimentalobservations considering the energy flux and the transfer of the angular momentumbetween three reservoirs: electrons, spins and the lattice (see Figure 2.7). But they donot explicitly include certain microscopic mechanisms responsible for ultrafast demag-netization.
Three-temperature model
In the experiments with picosecond laser pulses HC and lattice dynamics in normalmetals can be described by the two-temperature model (2TM) [92, 93] assuming thatelectron and phonon distributions can be characterized in terms of electron Te andlattice Tp temperatures, respectively.
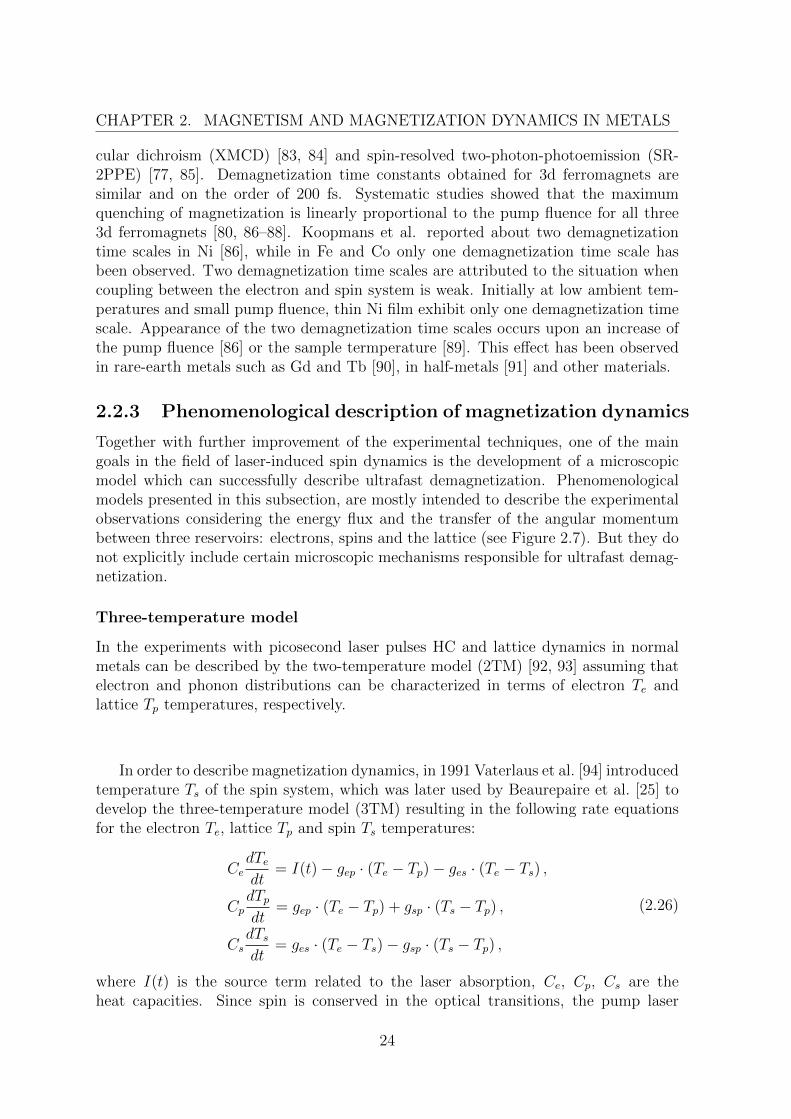
In order to describe magnetization dynamics, in 1991 Vaterlaus et al. [94] introducedtemperature Ts of the spin system, which was later used by Beaurepaire et al. [25] todevelop the three-temperature model (3TM) resulting in the following rate equationsfor the electron Te, lattice Tp and spin Ts temperatures:
CedTedt
= I(t)− gep · (Te − Tp)− ges · (Te − Ts) ,
CpdTpdt
= gep · (Te − Tp) + gsp · (Ts − Tp) ,
CsdTsdt
= ges · (Te − Ts)− gsp · (Ts − Tp) ,
(2.26)
where I(t) is the source term related to the laser absorption, Ce, Cp, Cs are theheat capacities. Since spin is conserved in the optical transitions, the pump laser
24
2.2. LASER-INDUCED DYNAMICS IN METALS AND METALLICMULTILAYERS
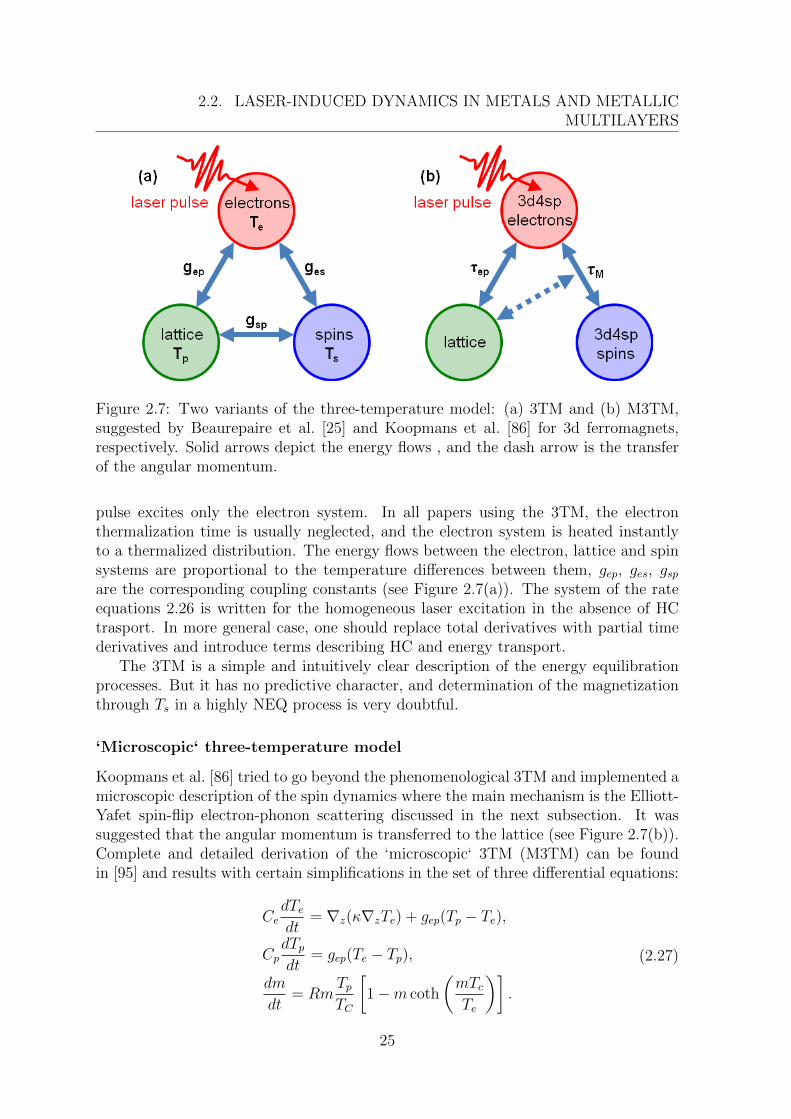
Figure 2.7: Two variants of the three-temperature model: (a) 3TM and (b) M3TM,suggested by Beaurepaire et al. [25] and Koopmans et al. [86] for 3d ferromagnets,respectively. Solid arrows depict the energy flows , and the dash arrow is the transferof the angular momentum.
pulse excites only the electron system. In all papers using the 3TM, the electronthermalization time is usually neglected, and the electron system is heated instantlyto a thermalized distribution. The energy flows between the electron, lattice and spinsystems are proportional to the temperature differences between them, gep, ges, gspare the corresponding coupling constants (see Figure 2.7(a)). The system of the rateequations 2.26 is written for the homogeneous laser excitation in the absence of HCtrasport. In more general case, one should replace total derivatives with partial timederivatives and introduce terms describing HC and energy transport.
The 3TM is a simple and intuitively clear description of the energy equilibrationprocesses. But it has no predictive character, and determination of the magnetizationthrough Ts in a highly NEQ process is very doubtful.
‘Microscopic‘ three-temperature model
Koopmans et al. [86] tried to go beyond the phenomenological 3TM and implemented amicroscopic description of the spin dynamics where the main mechanism is the Elliott-Yafet spin-flip electron-phonon scattering discussed in the next subsection. It wassuggested that the angular momentum is transferred to the lattice (see Figure 2.7(b)).Complete and detailed derivation of the ‘microscopic‘ 3TM (M3TM) can be foundin [95] and results with certain simplifications in the set of three differential equations:
CedTedt
= ∇z(κ∇zTe) + gep(Tp − Te),
CpdTpdt
= gep(Te − Tp),
dm
dt= Rm
TpTC
[1−m coth
(mTcTe
)].
(2.27)
25
CHAPTER 2. MAGNETISM AND MAGNETIZATION DYNAMICS IN METALS
This model has been proved to describe magnetization dynamics [86], but it has severalsignificant disadvantages:
• From the measurements of the total heat capacity it can be seen that the magneticcontribution is comparable to the electron contribution at the room temperature,and become comparable to the lattice heat capacity upon strong demagnetizationof the ferromagnetic film. Thus energy exchange between electron, lattice andspin systems cannot be neglected, as it is done in the M3TM.
• In the derivation of the spin-flip rate it was assumed that the energy differencebetween the initial and final electron states in the phonon-mediated spin-flipscattering process is ±∆ex ±Ep, where Ep is a phonon energy. Since ∆ex ∼ 1eVand the typical phonon energy∼ 30meV , Carva et al. [96] noted that it is not veryprobable that an electron can change its energy by ∆ex in the electron-phononscattering process.
• No suggestions have been made regarding the linear reflectivity.
2.2.4 Microscopic models for the origin of ultrafast demagne-tization
Direct interaction with the electric field of the pump pulse
In 2000 Zhang and Hubner suggested that the direct interaction with the electric field ofthe pump laser pulse is responsible for ultrafast demagnetization [97]. However, thereis no experimental evidence that this mechanism really takes place [26]. For instance,Zhang and Hubner predicted that the demagnetization of Ni saturates at about 50 %,but then demagnetization on the order of 70 − 80 % has been observed by Stamm etal. [83, 84]. Also according to Zhang and Hubner [97], laser-induced demagnetizationis almost instantaneous, and the experimental time constants should be determined bythe duration of the pump pulse. In the present thesis and some previous works it isdemonstrated that in the absence of the HC transport demagnetization time constantsare larger than the duration of the applied laser pulses.
Phonon-mediated spin-flip scattering
In a material with the spin-orbit coupling the electronic states are not purely spin-upor spin-down, but a mixture of a dominant spin-up (spin-down) and a small spin-down(spin-up) contribution:
ψk,↑ = [ak(r)| ↑〉+ bk(r)| ↓〉] eik·r, (2.28)
where k is the wave-vector. The interaction of an electron with a phonon with thewave-vector q can be described by the potential consisting of two parts [98]:
Wq = W 0q +W spin−orbit
q , (2.29)
26
2.2. LASER-INDUCED DYNAMICS IN METALS AND METALLICMULTILAYERS
where W 0q is the spin-independent part and W spin−orbit
q refers to the spin-dependentpart of the scattering potential. The spin-flip matrix element between a spin-up stateψk,↑ and a spin-down state ψk+q,↓ is given by
mk+q,↓;k,↑ = 〈ψk+q,↓|W 0q +W spin−orbit
q |ψk,↑〉. (2.30)
In 1954 Elliott noticed that the first part of this matrix element, related to W 0q is
non-zero, because it connects the large and small components of the two spinors [99].Then in 1963 Yafet demonstrated that it is essential to consider both parts of thepotential [100]. Thus due to the spin-orbit coupling the electron in the spin-up stateψk,↑ can scatter not only into another spin-up state ψk′,↑, but also into the spin-downstate ψk′,↓. In the theory of Elliott and Yafet the spin-flip probability asf is related tothe spin mixing parameter
〈b2〉 = min(〈ψk| ↑〉〈↑ |ψk〉, 〈ψk| ↓〉〈↓ |ψk〉), (2.31)
where the bar stands for a suitable average over all involved states. If 〈b2〉 = 0, allrelevant states are pure spin states, whereas 〈b2〉 = 0.5 corresponds to fully mixedstates. The exact relation between asf and 〈b2〉 is given by:
asf = p〈b2〉, (2.32)
where p is a material specific parameter.In 2005 Koopmans et al. [101] suggested that ultrafast demagnetization of a fer-
romagnet is accompanied with the transfer of the angular momentum to the lattice,which proceeds by means of the Elliott-Yafet spin-flip scattering. Initially the Elliot-Yafet spin-flip mechanism was used only for non-magnetic materials, because theoret-ical treatment of ferromagnets is rather complex. For this reason, the value of theElliott-Yafet spin-mixing parameter b2, calculated for Cu, was used as an estimationfor the value of the Elliott-Yafet spin-mixing parameter b2 in Ni. However, it is verysmall. Then Steiauf and Fahnle performed ab initio calculations of b2 for 3d ferromag-nets [98]. It appeared that b2 obtained for Fe, Co and Ni is about 25 times larger thanfor Cu. This result emphasizes the role of the Elliott-Yafet mechanism in ultrafast spindynamics.
In the M3TM Koopmans et al. [86] assumed a thermalized electron distribution.However, Carva et al. [96] found that the magnetization change rate calculated forthermalized electron distribution is too small to explain ultrafast demagnetization,and ultrafast spin dynamics is mostly governed by NEQ HCs which provide muchlarger magnetization change rates. Thus a new model supplemented with NEQ HCdynamics is required (see Chapter 5).
Electron-magnon scattering
Electrons can slip their spins, interacting not only with phonons, but also with magnons.In the early measurements performed to determine the heat capacity of ferromagneticmaterials [102], the signature of the electron-magnon interaction was identified fromthe additional term to the total measured heat capacity of the system which should be
27
CHAPTER 2. MAGNETISM AND MAGNETIZATION DYNAMICS IN METALS
accounted for in order to have a good description of the measured data. Carpene etal. [87] suggested the electron-magnon scattering as the origin of ultrafast demagneti-zation. Nevertheless the electron-magnon spin-flip scattering does not lead itself to thechange of the magnetization, in any case the angular momentum has to be transferredto the lattice, which means that an interaction with a phonon is required.
Superdiffusive hot carrier transport
Superdiffusive HC transport is the most recent microscopic model for ultrafast demag-netization, proposed by Battiato et al. [22, 23]. It does not consider transfer of theangular momentum, i.e spin flips, but describes the demagnetization process by spin-dependent transport of charge carriers out of a ferromagnetic layer. ‘Superdiffusive‘refers to HC transport which starts in the ballistic regime, but becomes diffusive onthe time scale of several hundreds of femtoseconds.
According to the model of the superdiffusive HC transport, electrons are excitedfrom quasi-localized d-bands to more mobile sp-bands. This excitation is assumed tobe spin conserving. Subsequently, electrons move away from the excited part of thesample. Since the majority and minority electrons have different lifetimes, resultingin a larger mean free path for majority electrons, HC transport lead to the ultrafastdemagnetization of the excited region.
2.3 Precessional magnetization dynamics
2.3.1 Homogeneous precession
Precessional motion of a magnetic moment ~m in an magnetic field ~H can be describedby the Landau-Lifshitz equation [103]:
d~m
dt= −γ
[~m× ~H
], (2.33)
where γ is the gyromagnetic ratio. For an electron with only the spin magnetic moment
γ
2π= gs
µBh≈ 28
GHz
T. (2.34)
Considering a homogeneously magnetized ferromagnetic sample with a volume V andN magnetic moments, (2.33) can be written for the magnetization ~M = N ~m/V :
d ~M
dt= −γ
[~M × ~Heff
], (2.35)
where ~Heff is the effective magnetic field, which is the sum of the external magnetic
field ~Hext, the field of the magneto-crystalline anisotropy ~Hanis, shape anisotropy, andother sample and material dependent contributions. In the case of non-homogeneousvariations of the magnetization ~M , one has to consider the exchange field ~Hex orig-inating from the interaction of the neighbouring magnetic moments [104]. It will beconsidered in the next subsection.
28
2.3. PRECESSIONAL MAGNETIZATION DYNAMICS
In order to describe the relaxation of the precessional motion to the equilibrium( ~Meq|| ~Heff ), Gilbert suggested a damping term proportional to the magnetization
change rate d ~M/dt:
d ~M
dt= −γ
[~M × ~Heff
]+
α
| ~M |
[~M × d ~M
dt
], (2.36)
where α is a dimensionless damping parameter. Equation (2.36) is known as the
Landau-Lifshitz-Gilbert (LLG) equation. It is valid for low temperatures and | ~M | =const.
At higher temperatures, the change of the magnitude of the magnetization vector~M can be taken into account, using the Landau-Lifshitz-Bloch (LLB) equation:
d ~M
dt= −γ
[~M × ~Heff
]+ γλ‖
(~M · ~Heff
)· ~M
| ~M |2− γλ⊥
[~M ×
[~M × ~Heff
]]| ~M |2
, (2.37)
where λ‖ and λ⊥ are the dimensionless longitudinal and transversal damping parame-ters [26].
2.3.2 Spin waves
The previous subsection is devoted to a homogeneous precession of the magnetization,when all magnetic moments in a ferromagnetic film precess in-phase and the exchangeinteraction between them can be omitted from the consideration. In this subsectionwe consider more general case of collective spin excitation, so-called spin waves, whenthe neighbouring magnetic moments are not parallel to each other.
In the absence of an external magnetic field, the Hamiltonian for the system ofthe localized spins includes only the exchange interaction (2.8). The x-, y-, and z-components of the spin operators can be expressed by the Pauli spin matrices [33]:
Sz =1
2
(1 00 −1
), Sx =
1
2
(0 11 0
), Sy =
1
2
(0 −ii 0
). (2.38)
If we consider the eigenstates of Sz
|α〉 =
(10
), |β〉 =
(01
), (2.39)
then
Sz|α〉 =1
2|α〉, Sz|β〉 = −1
2|β〉. (2.40)
From Sx, Sy we can switch to the spin reversal operators:
S+ = Sx + iSy =
(0 10 0
)and S− = Sx − iSy =
(0 01 0
)(2.41)
29
CHAPTER 2. MAGNETISM AND MAGNETIZATION DYNAMICS IN METALS
which act on the states |α〉 and |β〉 in the following way
S+|α〉 = 0, S+|β〉 = |α〉, S−|β〉 = 0, S−|α〉 = β〉. (2.42)
Considering the exchange coupling Jex between the nearest neighbours, (2.8) can berewritten as
H = −Jex∑i
∑δ
Si,z · Si+δ,z +1
2(Si,+Si+δ,− + Si,−Si+δ,+), (2.43)
where the first sum (index i) is the sum over all spins, and the second sum (index δ)corresponds to the sum over the nearest neighbours of the spin i. In the case of theferromagnetic coupling Jex > 0, in the ground state all spins are aligned in the samedirection:
|0〉 =∏i
|α〉i. (2.44)
Applying Sj,− to the ground state, we obtain a state |βj〉 with a reversed spin j. This
state is not an eigenstate of the Hamiltonian (2.43), because the operators Si,+Si+δ,−bring the system to the state |βj+δ〉. However, the linear combination of such states
|~k〉 =1√N
∑j
ei~k·~rj |βj〉 (2.45)
is an eigenstate. This state represents a spin wave: all spins precess around the z axiswith a phase shift between different spins, determined by the wave-vector ~k. Excitationof a spin wave flips on average one spin.
When the |~k| is small compared to a reciprocal lattice vector, but large compared toω/c, where ω is the spin wave frequency, one can use the magnetostatic approximationand describe spin waves with the classical equations of motion. Instead of single spins,one can switch to the continuous model with a space- and time-dependent magneti-zation ~M(~r, t). When neighbouring magnetic moments are not parallel to each other,it leads to an increase of the exchange energy and an additional contribution to theeffective field [104]:
~Hnonuniformex =
D
M0
∇2 ~M, (2.46)
where D is the exchange stiffness (for Fe D = 280 A2 ·meV [107, 108]).
Solving the Landau-Lifshitz equation (2.35) with ~Heff = ~Hext + ~Han + ~Hdem for anisotropic ferromagnet with the saturation magnetization Ms, one can derive the spinwave dispersion relation [104]:
f(k) = γ√
(Hext +Hanis +Dk2) · (Hext +Hanis + 4πMs sin2 θk +Dk2), (2.47)
where θk is the angle between ~Ms and ~k. In the present work we will consider preces-sional magnetization dynamics in a thin ferromagnetic film with free magnetic momentsat its boundary (no pinning).:
∂∆ ~M
∂z|z=0 =
∂∆ ~M
∂z|z=d = 0, (2.48)
30
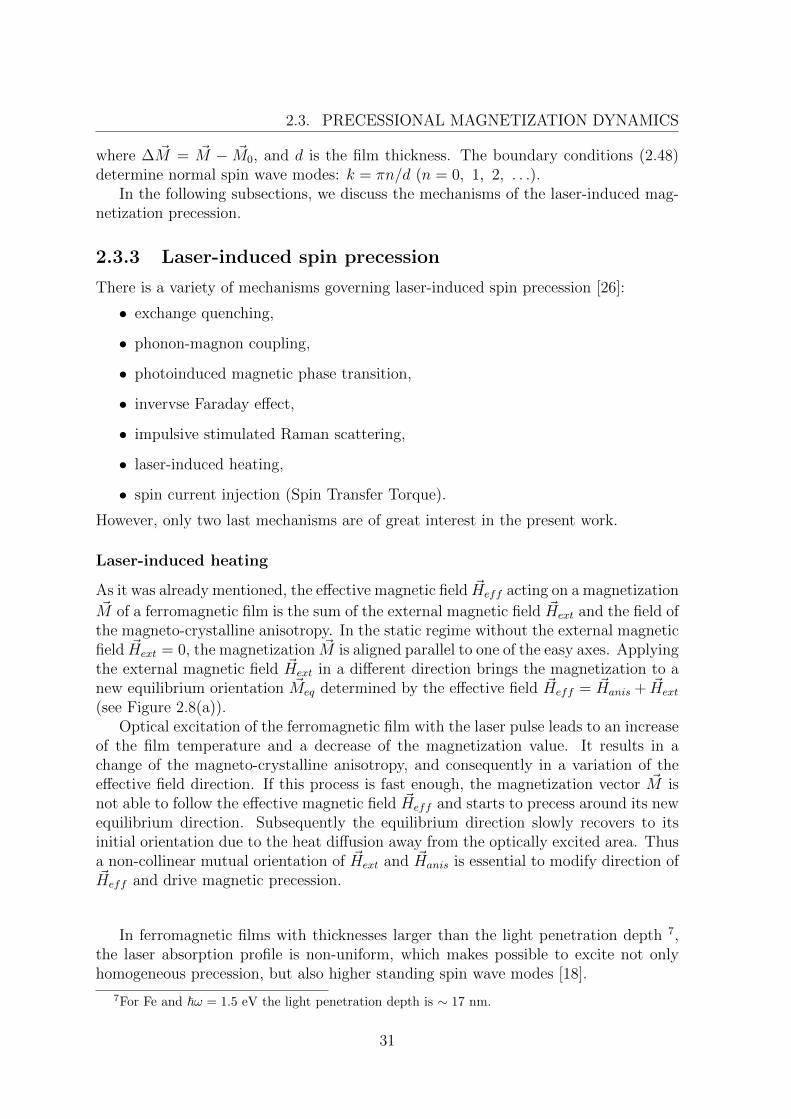
2.3. PRECESSIONAL MAGNETIZATION DYNAMICS
where ∆ ~M = ~M − ~M0, and d is the film thickness. The boundary conditions (2.48)determine normal spin wave modes: k = πn/d (n = 0, 1, 2, . . .).
In the following subsections, we discuss the mechanisms of the laser-induced mag-netization precession.
2.3.3 Laser-induced spin precession
There is a variety of mechanisms governing laser-induced spin precession [26]:
• exchange quenching,
• phonon-magnon coupling,
• photoinduced magnetic phase transition,
• invervse Faraday effect,
• impulsive stimulated Raman scattering,
• laser-induced heating,
• spin current injection (Spin Transfer Torque).
However, only two last mechanisms are of great interest in the present work.
Laser-induced heating
As it was already mentioned, the effective magnetic field ~Heff acting on a magnetization~M of a ferromagnetic film is the sum of the external magnetic field ~Hext and the field of
the magneto-crystalline anisotropy. In the static regime without the external magneticfield ~Hext = 0, the magnetization ~M is aligned parallel to one of the easy axes. Applyingthe external magnetic field ~Hext in a different direction brings the magnetization to anew equilibrium orientation ~Meq determined by the effective field ~Heff = ~Hanis + ~Hext
(see Figure 2.8(a)).Optical excitation of the ferromagnetic film with the laser pulse leads to an increase
of the film temperature and a decrease of the magnetization value. It results in achange of the magneto-crystalline anisotropy, and consequently in a variation of theeffective field direction. If this process is fast enough, the magnetization vector ~M isnot able to follow the effective magnetic field ~Heff and starts to precess around its newequilibrium direction. Subsequently the equilibrium direction slowly recovers to itsinitial orientation due to the heat diffusion away from the optically excited area. Thusa non-collinear mutual orientation of ~Hext and ~Hanis is essential to modify direction of~Heff and drive magnetic precession.
In ferromagnetic films with thicknesses larger than the light penetration depth 7,the laser absorption profile is non-uniform, which makes possible to excite not onlyhomogeneous precession, but also higher standing spin wave modes [18].
7For Fe and ~ω = 1.5 eV the light penetration depth is ∼ 17 nm.
31
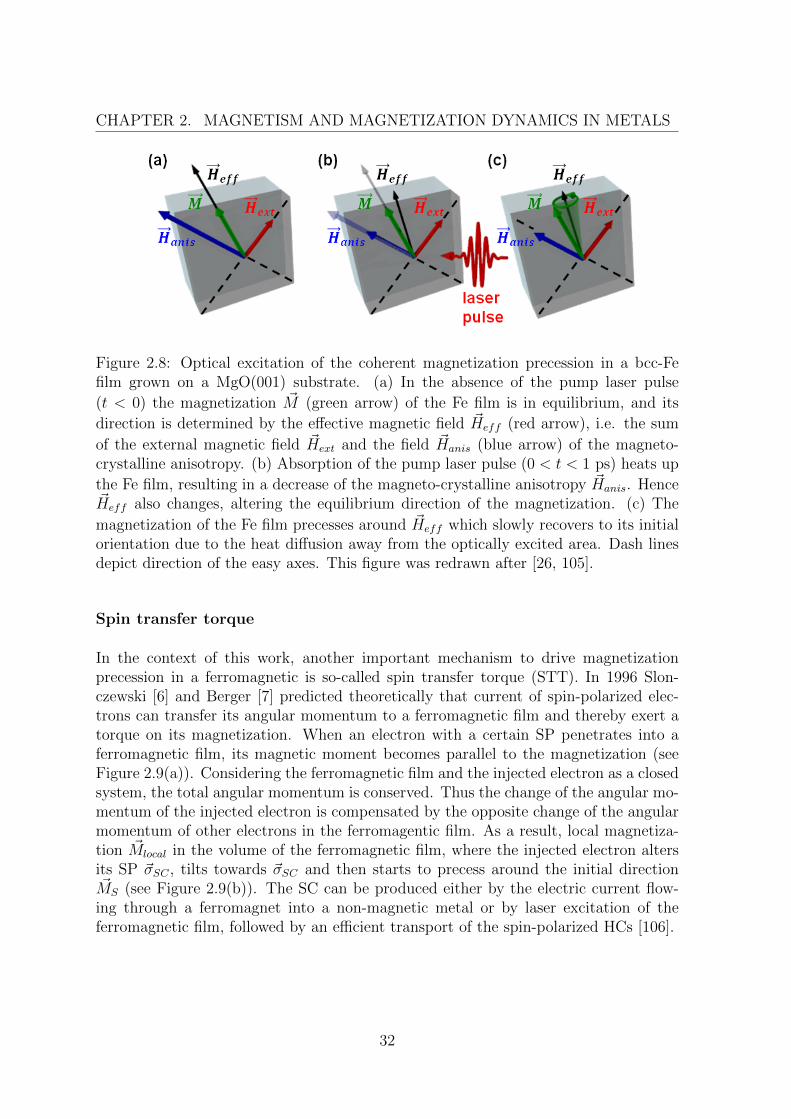
CHAPTER 2. MAGNETISM AND MAGNETIZATION DYNAMICS IN METALS
Figure 2.8: Optical excitation of the coherent magnetization precession in a bcc-Fefilm grown on a MgO(001) substrate. (a) In the absence of the pump laser pulse
(t < 0) the magnetization ~M (green arrow) of the Fe film is in equilibrium, and its
direction is determined by the effective magnetic field ~Heff (red arrow), i.e. the sum
of the external magnetic field ~Hext and the field ~Hanis (blue arrow) of the magneto-crystalline anisotropy. (b) Absorption of the pump laser pulse (0 < t < 1 ps) heats up
the Fe film, resulting in a decrease of the magneto-crystalline anisotropy ~Hanis. Hence~Heff also changes, altering the equilibrium direction of the magnetization. (c) The
magnetization of the Fe film precesses around ~Heff which slowly recovers to its initialorientation due to the heat diffusion away from the optically excited area. Dash linesdepict direction of the easy axes. This figure was redrawn after [26, 105].
Spin transfer torque
In the context of this work, another important mechanism to drive magnetizationprecession in a ferromagnetic is so-called spin transfer torque (STT). In 1996 Slon-czewski [6] and Berger [7] predicted theoretically that current of spin-polarized elec-trons can transfer its angular momentum to a ferromagnetic film and thereby exert atorque on its magnetization. When an electron with a certain SP penetrates into aferromagnetic film, its magnetic moment becomes parallel to the magnetization (seeFigure 2.9(a)). Considering the ferromagnetic film and the injected electron as a closedsystem, the total angular momentum is conserved. Thus the change of the angular mo-mentum of the injected electron is compensated by the opposite change of the angularmomentum of other electrons in the ferromagentic film. As a result, local magnetiza-tion ~Mlocal in the volume of the ferromagnetic film, where the injected electron altersits SP ~σSC , tilts towards ~σSC and then starts to precess around the initial direction~MS (see Figure 2.9(b)). The SC can be produced either by the electric current flow-
ing through a ferromagnet into a non-magnetic metal or by laser excitation of theferromagnetic film, followed by an efficient transport of the spin-polarized HCs [106].
32
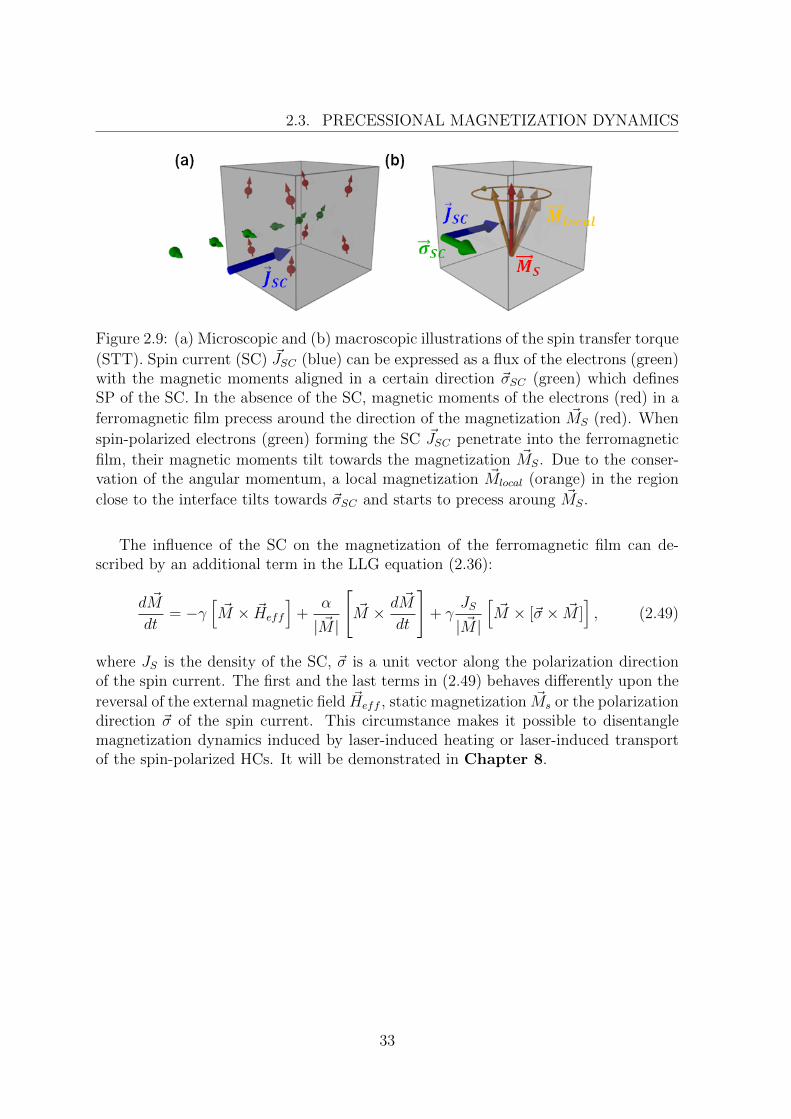
2.3. PRECESSIONAL MAGNETIZATION DYNAMICS
Figure 2.9: (a) Microscopic and (b) macroscopic illustrations of the spin transfer torque
(STT). Spin current (SC) ~JSC (blue) can be expressed as a flux of the electrons (green)with the magnetic moments aligned in a certain direction ~σSC (green) which definesSP of the SC. In the absence of the SC, magnetic moments of the electrons (red) in a
ferromagnetic film precess around the direction of the magnetization ~MS (red). When
spin-polarized electrons (green) forming the SC ~JSC penetrate into the ferromagnetic
film, their magnetic moments tilt towards the magnetization ~MS. Due to the conser-vation of the angular momentum, a local magnetization ~Mlocal (orange) in the region
close to the interface tilts towards ~σSC and starts to precess aroung ~MS.
The influence of the SC on the magnetization of the ferromagnetic film can de-scribed by an additional term in the LLG equation (2.36):
d ~M
dt= −γ
[~M × ~Heff
]+
α
| ~M |
[~M × d ~M
dt
]+ γ
JS
| ~M |
[~M × [~σ × ~M ]
], (2.49)
where JS is the density of the SC, ~σ is a unit vector along the polarization directionof the spin current. The first and the last terms in (2.49) behaves differently upon the
reversal of the external magnetic field ~Heff , static magnetization ~Ms or the polarizationdirection ~σ of the spin current. This circumstance makes it possible to disentanglemagnetization dynamics induced by laser-induced heating or laser-induced transportof the spin-polarized HCs. It will be demonstrated in Chapter 8.
33

Chapter 3
Time-resolved magneto-opticalprobe techniques
In this work variations of magnetization upon laser excitation of the metallic multilayer(ML) structures have been studied on a sub-picosecond time scale. To gain access tothis ultrafast dynamics, magneto-optical pump-probe techniques have been applied,employing an intense laser pulse to excite the system and a weak probe pulse to mea-sure its response. This chapter provides an insight into the linear magneto-opticalKerr effect (MOKE) proportional to the bulk magnetization and the magneto-inducedsecond harmonic generation (mSHG) which is primarily sensitive to the spin polariza-tion (SP) at surfaces and interfaces in the case of centrosymmetrical materials, butit can also possess bulk contributions upon inhomogeneous hot carrier (HC) and spindynamics.
After general introduction into the theory of light-matter interaction, phenomeno-logical description, macro- and microscopic formalisms of the static MOKE and mSHGresponses are discussed. The last section is devoted to the interpretation of the HCand spin dynamics probed with these two techniques.
3.1 Light-matter interaction
Theory of light-matter interaction is based on the electromagnetic wave equations andthe equations which describe properties of media. The electromagnetic wave equationsare the Maxwell’s equations:
~∇ · ~D = 4 · π · ρ, (3.1)
~∇ · ~B = 0, (3.2)
~∇× ~E = −1
c
∂ ~B
∂t, (3.3)
~∇× ~H =1
c
∂ ~D
∂t+
4π
c~j, (3.4)
where ~E, ~D are electric field and electric inductance, ~H, ~B are magnetic field andmagnetic inductance, ρ is a free charge density, ~j is a current density. The Maxwell’s
35
CHAPTER 3. TIME-RESOLVED MAGNETO-OPTICAL PROBE TECHNIQUES
equations are completed with the constitutive relations
~D = ~E + 4π ~P , ~P = ~P ( ~E),
~B = ~H + 4π ~M, ~M = ~M( ~H),
~j = ~j( ~E).
(3.5)
These relations describe the response of the medium to electromagnetic field: appear-ance of polarization ~P , magnetization ~M and conduction current ~j.
The induced polarization ~P to the electric field ~E of the incident laser pulse is givenby [109]
~P (~r, t) =
∫ +∞
0
dt1
∫ +∞
−∞χ(1)(~r − ~r1, t− t1) ~E(~r1, t1)d~r1
+
∫ +∞
0
dt1dt2
∫ +∞
−∞χ(2)(~r − ~r1, ~r − ~r2, t− t1, t− t2) ~E(~r1, t1) ~E(~r2, t2)d~r1~r2 + . . . ,
(3.6)
where χ(n) is the n-th order optical susceptibility tensor of rank (n + 1). Here onecan note that χ(n) has nonlocal and non-instantaneous character. It means that thepolarization ~P is not a point-like characteristic of a medium and does not changesimultaneously with the applied electric field ~E. The limits of the time integrals in (3.6)
are determined by the causality principle (t − t1 > 0, t − t2 > 0), i.e. only ~E in the
past moments affects the current value of ~P .From the Maxwell’s equations (3.1), (3.2), (3.3), (3.4) one can derive the optical
wave equation for the electric field ~E(~r, t) [109]:[~∇× (~∇×) +
1
c2
∂2
∂t2
]~E(~r, t) = −4π
c2
∂2
∂t2~P (~r, t). (3.7)
Let us assume that the electric field ~E(~r, t) can be expressed as the sum of themonochromatic plane waves:
~E(~r, t) =∑l
~El(kl, ωl) =∑l
~Elei(~kl·~r−ωlt. (3.8)
If the polarization ~P (~r, t) is a linear function of ~E(~r, t):
~P (~r, t) = ~P (1)(~r, t) =∑l
~Pl(kl, ωl) =∑l
χ(1)(ωl) ~El(~kl, ωl), (3.9)
the wave equation (3.7) can be rewritten as a system of the decoupled equations foreach frequency component:[
~∇× (~∇×)− ω2l
c2ε(ωl)
]~El(~kl, ω) = 0, (3.10)
36
3.2. MAGNETO-OPTICAL KERR EFFECT
where ε(ωl) = 1 + 4πχ(1)(ωl). It means that in this case all monochromatic planewaves propagate in a medium independently from each other and do not produce newfrequencies. Instead of the discrete set of the monochromatic waves (3.8), one canconsider a wave with a continuous spectrum:
E(t) =1
2π
∫ ∞−∞
E(Ω)eiΩtdΩ, (3.11)
where
E(Ω) =
∫ ∞−∞
E(t)e−iΩtdt = |E(Ω)|eiΦ(Ω). (3.12)
(3.11) and (3.12) are known as the inverse and direct Fourier transforms, respectively.|E(Ω)| is the spectral amplitude, and Φ(Ω) is the spectral phase. Since E(t) is a realfunction, E(Ω) = E∗(−Ω).
Presence of the nonlinear terms in the relation (3.6) between ~E(~r, t) and ~P (~r, t)results in the interaction of the different spectral components and the generation ofnew ones. For instance, the second order susceptibility χ(2) leads to such effects likesecond harmonic generation (2ω = ω + ω), sum-frequency generation (ω = ω1 + ω2),difference-frequency generation (2ω = ω1−ω2) and optical rectification (0 = ω−ω. Inthe following sections, we will consider only the linear MOKE and the mSHG.
3.2 Magneto-optical Kerr effect
In 1845 Michael Faraday found that the polarization of light propagating througha magnetized medium undergoes rotation by an angle proportional to the appliedmagnetic field [110]. Then thirty two years later John Kerr discovered that the sameeffect can be observed also in reflection [111].
3.2.1 Phenomenological description and macroscopic formal-ism
Macroscopic description of the MOKE is based on an analysis of the dielectric tensor.For a medium which is isotropic in the absence of the magnetization, the dielectrictensor can be written in the form [46]
ε = ε ·
1 i ·Qz −i ·Qy
−i ·Qz 1 i ·Qx
i ·Qy −i ·Qx 1
(3.13)
where ~Q = (Qx, Qy, Qz) is the Voigt vector [112], proportional to the magnetization~M . It can be expressed as a product of the Voigt constant q and the magnetization~M :
~Q = q · ~M. (3.14)
37
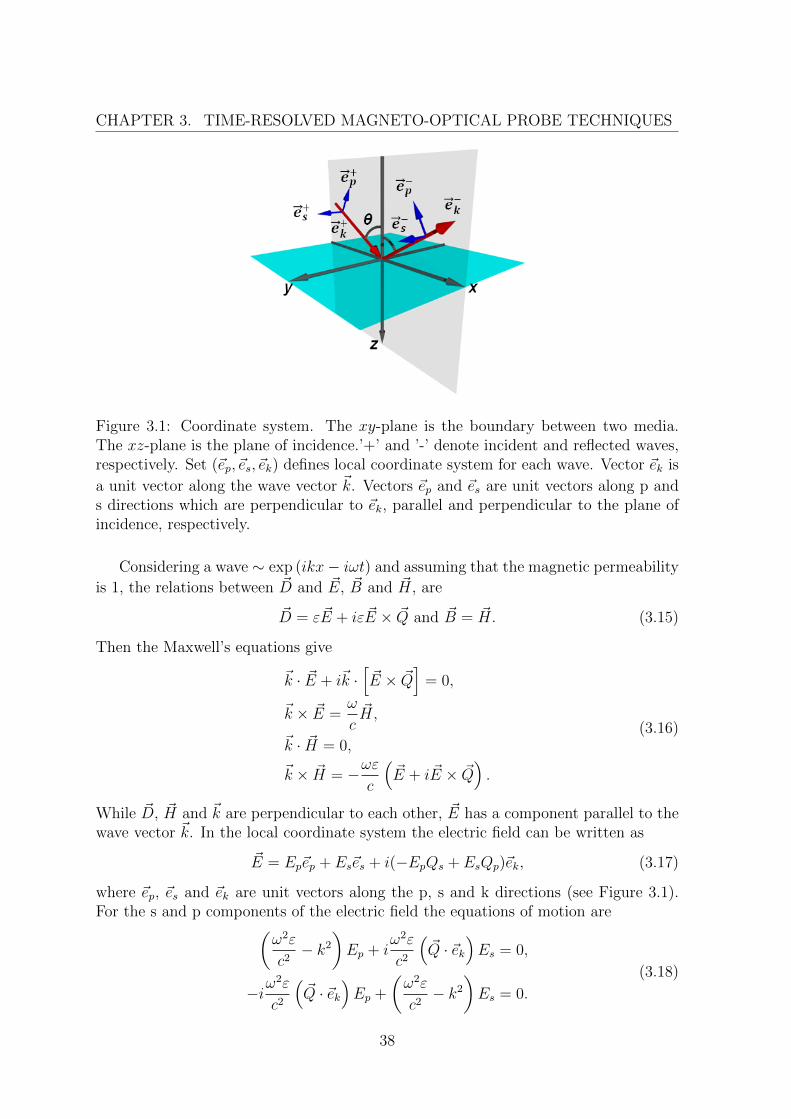
CHAPTER 3. TIME-RESOLVED MAGNETO-OPTICAL PROBE TECHNIQUES
Figure 3.1: Coordinate system. The xy-plane is the boundary between two media.The xz-plane is the plane of incidence.’+’ and ’-’ denote incident and reflected waves,respectively. Set (~ep, ~es, ~ek) defines local coordinate system for each wave. Vector ~ek is
a unit vector along the wave vector ~k. Vectors ~ep and ~es are unit vectors along p ands directions which are perpendicular to ~ek, parallel and perpendicular to the plane ofincidence, respectively.
Considering a wave ∼ exp (ikx− iωt) and assuming that the magnetic permeability
is 1, the relations between ~D and ~E, ~B and ~H, are
~D = ε ~E + iε ~E × ~Q and ~B = ~H. (3.15)
Then the Maxwell’s equations give
~k · ~E + i~k ·[~E × ~Q
]= 0,
~k × ~E =ω
c~H,
~k · ~H = 0,
~k × ~H = −ωεc
(~E + i ~E × ~Q
).
(3.16)
While ~D, ~H and ~k are perpendicular to each other, ~E has a component parallel to thewave vector ~k. In the local coordinate system the electric field can be written as
~E = Ep~ep + Es~es + i(−EpQs + EsQp)~ek, (3.17)
where ~ep, ~es and ~ek are unit vectors along the p, s and k directions (see Figure 3.1).For the s and p components of the electric field the equations of motion are(
ω2ε
c2− k2
)Ep + i
ω2ε
c2
(~Q · ~ek
)Es = 0,
−iω2ε
c2
(~Q · ~ek
)Ep +
(ω2ε
c2− k2
)Es = 0.
(3.18)
38
3.2. MAGNETO-OPTICAL KERR EFFECT
To the first order in Q, the normal modes are right (R) and left (L) circularly polarizedmodes with
kR,L = k
(1± 1
2~Q · ~ek
), and nR,L = n
(1± 1
2~Q · ~ek
), (3.19)
where k = (ω/c)√ε and n =
√ε are the wave vector and refractive index without
magnetization. In the local coordinate the relations between the s and p componentsof the R and L modes are
ERp = iER
s , ELp = −iEL
s . (3.20)
P-polarized light can be expressed as a superposition of the R and L modes. Uponthe reflection from a magnetic material the difference between refractive indices ofthe right and left circularly polarized components give rise to the in-phase S-polarizedcomponent which leads to the rotation of the polarization, and the out-of-phase S-polarized component which leads to the ellipticity.
To simulate reflection and transmission of a multilayer system we use an approachbased on the medium boundary and propagation matrices [27, 28].
The medium boundary matrix describes the relation between the x and y compo-nents of ~E and ~H with p and s components of the electric field:
ExEyHx
Hy
= A
E+p
E+s
E−pE−s
, (3.21)
where A is the medium boundary matrix:
A = cos θ−iQy sin θ i2 [tan θ(1+cos2 θ)Qx−Qz sin2 θ] − cos θ−iQy sin θ i
2 [− tan θ(1+cos2 θ)Qx−Qz sin2 θ]0 1 0 1
in2
(Qx tan θ+Qz) −n cos θ in2
(−Qx tan θ+Qz) n cos θ
n in2
(Qx sin θ+Qz cos θ) n in2
(Qx sin θ−Qz cos θ)
.
(3.22)
‘+‘ and ‘-‘ denote the waves propagating in the positive and negative directions withrespect to the z axis.
The medium propagation matrix describes the relations between Ep and Es at theboundaries z and z + d of the layer with thickness d:
E+p
E+s
E−pE−s
z
= D
E+p
E+s
E−pE−s
z+d
, (3.23)
where D is the medium propagation matrix:
D = S−1DS (3.24)
39
CHAPTER 3. TIME-RESOLVED MAGNETO-OPTICAL PROBE TECHNIQUES
with the matrix S expressing the relations between the y components of the R and Lmodes and the p and s components of the electric field
E+,Ry
E+,Ly
E−,Ry
E−,Ly
= S
E+p
E+s
E−pE−s
=1
2
−i 1 0 0i 1 0 00 0 −i 10 0 i 1
E+p
E+s
E−pE−s
, (3.25)
and the matrix D expressing the relations between the y components of the R and Lmodes at the boundaries z and z + d
E+,Ry
E+,Ly
E−,Ry
E−,Ly
z
= D
E+,Ry
E+,Ly
E−,Ry
E−,Ly
z+d
, (3.26)
D =
exp(−ik+Rd cos θ+R) 0 0 0
0 exp(−ik+Ld cos θ+L ) 0 0
0 0 exp(−ik−Rd cos θ−R) 0
0 0 0 exp(−ik−L d cos θ−L )
. (3.27)
Knowing the A and D matrices allows to calculate the magneto-optical responseof a multilayer structure, which consists of N layers. If we consider a beam of lightincoming from the initial medium i, a beam reflected back to the initial medium i anda beam transmitted into the final medium f will be a result of multiple reflections.
The electric fields in the media i and f can be expressed asE+p
E+s
E−pE−s
i
=
E+p
E+s
rppE+p + rpsE
+s
rspE+p + rssE
+s
and
E+p
E+s
00
f
=
tppE
+p + tpsE
+s
tspE+p + tssE
+s
00
(3.28)
Here r and t are the reflection and transmission coefficients for p- and s-polarizedcomponents. Since Ex, Ey, Hx and Hy are continuous at each interface, the relationbetween the electric fields in the media i and f can be derived as
Ai
E+p
E+s
E−pE−s
i
=N∏m=1
(AmDmA
−1m
)Af
E+p
E+s
E−pE−s
f
(3.29)
E+p
E+s
E−pE−s
i
= A−1i
N∏m=1
(AmDmA
−1m
)Af
E+p
E+s
E−pE−s
f
(3.30)
To simplify the expressions, we introduce the layer matrix Cm:
Cm = AmDmA−1m . (3.31)
40
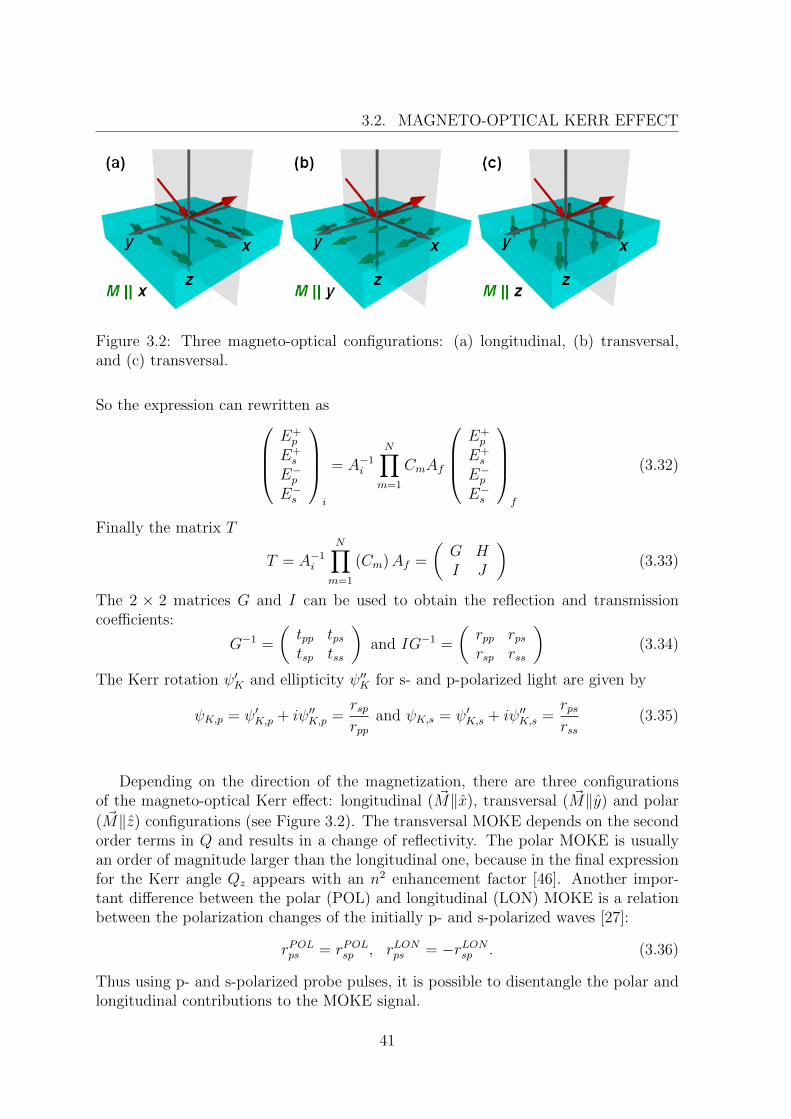
3.2. MAGNETO-OPTICAL KERR EFFECT
Figure 3.2: Three magneto-optical configurations: (a) longitudinal, (b) transversal,and (c) transversal.
So the expression can rewritten asE+p
E+s
E−pE−s
i
= A−1i
N∏m=1
CmAf
E+p
E+s
E−pE−s
f
(3.32)
Finally the matrix T
T = A−1i
N∏m=1
(Cm)Af =
(G HI J
)(3.33)
The 2 × 2 matrices G and I can be used to obtain the reflection and transmissioncoefficients:
G−1 =
(tpp tpstsp tss
)and IG−1 =
(rpp rpsrsp rss
)(3.34)
The Kerr rotation ψ′K and ellipticity ψ′′K for s- and p-polarized light are given by
ψK,p = ψ′K,p + iψ′′K,p =rsprpp
and ψK,s = ψ′K,s + iψ′′K,s =rpsrss
(3.35)
Depending on the direction of the magnetization, there are three configurationsof the magneto-optical Kerr effect: longitudinal ( ~M‖x), transversal ( ~M‖y) and polar
( ~M‖z) configurations (see Figure 3.2). The transversal MOKE depends on the secondorder terms in Q and results in a change of reflectivity. The polar MOKE is usuallyan order of magnitude larger than the longitudinal one, because in the final expressionfor the Kerr angle Qz appears with an n2 enhancement factor [46]. Another impor-tant difference between the polar (POL) and longitudinal (LON) MOKE is a relationbetween the polarization changes of the initially p- and s-polarized waves [27]:
rPOLps = rPOLsp , rLONps = −rLONsp . (3.36)
Thus using p- and s-polarized probe pulses, it is possible to disentangle the polar andlongitudinal contributions to the MOKE signal.
41
CHAPTER 3. TIME-RESOLVED MAGNETO-OPTICAL PROBE TECHNIQUES
3.2.2 Microscopic formalism
In 1955 Argyres showed that the Kerr effect is caused by the combined action ofthe exchange interaction and spin-orbit coupling [113]. The spin-orbit coupling actson the electrons like an external magnetic field, which results in the rotation of thepolarization of the linearly polarized light. However, if clockwise and counterclockwiserotations are equally probable, they will cancel each other, meaning that the spin-orbit interaction alone is not enough. In paramagnetic materials in the absence ofthe external magnetic field, there is no MOKE signal. In ferromagnets the exchangeinteraction splits the electronic band structure into the majority and minority sub-bands. The densities of states at the fixed energy are different in these sub-bands,therefore the Kerr rotations for majority and minority electrons no longer cancel eachother, and a non-zero MOKE signal can be observed. Thus it can be deduced thatqualitatively the MOKE is proportional to the difference in the optical transition ratesin the majority and minority sub-bands [114].
Following the self-consistent-field approach suggested by Ehrenreich and Cohen [115],one can obtain the expression for the off-diagonal terms of the linear susceptibility [114]:
χ(1)xy (q, ω,Mz) = −χ(1)
yx (q, ω,Mz)
=4πe2
V
λs.o.~ω
∑k,l,l′,σ
(〈k + q, l′, σ|y|klσ〉〈klσ|x|k + q, l′σ〉 f(Ek+q,l′σ)− f(Eklσ)
Ek+q,l′σ − Eklσ − ~ω + i~α1
),
(3.37)
where λs.o. is the spin-orbit coupling constant. Majority and minority energy sub-bandsEklσ are denoted with σ. |klσ〉 = 1
Vuklσe
ik·r are the Block states of the wave-vector~k and spin σ in the l-th band, V is the volume, ~q is the photon wave-vector, and α1
is the experimental resolution. The off-diagonal term χ(1)xy is responsible for the polar
Kerr rotation [114]:
ψPOLK = ψ′K + iψ′′K = − χ(1)xy
χ(1)xx
√1 + 4πχ
(1)xx
. (3.38)
If ~M‖z, all other off-diagonal elements vanish because of the selection rules.
3.3 Magneto-induced Second Harmonic Generation
In addition to the linear MOKE, one can also use non-linear magneto-optical tech-niques as magnetization-induced Second Harmonic Generation (mSHG) to monitormagnetization dynamics. Initially sensitivity of the surface/interface SHG to magne-tization was theoretically predicted by Pan et al. in 1989 [116]. Then in 1991 it wasexperimentally demonstrated on a Fe(110) surface by Reif et al. [117].
42
3.3. MAGNETO-INDUCED SECOND HARMONIC GENERATION
3.3.1 Macroscopic formalism
SHG arises from the nonlinear polarization P (2ω) induced by the incident laser fieldE(ω). In the electric dipole approximation the polarization P (2ω) can be written as
~P (2ω) = χ(2,D) ~E(ω) ~E(ω). (3.39)
The susceptibility tensor χ(2) has 27 components. Since χ(2)ijk ≡ χ
(2)ikj, the number of
the independent components can be reduced to 18, and the expression (3.39) can berewritten in the following matrix form:
PxPyPz
=
χxxx χxyy χxzz χxzy χxzx χxxyχyxx χyyy χyzz χyzy χyzx χyxyχzxx χzyy χzzz χzzy χzzx χzxy
ExExEyEyEzEz2EyEz2ExEz2ExEy
. (3.40)
Symmetry considerations show that the dipole contribution is zero in the bulk of acentrosymmetric medium, thereby limiting the electric dipole radiation to the surfacesand interfaces where the inversion symmetry is broken. The HC and spin transportmay give rise to the bulk contributions which will be addressed in the last section ofthis chapter.
Metallic multilayer structures studied in the present work consist of the epitaxialFe(001) and Au(001) films grown on the MgO substrate on the top of each other. With-out magnetization the (001) surface has 4mm symmetry (C4v). Because magnetization~M is an axial vector which conserves its orientation under the spatial inversion oper-
ation, its presence will not affect the inversion symmetry. Nevertheless, ~M does lowerthe symmetry of the film surface, introducing more non-zero tensor components thanin the case of the non-magnetic surfaces and interfaces [116]. The non-zero elementsof χ(2)(M) can be obtained from the invariance of χ(2)(M) under the symmetry oper-ations. Thus if the xz is the plane of incidence, for the (001) surface we find [116, 118]
χ(2) =
χoddxxx(My) χoddxyy(My) χoddxzz(My) χoddxzy(Mz) χevenxzx χoddxxy(Mx)χoddyxx(Mx) χoddyyy(Mx) χoddyzz(Mx) χevenyzy χoddyzx(Mz) χoddyxy(My)χevenzxx χevenzyy χevenzzz χoddzzy(Mx) χoddzzx(My) χoddzxy(Mz)
,
(3.41)where the even terms always contribute to the mSHG signal, while the odd termsdepends on the corresponding projection of the magnetization vector ~M . For theanalysis it is useful to separate the even and odd terms:
χ(2) = χ(2),even + χ(2),odd. (3.42)
In the first approximation, the even term χ(2),even is independent of the magnetization,and the odd term χ(2),odd is linearly proportional to the magnetization ~M and can beexpressed as [118]:
χ(2),oddijk = χ
(3)ijk,lMl, (3.43)
43
CHAPTER 3. TIME-RESOLVED MAGNETO-OPTICAL PROBE TECHNIQUES
where χ(3)ijk,l is the fourth-rank tensor independent of ~M .
In an optical experiment the mSHG intensity is measured for opposite directionsof the magnetization:
I↑↓2ω = | ~Eeven2ω |2 + | ~Eodd
2ω |2 ± 2| ~Eeven2ω | · | ~Eodd
2ω | cosφ2ω, (3.44)
where φ2ω is the optical phase shift between the even ~Eeven2ω and odd ~Eodd
2ω SH fields.It should be noted that in a lossless medium, the time-reversal properties of χ(2)(M)dictate that the real part of χ(2)(M) is an even function of M , while the imaginary
part is an odd function of M . It means that in this case the even ~Eeven2ω and odd ~Eodd
2ω
SH fields has a φ2ω = 90 phase shift.
Nonlinear optical response of a multilayer structure
Calculation of the mSHG response of a multilayer structure is a stepwise procedureand similar to the calculation of the linear magneto-optical response. First of all, onehas to find distribution of the fundamental field, which can be done using the self-consistent 4 × 4 matrix method described in the previous section 1. Since the mSHGis the second order effect, the liner MOKE rotation can be neglected, as well as thedepletion of the fundamental wave by the mSHG. Further we assume that there areonly electric dipole sources of the SH field at the interfaces. The following considerationcan also be performed in a more general case.
Following the ideas of Bloembergen and Pershan [119], at each interface we in-troduce an infinitely thin nonlinear sheet with thickness 2δ2 inside an infinitely thinvacuum sheet with thickness 2δ1 (see Figure 3.3). This sheet has a refractive index nij,the refractive index of the interface. The xz plane is the plane of incidence (ky = 0),therefore the induced polarization in the sheet is:
~P sh2ω (~rj, t) = ~P sh
2ω,j expi[2kx(ω)x−2ωt], (3.45)
where ~rj corresponds to the points in the plane of the interface j.
P sh2ω,k,j = χ
(2)klm,j(2ω)Eω,l,jEω,m,j, (3.46)
where k, l,m = x, y, z, and χ(2)klm(2ω) is the nonlinear susceptibility tensor of the inter-
face j. The presence of the source P sh2ω,j causes a discontinuity of the SH fields at the
interface j [46]. Discontinuity of the electric ∆E2ω, x, j and magnetic ∆H2ω,y,j fieldscan be derived from the boundary conditions, where the presence of the SH sourcepolarization is taken into account [120, 121]:
∆E2ω,x,j = − ikx(2ω)[nij(2ω)
]2 4πP sh2ω,z,j, (3.47)
∆H2ω,y,j =i2ω
c4πP sh
2ω,x,j. (3.48)
44
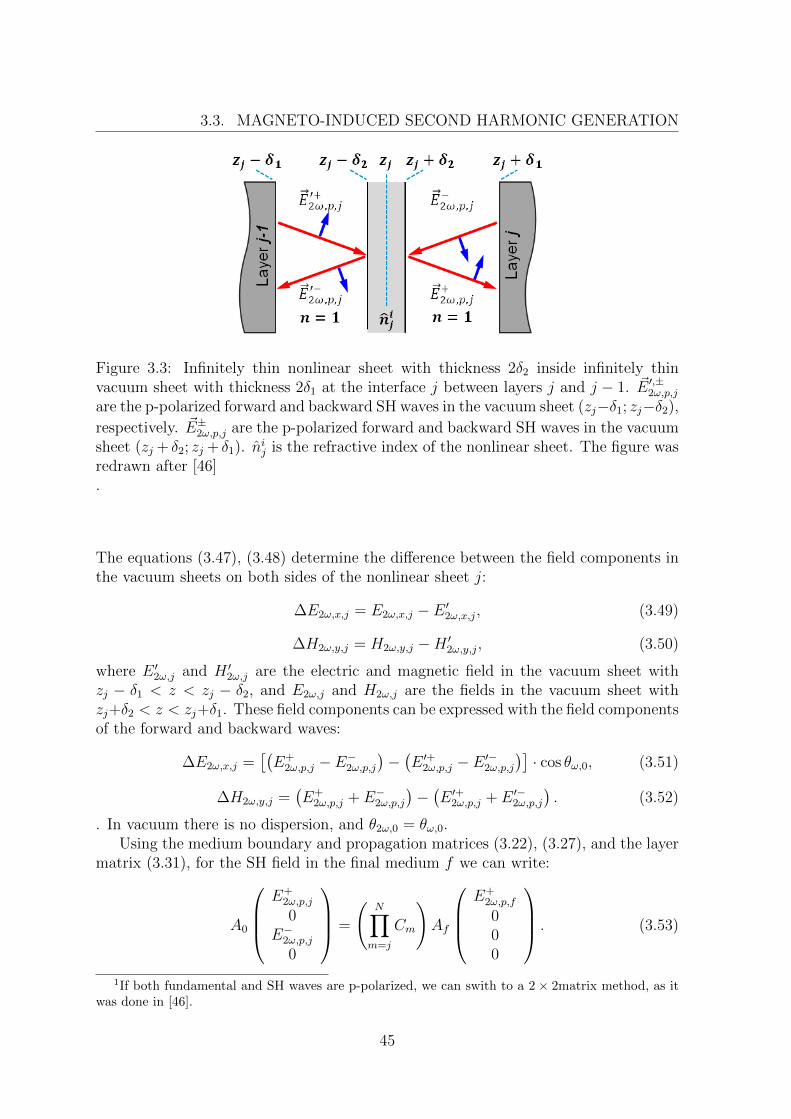
3.3. MAGNETO-INDUCED SECOND HARMONIC GENERATION
Figure 3.3: Infinitely thin nonlinear sheet with thickness 2δ2 inside infinitely thinvacuum sheet with thickness 2δ1 at the interface j between layers j and j − 1. ~E ′,±2ω,p,j
are the p-polarized forward and backward SH waves in the vacuum sheet (zj−δ1; zj−δ2),
respectively. ~E±2ω,p,j are the p-polarized forward and backward SH waves in the vacuumsheet (zj + δ2; zj + δ1). nij is the refractive index of the nonlinear sheet. The figure wasredrawn after [46].
The equations (3.47), (3.48) determine the difference between the field components inthe vacuum sheets on both sides of the nonlinear sheet j:
∆E2ω,x,j = E2ω,x,j − E ′2ω,x,j, (3.49)
∆H2ω,y,j = H2ω,y,j −H ′2ω,y,j, (3.50)
where E ′2ω,j and H ′2ω,j are the electric and magnetic field in the vacuum sheet withzj − δ1 < z < zj − δ2, and E2ω,j and H2ω,j are the fields in the vacuum sheet withzj+δ2 < z < zj+δ1. These field components can be expressed with the field componentsof the forward and backward waves:
∆E2ω,x,j =[(E+
2ω,p,j − E−2ω,p,j)−(E ′+2ω,p,j − E ′−2ω,p,j
)]· cos θω,0, (3.51)
∆H2ω,y,j =(E+
2ω,p,j + E−2ω,p,j)−(E ′+2ω,p,j + E ′−2ω,p,j
). (3.52)
. In vacuum there is no dispersion, and θ2ω,0 = θω,0.Using the medium boundary and propagation matrices (3.22), (3.27), and the layer
matrix (3.31), for the SH field in the final medium f we can write:
A0
E+
2ω,p,j
0E−2ω,p,j
0
=
(N∏m=j
Cm
)Af
E+
2ω,p,f
000
. (3.53)
1If both fundamental and SH waves are p-polarized, we can swith to a 2× 2matrix method, as itwas done in [46].
45
CHAPTER 3. TIME-RESOLVED MAGNETO-OPTICAL PROBE TECHNIQUES
If we define
T = A−10
(N∏m=j
Cm
)Af , (3.54)
then
E+2ω,p,j = T11 · E+
2ω,p,f , E−2ω,p,j = T31 · E+2ω,p,f ⇒ E−2ω,p,j =
T31
T11
· E+2ω,p,j. (3.55)
For SH field in the initial medium i:
Ai
00
E−2ω,p,j0
=
j−1∏m=1
C2ωm A0
E ′+2ω,p,f
0E ′−2ω,p,f
0
. (3.56)
If we define
T = A−1i
j−1∏m=1
(Cm)A0, (3.57)
thenT11 · E ′+2ω,p,j + T13 · E ′−2ω,p,j = 0. (3.58)
Thus we demonstrated how to calculate the outgoing SH waves generated at the inter-face j. Since the SH fields originating at the surfaces and interfaces are so small, wecan neglect interaction between them, and the total SH response is just a sum of theSH waves calculated separately for each interface.
3.3.2 Microscopic formalism
The odd components of the SH susceptibility tensor χ(2)ijm can be obtained in a similar
way as the off-diagonal components of the linear susceptibility (3.37) [114]:
χ(2)ijm
(2q‖, 2ω,M
)= 4π
e3q‖a
V
λs.o.~ω
×∑σ
∑k,l,l′,l′′
〈k + 2q‖, l′′σ|i|klσ〉〈klσ|j|k + q‖, l
′σ〉〈k + q‖, l′σ|m|k + 2q‖, l
′′σ〉
×
f(Ek+2q‖,l′′σ)−f(Ek+q‖,l
′σ)
Ek+2q‖,l′′σ−Ek+q‖,l′σ−~ω+i~α1
−f(Ek+q‖,l
′σ)−f(Eklσ)
Ek+q‖,l′σ−Eklσ−~ω+i~α1
Ek+2q‖,l′′σ − Eklσ − 2~ω + i2~α1
,
(3.59)
where 〈klσ|j|k+ 2q‖, l′σ〉 are the transition matrix elements which determine the sym-
metry and consequently the interface sensitivity. In some cases the matrix elementscan be treated as constants, but one has to introduce a cut-off to guarantee the surfacesensitivity. The odd components of χ(2) are also linearly proportional to the constant ofthe spin-orbit coupling λs.o.. So it is one of the key parameter for linear and nonlinearmagneto-optics.
46
3.4. HOT CARRIER DYNAMICS PROBED BY THE MOKE AND THE MSHG
3.4 Hot carrier dynamics probed by the MOKE
and the mSHG
Considerations of the MOKE and mSHG signals in two previous section are mostly re-lated to the steady state in the absence of the optical excitation or applied electric field.It was demonstrated that both MOKE and mSHG are sensitive to the magnetization.This section is devoted to the challenges in the interpretation of the pump-inducedvariations of the magneto-optical signals.
3.4.1 Variation of the magneto-optical constants
In the second section of this chapter it was shown that both MOKE rotation and el-lipticity are linearly proportional to the bulk magnetization, therefore their variationsshould reflect real magnetization dynamics. However, it was found that on a femtosec-ond time scale after the optical excitation both MOKE rotation and ellipticity can beaffected not only by the magnetization dynamics, but also by the state-filling effect,or so-called the optical bleaching [82]. The reason is that absorption of a strong pumplaser pulse leads to the generation of the non-equilibrium (NEQ) electrons above theFermi level and NEQ holes below the Fermi level, which populate final states and de-populate initial states of the linear optical transitions, respectively. Thus the pumppulse may partially block the optical transitions available for the probe pulse, or opennew ones. The state-filling effect decays together with the NEQ electron distributionduring the electron-electron thermalization. At the same time, an increase of the elec-tron and lattice temperatures changes the magneto-optical constant of a ferromagnet,which also causes the difference between the MOKE rotation and ellipticity. It shouldbe noted that because of the different depth sensitivities of the MOKE rotation andellipticity [122], the difference between their variations may occur even in the absenceof the optical artefacts, which should be also taken into account in the interpretationof the experimental data. In more detail this problem and its possible solution arediscussed in Chapters 5 and 6
3.4.2 Current- and spin-current-induced contributions to themSHG
On top of the surface/interface (bulk in non-centrosymmetric media) non-magnetic andmagneto-induced contributions, the mSHG response contains bulk terms proportionalto the charge current and spin current (SC). Both current- [123] and SC [124]-inducedcontributions have been observed in GaAs with relatively large light penetration depth.The current-induced SHG has been also demonstrated in graphene [125]. In spite ofsmall light penetration depth, such contributions can be also expected in metals, espe-cially in Au owing to a large inelastic mean free path, which facilitates high currents,and large spin-orbit coupling which is required for the magneto-optical effects. InChapters 7 and 8 it is demonstrated that the laser-induced SC pulse gives rise tothe SH field originating in the bulk of Au.
47

Chapter 4
Experimental details
To study ultrafast HC driven magnetization dynamics experimental setup (see fig-ure 4.1) for time-resolved MOKE and mSHG spectroscopy has been built in the FritzHaber Institute of the Max Planck Society. It is based on a pump-probe technique, em-ploying an intense laser pulse to excite the system and a weak probe pulse to measure itsresponse. The setup is driven by 14-fs, 40 nJ pulses with 820 nm central wavelength at1-MHz repetition rate and allows to switch easily between back-pump-front-probe andstandard front-pump-front-probe schemes. Implementation of the motorized stages inthe crucial parts of the setup and development of the LabView program to control themmade it possible to perform experiments in different magneto-optical and polarizationgeometries simultaneously in a reliable and controlled manner. In the following, theexperimental setup is described.
4.1 Ti:sapphire Oscillator with Cavity dumper
The Coherent Mantis laser system used in this work is a mode-locked Ti:sapphire(Ti:Sa) oscillator extended with a cavity dumper (see figure 4.2). The design incor-porates an Optically Pumped Semiconductor (OPS) laser. It pumps a Ti:Sa crystalwith 532-nm light, which serves as a gain medium with an extremely broad emissionband ranging from 700 to 900 nm [126, 127]. An optical cavity of length l restricts theradiation to the longitudinal modes of index m which satisfy the criterion:
mλm2
= l or νm =mc
2l, (4.1)
where λm and νm are the wavelength and the frequency of the longitudinal modem ∈ N.The mode spacing ∆ν = νm+1 − νm = c/(2l) is related to the cavity round-trip timeτRT = 1/∆ν. Forcing all the modes to have an equal phase (mode-locking) implies inthe time domain that all the waves of different frequencies will add constructively at onepoint, resulting in an intense and short burst of light (see Figure 4.3(b)). Ti:Sa permits
49
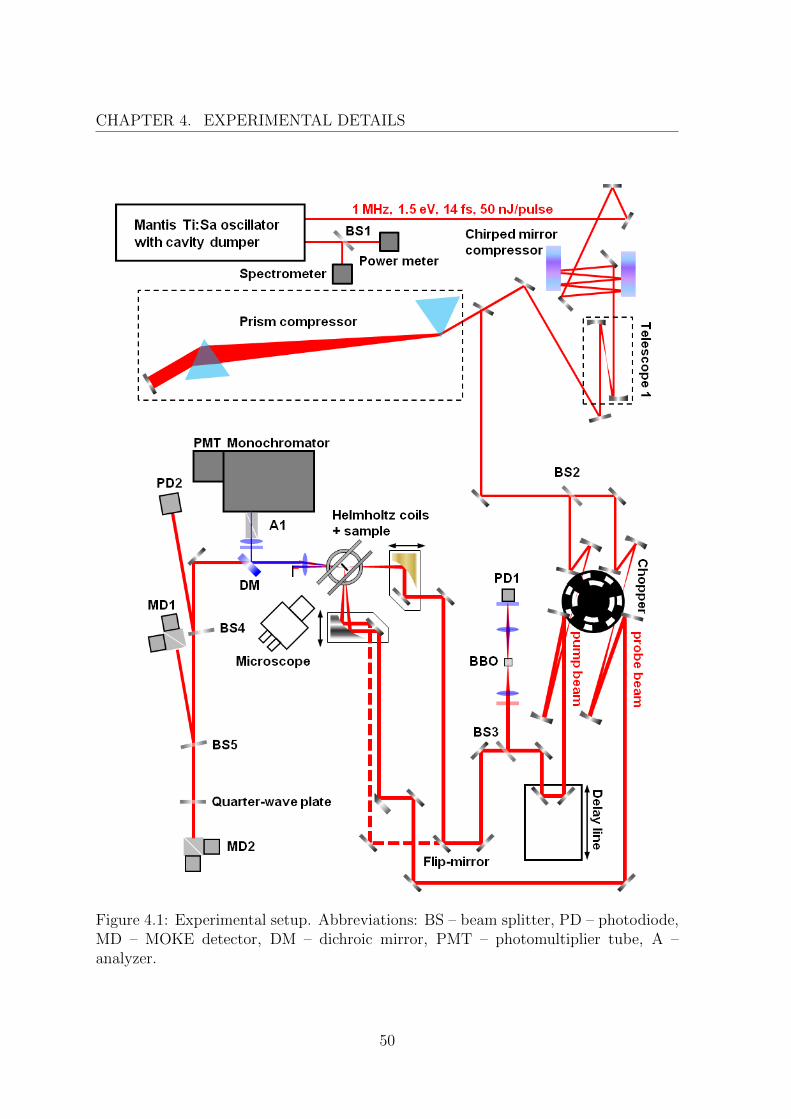
CHAPTER 4. EXPERIMENTAL DETAILS
Figure 4.1: Experimental setup. Abbreviations: BS – beam splitter, PD – photodiode,MD – MOKE detector, DM – dichroic mirror, PMT – photomultiplier tube, A –analyzer.
50
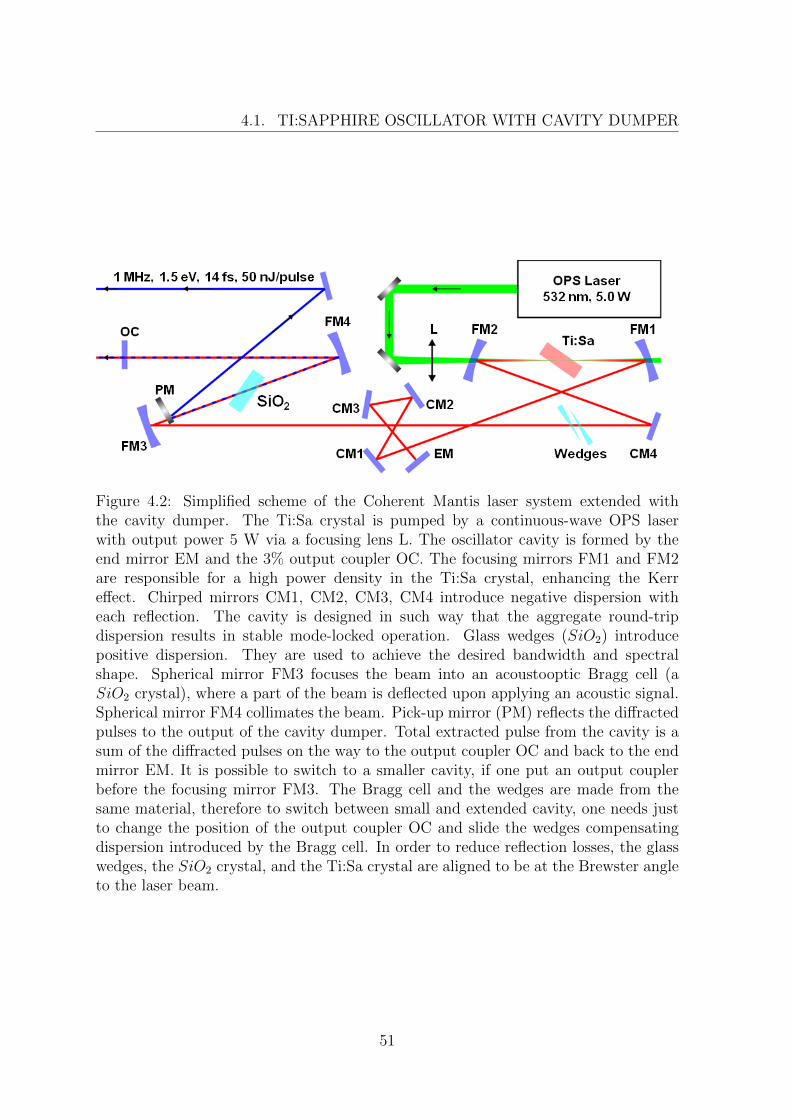
4.1. TI:SAPPHIRE OSCILLATOR WITH CAVITY DUMPER
Figure 4.2: Simplified scheme of the Coherent Mantis laser system extended withthe cavity dumper. The Ti:Sa crystal is pumped by a continuous-wave OPS laserwith output power 5 W via a focusing lens L. The oscillator cavity is formed by theend mirror EM and the 3% output coupler OC. The focusing mirrors FM1 and FM2are responsible for a high power density in the Ti:Sa crystal, enhancing the Kerreffect. Chirped mirrors CM1, CM2, CM3, CM4 introduce negative dispersion witheach reflection. The cavity is designed in such way that the aggregate round-tripdispersion results in stable mode-locked operation. Glass wedges (SiO2) introducepositive dispersion. They are used to achieve the desired bandwidth and spectralshape. Spherical mirror FM3 focuses the beam into an acoustooptic Bragg cell (aSiO2 crystal), where a part of the beam is deflected upon applying an acoustic signal.Spherical mirror FM4 collimates the beam. Pick-up mirror (PM) reflects the diffractedpulses to the output of the cavity dumper. Total extracted pulse from the cavity is asum of the diffracted pulses on the way to the output coupler OC and back to the endmirror EM. It is possible to switch to a smaller cavity, if one put an output couplerbefore the focusing mirror FM3. The Bragg cell and the wedges are made from thesame material, therefore to switch between small and extended cavity, one needs justto change the position of the output coupler OC and slide the wedges compensatingdispersion introduced by the Bragg cell. In order to reduce reflection losses, the glasswedges, the SiO2 crystal, and the Ti:Sa crystal are aligned to be at the Brewster angleto the laser beam.
51
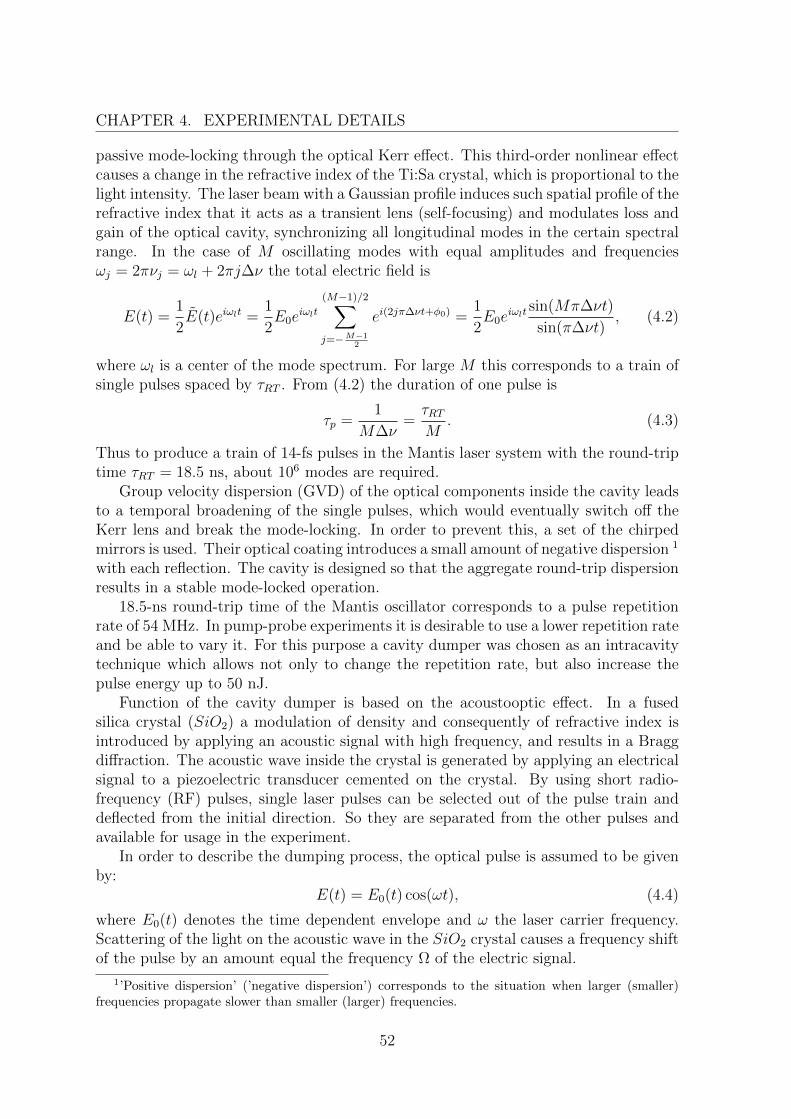
CHAPTER 4. EXPERIMENTAL DETAILS
passive mode-locking through the optical Kerr effect. This third-order nonlinear effectcauses a change in the refractive index of the Ti:Sa crystal, which is proportional to thelight intensity. The laser beam with a Gaussian profile induces such spatial profile of therefractive index that it acts as a transient lens (self-focusing) and modulates loss andgain of the optical cavity, synchronizing all longitudinal modes in the certain spectralrange. In the case of M oscillating modes with equal amplitudes and frequenciesωj = 2πνj = ωl + 2πj∆ν the total electric field is
E(t) =1
2E(t)eiωlt =
1
2E0e
iωlt
(M−1)/2∑j=−M−1
2
ei(2jπ∆νt+φ0) =1
2E0e
iωltsin(Mπ∆νt)
sin(π∆νt), (4.2)
where ωl is a center of the mode spectrum. For large M this corresponds to a train ofsingle pulses spaced by τRT . From (4.2) the duration of one pulse is
τp =1
M∆ν=τRTM
. (4.3)
Thus to produce a train of 14-fs pulses in the Mantis laser system with the round-triptime τRT = 18.5 ns, about 106 modes are required.
Group velocity dispersion (GVD) of the optical components inside the cavity leadsto a temporal broadening of the single pulses, which would eventually switch off theKerr lens and break the mode-locking. In order to prevent this, a set of the chirpedmirrors is used. Their optical coating introduces a small amount of negative dispersion 1
with each reflection. The cavity is designed so that the aggregate round-trip dispersionresults in a stable mode-locked operation.
18.5-ns round-trip time of the Mantis oscillator corresponds to a pulse repetitionrate of 54 MHz. In pump-probe experiments it is desirable to use a lower repetition rateand be able to vary it. For this purpose a cavity dumper was chosen as an intracavitytechnique which allows not only to change the repetition rate, but also increase thepulse energy up to 50 nJ.
Function of the cavity dumper is based on the acoustooptic effect. In a fusedsilica crystal (SiO2) a modulation of density and consequently of refractive index isintroduced by applying an acoustic signal with high frequency, and results in a Braggdiffraction. The acoustic wave inside the crystal is generated by applying an electricalsignal to a piezoelectric transducer cemented on the crystal. By using short radio-frequency (RF) pulses, single laser pulses can be selected out of the pulse train anddeflected from the initial direction. So they are separated from the other pulses andavailable for usage in the experiment.
In order to describe the dumping process, the optical pulse is assumed to be givenby:
E(t) = E0(t) cos(ωt), (4.4)
where E0(t) denotes the time dependent envelope and ω the laser carrier frequency.Scattering of the light on the acoustic wave in the SiO2 crystal causes a frequency shiftof the pulse by an amount equal the frequency Ω of the electric signal.
1’Positive dispersion’ (’negative dispersion’) corresponds to the situation when larger (smaller)frequencies propagate slower than smaller (larger) frequencies.
52
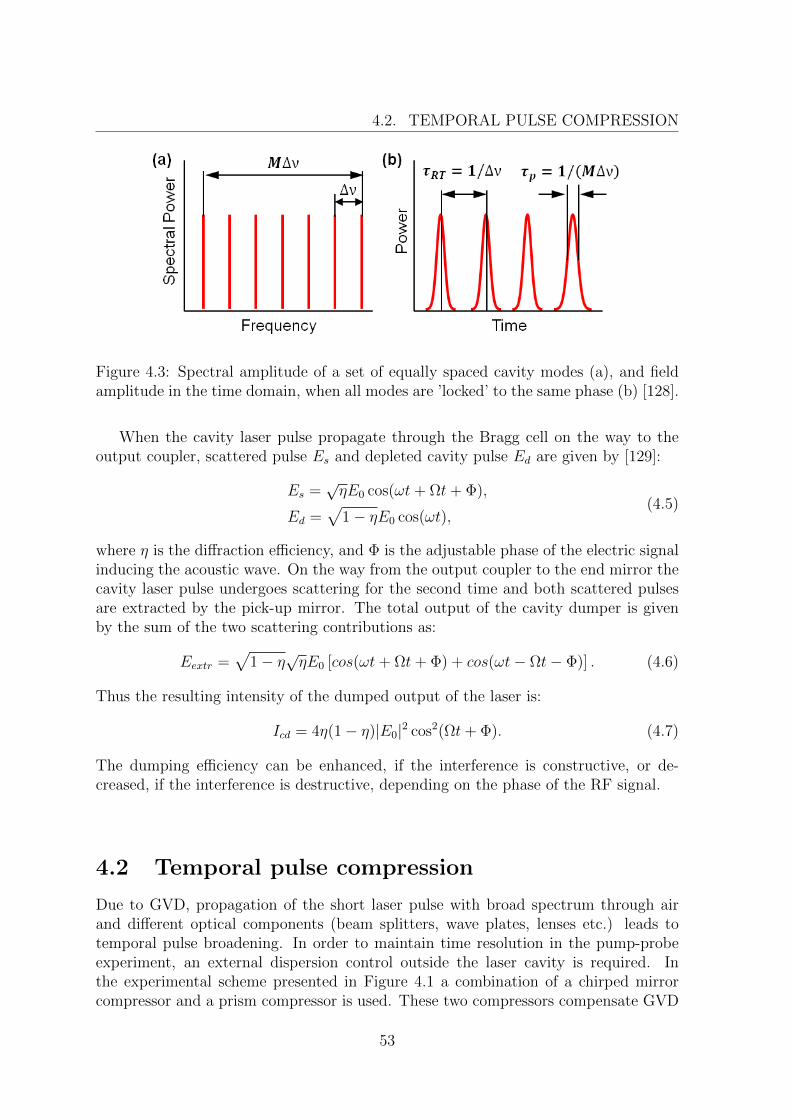
4.2. TEMPORAL PULSE COMPRESSION
Figure 4.3: Spectral amplitude of a set of equally spaced cavity modes (a), and fieldamplitude in the time domain, when all modes are ’locked’ to the same phase (b) [128].
When the cavity laser pulse propagate through the Bragg cell on the way to theoutput coupler, scattered pulse Es and depleted cavity pulse Ed are given by [129]:
Es =√ηE0 cos(ωt+ Ωt+ Φ),
Ed =√
1− ηE0 cos(ωt),(4.5)
where η is the diffraction efficiency, and Φ is the adjustable phase of the electric signalinducing the acoustic wave. On the way from the output coupler to the end mirror thecavity laser pulse undergoes scattering for the second time and both scattered pulsesare extracted by the pick-up mirror. The total output of the cavity dumper is givenby the sum of the two scattering contributions as:
Eextr =√
1− η√ηE0 [cos(ωt+ Ωt+ Φ) + cos(ωt− Ωt− Φ)] . (4.6)
Thus the resulting intensity of the dumped output of the laser is:
Icd = 4η(1− η)|E0|2 cos2(Ωt+ Φ). (4.7)
The dumping efficiency can be enhanced, if the interference is constructive, or de-creased, if the interference is destructive, depending on the phase of the RF signal.
4.2 Temporal pulse compression
Due to GVD, propagation of the short laser pulse with broad spectrum through airand different optical components (beam splitters, wave plates, lenses etc.) leads totemporal pulse broadening. In order to maintain time resolution in the pump-probeexperiment, an external dispersion control outside the laser cavity is required. Inthe experimental scheme presented in Figure 4.1 a combination of a chirped mirrorcompressor and a prism compressor is used. These two compressors compensate GVD
53
CHAPTER 4. EXPERIMENTAL DETAILS
in such a way that the laser pulse has the shortest length of about 14 fs at the sampleposition.
The chirped mirror compressor is a pair of parallel chirped mirrors which introducecertain amount of the negative dispersion, depending on the number of reflections.Moving a pick-up mirror (PM) along the chirped mirrors, one can change the numberof reflections and consequently the amount of the negative dispersion in a stepwisemanner. Two drawbacks of the chirped mirror compressor are an additional divergenceof the beam caused by a single reflection from a chirped mirror and an increase of thebeam path with the number of reflections, which in turn increases the beam size afterthe chirped mirror compressor. For this reason, a pair of spherical mirrors (telescope1: the first mirror is fixed, the second one is placed on a manual linear translator alongthe beam) is used to recollimate the beam for the prism compressor.
The prism compressor introduces both positive and negative dispersion. The amountof the positive dispersion depends on the amount of glass (fused silica/prism material)introduced into the beam. As for the negative dispersion, the part of the spectrumwith smaller wavelengths undergoes larger deflection in the first prism and consequentlypropagates through smaller thickness of glass at the second prism. Thus due to theangular dispersion of the prisms, different parts of the laser spectrum have differentoptical path in the prism compressor, which results in the negative contribution toGVD.
Since the SH intensity is proportional to the square of the intensity of the funda-mental pulse, it is a good reference to adjust duration of the laser pulse: the shorterlaser pulse at the sample surface, the larger the SH signal from the sample surface.One way to determine the pulse duration is to measure SH cross-correlation signal,originating between pump and probe signal beams, when two pulses overlap in spaceand time. The 20-fs SH cross-correlation signal shown in Figure 4.9(a) corresponds to14 fs duration of the pump and probe laser pulses. A beam splitter BS3 reflects smallportion of the pump beam for the reference channel, where it is focused into the BBOcrystal (see Figure 4.1). The blue filter in front of the photodiode PD1 transmits onlySH beam generated in the BBO crystal, which makes its signal sensitive not only tochanges of the average power of the laser output, but also to the pulse duration. A redfilter before the first lens focusing fundamental beam into the BBO crystal is used tosuppress SH beam going back to the main scheme.
The distance between two prisms in the prism compressor is so large, that when thepump and probe beams are focused with the parabolic mirrors, only the prism com-pressor is sufficient to achieve the smallest pulse duration 2. However, when lenses orthick filters are used, both compressors are required to maintain 20-fs time resolution.
4.3 Data acquisition
After the prism compressor the laser pulse is splitted with a beam splitter BS2 (80%)into the pump and probe pulses. Then both beams go through their own telescopes,constructed with pairs of spherical mirrors. These telescopes have three functions:
2In this case the pick-up mirror in the chirped mirror compressor is set to zero reflections.
54
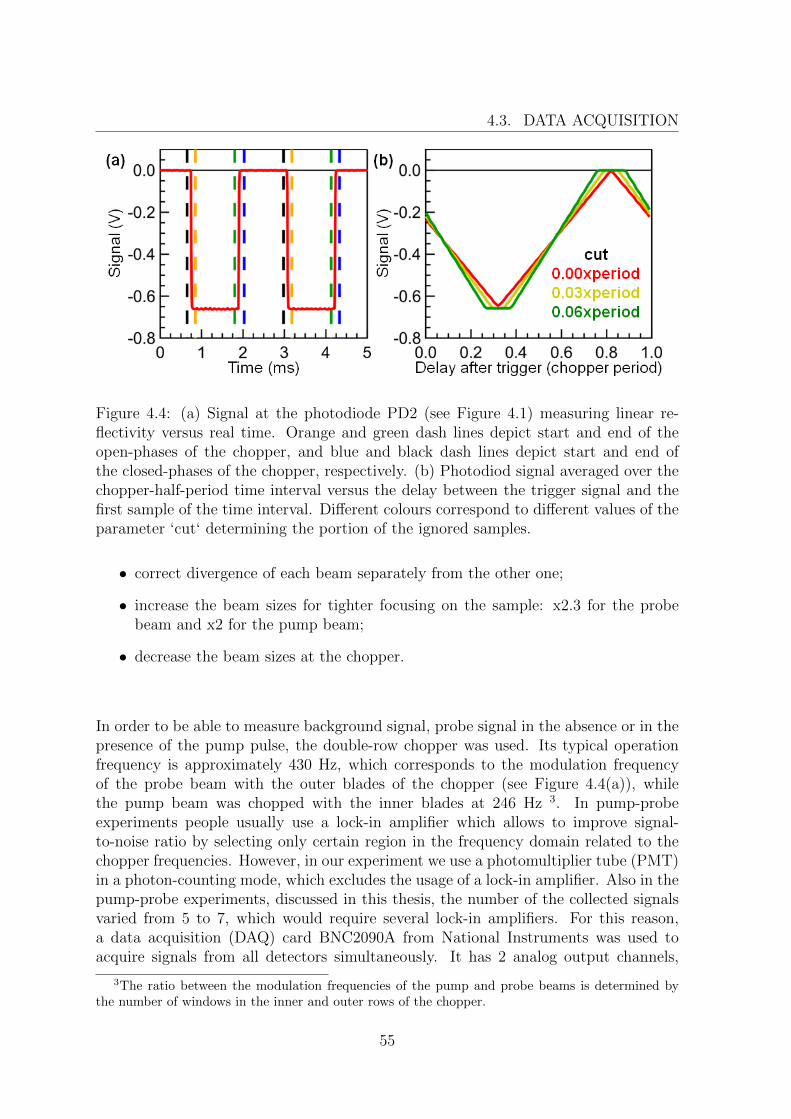
4.3. DATA ACQUISITION
Figure 4.4: (a) Signal at the photodiode PD2 (see Figure 4.1) measuring linear re-flectivity versus real time. Orange and green dash lines depict start and end of theopen-phases of the chopper, and blue and black dash lines depict start and end ofthe closed-phases of the chopper, respectively. (b) Photodiod signal averaged over thechopper-half-period time interval versus the delay between the trigger signal and thefirst sample of the time interval. Different colours correspond to different values of theparameter ‘cut‘ determining the portion of the ignored samples.
• correct divergence of each beam separately from the other one;
• increase the beam sizes for tighter focusing on the sample: x2.3 for the probebeam and x2 for the pump beam;
• decrease the beam sizes at the chopper.
In order to be able to measure background signal, probe signal in the absence or in thepresence of the pump pulse, the double-row chopper was used. Its typical operationfrequency is approximately 430 Hz, which corresponds to the modulation frequencyof the probe beam with the outer blades of the chopper (see Figure 4.4(a)), whilethe pump beam was chopped with the inner blades at 246 Hz 3. In pump-probeexperiments people usually use a lock-in amplifier which allows to improve signal-to-noise ratio by selecting only certain region in the frequency domain related to thechopper frequencies. However, in our experiment we use a photomultiplier tube (PMT)in a photon-counting mode, which excludes the usage of a lock-in amplifier. Also in thepump-probe experiments, discussed in this thesis, the number of the collected signalsvaried from 5 to 7, which would require several lock-in amplifiers. For this reason,a data acquisition (DAQ) card BNC2090A from National Instruments was used toacquire signals from all detectors simultaneously. It has 2 analog output channels,
3The ratio between the modulation frequencies of the pump and probe beams is determined bythe number of windows in the inner and outer rows of the chopper.
55
CHAPTER 4. EXPERIMENTAL DETAILS
which were used to set certain current through the Helmholtz coils, 2 channels fordigital or timing signal, and 8 analog input channels. Only 6 of these channels were inconstant use:
• first two channels were connected to the two outputs of the chopper, sending therectangular signals generated by the optocouplers;
• the third channel was connected to the photodiode PD1 (reference signal), con-trolling the energy of the laser pulse;
• the fourth channel was connected to the photodiode PD2, measuring linear re-flectivity;
• other two channels were connected to two identical MOKE detectors MD1 andMD2.
The PMT was connected to the amplifier forming TTL pulses which were sent to thechannel for timing signal to count the number of the rising edges corresponding to thenumber of photoelectrons. The DAQ card can acquire all input signal simultaneouslywith the sampling rate 100 kHz. Figure 4.4(a) shows the acquired signal from thephotodiode PD2 measuring linear reflectivity (see Figure 4.1). Using one of the choppersignals as a trigger for the acquisition process and analyzing all signals, it is possibleto determine the chopper frequency and which samples correspond to the open orclosed states of the chopper. Averaging the signal over the chopper-half-period timeintervals, one can obtain the dependence of the averaged signal on the delay betweenthe trigger and the first sample of the time interval, shown in Figure 4.4(b). When thefirst sample of the time interval corresponds to the first sample of the closed phase, theaveraged signal is almost zero, but when the first sample of the time interval becomescloser to the the first sample of the open phase, the averaged signal linearly increases.However, there are samples which correspond to the moments, when the laser beamwas partially blocked with the chopper blade. Removing some samples at the beginningand at the end of the half-period time interval from the averaging process results in theappearance of two plateaus: one corresponds to the open phase, another to the closedphase. Total duration of the ignored samples is determined by the parameter ‘cut‘ asa portion of the chopper period. From the dependences of the averaged signal on thedelay between the trigger and the first sample, obtained separately for the pump (theinner blades of the chopper) and probe (the outer blades of the chopper) beams, onecan set the delay between the trigger signal and the first sample of the open phase andthe parameter ‘cut‘ in a such way that they determine samples corresponding to oneof five phases:
• both beams are open Soo = S∗pump + S∗probe + Sbackground4;
• pump beam is open, and probe beam is closed Soc = Spump + Sbackground;
4S∗pump is the pump signal in the presence of the probe pulse, S∗probe is the probe signal in the
presence of the pump pulse
56
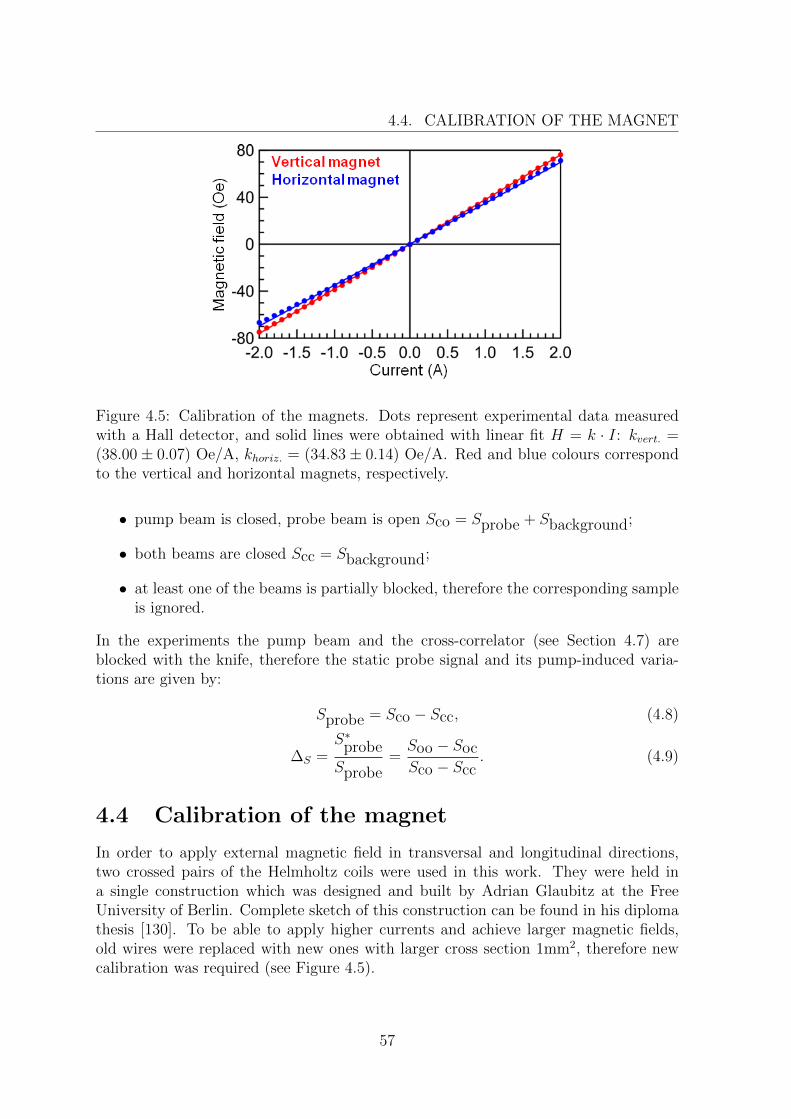
4.4. CALIBRATION OF THE MAGNET
Figure 4.5: Calibration of the magnets. Dots represent experimental data measuredwith a Hall detector, and solid lines were obtained with linear fit H = k · I: kvert. =(38.00± 0.07) Oe/A, khoriz. = (34.83± 0.14) Oe/A. Red and blue colours correspondto the vertical and horizontal magnets, respectively.
• pump beam is closed, probe beam is open Sco = Sprobe + Sbackground;
• both beams are closed Scc = Sbackground;
• at least one of the beams is partially blocked, therefore the corresponding sampleis ignored.
In the experiments the pump beam and the cross-correlator (see Section 4.7) areblocked with the knife, therefore the static probe signal and its pump-induced varia-tions are given by:
Sprobe = Sco − Scc, (4.8)
∆S =S∗probe
Sprobe=Soo − SocSco − Scc
. (4.9)
4.4 Calibration of the magnet
In order to apply external magnetic field in transversal and longitudinal directions,two crossed pairs of the Helmholtz coils were used in this work. They were held ina single construction which was designed and built by Adrian Glaubitz at the FreeUniversity of Berlin. Complete sketch of this construction can be found in his diplomathesis [130]. To be able to apply higher currents and achieve larger magnetic fields,old wires were replaced with new ones with larger cross section 1mm2, therefore newcalibration was required (see Figure 4.5).
57
CHAPTER 4. EXPERIMENTAL DETAILS
4.5 Samples
Samples studied in this work are epitaxial Fe/Au/Fe/MgO(001) and Au/Fe/MgO(001)structures. They have several significant advantages concerning the investigation of theoptically induced HC transport and ultrafast spin dynamics.
First, optically transparent MgO(001) substrate makes it possible to realize eitherback-pump-front-probe or front-pump-front-probe schemes (see Figure 4.6(d)).
Secondly, the remarkable feature of the epitaxial MLs is a well-defined structurewhich makes it suitable for ab initio analysis and suppresses inelastic HC scatteringon lattice inhomogeneities [49]. Thin Fe(001) and Au(001) films were grown in ultrahigh vacuum (UHV, ∼ 10−9 Torr) following [131, 132] and analyzed with microscopytechniques. Preparation technique is usually referred to as Molecular Beam Epitaxy(MBE). All Au/Fe/MgO(001) and Au(cap layer)/Fe/Au/Fe/MgO(001) samples havebeen prepared by Damian Burstel and Jan Meyburg, PhD students in the group ofDr. Detlef Diesing at the University of Duisburg-Essen in the department of PhysicalChemistry. Their MBE setup is very typical and reflects the common setup describedin [133].
The iron and gold films grow epitaxially with [001]Au||[001]Fe||[001]MgO and[010]Au||[110]Fe||[010]MgO (see Figure 4.6(a)). As it was discussed in Chapter 2,directions [100] and [010] in bcc-Fe correspond to the magnetization easy axes (seeFigure 4.6(c)). In the optical pump-probe experiments samples were mounted in thesample holder presented in Figure 4.6(b), so one of the easy axes was parallel to theplane of incidence, and the other one is perpendicular to it. It allows to performmeasurements in the transversal and longitudinal magneto-optical geometries either inremanence or in saturating magnetic field.
Usually each sample was divided into 9 regions with different Fe and Au thick-nesses. Perfomance of the back-pump-front-probe requires an ’alignment area’ (seeFigure 4.6(c)), a region with one Fe layer capped with thin Au layer, so the SHGcross-correlation signal, used to adjust the overlap between the back pump and probebeams and determine pump-probe zero delay, could be observed (see Figure 4.9). Whenthe alignment procedure was done, sample was moved parallel to its plane with themotorized stages to the region of interest. Experimental setup allows to align all threebeams (probe, back and front pump) at the same spot on the sample, so the switchingbetween back-pump-front-probe and front-pump-front-probe schemes can be done justby a flip of a mirror (see Figure 4.1). However, for reliability pump-probe overlap waschecked and corrected (if necessary) before each measurement.
Varying thicknesses and evaporation conditions, one can obtain two Fe films withdifferent coercivities. It makes possible to realize different mutual orientations of themagnetizations in the spin-emitter and the spin-collector. Collecting reflected back-pump and probe mSHG and MOKE signals, all magnetic configurations can be cor-rectly identified (see Figure 8.2).
58
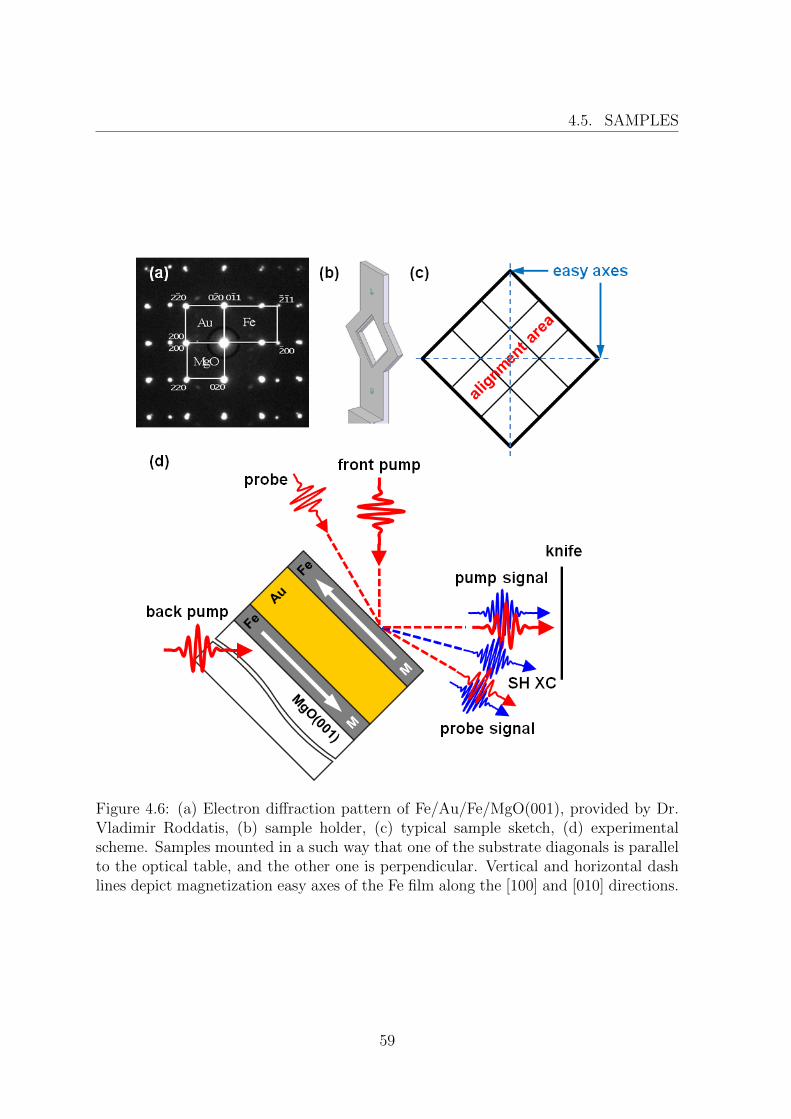
4.5. SAMPLES
Figure 4.6: (a) Electron diffraction pattern of Fe/Au/Fe/MgO(001), provided by Dr.Vladimir Roddatis, (b) sample holder, (c) typical sample sketch, (d) experimentalscheme. Samples mounted in a such way that one of the substrate diagonals is parallelto the optical table, and the other one is perpendicular. Vertical and horizontal dashlines depict magnetization easy axes of the Fe film along the [100] and [010] directions.
59
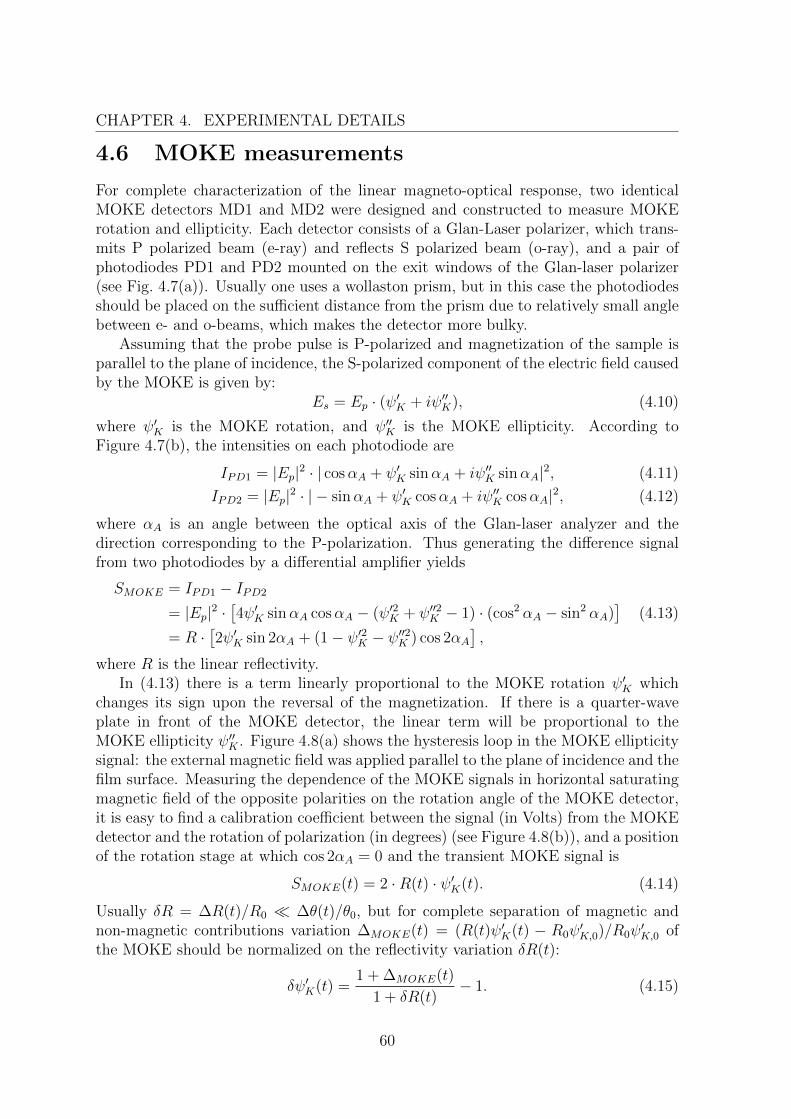
CHAPTER 4. EXPERIMENTAL DETAILS
4.6 MOKE measurements
For complete characterization of the linear magneto-optical response, two identicalMOKE detectors MD1 and MD2 were designed and constructed to measure MOKErotation and ellipticity. Each detector consists of a Glan-Laser polarizer, which trans-mits P polarized beam (e-ray) and reflects S polarized beam (o-ray), and a pair ofphotodiodes PD1 and PD2 mounted on the exit windows of the Glan-laser polarizer(see Fig. 4.7(a)). Usually one uses a wollaston prism, but in this case the photodiodesshould be placed on the sufficient distance from the prism due to relatively small anglebetween e- and o-beams, which makes the detector more bulky.
Assuming that the probe pulse is P-polarized and magnetization of the sample isparallel to the plane of incidence, the S-polarized component of the electric field causedby the MOKE is given by:
Es = Ep · (ψ′K + iψ′′K), (4.10)
where ψ′K is the MOKE rotation, and ψ′′K is the MOKE ellipticity. According toFigure 4.7(b), the intensities on each photodiode are
IPD1 = |Ep|2 · | cosαA + ψ′K sinαA + iψ′′K sinαA|2, (4.11)
IPD2 = |Ep|2 · | − sinαA + ψ′K cosαA + iψ′′K cosαA|2, (4.12)
where αA is an angle between the optical axis of the Glan-laser analyzer and thedirection corresponding to the P-polarization. Thus generating the difference signalfrom two photodiodes by a differential amplifier yields
SMOKE = IPD1 − IPD2
= |Ep|2 ·[4ψ′K sinαA cosαA − (ψ′2K + ψ′′2K − 1) · (cos2 αA − sin2 αA)
]= R ·
[2ψ′K sin 2αA + (1− ψ′2K − ψ′′2K ) cos 2αA
],
(4.13)
where R is the linear reflectivity.In (4.13) there is a term linearly proportional to the MOKE rotation ψ′K which
changes its sign upon the reversal of the magnetization. If there is a quarter-waveplate in front of the MOKE detector, the linear term will be proportional to theMOKE ellipticity ψ′′K . Figure 4.8(a) shows the hysteresis loop in the MOKE ellipticitysignal: the external magnetic field was applied parallel to the plane of incidence and thefilm surface. Measuring the dependence of the MOKE signals in horizontal saturatingmagnetic field of the opposite polarities on the rotation angle of the MOKE detector,it is easy to find a calibration coefficient between the signal (in Volts) from the MOKEdetector and the rotation of polarization (in degrees) (see Figure 4.8(b)), and a positionof the rotation stage at which cos 2αA = 0 and the transient MOKE signal is
SMOKE(t) = 2 ·R(t) · ψ′K(t). (4.14)
Usually δR = ∆R(t)/R0 ∆θ(t)/θ0, but for complete separation of magnetic andnon-magnetic contributions variation ∆MOKE(t) = (R(t)ψ′K(t) − R0ψ
′K,0)/R0ψ
′K,0 of
the MOKE should be normalized on the reflectivity variation δR(t):
δψ′K(t) =1 + ∆MOKE(t)
1 + δR(t)− 1. (4.15)
60
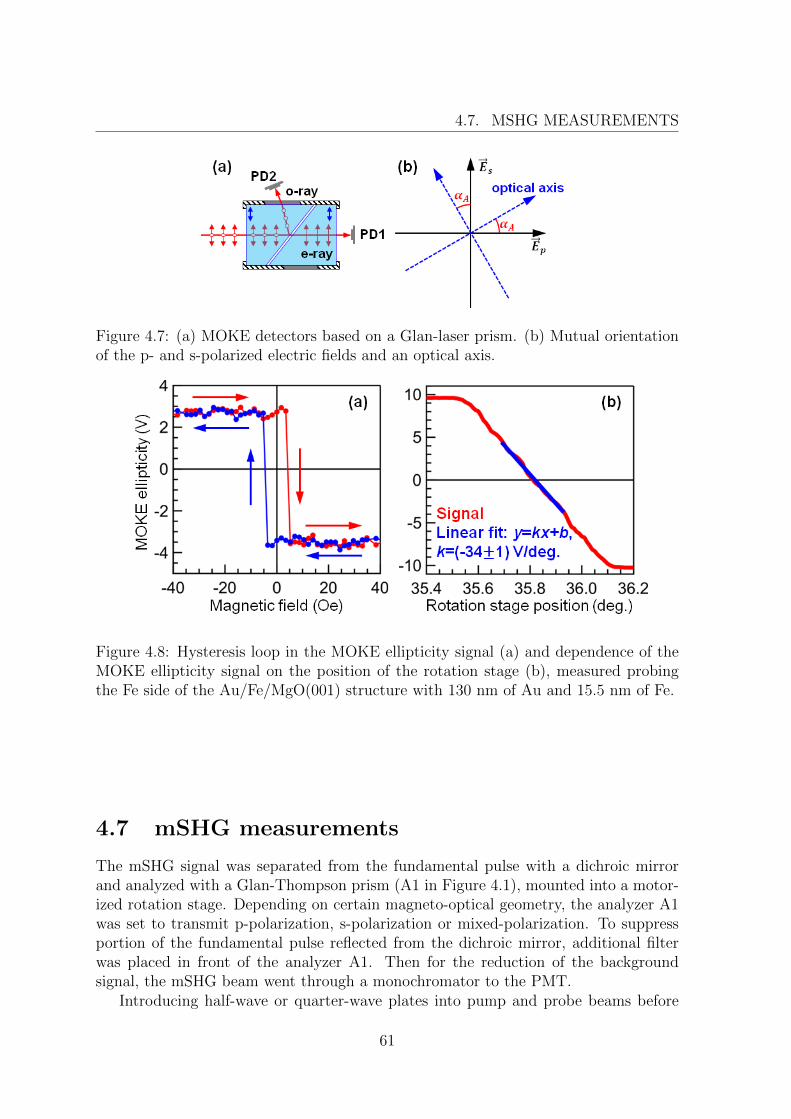
4.7. MSHG MEASUREMENTS
Figure 4.7: (a) MOKE detectors based on a Glan-laser prism. (b) Mutual orientationof the p- and s-polarized electric fields and an optical axis.
Figure 4.8: Hysteresis loop in the MOKE ellipticity signal (a) and dependence of theMOKE ellipticity signal on the position of the rotation stage (b), measured probingthe Fe side of the Au/Fe/MgO(001) structure with 130 nm of Au and 15.5 nm of Fe.
4.7 mSHG measurements
The mSHG signal was separated from the fundamental pulse with a dichroic mirrorand analyzed with a Glan-Thompson prism (A1 in Figure 4.1), mounted into a motor-ized rotation stage. Depending on certain magneto-optical geometry, the analyzer A1was set to transmit p-polarization, s-polarization or mixed-polarization. To suppressportion of the fundamental pulse reflected from the dichroic mirror, additional filterwas placed in front of the analyzer A1. Then for the reduction of the backgroundsignal, the mSHG beam went through a monochromator to the PMT.
Introducing half-wave or quarter-wave plates into pump and probe beams before
61
CHAPTER 4. EXPERIMENTAL DETAILS
the sample, it is possible to realize different polarization geometries. Since in the mostcases pump and probe beams were p-polarized, only p-in geometry will be consideredhere.
4.7.1 Data analysis
The mSHG electric field consists of the even and odd terms with respect to the reversalof the magnetization ~M :
~Etotal2ω = ~Eeven
2ω + ~Eodd2ω = ~β + α ~M. (4.16)
In the transversal magneto-optical geometry ( ~M‖y) both even and odd componentsare p-polarized, therefore measured mSHG intensity is given by
I↑↓2ω = | ~Eeven2ω |2 ± 2 · | ~Eeven
2ω · ~Eodd2ω | · cosφ+ | ~Eodd
2ω |2, (4.17)
where φ is a phase shift between the even Eeven2ω and odd Eodd
2ω SH fields, ‘±‘ corresponds
to opposite directions of the magnetization ~M . In the longitudinal magneto-optical ge-ometry ( ~M‖x) for p-polarized probe pulse ~Eeven
2ω is p-polarized, and ~Eodd2ω is s-polarized.
If the axis of the analyzer A1 is parallel to the p-polarization, I→2ω = I←2ω and the vari-ation of the even SH field is given by
δEeven2ω (t) =
Eeven2ω (t)− Eeven
2ω,0
Eeven2ω,0
=
√I→2ω(t) + I←2ω(t)
I→2ω,0 + I←2ω,0− 1, (4.18)
where I→0,2ω, I←0,2ω are the intensities measured without excitation. Using the intensities
I↑2ω, I↓2ω measured in the transversal magneto-optical geometry, it is possible to evaluatevariation of the odd SH field:
δEodd,T2ω (t) =
√√√√ (I↑2ω + I↓2ω)− (I→2ω + I←2ω)
(I↑2ω,0 + I↓2ω,0)− (I→2ω,0 + I←2ω,0)− 1. (4.19)
The cosine of the phase shift φT2ω between the even Eeven2ω and odd Eodd,T
2ω SH fields isgiven by
cosφT2ω(t) =I↑2ω − I
↓2ω
2√
(I→2ω + I←2ω)[(I↑2ω + I↓2ω)− (I→2ω + I←2ω)]. (4.20)
If | ~Eodd2ω | | ~Eeven
2ω | and φ2ω = const, one can neglect the last term in the expres-sion (4.17) for the mSHG intensity in the transversal magneto-optical configuration.Thus to evaluate variation of the even mSHG field ∆E2ω, one can use (4.18) with SHintensities measured in the transversal magneto-optical configuration. In this case thevariation of the odd SH field ∆Eodd,T
2ω will be given by
δEodd,T2ω (t) =
I↑2ω(t)− I↑2ω(t)
I↑2ω,0 − I↑2ω,0
·
√I↑2ω,0 + I↑2ω,0
I↑2ω(t) + I↑2ω(t)− 1. (4.21)
62
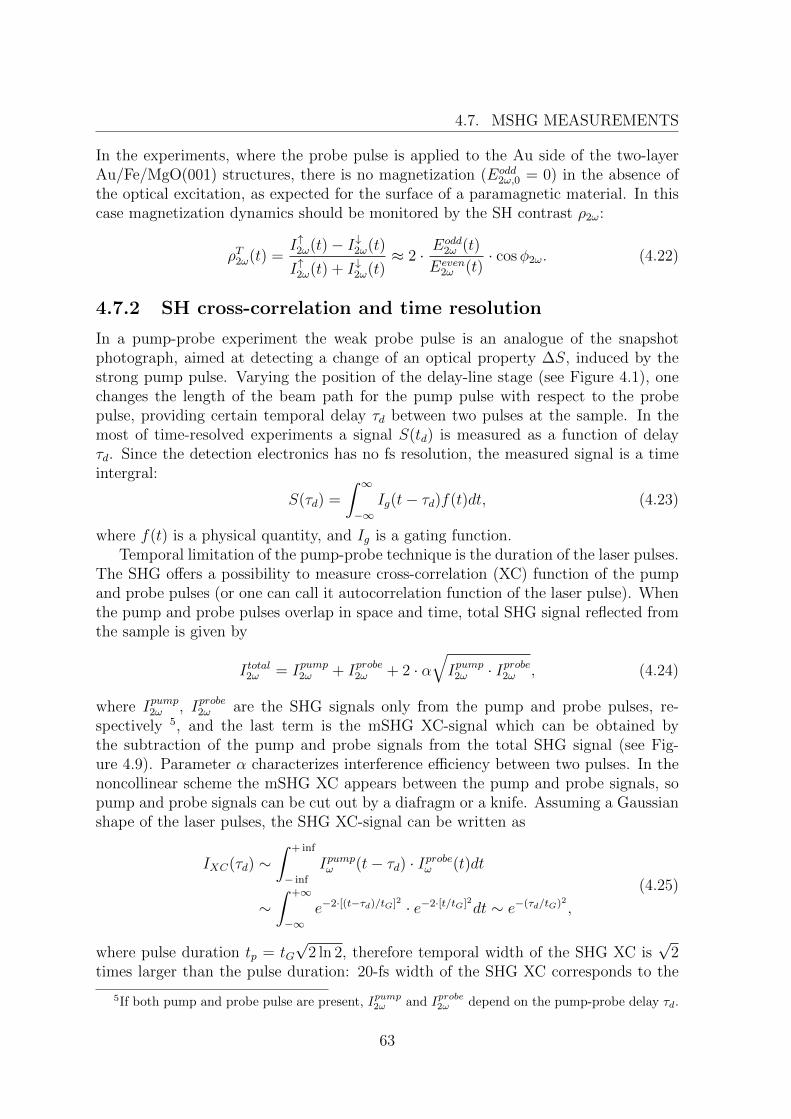
4.7. MSHG MEASUREMENTS
In the experiments, where the probe pulse is applied to the Au side of the two-layerAu/Fe/MgO(001) structures, there is no magnetization (Eodd
2ω,0 = 0) in the absence ofthe optical excitation, as expected for the surface of a paramagnetic material. In thiscase magnetization dynamics should be monitored by the SH contrast ρ2ω:
ρT2ω(t) =I↑2ω(t)− I↓2ω(t)
I↑2ω(t) + I↓2ω(t)≈ 2 · E
odd2ω (t)
Eeven2ω (t)
· cosφ2ω. (4.22)
4.7.2 SH cross-correlation and time resolution
In a pump-probe experiment the weak probe pulse is an analogue of the snapshotphotograph, aimed at detecting a change of an optical property ∆S, induced by thestrong pump pulse. Varying the position of the delay-line stage (see Figure 4.1), onechanges the length of the beam path for the pump pulse with respect to the probepulse, providing certain temporal delay τd between two pulses at the sample. In themost of time-resolved experiments a signal S(td) is measured as a function of delayτd. Since the detection electronics has no fs resolution, the measured signal is a timeintergral:
S(τd) =
∫ ∞−∞
Ig(t− τd)f(t)dt, (4.23)
where f(t) is a physical quantity, and Ig is a gating function.Temporal limitation of the pump-probe technique is the duration of the laser pulses.
The SHG offers a possibility to measure cross-correlation (XC) function of the pumpand probe pulses (or one can call it autocorrelation function of the laser pulse). Whenthe pump and probe pulses overlap in space and time, total SHG signal reflected fromthe sample is given by
I total2ω = Ipump2ω + Iprobe2ω + 2 · α√Ipump2ω · Iprobe2ω , (4.24)
where Ipump2ω , Iprobe2ω are the SHG signals only from the pump and probe pulses, re-spectively 5, and the last term is the mSHG XC-signal which can be obtained bythe subtraction of the pump and probe signals from the total SHG signal (see Fig-ure 4.9). Parameter α characterizes interference efficiency between two pulses. In thenoncollinear scheme the mSHG XC appears between the pump and probe signals, sopump and probe signals can be cut out by a diafragm or a knife. Assuming a Gaussianshape of the laser pulses, the SHG XC-signal can be written as
IXC(τd) ∼∫ + inf
− inf
Ipumpω (t− τd) · Iprobeω (t)dt
∼∫ +∞
−∞e−2·[(t−τd)/tG]2 · e−2·[t/tG]2dt ∼ e−(τd/tG)2 ,
(4.25)
where pulse duration tp = tG√
2 ln 2, therefore temporal width of the SHG XC is√
2times larger than the pulse duration: 20-fs width of the SHG XC corresponds to the
5If both pump and probe pulse are present, Ipump2ω and Iprobe2ω depend on the pump-probe delay τd.
63
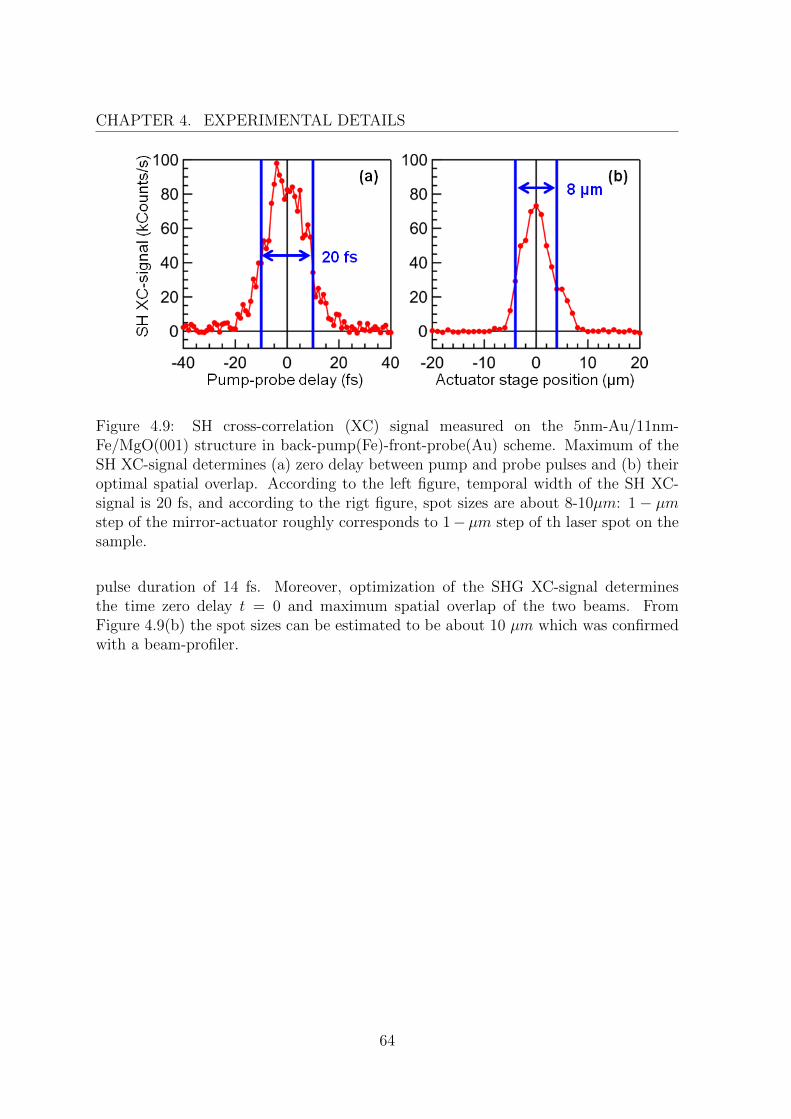
CHAPTER 4. EXPERIMENTAL DETAILS
Figure 4.9: SH cross-correlation (XC) signal measured on the 5nm-Au/11nm-Fe/MgO(001) structure in back-pump(Fe)-front-probe(Au) scheme. Maximum of theSH XC-signal determines (a) zero delay between pump and probe pulses and (b) theiroptimal spatial overlap. According to the left figure, temporal width of the SH XC-signal is 20 fs, and according to the rigt figure, spot sizes are about 8-10µm: 1 − µmstep of the mirror-actuator roughly corresponds to 1− µm step of th laser spot on thesample.
pulse duration of 14 fs. Moreover, optimization of the SHG XC-signal determinesthe time zero delay t = 0 and maximum spatial overlap of the two beams. FromFigure 4.9(b) the spot sizes can be estimated to be about 10 µm which was confirmedwith a beam-profiler.
64
Chapter 5
Ultrafast demagnetization of Fe inthe absence of hot carrier transport
One of the main goals of this work is to study ultrafast laser-induced demagnetizationof ferromagnetic films and understand the role of the hot carrier (HC) transport inthis process. Since it is not possible to exclude all other mechanisms contributing tothe magnetization dynamics and the HC relaxation, it has been decided to considertwo situations: (i) homogeneous optical excitation of a thin ferromagnetic film on anonconducting substrate, and (ii) a ferromagnetic film in contact with a non-magneticmetal. In the first case homogeneous laser absorption leads to a uniform HC spatialdistribution which in turn ensures the absence of the HC transport and its influenceon the magneto-optical response. Thus magnetization dynamics during first severalpicoseconds is governed by spin-flip processes. Subsequent relaxation of magnetizationoccurs due to the slow heat diffusion away from the excited area. In the second case anon-magnetic metal serves as a sink of spin-polarized HCs, thereby leading to ultrafastdemagnetization of the ferromagnetic film [22–24].
This chapter presents the experimental results obtained on a 8-nm polycrystallineFe film grown on the MgO(001) substrate and capped with 3 nm of MgO (see Fig-ure 5.1(a)). The sample was pumped and probed through the MgO substrate with14-fs laser pulses under ambient conditions. Laser-induced magnetization dynam-ics was monitored with the linear (MOKE) and nonlinear (mSHG) magneto-opticalresponses. In all-optical pump-probe experiments pump- and probe-induced opticaltransitions may involve the same electronic states, which results in the appearance ofthe state-filling effect (or so-called optical bleaching) in the measured signals. It com-plicates an interpretation of the experimental data, but on the other hand, it providesinformation about relaxation of the non-equilibrium (NEQ) HCs. In order to enhancesensitivity to the NEQ HC dynamics, we used pump and probe pulses with the samephoton energies ~ωpump = ~ωprobe = 1.5 eV. In this chapter, it is demonstrated thatthe analysis of both MOKE rotation and ellipticity makes it possible to disentanglecontributions of the transient magnetization and the optical bleaching using only fewreasonable assumptions.
Figures 5.1(b) and (c) show that relative variations of the linear reflectivity δR(t),MOKE rotation δψ′K(t) and ellipticity δψ′′K(t) undergo drastic changes at the time zero
65
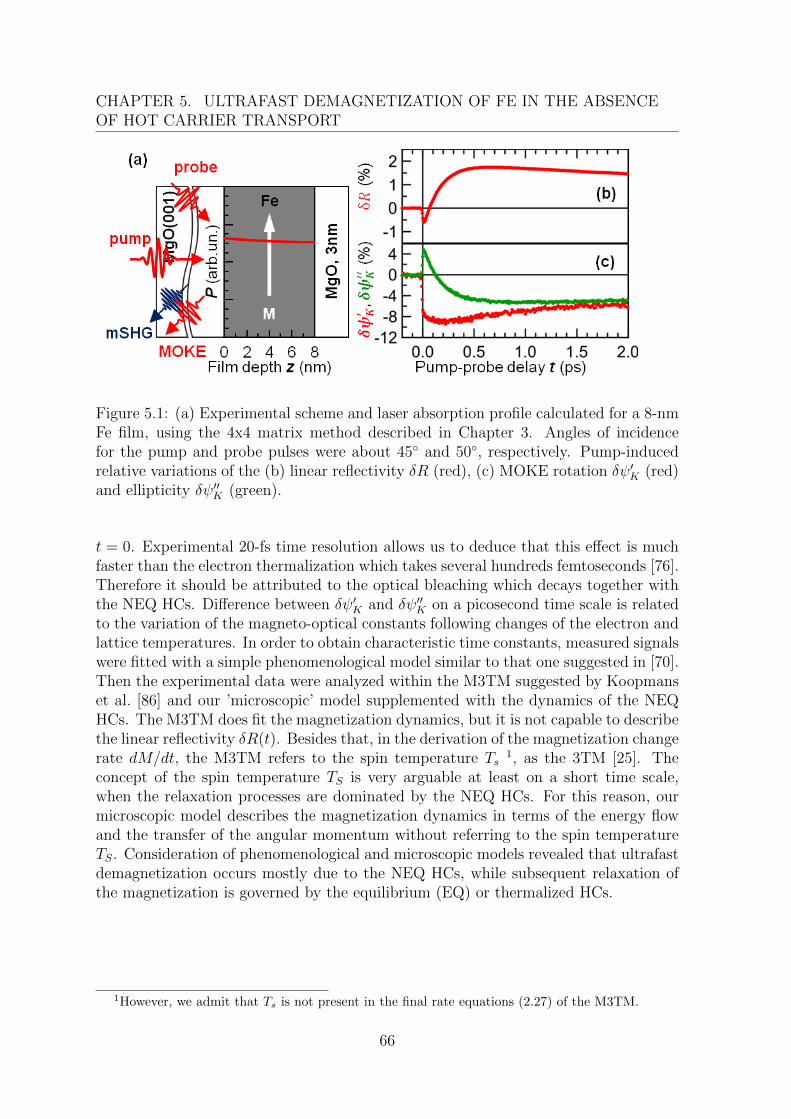
CHAPTER 5. ULTRAFAST DEMAGNETIZATION OF FE IN THE ABSENCEOF HOT CARRIER TRANSPORT
Figure 5.1: (a) Experimental scheme and laser absorption profile calculated for a 8-nmFe film, using the 4x4 matrix method described in Chapter 3. Angles of incidencefor the pump and probe pulses were about 45 and 50, respectively. Pump-inducedrelative variations of the (b) linear reflectivity δR (red), (c) MOKE rotation δψ′K (red)and ellipticity δψ′′K (green).
t = 0. Experimental 20-fs time resolution allows us to deduce that this effect is muchfaster than the electron thermalization which takes several hundreds femtoseconds [76].Therefore it should be attributed to the optical bleaching which decays together withthe NEQ HCs. Difference between δψ′K and δψ′′K on a picosecond time scale is relatedto the variation of the magneto-optical constants following changes of the electron andlattice temperatures. In order to obtain characteristic time constants, measured signalswere fitted with a simple phenomenological model similar to that one suggested in [70].Then the experimental data were analyzed within the M3TM suggested by Koopmanset al. [86] and our ’microscopic’ model supplemented with the dynamics of the NEQHCs. The M3TM does fit the magnetization dynamics, but it is not capable to describethe linear reflectivity δR(t). Besides that, in the derivation of the magnetization changerate dM/dt, the M3TM refers to the spin temperature Ts
1, as the 3TM [25]. Theconcept of the spin temperature TS is very arguable at least on a short time scale,when the relaxation processes are dominated by the NEQ HCs. For this reason, ourmicroscopic model describes the magnetization dynamics in terms of the energy flowand the transfer of the angular momentum without referring to the spin temperatureTS. Consideration of phenomenological and microscopic models revealed that ultrafastdemagnetization occurs mostly due to the NEQ HCs, while subsequent relaxation ofthe magnetization is governed by the equilibrium (EQ) or thermalized HCs.
1However, we admit that Ts is not present in the final rate equations (2.27) of the M3TM.
66
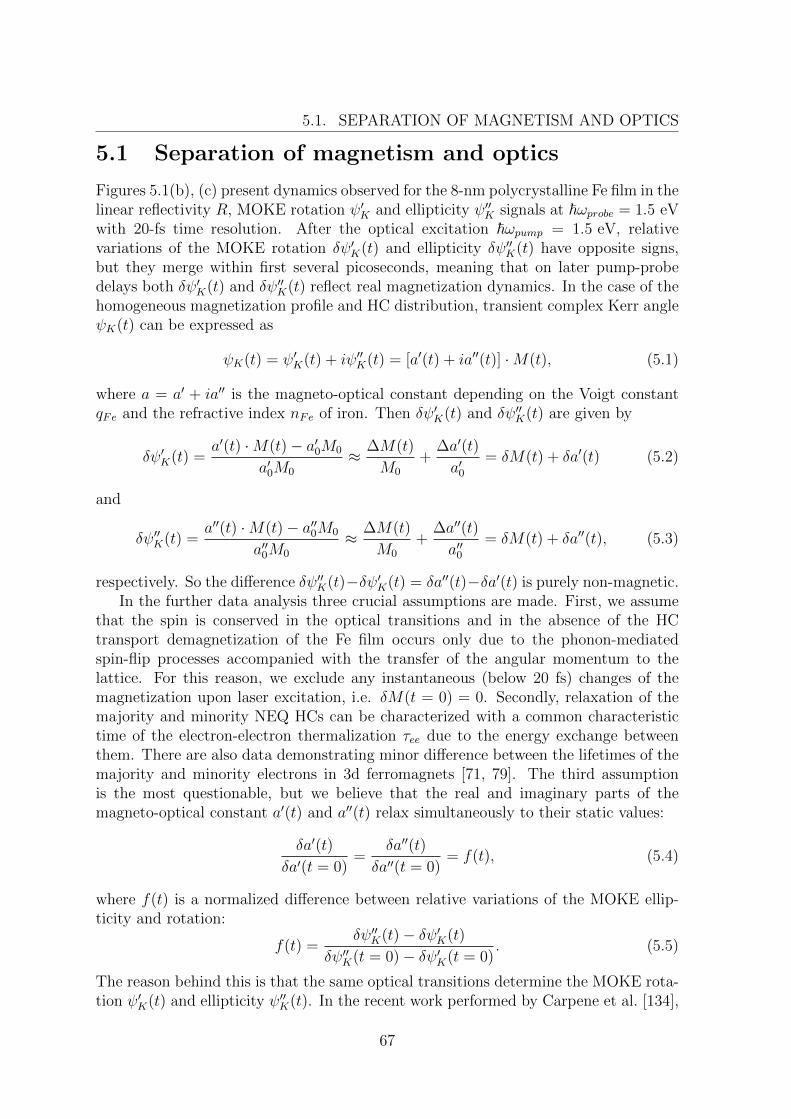
5.1. SEPARATION OF MAGNETISM AND OPTICS
5.1 Separation of magnetism and optics
Figures 5.1(b), (c) present dynamics observed for the 8-nm polycrystalline Fe film in thelinear reflectivity R, MOKE rotation ψ′K and ellipticity ψ′′K signals at ~ωprobe = 1.5 eVwith 20-fs time resolution. After the optical excitation ~ωpump = 1.5 eV, relativevariations of the MOKE rotation δψ′K(t) and ellipticity δψ′′K(t) have opposite signs,but they merge within first several picoseconds, meaning that on later pump-probedelays both δψ′K(t) and δψ′′K(t) reflect real magnetization dynamics. In the case of thehomogeneous magnetization profile and HC distribution, transient complex Kerr angleψK(t) can be expressed as
ψK(t) = ψ′K(t) + iψ′′K(t) = [a′(t) + ia′′(t)] ·M(t), (5.1)
where a = a′ + ia′′ is the magneto-optical constant depending on the Voigt constantqFe and the refractive index nFe of iron. Then δψ′K(t) and δψ′′K(t) are given by
δψ′K(t) =a′(t) ·M(t)− a′0M0
a′0M0
≈ ∆M(t)
M0
+∆a′(t)
a′0= δM(t) + δa′(t) (5.2)
and
δψ′′K(t) =a′′(t) ·M(t)− a′′0M0
a′′0M0
≈ ∆M(t)
M0
+∆a′′(t)
a′′0= δM(t) + δa′′(t), (5.3)
respectively. So the difference δψ′′K(t)−δψ′K(t) = δa′′(t)−δa′(t) is purely non-magnetic.In the further data analysis three crucial assumptions are made. First, we assume
that the spin is conserved in the optical transitions and in the absence of the HCtransport demagnetization of the Fe film occurs only due to the phonon-mediatedspin-flip processes accompanied with the transfer of the angular momentum to thelattice. For this reason, we exclude any instantaneous (below 20 fs) changes of themagnetization upon laser excitation, i.e. δM(t = 0) = 0. Secondly, relaxation of themajority and minority NEQ HCs can be characterized with a common characteristictime of the electron-electron thermalization τee due to the energy exchange betweenthem. There are also data demonstrating minor difference between the lifetimes of themajority and minority electrons in 3d ferromagnets [71, 79]. The third assumptionis the most questionable, but we believe that the real and imaginary parts of themagneto-optical constant a′(t) and a′′(t) relax simultaneously to their static values:
δa′(t)
δa′(t = 0)=
δa′′(t)
δa′′(t = 0)= f(t), (5.4)
where f(t) is a normalized difference between relative variations of the MOKE ellip-ticity and rotation:
f(t) =δψ′′K(t)− δψ′K(t)
δψ′′K(t = 0)− δψ′K(t = 0). (5.5)
The reason behind this is that the same optical transitions determine the MOKE rota-tion ψ′K(t) and ellipticity ψ′′K(t). In the recent work performed by Carpene et al. [134],
67
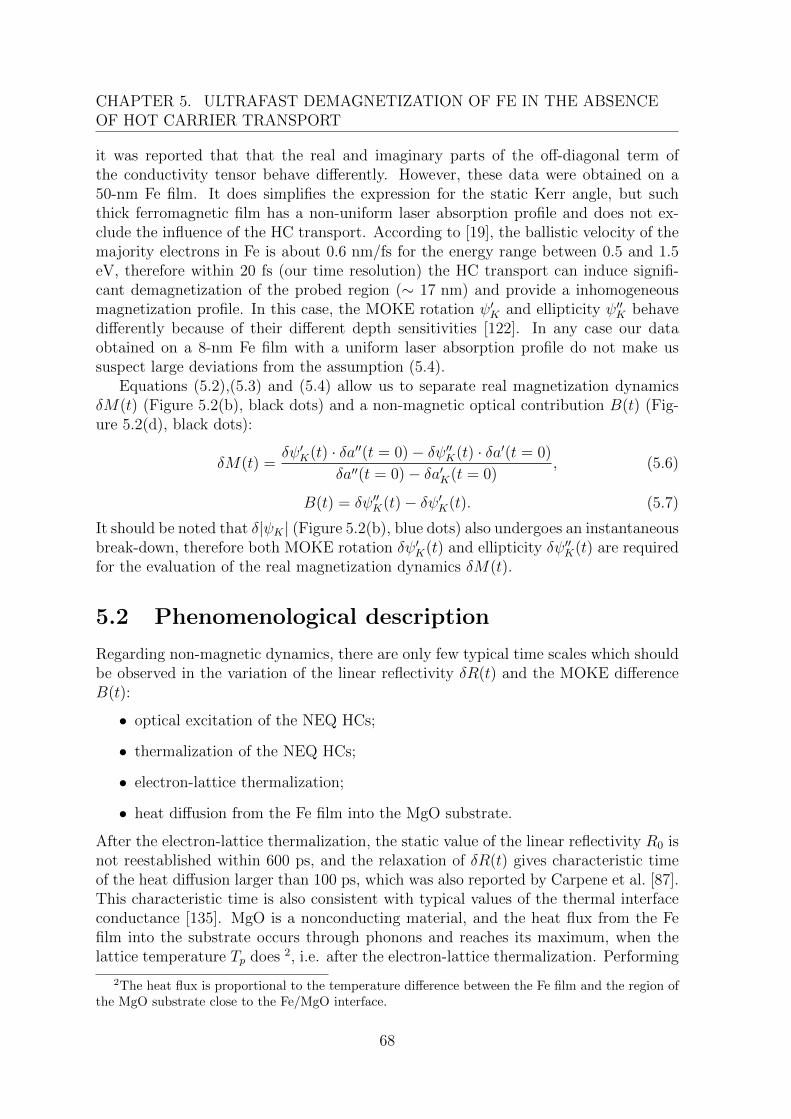
CHAPTER 5. ULTRAFAST DEMAGNETIZATION OF FE IN THE ABSENCEOF HOT CARRIER TRANSPORT
it was reported that that the real and imaginary parts of the off-diagonal term ofthe conductivity tensor behave differently. However, these data were obtained on a50-nm Fe film. It does simplifies the expression for the static Kerr angle, but suchthick ferromagnetic film has a non-uniform laser absorption profile and does not ex-clude the influence of the HC transport. According to [19], the ballistic velocity of themajority electrons in Fe is about 0.6 nm/fs for the energy range between 0.5 and 1.5eV, therefore within 20 fs (our time resolution) the HC transport can induce signifi-cant demagnetization of the probed region (∼ 17 nm) and provide a inhomogeneousmagnetization profile. In this case, the MOKE rotation ψ′K and ellipticity ψ′′K behavedifferently because of their different depth sensitivities [122]. In any case our dataobtained on a 8-nm Fe film with a uniform laser absorption profile do not make ussuspect large deviations from the assumption (5.4).
Equations (5.2),(5.3) and (5.4) allow us to separate real magnetization dynamicsδM(t) (Figure 5.2(b), black dots) and a non-magnetic optical contribution B(t) (Fig-ure 5.2(d), black dots):
δM(t) =δψ′K(t) · δa′′(t = 0)− δψ′′K(t) · δa′(t = 0)
δa′′(t = 0)− δa′K(t = 0), (5.6)
B(t) = δψ′′K(t)− δψ′K(t). (5.7)
It should be noted that δ|ψK | (Figure 5.2(b), blue dots) also undergoes an instantaneousbreak-down, therefore both MOKE rotation δψ′K(t) and ellipticity δψ′′K(t) are requiredfor the evaluation of the real magnetization dynamics δM(t).
5.2 Phenomenological description
Regarding non-magnetic dynamics, there are only few typical time scales which shouldbe observed in the variation of the linear reflectivity δR(t) and the MOKE differenceB(t):
• optical excitation of the NEQ HCs;
• thermalization of the NEQ HCs;
• electron-lattice thermalization;
• heat diffusion from the Fe film into the MgO substrate.
After the electron-lattice thermalization, the static value of the linear reflectivity R0 isnot reestablished within 600 ps, and the relaxation of δR(t) gives characteristic timeof the heat diffusion larger than 100 ps, which was also reported by Carpene et al. [87].This characteristic time is also consistent with typical values of the thermal interfaceconductance [135]. MgO is a nonconducting material, and the heat flux from the Fefilm into the substrate occurs through phonons and reaches its maximum, when thelattice temperature Tp does 2, i.e. after the electron-lattice thermalization. Performing
2The heat flux is proportional to the temperature difference between the Fe film and the region ofthe MgO substrate close to the Fe/MgO interface.
68
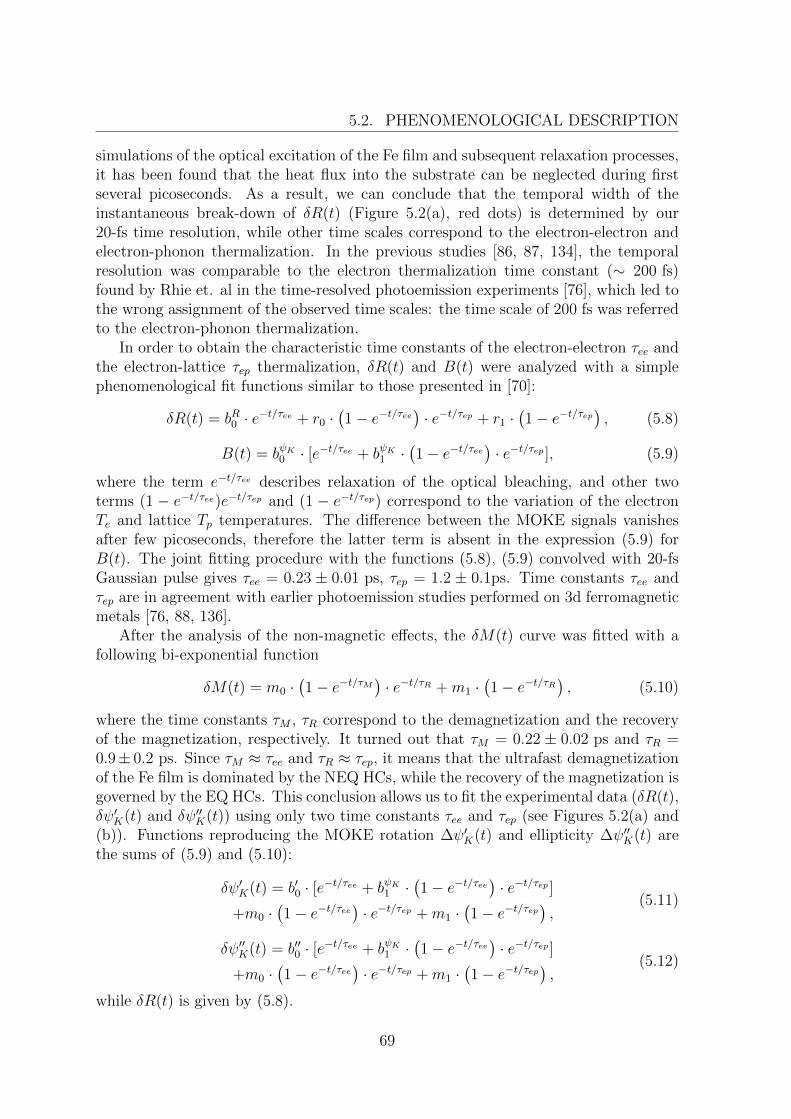
5.2. PHENOMENOLOGICAL DESCRIPTION
simulations of the optical excitation of the Fe film and subsequent relaxation processes,it has been found that the heat flux into the substrate can be neglected during firstseveral picoseconds. As a result, we can conclude that the temporal width of theinstantaneous break-down of δR(t) (Figure 5.2(a), red dots) is determined by our20-fs time resolution, while other time scales correspond to the electron-electron andelectron-phonon thermalization. In the previous studies [86, 87, 134], the temporalresolution was comparable to the electron thermalization time constant (∼ 200 fs)found by Rhie et. al in the time-resolved photoemission experiments [76], which led tothe wrong assignment of the observed time scales: the time scale of 200 fs was referredto the electron-phonon thermalization.
In order to obtain the characteristic time constants of the electron-electron τee andthe electron-lattice τep thermalization, δR(t) and B(t) were analyzed with a simplephenomenological fit functions similar to those presented in [70]:
δR(t) = bR0 · e−t/τee + r0 ·(1− e−t/τee
)· e−t/τep + r1 ·
(1− e−t/τep
), (5.8)
B(t) = bψK0 · [e−t/τee + bψK1 ·(1− e−t/τee
)· e−t/τep ], (5.9)
where the term e−t/τee describes relaxation of the optical bleaching, and other twoterms (1 − e−t/τee)e−t/τep and (1 − e−t/τep) correspond to the variation of the electronTe and lattice Tp temperatures. The difference between the MOKE signals vanishesafter few picoseconds, therefore the latter term is absent in the expression (5.9) forB(t). The joint fitting procedure with the functions (5.8), (5.9) convolved with 20-fsGaussian pulse gives τee = 0.23 ± 0.01 ps, τep = 1.2 ± 0.1ps. Time constants τee andτep are in agreement with earlier photoemission studies performed on 3d ferromagneticmetals [76, 88, 136].
After the analysis of the non-magnetic effects, the δM(t) curve was fitted with afollowing bi-exponential function
δM(t) = m0 ·(1− e−t/τM
)· e−t/τR +m1 ·
(1− e−t/τR
), (5.10)
where the time constants τM , τR correspond to the demagnetization and the recoveryof the magnetization, respectively. It turned out that τM = 0.22 ± 0.02 ps and τR =0.9± 0.2 ps. Since τM ≈ τee and τR ≈ τep, it means that the ultrafast demagnetizationof the Fe film is dominated by the NEQ HCs, while the recovery of the magnetization isgoverned by the EQ HCs. This conclusion allows us to fit the experimental data (δR(t),δψ′K(t) and δψ′′K(t)) using only two time constants τee and τep (see Figures 5.2(a) and(b)). Functions reproducing the MOKE rotation ∆ψ′K(t) and ellipticity ∆ψ′′K(t) arethe sums of (5.9) and (5.10):
δψ′K(t) = b′0 · [e−t/τee + bψK1 ·(1− e−t/τee
)· e−t/τep ]
+m0 ·(1− e−t/τee
)· e−t/τep +m1 ·
(1− e−t/τep
),
(5.11)
δψ′′K(t) = b′′0 · [e−t/τee + bψK1 ·(1− e−t/τee
)· e−t/τep ]
+m0 ·(1− e−t/τee
)· e−t/τep +m1 ·
(1− e−t/τep
),
(5.12)
while δR(t) is given by (5.8).
69
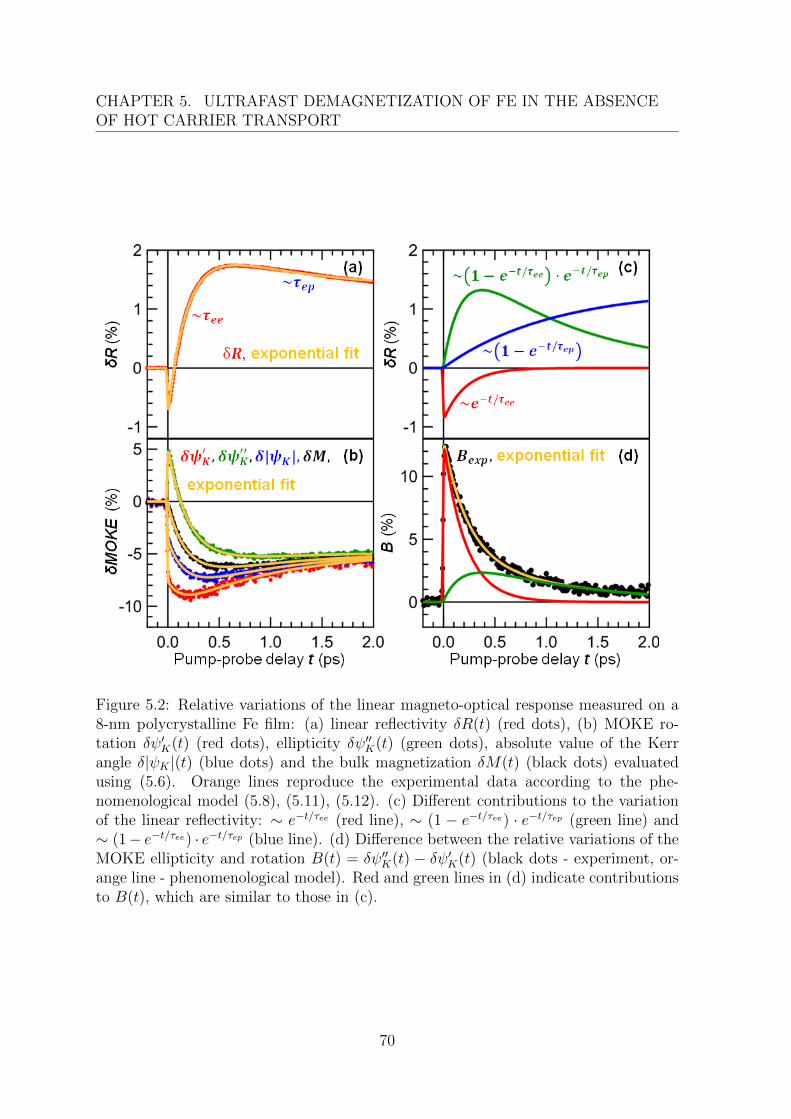
CHAPTER 5. ULTRAFAST DEMAGNETIZATION OF FE IN THE ABSENCEOF HOT CARRIER TRANSPORT
Figure 5.2: Relative variations of the linear magneto-optical response measured on a8-nm polycrystalline Fe film: (a) linear reflectivity δR(t) (red dots), (b) MOKE ro-tation δψ′K(t) (red dots), ellipticity δψ′′K(t) (green dots), absolute value of the Kerrangle δ|ψK |(t) (blue dots) and the bulk magnetization δM(t) (black dots) evaluatedusing (5.6). Orange lines reproduce the experimental data according to the phe-nomenological model (5.8), (5.11), (5.12). (c) Different contributions to the variationof the linear reflectivity: ∼ e−t/τee (red line), ∼ (1 − e−t/τee) · e−t/τep (green line) and∼ (1− e−t/τee) · e−t/τep (blue line). (d) Difference between the relative variations of theMOKE ellipticity and rotation B(t) = δψ′′K(t) − δψ′K(t) (black dots - experiment, or-ange line - phenomenological model). Red and green lines in (d) indicate contributionsto B(t), which are similar to those in (c).
70
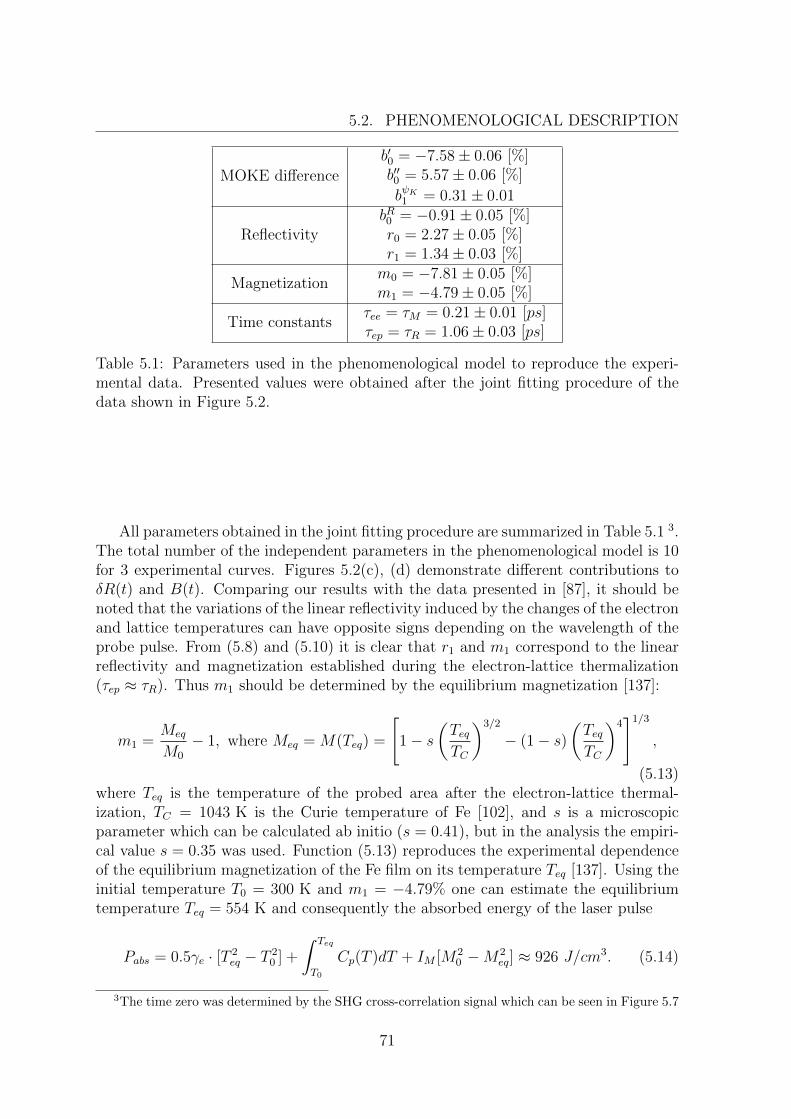
5.2. PHENOMENOLOGICAL DESCRIPTION
MOKE difference
b′0 = −7.58± 0.06 [%]b′′0 = 5.57± 0.06 [%]
bψK1 = 0.31± 0.01
ReflectivitybR0 = −0.91± 0.05 [%]r0 = 2.27± 0.05 [%]r1 = 1.34± 0.03 [%]
Magnetizationm0 = −7.81± 0.05 [%]m1 = −4.79± 0.05 [%]
Time constantsτee = τM = 0.21± 0.01 [ps]τep = τR = 1.06± 0.03 [ps]
Table 5.1: Parameters used in the phenomenological model to reproduce the experi-mental data. Presented values were obtained after the joint fitting procedure of thedata shown in Figure 5.2.
All parameters obtained in the joint fitting procedure are summarized in Table 5.1 3.The total number of the independent parameters in the phenomenological model is 10for 3 experimental curves. Figures 5.2(c), (d) demonstrate different contributions toδR(t) and B(t). Comparing our results with the data presented in [87], it should benoted that the variations of the linear reflectivity induced by the changes of the electronand lattice temperatures can have opposite signs depending on the wavelength of theprobe pulse. From (5.8) and (5.10) it is clear that r1 and m1 correspond to the linearreflectivity and magnetization established during the electron-lattice thermalization(τep ≈ τR). Thus m1 should be determined by the equilibrium magnetization [137]:
m1 =Meq
M0
− 1, where Meq = M(Teq) =
[1− s
(TeqTC
)3/2
− (1− s)(TeqTC
)4]1/3
,
(5.13)where Teq is the temperature of the probed area after the electron-lattice thermal-ization, TC = 1043 K is the Curie temperature of Fe [102], and s is a microscopicparameter which can be calculated ab initio (s = 0.41), but in the analysis the empiri-cal value s = 0.35 was used. Function (5.13) reproduces the experimental dependenceof the equilibrium magnetization of the Fe film on its temperature Teq [137]. Using theinitial temperature T0 = 300 K and m1 = −4.79% one can estimate the equilibriumtemperature Teq = 554 K and consequently the absorbed energy of the laser pulse
Pabs = 0.5γe · [T 2eq − T 2
0 ] +
∫ Teq
T0
Cp(T )dT + IM [M20 −M2
eq] ≈ 926 J/cm3. (5.14)
3The time zero was determined by the SHG cross-correlation signal which can be seen in Figure 5.7
71
CHAPTER 5. ULTRAFAST DEMAGNETIZATION OF FE IN THE ABSENCEOF HOT CARRIER TRANSPORT
Here γe ≈ 0.7 mJ · cm−3 · K−2 is the electronic specific heat, Cp is the lattice heatcapacity calculated within the Debye model (The Debye temperature of Fe TD =470 K) [102]. The last term in (5.14) describes the magnetic (exchange) energy in theapproximation of the mean field [36]. IM ≈ 1055 J/cm3 is the exchange parameterobtained from the temperature dependence of the total heat capacity of Fe [102].
5.3 Microscopic models
Using simple phenomenological model, it has been shown that upon homogeneousoptical excitation of the Fe film, demagnetization occurs on the time scale of the HCthermalization, while the time scale of the magnetization recovery corresponds to theelectron-phonon thermalization. This observation sustains the results of the ab-initiocalculations performed by Carva et al. for 3d ferromagnets [96]. They reported thatthe NEQ HCs provide a stronger demagnetization rate than thermalized ones, meaningthat NEQ HCs are essential for ultrafast spin dynamics. This conclusion emphasizesnecessity to consider finite electron thermalization time.
In this section we try go beyond the phenomenological description. As a startingpoint, we consider the M3TM [86]. Although the M3TM can separately reproducethe magnetization dynamics δM(t), it fails to describe the linear reflectivity δR(t).This problem is related to the assumption about an instantaneous electron thermaliza-tion, which has been proven to be wrong in the previous section. In order to providemore adequate description of the experimental data, we introduce a microscopic modelcomplemented with the NEQ HC dynamics.
5.3.1 Microscopic three-temperature model
The M3TM has already been discussed in Chapter 2. Its detailed derivation anddescription can be found in [86, 95]. For more clarity we rewrite the set of the M3TMrate equations (2.27):
CedTedt
= α exp
[−2(t− t0)2
t2G
]+ gep(Tp − Te),
CpdTpdt
= gep(Te − Tp),
dM
dt= ΓMMTp
[1−M coth
(MTcTe
)].
(5.15)
Because of the uniform HC distribution and magnetization profile, the term responsiblefor the electron heat conductivity is omitted here. α exp [−2(t− t0)2/t2G] is the sourceterm, where α is the absorption coefficient, t0 is the time zero, and tG is a time constantrelated to the duration of the laser pulse tpulse = 0.014 ps:
tG =tpulse√2 ln 2
≈ 0.017 ps. (5.16)
72
5.3. MICROSCOPIC MODELS
This value corresponds to the Gaussian pulse with a 20-fs width 4. Koopmans etal. [86] considered that the electron system is heated instantly to the certain electrontemperature at the time zero, which is then used as the initial condition. Considerationof the source term does not make any difference, but more clearly incorporates theexperimental time resolution.
Special form of the magnetization change rate in (5.15) dictates that the equilibriummagnetization Meq should be determined by
Meq = tanh
(MeqTcT
). (5.17)
The rate equations (5.15) explicitly determine the magnetization dynamics. However,Koopmans et al. [86] did not try to reproduce δR(t) within the M3TM. For this reason,some assumptions have to be made regarding the linear reflectivity δR(t) and theMOKE difference B(t). In earlier works it was suggested that the change of the linearreflectivity δR(t) of the 3d ferromagnetic metals is linearly proportional to the electronTe [51] and lattice Tp [138] temperatures:
δR(t) = re[Te(t)− T0] + rp[Tp(t)− T0]. (5.18)
Since both δR(t) and B(t) are attributed to the variations of the magneto-optical con-stants, B(t) should also depend linearly on the electron Te and lattice Tp temperatures,therefore the MOKE rotation δψ′K(t) and ellipticity δψ′′K(t) are given by:
δψ′K(t) = δM(t) + b′e[Te(t)− T0] + b′p[Tp(t)− T0],
δψ′′K(t) = δM(t) + b′′e [Te(t)− T0] + b′′p[Tp(t)− T0],(5.19)
where b′p/b′e = b′′p/b
′′e . Thus the equations (5.15), (5.18) and (5.19) completely define the
linear magneto-optical response of the Fe film. In general the electron-phonon couplinggep is not a constant and depends on the electron temperature Te [139]. However,according to the data presented in [139], up to 2000 K the dependence of the electron-phonon coupling gep in Fe on Te can be neglected.
Figures 5.3(a) and (b) demonstrate the results of the joint fitting procedure withinthe M3TM. Values of the adjustable parameters are summarized in Table 5.2. Evenbefore the fitting procedure, it could be noted that the only parameter which character-izes a non-magnetic dynamics in the M3TM during first several picoseconds after theoptical excitation is the electron-phonon coupling gep, which is not enough to describeδR(t) within the M3TM. For this reason, one may consider the heat flux into the MgOsubstrate. But we have already concluded that the characteristic time constant ∼ 1 psis too small for this process, and it can be neglected on small pump-probe delays. Asfor the magnetization dynamics, there are two parameters ΓM and gep which determinethe magnetization change rate. When δM(t) is analyzed separately from δR(t), it canbe perfectly reproduced within the M3TM (not shown here).
73
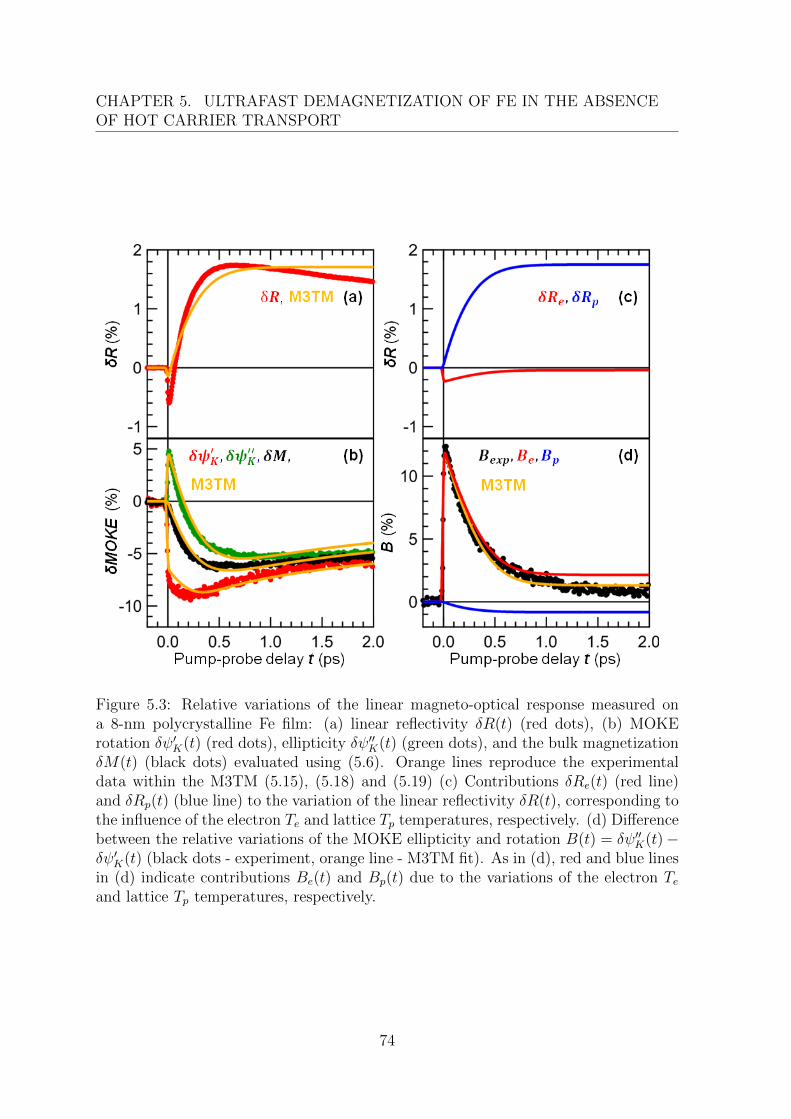
CHAPTER 5. ULTRAFAST DEMAGNETIZATION OF FE IN THE ABSENCEOF HOT CARRIER TRANSPORT
Figure 5.3: Relative variations of the linear magneto-optical response measured ona 8-nm polycrystalline Fe film: (a) linear reflectivity δR(t) (red dots), (b) MOKErotation δψ′K(t) (red dots), ellipticity δψ′′K(t) (green dots), and the bulk magnetizationδM(t) (black dots) evaluated using (5.6). Orange lines reproduce the experimentaldata within the M3TM (5.15), (5.18) and (5.19) (c) Contributions δRe(t) (red line)and δRp(t) (blue line) to the variation of the linear reflectivity δR(t), corresponding tothe influence of the electron Te and lattice Tp temperatures, respectively. (d) Differencebetween the relative variations of the MOKE ellipticity and rotation B(t) = δψ′′K(t)−δψ′K(t) (black dots - experiment, orange line - M3TM fit). As in (d), red and blue linesin (d) indicate contributions Be(t) and Bp(t) due to the variations of the electron Teand lattice Tp temperatures, respectively.
74
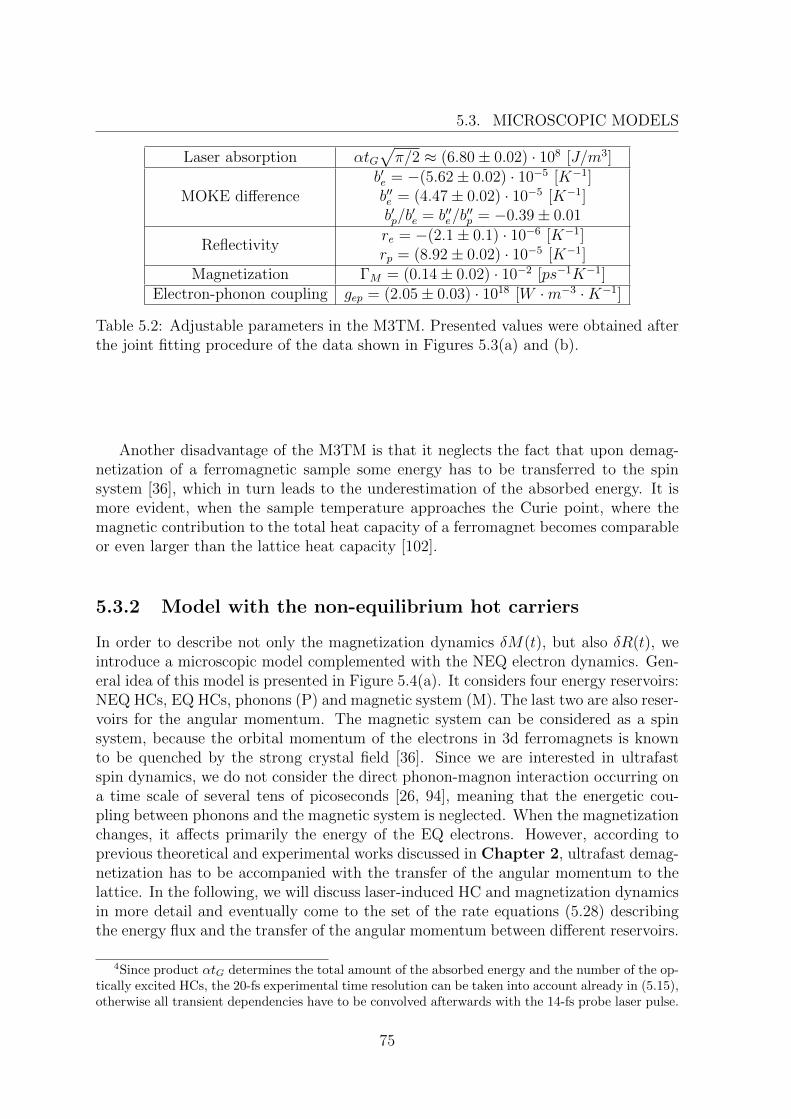
5.3. MICROSCOPIC MODELS
Laser absorption αtG√π/2 ≈ (6.80± 0.02) · 108 [J/m3]
MOKE differenceb′e = −(5.62± 0.02) · 10−5 [K−1]b′′e = (4.47± 0.02) · 10−5 [K−1]b′p/b
′e = b′′e/b
′′p = −0.39± 0.01
Reflectivityre = −(2.1± 0.1) · 10−6 [K−1]rp = (8.92± 0.02) · 10−5 [K−1]
Magnetization ΓM = (0.14± 0.02) · 10−2 [ps−1K−1]Electron-phonon coupling gep = (2.05± 0.03) · 1018 [W ·m−3 ·K−1]
Table 5.2: Adjustable parameters in the M3TM. Presented values were obtained afterthe joint fitting procedure of the data shown in Figures 5.3(a) and (b).
Another disadvantage of the M3TM is that it neglects the fact that upon demag-netization of a ferromagnetic sample some energy has to be transferred to the spinsystem [36], which in turn leads to the underestimation of the absorbed energy. It ismore evident, when the sample temperature approaches the Curie point, where themagnetic contribution to the total heat capacity of a ferromagnet becomes comparableor even larger than the lattice heat capacity [102].
5.3.2 Model with the non-equilibrium hot carriers
In order to describe not only the magnetization dynamics δM(t), but also δR(t), weintroduce a microscopic model complemented with the NEQ electron dynamics. Gen-eral idea of this model is presented in Figure 5.4(a). It considers four energy reservoirs:NEQ HCs, EQ HCs, phonons (P) and magnetic system (M). The last two are also reser-voirs for the angular momentum. The magnetic system can be considered as a spinsystem, because the orbital momentum of the electrons in 3d ferromagnets is knownto be quenched by the strong crystal field [36]. Since we are interested in ultrafastspin dynamics, we do not consider the direct phonon-magnon interaction occurring ona time scale of several tens of picoseconds [26, 94], meaning that the energetic cou-pling between phonons and the magnetic system is neglected. When the magnetizationchanges, it affects primarily the energy of the EQ electrons. However, according toprevious theoretical and experimental works discussed in Chapter 2, ultrafast demag-netization has to be accompanied with the transfer of the angular momentum to thelattice. In the following, we will discuss laser-induced HC and magnetization dynamicsin more detail and eventually come to the set of the rate equations (5.28) describingthe energy flux and the transfer of the angular momentum between different reservoirs.
4Since product αtG determines the total amount of the absorbed energy and the number of the op-tically excited HCs, the 20-fs experimental time resolution can be taken into account already in (5.15),otherwise all transient dependencies have to be convolved afterwards with the 14-fs probe laser pulse.
75
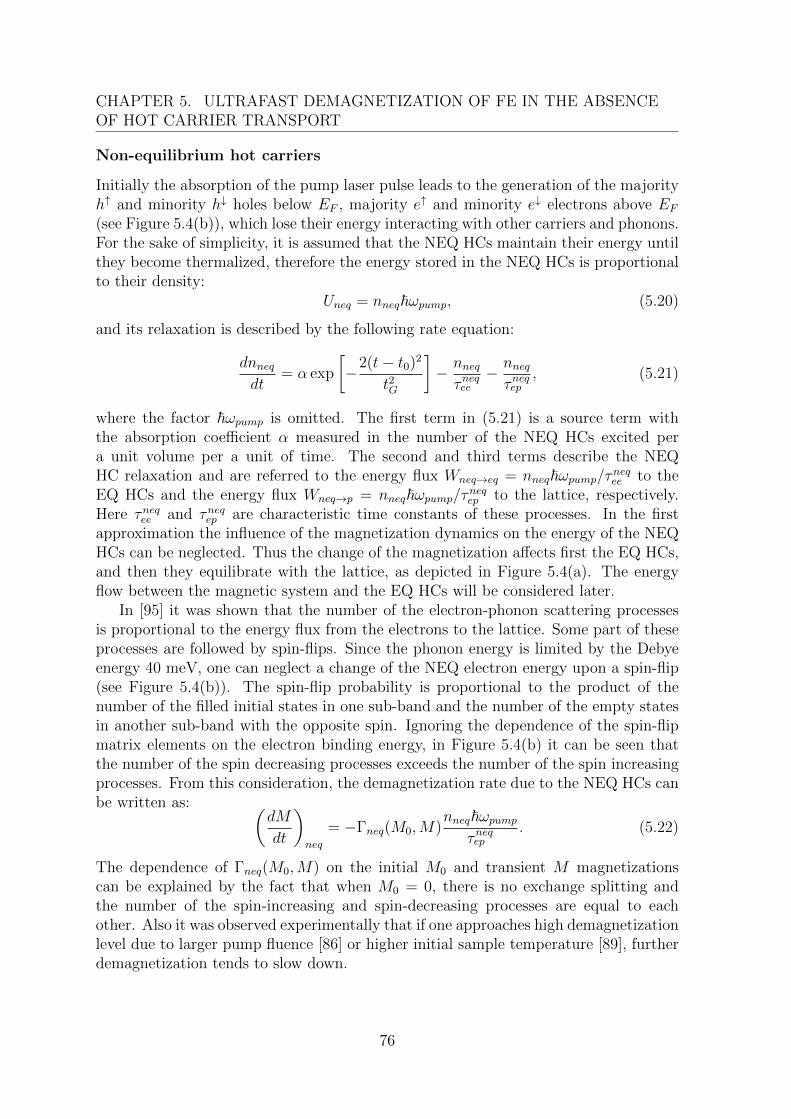
CHAPTER 5. ULTRAFAST DEMAGNETIZATION OF FE IN THE ABSENCEOF HOT CARRIER TRANSPORT
Non-equilibrium hot carriers
Initially the absorption of the pump laser pulse leads to the generation of the majorityh↑ and minority h↓ holes below EF , majority e↑ and minority e↓ electrons above EF(see Figure 5.4(b)), which lose their energy interacting with other carriers and phonons.For the sake of simplicity, it is assumed that the NEQ HCs maintain their energy untilthey become thermalized, therefore the energy stored in the NEQ HCs is proportionalto their density:
Uneq = nneq~ωpump, (5.20)
and its relaxation is described by the following rate equation:
dnneqdt
= α exp
[−2(t− t0)2
t2G
]− nneqτneqee
− nneqτneqep
, (5.21)
where the factor ~ωpump is omitted. The first term in (5.21) is a source term withthe absorption coefficient α measured in the number of the NEQ HCs excited pera unit volume per a unit of time. The second and third terms describe the NEQHC relaxation and are referred to the energy flux Wneq→eq = nneq~ωpump/τneqee to theEQ HCs and the energy flux Wneq→p = nneq~ωpump/τneqep to the lattice, respectively.Here τneqee and τneqep are characteristic time constants of these processes. In the firstapproximation the influence of the magnetization dynamics on the energy of the NEQHCs can be neglected. Thus the change of the magnetization affects first the EQ HCs,and then they equilibrate with the lattice, as depicted in Figure 5.4(a). The energyflow between the magnetic system and the EQ HCs will be considered later.
In [95] it was shown that the number of the electron-phonon scattering processesis proportional to the energy flux from the electrons to the lattice. Some part of theseprocesses are followed by spin-flips. Since the phonon energy is limited by the Debyeenergy 40 meV, one can neglect a change of the NEQ electron energy upon a spin-flip(see Figure 5.4(b)). The spin-flip probability is proportional to the product of thenumber of the filled initial states in one sub-band and the number of the empty statesin another sub-band with the opposite spin. Ignoring the dependence of the spin-flipmatrix elements on the electron binding energy, in Figure 5.4(b) it can be seen thatthe number of the spin decreasing processes exceeds the number of the spin increasingprocesses. From this consideration, the demagnetization rate due to the NEQ HCs canbe written as: (
dM
dt
)neq
= −Γneq(M0,M)nneq~ωpump
τneqep. (5.22)
The dependence of Γneq(M0,M) on the initial M0 and transient M magnetizationscan be explained by the fact that when M0 = 0, there is no exchange splitting andthe number of the spin-increasing and spin-decreasing processes are equal to eachother. Also it was observed experimentally that if one approaches high demagnetizationlevel due to larger pump fluence [86] or higher initial sample temperature [89], furtherdemagnetization tends to slow down.
76
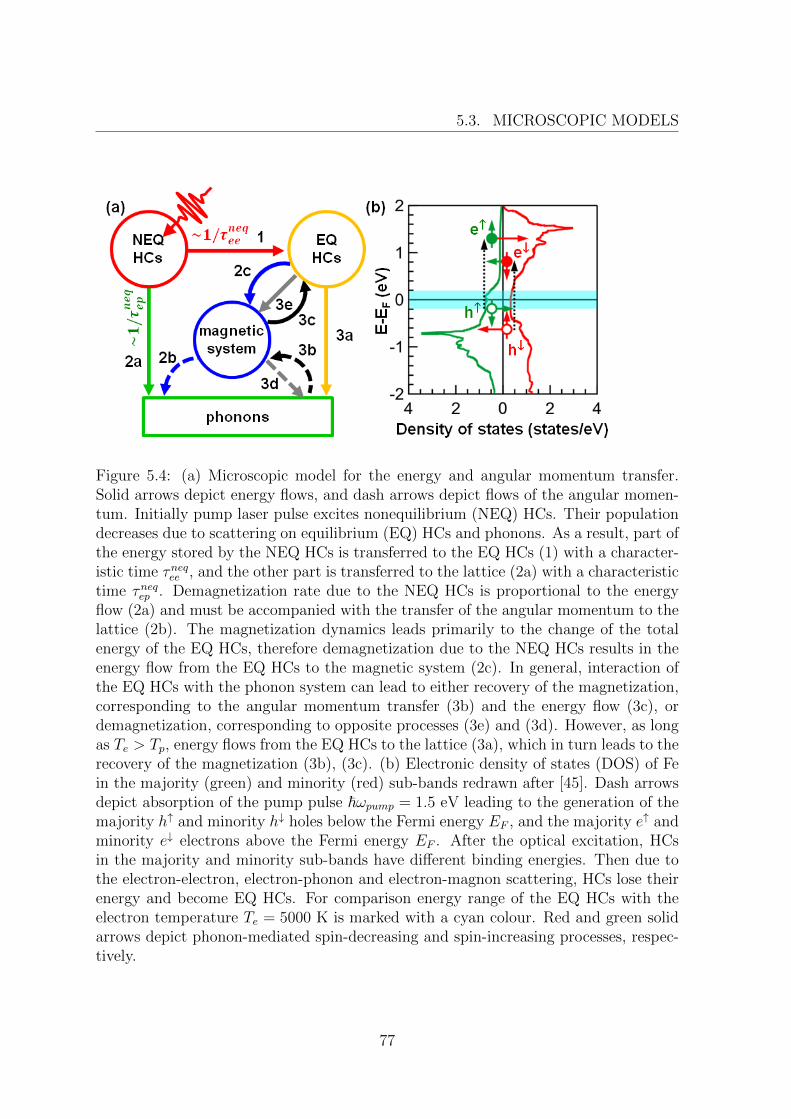
5.3. MICROSCOPIC MODELS
Figure 5.4: (a) Microscopic model for the energy and angular momentum transfer.Solid arrows depict energy flows, and dash arrows depict flows of the angular momen-tum. Initially pump laser pulse excites nonequilibrium (NEQ) HCs. Their populationdecreases due to scattering on equilibrium (EQ) HCs and phonons. As a result, part ofthe energy stored by the NEQ HCs is transferred to the EQ HCs (1) with a character-istic time τneqee , and the other part is transferred to the lattice (2a) with a characteristictime τneqep . Demagnetization rate due to the NEQ HCs is proportional to the energyflow (2a) and must be accompanied with the transfer of the angular momentum to thelattice (2b). The magnetization dynamics leads primarily to the change of the totalenergy of the EQ HCs, therefore demagnetization due to the NEQ HCs results in theenergy flow from the EQ HCs to the magnetic system (2c). In general, interaction ofthe EQ HCs with the phonon system can lead to either recovery of the magnetization,corresponding to the angular momentum transfer (3b) and the energy flow (3c), ordemagnetization, corresponding to opposite processes (3e) and (3d). However, as longas Te > Tp, energy flows from the EQ HCs to the lattice (3a), which in turn leads to therecovery of the magnetization (3b), (3c). (b) Electronic density of states (DOS) of Fein the majority (green) and minority (red) sub-bands redrawn after [45]. Dash arrowsdepict absorption of the pump pulse ~ωpump = 1.5 eV leading to the generation of themajority h↑ and minority h↓ holes below the Fermi energy EF , and the majority e↑ andminority e↓ electrons above the Fermi energy EF . After the optical excitation, HCsin the majority and minority sub-bands have different binding energies. Then due tothe electron-electron, electron-phonon and electron-magnon scattering, HCs lose theirenergy and become EQ HCs. For comparison energy range of the EQ HCs with theelectron temperature Te = 5000 K is marked with a cyan colour. Red and green solidarrows depict phonon-mediated spin-decreasing and spin-increasing processes, respec-tively.
77
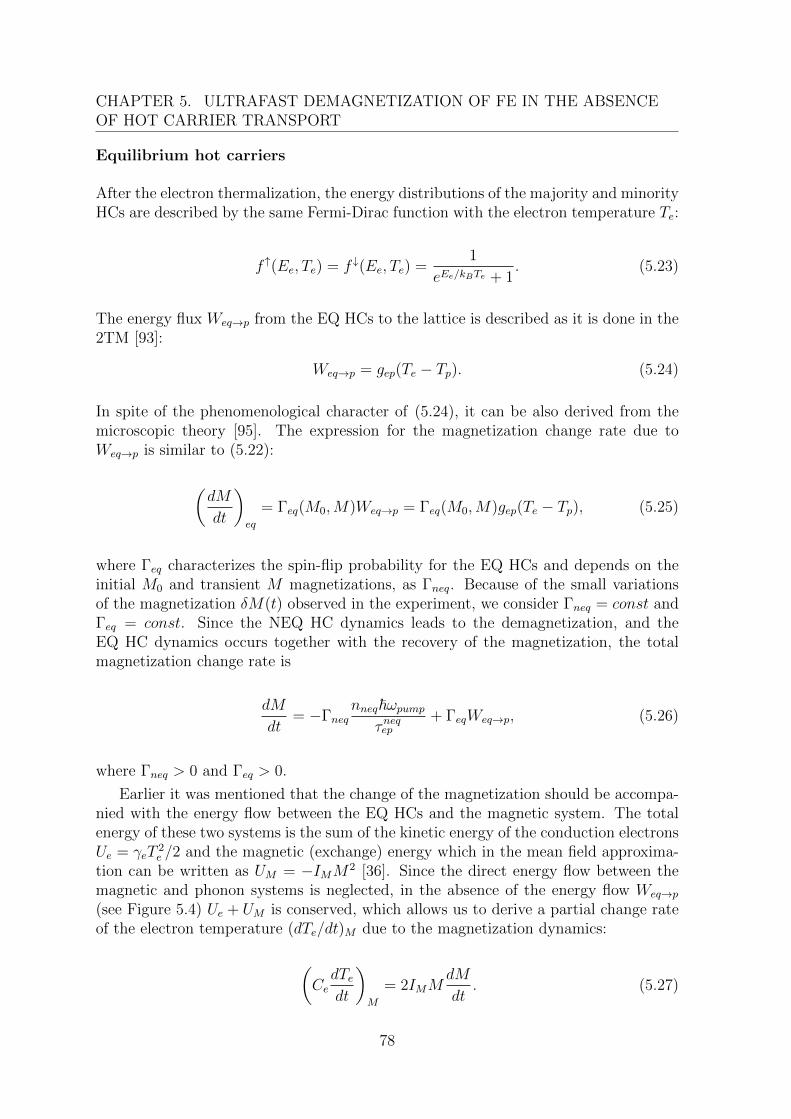
CHAPTER 5. ULTRAFAST DEMAGNETIZATION OF FE IN THE ABSENCEOF HOT CARRIER TRANSPORT
Equilibrium hot carriers
After the electron thermalization, the energy distributions of the majority and minorityHCs are described by the same Fermi-Dirac function with the electron temperature Te:
f ↑(Ee, Te) = f ↓(Ee, Te) =1
eEe/kBTe + 1. (5.23)
The energy flux Weq→p from the EQ HCs to the lattice is described as it is done in the2TM [93]:
Weq→p = gep(Te − Tp). (5.24)
In spite of the phenomenological character of (5.24), it can be also derived from themicroscopic theory [95]. The expression for the magnetization change rate due toWeq→p is similar to (5.22):
(dM
dt
)eq
= Γeq(M0,M)Weq→p = Γeq(M0,M)gep(Te − Tp), (5.25)
where Γeq characterizes the spin-flip probability for the EQ HCs and depends on theinitial M0 and transient M magnetizations, as Γneq. Because of the small variationsof the magnetization δM(t) observed in the experiment, we consider Γneq = const andΓeq = const. Since the NEQ HC dynamics leads to the demagnetization, and theEQ HC dynamics occurs together with the recovery of the magnetization, the totalmagnetization change rate is
dM
dt= −Γneq
nneq~ωpumpτneqep
+ ΓeqWeq→p, (5.26)
where Γneq > 0 and Γeq > 0.
Earlier it was mentioned that the change of the magnetization should be accompa-nied with the energy flow between the EQ HCs and the magnetic system. The totalenergy of these two systems is the sum of the kinetic energy of the conduction electronsUe = γeT
2e /2 and the magnetic (exchange) energy which in the mean field approxima-
tion can be written as UM = −IMM2 [36]. Since the direct energy flow between themagnetic and phonon systems is neglected, in the absence of the energy flow Weq→p(see Figure 5.4) Ue + UM is conserved, which allows us to derive a partial change rateof the electron temperature (dTe/dt)M due to the magnetization dynamics:
(CedTedt
)M
= 2IMMdM
dt. (5.27)
78
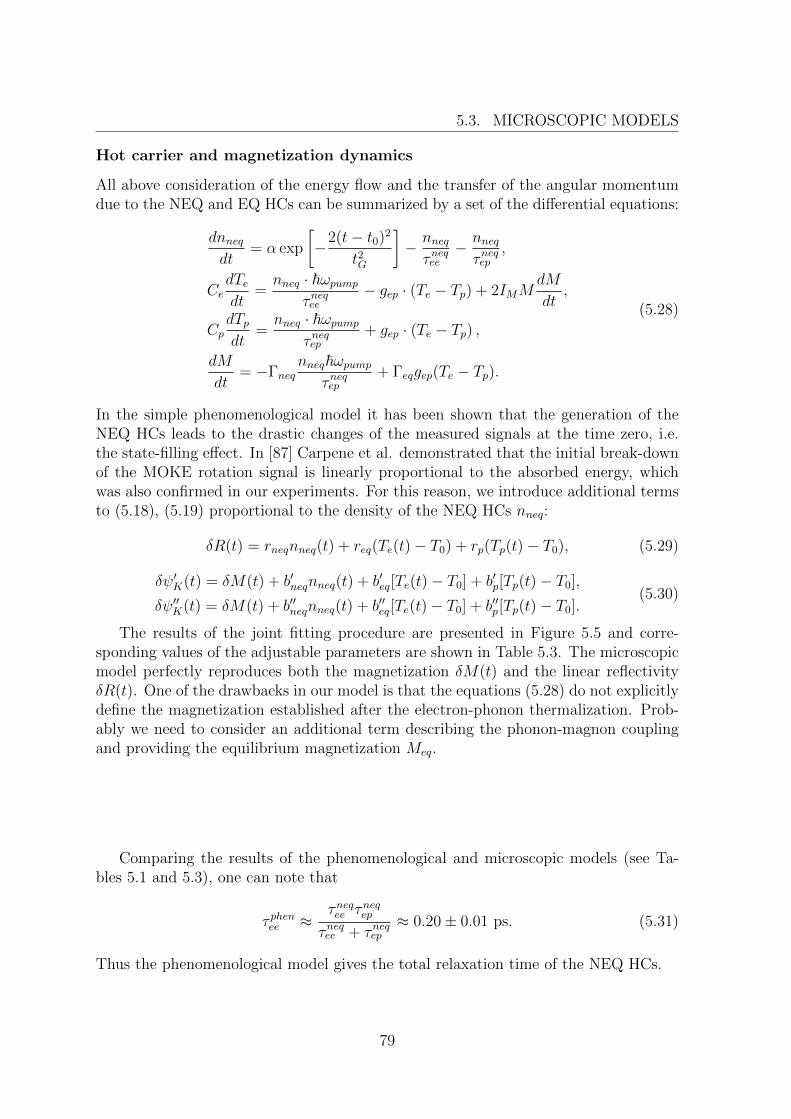
5.3. MICROSCOPIC MODELS
Hot carrier and magnetization dynamics
All above consideration of the energy flow and the transfer of the angular momentumdue to the NEQ and EQ HCs can be summarized by a set of the differential equations:
dnneqdt
= α exp
[−2(t− t0)2
t2G
]− nneqτneqee
− nneqτneqep
,
CedTedt
=nneq · ~ωpump
τneqee− gep · (Te − Tp) + 2IMM
dM
dt,
CpdTpdt
=nneq · ~ωpump
τneqep+ gep · (Te − Tp) ,
dM
dt= −Γneq
nneq~ωpumpτneqep
+ Γeqgep(Te − Tp).
(5.28)
In the simple phenomenological model it has been shown that the generation of theNEQ HCs leads to the drastic changes of the measured signals at the time zero, i.e.the state-filling effect. In [87] Carpene et al. demonstrated that the initial break-downof the MOKE rotation signal is linearly proportional to the absorbed energy, whichwas also confirmed in our experiments. For this reason, we introduce additional termsto (5.18), (5.19) proportional to the density of the NEQ HCs nneq:
δR(t) = rneqnneq(t) + req(Te(t)− T0) + rp(Tp(t)− T0), (5.29)
δψ′K(t) = δM(t) + b′neqnneq(t) + b′eq[Te(t)− T0] + b′p[Tp(t)− T0],
δψ′′K(t) = δM(t) + b′′neqnneq(t) + b′′eq[Te(t)− T0] + b′′p[Tp(t)− T0].(5.30)
The results of the joint fitting procedure are presented in Figure 5.5 and corre-sponding values of the adjustable parameters are shown in Table 5.3. The microscopicmodel perfectly reproduces both the magnetization δM(t) and the linear reflectivityδR(t). One of the drawbacks in our model is that the equations (5.28) do not explicitlydefine the magnetization established after the electron-phonon thermalization. Prob-ably we need to consider an additional term describing the phonon-magnon couplingand providing the equilibrium magnetization Meq.
Comparing the results of the phenomenological and microscopic models (see Ta-bles 5.1 and 5.3), one can note that
τ phenee ≈τneqee τneqep
τneqee + τneqep≈ 0.20± 0.01 ps. (5.31)
Thus the phenomenological model gives the total relaxation time of the NEQ HCs.
79
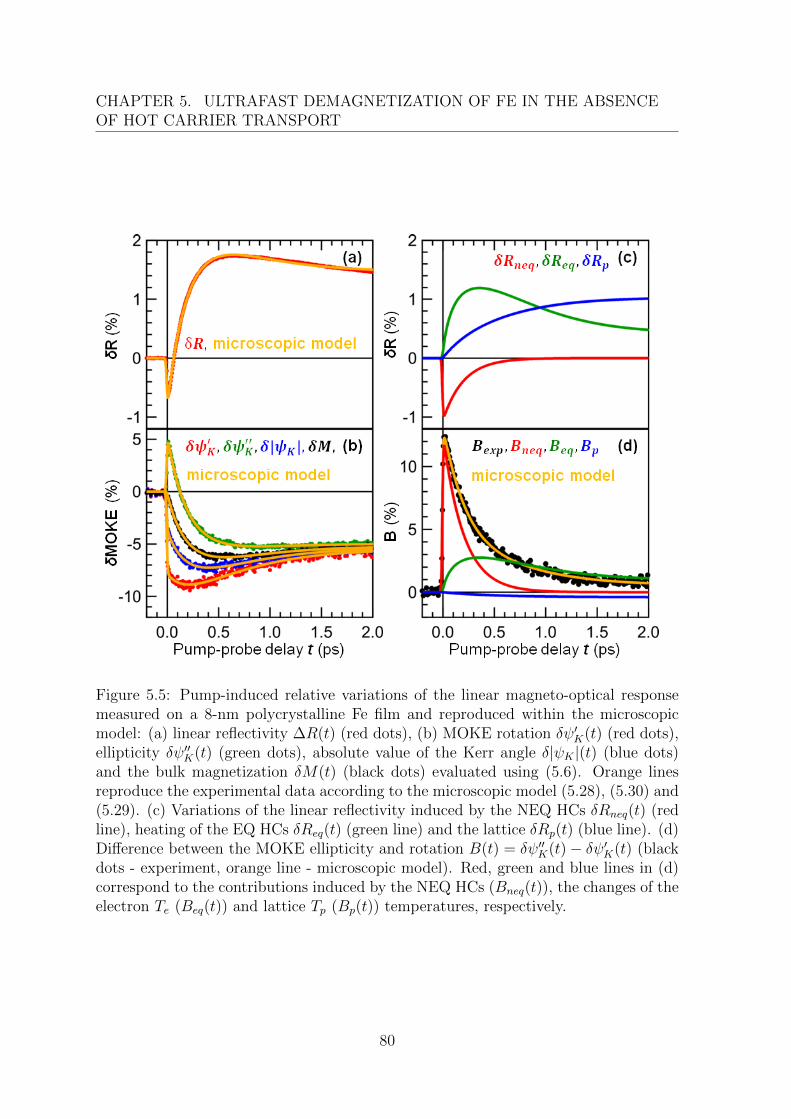
CHAPTER 5. ULTRAFAST DEMAGNETIZATION OF FE IN THE ABSENCEOF HOT CARRIER TRANSPORT
Figure 5.5: Pump-induced relative variations of the linear magneto-optical responsemeasured on a 8-nm polycrystalline Fe film and reproduced within the microscopicmodel: (a) linear reflectivity ∆R(t) (red dots), (b) MOKE rotation δψ′K(t) (red dots),ellipticity δψ′′K(t) (green dots), absolute value of the Kerr angle δ|ψK |(t) (blue dots)and the bulk magnetization δM(t) (black dots) evaluated using (5.6). Orange linesreproduce the experimental data according to the microscopic model (5.28), (5.30) and(5.29). (c) Variations of the linear reflectivity induced by the NEQ HCs δRneq(t) (redline), heating of the EQ HCs δReq(t) (green line) and the lattice δRp(t) (blue line). (d)Difference between the MOKE ellipticity and rotation B(t) = δψ′′K(t)− δψ′K(t) (blackdots - experiment, orange line - microscopic model). Red, green and blue lines in (d)correspond to the contributions induced by the NEQ HCs (Bneq(t)), the changes of theelectron Te (Beq(t)) and lattice Tp (Bp(t)) temperatures, respectively.
80
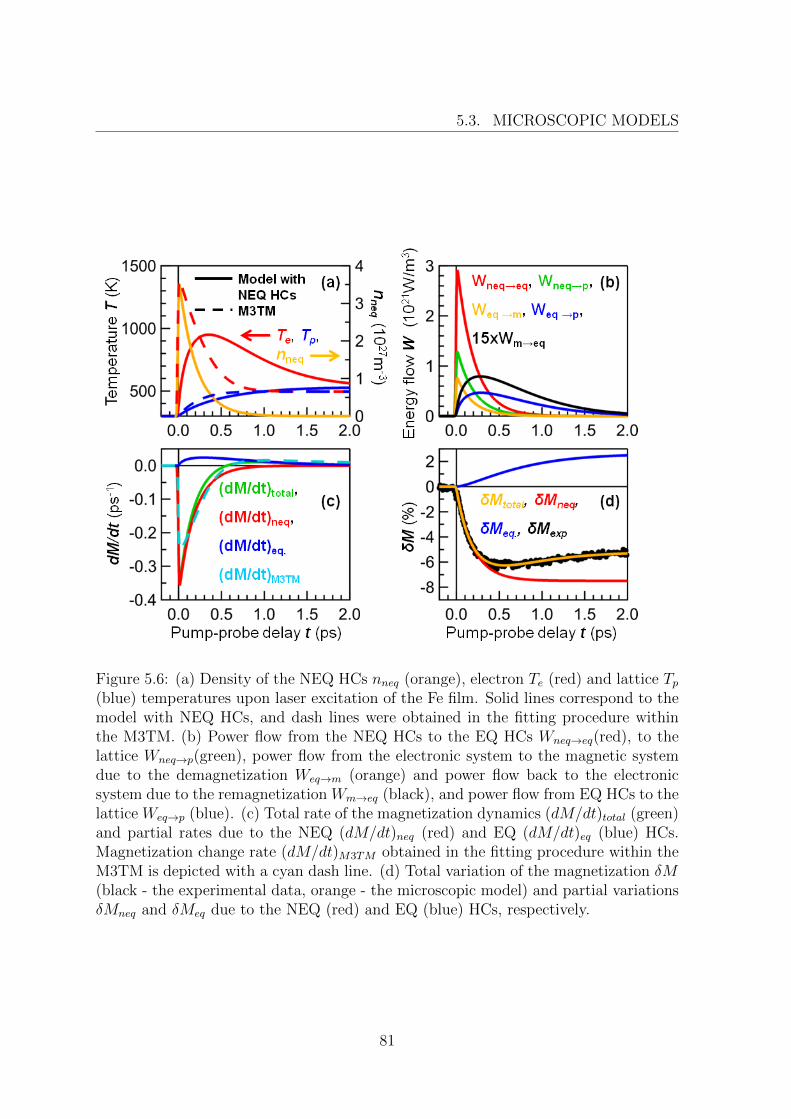
5.3. MICROSCOPIC MODELS
Figure 5.6: (a) Density of the NEQ HCs nneq (orange), electron Te (red) and lattice Tp(blue) temperatures upon laser excitation of the Fe film. Solid lines correspond to themodel with NEQ HCs, and dash lines were obtained in the fitting procedure withinthe M3TM. (b) Power flow from the NEQ HCs to the EQ HCs Wneq→eq(red), to thelattice Wneq→p(green), power flow from the electronic system to the magnetic systemdue to the demagnetization Weq→m (orange) and power flow back to the electronicsystem due to the remagnetization Wm→eq (black), and power flow from EQ HCs to thelattice Weq→p (blue). (c) Total rate of the magnetization dynamics (dM/dt)total (green)and partial rates due to the NEQ (dM/dt)neq (red) and EQ (dM/dt)eq (blue) HCs.Magnetization change rate (dM/dt)M3TM obtained in the fitting procedure within theM3TM is depicted with a cyan dash line. (d) Total variation of the magnetization δM(black - the experimental data, orange - the microscopic model) and partial variationsδMneq and δMeq due to the NEQ (red) and EQ (blue) HCs, respectively.
81
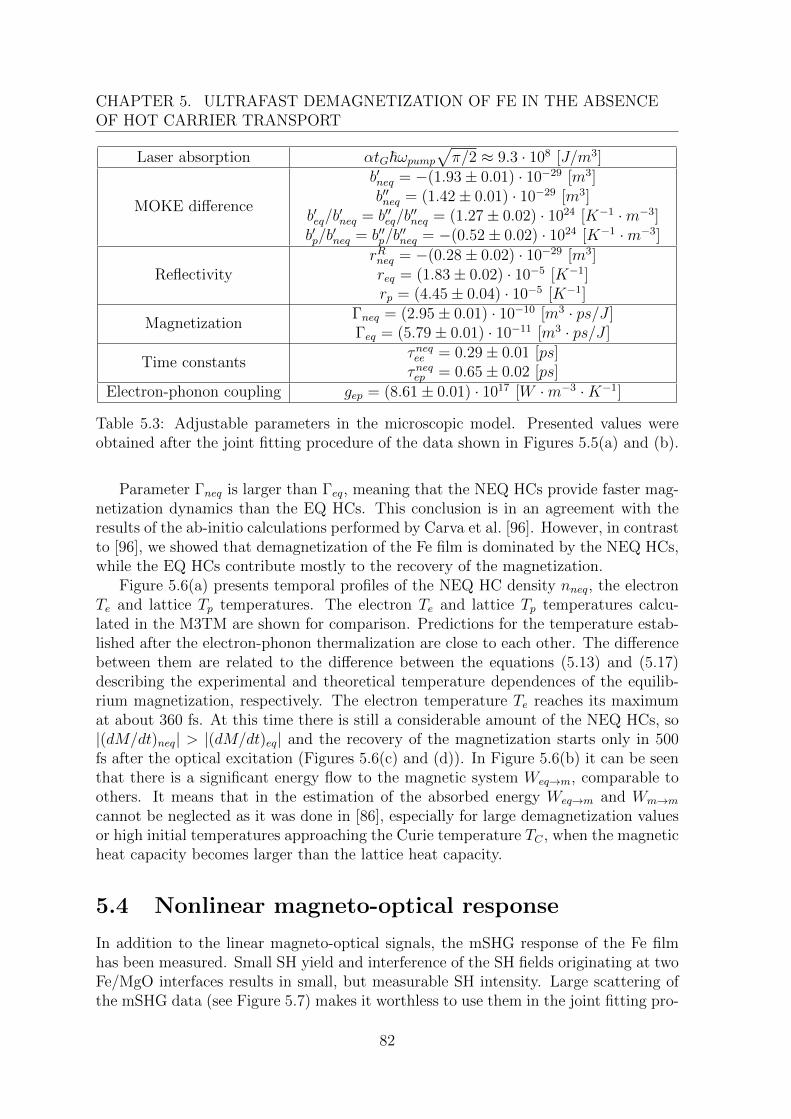
CHAPTER 5. ULTRAFAST DEMAGNETIZATION OF FE IN THE ABSENCEOF HOT CARRIER TRANSPORT
Laser absorption αtG~ωpump√π/2 ≈ 9.3 · 108 [J/m3]
MOKE difference
b′neq = −(1.93± 0.01) · 10−29 [m3]b′′neq = (1.42± 0.01) · 10−29 [m3]
b′eq/b′neq = b′′eq/b
′′neq = (1.27± 0.02) · 1024 [K−1 ·m−3]
b′p/b′neq = b′′p/b
′′neq = −(0.52± 0.02) · 1024 [K−1 ·m−3]
ReflectivityrRneq = −(0.28± 0.02) · 10−29 [m3]req = (1.83± 0.02) · 10−5 [K−1]rp = (4.45± 0.04) · 10−5 [K−1]
MagnetizationΓneq = (2.95± 0.01) · 10−10 [m3 · ps/J ]Γeq = (5.79± 0.01) · 10−11 [m3 · ps/J ]
Time constantsτneqee = 0.29± 0.01 [ps]τneqep = 0.65± 0.02 [ps]
Electron-phonon coupling gep = (8.61± 0.01) · 1017 [W ·m−3 ·K−1]
Table 5.3: Adjustable parameters in the microscopic model. Presented values wereobtained after the joint fitting procedure of the data shown in Figures 5.5(a) and (b).
Parameter Γneq is larger than Γeq, meaning that the NEQ HCs provide faster mag-netization dynamics than the EQ HCs. This conclusion is in an agreement with theresults of the ab-initio calculations performed by Carva et al. [96]. However, in contrastto [96], we showed that demagnetization of the Fe film is dominated by the NEQ HCs,while the EQ HCs contribute mostly to the recovery of the magnetization.
Figure 5.6(a) presents temporal profiles of the NEQ HC density nneq, the electronTe and lattice Tp temperatures. The electron Te and lattice Tp temperatures calcu-lated in the M3TM are shown for comparison. Predictions for the temperature estab-lished after the electron-phonon thermalization are close to each other. The differencebetween them are related to the difference between the equations (5.13) and (5.17)describing the experimental and theoretical temperature dependences of the equilib-rium magnetization, respectively. The electron temperature Te reaches its maximumat about 360 fs. At this time there is still a considerable amount of the NEQ HCs, so|(dM/dt)neq| > |(dM/dt)eq| and the recovery of the magnetization starts only in 500fs after the optical excitation (Figures 5.6(c) and (d)). In Figure 5.6(b) it can be seenthat there is a significant energy flow to the magnetic system Weq→m, comparable toothers. It means that in the estimation of the absorbed energy Weq→m and Wm→mcannot be neglected as it was done in [86], especially for large demagnetization valuesor high initial temperatures approaching the Curie temperature TC , when the magneticheat capacity becomes larger than the lattice heat capacity.
5.4 Nonlinear magneto-optical response
In addition to the linear magneto-optical signals, the mSHG response of the Fe filmhas been measured. Small SH yield and interference of the SH fields originating at twoFe/MgO interfaces results in small, but measurable SH intensity. Large scattering ofthe mSHG data (see Figure 5.7) makes it worthless to use them in the joint fitting pro-
82
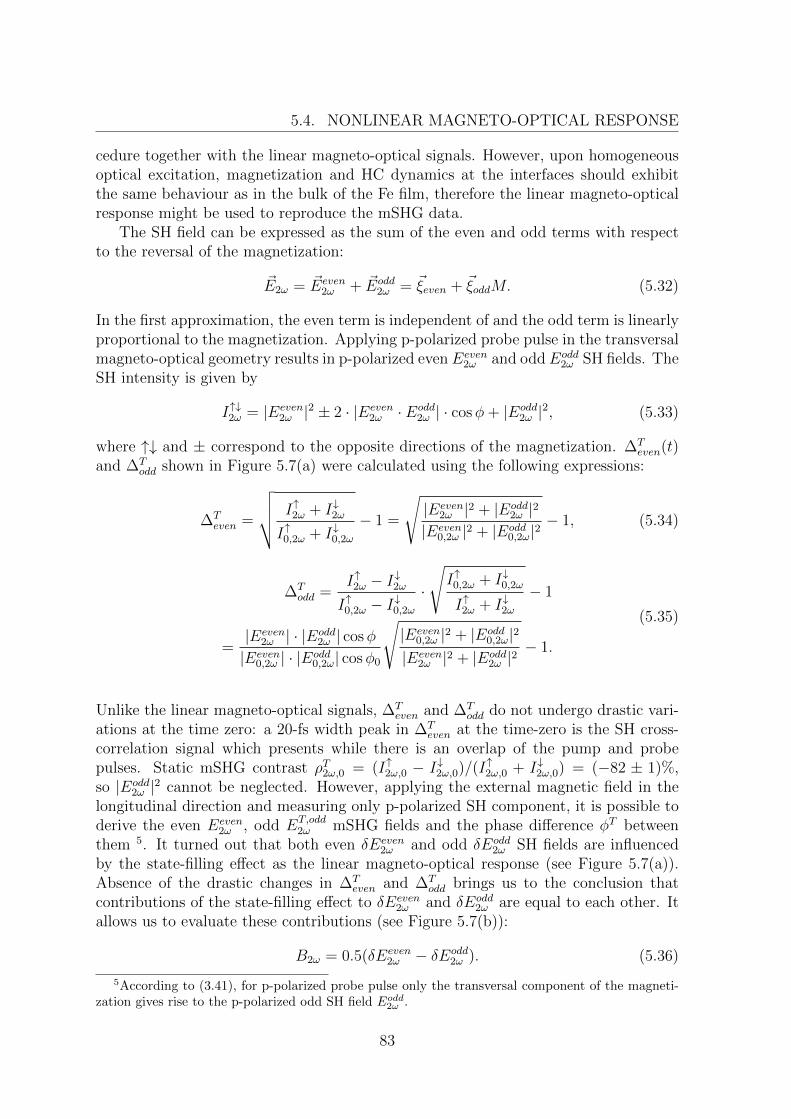
5.4. NONLINEAR MAGNETO-OPTICAL RESPONSE
cedure together with the linear magneto-optical signals. However, upon homogeneousoptical excitation, magnetization and HC dynamics at the interfaces should exhibitthe same behaviour as in the bulk of the Fe film, therefore the linear magneto-opticalresponse might be used to reproduce the mSHG data.
The SH field can be expressed as the sum of the even and odd terms with respectto the reversal of the magnetization:
~E2ω = ~Eeven2ω + ~Eodd
2ω = ~ξeven + ~ξoddM. (5.32)
In the first approximation, the even term is independent of and the odd term is linearlyproportional to the magnetization. Applying p-polarized probe pulse in the transversalmagneto-optical geometry results in p-polarized even Eeven
2ω and odd Eodd2ω SH fields. The
SH intensity is given by
I↑↓2ω = |Eeven2ω |2 ± 2 · |Eeven
2ω · Eodd2ω | · cosφ+ |Eodd
2ω |2, (5.33)
where ↑↓ and ± correspond to the opposite directions of the magnetization. ∆Teven(t)
and ∆Todd shown in Figure 5.7(a) were calculated using the following expressions:
∆Teven =
√√√√ I↑2ω + I↓2ω
I↑0,2ω + I↓0,2ω− 1 =
√|Eeven
2ω |2 + |Eodd2ω |2
|Eeven0,2ω |2 + |Eodd
0,2ω|2− 1, (5.34)
∆Todd =
I↑2ω − I↓2ω
I↑0,2ω − I↓0,2ω
·
√I↑0,2ω + I↓0,2ω
I↑2ω + I↓2ω− 1
=|Eeven
2ω | · |Eodd2ω | cosφ
|Eeven0,2ω | · |Eodd
0,2ω| cosφ0
√|Eeven
0,2ω |2 + |Eodd0,2ω|2
|Eeven2ω |2 + |Eodd
2ω |2− 1.
(5.35)
Unlike the linear magneto-optical signals, ∆Teven and ∆T
odd do not undergo drastic vari-ations at the time zero: a 20-fs width peak in ∆T
even at the time-zero is the SH cross-correlation signal which presents while there is an overlap of the pump and probepulses. Static mSHG contrast ρT2ω,0 = (I↑2ω,0 − I↓2ω,0)/(I↑2ω,0 + I↓2ω,0) = (−82 ± 1)%,so |Eodd
2ω |2 cannot be neglected. However, applying the external magnetic field in thelongitudinal direction and measuring only p-polarized SH component, it is possible toderive the even Eeven
2ω , odd ET,odd2ω mSHG fields and the phase difference φT between
them 5. It turned out that both even δEeven2ω and odd δEodd
2ω SH fields are influencedby the state-filling effect as the linear magneto-optical response (see Figure 5.7(a)).Absence of the drastic changes in ∆T
even and ∆Todd brings us to the conclusion that
contributions of the state-filling effect to δEeven2ω and δEodd
2ω are equal to each other. Itallows us to evaluate these contributions (see Figure 5.7(b)):
B2ω = 0.5(δEeven2ω − δEodd
2ω ). (5.36)
5According to (3.41), for p-polarized probe pulse only the transversal component of the magneti-zation gives rise to the p-polarized odd SH field Eodd
2ω .
83
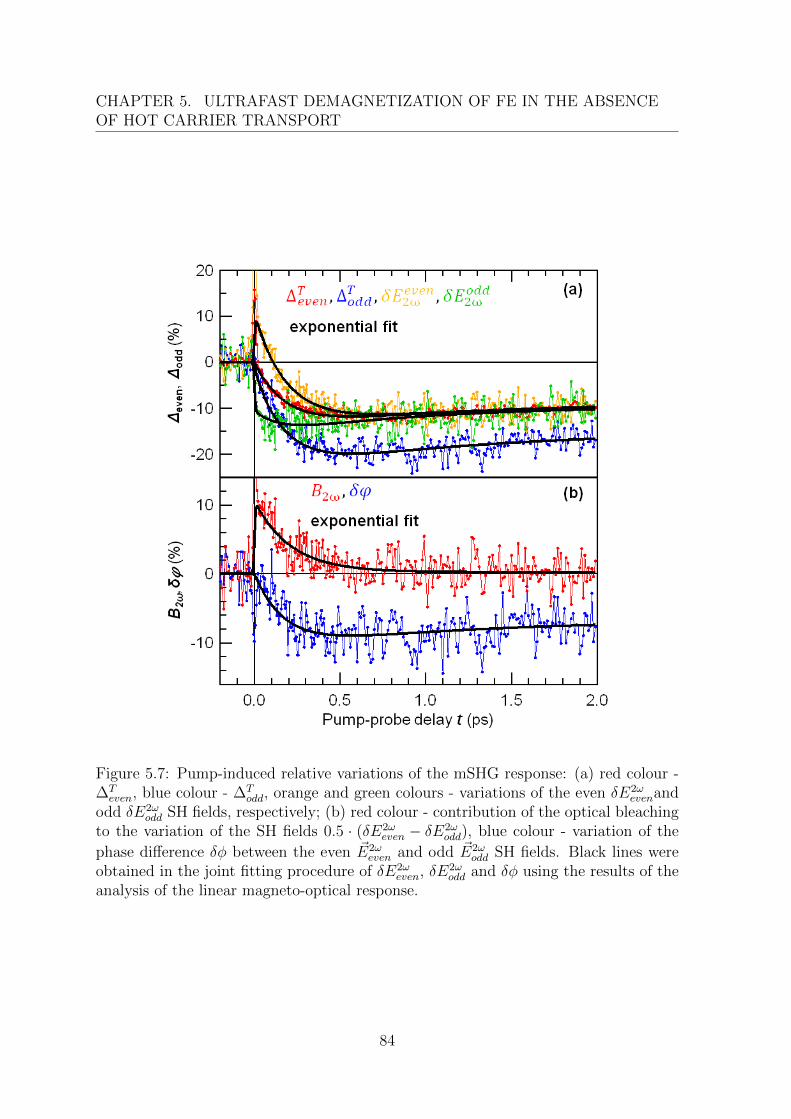
CHAPTER 5. ULTRAFAST DEMAGNETIZATION OF FE IN THE ABSENCEOF HOT CARRIER TRANSPORT
Figure 5.7: Pump-induced relative variations of the mSHG response: (a) red colour -∆Teven, blue colour - ∆T
odd, orange and green colours - variations of the even δE2ωevenand
odd δE2ωodd SH fields, respectively; (b) red colour - contribution of the optical bleaching
to the variation of the SH fields 0.5 · (δE2ωeven − δE2ω
odd), blue colour - variation of the
phase difference δφ between the even ~E2ωeven and odd ~E2ω
odd SH fields. Black lines wereobtained in the joint fitting procedure of δE2ω
even, δE2ωodd and δφ using the results of the
analysis of the linear magneto-optical response.
84
5.5. CONCLUSIONS
Because of the homogeneous optical excitation, HC and magnetization dynamics inthe bulk of the Fe film and at the Fe/MgO interfaces should be identical, thereforelinear magneto-optical response can be used to describe the mSHG signals.:
δEeven2ω (t) = b2ω · e−t/τee + κeven2ω · [r0 · (1− e−t/τee) · e−t/τep + r1 · (1− e−t/τep)], (5.37)
δEodd2ω (t) = −b2ω · e−t/τee + κodd2ω · [r0 · (1− e−t/τee) · e−t/τep + r1 · (1− e−t/τep)]
+ [m0 · (1− e−t/τM ) · e−t/τR +m1 · (1− e−t/τR)],(5.38)
δφ(t) = κφ2ω · [r0 · (1− e−t/τee) · e−t/τep + r1 · (1− e−t/τep)], (5.39)
where r0, r1, m0, m1, τee = τM , τep = τM are the fitting parameters obtained in thephenomenological model for the linear magneto-optical response. Here it is assumedthat in the absence of the state-filling effect variations of |~ξeven| and |~ξodd| are linearlyproportional to the variation of the linear reflectivity induced by the heating of theelectronic system and the lattice. Black solid lines in Figure 5.7 represent the resultof the joint fitting procedure with only four parameters b2ω = 10.5 ± 0.4%, κeven2ω =−6.6± 0.1, κodd2ω = −3.3± 0.1, κφ2ω = −4.98± 0.09. In spite of the small signal-to-noiseratio in the mSHG signals, there is a good agreement between the linear and nonlinearmagneto-optical responses. Also good fit quality supports our assumption about therelation between variations of |~ξeven|, |~ξodd| and ∆R.
5.5 Conclusions
Ultrafast demagnetization of Fe in the absence of the HC transport has been studiedusing time-resolved MOKE and mSHG techniques. In order to be more sensitive tothe generation of the NEQ HCs and their decay, we have utilized single-colour pump-probe experiments with the identical photon energies of the pump and probe pulses~ωpump = ~ωprobe = 1.5 eV. Owing to that, the state-filling effect [82] contributes to thereflectivity δR(t), MOKE rotation δψ′K(t) and ellipticity δψ′′K(t) signals. The differencebetween variations of the MOKE ellipticity and rotation B(t) = δψ′′K(t)− δψ′K(t) canappear not only due to the variation of the magneto-optical constants, but also inthe case of the inhomogeneous magnetization profile as a result of the different depthsensitivities [122]. However, by choosing 8-nm (i.e. homogeneously pumped) Fe film onthe non-conducting MgO substrate, we can exclude the HC transport (homogeneousmagnetization profile) and treat B(t) as a purely non-magnetic signal. In order toevaluate and characterize magnetization and HC dynamics, three main assumptionshave been made. (i) In the absence of the HC transport demagnetization is governedby the spin-flip processes accompanied with the transfer of the angular momentum tothe lattice. Assuming that the characteristic time of this demagnetization mechanismis considerably longer than the experimental 20-fs time resolution, one can neglectinstantaneous changes of the magnetization at the time zero ∆M(t = 0) = 0. (ii) Therelaxation dynamics of the majority and minority NEQ HCs has been described witha single characteristic time τee. The NEQ HC population decays into the thermalized(EQ HC) one which subsequently relaxes with a characteristic time τep due to the
85
CHAPTER 5. ULTRAFAST DEMAGNETIZATION OF FE IN THE ABSENCEOF HOT CARRIER TRANSPORT
electron-phonon interaction. (iii) These processes induce modifications of the MOKEsignals with the same temporal profile B(t). Thus one can evaluate real magnetizationdynamics, using the expression (5.6).
In order to obtain τee, τep, we have performed the joint fitting procedure for B(t),δR(t) curves with a sum of e−t/τee corresponding to the state-filling effect produced bythe NEQ HCs, (1−e−t/τee)e−t/τep and (1−e−t/τep) terms referred to the influence of theelectron Te and lattice Tp temperatures. At the same time δM(t) curve has been fittedusing the similar expression (5.10) with the time constants τM and τR characterizingthe demagnetization and remagnetization time scales, respectively. Initially these timeconstants were independent from τee and τep, but it turned out that τM ≈ τee and τR ≈τep, which means that the demagnetization is dominated by the NEQ HCs, while therecovery of the magnetization is governed by the EQ HCs. Subsequently from the jointfitting procedure performed for δR(t), δψ′K(t) and δψ′′K(t) with just two characteristictime constants, we have obtained τM = τee = 0.21± 0.01 ps, τR = τep = 1.06± 0.03 ps.Here it should be noted that the experimental 20-fs time resolution excludes otherpossible assignments of the time constants τee and τep, which were suggested in theprevious works performed on thin Fe [87, 134], Ni and Co films [86], where the smallesttime constant ∼ 100 fs was determined by the duration of the pump and probe pulsesrather than the electron thermalization.
In addition to the phenomenological description, we have developed a microscopicmodel based on the 2TM complemented with the NEQ HCs which have not beenconsidered neither in the 3TM [25] nor the M3TM [86]. In the microscopic model, theHC and magnetization dynamics has been described through the consideration of theenergy flux and the transfer of the angular momentum. It has been suggested that themagnetization change rate is proportional to the energy flow from the NEQ and EQHCs to the phonon system. The first process leads to the demagnetization, while thesecond one provides the recovery of the magnetization. In spite of certain assumptions,the microscopic model can reproduce the experimental data, including the transientreflectivity δR(t), with the same fit quality as the phenomenological description.
Summarizing, it has been demonstrated how the magnetization dynamics and theoptical effects can be disentangled from a complete set of the magneto-optical data.Both phenomenological and microscopic models reveal the dominant role of the NEQHCs in the ultrafast spin dynamics, as it was suggested in [96]. However, it has beenfound that the demagnetization occurs on the time scale of the HC thermalization∼ 200 fs due to the NEQ HCs, while the EQ HCs contribute mostly to the recovery ofthe magnetization.
86
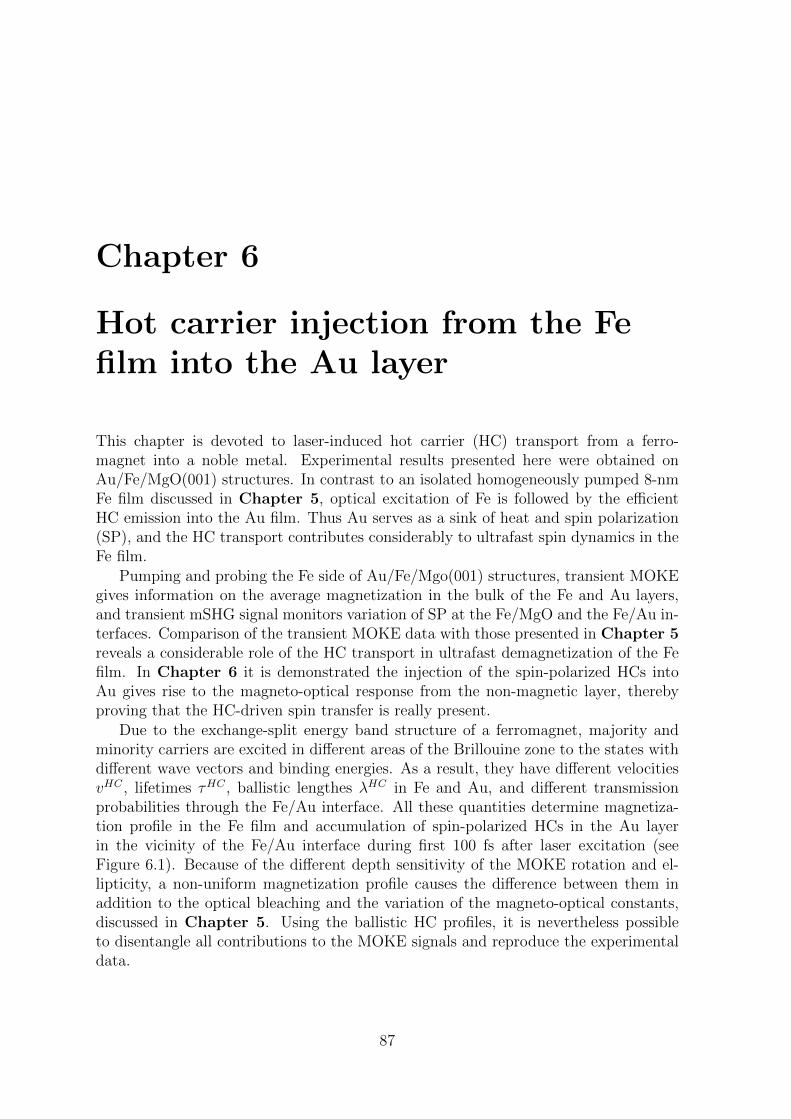
Chapter 6
Hot carrier injection from the Fefilm into the Au layer
This chapter is devoted to laser-induced hot carrier (HC) transport from a ferro-magnet into a noble metal. Experimental results presented here were obtained onAu/Fe/MgO(001) structures. In contrast to an isolated homogeneously pumped 8-nmFe film discussed in Chapter 5, optical excitation of Fe is followed by the efficientHC emission into the Au film. Thus Au serves as a sink of heat and spin polarization(SP), and the HC transport contributes considerably to ultrafast spin dynamics in theFe film.
Pumping and probing the Fe side of Au/Fe/Mgo(001) structures, transient MOKEgives information on the average magnetization in the bulk of the Fe and Au layers,and transient mSHG signal monitors variation of SP at the Fe/MgO and the Fe/Au in-terfaces. Comparison of the transient MOKE data with those presented in Chapter 5reveals a considerable role of the HC transport in ultrafast demagnetization of the Fefilm. In Chapter 6 it is demonstrated the injection of the spin-polarized HCs intoAu gives rise to the magneto-optical response from the non-magnetic layer, therebyproving that the HC-driven spin transfer is really present.
Due to the exchange-split energy band structure of a ferromagnet, majority andminority carriers are excited in different areas of the Brillouine zone to the states withdifferent wave vectors and binding energies. As a result, they have different velocitiesvHC , lifetimes τHC , ballistic lengthes λHC in Fe and Au, and different transmissionprobabilities through the Fe/Au interface. All these quantities determine magnetiza-tion profile in the Fe film and accumulation of spin-polarized HCs in the Au layerin the vicinity of the Fe/Au interface during first 100 fs after laser excitation (seeFigure 6.1). Because of the different depth sensitivity of the MOKE rotation and el-lipticity, a non-uniform magnetization profile causes the difference between them inaddition to the optical bleaching and the variation of the magneto-optical constants,discussed in Chapter 5. Using the ballistic HC profiles, it is nevertheless possibleto disentangle all contributions to the MOKE signals and reproduce the experimentaldata.
87
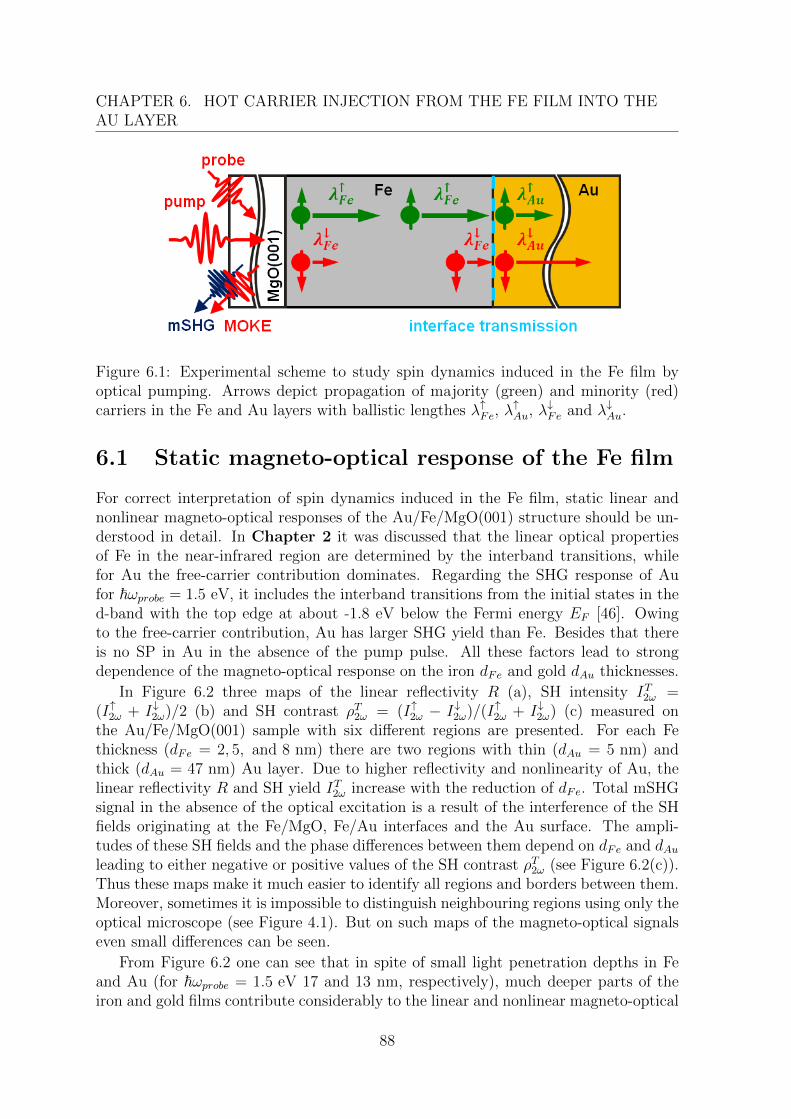
CHAPTER 6. HOT CARRIER INJECTION FROM THE FE FILM INTO THEAU LAYER
Figure 6.1: Experimental scheme to study spin dynamics induced in the Fe film byoptical pumping. Arrows depict propagation of majority (green) and minority (red)carriers in the Fe and Au layers with ballistic lengthes λ↑Fe, λ
↑Au, λ
↓Fe and λ↓Au.
6.1 Static magneto-optical response of the Fe film
For correct interpretation of spin dynamics induced in the Fe film, static linear andnonlinear magneto-optical responses of the Au/Fe/MgO(001) structure should be un-derstood in detail. In Chapter 2 it was discussed that the linear optical propertiesof Fe in the near-infrared region are determined by the interband transitions, whilefor Au the free-carrier contribution dominates. Regarding the SHG response of Aufor ~ωprobe = 1.5 eV, it includes the interband transitions from the initial states in thed-band with the top edge at about -1.8 eV below the Fermi energy EF [46]. Owingto the free-carrier contribution, Au has larger SHG yield than Fe. Besides that thereis no SP in Au in the absence of the pump pulse. All these factors lead to strongdependence of the magneto-optical response on the iron dFe and gold dAu thicknesses.
In Figure 6.2 three maps of the linear reflectivity R (a), SH intensity IT2ω =(I↑2ω + I↓2ω)/2 (b) and SH contrast ρT2ω = (I↑2ω − I↓2ω)/(I↑2ω + I↓2ω) (c) measured onthe Au/Fe/MgO(001) sample with six different regions are presented. For each Fethickness (dFe = 2, 5, and 8 nm) there are two regions with thin (dAu = 5 nm) andthick (dAu = 47 nm) Au layer. Due to higher reflectivity and nonlinearity of Au, thelinear reflectivity R and SH yield IT2ω increase with the reduction of dFe. Total mSHGsignal in the absence of the optical excitation is a result of the interference of the SHfields originating at the Fe/MgO, Fe/Au interfaces and the Au surface. The ampli-tudes of these SH fields and the phase differences between them depend on dFe and dAuleading to either negative or positive values of the SH contrast ρT2ω (see Figure 6.2(c)).Thus these maps make it much easier to identify all regions and borders between them.Moreover, sometimes it is impossible to distinguish neighbouring regions using only theoptical microscope (see Figure 4.1). But on such maps of the magneto-optical signalseven small differences can be seen.
From Figure 6.2 one can see that in spite of small light penetration depths in Feand Au (for ~ωprobe = 1.5 eV 17 and 13 nm, respectively), much deeper parts of theiron and gold films contribute considerably to the linear and nonlinear magneto-optical
88
6.1. STATIC MAGNETO-OPTICAL RESPONSE OF THE FE FILM
Figure 6.2: Maps of the linear reflectivity R(a), SH intensity I2ω(b) and SH contrast ρ2ω
measured probing through the MgO substrate a two-layer Au/Fe/MgO(001) samplewith six different regions: (1) dFe = 8 nm, dAu = 47 nm; (2) dFe = 5 nm, dAu = 47 nm;(3) dFe = 2 nm, dAu = 47 nm; (4) dFe = 8 nm, dAu = 5 nm; (5) dFe = 5 nm,dAu = 5 nm; (6) dFe = 2 nm, dAu = 5 nm.
responses. Since this chapter is devoted to the HC injection from the Fe film into theAu layer, our attention will be focused on the results obtained on the Au/Fe/MgO(001)structures with 130 nm of Au. Considering small pump-probe delays ∼ 40 − 60 fs, itallows us to simplify the interpretation of the experimental data, because for such thickAu film the presence of the Au surface does not affect the magneto-optical signals andit takes more time for the HCs to propagate back and forth across the sample.
Figure 6.3(a) shows the dependencies of the static linear reflectivity R0, MOKE
rotation ψ′K,0, ellipticity ψ′′K,0, and the MOKE magnitude |ψK,0| =√ψ′2K,0 + ψ′′2K,0 on
dFe for Au/Fe/MgO(001) structure with 130 nm of Au. The reflectivity signal R0
was scaled to fit the theoretical values for thick Fe films, where the reflectivity depen-dence on dFe is more or less flat. At the same time, no fitting procedure was usedfor the MOKE signals. Theoretical curves were calculated for the 130nm-Au/Xnm-Fe/0.5mm-MgO(001) structure probed with the laser pulse ~ωprobe = 1.5 eV at 50
angle of incidence, according to the self-consistent 4x4 matrix method described inChapter 3. The MgO substrate is 0.5 mm thick, so it takes about 5.8 ps for the laserpulse to go back and forth through it. Thus for 14-fs laser pulses no interference effectscaused by the MgO substrate should be observed. For this reason, in the calculationsdMgO = 0. It gives the same result as the calculations performed for dMgO = 0.5 mmand a 14-fs probe pulse with central wavelength 1.5 eV. Consideration of all frequencycomponents consumes more computational time than the consideration of only onesingle component with ~ω = 1.5 eV, therefore for the analysis of the transient sig-nals measured in the pump-probe experiments all calculations were done for singlewavelength ~ω = 1.5 eV.
89
CHAPTER 6. HOT CARRIER INJECTION FROM THE FE FILM INTO THEAU LAYER
In order to calculate the magneto-optical response of the Au/Fe/MgO(001) struc-tures with a non-uniform magnetization profiles, the Fe and Au films were splitted intothe sublayers with thicknesses ∆z = 0.1 nm, so the magnetization within one sublayeris nearly constant. Figure 6.3(b) presents the depth sensitivities of the longitudinalMOKE rotation w′K(z) and ellipticity w′′K(z) calculated for the Au/Fe/MgO(001) struc-ture with 15 nm of Fe and 130 nm of Au. They correspond to the contributions of thesublayer at the depth z in the Fe film to the MOKE signals. The total MOKE rotationψ′K and ellipticity ψ′′K signals are simply given by the sums of the contributions fromall the sublayers in the Fe and Au films:
ψ′K =∑j
w′K(zj)M(zj), ψ′′K =
∑j
w′′K(zj)M(zj). (6.1)
The depth sensitivities w′K(z), w′′K(z) changes with dFe, but Figure 6.3(b) reflects thegeneral tendency that w′′K(z) has its maximum at the Fe/MgO interface and decreaseswith the film depth z, while w′K(z) is small at the Fe/MgO interface and increasestowards the Fe/Au interface. Later in the analysis of the pump-probe experiments itwill be demonstrated that a non-uniform magnetization profile leads to the differentbehaviour of the MOKE rotation ψK(t) and ellipticity ψ′′K(t) even in the absence ofthe optical artefacts.
For the linear magneto-optical signal there is a good agreement between theoreticaland experimental results, but with the mSHG response situation is rather complicated.For the samples with 130 nm of Au, the total mSHG response presented in the Fig-ure 6.3(b) is the result of the interference of the SH fields ~E
Fe/MgO2ω and ~E
Fe/Au2ω origi-
nating at the Fe/MgO and Fe/Au interfaces. For the p-polarized probe pulse, the even
SH component ~Eeven2ω is p-polarized, while the odd SH component ~Eodd
2ω is p-polarized
in the transversal magneto-optical configuration ( ~M ||y :↑ and ↓) and s-polarized in
the longitudinal magneto-optical configuration ( ~M ||x :→ and ←) [116]. Using theanalyzer set to transmit only the p-polarized component and measuring SH intensitiesin both magneto-optical geometries, it is possible to evaluate the amplitudes of theeven | ~Eeven
2ω | and odd | ~Eodd,T2ω | SH fields1, and the optical phase φT2ω between them (see
Figure 6.3(c)):
| ~Eeven2ω | =
√I→2ω + I←2ω
2, (6.2)
| ~Eodd,T2ω | =
√I↑2ω + I↓2ω
2− I→2ω + I←2ω
2, (6.3)
cosφT2ω(t) =I↑2ω − I
↓2ω
2√
(I→2ω + I←2ω)[(I↑2ω + I↓2ω)− (I→2ω + I←2ω)]. (6.4)
1The mark ’T’ means that ~Eodd,T2ω arises only from the transversal magnetization component or
the spin current with the spin polarization ~σ||y, formed by the hot carriers propagating across thesample ~vHC ||z.
90
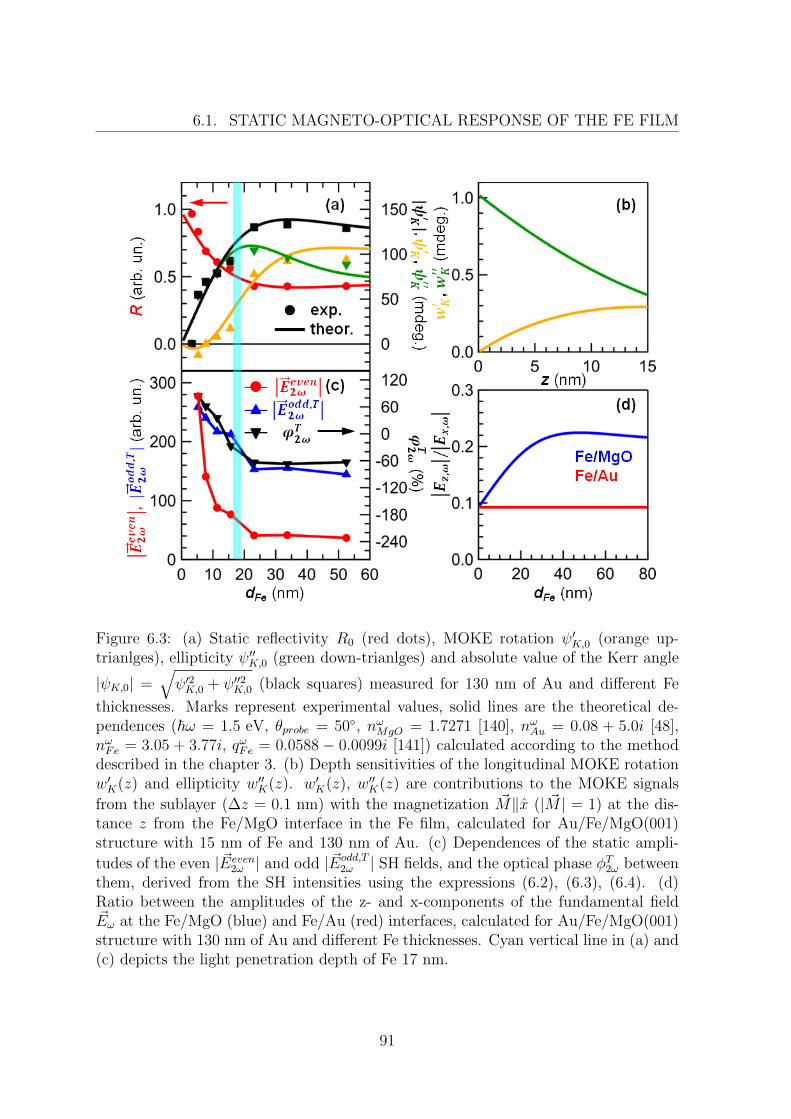
6.1. STATIC MAGNETO-OPTICAL RESPONSE OF THE FE FILM
Figure 6.3: (a) Static reflectivity R0 (red dots), MOKE rotation ψ′K,0 (orange up-trianlges), ellipticity ψ′′K,0 (green down-trianlges) and absolute value of the Kerr angle
|ψK,0| =√ψ′2K,0 + ψ′′2K,0 (black squares) measured for 130 nm of Au and different Fe
thicknesses. Marks represent experimental values, solid lines are the theoretical de-pendences (~ω = 1.5 eV, θprobe = 50, nωMgO = 1.7271 [140], nωAu = 0.08 + 5.0i [48],nωFe = 3.05 + 3.77i, qωFe = 0.0588 − 0.0099i [141]) calculated according to the methoddescribed in the chapter 3. (b) Depth sensitivities of the longitudinal MOKE rotationw′K(z) and ellipticity w′′K(z). w′K(z), w′′K(z) are contributions to the MOKE signals
from the sublayer (∆z = 0.1 nm) with the magnetization ~M‖x (| ~M | = 1) at the dis-tance z from the Fe/MgO interface in the Fe film, calculated for Au/Fe/MgO(001)structure with 15 nm of Fe and 130 nm of Au. (c) Dependences of the static ampli-
tudes of the even | ~Eeven2ω | and odd | ~Eodd,T
2ω | SH fields, and the optical phase φT2ω betweenthem, derived from the SH intensities using the expressions (6.2), (6.3), (6.4). (d)Ratio between the amplitudes of the z- and x-components of the fundamental field~Eω at the Fe/MgO (blue) and Fe/Au (red) interfaces, calculated for Au/Fe/MgO(001)structure with 130 nm of Au and different Fe thicknesses. Cyan vertical line in (a) and(c) depicts the light penetration depth of Fe 17 nm.
91
CHAPTER 6. HOT CARRIER INJECTION FROM THE FE FILM INTO THEAU LAYER
Because of the absorption of the fundamental and signal waves, the even EFe/Au,even2ω
and odd EFe/Au,odd2ω SH fields from the Fe/Au interface are negligibly small for thick Fe
films, but they rise with the reduction of dFe, increasing the amplitudes of the totaleven | ~Eeven
2ω | and odd | ~Eodd,T2ω | SH fields, and changing the optical phase φT2ω.
One can also calculate the SH response of the Au/Fe/MgO(001) structure using the4x4 matrix method 2, but in this case we have to deal with lots of unknown parameters.According to (3.41), in the transversal magneto-optical geometry ( ~M ||y) components
χzxx, χzzz, χxzx contribute to ~Eeven2ω and χxxx(My), χxzz(My), χzzx(My) contribute to
~Eodd2ω [116]. It could be possible to replace these components of the χ(2) tensor with
only two even and odd effective susceptibilities for each interface. However, because ofthe multiple reflections of the fundamental pulse in the Fe film and complex refractiveindices of Fe and Au, the ratio between the z- and x-components of the fundamentalelectric field ~E
Fe/MgOω at the Fe/MgO interface changes with the Fe thickness dFe (see
Figure 6.3(d)), therefore the effective susceptibilities of the Fe/MgO interface alsodepends on dFe. The ratio between the z- and x-components of the fundamental field~EFe/Auω at the Fe/Au interface is nearly constant, meaning that the initially transmitted
wave is much stronger than the waves reflected from the Fe/Au and Fe/MgO interfaces.In the following sections of this chapter we concentrate on the analysis of the tran-
sient MOKE signals. As for the transient mSHG response of the Fe film, it is better toanalyse it considering the experiments performed on the three-layer Fe/Au/Fe/MgO(001)structures with the pump pulse applied either from the same side of the samples asthe probe pulse, or from the opposite side. All these experiments are discussed inChapter 8.
6.2 Laser-induced demagnetization of the Fe film
Figure 6.4 presents pump-induced variations of the MOKE signals measured on theAu/Fe/MgO(001) structures with 130 nm of Au and different Fe thicknesses. Non-uniform laser absorption profile (see Figure 6.7(a)) and the presence of Au enhancethe efficiency of the HC transport. For thick Fe films dFe > 20 nm the MOKE rotationδψ′K(t) (see Figure 6.4(a)) undergoes instantaneous break-down, while the MOKEellipticity δψ′′K(t) (Figure 6.4(c)) decreases on a longer time scale. The reason is that thestate-filling effect results in the negative variation of δψ′K(t) and the positive variationof δψ′′K(t), as well as for the MgO/8nm-Fe/MgO sample discussed in Chapter 5. Atthe same time optically excited HCs propagate into the bulk of the Fe film, leading todemagnetization of the region close to the Fe/MgO interface and, consequently, to thenegative variations of δψ′K(t) and δψ′′K(t). So the contributions of the demagnetizationand the state-filling effect to δψ′′K(t) partially compensate each other.
All the curves presented in Figure 6.4 have been measured under the same inci-dent pump fluence. For thick films the influence of the Fe/Au interface on the laser
2Linear MOKE can be neglected for the calculations of the distribution of the fundamental electricfield ~Eω. Moreover, in the transversal magneto-optical geometry for p-polarized probe pulse botheven Eeven
2ω and odd Eodd2ω SH fields are p-polarized, meaning that it is possible to switch to the 2x2
matrices.
92
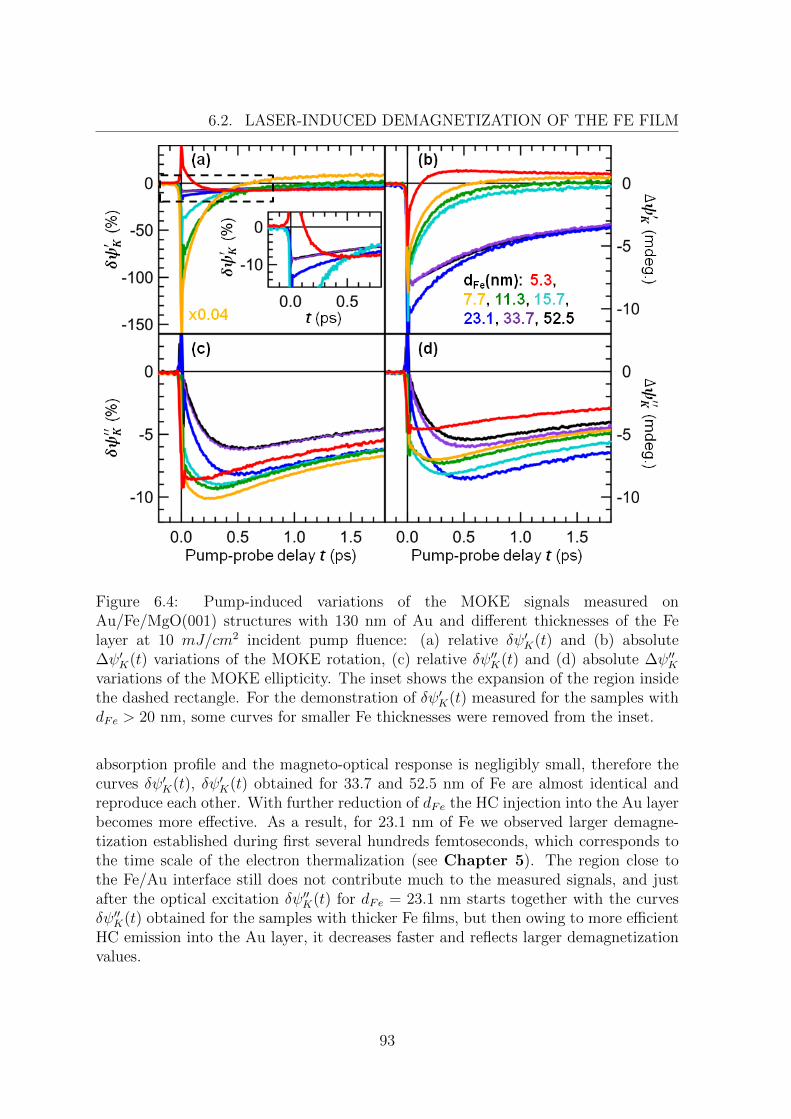
6.2. LASER-INDUCED DEMAGNETIZATION OF THE FE FILM
Figure 6.4: Pump-induced variations of the MOKE signals measured onAu/Fe/MgO(001) structures with 130 nm of Au and different thicknesses of the Felayer at 10 mJ/cm2 incident pump fluence: (a) relative δψ′K(t) and (b) absolute∆ψ′K(t) variations of the MOKE rotation, (c) relative δψ′′K(t) and (d) absolute ∆ψ′′Kvariations of the MOKE ellipticity. The inset shows the expansion of the region insidethe dashed rectangle. For the demonstration of δψ′K(t) measured for the samples withdFe > 20 nm, some curves for smaller Fe thicknesses were removed from the inset.
absorption profile and the magneto-optical response is negligibly small, therefore thecurves δψ′K(t), δψ′K(t) obtained for 33.7 and 52.5 nm of Fe are almost identical andreproduce each other. With further reduction of dFe the HC injection into the Au layerbecomes more effective. As a result, for 23.1 nm of Fe we observed larger demagne-tization established during first several hundreds femtoseconds, which corresponds tothe time scale of the electron thermalization (see Chapter 5). The region close tothe Fe/Au interface still does not contribute much to the measured signals, and justafter the optical excitation δψ′′K(t) for dFe = 23.1 nm starts together with the curvesδψ′′K(t) obtained for the samples with thicker Fe films, but then owing to more efficientHC emission into the Au layer, it decreases faster and reflects larger demagnetizationvalues.
93
CHAPTER 6. HOT CARRIER INJECTION FROM THE FE FILM INTO THEAU LAYER
For dFe < 20 nm the linear magneto-optical response becomes more sensitive tothe Fe/Au interface, and both MOKE rotation δψ′K(t) and ellipticity δψ′′K break downimmediately after the pump pulse. Velocity of the ballistic HCs vHC is about 1 nm/fsand corresponds to a 20-nm travel path within 20 fs (experimental time resolution),therefore the observed variations of the MOKE signals δψ′K(t) and δψ′′K(t) are consistentwith ultrafast demagnetization induced by the ballistic HC transport.
Certainly not all optically excited HCs leave the Fe film in the ballistic regime.Some of them scatter and produce secondary HCs, so the HC transport evolves fromthe ballistic regime to the diffusive regime. According to the previous experimentaland theoretical works performed on Fe and other ferromagnets [29], majority electronswith the positive SP are more mobile than other HCs. It also agrees with our resultsfor thick Fe films, otherwise we would have observed an increase of the magnetizationin the region close to the Fe/MgO interface: more mobile HCs propagate faster intothe bulk of the Fe film, leaving behind other HCs with opposite SP. When dFe becomescomparable to the ballistic length of the majority electrons λe↑ ∼ 3−5 nm, a significantamount of the positive SP is already injected into the Au layer during first 100 fs,and later we observe only the recovery of the magnetization (see the red curve inFigure 6.4(c)).
6.3 Model of the ballistic hot carrier transport
Since the static MOKE rotation ψ′K,0 changes its sign at about dFe = 8nm (see Fig-ure 6.3(a)), it is more appropriate to compare the absolute variations of the MOKErotation ∆ψ′K(t) and ∆ψ′′K(t) (see Figures 6.4(b) and (d)). As a result of differentdepth sensitivities and the influence of the optical artefacts, ∆ψ′K(t) and ∆ψ′′K(t) be-have differently with the reduction of dFe. It is also should be taken into accountthat the injection of the spin-polarized HCs gives rise to the MOKE signal from Au,which is demonstrated in Chapter 7. In order to disentangle all contributions, onehas to calculate spatial HC and magnetization profiles. Complete description of thesuperdiffusive transport of the spin-polarized HCs, leading to the redistribution of themagnetization in Fe and Au, requires an advanced model similar to those developedin [22, 24, 142–144]. Here we focus on the fastest time scale account only for theballistic HC transport.
6.3.1 Calculation of the ballistic hot carrier profile
Efficiency of the ballistic HC transport is defined by lifetimes and velocities of differentHCs excited in Fe by the pump laser pulse. T.O. Wehling and A. Lichtenstein haveperformed calculation [106] of the energy and momentum distribution of HCs excitedin Fe, based on the density functional theory as implemented in the WIEN2K pack-age [145] using the linearized augmented plane wave method and a generalized gradientapproximation [146] to the exchange and correlation potential. It was obtained thatHCs are excited to relatively small regions in the k-space (see Figure 6.5): one-third
of majority HCs has the wave vectors ~k parallel to the Fe/Au interface, and other
94

6.3. MODEL OF THE BALLISTIC HOT CARRIER TRANSPORT
Figure 6.5: Distribution of the optically excited majority (a) and minority (b) electrons(~ω = 1.5 eV) in the first Brillouin zone of Fe, calculated by T.O. Wehling and A.Lichtenstein using joint density of states.
two-thirds have the k-vectors with non-zero projection on the normal to the Fe/Auinterface; one-third of minority HCs starts to propagate perpendicular to the Fe/Auinterface, and the k-vectors of other two-thirds have zero projection on the normal tothe Fe/Au interface.
In the model of the HC transport four types of HCs are considered: majorityelectrons e↑ and minority holes h↓ with positive SP, minority electrons e↓ and majorityholes h↑ with negative SP. Figure 6.6(a) shows energy spectra of the optically excitedHCs (~ω = 1.5 eV) after momentum averaging [106]. So in addition to well-directedk-vectors, HCs have relatively narrow energy distributions. When HCs pass throughthe Fe/Au interface, their energies and momentum components parallel to the interfaceare conserved.
The known band structure of Au allows to calculate the normal-to-interface momentumcomponent of the injected HCs and corresponding ballistic velocity vHCAu (see Table 6.1).The velocities were calculated based on the density functional theory using the bandstructures of bulk Au obtained within the Vienna Ab Initio simulation package (VASP)with the projector augmented waves basis sets. Using HC velocities vHCFe in Fe andlifetimes τHCFe , τHCAu in Fe and Au estimated from ref. [19, 78], one can estimate ballisticlengths in Fe and Au for different types of HCs: λFe = vFeτFe and λAu = vAuτAu. Herewe have to admit difficulty of a theoretical treatment of 3d ferromagnets, discussed inChapter 2. Lifetimes of the minority carriers in Fe, reported recently by Kalteborn etal. [79], differ much from those presented in [19, 78], but the predictions for the lifetimeof the majority electrons are very close. It is known that the majority electrons in Feare excited mostly to the sp-band, while other HCs are in the d-band. It means thatthe majority electrons are more mobile and have larger ballistic lengths than other
95
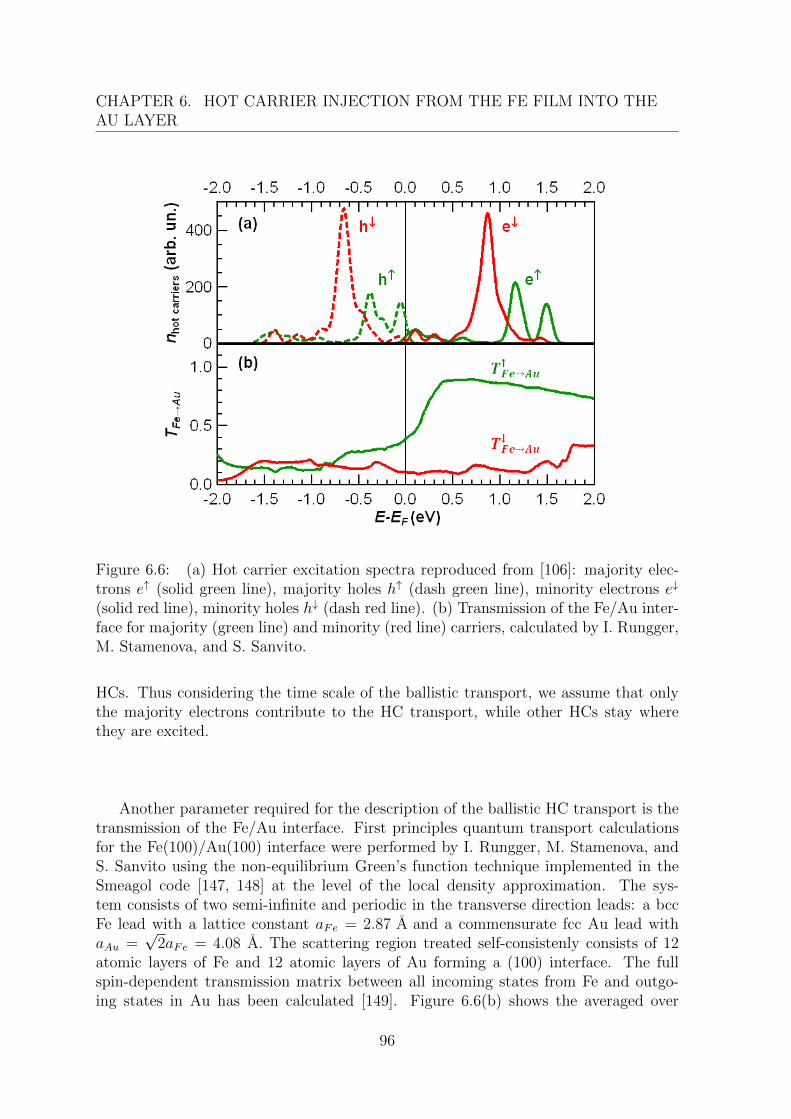
CHAPTER 6. HOT CARRIER INJECTION FROM THE FE FILM INTO THEAU LAYER
Figure 6.6: (a) Hot carrier excitation spectra reproduced from [106]: majority elec-trons e↑ (solid green line), majority holes h↑ (dash green line), minority electrons e↓
(solid red line), minority holes h↓ (dash red line). (b) Transmission of the Fe/Au inter-face for majority (green line) and minority (red line) carriers, calculated by I. Rungger,M. Stamenova, and S. Sanvito.
HCs. Thus considering the time scale of the ballistic transport, we assume that onlythe majority electrons contribute to the HC transport, while other HCs stay wherethey are excited.
Another parameter required for the description of the ballistic HC transport is thetransmission of the Fe/Au interface. First principles quantum transport calculationsfor the Fe(100)/Au(100) interface were performed by I. Rungger, M. Stamenova, andS. Sanvito using the non-equilibrium Green’s function technique implemented in theSmeagol code [147, 148] at the level of the local density approximation. The sys-tem consists of two semi-infinite and periodic in the transverse direction leads: a bccFe lead with a lattice constant aFe = 2.87 A and a commensurate fcc Au lead withaAu =
√2aFe = 4.08 A. The scattering region treated self-consistenly consists of 12
atomic layers of Fe and 12 atomic layers of Au forming a (100) interface. The fullspin-dependent transmission matrix between all incoming states from Fe and outgo-ing states in Au has been calculated [149]. Figure 6.6(b) shows the averaged over
96
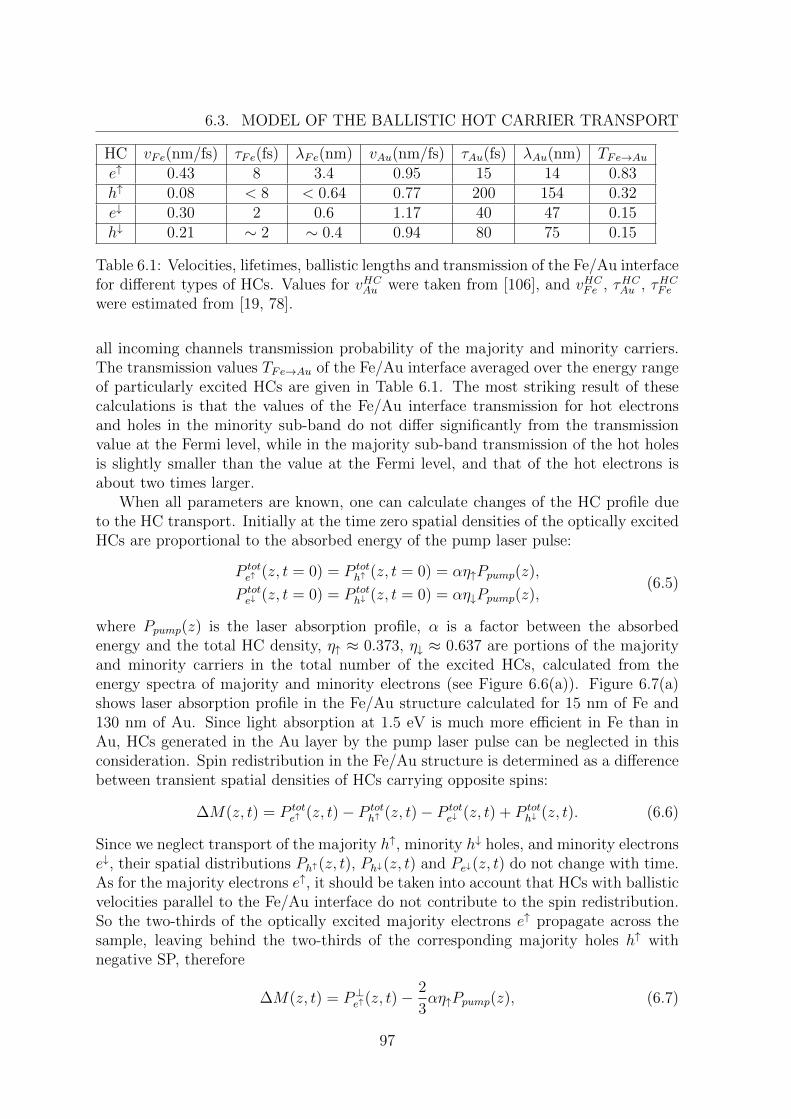
6.3. MODEL OF THE BALLISTIC HOT CARRIER TRANSPORT
HC vFe(nm/fs) τFe(fs) λFe(nm) vAu(nm/fs) τAu(fs) λAu(nm) TFe→Aue↑ 0.43 8 3.4 0.95 15 14 0.83h↑ 0.08 < 8 < 0.64 0.77 200 154 0.32e↓ 0.30 2 0.6 1.17 40 47 0.15h↓ 0.21 ∼ 2 ∼ 0.4 0.94 80 75 0.15
Table 6.1: Velocities, lifetimes, ballistic lengths and transmission of the Fe/Au interfacefor different types of HCs. Values for vHCAu were taken from [106], and vHCFe , τHCAu , τHCFe
were estimated from [19, 78].
all incoming channels transmission probability of the majority and minority carriers.The transmission values TFe→Au of the Fe/Au interface averaged over the energy rangeof particularly excited HCs are given in Table 6.1. The most striking result of thesecalculations is that the values of the Fe/Au interface transmission for hot electronsand holes in the minority sub-band do not differ significantly from the transmissionvalue at the Fermi level, while in the majority sub-band transmission of the hot holesis slightly smaller than the value at the Fermi level, and that of the hot electrons isabout two times larger.
When all parameters are known, one can calculate changes of the HC profile dueto the HC transport. Initially at the time zero spatial densities of the optically excitedHCs are proportional to the absorbed energy of the pump laser pulse:
P tote↑ (z, t = 0) = P tot
h↑ (z, t = 0) = αη↑Ppump(z),
P tote↓ (z, t = 0) = P tot
h↓ (z, t = 0) = αη↓Ppump(z),(6.5)
where Ppump(z) is the laser absorption profile, α is a factor between the absorbedenergy and the total HC density, η↑ ≈ 0.373, η↓ ≈ 0.637 are portions of the majorityand minority carriers in the total number of the excited HCs, calculated from theenergy spectra of majority and minority electrons (see Figure 6.6(a)). Figure 6.7(a)shows laser absorption profile in the Fe/Au structure calculated for 15 nm of Fe and130 nm of Au. Since light absorption at 1.5 eV is much more efficient in Fe than inAu, HCs generated in the Au layer by the pump laser pulse can be neglected in thisconsideration. Spin redistribution in the Fe/Au structure is determined as a differencebetween transient spatial densities of HCs carrying opposite spins:
∆M(z, t) = P tote↑ (z, t)− P tot
h↑ (z, t)− P tote↓ (z, t) + P tot
h↓ (z, t). (6.6)
Since we neglect transport of the majority h↑, minority h↓ holes, and minority electronse↓, their spatial distributions Ph↑(z, t), Ph↓(z, t) and Pe↓(z, t) do not change with time.As for the majority electrons e↑, it should be taken into account that HCs with ballisticvelocities parallel to the Fe/Au interface do not contribute to the spin redistribution.So the two-thirds of the optically excited majority electrons e↑ propagate across thesample, leaving behind the two-thirds of the corresponding majority holes h↑ withnegative SP, therefore
∆M(z, t) = P⊥e↑(z, t)−2
3αη↑Ppump(z), (6.7)
97
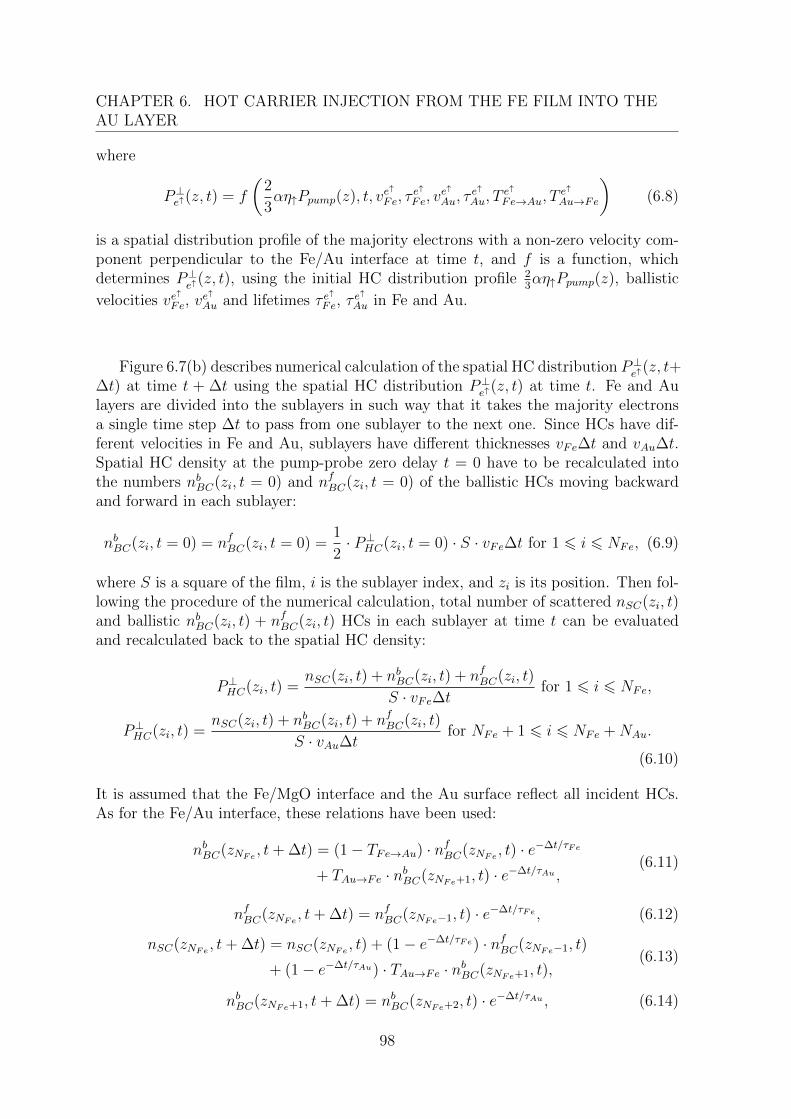
CHAPTER 6. HOT CARRIER INJECTION FROM THE FE FILM INTO THEAU LAYER
where
P⊥e↑(z, t) = f
(2
3αη↑Ppump(z), t, ve
↑
Fe, τe↑
Fe, ve↑
Au, τe↑
Au, Te↑
Fe→Au, Te↑
Au→Fe
)(6.8)
is a spatial distribution profile of the majority electrons with a non-zero velocity com-ponent perpendicular to the Fe/Au interface at time t, and f is a function, whichdetermines P⊥
e↑(z, t), using the initial HC distribution profile 23αη↑Ppump(z), ballistic
velocities ve↑Fe, v
e↑Au and lifetimes τ e
↑Fe, τ
e↑Au in Fe and Au.
Figure 6.7(b) describes numerical calculation of the spatial HC distribution P⊥e↑(z, t+
∆t) at time t + ∆t using the spatial HC distribution P⊥e↑(z, t) at time t. Fe and Au
layers are divided into the sublayers in such way that it takes the majority electronsa single time step ∆t to pass from one sublayer to the next one. Since HCs have dif-ferent velocities in Fe and Au, sublayers have different thicknesses vFe∆t and vAu∆t.Spatial HC density at the pump-probe zero delay t = 0 have to be recalculated intothe numbers nbBC(zi, t = 0) and nfBC(zi, t = 0) of the ballistic HCs moving backwardand forward in each sublayer:
nbBC(zi, t = 0) = nfBC(zi, t = 0) =1
2· P⊥HC(zi, t = 0) · S · vFe∆t for 1 6 i 6 NFe, (6.9)
where S is a square of the film, i is the sublayer index, and zi is its position. Then fol-lowing the procedure of the numerical calculation, total number of scattered nSC(zi, t)and ballistic nbBC(zi, t) + nfBC(zi, t) HCs in each sublayer at time t can be evaluatedand recalculated back to the spatial HC density:
P⊥HC(zi, t) =nSC(zi, t) + nbBC(zi, t) + nfBC(zi, t)
S · vFe∆tfor 1 6 i 6 NFe,
P⊥HC(zi, t) =nSC(zi, t) + nbBC(zi, t) + nfBC(zi, t)
S · vAu∆tfor NFe + 1 6 i 6 NFe +NAu.
(6.10)
It is assumed that the Fe/MgO interface and the Au surface reflect all incident HCs.As for the Fe/Au interface, these relations have been used:
nbBC(zNFe , t+ ∆t) = (1− TFe→Au) · nfBC(zNFe , t) · e−∆t/τFe
+ TAu→Fe · nbBC(zNFe+1, t) · e−∆t/τAu ,(6.11)
nfBC(zNFe , t+ ∆t) = nfBC(zNFe−1, t) · e−∆t/τFe , (6.12)
nSC(zNFe , t+ ∆t) = nSC(zNFe , t) + (1− e−∆t/τFe) · nfBC(zNFe−1, t)
+ (1− e−∆t/τAu) · TAu→Fe · nbBC(zNFe+1, t),(6.13)
nbBC(zNFe+1, t+ ∆t) = nbBC(zNFe+2, t) · e−∆t/τAu , (6.14)
98
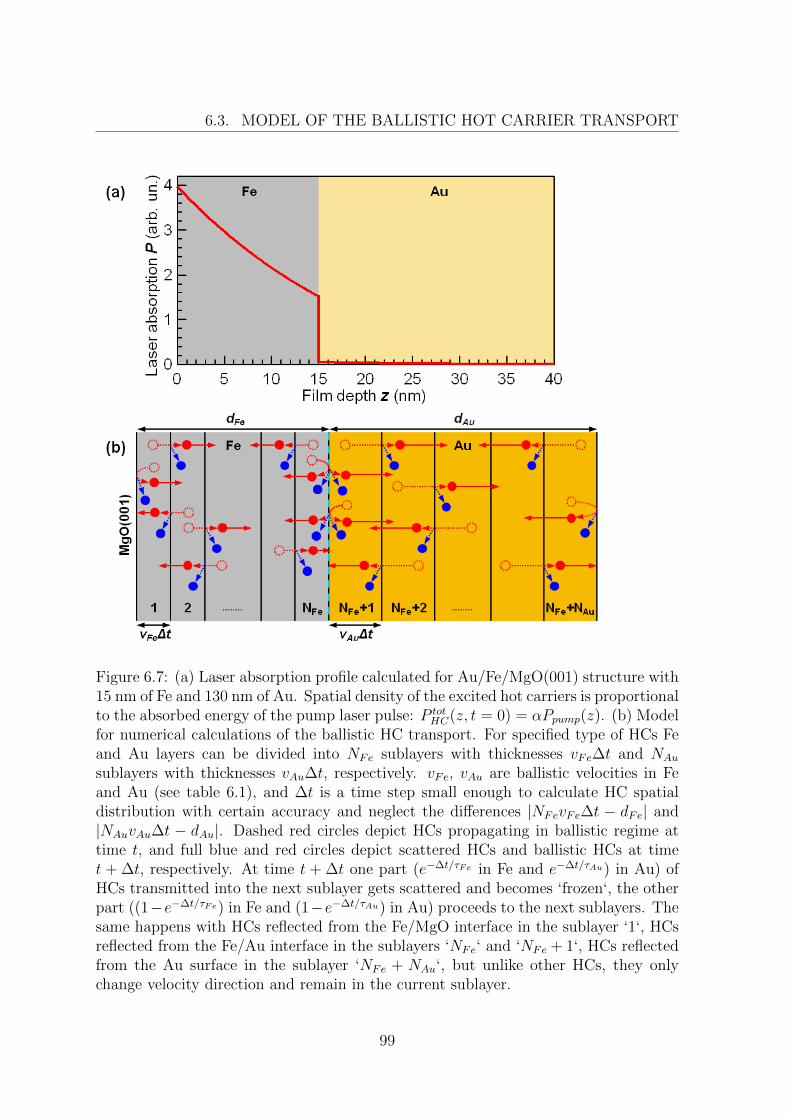
6.3. MODEL OF THE BALLISTIC HOT CARRIER TRANSPORT
Figure 6.7: (a) Laser absorption profile calculated for Au/Fe/MgO(001) structure with15 nm of Fe and 130 nm of Au. Spatial density of the excited hot carriers is proportionalto the absorbed energy of the pump laser pulse: P tot
HC(z, t = 0) = αPpump(z). (b) Modelfor numerical calculations of the ballistic HC transport. For specified type of HCs Feand Au layers can be divided into NFe sublayers with thicknesses vFe∆t and NAu
sublayers with thicknesses vAu∆t, respectively. vFe, vAu are ballistic velocities in Feand Au (see table 6.1), and ∆t is a time step small enough to calculate HC spatialdistribution with certain accuracy and neglect the differences |NFevFe∆t − dFe| and|NAuvAu∆t − dAu|. Dashed red circles depict HCs propagating in ballistic regime attime t, and full blue and red circles depict scattered HCs and ballistic HCs at timet + ∆t, respectively. At time t + ∆t one part (e−∆t/τFe in Fe and e−∆t/τAu) in Au) ofHCs transmitted into the next sublayer gets scattered and becomes ‘frozen‘, the otherpart ((1−e−∆t/τFe) in Fe and (1−e−∆t/τAu) in Au) proceeds to the next sublayers. Thesame happens with HCs reflected from the Fe/MgO interface in the sublayer ‘1‘, HCsreflected from the Fe/Au interface in the sublayers ‘NFe‘ and ‘NFe + 1‘, HCs reflectedfrom the Au surface in the sublayer ‘NFe + NAu‘, but unlike other HCs, they onlychange velocity direction and remain in the current sublayer.
99
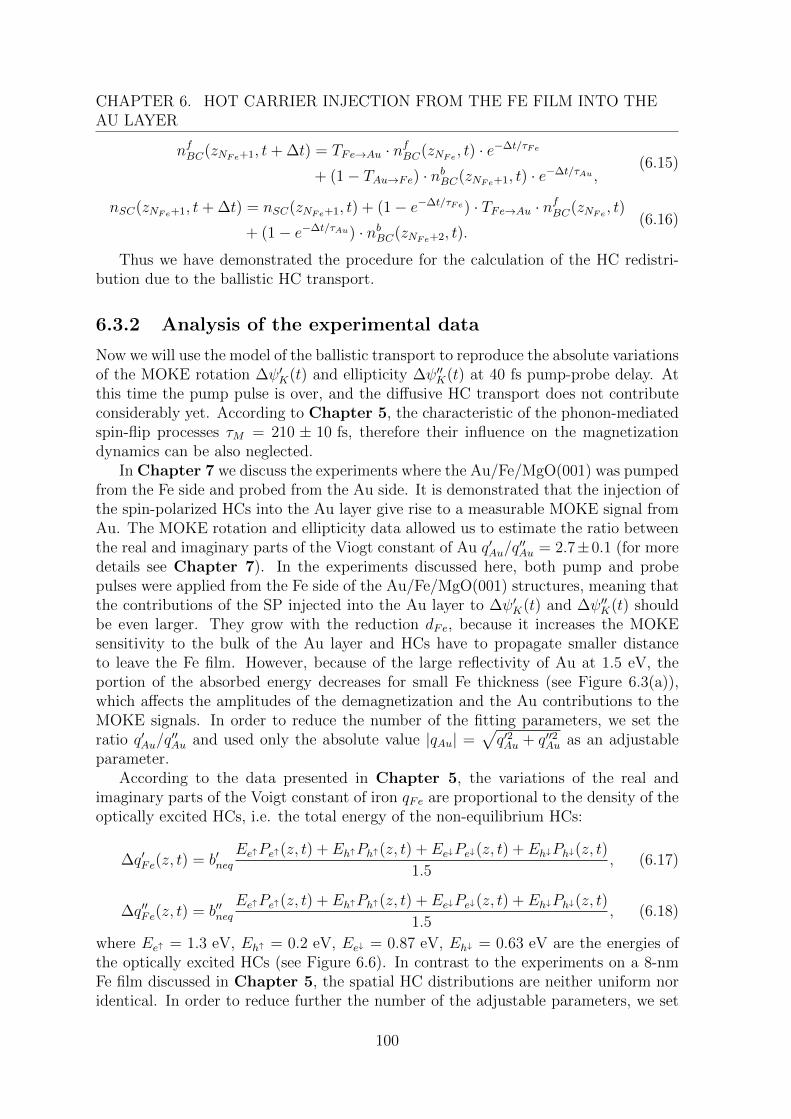
CHAPTER 6. HOT CARRIER INJECTION FROM THE FE FILM INTO THEAU LAYER
nfBC(zNFe+1, t+ ∆t) = TFe→Au · nfBC(zNFe , t) · e−∆t/τFe
+ (1− TAu→Fe) · nbBC(zNFe+1, t) · e−∆t/τAu ,(6.15)
nSC(zNFe+1, t+ ∆t) = nSC(zNFe+1, t) + (1− e−∆t/τFe) · TFe→Au · nfBC(zNFe , t)
+ (1− e−∆t/τAu) · nbBC(zNFe+2, t).(6.16)
Thus we have demonstrated the procedure for the calculation of the HC redistri-bution due to the ballistic HC transport.
6.3.2 Analysis of the experimental data
Now we will use the model of the ballistic transport to reproduce the absolute variationsof the MOKE rotation ∆ψ′K(t) and ellipticity ∆ψ′′K(t) at 40 fs pump-probe delay. Atthis time the pump pulse is over, and the diffusive HC transport does not contributeconsiderably yet. According to Chapter 5, the characteristic of the phonon-mediatedspin-flip processes τM = 210 ± 10 fs, therefore their influence on the magnetizationdynamics can be also neglected.
In Chapter 7 we discuss the experiments where the Au/Fe/MgO(001) was pumpedfrom the Fe side and probed from the Au side. It is demonstrated that the injection ofthe spin-polarized HCs into the Au layer give rise to a measurable MOKE signal fromAu. The MOKE rotation and ellipticity data allowed us to estimate the ratio betweenthe real and imaginary parts of the Viogt constant of Au q′Au/q
′′Au = 2.7±0.1 (for more
details see Chapter 7). In the experiments discussed here, both pump and probepulses were applied from the Fe side of the Au/Fe/MgO(001) structures, meaning thatthe contributions of the SP injected into the Au layer to ∆ψ′K(t) and ∆ψ′′K(t) shouldbe even larger. They grow with the reduction dFe, because it increases the MOKEsensitivity to the bulk of the Au layer and HCs have to propagate smaller distanceto leave the Fe film. However, because of the large reflectivity of Au at 1.5 eV, theportion of the absorbed energy decreases for small Fe thickness (see Figure 6.3(a)),which affects the amplitudes of the demagnetization and the Au contributions to theMOKE signals. In order to reduce the number of the fitting parameters, we set theratio q′Au/q
′′Au and used only the absolute value |qAu| =
√q′2Au + q′′2Au as an adjustable
parameter.According to the data presented in Chapter 5, the variations of the real and
imaginary parts of the Voigt constant of iron qFe are proportional to the density of theoptically excited HCs, i.e. the total energy of the non-equilibrium HCs:
∆q′Fe(z, t) = b′neqEe↑Pe↑(z, t) + Eh↑Ph↑(z, t) + Ee↓Pe↓(z, t) + Eh↓Ph↓(z, t)
1.5, (6.17)
∆q′′Fe(z, t) = b′′neqEe↑Pe↑(z, t) + Eh↑Ph↑(z, t) + Ee↓Pe↓(z, t) + Eh↓Ph↓(z, t)
1.5, (6.18)
where Ee↑ = 1.3 eV, Eh↑ = 0.2 eV, Ee↓ = 0.87 eV, Eh↓ = 0.63 eV are the energies ofthe optically excited HCs (see Figure 6.6). In contrast to the experiments on a 8-nmFe film discussed in Chapter 5, the spatial HC distributions are neither uniform noridentical. In order to reduce further the number of the adjustable parameters, we set
100
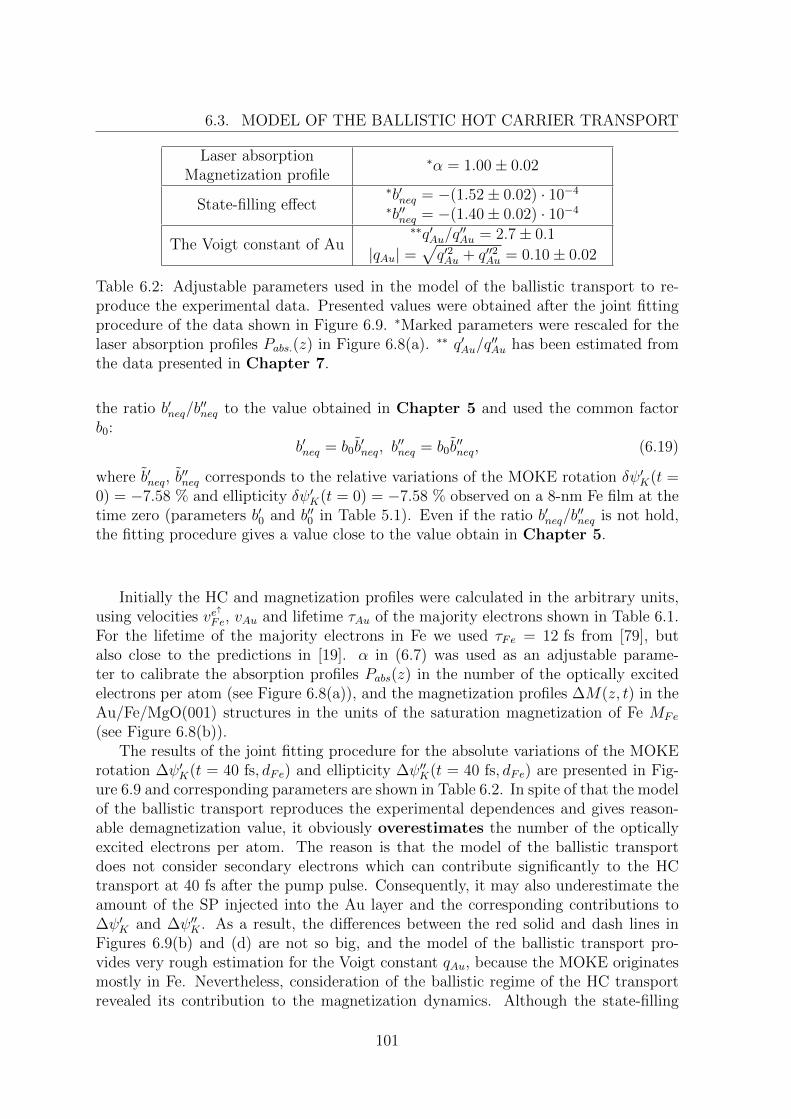
6.3. MODEL OF THE BALLISTIC HOT CARRIER TRANSPORT
Laser absorptionMagnetization profile
∗α = 1.00± 0.02
State-filling effect∗b′neq = −(1.52± 0.02) · 10−4
∗b′′neq = −(1.40± 0.02) · 10−4
The Voigt constant of Au∗∗q′Au/q
′′Au = 2.7± 0.1
|qAu| =√q′2Au + q′′2Au = 0.10± 0.02
Table 6.2: Adjustable parameters used in the model of the ballistic transport to re-produce the experimental data. Presented values were obtained after the joint fittingprocedure of the data shown in Figure 6.9. ∗Marked parameters were rescaled for thelaser absorption profiles Pabs.(z) in Figure 6.8(a). ∗∗ q′Au/q
′′Au has been estimated from
the data presented in Chapter 7.
the ratio b′neq/b′′neq to the value obtained in Chapter 5 and used the common factor
b0:b′neq = b0b
′neq, b
′′neq = b0b
′′neq, (6.19)
where b′neq, b′′neq corresponds to the relative variations of the MOKE rotation δψ′K(t =
0) = −7.58 % and ellipticity δψ′K(t = 0) = −7.58 % observed on a 8-nm Fe film at thetime zero (parameters b′0 and b′′0 in Table 5.1). Even if the ratio b′neq/b
′′neq is not hold,
the fitting procedure gives a value close to the value obtain in Chapter 5.
Initially the HC and magnetization profiles were calculated in the arbitrary units,using velocities ve
↑Fe, vAu and lifetime τAu of the majority electrons shown in Table 6.1.
For the lifetime of the majority electrons in Fe we used τFe = 12 fs from [79], butalso close to the predictions in [19]. α in (6.7) was used as an adjustable parame-ter to calibrate the absorption profiles Pabs(z) in the number of the optically excitedelectrons per atom (see Figure 6.8(a)), and the magnetization profiles ∆M(z, t) in theAu/Fe/MgO(001) structures in the units of the saturation magnetization of Fe MFe
(see Figure 6.8(b)).The results of the joint fitting procedure for the absolute variations of the MOKE
rotation ∆ψ′K(t = 40 fs, dFe) and ellipticity ∆ψ′′K(t = 40 fs, dFe) are presented in Fig-ure 6.9 and corresponding parameters are shown in Table 6.2. In spite of that the modelof the ballistic transport reproduces the experimental dependences and gives reason-able demagnetization value, it obviously overestimates the number of the opticallyexcited electrons per atom. The reason is that the model of the ballistic transportdoes not consider secondary electrons which can contribute significantly to the HCtransport at 40 fs after the pump pulse. Consequently, it may also underestimate theamount of the SP injected into the Au layer and the corresponding contributions to∆ψ′K and ∆ψ′′K . As a result, the differences between the red solid and dash lines inFigures 6.9(b) and (d) are not so big, and the model of the ballistic transport pro-vides very rough estimation for the Voigt constant qAu, because the MOKE originatesmostly in Fe. Nevertheless, consideration of the ballistic regime of the HC transportrevealed its contribution to the magnetization dynamics. Although the state-filling
101
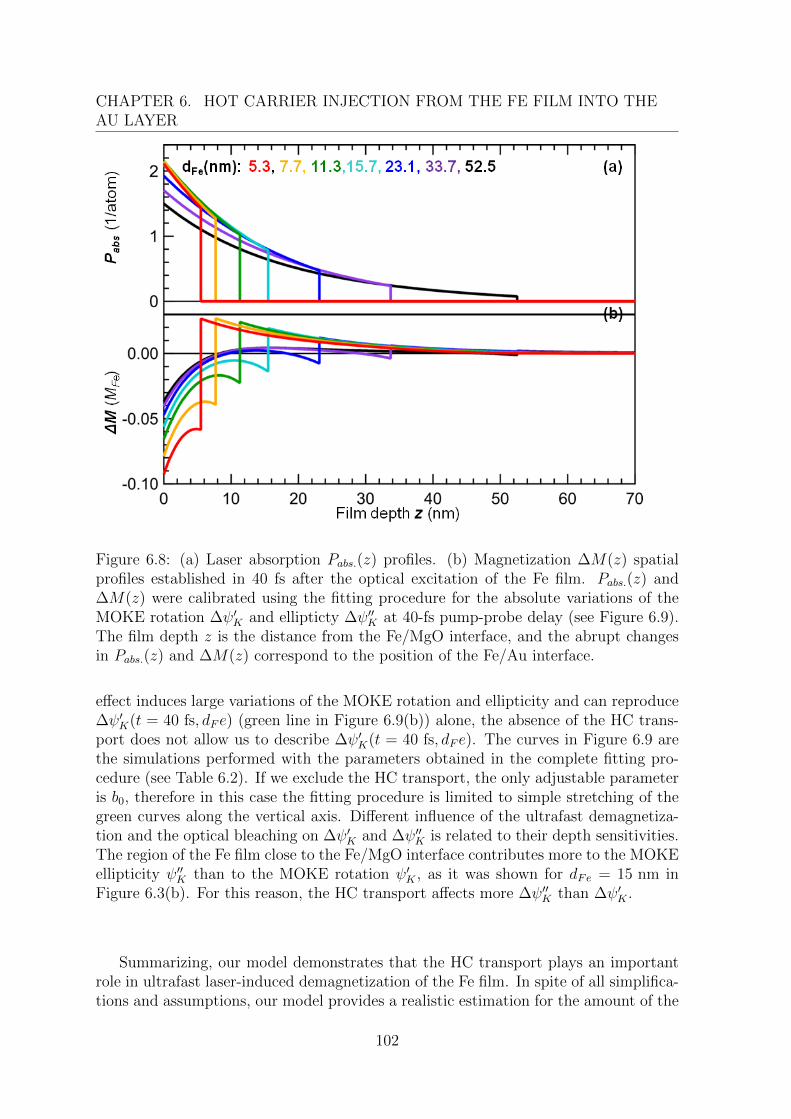
CHAPTER 6. HOT CARRIER INJECTION FROM THE FE FILM INTO THEAU LAYER
Figure 6.8: (a) Laser absorption Pabs.(z) profiles. (b) Magnetization ∆M(z) spatialprofiles established in 40 fs after the optical excitation of the Fe film. Pabs.(z) and∆M(z) were calibrated using the fitting procedure for the absolute variations of theMOKE rotation ∆ψ′K and ellipticty ∆ψ′′K at 40-fs pump-probe delay (see Figure 6.9).The film depth z is the distance from the Fe/MgO interface, and the abrupt changesin Pabs.(z) and ∆M(z) correspond to the position of the Fe/Au interface.
effect induces large variations of the MOKE rotation and ellipticity and can reproduce∆ψ′K(t = 40 fs, dF e) (green line in Figure 6.9(b)) alone, the absence of the HC trans-port does not allow us to describe ∆ψ′K(t = 40 fs, dF e). The curves in Figure 6.9 arethe simulations performed with the parameters obtained in the complete fitting pro-cedure (see Table 6.2). If we exclude the HC transport, the only adjustable parameteris b0, therefore in this case the fitting procedure is limited to simple stretching of thegreen curves along the vertical axis. Different influence of the ultrafast demagnetiza-tion and the optical bleaching on ∆ψ′K and ∆ψ′′K is related to their depth sensitivities.The region of the Fe film close to the Fe/MgO interface contributes more to the MOKEellipticity ψ′′K than to the MOKE rotation ψ′K , as it was shown for dFe = 15 nm inFigure 6.3(b). For this reason, the HC transport affects more ∆ψ′′K than ∆ψ′K .
Summarizing, our model demonstrates that the HC transport plays an importantrole in ultrafast laser-induced demagnetization of the Fe film. In spite of all simplifica-tions and assumptions, our model provides a realistic estimation for the amount of the
102
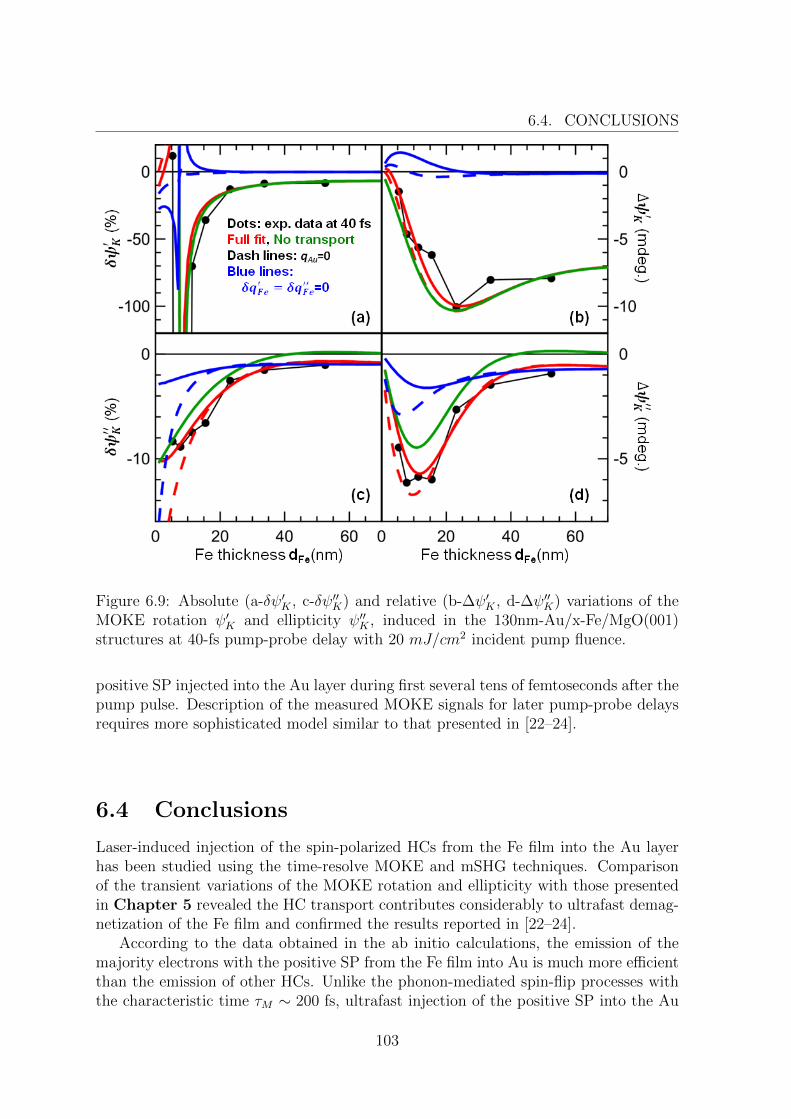
6.4. CONCLUSIONS
Figure 6.9: Absolute (a-δψ′K , c-δψ′′K) and relative (b-∆ψ′K , d-∆ψ′′K) variations of theMOKE rotation ψ′K and ellipticity ψ′′K , induced in the 130nm-Au/x-Fe/MgO(001)structures at 40-fs pump-probe delay with 20 mJ/cm2 incident pump fluence.
positive SP injected into the Au layer during first several tens of femtoseconds after thepump pulse. Description of the measured MOKE signals for later pump-probe delaysrequires more sophisticated model similar to that presented in [22–24].
6.4 Conclusions
Laser-induced injection of the spin-polarized HCs from the Fe film into the Au layerhas been studied using the time-resolve MOKE and mSHG techniques. Comparisonof the transient variations of the MOKE rotation and ellipticity with those presentedin Chapter 5 revealed the HC transport contributes considerably to ultrafast demag-netization of the Fe film and confirmed the results reported in [22–24].
According to the data obtained in the ab initio calculations, the emission of themajority electrons with the positive SP from the Fe film into Au is much more efficientthan the emission of other HCs. Unlike the phonon-mediated spin-flip processes withthe characteristic time τM ∼ 200 fs, ultrafast injection of the positive SP into the Au
103
CHAPTER 6. HOT CARRIER INJECTION FROM THE FE FILM INTO THEAU LAYER
layer via the HC transport results in a fast drop of the magnetization within first 20fs after the optical excitation of the Fe film. Modelling the HC and magnetizationspatial profiles established on the time scale of the ballistic HC transport, it is possibleto disentangle all contributions to the MOKE signals. Because of the different depthsensitivities, the HC transport affects more the MOKE ellipticity ∆ψ′′K(t) than theMOKE rotation ∆ψ′K(t). The latter is mostly determined by the state-filling effectduring first 100 fs.
The Voigt constant of gold qAu = 0.094 + 0.035i, obtained in the analysis of theMOKE data, is consistent with the experimental results, concerning the HC transportin Au (see Chapter 7), as well as the estimation for the SP injected into the Au layeron the time scale of the ballistic HC transport.
104
Chapter 7
Transport of spin-polarized hotcarriers in Au
In Chapter 6 the initial stage of the hot carrier (HC) transport was discussed, i.e. theinjection of spin-polarized HCs from a ferromagnetic film into a non-magnetic metal.The analysis of the transient MOKE rotation ∆ψ′K(t) and ellipticity ∆ψ′′K(t) revealedthat the HC transport plays a considerable role in ultrafast demagnetization of theFe film. Comparison of the ballistic lengths λHCFe and the transmission through theFe/Au interface TFe→Au, obtained for different HCs from the ab-initio calculations,clearly indicates that the spin current (SC) pulse injected from the Fe film into theAu layer is dominated by the majority electrons carrying positive spin polarization(SP), which is consistent with our experimental results. Owing to a large inelasticmean free path in Au, the injected spin-polarized HCs propagate further into the bulkof the non-magnetic layer without losing their initial SP. For the reasons mentionedabove, it can be assumed that the SC pulse in Au is formed only by the majorityelectrons with the positive SP. In order to study temporal evolution of the HC packetand the SC pulse, pump-probe experiments have been performed on epitaxial bilayerAu/Fe/MgO(001) structures with different thicknesses of the Fe and Au films. Incontrast to the experiments presented in Chapter 6, the probe pulse ~ωprobe = 1.5 eVhas been applied from the Au side (see Figure 7.1(a)).
Performing pump-probe experiments in the transversal and longitudinal magneto-optical geometries, it has been found that the total odd SH field ~Eodd
2ω is the sum of the
SP-induced SH field ~ESP2ω , originating at the Au surface, and the SC-induced SH field
~ESC2ω , originating in the bulk of Au. Analyzing the mSHG and MOKE signals, it is
demonstrated that the injected majority electrons propagate in Au in a quasi-ballisticregime. The steep front of the SC pulse consists of the optically excited electrons whichleave the Fe film in the ballistic regime, while the shallow trailing part of the SC pulseis formed by the secondary electrons.
105
CHAPTER 7. TRANSPORT OF SPIN-POLARIZED HOT CARRIERS IN AU
7.1 Transient magneto-optical response of Au
Since there is no initial SP in paramagnets, in the absence of the pump pulse the Aulayer does not contribute to the MOKE rotation and ellipticity:
ψ′Au,K(t < 0) = 0, ψ′′Au,K(t < 0) = 0. (7.1)
Also in the static regime there is neither HC current nor SC, and the measured SHintensity is the result of the interference of the SH fields ~E
Fe/MgO2ω , ~E
Fe/Au2ω and ~EAu surf.
2ω
originating at the Fe/MgO, Fe/Au interfaces and the Au surface, respectively. Herewe neglect the bulk quadrupole contribution. For Au it was shown to be small withrespect to the surface dipole one [150]. When the Au thickness dAu is large enough(> 40 nm, see Figure 7.3(b)) the Au surface can be considered as the only source of
the SH field. In the first approximation, the surface dipole polarization ~PAu surf.2ω can
be expressed as a sum of the even term independent of the magnetization ~M and theodd term linearly proportional to it:
PAu surf.2ω,i = χ
(2)ijkEω,jEω,k + χ
(3,SP )ijk,l Eω,jEω,kMl, (7.2)
where i, j, k = x, y, z, and χ(3,SP )ijk,l is a pseudo-tensor with respect to the last index.
This expression is also valid for the SH dipole polarizations ~PFe/MgO2ω and ~P
Fe/Au2ω at the
Fe/MgO and Fe/Au interfaces. At the negative pump-probe delays t < 0, there is noodd SH field originating at the Au surface. For this reason, spin dynamics in the bulkof the Au layer and at the Au surface has been monitored by the absolute variationsof the MOKE rotation ψ′K(t), ellipticity ψ′′K(t) and the SH contrast ρ2ω(t):
∆ψ′K(t) = ψ′K(t)− ψ′K,0, ∆ψ′′K(t) = ψ′′K(t)− ψ′′K,0, (7.3)
ρ2ω(t) =I↑2ω(t)− I↓2ω(t)
I↑2ω(t) + I↓2ω(t), (7.4)
where I↑2ω(t), I↓2ω(t) are the SH intensities measured for the opposite directions thesaturating magnetic field.
After the optical excitation of the Fe film, the HC current1, flowing in Au, breaksthe spatial inversion symmetry and hence gives rise to the bulk SH contribution:
PHC cur.2ω,i = χ
(3)ijkzEω,jEω,kjz, (7.5)
where the tensor χ(3)ijkzjz has exactly the same symmetry and non-zero components
as the tensor χ(2)ijk corresponding to the surface non-magnetic SH field. The surface
magnetic SH term χ(3,SP )ijk,l Ml has its bulk SC-induced ‘twin‘ as well:
P SC2ω,i = χ
(4,SC)ijkz,l Eω,jEω,kj
Sz,l. (7.6)
1Charge current is expected to be partially compensated by the displacement of the ’cold’ elec-trons [151].
106
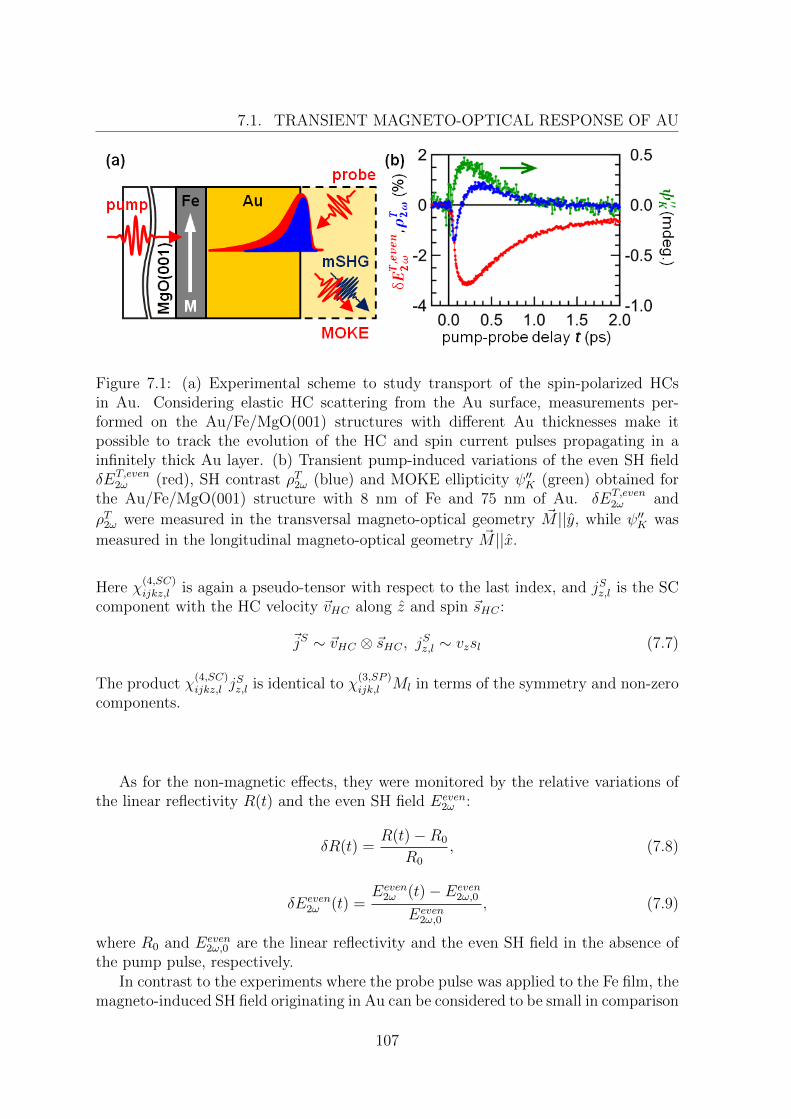
7.1. TRANSIENT MAGNETO-OPTICAL RESPONSE OF AU
Figure 7.1: (a) Experimental scheme to study transport of the spin-polarized HCsin Au. Considering elastic HC scattering from the Au surface, measurements per-formed on the Au/Fe/MgO(001) structures with different Au thicknesses make itpossible to track the evolution of the HC and spin current pulses propagating in ainfinitely thick Au layer. (b) Transient pump-induced variations of the even SH fieldδET,even
2ω (red), SH contrast ρT2ω (blue) and MOKE ellipticity ψ′′K (green) obtained forthe Au/Fe/MgO(001) structure with 8 nm of Fe and 75 nm of Au. δET,even
2ω and
ρT2ω were measured in the transversal magneto-optical geometry ~M ||y, while ψ′′K was
measured in the longitudinal magneto-optical geometry ~M ||x.
Here χ(4,SC)ijkz,l is again a pseudo-tensor with respect to the last index, and jSz,l is the SC
component with the HC velocity ~vHC along z and spin ~sHC :
~jS ∼ ~vHC ⊗ ~sHC , jSz,l ∼ vzsl (7.7)
The product χ(4,SC)ijkz,l j
Sz,l is identical to χ
(3,SP )ijk,l Ml in terms of the symmetry and non-zero
components.
As for the non-magnetic effects, they were monitored by the relative variations ofthe linear reflectivity R(t) and the even SH field Eeven
2ω :
δR(t) =R(t)−R0
R0
, (7.8)
δEeven2ω (t) =
Eeven2ω (t)− Eeven
2ω,0
Eeven2ω,0
, (7.9)
where R0 and Eeven2ω,0 are the linear reflectivity and the even SH field in the absence of
the pump pulse, respectively.In contrast to the experiments where the probe pulse was applied to the Fe film, the
magneto-induced SH field originating in Au can be considered to be small in comparison
107
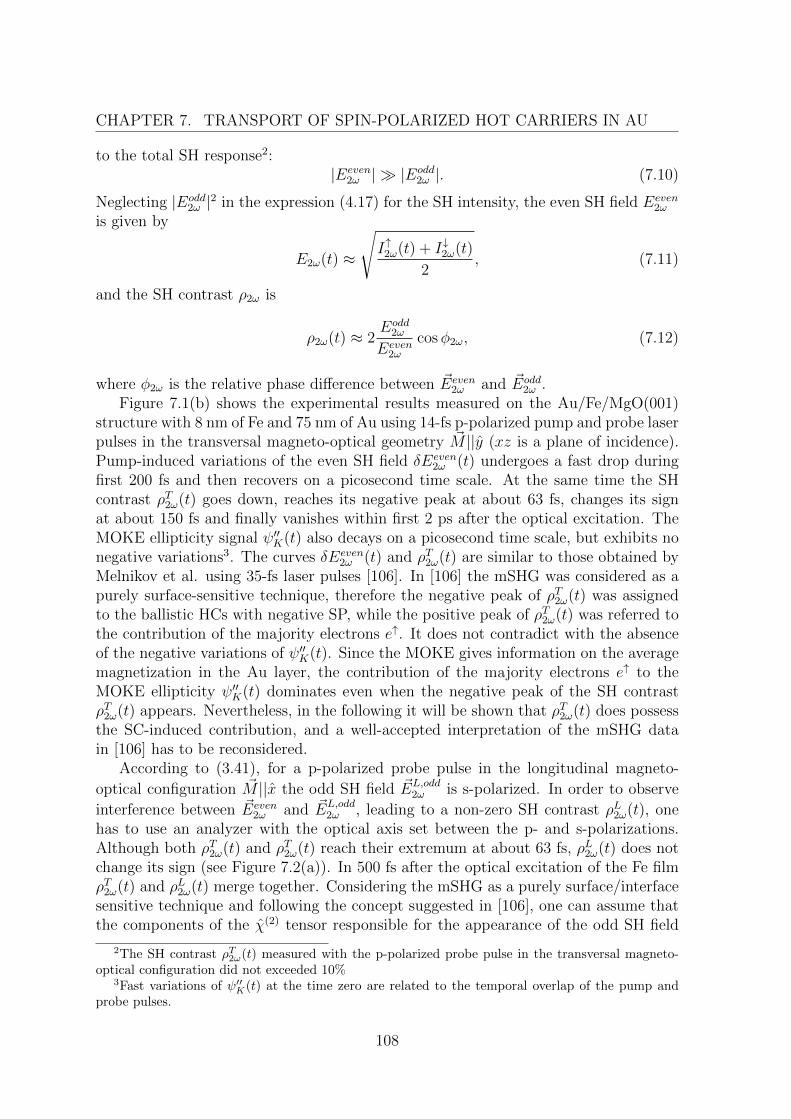
CHAPTER 7. TRANSPORT OF SPIN-POLARIZED HOT CARRIERS IN AU
to the total SH response2:|Eeven
2ω | |Eodd2ω |. (7.10)
Neglecting |Eodd2ω |2 in the expression (4.17) for the SH intensity, the even SH field Eeven
2ω
is given by
E2ω(t) ≈
√I↑2ω(t) + I↓2ω(t)
2, (7.11)
and the SH contrast ρ2ω is
ρ2ω(t) ≈ 2Eodd
2ω
Eeven2ω
cosφ2ω, (7.12)
where φ2ω is the relative phase difference between ~Eeven2ω and ~Eodd
2ω .Figure 7.1(b) shows the experimental results measured on the Au/Fe/MgO(001)
structure with 8 nm of Fe and 75 nm of Au using 14-fs p-polarized pump and probe laserpulses in the transversal magneto-optical geometry ~M ||y (xz is a plane of incidence).Pump-induced variations of the even SH field δEeven
2ω (t) undergoes a fast drop duringfirst 200 fs and then recovers on a picosecond time scale. At the same time the SHcontrast ρT2ω(t) goes down, reaches its negative peak at about 63 fs, changes its signat about 150 fs and finally vanishes within first 2 ps after the optical excitation. TheMOKE ellipticity signal ψ′′K(t) also decays on a picosecond time scale, but exhibits nonegative variations3. The curves δEeven
2ω (t) and ρT2ω(t) are similar to those obtained byMelnikov et al. using 35-fs laser pulses [106]. In [106] the mSHG was considered as apurely surface-sensitive technique, therefore the negative peak of ρT2ω(t) was assignedto the ballistic HCs with negative SP, while the positive peak of ρT2ω(t) was referred tothe contribution of the majority electrons e↑. It does not contradict with the absenceof the negative variations of ψ′′K(t). Since the MOKE gives information on the averagemagnetization in the Au layer, the contribution of the majority electrons e↑ to theMOKE ellipticity ψ′′K(t) dominates even when the negative peak of the SH contrastρT2ω(t) appears. Nevertheless, in the following it will be shown that ρT2ω(t) does possessthe SC-induced contribution, and a well-accepted interpretation of the mSHG datain [106] has to be reconsidered.
According to (3.41), for a p-polarized probe pulse in the longitudinal magneto-
optical configuration ~M ||x the odd SH field ~EL,odd2ω is s-polarized. In order to observe
interference between ~Eeven2ω and ~EL,odd
2ω , leading to a non-zero SH contrast ρL2ω(t), onehas to use an analyzer with the optical axis set between the p- and s-polarizations.Although both ρT2ω(t) and ρT2ω(t) reach their extremum at about 63 fs, ρL2ω(t) does notchange its sign (see Figure 7.2(a)). In 500 fs after the optical excitation of the Fe filmρT2ω(t) and ρL2ω(t) merge together. Considering the mSHG as a purely surface/interfacesensitive technique and following the concept suggested in [106], one can assume thatthe components of the χ(2) tensor responsible for the appearance of the odd SH field
2The SH contrast ρT2ω(t) measured with the p-polarized probe pulse in the transversal magneto-optical configuration did not exceeded 10%
3Fast variations of ψ′′K(t) at the time zero are related to the temporal overlap of the pump andprobe pulses.
108
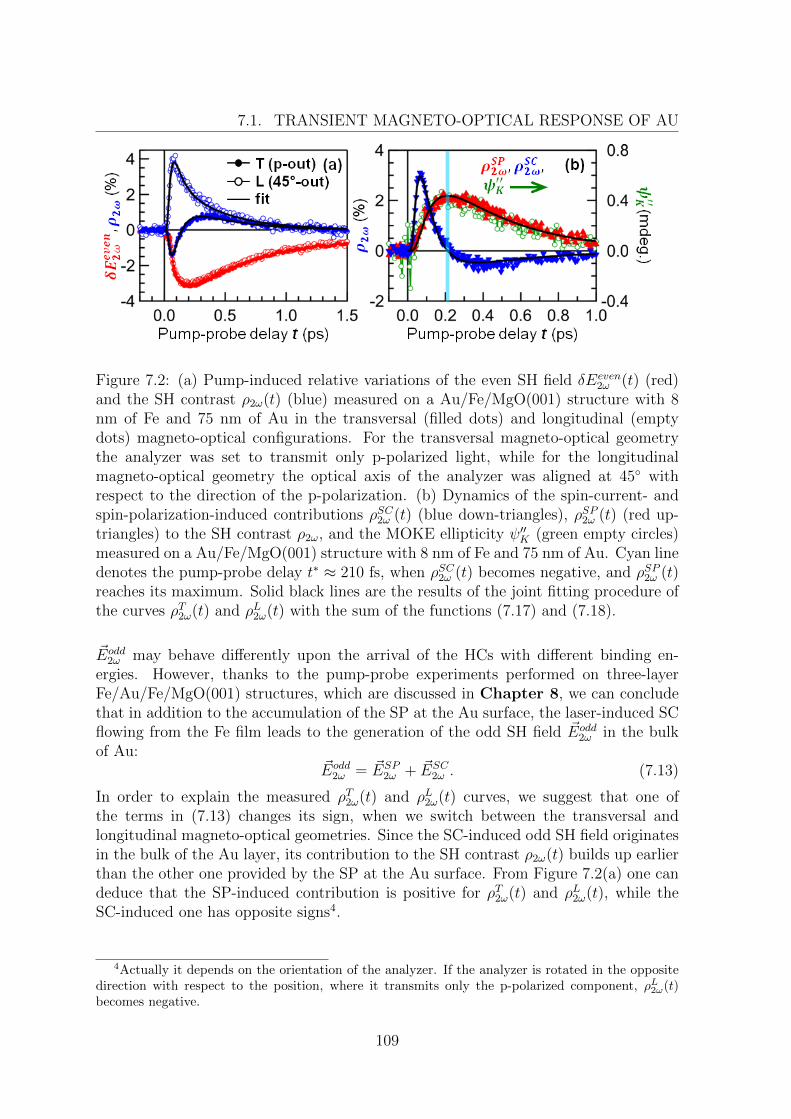
7.1. TRANSIENT MAGNETO-OPTICAL RESPONSE OF AU
Figure 7.2: (a) Pump-induced relative variations of the even SH field δEeven2ω (t) (red)
and the SH contrast ρ2ω(t) (blue) measured on a Au/Fe/MgO(001) structure with 8nm of Fe and 75 nm of Au in the transversal (filled dots) and longitudinal (emptydots) magneto-optical configurations. For the transversal magneto-optical geometrythe analyzer was set to transmit only p-polarized light, while for the longitudinalmagneto-optical geometry the optical axis of the analyzer was aligned at 45 withrespect to the direction of the p-polarization. (b) Dynamics of the spin-current- andspin-polarization-induced contributions ρSC2ω (t) (blue down-triangles), ρSP2ω (t) (red up-triangles) to the SH contrast ρ2ω, and the MOKE ellipticity ψ′′K (green empty circles)measured on a Au/Fe/MgO(001) structure with 8 nm of Fe and 75 nm of Au. Cyan linedenotes the pump-probe delay t∗ ≈ 210 fs, when ρSC2ω (t) becomes negative, and ρSP2ω (t)reaches its maximum. Solid black lines are the results of the joint fitting procedure ofthe curves ρT2ω(t) and ρL2ω(t) with the sum of the functions (7.17) and (7.18).
~Eodd2ω may behave differently upon the arrival of the HCs with different binding en-
ergies. However, thanks to the pump-probe experiments performed on three-layerFe/Au/Fe/MgO(001) structures, which are discussed in Chapter 8, we can concludethat in addition to the accumulation of the SP at the Au surface, the laser-induced SCflowing from the Fe film leads to the generation of the odd SH field ~Eodd
2ω in the bulkof Au:
~Eodd2ω = ~ESP
2ω + ~ESC2ω . (7.13)
In order to explain the measured ρT2ω(t) and ρL2ω(t) curves, we suggest that one ofthe terms in (7.13) changes its sign, when we switch between the transversal andlongitudinal magneto-optical geometries. Since the SC-induced odd SH field originatesin the bulk of the Au layer, its contribution to the SH contrast ρ2ω(t) builds up earlierthan the other one provided by the SP at the Au surface. From Figure 7.2(a) one candeduce that the SP-induced contribution is positive for ρT2ω(t) and ρL2ω(t), while theSC-induced one has opposite signs4.
4Actually it depends on the orientation of the analyzer. If the analyzer is rotated in the oppositedirection with respect to the position, where it transmits only the p-polarized component, ρL2ω(t)becomes negative.
109
CHAPTER 7. TRANSPORT OF SPIN-POLARIZED HOT CARRIERS IN AU
It should be noted that different components of χ(4,SC)ijkz,l j
Sz,l and χ
(3,SP )ijk,l Ml are re-
sponsible for the appearance of the odd SH field in the transversal and longitudinalmagneto-optical geometries, therefore ρL2ω(t) and ρT2ω(t) can be expressed as
ρL2ω(t) = ρSC2ω (t) + ρSP2ω (t), ρT2ω(t) = −αρSC2ω (t) + βρSP2ω (t), (7.14)
where ρSC2ω (t), ρSP2ω (t) are the temporal profiles of the SC- and SP-induced contributions,respectively. The coefficients α and β are account for different amplitudes of theseterms in two magneto-optical geometries. According to the theoretical predictionsfor the transmission through the Fe/Au interface (see Figure 6.6(b)) and the ballisticlengths in Fe (see Table 6.1), it is reasonable to assume that the SC pulse in Au isformed only by the majority electrons with the positive SP determined by the magne-tization ~MFe of the Fe film. When the front of the SC pulse reaches the Au surface,reflected majority electrons propagate back to the bulk of Au. As a result, they com-pensate the SC flowing from the Fe film, providing sharp peaks in the ρT2ω(t), ρL2ω(t) sig-nals at about 63 fs. From the mSHG data obtained on three-layer Fe/Au/Fe/MgO(001)structures it is evident that the SC reverses, because of the electrons reflected from theFe/Au interface (see Chapter 8). In a two-layer Au/Fe/MgO(001) structure all HCsapproaching the Au surface undergo spin-independent scattering, and the reversed SCshould have larger amplitude than in the case of a three-layer Fe/Au/Fe/MgO(001)structure with the same thickness of the Au spacer, where some portion of the spin-polarized HCs is transmitted into the spin-collector. When ρSC2ω (t) changes its sign, thereversed SC becomes larger than the direct one, and the amount of the positive SP,accumulated at the Au surface, is maximal. Thus
ρSC2ω (t∗) = 0 ⇒(dρSP2ω (t)
dt
)t=t∗
= 0. (7.15)
Using (7.15), it is possible to determine α and β in (7.14), and evaluate temporalprofiles of the SC- and SP-induced contributions ρSC2ω (t) and ρSP2ω (t):
ρSC2ω (t) =βρL2ω(t)− ρT2ω(t)
α + β, ρSP2ω (t) =
αρL2ω(t) + ρT2ω(t)
α + β. (7.16)
In spite of that ρSC2ω (t) is proportional to the convolution of the spatial profile of the SC~jS(z, t) with the depth sensitivity of the mSHG, it turned out that ρSC2ω (t) resembles thetime derivative of the SP at the Au surface, i.e. dρSP2ω (t)/dt, while ρSP2ω (t) reproducesthe MOKE ellipticity signal ψ′′K(t) (see Figure 7.2(b)). In order to derive characteristictime constants, ρSP2ω (t) was described with the following function
ρSP2ω (t) =A
2√π(b0 + b1(t− t0))
exp
(− (t− t0)2
4(b0 + b1(t− t0))
). (7.17)
The derivative of this function corresponds to the SC-induced contribution:
ρSC2ω (t) = − B
8√π(b0 + b1(t− t0))
[2b1
b0 + b1(t− t0)+
2b0(t− t0) + b1(t− t0)2
(b0 + b1(t− t0))2
]× exp
(− (t− t0)2
4(b0 + b1(t− t0))
).
(7.18)
110
7.1. TRANSIENT MAGNETO-OPTICAL RESPONSE OF AU
In Figure 7.2(a) it is demonstrated that the sum of the functions (7.17) and (7.18)approximately reproduces the measured curves ρT2ω(t) and ρL2ω(t). The correspondingadjustable parameters are shown in Table 7.1. Function (7.17) and its derivative (7.18)do not imply any specific model of the laser-induced HC generation in Fe and HCemission into the Au layer, but they exhibit two features which (should) present inρSP2ω (t) and ρSC2ω (t). (i) When ρSC2ω (t) changes the sign, ρSP2ω (t) reaches its maximum. (ii)There are also one maximum and one minimum of ρSC2ω (t), where ρSP2ω (t) changes itsconvexity.
In the next subsection it will be shown that HCs propagate in Au mostly in aquasi-ballistic regime, and the temporal profiles of the SH contrast ρ2ω and the MOKEellipticity ψ′′K(t) are determined by the emission of the majority electrons from the Fefilm, which increases on the time scale of the electron-electron thermalization in Fe∼ 200 fs (see Chapter 5) due to the generation of the secondary HCs, and decreaseson a larger time scale because of the relaxation processes.
7.1.1 Hot carrier transport: dependence on the Au thickness
Experimental data shown in Figure 7.2 were obtained on the Au/Fe/MgO(001) struc-ture with 75 nm of Au. Absence of the static MOKE signals and the SH contrastallowed us to neglect all contributions from the Fe film and treat SP and SC flowingin the Au layer as the only source of the magneto-optical response. However, it is notalways the case. For dAu = 23 nm the static SH contrasts ρT2ω,0 = −(1.7± 0.1) % andρL2ω,0 = (1.0 ± 0.2) % (see Figure 7.3(a)). During the first picosecond after the pumppulse, all injected majority electrons propagate to the Au surface and then return backinto the Fe film. Some part may be reflected from the Fe/Au interface, but it is sosmall that it does not provide significant contribution to the dynamic SH contrastsρT2ω(t) and ρL2ω(t). Thus on a larger time scale ρT2ω(t) and ρL2ω(t) monitor only the mag-netization dynamics in the ferromagnetic film. Figure 7.3(b) presents the dependency
of the ratio between the amplitudes of the SH fields ~EAu surf.2ω , ~E
Fe/Au2ω originating at
the Au surface and the Fe/Au interface, respectively. Assuming identical efficiencyof the SHG at the Au surface and the Fe/Au interface, the Fe/Au interface shouldcontribute considerably to the mSHG response for the Au thicknesses up to 40 nm. Asfor the linear magneto-optical response, the absorption of the signal wave in Au at thefundamental frequency ~ω = 1.5 eV is less efficient than the absorption of the SH wave(see Figure 2.5), therefore the contribution of the Fe film to the MOKE is considerablefor the Au thicknesses up to 70 nm (see Figure 7.3(d)). In spite of the fact that thecontributions from the Fe film to the magneto-optical signals complicates the analysisof the spin dynamics induced in the Au layer, they provide information about laser-induced demagnetization. Absolute variations of the MOKE ellipticity δψ′′K shown inFigure 7.3(c) indicate approximately 10 % demagnetization of the 8-nm Fe film at 2ps after the optical excitation. Since both spin-flip processes and the HC transportcontribute to the demagnetization of the ferromagnetic film, this value cannot be usedfor the estimation of the SP injected into the non-magnetic layer. We will come backto this problem later.
111
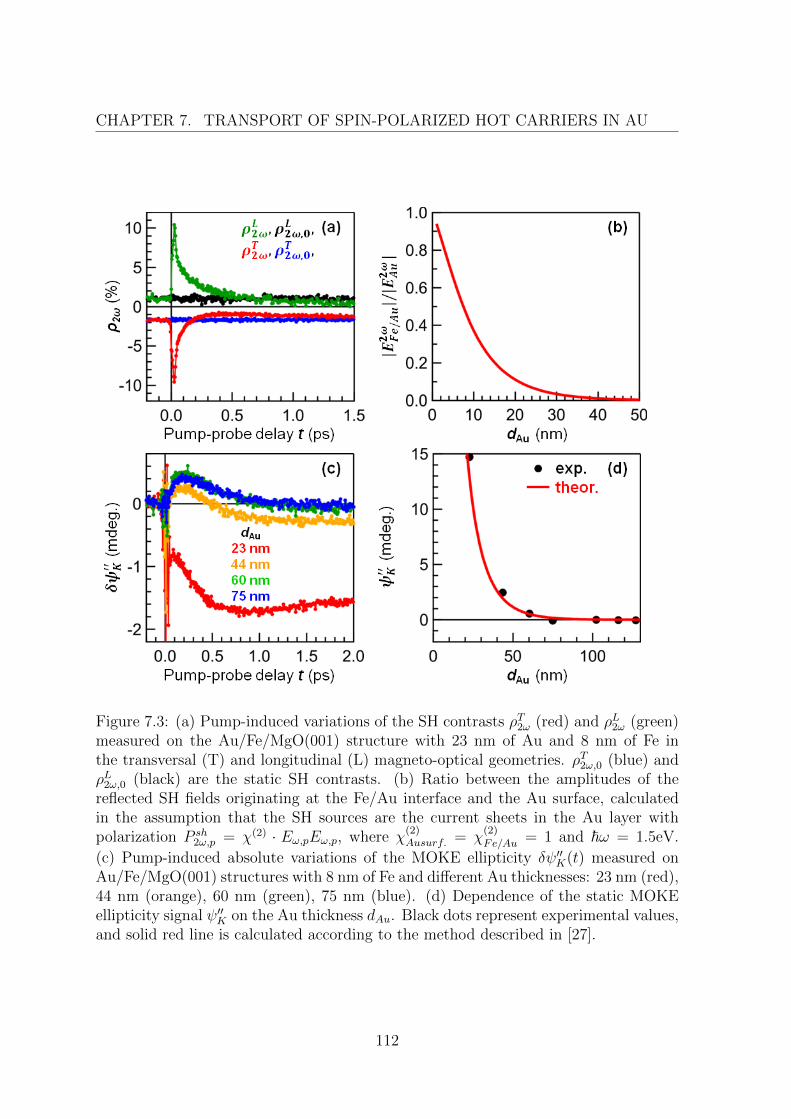
CHAPTER 7. TRANSPORT OF SPIN-POLARIZED HOT CARRIERS IN AU
Figure 7.3: (a) Pump-induced variations of the SH contrasts ρT2ω (red) and ρL2ω (green)measured on the Au/Fe/MgO(001) structure with 23 nm of Au and 8 nm of Fe inthe transversal (T) and longitudinal (L) magneto-optical geometries. ρT2ω,0 (blue) andρL2ω,0 (black) are the static SH contrasts. (b) Ratio between the amplitudes of thereflected SH fields originating at the Fe/Au interface and the Au surface, calculatedin the assumption that the SH sources are the current sheets in the Au layer withpolarization P sh
2ω,p = χ(2) · Eω,pEω,p, where χ(2)Ausurf. = χ
(2)Fe/Au = 1 and ~ω = 1.5eV.
(c) Pump-induced absolute variations of the MOKE ellipticity δψ′′K(t) measured onAu/Fe/MgO(001) structures with 8 nm of Fe and different Au thicknesses: 23 nm (red),44 nm (orange), 60 nm (green), 75 nm (blue). (d) Dependence of the static MOKEellipticity signal ψ′′K on the Au thickness dAu. Black dots represent experimental values,and solid red line is calculated according to the method described in [27].
112
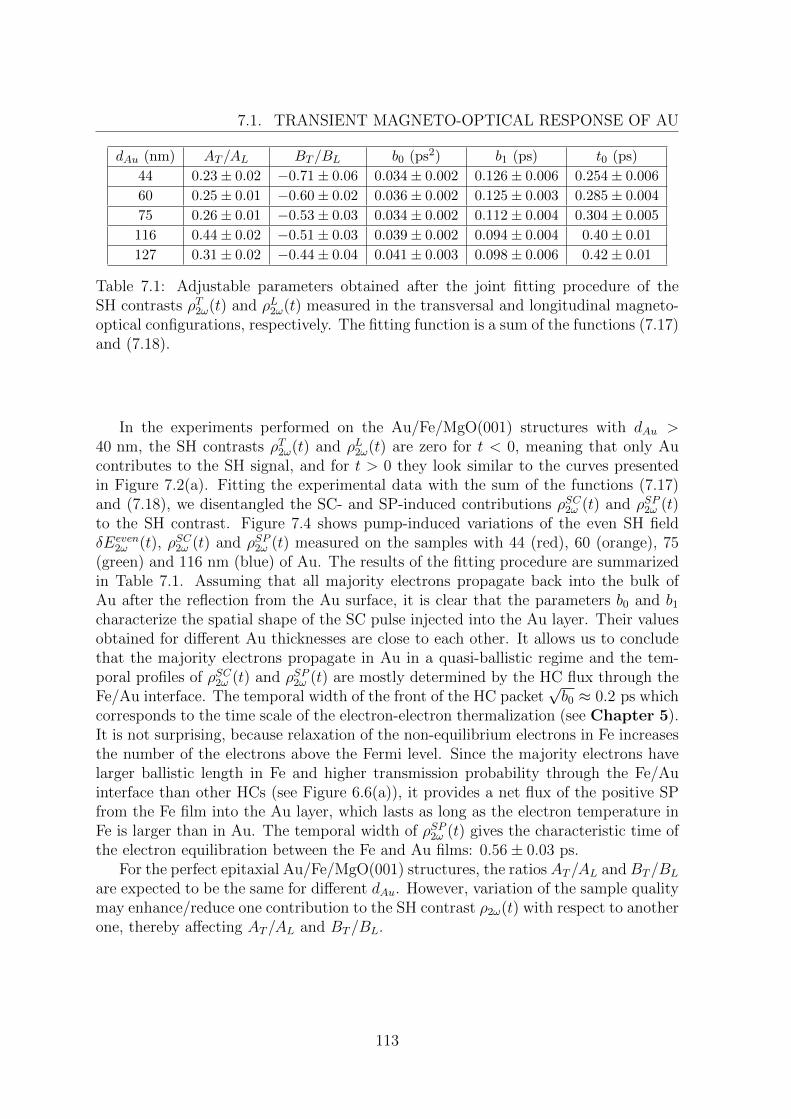
7.1. TRANSIENT MAGNETO-OPTICAL RESPONSE OF AU
dAu (nm) AT /AL BT /BL b0 (ps2) b1 (ps) t0 (ps)
44 0.23± 0.02 −0.71± 0.06 0.034± 0.002 0.126± 0.006 0.254± 0.006
60 0.25± 0.01 −0.60± 0.02 0.036± 0.002 0.125± 0.003 0.285± 0.004
75 0.26± 0.01 −0.53± 0.03 0.034± 0.002 0.112± 0.004 0.304± 0.005
116 0.44± 0.02 −0.51± 0.03 0.039± 0.002 0.094± 0.004 0.40± 0.01
127 0.31± 0.02 −0.44± 0.04 0.041± 0.003 0.098± 0.006 0.42± 0.01
Table 7.1: Adjustable parameters obtained after the joint fitting procedure of theSH contrasts ρT2ω(t) and ρL2ω(t) measured in the transversal and longitudinal magneto-optical configurations, respectively. The fitting function is a sum of the functions (7.17)and (7.18).
In the experiments performed on the Au/Fe/MgO(001) structures with dAu >40 nm, the SH contrasts ρT2ω(t) and ρL2ω(t) are zero for t < 0, meaning that only Aucontributes to the SH signal, and for t > 0 they look similar to the curves presentedin Figure 7.2(a). Fitting the experimental data with the sum of the functions (7.17)and (7.18), we disentangled the SC- and SP-induced contributions ρSC2ω (t) and ρSP2ω (t)to the SH contrast. Figure 7.4 shows pump-induced variations of the even SH fieldδEeven
2ω (t), ρSC2ω (t) and ρSP2ω (t) measured on the samples with 44 (red), 60 (orange), 75(green) and 116 nm (blue) of Au. The results of the fitting procedure are summarizedin Table 7.1. Assuming that all majority electrons propagate back into the bulk ofAu after the reflection from the Au surface, it is clear that the parameters b0 and b1
characterize the spatial shape of the SC pulse injected into the Au layer. Their valuesobtained for different Au thicknesses are close to each other. It allows us to concludethat the majority electrons propagate in Au in a quasi-ballistic regime and the tem-poral profiles of ρSC2ω (t) and ρSP2ω (t) are mostly determined by the HC flux through theFe/Au interface. The temporal width of the front of the HC packet
√b0 ≈ 0.2 ps which
corresponds to the time scale of the electron-electron thermalization (see Chapter 5).It is not surprising, because relaxation of the non-equilibrium electrons in Fe increasesthe number of the electrons above the Fermi level. Since the majority electrons havelarger ballistic length in Fe and higher transmission probability through the Fe/Auinterface than other HCs (see Figure 6.6(a)), it provides a net flux of the positive SPfrom the Fe film into the Au layer, which lasts as long as the electron temperature inFe is larger than in Au. The temporal width of ρSP2ω (t) gives the characteristic time ofthe electron equilibration between the Fe and Au films: 0.56± 0.03 ps.
For the perfect epitaxial Au/Fe/MgO(001) structures, the ratios AT/AL and BT/BL
are expected to be the same for different dAu. However, variation of the sample qualitymay enhance/reduce one contribution to the SH contrast ρ2ω(t) with respect to anotherone, thereby affecting AT/AL and BT/BL.
113
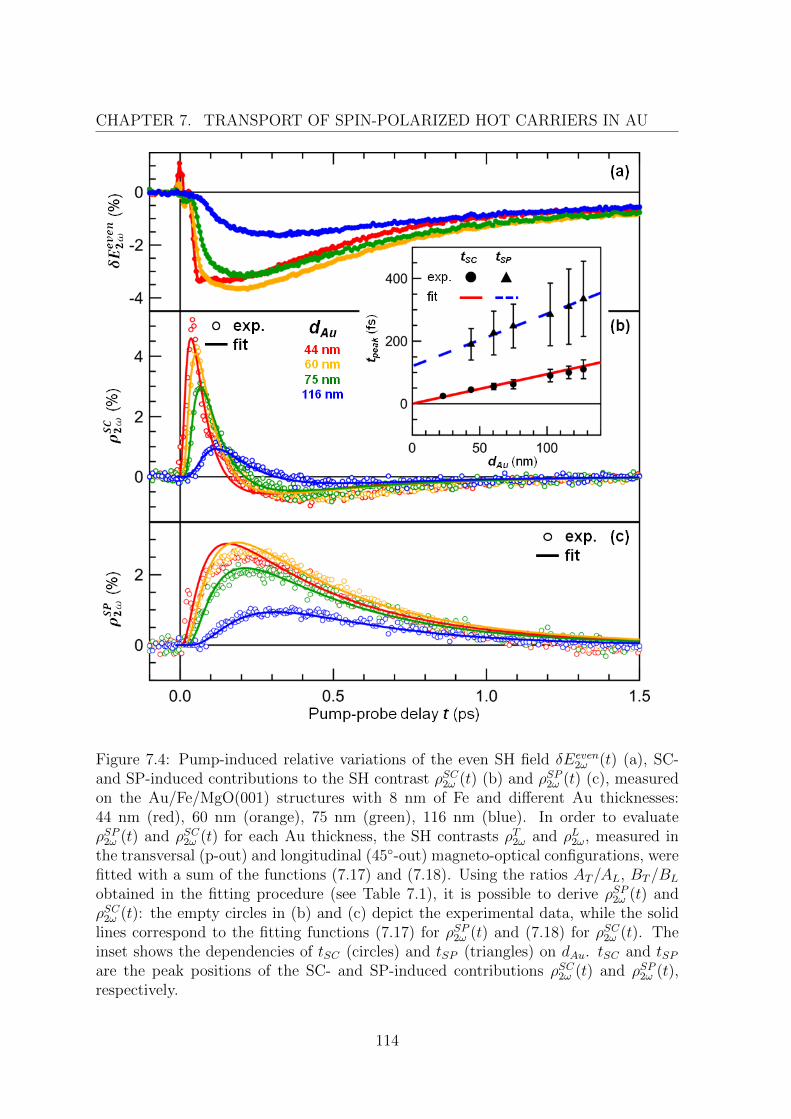
CHAPTER 7. TRANSPORT OF SPIN-POLARIZED HOT CARRIERS IN AU
Figure 7.4: Pump-induced relative variations of the even SH field δEeven2ω (t) (a), SC-
and SP-induced contributions to the SH contrast ρSC2ω (t) (b) and ρSP2ω (t) (c), measuredon the Au/Fe/MgO(001) structures with 8 nm of Fe and different Au thicknesses:44 nm (red), 60 nm (orange), 75 nm (green), 116 nm (blue). In order to evaluateρSP2ω (t) and ρSC2ω (t) for each Au thickness, the SH contrasts ρT2ω and ρL2ω, measured inthe transversal (p-out) and longitudinal (45-out) magneto-optical configurations, werefitted with a sum of the functions (7.17) and (7.18). Using the ratios AT/AL, BT/BL
obtained in the fitting procedure (see Table 7.1), it is possible to derive ρSP2ω (t) andρSC2ω (t): the empty circles in (b) and (c) depict the experimental data, while the solidlines correspond to the fitting functions (7.17) for ρSP2ω (t) and (7.18) for ρSC2ω (t). Theinset shows the dependencies of tSC (circles) and tSP (triangles) on dAu. tSC and tSPare the peak positions of the SC- and SP-induced contributions ρSC2ω (t) and ρSP2ω (t),respectively.
114
7.1. TRANSIENT MAGNETO-OPTICAL RESPONSE OF AU
In Figure 7.4 one can note that functions (7.17) and (7.18) describes the SC- andSP-induced contributions ρSC2ω (t) and ρSP2ω (t) for large Au thicknesses, and there aresome deviations for small Au thicknesses. The reason is that there are two types of themajority electrons which contribute to the spin dynamics in Au: optically excited elec-trons that leave the Fe film in the ballistic regime, and secondary electrons. Accordingto Figure 6.5, the optically excited electrons have well-directed velocity distribution incontrast to the secondary electrons. However, because of the higher binding energiesthe optically excited electrons have smaller lifetimes in Au. As a result, their contribu-tion to the SH contrast decreases faster with dAu than that of the secondary electrons.For dAu = 44 nm δEeven
2ω (t) exhibits a double-peak structure which is smeared into asingle broad peak for larger Au thicknesses. The sharp peak in δEeven
2ω (t), as well asthat of ρSC2ω (t), corresponds to the arrival of the optically excited electrons at the Ausurface.
The inset in Figure 7.4 shows that the position tSC of the positive peak of ρSC2ω (t)is linearly proportional to dAu, which is a true signature of the ballistic transport. Thelinear fit dAu = vAu1tSC (solid red line) gives the velocity of the majority electronswhich leave the Fe film in the ballistic regime: vAu1 = (1.06 ± 0.07) nm/fs. Theamplitude of the peak of ρSC2ω (t) decays with an increase of dAu. The exponential fit(not shown here) gives the ballistic length λAu1 = (25 ± 3) nm. Then the lifetimeis τAu1 = λAu1/vAu1 = (24 ± 4) fs. Both vAu1 and τAu1 are close to the results ofthe ab initio calculations [19, 106]. Position tSP of the peak of ρSP2ω (t) is also linearlyproportional to dAu, which supports our conclusion that all injected majority electronspropagate in Au in quasi-ballistic regime. The linear fit dAu = vAu2(tAu2 − t0) (dashblue line) gives the velocity of the secondary majority electrons vAu2 = (0.6±0.4) nm/fsand the time t0 = 120 ± 84 fs, when the flux of the secondary electrons through theFe/Au interface is maximal. The secondary electrons has smaller binding energies andlarger lifetimes than the optically excited electrons, therefore the amplitude of ρSP2ω (t)decreases slower with dAu than that of ρSC2ω (t).
When dAu > 65 nm, the MOKE signal reflects only spin dynamics in the Au layer.Figure 7.5 shows that in this case ratio between the MOKE ellipticity ψ′′K(t) androtation ψ′K(t) remains constant for t > 100 fs after the pump pulse. Moreover, thisratio is almost independent of the Au thickness. This allows us to conclude that theobserved variations of the MOKE signals are not related to the variations of the Voigtconstant of gold qAu and occur only due to spin transfer in the Au layer. Fitting theMOKE ellipticity ψ′′K(t) with the function 7.17, we demonstrate that for dAu > 65 nmthe SP-induced contribution to the SH contrast ρSP2ω (t) resembles the MOKE ellipticityψ′′K(t) (see Tables 7.1 and 7.2). It means that the magnetization profile in the probedregion of the Au layer is more or less homogeneous.
In order to obtain some information about the Voigt constant of gold qAu, we cal-culated the depth sensitivities of the MOKE rotation w′K,re(z), w′K,im(z) and ellipticityw′′K,re(z), w′′K,im(z) (see Figure 7.5). Curves w′′K,re(z), w′K,re(z), w′K,im(z) and w′′K,im(z)represent the dependencies of the MOKE ellipticity and rotation on the depth z∗ ofthe sublayer (∆z = 0.1 nm) with a unit magnetization m(z∗) = 1 and magneto-optical
115
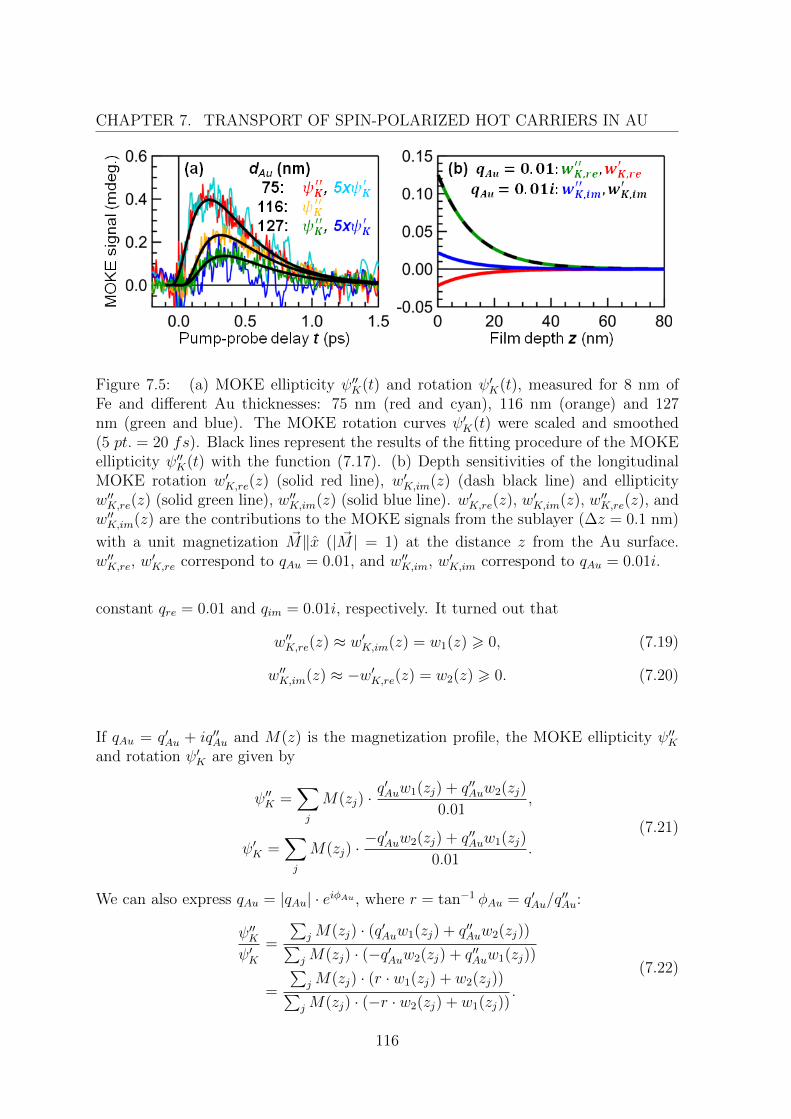
CHAPTER 7. TRANSPORT OF SPIN-POLARIZED HOT CARRIERS IN AU
Figure 7.5: (a) MOKE ellipticity ψ′′K(t) and rotation ψ′K(t), measured for 8 nm ofFe and different Au thicknesses: 75 nm (red and cyan), 116 nm (orange) and 127nm (green and blue). The MOKE rotation curves ψ′K(t) were scaled and smoothed(5 pt. = 20 fs). Black lines represent the results of the fitting procedure of the MOKEellipticity ψ′′K(t) with the function (7.17). (b) Depth sensitivities of the longitudinalMOKE rotation w′K,re(z) (solid red line), w′K,im(z) (dash black line) and ellipticityw′′K,re(z) (solid green line), w′′K,im(z) (solid blue line). w′K,re(z), w′K,im(z), w′′K,re(z), andw′′K,im(z) are the contributions to the MOKE signals from the sublayer (∆z = 0.1 nm)
with a unit magnetization ~M‖x (| ~M | = 1) at the distance z from the Au surface.w′′K,re, w
′K,re correspond to qAu = 0.01, and w′′K,im, w′K,im correspond to qAu = 0.01i.
constant qre = 0.01 and qim = 0.01i, respectively. It turned out that
w′′K,re(z) ≈ w′K,im(z) = w1(z) > 0, (7.19)
w′′K,im(z) ≈ −w′K,re(z) = w2(z) > 0. (7.20)
If qAu = q′Au + iq′′Au and M(z) is the magnetization profile, the MOKE ellipticity ψ′′Kand rotation ψ′K are given by
ψ′′K =∑j
M(zj) ·q′Auw1(zj) + q′′Auw2(zj)
0.01,
ψ′K =∑j
M(zj) ·−q′Auw2(zj) + q′′Auw1(zj)
0.01.
(7.21)
We can also express qAu = |qAu| · eiφAu , where r = tan−1 φAu = q′Au/q′′Au:
ψ′′Kψ′K
=
∑jM(zj) · (q′Auw1(zj) + q′′Auw2(zj))∑jM(zj) · (−q′Auw2(zj) + q′′Auw1(zj))
=
∑jM(zj) · (r · w1(zj) + w2(zj))∑jM(zj) · (−r · w2(zj) + w1(zj))
.
(7.22)
116
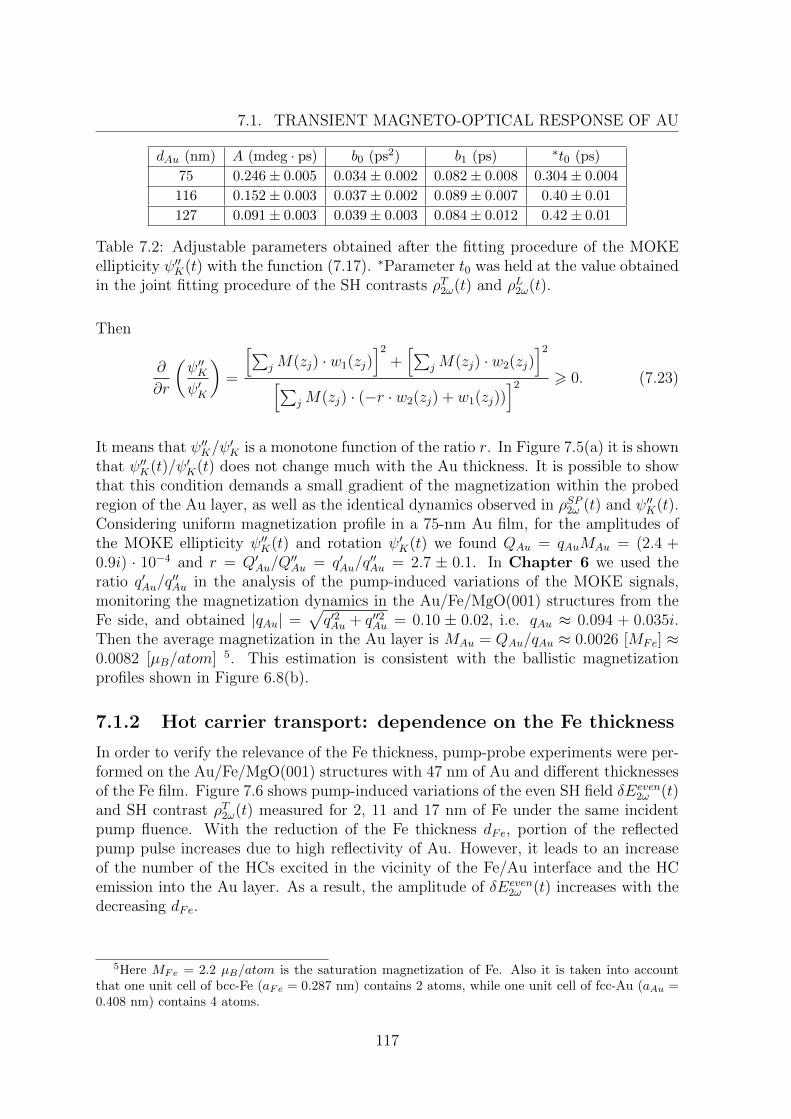
7.1. TRANSIENT MAGNETO-OPTICAL RESPONSE OF AU
dAu (nm) A (mdeg · ps) b0 (ps2) b1 (ps) ∗t0 (ps)
75 0.246± 0.005 0.034± 0.002 0.082± 0.008 0.304± 0.004
116 0.152± 0.003 0.037± 0.002 0.089± 0.007 0.40± 0.01
127 0.091± 0.003 0.039± 0.003 0.084± 0.012 0.42± 0.01
Table 7.2: Adjustable parameters obtained after the fitting procedure of the MOKEellipticity ψ′′K(t) with the function (7.17). ∗Parameter t0 was held at the value obtainedin the joint fitting procedure of the SH contrasts ρT2ω(t) and ρL2ω(t).
Then
∂
∂r
(ψ′′Kψ′K
)=
[∑jM(zj) · w1(zj)
]2
+[∑
jM(zj) · w2(zj)]2
[∑jM(zj) · (−r · w2(zj) + w1(zj))
]2 > 0. (7.23)
It means that ψ′′K/ψ′K is a monotone function of the ratio r. In Figure 7.5(a) it is shown
that ψ′′K(t)/ψ′K(t) does not change much with the Au thickness. It is possible to showthat this condition demands a small gradient of the magnetization within the probedregion of the Au layer, as well as the identical dynamics observed in ρSP2ω (t) and ψ′′K(t).Considering uniform magnetization profile in a 75-nm Au film, for the amplitudes ofthe MOKE ellipticity ψ′′K(t) and rotation ψ′K(t) we found QAu = qAuMAu = (2.4 +0.9i) · 10−4 and r = Q′Au/Q
′′Au = q′Au/q
′′Au = 2.7 ± 0.1. In Chapter 6 we used the
ratio q′Au/q′′Au in the analysis of the pump-induced variations of the MOKE signals,
monitoring the magnetization dynamics in the Au/Fe/MgO(001) structures from theFe side, and obtained |qAu| =
√q′2Au + q′′2Au = 0.10 ± 0.02, i.e. qAu ≈ 0.094 + 0.035i.
Then the average magnetization in the Au layer is MAu = QAu/qAu ≈ 0.0026 [MFe] ≈0.0082 [µB/atom] 5. This estimation is consistent with the ballistic magnetizationprofiles shown in Figure 6.8(b).
7.1.2 Hot carrier transport: dependence on the Fe thickness
In order to verify the relevance of the Fe thickness, pump-probe experiments were per-formed on the Au/Fe/MgO(001) structures with 47 nm of Au and different thicknessesof the Fe film. Figure 7.6 shows pump-induced variations of the even SH field δEeven
2ω (t)and SH contrast ρT2ω(t) measured for 2, 11 and 17 nm of Fe under the same incidentpump fluence. With the reduction of the Fe thickness dFe, portion of the reflectedpump pulse increases due to high reflectivity of Au. However, it leads to an increaseof the number of the HCs excited in the vicinity of the Fe/Au interface and the HCemission into the Au layer. As a result, the amplitude of δEeven
2ω (t) increases with thedecreasing dFe.
5Here MFe = 2.2 µB/atom is the saturation magnetization of Fe. Also it is taken into accountthat one unit cell of bcc-Fe (aFe = 0.287 nm) contains 2 atoms, while one unit cell of fcc-Au (aAu =0.408 nm) contains 4 atoms.
117
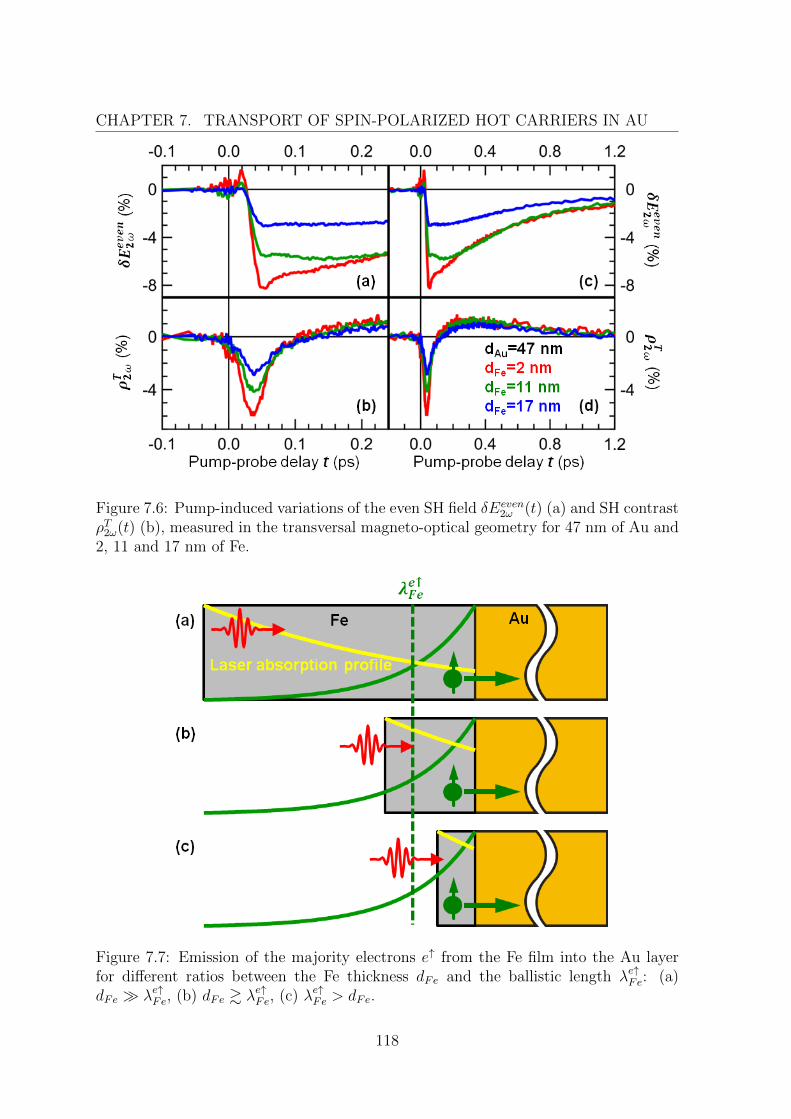
CHAPTER 7. TRANSPORT OF SPIN-POLARIZED HOT CARRIERS IN AU
Figure 7.6: Pump-induced variations of the even SH field δEeven2ω (t) (a) and SH contrast
ρT2ω(t) (b), measured in the transversal magneto-optical geometry for 47 nm of Au and2, 11 and 17 nm of Fe.
Figure 7.7: Emission of the majority electrons e↑ from the Fe film into the Au layerfor different ratios between the Fe thickness dFe and the ballistic length λe↑Fe: (a)dFe λe↑Fe, (b) dFe & λe↑Fe, (c) λe↑Fe > dFe.
118
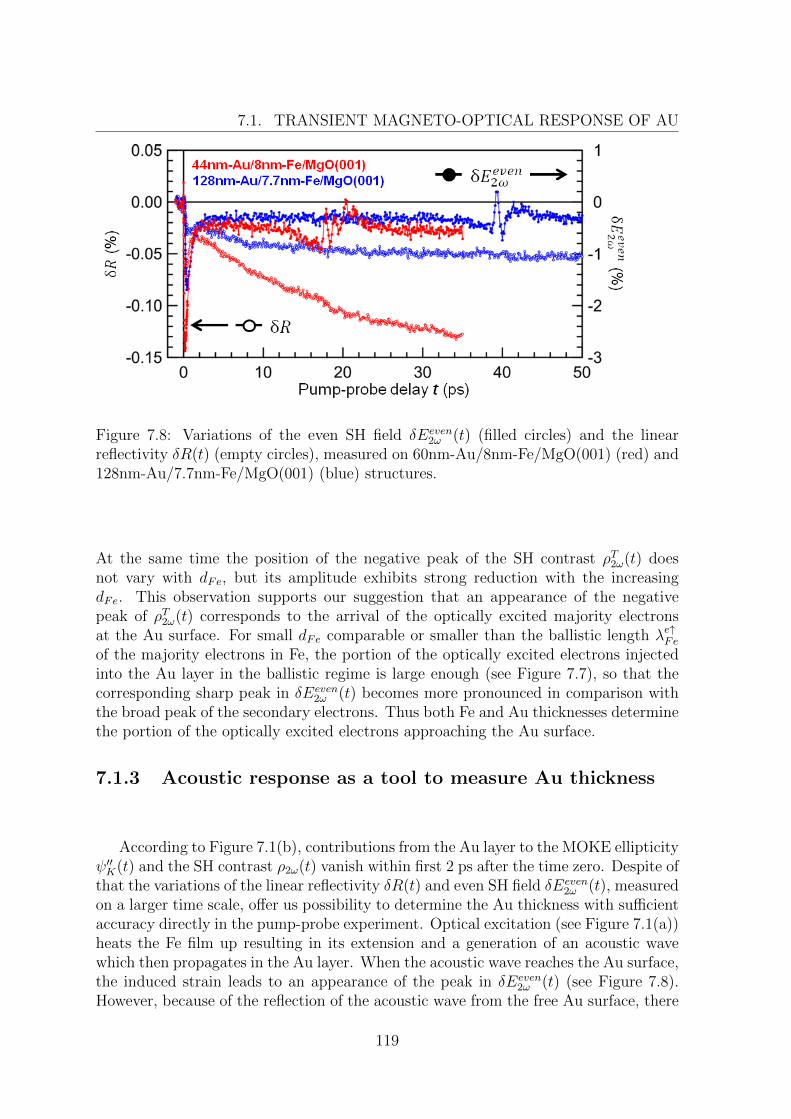
7.1. TRANSIENT MAGNETO-OPTICAL RESPONSE OF AU
Figure 7.8: Variations of the even SH field δEeven2ω (t) (filled circles) and the linear
reflectivity δR(t) (empty circles), measured on 60nm-Au/8nm-Fe/MgO(001) (red) and128nm-Au/7.7nm-Fe/MgO(001) (blue) structures.
At the same time the position of the negative peak of the SH contrast ρT2ω(t) doesnot vary with dFe, but its amplitude exhibits strong reduction with the increasingdFe. This observation supports our suggestion that an appearance of the negativepeak of ρT2ω(t) corresponds to the arrival of the optically excited majority electronsat the Au surface. For small dFe comparable or smaller than the ballistic length λe↑Feof the majority electrons in Fe, the portion of the optically excited electrons injectedinto the Au layer in the ballistic regime is large enough (see Figure 7.7), so that thecorresponding sharp peak in δEeven
2ω (t) becomes more pronounced in comparison withthe broad peak of the secondary electrons. Thus both Fe and Au thicknesses determinethe portion of the optically excited electrons approaching the Au surface.
7.1.3 Acoustic response as a tool to measure Au thickness
According to Figure 7.1(b), contributions from the Au layer to the MOKE ellipticityψ′′K(t) and the SH contrast ρ2ω(t) vanish within first 2 ps after the time zero. Despite ofthat the variations of the linear reflectivity δR(t) and even SH field δEeven
2ω (t), measuredon a larger time scale, offer us possibility to determine the Au thickness with sufficientaccuracy directly in the pump-probe experiment. Optical excitation (see Figure 7.1(a))heats the Fe film up resulting in its extension and a generation of an acoustic wavewhich then propagates in the Au layer. When the acoustic wave reaches the Au surface,the induced strain leads to an appearance of the peak in δEeven
2ω (t) (see Figure 7.8).However, because of the reflection of the acoustic wave from the free Au surface, there
119
CHAPTER 7. TRANSPORT OF SPIN-POLARIZED HOT CARRIERS IN AU
is no pronounced peak in δR(t). In Chapter 8 we discuss the experiments performedon three-layer Fe/Au/Fe/MgO(001) structures, where reflection of the acoustic wavefrom the Fe/Au interface results in the drastic variations of both even SH field δEeven
2ω (t)and linear reflectivity δR(t).
7.2 Conclusions
Transport of spin-polarized HCs in a non-magnetic Au film has been studied usingthe time-resolved MOKE and mSHG techniques. It has been demonstrated that thelaser-induced SC is formed predominantly by the majority electrons injected from theFe film into the Au layer. This result is consistent with the transmission of the Fe/Auinterface, obtained in the first-principle quantum transport calculations for the Fe/Austructure (see Figure 6.6(b)). The steep front of the SC pulse consists of the opticallyexcited electrons which leave the Fe film in the ballistic regime. Relaxation of theoptically excited electrons in Fe leads to the generation of the secondary electrons.They provide a net flux of the positive SP through the Fe/Au interface, as long asthe electron temperature in Fe is larger than in Au. Analysis of the SH contrast andMOKE signals give the characteristic time of the electron equilibration between the Feand Au films: 0.56± 0.03 ps. Both optically excited and secondary majority electronspropagate in Au in a quasi-ballistic regime, maintaining their initial SP. From theanalysis of the mSHG response we found the velocity of the optically excited majorityelectrons vAu1 = (1.06± 0.07) nm/fs and their lifetime τAu1 = (24± 4) fs in Au. Thesecondary electrons have smaller binding energies and hence longer lifetimes than theoptically excited electrons. However, their velocity distribution is more uniform andprovides smaller average velocity projection along z: vAu2 = (0.6± 0.4) nm/fs.
From the comparison of the SH contrasts ρT2ω(t) and ρL2ω(t) measured in the transver-sal and longitudinal magneto-optical geometries, it has been shown that in additionto the surface contribution, the SC gives rise to the odd SH field ~Eodd
2ω originating inthe bulk of Au. It has been confirmed in the experiments performed on three-layerFe/Au/Fe/MgO(001) structures (see Chapter 8). The SP-induced surface contribu-tion to the SH contrast ρ2ω(t) resembles the dynamics of the MOKE ellipticity ψ′′K(t),meaning that the magnetization profile within the probed region of the Au layer ismore or less uniform. The same conclusion follows from the independence of the ratioψ′′K(t)/ψ′K(t) from the Au thickness for dAu > 65 nm, when contributions of the Fe filmto the MOKE signals can be neglected. Assuming the uniform magnetization profile,from the amplitudes of ψ′′K(t) and ψ′K(t), measured on the Au/Fe/MgO(001) structurewith 8 nm of Fe and 75 nm of Au, we found QAu = qAuMAu = (2.4 + 0.9i) · 10−4
(Q′′Au/Q′Au = q′′Au/q
′Au = 2.7 ± 0.1). Using qAu = 0.094 + 0.035i (see Chapter 6), we
estimated the average magnetization built up in the Au layer by the SC flowing fromthe Fe film: MAu = QAu/qAu ≈ 0.0026 [MFe] ≈ 0.0082 [µB/atom].
120
Chapter 8
Spin dynamics induced in the Fefilm by hot carrier injection
In Chapters 6 and 7 we considered the hot carrier (HC) injection from a ferromag-netic film into a non-magnetic layer and transport of the spin-polarized HCs in anoble metal. In this chapter we discuss the injection of the spin-polarized HCs intoa ferromagnetic film. Pump-probe experiments have been performed on three-layerFe/Au/Fe/MgO(001) structures capped with thin Au layer, where the back pumppulse excites one of the Fe layers, the spin-emitter (E), and the front probe pulse mon-itors spin dynamics in the second Fe layer which serves as the spin collector (C) (see
Figure 8.1). Depending on the mutual orientation of the magnetizations ~ME and ~MC ,laser-induced spin current (SC) can lead to the absolute changes of the magnetization
∆| ~MC | (incoherent dynamics) or even drive its precessional motion via the spin transfertorque (STT) mechanism.
In the first section it will be demonstrated that it is possible to realize differentmutual orientations of the magnetizations ~ME, ~MC in the spin-emitter and the spin-collector. Then we will discuss the temporal profile of the SC flowing from the spin-emitter to the spin-collector. In Chapter 7 it has been suggested that the mSHGis sensitive not only to the magnetization dynamics at the interfaces, but also tothe SC flowing through the multilayer (ML) structure. Due to a more various setof possible magnetic configurations in three-layer Fe/Au/Fe/MgO(001) than in two-layer Au/Fe/MgO(001) structures, the measured mSHG response provides clear anddoubtless evidence for the appearance of the SC-induced SH contribution.
In the final section of this chapter, different types of the magnetization dynamics,induced in the spin-collector, will be demonstrated upon the analysis of the MOKEdata. Changing the direction of the external magnetic field ~Hext, we can disentanglecoherent magnetization dynamics driven by the laser-induced heating and the STT.Owing to more inhomogeneous spatial profile of the STT, the laser-induced SC canexcite higher spin wave modes than the laser-induced heating.
121
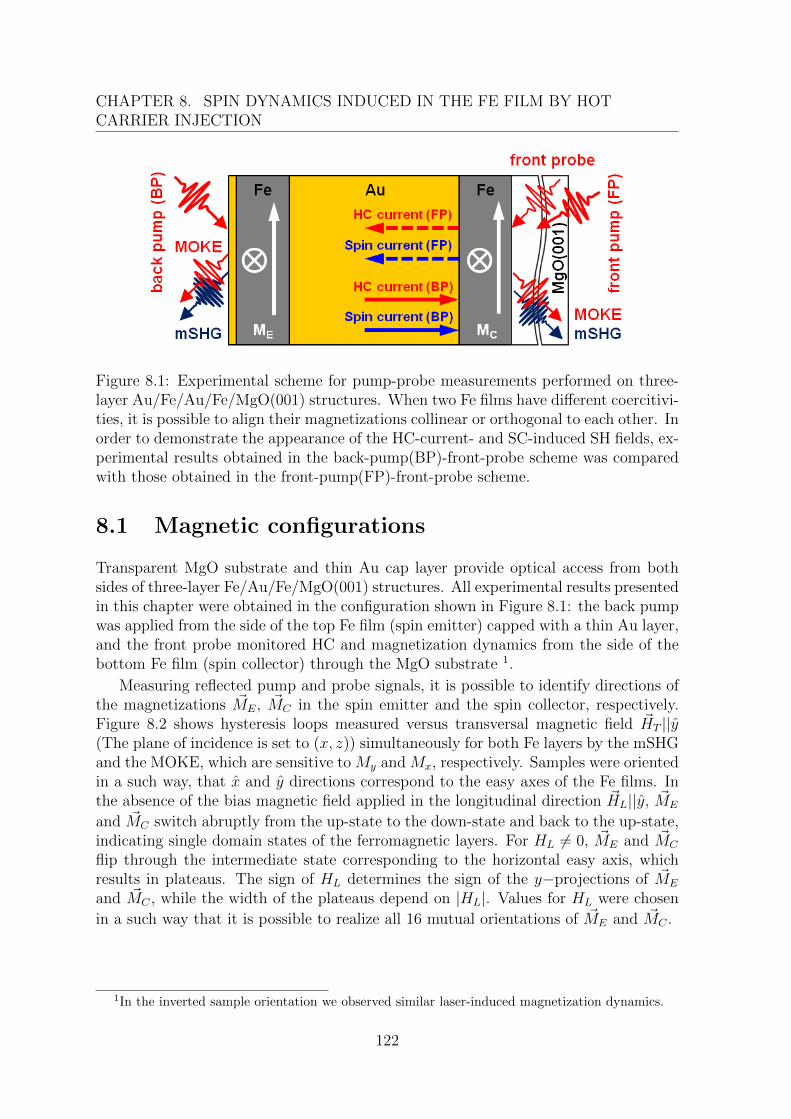
CHAPTER 8. SPIN DYNAMICS INDUCED IN THE FE FILM BY HOTCARRIER INJECTION
Figure 8.1: Experimental scheme for pump-probe measurements performed on three-layer Au/Fe/Au/Fe/MgO(001) structures. When two Fe films have different coercitivi-ties, it is possible to align their magnetizations collinear or orthogonal to each other. Inorder to demonstrate the appearance of the HC-current- and SC-induced SH fields, ex-perimental results obtained in the back-pump(BP)-front-probe scheme was comparedwith those obtained in the front-pump(FP)-front-probe scheme.
8.1 Magnetic configurations
Transparent MgO substrate and thin Au cap layer provide optical access from bothsides of three-layer Fe/Au/Fe/MgO(001) structures. All experimental results presentedin this chapter were obtained in the configuration shown in Figure 8.1: the back pumpwas applied from the side of the top Fe film (spin emitter) capped with a thin Au layer,and the front probe monitored HC and magnetization dynamics from the side of thebottom Fe film (spin collector) through the MgO substrate 1.
Measuring reflected pump and probe signals, it is possible to identify directions ofthe magnetizations ~ME, ~MC in the spin emitter and the spin collector, respectively.Figure 8.2 shows hysteresis loops measured versus transversal magnetic field ~HT ||y(The plane of incidence is set to (x, z)) simultaneously for both Fe layers by the mSHGand the MOKE, which are sensitive to My and Mx, respectively. Samples were orientedin a such way, that x and y directions correspond to the easy axes of the Fe films. Inthe absence of the bias magnetic field applied in the longitudinal direction ~HL||y, ~ME
and ~MC switch abruptly from the up-state to the down-state and back to the up-state,indicating single domain states of the ferromagnetic layers. For HL 6= 0, ~ME and ~MC
flip through the intermediate state corresponding to the horizontal easy axis, whichresults in plateaus. The sign of HL determines the sign of the y−projections of ~ME
and ~MC , while the width of the plateaus depend on |HL|. Values for HL were chosen
in a such way that it is possible to realize all 16 mutual orientations of ~ME and ~MC .
1In the inverted sample orientation we observed similar laser-induced magnetization dynamics.
122
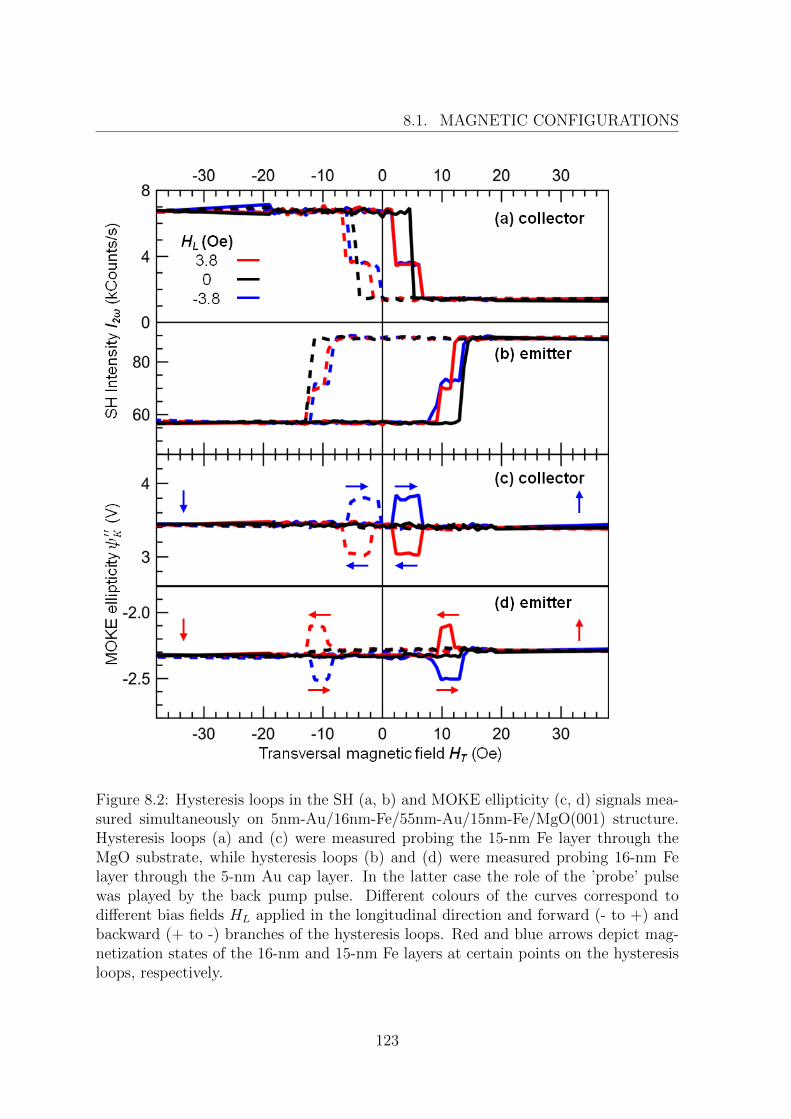
8.1. MAGNETIC CONFIGURATIONS
Figure 8.2: Hysteresis loops in the SH (a, b) and MOKE ellipticity (c, d) signals mea-sured simultaneously on 5nm-Au/16nm-Fe/55nm-Au/15nm-Fe/MgO(001) structure.Hysteresis loops (a) and (c) were measured probing the 15-nm Fe layer through theMgO substrate, while hysteresis loops (b) and (d) were measured probing 16-nm Felayer through the 5-nm Au cap layer. In the latter case the role of the ’probe’ pulsewas played by the back pump pulse. Different colours of the curves correspond todifferent bias fields HL applied in the longitudinal direction and forward (- to +) andbackward (+ to -) branches of the hysteresis loops. Red and blue arrows depict mag-netization states of the 16-nm and 15-nm Fe layers at certain points on the hysteresisloops, respectively.
123
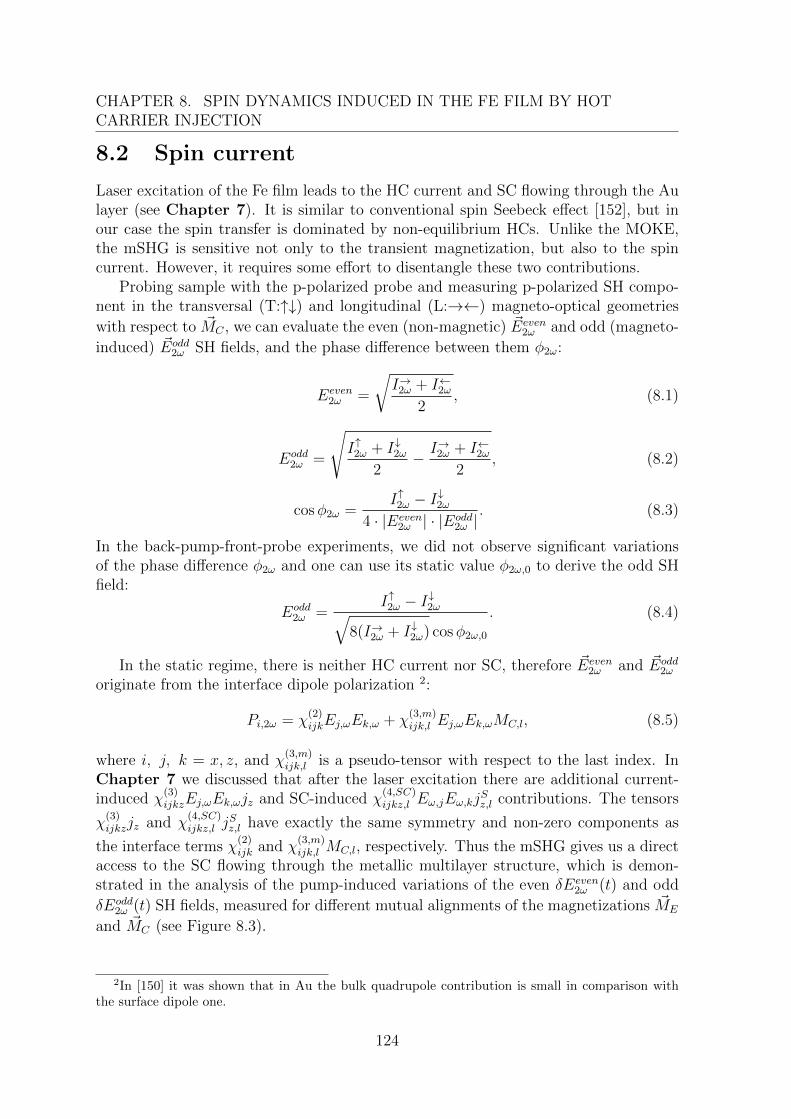
CHAPTER 8. SPIN DYNAMICS INDUCED IN THE FE FILM BY HOTCARRIER INJECTION
8.2 Spin current
Laser excitation of the Fe film leads to the HC current and SC flowing through the Aulayer (see Chapter 7). It is similar to conventional spin Seebeck effect [152], but inour case the spin transfer is dominated by non-equilibrium HCs. Unlike the MOKE,the mSHG is sensitive not only to the transient magnetization, but also to the spincurrent. However, it requires some effort to disentangle these two contributions.
Probing sample with the p-polarized probe and measuring p-polarized SH compo-nent in the transversal (T:↑↓) and longitudinal (L:→←) magneto-optical geometries
with respect to ~MC , we can evaluate the even (non-magnetic) ~Eeven2ω and odd (magneto-
induced) ~Eodd2ω SH fields, and the phase difference between them φ2ω:
Eeven2ω =
√I→2ω + I←2ω
2, (8.1)
Eodd2ω =
√I↑2ω + I↓2ω
2− I→2ω + I←2ω
2, (8.2)
cosφ2ω =I↑2ω − I
↓2ω
4 · |Eeven2ω | · |Eodd
2ω |. (8.3)
In the back-pump-front-probe experiments, we did not observe significant variationsof the phase difference φ2ω and one can use its static value φ2ω,0 to derive the odd SHfield:
Eodd2ω =
I↑2ω − I↓2ω√
8(I→2ω + I↓2ω) cosφ2ω,0
. (8.4)
In the static regime, there is neither HC current nor SC, therefore ~Eeven2ω and ~Eodd
2ω
originate from the interface dipole polarization 2:
Pi,2ω = χ(2)ijkEj,ωEk,ω + χ
(3,m)ijk,l Ej,ωEk,ωMC,l, (8.5)
where i, j, k = x, z, and χ(3,m)ijk,l is a pseudo-tensor with respect to the last index. In
Chapter 7 we discussed that after the laser excitation there are additional current-induced χ
(3)ijkzEj,ωEk,ωjz and SC-induced χ
(4,SC)ijkz,l Eω,jEω,kj
Sz,l contributions. The tensors
χ(3)ijkzjz and χ
(4,SC)ijkz,l j
Sz,l have exactly the same symmetry and non-zero components as
the interface terms χ(2)ijk and χ
(3,m)ijk,l MC,l, respectively. Thus the mSHG gives us a direct
access to the SC flowing through the metallic multilayer structure, which is demon-strated in the analysis of the pump-induced variations of the even δEeven
2ω (t) and odd
δEodd2ω (t) SH fields, measured for different mutual alignments of the magnetizations ~ME
and ~MC (see Figure 8.3).
2In [150] it was shown that in Au the bulk quadrupole contribution is small in comparison withthe surface dipole one.
124
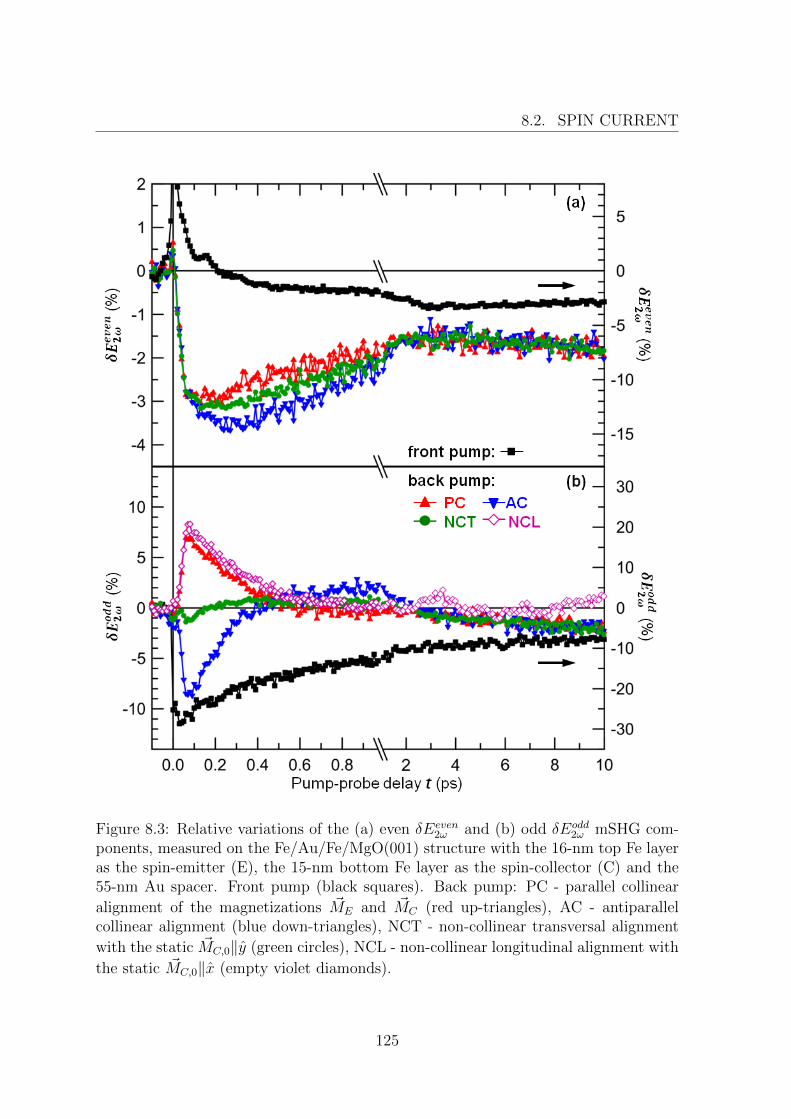
8.2. SPIN CURRENT
Figure 8.3: Relative variations of the (a) even δEeven2ω and (b) odd δEodd
2ω mSHG com-ponents, measured on the Fe/Au/Fe/MgO(001) structure with the 16-nm top Fe layeras the spin-emitter (E), the 15-nm bottom Fe layer as the spin-collector (C) and the55-nm Au spacer. Front pump (black squares). Back pump: PC - parallel collinear
alignment of the magnetizations ~ME and ~MC (red up-triangles), AC - antiparallelcollinear alignment (blue down-triangles), NCT - non-collinear transversal alignment
with the static ~MC,0‖y (green circles), NCL - non-collinear longitudinal alignment with
the static ~MC,0‖x (empty violet diamonds).
125
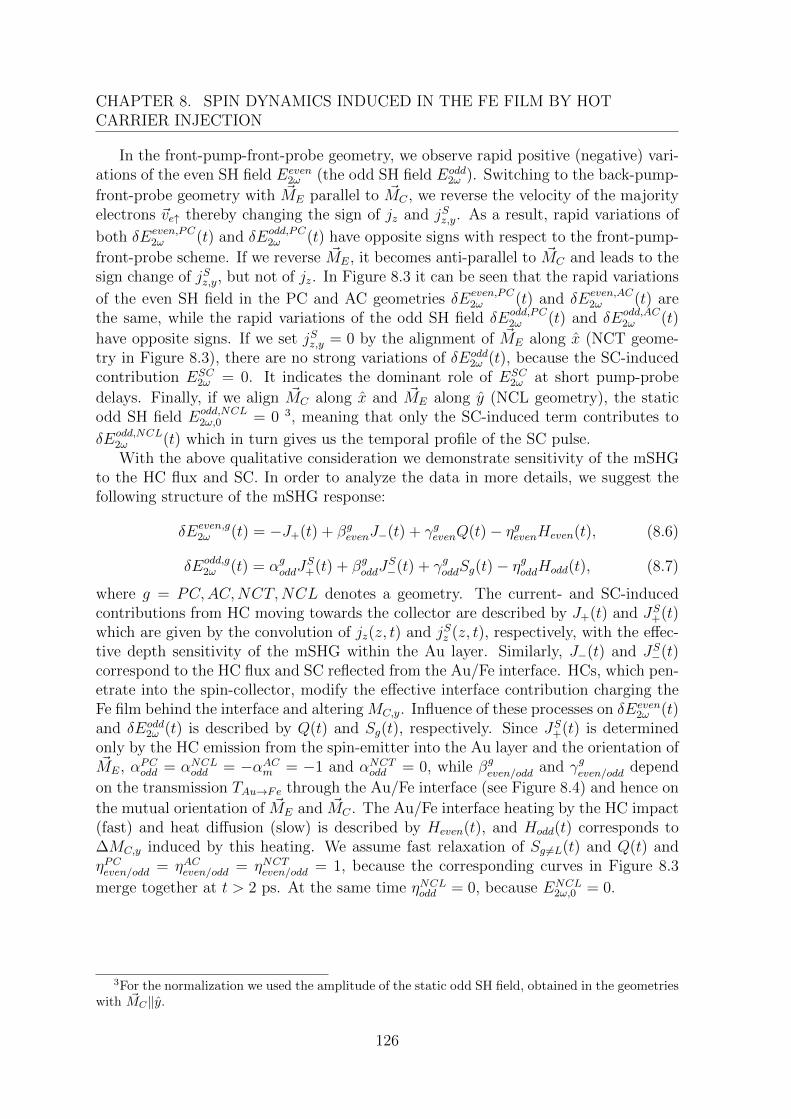
CHAPTER 8. SPIN DYNAMICS INDUCED IN THE FE FILM BY HOTCARRIER INJECTION
In the front-pump-front-probe geometry, we observe rapid positive (negative) vari-ations of the even SH field Eeven
2ω (the odd SH field Eodd2ω ). Switching to the back-pump-
front-probe geometry with ~ME parallel to ~MC , we reverse the velocity of the majorityelectrons ~ve↑ thereby changing the sign of jz and jSz,y. As a result, rapid variations of
both δEeven,PC2ω (t) and δEodd,PC
2ω (t) have opposite signs with respect to the front-pump-
front-probe scheme. If we reverse ~ME, it becomes anti-parallel to ~MC and leads to thesign change of jSz,y, but not of jz. In Figure 8.3 it can be seen that the rapid variations
of the even SH field in the PC and AC geometries δEeven,PC2ω (t) and δEeven,AC
2ω (t) arethe same, while the rapid variations of the odd SH field δEodd,PC
2ω (t) and δEodd,AC2ω (t)
have opposite signs. If we set jSz,y = 0 by the alignment of ~ME along x (NCT geome-try in Figure 8.3), there are no strong variations of δEodd
2ω (t), because the SC-inducedcontribution ESC
2ω = 0. It indicates the dominant role of ESC2ω at short pump-probe
delays. Finally, if we align ~MC along x and ~ME along y (NCL geometry), the staticodd SH field Eodd,NCL
2ω,0 = 0 3, meaning that only the SC-induced term contributes to
δEodd,NCL2ω (t) which in turn gives us the temporal profile of the SC pulse.With the above qualitative consideration we demonstrate sensitivity of the mSHG
to the HC flux and SC. In order to analyze the data in more details, we suggest thefollowing structure of the mSHG response:
δEeven,g2ω (t) = −J+(t) + βgevenJ−(t) + γgevenQ(t)− ηgevenHeven(t), (8.6)
δEodd,g2ω (t) = αgoddJ
S+(t) + βgoddJ
S−(t) + γgoddSg(t)− η
goddHodd(t), (8.7)
where g = PC,AC,NCT,NCL denotes a geometry. The current- and SC-inducedcontributions from HC moving towards the collector are described by J+(t) and JS+(t)which are given by the convolution of jz(z, t) and jSz (z, t), respectively, with the effec-tive depth sensitivity of the mSHG within the Au layer. Similarly, J−(t) and JS−(t)correspond to the HC flux and SC reflected from the Au/Fe interface. HCs, which pen-etrate into the spin-collector, modify the effective interface contribution charging theFe film behind the interface and altering MC,y. Influence of these processes on δEeven
2ω (t)and δEodd
2ω (t) is described by Q(t) and Sg(t), respectively. Since JS+(t) is determinedonly by the HC emission from the spin-emitter into the Au layer and the orientation of~ME, αPCodd = αNCLodd = −αACm = −1 and αNCTodd = 0, while βgeven/odd and γgeven/odd depend
on the transmission TAu→Fe through the Au/Fe interface (see Figure 8.4) and hence on
the mutual orientation of ~ME and ~MC . The Au/Fe interface heating by the HC impact(fast) and heat diffusion (slow) is described by Heven(t), and Hodd(t) corresponds to∆MC,y induced by this heating. We assume fast relaxation of Sg 6=L(t) and Q(t) andηPCeven/odd = ηACeven/odd = ηNCTeven/odd = 1, because the corresponding curves in Figure 8.3
merge together at t > 2 ps. At the same time ηNCLodd = 0, because ENCL2ω,0 = 0.
3For the normalization we used the amplitude of the static odd SH field, obtained in the geometrieswith ~MC‖y.
126
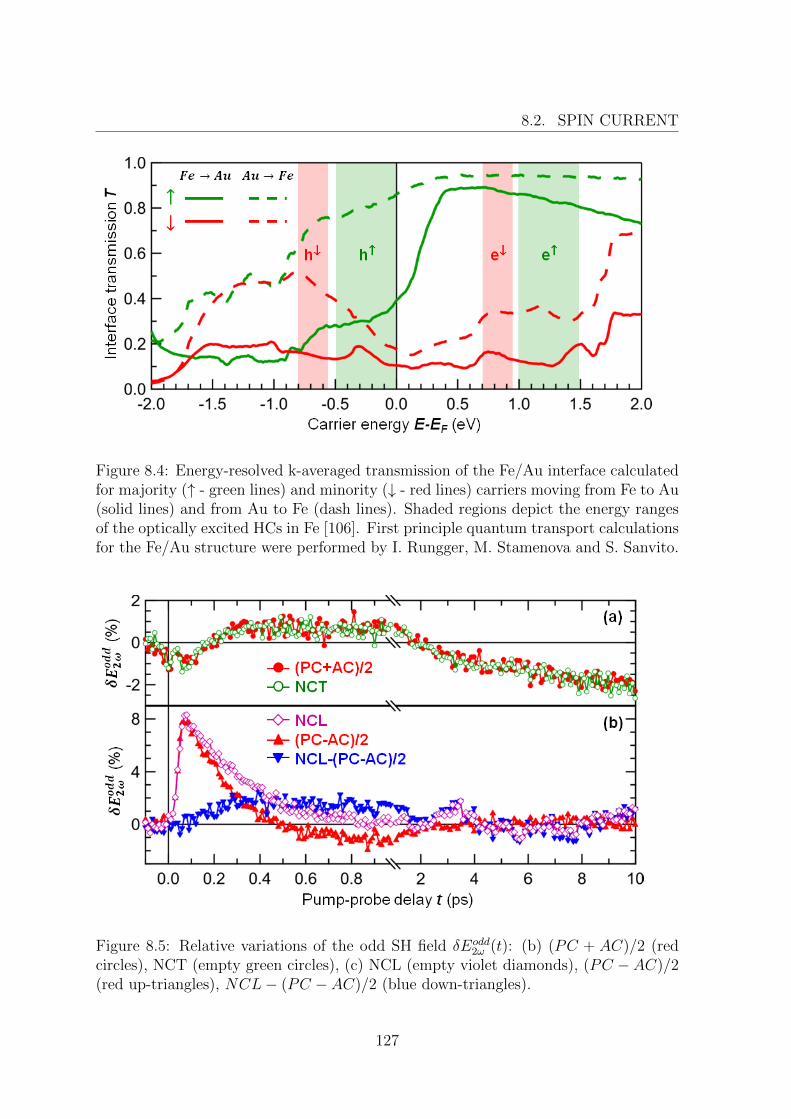
8.2. SPIN CURRENT
Figure 8.4: Energy-resolved k-averaged transmission of the Fe/Au interface calculatedfor majority (↑ - green lines) and minority (↓ - red lines) carriers moving from Fe to Au(solid lines) and from Au to Fe (dash lines). Shaded regions depict the energy rangesof the optically excited HCs in Fe [106]. First principle quantum transport calculationsfor the Fe/Au structure were performed by I. Rungger, M. Stamenova and S. Sanvito.
Figure 8.5: Relative variations of the odd SH field δEodd2ω (t): (b) (PC + AC)/2 (red
circles), NCT (empty green circles), (c) NCL (empty violet diamonds), (PC −AC)/2(red up-triangles), NCL− (PC − AC)/2 (blue down-triangles).
127
CHAPTER 8. SPIN DYNAMICS INDUCED IN THE FE FILM BY HOTCARRIER INJECTION
In the NCL geometry where ~MC,0 = (MC,x, 0, 0), the laser-induced SC jSz,y results
in ~MC = (MC,x,∆MC,y, 0) followed by a precession of ~MC around x axis. This leadsto an oscillatory behaviour of SL(t) observed in δENCL
2ω at larger pump-probe delays.
This precessional dynamics of ~MC is more clearly pronounced in the MOKE signals ona much longer time scale (up to 500 ps), which will be discussed in the next section.
The STT produced by the SC pulse with the spin polarization (SP) ~σSC ⊥ ~MC leadsto the excitation of several lowest standing spin wave modes in the spin-collector.The interference of these modes is quite complex at short delays where higher modesare strong and the precessional dynamics still develops. From the data shown inFigures 8.3(b) and 8.5, one can see that the amplitude SL(t) is on the order of 0.01 or∆MC,y ≈ 0.01MC,x.
Now let us focus on the HC reflection/transmission at the Au/Fe interface. In
Figure 8.5 one can see that δEeven/odd,NCT2ω (t) = (δE
even/odd,PC2ω (t) + δE
even/odd,AC2ω (t))/2
within the scattering of the experimental data. Reflected HC flux J−(t) and SC JS−(t)are proportional to the incoming HC flux, while Q(t) and Sg(t) are rather proportionalto the integral of this flux convolved with some sort of decay. So J−(t) 6= Q(t) andJS−(t) 6= Sg(t). This brings us to the relations:
βNCTeven/odd =βPCeven/odd + βACeven/odd
2and γNCTeven/odd =
γPCeven/odd + γACeven/odd2
. (8.8)
Regarding the current-induced SH components, (8.8) can be rewritten as
T⊥Au→Fe =T ↑Au→Fe + T ↓Au→Fe
2, (8.9)
where T ↑Au→Fe, T↓Au→Fe and T⊥Au→Fe are the interface transmissions for ~σe ↑↑ ~MC ,
~σe ↓↑ ~MC , and ~σe ⊥ ~MC in the PC, AC, and NCT geometries, respectively. Regardingthe SC-induced SH components the situation is more complex. In the PC and ACgeometries ~σSC does not change upon the reflection/transmission. If this is also the
case in the NCT geometry, where ~ME = (ME,x, 0, 0) and ~MC,0 = (0,MC,y, 0), then forthe reflected SC jSz,y(t) = 0 and the transmitted HCs do not affect MC,y, i.e. βNCTodd = 0and γNCTodd = 0. From (8.8) we get that βACodd = −βPCodd and γACodd = −γPCodd . This can betrue only under the condition T ↑Au→Fe = T ↓Au→Fe, which contradicts with the resultsof the first principle quantum transport calculations (see Figure 8.4). In addition tothat, demagnetization of the spin-collector alone cannot provide δEodd,NCT
2ω (t) > 0 at
0.2 ps < t < 2 ps. Thus if ~σe ⊥ ~MC in the incoming HC packet, ~σe must change uponthe reflection/transmission at the Au/Fe interface.
Let us consider the NCT geometry with ~ME = (ME,x, 0, 0) and ~MC,0 = (0,MC,y, 0)in more detail. Upon the HC emission from the spin-emitter, the spin quantizationaxis is set by ~ME, which means that σe,x is defined and σe,y oscillates. As a result, hotelectron reaches the spin-collector with random σe,yand in the incoming SC jSz,y = 0,because the average projection < σe,y >= 0. When an electron with defined σe,x andrandom σe,y penetrates into the Fe film which serves as a thermostat for σ, the newquantization axis is along y. So σe,y becomes defined and σe,x becomes random within
128
8.2. SPIN CURRENT
the characteristic time of the quantum spin decoherence. The angular momentum isabsorbed by the thermostat, which leads to ~MC = (∆MC,x,MC,y, 0). In other words,
HC spins orthogonal to ~MC rotate with equal probability towards the up- and down-states with respect to ~MC and are transmitted through and reflected from the interfacein accordance with T ↑↓Au→Fe. This leads to jSz,y 6= 0 in the reflected SC and non-zero
variation of MC,y, and fulfils the relations (8.8). Both βNCTodd , γNCTodd > 0 (T ↑Au→Fe >
T ↓Au→Fe), which explains δENCTodd (t) > 0 at 0.2 ps < t < 2 ps.
In Figure 8.5 we reproduce δEodd,NCL2ω (t) together with
δEodd,PA2ω (t) =
δEodd,PC2ω (t)− δEodd,AC
2ω (t)
2(8.10)
andδEodd,LPA
2ω (t) = δEodd,NCL2ω (t)− δEodd,PA
2ω (t). (8.11)
From the above considerations, βNCLodd = 0, ηNCLodd = 0, αNCLodd = 1, and γNCLodd = 1,because σe,y completely transfers into ∆MC,y. Thus
δEodd,NCL2ω (t) = JS+(t) + SNCL(t) (8.12)
provides the temporal profile of the direct SC pulse, modulated by the oscillationsof SNCL(t) with the amplitude ∼ 1 %. The direct SC pulse has a sharp front witha maximum at about 70 fs after the pump pulse. It gives the HC velocity in goldvAu ≈ 0.8 nm/fs, which is between the velocities of the optically excited and secondaryelectrons vAu1 = (1.06± 0.07) nm/fs and vAu2 = (0.6± 0.4) nm/fs (see Chapter 7).Then δEodd,NCL
2ω (t) decays with the time constant τSC = (306± 14) fs, which is com-parable to the characteristic time of the electron equilibration between the Fe andAu films 0.56 ± 0.03 ps, obtained in the experiments on two-layer Au/Fe/MgO(001)structures (see Chapter 7). Using αPCodd = 1, αACodd = −1, and ηPCodd = ηACodd , we derive
δEodd,PA2ω (t) = JS+(t) +
βPCodd − βACodd2
JS−(t) +γPCodd − γACodd
2SPC(t), (8.13)
where the heating-induced demagnetization of the spin-collector Hodd(t) is subtracted,and only the influence of the SC pulse is left. Since βACodd > 0, βPCodd < 0, γPCodd > 0,γACodd < 0, and at short delays SNCL(t) should behave similar to SPC(t),
δEodd,LPA2ω (t) =
βPCodd − βACodd2
JS−(t) + SNCL(t)− γPCodd − γACodd2
SPC(t) (8.14)
should resemble the temporal profile of the reflected SC pulse. Its front is not so sharpas that of the direct SC pulse, because some part of the incoming HCs are transmittedinto the spin-collector and the reflected HCs have smaller velocity projection |ve,z| thanthe incoming ones.
Summarizing, it has been demonstrated that the mSHG is sensitive to the SCflowing through the metallic multilayer structure. The mSHG data obtained on three-layer Fe/Au/Fe/MgO(001) structures are consistent with those obtained on two-layer
129
CHAPTER 8. SPIN DYNAMICS INDUCED IN THE FE FILM BY HOTCARRIER INJECTION
Au/Fe/MgO(001) probing the Au surface (see Chapter 7). The temporal profile of thelaser-induced SC is determined by the HC flux through the interface between the spin-emitter and the non-magnetic layer. The SC pulse consists of the optically excitedelectrons, leaving the Fe film in the ballistic regime, and the secondary electrons,which provide a net flux of the positive SP through the Fe/Au interface as long asthe electron temperature in Fe is larger than in Au. The major difference between theexperiments performed on Fe/Au/Fe/MgO(001) and Au/Fe/MgO(001) structures isthat the HC reflection from the clean Au surface is spin-independent, while the Au/Fe
interface transmits more effectively the majority electrons e↑ with respect to ~MC thanthe minority ones (see Figure 8.4).
8.3 Magnetization dynamics
Unlike the mSHG, the MOKE is exclusively sensitive to the magnetization. Figure 8.6presents the absolute variations of the MOKE rotation ∆ψ′K and ellipticity ∆ψ′′K mea-sured on a three-layer 5nm-Au/16nm-Fe(E)/55nm-Au/15nm-Fe(C)/MgO(001) struc-
ture for magnetic configurations, where the static magnetizations ~ME||y and ~MC ||x.Both ∆ψ′K and ∆ψ′′K exhibit various dynamics, which includes precession of the mag-
netization ~MC in the spin-collector, demagnetization induced by the HC injection andnon-magnetic effects affecting the MOKE signals. In terms of the HC transport allorthogonal magnetic geometries are identical to each other, meaning that changes ofthe magnetization magnitude ∆| ~MC | are the same. Thus linear combinations of ∆ψ′Kand ∆ψ′′K measured in the orthogonal magnetic configurations ~ME ⊥ ~MC allow us todisentangle coherent (precession) and incoherent (demagnetization) contributions tothe magnetization dynamics, which will be discussed in the following subsections.
8.3.1 Incoherent dynamics
Figure 8.7 presents pump-induced relative variations of the MOKE rotation δψ′K(t),ellipticity δψ′′K(t) and the linear reflectivity δR(t) measured on the 5nm-Au/16nm-Fe(E)/55nm-Au/15nm-Fe(C)/MgO(001) structure for parallel collinear (PCL), an-tiparallel collinear (ACL) and non-collinear (NCL) magnetic configurations, where the
static magnetization ~MC‖x. In the PCL and ACL magnetic geometries the relativevariations of the MOKE signals are given by:
δψ′K,PCL(t) =∆ψ′K,⇔(t)−∆ψ′K,⇒(t)
ψ′K,0,⇔ − ψ′K,0,⇒, δψ′′K,PCL(t) =
∆ψ′′K,⇔(t)−∆ψ′′K,⇒(t)
ψ′′K,0,⇔ − ψ′′K,0,⇒, (8.15)
δψ′K,ACL(t) =∆ψ′K,(t)−∆ψ′K,(t)
ψ′K,0, − ψ′K,0,, δψ′′K,ACL(t) =
∆ψ′′K,(t)−∆ψ′′K,(t)
ψ′′K,0, − ψ′′K,0,, (8.16)
where the upper arrow depicts the direction of ~ME, and the lower arrow depicts thedirection of ~MC , if one looks at the sample from the side of the probe pulse (see
130
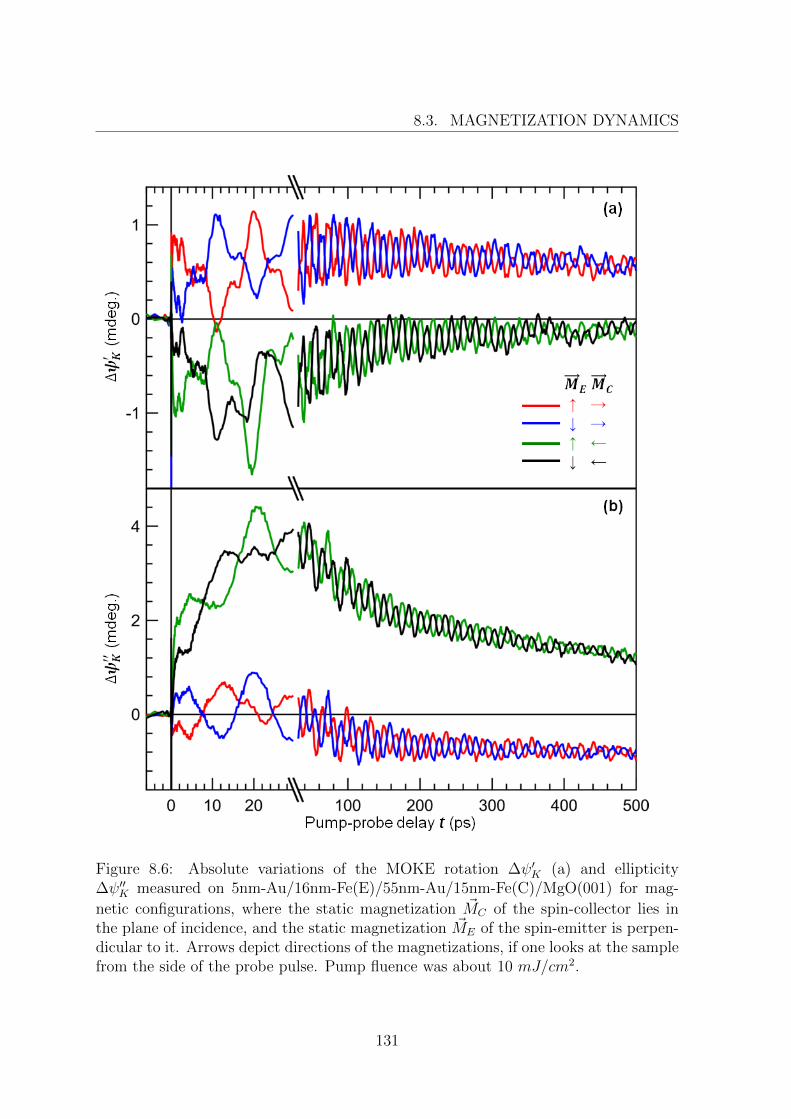
8.3. MAGNETIZATION DYNAMICS
Figure 8.6: Absolute variations of the MOKE rotation ∆ψ′K (a) and ellipticity∆ψ′′K measured on 5nm-Au/16nm-Fe(E)/55nm-Au/15nm-Fe(C)/MgO(001) for mag-
netic configurations, where the static magnetization ~MC of the spin-collector lies inthe plane of incidence, and the static magnetization ~ME of the spin-emitter is perpen-dicular to it. Arrows depict directions of the magnetizations, if one looks at the samplefrom the side of the probe pulse. Pump fluence was about 10 mJ/cm2.
131
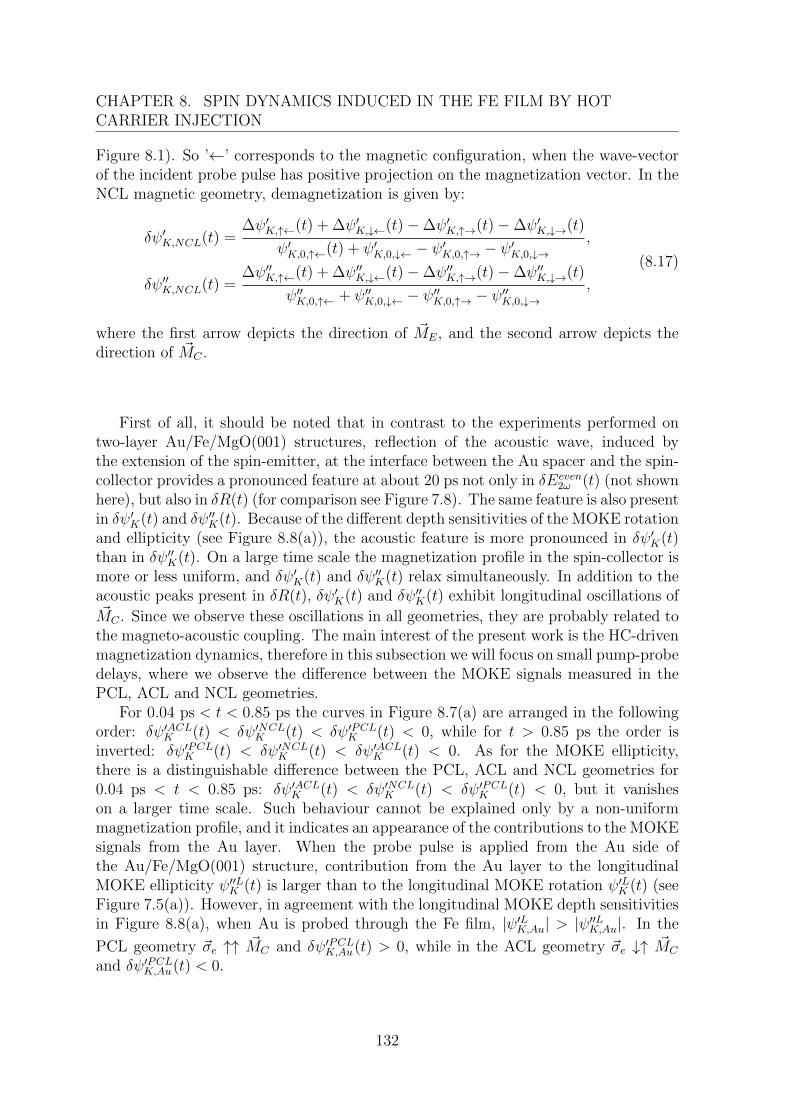
CHAPTER 8. SPIN DYNAMICS INDUCED IN THE FE FILM BY HOTCARRIER INJECTION
Figure 8.1). So ’←’ corresponds to the magnetic configuration, when the wave-vectorof the incident probe pulse has positive projection on the magnetization vector. In theNCL magnetic geometry, demagnetization is given by:
δψ′K,NCL(t) =∆ψ′K,↑←(t) + ∆ψ′K,↓←(t)−∆ψ′K,↑→(t)−∆ψ′K,↓→(t)
ψ′K,0,↑←(t) + ψ′K,0,↓← − ψ′K,0,↑→ − ψ′K,0,↓→,
δψ′′K,NCL(t) =∆ψ′′K,↑←(t) + ∆ψ′′K,↓←(t)−∆ψ′′K,↑→(t)−∆ψ′′K,↓→(t)
ψ′′K,0,↑← + ψ′′K,0,↓← − ψ′′K,0,↑→ − ψ′′K,0,↓→,
(8.17)
where the first arrow depicts the direction of ~ME, and the second arrow depicts thedirection of ~MC .
First of all, it should be noted that in contrast to the experiments performed ontwo-layer Au/Fe/MgO(001) structures, reflection of the acoustic wave, induced bythe extension of the spin-emitter, at the interface between the Au spacer and the spin-collector provides a pronounced feature at about 20 ps not only in δEeven
2ω (t) (not shownhere), but also in δR(t) (for comparison see Figure 7.8). The same feature is also presentin δψ′K(t) and δψ′′K(t). Because of the different depth sensitivities of the MOKE rotationand ellipticity (see Figure 8.8(a)), the acoustic feature is more pronounced in δψ′K(t)than in δψ′′K(t). On a large time scale the magnetization profile in the spin-collector ismore or less uniform, and δψ′K(t) and δψ′′K(t) relax simultaneously. In addition to theacoustic peaks present in δR(t), δψ′K(t) and δψ′′K(t) exhibit longitudinal oscillations of~MC . Since we observe these oscillations in all geometries, they are probably related to
the magneto-acoustic coupling. The main interest of the present work is the HC-drivenmagnetization dynamics, therefore in this subsection we will focus on small pump-probedelays, where we observe the difference between the MOKE signals measured in thePCL, ACL and NCL geometries.
For 0.04 ps < t < 0.85 ps the curves in Figure 8.7(a) are arranged in the followingorder: δψ′ACLK (t) < δψ′NCLK (t) < δψ′PCLK (t) < 0, while for t > 0.85 ps the order isinverted: δψ′PCLK (t) < δψ′NCLK (t) < δψ′ACLK (t) < 0. As for the MOKE ellipticity,there is a distinguishable difference between the PCL, ACL and NCL geometries for0.04 ps < t < 0.85 ps: δψ′ACLK (t) < δψ′NCLK (t) < δψ′PCLK (t) < 0, but it vanisheson a larger time scale. Such behaviour cannot be explained only by a non-uniformmagnetization profile, and it indicates an appearance of the contributions to the MOKEsignals from the Au layer. When the probe pulse is applied from the Au side ofthe Au/Fe/MgO(001) structure, contribution from the Au layer to the longitudinalMOKE ellipticity ψ′′LK (t) is larger than to the longitudinal MOKE rotation ψ′LK (t) (seeFigure 7.5(a)). However, in agreement with the longitudinal MOKE depth sensitivitiesin Figure 8.8(a), when Au is probed through the Fe film, |ψ′LK,Au| > |ψ′′LK,Au|. In the
PCL geometry ~σe ↑↑ ~MC and δψ′PCLK,Au(t) > 0, while in the ACL geometry ~σe ↓↑ ~MC
and δψ′PCLK,Au(t) < 0.
132
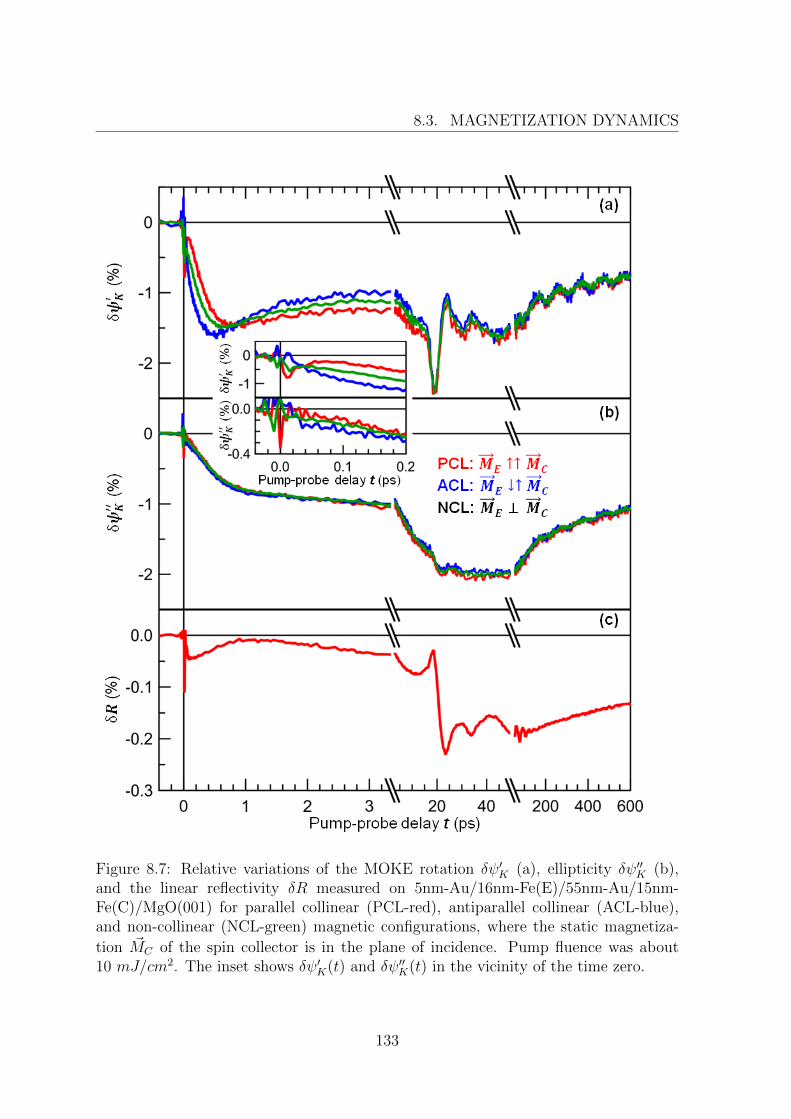
8.3. MAGNETIZATION DYNAMICS
Figure 8.7: Relative variations of the MOKE rotation δψ′K (a), ellipticity δψ′′K (b),and the linear reflectivity δR measured on 5nm-Au/16nm-Fe(E)/55nm-Au/15nm-Fe(C)/MgO(001) for parallel collinear (PCL-red), antiparallel collinear (ACL-blue),and non-collinear (NCL-green) magnetic configurations, where the static magnetiza-
tion ~MC of the spin collector is in the plane of incidence. Pump fluence was about10 mJ/cm2. The inset shows δψ′K(t) and δψ′′K(t) in the vicinity of the time zero.
133
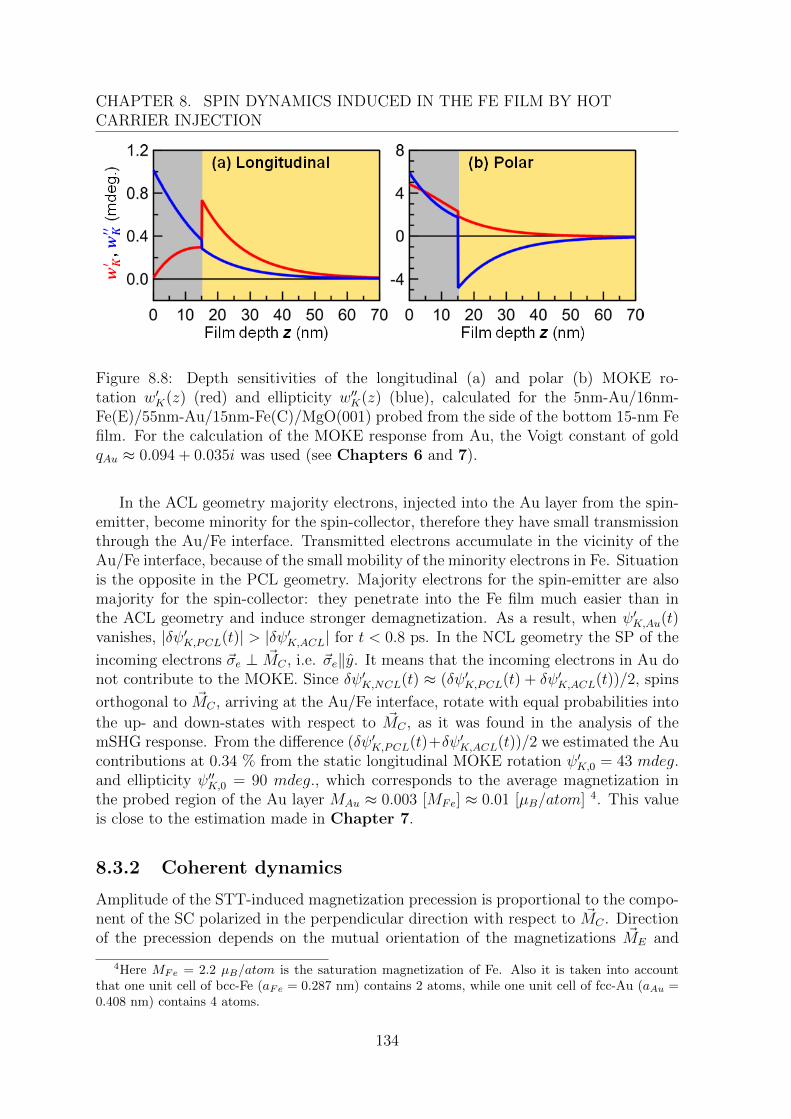
CHAPTER 8. SPIN DYNAMICS INDUCED IN THE FE FILM BY HOTCARRIER INJECTION
Figure 8.8: Depth sensitivities of the longitudinal (a) and polar (b) MOKE ro-tation w′K(z) (red) and ellipticity w′′K(z) (blue), calculated for the 5nm-Au/16nm-Fe(E)/55nm-Au/15nm-Fe(C)/MgO(001) probed from the side of the bottom 15-nm Fefilm. For the calculation of the MOKE response from Au, the Voigt constant of goldqAu ≈ 0.094 + 0.035i was used (see Chapters 6 and 7).
In the ACL geometry majority electrons, injected into the Au layer from the spin-emitter, become minority for the spin-collector, therefore they have small transmissionthrough the Au/Fe interface. Transmitted electrons accumulate in the vicinity of theAu/Fe interface, because of the small mobility of the minority electrons in Fe. Situationis the opposite in the PCL geometry. Majority electrons for the spin-emitter are alsomajority for the spin-collector: they penetrate into the Fe film much easier than inthe ACL geometry and induce stronger demagnetization. As a result, when ψ′K,Au(t)vanishes, |δψ′K,PCL(t)| > |δψ′K,ACL| for t < 0.8 ps. In the NCL geometry the SP of the
incoming electrons ~σe ⊥ ~MC , i.e. ~σe‖y. It means that the incoming electrons in Au donot contribute to the MOKE. Since δψ′K,NCL(t) ≈ (δψ′K,PCL(t) + δψ′K,ACL(t))/2, spins
orthogonal to ~MC , arriving at the Au/Fe interface, rotate with equal probabilities into
the up- and down-states with respect to ~MC , as it was found in the analysis of themSHG response. From the difference (δψ′K,PCL(t)+δψ′K,ACL(t))/2 we estimated the Aucontributions at 0.34 % from the static longitudinal MOKE rotation ψ′K,0 = 43 mdeg.and ellipticity ψ′′K,0 = 90 mdeg., which corresponds to the average magnetization inthe probed region of the Au layer MAu ≈ 0.003 [MFe] ≈ 0.01 [µB/atom] 4. This valueis close to the estimation made in Chapter 7.
8.3.2 Coherent dynamics
Amplitude of the STT-induced magnetization precession is proportional to the compo-nent of the SC polarized in the perpendicular direction with respect to ~MC . Directionof the precession depends on the mutual orientation of the magnetizations ~ME and
4Here MFe = 2.2 µB/atom is the saturation magnetization of Fe. Also it is taken into accountthat one unit cell of bcc-Fe (aFe = 0.287 nm) contains 2 atoms, while one unit cell of fcc-Au (aAu =0.408 nm) contains 4 atoms.
134
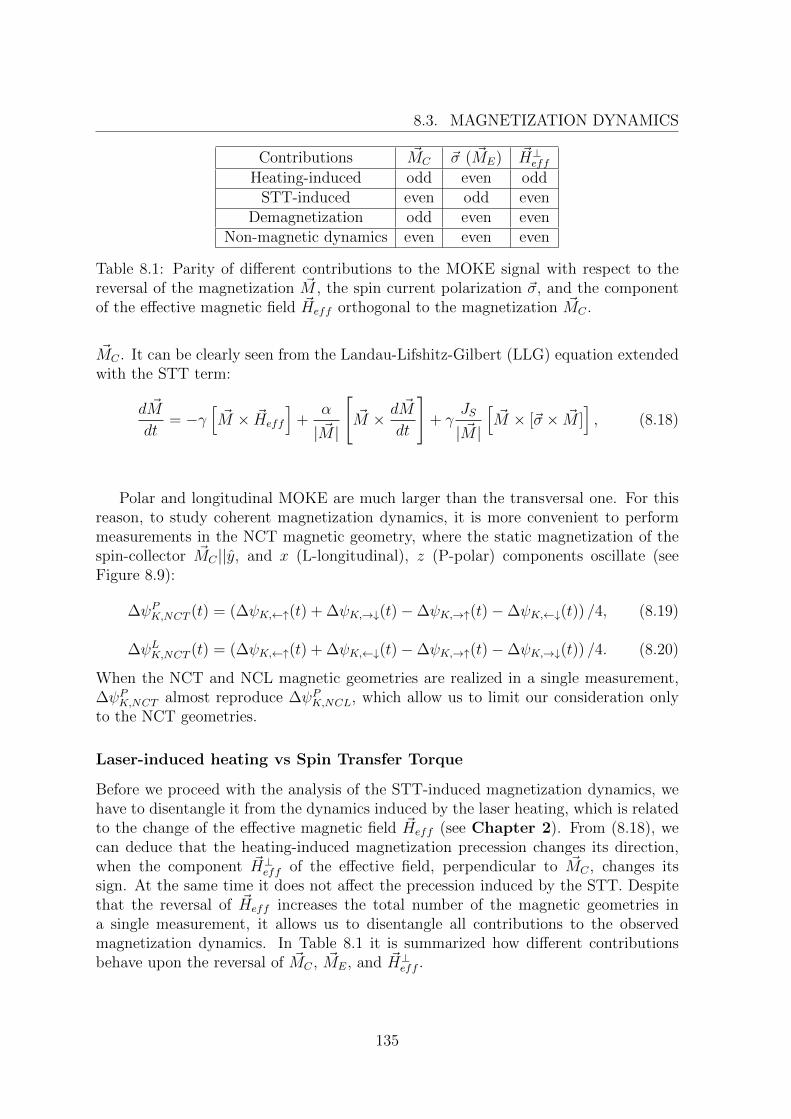
8.3. MAGNETIZATION DYNAMICS
Contributions ~MC ~σ ( ~ME) ~H⊥effHeating-induced odd even odd
STT-induced even odd evenDemagnetization odd even even
Non-magnetic dynamics even even even
Table 8.1: Parity of different contributions to the MOKE signal with respect to thereversal of the magnetization ~M , the spin current polarization ~σ, and the componentof the effective magnetic field ~Heff orthogonal to the magnetization ~MC .
~MC . It can be clearly seen from the Landau-Lifshitz-Gilbert (LLG) equation extendedwith the STT term:
d ~M
dt= −γ
[~M × ~Heff
]+
α
| ~M |
[~M × d ~M
dt
]+ γ
JS
| ~M |
[~M × [~σ × ~M ]
], (8.18)
Polar and longitudinal MOKE are much larger than the transversal one. For thisreason, to study coherent magnetization dynamics, it is more convenient to performmeasurements in the NCT magnetic geometry, where the static magnetization of thespin-collector ~MC ||y, and x (L-longitudinal), z (P-polar) components oscillate (seeFigure 8.9):
∆ψPK,NCT (t) = (∆ψK,←↑(t) + ∆ψK,→↓(t)−∆ψK,→↑(t)−∆ψK,←↓(t)) /4, (8.19)
∆ψLK,NCT (t) = (∆ψK,←↑(t) + ∆ψK,←↓(t)−∆ψK,→↑(t)−∆ψK,→↓(t)) /4. (8.20)
When the NCT and NCL magnetic geometries are realized in a single measurement,∆ψPK,NCT almost reproduce ∆ψPK,NCL, which allow us to limit our consideration onlyto the NCT geometries.
Laser-induced heating vs Spin Transfer Torque
Before we proceed with the analysis of the STT-induced magnetization dynamics, wehave to disentangle it from the dynamics induced by the laser heating, which is relatedto the change of the effective magnetic field ~Heff (see Chapter 2). From (8.18), wecan deduce that the heating-induced magnetization precession changes its direction,when the component ~H⊥eff of the effective field, perpendicular to ~MC , changes itssign. At the same time it does not affect the precession induced by the STT. Despitethat the reversal of ~Heff increases the total number of the magnetic geometries ina single measurement, it allows us to disentangle all contributions to the observedmagnetization dynamics. In Table 8.1 it is summarized how different contributionsbehave upon the reversal of ~MC , ~ME, and ~H⊥eff .
135
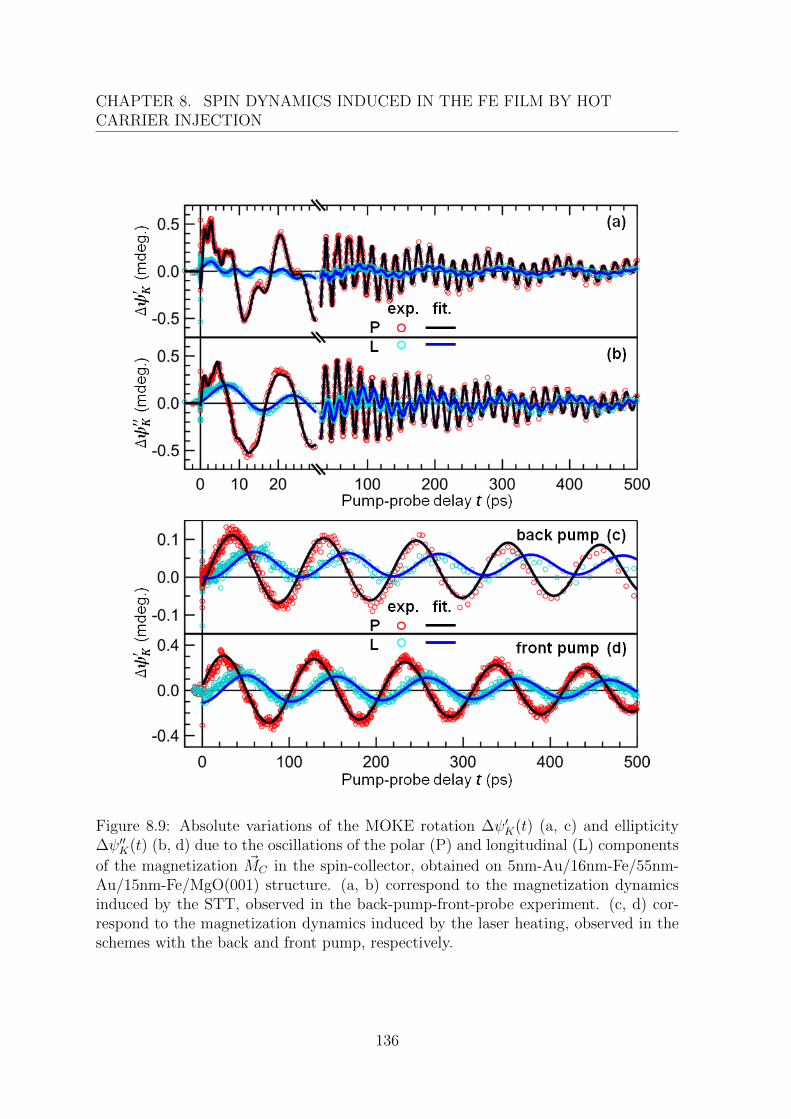
CHAPTER 8. SPIN DYNAMICS INDUCED IN THE FE FILM BY HOTCARRIER INJECTION
Figure 8.9: Absolute variations of the MOKE rotation ∆ψ′K(t) (a, c) and ellipticity∆ψ′′K(t) (b, d) due to the oscillations of the polar (P) and longitudinal (L) components
of the magnetization ~MC in the spin-collector, obtained on 5nm-Au/16nm-Fe/55nm-Au/15nm-Fe/MgO(001) structure. (a, b) correspond to the magnetization dynamicsinduced by the STT, observed in the back-pump-front-probe experiment. (c, d) cor-respond to the magnetization dynamics induced by the laser heating, observed in theschemes with the back and front pump, respectively.
136
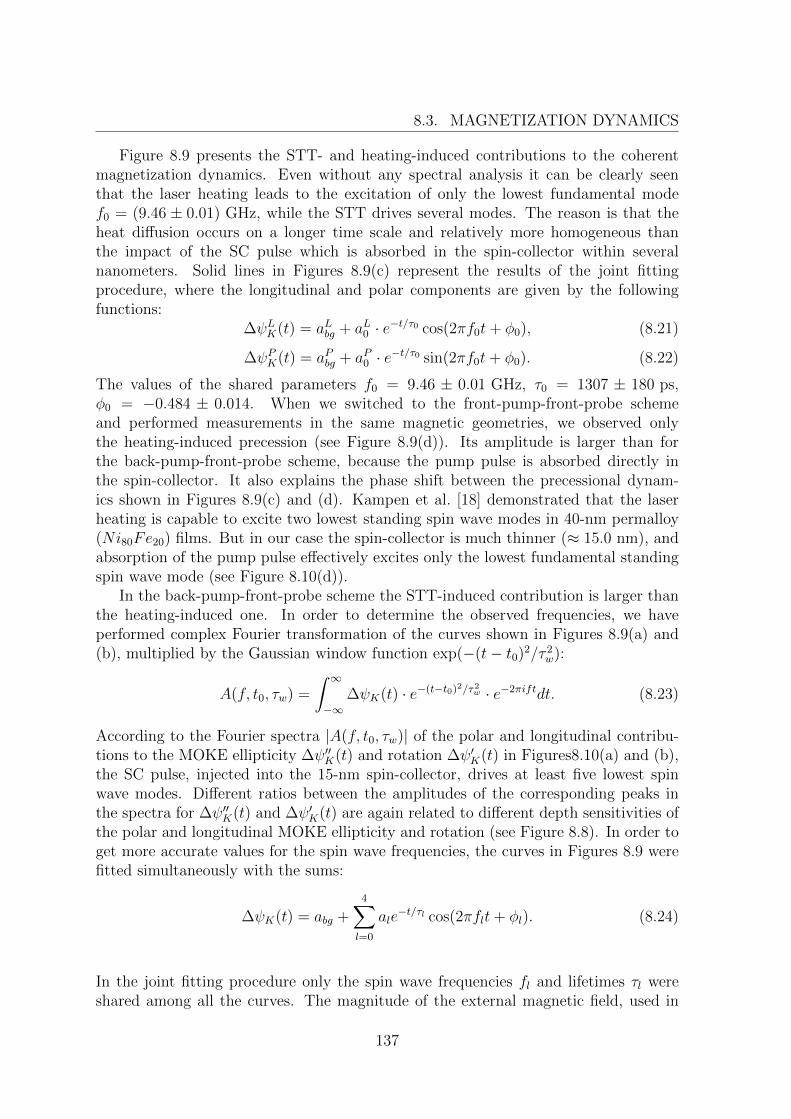
8.3. MAGNETIZATION DYNAMICS
Figure 8.9 presents the STT- and heating-induced contributions to the coherentmagnetization dynamics. Even without any spectral analysis it can be clearly seenthat the laser heating leads to the excitation of only the lowest fundamental modef0 = (9.46 ± 0.01) GHz, while the STT drives several modes. The reason is that theheat diffusion occurs on a longer time scale and relatively more homogeneous thanthe impact of the SC pulse which is absorbed in the spin-collector within severalnanometers. Solid lines in Figures 8.9(c) represent the results of the joint fittingprocedure, where the longitudinal and polar components are given by the followingfunctions:
∆ψLK(t) = aLbg + aL0 · e−t/τ0 cos(2πf0t+ φ0), (8.21)
∆ψPK(t) = aPbg + aP0 · e−t/τ0 sin(2πf0t+ φ0). (8.22)
The values of the shared parameters f0 = 9.46 ± 0.01 GHz, τ0 = 1307 ± 180 ps,φ0 = −0.484 ± 0.014. When we switched to the front-pump-front-probe schemeand performed measurements in the same magnetic geometries, we observed onlythe heating-induced precession (see Figure 8.9(d)). Its amplitude is larger than forthe back-pump-front-probe scheme, because the pump pulse is absorbed directly inthe spin-collector. It also explains the phase shift between the precessional dynam-ics shown in Figures 8.9(c) and (d). Kampen et al. [18] demonstrated that the laserheating is capable to excite two lowest standing spin wave modes in 40-nm permalloy(Ni80Fe20) films. But in our case the spin-collector is much thinner (≈ 15.0 nm), andabsorption of the pump pulse effectively excites only the lowest fundamental standingspin wave mode (see Figure 8.10(d)).
In the back-pump-front-probe scheme the STT-induced contribution is larger thanthe heating-induced one. In order to determine the observed frequencies, we haveperformed complex Fourier transformation of the curves shown in Figures 8.9(a) and(b), multiplied by the Gaussian window function exp(−(t− t0)2/τ 2
w):
A(f, t0, τw) =
∫ ∞−∞
∆ψK(t) · e−(t−t0)2/τ2w · e−2πiftdt. (8.23)
According to the Fourier spectra |A(f, t0, τw)| of the polar and longitudinal contribu-tions to the MOKE ellipticity ∆ψ′′K(t) and rotation ∆ψ′K(t) in Figures8.10(a) and (b),the SC pulse, injected into the 15-nm spin-collector, drives at least five lowest spinwave modes. Different ratios between the amplitudes of the corresponding peaks inthe spectra for ∆ψ′′K(t) and ∆ψ′K(t) are again related to different depth sensitivities ofthe polar and longitudinal MOKE ellipticity and rotation (see Figure 8.8). In order toget more accurate values for the spin wave frequencies, the curves in Figures 8.9 werefitted simultaneously with the sums:
∆ψK(t) = abg +4∑l=0
ale−t/τl cos(2πflt+ φl). (8.24)
In the joint fitting procedure only the spin wave frequencies fl and lifetimes τl wereshared among all the curves. The magnitude of the external magnetic field, used in
137
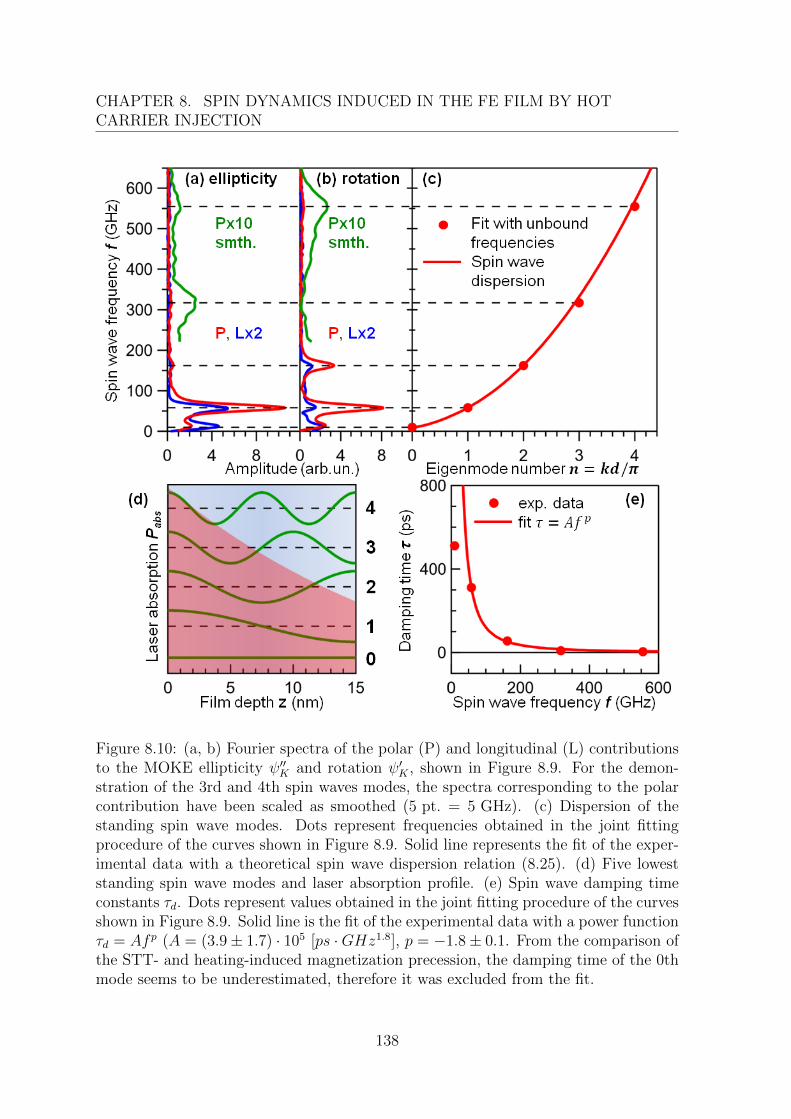
CHAPTER 8. SPIN DYNAMICS INDUCED IN THE FE FILM BY HOTCARRIER INJECTION
Figure 8.10: (a, b) Fourier spectra of the polar (P) and longitudinal (L) contributionsto the MOKE ellipticity ψ′′K and rotation ψ′K , shown in Figure 8.9. For the demon-stration of the 3rd and 4th spin waves modes, the spectra corresponding to the polarcontribution have been scaled as smoothed (5 pt. = 5 GHz). (c) Dispersion of thestanding spin wave modes. Dots represent frequencies obtained in the joint fittingprocedure of the curves shown in Figure 8.9. Solid line represents the fit of the exper-imental data with a theoretical spin wave dispersion relation (8.25). (d) Five loweststanding spin wave modes and laser absorption profile. (e) Spin wave damping timeconstants τd. Dots represent values obtained in the joint fitting procedure of the curvesshown in Figure 8.9. Solid line is the fit of the experimental data with a power functionτd = Afp (A = (3.9± 1.7) · 105 [ps ·GHz1.8], p = −1.8± 0.1. From the comparison ofthe STT- and heating-induced magnetization precession, the damping time of the 0thmode seems to be underestimated, therefore it was excluded from the fit.
138
8.3. MAGNETIZATION DYNAMICS
the experiments, was negligibly small in comparison with the anisotropy field Han ≈550 Oe [153] and 4πMs ≈ 2.2 T, therefore the theoretical spin wave dispersion rela-tion (2.47) can be rewritten as:
f(k) = γ√
(Hanis +Dk2) · (Hanis + 4πMs +Dk2), (8.25)
where the absence of pinning at the Au/Fe and Fe/MgO interfaces dictates that for thestanding spin waves k = πn/dFe. From the neutron scattering measurements [107] andspin-polarized electron energy loss spectroscopy [108], we know the exchange stiffness
D = 280 A2 ·meV . Thus the only adjustable parameter is the Fe thickness dFe. For
the experimental dependence of the spin wave frequency f on the spin wave modenumber (see Figure 8.10(c)), we obtain dFe = (14.3 ± 0.1) nm, which is close to 14.7nm, measured by Dr. Vladimir Roddatis with the transmission electron microscope.
Consideration of the LLG equation (8.18) with the damping parameter α inde-pendent of the spin wave frequency f leads to the spin wave lifetime τl ∼ 1/fl [104].However, in the experiment τl ∼ f−1.8
l (see Figure 8.10(e)). Relaxation of the excitedspin waves occurs via the interaction of the magnetic system with the electron andlattice systems. Detailed explanation of the observed dependence τ(f) requires furtherinvestigation.
The laser-induced STT has been already observed by Schellekens et al. [17] and Choiet al. [154]. In contrast to the present work, STT-induced magnetization dynamicsin [17, 154] is limited to the fundamental mode with k = 0, corresponding to thehomogeneous magnetization precession. The reason is that the thicknesses of theferromagnetic layers were only few nm and comparable to the absorption length of theSC. In our experiments we demonstrate excitation of the fourth standing spin wavemode with the wavelength λ4 = dFe/2 ≈ 7.5 nm (see Figure 8.10(d)). From theconsideration of the incoherent dynamics in the PCL, ACL and NCL geometries, weknow approximate temporal profiles of the MOKE contributions from the Au layer to∆ψ′LK (t) and ∆ψ′′LK (t). Subtracting these contributions from ∆ψ′LK (t) and ∆ψ′′LK (t), itis evident that the laser-induced SC tilts the magnetic moments of the spin-collectorin the vicinity of the Au/Fe interface towards ~ME. This fact is consistent with thatthe HC packet, injected from the spin-emitter into the Au spacer, is dominated bythe majority electrons (see Chapter 7). For this reason, there is no sign change ofthe spatial STT profile in the spin-collector. It brings us to the condition for theexcitation of the inhomogeneous spin wave modes: the characteristic length λSC of theSC absorption in the spin-collector should be smaller or comparable to the quarter-wavelength of the highest spin wave mode, i.e. λSC ∼ λ4/4 ≈ 1.9 nm.
When dFe ∼ λSC , the STT can be considered to be uniform within the spin-collector, and its modelling is rather simple. For large dFe it takes some time for theSC-induced perturbation of the magnetic order to propagate across the spin-collector.In other words, during first two picoseconds after the optical excitation of the spin-emitter, the standing spin waves in the spin-collector are not established yet. Assumingthat the injection of the SC into the spin-collector during first picosecond leads tothe tilt of the magnetization only in the 4-nm region close to the Au/Fe interface,we estimated the average magnetization component in this region, orthogonal to the
139
CHAPTER 8. SPIN DYNAMICS INDUCED IN THE FE FILM BY HOTCARRIER INJECTION
static magnetization ~MC , at about 0.006 [MFe]. This is very rough estimation, but itagrees with the amplitude of the standing spin waves established on a larger time scale0.002 [MFe]
5.
8.4 Conclusions
Spin dynamics, induced in a ferromagnetic film by the injection of the laser-inducedSC, has been studied on pseudo spin valve Fe/Au/Fe/MgO(001) structures with thetime-resolved MOKE and mSHG. Realizing different mutual orientations of the mag-netizations ~ME and ~MC in the spin-emitter and the spin-collector, it has been proventhat the mSHG is sensitive to the SC flowing across the metallic multilayer structure,while the MOKE is exclusively sensitive to the magnetization. Temporal profile of theSC-induced contribution to the mSHG agrees with the data, presented in Chapter 7,and the proposed scenario of the non-equilibrium spin Seebeck effect. The front ofthe SC pulse consists of the optically excited electrons, leaving the spin-emitter in theballistic regime, while the trailing part is formed by the secondary electrons, providinga net flux of the positive SP as long as the electron temperature in Fe is large than inAu.
Since the STT exerted on ~MC by the laser-induced SC is proportional to the SCcomponent polarized in the orthogonal direction, in the magnetic geometries, where~ME ↑↑ ~MC or ~ME ↓↑ ~MC , we observed only variations of the magnitude of the mag-
netization vector ~MC . At the same time, when ~ME ⊥ ~MC , the MOKE rotationψ′K(t) and ellipticity ψ′′K(t) exhibited various dynamics, which includes precession of
the magnetization ~MC (coherent dynamics), demagnetization (incoherent dynamics)and non-magnetic effects affecting the MOKE signals. Owing to different parity ofthese contributions with respect to the reversal of ~ME and ~MC , the coherent and inco-herent dynamics can be easily disentangled. Moreover, applying the external magneticfield in different directions for each magnetic geometry, it is even possible to separatethe heating- and STT-induced magnetization precession (see Table 8.1). The spatialprofile of the STT is essentially non-uniform, which results in the excitation of theseveral standing spin wave modes in the 15-nm spin-collector (see Figures 8.9). Thelaser-induced heating drives only the fundamental mode, corresponding to the homoge-neous magnetization precession. In Chapter 7 it has been shown that the SC flowingfrom the spin-emitter is dominated by the majority electrons with ~σe ↑↑ ~ME. Fromthe MOKE data measured on the three-layer Fe/Au/Fe/MgO(001) structure, it is also
evident that the injection of the laser-induced SC into the spin-collector tilts ~MC to-wards ~ME. Assuming no sign change in the spatial profile of the STT, excitation of thefourth standing spin wave mode (k4 = 4π/dFe) demands that the absorption length ofthe SC in the spin-collector λSC is comparable to the quarter-wavelength of the fourthmode λ4/4 ≈ 1.9 nm.
All experimental data obtained on the Au/Fe/MgO(001) and Fe/Au/Fe/MgO(001)
5In the geometries, where ~MC‖x, the static MOKE rotation and ellipticity are ψ′K,0 = 43 mdeg.and ψ′′K,0 = 90 mdeg., respectively.
140

8.4. CONCLUSIONS
structures are consistent with each other, which sustains the proposed scenario of theHC transport and the HC-driven magnetization dynamics. Subsequently our data canbe used to verify the results of the ab initio calculations and develop theoretical modelswhich more accurately describe the observations.
141

Chapter 9
Conclusions
9.1 Summary and Conclusions
Ultrafast hot carrier (HC) driven magnetization dynamics in metallic multilayer struc-tures have been studied using the time-resolved linear and nonlinear optical spec-troscopy. The present work is focused on several aspects of the laser-induced magne-tization dynamics:
• ultrafast laser-induced demagnetization of ferromagnetic films;
• transport of the spin-polarized HCs in a noble metal;
• magnetization dynamics induced in a ferromagnetic film by the injection of thespin-polarized HCs.
Each aspect has its special meaning and can be discussed separately from the others,but together they allow to develop a self-consistent model, describing all experimentalresults.
Ultrafast laser-induced demagnetization
Upon the laser excitation of a ferromagnetic film, both HC transport and spin-flip pro-cesses contribute to ultrafast demagnetization. The spin-flip processes, leading to thechange of the magnetization, have to be accompanied with the transfer of the angularmomentum to the lattice, which is so-called ‘bottle neck‘, determining the spin-fliprate. At the same time, demagnetization, induced by the HC transport, depends onlyon the velocities and lifetimes of the majority and minority HCs carrying oppositespins. Since it is impossible to exclude the influence of the spin-flip processes, pump-probe experiments have been performed on a 8-nm Fe film grown on a nonconductingMgO substrate and capped with 3 nm of MgO. Due to a homogeneous laser absorp-tion profile, the HC transport can be neglected and the magnetization dynamics isgoverned only by the spin-flip processes. In order to be more sensitive the generationof the non-equilibrium (NEQ) HCs, we have utilized the pump and probe pulses withidentical photon energies ~ωprobe = ~ωpump = 1.5 eV . Spin is conserved in the optical
143
CHAPTER 9. CONCLUSIONS
transitions, therefore there is no change of the magnetization at the time zero. As-suming that variation of the magneto-optical constants modifies the MOKE rotationδψ′K(t) and ellipticity δψ′′K(t) with the same temporal profile, determined by the dif-ference B(t) = δψ′′K(t)− δψ′K(t), it is possible to evaluate real magnetization dynamicsδM(t). Using simple phenomenological model to reproduce the relative variations ofthe linear reflectivity δR(t), MOKE rotation δψ′K(t) and ellipticity δψ′′K(t), it has beenfound that demagnetization of the Fe film occurs on the time scale of the electron-electron thermalization (τM = τee = 0.21± 0.01 ps), meaning that it is dominated bythe NEQ HCs. Subsequent recovery of the magnetization occurs on the time scale ofthe electron-phonon thermalization τR = τep = 1.06 ± 0.03 ps. So it is mostly deter-mined by the thermalized HCs. Owing to 20-fs experimental time resolution, we haveexcluded any other possible assignments of the observed time scales. Moreover, thecharacteristic time of the electron-electron thermalization τee is in agreement with thephotoemission studies performed on Fe [88] and Ni [76].
In order to go beyond the phenomenological description, we have tried to reproduceour data within the M3TM suggested by Koopmans et al. [86]. However, it is notcapable to describe the complete set of the linear magneto-optical signals and considersan instantaneous electron thermalization, which contradicts with our experimentalresults. Describing the HC and magnetization dynamics in terms of the energy flux andthe transfer of the angular momentum, we have developed a microscopic model. It hasbeen suggested that the magnetization change rate is proportional to the energy fluxfrom the NEQ and thermalized HCs to the lattice. In spite of the made assumptions,our microscopic model can perfectly reproduce all measured curves δR(t), δψ′K(t) andδψ′′K(t). It has revealed the dominant role of the NEQ HCs in ultrafast spin dynamics,as it was suggested by Carva et al. [96]. This result can be explained by the fact thatfor the NEQ HCs the phase space available for the spin-flip processes is larger thanthat for the thermalized HCs. However, in contrast to [96], we have found that thethermalized HCs contribute mostly to the recovery of the magnetization.
In order to understand the role of the HC transport, pump-probe experiments havebeen performed on two-layer Au/Fe/MgO(001) structures, where Au serves a sink ofheat and spin polarization (SP). In this case the most important parameters are theballistic lengths of the majority and minority HCs, and the transmission through theFe/Au interface. Analyzing the MOKE data, measured on Au/Fe/MgO(001) with 130nm of Au and different Fe thicknesses, and comparing them with those, obtained onthe 8-nm Fe film, it has been revealed that the HC transport plays a considerable rolein ultrafast demagnetization of the ferromagnetic film. Because of the different depthsensitivities, the MOKE rotation ψ′K(t) and ellipticity ψ′′K(t) are affected differentlyby the non-uniform magnetization dynamics and the variation of the magneto-opticalconstants.
Transport of the spin-polarized hot carriers in a noble metal
Probing the Au side of the Au/Fe/MgO(001), it has been demonstrated that the opticalexcitation of the Fe film leads to the generation of the spin current (SC) flowing inthe Au layer. This effect is an analog of the spin Seebeck effect [152], but in our
144
9.1. SUMMARY AND CONCLUSIONS
case it is dominated by the NEQ HCs. From the analysis of the mSHG and MOKEdata, measured on the Au/Fe/MgO(001) structures with different Au thicknesses, ithas been concluded that the front of the SC pulse consists of the optically excitedmajority electrons, leaving the Fe film in the ballistic regime, while the trailing part isformed by the secondary electrons, providing a net flux of the positive SP through theFe/Au interface as long as the electron temperature in Fe is larger than in Au. Bothoptically excited and secondary majority electrons propagate in Au in a quasi-ballisticregime. It means that the shape of the SC pulse in Au is mostly determined by the HCflux through the Fe/Au interface. The characteristic time of the electron equilibrationbetween the Fe and Au films has been estimated at 0.56±0.03 ps. In addition to that,we have found the velocity of the optically excited electrons vAu1 = (1.06±0.06) nm/fsand their lifetimes τAu1 = (24± 4) fs in Au. Both values are close to the predictionsmade in the ab initio calculations [19, 106]. The secondary electrons have smallerbinding energies and hence longer lifetimes than the primary ones. However, theirvelocity distribution is more uniform and results in a smaller velocity projection alongthe normal to the film plane: vAu2 = (0.6± 0.4) nm/fs. The number of the electrons,optically excited in the vicinity of the Fe/Au interface, decreases with the Fe thickness.Thus changing the Fe thickness, one can control the ratio between the primary andsecondary electrons, forming the SC pulse in Au.
Performing measurements in the transversal and longitudinal magneto-optical ge-ometries, it has been shown that in addition to the contribution from the Au sur-face, the SC gives rise to the odd SH field ~ESC
2ω originating in the bulk of Au. FordAu > 65 nm, when there is no contribution from the Fe film neither to the MOKEnor to the mSHG, the SP-induced surface contribution to the SH contrast ρSP2ω (t)resembles the temporal profile of the MOKE ellipticity ψ′′K(t), indicating more orless uniform magnetization profile within the probed region of the Au layer. Thesame conclusion can be made from the independence of the ratio ψ′′K(t)/ψ′K(t) fromtime and the Au thickness. In the analysis of the experimental data, obtained prob-ing either the Fe side or the Au side of the Au/Fe/MgO(001) structures, we havefound the Voigt constant of gold qAu = 0.094 + 0.035i and estimated the averagemagnetization built up in the 75-nm Au layer by the SC flowing from the Fe film:MAu = QAu/qAu ≈ 0.0026 [MFe] ≈ 0.0082 [µB/atom].
Injection of the spin-polarized hot carriers into a ferromagnetic film
Epitaxial pseudo spin valve Fe/Au/Fe/MgO(001) structure is a good model system,where one Fe layer serves as the spin-emitter (E), and the other one serves as the spin-collector (C). Probing samples simultaneously from both sides with the MOKE and
the mSHG, one can easily identify the directions of the magnetizations ~ME and ~MC .Polarization of the direct SC is set by the magnetization ~ME. Depending on the mu-tual orientation of ~ME and ~MC , hot electrons, propagating towards the spin-collector,can be effectively transmitted through the Au/Fe interface or reflected from it. It hasbeen demonstrated that the laser-induced SC, polarized in the orthogonal directionwith respect to ~MC , exerts a torque on ~MC and drives its precessional motion. Unfor-tunately, the STT is not the only mechanism, which can excite coherent magnetization
145
CHAPTER 9. CONCLUSIONS
dynamics. The laser-induced heating of the ferromagnetic film leads to the reductionof the anisotropy field ~Hanis, thereby altering the direction of the effective magneticfield ~Heff . As a result, the magnetization starts to precess around new equilibrium
direction determined by ~Heff . Eventually because of the heat diffusion away from theferromagnetic film, the equilibrium direction of the magnetization recovers to its initialorientation. Typical thickness of the Au spacer is several tens of nanometers, thereforeit suppresses the direct interaction of the back pump with the spin-collector and theamplitude of the heating-induced coherent dynamics is not expected to be large incomparison with the STT-induced one. Nevertheless, realizing different mutual orien-tations of ~ME, ~MC and the external magnetic field ~Hext, it is possible to disentangle allcontributions to the magnetization dynamics and analyze them separately from eachother.
Since the SC, polarized in the orthogonal direction with respect to ~MC , is ab-sorbed in the small region of the spin-collector close to the Au/Fe interface, the spatialprofile of the STT is essentially non-uniform. In the experiments performed on theFe/Au/Fe/MgO(001) structure, where the back pump was applied from the side of the16-nm top Fe layer (spin-emitter) and the probe pulse was applied from the side of the15-nm bottom Fe layer (spin-collector), the laser-induced SC pulse excited four loweststanding spin waves modes. It gives us the estimation for the SC absorption length:λSC ≈ λ4/4 ≈ 1.9 nm.
Regarding the mSHG response, a more various set of the magnetic geometries (incomparison with the experiments performed on the two-layer Au/Fe/MgO(001) struc-tures) allowed us to prove that the mSHG signal possess the SC-induced contributionand derive its temporal profile.
9.2 Outlook
The present work shed light on laser-induced demagnetization of the ferromagneticfilms and the HC-driven magnetization dynamics in metallic multilayers. In the mostcases the dominant role was attributed to the NEQ HCs. Since the HC excitation andsubsequent dynamics may vary with the spectrum of the pump laser pulse or depend onthe studied materials, further investigation is required for complete understanding ofthe underlying elementary processes and development of the theoretical models tendingto describe the experimental observations.
Comparing our experimental results concerning laser-induced demagnetization ofthe Fe film with other works performed on Ni [25, 76, 80–84, 86, 89] and Co [75, 85],there are certain similarities between them. For instance, the characteristic time of theelectron thermalization should be about 200 fs. However, in terms of the magnetizationdynamics, only for Ni two demagnetization time scales have been observed [86, 89].In Chapter 5 we demonstrated the magnetization change rate due to the NEQ andthermalized HCs are proportional to the energy flux to the lattice. In general thecorresponding proportionality factors Γneq and Γeq depend on the initial and transientmagnetizations M0 and M(t), but for the demagnetization values achieved in the ex-periment we did not notice it. Probably this dependence is more pronounced for Ni
146
9.2. OUTLOOK
than for Fe and Co. It may also explain the transition between two regimes, when oneor two demagnetization time scales can be observed [86, 89].
On the example of the Au/Fe/MgO(001) structures, it was demonstrated that thelaser-induced transport of the spin-polarized HCs leads to the accumulation of the SP inAu, which in turn gives rise to the measurable MOKE rotation and ellipticity. The HCinjection from the ferromagnetic film into the non-magnetic layer is much more efficientthan the usage of the external magnetic field [155], therefore this technique can be usedto determine the magneto-optical constants of the non-magnetic materials. Also theobservation of the SC-induced SH signal from Au should inspire reconsideration of theprevious works like [106] and more wide application of the mSHG as the nonlinear-optical technique for direct monitoring of SC pulses.
In light of further development of the magnetic storage devices, investigation of thelaser-induced SC pulses and SC-induced dynamics will continue to attract interest ofmany research groups. Eventually it may lead to a new breakthrough in spintronics.
147

Appendix A
Lists
A.1 Abbreviations
DAQ Data acquisitionDOS Density of statesEQ HCs Equilibrium (thermalized) hot carriersGVD Group velocity dispersionHC Hot carrierMRAM Magnetic random access memorymSHG Magneto-induced Second Harmonic GenerationMOKE Magneto-optical Kerr effectM3TM Microscopic three-temperature modeML MultilayerNEQ HCs Non-equilibrium HCsPMT Photomultiplier tubeRF Radio frequencySH Second HarmonicSHG Second Harmonic GenerationSC Spin currentSP Spin polarizationSTT Spin Transfer Torque2PPE Two-photon-photoemission2TM Two-temperature modelXMCD X-ray magnetic circular dichroism
149
APPENDIX A. LISTS
A.2 List of publications
Publication within this thesis
• A. Melnikov, A. Alekhin, D. Brstel, D. Diesing, T.O. Wehling, I. Rungger, M.Stamenova, S. Sanvito, and U. Bovensiepen: Ultrafast Non-local Spin Dynamicsin Metallic Bi-Layers by Linear and Non-linear Magneto-Optics. In: J-Y. Bigot,W. Hbner, T. Rasing, R. Chantrell (eds.), Ultrafast Magnetism I Proceedings ofUltrafast Magnetism Conference, Strasbourg, October 2013, Springer Proceed-ings in Physics, 159, 3436 (2015) [2014]
• A. Alekhin, D. Burstel, A. Melnikov, D. Diesing, and U. Bovensiepen: UltrafastLaser-Excited Spin Transport in Au/Fe/MgO(001): Relevance of the Fe LayerThickness. In: J-Y. Bigot, W. Hbner, T. Rasing, R. Chantrell (eds.), Ultra-fast Magnetism I Proceedings of Ultrafast Magnetism Conference, Strasbourg,October 2013, Springer Proceedings in Physics, 159, 241143 (2015) [2014]
Publication concerning other topics
• A.I. Alekhin, S.V. Zabotnov, L.A. Golovan’, P.A. Perminov, and P.K. Kashkarov”Dynamics of the pulsed picosecond laser ablation of silicon targets”, J. Opt.Technol. 78, 161 (2011).
In preparation
• A. Alekhin, I. Razdolski, M. Munzenberg, A. Melnikov ”Role of non-equilibriumhot carriers in ultrasfast laser-induced demagnetization of Fe”, in preparation forPhysical Review B
• I. Razdolski, A. Alekhin, N. Ilin, J. Meyburg, D. Diesing, V. Roddatis, I. Rung-ger, M. Stamenova, S. Sanvito, T.O. Wehling, U. Bovensiepen, and A. Melnikov”Ultrafast transport of spin-polarized hot carriers in Fe/Au/Fe/MgO(001): non-equilibrium spin Seebeck effect and spin current reflection at interfaces”, in prepa-ration for Physical Review Letters
• I. Razdolski, A. Alekhin, and A. Melnikov ”Strongly inhomogeneous ultrafastmagnetization dynamics optically excited via spin transfer torque mechanism”,in preparation for Nature Physics
150

A.3. CURRICULUM VITAE
A.3 Curriculum vitae
The curriculum vitae is omitted in the online version due to data privacy.
151

Appendix B
Acknowledgements
This research was supported by the Deutsche Forschungsgemeinschaft (ME 3570/1,Sfb 616), by the EU 7-th frame-work program (CRONOS) and by the Max-Planck-Gesellschaft (scholarship for doctoral students). This work would not have been possi-ble without help and support of many people to whom I want to express my gratitude:
• Prof. Dr. Martin Wolf for giving me an opportunity to perform my PhD studiesunder his supervision and to work in the lab at the Fritz Haber Institute of theMax Planck Society on very exciting topic.
• Prof. Dr. Martin Weinelt for becoming my second referee and being a part ofthe thesis committee, for the fruitful discussions.
• Dr. Alexey Melnikov for cosupervising my work, for his expertise and knowledgein the nonlinear optics, solid state physics and time-resolved techniques, that heshared with me, for constructive criticism and useful advices.
• Dr. Detleft Diesing (University of Duisburg-Essen) and his PhD students DamianBurstel and Jan Meyburg for the preparation of the two-layer Au/Fe/MgO(001)and the three-layer Fe/Au/Fe/MgO(001) structures; Dr. Markus Munzenberg(Ernst Moritz Arndt University of Greifswald) for the preparation of thin poly-crystalline Fe films capped with the MgO.
• Prof. Dr. Uwe Bovensiepen (University of Duisburg-Essen), Dr. Tobias Kampfrath,Dr. Ilya Razdolski for fruitful discussions.
• Dr. Tim O. Wehling, Prof. Dr. Alexander Lichtenstein, Dr. Ivan Rungger, Dr.Stefano Sanvito and Dr. Maria Stamenova for collaboration and performance ofthe ab initio calculations.
• Dr. Vladimir Roddatis for the electron microscopy of the studied samples.
• Marcel Krenz for his expertise and knowledge in the laser physics and lasertechnology.
• Albrecht Ropers for technical support.
153
APPENDIX B. ACKNOWLEDGEMENTS
• Thomas Zehentbauer, Viktor Platschkowski for help in the construction of theMOKE detectors.
• Workshop department for fast and high quality production of different parts usedin the experimental setup
• All current and former members of the Fritz-Haber-Institute for the good atmo-sphere and support: Dr. Alex Paarmann, Dr. Kramer Campen, Dr. KarstenHorn, Dr. Takashi Kumagai, Dr. Ralph Ernstorfer, Dr. Julia Stahler, LukasBraun, Jan-Christoph Deinert, Dr. Daniel Wegkamp, Laura Foglia, Dr. NikitaIlin, Dr. Marc Herzog, Sebastian Mahrlein, Selene Mor, Christopher Nicholson,Dr. Stephan Bottcher, Dr. Hendrik Vita and many others.
• Last but not least, I would like to thank my family and friends for their under-standing, support and encouragement.
154
Bibliography
[1] J. Kilby U.S. Patent 3.138.743 (Filed Feb. 1959).
[2] J. Kilby ”Invention of the Integrated Circuit IEEE Transactions on ElectronDevices”, ED23 (7): 648-654 (1976).
[3] www.intel.com
[4] Martin Hilbert, Lopez Priscila ”The World’s Technological Capacity to Store,Communicate, and Compute Information”, Science 332: 6065 (2011)
[5] . T. Kawahara, R. Takemura, K. Miura, J. Hayakawa, S. Ikeda, Y.M. Lee, R.Sasaki, Y. Gotot, K. Ito, T. Meguro, F. Matskura, H. Takahash, H. Matsuoka,and H. Ohno ”2 Mb SPRAM (Spin-Transfer Torque RAM) with bit-by-bit bi-directional current write and parallelizing-direction current read”, IEEE J Solid-State Circuits 43, 109 (2008)
[6] J.C. Slonczewski ”Current-driven excitation of magnetic multilayers”, J. Magn.Magn. Mater. 159, L1 (1996)
[7] L. Berger ”Emission of spin waves by a magnetic multilayer traversed by a cur-rent”, Phys. Rev. B 54, 9353 (1996)
[8] J.C. Slonczewski ”Excitation of spin waves by an electric current”, J. Magn.Magn. Mater. 195, L261 (1999).
[9] E.B. Myers, D.C. Ralph, J.A. Katine, R.N. Louie, R.A. Buhrman ”Current-induced switching of domains in magnetic multilayer devices”, Science 285, 867(1999).
[10] D.C. Ralph, M.D. Stiles ”Spin transfer torques”, J. Magn. Magn. Mater. 320,1190 (2008).
[11] I.N. Krivorotov, N.C. Emley, J.C. Sankey, S.I. Kiselev, D.C. Ralph, R.A.Buhrman ”Time-domain measurements of nanomagnet dynamics driven by Spin-Transfer Torques”, Science 307, 228 (2005).
[12] S. Serrano-Guisan, K. Rott, G. Reiss, J. Langer, B. Ocker, and H.W. Schumacher”Biased Quasiballistic Spin Torque Magnetization Reversal”, Phys. Rev. Lett.101, 087201 (2008).
155
BIBLIOGRAPHY
[13] S. Garzon, L. Ye, R.A. Webb, T.M. Crawford, M. Covington, and S. Kaka ”Co-herent control of nanomagnet dynamics via ultrafast spin torques pulses”, Phys.Rev. B 78, 180401 (2008).
[14] Y. Acremann, J.P. Strachan, V. Chembrolu, S.D. Andrews, T. Tyliszczak, J.A.Katine, M.J. Carey, B.M. Clemens, H.C. Siegmann, and J. Stohr ”Time-resolvedimaging of Spin Transfer Switching: beyond the macrospin concept”, Phys. Rev.Lett. 96, 217202 (2006).
[15] J.P. Strachan, V. Chembrolu, Y. Acremann, X.W. Yu, A.A. Tulapurkar, T.Tyliszczak, J.A. Katine, M.J. Carey, M.R. Scheinfein, H.C. Siegmann, and J.Stohr ”Direct observation of spin-torque driven magnetization reversal throughnonuniform modes”, Phys. Rev. Lett. 100, 247201 (2008).
[16] G. Malinowski, F. Dalla Longa, J.H.H. Rietjens, P.V. Paluskar, R. Huijink,H.J.M. Swagten, and B. Koopmans ”Control of speed and efficiency of ultra-fast demagnetization by dirrect transfer of spin angular momentum”, NaturePhysics 4, 855 (2008).
[17] A.J. Schellekens, K.C. Kuiper, R.R.J.C. de Wit, and B. Koopmans ”Ultrafastspin-transfer torque driven by femtosecond pulsed-laser excitation”, Nature Com-mun. 5, 4333 (2014).
[18] M. van Kampen, C. Jozsa, J.T. Kohlhepp, P. LeClair, L. Lagae, W.J.M. deJonge, and B. Koopmans ”All-optical probe of coherent spin waves”, Phys. Rev.Lett. 88, 227201 (2002).
[19] V.P. Zhukov, E.V. Chulkov, and P.M. Echenique, ”Lifetimes and inelastic meanfree path of low-energy excited electrons in Fe, Ni, Pt, and Au: Ab initio GW+Tcalculations”, Phys. Rev. B 73, 125105 (2006).
[20] M.D. Stiles, A. Zangwill ”Anatomy of spin transfer torque”, Phys. Rev. B 66,014407 (2002).
[21] W. Kim, S.-W. Lee, and K.-J. Lee ”Micromagnetic modelling on magnetizationdynamics in nanopillars driven by spin-transfer torque”, J. Phys. D: Appl. Phys.44, 384001 (2011).
[22] M. Battiato, K. Carva, and P.M. Oppeneer ”Superdiffusive Spin Transport as aMechanism of Ultrafast Demagnetization”, Phys. Rev. Lett. 105, 027203 (2010).
[23] M. Battiato, K. Carva, and P.M. Oppeneer ”Theory of laser-induced ultrafast su-perdiffusive spin transport in layered heterostructures”, Phys. Rev. B 86, 024404(2012).
[24] A. Eschenlohr, M. Battiato, P. Maldonado, N. Pontius, T. Kachel, K. Holldack,R. Mitzner, A. Fhlisch, P.M. Oppeneer, and C. Stamm ”Ultrafast spin transportas key to femtosecond demagnetization”, Nature Materials 12, 332 (2013).
156
BIBLIOGRAPHY
[25] E. Beaurepaire, J.-C. Merle, A. Daunois, and J.-Y. Bigot ”Ultrafast Spin Dy-namics in Ferromagnetic Nickel”, Phys. Rev. Lett. 76, 22, 4250 (1996).
[26] A. Kirilyuk, A.V. Kimel, and T. Rasing ”Ultrafast optical manipulation of mag-netic order”, Rev. Mod. Phys. 82, 2731-2784 (2010).
[27] J. Zak, E.R. Moog, C. Liu, and S.D. Bader ”Universal approach to magneto-optics”, JMMM 89, 107 (1990).
[28] J. Zak, E.R. Moog, C. Liu, and S.D. Bader ”Fundamental magnetooptics”, J.Appl. Phys. 68, 4203 (1990).
[29] J. Stohr and H.C. Siegmann ”Magnetism: From Fundamentals to NanoscaleDynamics”, Springer, Berlin (2006).
[30] L.D. Landau, E.M. Lifshitz ”Quantum mechanics - Non relativistic theory”,Course of theoretical physics, Volume 3, Institute of Physical Problems USSR,Academy of Science, Pergamon Press (1965).
[31] E.P. Wohlfarth, in Ferromagnetic Materials. A Handbook on the Properties ofMagnetically Ordered Substances, ed. by E.P. Wohlfarth, North-Holland, Ams-terdam (1980).
[32] S.P. Walch, W.A. Goddard III ”Theoretical studies of the bonding of sulfur tomodels of the (100)suface of nickel”, Surf. Sci. 72, 645 (1978).
[33] H. Ibach, H. Luth ”Solid-State Physics: An Introduction to Principles of Mate-rials Science”, fourth edition, Springer (2009).
[34] R.M. Bozorth ”Directional ferromagnetic properties of metals”, J. Appl. Phys.8, 575 (1937).
[35] V.A. Bokov ”Applied solid state physics. Physics of magnetic materials” (2002).
[36] V.Yu. Irkhin, Yu.P. Irkhin ”Electronic configuration, physical properties andcorrelation‘effects in d- and f-metals, and their compounds”, monograph, RussianAcademy of Science, Ural department, Institute for physics of metals (2004).
[37] N.F. Mott ”A discussion of the transition metals on the basis of quantum me-chanics.”, Proc. Phys. Soc. (London) 47, 571 (1935).
[38] J.C. Slater ”The Ferromagnetism of Nickel”, Phys. Rev. 49, 537 (1936).
[39] J.C. Slater ”The Ferromagnetism of Nickel. Temperature effects.”, Phys. Rev.49, 931 (1936).
[40] E.C. Stoner ”Collective electron specific heat and spin paramagnetism in metals”,Proc. Roy. Soc. (London) A 154, 656 (1936).
157
BIBLIOGRAPHY
[41] E.C. Stoner ”Collective electron ferromagnetism”, Proc. Roy. Soc. (London) A165, 372 (1938).
[42] F.J. Himpsel, J.E. Ortega, G.J. Mankey, R.F.Willis ”Magnetic nanostructures”,Adv. Phys. 47, 511 (1998).
[43] F.J. Himpsel, K.N. Altmann, in ”Solid State Photoemission and Related Meth-ods”, ed. by W. Schattke, M.V. Hove, Wiley-VCH Verlag, Weinheim (2003).
[44] J. Schafer, M. Hoinkis, Eli Rotenberg, P. Blaha, and R. Claessen ”Fermi surfaceand electron correlation effects of ferromagnetic iron”, Phys. Rev. B 72, 155115(2005).
[45] V.L. Moruzzi, J.F. Janak, A.R. Williams ”Calculated electronic properties ofmetals”, N.Y.: Pergamon Press (1978).
[46] K.H. Bennemann (ed.) ”Nonlinear optics in metals”, Clarendon Press, Oxford(1998).
[47] W. Greiner, L. Neise, and H. Stocker ”Thermodynamik and StatistischeMechanik”, Verlag, Harri Deutsch (1987).
[48] J.H. Weaver and H.P.R. Frederikse ”Optical properties of selected elements”,Handbook of Chemistry and Physics, 95th edition, Section 12 (2014).
[49] T. Juhasz, H.E. Elsayed-Ali, G.O. Smith, C. Suarez, and W.E. Bron, ”Directmeasurements of the transport of nonequilibrium electrons in gold films withdifferent crystal structures”, Phys. Rev. B 48, 15488 (1993).
[50] S.D. Brorson, J.G. Fujimoto, and E.P. Ippen ”Femtosecond Electronic Heat-Transport Dynamics in Thin Gold Films”, Phys. Rev. Lett. 59, 1962 (1987).
[51] R.W. Schoenlein, W.Z. Lin, J.G. Fujimoto, and G.L. Eesley ”Femtosecond stud-ies of nonequilibrium electronic processes in metals”, Phys. Rev. Lett. 58, 1680(1987).
[52] H.E. Elsayed-Ali, T.B. Norris, M.A. Pessot, and G.A. Mourou ”Time-resolvedobservation of electron-phonon relaxation in copper”, Phys. Rev. Lett. 58, 1212(1987).
[53] H.E. Elsayed-Ali, T. Juhasz, G.O. Smith, and W.E. Bron ”Femtosecond ther-moreflectivity and thermotransmissivity of polycrystalline and single-crystallinegold films”, Phys. Rev. B 43 (1991).
[54] W.S. Fann, R. Storz, and H.W.K. Tom ”Electron thermalization in gold”, Phys.Rev. B 46, 13592 (1992).
[55] W.S. Fann, R. Storz, H.W.K. Tom, and J. Bokor ”Direct measurement ofnonequilibrium electron-energy distributions in subpicosecond laser heated goldfilms”, Phys. Rev. Lett. 68, 2834 (1992).
158
BIBLIOGRAPHY
[56] R.H.M. Groeneveld, R. Sprik, A. Lagendijk ”Effect of a nonthermal electrondistribution on the electron-phonon energy relaxation process in noble metals”,Phys. Rev. B 45, 5079 (1992).
[57] C.-K. Sun, F. Vallee, L.H. Acioli, E.P. Ippen, and J.G. Fujimoto ”Femtosecond-tunable measurement of electron thermalization in gold”, Phys. Rev. B 50, 15337(1994).
[58] X.Y. Wang, D.M. Riffe, Y.-S. Lee, and M.C. Downer ”Time-resolved electron-temperature measurement in a highly excited gold target using femtosecondthermionic emission”, Phys. Rev. B 50, 8016 (1994).
[59] C.A. Schmuttenmaer, M. Aeschlimann, H.E. Elsayed-Ali, and R.J.D. Miller, D.A.Mantell, J. Cao and Y. Gao ”Time-resolved two-photon photoemission fromCu(100): Energy dependence of electron relaxation”, Phys. Rev. B 50, 8957(1994).
[60] R.H.M. Groeneveld, R. Sprik, A. Lagendijk ”Femtosecond spectroscopy ofelectron-electron and electron-phonon energy relaxation in Ag and Au”, Phys.Rev. B 51 (1995).
[61] C. Suarez, W.E. Bron, and T. Juhasz ”Dynamics and transport of electroniccarriers in thin gold films”, Phys. Rev. Lett. 75, 4536 (1995).
[62] T. Hertel, E. Knoesel, M. Wolf, and G. Ertl ”Ultrafast electron dynamics atCu(111): response of an electron gas to optical excitation”, Phys. Rev. Lett. 76,535 (1996).
[63] M. Aeschlimann, M. Bauer, S. Pawlik ”Competing nonradiative channels for hotelectron induced surface photochemistry”, Chem. Phys. 205, 127 (1996).
[64] J. Hohlfeld, U. Conrad, E. Matthias ”Does femtosecond time-resolved second-harmonic generation probe electron temperatures at surfaces”, Appl. Phys. B63, 541 (1996).
[65] H. Petek and S. Ogawa ”Femtosecond time-resolved two-photon photoemissionstudies of electron dynamics”, Progress in Surf. Sci. 56 (1997).
[66] J. Cao, Y. Gao, H.E. Elsayed-Ali, R.J.D. Miller, D.A. Mantell ”Femtosecond pho-toemission study of ultrafast electron dynamics in single-crystal Au(111) films”,Phys. Rev. B 58, 10948 (1998).
[67] K.L. Moore and T.D. Donnely ”Probing nonequilibrium electron distributions ingold by use of second-harmonic generation”, Opt. Lett. 24, 990 (1999).
[68] M. Bonn, D.N. Denzler, S. Funk, and M. Wolf ”Ultrafast electron dynamics atmetal surfaces: Competition between electron-phonon coupling and hot-electrontransport”, Phys. Rev. B 61, 1101 (2000).
159
BIBLIOGRAPHY
[69] J. Hohlfeld, S.-S. Wellershoff, J. Gudde, U. Conrad, V. Jahnke, E. Matthias”Electron and lattice dynamics following optical excitation of metals”, Chem.Phys. 251, 237 (2000).
[70] N. Del Fatti, C. Voisin, M. Achermann, S. Tzortzakis, D. Christofilos, and F.Vallee ”Nonequilibrium electron dynamics in noble metals”, Phys. Rev. B 61,16956 (2000).
[71] M. Bauer, M. Aeschlimann ”Dynamics of excited electrons in metals, thin filmsand nanostructures”, J. Electron. Spectrosc. Relat. Phenom. 124, 225 (2002).
[72] T. Kampfrath ”Charge-carrier dynamics in solids and gases observed by time-resolved terahertz spectroscopy”, PhD thesis at the Free University of Berlin(2005).
[73] J.J. Quinn ”Range of excited electrons in metals”, Phys. Rev. 126, 1453 (1962).
[74] P. Nozieres, D. Pines ”The theory of quantum liquids” Benjamin, New York,(1966).
[75] M. Aeschlimann, M. Bauer, S. Pawlik, W. Weber, R. Burgermeister, D. Oberli,and H.C. Siegman ”Ultrafast spin-dependent electron dynamics in fcc Co”, Phys.Rev. Lett. 79, 5158 (1997).
[76] H.-S. Rhie, H.A. Durr, and W. Eberhardt ”Femtosecond electron and spin dy-namics in Ni/W(110) films”, Phys. Rev. Lett. 90, 247201 (2003).
[77] A.B. Schmidt, M. Pickel, M. Donath, P. Buczek, A. Ernst, V.P. Zhukov, P.M.Echenique, L.M. Sandratskii, E.V. Chulkov, and M. Weinelt ”Ultrafast magnongeneration in an Fe film on Cu(100)”, Phys. Rev. Lett. 105, 197401 (2010).
[78] V.P. Zhukov, E.V. Chulkov, and P.M. Echenique ”Lifetimes of Excited Electronsin Fe and Ni: First-Principles GW and the T-Matrix Theory”, Phys. Rev. Lett.93, 096401 (2004).
[79] S. Kaltenborn and H.C. Schneider ”Spin-orbit coupling effects on spin-dependentinelastic electronic lifetimes in ferromagnets”, Phys. Rev. B 90, 201104 (2014).
[80] J. Hohlfeld, E. Matthias, R. Knorren, and K.H. Bennemann ”Nonequilibriummagnetization dynamics of nickel”, Phys. Rev. Lett. 78, 4861 (1997).
[81] H. Regensburger, R. Vollmer, and J. Kirschner ”Time-resolved magnetization-induced second-harmonic generation from the Ni(110) surface”, Phys. Rev. B 61,14716 (2000).
[82] B. Koopmans, M. van Kampen, J.T. Kohlhepp, and W.J.M. de Jonge ”Ultra-fast Magneto-Optics in Nickel: Magnetism or Optics?”, Phys. Rev. Lett. 85, 844(2000).
160
BIBLIOGRAPHY
[83] C. Stamm, T. Kachel, N. Pontius, R. Mitzner., T.Quast, K. Holldack, S. Khan, C.Lupulescu, E.F. Aziz, M. Wietstruk, H.A. Durr, and W. Eberhardt ”Femtosec-ond modification of electron localization and transfer of angular momentum innickel”, Nat. Mater. 6, 740 (2007).
[84] C. Stamm, N. Pontius, T. Kachel, M. Wietstruk, and H.A.Durr ”Femtosecondx-ray absorption spectroscopy of spin and orbital angular momentum in pho-toexcited Ni films during ultrafast demagnetization”, Phys. Rev. B 81, 104425(2010).
[85] A.B. Schmidt, M. Pickel, T. Allmers, M. Budke, J. Braun, M. Weinelt, and M.Donath ”Surface electronic structure of fcc Co films: a combined spin-resolvedone- and two-photon-photoemission study”, J. Phys. D: Appl. Phys. 41, 164003(2008).
[86] B. Koopmans, G. Malinowski, F. Dalla Longa, D. Steiauf, M. Fahnle, T. Roth, M.Cinchetti, and M. Aeschlimann ”Explaining the paradoxial diversity of ultrafastlaser-induced demagnetization”, Nature Materials 9, 259 (2010).
[87] E. Carpene, E. Mancini, C. Dallera, M. Brenna, E. Puppin, and S. D. Silvestri”Dynamics of electron-magnon interaction and ultrafast demagnetization in thiniron films”, Phys. Rev. B 78, 174422 (2008).
[88] A. Weber, F. Pressacco, S. Gunther, E. Mancini, P.M. Oppeneer, and C.H. Back”Ultrafast demagnetization dynamics of thin Fe/W(110) films: comparison oftime- and spin-resolved photoemission with time-resolved magneto-optic experi-ments”, Phys. Rev. B 84, 132412 (2011).
[89] T. Roth, A.J. Schellekens, S. Alebrand, O. Schmitt, D. Steil, B. Koopmans,M. Cinchetti, and M. Aeschlimann ”Temperature dependence of laser-induceddemagnetization in Ni: a key for identifying the underlying mechanism”, Phys.Rev. X 2, 021006 (2012).
[90] M. Wietstruk, A. Melnikov, C. Stamm, T. Kachel, N. Pontius, M. Sultan, C.Gahl, M. Weinelt, H.A. Durr, and U. Bovensiepen ”Hot-electron-driven enhance-ment of spin-lattice coupling in Gd and Tb 4f ferromagnets observed by femtosec-ond X-ray magnetic circular dichroism”, Phys. Rev. Lett. 106, 127401 (2011).
[91] G.M. Muller, J. Walowski, M. Djordjevic, G.-X. Miao, A. Gupta, A.V. Ramos,K. Gehrke, V. Moshnyaga, K. Samwer, J. Schmalhorst, A. Thomas, A. Hutten,G. Reiss, J.S. Moodera, and M. Munzenberg ”Spin polarization in half-metalsprobed by femtosecond spin excitation”, Nat. Mater. 8, 56 (2008).
[92] S.I. Anisimov, A.M. Bonch-Bruevich, M.A. El’yashevich, Y.A. Imas, N.A.Pavlenko, and G.S. Romanov ”Deistvie moshchnykh svetovykh potokov na met-ally” Zh. tekhn. fiziki 36, 1273 (1966) [”Effect of powerful light fluxes on metals”,Sov. Phys. Tech. Phys. 11, 945 (1967)].
161
BIBLIOGRAPHY
[93] S.I. Anisimov, B.L. Kapeliovich, and T.L. Perel’man ”Elektronnaya emissiya spoverkhnosti metallov pod deistviem ul’trakorotkikh lazernykh impul’sov” Zh.Eksp. Teor. Fiz. 66, 776 (1974) [”Electron emission from metal surfaces exposedto ultrashort laser pulses” Sov. Phys. JETP 39, 375 (1974)].
[94] A. Vaterlaus, T. Beutler, and F. Meier ”Spin-lattice relaxation time of ferromag-netic gadolinium determined with time-resolved spin-polarized photoemission”,Phys. Rev. Lett. 67, 3314 (1991).
[95] A.J. Schellekens ”Methods for controlling magnetization dynamics on the ulti-mate timescale”, PhD thesis, Eindhoven University of Technology (2014).
[96] K. Carva, M. Battiato, D. Legut, and P.M. Oppeneer ”Ab initio theory ofelectron-phonon mediated ultrafast spin relaxation of laser-excited hot electronsin transition-metal ferromagnets”, Phys. Rev. B 87, 184425 (2013).
[97] G.P. Zhang and W. Hubner ”Laser-induced ultrafast demagnetization in ferro-magnetic metals”, Phys. Rev. Lett. 85, 3025 (2000).
[98] D. Steiauf and M. Fahnle, ”Elliott-Yafet mechanism and the discussion of fem-tosecond magnetization dynamics”, Phys. Rev. B 79, 140401 (2009).
[99] R.J. Elliott ”Theory of the effect of spin-orbit coupling on magnetic resonancein some semiconductors”, Phys. Rev. 96, 266 (1954).
[100] Y.Yafet, in ”Solid State Physics”, edited by F. Seitz and D. Turnbull, Vol. 14,Academic, New York (1963).
[101] B. Koopmans, J.J.M. Ruigrok, F. Dalla Longa, and W.J.M. de Jonge ”UnifyingUltrafast Magnetization Dynamics”, Phys. Rev. Lett. 95, 267207 (2005).
[102] P.D. Desai ”Thermodynamic properties of iron and silicon”, J. Phys. Chem. Ref.Data 15, 967 (1986).
[103] L.D. Landau, E.M. Lifshitz ”For the theory of the magnetic permittivity disper-sion of ferromagnets”, M. Nauka (1969).
[104] A.G. Gurevich, G.A. Melkov ”Magnetic oscillations and waves”, M.:Fizmatlit(1994).
[105] E. Carpene, E. Mancini, D. Dazzi, C. Dallera, E. Puppin, and S. De Silvestri”Ultrafast three-dimensional magnetization precession and magnetic anisotropyof a photoexcited thin film of iron”, Phys. Rev. B 81, 060415 (2010).
[106] A. Melnikov, I. Razdolski, T.O. Wehling, Evangelos Th. Papaioannou, V. Rod-datis, P. Fumagalli, O. Aktsipetrow, A.I. Lichtenstein, and U. Bovensiepen ”Ul-trafast transport of laser-excited spin-polarized carriers in Au/Fe/MgO(001)”,Phys. Rev. Lett. 107, 076601 (2011).
162
BIBLIOGRAPHY
[107] H.A. Mook and R.M. Nicklow ”Neutron scattering investigation of the magneticexcitations in iron”, Phys. Rev. B 7, 336 (1973).
[108] J. Prokop, W.X. Tang, Y. Zhang, I. Tudosa, T.R.F. Peixoto, Kh. Zakeri, andJ. Kirschner ”Magnons in a ferromagnetic monolayer”, Phys. Rev. Lett. 102,177206 (2009).
[109] Y.R. Shen ”The principles of Nonlinear Optics”. Wiley-Interscience, John Wileyand Sons, 1st edition, (1984).
[110] M. Faraday ”On the magnetization of light and the illumination of magnetic linesof force”, Trans. Roy. Soc. (London), no. 5, 592, (1846).
[111] J. Kerr ”On the rotation of the plance of polarization by reflection from the poleof a magnet”, Phil. Mag. no. 3, 339 (1877).
[112] W. Voigt ”Magneto- and electro-optic” (B.G. Teubner, Leipzig, 1908); and“”Handbook der Elekrizitt und des Magnetismums”, Vol. IV:2, p. 393 (J.A.Barth, Leipzig, 1915).
[113] P.N. Argyres ”Theory of the Faraday and Kerr Effects in Ferromagnetics”, Phys.Rev. 97, 334 (1955).
[114] U. Pustogowa, W. Hubner, and K.H. Bennemann ”Theory for the nonlinearmagneto-optical Kerr effect at ferromagnetic transition-metal surfaces”, Phys.Rev. B 48, 8607 (1993).
[115] H. Ehrenreich, M.H. Cohen ”Self-consistent field approach to the many-electronproblem”, Phys. Rev. 115, 786 (1959).
[116] R.P. Pan, H.D. Wei, Y.R. Shen ”Optical second harmonic generation from mag-netized surfaces”, Phys. Rev. B 39, 1229 (1989).
[117] J. Reif, J.C. Zink, C.-M. Schneider, and J. Kirschner ”Effects of surface mag-netism on optical second harmonic generation”, Phys. Rev. Lett. 67, 2878 (1991).
[118] A. Kirilyuk, Th. Rasing ”Magnetization-induced-second-harmonic generationfrom surfaces and interfaces”, J. Opt. Soc. Am. B 22, 148 (2005).
[119] N. Bloembergen, P.S. Pershan ”Light Waves at the Boundary of Nonlinear Me-dia”, Phys. Rev. 128, 606 (1962).
[120] K.C. Rustagi ”Bilinear optical polarizability of silver”, Il Nuovo Cimento LIII,346 (1968).
[121] T.F. Heinz, C.K. Chen, D. Ricard, and Y.R. Shen ”Spectroscopy of molecularmonolayers by resonant second-harmonic generation”, Phys. Rev. Lett. 48, 478(1982).
163
BIBLIOGRAPHY
[122] G. Traeger, L. Wenzel, A. Hubert ”Computer experiments on the informationand the figure of merit and magnetooptics”, Phys. Stat. Sol. 131, 201 (1992).
[123] B.A. Ruzicka, L.K. Werake, G. Xu, J.B. Khurgin, E.Ya. Sherman, J.Z. Wu, andH. Zhao ”Second-harmonic generation induced by electric currents in GaAs”,Phys. Rev. Lett. 108, 077403 (2012).
[124] L.K. Werake and H. Zhao ”Observation of second-harminc generation inducedby pure spin currents”, Nat. Phys. 6, 875 (2010).
[125] A.Y. Bykov, T.V. Murzina, M.G. Rybin, and E.D. Obraztsova ”Second harmonicgeneration in multilayer graphene induced by direct electric current”, Phys. Rev.B 85, 121413 (2012).
[126] C. Hirlimann. ”Femtosecond Laser Pulses: Principles and Experiments”,Springer (1998).
[127] Operator’s Manual Mantis Modelocked Titanium:Sapphire Laser System. Coher-ent.
[128] J.-C. Diels, W. Rudolph ”Ultrashort Laser Pulse Phenomena: Fundamentals,Techniques, and Applications on a Femtosecond Time Scale”, Elsevier (2006).
[129] Cavity Dumper Pulse Switch Manual. Angewandte Physik&Elektronik GmbH.
[130] A. Glaubitz ‘Laser-induced femtosecond spin dynamics in metallic multilayers‘,Diploma thesis at the Free University of Berlin (2010).
[131] T.Muhge, A. Stierle, N. Metoki, H. Zabel, U.Pietsch ”Structural properties ofhigh-quality sputtered Fe films on Al2O3(1120) and MgO(001) substrates”, Appl.Phys. A 59, 659 (1994).
[132] D.T. Dekadjevi, P.A. Ryan, and B.J. Hickey ”Experimental evidence for electronchanneling in Fe/Au(100) Superlattices”, Phys. Rev. Lett. 86, 5787 (2001).
[133] Hans Luth, ”Surfaces and Interfaces of Solid Materials”, Springer-Verlag, Berlin,(1995).
[134] E. Carpene, H. Hedayat, F. Boschini, and C. Dallera ”Ultrafast demagnetizationof metals: collapsed exchange versus collective excitations”, Phys. Rev. B 91,174414 (2015).
[135] R.M. Costescu, M.A. Wall, and D.G. Gahill ”Thermal conductance of epitaxialinterfaces”, Phys. Rev. B 67, 054302 (2003).
[136] A.Goris, K.M. Dobrich, I. Panzer, A.B. Schmidt, M.Donath, and M. Weinelt”Role of spin-flip exchange scattering for hot-electron lifetimes in cobalt”, Phys.Rev. Lett. 107, 026601 (2011).
164
BIBLIOGRAPHY
[137] F. Kormann, A. Dick, B. Grabowski, B. Hallstedt, T. Hickel, and J. Neugebauer”Free energy of bcc iron: Integrated ab initio derivation of vibrational, electronicand magnetic contributions”, Phys. Rev. B 78, 033102 (2008).
[138] M. Djordjevic, M. Luttich, P. Moschkau, P. Guderian, T. Kampfrath, R.G. Ul-brich, M. Munzenberg, W. Felsch, and J.S. Moodera ”Comprehensive view onultrafast dynamics of ferromagnetic films”, Phys. Stat. Sol. 3, 1347 (2006).
[139] Z. Lin, L.V. Zhigilei, and V. Celli ”Electron-phonon couplingand electron heat capacity of metals under conditions of strongelectron-phonon nonequilibrium”, Phys. Rev. B 77, 075133 (2008).http://www.faculty.virginia.edu/CompMat/electron-phonon-coupling/
[140] R.E. Stephens and I.H. Malitson ”Index of Refraction of Magnesium Oxide”,Journal of Research of the National Bureau of Standards, Vol. 49, No. 4, 249-252 (1952).
[141] G.S. Krinchik and V.A. Artem’ev ”Magneto-optical properties of Ni, Co, and Fein the ultraviolet, visible, and infrared parts of the spectrum”, Sov. Phys. JETP,Vol. 26, No. 6, 1080-1085 (1968).
[142] D. Rudolf, C. La-O-Vorakiat, M. Battiato, R. Adam, J.M. Shaw, E. Turgut, P.Maldonado, S. Mathias, P. Grychtol, H.T. Nembach, T.J. Silva, M. Aeschlimann,H.C. Kapteyn, M.M. Murnane, C.M. Schneider, and P.M. Oppeneer ”Ultrafastmagnetization enhancement in metallic multilayers driven by superdiffusive spincurrent”, Nature Commun. 3, 1037 (2012).
[143] S. Kaltenborn, Yao-Hui Zhu, and Hans Christian Schneider ”Wave-diffusion the-ory of spin transport in metals after ultrashort-pulse excitation”, Phys. Rev. B85, 235101 (2012).
[144] B.Y. Mueller, A. Baral, S. Vollmar, M. Cinchetti, M. Aeschlimann, H.C. Schnei-der, and B. Rethfeld ”Feedback Effect during Ultrafast Demagnetization Dy-namics in Ferromagnets”, Phys. Rev. Lett. 111, 167204 (2013).
[145] P. Blaha, K. Schwarz, G. Madsen, D. Kvasnicka, J. Luitz ”WIEN2K, An Aug-mented Plane Wave + Local Orbitals Program for Calculating Crystal Proper-ties”, Vienna University of Technology, Austria (2001).
[146] J.P. Perdew, K. Burke, and M. Ernzerhof ”Generalized gradient approximationmade simple”, Phys. Rev. Lett. 77, 3865 (1996).
[147] J.M. Soler, E. Artacho, J.D. Gale, A. Garcia, J. Junquera, P. Ordejon, and D.Sanchez-Portal ”The SIESTA method for ab initio order-N materials simulation”,J. Phys.: Condens. Matter 14, 2745 (2002).
[148] A.R. Rocha, V.M. Garcia-Suarez, S. Bailey, C. Lambert, J. Ferrer, and S. San-vito ”Spin and molecular electronics in atomically generated orbital landscapes”,Phys. Rev. B 73, 085414 (2006).
165
BIBLIOGRAPHY
[149] CRONOS project report ”D5.6.1 Determination of ultrafast magnetization dy-namics in MgO/Fe/Au” (2013). www.cronostheory.eu
[150] F.X. Wang, F.J. Rodrıguez, W.M. Albers, R. Ahorinta, J.S. Sipe, and M. Kau-ranen ”Surface and bulk contributions to the second-order nonlinear optical re-sponse of a gold film”, Phys. Rev. B 80, 233402 (2009).
[151] A. Borisov, D. Sanchez-Portal, R. Diez Muino, P.M. Echenique ”Building up thescreening below the femtosecond scale”, Chem. Phys. Lett. 387, 95-100 (2004).
[152] K. Uchida, S. Takahaschi, K. Harii, J. Ieda, W. Koshibae, K. Ando, S. Maekawa,and E. Saitoh ”Observation of the spin Seebeck effect”, Nat. Letters 455, 778(2008).
[153] J.M. Florczak and E.D. Dahlberg ”Magnetization reversal in (100)Fe thin films”,Phys. Rev. B 44, 9338 (1991).
[154] G.-M. Choi, C.-H. Moon, B.-C. Min, K.-J. Lee, and D.G. Cahill ”Thermal spin-transfer torque driven by the spin-dependent Seebeck effect in metallic spin-valves”, Nat. Phys. 11, 576 (2015).
[155] J.C. McGroddy, A.J. McAlister, and E.A. Stern ”Polar reflection Faraday effectin silver and gold”, Phys. Rev. 139, A 1844 (1965).
166

Selbststandigkeitserklarung gemaß
§7 der Promotionsordnung
Samtliche verwendeten Hilfsmittel, Hilfen und Quellen sind an der entsprechendenStelle angegeben. Ich versichere, dass ich auf dieser Grundlage diese Arbeit selb-ststandig verfasst habe. Diese Arbeit wurde bisher weder in gleicher noch ahnlicherForm einer anderen Prufungskomission vorgelegt order veroffentlicht.
Berlin, den
Alexandr Alekhin
167