Embed Size (px)
Citation preview

Désir
ée J. Schneid
er Senso
ris
che und
analy
tis
che B
estim
mung vo
n Schärfe
Désirée Janet Schneider
Analyse des Capsaicinoidgehalts in ausgewählten
Chili–Produkten mithilfe der HPLC–MS und
Vergleich mit sensorischen Untersuchungen
VVBVVB LAUFERSWEILER VERLAG
édition scientifique
VVB LAUFERSWEILER VERLAGSTAUFENBERGRING 15D-35396 GIESSEN
Tel: 0641-5599888 Fax: [email protected]
VVB LAUFERSWEILER VERLAGédition scientifique
9 7 8 3 8 3 5 9 6 2 6 0 6
ISBN: 978-3-8359-6260-6
INAUGURAL-DISSERTATION
zur Erlangung des Doktorgrades (Dr. oec. troph.)
im Fachbereich Agrarwissenschaften, Ökotrophologie und
Umweltmanagement der Justus-Liebig-Universität Gießen
Photo cover: © photocrew - Fotolia
Das Werk ist in allen seinen Teilen urheberrechtlich geschützt.
Die rechtliche Verantwortung für den gesamten Inhalt dieses Buches liegt ausschließlich bei dem Autor dieses Werkes.
Jede Verwertung ist ohne schriftliche Zustimmung des Autors oder des Verlages unzulässig. Das gilt insbesondere für Vervielfältigungen, Übersetzungen, Mikroverfilmungen
und die Einspeicherung in und Verarbeitung durch elektronische Systeme.
1. Auflage 2014
All rights reserved. No part of this publication may be reproduced, stored in a retrieval system, or transmitted,
in any form or by any means, electronic, mechanical, photocopying, recording, or otherwise, without the prior
written permission of the Author or the Publishers.
st1 Edition 2014
© 2014 by VVB LAUFERSWEILER VERLAG, GiessenPrinted in Germany
VVB LAUFERSWEILER VERLAG
STAUFENBERGRING 15, D-35396 GIESSENTel: 0641-5599888 Fax: 0641-5599890
email: [email protected]
www.doktorverlag.de
édition scientifique
Professur für Prozesstechnik in Lebensmittel-
und Dienstleistungsbetrieben
Justus-Liebig-Universität Gießen
Analyse des Capsaicinoidgehalts in ausgewählten
Chili-Produkten mithilfe der HPLC–MS und Vergleich
mit sensorischen Untersuchungen
INAUGURAL-DISSERTATION
zur Erlangung des Doktorgrades (Dr. oec. troph.)
im Fachbereich Agrarwissenschaften, Ökotrophologie und
Umweltmanagement der Justus-Liebig-Universität Gießen
vorgelegt von
M. Sc. Désirée Janet Schneider
aus Hammelburg
Gießen, August 2014
Mit Genehmigung des Fachbereichs 09 Agrarwissenschaften,
Ökotrophologie und Umweltmanagement der
Justus-Liebig-Universität Gießen
1. Gutachter: Prof. Dr.-Ing. Elmar Schlich
2. Gutachter: Prof. Dr. Bernd Honermeier
Prüfer: Prof. Dr. Gertrud Morlock
Prüfer: Prof. Dr. Uwe Wenzel
Vorsitzende: Prof. Dr. Dr. Annette Otte
Tag der Disputation: 15. Dezember 2014

Danksagung
Mein besonderer Dank gilt meinem Doktorvater Prof. Dr.-Ing. Elmar Schlich, der mich
ermutigt hat, die Promotion in Angriff zu nehmen, und der mir stets mit seiner fach-
lichen Kompetenz beratend zur Seite stand. Seine Anregungen und kritischen Kom-
mentare haben zum guten Gelingen dieser Arbeit beigetragen.
An Herrn Prof. Dr. habil. Bernd Honermeier richtet sich mein Dank für die Über-
nahme der zweiten Berichterstattung.
Besonders danke ich Frau Prof. Dr. Ingrid Seuß-Baum, die mir die Möglichkeit gege-
ben hat, die Untersuchungen zur vorliegenden Arbeit an der Hochschule Fulda
durchzuführen. Ich danke ihr für die zahlreichen Diskussionen, die wertvollen Rat-
schläge und die fördernde und fordernde Betreuung.
Ganz besonders möchte ich mich bei meinen Kolleginnen und Kollegen, insbesonde-
re bei Caroline Stehling und Severin Thierau, für die gute Zusammenarbeit, die kon-
struktiven Diskussionen, die moralische Unterstützung und die angenehme und
freundschaftliche Atmosphäre bedanken.
Bei Frau Severin Thierau möchte ich mich zudem für die Hilfestellung bei der Durch-
führung der MS-Messungen bedanken.
Des Weiteren bedanke ich mich bei allen Studierenden des Fachbereichs Lebensmit-
teltechnologie der Hochschule Fulda, die sich als Panelisten bei der Durchführung
meiner sensorischen Versuche zur Verfügung gestellt haben.
Schließlich bedanke ich mich ganz herzlich bei meiner Familie und bei meinen
Freunden, die mich durch ihre stets liebevolle und moralische Unterstützung immer
wieder motiviert und zugleich für meine innere Ausgeglichenheit gesorgt haben.
Kurzfassung
In der vorliegenden Arbeit wird die Bestimmung der Reizschwellen von Capsaicin
und Dihydrocapsaicin in wässriger Lösung und zusätzlich von Capsaicin in Öl mithilfe
der 3-Alternative-Forced-Choice-Methode beschrieben. Die Reizschwelle (BET-Best-
Estimate-Threshold) wird für Capsaicin in wässriger Lösung bei 0,080 ppm bestimmt
und unterscheidet sich somit signifikant von der Reizschwelle des Dihydrocapsaicins
(0,049 ppm). Bei den als „Chili-Essern“ oder „Nicht-Chili-Essern“ ermittelten Perso-
nen unterscheiden sich diese Werte nicht signifikant. Die Reizschwelle von Capsaicin
in Öl liegt dagegen bei allen Panelisten etwa um den Faktor 10 höher als die von
Capsaicin in Wasser.
Im zweiten Abschnitt der Studie wird mithilfe der Zeitintensitätsprüfung der Einfluss
verschiedener Lebensmittelinhaltsstoffe (Wasser, Stärke, Fett und Zucker) einzeln
und in Kombinationen auf die durch Capsaicin hervorgerufene Schärfewahrnehmung
(maximal wahrgenommene Schärfeintensität – Imax) untersucht. Aus diesen Ergeb-
nissen mit Modellmatrices wird die Übertragbarkeit auf komplexere Matrices, wie
handelsübliche Salsas, abgeleitet. Die auftretenden Unterschiede werden mithilfe der
ANOVA (p < 0,05) und eines anschließenden Tukey-HSD-Tests auf Signifikanz ge-
testet.
Mit steigender Matrixkomplexität und zunehmendem Stärke-, Fett- und Zuckergehalt
sinkt die maximal wahrgenommene Schärfeintensität (Imax) sowohl in den Modell-
matrices als auch in handelsüblichen Salsas. Der Effekt des Fettanteils ist jedoch in
den Salsas nicht im gleichen Ausmaß zu beobachten wie in den Modellmatrices. Es
kann gezeigt werden, dass die abgeleiteten Aussagen aus den Studien an Modell-
matrices überwiegend auf handelsübliche Produkte übertragen werden können und
dass neben dem Fettgehalt der Zucker- und insbesondere der Stärkegehalt Einfluss
auf die Schärfewahrnehmung besitzen.
In einem dritten Abschnitt werden die Capsaicinoidkonzentrationen in ausgewählten
Salsas mithilfe der Hochleistungsflüssigkeitschromatographie gekoppelt mit Massen-
spektrometrie (HPLC-MS) quantifiziert und mit den sensorischen Evaluierungen kor-
reliert. Die stärkste Korrelation (R² = 0,8029) konnte zwischen den Capsaicinoid-
konzentrationen und der maximal wahrgenommenen Schärfeintensität (Imax) be-
stimmt werden. Dagegen wird für die sensorisch ermittelte Dauer der Schärfewahr-
nehmung (TDur) und die Fläche unter der Kurve bei der Zeitintensitätsprüfung eine
Korrelation mit dem Gehalt an Capsaicinoiden von R² = 0,5176 bzw. R² = 0,6898 er-
mittelt. Die erstellten Regressionsmodelle zeigen beispielhaft, wie empirische Be-
rechnungen durchgeführt werden und diese für spezifische Anwendungen bei schar-
fen Lebensmitteln genutzt werden können.
Abstract
In the present study, the pungency detection thresholds for capsaicin and dihydro-
capsaicin in aqueous solutions and additionally for capsaicin in oil-based solutions
are determined. Thresholds are measured using a 3-Alternative Forced Choice sen-
sory test. The group best estimate thresholds (BETs) are 0.080 and 0.049 ppm for
capsaicin and dihydrocapsaicin, respectively, in aqueous solutions, which is a signifi-
cant difference. The predefined chili “users” and “non users” do not significantly differ
in their perception of capsaicin and dihydrocapsaicin. In contrast, the threshold for
capsaicin in oil is approximately a factor of ten higher than the threshold in water.
In the second step, the influence of food ingredients (water, starch, fat, and sugar),
both individually and in combinations, on sensory perception of the pungency (the
maximum intensity of pungency, or Imax) of capsaicin is studied in various model food
systems using the time-intensity method. Furthermore, the transferability of the re-
sults obtained using model food matrices to complex matrices, such as commercially
available salsas, is investigated. Significant differences between the samples (p <
0.05) are examined by analysis of variance (ANOVA) followed by the Tukey-HSD
post-hoc test.
With increasing complexity of the matrix and starch, fat and sugar contents the per-
ception of pungency in both the model food matrices and the commercially available
salsa products is reduced. The effect of fat on the salsa products, however, does not
reduce pungency to the same extent as for the model matrices. These findings sug-
gest that in most instances, the conclusions from the model food matrices are appli-
cable to commercial products and that beyond fat, the sugar content, and particularly
the starch content, have an impact on pungency perception.
In the third step, the total capsaicinoid content in the salsas is quantified by high-
performance liquid chromatography-mass spectrometry (HPLC-MS) and correlated to
the results of the sensory evaluation. The best correlation (R² = 0.8029) is deter-
mined for the total capsaicinoid content and the maximum intensity of pungency (Imax)
in comparison with the duration of the total pungency perception, TDur (R² = 0.5176),
and the area under the curve (R² = 0.6898). The calculated regression models serve
as an example of how empirical calculations could be generated and used for the
evaluation of pungent products.
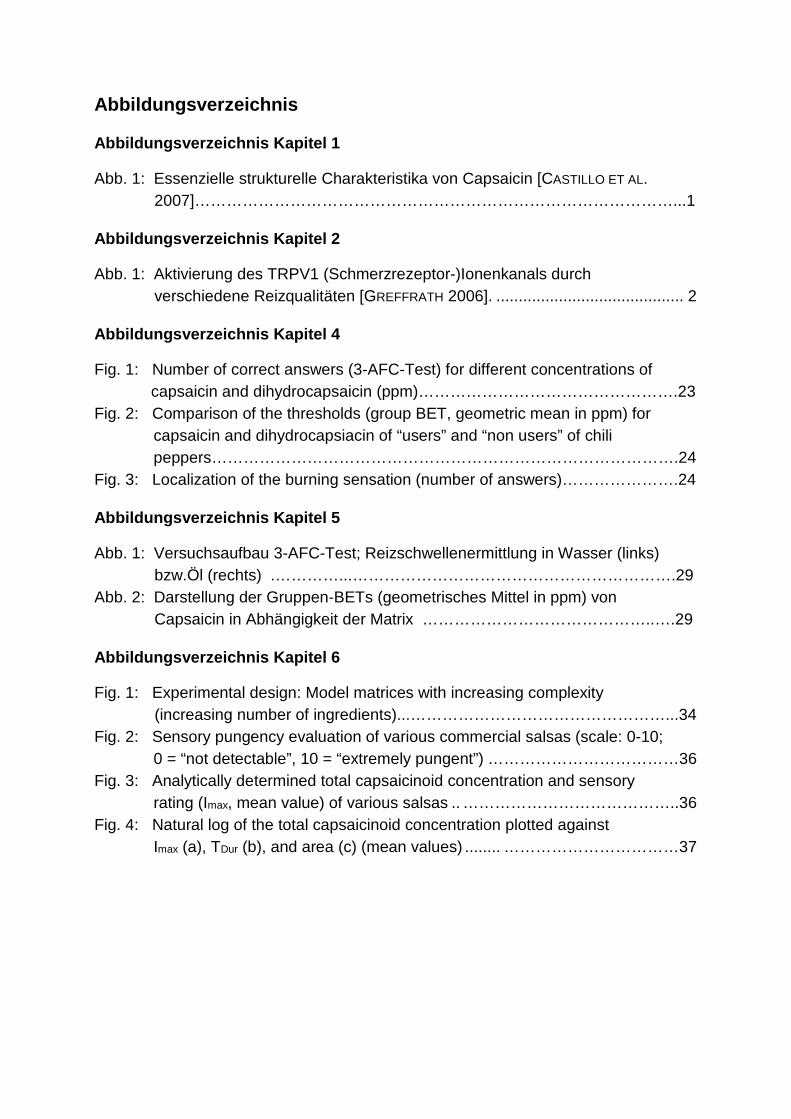
Abbildungsverzeichnis
Abbildungsverzeichnis Kapitel 1
Abb. 1: Essenzielle strukturelle Charakteristika von Capsaicin [CASTILLO ET AL. 2007]………………………………………………………………………………...1
Abbildungsverzeichnis Kapitel 2
Abb. 1: Aktivierung des TRPV1 (Schmerzrezeptor-)Ionenkanals durch verschiedene Reizqualitäten [GREFFRATH 2006]. .......................................... 2
Abbildungsverzeichnis Kapitel 4
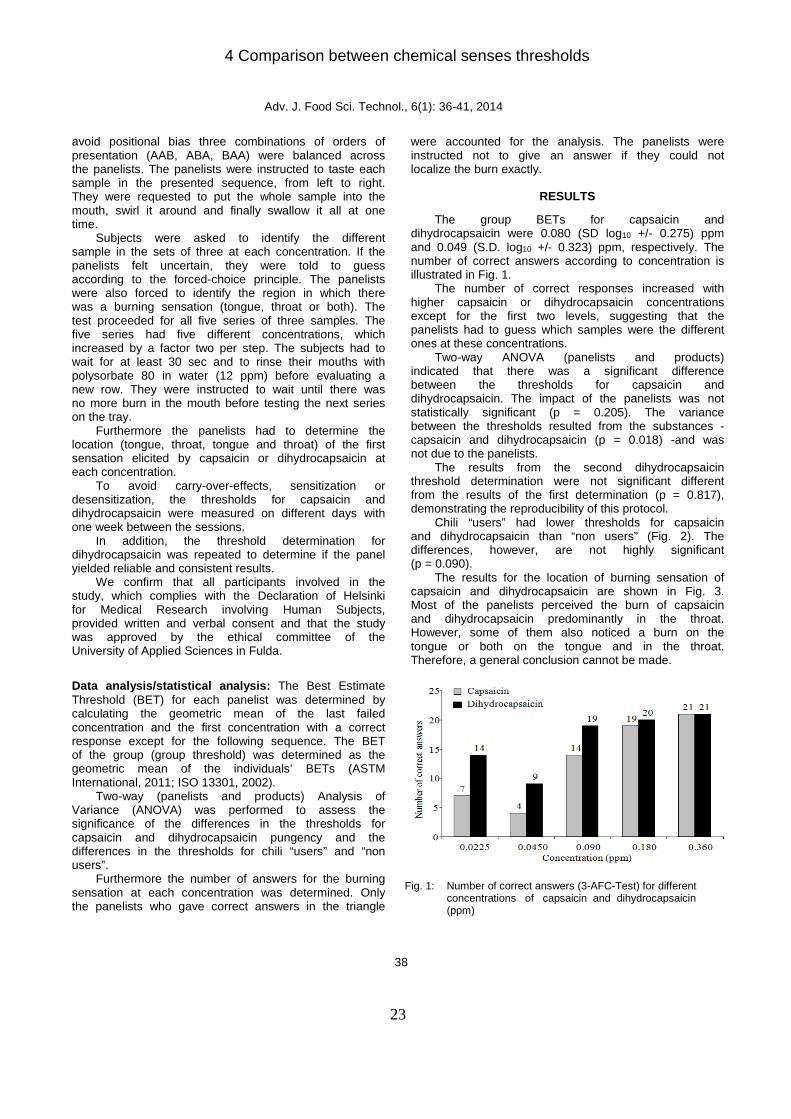
Fig. 1: Number of correct answers (3-AFC-Test) for different concentrations of capsaicin and dihydrocapsaicin (ppm)………………………………………….23
Fig. 2: Comparison of the thresholds (group BET, geometric mean in ppm) for capsaicin and dihydrocapsiacin of “users” and “non users” of chili peppers…………………………………………………………………………….24
Fig. 3: Localization of the burning sensation (number of answers)………………….24
Abbildungsverzeichnis Kapitel 5
Abb. 1: Versuchsaufbau 3-AFC-Test; Reizschwellenermittlung in Wasser (links) bzw.Öl (rechts) .…………...…………………………………………………….29
Abb. 2: Darstellung der Gruppen-BETs (geometrisches Mittel in ppm) von Capsaicin in Abhängigkeit der Matrix ……………………………………..….29
Abbildungsverzeichnis Kapitel 6
Fig. 1: Experimental design: Model matrices with increasing complexity (increasing number of ingredients)...…………………………………………...34
Fig. 2: Sensory pungency evaluation of various commercial salsas (scale: 0-10; 0 = “not detectable”, 10 = “extremely pungent”) ………………………………36
Fig. 3: Analytically determined total capsaicinoid concentration and sensory rating (Imax, mean value) of various salsas .. …………………………………..36
Fig. 4: Natural log of the total capsaicinoid concentration plotted against Imax (a), TDur (b), and area (c) (mean values) ........ ……………………………37

Abbildungsverzeichnis Kapitel 7
Abb. 1: Durchschnittliche Bewertung der maximal wahrgenommenen Schärfeintensität (Imax) bei verschiedenen Capsaicinkonzentrationen in Abhängigkeit von den Matrices (Wasser, Zucker, Stärke und Fett) ......... 42
Abb. 2: Durchschnittliche Bewertung der maximal wahrgenommenen Schärfe-intensität (Imax) bei verschiedenen Capsaicinkonzentrationen in Abhängigkeit von den Matrices ................................................................... 44
Abb. 3: Bestimmung des chemisch-analytischen Capsaicinoidgehalts aus handelsüblichen Salsas .............................................................................. 50

Tabellenverzeichnis
Tabellenverzeichnis Kapitel 3
Tab. 1: Statistische Auswertung der Daten mithilfe der ANOVA und des Post-hoc-Tests Tukey-HSD......................................................................... 13
Tabellenverzeichnis Kapitel 4
Tab. 1: Comparison of the threshold concentrations in the literature and differences in the materials and methods ...……………………………………25
Tabellenverzeichnis Kapitel 6
Tab. 1: Compositions of the model matrices……………………………………………33
Tab. 2: Compositions of the salsas and nutritional facts………………………………33
Tab. 3: Mean values of Imax (maximum intensity) for different concentrations of capsaicin in various matrices (first experiment, see also Fig. 1a) …………..35
Tab. 4: Mean values of Imax (maximum intensity) for different concentrations of capsaicin in various puddings (second experiment, see also Fig. 1b)……...35
Tab. 5: Capsaicinoid content in extracts of various commercial salsas ……………..36
Tab. 6: Mean pungency ratings for the salsas ……………........................................36
Tab. 7: Compositions of the different salsas used in the experiments and their corresponding sensory ratings and total capsaicinoid concentrations (ppm) ………………………………………………………………………………37
Tabellenverzeichnis Kapitel 7
Tab. 1: Überblick über verifizierte, teilweise verifizierte und falsifizierte Hypothesen ................................................................................................. 40
Tab. 2: Imax (Mittelwerte) bei verschiedenen Capsaicinkonzentrationen in unterschiedlichen Matrices (ANOVA) .......................................................... 43 Tab. 3: Imax (Mittelwerte) bei verschiedenen Capsaicinkonzentrationen in unterschiedlichen Matrices (ANOVA) mit steigender Anzahl an Komponenten .............................................................................................. 45 Tab. 4: Parameter der Kalibrationskurven von Capsaicin und Dihydrocapsaicin bei der HPLC-Analyse ................................................................................. 49 Tab. 5: Capsaicinoidgehalt, sensorisch maximal wahrgenommene Schärfeintensität (Imax) und Fettgehalt in den Salsas .................................... 52
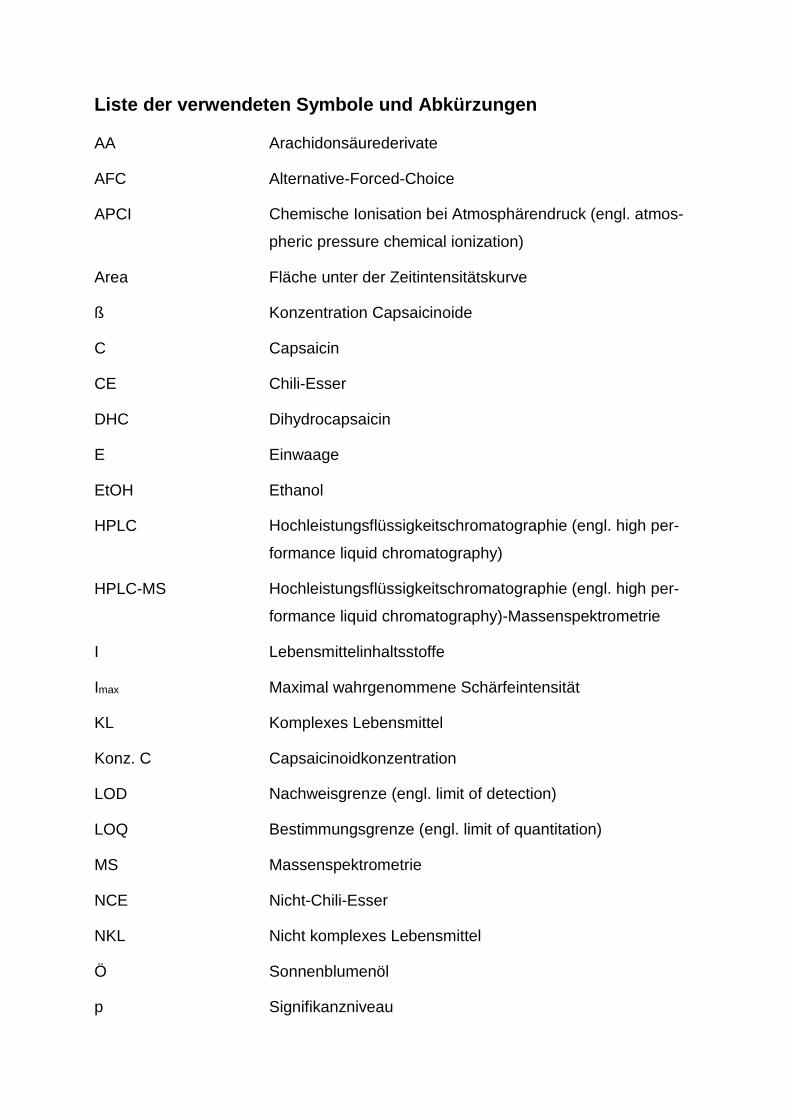
Liste der verwendeten Symbole und Abkürzungen
AA Arachidonsäurederivate
AFC Alternative-Forced-Choice
APCI Chemische Ionisation bei Atmosphärendruck (engl. atmos-
pheric pressure chemical ionization)
Area Fläche unter der Zeitintensitätskurve
ß Konzentration Capsaicinoide
C Capsaicin
CE Chili-Esser
DHC Dihydrocapsaicin
E Einwaage
EtOH Ethanol
HPLC Hochleistungsflüssigkeitschromatographie (engl. high per-
formance liquid chromatography)
HPLC-MS Hochleistungsflüssigkeitschromatographie (engl. high per-
formance liquid chromatography)-Massenspektrometrie
I Lebensmittelinhaltsstoffe
Imax Maximal wahrgenommene Schärfeintensität
KL Komplexes Lebensmittel
Konz. C Capsaicinoidkonzentration
LOD Nachweisgrenze (engl. limit of detection)
LOQ Bestimmungsgrenze (engl. limit of quantitation)
MS Massenspektrometrie
NCE Nicht-Chili-Esser
NKL Nicht komplexes Lebensmittel
Ö Sonnenblumenöl
p Signifikanzniveau

ppm Parts per million
R Reizschwelle
R² Bestimmtheitsmaß
SD Standardabweichung (engl. standard deviation)
TDur Dauer der Schärfewahrnehmung
TRPV1 Vanilloid-Rezeptor 1 (engl. Transient Receptor Potential
Vanilloid 1 – TRPV1), Schmerzrezeptor
w Massenkonzentration Capsaicinoide
W Wasser
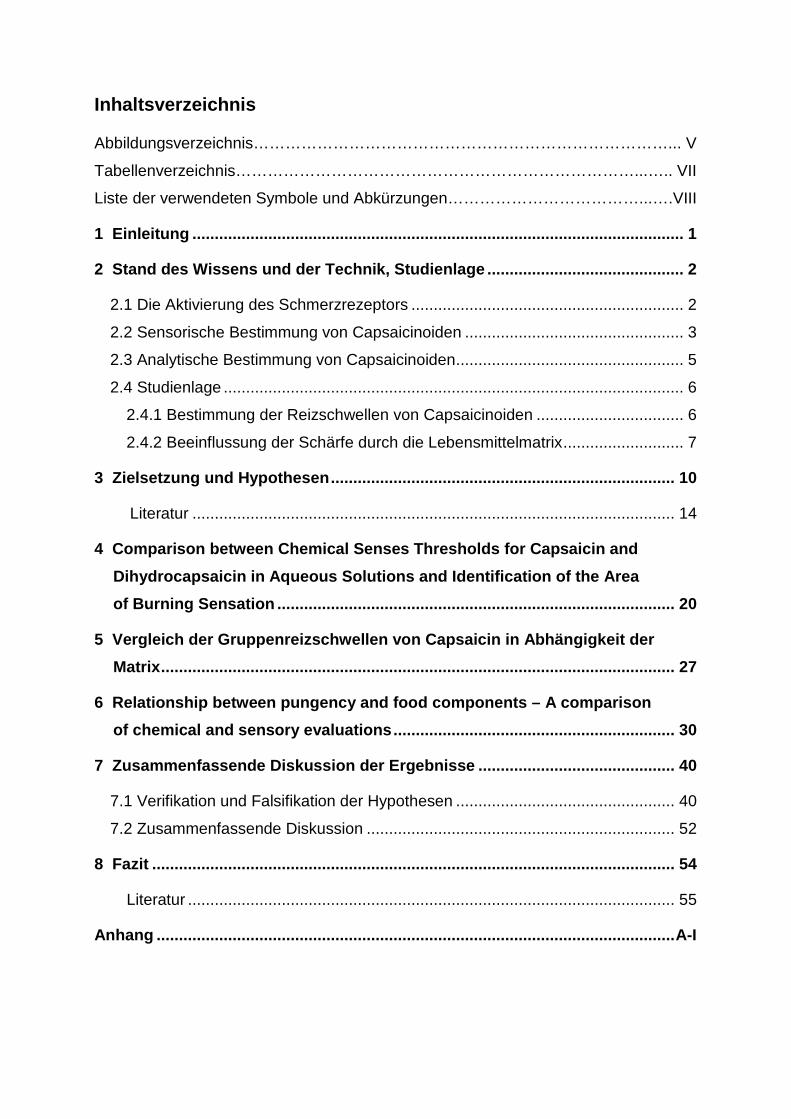
Inhaltsverzeichnis
Abbildungsverzeichnis……………………………………………………………………... V
Tabellenverzeichnis…………………………………………………………………...….. VII
Liste der verwendeten Symbole und Abkürzungen………………………………...….VIII
1 Einleitung ..................................... ......................................................................... 1
2 Stand des Wissens und der Technik, Studienlage . ........................................... 2
2.1 Die Aktivierung des Schmerzrezeptors ............................................................. 2
2.2 Sensorische Bestimmung von Capsaicinoiden ................................................. 3
2.3 Analytische Bestimmung von Capsaicinoiden ................................................... 5
2.4 Studienlage ....................................................................................................... 6
2.4.1 Bestimmung der Reizschwellen von Capsaicinoiden ................................. 6
2.4.2 Beeinflussung der Schärfe durch die Lebensmittelmatrix ........................... 7
3 Zielsetzung und Hypothesen ..................... ........................................................ 10
Literatur ............................................................................................................ 14
4 Comparison between Chemical Senses Thresholds fo r Capsaicin and
Dihydrocapsaicin in Aqueous Solutions and Identific ation of the Area
of Burning Sensation .............................. ........................................................... 20
5 Vergleich der Gruppenreizschwellen von Capsaicin in Abhängigkeit der
Matrix ............................................ ....................................................................... 27
6 Relationship between pungency and food component s – A comparison
of chemical and sensory evaluations ............... ................................................ 30
7 Zusammenfassende Diskussion der Ergebnisse ..... ....................................... 40
7.1 Verifikation und Falsifikation der Hypothesen ................................................. 40
7.2 Zusammenfassende Diskussion ..................................................................... 52
8 Fazit .......................................... ........................................................................... 54
Literatur ............................................................................................................. 55
Anhang ............................................ ........................................................................ A-I

.
1 Einleitung
1 Einleitung
Die Empfindung der Schärfe beim Konsum von Chili (Gattung: Capsicum) und dar-
aus produzierten Produkten wird durch eine Gruppe von Alkaloiden, die Capsaicinoi-
de, hervorgerufen. Diese sensorische (Schmerz-)Empfindung ist im Zusammenhang
mit dem Verzehr bestimmter Lebensmittel durchaus erwünscht.
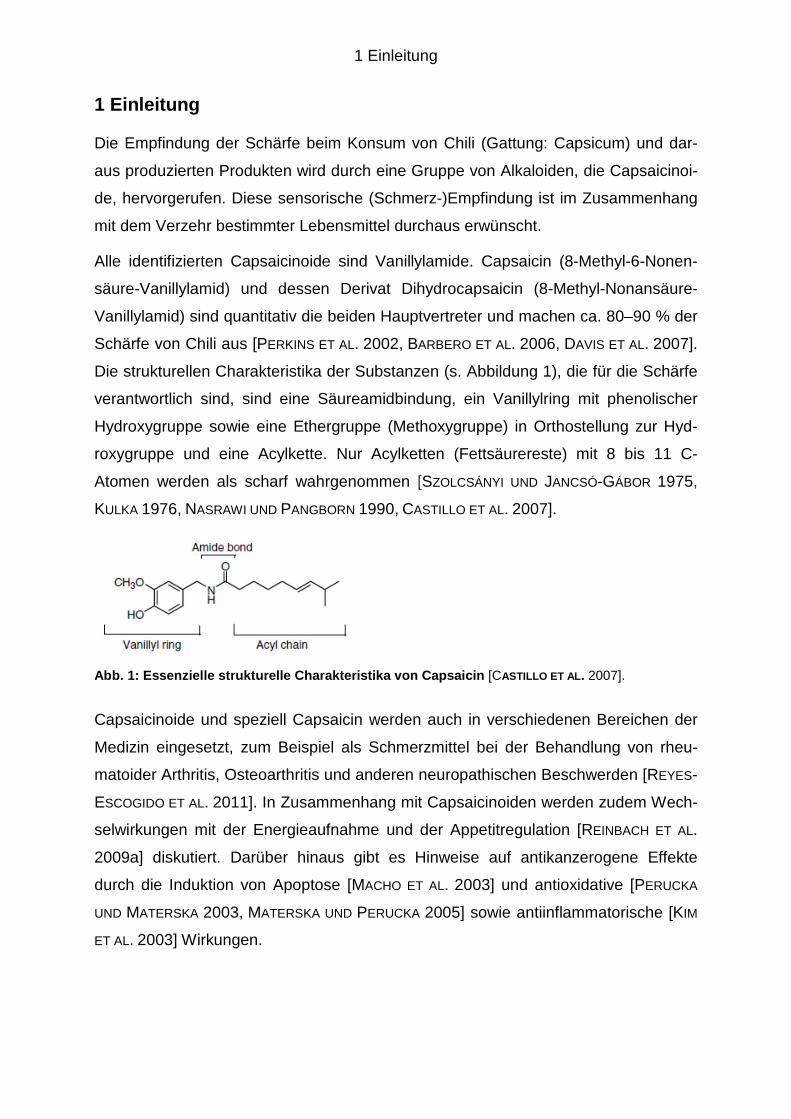
Alle identifizierten Capsaicinoide sind Vanillylamide. Capsaicin (8-Methyl-6-Nonen-
säure-Vanillylamid) und dessen Derivat Dihydrocapsaicin (8-Methyl-Nonansäure-
Vanillylamid) sind quantitativ die beiden Hauptvertreter und machen ca. 80–90 % der
Schärfe von Chili aus [PERKINS ET AL. 2002, BARBERO ET AL. 2006, DAVIS ET AL. 2007].
Die strukturellen Charakteristika der Substanzen (s. Abbildung 1), die für die Schärfe
verantwortlich sind, sind eine Säureamidbindung, ein Vanillylring mit phenolischer
Hydroxygruppe sowie eine Ethergruppe (Methoxygruppe) in Orthostellung zur Hyd-
roxygruppe und eine Acylkette. Nur Acylketten (Fettsäurereste) mit 8 bis 11 C-
Atomen werden als scharf wahrgenommen [SZOLCSÁNYI UND JANCSÓ-GÁBOR 1975,
KULKA 1976, NASRAWI UND PANGBORN 1990, CASTILLO ET AL. 2007].
Abb. 1: Essenzielle strukturelle Charakteristika vo n Capsaicin [CASTILLO ET AL . 2007].
Capsaicinoide und speziell Capsaicin werden auch in verschiedenen Bereichen der
Medizin eingesetzt, zum Beispiel als Schmerzmittel bei der Behandlung von rheu-
matoider Arthritis, Osteoarthritis und anderen neuropathischen Beschwerden [REYES-
ESCOGIDO ET AL. 2011]. In Zusammenhang mit Capsaicinoiden werden zudem Wech-
selwirkungen mit der Energieaufnahme und der Appetitregulation [REINBACH ET AL.
2009a] diskutiert. Darüber hinaus gibt es Hinweise auf antikanzerogene Effekte
durch die Induktion von Apoptose [MACHO ET AL. 2003] und antioxidative [PERUCKA
UND MATERSKA 2003, MATERSKA UND PERUCKA 2005] sowie antiinflammatorische [KIM
ET AL. 2003] Wirkungen.
2 Stand des Wissens und der Technik, Studienlage
2
2 Stand des Wissens und der Technik, Studienlage
2.1 Die Aktivierung des Schmerzrezeptors
Im Folgenden wird der Stand der Wissenschaft zur Physiologie der Schärfe-
empfindung kurz dargestellt.
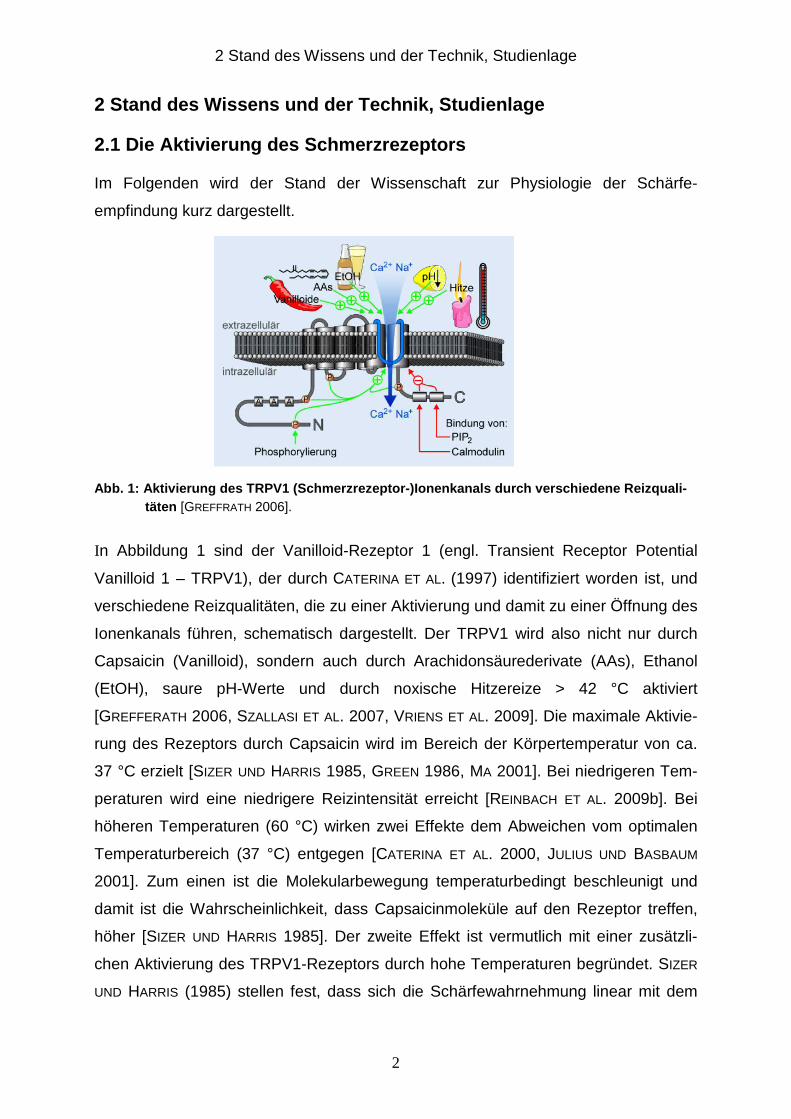
Abb. 1: Aktivierung des TRPV1 (Schmerzrezeptor-)Ion enkanals durch verschiedene Reizquali- täten [GREFFRATH 2006].
In Abbildung 1 sind der Vanilloid-Rezeptor 1 (engl. Transient Receptor Potential
Vanilloid 1 – TRPV1), der durch CATERINA ET AL. (1997) identifiziert worden ist, und
verschiedene Reizqualitäten, die zu einer Aktivierung und damit zu einer Öffnung des
Ionenkanals führen, schematisch dargestellt. Der TRPV1 wird also nicht nur durch
Capsaicin (Vanilloid), sondern auch durch Arachidonsäurederivate (AAs), Ethanol
(EtOH), saure pH-Werte und durch noxische Hitzereize > 42 °C aktiviert
[GREFFERATH 2006, SZALLASI ET AL. 2007, VRIENS ET AL. 2009]. Die maximale Aktivie-
rung des Rezeptors durch Capsaicin wird im Bereich der Körpertemperatur von ca.
37 °C erzielt [SIZER UND HARRIS 1985, GREEN 1986, MA 2001]. Bei niedrigeren Tem-
peraturen wird eine niedrigere Reizintensität erreicht [REINBACH ET AL. 2009b]. Bei
höheren Temperaturen (60 °C) wirken zwei Effekte dem Abweichen vom optimalen
Temperaturbereich (37 °C) entgegen [CATERINA ET AL. 2000, JULIUS UND BASBAUM
2001]. Zum einen ist die Molekularbewegung temperaturbedingt beschleunigt und
damit ist die Wahrscheinlichkeit, dass Capsaicinmoleküle auf den Rezeptor treffen,
höher [SIZER UND HARRIS 1985]. Der zweite Effekt ist vermutlich mit einer zusätzli-
chen Aktivierung des TRPV1-Rezeptors durch hohe Temperaturen begründet. SIZER
UND HARRIS (1985) stellen fest, dass sich die Schärfewahrnehmung linear mit dem

2 Stand des Wissens und der Technik, Studienlage
3
Temperaturanstieg verstärkt. Sie erklären dies mit einer Kombination aus Schärfe-
und Hitzeeinwirkung.
Ebenso sorgen pH-Werte im sauren oder hoch basischen Bereich für eine vorzeitige
Ionenkanalöffnung des TRPV1 [siehe auch Abb. 1; DHAKA ET AL. 2009].
Zahlreiche Studien beschäftigen sich sowohl mit der medizinischen Wirkung von
Capsaicinoiden als auch mit der analytischen und sensorischen Bestimmung von
Capsaicinoiden und der durch diese Stoffgruppe ausgelösten Schärfewahrnehmung,
worauf im Folgenden genauer eingegangen wird.
2.2 Sensorische Bestimmung von Capsaicinoiden
Die bekannteste Methode zur sensorischen Ermittlung der Schärfe ist der Scoville-
Test. Dieser geht auf Wilbur L. Scoville zurück, der 1912 eine Skala zur Bewertung
der Schärfe entwickelt hat. Durch Verdünnen eines Extrakts der zu untersuchenden
Probe mit zuckerhaltigem Wasser und anschließendes Verkosten wird die Schärfein-
tensität bestimmt. Jene Verdünnung, bei der keine Schärfe mehr wahrgenommen
wird, wird als Scoville-Grad angegeben [SCOVILLE 1912].
Die wissenschaftliche Grundlage des Scoville-Tests ist jedoch unzureichend. Die Me-
thode wird aufgrund von Desensibilisierungseffekten oft als nicht reproduzierbar,
subjektiv und ungenau kritisiert [GILETTE ET AL. 1984].
Die Desensibilisierung der Prüfer bei der sensorischen Analyse von scharfen Produk-
ten stellt eine wesentliche Hürde bei der Bewertung der Schärfeintensität dar. De-
sensibilisierung wird als reduzierte Sensitivität auf Stimuli definiert. Vermutlich ist sie
auf eine Erschöpfung von Neuropeptiden (Substanz P) zurückzuführen, die durch die
wiederholte Aktivierung des TRPV1-Rezeptors hervorgerufen wird [NASRAWI UND
PANGBORN 1990, ALLISON UND WORK 2004]. Das bedeutet, dass bei einem wiederhol-
ten Verzehr von Proben mit gleicher Capsaicinkonzentration die Intensität der zuletzt
konsumierten Capsaicinprobe weniger stark wahrgenommen wird als die der Proben
zuvor. Dieses Phänomen ist vor allem dann zu beobachten, wenn Pausen zwischen
den Probenverkostungen eingehalten werden [KARRER UND BARTOSHUK 1991,
PRESCOTT 1999]. Tritt eine Desensibilisierung auf (nach einer Belastung mit 10 ppm
Capsaicin), erholen sich Panelisten vermutlich nach 1 bis 2 Tagen [KARRER UND
BARTOSHUK 1991].

2 Stand des Wissens und der Technik, Studienlage
4
Sind die Zeitabstände zwischen den Probenverkostungen allerdings sehr kurz, bei-
spielsweise nur eine Minute [GREEN 1989], werden auch Sensibilisierungseffekte be-
obachtet. Als Sensibilisierung wird eine erhöhte Sensitivität auf Stimuli bezeichnet
[GREEN 1989, ALLISON UND WORK 2004]. Dabei wird eine konzentrationsgleiche Probe
mit Capsaicin intensiver wahrgenommen als die vorhergehende Probe.
Mit diesen paradoxen Phänomenen der Sensibilisierung und Desensibilisierung ha-
ben sich zahlreiche Arbeitsgruppen beschäftigt [GREEN 1989, 1991, KARRER UND
BARTOSHUK 1991, GREEN 1993, KARRER UND BARTOSHUK 1995, GREEN 1996,
MCBURNEY ET AL. 1997, PRESCOTT 1999, MCBURNEY ET AL. 2001, DOWELL ET AL. 2005].
Doch nicht nur die zeitlichen Abstände der Reizauslösung haben Einfluss auf Sensi-
bilisierungs- und Desensibilisierungseffekte, sondern auch die Konzentration der
Stimulussubstanz und die Anzahl der Reizauslösungen [DOWELL ET AL. 2005], interin-
dividuelle Unterschiede [CLIFF UND GREEN 1996, PRESCOTT 1999] sowie die ange-
wandte Methodik. Die Effekte in weniger komplexen Lösungen [GREEN 1989, KARRER
UND BARTOSHUK 1991, PRESCOTT 1999] scheinen ausgeprägter zu sein als in komple-
xen Lebensmittelmatrices, in denen die Effekte durch andere Lebensmittelinhaltsstof-
fe und durch Kauen und Abschlucken abgeschwächt zu werden scheinen [DOWELL ET
AL. 2005]. PRESCOTT (1999) konnte bei Versuchen in Modellmatrices zwar Desensibi-
lisierungs-, jedoch keine Sensibilisierungseffekte beobachten. Möglicherweise tritt
hier die stimulusinduzierte Erholung, beobachtet durch GREEN UND RENTMEISTER-
BRYANT (1998), auf.
Aufgrund dieser beobachteten und zum Teil widersprüchlich diskutierten Sensibilisie-
rungs- und Desensibilisierungseffekte bei wiederholtem Verzehr von scharfen Spei-
sen gestalten sich Wiederholungsprüfungen selbst im geschulten Panel schwierig.
Durch kurz aufeinanderfolgende Stimulation der Schmerzrezeptoren kann es also zu
fehlerhaften Ergebnissen kommen. Deshalb sind zwischen den Prüfungen ausrei-
chende Pausen wichtig, die in der industriellen Praxis aus ökonomischen und organi-
satorischen Gründen nur schwer zu realisieren sind.
2 Stand des Wissens und der Technik, Studienlage
5
2.3 Analytische Bestimmung von Capsaicinoiden
Aufgrund der beschriebenen Sensibilisierungs- und Desensibilisierungseffekte sowie
der Kritik am Scoville-Test werden heute überwiegend chemisch-analytische Metho-
den zur Bestimmung des Capsaicinoidgehalts eingesetzt, wie beispielsweise die
Spektrophotometrie, die Gas- und die Flüssigkeitschromatographie. Neben der Gas-
chromatographie [PEÑA-ALVAREZ ET AL. 2009] wird am häufigsten die Hochleistungs-
flüssigkeitschromatographie (engl. high performance liquid chromatography, HPLC)
angewendet [KOZUKUE ET AL. 2005, POYRAZOĞLU ET AL. 2005, BARBERO ET AL. 2006,
CHOI ET AL. 2006, GARCÉS-CLAVER ET AL. 2006, HIGASHIGUCHI ET AL. 2006, DAVIS ET AL.
2007, BARBERO ET AL. 2008a, b, TOPUZ ET AL. 2011]. Der HPLC-Analytik gehen ver-
schiedene Techniken zur Extraktion von Capsaicinoiden aus den Produkten voraus.
Basis dafür sind beispielsweise Mazeration [KIRSCHBAUM-TITZE ET AL. 2002], Extrakti-
on durch Rühren [CONTRERAS-PADILLA UND YAHIA 1998], Soxhlet-Extraktion
[KRAJEWSKA UND POWERS 1988, KOREL ET AL. 2002], Extraktion mithilfe von Enzymen
[SANTAMARIA ET AL. 2000], aber auch Extraktion mithilfe von Ultraschall [KARNKA ET AL.
2002, BARBERO ET AL. 2008b].
Die Bestimmung der Capsaicinoidgehalte mithilfe der HPLC ermöglicht im Gegen-
satz zu rein sensorischen Methoden zudem die Unterscheidung von einzelnen
Capsaicinoiden (insbesondere der beiden Hauptkomponenten Capsaicin und Dihyd-
rocapsaicin). Die Problematik einer rein analytischen Bestimmung des Schärfegra-
des liegt jedoch darin, dass die wahrgenommene Schärfeintensität nicht nur vom
Gehalt an Scharfsubstanzen, sondern auch von verschiedenen anderen Faktoren
beeinflusst wird. Zum einen ist die Wahrnehmung von Schärfe stark subjektiv ge-
prägt und Faktoren wie genetische Disposition, esskulturelle Gewohnheiten und indi-
viduelle Vorlieben nehmen Einfluss [LUDY UND MATTES 2012]. Zum anderen wird die
Schärfewahrnehmung maßgeblich von der Lebensmittelzusammensetzung beein-
flusst.
2 Stand des Wissens und der Technik, Studienlage
6
2.4 Studienlage
Aufgrund der Beeinflussung der Schärfewahrnehmung durch die Lebensmittelmatrix
soll im Folgenden ein kurzer Überblick über die bisherige Studienlage zu diesem
Thema gegeben werden.
2.4.1 Bestimmung der Reizschwellen von Capsaicinoid en
In den meisten Studien zur Reizschwellenermittlung von Capsaicinoiden wird nur die
Reizschwelle des Hauptvertreters Capsaicin bestimmt. Die Angaben zur Reizschwel-
le von Capsaicin liegen in einem Bereich von 0,019 ppm [TODD ET AL. 1977] bis 0,350
ppm [SIZER UND HARRIS 1985]. Diese große Spannweite ist vermutlich auf die ver-
schiedenen Methoden zur Bestimmung zurückzuführen. RENTMEISTER-BRYANT UND
GREEN (1997) haben festgestellt, dass die Reizschwelle im Rachen (0,098 ppm) we-
sentlich niedriger liegt als auf der Zunge (0,299 ppm). Dies bedeutet, dass es Unter-
schiede in der Reizschwelle geben müsste, abhängig davon, ob bei der Bestimmung
die Proben abgeschluckt oder ausgespuckt werden. Zudem lassen sich die Schwan-
kungen vermutlich auch durch den Einsatz unterschiedlicher Emulgatoren (Ethanol
vs. Polysorbat 80) und Matrices (Wasser, Öl, Zuckerlösungen) erklären. Die Ermitt-
lung der Reizschwellen verschiedener Capsaicinoide (Capsaicin, Dihydrocapsaicin
und Capsaicinoidgemische) können außerdem eine Rolle spielen. ORELLANA-
ESCOBEDO ET AL. (2012) haben die Reizschwelle eines Capsaicinoidgemisches aus
Capsaicin und Dihydrocapsaicin bestimmt und diese mit 0,050 ppm angegeben.
Während JURENITSCH (1981) unterschiedliche Reizschwellen für Capsaicin und
Dihydrocapsaicin bestimmt hat, konnten KRAJEWSKA UND POWERS (1988) keine signi-
fikanten Unterschiede bei der Reizschwellenermittlung der beiden Komponenten
feststellen und haben sowohl für Capsaicin als auch für Dihydrocapsaicin Werte im
Bereich von 0,039 bis 0,078 ppm bestimmt. In der Literatur wird auch die maximale
Schärfe von Capsaicin und Dihydrocapsaicin in Scoville-Einheiten mit 16.000.000 als
gleich angegeben [SCOVILLE 1912]. Die Reizschwellen von Capsaicin in Wasser
(0,310 ppm) und Öl (11,75 ppm) unterscheiden sich jedoch erheblich [LAWLESS ET AL.
2000].
Zudem finden sich Hinweise, dass Zucker die Wahrnehmung von Schärfe unter-
drückt bzw. die Reizschwelle erhöht [STEVENS UND LAWLESS 1986, NASRAWI UND
PANGBORN 1989, PRESCOTT ET AL. 1993]. Dies scheint allerdings nicht direkt von der
2 Stand des Wissens und der Technik, Studienlage
7
Konzentration an Saccharose abhängig zu sein [NASRAWI UND PANGBORN 1990]. Bei
gleichzeitiger oder vorausgehender oraler Saccharoseaufnahme wird die Reiz-
schwelle von Capsaicin erhöht, d. h., dass unter diesen Bedingungen erst bei höhe-
ren Capsaicinkonzentrationen ein wahrnehmbarer Reiz ausgelöst und die Schärfe-
wahrnehmung damit maskiert wird [SIZER UND HARRIS 1985]. Somit könnte das Vor-
handensein von Zucker in der Matrix einen Einfluss auf die Ergebnisse bei der Be-
stimmung der Reizschwelle haben.
2.4.2 Beeinflussung der Schärfe durch die Lebensmit telmatrix
Verschiedene Studien beschäftigen sich mit der Interaktion von Lebensmittelinhalts-
stoffen und Capsaicin. Die Interaktion zwischen Schärfe und Geschmack bzw. Aro-
mawahrnehmung ist in verschiedenen Matrices wie Tomaten-, Hühner- und Pilzsup-
pe sowie korrespondierenden Soßen untersucht worden. Nach Angaben von
KOSTYRA ET AL. (2010) verursacht eine steigende Komplexität (aus mehreren Zutaten
oder Substanzen bestehend) des Verzehrmediums eine abnehmende Schärfeinten-
sität ausgelöst durch Capsaicin. Insbesondere die Zugabe von Stärke bei Suppe ver-
ringert die Schärfeintensität.
Der Effekt bei komplexen Lebensmitteln lässt den Einfluss einer Erhöhung der Kon-
sistenz vermuten. Jedoch können REINBACH ET AL. (2007) keinen Einfluss unter-
schiedlicher Festigkeit (variierender Kohlenhydratanteil) auf die Schärfewahrneh-
mung bei Hamburgern nachweisen. Viskositätserhöhung, erzeugt durch die Zugabe
von Xanthan, reduziert zwar die Reizintensität, hat jedoch keinen Einfluss auf die
Dauer der Schärfewahrnehmung [NASRAWI UND PANGBORN 1989].
In der Literatur finden sich Hinweise, dass Chili die Intensität von Fleischaroma un-
terdrückt [REINBACH ET AL. 2007], während die Interaktion von Capsaicin mit Orange-,
Vanille- und Erdbeeraroma in wässrigen Lösungen zu inkonsistenten Ergebnissen
führt [PRESCOTT UND STEVENSON 1995]. Auch die Geschmacksqualitäten süß, bitter
und sauer werden von Schärfe in Abhängigkeit von der Matrix unterschiedlich beein-
flusst [KOSTYRA ET AL. 2010]. In wässrigen Lösungen von Capsaicin und Zucker oder
Salz wird die Wahrnehmung von Süße durch die Schärfe von Capsaicin unterdrückt,
während die Schärfe jedoch nicht durch die Süße reduziert wird. Die Wahrnehmung
der Salzigkeit wird durch die Zugabe von Capsaicin nicht beeinflusst, wogegen Salz
die Schärfe intensiviert [PRESCOTT ET AL. 1993]. Aufgrund der Aktivierung des Rezep-
tors durch pH-Werte im sauren oder stark basischen Bereich [DHAKA ET AL. 2009]

2 Stand des Wissens und der Technik, Studienlage
8
würde Capsaicin bei Lebensmitteln mit saurem oder hoch basischem Milieu schärfer
wahrgenommen werden als in Lebensmitteln mit einem pH-Wert im neutralen Be-
reich. Tomatensaft oder passierte Tomaten in verdickter Form sind häufig Basis von
capsaicinhaltigen Speisen und Produkten (z. B. Salsas); hierbei sollte die enthaltene
Säure das Schärfeempfinden des Capsaicins verstärken.
Der Einsatz verschiedener lebensmittelbasierter Neutralisationsmittel für den Schär-
fereiz wird in der Literatur kontrovers diskutiert. Diese sollen die Nozizeption (Schär-
fereiz) bei sensorischen Tests verkürzen, indem in den Proben enthaltene Capsai-
cinoide verdünnt, gelöst, chemisch gebunden, entfernt oder die Reaktion seitens des
Rezeptors blockiert wird [BÜTZER 2010].
Untersuchungen zur Neutralisationswirkung von süßen, bitteren, salzigen und sauren
Lösungen bezüglich der durch Capsaicin hervorgerufenen Schärfe zeigen, dass eine
zuckerhaltige Lösung die Schärfe am effektivsten reduziert [STEVEN UND LAWLESS
1986]. SIZER UND HARRIS (1985) geben verschiedene Konzentrationen von Natrium-
chlorid, Zitronensäure und Zucker zu Capsaicinlösungen und finden heraus, dass nur
Zucker die Schärfeintensität vermindern kann [SIZER UND HARRIS 1985]. HUTCHINSON
ET AL. (1990) können keine Unterschiede in der Neutralisationswirkung von Reis,
Wasser und Ananassaft feststellen. Verschiedene andere Arbeitsgruppen [STEVEN
UND LAWLESS 1986, HUTCHINSON ET AL. 1990] zeigen, dass die Reduzierung der
Schärfe am effektivsten ist, wenn die Neutralisationsmittel für einige Zeit im Mund
behalten werden.
Untersuchungen von BARON UND PENFIELD (1996) kommen überdies zu dem Ergeb-
nis, dass ein hoher Fettgehalt die Schärfewahrnehmung verringern kann. Das am
häufigsten empfohlene Neutralisationsmittel für die Anwendung bei Capsaicinschärfe
ist Milch. Der Wirkmechanismus wird dabei mit den lipophilen Eigenschaften des
Capsaicins erklärt [GOVINDARAJAN 1979]. In diesem Zusammenhang wird vermutet,
dass Capsaicin durch das Fett in der Milch aus der Rezeptorbindung gelöst und da-
mit der Reiz beendet wird. Während die Untersuchungen der Arbeitsgruppe von
BARON UND PENFIELD (1996) sowie CARDEN ET AL. (1999) zeigen, dass ein hoher Fett-
gehalt in Käsesoßen die Schärfewahrnehmung verringert, können andere Studien
diesen Einfluss des Fettgehalts nicht bestätigen [NASRAWI UND PANGBORN 1990,
EMRICK ET AL. 2005].

2 Stand des Wissens und der Technik, Studienlage
9
Die Unterdrückung der Schärfeempfindung durch Milch könnte jedoch auch auf Ef-
fekte der Milchtrockenbestandteile wie Laktose, Kaseine, Molkenproteine und anor-
ganische Salze zurückzuführen sein [TÖPEL 2007]. Die Wirkung von Kasein beruht
wahrscheinlich zum Teil auf hydrophoben Eigenschaften, aber auch auf der mizellä-
ren Struktur des Phosphoproteins, wodurch das Capsaicin auch von der Rezep-
tordomäne entfernt werden könnte [HENKIN 1991, BÜTZER 2010]. Eine Unterstützung
dieser These liefern Untersuchungen, die zeigen, dass Kasein die Teepolyphenole
Catechin [HASNI ET AL. 2011] sowie Tannin [SHUKLA ET AL. 2009] bindet und damit die
physiologischen Wirkungen dieser Substanzen reduziert (Beispiel: Tee mit Milch).
Ein vergleichbarer Wirkmechanismus könnte auch bei Capsaicin zutreffen.
Es liegen zwar einige Studien zur Interaktion von Lebensmittelinhaltsstoffen und der
Schärfewahrnehmung vor, die Ergebnisse sind jedoch sehr widersprüchlich. Kombi-
nationseffekte einzelner Faktoren, die die Schärfe beeinflussen könnten, sind bislang
noch nicht systematisch untersucht worden. Aufgrund möglicher Interaktionen in den
Lebensmittelmatrices liefern chemisch-analytische Bestimmungen der Capsaicinoid-
konzentrationen keine aussagekräftigen Informationen bezüglich der wahrgenomme-
nen Schärfeintensität in verschiedenen Lebensmitteln. Somit sind sensorische Prü-
fungen wichtige Instrumente für die Bewertung dieser Eigenschaft in Produktentwick-
lung und Qualitätssicherung in der Lebensmittelindustrie. Eine routinemäßige Be-
stimmung des Gehalts an Capsaicinoiden in Industrieprodukten mithilfe der Hochleis-
tungsflüssigkeitschromatographie-Massenspektrometrie (HPLC-MS) ist sinnvoll,
wenn darüber auf das Schärfeempfinden in Abhängigkeit von der Matrix geschlossen
werden könnte.
Erste Versuche, die analytisch ermittelten Konzentrationen an Scharfsubstanzen mit
der Scoville-Skala zu korrelieren, führen zu folgendem Umrechnungsfaktor: 1 ppm
Capsaicin entspricht ca. 16,1 Scoville-Einheiten [TODD ET AL. 1977].
KOREL ET AL. (2002) haben den Gehalt von Capsaicinoiden mittels HPLC bestimmt
und mit den entsprechenden Proben sensorische Tests durchgeführt. Dabei kann
ebenso eine Korrelation zwischen dem Gehalt an Capsaicinoiden und gemessenen
Scoville-Einheiten erstellt werden [KOREL ET AL. 2002]. Die Kritik am Scoville-Test ist
dabei jedoch weiterhin zu berücksichtigen.
3 Zielsetzung und Hypothesen
10
3 Zielsetzung und Hypothesen
Die Ziele der vorliegenden Arbeit sind die systematische Untersuchung des Ein-
flusses von Lebensmittelinhaltsstoffen auf die maximal wahrgenommene Schärfein-
tensität (Imax) von Capsaicinoiden sowie ein Vergleich von sensorischen und chemi-
schen Analysen des Capsaicinoidgehalts in verschiedenen Lebensmittelmatrices.
Zunächst werden die Reizschwellen von Capsaicin und Dihydrocapsaicin in wässri-
ger Lösung bestimmt. Es folgen Testreihen zur Beeinflussung der Reizschwelle von
Capsaicin durch Lösen in Öl. Diese Untersuchungen dienen der Festlegung geeigne-
ter Konzentrationsbereiche für die anschließenden Tests.
Im Rahmen dieser Untersuchungen wird der Einfluss von Lebensmittelinhaltsstoffen
auf die maximal wahrgenommene Schärfeintensität (Imax) in Modellmatrices systema-
tisch untersucht und es wird geprüft, ob sich die erzielten Ergebnisse zu den Mo-
dellmatrices auf handelsübliche Produkte übertragen lassen.
In einem letzten Schritt wird eine geeignete Methode zur Bestimmung des Capsai-
cinoidgehalts in handelsüblichen Produkten konzipiert und geprüft, ob eine Korrelati-
on zwischen dem chemisch-analytisch ermittelten Gehalt (mithilfe der HPLC-MS) und
der physiologisch empfundenen Schärfeintensität in diesen Produkten besteht.
Durch die Verknüpfung von Sensorik und Analytik werden mathematische Modelle
abgeleitet. Dies dient der Abschätzung und Vorhersage der Schärfeintensität von
scharfen Produkten. Zum einen kann so die Belastung des Panels verringert werden,
zum anderen können Fehlerquellen bei sensorischen Prüfungen von scharfen Pro-
dukten wie z. B. Sensibilisierungs- und Desensibilisierungseffekte minimiert werden.
Aussagen sensorischer Tests von scharfen Produkten können so verifiziert werden.
Um die dargestellten Ziele zu erreichen, werden entsprechende Hypothesen formu-
liert und die folgenden Arbeitsschritte geplant.
3 Zielsetzung und Hypothesen
11
Hypothese 1
Für die Substanzen Capsaicin und Dihydrocapsaicin s ind die sensorisch ermit-
telten Reizschwellen gleich.
Experimenteller Ansatz:
Mithilfe des 3-Alternative-Forced-Choice (AFC)-Tests [nach ASTM 679-04 und ISO
13301] werden die Reizschwellen (R) von Capsaicin (C) und Dihydrocapsaicin (DHC)
in Wasser (versetzt mit Polysorbat 80) bestimmt. Durch anschließende Varianzana-
lyse wird geprüft, ob diese nicht signifikant unterschiedlich sind (H0: µRC1 ≠ µRDHC2;
H1: µRC = µRDHC). [Kapitel 4]
Hypothese 2
Personen, die häufig Chili konsumieren, zeigen Dese nsibilisierungseffekte und
nehmen Schärfe (Capsaicinoide) somit erst bei höher en Konzentrationen wahr.
Experimenteller Ansatz:
Ein Panel wird nach Ermittlung von Metadaten und Daten bezüglich der Verzehrhäu-
figkeit von scharfen Produkten mithilfe eines Fragebogens in „Chili-Esser“ (CE) und
„Nicht-Chili-Esser“ (NCE) differenziert. Anschließend werden mit diesem Panel die
Reizschwellen (R) von Capsaicin und Dihydrocapsaicin in Wasser (versetzt mit Poly-
sorbat 80) ermittelt und die Ergebnisse für die Reizschwellen von „Chili-Essern“ und
„Nicht-Chili-Essern“ mithilfe der Varianzanalyse auf signifikante Unterschiede getes-
tet (H0: µRCE3 ≤ µRNCE4; H1: µRCE > µRNCE). [Kapitel 4]
Hypothese 3
Capsaicin wird aufgrund seiner lipophilen Eigenscha ften in einer ölhaltigen
Matrix weniger scharf wahrgenommen als in wässriger Lösung.
Experimenteller Ansatz:
Es werden die Reizschwellen (R) von Capsaicin in Wasser (versetzt mit Polysorbat
80) (W) und Sonnenblumenöl (Ö) mithilfe der 3-AFC-Methode [nach ASTM 679-04
und ISO 13301] ermittelt und die Ergebnisse mittels Varianzanalyse auf Signifikanz
getestet (H0: µRW5 ≤ µRÖ6; H1: µRW > µRÖ). [Kapitel 5]
1 RC: Reizschwelle Capsaicin 2 RDHC: Reizschwelle Dihydrocapsaicin 3 RCE: Reizschwelle „Chili-Esser“ 4 RNCE: Reizschwelle „Nicht-Chili-Esser“ 5 RW: Reizschwelle Capsaicin in Wasser (versetzt mit Polysorbat 80) 6 RÖ: Reizschwelle Capsaicin in Sonnenblumenöl
3 Zielsetzung und Hypothesen
12
Hypothese 4
Die maximal wahrgenommene Schärfeintensität (I max) in Lebensmittelmatrices
wird nicht nur von der Capsaicinoidkonzentration, s ondern auch von Lebens-
mittelinhaltsstoffen beeinflusst.
Experimenteller Ansatz:
Mithilfe der Zeitintensitätsprüfung [nach DIN 10970] wird die maximal wahrgenom-
mene Schärfeintensität (Imax) von verschiedenen Capsaicinoidkonzentrationen (Konz.
C) in ausgewählten Matrices (Wasser, Fett, Zucker und Stärke) (I) untersucht und
auftretende Unterschiede mithilfe der Varianzanalyse auf Signifikanz getestet (H0:
µKonz. C7 = µKonz. C + I8; H1: µKonz. C ≠ µKonz. C + I). [Kapitel 6]
Hypothese 5
Die maximal wahrgenommene Schärfeintensität (I max) sinkt mit steigender Le-
bensmittelkomplexität bei gleicher Capsaicinoidkonz entration.
Experimenteller Ansatz:
Mithilfe der Zeitintensitätsprüfung [nach DIN 10970] wird die maximal wahrgenom-
mene Schärfeintensität (Imax) verschiedener Capsaicinoidkonzentrationen in Modell-
matrices mit zunehmender Komplexität (steigende Anzahl an Komponenten) unter-
sucht und auftretende Unterschiede mithilfe der Varianzanalyse auf Signifikanz ge-
testet (H0: µKL9 ≥ µNKL10; H1: µKL < µNKL). [Kapitel 6]
Hypothese 6
Die Ergebnisse der sensorischen Untersuchungen an M odellmatrices können
auf handelsübliche Produkte übertragen werden.
Experimenteller Ansatz:
Die maximal wahrgenommenen Schärfeintensitäten (Imax) von ausgewählten han-
delsüblichen Salsas auf Chilibasis werden mithilfe der Zeitintensitätsprüfung [nach
DIN 10970] ermittelt. Anschließend werden die Salsas anhand der enthaltenen In-
haltsstoffe eingestuft und es wird geprüft, ob die maximal wahrgenommenen Schär-
feintensitäten (Imax) durch die vorhandenen Inhaltsstoffe in vergleichbarer Weise be-
einflusst werden wie in den Modellmatrices. [Kapitel 6]
7 Konz. C: Konzentration Capsaicinoide 8 Konz. C + I: Konzentration Capsaicinoide und Lebensmittelinhaltsstoffe (Wasser, Fett, Stärke, Zucker) 9 KL: Komplexes Lebensmittel 10 NKL: Nicht komplexes Lebensmittel
3 Zielsetzung und Hypothesen
13
Hypothese 7
Mithilfe mathematischer Modelle kann die maximal wa hrgenommene Schärfein-
tensität (I max) in handelsüblichen Produkten berechnet werden.
Experimenteller Ansatz:
Mithilfe der hierarchischen Regressionsanalyse werden mathematische Modelle ent-
wickelt, um eine Vorhersage bezüglich der maximal wahrgenommenen Schärfeinten-
sität (Imax) in Salsas auf Basis des chemisch-analytisch ermittelten Capsaicinoidge-
halts und des Fettgehalts treffen zu können. [Kapitel 6]
Hypothese 8
Sensorisch ermittelte Parameter lassen sich mit dem chemisch-analytisch er-
mittelten Gehalt an Capsaicinoiden in einem definie rten Konzentrationsbereich
korrelieren.
Experimenteller Ansatz:
Es wird eine Methode zur Extraktion der Hauptcapsaicinoide Capsaicin und Dihydro-
capsaicin aus handelsüblichen Salsas auf Chilibasis entwickelt. Anschließend wird
mithilfe der HPLC-MS der Capsaicinoidgehalt in verschiedenen Industrieprodukten
quantifiziert und mit der maximal wahrgenommenen Schärfeintensität (Imax), der
wahrgenommenen Schärfedauer (TDur) sowie der Fläche unter der Zeitintensitäts-
kurve (Area) korreliert. [Kapitel 6]
Statistik
Die Ermittlung des F-Wertes und des kritischen F-Wertes (SPSS) erfolgte basierend
auf dem Signifikanzniveau von α = 0,05. Damit wird die Wahrscheinlichkeit des Auf-
tretens des Fehlers 1. Art (falsches Akzeptieren der Alternativhypothese bzw. falsche
Ablehnung der Nullhypothese) limitiert [RUDOLF UND KUHLISCH 2008].
Tab. 1: Statistische Auswertung der Daten mithilfe der ANOVA und des Post-hoc-Tests Tukey- HSD
p-Wert Situation Entscheidung
p < 0,05 verschiedene Gruppenmittelwerte F > Fcritical Ablehnung von H0
p > 0,05 identische Gruppenmittelwerte F < Fcritical Akzeptanz von H0

Literatur
14
Literatur
[ALLISON UND WORK 2004] Allison AM, Work T: Fiery and frosty foods pose challeng-es in sensory evaluation. Food Technology 58 (2004):32-37.
[ASTM 679-04] ASTM International: E679-04: Standard practice for determination of odor and taste thresholds by a forced-choice ascending concentration series method of limits. Philadelphia, 2011:1-7.
[BARBERO ET AL. 2006] Barbero GF, Palma M, Barroso C: Pressurized liquid extrac-tion of capsaicinoids from peppers. Journal of Agricultural and Food Chemistry 54 (2006):3231-3236.
[BARBERO ET AL. 2008a] Barbero GF, Liazid A, Palma M, Barroso CG: Fast determina-tion of capsaicinoids from peppers by high-performance liquid chromatography using a reversed phase monolithic column. Food Chemistry 107 (2008):1276-1282.
[BARBERO ET AL. 2008b] Barbero GF, Liazid A, Palma M, Barroso CG: Ultrasound-assisted extraction of capsaicinoids from peppers. Talanta 75 (2008):1332-1337.
[BARON UND PENFIELD 1996] Baron RF, Penfield MP: Capsaicin heat intensity – con-centration, carrier, fat level, and serving temperature effects. Journal of Senso-ry Studies 11 (1996):295-316.
[BÜTZER 2010] Bützer P: Some like it hot. Pädagogische Hochschule St. Gallen. Alt-stätten (2010).
[CARDEN ET AL. 1999] Carden LA, Penfield MP, Saxton AM: Perception of heat in cheese sauces as affected by capsaicin concentration, fat level, fat mimetic and time. Journal of Food Science 64 (1999):175-179.
[CASTILLO ET AL. 2007] Castillo E, Torres-Gavilán A, Severiano P, Arturo N, López-Munguia A: Lipase-catalyzed synthesis of pungent capsaicin analogues. Food Chemistry 100 (2007):1202-1208.
[CATERINA ET AL. 1997] Caterina MJ, Schumacher MA, Tominaga M, Rosen TA, Lev-ine JD, Julius D: The capsaicin receptor: a heat-activated ion channel in the pain pathway. Nature 389 (1997):816-824.
[CATERINA ET AL. 2000] Caterina MJ, Leffler A, Malmberg AB, Martin WJ, Trafton J, Petersen-Zeitz KR, Koltzenburg M, Basbaum AI, Julius D: Impaired nocicep-tion and pain sensation in mice lacking the capsaicin receptor. Science 288 (2000):306-313.
[CHOI ET AL. 2006] Choi SH, Suh BS, Kozukue E, Kozukue N, Levin CE, Friedman M: Analysis of the contents of pungent compounds in fresh Korean red peppers and in pepper-containing foods. Journal of Agricultural and Food Chemistry 54 (2006):9024-9031.
[CONTRERAS-PADILLA UND YAHIA 1998] Contreras-Padilla M, Yahia EM: Changes in capsaicinoids during development, maturation, and senescence of chile pep-pers and relation with peroxidase activity. Journal of Agricultural and Food Chemistry 46 (1998):2075-2079.
Literatur
15
[CLIFF UND GREEN 1996] Cliff MA, Green BG: Sensitization and desensitization to capsaicin and menthol in the oral cavity: Interactions and individual differ-ences. Physiology and Behavior 59 (1996):487-494.
[DAVIS ET AL. 2007] Davis CB, Markey CE, Busch MA, Busch KW: Determination of capsaicinoids in Habanero peppers by chemometric analysis of UV spectral data. Journal of Agricultural and Food Chemistry 55 (2007):5925-5933.
[DHAKA ET AL. 2009] Dhaka A, Uzzell V, Dubin AE, Mathur J, Petrus M, Bandell M, Patapoutian A: TRPV1 is activated by both acidic and basic pH. The Journal of Neuroscience 29 (2009):153-158.
[DIN 10970] Deutsches Institut für Normung e.V.: 10970: Sensorische Prüfverfahren – Zeitintensitätsprüfung. Berlin, Beuth:2002.
[DOWELL ET AL. 2005] Dowell KJ, Chambers E, Milliken GA, Chambers DH: Predicting interstimulus intervals between samples for capsaicin-containing salsa with a range of heat levels. Journal of Sensory Studies 20 (2005):187-199.
[EMRICK ET AL. 2005] Emrick ME, Penfield MP, Bacon CD, Van Laack RVL, Brekke CJ: Heat intensity and warmed-over flavor in precooked chicken patties formu-lated at 3 fat levels and 3 pepper levels. Journal of Food Science 70 (2005):600-604.
[GARCÉS-CLAVER ET AL. 2006] Garcés-Claver A, Arnedo-Andrés MS, Abadia J, Gil-Ortega R, Álvarez-Fernández A: Determination of capsaicin and dihydrocap-saicin in Capsicum fruits by liquid chromatography-electrospray/time-of-flight mass spectrometry. Journal of Agricultural and Food Chemistry 54 (2006):9303-9311.
[GILETTE ET AL. 1984] Gilette MH, Appel CE, Lego MC: A new method for sensory evaluation of red pepper heat. Journal of Food Science 49 (1984):1028-1033.
[GOVINDARAJAN 1979] Govindarajan VS: Pungency: The stimuli and their evaluation. In: Boudreau JC (Hrsg.): Food Taste Chemistry. ACS Symposium Series 115 (1979):53-92.
[GREEN 1986] Green BG: Sensory interactions between capsaicin and temperature in the oral cavity. Chemical Senses 11 (1986):371-382.
[GREEN 1989] Green BG: Capsaicin sensitization and desensitization on the tongue produced by brief exposures to a low concentration. Neuroscience Letters 107 (1989):173-178.
[GREEN 1991] Green BG: Temporal characteristics of capsaicin sensitization and de-sensitization on the tongue. Physiology and Behavior 49 (1991):501-505.
[GREEN 1993] Green BG: Evidence that removal of capsaicin accelerates desensitiza-tion on the tongue. Neuroscience Letters 150 (1993):44-48.
[GREEN 1996] Chemesthesis: Pungency as a component of flavor. Trends in Food Science & Technology 7 (1996):415-420.
[GREEN UND RENTMEISTER-BRYANT 1998] Green BG, Rentmeister-Bryant H: Temporal characteristics of capsaicin desensitization and stimulus-induced recovery in the oral cavity. Physiology & Behavior 65 (1998):141-149.
Literatur
16
[GREFFRATH 2006] Greffrath W: Der Capsaicinrezeptor– Ein TRP zur Transduktion schmerzhafter Reize. Der Schmerz 3 (2006):219-225.
[HASNI ET AL. 2011] Hasni I, Bourassa P, Hamdani S, Samson G, Carpentier R, Tajmir-Riahi HA: Interaction of milk α- and ß-caseins with tea polyphenols. Food Chemistry 126 (2011):630-639.
[HENKIN 1991] Henkin R: Questions and Answers. Cooling the burn from hot peppers. JAMA 266 (1991):2766.
[HIGASHIGUCHI ET AL. 2006] Higashiguchi F, Nakamura H, Hayashi H, Kometani T: Purification and structure determination of glucosides of capsaicin and dihy-drocapsaicin from various Capsicum fruits. Journal of Agricultural and Food Chemistry 54 (2006):5948-5953.
[HUTCHINSON ET AL. 1990] Hutchinson SE, Trantow LA, Vickers ZM: The effectiveness of common foods for reduction of capsaicin burn. Journal of Sensory Studies 4 (1990):157-164.
[ISO 13301] International Standard 13301: Sensory analysis - Methology – General guidance for measuring odour, flavour and taste detection thresholds by a three-alternative forced-choice (3-AFC) procedure. 2002.
[JULIUS UND BASBAUM 2001] Julius D, Basbaum AI: Molecular mechanisms of noci-ception. Nature 413 (2001):203-210.
[JURENITSCH 1981] Jurenitsch J: Scharfstoffzusammensetzung in Früchten definierter Capsicum-Sippen -Konsequenzen für Qualitätsforderungen und taxonomische Aspekte. Journal of Pharmaceutical Sciences 49 (1981):321-328.
[KARNKA ET AL. 2002] Karnka R, Rayanakorn M, Watanesk S, Vaneesorn Y: Optimiza-tion of high-performance liquid chromatographic parameters for the determina-tion of capsaicinoid compounds using the simplex method. Analytical Sciences 18 (2002):661-665.
[KARRER UND BARTOSHUK 1991] Karrer T, Bartoshuk L: Capsaicin desensitization and recovery on the human tongue. Physiology & Behavior 49 (1991):757-764.
[KARRER UND BARTHOSUK 1995] Karrer T, Bartoshuk L: Effects of capsaicin desensiti-zation on taste in humans. Physiology & Behavior 57 (1995):421-429.
[KIM ET AL. 2003] Kim CS, Kawada T, Kim BS, Han IS, Choe SY, Kurata T, Yu R: Capsaicin exhibits anti-inflammatory property by inhibiting IkB-a degradation in LPS-stimulated peritoneal macrophages. Cellular Signalling 15 (2003):299-306.
[KIRSCHBAUM-TITZE ET AL. 2002] Kirschbaum-Titze P, Hiepler C, Mueller-Seitz E, Petz M: Pungency in paprika (Capsicum annum). 1. Decrease of capsaicinoid con-tent following cellular disruption. Journal of Agricultural and Food Chemistry 50 (2002):1260-1263.
[KOREL ET AL. 2002] Korel F, Bağdatlioğlu N, Balaban MÖ, Hisil Y: Ground red pep-pers: Capsaicinoids content, Scoville scores, and discrimination by an elec-tronic nose. Journal of Agricultural and Food Chemistry 50 (2002):3257-3261.
[KRAJEWSKA UND POWERS 1988] Krajewska AM, Powers JJ: Sensory properties of naturally occurring capsaicinoids. Journal of Food Science 53 (1988):902-905.
Literatur
17
[KOSTYRA ET AL. 2010] Kostyra E, Baryłko-Pikielna N, Dabrowska U: Relationship of pungency and leading flavour atrributes in model food matrices – temporal as-pects. Food Quality and Preference 21 (2010):197-206.
[KOZUKUE ET AL. 2005] Kozukue N, Han JS, Kozukue E, Lee SJ, Kim JA, Lee KR, Levin CE, Friedman M: Analysis of eight capsaicinoids in peppers and pepper-containing foods by high-performance liquid Cromatography and liquid-chromatography-mass spectrometry. Journal of Agricultural and Food Chemis-try 53 (2005):9172-9181.
[KULKA 1976] Kulka K: Aspects of functional groups and flavor. Journal of Agricultural and Food Chemistry 15 (1967):48-57.
[LAWLESS ET AL. 2000] Lawless HT, Hartono C, Hernandez S: Thresholds and su-prathreshold intensity functions for capsaicin in oil and aqueous based carri-ers. Journal of Sensory Studies 15 (2000):437-447.
[LUDY UND MATTES 2012] Ludy MJ, Mattes RD: Comparison of sensory, physiological, personality, and cultural attributes in regular spicy food users and non-users. Appetite 58 (2012):19-27.
[MA 2001] Ma Q: Vanilloid receptor homologue, VRL1, is expressed by both A- and C-fiber sensory neurons. Neuroreport 12 (2001):3693-3695.
[MACHO ET AL. 2003] Macho A, Lucena C, Sancho R, Daddario N, Minassi A, Muñoz E, Appendino G: Non-pungent capsaicinoids from sweet pepper – Synthesis and evaluation of the chemopreventive and anticancer potential. European Journal of Nutrition 42 (2003):2-9.
[MATERSKA UND PERUCKA 2005] Materska M, Perucka I: Antioxidant activity of the main phenolic compounds isolated from hot pepper fruit (Capsicum annuum L.). Journal of Agricultural and Food Chemistry 53 (2005):1750-1756.
[MCBURNEY ET AL. 1997] McBurney DH, Balaban CD, Christopher DE, Harvey C: Adaption to capsaicin within and across days. Physiology & Behavior 61 (1997):181-190.
[MCBURNEY ET AL. 2001] McBurney DH, Balaban CD, Popp JR, Rosenkranz JE: Adaption to capsaicin burn: effects of concentration and individual differences. Physiology & Behavior 72 (2001):205-216.
[NASRAWI UND PANGBORN 1989] Nasrawi CW, Pangborn RM: The influence of tastants on oral irritation by capsaicin. Journal of Sensory Studies 3 (1989):287-294.
[NASRAWI UND PANGBORN 1990] Nasrawi CW, Pangborn RM: Temporal effectiveness of mouth-rinsing on capsaicin mouth-burn. Physiology and Behavior 47 (1990):617-623.
[ORELLANA-ESCOBEDO ET AL. 2012] Orellana-Escobedo L, Ornelas-Paz JJ, Olivas GI, Guerrero-Beltran JA, Jimenez-Castro J, Sepulveda DR: Determination of ab-solute threshold and just noticeable difference in the sensory perception of pungency. Journal of Food Science 77 (2012):135-139.

Literatur
18
[PEÑA-ALVAREZ ET AL. 2009] Pena-Alvarez A, Ramirez-Maya E, Alvarado-Suárez LA: Analysis of capsaicin and dihydrocapsaicin in peppers and pepper sauces by solid phase microextraction – gas chromatography – mass spectrometry. Journal of Chromatography A 1216 (2009):2843-2847.
[PERKINS ET AL. 2002] Perkins B, Bushway R, Guthrie K, Fan T, Stewart B, Prince A, Williams M: Determination of capsaicinoids in salsa by liquid chromatography and enzyme immunoassay. Journal of AOAC International 85 (2002):82-85.
[PERUCKA UND MATERSKA 2003] Perucka I, Materska M: Antioxidant activity and con-tent of capsaicinoids isolated from paprika fruits. Polish Journal of Food and Nutrition Sciences 12/53 (2003):15-18.
[POYRAZOĞLU ET AL. 2011] Poyrazoğlu ES, Yemis O, Kadakal C, Artik N: Determina-tion of capsaicinoid profile of different chilli peppers grown in Turkey. Journal of the Science of Food and Agriculture 85 (2005):1435-1438.
[PRESCOTT ET AL. 1993] Prescott J, Allen S, Stephens L: Interactions between oral chemical irritation, taste and temperature. Chemical Senses 18 (1993):389-404.
[PRESCOTT 1999] Prescott J: The generalizability of capsaicin sensitization and de-sensitization. Physiology & Behavior 66 (1999):741-749.
[PRESCOTT UND STEVENSON 1995] Prescott J, Stevenson RJ: Effects of oral chemical irritation on tastes and flavors in frequent and infrequent users of chili. Physi-ology & Behavior 58 (1995):1117-1127.
[REINBACH ET AL. 2007] Reinbach HC, Meinert L, Ballabio D, Aaslyng MD, Bredie WLP, Olsen K, Møller P: Interactions between oral burn, meat flavor and tex-ture in chili spiced pork patties evaluated by time-intensity. Food Quality and Preference 18 (2007):909-919.
[REINBACH ET AL. 2009a] Reinbach HC, Smeets A, Martinussen T, Møller P, Wester-terp-Plantenga MS: Effects of capsaicin, green tea and CH-19 sweet pepper on appetite and energy intake in humans in negative and positive energy bal-ance. Clinical Nutrition 28 (2009):260-265.
[REINBACH ET AL. 2009b] Reinbach HC, Toft M, Moller P: Relationship between oral burn and temperature in chili spiced pork patties evaluated by time-intensity. Food Quality and Preference 20 (2009):42-49.
[RENTMEISTER-BRYANT AND GREEN 1997] Rentmeister-Bryant H, Green BG: Perceived irritation during ingestion of capsaicin or piperine: Comparison of trigeminal and non-trigeminal areas. Chemical Senses 22 (1997):257-266.
[REYES-ESCOGIDO ET AL. 2011] Reyes-Escogido ML, Gonzalez-Mondragon EG, Vazquez-Tzompantzi E: Chemical and pharmacological aspects of capsaicin. Molecules 16 (2011):1253-1270.
[RUDOLF UND KUHLISCH 2008] Rudolf M, Kuhlisch W: Biostatistik. Eine Einführung für Biowissenschaftler. 1. Auflage, München, Pearson Studium:2008.

Literatur
19
[SANTAMARIA ET AL. 2000] Santamaria RI, Reyes-Duarte MD, Bárzana E, Fernando E, Gama FM, Mota M, López-Munguia A: Selective enzyme-mediated extraction of capsaicinoids and carotenoids from chili Guajillo Puya (Capsicum annuum L.) using ethanol as solvent. Journal of Agricultural and Food Chemistry 48 (2000):3063-3067.
[SCOVILLE 1912] Scoville WL: Note on Capsicums. The Journal of the American Pharmaceutical Association 1 (1912):453-454.
[SHUKLA ET AL. 2009] Shukla A, Narayanan T, Zanchi D: Structure of casein micelles and their complexation with tannins. Soft Matter 5 (2009):2817-2972.
[SIZER UND HARRIS 1985] Sizer F, Harris N: The influence of common food additives and temperature on threshold perception of capsaicin. Chemical Senses 10 (1985):297-286.
[STEVENS UND LAWLESS 1986] Stevens DA, Lawless HT: Putting out the fire: Effects of tastants on oral chemical irritation. Perception and Psychophysics 39 (1986):346-350.
[SZALLASI ET AL. 2007] Szallasi A, Cortright DN, Blum CA, Eid SR: The vanilloid re-ceptor TRPV1: 10 years from channel cloning to antagonist proof-of-concept. Nature Reviews Drug Discovery 6 (2007):357-373.
[SZOLCSÁNYI UND JANCSÓ-GÁBOR 1975] Szolcsányi J, Jancsó-Gábor A: Sensory ef-fects of capsaicin congeners I. Relationship between chemical structure and pain-producing potency of pungent agents. Arzneimittel-Forschung 25 (1975):1877-1881.
[TODD ET AL. 1977] Todd PH, Bensinger MG, Biftu T: Determination of pungency due to capsicum by gas-liquid chromatography. Journal of Food Science 42 (1977):660-665.
[TÖPEL 2007] Töpel A: Chemie und Physik der Milch, Naturstoff - Rohstoff - Lebens-mittel. Hamburg: B. Behr's Verlag GmbH & Co. KG (2007).
[TOPUZ ET AL. 2011] Topuz A, Dincer C, Özdemir KS, Feng H, Kushad M: Influence of different drying methods on carotenoids and capsaicinoids of paprika (Cv., Jalapeno). Food Chemistry 129 (2011):860-865.
[VRIENS ET AL. 2009] Vriens J, Appendino G, Nilius B: Pharmacology of vanilloid tran-sient receptor potential cation channels. Molecular Pharmacology 75 (2009):1262-1279.

4 Comparison between chemical senses thresholds
20
4 Comparison between Chemical Senses Thresholds for Capsaicin
and Dihydrocapsaicin in Aqueous Solutions and Ident ification of
the Area of Burning Sensation
Désirée Janet Schneider 1, Ingrid Seuß-Baum 1, Elmar Schlich 2
Advance Journal of Food Science and Technology 6 (1) (2014): 36-41.
http://maxwellsci.com/jp/abstract.php?jid=AJFST&no=393&abs=07
1 Hochschule Fulda, Fachbereich Lebensmitteltechnologie, Marquardstr. 35, 36039
Fulda
2 Justus-Liebig-Universität Gießen, Institut für Prozesstechnik in Lebensmittel- und
Dienstleitungsbetrieben, Stephanstr. 24, 35390 Gießen
4 Comparison between chemical senses thresholds
21
Advance Journal of Food Science and Technology 6(1): 36-41, 2014 ISSN: 2042-4868; e-ISSN: 2042-4876 © Maxwell Scientific Organization, 2014 Submitted: August 12, 2013 Accepted: August 24, 2013 Published: January 10, 2014
Comparison between Chemical Senses Thresholds for C apsaicin and Dihydrocapsaicin in
Aqueous Solutions and Identification of the Area of Burning Sensation
1D.J. Schneider, 1I. Seuß-Baum and 2E. Schlich 1Department of Food Technology, University of Applied Sciences Fulda,
Marquardstraße 35, 36039 Fulda, Germany 2Department of Process Engineering in Food and Servicing Business, Justus-Liebig-University
Giessen, Faculty 09-Agricultural Sciences, Nutritional Sciences and Environmental Management, Stephanstr. 24, 35390 Gießen, Germany
Abstract: In the present study, the pungency detection thresholds for capsaicin and dihydrocapsaicin in aqueous solutions containing an emulsifier (polysorbate 80) were determined and compared. Thresholds were measured for 21 students (12 chili “users” and 9 “non users”) using a 3-Alternative Forced Choice sensory test with ascending concentrations of capsaicin and dihydrocapsaicin (0.025, 0.045, 0.090, 0.180 and 0.360 ppm, respectively). In addition, the panelists were asked where the irritation occurred (throat, tongue or both). The group Best Estimate Thresholds were 0.080 and 0.049 ppm for capsaicin and dihydrocapsaicin, respectively and differed significantly. Chili “users” and “non users” did not differ significantly in their perception of capsaicin and dihydrocapsaicin, suggesting that no desensitization effects occur. In accordance with previous studies, in most cases the first irritation was experienced in the throat.
Keywords: 3-AFC, burning localization, chili consumption, pungency, sensory thresholds
INTRODUCTION
Capsaicinoids are pungent compounds found in plants of the genus Capsicum. The primary sensory responses to these compounds, especially capsaicin, include burning, tingling and pain (Cliff and Heymann, 1992).
All capsaicinoids consist of vanillylamides of fatty acids. The main differences between these compounds are the length of the aliphatic side chain, the number of double bonds and their relative pungencies (Krajewska and Powers, 1988). Capsaicin (trans-8-methyl-N- vanillyl-6-nonenamide) and dihydrocapsaicin (8- methyl-N-vanillylnonanamide), which are the two major capsaicinoids in chili peppers, are responsible for approximately 90% of the total pungency (Barbero et al., 2006). These two compounds differ with respect to only one double bond.
The most common method for the determination of pungency attributed to capsaicinoids was developed by Scoville (1912).
There have been very few investigations of the pungency threshold for capsaicin and no reliable information exists on the absolute pungency threshold for dihydrocapsaicin.
Jurenitsch (1981) reported that capsaicin and dihydrocapsaicin were not equally pungent. Krajewska
and Powers (1988), however, measured the effect of each compound on the total pungency of Capsicum fruits and concluded that both capsaicin and dihydrocapsaicin have pungency thresholds within a range of 0.039 and 0.078 ppm and that they do not differ significantly. This result indicates that both compounds feel equally hot. These results are consistent with those of Todd et al. (1977), who reported the same pungency for dihydrocapsaicin and capsaicin.
Some studies have reported different thresholds for capsaicin. When investigating concentrations between 0.060 and 4.000 ppm in 0.5 log2 unit steps, Rozin et al. (1981) reported a threshold concentration of approximately 0.310 ppm in aqueous solutions. The threshold was defined as the lowest concentration at which the panelist was able to detect piquancy. Lawless et al. (2000) compared thresholds in aqueous solutions and oil-based systems. The concentrations of capsaicin presented in water were 0.03125, 0.0625, 0.125, 0.250 and 0.500 ppm, respectively. The mean group threshold was 0.310 (+/-0.030) ppm in water, which is consistent with the results of Rozin et al. (1981). However, the observations of Rozin et al. (1981) and Lawless et al. (2000) conflict with the results of Sizer and Harris (1985), who reported threshold scores between 0.090 and 0.350 ppm; most panelists required a concentration
Corresponding Author: D.J. Schneider, Department of Food Technology, University of Applied Sciences Fulda, Marquardstr. 35, 36039 Fulda, Germany, Tel.: +49 661 9640 537; Fax: +49 661 9640 505
36

4 Comparison between chemical senses thresholds
22
of 0.180 ppm capsaicin for recognition. Karrer and Bartoshuk (1991) agree with these findings because, in their study, a concentration of 0.100 ppm did not evoke a sensation in all subjects. Green (1989) and Schneider et al. (2011), however, reported lower thresholds of approximately 0.100 and 0.088 ppm, respectively. A possible explanation could be the existence of different thresholds depending on the location of the sensation in the mouth. Rentmeister-Bryant and Green (1997) reported threshold concentrations of 0.098 ppm for the throat, 0.180 ppm for the roof of the mouth and 0.299 ppm for the tongue. The latest studies report an absolute threshold concentration of 0.050 ppm for the total amount of capsaicinoids, defining the total capsaicinoid content as the sum of capsaicin and dihydrocapsaicin in the tested sample (Orellana-Escobedo et al., 2012). The varied thresholds could perhaps be explained by the different methods and different stimuli used.
Different authors (Green, 1989; Karrer and Bartoshuk, 1991, 1995) have reported desensitization effects due to regular chili consumption. Desensitization could lead to different thresholds between chili “users” and “non users”.
The main objective of this study was to determine absolute thresholds for dihydrocapsaicin and to compare them to the thresholds of capsaicin in aqueous solutions to find out if both substances were equally pungent.
Aqueous solutions were chosen to allow better comparability of our results with the results of previous studies. The second objective was to determine the location of the first sensation elicited by capsaicin and dihydrocapsaicin and to determine if chili “users” and “non users” differ with respect to capsaicin and dihydrocapsaicin perception because of desensitization effects. The 3-Alternative Forced Choice (3-AFC) method was used because the probability of a correct randomly selected guess is only one-third (ISO 13301, 2002) and therefore, the reliability is better.
MATERIALS AND METHODS
Subjects: Twenty-one healthy subjects (4 males, 17 females) between the ages of 20 and 25 participated in the study. They were all students from the Department of Food Technology at the University of Applied Sciences Fulda. They were selected because of their availability, their basic experience in sensory methods and evaluation and their willingness to participate. Chocolate and book vouchers were offered as incentives to participate.
Subjects filled out a simple questionnaire on the frequency of ingestion (7-point scale; more than once a day, daily, two or three times a week, once a week, once a month, less than once a month, once a year or less), preferred intensity (10-point scale; not pungent to extremely pungent) and time of last chili consumption (5-point scale; today to longer than one month ago).
The subjects were divided into “users” and “non
users” of chili peppers. Those who consumed chili at least once a week and who scored 5 or higher for preferred intensity were classified as high-frequency “users”; those with an intensity score lower than 5 and a chili consumption of less than once a week were classified as “non users”. In this study 12 subjects were classified as “users” and 9 as “non users”. Persons with a low chili-consume were also classified as “non users” in this study because no sensitization or desensitization effects can be expected. Stimuli/sample preparation: The two primary piquant components of chili pepper were the irritant compounds capsaicin (Sigma Aldrich, ≥95% purity from Capsicum sp.,) and dihydrocapsaicin (Sigma Aldrich, ~90% from Capsicum sp.,). Capsaicin and dihydrocapsaicin were not hydrophilic and therefore, the food-grade emulsifier polysorbate 80 (Carl Roth GmbH) was used to solve both compounds in water. The polysorbate 80-water mixture was served as the reference so that the panelists would not be able to use the bitter taste of polysorbate 80 to identify the sample containing capsaicin or dihydrocapsaicin. The clear emulsions of sample and reference sample did not differ in appearance.
Stock solutions of capsaicin and dihydrocapsaicin (1000 ppm) were prepared by mixing 10 mg of each irritant with 10 mL of deionized water containing polysorbate 80 (12 ppm). The mixtures were heated to 40°C and sonicated to ensure the complete dissolution of the irritants.
Experimental water-based samples were prepared by diluting the stock solutions with deionized water and sonicated again to ensure a homogeneous sample. The threshold concentrations of the sample solutions were 0.025, 0.045, 0.090, 0.180 and 0.360 ppm, respectively capsaicin or dihydrocapsaicin; the concentrations of the series increased in two-unit steps and were chosen based on pilot work.
In compliance with the guidelines of the ASTM E 679-04 (2011) total number of presentations was 105 for capsaicin and 210 for dihydrocapsaicin (one replication to determine the reproducibility of the panel).
Experimental procedure : According to the guidelines in ISO 13301 (2002) and ASTM E679-04 (2011), the 3- AFC test was used to evaluate the threshold values of capsaicin and dihydrocapsaicin.
Before determining the thresholds for dihydrocapsaicin and capsaicin a training session was conducted with sugar to familiarize the panelists with the procedure of a 3-AFC-test.
Each sample (5 mL) was coded and presented to the panelists in a laboratory glass. All samples were presented at room temperature. Five rows of three samples in ascending concentrations-one test sample and two reference samples (polysorbate 80-water mixture)-were presented to the panelists on a tray. To
Adv. J. Food Sci. Technol., 6(1): 36-41, 2014
37
4 Comparison between chemical senses thresholds
23
avoid positional bias three combinations of orders of presentation (AAB, ABA, BAA) were balanced across the panelists. The panelists were instructed to taste each sample in the presented sequence, from left to right. They were requested to put the whole sample into the mouth, swirl it around and finally swallow it all at one time.
Subjects were asked to identify the different sample in the sets of three at each concentration. If the panelists felt uncertain, they were told to guess according to the forced-choice principle. The panelists were also forced to identify the region in which there was a burning sensation (tongue, throat or both). The test proceeded for all five series of three samples. The five series had five different concentrations, which increased by a factor two per step. The subjects had to wait for at least 30 sec and to rinse their mouths with polysorbate 80 in water (12 ppm) before evaluating a new row. They were instructed to wait until there was no more burn in the mouth before testing the next series on the tray.
Furthermore the panelists had to determine the location (tongue, throat, tongue and throat) of the first sensation elicited by capsaicin or dihydrocapsaicin at each concentration.
To avoid carry-over-effects, sensitization or desensitization, the thresholds for capsaicin and dihydrocapsaicin were measured on different days with one week between the sessions.
In addition, the threshold determination for dihydrocapsaicin was repeated to determine if the panel yielded reliable and consistent results.
We confirm that all participants involved in the study, which complies with the Declaration of Helsinki for Medical Research involving Human Subjects, provided written and verbal consent and that the study was approved by the ethical committee of the University of Applied Sciences in Fulda.
Data analysis/statistical analysis: The Best Estimate Threshold (BET) for each panelist was determined by calculating the geometric mean of the last failed concentration and the first concentration with a correct response except for the following sequence. The BET of the group (group threshold) was determined as the geometric mean of the individuals’ BETs (ASTM International, 2011; ISO 13301, 2002).
Two-way (panelists and products) Analysis of Variance (ANOVA) was performed to assess the significance of the differences in the thresholds for capsaicin and dihydrocapsaicin pungency and the differences in the thresholds for chili “users” and “non users”.
Furthermore the number of answers for the burning sensation at each concentration was determined. Only the panelists who gave correct answers in the triangle
were accounted for the analysis. The panelists were instructed not to give an answer if they could not localize the burn exactly.
RESULTS
The group BETs for capsaicin and dihydrocapsaicin were 0.080 (SD log10 +/- 0.275) ppm and 0.049 (S.D. log10 +/- 0.323) ppm, respectively. The number of correct answers according to concentration is illustrated in Fig. 1.
The number of correct responses increased with higher capsaicin or dihydrocapsaicin concentrations except for the first two levels, suggesting that the panelists had to guess which samples were the different ones at these concentrations.
Two-way ANOVA (panelists and products) indicated that there was a significant difference between the thresholds for capsaicin and dihydrocapsaicin. The impact of the panelists was not statistically significant (p = 0.205). The variance between the thresholds resulted from the substances -capsaicin and dihydrocapsaicin (p = 0.018) -and was not due to the panelists.
The results from the second dihydrocapsaicin threshold determination were not significant different from the results of the first determination (p = 0.817), demonstrating the reproducibility of this protocol.
Chili “users” had lower thresholds for capsaicin and dihydrocapsaicin than “non users” (Fig. 2). The differences, however, are not highly significant (p = 0.090).
The results for the location of burning sensation of capsaicin and dihydrocapsaicin are shown in Fig. 3. Most of the panelists perceived the burn of capsaicin and dihydrocapsaicin predominantly in the throat. However, some of them also noticed a burn on the tongue or both on the tongue and in the throat. Therefore, a general conclusion cannot be made.
Fig. 1: Number of correct answers (3-AFC-Test) for different concentrations of capsaicin and dihydrocapsaicin (ppm)
Adv. J. Food Sci. Technol., 6(1): 36-41, 2014
38
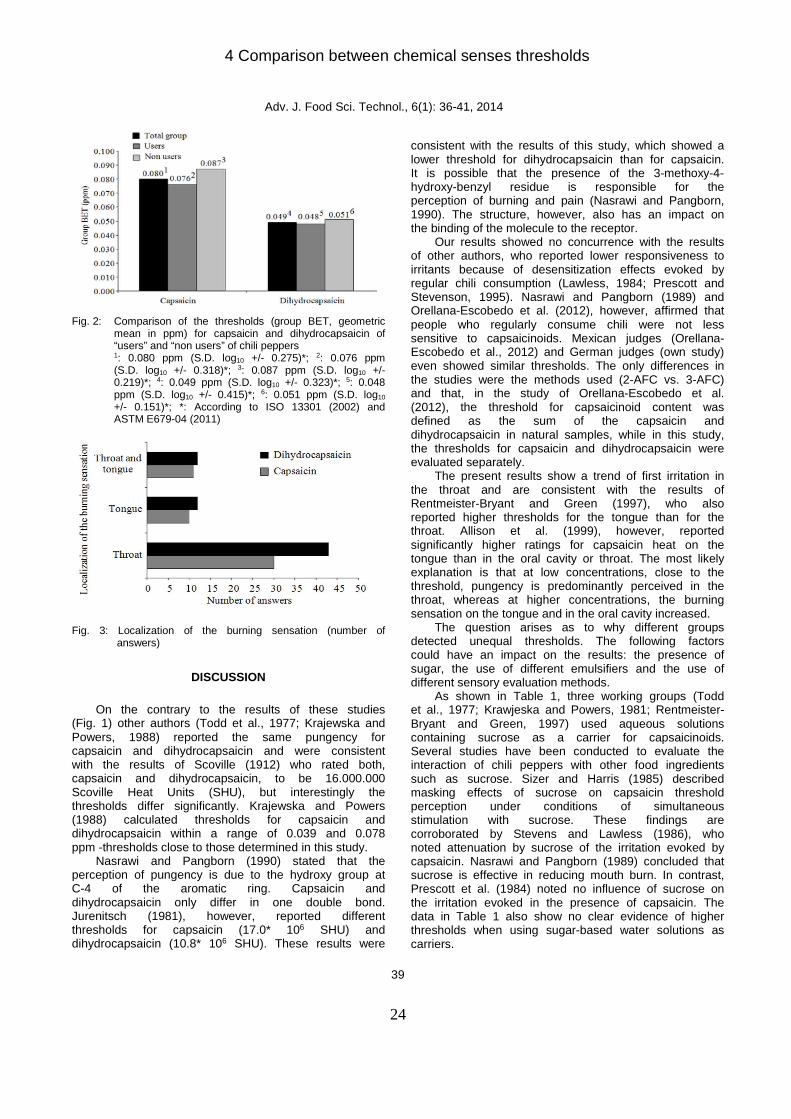
4 Comparison between chemical senses thresholds
24
Fig. 2: Comparison of the thresholds (group BET, geometric
mean in ppm) for capsaicin and dihydrocapsaicin of “users” and “non users” of chili peppers 1: 0.080 ppm (S.D. log10 +/- 0.275)*; 2: 0.076 ppm (S.D. log10 +/- 0.318)*; 3: 0.087 ppm (S.D. log10 +/- 0.219)*; 4: 0.049 ppm (S.D. log10 +/- 0.323)*; 5: 0.048 ppm (S.D. log10 +/- 0.415)*; 6: 0.051 ppm (S.D. log10 +/- 0.151)*; *: According to ISO 13301 (2002) and ASTM E679-04 (2011)
Fig. 3: Localization of the burning sensation (number of
answers)
DISCUSSION
On the contrary to the results of these studies
(Fig. 1) other authors (Todd et al., 1977; Krajewska and Powers, 1988) reported the same pungency for capsaicin and dihydrocapsaicin and were consistent with the results of Scoville (1912) who rated both, capsaicin and dihydrocapsaicin, to be 16.000.000 Scoville Heat Units (SHU), but interestingly the thresholds differ significantly. Krajewska and Powers (1988) calculated thresholds for capsaicin and dihydrocapsaicin within a range of 0.039 and 0.078 ppm -thresholds close to those determined in this study.
Nasrawi and Pangborn (1990) stated that the perception of pungency is due to the hydroxy group at C-4 of the aromatic ring. Capsaicin and dihydrocapsaicin only differ in one double bond. Jurenitsch (1981), however, reported different thresholds for capsaicin (17.0* 106 SHU) and dihydrocapsaicin (10.8* 106 SHU). These results were
consistent with the results of this study, which showed a lower threshold for dihydrocapsaicin than for capsaicin. It is possible that the presence of the 3-methoxy-4-hydroxy-benzyl residue is responsible for the perception of burning and pain (Nasrawi and Pangborn, 1990). The structure, however, also has an impact on the binding of the molecule to the receptor.
Our results showed no concurrence with the results of other authors, who reported lower responsiveness to irritants because of desensitization effects evoked by regular chili consumption (Lawless, 1984; Prescott and Stevenson, 1995). Nasrawi and Pangborn (1989) and Orellana-Escobedo et al. (2012), however, affirmed that people who regularly consume chili were not less sensitive to capsaicinoids. Mexican judges (Orellana-Escobedo et al., 2012) and German judges (own study) even showed similar thresholds. The only differences in the studies were the methods used (2-AFC vs. 3-AFC) and that, in the study of Orellana-Escobedo et al. (2012), the threshold for capsaicinoid content was defined as the sum of the capsaicin and dihydrocapsaicin in natural samples, while in this study, the thresholds for capsaicin and dihydrocapsaicin were evaluated separately.
The present results show a trend of first irritation in the throat and are consistent with the results of Rentmeister-Bryant and Green (1997), who also reported higher thresholds for the tongue than for the throat. Allison et al. (1999), however, reported significantly higher ratings for capsaicin heat on the tongue than in the oral cavity or throat. The most likely explanation is that at low concentrations, close to the threshold, pungency is predominantly perceived in the throat, whereas at higher concentrations, the burning sensation on the tongue and in the oral cavity increased.
The question arises as to why different groups detected unequal thresholds. The following factors could have an impact on the results: the presence of sugar, the use of different emulsifiers and the use of different sensory evaluation methods.
As shown in Table 1, three working groups (Todd et al., 1977; Krawjeska and Powers, 1981; Rentmeister-Bryant and Green, 1997) used aqueous solutions containing sucrose as a carrier for capsaicinoids. Several studies have been conducted to evaluate the interaction of chili peppers with other food ingredients such as sucrose. Sizer and Harris (1985) described masking effects of sucrose on capsaicin threshold perception under conditions of simultaneous stimulation with sucrose. These findings are corroborated by Stevens and Lawless (1986), who noted attenuation by sucrose of the irritation evoked by capsaicin. Nasrawi and Pangborn (1989) concluded that sucrose is effective in reducing mouth burn. In contrast, Prescott et al. (1984) noted no influence of sucrose on the irritation evoked in the presence of capsaicin. The data in Table 1 also show no clear evidence of higher thresholds when using sugar-based water solutions as carriers.
Adv. J. Food Sci. Technol., 6(1): 36-41, 2014
39
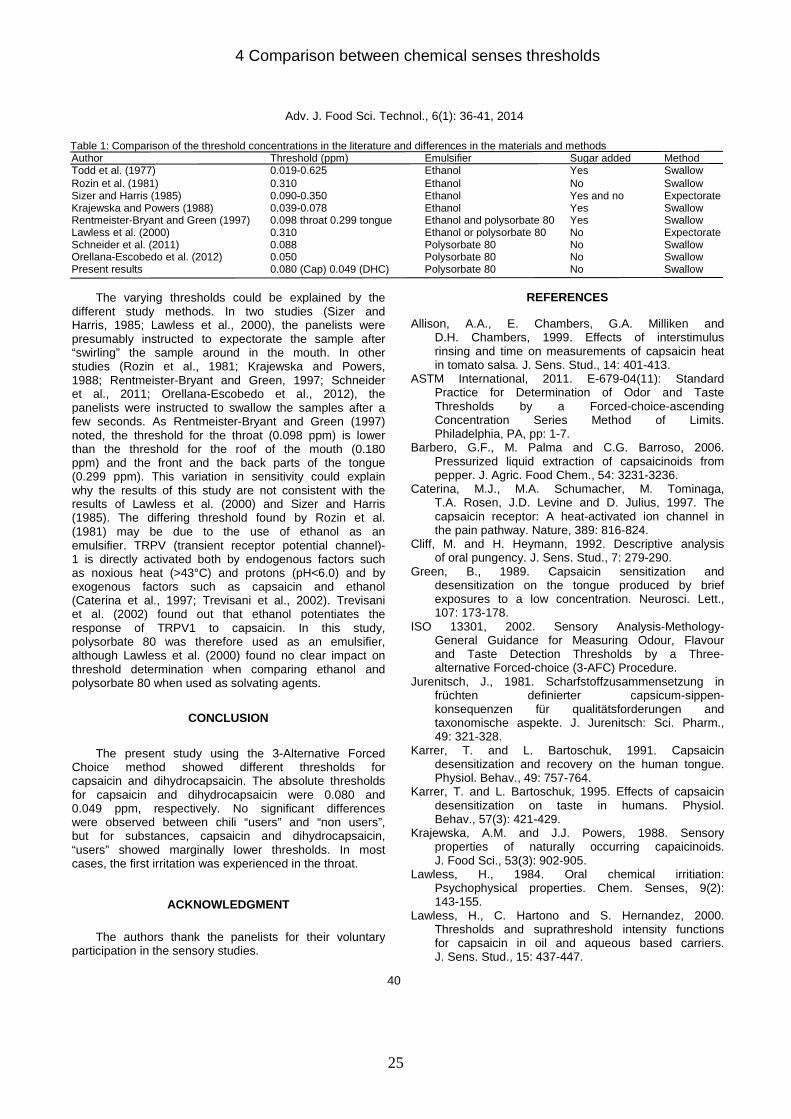
4 Comparison between chemical senses thresholds
25
Table 1: Comparison of the threshold concentrations in the literature and differences in the materials and methods Author Threshold (ppm) Emulsifier Sugar added Method Todd et al. (1977) 0.019-0.625 Ethanol Yes Swallow Rozin et al. (1981) 0.310 Ethanol No Swallow Sizer and Harris (1985) 0.090-0.350 Ethanol Yes and no Expectorate Krajewska and Powers (1988) 0.039-0.078 Ethanol Yes Swallow Rentmeister-Bryant and Green (1997) 0.098 throat 0.299 tongue Ethanol and polysorbate 80 Yes Swallow Lawless et al. (2000) 0.310 Ethanol or polysorbate 80 No Expectorate Schneider et al. (2011) 0.088 Polysorbate 80 No Swallow Orellana-Escobedo et al. (2012) 0.050 Polysorbate 80 No Swallow Present results 0.080 (Cap) 0.049 (DHC) Polysorbate 80 No Swallow
The varying thresholds could be explained by the
different study methods. In two studies (Sizer and Harris, 1985; Lawless et al., 2000), the panelists were presumably instructed to expectorate the sample after “swirling” the sample around in the mouth. In other studies (Rozin et al., 1981; Krajewska and Powers, 1988; Rentmeister-Bryant and Green, 1997; Schneider et al., 2011; Orellana-Escobedo et al., 2012), the panelists were instructed to swallow the samples after a few seconds. As Rentmeister-Bryant and Green (1997) noted, the threshold for the throat (0.098 ppm) is lower than the threshold for the roof of the mouth (0.180 ppm) and the front and the back parts of the tongue (0.299 ppm). This variation in sensitivity could explain why the results of this study are not consistent with the results of Lawless et al. (2000) and Sizer and Harris (1985). The differing threshold found by Rozin et al. (1981) may be due to the use of ethanol as an emulsifier. TRPV (transient receptor potential channel)- 1 is directly activated both by endogenous factors such as noxious heat (>43°C) and protons (pH<6.0) and by exogenous factors such as capsaicin and ethanol (Caterina et al., 1997; Trevisani et al., 2002). Trevisani et al. (2002) found out that ethanol potentiates the response of TRPV1 to capsaicin. In this study, polysorbate 80 was therefore used as an emulsifier, although Lawless et al. (2000) found no clear impact on threshold determination when comparing ethanol and polysorbate 80 when used as solvating agents.
CONCLUSION
The present study using the 3-Alternative Forced
Choice method showed different thresholds for capsaicin and dihydrocapsaicin. The absolute thresholds for capsaicin and dihydrocapsaicin were 0.080 and 0.049 ppm, respectively. No significant differences were observed between chili “users” and “non users”, but for substances, capsaicin and dihydrocapsaicin, “users” showed marginally lower thresholds. In most cases, the first irritation was experienced in the throat.
ACKNOWLEDGMENT The authors thank the panelists for their voluntary
participation in the sensory studies.
REFERENCES
Allison, A.A., E. Chambers, G.A. Milliken and D.H. Chambers, 1999. Effects of interstimulus rinsing and time on measurements of capsaicin heat in tomato salsa. J. Sens. Stud., 14: 401-413.
ASTM International, 2011. E-679-04(11): Standard Practice for Determination of Odor and Taste Thresholds by a Forced-choice-ascending Concentration Series Method of Limits. Philadelphia, PA, pp: 1-7.
Barbero, G.F., M. Palma and C.G. Barroso, 2006. Pressurized liquid extraction of capsaicinoids from pepper. J. Agric. Food Chem., 54: 3231-3236.
Caterina, M.J., M.A. Schumacher, M. Tominaga, T.A. Rosen, J.D. Levine and D. Julius, 1997. The capsaicin receptor: A heat-activated ion channel in the pain pathway. Nature, 389: 816-824.
Cliff, M. and H. Heymann, 1992. Descriptive analysis of oral pungency. J. Sens. Stud., 7: 279-290.
Green, B., 1989. Capsaicin sensitization and desensitization on the tongue produced by brief exposures to a low concentration. Neurosci. Lett., 107: 173-178.
ISO 13301, 2002. Sensory Analysis-Methology- General Guidance for Measuring Odour, Flavour and Taste Detection Thresholds by a Three-alternative Forced-choice (3-AFC) Procedure.
Jurenitsch, J., 1981. Scharfstoffzusammensetzung in früchten definierter capsicum-sippen- konsequenzen für qualitätsforderungen and taxonomische aspekte. J. Jurenitsch: Sci. Pharm., 49: 321-328.
Karrer, T. and L. Bartoschuk, 1991. Capsaicin desensitization and recovery on the human tongue. Physiol. Behav., 49: 757-764.
Karrer, T. and L. Bartoschuk, 1995. Effects of capsaicin desensitization on taste in humans. Physiol. Behav., 57(3): 421-429.
Krajewska, A.M. and J.J. Powers, 1988. Sensory properties of naturally occurring capaicinoids. J. Food Sci., 53(3): 902-905.
Lawless, H., 1984. Oral chemical irritiation: Psychophysical properties. Chem. Senses, 9(2): 143-155.
Lawless, H., C. Hartono and S. Hernandez, 2000. Thresholds and suprathreshold intensity functions for capsaicin in oil and aqueous based carriers. J. Sens. Stud., 15: 437-447.
40
Adv. J. Food Sci. Technol., 6(1): 36-41, 2014
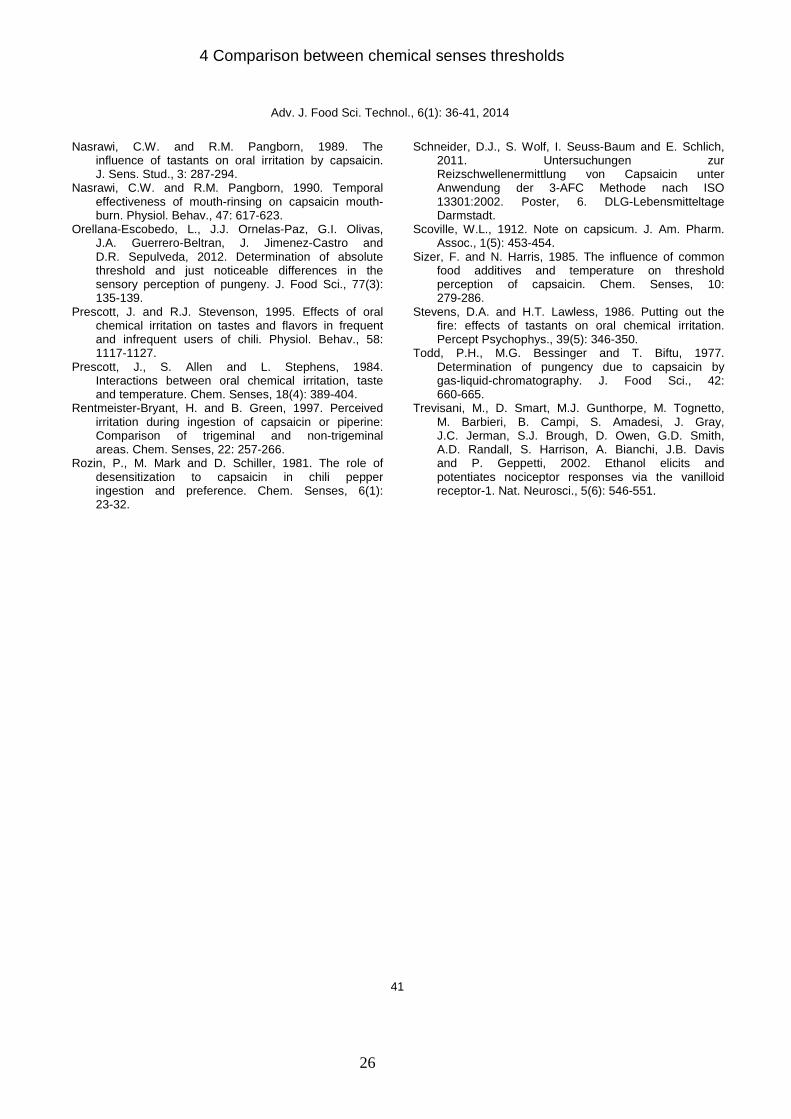
4 Comparison between chemical senses thresholds
26
Nasrawi, C.W. and R.M. Pangborn, 1989. The
influence of tastants on oral irritation by capsaicin. J. Sens. Stud., 3: 287-294.
Nasrawi, C.W. and R.M. Pangborn, 1990. Temporal effectiveness of mouth-rinsing on capsaicin mouth-burn. Physiol. Behav., 47: 617-623.
Orellana-Escobedo, L., J.J. Ornelas-Paz, G.I. Olivas, J.A. Guerrero-Beltran, J. Jimenez-Castro and D.R. Sepulveda, 2012. Determination of absolute threshold and just noticeable differences in the sensory perception of pungeny. J. Food Sci., 77(3): 135-139.
Prescott, J. and R.J. Stevenson, 1995. Effects of oral chemical irritation on tastes and flavors in frequent and infrequent users of chili. Physiol. Behav., 58: 1117-1127.
Prescott, J., S. Allen and L. Stephens, 1984. Interactions between oral chemical irritation, taste and temperature. Chem. Senses, 18(4): 389-404.
Rentmeister-Bryant, H. and B. Green, 1997. Perceived irritation during ingestion of capsaicin or piperine: Comparison of trigeminal and non-trigeminal areas. Chem. Senses, 22: 257-266.
Rozin, P., M. Mark and D. Schiller, 1981. The role of desensitization to capsaicin in chili pepper ingestion and preference. Chem. Senses, 6(1): 23-32.
Schneider, D.J., S. Wolf, I. Seuss-Baum and E. Schlich,
2011. Untersuchungen zur Reizschwellenermittlung von Capsaicin unter Anwendung der 3-AFC Methode nach ISO 13301:2002. Poster, 6. DLG-Lebensmitteltage Darmstadt.
Scoville, W.L., 1912. Note on capsicum. J. Am. Pharm. Assoc., 1(5): 453-454.
Sizer, F. and N. Harris, 1985. The influence of common food additives and temperature on threshold perception of capsaicin. Chem. Senses, 10: 279-286.
Stevens, D.A. and H.T. Lawless, 1986. Putting out the fire: effects of tastants on oral chemical irritation. Percept Psychophys., 39(5): 346-350.
Todd, P.H., M.G. Bessinger and T. Biftu, 1977. Determination of pungency due to capsaicin by gas-liquid-chromatography. J. Food Sci., 42: 660-665.
Trevisani, M., D. Smart, M.J. Gunthorpe, M. Tognetto, M. Barbieri, B. Campi, S. Amadesi, J. Gray, J.C. Jerman, S.J. Brough, D. Owen, G.D. Smith, A.D. Randall, S. Harrison, A. Bianchi, J.B. Davis and P. Geppetti, 2002. Ethanol elicits and potentiates nociceptor responses via the vanilloid receptor-1. Nat. Neurosci., 5(6): 546-551.
Adv. J. Food Sci. Technol., 6(1): 36-41, 2014
41

5 Vergleich der Gruppenreizschwellen
27
5 Vergleich der Gruppenreizschwellen von Capsaicin in
Abhängigkeit der Matrix
Désirée Janet Schneider 1, Ingrid Seuß-Baum 1, Elmar Schlich 2
ErnährungsUmschau (60) 10 (2013): 178-179.
DOI 10.4455/eu.2013.034.
1 Hochschule Fulda, Fachbereich Lebensmitteltechnologie, Marquardstr. 35, 36039
Fulda
2 Justus-Liebig-Universität Gießen, Institut für Prozesstechnik in Lebensmittel- und
Dienstleitungsbetrieben, Stephanstr. 24, 35390 Gießen
5 Vergleich der Gruppenreizschwellen
28
Vergleich der Gruppenreizschwellen von Capsaicin in Abhängigkeit der Matrix 1 Désirée Janet Schneider, Ingrid Seuß-Baum, Fulda; Elmar Schlich, Gießen
Einleitung und Fragestellung Capsaicin ist die mengenmäßig wichtigste Schärfe auslösende Subs- tanz in Chili (Capsicum annuum) [1]. Die Intensität und die Dauer des Schärfereizes werden jedoch maß- geblich von der Lebensmittelmatrix beeinflusst [2]. Ziel des Projektes war es deshalb, den Einfluss unterschied-licher Matrices (Öl und Wasser) auf die Reizschwelle von Capsaicin in Mund und Rachenbereich zu unter-suchen.
Methodik Mithilfe des 3-Alternative-Forced- Choice-Tests (3-AFC), angelehnt an ISO 13301 [3], wurden die Reiz- schwellen von Capsaicin (Produzent: Sigma-Aldrich, > 95 %) in wässriger Lösung (unter Einsatz des Emulga- tors Polysorbat 80) und in Sonnen-blumenöl bestimmt.
Dazu wurden den Panelisten (21 frei-willige Studierende) für die Reiz-schwellenermittlung in Wasser 5 Probelösungen (á 5 mL) mit unter-schiedlichen Capsaicinkonzentratio- nen gereicht [3]. Dabei stiegen die Konzentrationen an Capsaicin um den Faktor 2 an. Für die Reizschwel-lenermittlung in Sonnenblumenöl wurden die Konzentrationen je Do- sierung um den Faktor 3 erhöht. Bei jedem dargereichten Dreieck (beste- hend aus einer Testprobe [mit Cap- saicin] und zwei Referenzproben [Wasser versetzt mit Polysorbat 80, oder Sonnenblumenöl]) musste die abweichende Probe identifiziert wer- den (Forced-Choice-Prinzip). Der Ver-suchsaufbau ist in ♦ Abbildung 1 schematisch dargestellt.
Zusätzlich wurden mithilfe eines Fragebogens Metadaten und Daten bezüglich der Verzehrshäufigkeit von scharfen Produkten erfasst.
Die Ermittlung der Reizschwellen er- folgte mithilfe der Best-Estimate- Threshold (BET)-Methode [3]. Darü- ber hinaus wurde eine Varianzana- lyse (ANOVA) durchgeführt.
1Aktualisierte Version eines Posters ausgestellt im Rahmen des Deutschen Sensoriktags 2012 „Vom Sinn der Sinne“, Herausforderungen der modernen Sensorik, Deutsche Gesellschaft für Sensorik (DGSens) e. V. (09. November 2012 in Neustadt a. d. Weinstraße, Deutschland)
Ergebnisse Der BET der Gruppe lag für Capsaicin in Wasser bei 0,080 ppm und in Son-nenblumenöl bei 0,826 ppm (♦ Ab- bildung 2). Die ANOVA zeigt, dass in der Öl-Matrix ein signifikant höherer (p < 0,01) Schwellenwert festgestellt wurde als in der Wasser-Matrix. Mithilfe des Fragebogens wurden 12 Studierende als „Chili-Esser“ und 9 Studierende als „Nicht-Chili-Esser“ klassifiziert. Aufgrund der geringen Probandenzahl ist jedoch eine ge- trennte Gruppenauswertung als kri- tisch anzusehen, weshalb darauf verzichtet wurde.
Diskussion Auch LAWLESS und Kollegen [4] be- richten von höheren Capsaicin-Schwellenwerten in Öl (11,75 ppm) im Vergleich zu Wasser (0,310 ppm). Die deutlichen Abweichungen zu den hier ermittelten Werten lassen sich durch ein unterschiedliches Versuchs-design erklären. Während in der vorliegenden Studie die Proben ge-schluckt wurden, wurden bei LAWLESS et al. [4] die Proben wieder ausge- spuckt. RENTMEISTER-BRYANT und GREEN [5] bestätigen diese Vermutung, da sie für den Rachenraum niedrigere Schwellenwerte für Capsaicin in wässrigen Lösungen ermittelten als für die Zunge. Die hier ermittelten Reizschwellen in Wasser stimmen auch überein mit Studien, die die Reiz-schwellen von Capsaicinoiden in Wasser (0,05 ppm) bestimmt haben. Die Proben wurden in dieser Studie ebenfalls geschluckt [6]. Der maskierende Effekt von Fett in der Matrix wurde durch verschiedene Studien bestätigt, die zeigten, dass ein
Wissenschaft & Forschung | Original
Peer-Review -Verfahren | Eingegangen: 22.03.2013 | Akzeptiert: 30. 05.2013
Zusammenfassung Die Reizschwellen von Capsaicin in Öl- und Wasser-Matrix, die mit der 3-AFC-Methode ermittelt wurden, unterschieden sich signifikant. Die Reizschwelle in Öl lag etwa um den Faktor 10 höher als die in Wasser. Schlüsselwörter: Capsaicin, Wasser, Öl, Reizschwelle, 3-AFC, Geschmack, Sensorik
Zitierweise: Schneider DJ, Seuß-Baum I, Schlich E (2013) Comparison of the group thresholds of Capsaicin depending on the matrix. Ernaeh- rungs Umschau international 60(10): 178–179 The English version of this article is available online: DOI 10.4455/eu.2013.034
178 Ernaehrungs Umschau international | 10/2013

5 Vergleich der Gruppenreizschwellen
29
hoher Fettgehalt die Schärfewahrneh-mung verringert [2, 7]. Die Ursache für den Einfluss von Fett auf die Wahrnehmung von Capsaicin liegt vermutlich darin, dass das lipophile Capsaicin in einer fetthaltigen Matrix besser gelöst und so die Bindung am Schmerzrezeptor im Mund gestört wird [2], während das polare Lö-sungsmittel Wasser Capsaicin nicht lösen kann [2, 8]. Eine weitere These zur intensiveren Wahrnehmung von Capsaicin in Wasser ist, dass Wasser eine einfache, wenig komplexe Matrix darstellt und es deshalb zu keinen In-terferenzen durch andere Inhaltsstoffe kommt wie bei Matrices mit komple- xerem Aufbau [8]. Andere Arbeitsgruppen konnten je- doch keine signifikante Neutralisati-onswirkung von Fettkomponenten bei zuvor ausgelöstem Schärfereiz nachweisen [9, 10]. Eine mögliche Be-gründung hierfür wäre, dass Capsai- cin in einer Öl-Matrix zu einem ge- ringeren Schärfereiz führt, da die In-teraktion mit dem Rezeptor einge- schränkt ist, jedoch ein schon ausge- löster Schärfereiz nicht durch nach-folgend aufgenommenes Fett unter- drückt oder vermindert wird, da das Capsaicin bereits mit dem Rezeptor interagiert. Aufgrund der geringen Probanden- zahl sollen die Ergebnisse in einer grö- ßer angelegten Studie verifiziert wer- den, um auch Unterschiede zwischen „Chili-Essern“ und „Nicht-Chili- Essern“ feststellen zu können.
Désirée Janet Schneider MSc 1, Prof. Dr. Ingrid Seuß-Baum 1 Prof. Dr.-Ing. Elmar Schlich 2 1Hochschule Fulda Fachbereich Lebensmitteltechnologie Marquardstr.35, 36039 Fulda E-Mail: [email protected] E-Mail: [email protected] 2Justus-Liebig-Universität Gießen Institut für Landtechnik Professur für Prozesstechnik in Lebensmittel- und Dienstleistungsbetrieben Stephanstr. 24, 35390 Gießen E-Mail: [email protected] Interessenkonflikt Die Autoren erklären, dass kein Interessenkon- flikt im Sinne der Richtlinien des International Committee of Medical Journal Editors besteht.
Literatur
1. Contreras-Padilla M, Yahia EM (1998) Changes in capsaicinoids during develop- ment, maturation, and senescence of chile peppers and relation with peroxidise activ- ity. J Agric Food Chem 46: 2075–2079
2. Baron RF, Penfield MP (1996) Capsaicin heat intensity – concentration, carrier, fat level, and serving temperature effects. J Sensory Stud 11: 295–316
3. ISO 13301. Sensory analysis — Methodol- ogy — General guidance for measuring odour, flavour and taste detection thresholds by a three-alternative forced-choice (3-AFC) procedure (2002)
4. Lawless H, Hartono C, Hernandez S (2000)
Thresholds and suprathreshold intensity functions for capsaicin in oil and aqueous based carriers. J Sens Stud 15: 437–447
5. Rentmeister-Bryant H, Green B (1997) Per-ceived irritation during ingestion of cap- saicin or piperine: comparison of trigeminal and non-trigeminal areas. Chem Senses 22: 257–266
6. Orellana-Escobedo L, Ornelas-Paz JJ, Olivas GI et al. (2012) Determination of absolute threshold and just noticeable differences in the sensory perception of pungeny. J Food Sci 77(3): 13–139
7. Carden LA, Penfield MP, Saxton AM (1999) Perception of heat in cheese sauces as affeced by capsaicin concentration, fat level, fat mimetic and time. J Food Sci 64: 175–179
8. Kostyra E, Barylko-Pikielna N, Dabrowska U (2010) Relationship of pungency and lead- ing flavour attributes in model food matri- ces – temporal aspects. Food Qual Pref 21: 197–206
9. Hutchinson SE, Trantow LA, Vickers ZM (1990) The effectiveness of common foods for reduction of capsaicin burn. J Sensory Stud 4: 157–164
10. Nasrawi CW, Pangborn RM (1990) Temporal effectiveness of mouth-rinsing on capsaicin mouth-burn. Physiol Behav 47: 617–623
Abb. 2: Darstellung der Gruppen-BETs (geome-trisches Mittel in ppm) von Capsaicin in Abhängigkeit der Matrix BET = Best-Estimate-Threshold
Abb. 1: Versuchsaufbau 3-AFC-Test; Reizschwellenermittlung in Wasser (links) bzw. Öl (rechts) 3-AFC-Test = 3-Alternative-Forced-Choice-Test
DOI: 10.4455/eu.2013.034
Ernaehrungs Umschau international | 10/2013 179
6 Relationship between pungency
30
6 Relationship between pungency and food components –
A comparison of chemical and sensory evaluations
Désirée Janet Schneider 1, Ingrid Seuß-Baum 1, Elmar Schlich 2
Food Quality and Preference 38 (2014): 98-106.
DOI: 10.1016/j.foodqual.2014.05.017
1 Hochschule Fulda, Fachbereich Lebensmitteltechnologie, Marquardstr. 35, 36039
Fulda
2 Justus-Liebig-Universität Gießen, Institut für Prozesstechnik in Lebensmittel- und
Dienstleitungsbetrieben, Stephanstr. 24, 35390 Gießen

6 Relationship between pungency
31
Food Quality and Preference 38 (2014) 98–106
Relationship between pungency and food components – A comparison of chemical and sensory evaluations
Désirée J. Schneider a,*, Ingrid Seuß-Baum a, Elmar Schlich b
a Department of Food Technology, University of Applied Sciences Fulda, Marquardstr. 35, 36039 Fulda, Germany bDepartment of Process Engineering in Food and Servicing Business, Justus Liebig University Giessen, Stephanstr. 24, 35390 Giessen, Germany
ARTICLE INFO ABSTRACT
Article history: Received 30 January 2014 Received in revised form 28 May 2014 Accepted 29 May 2014 Available online 6 June 2014
The influence of food ingredients (water, starch, fat, and sugar), individually and in combination, on the sensory perception of the pungency of capsaicin was studied in model food systems using the time-inten-sity method. Furthermore, the transferability of the results obtained using model food matrices to com-plex matrices, such as convenience salsas, was investigated. Significant differences between the samples (p < 0.05) were examined by analysis of variance (ANOVA) followed by the Tukey-HSD post hoc test. A highly complex matrix and a high starch content reduced the perception of pungency in both the model food matrices and the convenience salsa products. Therefore, the time-related maximum intensity of pungency (Imax) was affected by other factors in addition to the capsaicin concentration. The total capsaicinoid content in the salsas was quantified by high-performance liquid chromatogra-phy–mass spectrometry (HPLC–MS) and correlated to the results of the sensory evaluation. The best cor-relation (R2 = 0.8029) was observed for the total capsaicinoid content and the maximum intensity of pungency (Imax) in comparison to the duration of the total pungency perception TDur (R2 = 0.5176) and the area under the curve (R2 = 0.6898). The calculated regression models serve as an example of how empirical calculations can be generated and used in a specific context.
© 2014 Elsevier Ltd. All rights reserved.
Keywords: Capsaicinoid Pungency Salsa Time-intensity analysis HPLC–MS analysis
Introduction
Capsaicinoids are responsible for the pungency of chili peppers (Capsicum fruit) and chili pepper products (Perkins et al., 2002). Pungency is often expressed in Scoville Heat Units (SHUs). The SHU test was developed by Scoville (1912). However, the accuracy of this organoleptic test has been criticized as inadequate. Numer- ous analytical methods have been published describing the identification and quantification of the capsaicinoid content of chili peppers. The most common techniques include gas chromatogra- phy with mass spectrometry (MS) (Peña-Alvarez, Ramirez- Maya, & Alvarado-Suárez, 2009), liquid chromatography (LC) with ultraviolet (UV) (Poyrazoğlu, Yemis, Kadakal, & Artik, 2005) and fluorescence detection (Kirschbaum-Titze, Hiepler, Mueller-Seitz, & Petz, 2002; Topuz, Dincer, Özdemir, Feng, & Kushad, 2011), and LC–MS (Barbero, Liazid, Palma, & Barroso, 2008; Barbero, Palma, & Barroso, 2006; Choi et al., 2006; Garcés-Claver, Arnedo-Andrés, Abadia, Gil-Ortega, & Àlvarez-Fernández, 2006). * Corresponding author. Tel.: +49 (0) 6619640537; fax: +49 (0) 6619640505.
E-mail addresses: [email protected] (D.J. Schneider), ingrid. [email protected] (I. Seuß-Baum), [email protected] (E. Schlich). http://dx.doi.org/10.1016/j.foodqual.2014.05.017 0950-3293/© 2014 Elsevier Ltd. All rights reserved.
The threshold determination of pure capsaicin in oil and aqueous solutions (Lawless, Hartono, & Hernandez, 2000) and of capsaicin and dihydrocapsaicin (Schneider, Seuß-Baum, & Schlich, 2014) or both substances together in aqueous solutions (Orellana-Escobedo et al., 2012) has been reported. Sensory studies have also examined the pain-relieving effect of foods, such as rice, water, butter, and pineapple juice (Hutchinson, Trantow, & Vickers, 1990), or solutions of quinine, sucrose, sodium chloride (NaCl), citric acid, or water (Stevens & Lawless, 1986) on the pungency induced by capsaicin.
The diminishment (or decline) in pungency was most effective when the neutralizers were held in the mouth (Hutchinson et al., 1990; Stevens & Lawless, 1986). While Hutchinson et al. (1990) did not observe a significant difference between the neutralizers, Stevens and Lawless (1986) reported that sugar was the most effective in reducing pungency. Furthermore, Nasrawi and Pangborn (1990) evaluated the temporal effectiveness of mouth-rinsing with different solutions, including water, ethanol, 10% sucrose (w/w) and milk with different fat levels. Oral rinsing signifi-cantly reduced the pungency evoked by capsaicin in this study. Other authors have evaluated the perceived pungency and the interaction between pungency and taste or flavor perception in different food matrices, such as tomato, chicken, and mushroom
Contents lists available at ScienceDirect
Food Quality and Preference
journal homepage: www.elsevier.com/locate/foodqual
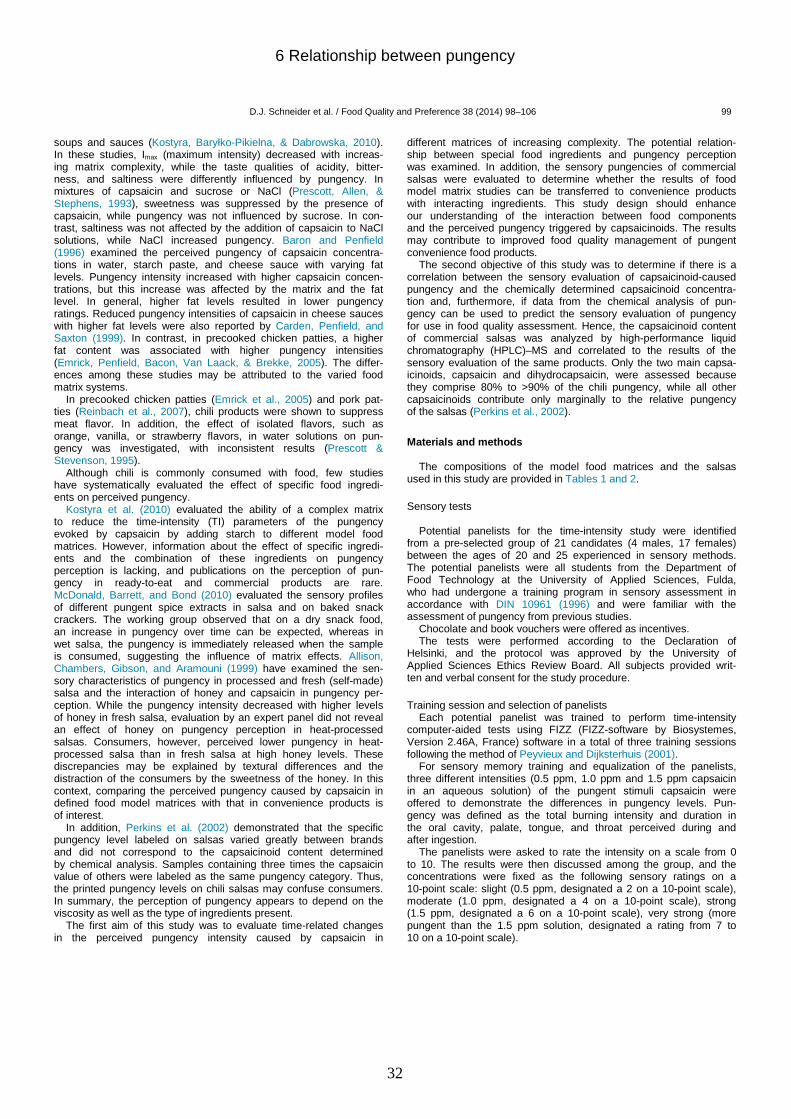
6 Relationship between pungency
32
soups and sauces (Kostyra, Baryłko-Pikielna, & Dabrowska, 2010). In these studies, Imax (maximum intensity) decreased with increas- ing matrix complexity, while the taste qualities of acidity, bitter- ness, and saltiness were differently influenced by pungency. In mixtures of capsaicin and sucrose or NaCl (Prescott, Allen, & Stephens, 1993), sweetness was suppressed by the presence of capsaicin, while pungency was not influenced by sucrose. In con-trast, saltiness was not affected by the addition of capsaicin to NaCl solutions, while NaCl increased pungency. Baron and Penfield (1996) examined the perceived pungency of capsaicin concentra-tions in water, starch paste, and cheese sauce with varying fat levels. Pungency intensity increased with higher capsaicin concen-trations, but this increase was affected by the matrix and the fat level. In general, higher fat levels resulted in lower pungency ratings. Reduced pungency intensities of capsaicin in cheese sauces with higher fat levels were also reported by Carden, Penfield, and Saxton (1999). In contrast, in precooked chicken patties, a higher fat content was associated with higher pungency intensities (Emrick, Penfield, Bacon, Van Laack, & Brekke, 2005). The differ-ences among these studies may be attributed to the varied food matrix systems.
In precooked chicken patties (Emrick et al., 2005) and pork pat- ties (Reinbach et al., 2007), chili products were shown to suppress meat flavor. In addition, the effect of isolated flavors, such as orange, vanilla, or strawberry flavors, in water solutions on pun- gency was investigated, with inconsistent results (Prescott & Stevenson, 1995).
Although chili is commonly consumed with food, few studies have systematically evaluated the effect of specific food ingredi- ents on perceived pungency.
Kostyra et al. (2010) evaluated the ability of a complex matrix to reduce the time-intensity (TI) parameters of the pungency evoked by capsaicin by adding starch to different model food matrices. However, information about the effect of specific ingredi-ents and the combination of these ingredients on pungency perception is lacking, and publications on the perception of pun- gency in ready-to-eat and commercial products are rare. McDonald, Barrett, and Bond (2010) evaluated the sensory profiles of different pungent spice extracts in salsa and on baked snack crackers. The working group observed that on a dry snack food, an increase in pungency over time can be expected, whereas in wet salsa, the pungency is immediately released when the sample is consumed, suggesting the influence of matrix effects. Allison, Chambers, Gibson, and Aramouni (1999) have examined the sen-sory characteristics of pungency in processed and fresh (self-made) salsa and the interaction of honey and capsaicin in pungency per-ception. While the pungency intensity decreased with higher levels of honey in fresh salsa, evaluation by an expert panel did not reveal an effect of honey on pungency perception in heat-processed salsas. Consumers, however, perceived lower pungency in heat-processed salsa than in fresh salsa at high honey levels. These discrepancies may be explained by textural differences and the distraction of the consumers by the sweetness of the honey. In this context, comparing the perceived pungency caused by capsaicin in defined food model matrices with that in convenience products is of interest.
In addition, Perkins et al. (2002) demonstrated that the specific pungency level labeled on salsas varied greatly between brands and did not correspond to the capsaicinoid content determined by chemical analysis. Samples containing three times the capsaicin value of others were labeled as the same pungency category. Thus, the printed pungency levels on chili salsas may confuse consumers. In summary, the perception of pungency appears to depend on the viscosity as well as the type of ingredients present.
The first aim of this study was to evaluate time-related changes in the perceived pungency intensity caused by capsaicin in
different matrices of increasing complexity. The potential relation- ship between special food ingredients and pungency perception was examined. In addition, the sensory pungencies of commercial salsas were evaluated to determine whether the results of food model matrix studies can be transferred to convenience products with interacting ingredients. This study design should enhance our understanding of the interaction between food components and the perceived pungency triggered by capsaicinoids. The results may contribute to improved food quality management of pungent convenience food products.
The second objective of this study was to determine if there is a correlation between the sensory evaluation of capsaicinoid-caused pungency and the chemically determined capsaicinoid concentra- tion and, furthermore, if data from the chemical analysis of pun- gency can be used to predict the sensory evaluation of pungency for use in food quality assessment. Hence, the capsaicinoid content of commercial salsas was analyzed by high-performance liquid chromatography (HPLC)–MS and correlated to the results of the sensory evaluation of the same products. Only the two main capsa-icinoids, capsaicin and dihydrocapsaicin, were assessed because they comprise 80% to >90% of the chili pungency, while all other capsaicinoids contribute only marginally to the relative pungency of the salsas (Perkins et al., 2002).
Materials and methods
The compositions of the model food matrices and the salsas used in this study are provided in Tables 1 and 2. Sensory tests
Potential panelists for the time-intensity study were identified from a pre-selected group of 21 candidates (4 males, 17 females) between the ages of 20 and 25 experienced in sensory methods. The potential panelists were all students from the Department of Food Technology at the University of Applied Sciences, Fulda, who had undergone a training program in sensory assessment in accordance with DIN 10961 (1996) and were familiar with the assessment of pungency from previous studies.
Chocolate and book vouchers were offered as incentives. The tests were performed according to the Declaration of
Helsinki, and the protocol was approved by the University of Applied Sciences Ethics Review Board. All subjects provided writ- ten and verbal consent for the study procedure. Training session and selection of panelists
Each potential panelist was trained to perform time-intensity computer-aided tests using FIZZ (FIZZ-software by Biosystemes, Version 2.46A, France) software in a total of three training sessions following the method of Peyvieux and Dijksterhuis (2001).
For sensory memory training and equalization of the panelists, three different intensities (0.5 ppm, 1.0 ppm and 1.5 ppm capsaicin in an aqueous solution) of the pungent stimuli capsaicin were offered to demonstrate the differences in pungency levels. Pun- gency was defined as the total burning intensity and duration in the oral cavity, palate, tongue, and throat perceived during and after ingestion.
The panelists were asked to rate the intensity on a scale from 0 to 10. The results were then discussed among the group, and the concentrations were fixed as the following sensory ratings on a 10-point scale: slight (0.5 ppm, designated a 2 on a 10-point scale), moderate (1.0 ppm, designated a 4 on a 10-point scale), strong (1.5 ppm, designated a 6 on a 10-point scale), very strong (more pungent than the 1.5 ppm solution, designated a rating from 7 to 10 on a 10-point scale).
D.J. Schneider et al. / Food Quality and Preference 38 (2014) 98–106 99
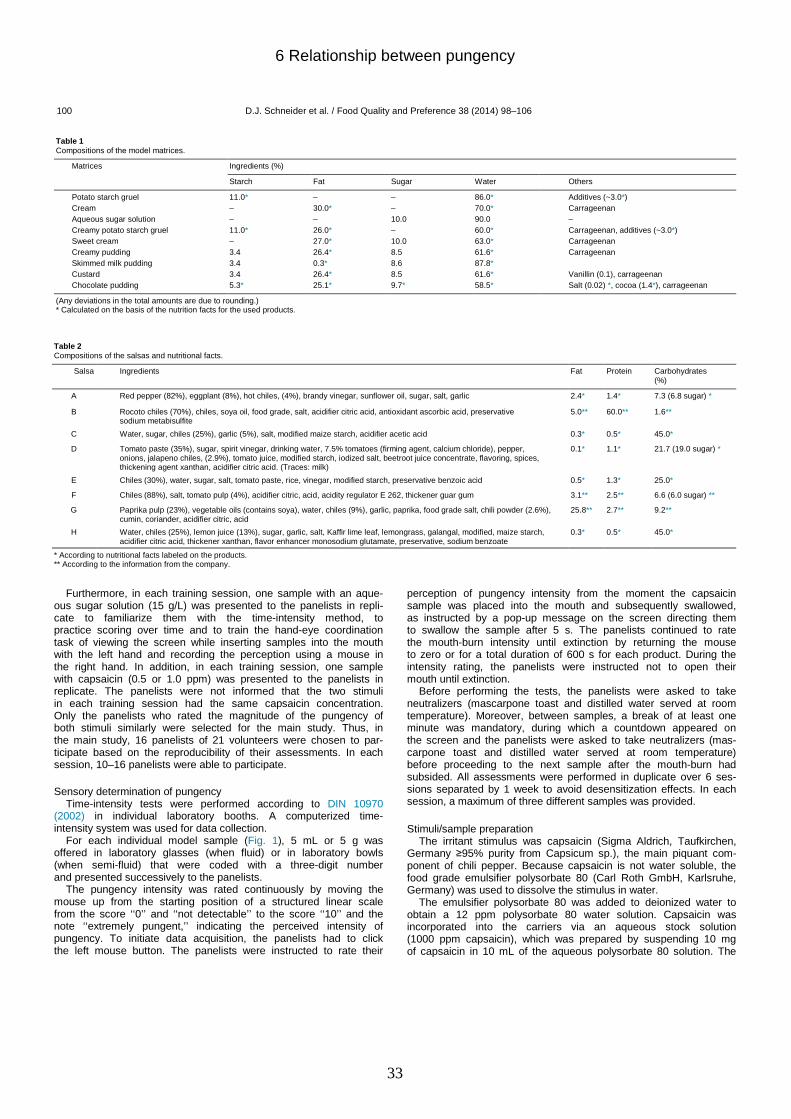
6 Relationship between pungency
33
Table 1 Compositions of the model matrices.
Matrices Ingredients (%)
Starch Fat Sugar Water Others
Potato starch gruel Cream Aqueous sugar solution Creamy potato starch gruel Sweet cream Creamy pudding Skimmed milk pudding Custard Chocolate pudding
11.0* – – 11.0* – 3.4 3.4 3.4 5.3*
– 30.0* – 26.0* 27.0* 26.4* 0.3* 26.4* 25.1*
– – 10.0 – 10.0 8.5 8.6 8.5 9.7*
86.0* 70.0* 90.0 60.0* 63.0* 61.6* 87.8* 61.6* 58.5*
Additives (~3.0*) Carrageenan – Carrageenan, additives (~3.0*) Carrageenan Carrageenan Vanillin (0.1), carrageenan Salt (0.02) *, cocoa (1.4*), carrageenan
(Any deviations in the total amounts are due to rounding.) * Calculated on the basis of the nutrition facts for the used products.
Table 2 Compositions of the salsas and nutritional facts.
Salsa Ingredients Fat Protein Carbohydrates (%)
A Red pepper (82%), eggplant (8%), hot chiles, (4%), brandy vinegar, sunflower oil, sugar, salt, garlic 2.4* 1.4* 7.3 (6.8 sugar) *
B Rocoto chiles (70%), chiles, soya oil, food grade, salt, acidifier citric acid, antioxidant ascorbic acid, preservative sodium metabisulfite
5.0** 60.0** 1.6**
C Water, sugar, chiles (25%), garlic (5%), salt, modified maize starch, acidifier acetic acid 0.3* 0.5* 45.0*
D Tomato paste (35%), sugar, spirit vinegar, drinking water, 7.5% tomatoes (firming agent, calcium chloride), pepper, onions, jalapeno chiles, (2.9%), tomato juice, modified starch, iodized salt, beetroot juice concentrate, flavoring, spices, thickening agent xanthan, acidifier citric acid. (Traces: milk)
0.1* 1.1* 21.7 (19.0 sugar) *
E Chiles (30%), water, sugar, salt, tomato paste, rice, vinegar, modified starch, preservative benzoic acid 0.5* 1.3* 25.0*
F Chiles (88%), salt, tomato pulp (4%), acidifier citric, acid, acidity regulator E 262, thickener guar gum 3.1** 2.5** 6.6 (6.0 sugar) **
G Paprika pulp (23%), vegetable oils (contains soya), water, chiles (9%), garlic, paprika, food grade salt, chili powder (2.6%), cumin, coriander, acidifier citric, acid
25.8** 2.7** 9.2**
H Water, chiles (25%), lemon juice (13%), sugar, garlic, salt, Kaffir lime leaf, lemongrass, galangal, modified, maize starch, acidifier citric acid, thickener xanthan, flavor enhancer monosodium glutamate, preservative, sodium benzoate
0.3* 0.5* 45.0*
* According to nutritional facts labeled on the products. ** According to the information from the company.
Furthermore, in each training session, one sample with an aque-
ous sugar solution (15 g/L) was presented to the panelists in repli-cate to familiarize them with the time-intensity method, to practice scoring over time and to train the hand-eye coordination task of viewing the screen while inserting samples into the mouth with the left hand and recording the perception using a mouse in the right hand. In addition, in each training session, one sample with capsaicin (0.5 or 1.0 ppm) was presented to the panelists in replicate. The panelists were not informed that the two stimuli in each training session had the same capsaicin concentration. Only the panelists who rated the magnitude of the pungency of both stimuli similarly were selected for the main study. Thus, in the main study, 16 panelists of 21 volunteers were chosen to par-ticipate based on the reproducibility of their assessments. In each session, 10–16 panelists were able to participate. Sensory determination of pungency
Time-intensity tests were performed according to DIN 10970 (2002) in individual laboratory booths. A computerized time- intensity system was used for data collection.
For each individual model sample (Fig. 1), 5 mL or 5 g was offered in laboratory glasses (when fluid) or in laboratory bowls (when semi-fluid) that were coded with a three-digit number and presented successively to the panelists.
The pungency intensity was rated continuously by moving the mouse up from the starting position of a structured linear scale from the score ‘‘0’’ and ‘‘not detectable’’ to the score ‘‘10’’ and the note ‘‘extremely pungent,’’ indicating the perceived intensity of pungency. To initiate data acquisition, the panelists had to click the left mouse button. The panelists were instructed to rate their
perception of pungency intensity from the moment the capsaicin sample was placed into the mouth and subsequently swallowed, as instructed by a pop-up message on the screen directing them to swallow the sample after 5 s. The panelists continued to rate the mouth-burn intensity until extinction by returning the mouse to zero or for a total duration of 600 s for each product. During the intensity rating, the panelists were instructed not to open their mouth until extinction.
Before performing the tests, the panelists were asked to take neutralizers (mascarpone toast and distilled water served at room temperature). Moreover, between samples, a break of at least one minute was mandatory, during which a countdown appeared on the screen and the panelists were asked to take neutralizers (mas-carpone toast and distilled water served at room temperature) before proceeding to the next sample after the mouth-burn had subsided. All assessments were performed in duplicate over 6 ses-sions separated by 1 week to avoid desensitization effects. In each session, a maximum of three different samples was provided. Stimuli/sample preparation
The irritant stimulus was capsaicin (Sigma Aldrich, Taufkirchen, Germany ≥95% purity from Capsicum sp.), the main piquant com-ponent of chili pepper. Because capsaicin is not water soluble, the food grade emulsifier polysorbate 80 (Carl Roth GmbH, Karlsruhe, Germany) was used to dissolve the stimulus in water.
The emulsifier polysorbate 80 was added to deionized water to obtain a 12 ppm polysorbate 80 water solution. Capsaicin was incorporated into the carriers via an aqueous stock solution (1000 ppm capsaicin), which was prepared by suspending 10 mg of capsaicin in 10 mL of the aqueous polysorbate 80 solution. The
100 D.J. Schneider et al. / Food Quality and Preference 38 (2014) 98–106
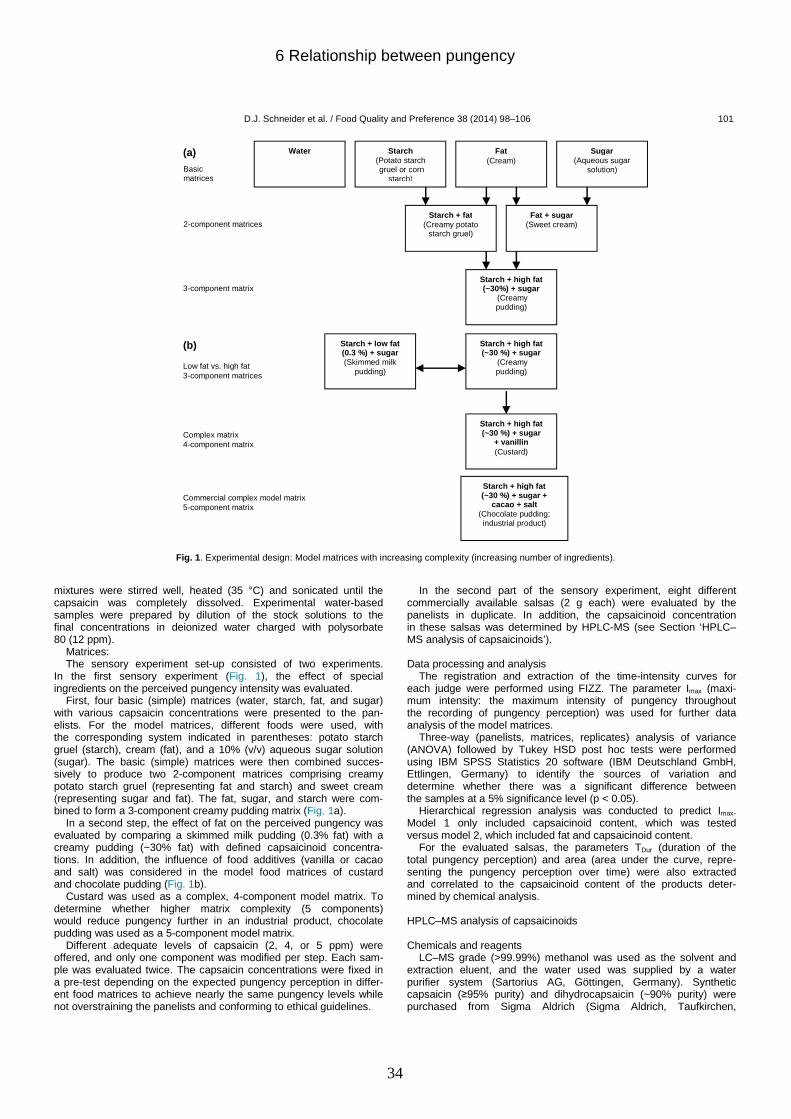
6 Relationship between pungency
34
Fig. 1 . Experimental design: Model matrices with increasing complexity (increasing number of ingredients).
mixtures were stirred well, heated (35 °C) and sonicated until the capsaicin was completely dissolved. Experimental water-based samples were prepared by dilution of the stock solutions to the final concentrations in deionized water charged with polysorbate 80 (12 ppm).
Matrices: The sensory experiment set-up consisted of two experiments.
In the first sensory experiment (Fig. 1), the effect of special ingredients on the perceived pungency intensity was evaluated.
First, four basic (simple) matrices (water, starch, fat, and sugar) with various capsaicin concentrations were presented to the pan-elists. For the model matrices, different foods were used, with the corresponding system indicated in parentheses: potato starch gruel (starch), cream (fat), and a 10% (v/v) aqueous sugar solution (sugar). The basic (simple) matrices were then combined succes-sively to produce two 2-component matrices comprising creamy potato starch gruel (representing fat and starch) and sweet cream (representing sugar and fat). The fat, sugar, and starch were com-bined to form a 3-component creamy pudding matrix (Fig. 1a).
In a second step, the effect of fat on the perceived pungency was evaluated by comparing a skimmed milk pudding (0.3% fat) with a creamy pudding (~30% fat) with defined capsaicinoid concentra- tions. In addition, the influence of food additives (vanilla or cacao and salt) was considered in the model food matrices of custard and chocolate pudding (Fig. 1b).
Custard was used as a complex, 4-component model matrix. To determine whether higher matrix complexity (5 components) would reduce pungency further in an industrial product, chocolate pudding was used as a 5-component model matrix.
Different adequate levels of capsaicin (2, 4, or 5 ppm) were offered, and only one component was modified per step. Each sam-ple was evaluated twice. The capsaicin concentrations were fixed in a pre-test depending on the expected pungency perception in differ-ent food matrices to achieve nearly the same pungency levels while not overstraining the panelists and conforming to ethical guidelines.
In the second part of the sensory experiment, eight different commercially available salsas (2 g each) were evaluated by the panelists in duplicate. In addition, the capsaicinoid concentration in these salsas was determined by HPLC-MS (see Section ‘HPLC–MS analysis of capsaicinoids’). Data processing and analysis
The registration and extraction of the time-intensity curves for each judge were performed using FIZZ. The parameter Imax (maxi-mum intensity: the maximum intensity of pungency throughout the recording of pungency perception) was used for further data analysis of the model matrices.
Three-way (panelists, matrices, replicates) analysis of variance (ANOVA) followed by Tukey HSD post hoc tests were performed using IBM SPSS Statistics 20 software (IBM Deutschland GmbH, Ettlingen, Germany) to identify the sources of variation and determine whether there was a significant difference between the samples at a 5% significance level (p < 0.05).
Hierarchical regression analysis was conducted to predict Imax. Model 1 only included capsaicinoid content, which was tested versus model 2, which included fat and capsaicinoid content.
For the evaluated salsas, the parameters TDur (duration of the total pungency perception) and area (area under the curve, repre-senting the pungency perception over time) were also extracted and correlated to the capsaicinoid content of the products deter-mined by chemical analysis. HPLC–MS analysis of capsaicinoids Chemicals and reagents
LC–MS grade (>99.99%) methanol was used as the solvent and extraction eluent, and the water used was supplied by a water purifier system (Sartorius AG, Göttingen, Germany). Synthetic capsaicin (≥95% purity) and dihydrocapsaicin (~90% purity) were purchased from Sigma Aldrich (Sigma Aldrich, Taufkirchen,
D.J. Schneider et al. / Food Quality and Preference 38 (2014) 98–106 101
Basic matrices
Water
Starch (Potato starch gruel or corn
starch)
Fat (Cream)
Sugar (Aqueous sugar
solution)
Starch + fat (Creamy potato
starch gruel)
Fat + sugar (Sweet cream)
Starch + high fat (~30%) + sugar
(Creamy pudding)
2-component matrices
3-component matrix
(a)
Starch + high fat (~30 %) + sugar
+ vanillin (Custard)
Starch + high fat (~30 %) + sugar +
cacao + salt (Chocolate pudding; industrial product)
Starch + low fat (0.3 %) + sugar (Skimmed milk
pudding)
Starch + high fat (~30 %) + sugar
(Creamy pudding)
Complex matrix 4-component matrix
Low fat vs. high fat 3-component matrices
Commercial complex model matrix 5-component matrix
(b)
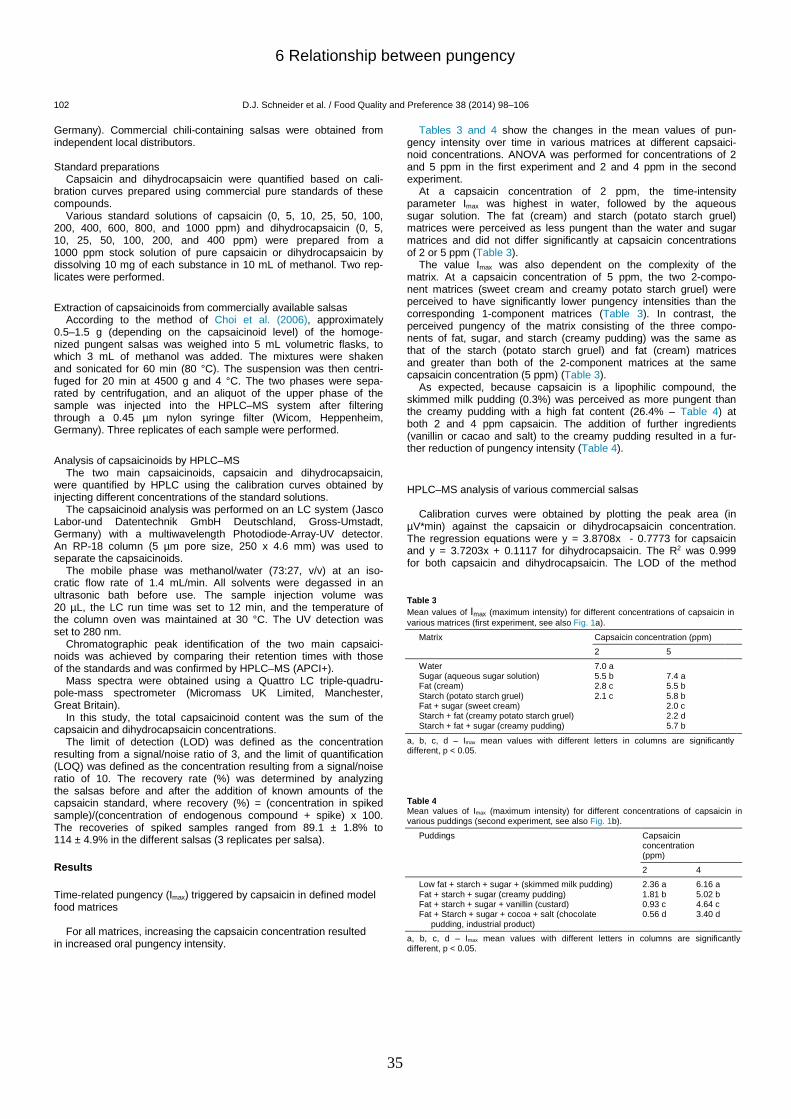
6 Relationship between pungency
35
Germany). Commercial chili-containing salsas were obtained from independent local distributors. Standard preparations
Capsaicin and dihydrocapsaicin were quantified based on cali-bration curves prepared using commercial pure standards of these compounds.
Various standard solutions of capsaicin (0, 5, 10, 25, 50, 100, 200, 400, 600, 800, and 1000 ppm) and dihydrocapsaicin (0, 5, 10, 25, 50, 100, 200, and 400 ppm) were prepared from a 1000 ppm stock solution of pure capsaicin or dihydrocapsaicin by dissolving 10 mg of each substance in 10 mL of methanol. Two rep-licates were performed. Extraction of capsaicinoids from commercially available salsas
According to the method of Choi et al. (2006), approximately 0.5–1.5 g (depending on the capsaicinoid level) of the homoge- nized pungent salsas was weighed into 5 mL volumetric flasks, to which 3 mL of methanol was added. The mixtures were shaken and sonicated for 60 min (80 °C). The suspension was then centri-fuged for 20 min at 4500 g and 4 °C. The two phases were sepa-rated by centrifugation, and an aliquot of the upper phase of the sample was injected into the HPLC–MS system after filtering through a 0.45 µm nylon syringe filter (Wicom, Heppenheim, Germany). Three replicates of each sample were performed. Analysis of capsaicinoids by HPLC–MS
The two main capsaicinoids, capsaicin and dihydrocapsaicin, were quantified by HPLC using the calibration curves obtained by injecting different concentrations of the standard solutions.
The capsaicinoid analysis was performed on an LC system (Jasco Labor-und Datentechnik GmbH Deutschland, Gross-Umstadt, Germany) with a multiwavelength Photodiode-Array-UV detector. An RP-18 column (5 µm pore size, 250 x 4.6 mm) was used to separate the capsaicinoids.
The mobile phase was methanol/water (73:27, v/v) at an iso- cratic flow rate of 1.4 mL/min. All solvents were degassed in an ultrasonic bath before use. The sample injection volume was 20 µL, the LC run time was set to 12 min, and the temperature of the column oven was maintained at 30 °C. The UV detection was set to 280 nm.
Chromatographic peak identification of the two main capsaici- noids was achieved by comparing their retention times with those of the standards and was confirmed by HPLC–MS (APCI+).
Mass spectra were obtained using a Quattro LC triple-quadru- pole-mass spectrometer (Micromass UK Limited, Manchester, Great Britain).
In this study, the total capsaicinoid content was the sum of the capsaicin and dihydrocapsaicin concentrations.
The limit of detection (LOD) was defined as the concentration resulting from a signal/noise ratio of 3, and the limit of quantification (LOQ) was defined as the concentration resulting from a signal/noise ratio of 10. The recovery rate (%) was determined by analyzing the salsas before and after the addition of known amounts of the capsaicin standard, where recovery (%) = (concentration in spiked sample)/(concentration of endogenous compound + spike) x 100. The recoveries of spiked samples ranged from 89.1 ± 1.8% to 114 ± 4.9% in the different salsas (3 replicates per salsa). Results Time-related pungency (Imax) triggered by capsaicin in defined model food matrices
For all matrices, increasing the capsaicin concentration resulted in increased oral pungency intensity.
Tables 3 and 4 show the changes in the mean values of pun-
gency intensity over time in various matrices at different capsaici- noid concentrations. ANOVA was performed for concentrations of 2 and 5 ppm in the first experiment and 2 and 4 ppm in the second experiment.
At a capsaicin concentration of 2 ppm, the time-intensity parameter Imax was highest in water, followed by the aqueous sugar solution. The fat (cream) and starch (potato starch gruel) matrices were perceived as less pungent than the water and sugar matrices and did not differ significantly at capsaicin concentrations of 2 or 5 ppm (Table 3).
The value Imax was also dependent on the complexity of the matrix. At a capsaicin concentration of 5 ppm, the two 2-compo- nent matrices (sweet cream and creamy potato starch gruel) were perceived to have significantly lower pungency intensities than the corresponding 1-component matrices (Table 3). In contrast, the perceived pungency of the matrix consisting of the three compo- nents of fat, sugar, and starch (creamy pudding) was the same as that of the starch (potato starch gruel) and fat (cream) matrices and greater than both of the 2-component matrices at the same capsaicin concentration (5 ppm) (Table 3).
As expected, because capsaicin is a lipophilic compound, the skimmed milk pudding (0.3%) was perceived as more pungent than the creamy pudding with a high fat content (26.4% – Table 4) at both 2 and 4 ppm capsaicin. The addition of further ingredients (vanillin or cacao and salt) to the creamy pudding resulted in a fur-ther reduction of pungency intensity (Table 4).
HPLC–MS analysis of various commercial salsas
Calibration curves were obtained by plotting the peak area (in µV*min) against the capsaicin or dihydrocapsaicin concentration. The regression equations were y = 3.8708x - 0.7773 for capsaicin and y = 3.7203x + 0.1117 for dihydrocapsaicin. The R2 was 0.999 for both capsaicin and dihydrocapsaicin. The LOD of the method Table 3 Mean values of Imax (maximum intensity) for different concentrations of capsaicin in various matrices (first experiment, see also Fig. 1a).
Matrix Capsaicin concentration (ppm)
2 5
Water Sugar (aqueous sugar solution) Fat (cream) Starch (potato starch gruel) Fat + sugar (sweet cream) Starch + fat (creamy potato starch gruel) Starch + fat + sugar (creamy pudding)
7.0 a 5.5 b 2.8 c 2.1 c
7.4 a 5.5 b 5.8 b 2.0 c 2.2 d 5.7 b
a, b, c, d – Imax mean values with different letters in columns are significantly different, p < 0.05.
Table 4 Mean values of Imax (maximum intensity) for different concentrations of capsaicin in various puddings (second experiment, see also Fig. 1b).
Puddings Capsaicin concentration (ppm)
2 4
Low fat + starch + sugar + (skimmed milk pudding) Fat + starch + sugar (creamy pudding) Fat + starch + sugar + vanillin (custard) Fat + Starch + sugar + cocoa + salt (chocolate
pudding, industrial product)
2.36 a 1.81 b 0.93 c 0.56 d
6.16 a 5.02 b 4.64 c 3.40 d
a, b, c, d – Imax mean values with different letters in columns are significantly different, p < 0.05.
102 D.J. Schneider et al. / Food Quality and Preference 38 (2014) 98–106

6 Relationship between pungency
36
was 0.49 ppm for capsaicin and 0.34 ppm for dihydrocapsaicin, and the LOQ values were calculated to be 1.16 and 1.21 ppm for capsa-icin and dihydrocapsaicin, respectively.
Capsaicin and dihydrocapsaicin were identified by the spectra of standard analyte solutions and their retention times in LC–MS. The capsaicinoids (Table 5) in the different salsas were quantified based on the peak areas. The SHU rating of each salsa was calcu-lated based on the total capsaicinoid content.
The evaluation revealed a high variation in total capsaicinoid content in the analyzed salsas, as illustrated in Table 5. Sensory evaluation of pungency perception in various commercial salsas
The results of the sensory evaluation of the salsas are demon-strated in Table 6. On the basis of the individual data, the mean
Table 6 Mean pungency ratings for the salsas.
Salsa Sensory rating1
A B C D E F G H
2.61 a 8.45 e 2.83 a,b 2.92 a,b 3.06 b 5.59 c 7.71 d 7.91 d
1 a, b, c, d, e – Imax mean values with different letters in columns are significantly different, p < 0.05.
Fig. 2 . Sensory pungency evaluation of various commercial salsas (scale: 0-10; 0 = ‘‘not detectable’’, 10 = ‘‘extremely pungent’’).
values of Imax were calculated. Salsas A, C, and D did not differ sig-nificantly in pungency. Furthermore, salsas C, D, and E and salsas G and H were rated as equally pungent (p < 0.05).
To illustrate the distributions of the pungency evaluations of the salsas, the data were transformed to box plots (Fig. 2). The box plots verify the statistical analysis of the data (Table 6) and also show the median, lowest, and highest data points and the spread and distribution of the data values. The spread of the data can be explained by individual differences in pungency perception by the panelists.
To determine if the pungency rating was only a function of the total capsaicinoid concentration, the sensory pungency rating (Imax) and the capsaicinoid concentrations determined by chemical analysis were compared (Fig. 3).
As shown in Fig. 3, the rating did not depend solely on the total capsaicinoid concentration. Salsas with nearly the same mean Imax often differed in total capsaicinoid content. For example, the sen- sory pungency ratings of salsas G and H did not differ significantly, despite that the total capsaicinoid content of salsa H was nearly twice the capsaicinoid content of salsa G. These results further sug-gest that the food matrix influences the perception of pungency.
Nonetheless, hierarchical regression analysis identified the capsaicinoid content as the strongest predictor of Imax in salsas, which explained approximately 82% of the variance. When adding fat to the model, based on the assumption that the fat content influences pungency perception, approximately 90% of the vari- ance was explained, although the F change associated with delta R square was not statistically significant (p = 0.09). In the model matrices, however, the influence of fat was statistically significant.
To further determine the applicability of the conclusions from the model food matrix trials to commercial salsas and whether the components of the model food matrices interacted and influ-enced the pungency rating in a similar manner in convenience
Fig. 3 . Analytically determined total capsaicinoid concentration and sensory rating (Imax, mean value) of various salsas.
0
20
40
60
80
100
120
140
A B C D E F G H
Salsas
Tot
al c
apsa
icin
oid
conc
entra
tion
(ppm
)
0
1
2
3
4
5
6
7
8
9
10
Rating (Im
ax)
Total capsaicinoid concentration (ppm) Rating (Imax)
n.d.
Table 5 Capsaicinoid content in extracts of various commercial salsas.
Salsa Capsaicin (mg/kg) Dihydrocapsaicin (mg/kg) Total capsaicinoid Content (mg/kg)1
Calculated SHUs2
A B C D E F G H
n.d. 42.17 (±1.83) 7.16 (±1.04) 9.91 (±1.75) 16.61 (±0.97) 50.88 (±2.72) 37.64 (±3.19) 76.61(±2.97)
n.d. 36.49 (±2.01) 2.87 (±0.36) n.d. 10.49 (±1.29) 24.12 (±0.86) 31.01 (±5.01) 45.57 (±1.10)
78.66 10.02 9.91 27.10 75.00 68.65 122.18
1266.43 161.32 159.55 436.31 1207.50 1105.27 1967.10
Values in mg/ kg (ppm) ±SD of fresh weight; n = 3; n.d. not detected. 1 The total capsaicinoid content was defined as the sum of capsaicin and dihydrocapsaicin. 2 The calculation was performed by multiplying the total capsaicinoid content (in ppm) by the factor 16.1 [Todd et al., 1977].
D.J. Schneider et al. / Food Quality and Preference 38 (2014) 98–106 103
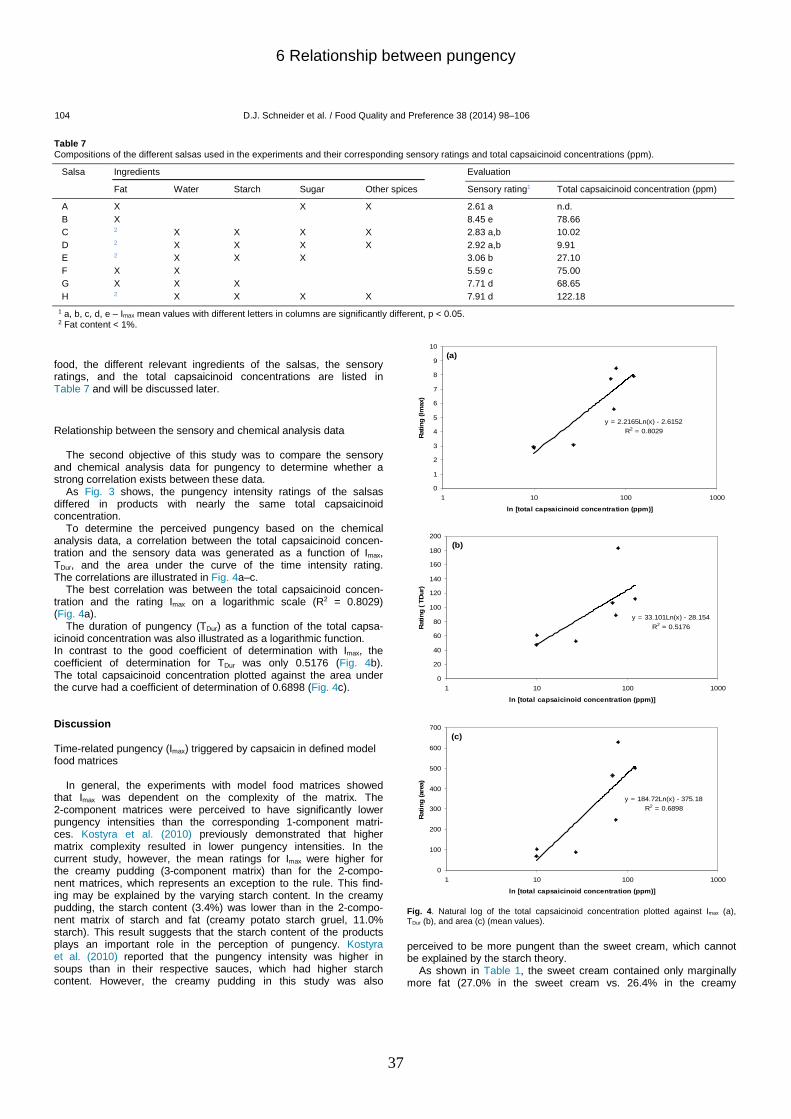
6 Relationship between pungency
37
Table 7 Compositions of the different salsas used in the experiments and their corresponding sensory ratings and total capsaicinoid concentrations (ppm).
Salsa Ingredients Evaluation
Fat Water Starch Sugar Other spices Sensory rating1 Total capsaicinoid concentration (ppm)
A B C D E F G H
X X 2
2
2
X X 2
X X X X X X
X X X X X
X X X X X
X X X X
2.61 a 8.45 e 2.83 a,b 2.92 a,b 3.06 b 5.59 c 7.71 d 7.91 d
n.d. 78.66 10.02 9.91 27.10 75.00 68.65 122.18
1 a, b, c, d, e – Imax mean values with different letters in columns are significantly different, p < 0.05. 2 Fat content < 1%.
food, the different relevant ingredients of the salsas, the sensory ratings, and the total capsaicinoid concentrations are listed in Table 7 and will be discussed later. Relationship between the sensory and chemical analysis data
The second objective of this study was to compare the sensory and chemical analysis data for pungency to determine whether a strong correlation exists between these data.
As Fig. 3 shows, the pungency intensity ratings of the salsas differed in products with nearly the same total capsaicinoid concentration.
To determine the perceived pungency based on the chemical analysis data, a correlation between the total capsaicinoid concen-tration and the sensory data was generated as a function of Imax, TDur, and the area under the curve of the time intensity rating. The correlations are illustrated in Fig. 4a–c.
The best correlation was between the total capsaicinoid concen-tration and the rating Imax on a logarithmic scale (R2 = 0.8029) (Fig. 4a).
The duration of pungency (TDur) as a function of the total capsa-icinoid concentration was also illustrated as a logarithmic function. In contrast to the good coefficient of determination with Imax, the coefficient of determination for TDur was only 0.5176 (Fig. 4b). The total capsaicinoid concentration plotted against the area under the curve had a coefficient of determination of 0.6898 (Fig. 4c). Discussion Time-related pungency (Imax) triggered by capsaicin in defined model food matrices
In general, the experiments with model food matrices showed that Imax was dependent on the complexity of the matrix. The 2-component matrices were perceived to have significantly lower pungency intensities than the corresponding 1-component matri- ces. Kostyra et al. (2010) previously demonstrated that higher matrix complexity resulted in lower pungency intensities. In the current study, however, the mean ratings for Imax were higher for the creamy pudding (3-component matrix) than for the 2-compo- nent matrices, which represents an exception to the rule. This find- ing may be explained by the varying starch content. In the creamy pudding, the starch content (3.4%) was lower than in the 2-compo-nent matrix of starch and fat (creamy potato starch gruel, 11.0% starch). This result suggests that the starch content of the products plays an important role in the perception of pungency. Kostyra et al. (2010) reported that the pungency intensity was higher in soups than in their respective sauces, which had higher starch content. However, the creamy pudding in this study was also
Fig. 4 . Natural log of the total capsaicinoid concentration plotted against Imax (a), TDur (b), and area (c) (mean values).
perceived to be more pungent than the sweet cream, which cannot be explained by the starch theory.
As shown in Table 1, the sweet cream contained only marginally more fat (27.0% in the sweet cream vs. 26.4% in the creamy
y = 2.2165Ln(x) - 2.6152
R2 = 0.8029
0
1
2
3
4
5
6
7
8
9
10
1 10 100 1000
ln [total capsaicinoid concentration (ppm)]
Rat
ing
(Im
ax)
(a)
y = 33.101Ln(x) - 28.154
R2 = 0.5176
0
20
40
60
80
100
120
140
160
180
200
1 10 100 1000
ln [total capsaicinoid concentration (ppm)]
Rat
ing
( T
Dur
)
(b)
y = 184.72Ln(x) - 375.18
R2 = 0.6898
0
100
200
300
400
500
600
700
1 10 100 1000
ln [total capsaicinoid concentration (ppm)]
Rat
ing
(are
a)
(c)
104 D.J. Schneider et al. / Food Quality and Preference 38 (2014) 98–106
6 Relationship between pungency
38
pudding) and sugar (10.0% in the sweet cream vs. 8.5% in the creamy pudding) than the creamy pudding. Therefore, it is unclear why the sweet cream was perceived as less pungent than the creamy pudding. It is possible that the pleasant feeling of the sweet cream in the mouth influenced the panelists and the perceived pungency.
As expected, a higher fat content in model food matrices resulted in lower pungency scores, as observed in the skimmed milk pudding and the creamy pudding. Carden et al. (1999) reported that the pungency intensity of cheese sauces increased as the fat levels decreased, but Emrick et al. (2005) stated that a higher fat content in chicken patties increased the pungency inten-sity. These discrepancies can be explained by the different compo-sitions of the food matrix systems. In emulsion-type products, the fat may function as a coating to insulate the tongue, whereas in chopped and formed meat products, the higher fat content intensi- fies the pungency (Emrick et al., 2005).
Further studies should be performed with varying starch and fat contents in single-component models to verify this conclusion. Moreover, the viscosities of the model food matrices should be measured to adequately determine the effects of viscosity on pungency perception. Sensory evaluation of pungency perception in various commercial salsas and comparison to model food matrices
As shown in Table 7, the pungency ratings of salsas A, C, and D did not differ significantly (p < 0.05). Salsas C and D were com- posed of the same ingredients and had similar total capsaicinoid concentrations, so similar pungency perceptions were anticipated. In salsa A, however, the total capsaicinoid concentration was below the LOD, but the pungency rating did not differ from those of salsas C and D. Different groups (Lawless et al., 2000; Schneider, Seuß-Baum, & Schlich, 2013) have reported higher thresholds for capsa-icin in aqueous solutions compared to oil-based solutions. Other authors have reported a masking effect of fat in food matrices (Baron & Penfield, 1996; Carden et al., 1999). Therefore, salsa A, a fat-based salsa, was expected to be rated as less pungent than the water-based salsas C and D. However, while salsas C and D con-tained starch, salsa A did not; thus, the starch content reduced the perceived pungency intensity in this experiment.
Salsas G and H also did not differ significantly (p < 0.05) in pun-gency perception, despite that the total capsaicinoid content of salsa H was nearly twice the capsaicinoid content of salsa G (Table 7). Salsa G was, similar to salsa A, a fat-based salsa, and it was therefore expected to be perceived as less pungent than the water-based salsa H. The low sensory rating of salsa H may be due to the presence of starch and sugar, which made this salsa more complex than salsa G; thus, it was perceived as less pungent even though its total capsaicinoid content was much higher. These results are consistent with the findings for the model food matrices in this study, which also demonstrated that the starch content and the complexity of the food matrix play an important role in pun- gency perception. The above results suggest that these two aspects have a greater impact on pungency perception than the presence of fat in the food, consistent with the results of previous studies (Kostyra et al., 2010).
The results of hierarchical regression analysis showed that add- ing the fat level to the model increases the model’s predictive capacity insignificantly, despite the fact that R square increases by approximately 8%. In the model matrices, the influence of fat on pungency perception was significant. Considering that there is empirical evidence that the fat level should matter, the effect of fat may be attenuated in a complex matrix of convenience salsas. Additionally, the fat levels were deduced from the nutritional labels, which possibly contain errors compared to the analytical
measurement of fat levels. This might explain the insignificant influence of fat in commercial salsas.
The sensory evaluations of salsas C, D, and E were also quite similar and did not differ significantly (p < 0.05). The total capsaici-noid contents of salsas C and D were similar, whereas salsa E con-tained approximately three times more capsaicinoids than salsas C and D. These three salsas were all water-based and contained starch and sugar. The presence of other pungent ingredients (which were not quantified) in salsas C and D could explain why these salsas were rated equally as pungent as salsa E.
Salsas B and F had nearly the same total capsaicinoid content, but salsa F was rated as less pungent. The lower rating of salsa F might be due to the presence of sugar and its presumably higher viscosity. In this context, Hutchinson et al. (1990) demonstrated that a tactile sensation, such as that caused by a higher dry matter content, can reduce the pungency intensity of foods.
These findings suggest that the conclusions from the study of the model food matrices are applicable to commercial products, even if the effect of fat in the salsas was not significant. Our results indicate that in addition to fat, the starch and sugar contents and the complexity of the matrix have an impact on pungency perception. Relationship between the sensory and chemical analysis data
Because the pungency intensity ratings of the salsas differed in salsas with nearly the same total capsaicinoid concentrations, determining the capsaicinoid content via HPLC and calculating the SHU by multiplying the analyzed capsaicinoid concentration by a factor of 16.1 (Todd, Besinger, & Biftu, 1977) may yield unreliable results. Furthermore, the pungency intensity provided on salsas is not always consistent with the capsaicinoid content as determined by chemical analysis (Perkins et al., 2002), thus misleading consumers.
For this purpose, we examined the correlation between sensory and analytically obtained data.
The application of chemical analysis data to the sensory evalu- ation of pungency in commercial products would best be achieved by examining the correlation between Imax and the total capsaici- noid concentration. This correlation could be utilized in industry to estimate the perceived pungencies in salsas as a function of the capsaicinoid concentrations determined by chemical analysis. Our regression equations are an example of how empirical calcula-tions can be generated and used in a specific context. Conclusion and outlook
Our results demonstrate that the pungency caused by capsaici-noids is influenced by the presence of specific food ingredients (e.g., starch) and the complexity of the matrix in both model food matrices and commercial convenience products. Thus, pungency data evaluated by standard organoleptic tests based on water solutions, i.e., the Scoville test, cannot be accurately applied to con-venience products. Furthermore, the total capsaicinoid concentra-tions in products determined by chemical analysis and the SHU calculated from these data are not consistent with the perceived pungency in convenience products.
The calculated regression curves for the relationship between perceived pungency intensity (Imax) and total capsaicinoid concen-tration (R2 = 0.8029) might be used to estimate the perceived pun-gency in commercial products based on the total capsaicinoid concentration determined by chemical analysis that considers the food matrix and the specific ingredients. To verify these corre-lations, additional salsas will be investigated in further studies to
D.J. Schneider et al. / Food Quality and Preference 38 (2014) 98–106 105
6 Relationship between pungency
39
determine whether pungency perception can be estimated accu- rately using the correlations identified in this study. References Allison, A. A., Chambers, E., IV, Gibson, E., & Aramouni, F. M. (1999). Sensory
characteristics of heat-processed and fresh tomato salsa containing honey. Journal of Food Science, 64(3), 560–564.
Barbero, G. F., Liazid, A., Palma, M., & Barroso, C. G. (2008). Fast determintion of capsaicinoids from peppers by high-performance liquid chromtography using a reversed phase monolithic column. Food Chemistry, 107, 1276–1282.
Barbero, G. F., Palma, M., & Barroso, C. G. (2006). Pressurized liquid extraction of capsaicinoids from peppers. Journal of Agricultural and Food Chemistry, 54, 3231–3236.
Baron, R. F., & Penfield, M. P. (1996). Capsaicin heat intensity – concentration, carrier, fat level, and serving temperature effects. Journal of Sensory Studies, 11, 295–316.
Carden, L. A., Penfield, M. P., & Saxton, A. M. (1999). Perception of heat in cheese sauces as affected by capsaicin concentration, fat level, fat mimetic and time. Journal of Food Science, 64(1), 175–179.
Choi, S., Suh, B., Kozukue, E., Kozukue, N., Levin, C. E., & Friedman, M. (2006). Analysis of the contents of pungent compounds in fresh Korean red peppers and in pepper-containing foods. Journal of Agricultural and Food Chemistry, 54, 9024–9031.
DIN 10961 (1996). Schulung von Prüfpersonen für sensorische Prüfpersonen. 1996-08. DIN 10970 (2002). Zeitintensitätsprüfung. 2002–09. Emrick, M. E., Penfield, M. P., Bacon, C. D., Van Laack, R. V. L., & Brekke, C. J. (2005).
Heat intensity and warmed-over flavor in precooked chicken patties formulated at 3 fat levels and 3 pepper levels. Journal of Food Science, 70(9), 600–604.
Garcés-Claver, A., Arnedo-Andrés, M. S., Abadia, J., Gil-Ortega, R., & Àlvarez- Fernández, A. (2006). Determination of capsaicin and dihydrocapsaicin in capsicum fruits by liquid chromatography-electrospray/time-of-flight mass spectrometry. Journal of Agricultural and Food Chemistry, 54, 9303–9311.
Hutchinson, S. E., Trantow, L. A., & Vickers, Z. M. (1990). The effectiveness of common foods for reduction of capsaicin burn. Journal of Sensory Studies, 4, 157–164.
Kirschbaum-Titze, P., Hiepler, C., Mueller-Seitz, E., & Petz, M. (2002). Pungency in paprika (capsicum annuum). 1. Decrease of capsaicinoid content following cellular disruption. Journal of Agricultural and Food Chemistry, 50, 1260–1263.
Kostyra, E., Baryłko-Pikielna, N., & Dabrowska, U. (2010). Relationship of pungency and leading flavour attributes in model food matrices – temporal aspects. Food Quality and Preference, 21, 197–206.
Lawless, H. T., Hartono, C., & Hernandez, S. (2000). Thresholds and suprathreshold intensity functions for capsaicin in oil and aqueous based carriers. Journal of Sensory Studies, 15, 437–447.
McDonald, S., Barrett, P., & Bond, L. (2010). What kind of hot is it? Perfumer &
Flavorist, 35(7), 32–39. Nasrawi, C. W., & Pangborn, R. M. (1990). Temporal effectiveness of mouth-rinsing
on capsaicin mouth-burn. Physiology & Behavior, 47(4), 617–623. Orellana-Escobedo, L., Ornelas-Paz, J. J., Olivas, G. I., Guerrero-Beltran, J. A., Jimenez-
Castro, J., & Sepulveda, D. R. (2012). Determination of absolute threshold and just noticeable difference in the sensory perception of pungency. Journal of Food Science, 77(3), 135–139.
Peña-Alvarez, A., Ramirez-Maya, E., & Alvarado-Suárez, L. Á. (2009). Analysis of capsaicin and dihydrocapsaicin in peppers and pepper sauces by solid phase microextraction-gas chromatography–mass spectrometry. Journal of Chromatography A, 1216, 2843–2847.
Perkins, B., Bushway, R., Guthrie, K., Fan, T., Stewart, B., Prince, A., et al. (2002). Determination of capsaicinoids in salsa by liquid chromatography and enzyme immunoassay. Journal of AOAC International, 85(1), 82–85.
Peyvieux, C., & Dijksterhuis, G. (2001). Training a sensory panel for TI: A case study. Food Quality and Preference, 12, 19–28.
Poyrazoğlu, E. S., Yemis, O., Kadakal, C., & Artik, N. (2005). Determination of capsaicinoid profile of different chilli peppers grown in Turkey. Journal of the Science of Food and Agriculture, 85, 1435–1438.
Prescott, J., Allen, S., & Stephens, L. (1993). Interactions between oral chemical irritation, taste and temperature. Chemical Senses, 18(4), 389–404.
Prescott, J., & Stevenson, R. J. (1995). Effects of oral chemical irritation on tastes and flavors in frequent and infrequent users of chili. Physiology & Behavior, 58(6), 1117–1127.
Reinbach, H. C., Meinert, L., Ballabio, D., Aaslyng, M. D., Bredie, W. L. P., Olsen, K., et al. (2007). Interactions between oral burn, meat flavor and texture in chili spiced pork patties evaluated by time-intensity. Food Quality and Preference, 18, 909–919.
Schneider, D. J., Seuß-Baum, I., & Schlich, E. (2013). Comparison of the group thresholds of capsaicin depending on the matrix. ErnaehrungsUmschau international, 10, 178–179.
Schneider, D. J., Seuß-Baum, I., & Schlich, E. (2014). Comparison between chemical senses thresholds for capsaicin and dihydrocapsaicin in aqueous solutions and identification of the area of burning sensation. Advance Journal of Food Science and Technology, 6(1), 36–41.
Scoville, W. L. (1912). Note on capsicums. The Journal of the American Pharmaceutical Association, 1, 453–454.
Stevens, D. A., & Lawless, H. T. (1986). Putting out the fire: Effects of tastants on oral chemical irritation. Perception & Psychophysics, 39(5), 346–350.
Todd, P. H., Besinger, M. G., & Biftu, T. (1977). Determination of pungency due to capsicum by gas–liquid chromatography. Journal of Food Science, 42(3), 660–664.
Topuz, A., Dincer, C., Özdemir, K. S., Feng, H., & Kushad, M. (2011). Influence of different drying methods on carotenoids and capsaicinoids of paprika (Cv., Jalapeno). Food Chemistry, 129, 860–865.
106 D.J. Schneider et al. / Food Quality and Preference 38 (2014) 98–106
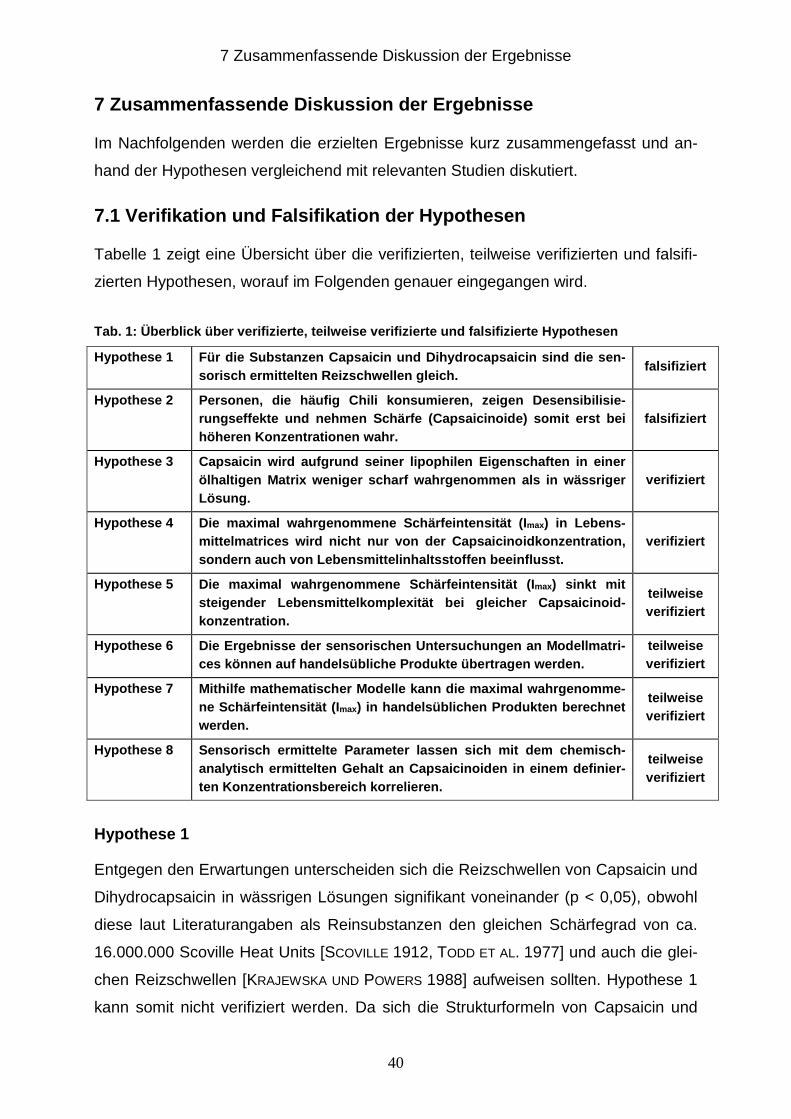
7 Zusammenfassende Diskussion der Ergebnisse
40
7 Zusammenfassende Diskussion der Ergebnisse
Im Nachfolgenden werden die erzielten Ergebnisse kurz zusammengefasst und an-
hand der Hypothesen vergleichend mit relevanten Studien diskutiert.
7.1 Verifikation und Falsifikation der Hypothesen
Tabelle 1 zeigt eine Übersicht über die verifizierten, teilweise verifizierten und falsifi-
zierten Hypothesen, worauf im Folgenden genauer eingegangen wird.
Tab. 1: Überblick über verifizierte, teilweise veri fizierte und falsifizierte Hypothesen
Hypothese 1 Für die Substanzen Capsaicin und Dihydrocapsaicin s ind die sen-sorisch ermittelten Reizschwellen gleich.
falsifiziert
Hypothese 2 Personen, die häufig Chili konsumieren, zeigen Dese nsibilisie-rungseffekte und nehmen Schärfe (Capsaicinoide) som it erst bei höheren Konzentrationen wahr.
falsifiziert
Hypothese 3 Capsaicin wird aufgrund seiner lipophilen Eigenscha ften in einer ölhaltigen Matrix weniger scharf wahrgenommen als i n wässriger Lösung.
verifiziert
Hypothese 4 Die maximal wahrgenommene Schärfeintensität (I max) in Lebens-mittelmatrices wird nicht nur von der Capsaicinoidk onzentration, sondern auch von Lebensmittelinhaltsstoffen beeinfl usst.
verifiziert
Hypothese 5 Die maximal wahrgenommene Schärfeintensität (I max) sinkt mit steigender Lebensmittelkomplexität bei gleicher Cap saicinoid-konzentration.
teilweise verifiziert
Hypothese 6 Die Ergebnisse der sensorischen Untersuchungen an M odellmatri-ces können auf handelsübliche Produkte übertragen w erden.
teilweise verifiziert
Hypothese 7 Mithilfe mathematischer Modelle kann die maximal wa hrgenomme-ne Schärfeintensität (I max) in handelsüblichen Produkten berechnet werden.
teilweise verifiziert
Hypothese 8 Sensorisch ermittelte Parameter lassen sich mit dem chemisch- analytisch ermittelten Gehalt an Capsaicinoiden in einem definier-ten Konzentrationsbereich korrelieren.
teilweise verifiziert
Hypothese 1
Entgegen den Erwartungen unterscheiden sich die Reizschwellen von Capsaicin und
Dihydrocapsaicin in wässrigen Lösungen signifikant voneinander (p < 0,05), obwohl
diese laut Literaturangaben als Reinsubstanzen den gleichen Schärfegrad von ca.
16.000.000 Scoville Heat Units [SCOVILLE 1912, TODD ET AL. 1977] und auch die glei-
chen Reizschwellen [KRAJEWSKA UND POWERS 1988] aufweisen sollten. Hypothese 1
kann somit nicht verifiziert werden. Da sich die Strukturformeln von Capsaicin und
7 Zusammenfassende Diskussion der Ergebnisse
41
Dihydrocapsaicin lediglich durch eine Doppelbindung am C6-Atom unterscheiden,
könnte diese die Bindung am Rezeptor beeinflussen. Der Einfluss der Länge und
Zusammensetzung der Seitenkette des Moleküls auf das Schärfeempfinden zeigt
sich auch dadurch, dass Vanillin, das keine Seitenkette besitzt, aber ansonsten ähn-
lich der Struktur von Capsaicinoiden ist, kein Schärfeempfinden auslöst [KULKA
1967].
Hypothese 2
Die Reizschwellen von Personen, die häufig Chili konsumieren, und von Personen,
die selten Chili konsumieren, unterscheiden sich entgegen der Annahme nicht signi-
fikant (p > 0,05) voneinander. Die von anderen Autoren [LAWLESS 1984, GREEN 1989,
KARRER UND BARTOSHUK 1991, 1995, PRESCOTT UND STEVENSON 1995] beobachteten
Desensibilisierungseffekte aufgrund häufigen Chilikonsums zeigen in der vorliegen-
den Studie keinen Einfluss auf die Reizschwellen von Capsaicin und Dihydrocapsai-
cin in Wasser (versetzt mit Polysorbat 80). ORELLANA-ESCOBEDO ET AL. (2012) ermit-
teln eine Reizschwelle für Capsaicinoide bei Mexikanern von 0,05 ppm. Diese Reiz-
schwelle unterscheidet sich nicht wesentlich von den Reizschwellen deutscher Pro-
banden, obwohl Mexikaner in der Regel häufiger und mehr Chili konsumieren. In der
vorliegenden Studie zeigt sich sogar eher der Trend (p = 0,09), dass „Chili-Esser“
Capsaicin und Dihydrocapsaicin bereits bei geringeren Konzentrationen wahrneh-
men als „Nicht-Chili-Esser“. Hypothese 2 kann somit ebenfalls nicht bestätigt werden.
Hypothese 3
Jedoch unterscheiden sich die Reizschwellen von Capsaicin in Öl und in Wasser
(versetzt mit Polysorbat 80) entsprechend der formulierten Hypothese signifikant (p <
0,05). Diese Ergebnisse bestätigen somit die Beobachtungen von LAWLESS ET AL.
(2000). Die Abweichungen der absoluten Werte zu denen von LAWLESS ET AL. (2000)
können mit dem unterschiedlichen Studiendesign erklärt werden. Während in der
Studie von LAWLESS ET AL. (2000) die Proben wieder ausgespuckt worden sind, sind
diese in der vorliegenden Studie abgeschluckt worden. Auch RENTMEISTER-BRYANT
UND GREEN (1997) beschreiben niedrigere Reizschwellen für Capsaicin für den Ra-
chen im Vergleich zur Zunge. Die Ursache für den Unterschied einer Lösung in Öl
oder in Wasser auf die Wahrnehmung von Capsaicin kann mit den lipophilen Eigen-
schaften des Capsaicins erklärt werden. Durch die dadurch bedingte verbesserte

7 Zusammenfassende Diskussion der Ergebnisse
42
Löslichkeit könnte die Bindung am TRPV1-Rezeptor im Mund gestört sein [BARON
UND PENFILED 1996]. Hypothese 3 kann somit verifiziert werden.
In der vorliegenden Studie sind die Ermittlung der Reizschwellen durch die niedrige
Teilnehmerzahl von 21 Panelisten und die weitere Clusterunterteilung in 12 „Chili-
Esser“ und 9 „Nicht-Chili-Esser“ jedoch als problematisch anzusehen, auch wenn bei
der Wiederholung der Tests kein signifikanter Unterschied zu den ersten Ergebnis-
sen festgestellt werden konnte und die Reproduzierbarkeit der Versuche in diesem
Panel somit nachgewiesen ist. Um die Erkenntnisse bezüglich der Reizschwellen
insbesondere bei der Unterscheidung in „Chili-Esser“ und „Nicht-Chili-Esser“ jedoch
verifizieren zu können, müssten die Versuche mit einer höheren Anzahl an Panelis-
ten wiederholt werden.
Hypothese 4
Wie aus Abbildung 1 ersichtlich, steigt die maximal wahrgenommene Schärfeintensi-
tät (Imax) in Abhängigkeit von der Capsaicinoidkonzentration in allen untersuchten
Matrices an, wird jedoch auch von der Lebensmittelmatrix beeinflusst. Hypothese 4
kann somit ebenfalls verifiziert werden.
Abb. 1: Durchschnittliche Bewertung der maximal wah rgenommenen Schärfeintensität (I max)
bei verschiedenen Capsaicinkonzentrationen in Abhän gigkeit von den Matrices (Was-ser, Zucker, Stärke und Fett).
Schärfeintensität - Basismatrices
0
1
2
3
4
5
6
7
8
9
10
0 2 4 6 8 10 12 14 16 18 20
Capsaicinkonzentration (ppm)
Ima
x
Wasser Zucker (Zucker in Wasser gelöst)
Stärke (Kartoffelbrei) Fett (Sahne)
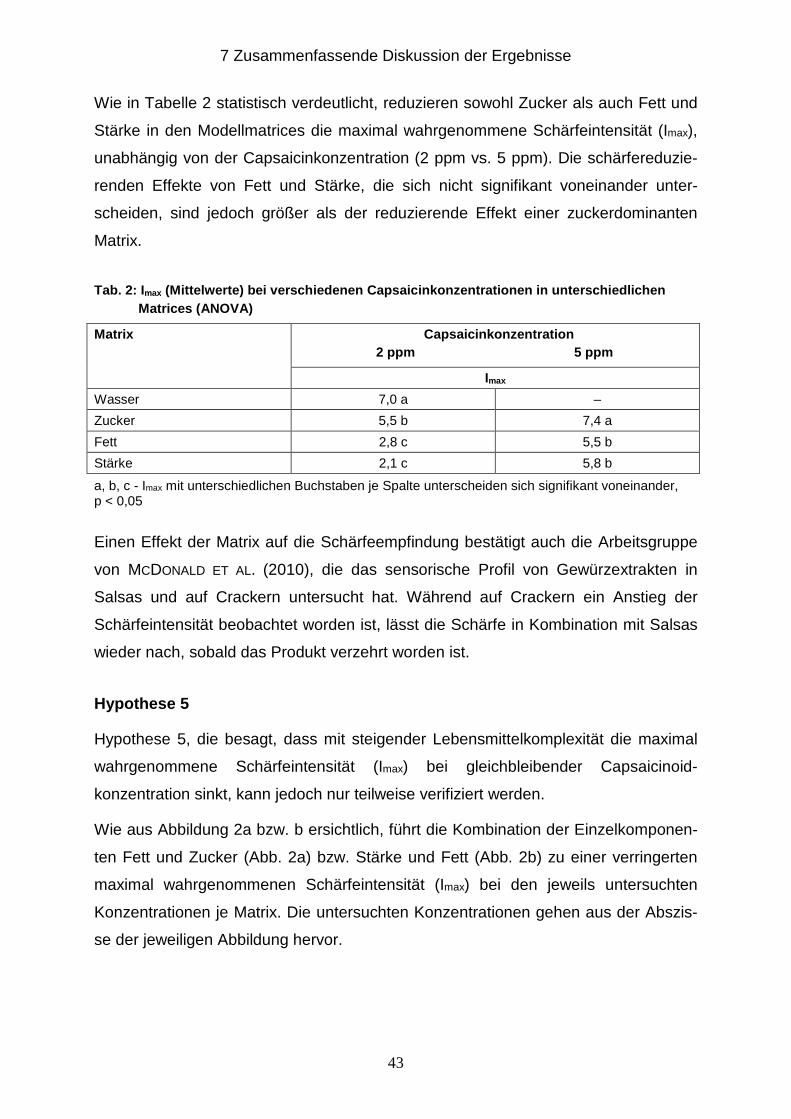
7 Zusammenfassende Diskussion der Ergebnisse
43
Wie in Tabelle 2 statistisch verdeutlicht, reduzieren sowohl Zucker als auch Fett und
Stärke in den Modellmatrices die maximal wahrgenommene Schärfeintensität (Imax),
unabhängig von der Capsaicinkonzentration (2 ppm vs. 5 ppm). Die schärfereduzie-
renden Effekte von Fett und Stärke, die sich nicht signifikant voneinander unter-
scheiden, sind jedoch größer als der reduzierende Effekt einer zuckerdominanten
Matrix.
Tab. 2: Imax (Mittelwerte) bei verschiedenen Capsaicinkonzentra tionen in unterschiedlichen Matrices (ANOVA)
Matrix Capsaicink onzentration 2 ppm 5 ppm
Imax
Wasser 7,0 a –
Zucker 5,5 b 7,4 a
Fett 2,8 c 5,5 b
Stärke 2,1 c 5,8 b
a, b, c - Imax mit unterschiedlichen Buchstaben je Spalte unterscheiden sich signifikant voneinander, p < 0,05
Einen Effekt der Matrix auf die Schärfeempfindung bestätigt auch die Arbeitsgruppe
von MCDONALD ET AL. (2010), die das sensorische Profil von Gewürzextrakten in
Salsas und auf Crackern untersucht hat. Während auf Crackern ein Anstieg der
Schärfeintensität beobachtet worden ist, lässt die Schärfe in Kombination mit Salsas
wieder nach, sobald das Produkt verzehrt worden ist.
Hypothese 5
Hypothese 5, die besagt, dass mit steigender Lebensmittelkomplexität die maximal
wahrgenommene Schärfeintensität (Imax) bei gleichbleibender Capsaicinoid-
konzentration sinkt, kann jedoch nur teilweise verifiziert werden.
Wie aus Abbildung 2a bzw. b ersichtlich, führt die Kombination der Einzelkomponen-
ten Fett und Zucker (Abb. 2a) bzw. Stärke und Fett (Abb. 2b) zu einer verringerten
maximal wahrgenommenen Schärfeintensität (Imax) bei den jeweils untersuchten
Konzentrationen je Matrix. Die untersuchten Konzentrationen gehen aus der Abszis-
se der jeweiligen Abbildung hervor.
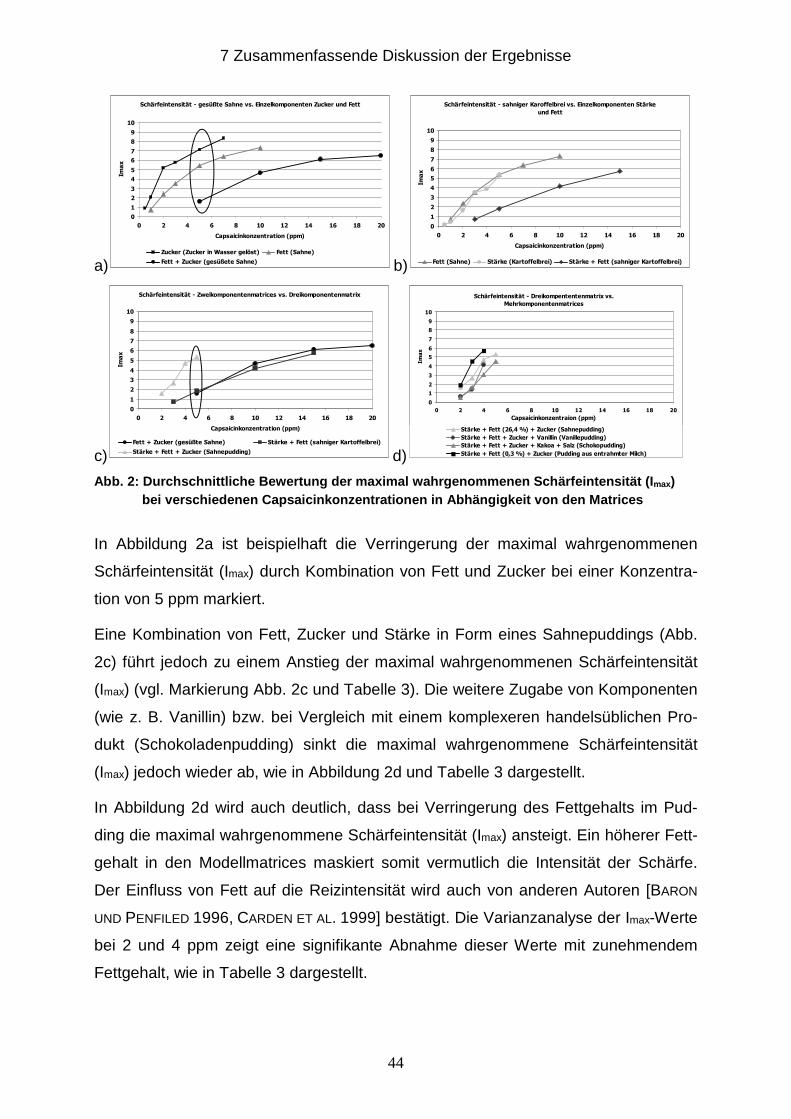
7 Zusammenfassende Diskussion der Ergebnisse
44
a) b)
c) d)
Abb. 2: Durchschnittliche Bewertung der maximal wah rgenommenen Schärfeintensität (I max) bei verschiedenen Capsaicinkonzentrati onen in Abhängigkeit von den Matrices
In Abbildung 2a ist beispielhaft die Verringerung der maximal wahrgenommenen
Schärfeintensität (Imax) durch Kombination von Fett und Zucker bei einer Konzentra-
tion von 5 ppm markiert.
Eine Kombination von Fett, Zucker und Stärke in Form eines Sahnepuddings (Abb.
2c) führt jedoch zu einem Anstieg der maximal wahrgenommenen Schärfeintensität
(Imax) (vgl. Markierung Abb. 2c und Tabelle 3). Die weitere Zugabe von Komponenten
(wie z. B. Vanillin) bzw. bei Vergleich mit einem komplexeren handelsüblichen Pro-
dukt (Schokoladenpudding) sinkt die maximal wahrgenommene Schärfeintensität
(Imax) jedoch wieder ab, wie in Abbildung 2d und Tabelle 3 dargestellt.
In Abbildung 2d wird auch deutlich, dass bei Verringerung des Fettgehalts im Pud-
ding die maximal wahrgenommene Schärfeintensität (Imax) ansteigt. Ein höherer Fett-
gehalt in den Modellmatrices maskiert somit vermutlich die Intensität der Schärfe.
Der Einfluss von Fett auf die Reizintensität wird auch von anderen Autoren [BARON
UND PENFILED 1996, CARDEN ET AL. 1999] bestätigt. Die Varianzanalyse der Imax-Werte
bei 2 und 4 ppm zeigt eine signifikante Abnahme dieser Werte mit zunehmendem
Fettgehalt, wie in Tabelle 3 dargestellt.
Schärfeintensität - gesüßte Sahne vs. Einzelkomponenten Zucker und Fett
0
1
2
3
4
5
6
7
8
9
10
0 2 4 6 8 10 12 14 16 18 20
Capsaicinkonzentration (ppm)
Ima
x
Zucker (Zucker in Wasser gelöst) Fett (Sahne)
Fett + Zucker (gesüßete Sahne)
Schärfeintensität - sahniger Karoffelbrei vs. Einzelkomponenten Stärke
und Fett
0
1
2
3
4
5
6
7
8
9
10
0 2 4 6 8 10 12 14 16 18 20
Capsaicinkonzentration (ppm)
Ima
x
Fett (Sahne) Stärke (Kartoffelbrei) Stärke + Fett (sahniger Kartoffelbrei)
Schärfeintensität - Zweikomponentenmatrices vs. Dreikomponentenmatrix
0
1
2
3
4
5
6
7
8
9
10
0 2 4 6 8 10 12 14 16 18 20
Capsaicinkonzentration (ppm)
Ima
x
Fett + Zucker (gesüßte Sahne) Stärke + Fett (sahniger Kartoffelbrei)
Stärke + Fett + Zucker (Sahnepudding)
Schärfeintensität - Dreikompententenmatrix vs.
Mehrkomponentenmatrices
0
1
2
3
4
5
6
7
8
9
10
0 2 4 6 8 10 12 14 16 18 20
Capsaicinkonzentraion (ppm)Im
ax
Stärke + Fett (26,4 %) + Zucker (Sahnepudding)
Stärke + Fett + Zucker + Vanillin (Vanillepudding)
Stärke + Fett + Zucker + Kakoa + Salz (Schokopudding)
Stärke + Fett (0,3 %) + Zucker (Pudding aus entrahmter Milch)
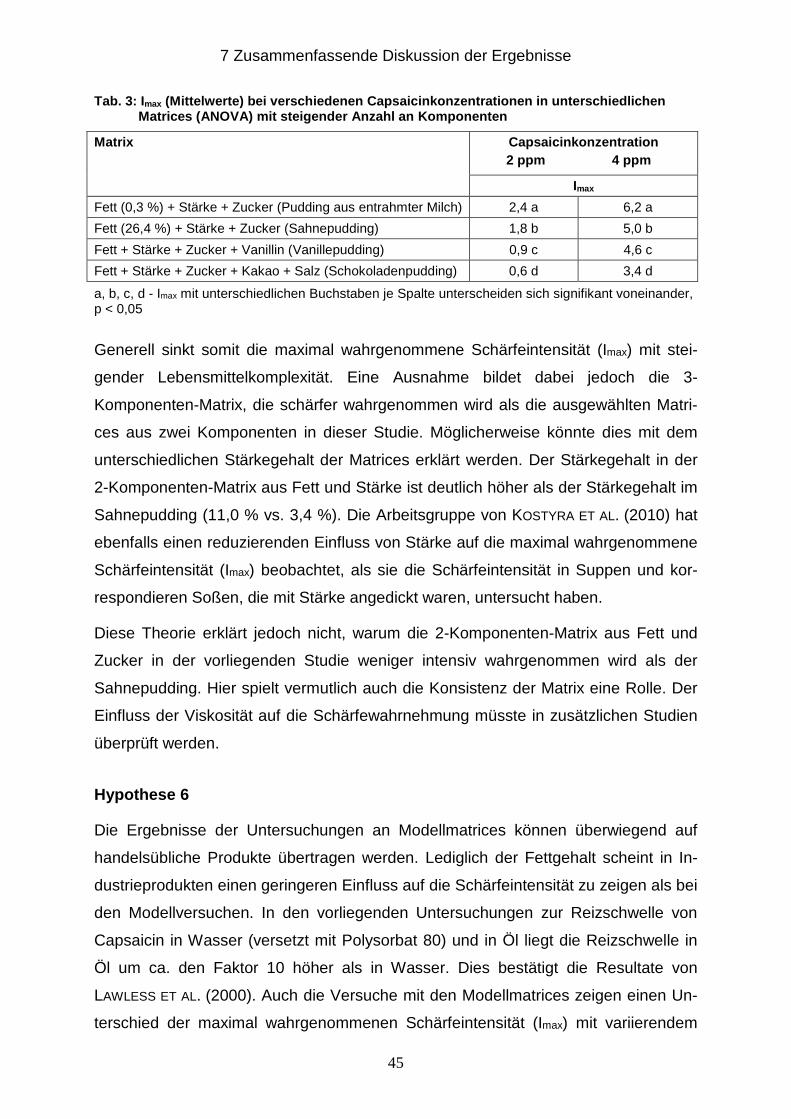
7 Zusammenfassende Diskussion der Ergebnisse
45
Tab. 3: Imax (Mittelwerte) bei verschiedenen Capsaicinkonzentra tionen in unterschiedlichen Matrices (ANOVA) mit steigender Anzahl an Komponenten
Matrix Capsaicinkonzentration 2 ppm 4 ppm
Imax
Fett (0,3 %) + Stärke + Zucker (Pudding aus entrahmter Milch) 2,4 a 6,2 a
Fett (26,4 %) + Stärke + Zucker (Sahnepudding) 1,8 b 5,0 b
Fett + Stärke + Zucker + Vanillin (Vanillepudding) 0,9 c 4,6 c
Fett + Stärke + Zucker + Kakao + Salz (Schokoladenpudding) 0,6 d 3,4 d
a, b, c, d - Imax mit unterschiedlichen Buchstaben je Spalte unterscheiden sich signifikant voneinander, p < 0,05
Generell sinkt somit die maximal wahrgenommene Schärfeintensität (Imax) mit stei-
gender Lebensmittelkomplexität. Eine Ausnahme bildet dabei jedoch die 3-
Komponenten-Matrix, die schärfer wahrgenommen wird als die ausgewählten Matri-
ces aus zwei Komponenten in dieser Studie. Möglicherweise könnte dies mit dem
unterschiedlichen Stärkegehalt der Matrices erklärt werden. Der Stärkegehalt in der
2-Komponenten-Matrix aus Fett und Stärke ist deutlich höher als der Stärkegehalt im
Sahnepudding (11,0 % vs. 3,4 %). Die Arbeitsgruppe von KOSTYRA ET AL. (2010) hat
ebenfalls einen reduzierenden Einfluss von Stärke auf die maximal wahrgenommene
Schärfeintensität (Imax) beobachtet, als sie die Schärfeintensität in Suppen und kor-
respondieren Soßen, die mit Stärke angedickt waren, untersucht haben.
Diese Theorie erklärt jedoch nicht, warum die 2-Komponenten-Matrix aus Fett und
Zucker in der vorliegenden Studie weniger intensiv wahrgenommen wird als der
Sahnepudding. Hier spielt vermutlich auch die Konsistenz der Matrix eine Rolle. Der
Einfluss der Viskosität auf die Schärfewahrnehmung müsste in zusätzlichen Studien
überprüft werden.
Hypothese 6
Die Ergebnisse der Untersuchungen an Modellmatrices können überwiegend auf
handelsübliche Produkte übertragen werden. Lediglich der Fettgehalt scheint in In-
dustrieprodukten einen geringeren Einfluss auf die Schärfeintensität zu zeigen als bei
den Modellversuchen. In den vorliegenden Untersuchungen zur Reizschwelle von
Capsaicin in Wasser (versetzt mit Polysorbat 80) und in Öl liegt die Reizschwelle in
Öl um ca. den Faktor 10 höher als in Wasser. Dies bestätigt die Resultate von
LAWLESS ET AL. (2000). Auch die Versuche mit den Modellmatrices zeigen einen Un-
terschied der maximal wahrgenommenen Schärfeintensität (Imax) mit variierendem
7 Zusammenfassende Diskussion der Ergebnisse
46
Fettgehalt. Identische Konzentrationen von Capsaicin (getestet an einer Konzentra-
tion von 2 bzw. 4 ppm) in Pudding (hergestellt mit Magermilch) werden deutlich in-
tensiver wahrgenommen als in einem cremigen Pudding, der mit Sahne hergestellt
wird. Während durch diese Erhöhung des Fettgehalts um ca. 25 % (Pudding aus ent-
rahmter Milch vs. Sahnepudding, vgl. Abbildung 2d) eine signifikante Verringerung
der maximal wahrgenommenen Schärfeintensität (Imax) zu beobachten ist, ist der ent-
sprechende Einfluss von Fett in handelsüblichen Produkten nicht in diesem Ausmaß
festzustellen.
Die sensorische Bewertung bezüglich der Schärfeintensität der Salsa A auf Ölbasis
unterscheidet sich nicht signifikant von den Bewertungen der wasserbasierten Salsas
C und D, die sogar einen höheren Capsaicinoidgehalt aufweisen. Salsa C und D ent-
halten Stärke, Salsa A jedoch nicht. Somit werden die Ergebnisse der Untersuchun-
gen mit Modellmatrices, dass das Vorhandensein von Stärke in der Matrix die maxi-
mal wahrgenommene Schärfeintensität (Imax) maskiert, in den handelsüblichen Pro-
dukten bestätigt.
Trotz des hohen Fettgehalts (25,8 %) der Salsa G weicht die maximal wahrgenom-
mene Schärfeintensität (Imax) dieser Salsa sensorisch nicht signifikant von der Schär-
feintensität der wasserbasierten Salsa H ab, die jedoch annährend den doppelten
Gehalt an Capsaicinoiden aufweist (68,65 ppm in Salsa G vs. 122,18 ppm in Salsa
H). Salsa H enthält zwar kaum Fett, jedoch Stärke und Zucker, die in Salsa G nicht
enthalten sind. Neben dem Effekt der Stärke könnte hier noch der maskierende Ef-
fekt von Zucker, der in den Modellmatrices ebenfalls beobachtet worden ist, eine Rol-
le hinsichtlich der maximal wahrgenommenen Schärfeintensität (Imax) spielen. Die
Wirkung von Zucker zeigt sich auch beim Vergleich der industriell hergestellten Sal-
sas B und F. Beide Salsas zeigen annährend den gleichen Capsaicinoidgehalt, Salsa
F wird jedoch als weniger scharf eingestuft. Beide Salsas enthalten ähnliche Gehalte
an Öl (5,0 % vs. 3,1 %), Salsa F enthält jedoch zusätzlich Zucker. Der postulierte
maskierende Effekt von Zucker in Industrieprodukten wird durch diese Beobachtung
unterstützt. Verschiedene Studien [NASRAWI UND PANGBORN 1989, 1990, PRESCOTT ET
AL. 1993] belegen eine Interaktion zwischen Zucker bzw. Süße und Schärfe. Auch
NASRAWI UND PANGBORN (1989) zeigen, dass Zucker in einer wässrigen Capsaicinlö-
sung (2 ppm) die maximal wahrgenommene Schärfeintensität (Imax) signifikant verrin-
gert im Vergleich zu einer reinen Capsaicinlösung ohne Zucker. Einen Erklärungsan-
satz hierfür liefern die Ergebnisse von FROEHLICH ET AL. (1987). Diese Studie zeigt,

7 Zusammenfassende Diskussion der Ergebnisse
47
dass Speichel, der durch Zucker stimuliert wird, einen höheren Gehalt an Protein und
Alpha-Amylasen aufweist als Speichel ohne Stimulierung oder durch Stimulierung mit
Natriumchlorid oder Zitronensäure, wobei die Unterschiede aber nicht signifikant sind
[FROEHLICH ET AL. 1987]. Der proteinreichere Speichel könnte eine schützende
Schicht zwischen Capsaicin und der Mundschleimhaut bilden und somit die Sub-
stanz-P-Freisetzung inhibieren, was zu einer geringeren maximal wahrgenommenen
Schärfeintensität (Imax) führt. Ein möglicher anderer Erklärungsansatz lautet, dass
Zucker das „Pleasure Center“ im zentralen Nervensystem oder die Freisetzung von
endogenen Opiaten stimulieren könnte, was zu einer Reduzierung der maximal
wahrgenommenen Schärfeintensität (Imax) führen könnte [NASRAWI UND PANGBORN
1989]. Letztere Erklärung über die Wirkung auf zentraler Ebene scheint für den
schärfereduzierenden Effekt von Zucker wahrscheinlicher, da Versuche, die mit dem
Süßstoff Acesulfam K durchgeführt worden sind, zu einem ähnlichen Effekt führten
[SCHNEIDER UND SEUß-BAUM 2013].
Eine Speichelstimulierung durch Stärke führt zu einem signifikanten Anstieg der Pro-
teinkonzentration im Speichel [FROEHLICH ET AL. 1987]. Somit könnte die Theorie der
Schutzschichtbildung bei Vorhandensein von Stärke im Lebensmittel eine Rolle spie-
len.
Darüber hinaus zeigt Salsa F optisch eine höhere Viskosität als Salsa B, was die
maximal wahrgenommene Schärfeintensität (Imax) zusätzlich unterdrücken könnte.
Auch die Arbeitsgruppen von HUTCHINSON ET AL. (1990) und NASRAWI UND PANGBORN
(1989) haben gezeigt, dass taktile Empfindungen die Schärfewahrnehmung vermin-
dern können.
Hypothese 6 kann somit teilweise verifiziert werden. Die maskierenden Effekte durch
Zucker und Stärke, die in den Modellmatrices beobachtet worden sind, sind auch in
den handelsüblichen Produkten nachzuvollziehen. Der signifikante Einfluss von Fett
bei den Untersuchungen der Modellmatrices und zur Reizschwelle konnte jedoch
nicht in gleichem Ausmaß in den Industrieprodukten festgestellt werden. Die Wirkung
von Fett auf die maximal wahrgenommene Schärfeintensität (Imax) scheint in han-
delsüblichen Produkten, die wesentlich komplexer zusammengesetzt sind als die
untersuchten Modellmatrices, verloren zu gehen bzw. von anderen Effekten über-
deckt zu werden.

7 Zusammenfassende Diskussion der Ergebnisse
48
Hypothese 7
Hypothese 7, bei der davon ausgegangen wird, dass mithilfe mathematischer Model-
le die maximal wahrgenommene Schärfeintensität (Imax) berechnet werden könnte,
kann in Bezug auf die Diskussion zu Hypothese 6 ebenfalls nur teilweise verifiziert
werden.
Eine mögliche Gleichung zur Vorhersage von Imax in Produkten könnte lauten:
Imax = 2.2977 + 0.0881 * Fett + 0.0495 * Capsaicinoidgeh alt
Die maximal wahrgenommene Schärfeintensität (Imax) auf Basis des chemisch-
analytisch ermittelten Gehalts an Capsaicinoiden zu berechnen, erklärt dabei ca.
82 % der Varianz der maximal wahrgenommenen Schärfeintensität (Imax). Wird der
Fettgehalt mithilfe der hierarchischen Regressionsanalyse in das Modell aufgenom-
men, können ca. 90 % der Varianz erklärt werden. Die Änderung des R² um ca. 8 %
ist jedoch statistisch nicht signifikant (p = 0,09).
In weiteren Studien dazu könnte die bisher ungeklärte Restvarianz von ca. 10 %
durch die chemisch-analytische Bestimmung des Stärke- und Zuckergehalts der Sal-
sas und die anschließende Aufnahme dieser beiden Faktoren in das Modell verbes-
sert werden. Zusätzlich ist anzumerken, dass der Fettgehalt in den Salsas nicht ana-
lytisch bestimmt worden ist, sondern die Berechnung auf Basis der Nährwertangaben
bzw. der Auskunft der Herstellerfirmen durchgeführt worden ist. Ungenauigkeiten in
den Angaben könnten den nicht signifikanten Einfluss des Fettgehaltes erklären.
Hypothese 8
Wie aus dem dargestellten mathematischen Modell hervorgeht, spielt der Gesamt-
capsaicinoidgehalt trotz des additiven Einflusses der Lebensmittelmatrix auf die Sen-
sorik eine entscheidende Rolle. Deshalb war es Ziel dieser Arbeit, Korrelationen zwi-
schen sensorisch bestimmten Parametern wie Imax, TDur und Area (mithilfe der Zeitin-
tensitätsprüfung) und den chemisch-analytisch ermittelten Capsaicinoidgehalten zu
erstellen.
Um Hypothese 8 zu überprüfen, wird zunächst eine HPLC-Methode (CONTRERAS-
PADILLA UND YAHIA 1998) modifiziert und an die vorliegenden Matrices adaptiert sowie
anschließend hinsichtlich der Selektivität bei der chromatographischen Trennung mit-
tels einer RP-C18-Säule durch Variation der Eluentenzusammensetzung, der Säulen-
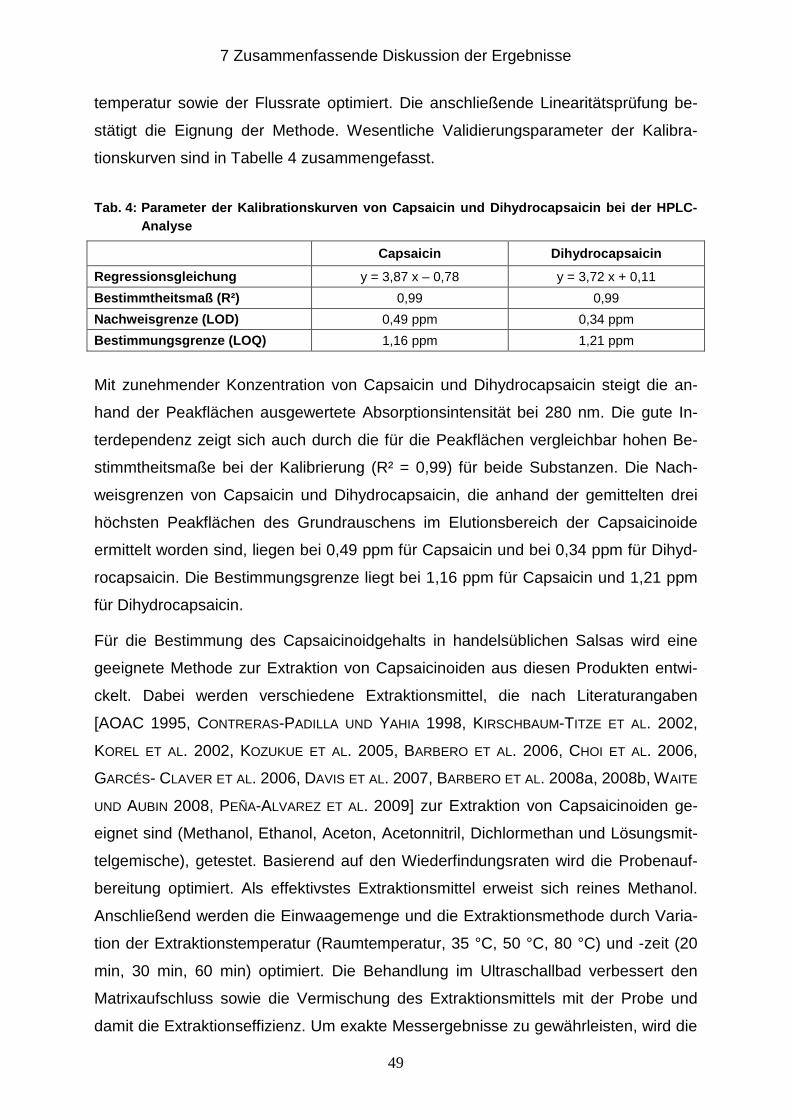
7 Zusammenfassende Diskussion der Ergebnisse
49
temperatur sowie der Flussrate optimiert. Die anschließende Linearitätsprüfung be-
stätigt die Eignung der Methode. Wesentliche Validierungsparameter der Kalibra-
tionskurven sind in Tabelle 4 zusammengefasst.
Tab. 4: Parameter der Kalibrationskurven von Capsai cin und Dihydrocapsaicin bei der HPLC-Analyse
Capsaicin Dihydrocapsaicin
Regressionsgleichung y = 3,87 x – 0,78 y = 3,72 x + 0,11
Bestimmtheitsmaß (R²) 0,99 0,99
Nachweisgrenze (LOD) 0,49 ppm 0,34 ppm
Bestimmungsgrenze (LOQ) 1,16 ppm 1,21 ppm
Mit zunehmender Konzentration von Capsaicin und Dihydrocapsaicin steigt die an-
hand der Peakflächen ausgewertete Absorptionsintensität bei 280 nm. Die gute In-
terdependenz zeigt sich auch durch die für die Peakflächen vergleichbar hohen Be-
stimmtheitsmaße bei der Kalibrierung (R² = 0,99) für beide Substanzen. Die Nach-
weisgrenzen von Capsaicin und Dihydrocapsaicin, die anhand der gemittelten drei
höchsten Peakflächen des Grundrauschens im Elutionsbereich der Capsaicinoide
ermittelt worden sind, liegen bei 0,49 ppm für Capsaicin und bei 0,34 ppm für Dihyd-
rocapsaicin. Die Bestimmungsgrenze liegt bei 1,16 ppm für Capsaicin und 1,21 ppm
für Dihydrocapsaicin.
Für die Bestimmung des Capsaicinoidgehalts in handelsüblichen Salsas wird eine
geeignete Methode zur Extraktion von Capsaicinoiden aus diesen Produkten entwi-
ckelt. Dabei werden verschiedene Extraktionsmittel, die nach Literaturangaben
[AOAC 1995, CONTRERAS-PADILLA UND YAHIA 1998, KIRSCHBAUM-TITZE ET AL. 2002,
KOREL ET AL. 2002, KOZUKUE ET AL. 2005, BARBERO ET AL. 2006, CHOI ET AL. 2006,
GARCÉS- CLAVER ET AL. 2006, DAVIS ET AL. 2007, BARBERO ET AL. 2008a, 2008b, WAITE
UND AUBIN 2008, PEÑA-ALVAREZ ET AL. 2009] zur Extraktion von Capsaicinoiden ge-
eignet sind (Methanol, Ethanol, Aceton, Acetonnitril, Dichlormethan und Lösungsmit-
telgemische), getestet. Basierend auf den Wiederfindungsraten wird die Probenauf-
bereitung optimiert. Als effektivstes Extraktionsmittel erweist sich reines Methanol.
Anschließend werden die Einwaagemenge und die Extraktionsmethode durch Varia-
tion der Extraktionstemperatur (Raumtemperatur, 35 °C, 50 °C, 80 °C) und -zeit (20
min, 30 min, 60 min) optimiert. Die Behandlung im Ultraschallbad verbessert den
Matrixaufschluss sowie die Vermischung des Extraktionsmittels mit der Probe und
damit die Extraktionseffizienz. Um exakte Messergebnisse zu gewährleisten, wird die
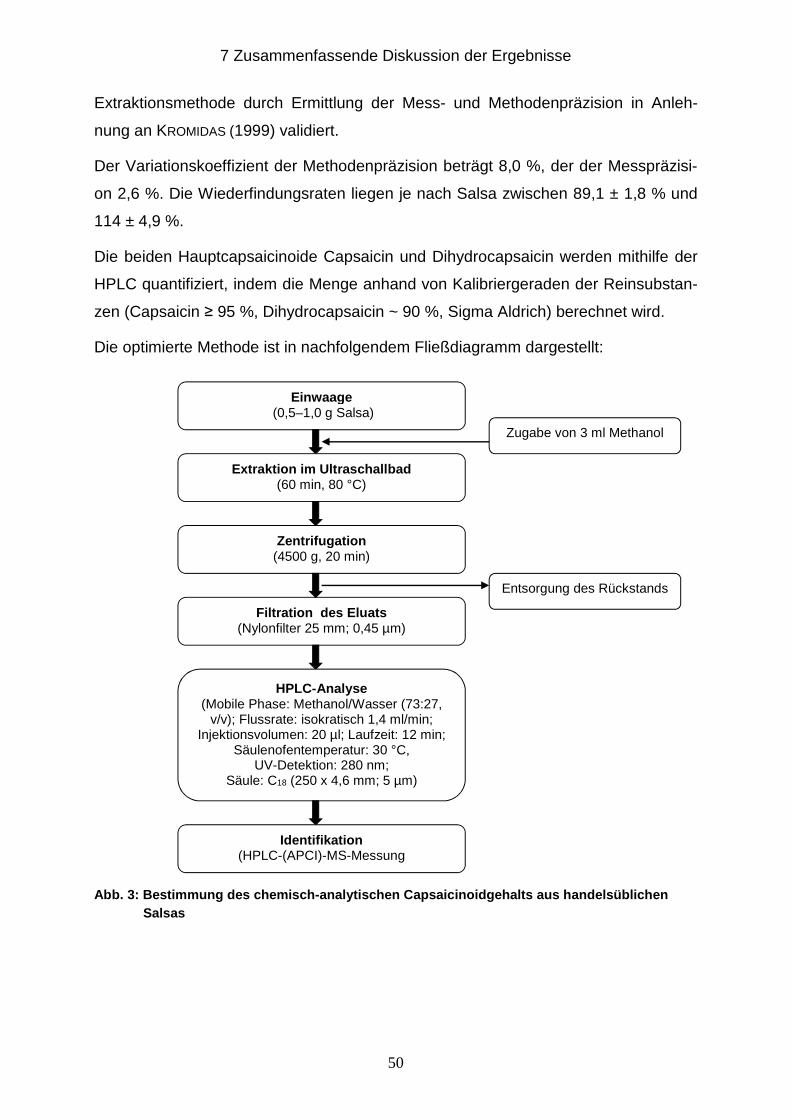
7 Zusammenfassende Diskussion der Ergebnisse
50
Extraktionsmethode durch Ermittlung der Mess- und Methodenpräzision in Anleh-
nung an KROMIDAS (1999) validiert.
Der Variationskoeffizient der Methodenpräzision beträgt 8,0 %, der der Messpräzisi-
on 2,6 %. Die Wiederfindungsraten liegen je nach Salsa zwischen 89,1 ± 1,8 % und
114 ± 4,9 %.
Die beiden Hauptcapsaicinoide Capsaicin und Dihydrocapsaicin werden mithilfe der
HPLC quantifiziert, indem die Menge anhand von Kalibriergeraden der Reinsubstan-
zen (Capsaicin ≥ 95 %, Dihydrocapsaicin ~ 90 %, Sigma Aldrich) berechnet wird.
Die optimierte Methode ist in nachfolgendem Fließdiagramm dargestellt:
Abb. 3: Bestimmung des chemisch-analytischen Capsai cinoidgehalts aus handelsüblichen
Salsas
Einwaage (0,5–1,0 g Salsa)
Extraktion im Ultraschallbad (60 min, 80 °C)
Filtration des Eluats (Nylonfilter 25 mm; 0,45 µm)
HPLC-Analyse (Mobile Phase: Methanol/Wasser (73:27,
v/v); Flussrate: isokratisch 1,4 ml/min; Injektionsvolumen: 20 µl; Laufzeit: 12 min;
Säulenofentemperatur: 30 °C, UV-Detektion: 280 nm;
Säule: C18 (250 x 4,6 mm; 5 µm)
Identifikation (HPLC-(APCI)-MS-Messung
Zentrifugation (4500 g, 20 min)
Zugabe von 3 ml Methanol
Entsorgung des Rückstands

7 Zusammenfassende Diskussion der Ergebnisse
51
Mithilfe der Kalibriergeraden werden aus den Peakflächen von Capsaicin und Dihyd-
rocapsaicin der analysierten Salsas die Konzentrationen (ß) bestimmt und mithilfe
des Probenvolumens (3 ml) und der Einwaage (E) als Massenkonzentrationen (w)
berechnet. Die Berechnung erfolgte mit nachstehender Formel:
w [mg/kg] = ß [mg/L] * 0,003 L * 1000 E [g]
w = Massenkonzentration Capsaicinoide ß = Konzentration Capsaicinoide E = Einwaage
Zur Identifizierung werden die Retentionszeiten der Peaks mit denen der Stan-
dardsubstanzen Capsaicin und Dihydrocapsaicin abgeglichen und über die spezifi-
schen Massen (MS, APCI+) identifiziert. Die ermittelten Gehalte sind in Tabelle 5 in
Kapitel 7.2 dargestellt.
Nach Bestimmung des Capsaicinoidgehalts in den Salsas werden die Gehalte mit
den sensorisch ermittelten maximal wahrgenommenen Schärfeintensitäten (Imax) kor-
reliert.
Der mithilfe der Zeitintensitätsprüfung sensorisch ermittelte Parameter Imax korreliert
gut (R² = 0,8029) mit den chemisch-analytisch bestimmten Capsaicinoidgehalten in
handelsüblichen Produkten. Eine Berechnung mit den sensorischen Parametern TDur
und Area führt hingegen nur zu Werten von R² = 0,5176 bzw. R² = 0,6898. Hypothe-
se 8 kann somit nur teilweise, d. h. für den Parameter Imax, verifiziert werden.
Eine Beeinflussung der Schärfewahrnehmung durch die schärfeauslösende Sub-
stanz Piperin kann weitestgehend ausgeschlossen werden. Salsas, in denen Piperin
über Massenspektrometrie detektiert werden konnte (auch wenn dieses auf den Pro-
dukten nicht deklariert worden ist), sind nicht in die Auswertung aufgenommen wor-
den, da Piperin ebenfalls mit dem TRPV1-Rezeptor interagiert [MCNAMARA ET AL.
2005].
Eine zusätzliche Bestimmung von Nordihydrocapsaicin, einer schärfeauslösenden
Minorkomponente aus Chili, in den Salsas könnte eine Korrelation zwischen che-
misch-analytisch bestimmten Scharfstoffen und sensorischen Parametern möglich-
erweise verbessern.
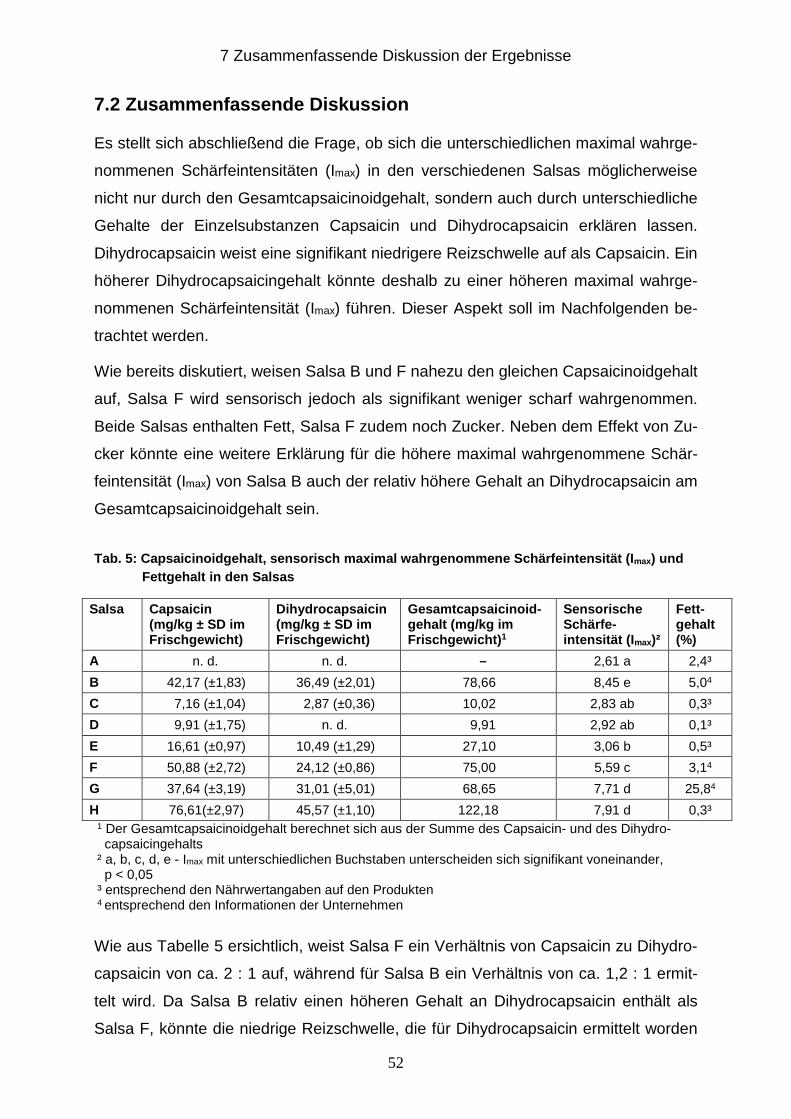
7 Zusammenfassende Diskussion der Ergebnisse
52
7.2 Zusammenfassende Diskussion
Es stellt sich abschließend die Frage, ob sich die unterschiedlichen maximal wahrge-
nommenen Schärfeintensitäten (Imax) in den verschiedenen Salsas möglicherweise
nicht nur durch den Gesamtcapsaicinoidgehalt, sondern auch durch unterschiedliche
Gehalte der Einzelsubstanzen Capsaicin und Dihydrocapsaicin erklären lassen.
Dihydrocapsaicin weist eine signifikant niedrigere Reizschwelle auf als Capsaicin. Ein
höherer Dihydrocapsaicingehalt könnte deshalb zu einer höheren maximal wahrge-
nommenen Schärfeintensität (Imax) führen. Dieser Aspekt soll im Nachfolgenden be-
trachtet werden.
Wie bereits diskutiert, weisen Salsa B und F nahezu den gleichen Capsaicinoidgehalt
auf, Salsa F wird sensorisch jedoch als signifikant weniger scharf wahrgenommen.
Beide Salsas enthalten Fett, Salsa F zudem noch Zucker. Neben dem Effekt von Zu-
cker könnte eine weitere Erklärung für die höhere maximal wahrgenommene Schär-
feintensität (Imax) von Salsa B auch der relativ höhere Gehalt an Dihydrocapsaicin am
Gesamtcapsaicinoidgehalt sein.
Tab. 5: Capsaicinoidgehalt, sensorisch maximal wahr genommene Schärfeintensität (I max) und Fettgehalt in den Salsas
1 Der Gesamtcapsaicinoidgehalt berechnet sich aus der Summe des Capsaicin- und des Dihydro- capsaicingehalts ² a, b, c, d, e - Imax mit unterschiedlichen Buchstaben unterscheiden sich signifikant voneinander, p < 0,05 ³ entsprechend den Nährwertangaben auf den Produkten 4 entsprechend den Informationen der Unternehmen
Wie aus Tabelle 5 ersichtlich, weist Salsa F ein Verhältnis von Capsaicin zu Dihydro-
capsaicin von ca. 2 : 1 auf, während für Salsa B ein Verhältnis von ca. 1,2 : 1 ermit-
telt wird. Da Salsa B relativ einen höheren Gehalt an Dihydrocapsaicin enthält als
Salsa F, könnte die niedrige Reizschwelle, die für Dihydrocapsaicin ermittelt worden
Salsa Capsaicin (mg/kg ± SD im Frischgewicht)
Dihydrocapsaicin (mg/kg ± SD im Frischgewicht)
Gesamtcapsaicinoid-gehalt (mg/kg im Frischgewicht) 1
Sensorische Schärfe-intensität (I max)²
Fett-gehalt (%)
A n. d. n. d. – 2,61 a 2,4³
B 42,17 (±1,83) 36,49 (±2,01) 78,66 8,45 e 5,04
C 7,16 (±1,04) 2,87 (±0,36) 10,02 2,83 ab 0,3³
D 9,91 (±1,75) n. d. 9,91 2,92 ab 0,1³
E 16,61 (±0,97) 10,49 (±1,29) 27,10 3,06 b 0,5³
F 50,88 (±2,72) 24,12 (±0,86) 75,00 5,59 c 3,14
G 37,64 (±3,19) 31,01 (±5,01) 68,65 7,71 d 25,84
H 76,61(±2,97) 45,57 (±1,10) 122,18 7,91 d 0,3³

7 Zusammenfassende Diskussion der Ergebnisse
53
ist, mit der signifikant höher wahrgenommenen maximalen Schärfeintensität (Imax)
dieses Produktes assoziiert sein. Auch beim Vergleich der Salsas G und H könnte
der relativ höhere Gehalt an Dihydrocapsaicin (Verhältnis Capsaicin zu Dihydro-
capsaicin: ca. 1,2 : 1) im Vergleich zu Salsa H (ca. 1,7 : 1) Ursache für die ähnliche
maximal wahrgenommene Schärfeintensität (Imax) bei Salsa G sein, obwohl der Ge-
samtcapsaicinoidgehalt im Vergleich zu Salsa H niedriger ist. Der Einfluss eines hö-
heren Dihydrocapsaicingehalts auf die Intensität der Schärfe lässt sich jedoch nicht
bei den Salsas C, D und E nachweisen. Diese unterscheiden sich nicht in der maxi-
mal wahrgenommenen Schärfeintensität (Imax), obwohl Salsa E den höchsten Ge-
samtcapsaicinoidgehalt sowie den höchsten Dihydrocapsaicingehalt aufweist (vgl.
Tabelle 5). Die Vermutung, dass die unterschiedlichen Reizschwellen von Capsaicin
und Dihydrocapsaicin einen Einfluss auf die maximal wahrgenommene Schärfeinten-
sität (Imax) in handelsüblichen Produkten haben, kann somit nicht eindeutig nachge-
wiesen werden.
Auch die unterschiedlichen Reizschwellen von Capsaicin in wässriger und ölbasierter
Matrix können für handelsübliche Industrieprodukte nicht verifiziert werden. Salsa A,
C und D unterscheiden sich nicht signifikant in der sensorisch maximal wahrgenom-
menen Schärfeintensität (Imax) (Tabelle 5). In Salsa A beträgt der Fettgehalt 2,4 %,
während die Fettgehalte der Salsas C und D unter 0,5 % liegen. Zum einen ist der
Fettgehalt von Salsa A wohl zu gering, um die Schärfeintensität zu maskieren, zum
anderen enthalten die Salsas C und D zusätzlich Stärke, was, wie bereits diskutiert,
einen reduzierenden Einfluss auf die maximal wahrgenommene Schärfeintensität
(Imax) haben könnte.
Die Maskierung der maximal wahrgenommenen Schärfeintensität (Imax) durch Fett in
der Matrix kann jedoch auch nicht beim Vergleich von Salsa G und H bestätigt wer-
den, die sensorisch als gleich scharf bewertet worden sind, obwohl Salsa H nahezu
den doppelten Capsaicinoidgehalt aufweist wie Salsa G (122,18 ppm vs. 68,65 ppm;
vgl. Tabelle 5). Salsa G besitzt jedoch einen Fettanteil von 25,8 %, während Salsa H
nahezu kein Fett (< 0,5 %) enthält. Das zeigt, dass sich auch bei einem höheren
Fettgehalt in handelsüblichen Produkten die ermittelte Reizschwellenerhöhung um
ca. den Faktor 10 bei Lösung von Capsaicin in Öl im Vergleich zu Wasser nicht veri-
fizieren lässt. Somit ist die geringere sensorisch maximal wahrgenommene Schär-
feintensität (Imax) in Salsa H vermutlich auf den Stärke- und Zuckergehalt in dieser
8 Fazit
54
Soße zurückzuführen. Der Effekt von Fett auf die maximal wahrgenommene Schär-
feintensität (Imax) scheint vor allem dann ausgeprägt zu sein, wenn der Gehalt in der
Matrix sehr hoch (nahezu 100 %) ist. Die Komplexität der Matrix sowie der Stärke-
gehalt in der Matrix (vgl. Ergebnisse von KOSTYRA ET AL. 2010) scheinen jedoch
ebenfalls einen Effekt zu haben.
Somit lässt sich schlussfolgern, dass die Ergebnisse aus den Reizschwellenunter-
suchungen nicht unmittelbar auf handelsübliche Produkte zu übertragen sind. Die
Komplexität der industriell gefertigten Produkte spielt eine wesentliche Rolle bei der
Wahrnehmung der Schärfeintensität.
Abschließend ist anzumerken, dass neben dem Einfluss der Matrix auch weitere Fak-
toren eine Rolle bei der Wahrnehmung der maximal wahrgenommenen Schärfein-
tensität (Imax) spielen können. Zu diesen Faktoren zählen beispielsweise genetische
Unterschiede und kulturelle Faktoren (Essgewohnheiten) [LUDY UND MATTES 2012].
Aber auch der Menstruationszyklus [RILEY ET AL. 1999, REZAII ET AL. 2012] und die
Schulung der Panelisten [ALLISON ET AL. 1999] können Einfluss auf das Schmerzemp-
finden und somit die maximal wahrgenommene Schärfeintensität (Imax) zeigen. Ana-
lysen, die auf den Menschen als Messinstrument zurückgreifen, sind und bleiben
somit auch immer multifaktoriell beeinflusst.
8 Fazit
Die vorliegende Arbeit zeigt, dass Inhaltsstoffe im Lebensmittel die maximal wahrge-
nommene Schärfeintensität (Imax) maßgeblich beeinflussen. Ergebnisse der Modell-
matrices können zum großen Teil auf handelsübliche Produkte übertragen werden.
Zwischen dem chemisch-analytisch ermittelten Capsaicinoidgehalt und dem senso-
risch bestimmten Parameter Imax wird ein Bestimmtheitsmaß von R² = 0,8029 be-
rechnet. Eine Berechnung mit den sensorischen Parametern TDur und Area führt hin-
gegen nur zu Werten von R² = 0,5176 bzw. R² = 0,6898.
Literatur
55
Literatur
[ALLISON ET AL. 1999] Allison AA, Chambers IV E, Gibson E, Aramouni FM: Sensory characteristics of heat-processed and fresh tomato salsa containing honey. Journal of Food Science 64 (1999):560-564.
[AOAC 1995] AOAC Official Method 995.03: Capsaicinoids in Capsicums and their extractives liquid chromatographic method. First action 1995.
[BARBERO ET AL. 2006] Barbero GF, Palma M, Barroso C: Pressurized liquid extrac-tion of capsaicinoids from peppers. Journal of Agricultural and Food Chemistry 54 (2006):3231-3236.
[BARBERO ET AL. 2008a] Barbero GF, Liazid A, Palma M, Barroso CG: Fast determina-tion of capsaicinoids from peppers by high-performance liquid chromatography using a reversed phase monolithic column. Food Chemistry 107 (2008):1276-1282.
[BARBERO ET AL. 2008b] Barbero GF, Liazid A, Palma M, Barroso CG: Ultrasound-assisted extraction of capsaicinoids from peppers. Talanta 75 (2008):1332-1337.
[BARON UND PENFIELD 1996] Baron RF, Penfield MP: Capsaicin heat intensity – con-centration, carrier, fat level, and serving temperature effects. Journal of Senso-ry Studies 11 (1996):295-316.
[CARDEN ET AL. 1999] Carden LA, Penfield MP, Saxton AM: Perception of heat in cheese sauces as affected by capsaicin concentration, fat level, fat mimetic and time. Journal of Food Science 64 (1999):175-179.
[CHOI ET AL. 2006] Choi SH, Suh BS, Kozukue E, Kozukue N, Levin CE, Friedman M: Analysis of the contents of pungent compounds in fresh Korean red peppers and in pepper-containing foods. Journal of Agricultural and Food Chemistry 54 (2006):9024-9031.
[CONTRERAS-PADILLA UND YAHIA 1998] Contreras-Padilla M, Yahia EM: Changes in capsaicinoids during development, maturation, and senescence of chile pep-pers and relation with peroxidase activity. Journal of Agricultural and Food Chemistry 46 (1998):2075-2079.
[DAVIS ET AL. 2007] Davis CB, Markey CE, Busch MA, Busch KW: Determination of capsaicinoids in Habanero peppers by chemometric analysis of UV spectral data. Journal of Agricultural and Food Chemistry 55 (2007):5925-5933.
[FROEHLICH ET AL. 1987] Froehlich DA, Pangborn RM und Whitaker JR: The effect of oral stimulation on human parotid salivary flow rate and alpha-amylase secre-tion. Physiology & Behavior 41 (1987):209-2017.
[GARCÉS-CLAVER ET AL. 2006] Garcés-Claver A, Arnedo-Andrés MS, Abadia J, Gil-Ortega R, Álvarez-Fernández A: Determination of capsaicin and dihydrocap-saicin in Capsicum fruits by liquid chromatography-electrospray/time-of-flight mass spectrometry. Journal of Agricultural and Food Chemistry 54 (2006):9303-9311.
Literatur
56
[GREEN 1989] Green BG: Capsaicin sensitization and desensitization on the tongue produced by brief exposures to a low concentration. Neuroscience Letters 107 (1989):173-178.
[HUTCHINSON ET AL. 1990] Hutchinson SE, Trantow LA, Vickers ZM: The effectiveness of common foods for reduction of capsaicin burn. Journal of Sensory Studies 4 (1990):157-164.
[KARRER UND BARTOSHUK 1991] Karrer T, Bartoshuk L: Capsaicin desensitization and recovery on the human tongue. Physiology & Behavior 49 (1991):757-764.
[KARRER UND BARTHOSUK 1995] Karrer T, Bartoshuk L: Effects of capsaicin desensiti-zation on taste in humans. Physiology & Behavior 57 (1995):421-429.
[KIRSCHBAUM-TITZE ET AL. 2002] Kirschbaum-Titze P, Hiepler C, Mueller-Seitz E, Petz M: Pungency in paprika (Capsicum annum). 1. Decrease of capsaicinoid con-tent following cellular disruption. Journal of Agricultural and Food Chemistry 50 (2002):1260-1263.
[KOREL ET AL. 2002] Korel F, Bağdatlioğlu N, Balaban MÖ, Hisil Y: Ground red pep-pers: Capsaicinoids content, Scoville scores, and discrimination by an elec-tronic nose. Journal of Agricultural and Food Chemistry 50 (2002):3257-3261.
[KOSTYRA ET AL. 2010] Kostyra E, Baryłko-Pikielna N, Dabrowska U: Relationship of pungency and leading flavour atrributes in model food matrices – temporal as-pects. Food Quality and Preference 21 (2010):197-206.
[KOZUKUE ET AL. 2005] Kozukue N, Han JS, Kozukue E, Lee SJ, Kim JA, Lee KR, Levin CE, Friedman M: Analysis of eight capsaicinoids in peppers and pepper-containing foods by high-performance liquid Ccromatography and liquid-chromatography-mass spectrometry. Journal of Agricultural and Food Chemis-try 53 (2005):9172-9181.
[KRAJEWSKA UND POWERS 1988] Krajewska AM, Powers JJ: Sensory properties of naturally occurring capsaicinoids. Journal of Food Science 53 (1988):902-905.
[KROMIDAS 1999] Kromidas S: Validierung in der Analytik. In: Gruber U, Klein W (Hrsg.): Die Praxis der instrumentellen Analytik. Weinheim, Wiley-VCH:1999.
[KULKA 1976] Kulka K: Aspects of functional groups and flavor. Journal of Agricultural and Food Chemistry 15 (1967):48-57.
[LAWLESS 1984] Lawless H: Oral chemical irritation: psychophysical properties. Chemical Senses 9 (1984):143-155.
[LAWLESS ET AL. 2000] Lawless HT, Hartono C, Hernandez S: Thresholds and su-prathreshold intensity functions for capsaicin in oil and aqueous based carri-ers. Journal of Sensory Studies 15 (2000):437-447.
[LUDY UND MATTES 2012] Ludy MJ, Mattes RD: Comparison of sensory, physiological, personality, and cultural attributes in regular spicy food users and non-users. Appetite 58 (2012):19-27.
[McDonald et al. 2010] McDonald S, Barrett P, Bond L: What kind of hot is it?. Per-fumer & Flavorist 35 (2010):32-39.
Literatur
57
[MCNAMARA ET AL. 2005] McNamara FN, Randall A, Gunthorpe MJ: Effects of piper-ine, the pungent component of black pepper, at the human vanilloid receptor (TRPV1). British Journal of Pharmacology 144 (2005):781-790.
[NASRAWI UND PANGBORN 1989] Nasrawi CW, Pangborn RM: The influence of tastants on oral irritation by capsaicin. Journal of Sensory Studies 3 (1989):287-294.
[NASRAWI UND PANGBORN 1990] Nasrawi CW, Pangborn RM: Temporal effectiveness of mouth-rinsing on capsaicin mouth-burn. Physiology and Behavior 47 (1990):617-623.
[ORELLANA-ESCOBEDO ET AL. 2012] Orellana- Escobedo L, Ornelas-Paz JJ, Olivas GI, Guerrero-Beltran JA, Jimenez-Castro J, Sepulveda DR: Determination of ab-solute threshold and just noticeable difference in the sensory perception of pungency. Journal of Food Science 77 (2012):135-139.
[PEÑA-ALVAREZ ET AL. 2009] Pena-Alvarez A, Ramirez-Maya E, Alvarado-Suárez LA: Analysis of capsaicin and dihydrocapsaicin in peppers and pepper sauces by solid phase microextraction – gas chromatography – mass spectrometry. Journal of Chromatography A 1216 (2009):2843-2847.
[PRESCOTT ET AL. 1993] Prescott J, Allen S, Stephens L: Interactions between oral chemical irritation, taste and temperature. Chemical Senses 18 (1993):389-404.
[PRESCOTT UND STEVENSON 1995] Prescott J, Stevenson RJ: Effects of oral chemical irritation on tastes and flavors in frequent and infrequent users of chili. Physi-ology & Behavior 58 (1995):1117-1127.
[RENTMEISTER-BRYANT AND GREEN 1997] Rentmeister-Bryant H, Green BG: Perceived irritation during ingestion of capsaicin or piperine: Comparison of trigeminal and non-trigeminal areas. Chemical Senses 22 (1997):257-266.
[REZAII ET AL. 2012] Rezaii T, Hirschberg AL, Carlström, Ernberg M: The influence of menstrual phases on pain modulation in healthy women. The Journal of Pain 13 (2012):646-655.
[RILEY ET AL. 1999] Riley III JL, Robinson ME, Wise EA, Price DD: A meta-analytic review of pain perception across the menstrual cycle. Pain 81 (1999):225-235.
[SCHNEIDER UND SEUß-BAUM 2013] Schneider DJ, Seuß-Baum I: Sensorische Unter-suchungen zur Neutralisation von Schärfeempfindung hervorgerufen durch den Verzehr von Chili. Poster, Veranstaltung Forschen und Vernetzen, Hoch-schule Fulda, 27.11.2013.
[SCOVILLE 1912] Scoville WL: Note on Capsicums. The Journal of the American Pharmaceutical Association 1 (1912):453-454.
[TODD ET AL. 1977] Todd PH, Bensinger MG, Biftu T: Determination of pungency due to capsicum by gas-liquid chromatography. Journal of Food Science 42 (1977):660-665.
[WAITE UND AUBIN 2008] Waite MS, Aubin AJ: A modular HPLC system for routine analysis of capsaicin from hot sauces. Waters Cooperation. 2008.

Anhang
A-I
Justus – Liebig – Universität Gießen
Fachbereich 09
Agrarwissenschaften, Ökotrophologie und Umweltmanagement
Institut für Landtechnik
Professur für Prozesstechnik in Lebensmittel- und Dienstleistungsbetrieben
Analyse des Capsaicinoidgehalts in ausgewählten Chili–
Produkten mithilfe der HPLC–MS und Vergleich mit
sensorischen Untersuchungen
- Anhang -
Anhang
A-II
Publikationsliste Désirée Schneider
Fachzeitschriften, Journale
Schneider DJ, Seuß-Baum I, Schlich E: Relationship between pungency and food components – A comparison of chemical and sensory evaluations. Food Quality and Preference 38 (2014):98-106. DOI: 10.1016/j.foodqual.2014.05.017
Schneider DJ, Seuß-Baum I, Schlich E: Comparison between chemical senses thresholds for capsaicin and dihydrocapsaicin in aqueous solutions and identi-fication of the area of burning sensation. Advance Journal of Food Science and Technology 6(1) (2014): 36-41, 2014.
Schneider DJ, Seuß-Baum I, Schlich E: Vergleich der Gruppenreizschwellen von Capsaicin in Abhängigkeit der Matrix. ErnährungsUmschau 60 (10) (2013):178-179. DOI 10.4455/eu.2013.034
Schneider DJ, Seuß-Baum I, Schlich E: Comparison of the group threshold of Capsa-icin depending on the matrix. Ernaehrungs Umschau international 60 (10) (2013):178-179. DOI: 10.4455/eu.2013.034
Vorträge
Schneider D, Seuß-Baum I, Schlich E: Schärfeintensität von Capsaicin in Abhängig-keit von der Lebensmittelzusammensetzung. Jahrestagung 2014 des Fach-ausschusses Haushaltstechnik in der Deutschen Gesellschaft für Hauswirt-schaft (dgh), Fulda, 20.02.-21.02.2014.
Schneider D, Seuß-Baum I, Schlich E: Determination of thresholds for Capsaicin in aqueous and oil-based solutions. Proceedings of the 245th ACS National Meeting and Exposition, April 7th-11th, New Orleans (2013).
Schneider D, Seuß-Baum I, Schlich E: Bestimmung der Reizschwellen von Capsaicin in Öl und Wasser mit Hilfe der 3-AFC Methode. Jahrestagung 2013 des Fach-ausschusses Haushaltstechnik in der Deutschen Gesellschaft für Hauswirt-schaft (dgh), Koblenz, 28.02.-01.03.2013.

Anhang
A-III
Posterpräsentationen
Schneider D, Seuß-Baum I: Sensorische Untersuchungen zur Neutralisation von Schärfeempfindung hervorgerufen durch den Verzehr von Chili. Poster, Ver-anstaltung Forschen und Vernetzen, Hochschule Fulda, 27.11.2013.
Schneider D, Seuß-Baum I, Schlich E: Einfluss der Art und Anzahl an Komponenten im Lebensmittel auf die Schärfewahrnehmung. Poster, 8. DLG-Lebensmitteltage, 25.09.2013.
Schneider DJ, Seuß-Baum I, Nachtsheim R, Schlich E: Perception of heat intensity affected by capsaicin in different model food matrices. Poster, at 10th Pangborn Sensory Science Symposium, Rio de Janeiro, Brazil, 11-15 August 2013.
Schneider D, Schaller L, Seuß-Baum I, Schlich E: Vergleich des Schärfeprofils ver-schiedener Schärfe auslösender Substanzen mit Hilfe der Profilprüfung (nach DIN 10967-1). Poster, Deutscher Sensoriktag 2012. Deutsche Gesellschaft für Sensorik (DGSens) e.V., 09. November 2012.
Schneider D, Schlich E, Seuß-Baum I: Ermittlung der Reizschwellen von Capsaicin in Abhängigkeit der Matrix (Wasser und Öl). Poster, Deutscher Sensoriktag 2012. Deutsche Gesellschaft für Sensorik (DGSens) e.V., 09. November 2012.
(Auszeichnung durch die DGSens als Bestes Poster 2012)
Schneider D, Fuckerer K, Schlich E, Seuß-Baum I: Untersuchungen der Schärfein-tensität in Abhängigkeit der Matrix mit Hilfe der Zeitintensitätsprüfung (nach DIN 10970). Poster, 7. DLG-Lebensmitteltage, 17.-18. September 2012.
Schneider D, Wolf S, Schlich E, Seuß-Baum I: Untersuchungen zur Reizschwel-lenermittlung von Capsaicin unter Anwendung der 3-AFC Methode nach ISO 13301:2002. Poster, 6. DLG-Lebensmitteltage, 21.-22. September 2011.
Erklärung
„Ich erkläre: Ich habe die vorgelegte Dissertation selbstständig und ohne unerlaubte
fremde Hilfe und nur mit den Hilfen angefertigt, die ich in der Dissertation angegeben
habe. Alle Textstellen, die wörtlich oder sinngemäß aus veröffentlichten Schriften
entnommen sind, und alle Angaben, die auf mündlichen Auskünften beruhen, sind
als solche kenntlich gemacht. Bei den von mir durchgeführten und in der Dissertation
erwähnten Untersuchungen habe ich die Grundsätze guter wissenschaftlicher Praxis,
wie sie in der „Satzung der Justus-Liebig-Universität Gießen zur Sicherung guter
wissenschaftlicher Praxis“ niedergelegt sind, eingehalten.“
Désir
ée J. Schneid
er Senso
ris
che und
analy
tis
che B
estim
mung vo
n Schärfe
Désirée Janet Schneider
Analyse des Capsaicinoidgehalts in ausgewählten
Chili–Produkten mithilfe der HPLC–MS und
Vergleich mit sensorischen Untersuchungen
VVBVVB LAUFERSWEILER VERLAG
édition scientifique
VVB LAUFERSWEILER VERLAGSTAUFENBERGRING 15D-35396 GIESSEN
Tel: 0641-5599888 Fax: [email protected]
VVB LAUFERSWEILER VERLAGédition scientifique
9 7 8 3 8 3 5 9 6 2 6 0 6
ISBN: 978-3-8359-6260-6
INAUGURAL-DISSERTATION
zur Erlangung des Doktorgrades (Dr. oec. troph.)
im Fachbereich Agrarwissenschaften, Ökotrophologie und
Umweltmanagement der Justus-Liebig-Universität Gießen
Photo cover: © photocrew - Fotolia