Embed Size (px)
Citation preview
Proceeding of 9th International Seminar on Industrial Engineering and Management
ISSN : 1978-774X
Genetic Algorithm Cellular Manufacture PS-66 Agung Yugo Ngumboro
ANALYSIS & EVALUATION OF PLANT PRODUCTION LAYOUT PT ARKHA
JAYANTI PERSADA USING GROUP OF TECHNOLOGY CONCEPT WITH GENETIC ALGORITHM APPROACH
Agung Yugo Ngumboro1, Budi Aribowo2
Industrial Engineering, Faculty of Science and Technology, University of Al Azhar Indonesia, Jakarta 12110, Indonesia
ABSTRACT
PT. Arkha Jayanti Persada is a company in which they are involve in manufacturing business. Currently, the problems they are facing are the inefficient layout of their machines inside their production floor, where they put their machines too far away from each others. In order to solve the problem, the concepts of group of technology with genetic algorithm (GA’s) for optimization have already been proposed as a method for designing the layout of production machines. Utilizing GA’s cellular manufactur will generate grouping efficiency of 83.47% in the 25th generation and GA’s machine arrangement will generate coefficient flow of 274.356 annually on the 7th generation. Key words: Genetic Algorithm, Group of Technology, Optimization
1. INTRODUCTION 1.1. Background
Inside the manufacturing industry, one of
the most common problems is how to optimize and how to generate production time more efficiently without increasing cost too significantly.
Object of research has been done inside PT. Arkha Jayanti Persada’s factory which is located in the industry area Citeureup, Bogor, West Java. They are known as metal manufacturer company which produces various excavator components.
Genetic Algorithm (GA’s) will be used during this research. This method will divide every work center and put them insed the cells of Group Technology, where each combination of possibilities of machine placement will be calculated by their performance to produce optimum solution until n generation.
1.2. Identification of Problem
PT Arkha Jayanti Persada have 5
department of production. The research object is located in the 3rd department, where that particular department produces component of Assy Skirt LH and RH. This
department has 16 units of machine and production facilities including raw material warehouse and finished material warehouse.
The layout of machines this company applies is called process layout. This type of
production layout has rather unique characteristic in which the shift of material relatively slow resulting in bigger queue in component products. The machine set up is always changing because each machine produces various type of component and often the process is back and forth.
Formulation of problems is how layout production should be applied and how much is the difference of efficiency by utilizing proposed layout. In other side research never examine the cost to re-layout the machines and Only examined the 3rd department with 16 machines and 58 components.
2. THEORETICAL BACKGROUND
2.1. Factory Layout Design
Factory Layout Design is an activity that
includes analysis, creating concept, devise and fulfill system for manufacturer of service industry. With a purpose to optimize connection between operators, material
Proceeding of 9th International Seminar on Industrial Engineering and Management
ISSN : 1978-774X
Genetic Algorithm Cellular Manufacture Agung Yugo Ngumboro PS-67
flows, information flows, and etc with hope to produce accurate production prototype, low cost, and safe (Apple, 1990).
2.2. Group Technology Layout
In this type of layout, commonly different
component will be grouped together based on the similarity of component shape, type of machines or equipments used. Machines were grouped together and placed inside manufacturing cells. (Purnomo, 2008)
2.3. Grouping Efficiency
Grouping Efficiency Method is sum up
between utilization ratio of machines and movement between cells. Value of n1 is the ratio of number 1 inside the block. Meanwhile, the value of n2 is the ratio of number 0 outside the block. Value w shows weighting towards n1 and n2. The suggested value for w is 0.5, because assuming weighting for n1 and n2 is the same. Perfect value for Grouping Efficiency is 1, where
acquired efficiency will reach 100% (Chandrasekharan & Rajagopalan; 1986). Equation for Grouping Efficiency is:
𝜂1 =𝑜−𝑒
𝑜−𝑒+𝑣 (1)
𝜂2 =𝑀𝑃−𝑜−𝑣
𝑀𝑃−𝑜−𝑣+𝑒 (2)
𝜂 = 𝑤𝜂1 + (1 − 𝑤)𝜂2 (3)
o = Number of 1 in the matrix e = exceptional elements
v = Number of Voids M = Number of Machines P = Number of Parts n = Grouping Efficiency 2.4. Distance Calculation Method
Distance is one of the parameters
measure from material handling component. In order to handle materials, there is a movement from one place to another, the formula to measure distance is: (Heragu, 1997)
𝐷𝑖𝑗 = |𝑥𝑖 − 𝑥𝑗| + |𝑦𝑖 − 𝑦𝑗| (4)
xi = center coordinate x from i facility yi = center coordinate y from j facility
2.5. Genetic Algorithm (GA’s)
Genetic Algorithm was invented in 1970
by John Holland. John Holland was inspired by Charles Darwin’s theory of natural selection. 2.6. Parameter of Genetic Algorithm
Goldberg define the parameters to be
used in Genetic Algorithm is: (Obitko, 2008) - Population Size
- Number of Generations
- Probability of crossover
- Probability of mutation 2.7. Genetic Operators
Genetic Operators is useful to introduce
new strings in the populations (Gen, M, 2000).
2.8. Selection
Processes that have been done is to find new population prior to the next generations This new populations came from parents and offspring which have the best fitness level.
2.9. Crossover
Increase random numbers between 0 to 1 for every chromosome and parents. Compare the values of random number with the probability of crossover (Pc) with the parameters. If the value of random number is lesser of equal to value of Pc, then chromosomes will experience crossover process and will become parent and vice versa.
Match parents in the population randomly, with maximum number of parents pairs is equal to chromosomes parent divided by two. Decide the value of crossing site r position of gen exchange by increasing random number between 1 until (m-1) in 2 units where m is the length of gen.
Crossed gens with one parent to another that placed between crossing site until shape like chromosome offspring crossover. (Tompkins et.al., 1996)
Proceeding of 9th International Seminar on Industrial Engineering and Management
ISSN : 1978-774X
Genetic Algorithm Cellular Manufacture PS-68 Agung Yugo Ngumboro
2.10. Mutation
Increase random number between 0 and 1 in every gen of chromosome. Compare that random number with probability of mutation (Pm). If the random number generated is lesser of equal to Pm, then gen inside the sub-chromosome will experience mutation. Furthermore, exchange mutated gen with gen in the right side. If there are 2 gens that experiencing mutation then exchange the right side gen first. 2.11. Encoding & Decoding
Encoding (chromosome representation) is a process to transfer from real information to the chromosome. This process of chromosome representation has the purpose to decide what kind of information will enter the chromosome.
A chromosome is consisted of gen, where one gen shows one work station. One chromosome is consisted of group of gen, where every gen shows the work element from the rail of production.
Decoding process is the opposite of encoding process. Decoding process transfer information inside every chromosomes to the real information. Every chromosomes inside the population will be processed until they generate several feasible line of production according to the population size. The generated line of production will be evaluated with the fitness value according to the fitness function. 3. RESEARCH METHOD
Research method for data collection has been done with two ways, by primary data and secondary data. The primary data is colecting data with directly observation and calculation like as flow process, machine dimesion, work center dimension and distance between facillity.
In other side, a secondary data is colecting data with undirectly observation. This type data obtained from supervisior and foremen in the factory. Like as type material handling, lot production, machine capacity, production cost and others.
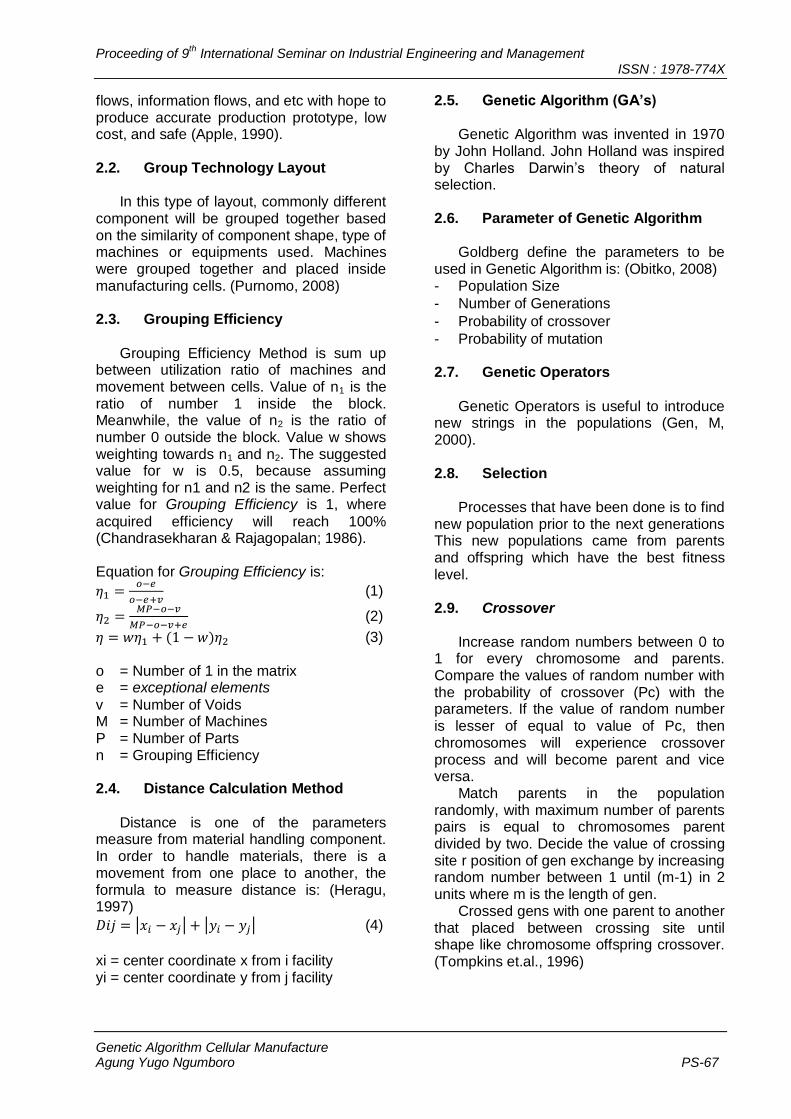
Figure 1. Research Method
After data was collected. Then
calculated by genetic alghorithm. There are two type’s of calculations. First, using genetic alghorithm cellular manufacture for clustering machine and facility in the group of technology. And secondly by genetic alghorithm for machine and facility arrangement for searching best value or finding optimize solution.
Proceeding of 9th International Seminar on Industrial Engineering and Management
ISSN : 1978-774X
Genetic Algorithm Cellular Manufacture Agung Yugo Ngumboro PS-69
4. RESULT AND DISCUSSION
Data processing has been done in 2
steps, grouping of manufacture cells, machine layout design and production facility using genetic algorithm (GA’s) method. 4.1. Genetic Algorithm Cell
Manufacture
GA’s cell manufacture will grouped
machines and component to incidence matrix which only has 2 value 1 and 0. Value 1 shows that component will go through machines. Value 0 shows component do not go through machines.
4.1.1. Fitness Function
Fitness Function that used for incidence matrix is grouping efficiency function. 4.1.2. Parameter
Deciding the parameters is as follows: - Number of generations : 25
- Number of Cells : 5
- Population Size : 8
- Crossover Probability : 0,95
- Mutation Probability : 0,05 4.1.3. Encoding Process
Gen Initialization for every chromosomes
in the first generation, by increasing random number as shown in table.
Table 1 Initialization of Chromosome
4.1.4. Decoding Process
Translate gen value in the table 1 to the
incidence matrix. Every gen will be group to group cell of technology as shown in below table.
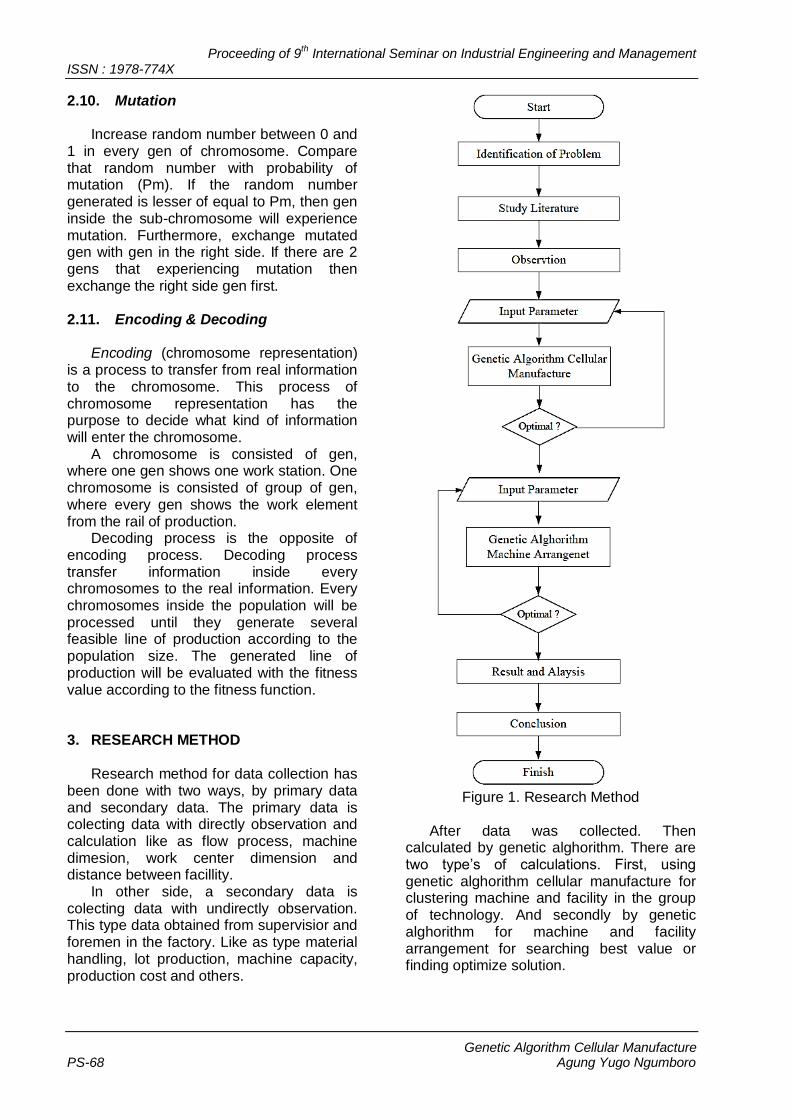
Table 2. Decoding Chromosome 1
Table 3. Grouping efficiency Chromosome 1
4.1.5. Crossover Process
Decide the chromosome that is feasible to be parent using random number between 0 and 1. If the value of crossover probability higher than the random number then that particular chromosome is feasible to be parent and vice versa as shown below:
Table 4. Determination of parent
Decide the parent pair and gen that will be cross. Increase the random number between 1 and 16 for machines. Then increase the random number from 1 to 58 for part as shown below:
Table 5. Crossing site
Exchange gen from both of parents until they generate chromosomes for the next generation. The result from crossover is called chromosome offspring crossover as shown below:
Proceeding of 9th International Seminar on Industrial Engineering and Management
ISSN : 1978-774X
Genetic Algorithm Cellular Manufacture PS-70 Agung Yugo Ngumboro
Table 6 Offspring crossover
Once again do decoding process for offspring crossover using incidence matrix to find grouping efficiency. 4.1.6. Mutation Process
Generate random value between 0 and 1
in every gen. compare that random number with mutation probability (Pm), if the random number that generated is lesser or equal to Pm, then gen in that sum-chromosome will experience mutation with gen located in the right side as shown in the table 6.
Do decoding process once again for offspring mutation using incidence matrix to find grouping efficiency. 4.1.7. Selection Process
Sort grouping efficiency from big to small as shown in the table below:
Table 7 Chromosome Selection Process
Eight chromosomes above is feasible as a parent for the next generations and chromosome that did not selected will be eliminated. Repeat the process above for 25 generations.
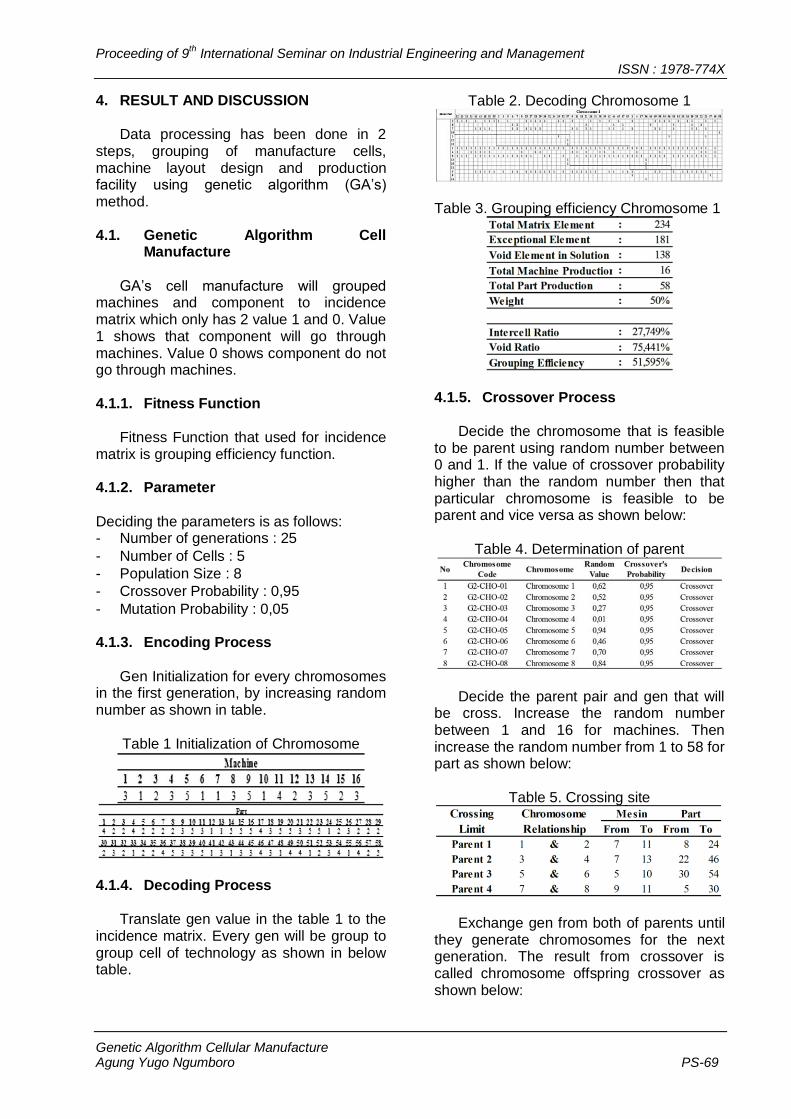
Inside the graphic shape then GA’s cell grouping manufacturer generate value like graphic below:
Figure 1. GA’s Cellular Manufactur 25th gen
The result from GA’s cell grouping after 25 generation optimum solution with the value of 83.45% will be retrieved. Table 8. Machines grouping 25th generation
4.2. GA’s Machine Arrangement
GA’s machine layout is used for
arranging machines in each cells in production floor. This method needs input such as production volume, machine distance, process flow. 4.2.1. Fitness Function
Fitness Function that used as algorithm
method for machine layout is function to minimize coefficient in flow. 4.2.2. Parameter
- Number of Generations : 7 Generasi
- Number of Gen : 21 Gen
- Population size : 6 Kromosom
- Crossover Probability : 0,95
- Mutation Probability : 0,02 4.2.3. Encoding Process
Gen initialization every chromosomes in
the first generations. Increase random number for every gen in the table below:
Proceeding of 9th International Seminar on Industrial Engineering and Management
ISSN : 1978-774X
Genetic Algorithm Cellular Manufacture Agung Yugo Ngumboro PS-71
Tabel 9 Initialization chromosome
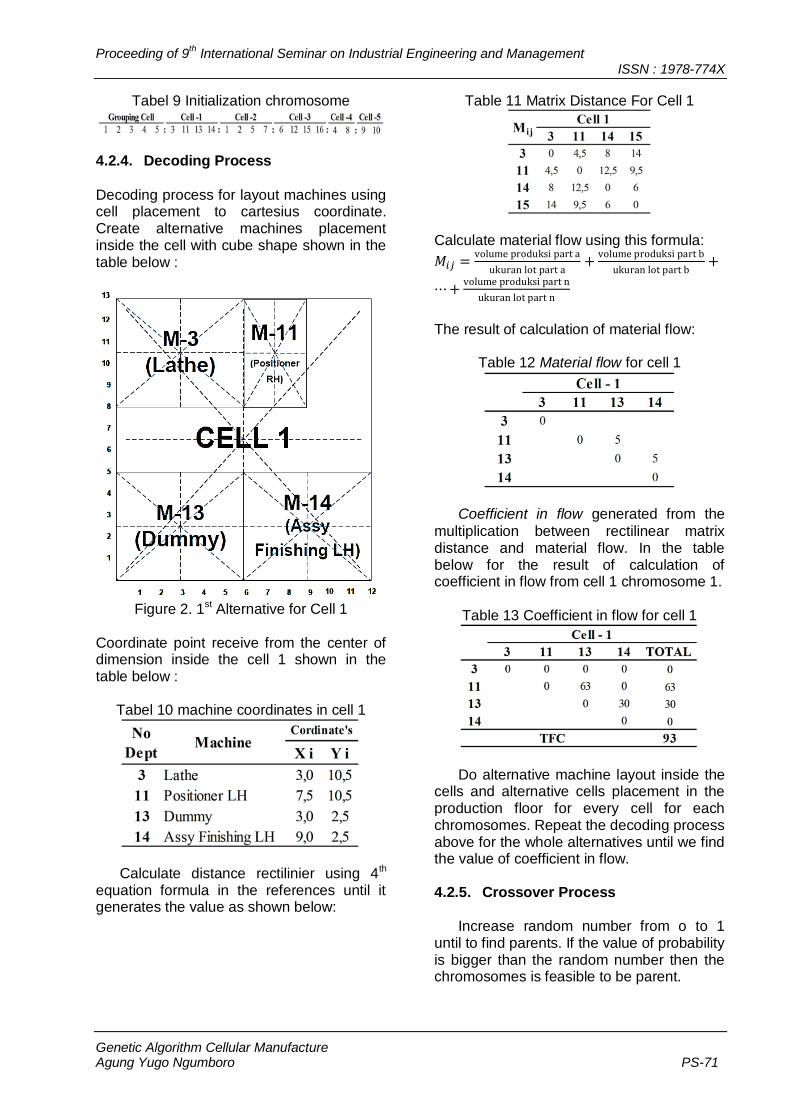
4.2.4. Decoding Process
Decoding process for layout machines using cell placement to cartesius coordinate. Create alternative machines placement inside the cell with cube shape shown in the table below :
Figure 2. 1st Alternative for Cell 1
Coordinate point receive from the center of dimension inside the cell 1 shown in the table below :
Tabel 10 machine coordinates in cell 1
Calculate distance rectilinier using 4th equation formula in the references until it generates the value as shown below:
Table 11 Matrix Distance For Cell 1
Calculate material flow using this formula:
𝑀𝑖𝑗 =volume produksi part a
ukuran lot part a+
volume produksi part b
ukuran lot part b+
⋯ +volume produksi part n
ukuran lot part n
The result of calculation of material flow:
Table 12 Material flow for cell 1
Coefficient in flow generated from the
multiplication between rectilinear matrix distance and material flow. In the table below for the result of calculation of coefficient in flow from cell 1 chromosome 1.
Table 13 Coefficient in flow for cell 1
Do alternative machine layout inside the cells and alternative cells placement in the production floor for every cell for each chromosomes. Repeat the decoding process above for the whole alternatives until we find the value of coefficient in flow. 4.2.5. Crossover Process
Increase random number from o to 1 until to find parents. If the value of probability is bigger than the random number then the chromosomes is feasible to be parent.
Proceeding of 9th International Seminar on Industrial Engineering and Management
ISSN : 1978-774X
Genetic Algorithm Cellular Manufacture PS-72 Agung Yugo Ngumboro
Table 14 The determination of parent
Increase again the random number to decide parent pair and gens that are going to be used for crossover.
Table 15 Crossing site
Table 16 Chromosome Offsprings Crossover
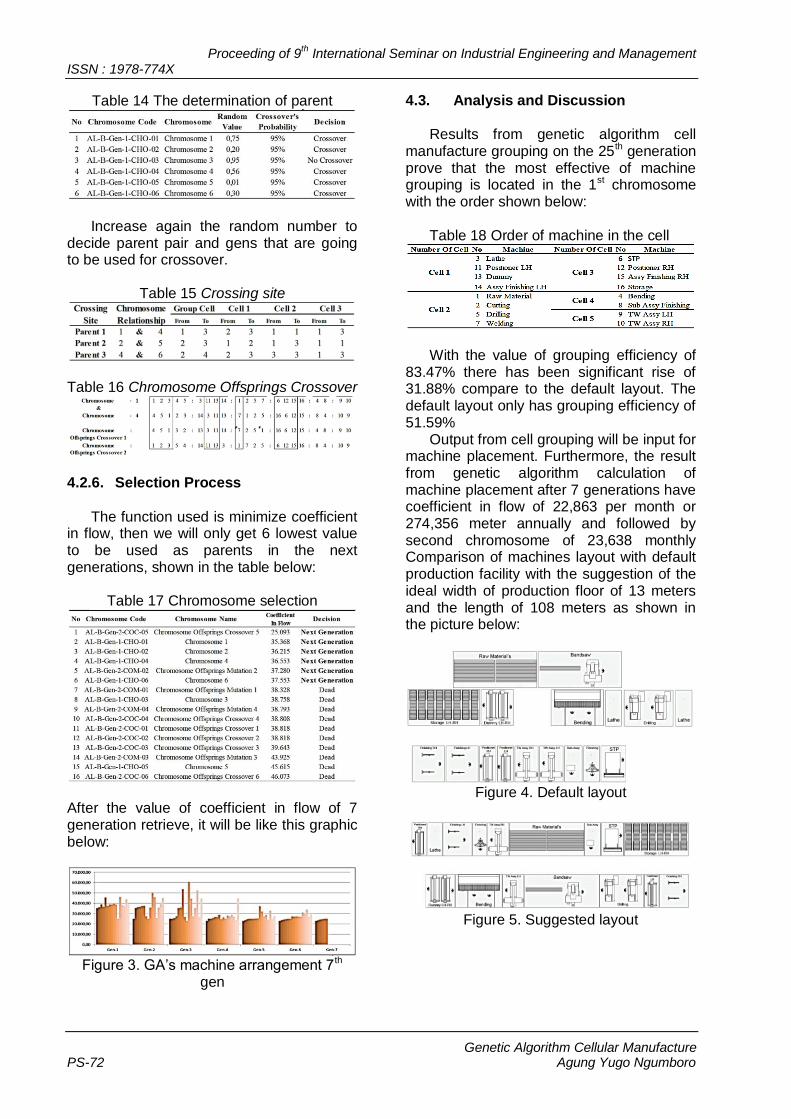
4.2.6. Selection Process
The function used is minimize coefficient
in flow, then we will only get 6 lowest value to be used as parents in the next generations, shown in the table below:
Table 17 Chromosome selection
After the value of coefficient in flow of 7 generation retrieve, it will be like this graphic below:
Figure 3. GA’s machine arrangement 7th
gen
4.3. Analysis and Discussion
Results from genetic algorithm cell
manufacture grouping on the 25th generation prove that the most effective of machine grouping is located in the 1st chromosome with the order shown below:
Table 18 Order of machine in the cell
With the value of grouping efficiency of
83.47% there has been significant rise of 31.88% compare to the default layout. The default layout only has grouping efficiency of 51.59%
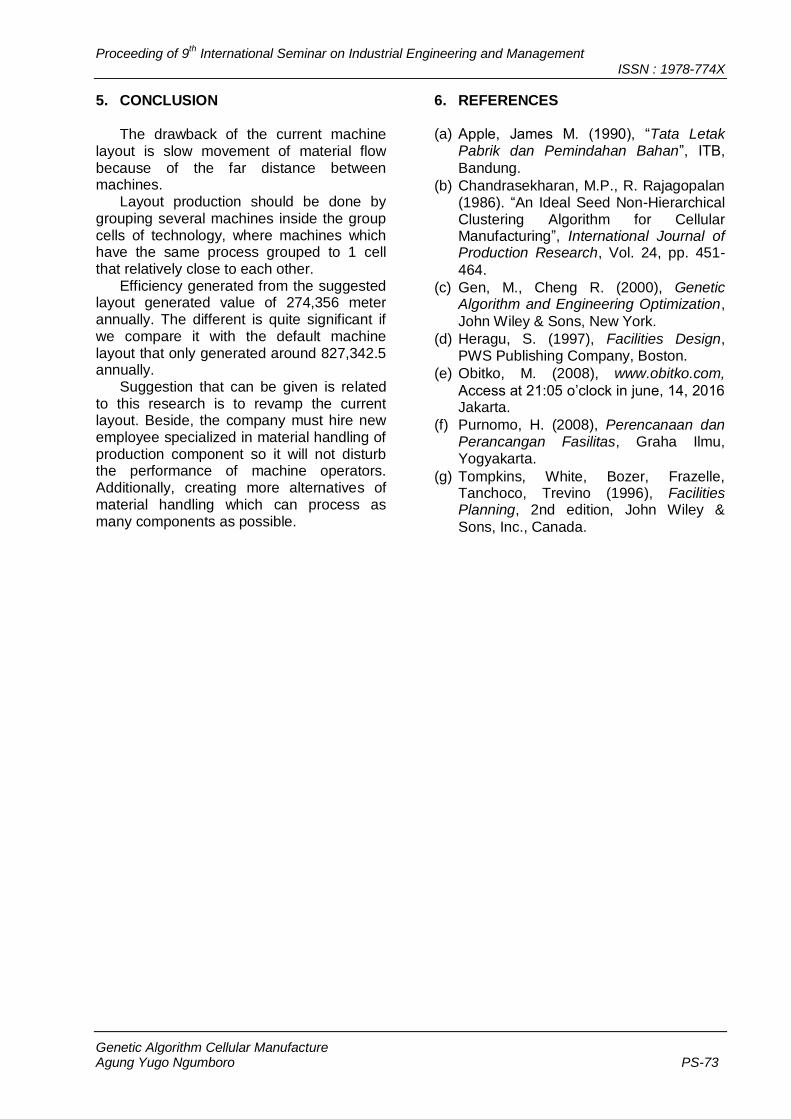
Output from cell grouping will be input for machine placement. Furthermore, the result from genetic algorithm calculation of machine placement after 7 generations have coefficient in flow of 22,863 per month or 274,356 meter annually and followed by second chromosome of 23,638 monthly Comparison of machines layout with default production facility with the suggestion of the ideal width of production floor of 13 meters and the length of 108 meters as shown in the picture below:
Figure 4. Default layout
Figure 5. Suggested layout
Proceeding of 9th International Seminar on Industrial Engineering and Management
ISSN : 1978-774X
Genetic Algorithm Cellular Manufacture Agung Yugo Ngumboro PS-73
5. CONCLUSION
The drawback of the current machine
layout is slow movement of material flow because of the far distance between machines.
Layout production should be done by grouping several machines inside the group cells of technology, where machines which have the same process grouped to 1 cell that relatively close to each other.
Efficiency generated from the suggested layout generated value of 274,356 meter annually. The different is quite significant if we compare it with the default machine layout that only generated around 827,342.5 annually.
Suggestion that can be given is related to this research is to revamp the current layout. Beside, the company must hire new employee specialized in material handling of production component so it will not disturb the performance of machine operators. Additionally, creating more alternatives of material handling which can process as many components as possible.
6. REFERENCES
(a) Apple, James M. (1990), “Tata Letak
Pabrik dan Pemindahan Bahan”, ITB,
Bandung.
(b) Chandrasekharan, M.P., R. Rajagopalan (1986). “An Ideal Seed Non-Hierarchical Clustering Algorithm for Cellular Manufacturing”, International Journal of Production Research, Vol. 24, pp. 451-
464.
(c) Gen, M., Cheng R. (2000), Genetic Algorithm and Engineering Optimization,
John Wiley & Sons, New York.
(d) Heragu, S. (1997), Facilities Design, PWS Publishing Company, Boston.
(e) Obitko, M. (2008), www.obitko.com,
Access at 21:05 o’clock in june, 14, 2016 Jakarta.
(f) Purnomo, H. (2008), Perencanaan dan Perancangan Fasilitas, Graha Ilmu, Yogyakarta.
(g) Tompkins, White, Bozer, Frazelle, Tanchoco, Trevino (1996), Facilities Planning, 2nd edition, John Wiley &
Sons, Inc., Canada.


![Quantitative 3D Analysis of Plant Roots Growing in Soil ... · Quantitative 3D Analysis of Plant Roots Growing in Soil Using Magnetic Resonance Imaging1[OPEN] Dagmar van Dusschoten*,](https://img.pdfslide.org/doc/110x75/5ebda7bf743d581abc30e017/quantitative-3d-analysis-of-plant-roots-growing-in-soil-quantitative-3d-analysis.jpg)