Embed Size (px)
Citation preview
Analysis of AU-rich Elements in the Yeast Pichia pastoris
vorgelegt von
Diplom-Biologe
Thomas Lautz
Von der Fakultät III - Prozesswissenschaften
der Technischen Universität Berlin
zur Erlangung des akademischen Grades
Doktor der Naturwissenschaften
- Dr. rer. nat. -
genehmigte Dissertation
Promotionsausschuss:
Vorsitzender: Prof. Dr. Roland Lauster
Berichter: Dekan Univ.-Prof. Dipl.-Ing. Dr. Ulf Stahl
Berichter: Prof. Dr. rer. nat. Christine Lang
Tag der wissenschaftlichen Aussprache: 11.12.2007
Berlin 2008
D83


Aufgeben ist das Letzte, was man sich erlauben darf.

Acknowledgements - Danksagung
Herrn Prof. Dr. Ulf Stahl möchte ich für die langjährige Unterstützung und die
Möglichkeit danken, diese Arbeit am Institut für Biotechnologie, Fachgebiet
Mikrobiologie und Genetik, der Technischen Universität Berlin anzufertigen.
Ganz besonderer Dank gilt Prof. Dr. Christine Lang, in deren Arbeitsgruppe diese
Arbeit angefertigt wurde. Ich bedanke mich herzlich für die finanzielle Unterstützung,
die Betreuung dieser Arbeit, die Hilfe bei der Antragsstellung des Stipendiums und
die Korrektur der Dissertation. Außerdem möchte ich mich für die konstruktive Kritik
und ständige Diskussionsbereitschaft bedanken.
Meiner Arbeitsgruppe danke ich herzlich für die nette Aufnahme und das tolle
Arbeitsklima. Insbesondere bedanke ich mich bei Herrn Dr. Sean-Patrick Riechers,
Andreas Raab und Frau Dr. Kristina Martin für die zahllosen wissenschaftlichen
Diskussionen und bei Birgit Baumann für den netten Laboralltag sowie der
Unterstützung bei diversen Versuchen und technischen Fragen. Meinen Praktikanten
Kongla Sopachai, Sandra George, Caroline Heunemann, Heidi Löwa und Diana
Güttner möchte ich für ihre Mitarbeit an meinem Projekt danken. Spezieller Dank gilt
Heidi für ihr monatelanges Engagement bei der Reproduktion der Daten zur
Proteinexpression. Außerdem bedanke ich mich bei Dr. Mewes Böttner für die
theoretische und Natalia Bolotina für die praktische Unterstützung am Anfang meiner
Doktorarbeit.
Desweiteren bedanke ich mich bei Dr. Udo Schmidt, der speziell für den Bereich
RNA, aber auch für Fußball, immer ein sehr guter Diskussionspartner war. Susanne
Engelhardt, Laura Funk und Anja Spielvogel danke ich für ihre geduldige Hilfe im
Radioaktivlabor.
Isabell Schwieger (FMP Berlin-Buch), Roslin Bensmann und meiner Frau Katja Lautz
(FMP Berlin-Buch) danke ich für die zusätzliche Durchsicht und Korrektur der
Dissertation.

Außerdem bedanke ich mich bei allen anderen (auch ehemaligen) Mitarbeitern des
Instituts, die mich bei dieser Arbeit durch ihr Zutun oder durch ihren Humor
unterstützt haben.
Meiner Frau Katja Lautz danke ich für die ständige und unaufhörliche Unterstützung
in Wissenschaft und Alltagsleben. Es tut so gut, jemanden an seiner Seite zu haben,
der einen immer versteht und bedingungslose Rücksicht übt. Meinen Eltern, meiner
Schwester und meinem Schwager, meinen Groß- und Schwiegereltern danke ich für
die Unterstützung und das Verständnis während der Doktorarbeit, aber auch der
letzten zehn Jahre. Es betrübt mich, dass meine verstorbenen Großväter den Tag
der Verteidigung nicht mehr erleben durften.
Schließlich will ich noch meinen besten Freunden danken, die mir nicht nur in
schwierigen Stunden immer zur Seite standen. Großer Dank gilt meinem
langjährigen Freund Matthias Melchers, der mich mit seiner Art von Humor immer
aufheitern konnte, obwohl ihm das sicher nicht immer bewusst war.
Content
List of Abbreviations................................................................................................. I
Index of Figures and Tables ................................................................................... III
1 RNA interference (RNAi) – Basics and Applications...................................... 1
1.1 Double-stranded RNA – Triggers of RNAi.................................................... 1
1.1.1 Small interfering RNAs (siRNAs)........................................................... 2
1.1.2 MicroRNAs (miRNAs) ........................................................................... 3
1.1.3 Identification of miRNAs........................................................................ 5
1.1.4 Principles of microRNA targeting .......................................................... 5
1.2 MiRNA targets – Regulators of essential cellular processes ........................ 7
1.2.1 MiRNAs in serious diseases.................................................................. 7
1.2.2 Expression analysis of miRNAs in cancer ............................................. 8
1.2.3 MiRNAs and their targets – a potential role in human cancer ............... 9
1.3 RNAi as a tool in Gene Therapy................................................................. 12
1.3.1 The cellular interferon (IFN) response and off-targets effects (OTEs). 12
1.3.2 miRNA pathway saturation.................................................................. 13
1.3.3 Chemical siRNA-modifications and the application of small hairpin
RNAs (shRNAs) can prolong RNAi-mediated effects ........................................ 14
1.3.4 Delivery of siRNA can be enhanced by chemical siRNA-modifications
and the application of viral vectors .................................................................... 15
1.3.5 Therapeutic targets in RNAi-based applications ................................. 16
1.3.6 Concluding remarks ............................................................................ 16
2 Subject Description......................................................................................... 18
2.1 ARE-mediated gene regulation .................................................................. 18
2.1.1 AREs as cis-acting elements............................................................... 18
2.1.2 ARE mRNA binding proteins (ARE-BPs) as trans-acting factors ........ 20
2.1.3 ARE-mediated mRNA degradation (AMD) .......................................... 22
2.1.4 AREs in yeast...................................................................................... 24
2.2 Aim of the thesis......................................................................................... 25
3 Materials and Methods.................................................................................... 27
3.1 Materials..................................................................................................... 27
3.1.1 Primers................................................................................................ 27
3.1.2 Plasmids.............................................................................................. 29
3.1.3 Strains................................................................................................. 29
3.1.4 Media .................................................................................................. 29
3.1.5 Buffers, solutions, reagents................................................................. 30
3.1.6 Enzymes ............................................................................................. 32
3.1.7 Antibodies ........................................................................................... 33
3.1.8 Programmes and databases ............................................................... 33
3.2 Cultivation techniques ................................................................................ 33
3.2.1 E. coli culture preparation and growth conditions................................ 33
3.2.2 P. pastoris culture preparation and growth conditions......................... 34
3.3 DNA Techniques ........................................................................................ 34
3.3.1 Agarose gel electrophoresis................................................................ 34
3.3.2 Plasmidisolation from E. coli ............................................................... 35
3.3.3 Restriction of DNA............................................................................... 35
3.3.4 PCR Amplification ............................................................................... 35
3.3.5 Purification of DNA fragments ............................................................. 36
3.3.6 Hybridisation of oligonucleotides......................................................... 36
3.3.7 Klenow fill up reaction ......................................................................... 36
3.3.8 Ligation of DNA fragments .................................................................. 37
3.3.9 Transformation of E. coli ..................................................................... 37
3.3.10 Colony-PCR of E. coli ......................................................................... 37
3.3.11 Transformation of P. pastoris .............................................................. 38
3.3.12 Colony-PCR of P. pastoris .................................................................. 38
3.3.13 Isolation of total/genomic DNA from P. pastoris .................................. 39
3.4 RNA Techniques ........................................................................................ 39
3.4.1 PCR based probe synthesis................................................................ 39
3.4.2 Radioactive labelling of PCR generated probes.................................. 40
3.4.3 Isolation of total RNA from P. pastoris ................................................ 40
3.4.4 Denaturing RNA gel electrophoresis ................................................... 41
3.4.5 Northern Blotting ................................................................................. 42
3.4.6 Probe hybridisation and detection ....................................................... 42
3.5 RNA-protein interaction techniques............................................................ 43
3.5.1 Template matrices for in vitro transcription.......................................... 43
3.5.2 In vitro transcription............................................................................. 43
3.5.3 End-labelling of oligonucleotides......................................................... 44
3.5.4 Purification of in vitro transcripts ......................................................... 44
3.5.5 Binding reaction .................................................................................. 45
3.6 Protein Techniques .................................................................................... 46
3.6.1 Preparation of crude cell extracts........................................................ 46
3.6.2 Bradford protein determination............................................................ 46
3.6.3 SDS PAGE.......................................................................................... 47
3.6.4 Western Blotting.................................................................................. 47
3.6.5 Coomassie blue staining ..................................................................... 48
3.6.6 Immunodetection of proteins ............................................................... 48
3.7 Bioinformatics............................................................................................. 48
3.7.1 RNA secondary structure prediction.................................................... 48
3.7.2 Calculation of relative protein expression and mRNA stability ............ 49
3.7.3 Calculation of translational effects....................................................... 49
4 Results ............................................................................................................. 50
4.1 Construction of P. pastoris expression clones............................................ 50
4.1.1 Selection of AREs – the human c-fos and TNFα AREs ...................... 50
4.1.2 Construction of the basic expression vectors – Human AREs are cloned
into the 3’ UTR .................................................................................................. 51
4.1.3 Cloning of human cDNAs – example cDNAs for analysis ................... 52
4.1.4 Selection of cDNAs – AT-rich sequences in the coding region are a
critical factor ...................................................................................................... 54
4.1.5 Transformation of the new constructs in P. pastoris – creation of
expression clones.............................................................................................. 55
4.2 Analysis of P. pastoris expression clones .................................................. 56
4.2.1 Standardized comparison of the protein level – AREs can influence
translation in P. pastoris .................................................................................... 56
4.2.2 Standardized comparison of the mRNA level – AREs can influence
transcript stability in P. pastoris ......................................................................... 60
4.3 Identifying factors that influence ARE-based regulation in P. pastoris ....... 64
4.3.1 Mutational analysis – exchange of one nucleotide upstream of the c-fos
ARE alters mRNA and protein level .................................................................. 64
4.3.2 Analysis of RNA-protein-interactions in vitro – both AREs bind a protein
of the same size ................................................................................................ 68
4.3.3 Creation of RNA transcripts – in vitro transcription.............................. 68
4.3.4 Gel retardation experiments – the TNFα and c-fos ARE bind a 14 kDa
protein 70
4.3.5 Gel retardation experiments – demonstrating the specific binding to
both transcripts.................................................................................................. 73
5 Discussion ....................................................................................................... 76
5.1 The ARE-based regulatory pathway is conserved among eukaryotes – also
in P. pastoris ......................................................................................................... 76
5.1.1 Identical AREs can have different effects – like in mammals .............. 77
5.2 Stem-loop structures are critical factors for transcript stability and translation
82
5.2.1 The different observed effects of the c-fos ARE can be correlated to the
local ARE structure............................................................................................ 83
5.2.2 Exchange of one nucleotide upstream of the c-fos ARE alters structure,
mRNA and protein level of the pPICHcfos29+S+S reporter .............................. 84
5.2.3 The identified stem-loop (hairpin A) can influence translation of non-
ARE, TNFα ARE and c-fos ARE-containing transcripts .................................... 86
5.2.4 ARE-flanking sequences and structures play a role in ARE-mediated
regulation of transcript stablity and translation .................................................. 89
5.2.5 Identified stem-loops play a crucial role in ARE-mediated regulation – a
model 92
6 Outlook............................................................................................................. 96
7 Summary.......................................................................................................... 97
8 Zusammenfassung.......................................................................................... 98
9 References ....................................................................................................... 99
10 Appendix .....................................................................................................119
I
List of Abbreviations A Adenine
AmpR Ampicillin resistance
AOX1 Alcohol oxidase 1
APS Ammoniumpersulfate
bp Base pairs
BSA Bovine serum albumin
C Cytosine
ColE Origin of replication for E. coli
C-Source Carbon source
Da Dalton
DNA Deoxyribonucleic acid
dNTP Deoxyribonucleotide
DTT Dithiotreitol
EDTA Ethylenediamine-tetra-acetic acid
Fig. Figure
g Gramm
h Hour
l Liter
m Meter
M Molar
MOPS Morpholinopropane-sulfuric acid
mRNA messenger RNA
n/a Not available / not analyzed
OD Optical density
ORF Open reading frame
Ori Origin of replication
PBS Phosphate buffered saline
PCR Polymerase chain reaction
PMSF Phenylmethylsulfonylfluoride
RNA Ribonucleic acid
RT Room temperature
II
RV Relative value
SDS Sodium-dodecyl sulfate
SGD Saccharomyces Genome Database
SSC Saline buffered sodium citrate
T Thymine
TAE Tris-acetate-EDTA
TEMED N, N, N´, N´-Tetra-
methylethylethylendiamine
U Uracile
UTR Untranslated region
UV Ultraviolet radiation
V Volt
X g Multiple of acceleration of gravity
YE Yeast extract
YNB Yeast nitrogen base
III
Index of Figures and Tables Figures Figure 1: Mammalian Mechanisms of RNAi ........................................................... 4
Figure 2: The 69 nt c-fos ARE consists of two structurally and functionally distinct domains. .................................................................................................... 19
Figure 3: The human 74 nt TNFα ARE................................................................... 20
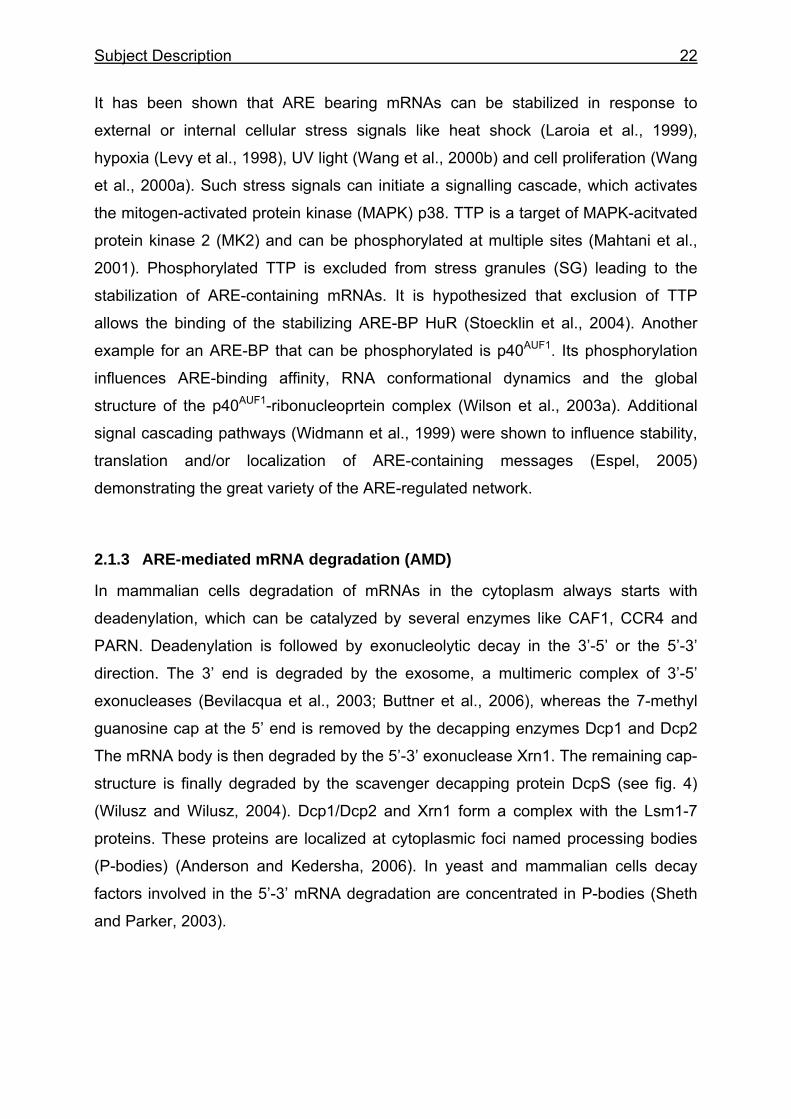
Figure 4: Degradation of mRNA in mammalian cells........................................... 23
Figure 5: Schematic overview of c-fos and TNFα ARE locations from the literature .................................................................................................................. 52
Figure 6: Basic expression vectors used for creation of Pichia expression clones ...................................................................................................................... 53
Figure 7: Schematic overview of the P. pastoris endogenous AOX1 gene (A) and the expression cassette used in the vector pPICHS (B) .............................. 55
Figure 8: Representative gel of a P. pastoris colony PCR. ................................. 56
Figure 9: Expression analysis of cDNA 45 and 205 constructs by Western Blot (A and C) and quantified expression analysis normalized to the total protein amount and the pPICH value (B and D) ................................................................ 58
Figure 10: Expression analysis of cDNA 29 constructs by Western Blot (A) and quantified expression analysis of cDNA 29 constructs normalized to the total protein amount and the pPICH value (B) .............................................................. 59
Figure 11: (A) Creation of the radioactively labelled probe against the 5’ UTR of the AOX1 gene in the vector pPICHS and (B) its targets under inducing conditions ............................................................................................................... 61
Figure 12: mRNA stability analysis of cDNA 45 and 205 constructs by Northern Blot (A and C) and quantified mRNA stability analysis normalized to the engodenous AOX mRNA and the pPICH value (B and D) ................................... 62
Figure 13: mRNA stability analysis of cDNA 29 constructs by Northern Blot (A) and quantified mRNA stability analysis of cDNA 29 constructs normalized to the engodenous AOX mRNA and the pPICH value (B)........................................ 63
IV
Figure 14: (A) Schematic overview of construct pPICHcfos29+S+S. (B) Single point mutations introduced into the NotI restriction site resulting in an altered secondary structure prediction............................................................................. 65
Figure 15: (A) Expression analysis of NotImut constructs derived from pPICHcfos29+S+S by Western Blot. (B) Quantified expression analysis of NotImut constructs derived from pPICHcfos29+S+S normalized to the total protein amount and the pPICH value.................................................................... 66
Figure 16: (A) mRNA stability analysis of NotImut constructs derived from pPICHcfos29+S+S by Northern Blot. (B) Quantified mRNA stability analysis of NotImut constructs derived from pPICHcfos29+S+S normalized to the engodenous AOX mRNA and the pPICHcfos29+S+S value................................ 67
Figure 17: Consensus sequence of the promoter T7 .......................................... 68
Figure 18: Typical result of an in vitro transcription ........................................... 69
Figure 19: Gel retardation of the (A) TNFα ARE transcript and (B) c-fos ARE transcript with a P. pastoris endogenous protein of approximately 14 kDa ..... 72
Figure 20: Competition assay of the TNFα ARE transcript (A) and the c-fos ARE transcript (B) with unlabelled transcript as a specific competitor ..................... 74
Figure 21: Competition assay of the TNFα ARE transcript (A) and the c-fos ARE transcript (B) with yeast tRNA as an unspecific competitor............................... 75
Figure 21: Transcript stability and translational rates of cDNA 45 (A) and 205 (C) and translational repression/activation triggered by introduced modifications (B and D) ......................................................................................... 79
Figure 22: Transcript stability and translational rates of cDNA 29 (A) and translational repression/activation triggered by introduced modifications (B) 81
Figure 23: Schematic overview of an RNA stem-loop......................................... 83
Figure 24: Transcript stability and translational rates of cDNA 29 NotI-site mutants (A) and translational repression/activation triggered by introduced modifications (B) .................................................................................................... 85
Figure 25: Sections of the mRNA secondary structure predictions of analysed constructs ............................................................................................................... 88
Figure 26: A schematic model of the c-fos ARE regulation in P. pastoris ........ 94

V
Tables Table 1: Classification of AREs based on the presence of the pentamer AUUUA and the nonamer UUAUUUA(U/A)(U/A)................................................................. 19
Table 2: A small subset of known ARE-BPs ........................................................ 21
Table 3: Scheme for Bradford calibration ............................................................ 46
Introduction 1
1 RNA interference (RNAi) – Basics and Applications In 1998, Andy Fire and Craig Mello initially characterized the potential of double-
stranded RNA (dsRNA) to specifically silence genes in the nematode
Caenorhabditis elegans. Although the silencing effects of complementary antisense
RNA had been previously investigated (Guo and Kemphues, 1995), Fire and Mello
were the first to show that small amounts of dsRNA were able to specifically and very
potently silence its complementary target - a phenomenon termed RNA interference
or RNAi (Fire et al., 1998). These experiments could also explain the observation
that the introduction of a dsRNA encoding the purple colour of petunias in plant cells
did not make the plant turn purple, but rather white (Jorgensen, 1990). In the
following years, more and more scientists studied RNAi (Gerstein and Douglas,
2007) with the result that it is an important and widely spread cellular tool to control
gene expression in such diverse kingdoms such as fungi, plants and animals (Ding et
al., 2004). It has become obvious that the greatest potential of RNAi is based on the
specific and potent knockdown of genes whose sequence is known and which cause
disease (history of uncovering the mechanism of RNAi; (Sen and Blau, 2006)). Fire
and Mello received the Nobel Prize in Physiology or Medicine in 2006 for their
revolutionary discovery (Paulson and Gonzalez-Alegre, 2006).
1.1 Double-stranded RNA – Triggers of RNAi
RNAi pathways are triggered by small dsRNA molecules (~19 – 23 nt in length),
which can either be subjected exogenously to the cell (small interfering RNAs –
siRNAs), or processed endogenously from larger dsRNA molecules (micro RNAs –
miRNA, miR). These small RNAs mediate sequence-specific mRNA cleavage or
translational silencing, depending on the rate of complementarity to their target (post-
transcriptional gene silencing – PTGS). Additionally, RNAi pathways can also
regulate heterochromatin formation and transcriptional gene silencing in the nucleus
(TGS; nuclear RNAi) through DNA methylation (Lippman and Martienssen, 2004;
Wassenegger, 2005; Weinberg et al., 2006).
Introduction 2
1.1.1 Small interfering RNAs (siRNAs)
Expression vectors encoding hairpin or linear long dsRNA molecules can be
introduced into cells using common transfection methods. Transcribed small hairpin
RNAs (shRNAs) are transported into the cytoplasm by the dsRNA-binding
karyopherin exportin-5 (Yi et al., 2003) (see also fig. 1). Alternatively, cells can be
transfected with synthetic double-stranded siRNAs, whose 5’ ends are
phosphorylated by endogenous kinases in the cytoplasm. The RNA duplexes are
then processed by the RISC loading complex (RLC) consisting of the ribonuclease
type III named Dicer (Bernstein et al., 2001; Carmell and Hannon, 2004), TAR RNA-
binding protein (TRBP) and protein activator of protein kinase PKR (PACT) (Lee et
al., 2006). The resulting short DNA fragments are termed siRNAs and are 21 nt to 23
nt in length. SiRNAs are characterized by a 2 nt overhang at both 3’ ends (usually
deoxythymidine) and a phosphate-group at their 5’ ends (Elbashir et al., 2001).
Afterwards, TRBP transfers the RLC to Argonaute 2 (Ago2). This newly formed
protein complex is termed the RNA-induced silencing complex (RISC) (Liu et al.,
2004; Chendrimada et al., 2005; Haase et al., 2005). Currently it is proposed that the
double-stranded siRNA is loaded onto Ago2 (Matranga et al., 2005). As it is a
characteristic for members of the Argonaute family, Ago2 contains an amino-terminal
PAZ (PIWI-Argonaute-Zwille) and a carboxy-terminal RNase H-like PIWI domain
which bind the 3’ end (Lingel et al., 2004) or the phosphorylated 5’ end (Ma et al.,
2004; Parker et al., 2005) of the “guide strand” (anti-sense strand), respectively. The
specific incorporation of the guide strand is determined by the less
thermodynamically stable 5’ end of the siRNA (Khvorova et al., 2003). Ago2 can
cleave the “passenger strand” (sense strand), which then dissociates from the guide
strand and is consequently degraded. Alternatively, it is possible that the siRNA
duplex is unwound by an RNA helicase and the passenger strand subsequently
degraded (Matranga et al., 2005; Preall and Sontheimer, 2005; Rand et al., 2005).
Recently, RNA helicase A has been identified to be a RISC-associated factor and to
be involved in RISC loading and unwinding the siRNA duplex (Robb and Rana,
2007). Once the single stranded guide strand is incorporated (active RISC), the guide
strand leads the RISC to its complementary target RNA, which is afterwards cleaved
10 nt to 11 nt from the guide strand’s 5’ end through the “slicing activity” of the Ago2
PIWI domain (Liu et al., 2004; Meister et al., 2004; Song et al., 2004). Degradation of
the cleaved target mRNA most likely occurs in cytoplasmic processing bodies (P-
Introduction 3
bodies), which are associated with Ago2 and RISC (Jakymiw et al., 2005; Liu et al.,
2005). In addition, it has also been shown that RNA helicase rck/p54 is a further part
of human RISC (Gregory et al., 2005; Chu and Rana, 2006) and is involved in mRNA
degradation in P-bodies as well (Cougot et al., 2004).
1.1.2 MicroRNAs (miRNAs)
In contrast to the siRNA pathway, the miRNA pathway is initiated in the nucleus
(fig. 1). MiRNAs are encoded either on the sense, or on the anti-sense strand of
introns and intergenic regions (Lagos-Quintana et al., 2001; Lee and Ambros, 2001;
Rodriguez et al., 2004). The majority of known miRNAs are transcribed by RNA
polymerase II (Lee et al., 2004), although miRNAs transcribed by RNA polymerase III
have been reported (Borchert et al., 2006). Primary miRNAs (pri-miRNAs) can be
mono- or polycistronic transcripts and have a varying length of a few hundreds to
thousand nucleotides. As is usual for RNA polymerase II transcripts, they possess a
5’-end cap and a 3’ poly(A)-tail (Cai et al., 2004). Pri-miRNAs form a stem-loop
structure that is flanked by single-stranded RNA sequences (Lee et al., 2002).
Subsequently, pri-miRNAs are processed by the microprocessor complex consisting
of the RNase III Drosha which displays affinity to the hairpin and the overhanging
single strands of the pri-miRNA (Zeng and Cullen, 2005), and its dsRNA binding co-
factor DGCR8 (DiGeorge syndrome critical region gene-8) (Gregory et al., 2004; Han
et al., 2006). Processing products (precursor miRNAs or pre-miRNAs) are hairpin
RNAs of ~70 nt up to 100 nt in length (Lee et al., 2003), containing a 5’ phosphate
and a 2 nt 3’ overhanging end (Kim, 2005). Afterwards, the pre-miRNAs are
transported into the cytoplasm by exportin-5 through a RanGTP-dependent
mechanism (Yi et al., 2003; Bohnsack et al., 2004; Lund et al., 2004). They are cut by
the Dicer-TRBP-PACT-complex (RISC loading complex, RLC) in the cytoplasm into
~22 nt mature microRNAs (miRNAs). Afterwards, RLC transfers the miRNA to RISC-
associated Ago2. The miRNA duplex is unwound and the passenger strand
discarded (Preall and Sontheimer, 2005). The guide strand can now direct the active
RISC to its target mRNA. An important determinant for miRNA targeting are positions
2 to 8 of the guide strand’s 5’ end called the “seed” region (Lewis et al., 2005).
Bulges that can form in the middle of the guide strand due to imperfect
complementarity to its target mRNA are not susceptible to Ago2-mediated cleavage.
As a consequence, RISC-miRNA-complexes accumulate in P-bodies where the
Introduction 4
target mRNA is translationally repressed and/or degraded afterwards (Liu et al.,
2005; Chan and Slack, 2006; Chu and Rana, 2006). However, the mechanisms
underlying miRNA-mediated translational silencing and mRNA degradation are not
fully characterized.
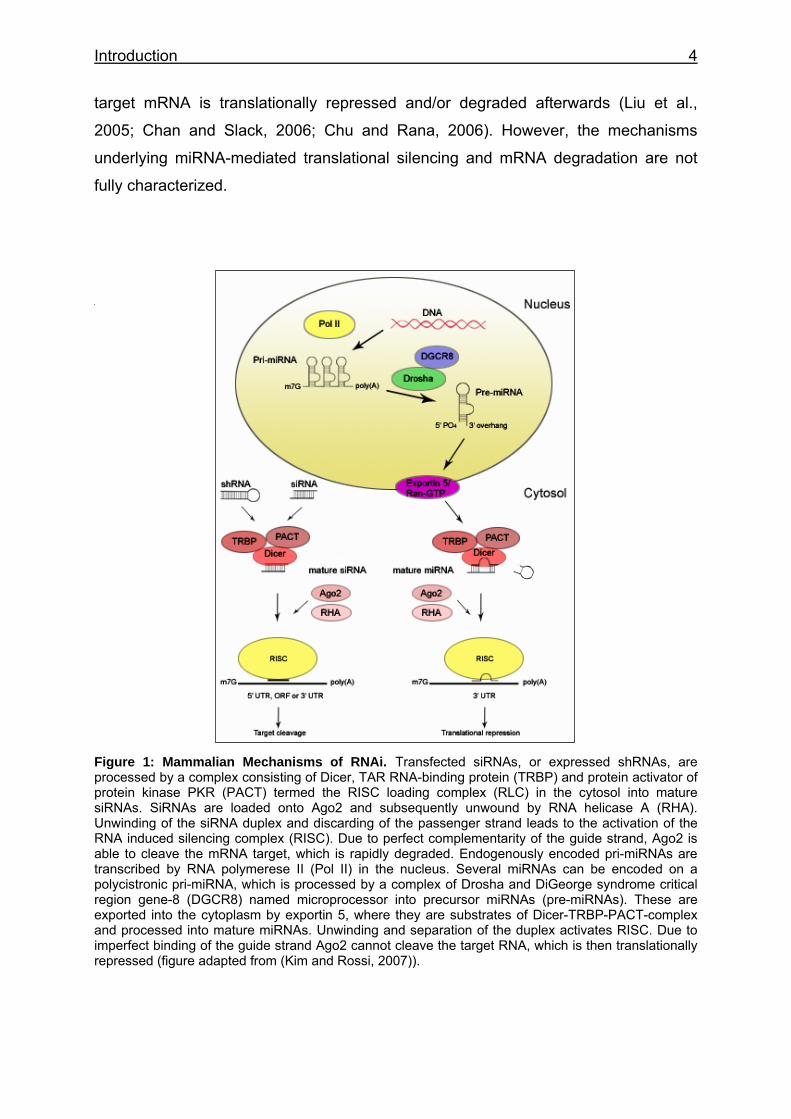
Figure 1: Mammalian Mechanisms of RNAi. Transfected siRNAs, or expressed shRNAs, are processed by a complex consisting of Dicer, TAR RNA-binding protein (TRBP) and protein activator of protein kinase PKR (PACT) termed the RISC loading complex (RLC) in the cytosol into mature siRNAs. SiRNAs are loaded onto Ago2 and subsequently unwound by RNA helicase A (RHA). Unwinding of the siRNA duplex and discarding of the passenger strand leads to the activation of the RNA induced silencing complex (RISC). Due to perfect complementarity of the guide strand, Ago2 is able to cleave the mRNA target, which is rapidly degraded. Endogenously encoded pri-miRNAs are transcribed by RNA polymerese II (Pol II) in the nucleus. Several miRNAs can be encoded on a polycistronic pri-miRNA, which is processed by a complex of Drosha and DiGeorge syndrome critical region gene-8 (DGCR8) named microprocessor into precursor miRNAs (pre-miRNAs). These are exported into the cytoplasm by exportin 5, where they are substrates of Dicer-TRBP-PACT-complex and processed into mature miRNAs. Unwinding and separation of the duplex activates RISC. Due to imperfect binding of the guide strand Ago2 cannot cleave the target RNA, which is then translationally repressed (figure adapted from (Kim and Rossi, 2007)).
Introduction 5
1.1.3 Identification of miRNAs
Hundreds of miRNAs have been identified to date (Bentwich et al., 2005; Zamore and
Haley, 2005; Berezikov et al., 2006) (http://microrna.sanger.ac.uk) and the number is
rapidly growing. In C. elegans the first miRNAs (lin-4 and let-7) were identified
genetically by chromosomal walking (Lee et al., 1993; Reinhart et al., 2000; Lee and
Ambros, 2001). The application of in silico tools accelerates the bioinformatic
identification of new miRNA coding sequences. Computer programs used for
bioinformatic miRNA identification are miRseeker, miRScan, PalGrade, ProMiR, and
miRAlign as examples that have been compared recently (Chaudhuri and Chatterjee,
2007; Doran and Strauss, 2007). The predictive function of these algorithms relies on
the conservation of miRNAs among related species (conservation criterion), the
stem-loop of pre-miRNAs and the coding sequence of the miRNA in one arm of that
stem-loop (structure criterion). Once a miRNA has been predicted, its expression
(expression criterion) has to be analysed by Northern blotting, RT-PCR, RNase
protection assay (RNP) or microarray analysis (Chaudhuri and Chatterjee, 2007;
Lindow and Gorodkin, 2007).
1.1.4 Principles of microRNA targeting
In order to understand the functionality of certain miRNA species, it is essential to
characterize their specific mRNA targets. Each miRNA can target hundreds of
transcripts due to its imperfect binding (Bartel and Chen, 2004; Lim et al., 2005). It is
also possible that a single mRNA can be a target of several miRNAs (Lewis et al.,
2003; John et al., 2004; Kiriakidou et al., 2004; Krek et al., 2005). This agrees with
the finding that multiple target sites in the same target RNA can increase the rate of
translational repression (Doench et al., 2003), whereas the optimal distance between
miRNA seeds in the target has been elucidated to be from 13 up to 35 nt (Saetrom et
al., 2007). Combinatorial binding of different miRNAs to one target is proposed to
result in the normally detectable expression, suggesting a regulatory “fine-tuning”
based on miRNA binding.
In general, miR targeting relies on nucleotides 2 to 8 from the 5’ end of the guide
strand. Currently, this minimal “seed” region is regarded to be the most important
factor in terms of efficiently silencing genes (Doench and Sharp, 2004; Kim and Nam,
2006). Consequently, mismatches at positions 1, 9 or 10 and/or the 3’ region do not
Introduction 6
significantly affect the target repression. However, seed regions can be as small as
4 nt due to truncations by G:U wobble base pairs. Such interruptions require
compensatory pairing of the 3’ end in order to efficiently repress the target. In
contrast, a perfect 3’ end pairing is not sufficient for target repression. Thus, target
sites are classified into 5’ dominant and 3’ compensatory sites, reflecting the
asymmetry of a functional miRNA (Brennecke et al., 2005). It has also been reported
that the seed sequence alone is a non-sufficient marker for targeting (Didiano and
Hobert, 2006). When searching for further factors that regulate miRNA targeting, an
additional aspect attracts attention - target accessibility. Indeed, it has been
demonstrated that target accessibility and siRNA duplex asymmetry can alter
knockdown efficiency by 26% to almost 40% (Shao et al., 2007). This is further
supported by the finding that the transfer of a freely accessible miRNA target site into
a thermodynamically stable hairpin adversely affects siRNA-mediated silencing
(Kurreck, 2006). To access its target, it has been hypothesised that at least three
tandem single-stranded nucleotides are required for hybridization to the 5’ seed
region of a miRNA (Robins et al., 2005). Recently, a two-step model for miRNA-
target-hybridization was proposed. In the first step, the miRNA nucleates
hybridization with four consecutive nucleotides. In the second step, base-pairing is
driven forward resulting in the abolishment of the target secondary structure (Long et
al., 2007). Although natural targets of miRNAs are located in the 3’ UTR of their
target transcripts, silencing is also efficient when the complementary target site is
located at the 5’ UTR. It has been suggested that the target site itself may be located
at any position in order to maintain knockdown (Lytle et al., 2007).
Several computational algorithms have been developed in order to predict miRNA
targets. Examples such as TargetScanS, PicTar, DIANAmicroT, miRanda, and
RNAhybrid rely on complementarity, conservation and thermodynamics in order to
find matching target sites (Chaudhuri and Chatterjee, 2007; Doran and Strauss,
2007; Lindow and Gorodkin, 2007). Interestingly, it has been shown that the non-
protein coding gene IPS1 (Induced by Phosphate Starvation1) from
Arabidopsis thaliana displays complementarity to miR-399. The expected cleavage
site is covered by a non-matching loop, avoiding cleavage and sequestering miR-
399. This process is termed “target mimicry” (Franco-Zorrilla et al., 2007).
Furthermore, it is known that endogenous miRNAs can be targeted by synthetic
siRNAs named “antagomirs” and it is also likely to occur naturally (Mattes et al.,
Introduction 7
2007). Current computer programmes used for target prediction do not consider
target mimicry or other non-coding RNAs (such as miRNAs) as potential targets.
1.2 MiRNA targets – Regulators of essential cellular processes
In order to verify miRNA targets, the most commonly used tools are reporter gene
systems as well as miRNA gene knockdown techniques and target point mutations.
Most miRNAs targets are currently undefined. Experimentally validated targets can
be found in TarBase (http://www.diana.pcbi.upenn.edu/tarbase.html).
1.2.1 MiRNAs in serious diseases
MiRNAs regulate such diverse processes such as anti-viral defense (Ding et al.,
2004; Lecellier et al., 2005), cell development, proliferation, survival, apoptosis and
signal transduction (Yeung et al., 2005).
MiRNAs in vertebrates have also been functionally implicated in cardiogenesis,
myogenesis, neurogenesis, and hematopoiesis (Alvarez-Garcia and Miska, 2005;
Zhao and Srivastava, 2007). According to these observations, many miRNAs display
a spatial expression in a tissue-specific manner (Lagos-Quintana et al., 2002;
Wienholds and Plasterk, 2005). The involvement of miRNAs in these cellular
processes and in organogenesis demonstrates specific expression patterns.
Deregulation of such patterns strongly increases the likelihood of several serious
diseases. Thus, miRNAs and their targets or proteins involved in miRNA biogenesis
are suspected, or have even been demonstrated, to contribute to diverse diseases if
they are de-regulated. Examples are neurodegenerative diseases such as spinal
muscular atrophy (SMA) (Dostie et al., 2003) or fragile X mental retardation (FXMR).
FXMR is caused by down-regulation of the fragile X mental retardation protein, which
has otherwise been shown to be a likely part of RISC in Drosophila melanogaster
(Ishizuka et al., 2002). Moreover, deletion of DGCR8, a component of the
Microprocessor complex that is involved in miRNA biogenesis, is associated with the
DiGeorge syndrome (heart defects and schizophrenia) (Shiohama et al., 2003).
Introduction 8
1.2.2 Expression analysis of miRNAs in cancer
In order to analyse miRNA expression patterns, the use of custom micro arrays made
large miRNA profiling studies possible. Based on large miRNA profiling studies,
several distinct expression signatures of different cancer types could be set up and
certain miRNAs determined as biomarkers for cancer. As the number of identified
miRNAs is continuously growing and can be queried in databases as well as their
targets, only a small subset of miRNAs is considered here in order to give a short
overview of the broad range of involvements, targets and functions.
In order to differentiate lung cancer and healthy cells, a set of 42 miRNAs could be
identified, including miR-21 (Yanaihara et al., 2006). Another study revealed a
signature of 15 miRNAs in order to characterize breast cancer cells. Among these
were miR-145, miR-21 and miR-155 (Iorio et al., 2005). For chronic lymphocytic
leukemia (CLL), a profiling set of 13 miRNAs were identified including miR-15a, miR-
155 and miR-16-1/2 (Calin et al., 2007). Another genome-wide analysis revealed a
solid-cancer signature including miR-155, miR-17–5p, miR- 20a, miR-21, miR-92 and
miR-106a (Volinia et al., 2006). Further studies include profiles for head and neck
cancer (Tran et al., 2007), prostate cancer (Porkka et al., 2007), colon cancer (Akao
et al., 2007), pancreatic cancer (Bloomston et al., 2007) and additional profiles for
other types of cancer (Gaur et al., 2007). These profiles serve to characterize poorly
understood human cancer in addition to mRNA expression profiles (Lu et al., 2005;
Waldman and Terzic, 2007). These studies have demonstrated that miRNAs can
either be down- or upregulated in cancer, compared to non-cancer tissues (Jay et al.,
2007).
The expression of miR-15/16 is deleted, or at least down-regulated, in approximately
68% of B cell chronic lymphocytic leukaemia (B-CLL) (Calin et al., 2002; Calin et al.,
2004a). The first identified miRNAs involved in solid tumorigenesis were miR-
143/145, which display repressed expression in colon cancer (Michael et al., 2003;
Akao et al., 2007) and lung cancer (Yanaihara et al., 2006). Let-7 has also been
reported to be down-regulated in human lung cancer (Takamizawa et al., 2004;
Yanaihara et al., 2006). MiR-125a and miR-125b are also down-regulated in breast
cancer (Iorio et al., 2005). Recently, the down-regulation of miR-16, miR-143/145,
MiR-125a and miR-125b and Let-7-family members was additionally shown in
prostate cancer (Porkka et al., 2007).
Introduction 9
In contrast to miR-15/16, the expression of the miR-17-92 was increased in B-CLL
(He et al., 2005). This six-stem-loop polycistron encodes seven miRNAs: miR-17-5p,
miR-17-3p, miR-18a, miR-19a, miR-20a, miR-19b-1 and mir-92-1. Increased
expression can be observed in lymphomagenesis (Wienholds and Plasterk, 2005) as
well as in lung cancers (Hayashita et al., 2005). It is also known as “OncomiR-1” for
oncogenic miRNA-1 (He et al., 2005). Another miRNA that is upregulated in different
kinds of cancer is miR-155 in correlation with its host gene B-cell integration cluster
(BIC). Upregulation has been reported in childhood Burkitt lymphoma (Metzler et al.,
2004), lung cancer (Yanaihara et al., 2006) and breast cancer (Iorio et al., 2005).
Recent studies revealed the high over-expression of miR-21 in breast tumors (Si et
al., 2007) and head and neck cancer cell lines (Tran et al., 2007). There are a lot
more specific miRNAs that are de-regulated in other types of cancer and cannot be
discussed here (Kusenda et al., 2006; Szafranska et al., 2007; Tran et al., 2007).
1.2.3 MiRNAs and their targets – a potential role in human cancer
The majority of known miRNAs is encoded in intergenic regions or within introns of
either non-protein-coding or protein-coding sequences. They can be encoded on the
sense or on the anti-sense strand (Lagos-Quintana et al., 2001; Mourelatos et al.,
2002). However, miRNAs can also be located in exons or have their own promoters
for transcription (Rodriguez et al., 2004; Zhao and Srivastava, 2007). A further
feature of similar miRNAs is their clustered organization in polycistronic transcripts
(Houbaviy et al., 2003). MiRNAs have been shown to be involved in cell growth,
proliferation and apoptosis. In general, cancer is characterized by a deregulation of
these processes (Lu et al., 2005; Sood et al., 2006; Zhang et al., 2006). Interestingly,
a large number of human miRNAs are indeed located at cancer-related genomic
regions (Calin et al., 2004b).
MiR-15/16 down-regulate the expression of the antiapoptotic factor B cell lymphoma
2 (Bcl2) (Cimmino et al., 2005). Bcl2 is over-expressed in different kinds of cancers
like lymphomas, carcinomas and leukemias (Sanchez-Beato et al., 2003). The Let-7
miRNA family (lethal-7) are negative regulators of the onco-gene RAS in C. elegans
(Johnson et al., 2005). Members of the guanine nucleotide binding ras gene family
(K-, H- and N-RAS), which are localized at the inner plasma membrane, additionally
often carry mutations in human cancer (Ishimura et al., 2003). The expression of the
polycistronic cluster miR-17-92 is induced by the proto-oncogene c-myc that binds
Introduction 10
upstream of the miR-17 locus. Recently, a synergistic co-operation between c-myc
and miR-17-92 was demonstrated to contribute to aggressive cancer development
(Tagawa et al., 2007). Furthermore, miR-17-5-p and miR-20a from this cluster down-
regulate expression of E2F1 (O'Donnell et al., 2005). The oncogenes ERBB2 and
ERBB3 are suppressed by miR-125a/b (Scott et al., 2007). miR-372 and miR-373
are two oncogenes identified in testicular germ cell tumors that slow down the p53
pathway (Voorhoeve et al., 2006). It is known that miR-181 is involved in
hematopoietic differentiation (Chen et al., 2004). A very recent study could provide
evidence for the involvement of miR-181a in acute myeloid leukaemia (AML),
modulating the expression of 28 target genes that had been predicted earlier. A
recent finding is that the deletion or inhibition of miR-21 expression in human
hepatocellular cancer (HCC) increased the expression of the ubiquitous phosphatase
and tensin homolog tumor suppressor PTEN being a direct target of miR-21 (Meng et
al., 2007a). PTEN is a regulator of the PI3KAkt signalling pathway
(phosphatidylinositide kinase), whose activation is associated with the formation of
many tumors (Altomare and Testa, 2005). There is further evidence that miRNAs are
involved in the in PI3KAkt pathway, which can be activated by the oncogene TCL1.
Expression of TCL1 is regulated by miR-29 and miR-181in B-CLL (Calin et al.,
2007). A direct target of miR-155 is currently uncertain. However, its host gene is
known to interact with c-myc in avian lymphoma (Tam et al., 2002).
Predicted targets of miR-155, miR-17–5p, miR- 20a, miR-21, miR-92 and miR-106a
turned out to be tumor suppressors and oncogenes (Volinia et al., 2006). Recently, a
set of seven miRNAs has been shown to be involved in head and neck cancer (let7-
a, miR-16, miR-21, miR-205, miR-342, miR-346, and miR-373) (Tran et al., 2007). A
significantly high number of their predicted targets are likely to play a role in
carcinogenesis. However, predicted targets and the extent of regulatory influence
still have to be confirmed experimentally.
A specific class of genes frequently related to cancer are cytokines, proto-oncogenes
and transcription factors, whose expression is regulated by an AU rich element (ARE)
in the 3’ UTR of their mRNAs. An example for this class is the proto-oncogene c-myc,
whose over-expression down-regulates the PI3K pathway (Bellmann et al., 2006).
PI3K inactivates the ARE-binding protein (ARE-BP) KSRP (K homology-type splicing
regulatory protein), which in turn promotes decay of β-catenin (Gherzi et al., 2006). β-
catenin has been implicated in human colon cancer (Verma et al., 2003). Other
Introduction 11
targets of KSRP are hnRNP A/B/F mRNAs (Ruggiero et al., 2007) which encode
different ARE-BPs and can play a role in chronic myelogenous leukaemia (Perrotti
and Neviani, 2007). Furthermore, hnRNP A1 binds miR-18 pri-miRNA and regulates
its processing (Grosshans and Svoboda, 2007). A similar type of interaction has been
shown between miR-370 and the ARE-regulated interleukin-6 (IL-6). IL-6 is over-
expressed in malignant human cholangiocytes and reduces miR-370 expression
(Meng et al., 2007b). Other ARE-regulated genes are colony-stimulating factor-1
(CSF-1), whose over-expression promotes ovarian cancer progression, the proto-
oncogene c-fos, which is involved in cervical cancer (van Riggelen et al., 2005) and
vascular endothelial growth factor (VEGF). VEGF is involved in age-related macular
degeneration and different kinds of cancer (Aigner, 2007; Shen et al., 2007).
Although ARE-regulated gene products and miRNAs are involved in the regulation of
the same cellular pathways such as PI3K and proliferation, direct interactions
between miRNAs or compoments of the miRNA pathway have only rarely been
reported. The D. melanogaster VIG protein, a homologue of the human ARE-BP PAI-
RBP-1 (plasminogen activator inhibitor-RBP-1), was shown to be included in RISC.
Furthermore, microRNAs could be localized to identical cytoplasmic bodies (Liu et al.,
2005) as ARE-BPs (Stoecklin et al., 2004). Finally, the regulation of a tumor necrosis
factor α-3’ UTR-containing reporter (TNFα) by miR16-1 and the ARE-BP
Tristetraprolin (TTP) was shown in D. melanogaster (Jing et al., 2005). More recently,
the ARE-mediated up-regulation of translation of a TNFα ARE-bearing reporter by
FXR1 and Argonaute 2 has been demonstrated. Both proteins can interact with each
other and are involved in the assembly of RISC (Vasudevan and Steitz, 2007).
Another report revealed that human microRNAs target genes with AT-rich/AU-rich 3’
UTRs implicated in transcription and translation processes, which supports a possible
regulatory role depending on miRNAs (Robins and Press, 2005).
In summary, this data provides direct and indirect evidence for the involvement of
specific miRNA deregulation in human cancer. MiRNAs can function as tumor
suppressors or oncogenes or at least induce/inhibit expression of those. This
suggests the possibility that miRNA can be exploited for clinical applications such as
a therapeutic for human diseases, especially for cancer diagnosis, prognosis and
treatment.
Introduction 12
1.3 RNAi as a tool in Gene Therapy
The potential of RNAi-based gene therapy relies on the capacity of siRNAs to
specifically and potently silence complementary disease-causing targets, which either
can be mRNAs or miRNAs acting as oncogenes. In order to establish successful
therapies a number of major issues need to be solved in siRNA applications:
Unspecific and off-target effects (OTEs), stability and simultaneous effectiveness of
an siRNA and efficient tissue-specific as well as human dose-feasible delivery in vivo.
1.3.1 The cellular interferon (IFN) response and off-targets effects (OTEs)
Highly abundant siRNAs (21 nt) or long dsRNA molecules (30 nt or longer) are able
to induce an endogenous type I interferon (IFN) response (Sledz et al., 2003; de
Veer et al., 2005; Kim and Rossi, 2007) through the activation of dsRNA-dependent
protein kinase, which starts to phosphorylate the α-subunit of eukaryotic initiation
factor 2 (eIF2a). As a consequence, protein synthesis is inhibited unspecifically
(Stark et al., 1998). In addition, dsRNA can activate 2’,5’-OligoA synthetase. The
synthesis of 2’,5’-polyadenylic acid induces the non-specific RNase L, which
degrades ssRNA (de Veer et al., 2005). Both processes are lethal for the cell and
lead to apoptosis (Gil and Esteban, 2000). A recent study examined the effect of non-
targeting, unspecific siRNA molecules in tumor cells. Although there were no
sequence complementary targets an IFN response could be detected affecting cell
viability, proliferation and apoptosis in human tumor cells. In order to monitor
unspecific cellular activities the expression of IFN-related genes such as diverse
interferons, tumour necrosis factor α or interleukin-6 need to be analysed frequently
(Tschaharganeh et al., 2007), something which has already been considered before
(Grimm et al., 2006).
Moreover, it has been reported that siRNAs can also act as miRNAs (Doench et al.,
2003). As mentioned before, a perfect sequence match is not required for miRNA
targeting. This might result in unwanted OTEs due to translational silencing or mRNA
degradation of non-desired targets (Jackson et al., 2006). A set of 15 consecutive
nucleotides was shown to be sufficient for silencing non-targeted transcripts.
Interestingly, a silencing effect of the passenger strand was observed in the case of
an IGF1R (insulin-like growth factor receptor) targeting siRNA (Jackson et al., 2003).
It was recently shown that OTEs can be mediated by cooperation of transfected
Introduction 13
siRNAs with endogenous miRNAs. Optimal spacing of target seed regions for gene
silencing could be determined as 13 nt up to 35 nt. This optimal spacing was
detected more frequently in off-target genes than in non-off target genes, despite
having seed sites (Saetrom et al., 2007).
While designing siRNAs it is important to utilize bioinformatics sequence tools to
reduce the possibility of OTE. To yield appropriate gene silencing and maximum
reduced OTEs, several rules for siRNA generation have been established.
Parameters concerning sequence, size and structure are linked to effective RNAi.
Optimal siRNA length of 21-23 nt, a GC content between 36% and 52%, 2 nt 3’
overhanging ends with 5’ blunt ends, targeting the open reading frame and some
more criteria have successfully been applied to mediate efficient gene silencing and
to avoid OTEs (Elbashir et al., 2002; Izquierdo, 2005; De Paula et al., 2007). In
addition, it is known that siRNA modifications, particularly O-methyl-groups at the
ribose 2’ position within the seed region can also contribute to a reduction of OTEs
(Fedorov et al., 2006; Jackson et al., 2006). Nevertheless, any in silico created
siRNA requires an experimental validation and analysis.
1.3.2 miRNA pathway saturation
Another problematic limitation in RNAi based gene therapy is the fact that ectopically
expressed shRNAs/siRNAs (small hairpin RNA, see 1.3.3) can compete with
endogenous miRNAs for components of the RNAi pathway. As a consequence,
miRNAs can be inhibited resulting in alterations of its expression. This was recently
demonstrated by a combinatorial approach using synthetic siRNAs and expressed
shRNAs. It turned out that competition can occur between synthetic siRNAs,
expressed shRNAs and endogenous miRNAs. This competition partially depends on
the saturation of exportin 5, which is responsible for the transport of miRNAs and
shRNAs from the nucleus to the cytoplasm (Yi et al., 2003). Another bottleneck
identified is the incorporation of shRNAs and siRNAs into RISC and an involvement
of TRBP in this issue. Interestingly, siRNAs expressed from a microRNA backbone
do not compete with each other and the RNAi machinery (Koller et al., 2006;
Castanotto et al., 2007). Furthermore, it was shown that a high expression of shRNA
induced the saturation of exportin 5 in an in vivo mouse model, resulting in down-
regulation of miRNA export from the nucleus and following tissue-damage and death
(Grimm et al., 2006).
Introduction 14
1.3.3 Chemical siRNA-modifications and the application of small hairpin RNAs (shRNAs) can prolong RNAi-mediated effects
Specific gene inhibition by siRNAs in mammalian culture cells is only transient in
contrast to worms or plants, where these effects are stable. The RNA-dependent
RNA polymerase (RdRp) in these organisms can use the siRNA antisense strand as
a primer in order to produce a dsRNA precursor from the target mRNA. This
precursor can again serve as a substrate for Dicer (secondary siRNA) and silence
the same target. Till date, no homologue of RdRp has yet been found in vertebrates
(Ahlquist, 2002; Chiu and Rana, 2002).
Transient siRNA-mediated effects are unsuitable for long-term experiments or long-
lasting therapeutic applications. In order to avoid nucleolytic degradation and to
maintain activity at the same time, several modifications of the siRNA have been
tested. It was found that the ribose 2’-OH is not required for gene silencing activity
and that chemical modifications at this specific position increased siRNA stability and
prolonged the RNAi effect. However, modifications leading to alterations of the RNA
A-form major groove of the guide strand-mRNA helix resulted in a complete loss of
siRNA activity (Chiu and Rana, 2003; Czauderna et al., 2003a). The most common
chemical siRNA modifications are phosphodiester modifications at the nucleic acid
backbone like phosphorothioate (PS) or boranophosphonate (-BH3) and 2’-ribose
modifications like 2’-O-methyl (2’-OMe), 2’- deoxy-2’-fluoro modifications as well as
locked nucleic acids. Backbone modifications have been shown to increase siRNA
stability, whereas 2’-modifications have an additional potential to reduce interferon
response activation (De Paula et al., 2007).
The application of chemically synthesized shRNAs was shown to elevate RNAi-
mediated effects. ShRNAs form a stem of 19-29 bp flanked by a loop structure which
is processed by Dicer into a mature siRNA. Best results were obtained with a 29 bp
stem of the shRNA hairpin (Siolas et al., 2005). Additional prolongation of silencing
effects could be demonstrated by endogenous vector-based expression of shRNAs
(Brummelkamp et al., 2002b; Paddison et al., 2002; Sui et al., 2002). However, it is
known that vector-based shRNA expression is a possible activator of the interferon
response (Bridge et al., 2003). In vivo shRNA expression can be driven by RNA
polymerase II promoters. The resulting transcripts contain a poly(A)tail and a 5’-cap
in order to mimic pri-miRNAs. Alternatively, two RNA polymerase III (pol III)
promoters like H1 or U6 can be used to transcribe either sense and anti-sense strand
Introduction 15
of an siRNA or the complete shRNA as a single transcript (Miyagishi and Taira, 2002;
De Paula et al., 2007). A disadvantage of the constitutive activity of these promoters
is their disability to adjust to specific cellular conditions in order to regulate growth
and survival. Importantly, the development of inducible pol III promoters by inserting
the target sequence for transcription inhibitors can largely avoid this problem
(Czauderna et al., 2003b; Wiznerowicz and Trono, 2003; Gupta et al., 2004).
1.3.4 Delivery of siRNA can be enhanced by chemical siRNA-modifications and the application of viral vectors
Furthermore, chemical modifications of siRNAs can be exploited to perform cell-
specific delivery of an siRNA. As siRNAs possess a negatively charged backbone,
they are not easily able to pass through cellular membranes. They can be modified
with cholesterol, cell-penetrating peptides (CPPs) for this purpose, or incorporated
into stable nucleic acid lipid particles (SNALPs) and cationic lipids/polymers. More
target-specific approaches for delivering siRNAs are modifications with receptor-
specific aptamers, heavy-chain antibody fragments (Fabs) or protamine and
incapsulation into nanoparticles (De Paula et al., 2007; Kim and Rossi, 2007).
Despite great progress in this field, the use of siRNAs and expression vectors is
limited. Bringing siRNAs or plasmids into cells requires techniques such as
transfection, electroporation or microinjection. Mammalian cell lines (or easily
accessible organs) are susceptible to these methods in contrast to non-dividing,
primary or stem cells (Clayton, 2004; Hannon and Rossi, 2004). Furthermore, in vivo
intravenous or hydrodynamic applications of siRNA often use high amounts of siRNA
in order to achieve appropriate effects. As described before, high siRNA
concentrations can result in an unspecific interferon response (Aigner, 2007).
In order to resolve these difficulties, viral vectors have also been established for
siRNA-mediated gene therapy, including retroviral, lentiviral, adenoviral and adeno-
associated viral (AAV) vectors. In general, retroviral vectors are derived from murine
stem cell virus Moloney murine leukaemia virus and can integrate in replicating cells,
whereas lentiviral vectors are derived from human immuno-deficiency virus (HIV)-1
and can integrate in (non-)dividing cells. Chromosomal integration guarantees long-
term and stable expression, but carries the risk of insertional mutations. Adenoviral
vectors and AAVs are applied when only a moderately stable expression is needed.
These vectors do not integrate into the genome and thus prevent the risk of disease-
Introduction 16
causing and/or lethal mutations (De Paula et al., 2007; Kim and Rossi, 2007; Masiero
et al., 2007). In contrast to their advantages, viral vectors also lack sufficient target
specificity. Even more importantly, the putative toxicity effects will limit or even
prevent its application in humans (Reid et al., 2002).
1.3.5 Therapeutic targets in RNAi-based applications
There are several studies that address the question of siRNA approaches in cancer
therapy in order to silence over-expressed onco-genes.
As mentioned before, the ras gene family often carries mutations in different cancer
types. When mutated, K-RAS was silenced in human pancreatic cells by applying a
retroviral expression vector and tumorigenicity was abolished (Brummelkamp et al.,
2002a). Silencing of mutated K-RAS by synthetic siRNAs also reduced the
angiogenic potential in these cell lines (Brummelkamp et al., 2002a; Fleming et al.,
2005). Both observations make the ras gene family a potential target for in vivo
siRNA-based therapies. Furthermore, mutations in ras genes induce constitutive
activation of the serine/threonine kinase Raf-1. SiRNA-mediated knockdown of Raf-1
in cerebral microvascular endothelial cells demonstrated inhibition of tumor growth
and identified Raf-1 as a potential therapeutic target (Culmsee et al., 2006).
Interestingly, Raf-1 activity can also be triggered by vascular endothelial growth
factor VEGF (Alavi et al., 2003). ARE-regulated VEGF has already successfully been
targeted by siRNAs in clinical trials as well as its cellular receptor VEGFR1 (Aigner,
2007; Kim and Rossi, 2007). Further examples of ARE-regulated genes that are
targeted in RNAi gene therapy are β-catenin in human colon cancer (Verma et al.,
2003) and murine melanoma growth inhibition (Takahashi et al., 2006), c-myc in
human breast cancer (Wang et al., 2005) and TNFα in collagen-induced arthritis
(Schiffelers et al., 2005; Khoury et al., 2006). There are numerous further examples
and larger overviews of siRNA therapeutic applications and can be found in the
literature (Aigner, 2007; Masiero et al., 2007).
1.3.6 Concluding remarks
The discovery of dsRNA silencing effects and the following elucidation of the RNA
silencing pathways has revolutionized biological research. Science is fast moving
forward in the RNAi field, but there are still a lot of questions to be answered. There
Introduction 17
is still a need to understand and unravel the detailed enzymatic characteristics of the
RNAi pathways, including siRNA function, miRNA biogenesis, chromatin remodelling
and DNA methylation. It is clear that not all components of RISC have been
identified. This is absolutely essential in order to understand how RNAi really works
in detail and might lead to the answer of the question why functional microRNAs or
siRNAs have a length of 21 nt and (only) the seed region is an important factor for
targeting. Elucidating the secrets of miRNA targeting is a further essential aspect that
will require attention. Although interesting and progressive consolidated findings have
been made concerning miRNA and target structure, it will be necessary to
understand why certain nucleotides of a miRNA are less important than others. It has
been shown that many endogenous miRNAs and their targets are involved in
different types of cancer. The identification of these targets will definitely contribute to
a better understanding of how cancer evolves and reveal targets for gene therapy. A
putative target class are ARE-regulated gene targets, whose deregulation has
already been shown to be responsible for cancer in various tissues. Furthermore,
there is emerging evidence for their regulation by miRNAs and/or their involvement in
miRNA pathways. Although AREs are located in 3’ UTRs of mRNAs, ARE-regulated
genes are involved in the same cellular processes such as miRNAs and even a few
connections have been demonstrated between ARE- and miRNA-regulation,
although a direct breakthrough has not yet been reported.
The therapeutic potential of siRNAs in diverse diseases has been shown. Non-viral
delivery systems provide several advantages versus viral delivery. Although even
viral therapeutic approaches can be applied safely, the most important advantage of
non-viral delivery is its much safer application. Currently, there have been attempts at
overcoming hurdles such as low transfection efficiency through generating
appropriate lipid or polymeric vehicles for transportation. This will likely lead to the
discovery of techniques that can be exploited to distribute RNAi effectors in human
dose feasible amounts. However, great success has already been achieved by
applying RNA-based therapies to AMD and viral diseases (Kim and Rossi, 2007). In
order to only target in vivo cancer cells, different possibilities have been examined
such as targeting specific receptors that are primarily expressed on the surface of
cancer cells – this research has been very promising.
Subject Description 18
2 Subject Description The tight regulation of mRNA stability and translation by specific cis-acting
sequences and trans-acting factors is an essential means for the control of gene
expression. These processes allow cells to rapidly adjust the expression pattern of
regulatory factors and response transiently to internal and external signals including
cell proliferation, signal transduction, inflammatory stimuli and radiation. A today well
known important cis-acting sequence element that controls mRNA stability is the AU-
rich element (ARE) found in the 3’ untranslated region (3’ UTR) of many, but not all,
unstable mRNAs of various growth factors, cytokines, proto-oncogenes and
transcription factors.
2.1 ARE-mediated gene regulation More than 20 years ago Gray Shaw and Robert Kamen (Shaw and Kamen, 1986)
demonstrated that a 51 nt AU rich sequence (ARE) from the human lymphokine gene
granulocyte-monocyte colony stimulating factor (GM-CSF) caused the otherwise
stable β-globin mRNA to become highly unstable in vivo. Since then extensive afford
has been made to identify the mechanism that AREs undergo.
2.1.1 AREs as cis-acting elements
AREs can have a varying sequence length of 50 nt up to 150 nt. Their location within
the 3’ UTR of their host mRNAs can vary widely as well. In normal resting cells AREs
mediate the rapid deadenylation-dependent degradation of its host mRNA, but
depending on the cellular context and precise stimuli the same AREs are also
capable to stabilize their host mRNA. Such stimuli can be hypoxia (Levy et al., 1998),
UV light (Wang et al., 2000b) or treatment with phorbol ester (Wilson et al., 2003b).
The first identified ARE sequence motif was the pentamer AUUUA. Although the
presence of the sequence pentamer does not necessarily mean a destabilizing
function, it plays a critical role in determining the effect of an ARE. By use of a
synthetic ARE the nonamer UUAUUUA(U/A)(U/A) was demonstrated to have a
modest destabilizing effect. Based on the pentamer AUUUA, AREs have been
grouped into three classes (Chen and Shyu, 1995; Barreau et al., 2005) (see table
1). Class I AREs contain 1 to 5 dispersed AUUUA motifs in a U-rich context. Class II
Subject Description 19
AREs contain at least two overlapping UUAUUUA(U/A)(U/A) nonamers. Class III
AREs are less well defined and do not contain an AUUUA pentamer. These classes
represent functionally and structurally independent distinct sequence motifs.
Table 1: Classification of AREs based on the presence of the pentamer AUUUA and the nonamer UUAUUUA(U/A)(U/A). Data taken from (Barreau et al., 2005).
Class Definition Example gene
Class I 1 to 5 dispersed AUUUA motifs
in a U-rich context
c-myc, c-fos, Cyclin A, B1 &
D1
Class IIA (AUUU)5A GM-CSF, TNFα
Class IIB (AUUUA)4A Interferonα
Class IIC (A/U)(AUUU)3(A/U) Cox-2, IL-2/3, VEGF
Class III No AUUUA, U-rich region c-jun, GLUT1, p53, hsp 70
The ARE of the human proto-oncogene c-fos is a well studied example of class I. The
c-fos gene encodes a transcription factor that plays a role in cell growth and
differentiation. Rapid decay of the c-fos transcript is maintained by both the protein-
coding region (Chen et al., 1992; Schiavi et al., 1994), which is structurally unrelated
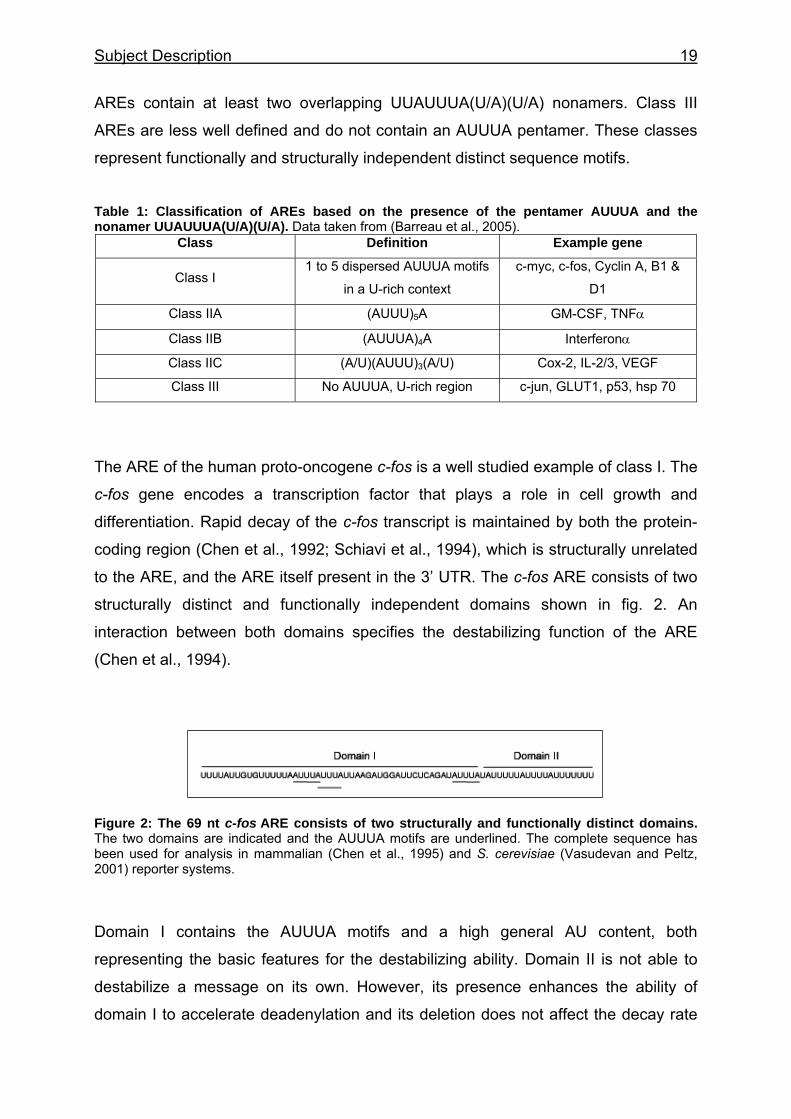
to the ARE, and the ARE itself present in the 3’ UTR. The c-fos ARE consists of two
structurally distinct and functionally independent domains shown in fig. 2. An
interaction between both domains specifies the destabilizing function of the ARE
(Chen et al., 1994).
Figure 2: The 69 nt c-fos ARE consists of two structurally and functionally distinct domains. The two domains are indicated and the AUUUA motifs are underlined. The complete sequence has been used for analysis in mammalian (Chen et al., 1995) and S. cerevisiae (Vasudevan and Peltz, 2001) reporter systems.
Domain I contains the AUUUA motifs and a high general AU content, both
representing the basic features for the destabilizing ability. Domain II is not able to
destabilize a message on its own. However, its presence enhances the ability of
domain I to accelerate deadenylation and its deletion does not affect the decay rate
Subject Description 20
of the mRNA body. Both domains have been studied extensively in a mammalian
reporter system (Chen et al., 1995) and in the yeast S. cerevisiae (Vasudevan and
Peltz, 2001).
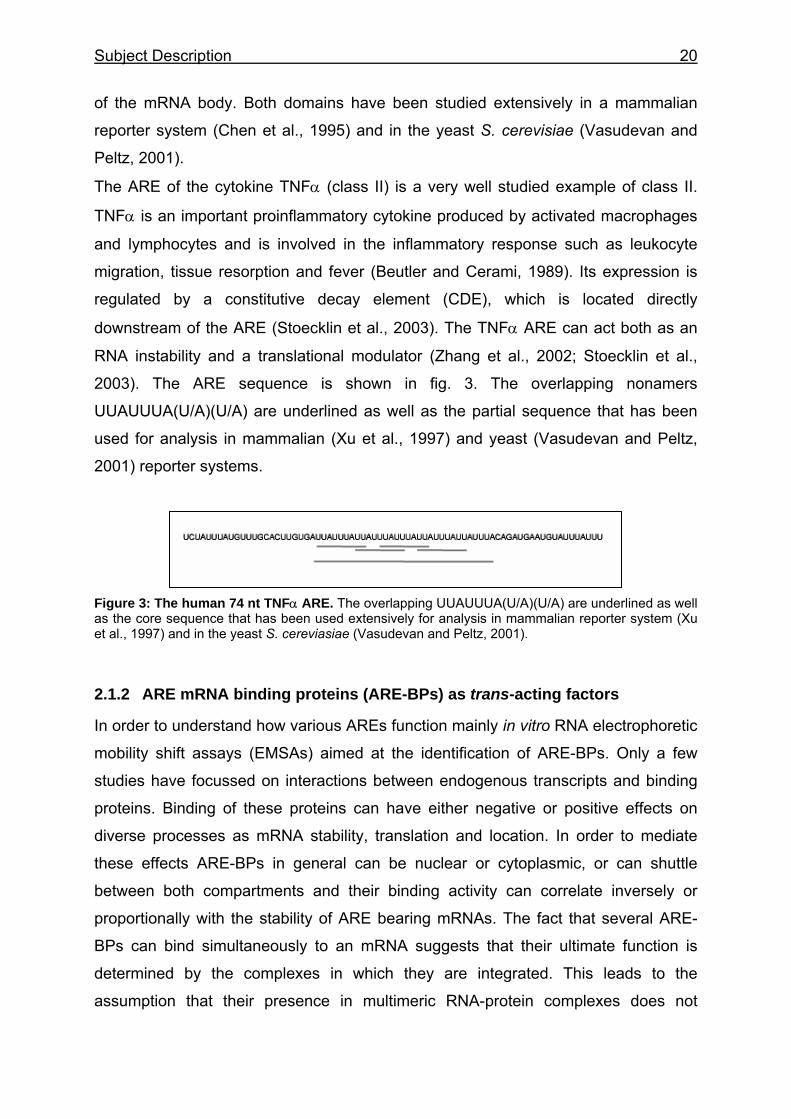
The ARE of the cytokine TNFα (class II) is a very well studied example of class II.
TNFα is an important proinflammatory cytokine produced by activated macrophages
and lymphocytes and is involved in the inflammatory response such as leukocyte
migration, tissue resorption and fever (Beutler and Cerami, 1989). Its expression is
regulated by a constitutive decay element (CDE), which is located directly
downstream of the ARE (Stoecklin et al., 2003). The TNFα ARE can act both as an
RNA instability and a translational modulator (Zhang et al., 2002; Stoecklin et al.,
2003). The ARE sequence is shown in fig. 3. The overlapping nonamers
UUAUUUA(U/A)(U/A) are underlined as well as the partial sequence that has been
used for analysis in mammalian (Xu et al., 1997) and yeast (Vasudevan and Peltz,
2001) reporter systems.
Figure 3: The human 74 nt TNFα ARE. The overlapping UUAUUUA(U/A)(U/A) are underlined as well as the core sequence that has been used extensively for analysis in mammalian reporter system (Xu et al., 1997) and in the yeast S. cereviasiae (Vasudevan and Peltz, 2001).
2.1.2 ARE mRNA binding proteins (ARE-BPs) as trans-acting factors
In order to understand how various AREs function mainly in vitro RNA electrophoretic
mobility shift assays (EMSAs) aimed at the identification of ARE-BPs. Only a few
studies have focussed on interactions between endogenous transcripts and binding
proteins. Binding of these proteins can have either negative or positive effects on
diverse processes as mRNA stability, translation and location. In order to mediate
these effects ARE-BPs in general can be nuclear or cytoplasmic, or can shuttle
between both compartments and their binding activity can correlate inversely or
proportionally with the stability of ARE bearing mRNAs. The fact that several ARE-
BPs can bind simultaneously to an mRNA suggests that their ultimate function is
determined by the complexes in which they are integrated. This leads to the
assumption that their presence in multimeric RNA-protein complexes does not
Subject Description 21
necessarily rely on their RNA-binding activity (reviewed in Chen & Shyu, 1995,
Barreau et al. 2006).
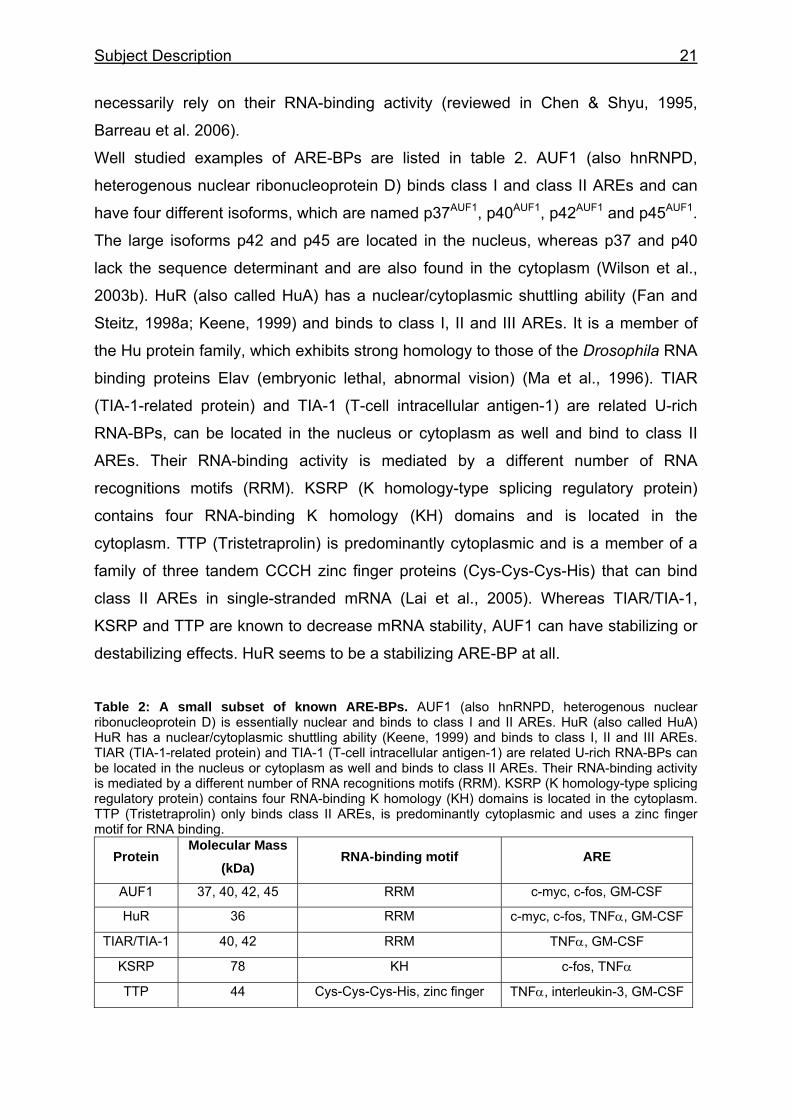
Well studied examples of ARE-BPs are listed in table 2. AUF1 (also hnRNPD,
heterogenous nuclear ribonucleoprotein D) binds class I and class II AREs and can
have four different isoforms, which are named p37AUF1, p40AUF1, p42AUF1 and p45AUF1.
The large isoforms p42 and p45 are located in the nucleus, whereas p37 and p40
lack the sequence determinant and are also found in the cytoplasm (Wilson et al.,
2003b). HuR (also called HuA) has a nuclear/cytoplasmic shuttling ability (Fan and
Steitz, 1998a; Keene, 1999) and binds to class I, II and III AREs. It is a member of
the Hu protein family, which exhibits strong homology to those of the Drosophila RNA
binding proteins Elav (embryonic lethal, abnormal vision) (Ma et al., 1996). TIAR
(TIA-1-related protein) and TIA-1 (T-cell intracellular antigen-1) are related U-rich
RNA-BPs, can be located in the nucleus or cytoplasm as well and bind to class II
AREs. Their RNA-binding activity is mediated by a different number of RNA
recognitions motifs (RRM). KSRP (K homology-type splicing regulatory protein)
contains four RNA-binding K homology (KH) domains and is located in the
cytoplasm. TTP (Tristetraprolin) is predominantly cytoplasmic and is a member of a
family of three tandem CCCH zinc finger proteins (Cys-Cys-Cys-His) that can bind
class II AREs in single-stranded mRNA (Lai et al., 2005). Whereas TIAR/TIA-1,
KSRP and TTP are known to decrease mRNA stability, AUF1 can have stabilizing or
destabilizing effects. HuR seems to be a stabilizing ARE-BP at all.
Table 2: A small subset of known ARE-BPs. AUF1 (also hnRNPD, heterogenous nuclear ribonucleoprotein D) is essentially nuclear and binds to class I and II AREs. HuR (also called HuA) HuR has a nuclear/cytoplasmic shuttling ability (Keene, 1999) and binds to class I, II and III AREs. TIAR (TIA-1-related protein) and TIA-1 (T-cell intracellular antigen-1) are related U-rich RNA-BPs can be located in the nucleus or cytoplasm as well and binds to class II AREs. Their RNA-binding activity is mediated by a different number of RNA recognitions motifs (RRM). KSRP (K homology-type splicing regulatory protein) contains four RNA-binding K homology (KH) domains is located in the cytoplasm. TTP (Tristetraprolin) only binds class II AREs, is predominantly cytoplasmic and uses a zinc finger motif for RNA binding.
Protein Molecular Mass
(kDa) RNA-binding motif ARE
AUF1 37, 40, 42, 45 RRM c-myc, c-fos, GM-CSF
HuR 36 RRM c-myc, c-fos, TNFα, GM-CSF
TIAR/TIA-1 40, 42 RRM TNFα, GM-CSF
KSRP 78 KH c-fos, TNFα
TTP 44 Cys-Cys-Cys-His, zinc finger TNFα, interleukin-3, GM-CSF
Subject Description 22
It has been shown that ARE bearing mRNAs can be stabilized in response to
external or internal cellular stress signals like heat shock (Laroia et al., 1999),
hypoxia (Levy et al., 1998), UV light (Wang et al., 2000b) and cell proliferation (Wang
et al., 2000a). Such stress signals can initiate a signalling cascade, which activates
the mitogen-activated protein kinase (MAPK) p38. TTP is a target of MAPK-acitvated
protein kinase 2 (MK2) and can be phosphorylated at multiple sites (Mahtani et al.,
2001). Phosphorylated TTP is excluded from stress granules (SG) leading to the
stabilization of ARE-containing mRNAs. It is hypothesized that exclusion of TTP
allows the binding of the stabilizing ARE-BP HuR (Stoecklin et al., 2004). Another
example for an ARE-BP that can be phosphorylated is p40AUF1. Its phosphorylation
influences ARE-binding affinity, RNA conformational dynamics and the global
structure of the p40AUF1-ribonucleoprtein complex (Wilson et al., 2003a). Additional
signal cascading pathways (Widmann et al., 1999) were shown to influence stability,
translation and/or localization of ARE-containing messages (Espel, 2005)
demonstrating the great variety of the ARE-regulated network.
2.1.3 ARE-mediated mRNA degradation (AMD)
In mammalian cells degradation of mRNAs in the cytoplasm always starts with
deadenylation, which can be catalyzed by several enzymes like CAF1, CCR4 and
PARN. Deadenylation is followed by exonucleolytic decay in the 3’-5’ or the 5’-3’
direction. The 3’ end is degraded by the exosome, a multimeric complex of 3’-5’
exonucleases (Bevilacqua et al., 2003; Buttner et al., 2006), whereas the 7-methyl
guanosine cap at the 5’ end is removed by the decapping enzymes Dcp1 and Dcp2
The mRNA body is then degraded by the 5’-3’ exonuclease Xrn1. The remaining cap-
structure is finally degraded by the scavenger decapping protein DcpS (see fig. 4)
(Wilusz and Wilusz, 2004). Dcp1/Dcp2 and Xrn1 form a complex with the Lsm1-7
proteins. These proteins are localized at cytoplasmic foci named processing bodies
(P-bodies) (Anderson and Kedersha, 2006). In yeast and mammalian cells decay
factors involved in the 5’-3’ mRNA degradation are concentrated in P-bodies (Sheth
and Parker, 2003).
Subject Description 23
Figure 4: Degradation of mRNA in mammalian cells. Degradation is initiated by deadenylation, which can be catalysed by several enzymes like CAF1, CCR4 and PARN. Afterwards the mRNA body can be degraded in 5’-3’ direction by the decapping complex (Dcp1/Dcp2) and the exoribonuclease XRN1. Alternatively, the transcript can be degraded in 3’-5’ direction by the exosome, a large complex of exonucleases. The remaining m7G cap is degraded by the scavenger decapping protein DcpS. These basic processes can be dramatically altered by a large number of mRNA-binding proteins (permission for use of this figure granted by Elsevier) (Wilusz and Wilusz, 2004).
It was demonstrated that the mammalian exosome mediates the degradation of ARE
bearing mRNAs in vitro (Mukherjee et al., 2002). Furthermore, it was shown that TTP
is recruited to stress granules (SGs; reviewed in Anderson and Kedersha, 2006).
SGs are dynamic cytoplasmic foci that are assembled in response to environmental
stress and where stalled translation initiation complexes accumulate. Typical SG-
associated proteins are TIA-1, TIAR and HuR (Stoecklin et al., 2004). Additionally,
AMD was shown to be inhibited by the knockdown of Xrn1 and as a consequence
uses primarily the 5’-3’ decay pathway. It was hypothesized that P-bodies may
participate in AMD (Stoecklin et al., 2006). Recently it was demonstrated that the
degradation of a GM-CSF ARE-containing reporter transcript needs
poly(A)ribonuclease PARN, enzymes involved in 5’-3’ as well as 3’-5’ (exosome)
decay. The reporter accumulates in discrete cytoplasmic granular structures, which
could be differentiated from P-bodies and stress granules (Lin et al., 2007). These
observations are complementary to the finding that ARE-mRNA localized to P-bodies
by using DCP1a-GFP as a marker (Franks and Lykke-Andersen, 2007). In conclusion
these findings demonstrate complexity of AMD and that it has not been fully
understood till today.
Subject Description 24
2.1.4 AREs in yeast
ARE-mediated mRNA decay is a highly conserved mechanism among eukaryotes
(Fan and Steitz, 1998b). The AU-rich 3’ UTR of the yeast transcript TIF51A (encodes
eIF5A protein) and MFA2 (mating pheromone 2) as well as the human c-fos and
TNFα AREs were demonstrated to regulate mRNA stability in the yeast S. cerevisiae
(Vasudevan and Peltz, 2001). Deadenylation-dependent decapping that leads to the
decay of the mRNA body was demonstrated as well. Moreover, they were able to
identify the 51 kDa yeast ELAV homologue Pub1p (Poly(U)-binding protein, also
RNP1) (Anderson et al., 1993; Cusick, 1994) as a regulator of TNFα ARE-mediated
stability, but not of MFA2 transcript stability. They could further show the
dependency on the Hog1p/p38 MAP kinase pathway, which was examined in more
detail for the translational regulation of the MFA2 transcript (Vasudevan et al., 2005),
and the regulation of MFA2 mRNA turnover by the yeast homologue of Hsp70, Ssa1p
(Duttagupta et al., 2003). Pub1p has also been shown to selectively bind to a
stabilizer element (STE) located in the 5’ UTR of the upstream open reading frame
(uORF) containing transcripts YAP1 and GCN4 and to prevent their turnover through
the NMD pathway (nonsense-mediated mRNA decay) (Ruiz-Echevarria and Peltz,
2000). These results demonstrate that Pub1p can bind to at least two classes of
stability elements and modulate decay. Additionally the global mRNA turnover in
isogenic PUB1 and ∆pub1 strains was examined (Duttagupta et al., 2005) involving
the identification of 573 transcripts that are destabilized and 78 that are stabilized by
the loss of Pub1p. Direct interaction targets of Pub1p regulate such diverse
processes and components like protein biosynthesis, ribosomal biogenesis and
ribonucleoprotein complexes. In agreement with findings in mammalian cells the
ARE-regulatory network consisting of ARE-sequences and ARE-BPs displays a high
complexity as well. However, the ARE network has been analysed in yeast in a far
less extent than in mammalian cells. It could be shown that yeast is a well-
established system for the analysis of AREs and can contribute to the understanding
of how AREs regulate gene expression.
Subject Description 25
2.2 Aim of the thesis
The baker’s yeast Saccharomyces cerevisiae as well as the methylotrophic yeast
Pichia pastoris are suitable hosts for the production of proteins of higher organisms.
This process is called heterologous protein expression. Previous work demonstrated
that not all selected (human) proteins could be expressed in the yeast P. pastoris and
that all analysed transcripts so far are characterized by a low transcript stability
(Boettner, 2004). Low transcript stability can be a relevant parameter for low
recombinant protein expression (Mikaelian et al., 1996). In order to modulate,
preferably increase, stability of selected transcripts and possibly as a consequence
from that increase the yield of the heterologous protein expression in the yeast
P. pastoris, ARE-mediated effects on mRNA stability and translation are to be
exploited. Based on this hypothesis this work aimed at the following aspects.
1. Is there a functional ARE network in the yeast P. pastoris that controls transcription
and translation as it is described in other eukaryotes?
It is not known whether there are ARE-mediated effects in the yeast P. pastoris or not
until today. Thus no endogenous ARE-containing mRNA or ARE-BP can be selected
for analysis so far. Consequently a heterologous system has to be established like it
has successfully been used as a reporter system in mammalian cell lines (Xu et al.,
1997) and in the yeast S. cerevisiae (Vasudevan and Peltz, 2001). For this purpose
the well described human AREs of the proto-oncogene c-fos and the cytokine TNFα
will be cloned into the 3’ UTR of P. pastoris expression vectors. Their effects will be
analysed on the mRNA and protein level in order to determine possible ARE-
mediated effects.
2. If AREs have an effect in the yeast P. pastoris, is it possible to increase transcript
stabilities and/or yields of heterologous protein expression?
If the cloned AREs have a (general) stabilizing effect on transcript stability and/or an
increasing effect on translation, it would be of great importance for the
biotechnological production of proteins that could be expressed only in low amounts
so far. Independently of the observed effects the molecular background of the ARE-
regulation will be interesting to explore.

Subject Description 26
3. If AREs have an effect in the yeast P. pastoris, which factors influence their
activity?
ARE-mediated regulation of transcript stability and translation is based on a large
variety of mRNA sequences and specific ARE-BPs as it is described above.
Establishing a system for the analysis of AREs in the yeast P. pastoris will provide an
alternative system for ARE-analysis which can help to identify novel regulatory
factors in this yeast and thus give a more detailed look into the cellular ARE network,
which will be of general interest.
Materials and Methods 27
3 Materials and Methods
3.1 Materials
3.1.1 Primers
Primers were purchased from Metabion GmbH, Martinsried, Germany.
Primers for cloning the c-fos ARE:
3:NSXc-fos-for:
5’-
ATAAGAATGCGGCCGCTTGACTCGAGTTTTATTGTGTTTTTAATTTATTTATTAAG
ATGGATTCTCAGATATTTA-3’
4:Ec-fos-rev:
5’-
CGGAATTCGGTAGAAAAAAATAAAATAAAAATATAAATATCTGAGAATCCATCTT-
3’
Primers for cloning the TNFα ARE:
5:NSXtnf-for:
5’-GGCCGCTTGACTCGAGATTATTTATTATTTATTTATTATTTATTTATTTAG-3’
6: Etnf-rev:
5’-AATTCTAAATAAATAAATAATAAATAAATAATAAATAATCTCGAGTCAAGC-3’
Primers for removing the STREP-II-Tag from pPICHS / creation of vector pPICH:
16: NotIStopAvrIIw/oStrep-for: 5’-GGCCGCTTGAATTCC-3’
17: NotIStopAvrIIw/oStrep-rev: 5’-CTAGGGAATTCAAGC-3’
Primers for amplification of cDNA 29:
5’Primer: 5’-GAAGATCTATGACTCTGGAAGAAGTCCG-3’
3’Primer: 5’-ATAGTTAGCGGCCGCTCACTCGGGGAGGGTGATGC-3’
3’-Primer (w/o stopcodon): 5’-ATAGTTAGCGGCCGCCTCGGGGAGGGTGATGC-3’
Materials and Methods 28
Primers for universal E. coli and P. pastoris colony PCR (a kind gift from Mewes
Böttner):
5´-AOX1-f: 5´-GACTGGTTCCAATTGACAAGC-3´
3´-AOX1-r: 5´-CAAATGGCATTCTGACATCC-3´
Primers for constructs without STREP-II-Tag for P. pastoris colony PCR:
5´-AOX1-f and 18:w/oStrep-rev: 5’-GCCCTAGGGAATTCAAGCGGCCGC-3’
Primers for AOX1 probe generation against the 5’ UTR from pPICHS (a kind gift from
Mewes Böttner):
AOX1UTRkurz5´: 5´-ATCATCATTATTAGCTTACTTTCA-3´
AOX1UTR3´II: 5´-CGTGATGGTGATGGTGATGAGAC-3´
Primers for generating a probe against endogenous Actin of P. pastoris:
PpAct-f: 5’-CAATGGTTCCGGTATGTGTAA-3’
pPAct-r: 5’-TCGAACATGATTTGGGTCATCTT-3’
Primers for creation of in vitro transcription templates:
T7-cfos-for: 5’-
TAATACGACTCACTATAGGTTTTATTGTGTTTTTAATTTATTTATTAAGATG-3’
T7-cfos-rev: 5’- AAAAAAATAAAATAAAAATATAAATATCTGAGAATC-3’
T7-tnf-for: 5’-TAATACGACTCACTATAGG-3’
T7-tnf-rev: 5’-
TAAATAAATAAATAATAAATAAATAATAAATAATCCTATAGTGAGTCGTATTA -3’
Primers for insertion of single point mutations in the pPICHcfos29+S+S construct:
NotImutI-for: 5’-GGCCACTTGAC-3’
NotImutI-rev: 5’-TCGAGTCAAGT-3’
NotImutII-for: 5’-GGCCTCTTGAC-3’
NotImutII-rev: 5’-TCGAGTCAAGA-3’
Materials and Methods 29
NotImutIII-for: 5’-GGCCGGTTGAC-3’
NotImutIII-rev: 5’-TCGAGTCAACC-3’
3.1.2 Plasmids
pPICHS (a kind gift from Mewes Böttner; Böttner et al. 2002)
Derived from pPIC3.5 (Invitrogen); contains an
expression cassette with a 5’ coding sequence for a
HIS6-Tag and a 3’ coding sequence for a STREP-II-
Tag. cDNAs can be cloned between these tags using
BamHI and NotI.
3.1.3 Strains
E. coli JM109 (Stratagene, CA) e14-(McrA-), recA1, endA1, gyrA96,
thi-1, hsdR17(rK-mK+),supE44,relA1,∆(lac-proAB),
[F’traD36proABlaqlqZ∆M15]
E. coli XL-1 blue (Stratagene, CA) recA1, endA1, gyrA96, thi-1,
hsdR17, supE44 relA1 lac [F'proAB lacIqZ∆M15 Tn10
(Tetr)]
P. pastoris GS115 (his4; Invitrogen™, CA)
3.1.4 Media
LB medium 1 % tryptone; 0.5 % yeast extract; 0.5 % NaCl; pH 7.2.
LB agar plates 1.5 % Agar (Serva, Heidelberg, Germany) added to
the medium
Antibiotic concentration Ampicillin (Boehringer, Mannheim, Germany),
100 µg/ml
Trace elements (1000x,
100 ml)
175 mg ZnSO4x7H2O; 50 mg FeSO4x7H2O; 10 mg
CuSO4x5H2O; 10 mg MnCl2x4H2O; 10 mg
Na2MoO4x2H2O;
Dissolve in 10 mM EDTA and filtrate sterilely; storage
at 4°C
Vitamine solution (250x, 0.0625 g biotin; 1.25 g Ca-pantothenate; 0.25 g
Materials and Methods 30
100 ml) nicotinic acid; 0.625 g pyridoxine; 0.25 g thiamine;
filtrate sterilely; storage at 4°C
WMIX 1 litre: 10 g Na-glutamate; 75 mg meso-inosite;
250 mg MgCl2x6H2O; 100 mg CaCl2 x2H2O; 550 mg
MgSO4 x7H2O; dissolved in 860 ml H2O and
autoclaved. Afterwards addition of 40 ml 0.5 M Ka-
phosphate buffer pH 6.5; 100 ml 20 % glucose; 1 ml
1000x trace elements; 4 ml 250x vitamine solution;
WMIXNH4Cl 1 litre: 3.16 g NH4Cl; 75 mg meso-inosite; 250 mg
MgCl2x6 H2O;100 mg CaCl2x2H2O; 550 mg
MgSO4x7H2O; dissolved in 500 ml H2O and
autoclaved. Afterwards addition of 400 ml 0.5 M Ka-
phosphate buffer pH 6.5; 100 ml 20 % glucose; 1 ml
1000x trace elements; 4 ml 250x vitamine solution;
YEPD medium 0.5 % yeast extract; 2 % glucose; 2 % tryptone; pH 6.3
YNB medium 0.67 % YNB ("yeast nitrogen base", Difco, Augsburg,
Germany); 2 % glucose
YNB agar plates 2 % Agar (Serva, Heidelberg, Germany) added to the
medium
3.1.5 Buffers, solutions, reagents
Acrylamide solution 40 % Acrylamide; 29:1 Acrylamide: Bis-Acrylamide
(Biometra, Göttingen, Germany)
[γ-P32]CTP / ATP Hartmann Analytic GmbH, Braunschweig, Germany
[α-P32]UTP Hartmann Analytic GmbH, Braunschweig, Germany
100 bp-marker MBI Fermentas, St. Leon-Rot, Germany
Agarose SeaKem ME Biozym, Hess. Oldendorf, Germany
Agarose gel loading buffer
(stopper solution)
60 % Saccharose; 20 mM EDTA; 0.025 %
Bromephenol blue
APS, Ammoniumpersulfate APS-solution 10 % in H2O (Serva, Heidelberg,
Germany)
Binding buffer (5 x) 50 mM HEPES pH 7.0, 200 mM KCl, 15 mM MgCl2, 5
mM DTT, 25% glycerol; aliquotted and stored at -80°C.
Materials and Methods 31
Bio-Rad Protein Assay Kit BioRad, München, Germany
BSA, Bovine serum
albumin
Sigma, Deisenhofen, Germany; Fraction V, 96-99 %
Complete, Mini (protease
inhibitor cocktail)
Roche Applied Science, Mannheim, Germany
Coomassie gel staining
solution for SDS
polyacrylamidegels
2 g/l Coomassie Brilliant Blue R250; 30 % methanol;
60 % distilled H2O; 10 % acetic acid.
Ethidiumbromide (10
mg/ml stocksolution)
BioRad, München, Germany
Gel destaining solution for
Coomassie blue stained
SDS polyacrylamidegels
45 % methanol; 45 % distilled water; 10 % acetic acid
Gel drying solution for SDS
polyacrylamidegels
10 % glycerine; 30 % methanol; 60 % distilled water
Gene RulerTM 100bp DNA
Ladder Plus
MBI Fermentas, St. Leon-Rot, Germany
Gene RulerTM DNA Ladder
Mix
MBI Fermentas, St. Leon-Rot, Germany
glass beads 0.25-0.5 µn (Roth, Karlsruhe)
Heparin sodium (177,000
IU/g)
Serva, Heidelberg, Germany
HRP substrate Western LightningTM Chemiluminescent Reagent Plus
(Perkin Elmer, MA)
Laemmli buffer (4 x) 8 % SDS; 20 % glycerol; 20 % ß-mercaptoethanol; Tris-
HCl pH 6.8; 0.05 % bromephenol blue.
Lysis buffer for total RNA
extraction
10 mM Tris, pH 8.0, 1 mM EDTA, 1% SDS, 100 mM
NaCl, 2 % Triton X-100
MOPS buffer (10 x) 250 mM MOPS; 50 mM Na-acetate; 20 mM EDTA; pH
7.0 (with NaOH)
MOPS buffer (10 x) 250 mM MOPS, 50 mM NaOAc, 20 mM EDTA (pH 7.0,
adjusted with NaOH) in 0.1 % DEPC treated H2O
PBS (phosphate buffered
saline)
150 mM NaCl; 8.4 mM Na2HPO4; 1.6 mM KH2PO4,
pH 7.4
Materials and Methods 32
PBST 1x PBS pH 7.4; 0.05 % Tween 20
PMSF Fluka, Biochemika, Sigma-Aldrich, Germany
Rainbow marker Amersham, Braunschweig, Germany
Rapid Hyb Buffer GE Healthcare, Amersham, Braunschweig, Germany
RNA Ladder, Low Range,
ready-to-use
MBI Fermentas, St. Leon-Rot, Germany
RNA sample buffer 250 µl formamide, 83 µl 35 % formaldehyde, 50 µl
10*MOPS, 100 µl 50 % (v/v) glycerol, 10 µl 2,5 % (w/v)
bromephenoleblue, 7,5 µl EtBr (10mg/ml)
RNA stop buffer For a final volume of 5 ml: 4 ml formamide, 1 ml 50 mM
Tris/HCl, pH 7.6 (in 0.1% DEPC H2O), 0.0125 g
bromphenolblue, 0.0125 g xylenecyanol; aliquotted and
stored at -80°C.
SDS PAGE buffer for
separating gel (4x)
1.5 M Tris; 0.4 % SDS; pH 8.8
SDS PAGE buffer for
stacking gel (4x)
0.5 M Tris; 0.4 % SDS; pH 6.8
SDS PAGE running buffer
(10x)
144.1 g glycine; 30.2 g Tris; 10 g SDS ad 1 litre with
distilled water
SSC buffer (20 x) 3 M NaCl; 0.3 % Na-citrate; pH 7.0
TAE buffer 20 mM sodium acetate; 40 mM Tris; 2 mM EDTA; with
glacial acetic acid pH 8.3
TBE buffer (10 x) 1 M Tris-HCl, 1 M boric acid, 10 mM EDTA (pH 8.3)
TE buffer (10 x) 0.1 M Tris-HCl; 0.01 M EDTA pH 8.0
TEMED N, N, N´, N´-tetramethyl ethylene diamine (Serva,
Heidelberg, Germany)
Transfer Buffer for Western
Blotting
3.03 g Tris, 14.4 g glycine, 100 ml methanol ad 1 l with
distilled water
Urea Serva, Heidelberg, Germany
3.1.6 Enzymes
Restriction enzymes MBI Fermentas, St. Leon-Rot, Germany
GenTherm DNA- Rapidozym, Berlin, Germany
Materials and Methods 33
Polymerase (5U/µl)
Klenow polymerase MBI Fermentas, St. Leon-Rot, Germany
Ribonuclease A (RNase A) MBI Fermentas, St. Leon-Rot, Germany
RNasin ® Plus RNase
Inhibitor
Promega, Madison (WI), USA
T4 DNA ligase MBI Fermentas, St. Leon-Rot, Germany
T7 RNA Polymerase MBI Fermentas, St. Leon-Rot, Germany
Takara Ex TaqTM (5U/µl) Takara Bio Inc., Shiga, Japan
3.1.7 Antibodies
Horse radish peroxidase
coupled rabbit anti mouse
immunoglobulin
DAKO, Denmark
Penta His® antibody Qiagen, Hilden, Germany
3.1.8 Programmes and databases
BioEdit Sequence
Alignment Editor V7.0.4.1
Hall, T. A. 1999;
http://www.mbio.ncsu.edu/BioEdit/bioedit.html
Saccharomyces Genome
Database
Dolinksi et al. 1998
http://www.yeastgenome.org/
Tina V2.09f Raytest Isotopenmeßgeräte GmbH
mFold v2.3 http://frontend.bioinfo.rpi.edu/applications/mfold/cgi-
bin/rna-form1-2.3.cgi
(Zuker, 2003)
3.2 Cultivation techniques
3.2.1 E. coli culture preparation and growth conditions
For E. coli freezing cultures 300 µl 50% glycerol (v/v) were added to 1 ml of an
exponentially growing culture. Cells were stored in a Cryo.s tube Cellstar® (Greiner
GmbH, Frickenhausen, Germany) at -80°C.
Materials and Methods 34
E. coli cultures were grown on a reciprocal shaker at 120 rpm and 37°C. The culture
volume did not exceed 1/5 of the flask used for cultivation.
3.2.2 P. pastoris culture preparation and growth conditions
For P. pastoris freezing cultures 500 µl 50% glycerol (v/v) were added to 1 ml of a 3
days pre-culture. Cells were stored in a Cryo.s tube Cellstar® (Greiner GmbH,
Frickenhausen, Germany) at -80°C.
20 ml WMIX pre-cultures were inoculated with 100 µl of a freezing culture and grown
in 250 ml baffled flasks for 3 days on a circular shaker at 160 rpm and 28°C. After
measuring the optical density OD600 (approx. 20-25) cells were centrifuged at 8000 x
g for 2 minutes in 50 ml Greiner centrifugation tubes. The supernatant was decanted
and cells were resuspended in 45 ml WMIX, 4.25 ml sterile Aquadest., 250 µl 20%
glucose and 500 µl methanol (total 50 ml). After measuring the OD600 again cultures
were further incubated in 250 ml baffled flasks on a circular shaker at 160 rpm and
28°C. For isolation of total RNA samples were taken after 2 hours. For the analysis of
protein expression cells were grown for 24 hours, feeding again with 250 µl 20%
glucose and 500 µl methanol.
3.3 DNA Techniques
3.3.1 Agarose gel electrophoresis
Agarose gel electrophoresis was performed in a Minigel device (BioRad, Sub-Cell GT
Mini, München, Germany) using a 1% (w/v) TAE gel. Samples were mixed with 1/2
(v/v) stopper solution and applied to the gel. 1 µg of λ-DNA restricted with Hind III
(BioLab, Swalbach, Germany), 100 bp ruler (MBI Fermentas, St.Leon-Rot, Germany)
or 100 bp Plus DNA Ladder (Bioneer, Deajeon, Korea) were used as markers. DNA
was separated at 75 V for 30 to 90 minutes. Gels were stained for 15 minutes in an
ethidium bromide solution (0.4 mg/l TAE buffer) and for detection exposed to UV-light
(λ=254 nm). Gels were documented using a Video documentation system
(Photointegrator V4.66, INTAS, Göttingen, Germany).
Materials and Methods 35
3.3.2 Plasmidisolation from E. coli
For the isolation of small amounts of plasmid DNA (1 up to 5 µg) from E. coli a 1.5 ml
overnight LBAmp culture (100 µg/ml) was incubated on a reciprocal shaker (120
U/min) at 37°C. Plasmid isolation was performed using the GFXTMMicro Plasmid Kit
(Amersham, Braunschweig, Germany) following manufacturer’s instructions.
Alternatively, isolation was carried out following the standard protocol (Ausubel et al.,
1994). Isolated DNA was solved in 100 µl TE buffer. For restriction analysis 10 µl of
this mini preparation was applied.
For the isolation of larger amounts of plasmid DNA from E. coli a 25 ml culture was
incubated as described above. Plasmid isolation was performed using the Plasmid
Midi Kit (Qiagen, Hilden, Germany) following manufacturer’s instructions.
3.3.3 Restriction of DNA
All restrictions were arranged in a final volume of 30 µl, containing the DNA (1 up to 5
µg), 3 µl of the manufacturer’s 10 x restriction buffer and 10 to 20 units of the
restriction enzyme. The samples were incubated for at least two hours at 37°C in a
water quench.
3.3.4 PCR Amplification
For amplification of cDNA 29 a 50 µl approach was set up, containing 5 µl of 10 x
Takara Ex Taq buffer, 0.3 µl of Takara Ex Taq (3.75 units), 1 µl of the primers (10
pmol/µl), 5 µl of the dNTP stock solution (12.5 mM) and 200 ng template DNA. The
PCR programme was 94°C for 4 minutes, then 30 cycles 94°C for 45 seconds, 50°C
for 45 seconds, 72°C for 1 minute 20 seconds.
All other PCRs were arranged in a final volume of 20 µl, containing 5 µl of 4 x PCR
buffer, 0.3 µl of GenTherm DNA-polymerase (1,6 units), 0.4 µl of each primer (10
pmol/µl), 1.6 µl of the dNTP stock solution (12.5 mM) and approx. 100 ng template
DNA, if not indicated.
Materials and Methods 36
3.3.5 Purification of DNA fragments
DNA fragments like PCR or restriction products were purified using the Qiaquick PCR
purification kit (Qiagen, Hilden, Germany) following manufacturer’s instructions. DNA
was eluted in 30 µl TE buffer
3.3.6 Hybridisation of oligonucleotides
Oligos were designed to have already compatible overhanging ends for their specific
clonings. For Hybridisation 100 pmol of each oligonucleotide in Annealing buffer AB
(10mM Tris*HCl, pH 8,0 ) were denatured for 10 minutes in a water quench. The
temperature was decreased to 80°C through addition of ice. The samples were
cooled down to room temperature for 90 minutes and were finally stored at -80°C.
Hybridised oligonucleotides were:
3:NSXc-fos-for and 4:Ec-fos-rev c-fos ARE
5:NSXtnf-for and 6: Etnf-rev
TNFα ARE
16:NotIStopAvrIIw/oStrep-for and
17:NotIStopAvrIIw/oStrep-rev
For removal of the STREP II tag
NotImutI-for and NotImutI-rev
NotImutII-for and NotImutII-rev
NotImutII-for and NotImutII-rev
For single point mutagenesis
3.3.7 Klenow fill up reaction
After hybridization overlapping oligonucleotides, especially the c-fos ARE hybrid,
were filled up with klenow polymerase. A 30 µl sample contained 20 µl hybridized
oligonucleotides, 3 µl 10 x klenow buffer, 2 µl dNTPs (12.5 mM), 1 µl klenow
polymerase and 4 µl Aquadest. The samples were incubated for 30 minutes at 37°C in
a water quench. The enzyme was then inactivated for 10 minutes at at 75°C and the
samples were purified with the Qiaquick PCR purification kit (Qiagen, Hilden,
Germany).
Materials and Methods 37
3.3.8 Ligation of DNA fragments
Ligation reactions were arranged in a final volume of 20 µl, containing 2 µl 10 x T4
ligation buffer, 1 µl T4 ligase (1U) and vector / insert in a 1:3 proportion. The samples
were incubated for two hours at room temperature or over night at 16°C.
3.3.9 Transformation of E. coli
A 20 ml LB pre-culture (w/o ampicillin) was inoculated with 50 µl of a JM109 / XL1
Blue freezing culture and incubated on a reciprocal shaker (120 U/min) over night at
37°C. The 100 ml LB main-culture (w/o ampicillin) was inoculated with 1% of the pre-
culture (v/v) and incubated up to on OD600 of 0.4 (approximately 2 hours and 20
minutes). Cells were cooled down on ice and afterwards centrifuged for 10 minutes at
4,000 rpm and 4°C in a GSA centrifugation tube (Centrifuge RC50 Sorvall Du Pont
de Nemours, Bad Homburg, Germany, GSA rotor). The pellet was washed in an ice
cold TFBI solution (0.1 M MgCl2; 0.01 M Tris-HCl, pH 7.6), centrifuged again and
then washed with 50 ml of an ice cold TFBII solution (0.1 M CaCl2; 0.01 M Tris-HCl,
pH 7.0). After a next centrifugation step the cells were resuspended in 4 ml of TFBII
solution and incubated for 30 minutes on ice. After addition of 800 µl glycerol aliquots
of 240 µl were frozen at -80°C.
The transformation mixture contained 100 µl PEG-solution (1 mM EDTA;0.2 M NaCl;
8 % PEG, 2,000;10 mM Tris-HCl, pH 7.6), the ligation sample (20 µl) or a control
plasmid (1 µg) and the 240 µl aliquot of competent cells. The samples were placed
on ice for 30 minutes and then subjected to a 42°C water quench for one minute
(heat shock). 1 ml LB medium was added immediately and cells were incubated for
60 up to 90 minutes at 37°C on a reciprocal shaker at 120 rpm. Afterwards 100 µl of
the culture were spread onto LBAmp plates (100 µg/µl). The remaining cells were
centrifuged for 10 seconds at 12,000 rpm and the supernatant was discarded. Cells
were then resuspended in the remaining medium and spread onto LBAmp plates, too.
The plates were incubated over night at 37°C.
3.3.10 Colony-PCR of E. coli
Single E. coli colonies were dissolved in 10 µl of Aquadest., which 1 µl was used of as
the PCR template. 0.6 µl DMSO were added per sample. The PCR reaction was set
up as described under PCR amplification (see 3.3.4). If the primers have been 5´-
Materials and Methods 38
AOX1-f and 3´-AOX1-r the PCR programme was 94°C for 4 minutes, then 24 cycles
94°C for 45 seconds, 55°C for 30 seconds, 72°C for 1 minute 20 seconds. If the
primers have been 5´-AOX1-f and Ec-fos-rev or Etnf-rev the PCR programme was
94°C for 4 minutes, then 30 cycles 94°C for 45 seconds, 50°C for 45 seconds, 72°C
for 1 minute 20 seconds.
3.3.11 Transformation of P. pastoris
Electroporation was carried out after a modified standard protocol (Invitrogen 1997).
A 20 ml YEPD pre-culture was inoculated with 50 µl of a P. pastoris GS115 freezing
culture (his4; InvitrogenTM, CA) and incubated on a reciprocal shaker (120 rpm) at
28°C for three days. Then a 500 ml YEPD main-culture was inoculated with 0.2 ml of
the pre-culture and incubated over night for approximately 16 hours till the culture
reached an optical density of OD600 ≈ 1.3 to 1.5. Cells were then centrifuged in a GS3
tube at 4000 rpm and 4°C for 10 minutes. Afterwards cells were washed twice with
500 ml ice cold Aquadest. and once with ice cold 1 M sorbitol. Finally cells were
resuspended in 1 ml ice cold 1 M sorbitol frozen at -80°C in 80 µl aliquots. Cells were
competent up to 8 days.
For electroporation 10 µg of a plasmid were linearized using 30 units of the restriction
enzymes SalI or StuI, depending on the sequence of the cloned cDNA. Restriction
was done as described above (see 3.3.3). The samples were purified during dialysis
against Aquadest. for 1 hour using a nitrocellulose filter (0.025 µm, Millipore, MA)
afterwards mixed with an 80 µl aliquot of competent Pichia cells and incubated on ice
for 5 minutes. The cells were then transferred to an ice cold 0.2 cm electroporation
cuvette. Electroporation parameters were 1500 V, 200 Ω and 25 µF. Immediately
after the electric pulse 1 ml ice cold 1 M sorbitol was added to the cuvettes. Twice
500 µl of the cell suspension were finally spread on YNB plates and incubated for 3
days at 28°C.
3.3.12 Colony-PCR of P. pastoris
Stable integration of the expression cassette was checked by colony-PCR. Selected
His+-colonies were transferred to 100 µl YNB medium and incubated at 28°C over
night. This was necessary to avoid false positives. Reactions were set up as
described above (3.3.4). 2 µl of the over night culture were applied to the PCR
Materials and Methods 39
mixture, primers were 5´-AOX1-f and 3´-AOX1-r and 0.6 µl DMSO were added. The
programme was 94°C for 4 minutes, then 30 cycles 94°C for 15 seconds, 55°C for 45
seconds, 72°C for 2 minutes 30 seconds.
3.3.13 Isolation of total/genomic DNA from P. pastoris
10 ml of a 3 days culture were harvested in 15 ml Greiner falcon tubes by
centrifugation at 8.000 rpm for 3 minutes at 4°C. The medium was decanted, cells
were resuspended in 500 µl distilled water and transferred to an eppi tube. Cells
were centrifuged again (5 minutes, 5.000 rpm, 4°C) and then resuspended in 200 µl
lysisbuffer. After addition of 300 ml glass beads, 100 µl phenol and 100 µl
chloroform/isoamylalcohol (24:1) the samples were vortexed for 3 to 4 minutes. Then
600 µl TE buffer were added and the samples were centrifuged for 5 minutes at
10.000 rpm. The upper aqueous phase was transferred to a new 2 ml eppi tube and
1 ml ethanolabs. (96%) was added. The samples were centrifuged again at 10.000
rpm for 10 minutes, the pellet was resuspended in 400 µl TE buffer and transferred
again to a new eppi tube. 3 µl RNase A (10 µg/µl) were added and the samples were
incubated for 5 minutes at 37°C in a water quench. The DNA was precipitated by
addition of 10 µl 5 M ammonium acetate and 1 ml ethanolabs. (96%) and
centrifugation for 10.000 rpm for 10 minutes. The pellet was washed with 70%
ethanol und afterwards dried at room temperature. Finally the pellet was solved in
50 µl TE buffer.
3.4 RNA Techniques
3.4.1 PCR based probe synthesis
The AOX1 probe (146 bp) was generated from the 5’ UTR of the vector pPICHS (see
appendix, fig. 1 for vector map) through PCR. 2.5 ng of the plasmid, 20 pmol of the
primers AOX1UTR3´II and AOX1UTRkurz5´ and 2 µl of the dNTP stock solution
(12.5 mM) were used for the PCR in a 20 µl volume. The PCR programme was 94°C
for 2 minutes, then 30 cycles 94°C for 15 seconds, 40°C for 15 seconds, 72°C for 30
seconds and a final step of 72°C for 10 minutes. The result of the PCR reaction was
checked by agarose gel electrophoresis.
Materials and Methods 40
The Actin probe (341 bp) was generated from P. pastoris genomic DNA (see 3.3.13)
via PCR. 1 µl of a genomic DNA preparation and the primers PpAct-f and pPAct-r
were used for the PCR reaction. The PCR reaction was performed in a 20 µl volume
as described above (see 3.3.4). The programme was 94°C for 4 minutes, then 30
cycles 94°C for 15 seconds, 55°C for 45 seconds, 72°C for 2 minutes 30 seconds.
The result of the PCR reaction was checked by agarose gel electrophoresis.
3.4.2 Radioactive labelling of PCR generated probes
Approximately 50 ng of a PCR generated probe were labelled radioactively using the
Megaprime DNA Labelling System (GE Healthcare, Amersham, Braunschweig,
Germany). Normally 10 ng probe per 1 ml hybridization buffer are applied. The PCR
product was mixed with 5 µl random primer solution and filled up to 30 µl with distilled
water. The sample was incubated for 3 minutes at 100 °C and then directly put into
liquid nitrogen. The frozen sample was put on ice. Then 4 µl of each dNTP (except
the radioactive dNTP), 5 µl 10 x reaction buffer and 2 µl Klenow enzyme (all provided
with the kit) were added. Finally 1 µl radioactively labelled α[P32]ATP or α[P32]CTP
(Hartmann Analytic GmbH, Braunschweig, Germany) was added. If the radioactivity
has already passed the first date of its half life 2 µl were added. The samples were
incubated for 30 minutes at 37 °C and could then be stored at -20°C. Normally the
labelled probes were used directly for hybridization.
3.4.3 Isolation of total RNA from P. pastoris
Cultures were incubated as described (see 3.2.2). For isolation of total RNA all steps
were performed on ice, all solutions were treated with 0.1 % DEPC and pipette tips
as well as all tubes were RNase free. After incubation cells were directly put on ice
and an amount of 100 OD600 was harvested by centrifugation in a pre-cooled 50 ml
falcon tube for 2 minutes at 8.000 rpm and 4°C. The medium was discarded, cells
were resuspended in 1 ml ice cold 10 mM Tris/HCl pH 8.0 and transferred to a 2 ml
tube (RNase free) and centrifuged again for 30 seconds at 12.000 rpm and 4 °C.
Afterwards, cells could be stored at -80°C.
The pellet was resuspended in 500 µl ice cold 0.5 M NaCl/200 mM Tris/HCl pH
7.5/10 mM EDTA and 500 µl glass beads (RNase free, sterilized for 4 – 6 hours at
160°C) were added. The suspension was mixed with 250 µl at 60°C pre-warmed
Materials and Methods 41
phenol (liquified and Tris saturated, Biomol, Hamburg), 25 µl 10 % SDS and 30 µl 3
M NaOAc, pH 4.8. The samples were vortexed with full speed for 3 minutes and then
incubated for 5 minutes at 60°C. After cooling down to room temperature for
approximately 5 minutes 250 µl chloroform/isoamylalcohol (24:1 mixture) were
added. The samples were heavily shaken, centrifuged for 3 minutes at 12.000 rpm
and the upper aqueous phase was transferred to a new tube. After adding 500 µl pre-
warmed phenol and 50 µl 3 M NaOAc, pH 4.8, samples were heavily shaken again,
centrifuged for 3 minutes at 12.000 rpm and the upper aqueous phase was
transferred to a new tube. Then 500 µl chloroform/isoamylalcohol (24:1 mixture) were
added. Sample were heavily shaken again and centrifuged for 3 minutes at 12.000
rpm. The upper aqueous phase (approximately 400 µl) was transferred to a new
tube. Total RNA was precipitated by addition of 40 µl 3 M NaOAc, pH 4.8 and 1.2 ml
absolute ethanol at -80°C for 1 hour and by centrifugation for 20 minutes at 12.000
rpm and 4°C. The supernatant was wasted and samples were dried for 5 to 10
minutes at room temperature. Finally, RNA was solved in 35 µl RNA sample buffer. 5
µl of the sample were used to measure the concentration and purity with a
photometer at 260 (1 OD260 ≈ 40 µg/ml), 280 and 310 nm. Samples could be stored
at -80°C, but were normally directly prepared for gel electrophoresis.
3.4.4 Denaturing RNA gel electrophoresis
RNA solved in RNA sample buffer was denatured at 65 °C for 10 minutes and
directly put on ice. For the gel electrophoresis 20 µg of each sample were loaded
onto the lanes.
For preparation of denaturing RNA gels 1.3 % agarose was boiled in 1 x MOPS. The
liquid was cooled down at room temperature and 2% formaldehyde (37%) was added
under the extractor hood. The gel was then poured into the electrophoresis chamber.
Total RNA was then separated at 75 V for 2.5 hours till the bromphenol band
reached 2/3 of the gel size. The running buffer was 1 x MOPS. Gels were
documented using a Video documentation system (Photointegrator V4.66, INTAS,
Göttingen, Germany).
Materials and Methods 42
3.4.5 Northern Blotting
The gel was washed twice in 20 x SSC buffer. RNA was transferred on a nylon
membrane (Hybond N+, Amersham, Braunschweig, Germany) by capillary blotting.
Therefore 6 sheets of 3 MM whatman paper of the same size like the gel were
soaked in 20 x SSC buffer and put on a cling film. The gel was positioned on the
whatman paper. The cling film was turned down covering all edges of the gel to put
the membrane on the top avoiding air bubbles. The two left 3 MM whatman paper
sheets were put onto the membrane and a layer of 15 cm pulp on the top was
covered by a glass plate, which was weighted down with a weight of 300 g (like a half
filled 500 ml water bottle). RNA was blotted over night for at least 12 hours.
The gel lanes were then marked and the RNA was cross-linked from both sides to
the membrane using a Stratalinker 1800 in auto-cross-link-mode (Stratagene, CA).
The successful transfer to the membrane was then checked under UV light. The
bands of the ribosomal RNA were marked, too. The membrane could be stored
covered in pulp and aluminium foil at 4°C.
3.4.6 Probe hybridisation and detection
The nylon membrane was put into a glass hybridization tube and attached to the
inner surface of the tube avoiding air bubbles by using 9 ml rapid hyb buffer.
Normally 1 ml rapid hyb buffer is applied for 1 cm2 membrane surface. The
membrane was incubated for pre-hybridization for 20 minutes at 38°C for the AOX1
probe in a hybridization oven. The radioactively labelled probes (see 3.4.2) were
denatured for 5 minutes at 100 °C and then put on ice for 5 minutes and then
transferred into the hybridization buffer. Hybridization was done for 4 hours at 38°C.
Afterwards the probe containing hybridization buffer could be store at -20°C and
reused 3 times. The membrane was then firstly washed with 2 x SSC + 0.1 % SDS at
room temperature, and then secondly washed twice with 1 x SSC + 0.1 % SDS at
38°C. Finally the membrane was covered by thermoplastic foil and shrink-wrapped.
Detection was done by exposition to an x-ray film (SupeRX, Fuji, Japan) for 3 to 5
days.
For detection of actin mRNA the membrane was again subjected to pre-hybridization
without incubation in stripping solution. Pre-hybridization for 20 minutes and
Materials and Methods 43
hybridization itself for 1 hour were performed at 65°C as well as the two final washing
steps. Exposition was done for only 1 day.
3.5 RNA-protein interaction techniques
3.5.1 Template matrices for in vitro transcription
For creation of the TNFα-ARE template for an in vitro transcription 2.2 nmol of each
of the T7-tnf-for and T7-tnf-rev oligonucleotetides were hybridized as described
above (see 3.3.6). The sample was directly used for in vitro transcription and could
be stored at -20°C.
The c-fos ARE template for an in vitro transcription was created by PCR in a 20 µl
PCR reaction mix as described above (see 3.3.4). 0.1 µl Takara Taq polymerase
(0.5 U), the primers T7-cfos-for and T7-cfos-rev and 100 ng of the plasmid
pPICHcfosARE4 were added. The PCR programme was 94°C for 4 minutes, then 30
cycles 94°C for 15 seconds, 55°C for 45 seconds, 72°C for 25 seconds. The sample
was directly used for in vitro transcription without purification and could be stored at -
20°C.
3.5.2 In vitro transcription
For in vitro transcription reactions were set up in a final volume of 20 µl. 3 µl up to
7 µl DNA template, 4 µl 5 x transcription buffer, 1 µl T7-RNA polymerase (20 units;
both from MBI Fermentas, St. Leon-Rot, Germany, delivered together), 0.75 µl
RNasin (30 units, Promega, Madison (WI), USA), 4µl 2.5 mM rNTPs (Ambion,
Applied Biosystems, Darmstadt, Germany) were mixed and filled up to 19 µl with
distilled water (0.1 % DEPC). Afterwards 1 µl radioactively labelled α[32P]UTP
(Hartmann Analytic GmbH, Braunschweig) was added to the reaction mix. For non-
radioactively transcripts the mix was directly filled up to a volume of 20 µl. The
samples were incubated for 2 hours at 37°C. The samples were then mixed with
10 µl RNA stop buffer and could be stored at -20°C, but were normally directly
subjected to a denaturing polyacrylamide gel electrophoresis for purification.
Materials and Methods 44
3.5.3 End-labelling of oligonucleotides
For controlling the size of in vitro transcripts random oligonucleotides (34 nt and
70 nt) were radioactively labelled. For this purpose a 20 µl was set up containing 2 µl
oligonucleotide (200 pmol), 14 µl Aqua dest., 2 µl 10 x labelling buffer (delivered with
kinase), 1 µl γ[32P]ATP and 1 µl T4-Kinase (10 U, MBI Fermentas, St. Leon-Rot,
Germany), which labels the 5’ end. The samples were incubated for 30 minutes at
37°C. Afterwards the kinase was inactivated by an incubation for 4 minutes at 65 °C.
1 µl was applied to the gel (see purification of in vitro transcripts, 3.5.4).
3.5.4 Purification of in vitro transcripts
In vitro transcripts were denatured for 10 minutes at 65°C in a water quench and
separated on a denaturing 5% 1 mm polyacrylamide gel. A 25 ml gel volume
contained 12 g Urea (8 M) to avoid secondary structures, 2.5 ml 10 x TBE buffer, 14
ml distilled water (0.1 % DEPC) and 3.125 ml PAA stocksolution (40%, 29:1).
Polymerisation was started by simultaneous addition of 500µl 10% APS and 250 µl
TEMED. The gel was quickly poured between the glassplates (18 x 20 cm), which
were sealed before with agarose, the gel comb was inserted and removed again after
3 minutes, when the gel was polymerized. The remaining gel parts covering the lanes
were removed carefully. Before loading the samples into the lanes, the lanes were
again carefully cleaned by washing them with running buffer (1 x TBE). The gel was
run in a Zabona vertical chamber (Zabona AG, Basel, Schweiz) for 2 hours at 100 V.
After the gel run the running buffer was carefully removed with a plastic bottle and
then wasted. The upper glass plate was removed and the bottom plate together with
the gel covered with cling film. A 5 minute exposition to an x-ray film (SupeRX, Fuji,
Japan) revealed the radioactively labelled transcripts. The position was marked on
the gel for the radioactive transcripts and for the non radioactive ones on the same
height as well. Now the transcripts could be cut out of the gel and be eluted in 400 µl
elutionbuffer (0.5 M ammoniumacetate, 0.1 mM EDTA, 0.1% SDS) over night at 4°C.
The buffer was transferred to a new tube and RNA was precipitated with 1.2 ml 96%
ethanol for 1 hour at -20°C. Then the samples were centrifuged for 15 minutes at
12.000 rpm and 4°C. The supernatant was wasted and the precipitated RNA was
washed with 70% ethanol (set up with DEPC-treated Aquadest.). After a next
centrifugation the pellet was dried for 5 minutes at room temperature. Radioactive
Materials and Methods 45
transcripts were solved in 50 µl distilled water (0.1 % DEPC), non-radioactive
samples were solved in 5 µl distilled water (0.1 % DEPC), which were pooled
afterwards.
The success of purification and yield were controlled on a denaturing formaldehyde
gel (2 µl). Transcripts could be stored at -20°C.
3.5.5 Binding reaction
The crude protein extract applied to the binding reaction was created as described
under 3.6.1. Samples were taken after 2 hours of induction.
A 20 µl binding sample was pipetted as follows: x µl DEPC Aquadest., 4 µl 5 x binding
buffer, 3 µl heparin solution (10 µg/µl), x µl crude protein extract (0, 5, 25 and 50 µg)
and 2.5 µl labelled transcript (100 ng).
Proteinase K digested samples were prepared as follows: 7.5 µl proteinase K (150
µg; Merck, KGaA, Darmstadt, Germany) were mixed with 5, 25 and 50 µg protein
extract, if necessary filled up to 10.5 µl with DEPC Aquadest. and incubated over night
at 37°C. These samples were mixed with 4 µl 5 x binding buffer, 3 µl heparin solution
(10 µg/µl) and 2.5 µl labelled transcript (100 ng).
The samples were then incubated for 30 minutes on ice at 4°C. Afterwards samples
were cross-linked in a stratalinker 1800 (Stratagene, CA) to bind proteins to the
transcripts. Then 5 µg RNase A (10 mg/ml) were added and the samples incubated
for 15 minutes at 37°C. Samples were then mixed with 10 µl 4 x Laemmli buffer,
denatured for 3 minutes at 100°C and directly put on ice. After cooling down samples
were centrifuged shortly.
Samples were separated on an 8% PAA-Gel. Glass plates were prepared as
described under 3.5.4. The 30 ml gel mixture contained 6 ml PAA (40%, 29:1), 7.5 ml
4 x SDS PAGE buffer for separating gels and 16.5 ml Aquadest.. Polymerisation was
started by addition of 500 µl 10% APS and 250 µl TEMED. The gel pre-run at 100 V
and 4°C was done for 30 minutes. Samples were loaded onto the gel and the gel run
was done for 3 hours at 100 V and 4°C. The gel was transferred to 3 MM Whatman
paper (Whatman Int., Maidstone, England), covered with a cling film and dried for 45
minutes on gel dryer (Zabona AG, Basel, Schweiz) at 80°C. The gel was exposed to
an x-ray film (SupeRX, Fuji, Japan) for 3 to 7 days.
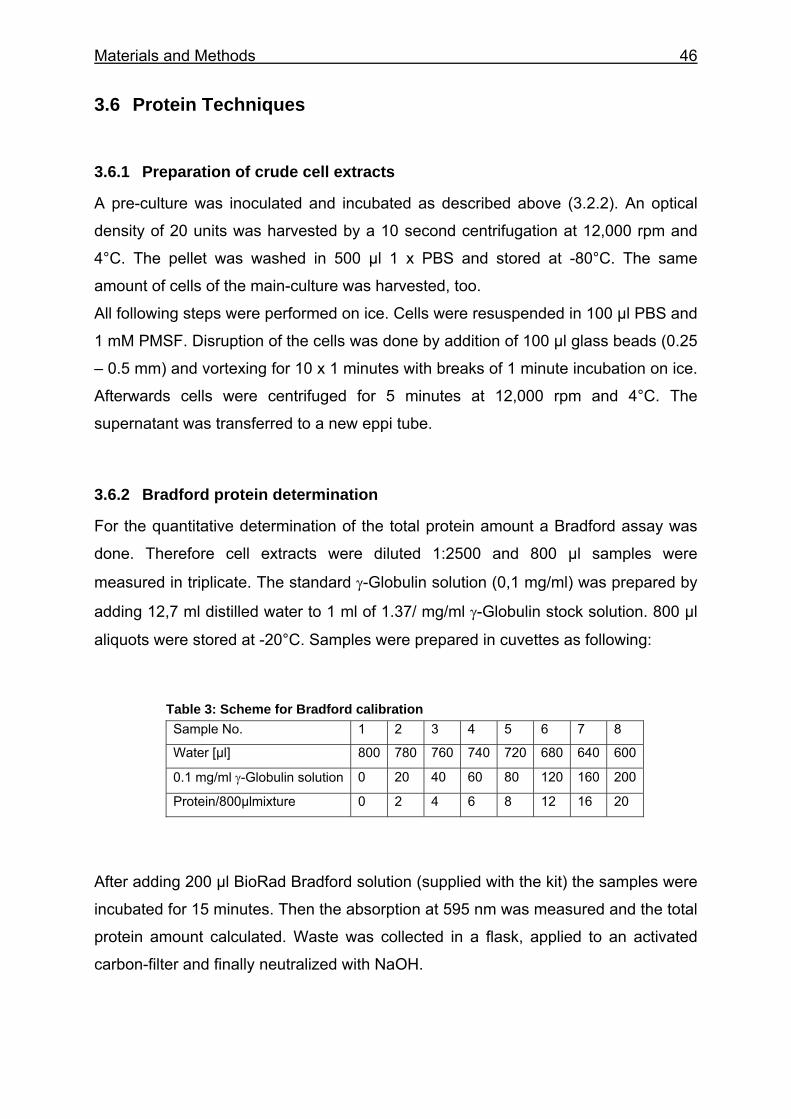
Materials and Methods 46
3.6 Protein Techniques
3.6.1 Preparation of crude cell extracts
A pre-culture was inoculated and incubated as described above (3.2.2). An optical
density of 20 units was harvested by a 10 second centrifugation at 12,000 rpm and
4°C. The pellet was washed in 500 µl 1 x PBS and stored at -80°C. The same
amount of cells of the main-culture was harvested, too.
All following steps were performed on ice. Cells were resuspended in 100 µl PBS and
1 mM PMSF. Disruption of the cells was done by addition of 100 µl glass beads (0.25
– 0.5 mm) and vortexing for 10 x 1 minutes with breaks of 1 minute incubation on ice.
Afterwards cells were centrifuged for 5 minutes at 12,000 rpm and 4°C. The
supernatant was transferred to a new eppi tube.
3.6.2 Bradford protein determination
For the quantitative determination of the total protein amount a Bradford assay was
done. Therefore cell extracts were diluted 1:2500 and 800 µl samples were
measured in triplicate. The standard γ-Globulin solution (0,1 mg/ml) was prepared by
adding 12,7 ml distilled water to 1 ml of 1.37/ mg/ml γ-Globulin stock solution. 800 µl
aliquots were stored at -20°C. Samples were prepared in cuvettes as following:
Table 3: Scheme for Bradford calibration Sample No. 1 2 3 4 5 6 7 8
Water [µl] 800 780 760 740 720 680 640 600
0.1 mg/ml γ-Globulin solution 0 20 40 60 80 120 160 200
Protein/800µlmixture 0 2 4 6 8 12 16 20
After adding 200 µl BioRad Bradford solution (supplied with the kit) the samples were
incubated for 15 minutes. Then the absorption at 595 nm was measured and the total
protein amount calculated. Waste was collected in a flask, applied to an activated
carbon-filter and finally neutralized with NaOH.
Materials and Methods 47
3.6.3 SDS PAGE
For separation of proteins a 1 mm 15 % polyacrylamide separating gel (8.5 x 5.5 cm)
and a 4.5 % stacking (8.5 x 1.5 cm) gel were used. For 7.5 ml separation gel 2.75 ml
Aquadest., 1.9 ml SDS PAGE buffer for separating gel and 2.8 ml acrylamide solution
were mixed. Then 50 µl 10% APS solution and 15 µ TEMED were added
simultaneously to start polymerisation. The gel was poured between the fixed glass
plates in the mini gel device (mini protean® 3, BioRad, München, Germany) and
covered with isopropanol/water (1:1). After polymerisation the isopropanol/water was
decanted. For 5 ml stacking gel 3.14 ml distilled water, 1.25 ml SDS PAGE buffer for
stacking gel and 0.55 ml acrylamide solution were mixed. Then 50 µl 10% APS
solution and 10 µ TEMED were added simultaneously to start polymerisation. The
stacking gel was poured onto the separating gel and the gel comb was inserted
carefully. 1/4 Laemmli buffer (4x) of the final volume was added to 25 µg of protein
extract of cDNA 205 - and 45-constructs. For cDNA 29 protein extracts an amount of
1,5 µg was used. Proteins were denatured for 3 minutes at 95°C, centrifuged at
13,000 rpm at 4°C and then placed on ice. The gel was prepared in the gel apparatus
and the chamber was filled with 1 x SDS PAGE running buffer. The comb was
removed carefully, lanes were washed and samples loaded onto the gel. Samples
were separated at 100 V for 2 hours.
The upper gel part above the 46 kDa band (yellow) of the rainbow marker was
applied to Coomassie blue-staining (see 3.6.5) and used for later quantification. The
bottom part of the gel containing the proteins of interest was subjected to Western
Blotting.
3.6.4 Western Blotting
SDS polyacrylamide gels were electroblotted onto PVDF membranes (Millipore, MA)
in a semi-dry Blotter (Hölzel, Wörth, Germany). For this purpose 4 layers of 3 MM
WhatmanTM paper (Whatman Int., Maidstone, England) previously cut to the same
size of the gel and soaked in transfer-buffer are placed below the PVDF membrane,
which has been previously activated with ethanolabs. The gel is then placed on top of
the filter and covered with 4 additional layers of 3 MM WhatmanTM paper (Whatman
Int., Maidstone, England). Gels were electroblotted at 500 mA per gel for 20 min.
Materials and Methods 48
3.6.5 Coomassie blue staining
The upper parts of the SDS polyacrylamide gels were incubated in Coomassie gel
staining solution for SDS polyacrylamidegels over night at room temperature. Then
gels were applied three times to gel destaining solution for Coomassie blue stained
SDS polyacrylamidegel for 1 hour. Next the gel was placed into gel drying solution for
SDS polyacrylamidegels for 30 minutes. During that incubation two gel drying films
(Promega, Madison (WI), USA) were placed into water for 30 minutes. Then the gel
was placed between the two layers of gel drying films and dried for 3 days.
3.6.6 Immunodetection of proteins
Membranes were placed into 20 ml blocking solution (3 % BSA, 0.1 % Tween20 in 1
x PBS) and incubated over night at 4°C. All following incubations were done at room
temperature and gentle shaking unless indicated. For detection of the His6 tag
membranes were incubated for 1 hour in antibody solution I (10 ml blocking solution
and 5 µl Penta-His antibody (1:4000; BSA-free, mouse monoclonal IgG1; Qiagen,
Hilden, Germany). The antibody solution was stable up to four weeks and could be
reused (storage at 4°C). Then the membranes were washed three times for 10
minutes in 20 ml PBST (1 x PBS and 0.05% (v/v) Tween 20). The incubation with the
second antibody was done in antibody solution II (20 ml 1 x PBS, 5 % milk powder
and 5 µl secondary rabbit α-mouse HRP antibody (Dako, Denmark)). Then the
membranes were washed again three times for 10 minutes in 20 ml PBST (1 x PBS
and 0.05% (v/v) Tween 20). Bands were visualized with NEN TM System (Perkin
Elmer, Life Science, Boston, USA), which contains luminol as HRP substrate.
3.7 Bioinformatics
3.7.1 RNA secondary structure prediction
For mRNA secondary structure prediction the mFold webserver v2.3
(http://frontend.bioinfo.rpi.edu/applications/mfold/cgi-bin/rna-form1-2.3.cgi) was used
applying the following parameters: linear sequence, folding temperature 28°C,
percent suboptimality 5, upper bound 50, window parameter default, maximum
interior/bulge loop size 30, maximum asymmetry of an interior/bulge loop 30, maxium
Materials and Methods 49
distance between paired bases no limit, image width huge, structure format bases,
energy dot plot on, structure draw mode default, base numbering frequency 20,
sequence numbering offset 0, regularization angle (in degrees) 0, structure rotation
angle (in degrees) auto, structure annotation high-light. The region to be high-lighted
was inserted.
3.7.2 Calculation of relative protein expression and mRNA stability
Quantification was performed with the programme Tina V2.09f. For calculation of the
relative protein expression, firstly, a selected region of the Coomassie stained SDS-
PAA gel was quantified. The quantified pPICH value was divided by each quantified
value of the detected proteins resulting in value A. Secondly, detected protein signals
were quantified. Each signal was divided by the pPICH value resulting in value B. To
get relative values (RVprotein), which are consequently normalized the pPICH value,
values A and B were multiplied. Each experiment was repeated at least twice. From
these experiments the average values and standard deviation were calculated.
For calculation procedure of the relative mRNA stability is similar. Instead of total
protein and protein signals, the endogenous AOX1 mRNA and mRNA of constructs
to be analysed was detected.
3.7.3 Calculation of translational effects
For calculation of translational effects, the average values RVprotein were divided by
RVmRNA for each experiment and construct (see 3.7.2). From this data the average
value (RVTE) and standard deviation was calculated.
Results 50
4 Results In this thesis, the effect of human AU rich elements (AREs) was analysed in the yeast
P. pastoris. AREs are mRNA cis-acting elements, which can regulate mRNA turnover
and translation through the interplay with ARE binding proteins (ARE-BPs). These
ARE-BPs or trans-acting factors can either promote or prevent degradation of the
ARE-containing transcript as well as translation by recruiting proteins or protein
complexes involved in these processes.
In contrast to other model organisms such as D. melanogaster, Homo sapiens,
Xenopus sp. and S. cerevisiae, a possible ARE-mediated regulatory system has to
date, not been examined in P. pastoris.
4.1 Construction of P. pastoris expression clones
There is no knowledge about the effects of AREs, ARE-BPs or other factors involved
in P. pastoris. Thus, no endogenous ARE-containing mRNA or ARE-BP could be
selected for analysis to date. However, to find out if this highly conserved mechanism
in eukaryotes is also present in P. pastoris, it is possible to use a heterologous
reporter mRNA or protein. Testing the effect of a known ARE from a different
organism than P. pastoris on transcript stability and translation can help to prove the
existence of an ARE-regulated mRNA turnover pathway. Such heterologous systems
are commonly used to demonstrate principle effects in an organism and to identify
components involved. In order to establish a heterologous ARE-regulated system for
P. pastoris, two human AREs that are well described in the literature and three
human cDNAs as repoters were selected for analysis.
4.1.1 Selection of AREs – the human c-fos and TNFα AREs
ARE regulatory systems are described for many eukaryotic model organisms. Since
the time that ARE function was first described in human cells (Shaw and Kamen,
1986), research in this field has mainly focussed on mammalian systems. As a
consequence, a large number of AREs and associated factors could be identified in
these systems. However, there are only a few AREs whose regulatory effects and
interactions have been analysed to a greater extent till date. Two examples are the
AREs of the proto-oncogene c-fos (class I ARE) and of the cytokine TNFα
Results 51
(class II ARE) (Barreau et al., 2005). Since these AREs have additionally been
shown to trigger ARE-mediated mRNA decay in S. cerevisiae (Vasudevan and Peltz,
2001), they were selected for analysis in P. pastoris (fig. 6).
4.1.2 Construction of the basic expression vectors – Human AREs are cloned into the 3’ UTR
Before the ARE sequences could be cloned into P. pastoris expression vectors, the
question of where exactly the AREs are located in the 3’ UTR had to be answered. It
could not be excluded that the distance to the stop codon might have had an effect
on regulation. As a consequence, the original locations of the c-fos and TNFα AREs
in their native mRNAs and in eukaryotic reporter systems were examined (fig. 5). It
turned out that their position can vary widely. They are located more than 400
nucleotides downstream of the stop codon in their native mRNAs, whereas in the
S. cerevisiae reporter system they were cloned directly next to the stop codon and in
the mammalian reporter system they were cloned near the stop codon, respectively.
Obviously, the position of these AREs (or of AREs in general) only plays a
subordinate role in the ARE-mediated regulatory system. This suggests that the basic
ARE function does not depend on distance to the stop codon.
For general analysis (detection and purification), cDNAs were cloned into the vectors
pPICHS (Boettner et al., 2002) (see appendix, fig. 1 for vector map) and pPICH (see
appendix, fig. 2 for vector map), both containing a 6 x His- at the N-terminal and in
the case of pPICHS an additional a Strep-II-tag at the C-terminal end of the mature
protein. The AREs were cloned into the 3’ UTR directly downstream of the stopcodon
of the vector pPICH (fig. 6; see appendix, fig. 3 and 4 for vector map).
The vector pPICHS was restricted with NotI and AvrII to create the pPICH construct.
The oligonucleotides 16:NotIStopAvrIIw/oStrep-for and 17:NotIStopAvrIIw/oStrep-rev
were hybridized. The resulting double-stranded DNA fragment already possessed the
corresponding overhanging ends needed for ligation. The ARE-containing vectors
were established derived from this newly generated construct. To clone the c-fos
ARE into pPICH, the two oligonucleotides 3:NSXc-fos-for and 4:Ec-fos-rev were
hybridized. The overhanging ends were filled up with dNTPs using klenow enzyme.
The two oligonucleotides 5:NSXtnf-for and 6: Etnf-rev were hybridized for the TNFα
ARE. The resulting hybrid already contained the correct overhanging ends.
Subsequently, the c-fos dsDNA fragment was restricted with NotI and EcoRI as well
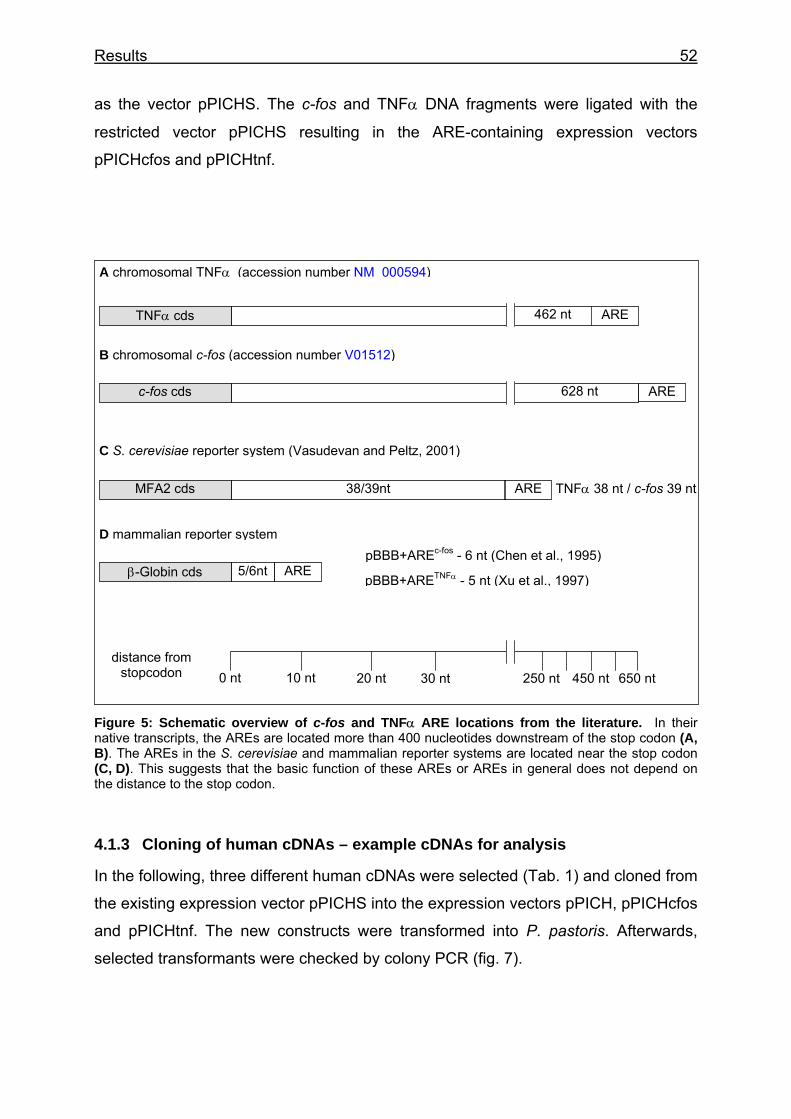
Results 52
as the vector pPICHS. The c-fos and TNFα DNA fragments were ligated with the
restricted vector pPICHS resulting in the ARE-containing expression vectors
pPICHcfos and pPICHtnf.
A chromosomal TNFα (accession number NM 000594)
462 nt ARE TNFα cds
B chromosomal c-fos (accession number V01512)
628 nt c-fos cds ARE
C S. cerevisiae reporter system (Vasudevan and Peltz, 2001)
38/39nt MFA2 cds ARE TNFα 38 nt / c-fos 39 nt
D mammalian reporter system pBBB+AREc-fos - 6 nt (Chen et al., 1995)
distance from stopcodon 0 nt 10 nt 20 nt 30 nt
pBBB+ARETNFα - 5 nt (Xu et al., 1997) ARE 5/6nt β-Globin cds
450 nt 650 nt 250 nt
Figure 5: Schematic overview of c-fos and TNFα ARE locations from the literature. In their native transcripts, the AREs are located more than 400 nucleotides downstream of the stop codon (A, B). The AREs in the S. cerevisiae and mammalian reporter systems are located near the stop codon (C, D). This suggests that the basic function of these AREs or AREs in general does not depend on the distance to the stop codon.
4.1.3 Cloning of human cDNAs – example cDNAs for analysis
In the following, three different human cDNAs were selected (Tab. 1) and cloned from
the existing expression vector pPICHS into the expression vectors pPICH, pPICHcfos
and pPICHtnf. The new constructs were transformed into P. pastoris. Afterwards,
selected transformants were checked by colony PCR (fig. 7).
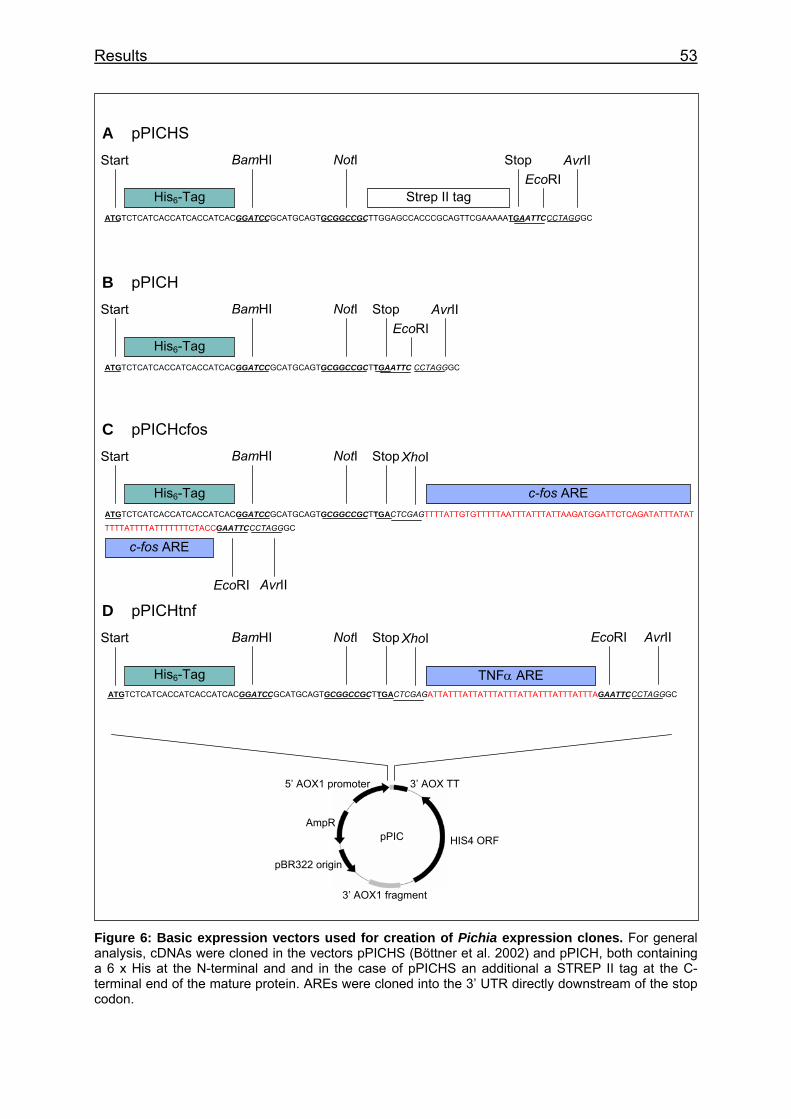
Results 53
A pPICHS
ATGTCTCATCACCATCACCATCACGGATCCGCATGCAGTGCGGCCGCTTGGAGCCACCCGCAGTTCGAAAAATGAATTCCCTAGGGC
Stop EcoRI
AvrII
Strep II tag
NotI BamHI Start
His6-Tag
B pPICH
ATGTCTCATCACCATCACCATCACGGATCCGCATGCAGTGCGGCCGCTTGAATTC CCTAGGGC
Stop EcoRI
AvrII NotI BamHI Start
His6-Tag
C pPICHcfos
ATGTCTCATCACCATCACCATCACGGATCCGCATGCAGTGCGGCCGCTTGACTCGAGTTTTATTGTGTTTTTAATTTATTTATTAAGATGGATTCTCAGATATTTATAT
TTTTATTTTATTTTTTTCTACCGAATTCCCTAGGGC
XhoI
c-fos ARE
StopNotI BamHI Start
His6-Tag
AvrII EcoRI
c-fos ARE
D pPICHtnf
ATGTCTCATCACCATCACCATCACGGATCCGCATGCAGTGCGGCCGCTTGACTCGAGATTATTTATTATTTATTTATTATTTATTTATTTAGAATTCCCTAGGGC
AvrII XhoI EcoRI
TNFα ARE
StopNotI BamHI Start
His6-Tag
5’ AOX1 promoter 3’ AOX TT
AmpR pPIC HIS4 ORF
pBR322 origin
3’ AOX1 fragment
Figure 6: Basic expression vectors used for creation of Pichia expression clones. For general analysis, cDNAs were cloned in the vectors pPICHS (Böttner et al. 2002) and pPICH, both containing a 6 x His at the N-terminal and and in the case of pPICHS an additional a STREP II tag at the C-terminal end of the mature protein. AREs were cloned into the 3’ UTR directly downstream of the stop codon.
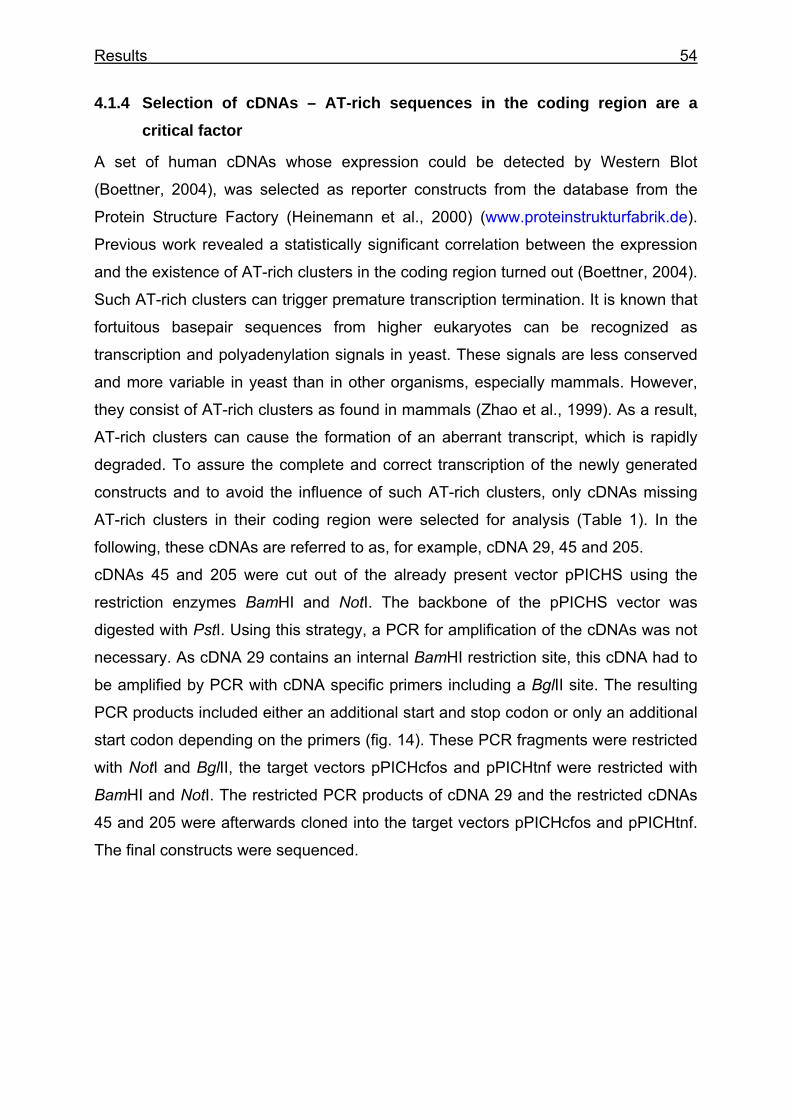
Results 54
4.1.4 Selection of cDNAs – AT-rich sequences in the coding region are a critical factor
A set of human cDNAs whose expression could be detected by Western Blot
(Boettner, 2004), was selected as reporter constructs from the database from the
Protein Structure Factory (Heinemann et al., 2000) (www.proteinstrukturfabrik.de).
Previous work revealed a statistically significant correlation between the expression
and the existence of AT-rich clusters in the coding region turned out (Boettner, 2004).
Such AT-rich clusters can trigger premature transcription termination. It is known that
fortuitous basepair sequences from higher eukaryotes can be recognized as
transcription and polyadenylation signals in yeast. These signals are less conserved
and more variable in yeast than in other organisms, especially mammals. However,
they consist of AT-rich clusters as found in mammals (Zhao et al., 1999). As a result,
AT-rich clusters can cause the formation of an aberrant transcript, which is rapidly
degraded. To assure the complete and correct transcription of the newly generated
constructs and to avoid the influence of such AT-rich clusters, only cDNAs missing
AT-rich clusters in their coding region were selected for analysis (Table 1). In the
following, these cDNAs are referred to as, for example, cDNA 29, 45 and 205.
cDNAs 45 and 205 were cut out of the already present vector pPICHS using the
restriction enzymes BamHI and NotI. The backbone of the pPICHS vector was
digested with PstI. Using this strategy, a PCR for amplification of the cDNAs was not
necessary. As cDNA 29 contains an internal BamHI restriction site, this cDNA had to
be amplified by PCR with cDNA specific primers including a BglII site. The resulting
PCR products included either an additional start and stop codon or only an additional
start codon depending on the primers (fig. 14). These PCR fragments were restricted
with NotI and BglII, the target vectors pPICHcfos and pPICHtnf were restricted with
BamHI and NotI. The restricted PCR products of cDNA 29 and the restricted cDNAs
45 and 205 were afterwards cloned into the target vectors pPICHcfos and pPICHtnf.
The final constructs were sequenced.
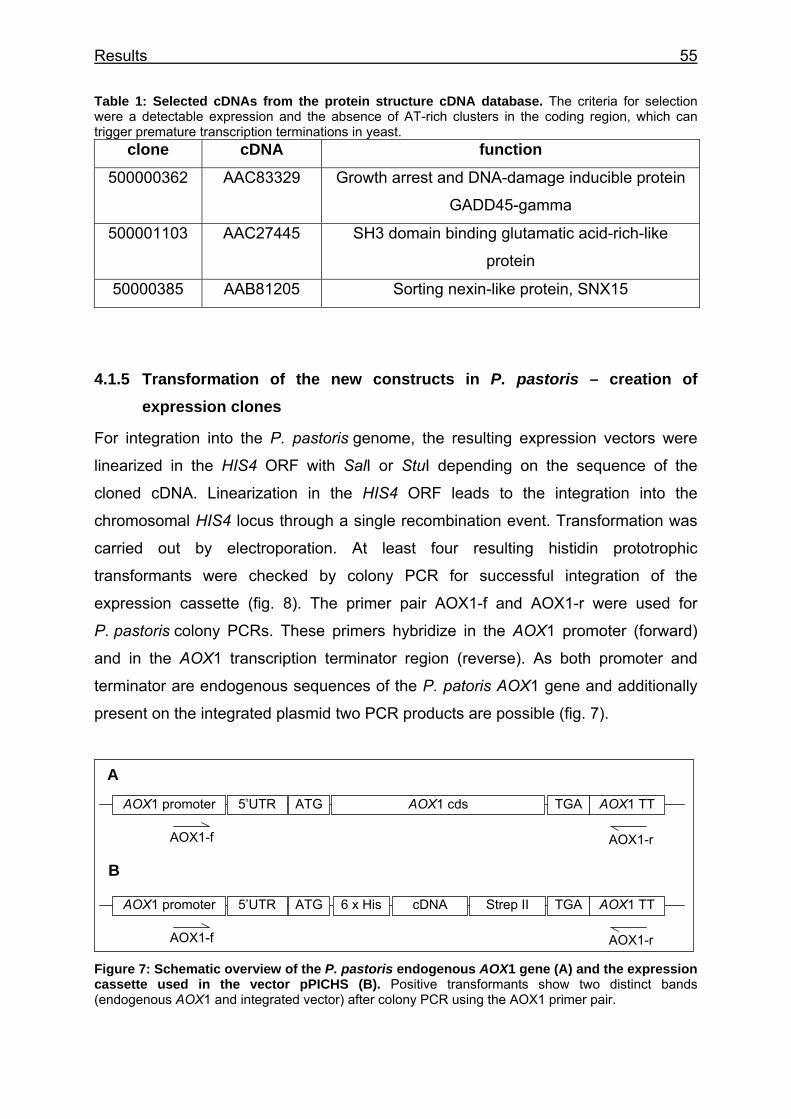
Results 55
Table 1: Selected cDNAs from the protein structure cDNA database. The criteria for selection were a detectable expression and the absence of AT-rich clusters in the coding region, which can trigger premature transcription terminations in yeast.
clone cDNA function
500000362 AAC83329 Growth arrest and DNA-damage inducible protein
GADD45-gamma
500001103 AAC27445 SH3 domain binding glutamatic acid-rich-like
protein
50000385 AAB81205 Sorting nexin-like protein, SNX15
4.1.5 Transformation of the new constructs in P. pastoris – creation of expression clones
For integration into the P. pastoris genome, the resulting expression vectors were
linearized in the HIS4 ORF with SalI or StuI depending on the sequence of the
cloned cDNA. Linearization in the HIS4 ORF leads to the integration into the
chromosomal HIS4 locus through a single recombination event. Transformation was
carried out by electroporation. At least four resulting histidin prototrophic
transformants were checked by colony PCR for successful integration of the
expression cassette (fig. 8). The primer pair AOX1-f and AOX1-r were used for
P. pastoris colony PCRs. These primers hybridize in the AOX1 promoter (forward)
and in the AOX1 transcription terminator region (reverse). As both promoter and
terminator are endogenous sequences of the P. patoris AOX1 gene and additionally
present on the integrated plasmid two PCR products are possible (fig. 7).
A
AOX1 promoter 5’UTR ATG AOX1 cds TGA AOX1 TT
AOX1-f AOX1-r
B
AOX1 promoter 5’UTR ATG 6 x His cDNA Strep II TGA AOX1 TT
AOX1-f AOX1-r
Figure 7: Schematic overview of the P. pastoris endogenous AOX1 gene (A) and the expression cassette used in the vector pPICHS (B). Positive transformants show two distinct bands (endogenous AOX1 and integrated vector) after colony PCR using the AOX1 primer pair.
Results 56
A typical PCR sample shows the band of the endogenous AOX1 gene at
approximately 2.2 kb and the successfully integrated AOX expression cassette
depending on the size of the cloned cDNA (fig. 8).
PCR product of the endogenous AOX1 gene
2 kb
0.8 kb
PCR product of the integrated vector
0.7 kb
Figure 8: Representative gel of a P. pastoris colony PCR. Up to five colonies were tested for the integration of the expression cassette. Primers (AOX1-f and AOX1-r) hybridize in the AOX1 promoter and terminator of the integrated vector and the endogenous AOX1 gene resulting in two bands.
4.2 Analysis of P. pastoris expression clones
To analyse the C-terminal protein, modifications and introduced AREs in P. pastoris
possible effects on transcript stability and translation were tested by Northern and
Western Blot under standardized conditions. Experiments were performed in 50 ml
cultures and carried out according to the Invitrogen protocols (Invitrogen, 1997). Each
experiment was repeated at least twice for the total set of clones for each cDNA.
4.2.1 Standardized comparison of the protein level – AREs can influence translation in P. pastoris
Yeast pre-cultures were cultivated for three days in WMIXNH4Cl / 2.0% (w/v)
glucose. Cells were then resuspended in fresh WMIXNH4Cl with 0.1% glucose (w/v)
and 1% methanol (v/v). This main culture was fed again with 0.1% glucose (w/v) and
1% methanol (v/v) and cultivated for 24 hours. As a control, a strain transformed with
the empty vector pPICHcfos was always treated like the other cultures. Cells were
mechanically disrupted with glass beads and the total protein amount was
determined via Bradford assay. For experiments with cDNA 45 and 205, constructs
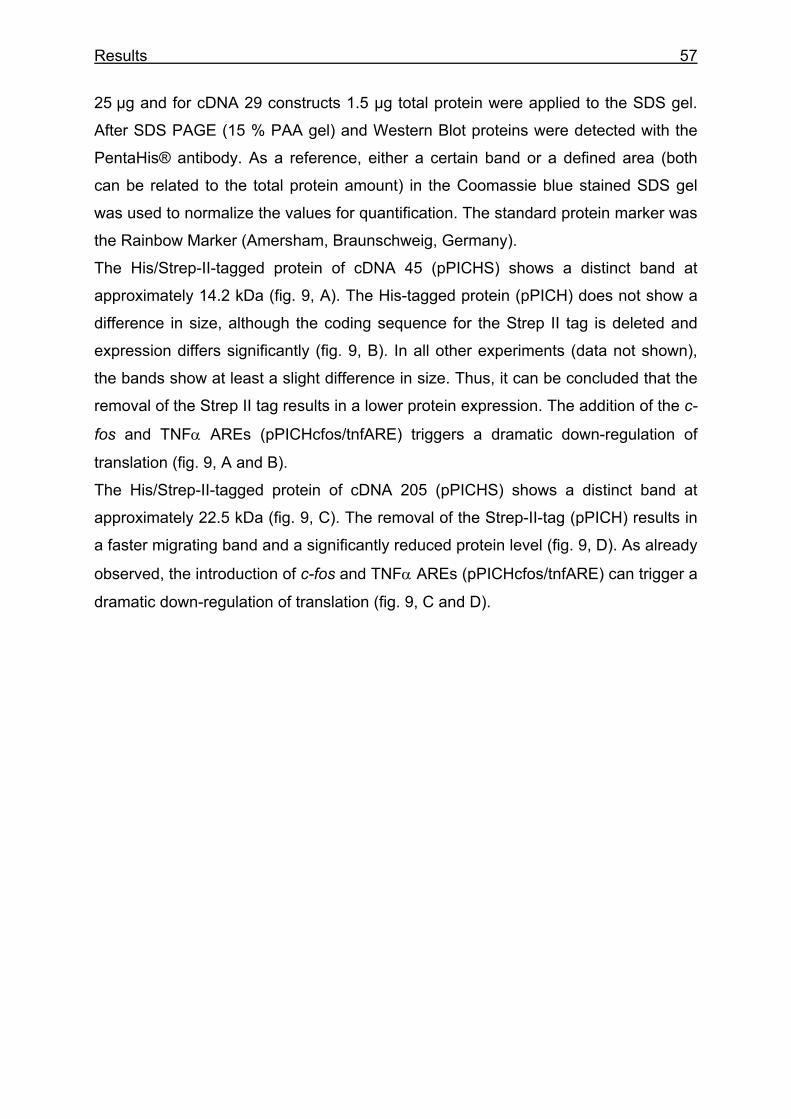
Results 57
25 µg and for cDNA 29 constructs 1.5 µg total protein were applied to the SDS gel.
After SDS PAGE (15 % PAA gel) and Western Blot proteins were detected with the
PentaHis® antibody. As a reference, either a certain band or a defined area (both
can be related to the total protein amount) in the Coomassie blue stained SDS gel
was used to normalize the values for quantification. The standard protein marker was
the Rainbow Marker (Amersham, Braunschweig, Germany).
The His/Strep-II-tagged protein of cDNA 45 (pPICHS) shows a distinct band at
approximately 14.2 kDa (fig. 9, A). The His-tagged protein (pPICH) does not show a
difference in size, although the coding sequence for the Strep II tag is deleted and
expression differs significantly (fig. 9, B). In all other experiments (data not shown),
the bands show at least a slight difference in size. Thus, it can be concluded that the
removal of the Strep II tag results in a lower protein expression. The addition of the c-
fos and TNFα AREs (pPICHcfos/tnfARE) triggers a dramatic down-regulation of
translation (fig. 9, A and B).
The His/Strep-II-tagged protein of cDNA 205 (pPICHS) shows a distinct band at
approximately 22.5 kDa (fig. 9, C). The removal of the Strep-II-tag (pPICH) results in
a faster migrating band and a significantly reduced protein level (fig. 9, D). As already
observed, the introduction of c-fos and TNFα AREs (pPICHcfos/tnfARE) can trigger a
dramatic down-regulation of translation (fig. 9, C and D).
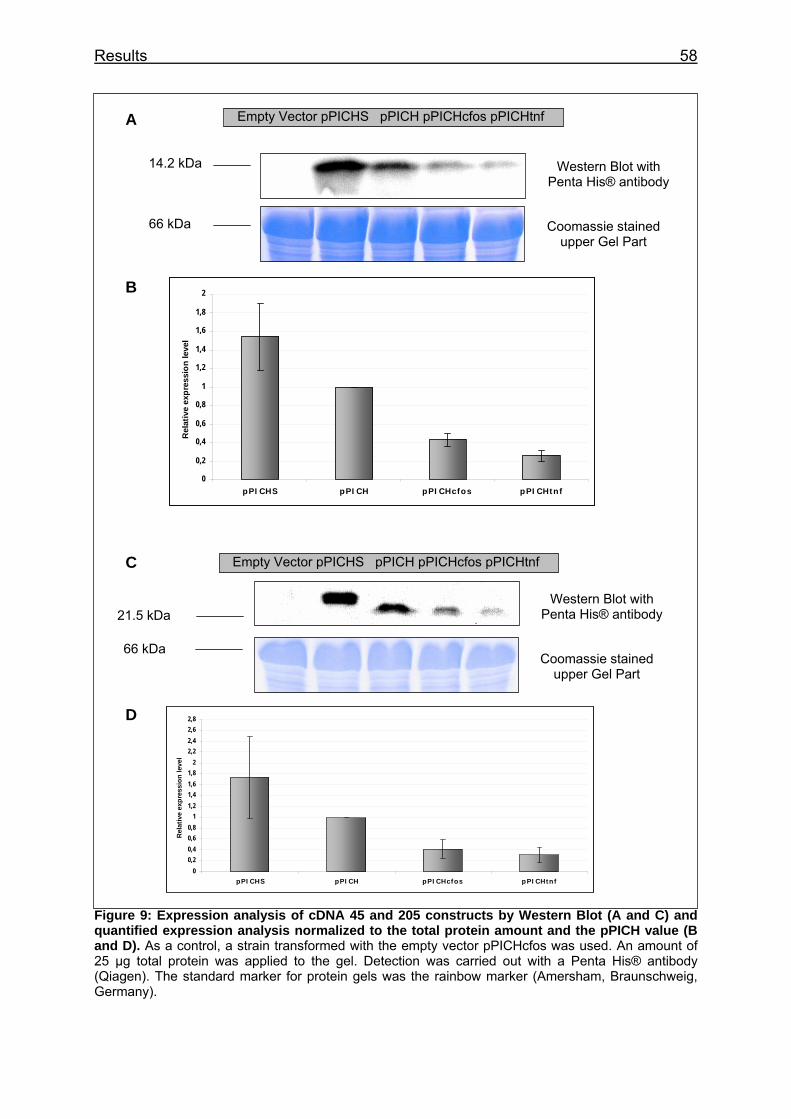
Results 58
Empty Vector pPICHS pPICH pPICHcfos pPICHtnf A
14.2 kDa Western Blot with Penta His® antibody
66 kDa Coomassie stained upper Gel Part
0
0,2
0,4
0,6
0,8
1
1,2
1,4
1,6
1,8
2
pPICHS pPICH pPICHcfos pPICHtnf
Rel
ativ
e ex
pres
sion
leve
l
B
C
21.5 kDa
Empty Vector pPICHS pPICH pPICHcfos pPICHtnf
Western Blot with Penta His® antibody
66 kDa Coomassie stained
upper Gel Part
D
00,20,40,60,8
11,21,41,61,8
22,22,42,62,8
pPICHS pPICH pPICHcfos pPICHtnf
Rel
ativ
e ex
pres
sion
leve
l
Figure 9: Expression analysis of cDNA 45 and 205 constructs by Western Blot (A and C) and quantified expression analysis normalized to the total protein amount and the pPICH value (B and D). As a control, a strain transformed with the empty vector pPICHcfos was used. An amount of 25 µg total protein was applied to the gel. Detection was carried out with a Penta His® antibody (Qiagen). The standard marker for protein gels was the rainbow marker (Amersham, Braunschweig, Germany).
Results 59
The His/Strep-II-tagged protein of cDNA 29 (pPICHS) shows a distinct band at
approximately 23.0 kDa (fig. 10, A). The removal of the Strep-II-tag (pPICH) reduces
the protein size and significantly reduces the protein level (fig. 10, B). The addition of
a start and stop codon by PCR leads to a highly increased protein expression level
(pPICH+S+S). Interestingly, the introduction of the c-fos ARE into pPICH+S+S does
not cause such a dramatic down-regulation of translation by far (pPICHcfos+S+S) as
it could be observed for cDNAs 45 and 205 (fig. 9), whereas the TNFα ARE
(pPICHtnf+S+S) results with a similarly lowered expression level. To test the
influence of the additional stop codon in both ARE-constructs, the stop codon was
deleted by PCR with a corresponding primer (pPICHcfos/tnf+S). In both cases a
further down-regulation of translation can be observed.
Empty pPICHS pPICH pPICH pPICH pPICH pPICH pPICH vector +S+S cfos tnf cfos tnf A +S+S +S+S +S +S
Western Blot with Penta His® antibody 21.5 kDa
Coomassie stained upper Gel Part 66 kDa
B
0
0,2
0,4
0,6
0,8
1
1,2
pPICHs pPICH pPICH+S+S pPICHcfos+S+S pPICHtnf+S+S pPICHcfos+S pPICHtnf+S
Rel
ativ
e ex
pres
sion
leve
l
Figure 10: Expression analysis of cDNA 29 constructs by Western Blot (A) and quantified expression analysis of cDNA 29 constructs normalized to the total protein amount and the pPICH value (B). As a control, a strain transformed with the empty vector pPICHcfos was used. An amount of 1.5 µg total protein was applied to the gel. Detection was carried out with a Penta His® antibody (Qiagen, Hilden, Germany). The standard marker for protein gels was the rainbow marker (Amersham, Braunschweig, Germany). The constructs marked with +S+S have an additional start and stop codon, constructs marked with only +S have an additional start codon.
Results 60
4.2.2 Standardized comparison of the mRNA level – AREs can influence transcript stability in P. pastoris
To gain further insight into the regulation of the ARE-mediated effects found on
translation, the transcriptional level was also analysed. Transcript half-lives were not
measured in this study. A reduced rate of AOX1 promoter activity in the ARE-
containing constructs is unlikely and no effects like that have ever been reported
between any ARE and promoter. As a result, in the following mRNA abundance is
equated with the transcript stability itself.
Yeast cultivation procedures were the same as for the protein expression analysis.
Samples were taken two hours after resuspension in fresh WMIXNH4Cl with 0.1%
glucose (w/v) and 1% methanol (v/v). As a control, a strain transformed with the
empty vector pPICHcfos was always treated like the other cultures. Cells were
disrupted mechanically with glass beads. Total RNA was isolated and the yield was
determined photometrically. 20 µg of total RNA were used for denaturing agarose gel
electrophoresis and Northern Blot. To obtain comparable results, all transcripts were
detected with the same radioactively labelled probe against the 5’ UTR (fig. 11, A).
This 5’ UTR is not only present in the integrated expression vectors, but also in the
original AOX1 gene. Therefore, two mRNAs can be detected, the endogenous AOX1
mRNA as a loading control and the transcripts of interest encoded on the integrated
expression vectors (fig. 11, B). As a further loading control, a PCR generated probe
against endogenous actin mRNA was applied to the membranes (data not shown). In
order to avoid experimental variations, the membranes were not treated with stripping
solution which can lead to a loss of signal intensity. The standard RNA marker was
the Low Range RNA Ladder (MBI Fermentas, St. Leon-Rot, Germany).
Due to the additional Strep-II-tag coding sequence, the cDNA 45 mRNA of construct
pPICHS is slightly bigger than pPICH (fig. 12, A). However, the amount of the
transcript is nearly the same (fig. 12, B). The introduction of the c-fos ARE leads to
two distinct bands which differ approximately 200 nt in size (pPICHcfos). It is possible
that the human c-fos ARE is recognized as a poly(A) signal in P. pastoris. However, it
can be assumed that both transcripts are translated. Thus, in the case of the c-fos
ARE a strong down-regulation of transcript stability can be observed as well as in the
case of the TNFα ARE (pPICHtnf).
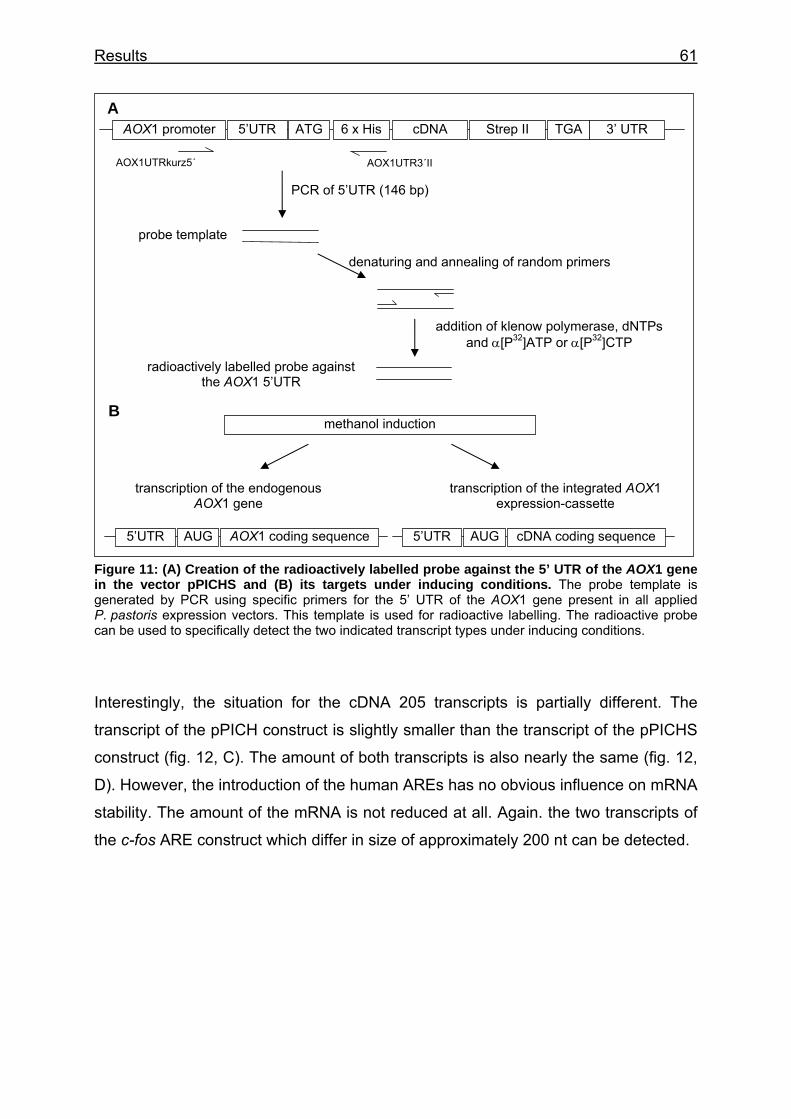
Results 61
A 5’UTR AOX1 promoter ATG Strep II cDNA TGA 3’ UTR 6 x His
AOX1UTRkurz5´ AOX1UTR3´II
PCR of 5’UTR (146 bp)
probe template
denaturing and annealing of random primers
addition of klenow polymerase, dNTPs and α[P32]ATP or α[P32]CTP
radioactively labelled probe against
the AOX1 5’UTR
B methanol induction
transcription of the endogenous AOX1 gene
transcription of the integrated AOX1 expression-cassette
5’UTR AUG AOX1 coding sequence 5’UTR AUG cDNA coding sequence
Figure 11: (A) Creation of the radioactively labelled probe against the 5’ UTR of the AOX1 gene in the vector pPICHS and (B) its targets under inducing conditions. The probe template is generated by PCR using specific primers for the 5’ UTR of the AOX1 gene present in all applied P. pastoris expression vectors. This template is used for radioactive labelling. The radioactive probe can be used to specifically detect the two indicated transcript types under inducing conditions.
Interestingly, the situation for the cDNA 205 transcripts is partially different. The
transcript of the pPICH construct is slightly smaller than the transcript of the pPICHS
construct (fig. 12, C). The amount of both transcripts is also nearly the same (fig. 12,
D). However, the introduction of the human AREs has no obvious influence on mRNA
stability. The amount of the mRNA is not reduced at all. Again. the two transcripts of
the c-fos ARE construct which differ in size of approximately 200 nt can be detected.
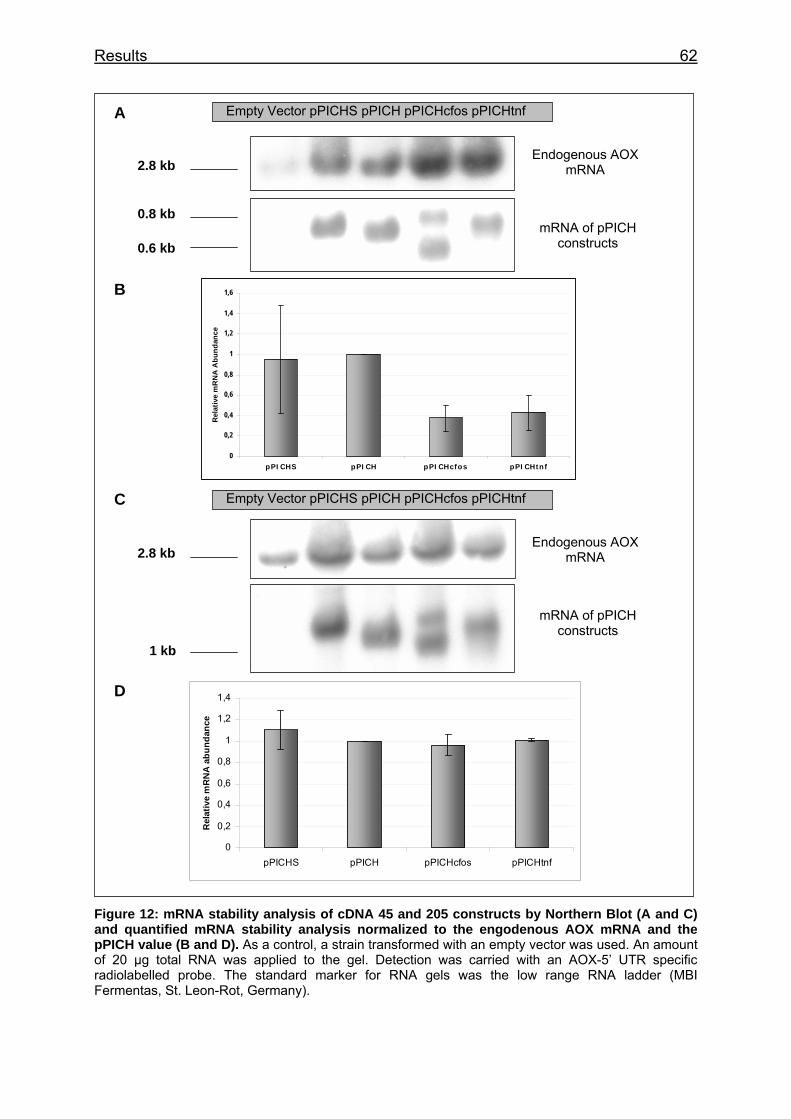
Results 62
Figure 12: mRNA stability analysis of cDNA 45 and 205 constructs by Northern Blot (A and C) and quantified mRNA stability analysis normalized to the engodenous AOX mRNA and the pPICH value (B and D). As a control, a strain transformed with an empty vector was used. An amount of 20 µg total RNA was applied to the gel. Detection was carried with an AOX-5’ UTR specific radiolabelled probe. The standard marker for RNA gels was the low range RNA ladder (MBI Fermentas, St. Leon-Rot, Germany).
Endogenous AOX mRNA
Empty Vector pPICHS pPICH pPICHcfos pPICHtnf A
2.8 kb
0.8 kb mRNA of pPICH
constructs 0.6 kb
0
0,2
0,4
0,6
0,8
1
1,2
1,4
1,6
pPICHS pPICH pPICHcfos pPICHtnf
Rel
ativ
e m
RN
A A
bund
ance
B
C
Endogenous AOX mRNA
Empty Vector pPICHS pPICH pPICHcfos pPICHtnf
mRNA of pPICH constructs
0
0,2
0,4
0,6
0,8
1
1,2
1,4
pPICHS pPICH pPICHcfos pPICHtnf
Rel
ativ
e m
RN
A a
bund
ance
2.8 kb
1 kb
D
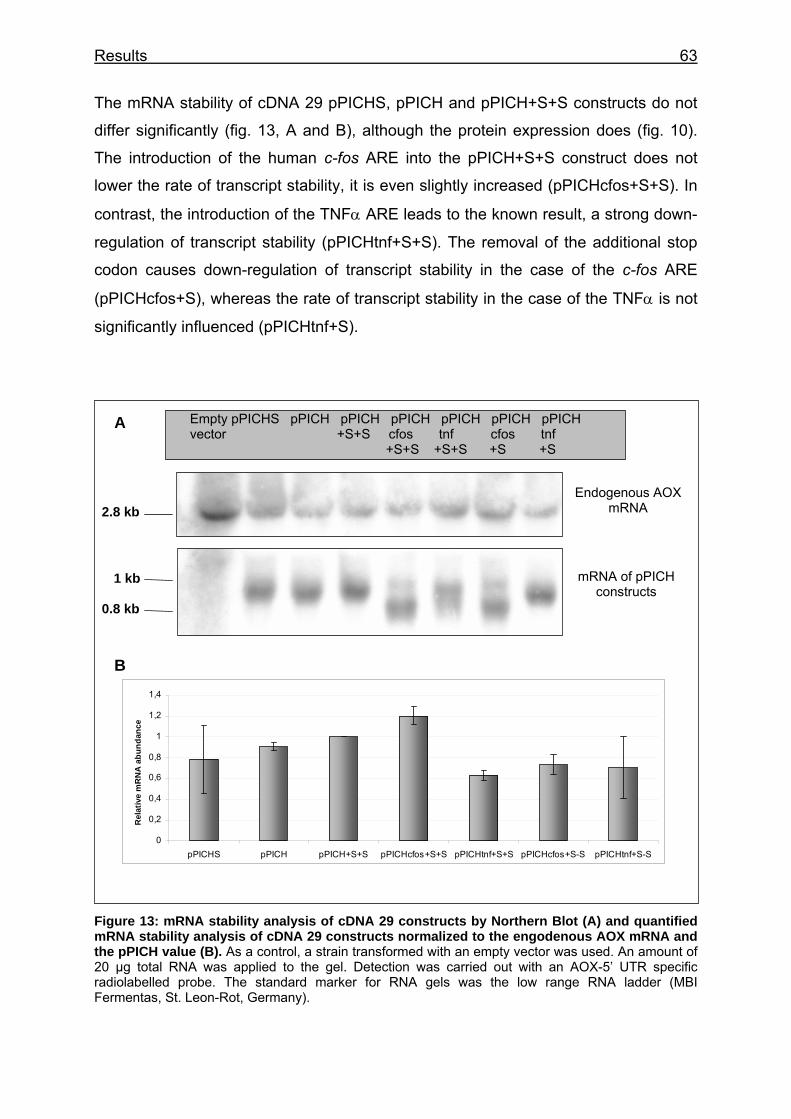
Results 63
The mRNA stability of cDNA 29 pPICHS, pPICH and pPICH+S+S constructs do not
differ significantly (fig. 13, A and B), although the protein expression does (fig. 10).
The introduction of the human c-fos ARE into the pPICH+S+S construct does not
lower the rate of transcript stability, it is even slightly increased (pPICHcfos+S+S). In
contrast, the introduction of the TNFα ARE leads to the known result, a strong down-
regulation of transcript stability (pPICHtnf+S+S). The removal of the additional stop
codon causes down-regulation of transcript stability in the case of the c-fos ARE
(pPICHcfos+S), whereas the rate of transcript stability in the case of the TNFα is not
significantly influenced (pPICHtnf+S).
Empty pPICHS pPICH pPICH pPICH pPICH pPICH pPICH A vector +S+S cfos tnf cfos tnf +S+S +S+S +S +S
Endogenous AOX mRNA 2.8 kb
mRNA of pPICH constructs
1 kb
0.8 kb
0
0,2
0,4
0,6
0,8
1
1,2
1,4
pPICHS pPICH pPICH+S+S pPICHcfos+S+S pPICHtnf+S+S pPICHcfos+S-S pPICHtnf+S-S
Rel
ativ
e m
RN
A a
bund
ance
B
Figure 13: mRNA stability analysis of cDNA 29 constructs by Northern Blot (A) and quantified mRNA stability analysis of cDNA 29 constructs normalized to the engodenous AOX mRNA and the pPICH value (B). As a control, a strain transformed with an empty vector was used. An amount of 20 µg total RNA was applied to the gel. Detection was carried out with an AOX-5’ UTR specific radiolabelled probe. The standard marker for RNA gels was the low range RNA ladder (MBI Fermentas, St. Leon-Rot, Germany).
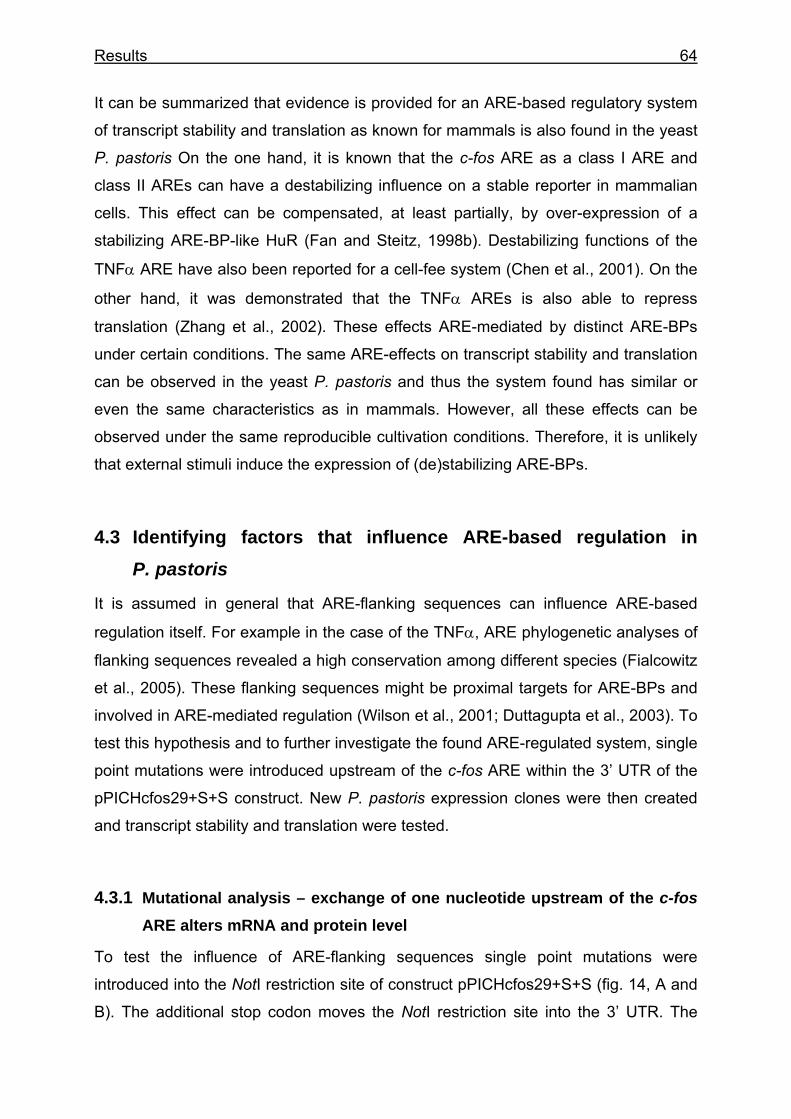
Results 64
It can be summarized that evidence is provided for an ARE-based regulatory system
of transcript stability and translation as known for mammals is also found in the yeast
P. pastoris On the one hand, it is known that the c-fos ARE as a class I ARE and
class II AREs can have a destabilizing influence on a stable reporter in mammalian
cells. This effect can be compensated, at least partially, by over-expression of a
stabilizing ARE-BP-like HuR (Fan and Steitz, 1998b). Destabilizing functions of the
TNFα ARE have also been reported for a cell-fee system (Chen et al., 2001). On the
other hand, it was demonstrated that the TNFα AREs is also able to repress
translation (Zhang et al., 2002). These effects ARE-mediated by distinct ARE-BPs
under certain conditions. The same ARE-effects on transcript stability and translation
can be observed in the yeast P. pastoris and thus the system found has similar or
even the same characteristics as in mammals. However, all these effects can be
observed under the same reproducible cultivation conditions. Therefore, it is unlikely
that external stimuli induce the expression of (de)stabilizing ARE-BPs.
4.3 Identifying factors that influence ARE-based regulation in P. pastoris
It is assumed in general that ARE-flanking sequences can influence ARE-based
regulation itself. For example in the case of the TNFα, ARE phylogenetic analyses of
flanking sequences revealed a high conservation among different species (Fialcowitz
et al., 2005). These flanking sequences might be proximal targets for ARE-BPs and
involved in ARE-mediated regulation (Wilson et al., 2001; Duttagupta et al., 2003). To
test this hypothesis and to further investigate the found ARE-regulated system, single
point mutations were introduced upstream of the c-fos ARE within the 3’ UTR of the
pPICHcfos29+S+S construct. New P. pastoris expression clones were then created
and transcript stability and translation were tested.
4.3.1 Mutational analysis – exchange of one nucleotide upstream of the c-fos
ARE alters mRNA and protein level
To test the influence of ARE-flanking sequences single point mutations were
introduced into the NotI restriction site of construct pPICHcfos29+S+S (fig. 14, A and
B). The additional stop codon moves the NotI restriction site into the 3’ UTR. The
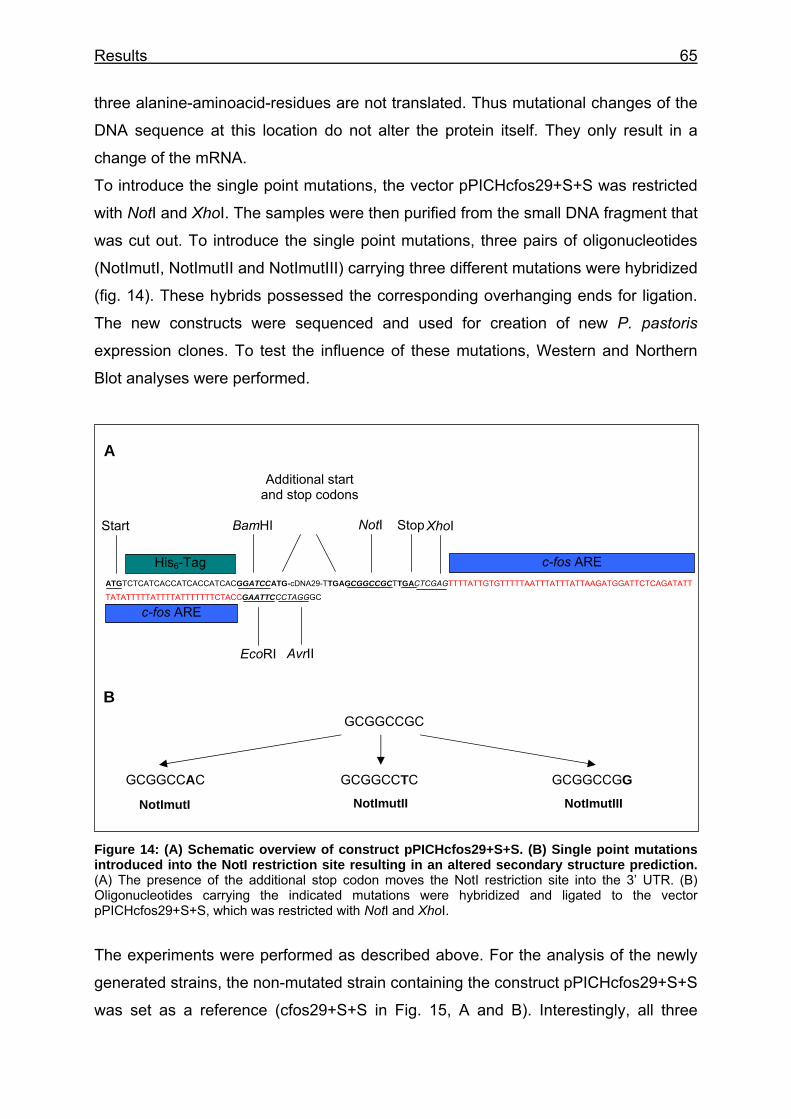
Results 65
three alanine-aminoacid-residues are not translated. Thus mutational changes of the
DNA sequence at this location do not alter the protein itself. They only result in a
change of the mRNA.
To introduce the single point mutations, the vector pPICHcfos29+S+S was restricted
with NotI and XhoI. The samples were then purified from the small DNA fragment that
was cut out. To introduce the single point mutations, three pairs of oligonucleotides
(NotImutI, NotImutII and NotImutIII) carrying three different mutations were hybridized
(fig. 14). These hybrids possessed the corresponding overhanging ends for ligation.
The new constructs were sequenced and used for creation of new P. pastoris
expression clones. To test the influence of these mutations, Western and Northern
Blot analyses were performed.
A
Additional start and stop codons
BamHI Stop XhoI NotI
c-fos ARE
Start
His6-Tag
Fi(Op
T
g
w
ATGTCTCATCACCATCACCATCACGGATCCATG-cDNA29-TTGAGCGGCCGCTTGACTCGAGTTTTATTGTGTTTTTAATTTATTTATTAAGATGGATTCTCAGATATT
TATATTTTTATTTTATTTTTTTCTACCGAATTCCCTAGGGC
c-fos ARE
AvrII EcoRI
B GCGGCCGC
GCGGCCAC GCGGCCTC GCGGCCGG
NotImutII NotImutIII NotImutI
igure 14: (A) Schematic overview of construct pPICHcfos29+S+S. (B) Single point mutations ntroduced into the NotI restriction site resulting in an altered secondary structure prediction. A) The presence of the additional stop codon moves the NotI restriction site into the 3’ UTR. (B) ligonucleotides carrying the indicated mutations were hybridized and ligated to the vector PICHcfos29+S+S, which was restricted with NotI and XhoI.
he experiments were performed as described above. For the analysis of the newly
enerated strains, the non-mutated strain containing the construct pPICHcfos29+S+S
as set as a reference (cfos29+S+S in Fig. 15, A and B). Interestingly, all three
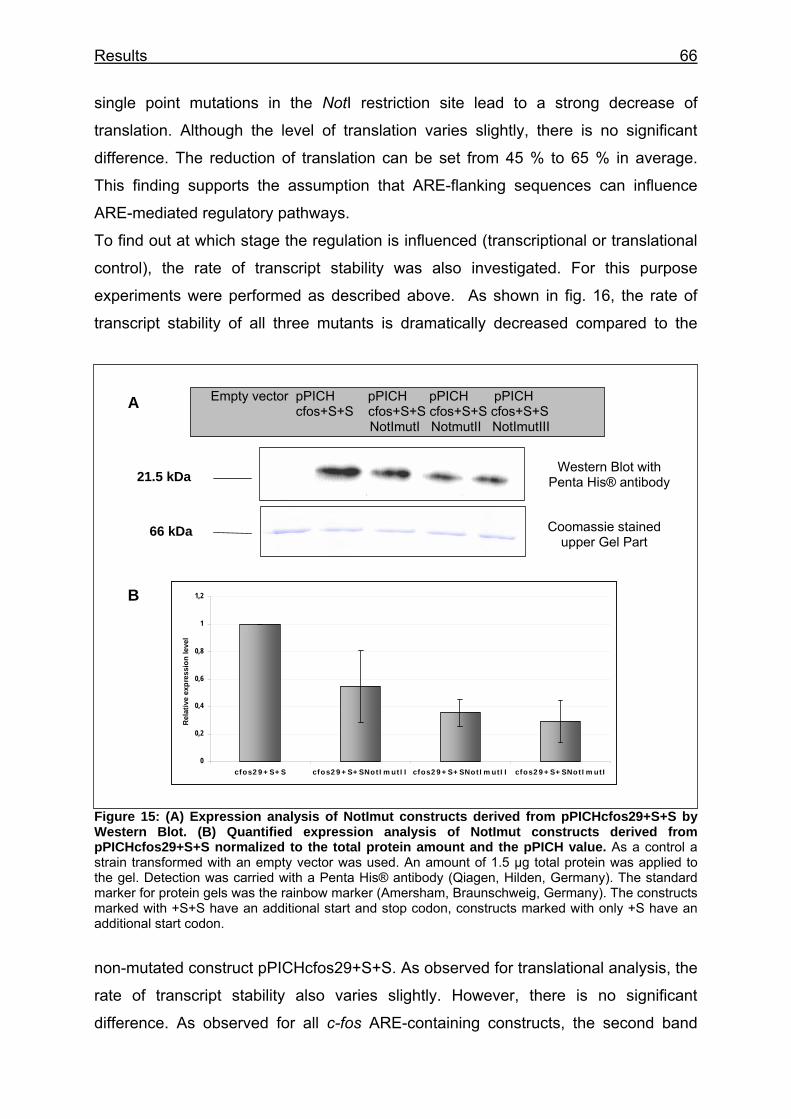
Results 66
single point mutations in the NotI restriction site lead to a strong decrease of
translation. Although the level of translation varies slightly, there is no significant
difference. The reduction of translation can be set from 45 % to 65 % in average.
This finding supports the assumption that ARE-flanking sequences can influence
ARE-mediated regulatory pathways.
To find out at which stage the regulation is influenced (transcriptional or translational
control), the rate of transcript stability was also investigated. For this purpose
experiments were performed as described above. As shown in fig. 16, the rate of
transcript stability of all three mutants is dramatically decreased compared to the
Figure 15: (A) Expression analysis of NotImut constructs derived from pPICHcfos29+S+S by Western Blot. (B) Quantified expression analysis of NotImut constructs derived from pPICHcfos29+S+S normalized to the total protein amount and the pPICH value. As a control a strain transformed with an empty vector was used. An amount of 1.5 µg total protein was applied to the gel. Detection was carried with a Penta His® antibody (Qiagen, Hilden, Germany). The standard marker for protein gels was the rainbow marker (Amersham, Braunschweig, Germany). The constructs marked with +S+S have an additional start and stop codon, constructs marked with only +S have an additional start codon.
non-mutated construct pPICHcfos29+S+S. As observed for translational analysis, the
rate of transcript stability also varies slightly. However, there is no significant
difference. As observed for all c-fos ARE-containing constructs, the second band
66 kDa
Western Blot with Penta His® antibody
Coomassie stained upper Gel Part
21.5 kDa
Empty vector pPICH pPICH pPICH pPICH cfos+S+S cfos+S+S cfos+S+S cfos+S+S NotImutI NotmutII NotImutIII
0
0,2
0,4
0,6
0,8
1
1,2
cfos29+S+S cfos29+S+SNotImutII cfos29+S+SNotImutII cfos29+S+SNotImutI
Rel
ativ
e ex
pres
sion
leve
l
A
B
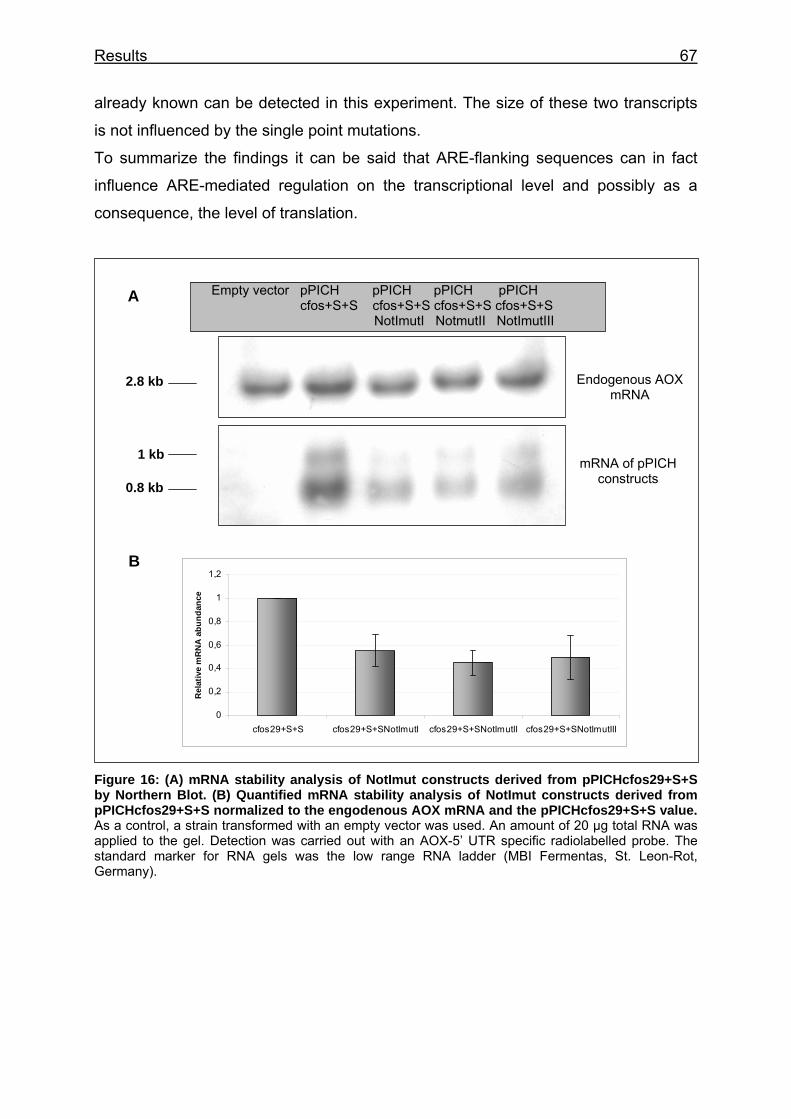
Results 67
already known can be detected in this experiment. The size of these two transcripts
is not influenced by the single point mutations.
To summarize the findings it can be said that ARE-flanking sequences can in fact
influence ARE-mediated regulation on the transcriptional level and possibly as a
consequence, the level of translation.
Empty vector pPICH pPICH pPICH pPICH
Figure 16: (A) mRNA stability analysis of NotImut constructs derived from pPICHcfos29+S+S by Northern Blot. (B) Quantified mRNA stability analysis of NotImut constructs derived from pPICHcfos29+S+S normalized to the engodenous AOX mRNA and the pPICHcfos29+S+S value. As a control, a strain transformed with an empty vector was used. An amount of 20 µg total RNA was applied to the gel. Detection was carried out with an AOX-5’ UTR specific radiolabelled probe. The standard marker for RNA gels was the low range RNA ladder (MBI Fermentas, St. Leon-Rot, Germany).
cfos+S+S cfos+S+S cfos+S+S cfos+S+S NotImutI NotmutII NotImutIII
2.8 kb
0.8 kb
1 kb
A
Endogenous AOX mRNA
mRNA of pPICH constructs
B
0
0,2
0,4
0,6
0,8
1
1,2
cfos29+S+S cfos29+S+SNotImutI cfos29+S+SNotImutII cfos29+S+SNotImutIII
Rel
ativ
e m
RN
A a
bund
ance
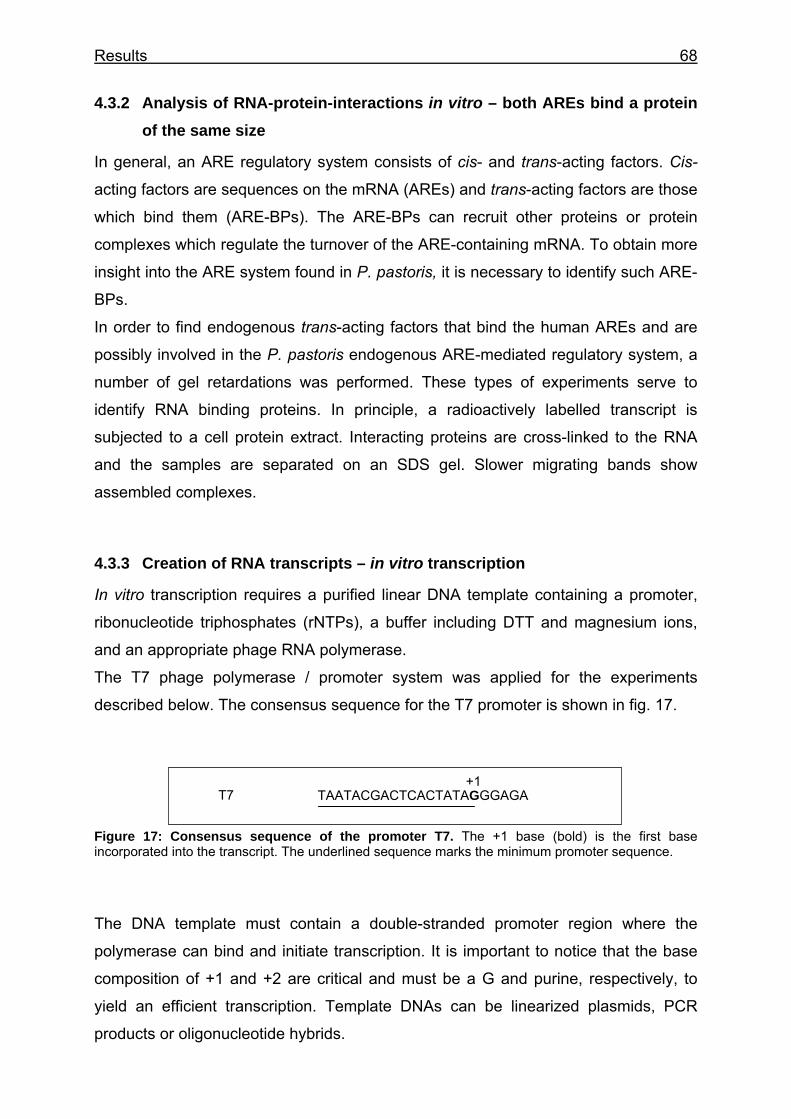
Results 68
4.3.2 Analysis of RNA-protein-interactions in vitro – both AREs bind a protein of the same size
In general, an ARE regulatory system consists of cis- and trans-acting factors. Cis-
acting factors are sequences on the mRNA (AREs) and trans-acting factors are those
which bind them (ARE-BPs). The ARE-BPs can recruit other proteins or protein
complexes which regulate the turnover of the ARE-containing mRNA. To obtain more
insight into the ARE system found in P. pastoris, it is necessary to identify such ARE-
BPs.
In order to find endogenous trans-acting factors that bind the human AREs and are
possibly involved in the P. pastoris endogenous ARE-mediated regulatory system, a
number of gel retardations was performed. These types of experiments serve to
identify RNA binding proteins. In principle, a radioactively labelled transcript is
subjected to a cell protein extract. Interacting proteins are cross-linked to the RNA
and the samples are separated on an SDS gel. Slower migrating bands show
assembled complexes.
4.3.3 Creation of RNA transcripts – in vitro transcription
In vitro transcription requires a purified linear DNA template containing a promoter,
ribonucleotide triphosphates (rNTPs), a buffer including DTT and magnesium ions,
and an appropriate phage RNA polymerase.
The T7 phage polymerase / promoter system was applied for the experiments
described below. The consensus sequence for the T7 promoter is shown in fig. 17.
Figure 17: Consensus sequence of the promoter T7. The +1 base (bold) is the first base incorporated into the transcript. The underlined sequence marks the minimum promoter sequence.
The DNA template must contain a double-stranded promoter region where the
polymerase can bind and initiate transcription. It is important to notice that the base
composition of +1 and +2 are critical and must be a G and purine, respectively, to
yield an efficient transcription. Template DNAs can be linearized plasmids, PCR
products or oligonucleotide hybrids.
TAATACGACTCACTATAGGGAGA +1
T7
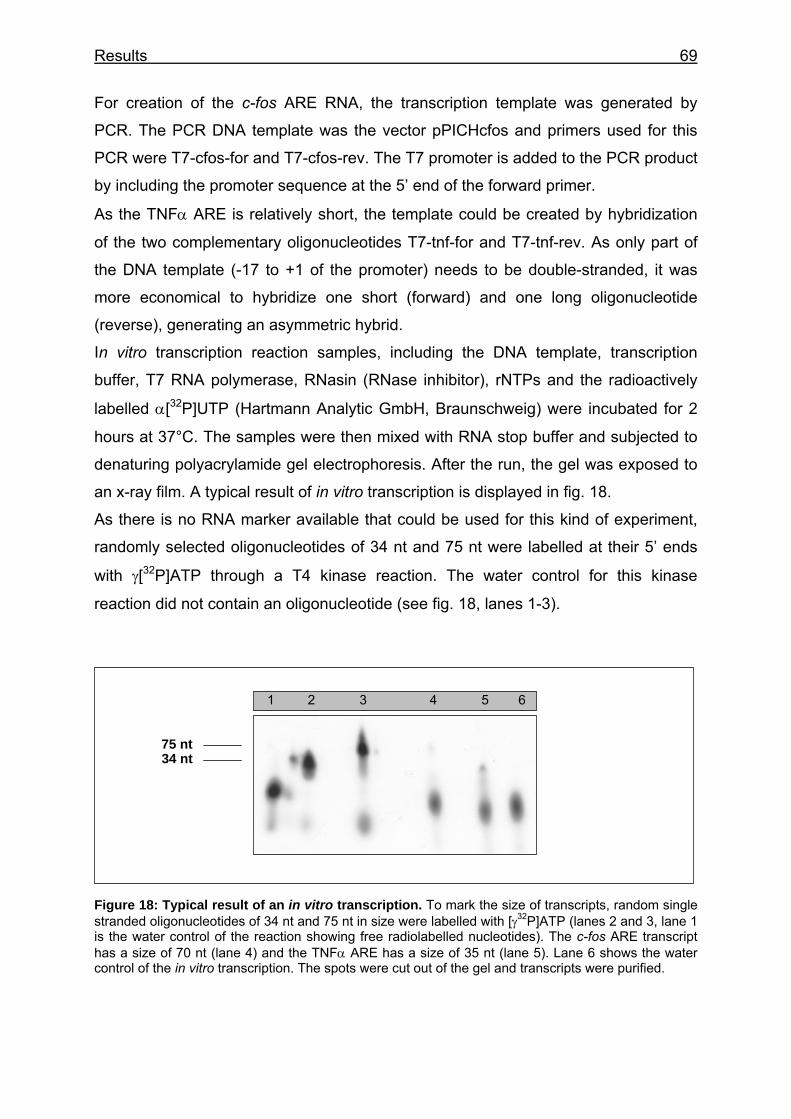
Results 69
For creation of the c-fos ARE RNA, the transcription template was generated by
PCR. The PCR DNA template was the vector pPICHcfos and primers used for this
PCR were T7-cfos-for and T7-cfos-rev. The T7 promoter is added to the PCR product
by including the promoter sequence at the 5’ end of the forward primer.
As the TNFα ARE is relatively short, the template could be created by hybridization
of the two complementary oligonucleotides T7-tnf-for and T7-tnf-rev. As only part of
the DNA template (-17 to +1 of the promoter) needs to be double-stranded, it was
more economical to hybridize one short (forward) and one long oligonucleotide
(reverse), generating an asymmetric hybrid.
In vitro transcription reaction samples, including the DNA template, transcription
buffer, T7 RNA polymerase, RNasin (RNase inhibitor), rNTPs and the radioactively
labelled α[32P]UTP (Hartmann Analytic GmbH, Braunschweig) were incubated for 2
hours at 37°C. The samples were then mixed with RNA stop buffer and subjected to
denaturing polyacrylamide gel electrophoresis. After the run, the gel was exposed to
an x-ray film. A typical result of in vitro transcription is displayed in fig. 18.
As there is no RNA marker available that could be used for this kind of experiment,
randomly selected oligonucleotides of 34 nt and 75 nt were labelled at their 5’ ends
with γ[32P]ATP through a T4 kinase reaction. The water control for this kinase
reaction did not contain an oligonucleotide (see fig. 18, lanes 1-3).
1 2 3 4 5 6
Figure 18: Typical result of an in vitro transcription. To mark the size of transcripts, random single stranded oligonucleotides of 34 nt and 75 nt in size were labelled with [γ32P]ATP (lanes 2 and 3, lane 1 is the water control of the reaction showing free radiolabelled nucleotides). The c-fos ARE transcript has a size of 70 nt (lane 4) and the TNFα ARE has a size of 35 nt (lane 5). Lane 6 shows the water control of the in vitro transcription. The spots were cut out of the gel and transcripts were purified.
34 nt 75 nt
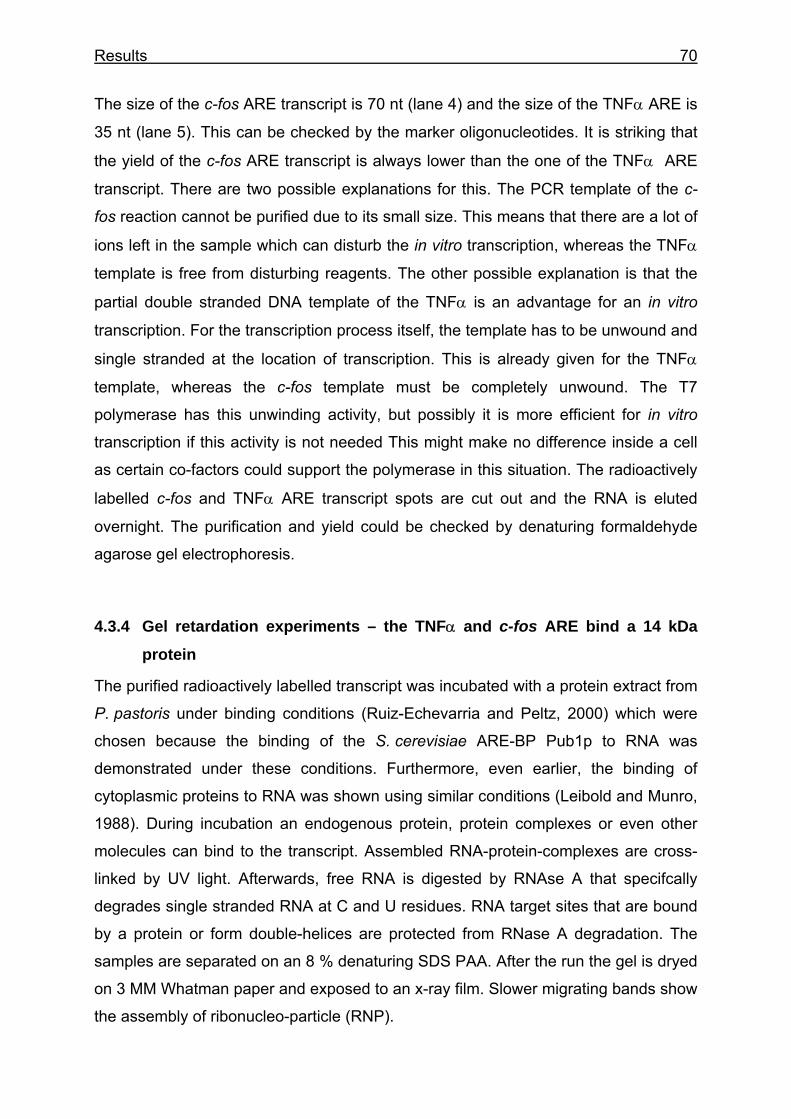
Results 70
The size of the c-fos ARE transcript is 70 nt (lane 4) and the size of the TNFα ARE is
35 nt (lane 5). This can be checked by the marker oligonucleotides. It is striking that
the yield of the c-fos ARE transcript is always lower than the one of the TNFα ARE
transcript. There are two possible explanations for this. The PCR template of the c-
fos reaction cannot be purified due to its small size. This means that there are a lot of
ions left in the sample which can disturb the in vitro transcription, whereas the TNFα
template is free from disturbing reagents. The other possible explanation is that the
partial double stranded DNA template of the TNFα is an advantage for an in vitro
transcription. For the transcription process itself, the template has to be unwound and
single stranded at the location of transcription. This is already given for the TNFα
template, whereas the c-fos template must be completely unwound. The T7
polymerase has this unwinding activity, but possibly it is more efficient for in vitro
transcription if this activity is not needed This might make no difference inside a cell
as certain co-factors could support the polymerase in this situation. The radioactively
labelled c-fos and TNFα ARE transcript spots are cut out and the RNA is eluted
overnight. The purification and yield could be checked by denaturing formaldehyde
agarose gel electrophoresis.
4.3.4 Gel retardation experiments – the TNFα and c-fos ARE bind a 14 kDa
protein
The purified radioactively labelled transcript was incubated with a protein extract from
P. pastoris under binding conditions (Ruiz-Echevarria and Peltz, 2000) which were
chosen because the binding of the S. cerevisiae ARE-BP Pub1p to RNA was
demonstrated under these conditions. Furthermore, even earlier, the binding of
cytoplasmic proteins to RNA was shown using similar conditions (Leibold and Munro,
1988). During incubation an endogenous protein, protein complexes or even other
molecules can bind to the transcript. Assembled RNA-protein-complexes are cross-
linked by UV light. Afterwards, free RNA is digested by RNAse A that specifcally
degrades single stranded RNA at C and U residues. RNA target sites that are bound
by a protein or form double-helices are protected from RNase A degradation. The
samples are separated on an 8 % denaturing SDS PAA. After the run the gel is dryed
on 3 MM Whatman paper and exposed to an x-ray film. Slower migrating bands show
the assembly of ribonucleo-particle (RNP).
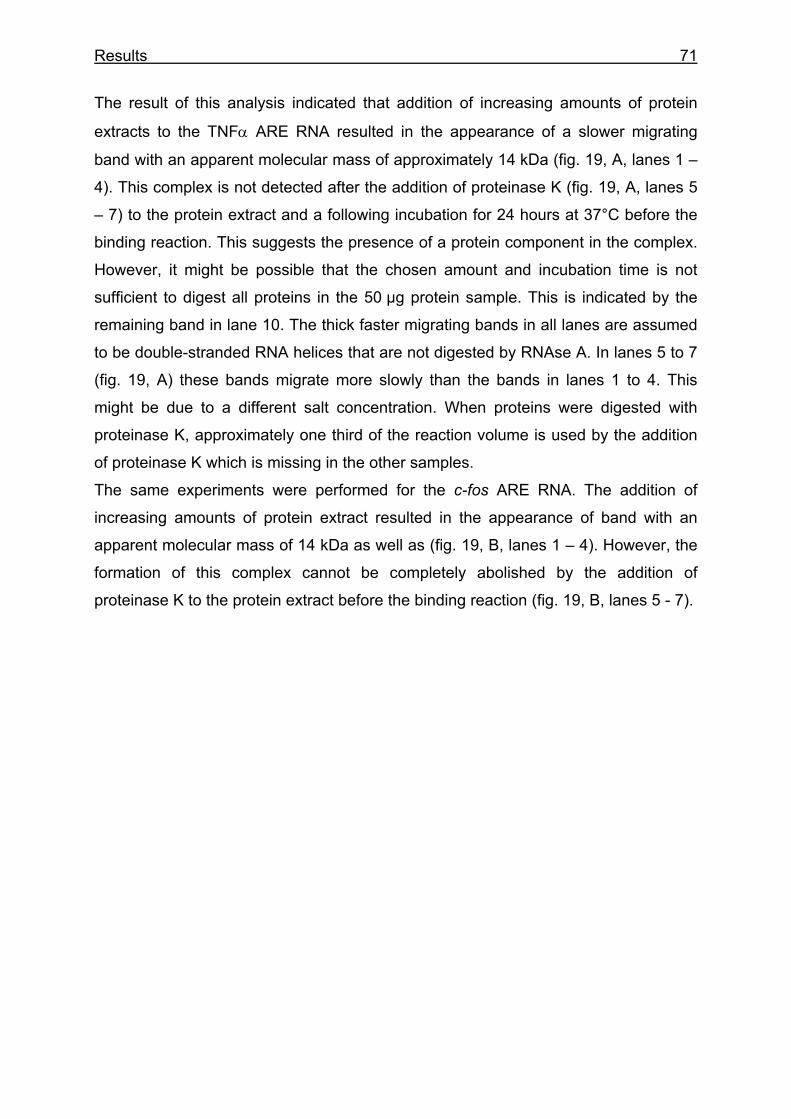
Results 71
The result of this analysis indicated that addition of increasing amounts of protein
extracts to the TNFα ARE RNA resulted in the appearance of a slower migrating
band with an apparent molecular mass of approximately 14 kDa (fig. 19, A, lanes 1 –
4). This complex is not detected after the addition of proteinase K (fig. 19, A, lanes 5
– 7) to the protein extract and a following incubation for 24 hours at 37°C before the
binding reaction. This suggests the presence of a protein component in the complex.
However, it might be possible that the chosen amount and incubation time is not
sufficient to digest all proteins in the 50 µg protein sample. This is indicated by the
remaining band in lane 10. The thick faster migrating bands in all lanes are assumed
to be double-stranded RNA helices that are not digested by RNAse A. In lanes 5 to 7
(fig. 19, A) these bands migrate more slowly than the bands in lanes 1 to 4. This
might be due to a different salt concentration. When proteins were digested with
proteinase K, approximately one third of the reaction volume is used by the addition
of proteinase K which is missing in the other samples.
The same experiments were performed for the c-fos ARE RNA. The addition of
increasing amounts of protein extract resulted in the appearance of band with an
apparent molecular mass of 14 kDa as well as (fig. 19, B, lanes 1 – 4). However, the
formation of this complex cannot be completely abolished by the addition of
proteinase K to the protein extract before the binding reaction (fig. 19, B, lanes 5 - 7).
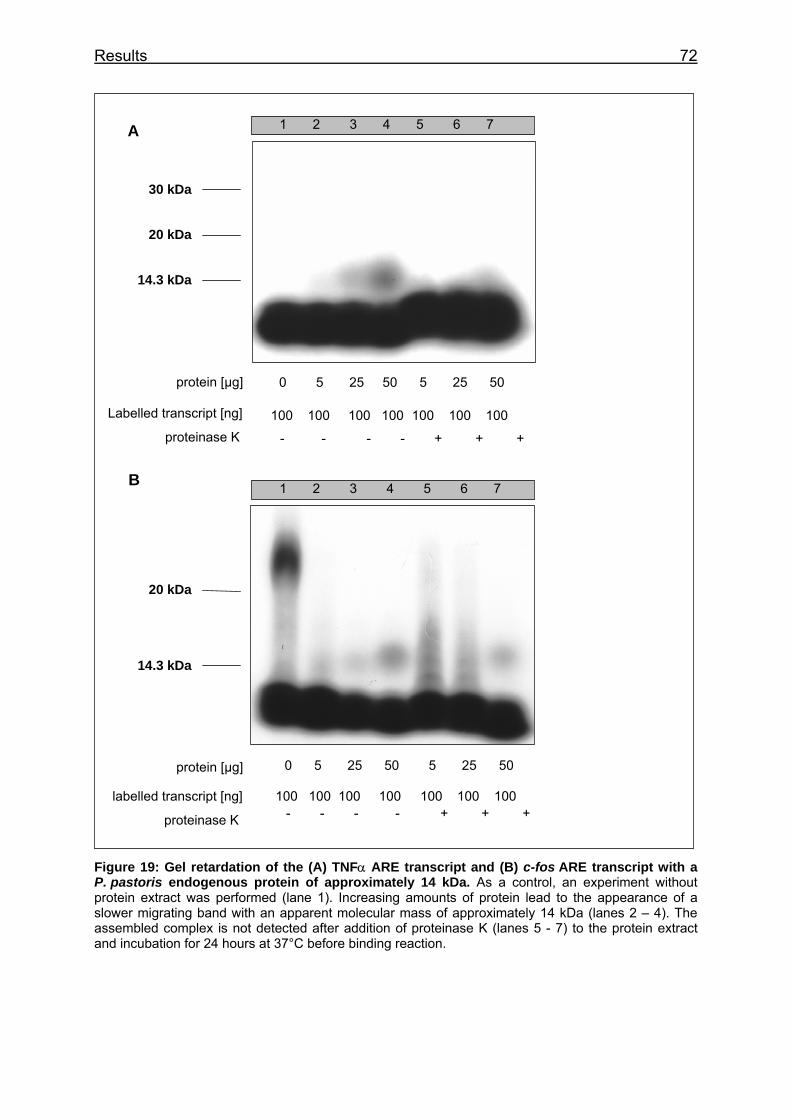
Results 72
1 2 3 4 5 6 7 A
30 kDa
20 kDa
14.3 kDa
protein [µg] 0 5 25 50 5 25 50
Labelled transcript [ng] 100 100 100 100 100 100 100 proteinase K - - - - + + +
B 1 2 3 4 5 6 7
20 kDa
14.3 kDa
0 5 25 50 5 25 50 protein [µg]
labelled transcript [ng] - - - - + + + 100 100 100 100 100 100 100
proteinase K
Figure 19: Gel retardation of the (A) TNFα ARE transcript and (B) c-fos ARE transcript with a P. pastoris endogenous protein of approximately 14 kDa. As a control, an experiment without protein extract was performed (lane 1). Increasing amounts of protein lead to the appearance of a slower migrating band with an apparent molecular mass of approximately 14 kDa (lanes 2 – 4). The assembled complex is not detected after addition of proteinase K (lanes 5 - 7) to the protein extract and incubation for 24 hours at 37°C before binding reaction.
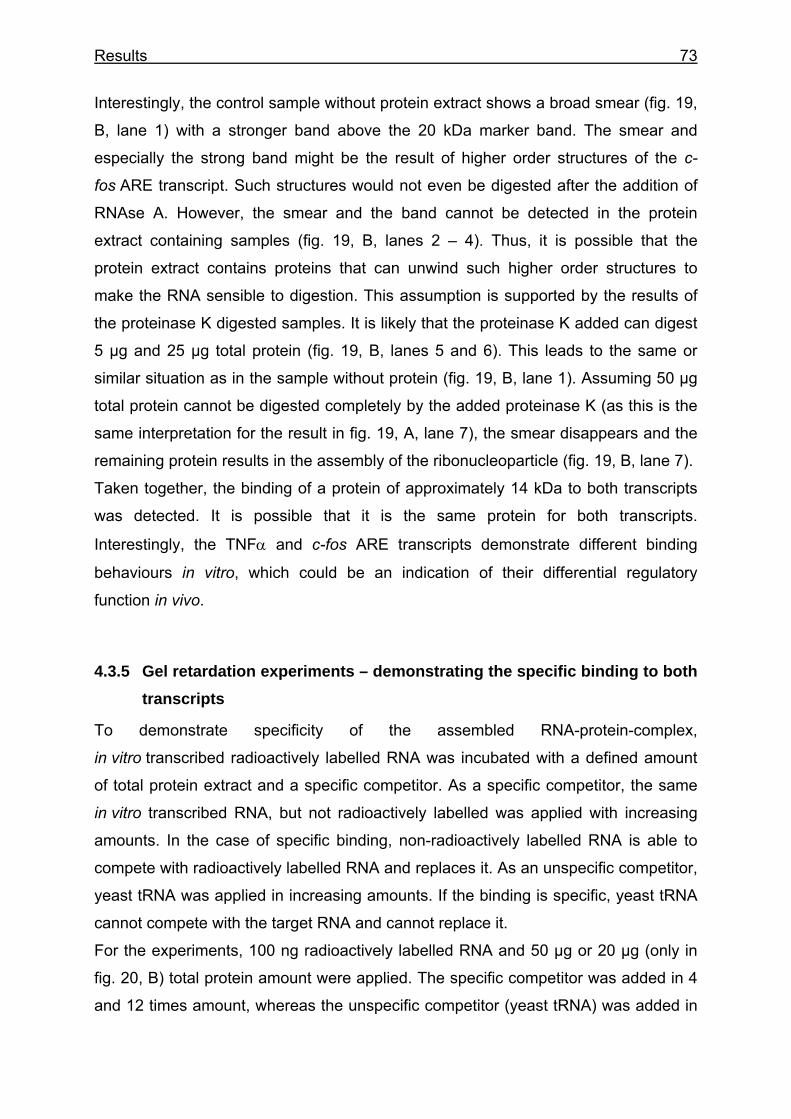
Results 73
Interestingly, the control sample without protein extract shows a broad smear (fig. 19,
B, lane 1) with a stronger band above the 20 kDa marker band. The smear and
especially the strong band might be the result of higher order structures of the c-
fos ARE transcript. Such structures would not even be digested after the addition of
RNAse A. However, the smear and the band cannot be detected in the protein
extract containing samples (fig. 19, B, lanes 2 – 4). Thus, it is possible that the
protein extract contains proteins that can unwind such higher order structures to
make the RNA sensible to digestion. This assumption is supported by the results of
the proteinase K digested samples. It is likely that the proteinase K added can digest
5 µg and 25 µg total protein (fig. 19, B, lanes 5 and 6). This leads to the same or
similar situation as in the sample without protein (fig. 19, B, lane 1). Assuming 50 µg
total protein cannot be digested completely by the added proteinase K (as this is the
same interpretation for the result in fig. 19, A, lane 7), the smear disappears and the
remaining protein results in the assembly of the ribonucleoparticle (fig. 19, B, lane 7).
Taken together, the binding of a protein of approximately 14 kDa to both transcripts
was detected. It is possible that it is the same protein for both transcripts.
Interestingly, the TNFα and c-fos ARE transcripts demonstrate different binding
behaviours in vitro, which could be an indication of their differential regulatory
function in vivo.
4.3.5 Gel retardation experiments – demonstrating the specific binding to both transcripts
To demonstrate specificity of the assembled RNA-protein-complex,
in vitro transcribed radioactively labelled RNA was incubated with a defined amount
of total protein extract and a specific competitor. As a specific competitor, the same
in vitro transcribed RNA, but not radioactively labelled was applied with increasing
amounts. In the case of specific binding, non-radioactively labelled RNA is able to
compete with radioactively labelled RNA and replaces it. As an unspecific competitor,
yeast tRNA was applied in increasing amounts. If the binding is specific, yeast tRNA
cannot compete with the target RNA and cannot replace it.
For the experiments, 100 ng radioactively labelled RNA and 50 µg or 20 µg (only in
fig. 20, B) total protein amount were applied. The specific competitor was added in 4
and 12 times amount, whereas the unspecific competitor (yeast tRNA) was added in
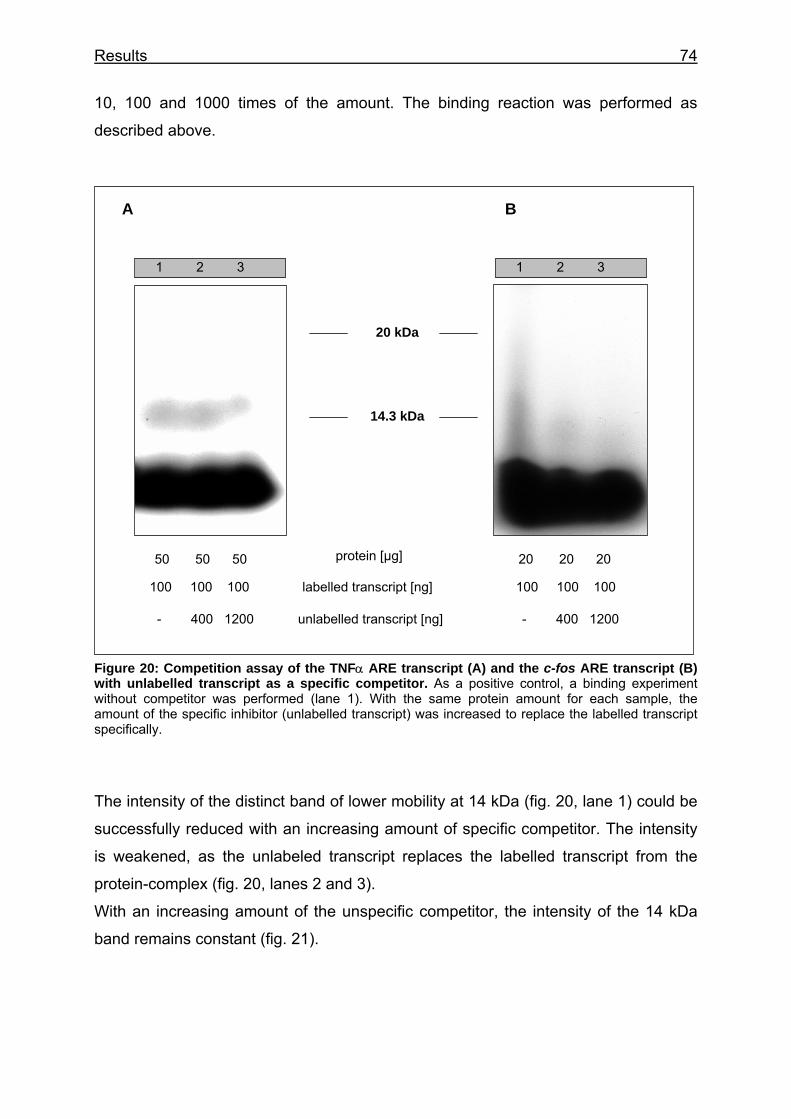
Results 74
10, 100 and 1000 times of the amount. The binding reaction was performed as
described above.
A B
1 2 3 1 2 3
14.3 kDa
20 kDa
protein [µg] 20 20 20 50 50 50
100 100 100 labelled transcript [ng] 100 100 100
- 400 1200 unlabelled transcript [ng] - 400 1200
Figure 20: Competition assay of the TNFα ARE transcript (A) and the c-fos ARE transcript (B) with unlabelled transcript as a specific competitor. As a positive control, a binding experiment without competitor was performed (lane 1). With the same protein amount for each sample, the amount of the specific inhibitor (unlabelled transcript) was increased to replace the labelled transcript specifically.
The intensity of the distinct band of lower mobility at 14 kDa (fig. 20, lane 1) could be
successfully reduced with an increasing amount of specific competitor. The intensity
is weakened, as the unlabeled transcript replaces the labelled transcript from the
protein-complex (fig. 20, lanes 2 and 3).
With an increasing amount of the unspecific competitor, the intensity of the 14 kDa
band remains constant (fig. 21).
Results 75
A B 1 2 3 4 1 2 3 4
Figure 21: Competition assay of the TNFα ARE transcript (A) and the c-fos ARE transcript (B) with yeast tRNA as an unspecific competitor. As a positive control, a binding experiment without tRNA was performed (lane 1).
In summary, the complex assembly is very specific for the tested RNAs, also for both
the TNFα and the c-fos ARE transcript as the signal can be reduced by a specific
competitor and as it fails to assemble on the non-specific yeast tRNA. These results
demonstrate that the TNFα ARE and c-fos RNA are able to interact with at least one
cellular protein of P. pastoris and form an RNP.
14.3 kDa
20 kDa
protein [µg] 50 50 50 50 50 50 50 50
labelled transcript [ng] 100 100 100 100 100 100 100 100
yeast tRNA [µg] - 1 10 100 - 1 10 100
Discussion 76
5 Discussion The subject of this thesis is the analysis of AU rich elements in the yeast P. pastoris
and is divided into two major parts. In the first part, the effects of AREs in the yeast
P. pastoris were determined. A heterologous system for analysis was developed for
this purpose. In the second part, the ARE-mediated regulatory effects on transcript
stability and translation found were further characterized. It is shown that ARE-
flanking sequences and structures can have a strong effect on the regulation of an
ARE-containing transcript. In addition, an endogenous P. pastoris ARE-BP, which
binds specifically to ARE-RNA, could be detected.
5.1 The ARE-based regulatory pathway is conserved among eukaryotes – also in P. pastoris
The tight regulation of transcription and translation is essential for the control of gene
expression (Mitchell and Tollervey, 2000; Barreau et al., 2005). A large number of
mRNAs encoding cytokines, growth factors and proto-oncogenes display regulation
depending on AREs located in the 3’ UTR of their transcripts. Such transcripts are
targeted for degradation in normal resting or unstimulated cells leading to a low level
of translation. In response to intra- or extracellular stimuli, transcripts containing
AREs can be rapidly stabilized and the cell can adapt its gene expression pattern to
the new conditions (Wodnar-Filipowicz and Moroni, 1990; Levy et al., 1998;
Bevilacqua et al., 2003). Destabilization and stabilization ARE-mediated through the
interplay with specific ARE-BPs, of which a large number has been identified till date
(Barreau et al., 2005). However, despite efforts in this field the mechanical basis of
ARE-mediated mRNA instability remains unclear. The regulation based on AREs and
ARE-BPs is widespread among eukaryotes (Fan and Steitz, 1998b), it is even also
present in the yeast S. cerevisiae (Vasudevan and Peltz, 2001). Evidence for an ARE
system in the yeast P. pastoris is provided in this thesis. The unravelled
characteristics of this system demonstrate strong similarities to consolidated findings
in other organisms.
Discussion 77
5.1.1 Identical AREs can have different effects – like in mammals
In the literature AREs are described as destabilizing elements located in the mRNA
3’ UTR of so called early response genes. Cloning AREs into the 3’ UTR of a reporter
transcript triggers rapid degradation (Shaw and Kamen, 1986; Fan and Steitz, 1998b;
Cok et al., 2003). In addition, AREs can play a role in translational efficiency of target
mRNAs (Piecyk et al., 2000; Zhang et al., 2002). Once cells are exposed to specific
extracellular signals, the same AREs are required for transcript stabilization and/or
increased translational efficiency.
In order to analyse AREs in the yeast P. pastoris the human c-fos and TNFα AREs
were cloned into the 3’ UTR of different reporters. These reporter constructs were
used to generate P. pastoris strains. Analysis of these newly generated strains
demonstrated the functionality of AREs in the yeast P. pastoris. Stabilizing and
destabilizing effects as well as translational repression were observed. These effects
could be distinguished from simple coding sequence modifications, which only result
in a change of translational efficiency. The data is characterized by considerable
similarities to the ARE effects already known from other eukaryotes, and thus an
ARE-mediated regulation of transcript stability and translation in the yeast P. pastoris
is evident.
When analysing reporter cDNA 45 strains it became obvious that the cloned AREs
have the capacity to significantly decrease mRNA stability by approximately 60% to
70% compared to the reference without an ARE in the cDNA’s 3’ UTR. Most probably
as a consequence of this, translation is also decreased in the same range as well
(fig. 21, A). This data suggests that the reduced accumulation levels of cDNA 45
mRNA is due to a posttranscriptional event. Reduced transcript stability is
characteristic for AREs. This is triggered by the binding of a destabilizing ARE-BP,
which can recruit a set of mRNA degrading enzymes, which is called the exosome, in
the cytosol. The exosome is a 300-400 kDa complex consisting of 11 proteins which
degrade ARE-containing transcripts in 3’-to-5’ direction and thus lead to a lower
transcript half life (Chen et al., 2001). The Strep II protein modification alters protein
expression. In general it is accepted that protein tags change protein charge and/or
solubility (Braun et al., 2002), which results in different protein accumulation. A
positive or negative influence on protein expression cannot be predicted. To clarify
influence on translation of both, protein modification and AREs, translational
repression/activation was additionally calculated. For this purpose protein expression
Discussion 78
was normalized to the corresponding mRNA stability values. A factor of 1 displays no
change on the translational level, whereas a factor 1.5 (or higher) and 0.5 (or lower)
was defined to be significant for translational activation or repression, respectively.
The data demonstrates that there is no influence on translation in the case of the
AREs for this reporter. In contrast, the addition of the Strep II tag modification results
in an approximately 1.5 times protein expression level.
The results of reporter cDNA 205 strains are different. The insertion of the AREs
does not affect mRNA stability of the reporter at all. Both ARE-modifications only lead
to a significantly reduced protein expression by 60% to 70% compared to the
reference without an ARE in its 3’ UTR (fig. 21, C) suggesting a regulatory effect on
translation. A significant translational repression of more than 50% can be calculated
(fig. 21, D). It is known that a direct correlation between translation and transcription
cannot always be observed. HuR, for example, can bind to TNFα or Cox-2 mRNA.
While increasing stability of the ARE-containing transcript, translation is decreased
(Katsanou et al., 2005). However, it is interesting that the inserted ARE sequences
have different effects on different reporters. The Strep II tag modification only results
in a change of translation as it could be observed before for cDNA 45 previously.
Surprisingly, insertion of the c-fos ARE does not result in a rapid change of mRNA
stability or protein expression for reporter cDNA 29 (fig. 22, A, pPICHcfos+S+S) as
could be observed for the two other reporters (fig. 21). In every performed experiment
protein expression is slightly lower and mRNA stability is slightly higher than the
reference without an ARE (fig. 22, A, pPICH+S+S). This finding suggests another
method of c-fos ARE regulation for this reporter.
Insertion of the TNFα ARE element results in a strong down regulation of transcript
stability (pPICHtnf+S+S) and as a result, expression from that protein is also
decreased. Transcript stability and translational rates are not reduced in the same
range. However, the difference is defined not to be significant (fig. 22, B).
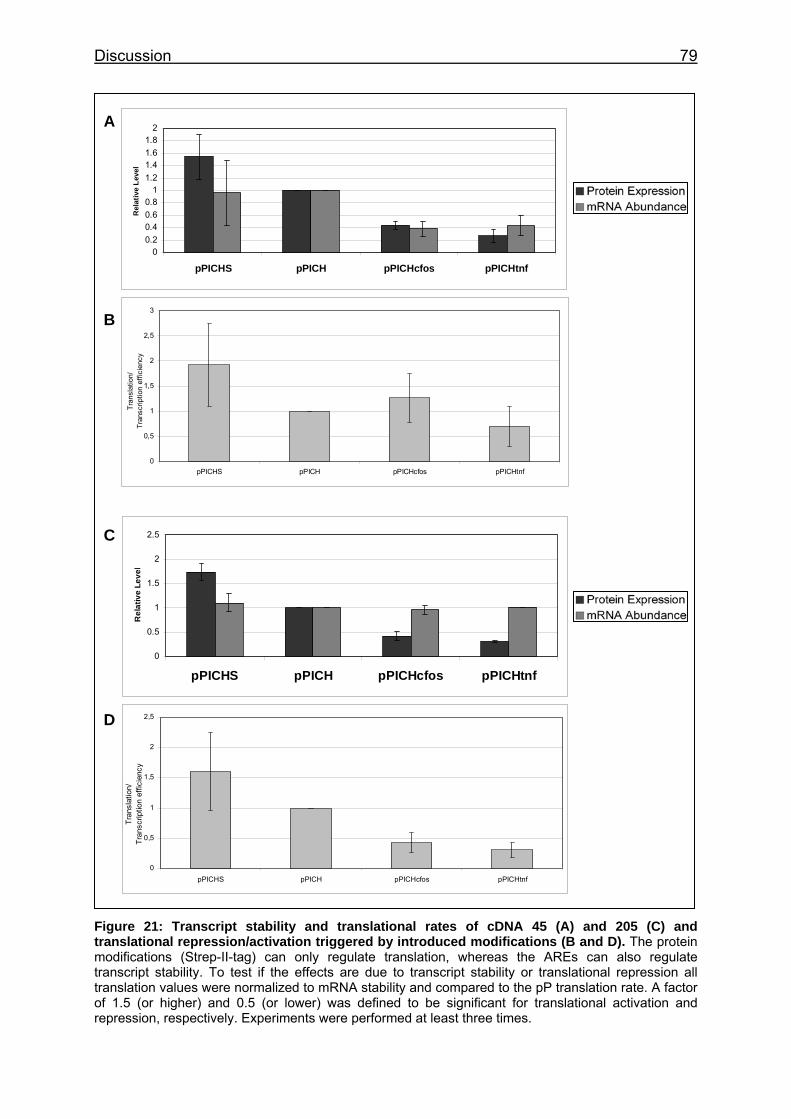
Discussion 79
0
0,5
1
1,5
2
2,5
pPICHS pPICH pPICHcfos pPICHtnf
Tran
slat
ion/
Tr
ansc
riptio
n ef
ficie
ncy
0
0,5
1
1,5
2
2,5
3
pPICHS pPICH pPICHcfos pPICHtnf
Tran
slat
ion/
Tran
scrip
tion
effic
ienc
y
0
0.5
1
1.5
2
2.5
pPICHS pPICH pPICHcfos pPICHtnf
Rel
ativ
e Le
vel
00.20.40.60.8
11.21.41.61.8
2
pPICHS pPICH pPICHcfos pPICHtnf
Rel
ativ
e Le
vel
A
B
C
D
Figure 21: Transcript stability and translational rates of cDNA 45 (A) and 205 (C) and translational repression/activation triggered by introduced modifications (B and D). The protein modifications (Strep-II-tag) can only regulate translation, whereas the AREs can also regulate transcript stability. To test if the effects are due to transcript stability or translational repression all translation values were normalized to mRNA stability and compared to the pP translation rate. A factor of 1.5 (or higher) and 0.5 (or lower) was defined to be significant for translational activation and repression, respectively. Experiments were performed at least three times.
Discussion 80
The additional stop codon was removed (fig. 22, A, pPICHcfos/tnf+S) to test if the
three additional amino acid residues encoded by the NotI restriction site (see fig. 14)
have any detectable influence on ARE-dependent regulation (fig. 22, A,
pPICHcfos/tnf+S). The modification led to a further translational repression and to a
non-detectable level of protein for both constructs, which means a far stronger
reduction in the case of the c-fos ARE-containing reporter. Interestingly, mRNA
stability of the c-fos reporter is reduced by half in comparison to the c-fos reporter
including the additional stop, whereas mRNA stability of the TNFα construct without
the additional stop codon does not show a significant change. Comparing the non-
ARE construct containing strains, the major change observed is in the protein
expression level. The removal of the additional start and stop codons (fig. 22,
pPICH) leads to a strong decrease of translation, whereas mRNA stability remains at
the same level. Although this step includes two modifications, it can be assumed that
the additional stop codon can play an important role in the rapid change in
translation, whereas the additional start codon only has a subordinated role. This
assumption is consistent with the observation that the removal of the additional stop
codon in the case of the ARE-containing constructs leads to a strong down regulation
of translation. It is likely that similar, or even the same effects, are observed. The
Strep II tag modification does not lead to a significant change in transcript stability,
although it shows a high variation (pPICHS). This variation has also been reported for
protein expression. However, the additional Strep II tag increases protein expression
as has been observed for all other reporters. To determine whether translational
activation or repression plays a role in all of these observations protein expression
was normalized to the corresponding mRNA stability values (fig. 22, B) as described
above. The insertion of the c-fos and TNFα ARE results in a slight translational
repression, which is defined not to be significant (pPICHcfos/tnf+S+S), whereas the
removal of the additional stop codon results in a significant repression
(pPICHcfos/tnf+S).
For historical reasons AREs are known as destabilizing elements that provoke
degradation of the host mRNA. However, depending on a precise stimulus, the
presence of an ARE can also lead to the stabilization of an mRNA. In this context
attention was drawn to ARE-BPs which are mediators of these effects. ARE-BPs
such as TTP, AUF1 and HuR are expressed at a certain stage in the cell cycle or due
to a certain stimulus. In this way they are able to act on different species of ARE-
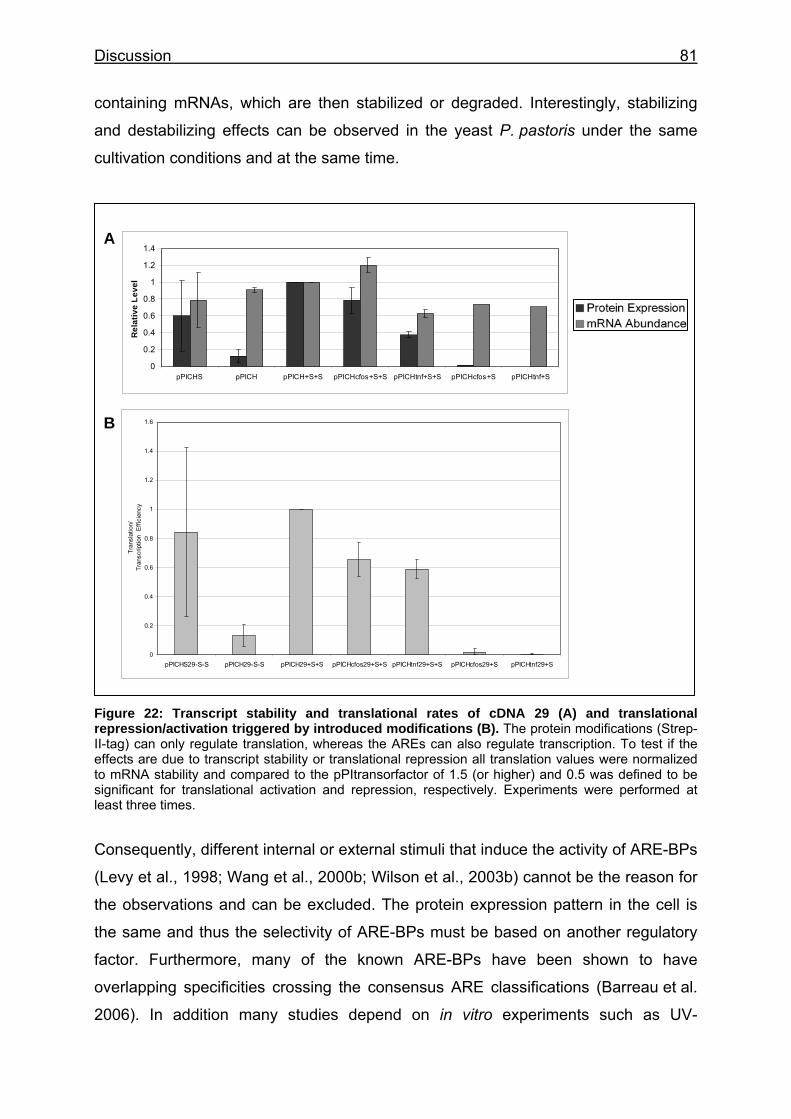
Discussion 81
containing mRNAs, which are then stabilized or degraded. Interestingly, stabilizing
and destabilizing effects can be observed in the yeast P. pastoris under the same
cultivation conditions and at the same time.
A
0
0.2
0.4
0.6
0.8
1
1.2
1.4
1.6
pPICHS29-S-S pPICH29-S-S pPICH29+S+S pPICHcfos29+S+S pPICHtnf29+S+S pPICHcfos29+S pPICHtnf29+S
Tran
slat
ion/
Tran
scrip
tion
Effi
cien
c y
0
0.2
0.4
0.6
0.8
1
1.2
1.4
pPICHS pPICH pPICH+S+S pPICHcfos+S+S pPICHtnf+S+S pPICHcfos+S pPICHtnf+S
Rel
ativ
e Le
vel
B
Figure 22: Transcript stability and translational rates of cDNA 29 (A) and translational repression/activation triggered by introduced modifications (B). The protein modifications (Strep-II-tag) can only regulate translation, whereas the AREs can also regulate transcription. To test if the effects are due to transcript stability or translational repression all translation values were normalized to mRNA stability and compared to the pPItransorfactor of 1.5 (or higher) and 0.5 was defined to be significant for translational activation and repression, respectively. Experiments were performed at least three times.
Consequently, different internal or external stimuli that induce the activity of ARE-BPs
(Levy et al., 1998; Wang et al., 2000b; Wilson et al., 2003b) cannot be the reason for
the observations and can be excluded. The protein expression pattern in the cell is
the same and thus the selectivity of ARE-BPs must be based on another regulatory
factor. Furthermore, many of the known ARE-BPs have been shown to have
overlapping specificities crossing the consensus ARE classifications (Barreau et al.
2006). In addition many studies depend on in vitro experiments such as UV-
Discussion 82
crosslinking assays. Only a relatively small number of experiments have studied the
associations between endogenous ARE-mRNAs and ARE-BPs. Some of these
studies mention or discuss the involvement of ARE-flanking sequences in the binding
of ARE-BPs to their target mRNAs. For example, in the case of the TNFα ARE
phylogenetic analyses of flanking sequences revealed a high conservation among
different species (Fialcowitz et al., 2005). It is hypothesized that such flanking
sequences might be proximal targets for ARE-BPs and involved in ARE-mediated
regulation (Wilson et al., 2001; Duttagupta et al., 2003). Furthermore, it is known that
the ARE secondary structure can also be a criterion for ARE-BP selectivity.
5.2 Stem-loop structures are critical factors for transcript stability and translation
RNA molecules can form different structures of high complexity. The most important
structural element of RNA is the A-form double helix, which is dominant in RNA
stems. However, a simple A-form RNA stem is not a RNA motif. Motifs change their
conformation if residues are added or deleted, whereas A-form stems can only differ
in length (Svoboda and Di Cara, 2006).
Hairpins or stem-loops consist of an A-form helix with not only internal loops or
bulges but also terminal loops. The structure of a RNA hairpin depends on several
parameters such as loop size, stem length and the number of bulges among others
(fig. 23).
It has been reported that RNA hairpins can regulate stability, translation and
localization of its target mRNA, as was shown for the ARE-containing interleukin-6
and c-myc transcripts (Chabanon et al., 2005; Paschoud et al., 2006). As a
consequence, it is generally accepted that the functionality of AREs depends on
different ARE-BPs, and additionally, also on the sequence accessibility as well.
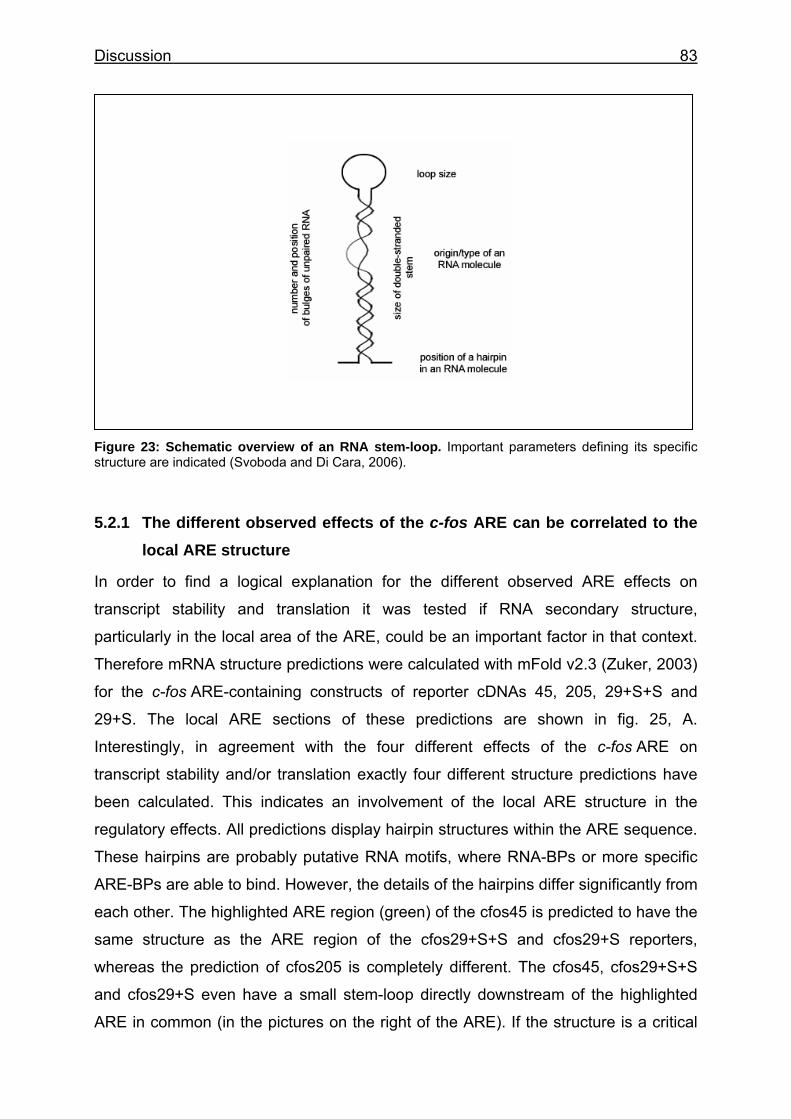
Discussion 83
Figure 23: Schematic overview of an RNA stem-loop. Important parameters defining its specific structure are indicated (Svoboda and Di Cara, 2006).
5.2.1 The different observed effects of the c-fos ARE can be correlated to the local ARE structure
In order to find a logical explanation for the different observed ARE effects on
transcript stability and translation it was tested if RNA secondary structure,
particularly in the local area of the ARE, could be an important factor in that context.
Therefore mRNA structure predictions were calculated with mFold v2.3 (Zuker, 2003)
for the c-fos ARE-containing constructs of reporter cDNAs 45, 205, 29+S+S and
29+S. The local ARE sections of these predictions are shown in fig. 25, A.
Interestingly, in agreement with the four different effects of the c-fos ARE on
transcript stability and/or translation exactly four different structure predictions have
been calculated. This indicates an involvement of the local ARE structure in the
regulatory effects. All predictions display hairpin structures within the ARE sequence.
These hairpins are probably putative RNA motifs, where RNA-BPs or more specific
ARE-BPs are able to bind. However, the details of the hairpins differ significantly from
each other. The highlighted ARE region (green) of the cfos45 is predicted to have the
same structure as the ARE region of the cfos29+S+S and cfos29+S reporters,
whereas the prediction of cfos205 is completely different. The cfos45, cfos29+S+S
and cfos29+S even have a small stem-loop directly downstream of the highlighted
ARE in common (in the pictures on the right of the ARE). If the structure is a critical
Discussion 84
factor in this system the binding of a different protein to cfos205 ARE and to the c-
fos ARE structure in cfos45, cfos29+S+S and cfos29+S is a logical consequence.
However, this cannot explain all the effects observed. The involvement in binding
selectivity of ARE-BPs of neighbouring hairpins is very likely. Cfos45 has no
additional stem-loops whereas the prediction of cfos29+S+S shows a large hairpin
directly upstream of the ARE (hairpin B), a second one even further upstream
(hairpin C) and a third one (hairpin D) downstream of the hairpin the three c-fos
constructs have in common. This high number of additional hairpins most probably
strongly influences the accessibility of the ARE itself, and thus can possibly modulate
the binding of an ARE-BP or of an RNA-BP proximal to the ARE. Examining the
hairpins of cfos29+S, it turns out that hairpin C is also present. This hairpin very likely
does not play a role in the regulation in contrast to the newly predicted hairpin A of
cfos29+S. This one possibly influences the assembly of the same protein complex to
the ARE like in cfos29+S+S and resulting from that the formation of hairpin A seems
to alter transcript stability and translation as well in an ARE-dependent manner.
In summary the results suggest a direct involvement of the RNA secondary structure
flanking the ARE resulting in different effects on transcript stability and translation.
These effects are most likely mediated by different ARE-BPs, whose binding is
selected by the discovered secondary structure binding motifs. Focussing on the
mRNA secondary structure as the only critical regulatory aspect, it must not be
disregarded that there may also be observed influences due to the protein
modification from construct cfos29+S+S to cfos29+S. In addition, the global structure
of each special mRNA molecule may have an influence on its turnover or regulation.
In order to rule out such influences attention in the next experiments was drawn to
cDNA 29 reporter constructs.
5.2.2 Exchange of one nucleotide upstream of the c-fos ARE alters structure, mRNA and protein level of the pPICHcfos29+S+S reporter
In order to test if the predicted structures are really involved in ARE-BP selectivity
and thus in the regulation of transcript stability and/or translation, a number of single-
point mutations within the NotI restriction site of reporter pPICHcfos29+S+S was
introduced. Changing nucleotides within this sequence does not change the protein
primary structure as it is located in the 3’ UTR (see fig. 14 for details). Interestingly,
all three single-point mutations lead to a rapid downregulation of transcript stability
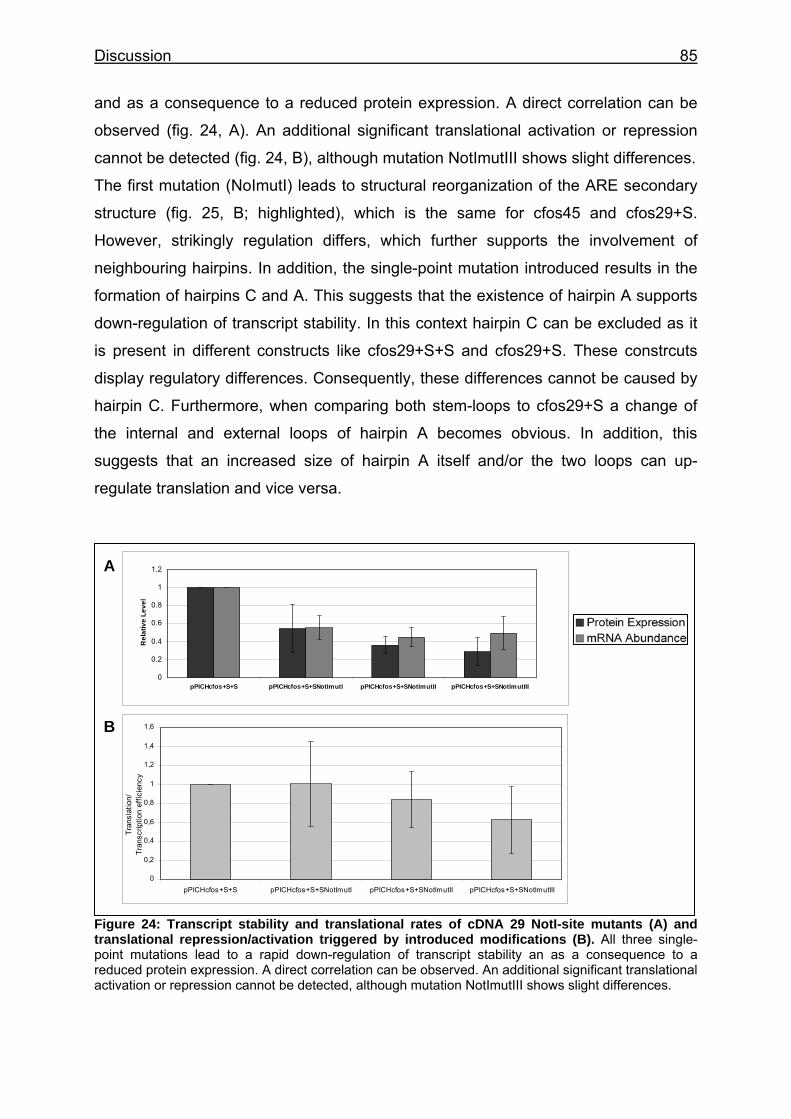
Discussion 85
and as a consequence to a reduced protein expression. A direct correlation can be
observed (fig. 24, A). An additional significant translational activation or repression
cannot be detected (fig. 24, B), although mutation NotImutIII shows slight differences.
The first mutation (NoImutI) leads to structural reorganization of the ARE secondary
structure (fig. 25, B; highlighted), which is the same for cfos45 and cfos29+S.
However, strikingly regulation differs, which further supports the involvement of
neighbouring hairpins. In addition, the single-point mutation introduced results in the
formation of hairpins C and A. This suggests that the existence of hairpin A supports
down-regulation of transcript stability. In this context hairpin C can be excluded as it
is present in different constructs like cfos29+S+S and cfos29+S. These constrcuts
display regulatory differences. Consequently, these differences cannot be caused by
hairpin C. Furthermore, when comparing both stem-loops to cfos29+S a change of
the internal and external loops of hairpin A becomes obvious. In addition, this
suggests that an increased size of hairpin A itself and/or the two loops can up-
regulate translation and vice versa.
0
0,2
0,4
0,6
0,8
1
1,2
1,4
1,6
pPICHcfos+S+S pPICHcfos+S+SNotImutI pPICHcfos+S+SNotImutII pPICHcfos+S+SNotImutIII
Tran
slat
ion/
Tr
ansc
riptio
n ef
ficie
ncy
0
0.2
0.4
0.6
0.8
1
1.2
pPICHcfos+S+S pPICHcfos+S+SNotImutI pPICHcfos+S+SNotImutII pPICHcfos+S+SNotImutIII
Rel
ativ
e Le
vel
A
B
Figure 24: Transcript stability and translational rates of cDNA 29 NotI-site mutants (A) and translational repression/activation triggered by introduced modifications (B). All three single-point mutations lead to a rapid down-regulation of transcript stability an as a consequence to a reduced protein expression. A direct correlation can be observed. An additional significant translational activation or repression cannot be detected, although mutation NotImutIII shows slight differences.
Discussion 86
This assumption is further supported by the introduction of the second mutation
(NotImutII). Hairpins C and A are fused to a large stem-loop structure at the same
location as hairpin A before. In this construct hairpin A is even larger than in mutant
NotImutI. Most probably this specifically enlarged hairpin inhibits the binding of a
RNA-BP that can repress translation as observed for construct cfos29+S. This
perfectly agrees with the structure and the regulatory effects of cfos45. If a large
hairpin A inhibits the formation or binding of a protein complex and a small one
promotes binding at or near the ARE, this protein complex will not bind to the cfos45
ARE structure because hairpin A is not present. This means the same effect for a
large hairpin A or its absence, leading to the inhibition of the binding of a translational
repressor.
The third mutation (NotImutIII) does not reorganize the ARE structure when
compared to the two previous mutations. In this case, the size of both loops of hairpin
B is altered, particularly the size of the terminal loop. Interestingly, mRNA stability is
decreased in the same range as in NotImutI and NotImutII. However, translation
differs slightly from the rate of transcript stability. This data suggests that hairpin B
plays a putative role in the c-fos ARE regulation. It is likely that the different
structures lead to similar results, but are bound by different RNA-BPs. This
completely agrees with the observations and explanations made for the c-fos ARE
constructs in fig. 25, A.
It can be summarized that binding selectivity of RNA-BPs of the analysed c-fos ARE
constructs can be directly related to the ARE or ARE-flanking structures. It is most
likely that the cDNA 205 c-fos ARE is bound by a completely different protein or
protein complex. The cDNA 45 and cDNA 29 reporter constructs exhibit different
regulatory backgrounds, which can be traced back to hairpins A and B, whose
existence and size is critical for the ARE-mediated effects.
5.2.3 The identified stem-loop (hairpin A) can influence translation of non-
ARE, TNFα ARE and c-fos ARE-containing transcripts
Compared to the c-fos ARE structure the TNFα ARE forms a predicted hairpin with
one or two internal and one terminal loop (fig. 25, C and D) in all constructs.
However, different regulatory effects are observed. This also suggests neighbouring
structures are in involved, as shown for the c-fos ARE. Interestingly, a particular
Discussion 87
TNFα ARE-containing constructs of reporter cDNA 29 (tnf29+S) displays the
predicted hairpin A that has already been shown to be essential for c-fos ARE
regulation. Interestingly, in this TNFα construct hairpin A only has also an effect on
translation. Additionally, the large (fused) terminal loop of hairpin A in tnf29+S+S
does not lead to a significant translational repression (fig. 22, B), whereas the small
terminal loop of hairpin A in tnf29+S does as could be observed for the c-fos ARE
constructs. Nevertheless, it is noteworthy that the removal of the additional stop
codon also changes the protein primary structure, as in the case of the cfos29+S
reporter. It is much more likely that the structural mRNA motifs in this system play an
essential role, however. This is supported by the structure predictions (the start of the
3’ UTR is highlighted in green, there is no ARE present) of the non-ARE-containing
constructs of reporter cDNA 29 (fig. 25, C), which also display hairpin A. In the case
of cDNA 29-S-S, translation is almost completely repressed. This is an additional
indication of what the function of hairpin A is. If it is small, translation is repressed in
non-ARE-containing constructs, whereas a large hairpin A increases translation
(cDNA 29+S+S). For the remaining two constructs tnf45 and tnf205 (fig. 25, D) a
different type of binding is likely for the same reason. The neighbouring hairpins are
completely different suggesting a different set of bound ARE-BPs.
To summarize the data, the identification of hairpin A has to be spotlighted. This
stem-loop structure regulates translation of non-ARE and TNFα ARE-containing
mRNAs depending on its size. A large hairpin A increases translation, whereas a
small one leads to a decrease. The size of hairpin A is also a critical factor for the
translational regulation of the cDNA 29cfos constructs. If hairpin A is present as in
construct pPICHcfos+S (fig. 22, A and D5, A), translation is inhibited as well.
Interestingly, c-fos ARE regulation is different, which is demonstrated by an influence
of hairpin B on transcript stability.
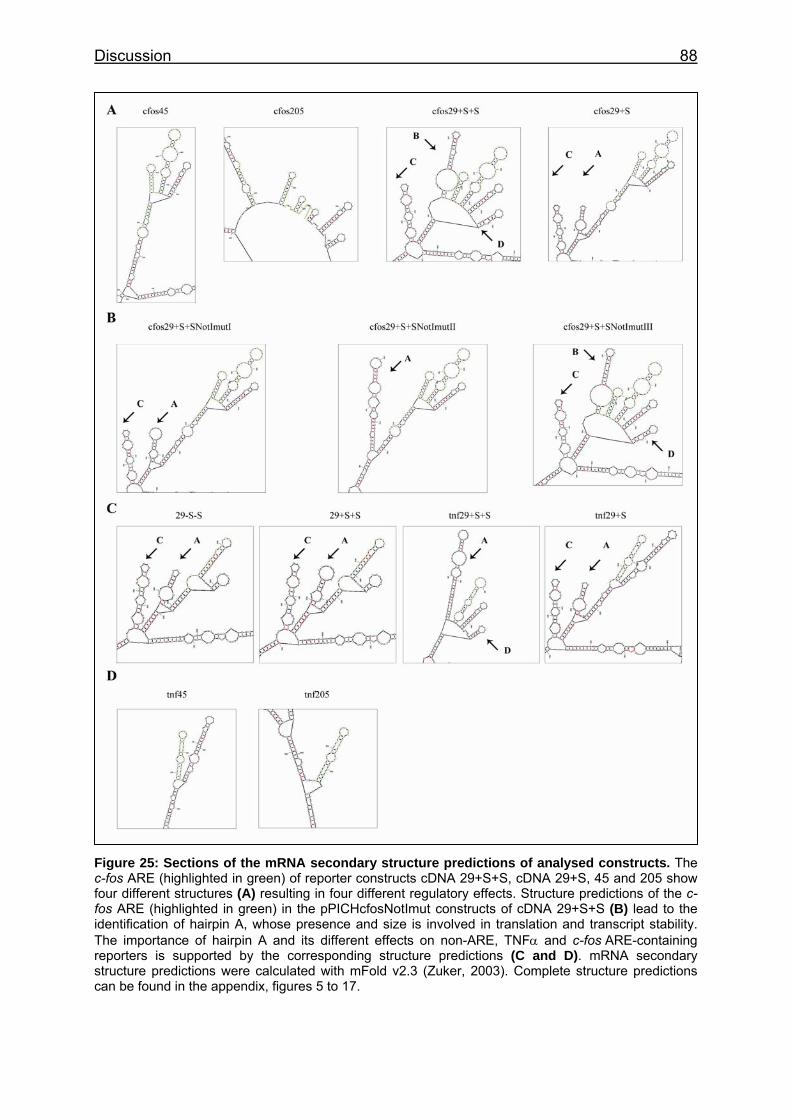
Discussion 88
Figure 25: Sections of the mRNA secondary structure predictions of analysed constructs. The c-fos ARE (highlighted in green) of reporter constructs cDNA 29+S+S, cDNA 29+S, 45 and 205 show four different structures (A) resulting in four different regulatory effects. Structure predictions of the c-fos ARE (highlighted in green) in the pPICHcfosNotImut constructs of cDNA 29+S+S (B) lead to the identification of hairpin A, whose presence and size is involved in translation and transcript stability. The importance of hairpin A and its different effects on non-ARE, TNFα and c-fos ARE-containing reporters is supported by the corresponding structure predictions (C and D). mRNA secondary structure predictions were calculated with mFold v2.3 (Zuker, 2003). Complete structure predictions can be found in the appendix, figures 5 to 17.
Discussion 89
5.2.4 ARE-flanking sequences and structures play a role in ARE-mediated regulation of transcript stablity and translation
Currently literature discusses that ARE-flanking sequences can have an influence on
the ARE-based regulation itself. ARE-flanking sequences are suspected to be
proximal target sites for ARE-BPs or its interaction partners (Wilson et al., 2001).
Experiments in S. cerevisiae also suggest that the surrounding context or secondary
structure is important for the recognition of the ARE of MFA2 by regulatory factors
(Duttagupta et al., 2003). Stem-loop structures downstream (Paschoud et al., 2006)
or within an ARE (Chabanon et al., 2005; Fialcowitz et al., 2005) have already been
identified and shown to be important for ARE-regulation.
Evidence is provided in this thesis which supports the involvement of ARE-flanking
sequences. Data obtained shows that single-point mutations within the 3’ UTR
directly upstream of the c-fos ARE (flanking sequence) play a crucial role in the
examined system. Furthermore, mRNA secondary structure within or nearby the
AREs is the key to understanding the different regulation. It could be demonstrated
that surrounding hairpins, whose size and existence is dependent on the sequence,
are involved in transcript stability and translation.
It can be summarized that the observed effects and most likely as a consequence the
binding selectivity of ARE binding proteins of the analysed c-fos ARE constructs can
be directly related to the ARE or flanking ARE structures. It is most likely that the
cDNA 205 c-fos ARE is bound by a different protein or protein complex than the c-fos
ARE construct of cDNA 29 and cDNA 45. This makes sense, as the structure is
completely different and parts of the ARE sequence is unpaired. RNA binding
proteins have different binding motifs, the best known of which are the RNA
recognition motif (RRM) (Maris et al., 2005) and the double-stranded RNA binding
motif (dsRBM) (Chang and Ramos, 2005). RRMs are often found in multiple copies in
eukaryotic proteins and/or together with additional domains and can bind single
stranded as well as double stranded RNA molecules. The human HuR ARE-BP has
three RRMs, no additional ARE binding domains and can stabilize c-fos ARE-
containing host mRNAs (Peng et al., 1998). The most abundant additional domains
are the zinc fingers of the CCCH (Cys-Cys-Cys-His) and CCHC (Cys-Cys-His-Cys)
type. While the well known CCHHs bind double-stranded DNA or RNA, the CCCH
and CCHC domains bind single stranded RNA. Well studied CCCH domain
containing ARE-BPs are the mammalian Tristetraprolin (TTP, zfp-36) and AUF1, both
Discussion 90
involved in the degradation of c-fos and TNFα ARE host mRNAs (Barreau et al.,
2005). This fact demonstrates the complexity of the ARE-mediated regulation and the
overlapping specificity of ARE-BPs. Since the primary sequence of an existing RNA
helix is an unlikely feature for binding specificity, the recognition of flanking non-
helical structures by a RNA-BP within the duplex RNA have been suggested as such
a feature (Chang and Ramos, 2005). This is in agreement with the results of the
performed experiments and predicted mRNA secondary structures. Concerning
theses structures, hairpins A and B play a crucial role. Hairpin A is present in the
non-ARE-containing constructs of reporter cDNA 29. A small size, thereby meaning
the terminal loop, results in a drastic translational repression compared to the large
size. This suggests that the large loop promotes translation. The functionality of
hairpin A in the TNFα ARE-containing reporter constructs of cDNA 29 is the same.
The presence of a small hairpin A results in a strong translational repression which
can be abolished by a large (fused) hairpin A. This fact is strongly supported by the
data of the c-fos ARE reporter constructs. The highly complex hairpin structure of
construct pPICHcfos29+S+S is an exceptional case. This structure does not lead to
down-regulation of transcript stability or translation compared to the non-ARE
construct. Thus, it can be concluded that the structure is a binding motif for a
stabilizing ARE-BP. This clearly demonstrates a direct correlation between the ARE-
mediated regulation of transcript stability and hairpin B. In contrast, creation of a
small sized hairpin A in this construct leads to a moderate decrease of the mRNA
stability and a rapid inhibition of translation (pPICHcfos29+S). Interestingly, a small
hairpin A also triggers strong translational inhibition in the pPICHtnf29+S construct.
However, it cannot be said if hairpin A mediates a direct or indirect (independent)
effect. It seems to be an ARE-independent effect as hairpin A is also predicted for
non-ARE constructs and its translational repressing activity can be observed for such
constructs.Further studies are necessary to investigate the connection between these
effects. However, the decreased mRNA stability underlines the different regulation of
the c-fos and TNFα AREs. Although the presence of hairpin A in construct
pPICHcfos29+S results in a lowered mRNA stability it cannot be completely excluded
that the protein modification plays a role in this context. Nevertheless, this is pretty
unlikely as other modifications such as addition or removal of the Strep-II-tag can be
handled like controls, which do not change the mRNA level. An increased size of
hairpin A (pPICHcfos29+S+SNotImutI/II) abolishes translational repression. It is likely
Discussion 91
that a large hairpin A inhibits the formation or binding of a protein complex and a
small hairpin A promotes binding at or near the ARE. This protein complex cannot
bind to the cfos45 ARE structure because hairpin A is not present. This explains why
the translational inhibition can be observed for pPICHcfos29+S and not for
pPICHcfos29+S+SNotImutI/II and pPICHcfos45.
Importantly, it is striking that different reporters display different types of regulation in
our system. The involvement of ARE-flanking sequences or structures, respectively,
from the applied reporters are likely to influence the ARE-mRNA turnover, thereby
affecting the selectivity of RNA-BPs. This could explain the binding of different ARE-
BPs to the same ARE described in the literature. For example, in vitro studies
showed that recombinant and purified AUF1 can bind the TNFα-ARE-RNA (Wilson et
al., 1999), whereas the same ARE is bound by TTP when cloned in the 3’ UTR of a
mammalian reporter construct (Lai et al., 2002). There are several (heterologous)
systems available for analysis of AREs and described in the literature. Examples are
mammalian GFP reporter (Raineri et al., 2004), β-globin reporter (Peng et al., 1998)
and Luciferase/Renilla reporter systems (Barreau et al., 2006) as well as
S. cerevisiae MFA2 reporter (Vasudevan and Peltz, 2001). With the background of
this thesis it can be hypothesized that the application of such reporter systems can
identifiy ARE-BPs and give an idea of how regulation can work in fact, but regulation
of a wild type ARE mRNA might differ significantly. This strongly suggests the
analysis of wild type ARE-regulation transcripts in order to determine their real
regulation.
Finally it can be summarized that a functional ARE network that controls transcription
and translation as it is known from other eukaryotes could be demonstrated in the
yeast P. pastoris for the first time. However, although a slight mRNA stabilizing effect
of the c-fos ARE can be observed in construct pPICHcfos29+S+S, it is evident that
AREs are not suitable for mRNA stabilization or increasing protein expression in
general. For this purpose it is likely that the application of a different 3’ UTR, instead
of the AOX1 3’ UTR, would lead to a stabilization of the transcripts and probably to
an increased protein expression. This project further shows the direct involvement of
ARE-flanking structures in the turnover of its host transcript.
Discussion 92
5.2.5 Identified stem-loops play a crucial role in ARE-mediated regulation – a model
One crucial finding in the presented work is the involvement of ARE-flanking
sequences in ARE-mediated regulation of transcript stability and translation. In
addition, all gathered data about these two processes in P. pastoris suggest ARE-
and flanking structures play an essential role. In a broader sense, flanking sequences
also include the coding sequence of the chosen reporter cDNAs. However, RNA
binding motifs have not been described in the literature for the three analysed
cDNAs. Furthermore their cellular function does not suggest the necessity of that kind
of regulation. CDNA 29 encodes a DNA damage inducible protein (GADD45),
whereas cDNA 45 encodes a SH3 domain binding glutamatic acid-rich-like protein
and cDNA 205 the sorting nexin SNX15. Similar transcripts, proteins or family
members have an ARE independent regulation. It is concluded that the structure of
the mRNA itself is the sole factor for selectivity of RNA-BPs and consequently
influences transcript stability and translation in the examined yeast system.
Setting the focus on the identified hairpin A, a model can be proposed that shows the
relation between hairpin A and the effects on regulation (fig. 26). Firstly, this model
describes the binding of ARE-BP I to the core sequence of the c-fos ARE. This
interaction is likely as the target ARE structure remains the same while the
surrounding context changes. Furthermore this explains the basic destabilizing
function of AREs. Secondly, the surrounding context can be a factor for selectivity of
RNA-BPs, possible modulator proteins. One example could be PSBP (proximal
stabilizing binding protein) which binds to a hairpin directly upstream of the ARE. The
activity of PSBP abolishes the destabilizing function of ARE-BP I and consequently
leads to the stabilization of the ARE-containing transcript. It cannot be predicted if
there is a direct interaction between PSBP and ARE-BP I and which effects such an
interaction might have. However, the interaction which results in an inhibition of ARE-
BP I binding motifs for mRNA degrading enzymes is likely. If the target site of PSBP
is altered (change of size of internal and terminal loops), its binding is inhibited and
the ARE-containing transcript is rapidly degraded due to the destabilizing function of
ARE-BP I. If the flanking sequence/structure is changed and a small-sized hairpin A
is present it is recognized by TLR (translational repressor). This protein has a
negative influence on translation. Thus, an additive effect of TLR and ARE-BP I can
be observed. Both direct and indirect interaction of TLR and ARE-BP I cannot be
Discussion 93
excluded. If the size of hairpin A is increased or if hairpin A is not present, TLR
cannot bind to its target and its translation repressing activity can no longer be
detected. The ARE-containing transcript is rapidly degraded due to the binding of
ARE-BP I. Furthermore it is likely that TLR also binds the non-ARE and TNFα ARE-
containing transcript exhibiting a small-sized hairpin A and consistently does not bind
a large hairpin A.
It has to be added that AREs have been implicated with the miRNA pathway and the
involvement of miRNA16 in the degradation of a TNFα-ARE-bearing reporter is
known (see RNAi – Basics and Applications). Although translational repression can
observed due to structural reorganization and different (hairpin A), partially single-
stranded RNA strands (tnf/cfos205 constructs) and a certain miRNA could thus gain
access its target sequence, till date nothing is known about a RNAi pathway in
P. pastoris. Even a proof of miRNA interaction with these special sequences would
not provide evidence for a direct connection to the ARE-mediated posttranscriptional
regulation. It has been reported that target site accessibility (Kertesz et al., 2007) and
an AU-rich nucleotide composition near the miRNA target site can be a criterion for
efficient silencing (Grimson et al., 2007). However, an involvement of hypothetic
miRNAs in the examined yeast system is questionable. In other words an
involvement of miRNAs can only be conjectured or speculated about. An involvement
of ARE-BPs which inhibit the translational machinery is much more likely and is in
large agreement with published data.
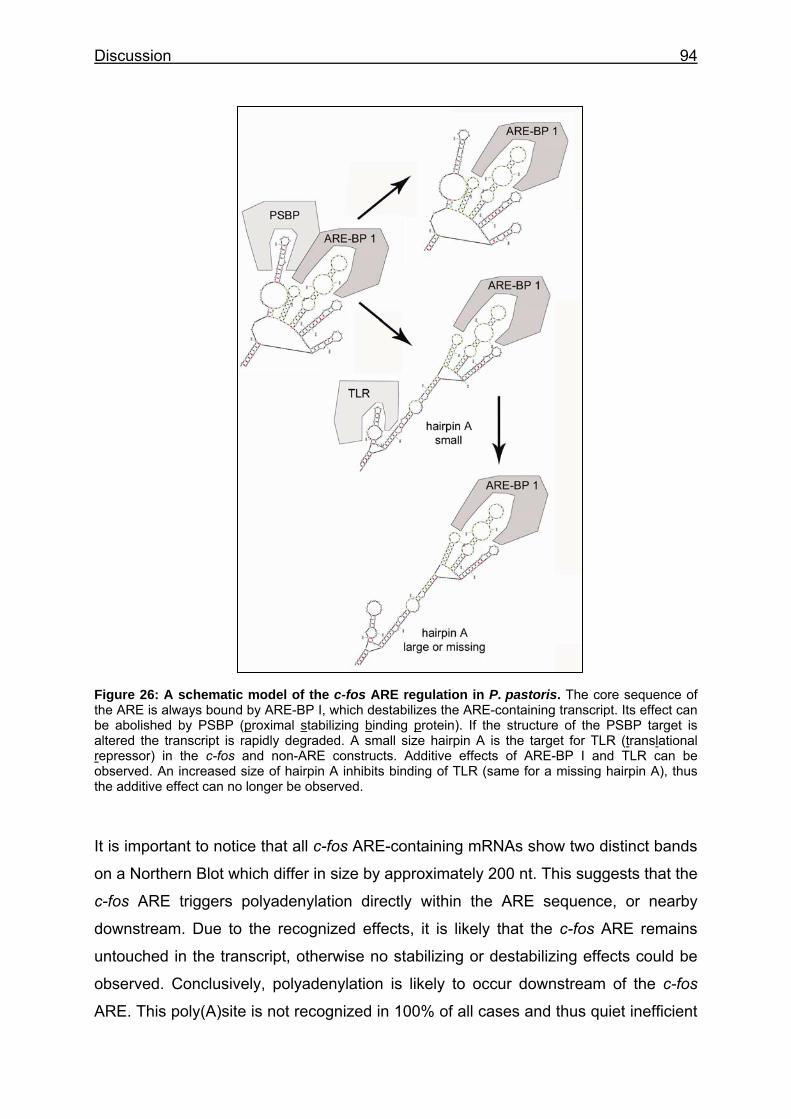
Discussion 94
Figure 26: A schematic model of the c-fos ARE regulation in P. pastoris. The core sequence of the ARE is always bound by ARE-BP I, which destabilizes the ARE-containing transcript. Its effect can be abolished by PSBP (proximal stabilizing binding protein). If the structure of the PSBP target is altered the transcript is rapidly degraded. A small size hairpin A is the target for TLR (translational repressor) in the c-fos and non-ARE constructs. Additive effects of ARE-BP I and TLR can be observed. An increased size of hairpin A inhibits binding of TLR (same for a missing hairpin A), thus the additive effect can no longer be observed.
It is important to notice that all c-fos ARE-containing mRNAs show two distinct bands
on a Northern Blot which differ in size by approximately 200 nt. This suggests that the
c-fos ARE triggers polyadenylation directly within the ARE sequence, or nearby
downstream. Due to the recognized effects, it is likely that the c-fos ARE remains
untouched in the transcript, otherwise no stabilizing or destabilizing effects could be
observed. Conclusively, polyadenylation is likely to occur downstream of the c-fos
ARE. This poly(A)site is not recognized in 100% of all cases and thus quiet inefficient
Discussion 95
as a second AU rich region approximately 200 nt downstream can be found in the
transcript, it can be assumed that this sequence represents the original poly(A) site.
In order to analyse the found complex ARE regulation in P. pastoris UV-crosslinking
assays were performed as a first step to identify ARE-BPs. The cloned sequences of
the c-fos and TNFα AREs were used as target mRNAs for this purpose (fig. 6).
These experiments demonstrated the specific binding of a 14 KDa to both transcripts.
It is possible that either one single protein binds both RNAs or that two proteins of
similar size are detected. The TNFα signal always seems to run slightly higher than
the 14.3 kDa marker band, whereas the c-fos signal always seems to run a bit lower.
The untreated c-fos ARE sample (fig. 19, B) shows a broad smear, which suggests
the formation of internal hybridization products. In order to avoid this issue,
denaturing of the transcript prior to the binding reaction could avoid this problem. It
seems as if secondary structures persist in the presence of a low amount of crude
cell extract (fig. 19, B, lanes 2, 3, 5 and 6). This suggests a helicase activity in the
extract making the RNA accessible at higher amounts of the cell extract (fig. 19, B,
lanes 4 and 7) to the RNase A treatment after cross-linking. Consequently only the
bound protein species can be detected in these samples. In agreement with the
TNFα gel retardation assay (fig. 19, A, lane 7) it is possible that proteinase K activity
was not sufficient to digest 50 µg total protein resulting in the same detectable band
at approximately 14 kDa as can be observed in the sample without proteinase K
treatment (fig. 19, B, lanes 4 and 7). However the signal is weakened by treatment
with RNAse A.
Until sequence data is available for this ARE-BP comparison to already known ARE-
BPs can only be made by size. A comparison based on the size of the protein only
does not lead to the identification of a possible homologue. ARE-BPs like AUF1, HuR
and TTP are approximately 20 kDa to large in size. Purification and following
sequencing will lead to a characterization of the found ARE-BP.
Outlook 96
6 Outlook To define the role of the identified 14 kDa ARE-BP in vivo will be an interesting step
further. Therefore the protein has to be purified through affinity binding and
sequenced. For this purpose protein species with RNA binding activity will have to be
purified from a total protein extract. In the first step the crude total protein extract is
subjected to commercially available heparin sepharose. In the second step the
sample is subjected to DEAE-Sepharose. Binding is dependent on the buffer pH. If
the protein has positive charge it will be in the flow through, while a negative charge
makes it bind to the resin. The target transcript can be bound to commercially
available adipic acid dihydrazide-agarose beads (Sigma) (Caputi et al., 1999). In the
last step the purified extract is incubated with the RNA beads. Samples are finally
separated on a denaturing SDS gel. The purified protein can be visualized with
protein staining like Coomassie blue or silver staining. Protein sequencing by mass
spectrometry will identify the primary structure of the protein, lead to the identification
of homologues in other organisms and give information of the protein’s
characteristics. For in vivo analyses the construction of a P. pastoris deletion or over-
expression mutant is interesting to further characterize the identified ARE system in
detail.
Furthermore it will be interesting to transfer knowledge of translation inhibiting
structures to other expression systems in order to increase or modify protein yields. If
significant differences between mRNA abundance and protein expression level can
be detected, it is possible to change local secondary structures in the 3’ UTR without
affecting the protein.
Summary 97
7 Summary
The tight regulation of mRNA stability and translation by specific cis-acting
sequences and trans-acting factors is an essential means for the control of gene
expression. These processes allow cells to rapidly adjust the expression pattern of
regulatory factors and response transiently to internal and external signals including
cell proliferation, signal transduction, inflammatory stimuli and radiation. A well known
important cis-acting sequence element that controls mRNA stability is the AU-rich
element (ARE) found in the 3’ untranslated region (3’UTR) of many, but not all,
unstable mRNAs of various growth factors, cytokines, proto-oncogenes and
transcription factors.
A heterologous system for the analysis of AREs in the yeast Pichia pastoris was
established. The AREs from the human proto-oncogene c-fos and the cytokine TNFα
were separately cloned into the 3’ UTR of P. pastoris expression vectors. It was
demonstrated that both AREs are functional in this yeast and that they are regulated
in different ways. This finding further stresses that the ARE-regulated system is
conserved among eukaryotes and it underlines the importance of the system in the
cellular context. A set of reporter constructs and mutational analysis were used to,
analyse the importance of two special hairpins, which we hypothesize to have
significant influence on transcript stability and translation. Thus, evidence is provided
for the involvement of ARE-flanking sequences in ARE-mediated mRNA turnover and
most likely in the selectivity of RNA-binding proteins. Finally, a model is proposed
that explains the observed effects on protein and mRNA level in a RNA-structure-
dependent manner. In order to find further support for the findings and to identify
ARE-BPs gel retardation assays were performed. As a result an approximately
14 kDa protein could be identified as a binding partner of the core c-fos and TNFα
AREs in Pichia.
Zusammenfassung 98
8 Zusammenfassung
Die strenge Regulation von mRNA Stabilität und Translation durch spezifische “cis-
acting“-Sequenzen und „trans-acting“-Faktoren ist für die Kontrolle der
Genexpression ein essentielles Mittel. Diese Prozesse erlauben es der Zelle, das
Expressionsmuster von regulatorischen Faktoren als transiente Antwort auf interne
oder externe Signale wie Zellproliferation, Signaltransduktion, inflammatorische
Stimuli oder (UV)-Strahlung einzustellen. Eine heute gut untersuchte „cis-acting“-
Sequenz, die die mRNA-Stabilität kontrolliert, ist das „AU reiche Element“ oder „AU
rich element“ (ARE), das in der 3’ untranslatierten Region (3’ UTR) von vielen, aber
nicht allen, instabilen mRNAs von verschiedenen Wachstumsfaktoren, Cytokinen,
Protooncogenen und Transkriptionsfakotren zu finden ist.
Es wurde ein heterologes System für die Analyse von AREs in der Hefe P. pastoris
etabiliert. Die zwei AREs des humanen Protoonkogen c-fos und des Cytokins TNFα
wurden in die 3’ UTR von P. pastoris Expressionsvektoren kloniert. Es wurde gezeigt,
dass beide AREs in dieser Hefe Funktionalität besitzen und verschiedenartig reguliert
werden. Dieses Ergebnis betont zusätzlich die Konservierung des ARE-regulierten
Systems unter Eukaryonten und unterstreicht seine Wichtigkeit im zellulären
Zusammenhang. Eine Auswahl von verschiedenen Reporterkonstrukten sowie
Mutationsanalysen zeigten die Wichtigkeit zweier spezieller mRNA Hairpins, die
einen signifikanten Einfluss auf Transkriptstabilität und Translation haben können.
Damit konnte die Involvierung von ARE-flankierenden Sequenzen und Strukturen bei
dem ARE-regulierten mRNA-Umsatz und sehr wahrscheinlich bei der Selektion von
ARE-Bindungsproteinen (ARE-BP). Schließlich konnte ein Modell aufgestellt werden,
das die beobachteten Effekte abhängig von der mRNA Sekundärstruktur erklärt. Um
weitere für dieses Modell unterstützende Daten zu sammeln und um endogene ARE-
BPs zu identifizieren, wurden Gelretardationsassays durchgeführt. Es konnte ein ca.
14 kDa großes Protein als Bindungspartner für die c-fos als auch TNFα ARE
Sequenzen identifizert werden.
References 99
9 References Ahlquist, P. (2002). RNA-dependent RNA polymerases, viruses, and RNA silencing. Science. 296(5571): 1270-3.
Aigner, A. (2007). Applications of RNA interference: current state and prospects for siRNA-based strategies in vivo. Appl Microbiol Biotechnol. 76(1): 9-21.
Akao, Y., Y. Nakagawa and T. Naoe (2007). MicroRNA-143 and -145 in colon cancer. DNA Cell Biol. 26(5): 311-20.
Alavi, A., J. D. Hood, R. Frausto, D. G. Stupack and D. A. Cheresh (2003). Role of Raf in vascular protection from distinct apoptotic stimuli. Science. 301(5629): 94-6.
Altomare, D. A. and J. R. Testa (2005). Perturbations of the AKT signaling pathway in human cancer. Oncogene. 24(50): 7455-64.
Alvarez-Garcia, I. and E. A. Miska (2005). MicroRNA functions in animal development and human disease. Development. 132(21): 4653-62.
Anderson, J. T., M. R. Paddy and M. S. Swanson (1993). PUB1 is a major nuclear and cytoplasmic polyadenylated RNA-binding protein in Saccharomyces cerevisiae. Mol Cell Biol. 13(10): 6102-13.
Anderson, P. and N. Kedersha (2006). RNA granules. J Cell Biol. 172(6): 803-8.
Ausubel, F. M., R. Brent, R. E. Kingston, D. D. Moore, J. G. Seidman, J. A. Smith and K. Struhl (1994). Current Protocols in Molecular Biology.
Barreau, C., L. Paillard and H. B. Osborne (2005). AU-rich elements and associated factors: are there unifying principles? Nucleic Acids Res. 33(22): 7138-50.
Barreau, C., T. Watrin, H. Beverley Osborne and L. Paillard (2006). Protein expression is increased by a class III AU-rich element and tethered CUG-BP1. Biochem Biophys Res Commun. 347(3): 723-30.
Bartel, D. P. and C. Z. Chen (2004). Micromanagers of gene expression: the potentially widespread influence of metazoan microRNAs. Nat Rev Genet. 5(5): 396-400.
Bellmann, K., J. Martel, D. J. Poirier, M. M. Labrie and J. Landry (2006). Downregulation of the PI3K/Akt survival pathway in cells with deregulated expression of c-Myc. Apoptosis. 11(8): 1311-9.
References 100
Bentwich, I., A. Avniel, Y. Karov, R. Aharonov, S. Gilad, O. Barad, A. Barzilai, P. Einat, U. Einav, E. Meiri, E. Sharon, Y. Spector and Z. Bentwich (2005). Identification of hundreds of conserved and nonconserved human microRNAs. Nat Genet. 37(7): 766-70.
Berezikov, E., F. Thuemmler, L. W. van Laake, I. Kondova, R. Bontrop, E. Cuppen and R. H. Plasterk (2006). Diversity of microRNAs in human and chimpanzee brain. Nat Genet. 38(12): 1375-7.
Bernstein, E., A. A. Caudy, S. M. Hammond and G. J. Hannon (2001). Role for a bidentate ribonuclease in the initiation step of RNA interference. Nature. 409(6818): 363-6.
Beutler, B. and A. Cerami (1989). The biology of cachectin/TNF--a primary mediator of the host response. Annu Rev Immunol. 7: 625-55.
Bevilacqua, A., M. C. Ceriani, S. Capaccioli and A. Nicolin (2003). Post-transcriptional regulation of gene expression by degradation of messenger RNAs. J Cell Physiol. 195(3): 356-72.
Bloomston, M., W. L. Frankel, F. Petrocca, S. Volinia, H. Alder, J. P. Hagan, C. G. Liu, D. Bhatt, C. Taccioli and C. M. Croce (2007). MicroRNA expression patterns to differentiate pancreatic adenocarcinoma from normal pancreas and chronic pancreatitis. Jama. 297(17): 1901-8.
Boettner, M. (2004). Die Expression humaner Proteine in der Hefe Pichia pastoris: Hochdurchsatzverfahren und bioinformatische Identifizierung von Expression-beeinflussenden Sequenzmerkmalen. Dissertation.
Boettner, M., B. Prinz, C. Holz, U. Stahl and C. Lang (2002). High-throughput screening for expression of heterologous proteins in the yeast Pichia pastoris. J Biotechnol. 99(1): 51-62.
Bohnsack, M. T., K. Czaplinski and D. Gorlich (2004). Exportin 5 is a RanGTP-dependent dsRNA-binding protein that mediates nuclear export of pre-miRNAs. Rna. 10(2): 185-91.
Borchert, G. M., W. Lanier and B. L. Davidson (2006). RNA polymerase III transcribes human microRNAs. Nat Struct Mol Biol. 13(12): 1097-101.
Braun, P., Y. Hu, B. Shen, A. Halleck, M. Koundinya, E. Harlow and J. LaBaer (2002). Proteome-scale purification of human proteins from bacteria. Proc Natl Acad Sci U S A. 99(5): 2654-9.
Brennecke, J., A. Stark, R. B. Russell and S. M. Cohen (2005). Principles of microRNA-target recognition. PLoS Biol. 3(3): e85.
References 101
Bridge, A. J., S. Pebernard, A. Ducraux, A. L. Nicoulaz and R. Iggo (2003). Induction of an interferon response by RNAi vectors in mammalian cells. Nat Genet. 34(3): 263-4.
Brummelkamp, T. R., R. Bernards and R. Agami (2002a). Stable suppression of tumorigenicity by virus-mediated RNA interference. Cancer Cell. 2(3): 243-7.
Brummelkamp, T. R., R. Bernards and R. Agami (2002b). A system for stable expression of short interfering RNAs in mammalian cells. Science. 296(5567): 550-3.
Buttner, K., K. Wenig and K. P. Hopfner (2006). The exosome: a macromolecular cage for controlled RNA degradation. Mol Microbiol. 61(6): 1372-9.
Cai, X., C. H. Hagedorn and B. R. Cullen (2004). Human microRNAs are processed from capped, polyadenylated transcripts that can also function as mRNAs. Rna. 10(12): 1957-66.
Calin, G. A., C. D. Dumitru, M. Shimizu, R. Bichi, S. Zupo, E. Noch, H. Aldler, S. Rattan, M. Keating, K. Rai, L. Rassenti, T. Kipps, M. Negrini, F. Bullrich and C. M. Croce (2002). Frequent deletions and down-regulation of micro- RNA genes miR15 and miR16 at 13q14 in chronic lymphocytic leukemia. Proc Natl Acad Sci U S A. 99(24): 15524-9.
Calin, G. A., C. G. Liu, C. Sevignani, M. Ferracin, N. Felli, C. D. Dumitru, M. Shimizu, A. Cimmino, S. Zupo, M. Dono, M. L. Dell'Aquila, H. Alder, L. Rassenti, T. J. Kipps, F. Bullrich, M. Negrini and C. M. Croce (2004a). MicroRNA profiling reveals distinct signatures in B cell chronic lymphocytic leukemias. Proc Natl Acad Sci U S A. 101(32): 11755-60.
Calin, G. A., Y. Pekarsky and C. M. Croce (2007). The role of microRNA and other non-coding RNA in the pathogenesis of chronic lymphocytic leukemia. Best Pract Res Clin Haematol. 20(3): 425-37.
Calin, G. A., C. Sevignani, C. D. Dumitru, T. Hyslop, E. Noch, S. Yendamuri, M. Shimizu, S. Rattan, F. Bullrich, M. Negrini and C. M. Croce (2004b). Human microRNA genes are frequently located at fragile sites and genomic regions involved in cancers. Proc Natl Acad Sci U S A. 101(9): 2999-3004.
Caputi, M., A. Mayeda, A. R. Krainer and A. M. Zahler (1999). hnRNP A/B proteins are required for inhibition of HIV-1 pre-mRNA splicing. Embo J. 18(14): 4060-7.
Carmell, M. A. and G. J. Hannon (2004). RNase III enzymes and the initiation of gene silencing. Nat Struct Mol Biol. 11(3): 214-8.
Castanotto, D., K. Sakurai, R. Lingeman, H. Li, L. Shively, L. Aagaard, H. Soifer, A. Gatignol, A. Riggs and J. J. Rossi (2007). Combinatorial delivery of small interfering RNAs reduces RNAi efficacy by selective incorporation into RISC. Nucleic Acids Res. 35(15): 5154-64.
References 102
Chabanon, H., I. Mickleburgh, B. Burtle, C. Pedder and J. Hesketh (2005). An AU-rich stem-loop structure is a critical feature of the perinuclear localization signal of c-myc mRNA. Biochem J. 392(Pt 3): 475-83.
Chan, S. P. and F. J. Slack (2006). microRNA-mediated silencing inside P-bodies. RNA Biol. 3(3): 97-100.
Chang, K. Y. and A. Ramos (2005). The double-stranded RNA-binding motif, a versatile macromolecular docking platform. Febs J. 272(9): 2109-17.
Chaudhuri, K. and R. Chatterjee (2007). MicroRNA detection and target prediction: integration of computational and experimental approaches. DNA Cell Biol. 26(5): 321-37.
Chen, C. Y., T. M. Chen and A. B. Shyu (1994). Interplay of two functionally and structurally distinct domains of the c-fos AU-rich element specifies its mRNA-destabilizing function. Mol Cell Biol. 14(1): 416-26.
Chen, C. Y., R. Gherzi, S. E. Ong, E. L. Chan, R. Raijmakers, G. J. Pruijn, G. Stoecklin, C. Moroni, M. Mann and M. Karin (2001). AU binding proteins recruit the exosome to degrade ARE-containing mRNAs. Cell. 107(4): 451-64.
Chen, C. Y. and A. B. Shyu (1995). AU-rich elements: characterization and importance in mRNA degradation. Trends Biochem Sci. 20(11): 465-70.
Chen, C. Y., N. Xu and A. B. Shyu (1995). mRNA decay mediated by two distinct AU-rich elements from c-fos and granulocyte-macrophage colony-stimulating factor transcripts: different deadenylation kinetics and uncoupling from translation. Mol Cell Biol. 15(10): 5777-88.
Chen, C. Y., Y. You and A. B. Shyu (1992). Two cellular proteins bind specifically to a purine-rich sequence necessary for the destabilization function of a c-fos protein-coding region determinant of mRNA instability. Mol Cell Biol. 12(12): 5748-57.
Chen, C. Z., L. Li, H. F. Lodish and D. P. Bartel (2004). MicroRNAs modulate hematopoietic lineage differentiation. Science. 303(5654): 83-6.
Chendrimada, T. P., R. I. Gregory, E. Kumaraswamy, J. Norman, N. Cooch, K. Nishikura and R. Shiekhattar (2005). TRBP recruits the Dicer complex to Ago2 for microRNA processing and gene silencing. Nature. 436(7051): 740-4.
Chiu, Y. L. and T. M. Rana (2002). RNAi in human cells: basic structural and functional features of small interfering RNA. Mol Cell. 10(3): 549-61.
Chiu, Y. L. and T. M. Rana (2003). siRNA function in RNAi: a chemical modification analysis. Rna. 9(9): 1034-48.
References 103
Chu, C. Y. and T. M. Rana (2006). Translation repression in human cells by microRNA-induced gene silencing requires RCK/p54. PLoS Biol. 4(7): e210.
Cimmino, A., G. A. Calin, M. Fabbri, M. V. Iorio, M. Ferracin, M. Shimizu, S. E. Wojcik, R. I. Aqeilan, S. Zupo, M. Dono, L. Rassenti, H. Alder, S. Volinia, C. G. Liu, T. J. Kipps, M. Negrini and C. M. Croce (2005). miR-15 and miR-16 induce apoptosis by targeting BCL2. Proc Natl Acad Sci U S A. 102(39): 13944-9.
Clayton, J. (2004). RNA interference: the silent treatment. Nature. 431(7008): 599-605.
Cok, S. J., S. J. Acton and A. R. Morrison (2003). The proximal region of the 3'-untranslated region of cyclooxygenase-2 is recognized by a multimeric protein complex containing HuR, TIA-1, TIAR, and the heterogeneous nuclear ribonucleoprotein U. J Biol Chem. 278(38): 36157-62.
Cougot, N., S. Babajko and B. Seraphin (2004). Cytoplasmic foci are sites of mRNA decay in human cells. J Cell Biol. 165(1): 31-40.
Culmsee, C., E. Gasser, S. Hansen, J. C. Tonn, E. Wagner and R. Goldbrunner (2006). Effects of Raf-1 siRNA on human cerebral microvascular endothelial cells: a potential therapeutic strategy for inhibition of tumor angiogenesis. Brain Res. 1125(1): 147-54.
Cusick, M. E. (1994). Purification and identification of two major single-stranded binding proteins of yeast Saccharomyces cerevisiae as ribosomal protein L4 and histone H2B. Biochim Biophys Acta. 1217(1): 31-40.
Czauderna, F., M. Fechtner, S. Dames, H. Aygun, A. Klippel, G. J. Pronk, K. Giese and J. Kaufmann (2003a). Structural variations and stabilising modifications of synthetic siRNAs in mammalian cells. Nucleic Acids Res. 31(11): 2705-16.
Czauderna, F., A. Santel, M. Hinz, M. Fechtner, B. Durieux, G. Fisch, F. Leenders, W. Arnold, K. Giese, A. Klippel and J. Kaufmann (2003b). Inducible shRNA expression for application in a prostate cancer mouse model. Nucleic Acids Res. 31(21): e127.
De Paula, D., M. V. Bentley and R. I. Mahato (2007). Hydrophobization and bioconjugation for enhanced siRNA delivery and targeting. Rna. 13(4): 431-56.
de Veer, M. J., C. A. Sledz and B. R. Williams (2005). Detection of foreign RNA: implications for RNAi. Immunol Cell Biol. 83(3): 224-8.
Didiano, D. and O. Hobert (2006). Perfect seed pairing is not a generally reliable predictor for miRNA-target interactions. Nat Struct Mol Biol. 13(9): 849-51.
Ding, S. W., H. Li, R. Lu, F. Li and W. X. Li (2004). RNA silencing: a conserved antiviral immunity of plants and animals. Virus Res. 102(1): 109-15.
References 104
Doench, J. G., C. P. Petersen and P. A. Sharp (2003). siRNAs can function as miRNAs. Genes Dev. 17(4): 438-42.
Doench, J. G. and P. A. Sharp (2004). Specificity of microRNA target selection in translational repression. Genes Dev. 18(5): 504-11.
Doran, J. and W. M. Strauss (2007). Bio-informatic trends for the determination of miRNA-target interactions in mammals. DNA Cell Biol. 26(5): 353-60.
Dostie, J., Z. Mourelatos, M. Yang, A. Sharma and G. Dreyfuss (2003). Numerous microRNPs in neuronal cells containing novel microRNAs. Rna. 9(2): 180-6.
Duttagupta, R., B. Tian, C. J. Wilusz, D. T. Khounh, P. Soteropoulos, M. Ouyang, J. P. Dougherty and S. W. Peltz (2005). Global analysis of Pub1p targets reveals a coordinate control of gene expression through modulation of binding and stability. Mol Cell Biol. 25(13): 5499-513.
Duttagupta, R., S. Vasudevan, C. J. Wilusz and S. W. Peltz (2003). A yeast homologue of Hsp70, Ssa1p, regulates turnover of the MFA2 transcript through its AU-rich 3' untranslated region. Mol Cell Biol. 23(8): 2623-32.
Elbashir, S. M., J. Harborth, K. Weber and T. Tuschl (2002). Analysis of gene function in somatic mammalian cells using small interfering RNAs. Methods. 26(2): 199-213.
Elbashir, S. M., W. Lendeckel and T. Tuschl (2001). RNA interference is mediated by 21- and 22-nucleotide RNAs. Genes Dev. 15(2): 188-200.
Espel, E. (2005). The role of the AU-rich elements of mRNAs in controlling translation. Semin Cell Dev Biol. 16(1): 59-67.
Fan, X. C. and J. A. Steitz (1998a). HNS, a nuclear-cytoplasmic shuttling sequence in HuR. Proc Natl Acad Sci U S A. 95(26): 15293-8.
Fan, X. C. and J. A. Steitz (1998b). Overexpression of HuR, a nuclear-cytoplasmic shuttling protein, increases the in vivo stability of ARE-containing mRNAs. Embo J. 17(12): 3448-60.
Fedorov, Y., E. M. Anderson, A. Birmingham, A. Reynolds, J. Karpilow, K. Robinson, D. Leake, W. S. Marshall and A. Khvorova (2006). Off-target effects by siRNA can induce toxic phenotype. Rna. 12(7): 1188-96.
Fialcowitz, E. J., B. Y. Brewer, B. P. Keenan and G. M. Wilson (2005). A hairpin-like structure within an AU-rich mRNA-destabilizing element regulates trans-factor binding selectivity and mRNA decay kinetics. J Biol Chem. 280(23): 22406-17.
References 105
Fire, A., S. Xu, M. K. Montgomery, S. A. Kostas, S. E. Driver and C. C. Mello (1998). Potent and specific genetic interference by double-stranded RNA in Caenorhabditis elegans. Nature. 391(6669): 806-11.
Fleming, J. B., G. L. Shen, S. E. Holloway, M. Davis and R. A. Brekken (2005). Molecular consequences of silencing mutant K-ras in pancreatic cancer cells: justification for K-ras-directed therapy. Mol Cancer Res. 3(7): 413-23.
Franco-Zorrilla, J. M., A. Valli, M. Todesco, I. Mateos, M. I. Puga, I. Rubio-Somoza, A. Leyva, D. Weigel, J. A. Garcia and J. Paz-Ares (2007). Target mimicry provides a new mechanism for regulation of microRNA activity. Nat Genet. 39(8): 1033-7.
Franks, T. M. and J. Lykke-Andersen (2007). TTP and BRF proteins nucleate processing body formation to silence mRNAs with AU-rich elements. Genes Dev. 21(6): 719-35.
Gaur, A., D. A. Jewell, Y. Liang, D. Ridzon, J. H. Moore, C. Chen, V. R. Ambros and M. A. Israel (2007). Characterization of microRNA expression levels and their biological correlates in human cancer cell lines. Cancer Res. 67(6): 2456-68.
Gerstein, M. and S. M. Douglas (2007). RNAi development. PLoS Comput Biol. 3(4): e80.
Gherzi, R., M. Trabucchi, M. Ponassi, T. Ruggiero, G. Corte, C. Moroni, C. Y. Chen, K. S. Khabar, J. S. Andersen and P. Briata (2006). The RNA-binding protein KSRP promotes decay of beta-catenin mRNA and is inactivated by PI3K-AKT signaling. PLoS Biol. 5(1): e5.
Gil, J. and M. Esteban (2000). Induction of apoptosis by the dsRNA-dependent protein kinase (PKR): mechanism of action. Apoptosis. 5(2): 107-14.
Gregory, R. I., T. P. Chendrimada, N. Cooch and R. Shiekhattar (2005). Human RISC couples microRNA biogenesis and posttranscriptional gene silencing. Cell. 123(4): 631-40.
Gregory, R. I., K. P. Yan, G. Amuthan, T. Chendrimada, B. Doratotaj, N. Cooch and R. Shiekhattar (2004). The Microprocessor complex mediates the genesis of microRNAs. Nature. 432(7014): 235-40.
Grimm, D., K. L. Streetz, C. L. Jopling, T. A. Storm, K. Pandey, C. R. Davis, P. Marion, F. Salazar and M. A. Kay (2006). Fatality in mice due to oversaturation of cellular microRNA/short hairpin RNA pathways. Nature. 441(7092): 537-41.
Grimson, A., K. K. Farh, W. K. Johnston, P. Garrett-Engele, L. P. Lim and D. P. Bartel (2007). MicroRNA targeting specificity in mammals: determinants beyond seed pairing. Mol Cell. 27(1): 91-105.
References 106
Grosshans, H. and P. Svoboda (2007). miRNA, piRNA, siRNA -- kleine wiener ribonukleinsauren. Bioessays. 29(9): 940-3.
Guo, S. and K. J. Kemphues (1995). par-1, a gene required for establishing polarity in C. elegans embryos, encodes a putative Ser/Thr kinase that is asymmetrically distributed. Cell. 81(4): 611-20.
Gupta, S., R. A. Schoer, J. E. Egan, G. J. Hannon and V. Mittal (2004). Inducible, reversible, and stable RNA interference in mammalian cells. Proc Natl Acad Sci U S A. 101(7): 1927-32.
Haase, A. D., L. Jaskiewicz, H. Zhang, S. Laine, R. Sack, A. Gatignol and W. Filipowicz (2005). TRBP, a regulator of cellular PKR and HIV-1 virus expression, interacts with Dicer and functions in RNA silencing. EMBO Rep. 6(10): 961-7.
Han, J., Y. Lee, K. H. Yeom, J. W. Nam, I. Heo, J. K. Rhee, S. Y. Sohn, Y. Cho, B. T. Zhang and V. N. Kim (2006). Molecular basis for the recognition of primary microRNAs by the Drosha-DGCR8 complex. Cell. 125(5): 887-901.
Hannon, G. J. and J. J. Rossi (2004). Unlocking the potential of the human genome with RNA interference. Nature. 431(7006): 371-8.
Hayashita, Y., H. Osada, Y. Tatematsu, H. Yamada, K. Yanagisawa, S. Tomida, Y. Yatabe, K. Kawahara, Y. Sekido and T. Takahashi (2005). A polycistronic microRNA cluster, miR-17-92, is overexpressed in human lung cancers and enhances cell proliferation. Cancer Res. 65(21): 9628-32.
He, L., J. M. Thomson, M. T. Hemann, E. Hernando-Monge, D. Mu, S. Goodson, S. Powers, C. Cordon-Cardo, S. W. Lowe, G. J. Hannon and S. M. Hammond (2005). A microRNA polycistron as a potential human oncogene. Nature. 435(7043): 828-33.
Heinemann, U., J. Frevert, K. Hofmann, G. Illing, C. Maurer, H. Oschkinat and W. Saenger (2000). An integrated approach to structural genomics. Prog Biophys Mol Biol. 73(5): 347-62.
Houbaviy, H. B., M. F. Murray and P. A. Sharp (2003). Embryonic stem cell-specific MicroRNAs. Dev Cell. 5(2): 351-8.
Invitrogen (1997). A Manual of Methods for Expression of Recombinant Proteins in Pichia pastoris.
Iorio, M. V., M. Ferracin, C. G. Liu, A. Veronese, R. Spizzo, S. Sabbioni, E. Magri, M. Pedriali, M. Fabbri, M. Campiglio, S. Menard, J. P. Palazzo, A. Rosenberg, P. Musiani, S. Volinia, I. Nenci, G. A. Calin, P. Querzoli, M. Negrini and C. M. Croce (2005). MicroRNA gene expression deregulation in human breast cancer. Cancer Res. 65(16): 7065-70.
References 107
Ishimura, N., K. Yamasawa, M. A. Karim Rumi, Y. Kadowaki, S. Ishihara, Y. Amano, Y. Nio, T. Higami and Y. Kinoshita (2003). BRAF and K-ras gene mutations in human pancreatic cancers. Cancer Lett. 199(2): 169-73.
Ishizuka, A., M. C. Siomi and H. Siomi (2002). A Drosophila fragile X protein interacts with components of RNAi and ribosomal proteins. Genes Dev. 16(19): 2497-508.
Izquierdo, M. (2005). Short interfering RNAs as a tool for cancer gene therapy. Cancer Gene Ther. 12(3): 217-27.
Jackson, A. L., S. R. Bartz, J. Schelter, S. V. Kobayashi, J. Burchard, M. Mao, B. Li, G. Cavet and P. S. Linsley (2003). Expression profiling reveals off-target gene regulation by RNAi. Nat Biotechnol. 21(6): 635-7.
Jackson, A. L., J. Burchard, J. Schelter, B. N. Chau, M. Cleary, L. Lim and P. S. Linsley (2006). Widespread siRNA "off-target" transcript silencing mediated by seed region sequence complementarity. Rna. 12(7): 1179-87.
Jakymiw, A., S. Lian, T. Eystathioy, S. Li, M. Satoh, J. C. Hamel, M. J. Fritzler and E. K. Chan (2005). Disruption of GW bodies impairs mammalian RNA interference. Nat Cell Biol. 7(12): 1267-74.
Jay, C., J. Nemunaitis, P. Chen, P. Fulgham and A. W. Tong (2007). miRNA profiling for diagnosis and prognosis of human cancer. DNA Cell Biol. 26(5): 293-300.
Jing, Q., S. Huang, S. Guth, T. Zarubin, A. Motoyama, J. Chen, F. Di Padova, S. C. Lin, H. Gram and J. Han (2005). Involvement of microRNA in AU-rich element-mediated mRNA instability. Cell. 120(5): 623-34.
John, B., A. J. Enright, A. Aravin, T. Tuschl, C. Sander and D. S. Marks (2004). Human MicroRNA targets. PLoS Biol. 2(11): e363.
Johnson, S. M., H. Grosshans, J. Shingara, M. Byrom, R. Jarvis, A. Cheng, E. Labourier, K. L. Reinert, D. Brown and F. J. Slack (2005). RAS is regulated by the let-7 microRNA family. Cell. 120(5): 635-47.
Jorgensen, R. (1990). Altered gene expression in plants due to trans interactions between homologous genes. Trends Biotechnol. 8(12): 340-4.
Katsanou, V., O. Papadaki, S. Milatos, P. J. Blackshear, P. Anderson, G. Kollias and D. L. Kontoyiannis (2005). HuR as a negative posttranscriptional modulator in inflammation. Mol Cell. 19(6): 777-89.
Keene, J. D. (1999). Why is Hu where? Shuttling of early-response-gene messenger RNA subsets. Proc Natl Acad Sci U S A. 96(1): 5-7.
References 108
Kertesz, M., N. Iovino, U. Unnerstall, U. Gaul and E. Segal (2007). The role of site accessibility in microRNA target recognition. Nat Genet. 39(10): 1278-84.
Khoury, M., P. Louis-Plence, V. Escriou, D. Noel, C. Largeau, C. Cantos, D. Scherman, C. Jorgensen and F. Apparailly (2006). Efficient new cationic liposome formulation for systemic delivery of small interfering RNA silencing tumor necrosis factor alpha in experimental arthritis. Arthritis Rheum. 54(6): 1867-77.
Khvorova, A., A. Reynolds and S. D. Jayasena (2003). Functional siRNAs and miRNAs exhibit strand bias. Cell. 115(2): 209-16.
Kim, D. H. and J. J. Rossi (2007). Strategies for silencing human disease using RNA interference. Nat Rev Genet. 8(3): 173-84.
Kim, V. N. (2005). MicroRNA biogenesis: coordinated cropping and dicing. Nat Rev Mol Cell Biol. 6(5): 376-85.
Kim, V. N. and J. W. Nam (2006). Genomics of microRNA. Trends Genet. 22(3): 165-73.
Kiriakidou, M., P. T. Nelson, A. Kouranov, P. Fitziev, C. Bouyioukos, Z. Mourelatos and A. Hatzigeorgiou (2004). A combined computational-experimental approach predicts human microRNA targets. Genes Dev. 18(10): 1165-78.
Koller, E., S. Propp, H. Murray, W. Lima, B. Bhat, T. P. Prakash, C. R. Allerson, E. E. Swayze, E. G. Marcusson and N. M. Dean (2006). Competition for RISC binding predicts in vitro potency of siRNA. Nucleic Acids Res. 34(16): 4467-76.
Krek, A., D. Grun, M. N. Poy, R. Wolf, L. Rosenberg, E. J. Epstein, P. MacMenamin, I. da Piedade, K. C. Gunsalus, M. Stoffel and N. Rajewsky (2005). Combinatorial microRNA target predictions. Nat Genet. 37(5): 495-500.
Kurreck, J. (2006). siRNA Efficiency: Structure or Sequence-That Is the Question. J Biomed Biotechnol. 2006(4): 83757.
Kusenda, B., M. Mraz, J. Mayer and S. Pospisilova (2006). MicroRNA biogenesis, functionality and cancer relevance. Biomed Pap Med Fac Univ Palacky Olomouc Czech Repub. 150(2): 205-15.
Lagos-Quintana, M., R. Rauhut, W. Lendeckel and T. Tuschl (2001). Identification of novel genes coding for small expressed RNAs. Science. 294(5543): 853-8.
Lagos-Quintana, M., R. Rauhut, A. Yalcin, J. Meyer, W. Lendeckel and T. Tuschl (2002). Identification of tissue-specific microRNAs from mouse. Curr Biol. 12(9): 735-9.
References 109
Lai, W. S., D. M. Carrick and P. J. Blackshear (2005). Influence of nonameric AU-rich tristetraprolin-binding sites on mRNA deadenylation and turnover. J Biol Chem. 280(40): 34365-77.
Lai, W. S., E. A. Kennington and P. J. Blackshear (2002). Interactions of CCCH zinc finger proteins with mRNA: non-binding tristetraprolin mutants exert an inhibitory effect on degradation of AU-rich element-containing mRNAs. J Biol Chem. 277(11): 9606-13.
Laroia, G., R. Cuesta, G. Brewer and R. J. Schneider (1999). Control of mRNA decay by heat shock-ubiquitin-proteasome pathway. Science. 284(5413): 499-502.
Lecellier, C. H., P. Dunoyer, K. Arar, J. Lehmann-Che, S. Eyquem, C. Himber, A. Saib and O. Voinnet (2005). A cellular microRNA mediates antiviral defense in human cells. Science. 308(5721): 557-60.
Lee, R. C. and V. Ambros (2001). An extensive class of small RNAs in Caenorhabditis elegans. Science. 294(5543): 862-4.
Lee, R. C., R. L. Feinbaum and V. Ambros (1993). The C. elegans heterochronic gene lin-4 encodes small RNAs with antisense complementarity to lin-14. Cell. 75(5): 843-54.
Lee, Y., C. Ahn, J. Han, H. Choi, J. Kim, J. Yim, J. Lee, P. Provost, O. Radmark, S. Kim and V. N. Kim (2003). The nuclear RNase III Drosha initiates microRNA processing. Nature. 425(6956): 415-9.
Lee, Y., I. Hur, S. Y. Park, Y. K. Kim, M. R. Suh and V. N. Kim (2006). The role of PACT in the RNA silencing pathway. Embo J. 25(3): 522-32.
Lee, Y., K. Jeon, J. T. Lee, S. Kim and V. N. Kim (2002). MicroRNA maturation: stepwise processing and subcellular localization. Embo J. 21(17): 4663-70.
Lee, Y., M. Kim, J. Han, K. H. Yeom, S. Lee, S. H. Baek and V. N. Kim (2004). MicroRNA genes are transcribed by RNA polymerase II. Embo J. 23(20): 4051-60.
Leibold, E. A. and H. N. Munro (1988). Cytoplasmic protein binds in vitro to a highly conserved sequence in the 5' untranslated region of ferritin heavy- and light-subunit mRNAs. Proc Natl Acad Sci U S A. 85(7): 2171-5.
Levy, N. S., S. Chung, H. Furneaux and A. P. Levy (1998). Hypoxic stabilization of vascular endothelial growth factor mRNA by the RNA-binding protein HuR. J Biol Chem. 273(11): 6417-23.
Lewis, B. P., C. B. Burge and D. P. Bartel (2005). Conserved seed pairing, often flanked by adenosines, indicates that thousands of human genes are microRNA targets. Cell. 120(1): 15-20.
References 110
Lewis, B. P., I. H. Shih, M. W. Jones-Rhoades, D. P. Bartel and C. B. Burge (2003). Prediction of mammalian microRNA targets. Cell. 115(7): 787-98.
Lim, L. P., N. C. Lau, P. Garrett-Engele, A. Grimson, J. M. Schelter, J. Castle, D. P. Bartel, P. S. Linsley and J. M. Johnson (2005). Microarray analysis shows that some microRNAs downregulate large numbers of target mRNAs. Nature. 433(7027): 769-73.
Lin, W. J., A. Duffy and C. Y. Chen (2007). Localization of AU-rich element-containing mRNA in cytoplasmic granules containing exosome subunits. J Biol Chem. 282(27): 19958-68.
Lindow, M. and J. Gorodkin (2007). Principles and limitations of computational microRNA gene and target finding. DNA Cell Biol. 26(5): 339-51.
Lingel, A., B. Simon, E. Izaurralde and M. Sattler (2004). Nucleic acid 3'-end recognition by the Argonaute2 PAZ domain. Nat Struct Mol Biol. 11(6): 576-7.
Lippman, Z. and R. Martienssen (2004). The role of RNA interference in heterochromatic silencing. Nature. 431(7006): 364-70.
Liu, J., M. A. Carmell, F. V. Rivas, C. G. Marsden, J. M. Thomson, J. J. Song, S. M. Hammond, L. Joshua-Tor and G. J. Hannon (2004). Argonaute2 is the catalytic engine of mammalian RNAi. Science. 305(5689): 1437-41.
Liu, J., M. A. Valencia-Sanchez, G. J. Hannon and R. Parker (2005). MicroRNA-dependent localization of targeted mRNAs to mammalian P-bodies. Nat Cell Biol. 7(7): 719-23.
Long, D., R. Lee, P. Williams, C. Y. Chan, V. Ambros and Y. Ding (2007). Potent effect of target structure on microRNA function. Nat Struct Mol Biol. 14(4): 287-94.
Lu, J., G. Getz, E. A. Miska, E. Alvarez-Saavedra, J. Lamb, D. Peck, A. Sweet-Cordero, B. L. Ebert, R. H. Mak, A. A. Ferrando, J. R. Downing, T. Jacks, H. R. Horvitz and T. R. Golub (2005). MicroRNA expression profiles classify human cancers. Nature. 435(7043): 834-8.
Lund, E., S. Guttinger, A. Calado, J. E. Dahlberg and U. Kutay (2004). Nuclear export of microRNA precursors. Science. 303(5654): 95-8.
Lytle, J. R., T. A. Yario and J. A. Steitz (2007). Target mRNAs are repressed as efficiently by microRNA-binding sites in the 5' UTR as in the 3' UTR. Proc Natl Acad Sci U S A. 104(23): 9667-72.
Ma, J. B., K. Ye and D. J. Patel (2004). Structural basis for overhang-specific small interfering RNA recognition by the PAZ domain. Nature. 429(6989): 318-22.
References 111
Ma, W. J., S. Cheng, C. Campbell, A. Wright and H. Furneaux (1996). Cloning and characterization of HuR, a ubiquitously expressed Elav-like protein. J Biol Chem. 271(14): 8144-51.
Mahtani, K. R., M. Brook, J. L. Dean, G. Sully, J. Saklatvala and A. R. Clark (2001). Mitogen-activated protein kinase p38 controls the expression and posttranslational modification of tristetraprolin, a regulator of tumor necrosis factor alpha mRNA stability. Mol Cell Biol. 21(19): 6461-9.
Maris, C., C. Dominguez and F. H. Allain (2005). The RNA recognition motif, a plastic RNA-binding platform to regulate post-transcriptional gene expression. Febs J. 272(9): 2118-31.
Masiero, M., G. Nardo, S. Indraccolo and E. Favaro (2007). RNA interference: implications for cancer treatment. Mol Aspects Med. 28(1): 143-66.
Matranga, C., Y. Tomari, C. Shin, D. P. Bartel and P. D. Zamore (2005). Passenger-strand cleavage facilitates assembly of siRNA into Ago2-containing RNAi enzyme complexes. Cell. 123(4): 607-20.
Mattes, J., M. Yang and P. S. Foster (2007). Regulation of microRNA by antagomirs: a new class of pharmacological antagonists for the specific regulation of gene function? Am J Respir Cell Mol Biol. 36(1): 8-12.
Meister, G., M. Landthaler, A. Patkaniowska, Y. Dorsett, G. Teng and T. Tuschl (2004). Human Argonaute2 mediates RNA cleavage targeted by miRNAs and siRNAs. Mol Cell. 15(2): 185-97.
Meng, F., R. Henson, H. Wehbe-Janek, K. Ghoshal, S. T. Jacob and T. Patel (2007a). MicroRNA-21 regulates expression of the PTEN tumor suppressor gene in human hepatocellular cancer. Gastroenterology. 133(2): 647-58.
Meng, F., H. Wehbe-Janek, R. Henson, H. Smith and T. Patel (2007b). Epigenetic regulation of microRNA-370 by interleukin-6 in malignant human cholangiocytes. Oncogene.
Metzler, M., M. Wilda, K. Busch, S. Viehmann and A. Borkhardt (2004). High expression of precursor microRNA-155/BIC RNA in children with Burkitt lymphoma. Genes Chromosomes Cancer. 39(2): 167-9.
Michael, M. Z., O. C. SM, N. G. van Holst Pellekaan, G. P. Young and R. J. James (2003). Reduced accumulation of specific microRNAs in colorectal neoplasia. Mol Cancer Res. 1(12): 882-91.
Mikaelian, I., M. Krieg, M. J. Gait and J. Karn (1996). Interactions of INS (CRS) elements and the splicing machinery regulate the production of Rev-responsive mRNAs. J Mol Biol. 257(2): 246-64.
References 112
Mitchell, P. and D. Tollervey (2000). mRNA stability in eukaryotes. Curr Opin Genet Dev. 10(2): 193-8.
Miyagishi, M. and K. Taira (2002). U6 promoter-driven siRNAs with four uridine 3' overhangs efficiently suppress targeted gene expression in mammalian cells. Nat Biotechnol. 20(5): 497-500.
Mourelatos, Z., J. Dostie, S. Paushkin, A. Sharma, B. Charroux, L. Abel, J. Rappsilber, M. Mann and G. Dreyfuss (2002). miRNPs: a novel class of ribonucleoproteins containing numerous microRNAs. Genes Dev. 16(6): 720-8.
Mukherjee, D., M. Gao, J. P. O'Connor, R. Raijmakers, G. Pruijn, C. S. Lutz and J. Wilusz (2002). The mammalian exosome mediates the efficient degradation of mRNAs that contain AU-rich elements. Embo J. 21(1-2): 165-74.
O'Donnell, K. A., E. A. Wentzel, K. I. Zeller, C. V. Dang and J. T. Mendell (2005). c-Myc-regulated microRNAs modulate E2F1 expression. Nature. 435(7043): 839-43.
Paddison, P. J., A. A. Caudy, E. Bernstein, G. J. Hannon and D. S. Conklin (2002). Short hairpin RNAs (shRNAs) induce sequence-specific silencing in mammalian cells. Genes Dev. 16(8): 948-58.
Parker, J. S., S. M. Roe and D. Barford (2005). Structural insights into mRNA recognition from a PIWI domain-siRNA guide complex. Nature. 434(7033): 663-6.
Paschoud, S., A. M. Dogar, C. Kuntz, B. Grisoni-Neupert, L. Richman and L. C. Kuhn (2006). Destabilization of interleukin-6 mRNA requires a putative RNA stem-loop structure, an AU-rich element, and the RNA-binding protein AUF1. Mol Cell Biol. 26(22): 8228-41.
Paulson, H. and P. Gonzalez-Alegre (2006). RNAi gets its prize. Lancet Neurol. 5(12): 997-9.
Peng, S. S., C. Y. Chen, N. Xu and A. B. Shyu (1998). RNA stabilization by the AU-rich element binding protein, HuR, an ELAV protein. Embo J. 17(12): 3461-70.
Perrotti, D. and P. Neviani (2007). From mRNA metabolism to cancer therapy: chronic myelogenous leukemia shows the way. Clin Cancer Res. 13(6): 1638-42.
Piecyk, M., S. Wax, A. R. Beck, N. Kedersha, M. Gupta, B. Maritim, S. Chen, C. Gueydan, V. Kruys, M. Streuli and P. Anderson (2000). TIA-1 is a translational silencer that selectively regulates the expression of TNF-alpha. Embo J. 19(15): 4154-63.
Porkka, K. P., M. J. Pfeiffer, K. K. Waltering, R. L. Vessella, T. L. Tammela and T. Visakorpi (2007). MicroRNA expression profiling in prostate cancer. Cancer Res. 67(13): 6130-5.
References 113
Preall, J. B. and E. J. Sontheimer (2005). RNAi: RISC gets loaded. Cell. 123(4): 543-5.
Raineri, I., D. Wegmueller, B. Gross, U. Certa and C. Moroni (2004). Roles of AUF1 isoforms, HuR and BRF1 in ARE-dependent mRNA turnover studied by RNA interference. Nucleic Acids Res. 32(4): 1279-88.
Rand, T. A., S. Petersen, F. Du and X. Wang (2005). Argonaute2 cleaves the anti-guide strand of siRNA during RISC activation. Cell. 123(4): 621-9.
Reid, T., R. Warren and D. Kirn (2002). Intravascular adenoviral agents in cancer patients: lessons from clinical trials. Cancer Gene Ther. 9(12): 979-86.
Reinhart, B. J., F. J. Slack, M. Basson, A. E. Pasquinelli, J. C. Bettinger, A. E. Rougvie, H. R. Horvitz and G. Ruvkun (2000). The 21-nucleotide let-7 RNA regulates developmental timing in Caenorhabditis elegans. Nature. 403(6772): 901-6.
Robb, G. B. and T. M. Rana (2007). RNA helicase A interacts with RISC in human cells and functions in RISC loading. Mol Cell. 26(4): 523-37.
Robins, H., Y. Li and R. W. Padgett (2005). Incorporating structure to predict microRNA targets. Proc Natl Acad Sci U S A. 102(11): 4006-9.
Robins, H. and W. H. Press (2005). Human microRNAs target a functionally distinct population of genes with AT-rich 3' UTRs. Proc Natl Acad Sci U S A. 102(43): 15557-62.
Rodriguez, A., S. Griffiths-Jones, J. L. Ashurst and A. Bradley (2004). Identification of mammalian microRNA host genes and transcription units. Genome Res. 14(10A): 1902-10.
Ruggiero, T., M. Trabucchi, M. Ponassi, G. Corte, C. Y. Chen, L. al-Haj, K. S. Khabar, P. Briata and R. Gherzi (2007). Identification of a set of KSRP target transcripts upregulated by PI3K-AKT signaling. BMC Mol Biol. 8: 28.
Ruiz-Echevarria, M. J. and S. W. Peltz (2000). The RNA binding protein Pub1 modulates the stability of transcripts containing upstream open reading frames. Cell. 101(7): 741-51.
Saetrom, P., B. S. Heale, O. Snove, Jr., L. Aagaard, J. Alluin and J. J. Rossi (2007). Distance constraints between microRNA target sites dictate efficacy and cooperativity. Nucleic Acids Res. 35(7): 2333-42.
Sanchez-Beato, M., A. Sanchez-Aguilera and M. A. Piris (2003). Cell cycle deregulation in B-cell lymphomas. Blood. 101(4): 1220-35.
References 114
Schiavi, S. C., C. L. Wellington, A. B. Shyu, C. Y. Chen, M. E. Greenberg and J. G. Belasco (1994). Multiple elements in the c-fos protein-coding region facilitate mRNA deadenylation and decay by a mechanism coupled to translation. J Biol Chem. 269(5): 3441-8.
Schiffelers, R. M., J. Xu, G. Storm, M. C. Woodle and P. V. Scaria (2005). Effects of treatment with small interfering RNA on joint inflammation in mice with collagen-induced arthritis. Arthritis Rheum. 52(4): 1314-8.
Scott, G. K., A. Goga, D. Bhaumik, C. E. Berger, C. S. Sullivan and C. C. Benz (2007). Coordinate suppression of ERBB2 and ERBB3 by enforced expression of micro-RNA miR-125a or miR-125b. J Biol Chem. 282(2): 1479-86.
Sen, G. L. and H. M. Blau (2006). A brief history of RNAi: the silence of the genes. Faseb J. 20(9): 1293-9.
Shao, Y., C. Y. Chan, A. Maliyekkel, C. E. Lawrence, I. B. Roninson and Y. Ding (2007). Effect of target secondary structure on RNAi efficiency. Rna. 13(10): 1631-40.
Shaw, G. and R. Kamen (1986). A conserved AU sequence from the 3' untranslated region of GM-CSF mRNA mediates selective mRNA degradation. Cell. 46(5): 659-67.
Shen, H. L., W. Xu, Z. Y. Wu, L. L. Zhou, R. J. Qin and H. R. Tang (2007). Vector-based RNAi approach to isoform-specific downregulation of vascular endothelial growth factor (VEGF)165 expression in human leukemia cells. Leuk Res. 31(4): 515-21.
Sheth, U. and R. Parker (2003). Decapping and decay of messenger RNA occur in cytoplasmic processing bodies. Science. 300(5620): 805-8.
Shiohama, A., T. Sasaki, S. Noda, S. Minoshima and N. Shimizu (2003). Molecular cloning and expression analysis of a novel gene DGCR8 located in the DiGeorge syndrome chromosomal region. Biochem Biophys Res Commun. 304(1): 184-90.
Si, M. L., S. Zhu, H. Wu, Z. Lu, F. Wu and Y. Y. Mo (2007). miR-21-mediated tumor growth. Oncogene. 26(19): 2799-803.
Siolas, D., C. Lerner, J. Burchard, W. Ge, P. S. Linsley, P. J. Paddison, G. J. Hannon and M. A. Cleary (2005). Synthetic shRNAs as potent RNAi triggers. Nat Biotechnol. 23(2): 227-31.
Sledz, C. A., M. Holko, M. J. de Veer, R. H. Silverman and B. R. Williams (2003). Activation of the interferon system by short-interfering RNAs. Nat Cell Biol. 5(9): 834-9.
Song, J. J., S. K. Smith, G. J. Hannon and L. Joshua-Tor (2004). Crystal structure of Argonaute and its implications for RISC slicer activity. Science. 305(5689): 1434-7.
References 115
Sood, P., A. Krek, M. Zavolan, G. Macino and N. Rajewsky (2006). Cell-type-specific signatures of microRNAs on target mRNA expression. Proc Natl Acad Sci U S A. 103(8): 2746-51.
Stark, G. R., I. M. Kerr, B. R. Williams, R. H. Silverman and R. D. Schreiber (1998). How cells respond to interferons. Annu Rev Biochem. 67: 227-64.
Stoecklin, G., M. Lu, B. Rattenbacher and C. Moroni (2003). A constitutive decay element promotes tumor necrosis factor alpha mRNA degradation via an AU-rich element-independent pathway. Mol Cell Biol. 23(10): 3506-15.
Stoecklin, G., T. Mayo and P. Anderson (2006). ARE-mRNA degradation requires the 5'-3' decay pathway. EMBO Rep. 7(1): 72-7.
Stoecklin, G., T. Stubbs, N. Kedersha, S. Wax, W. F. Rigby, T. K. Blackwell and P. Anderson (2004). MK2-induced tristetraprolin:14-3-3 complexes prevent stress granule association and ARE-mRNA decay. Embo J. 23(6): 1313-24.
Sui, G., C. Soohoo, B. Affar el, F. Gay, Y. Shi, W. C. Forrester and Y. Shi (2002). A DNA vector-based RNAi technology to suppress gene expression in mammalian cells. Proc Natl Acad Sci U S A. 99(8): 5515-20.
Svoboda, P. and A. Di Cara (2006). Hairpin RNA: a secondary structure of primary importance. Cell Mol Life Sci. 63(7-8): 901-8.
Szafranska, A. E., T. S. Davison, J. John, T. Cannon, B. Sipos, A. Maghnouj, E. Labourier and S. A. Hahn (2007). MicroRNA expression alterations are linked to tumorigenesis and non-neoplastic processes in pancreatic ductal adenocarcinoma. Oncogene. 26(30): 4442-52.
Tagawa, H., K. Karube, S. Tsuzuki, K. Ohshima and M. Seto (2007). Synergistic action of the microRNA-17 polycistron and Myc in aggressive cancer development. Cancer Sci. 98(9): 1482-90.
Takahashi, Y., M. Nishikawa and Y. Takakura (2006). Suppression of tumor growth by intratumoral injection of short hairpin RNA-expressing plasmid DNA targeting beta-catenin or hypoxia-inducible factor 1alpha. J Control Release. 116(1): 90-5.
Takamizawa, J., H. Konishi, K. Yanagisawa, S. Tomida, H. Osada, H. Endoh, T. Harano, Y. Yatabe, M. Nagino, Y. Nimura, T. Mitsudomi and T. Takahashi (2004). Reduced expression of the let-7 microRNAs in human lung cancers in association with shortened postoperative survival. Cancer Res. 64(11): 3753-6.
Tam, W., S. H. Hughes, W. S. Hayward and P. Besmer (2002). Avian bic, a gene isolated from a common retroviral site in avian leukosis virus-induced lymphomas that encodes a noncoding RNA, cooperates with c-myc in lymphomagenesis and erythroleukemogenesis. J Virol. 76(9): 4275-86.
References 116
Tran, N., T. McLean, X. Zhang, C. J. Zhao, J. M. Thomson, C. O'Brien and B. Rose (2007). MicroRNA expression profiles in head and neck cancer cell lines. Biochem Biophys Res Commun. 358(1): 12-7.
Tschaharganeh, D., V. Ehemann, T. Nussbaum, P. Schirmacher and K. Breuhahn (2007). Non-specific effects of siRNAs on tumor cells with implications on therapeutic applicability using RNA interference. Pathol Oncol Res. 13(2): 84-90.
van Riggelen, J., G. Buchwalter, U. Soto, J. De-Castro Arce, H. Z. Hausen, B. Wasylyk and F. Rosl (2005). Loss of net as repressor leads to constitutive increased c-fos transcription in cervical cancer cells. J Biol Chem. 280(5): 3286-94.
Vasudevan, S., N. Garneau, D. Tu Khounh and S. W. Peltz (2005). p38 mitogen-activated protein kinase/Hog1p regulates translation of the AU-rich-element-bearing MFA2 transcript. Mol Cell Biol. 25(22): 9753-63.
Vasudevan, S. and S. W. Peltz (2001). Regulated ARE-mediated mRNA decay in Saccharomyces cerevisiae. Mol Cell. 7(6): 1191-200.
Vasudevan, S. and J. A. Steitz (2007). AU-rich-element-mediated upregulation of translation by FXR1 and Argonaute 2. Cell. 128(6): 1105-18.
Verma, U. N., R. M. Surabhi, A. Schmaltieg, C. Becerra and R. B. Gaynor (2003). Small interfering RNAs directed against beta-catenin inhibit the in vitro and in vivo growth of colon cancer cells. Clin Cancer Res. 9(4): 1291-300.
Volinia, S., G. A. Calin, C. G. Liu, S. Ambs, A. Cimmino, F. Petrocca, R. Visone, M. Iorio, C. Roldo, M. Ferracin, R. L. Prueitt, N. Yanaihara, G. Lanza, A. Scarpa, A. Vecchione, M. Negrini, C. C. Harris and C. M. Croce (2006). A microRNA expression signature of human solid tumors defines cancer gene targets. Proc Natl Acad Sci U S A. 103(7): 2257-61.
Voorhoeve, P. M., C. le Sage, M. Schrier, A. J. Gillis, H. Stoop, R. Nagel, Y. P. Liu, J. van Duijse, J. Drost, A. Griekspoor, E. Zlotorynski, N. Yabuta, G. De Vita, H. Nojima, L. H. Looijenga and R. Agami (2006). A genetic screen implicates miRNA-372 and miRNA-373 as oncogenes in testicular germ cell tumors. Cell. 124(6): 1169-81.
Waldman, S. A. and A. Terzic (2007). Translating MicroRNA discovery into clinical biomarkers in cancer. Jama. 297(17): 1923-5.
Wang, W., M. C. Caldwell, S. Lin, H. Furneaux and M. Gorospe (2000a). HuR regulates cyclin A and cyclin B1 mRNA stability during cell proliferation. Embo J. 19(10): 2340-50.
Wang, W., H. Furneaux, H. Cheng, M. C. Caldwell, D. Hutter, Y. Liu, N. Holbrook and M. Gorospe (2000b). HuR regulates p21 mRNA stabilization by UV light. Mol Cell Biol. 20(3): 760-9.
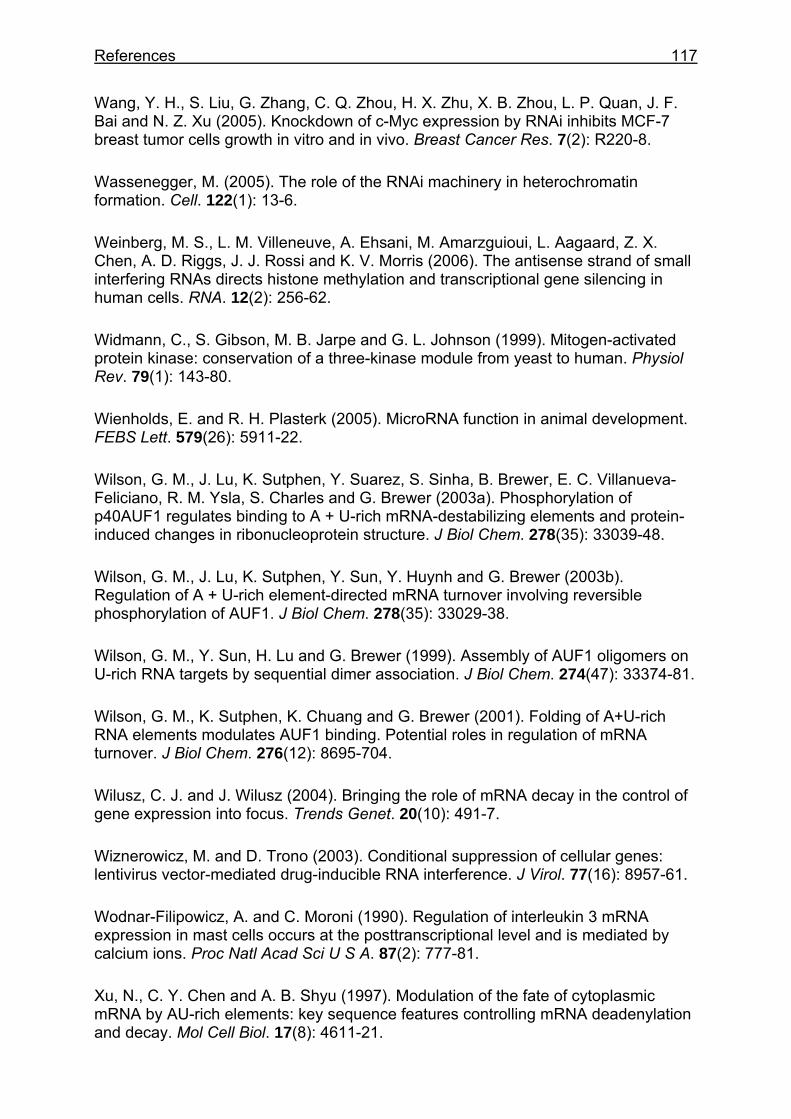
References 117
Wang, Y. H., S. Liu, G. Zhang, C. Q. Zhou, H. X. Zhu, X. B. Zhou, L. P. Quan, J. F. Bai and N. Z. Xu (2005). Knockdown of c-Myc expression by RNAi inhibits MCF-7 breast tumor cells growth in vitro and in vivo. Breast Cancer Res. 7(2): R220-8.
Wassenegger, M. (2005). The role of the RNAi machinery in heterochromatin formation. Cell. 122(1): 13-6.
Weinberg, M. S., L. M. Villeneuve, A. Ehsani, M. Amarzguioui, L. Aagaard, Z. X. Chen, A. D. Riggs, J. J. Rossi and K. V. Morris (2006). The antisense strand of small interfering RNAs directs histone methylation and transcriptional gene silencing in human cells. RNA. 12(2): 256-62.
Widmann, C., S. Gibson, M. B. Jarpe and G. L. Johnson (1999). Mitogen-activated protein kinase: conservation of a three-kinase module from yeast to human. Physiol Rev. 79(1): 143-80.
Wienholds, E. and R. H. Plasterk (2005). MicroRNA function in animal development. FEBS Lett. 579(26): 5911-22.
Wilson, G. M., J. Lu, K. Sutphen, Y. Suarez, S. Sinha, B. Brewer, E. C. Villanueva-Feliciano, R. M. Ysla, S. Charles and G. Brewer (2003a). Phosphorylation of p40AUF1 regulates binding to A + U-rich mRNA-destabilizing elements and protein-induced changes in ribonucleoprotein structure. J Biol Chem. 278(35): 33039-48.
Wilson, G. M., J. Lu, K. Sutphen, Y. Sun, Y. Huynh and G. Brewer (2003b). Regulation of A + U-rich element-directed mRNA turnover involving reversible phosphorylation of AUF1. J Biol Chem. 278(35): 33029-38.
Wilson, G. M., Y. Sun, H. Lu and G. Brewer (1999). Assembly of AUF1 oligomers on U-rich RNA targets by sequential dimer association. J Biol Chem. 274(47): 33374-81.
Wilson, G. M., K. Sutphen, K. Chuang and G. Brewer (2001). Folding of A+U-rich RNA elements modulates AUF1 binding. Potential roles in regulation of mRNA turnover. J Biol Chem. 276(12): 8695-704.
Wilusz, C. J. and J. Wilusz (2004). Bringing the role of mRNA decay in the control of gene expression into focus. Trends Genet. 20(10): 491-7.
Wiznerowicz, M. and D. Trono (2003). Conditional suppression of cellular genes: lentivirus vector-mediated drug-inducible RNA interference. J Virol. 77(16): 8957-61.
Wodnar-Filipowicz, A. and C. Moroni (1990). Regulation of interleukin 3 mRNA expression in mast cells occurs at the posttranscriptional level and is mediated by calcium ions. Proc Natl Acad Sci U S A. 87(2): 777-81.
Xu, N., C. Y. Chen and A. B. Shyu (1997). Modulation of the fate of cytoplasmic mRNA by AU-rich elements: key sequence features controlling mRNA deadenylation and decay. Mol Cell Biol. 17(8): 4611-21.
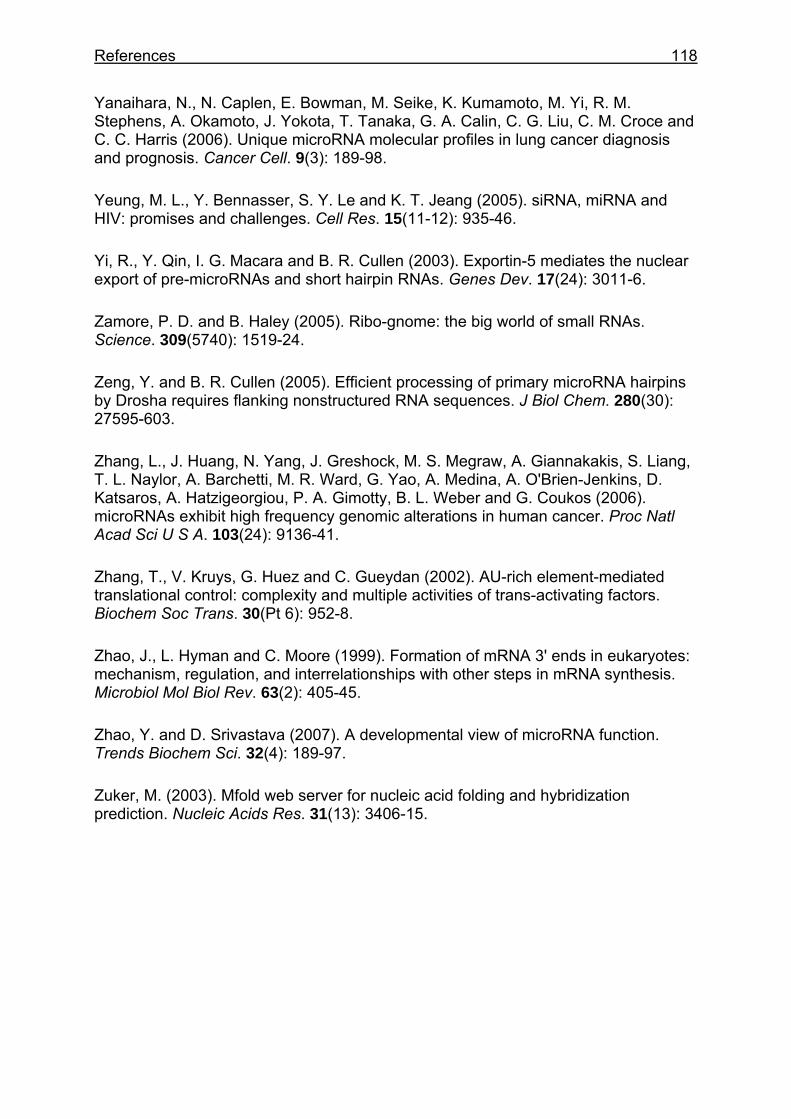
References 118
Yanaihara, N., N. Caplen, E. Bowman, M. Seike, K. Kumamoto, M. Yi, R. M. Stephens, A. Okamoto, J. Yokota, T. Tanaka, G. A. Calin, C. G. Liu, C. M. Croce and C. C. Harris (2006). Unique microRNA molecular profiles in lung cancer diagnosis and prognosis. Cancer Cell. 9(3): 189-98.
Yeung, M. L., Y. Bennasser, S. Y. Le and K. T. Jeang (2005). siRNA, miRNA and HIV: promises and challenges. Cell Res. 15(11-12): 935-46.
Yi, R., Y. Qin, I. G. Macara and B. R. Cullen (2003). Exportin-5 mediates the nuclear export of pre-microRNAs and short hairpin RNAs. Genes Dev. 17(24): 3011-6.
Zamore, P. D. and B. Haley (2005). Ribo-gnome: the big world of small RNAs. Science. 309(5740): 1519-24.
Zeng, Y. and B. R. Cullen (2005). Efficient processing of primary microRNA hairpins by Drosha requires flanking nonstructured RNA sequences. J Biol Chem. 280(30): 27595-603.
Zhang, L., J. Huang, N. Yang, J. Greshock, M. S. Megraw, A. Giannakakis, S. Liang, T. L. Naylor, A. Barchetti, M. R. Ward, G. Yao, A. Medina, A. O'Brien-Jenkins, D. Katsaros, A. Hatzigeorgiou, P. A. Gimotty, B. L. Weber and G. Coukos (2006). microRNAs exhibit high frequency genomic alterations in human cancer. Proc Natl Acad Sci U S A. 103(24): 9136-41.
Zhang, T., V. Kruys, G. Huez and C. Gueydan (2002). AU-rich element-mediated translational control: complexity and multiple activities of trans-activating factors. Biochem Soc Trans. 30(Pt 6): 952-8.
Zhao, J., L. Hyman and C. Moore (1999). Formation of mRNA 3' ends in eukaryotes: mechanism, regulation, and interrelationships with other steps in mRNA synthesis. Microbiol Mol Biol Rev. 63(2): 405-45.
Zhao, Y. and D. Srivastava (2007). A developmental view of microRNA function. Trends Biochem Sci. 32(4): 189-97.
Zuker, M. (2003). Mfold web server for nucleic acid folding and hybridization prediction. Nucleic Acids Res. 31(13): 3406-15.
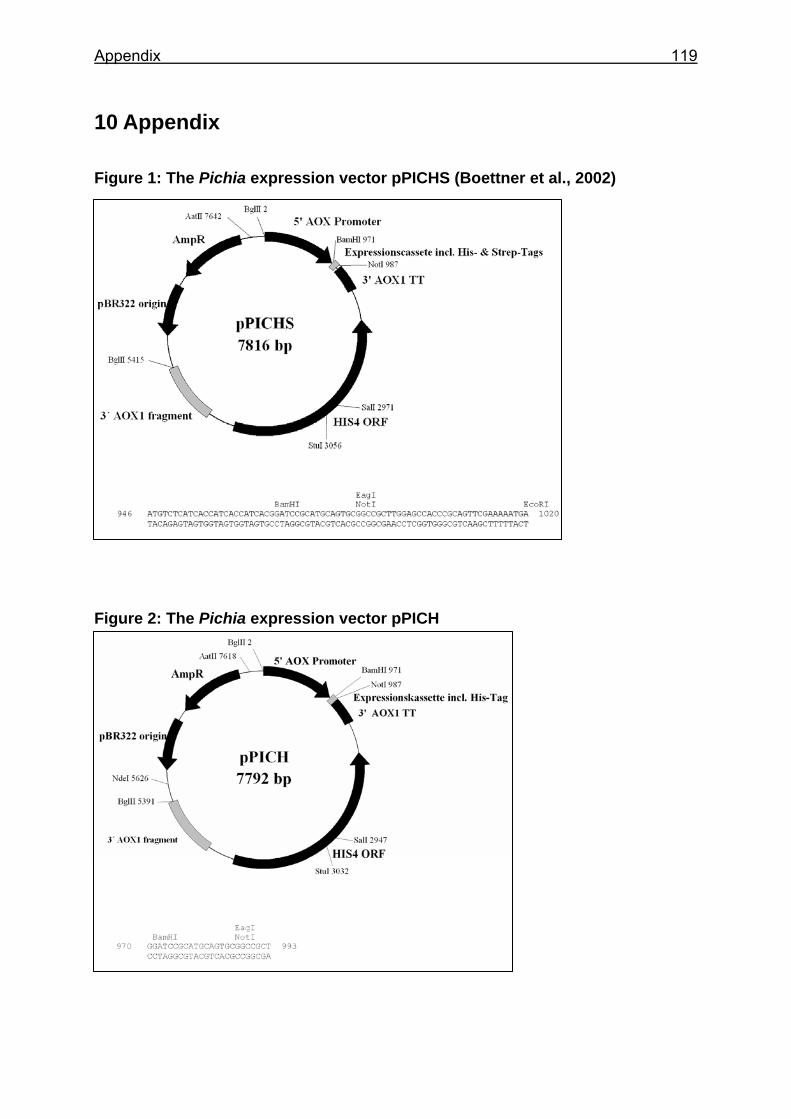
Appendix 119
10 Appendix Figure 1: The Pichia expression vector pPICHS (Boettner et al., 2002) Figure 2: The Pichia expression vector pPICH
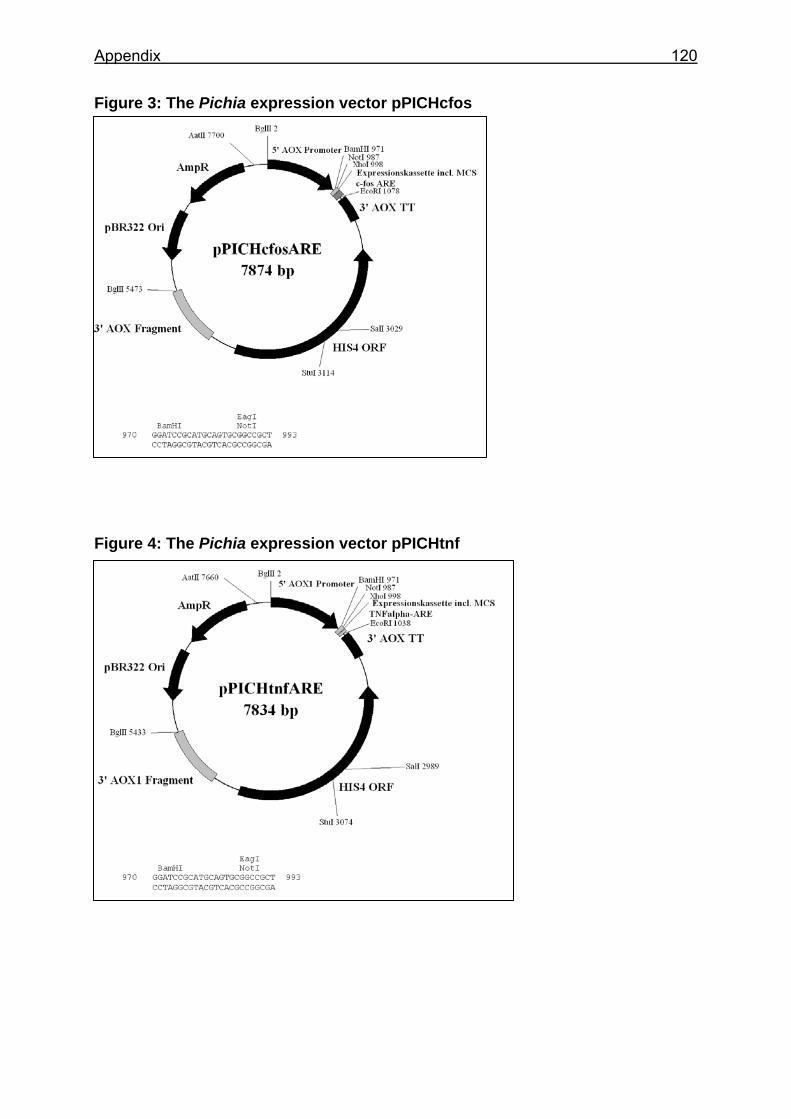
Appendix 120
Figure 3: The Pichia expression vector pPICHcfos Figure 4: The Pichia expression vector pPICHtnf
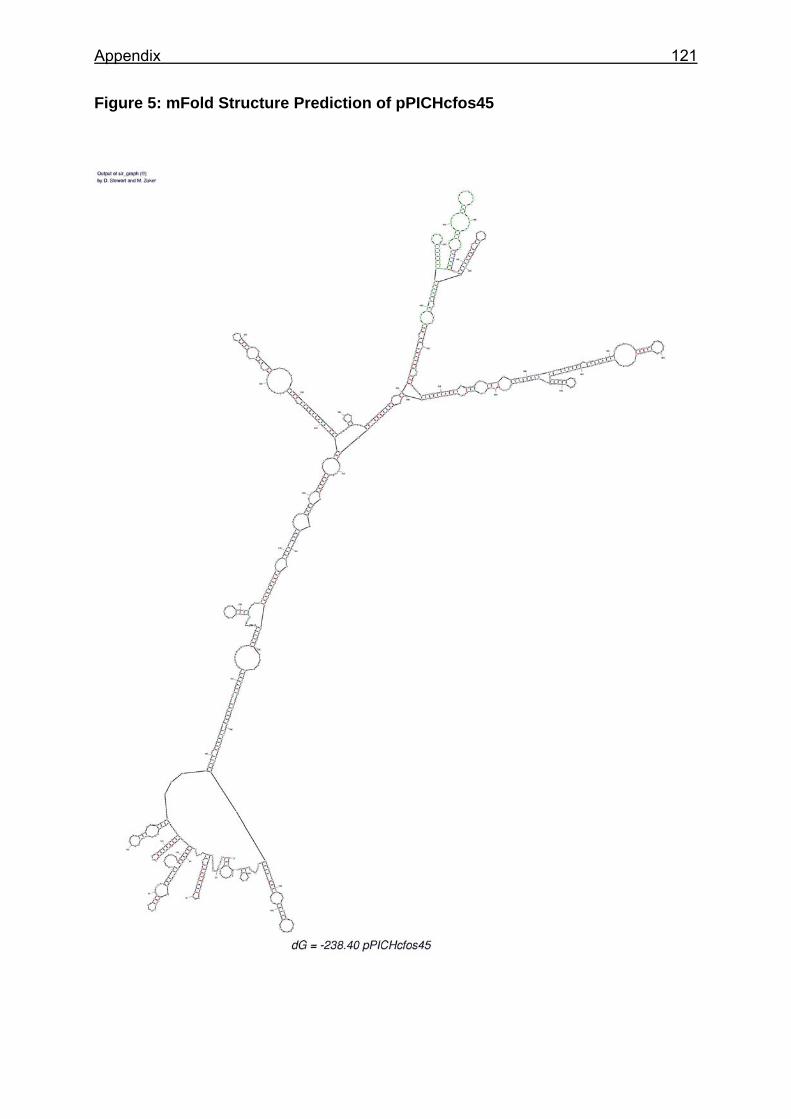
Appendix 121
Figure 5: mFold Structure Prediction of pPICHcfos45
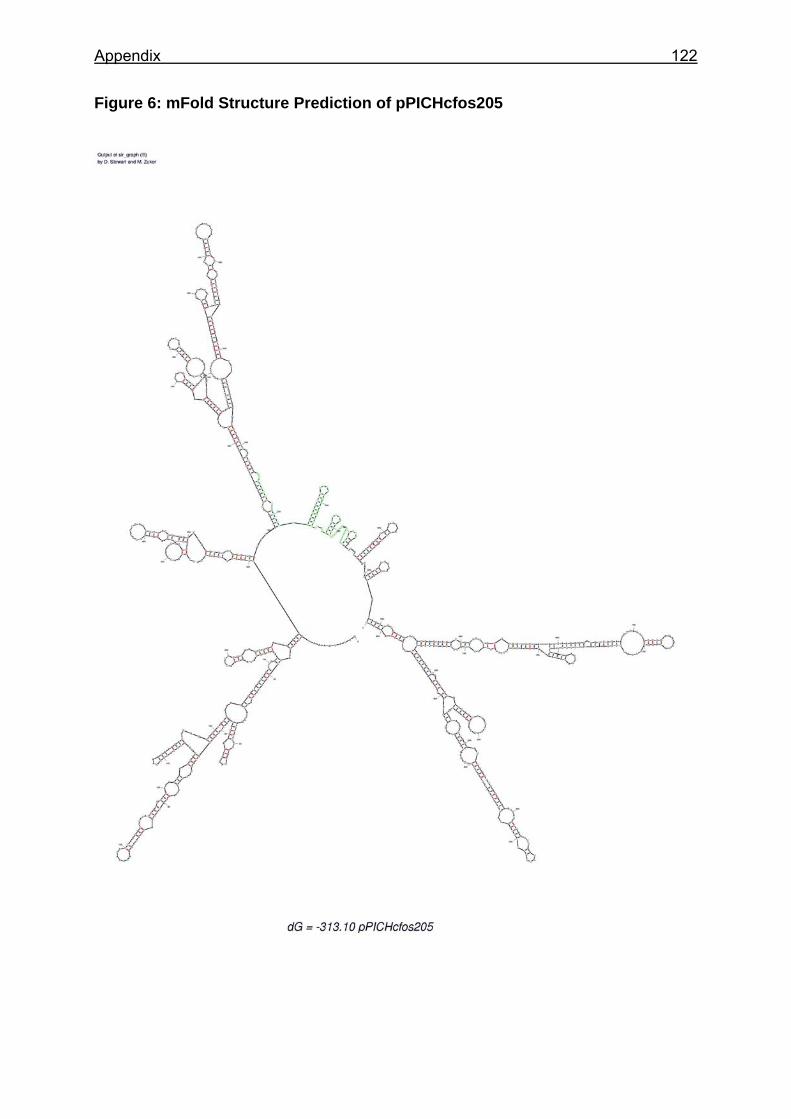
Appendix 122
Figure 6: mFold Structure Prediction of pPICHcfos205
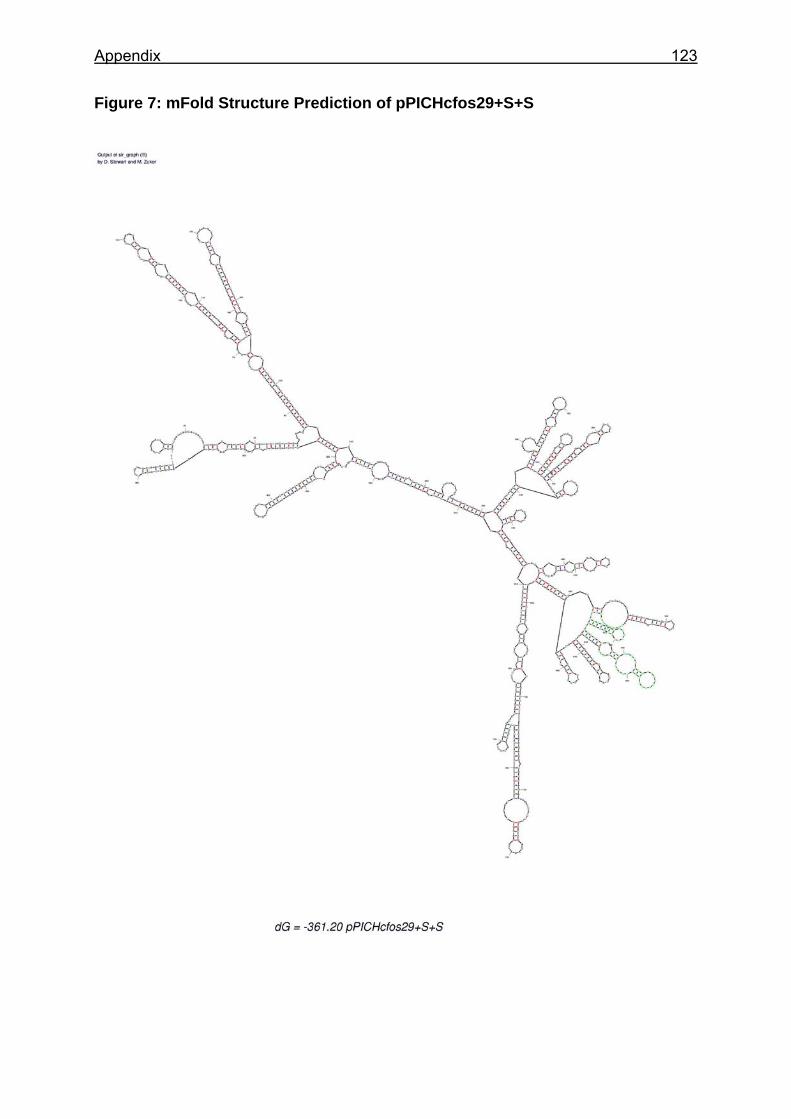
Appendix 123
Figure 7: mFold Structure Prediction of pPICHcfos29+S+S
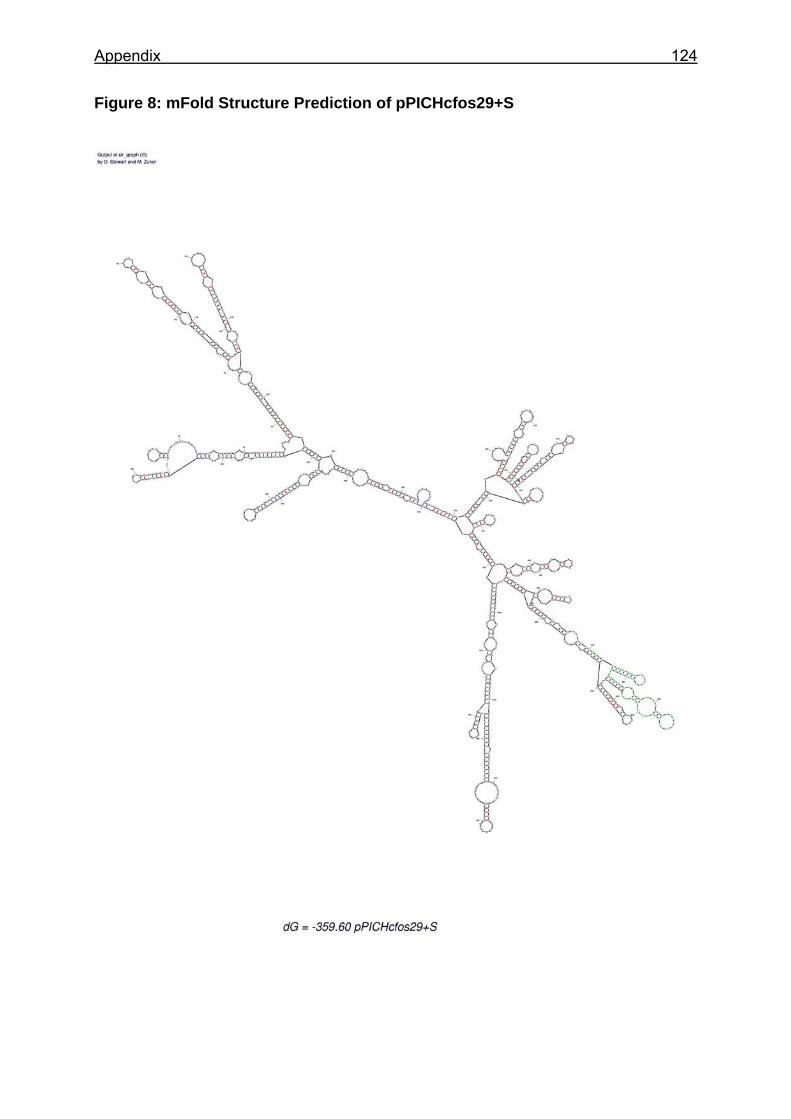
Appendix 124
Figure 8: mFold Structure Prediction of pPICHcfos29+S
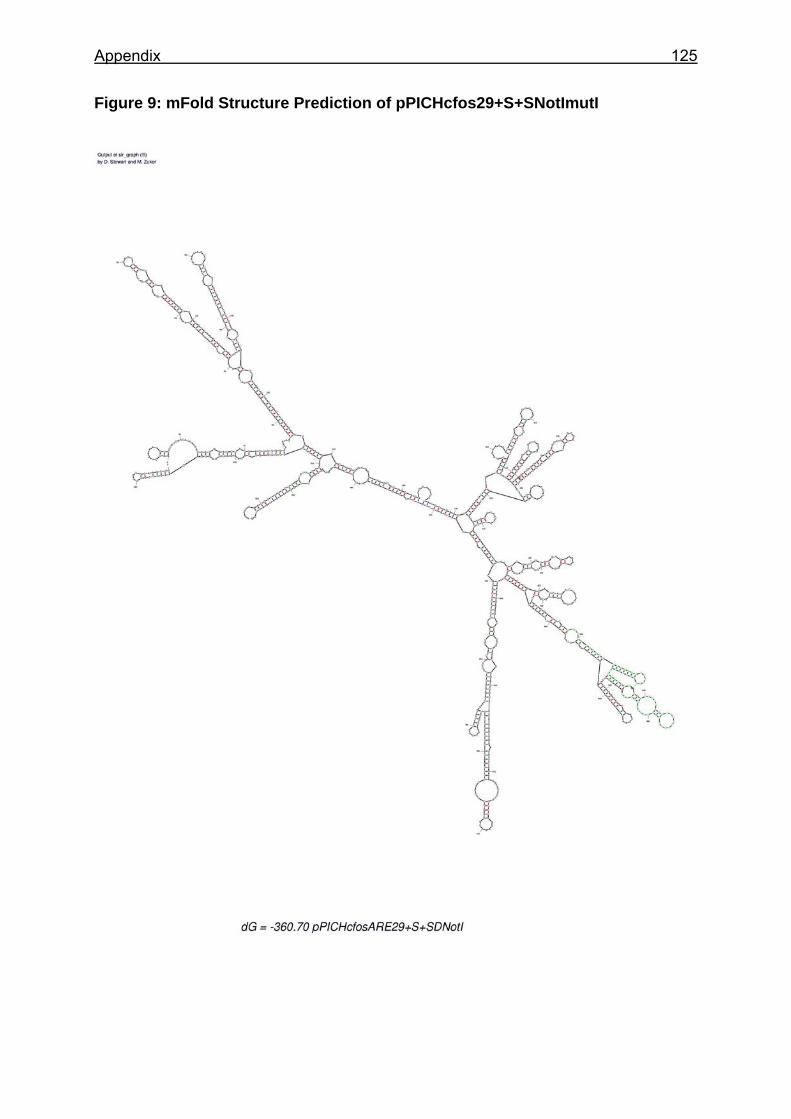
Appendix 125
Figure 9: mFold Structure Prediction of pPICHcfos29+S+SNotImutI
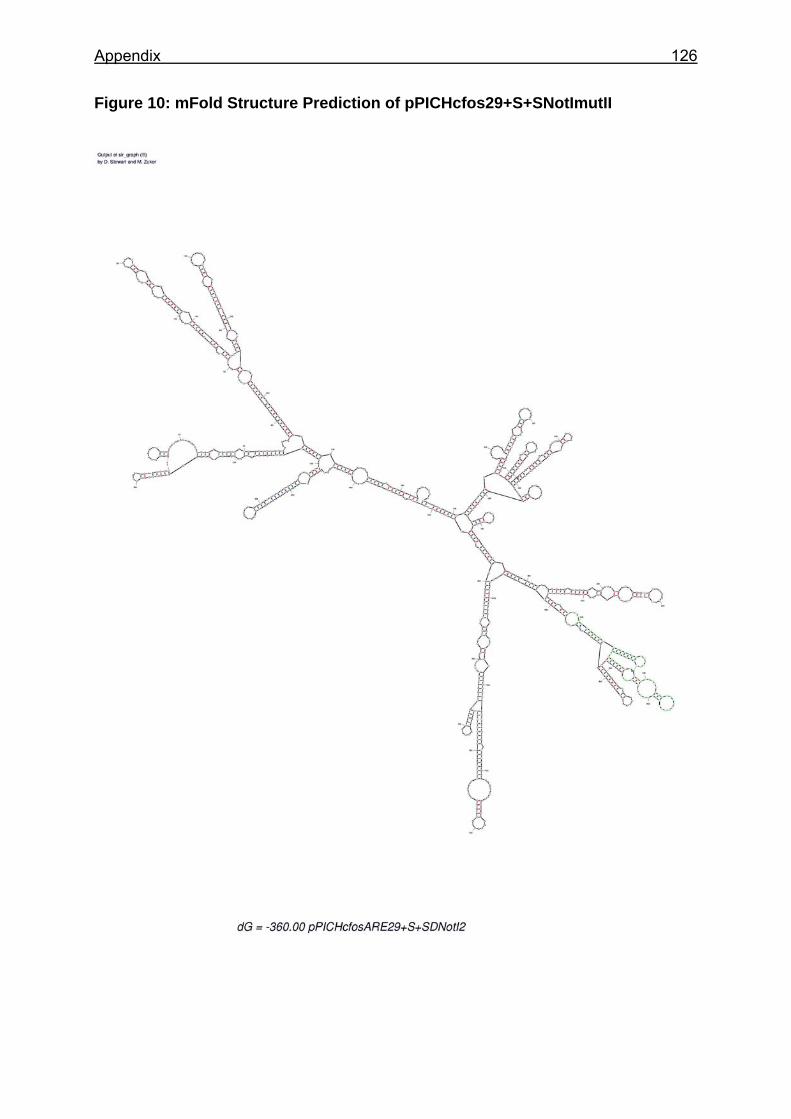
Appendix 126
Figure 10: mFold Structure Prediction of pPICHcfos29+S+SNotImutII
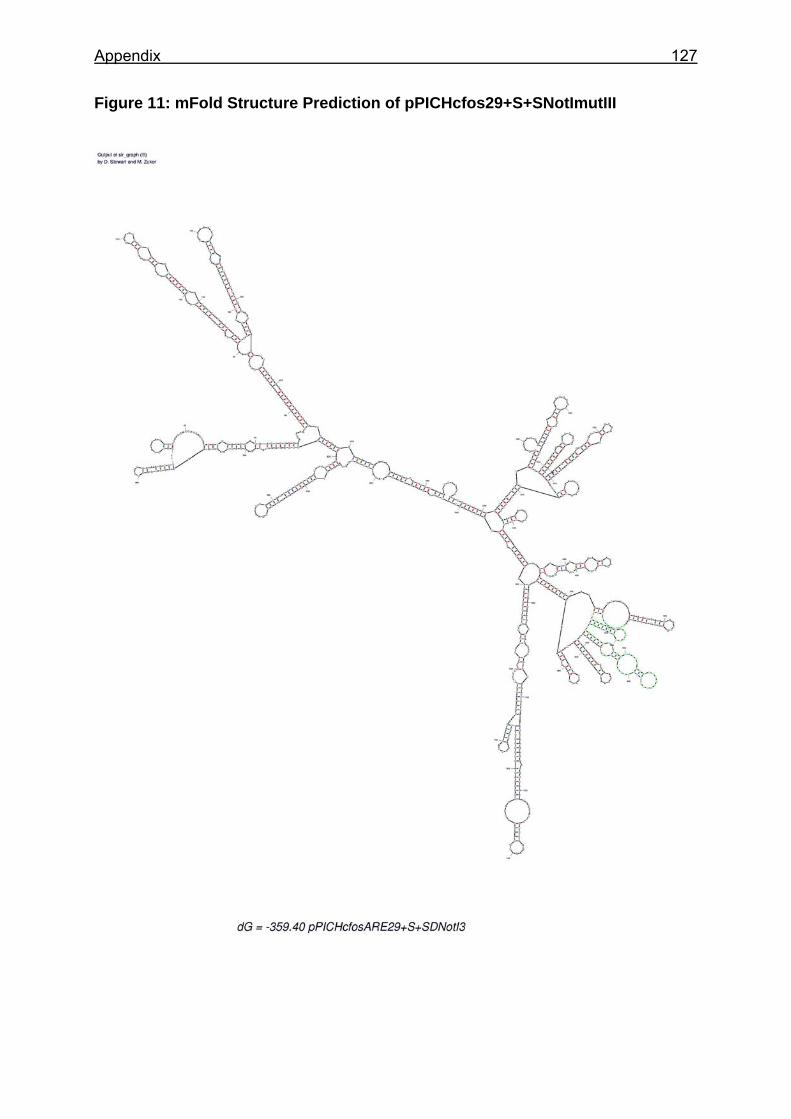
Appendix 127
Figure 11: mFold Structure Prediction of pPICHcfos29+S+SNotImutIII
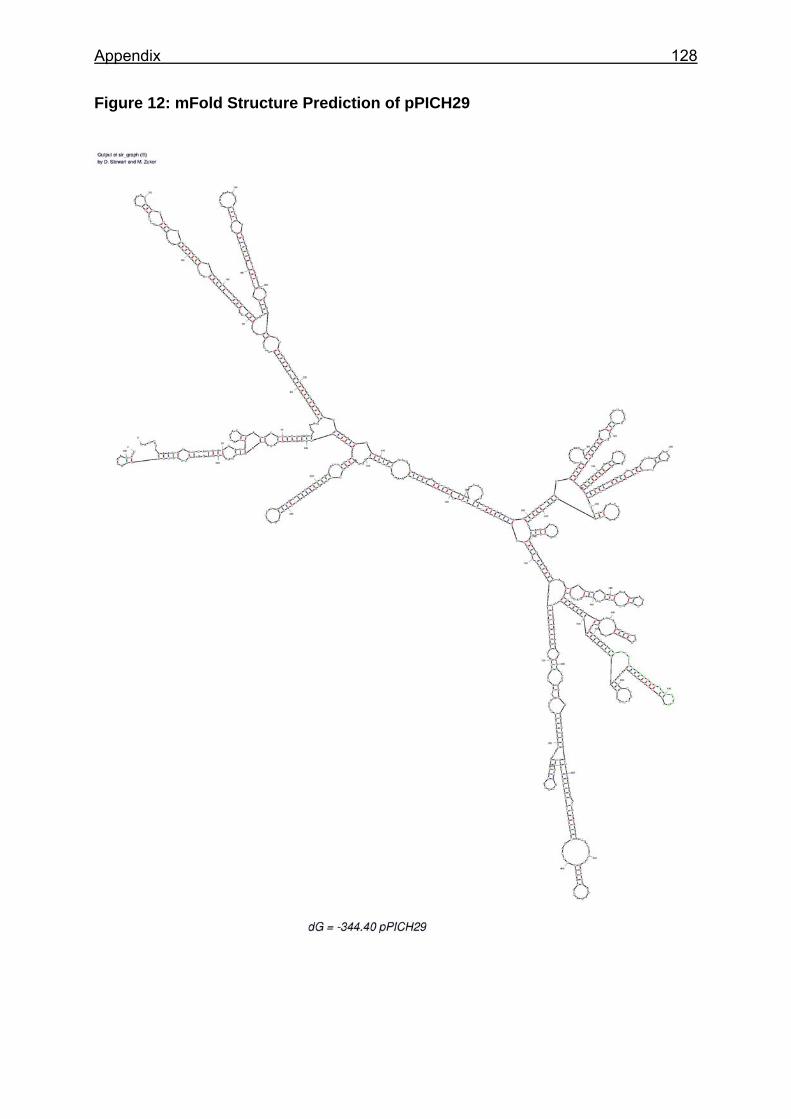
Appendix 128
Figure 12: mFold Structure Prediction of pPICH29
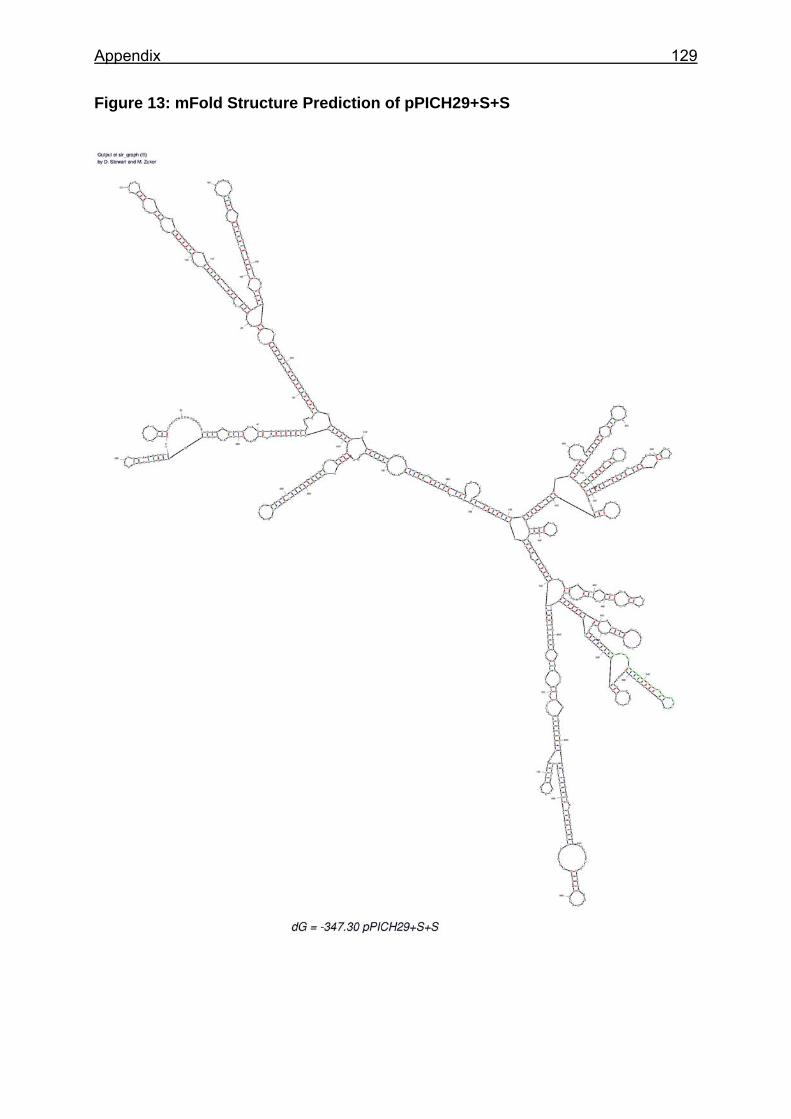
Appendix 129
Figure 13: mFold Structure Prediction of pPICH29+S+S
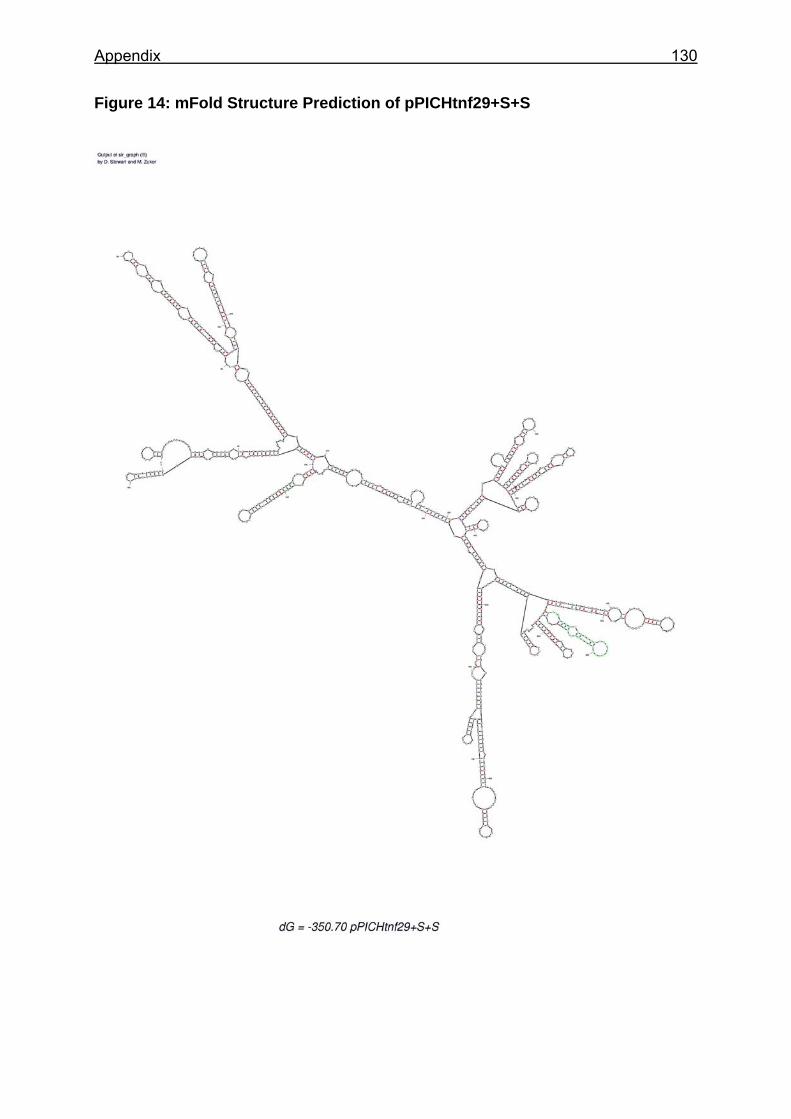
Appendix 130
Figure 14: mFold Structure Prediction of pPICHtnf29+S+S
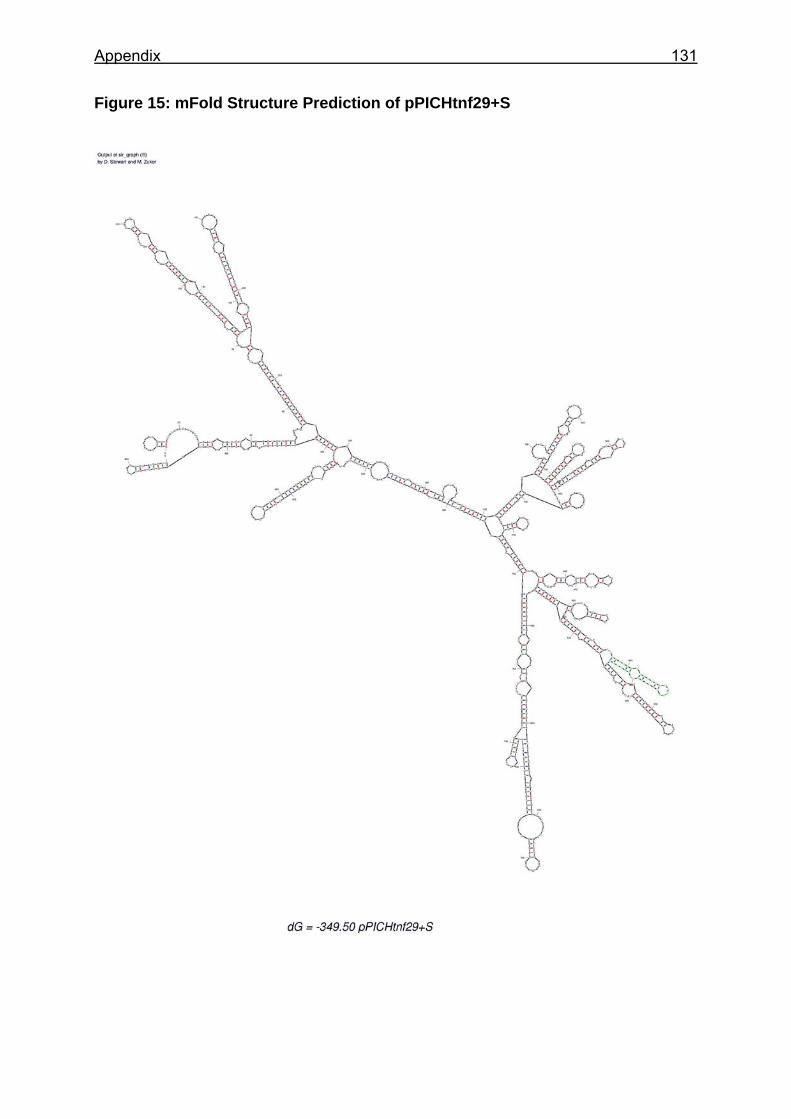
Appendix 131
Figure 15: mFold Structure Prediction of pPICHtnf29+S
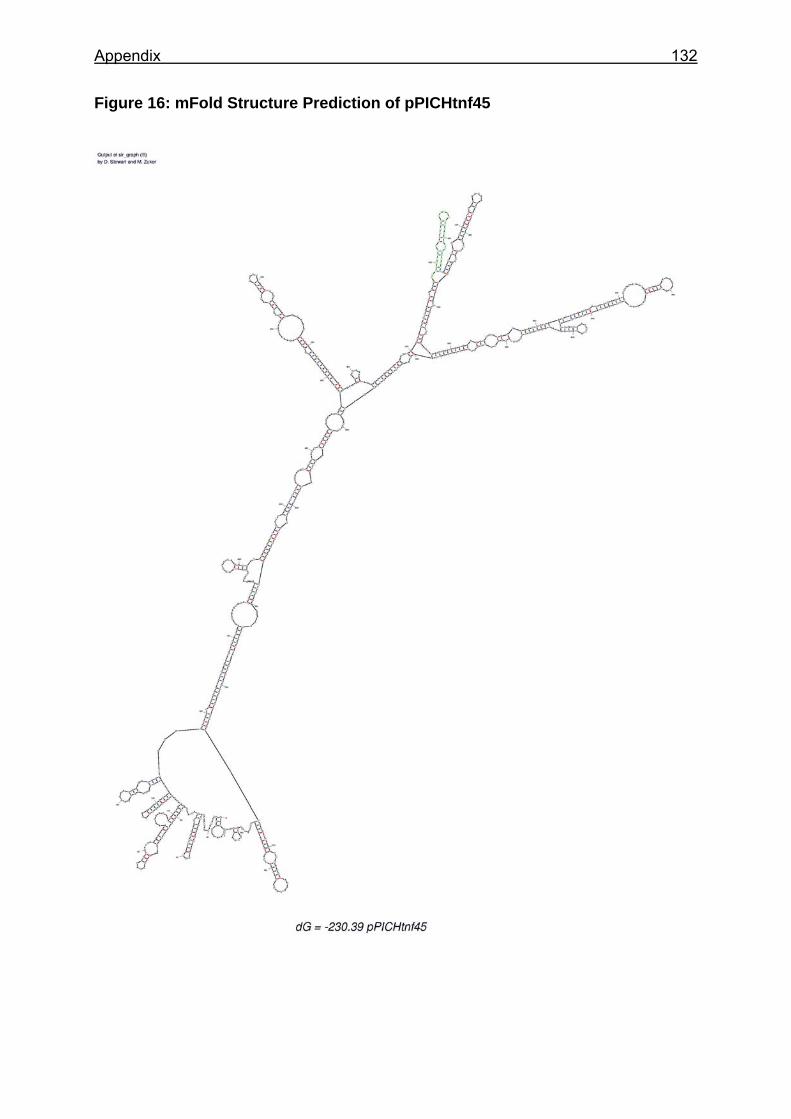
Appendix 132
Figure 16: mFold Structure Prediction of pPICHtnf45
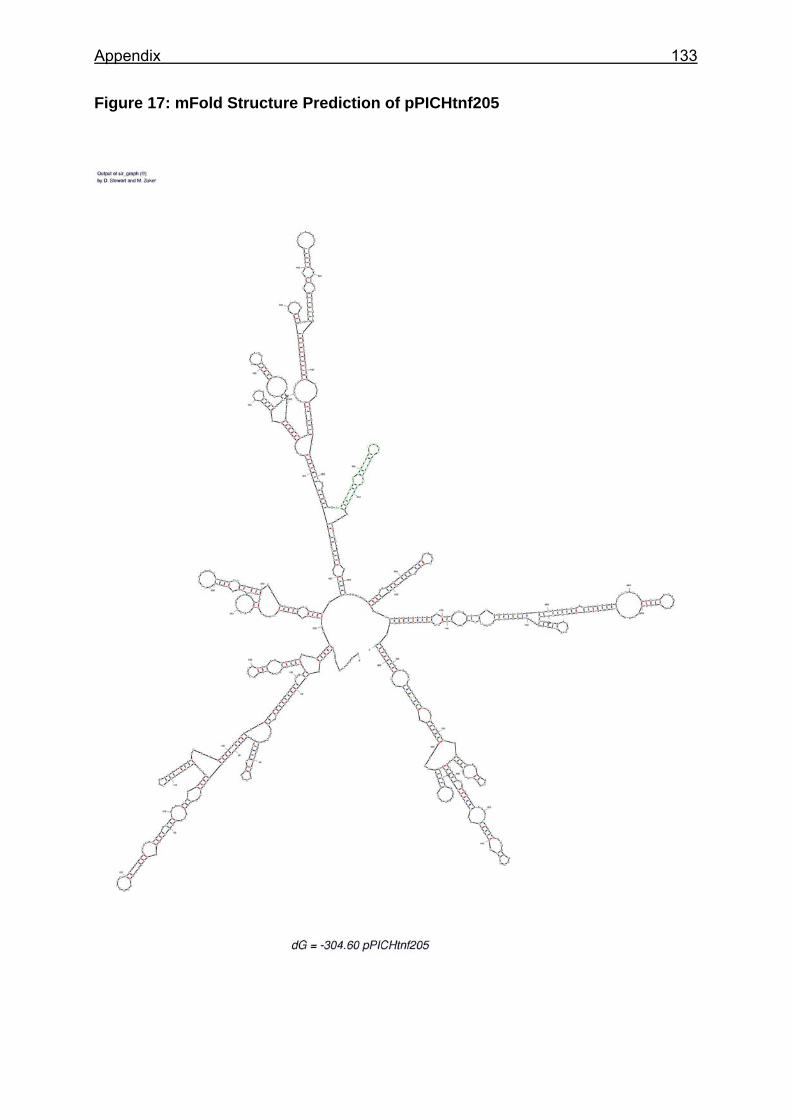
Appendix 133
Figure 17: mFold Structure Prediction of pPICHtnf205