Embed Size (px)
Citation preview
Antrieb im WandelDie Elektrifizierung des Antriebsstrangs von Fahrzeugen und ihre Auswirkung auf den Maschinen- und Anlagenbau und die Zulieferindustrie
Bild
quel
le:
ZF F
riedr
ichs
hafe
n
In Kooperation mitForum Elektromobilität
Executive summary
© by FEV – all rights reserved. Confidential – no passing on to third parties
Executive summary report
Prepared for
VDMA – Forum Elektromobilität
FEV Consulting GmbH
ANTRIEB IM WANDEL – AUSWIRKUNGEN DER
ELEKTRIFIZIERUNG DES ANTRIEBSSTRANGS AUF DEN
Frankfurt am Main, March 1st 2018
MASCHINEN- UND ANLAGENBAU
© by FEV – all rights reserved. Confidential – no passing on to third parties |
Agenda
Conclusions and study approach
Passenger car market
Commercial vehicle market
Non-road mobile machinery
Follow-up services
Contacts
VDMA, Antrieb im Wandel, Executive Summary Report, 1st March 2018 2
© by FEV – all rights reserved. Confidential – no passing on to third parties |
This study analyzes value creation in three vehicle categories: Passenger
cars, commercial vehicles and non-road mobile machinery
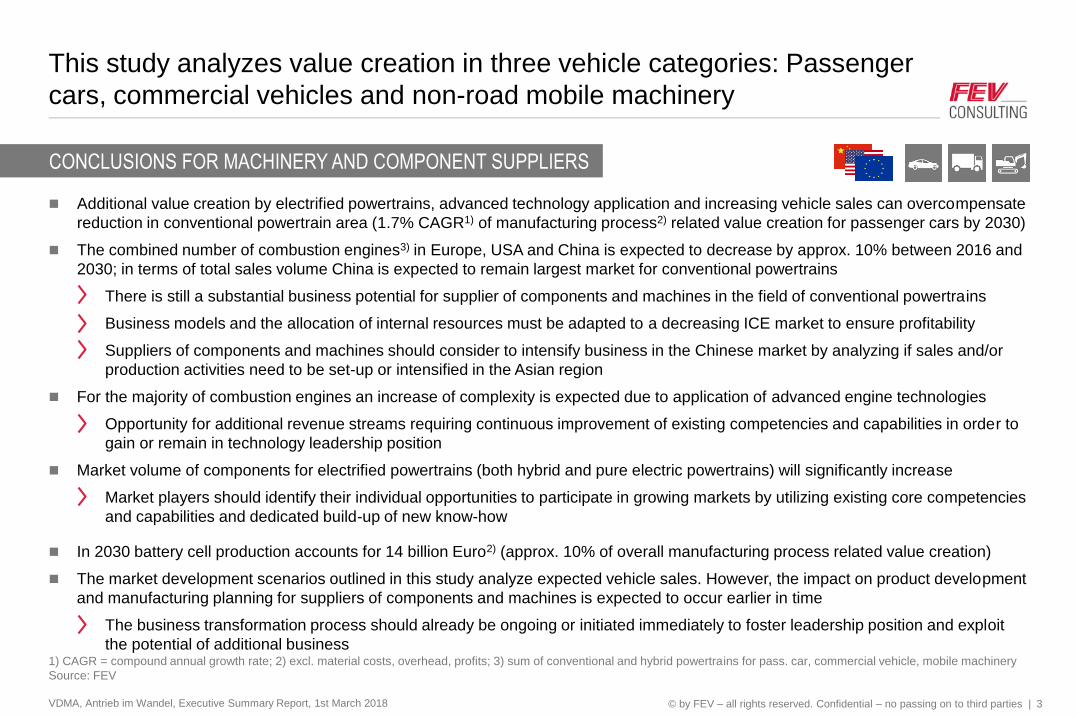
Additional value creation by electrified powertrains, advanced technology application and increasing vehicle sales can overcompensate
reduction in conventional powertrain area (1.7% CAGR1) of manufacturing process2) related value creation for passenger cars by 2030)
The combined number of combustion engines3) in Europe, USA and China is expected to decrease by approx. 10% between 2016 and
2030; in terms of total sales volume China is expected to remain largest market for conventional powertrains
There is still a substantial business potential for supplier of components and machines in the field of conventional powertrains
Business models and the allocation of internal resources must be adapted to a decreasing ICE market to ensure profitability
Suppliers of components and machines should consider to intensify business in the Chinese market by analyzing if sales and/or
production activities need to be set-up or intensified in the Asian region
For the majority of combustion engines an increase of complexity is expected due to application of advanced engine technologies
Opportunity for additional revenue streams requiring continuous improvement of existing competencies and capabilities in order to
gain or remain in technology leadership position
Market volume of components for electrified powertrains (both hybrid and pure electric powertrains) will significantly increase
Market players should identify their individual opportunities to participate in growing markets by utilizing existing core competencies
and capabilities and dedicated build-up of new know-how
In 2030 battery cell production accounts for 14 billion Euro2) (approx. 10% of overall manufacturing process related value creation)
The market development scenarios outlined in this study analyze expected vehicle sales. However, the impact on product development
and manufacturing planning for suppliers of components and machines is expected to occur earlier in time
The business transformation process should already be ongoing or initiated immediately to foster leadership position and exploit
the potential of additional business
VDMA, Antrieb im Wandel, Executive Summary Report, 1st March 2018 3
CONCLUSIONS FOR MACHINERY AND COMPONENT SUPPLIERS
1) CAGR = compound annual growth rate; 2) excl. material costs, overhead, profits; 3) sum of conventional and hybrid powertrains for pass. car, commercial vehicle, mobile machinery
Source: FEV
© by FEV – all rights reserved. Confidential – no passing on to third parties |
Increased powertrain complexity and market growth in China is expected to
compensate decrease in value creation due to shift to electric powertrains
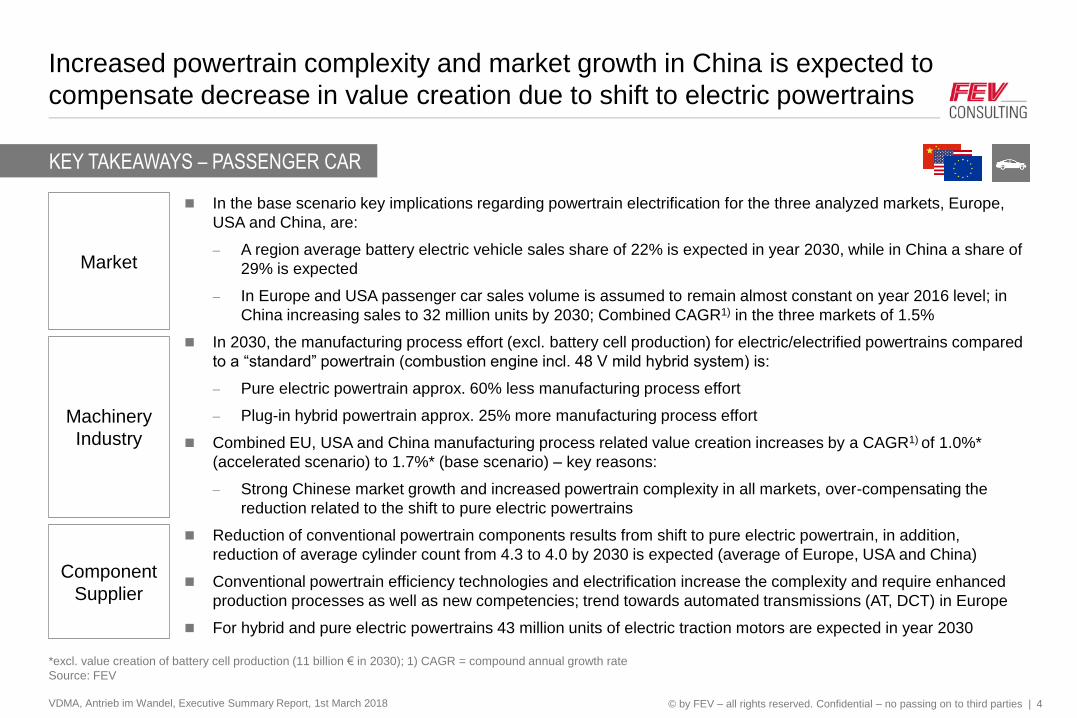
In the base scenario key implications regarding powertrain electrification for the three analyzed markets, Europe,
USA and China, are:
A region average battery electric vehicle sales share of 22% is expected in year 2030, while in China a share of
29% is expected
In Europe and USA passenger car sales volume is assumed to remain almost constant on year 2016 level; in
China increasing sales to 32 million units by 2030; Combined CAGR1) in the three markets of 1.5%
In 2030, the manufacturing process effort (excl. battery cell production) for electric/electrified powertrains compared
to a “standard” powertrain (combustion engine incl. 48 V mild hybrid system) is:
Pure electric powertrain approx. 60% less manufacturing process effort
Plug-in hybrid powertrain approx. 25% more manufacturing process effort
Combined EU, USA and China manufacturing process related value creation increases by a CAGR1) of 1.0%*
(accelerated scenario) to 1.7%* (base scenario) – key reasons:
Strong Chinese market growth and increased powertrain complexity in all markets, over-compensating the
reduction related to the shift to pure electric powertrains
Reduction of conventional powertrain components results from shift to pure electric powertrain, in addition,
reduction of average cylinder count from 4.3 to 4.0 by 2030 is expected (average of Europe, USA and China)
Conventional powertrain efficiency technologies and electrification increase the complexity and require enhanced
production processes as well as new competencies; trend towards automated transmissions (AT, DCT) in Europe
For hybrid and pure electric powertrains 43 million units of electric traction motors are expected in year 2030
VDMA, Antrieb im Wandel, Executive Summary Report, 1st March 2018 4
KEY TAKEAWAYS – PASSENGER CAR
*excl. value creation of battery cell production (11 billion € in 2030); 1) CAGR = compound annual growth rate
Source: FEV
Market
Machinery
Industry
Component
Supplier
© by FEV – all rights reserved. Confidential – no passing on to third parties |
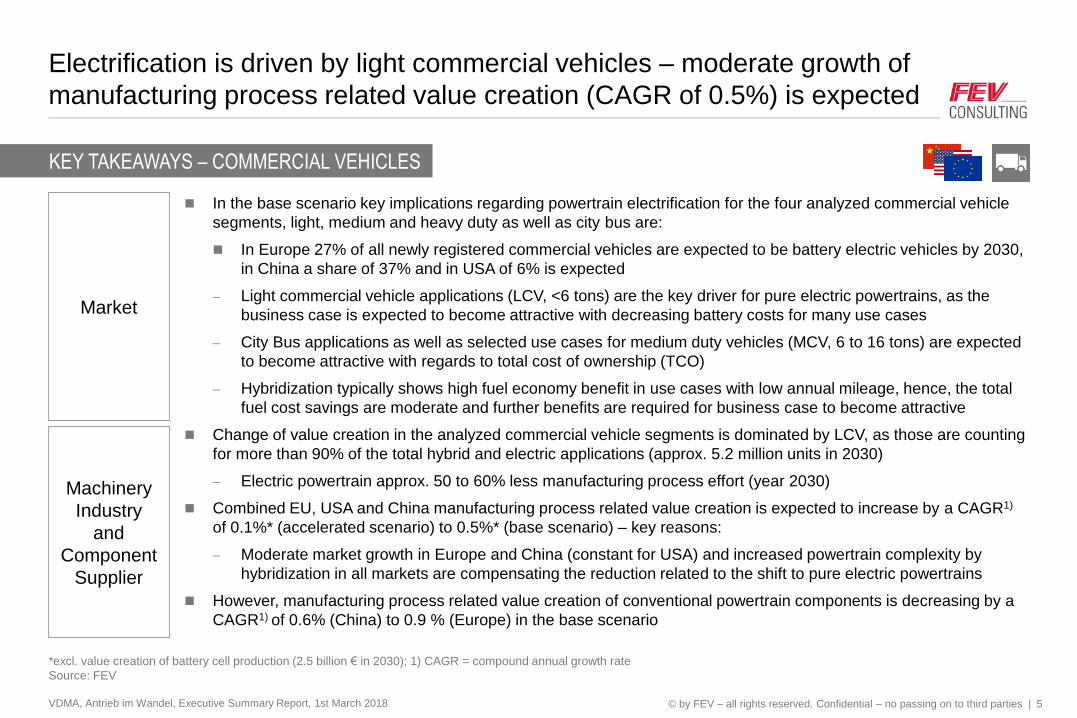
Electrification is driven by light commercial vehicles – moderate growth of
manufacturing process related value creation (CAGR of 0.5%) is expected
In the base scenario key implications regarding powertrain electrification for the four analyzed commercial vehicle
segments, light, medium and heavy duty as well as city bus are:
In Europe 27% of all newly registered commercial vehicles are expected to be battery electric vehicles by 2030,
in China a share of 37% and in USA of 6% is expected
Light commercial vehicle applications (LCV, <6 tons) are the key driver for pure electric powertrains, as the
business case is expected to become attractive with decreasing battery costs for many use cases
City Bus applications as well as selected use cases for medium duty vehicles (MCV, 6 to 16 tons) are expected
to become attractive with regards to total cost of ownership (TCO)
Hybridization typically shows high fuel economy benefit in use cases with low annual mileage, hence, the total
fuel cost savings are moderate and further benefits are required for business case to become attractive
Change of value creation in the analyzed commercial vehicle segments is dominated by LCV, as those are counting
for more than 90% of the total hybrid and electric applications (approx. 5.2 million units in 2030)
Electric powertrain approx. 50 to 60% less manufacturing process effort (year 2030)
Combined EU, USA and China manufacturing process related value creation is expected to increase by a CAGR1)
of 0.1%* (accelerated scenario) to 0.5%* (base scenario) – key reasons:
Moderate market growth in Europe and China (constant for USA) and increased powertrain complexity by
hybridization in all markets are compensating the reduction related to the shift to pure electric powertrains
However, manufacturing process related value creation of conventional powertrain components is decreasing by a
CAGR1) of 0.6% (China) to 0.9 % (Europe) in the base scenario
VDMA, Antrieb im Wandel, Executive Summary Report, 1st March 2018 5
KEY TAKEAWAYS – COMMERCIAL VEHICLES
*excl. value creation of battery cell production (2.5 billion € in 2030); 1) CAGR = compound annual growth rate
Source: FEV
Market
Machinery
Industry
and
Component
Supplier
© by FEV – all rights reserved. Confidential – no passing on to third parties |
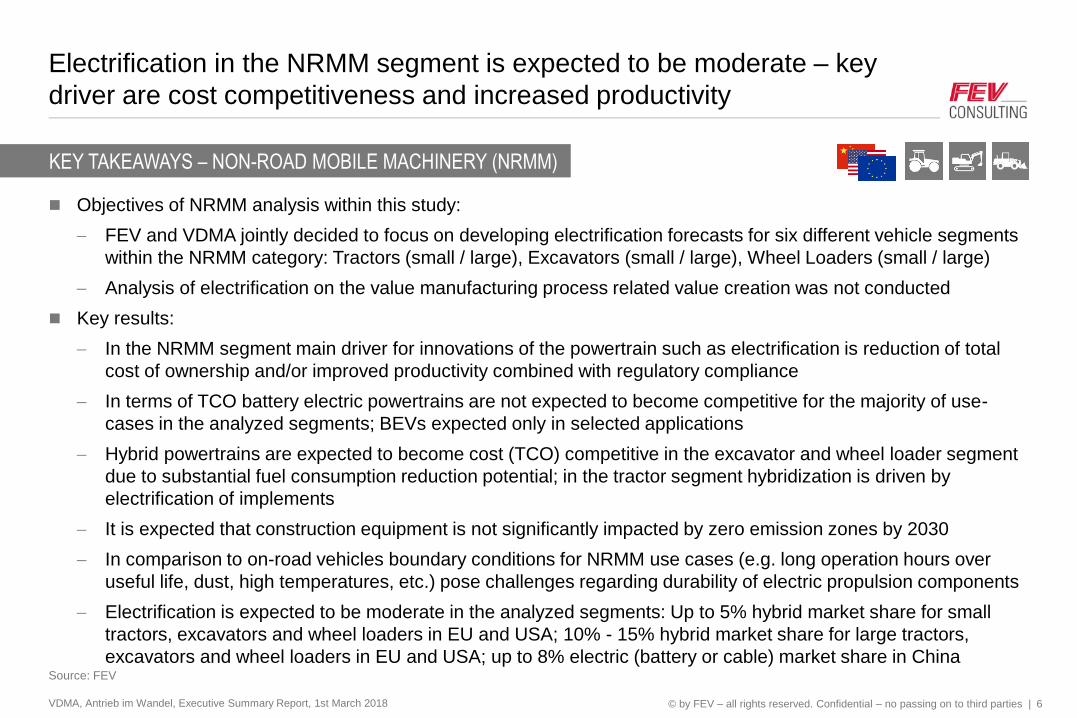
Objectives of NRMM analysis within this study:
FEV and VDMA jointly decided to focus on developing electrification forecasts for six different vehicle segments
within the NRMM category: Tractors (small / large), Excavators (small / large), Wheel Loaders (small / large)
Analysis of electrification on the value manufacturing process related value creation was not conducted
Key results:
In the NRMM segment main driver for innovations of the powertrain such as electrification is reduction of total
cost of ownership and/or improved productivity combined with regulatory compliance
In terms of TCO battery electric powertrains are not expected to become competitive for the majority of use-
cases in the analyzed segments; BEVs expected only in selected applications
Hybrid powertrains are expected to become cost (TCO) competitive in the excavator and wheel loader segment
due to substantial fuel consumption reduction potential; in the tractor segment hybridization is driven by
electrification of implements
It is expected that construction equipment is not significantly impacted by zero emission zones by 2030
In comparison to on-road vehicles boundary conditions for NRMM use cases (e.g. long operation hours over
useful life, dust, high temperatures, etc.) pose challenges regarding durability of electric propulsion components
Electrification is expected to be moderate in the analyzed segments: Up to 5% hybrid market share for small
tractors, excavators and wheel loaders in EU and USA; 10% - 15% hybrid market share for large tractors,
excavators and wheel loaders in EU and USA; up to 8% electric (battery or cable) market share in China
Electrification in the NRMM segment is expected to be moderate – key
driver are cost competitiveness and increased productivity
VDMA, Antrieb im Wandel, Executive Summary Report, 1st March 2018 6
KEY TAKEAWAYS – NON-ROAD MOBILE MACHINERY (NRMM)
Source: FEV
© by FEV – all rights reserved. Confidential – no passing on to third parties |
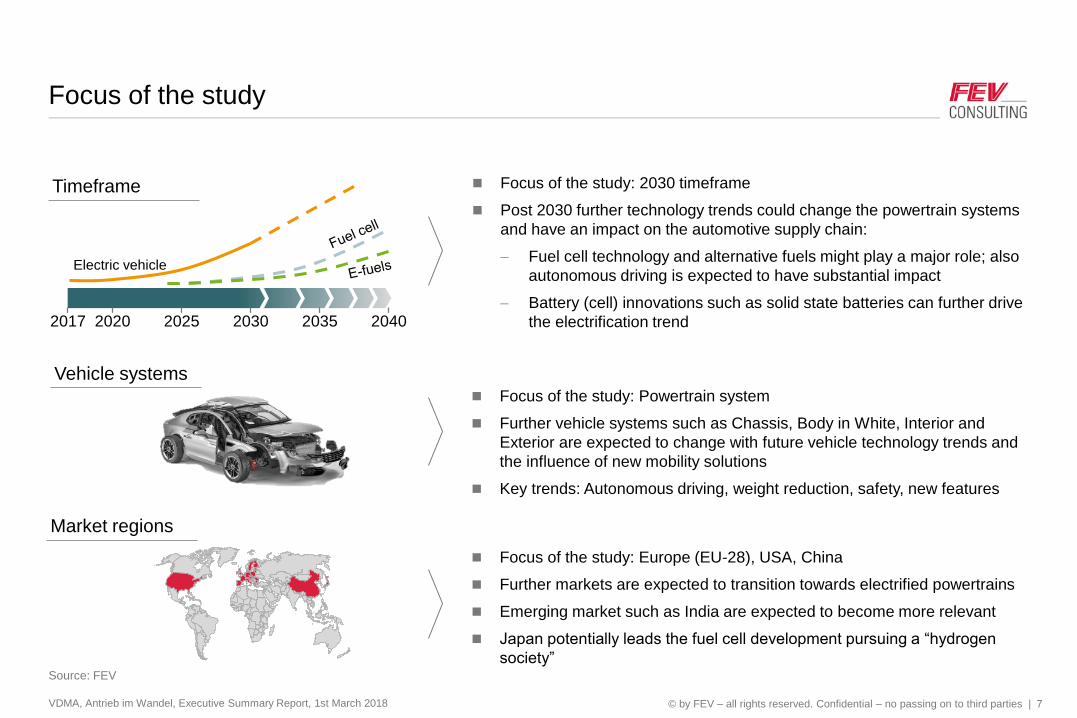
Focus of the study
VDMA, Antrieb im Wandel, Executive Summary Report, 1st March 2018 7
Source: FEV
2017 20302020 2025 20402035
Electric vehicle
Timeframe
Vehicle systems
Market regions
Focus of the study: 2030 timeframe
Post 2030 further technology trends could change the powertrain systems
and have an impact on the automotive supply chain:
Fuel cell technology and alternative fuels might play a major role; also
autonomous driving is expected to have substantial impact
Battery (cell) innovations such as solid state batteries can further drive
the electrification trend
Focus of the study: Powertrain system
Further vehicle systems such as Chassis, Body in White, Interior and
Exterior are expected to change with future vehicle technology trends and
the influence of new mobility solutions
Key trends: Autonomous driving, weight reduction, safety, new features
Focus of the study: Europe (EU-28), USA, China
Further markets are expected to transition towards electrified powertrains
Emerging market such as India are expected to become more relevant
Japan potentially leads the fuel cell development pursuing a “hydrogen
society”
© by FEV – all rights reserved. Confidential – no passing on to third parties |
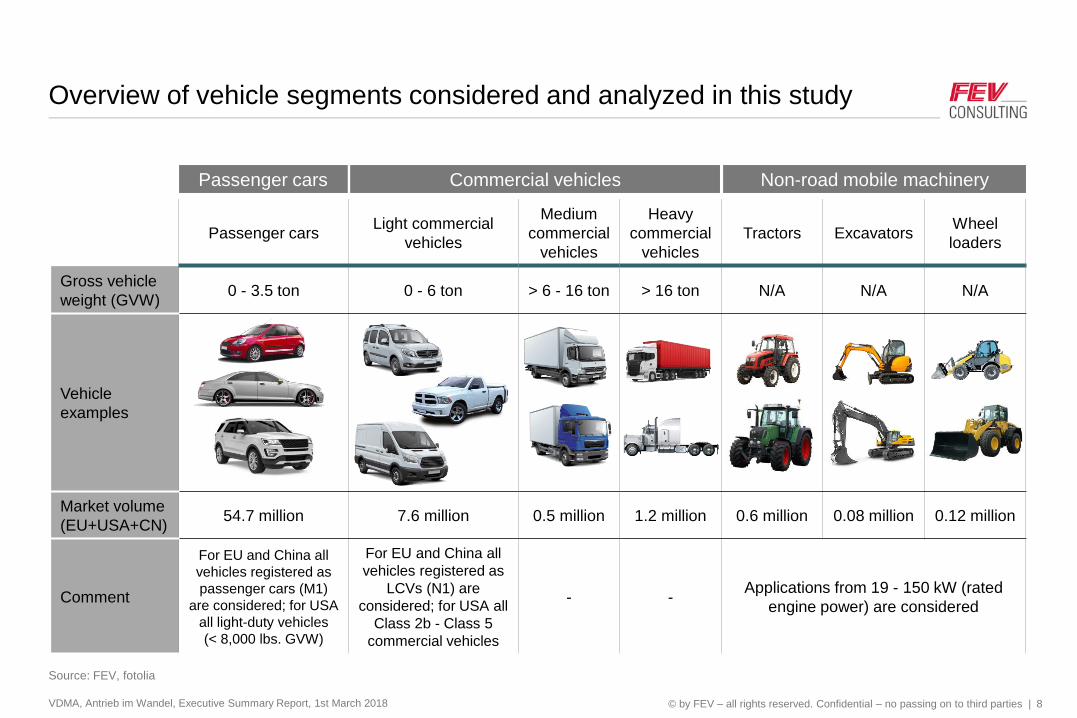
Passenger carsLight commercial
vehicles
Medium
commercial
vehicles
Heavy
commercial
vehicles
Tractors ExcavatorsWheel
loaders
Gross vehicle
weight (GVW)0 - 3.5 ton 0 - 6 ton > 6 - 16 ton > 16 ton N/A N/A N/A
Vehicle
examples
Market volume
(EU+USA+CN)54.7 million 7.6 million 0.5 million 1.2 million 0.6 million 0.08 million 0.12 million
Comment
For EU and China all
vehicles registered as
passenger cars (M1)
are considered; for USA
all light-duty vehicles
(< 8,000 lbs. GVW)
For EU and China all
vehicles registered as
LCVs (N1) are
considered; for USA all
Class 2b - Class 5
commercial vehicles
- -Applications from 19 - 150 kW (rated
engine power) are considered
Overview of vehicle segments considered and analyzed in this study
VDMA, Antrieb im Wandel, Executive Summary Report, 1st March 2018 8
Source: FEV, fotolia
Passenger cars Commercial vehicles Non-road mobile machinery
© by FEV – all rights reserved. Confidential – no passing on to third parties |
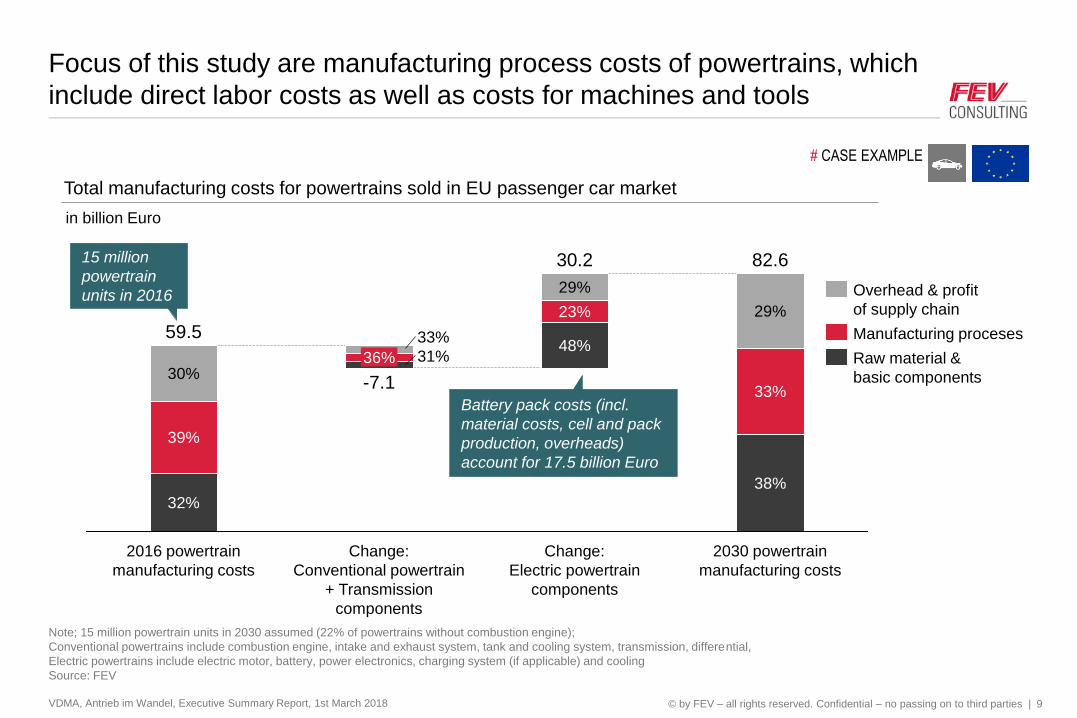
Focus of this study are manufacturing process costs of powertrains, which
include direct labor costs as well as costs for machines and tools
VDMA, Antrieb im Wandel, Executive Summary Report, 1st March 2018 9
Note; 15 million powertrain units in 2030 assumed (22% of powertrains without combustion engine);
Conventional powertrains include combustion engine, intake and exhaust system, tank and cooling system, transmission, differential,
Electric powertrains include electric motor, battery, power electronics, charging system (if applicable) and cooling
Source: FEV
29%
Change:
Electric powertrain
components
30.2
48%
23%
2030 powertrain
manufacturing costs
82.6
38%
33%
29%
Change:
Conventional powertrain
+ Transmission
components
-7.1
31%36%
33%
2016 powertrain
manufacturing costs
59.5
32%
39%
30%Raw material &
basic components
Manufacturing proceses
Overhead & profit
of supply chain
15 million
powertrain
units in 2016
Total manufacturing costs for powertrains sold in EU passenger car market
in billion Euro
# CASE EXAMPLE
Battery pack costs (incl.
material costs, cell and pack
production, overheads)
account for 17.5 billion Euro
© by FEV – all rights reserved. Confidential – no passing on to third parties |
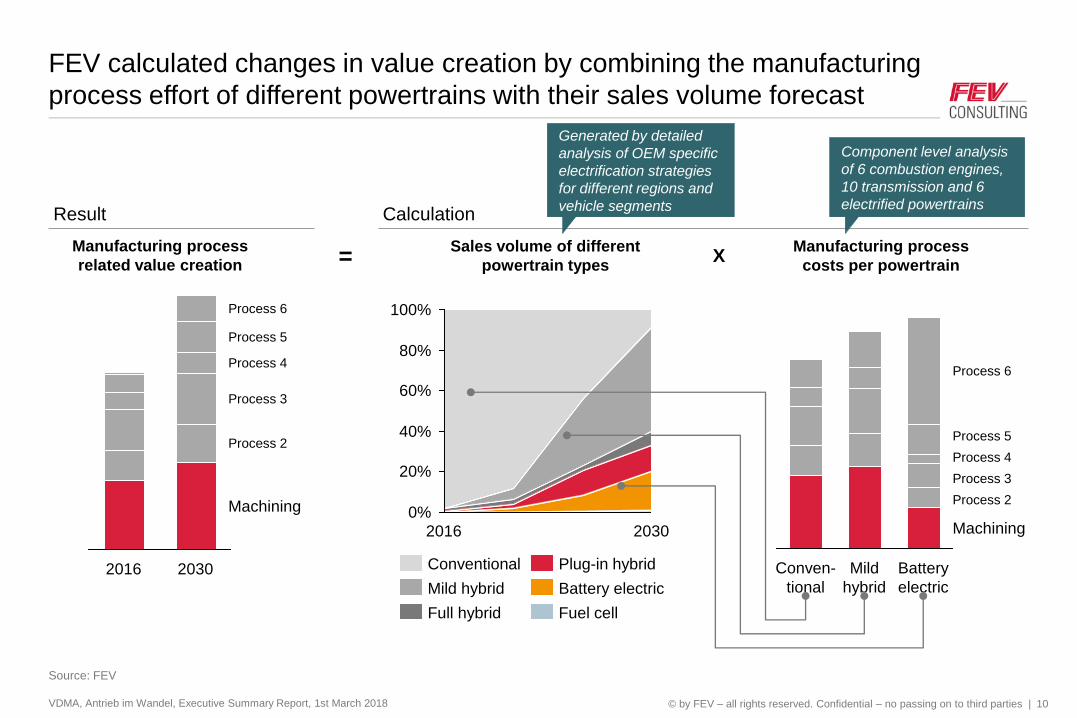
FEV calculated changes in value creation by combining the manufacturing
process effort of different powertrains with their sales volume forecast
VDMA, Antrieb im Wandel, Executive Summary Report, 1st March 2018 10
Source: FEV
Machining
Process 2
Process 3
Process 4
Process 5
Process 6
20302016
Manufacturing process
related value creation
100%
80%
60%
40%
20%
0%
20302016
Full hybrid
Mild hybrid
Conventional
Fuel cell
Battery electric
Plug-in hybrid
Sales volume of different
powertrain types
Manufacturing process
costs per powertrainX
Process 2
Machining
Process 3
Process 4
Process 5
Process 6
Battery
electric
Mild
hybrid
Conven-
tional
Result Calculation
=
Generated by detailed
analysis of OEM specific
electrification strategies
for different regions and
vehicle segments
Component level analysis
of 6 combustion engines,
10 transmission and 6
electrified powertrains
© by FEV – all rights reserved. Confidential – no passing on to third parties |
Agenda
Conclusions and study approach
Passenger car market
Commercial vehicle market
Non-road mobile machinery
Follow-up services
Contacts
VDMA, Antrieb im Wandel, Executive Summary Report, 1st March 2018 11
© by FEV – all rights reserved. Confidential – no passing on to third parties |
121
100
47
20252016 2020 2030
100
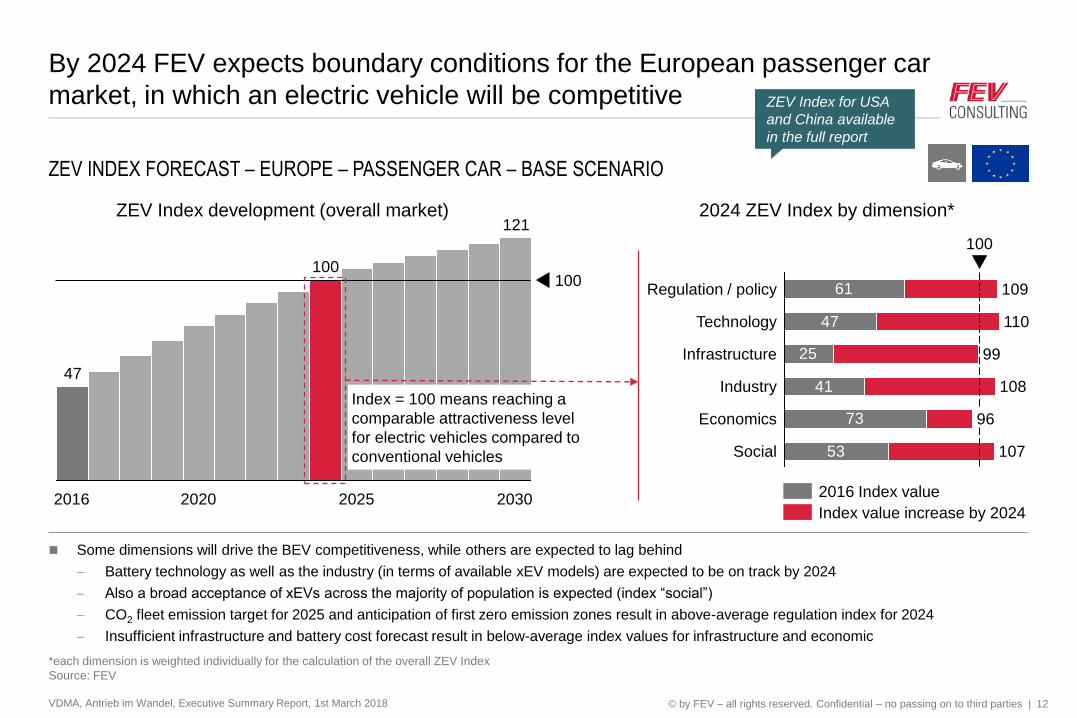
By 2024 FEV expects boundary conditions for the European passenger car
market, in which an electric vehicle will be competitive
VDMA, Antrieb im Wandel, Executive Summary Report, 1st March 2018 12
ZEV INDEX FORECAST – EUROPE – PASSENGER CAR – BASE SCENARIO
*each dimension is weighted individually for the calculation of the overall ZEV Index
Source: FEV
ZEV Index development (overall market) 2024 ZEV Index by dimension*
61
47
25
41
73
53
Economics
Regulation / policy 109
Technology 110
Infrastructure 99
108
96
Industry
Social 107
Some dimensions will drive the BEV competitiveness, while others are expected to lag behind
Battery technology as well as the industry (in terms of available xEV models) are expected to be on track by 2024
Also a broad acceptance of xEVs across the majority of population is expected (index “social”)
CO2 fleet emission target for 2025 and anticipation of first zero emission zones result in above-average regulation index for 2024
Insufficient infrastructure and battery cost forecast result in below-average index values for infrastructure and economic
2016 Index value
100
Index = 100 means reaching a
comparable attractiveness level
for electric vehicles compared to
conventional vehicles
Index value increase by 2024
ZEV Index for USA
and China available
in the full report
© by FEV – all rights reserved. Confidential – no passing on to third parties |
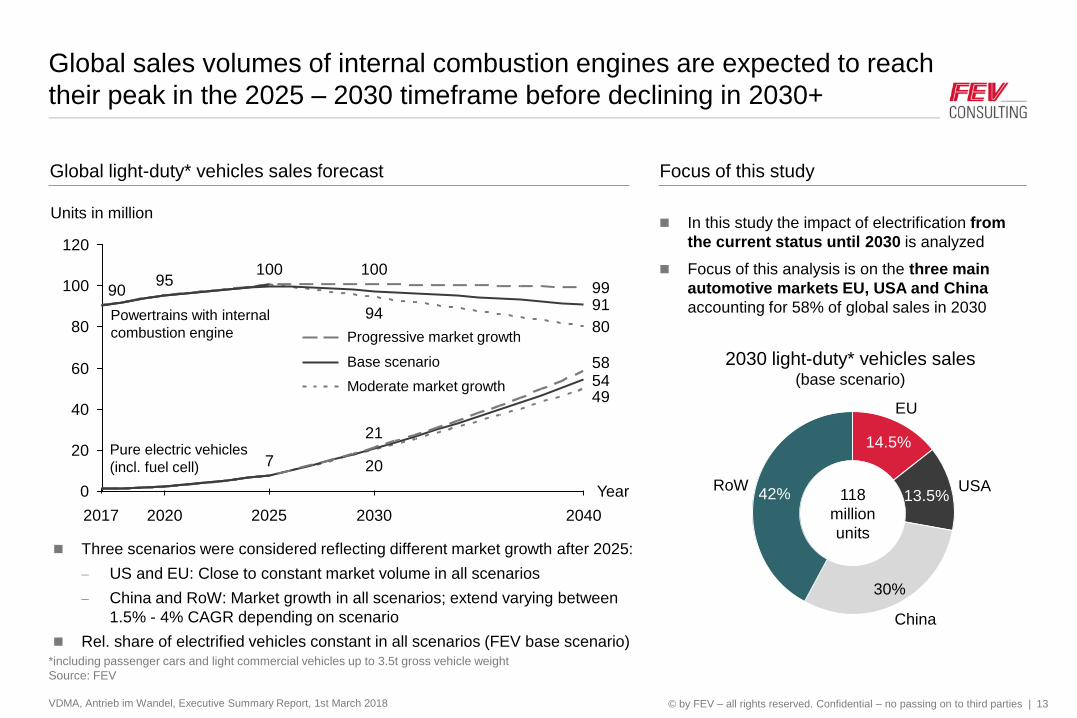
Global sales volumes of internal combustion engines are expected to reach
their peak in the 2025 – 2030 timeframe before declining in 2030+
VDMA, Antrieb im Wandel, Executive Summary Report, 1st March 2018 13
*including passenger cars and light commercial vehicles up to 3.5t gross vehicle weight
Source: FEV
120
100
80
60
40
20
0
204020302020
Units in million
Year
5854
91
49
80
21
100
20
94
7
10095
90 99
Powertrains with internal
combustion engine
Pure electric vehicles
(incl. fuel cell)
Base scenario
Moderate market growth
Progressive market growth
Three scenarios were considered reflecting different market growth after 2025:
US and EU: Close to constant market volume in all scenarios
China and RoW: Market growth in all scenarios; extend varying between
1.5% - 4% CAGR depending on scenario
Rel. share of electrified vehicles constant in all scenarios (FEV base scenario)
20252017
Global light-duty* vehicles sales forecast Focus of this study
In this study the impact of electrification from
the current status until 2030 is analyzed
Focus of this analysis is on the three main
automotive markets EU, USA and China
accounting for 58% of global sales in 2030
30%
China
42%RoW USA
13.5%
EU
14.5%
2030 light-duty* vehicles sales (base scenario)
118
million
units
© by FEV – all rights reserved. Confidential – no passing on to third parties |
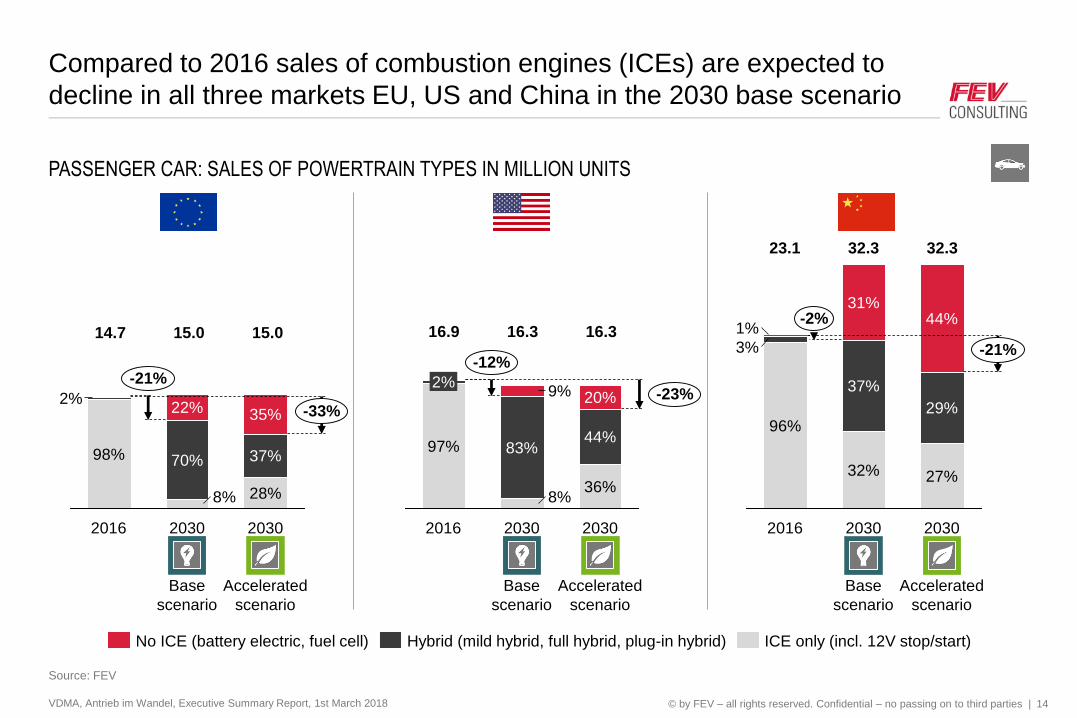
Compared to 2016 sales of combustion engines (ICEs) are expected to
decline in all three markets EU, US and China in the 2030 base scenario
VDMA, Antrieb im Wandel, Executive Summary Report, 1st March 2018 14
PASSENGER CAR: SALES OF POWERTRAIN TYPES IN MILLION UNITS
Source: FEV
-33%
-21%
2030
Accelerated
scenario
28%
37%
35%2%
2030
Base
scenario
8%
70%
22%
2016
98%
ICE only (incl. 12V stop/start)Hybrid (mild hybrid, full hybrid, plug-in hybrid)No ICE (battery electric, fuel cell)
14.7 15.0 15.0
2%-23%
-12%
2030
Accelerated
scenario
36%
44%
20%
2030
Base
scenario
8%
83%
9%
2016
97%
27%
29%
44%
2030
Base
scenario
32%
37%
-21%
-2%
2030
Accelerated
scenario
31%
2016
96%
3%
1%16.9 16.3 16.3
23.1 32.3 32.3
© by FEV – all rights reserved. Confidential – no passing on to third parties |
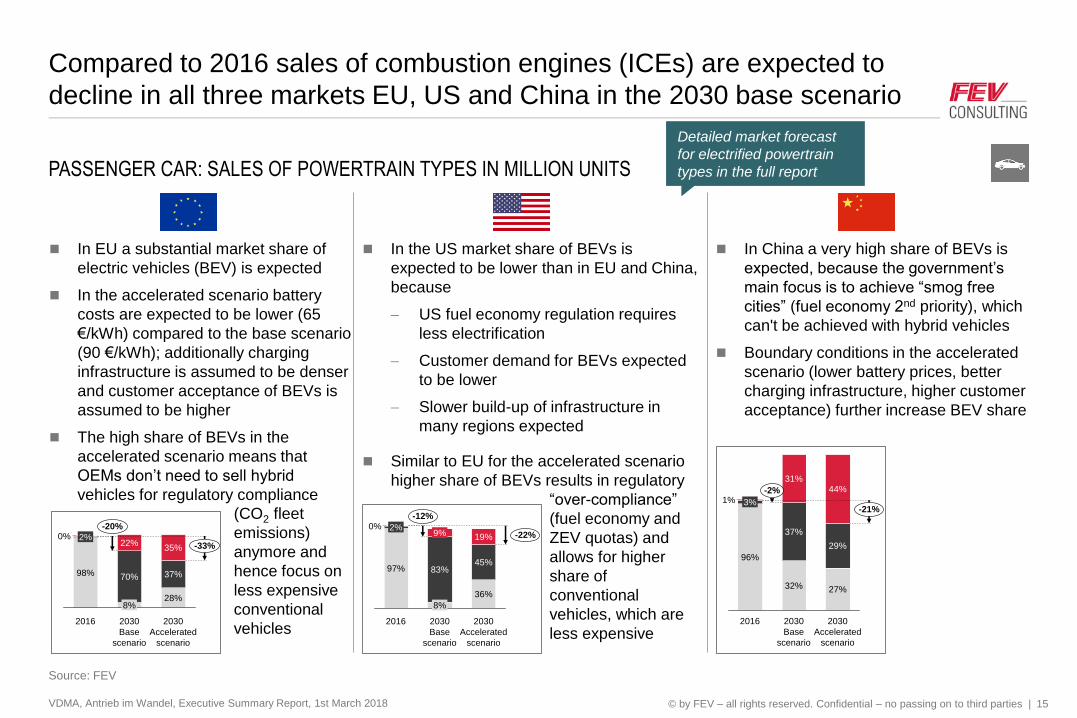
Compared to 2016 sales of combustion engines (ICEs) are expected to
decline in all three markets EU, US and China in the 2030 base scenario
VDMA, Antrieb im Wandel, Executive Summary Report, 1st March 2018 15
PASSENGER CAR: SALES OF POWERTRAIN TYPES IN MILLION UNITS
Source: FEV
-33%
-20%
2030
Accelerated
scenario
28%
37%
35%
2030
Base
scenario
8%
70%
22%
2016
98%
2%0% -22%
-12%
2030
Accelerated
scenario
36%
45%
19%
2030
Base
scenario
8%
83%
9%
2016
97%
2%0%
96%
-21%
2016 2030
Accelerated
scenario
-2%
27%
31%
32%
37%
3%
2030
Base
scenario
29%
44%
1%
In EU a substantial market share of
electric vehicles (BEV) is expected
In the accelerated scenario battery
costs are expected to be lower (65
€/kWh) compared to the base scenario
(90 €/kWh); additionally charging
infrastructure is assumed to be denser
and customer acceptance of BEVs is
assumed to be higher
The high share of BEVs in the
accelerated scenario means that
OEMs don’t need to sell hybrid
vehicles for regulatory compliance “over-compliance”
(fuel economy and
ZEV quotas) and
allows for higher
share of
conventional
vehicles, which are
less expensive
In the US market share of BEVs is
expected to be lower than in EU and China,
because
US fuel economy regulation requires
less electrification
Customer demand for BEVs expected
to be lower
Slower build-up of infrastructure in
many regions expected
Similar to EU for the accelerated scenario
higher share of BEVs results in regulatory
(CO2 fleet
emissions)
anymore and
hence focus on
less expensive
conventional
vehicles
In China a very high share of BEVs is
expected, because the government’s
main focus is to achieve “smog free
cities” (fuel economy 2nd priority), which
can't be achieved with hybrid vehicles
Boundary conditions in the accelerated
scenario (lower battery prices, better
charging infrastructure, higher customer
acceptance) further increase BEV share
Detailed market forecast
for electrified powertrain
types in the full report
© by FEV – all rights reserved. Confidential – no passing on to third parties |
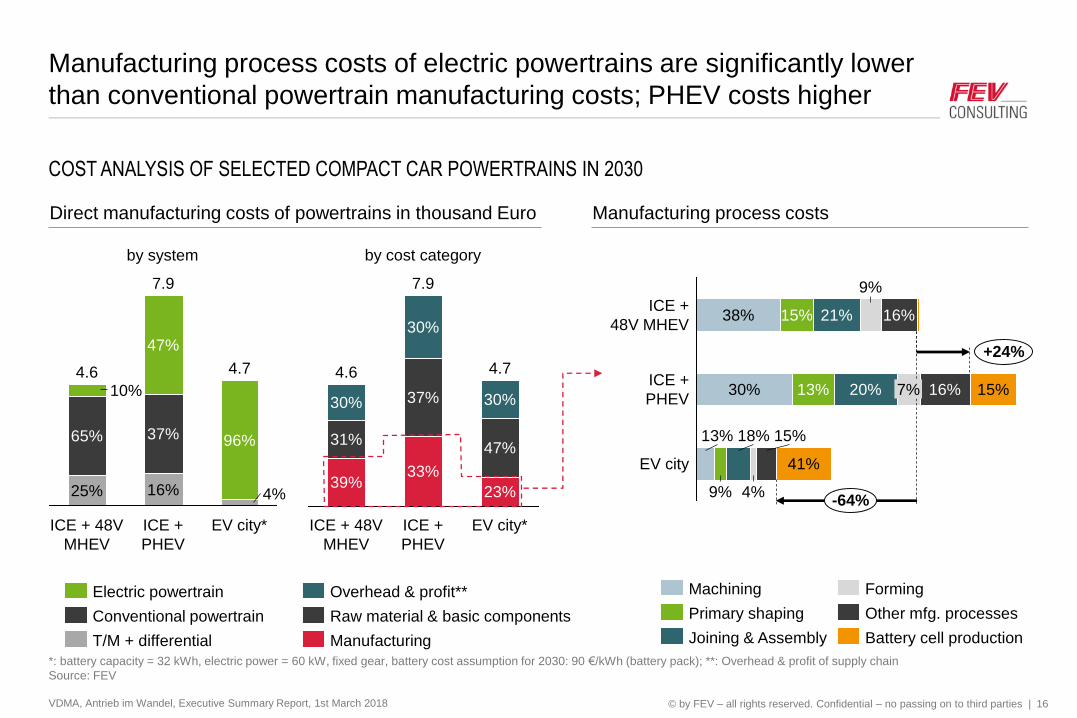
Manufacturing process costs of electric powertrains are significantly lower
than conventional powertrain manufacturing costs; PHEV costs higher
VDMA, Antrieb im Wandel, Executive Summary Report, 1st March 2018 16
COST ANALYSIS OF SELECTED COMPACT CAR POWERTRAINS IN 2030
*: battery capacity = 32 kWh, electric power = 60 kW, fixed gear, battery cost assumption for 2030: 90 €/kWh (battery pack); **: Overhead & profit of supply chain
Source: FEV
37%
47%
ICE + 48V
MHEV
4.6
25%
65%
10%
EV city*
4.7
4%
96%
ICE +
PHEV
7.9
16%
T/M + differential
Conventional powertrain
Electric powertrain
7% 16% 15%
-64%
38% 15% 21%
9%
16%
+24%
EV city
13%
9%
18%
4%
15%
41%
ICE +
PHEV30% 13% 20%
ICE +
48V MHEV
Battery cell production
Other mfg. processes
Forming
Joining & Assembly
Primary shaping
Machining
Direct manufacturing costs of powertrains in thousand Euro
by system
ICE +
PHEV
4.7
EV city*
23%
7.9
33%
37%
30%
ICE + 48V
MHEV
4.6
39%
31%
30% 30%
47%
Overhead & profit**
Manufacturing
Raw material & basic components
by cost category
Manufacturing process costs
© by FEV – all rights reserved. Confidential – no passing on to third parties |
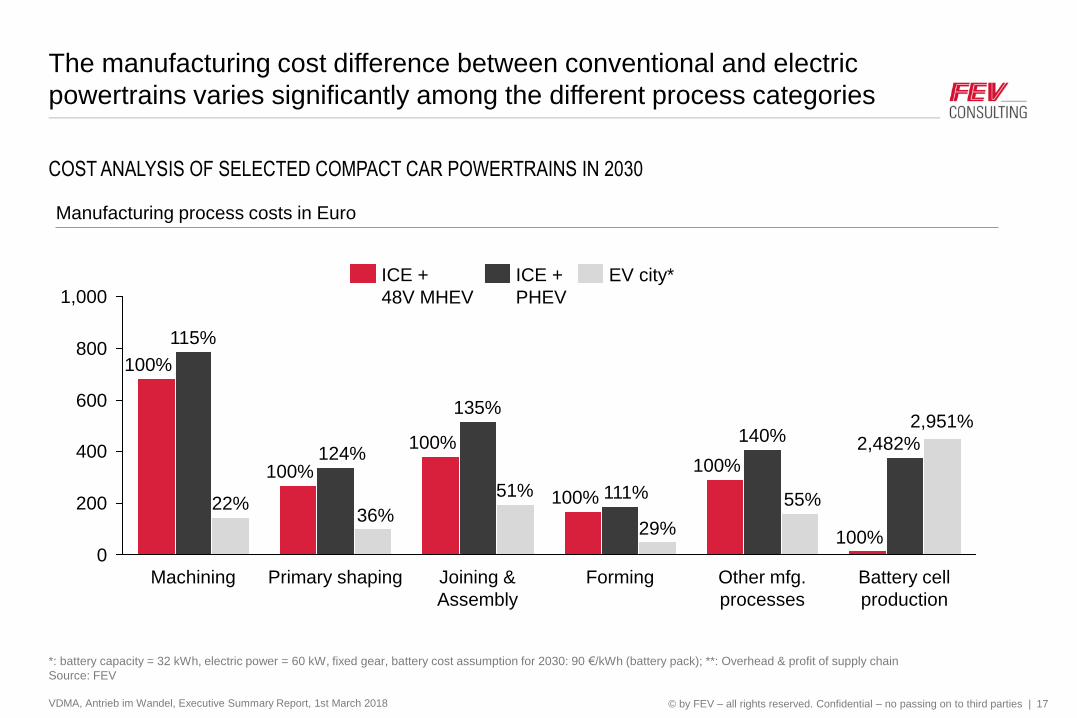
The manufacturing cost difference between conventional and electric
powertrains varies significantly among the different process categories
VDMA, Antrieb im Wandel, Executive Summary Report, 1st March 2018 17
COST ANALYSIS OF SELECTED COMPACT CAR POWERTRAINS IN 2030
*: battery capacity = 32 kWh, electric power = 60 kW, fixed gear, battery cost assumption for 2030: 90 €/kWh (battery pack); **: Overhead & profit of supply chain
Source: FEV
Manufacturing process costs in Euro
200
0
800
1,000
600
400
Battery cell
production
2,951%
2,482%
100%
Other mfg.
processes
55%
140%
100%
Forming
29%
111%100%
Joining &
Assembly
22%
115%
100%
51%
135%
100%
Primary shaping
36%
124%100%
Machining
EV city*ICE +
PHEV
ICE +
48V MHEV
© by FEV – all rights reserved. Confidential – no passing on to third parties |
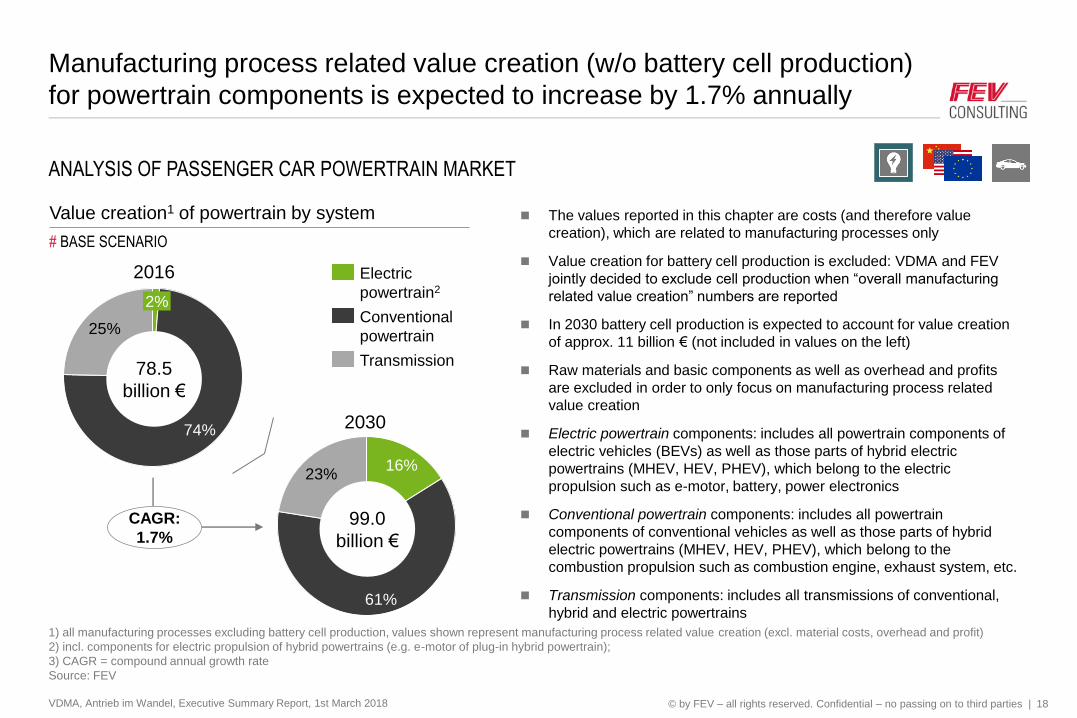
Manufacturing process related value creation (w/o battery cell production)
for powertrain components is expected to increase by 1.7% annually
VDMA, Antrieb im Wandel, Executive Summary Report, 1st March 2018 18
ANALYSIS OF PASSENGER CAR POWERTRAIN MARKET
1) all manufacturing processes excluding battery cell production, values shown represent manufacturing process related value creation (excl. material costs, overhead and profit)
2) incl. components for electric propulsion of hybrid powertrains (e.g. e-motor of plug-in hybrid powertrain);
3) CAGR = compound annual growth rate
Source: FEV
2%
25%
74%
78.5
billion €
Value creation1 of powertrain by system
23%
61%
16%
99.0
billion €
Transmission
Conventional
powertrain
Electric
powertrain2
2030
2016
CAGR:
1.7%
# BASE SCENARIO
The values reported in this chapter are costs (and therefore value
creation), which are related to manufacturing processes only
Value creation for battery cell production is excluded: VDMA and FEV
jointly decided to exclude cell production when “overall manufacturing
related value creation” numbers are reported
In 2030 battery cell production is expected to account for value creation
of approx. 11 billion € (not included in values on the left)
Raw materials and basic components as well as overhead and profits
are excluded in order to only focus on manufacturing process related
value creation
Electric powertrain components: includes all powertrain components of
electric vehicles (BEVs) as well as those parts of hybrid electric
powertrains (MHEV, HEV, PHEV), which belong to the electric
propulsion such as e-motor, battery, power electronics
Conventional powertrain components: includes all powertrain
components of conventional vehicles as well as those parts of hybrid
electric powertrains (MHEV, HEV, PHEV), which belong to the
combustion propulsion such as combustion engine, exhaust system, etc.
Transmission components: includes all transmissions of conventional,
hybrid and electric powertrains
© by FEV – all rights reserved. Confidential – no passing on to third parties |
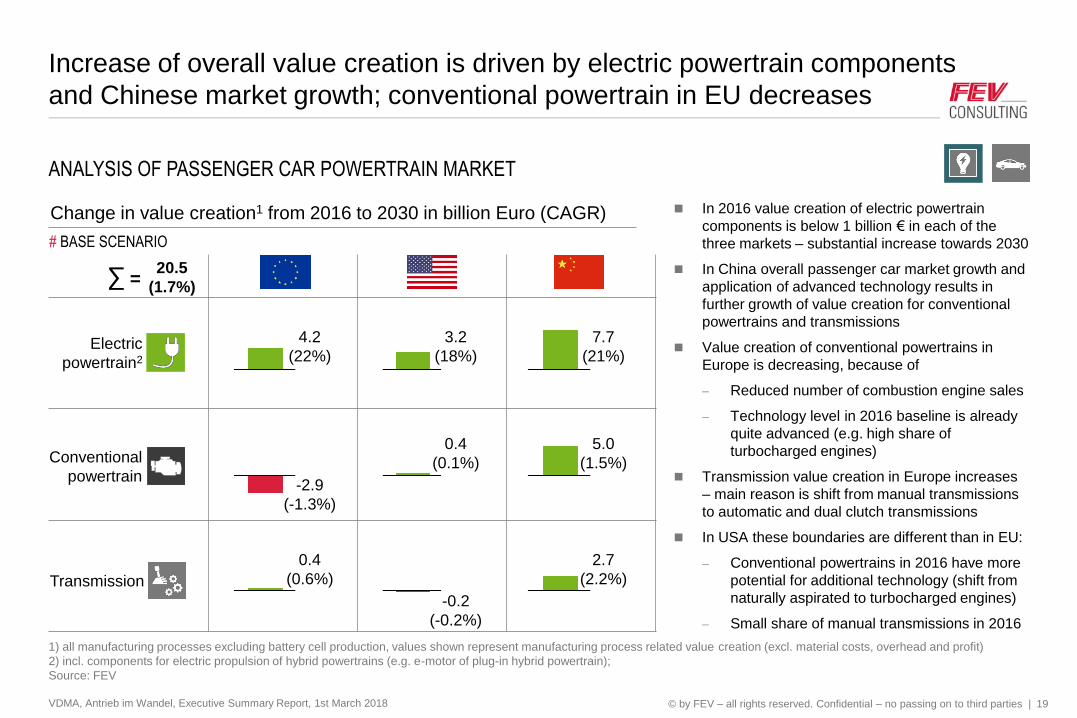
Increase of overall value creation is driven by electric powertrain components
and Chinese market growth; conventional powertrain in EU decreases
VDMA, Antrieb im Wandel, Executive Summary Report, 1st March 2018 19
ANALYSIS OF PASSENGER CAR POWERTRAIN MARKET
1) all manufacturing processes excluding battery cell production, values shown represent manufacturing process related value creation (excl. material costs, overhead and profit)
2) incl. components for electric propulsion of hybrid powertrains (e.g. e-motor of plug-in hybrid powertrain);
Source: FEV
Change in value creation1 from 2016 to 2030 in billion Euro (CAGR)
# BASE SCENARIO
4.2
(22%)
3.2
(18%)
7.7
(21%)
-2.9
(-1.3%)
0.4
(0.1%)
5.0
(1.5%)
0.4
(0.6%)
-0.2
(-0.2%)
2.7
(2.2%)Transmission
Conventional
powertrain
Electric
powertrain2
In 2016 value creation of electric powertrain
components is below 1 billion € in each of the
three markets – substantial increase towards 2030
In China overall passenger car market growth and
application of advanced technology results in
further growth of value creation for conventional
powertrains and transmissions
Value creation of conventional powertrains in
Europe is decreasing, because of
Reduced number of combustion engine sales
Technology level in 2016 baseline is already
quite advanced (e.g. high share of
turbocharged engines)
Transmission value creation in Europe increases
– main reason is shift from manual transmissions
to automatic and dual clutch transmissions
In USA these boundaries are different than in EU:
Conventional powertrains in 2016 have more
potential for additional technology (shift from
naturally aspirated to turbocharged engines)
Small share of manual transmissions in 2016
∑ =20.5
(1.7%)
© by FEV – all rights reserved. Confidential – no passing on to third parties |
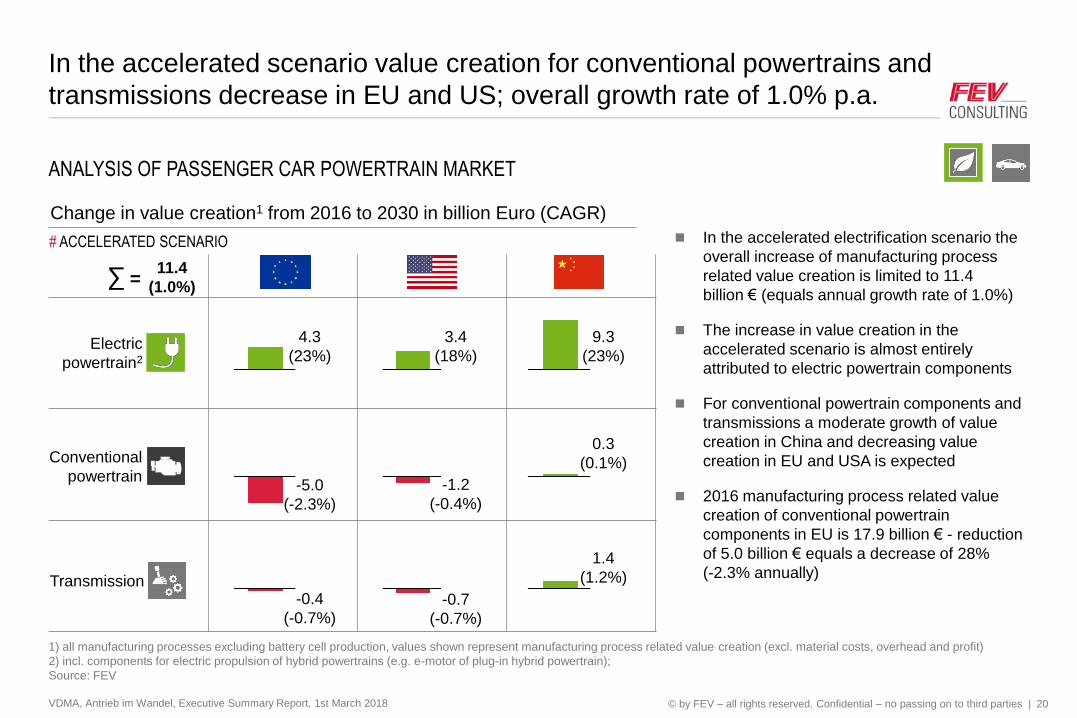
In the accelerated scenario value creation for conventional powertrains and
transmissions decrease in EU and US; overall growth rate of 1.0% p.a.
VDMA, Antrieb im Wandel, Executive Summary Report, 1st March 2018 20
ANALYSIS OF PASSENGER CAR POWERTRAIN MARKET
1) all manufacturing processes excluding battery cell production, values shown represent manufacturing process related value creation (excl. material costs, overhead and profit)
2) incl. components for electric propulsion of hybrid powertrains (e.g. e-motor of plug-in hybrid powertrain);
Source: FEV
Change in value creation1 from 2016 to 2030 in billion Euro (CAGR)
4.3
(23%)
3.4
(18%)
9.3
(23%)
-5.0
(-2.3%)
-1.2
(-0.4%)
0.3
(0.1%)
-0.4
(-0.7%)-0.7
(-0.7%)
1.4
(1.2%)Transmission
Conventional
powertrain
Electric
powertrain2
# ACCELERATED SCENARIO
∑ =11.4
(1.0%)
In the accelerated electrification scenario the
overall increase of manufacturing process
related value creation is limited to 11.4
billion € (equals annual growth rate of 1.0%)
The increase in value creation in the
accelerated scenario is almost entirely
attributed to electric powertrain components
For conventional powertrain components and
transmissions a moderate growth of value
creation in China and decreasing value
creation in EU and USA is expected
2016 manufacturing process related value
creation of conventional powertrain
components in EU is 17.9 billion € - reduction
of 5.0 billion € equals a decrease of 28%
(-2.3% annually)
© by FEV – all rights reserved. Confidential – no passing on to third parties |
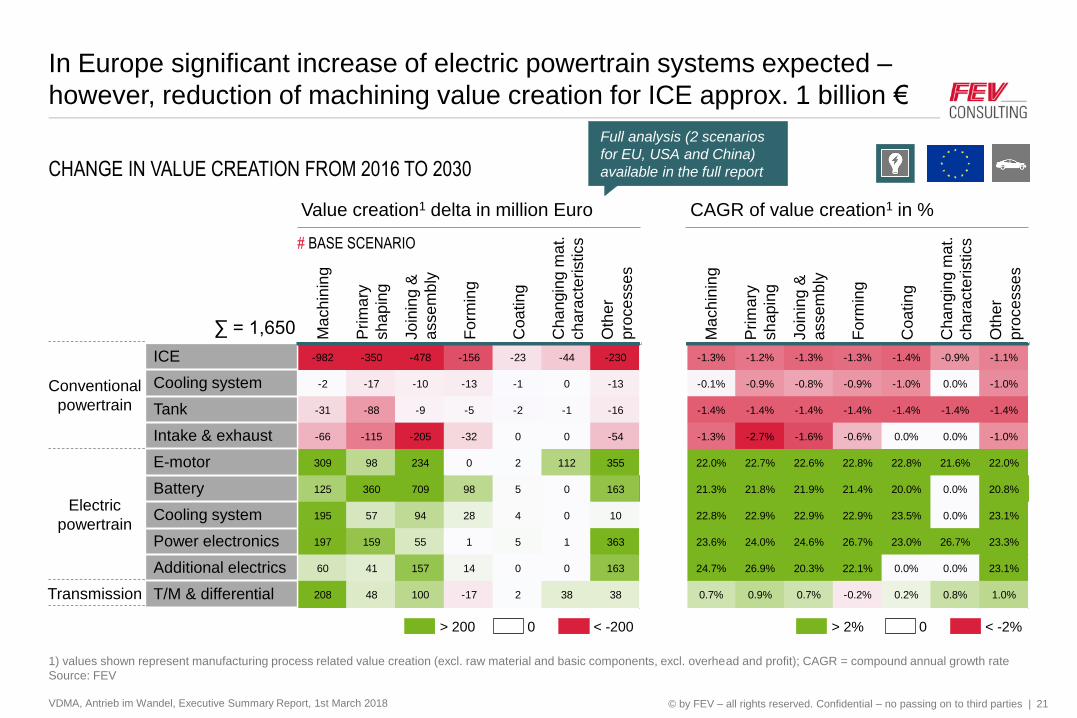
In Europe significant increase of electric powertrain systems expected –
however, reduction of machining value creation for ICE approx. 1 billion €
VDMA, Antrieb im Wandel, Executive Summary Report, 1st March 2018 21
CHANGE IN VALUE CREATION FROM 2016 TO 2030
1) values shown represent manufacturing process related value creation (excl. raw material and basic components, excl. overhead and profit); CAGR = compound annual growth rate
Source: FEV
Ma
ch
inin
g
Prim
ary
sh
ap
ing
Jo
inin
g &
asse
mb
ly
Fo
rmin
g
Coa
tin
g
Cha
ngin
g m
at.
ch
ara
cte
ristics
Oth
er
pro
ce
sse
s
ICE
Cooling system
Tank
Intake & exhaust
E-motor
Battery
Cooling system
Power electronics
Additional electrics
T/M & differentialTransmission
Conventional
powertrain
Electric
powertrain
Ma
ch
inin
g
Prim
ary
sh
ap
ing
Jo
inin
g &
asse
mb
ly
Fo
rmin
g
Coa
tin
g
Cha
ngin
g m
at.
ch
ara
cte
ristics
Oth
er
pro
ce
sse
s
< -2000> 200 < -2%0> 2%
-982 -350 -478 -156 -23 -44 -230
-2 -17 -10 -13 -1 0 -13
-31 -88 -9 -5 -2 -1 -16
-66 -115 -205 -32 0 0 -54
309 98 234 0 2 112 355
125 360 709 98 5 0 163
195 57 94 28 4 0 10
197 159 55 1 5 1 363
60 41 157 14 0 0 163
208 48 100 -17 2 38 38
-1.3% -1.2% -1.3% -1.3% -1.4% -0.9% -1.1%
-0.1% -0.9% -0.8% -0.9% -1.0% 0.0% -1.0%
-1.4% -1.4% -1.4% -1.4% -1.4% -1.4% -1.4%
-1.3% -2.7% -1.6% -0.6% 0.0% 0.0% -1.0%
22.0% 22.7% 22.6% 22.8% 22.8% 21.6% 22.0%
21.3% 21.8% 21.9% 21.4% 20.0% 0.0% 20.8%
22.8% 22.9% 22.9% 22.9% 23.5% 0.0% 23.1%
23.6% 24.0% 24.6% 26.7% 23.0% 26.7% 23.3%
24.7% 26.9% 20.3% 22.1% 0.0% 0.0% 23.1%
0.7% 0.9% 0.7% -0.2% 0.2% 0.8% 1.0%
Value creation1 delta in million Euro CAGR of value creation1 in %
# BASE SCENARIO
∑ = 1,650
Full analysis (2 scenarios
for EU, USA and China)
available in the full report
© by FEV – all rights reserved. Confidential – no passing on to third parties |
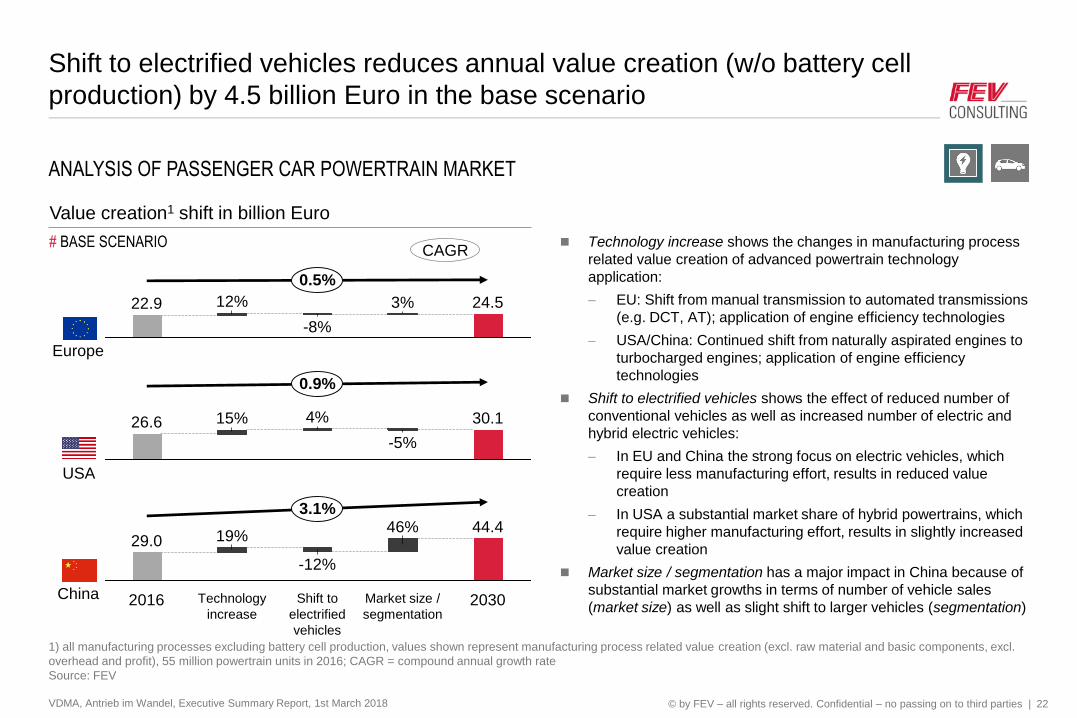
Shift to electrified vehicles reduces annual value creation (w/o battery cell
production) by 4.5 billion Euro in the base scenario
VDMA, Antrieb im Wandel, Executive Summary Report, 1st March 2018 22
ANALYSIS OF PASSENGER CAR POWERTRAIN MARKET
22.9
0.5%
-8%
3% 24.512%
30.115% 4%
-5%
26.6
0.9%
44.446%
Market size /
segmentation
3.1%
Technology
increase
29.0 19%
-12%
Shift to
electrified
vehicles
2016 2030
Value creation1 shift in billion Euro
1) all manufacturing processes excluding battery cell production, values shown represent manufacturing process related value creation (excl. raw material and basic components, excl.
overhead and profit), 55 million powertrain units in 2016; CAGR = compound annual growth rate
Source: FEV
Europe
USA
China
# BASE SCENARIO Technology increase shows the changes in manufacturing process
related value creation of advanced powertrain technology
application:
EU: Shift from manual transmission to automated transmissions
(e.g. DCT, AT); application of engine efficiency technologies
USA/China: Continued shift from naturally aspirated engines to
turbocharged engines; application of engine efficiency
technologies
Shift to electrified vehicles shows the effect of reduced number of
conventional vehicles as well as increased number of electric and
hybrid electric vehicles:
In EU and China the strong focus on electric vehicles, which
require less manufacturing effort, results in reduced value
creation
In USA a substantial market share of hybrid powertrains, which
require higher manufacturing effort, results in slightly increased
value creation
Market size / segmentation has a major impact in China because of
substantial market growths in terms of number of vehicle sales
(market size) as well as slight shift to larger vehicles (segmentation)
CAGR
© by FEV – all rights reserved. Confidential – no passing on to third parties |
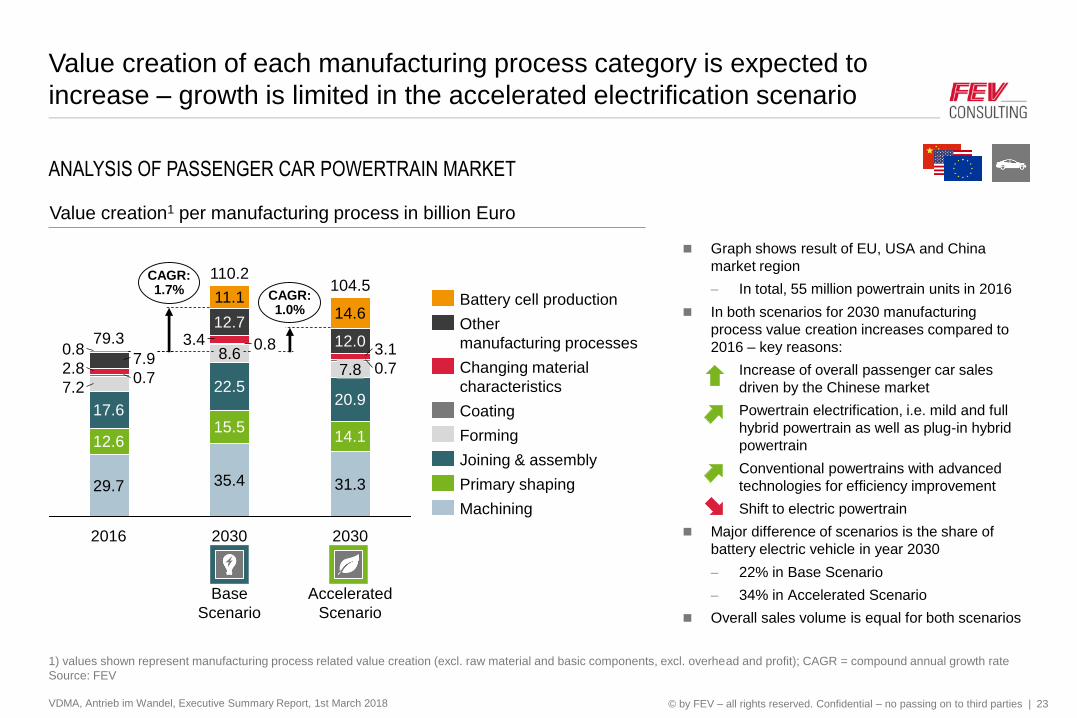
Value creation of each manufacturing process category is expected to
increase – growth is limited in the accelerated electrification scenario
VDMA, Antrieb im Wandel, Executive Summary Report, 1st March 2018 23
ANALYSIS OF PASSENGER CAR POWERTRAIN MARKET
1) values shown represent manufacturing process related value creation (excl. raw material and basic components, excl. overhead and profit); CAGR = compound annual growth rate
Source: FEV
8.60.83.4
12.7
11.1
22.5
104.5CAGR:1.0%
110.2CAGR:1.7%
2030
Accelerated
Scenario
31.3
14.115.5
0.7
3.112.0
14.6
2030
Base
Scenario
35.4
2016
79.3
29.7
12.6
17.6
7.80.7
2.87.9
0.8
20.97.2
Machining
Primary shaping
Joining & assembly
Forming
Coating
Changing material
characteristics
Other
manufacturing processes
Battery cell production
Graph shows result of EU, USA and China
market region
In total, 55 million powertrain units in 2016
In both scenarios for 2030 manufacturing
process value creation increases compared to
2016 – key reasons:
Increase of overall passenger car sales
driven by the Chinese market
Powertrain electrification, i.e. mild and full
hybrid powertrain as well as plug-in hybrid
powertrain
Conventional powertrains with advanced
technologies for efficiency improvement
Shift to electric powertrain
Major difference of scenarios is the share of
battery electric vehicle in year 2030
22% in Base Scenario
34% in Accelerated Scenario
Overall sales volume is equal for both scenarios
Value creation1 per manufacturing process in billion Euro
© by FEV – all rights reserved. Confidential – no passing on to third parties |
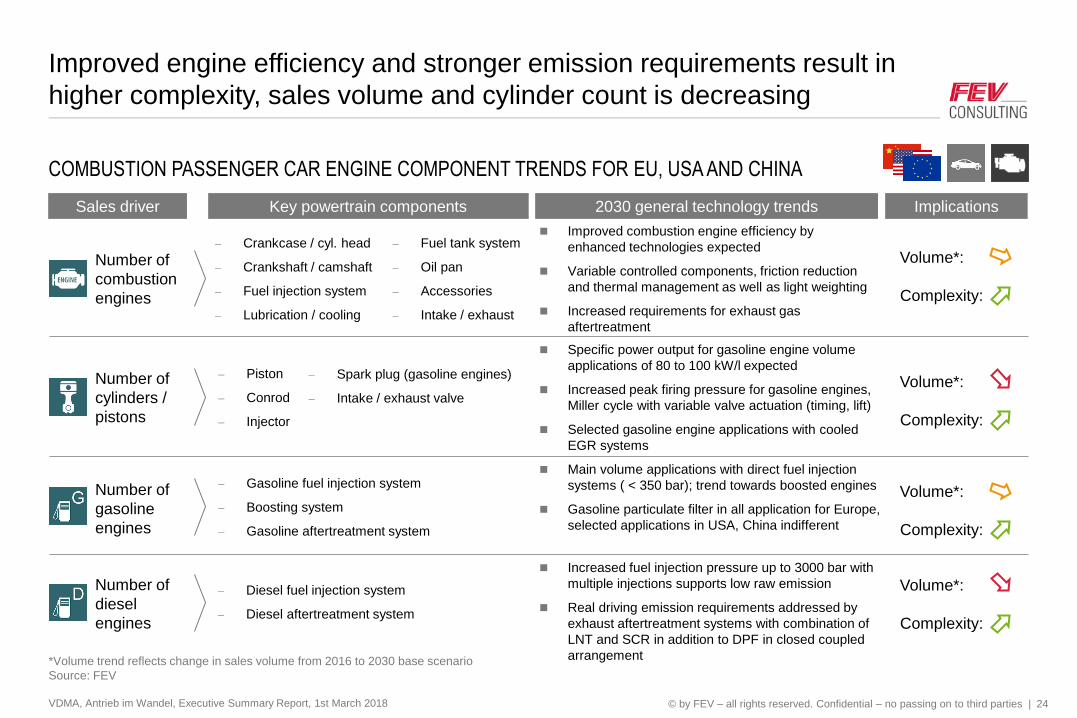
Improved engine efficiency and stronger emission requirements result in
higher complexity, sales volume and cylinder count is decreasing
VDMA, Antrieb im Wandel, Executive Summary Report, 1st March 2018 24
COMBUSTION PASSENGER CAR ENGINE COMPONENT TRENDS FOR EU, USA AND CHINA
*Volume trend reflects change in sales volume from 2016 to 2030 base scenario
Source: FEV
Crankcase / cyl. head
Crankshaft / camshaft
Fuel injection system
Lubrication / cooling
Gasoline fuel injection system
Boosting system
Gasoline aftertreatment system
Piston
Conrod
Injector
Diesel fuel injection system
Diesel aftertreatment system
Fuel tank system
Oil pan
Accessories
Intake / exhaust
Spark plug (gasoline engines)
Intake / exhaust valve
Sales driver ImplicationsKey powertrain components
Number of
combustion
engines
Number of
cylinders /
pistons
Number of
gasoline
engines
Number of
diesel
engines
Volume*:
Complexity:
Volume*:
Complexity:
Volume*:
Complexity:
Volume*:
Complexity:
2030 general technology trends
Improved combustion engine efficiency by
enhanced technologies expected
Variable controlled components, friction reduction
and thermal management as well as light weighting
Increased requirements for exhaust gas
aftertreatment
Specific power output for gasoline engine volume
applications of 80 to 100 kW/l expected
Increased peak firing pressure for gasoline engines,
Miller cycle with variable valve actuation (timing, lift)
Selected gasoline engine applications with cooled
EGR systems
Main volume applications with direct fuel injection
systems ( < 350 bar); trend towards boosted engines
Gasoline particulate filter in all application for Europe,
selected applications in USA, China indifferent
Increased fuel injection pressure up to 3000 bar with
multiple injections supports low raw emission
Real driving emission requirements addressed by
exhaust aftertreatment systems with combination of
LNT and SCR in addition to DPF in closed coupled
arrangement
© by FEV – all rights reserved. Confidential – no passing on to third parties |
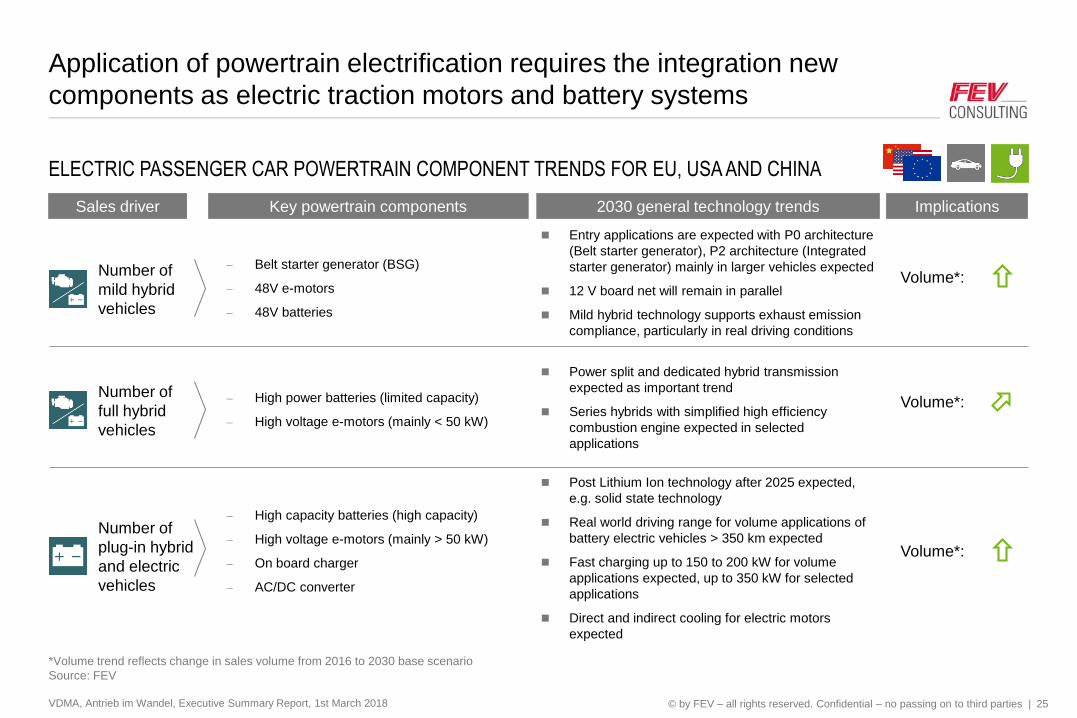
Application of powertrain electrification requires the integration new
components as electric traction motors and battery systems
VDMA, Antrieb im Wandel, Executive Summary Report, 1st March 2018 25
ELECTRIC PASSENGER CAR POWERTRAIN COMPONENT TRENDS FOR EU, USA AND CHINA
*Volume trend reflects change in sales volume from 2016 to 2030 base scenario
Source: FEV
Belt starter generator (BSG)
48V e-motors
48V batteries
Sales driver ImplicationsKey powertrain components
Number of
mild hybrid
vehicles
Volume*:
Number of
plug-in hybrid
and electric
vehicles
High power batteries (limited capacity)
High voltage e-motors (mainly < 50 kW)
Number of
full hybrid
vehicles
Volume*:
Volume*:
High capacity batteries (high capacity)
High voltage e-motors (mainly > 50 kW)
On board charger
AC/DC converter
2030 general technology trends
Entry applications are expected with P0 architecture
(Belt starter generator), P2 architecture (Integrated
starter generator) mainly in larger vehicles expected
12 V board net will remain in parallel
Mild hybrid technology supports exhaust emission
compliance, particularly in real driving conditions
Power split and dedicated hybrid transmission
expected as important trend
Series hybrids with simplified high efficiency
combustion engine expected in selected
applications
Post Lithium Ion technology after 2025 expected,
e.g. solid state technology
Real world driving range for volume applications of
battery electric vehicles > 350 km expected
Fast charging up to 150 to 200 kW for volume
applications expected, up to 350 kW for selected
applications
Direct and indirect cooling for electric motors
expected
© by FEV – all rights reserved. Confidential – no passing on to third parties |
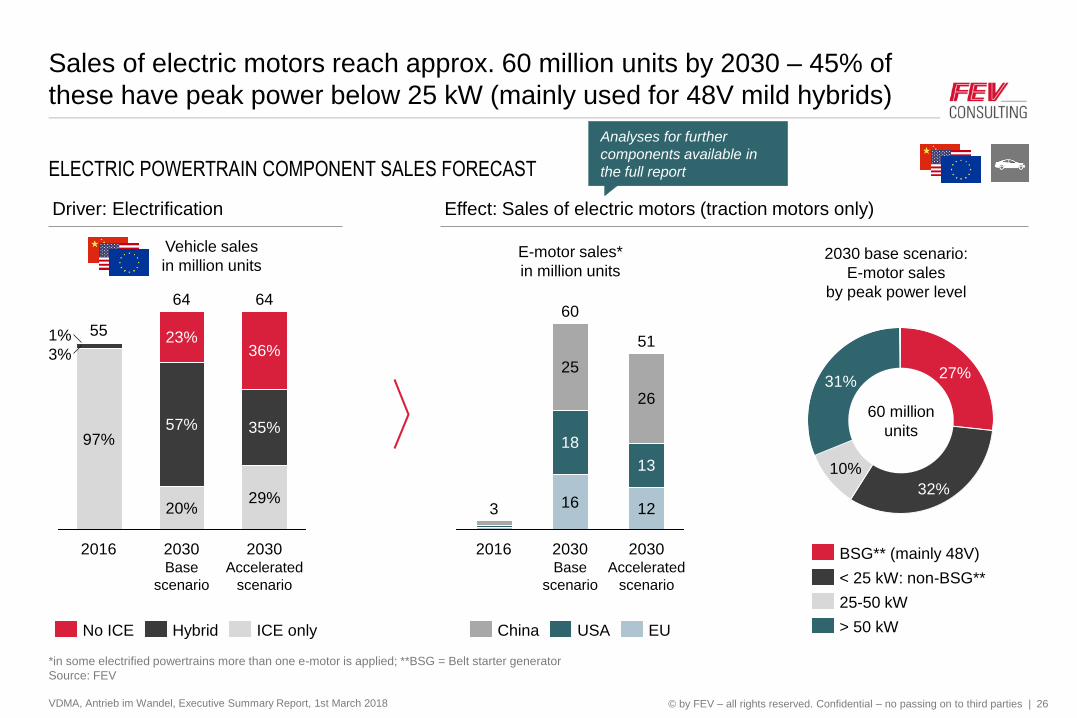
Sales of electric motors reach approx. 60 million units by 2030 – 45% of
these have peak power below 25 kW (mainly used for 48V mild hybrids)
VDMA, Antrieb im Wandel, Executive Summary Report, 1st March 2018 26
ELECTRIC POWERTRAIN COMPONENT SALES FORECAST
*in some electrified powertrains more than one e-motor is applied; **BSG = Belt starter generator
Source: FEV
20%
57%
23%
2016
55
97%
3%
1%
2030 Accelerated
scenario
64
29%
35%
36%
2030Base
scenario
64
ICE onlyHybridNo ICE
Driver: Electrification Effect: Sales of electric motors (traction motors only)
Vehicle sales
in million unitsE-motor sales*
in million units
2016
3
2030Base
scenario
60
16
18
25
2030 Accelerated
scenario
51
12
13
26
USAChina EU
32%
27%31%
10%
< 25 kW: non-BSG**
> 50 kW
25-50 kW
BSG** (mainly 48V)
60 million
units
2030 base scenario:
E-motor sales
by peak power level
Analyses for further
components available in
the full report
© by FEV – all rights reserved. Confidential – no passing on to third parties |
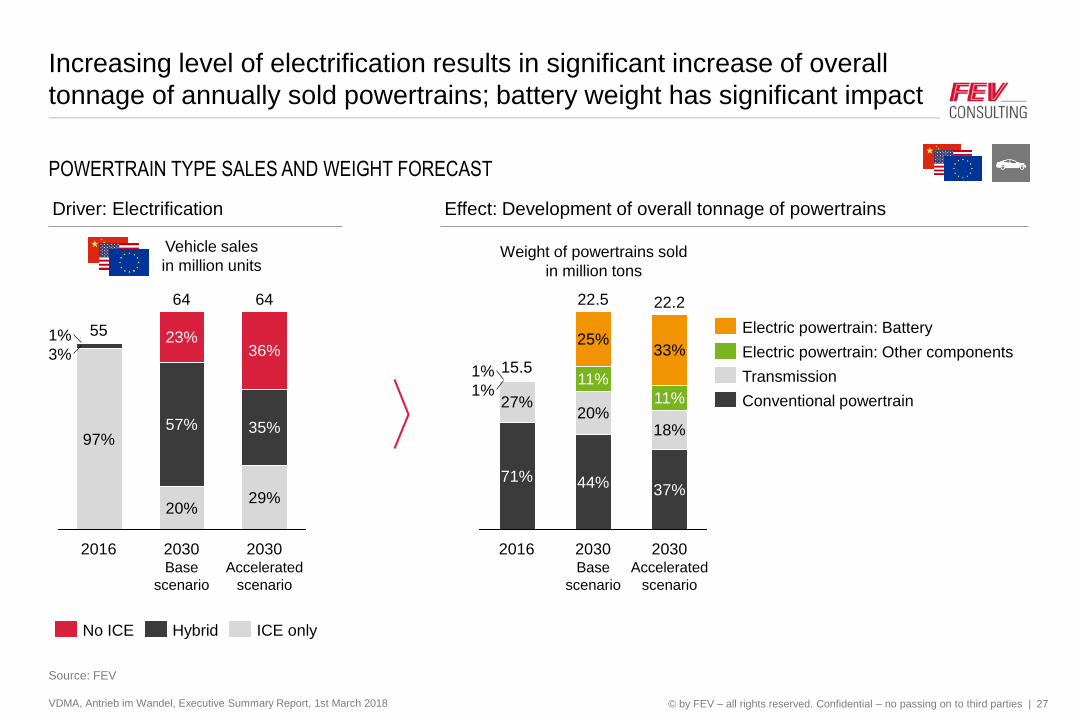
Increasing level of electrification results in significant increase of overall
tonnage of annually sold powertrains; battery weight has significant impact
VDMA, Antrieb im Wandel, Executive Summary Report, 1st March 2018 27
POWERTRAIN TYPE SALES AND WEIGHT FORECAST
Source: FEV
2030 Accelerated
scenario
64
29%
35%
36%
2030Base
scenario
64
20%
57%
23%
2016
55
97%
3%
1%
ICE onlyHybridNo ICE
Driver: Electrification
Vehicle sales
in million units
Effect: Development of overall tonnage of powertrains
Weight of powertrains sold
in million tons
1%
1%
2030 Accelerated
scenario
22.2
37%
18%
11%
33%
2030Base
scenario
22.5
44%
20%
11%
25%
2016
15.5
71%
27% Conventional powertrain
Transmission
Electric powertrain: Other components
Electric powertrain: Battery
© by FEV – all rights reserved. Confidential – no passing on to third parties |
Agenda
Conclusions and study approach
Passenger car market
Commercial vehicle market
Non-road mobile machinery
Follow-up services
Contacts
VDMA, Antrieb im Wandel, Executive Summary Report, 1st March 2018 28
© by FEV – all rights reserved. Confidential – no passing on to third parties |
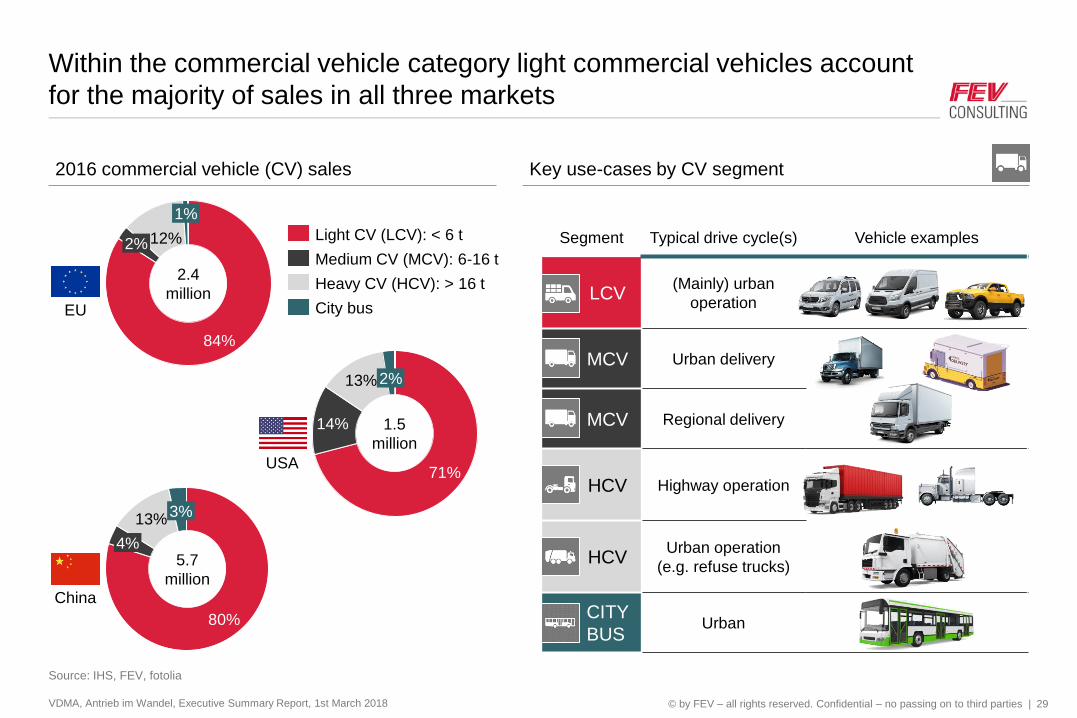
Within the commercial vehicle category light commercial vehicles account
for the majority of sales in all three markets
VDMA, Antrieb im Wandel, Executive Summary Report, 1st March 2018 29
Source: IHS, FEV, fotolia
Segment Typical drive cycle(s) Vehicle examples
LCV(Mainly) urban
operation
MCV Urban delivery
MCV Regional delivery
HCV Highway operation
HCVUrban operation
(e.g. refuse trucks)
CITY
BUSUrban
1%
12%2%
84%
City bus
Heavy CV (HCV): > 16 t
Medium CV (MCV): 6-16 t
Light CV (LCV): < 6 t
2%13%
14%
71%
3%13%
4%
80%
2016 commercial vehicle (CV) sales Key use-cases by CV segment
EU
USA
China
5.7
million
1.5
million
2.4
million
© by FEV – all rights reserved. Confidential – no passing on to third parties |
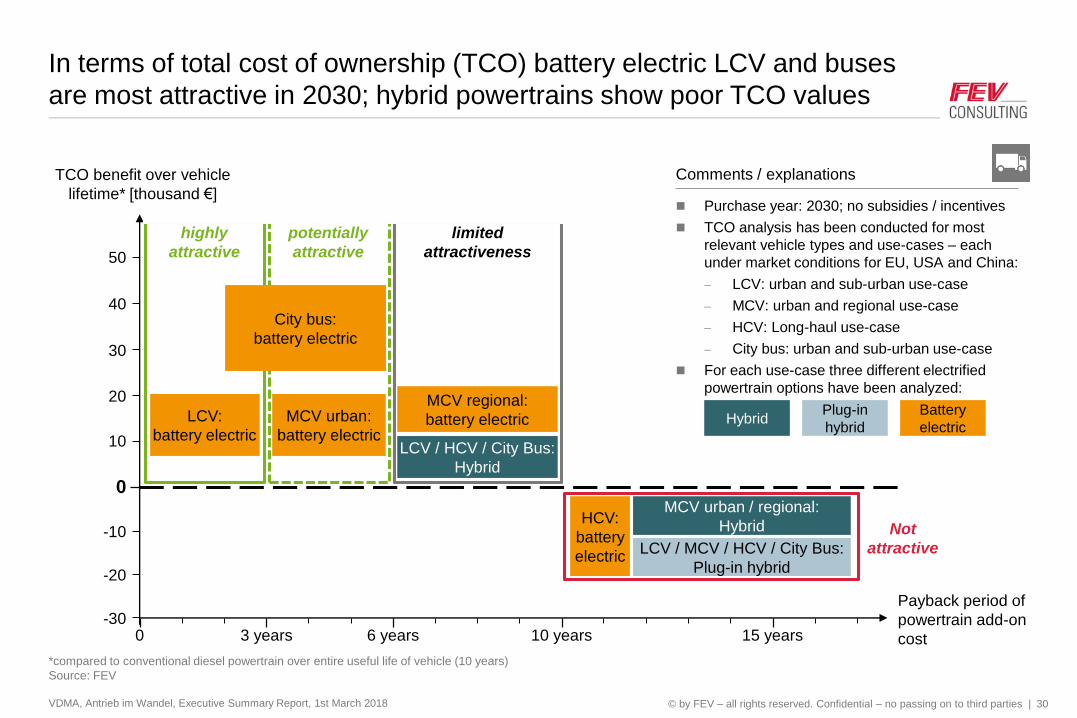
In terms of total cost of ownership (TCO) battery electric LCV and buses
are most attractive in 2030; hybrid powertrains show poor TCO values
VDMA, Antrieb im Wandel, Executive Summary Report, 1st March 2018 30
*compared to conventional diesel powertrain over entire useful life of vehicle (10 years)
Source: FEV
highly
attractive
limited
attractiveness
potentially
attractive
LCV:
battery electric
MCV urban:
battery electric
MCV regional:
battery electric
LCV / HCV / City Bus:
Hybrid
Not
attractive
HCV:
battery
electricLCV / MCV / HCV / City Bus:
Plug-in hybrid
MCV urban / regional:
Hybrid
Payback period of
powertrain add-on
cost0 6 years 10 years 15 years
TCO benefit over vehicle
lifetime* [thousand €]
3 years
-20
-10
0
10
20
30
40
50
HybridPlug-in
hybrid
Battery
electric
Purchase year: 2030; no subsidies / incentives
TCO analysis has been conducted for most
relevant vehicle types and use-cases – each
under market conditions for EU, USA and China:
LCV: urban and sub-urban use-case
MCV: urban and regional use-case
HCV: Long-haul use-case
City bus: urban and sub-urban use-case
For each use-case three different electrified
powertrain options have been analyzed:
Comments / explanations
City bus:
battery electric
-30
© by FEV – all rights reserved. Confidential – no passing on to third parties |
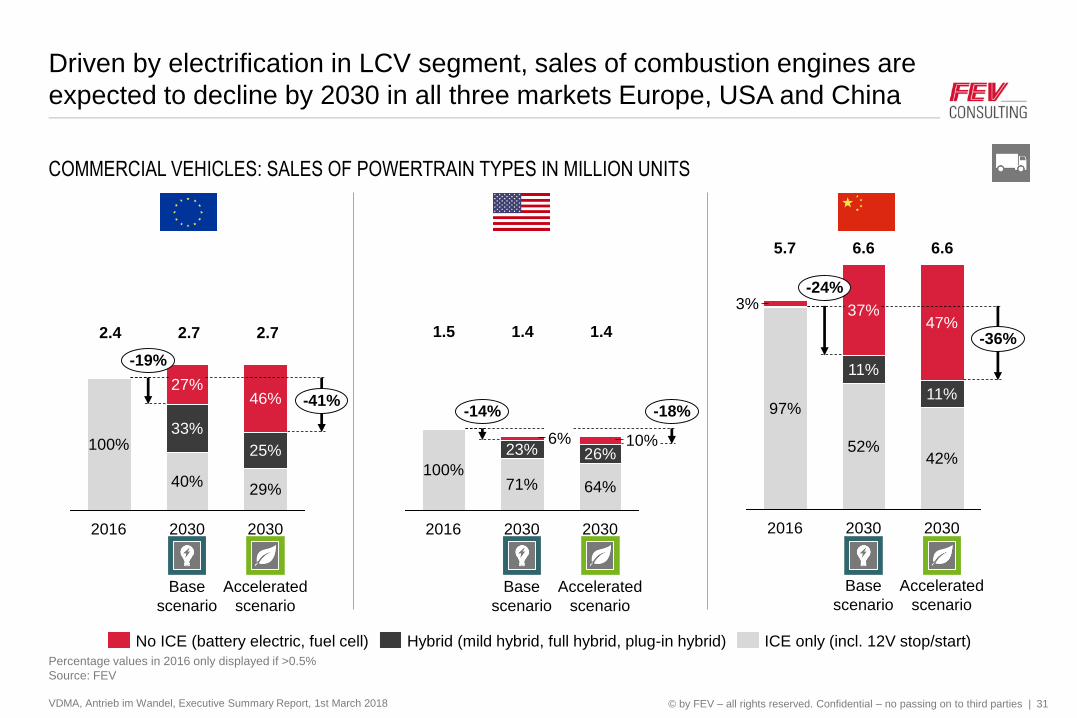
Driven by electrification in LCV segment, sales of combustion engines are
expected to decline by 2030 in all three markets Europe, USA and China
VDMA, Antrieb im Wandel, Executive Summary Report, 1st March 2018 31
COMMERCIAL VEHICLES: SALES OF POWERTRAIN TYPES IN MILLION UNITS
Percentage values in 2016 only displayed if >0.5%
Source: FEV
46%
2030
Base
scenario
40%
33%
27%
2016
100%
-41%
-19%
2030
Accelerated
scenario
29%
25%
ICE only (incl. 12V stop/start)Hybrid (mild hybrid, full hybrid, plug-in hybrid)No ICE (battery electric, fuel cell)
-18%-14%
2030
Accelerated
scenario
6%
2016
100%64%
26%10%
2030
Base
scenario
71%
23%
97%
3%
-36%
-24%
2030
Accelerated
scenario
42%
47%
2030
Base
scenario
52%
11%
37%
2016
11%
2.4 2.7 2.7 1.5 1.4 1.4
5.7 6.6 6.6
© by FEV – all rights reserved. Confidential – no passing on to third parties |
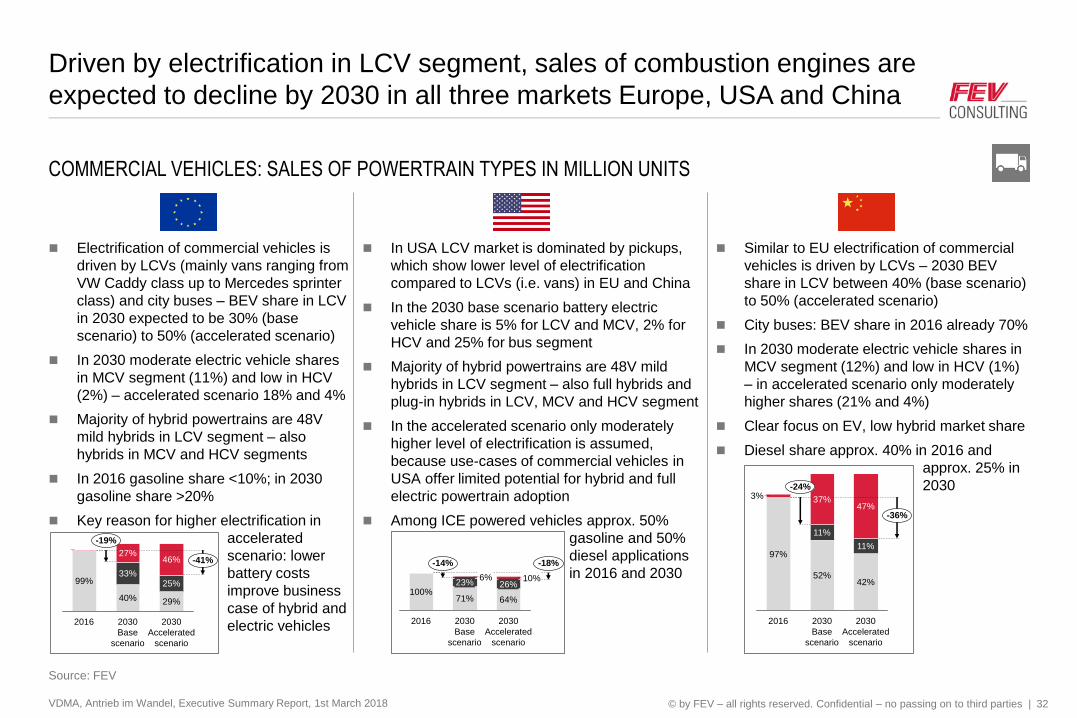
Driven by electrification in LCV segment, sales of combustion engines are
expected to decline by 2030 in all three markets Europe, USA and China
VDMA, Antrieb im Wandel, Executive Summary Report, 1st March 2018 32
COMMERCIAL VEHICLES: SALES OF POWERTRAIN TYPES IN MILLION UNITS
Source: FEV
Electrification of commercial vehicles is
driven by LCVs (mainly vans ranging from
VW Caddy class up to Mercedes sprinter
class) and city buses – BEV share in LCV
in 2030 expected to be 30% (base
scenario) to 50% (accelerated scenario)
In 2030 moderate electric vehicle shares
in MCV segment (11%) and low in HCV
(2%) – accelerated scenario 18% and 4%
Majority of hybrid powertrains are 48V
mild hybrids in LCV segment – also
hybrids in MCV and HCV segments
In 2016 gasoline share <10%; in 2030
gasoline share >20%
Key reason for higher electrification in
accelerated
scenario: lower
battery costs
improve business
case of hybrid and
electric vehicles
In USA LCV market is dominated by pickups,
which show lower level of electrification
compared to LCVs (i.e. vans) in EU and China
In the 2030 base scenario battery electric
vehicle share is 5% for LCV and MCV, 2% for
HCV and 25% for bus segment
Majority of hybrid powertrains are 48V mild
hybrids in LCV segment – also full hybrids and
plug-in hybrids in LCV, MCV and HCV segment
In the accelerated scenario only moderately
higher level of electrification is assumed,
because use-cases of commercial vehicles in
USA offer limited potential for hybrid and full
electric powertrain adoption
Among ICE powered vehicles approx. 50%
gasoline and 50%
diesel applications
in 2016 and 2030
Similar to EU electrification of commercial
vehicles is driven by LCVs – 2030 BEV
share in LCV between 40% (base scenario)
to 50% (accelerated scenario)
City buses: BEV share in 2016 already 70%
In 2030 moderate electric vehicle shares in
MCV segment (12%) and low in HCV (1%)
– in accelerated scenario only moderately
higher shares (21% and 4%)
Clear focus on EV, low hybrid market share
Diesel share approx. 40% in 2016 and
approx. 25% in
2030
-41%
-19%
2030
Accelerated
scenario
2030
Base
scenario
2016
99%
1%
25%
29%
46%
40%
33%
27%-18%-14%
2030
Accelerated
scenario
64%
26%10%
2030
Base
scenario
71%
23%6%
2016
100%
-36%
-24%
2030
Accelerated
scenario
42%
11%
47%
2030
Base
scenario
52%
11%
37%
2016
97%
3%
© by FEV – all rights reserved. Confidential – no passing on to third parties |
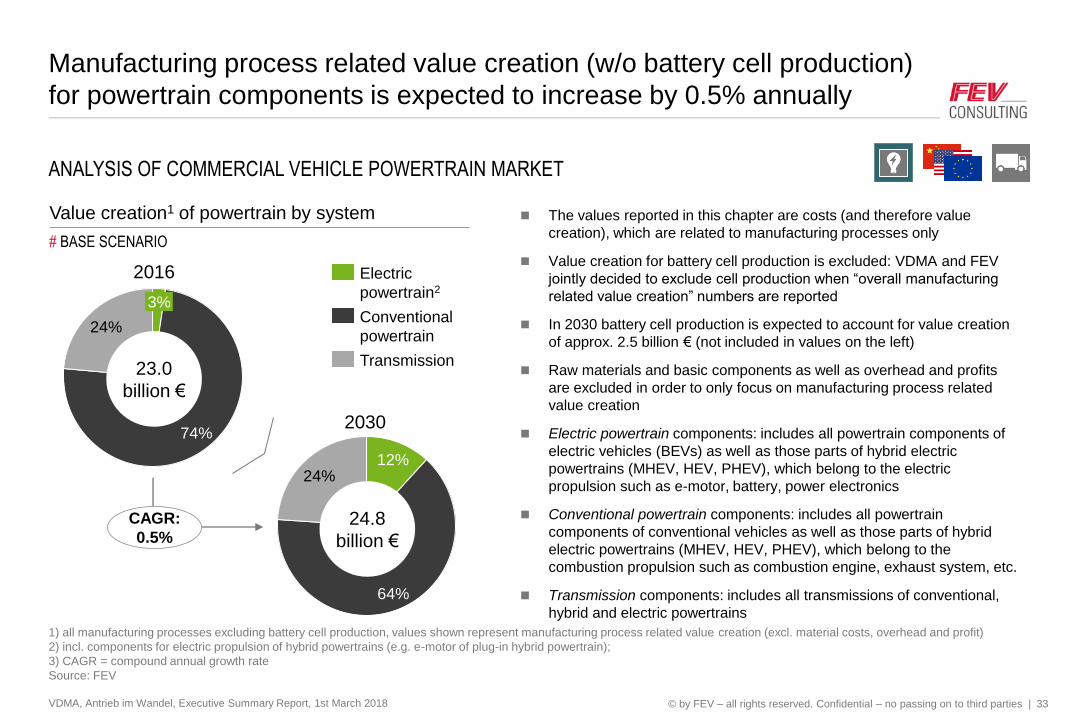
Manufacturing process related value creation (w/o battery cell production)
for powertrain components is expected to increase by 0.5% annually
VDMA, Antrieb im Wandel, Executive Summary Report, 1st March 2018 33
ANALYSIS OF COMMERCIAL VEHICLE POWERTRAIN MARKET
1) all manufacturing processes excluding battery cell production, values shown represent manufacturing process related value creation (excl. material costs, overhead and profit)
2) incl. components for electric propulsion of hybrid powertrains (e.g. e-motor of plug-in hybrid powertrain);
3) CAGR = compound annual growth rate
Source: FEV
3%
24%
74%
23.0
billion €
Value creation1 of powertrain by system
24%
64%
12%
24.8
billion €
Transmission
Conventional
powertrain
Electric
powertrain2
2030
2016
CAGR:
0.5%
# BASE SCENARIO
The values reported in this chapter are costs (and therefore value
creation), which are related to manufacturing processes only
Value creation for battery cell production is excluded: VDMA and FEV
jointly decided to exclude cell production when “overall manufacturing
related value creation” numbers are reported
In 2030 battery cell production is expected to account for value creation
of approx. 2.5 billion € (not included in values on the left)
Raw materials and basic components as well as overhead and profits
are excluded in order to only focus on manufacturing process related
value creation
Electric powertrain components: includes all powertrain components of
electric vehicles (BEVs) as well as those parts of hybrid electric
powertrains (MHEV, HEV, PHEV), which belong to the electric
propulsion such as e-motor, battery, power electronics
Conventional powertrain components: includes all powertrain
components of conventional vehicles as well as those parts of hybrid
electric powertrains (MHEV, HEV, PHEV), which belong to the
combustion propulsion such as combustion engine, exhaust system, etc.
Transmission components: includes all transmissions of conventional,
hybrid and electric powertrains
© by FEV – all rights reserved. Confidential – no passing on to third parties |
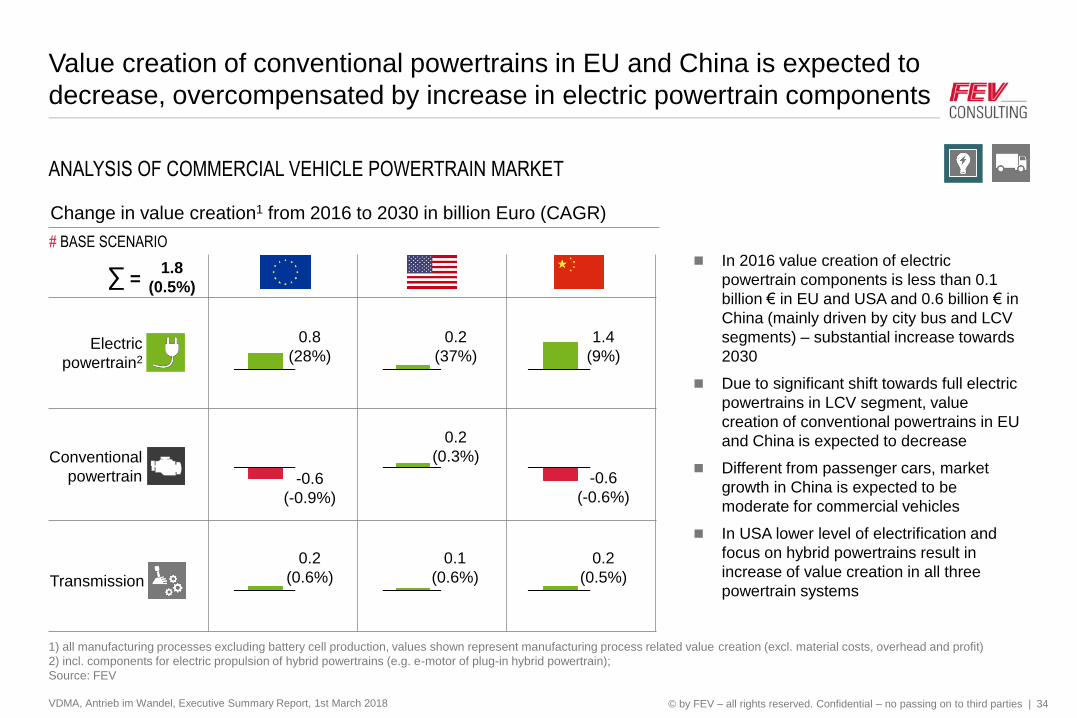
Value creation of conventional powertrains in EU and China is expected to
decrease, overcompensated by increase in electric powertrain components
VDMA, Antrieb im Wandel, Executive Summary Report, 1st March 2018 34
ANALYSIS OF COMMERCIAL VEHICLE POWERTRAIN MARKET
1) all manufacturing processes excluding battery cell production, values shown represent manufacturing process related value creation (excl. material costs, overhead and profit)
2) incl. components for electric propulsion of hybrid powertrains (e.g. e-motor of plug-in hybrid powertrain);
Source: FEV
Change in value creation1 from 2016 to 2030 in billion Euro (CAGR)
# BASE SCENARIO
0.8
(28%)
0.2
(37%)
1.4
(9%)
-0.6
(-0.9%)
0.2
(0.3%)
-0.6
(-0.6%)
0.2
(0.6%)
0.2
(0.5%)Transmission
Conventional
powertrain
Electric
powertrain2
0.1
(0.6%)
∑ =1.8
(0.5%)
In 2016 value creation of electric
powertrain components is less than 0.1
billion € in EU and USA and 0.6 billion € in
China (mainly driven by city bus and LCV
segments) – substantial increase towards
2030
Due to significant shift towards full electric
powertrains in LCV segment, value
creation of conventional powertrains in EU
and China is expected to decrease
Different from passenger cars, market
growth in China is expected to be
moderate for commercial vehicles
In USA lower level of electrification and
focus on hybrid powertrains result in
increase of value creation in all three
powertrain systems
© by FEV – all rights reserved. Confidential – no passing on to third parties |
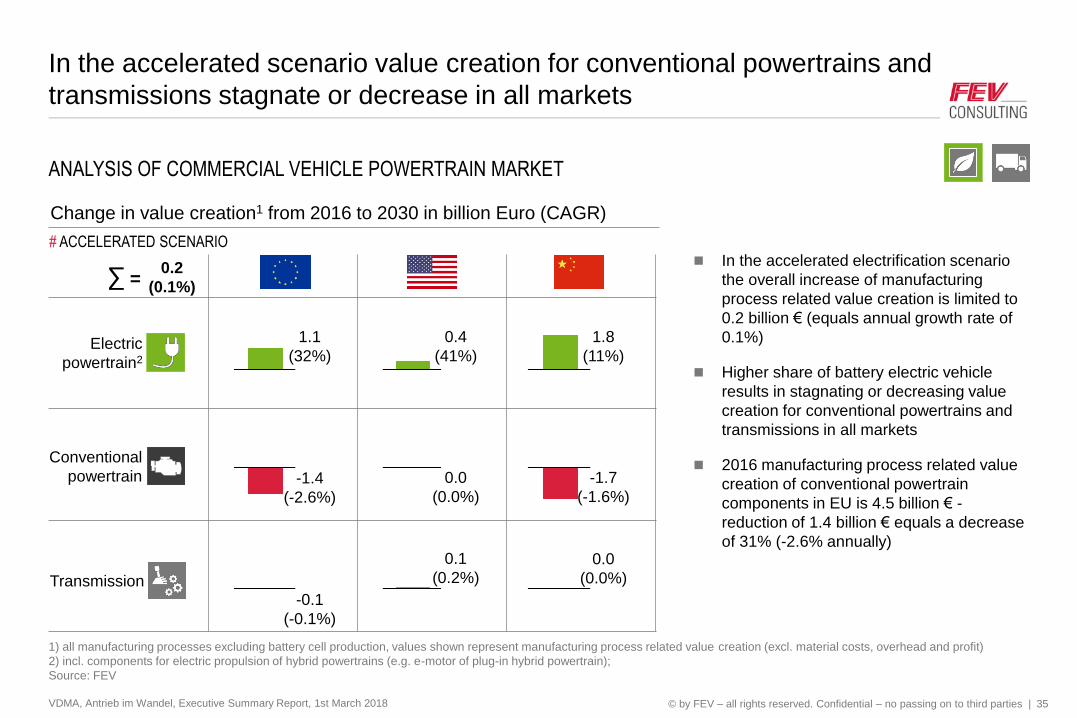
In the accelerated scenario value creation for conventional powertrains and
transmissions stagnate or decrease in all markets
VDMA, Antrieb im Wandel, Executive Summary Report, 1st March 2018 35
ANALYSIS OF COMMERCIAL VEHICLE POWERTRAIN MARKET
1) all manufacturing processes excluding battery cell production, values shown represent manufacturing process related value creation (excl. material costs, overhead and profit)
2) incl. components for electric propulsion of hybrid powertrains (e.g. e-motor of plug-in hybrid powertrain);
Source: FEV
1.1
(32%)
0.4
(41%)
1.8
(11%)
-1.4
(-2.6%)
0.0
(0.0%)
-1.7
(-1.6%)
-0.1
(-0.1%)
0.1
(0.2%)
0.0
(0.0%)Transmission
Conventional
powertrain
Electric
powertrain2
# ACCELERATED SCENARIO
∑ =0.2
(0.1%)
In the accelerated electrification scenario
the overall increase of manufacturing
process related value creation is limited to
0.2 billion € (equals annual growth rate of
0.1%)
Higher share of battery electric vehicle
results in stagnating or decreasing value
creation for conventional powertrains and
transmissions in all markets
2016 manufacturing process related value
creation of conventional powertrain
components in EU is 4.5 billion € -
reduction of 1.4 billion € equals a decrease
of 31% (-2.6% annually)
Change in value creation1 from 2016 to 2030 in billion Euro (CAGR)
© by FEV – all rights reserved. Confidential – no passing on to third parties |
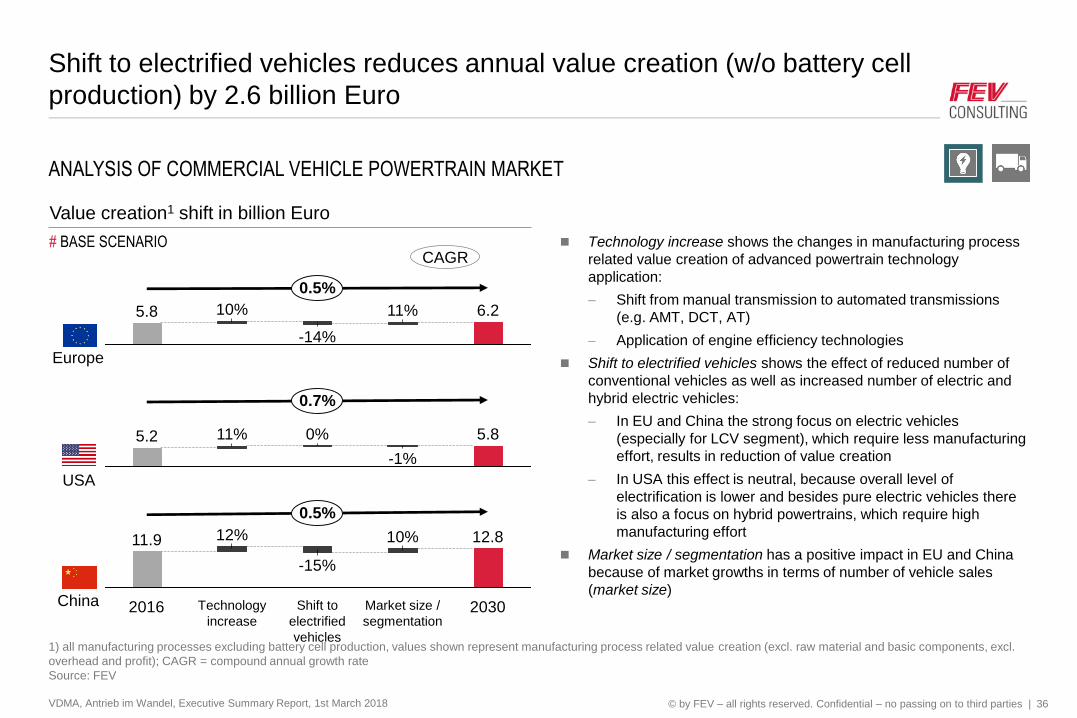
Shift to electrified vehicles reduces annual value creation (w/o battery cell
production) by 2.6 billion Euro
VDMA, Antrieb im Wandel, Executive Summary Report, 1st March 2018 36
ANALYSIS OF COMMERCIAL VEHICLE POWERTRAIN MARKET
6.25.8
-14%
11%
0.5%
10%
-1%
0% 5.85.2 11%
0.7%
2030Technology
increase
Market size /
segmentation
11.9
0.5%
2016
12% 12.810%
Shift to
electrified
vehicles
-15%
Value creation1 shift in billion Euro
1) all manufacturing processes excluding battery cell production, values shown represent manufacturing process related value creation (excl. raw material and basic components, excl.
overhead and profit); CAGR = compound annual growth rate
Source: FEV
Europe
USA
China
# BASE SCENARIO Technology increase shows the changes in manufacturing process
related value creation of advanced powertrain technology
application:
Shift from manual transmission to automated transmissions
(e.g. AMT, DCT, AT)
Application of engine efficiency technologies
Shift to electrified vehicles shows the effect of reduced number of
conventional vehicles as well as increased number of electric and
hybrid electric vehicles:
In EU and China the strong focus on electric vehicles
(especially for LCV segment), which require less manufacturing
effort, results in reduction of value creation
In USA this effect is neutral, because overall level of
electrification is lower and besides pure electric vehicles there
is also a focus on hybrid powertrains, which require high
manufacturing effort
Market size / segmentation has a positive impact in EU and China
because of market growths in terms of number of vehicle sales
(market size)
CAGR
© by FEV – all rights reserved. Confidential – no passing on to third parties |
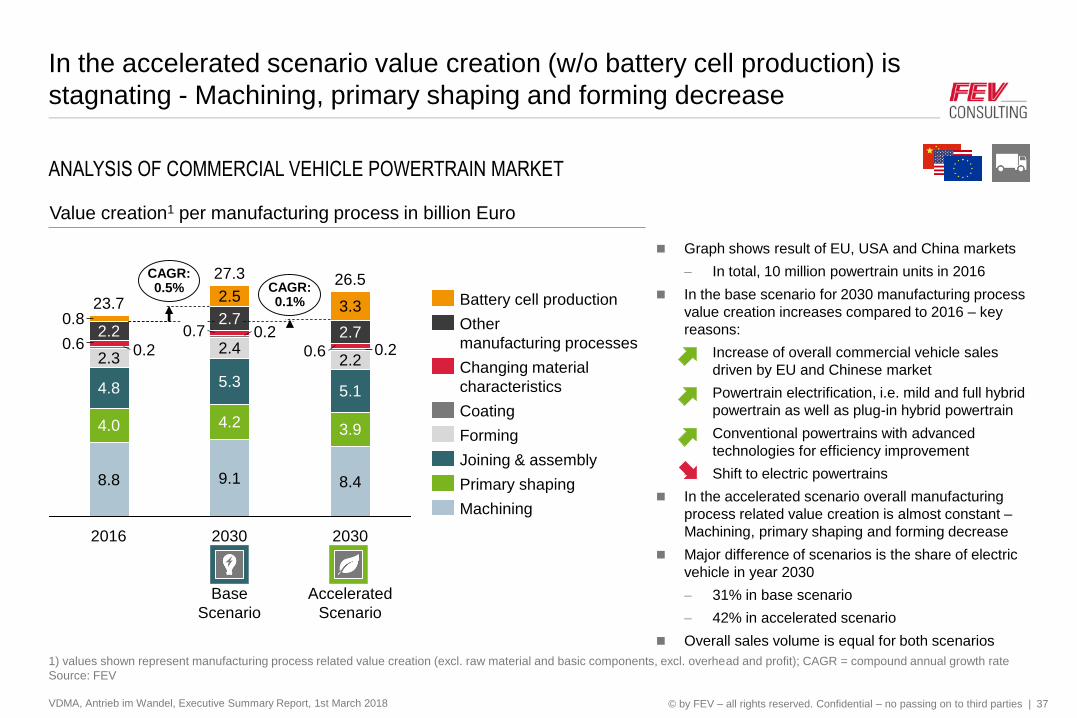
In the accelerated scenario value creation (w/o battery cell production) is
stagnating - Machining, primary shaping and forming decrease
VDMA, Antrieb im Wandel, Executive Summary Report, 1st March 2018 37
ANALYSIS OF COMMERCIAL VEHICLE POWERTRAIN MARKET
1) values shown represent manufacturing process related value creation (excl. raw material and basic components, excl. overhead and profit); CAGR = compound annual growth rate
Source: FEV
2.5
2016
23.7
8.8
4.0
4.8
2.30.20.6
2.20.8
3.9
5.1
2.20.20.6
2.7
3.3
2030
Base
Scenario
0.7
4.2
5.3
2.40.2
2.7
9.1
CAGR:0.1%
27.3CAGR:0.5%
2030
Accelerated
Scenario
8.4
26.5
Forming
Coating
Changing material
characteristics
Other
manufacturing processes
Battery cell production
Machining
Primary shaping
Joining & assembly
Graph shows result of EU, USA and China markets
In total, 10 million powertrain units in 2016
In the base scenario for 2030 manufacturing process
value creation increases compared to 2016 – key
reasons:
Increase of overall commercial vehicle sales
driven by EU and Chinese market
Powertrain electrification, i.e. mild and full hybrid
powertrain as well as plug-in hybrid powertrain
Conventional powertrains with advanced
technologies for efficiency improvement
Shift to electric powertrains
In the accelerated scenario overall manufacturing
process related value creation is almost constant –
Machining, primary shaping and forming decrease
Major difference of scenarios is the share of electric
vehicle in year 2030
31% in base scenario
42% in accelerated scenario
Overall sales volume is equal for both scenarios
Value creation1 per manufacturing process in billion Euro
© by FEV – all rights reserved. Confidential – no passing on to third parties |
Agenda
Conclusions and study approach
Passenger car market
Commercial vehicle market
Non-road mobile machinery
Follow-up services
Contacts
VDMA, Antrieb im Wandel, Executive Summary Report, 1st March 2018 38
© by FEV – all rights reserved. Confidential – no passing on to third parties |
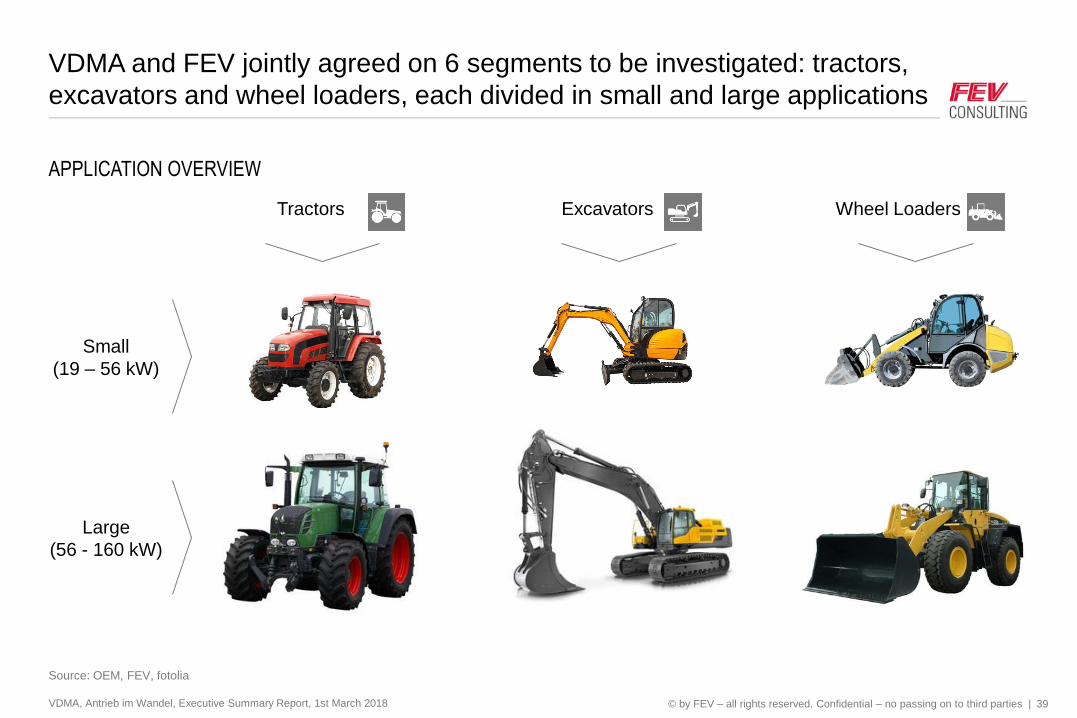
VDMA and FEV jointly agreed on 6 segments to be investigated: tractors,
excavators and wheel loaders, each divided in small and large applications
39
APPLICATION OVERVIEW
Source: OEM, FEV, fotolia
Small
(19 – 56 kW)
Large
(56 - 160 kW)
Tractors Excavators Wheel Loaders
VDMA, Antrieb im Wandel, Executive Summary Report, 1st March 2018
© by FEV – all rights reserved. Confidential – no passing on to third parties |
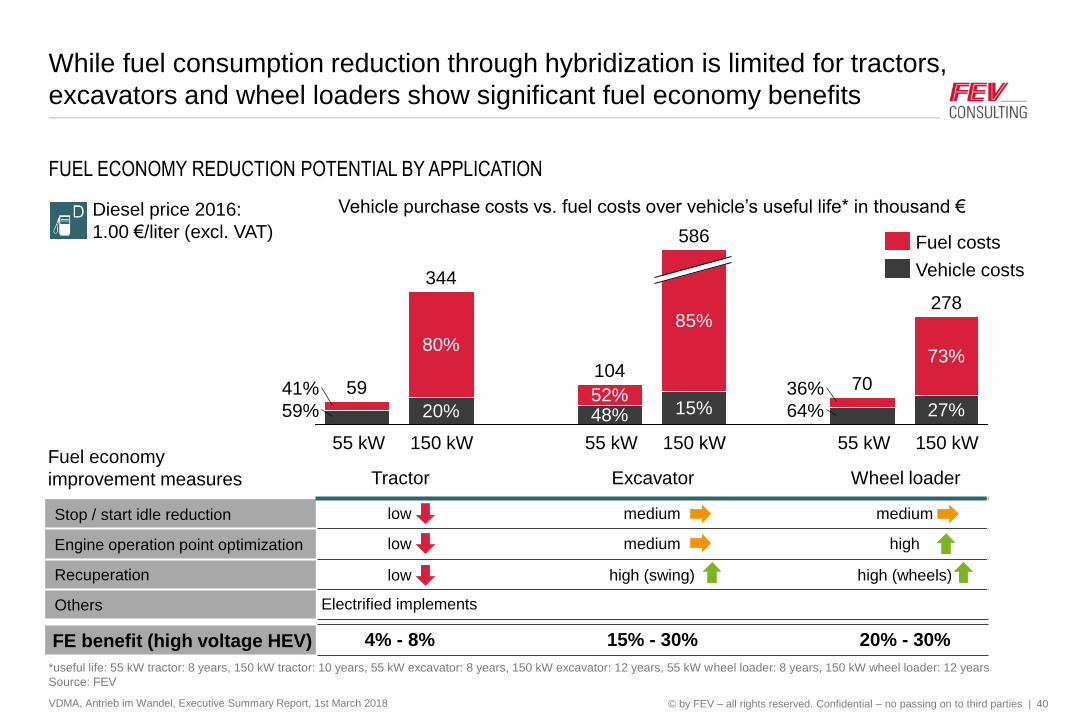
While fuel consumption reduction through hybridization is limited for tractors,
excavators and wheel loaders show significant fuel economy benefits
VDMA, Antrieb im Wandel, Executive Summary Report, 1st March 2018 40
FUEL ECONOMY REDUCTION POTENTIAL BY APPLICATION
*useful life: 55 kW tractor: 8 years, 150 kW tractor: 10 years, 55 kW excavator: 8 years, 150 kW excavator: 12 years, 55 kW wheel loader: 8 years, 150 kW wheel loader: 12 years
Source: FEV
104
48%52%
344
20%
80%
59
59%
41%
278
27%
73%
70
64%
36%
586
15%
85%
Vehicle costs
Fuel costs
Diesel price 2016:
1.00 €/liter (excl. VAT)
Vehicle purchase costs vs. fuel costs over vehicle’s useful life* in thousand €
55 kW 150 kW 55 kW 150 kW 55 kW 150 kW
Tractor Excavator Wheel loader
Stop / start idle reduction low medium medium
Engine operation point optimization low medium high
Recuperation low high (swing) high (wheels)
Others Electrified implements
Fuel economy
improvement measures
FE benefit (high voltage HEV) 4% - 8% 15% - 30% 20% - 30%
© by FEV – all rights reserved. Confidential – no passing on to third parties |
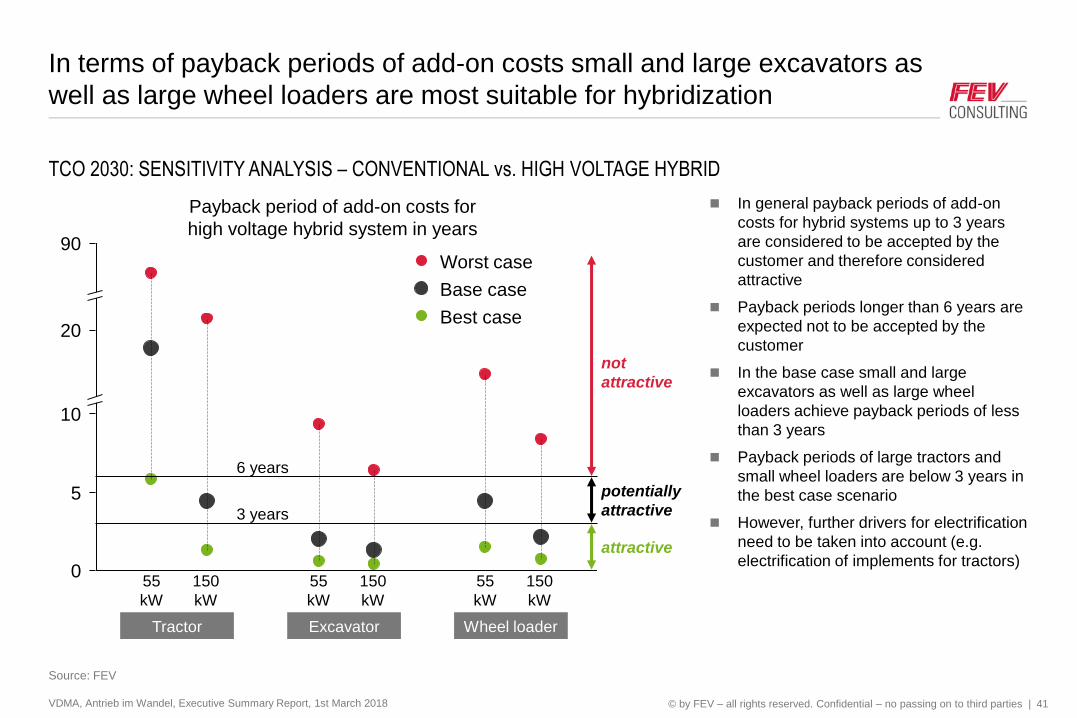
In terms of payback periods of add-on costs small and large excavators as
well as large wheel loaders are most suitable for hybridization
VDMA, Antrieb im Wandel, Executive Summary Report, 1st March 2018 41
TCO 2030: SENSITIVITY ANALYSIS – CONVENTIONAL vs. HIGH VOLTAGE HYBRID
Source: FEV
90
20
10
5
0
Worst case
Best case
Base case
Tractor
55
kW
150
kW
Excavator
55
kW
150
kW
Wheel loader
55
kW
150
kW
Payback period of add-on costs for
high voltage hybrid system in years
In general payback periods of add-on
costs for hybrid systems up to 3 years
are considered to be accepted by the
customer and therefore considered
attractive
Payback periods longer than 6 years are
expected not to be accepted by the
customer
In the base case small and large
excavators as well as large wheel
loaders achieve payback periods of less
than 3 years
Payback periods of large tractors and
small wheel loaders are below 3 years in
the best case scenario
However, further drivers for electrification
need to be taken into account (e.g.
electrification of implements for tractors) attractive
potentially
attractive
not
attractive
6 years
3 years
© by FEV – all rights reserved. Confidential – no passing on to third parties |
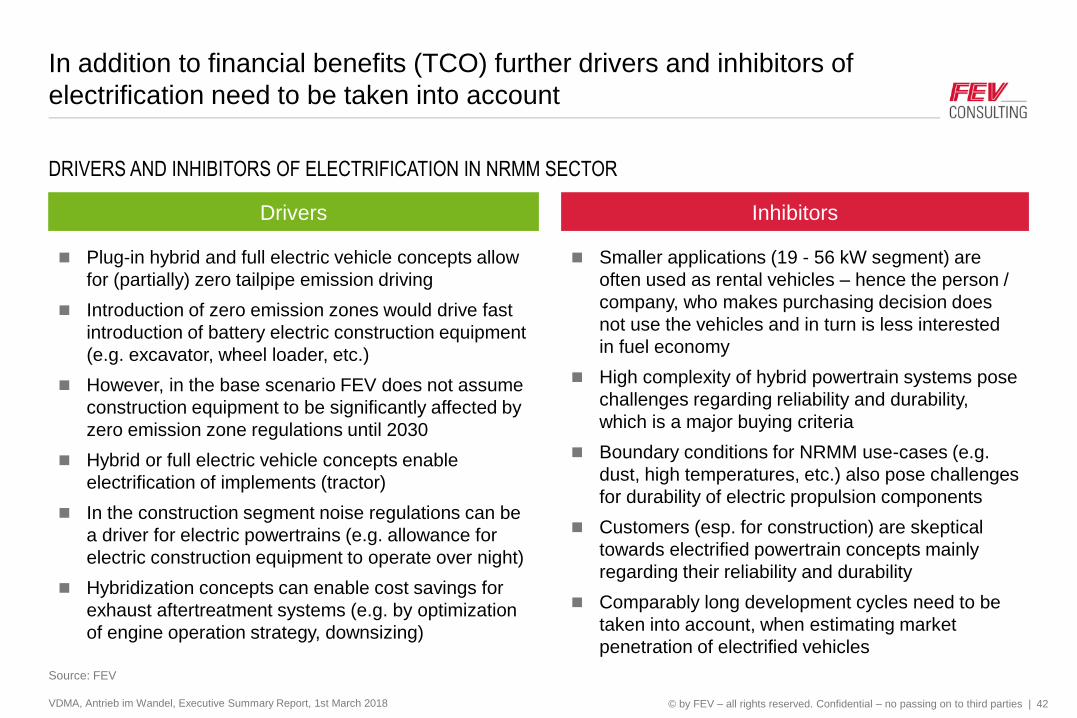
In addition to financial benefits (TCO) further drivers and inhibitors of
electrification need to be taken into account
VDMA, Antrieb im Wandel, Executive Summary Report, 1st March 2018 42
DRIVERS AND INHIBITORS OF ELECTRIFICATION IN NRMM SECTOR
Source: FEV
Plug-in hybrid and full electric vehicle concepts allow
for (partially) zero tailpipe emission driving
Introduction of zero emission zones would drive fast
introduction of battery electric construction equipment
(e.g. excavator, wheel loader, etc.)
However, in the base scenario FEV does not assume
construction equipment to be significantly affected by
zero emission zone regulations until 2030
Hybrid or full electric vehicle concepts enable
electrification of implements (tractor)
In the construction segment noise regulations can be
a driver for electric powertrains (e.g. allowance for
electric construction equipment to operate over night)
Hybridization concepts can enable cost savings for
exhaust aftertreatment systems (e.g. by optimization
of engine operation strategy, downsizing)
Smaller applications (19 - 56 kW segment) are
often used as rental vehicles – hence the person /
company, who makes purchasing decision does
not use the vehicles and in turn is less interested
in fuel economy
High complexity of hybrid powertrain systems pose
challenges regarding reliability and durability,
which is a major buying criteria
Boundary conditions for NRMM use-cases (e.g.
dust, high temperatures, etc.) also pose challenges
for durability of electric propulsion components
Customers (esp. for construction) are skeptical
towards electrified powertrain concepts mainly
regarding their reliability and durability
Comparably long development cycles need to be
taken into account, when estimating market
penetration of electrified vehicles
Drivers Inhibitors
© by FEV – all rights reserved. Confidential – no passing on to third parties |
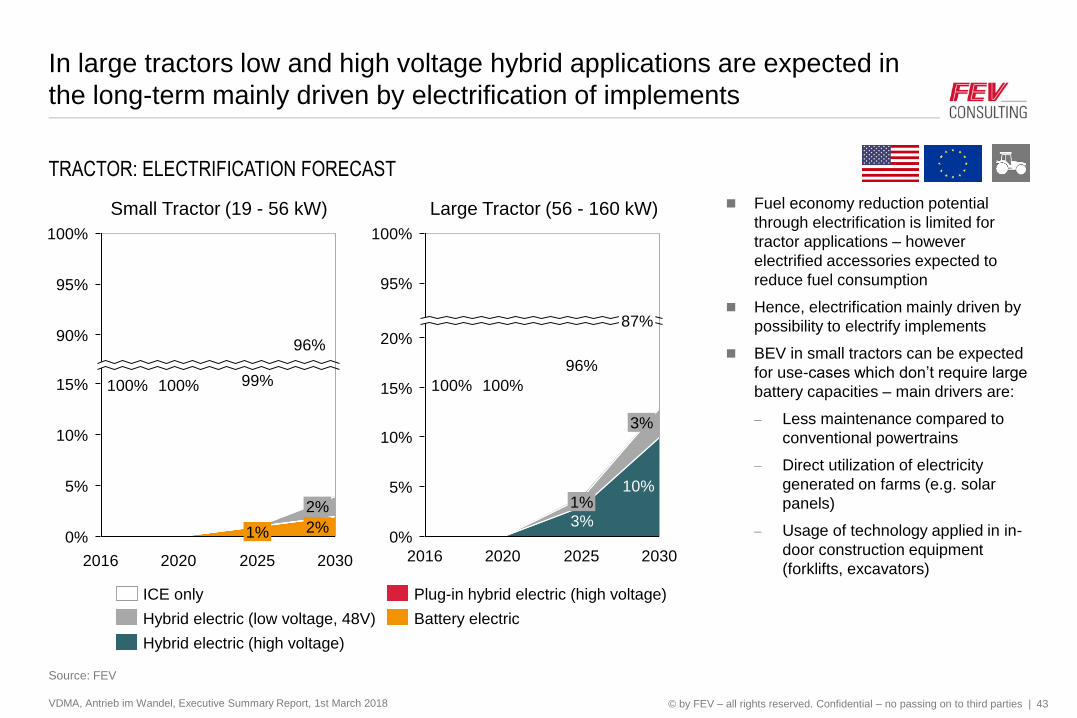
In large tractors low and high voltage hybrid applications are expected in
the long-term mainly driven by electrification of implements
VDMA, Antrieb im Wandel, Executive Summary Report, 1st March 2018 43
TRACTOR: ELECTRIFICATION FORECAST
Source: FEV
15%
95%
90%
100%
5%
0%
10%
2030
2%
2%
96%
2025
1%
99%
2020
100%
2016
100%
Hybrid electric (low voltage, 48V)
Hybrid electric (high voltage)
Plug-in hybrid electric (high voltage)ICE only
Battery electric
10%
3%0%
100%
15%
10%
20%
5%
95%
2020
96%
100%
2030
3%
100%
2016 2025
1%
87%
Fuel economy reduction potential
through electrification is limited for
tractor applications – however
electrified accessories expected to
reduce fuel consumption
Hence, electrification mainly driven by
possibility to electrify implements
BEV in small tractors can be expected
for use-cases which don’t require large
battery capacities – main drivers are:
Less maintenance compared to
conventional powertrains
Direct utilization of electricity
generated on farms (e.g. solar
panels)
Usage of technology applied in in-
door construction equipment
(forklifts, excavators)
Small Tractor (19 - 56 kW) Large Tractor (56 - 160 kW)
© by FEV – all rights reserved. Confidential – no passing on to third parties |
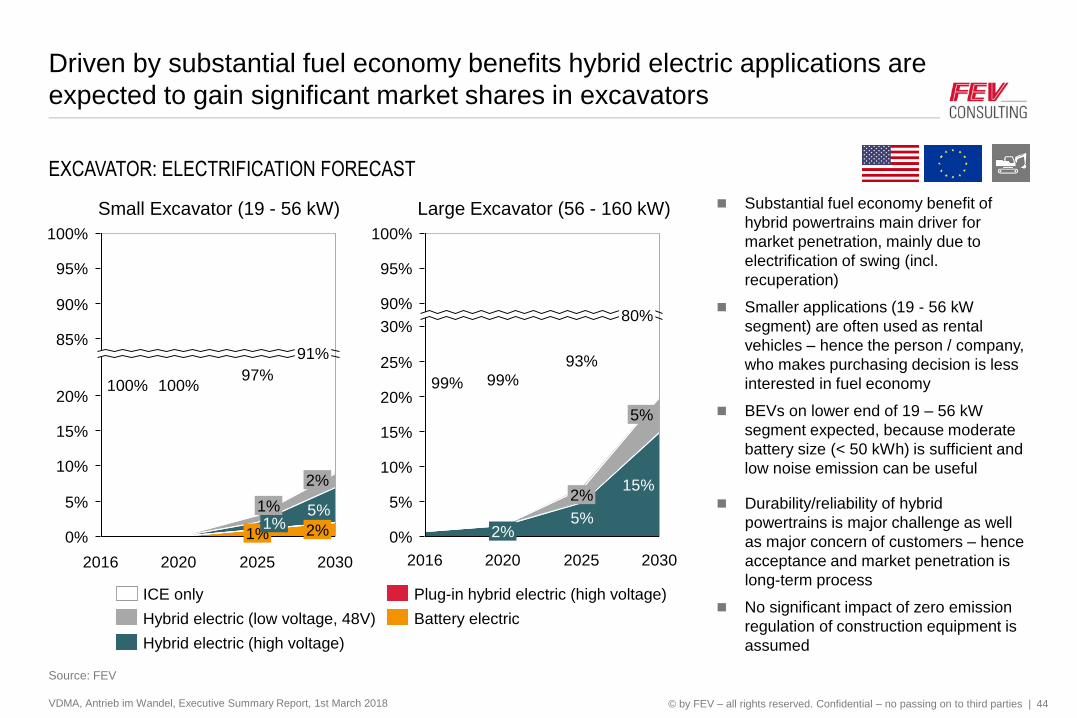
Driven by substantial fuel economy benefits hybrid electric applications are
expected to gain significant market shares in excavators
VDMA, Antrieb im Wandel, Executive Summary Report, 1st March 2018 44
EXCAVATOR: ELECTRIFICATION FORECAST
Source: FEV
5%
85%
20%
95%
90%
100%
10%
0%
15%
5%
97%
2020
100%
2016
100%
1%
2%
2%
20302025
1%1%
91%
Battery electric
Hybrid electric (high voltage)
Hybrid electric (low voltage, 48V)
ICE only Plug-in hybrid electric (high voltage)
15%
5%
100%
95%
25%
20%
15%
10%
5%
0%
30%
90%
2030
5%
2%
99%
2016
99%
80%
2025
2%
93%
2020
Substantial fuel economy benefit of
hybrid powertrains main driver for
market penetration, mainly due to
electrification of swing (incl.
recuperation)
Smaller applications (19 - 56 kW
segment) are often used as rental
vehicles – hence the person / company,
who makes purchasing decision is less
interested in fuel economy
BEVs on lower end of 19 – 56 kW
segment expected, because moderate
battery size (< 50 kWh) is sufficient and
low noise emission can be useful
Durability/reliability of hybrid
powertrains is major challenge as well
as major concern of customers – hence
acceptance and market penetration is
long-term process
No significant impact of zero emission
regulation of construction equipment is
assumed
Small Excavator (19 - 56 kW) Large Excavator (56 - 160 kW)
© by FEV – all rights reserved. Confidential – no passing on to third parties |
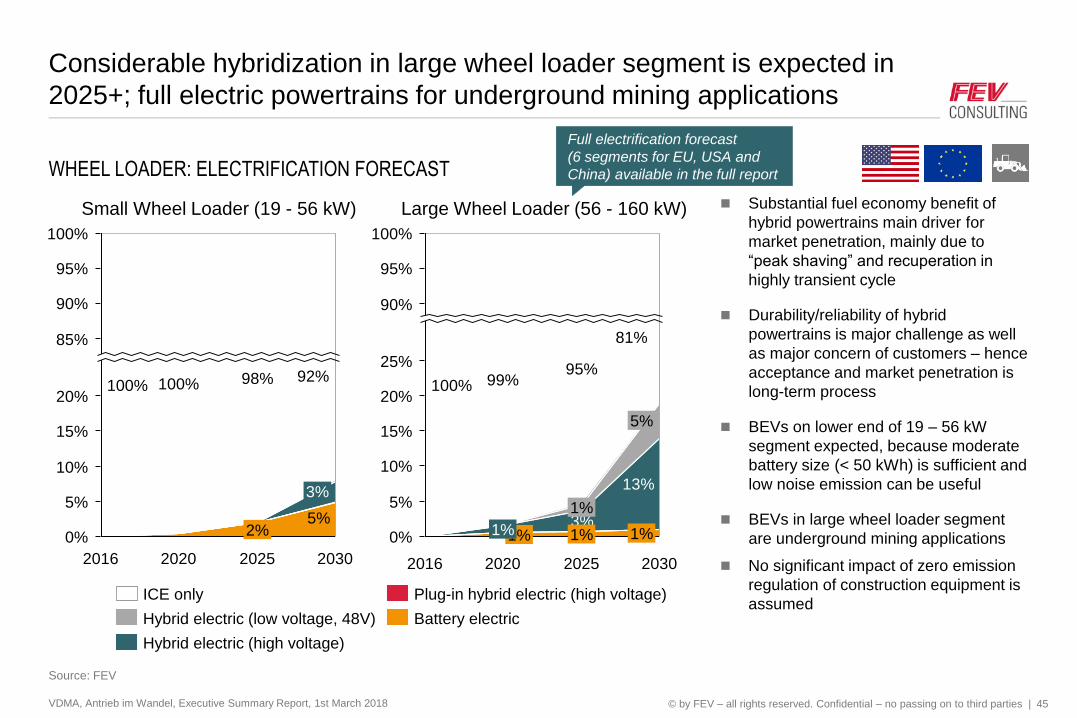
Considerable hybridization in large wheel loader segment is expected in
2025+; full electric powertrains for underground mining applications
VDMA, Antrieb im Wandel, Executive Summary Report, 1st March 2018 45
WHEEL LOADER: ELECTRIFICATION FORECAST
Source: FEV
5%
100%
95%
90%
85%
20%
15%
10%
5%
0%
2030
3%
92%
2025
2%
98%
2020
100%
2016
100%
Battery electric
Plug-in hybrid electric (high voltage)
Hybrid electric (high voltage)
Hybrid electric (low voltage, 48V)
ICE only
13%
3%
25%
90%
5%
0%
95%
100%
20%
15%
10%
2030
1%
5%
81%
2025
1%
1%
95%
2020
1%1%
99%
2016
100%
Substantial fuel economy benefit of
hybrid powertrains main driver for
market penetration, mainly due to
“peak shaving” and recuperation in
highly transient cycle
Durability/reliability of hybrid
powertrains is major challenge as well
as major concern of customers – hence
acceptance and market penetration is
long-term process
BEVs on lower end of 19 – 56 kW
segment expected, because moderate
battery size (< 50 kWh) is sufficient and
low noise emission can be useful
BEVs in large wheel loader segment
are underground mining applications
No significant impact of zero emission
regulation of construction equipment is
assumed
Small Wheel Loader (19 - 56 kW) Large Wheel Loader (56 - 160 kW)
Full electrification forecast
(6 segments for EU, USA and
China) available in the full report
© by FEV – all rights reserved. Confidential – no passing on to third parties |
Agenda
Conclusions and study approach
Passenger car market
Commercial vehicle market
Non-road mobile machinery
Follow-up services
Contacts
VDMA, Antrieb im Wandel, Executive Summary Report, 1st March 2018 46
© by FEV – all rights reserved. Confidential – no passing on to third parties |
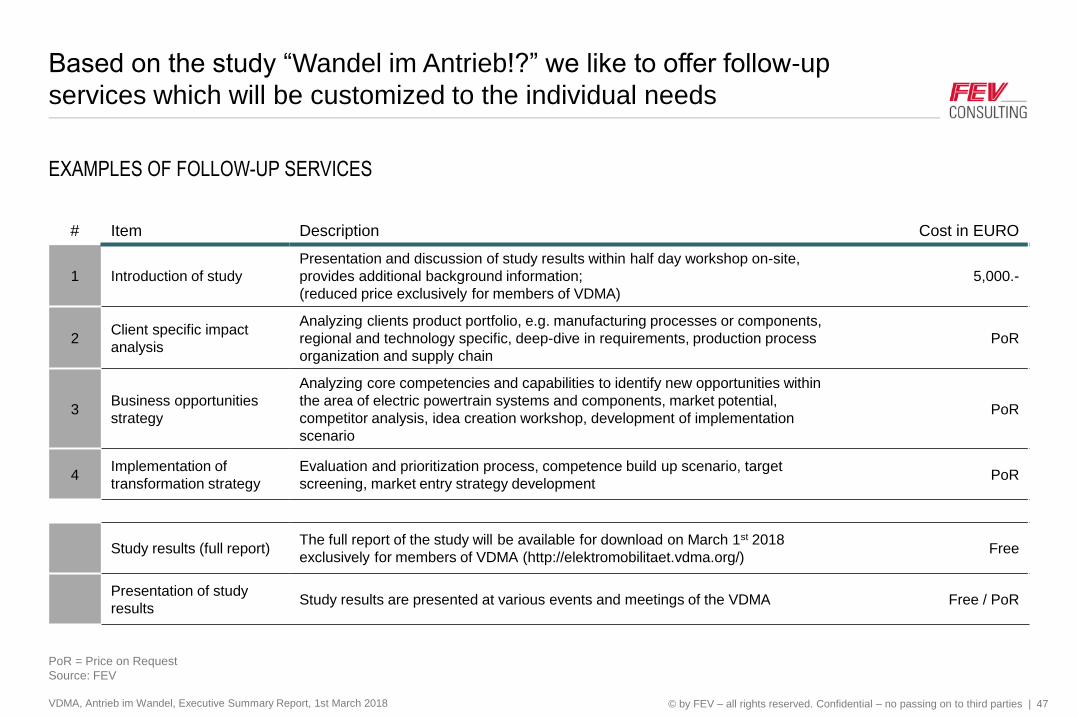
Based on the study “Wandel im Antrieb!?” we like to offer follow-up
services which will be customized to the individual needs
VDMA, Antrieb im Wandel, Executive Summary Report, 1st March 2018 47
EXAMPLES OF FOLLOW-UP SERVICES
PoR = Price on Request
Source: FEV
# Item Description Cost in EURO
1 Introduction of study
Presentation and discussion of study results within half day workshop on-site,
provides additional background information;
(reduced price exclusively for members of VDMA)
5,000.-
2Client specific impact
analysis
Analyzing clients product portfolio, e.g. manufacturing processes or components,
regional and technology specific, deep-dive in requirements, production process
organization and supply chain
PoR
3Business opportunities
strategy
Analyzing core competencies and capabilities to identify new opportunities within
the area of electric powertrain systems and components, market potential,
competitor analysis, idea creation workshop, development of implementation
scenario
PoR
4Implementation of
transformation strategy
Evaluation and prioritization process, competence build up scenario, target
screening, market entry strategy developmentPoR
Study results (full report)The full report of the study will be available for download on March 1st 2018
exclusively for members of VDMA (http://elektromobilitaet.vdma.org/)Free
Presentation of study
resultsStudy results are presented at various events and meetings of the VDMA Free / PoR
© by FEV – all rights reserved. Confidential – no passing on to third parties |
Agenda
Conclusions and study approach
Passenger car market
Commercial vehicle market
Non-road mobile machinery
Follow-up services
Contacts
VDMA, Antrieb im Wandel, Executive Summary Report, 1st March 2018 48
© by FEV – all rights reserved. Confidential – no passing on to third parties |
# Aachen # Munich # Auburn Hills
FEV Consulting GmbH - Neuenhofstraße 181 - 52078 Aachen - Germany - www.fev-consulting.com
Contact – FEV Consulting
VDMA, Antrieb im Wandel, Executive Summary Report, 1st March 2018 49
Manager
Phone +49 241 5689-574
Mobile +49 175 9338913
Dr.-Ing.
Michael WittlerSenior Consultant
Phone +49 241 5689-6054
Mobile +49 152 01524306
M.Sc.
Thomas LüdigerManaging Director
Phone +49 241 5689-9744
Mobile +49 160 94110987
Dipl.-Wirt.-Ing.
Alexander Nase
© by FEV – all rights reserved. Confidential – no passing on to third parties |
Contact – VDMA
VDMA, Antrieb im Wandel, Executive Summary Report, 1st March 2018 50
Stellv. Hauptgeschäftsführer
Phone +49 69 6603-1331
Hartmut RauenProjektleitung
Phone +49 69 6603-1820
Alexander Raßmann

elektromobilitaet.vdma.org
VDMA Forum Elektromobilität
Lyoner Straße 1860528 Frankfurt am Main
Internet elektromobilitaet.vdma.org