Embed Size (px)
Citation preview
8/22/2019 Bundesliga 2011.pdf
http://slidepdf.com/reader/full/bundesliga-2011pdf 1/64
The economic state of p rofessional football
REPORT
8/22/2019 Bundesliga 2011.pdf
http://slidepdf.com/reader/full/bundesliga-2011pdf 2/64
FOREwORD Dr Reinhard Rauball,
President of the League Association
POPULARITY AND GROwTH 2011 Bund esliga Report:
The economic state of professional football
TAxES AND DUTIES
JOBS
BUSINESS DATA BUNDESLIGA Facts and figures
Financial mix
Income statement
Results and indicators
Relation of payroll costs for match operations to total revenue
Groups by payroll costs
Groups by league table position
BUSINESS DATA BUNDESLIGA 2 Facts and figures
Financial mix
Income statement
Results and indicators
Relation of payroll costs for match operations to total revenue
Groups by payroll costs
Groups by league table position
BUSINESS DATA LICENSED FOOTBALL Facts and figures
Financial mix
Income statement
Results and indicators
Relation of payroll costs for match operations to total revenue
SPECTATORS Report
Development
2
4
18
20
2122
24
26
28
29
30
32
3334
36
38
40
41
42
44
4546
48
50
52
53
5454
56
8/22/2019 Bundesliga 2011.pdf
http://slidepdf.com/reader/full/bundesliga-2011pdf 3/64
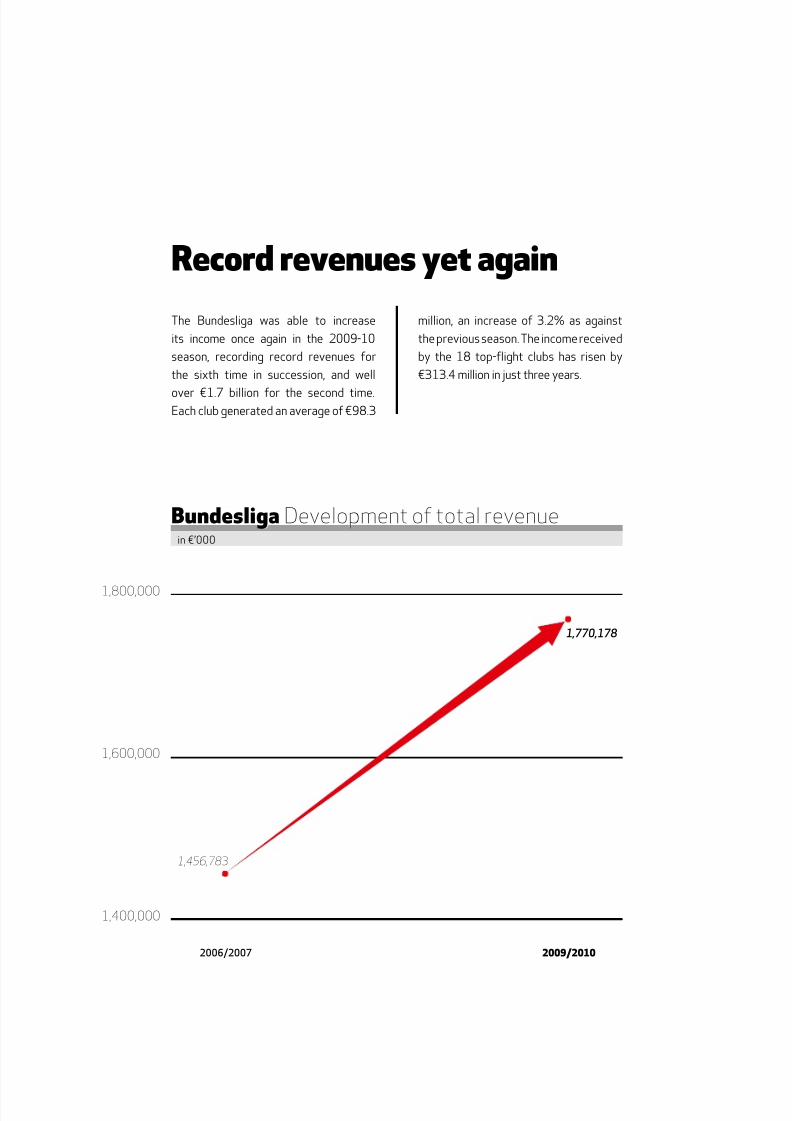
1,456,783
1,770,178
1,800,000
1,600,000
1,400,000
2006/2007 2009/2010
Bundesliga Development of total revenuein €’000
The Bundesliga was able to increase
its income once again in the 2009-10
season, recording record revenues for
the sixth time in succession, and well
over €1.7 billion for the second time.Each club generated an average of €98.3
million, an increase of 3.2% as against
the previous season. The income received
by the 18 top-flight clubs has risen by
€313.4 million in just three years.
Record revenues yet again
8/22/2019 Bundesliga 2011.pdf
http://slidepdf.com/reader/full/bundesliga-2011pdf 4/64
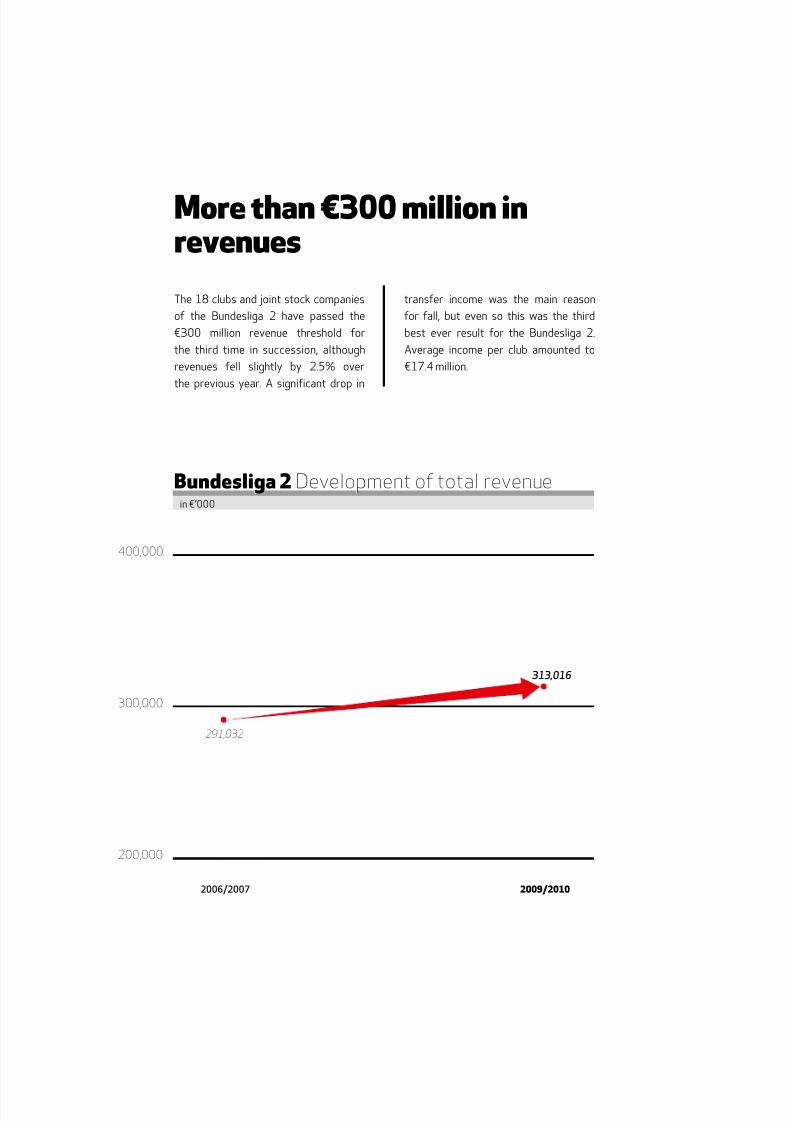
291,032
313,016
400,000
300,000
200,000
2006/2007 2009/2010
Bundesliga 2 Development of total revenuein €’000
The 18 clubs and joint stock companies
of the Bundesliga 2 have passed the
€300 million revenue threshold for
the third time in succession, although
revenues fell slightly by 2.5% over
the previous year. A significant drop in
transfer income was the main reason
for fall, but even so this was the third
best ever result for the Bundesliga 2.
Average income per club amounted to
€17.4 million.
More than €300 million inrevenues

8/22/2019 Bundesliga 2011.pdf
http://slidepdf.com/reader/full/bundesliga-2011pdf 5/64
The economic state of professional football
RepoRt
8/22/2019 Bundesliga 2011.pdf
http://slidepdf.com/reader/full/bundesliga-2011pdf 6/64
The appeal and popularity of the
Bundesliga is still on a high, and
the television ratings illustrate
the enormous interest shown
in the game both at home and, increas-
ingly, abroad. This season’s opening
match, for example, was shown live in
197 countries, and all 208 FIFA coun-
tries are now able to watch the Bundes-
liga on TV. These figures are matched
by significant increases in income from
global media marketing. The Bundes-
liga is no longer just a premium national
product; it has long since evolved into an
international brand.
Investments in new stadiums and the
conversion of other stadiums into
modern arenas offering more comfort
and the highest possible level of safety
have played an essential role in the con-tinuing, enormous popularity of profes-
sional football. After seven record years
in succession, spectator figures in the
2009-10 season came to rest at the
same high level as that seen last season:
almost 12.8 million people visited the
stadium to watch a Bundesliga match.
That’s an average of 41,802 spectators
per fixture, bringing Germany to the
top of the world’s attendance tables,
way ahead of the other top European
leagues.It is pleasing to note that the Bundesliga
was able to increase revenues to a his-
toric high of over €2 billion despite the
global financial crisis and economic re-
cession. This is testimony to the dynamic
growth experienced by licensed foot-
ball, particularly over the last few years,
growth which takes place from a healthy
base thanks to a balanced mix of income
from media rights, advertising and gate
receipts.
The staggering €2 billion in revenues
makes professional football a huge eco-
nomic factor in its own right. The clubs
and joint stock companies of the Bun-
desliga and Bundesliga 2 provide over
40,000 jobs and pay taxes of around
€700 million; they are without a doubt
important employers who contribute
considerable economic stimulus, even in
structurally weak regions. But even Ger-
man professional football shows the odd
trend here or there which is unable to
please. Yet the economic functioning of
the Bundesliga is a basis from which pro-
fessional football can carry out its many
communal and social activities. These
are essential to the German Football As-
sociation (DFB) and amateur and grass-
roots sports.
The League Association continues to
focus its activities on the actual sport
of football, of course. It is here that the
clubs have made great headway in the
last few years, and they are now onceagain able to compete at an international
level, thanks in part to the large number
of new stars emerging from the league’s
own youth academies. The Bundesliga
can therefore be expected to overtake
Italy and climb to third place in the UEFA
five-year rankings this season. If this
happens, then three instead of two clubs
will definitely go into the Champions
League at the start of the 2011-12 sea-
son, with another qualification place up
for grabs, too. This is an outstanding op-portunity for the Bundesliga to present
itself to even greater advantage on the
international stage and to win new fans
all over the world.
With best wishes for a thrilling season,
Dr Reinhard Rauball
President of the League Association
Dear Readers
2 2011 Bundesliga Report The economic state of professional football

8/22/2019 Bundesliga 2011.pdf
http://slidepdf.com/reader/full/bundesliga-2011pdf 7/64
“The clubs of the
Bundesliga and
Bundesliga 2
are without a
doubt important
employers
who contributeconsiderable
economic stimulus,
even in structurally
weak regions.”
Dr Reinhard Rauball
President of the League Association
3
8/22/2019 Bundesliga 2011.pdf
http://slidepdf.com/reader/full/bundesliga-2011pdf 8/64
4 2011 Bundesliga Report The economic state of professional football
8/22/2019 Bundesliga 2011.pdf
http://slidepdf.com/reader/full/bundesliga-2011pdf 9/64
Ppty
t >
5
8/22/2019 Bundesliga 2011.pdf
http://slidepdf.com/reader/full/bundesliga-2011pdf 10/64
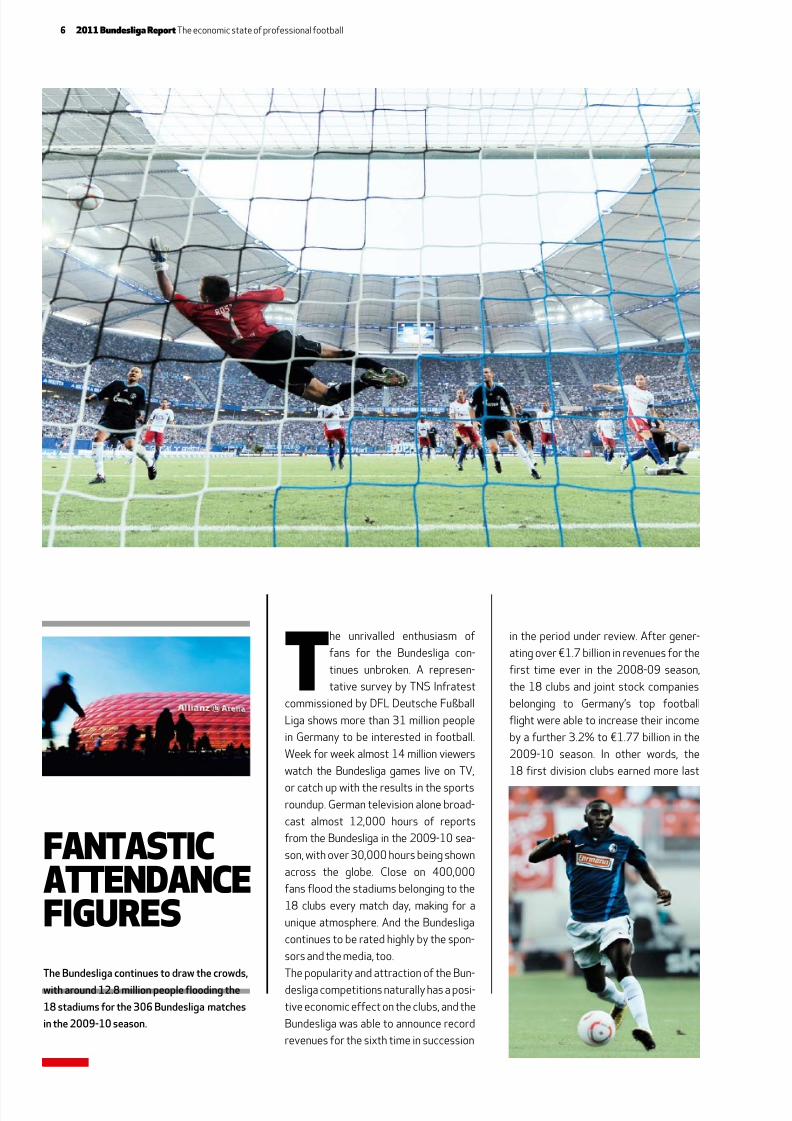
The unrivalled enthusiasm of
fans for the Bundesliga con-
tinues unbroken. A represen-
tative survey by TNS Infratest
commissioned by DFL Deutsche Fußball
Liga shows more than 31 million people
in Germany to be interested in football.
Week for week almost 14 million viewers
watch the Bundesliga games live on TV,
or catch up with the results in the sportsroundup. German television alone broad-
cast almost 12,000 hours of reports
from the Bundesliga in the 2009-10 sea-
son, with over 30,000 hours being shown
across the globe. Close on 400,000
fans flood the stadiums belonging to the
18 clubs every match day, making for a
unique atmosphere. And the Bundesliga
continues to be rated highly by the spon-
sors and the media, too.
The popularity and attraction of the Bun-
desliga competitions naturally has a posi-
tive economic effect on the clubs, and the
Bundesliga was able to announce record
revenues for the sixth time in succession
in the period under review. After gener-
ating over €1.7 billion in revenues for the
first time ever in the 2008-09 season,
the 18 clubs and joint stock companies
belonging to Germany’s top football
flight were able to increase their income
by a further 3.2% to €1.77 billion in the
2009-10 season. In other words, the
18 first division clubs earned more last
FanTasTicaTTendanceFigures
The Bundesliga continues to draw the crowds,
with around 12.8 million people flooding the
18 stadiums for the 306 Bundesliga matches
in the 2009-10 season.
6 2011 Bundesliga Report The economic state of professional football
8/22/2019 Bundesliga 2011.pdf
http://slidepdf.com/reader/full/bundesliga-2011pdf 11/64
season than all 36 Bundesliga and Bun-
desliga 2 clubs together in the 2006-07
season.
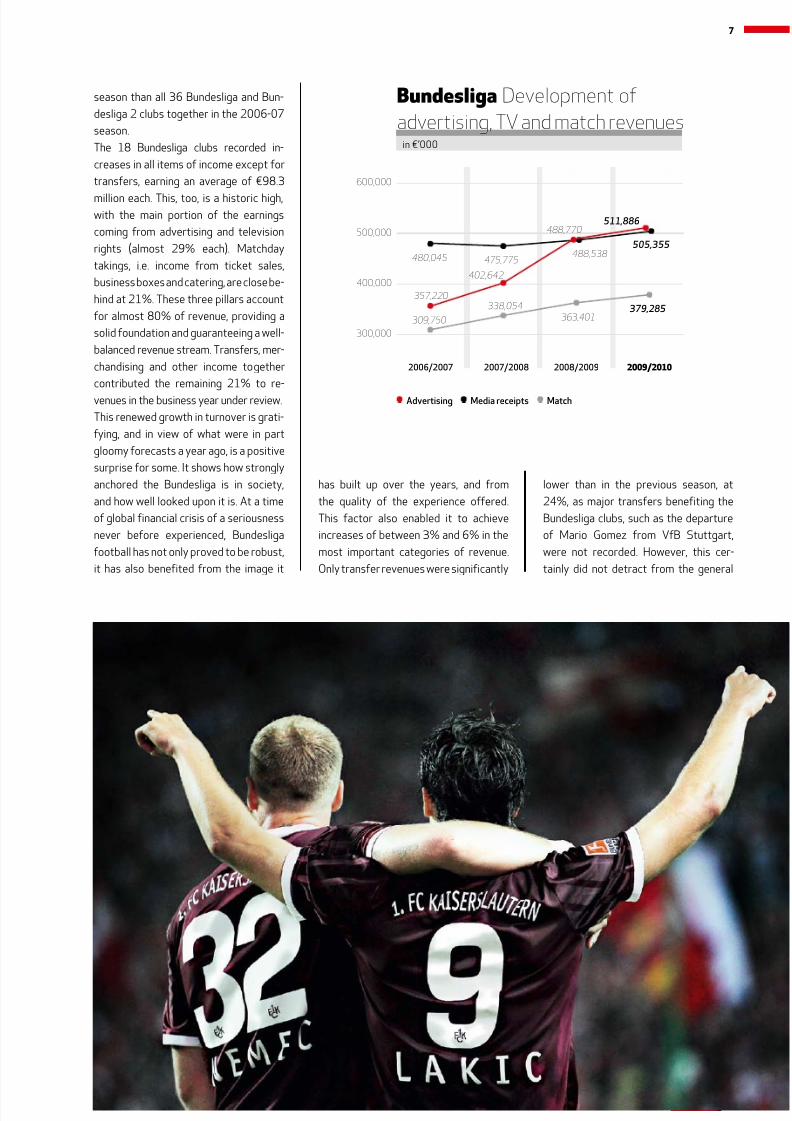
The 18 Bundesliga clubs recorded in-
creases in all items of income except for
transfers, earning an average of €98.3
million each. This, too, is a historic high,with the main portion of the earnings
coming from advertising and television
rights (almost 29% each). Matchday
takings, i.e. income from ticket sales,
business boxes and catering, are close be-
hind at 21%. These three pillars account
for almost 80% of revenue, providing a
solid foundation and guaranteeing a well-
balanced revenue stream. Transfers, mer-
chandising and other income together
contributed the remaining 21% to re-
venues in the business year under review.
This renewed growth in turnover is grati-
fying, and in view of what were in part
gloomy forecasts a year ago, is a positive
surprise for some. It shows how strongly
anchored the Bundesliga is in society,
and how well looked upon it is. At a time
of global financial crisis of a seriousness
never before experienced, Bundesliga
football has not only proved to be robust,
it has also benefited from the image it
has built up over the years, and from
the quality of the experience offered.
This factor also enabled it to achieve
increases of between 3% and 6% in the
most important categories of revenue.
Only transfer revenues were significantly
lower than in the previous season, at
24%, as major transfers benefiting the
Bundesliga clubs, such as the departure
of Mario Gomez from VfB Stuttgart,
were not recorded. However, this cer-
tainly did not detract from the general
357,220
402,642
488,770511,886
600,000
500,000
400,000
300,000
2006/2007 2007/2008 2008/2009 2009/2010
B Development of
advertising, TV and match revenuesin €’000
480,045 475,775488,538
505,355
309,750
338,054
363,401379,285
Advertising Media receipts Match
7
8/22/2019 Bundesliga 2011.pdf
http://slidepdf.com/reader/full/bundesliga-2011pdf 12/64
prosperity of the Bundesliga, as trans-
fer fees are more volatile than any other
revenue item, with contract periods,
sports developments and personal deci-
sions by players and clubs playing a sig-
nificant role in this segment.
Fears that the fraught situation in thegeneral economy might result in a marked
slowdown in advertising income also
proved to be unfounded. On the contrary,
the already high revenues increased again
by 4.7% to €28.4 million per Bundesliga
club, a total of €511,9 million, bringing the
Bundesliga to the top of the sponsorship
tables once again. Bundesliga shirt spon-
sorship, perimeter board advertising and
hospitality continue to be popular com-
munication platforms for advertisers, and
are clearly more or less inviolable, even in
rv tm
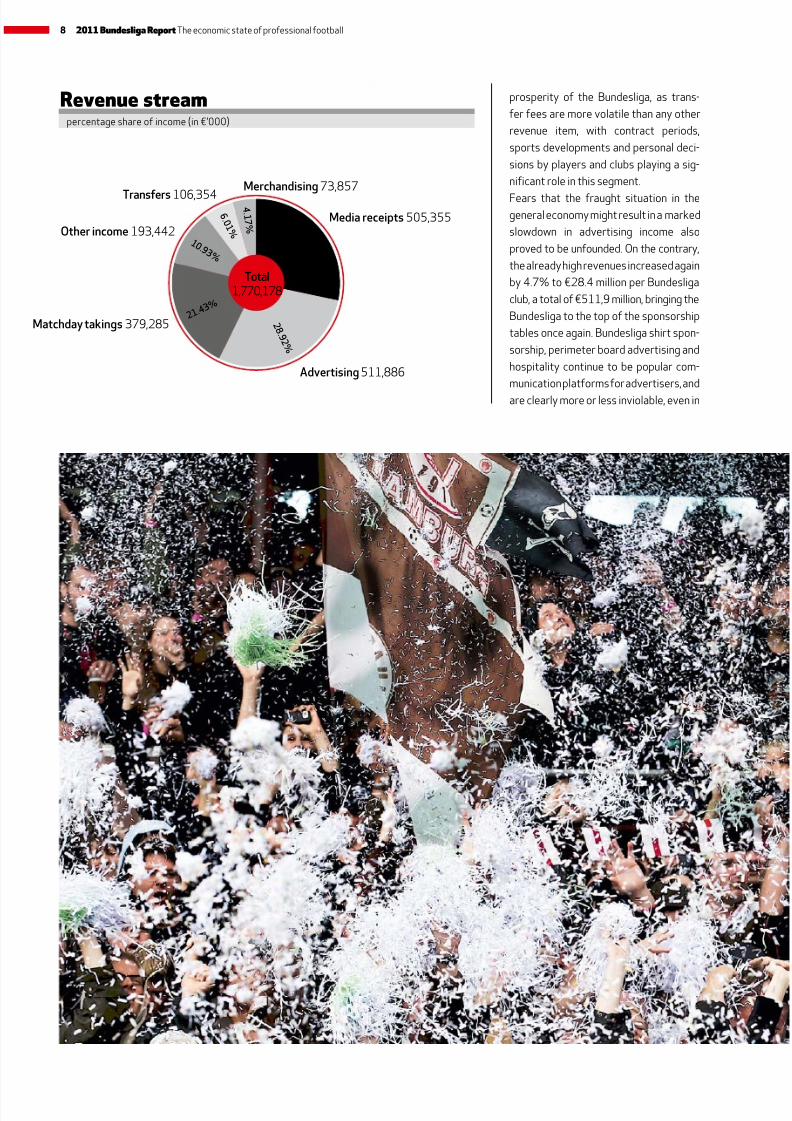
Total1,770,178
4 . 1 7 %
2 8 . 9 2 %
6 . 0 1 %
1 0 .9 3 %
2 1. 4 3 %
2 8 . 5 5 %
percentage share of income (in €’000)
Media receipts 505,355
Advertising 511,886
Matchday takings 379,285
Other income 193,442
Transfers 106,354Merchandising 73,857
8 2011 Bundesliga Report The economic state of professional football
8/22/2019 Bundesliga 2011.pdf
http://slidepdf.com/reader/full/bundesliga-2011pdf 13/64
times of crisis. Revenues generated by
advertising partners increased 43.3% in
the last three years, more strongly than
any other source of revenue. The combi-
nation of regional relevance and national
coverage is clearly a convincing argument
for sponsors in the long term, no matterwhat their size.
The spectator figures also bear testi-
mony to the attractiveness and popular-
ity of the Bundesliga, with the high
number of visitors to the stadium con-
tinuing unchecked. As in the previous
season, around 12.8 million spectators
watched the matches of the top 18 clubs
in the 2009-10 season. This is an aver-
age of 41,802 visitors to each fixture,
resulting once again in record income: the
Bundesliga earned €379.3 million from
gate receipts, catering, and the sale of
business boxes, an average of €21.1 mil-
lion per club and an increase of 4.4% as
against the 2008-09 season.
The Bundesliga recorded a minimal de-
cline in spectators of 0.3% over the
record 2008-09 season, a fall which canbe explained by smaller stadium capa-
cities after rebuilding, and the long winter.
Germany’s top league continues to lead
the way in Europe in terms of public re-
sponse: a first division match in this coun-
try is seen by 7,500 people more than a
game in England’s Premier League, which
comes second in the popularity stakes.
And Germany sees almost 14,000 spec-
tators more per match day than Spain, a
50% difference.
The fact that 55% of spectators hold
season tickets is not only evidence of an
unceasing demand for the game, but also
proof of the work by the clubs to achieve
a balanced mix of regular fans and occa-
sional visitors. Whilst the proportion of
season tickets can reach as much as 90%
in other leagues, the Bundesliga clubs are
doing their best to ensure that German
professional football does not become
a closed society. This is illustrated by the
ticket prices, which continue to be af-fordable for fans. A day ticket for a Bun-
desliga match cost an average of €21.89
and for a second division game €13.77 in
the 2009-10 season. This makes the Bun-
desliga Europe’s best priced first division:
a ticket in England, for example, costs al-
most twice as much on average.
It is also gratifying to note that income
from media receipts has continued to
rise – and this despite the fact that in-
come from national television contracts
was slightly lower than in the past. Thisdent in income from national TV, which
will have been smoothed out in the
2009-10 season, was more than compen-
sated for by the successful marketing of
media rights abroad, additional income
from the German FA Cup, which was
broadcast fully on subscription TV for the
first time ever, and TV income resulting
from the fantastic success of the German
clubs in the European cups.
In all, the results confirm what the DFL
had long since prophesied: that the high
standards currently achieved are not con-
ducive to further huge leaps in revenue
such as those recorded over the last few
Fun For allages
Over 31 million people in Germany say they
are interested in football. The Bundesliga
fascinates all ages, genders and origins.
And even the smallest fans can take part by
joining one of the many KidsClubs attached
to the clubs.
9
8/22/2019 Bundesliga 2011.pdf
http://slidepdf.com/reader/full/bundesliga-2011pdf 14/64
10 2011 Bundesliga Report The economic state of professional football
8/22/2019 Bundesliga 2011.pdf
http://slidepdf.com/reader/full/bundesliga-2011pdf 15/64
years. The rapid growth is losing momen-tum. The stadiums are almost full, most of
the advertising spaces in the arenas have
been sold, and national media income
is also more likely to rise slowly than in
leaps and bounds.
But income is only one side of the coin,
and despite record income, expenses
rose even faster. As a result, the 18 clubs
as a whole made a loss, and the Bundes-
liga was unable to announce yet anotherprofit after the previous season’s suc-
cess.
It should be noted here, however, that
the greatest part of the total loss was at-
tributable to only three clubs. Together,
these produced a shortfall of €72.2 mil-
lion, 92.7% of the total deficit, due in part
to one-time effects such as construc-
tion works on stadiums. Seven of the 18
The Bundesligaworldwide
Enthusiasm for the Bundesliga is enormous anywhere in the world, and the matches
can be watched in all 208 FIFA member states, usually live. In the 2009-10 season
more than 30,000 hours of Bundesliga were shown throughout the world, 12,000
of which in Germany. DFL subsidiary SPORTCAST produces the basic feed for all
612 Bundesliga and Bundesliga 2 matches and distributes it to the many Bundesliga
partners all over the world in full HD quality. And from January 2011 one Bundesliga
fixture per match day is broadcast in 3D!
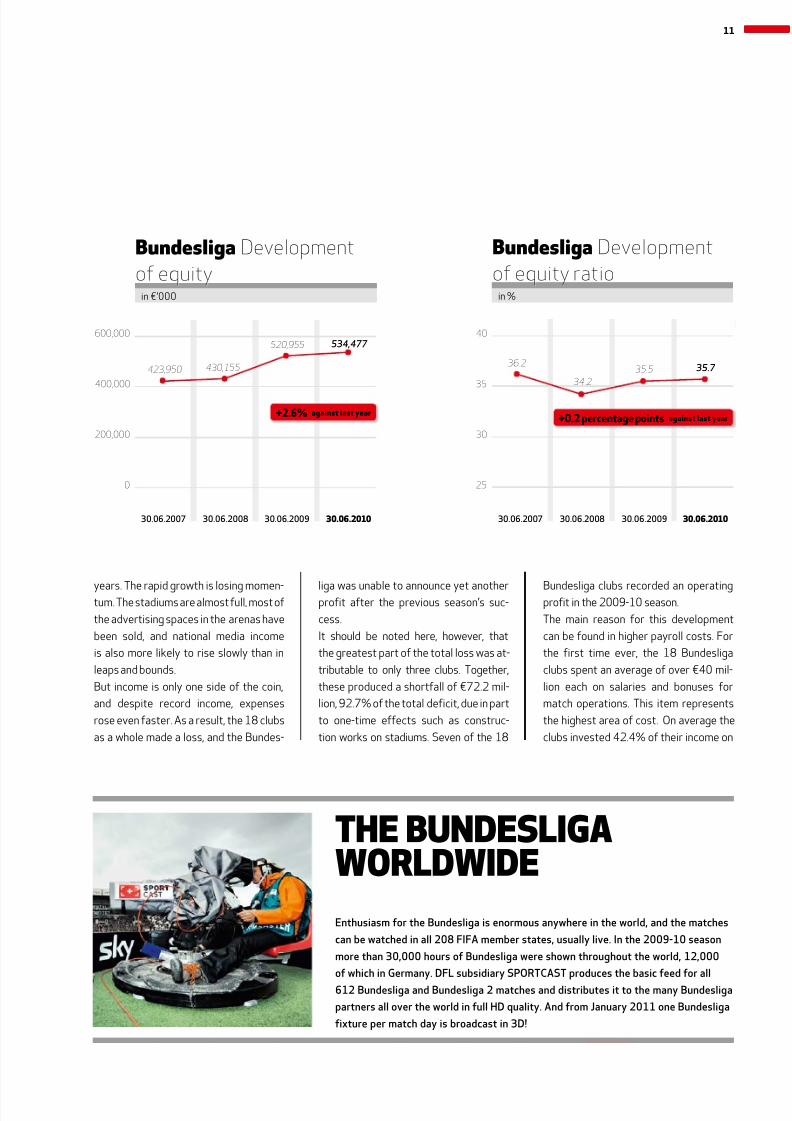
Bundesliga clubs recorded an operatingprofit in the 2009-10 season.
The main reason for this development
can be found in higher payroll costs. For
the first time ever, the 18 Bundesliga
clubs spent an average of over €40 mil-
lion each on salaries and bonuses for
match operations. This item represents
the highest area of cost. On average the
clubs invested 42.4% of their income on
36.2423,950
34.2
430,155
520,955
35.5
534,477
35.7
600,000
400,000
200,000
0
40
35
30
25
30.06.200830.06.2007 30.06.200730.06.2009 30.06.200830.06.2010 30.06.201030.06.2009
in €’000 in %
B Development
of equity
B Development
of equity ratio
+2.6% against last year+0.2 percentage points against last year
11
8/22/2019 Bundesliga 2011.pdf
http://slidepdf.com/reader/full/bundesliga-2011pdf 16/64
salaries for the professional players and
coaching teams, overstepping slightly
the steady threshold of 40% recorded
in the previous seasons. The Bundes-
liga’s 42.4% is, however, still very moder-
ate when compared to the other majorleagues in Europe, where many clubs
spend up to 70% of their revenues on
salaries for players and coaches.
The cost of transfers in the 18 Bundesliga
clubs – this item includes depreciation on
player assets and other expenditure such
as fees for player agents – also showed
an above-average increase, accounting
for 15.3% of total expenditure.
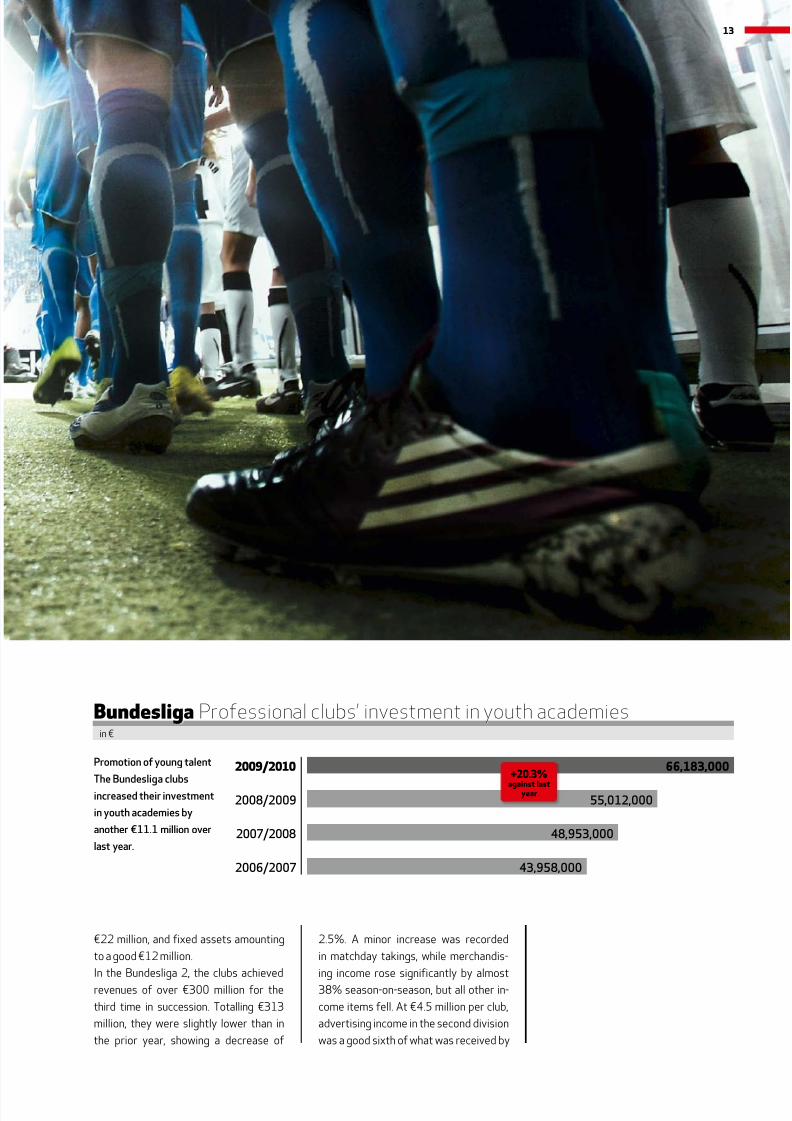
In contrast, it is gratifying to note the
growing investment in young players,
amateurs and youth academies, with an
average of €3.7 million being spent by
each club. The total for the Bundesliga
as a whole is €66.2 million, a new record.
Last season, spending on work with young
talents was 51% higher than in 2006-07;
that this is a worthwhile investment is il-
lustrated by the success of the young
German national team in the 2010 FIFA
World Cup in South Africa, the membersof which were all Bundesliga players. And
in the Bundesliga, too, more young talents
and teams with a lower average age are
playing games which move them into the
public eye.
The equity ratio of the Bundesliga clubs
currently amounts to 35.7% and is thus
at the same level as it has been for the
last few years. Equity per club averages
€29.7 million (total: €534.5 million),
with 15 of 18 clubs returning a positive
result. Average liabilities per club in-
creased 5.6% to €35.8 million. These
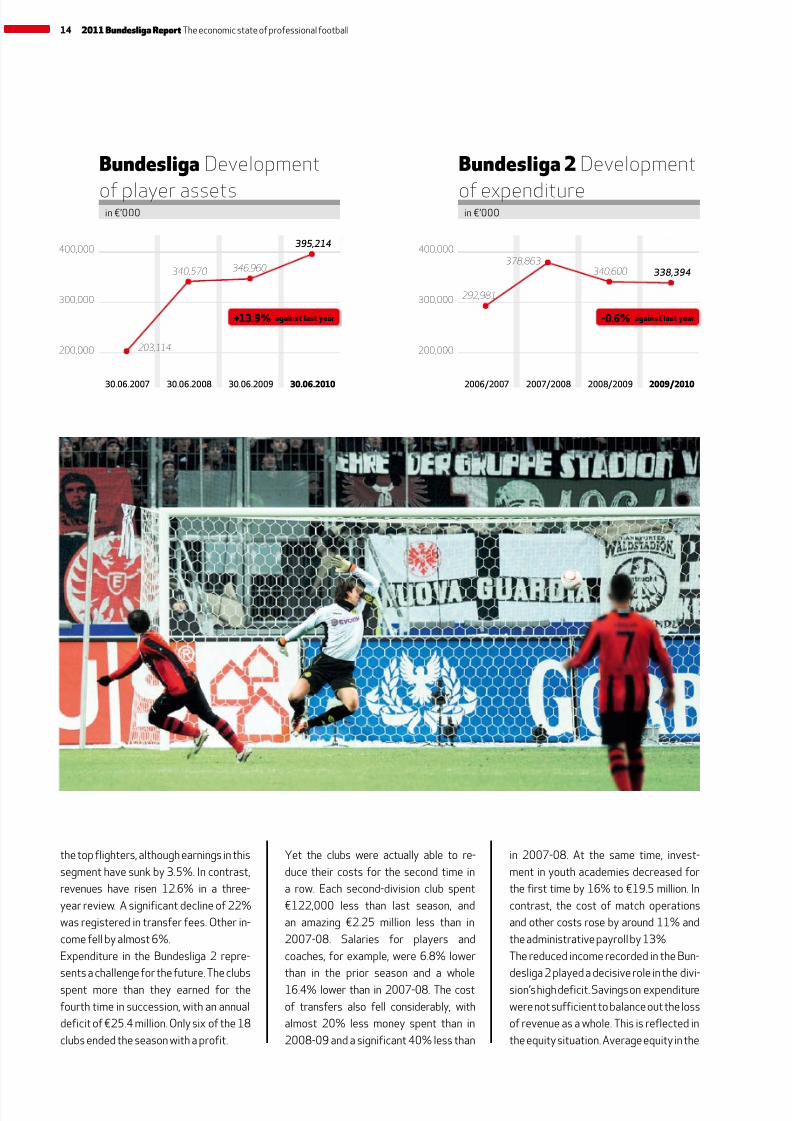
are offset on the balance sheet by player
assets, which have increased 13.9% to
12 2011 Bundesliga Report The economic state of professional football
8/22/2019 Bundesliga 2011.pdf
http://slidepdf.com/reader/full/bundesliga-2011pdf 17/64
43,958,000
48,953,000
55,012,000
66,183,000
2006/2007
2007/2008
2008/2009
2009/2010Promotion of young talent
The Bundesliga clubsincreased their investment
in youth academies by
another €11.1 million over
last year.
+20.3%against last
year
B Professional clubs’ investment in youth academiesin ¤
€22 million, and fixed assets amounting
to a good €12 million.
In the Bundesliga 2, the clubs achieved
revenues of over €300 million for the
third time in succession. Totalling €313
million, they were slightly lower than in
the prior year, showing a decrease of
2.5%. A minor increase was recorded
in matchday takings, while merchandis-
ing income rose significantly by almost
38% season-on-season, but all other in-
come items fell. At €4.5 million per club,
advertising income in the second division
was a good sixth of what was received by
13
8/22/2019 Bundesliga 2011.pdf
http://slidepdf.com/reader/full/bundesliga-2011pdf 18/64
the top flighters, although earnings in this
segment have sunk by 3.5%. In contrast,
revenues have risen 12.6% in a three-
year review. A significant decline of 22%
was registered in transfer fees. Other in-
come fell by almost 6%.
Expenditure in the Bundesliga 2 repre-
sents a challenge for the future. The clubs
spent more than they earned for the
fourth time in succession, with an annual
deficit of €25.4 million. Only six of the 18
clubs ended the season with a profit.
203,114
292,981
340,570
378,863346,960 340,600
395,214
338,394
400,000
300,000
200,000
400,000
300,000
200,000
30.06.2007 2006/200730.06.2008 2007/200830.06.2010 2009/201030.06.2009 2008/2009
in €’000 in €’000
B Development
of player assets
B 2 Development
of expenditure
+13.9% -0.6%against last year against last year
Yet the clubs were actually able to re-
duce their costs for the second time in
a row. Each second-division club spent
€122,000 less than last season, and
an amazing €2.25 million less than in
2007-08. Salaries for players and
coaches, for example, were 6.8% lower
than in the prior season and a whole
16.4% lower than in 2007-08. The cost
of transfers also fell considerably, with
almost 20% less money spent than in
2008-09 and a significant 40% less than
in 2007-08. At the same time, invest-
ment in youth academies decreased for
the first time by 16% to €19.5 million. In
contrast, the cost of match operations
and other costs rose by around 11% and
the administrative payroll by 13%.
The reduced income recorded in the Bun-
desliga 2 played a decisive role in the divi-
sion’s high deficit. Savings on expenditure
were not sufficient to balance out the loss
of revenue as a whole. This is reflected in
the equity situation. Average equity in the
14 2011 Bundesliga Report The economic state of professional football
8/22/2019 Bundesliga 2011.pdf
http://slidepdf.com/reader/full/bundesliga-2011pdf 19/64
15
8/22/2019 Bundesliga 2011.pdf
http://slidepdf.com/reader/full/bundesliga-2011pdf 20/64
clubs in the 2008-09 season amounted
to €0.6 million, but this item is now nega-
tive at minus €2.4 million. The equity ratio
in the Bundesliga 2 is therefore minus
30.9%. Liabilities have increased by 29%
and now average €7.1 million per club.The results can be summarised as follows:
German licensed football has achieved
a new record high with total revenues at
€2.083 billion, 2.3% more than in the pre-
vious season. Income increased in all seg-
ments except for transfers. Income from
media rights represents the largest single
item at €610.7 million, followed closely
by advertising income at €593.4 million
and matchday takings at €441.7 million.
Around 85% of income was generated by
the Bundesliga clubs.
At the same time, expenditure also
reached an all-time high at €2.186 billion,
with the 36 Bundesliga and Bundesliga 2
clubs spending a total of €103.2 million
more than they earned. In the 2009-10
season 13 of the 36 clubs were in the
black. Salaries for players and coaches
represent by far the largest expense item
at €883 million, 7.5% more than last year.
In all, professional football can pride
itself on the income generated and itssignificant growth at a time of crisis. But
getting its expenses under control will
be an important task in the months and
years to come.
The League Association recognises this
and has already reacted accordingly: at
the General Assembly in August 2010 the
36 professional clubs voted unanimously
for stricter regulations for the licensing
system and for the compulsory introduc-
tion of a second assessment of economic
viability in the autumn of each year. Oneof the requirements is an improvement
in the equity situation. A commission of
club representatives and DFL experts
has therefore been set up to improve the
procedure. This is an indication of how
seriously the state of affairs is taken by
the League Association and the DFL, and
indeed by the clubs themselves, particu-
larly in light of the financial fair play con-
cept introduced by the UEFA Executive
Committee.
The Bundesliga has followed an ambitious
and at the same time sound economic
course over the last few years which sets
it apart from other top European leagues,
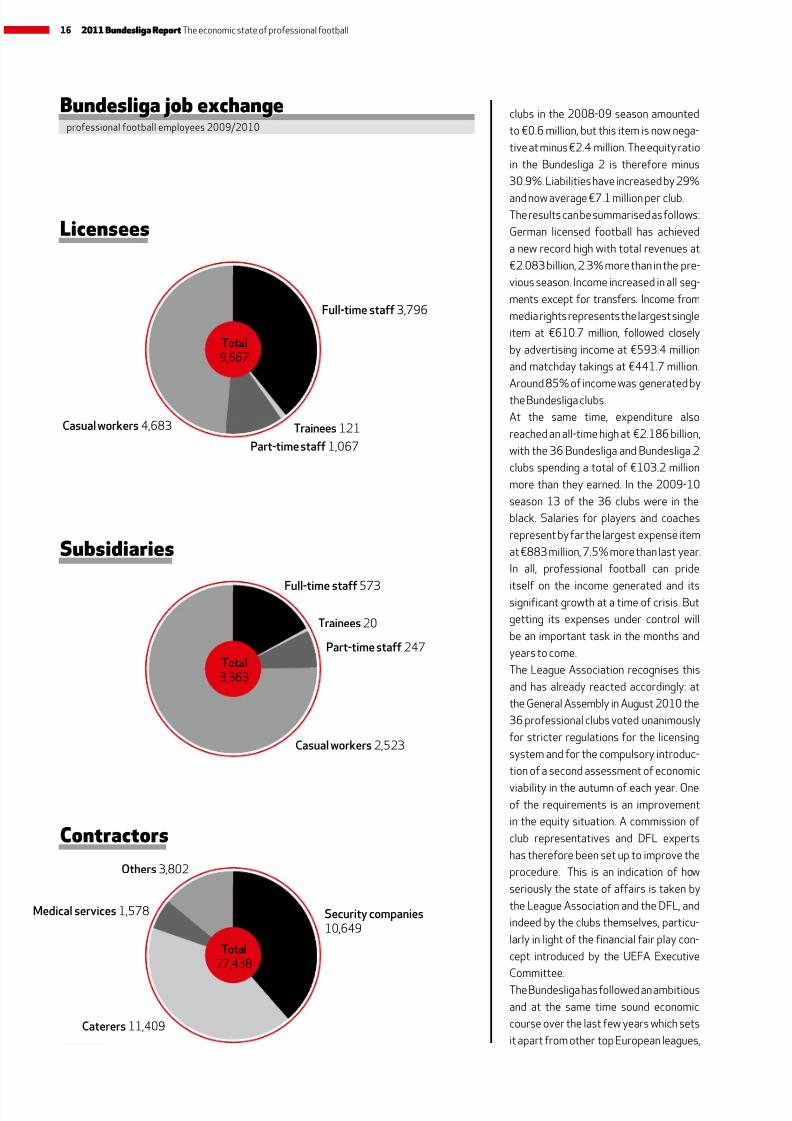
Total3,363
Full-time staff 573
Trainees 20
Part-time staff 247
Casual workers 2,523
Total9,667
Full-time staff 3,796
Trainees 121
Part-time staff 1,067
Casual workers 4,683
Total27,438
Caterers 11,409
Medical services 1,578
Others 3,802
Security companies10,649
B jb xprofessional football employees 2009/2010
l
sb
ctt
16 2011 Bundesliga Report The economic state of professional football
8/22/2019 Bundesliga 2011.pdf
http://slidepdf.com/reader/full/bundesliga-2011pdf 21/64
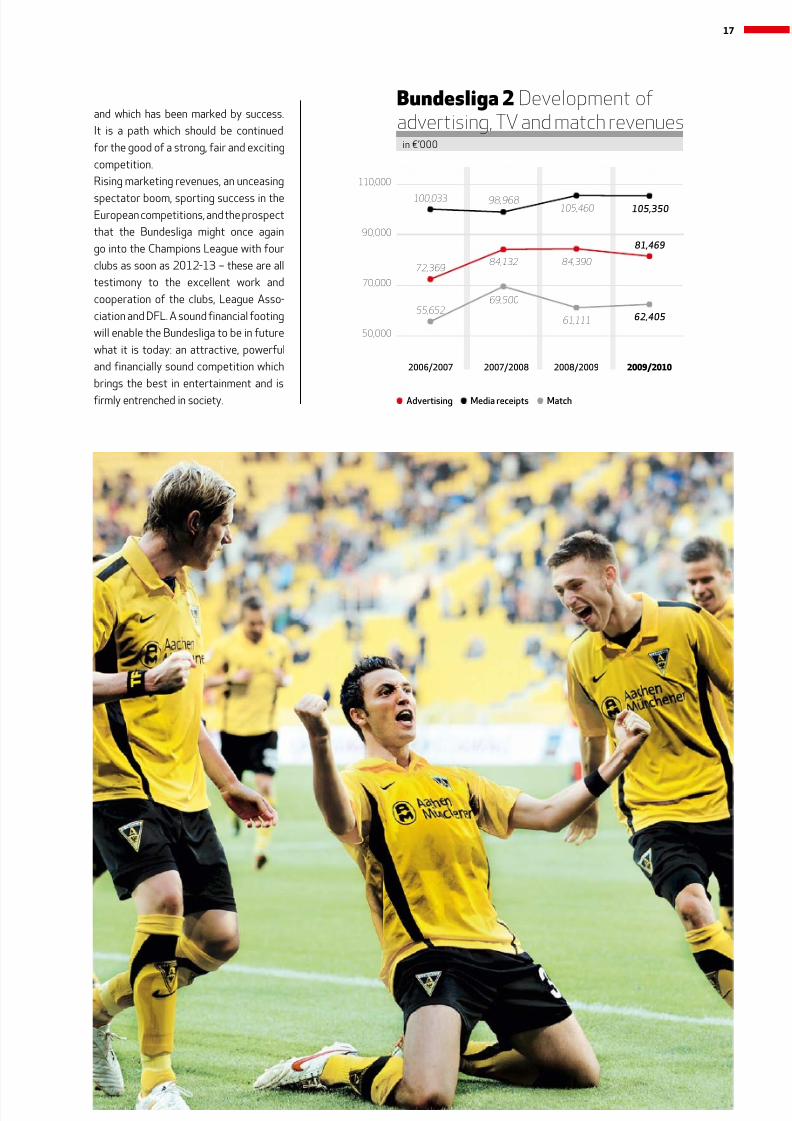
72,36984,132 84,390
81,469
110,000
90,000
70,000
50,000
2006/2007 2007/2008 2008/2009 2009/2010
in €’000
Advertising Media receipts Match
100,033 98,968105,460 105,350
55,652
69,500
61,111 62,405
B 2 Development ofadvertising, TV and match revenues
and which has been marked by success.
It is a path which should be continued
for the good of a strong, fair and exciting
competition.
Rising marketing revenues, an unceasing
spectator boom, sporting success in theEuropean competitions, and the prospect
that the Bundesliga might once again
go into the Champions League with four
clubs as soon as 2012-13 – these are all
testimony to the excellent work and
cooperation of the clubs, League Asso-
ciation and DFL. A sound financial footing
will enable the Bundesliga to be in future
what it is today: an attractive, powerful
and financially sound competition which
brings the best in entertainment and is
firmly entrenched in society.
17
8/22/2019 Bundesliga 2011.pdf
http://slidepdf.com/reader/full/bundesliga-2011pdf 22/64
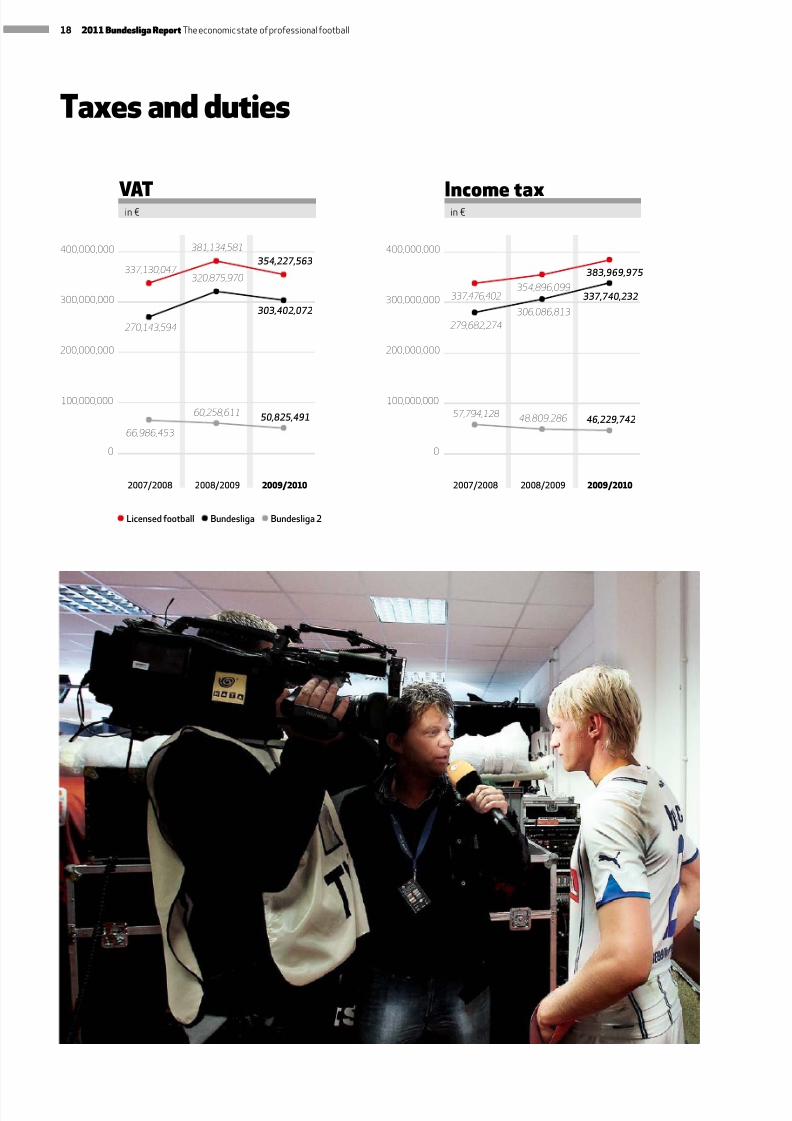
Taxes and duties
337,476,402
57,794,128
279,682,274
337,130,047
270,143,594
66,986,453
354,896,099
48,809,286
306,086,813
381,134,581
320,875,970
60,258,611
383,969,975
46,229,742
337,740,232
354,227,563
303,402,072
50,825,491
400,000,000
300,000,000
200,000,000
100,000,000
0
400,000,000
300,000,000
200,000,000
100,000,000
0
2007/2008 2007/20082008/2009 2008/20092009/2010 2009/2010
VAT Income taxin € in €
Licensed football Bundesliga Bundesliga 2
18 2011 Bundesliga Report The economic state of professional football
8/22/2019 Bundesliga 2011.pdf
http://slidepdf.com/reader/full/bundesliga-2011pdf 23/64
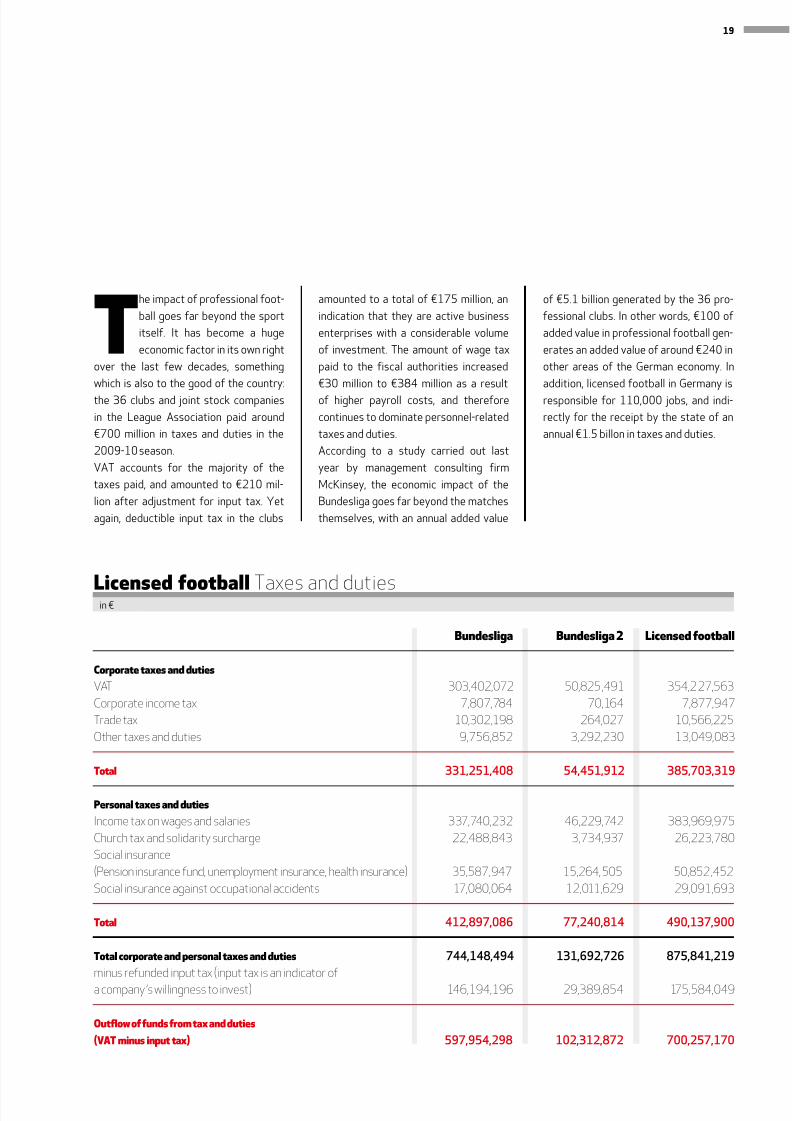
The impact of professional foot-
ball goes far beyond the sport
itself. It has become a huge
economic factor in its own right
over the last few decades, something
which is also to the good of the country:
the 36 clubs and joint stock companies
in the League Association paid around
€700 million in taxes and duties in the
2009-10 season.
VAT accounts for the majority of the
taxes paid, and amounted to €210 mil-
lion after adjustment for input tax. Yet
again, deductible input tax in the clubs
amounted to a total of €175 million, an
indication that they are active business
enterprises with a considerable volume
of investment. The amount of wage tax
paid to the fiscal authorities increased
€30 million to €384 million as a result
of higher payroll costs, and therefore
continues to dominate personnel-related
taxes and duties.
According to a study carried out last
year by management consulting firm
McKinsey, the economic impact of the
Bundesliga goes far beyond the matches
themselves, with an annual added value
of €5.1 billion generated by the 36 pro-
fessional clubs. In other words, €100 of
added value in professional football gen-
erates an added value of around €240 in
other areas of the German economy. In
addition, licensed football in Germany is
responsible for 110,000 jobs, and indi-
rectly for the receipt by the state of an
annual €1.5 billon in taxes and duties.
Bundesliga Bundesliga 2 Licensed football
Corporate taxes and duties
VAT 303,402,072 50,825,491 354,227,563Corporate income tax 7,807,784 70,164 7,877,947Trade tax 10,302,198 264,027 10,566,225Other taxes and duties 9,756,852 3,292,230 13,049,083
Total 331,251,408 54,451,912 385,703,319
Personal taxes and duties
Income tax on wages and salaries 337,740,232 46,229,742 383,969,975Church tax and solidarity surcharge 22,488,843 3,734,937 26,223,780Social insurance(Pension insurance fund, unemployment insurance, health insurance) 35,587,947 15,264,505 50,852,452Social insurance against occupational accidents 17,080,064 12,011,629 29,091,693
Total 412,897,086 77,240,814 490,137,900
Total corporate and personal taxes and duties 744,148,494 131,692,726 875,841,219
minus refunded input tax (input tax is an indicator ofa company ’s willingness to invest) 146,194,196 29,389,854 175,584,049
Outflow of funds from tax and duties
(VAT minus input tax) 597,954,298 102,312,872 700,257,170
Licensed football Taxes and dutiesin €
19
8/22/2019 Bundesliga 2011.pdf
http://slidepdf.com/reader/full/bundesliga-2011pdf 24/64
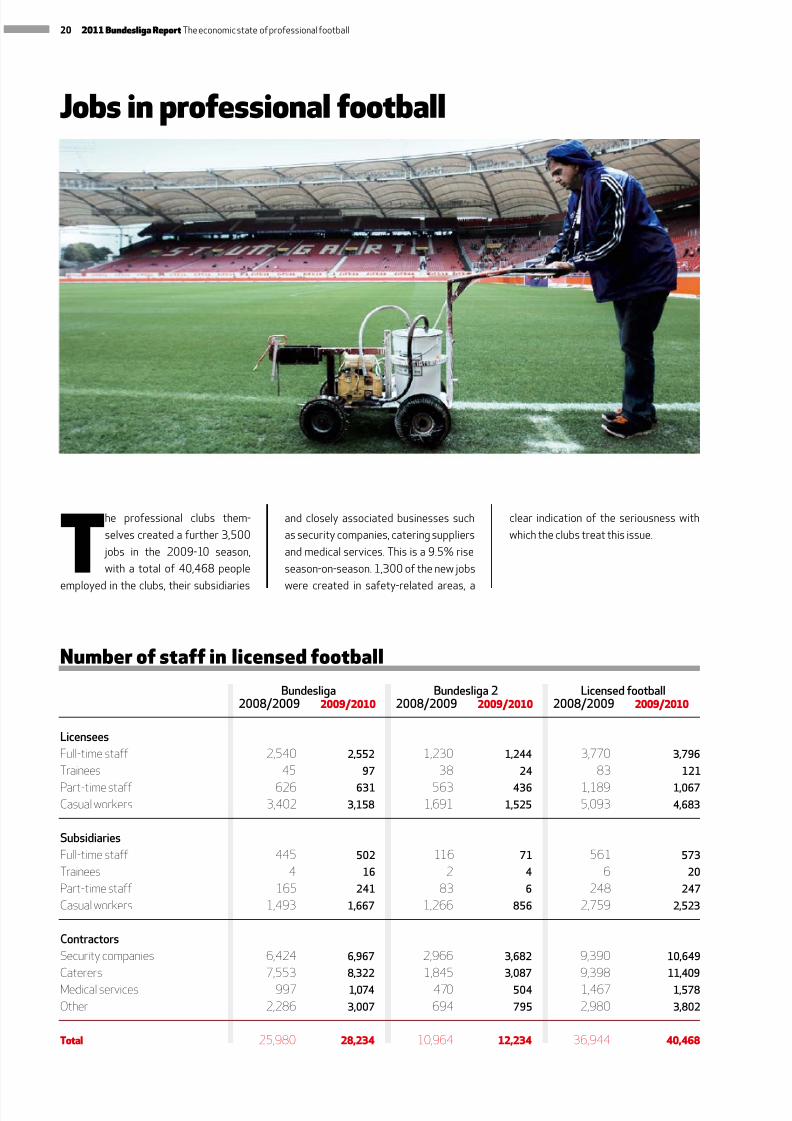
Jobs in professional football
T
he professional clubs them-
selves created a further 3,500
jobs in the 2009-10 season,
with a total of 40,468 people
employed in the clubs, their subsidiaries
and closely associated businesses such
as security companies, catering suppliers
and medical services. This is a 9.5% rise
season-on-season. 1,300 of the new jobs
were created in safety-related areas, a
Number of staff in licensed football
Licensees
Full-time staff 2,540 2,552 1,230 1,244 3,770 3,796 Trainees 45 97 38 24 83 121
Part-time staff 626 631 563 436 1,189 1,067 Casual workers 3,402 3,158 1,691 1,525 5,093 4,683
Subsidiaries
Full-time staff 445 502 116 71 561 573 Trainees 4 16 2 4 6 20 Part-time staff 165 241 83 6 248 247 Casual workers 1,493 1,667 1,266 856 2,759 2,523
Contractors
Security companies 6,424 6,967 2,966 3,682 9,390 10,649 Caterers 7,553 8,322 1,845 3,087 9,398 11,409
Medical services 997 1,074 470 504 1,467 1,578 Other 2,286 3,007 694 795 2,980 3,802
Total 25,980 28,234 10,964 12,234 36,944 40,468
Bundesliga Bundesliga 2 Licensed football2008/2009 2009/2010 2008/2009 2009/2010 2008/2009 2009/2010
clear indication of the seriousness with
which the clubs treat this issue.
20 2011 Bundesliga Report The economic state of professional football
8/22/2019 Bundesliga 2011.pdf
http://slidepdf.com/reader/full/bundesliga-2011pdf 25/64
Business data
Bundesliga >
21
8/22/2019 Bundesliga 2011.pdf
http://slidepdf.com/reader/full/bundesliga-2011pdf 26/64
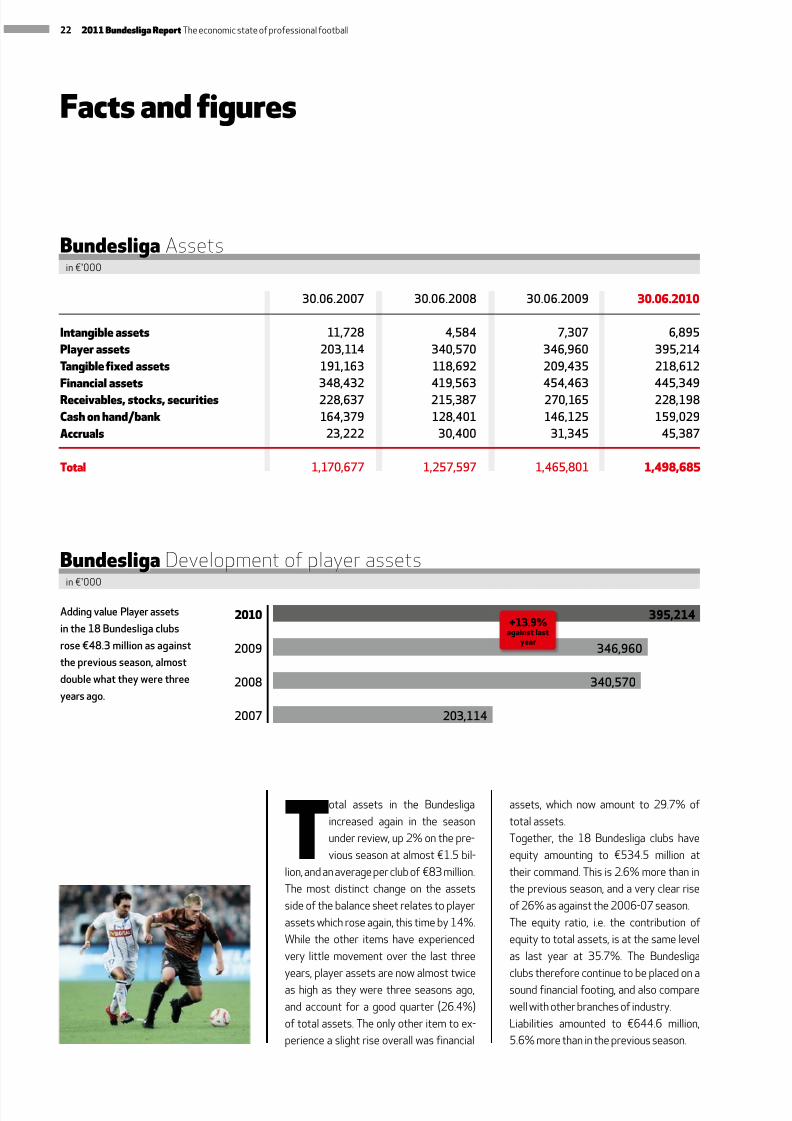
Total assets in the Bundesliga
increased again in the season
under review, up 2% on the pre-
vious season at almost €1.5 bil-
lion, and an average per club of €83 million.
The most distinct change on the assets
side of the balance sheet relates to player
assets which rose again, this time by 14%.
While the other items have experienced
very little movement over the last three
years, player assets are now almost twice
as high as they were three seasons ago,
and account for a good quarter (26.4%)
of total assets. The only other item to ex-
perience a slight rise overall was financial
Facts and figures
assets, which now amount to 29.7% of
total assets.
Together, the 18 Bundesliga clubs have
equity amounting to €534.5 million at
their command. This is 2.6% more than in
the previous season, and a very clear rise
of 26% as against the 2006-07 season.
The equity ratio, i.e. the contribution of
equity to total assets, is at the same level
as last year at 35.7%. The Bundesliga
clubs therefore continue to be placed on a
sound financial footing, and also compare
well with other branches of industry.
Liabilities amounted to €644.6 million,
5.6% more than in the previous season.
30.06.2007 30.06.2008 30.06.2009 30.06.2010
Intangible assets 11,728 4,584 7,307 6,895
Player assets 203,114 340,570 346,960 395,214
Tangible fixed assets 191,163 118,692 209,435 218,612
Financial assets 348,432 419,563 454,463 445,349
Receivables, stocks, securities 228,637 215,387 270,165 228,198
Cash on hand/bank 164,379 128,401 146,125 159,029
Accruals 23,222 30,400 31,345 45,387
Total 1,170,677 1,257,597 1,465,801 1,498,685
Bundesliga Assetsin €'000
203,114
340,570
346,960
395,214
2007
2008
2009
2010AddingvaluePlayerassets
inthe18Bundesligaclubs
rose€48.3millionasagainst
thepreviousseason,almost
doublewhattheywerethree
yearsago.
+13.9%against last
year
Bundesliga Development of player assetsin €'000
22 2011 Bundesliga Report The economic state of professional football
8/22/2019 Bundesliga 2011.pdf
http://slidepdf.com/reader/full/bundesliga-2011pdf 27/64
30.06.2007 30.06.2008 30.06.2009 30.06.2010
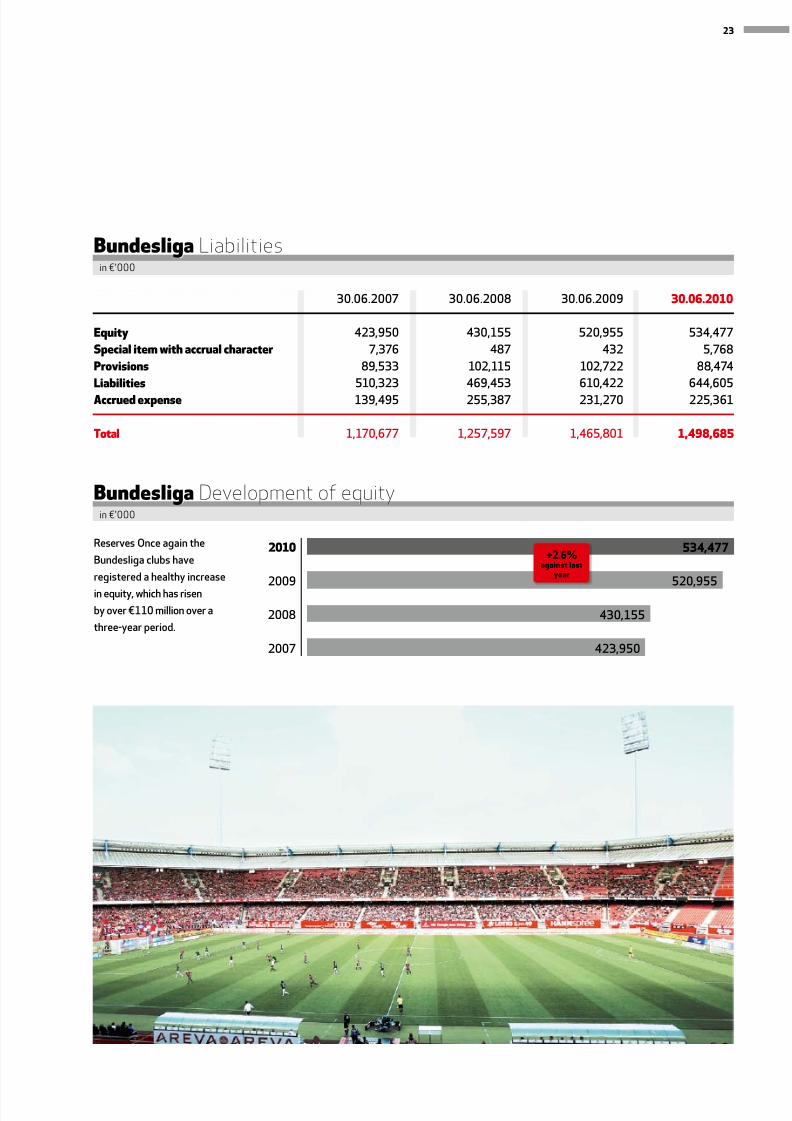
Equity 423,950 430,155 520,955 534,477
Special item with accrual character 7,376 487 432 5,768
Provisions 89,533 102,115 102,722 88,474
Liabilities 510,323 469,453 610,422 644,605
Accrued expense 139,495 255,387 231,270 225,361
Total 1,170,677 1,257,597 1,465,801 1,498,685
Bundesliga Liabilities
423,950
430,155
520,955
534,4772010
2008
2009
2007
ReservesOnceagainthe
Bundesligaclubshave
registeredahealthyincrease
inequity,whichhasrisen
byover€110millionovera
three-yearperiod.
+2.6%against last
year
Bundesliga Development of equity
in €'000
in €'000
23
8/22/2019 Bundesliga 2011.pdf
http://slidepdf.com/reader/full/bundesliga-2011pdf 28/64
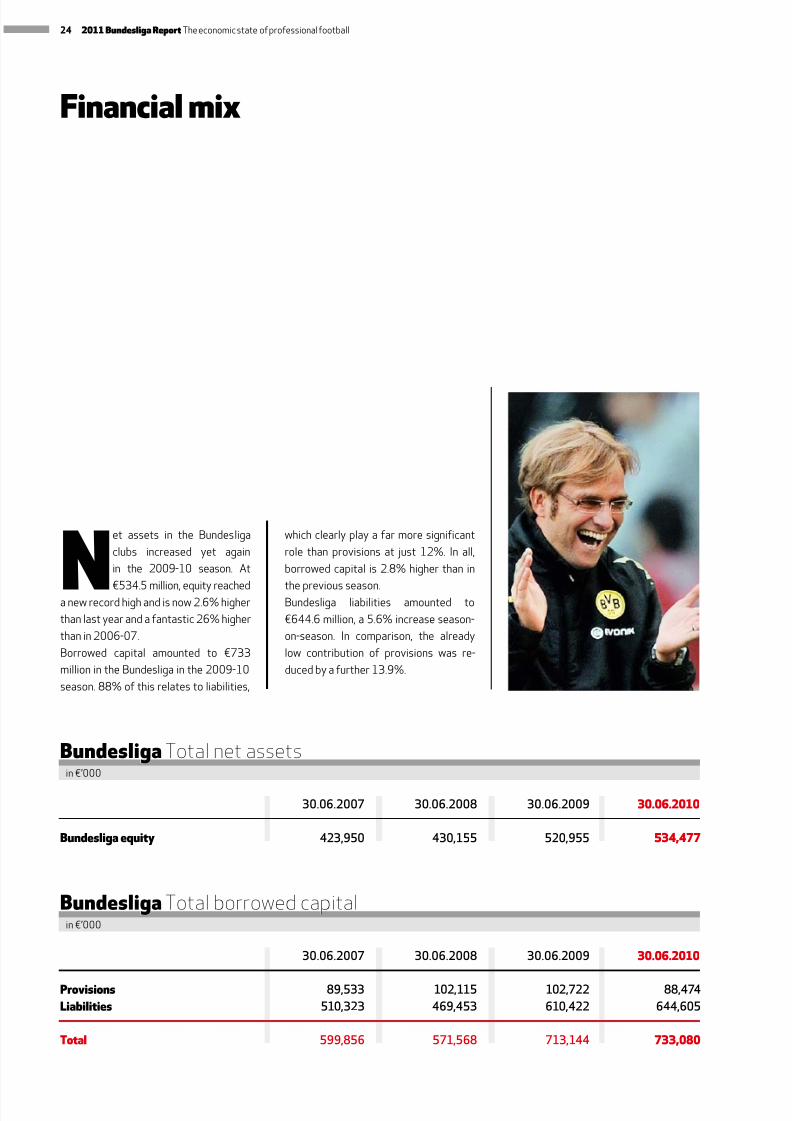
30.06.2007 30.06.2008 30.06.2009 30.06.2010
Provisions 89,533 102,115 102,722 88,474
Liabilities 510,323 469,453 610,422 644,605
Total 599,856 571,568 713,144 733,080
BundesligaTotal borrowed capital
30.06.2007 30.06.2008 30.06.2009 30.06.2010
Bundesligaequity 423,950 430,155 520,955 534,477
BundesligaTotal net assetsin €’000
in €’000
N
et assets in the Bundesliga
clubs increased yet again
in the 2009-10 season. At
€534.5 million, equity reacheda new record high and is now 2.6% higher
than last year and a fantastic 26% higher
than in 2006-07.
Borrowed capital amounted to €733
million in the Bundesliga in the 2009-10
season. 88% of this relates to liabilities,
which clearly play a far more significant
role than provisions at just 12%. In all,
borrowed capital is 2.8% higher than in
the previous season.Bundesliga liabilities amounted to
€644.6 million, a 5.6% increase season-
on-season. In comparison, the already
low contribution of provisions was re-
duced by a further 13.9%.
Financialmix
24 2011 Bundesliga Report The economic state of professional football
8/22/2019 Bundesliga 2011.pdf
http://slidepdf.com/reader/full/bundesliga-2011pdf 29/64
25
8/22/2019 Bundesliga 2011.pdf
http://slidepdf.com/reader/full/bundesliga-2011pdf 30/64
Income statement
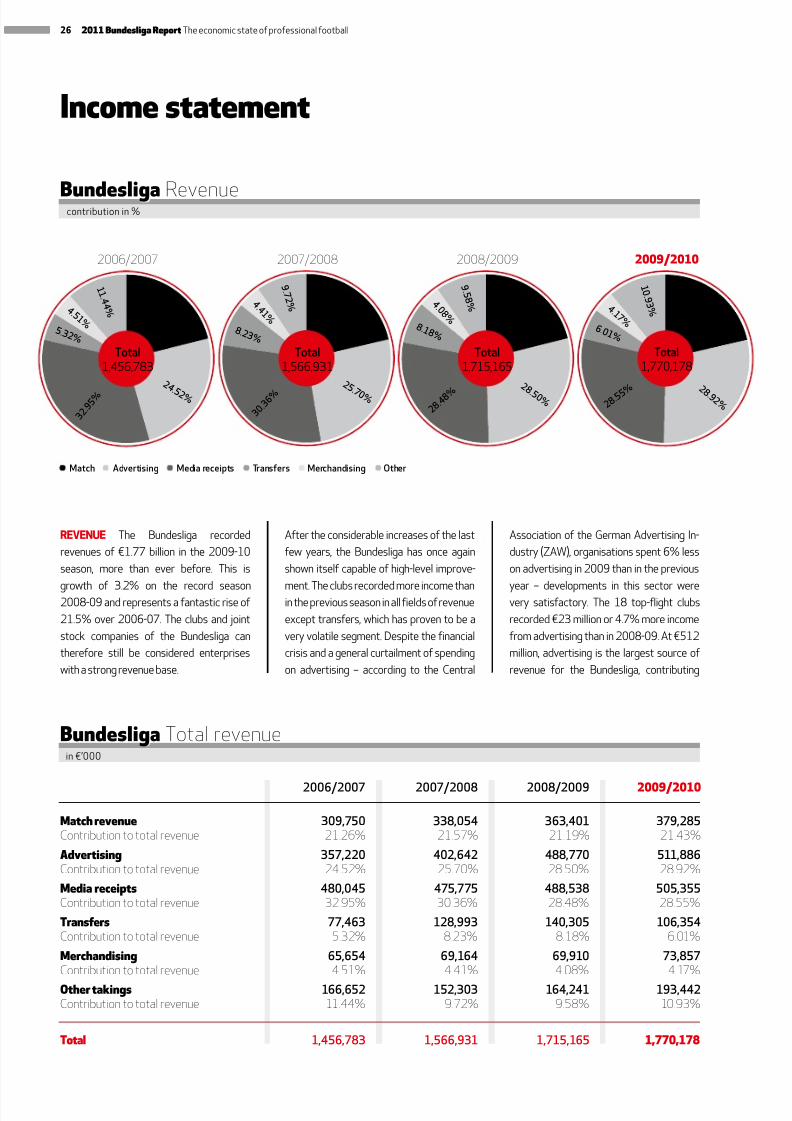
After the considerable increases of the last
few years, the Bundesliga has once again
shown itself capable of high-level improve-
ment. The clubs recorded more income thanin the previous season in all fields of revenue
except transfers, which has proven to be a
very volatile segment. Despite the financial
crisis and a general curtailment of spending
on advertising – according to the Central
Association of the German Advertising In-
dustry (ZAW), organisations spent 6% less
on advertising in 2009 than in the previous
year – developments in this sector werevery satisfactory. The 18 top-flight clubs
recorded €23 million or 4.7% more income
from advertising than in 2008-09. At €512
million, advertising is the largest source of
revenue for the Bundesliga, contributing
REVENUE The Bundesliga recorded
revenues of €1.77 billion in the 2009-10
season, more than ever before. This is
growth of 3.2% on the record season2008-09 and represents a fantastic rise of
21.5% over 2006-07. The clubs and joint
stock companies of the Bundesliga can
therefore still be considered enterprises
with a strong revenue base.
2006/2007 2007/2008 2008/2009 2009/2010
Match revenue 309,750 338,054 363,401 379,285Contribution to total revenue 21.26% 21.57% 21.19% 21.43%
Advertising 357,220 402,642 488,770 511,886Contribution to total revenue 24.52% 25.70% 28.50% 28.92%
Media receipts 480,045 475,775 488,538 505,355Contribution to total revenue 32.95% 30.36% 28.48% 28.55%
Transfers 77,463 128,993 140,305 106,354Contribution to total revenue 5.32% 8.23% 8.18% 6.01%
Merchandising 65,654 69,164 69,910 73,857Contribution to total revenue 4.51% 4.41% 4.08% 4.17%
Other takings 166,652 152,303 164,241 193,442Contribution to total revenue 11.44% 9.72% 9.58% 10.93%
Total 1,456,783 1,566,931 1,715,165 1,770,178
Bundesliga Total revenuein €’000
Bundesliga Revenue
Total1,456,783
Total1,566,931
Total1,715,165
2006/2007 2007/2008 2008/2009
1 1 . 4 4 %
3 0 . 3 6 %
9 . 5 8 %
2 4 .5 2 %
2 5 .7 0 % 2 8 .5 0 %
4 . 5 1 % 5 .3 2 %
3 2 . 9 5 %
2 1 . 2 6 %
9 . 7 2 % 4 . 0 8 %
4 . 4 1 % 8 .1 8 % 8 .2 3 %
2 8 . 4 8 %
2 1 . 5 7 %
2 1 . 1 9 %
Match Advertising Mediareceipts Transfers Merchandising Other
Total1,770,178
1 0 . 9 3 %
2 8 . 9 2 %
4 . 1 7 % 6 .0 1 %
2 8. 5 5 %
2 1 . 4 3 %
2009/2010
contribution in %
26 2011 Bundesliga Report The economic state of professional football
8/22/2019 Bundesliga 2011.pdf
http://slidepdf.com/reader/full/bundesliga-2011pdf 31/64
almost 28.9% to total revenues. This is fol-
lowed closely by income from the market-
ing of media rights. The Bundesliga clubs
received €505 million (up 3.4% season-
on-season), a contribution of 28.6% to
total income. Matchday takings are thethird-largest source of revenue, with a
contribution of 21.4%. The greatest role
here is played by ticket receipts, which
increased 4.4%. This balanced mix of
revenues is supplemented by money
from transfers, merchandising and other
income. Together, these segments con-
tribute 21.1% to total income, whereby
merchandising income has been growing
steadily, and can boast growth of 12.5%
within just four seasons.
EXPENDITURE The Bundesliga has in-
creased its expenditure considerably
over the last few years. The 18 clubs
spent a total of almost €1.85 billion in
2009-10, a further increase season-on-
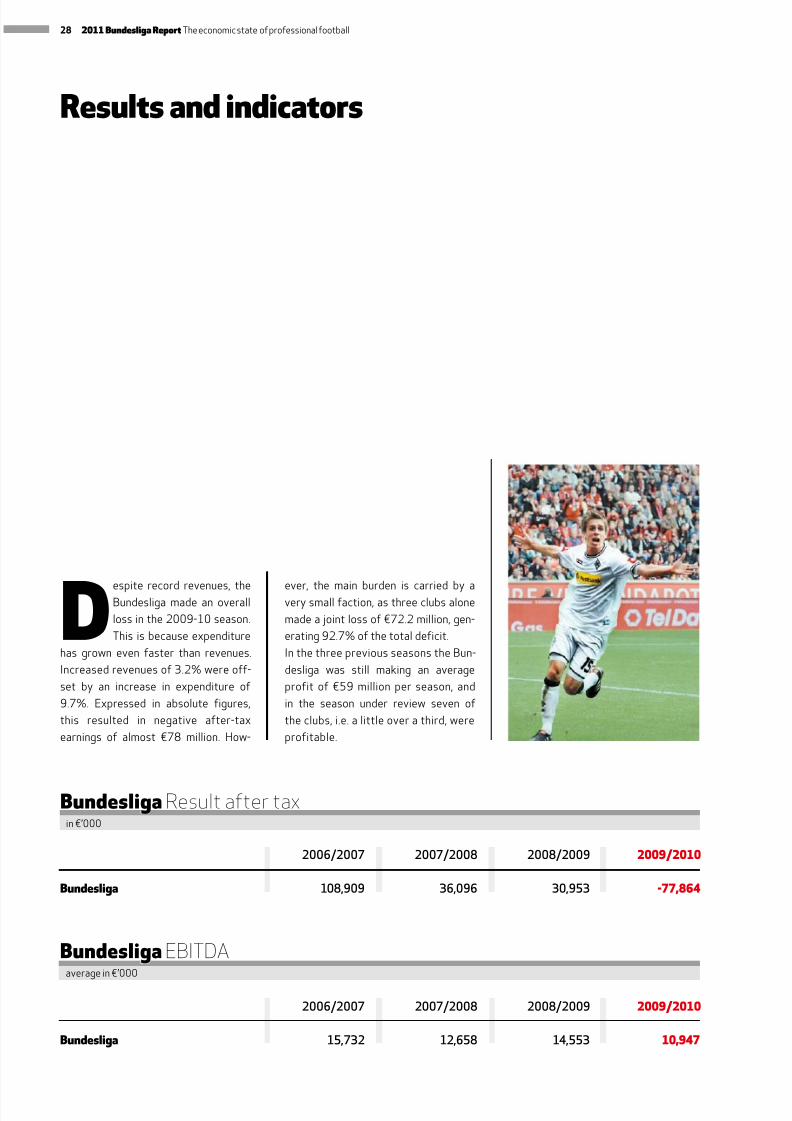
season of 9.7%.The predominant cost factor here is that of
match personnel, i.e. salaries and bonuses
for players and coaches, on which around
€750 million was spent in 2009-10. This
can be seen as an investment in sporting
excellence, and for the first time ever the
clubs paid an average of €40 million each
for their professionals. Payroll costs for
match operations account for 41% of
total costs, which is still much less than in
any other top league.
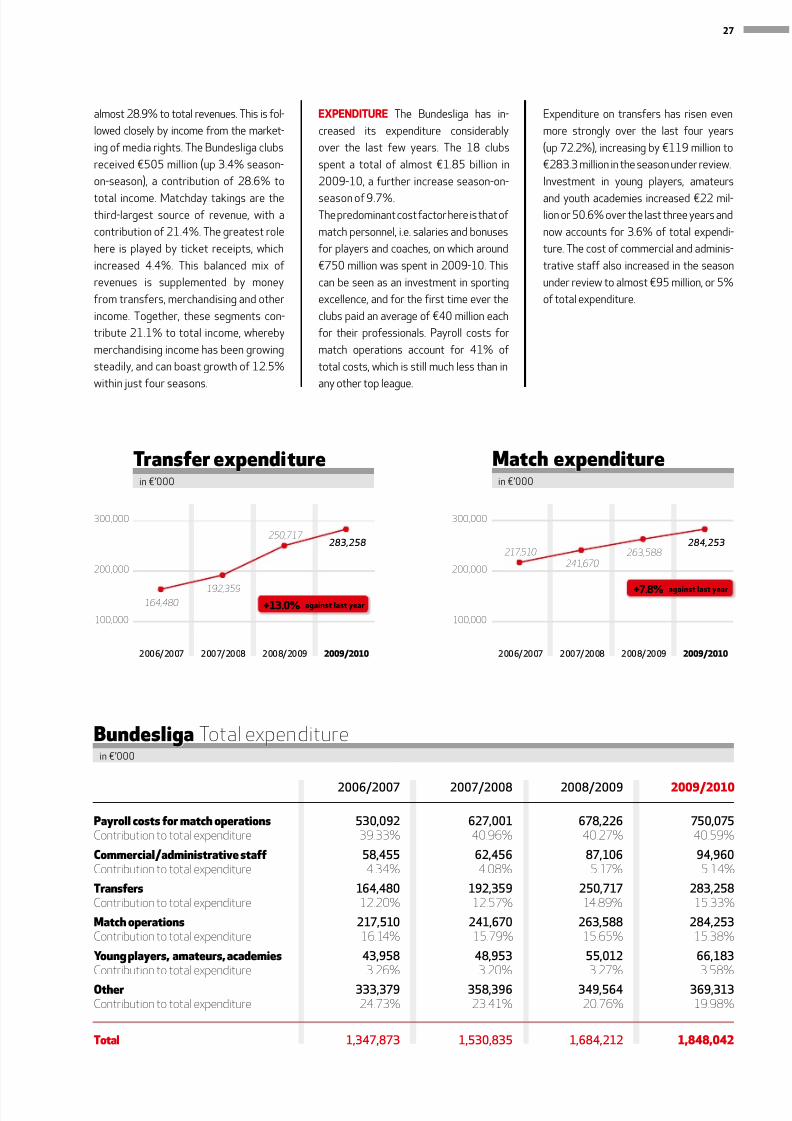
Expenditure on transfers has risen even
more strongly over the last four years
(up 72.2%), increasing by €119 million to
€283.3 million in the season under review.
Investment in young players, amateurs
and youth academies increased €22 mil-lion or 50.6% over the last three years and
now accounts for 3.6% of total expendi-
ture. The cost of commercial and adminis-
trative staff also increased in the season
under review to almost €95 million, or 5%
of total expenditure.
2006/2007 2007/2008 2008/2009 2009/2010
Payroll costs for match operations 530,092 627,001 678,226 750,075Contribution to total expenditure 39.33% 40.96% 40.27% 40.59%
Commercial/administrative staff 58,455 62,456 87,106 94,960Contribution to total expenditure 4.34% 4.08% 5.17% 5.14%
Transfers 164,480 192,359 250,717 283,258Contribution to total expenditure 12.20% 12.57% 14.89% 15.33%
Match operations 217,510 241,670 263,588 284,253Contribution to total expenditure 16.14% 15.79% 15.65% 15.38%
Young players, amateurs, academies 43,958 48,953 55,012 66,183Contribution to total expenditure 3.26% 3.20% 3.27% 3.58%
Other 333,379 358,396 349,564 369,313Contribution to total expenditure 24.73% 23.41% 20.76% 19.98%
Total 1,347,873 1,530,835 1,684,212 1,848,042
Bundesliga Total expenditurein €’000
164,480
192,359
250,717283,258
300,000
200,000
100,000
2006/2007 2007/2008 2008/2009 2009/2010
Transfer expenditurein €’000
+13.0% against last year
217,510
241,670
263,588284,253
300,000
200,000
100,000
2006/2007 2007/2008 2008/2009 2009/2010
Match expenditurein €’000
+7.8% against last year
27
8/22/2019 Bundesliga 2011.pdf
http://slidepdf.com/reader/full/bundesliga-2011pdf 32/64
2006/2007 2007/2008 2008/2009 2009/2010
Bundesliga 108,909 36,096 30,953 -77,864
2006/2007 2007/2008 2008/2009 2009/2010
Bundesliga 15,732 12,658 14,553 10,947
BundesligaResult after taxin €’000
BundesligaEBITDAaverage in €’000
Resultsandindicators
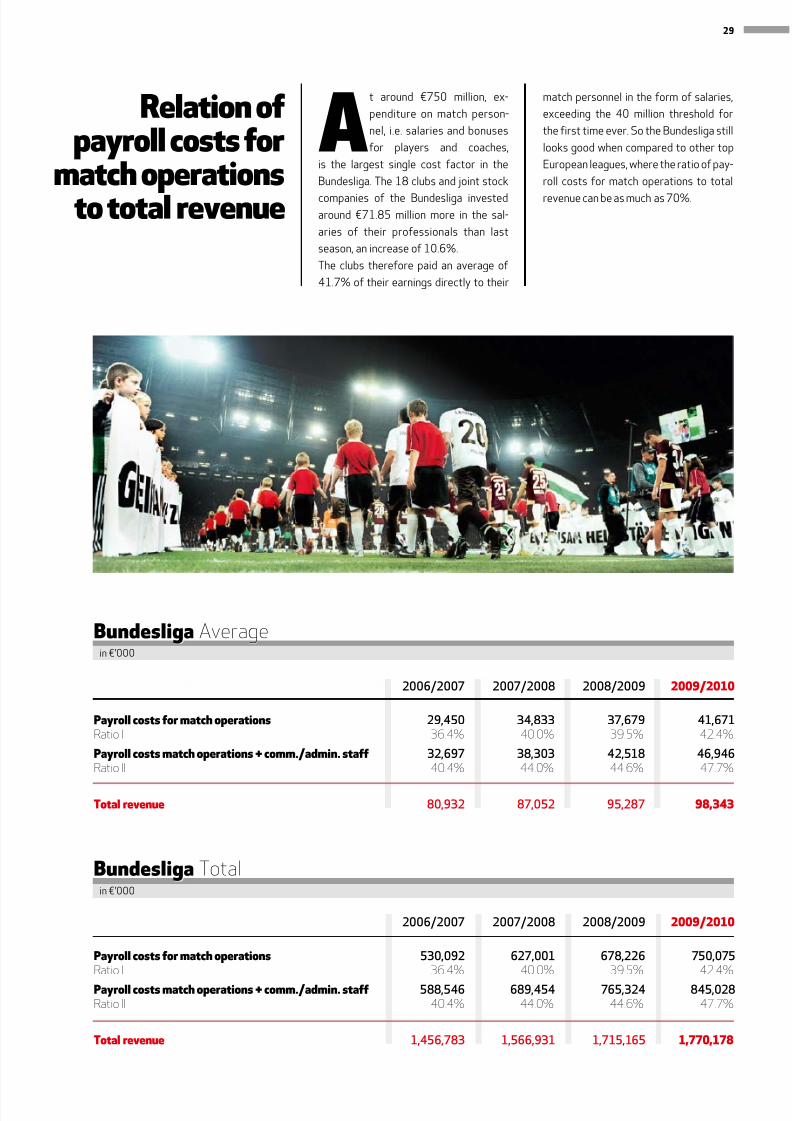
Despite record revenues, theBundesliga made an overall
loss in the 2009-10 season.
This is because expenditure
has grown even faster than revenues.
Increased revenues of 3.2% were off-
set by an increase in expenditure of
9.7%. Expressed in absolute figures,
this resulted in negative after-tax
earnings of almost €78 million. How-
ever, the main burden is carried by avery small faction, as three clubs alone
made a joint loss of €72.2 million, gen-
erating 92.7% of the total deficit.
In the three previous seasons the Bun-
desliga was still making an average
profit of €59 million per season, and
in the season under review seven of
the clubs, i.e. a little over a third, were
profitable.
28 2011 Bundesliga Report The economic state of professional football
8/22/2019 Bundesliga 2011.pdf
http://slidepdf.com/reader/full/bundesliga-2011pdf 33/64
2006/2007 2007/2008 2008/2009 2009/2010
Payroll costs for match operations 29,450 34,833 37,679 41,671Ratio I 36.4% 40.0% 39.5% 42.4%
Payroll costs match operations + comm./admin. staff 32,697 38,303 42,518 46,946Ratio II 40.4% 44.0% 44.6% 47.7%
Total revenue 80,932 87,052 95,287 98,343
2006/2007 2007/2008 2008/2009 2009/2010
Payroll costs for match operations 530,092 627,001 678,226 750,075Ratio I 36.4% 40.0% 39.5% 42.4%
Payroll costs match operations + comm./admin. staff 588,546 689,454 765,324 845,028Ratio II 40.4% 44.0% 44.6% 47.7%
Total revenue 1,456,783 1,566,931 1,715,165 1,770,178
Bundesliga Average
Bundesliga Totalin €’000
in €’000
Relation ofpayroll costs for
match operationsto total revenue
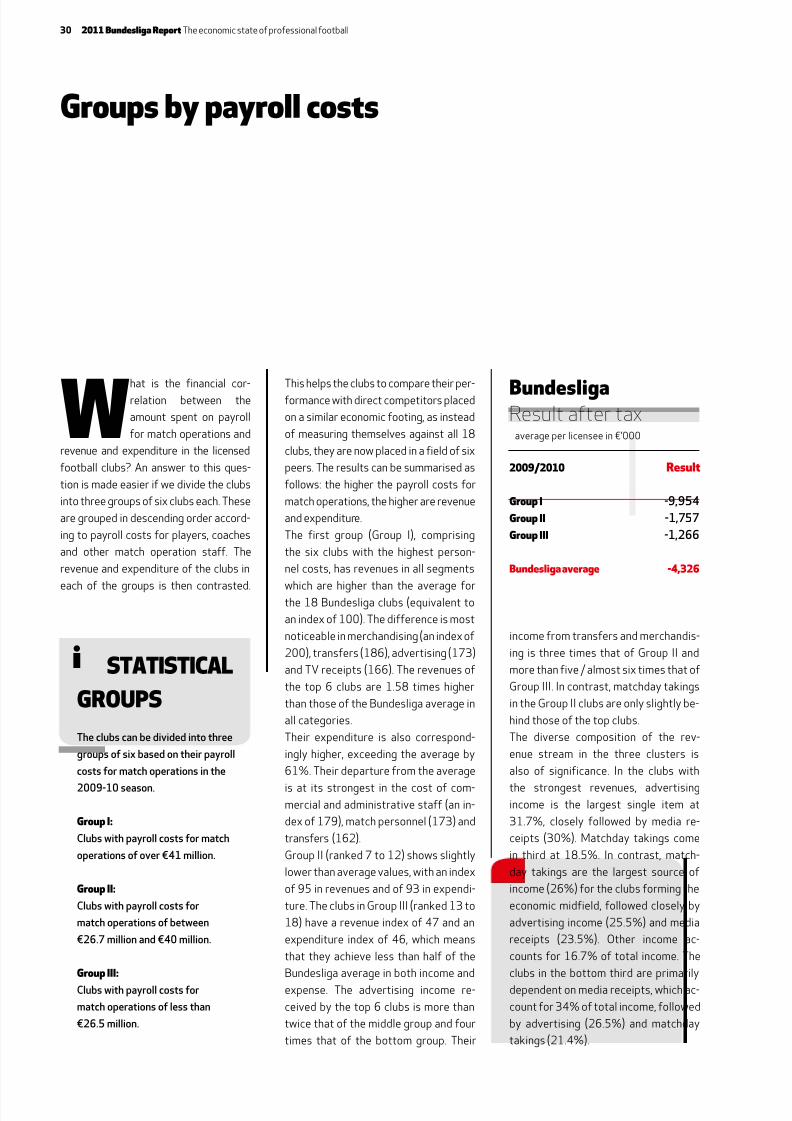
At around €750 million, ex-
penditure on match person-
nel, i.e. salaries and bonuses
for players and coaches,
is the largest single cost factor in the
Bundesliga. The 18 clubs and joint stock
companies of the Bundesliga investedaround €71.85 million more in the sal-
aries of their professionals than last
season, an increase of 10.6%.
The clubs therefore paid an average of
41.7% of their earnings directly to their
match personnel in the form of salaries,
exceeding the 40 million threshold for
the first time ever. So the Bundesliga still
looks good when compared to other top
European leagues, where the ratio of pay-
roll costs for match operations to total
revenue can be as much as 70%.
29
8/22/2019 Bundesliga 2011.pdf
http://slidepdf.com/reader/full/bundesliga-2011pdf 34/64
2009/2010 Res
Gr I -9,954
Gr II -1,757
Gr III -1,266
Bndesig verge -4,326
BndesigResult after tax
average per licensee in €’000
Grs by yr ss
What is the financial cor-
relation between the
amount spent on payroll
for match operations and
revenue and expenditure in the licensed
football clubs? An answer to this ques-
tion is made easier if we divide the clubs
into three groups of six clubs each. These
are grouped in descending order accord-
ing to payroll costs for players, coaches
and other match operation staff. The
revenue and expenditure of the clubs in
each of the groups is then contrasted.
This helps the clubs to compare their per-
formance with direct competitors placed
on a similar economic footing, as instead
of measuring themselves against all 18
clubs, they are now placed in a field of six
peers. The results can be summarised as
follows: the higher the payroll costs for
match operations, the higher are revenue
and expenditure.
The first group (Group I), comprising
the six clubs with the highest person-
nel costs, has revenues in all segments
which are higher than the average forthe 18 Bundesliga clubs (equivalent to
an index of 100). The difference is most
noticeable in merchandising (an index of
200), transfers (186), advertising (173)
and TV receipts (166). The revenues of
the top 6 clubs are 1.58 times higher
than those of the Bundesliga average in
all categories.
Their expenditure is also correspond-
ingly higher, exceeding the average by
61%. Their departure from the average
is at its strongest in the cost of com-mercial and administrative staff (an in-
dex of 179), match personnel (173) and
transfers (162).
Group II (ranked 7 to 12) shows slightly
lower than average values, with an index
of 95 in revenues and of 93 in expendi-
ture. The clubs in Group III (ranked 13 to
18) have a revenue index of 47 and an
expenditure index of 46, which means
that they achieve less than half of the
Bundesliga average in both income and
expense. The advertising income re-
ceived by the top 6 clubs is more than
twice that of the middle group and four
times that of the bottom group. Their
StatIStIcal
GRoupS
Theclubscanbedividedintothree
groupsofsixbasedontheirpayroll
costsformatchoperationsinthe
2009-10season.
Gr I:
Clubswithpayrollcostsformatch
operationsofover€41million.
Gr II:
Clubswithpayrollcostsfor
matchoperationsofbetween
€26.7millionand€40million.
Gr III:
Clubswithpayrollcostsfor
matchoperationsoflessthan
€26.5million.
iincome from transfers and merchandis-
ing is three times that of Group II and
more than five / almost six times that of
Group III. In contrast, matchday takings
in the Group II clubs are only slightly be-
hind those of the top clubs.
The diverse composition of the rev-
enue stream in the three clusters is
also of significance. In the clubs with
the strongest revenues, advertisingincome is the largest single item at
31.7%, closely followed by media re-
ceipts (30%). Matchday takings come
in third at 18.5%. In contrast, match-
day takings are the largest source of
income (26%) for the clubs forming the
economic midfield, followed closely by
advertising income (25.5%) and media
receipts (23.5%). Other income ac-
counts for 16.7% of total income. The
clubs in the bottom third are primarily
dependent on media receipts, which ac-
count for 34% of total income, followed
by advertising (26.5%) and matchday
takings (21.4%).
30 2011 Bundesliga Report The economic state of professional football
8/22/2019 Bundesliga 2011.pdf
http://slidepdf.com/reader/full/bundesliga-2011pdf 35/64
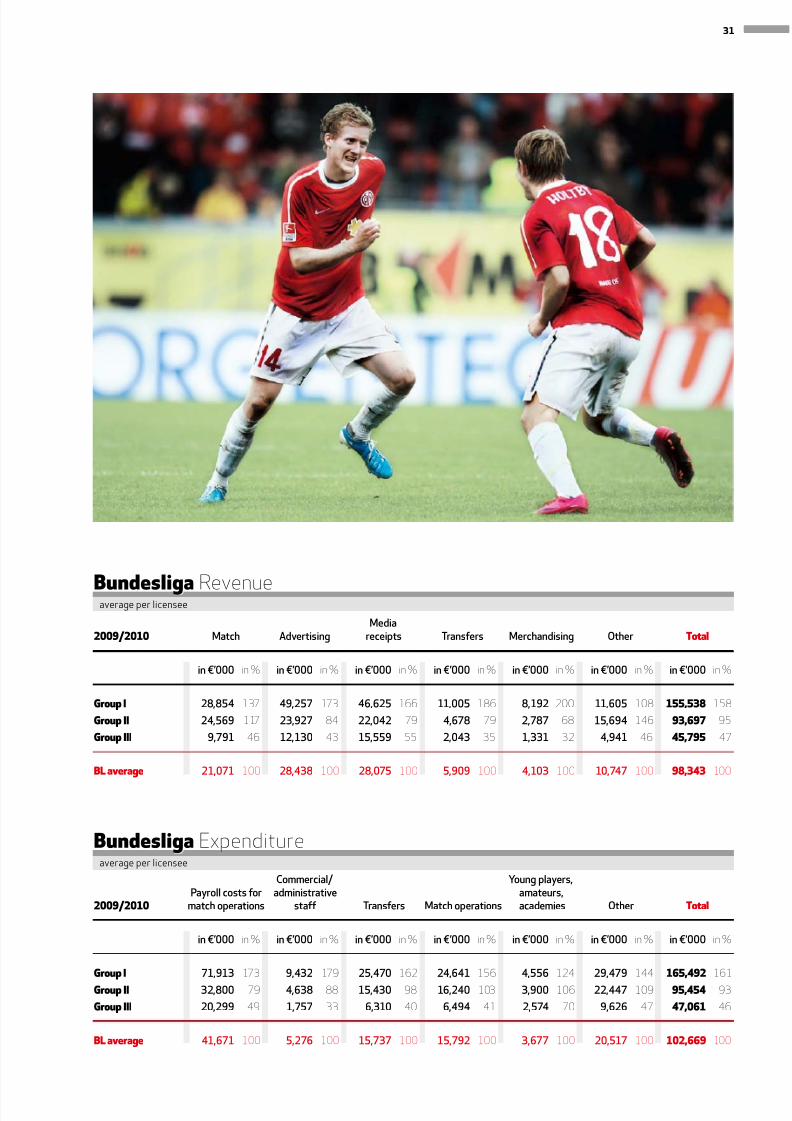
in€’000 in % in€’000 in % in€’000 in % in€’000 in % in€’000 in % in€’000 in % in€’000 in %
Gr I 28,854 137 49,257 173 46,625 166 11,005 186 8,192 200 11,605 108 155,538 158
Gr II 24,569 117 23,927 84 22,042 79 4,678 79 2,787 68 15,694 146 93,697 95
Gr III 9,791 46 12,130 43 15,559 55 2,043 35 1,331 32 4,941 46 45,795 47
Bl verge 21,071 100 28,438 100 28,075 100 5,909 100 4,103 100 10,747 100 98,343 100
in€’000 in % in€’000 in % in€’000 in % in€’000 in % in€’000 in % in€’000 in % in€’000 in %
Gr I 71,913 173 9,432 179 25,470 162 24,641 156 4,556 124 29,479 144 165,492 161
Gr II 32,800 79 4,638 88 15,430 98 16,240 103 3,900 106 22,447 109 95,454 93
Gr III 20,299 49 1,757 33 6,310 40 6,494 41 2,574 70 9,626 47 47,061 46
Bl verge 41,671 100 5,276 100 15,737 100 15,792 100 3,677 100 20,517 100 102,669 100
Media2009/2010 Match Advertising receipts Transfers Merchandising Other t
Commercial/ Youngplayers, Payrollcostsfor administrative amateurs, 2009/2010 matchoperations staff Transfers Matchoperations academies Other t
Bndesig Revenue
Bndesig Expenditure
average per licensee
average per licensee
31
8/22/2019 Bundesliga 2011.pdf
http://slidepdf.com/reader/full/bundesliga-2011pdf 36/64
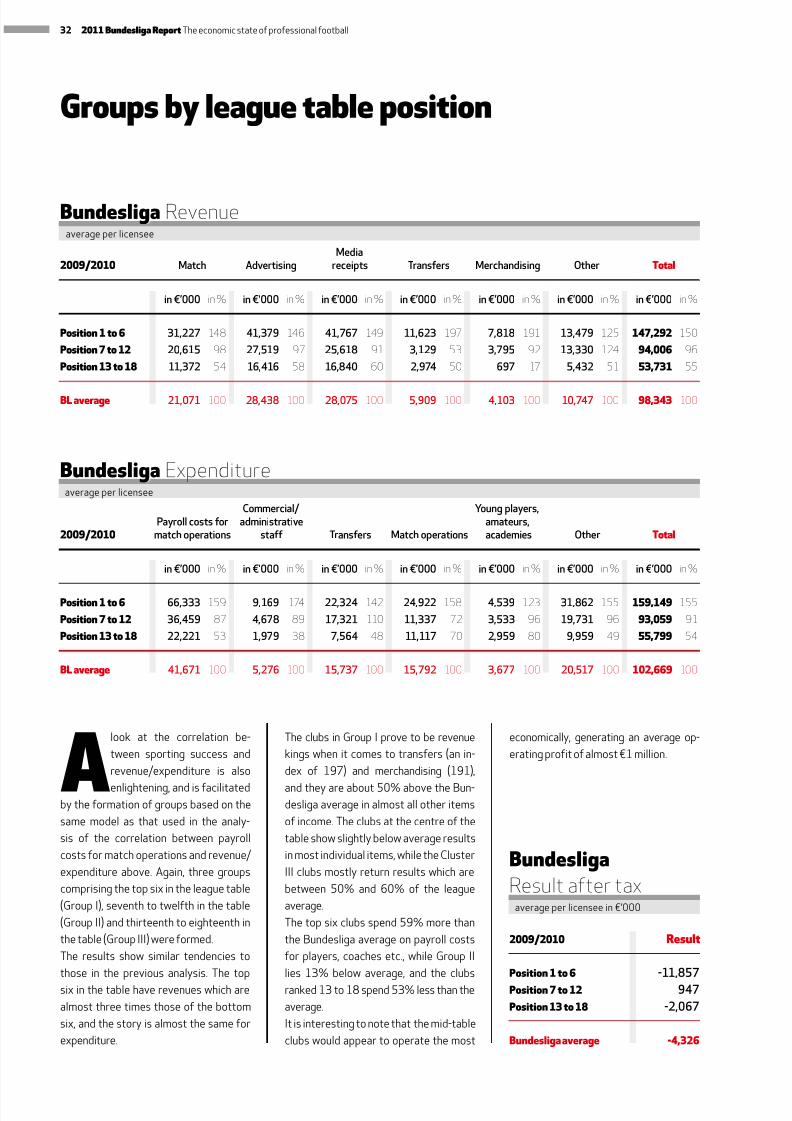
A
look at the correlation be-
tween sporting success and
revenue/expenditure is also
enlightening, and is facilitatedby the formation of groups based on the
same model as that used in the analy-
sis of the correlation between payroll
costs for match operations and revenue/
expenditure above. Again, three groups
comprising the top six in the league table
(Group I), seventh to twelfth in the table
(Group II) and thirteenth to eighteenth in
the table (Group III) were formed.
The results show similar tendencies to
those in the previous analysis. The top
six in the table have revenues which are
almost three times those of the bottom
six, and the story is almost the same for
expenditure.
The clubs in Group I prove to be revenue
kings when it comes to transfers (an in-
dex of 197) and merchandising (191),
and they are about 50% above the Bun-desliga average in almost all other items
of income. The clubs at the centre of the
table show slightly below average results
in most individual items, while the Cluster
III clubs mostly return results which are
between 50% and 60% of the league
average.
The top six clubs spend 59% more than
the Bundesliga average on payroll costs
for players, coaches etc., while Group II
lies 13% below average, and the clubs
ranked 13 to 18 spend 53% less than the
average.
It is interesting to note that the mid-table
clubs would appear to operate the most
economically, generating an average op-
erating profit of almost €1 million.
Groups by league table position
in€’000 in% in€’000 in% in€’000 in% in€’000 in% in€’000 in% in€’000 in% in€’000 in%
Position 1 to 6 31,227 148 41,379 146 41,767 149 11,623 197 7,818 191 13,479 125 147,292 150
Position 7 to 12 20,615 98 27,519 97 25,618 91 3,129 53 3,795 92 13,330 124 94,006 96
Position 13 to 18 11,372 54 16,416 58 16,840 60 2,974 50 697 17 5,432 51 53,731 55
BL average 21,071 100 28,438 100 28,075 100 5,909 100 4,103 100 10,747 100 98,343 100
in€’000 in% in€’000 in% in€’000 in% in€’000 in% in€’000 in% in€’000 in% in€’000 in%
Position 1 to 6 66,333 159 9,169 174 22,324 142 24,922 158 4,539 123 31,862 155 159,149 155
Position 7 to 12 36,459 87 4,678 89 17,321 110 11,337 72 3,533 96 19,731 96 93,059 91
Position 13 to 18 22,221 53 1,979 38 7,564 48 11,117 70 2,959 80 9,959 49 55,799 54
BL average 41,671 100 5,276 100 15,737 100 15,792 100 3,677 100 20,517 100 102,669 100
Media2009/2010 Match Advertising receipts Transfers Merchandising Other Total
Commercial/ Youngplayers, Payrollcostsfor administrative amateurs, 2009/2010 matchoperations staff Transfers Matchoperations academies Other Total
2009/2010 Result
Position 1 to 6 -11,857
Position 7 to 12 947
Position 13 to 18 -2,067
Bundesliga average -4,326
Bundesliga Expenditure
BundesligaResultaftertax
average per licensee in €’000
Bundesliga Revenueaverage per licensee
average per licensee
32 2011 Bundesliga Report The economic state of professional football

8/22/2019 Bundesliga 2011.pdf
http://slidepdf.com/reader/full/bundesliga-2011pdf 37/64
Business dataBundesliga 2 >
33
8/22/2019 Bundesliga 2011.pdf
http://slidepdf.com/reader/full/bundesliga-2011pdf 38/64
Facts and figures
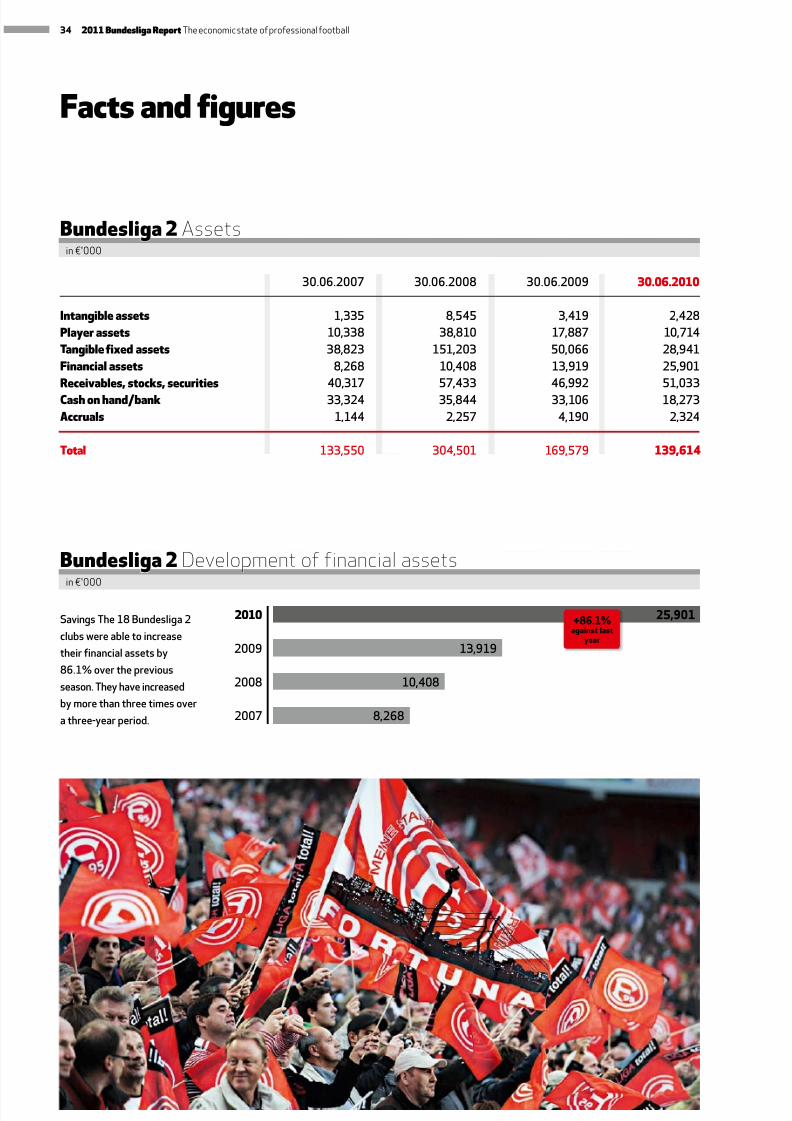
30.06.2007 30.06.2008 30.06.2009 30.06.2010
Intangible assets 1,335 8,545 3,419 2,428
Player assets 10,338 38,810 17,887 10,714
Tangible fixed assets 38,823 151,203 50,066 28,941
Financial assets 8,268 10,408 13,919 25,901
Receivables, stocks, securities 40,317 57,433 46,992 51,033
Cash on hand/bank 33,324 35,844 33,106 18,273
Accruals 1,144 2,257 4,190 2,324
Total 133,550 304,501 169,579 139,614
Bundesliga 2 Assets
8,268
10,408
13,919
25,901SavingsThe18Bundesliga2
clubswereabletoincrease
theirfinancialassetsby
86.1%overtheprevious
season.Theyhaveincreased
bymorethanthreetimesover
athree-yearperiod.
+86.1%against last
year
Bundesliga 2 Development of financial assets
2007
2008
2009
2010
in €'000
in €'000
34 2011 Bundesliga Report The economic state of professional football
8/22/2019 Bundesliga 2011.pdf
http://slidepdf.com/reader/full/bundesliga-2011pdf 39/64
Total assets in the Bundesliga 2
amounted to €139.6 million in
the 2009-10 season, an aver-
age of €7.7 million per club, and
a drop of 17.7% over the last season. This
can primarily be explained by the compo-
sition of the division, which changes con-
stantly as a result of the promotions and
relegations each season, with a consider-
able impact on the balance sheet.
Fixed assets amounted to €28.9 mil-
lion, while financial assets accounted
for €25.9 million. The largest single item
under assets was receivables, inventory
and securities at €51 million.
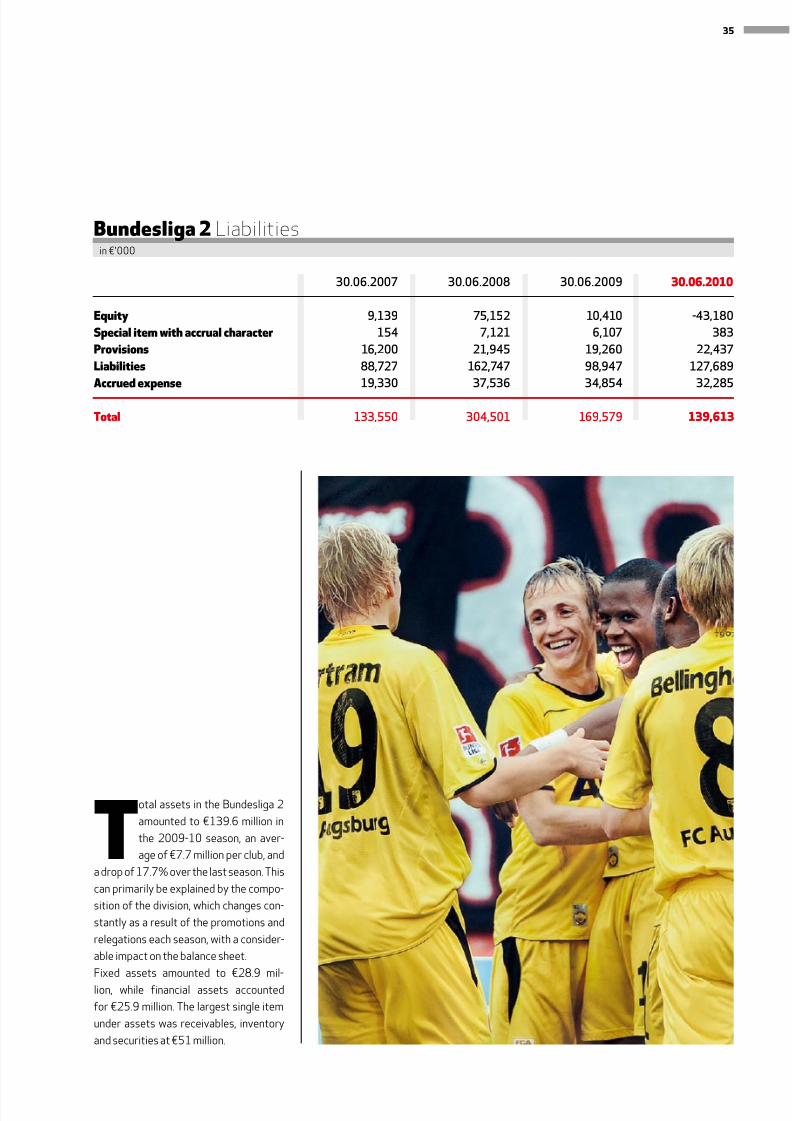
30.06.2007 30.06.2008 30.06.2009 30.06.2010
Equity 9,139 75,152 10,410 -43,180
Special item with accrual character 154 7,121 6,107 383
Provisions 16,200 21,945 19,260 22,437
Liabilities 88,727 162,747 98,947 127,689
Accrued expense 19,330 37,536 34,854 32,285
Total 133,550 304,501 169,579 139,613
Bundesliga 2 Liabilitiesin €'000
35
8/22/2019 Bundesliga 2011.pdf
http://slidepdf.com/reader/full/bundesliga-2011pdf 40/64
36 2011 Bundesliga Report The economic state of professional football
8/22/2019 Bundesliga 2011.pdf
http://slidepdf.com/reader/full/bundesliga-2011pdf 41/64
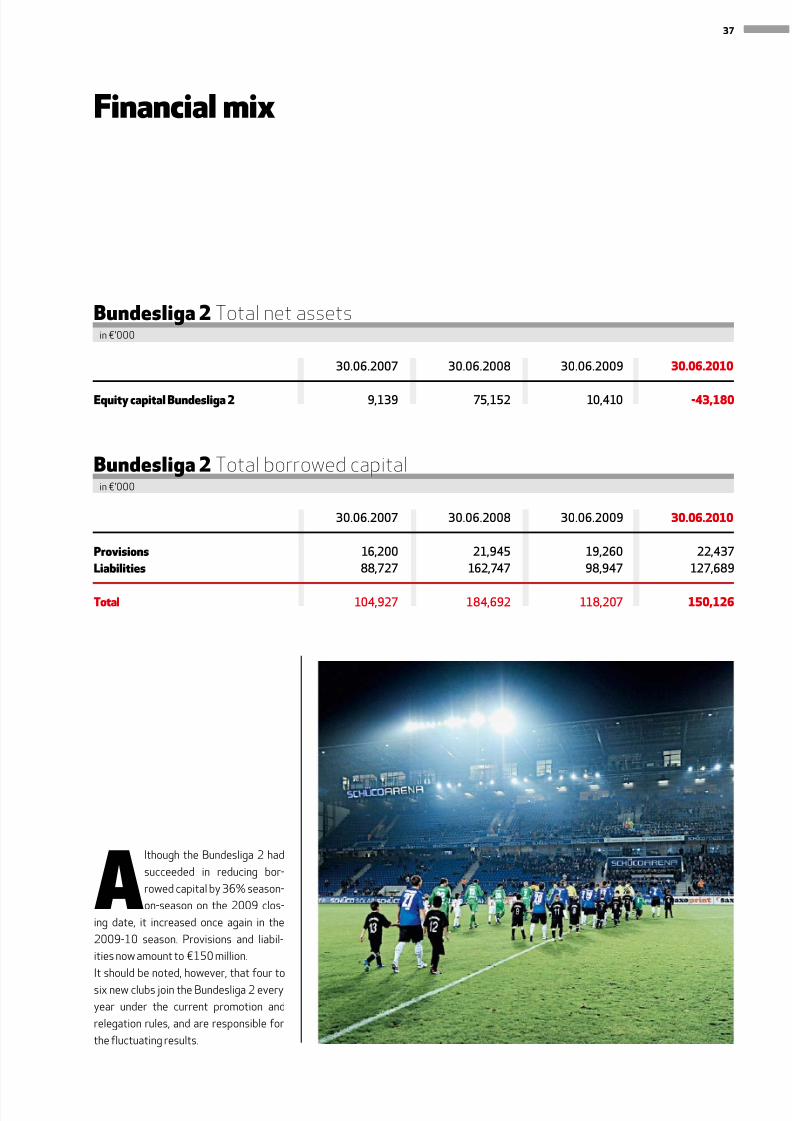
Although the Bundesliga 2 had
succeeded in reducing bor-
rowed capital by 36% season-
on-season on the 2009 clos-
ing date, it increased once again in the
2009-10 season. Provisions and liabil-
ities now amount to €150 million.
It should be noted, however, that four to
six new clubs join the Bundesliga 2 every
year under the current promotion and
relegation rules, and are responsible for
the fluctuating results.
Financial mix
30.06.2007 30.06.2008 30.06.2009 30.06.2010
Provisions 16,200 21,945 19,260 22,437
Liabilities 88,727 162,747 98,947 127,689
Total 104,927 184,692 118,207 150,126
Bundesliga 2 Total borrowed capital
30.06.2007 30.06.2008 30.06.2009 30.06.2010
Equity capital Bundesliga 2 9,139 75,152 10,410 -43,180
Bundesliga 2 Total net assetsin €’000
in €’000
37
8/22/2019 Bundesliga 2011.pdf
http://slidepdf.com/reader/full/bundesliga-2011pdf 42/64
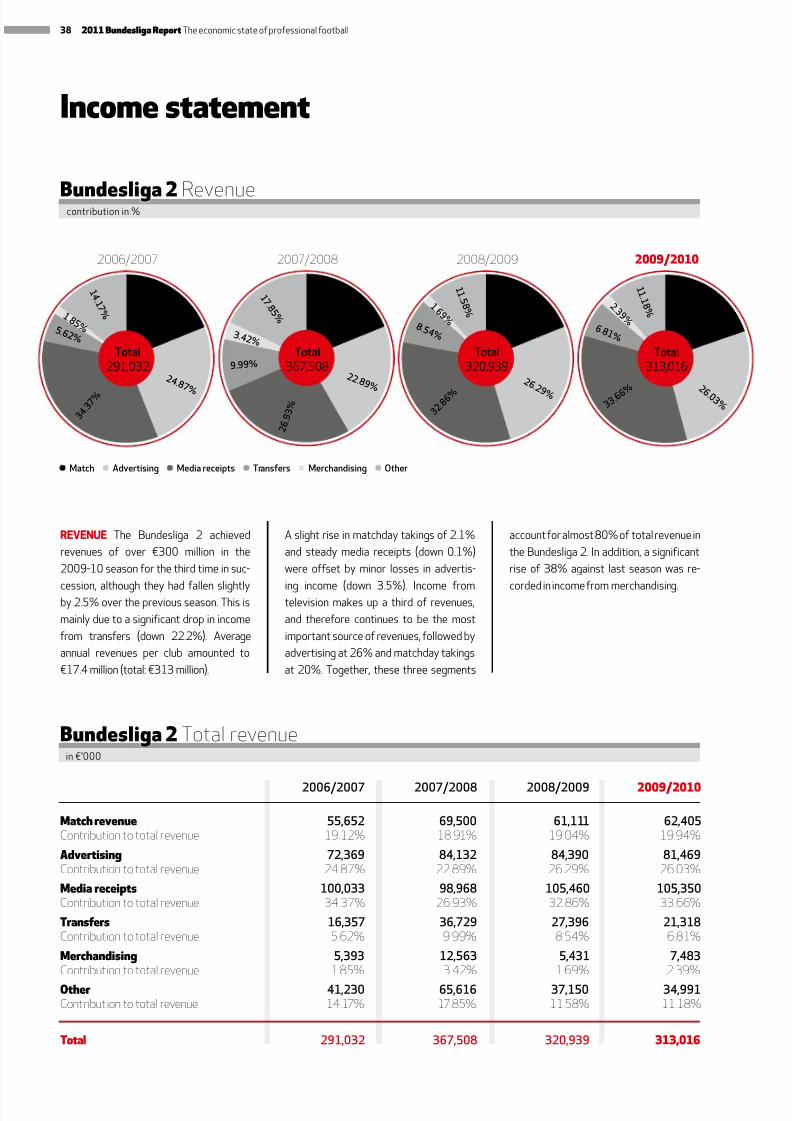
REVENUE The Bundesliga 2 achieved
revenues of over €300 million in the
2009-10 season for the third time in suc-
cession, although they had fallen slightlyby 2.5% over the previous season. This is
mainly due to a significant drop in income
from transfers (down 22.2%). Average
annual revenues per club amounted to
€17.4 million (total: €313 million).
A slight rise in matchday takings of 2.1%
and steady media receipts (down 0.1%)
were offset by minor losses in advertis-
ing income (down 3.5%). Income fromtelevision makes up a third of revenues,
and therefore continues to be the most
important source of revenues, followed by
advertising at 26% and matchday takings
at 20%. Together, these three segments
account for almost 80% of total revenue in
the Bundesliga 2. In addition, a significant
rise of 38% against last season was re-
corded in income from merchandising.
Income statement
Bundesliga 2 Revenue
2006/2007 2007/2008 2008/2009
Match Advertising Media receipts Transfers Merchandising Other
Total313,016
1 1 . 1 8 %
2 6 .0 3 %
2 . 3 9 % 6 .8 1 %
3 3. 6 6 %
1 9 . 9 4 %
2009/2010
Total291,032
Total367,508
Total320,939
1 4 . 1 7 %
2 6
. 9 3 %
1 1 . 5 8 %
2 4 .8 7 %
2 2 .8 9 % 2 6 .2 9 %
1 .8 5 % 5 .6 2 %
3 4 . 3 7 %
1 9 . 1 2 % 1 7 . 8 5 %
1 . 6 9 %
3 .4 2 %
8 .5 4 %
9.99 %
3 2 . 8 6 %
1 8 . 9 1 %
1 9 . 0 4 %
contribution in %
2006/2007 2007/2008 2008/2009 2009/2010
Match revenue 55,652 69,500 61,111 62,405Contribution to total revenue 19.12% 18.91% 19.04% 19.94%
Advertising 72,369 84,132 84,390 81,469Contribution to total revenue 24.87% 22.89% 26.29% 26.03%
Media receipts 100,033 98,968 105,460 105,350Contribution to total revenue 34.37% 26.93% 32.86% 33.66%
Transfers 16,357 36,729 27,396 21,318Contribution to total revenue 5.62% 9.99% 8.54% 6.81%
Merchandising 5,393 12,563 5,431 7,483Contribution to total revenue 1.85% 3.42% 1.69% 2.39%
Other 41,230 65,616 37,150 34,991Contribution to total revenue 14.17% 17.85% 11.58% 11.18%
Total 291,032 367,508 320,939 313,016
Bundesliga 2 Total revenuein €’000
38 2011 Bundesliga Report The economic state of professional football
8/22/2019 Bundesliga 2011.pdf
http://slidepdf.com/reader/full/bundesliga-2011pdf 43/64
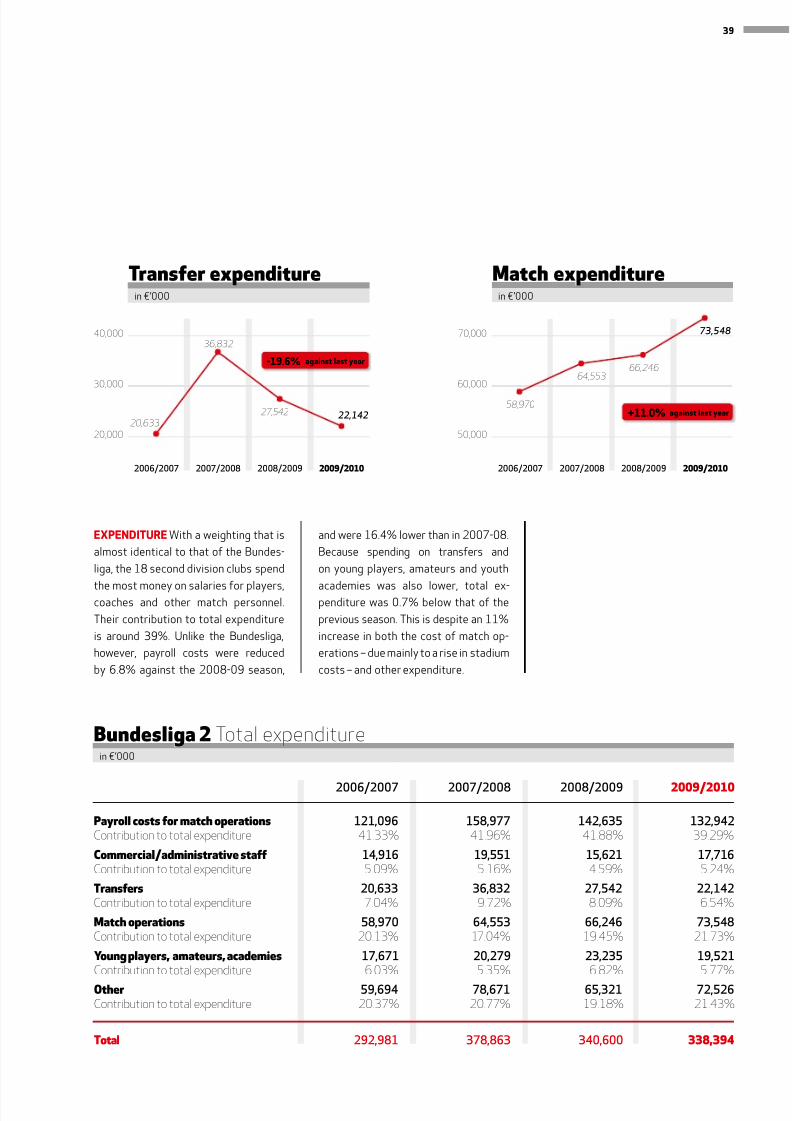
EXPENDITURE With a weighting that is
almost identical to that of the Bundes-
liga, the 18 second division clubs spend
the most money on salaries for players,coaches and other match personnel.
Their contribution to total expenditure
is around 39%. Unlike the Bundesliga,
however, payroll costs were reduced
by 6.8% against the 2008-09 season,
and were 16.4% lower than in 2007-08.
Because spending on transfers and
on young players, amateurs and youth
academies was also lower, total ex-penditure was 0.7% below that of the
previous season. This is despite an 11%
increase in both the cost of match op-
erations – due mainly to a rise in stadium
costs – and other expenditure.
2006/2007 2007/2008 2008/2009 2009/2010
Payroll costs for match operations 121,096 158,977 142,635 132,942Contribution to total expenditure 41.33% 41.96% 41.88% 39.29%
Commercial/administrative staff 14,916 19,551 15,621 17,716Contribution to total expenditure 5.09% 5.16% 4.59% 5.24%
Transfers 20,633 36,832 27,542 22,142Contribution to total expenditure 7.04% 9.72% 8.09% 6.54%
Match operations 58,970 64,553 66,246 73,548 Contribution to total expenditure 20.13% 17.04% 19.45% 21.73%
Young players, amateurs, academies 17,671 20,279 23,235 19,521Contribution to total expenditure 6.03% 5.35% 6.82% 5.77%
Other 59,694 78,671 65,321 72,526 Contribution to total expenditure 20.37% 20.77% 19.18% 21.43%
Total 292,981 378,863 340,600 338,394
Bundesliga 2 Total expenditurein €’000
20,633
36,832
27,542 22,142
40,000
30,000
20,000
2006/2007 2007/2008 2008/2009 2009/2010
Transfer expenditurein €’000
-19.6% against last year
58,970
64,55366,246
73,54870,000
60,000
50,000
2006/2007 2007/2008 2008/2009 2009/2010
Match expenditurein €’000
+11.0% against last year
39
8/22/2019 Bundesliga 2011.pdf
http://slidepdf.com/reader/full/bundesliga-2011pdf 44/64
2006/2007 2007/2008 2008/2009 2009/2010
Bundesliga 2 -1,948 -11,355 -19,660 -25,378
2006/2007 2007/2008 2008/2009 2009/2010
Bundesliga 2 785 1,854 255 -172
Bundesliga 2 Resul fer x
Bundesliga 2 Ebitda
in €’000
average in €’000
Results and indicators
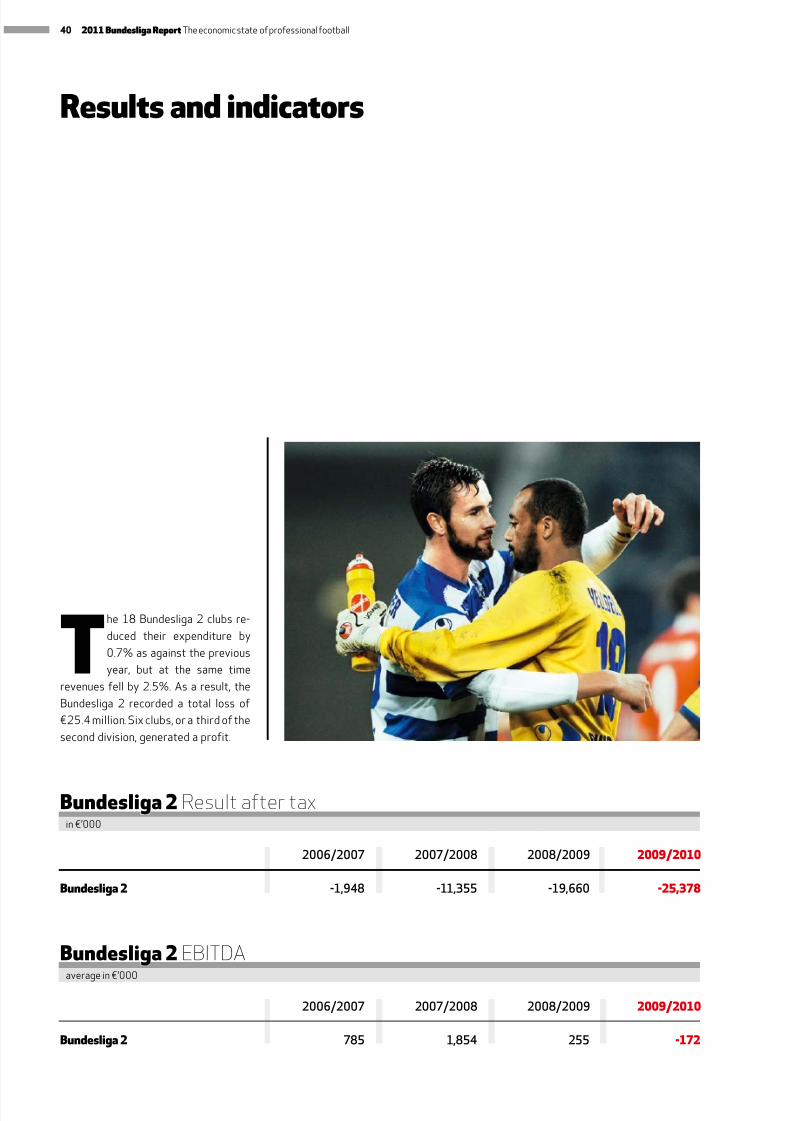
The 18 Bundesliga 2 clubs re-
duced their expenditure by
0.7% as against the previous
year, but at the same time
revenues fell by 2.5%. As a result, the
Bundesliga 2 recorded a total loss of
€25.4 million. Six clubs, or a third of the
second division, generated a profit.
40 2011 Bundesliga Report The economic state of professional football
8/22/2019 Bundesliga 2011.pdf
http://slidepdf.com/reader/full/bundesliga-2011pdf 45/64
2006/2007 2007/2008 2008/2009 2009/2010
Payroll costs for match operations 6,728 8,832 7,924 7,386Ratio I 41.6% 43.3% 44.4% 42.5%
Payroll costs match operations + comm./admin. staff 7,556 9,918 8,792 8,370Ratio II 46.7% 48.6% 49.3% 48.1%
Total revenue 16,168 20,417 17,830 17,390
2006/2007 2007/2008 2008/2009 2009/2010
Payroll costs for match operations 121,096 158,977 142,635 132,942Ratio I 41.6% 43.3% 44.4% 42.5%
Payroll costs match operations + comm./admin. staff 136,012 178,528 158,256 150,658 Ratio II 46.7% 48.6% 49.3% 48.1%
Total revenue 291,032 367,508 320,939 313,016
Bundesliga 2 Average
Bundesliga 2 Totalin €’000
in €’000
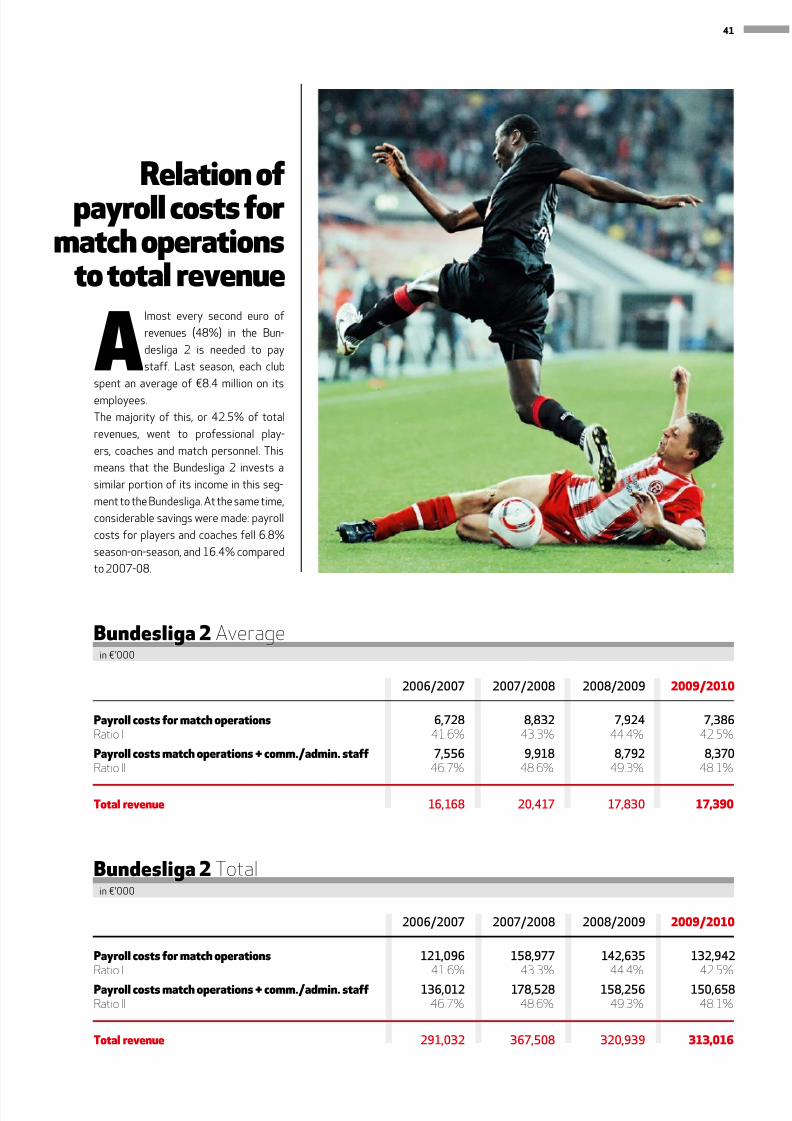
Almost every second euro of
revenues (48%) in the Bun-
desliga 2 is needed to pay
staff. Last season, each club
spent an average of €8.4 million on its
employees.
The majority of this, or 42.5% of total
revenues, went to professional play-
ers, coaches and match personnel. This
means that the Bundesliga 2 invests a
similar portion of its income in this seg-
ment to the Bundesliga. At the same time,
considerable savings were made: payroll
costs for players and coaches fell 6.8%
season-on-season, and 16.4% compared
to 2007-08.
Relation ofpayroll costs for
match operationsto total revenue
41
8/22/2019 Bundesliga 2011.pdf
http://slidepdf.com/reader/full/bundesliga-2011pdf 46/64
2009/2010 Rest
Gr I -2,838
Gr II -1,445
Gr III 53
Average Bndesiga 2 -1,410
Bndesiga 2Result after tax
average per licensee in €’000
Grs by ayr sts
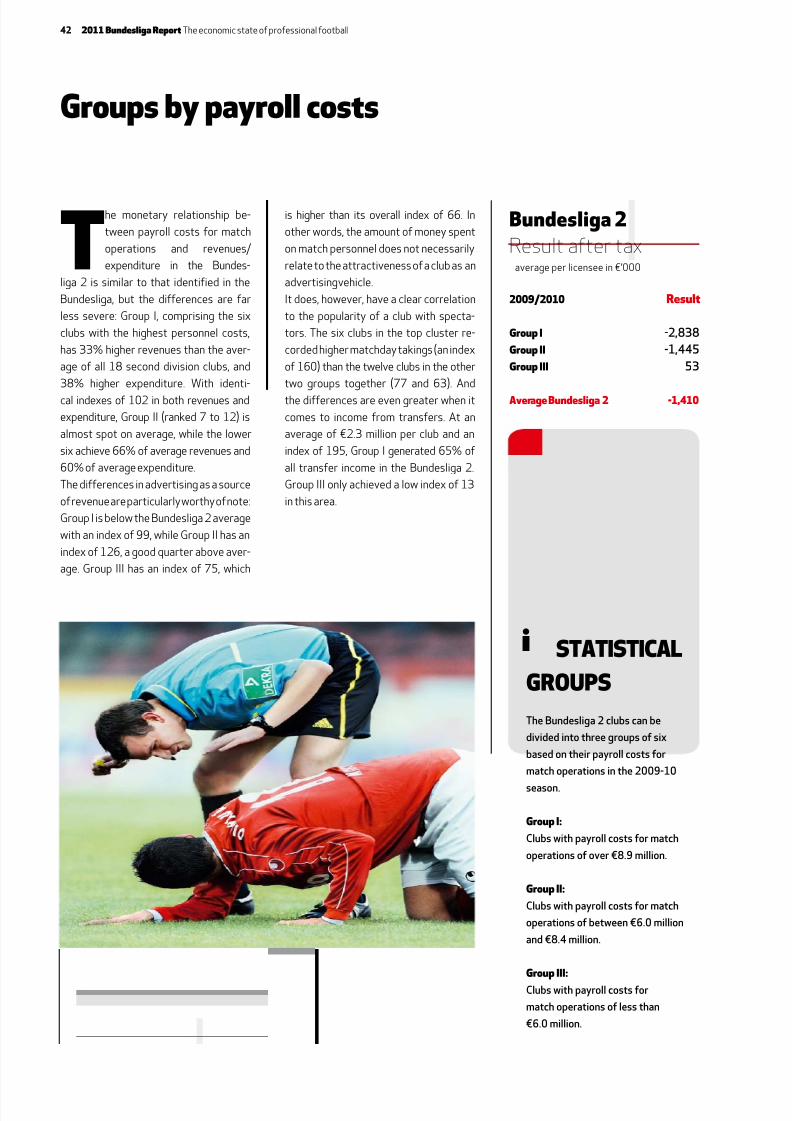
The monetary relationship be-
tween payroll costs for match
operations and revenues/
expenditure in the Bundes-
liga 2 is similar to that identified in the
Bundesliga, but the differences are far
less severe: Group I, comprising the six
clubs with the highest personnel costs,
has 33% higher revenues than the aver-
age of all 18 second division clubs, and
38% higher expenditure. With identi-
cal indexes of 102 in both revenues and
expenditure, Group II (ranked 7 to 12) is
almost spot on average, while the lower
six achieve 66% of average revenues and
60% of average expenditure.
The differences in advertising as a source
of revenue are particularly worthy of note:
Group I is below the Bundesliga 2 average
with an index of 99, while Group II has an
index of 126, a good quarter above aver-
age. Group III has an index of 75, which
is higher than its overall index of 66. In
other words, the amount of money spent
on match personnel does not necessarily
relate to the attractiveness of a club as an
advertising vehicle.
It does, however, have a clear correlation
to the popularity of a club with specta-
tors. The six clubs in the top cluster re-
corded higher matchday takings (an index
of 160) than the twelve clubs in the other
two groups together (77 and 63). And
the differences are even greater when it
comes to income from transfers. At an
average of €2.3 million per club and an
index of 195, Group I generated 65% of
all transfer income in the Bundesliga 2.
Group III only achieved a low index of 13
in this area.
STATISTIcAl
GRoupS
TheBundesliga2clubscanbe
dividedintothreegroupsofsix
basedontheirpayrollcostsfor
matchoperationsinthe2009-10
season.
Gr I:
Clubswithpayrollcostsformatch
operationsofover€8.9million.
Gr II:
Clubswithpayrollcostsformatch
operationsofbetween€6.0million
and€8.4million.
Gr III:
Clubswithpayrollcostsfor
matchoperationsoflessthan
€6.0million.
i
42 2011 Bundesliga Report The economic state of professional football
8/22/2019 Bundesliga 2011.pdf
http://slidepdf.com/reader/full/bundesliga-2011pdf 47/64
in€’000 in % in€’000 in % in€’000 in % in€’000 in % in€’000 in % in€’000 in % in€’000 in %
Gr I 5,534 160 4,477 99 7,161 122 2,309 195 450 108 3,147 162 23,078 133
Gr II 2,670 77 5,694 126 6,145 105 1,086 92 482 116 1,618 83 17,695 102
Gr III 2,197 63 3,407 75 4,253 73 157 13 316 76 1,067 55 11,396 66
Average Bl 2 3,467 100 4,526 100 5,853 100 1,184 100 416 100 1,944 100 17,390 100
in€’000 in % in€’000 in % in€’000 in % in€’000 in % in€’000 in % in€’000 in % in€’000 in %
Gr I 10,056 136 1,177 120 1,781 145 5,449 133 1,520 140 5,932 147 25,916 138
Gr II 7,182 97 1,074 109 1,449 118 4,400 108 1,188 110 3,846 95 19,139 102
Gr III 4,918 67 701 71 461 37 2,409 59 546 50 2,309 57 11,344 60
Average Bl 2 7,386 100 984 100 1,230 100 4,086 100 1,084 100 4,029 100 18,800 100
Media2009/2010 Match Advertising receipts Transfers Merchandising Other Tta
Commercial/ Youngplayers, Payrollcostsfor administrative amateurs, 2009/2010 matchoperations staff Transfers Matchoperations academies Other Tta
Bndesiga 2 Revenue
Bndesiga 2 Expenditure
average per licensee
average per licensee
43
8/22/2019 Bundesliga 2011.pdf
http://slidepdf.com/reader/full/bundesliga-2011pdf 48/64
in€’000 in% in€’000 in% in€’000 in% in€’000 in% in€’000 in% in€’000 in% in€’000 in%
Position 1 to 6 5,477 158 5,199 115 6,150 105 280 24 841 202 2,095 108 20,043 115
Position 7 to 12 2,791 80 4,258 94 6,857 117 2,507 212 142 34 2,475 127 19,030 109
Position 13 to 18 2,133 62 4,121 91 4,551 78 767 65 264 63 1,261 65 13,097 75
Average BL 2 3,467 100 4,526 100 5,853 100 1,184 100 416 100 1,944 100 17,390 100
in€’000 in% in€’000 in% in€’000 in% in€’000 in% in€’000 in% in€’000 in% in€’000 in%
Position 1 to 6 8,679 118 1,076 109 1,245 101 5,087 125 1,109 102 4,436 110 21,633 115
Position 7 to 12 7,903 107 990 101 1,729 141 4,142 101 1,425 131 4,515 112 20,704 110
Position 13 to 18 5,575 75 887 90 716 58 3,029 74 719 66 3,136 78 14,062 75
Average BL 2 7,386 100 984 100 1,230 100 4,086 100 1,084 100 4,029 100 18,800 100
Media2009/2010 Match Advertising receipts Transfers Merchandising Other Total
Commercial/ Youngplayers, Payrollcostsfor administrative amateurs, 2009/2010 matchoperations staff Transfers Matchoperations academies Other Total
2009/2010 Result
Position 1 to 6 -1,590
Position 7 to 12 -1,675
Position 13 to 18 -965
Average Bundesliga 2 -1,410
Bundesliga 2Resultaftertax
Bundesliga 2 Revenue
Bundesliga 2 Expenditure
average per licensee in €’000
average per licensee
average per licensee
Groups by league table position
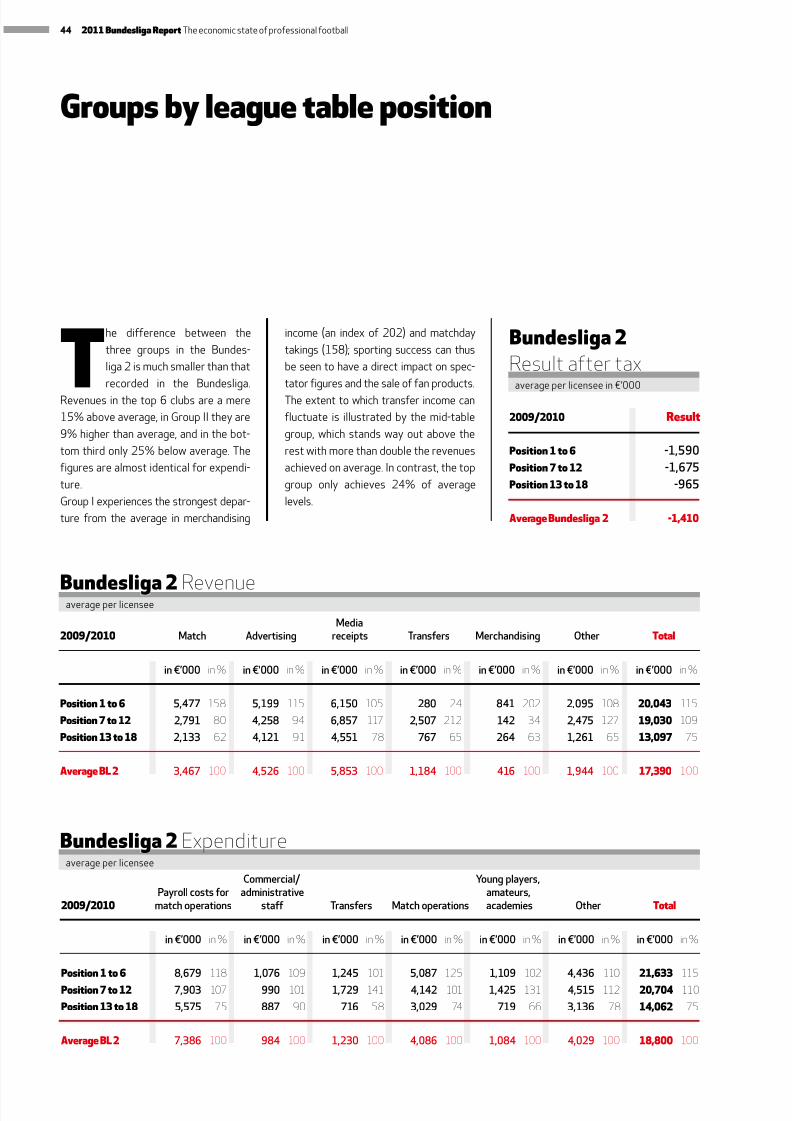
T
he difference between the
three groups in the Bundes-
liga 2 is much smaller than that
recorded in the Bundesliga.
Revenues in the top 6 clubs are a mere
15% above average, in Group II they are
9% higher than average, and in the bot-
tom third only 25% below average. The
figures are almost identical for expendi-
ture.
Group I experiences the strongest depar-
ture from the average in merchandising
income (an index of 202) and matchday
takings (158); sporting success can thus
be seen to have a direct impact on spec-
tator figures and the sale of fan products.
The extent to which transfer income can
fluctuate is illustrated by the mid-table
group, which stands way out above the
rest with more than double the revenues
achieved on average. In contrast, the top
group only achieves 24% of average
levels.
44 2011 Bundesliga Report The economic state of professional football
8/22/2019 Bundesliga 2011.pdf
http://slidepdf.com/reader/full/bundesliga-2011pdf 49/64
Business data
licensed football >
45
8/22/2019 Bundesliga 2011.pdf
http://slidepdf.com/reader/full/bundesliga-2011pdf 50/64
30.06.2007 30.06.2008 30.06.2009 30.06.2010
Intangible assets 13,063 13,129 10,726 9,323
Player assets 213,452 379,380 364,847 405,928
Tangible fixed assets 229,986 269,895 259,501 247,553
Financial assets 356,701 429,971 468,382 471,250
Receivables, stocks, securities 268,955 272,820 317,158 279,231
Cash on hand/bank 197,703 164,246 179,231 177,303
Accruals 24,366 32,659 35,537 47,712
Total 1,304,227 1,562,098 1,635,380 1,638,300
Licensed football Assets
213,452
379,380
364,847
405,928OntheincreaseThe36
professionalclubshave
increasedtheirplayerassets
byaround90%withinjust
threeyears,achievinganew
recordat€406million.
+11.3%against last
year
Licensed football Development of player assets
2007
2008
2009
2010
in €'000
in €'000
Facts and figures
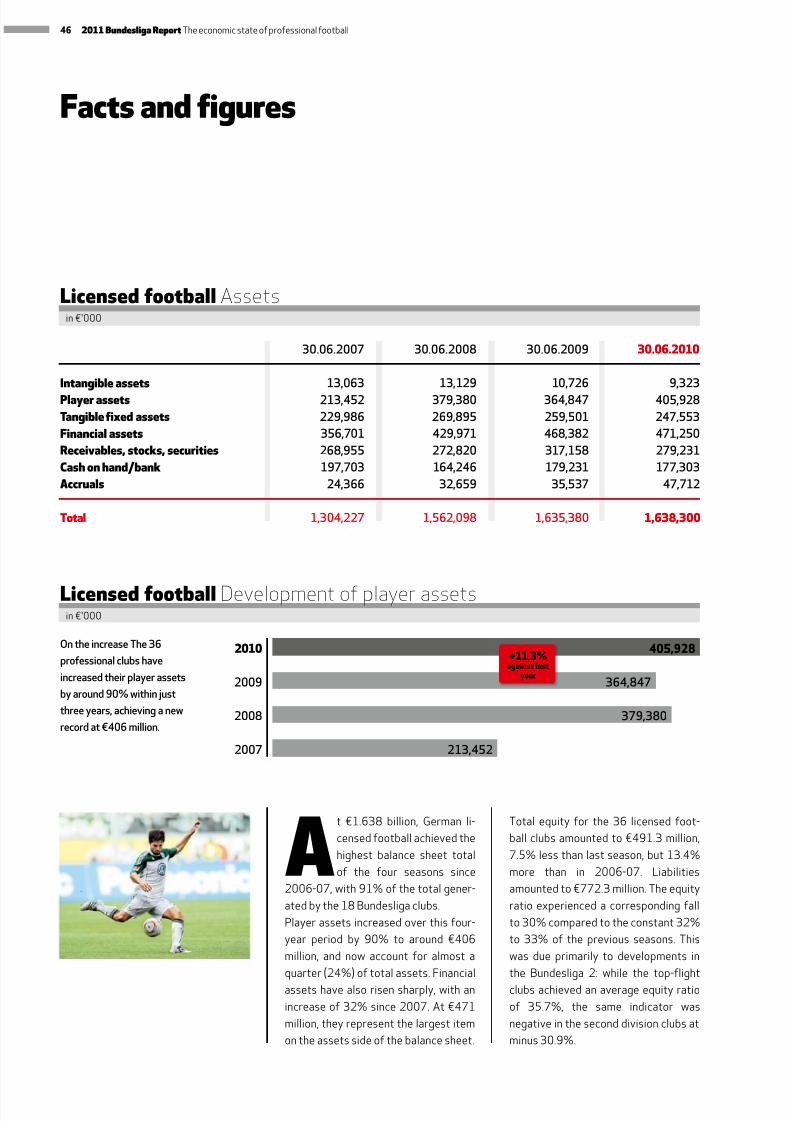
At €1.638 billion, German li-
censed football achieved the
highest balance sheet total
of the four seasons since
2006-07, with 91% of the total gener-
ated by the 18 Bundesliga clubs.
Player assets increased over this four-
year period by 90% to around €406
million, and now account for almost a
quarter (24%) of total assets. Financial
assets have also risen sharply, with an
increase of 32% since 2007. At €471
million, they represent the largest item
on the assets side of the balance sheet.
Total equity for the 36 licensed foot-
ball clubs amounted to €491.3 million,
7.5% less than last season, but 13.4%
more than in 2006-07. Liabilities
amounted to €772.3 million. The equity
ratio experienced a corresponding fall
to 30% compared to the constant 32%
to 33% of the previous seasons. This
was due primarily to developments in
the Bundesliga 2: while the top-flight
clubs achieved an average equity ratio
of 35.7%, the same indicator was
negative in the second division clubs at
minus 30.9%.
46 2011 Bundesliga Report The economic state of professional football
8/22/2019 Bundesliga 2011.pdf
http://slidepdf.com/reader/full/bundesliga-2011pdf 51/64
30.06.2007 30.06.2008 30.06.2009 30.06.2010
Equity 433,089 505,307 531,365 491,297
Special item with accrual character 7,530 7,608 6,539 6,150
Provisions 105,734 124,060 121,982 110,911
Liabilities 599,050 632,200 709,369 772,294
Accrued expense 158,825 292,923 266,125 257,645
Total 1,304,227 1,562,098 1,635,380 1,638,300
Licensed football Liabilitiesin €'000
47
8/22/2019 Bundesliga 2011.pdf
http://slidepdf.com/reader/full/bundesliga-2011pdf 52/64
30.06.2007 30.06.2008 30.06.2009 30.06.2010
Provisions 105,734 124,060 121,982 110,911
Liabilities 599,050 632,200 709,369 772,294
Total 704,784 756,260 831,350 883,206
LicensedfootballTotal borrowed capital
30.06.2007 30.06.2008 30.06.2009 30.06.2010
Equityinlicensedfootball 433,089 505,307 531,365 491,297
LicensedfootballTotal net assetsin €’000
in €’000
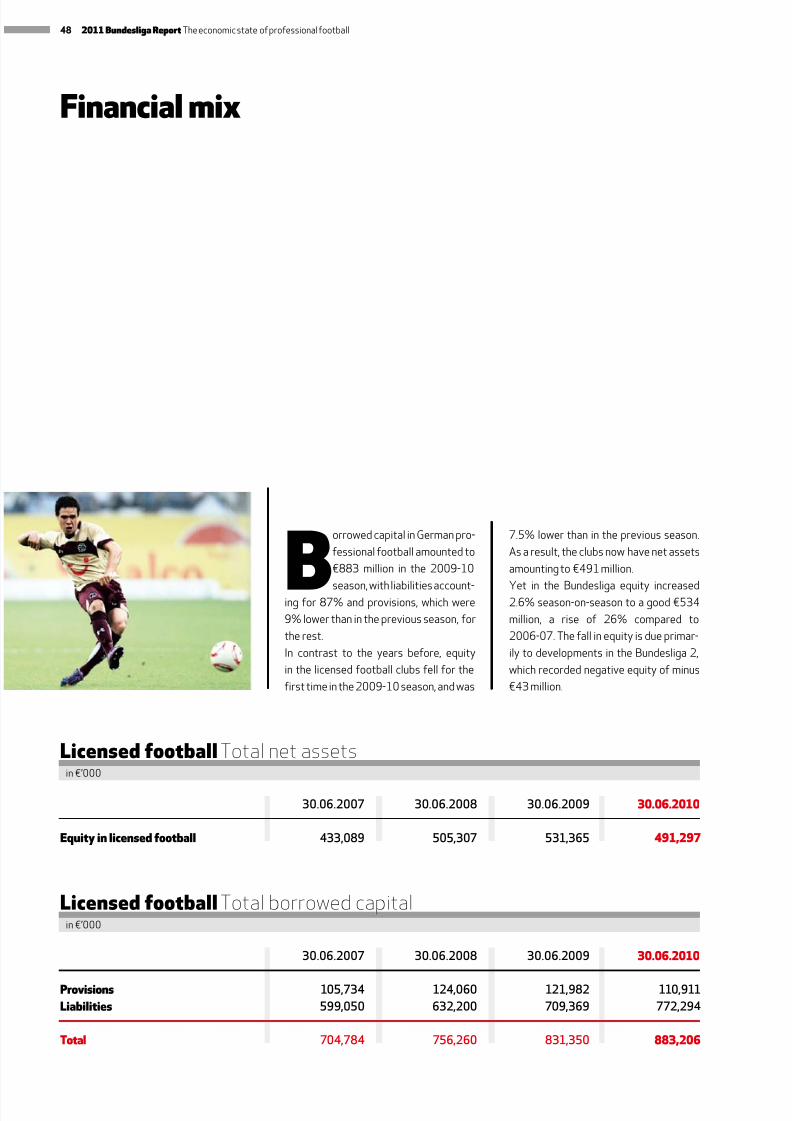
B
orrowed capital in German pro-
fessional football amounted to
€883 million in the 2009-10
season, with liabilities account-ing for 87% and provisions, which were
9% lower than in the previous season, for
the rest.
In contrast to the years before, equity
in the licensed football clubs fell for the
first time in the 2009-10 season, and was
7.5% lower than in the previous season.
As a result, the clubs now have net assets
amounting to €491 million.
Yet in the Bundesliga equity increased2.6% season-on-season to a good €534
million, a rise of 26% compared to
2006-07. The fall in equity is due primar-
ily to developments in the Bundesliga 2,
which recorded negative equity of minus
€43 million.
Financialmix
48 2011 Bundesliga Report The economic state of professional football
8/22/2019 Bundesliga 2011.pdf
http://slidepdf.com/reader/full/bundesliga-2011pdf 53/64
49
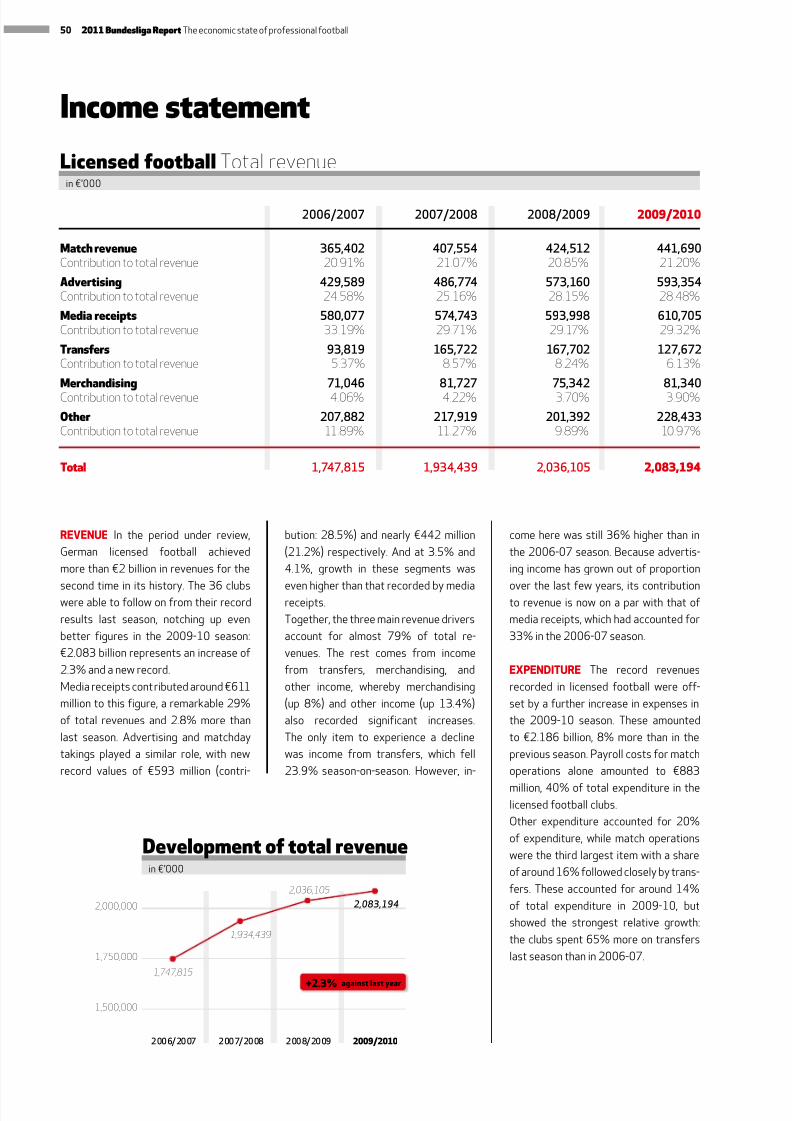
8/22/2019 Bundesliga 2011.pdf
http://slidepdf.com/reader/full/bundesliga-2011pdf 54/64
REVENUE In the period under review,
German licensed football achieved
more than €2 billion in revenues for the
second time in its history. The 36 clubswere able to follow on from their record
results last season, notching up even
better figures in the 2009-10 season:
€2.083 billion represents an increase of
2.3% and a new record.
Media receipts cont ributed around €611
million to this figure, a remarkable 29%
of total revenues and 2.8% more than
last season. Advertising and matchday
takings played a similar role, with new
record values of €593 million (contri-
bution: 28.5%) and nearly €442 million
(21.2%) respectively. And at 3.5% and
4.1%, growth in these segments was
even higher than that recorded by mediareceipts.
Together, the three main revenue drivers
account for almost 79% of total re-
venues. The rest comes from income
from transfers, merchandising, and
other income, whereby merchandising
(up 8%) and other income (up 13.4%)
also recorded significant increases.
The only item to experience a decline
was income from transfers, which fell
23.9% season-on-season. However, in-
come here was still 36% higher than in
the 2006-07 season. Because advertis-
ing income has grown out of proportion
over the last few years, its contributionto revenue is now on a par with that of
media receipts, which had accounted for
33% in the 2006-07 season.
EXPENDITURE The record revenues
recorded in licensed football were off-
set by a further increase in expenses in
the 2009-10 season. These amounted
to €2.186 billion, 8% more than in the
previous season. Payroll costs for match
operations alone amounted to €883
million, 40% of total expenditure in thelicensed football clubs.
Other expenditure accounted for 20%
of expenditure, while match operations
were the third largest item with a share
of around 16% followed closely by trans-
fers. These accounted for around 14%
of total expenditure in 2009-10, but
showed the strongest relative growth:
the clubs spent 65% more on transfers
last season than in 2006-07.
2006/2007 2007/2008 2008/2009 2009/2010
Match revenue 365,402 407,554 424,512 441,690Contribution to total revenue 20.91% 21.07% 20.85% 21.20%
Advertising 429,589 486,774 573,160 593,354Contribution to total revenue 24.58% 25.16% 28.15% 28.48%
Media receipts 580,077 574,743 593,998 610,705Contribution to total revenue 33.19% 29.71% 29.17% 29.32%
Transfers 93,819 165,722 167,702 127,672Contribution to total revenue 5.37% 8.57% 8.24% 6.13%
Merchandising 71,046 81,727 75,342 81,340Contribution to total revenue 4.06% 4.22% 3.70% 3.90%
Other 207,882 217,919 201,392 228,433Contribution to total revenue 11.89% 11.27% 9.89% 10.97%
Total 1,747,815 1,934,439 2,036,105 2,083,194
Licensed football Total revenuein €’000
1,747,815
1,934,439
2,036,105
2,083,1942,000,000
1,750,000
1,500,000
2006/2007 2007/2008 2008/2009 2009/2010
Development of total revenuein €’000
+2.3% against last year
Income statement
50 2011 Bundesliga Report The economic state of professional football
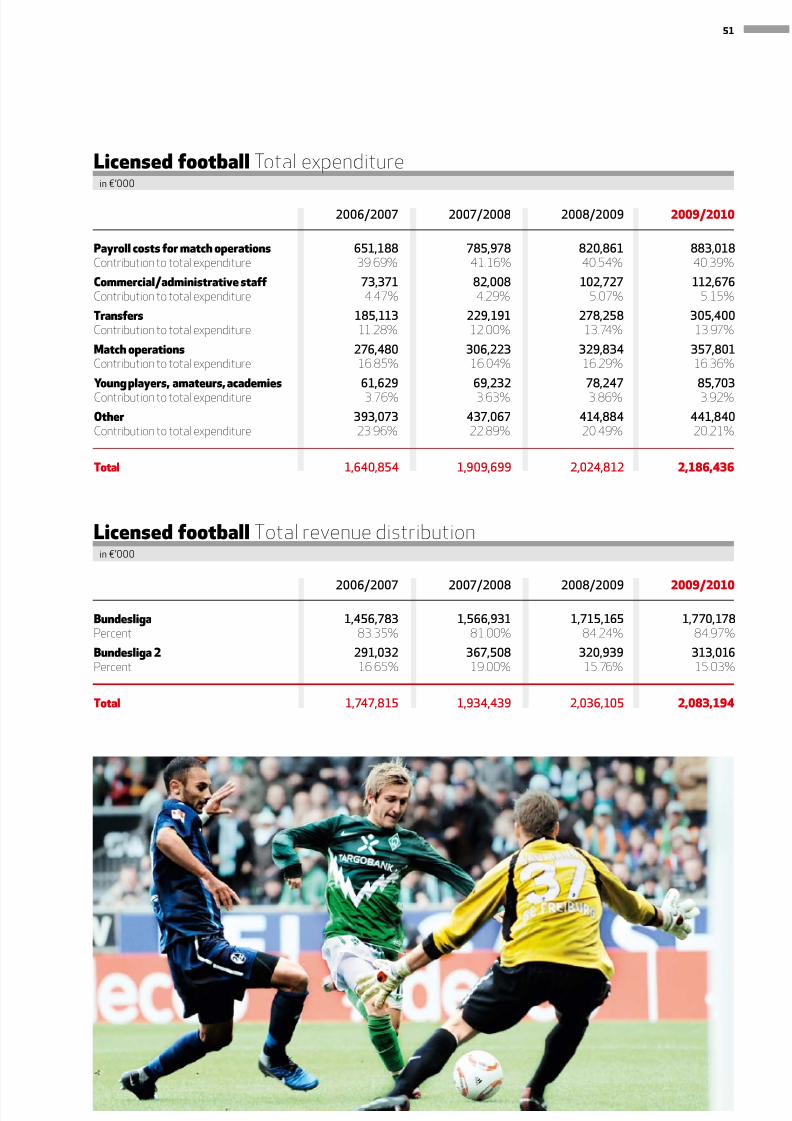
8/22/2019 Bundesliga 2011.pdf
http://slidepdf.com/reader/full/bundesliga-2011pdf 55/64
2006/2007 2007/2008 2008/2009 2009/2010
Payroll costs for match operations 651,188 785,978 820,861 883,018Contribution to total expenditure 39.69% 41.16% 40.54% 40.39%
Commercial/administrative staff 73,371 82,008 102,727 112,676Contribution to total expenditure 4.47% 4.29% 5.07% 5.15%
Transfers 185,113 229,191 278,258 305,400Contribution to total expenditure 11.28% 12.00% 13.74% 13.97%
Match operations 276,480 306,223 329,834 357,801Contribution to total expenditure 16.85% 16.04% 16.29% 16.36%
Young players, amateurs, academies 61,629 69,232 78,247 85,703Contribution to total expenditure 3.76% 3.63% 3.86% 3.92%
Other 393,073 437,067 414,884 441,840Contribution to total expenditure 23.96% 22.89% 20.49% 20.21%
Total 1,640,854 1,909,699 2,024,812 2,186,436
Licensed football Total expenditurein €’000
2006/2007 2007/2008 2008/2009 2009/2010
Bundesliga 1,456,783 1,566,931 1,715,165 1,770,178Percent 83.35% 81.00% 84.24% 84.97%
Bundesliga 2 291,032 367,508 320,939 313,016Percent 16.65% 19.00% 15.76% 15.03%
Total 1,747,815 1,934,439 2,036,105 2,083,194
Licensed football Total revenue distributionin €’000
51
8/22/2019 Bundesliga 2011.pdf
http://slidepdf.com/reader/full/bundesliga-2011pdf 56/64
2006/2007 2007/2008 2008/2009 2009/2010
Licensed football 106,961 24,740 11,293 -103,242
2006/2007 2007/2008 2008/2009 2009/2010
Licensed football 8,259 7,256 7,404 5,388
Licensed football Resul fer x
Licensed football Ebitda
in €’000
average in €’000
Results and indicators
German licensed football re-
corded a net loss of €103 mil-
lion in the 2009-10 season,
almost 25% of which was
generated by the Bundesliga 2. By way
of comparison, the second division clubs
contributed only 15% to total revenues.
While the Bundesliga 2 had already re-
corded higher expenditure than income
several years running, the Bundesliga
returned a loss of around €78 million for
the first time, after a profit of €31 million
in the 2008-09 season. 13 of the 36 li-
censed clubs, i.e. around a third, closed the
2009-10 season with a profit after tax.
52 2011 Bundesliga Report The economic state of professional football
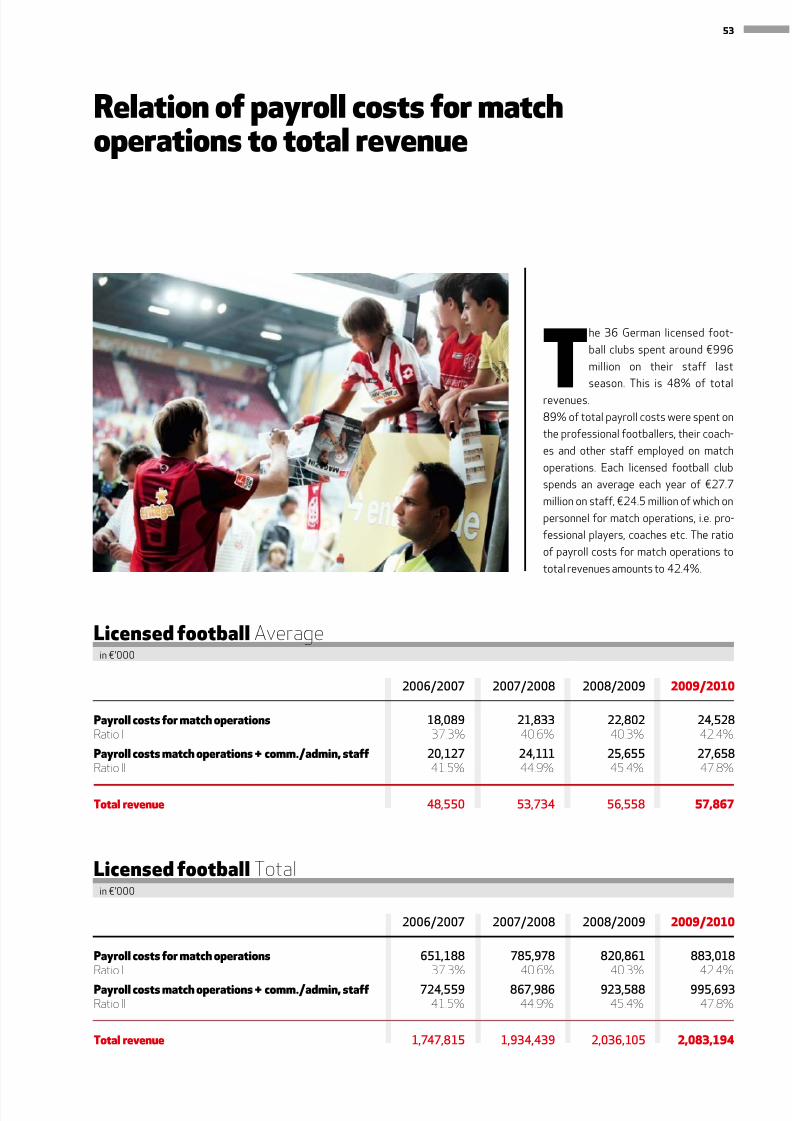
8/22/2019 Bundesliga 2011.pdf
http://slidepdf.com/reader/full/bundesliga-2011pdf 57/64
2006/2007 2007/2008 2008/2009 2009/2010
Payroll costs for match operations 18,089 21,833 22,802 24,528 Ratio I 37.3% 40.6% 40.3% 42.4%
Payroll costs match operations + comm./admin, staff 20,127 24,111 25,655 27,658Ratio II 41.5% 44.9% 45.4% 47.8%
Total revenue 48,550 53,734 56,558 57,867
2006/2007 2007/2008 2008/2009 2009/2010
Payroll costs for match operations 651,188 785,978 820,861 883,018 Ratio I 37.3% 40.6% 40.3% 42.4%
Payroll costs match operations + comm./admin, staff 724,559 867,986 923,588 995,693Ratio II 41.5% 44.9% 45.4% 47.8%
Total revenue 1,747,815 1,934,439 2,036,105 2,083,194
Licensed football Average
Licensed football Total
in €’000
in €’000
Relation of payroll costs for matchoperations to total revenue
T
he 36 German licensed foot-
ball clubs spent around €996
million on their staff last
season. This is 48% of total
revenues.
89% of total payroll costs were spent on
the professional footballers, their coach-
es and other staff employed on match
operations. Each licensed football club
spends an average each year of €27.7
million on staff, €24.5 million of which on
personnel for match operations, i.e. pro-
fessional players, coaches etc. The ratio
of payroll costs for match operations to
total revenues amounts to 42.4%.
53
8/22/2019 Bundesliga 2011.pdf
http://slidepdf.com/reader/full/bundesliga-2011pdf 58/64
Exactly 17,374,518 spectators
watched a Bundesliga or Bun-
desliga 2 match in the 2009-10
season. This is the third highest
number ever recorded, and is the equiva-
lent of 28,390 spectators per fixture.
The Bundesliga has therefore cemented
the record results achieved in the past.
After chalking up new spectator records
every year for seven years in a row, 12.791
million spectators saw the 18 top-flight
clubs last season, an average of 41,802
per match. This is almost exactly the same
number as in the previous season. The
minimal decline of 0.24% is only 30,976
spectators less across the season, and at
306 matches per season represents a de-
cline of just 101 visitors per fixture. Giventhe short break between the first and
second half of the season combined with
a comparatively long and hard winter, and
several stadium conversions reducing the
number of seats available, the Bundesliga
has clearly strengthened its position and
continues to draw the crowds.
Over half the tickets for Bundesliga
matches or 58% were season tickets in
the 2009-10 season. The average en-
trance fee increased moderately from
€20.79 to €21.89 across all Bundes-
liga clubs and all categories of ticket from
standing room to grandstand. Gross gate
receipts rose by €11 million to €217.4
million.
This friendly pricing system, together with
attractive sport and a competition whose
balanced nature is unique in international
comparison, is one of the reasons that the
Bundesliga is more popular with specta-
tors than any other European football
league. Visitors to a stadium in England,
Italy or Spain pay 50% to 100% more for
a ticket than in Germany.
In the Bundesliga 2 the number of spec-
tators fell slightly season-on-season by
3.7% to 4.583 million. This means that
an average of 14,977 million people went
to the stadium to watch a second division
match live. Last year the average number
was 15,550, but the demand for season
tickets was slightly lower this time round,
and their contribution to the number of
tickets sold fell from 52.5% to 43.3%.
The average entrance fee in the Bundes-
liga 2 was €13.77, around 3% more than
in the previous season.
Spectator report
54 2011 Bundesliga Report The economic state of professional football
8/22/2019 Bundesliga 2011.pdf
http://slidepdf.com/reader/full/bundesliga-2011pdf 59/64
2007/2008 2008/2009 2009/2010
Total paid admissions 17,432,953 17,580,821 17,374,518
of which season tickets (total) 9,683,298 10,048,680 9,441,338
proportion of season tickets (relative) 55.55% 57.16% 54.34%
of which day tickets (total) 7,749,655 7,532,141 7,933,180
proportion of day tickets (relative) 44.45% 42.84% 45.66%
Paid admissions, per match 28,485 28,727 28,390
of which season tickets per match 14,530 13,999 15,427
of which day tickets per match 13,955 14,728 12,963
Gross average ticket price (in €) 17.52 18.78 19.81
2007/2008 2008/2009 2009/2010
Total paid admissions 11,926,395 12,822,484 12,791,508
of which season tickets (total) 6,887,844 7,552,746 7,458,728
proportion of season tickets (relative) 57.75% 58.90% 58.31%
of which day tickets (total) 5,038,551 5,269,738 5,332,780
proportion of day tickets (relative) 42.25% 41.10% 41.69%
Paid admissions, per match 38,975 41,904 41,802
of which season tickets per match 22,509 24,682 24,375
of which day tickets per match 16,466 17,221 17,427
Gross average ticket price (in €) 19.47 20.79 21.89
2007/2008 2008/2009 2009/2010
Total paid admissions 5,506,558 4,758,337 4,583,010of which season tickets (total) 2,795,454 2,495,934 1,982,610
proportion of season tickets (relative) 50.77% 52.45% 43.26%
of which day tickets (total) 2,711,104 2,262,403 2,600,400
proportion of day tickets (relative) 49.23% 47.55% 56.74%
Paid admissions, per match 17,995 15,550 14,977
of which season tickets per match 9,135 8,157 6,480
of which day tickets per match 8,860 7,393 8,497
Gross average ticket price (in €) 13.30 13.35 13.77
Licensed football Paying spectators
Bundesliga Paying spectators
Bundesliga 2 Paying spectators
55
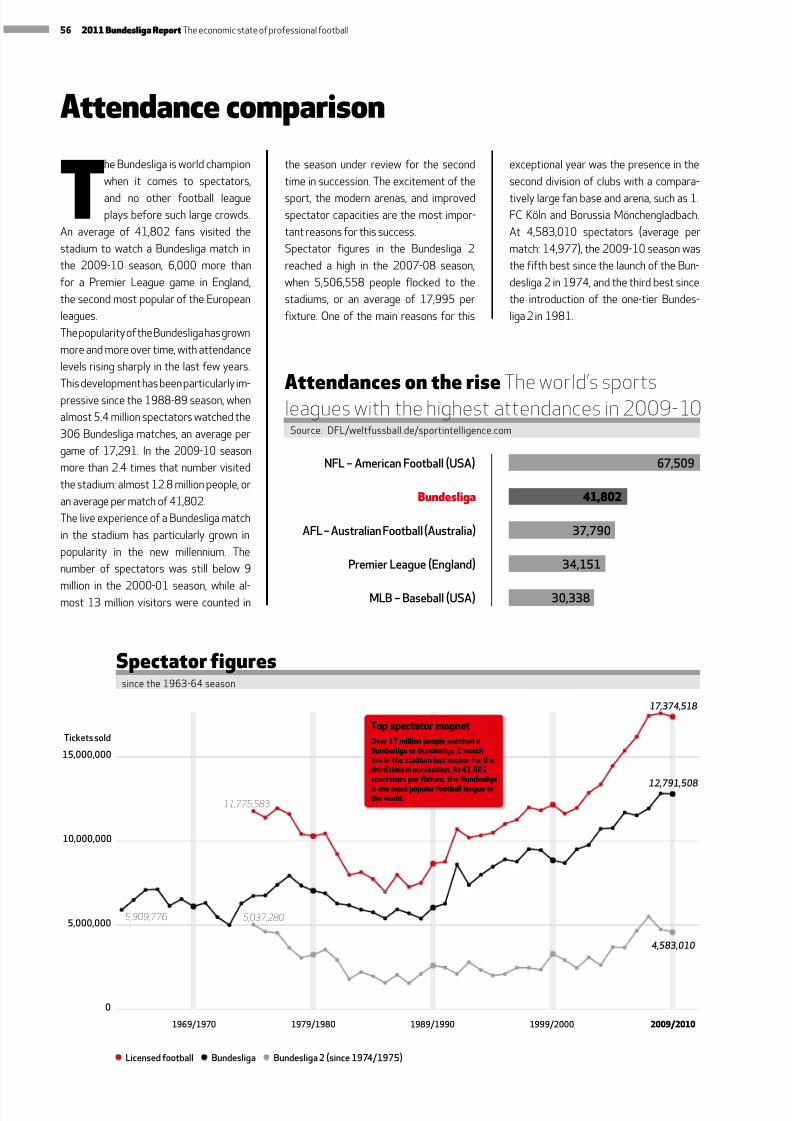
8/22/2019 Bundesliga 2011.pdf
http://slidepdf.com/reader/full/bundesliga-2011pdf 60/64
The Bundesliga is world champion
when it comes to spectators,
and no other football leagueplays before such large crowds.
An average of 41,802 fans visited the
stadium to watch a Bundesliga match in
the 2009-10 season, 6,000 more than
for a Premier League game in England,
the second most popular of the European
leagues.
The popularity of the Bundesliga has grown
more and more over time, with attendance
levels rising sharply in the last few years.
This development has been particularly im-
pressive since the 1988-89 season, when
almost 5.4 million spectators watched the
306 Bundesliga matches, an average per
game of 17,291. In the 2009-10 season
more than 2.4 times that number visited
the stadium: almost 12.8 million people, or
an average per match of 41,802.
The live experience of a Bundesliga match
in the stadium has particularly grown in
popularity in the new millennium. The
number of spectators was still below 9
million in the 2000-01 season, while al-most 13 million visitors were counted in
the season under review for the second
time in succession. The excitement of the
sport, the modern arenas, and improvedspectator capacities are the most impor-
tant reasons for this success.
Spectator figures in the Bundesliga 2
reached a high in the 2007-08 season,
when 5,506,558 people flocked to the
stadiums, or an average of 17,995 per
fixture. One of the main reasons for this
exceptional year was the presence in the
second division of clubs with a compara-
tively large fan base and arena, such as 1.FC Köln and Borussia Mönchengladbach.
At 4,583,010 spectators (average per
match: 14,977), the 2009-10 season was
the fifth best since the launch of the Bun-
desliga 2 in 1974, and the third best since
the introduction of the one-tier Bundes-
liga 2 in 1981.
15,000,000
10,000,000
5,000,000
0
1969/1970 1979/1980 1989/1990 1999/2000 2009/2010
Licensed football Bundesliga Bundesliga 2 (since 1974/1975)
17,374,518
5,909,776
11,775,583
5,037,280
12,791,508
4,583,010
Tickets sold
Spectator figuressince the 1963-64 season
Top spectator magnet
Over 17 million people watched aBundesliga or Bundesliga 2 matchlive in the stadium last season for thethird time in succession. At 41,802spectators per fixture, the Bundesligais the most popular football league inthe world.
Attendance comparison
34,151
37,790
30,338
41,802
67,509
Attendances on the rise The world’s sportsleagues with the highest attendances in 2009-10
NFL – American Football (USA)
AFL – Australian Football (Australia)
Bundesliga
Premier League (England)
MLB – Baseball (USA)
Source: DFL/weltfussball.de/sportintelligence.com
56 2011 Bundesliga Report The economic state of professional football
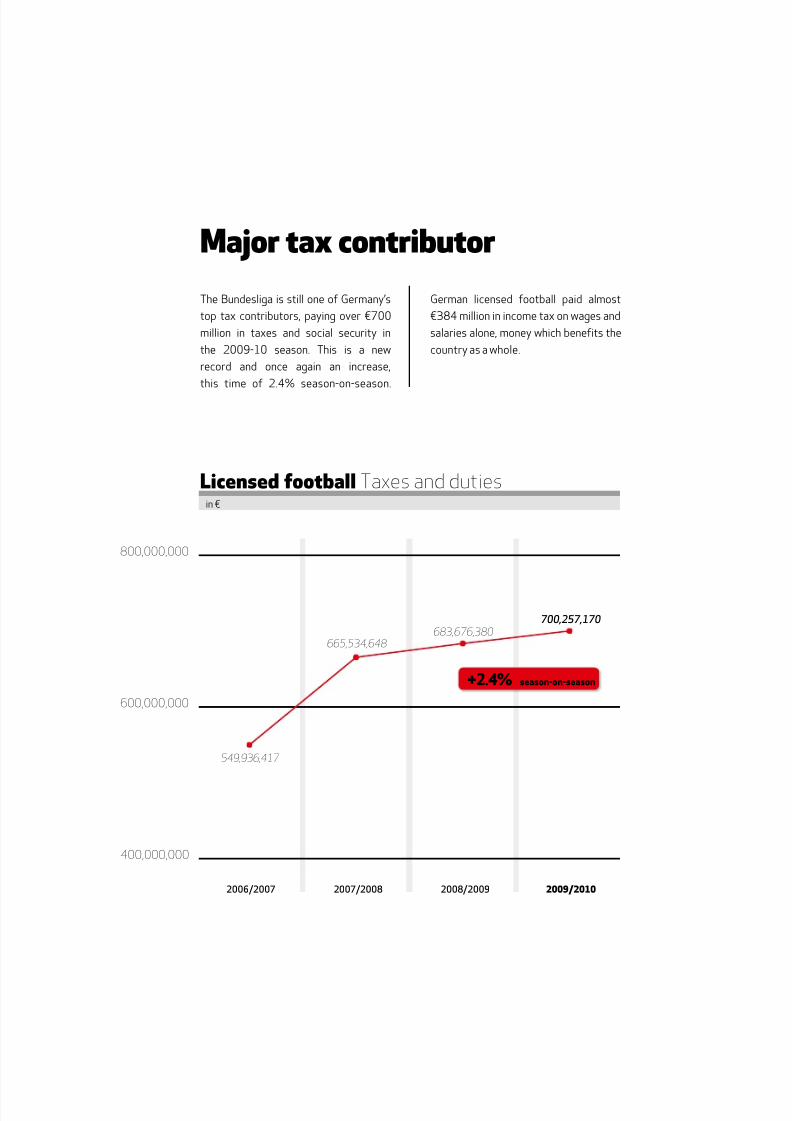
8/22/2019 Bundesliga 2011.pdf
http://slidepdf.com/reader/full/bundesliga-2011pdf 61/64
549,936,417
665,534,648683,676,380
700,257,170
800,000,000
600,000,000
400,000,000
2006/2007 2007/2008 2008/2009 2009/2010
Licensed football Taxes and dutiesin €
+2.4% season-on-season
The Bundesliga is still one of Germany’s
top tax contributors, paying over €700
million in taxes and social security in
the 2009-10 season. This is a new
record and once again an increase,
this time of 2.4% season-on-season.
German licensed football paid almost
€384 million in income tax on wages and
salaries alone, money which benefits the
country as a whole.
Major ta contributor
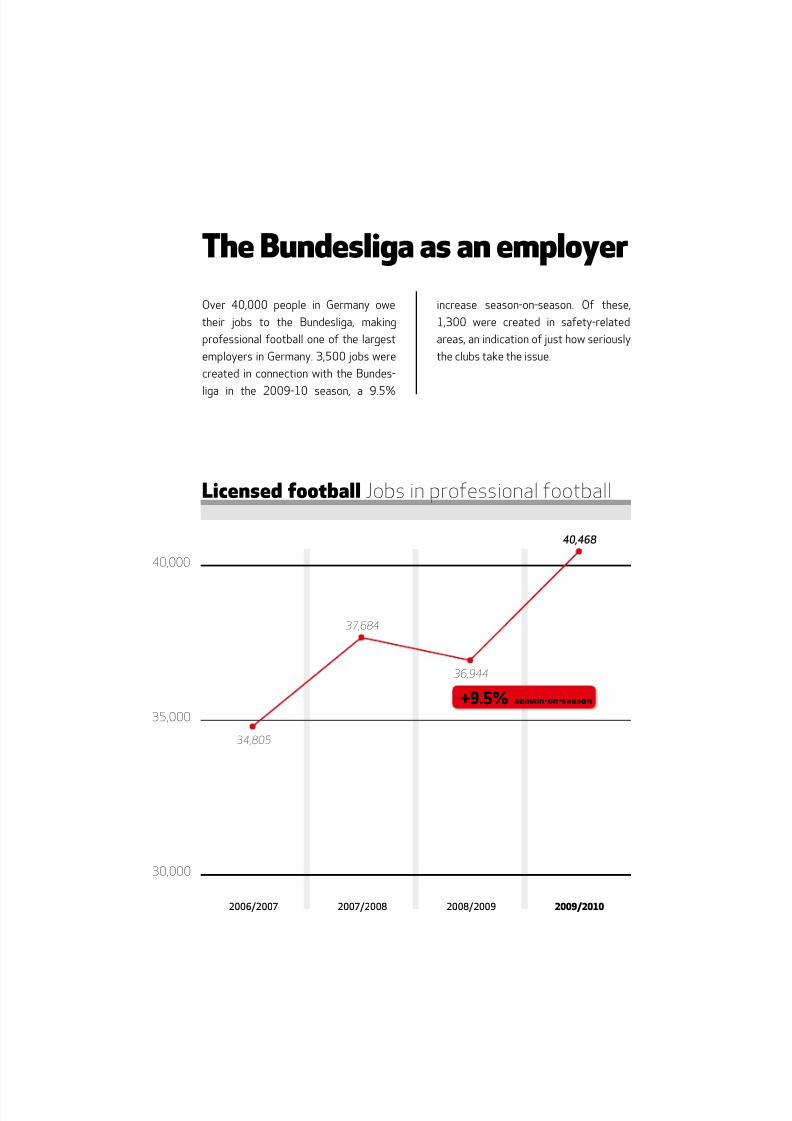
8/22/2019 Bundesliga 2011.pdf
http://slidepdf.com/reader/full/bundesliga-2011pdf 62/64
34,805
37,684
36,944
40,468
40,000
35,000
30,000
2006/2007 2007/2008 2008/2009 2009/2010
Licensed football Jobs in professional football
+9.5% season-on-season
Over 40,000 people in Germany owe
their jobs to the Bundesliga, making
professional football one of the largest
employers in Germany. 3,500 jobs were
created in connection with the Bundes-
liga in the 2009-10 season, a 9.5%
increase season-on-season. Of these,
1,300 were created in safety-related
areas, an indication of just how seriously
the clubs take the issue.
The Bundesliga as an employer
8/22/2019 Bundesliga 2011.pdf
http://slidepdf.com/reader/full/bundesliga-2011pdf 63/64
PUBLISHER DFL Deutsche Fußball Liga GmbH
Guiollettstraße 44–46
60325 Frankfur t/Main
GermanyTel. +49 69 65005-0
Fax +49 69 65005-557
E-mail [email protected]
www.bundesliga.de
EDITOR-IN-CHIEF Tom Bende r
PROJECT MANAGER Christian Pfennig
EDITOR AND COORDINATOR Tobias Schild
SUPPORT TEAM Tom Ballenweg, Jörg Degenhart, Dr Jan Lehman n,
Dr Dirk Meyer-Bosse, Werner Möglich,
Malte Schulz, Roman Walch
FINAL EDITOR Dr Harro Schweizer
PHOTO EDITORS DFL Deutsche Fußball Liga GmbH,
Speedpool GmbH
IMAGES DFL Deutsche Fußball Liga GmbH,
Getty Images Deutschland GmbH,
Witters Spor t-Presse-Fotos GmbH
DESIGN AND LAYOUT Speedpool GmbH
PRINTERS Hansmann Verlag Sponholtz Druck GmbH
TRANSLATOR AND FINAL EDITOR Natalie S. Wilcock
8/22/2019 Bundesliga 2011.pdf
http://slidepdf.com/reader/full/bundesliga-2011pdf 64/64
DFL Deutsche Fußball Liga GmbHGuiollettstraße 44–4660325 Frankfurt/MainGermany
Tel. +49 69 65005-0Fax +49 69 65005-557E-mail [email protected]
www.bundesliga.de