Embed Size (px)
Citation preview
8/3/2019 call 1T11 ENG FINAL
http://slidepdf.com/reader/full/call-1t11-eng-final 1/8
Results Conference Call – 1Q11
May 2, 2011
8/3/2019 call 1T11 ENG FINAL
http://slidepdf.com/reader/full/call-1t11-eng-final 2/8
The information contained in this presentation may include statements which constitute
forward-looking statements, as defined by Section 27A of the U.S. Securities
Act of 1933, as amended, and Section 21E of the U.S. Securities Exchange Act of
1934, as amended. Such forward-looking statements involve a certain degree of risk
and uncertainty with respect to business, financial, trend, strategy and other forecasts,
and are based on assumptions, data or methods that, although considered reasonable
by the company at the time, may be incorrect or imprecise, or may not be
possible to realize. The company gives no assurance that expectations disclosed in
this presentation will be confirmed. Prospective investors are cautioned that any suchforward-looking statements are not guarantees of future performance and involve risks
and uncertainties, and that actual results may differ materially from those in the
forward-looking statements, due to a variety of factors, including, but not limited to, the
risks of international business and other risks referred to in the company’s filings with
the CVM and SEC. The company does not undertake, and specifically disclaims any
obligation to update any forward-looking statements, which are valid only for the date on
which they are made.
Legal Notice
2
8/3/2019 call 1T11 ENG FINAL
http://slidepdf.com/reader/full/call-1t11-eng-final 3/8
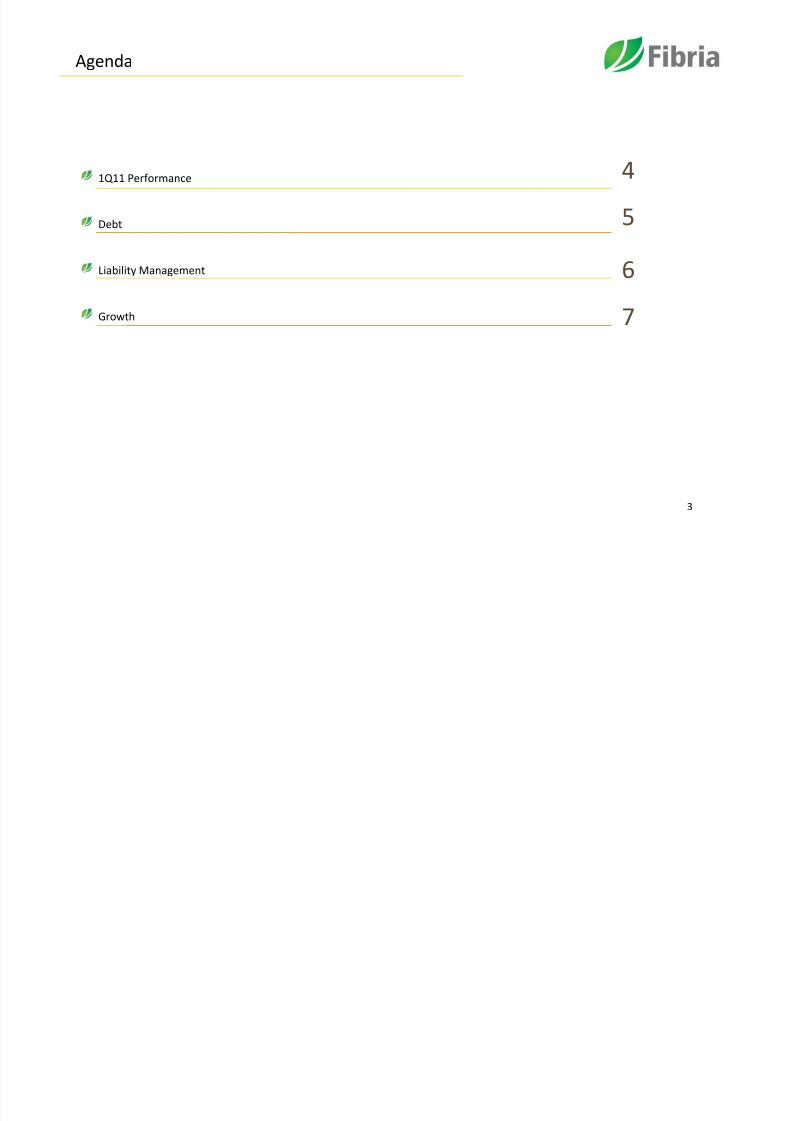
Agenda
1Q11 Performance
Debt
Liability Management
Growth
4
5
6
7
3
8/3/2019 call 1T11 ENG FINAL
http://slidepdf.com/reader/full/call-1t11-eng-final 4/8
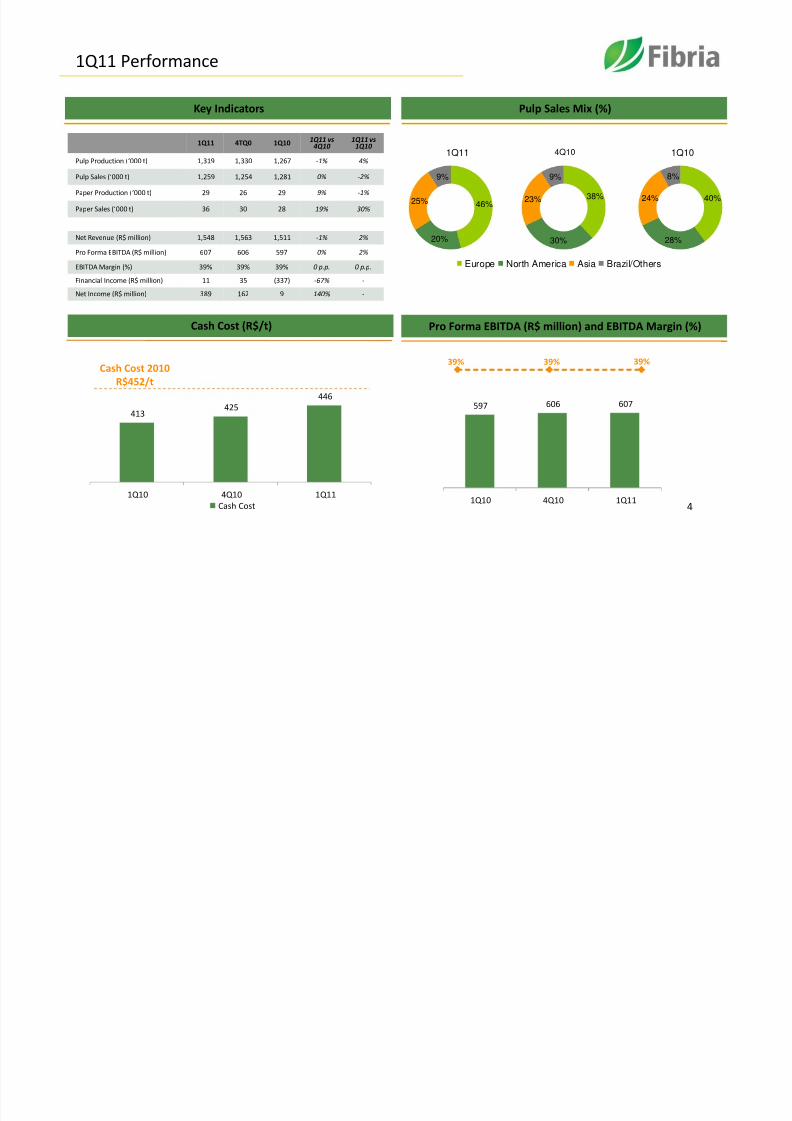
1Q11 Performance
Key Indicators Pulp Sales Mix (%)
Cash Cost (R$/t) Pro Forma EBITDA (R$ million) and EBITDA Margin (%)
1Q11 4TQ0 1Q10 1Q11 vs4Q10
1Q11 vs1Q10
Pulp Production (‘000 t) 1,319 1,330 1,267 -1% 4%
Pulp Sales (‘000 t) 1,259 1,254 1,281 0% -2%
Paper Production (‘000 t) 29 26 29 9% -1%
Paper Sales (‘000 t) 36 30 28 19% 30%
Net Revenue (R$ million) 1,548 1,563 1,511 -1% 2%
Pro Forma EBITDA (R$ million) 607 606 597 0% 2%
EBITDA Margin (%) 39% 39% 39% 0 p.p. 0 p.p.
Financial Income (R$ million) 11 35 (337) -67% -
Net Income (R$ million) 389 162 9 140% -
46%
20%
25%
9%
1Q11
413425
446
1Q10 4Q10 1Q11
Cash Cost
597 606 607
1Q10 4Q10 1Q11
39% 39% 39%
4
38%
30%
23%
9%
4Q10
Europe North America Asia Brazil/Others
40%
28%
24%
8%
1Q10
Cash Cost 2010
R$452/t
8/3/2019 call 1T11 ENG FINAL
http://slidepdf.com/reader/full/call-1t11-eng-final 5/8
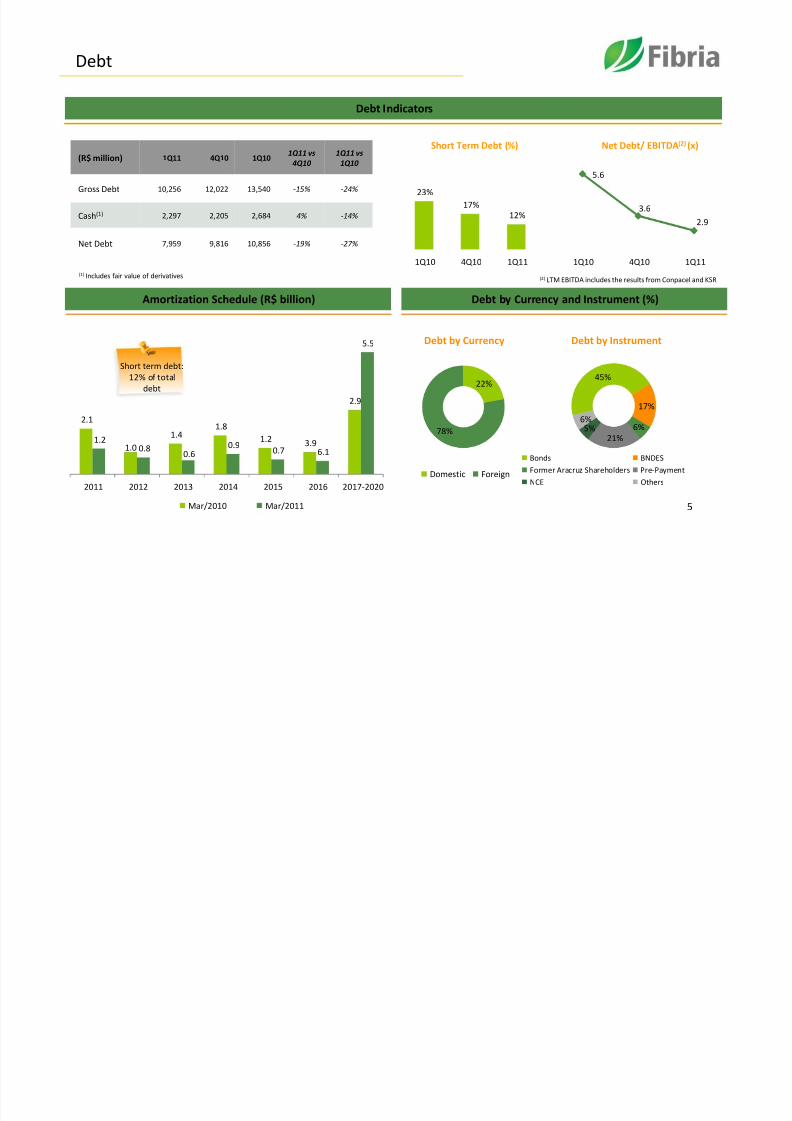
Debt
Amortization Schedule (R$ billion)
Debt Indicators
Debt by Currency and Instrument (%)
(R$ million) 1Q11 4Q10 1Q101Q11 vs
4Q10
1Q11 vs
1Q10
Gross Debt 10,256 12,022 13,540 -15% -24%
Cash(1) 2,297 2,205 2,684 4% -14%
Net Debt 7,959 9,816 10,856 -19% -27%
23%17%
12%
1Q10 4Q10 1Q11
Short Term Debt (%) Net Debt/ EBITDA(2) (x)
5.6
3.6
2.9
1Q10 4Q10 1Q11
(2) LTM EBITDA includes the results from Conpacel and KSR
2.1
1.0
1.41.8
1.2 3.9
2.9
1.20.8
0.60.9
0.7 6.1
5.5
2011 2012 2013 2014 2015 2016 2017-2020
Mar/2010 Mar/2011
22%
78%
Debt by Currency
Domestic Foreign
45%
17%
6%
21%5%
6%
Debt by Instrument
Bonds BNDES
Former Aracruz Shareholders Pre-Payment
NCE Others
5
(1) Includes fair value of derivatives
Short term debt:
12% of total
debt
8/3/2019 call 1T11 ENG FINAL
http://slidepdf.com/reader/full/call-1t11-eng-final 6/8
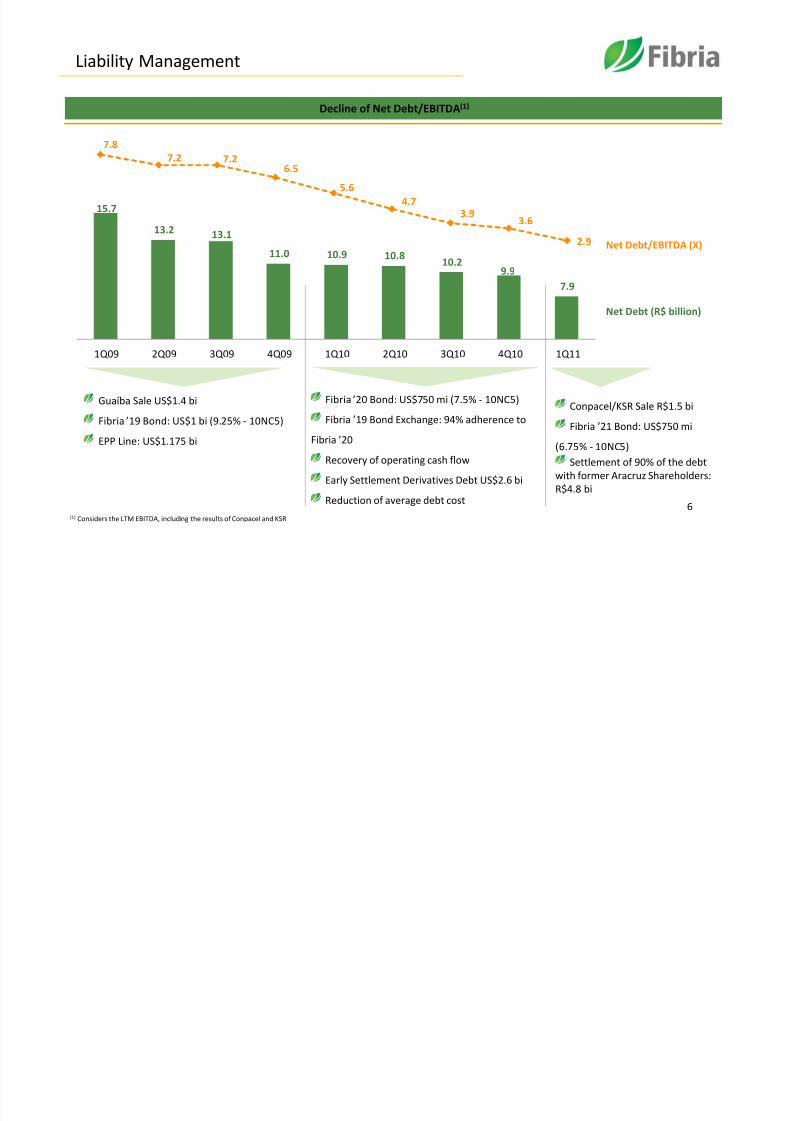
7.8
7.2 7.26.5
5.6
4.73.9
3.6
2.9
Liability Management
6
15.7
13.2 13.1
11.0 10.9 10.810.2
9.9
7.9
1Q09 2Q09 3Q09 4Q09 1Q10 2Q10 3Q10 4Q10 1Q11
Net Debt/EBITDA (X)
Fibria ’20 Bond: US$750 mi (7.5% - 10NC5)
Fibria ’19 Bond Exchange: 94% adherence to
Fibria ’20
Recovery of operating cash flow
Early Settlement Derivatives Debt US$2.6 bi
Reduction of average debt cost
Net Debt (R$ billion)
Conpacel/KSR Sale R$1.5 bi
Fibria ’21 Bond: US$750 mi
(6.75% - 10NC5)
Settlement of 90% of the debt
with former Aracruz Shareholders:
R$4.8 bi
Guaíba Sale US$1.4 bi
Fibria ’19 Bond: US$1 bi (9.25% - 10NC5)
EPP Line: US$1.175 bi
Decline of Net Debt/EBITDA(1)
(1) Considers the LTM EBITDA, including the results of Conpacel and KSR
8/3/2019 call 1T11 ENG FINAL
http://slidepdf.com/reader/full/call-1t11-eng-final 7/8
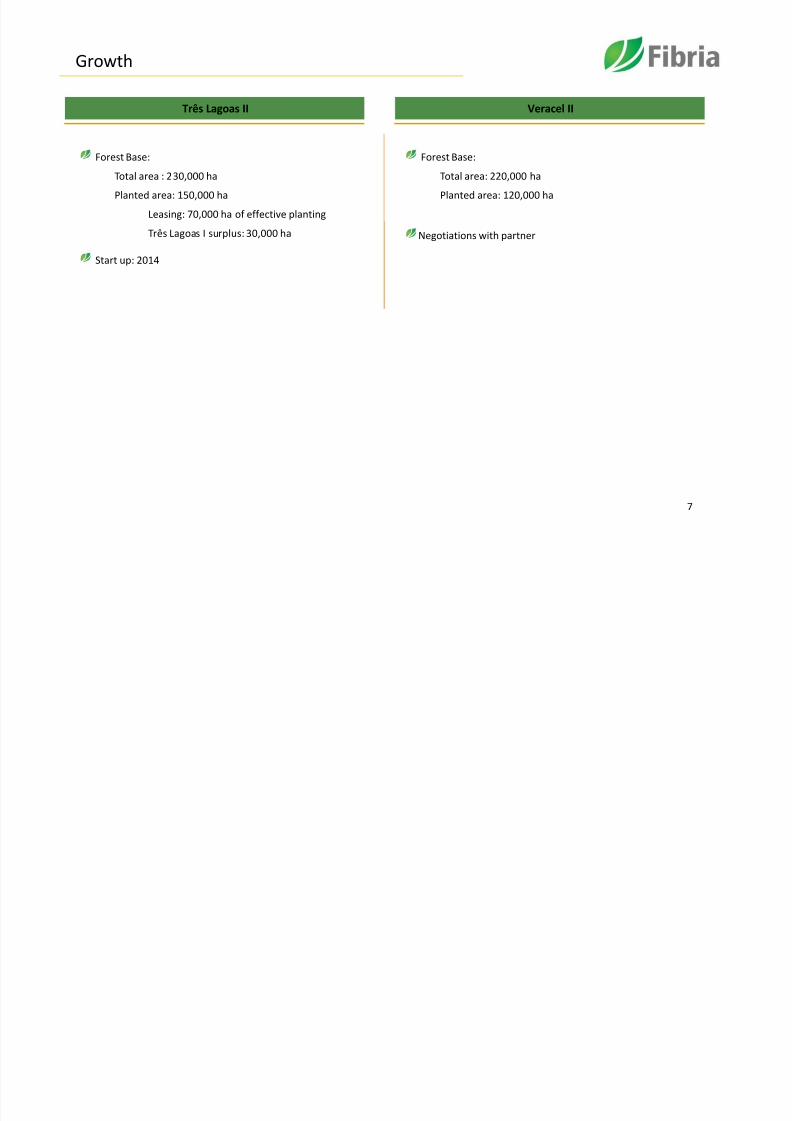
Growth
Três Lagoas II
7
Veracel II
Forest Base:
Total area : 230,000 ha
Planted area: 150,000 ha
Leasing: 70,000 ha of effective planting
Três Lagoas I surplus: 30,000 ha
Start up: 2014
Forest Base:
Total area: 220,000 ha
Planted area: 120,000 ha
Negotiations with partner
8/3/2019 call 1T11 ENG FINAL
http://slidepdf.com/reader/full/call-1t11-eng-final 8/8
Investor Relations Team:
Website: www.fibria.com.br/ri
E-mail: [email protected]
Tel.: +55 (11) 2138-4565
8


![nagano-traveler-call-leaflet · 2017. 7. 19. · Call Center for Traveler Support Multilingual NAGANO Azusa River, Kamikouchi NAGANO PEOPLE CALL CENTER YOU [TRAVELER] CALL CALL 3-way](https://img.pdfslide.org/doc/110x75/5ff778a5bf22974fca7e22d1/nagano-traveler-call-leaflet-2017-7-19-call-center-for-traveler-support-multilingual.jpg)


![Call Center[1]](https://img.pdfslide.org/doc/110x75/577c7c1b1a28abe054994e3b/call-center1.jpg)

![Programme [eng]](https://img.pdfslide.org/doc/110x75/568c52e41a28ab4916b88c02/programme-eng-56fc6d05dac74.jpg)