Embed Size (px)
Citation preview
Fakultät für Medizin
Institut für Virologie
Characterization of Endogenous Major Histocompatibility Complex Class II Antigen
Processing Pathways for Modified Vaccinia Virus Ankara Infection
Yi Zhang
Vollständiger Abdruck der von der Fakultät für Medizin der Technischen Universität München zur Erlangung des akademischen Grades eines
Doctor of Philosophy (Ph.D.)
genehmigten Dissertation.
Vorsitzender: Univ.-Prof. Dr. Agnes Görlach
Betreuer: Univ.-Prof. Dr. Ingo Drexler
Prüfer der Dissertation:
1. apl. Prof. Dr. Anne Krug
2. Priv.-Doz. Dr. Klaus-Peter Janssen
Die Dissertation wurde am 27.11.2013 bei der Fakultät für Medizin der Technischen Universität München eingereicht und durch die Fakultät für Medizin am 29.01.2014 angenommen.
TABLE OF CONTENTS
I
Table of Contents
Table of Contents ................................................................................................................. I
Index of Figures .................................................................................................................. V
Index of Tables ................................................................................................................. VII
Abbrevations .................................................................................................................. VIII
1. Introduction ................................................................................................................... 1
1.1 Dendritic cells (DCs) are highly efficient antigen-presenting cells ................................. 1 1.1.1 Distinct DCs maturation process facilitates the antigen accumulation and T cell
stimulation .................................................................................................................................. 1 1.1.2 Antigen processing and presentation by APCs .............................................................. 3
1.1.2.1 Direct and cross presentation by MHC I ............................................................................. 3 1.1.2.2 Exogenous and endogenous antigen presentation by MHC II ............................................ 6
1.2 MVA and its immunogenicity ............................................................................................ 9 1.2.1 MVA is a potent recombinant vaccine candidate .......................................................... 9 1.2.2 The life cycle of VACV/MVA .................................................................................... 10 1.2.3 Innate anti-viral responses after poxvirus infection ..................................................... 12 1.2.4 Adaptive immunity against MVA infection ................................................................ 13
1.3 Autophagy and its role in antigen presentation ............................................................. 15 1.3.1 Functional autophagy is constituted of autophagosome formation and autophagic flux
15 1.3.2 Autophagy contributes to innate and adaptive immunity ............................................ 18
2. Aims of the study ........................................................................................................ 20
3. Material and Methods ................................................................................................ 22
3.1 Materials ............................................................................................................................ 22 3.1.1 Plasmids ....................................................................................................................... 22 3.1.2 Antibodies .................................................................................................................... 22 3.1.3 Cells, viruses and mice ................................................................................................ 24
3.1.3.1 Cells .................................................................................................................................. 24 3.1.3.2 Viruses .............................................................................................................................. 25 3.1.3.3 Mice .................................................................................................................................. 26
3.1.4 Buffers, solutions and media ........................................................................................ 27
TABLE OF CONTENTS
II
3.1.4.1 Media for cell culture ........................................................................................................ 27 3.1.4.2 Solutions for cell culture applications ............................................................................... 28 3.1.4.3 Buffers for IF .................................................................................................................... 28 3.1.4.4 Buffers and solutions for protein biochemistry ................................................................ 30 3.1.4.5 Buffers for Flow Activated Cell Sorting (FACS) ............................................................. 31
3.2 Methods .............................................................................................................................. 32 3.2.1 Tissue culture ............................................................................................................... 32
3.2.1.1 Cell lines ........................................................................................................................... 32 3.2.1.2 Primary cells ..................................................................................................................... 33
3.2.1.2.1 Generation and culture of bone marrow derived DCs ............................................... 33 3.2.1.2.2 Isolation and culture of primary dermal fibroblasts ................................................... 33
3.2.1.3 Cultivation of C4H3 hybridoma and production of C4H3 antibodies .............................. 34 3.2.1.4 Cryopreservation of cells .................................................................................................. 35 3.2.1.5 Transient transfection of cell lines and BMDCs ............................................................... 35
3.2.1.5.1 Transfection of cell lines ............................................................................................ 36 3.2.1.5.2 Transfection of BMDCs ............................................................................................. 36
3.2.2 Virological methods ..................................................................................................... 36 3.2.2.1 In vitro infection of cells with MVA and VACV ............................................................. 36 3.2.2.2 Virus amplification and crude stock preparation .............................................................. 37 3.2.2.3 Virus purification .............................................................................................................. 37 3.2.2.4 Virus titration and growth kinetics ................................................................................... 38
3.2.3 Confocal laser scanning microscopy (CLSM) ............................................................. 38 3.2.3.1 Intracellular IF .................................................................................................................. 38 3.2.3.2 Live cell imaging and co-localization analysis ................................................................. 39
3.2.4 Protein biochemistry .................................................................................................... 40 3.2.4.1 Preparation of cell lysates ................................................................................................. 40 3.2.4.2 Determination of protein concentration ............................................................................ 40 3.2.4.3 Immunoprecipitation (IP) .................................................................................................. 40 3.2.4.4 Polyacrylamide gel electrophoresis .................................................................................. 41 3.2.4.5 Immunoblotting (IB) ......................................................................................................... 42
3.2.5 Flow chemistry ............................................................................................................. 43
4. Results .......................................................................................................................... 44
4.1 MVA induced autophagy and the molecular mechanisms behind ............................... 44 4.1.1 MVA accumulates LC3 to induce autophagosome formation ..................................... 44
4.1.1.1 LC3 is increased in BMDCs, BMDMs, and HeLa cells after MVA infection ................. 44 4.1.1.2 VACV enhances LC3 lipidation ....................................................................................... 45 4.1.1.3 LC3-II conversion is abolished in Atg7-deficient BMDCs .............................................. 46
4.1.2 Autophagic flux is enhanced by MVA ........................................................................ 48
TABLE OF CONTENTS
III
4.1.2.1 Autophagosomes and autolysosomes are detectable by immunofluorescence after
transfecting mRFP-EGFP-LC3 plasmids ........................................................................................... 48 4.1.2.2 EGFP-LC3 is degraded in the lysosome upon MVA infection ........................................ 52 4.1.2.3 Fusion of autophagosome with lysosomes is increased .................................................... 55
4.1.3 MVA-induced autophagy requires the TLRs adaptor protein MyD88 ....................... 57 4.1.3.1 MyD88 and Beclin-1 levels are upregulated .................................................................... 57 4.1.3.2 MVA infection fails to induce autophagy in MyD88 -/- BMDCs ..................................... 58 4.1.3.3 Starvation-induced autophagy is functional in MyD88 -/- BMDCs .................................. 59 4.1.3.4 Autophagy induction requires viral replication intermediates .......................................... 60
4.2 Endogenous MHC II presentation of MVA-produced HEL ......................................... 63 4.2.1 Infected BMDCs fail to endocytose exogenous apoptotic cell debris ......................... 63 4.2.2 Endogenous viral antigens are presented to CD4+ T cells ........................................... 65 4.2.3 HEL-MHC II complexes are detected in the cytoplasm and on the cell membrane .... 66
4.2.3.1 Aw3.18 mAb only recognizes surface antigen-MHC II complexes ................................. 66 4.2.3.2 C4H3 monoclonal antibodies recognize intracellular pHEL/I-Ak .................................... 68 4.2.3.3 Self-produced C4H3 mAb additionally recognizes the pHEL46-61/I-Ak complexes ...... 70
4.2.4 Endogenously loaded pHEL46-61/I-Ak are present in BMDCs infected with MVA-
HEL 70 4.2.5 The presentation of pHEL46-61/I-Ak associates with MHC II .................................... 71
4.3 Detection of viral antigens and intracellular organelles by confocal laser scanning
microscopy ................................................................................................................................... 73 4.3.1 Spatiotemporal distribution pattern of foreign gene expression under control of early
or late promoters by recombinant MVA ................................................................................... 73 4.3.1.1 EGFP expression pattern ................................................................................................... 73 4.3.1.2 OVA expression pattern .................................................................................................... 75
4.3.2 Spatiotemporal distribution pattern of viral antigens during infection ........................ 76 4.3.2.1 H3 is present around viral factories and then transported to the cell membrane .............. 76 4.3.2.2 A27 is present around viral factoris only .......................................................................... 77
4.3.3 Cellular organelles undergo morphological changes upon infection ........................... 78 4.3.3.1 Early endosomes do not co-localize with viral factories .................................................. 78 4.3.3.2 The Golgi complexes co-localize with viral factories ...................................................... 80 4.3.3.3 Detection of the MHC II containing compartment (MIIC) .............................................. 84
4.3.3.3.1 MIIC transforms into a large tubular structure only upon MVA infection ................ 84 4.3.3.3.2 MIIC co-localize with viral factories ......................................................................... 84
4.3.3.4 MHC II co-localize with MIIC and then move on to the cell surface during cell
maturation .......................................................................................................................................... 86 4.3.3.5 MHC II co-localizes with lysosomes ................................................................................ 87
TABLE OF CONTENTS
IV
5. Discussion .................................................................................................................... 89
5.1 Autophagy is important for MVA-related MHC class II antigen processing and
presentation ................................................................................................................................. 89 5.1.1 Methods and limitations to monitor autophagy in BMDCs ......................................... 89
5.1.1.1 Interpretation of LC3-turnover analysis by immunoblotting ............................................ 89 5.1.1.2 Dissection of autophagy maturation by EGFP/mRFP-LC3 lysosomal delivery and
proteolysis .......................................................................................................................................... 91 5.1.2 Both MVA and VACV infection activate autophagy in BMDCs ................................ 93
5.1.2.1 Atg7 is required for MVA induced autophagy in BMDCs ............................................... 93 5.1.2.2 MVA infection induces stronger autophagy than VACV infection .................................. 94
5.1.3 MVA induces autophagy through a TLRs adaptor protein .......................................... 94 5.2 Endogenous antigen presentation of HEL peptides ....................................................... 97
5.2.1 Endocytotic ability of MVA-infected BMDCs is impaired ......................................... 97 5.2.2 Infected BMDCs can present endogenous antigens to CD4+ T cells on MHC II ........ 98 5.2.3 Endogenous HEL peptides are processed and presented by MHC II .......................... 99
5.3 Excellular and intracellular events in MVA infected BMDCs ................................... 101 5.3.1 Expression and spatiotemporal distribution pattern of viral products ....................... 101 5.3.2 Co-localization of viral factory, MIIC and Golgi complex ....................................... 102
6. Conclusions and Outlook ......................................................................................... 105
7. References .................................................................................................................. 106
8. Appendix .................................................................................................................... 119
8.1 Equipment ....................................................................................................................... 119 8.2 Consumables .................................................................................................................... 120
Acknowledgment .............................................................................................................. 122
Curriculum Vitae ............................................................................................................. 123
INDEX OF FIGURES
V
Index of Figures
Figure 1. Comparison of immature and mature DCs reflects a dramatic change in
morphology and function .................................................................................................... 3
Figure 2. Schematic diagram of antigen presentations by MHC I and MHC II ........ 5
Figure 3. Four models of endogenous antigens processing and presentation
pathways exist in DCs .......................................................................................................... 8
Figure 4. Infectious cycle of VACV in permissive cells ............................................... 11
Figure 5. Biogenesis of autophagy and its inhibitors ................................................... 17
Figure 6. Kinetic expression of LC3 in MVA infected BMDCs, BMDMs and HeLa
cells 45
Figure 7. The expression of LC3 in VACV infected BMDCs ..................................... 46
Figure 8. The expression of LC3 in Atg7-deficient BMDCs ....................................... 47
Figure 9. Transient transfection of HeLa cells with the mRFP-EGFP-LC3
expression plasmid ............................................................................................................. 50
Figure 10. Optimization of chloroquine concentration in mRFP-EGFP-LC3
transfected HeLa cells ....................................................................................................... 52
Figure 11. mRFP-EGFP-LC3 quenching assay in HeLa cells .................................... 54
Figure 12. Autophagic flux in MVA-EGFP P7.5 infected HeLa cells ........................ 56
Figure 13. Kinetic analysis of Beclin-1 and MyD88 expression in MVA infected
BMDCs 58
Figure 14. Analysis of Beclin-1 and LC3 in MVA or VACV infected BMDCs ......... 59
Figure 15. Expression of LC3 in MVA or VACV-infected MyD88 deficient BMDCs
60
Figure 16. The expression of LC3 under conditions that block viral DNA replication
62
INDEX OF FIGURES
VI
Figure 17. Schematic presentation of endocytosis assay methods .............................. 64
Figure 18. Stimulation of CD4ova T cells by OVA peptide or MVA-OVA PK1L
infected BMDCs ................................................................................................................. 65
Figure 19. Presentation of HEL antigens was detected by FACS using Aw3.18 mAb
68
Figure 20. Comparison of pHEL/MHC II immunofluorescence by using Aw3.18
mAb and C4H3 mAb ......................................................................................................... 69
Figure 21. Intracellular staining of pHEL46-61/I-Ak by using purified C4H3 mAb
or hybridoma supernatant ................................................................................................ 70
Figure 22. Kinetics of pHEL46-61/I-Ak expression in MVA-HEL P7.5 infected
BMDCs 71
Figure 23. Co-localization of C4H3 and MHC II in MVA-HEL P7.5 infected
BMDCs 72
Figure 24. Detection of EGFP expression under the control of MVA early (PK1L)
or late (P11) promoters ...................................................................................................... 74
Figure 25. Characterization of recombinant OVA expression in the cytoplasm ...... 75
Figure 26. Spatiotemporal distribution of H3 in MVA-infected HeLa cells ............. 76
Figure 27. Characterization of viral antigen A27 localization in the cytoplasm ....... 77
Figure 28. Kinetics of recombinant gene expression and localization of early
endosomes in MVA infected DC 2.4 or HeLa cells ......................................................... 80
Figure 29. Temporal distribution of Golgi complexes and viral factories in infected
HeLa cells or BMDCs ........................................................................................................ 83
Figure 30. Monitoring the MIIC transformation upon MVA infection or LPS
stimulation 86
Figure 31. Transport of MHC II during the maturation of BMDCs ......................... 87
Figure 32. MHC II co-localizes with LAMP-2 ............................................................. 88
INDEX OF TABLES
VII
Index of Tables
Table 1. Plasmids for immunofluorescence (IF) and immunoprecipitation (IP) ...... 22
Table 2. Primary antibodies for immunofluorescence (IF) , immunoblotting (IB)
and immunoprecipitation( IP) and flow chemistry .................................................. 22
Table 3. Secondary antibodies for IF, IB, IP, flow chemistry and dye for live
imaging 24
Table 4. Cell lines and primary cells ............................................................................. 24
Table 5. Index of viruses ................................................................................................ 25
Table 6. Index of mouse strains ..................................................................................... 26
Table 7. Cell culture media ............................................................................................ 27
Table 8. Solutions for cell culture application .............................................................. 28
Table 9. Buffers used for IF ........................................................................................... 28
Table 10. Buffers and solutions used for protein biochemistry .................................. 30
Table 11. Buffers for FACS analysis ............................................................................. 31
Table 12. Composition of SDS-PAGE gels ................................................................... 41
ABBREVATIONS
VIII
Abbrevations
Abs/mAbs Antibodies/monoclonal Abs
APCs/pAPCs Antigen presenting cells/ professional APCs
Atg Autophagy related protein
BMDCs/DCs Bone marrow derived dendritic cells/dendritic cells
CD Cluster of differentiation
CLIP Class-II-associated Ii peptide
CLSM Confocal laser scan microscope
CQ chloroquine
CTL Cytotoxic T Lymphocyte
CVA Chorioallantois vaccinia virus
ddH2O Double distilled water
EGFP Enhanced green fluorescent protein
ER Endoplasmic reticulum
FACS Fluorescence activated cell sorting
GM-CSF Granulocyte-macrophage colony-stimulating factor
HEL Hen egg lysozyme
HLA-DM Human leukocyte antigen-DM
ABBREVATIONS
IX
Hsp Heat shock protein
IB Immunoblotting
IFN Interferon
Ii Invariant chain
IL Interleukin
IP Immunoprecipitation
LAMP Lysosome associated membrane protein
LC Microtubule-associated protein light chain
LPS Lipopolysaccharide
MAL MyD88-adapter like
MHC Major histocompatibility complex
MIIC MHC II containing compartment
MOI Multiplicity of infection
mRFP Monomeric red fluorescent protein
MVA Modified vaccinia virus Ankara
MyD88 Myeloid differentiation primary response gene 88
OVA Chicken ovalbumin
PAGE Polyacrylamide gel electrophoresis
PAMPs Pathogen-associated molecular patterns
ABBREVATIONS
X
PCR Poly chain reaction
PE Phosphatidylethanolamine
p.i. Post transfection
PRR Pathogen recognition receptor
p.t. Post transfection
PUVA Psoralen in combination with ultraviolet (UVA) radiation treatment
RT Room temperature
SARM Sterile α-and armadillo motif-containing protein
TAP(s) Transporter(s) associated with antigen processing
TLR Toll like receptor
TNF Tumor necrosis factor
TRAM TRIF-related adaptor molecule
TRIF Toll/interleukin-1 receptor domain-containing adapter protein
VACV Vaccinia virus
v/v Volume per volume
w/o Without
w/v Weight per volume
INTRODUCTION
1
1. Introduction
1.1 Dendritic cells (DCs) are highly efficient antigen-presenting cells
The cells that first encounter the antigenic particles and then process and consequently
present the recognizable antigens to T cells are called antigen-presenting cells (APCs).
Though several cell types can exert antigen-presenting function in vivo, certain cells
including B cells, macrophages and dendritic cells (DCs) that are very efficient for this
work are further considered as professional APCs (pAPCs).
1.1.1 Distinct DCs maturation process facilitates the antigen accumulation and T cell stimulation
Dendritic cells (DCs), a talented member of professional APCs, are a key link between the
innate and adaptive immune system. They are endowed with the strong capability of
sensing and ingesting microorganisms by using several cellular pathways and numerous
receptors on the cell surface as well as endoplasmic reticulum membrane. Upon pathogen
recognition, they can secrete large amount of cytokines (e.g. type I interferons, IFN I) to
limit the spread of infection, thus providing first line of defense against invading
pathogens.1 DCs are also superior at controlling the quality of T cell responses by secretion
of cytokines or costimulatory molecules that drive naïve lymphocytes into distinct kinds of
effectors. They alert helper T cells, which allow the activation of macrophages, natural
killer cells as well as B cells. Cytotoxic T cells can be authorized by helper T cells-licensed
DCs to lyse the infected cells. Thereby, DCs successfully initiate primary immune
responses.2
Most DCs have long finger-like processes, similar to the dendrites of neurons. This
morphological characteristic of DCs helps to accumulate a diverse array of antigens from
the surrounding environment by endocytosis, as well as facilitates extensive interaction
with T cells. The migration of DCs from peripheral sites to the secondary lymphoid organs
is accompanied by degradation of the internalized pathogens and changes of surface
molecules, which benefit the subsequent presentation of antigens to T cells via major
INTRODUCTION
2
histocompatibility complexes (MHC) I/II.3
In vivo and in vitro, DCs exist in two functional and phenotypical stages: immature DCs
and mature DCs (Fig. 1). Immature DCs are specialized in pathogen uptake by
macropinocytosis, receptor-mediated endocytosis and phagocytosis,4 while expressing low
levels of surface MHC I and II molecules as well as costimulatory signals such as CD
(cluster of differentiation) 40, CD80, and CD86. Thus, immature DCs can capture and
process antigens, but are insufficient to activate T cells because the antigen presentation
lacks the adequate costimulation.5 In order to stimulate T cells, immature DCs need to
undergo a maturation process that is started once DCs receive a stimuli, for example
through components of the bacterial wall (e.g. lipopolysaccharide, LPS), viral gene
products (e.g. double stranded RNA, dsRNA) or inflammatory cytokines (e.g. tumor
necrosis factor α, TNF-α).6 After that, DCs redistribute MHC II molecules from
intracellular endocytic compartments to the cell surface, while selectively decreasing their
internalization activity but dramatically upregulating costimulatory molecules on the
plasma membrane to be ready for recognition by T cells.7 Upon maturation, DCs migrate
from peripheral sites to lymph nodes to share the antigenic peptides with lymph node-
resident macrophages that disseminate the dangerous information, and most importantly
they complete their task to stimulate T-cells.8
INTRODUCTION
3
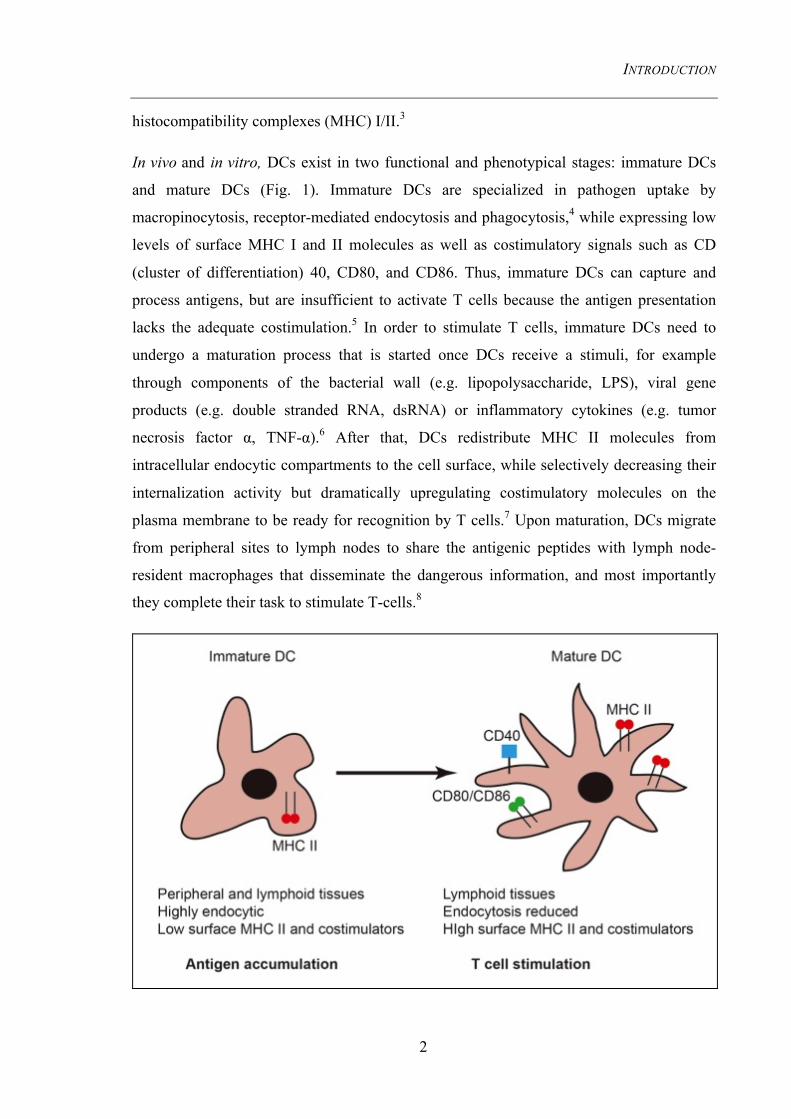
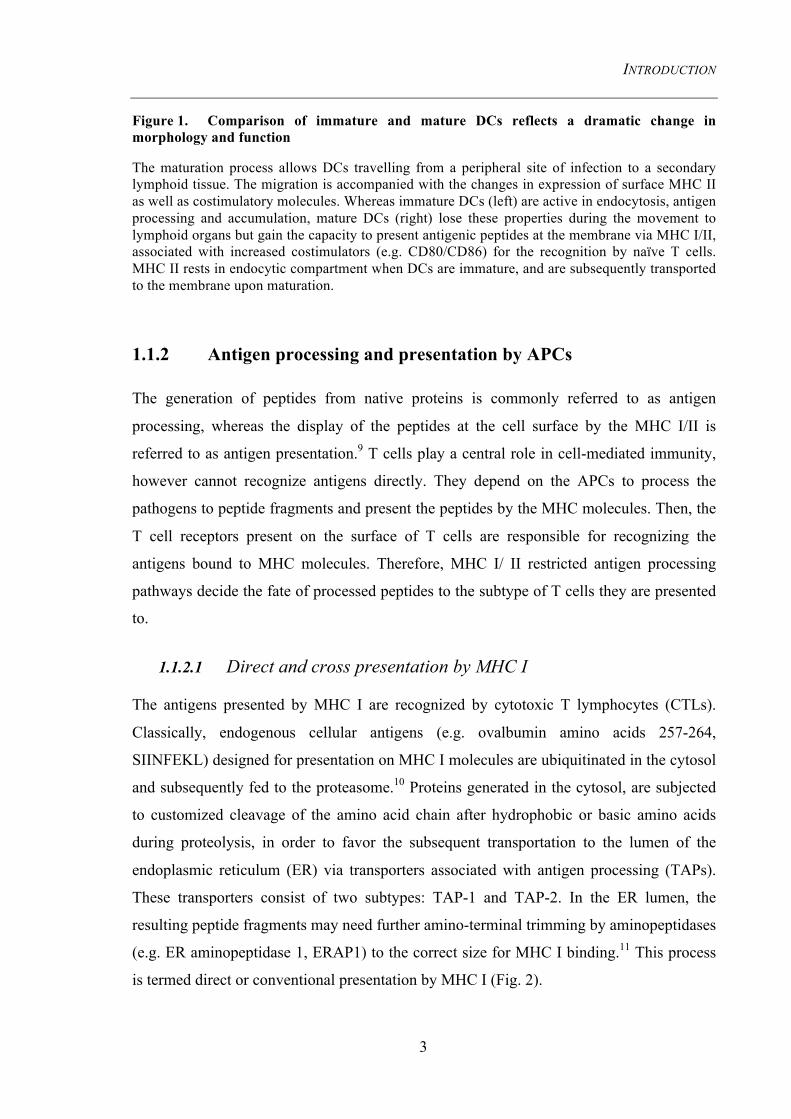
Figure 1. Comparison of immature and mature DCs reflects a dramatic change in morphology and function
The maturation process allows DCs travelling from a peripheral site of infection to a secondary lymphoid tissue. The migration is accompanied with the changes in expression of surface MHC II as well as costimulatory molecules. Whereas immature DCs (left) are active in endocytosis, antigen processing and accumulation, mature DCs (right) lose these properties during the movement to lymphoid organs but gain the capacity to present antigenic peptides at the membrane via MHC I/II, associated with increased costimulators (e.g. CD80/CD86) for the recognition by naïve T cells. MHC II rests in endocytic compartment when DCs are immature, and are subsequently transported to the membrane upon maturation.
1.1.2 Antigen processing and presentation by APCs
The generation of peptides from native proteins is commonly referred to as antigen
processing, whereas the display of the peptides at the cell surface by the MHC I/II is
referred to as antigen presentation.9 T cells play a central role in cell-mediated immunity,
however cannot recognize antigens directly. They depend on the APCs to process the
pathogens to peptide fragments and present the peptides by the MHC molecules. Then, the
T cell receptors present on the surface of T cells are responsible for recognizing the
antigens bound to MHC molecules. Therefore, MHC I/ II restricted antigen processing
pathways decide the fate of processed peptides to the subtype of T cells they are presented
to.
1.1.2.1 Direct and cross presentation by MHC I
The antigens presented by MHC I are recognized by cytotoxic T lymphocytes (CTLs).
Classically, endogenous cellular antigens (e.g. ovalbumin amino acids 257-264,
SIINFEKL) designed for presentation on MHC I molecules are ubiquitinated in the cytosol
and subsequently fed to the proteasome.10 Proteins generated in the cytosol, are subjected
to customized cleavage of the amino acid chain after hydrophobic or basic amino acids
during proteolysis, in order to favor the subsequent transportation to the lumen of the
endoplasmic reticulum (ER) via transporters associated with antigen processing (TAPs).
These transporters consist of two subtypes: TAP-1 and TAP-2. In the ER lumen, the
resulting peptide fragments may need further amino-terminal trimming by aminopeptidases
(e.g. ER aminopeptidase 1, ERAP1) to the correct size for MHC I binding.11 This process
is termed direct or conventional presentation by MHC I (Fig. 2).
INTRODUCTION
4
However, the restriction of this direct MHC I pathway is insufficient to activate naïve
CTLs in two scenarios: the intracellular pathogen does not infect APCs (e.g. tumors
pathogens) or compromises their direct MHC I presentation (e.g. Measles virus and
vaccinia virus12) by preventing the appearance of the peptide/MHC I complex on the cell
surface. As a consequence, this flaw of direct presentation can be utilized by some viruses
and tumors to evade lymphocyte recognition so that avoid the host immune surveillance.13
This phenomenon strongly suggested that other possible pathways exist besides the
classical rule of antigen presentation.
In line with this, in 1976 Bevan et al. have shown that exogenous antigens endocytosed by
APCs can also elicit potent CTL responses, a process which was later on named “cross-
presentation”.14 Although the mechanistic details need to be further elucidated, it has been
proven that exogenous antigens leak out from endosomal vesicles and enter the ER to be
loaded on MHC I. This alternative presentation pathway is critical for the induction of
adaptive immune responses against viral antigens or tumor antigens which are not
endogenously synthesized within APCs, but are able to license CTLs by neighboring APCs
(Fig. 2).15 Using the attenuated vaccinia virus (VACV) strain− modified vaccinia virus
Ankara (MVA), our group demonstrated that the primary CTL response against VACV-
produced antigens is dominated by cross-priming in vivo, while infected DCs failed to
induce primary CTL responses.16-18 Therefore, theoretically, any viral infection may induce
CTLs by combining the direct presentation and cross presentation by MHC class I.
INTRODUCTION
5
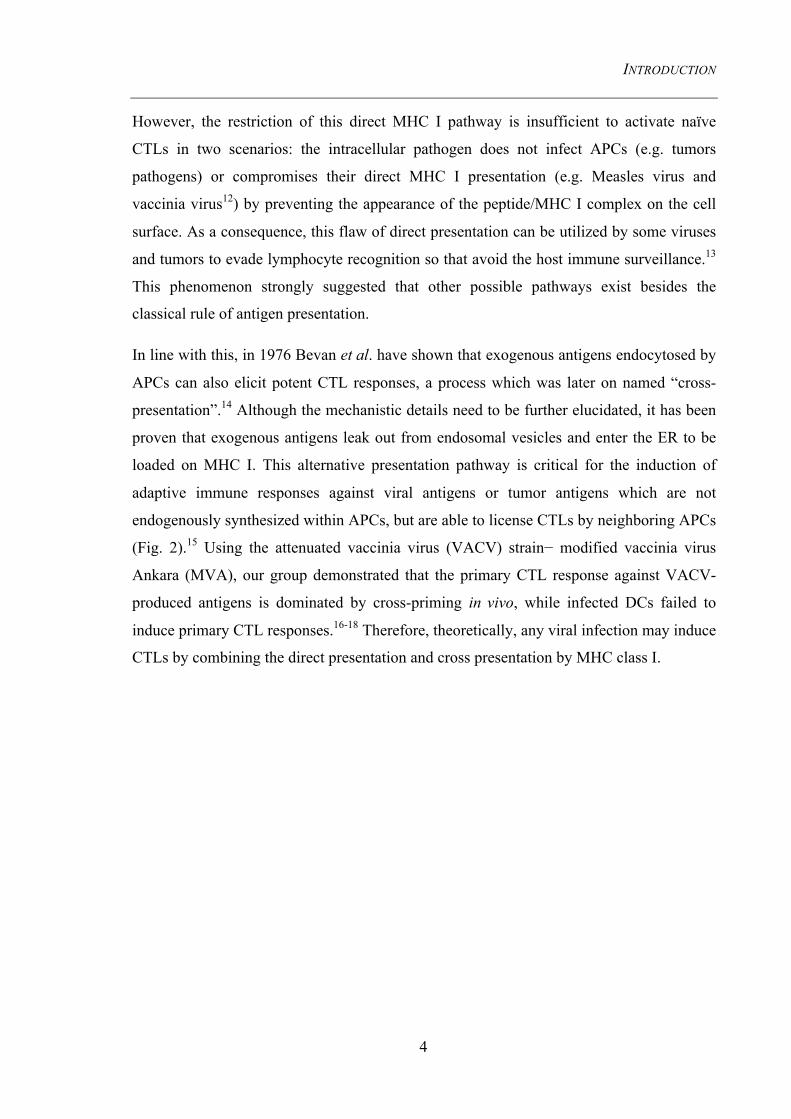
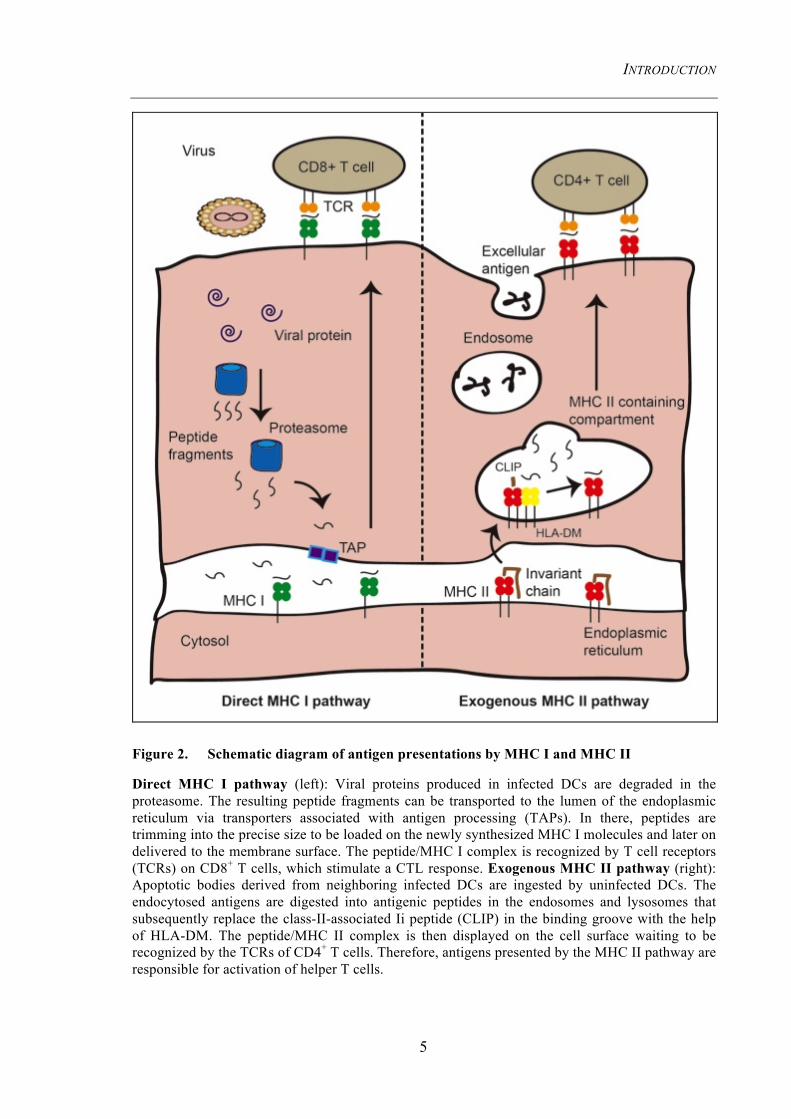
Figure 2. Schematic diagram of antigen presentations by MHC I and MHC II
Direct MHC I pathway (left): Viral proteins produced in infected DCs are degraded in the proteasome. The resulting peptide fragments can be transported to the lumen of the endoplasmic reticulum via transporters associated with antigen processing (TAPs). In there, peptides are trimming into the precise size to be loaded on the newly synthesized MHC I molecules and later on delivered to the membrane surface. The peptide/MHC I complex is recognized by T cell receptors (TCRs) on CD8+ T cells, which stimulate a CTL response. Exogenous MHC II pathway (right): Apoptotic bodies derived from neighboring infected DCs are ingested by uninfected DCs. The endocytosed antigens are digested into antigenic peptides in the endosomes and lysosomes that subsequently replace the class-II-associated Ii peptide (CLIP) in the binding groove with the help of HLA-DM. The peptide/MHC II complex is then displayed on the cell surface waiting to be recognized by the TCRs of CD4+ T cells. Therefore, antigens presented by the MHC II pathway are responsible for activation of helper T cells.
INTRODUCTION
6
1.1.2.2 Exogenous and endogenous antigen presentation by MHC II
Whereas MHC I is designed to present endogenous peptides to CTLs, MHC II molecules
present exogenous protein fragments to CD4+ helper T cells. After microbes or viral
products have been endocytosed, they are digested into peptides of 13-17 amino acids
length and loaded on MHC II in the endocytic compartment. Newly synthesized MHC II
molecules are targeted from the Golgi complex to vesicular compartments through a signal
in the cytoplasmic tail of the invariant chain (Ii) of MHC II (Fig. 2). Once MHC class II
arrives there, Ii is gradually degraded, leaving only a class-II-associated Ii peptide (CLIP)
in the binding groove. With the help of the MHC II-like molecule HLA-DM (in human,
H2-M in mouse), CLIP is released from the groove, which allows antigen peptides to bind.
Particularly, the Ii cleavage and peptides exchange with CLIP that bound to MHC II occurs
in a specific late endosomal compartment called the MHC class II containing compartment
(MIIC). Afterwards, MHC II molecules are released from MIIC and transported to the
plasma membrane to present the cargo peptides to CD4+ T cells. This process is termed
MHC II–restricted exogenous antigen presentation.
Similar to MHC I, the presentation of endocytic peptides is not exclusive to MHC II,
which has been already demonstrated by several studies.19-21 But unlike MHC I, the routes
by which endogenous antigens meet MHC class II are very diverse. It has been shown that
endogenous peptides derived from endosomal and plasma membrane, as well as
mitochondrial or nuclear generated peptides are all able to enter the MHC II antigen
presentation pathway.22 There are four models proposed to elucidate how these
endogenous peptides can access MHC II (Fig. 3). Briefly, the first two possibilities are
similar to the direct MHC I processing pathway, in which cytosolic peptides are imported
into the ER via TAP or some other ER membrane transporters (e.g. Sec61). The peptides
either travel together with MHC class II-Ii to endosomal compartments and then with the
help of HLA-DM are loaded onto MHC II (e.g. influenza hemagglutinin, HA)23 or they
occupy the peptide-binding groove of MHC class II ahead of Ii when MHC II still remains
in the ER (e.g. a 12-mer HA peptide)24. The third pathway is suggested to be dependent on
lysosome associated membrane protein 2a (LAMP-2a, the chaperone-mediated autophagy
transporter) rather than TAP. In this pathway, proteins (e.g. Glutamate decarboxylase 65,
INTRODUCTION
7
GAD65) are degraded initially by the proteasome and subsequently imported into MIIC by
LAMP-2a transporter. The fourth pathway postulated suggests that antigens are delivered
to the lysosome for MHC II processing by macroautophagy (refer to Chapter 1. 3). Up to
date, the last route has been demonstrated for some antigens, such as Epstein-Barr virus
nuclear antigen 1 (EBNA-1) and influenza matrix protein 1 (MP1). Paludan et al.
demonstrated that blocking autophagy by 3-MA or using small interfering RNA (siRNA)
downregulating Atg12, leads to EBNA-1 slowly accumulating in cytosolic
autophagosomes. Therefore, MHC class II-restricted presentation of endogenous EEBNA-
1 to T cells was reduced.25 Additionally, it was reported that targeting of MP1 to
autophagosomes via fusion of the autophagosome-associated protein in DCs led to strongly
enhanced MHC II presentation to CD4+ T cells clones.26
In conclusion, DCs are unique among all APCs in many critical ways. Unlike macrophages
or B cells, which are emphasized by the extraordinary capacity for endocytosis or antibody
secretion, the primary function of DCs appears to be antigen presentation. They have
distinct maturation and migration properties, enabling them to proactively seek naïve T
cells to present the carried antigens. These specialties have interesting implications for how
DCs may use several mechanisms to process antigens from diverse sources and choose
different T cells populations for presentation.
INTRODUCTION
8
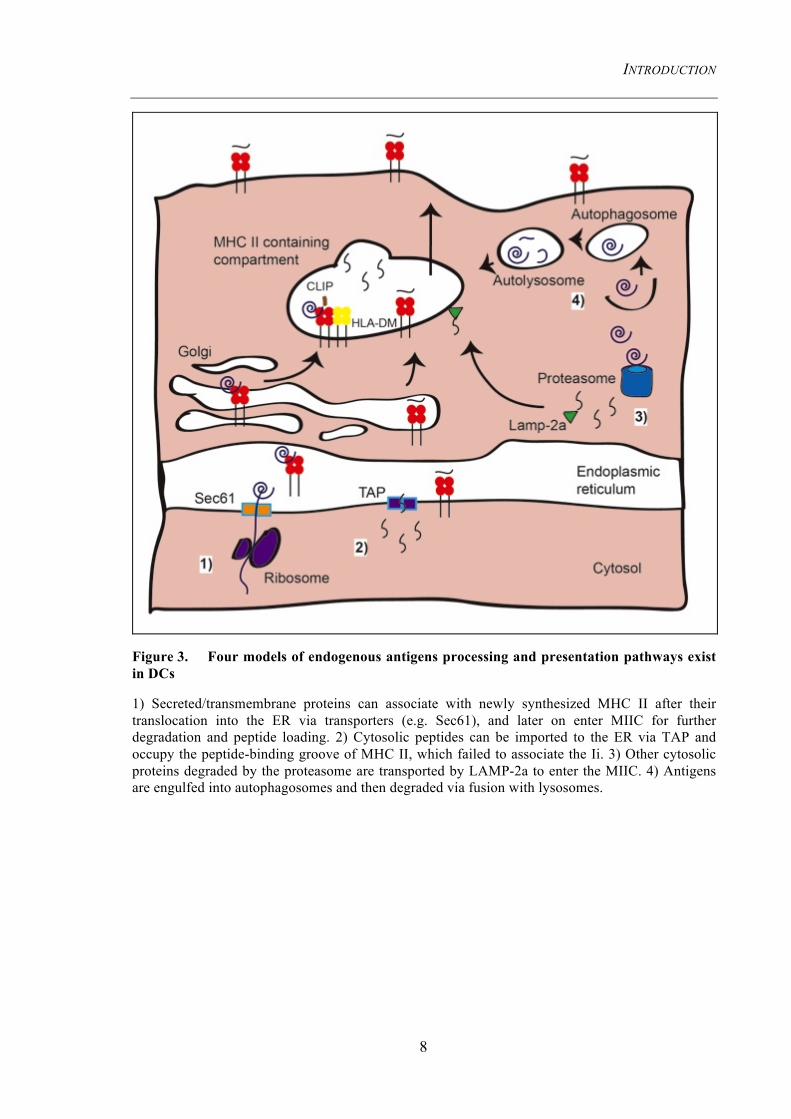
Figure 3. Four models of endogenous antigens processing and presentation pathways exist in DCs
1) Secreted/transmembrane proteins can associate with newly synthesized MHC II after their translocation into the ER via transporters (e.g. Sec61), and later on enter MIIC for further degradation and peptide loading. 2) Cytosolic peptides can be imported to the ER via TAP and occupy the peptide-binding groove of MHC II, which failed to associate the Ii. 3) Other cytosolic proteins degraded by the proteasome are transported by LAMP-2a to enter the MIIC. 4) Antigens are engulfed into autophagosomes and then degraded via fusion with lysosomes.
INTRODUCTION
9
1.2 MVA and its immunogenicity
1.2.1 MVA is a potent recombinant vaccine candidate
The poxviruses comprise a family of double-stranded DNA (dsDNA) viruses that replicate
in the cytoplasm of vertebrate and invertebrate cells.27 One of the famous members in this
family is variola virus, the cause of smallpox, which once altered human history by leading
to the devastating disease in the mid-18th century.28 In 1980, the World Health
Organization (WHO) announced the eradication of smallpox. Since then potential life-
threatening viral infections caused by poxviruses are rare but can occur, e.g. monkeypox
which are sporadically spreading out in the human populations.29 Since Edward Jenner
used cowpox as a prophylactic agent against smallpox in1798, vaccination has been greatly
developed including VACV as a vaccine.30 VACV contains a dsDNA genome of
approximately 190 kb encoding more than 200 proteins. Some characteristics of VACV,
such as a large packaging capacity for recombinant DNA, precise virus-specific control of
target gene expression, lack of persistence or genomic integration into the host genome and
an extremely effective immunogenicity, made VACV the first generation of vaccines used
worldwide.31 However, as live VACV contained these vaccines, between 14 and 52 people
per 1 million people vaccinated for the first time experienced potentially life-threatening
reactions such as serious skin rashes and inflammation of the brain
(http://www.bt.cdc.gov/agent/smallpox/vaccination/facts.asp). Hence, for safety
considerations including the fact that the number of immunosuppressed individuals is
growing, the next generation of vaccines is asking for a candidate, which is replication-
defective in human cells and qualified for expressing recombinant antigens of interest. To
address this demand, the attenuated VACV strain−MVA was developed and profoundly
investigated by the German scientist Professor Anton Mayr.32
After more than 570 tissue culture passages in chicken embryo fibroblasts (CEF), 15% of
the VACV genome including host range genes was removed in MVA.33 MVA replication
is non-permissive in human cells due to a blockage in viral replication, which occurs late at
the stage of virus assembly.34 Because of the high safety record, strong immunogenicity, as
well as the large packaging capacity, MVA is designed as a prevaccine at the end of the
small pox eradication campaign, and is considered as one of the prospective vaccine
candidates against Hepatitis B virus (HBV) or Human Immunodeficiency Virus (HIV),
INTRODUCTION
10
or for the immunotherapy of malignant diseases.31,35
1.2.2 The life cycle of VACV/MVA
As illustrated in Fig. 4, the replication cycle of VACV has been well studied and two
distinct entry forms have been characterized: 1) the intracellular matured virions (IMV)
which bind to the cell surface and subsequently fuse with the cell membrane; 2) the
extracellular enveloped virions (EEV) which enter the cell by endocytosis that lose the
extra outer membrane in the low pH condition to expose the IMV.36 Once the viral and
host membranes fuse with each other, the viral core is released into the cytoplasm to start
the early mRNA transcription, leading to the expression of a variety of proteins including
DNA polymerases, intermediate transcription factors, and RNA polymerases, which are
required for the subsequent cascade of gene replication. After that, uncoating of the virus
core enables the viral DNA replication and the subsequent waves of intermediate and late
gene transcription. Unlike the early mRNA transcription which is strictly controlled by the
viral transcriptional factors, intermediate and late gene expression require additional host-
derived transcription factors to accelerate gene expression, indicating that viruses hijack
the host cellular machinery to serve for its own replication cycle. As a specialty of VACV,
viral DNA replication occurs outside of the nuclei, in an organelle named “viral factory”. It
is a discrete cytoplasmic structure that forms during the intermediate and late gene
transcription, and it is also the place where the early VACV proteins accumulate. This
distinct cellular compartment is investigated in many studies as it is speculated to have
close relation with the host cellular organelles and components, such as the ER37, 38 and
vimentin intermediate filaments (IFs)39. The IMV assemble in viral factory and
subsequently migrate via microtubule mediated trafficking and wrapping with Golgi-
derived membranes to form intracellular enveloped viruses (IEV). The IEV are further
transported to the cell periphery on microtubules where they fuse with the plasma
membrane to form cell-associatd enveloped (CEV), which are later on released directly as
free EEV particles.40
Further studies by Meyer et al. revealed that six major deletions reduced the size of the
entire genome in VACV wild-type-strain chorioallantois vaccinia virus Ankara (CVA) to
177 kb for the MVA strain. The elimination of host range genes such as K1L or C7L
results in the lack of late gene expression in several MVA infected human and murine cell
INTRODUCTION
11
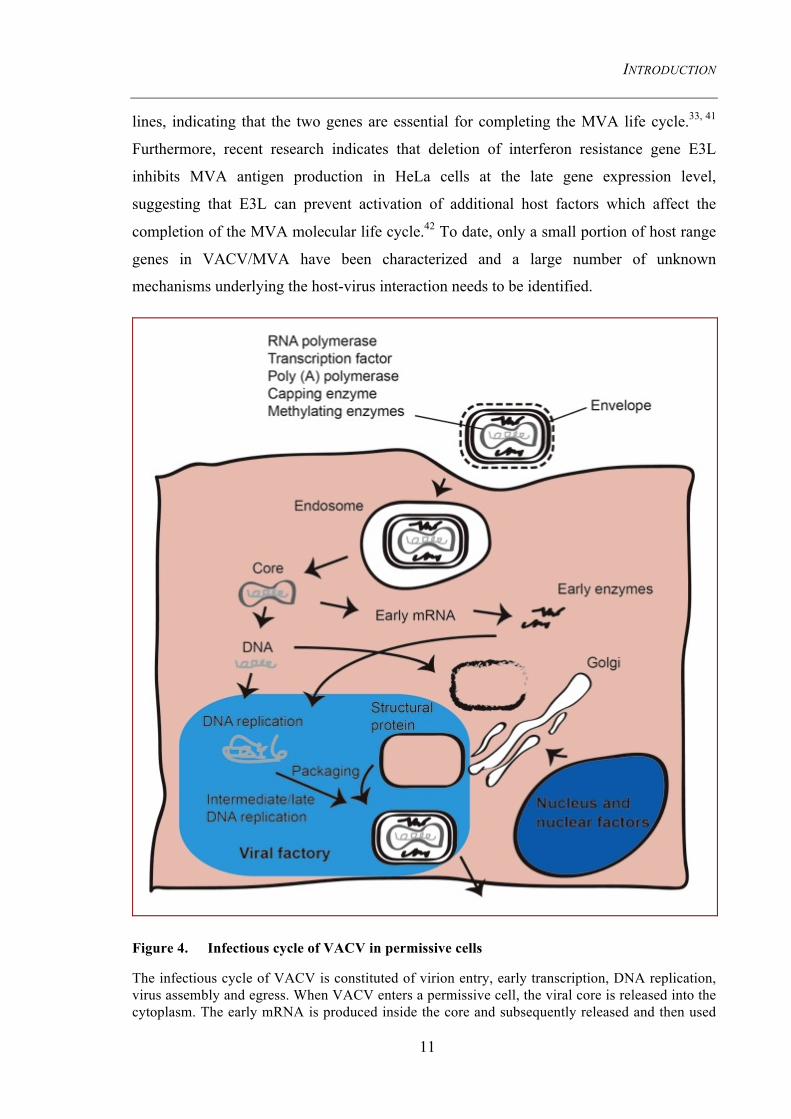
lines, indicating that the two genes are essential for completing the MVA life cycle.33, 41
Furthermore, recent research indicates that deletion of interferon resistance gene E3L
inhibits MVA antigen production in HeLa cells at the late gene expression level,
suggesting that E3L can prevent activation of additional host factors which affect the
completion of the MVA molecular life cycle.42 To date, only a small portion of host range
genes in VACV/MVA have been characterized and a large number of unknown
mechanisms underlying the host-virus interaction needs to be identified.
Figure 4. Infectious cycle of VACV in permissive cells
The infectious cycle of VACV is constituted of virion entry, early transcription, DNA replication, virus assembly and egress. When VACV enters a permissive cell, the viral core is released into the cytoplasm. The early mRNA is produced inside the core and subsequently released and then used
INTRODUCTION
12
to generate early enzymes, which serve for viral DNA replication. The DNA replication cascade lasts around 2 to12h to allow the expression of late genes that are required for virion assembly. Newly synthesized DNA and viral components are then recruited to the viral factory to be packaged into virions and wrapped into enveloped virus.
1.2.3 Innate anti-viral responses after poxvirus infection
Techniques of genetic engineering now enable researchers to reduce the virulence of
poxviruses in order to generate safer and optimized vaccines that can stimulate the immune
response. On the other side, the host immune response also attempts to control the viral
spread by introducing characteristic cellular changes such as apoptosis and necrosis.
Therefore, it is important to understand these intracellular events that restrict viral infection
in order to design an effective vaccine with the capability to strengthen the anti-viral
defense. Based on the efforts of several research groups, it is now believed that binding
and entry of poxviruses into mammalian cells is an efficient process, and that any
restriction events which limit the viral replication, e.g. in non-permissive cells like human
DCs or for replication-deficient viral strains such as MVA will occur after the virus has
entered the host cell.43,44 Once the virus core is released into the cytoplasm, the battle
between virus and host starts. Though the mechanisms have not been completely
elucidated, four categories of restriction points in cells regulating the poxvirus infection
have been proposed. The first event is control of the cell cycle in infected cells. It was
reported that deletion of the growth factor genes in VACV results in attenuation in infected
animals, suggesting that the viruses encodes growth factors to stimulate quiescent cells so
that the viral replication levels in these infected or the neighboring cells are increased.45
MVA infection in HeLa cells was demonstrated to upregulate the gene encoding
interleukin 1A (IL-1A) and to stimulate the expression of nuclear factor kappa B (NF-κB)
components, which are involved in host resistance.46 Secondly, different cell types restrict
virus replication to be abolished at different stages. Human DCs are not permissive for the
replications of both VACV and MVA,34 that the infection was abortive after early gene
expression,16 whereas late viral products are detected in MVA infected murine myeloid
DCs (Thiele and Zhang, unpublished data). The third category includes the complementing
factors from host cells such as trans-acting transcription factors. The virus usurps these
factors to complete the viral activities, like core uncoating, intermediate and late gene
transcription, protein synthesis and virion trafficking. For example, the chaperon
INTRODUCTION
13
protein−heat shock protein 90 (Hsp90) that assists proteins to fold properly and stabilizes
protein structures was shown to modulate VACV replication by interacting with the viral
core protein 4a.47 The fourth intracellular event comprises the signal transduction pathways
(e.g. interferon (IFN) pathway, Toll-like receptor (TLR) pathways and NF-κB signaling
pathway) that respond to viral infection and are critical for the anti-viral defense. Of these,
the best-studied pathway may be the IFN-mediated antiviral state. Since host and virus
have exerted powerful selective pressure on each other, almost all viruses have evolved
defense mechanisms to avoid recognition by the host immune system. In line with this,
García-Arriaza et al. deleted VACV genes (C6L and K7R), which encode inhibitors of the
IFN pathway, to improve adaptive and memory immune responses of a MVA based HIV
vaccine.48 Up to date, the knowledge of which regulatory factors control the intracellular
steps that determine a given poxvirus infection to be permissive or restrictive is still
growing.
1.2.4 Adaptive immunity against MVA infection
It has been well characterized that the primary target of MVA infection in vivo are APCs,
such as DCs, and macrophages.49 In MVA infected peripheral blood mononuclear cells
(PBMCs), it was also shown that CD8+ T cell epitopes are dominant in early, and non-
structural viral genes and transcription factors, while CD4+ T cell epitopes are concentrated
in late, viral structural proteins and enzymes involved in viral replication.50 This evidence
suggests that the adaptive immunity has developed clear labor division to respond to the
different levels of viral invasion.
One major aim in vaccination and immunotherapy is the induction of strong CTL
activation in APCs directly against the viral or tumor antigens respectively. With the
purpose to improve CD8+ T cells responses as one potential strategy to optimize the
vaccine, it has been investigated how processing and MHC I restricted presentation of
antigenic peptides can be enhanced (PhD Thesis of Dr. Georg Gasteiger, The Role of
Antigen Presentation and Immunodominance for the Induction and Expansion of Cytotoxic
T cell Responses with MVA Vector Vaccines,
http://mediatum.ub.tum.de/node?id=647691). It has been demonstrated that cross-priming
can dominate the induction of CTL responses to a virus that efficiently infects DCs and
allows strong antigen-presentation by the APCs.17
INTRODUCTION
14
On the other hand, infection of CD4+ T cell deficient mice resulted in delayed viral
clearance, increased mortality and failure to develop virus-specific antibody responses,
suggesting that CD4+ T cells are essential for the maintenance and recall of CTL
responses.30 The CD4+ T cells can also elicit a protective antibody response to some
VACV proteins (e.g. A27L, B5R) that are known to be strongly targeted by humoral and
cellular responses upon VACV vaccination.51 Recently, Sette et al. have reported that the
antibody response to each particular protein target needs to be accompanied by a matched
CD4+ T cells response.52 Although covalent linkage of the B cell-T cell epitopes is not
necessary for the generation of antibodies in all cases, it seems required for a large virus
like VACV. Therefore, the induction of efficient CD4+ T cell responses is becoming a hot
spot in the development of potent candidate vaccines.
To sum up, replication-deficient MVA preferentially targets APCs and can stimulate
strong CTL responses by direct as well as cross presentation especially in DCs. This
attenuated virus strain has low virulence and high expression levels of foreign fusion
proteins, which makes it an ideal vector for both prophylactic and therapeutic vaccination.
However, the requirements for efficient induction and activation of CD4+ T cells needs to
be further chracterized.
INTRODUCTION
15
1.3 Autophagy and its role in antigen presentation
1.3.1 Functional autophagy is constituted of autophagosome formation and autophagic flux
Autophagy is an evolutionary ancient cellular system for cell survival that reacts to a
variety of stresses, including bacteria and virus infection, as well as starvation. By
developing an intracellular bulk pathway, autophagy delivers cytoplasmic materials to
lysosomes to be degraded, thus providing energy for cell metabolism or eliminating
pathogens by lysosomal lysis. This process starts with the generation of a double-
membrane organelle termed “autophagosome”, which engulfs the surrounding proteins and
organelles, and undergoes maturation by emerging with the lysosome to form the
“autolysosome” that can share the acidic environment and lysosomal enzymes for
degradation of inner cargo. This multi-step dynamic process is called “autophagic flux”.
Together with autophagosome initiation, it represents the function of autophagy.
Autophagy is classified as macroautophagy, microautophagy and chaperone-mediated
autophagy, out of which the most extensively studied class is macroautophagy.53
Microautophagy is a mechanism for invagination, protrusion and septation part of
lysosomal membrane to uptake the cytosolic material. Chaperone-mediated autophagy
involves the direct translocation of cytosolic proteins across lysosomal membranes for
rapid degradation, which requires selective proteins to be recognized by chaperone
proteins.54 This thesis will mainly focus on the macroautophagy (simply referred as
autophagy hereafter).
As depicted in Fig. 5, autophagy is a highly regulated process that comprises several stages.
Briefly, the first autophagic regulatory process involves the de-repression of the
mammalian target of rapamycin (mTOR) Serine/Threonine (Ser/Thr) kinase, which
inhibits autophagy by phosphorylating autophagy related gene-encoded protein (Atg)-13
(Atg13).55 When mTOR is downregulated, the re-association of de-phosphorylated Atg13
with Atg1 stimulates its catalytic activity and initiates autophagosome formation. Among
the first step, Beclin-1 (the mammalian orthologue of Atg6) plays an important role in
forming a complex with phosphoinositide-3 kinase class III (PIK3C3). For incorporation
into this complex, Beclin-1 has to dissociate with anti-apoptotic Bcl-2 and Bcl-xL, which
INTRODUCTION
16
anchor Beclin-1 at the ER membrane. There is evidence showing that Bcl-2 by binding
with Beclin-1 interferes with the interaction of Beclin-1 and PIK3C3, which functions as a
brake of autophagy and autophagic cell death.56 Additionally, autophagy maturation is also
enhanced by association of the Beclin-1-PIK3C3 complex with UV irradiation resistance-
associated gene (UVRAG).57 Two ubiquitin-like conjugation systems constitute the
autophagosome elongation process. In both pathways, E1-like enzyme Atg7 essentially
contributes to the complex conjugation, especially the phosphatidylethanolamine (PE) to
microtubule-associated protein light chain 3 (LC3, mammalian homologue of Atg8), which
leads to the turnover from the cytosolic form LC3-I to the autophagic-associated form
LC3-II. When the autolysosome has emerged, LC3-II on the inner membrane as well as the
luminal contents of autophagic vacuoles are consequently degraded within this acidic
compartment.55
INTRODUCTION
17
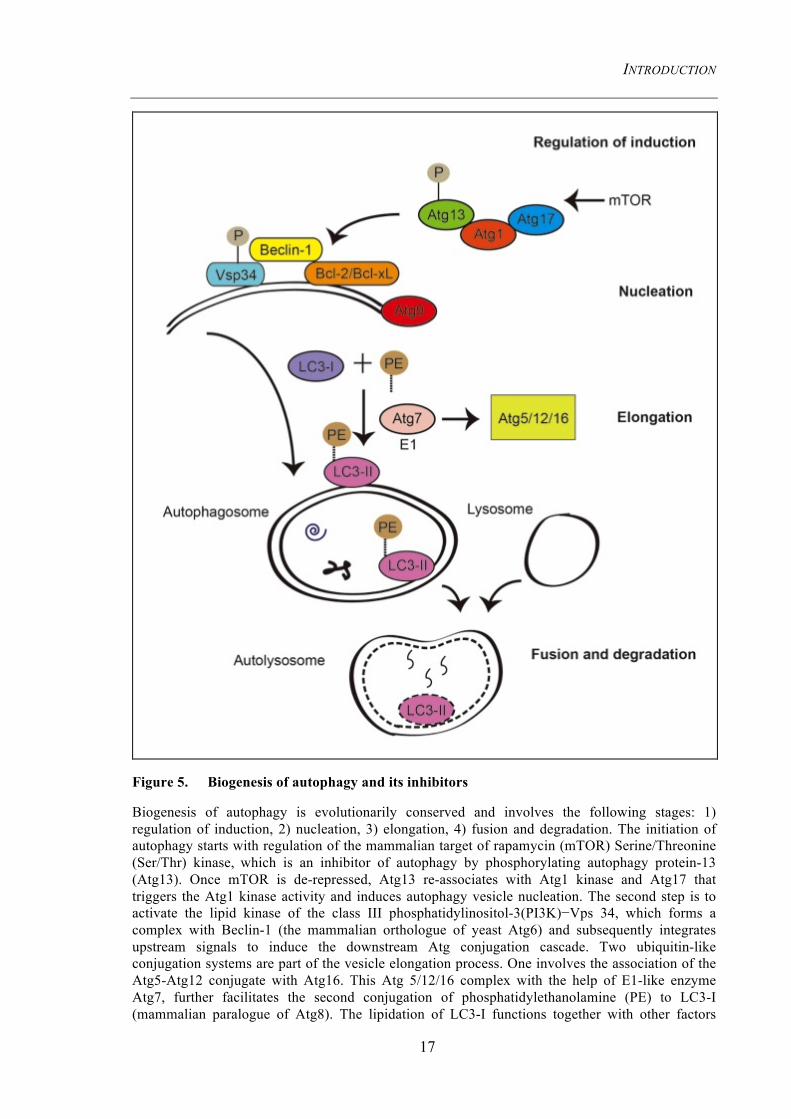
Figure 5. Biogenesis of autophagy and its inhibitors
Biogenesis of autophagy is evolutionarily conserved and involves the following stages: 1) regulation of induction, 2) nucleation, 3) elongation, 4) fusion and degradation. The initiation of autophagy starts with regulation of the mammalian target of rapamycin (mTOR) Serine/Threonine (Ser/Thr) kinase, which is an inhibitor of autophagy by phosphorylating autophagy protein-13 (Atg13). Once mTOR is de-repressed, Atg13 re-associates with Atg1 kinase and Atg17 that triggers the Atg1 kinase activity and induces autophagy vesicle nucleation. The second step is to activate the lipid kinase of the class III phosphatidylinositol-3(PI3K)−Vps 34, which forms a complex with Beclin-1 (the mammalian orthologue of yeast Atg6) and subsequently integrates upstream signals to induce the downstream Atg conjugation cascade. Two ubiquitin-like conjugation systems are part of the vesicle elongation process. One involves the association of the Atg5-Atg12 conjugate with Atg16. This Atg 5/12/16 complex with the help of E1-like enzyme Atg7, further facilitates the second conjugation of phosphatidylethanolamine (PE) to LC3-I (mammalian paralogue of Atg8). The lipidation of LC3-I functions together with other factors
INTRODUCTION
18
(such as Atg9) to assemble the phagophore, elongate the membrane of the autophagosome and lead to the fusion with the lysosome. The autophagosome fuses with the lysosome to generate the autolysosome, where the inner membrane as well as the inside contents are degraded by lysosomal enzymes which are active in this acidic compartment. Red blocking arrows indicate the inhibitors of autophagy. Bcl2 and Bcl-xL are regulators of Beclin-1.
1.3.2 Autophagy contributes to innate and adaptive immunity
Autophagy ingests intracellular microorganisms into autophagosomes and subsequently
delivers these pathogens to lysosomes for hydrolysis, suggesting a direct antimicrobial
function of autophagy. It is suggested that autophagy provides a series of barriers against
the invasion of viruses and bacteria.58 Except for degradation of engulfed pathogens in the
autolysosome, the LC3-associated phagocytosis involves the engagement of the autophagic
machinery while the bacterium is captured by phagosomes. Evidence showed that LC3 and
Beclin-1 were recruited to the phagosomes, facilitating phagosomes fusion with the
lysosome, thus allowing a rapid acidification and enhanced killing of the ingested
organism.59 Furthermore, a group of autophagic adaptors, known as sequestosome 1-like
receptors (SLRs), can recognize molecular tags (such as ubiquitin) present on invading
pathogens or damaged host components that activate autophagy in order to restrict the
proliferation of bacteria.60
To initiate autophagy, mammalian cells detect the presence, location and extent of the
pathogen invasion. Different pattern recognition receptor (PRR) families identify distinct
pathogen-associated molecular patterns (PAMPs) on the cell surface and intracellularly.57
Toll-like receptors (TLRs) represent a conserved family of innate immune recognition
receptors that play key roles in the recognition of PAMPs leading to the induction of innate
and adaptive immune responses.61 They are critical PRRs that are in charge of recognizing
both extracellular pathogen products (such as LPS and lipopeptide recognized by TLR4, 2
and 6 respectively) and endosomal dangerous molecules (such as single-stranded DNA,
single-stranded RNA and double-stranded RNA recognized by TLR9, 7, 8 and 3
respectively). Delgado et al. have found out that ssRNA induces the autophagy in a Beclin-
1-dependent manner, which functionally eliminates the intracellular pathogens via myeloid
differentiation factor 88 (MyD88).62 In return, it was also shown that autophagy transports
Sendai and Vesicular stomatitis virus replication intermediates to TLR7/8 that is required
for IFN-α production by DCs in response to these viral infections.63 Furthermore, Shi and
INTRODUCTION
19
colleagues have demonstrated TLR signaling pathways enhance autophagy via the adapter
proteins MyD88 and Toll-IL-1 receptor (TIR)-domain-containing adapter-inducing
interferon-β (TRIF).56, 64 These evidences indicate a close link between the TLR signaling
pathway and the autophagic system, revealing that TLRs and autophagy influence each
other, thereby amplifying the outputs of both systems in response to pathogen invasion.
The function of autophagy is not only confined in direct elimination of microorganisms, it
is also called a bulk “topological inverter” by transporting proteins from the cytoplasm into
antigen–processing compartments.58 Since the autophagosome contains a double
membrane and internal membrane sheets, MIIC was observed to obtain a typical
multilaminar morphology by fusion with the autophagosome under the electron
microscope.65 As a byproduct of this, MHC II received more peptides from hydrolysis in
autolysosome degradation. Accordingly, antigen processing for MHC II presentation to
CD4+ helper T cells is benefited. Lee et al. showed that Atg5 deficiency in DCs
compromised the development of CD4+ T cells responses upon herpes simplex virus (HSV)
infection of mice.66
In summary, autophagy influences innate and adaptive immune responses through its
effects on eating-and-killing the microorganisms, TLR mediated cytokine secretion,
antigen presentation, CD4+ T cell stimulation as well as some other functions that are too
extensive to be covered in this introduction.
AIMS OF THE STUDY
20
2. Aims of the study
Using the attenuated VACV strain MVA, it was demonstrated that primary CTL responses
against VACV-derived antigens were dominated by cross-priming in vivo, while infected
DCs failed to induce primary CTLs. Recently, our group discovered that inhibition of
autophagy by chemical inhibitors leads to decreased specific CD4+ T cell responses against
endogenous MVA antigen. Though it has not yet been proven that these MHC II ligands
are generated from autophagy substrates, at least this result suggests that autophagy
facilitates the presentation process of these. Given that MVA-infected DCs are prone to
apoptosis quite fast and that the endocytic ability of infected DCs is significantly impaired,
the endogenous antigen presentation through autophagy seems able to reconstitute the loss
of exogenously acquired MHC class II antigens to some extent. Especially in DCs, where
the endocytic system seem to be leaky and releases exogenous antigen for cross-
presentation on MHC I, autophagic re-transfer of these cytoplasmic antigens that have
escaped from endosomes back to its original destinations seems very likely. Finally, TLRs
have been shown to play an important role in the sensing of MVA. The TLR2-TLR6-
MyD88, MDA-5-IPS-1 and NALP3 inflammasome pathway has been described as one of
the main innate sensors of MVA in bone marrow derived macrophages (BMDMs) and
bone marrow derived dendritic cells (BMDCs).67 Therefore, the induction of the TLR
signaling might stimulate downstream autophagy, resulting in a cooperation of both
sensing and effector system in the responses to the viral infection.
To prove this hypothesis, the central objective of this thesis was to investigate and
characterize the cellular events and the underlying molecular mechanisms that control and
shape the MHC II restricted endogenous antigen presentation pathway in professional
APCs and cell lines during acute MVA infection. To address this aim, the experimental
work consists of the following three parts:
A. Monitor the change of autophagy behavior during MVA infection.
1) Determine if the autophagy system contributes to the delivery of endogenous viral
antigens into endocytic compartments for peptide-MHC II complex formation and
presentation.
AIMS OF THE STUDY
21
2) Include of fluorescently labelled recombinant MVA expressing MHC II model
antigens (e.g. MVA-mRFP-HEL).
3) Investigate of the intracellular trafficking of HEL-MHC II complex in DCs and
characterization of the activation of CD4+ T cell populations by BMDCs upon MVA-
mRFP-HEL infection to verify the endogenous presentation pathway.
B. Investigate the influence of the TLR signaling pathway on the autophagic system
upon MVA infection.
1) Analyse of the protein expression levels of autophagy associated gene products (e.g.
Beclin-1 and LC3-I/II) and TLR adaptors (e.g. MyD88) in the steady state
condition, upon viral infection and after amino acids starvation.
2) Investigate the interactions between these proteins and their influence on autophagy
function.
C. Determine the spatiotemporal pattern of viral antigen expression and localization/
redistribution of structural or non-structural viral gene products in cellular
compartments during the course of infection. The main focus here is to analyse the
co-localization of the viral factory with cellular organelles as well as the cell skeleton.
MATERIAL AND METHODS
22
3. Material and Methods
3.1 Materials
For detailed information on equipment, consumable items and reagents as well as kits and
enzymes please refer to the lists provided in Chapter 8. Appendix.
3.1.1 Plasmids
The plasmids listed in Table 1 were either commercially available or kind gifts.
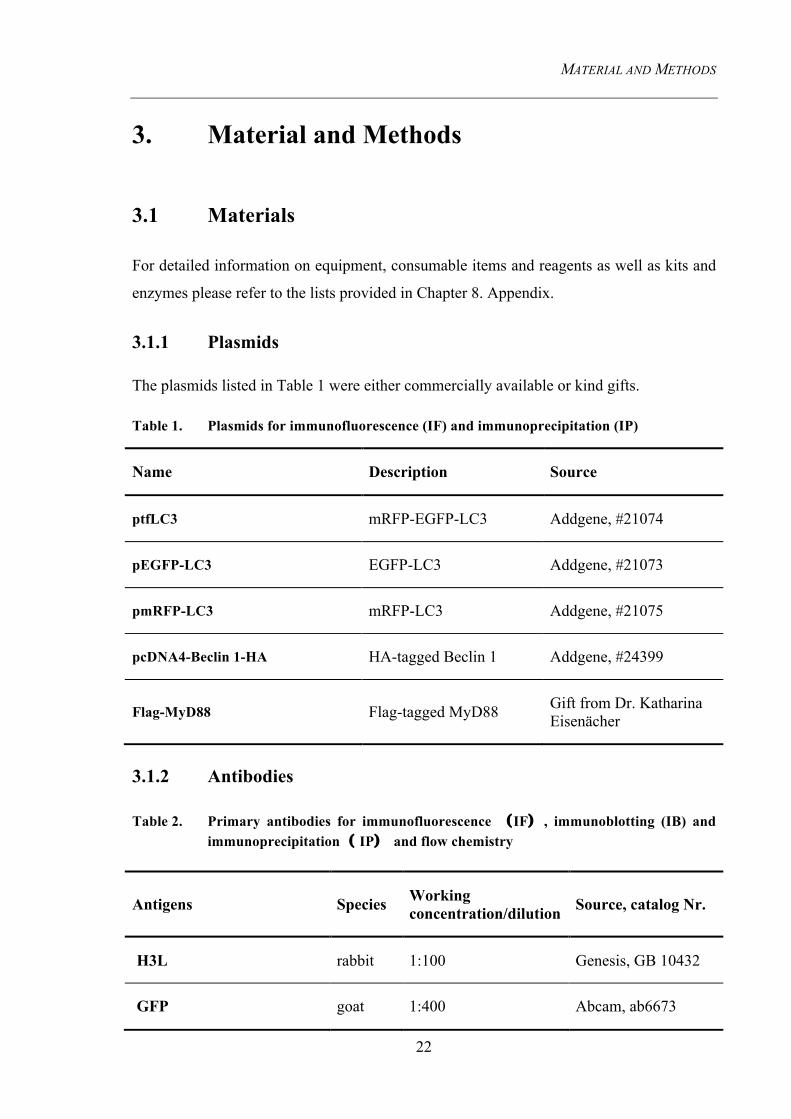
Table 1. Plasmids for immunofluorescence (IF) and immunoprecipitation (IP)
Name Description Source
ptfLC3 mRFP-EGFP-LC3 Addgene, #21074
pEGFP-LC3 EGFP-LC3 Addgene, #21073
pmRFP-LC3 mRFP-LC3 Addgene, #21075
pcDNA4-Beclin 1-HA HA-tagged Beclin 1 Addgene, #24399
Flag-MyD88 Flag-tagged MyD88 Gift from Dr. Katharina Eisenächer
3.1.2 Antibodies
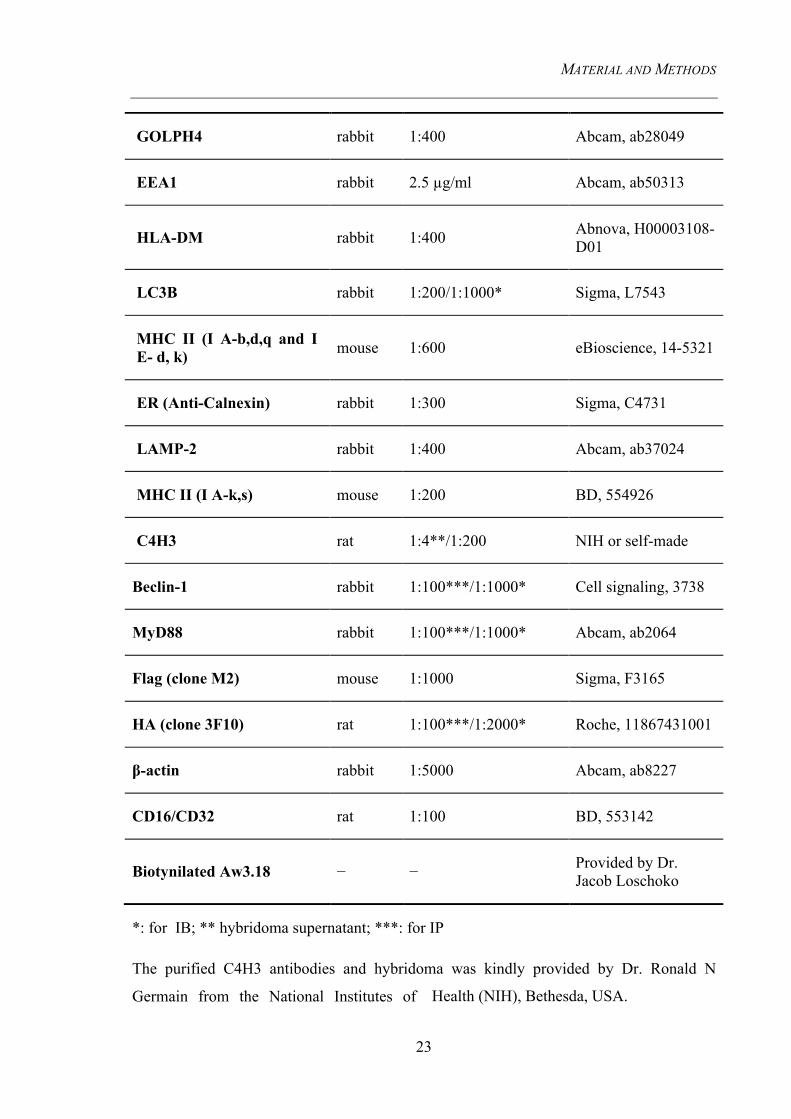
Table 2. Primary antibodies for immunofluorescence (IF) , immunoblotting (IB) and immunoprecipitation( IP) and flow chemistry
Antigens Species Working concentration/dilution Source, catalog Nr.
H3L
rabbit 1:100 Genesis, GB 10432
GFP
goat 1:400 Abcam, ab6673
MATERIAL AND METHODS
23
*: for IB; ** hybridoma supernatant; ***: for IP
The purified C4H3 antibodies and hybridoma was kindly provided by Dr. Ronald N
Germain from the National Institutes of Health (NIH), Bethesda, USA.
GOLPH4
rabbit 1:400 Abcam, ab28049
EEA1
rabbit 2.5 µg/ml Abcam, ab50313
HLA-DM
rabbit 1:400 Abnova, H00003108-D01
LC3B
rabbit 1:200/1:1000* Sigma, L7543
MHC II (I A-b,d,q and I E- d, k)
mouse 1:600 eBioscience, 14-5321
ER (Anti-Calnexin)
rabbit 1:300 Sigma, C4731
LAMP-2
rabbit 1:400 Abcam, ab37024
MHC II (I A-k,s)
mouse 1:200 BD, 554926
C4H3
rat 1:4**/1:200 NIH or self-made
Beclin-1 rabbit 1:100***/1:1000* Cell signaling, 3738
MyD88 rabbit 1:100***/1:1000* Abcam, ab2064
Flag (clone M2) mouse 1:1000 Sigma, F3165
HA (clone 3F10) rat 1:100***/1:2000* Roche, 11867431001
β-actin rabbit 1:5000 Abcam, ab8227
CD16/CD32 rat 1:100 BD, 553142
Biotynilated Aw3.18 − − Provided by Dr. Jacob Loschoko
MATERIAL AND METHODS
24
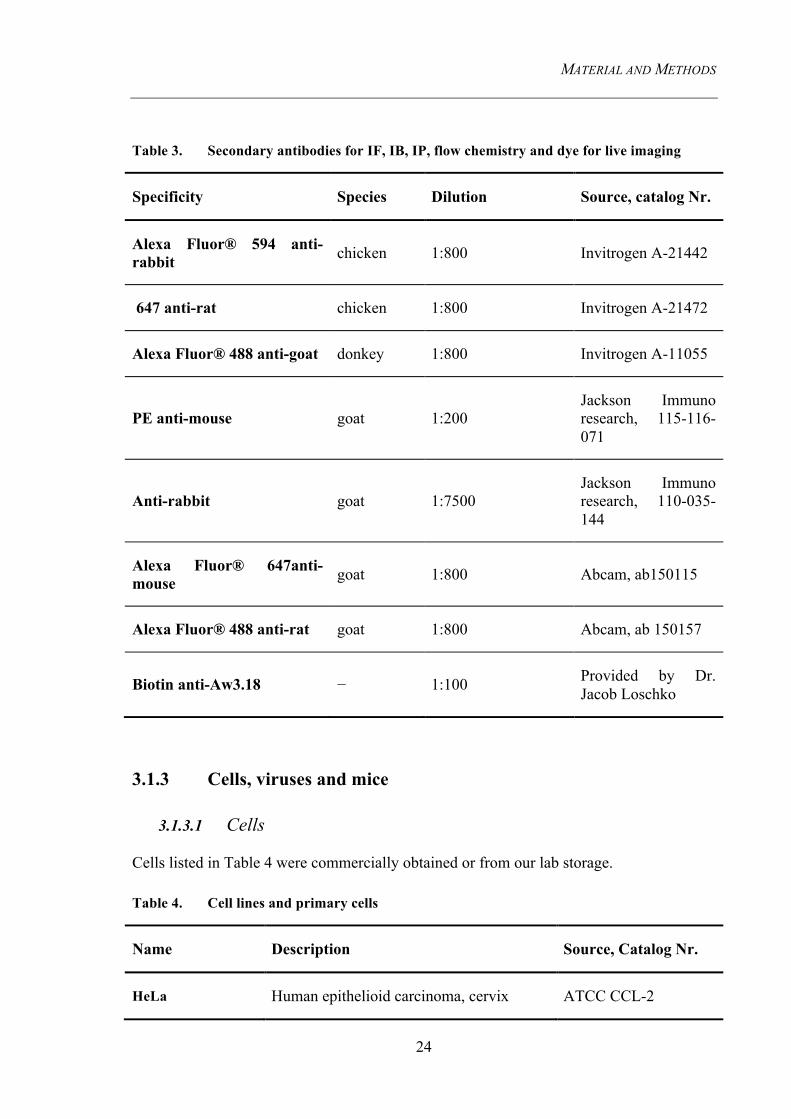
Table 3. Secondary antibodies for IF, IB, IP, flow chemistry and dye for live imaging
Specificity Species Dilution Source, catalog Nr.
Alexa Fluor® 594 anti-rabbit chicken 1:800 Invitrogen A-21442
647 anti-rat chicken 1:800 Invitrogen A-21472
Alexa Fluor® 488 anti-goat donkey 1:800 Invitrogen A-11055
PE anti-mouse goat 1:200 Jackson Immuno research, 115-116-071
Anti-rabbit goat 1:7500 Jackson Immuno research, 110-035-144
Alexa Fluor® 647anti-mouse goat 1:800 Abcam, ab150115
Alexa Fluor® 488 anti-rat goat 1:800 Abcam, ab 150157
Biotin anti-Aw3.18 − 1:100 Provided by Dr. Jacob Loschko
3.1.3 Cells, viruses and mice
3.1.3.1 Cells
Cells listed in Table 4 were commercially obtained or from our lab storage.
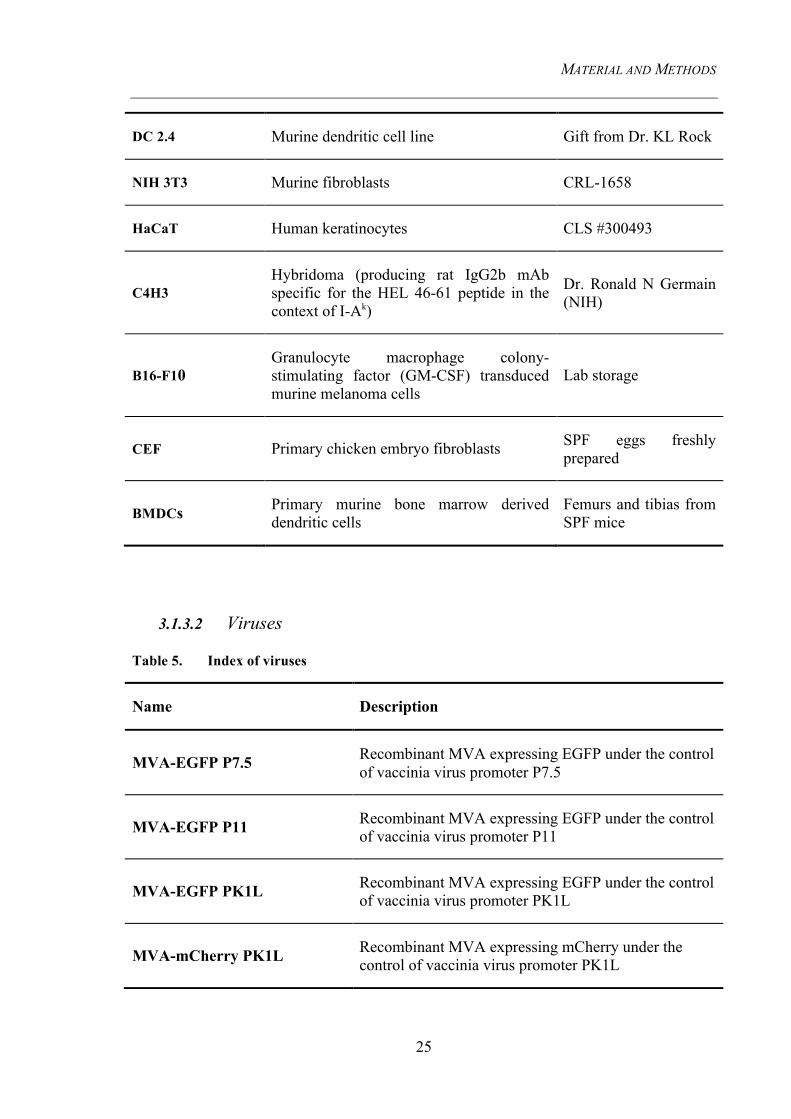
Table 4. Cell lines and primary cells
Name Description Source, Catalog Nr.
HeLa Human epithelioid carcinoma, cervix ATCC CCL-2
MATERIAL AND METHODS
25
DC 2.4 Murine dendritic cell line Gift from Dr. KL Rock
NIH 3T3 Murine fibroblasts CRL-1658
HaCaT Human keratinocytes CLS #300493
C4H3 Hybridoma (producing rat IgG2b mAb specific for the HEL 46-61 peptide in the context of I-Ak)
Dr. Ronald N Germain (NIH)
B16-F10 Granulocyte macrophage colony-stimulating factor (GM-CSF) transduced murine melanoma cells
Lab storage
CEF Primary chicken embryo fibroblasts SPF eggs freshly prepared
BMDCs Primary murine bone marrow derived dendritic cells
Femurs and tibias from SPF mice
3.1.3.2 Viruses
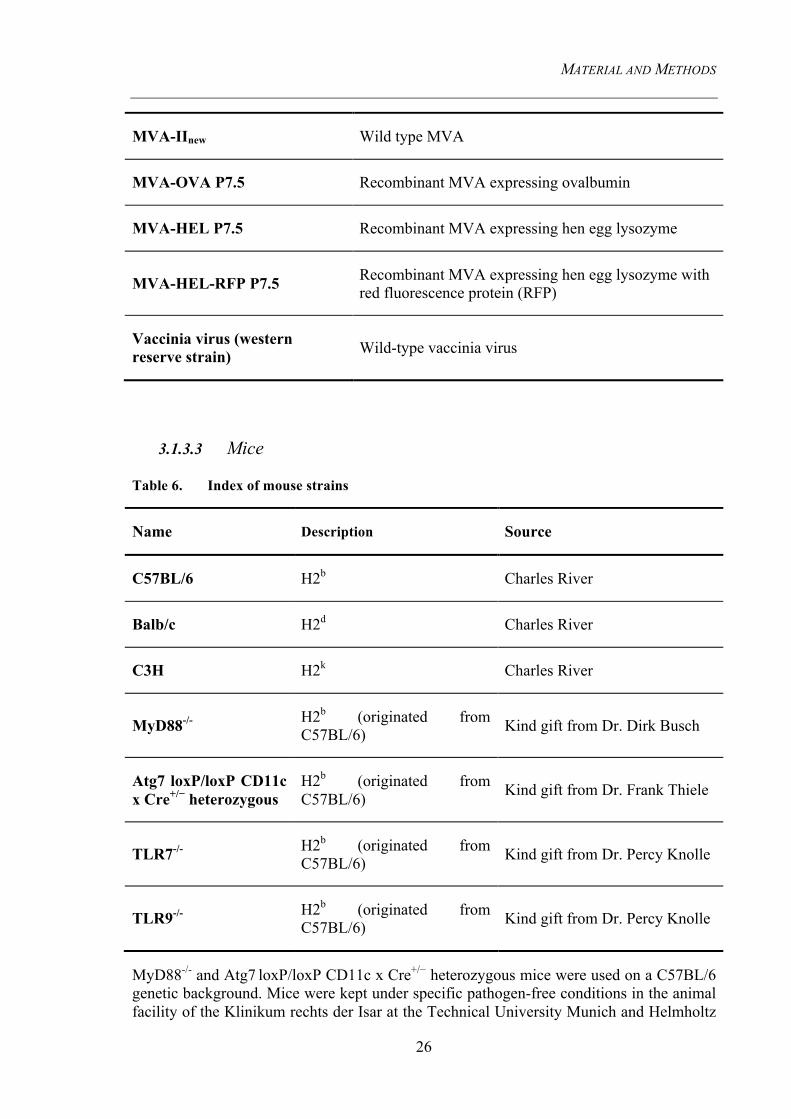
Table 5. Index of viruses
Name Description
MVA-EGFP P7.5 Recombinant MVA expressing EGFP under the control of vaccinia virus promoter P7.5
MVA-EGFP P11 Recombinant MVA expressing EGFP under the control of vaccinia virus promoter P11
MVA-EGFP PK1L Recombinant MVA expressing EGFP under the control of vaccinia virus promoter PK1L
MVA-mCherry PK1L Recombinant MVA expressing mCherry under the control of vaccinia virus promoter PK1L
MATERIAL AND METHODS
26
MVA-IInew Wild type MVA
MVA-OVA P7.5 Recombinant MVA expressing ovalbumin
MVA-HEL P7.5 Recombinant MVA expressing hen egg lysozyme
MVA-HEL-RFP P7.5 Recombinant MVA expressing hen egg lysozyme with red fluorescence protein (RFP)
Vaccinia virus (western reserve strain) Wild-type vaccinia virus
3.1.3.3 Mice
Table 6. Index of mouse strains
Name Description Source
C57BL/6 H2b Charles River
Balb/c H2d Charles River
C3H H2k Charles River
MyD88-/- H2b (originated from C57BL/6) Kind gift from Dr. Dirk Busch
Atg7 loxP/loxP CD11c x Cre+/− heterozygous
H2b (originated from C57BL/6) Kind gift from Dr. Frank Thiele
TLR7-/- H2b (originated from C57BL/6) Kind gift from Dr. Percy Knolle
TLR9-/- H2b (originated from C57BL/6) Kind gift from Dr. Percy Knolle
MyD88-/- and Atg7 loxP/loxP CD11c x Cre+/− heterozygous mice were used on a C57BL/6 genetic background. Mice were kept under specific pathogen-free conditions in the animal facility of the Klinikum rechts der Isar at the Technical University Munich and Helmholtz
MATERIAL AND METHODS
27
Zentrum Munich. Experiments are performed in accordance with the German animal care and ethics legislation and approved by the local government authorities.
3.1.4 Buffers, solutions and media
3.1.4.1 Media for cell culture
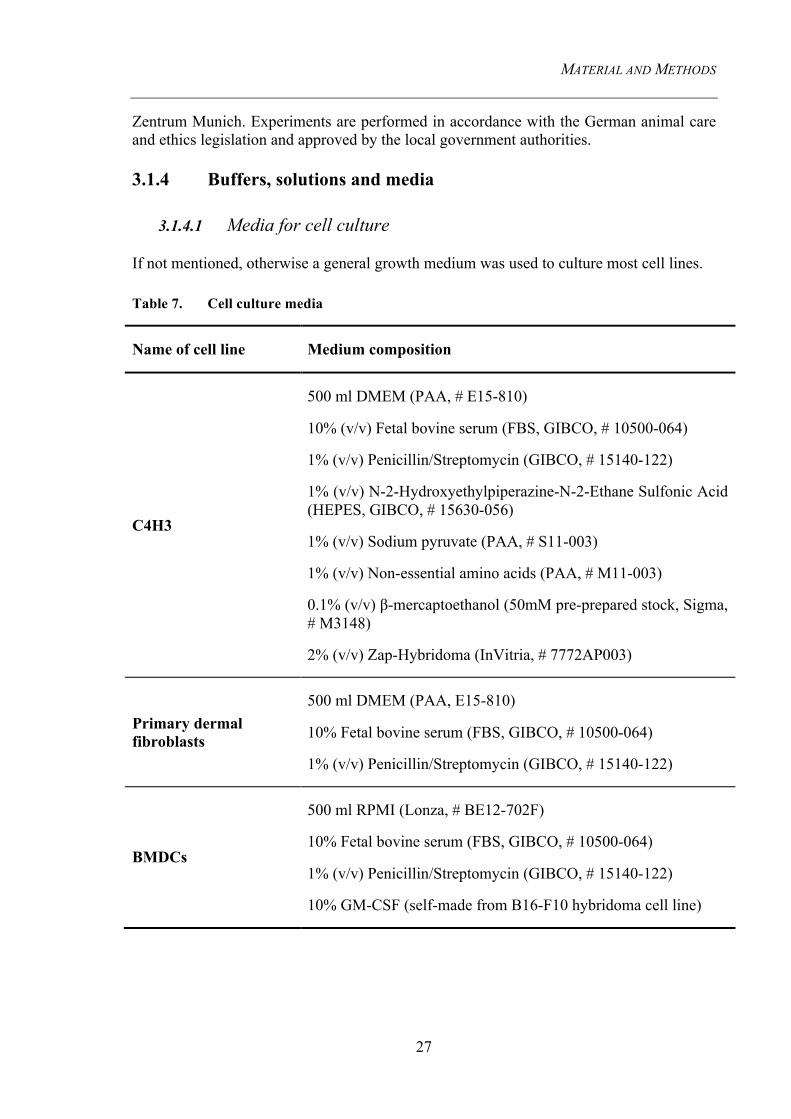
If not mentioned, otherwise a general growth medium was used to culture most cell lines.
Table 7. Cell culture media
Name of cell line Medium composition
C4H3
500 ml DMEM (PAA, # E15-810)
10% (v/v) Fetal bovine serum (FBS, GIBCO, # 10500-064)
1% (v/v) Penicillin/Streptomycin (GIBCO, # 15140-122)
1% (v/v) N-2-Hydroxyethylpiperazine-N-2-Ethane Sulfonic Acid (HEPES, GIBCO, # 15630-056)
1% (v/v) Sodium pyruvate (PAA, # S11-003)
1% (v/v) Non-essential amino acids (PAA, # M11-003)
0.1% (v/v) β-mercaptoethanol (50mM pre-prepared stock, Sigma, # M3148)
2% (v/v) Zap-Hybridoma (InVitria, # 7772AP003)
Primary dermal fibroblasts
500 ml DMEM (PAA, E15-810)
10% Fetal bovine serum (FBS, GIBCO, # 10500-064)
1% (v/v) Penicillin/Streptomycin (GIBCO, # 15140-122)
BMDCs
500 ml RPMI (Lonza, # BE12-702F)
10% Fetal bovine serum (FBS, GIBCO, # 10500-064)
1% (v/v) Penicillin/Streptomycin (GIBCO, # 15140-122)
10% GM-CSF (self-made from B16-F10 hybridoma cell line)
MATERIAL AND METHODS
28
General
500 ml RPMI (Lonza, # BE12-702F)
10% Fetal bovine serum (FBS, GIBCO, # 10500-064)
1% (v/v) Penicillin/Streptomycin (GIBCO, # 15140-122)
Freezing medium
70% complete culture medium of the respective cell line
20% FCS Fetal bovine serum (FBS, GIBCO, # 10500-064)
10% DMSO (Sigma, # D2650)
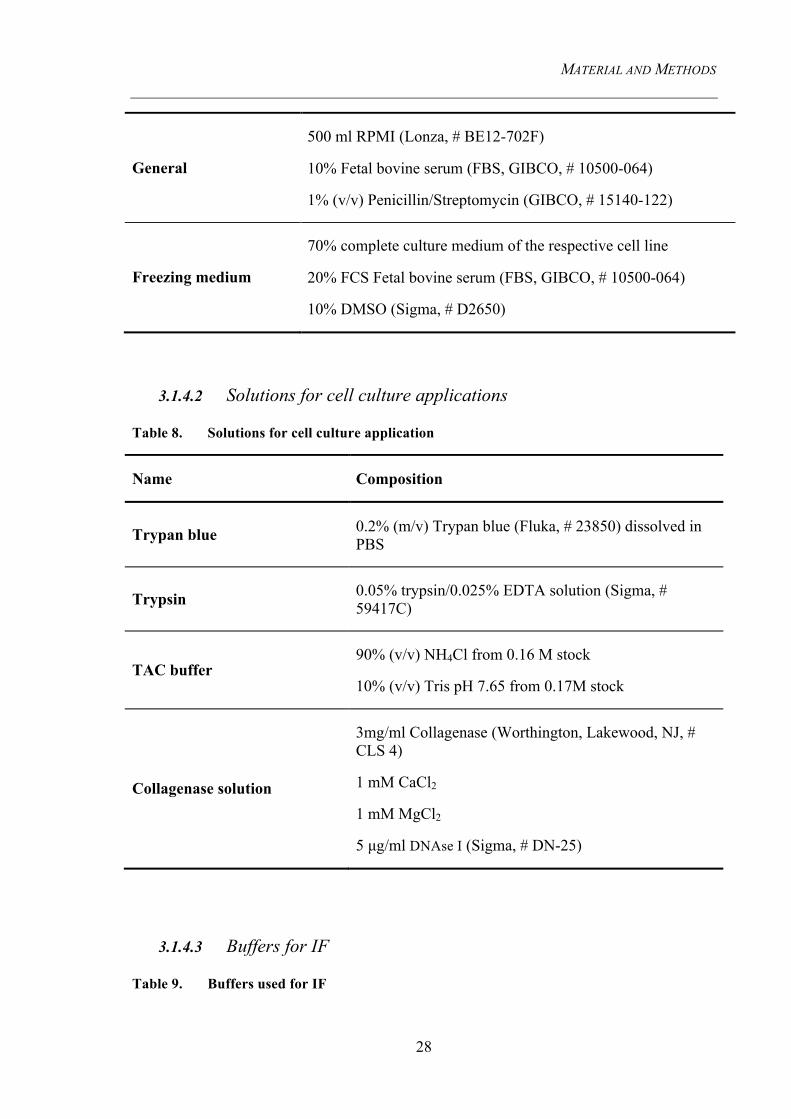
3.1.4.2 Solutions for cell culture applications
Table 8. Solutions for cell culture application
Name Composition
Trypan blue 0.2% (m/v) Trypan blue (Fluka, # 23850) dissolved in PBS
Trypsin 0.05% trypsin/0.025% EDTA solution (Sigma, # 59417C)
TAC buffer 90% (v/v) NH4Cl from 0.16 M stock
10% (v/v) Tris pH 7.65 from 0.17M stock
Collagenase solution
3mg/ml Collagenase (Worthington, Lakewood, NJ, # CLS 4)
1 mM CaCl2
1 mM MgCl2
5 µg/ml DNAse I (Sigma, # DN-25)
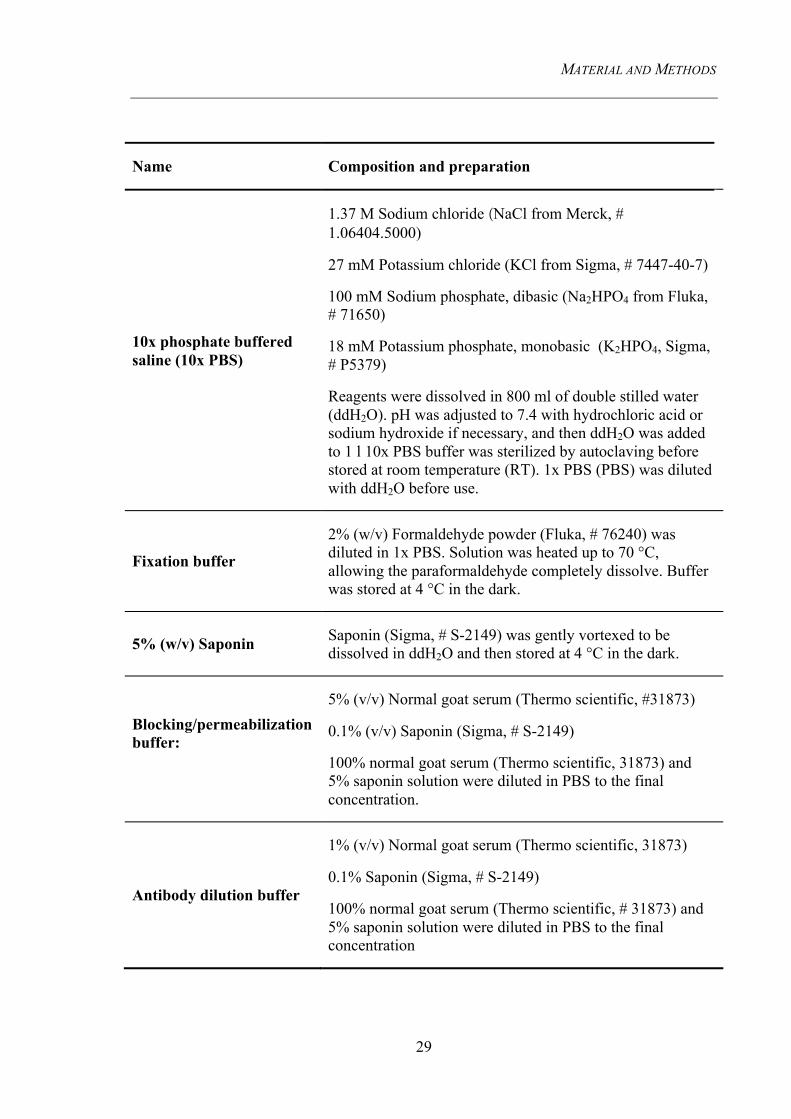
3.1.4.3 Buffers for IF
Table 9. Buffers used for IF
MATERIAL AND METHODS
29
Name Composition and preparation
10x phosphate buffered saline (10x PBS)
1.37 M Sodium chloride (NaCl from Merck, # 1.06404.5000)
27 mM Potassium chloride (KCl from Sigma, # 7447-40-7)
100 mM Sodium phosphate, dibasic (Na2HPO4 from Fluka, # 71650)
18 mM Potassium phosphate, monobasic (K2HPO4, Sigma, # P5379)
Reagents were dissolved in 800 ml of double stilled water (ddH2O). pH was adjusted to 7.4 with hydrochloric acid or sodium hydroxide if necessary, and then ddH2O was added to 1 l 10x PBS buffer was sterilized by autoclaving before stored at room temperature (RT). 1x PBS (PBS) was diluted with ddH2O before use.
Fixation buffer
2% (w/v) Formaldehyde powder (Fluka, # 76240) was diluted in 1x PBS. Solution was heated up to 70 °C, allowing the paraformaldehyde completely dissolve. Buffer was stored at 4 °C in the dark.
5% (w/v) Saponin Saponin (Sigma, # S-2149) was gently vortexed to be dissolved in ddH2O and then stored at 4 °C in the dark.
Blocking/permeabilization buffer:
5% (v/v) Normal goat serum (Thermo scientific, #31873)
0.1% (v/v) Saponin (Sigma, # S-2149)
100% normal goat serum (Thermo scientific, 31873) and 5% saponin solution were diluted in PBS to the final concentration.
Antibody dilution buffer
1% (v/v) Normal goat serum (Thermo scientific, 31873)
0.1% Saponin (Sigma, # S-2149)
100% normal goat serum (Thermo scientific, # 31873) and 5% saponin solution were diluted in PBS to the final concentration
MATERIAL AND METHODS
30
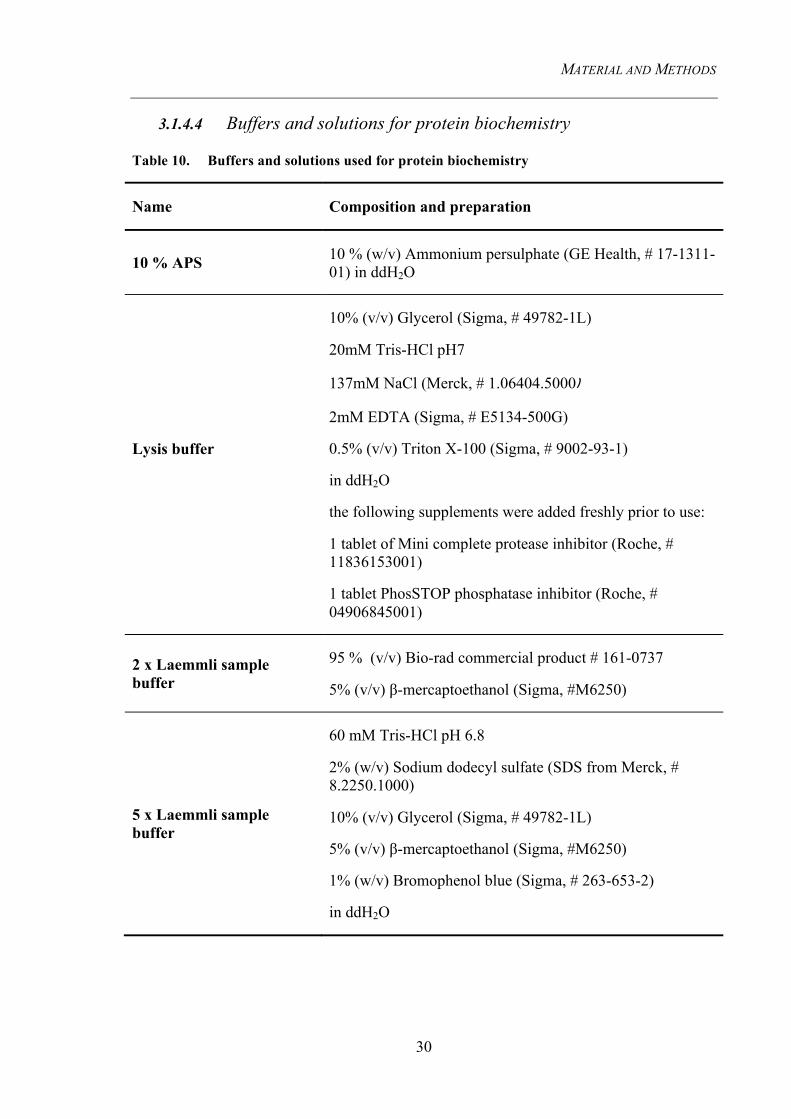
3.1.4.4 Buffers and solutions for protein biochemistry
Table 10. Buffers and solutions used for protein biochemistry
Name Composition and preparation
10 % APS 10 % (w/v) Ammonium persulphate (GE Health, # 17-1311-01) in ddH2O
Lysis buffer
10% (v/v) Glycerol (Sigma, # 49782-1L)
20mM Tris-HCl pH7
137mM NaCl (Merck, # 1.06404.5000)
2mM EDTA (Sigma, # E5134-500G)
0.5% (v/v) Triton X-100 (Sigma, # 9002-93-1)
in ddH2O
the following supplements were added freshly prior to use:
1 tablet of Mini complete protease inhibitor (Roche, # 11836153001)
1 tablet PhosSTOP phosphatase inhibitor (Roche, # 04906845001)
2 x Laemmli sample buffer
95 % (v/v) Bio-rad commercial product # 161-0737
5% (v/v) β-mercaptoethanol (Sigma, #M6250)
5 x Laemmli sample buffer
60 mM Tris-HCl pH 6.8
2% (w/v) Sodium dodecyl sulfate (SDS from Merck, # 8.2250.1000)
10% (v/v) Glycerol (Sigma, # 49782-1L)
5% (v/v) β-mercaptoethanol (Sigma, #M6250)
1% (w/v) Bromophenol blue (Sigma, # 263-653-2)
in ddH2O
MATERIAL AND METHODS
31
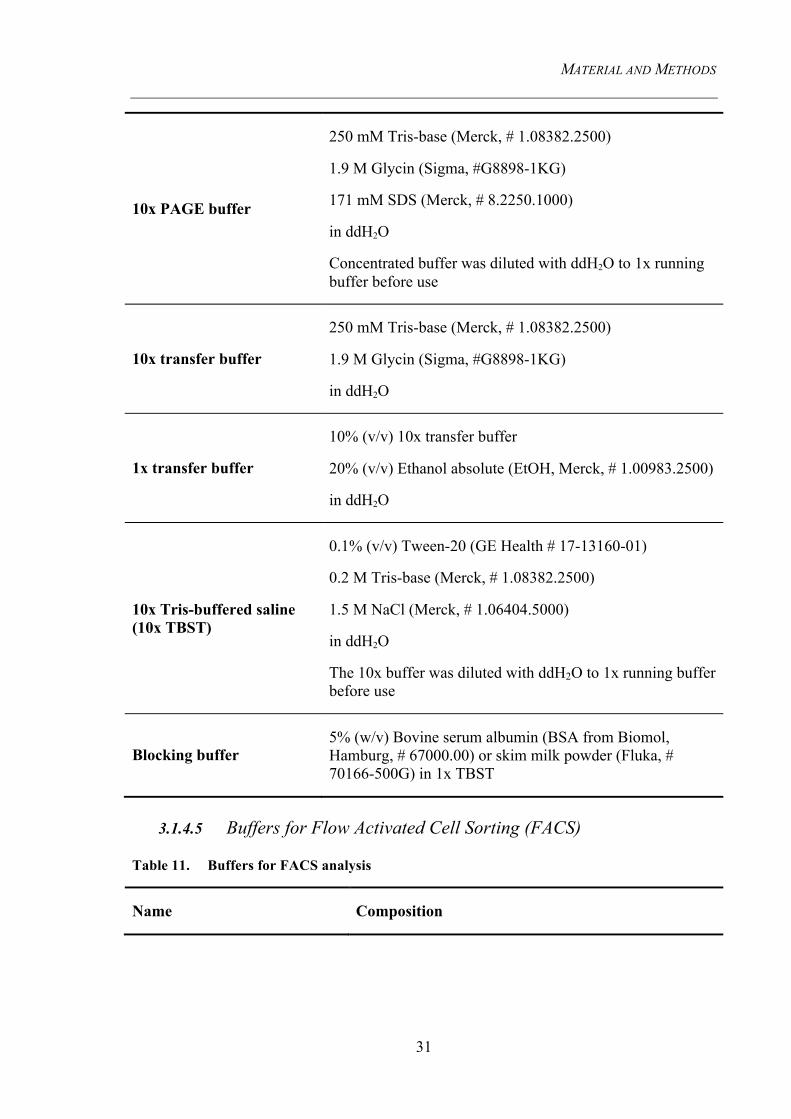
10x PAGE buffer
250 mM Tris-base (Merck, # 1.08382.2500)
1.9 M Glycin (Sigma, #G8898-1KG)
171 mM SDS (Merck, # 8.2250.1000)
in ddH2O
Concentrated buffer was diluted with ddH2O to 1x running buffer before use
10x transfer buffer
250 mM Tris-base (Merck, # 1.08382.2500)
1.9 M Glycin (Sigma, #G8898-1KG)
in ddH2O
1x transfer buffer
10% (v/v) 10x transfer buffer
20% (v/v) Ethanol absolute (EtOH, Merck, # 1.00983.2500)
in ddH2O
10x Tris-buffered saline (10x TBST)
0.1% (v/v) Tween-20 (GE Health # 17-13160-01)
0.2 M Tris-base (Merck, # 1.08382.2500)
1.5 M NaCl (Merck, # 1.06404.5000)
in ddH2O
The 10x buffer was diluted with ddH2O to 1x running buffer before use
Blocking buffer 5% (w/v) Bovine serum albumin (BSA from Biomol, Hamburg, # 67000.00) or skim milk powder (Fluka, # 70166-500G) in 1x TBST
3.1.4.5 Buffers for Flow Activated Cell Sorting (FACS)
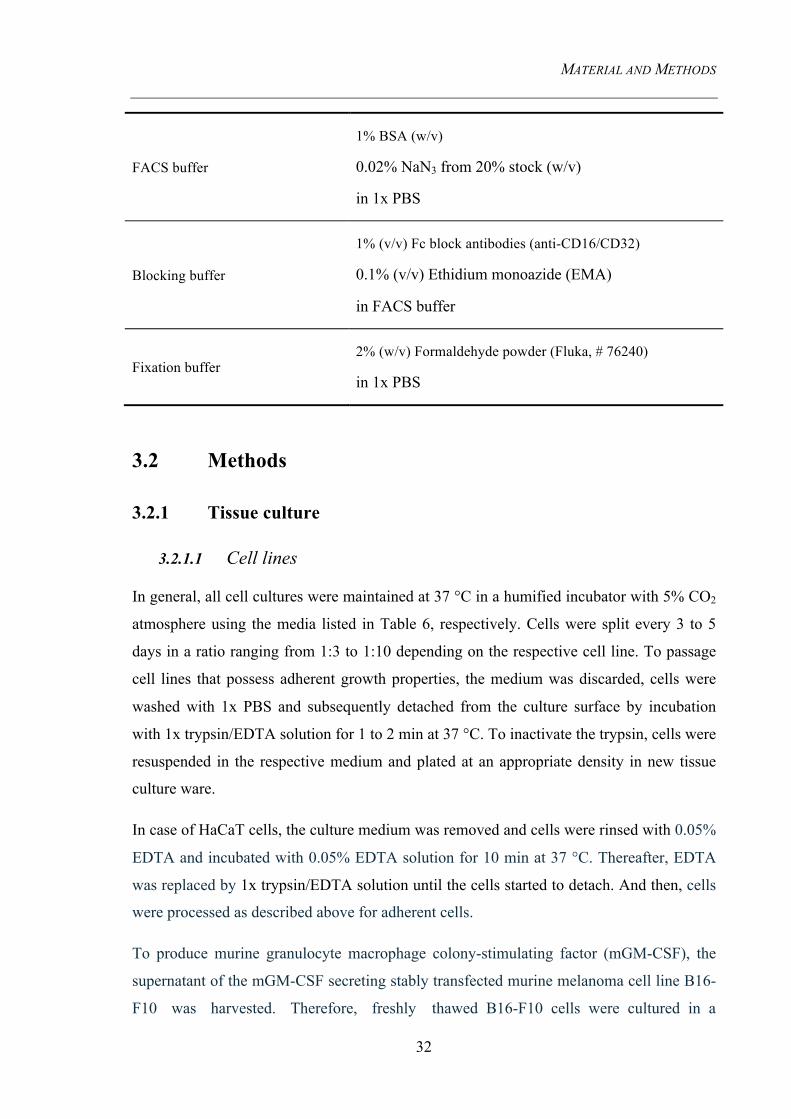
Table 11. Buffers for FACS analysis
Name Composition
MATERIAL AND METHODS
32
FACS buffer
1% BSA (w/v)
0.02% NaN3 from 20% stock (w/v)
in 1x PBS
Blocking buffer
1% (v/v) Fc block antibodies (anti-CD16/CD32)
0.1% (v/v) Ethidium monoazide (EMA)
in FACS buffer
Fixation buffer 2% (w/v) Formaldehyde powder (Fluka, # 76240)
in 1x PBS
3.2 Methods
3.2.1 Tissue culture
3.2.1.1 Cell lines
In general, all cell cultures were maintained at 37 °C in a humified incubator with 5% CO2
atmosphere using the media listed in Table 6, respectively. Cells were split every 3 to 5
days in a ratio ranging from 1:3 to 1:10 depending on the respective cell line. To passage
cell lines that possess adherent growth properties, the medium was discarded, cells were
washed with 1x PBS and subsequently detached from the culture surface by incubation
with 1x trypsin/EDTA solution for 1 to 2 min at 37 °C. To inactivate the trypsin, cells were
resuspended in the respective medium and plated at an appropriate density in new tissue
culture ware.
In case of HaCaT cells, the culture medium was removed and cells were rinsed with 0.05%
EDTA and incubated with 0.05% EDTA solution for 10 min at 37 °C. Thereafter, EDTA
was replaced by 1x trypsin/EDTA solution until the cells started to detach. And then, cells
were processed as described above for adherent cells.
To produce murine granulocyte macrophage colony-stimulating factor (mGM-CSF), the
supernatant of the mGM-CSF secreting stably transfected murine melanoma cell line B16-
F10 was harvested. Therefore, freshly thawed B16-F10 cells were cultured in a
MATERIAL AND METHODS
33
T185 flask for one week before starting to collect the supernatant. Cells that reached 90%
confluence were split every 3 days at ratio of 1:20 until 10 T185 flasks were seeded with
cells. Supernatant was separately harvested on day 3, 4, 5, 6 post seeding, stored separately
and then sterile filtrated through a 0.22 µm filter. Before aliquoting, the supernatants were
first tested on chocolate agar plate for bacterial contamination. If uncontaminated,
supernatants were further tested for the efficiency to generate BMDCs.
Cell lines were tested for mycoplasma contamination at regular intervals. Therefore, cell
culture supernatant was subjected to either PCR or nucleic acid staining.
3.2.1.2 Primary cells
3.2.1.2.1 Generation and culture of bone marrow derived DCs
Bone marrow derived DCs (BMDCs) were generated from wild-type C57BL/6 mice and
C3H mice or other mouse strains according to the respective experiments. Mice were
euthanized by Isofluran inhalation and the body was disinfected with 70% EtOH. To
obtain bone marrow cells, the femurs and tibias were removed and separated from fur and
muscle tissue. Precleared bones were rinsed with 70% EtOH and then immersed in fresh
medium. Two edges of bones were cut open with sterilized scissors, and then the exposed
bone marrow was flushed out with general medium into a 10 cm Petri dish by using a
syringe with 30G needle under sterile conditions. After centrifugation at 1500 rpm at room
temperature (RT) for 5 min, the cell pellet was resuspended in 3 ml TAC buffer to lyse red
blood cells at 37 °C for 2 minutes. Red blood cell lysis was blocked by adding 37 ml fresh
medium to the cells. Cells were filtered through a 100 µm sterile filter and centrifuged at
1500 rpm and RT for 5 min. The cell pellet was finally resuspended in fresh medium and
cell numbers were determined using a hemacytometer.
5 x 10⁶ bone marrow cells were seeded in 10 cm petri dishes in a total volume of 10 ml
BMDCs medium and incubated at 37 °C for 7 days. On day 4, 10 ml fresh BMDC medium
were added. On day 6, 10 ml of the cell suspension were centrifuged at 1500 rpm and RT
for 5 min to remove the supernatant. Cell pellets were resuspended in 10 ml fresh BMDC
medium and transferred back into the dishes.
3.2.1.2.2 Isolation and culture of primary dermal fibroblasts
MATERIAL AND METHODS
34
Primary dermal fibroblasts were obtained from C57BL/6 mice. The hair on the belly and
back of mice was removed by hair removal cream (Veet), and then washed away with
ddH2O. The exposed skin was air dried for 10 min at RT. Afterwards, mice were
euthanized by Isofluran inhalation and the body was disinfected with 70% EtOH. The skin
was dissected from the body, and then placed on the lid of a 10 cm petri dish with the
epidermal side facing down by using sterile forceps. Fat and loose fascia were trimmed
away by using disposable scalpels and scissors. To keep the tissue from drying, the tissue
was rinsed with fresh medium every few minutes. After the trimming was complete, the
tissue was cut into strips of approximately 0.5 cm x 1.5 cm and submerged into a 1.5 ml
Eppendorf tube containing 700 µl collagenase solution. The tissue was completely
shredded by cutting up and down using scissors, and then incubated at 37 °C for 2h for
collagenase digestion.
At the end of the collagenase digestion, 10 mM EDTA was added to the tissue suspension
to block the activity of Ca2+ and Mg2+. The suspension was thoroughly vortexed and then
left at RT for 10 min before transferred into a 15 ml Falcon tube; 5 ml fresh medium was
used to thoroughly flush the Eppendorf tube. The flushing medium was combined with the
suspension afterwards. The entire mixture was filtered through a 100 µm filter. 20 ml
medium was used to wash the Falcon tube again. The flushing medium together with the
filtered mixture was centrifuged at 1500 rpm and RT for 5 min. The supernatant was
carefully removed without touching the fat on the surface of the pellet. The wash step was
repeated 1 to 2 times before the supernatant was completely clear. The cell pellet was
resuspended in 5 ml fresh medium and the cell number was determined by using a
hemacytometer. The cell suspension was diluted in medium to yield 8 x 10³ live cells/ cm2
to be further cultured in a T 75 flask. After initial seeding of the primary culture, the
medium was changed after 24 h, and then once every 48 h. Once the culture was around
90 % confluent, cells were subcultured at a ratio of 1:5 to 1:10 or cryopreserved.
3.2.1.3 Cultivation of C4H3 hybridoma and production of C4H3 antibodies
C4H3 hybridoma was shipped in freezing medium on dry ice. To take frozen cells into
culture, the cryovial containing the frozen cells was removed from dry ice and immediately
placed into a 37 °C water bath. Cells were quickly thawed by gently swirling the vial in the
water bath. The cell suspension was then transferred into a 50ml Falcon tube
MATERIAL AND METHODS
35
containing 10 ml of pre-cooled complete DMEM medium. Cells were centrifuged at 1500
rpm and 4 °C for 5 min. The supernatant was removed and the cell pellet was resuspended
in 2 ml of fresh medium and seeded in one well of a 6-well plate. Cells were cultured at
37 °C and 5% CO2 until the cell amount increased one fold. During log-phase growth, cells
were subcultured at a ratio of 1:2 until there was enough amount to harvest the medium
containing the C4H3 antibodies.
Total cell number and cell viability were determined in a hemacytometer using Trypan
blue staining to discriminate live and dead cells. Cells were mixed with 0.2 % Trypan blue
in PBS at a ratio of 1:1, and then the number of living (unstained) cells was counted.
Afterwards, cells were seeded at a concentration of 2 x 10⁴ cells/ml in a T75 flask and
subcultured until the cells reached a density of 1 x 10⁵ cells /ml.
Cells were seeded at a concentration of 1 x 10⁷ cells/ml in a T25 flask for 3 to 4 days until
the color of the medium turned yellow. The antibodies-containing supernatant was
collected by centrifugation of the cells at 1700 rpm and 4 °C for 10 min. Prior to storage at
4 °C, the supernatant was filtered through a 0.22 µm filter.
3.2.1.4 Cryopreservation of cells
To keep a stock of cells with a low passage number, cells were frozen as permanent
cultures in liquid nitrogen. Cells grown in log phase that have reached a confluence of
90 % were detached from the culture surface by either incubation with 1 x trypsin/EDTA
solution (adherent cells) or flushing with culture medium (suspension cells). After
counting and centrifugation at 1500 rpm and RT for 5 min, 1 to 3 x 10⁶ cells were
resuspended in 1 ml freezing medium, and then frozen down in a freezing container which
provides a cooling rate of 1 °C/min for controlled cryopreservation of cells. After storing
the frozen cells at -80 °C for one day, cells were transferred into liquid nitrogen for long-
term storage.
3.2.1.5 Transient transfection of cell lines and BMDCs
Transient transfection of cell lines was performed using FuGENE® HD transfection
reagent (Roche, #05 061 369 001) or X-tremeGene HP DNA transfection reagent (Roche,
# 06366236001), together with serum-free RPMI 1640 medium. BMDCs were transfected
using the Amaxa® mouse dendritic cell nucleofector® kit (# VPA-1011) and the
MATERIAL AND METHODS
36
respective electroporation device (Lonza, nucleofectorTM) according to the manufacturers
instructions.
3.2.1.5.1 Transfection of cell lines
For the purpose of microscopy, 2 x 10⁵ HeLa cells were plated in 2 ml culture medium and
seeded in 35 mm dishes with glass bottom the day before transfection (to obtain about 70%
confluency at the day of transfection). Transfection was carried out according to the
protocol provided by the manufacturer. Briefly, FuGENE transfection reagent, DNA and
diluent were adjusted to RT. DNA was diluted with serum-free medium to a concentration
of 2 µg plasmid DNA/100 µl medium. 3 µl FuGENE transfection reagent or 6 µl X-
tremeGene transfection reagent (3:2 to 3:1 reagent to DNA ratio) was added into the
medium containing DNA to form transfection complexes. The complex was vortexed for
one to second seconds for mixing, and then it was incubated for 15 min at RT. Afterwards,
the transfection complex was added to the cells in a drop-wise manner and then the plates
were swirled to evenly distribute the transfection complexes over the entire culture plate
surface. After 16 h of incubation at 37 °C and 5% CO2 in a humified incubator, the cells
were subsequently subjected to viral infection or lysis for subsequent western blot analysis.
3.2.1.5.2 Transfection of BMDCs
On day 7, 1 x 10⁶ immature BMDCs per sample were centrifuged at 1500 rpm and RT for
5 min. The supernatant was completely discarded so that no residual medium covered the
cell pellet. The cell pellet was resuspended in 100 µl RT nucleofector solution per sample.
2 µg plasmid DNA or control vector expressing enhanced green fluorescent protein (EGFP)
was added to the suspension. The cell/DNA suspension was transferred into a certified
cuvette and then subjected to program Y-001 in the Nucleofector machine. 400 µl of the
culture medium was added to the cuvette and then the whole mixture was transferred to the
35 mm dish with glass bottom. Afterwards, the cells were incubated in humified incubator
at 37 °C and 5% CO2 for 16 h before they were subjected to virus infection.
3.2.2 Virological methods
3.2.2.1 In vitro infection of cells with MVA and VACV
For MVA and VACV infection of adherent cell lines (cells grown in log phase) and
MATERIAL AND METHODS
37
suspension cells (e.g. BMDCs on day 7-10), desired cell populations were either detached
from the culture plate by trypsin/ETDA or scraped off from the plate respectively, and then
centrifuged at 1500 rpm and RT for 5 min. The supernatant was removed, only
approximately 500 µl medium remained to cover the pellets. Virus (stored at -20 °C or -
80 °C) was thawed at RT and sonified for 30 seconds in ice water to singularize viral
particles. The desired multiplicity of infection (MOI) was added into the medium and
gently mixed with the cell pellet. Cells were incubated with high concentration of virus at
37 °C for 30 min before diluted with fresh medium that cell density was adapted to a
concentration of 2 x 10⁶ cells/ml. Viral infection was carried out according to the
respective experimental setup.
3.2.2.2 Virus amplification and crude stock preparation
For large scale MVA virus preparations primary CEFs were cultured in 10-40 T225 flasks
at 37 °C. After 2-3 days, the 95 % confluent cell layer was infected at an MOI of 3 by
adding the calculated volume of virus suspension diluted in 1 ml medium to each flask.
CEFs were cultivated for another 2-3 days until a cytopathic effect without obvious cell
death was recognizable. The cells were scraped off the plate and transferred into a 50ml
Falcon tube. Cell suspension was centrifuged at 1700 rpm and 4 °C for 5 min. Cell pellets
were resuspended in 4 ml of 10 mM Tris buffer (pH 9.0) and the Falcon tube was washed 2
times with 4 ml 10 mM Tris buffer (pH 9.0). Resuspended cells together with wash buffer
were transferred into a fresh 50 ml Falcon tube. This crude stock virus preparation was
either stored at -80 °C or further purified.
3.2.2.3 Virus purification
MVA crude stock preparations were purified from cellular debris and proteins by
saccharose cushion ultra-centrifugation. To break down the cells and to separate virus
particles, crude stock preparations were homogenized in ice water by 30 strokes in a 40-ml
douncer with a pestle. Cellular debris was pelleted by centrifuging the suspension at 4000
rpm and 4 °C for 5 min. The virus containing supernatant was transferred to a fresh 50 ml
Falcon tube and the pellet was resuspended in 25 ml of cold 10 mM Tris buffer (pH 9.0)
and returned to the douncer. The procedure was repeated a total of three times and resulted
in a maximum of 80 ml of virus suspension. Ultracentrifugation cups for the Beckman
rotor SW28 were prepared with 25 ml of 36% sucrose (w/v) in 10 mM Tris buffer
MATERIAL AND METHODS
38
(pH 9.0) and the virus suspension was carefully laid onto the cushion. Virus particles were
pelleted by ultracentrifugation at 13500 rpm and 4 °C for 90 min (Optima LE 80K
centrifuge, roter: SW28). The supernatant was removed and the pellets resuspended in a
maximum volume of 12 ml 1 mM Tris pH 9.0. For the second purification step,
ultracentrifugation cups for Beckman rotor SW41 were prepared with 9.5 ml of sucrose
36% in 10 mM Tris buffer pH 9.0 and the purified virus suspension was again carefully
laid onto the cushion. Virus particles were pelleted by ultracentrifugation for 90 min at
13.500 rpm and 4 °C (Optima LE 80K, rotor: SW41). The supernatant was removed
carefully and the obtained virus pellet was resuspended in 3 to 6 ml 1 mM Tris pH 9.0 and
stored at -80 °C.
3.2.2.4 Virus titration and growth kinetics
The infectivity of a MVA suspension was determined by titration and plaque formation
frequency. Virus material was freeze-thawed thrice (-80° and 37° water bath) and
sonicated three times for one minute in 50% ice water in a cup sonicator. The virus
suspension was serially diluted in 2% RPMI medium to result in dilutions from 10-1 to 10-
11. Primary CEFs were harvested by trypsinization, split 1:10, and resuspended in a final
volume of 10 ml 2% RPMI medium. 100 µl of cell suspension per well were plated into a
flat bottom 96-well plate. Each time, 100 µl of the virus dilutions with different titration
were added per well to a total of 16 wells/dilution. Cells were then incubated at 37 °C for 7
days, analyzed for cytopathic effect by microscopy and the virus titer was calculated based
on the number of CPE per dilution.
To test whether recombinant viruses had similar growth kinetics as wild-type virus CEFs
were infected at MOI 0.01 and harvested at different time points (whereas t=0 is harvested
immediately to control the viral input). Titration was carried out for each time point.
3.2.3 Confocal laser scanning microscopy (CLSM)
3.2.3.1 Intracellular IF
Briefly, cells were grown on Cell ViewTM – cell culture dishes with glass bottom (Greiner
Bio-one, 627975) until they reached 80% confluency before staining. Usually, BMDCs
were seeded on Cell View® dishes at a concentration of 2.5 x 10⁵/ cm2 one day before
MATERIAL AND METHODS
39
infection. If cells were infected in advance, virus at the indicated MOI was administered to
the cells with the 200 µl medium only covering the cell surface, to allow for virus
attachment for 0.5 h. Afterwards, 300 µl fresh medium were supplemented to optimize
growth condition. To terminate the infection, the medium were decanted and cells were
washed twice with ice cold 1x PBS. For fixation, cells were covered with 2%
formaldehyde (200 µl) for 15 min at RT. Afterwards, the cells were rinsed 3x in cold PBS.
Specimen were permeablized and blocked for unspecific binding together in blocking
buffer for 60 min at RT, followed by primary antibodies incubation overnight at 4 °C or 1h
in the dark at RT. Cells were washed 3x in cold PBS for 5 min before being probed with
fluorochrome-conjugated secondary antibodies diluted in antibody dilution buffer for 60
minutes at RT in the dark. Cells were gently washed again 3x in cold PBS for 5 minutes
each. DAPI containing mounting medium was added to the samples. Samples were
examined using appropriate excitation/emission wavelength under a confocal laser
scanning microscope (Olympus, Fluoview FV10i) 9.
3.2.3.2 Live cell imaging and co-localization analysis
First, cells were seeded in Cell ViewTM – cell culture dishes with glass bottom at a
concentration of 1-2.5 x 10⁵ cells/cm2 one day before imaging. Before starting to observe,
cells should be checked for the presence of the respective fluorescence signals under a
normal fluorescence microscope. Then the incubator in the Fluoview FV10i confocal
microscope was turned on and the temperature was set to 37 °C and 5% CO2 30 min before
putting the dishes inside. Dishes were kept in the incubator for at least 30 min to allow the
cells to adjust to the environment before the images were taken. Next, the depth of the lens
and the time frame of observation were set up and taking pictures was started. Normally, to
insure the quality of images, test shooting should be performed in the first two cycles.
To analyze the co-localization of two or more channels of images, Olympus FV10-ASW
2.0 was used for analysis. First, the intense value was adjusted according to the photo
quality by the 2D “auto change” function. Then the positive regions of each channel were
exported individually and counted by blind counting for quantification. In each sample, at
least 10 cells were taken into analysis and the experiment was repeated for 3 times.
Alternatively, the merge image was exported and co-localization was indicated by double
or triple color.
MATERIAL AND METHODS
40
3.2.4 Protein biochemistry
3.2.4.1 Preparation of cell lysates
Cells were grown in 10 cm tissue culture dishes until the cell density reached 80%
confluency. Lysates were collected at the indicated conditions and time points under each
experimental setup. In brief, the culture medium was removed and cells were washed twice
with ice cold PBS and then lysed with 500 µl complete lysis buffer. Afterwards, the dish
was placed on ice for 5 min for lysis of the cells. Cells were then scraped off and
transferred into 1.5 ml Eppendorf tubes to be sonified in ice water for 30 seconds to
promote complete release of cytoplasmic proteins into the lysis buffer. The lysates were
further incubated on ice for 15 min. To remove cell debris, the lysates were centrifuged at
13000 rpm and 4 °C for 20 min. The cleared cell lysate was transferred into a fresh pre-
cooled 1.5 ml Eppendorf tube and used for further analysis. For long-term storage, the
lysates were immediately stored at -20 °C.
3.2.4.2 Determination of protein concentration
To determine the protein concentration of the cell lysates, a protein standard using
different dilutions of bovine serum albumin stock solution was prepared. Bradford reagent
was obtained from Bio-Rad (Cat. No. 500-0006) and used according to the manufacturer´s
instructions. The protein concentration was determined at 595 nm using the SmartSpec
Plus Spectrophotometer (Bio-Rad, 170-2525).
3.2.4.3 Immunoprecipitation (IP)
For IP experiments, Protein G sepharose beads (PGS, GE healthcare life science, 17-0618-
01) were used. Prior to IP, the protein concentration was determined by Bradford assay. 2-
4 mg of the protein lysates were subjected to IP. A pre-clear step was performed to reduce
unspecific binding between sepharose beads and proteins. Therefore, 100 µl of PGS per
sample were washed with 500 µl lysis buffer, and centrifuged at 6000 rpm and 4 °C for 5
min. The washing step was repeated for two more times and then the PGS was
resuspended in the cell lysates. After incubation for 1h at 4 °C on a roller shaker, pre-
cleared lysates were centrifuged at 6000 rpm at 4 °C for 5 min to separate the PGS beads
from the pre-cleared supernatant which is subsequently used for IP. The pre-cleared lysate
was then transferred into a fresh 1.5 ml Eppendorf tube and the antibodies used for
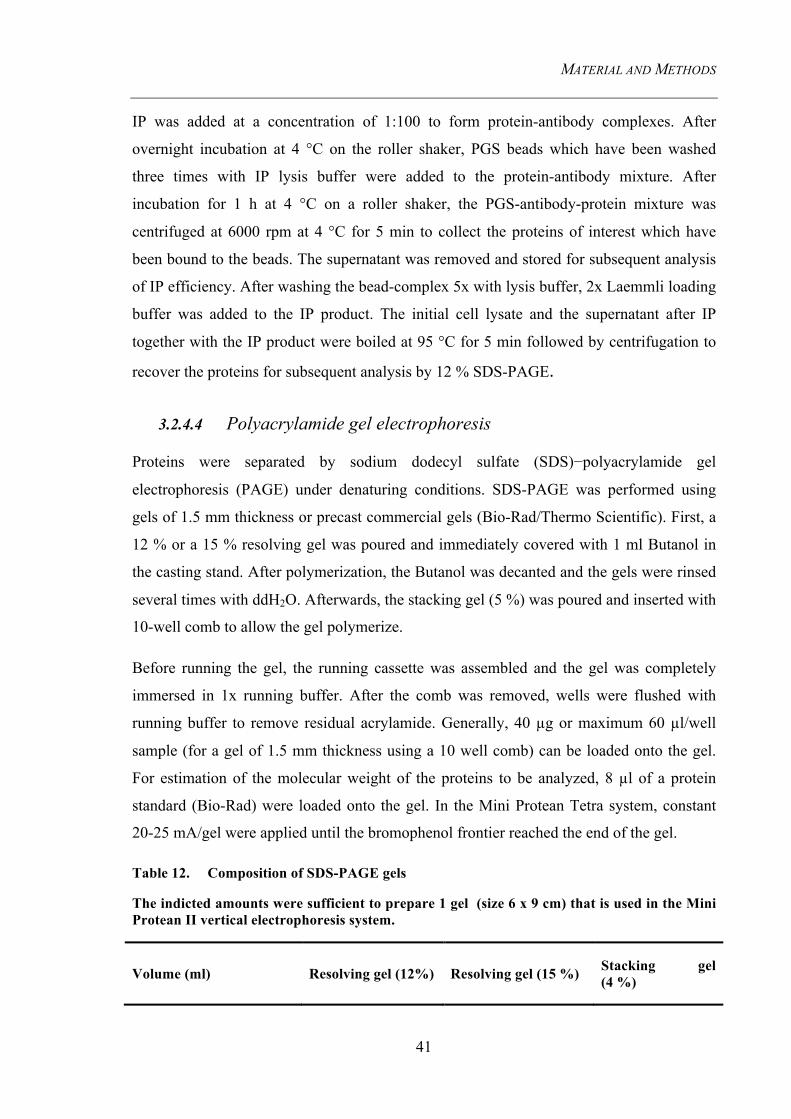
MATERIAL AND METHODS
41
IP was added at a concentration of 1:100 to form protein-antibody complexes. After
overnight incubation at 4 °C on the roller shaker, PGS beads which have been washed
three times with IP lysis buffer were added to the protein-antibody mixture. After
incubation for 1 h at 4 °C on a roller shaker, the PGS-antibody-protein mixture was
centrifuged at 6000 rpm at 4 °C for 5 min to collect the proteins of interest which have
been bound to the beads. The supernatant was removed and stored for subsequent analysis
of IP efficiency. After washing the bead-complex 5x with lysis buffer, 2x Laemmli loading
buffer was added to the IP product. The initial cell lysate and the supernatant after IP
together with the IP product were boiled at 95 °C for 5 min followed by centrifugation to
recover the proteins for subsequent analysis by 12 % SDS-PAGE.
3.2.4.4 Polyacrylamide gel electrophoresis
Proteins were separated by sodium dodecyl sulfate (SDS)−polyacrylamide gel
electrophoresis (PAGE) under denaturing conditions. SDS-PAGE was performed using
gels of 1.5 mm thickness or precast commercial gels (Bio-Rad/Thermo Scientific). First, a
12 % or a 15 % resolving gel was poured and immediately covered with 1 ml Butanol in
the casting stand. After polymerization, the Butanol was decanted and the gels were rinsed
several times with ddH2O. Afterwards, the stacking gel (5 %) was poured and inserted with
10-well comb to allow the gel polymerize.
Before running the gel, the running cassette was assembled and the gel was completely
immersed in 1x running buffer. After the comb was removed, wells were flushed with
running buffer to remove residual acrylamide. Generally, 40 µg or maximum 60 µl/well
sample (for a gel of 1.5 mm thickness using a 10 well comb) can be loaded onto the gel.
For estimation of the molecular weight of the proteins to be analyzed, 8 µl of a protein
standard (Bio-Rad) were loaded onto the gel. In the Mini Protean Tetra system, constant
20-25 mA/gel were applied until the bromophenol frontier reached the end of the gel.
Table 12. Composition of SDS-PAGE gels
The indicted amounts were sufficient to prepare 1 gel (size 6 x 9 cm) that is used in the Mini Protean II vertical electrophoresis system.
Volume (ml) Resolving gel (12%) Resolving gel (15 %) Stacking gel (4 %)
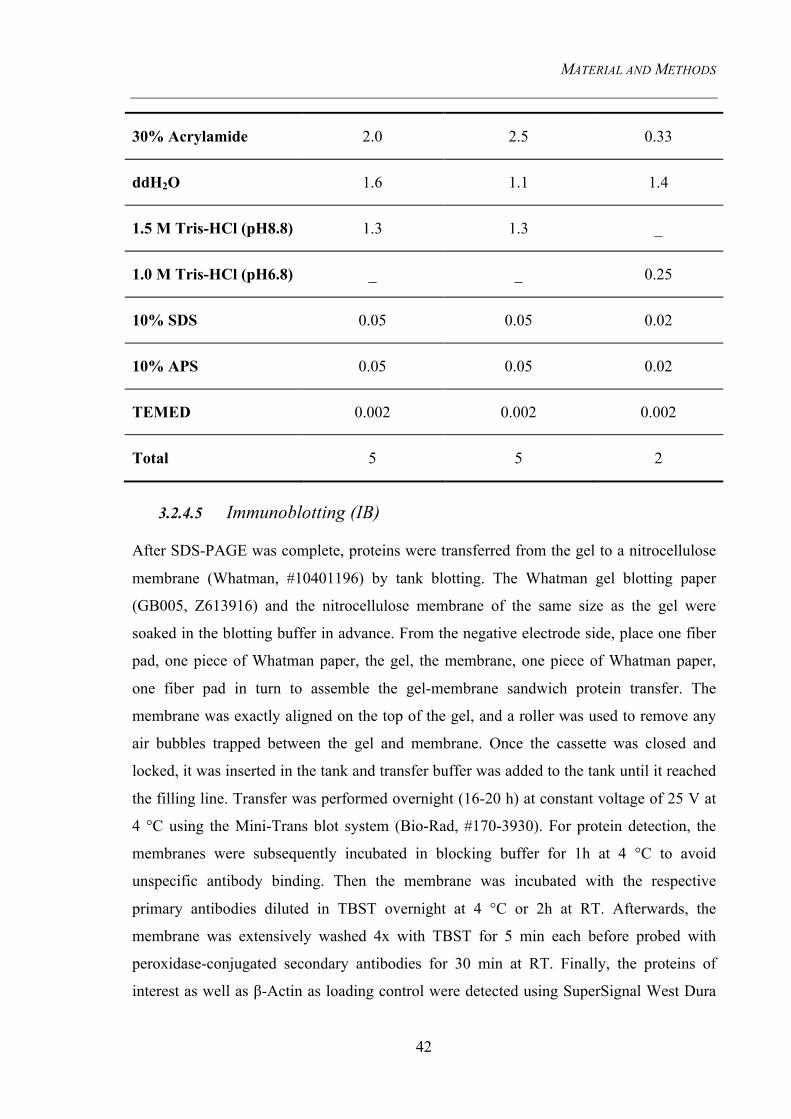
MATERIAL AND METHODS
42
30% Acrylamide 2.0 2.5 0.33
ddH2O 1.6 1.1 1.4
1.5 M Tris-HCl (pH8.8) 1.3 1.3 _
1.0 M Tris-HCl (pH6.8) _ _ 0.25
10% SDS 0.05 0.05 0.02
10% APS 0.05 0.05 0.02
TEMED 0.002 0.002 0.002
Total 5 5 2
3.2.4.5 Immunoblotting (IB)
After SDS-PAGE was complete, proteins were transferred from the gel to a nitrocellulose
membrane (Whatman, #10401196) by tank blotting. The Whatman gel blotting paper
(GB005, Z613916) and the nitrocellulose membrane of the same size as the gel were
soaked in the blotting buffer in advance. From the negative electrode side, place one fiber
pad, one piece of Whatman paper, the gel, the membrane, one piece of Whatman paper,
one fiber pad in turn to assemble the gel-membrane sandwich protein transfer. The
membrane was exactly aligned on the top of the gel, and a roller was used to remove any
air bubbles trapped between the gel and membrane. Once the cassette was closed and
locked, it was inserted in the tank and transfer buffer was added to the tank until it reached
the filling line. Transfer was performed overnight (16-20 h) at constant voltage of 25 V at
4 °C using the Mini-Trans blot system (Bio-Rad, #170-3930). For protein detection, the
membranes were subsequently incubated in blocking buffer for 1h at 4 °C to avoid
unspecific antibody binding. Then the membrane was incubated with the respective
primary antibodies diluted in TBST overnight at 4 °C or 2h at RT. Afterwards, the
membrane was extensively washed 4x with TBST for 5 min each before probed with
peroxidase-conjugated secondary antibodies for 30 min at RT. Finally, the proteins of
interest as well as β-Actin as loading control were detected using SuperSignal West Dura
MATERIAL AND METHODS
43
Chemiluminescent Substrate (Thermo Scientific, #34075). Band intensities were quantified
using the Image Lab software (Bio-Rad, ChemiDoc MP Imaging System) and statistically
analyzed with GraphPad Prism 5.
If it was necessary to incubate the membrane with a secondary different antibodies, the
previous antibodies was removed by stripping. Briefly, the membrane was rinsed in TBST
for 10 min, followed by incubation with Restore Western Blot Stripping Buffer (Bio-Rad,
#5000006) at RT for 15 min with gentle agitation. After washing in TBST 3 x at RT for 5
min, the stripped membrane was blocked for 0.5-1 h in blocking buffer and then subjected
to a second round of protein detection.
3.2.5 Flow chemistry
For intracellular cytokine staining, 200 µl cell suspension contained 5 x 10⁵ cells per
sample were transferred to V-bottomed 96-well plates. Cells were centrifuged at 1400 rpm
at 4 °C and then washed one time with 150 µl FACS buffer. To discriminate dead/live cells
and prevent binding of antibodies to Fc receptors, cells were incubated with 50 µl blocking
buffer contains EMA (1:1000) and Fc blocking antibodies (1:100) for 20 min under light.
Afterwards, cells were washed twice with 150 µl FACS buffer. For surface marker staining,
cells were stained with 50 µl FACS buffer contained the respective antibodies for 20 min
on ice in the dark. For intracellular cytokine staining, cells were treated with 100 µl
Cytofix/Cytoperm to fix and permeabilize cell membranes for 15 min on ice. And then
cells were washed 3 x PermWash buffer before they were stained with 50 µl FACS buffer
contained the respective antibodies for 20 min. After staining, cells were washed again 3 x
150 µl FACS buffer, resuspended in 300 µl FACS buffer plus 60µl fixation buffer and
store at 4 °C in dark until analysis. FACS data were analyzed with FlowJo software.
RESULTS
44
4. Results
4.1 MVA induced autophagy and the molecular mechanisms behind
Autophagy controls and shapes the quality and extent of viral antigen presentation,
especially by MHC II molecules. In order to characterize the molecular and cellular
mechanisms, which impact autophagy during acute poxviral infection, this dynamic and
multi-step process from its signaling initiation to functional maturation was investigated.
4.1.1 MVA accumulates LC3 to induce autophagosome formation
4.1.1.1 LC3 is increased in BMDCs, BMDMs, and HeLa cells after MVA infection
As mentioned in the Introduction, cytosolic LC3-I conjugates with PE and converts to
lipidated autophagosome-associated LC3-II upon induction of autophagy. Up to now,
LC3-II is the only protein marker that is reliably associated with completion on the double-
membrane of functional autophagosomes.68 The amount of LC3-II is closely correlated
with the number of autophagosomes.69 Therefore, monitoring the conversion of LC3-I to
LC3-II is widely accepted to measure autophagosome formation.70
The first experiment aimed to detect quantitative changes of the two LC3 isoforms in
BMDCs during the first 8h of MVA infection. As shown in Fig. 6A, kinetic analysis of
LC3 expression by western blot exhibited an increasing amount of both LC3 isoforms up
to 8h post infection (pi) in a time-dependent manner. Particularly, LC3-I showed a
prominent upregulation, while enhanced LC3-II production revealed an increased
autophagosome formation upon viral infection.
To distinguish the source of LC3-II upregulation, the lysosomotropic agent chloroquine
was applied to prevent endosomal acidification. After that, the amount of LC3-II was
measured in the presence and absence of virus (Fig. 6B). As shown by immunoblotting,
chloroquine was able to increase LC3-II protein levels by inhibiting its autophagic
degradation within the lysosome. In BMDCs, an obvious increase of LC3-II at 8h of MVA
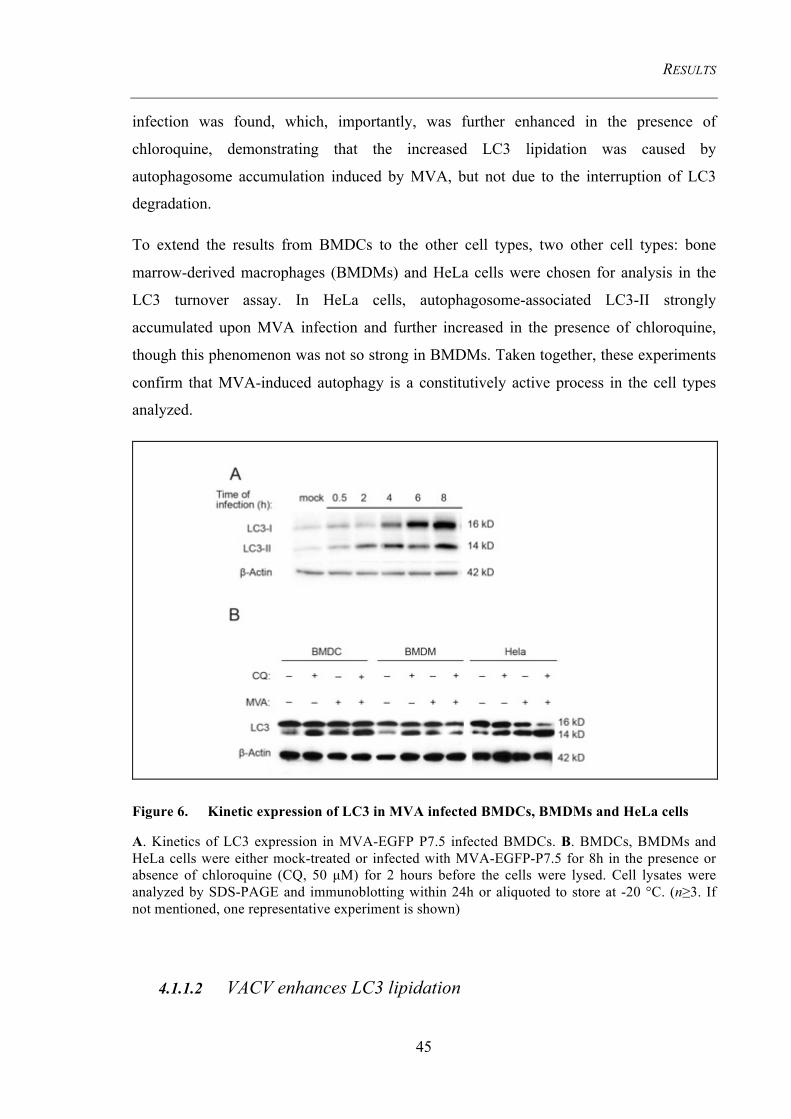
RESULTS
45
infection was found, which, importantly, was further enhanced in the presence of
chloroquine, demonstrating that the increased LC3 lipidation was caused by
autophagosome accumulation induced by MVA, but not due to the interruption of LC3
degradation.
To extend the results from BMDCs to the other cell types, two other cell types: bone
marrow-derived macrophages (BMDMs) and HeLa cells were chosen for analysis in the
LC3 turnover assay. In HeLa cells, autophagosome-associated LC3-II strongly
accumulated upon MVA infection and further increased in the presence of chloroquine,
though this phenomenon was not so strong in BMDMs. Taken together, these experiments
confirm that MVA-induced autophagy is a constitutively active process in the cell types
analyzed.
Figure 6. Kinetic expression of LC3 in MVA infected BMDCs, BMDMs and HeLa cells
A. Kinetics of LC3 expression in MVA-EGFP P7.5 infected BMDCs. B. BMDCs, BMDMs and HeLa cells were either mock-treated or infected with MVA-EGFP-P7.5 for 8h in the presence or absence of chloroquine (CQ, 50 µM) for 2 hours before the cells were lysed. Cell lysates were analyzed by SDS-PAGE and immunoblotting within 24h or aliquoted to store at -20 °C. (n≥3. If not mentioned, one representative experiment is shown)
4.1.1.2 VACV enhances LC3 lipidation
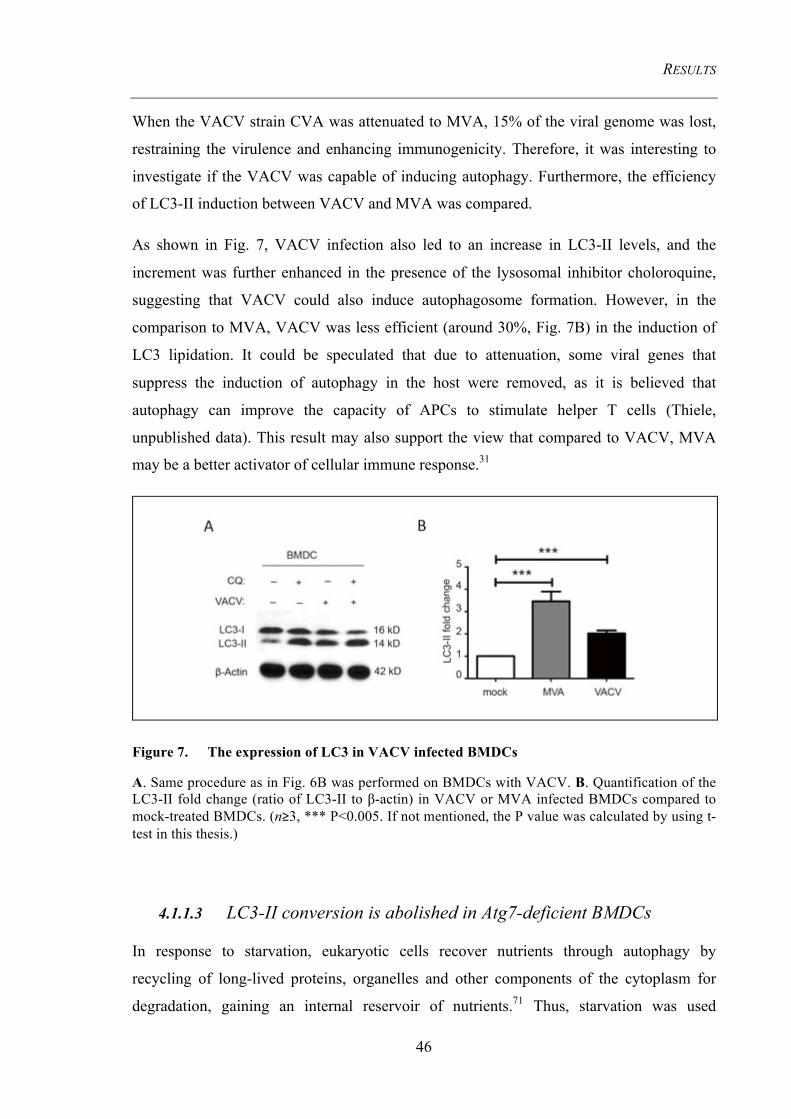
RESULTS
46
When the VACV strain CVA was attenuated to MVA, 15% of the viral genome was lost,
restraining the virulence and enhancing immunogenicity. Therefore, it was interesting to
investigate if the VACV was capable of inducing autophagy. Furthermore, the efficiency
of LC3-II induction between VACV and MVA was compared.
As shown in Fig. 7, VACV infection also led to an increase in LC3-II levels, and the
increment was further enhanced in the presence of the lysosomal inhibitor choloroquine,
suggesting that VACV could also induce autophagosome formation. However, in the
comparison to MVA, VACV was less efficient (around 30%, Fig. 7B) in the induction of
LC3 lipidation. It could be speculated that due to attenuation, some viral genes that
suppress the induction of autophagy in the host were removed, as it is believed that
autophagy can improve the capacity of APCs to stimulate helper T cells (Thiele,
unpublished data). This result may also support the view that compared to VACV, MVA
may be a better activator of cellular immune response.31
Figure 7. The expression of LC3 in VACV infected BMDCs
A. Same procedure as in Fig. 6B was performed on BMDCs with VACV. B. Quantification of the LC3-II fold change (ratio of LC3-II to β-actin) in VACV or MVA infected BMDCs compared to mock-treated BMDCs. (n≥3, *** P<0.005. If not mentioned, the P value was calculated by using t-test in this thesis.)
4.1.1.3 LC3-II conversion is abolished in Atg7-deficient BMDCs
In response to starvation, eukaryotic cells recover nutrients through autophagy by
recycling of long-lived proteins, organelles and other components of the cytoplasm for
degradation, gaining an internal reservoir of nutrients.71 Thus, starvation was used
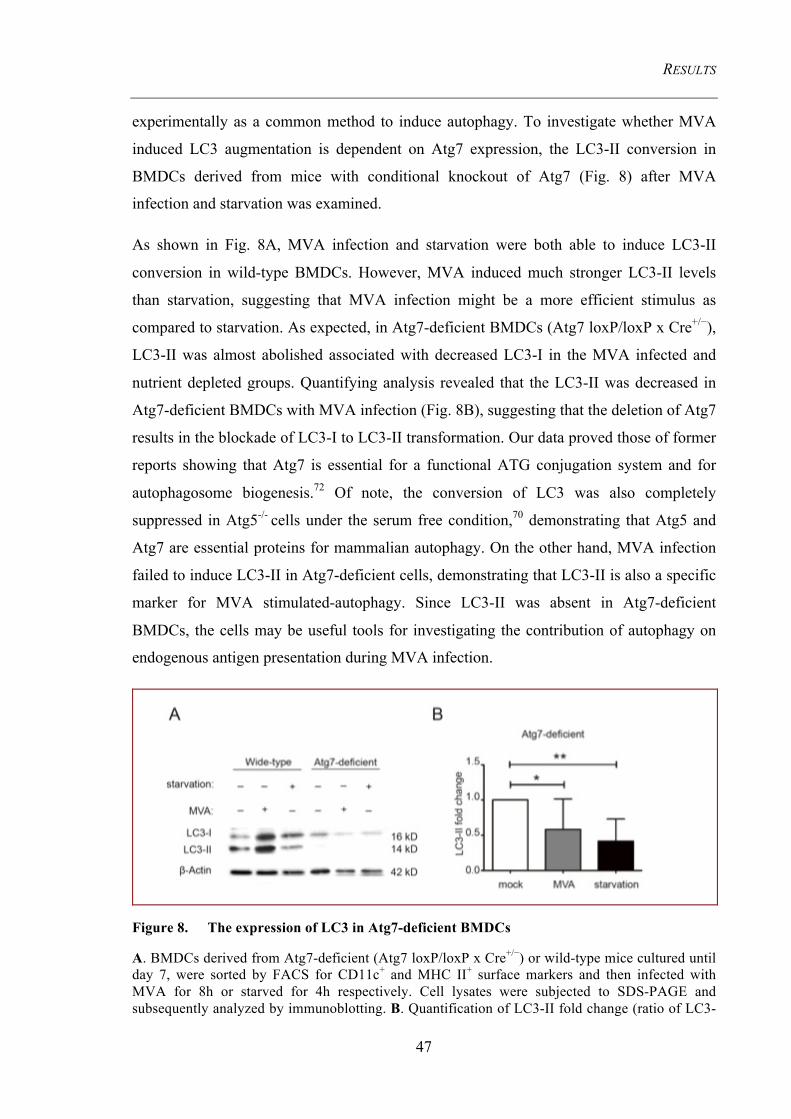
RESULTS
47
experimentally as a common method to induce autophagy. To investigate whether MVA
induced LC3 augmentation is dependent on Atg7 expression, the LC3-II conversion in
BMDCs derived from mice with conditional knockout of Atg7 (Fig. 8) after MVA
infection and starvation was examined.
As shown in Fig. 8A, MVA infection and starvation were both able to induce LC3-II
conversion in wild-type BMDCs. However, MVA induced much stronger LC3-II levels
than starvation, suggesting that MVA infection might be a more efficient stimulus as
compared to starvation. As expected, in Atg7-deficient BMDCs (Atg7 loxP/loxP x Cre+/−),
LC3-II was almost abolished associated with decreased LC3-I in the MVA infected and
nutrient depleted groups. Quantifying analysis revealed that the LC3-II was decreased in
Atg7-deficient BMDCs with MVA infection (Fig. 8B), suggesting that the deletion of Atg7
results in the blockade of LC3-I to LC3-II transformation. Our data proved those of former
reports showing that Atg7 is essential for a functional ATG conjugation system and for
autophagosome biogenesis.72 Of note, the conversion of LC3 was also completely
suppressed in Atg5-/- cells under the serum free condition,70 demonstrating that Atg5 and
Atg7 are essential proteins for mammalian autophagy. On the other hand, MVA infection
failed to induce LC3-II in Atg7-deficient cells, demonstrating that LC3-II is also a specific
marker for MVA stimulated-autophagy. Since LC3-II was absent in Atg7-deficient
BMDCs, the cells may be useful tools for investigating the contribution of autophagy on
endogenous antigen presentation during MVA infection.
Figure 8. The expression of LC3 in Atg7-deficient BMDCs
A. BMDCs derived from Atg7-deficient (Atg7 loxP/loxP x Cre+/−) or wild-type mice cultured until day 7, were sorted by FACS for CD11c+ and MHC II+ surface markers and then infected with MVA for 8h or starved for 4h respectively. Cell lysates were subjected to SDS-PAGE and subsequently analyzed by immunoblotting. B. Quantification of LC3-II fold change (ratio of LC3-
RESULTS
48
II to β-actin) in Atg7-deficient BMDCs. (n≥3, * p<0.05, ** p<0.01)
4.1.2 Autophagic flux is enhanced by MVA
4.1.2.1 Autophagosomes and autolysosomes are detectable by immunofluorescence after transfecting mRFP-EGFP-LC3 plasmids
To quantify the autophagic flux and to visualize the intracellular flow of viral antigens into
autophagic and/or degradative compartments, it is necessary to monitor the autophagy
morphology intracellularly. To obtain a better image on the cellular level, endogenous LC3
was analyzed by using anti-LC3 antibodies for immunofluorescence staining in HeLa cells,
as this cell line allows for a strong MVA-induced autophagy (Fig. 6) and preserves a
largely unchanged cell shape during infection. However, the amount of endogenous LC3
protein was inefficient for intracellular staining, thus the staining was not satisfying (data
not shown). To overcome this limitation, LC3 bearing a fluorescent protein tag such as
EGFP or/and monomeric RFP (mRFP) at its N-terminus was expressed from a mammalian
expression vector and used for detection. The working model of this system is depicted in
Fig. 9A, showing that both mRFP-LC3 and EGFP-LC3 can be incorporated on the outer
and inner membranes of the autophagosome. EGFP-tagged LC3 is sensitive to the acidic
environment, so that the green fluorescence signals due to increasing instability are self-
quenched when they have been delivered to the lysosome. In contrast, mRFP exhibits a
more stable fluorescence in low pH compartments. Therefore, more mRFP-LC3 in contrast
to EGFP-LC3 can be detected in the autolysosome (red signal),73 whereas the
autophagosome is visualized by both fluorochromes presented as yellow signals as a result
of the overlay of mRFP and EGFP when co-expressed.74
Due to transient transfection of the LC3 expression plasmid, it is worthwhile to perform a
screening to identify the observation frame that gives the best signal to noise ratio. As
shown in Fig. 9B, HeLa cells were analyzed at 8h, 16h and 24h after transfection with
mRFP-EGFP-LC3. Obviously, at 8h post transfection (p.t.), strong expression of the
cytosolic form of LC3 was observed since mRFP and EGFP were detected spreading over
the entire cytoplasm. However, at 16h p.t., dot-like mRFP and EGFP accumulation was
overlapping, indicating that cytosolic LC3-I was transformed to LC3-II, which
accumulated on the double-membrane of the autophagosome. At 24h p.t., green
RESULTS
49
fluorescence signals declined and a few mRFP positive dots were separately found from
EGFP. Concluding from the pictures, mRFP-EGFP LC3 expression plasmids are
successfully expressed in HeLa cells, allowing the characterization of the continuous
autophagic flux. Based on the given results, the optimal observation frame to analyze the
autophagic compartment should be between 16h and 24h after transfection of the LC3
expression plasmid.
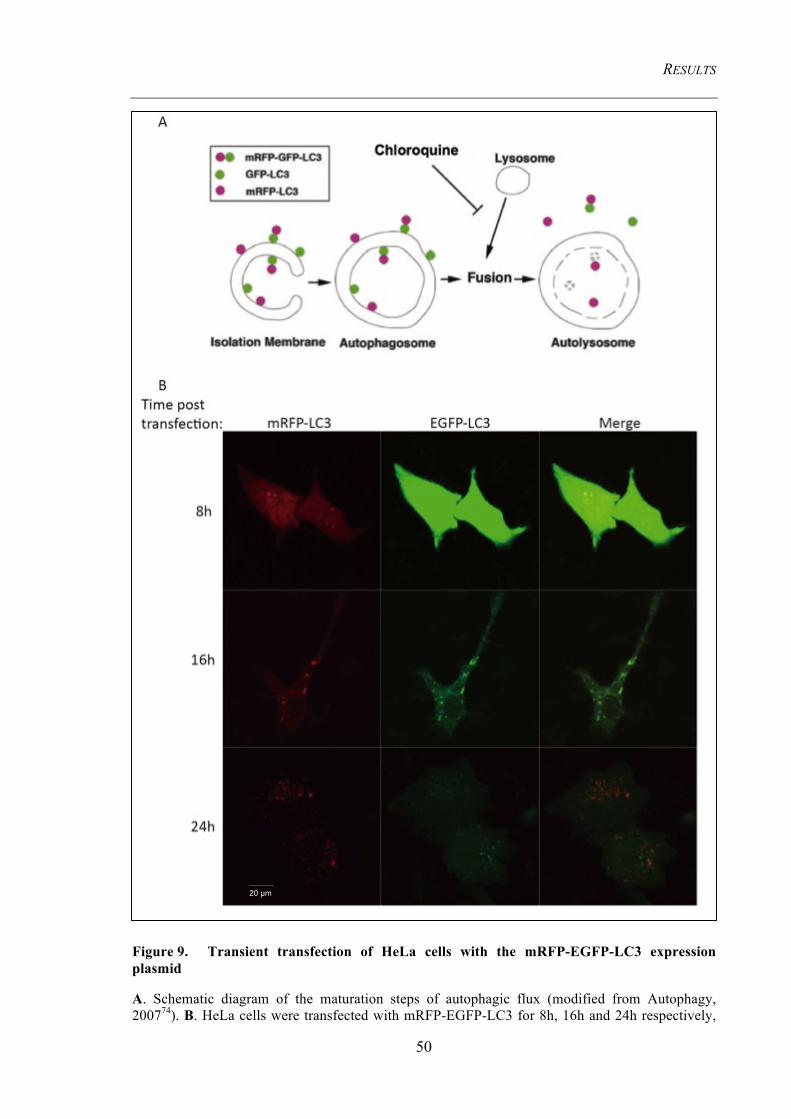
RESULTS
50
Figure 9. Transient transfection of HeLa cells with the mRFP-EGFP-LC3 expression plasmid
A. Schematic diagram of the maturation steps of autophagic flux (modified from Autophagy, 200774). B. HeLa cells were transfected with mRFP-EGFP-LC3 for 8h, 16h and 24h respectively,
20 µm
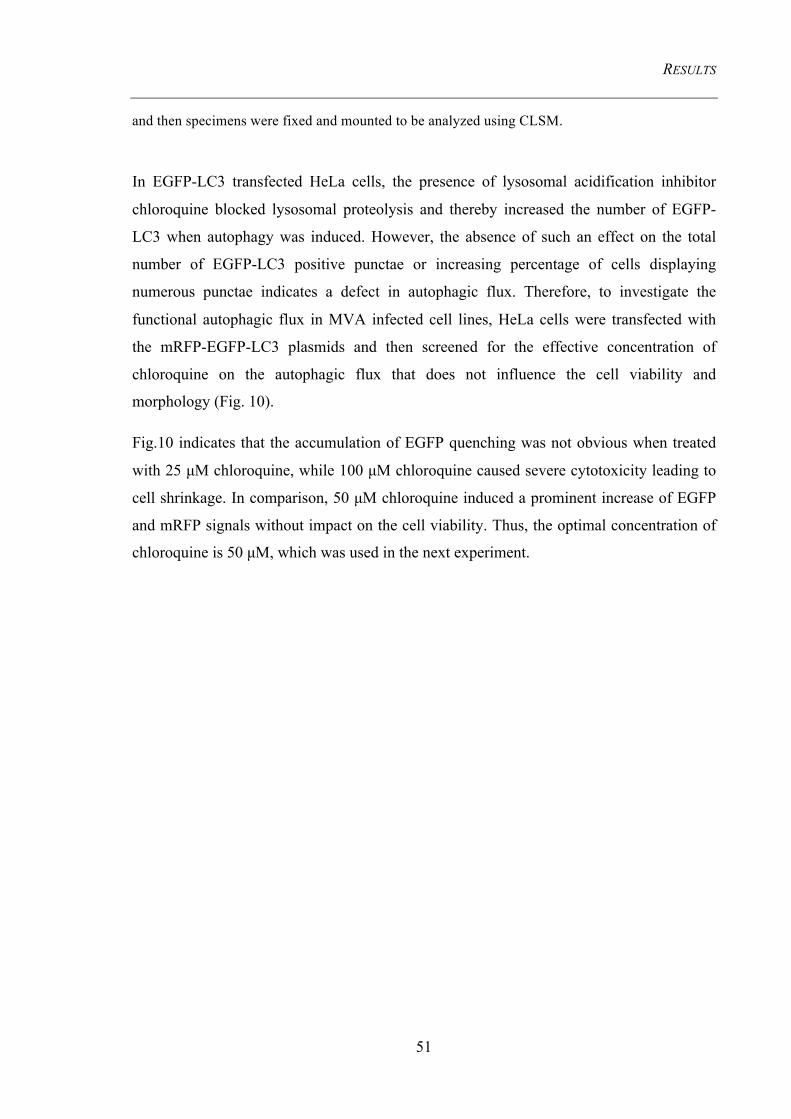
RESULTS
51
and then specimens were fixed and mounted to be analyzed using CLSM.
In EGFP-LC3 transfected HeLa cells, the presence of lysosomal acidification inhibitor
chloroquine blocked lysosomal proteolysis and thereby increased the number of EGFP-
LC3 when autophagy was induced. However, the absence of such an effect on the total
number of EGFP-LC3 positive punctae or increasing percentage of cells displaying
numerous punctae indicates a defect in autophagic flux. Therefore, to investigate the
functional autophagic flux in MVA infected cell lines, HeLa cells were transfected with
the mRFP-EGFP-LC3 plasmids and then screened for the effective concentration of
chloroquine on the autophagic flux that does not influence the cell viability and
morphology (Fig. 10).
Fig.10 indicates that the accumulation of EGFP quenching was not obvious when treated
with 25 µM chloroquine, while 100 µM chloroquine caused severe cytotoxicity leading to
cell shrinkage. In comparison, 50 µM chloroquine induced a prominent increase of EGFP
and mRFP signals without impact on the cell viability. Thus, the optimal concentration of
chloroquine is 50 µM, which was used in the next experiment.
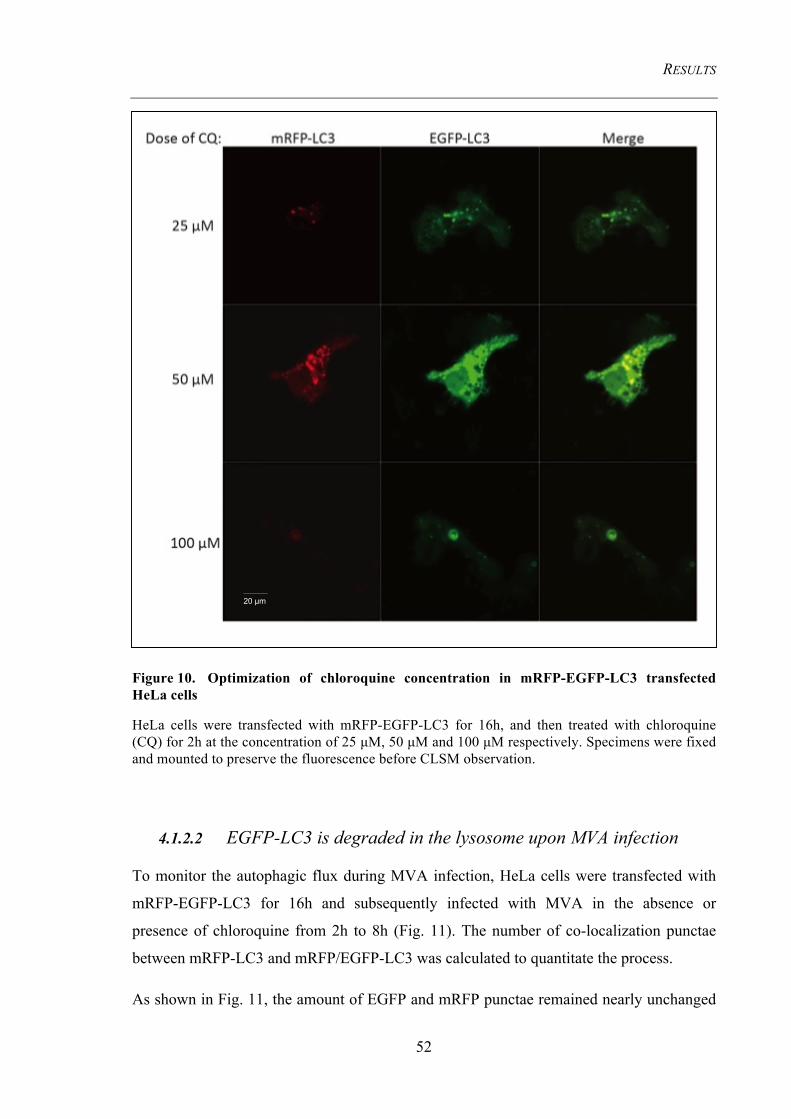
RESULTS
52
Figure 10. Optimization of chloroquine concentration in mRFP-EGFP-LC3 transfected HeLa cells
HeLa cells were transfected with mRFP-EGFP-LC3 for 16h, and then treated with chloroquine (CQ) for 2h at the concentration of 25 µM, 50 µM and 100 µM respectively. Specimens were fixed and mounted to preserve the fluorescence before CLSM observation.
4.1.2.2 EGFP-LC3 is degraded in the lysosome upon MVA infection
To monitor the autophagic flux during MVA infection, HeLa cells were transfected with
mRFP-EGFP-LC3 for 16h and subsequently infected with MVA in the absence or
presence of chloroquine from 2h to 8h (Fig. 11). The number of co-localization punctae
between mRFP-LC3 and mRFP/EGFP-LC3 was calculated to quantitate the process.
As shown in Fig. 11, the amount of EGFP and mRFP punctae remained nearly unchanged
20 µm
RESULTS
53
from 2h to 4h p.i. in the absence of lysosomal inhibitor, indicating that autophagosome
formation had not been initiated yet. The green and red signals were overlapping in almost
all punctae, suggesting that the autophagosomes had not yet merged with the lysosome.
Then, the two fluorophores were separately detected in the cytoplasm from 6h p.i. on,
while at the same time a decreased number of yellow dots was observed due to the
quenching of EGFP in the acidic environment of the lysosome. At 8h p.i., the EGFP
punctae markedly decreased, leaving only the mRFP localized in the autolysosome. In
comparison, due to the inhibition of the autophagic flux by chloroquine treatment, the
individual mRFP positive signals could not be detected, demonstrating that the inhibition
of lysosomal acidification is able to prevent the degradation of EGFP. Furthermore, the
increasing number of double-positive signals (EGFP and mRFP) in chloroquine treated
cells and increased mRFP dots in only MVA infected cells indicated that autophagosome
biogenesis was induced upon viral infection.
The statistical analysis of the percentage of co-localized of mRFP/EGFP double-positive to
total mRFP positive dots clearly showed that the co-localization rate dropped from around
80% (2h p.i.) to 50% (8h p.i.) caused by MVA infection. However, the percentage of that
had not significant changed during MVA infection, when chloroquine had been added (Fig.
11B). Therefore, this result for the first time demonstrates the existence of a functional-
active autophagic flux in MVA infected HeLa cells. More importantly, that the enhanced
autophagic flux delivers the cargo to lysosome and leading to degradation.
RESULTS
54
Figure 11. mRFP-EGFP-LC3 quenching assay in HeLa cells
A. HeLa cells were transfected with mRFP-EGFP-LC3 for 16h and then infected with MVA for 2h, 4h, 6h or 8h respectively. On the most right panel, MVA infected cells were treated with Chloroquine (CQ, 50 μM) for 2h. B. Quantification of the ratio of mRFP-EGFP double positive signals to single mRFP positive signals. (n≥3, over 10 cells were counted in each sample per experiment, ** P< 0.01.)
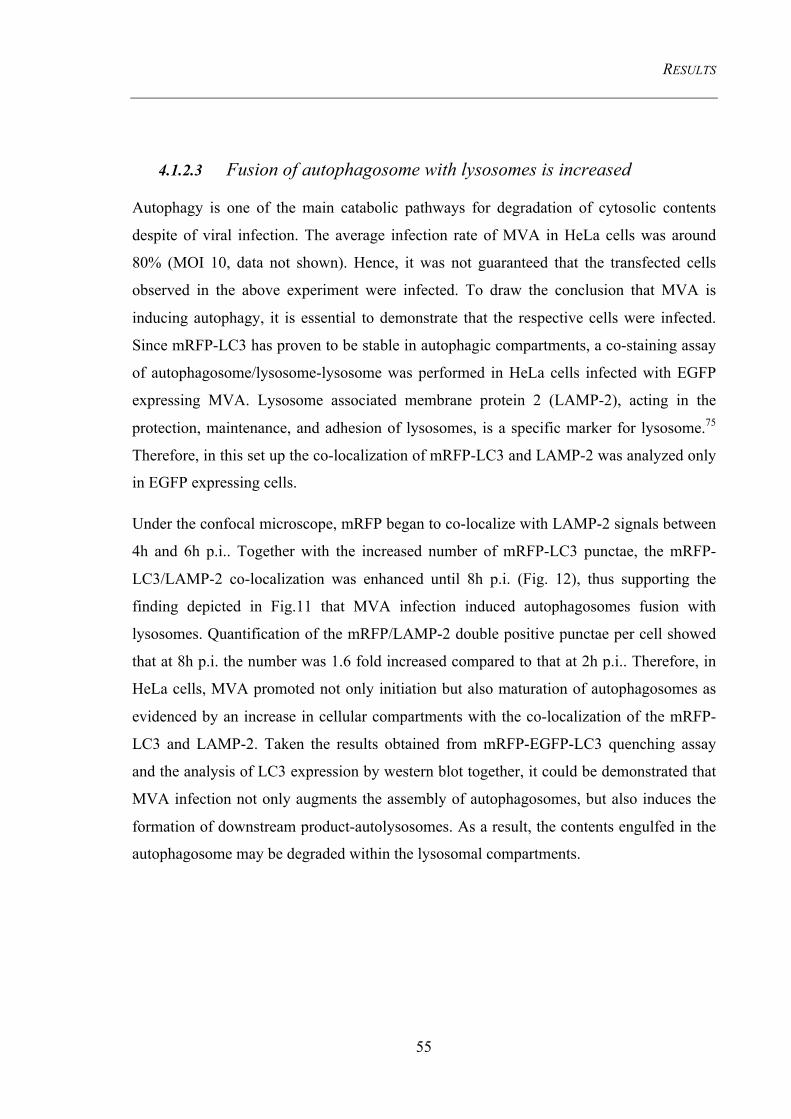
RESULTS
55
4.1.2.3 Fusion of autophagosome with lysosomes is increased
Autophagy is one of the main catabolic pathways for degradation of cytosolic contents
despite of viral infection. The average infection rate of MVA in HeLa cells was around
80% (MOI 10, data not shown). Hence, it was not guaranteed that the transfected cells
observed in the above experiment were infected. To draw the conclusion that MVA is
inducing autophagy, it is essential to demonstrate that the respective cells were infected.
Since mRFP-LC3 has proven to be stable in autophagic compartments, a co-staining assay
of autophagosome/lysosome-lysosome was performed in HeLa cells infected with EGFP
expressing MVA. Lysosome associated membrane protein 2 (LAMP-2), acting in the
protection, maintenance, and adhesion of lysosomes, is a specific marker for lysosome.75
Therefore, in this set up the co-localization of mRFP-LC3 and LAMP-2 was analyzed only
in EGFP expressing cells.
Under the confocal microscope, mRFP began to co-localize with LAMP-2 signals between
4h and 6h p.i.. Together with the increased number of mRFP-LC3 punctae, the mRFP-
LC3/LAMP-2 co-localization was enhanced until 8h p.i. (Fig. 12), thus supporting the
finding depicted in Fig.11 that MVA infection induced autophagosomes fusion with
lysosomes. Quantification of the mRFP/LAMP-2 double positive punctae per cell showed
that at 8h p.i. the number was 1.6 fold increased compared to that at 2h p.i.. Therefore, in
HeLa cells, MVA promoted not only initiation but also maturation of autophagosomes as
evidenced by an increase in cellular compartments with the co-localization of the mRFP-
LC3 and LAMP-2. Taken the results obtained from mRFP-EGFP-LC3 quenching assay
and the analysis of LC3 expression by western blot together, it could be demonstrated that
MVA infection not only augments the assembly of autophagosomes, but also induces the
formation of downstream product-autolysosomes. As a result, the contents engulfed in the
autophagosome may be degraded within the lysosomal compartments.
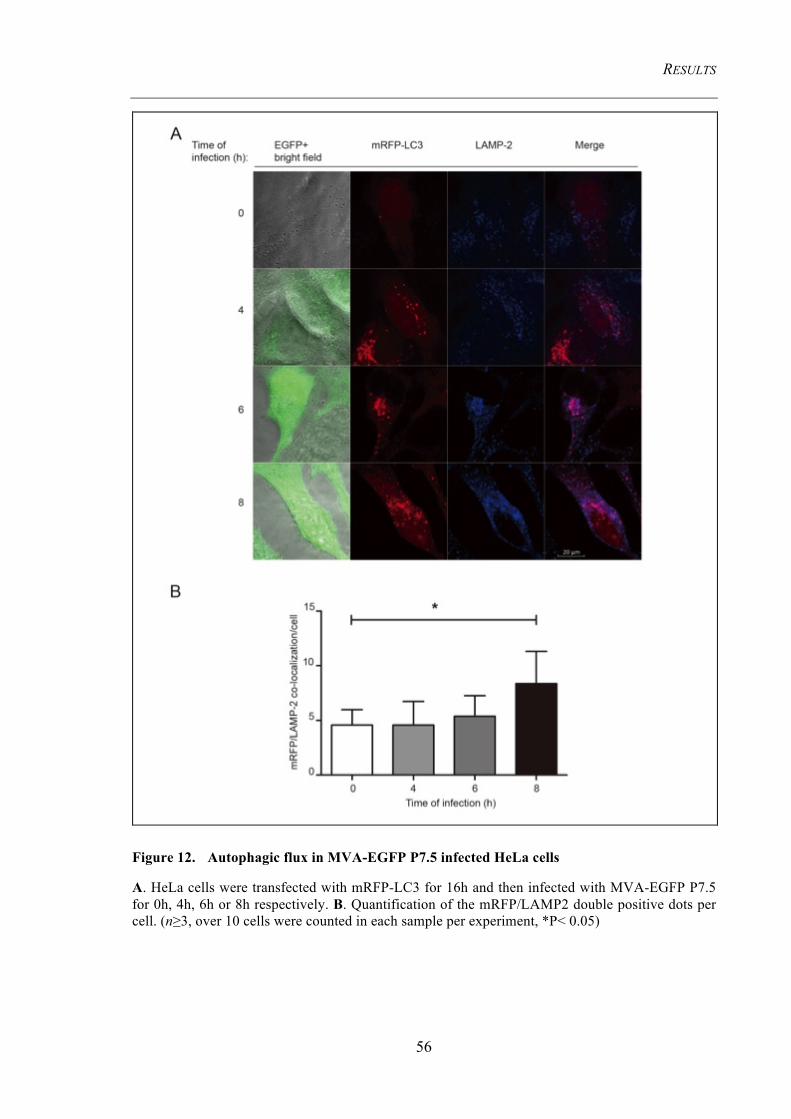
RESULTS
56
Figure 12. Autophagic flux in MVA-EGFP P7.5 infected HeLa cells
A. HeLa cells were transfected with mRFP-LC3 for 16h and then infected with MVA-EGFP P7.5 for 0h, 4h, 6h or 8h respectively. B. Quantification of the mRFP/LAMP2 double positive dots per cell. (n≥3, over 10 cells were counted in each sample per experiment, *P< 0.05)
RESULTS
57
4.1.3 MVA-induced autophagy requires the TLRs adaptor protein MyD88
4.1.3.1 MyD88 and Beclin-1 levels are upregulated
The results presented above demonstrate that MVA infection induced functional autophagy.
However, the molecular mechanisms and the signaling pathways responsible for viral-
induced autophagy remain elusive. TLRs are an important family member of PRRs that
also play a role in sensing MVA infection in dendritic cells. Published data suggest that the
TLRs adaptor protein MyD88 is an essential factor for the induction of autophagy by
interacting with Beclin-1.55, 61-63 Beclin-1, the homologue of Atg6 in mammalian cells, is
targeted by viruses like influenza A, HSV-1 and HIV to subvert the autophagy pathway for
their own benefits, resulting in an increased viral replication and/or control over apoptosis
of their host cells.76 Therefore, it seems worthwhile to investigate the role of these two
proteins in MVA-induced autophagy.
First, the protein levels of MyD88 and Beclin-1 were examined by western blot in BMDCs
during MVA infection. It was observed that the amounts of both proteins were gradually
increased upon infection (Fig. 13). At 8h p.i., MyD88 was significantly more abundant (3.5
fold) compared to the mock control. The expression of Beclin-1 was also mildly increased,
though not as strong as MyD88 (about 1.6 fold at 8h p.i. compared to the to the mock
control).
RESULTS
58
Figure 13. Kinetic analysis of Beclin-1 and MyD88 expression in MVA infected BMDCs
A. Kinetics of MyD88 and Beclin-1 expression in mock treated and MVA-EGFP P7.5 infected BMDCs at 0.5h, 2h, 4h, 6h and 8h p.i. respectively. Cell lysates were subjected to SDS-PAGE and analyzed by western blot within 24h. B. Quantification of Beclin-1 and MyD88 protein levels (fold change compared to the mock control at 8h p.i.). (n≥3, ** P< 0.01, *** P< 0.005)
4.1.3.2 MVA infection fails to induce autophagy in MyD88 -/- BMDCs
It is comprehensible that Beclin-1 was increased as autophagy was activated by viral
infection, but the reason for MyD88 upregulation was not clear. To determine the role of
MyD88 in MVA induced autophagy, the expression levels of Beclin-1 and LC3 were
monitored by kinetic western blot analysis in BMDCs derived from MyD88 homozygous
knockout mice (Fig. 14).
During infection, both LC3-I and LC3-II levels did not significantly change compared to
that of the mock control, suggesting autophagy was not induced by MVA infection.
Strikingly, a prominent decrease of Beclin-1 expression was found depending on the time
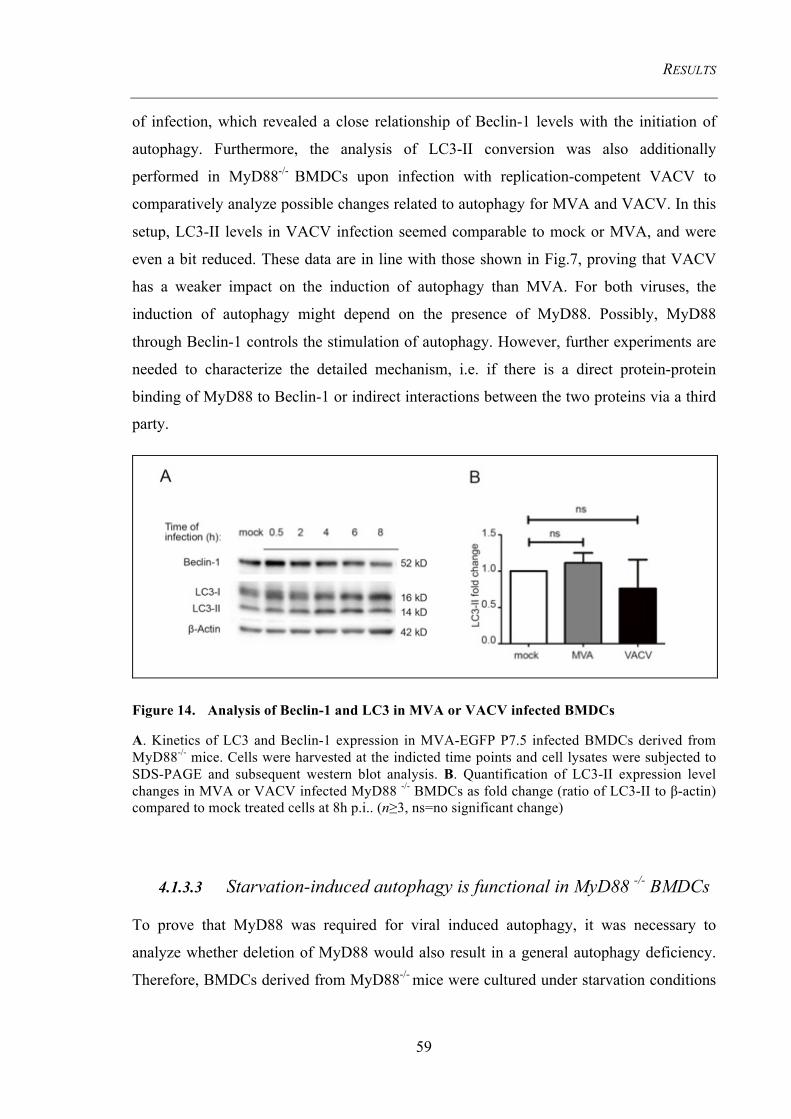
RESULTS
59
of infection, which revealed a close relationship of Beclin-1 levels with the initiation of
autophagy. Furthermore, the analysis of LC3-II conversion was also additionally
performed in MyD88-/- BMDCs upon infection with replication-competent VACV to
comparatively analyze possible changes related to autophagy for MVA and VACV. In this
setup, LC3-II levels in VACV infection seemed comparable to mock or MVA, and were
even a bit reduced. These data are in line with those shown in Fig.7, proving that VACV
has a weaker impact on the induction of autophagy than MVA. For both viruses, the
induction of autophagy might depend on the presence of MyD88. Possibly, MyD88
through Beclin-1 controls the stimulation of autophagy. However, further experiments are
needed to characterize the detailed mechanism, i.e. if there is a direct protein-protein
binding of MyD88 to Beclin-1 or indirect interactions between the two proteins via a third
party.
Figure 14. Analysis of Beclin-1 and LC3 in MVA or VACV infected BMDCs
A. Kinetics of LC3 and Beclin-1 expression in MVA-EGFP P7.5 infected BMDCs derived from MyD88-/- mice. Cells were harvested at the indicted time points and cell lysates were subjected to SDS-PAGE and subsequent western blot analysis. B. Quantification of LC3-II expression level changes in MVA or VACV infected MyD88 -/- BMDCs as fold change (ratio of LC3-II to β-actin) compared to mock treated cells at 8h p.i.. (n≥3, ns=no significant change)
4.1.3.3 Starvation-induced autophagy is functional in MyD88 -/- BMDCs
To prove that MyD88 was required for viral induced autophagy, it was necessary to
analyze whether deletion of MyD88 would also result in a general autophagy deficiency.
Therefore, BMDCs derived from MyD88-/- mice were cultured under starvation conditions
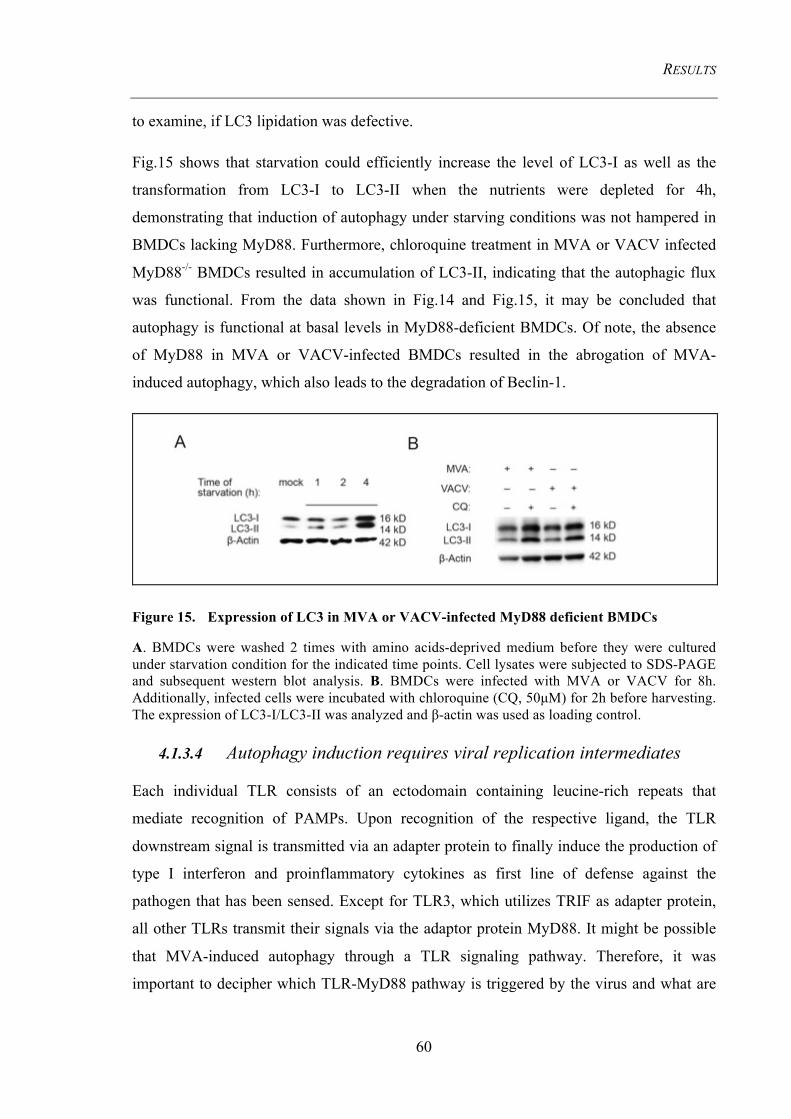
RESULTS
60
to examine, if LC3 lipidation was defective.
Fig.15 shows that starvation could efficiently increase the level of LC3-I as well as the
transformation from LC3-I to LC3-II when the nutrients were depleted for 4h,
demonstrating that induction of autophagy under starving conditions was not hampered in
BMDCs lacking MyD88. Furthermore, chloroquine treatment in MVA or VACV infected
MyD88-/- BMDCs resulted in accumulation of LC3-II, indicating that the autophagic flux
was functional. From the data shown in Fig.14 and Fig.15, it may be concluded that
autophagy is functional at basal levels in MyD88-deficient BMDCs. Of note, the absence
of MyD88 in MVA or VACV-infected BMDCs resulted in the abrogation of MVA-
induced autophagy, which also leads to the degradation of Beclin-1.
Figure 15. Expression of LC3 in MVA or VACV-infected MyD88 deficient BMDCs
A. BMDCs were washed 2 times with amino acids-deprived medium before they were cultured under starvation condition for the indicated time points. Cell lysates were subjected to SDS-PAGE and subsequent western blot analysis. B. BMDCs were infected with MVA or VACV for 8h. Additionally, infected cells were incubated with chloroquine (CQ, 50µM) for 2h before harvesting. The expression of LC3-I/LC3-II was analyzed and β-actin was used as loading control.
4.1.3.4 Autophagy induction requires viral replication intermediates
Each individual TLR consists of an ectodomain containing leucine-rich repeats that
mediate recognition of PAMPs. Upon recognition of the respective ligand, the TLR
downstream signal is transmitted via an adapter protein to finally induce the production of
type I interferon and proinflammatory cytokines as first line of defense against the
pathogen that has been sensed. Except for TLR3, which utilizes TRIF as adapter protein,
all other TLRs transmit their signals via the adaptor protein MyD88. It might be possible
that MVA-induced autophagy through a TLR signaling pathway. Therefore, it was
important to decipher which TLR-MyD88 pathway is triggered by the virus and what are
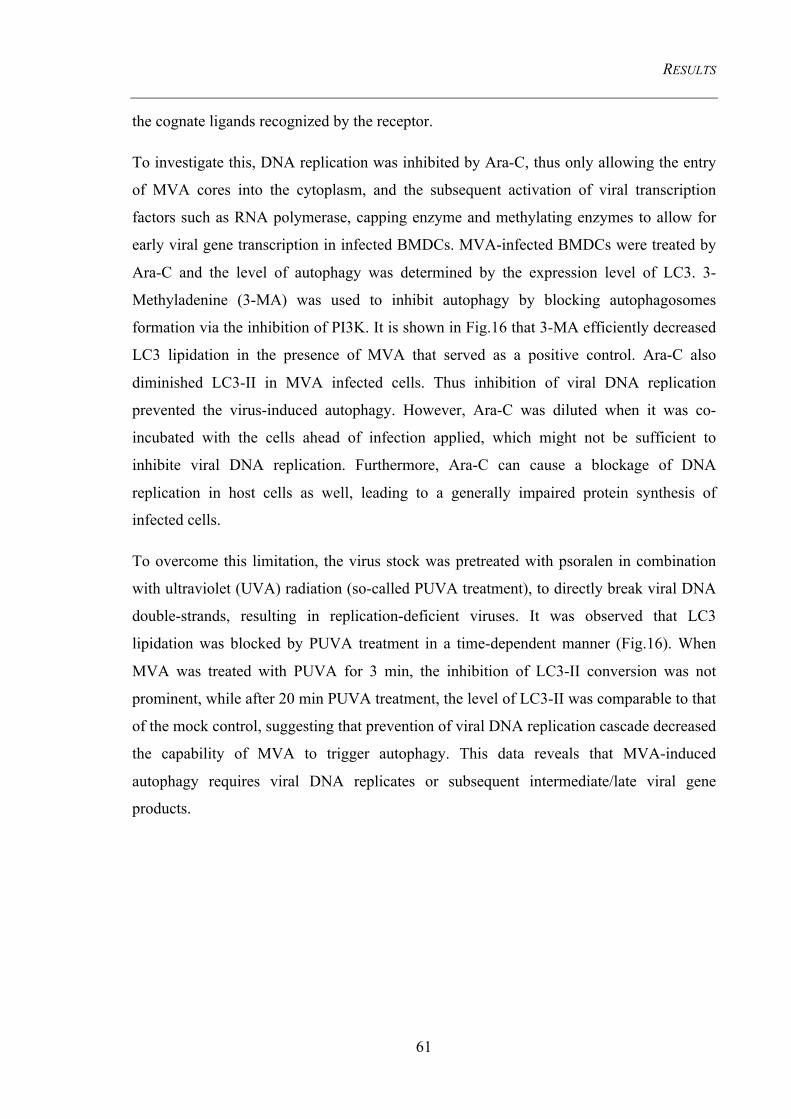
RESULTS
61
the cognate ligands recognized by the receptor.
To investigate this, DNA replication was inhibited by Ara-C, thus only allowing the entry
of MVA cores into the cytoplasm, and the subsequent activation of viral transcription
factors such as RNA polymerase, capping enzyme and methylating enzymes to allow for
early viral gene transcription in infected BMDCs. MVA-infected BMDCs were treated by
Ara-C and the level of autophagy was determined by the expression level of LC3. 3-
Methyladenine (3-MA) was used to inhibit autophagy by blocking autophagosomes
formation via the inhibition of PI3K. It is shown in Fig.16 that 3-MA efficiently decreased
LC3 lipidation in the presence of MVA that served as a positive control. Ara-C also
diminished LC3-II in MVA infected cells. Thus inhibition of viral DNA replication
prevented the virus-induced autophagy. However, Ara-C was diluted when it was co-
incubated with the cells ahead of infection applied, which might not be sufficient to
inhibite viral DNA replication. Furthermore, Ara-C can cause a blockage of DNA
replication in host cells as well, leading to a generally impaired protein synthesis of
infected cells.
To overcome this limitation, the virus stock was pretreated with psoralen in combination
with ultraviolet (UVA) radiation (so-called PUVA treatment), to directly break viral DNA
double-strands, resulting in replication-deficient viruses. It was observed that LC3
lipidation was blocked by PUVA treatment in a time-dependent manner (Fig.16). When
MVA was treated with PUVA for 3 min, the inhibition of LC3-II conversion was not
prominent, while after 20 min PUVA treatment, the level of LC3-II was comparable to that
of the mock control, suggesting that prevention of viral DNA replication cascade decreased
the capability of MVA to trigger autophagy. This data reveals that MVA-induced
autophagy requires viral DNA replicates or subsequent intermediate/late viral gene
products.
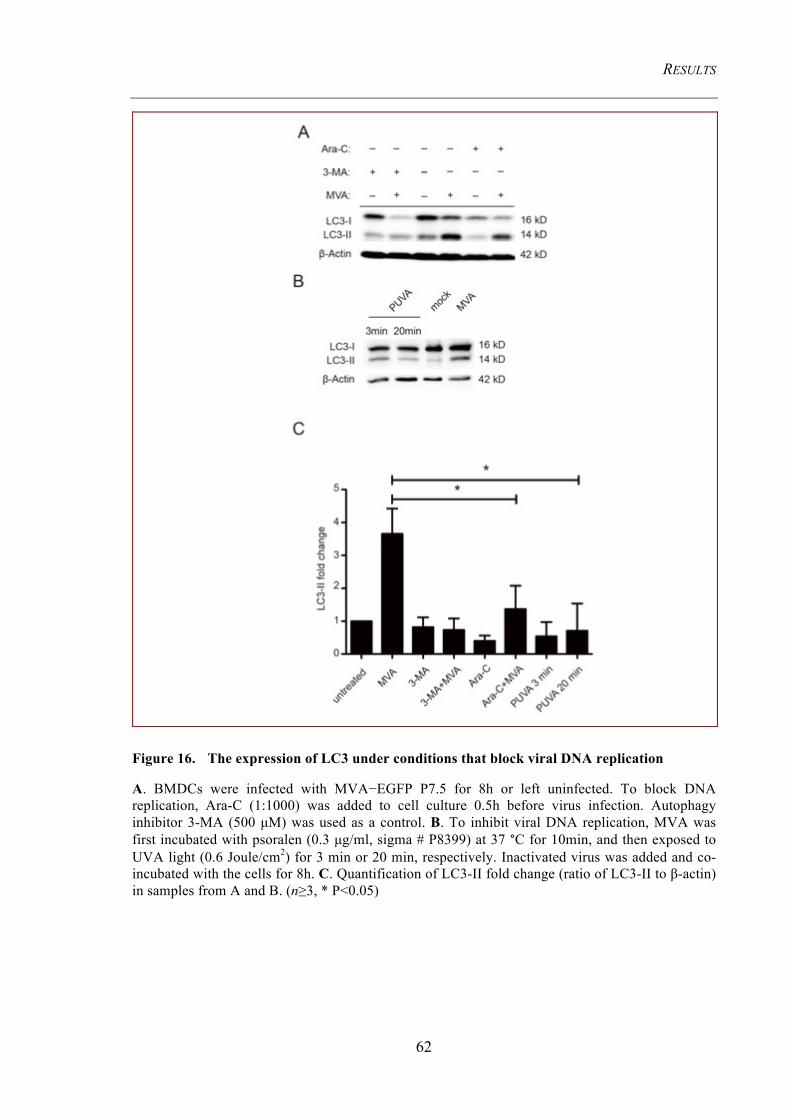
RESULTS
62
Figure 16. The expression of LC3 under conditions that block viral DNA replication
A. BMDCs were infected with MVA−EGFP P7.5 for 8h or left uninfected. To block DNA replication, Ara-C (1:1000) was added to cell culture 0.5h before virus infection. Autophagy inhibitor 3-MA (500 µM) was used as a control. B. To inhibit viral DNA replication, MVA was first incubated with psoralen (0.3 µg/ml, sigma # P8399) at 37 °C for 10min, and then exposed to UVA light (0.6 Joule/cm2) for 3 min or 20 min, respectively. Inactivated virus was added and co-incubated with the cells for 8h. C. Quantification of LC3-II fold change (ratio of LC3-II to β-actin) in samples from A and B. (n≥3, * P<0.05)
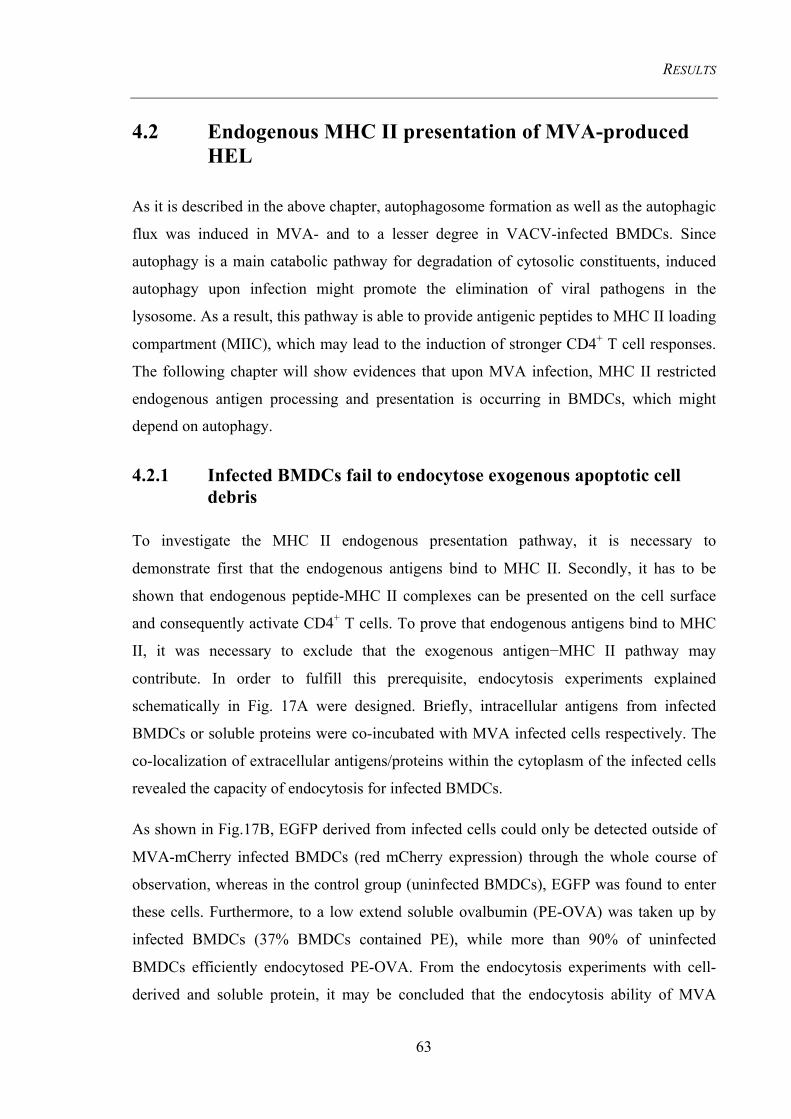
RESULTS
63
4.2 Endogenous MHC II presentation of MVA-produced HEL
As it is described in the above chapter, autophagosome formation as well as the autophagic
flux was induced in MVA- and to a lesser degree in VACV-infected BMDCs. Since
autophagy is a main catabolic pathway for degradation of cytosolic constituents, induced
autophagy upon infection might promote the elimination of viral pathogens in the
lysosome. As a result, this pathway is able to provide antigenic peptides to MHC II loading
compartment (MIIC), which may lead to the induction of stronger CD4+ T cell responses.
The following chapter will show evidences that upon MVA infection, MHC II restricted
endogenous antigen processing and presentation is occurring in BMDCs, which might
depend on autophagy.
4.2.1 Infected BMDCs fail to endocytose exogenous apoptotic cell debris
To investigate the MHC II endogenous presentation pathway, it is necessary to
demonstrate first that the endogenous antigens bind to MHC II. Secondly, it has to be
shown that endogenous peptide-MHC II complexes can be presented on the cell surface
and consequently activate CD4+ T cells. To prove that endogenous antigens bind to MHC
II, it was necessary to exclude that the exogenous antigen−MHC II pathway may
contribute. In order to fulfill this prerequisite, endocytosis experiments explained
schematically in Fig. 17A were designed. Briefly, intracellular antigens from infected
BMDCs or soluble proteins were co-incubated with MVA infected cells respectively. The
co-localization of extracellular antigens/proteins within the cytoplasm of the infected cells
revealed the capacity of endocytosis for infected BMDCs.
As shown in Fig.17B, EGFP derived from infected cells could only be detected outside of
MVA-mCherry infected BMDCs (red mCherry expression) through the whole course of
observation, whereas in the control group (uninfected BMDCs), EGFP was found to enter
these cells. Furthermore, to a low extend soluble ovalbumin (PE-OVA) was taken up by
infected BMDCs (37% BMDCs contained PE), while more than 90% of uninfected
BMDCs efficiently endocytosed PE-OVA. From the endocytosis experiments with cell-
derived and soluble protein, it may be concluded that the endocytosis ability of MVA
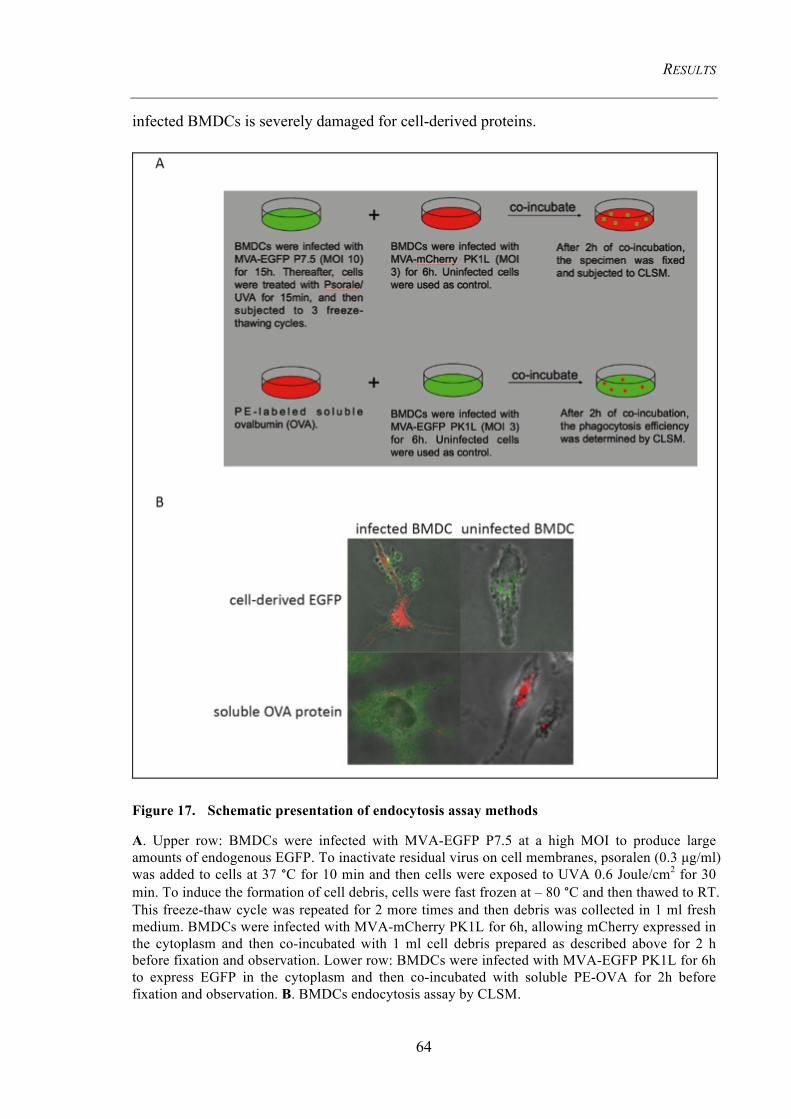
RESULTS
64
infected BMDCs is severely damaged for cell-derived proteins.
Figure 17. Schematic presentation of endocytosis assay methods
A. Upper row: BMDCs were infected with MVA-EGFP P7.5 at a high MOI to produce large amounts of endogenous EGFP. To inactivate residual virus on cell membranes, psoralen (0.3 µg/ml) was added to cells at 37 °C for 10 min and then cells were exposed to UVA 0.6 Joule/cm2 for 30 min. To induce the formation of cell debris, cells were fast frozen at – 80 °C and then thawed to RT. This freeze-thaw cycle was repeated for 2 more times and then debris was collected in 1 ml fresh medium. BMDCs were infected with MVA-mCherry PK1L for 6h, allowing mCherry expressed in the cytoplasm and then co-incubated with 1 ml cell debris prepared as described above for 2 h before fixation and observation. Lower row: BMDCs were infected with MVA-EGFP PK1L for 6h to express EGFP in the cytoplasm and then co-incubated with soluble PE-OVA for 2h before fixation and observation. B. BMDCs endocytosis assay by CLSM.
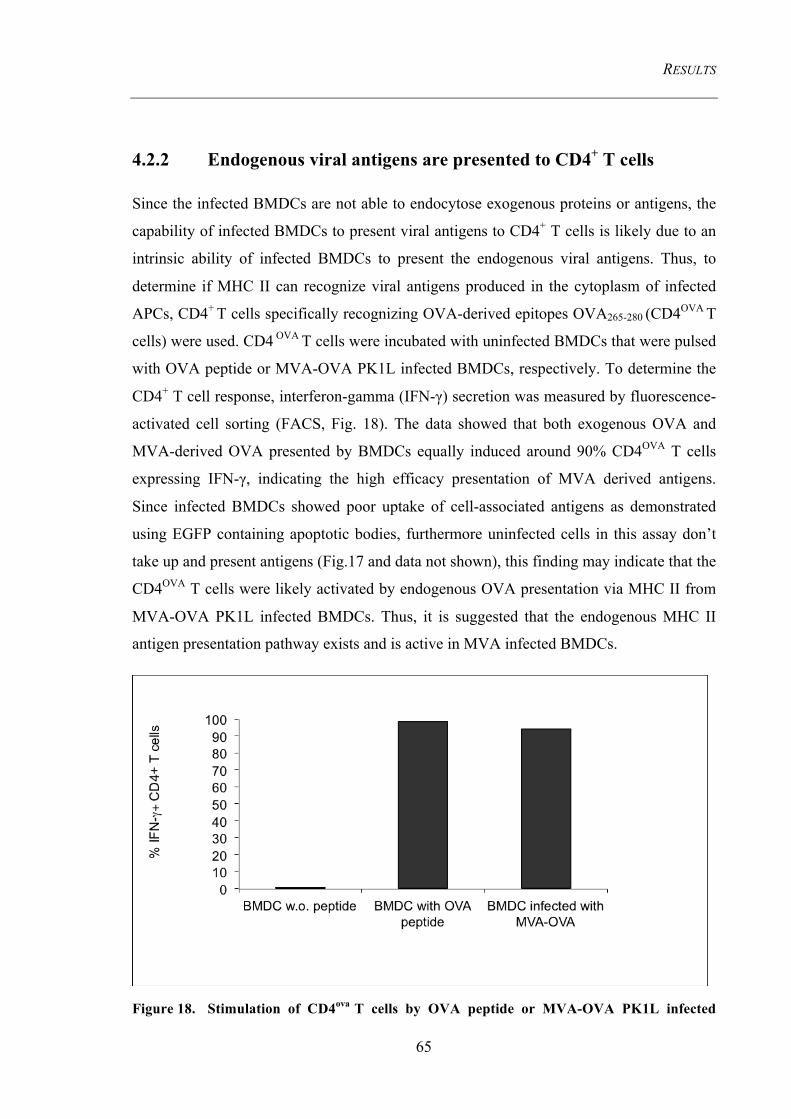
RESULTS
65
4.2.2 Endogenous viral antigens are presented to CD4+ T cells
Since the infected BMDCs are not able to endocytose exogenous proteins or antigens, the
capability of infected BMDCs to present viral antigens to CD4+ T cells is likely due to an
intrinsic ability of infected BMDCs to present the endogenous viral antigens. Thus, to
determine if MHC II can recognize viral antigens produced in the cytoplasm of infected
APCs, CD4+ T cells specifically recognizing OVA-derived epitopes OVA265-280 (CD4OVA T
cells) were used. CD4 OVA T cells were incubated with uninfected BMDCs that were pulsed
with OVA peptide or MVA-OVA PK1L infected BMDCs, respectively. To determine the
CD4+ T cell response, interferon-gamma (IFN-γ) secretion was measured by fluorescence-
activated cell sorting (FACS, Fig. 18). The data showed that both exogenous OVA and
MVA-derived OVA presented by BMDCs equally induced around 90% CD4OVA T cells
expressing IFN-γ, indicating the high efficacy presentation of MVA derived antigens.
Since infected BMDCs showed poor uptake of cell-associated antigens as demonstrated
using EGFP containing apoptotic bodies, furthermore uninfected cells in this assay don’t
take up and present antigens (Fig.17 and data not shown), this finding may indicate that the
CD4OVA T cells were likely activated by endogenous OVA presentation via MHC II from
MVA-OVA PK1L infected BMDCs. Thus, it is suggested that the endogenous MHC II
antigen presentation pathway exists and is active in MVA infected BMDCs.
Figure 18. Stimulation of CD4ova T cells by OVA peptide or MVA-OVA PK1L infected
RESULTS
66
BMDCs
BMDCs were incubated either with or w/o OVA peptide (2 µg/ml) or infected with MVA-OVA PK1L (MOI 10) overnight. Infected BMDCs were sorted for double positive signals of MHC II and CD86, and then incubated with CD4+ T cells. The cultures were incubated for 14h at 37 °C and the stimulation of the T cells was analyzed by subsequent intracellular cytokine staining (ICS). (Experimental data as a courtesy of Frank Thiele)
4.2.3 HEL-MHC II complexes are detected in the cytoplasm and on the cell membrane
4.2.3.1 Aw3.18 mAb only recognizes surface antigen-MHC II complexes
It has been shown that endogenous-presentation of viral antigens by MHC II exist in MVA
infected BMDCs. But how does this pathway deliver endogenous MVA antigens to be
loaded on MHC II molecules and which cellular organelles contribute to this pathway? To
investigate that, the Aw3.18 monoclonal antibodies (Aw3.18 mAbs; biotinylated), which
specifically recognizes the peptide/MHC II complex of hen egg lysozyme peptide 48-62
(pHEL48-62) and the MHC II molecule I-Ak (pHEL/I-Ak) was used. Aw3.18 mAb has
been successfully used to detect the pHEL48-62/I-Ak on the surface of splenocytes.77 To
test whether Aw3.18 mAb could recognize the complex on BMDCs generated from C3H
mouse, presenting MHC II (I-Ak), were applied in the following experiments in the chapter
if not specified. Cells pulsed exogenously with different amounts of HEL protein for 6h or
16h, respectively, to screen for the appropriate protein amount and optimal time point after
pulsing to detect the complexes on cellular membranes. The pHEL/I-Ak expression was
determined by surface staining with Aw3.18 mAb by FACS.
As was shown in Fig. 19, 80% of BMDCs presented pHEL/I-Ak when 5000 µg/ml HEL
were incubated with the cells for 6h. Until 16h, 80% of BMDCs pulsed with 500 µg/ml
HEL presented pHEL/I-Ak, indicating that HEL antigens were presented in a time
dependent manner. However, a relatively high background staining was observed when the
cells were not pulsed with any HEL protein.

RESULTS
67
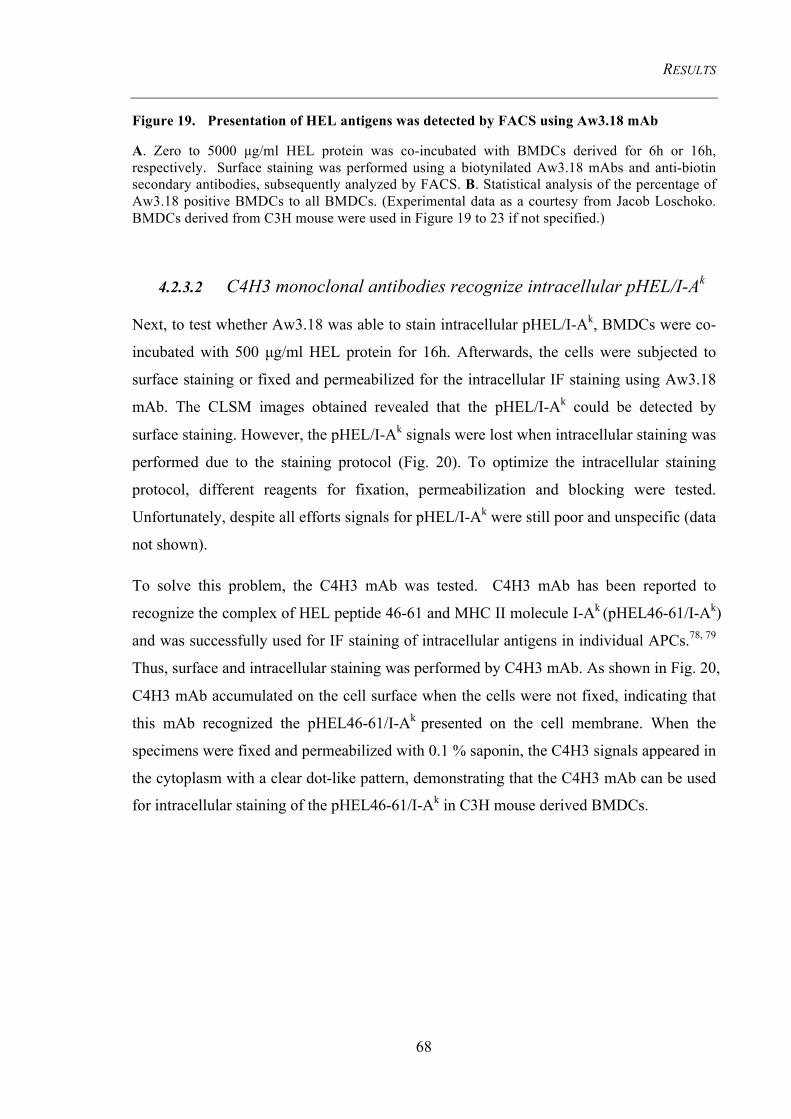
RESULTS
68
Figure 19. Presentation of HEL antigens was detected by FACS using Aw3.18 mAb
A. Zero to 5000 µg/ml HEL protein was co-incubated with BMDCs derived for 6h or 16h, respectively. Surface staining was performed using a biotynilated Aw3.18 mAbs and anti-biotin secondary antibodies, subsequently analyzed by FACS. B. Statistical analysis of the percentage of Aw3.18 positive BMDCs to all BMDCs. (Experimental data as a courtesy from Jacob Loschoko. BMDCs derived from C3H mouse were used in Figure 19 to 23 if not specified.)
4.2.3.2 C4H3 monoclonal antibodies recognize intracellular pHEL/I-Ak
Next, to test whether Aw3.18 was able to stain intracellular pHEL/I-Ak, BMDCs were co-
incubated with 500 µg/ml HEL protein for 16h. Afterwards, the cells were subjected to
surface staining or fixed and permeabilized for the intracellular IF staining using Aw3.18
mAb. The CLSM images obtained revealed that the pHEL/I-Ak could be detected by
surface staining. However, the pHEL/I-Ak signals were lost when intracellular staining was
performed due to the staining protocol (Fig. 20). To optimize the intracellular staining
protocol, different reagents for fixation, permeabilization and blocking were tested.
Unfortunately, despite all efforts signals for pHEL/I-Ak were still poor and unspecific (data
not shown).
To solve this problem, the C4H3 mAb was tested. C4H3 mAb has been reported to
recognize the complex of HEL peptide 46-61 and MHC II molecule I-Ak (pHEL46-61/I-Ak)
and was successfully used for IF staining of intracellular antigens in individual APCs.78, 79
Thus, surface and intracellular staining was performed by C4H3 mAb. As shown in Fig. 20,
C4H3 mAb accumulated on the cell surface when the cells were not fixed, indicating that
this mAb recognized the pHEL46-61/I-Ak presented on the cell membrane. When the
specimens were fixed and permeabilized with 0.1 % saponin, the C4H3 signals appeared in
the cytoplasm with a clear dot-like pattern, demonstrating that the C4H3 mAb can be used
for intracellular staining of the pHEL46-61/I-Ak in C3H mouse derived BMDCs.
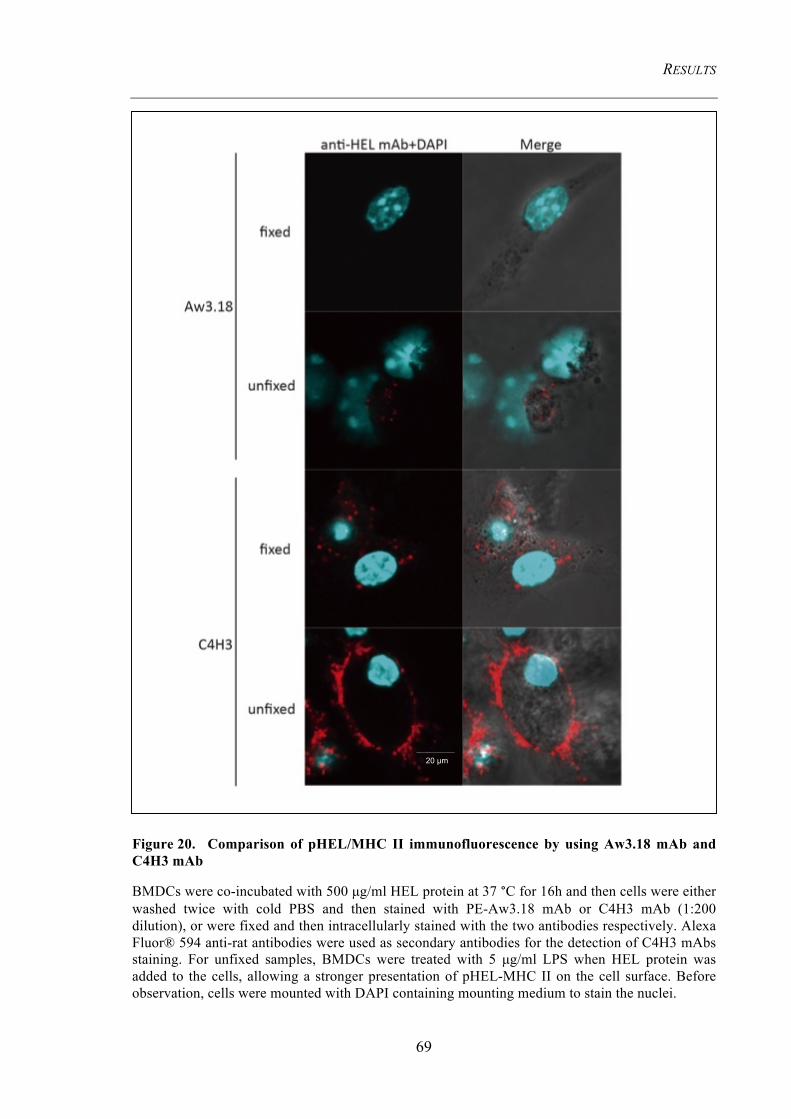
RESULTS
69
Figure 20. Comparison of pHEL/MHC II immunofluorescence by using Aw3.18 mAb and C4H3 mAb
BMDCs were co-incubated with 500 µg/ml HEL protein at 37 °C for 16h and then cells were either washed twice with cold PBS and then stained with PE-Aw3.18 mAb or C4H3 mAb (1:200 dilution), or were fixed and then intracellularly stained with the two antibodies respectively. Alexa Fluor® 594 anti-rat antibodies were used as secondary antibodies for the detection of C4H3 mAbs staining. For unfixed samples, BMDCs were treated with 5 µg/ml LPS when HEL protein was added to the cells, allowing a stronger presentation of pHEL-MHC II on the cell surface. Before observation, cells were mounted with DAPI containing mounting medium to stain the nuclei.
20 µm
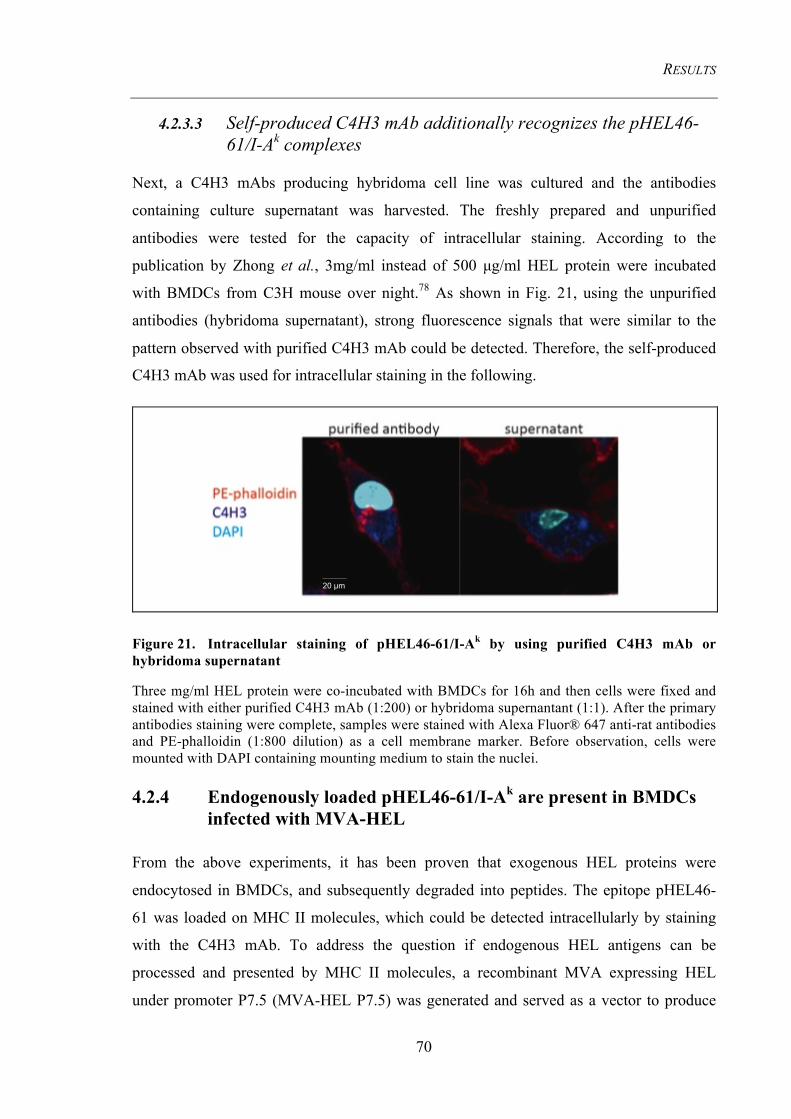
RESULTS
70
4.2.3.3 Self-produced C4H3 mAb additionally recognizes the pHEL46-61/I-Ak complexes
Next, a C4H3 mAbs producing hybridoma cell line was cultured and the antibodies
containing culture supernatant was harvested. The freshly prepared and unpurified
antibodies were tested for the capacity of intracellular staining. According to the
publication by Zhong et al., 3mg/ml instead of 500 µg/ml HEL protein were incubated
with BMDCs from C3H mouse over night.78 As shown in Fig. 21, using the unpurified
antibodies (hybridoma supernatant), strong fluorescence signals that were similar to the
pattern observed with purified C4H3 mAb could be detected. Therefore, the self-produced
C4H3 mAb was used for intracellular staining in the following.
Figure 21. Intracellular staining of pHEL46-61/I-Ak by using purified C4H3 mAb or hybridoma supernatant
Three mg/ml HEL protein were co-incubated with BMDCs for 16h and then cells were fixed and stained with either purified C4H3 mAb (1:200) or hybridoma supernantant (1:1). After the primary antibodies staining were complete, samples were stained with Alexa Fluor® 647 anti-rat antibodies and PE-phalloidin (1:800 dilution) as a cell membrane marker. Before observation, cells were mounted with DAPI containing mounting medium to stain the nuclei.
4.2.4 Endogenously loaded pHEL46-61/I-Ak are present in BMDCs infected with MVA-HEL
From the above experiments, it has been proven that exogenous HEL proteins were
endocytosed in BMDCs, and subsequently degraded into peptides. The epitope pHEL46-
61 was loaded on MHC II molecules, which could be detected intracellularly by staining
with the C4H3 mAb. To address the question if endogenous HEL antigens can be
processed and presented by MHC II molecules, a recombinant MVA expressing HEL
under promoter P7.5 (MVA-HEL P7.5) was generated and served as a vector to produce
20 µm
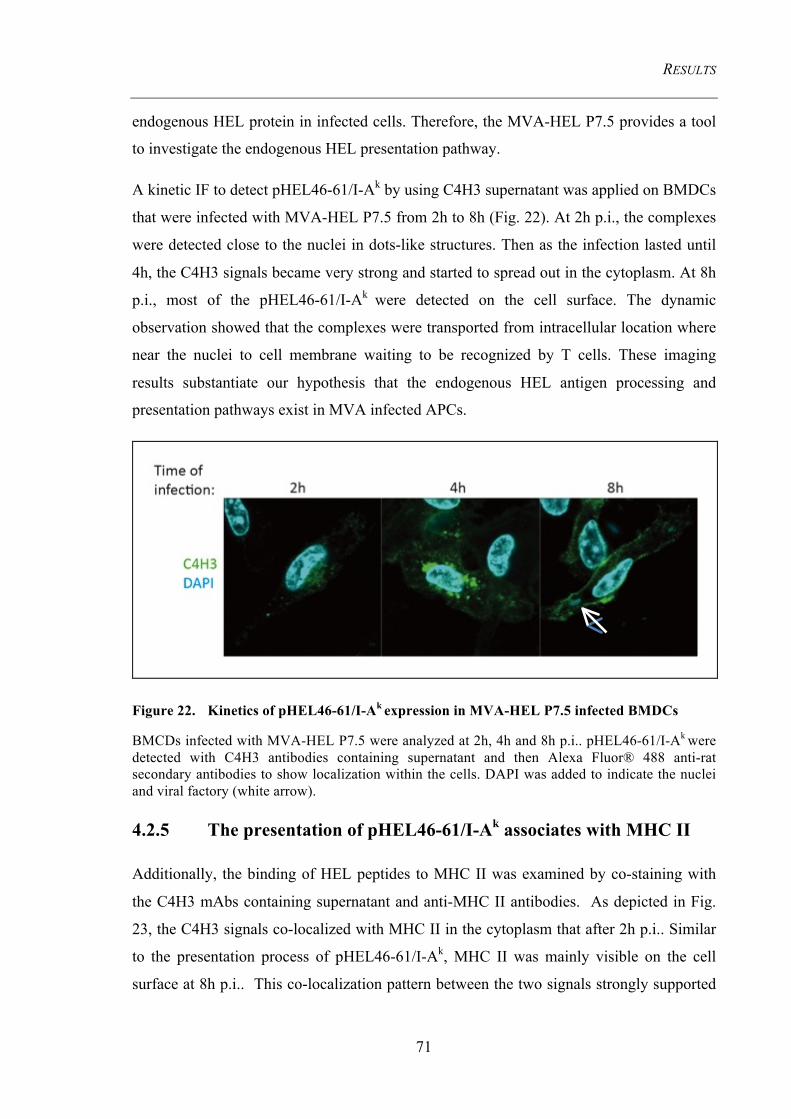
RESULTS
71
endogenous HEL protein in infected cells. Therefore, the MVA-HEL P7.5 provides a tool
to investigate the endogenous HEL presentation pathway.
A kinetic IF to detect pHEL46-61/I-Ak by using C4H3 supernatant was applied on BMDCs
that were infected with MVA-HEL P7.5 from 2h to 8h (Fig. 22). At 2h p.i., the complexes
were detected close to the nuclei in dots-like structures. Then as the infection lasted until
4h, the C4H3 signals became very strong and started to spread out in the cytoplasm. At 8h
p.i., most of the pHEL46-61/I-Ak were detected on the cell surface. The dynamic
observation showed that the complexes were transported from intracellular location where
near the nuclei to cell membrane waiting to be recognized by T cells. These imaging
results substantiate our hypothesis that the endogenous HEL antigen processing and
presentation pathways exist in MVA infected APCs.
Figure 22. Kinetics of pHEL46-61/I-Ak expression in MVA-HEL P7.5 infected BMDCs
BMCDs infected with MVA-HEL P7.5 were analyzed at 2h, 4h and 8h p.i.. pHEL46-61/I-Ak were detected with C4H3 antibodies containing supernatant and then Alexa Fluor® 488 anti-rat secondary antibodies to show localization within the cells. DAPI was added to indicate the nuclei and viral factory (white arrow).
4.2.5 The presentation of pHEL46-61/I-Ak associates with MHC II
Additionally, the binding of HEL peptides to MHC II was examined by co-staining with
the C4H3 mAbs containing supernatant and anti-MHC II antibodies. As depicted in Fig.
23, the C4H3 signals co-localized with MHC II in the cytoplasm that after 2h p.i.. Similar
to the presentation process of pHEL46-61/I-Ak, MHC II was mainly visible on the cell
surface at 8h p.i.. This co-localization pattern between the two signals strongly supported
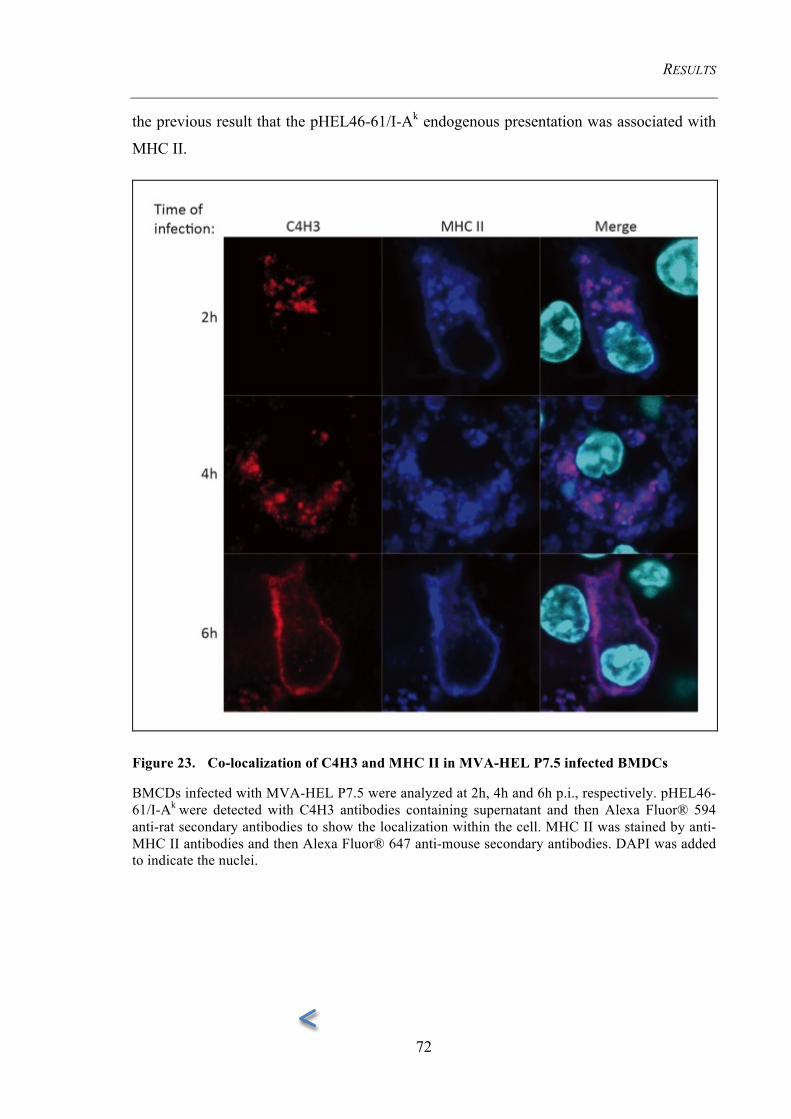
RESULTS
72
the previous result that the pHEL46-61/I-Ak endogenous presentation was associated with
MHC II.
Figure 23. Co-localization of C4H3 and MHC II in MVA-HEL P7.5 infected BMDCs
BMCDs infected with MVA-HEL P7.5 were analyzed at 2h, 4h and 6h p.i., respectively. pHEL46-61/I-Ak were detected with C4H3 antibodies containing supernatant and then Alexa Fluor® 594 anti-rat secondary antibodies to show the localization within the cell. MHC II was stained by anti-MHC II antibodies and then Alexa Fluor® 647 anti-mouse secondary antibodies. DAPI was added to indicate the nuclei.
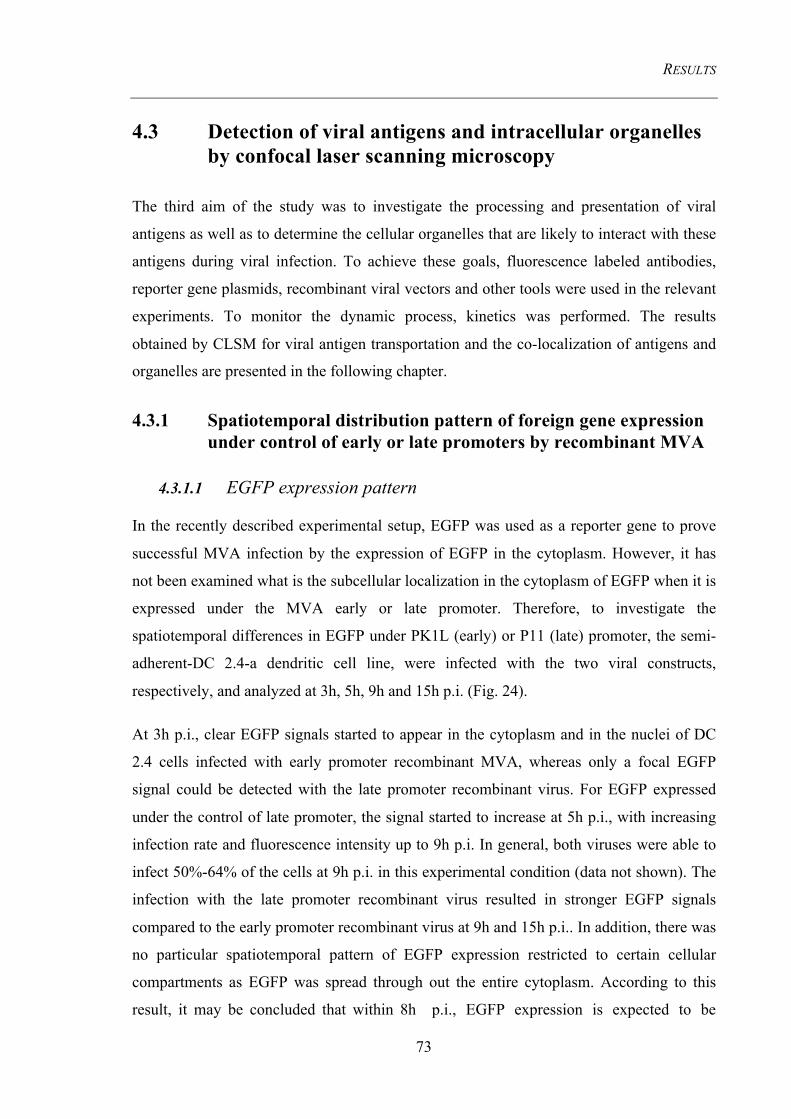
RESULTS
73
4.3 Detection of viral antigens and intracellular organelles by confocal laser scanning microscopy
The third aim of the study was to investigate the processing and presentation of viral
antigens as well as to determine the cellular organelles that are likely to interact with these
antigens during viral infection. To achieve these goals, fluorescence labeled antibodies,
reporter gene plasmids, recombinant viral vectors and other tools were used in the relevant
experiments. To monitor the dynamic process, kinetics was performed. The results
obtained by CLSM for viral antigen transportation and the co-localization of antigens and
organelles are presented in the following chapter.
4.3.1 Spatiotemporal distribution pattern of foreign gene expression under control of early or late promoters by recombinant MVA
4.3.1.1 EGFP expression pattern
In the recently described experimental setup, EGFP was used as a reporter gene to prove
successful MVA infection by the expression of EGFP in the cytoplasm. However, it has
not been examined what is the subcellular localization in the cytoplasm of EGFP when it is
expressed under the MVA early or late promoter. Therefore, to investigate the
spatiotemporal differences in EGFP under PK1L (early) or P11 (late) promoter, the semi-
adherent-DC 2.4-a dendritic cell line, were infected with the two viral constructs,
respectively, and analyzed at 3h, 5h, 9h and 15h p.i. (Fig. 24).
At 3h p.i., clear EGFP signals started to appear in the cytoplasm and in the nuclei of DC
2.4 cells infected with early promoter recombinant MVA, whereas only a focal EGFP
signal could be detected with the late promoter recombinant virus. For EGFP expressed
under the control of late promoter, the signal started to increase at 5h p.i., with increasing
infection rate and fluorescence intensity up to 9h p.i. In general, both viruses were able to
infect 50%-64% of the cells at 9h p.i. in this experimental condition (data not shown). The
infection with the late promoter recombinant virus resulted in stronger EGFP signals
compared to the early promoter recombinant virus at 9h and 15h p.i.. In addition, there was
no particular spatiotemporal pattern of EGFP expression restricted to certain cellular
compartments as EGFP was spread through out the entire cytoplasm. According to this
result, it may be concluded that within 8h p.i., EGFP expression is expected to be
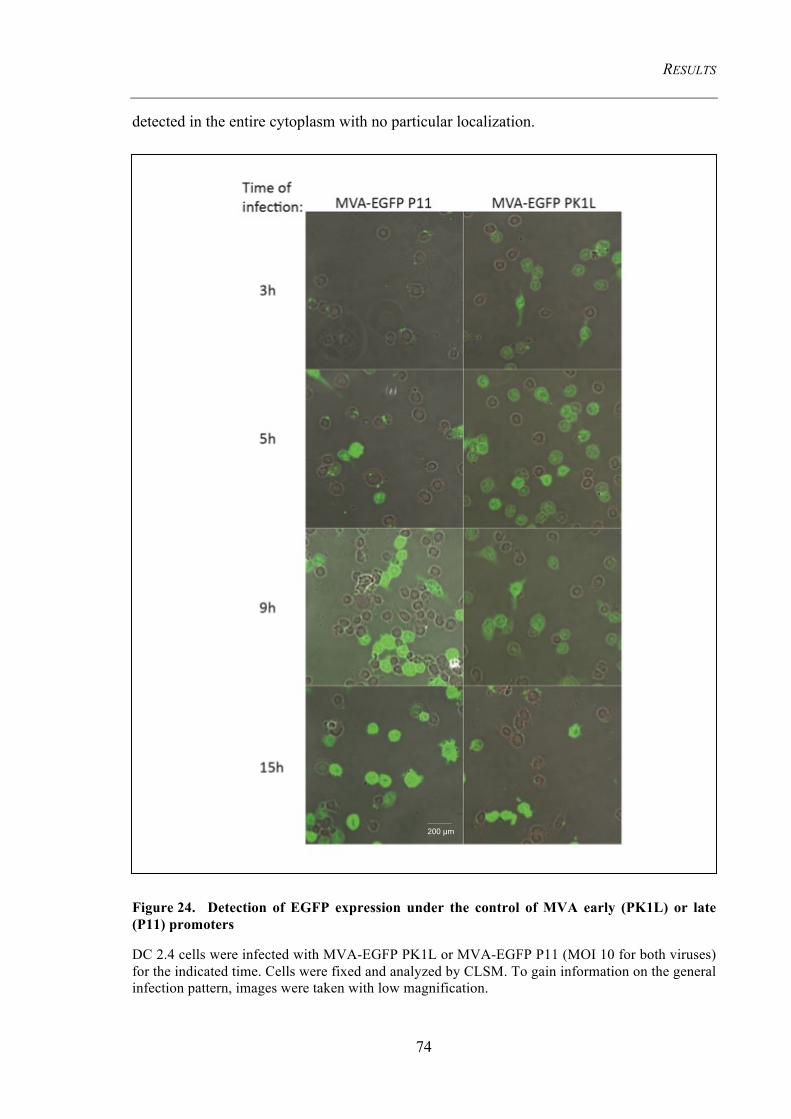
RESULTS
74
detected in the entire cytoplasm with no particular localization.
Figure 24. Detection of EGFP expression under the control of MVA early (PK1L) or late (P11) promoters
DC 2.4 cells were infected with MVA-EGFP PK1L or MVA-EGFP P11 (MOI 10 for both viruses) for the indicated time. Cells were fixed and analyzed by CLSM. To gain information on the general infection pattern, images were taken with low magnification.
200 µm
RESULTS
75
4.3.1.2 OVA expression pattern
Another well established model antigen is full-length ovalbumin (OVA). OVA was
expressed under the control of the early and late promoter P7.5 (MVA-OVA P7.5) in DC
2.4 cells (Fig. 25). To optimize the detection, anti-OVA primary antibodies concentrations
were tested. Images indicated that a 1:200 dilution worked the best, showing a strong
staining with low background. OVA fusion protein was detected spreading out in the entire
cytoplasm. Additionally, no OVA co-localization with viral factory was found at 8h p.i.,
indicating no exclusive regions of OVA expression in the cytoplasm.
Figure 25. Characterization of recombinant OVA expression in the cytoplasm
A. DC 2.4 cells were infected with MVA-OVA P7.5 (MOI 10) for 8h. Specimens were incubated with anti-OVA primary antibodies diluted 1:100, 1:200 and 1:400 respectively. After washing, samples were stained with Alex Fluor® 594 anti-rabbit secondary antibodies. B. A sample stained with anti-OVA antibodies diluted 1:200 was analyzed for subcellular localization of OVA. DAPI stained for nuclei and viral factory (white arrow points to viral factory).
20 µm
20 µm
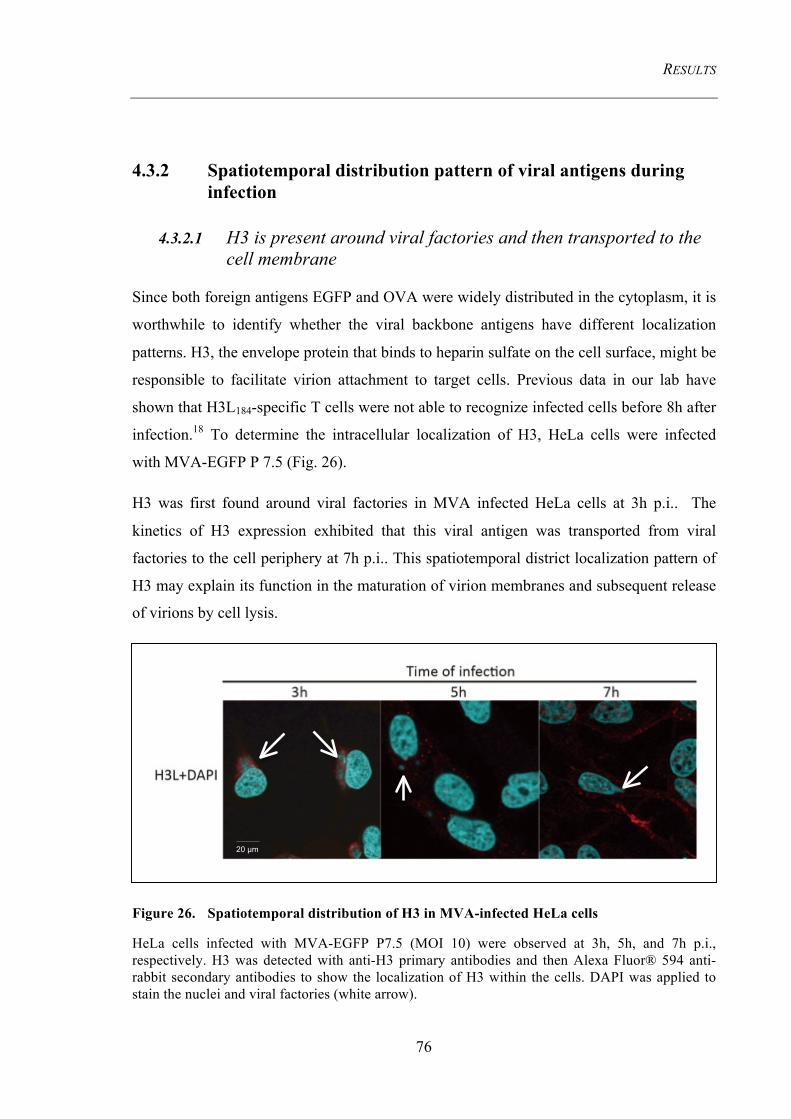
RESULTS
76
4.3.2 Spatiotemporal distribution pattern of viral antigens during infection
4.3.2.1 H3 is present around viral factories and then transported to the cell membrane
Since both foreign antigens EGFP and OVA were widely distributed in the cytoplasm, it is
worthwhile to identify whether the viral backbone antigens have different localization
patterns. H3, the envelope protein that binds to heparin sulfate on the cell surface, might be
responsible to facilitate virion attachment to target cells. Previous data in our lab have
shown that H3L184-specific T cells were not able to recognize infected cells before 8h after
infection.18 To determine the intracellular localization of H3, HeLa cells were infected
with MVA-EGFP P 7.5 (Fig. 26).
H3 was first found around viral factories in MVA infected HeLa cells at 3h p.i.. The
kinetics of H3 expression exhibited that this viral antigen was transported from viral
factories to the cell periphery at 7h p.i.. This spatiotemporal district localization pattern of
H3 may explain its function in the maturation of virion membranes and subsequent release
of virions by cell lysis.
Figure 26. Spatiotemporal distribution of H3 in MVA-infected HeLa cells
HeLa cells infected with MVA-EGFP P7.5 (MOI 10) were observed at 3h, 5h, and 7h p.i., respectively. H3 was detected with anti-H3 primary antibodies and then Alexa Fluor® 594 anti-rabbit secondary antibodies to show the localization of H3 within the cells. DAPI was applied to stain the nuclei and viral factories (white arrow).
20 µm
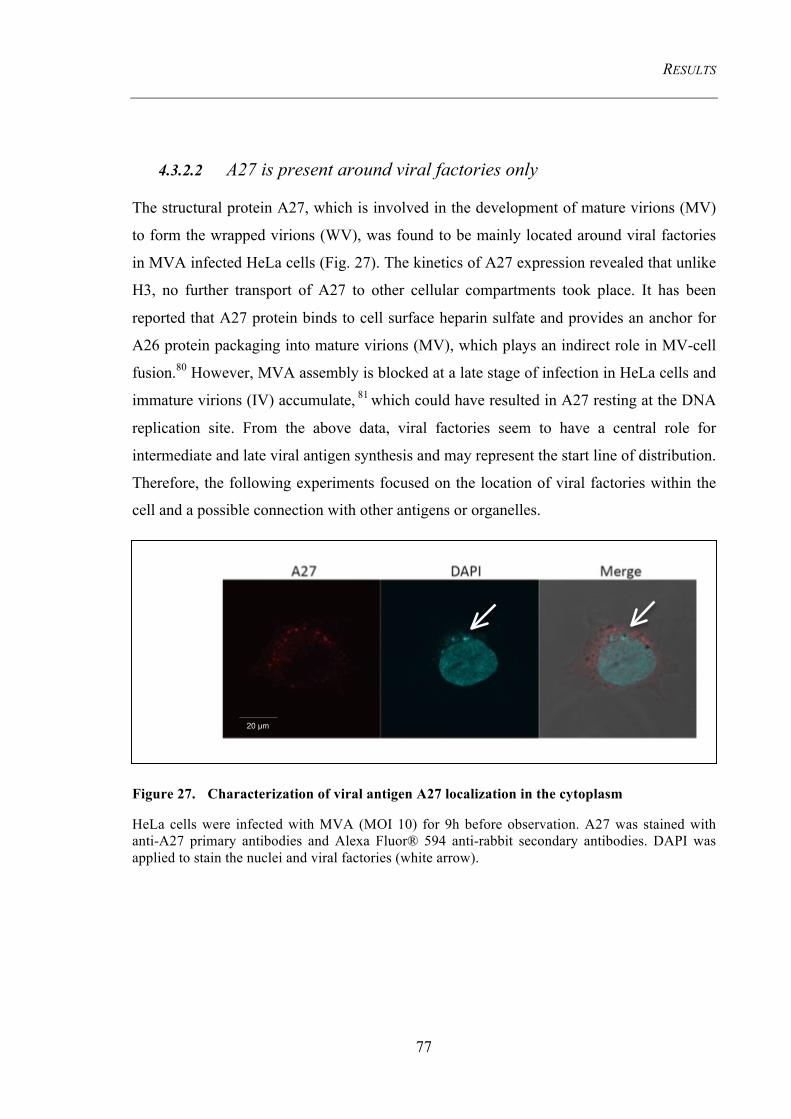
RESULTS
77
4.3.2.2 A27 is present around viral factories only
The structural protein A27, which is involved in the development of mature virions (MV)
to form the wrapped virions (WV), was found to be mainly located around viral factories
in MVA infected HeLa cells (Fig. 27). The kinetics of A27 expression revealed that unlike
H3, no further transport of A27 to other cellular compartments took place. It has been
reported that A27 protein binds to cell surface heparin sulfate and provides an anchor for
A26 protein packaging into mature virions (MV), which plays an indirect role in MV-cell
fusion.80 However, MVA assembly is blocked at a late stage of infection in HeLa cells and
immature virions (IV) accumulate, 81 which could have resulted in A27 resting at the DNA
replication site. From the above data, viral factories seem to have a central role for
intermediate and late viral antigen synthesis and may represent the start line of distribution.
Therefore, the following experiments focused on the location of viral factories within the
cell and a possible connection with other antigens or organelles.
Figure 27. Characterization of viral antigen A27 localization in the cytoplasm
HeLa cells were infected with MVA (MOI 10) for 9h before observation. A27 was stained with anti-A27 primary antibodies and Alexa Fluor® 594 anti-rabbit secondary antibodies. DAPI was applied to stain the nuclei and viral factories (white arrow).
20 µm
RESULTS
78
4.3.3 Cellular organelles undergo morphological changes upon infection
4.3.3.1 Early endosomes do not co-localize with viral factories
One of the most important antigen transport pathways from the plasma membrane to the
MHC II containing compartment is via endosomes. Early endosomes receive endocytosed
material and sort them for vesicular transport to late endosomes and lysosomes or for
recycling to the plasma membrane.82 Exogenous antigens can be processed through this
pathway and then be loaded onto MHC II, e.g. exogenous HEL protein was internalized in
BMDCs and the pHEL-46-61 was detected in the cytoplasm as well as on the cell surface
(see Fig. 20 and Fig. 21). Therefore, it is interesting to investigate if (early) endosomes are
involved in the formation of endogenous viral peptide-MHC II complexes. DC 2.4 and
HeLa cells were infected with MVA-EGFP P11 and then stained with the early endosome
marker (EEA1). EEA1 localizes exclusively to early endosomes and has an important role
in endosomal trafficking.
As shown in Fig. 27A, it was observed that EEA1 was distributed in dots-like pattern in
the cytoplasm at all the time points. When EGFP started to be expressed at 5h p.i., there
was no co-localization with endosomes (EEA1) and EGFP. At 7h p.i., the EEA1 signals
located in the cytoplasm without significant location changes, while EGFP was spread out
in the infected DC 2.4. HeLa cells were then co-stained with DAPI and EEA1 to
investigate the connection between early endosomes and viral factories (Fig. 27B). During
the infection (from 3h to 7h p.i.), no clear co-localization of the two compartments was
detected. From the above data, it may be concluded that there is no direct contact of early
endosomes with viral factories.
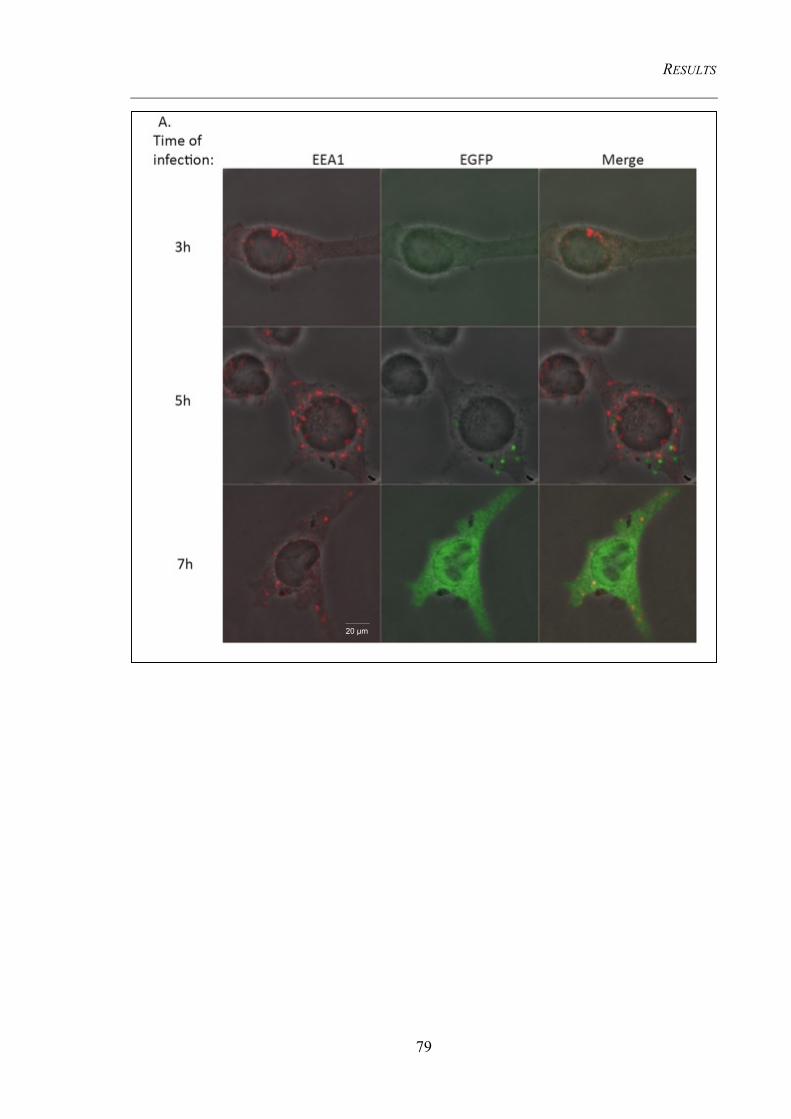
RESULTS
79
20 µm
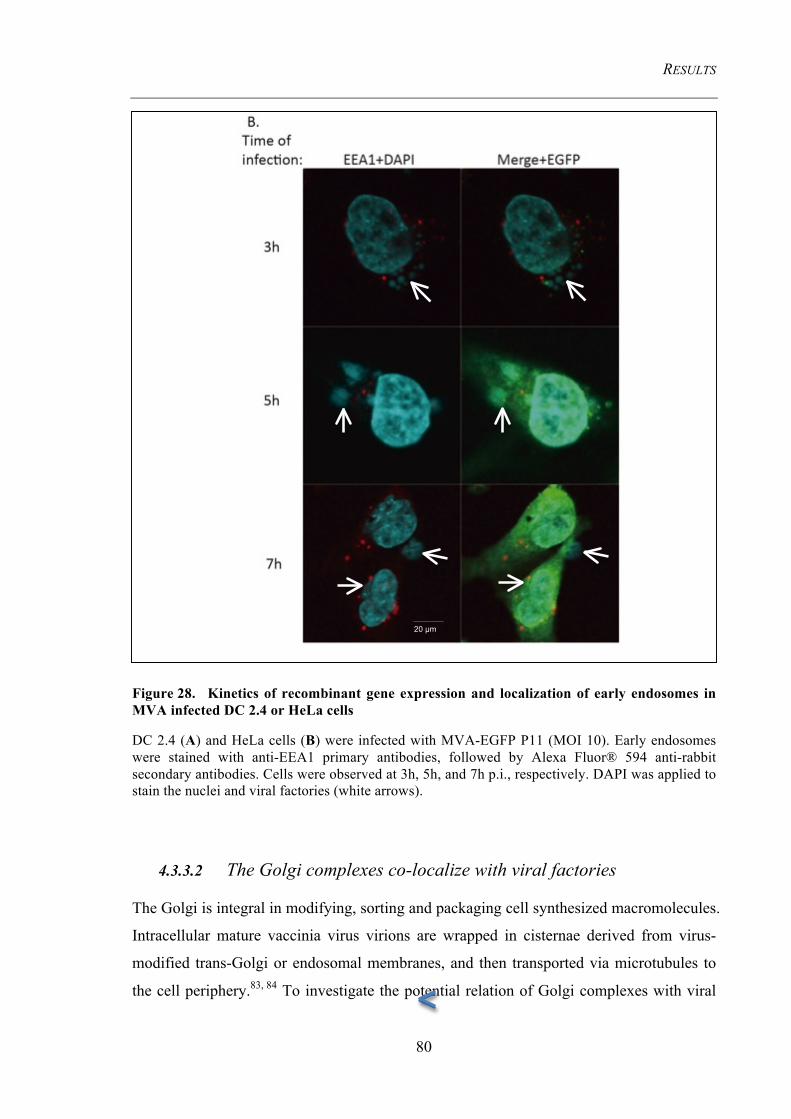
RESULTS
80
Figure 28. Kinetics of recombinant gene expression and localization of early endosomes in MVA infected DC 2.4 or HeLa cells
DC 2.4 (A) and HeLa cells (B) were infected with MVA-EGFP P11 (MOI 10). Early endosomes were stained with anti-EEA1 primary antibodies, followed by Alexa Fluor® 594 anti-rabbit secondary antibodies. Cells were observed at 3h, 5h, and 7h p.i., respectively. DAPI was applied to stain the nuclei and viral factories (white arrows).
4.3.3.2 The Golgi complexes co-localize with viral factories
The Golgi is integral in modifying, sorting and packaging cell synthesized macromolecules.
Intracellular mature vaccinia virus virions are wrapped in cisternae derived from virus-
modified trans-Golgi or endosomal membranes, and then transported via microtubules to
the cell periphery.83, 84 To investigate the potential relation of Golgi complexes with viral
20 µm
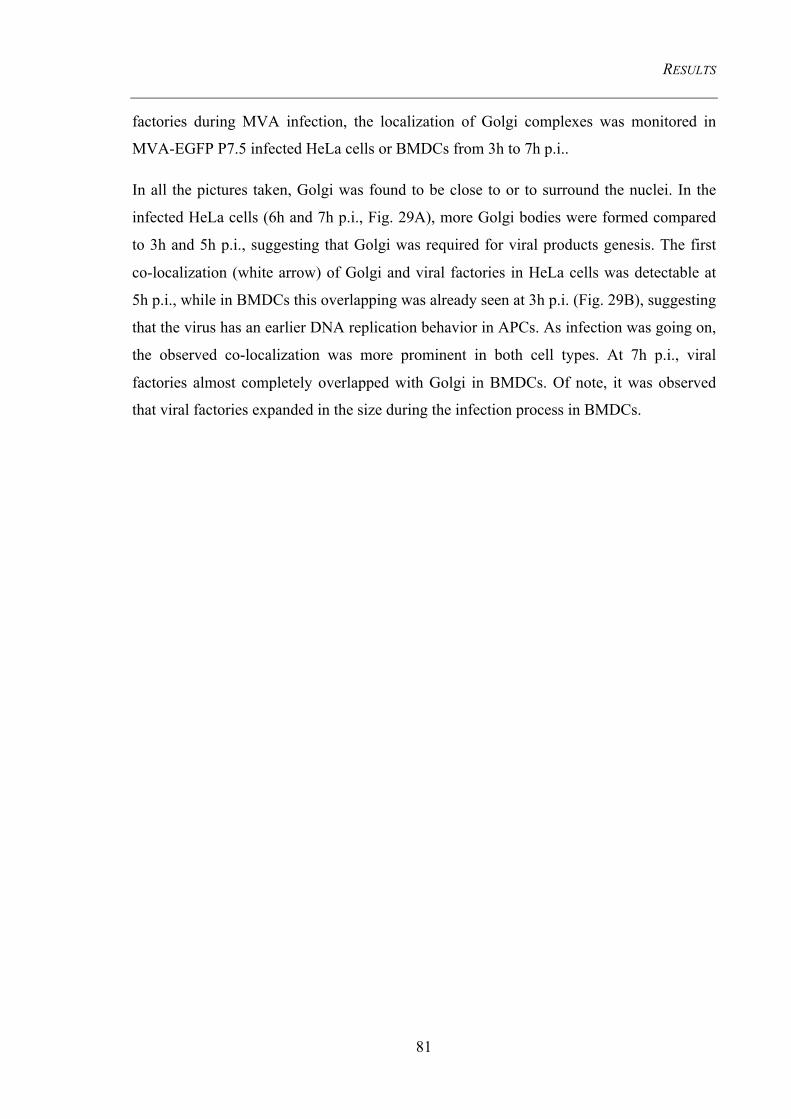
RESULTS
81
factories during MVA infection, the localization of Golgi complexes was monitored in
MVA-EGFP P7.5 infected HeLa cells or BMDCs from 3h to 7h p.i..
In all the pictures taken, Golgi was found to be close to or to surround the nuclei. In the
infected HeLa cells (6h and 7h p.i., Fig. 29A), more Golgi bodies were formed compared
to 3h and 5h p.i., suggesting that Golgi was required for viral products genesis. The first
co-localization (white arrow) of Golgi and viral factories in HeLa cells was detectable at
5h p.i., while in BMDCs this overlapping was already seen at 3h p.i. (Fig. 29B), suggesting
that the virus has an earlier DNA replication behavior in APCs. As infection was going on,
the observed co-localization was more prominent in both cell types. At 7h p.i., viral
factories almost completely overlapped with Golgi in BMDCs. Of note, it was observed
that viral factories expanded in the size during the infection process in BMDCs.
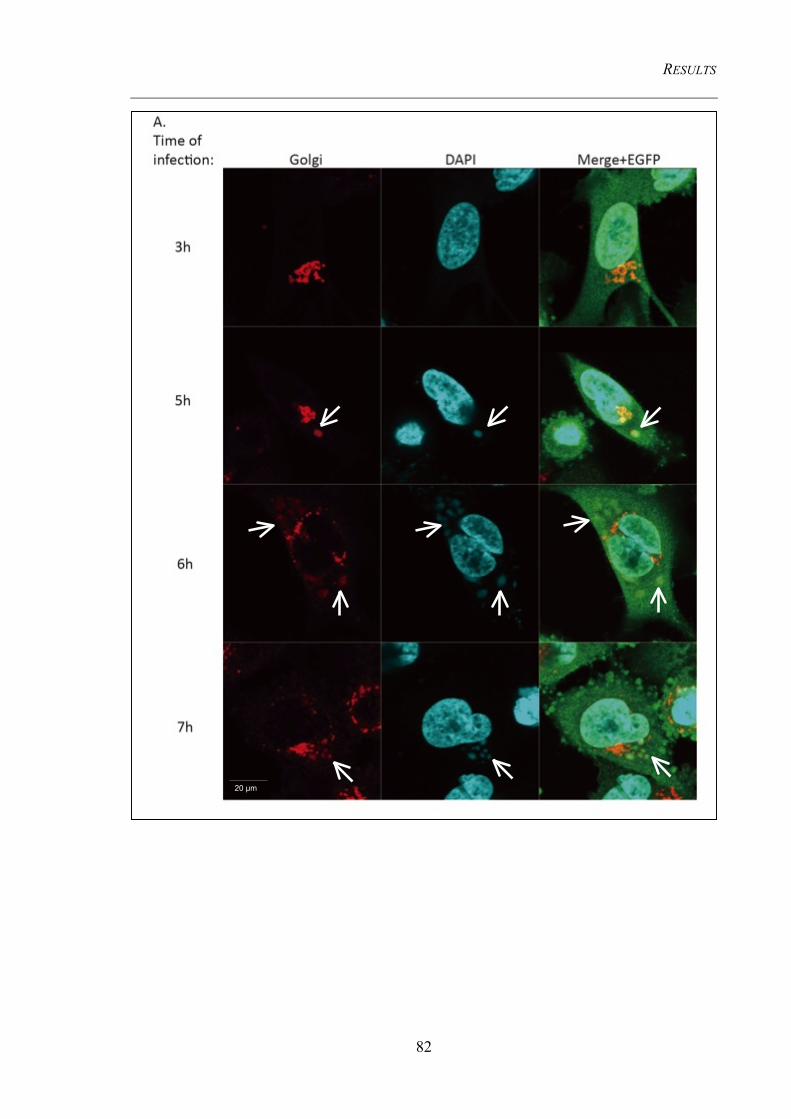
RESULTS
82
20 µm
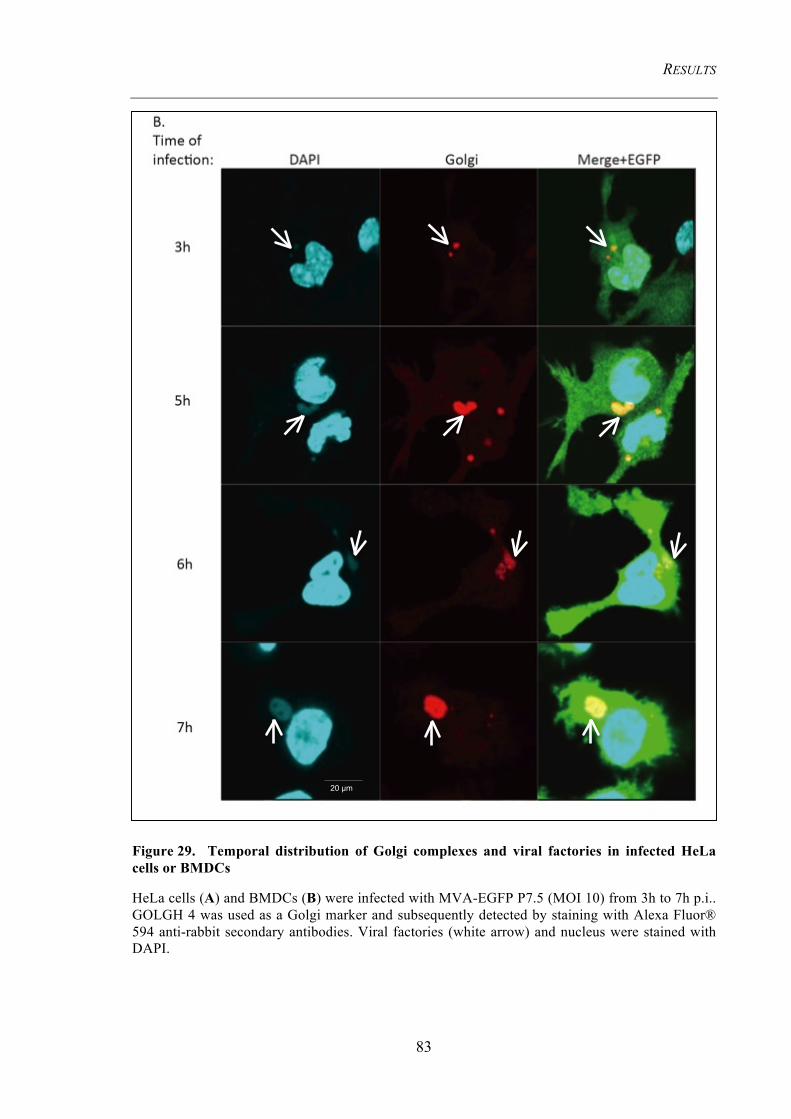
RESULTS
83
Figure 29. Temporal distribution of Golgi complexes and viral factories in infected HeLa cells or BMDCs
HeLa cells (A) and BMDCs (B) were infected with MVA-EGFP P7.5 (MOI 10) from 3h to 7h p.i.. GOLGH 4 was used as a Golgi marker and subsequently detected by staining with Alexa Fluor® 594 anti-rabbit secondary antibodies. Viral factories (white arrow) and nucleus were stained with DAPI.
20 µm
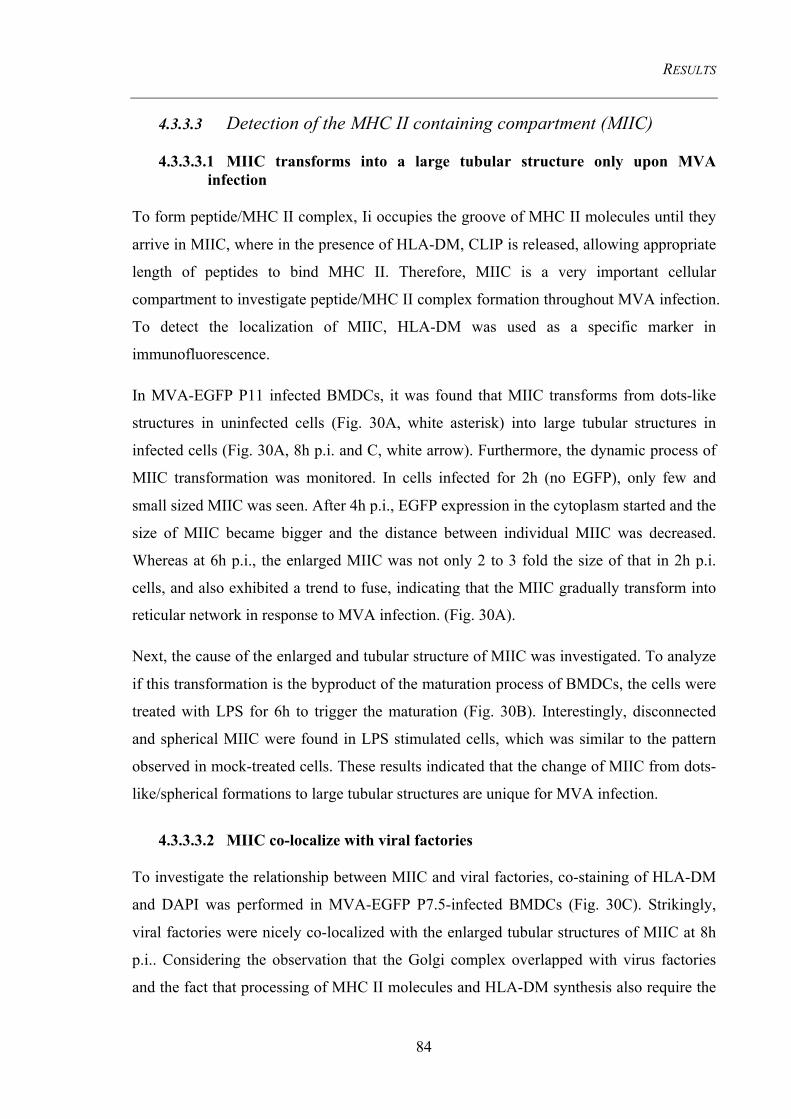
RESULTS
84
4.3.3.3 Detection of the MHC II containing compartment (MIIC)
4.3.3.3.1 MIIC transforms into a large tubular structure only upon MVA infection
To form peptide/MHC II complex, Ii occupies the groove of MHC II molecules until they
arrive in MIIC, where in the presence of HLA-DM, CLIP is released, allowing appropriate
length of peptides to bind MHC II. Therefore, MIIC is a very important cellular
compartment to investigate peptide/MHC II complex formation throughout MVA infection.
To detect the localization of MIIC, HLA-DM was used as a specific marker in
immunofluorescence.
In MVA-EGFP P11 infected BMDCs, it was found that MIIC transforms from dots-like
structures in uninfected cells (Fig. 30A, white asterisk) into large tubular structures in
infected cells (Fig. 30A, 8h p.i. and C, white arrow). Furthermore, the dynamic process of
MIIC transformation was monitored. In cells infected for 2h (no EGFP), only few and
small sized MIIC was seen. After 4h p.i., EGFP expression in the cytoplasm started and the
size of MIIC became bigger and the distance between individual MIIC was decreased.
Whereas at 6h p.i., the enlarged MIIC was not only 2 to 3 fold the size of that in 2h p.i.
cells, and also exhibited a trend to fuse, indicating that the MIIC gradually transform into
reticular network in response to MVA infection. (Fig. 30A).
Next, the cause of the enlarged and tubular structure of MIIC was investigated. To analyze
if this transformation is the byproduct of the maturation process of BMDCs, the cells were
treated with LPS for 6h to trigger the maturation (Fig. 30B). Interestingly, disconnected
and spherical MIIC were found in LPS stimulated cells, which was similar to the pattern
observed in mock-treated cells. These results indicated that the change of MIIC from dots-
like/spherical formations to large tubular structures are unique for MVA infection.
4.3.3.3.2 MIIC co-localize with viral factories
To investigate the relationship between MIIC and viral factories, co-staining of HLA-DM
and DAPI was performed in MVA-EGFP P7.5-infected BMDCs (Fig. 30C). Strikingly,
viral factories were nicely co-localized with the enlarged tubular structures of MIIC at 8h
p.i.. Considering the observation that the Golgi complex overlapped with virus factories
and the fact that processing of MHC II molecules and HLA-DM synthesis also require the
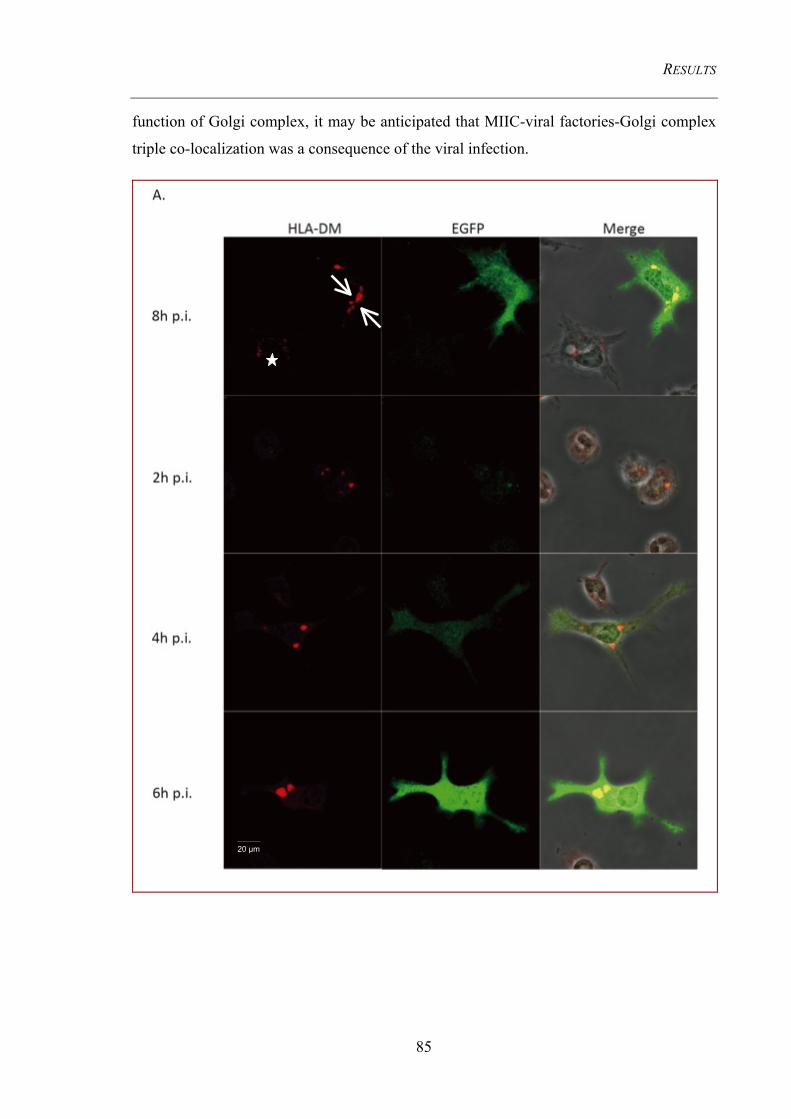
RESULTS
85
function of Golgi complex, it may be anticipated that MIIC-viral factories-Golgi complex
triple co-localization was a consequence of the viral infection.
20 µm
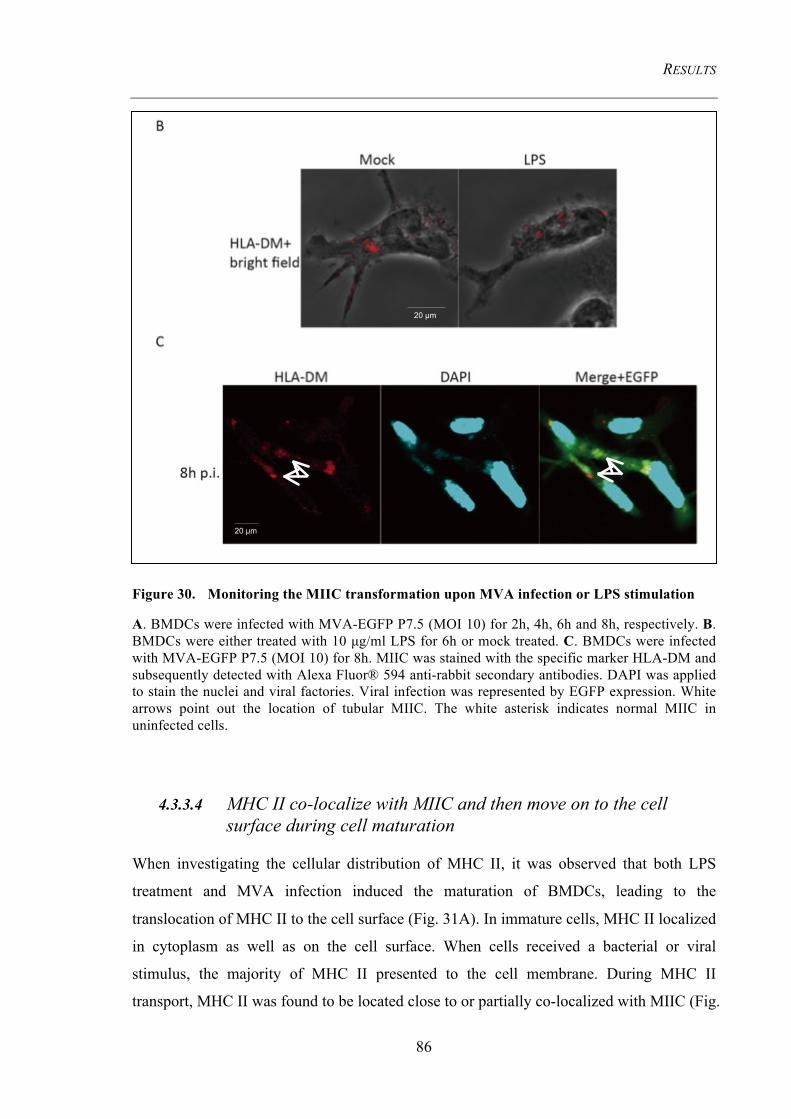
RESULTS
86
Figure 30. Monitoring the MIIC transformation upon MVA infection or LPS stimulation
A. BMDCs were infected with MVA-EGFP P7.5 (MOI 10) for 2h, 4h, 6h and 8h, respectively. B. BMDCs were either treated with 10 µg/ml LPS for 6h or mock treated. C. BMDCs were infected with MVA-EGFP P7.5 (MOI 10) for 8h. MIIC was stained with the specific marker HLA-DM and subsequently detected with Alexa Fluor® 594 anti-rabbit secondary antibodies. DAPI was applied to stain the nuclei and viral factories. Viral infection was represented by EGFP expression. White arrows point out the location of tubular MIIC. The white asterisk indicates normal MIIC in uninfected cells.
4.3.3.4 MHC II co-localize with MIIC and then move on to the cell surface during cell maturation
When investigating the cellular distribution of MHC II, it was observed that both LPS
treatment and MVA infection induced the maturation of BMDCs, leading to the
translocation of MHC II to the cell surface (Fig. 31A). In immature cells, MHC II localized
in cytoplasm as well as on the cell surface. When cells received a bacterial or viral
stimulus, the majority of MHC II presented to the cell membrane. During MHC II
transport, MHC II was found to be located close to or partially co-localized with MIIC (Fig.
20 µm
20 µm
RESULTS
87
31B). This result might suggest that viral peptides replace li to bind on MHC II in the
MIIC, leading to presentation of the peptide/MHC II complexes on the cell surface waiting
for the recognition by CD4+ T cells.
Figure 31. Transport of MHC II during the maturation of BMDCs
A. BMDCs were either mock-treated or incubated with LPS (10 µg/ml) for 6h, or infected with MVA-EGFP P7.5 (MOI 10) for 8h. MHC II was stained with anti-MHC II primary antibodies and then Alexa Fluor® 647 anti-mouse secondary antibodies. DAPI was used to stain the nuclei and viral factory (white arrow). B. BMDCs were infected with MVA-EGFP P7.5, MHC II was stained with the anti-MHC II primary antibodies and subsequently detected with Alexa Fluor® 647 anti-mouse secondary antibodies. Viral infection was represented by EGFP expression.
4.3.3.5 MHC II co-localizes with lysosomes
The above experiments have already shown that the MIIC have specific spatial
organization which is transforming during MVA transfection. MHC II was also observed
to co-localize with MIIC and then to be rapidly distributed to the cell surface in infected
BMDCs. To gain a better understanding of this process, C57BL/6 mouse primary dermal
20 µm
20 µm
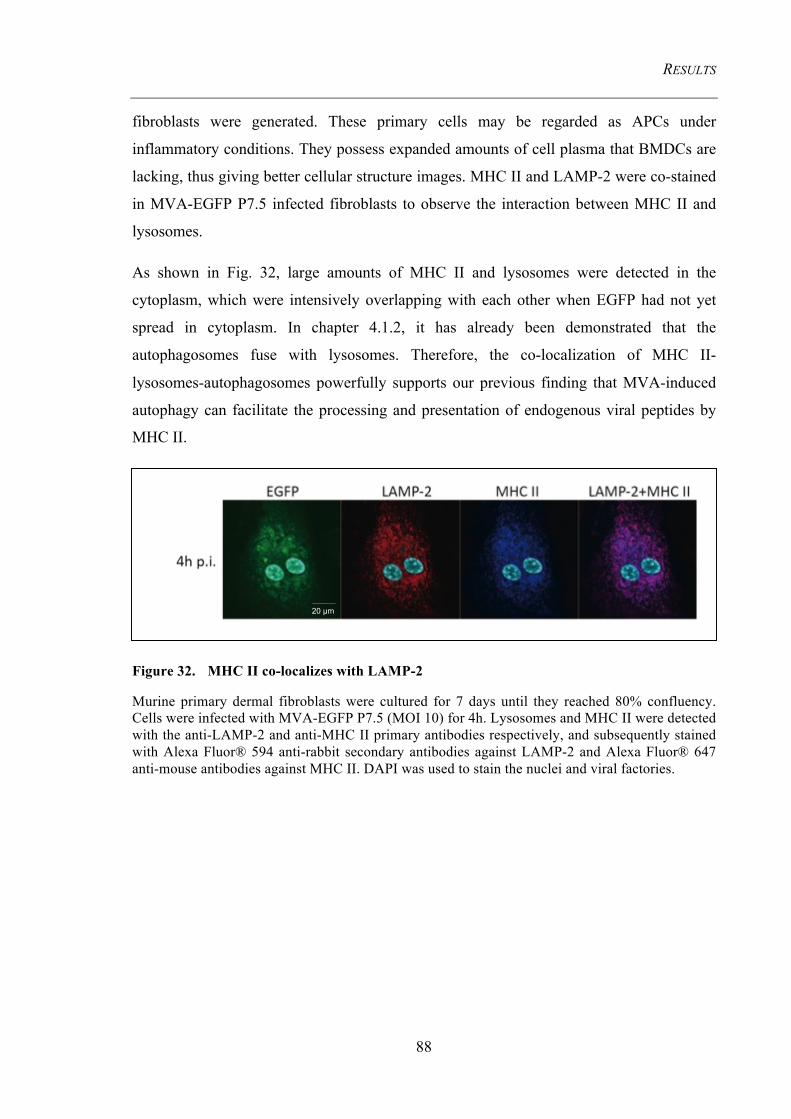
RESULTS
88
fibroblasts were generated. These primary cells may be regarded as APCs under
inflammatory conditions. They possess expanded amounts of cell plasma that BMDCs are
lacking, thus giving better cellular structure images. MHC II and LAMP-2 were co-stained
in MVA-EGFP P7.5 infected fibroblasts to observe the interaction between MHC II and
lysosomes.
As shown in Fig. 32, large amounts of MHC II and lysosomes were detected in the
cytoplasm, which were intensively overlapping with each other when EGFP had not yet
spread in cytoplasm. In chapter 4.1.2, it has already been demonstrated that the
autophagosomes fuse with lysosomes. Therefore, the co-localization of MHC II-
lysosomes-autophagosomes powerfully supports our previous finding that MVA-induced
autophagy can facilitate the processing and presentation of endogenous viral peptides by
MHC II.
Figure 32. MHC II co-localizes with LAMP-2
Murine primary dermal fibroblasts were cultured for 7 days until they reached 80% confluency. Cells were infected with MVA-EGFP P7.5 (MOI 10) for 4h. Lysosomes and MHC II were detected with the anti-LAMP-2 and anti-MHC II primary antibodies respectively, and subsequently stained with Alexa Fluor® 594 anti-rabbit secondary antibodies against LAMP-2 and Alexa Fluor® 647 anti-mouse antibodies against MHC II. DAPI was used to stain the nuclei and viral factories.
20 µm
DISCUSSION
89
5. Discussion
5.1 Autophagy is important for MVA-related MHC class II antigen processing and presentation
Recent in vitro data in our group showed that activation of CD4+ T cells stimulated by
MVA antigens from MVA infected BMDCs was hampered by the inhibition of autophagy
in those APCs. Particularly, the decreased T cell response was more prominent against the
late viral antigens than against the early ones (Thiele, unpublished data). These findings
suggest that autophagy may be involved in MVA antigen presentation by MHC II, though
the underlying mechanism remains elusive. As autophagy delivers cytosolic material to
lysosomes for degradation, it can be assumed that APCs (e.g. BMDCs) direct the
autophagy machinery against viral infection by promoting the survival rate of infected
cells through activation of the innate immune system (e.g. delivery of the respective TLR
ligands to endosomes), or by feeding MHC II the peptides to induce a T cell response for
the adaptive immunity.85 Of note, the function of autophagy aiming to clear cytosol-
invading microbes is referred to as “xenophagy”, which is considered as an important
component of the innate immune system.86 Thus, investigating the mechanisms of
autophagy-mediated viral antigen presentation, especially for endogenous antigens
presented by MHC II, might highlight new aspects of this essential pathway.
5.1.1 Methods and limitations to monitor autophagy in BMDCs
To demonstrate the status quo of autophagy within a cell, it is essential to identify the
criteria, which determine the occurrence of an autophagic process. Unfortunately, it is a
“moving target” as the field evolves very quickly and there are no generally applicable
criteria that fit in every experimental setup to address particular cells, tissues or organisms.
Accordingly, several independent methods should be combined to allow for a more reliable
interpretation of this dynamic process.68 54, 87
5.1.1.1 Interpretation of LC3-turnover analysis by immunoblotting
DISCUSSION
90
Western blot analysis of LC3 expression is the most widely used method to determine
autophagosome formation.54 This method detects a rather early step in this process and to
some extent reflects the initiation of autophagy. LC3-I is an ubiquitin-like protein that can
be conjugated to phosphatidylethanolamine (PE) to become LC3-II. Although the
molecular weight of LC3-II (18kD) is larger than that of LC3-I (16kD) because of PE
conjugation, the appeal size of LC3-II on an SDS-PAGE is around 14 kD, which is smaller
than that of LC3-I with a size of around 16 kD. This contradictory phenomenon is due to
the extreme hydrophobicity of the PE molecule so that LC3-II runs faster than LC3-I.69
Caution should be raised that LC3 conversion from LC3-I to LC3-II only represents the
protein lipidation, which is only the primary step of autophagosome formation. LC3
processing actually defines a functional autophagy.69 Inhibition of autophagosomes’ fusion
with lysosomes or loss of degradative function of lysosomes can also result in a similar
high level of LC3-II, because it inhibits LC3-II degradation or its recycling from the
membrane of autophagosomes.69 Hence, the measurement of the LC3-II turnover by
western blot analysis needs to include experimental control in the presence or absence of
lysosomal protease inhibitors or lysosomotropic agents, such as chloroquine or
bafilomycin A1. Only when the LC3-II further accumulates in the presence of a suitable
inhibitor, the conclusion of the upregulation of autophagy can be drawn. In line with this,
when chloroquine was applied in MVA or VACV infected cells (Fig. 6B and Fig. 7), it
could be demonstrated that the increase of LC3-II is not because of a halted degradation.
In yeast, the amounts of Atg8, the homologue of LC3, increases at least 10 fold upon the
induction of autophagy.88 However, in mammalian cells the total amount of LC3 may
remain unchanged under the same condition because of increased conversion from LC3-I
to LC3-II or fast degradation of LC3-II being delivered to lysosomes. Hence, determine the
kinetics of the LC3 turnover is necessary to monitor the autophagosome formation during
MVA infection. Since the VACV/MVA replication cycle is completed within 8h p.i., the
kinetics of LC3 turnover was chosen within the first 8h p.i. accordingly in Fig. 6. LC3
expression increased gradually during the time of infection, clearly demonstrating that
MVA-induced autophagy is a constitutively active process. It is possible that LC3-II will
increase relative to LC3-I after 8h p.i., because MVA infection interferes with host cellular
translation machinery which would selectively inhibit the host protein synthesis (Thiele,
unpublished data), which might leading to a rapid shut down of newly synthesized LC3-I.
DISCUSSION
91
In comparison, actin as a long-life protein is required by VACV to induce actin-based viral
motility, has a general half-life of 48h.89, 90 Thus, it is more accurate to calculate the ratio
of LC3-II to β-actin than LC3-II to LC3-I if LC3-I is not abundant in the cells or tissues
analyzed.
5.1.1.2 Dissection of autophagy maturation by EGFP/mRFP-LC3 lysosomal delivery and proteolysis
Autophagic activity does not just include the increased synthesis or lipidation of LC3-II, or
an increase in the formation of autophagosomes, but most importantly the enhanced
autophagic flux. Only if the entire system is functional, the engulfed materials can be
finally delivered to lysosomes for degradation. Moloughney et al. found that VACV
infection led to massive LC3 lipidation, but devoid of autophagosome formation and
autophagic flux in the virus infected cells.91 Hence, autophagic substrates need to be
monitored to verify that they have reached the autolysosomes and become degraded. This
process is also referred to as autophagy maturation.
Due to different stability in the lysosomal environment, mRFP-LC3 and EGFP-LC3
exhibit distinct detection patterns when autophagosomes undergo maturation, which can be
utilized for dissecting the status of the autophagic flux.74 However, it may be problematic
to only count the number of EGFP-LC3 punctae, as in infected cells new EGFP-LC3 is
being synthesized when earlier produced EGFP-LC3 is degraded within autolysosomes.
This probably explains the prominent increase of LC3-II at 4h p.i., which was detected by
western blot (Fig. 6), while no corresponding increase in EGFP-LC3 punctae was observed
by microscope analysis (Fig. 11). A possible solution to circumvent this effect is the
application of chloroquine in cells transfected with EGFP-LC3 expression plasmids. In this
case, EGFP-LC3 cannot be degraded because the access to lysosomes is blocked. As a
result, the number of the green fluorescent punctae was markedly increased in MVA-
infected cells, which had been treated with choloroquine (Fig. 11 6h and 8h p.i.). In
contrast, the metabolism of EGFP-LC3 in MVA infected samples revealed the increased
amount of LC3 proteins at 6h p.i., while decreased LC3 at 8h p.i. as they were delivered to
autolysosomes for subsequent degradation.
Another alternative is co-localizing the mRFP-LC3 with a lysosomal marker, such as
LAMP-2. It is known that GFP has a relatively higher pKa value (pKa=6.2) than mRFP
DISCUSSION
92
(pKa=4.8), suggesting that mRFP is resistant to the acidic lysosomal environment.74, 92
Although, co-localization between mRFP-LC3 with LAMP-2 is not sufficient to
demonstrate the proteolysis of autophagic substrates in autolysosomes, it directly proves
the fusion between autophagosome and lysosome. In Fig. 12, an obvious increase in
mRFP-LC3 punctae co-localized with LAMP-2 was seen, supporting two previous results:
1) mRFP-LC3 accumulation induced by viral infection is in line with the increase of LC3
lipidation detected by western blot analysis. 2) mRFP-LC3 delivery to lysosomes
corresponds to the decreased amount of EGFP-LC3 punctae during autophagy maturation.
One should be careful that when EGFP-LC3 was overexpressed by transient transfection,
large amounts of fluorescent dots were observed without any relation to autophagy,
indicating that EGFP-LC3 can form aggregates independently of autophagy.70 Thus, to
circumvent this experimental draw back, the use of EGFP-LC3 transgenic mice or cell
lines either stably expressing EGFP-LC3 or mutated EGFP-LC3, which lacks the capacity
to form these artificial aggregates is recommended.74 To generate transgenic mice that
express EGFP-LC3 in dendritic cells might fulfill our experimental requirements, but it is a
time-consuming work. Therefore, to exclude or minimize the false positive signals derived
from artificial aggregates due to over expression, the time point after transfection for
analysis (Fig. 9) as well as the amount of the plasmid used for transfection (data not shown)
were carefully determined in time and dose-dependent experimental evaluation. It was
shown that the aggregation effect can be diminished by a low amount of plasmid DNA and
also the time of analysis after transfection was important. A strong background was
observed when the samples were analyzed earlier than 16h post transfection, while after
24h, the fluorescence signals were below the detection limit.
In addition, the effective chloroquine concentration that was not toxic to BMDCs and
HeLa cells was determined, because this chemical inhibitor which has been used for an
anti-malarial drug has broad biological effects.93 The well-known effects of chloroquine
include radiosensitizing through lysosome permeabilization94 and chemosensitization by
inhibition of ATP-binding cassette transporters.93 Fan et al. reported that chloroquine
increased the volume of lysosomes at low concentration (from 0.25 to 32 µM), and induced
cell apoptosis and necrosis at higher concentration (64 to 128 µM), exerting an anti-tumor
effect in A549 lung cancer cells.95 In line with this, as shown in Fig. 11 that application of
100 µM of chloroquine lead to strong cytotoxicity, while the accumulation of LC3 is not
DISCUSSION
93
clear when chloroquine was used at a lower concentration of 25 µM. In conclusion, in
order to establish the transient transfection of fluorescence-tagged LC3 plasmids as a
reliable method in the research of autophagic flux, the dose of plasmid DNA and the time
frame of observation as well as the concentration of chloroquine should be carefully
optimized. Secondly, this system works well in the experimental setup described here and
the microscope data nicely support the immunoblotting results.
5.1.2 Both MVA and VACV infection activate autophagy in BMDCs
5.1.2.1 Atg7 is required for MVA induced autophagy in BMDCs
It is thought that the E1 enzymatic activity encoded by Atg7 is essential for autophagy
involving the ubiquitin-like protein Atg8.96 However, Chang et al. provide evidence that an
Atg7- or Atg-3 independent autophagy pathway exists that facilitates programmed
reduction of cell size during intestine cell death.97 Nishida et al. showed that mouse
embryo fibroblasts (MEFs) lacking Atg5 or Atg7 are able to form autophagosomes/
autolysosomes, though the conversion of LC3-II cannot occur, suggesting an Atg5/Atg7
independent alternative mechanism of autophagy.98 These reports show that autophagy can
occur independently of certain Atg proteins. Whether VACV, the wild-type virus strain,
can induce autophagy or if autophagosome formation requires the expression of Atg7 in
VACV/MVA infected cells remains controversial. It was reported that VACV infected
ovarian cancer cells induce marked lipidation of LC3 proteins, but there is no general
activation of the autophagic process.99 Massive LC3 lipidation was observed in mouse
fibroblast cells upon VACV infection but this was independent of Atg5 and Atg7, which
suggested an incomplete autophagy.91 Deng’s group showed that the infection of
macrophages and conventional DCs with MVA but not VACV triggers autophagy
formation and that the LC3 turnover is dependent on Atg5 (information taken from XIX
Poxvirus, Asfarvirus & Iridovirus Conference, Salamanca 2012).
In the present study, the immunoblotting analysis showed that the LC3-II bands were
almost absent in BMDCs derived from Atg7 conditional deficient mice, which were
infected with MVA or subjected to nutrient starvation (Fig. 8). Furthermore, VACV
induced LC3-II upregulation was also devoid in Atg7 deficient BMDCs. These results
demonstrated that Atg7 is required for LC3 turnover induced by VACV or MVA infection
in BMDCs. These controversial data can be reasoned with different cell types used in
DISCUSSION
94
the respective experimental settings, because autophagy is a conserved protective cell
function that affects many cell types. For example, apparent induction of LC3-II in MEFs
is detected after 30 min starvation,69 whereas in the comparable condition it takes 4h in
BMDCs to induce LC3-II lipidation (Fig. 10). Therefore, it is reasonable to assume that
there is another unknown factor assisting LC3-II lipidation in a very short time in MEFs,
which are reported to have an Atg5-/7- independent autophagy pathway.98 In further, the
investigation of the role of Atg7 in MVA-induced autophagy can be extended to the
analysis of antigen presentation ability, such as comparison of the CD4+ T cell responses
against the MVA infected Atg7-deficient and wild-type BMDCs.
5.1.2.2 MVA infection induces stronger autophagy than VACV infection
In this study, it has been found that VACV was able to induce LC3-I conversion to LC3-II,
though it was less efficient than MVA (Fig. 7). Moreover, LC3 lipidation is aborted in both
VACV and MVA-infected MyD88-deficient BMDCs, indicating that both viruses may use
the same machinery to activate autophagy. However, the ancestor VACV was much
attenuated to generate MVA, thus the host range gene in VACV that may suppress
autophagy induction could be lost in the MVA genome. MVA induces apoptosis in human
DCs earlier than VACV due to the earlier downregulation of Bcl-2 and Bcl-xL in MVA-
infected cells than VACV.34 The anti-apoptotic family members Bcl-2, Bcl-xL and Bcl-w,
are known as cell death regulators controlling the intrinsic apoptotic pathway in
mitochondria by inhibiting mitochondrial depolarization in order to prevent the release of
apoptogenic factors.100 Additionally, the Bcl-2 homology (BH) domain 3 (named BH3
domain) of Beclin-1 can bind to the BH3-binding groove present in the Bcl-2 protein, so
that Bcl-2 blocks the formation of the Beclin-1/PIK3C3 complex to inhibit autophagosome
formation.101 In the therapeutic design for Alzheimer’s disease, small molecule drugs
which can prevent the binding of Bcl-2 to Beclin-1 are considered as promising candidates
because they can promote autophagy.102 Hence, differences in the genomic background
between MVA and VACV as well as the finding discussed above that the earlier
downregulation of anti-apoptotic proteins in MVA-infected cells occurs earlier, could
provide some explanations of why MVA induces stronger autophagy than VACV.
5.1.3 MVA induces autophagy through a TLRs adaptor protein
DISCUSSION
95
Autophagy has been considered to be an innate defense mechanism to eliminate bacterial
pathogens including group A Streptococcus and Shigella flexneri.103, 104 There is growing
evidence that PRRs play a role in the activation of autophagy upon detection of pathogen-
derived molecules. It has been reported that upon engagement with the respective ligands,
TLRs trigger Beclin-1 to be recruited to the phagosome. Subsequently, other autophagy
associated proteins, such as Atg5, Atg7 and LC3 were upregulated to facilitate the fusion
of phagosomes with lysosomes, leading to rapid acidification and enhanced killing of the
ingested organisms in the phagosome-autophagy system.59 Additionally, by screening a
panel of PAMPs for the capability to induce autophagy, it was found that ligands for TLR7
(ssRNA), TLR3 (Poly (I:C)) and TLR4 (LPS) are able to evoke GFP-LC3 punctae.62
Thereafter, the TLR adaptor proteins involve MyD88, MyD88-adapter like (MAL), TRIF,
TRIF-related adaptor molecule (TRAM) and sterile α-and armadillo motif-containing
protein (SARM) were investigated for their role in TLR signaling-induced autophagy. Xu
et al. suggested that autophagy is regulated through a TRIF-dependent, MyD88-
independent TLR4 signaling pathway.105 Delgado and colleagues reported that the
induction of autophagy is abrogated specifically in response to TLR7 ligands but not
starvation in cells subjected to MyD88 knockdown.62 In line with this, it was also found
that MVA-induced autophagy was dependent on MyD88, while starvation induced
autophagy was not hampered in MyD88 knockout BMDCs (Fig. 15). Since MyD88 is one
of the two key adaptor proteins that initiates all TLR signaling pathways except TLR3 that
utilizes TRIF, MyD88 provides a good target to investigate a potential link for MVA-
dependent TLR signaling to control autophagy.
To elucidate how the TLR signaling pathway impacts autophagy, Shi and colleagues
revealed that LPS-mediated activation of TLR4 triggers the interaction of Beclin-1 with
MyD88 and TRIF, thereby reducing the binding of Beclin1 to Bcl-2. These adaptor
proteins consequently activate TRAF6, which induce the Lys63-linked ubiquitination of
Beclin-1 at Lys117 in the BH3 domain. The ubiquitination of Beclin-1 then provokes its
oligomerization and stimulates autophagy.56, 64 Therefore, it is proven that Beclin-1 is a
molecular platform assembling an interactome with stimulating components from TLR
adapter proteins (e.g. MyD88), which regulate the initiation of autophagosome formation.
On the other hand, Lysakova-Devine et al. identified that an 11-aa-long peptide from
VACV protein A46 fused to a cell-penetrating delivery sequence, which potently inhibits
DISCUSSION
96
TLR4 through MAL and TRAM,106 suggesting that VACV tries to escape from immune
recognition by inhibiting TLRs. This finding may indicate that MVA, which also expresses
A46, activate autophagy by manipulating TLR4. However, in this thesis it was found that
when BMDCs were treated with the TLR4 ligand LPS, the upregulation of autophagy was
not prominent (data not shown). When the double-stranded viral DNA was disrupted by
PUVA treatment leading to replication-deficient viruses, the MVA-induced LC3-II
turnover was consequently inhibited in a time-dependent manner (Fig. 16B). Moreover,
chemical reagent Ara-C which interferes with DNA synthesis showed a comparable
inhibition of LC3-II lipidation, though the reasons for severe variation on LC3-I level need
to be further elucidated (Fig. 16A). These results strongly suggest that viral replicates or
subsequent intermediate/late viral gene products are necessary to stimulate LC3-II
conversion. Therefore, MVA-induced autophagy may not depend on TLRs on the cell
surface but on the ones located on the endosomal membrane, such as TLR7/8, TLR9 and
TLR3, which recognize ssRNA, ssDNA and dsRNA, respectively. In line with this, it was
found that MyD88 is significantly upregulated upon MVA infection, raising the level of
MyD88 to 3.5 fold at 8h p.i. compared to mock treated cells. Besides, the level of Beclin-1
was also increased in wild-type BMDCs upon MVA infection, while decreased in MyD88-
deficient BMDCs, suggesting a close link between MyD88 and Beclin-1 in the induction
of autophagy. Therefore, further research should be carried out to identify whether there is
a direct interaction between MyD88 and Beclin-1. Particularly with regard to the current
data that the increased levels of MyD88 and Beclin-1 are associated with autophagy
induction, it can be speculated that MVA infection activates the TLR signaling pathways
via adaptor protein MyD88 to induce autophagy.
DISCUSSION
97
5.2 Endogenous antigen presentation of HEL peptides
5.2.1 Endocytotic ability of MVA-infected BMDCs is impaired
Vaccinia virus utilizes multiple mechanisms to penetrate the cell membrane, among which
the most productive entry is reported to be dominated by low pH-dependent endocytosis
into large uncoated vacuoles that occurs in cell-to-cell spread of extracellular enveloped
virions (EEV).107 When EEV is endocytosed into host cells, its outer membrane is
disrupted in the low-pH condition and by fusion the endosomal membrane with the
exposed intracellular matured virions (IMV), the core is released into the cytoplasm.108 A
recent study suggests that both IMV and EEV are taken up mainly via macropinocytosis,
which is a regulated form of endocytosis that mediates the non-sensitive uptake of soluble
antigens, but does not rely on low pH-fusion to allow for entering the cytoplasm.109, 110
VACV may use macropinocytosis to enter the cells because their large size is comparable
to the apoptotic bodies that are macropinocytosed by phagocytes or other cell types.
Additionally, macropinocytosis of apoptotic debris is triggered by surface-exposed
phosphatidylserine (PS), which is enriched on the IMV virion membrane, so that the IMV
can mimic the apoptotic bodies to enter cells by macropinocytosis.107 The advantage of this
entry is that by mimicking apoptotic bodies, virions can avoid being detected by the
immune system, because this process does not require receptor-specific interaction. On the
other side, since APCs like macrophages and DCs possess very strong endocytosis ability,
they are preferentially targeted by VACV in vivo.49 The viruses, commonly used for
infection in this thesis are IMV, because the purification of MVA is based on material
gained from lysates of infected chicken embryo fibroblasts (CEF). As a result, the infection
rates of VACV or MVA in DCs are quite high. For example, around 50% to 64% of DC
2.4 cells expressed EGFP when MVA-EGFP P7.5 was applied to these cells for 9h (Fig.
24). The infection rate of BMDCs was close to 70% using the same experimental setup
(data not shown), demonstrating DCs seems to be easily infected by MVA.
An accepted hallmark of DC maturation is the eventual down-regulation of the endocytic
capacity in these cells.111 Wilson and others have shown that upon malaria infection,
mature DCs downregulate their capacity to cross-present newly encountered antigens in
vivo while maintaining the ability to present endogenous antigens. They argued that this
impairment was due to the downregulation of endocytosis that accompanies DC
DISCUSSION
98
maturation.112 Usually, studies employed the activation of T lymphocyte as a marker for
the endocytotic ability of DCs or electron microscope techniques to track artificial particles,
reflecting the endocytosis process in APCs.113, 114 Unlike others, by using recombinant
MVA containing fluorescent reporter proteins such as EGFP or mCherry, we were able to
observe endocytosis of viral gene products in BMDCs using confocal microscopy. By
analyzing the co-localization of exogenous proteins with cellular compartments in BMDCs,
the data clearly demonstrates that within 8h after MVA infection, infected BMDCs were
not able to endocytose cell-derived protein (from MVA-EGFP P7.5 infected cells) as well
as soluble protein (exogenously pulsed OVA protein) into the cytoplasm (Fig. 17). In
comparison, uninfected BMDCs have strong endocytotic activity so that the large amounts
of co-localization of EGFP or PE-OVA were detected in the cells, which is in line with the
reports described above.
5.2.2 Infected BMDCs can present endogenous antigens to CD4+ T cells on MHC II
As described above MVA infection strongly impairs the endocytosis capacity of BMDCs.
Furthermore, it was reported that apoptotic cell death was detected from 14h p.i. on in
MVA-infected DCs.34, 107 Therefore, uptake of apoptotic cell debris by BMDCs from
neighboring MVA-infected cells within 14h p.i. should be very limited. Consequently, it is
assumed that the presentation of viral antigens by MHC II molecules to CD4+ T cells is
hampered. However, when BMDCs were incubated with MVA-OVA PK1L for 16h and
sorted thereby allowing only infected BMDCs to contact antigen-specific CD4+ T cells
(CD4OVA T cells), nearly 90% of CD4OVA T cells were stimulated by OVA antigens as
indicated by IFN-γ secretion (Fig. 18). Based on this result, it is reasonable to argue that
the CD4OVA T cell activation exclusively reflects the efficacy of endogenous antigen
presentation in infected BMDCs. In addition, the comparison of exogenous soluble OVA
protein with the MVA-OVA PK1L derived endogenous antigen surprisingly showed that
although both proteins were processed via different presentation pathways, they stimulated
similar levels of IFN-γ secretion in CD4OVA, suggesting a high efficiency of the
endogenous pathway in BMDCs.
However, this in vitro experimental read out is relatively artificial compared to the in vivo
situation because only infected BMDCs were picked up to incubated with T cells. In vivo,
DISCUSSION
99
Gasteiger et al. demonstrated that CTL responses against MVA-produced antigens are
dominated by cross-priming in DCs,17 which suggests that large portion of DCs remains
uninfected in vivo thus endocytose extracellular antigens and presented to CTLs. Although
the direct presentation of endogenous antigen by MHC II to CD4+ T cells has not been
investigated in vivo yet, it is speculated that this mechanism maybe not relevant for
primary MVA vaccination, rather important to stimulate CD4+ T cells after MVA infection
of DCs in secondary responses because the direct presentation could process and present
antigens much faster. Additionally, DCs generated from bone marrow precursors in vitro
are great tool to study and understand antigen presentation properties, but the cultured
BMDCs resemble a somewhat homogenous population compared to the actual in vivo
situation. Distinct DC subpopulations with diverse antigen-presentation abilities exert their
immunological function in different lymphoid organs in vivo. Hence, this natural
heterogeneity has to be taken into account when analyzing and interpreting antigen
presentation experiments performed with DCs differentiated in vitro.
5.2.3 Endogenous HEL peptides are processed and presented by MHC II
So far, it has been shown that endogenous viral antigen presentation by MHC II is
occuring in MVA-infected DCs. However, the intracellular events such as the initial
transport of peptides from the cytoplasm to MIIC, the peptide loading on MHC II
molecules as well as the subsequent trafficking of the peptide/MHC class II complex to the
cell surface, are poorly understood. The conventional experimental read out of DC-T cell
interaction is T cell proliferation and activation, which relies on the secretion of different
patterns of cytokines, including IFN-γ and IL-2. This method is suitable to analyze the
efficiency of T cells stimulation by specific peptides as well as to determine the amount of
peptide/MHC class II complex on the cell surface, but it is not eligible to characterize the
intracellular antigen processing, neither can it be used to address the questions mentioned
above. Therefore, model protein antigens such as HEL or OVA constitute a very elegant
tool to examine the intracellular antigen presentation pathways. APCs process HEL into
four major peptide families, which were identified biochemically by analyzing the
peptide/MHC class II complex using mass spectrometry.115 Among these peptides, peptide
46-61 of HEL (NTDGSTDYGILQINSR) was abundantly selected for a strong binding
motif.115 Monoclonal antibodies (mAbs) recognizing HEL peptides bound to the
DISCUSSION
100
MHC II molecule I-Ak and have been intensively reported to provide a tool to better
understand the peptide/MHC II intracellular interactions.26, 116 By staining the complexes
with the C4H3 mAbs, Inaba and colleagues reported that in MIICs of immature DCs, the
formation of pHEL/MHC II is inhibited, suggesting an arrest of antigen presentation at the
peptide-loading step in the absence of DC maturation stimuli.79 In this thesis, the C4H3
mAbs enriched in a hybridoma supernatant proved to be sufficient for intracellular staining
of pHEL/I-Ak complexes (Fig. 20 and 21). Compared to the Aw3.18 mAbs, which
recognize the same epitope, the C4H3 mAbs have stronger affinity as well as cell viability
after staining the complexes. The staining exhibited a dot-like structure in the cytoplasm
and on the cell membrane, which was similar to previous published images.78
A recombinant MVA expressing the entire HEL protein under the early and late promoter
P7.5 was constructed, allowing us to characterize endogenous processing of viral gene
products in APCs on a single cell basis by immunofluorescence using confocal microscopy.
Using the C4H3 mAbs, a detailed spatiotemporal analysis of when and where MHC II
molecules are loaded with HEL peptides was revealed (Fig. 22 and Fig. 23). For the first
time, direct proof of endogenous HEL antigen processing and presentation in MVA
infected APCs was provided. When HEL was expressed under the control of the P7.5
promoter, pHEL/I-Ak was formed after 2h infection in BMDCs and was localized near the
nuclei. The complexes appeared on the cell membrane at 6h to 8h p.i.. pHEL/I-Ak was
strongly co-localized with MHC II, demonstrating that the efficiency of this antigen
processing and presentation pathway was quite high. The MVA-HEL P7.5 virus provides
an excellent tool to characterize the cellular mechanisms that may control this pathway.
For example, it can be used to investigate whether MVA-induced autophagy impacts the
quality and extent of HEL antigen presentation.
DISCUSSION
101
5.3 Excellular and intracellular events in MVA infected BMDCs
CLSM is a fast developing technique for obtaining high-resolution optical images with
depth selectivity. The basic key to the confocal approach is the use of spatial filtering
techniques to eliminate the focus light or glare in samples where the thickness exceeds the
immediate plane of focus. Therefore, images can be acquired point-by-point and
reconstructed with a computer, even allowing three-dimensional reconstructions of images
acquired by different depth levels. In recent years, CLSM became widely established as a
research instrument in bio and life sciences, especially in cell biology.117 Additionally, the
multicolor immunofluorescence technique applied with CLSM enables us to analyze
different cellular organelles and pathogens in one image, thus greatly improving the study
of antigen presentation on the cellular level. In this thesis, CLSM has been widely used to
investigate the autophagic flux and the endocytosis ability of BMDCs, as well as antigen
processing and trafficking upon viral infection and chemical stimulation.
5.3.1 Expression and spatiotemporal distribution pattern of viral products
It is known that late viral gene expression is abolished in human DCs infected by VACV
or MVA, including in the absence of viral DNA replication.16, 118, 119 Interestingly, when
compare the expression of recombinant protein EGFP under the control of an early or late
promoter, respectively, it was possible to detect EGFP expression in murine BMDCs (Fig.
23). Additionally, the late viral antigen-H3 was also observed in MVA-infected murine
BMDCs (Fig. 26). The reasons for the abortive late gene expression in human DCs, but not
in murine DCs upon infection with VACV or MVA have not been assessed in the
publications. While it is also difficult to directly compare the two kinds of DCs, as the
entire DC system in response to viral infections is considered to be quite dynamic. The
BMDCs used in this thesis are of myeloid origin generated from inbred laboratory mice,
while most readily available source of human DCs is blood. It is concluded that culture-
generated DCs might be more like the immunogenic type of DC that is incline to response
to infections and pathogens, whereas DCs freshly isolated from blood might be involved in
the steady-state maintenance of self-tolerance.120 The discrepancies of mouse and human
DC population are not going to be extensively discussed here, but it should be
DISCUSSION
102
taken into account when comparison the outcome of viral gene expression in these DCs.
From the observation of the spatiotemporal distribution pattern of the two viral antigens
H3 and A27, it was concluded that viral factories could play an important role in antigen
generation and function. Both viral proteins were initially detected around the viral
factories, whereas only H3 translocated to the cell surface at later time points after
infection (Fig. 26). Up to date, there is only limited information indicating that envelope
protein H3 present on mature virions (MV) binds to heparin sulfate on the cell surface and
might provide virion attachment to target cells. McCausland et al. have published that by
using human mAb against H3 in the combination therapy of VACV infection in a small
animal model provides protection similar to vaccinia immune globulin, suggesting H3 is an
immunodominant antigen.121 According to the literature so far, it is the first hand image to
elucidate the subcellular pattern of H3 after infection. Further research may be required to
interpret the intracellular behavior of H3.
It was reported that the A27 is required for the transport of intracellular mature virions
(IMV) between the virus factory to the site of intracellular envelop virions (IEV)
formation.122 They argued that A27 participates in microtubule-dependent dispersal of
accumulated IMV particles. Moreover, A27 binds to cell surface heparin sulfate, providing
an anchor for A26 protein packaging into MV, which results in MV progeny with
increased plasma membrane fusion activity upon cell entry.80 From these findings, it is
thought that A27 is an important structural protein involved in virion development. In this
thesis, A27 was found to be located surrounding the viral factories and partially close to
nuclei. Even in the later infection period, A27 was not translocate to the marginal areas of
the infected cells. Although, in BMDCs or Hela cells, MVA is not able to the finish its
viral replication cycle, viral factories are formed between 3h to 5h post infection. Both, the
immunodominant protein (H3) and envelope structure protein (A27) were synthesized
around the viral factories, demonstrating that viral factories are not only the viral DNA
replication site, but also the viral proteins packing center for viral proteins which is crucial
for viral particle generation.
5.3.2 Co-localization of viral factory, MIIC and Golgi complex
Earlier reports suggested that the Golgi complex might participate in virus assembly as it
was found that the first VACV envelope originated from a cellular tubulovesicular
DISCUSSION
103
compartment, which was related to the endoplasmic reticulum-Golgi intermediate
compartment (ERGIC).39 Cluett et al. found that the acquisition of the membrane envelope
by VACV has occured at the cis- and trans-Golgi-network site.84 Though it is not clear
whether viral factories have direct interaction with the Golgi, these findings prove that
viral factories are crucial compartments that might usurp the Golgi to serve for viral
protein processing and assembly of new virions. Fig. 29 showed that the co-localization
between Golgi and viral factories was prominent in MVA infected HeLa cells as well as
BMDCs. However, some differences concerning the interaction of Golgi and viral factories
during MVA infection were noticed between the two cell types: 1) the Golgi complex
almost completely overlapped with viral factories in BMDCs, whereas the co-localization
in HeLa cells was only partial; 2) the Golgi in HeLa cells seemed to maintain a network-
like structure, while it exhibited a spherical shape in BMDCs. The morphological diversity
might be due to a more abundant and stretchable cytoplasm in HeLa cells, which allows
for more space for cellular organelles. BMDCs are generally smaller than HeLa cells, and
they are specialized in antigens uptake so that the endosomal systems (e.g. endosomes and
lysosomes) are much bigger than that in HeLa cells with regard to the LAMP-2 staining
pattern in HeLa cells (Fig. 12) or BMDCs (Fig. 29 and 31). Therefore, the Golgi complex
in BMDCs looks more compact than in HeLa cells.
Another important finding in this thesis is that the MIIC was observed to transform into a
large tubular structure only upon MVA infection and consequently co-localized with viral
factories (Fig. 30). The fusion structure of MIIC displayed at the later time points after
infection suggests that MVA infection may change the cytoskeleton which may provide a
scaffold for the MHC II complex transport. Although it needs more evidence to prove that
the three compartments directly interact with each other, the co-localization could provide
an opportunity e.g. a tunnel which delivers viral products to MIIC where MHC II
molecules, lysozymes and HLA-DM are accumulated. Therefore, the morphological
changes of MIIC in BMDCs could represent an immune defense mechanism to protect
these cells from viral invasion. This observation is partially in accordance with the
pervious report that a similar spatial transformation of MIIC was found in the murine
dendritic cell line-D1, which had been stimulated with LPS for 6h.123 However, the
detection of this MIIC transformation upon treatment with the same dose of LPS for the
same time failed in BMDCs (Fig. 30B). Hence, it was assumed that this unique
DISCUSSION
104
conformational change of MIIC triggered by MVA infection is in favor for the antigen
presentation in BMDCs.
CONCLUSIONS AND OUTLOOK
105
6. Conclusions and Outlook
The results obtained in this thesis contribute to the better understanding of the processing
and presentation of endogenous MVA antigens by MHC class II molecules assisted by the
autophagy system and the spatiotemporal co-localization of cellular organelles with sites of
viral antigens production following infection. First of all, the study provides evidences that
MVA-induced autophagy delivers the cytosolic components to the lysosomal compartment,
which provides an opportunity for endogenous antigens to gain access to the MHC II
antigen presentation pathway. The data demonstrates that the TLR adaptor protein MyD88
and Atg7, are crucial for the induction of the autophagy upon MVA infection, which
correlates with enhanced expression of the autophagy-related protein Beclin-1. Moreover,
viral DNA replicates or subsequent intermediate/late viral gene products are necessary for
the activation of autophagy, suggesting that MVA may be recognized by PRRs like
TLR7/8 or TLR9 that recruit both MyD88 and Beclin-1 to trigger the stimulation of
autophagy. Secondly, by utilizing a recombinant MVA construct expressing the model
antigen HEL, this study provides for the first time the direct evidence that the endogenous
HEL peptide 46-61 is endogenously processed, bound to MHC II molecules and presented
on the cell surface. Finally, a functional immunofluorescence protocol for confocal laser
scan microscope observation was established to monitor the transport and spatiotemporal
distribution pattern of MVA-produced recombinant and viral antigens, as well as to
demonstrate their connection with cellular organelles. For the first time, a triple co-
localization between the Golgi complex, MHC II loading compartment and the viral DNA
replication site namely MVA-induced viral factories could be discovered. The distinct
partial co-localization among the three compartments might provide a place where viral
products are simultaneously processed in Golgi for viral particle packaging and can be
delivered to endosomal vesicles for degradation and subsequent presentation via MHC
class II molecules.
The above findings extend our knowledge about MVA antigen presentation in dendritic
cells and the induction of adaptive immunity towards viral infection. The MVA-induced
autophagy, which contributes to intracellular antigen processing and transport might be
important to expand memory CD4+ T cells in secondary response after direct infection of
CONCLUSIONS AND OUTLOOK
106
DCs. Although immature DCs are very specialized in the endocytosis of exogenous
antigens, infection-triggered autophagy could be beneficial for mature DCs which are no
longer able to ingest extracellular antigens, or which are infected by noncytolytic
pathogens that leave infected host cells intact. Our findings can be exploited for future
vaccine design, i.e. to improve stimulation of T helper cells by using a recombinant MVA
vaccine, which delivers antigens that are targeted by autophagy to promote antigen
presentation by MHC II.
In general, the above findings represent the first attempt to characterize the cellular
components that control and shape the endogenous antigen presentation pathway in the
course of viral infection. To acquire a deeper understanding of the underlying molecular
mechanisms, the following experiments are planned for future research:
1) Investigate the interaction between MyD88 and Beclin-1 in virus-infected cells by co-
transfecting Flag-MyD88 and HA-Beclin-1 plasmids and perform immunoprecipitation (IP)
on the cell lysate. By detection of Flag- and HA-tagged proteins, the question whether
MyD88 indeed targets Beclin-1 to initiate autophagy can be addressed.
2) Decipher the possible TLR pathway(s) which is/are responsible for the recognition of
MVA upon infection and which regulate autophagy through the TLR adaptor protein
MyD88 by analyzing LC3 levels mice lacking individual TLR. Since MyD88 participates
in the downstream signaling of all TLRs except TLR3, it is important to pinpoint the TLR
pathway for subsequent characterization of the underlying mechanisms.
3) Monitor the intracellular distribution of pHEL46-61/I-Ak and autophagic compartments,
as well as the presentation of pHEL46-61/I-Ak on the cell surface in the presence or
absence of autophagy inhibitors. By utilizing methods such as CLSM and FACS, the
impact of autophagy on processing and presentation pathways of endogenous HEL
peptides can be visualized and quantified.
7. References
1. Trombetta ES, Mellman I. Cell biology of antigen processing in vitro and
REFERENCES
107
in vivo. Annual review of immunology 2005; 23:975-1028.
2. Banchereau J, Briere F, Caux C, Davoust J, Lebecque S, Liu YJ, et al.
Immunobiology of dendritic cells. Annual review of immunology 2000; 18:767-811.
3. Parham P. The Immune System, 3rd Edition. 2009.
4. Neefjes J, Jongsma ML, Paul P, Bakke O. Towards a systems understanding of
MHC class I and MHC class II antigen presentation. Nature reviews Immunology 2011;
11:823-36.
5. Lutz MB, Schuler G. Immature, semi-mature and fully mature dendritic cells:
which signals induce tolerance or immunity? Trends in immunology 2002; 23:445-9.
6. Segura E, Villadangos JA. Antigen presentation by dendritic cells in vivo. Current
opinion in immunology 2009; 21:105-10.
7. Mellman I, Steinman RM. Dendritic cells: specialized and regulated antigen
processing machines. Cell 2001; 106:255-8.
8. Thery C, Amigorena S. The cell biology of antigen presentation in dendritic cells.
Current opinion in immunology 2001; 13:45-51.
9. Kenneth P. Murphy PT, Mark Walport, Charles Janeway. Janeway's Immuno
Biology, Seventh Edition. 2008.
10. Xu RH, Remakus S, Ma X, Roscoe F, Sigal LJ. Direct presentation is sufficient for
an efficient anti-viral CD8+ T cell response. PLoS pathogens 2010; 6:e1000768.
11. Kloetzel PM, Ossendorp F. Proteasome and peptidase function in MHC-class-I-
mediated antigen presentation. Current opinion in immunology 2004; 16:76-81.
12. Heath WR, Carbone FR. Cross-presentation in viral immunity and self-tolerance.
Nature reviews Immunology 2001; 1:126-34.
13. Kurts C, Robinson BW, Knolle PA. Cross-priming in health and disease. Nature
reviews Immunology 2010; 10:403-14.
14. Bevan MJ. Cross-priming for a secondary cytotoxic response to minor H antigens
with H-2 congenic cells which do not cross-react in the cytotoxic assay. The
REFERENCES
108
Journal of experimental medicine 1976; 143:1283-8.
15. Ramachandra L, Simmons D, Harding CV. MHC molecules and microbial antigen
processing in phagosomes. Current opinion in immunology 2009; 21:98-104.
16. Kastenmuller W, Drexler I, Ludwig H, Erfle V, Peschel C, Bernhard H, et al.
Infection of human dendritic cells with recombinant vaccinia virus MVA reveals general
persistence of viral early transcription but distinct maturation-dependent cytopathogenicity.
Virology 2006; 350:276-88.
17. Gasteiger G, Kastenmuller W, Ljapoci R, Sutter G, Drexler I. Cross-priming of
cytotoxic T cells dictates antigen requisites for modified vaccinia virus Ankara vector
vaccines. Journal of virology 2007; 81:11925-36.
18. Kastenmuller W, Gasteiger G, Gronau JH, Baier R, Ljapoci R, Busch DH, et al.
Cross-competition of CD8+ T cells shapes the immunodominance hierarchy during boost
vaccination. The Journal of experimental medicine 2007; 204:2187-98.
19. Dengjel J, Schoor O, Fischer R, Reich M, Kraus M, Muller M, et al. Autophagy
promotes MHC class II presentation of peptides from intracellular source proteins.
Proceedings of the National Academy of Sciences of the United States of America 2005;
102:7922-7.
20. Dongre AR, Kovats S, deRoos P, McCormack AL, Nakagawa T, Paharkova-
Vatchkova V, et al. In vivo MHC class II presentation of cytosolic proteins revealed by
rapid automated tandem mass spectrometry and functional analyses. European journal of
immunology 2001; 31:1485-94.
21. Rudensky A, Preston-Hurlburt P, Hong SC, Barlow A, Janeway CA, Jr. Sequence
analysis of peptides bound to MHC class II molecules. Nature 1991; 353:622-7.
22. Schmid D, Munz C. Immune surveillance of intracellular pathogens via autophagy.
Cell death and differentiation 2005; 12 Suppl 2:1519-27.
23. Aichinger G, Karlsson L, Jackson MR, Vestberg M, Vaughan JH, Teyton L, et al.
Major histocompatibility complex class II-dependent unfolding, transport, and degradation
of endogenous proteins. The Journal of biological chemistry 1997; 272:29127-36.
REFERENCES
109
24. Malnati MS, Marti M, LaVaute T, Jaraquemada D, Biddison W, DeMars R, et al.
Processing pathways for presentation of cytosolic antigen to MHC class II-restricted T
cells. Nature 1992; 357:702-4.
25. Paludan C, Schmid D, Landthaler M, Vockerodt M, Kube D, Tuschl T, et al.
Endogenous MHC class II processing of a viral nuclear antigen after autophagy. Science
2005; 307:593-6.
26. Schmid D, Pypaert M, Munz C. Antigen-loading compartments for major
histocompatibility complex class II molecules continuously receive input from
autophagosomes. Immunity 2007; 26:79-92.
27. Moss B. Field's Virology, Fifth Edition, Chapter 84 Poxviridae, the viruses and
their replication. 2007.
28. Frank F. Smallpox and Its Eradication (History of International Publich Health,
No.6). 1988.
29. Knight J. Prairie-dog model offers hope of tackling monkeypox virus. Nature 2003;
423:674.
30. Kennedy RB, Ovsyannikova IG, Jacobson RM, Poland GA. The immunology of
smallpox vaccines. Current opinion in immunology 2009; 21:314-20.
31. Drexler I, Staib C, Sutter G. Modified vaccinia virus Ankara as antigen delivery
system: how can we best use its potential? Current opinion in biotechnology 2004; 15:506-
12.
32. Moss B, Carroll MW, Wyatt LS, Bennink JR, Hirsch VM, Goldstein S, et al. Host
range restricted, non-replicating vaccinia virus vectors as vaccine candidates. Advances in
experimental medicine and biology 1996; 397:7-13.
33. Meyer H, Sutter G, Mayr A. Mapping of deletions in the genome of the highly
attenuated vaccinia virus MVA and their influence on virulence. The Journal of general
virology 1991; 72 ( Pt 5):1031-8.
34. Chahroudi A, Garber DA, Reeves P, Liu L, Kalman D, Feinberg MB. Differences
and similarities in viral life cycle progression and host cell physiology after infection of
REFERENCES
110
human dendritic cells with modified vaccinia virus Ankara and vaccinia virus. Journal of
virology 2006; 80:8469-81.
35. Earl PL, Americo JL, Wyatt LS, Eller LA, Whitbeck JC, Cohen GH, et al.
Immunogenicity of a highly attenuated MVA smallpox vaccine and protection against
monkeypox. Nature 2004; 428:182-5.
36. Moss B. Poxvirus cell entry: how many proteins does it take? Viruses 2012; 4:688-
707.
37. Tolonen N, Doglio L, Schleich S, Krijnse Locker J. Vaccinia virus DNA replication
occurs in endoplasmic reticulum-enclosed cytoplasmic mini-nuclei. Molecular biology of
the cell 2001; 12:2031-46.
38. Novoa RR, Calderita G, Arranz R, Fontana J, Granzow H, Risco C. Virus factories:
associations of cell organelles for viral replication and morphogenesis. Biology of the cell /
under the auspices of the European Cell Biology Organization 2005; 97:147-72.
39. Risco C, Rodriguez JR, Lopez-Iglesias C, Carrascosa JL, Esteban M, Rodriguez D.
Endoplasmic reticulum-Golgi intermediate compartment membranes and vimentin
filaments participate in vaccinia virus assembly. Journal of virology 2002; 76:1839-55.
40. Herrero-Martinez E, Roberts KL, Hollinshead M, Smith GL. Vaccinia virus
intracellular enveloped virions move to the cell periphery on microtubules in the absence
of the A36R protein. The Journal of general virology 2005; 86:2961-8.
41. Backes S, Sperling KM, Zwilling J, Gasteiger G, Ludwig H, Kremmer E, et al.
Viral host-range factor C7 or K1 is essential for modified vaccinia virus Ankara late gene
expression in human and murine cells, irrespective of their capacity to inhibit protein
kinase R-mediated phosphorylation of eukaryotic translation initiation factor 2alpha. The
Journal of general virology 2010; 91:470-82.
42. Ludwig H, Mages J, Staib C, Lehmann MH, Lang R, Sutter G. Role of viral factor
E3L in modified vaccinia virus ankara infection of human HeLa Cells: regulation of the
virus life cycle and identification of differentially expressed host genes. Journal of virology
2005; 79:2584-96.
REFERENCES
111
43. McFadden G. Poxvirus tropism. Nature reviews Microbiology 2005; 3:201-13.
44. Senkevich TG, Ward BM, Moss B. Vaccinia virus entry into cells is dependent on a
virion surface protein encoded by the A28L gene. Journal of virology 2004; 78:2357-66.
45. Seet BT, Johnston JB, Brunetti CR, Barrett JW, Everett H, Cameron C, et al.
Poxviruses and immune evasion. Annual review of immunology 2003; 21:377-423.
46. Guerra S, Lopez-Fernandez LA, Conde R, Pascual-Montano A, Harshman K,
Esteban M. Microarray analysis reveals characteristic changes of host cell gene expression
in response to attenuated modified vaccinia virus Ankara infection of human HeLa cells.
Journal of virology 2004; 78:5820-34.
47. Hung JJ, Chung CS, Chang W. Molecular chaperone Hsp90 is important for
vaccinia virus growth in cells. Journal of virology 2002; 76:1379-90.
48. Garcia-Arriaza J, Arnaez P, Gomez CE, Sorzano CO, Esteban M. Improving
Adaptive and Memory Immune Responses of an HIV/AIDS Vaccine Candidate MVA-B
by Deletion of Vaccinia Virus Genes (C6L and K7R) Blocking Interferon Signaling
Pathways. PloS one 2013; 8:e66894.
49. Liu L, Chavan R, Feinberg MB. Dendritic cells are preferentially targeted among
hematolymphocytes by Modified Vaccinia Virus Ankara and play a key role in the
induction of virus-specific T cell responses in vivo. BMC immunology 2008; 9:15.
50. Jing L, Davies DH, Chong TM, Chun S, McClurkan CL, Huang J, et al. An
extremely diverse CD4 response to vaccinia virus in humans is revealed by proteome-wide
T-cell profiling. Journal of virology 2008; 82:7120-34.
51. Yin L, Calvo-Calle JM, Cruz J, Newman FK, Frey SE, Ennis FA, et al. CD4+ T
cells provide intermolecular help to generate robust antibody responses in vaccinia virus-
vaccinated humans. Journal of immunology 2013; 190:6023-33.
52. Sette A, Moutaftsi M, Moyron-Quiroz J, McCausland MM, Davies DH, Johnston
RJ, et al. Selective CD4+ T cell help for antibody responses to a large viral pathogen:
deterministic linkage of specificities. Immunity 2008; 28:847-58.
53. Kaushik S, Massey AC, Mizushima N, Cuervo AM. Constitutive activation of
REFERENCES
112
chaperone-mediated autophagy in cells with impaired macroautophagy. Molecular biology
of the cell 2008; 19:2179-92.
54. Mizushima N, Yoshimori T, Levine B. Methods in mammalian autophagy research.
Cell 2010; 140:313-26.
55. Maiuri MC, Zalckvar E, Kimchi A, Kroemer G. Self-eating and self-killing:
crosstalk between autophagy and apoptosis. Nature reviews Molecular cell biology 2007;
8:741-52.
56. Shi CS, Kehrl JH. MyD88 and Trif target Beclin 1 to trigger autophagy in
macrophages. The Journal of biological chemistry 2008; 283:33175-82.
57. Munz C. Beclin-1 targeting for viral immune escape. Viruses 2011; 3:1166-78.
58. Deretic V, Saitoh T, Akira S. Autophagy in infection, inflammation and immunity.
Nature reviews Immunology 2013; 13:722-37.
59. Sanjuan MA, Dillon CP, Tait SW, Moshiach S, Dorsey F, Connell S, et al. Toll-like
receptor signalling in macrophages links the autophagy pathway to phagocytosis. Nature
2007; 450:1253-7.
60. Thurston TL, Ryzhakov G, Bloor S, von Muhlinen N, Randow F. The TBK1
adaptor and autophagy receptor NDP52 restricts the proliferation of ubiquitin-coated
bacteria. Nature immunology 2009; 10:1215-21.
61. Watts C, West MA, Zaru R. TLR signalling regulated antigen presentation in
dendritic cells. Current opinion in immunology 2010; 22:124-30.
62. Delgado MA, Elmaoued RA, Davis AS, Kyei G, Deretic V. Toll-like receptors
control autophagy. The EMBO journal 2008; 27:1110-21.
63. Lee HK, Lund JM, Ramanathan B, Mizushima N, Iwasaki A. Autophagy-
dependent viral recognition by plasmacytoid dendritic cells. Science 2007; 315:1398-401.
64. Shi CS, Kehrl JH. Traf6 and A20 differentially regulate TLR4-induced autophagy
by affecting the ubiquitination of Beclin 1. Autophagy 2010; 6:986-7.
65. Schmid D, Munz C. Innate and adaptive immunity through autophagy. Immunity
REFERENCES
113
2007; 27:11-21.
66. Lee HK, Mattei LM, Steinberg BE, Alberts P, Lee YH, Chervonsky A, et al. In
vivo requirement for Atg5 in antigen presentation by dendritic cells. Immunity 2010;
32:227-39.
67. Delaloye J, Roger T, Steiner-Tardivel QG, Le Roy D, Knaup Reymond M, Akira S,
et al. Innate immune sensing of modified vaccinia virus Ankara (MVA) is mediated by
TLR2-TLR6, MDA-5 and the NALP3 inflammasome. PLoS pathogens 2009; 5:e1000480.
68. Klionsky DJ, Abeliovich H, Agostinis P, Agrawal DK, Aliev G, Askew DS, et al.
Guidelines for the use and interpretation of assays for monitoring autophagy in higher
eukaryotes. Autophagy 2008; 4:151-75.
69. Mizushima N, Yoshimori T. How to interpret LC3 immunoblotting. Autophagy
2007; 3:542-5.
70. Kuma A, Matsui M, Mizushima N. LC3, an autophagosome marker, can be
incorporated into protein aggregates independent of autophagy: caution in the
interpretation of LC3 localization. Autophagy 2007; 3:323-8.
71. Scott RC, Schuldiner O, Neufeld TP. Role and regulation of starvation-induced
autophagy in the Drosophila fat body. Developmental cell 2004; 7:167-78.
72. Komatsu M, Waguri S, Ueno T, Iwata J, Murata S, Tanida I, et al. Impairment of
starvation-induced and constitutive autophagy in Atg7-deficient mice. The Journal of cell
biology 2005; 169:425-34.
73. Katayama H, Yamamoto A, Mizushima N, Yoshimori T, Miyawaki A. GFP-like
proteins stably accumulate in lysosomes. Cell structure and function 2008; 33:1-12.
74. Kimura S, Noda T, Yoshimori T. Dissection of the autophagosome maturation
process by a novel reporter protein, tandem fluorescent-tagged LC3. Autophagy 2007;
3:452-60.
75. Cuervo AM, Dice JF. Unique properties of lamp2a compared to other lamp2
isoforms. Journal of cell science 2000; 113 Pt 24:4441-50.
REFERENCES
114
76. Gannage M, Ramer PC, Munz C. Targeting Beclin 1 for viral subversion of
macroautophagy. Autophagy 2010; 6:166-7.
77. Loschko J, Heink S, Hackl D, Dudziak D, Reindl W, Korn T, et al. Antigen
targeting to plasmacytoid dendritic cells via Siglec-H inhibits Th cell-dependent
autoimmunity. Journal of immunology 2011; 187:6346-56.
78. Zhong G, Reis e Sousa C, Germain RN. Production, specificity, and functionality
of monoclonal antibodies to specific peptide-major histocompatibility complex class II
complexes formed by processing of exogenous protein. Proceedings of the National
Academy of Sciences of the United States of America 1997; 94:13856-61.
79. Inaba K, Turley S, Iyoda T, Yamaide F, Shimoyama S, Reis e Sousa C, et al. The
formation of immunogenic major histocompatibility complex class II-peptide ligands in
lysosomal compartments of dendritic cells is regulated by inflammatory stimuli. The
Journal of experimental medicine 2000; 191:927-36.
80. Chang TH, Chang SJ, Hsieh FL, Ko TP, Lin CT, Ho MR, et al. Crystal structure of
vaccinia viral A27 protein reveals a novel structure critical for its function and complex
formation with A26 protein. PLoS pathogens 2013; 9:e1003563.
81. Sancho MC, Schleich S, Griffiths G, Krijnse-Locker J. The block in assembly of
modified vaccinia virus Ankara in HeLa cells reveals new insights into vaccinia virus
morphogenesis. Journal of virology 2002; 76:8318-34.
82. Mu FT, Callaghan JM, Steele-Mortimer O, Stenmark H, Parton RG, Campbell PL,
et al. EEA1, an early endosome-associated protein. EEA1 is a conserved alpha-helical
peripheral membrane protein flanked by cysteine "fingers" and contains a calmodulin-
binding IQ motif. The Journal of biological chemistry 1995; 270:13503-11.
83. Husain M, Moss B. Similarities in the induction of post-Golgi vesicles by the
vaccinia virus F13L protein and phospholipase D. Journal of virology 2002; 76:7777-89.
84. Cluett EB, Machamer CE. The envelope of vaccinia virus reveals an unusual
phospholipid in Golgi complex membranes. Journal of cell science 1996; 109 ( Pt 8):2121-
31.
REFERENCES
115
85. Orvedahl A, Levine B. Viral evasion of autophagy. Autophagy 2008; 4:280-5.
86. Knodler LA, Celli J. Eating the strangers within: host control of intracellular
bacteria via xenophagy. Cellular microbiology 2011; 13:1319-27.
87. Klionsky DJ, Abdalla FC, Abeliovich H, Abraham RT, Acevedo-Arozena A, Adeli
K, et al. Guidelines for the use and interpretation of assays for monitoring autophagy.
Autophagy 2012; 8:445-544.
88. Huang WP, Scott SV, Kim J, Klionsky DJ. The itinerary of a vesicle component,
Aut7p/Cvt5p, terminates in the yeast vacuole via the autophagy/Cvt pathways. The Journal
of biological chemistry 2000; 275:5845-51.
89. Dugina V, Zwaenepoel I, Gabbiani G, Clement S, Chaponnier C. Beta and gamma-
cytoplasmic actins display distinct distribution and functional diversity. Journal of cell
science 2009; 122:2980-8.
90. Humphries AC, Dodding MP, Barry DJ, Collinson LM, Durkin CH, Way M.
Clathrin potentiates vaccinia-induced actin polymerization to facilitate viral spread. Cell
host & microbe 2012; 12:346-59.
91. Moloughney JG, Monken CE, Tao H, Zhang H, Thomas JD, Lattime EC, et al.
Vaccinia virus leads to ATG12-ATG3 conjugation and deficiency in autophagosome
formation. Autophagy 2011; 7:1434-47.
92. Ni HM, Bockus A, Wozniak AL, Jones K, Weinman S, Yin XM, et al. Dissecting
the dynamic turnover of GFP-LC3 in the autolysosome. Autophagy 2011; 7:188-204.
93. Alcantara LM, Kim J, Moraes CB, Franco CH, Franzoi KD, Lee S, et al.
Chemosensitization potential of P-glycoprotein inhibitors in malaria parasites.
Experimental parasitology 2013; 134:235-43.
94. Zhao H, Cai Y, Santi S, Lafrenie R, Lee H. Chloroquine-mediated
radiosensitization is due to the destabilization of the lysosomal membrane and subsequent
induction of cell death by necrosis. Radiation research 2005; 164:250-7.
95. Fan C, Wang W, Zhao B, Zhang S, Miao J. Chloroquine inhibits cell growth and
induces cell death in A549 lung cancer cells. Bioorganic & medicinal chemistry 2006;
REFERENCES
116
14:3218-22.
96. Komatsu M, Wang QJ, Holstein GR, Friedrich VL, Jr., Iwata J, Kominami E, et al.
Essential role for autophagy protein Atg7 in the maintenance of axonal homeostasis and
the prevention of axonal degeneration. Proceedings of the National Academy of Sciences
of the United States of America 2007; 104:14489-94.
97. Chang TK, Shravage BV, Hayes SD, Powers CM, Simin RT, Wade Harper J, et al.
Uba1 functions in Atg7- and Atg3-independent autophagy. Nature cell biology 2013;
15:1067-78.
98. Nishida Y, Arakawa S, Fujitani K, Yamaguchi H, Mizuta T, Kanaseki T, et al.
Discovery of Atg5/Atg7-independent alternative macroautophagy. Nature 2009; 461:654-8.
99. Whilding LM, Archibald KM, Kulbe H, Balkwill FR, Oberg D, McNeish IA.
Vaccinia virus induces programmed necrosis in ovarian cancer cells. Molecular therapy :
the journal of the American Society of Gene Therapy 2013.
100. Elmore S. Apoptosis: a review of programmed cell death. Toxicologic pathology
2007; 35:495-516.
101. Into T, Inomata M, Takayama E, Takigawa T. Autophagy in regulation of Toll-like
receptor signaling. Cellular signalling 2012; 24:1150-62.
102. Salminen A, Kaarniranta K, Kauppinen A, Ojala J, Haapasalo A, Soininen H, et al.
Impaired autophagy and APP processing in Alzheimer's disease: The potential role of
Beclin 1 interactome. Progress in neurobiology 2013; 106-107:33-54.
103. Nakagawa I, Amano A, Mizushima N, Yamamoto A, Yamaguchi H, Kamimoto T,
et al. Autophagy defends cells against invading group A Streptococcus. Science 2004;
306:1037-40.
104. Ogawa M, Yoshimori T, Suzuki T, Sagara H, Mizushima N, Sasakawa C. Escape
of intracellular Shigella from autophagy. Science 2005; 307:727-31.
105. Xu Y, Jagannath C, Liu XD, Sharafkhaneh A, Kolodziejska KE, Eissa NT. Toll-
like receptor 4 is a sensor for autophagy associated with innate immunity. Immunity 2007;
27:135-44.
REFERENCES
117
106. Lysakova-Devine T, Keogh B, Harrington B, Nagpal K, Halle A, Golenbock DT, et
al. Viral inhibitory peptide of TLR4, a peptide derived from vaccinia protein A46,
specifically inhibits TLR4 by directly targeting MyD88 adaptor-like and TRIF-related
adaptor molecule. Journal of immunology 2010; 185:4261-71.
107. Mercer J, Helenius A. Vaccinia virus uses macropinocytosis and apoptotic mimicry
to enter host cells. Science 2008; 320:531-5.
108. Vanderplasschen A, Hollinshead M, Smith GL. Intracellular and extracellular
vaccinia virions enter cells by different mechanisms. The Journal of general virology 1998;
79 ( Pt 4):877-87.
109. Sandgren KJ, Wilkinson J, Miranda-Saksena M, McInerney GM, Byth-Wilson K,
Robinson PJ, et al. A differential role for macropinocytosis in mediating entry of the two
forms of vaccinia virus into dendritic cells. PLoS pathogens 2010; 6:e1000866.
110. Lim JP, Gleeson PA. Macropinocytosis: an endocytic pathway for internalising
large gulps. Immunology and cell biology 2011; 89:836-43.
111. West MA, Wallin RP, Matthews SP, Svensson HG, Zaru R, Ljunggren HG, et al.
Enhanced dendritic cell antigen capture via toll-like receptor-induced actin remodeling.
Science 2004; 305:1153-7.
112. Wilson NS, Behrens GM, Lundie RJ, Smith CM, Waithman J, Young L, et al.
Systemic activation of dendritic cells by Toll-like receptor ligands or malaria infection
impairs cross-presentation and antiviral immunity. Nature immunology 2006; 7:165-72.
113. Platt CD, Ma JK, Chalouni C, Ebersold M, Bou-Reslan H, Carano RA, et al.
Mature dendritic cells use endocytic receptors to capture and present antigens. Proceedings
of the National Academy of Sciences of the United States of America 2010; 107:4287-92.
114. Ranftler C, Auinger P, Meisslitzer-Ruppitsch C, Ellinger A, Neumuller J, Pavelka
M. Electron microscopy of endocytic pathways. Methods in molecular biology 2013;
931:437-47.
115. Unanue ER. From antigen processing to peptide-MHC binding. Nature
immunology 2006; 7:1277-9.
REFERENCES
118
116. Dadaglio G, Nelson CA, Deck MB, Petzold SJ, Unanue ER. Characterization and
quantitation of peptide-MHC complexes produced from hen egg lysozyme using a
monoclonal antibody. Immunity 1997; 6:727-38.
117. Pawley JE. Handbook of Biological Confocal Microscopy. 2006.
118. Bronte V, Carroll MW, Goletz TJ, Wang M, Overwijk WW, Marincola F, et al.
Antigen expression by dendritic cells correlates with the therapeutic effectiveness of a
model recombinant poxvirus tumor vaccine. Proceedings of the National Academy of
Sciences of the United States of America 1997; 94:3183-8.
119. Drillien R, Spehner D, Bohbot A, Hanau D. Vaccinia virus-related events and
phenotypic changes after infection of dendritic cells derived from human monocytes.
Virology 2000; 268:471-81.
120. Shortman K, Liu YJ. Mouse and human dendritic cell subtypes. Nature reviews
Immunology 2002; 2:151-61.
121. McCausland MM, Benhnia MR, Crickard L, Laudenslager J, Granger SW, Tahara
T, et al. Combination therapy of vaccinia virus infection with human anti-H3 and anti-B5
monoclonal antibodies in a small animal model. Antiviral therapy 2010; 15:661-75.
122. Sanderson CM, Hollinshead M, Smith GL. The vaccinia virus A27L protein is
needed for the microtubule-dependent transport of intracellular mature virus particles. The
Journal of general virology 2000; 81:47-58.
123. van Nispen tot Pannerden HE, Geerts WJ, Kleijmeer MJ, Heijnen HF. Spatial
organization of the transforming MHC class II compartment. Biology of the cell / under
the auspices of the European Cell Biology Organization 2010; 102:581-91.
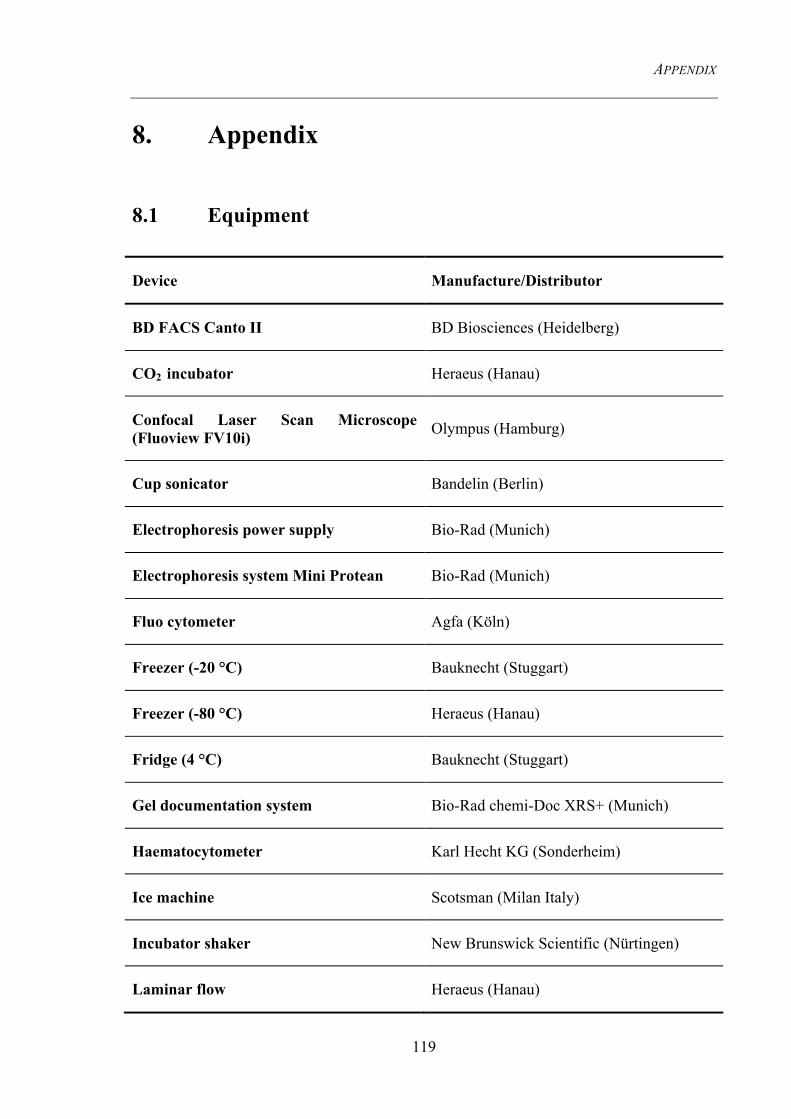
APPENDIX
119
8. Appendix
8.1 Equipment
Device Manufacture/Distributor
BD FACS Canto II BD Biosciences (Heidelberg)
CO2 incubator Heraeus (Hanau)
Confocal Laser Scan Microscope (Fluoview FV10i) Olympus (Hamburg)
Cup sonicator Bandelin (Berlin)
Electrophoresis power supply Bio-Rad (Munich)
Electrophoresis system Mini Protean Bio-Rad (Munich)
Fluo cytometer Agfa (Köln)
Freezer (-20 °C) Bauknecht (Stuggart)
Freezer (-80 °C) Heraeus (Hanau)
Fridge (4 °C) Bauknecht (Stuggart)
Gel documentation system Bio-Rad chemi-Doc XRS+ (Munich)
Haematocytometer Karl Hecht KG (Sonderheim)
Ice machine Scotsman (Milan Italy)
Incubator shaker New Brunswick Scientific (Nürtingen)
Laminar flow Heraeus (Hanau)
APPENDIX
120
Micropipette Gilson (Middleton, USA)
Microwave Siemens (Munich)
Multi channel pipette Brand (Wertheim)
Nitrogen freezing tank Forma Scientific (Marietta, OH, USA )
UV/VIS Bio-photometer Pharmacia Biotech (Uppsala, Sweden)
pH-meter InoLab (Weilheim)
Pipettor Eppendorf (Hamburg)
Rotor Model 200/2.0 Bio-rad (Munich)
Sealing apparatus Folio Rische+Herfurth GMBH (Hamburg)
Trans-Blot Electrophoretic Transfer cell Bio-Rad (Munich)
Ultracentrifuge Beckmann (Munich)
Universal Hood Bio-Rad (Munich)
Vortexer Scientific Industries (Bohemia, NY, USA)
Waterbath Julabo (seelbach)
8.2 Consumables
Item Manufacturer/Distributor
Cell culture flask with vented screw (25 cm2, 75 cm2 and 185 cm2) BD Falcon (Franklin Lakes, NJ, USA)
APPENDIX
121
Cell culture plates (6-well) BD Falcon (Franklin Lakes, NJ, USA)
Cell scraper Sarstedt (Nümbrecht)
CL-X posure film Thermo (Rockford, IL, USA)
Conical Tubes (15ml and 50 ml) BD Falcon (Franklin Lakes, NJ, USA)
Filter tips Greiner Bio-One (Frickenhausen)
Nitrocellulose membrane GE Healthcare
Parafilm Roth (Karlsruhe)
Petri dish Nunc (Wiesbaden)
Petri dish (100 mm x 15mm) BD Falcon (Franklin Lakes, NJ, USA)
Safe lock microcentrifuge tubes (0.5 ml, 1.5 ml and 2 ml) Eppendorf (Hamburg)
Syringe filter (0.2 µM) Corning (Lowell, MA, USA)
Syringe sterile (1 ml) B.Braun (Melsungen)
Ultracentrifuge tubes (Ultra clear) Beckmann (Munich)
Whatman 3 mm blotting paper GE Healthcare
ACKNOWLEDGMENT
122
Acknowledgment
First of all, I would like to thank my supervisor Prof. Dr. Ingo Drexler for giving me the
opportunity to carry out my PhD thesis in his lab. In particular, I am thankful for his
supports and patience for maintenance a successful supervision in such a long distance for
more than two years. I am grateful for his trusts, the stimulating discussion as well as the
kind criticism that I am able to learn so much lab skills and gain the scientific way of
thinking to become independent in research.
I want to thank Prof. Anne Krug and Dr. Klaus-Peter Janssen for external supervision for
my PhD thesis. Especial gratefulness to Anne, for the inspiring discussion in the thesis
committee meeting and the following collaboration that make this project more interesting.
Many thanks go to Dr. Katharina Eisenächer for all the help in experiments optimization,
thesis writing and most importantly her warm hugs that light up the way in the darkest
moments. I further want to thank Dr. Jacob Loschko for initiating the collaboration.
I want to thank Prof. Ulrike Protzer for giving me the chance to finish PhD study when my
group moved to Düsseldorf. I am grateful for the nice discussion and the precious mice
sources from Prof. Percy Knolle and Prof. Dirk H. Busch.
All the thanks to my group members: Andi, Frank, Sha, David, Borja, Ronny and Robert
for providing materials, technical supports and helpful discussions. In particular, I want to
thank Andi for your friendship and humors from time to time during the painful writing.
Beate, Vera, Clemens, Claudia, Jessi, Judith, Flo and all the members in
Schneckenburgerstr.8: thank you for all the fun we had together.
And thanks for our secretaries Barbara and Andrea to solve all the “bothers” I ask for.
I want to give the deepest gratefulness to my parents for supporting and encouraging me in
the past thirty years. Thank you my aunt Dr. Wenge Ma and uncle Dr. Jiangkai Chen that I
have learned so much from you. Last but not least, thank my husband for the love and
accompany.
CURRICULUM VITAE
123
Curriculum Vitae
PERSONAL INFORMATION
Yi Zhang
Date of birth: May 14th, 1983
Place of birth: Chongqing, China
Citizenship: Chinese
Current address: Prinzregenten Strasse 135, 81677, Munich, Germany
Email address: [email protected]
EDUCATION
09/2009 to date PhD Thesis entitled: “Characterization of Endogenous Major
Histocompatibility Complex Class II Antigen Processing Pathways for Modified Vaccinia
Virus Ankara Infection” in the Research Group of Prof. Dr. med. Ingo Drexler at Institute
of Virology of Technische Universität München, Germany
09/2006-06/2009 M.S. Pharmaceutical Science, West China School of Pharmacy,
Sichuan University, China. Master Thesis entitled: “Preparation of antisense
oligodeoxynucleotide -Protamine sulfate-human serum a-PLGA nanoparticles and
evaluation of their nucleus targeting property in vitro”
09/2002-06/2006 B.S. Biotechnology, School of Life Science, Sichuan University, China.
Bachelor Thesis entitled: “Study on the preparation of antisense oligodeoxynucleotide
nanoparticles and evaluation of their related properties”
09/1999-06/2002 High School, Bashu Middle School, Chongqing, China
PUBLICATIONS AND CONFERENCE ATTENDING
Inhibition of the EGFR with nanoparticles encapsulating antisense oligonucleotides of the
CURRICULUM VITAE
124
EGFR enhances radiosensitivity in SCCVII cells. Ping Y, Jian Z, Yi Z, Huoyu Z, Feng L,
Yuqiong Y, Shixi L.Med Oncol. 2010 Sep;27(3):715-21.
Inhibition of ataxia-telangiectasia mutated by antisense oligonucleotide nanoparticles
induces radiosensitization of head and neck squamous-cell carcinoma in mice. Zou J, Qiao
X, Ye H, Zhang Y, Xian J, Zhao H, Liu S. Cancer Biother Radiopharm. 2009
Jun;24(3):339-46.
Preparation of ASODN-Protamine-HSA-PLGA nanoparticles and initial evaluation of their
nucleus targeting property in vitro. Part I: Physicochemical characterization. Zhang Yi,
Yuan Li, Yan Xiaoling, Gong Tao, Liu Jiu, Zhang Zhirong, Sun Xun. Jounal of Sichuan
University (Medical Science Eidtion), 2009 (03): 555-558
Study on the preparation of antisense oligodeoxynucleotide-PLGA nanoparticles and its
properties. YAN Xiao-ling, ZHANG Yi, GONG Tao, ZHANG Zhi-rong, SUN Xun. West
China Journal of Pharmaceutical Science, 2009 (2): 136- 138
2012 XIX International Poxvirus, Asfarvirus and Iridovirus Conference, Spain, poster
section: Endogenous MHC class II Antigen Processing Pathway in Modified Vaccinia
Virus Ankara Infection. Yi Zhang, Frank Thiele, and Ingo Drexler
MVA-infected Dendritic Cells Activate CD4+ T cells via Endogenous MHC Class II
Presentation Pathways. Frank Thiele, Yi Zhang, Sha Tao, Andreas Muschaweckh, Tina
Zollmann, Ulrike Protzer, Rubert Abele and Ingo Drexler. Journal of Virology (in
submission).