Embed Size (px)
Citation preview
Colour Image Segmentation Approach for Detection of Malaria
Parasites Using Various Colour Models and k-Means Clustering
AIMI SALIHAH ABDUL-NASIR1, MOHD YUSOFF MASHOR2, ZEEHAIDA MOHAMED3 1,2Electronic & Biomedical Intelligent Systems (EBItS) Research Group
School of Mechatronic Engineering Universiti Malaysia Perlis
Campus Pauh Putra, 02600 Pauh, Perlis MALAYSIA
3Department of Medical Microbiology & Parasitology, School of Medical Sciences Health Campus, Universiti Sains Malaysia
16150 Kubang Kerian, Kelantan MALAYSIA
Email: [email protected], [email protected], [email protected] Abstract: - Malaria is a serious global health problem that is responsible for nearly one million deaths each year. With the large number of cases diagnosed over the year, rapid detection and accurate diagnosis of malaria infection which facilitates prompt treatment are essential to control malaria. This paper presents a colour image segmentation approach for detection of malaria parasites that has been applied on malaria images of P. vivax species. In order to obtain the segmented red blood cells infected with malaria parasites, the images are first enhanced by using partial contrast stretching. Then, an unsupervised segmentation technique namely k-means clustering has been used to segment the infected cell from the background. Different colour components of RGB, HSI and C-Y colour models have been analysed to identify colour component that can give significant segmentation performance. Finally, median filter and seeded region growing area extraction algorithms have been applied for smoothing the image and remove any unwanted regions from the image, respectively. The proposed segmentation method has been evaluated on 100 malaria images. Overall, segmentation using S component of C-Y colour model has proven to be the best in segmenting the malaria image with segmentation accuracy and F-score of 99.46% and 0.9370, respectively.
Key-Words: - Malaria, Colour Segmentation, Colour Models, k-Means Clustering, Seeded Region Growing Area Extraction. 1 Introduction Malaria is a serious global health problem, causing widespread sufferings and deaths particularly in Africa and south Asia. In 2010, about 3.3 billion people which are half of the world populations are at risk of malaria. In addition, this disease has caused the death of an estimation of 655,000 people in 2010, with 86% of the victims are children under five years of age [1]. Malaria is caused by a peripheral blood parasite of the genus Plasmodium. The genus Plasmodium has five species that can cause human infection namely P. falciparum, P. vivax, P. ovale, P. malariae and P. knowlesi [2].
Prompt and accurate diagnoses of malaria infection are the main keys to control and cure this disease effectively. Currently, the most economic and reliable diagnosis which is based on microscopic examination of blood slide, especially based on the thin blood smear, still remains the gold
standard for laboratory diagnosis of malaria [3]-[5]. In general, detection of the presence of malaria parasites in the examined blood slide is one of the most important tasks in malaria diagnosis [6]. The procedure is performed manually by expert microbiologists by searching for the parasites in blood slide using a light microscope [4], [5].
During malaria diagnosis, the presence of the parasites is recognizable by their physical features as well as the appearance of the red blood cells (RBCs) that they have infected [7]. Here, visual detection of the parasites becomes efficient by using the Giemsa stain. The staining process slightly colorizes the RBCs, but highlights the parasites, white blood cells (WBCs), platelets and artefacts [7]. Thus, the whole process requires an ability to differentiate between the malaria parasites or infected RBCs with these non-parasitic stained components (normal RBCs, WBCs, platelets and
WSEAS TRANSACTIONS on BIOLOGY and BIOMEDICINE Aimi Salihah Abdul-Nasir, Mohd Yusoff Mashor, Zeehaida Mohamed
E-ISSN: 2224-2902 41 Issue 1, Volume 10, January 2013
artefacts) using visual information. However, the manual recognition method is time consuming and effortful especially in situation where large number of samples require reliable analysis [4]. Therefore, fast and efficient methods are required for detection of malaria parasites in order to prevent the false diagnosis of malaria.
In order to detect the malaria parasites, one of the main tasks that need to be performed during image processing is the segmentation of malaria image. It is performed before the parasite recognition to segment the parasite or infected cell from its complicated blood cells background. Many current research efforts have been focused on new approaches in segmenting the malaria image by using various image processing techniques such as thresholding [8]-[10], watershed [11]-[13], morphological [14], normalized cut [15] and fuzzy divergence [16].
Mandal et al. [15] have proposed a segmentation method based on optimized normalized cut (NCut) algorithm for segmenting the RBCs that have been infected with malaria parasites in peripheral blood smears. The NCut algorithm is based on a global criterion and it maximizes both the total dissimilarity between the different groups and the total similarity within the groups. Here, the NCut has been applied in four colour models which are RGB, HSV, YCbCr and NTSC. By using this method, the segmented trophozoite and schizont have been obtained and the results indicate that the performance of the NCut is best in HSV colour model. However, the results shown that the artefacts are still appeared on the segmented image. As this algorithm is based on global criterion, any unintended noises can significantly reduce the segmentation accuracy.
Anggraini et al. [9] have proposed a histogram-based thresholding method to identify the presence of malaria parasites in thin blood smears of P. falciparum species. The grayscale malaria images have been segmented using global thresholding to obtain the RBCs and other blood cells components in each image. Then, the parasite and infected cell components are obtained by applying multiple thresholds on the segmented image. This step is based on the knowledge that cytoplasm of the parasite appears lighter, while the nucleus of the parasite appears darker compared to the cytoplasm of the RBC. Even though the threshold levels have been selected automatically, this method is heavily depends on image quality and fails when the histogram does not have distinct valleys.
Since the actual malaria diagnosis is performed based on stained slide, different approaches for
colour image segmentation of malaria have been published in literature. A typical malaria image consists of three main regions namely parasites or infected cells, normal RBCs and background regions as shown in Fig.2. In order to get an accurate diagnosis, the proposed segmentation method must be capable of differentiating between the malaria parasites or infected cells with the non-parasitic stained components. However, majority of existing methods for segmentation of malaria image do not addressed this requirement effectively except in [12], [17]. In [17], a Bayesian pixel classifier has been employed in order to differentiate between the stained and non-stained pixels. Then, the detected stained pixels have been processed to form labelled connected components of the parasite.
In further studies, segmentation of malaria image using thresholding [8]-[10] and morphological [14] have given promising results. However, these techniques are very sensitive to image quality. The differences in smear preparation can also cause variations as often as the imaging conditions. For example, acidity (pH) of the buffer solution can significantly affect the appearance of the parasites and RBCs [7]. In addition, the non-standard preparation of the slide can also lead on producing the under or over-staining conditions of the slide. Based on these arguments, the current study will utilize the potential of colour image segmentation approach using various colour models and k-means clustering algorithm in order to obtain the fully segmented RBCs infected with malaria parasites based on the thin blood smear images. 2 Methodology The proposed procedures to develop new image processing approach for segmentation of malaria parasites are summarized as follows: Step 1:
Step 2:
Step 3:
Step 4:
Step 5:
Step 6:
Capture the malaria slide images. Apply the contrast enhancement technique namely partial contrast stretching technique on original malaria image. Extract the colour components of RGB (red, green, blue), HSI (hue, saturation, intensity) and C-Y colour models from the enhanced image. Apply the unsupervised segmentation technique namely k-means clustering algorithm. Apply the 7×7 pixels median filter. Apply the seeded region growing area extraction algorithm.
WSEAS TRANSACTIONS on BIOLOGY and BIOMEDICINE Aimi Salihah Abdul-Nasir, Mohd Yusoff Mashor, Zeehaida Mohamed
E-ISSN: 2224-2902 42 Issue 1, Volume 10, January 2013
Stretching process
Compression process
NminTH NmaxTH
minTH maxTH
255 0
255 0
Compression process
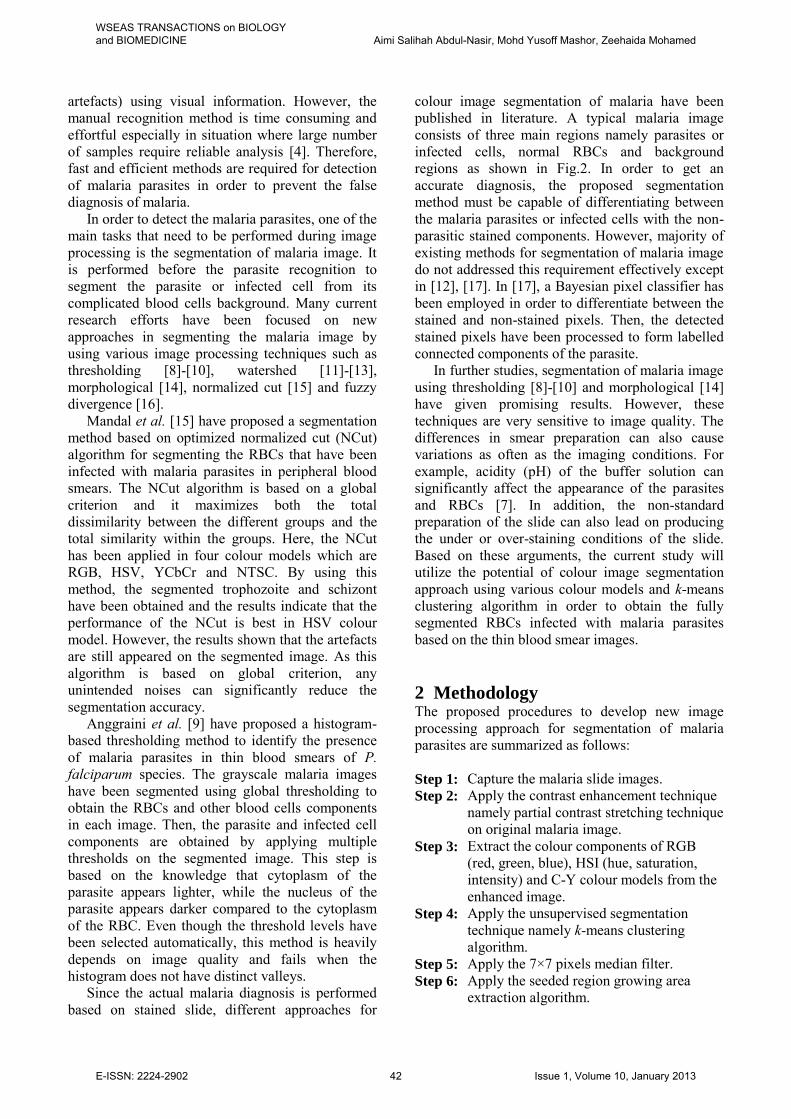
Further details for the image acquisition, contrast enhancement, image segmentation as well as the evaluation of segmentation performance are discussed in the following sections. 2.1 Image Acquisition The first step is to acquire the images of malaria samples. In this study, the malaria images of ring, trophozoite and gametocyte stages have been captured from the thin blood smears of P. vivax samples. The malaria slides are prepared by Medical Microbiology & Parasitology Department, Hospital University Science Malaysia (HUSM). Each slide has been stained by using the Giemsa staining. The malaria slides are examined using 100X oil immersion objective of Leica DLMA microscope. The images are then captured using Infinity-2 digital camera at a resolution setting of 800×600 pixels and saved in BMP format. The captured images are studied under the supervision of microbiologists in order to recognize and differentiate between the three life-cycle stages of P. vivax species.
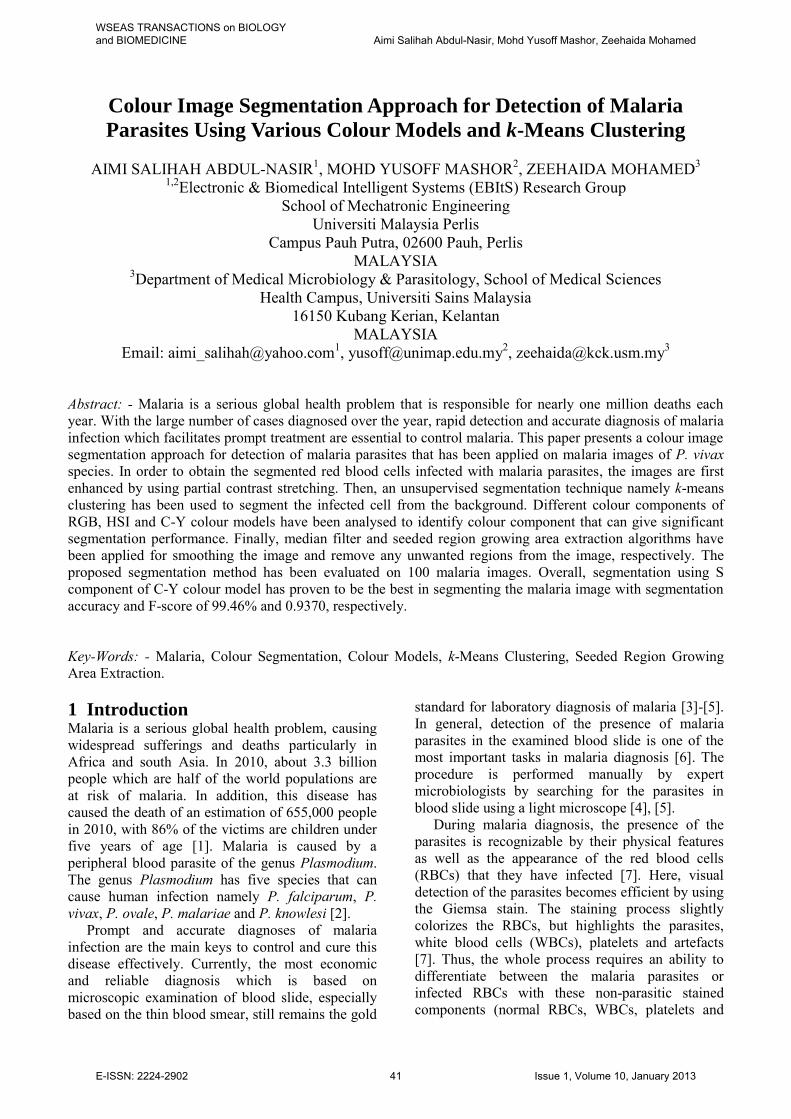
Fig.1 shows a set of Leica DLMA microscope, Infinity-2 digital camera and personal computer interfaced together to acquire the malaria images. In order to assess the proposed segmentation method, 100 malaria images with various conditions have been captured from five malaria slides and will be processed using the proposed procedure. Fig.2(a) and (b) show the samples of the captured malaria images with uniform distribution of RBCs and stacking RBCs, respectively. Meanwhile, Fig.2(c) and (d) show the samples of the captured malaria images with the presence of platelet (red circle) and artefacts, respectively. Based on these malaria images, it can be seen that the colour of the parasites and normal RBCs regions varies in each slide due to the non-standard preparation of the blood slides.
Fig.1 A set of Leica DLMA microscope, Infinity-2
digital camera and personal computer interfaced together to acquire the malaria images
(a) (b)
(c) (d)
Fig.2 Samples of the captured malaria images
2.2 Contrast Enhancement Using Partial
Contrast Stretching The malaria images captured through the microscope may have their own weaknesses such as blurred or low contrast. Thus, a contrast enhancement technique namely partial contrast stretching (PCS) is utilized to improve the image quality and contrast of malaria image. This technique is based on a linear mapping function that is used to increase the contrast and brightness levels of the image. The detail descriptions of PCS technique can be referred in [18], [19].
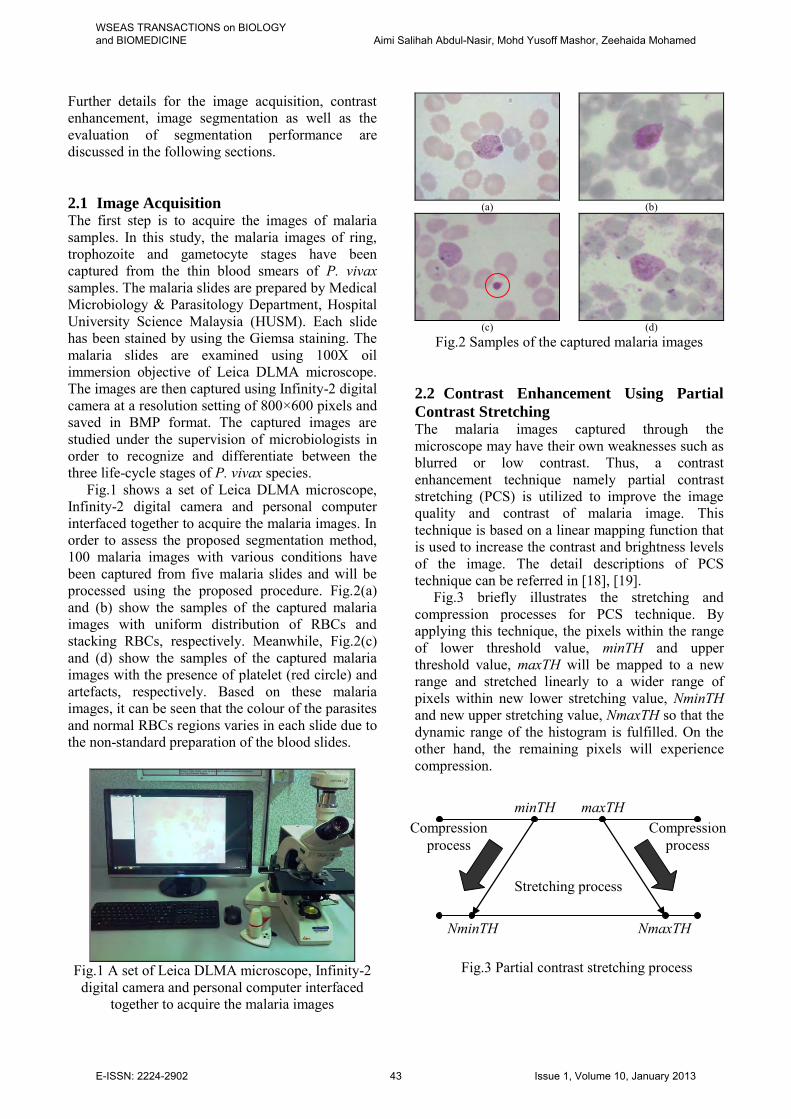
Fig.3 briefly illustrates the stretching and compression processes for PCS technique. By applying this technique, the pixels within the range of lower threshold value, minTH and upper threshold value, maxTH will be mapped to a new range and stretched linearly to a wider range of pixels within new lower stretching value, NminTH and new upper stretching value, NmaxTH so that the dynamic range of the histogram is fulfilled. On the other hand, the remaining pixels will experience compression.
Fig.3 Partial contrast stretching process
WSEAS TRANSACTIONS on BIOLOGY and BIOMEDICINE Aimi Salihah Abdul-Nasir, Mohd Yusoff Mashor, Zeehaida Mohamed
E-ISSN: 2224-2902 43 Issue 1, Volume 10, January 2013
2.3 Detection of Malaria Parasites Based on
RGB, HSI and C-Y colour Models Since the differences in smear preparation as well as the imaging condition can cause variations in malaria images, selection of colour component is very important as this step may ease the parasite detection and segmentation process. Thus, the current study investigates three types of colour models which are RGB, HSI and C-Y colour models. The RGB is the best known colour model and is widely used for acquiring and displaying colour digital images. Each colour pixel is represented by its three components which are red (R), green (G) and blue (B). As for the HSI and C-Y colour models, the two colour models have been chosen because both are very important and attractive colour models for image processing applications as they can represent colour similarly as how the human eye senses colour [20], [21].
The HSI colour model represents every colour with three components which are hue (H), saturation (S) and intensity (I). Hue is a colour attribute that describes a pure colour, whereas saturation gives a measure to which the white light is mixed with the pure colour [22]. The intensity expresses the brightness of the hue and saturation. The conversion from RGB to HSI colour model can be computed using the following equation [20]:
θθ
Hue360 if
ifGBGB
(1)
21
1
221
BGBRGR
BRGRcosθ (2)
BGRBGR
Saturation ,,min3
1
(3)
BGRIntensity 31
(4)
The C-Y colour model consists of three colour
components which are R-Y, G-Y and B-Y, and one luminance (Y) component. Here, R-Y, G-Y and B-Y are the subtraction of Y from R, G and B components, respectively. However, only two of three colour components are needed to define a colour. The conversion from RGB to C-Y colour model can be computed using the following equation [21]:
0.2990.7010.299
YBYR
Y
0.5870.587
0.587
BGR
0.8860.114
0.114
(5)
Here, both R-Y and B-Y represent the chromaticity of a colour. In C-Y colour model, saturation (S) and hue, θ which represent the colour property, can also be derived from the R-Y and B-Y components as follows [21]:
22 )()( YBYRS (6)
,
,1
undefinedYBYR
tanθ
0for
0for
S
S
(7)
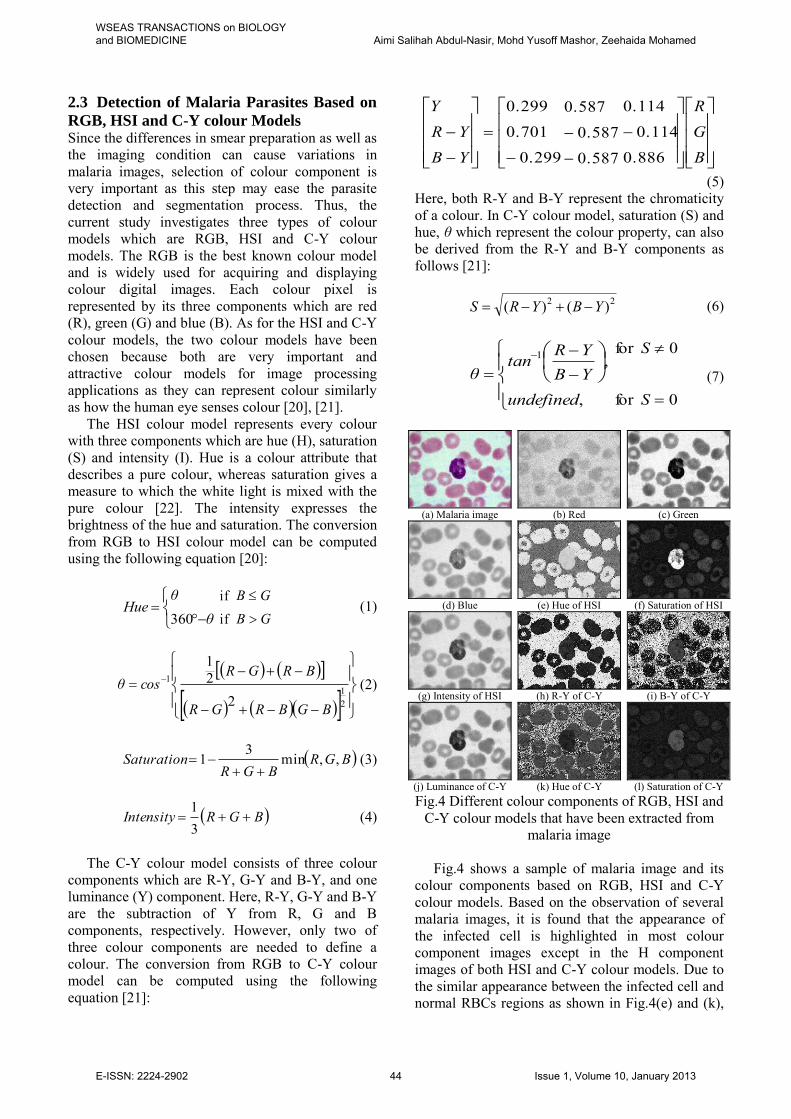
(a) Malaria image (b) Red (c) Green
(d) Blue (e) Hue of HSI (f) Saturation of HSI
(g) Intensity of HSI (h) R-Y of C-Y (i) B-Y of C-Y
(j) Luminance of C-Y (k) Hue of C-Y (l) Saturation of C-Y Fig.4 Different colour components of RGB, HSI and
C-Y colour models that have been extracted from malaria image
Fig.4 shows a sample of malaria image and its
colour components based on RGB, HSI and C-Y colour models. Based on the observation of several malaria images, it is found that the appearance of the infected cell is highlighted in most colour component images except in the H component images of both HSI and C-Y colour models. Due to the similar appearance between the infected cell and normal RBCs regions as shown in Fig.4(e) and (k),
WSEAS TRANSACTIONS on BIOLOGY and BIOMEDICINE Aimi Salihah Abdul-Nasir, Mohd Yusoff Mashor, Zeehaida Mohamed
E-ISSN: 2224-2902 44 Issue 1, Volume 10, January 2013
it would be difficult to segment the infected cell from the normal RBCs in case of using the H component image. Thus, the rest colour components have been chosen to be fed as the input images to k-means clustering for further segmentation process.
2.4 Image Segmentation Using k-Means
Clustering After transforming the RGB into HSI and C-Y colour models, the next and important step in image segmentation is to extract the meaningful region from malaria image. The malaria slides are usually stained to highlight the region of interest (ROI) which is referred to the parasite or infected cell. However, segmenting the parasite or infected cell in an image is not an easy task due to the inconsistency intensity of these two regions as it may appear lighter or darker depending in the pH of the buffer used.
In order to reduce the tedious task of manual segmentation, an unsupervised pixel segmentation based on k-means clustering algorithm [23] is applied for easily segmenting the infected cell from its complicated blood cells background. The k-means is a clustering method which is one of the most popular unsupervised learning algorithms due to its simplicity. In this study, each colour component image of the RGB, HSI and C-Y colour models that has been extracted from the enhanced RGB image will be fed as input to k-means clustering for further segmentation process.
Consider a malaria image with resolution of X × Y pixels to be clustered into nc regions. Let p(x,y) as an input pixel to be clustered and cj is the j-th centre (cluster) (x = 1, 2, …, X, y = 1, 2, …, Y and j = 1, 2, …, nc). For segmentation of malaria image, the number of clusters, j are set to 3. The k-means clustering algorithm for image segmentation can be implemented as follows: 1. Initialize the centres using:
c
yxpyxpy)p(x,j n
minmaxjminc
212 ),(),( (8)
where minp(x,y) and maxp(x,y) are the minimum and maximum pixel levels in the image.
2. For each pixel of an image, calculate the Euclidean distance, d using:
jcyxpd ),( (9)
3. Assign all pixels to the nearest centre based on d.
4. When all pixels have been assigned, recalculate the new position of the centres using:
j jcy cxj
j yxpn
c ),(1
(10)
5. Repeat steps 2 to 4 until there is no significant
change in the centre positions.
2.5 Image Filtering Using Median Filter
Algorithm After the segmented infected cell has been obtained using k-means clustering, there might be some unwanted regions or noise that are still encountered in the image. Thus, median filter is used as a noise removal in order to obtain a noise-free image. Due to its good smoothing effect, it can also be used to fill the small holes that might appear on the segmented infected cell. Here, the neighbourhood of n × n (n = 7) pixels is used because large neighbourhoods produce more severe smoothing.
2.6 Seeded Region Growing Area Extraction
Algorithm In this study, a modified version of conventional seed based region growing algorithm namely seeded region growing area extraction (SRGAE) algorithm [24] has been applied on the segmented image. This algorithm is chosen due to its capability to label the ROI according to their order in the image as well as extracting the size of the segmented region. Since the segmentation using k-means clustering is based only on colour information of the pixels in the image, some artefacts and unwanted regions which share the same colour as the infected cell are still appeared on the segmented image. Thus, the SRGAE algorithm is applied for the two main purposes. First is to calculate the total area in pixels for the ROI. Secondly is to remove any unwanted regions that are bigger in size in which cannot be cleaned by using the 7×7 pixels median filter.
In order to apply the SRGAE algorithm, the segmented malaria image will first be converted into binary image, where the ROI and background regions will be assigned to 0 and 255, respectively. Then, the SRGAE algorithm can be implemented as follows [24]:
WSEAS TRANSACTIONS on BIOLOGY and BIOMEDICINE Aimi Salihah Abdul-Nasir, Mohd Yusoff Mashor, Zeehaida Mohamed
E-ISSN: 2224-2902 45 Issue 1, Volume 10, January 2013
1. Initialize Area[k] = 0 and set the value of k = 0, where Area is the total pixels for the ROI and k is the number of current ROI.
2. Search for the seed with intensity of pixel, I = 0. If the seed is found, increase k to k + 1 and Area[k] = 1; else go to step 7.
3. Search for the neighbourhood of 8 surrounding pixels, grow if I = 0 and increase Area[k] = Area[k] + 1 for each pixel that satisfies the growing condition.
4. Grow from the neighbour pixels in step 3 and increase Area[k] = Area[k] + 1 for each pixel that satisfies the growing condition.
5. Repeat steps 3 to 4 until all pixels have been considered to be grown or the region cannot be grown anymore.
6. Repeat steps 2 to 5 for the new seed which is not belong to the previous ROI(s).
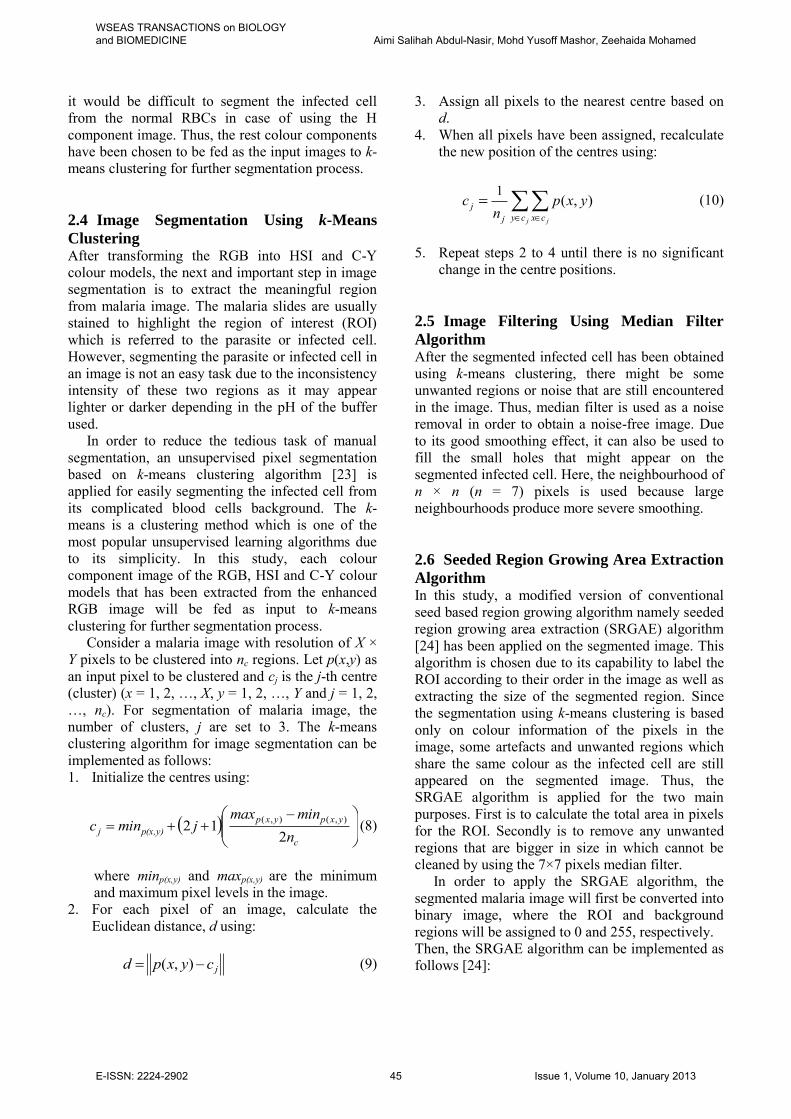
7. End. Afterwards, the selection of ROI is determined
based on its size. Fig.5 shows a single infected cell in malaria image with its area. After performing analyses on several malaria images, it has been found that a typical infected cell may have the area which is greater than 5000 pixels. Thus, any regions which are less than 5000 pixels are considered as non-parasite and will be eliminated from the image during region growing process. This value is chosen by considering the size of the infected cell from the three malaria stages which are ring, trophozoite and gametocyte stages. Therefore, the intensity of pixels which are included as ROI will be set to RGB colour of the enhanced malaria image, while the intensity of pixels which are not included as ROI will be set to 255.
(a) Ring.
Area=11061 (b) Ring.
Area=13965 (c) Ring.
Area=14768
(d) Trophozoite.
Area=15371 (e) Trophozoite.
Area=17461 (f) Trophozoite.
Area=19438
(g) Gametocyte.
Area=20321 (h) Gametocyte.
Area=19681 (i) Gametocyte.
Area=22170 Fig.5 A single infected cell in malaria image
2.7 Analysis of Segmentation Performance After the proposed colour image segmentation approach using various colour models and k-means clustering have been performed, a common quantitative analysis is conducted in order to assess the overall performance of the proposed segmentation method. The performances of the proposed segmentation method are evaluated by using six objective indices. These indices are accuracy, sensitivity, specificity, precision, recall and F-score. The quality of segmented image is determined based on pixels similarity of the resultant segmented image against the manual segmented image. The accuracy, sensitivity and specificity are defined based on Equation 11, 12 and 13, respectively.
100
FNFPTNTPTNTPAccuracy
(11)
100
FNTP
TPySensitivit
(12)
100
FPTN
TNySpecificit
(13)
TP, TN, FP and FN are the true positive, true negative, false positive and false negative, respectively. Based on validation from microbiologists, TP is refer as the positive region (infected cell) that has been correctly segmented as positive region, while TN is refer as the negative region (normal RBCs and background) that has been correctly segmented as negative region. Based on the above equations, segmentation accuracy can be obtained by calculating the percentage of pixels that are correctly segmented as infected cell or background in the image. The sensitivity is defined as the percentage of pixels that are correctly segmented as positive region, while the specificity is defined as the percentage of pixels that are correctly segmented as negative region.
Afterwards, the performances of the proposed segmentation method are further evaluated by using the precision, recall and F-score measures as defined in Equation 14, 15 and 16, respectively.
Precision = FPTP
TP
(14)
Recall = FNTP
TP
(15)
WSEAS TRANSACTIONS on BIOLOGY and BIOMEDICINE Aimi Salihah Abdul-Nasir, Mohd Yusoff Mashor, Zeehaida Mohamed
E-ISSN: 2224-2902 46 Issue 1, Volume 10, January 2013
F-score = recallprecisionrecallprecision
2
(16)
The precision and recall represent the quality of segmented image either the image is over-segmented or under-segmented. Low precision value will relate to over-segmentation, while low recall value will relate to under-segmentation. Here, recall is similar to the sensitivity. F-score is a combination of precision and recall to provide a single statistical measure for the segmented image, which will be 1 for a perfect segmentation.
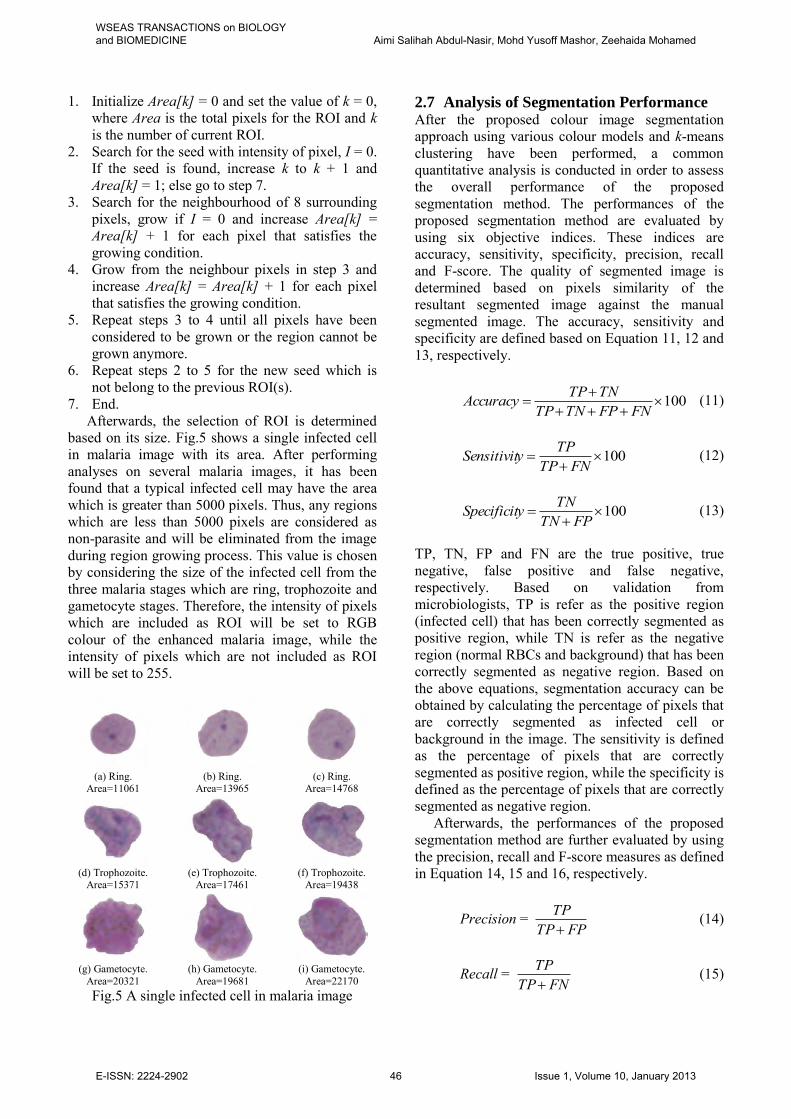
3 Results and Discussions In this study, the proposed colour image segmentation approach using various colour models and k-means clustering have been applied on 100 malaria images of P. vivax species. Comparisons between different colour components of RGB, HSI and C-Y colour models that have been used as input images to k-means clustering have been made in order to recognize the significance of each colour component on image segmentation. In order to assess the proposed work, the captured malaria images with various conditions have been processed using the proposed procedure. The qualities of segmented images have been determined based on both qualitative and quantitative evaluations. 3.1 Qualitative Analysis The original malaria images of ring, trophozoite and gametocyte stages named as Ring_1, Trophozoite_1 and Gametocyte_1 are shown in Fig.6(a)-(c), respectively. Based on these malaria images, the morphologies of infected cell are hardly seen due to the low image contrast. The results of applying the partial contrast stretching technique on Ring_1, Trophozoite_1 and Gametocyte_1 images are shown in Fig.7(a)-(c), respectively. Based on these resultant images, the contrast of the infected cell, RBCs and background regions has been improved significantly compared to the original images.
(a) Ring_1 image (b) Trophozoite_1
image (c) Gametocyte_1
image Fig.6 Original malaria images
(a) Ring_1 image (b) Trophozoite_1
image (c) Gametocyte_1
image Fig.7 Results of images of partial contrast stretching
technique
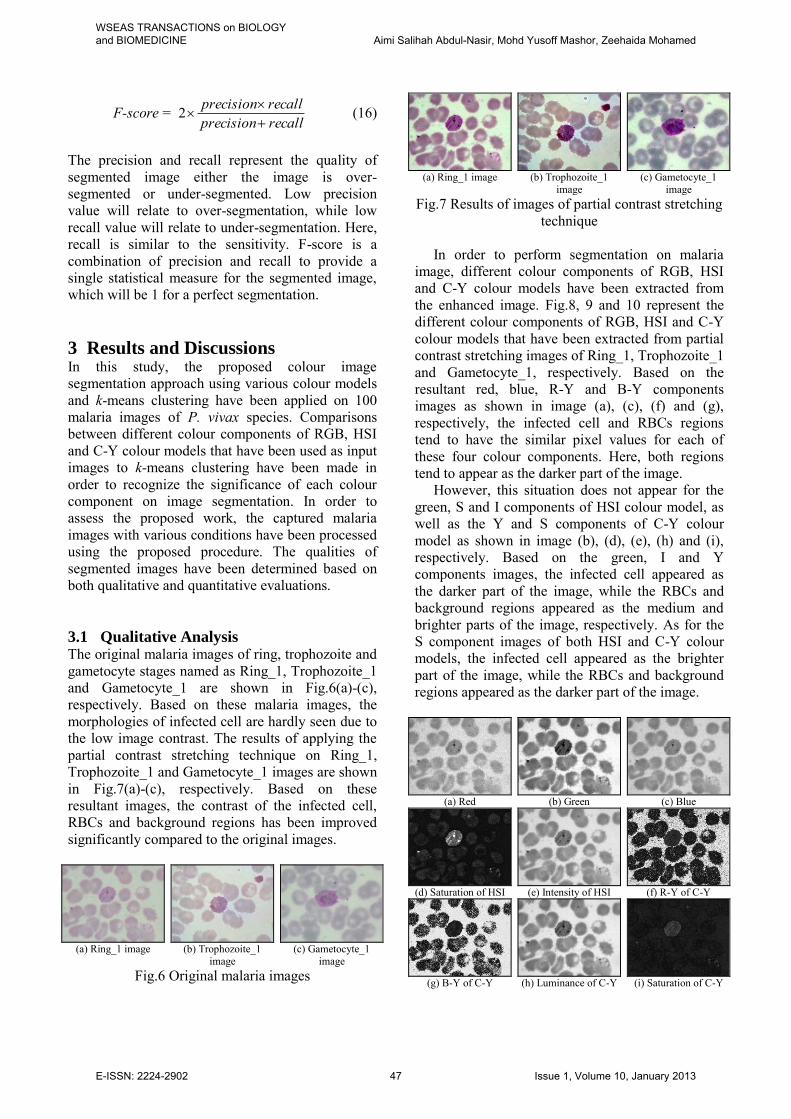
In order to perform segmentation on malaria image, different colour components of RGB, HSI and C-Y colour models have been extracted from the enhanced image. Fig.8, 9 and 10 represent the different colour components of RGB, HSI and C-Y colour models that have been extracted from partial contrast stretching images of Ring_1, Trophozoite_1 and Gametocyte_1, respectively. Based on the resultant red, blue, R-Y and B-Y components images as shown in image (a), (c), (f) and (g), respectively, the infected cell and RBCs regions tend to have the similar pixel values for each of these four colour components. Here, both regions tend to appear as the darker part of the image.
However, this situation does not appear for the green, S and I components of HSI colour model, as well as the Y and S components of C-Y colour model as shown in image (b), (d), (e), (h) and (i), respectively. Based on the green, I and Y components images, the infected cell appeared as the darker part of the image, while the RBCs and background regions appeared as the medium and brighter parts of the image, respectively. As for the S component images of both HSI and C-Y colour models, the infected cell appeared as the brighter part of the image, while the RBCs and background regions appeared as the darker part of the image.
(a) Red (b) Green (c) Blue
(d) Saturation of HSI (e) Intensity of HSI (f) R-Y of C-Y
(g) B-Y of C-Y (h) Luminance of C-Y (i) Saturation of C-Y
WSEAS TRANSACTIONS on BIOLOGY and BIOMEDICINE Aimi Salihah Abdul-Nasir, Mohd Yusoff Mashor, Zeehaida Mohamed
E-ISSN: 2224-2902 47 Issue 1, Volume 10, January 2013
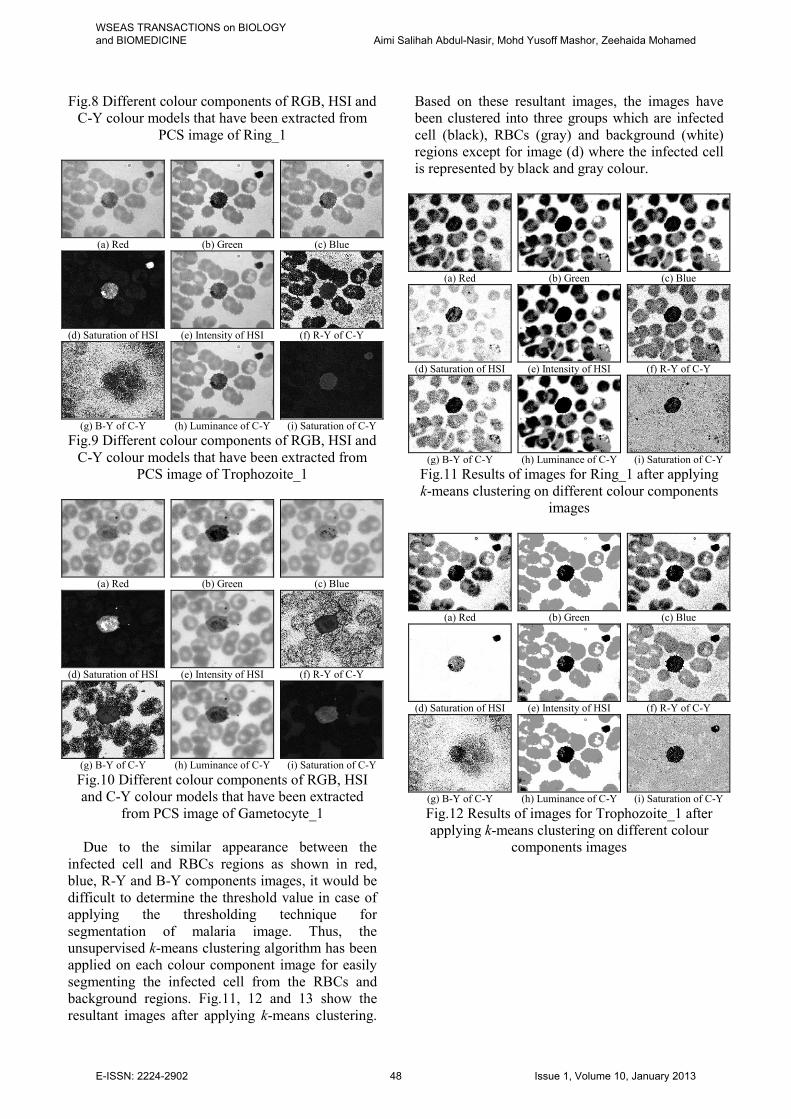
Fig.8 Different colour components of RGB, HSI and C-Y colour models that have been extracted from
PCS image of Ring_1
(a) Red (b) Green (c) Blue
(d) Saturation of HSI (e) Intensity of HSI (f) R-Y of C-Y
(g) B-Y of C-Y (h) Luminance of C-Y (i) Saturation of C-Y
Fig.9 Different colour components of RGB, HSI and C-Y colour models that have been extracted from
PCS image of Trophozoite_1
(a) Red (b) Green (c) Blue
(d) Saturation of HSI (e) Intensity of HSI (f) R-Y of C-Y
(g) B-Y of C-Y (h) Luminance of C-Y (i) Saturation of C-Y Fig.10 Different colour components of RGB, HSI and C-Y colour models that have been extracted
from PCS image of Gametocyte_1
Due to the similar appearance between the infected cell and RBCs regions as shown in red, blue, R-Y and B-Y components images, it would be difficult to determine the threshold value in case of applying the thresholding technique for segmentation of malaria image. Thus, the unsupervised k-means clustering algorithm has been applied on each colour component image for easily segmenting the infected cell from the RBCs and background regions. Fig.11, 12 and 13 show the resultant images after applying k-means clustering.
Based on these resultant images, the images have been clustered into three groups which are infected cell (black), RBCs (gray) and background (white) regions except for image (d) where the infected cell is represented by black and gray colour.
(a) Red (b) Green (c) Blue
(d) Saturation of HSI (e) Intensity of HSI (f) R-Y of C-Y
(g) B-Y of C-Y (h) Luminance of C-Y (i) Saturation of C-Y
Fig.11 Results of images for Ring_1 after applying k-means clustering on different colour components
images
(a) Red (b) Green (c) Blue
(d) Saturation of HSI (e) Intensity of HSI (f) R-Y of C-Y
(g) B-Y of C-Y (h) Luminance of C-Y (i) Saturation of C-Y Fig.12 Results of images for Trophozoite_1 after applying k-means clustering on different colour
components images
WSEAS TRANSACTIONS on BIOLOGY and BIOMEDICINE Aimi Salihah Abdul-Nasir, Mohd Yusoff Mashor, Zeehaida Mohamed
E-ISSN: 2224-2902 48 Issue 1, Volume 10, January 2013
(a) Red (b) Green (c) Blue
(d) Saturation of HSI (e) Intensity of HSI (f) R-Y of C-Y
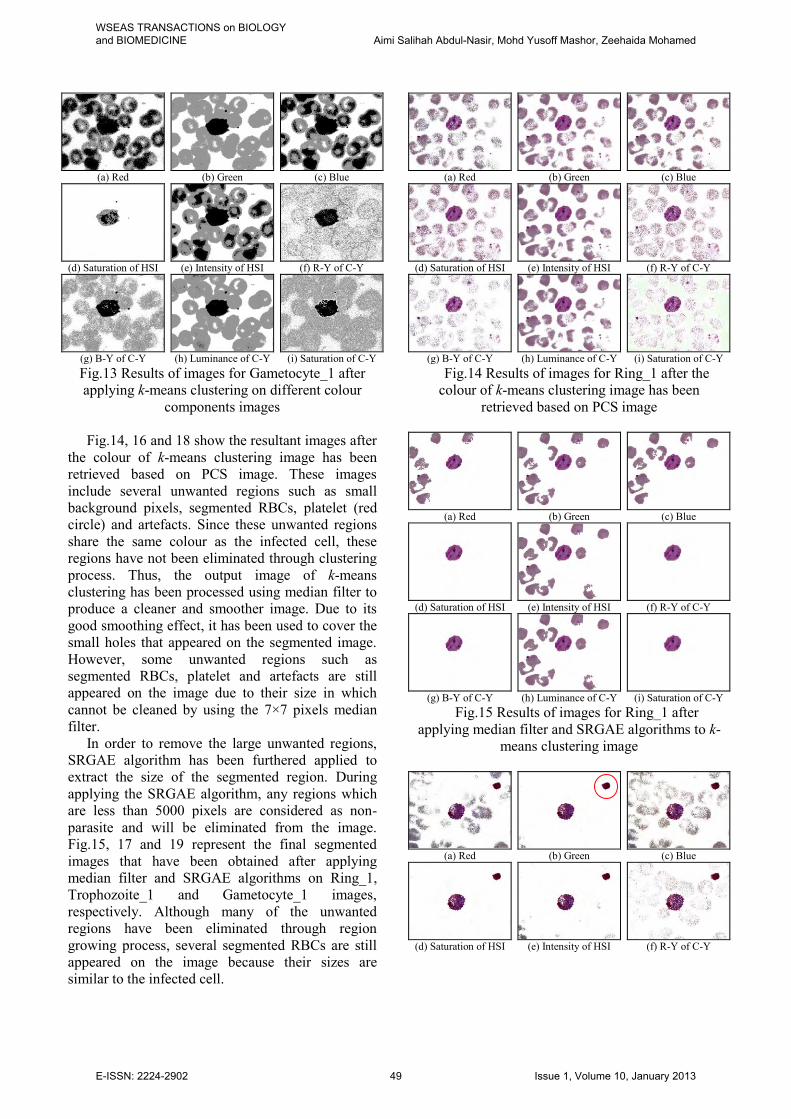
(g) B-Y of C-Y (h) Luminance of C-Y (i) Saturation of C-Y Fig.13 Results of images for Gametocyte_1 after applying k-means clustering on different colour
components images
Fig.14, 16 and 18 show the resultant images after the colour of k-means clustering image has been retrieved based on PCS image. These images include several unwanted regions such as small background pixels, segmented RBCs, platelet (red circle) and artefacts. Since these unwanted regions share the same colour as the infected cell, these regions have not been eliminated through clustering process. Thus, the output image of k-means clustering has been processed using median filter to produce a cleaner and smoother image. Due to its good smoothing effect, it has been used to cover the small holes that appeared on the segmented image. However, some unwanted regions such as segmented RBCs, platelet and artefacts are still appeared on the image due to their size in which cannot be cleaned by using the 7×7 pixels median filter.
In order to remove the large unwanted regions, SRGAE algorithm has been furthered applied to extract the size of the segmented region. During applying the SRGAE algorithm, any regions which are less than 5000 pixels are considered as non-parasite and will be eliminated from the image. Fig.15, 17 and 19 represent the final segmented images that have been obtained after applying median filter and SRGAE algorithms on Ring_1, Trophozoite_1 and Gametocyte_1 images, respectively. Although many of the unwanted regions have been eliminated through region growing process, several segmented RBCs are still appeared on the image because their sizes are similar to the infected cell.
(a) Red (b) Green (c) Blue
(d) Saturation of HSI (e) Intensity of HSI (f) R-Y of C-Y
(g) B-Y of C-Y (h) Luminance of C-Y (i) Saturation of C-Y
Fig.14 Results of images for Ring_1 after the colour of k-means clustering image has been
retrieved based on PCS image
(a) Red (b) Green (c) Blue
(d) Saturation of HSI (e) Intensity of HSI (f) R-Y of C-Y
(g) B-Y of C-Y (h) Luminance of C-Y (i) Saturation of C-Y
Fig.15 Results of images for Ring_1 after applying median filter and SRGAE algorithms to k-
means clustering image
(a) Red (b) Green (c) Blue
(d) Saturation of HSI (e) Intensity of HSI (f) R-Y of C-Y
WSEAS TRANSACTIONS on BIOLOGY and BIOMEDICINE Aimi Salihah Abdul-Nasir, Mohd Yusoff Mashor, Zeehaida Mohamed
E-ISSN: 2224-2902 49 Issue 1, Volume 10, January 2013
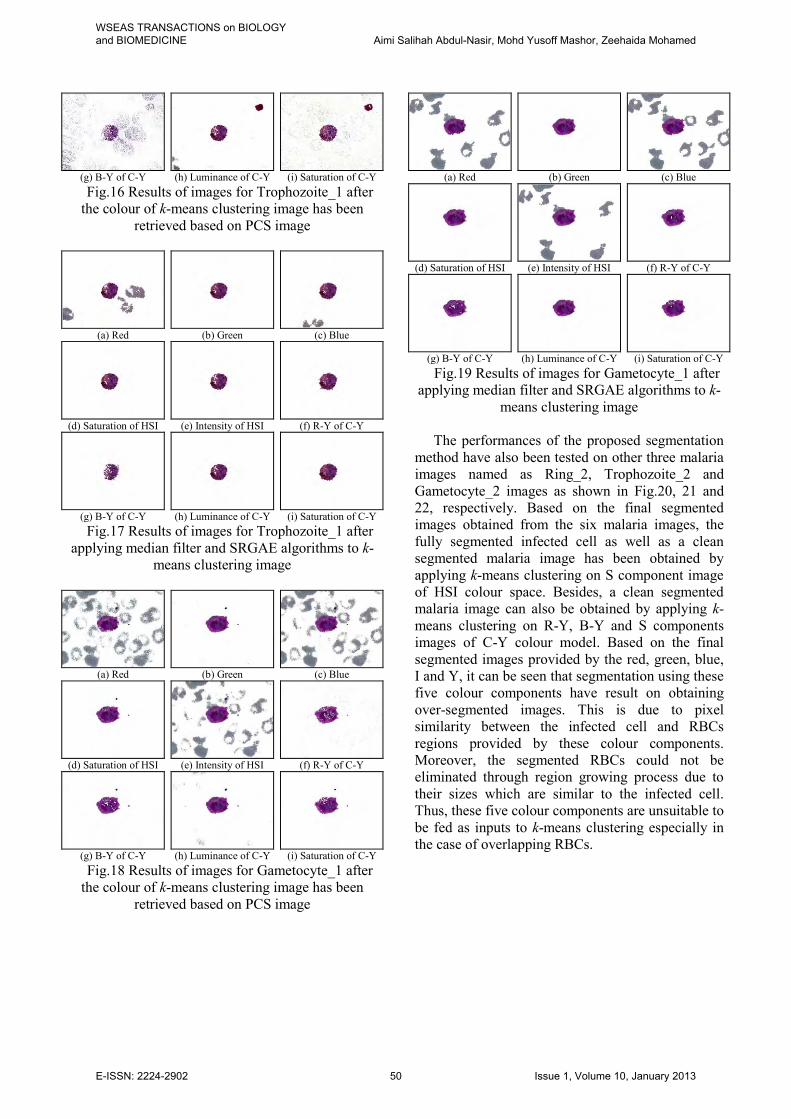
(g) B-Y of C-Y (h) Luminance of C-Y (i) Saturation of C-Y Fig.16 Results of images for Trophozoite_1 after
the colour of k-means clustering image has been retrieved based on PCS image
(a) Red (b) Green (c) Blue
(d) Saturation of HSI (e) Intensity of HSI (f) R-Y of C-Y
(g) B-Y of C-Y (h) Luminance of C-Y (i) Saturation of C-Y Fig.17 Results of images for Trophozoite_1 after
applying median filter and SRGAE algorithms to k-means clustering image
(a) Red (b) Green (c) Blue
(d) Saturation of HSI (e) Intensity of HSI (f) R-Y of C-Y
(g) B-Y of C-Y (h) Luminance of C-Y (i) Saturation of C-Y Fig.18 Results of images for Gametocyte_1 after
the colour of k-means clustering image has been retrieved based on PCS image
(a) Red (b) Green (c) Blue
(d) Saturation of HSI (e) Intensity of HSI (f) R-Y of C-Y
(g) B-Y of C-Y (h) Luminance of C-Y (i) Saturation of C-Y Fig.19 Results of images for Gametocyte_1 after
applying median filter and SRGAE algorithms to k-means clustering image
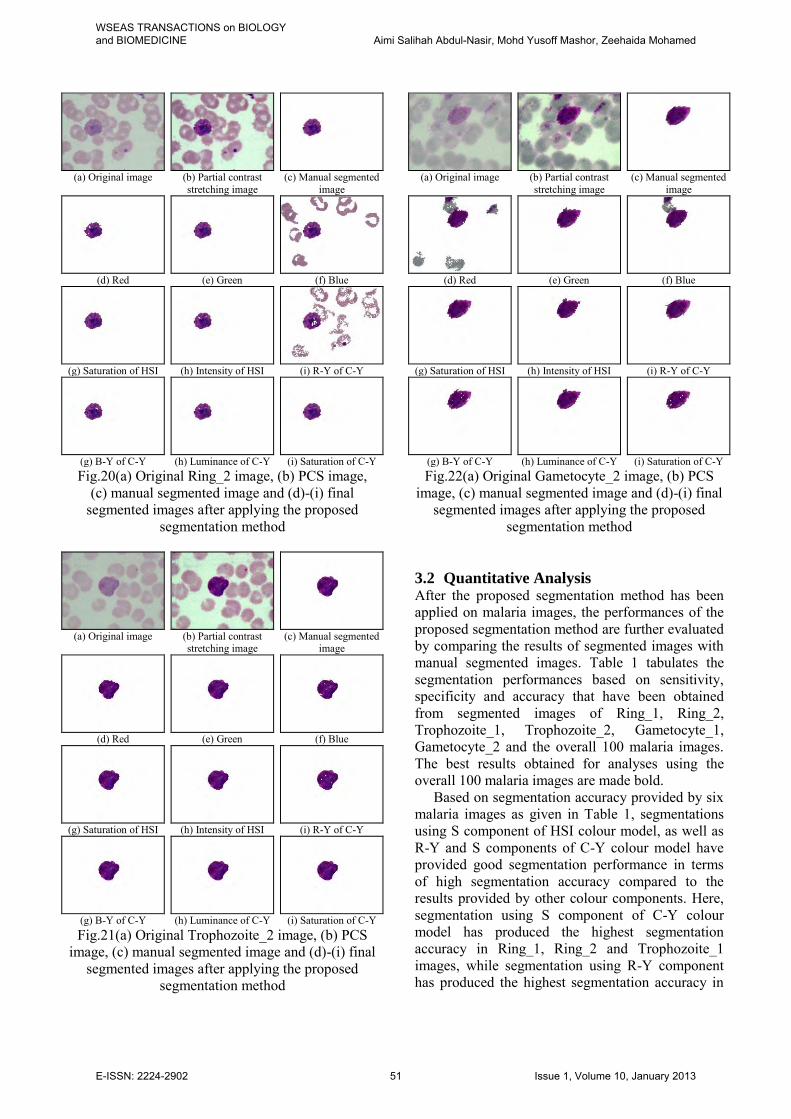
The performances of the proposed segmentation
method have also been tested on other three malaria images named as Ring_2, Trophozoite_2 and Gametocyte_2 images as shown in Fig.20, 21 and 22, respectively. Based on the final segmented images obtained from the six malaria images, the fully segmented infected cell as well as a clean segmented malaria image has been obtained by applying k-means clustering on S component image of HSI colour space. Besides, a clean segmented malaria image can also be obtained by applying k-means clustering on R-Y, B-Y and S components images of C-Y colour model. Based on the final segmented images provided by the red, green, blue, I and Y, it can be seen that segmentation using these five colour components have result on obtaining over-segmented images. This is due to pixel similarity between the infected cell and RBCs regions provided by these colour components. Moreover, the segmented RBCs could not be eliminated through region growing process due to their sizes which are similar to the infected cell. Thus, these five colour components are unsuitable to be fed as inputs to k-means clustering especially in the case of overlapping RBCs.
WSEAS TRANSACTIONS on BIOLOGY and BIOMEDICINE Aimi Salihah Abdul-Nasir, Mohd Yusoff Mashor, Zeehaida Mohamed
E-ISSN: 2224-2902 50 Issue 1, Volume 10, January 2013
(a) Original image (b) Partial contrast
stretching image (c) Manual segmented
image
(d) Red (e) Green (f) Blue
(g) Saturation of HSI (h) Intensity of HSI (i) R-Y of C-Y
(g) B-Y of C-Y (h) Luminance of C-Y (i) Saturation of C-Y Fig.20(a) Original Ring_2 image, (b) PCS image,
(c) manual segmented image and (d)-(i) final segmented images after applying the proposed
segmentation method
(a) Original image (b) Partial contrast
stretching image (c) Manual segmented
image
(d) Red (e) Green (f) Blue
(g) Saturation of HSI (h) Intensity of HSI (i) R-Y of C-Y
(g) B-Y of C-Y (h) Luminance of C-Y (i) Saturation of C-Y Fig.21(a) Original Trophozoite_2 image, (b) PCS
image, (c) manual segmented image and (d)-(i) final segmented images after applying the proposed
segmentation method
(a) Original image (b) Partial contrast
stretching image (c) Manual segmented
image
(d) Red (e) Green (f) Blue
(g) Saturation of HSI (h) Intensity of HSI (i) R-Y of C-Y
(g) B-Y of C-Y (h) Luminance of C-Y (i) Saturation of C-Y Fig.22(a) Original Gametocyte_2 image, (b) PCS
image, (c) manual segmented image and (d)-(i) final segmented images after applying the proposed
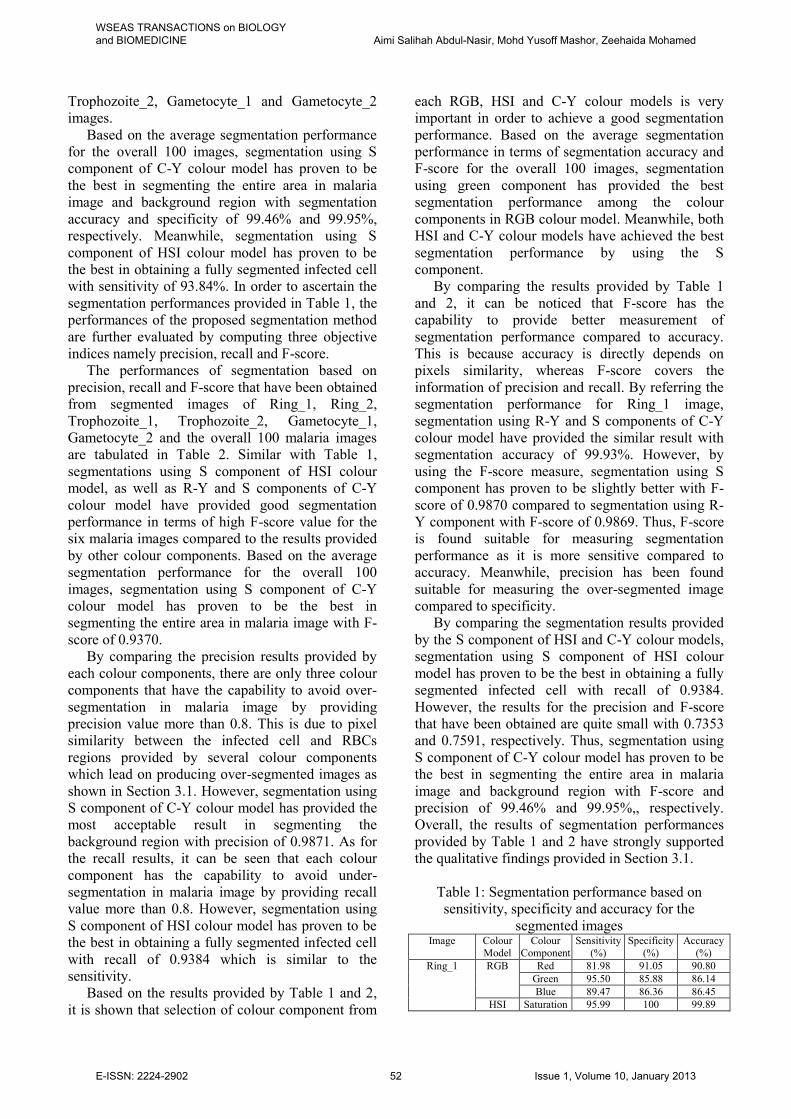
segmentation method 3.2 Quantitative Analysis After the proposed segmentation method has been applied on malaria images, the performances of the proposed segmentation method are further evaluated by comparing the results of segmented images with manual segmented images. Table 1 tabulates the segmentation performances based on sensitivity, specificity and accuracy that have been obtained from segmented images of Ring_1, Ring_2, Trophozoite_1, Trophozoite_2, Gametocyte_1, Gametocyte_2 and the overall 100 malaria images. The best results obtained for analyses using the overall 100 malaria images are made bold.
Based on segmentation accuracy provided by six malaria images as given in Table 1, segmentations using S component of HSI colour model, as well as R-Y and S components of C-Y colour model have provided good segmentation performance in terms of high segmentation accuracy compared to the results provided by other colour components. Here, segmentation using S component of C-Y colour model has produced the highest segmentation accuracy in Ring_1, Ring_2 and Trophozoite_1 images, while segmentation using R-Y component has produced the highest segmentation accuracy in
WSEAS TRANSACTIONS on BIOLOGY and BIOMEDICINE Aimi Salihah Abdul-Nasir, Mohd Yusoff Mashor, Zeehaida Mohamed
E-ISSN: 2224-2902 51 Issue 1, Volume 10, January 2013
Trophozoite_2, Gametocyte_1 and Gametocyte_2 images.
Based on the average segmentation performance for the overall 100 images, segmentation using S component of C-Y colour model has proven to be the best in segmenting the entire area in malaria image and background region with segmentation accuracy and specificity of 99.46% and 99.95%, respectively. Meanwhile, segmentation using S component of HSI colour model has proven to be the best in obtaining a fully segmented infected cell with sensitivity of 93.84%. In order to ascertain the segmentation performances provided in Table 1, the performances of the proposed segmentation method are further evaluated by computing three objective indices namely precision, recall and F-score.
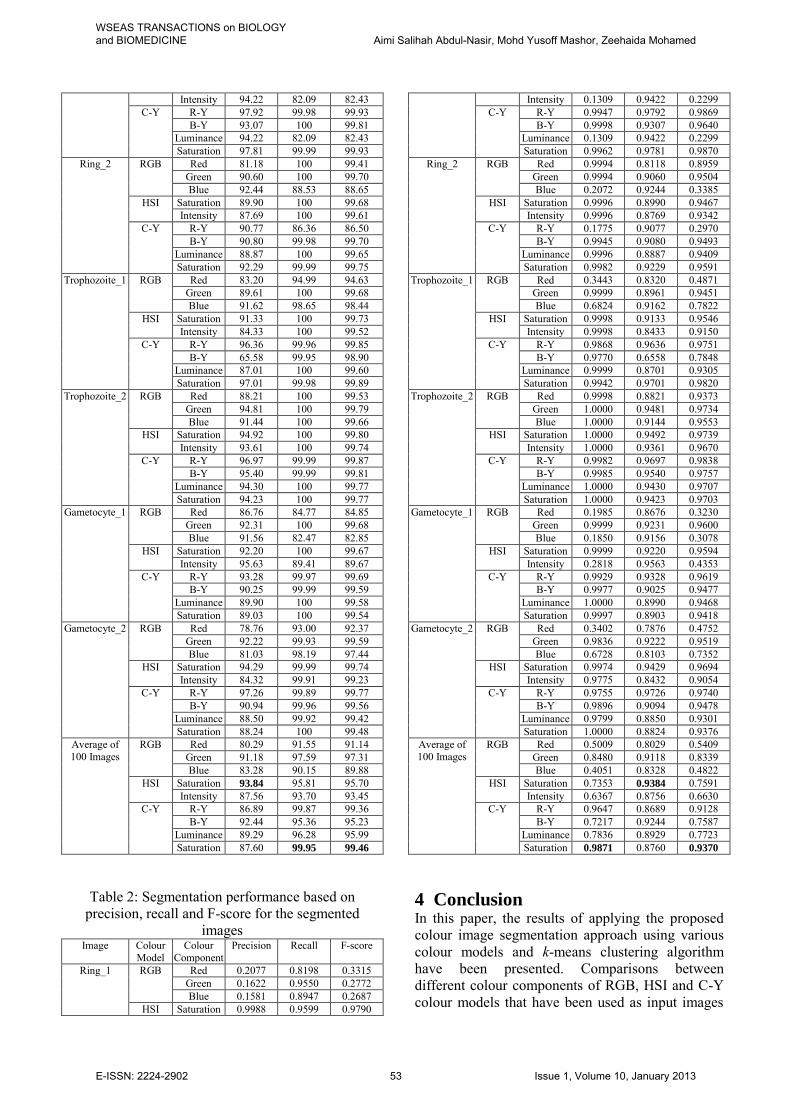
The performances of segmentation based on precision, recall and F-score that have been obtained from segmented images of Ring_1, Ring_2, Trophozoite_1, Trophozoite_2, Gametocyte_1, Gametocyte_2 and the overall 100 malaria images are tabulated in Table 2. Similar with Table 1, segmentations using S component of HSI colour model, as well as R-Y and S components of C-Y colour model have provided good segmentation performance in terms of high F-score value for the six malaria images compared to the results provided by other colour components. Based on the average segmentation performance for the overall 100 images, segmentation using S component of C-Y colour model has proven to be the best in segmenting the entire area in malaria image with F-score of 0.9370.
By comparing the precision results provided by each colour components, there are only three colour components that have the capability to avoid over-segmentation in malaria image by providing precision value more than 0.8. This is due to pixel similarity between the infected cell and RBCs regions provided by several colour components which lead on producing over-segmented images as shown in Section 3.1. However, segmentation using S component of C-Y colour model has provided the most acceptable result in segmenting the background region with precision of 0.9871. As for the recall results, it can be seen that each colour component has the capability to avoid under-segmentation in malaria image by providing recall value more than 0.8. However, segmentation using S component of HSI colour model has proven to be the best in obtaining a fully segmented infected cell with recall of 0.9384 which is similar to the sensitivity.
Based on the results provided by Table 1 and 2, it is shown that selection of colour component from
each RGB, HSI and C-Y colour models is very important in order to achieve a good segmentation performance. Based on the average segmentation performance in terms of segmentation accuracy and F-score for the overall 100 images, segmentation using green component has provided the best segmentation performance among the colour components in RGB colour model. Meanwhile, both HSI and C-Y colour models have achieved the best segmentation performance by using the S component.
By comparing the results provided by Table 1 and 2, it can be noticed that F-score has the capability to provide better measurement of segmentation performance compared to accuracy. This is because accuracy is directly depends on pixels similarity, whereas F-score covers the information of precision and recall. By referring the segmentation performance for Ring_1 image, segmentation using R-Y and S components of C-Y colour model have provided the similar result with segmentation accuracy of 99.93%. However, by using the F-score measure, segmentation using S component has proven to be slightly better with F-score of 0.9870 compared to segmentation using R-Y component with F-score of 0.9869. Thus, F-score is found suitable for measuring segmentation performance as it is more sensitive compared to accuracy. Meanwhile, precision has been found suitable for measuring the over-segmented image compared to specificity.
By comparing the segmentation results provided by the S component of HSI and C-Y colour models, segmentation using S component of HSI colour model has proven to be the best in obtaining a fully segmented infected cell with recall of 0.9384. However, the results for the precision and F-score that have been obtained are quite small with 0.7353 and 0.7591, respectively. Thus, segmentation using S component of C-Y colour model has proven to be the best in segmenting the entire area in malaria image and background region with F-score and precision of 99.46% and 99.95%,, respectively. Overall, the results of segmentation performances provided by Table 1 and 2 have strongly supported the qualitative findings provided in Section 3.1.
Table 1: Segmentation performance based on sensitivity, specificity and accuracy for the
segmented images Image Colour
Model Colour
Component Sensitivity
(%) Specificity
(%) Accuracy
(%) Ring_1 RGB Red 81.98 91.05 90.80
Green 95.50 85.88 86.14 Blue 89.47 86.36 86.45
HSI Saturation 95.99 100 99.89
WSEAS TRANSACTIONS on BIOLOGY and BIOMEDICINE Aimi Salihah Abdul-Nasir, Mohd Yusoff Mashor, Zeehaida Mohamed
E-ISSN: 2224-2902 52 Issue 1, Volume 10, January 2013
Intensity 94.22 82.09 82.43 C-Y R-Y 97.92 99.98 99.93
B-Y 93.07 100 99.81 Luminance 94.22 82.09 82.43 Saturation 97.81 99.99 99.93
Ring_2 RGB Red 81.18 100 99.41 Green 90.60 100 99.70 Blue 92.44 88.53 88.65
HSI Saturation 89.90 100 99.68 Intensity 87.69 100 99.61
C-Y R-Y 90.77 86.36 86.50 B-Y 90.80 99.98 99.70
Luminance 88.87 100 99.65 Saturation 92.29 99.99 99.75
Trophozoite_1 RGB Red 83.20 94.99 94.63 Green 89.61 100 99.68 Blue 91.62 98.65 98.44
HSI Saturation 91.33 100 99.73 Intensity 84.33 100 99.52
C-Y R-Y 96.36 99.96 99.85 B-Y 65.58 99.95 98.90
Luminance 87.01 100 99.60 Saturation 97.01 99.98 99.89
Trophozoite_2 RGB Red 88.21 100 99.53 Green 94.81 100 99.79 Blue 91.44 100 99.66
HSI Saturation 94.92 100 99.80 Intensity 93.61 100 99.74
C-Y R-Y 96.97 99.99 99.87 B-Y 95.40 99.99 99.81
Luminance 94.30 100 99.77 Saturation 94.23 100 99.77
Gametocyte_1 RGB Red 86.76 84.77 84.85 Green 92.31 100 99.68 Blue 91.56 82.47 82.85
HSI Saturation 92.20 100 99.67 Intensity 95.63 89.41 89.67
C-Y R-Y 93.28 99.97 99.69 B-Y 90.25 99.99 99.59
Luminance 89.90 100 99.58 Saturation 89.03 100 99.54
Gametocyte_2 RGB Red 78.76 93.00 92.37 Green 92.22 99.93 99.59 Blue 81.03 98.19 97.44
HSI Saturation 94.29 99.99 99.74 Intensity 84.32 99.91 99.23
C-Y R-Y 97.26 99.89 99.77 B-Y 90.94 99.96 99.56
Luminance 88.50 99.92 99.42 Saturation 88.24 100 99.48
Average of 100 Images
RGB Red 80.29 91.55 91.14 Green 91.18 97.59 97.31 Blue 83.28 90.15 89.88
HSI Saturation 93.84 95.81 95.70 Intensity 87.56 93.70 93.45
C-Y R-Y 86.89 99.87 99.36 B-Y 92.44 95.36 95.23
Luminance 89.29 96.28 95.99 Saturation 87.60 99.95 99.46
Table 2: Segmentation performance based on precision, recall and F-score for the segmented
images Image Colour
Model Colour
Component Precision Recall F-score
Ring_1 RGB Red 0.2077 0.8198 0.3315 Green 0.1622 0.9550 0.2772 Blue 0.1581 0.8947 0.2687
HSI Saturation 0.9988 0.9599 0.9790
Intensity 0.1309 0.9422 0.2299 C-Y R-Y 0.9947 0.9792 0.9869
B-Y 0.9998 0.9307 0.9640 Luminance 0.1309 0.9422 0.2299 Saturation 0.9962 0.9781 0.9870
Ring_2 RGB Red 0.9994 0.8118 0.8959 Green 0.9994 0.9060 0.9504 Blue 0.2072 0.9244 0.3385
HSI Saturation 0.9996 0.8990 0.9467 Intensity 0.9996 0.8769 0.9342
C-Y R-Y 0.1775 0.9077 0.2970 B-Y 0.9945 0.9080 0.9493
Luminance 0.9996 0.8887 0.9409 Saturation 0.9982 0.9229 0.9591
Trophozoite_1 RGB Red 0.3443 0.8320 0.4871 Green 0.9999 0.8961 0.9451 Blue 0.6824 0.9162 0.7822
HSI Saturation 0.9998 0.9133 0.9546 Intensity 0.9998 0.8433 0.9150
C-Y R-Y 0.9868 0.9636 0.9751 B-Y 0.9770 0.6558 0.7848
Luminance 0.9999 0.8701 0.9305 Saturation 0.9942 0.9701 0.9820
Trophozoite_2 RGB Red 0.9998 0.8821 0.9373 Green 1.0000 0.9481 0.9734 Blue 1.0000 0.9144 0.9553
HSI Saturation 1.0000 0.9492 0.9739 Intensity 1.0000 0.9361 0.9670
C-Y R-Y 0.9982 0.9697 0.9838 B-Y 0.9985 0.9540 0.9757
Luminance 1.0000 0.9430 0.9707 Saturation 1.0000 0.9423 0.9703
Gametocyte_1 RGB Red 0.1985 0.8676 0.3230 Green 0.9999 0.9231 0.9600 Blue 0.1850 0.9156 0.3078
HSI Saturation 0.9999 0.9220 0.9594 Intensity 0.2818 0.9563 0.4353
C-Y R-Y 0.9929 0.9328 0.9619 B-Y 0.9977 0.9025 0.9477
Luminance 1.0000 0.8990 0.9468 Saturation 0.9997 0.8903 0.9418
Gametocyte_2 RGB Red 0.3402 0.7876 0.4752 Green 0.9836 0.9222 0.9519 Blue 0.6728 0.8103 0.7352
HSI Saturation 0.9974 0.9429 0.9694 Intensity 0.9775 0.8432 0.9054
C-Y R-Y 0.9755 0.9726 0.9740 B-Y 0.9896 0.9094 0.9478
Luminance 0.9799 0.8850 0.9301 Saturation 1.0000 0.8824 0.9376
Average of 100 Images
RGB Red 0.5009 0.8029 0.5409 Green 0.8480 0.9118 0.8339 Blue 0.4051 0.8328 0.4822
HSI Saturation 0.7353 0.9384 0.7591 Intensity 0.6367 0.8756 0.6630
C-Y R-Y 0.9647 0.8689 0.9128 B-Y 0.7217 0.9244 0.7587
Luminance 0.7836 0.8929 0.7723 Saturation 0.9871 0.8760 0.9370
4 Conclusion In this paper, the results of applying the proposed colour image segmentation approach using various colour models and k-means clustering algorithm have been presented. Comparisons between different colour components of RGB, HSI and C-Y colour models that have been used as input images
WSEAS TRANSACTIONS on BIOLOGY and BIOMEDICINE Aimi Salihah Abdul-Nasir, Mohd Yusoff Mashor, Zeehaida Mohamed
E-ISSN: 2224-2902 53 Issue 1, Volume 10, January 2013
to k-means clustering have been made in order to recognize the significance of applying each colour component for segmentation of malaria image. The proposed segmentation method has been tested on 100 malaria images qualitatively and quantitatively. Based on the qualitative findings provided in Section 3.1, a fully and smoother infected cell has been obtained by applying k-means clustering on S component image of HSI colour model. Meanwhile, a clean segmented image has been obtained by using the S component image of C-Y colour model. Quantitatively, the results indicate that segmentation using S component of C-Y colour model has proven to be the best in segmenting the entire area in malaria image with F-score and precision of 0.9370 and 0.9871, respectively. Meanwhile, segmentation using S component of HSI colour model has proven to be the best in obtaining a fully segmented infected cell with recall of 0.9384. Acknowledgements The authors gratefully acknowledges and thanks the team members of malaria research at Universiti Malaysia Perlis (UniMAP) for making this research achievable and Universiti Sains Malaysia (USM) for providing the malaria blood samples and validate the results. References: [1] WHO, World Malaria Report 2011, World
Health Organization, 2011. [2] J. Cox-Singh, T. M. E. Davis, K. S. Lee, S. S.
G. Shamsul, A. Matusop, S. Ratnam, H. A. Rahman, D. J. Conway, and B. Singh, Plasmodium knowlesi malaria in humans is widely distributed and potentially life threatening, Clinical Infectious Disease, Vol.46, No.2, 2008, pp. 165-171.
[3] A. Moody, Rapid diagnostic tests for malaria parasites, Clinical Microbiology Reviews, Vol.15, No.1, 2002, pp. 66-78.
[4] Y. Purwar, S. L. Shah, G. Clarke, A. Almugairi, and A. Muehlenbachs, Automated and unsupervised detection of malarial parasites in microscopic images, Malaria Journal, Vol.10, 2011, pp. 1-10.
[5] M. T. Makler, C. J. Palmer, and A. L. Alger, A review of practical techniques for the diagnosis of malaria, Annals of Tropical Medicine & Parasitology, Vol.92, No.4, 1998, pp. 419-433.
[6] F. B. Tek, A. G. Dempster, and I. Kale, Parasite detection and identification for automated thin blood film malaria diagnosis, Computer Vision
and Image Understanding, Vol.114, No.1, 2010, pp. 21-32.
[7] WHO, Basic Malaria Microscopy, Part I. Learner’s Guide, World Health Organization, 2010.
[8] N. E. Ross, C. J. Pritchard, D. M. Rubin, and A. G. Duse, Automated image processing method for the diagnosis and classification of malaria on thin blood smears, Medical & Biological Engineering & Computing, Vol.44, 2006, pp. 427-436.
[9] D. Anggraini, A. S. Nugroho, C. Pratama, I. E. Rozi, A. A. Iskandar, and R. N. Hartono, Automated status identification of microscopic images obtained from malaria thin blood smears, 2011 International Conference on Electrical Engineering and Informatics, 2011.
[10] V. V. Panchbhai, L. B. Damahe, A. V. Nagpure, and P. N. Chopkar, RBCs and parasites segmentation from thin smear blood cell images, I.J. Image, Graphics and Signal Processing, Vol.10, 2012, pp. 54-60.
[11] K. N. R. Mohana-Rao and A. G. Dempster, Modification on distance transform to avoid over-segmentation and under-segmentation, 4th EURASIP - IEEE Region 8 International Symposium on Video/Image Processing and Multimedia Communications, 2002, pp. 295-301.
[12] F. B. Tek, Computerised diagnosis of malaria, Ph.D. Thesis, School of Life Sciences, University of Westminster, London, United Kingdom, 2007.
[13] D. Das, M. Ghosh, C. Chakraborty, A. K. Maiti, and M. Pal, Probabilistic prediction of malaria using morphological and textural information, 2011 International Conference on Image Information Processing, 2011.
[14] C. D. Ruberto, A. Dempster, S. Khan, and B. Jarra, Analysis of infected blood cell images using morphological operators, Image and Vision Computing, Vol.20, No.2, 2002, pp. 133-146.
[15] S. Mandal, A. Kumar, J. Chatterjee, M. Manjunatha, and A. K. Ray, Segmentation of blood smear images using normalized cuts for detection of malarial parasites, 2010 Annual IEEE India Conference, 2010.
[16] M. Ghosh, D. Das, C. Chakraborty, and A. K. Ray, Plasmodium vivax segmentation using modified fuzzy divergence, 2011 International Conference on Image Information Processing, 2011.
[17] F. B. Tek, A. G. Dempster, and I. Kale, Malaria parasite detection in peripheral blood images,
WSEAS TRANSACTIONS on BIOLOGY and BIOMEDICINE Aimi Salihah Abdul-Nasir, Mohd Yusoff Mashor, Zeehaida Mohamed
E-ISSN: 2224-2902 54 Issue 1, Volume 10, January 2013
British Machine Vision Conference, 2006, pp. 347-356.
[18] A. R. Weeks, Fundamentals of Electronic Image Processing, SPIE Optical Engineering Press, 1996.
[19] A. N. Aimi Salihah, M. Y. Mashor, N. H. Harun, and H. Rosline, Colour image enhancement techniques for acute leukaemia blood cell morphological features, 2010 IEEE International Conference on Systems, Man, and Cybernetics, 2010, pp. 3677-3682.
[20] R. C. Gonzalez and R. E. Woods, Digital Image Processing, Prentice Hall, 2007.
[21] E. R. Dougherty, Electronic Imaging Technology, SPIE-The International Society for Optical Engineering, 1999.
[22] B. Jahne, Digital Image Processing, Springer-Verlag Berlin, Heidelberg, 2005.
[23] J. MacQueen, Some methods for classification and analysis of multivariate observations, Proceedings of 5th Berkeley Symposium on Mathematical Statistics and Probability, 1967, pp. 281-297.
[24] N. H. Harun, M. Y. Mashor, and H. Rosline, Calculation of blast area for acute leukemia blood cells images, Proceedings of the International Postgraduate Conference on Engineering, 2010.
WSEAS TRANSACTIONS on BIOLOGY and BIOMEDICINE Aimi Salihah Abdul-Nasir, Mohd Yusoff Mashor, Zeehaida Mohamed
E-ISSN: 2224-2902 55 Issue 1, Volume 10, January 2013