Embed Size (px)
Citation preview
Contact mechanical measurements under high frequency oscillation
Disser tat ion
zur Erlangung des Grades eines Doktors
der Naturwissenschaften
vorgelegt von
Sergiy Rudenkiy
aus Kharkiv (Ukraine)
genehmigt von der Fakultät für Natur- und Materialwissenschaften
der Technischen Universität Clausthal
Tag der mündlichen Prüfung
16 Nov. 2007
___________________________________________________________________________
ii
Vorsitzender der Promotionskommission
Prof. Dr. W. Schade
Hauptberichterstatter
Prof. Dr. D. Johannsmann
Berichterstatter
Priv.-Doz. Dr. Jörg Adams
angefertigt am
Institut für Physikalische Chemie
Technische Universität Clausthal
Arnold-Sommerfeld-str. 4
38678 Clausthal-Zellerfeld
iii
Hiermit erkläre ich an Eides Statt, dass ich die bei der Fakultät für Material- und
Naturwissenschaften der Technischen Universität Clausthal eingereichte Dissertation
selbständig und ohne unerlaubte Hilfe verfasst und die benutzten Hilfsmittel vollständig
angegeben habe.
Datum: Unterschrift
___________________________________________________________________________
iv
Acknowledgment
At this place I would like to say thanks to all people who have contributed directly or
indirectly to the success of this dissertation.
I would like to sincerely thank my research advisor, Professor Dr. Diethelm
Johannsmann.
First part of my work was done with the help of Dr. B. Du. I would like to thank him
for the team-work in the labor. I would also like to thank Johanna Bünsow and Kerstin von
der Ehe for the funny atmosphere in the office during my sty in IPC TU-Clausthal. Also
thanks them and all other peoples from the group of prof. Dr. Diethelm Johannsmann for the
powerful discussion of my work during group seminars.
Thanks for the discussions and cooperation with all of my colleagues have contributed
substantially to this work. Thanks for all institutes coworker for the nice time in IPC TU-
Clausthal.
Thanks to the workshop workers and actually Mr. Cronjäger for the all things I need to
build during my PhD work.
I dedicate this thesis to my father and mother.
v
Abstract
Micromechanical contacts between a spherical surface and a solid plane have been
investigated with acoustic resonators. The elastic stiffness of the contact as well as the static
friction coefficient have been inferred from the shifts of frequency and bandwidth of the
resonator as a function of shear amplitude. In the limit of small amplitudes, the shifts of
frequency and bandwidth, ∆f and ∆Γ, are well described by the Mindlin model. The
frequency shift (that is, the apparent spring constant) decreases linearly with shear amplitude.
From the intercept with the ordinate and the slope, one infers the spring constant and the static
friction coefficient, respectively.
When employing very high levels of oscillatory shear stress, one irreversibly changes
the stiffness of the contacts. Both a weakening and a strengthening can be found, depending
on the conditions.
Increasing the environmental humidity leads to the formation of capillary bridges and
menisci in the area of contact. The capillary forces increase the stiffness of the contacts.
Further, the liquid acts as a lubricant, decreasing the static friction coefficient. The contact
strength strongly increases when the sample returns to the dry state after having been exposed
to high humidity. The effect is termed “hysteretic sandcastle effect”. It is explained by a
deformation of the two surfaces under the influence of the Laplace pressure. Further
application of high-frequency oscillatory stress can reverse this effect (that is, disrupt the
bonds formed during the dry–humid–dry cycles). Larger contacts tended to be more stable
against this shear-induced removal of the sandcastle effect than smaller ones.
Measurements of the adhesion force between AFM-cantilevers and the surface of
acoustic resonators covered with mica showed a strong decrease of the pull-off force with
shear amplitude. Similar results were found in colloidal probe experiments, where a glass
sphere was glued to the cantilever. Three regimes were identified, which consisted of two
plateaus at very low and high amplitudes and an intermediate range, characterized by a
logarithmic decrease of the pull-off force with amplitude. The logarithmic dependence on
amplitude suggests that thermally activated processes govern the detachment dynamics.
___________________________________________________________________________
vi
Zusammenfassung
Gegenstand der Untersuchung war der mikromechanische Kontakt zwischen einer
sphärischen und einer ebenen Oberfläche mittels akustischen Resonatoren. Die elastische
Steifigkeit des Kontakts sowie der statische Reibungskoeffizient wurden aus den Verschie-
bungen von Frequenz und Bandbreite des Resonators als Funktion der Scheramplitude er-
schlossen. Im Grenzfall kleiner Amplituden lassen sich Bandbreiten- und Frequenzverschie-
bung, ∆Γ bzw. ∆f, gut durch das Mindlin-Modell beschreiben. Die Frequenzverschiebung
(die scheinbare Federkonstante) nimmt linear mit der Scheramplitude ab. Aus dem
Ordinatenabschnitt lässt sich die Federkonstante und aus der Steigung der statische
Reibungskoeffizient bestimmen.
Werden hohe oszillatorische Scherspannungen angelegt, wird die Steifigkeit der
Kontakte irreversibel verändert. Je nach Bedingungen findet man eine Ab- oder Zunahme der
Steifigkeit.
Erhöhung der Luftfeuchtigkeit führt zur Bildung von Kapillarbrücken und Menisken
an der Kontaktfläche. Die Kapillarkräfte führen zu einer Zunahme der Kontaktsteifigkeit.
Außerdem wirkt die Flüssigkeit als Schmiermittel, was den statischen Reibungskoeffizienten
senkt. Die Kontaktsteifigkeit steigt stark an, wenn ein zunächst der Feuchtigkeit ausgesetzter
Kontakt wieder eintrocknet. Dieser Effekt wurde als „hysteretischer Sandburg-Effekt“
(hysteretic sandcastle effect) bezeichnet. Er lässt sich durch Deformation der Kontaktstellen
aufgrund des Laplace–Drucks erklären. Weitere Einwirkung hochfrequenter Scherfelder kann
diesen Effekt umkehren, also die Bindungsstellen wieder trennen, die sich während der
Trocken–Feucht–Trocken–Zyklen gebildet haben. Größere Kontaktflächen erwiesen sich als
stabiler als kleine gegenüber diesem scherinduzierten Abbau des Sandburg-Effekts.
Messungen der Adhäsionskraft zwischen einem AFM-Cantilever und der Oberfläche
von akustischen Resonatoren, welche mit Glimmer beschichtet waren, zeigten eine starke
Abnahme der Abreißkraft mit zunehmender Schermplitude. Ähnliche Ergebnisse zeigten
Versuche mit kolloidal modifizierten Sonden, bei denen eine Glaskugel an der
Cantileverspitze befestigt wurde. Drei Bereiche ließen sich unterscheiden: zwei Plateaus bei
sehr kleinen und großen Amplituden sowie ein mittlerer Bereich, der sich durch einen
logarithmischen Abfall der Abreißkraft mit der Scheramplitude auszeichnet. Die
logarithmische Abhängigkeit legt nahe, dass thermisch aktivierte Prozesse die Dynamik der
Ablösung bestimmen.
Table of contents ___________________________________________________________________________
1
Table of contents
Acknowledgment ...................................................................................................................... iv
Abstract ...................................................................................................................................... v
Zusammenfassung..................................................................................................................... vi
Table of contents ........................................................................................................................ 1
1. Introduction ........................................................................................................................ 3
2. Fundamentals of contact mechanics................................................................................... 5
2.1. Introduction ...............................................................................................................5
2.2. Hertz theory of elastic contact...................................................................................5
2.3. Adhesion....................................................................................................................7
2.4. Capillary forces .........................................................................................................8
2.5. Friction ....................................................................................................................10
3. The Quartz Crystal Microbalance (QCM) ....................................................................... 13
3.1. Introduction .............................................................................................................13
3.2. Complex resonance frequency ................................................................................14
3.3. The Butterworth-van-Dyke electromechanical equivalent circuit ..........................16
3.4. The QCM as instrument in contact mechanic measurements .................................17
3.5. Dybwad model ........................................................................................................18
3.6. Mindlin theory.........................................................................................................20
4. Contact mechanics measurements via the drive level dependence of ∆f and ∆Γ ............ 24
4.1. Introduction .............................................................................................................24
4.2. Experimental details................................................................................................25
4.3. Single sphere contact...............................................................................................27
4.4. Single sphere in water droplet.................................................................................32
4.5. Sandcastle effect in single sphere–plate contact with organic vapors ....................34
4.6. Sandcastle effect in single sphere–plate contact with organic liquid......................37
4.7. Glass spheres with the diameter of 700 µm ............................................................38
4.8. Glass spheres with a diameter of 225 µm ...............................................................44
4.9. Glass spheres with the diameter of 112 µm ............................................................48
Table of contents ___________________________________________________________________________
2
4.10. Effect of added mass in experiments using glass spheres with a
diameter of 700 µm .............................................................................................................53
4.11. Effect of added mass in experiments using glass spheres with a
diameter of 225 µm .............................................................................................................56
4.12. Sandcastle effect......................................................................................................61
4.13. Conclusion...............................................................................................................64
5. Effect of high-frequency shear in adhesion force measurements .................................... 66
5.1. Introduction .............................................................................................................66
5.2. Experimental details................................................................................................66
5.3. Mica sample preparation .........................................................................................68
5.4. Detachment of an AFM cantilever from a solid surface under high
frequency shear ...................................................................................................................69
5.5. Detachment of a glass sphere from a solid surface under high
frequency shear ...................................................................................................................73
5.6. Conclusion...............................................................................................................75
6. Literature .......................................................................................................................... 77
CURRICULUM VITAE .......................................................................................................... 84
Introduction ___________________________________________________________________________
3
1. Introduction
Friction between solid surfaces is of outstanding importance in many areas of science
and engineering. The first study of the friction was carried out by Leonardo daVinci about
five centuries ago [1, 2, 3, 39]. Later, in the 17th century Guillaume Amontons phrased two
basic empirical laws of sliding friction. Friction is proportional to the applied normal force
and friction is independent of the contact area of the sliding surfaces. One century later
Charles Augustin de Coulomb introduced the third empirical law, namely that the friction
force is independent of the sliding velocity. Together, these three ‘laws’ are known as the
Amontons–Coulomb laws of sliding friction. They can be described with the simple equation
µ = F/N, where µ is the constant or friction coefficient, F is the applied force, and N is the
normal load [4].
In the Amontons–Coulomb law, friction is independent of the area of contact. It
depends only on the load. It is a consequence of the fact that for most practical surfaces the
average contact area increases linearly with the applied normal force [5]. Bowden and Tabor
have expressed the friction force as a function of real contact area [6]. The real area of
contact between solid surfaces is much smaller than the apparent contact.
Further investigations of the friction is became possible with new technique like
Atomic Force Microscopy (AFM), the Surface Forces Apparatus (SFA), and the Quartz
Crystal Microbalance (QCM). AFM is characterized by atomic-scale length measurements,
slow sliding or long time scales, and high shear stress [7]. With an AFM, it is possible to
measure lateral force exerted by a single atom at a sharp tip. The SFA was first developed by
Bowden and Tabor in the 1950´s and later adapted for friction measurements. The SFA
covers comparatively long length and time scales and medium range stresses [8]. The use of
the QCM in tribological measurements was first demonstrated by Jacqueline Krim and co-
workers [7, 9, 10]. This technique is accurate enough to measure forces down to the atomic
scale. The QCM covers atomic length scales, short time scales and low shear stress.
The idea that fiction is related to the bonding energy between surfaces was expressed
by Zhong et al [11]. The friction coefficient also depends on the adsorption energy and the
adhesion between the solid surfaces. The adhesion energy is affected by long range forces in
addition to the force acting right at the surface. Plastic deformation also plays some role.
This statement is valid in a wide range of experiments.
Introduction ___________________________________________________________________________
4
In order to investigate the force of adhesion between surfaces and nano-asperities, the
AFM is widely used [12, 13]. The sharp tip of the AFM-cantilever makes it difficult to
quantify the relation between contact area and friction at the nanoscale. An alternative it to
use small clusters materials with defined shape mounted to the AFM-cantilever [14, 15].
Finally, recent theoretical investigation for the continuum mechanics can not be
applied to nanometer-sized contacts. Continuum theory brakes down at atomic scale [16].
When placing two solid surfaces in contact and sliding them over each other, the total force of
friction is the outcome of a number of different physical phenomena. There is elastic
deformation, adhesion, wear, and others. Each of these phenomena plays its own role and
depends differently on the area of contact.
There are several motivations to study tribology on the nanoscale and at high
frequency. Using the QCM in our investigation, we try to understand the phenomena of
friction and adhesion that take place under high frequency oscillatory shear and on short time
scales. This work is not concerned with the nanotribology in sense of single contacts. In our
investigation we have used multi-asperity contacts between an assembly of the spheres and a
plate. It is also known that the presence of the lubricant has a large influence on friction.
Sometimes, small volumes of the water can play the role of lubricant. Condensation of water
plays a significant role in friction phenomena. For this reason, it is also interesting to
investigate friction and adhesion in high humidity.
To analyze the data from the QCM experiments we use the Mindlin model [17]. This
model describes stick–slip transition in the Hertz contact under oscillatory force. It involves
partial slip at the rim of the contact area.
Fundamentals of contact mechanics ___________________________________________________________________________
5
2. Fundamentals of contact mechanics
2.1. Introduction
The aim of this part is to provide a short review of the current knowledge in the field
of contact mechanics. The subject of contact mechanics may be said to have started with the
work of Heinrich Hertz.
Section 2.2 shortly introduces Hetrz studies in field of contact between two elastic
half-space spheres. In section 2.3, we will talk about the nature of adhesion between bodies.
Section 2.4 will describe more in detail meniscus forces or capillary forces. These forces play
a significant role in adhesion and friction. The presence of liquid menisci in the contact
increases the adhesion force between the bodies. In our experimental results, we will show
that capillary forces increase the real area of contact between two bodies. In section 2.5, we
will discuss some aspects of the friction forces. For microscopic surfaces, we have a
dependence of the friction force on the area of contact. Therefore, menisci in the contact will
increase the real area of contact and increase the friction force. On the other hand, they can
also act as lubricants.
2.2. Hertz theory of elastic contact
In 1889 Hertz started his work on mechanics. He had studied interference of the light
passed through two cylindrical lenses in contact. After five years of experimental and
theoretical work he published his book “Die Prinzipien der Mechanik in neuem
Zusammenhange dargestellt”, in 1894.
In this work, Hertz solved the problem of two elastic spheres pushed against each
other. The expression “elastic spheres in contact” means that we have two elastic bodies
whose deformation is small in comparison with the linear size of the bodies. In the case of
spheres, this implies that the deformation is small compared to the radii of curvature of the
undeformed surfaces. The contact stresses are highly concentrated at the region of contact.
The size of the bodies is larger than the contact area and there is no influence of the stress on
to the volume elements distant from the contact. In Hertz theory we neglect the tangential
displacements produced by the contact pressure [76].
Fundamentals of contact mechanics ___________________________________________________________________________
6
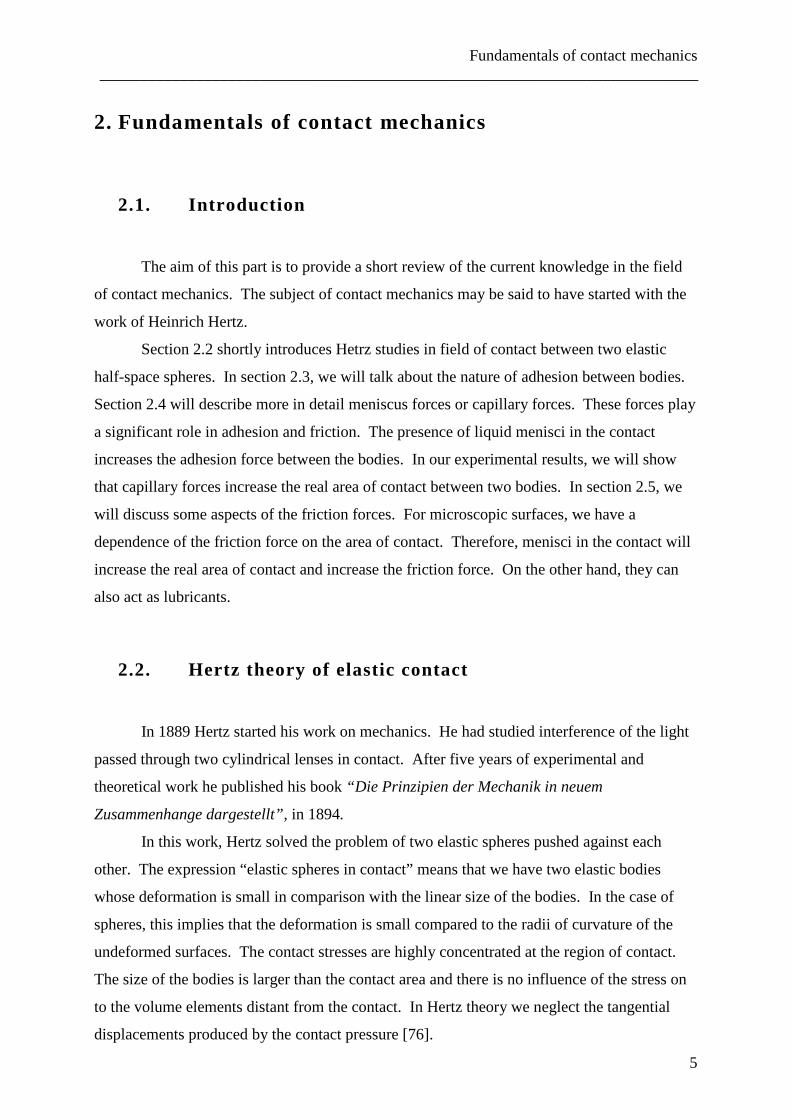
In the general case, we have two elastic spheres with radii R1 and R2. The surfaces of
these spheres are frictionless. Without applied pressure the spheres are in contact (Fig. 1a).
Under a vertical force, P, the contact area is displaced by some values u1(r) and u2(r) for the
first and the second sphere, respectively. The centers of the two spheres approach each other
by a distance δ and contact is achieved on a circle with radius a (Fig. 1b).
The boundary conditions for the displacement in the area of contact can be written as
( ) ( ) 21 2
1
2u r u r r
Rδ + = −
, r a≤ Eq. 2.1
where 1/R=1/R1+1/R2 is the mean curvature.
The dependence of contact radius on the force in Hertz theory can be written as
3 3
4
PRa
E= Eq. 2.2
where the effective Young modulus is given as
2 21 2
1 2
1 11
E E E
ν ν− −= + Eq. 2.3
The value of a, can be calculated for known parameters of P, R, and E. This value is
termed “Hertz radius”, RHertz, in the results section (see, for example, Table 1 in section 4.3).
(a)
R1
R2
(b)
u1
u2
P
δ
R1
R2a
Fig. 1. Two spheres in single point contact (a) and under vertical pressure (b)
Fundamentals of contact mechanics ___________________________________________________________________________
7
In Eq. 2.3, E1, E2, ν and ν2 are Young’s moduli and Poisson ratios for the first and second
body, respectively. The indentation δ of the two solids is given by
12 2 3
2
9
16
a P
R REδ
= =
Eq. 2.4
The distribution of the pressure is
12 2
0 1r
p pa
= −
Eq. 2.5
where p0 is the maximum pressure in the centre of contact given by
12 3
0 2 3 2
3 6
2
P PEp
a Rπ π
= =
. Eq. 2.6
When we have a contact between a sphere and a surface, (R2→∞, E2>>E 1) we have
21
1
11
E E
ν−= Eq. 2.7
The relation between the applied load and the approach distance, δ, is
23const Pδ = ⋅ ,
32P const δ= ⋅ Eq. 2.8
This result is true for the bodies of different shape.
2.3. Adhesion
The adhesion force between a sphere and a smooth surface is a fundamental problem
in engineering. Particle adhesion is controlled by dispersive forces (JKR model of elastic
contact [18]), local chemical bonding, charge, and capillary attraction. These forces are
strongly affected by surface properties like roughness and surface chemistry.
The JKR model deals with the interaction caused with the Van der Waals (vdW)
forces. This interaction is always presented and cannot be removed. To describe the
attractive force of the deformable spherical particles, Johnson et al. [18, 19] extended Hertz
theory of elastic contact. They find that
Fundamentals of contact mechanics ___________________________________________________________________________
8
3
2JKRF Rπ γ= Eq. 2.9
where R is equivalent radius and γ is the interfacial energy. Eq. 2.9 is applies in the
absence of a load.
Charge or electrostatic forces are due to the electricity phenomena. Electrostatic forces
arise when two surfaces electrically charged.
The capillary force is an attractive force that arises from the Laplace pressure (Eq. 2.11)
of curved menisci between the two surfaces. The menisci form as a result of condensation of
vapor in the environment of the surfaces. The capillary condensation of some liquids, most
notably water, gives rise to adhesion force in the contact zone. More details on the capillary force
will be discussed in the next section.
2.4. Capillary forces
For simplicity this section we mostly deal with water vapors, but most of the
statements hold for other liquids, as well. Menisci on the contact can be formed, if the radius
of curvature of the micro contacts is below a certain critical radius [21]. This radius is
approximately equal to the Kelvin radius. Lord Kelvin derived the relationship between the
vapor pressure of a liquid, P, and mean radius of curvature, rK, of the liquid vapor interface
[22, 26, 27]:
MK
ln( )s
Vr
PRT
P
γ= − Eq. 2.10
where VM is the molar volume of the liquid, γ is the surface tension, R is the universal
gas constant, T is the temperature, and Ps is the saturation vapor pressure. For water at room
temperature, the surface tension is γ = 0.074 N/m, the molar volume is VM = 18 10-6 m3 mol-1,
the universal gas constant is R = 8.31 m3 Pa mol-1 K-1, and the temperature is T = 300 K. For
P/Ps ~ 0.9, we obtain Kelvin radius of about 5 nm.
The capillary forces are well studied in the works of Young, Laplace, and Kelvin. The
additional pressure due to the curvature radius of the menisci is described by the Laplace
pressure [23, 24]
Fundamentals of contact mechanics ___________________________________________________________________________
9
1 2
1 1p
R Rγ
∆ = +
Eq. 2.11
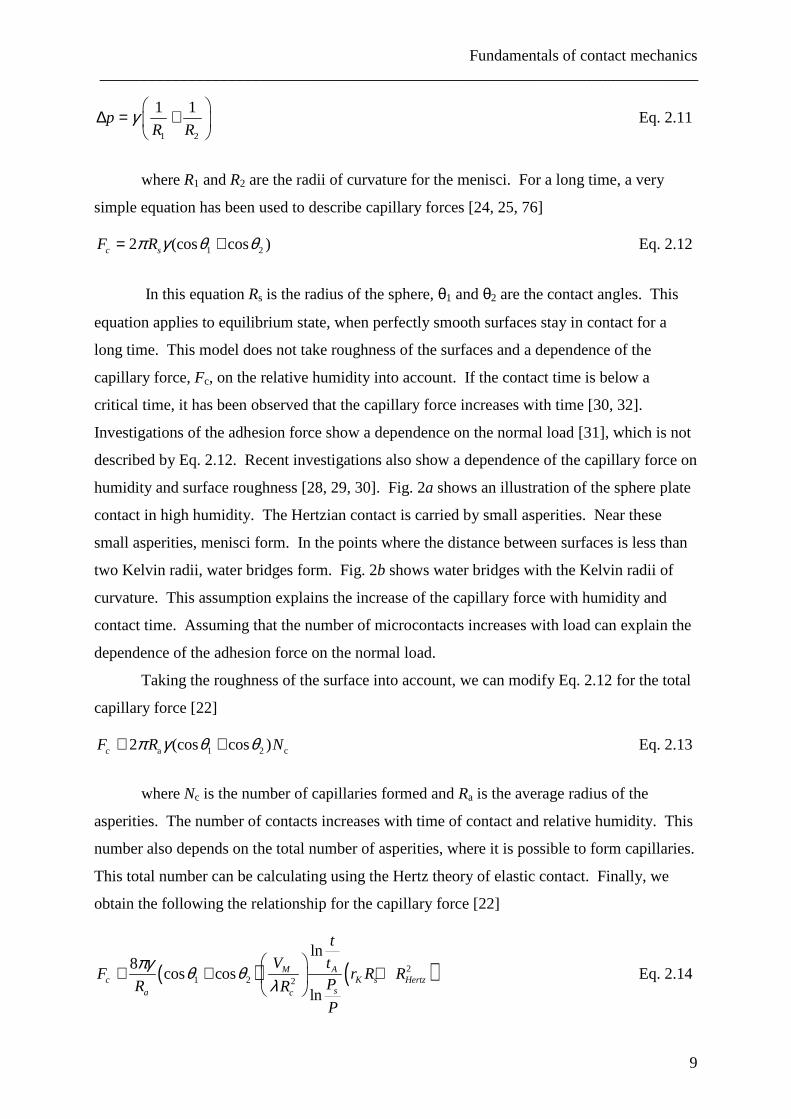
where R1 and R2 are the radii of curvature for the menisci. For a long time, a very
simple equation has been used to describe capillary forces [24, 25, 76]
1 22 (cos cos )c sF Rπ γ θ θ= + Eq. 2.12
In this equation Rs is the radius of the sphere, θ1 and θ2 are the contact angles. This
equation applies to equilibrium state, when perfectly smooth surfaces stay in contact for a
long time. This model does not take roughness of the surfaces and a dependence of the
capillary force, Fc, on the relative humidity into account. If the contact time is below a
critical time, it has been observed that the capillary force increases with time [30, 32].
Investigations of the adhesion force show a dependence on the normal load [31], which is not
described by Eq. 2.12. Recent investigations also show a dependence of the capillary force on
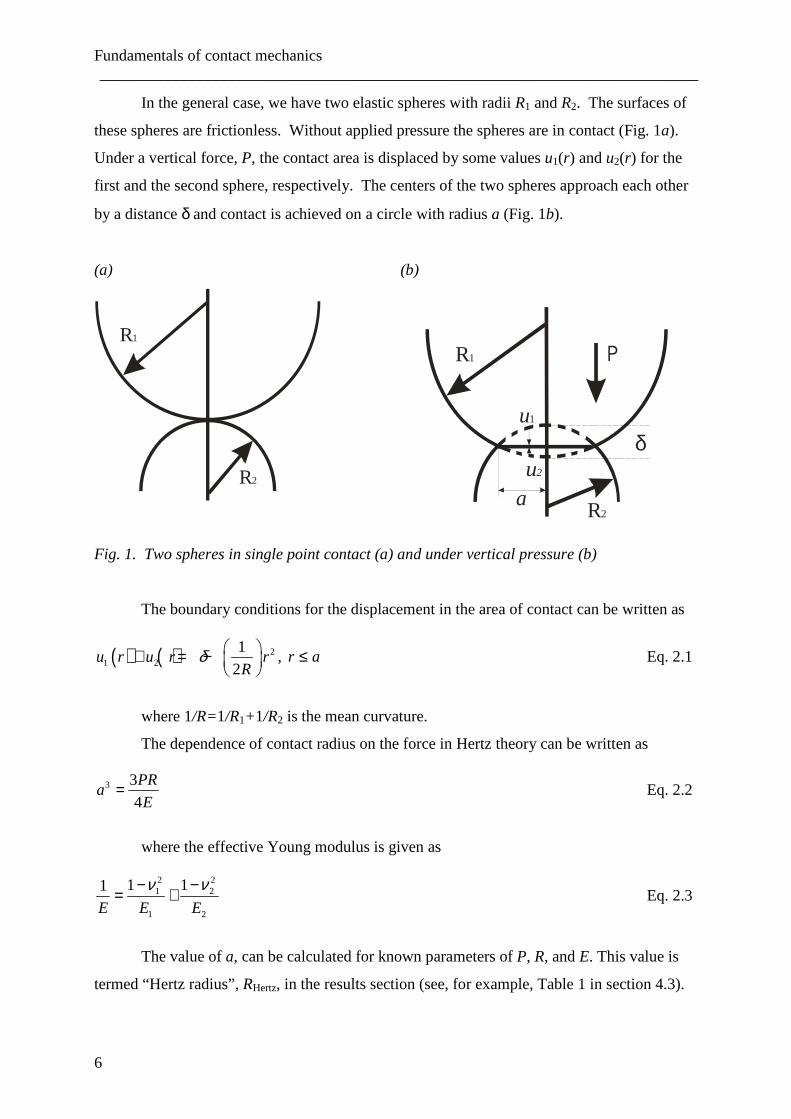
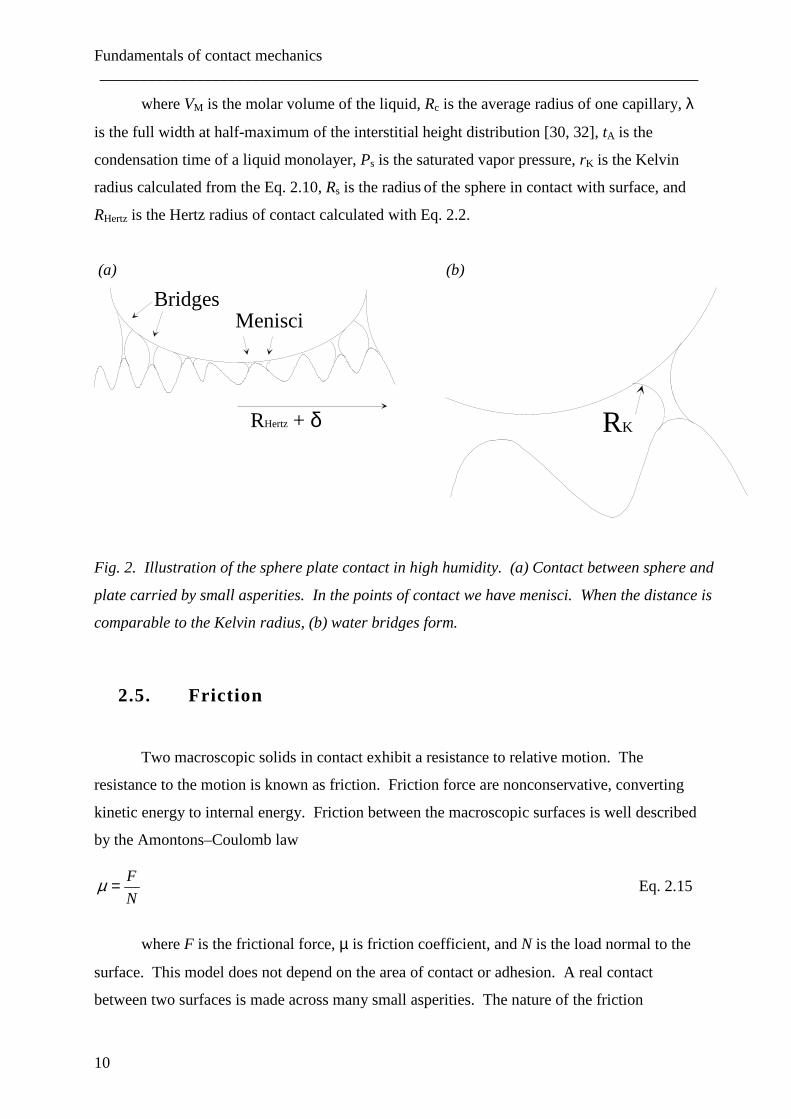
humidity and surface roughness [28, 29, 30]. Fig. 2a shows an illustration of the sphere plate
contact in high humidity. The Hertzian contact is carried by small asperities. Near these
small asperities, menisci form. In the points where the distance between surfaces is less than
two Kelvin radii, water bridges form. Fig. 2b shows water bridges with the Kelvin radii of
curvature. This assumption explains the increase of the capillary force with humidity and
contact time. Assuming that the number of microcontacts increases with load can explain the
dependence of the adhesion force on the normal load.
Taking the roughness of the surface into account, we can modify Eq. 2.12 for the total
capillary force [22]
a 1 2 c2 (cos cos )cF R Nπ γ θ θ≅ + Eq. 2.13
where Nc is the number of capillaries formed and Ra is the average radius of the
asperities. The number of contacts increases with time of contact and relative humidity. This
number also depends on the total number of asperities, where it is possible to form capillaries.
This total number can be calculating using the Hertz theory of elastic contact. Finally, we
obtain the following the relationship for the capillary force [22]
( ) ( )21 2 2
ln8
cos cosln
M Ac K s Hertz
sa c
t
V tF r R R
PR RP
πγ θ θλ
≅ + +
Eq. 2.14
Fundamentals of contact mechanics ___________________________________________________________________________
10
where VM is the molar volume of the liquid, Rc is the average radius of one capillary, λ
is the full width at half-maximum of the interstitial height distribution [30, 32], tA is the
condensation time of a liquid monolayer, Ps is the saturated vapor pressure, rK is the Kelvin
radius calculated from the Eq. 2.10, Rs is the radius of the sphere in contact with surface, and
RHertz is the Hertz radius of contact calculated with Eq. 2.2.
2.5. Friction
Two macroscopic solids in contact exhibit a resistance to relative motion. The
resistance to the motion is known as friction. Friction force are nonconservative, converting
kinetic energy to internal energy. Friction between the macroscopic surfaces is well described
by the Amontons–Coulomb law
F
Nµ = Eq. 2.15
where F is the frictional force, µ is friction coefficient, and N is the load normal to the
surface. This model does not depend on the area of contact or adhesion. A real contact
between two surfaces is made across many small asperities. The nature of the friction
(a)
BridgesMenisci
RHertz + δ
(b)
RK
Fig. 2. Illustration of the sphere plate contact in high humidity. (a) Contact between sphere and
plate carried by small asperities. In the points of contact we have menisci. When the distance is
comparable to the Kelvin radius, (b) water bridges form.
Fundamentals of contact mechanics ___________________________________________________________________________
11
between these small asperities is rather different from macroscopic friction as by the
Amontons–Coulomb law.
Bowden and Tabor [39] have modified the classical Amontons–Coulomb friction law.
They define friction force as the product of a critical stress, σs, and the real area of contact, Σr
s rF σ= Σ Eq. 2.16
Following to the Greenwood–Williamson [5, 82, 89] model, the real area of contact is
proportional to the normal load. There are others models describing friction phenomena.
These take phonon friction (Tomlinson) and electronic friction into account.
In the Tomlinson model [20] friction occurs due to the vibration of the atomic lattice.
The atoms close to surface vibrate when the atoms of the opposite surface slip across. These
phonons dissipate energy, which leads to friction.
Electronic friction can also contribute to the friction force [33, 34, 35, 36, 37]. The
electronic mechanism involves energy transfer to the conduction electrons. Sliding across a
metal substrate causes excitations of the conduction electrons near the interface. The
excitations generate electron–hole pairs. These pairs have very short lifetimes in metals.
When these electron–hole pairs recombine, the excess energy is dissipated as heat.
In order to initiate sliding it is necessary to exert a force. The force that we need to
initiate the sliding is known as the static friction force. This force usually is large than the one
required to keep the surfaces in motion. However, in this situation partial slip occurs. The
region of the slip is confined to the edge. In the central part of the contact we have stick [42].
A phenomenon closely correlated to the static friction is “stick–slip” friction. This
term was first used by Bowden and Tabor [39], when described the relative motion of two
surfaces in the contact. They noted that the motion is controlled by the kinematic friction law
often the surfaces have started slipping. On the contrary, the motion is described by static
friction when the surfaces stick. However, when the relative motion is slow (for example
when an oscillatory motion changes direction) it is necessary to review static and kinematic
models and brings them to a synthesis. Atomic-scale stick–slip friction was first measured
with an AFM by Mate et al. in 1987 [38]. Since 1987, atomic scale stick–slip friction for
different materials has been observed.
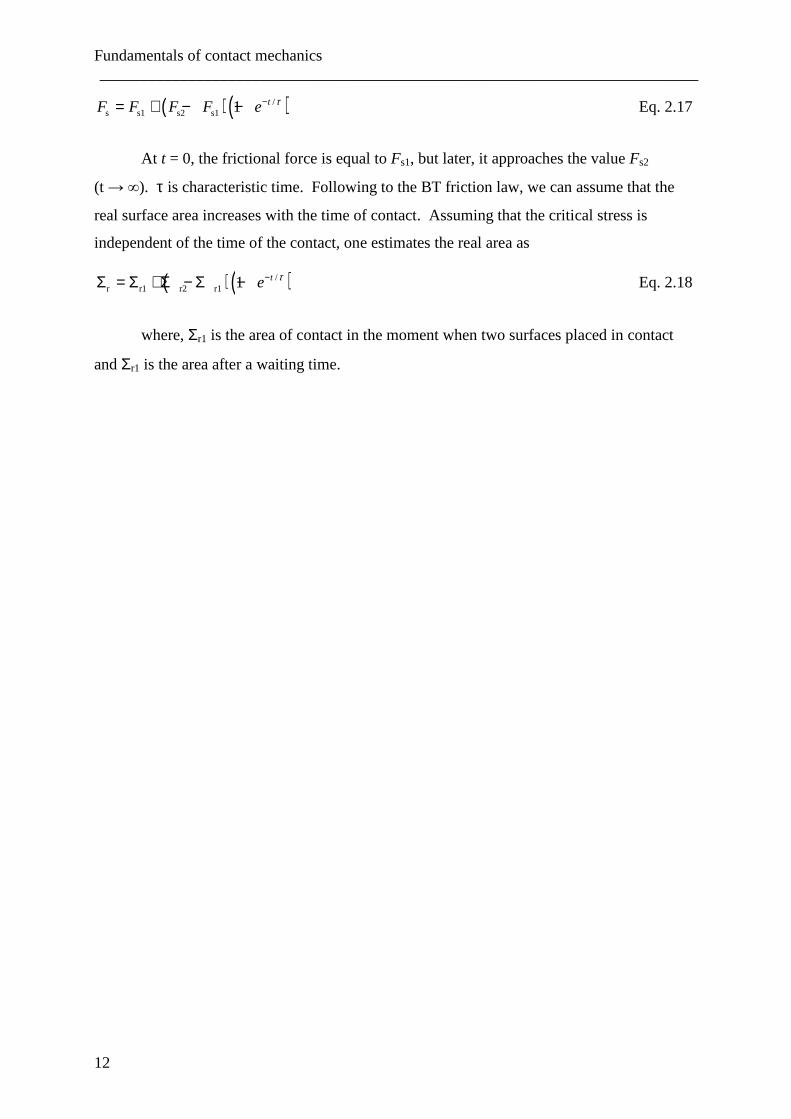
One of the phenomenological theories of the transition from stick–slip motion to
smooth sliding is based on the assumption that the static friction force depends on time [78,
79, 80, 81]
Fundamentals of contact mechanics ___________________________________________________________________________
12
( )( )/s s1 s2 s1 1 tF F F F e τ−= + − − Eq. 2.17
At t = 0, the frictional force is equal to Fs1, but later, it approaches the value Fs2
(t → ∞). τ is characteristic time. Following to the BT friction law, we can assume that the
real surface area increases with the time of contact. Assuming that the critical stress is
independent of the time of the contact, one estimates the real area as
( )( )/r r1 r2 r1 1 te τ−Σ = Σ + Σ − Σ − Eq. 2.18
where, Σr1 is the area of contact in the moment when two surfaces placed in contact
and Σr1 is the area after a waiting time.
The Quartz Crystal Microbalance (QCM) ___________________________________________________________________________
13
3. The Quartz Crystal Microbalance (QCM)
3.1. Introduction
Pierre and Marie Curie showed in 1880 that crystal of Rochelle salt could produce
electricity when pressure was applied [45, 46, 47]. Later, the opposite effect was
demonstrated, as well. The crystal produces a strain upon application of an electric voltage.
These findings were the discovery of the piezoelectric effect. Initially this effect did not
receive much interest. In 1917, almost forty years after its discovery, Paul Langevin
developed the first application of the piezoelectric effect when he constructed an underwater
ultrasonic detector.
Further developments of the quartz crystal devices started in 1934, when the AT-cut
quartz crystal was introduced. The advantage of the AT-cut is that it has nearly zero
frequency shift drift with the temperature around room temperature. In 1959 Sauerbrey
published a paper which showed that the frequency shift of a quartz crystal resonator is
directly proportional to the added mass [48]. Sauerbrey work discovered a new quantitative
tool to measure very small masses.
Nowadays the quartz crystal microbalance (QCM) is a well-known and widely used
instrument to measure film thickness in the nanometer range. However, the quartz crystal
responds to many other physical parameters such as temperature, stress and viscosity. We use
the term QCM in all these applications, even when the device is not used as a balance. The
QCM can be combined with the other technique such as cyclovoltammetry [53], surface
plasmon resonance spectroscopy [49, 50], atomic force microscopy [51, 52], and others. The
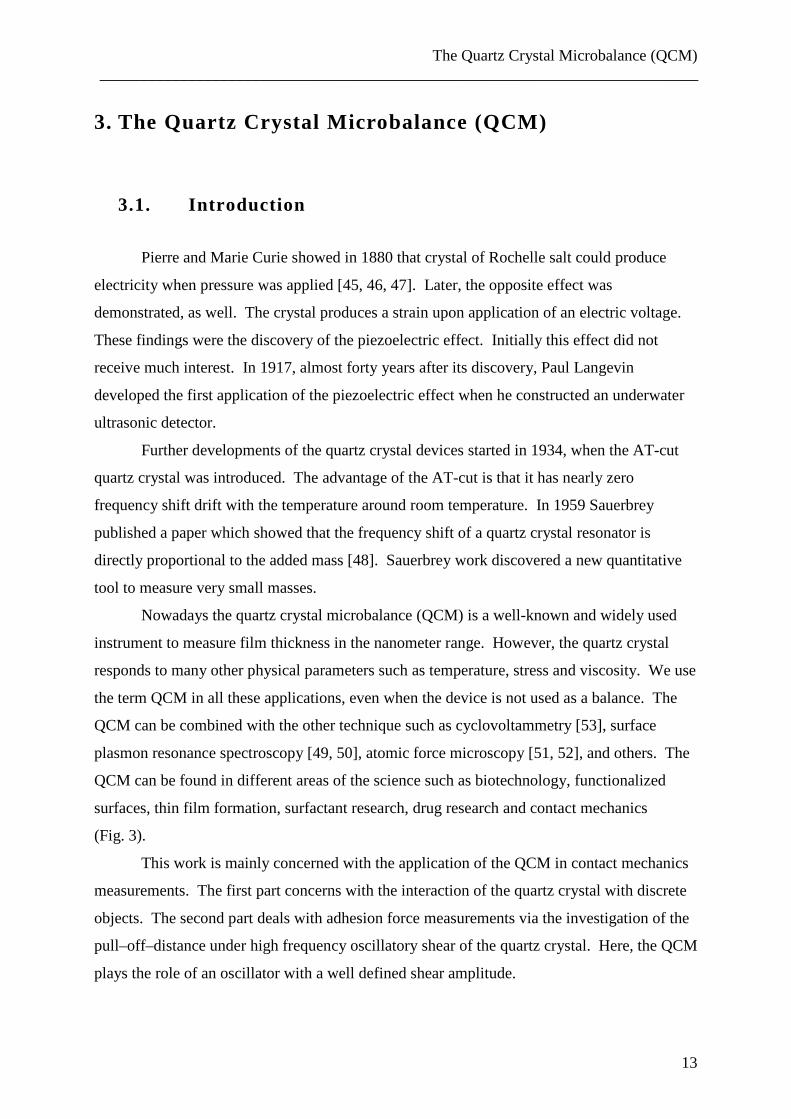
QCM can be found in different areas of the science such as biotechnology, functionalized
surfaces, thin film formation, surfactant research, drug research and contact mechanics
(Fig. 3).
This work is mainly concerned with the application of the QCM in contact mechanics
measurements. The first part concerns with the interaction of the quartz crystal with discrete
objects. The second part deals with adhesion force measurements via the investigation of the
pull–off–distance under high frequency oscillatory shear of the quartz crystal. Here, the QCM
plays the role of an oscillator with a well defined shear amplitude.
The Quartz Crystal Microbalance (QCM) ___________________________________________________________________________
14
QCM
QCM
QCM
QCM
QCM
Mass
Sphere-plate Contact
AFM/ colloidal probeadhesion under HF shear
Colloidal Dispersion
Viscoelastic multilayers
Fig. 3. Different applications of the QCM.
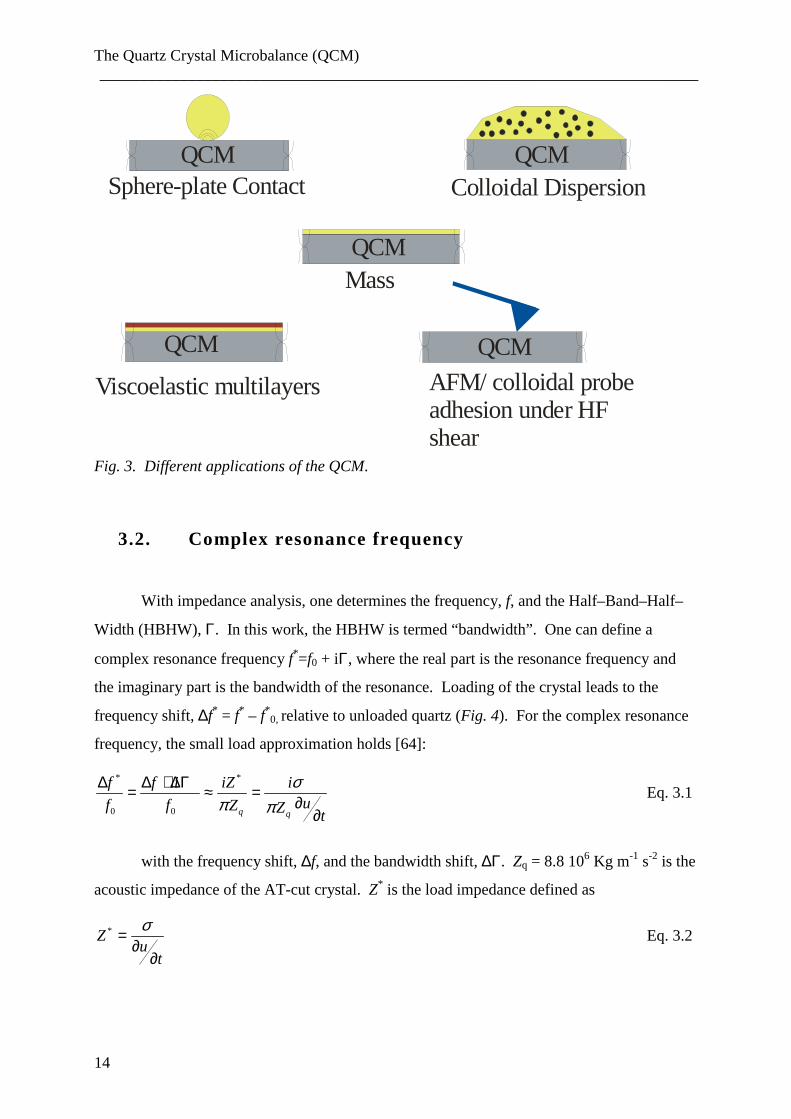
3.2. Complex resonance frequency
With impedance analysis, one determines the frequency, f, and the Half–Band–Half–
Width (HBHW), Γ. In this work, the HBHW is termed “bandwidth”. One can define a
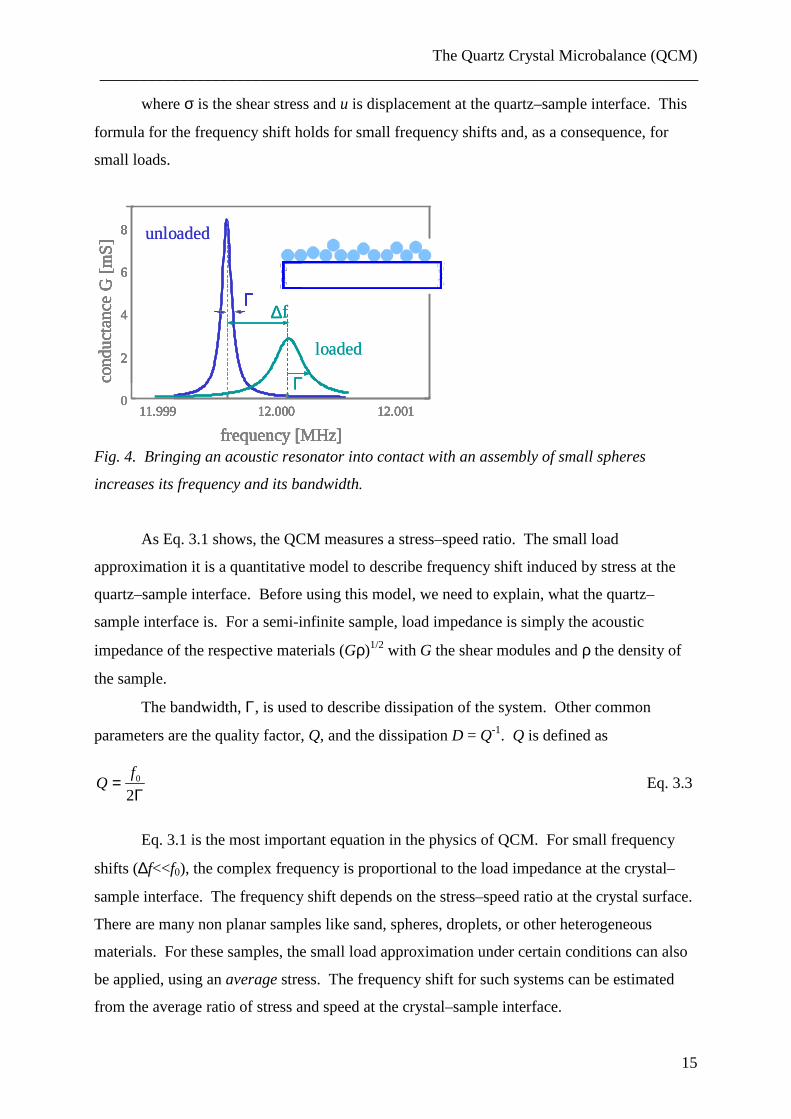
complex resonance frequency f*=f0 + iΓ, where the real part is the resonance frequency and
the imaginary part is the bandwidth of the resonance. Loading of the crystal leads to the
frequency shift, ∆f* = f* – f*0, relative to unloaded quartz (Fig. 4). For the complex resonance
frequency, the small load approximation holds [64]:
* *
0 0 q q
f f i iZ iuf f Z Z t
σπ π
∆ ∆ + ∆Γ= ≈ =∂
∂ Eq. 3.1
with the frequency shift, ∆f, and the bandwidth shift, ∆Γ. Zq = 8.8 106 Kg m-1 s-2 is the
acoustic impedance of the AT-cut crystal. Z* is the load impedance defined as
*Zu
t
σ=∂
∂ Eq. 3.2
The Quartz Crystal Microbalance (QCM) ___________________________________________________________________________
15
where σ is the shear stress and u is displacement at the quartz–sample interface. This
formula for the frequency shift holds for small frequency shifts and, as a consequence, for
small loads.
11.999 12.000 12.0010
2
4
6
8
Γ
cond
ucta
nce G
[mS
]
frequency [MHz]
∆f
Γ
loaded
11.999 12.000 12.0010
2
4
6
8
Γ
cond
ucta
nce G
[mS
]
frequency [MHz]
11.999 12.000 12.0010
2
4
6
8
Γ
unloaded
cond
ucta
nce G
[mS
]
frequency [MHz]
11.999 12.000 12.0010
2
4
6
8
Γ
cond
ucta
nce G
[mS
]
frequency [MHz]
∆f∆f
Γ
loaded
11.999 12.000 12.0010
2
4
6
8
Γ
cond
ucta
nce G
[mS
]
frequency [MHz]
11.999 12.000 12.0010
2
4
6
8
Γ
unloaded
cond
ucta
nce G
[mS
]
frequency [MHz] Fig. 4. Bringing an acoustic resonator into contact with an assembly of small spheres
increases its frequency and its bandwidth.
As Eq. 3.1 shows, the QCM measures a stress–speed ratio. The small load
approximation it is a quantitative model to describe frequency shift induced by stress at the
quartz–sample interface. Before using this model, we need to explain, what the quartz–
sample interface is. For a semi-infinite sample, load impedance is simply the acoustic
impedance of the respective materials (Gρ)1/2 with G the shear modules and ρ the density of
the sample.
The bandwidth, Γ, is used to describe dissipation of the system. Other common
parameters are the quality factor, Q, and the dissipation D = Q-1. Q is defined as
0
2
fQ =
Γ Eq. 3.3
Eq. 3.1 is the most important equation in the physics of QCM. For small frequency
shifts (∆f<<f0), the complex frequency is proportional to the load impedance at the crystal–
sample interface. The frequency shift depends on the stress–speed ratio at the crystal surface.
There are many non planar samples like sand, spheres, droplets, or other heterogeneous
materials. For these samples, the small load approximation under certain conditions can also
be applied, using an average stress. The frequency shift for such systems can be estimated
from the average ratio of stress and speed at the crystal–sample interface.
The Quartz Crystal Microbalance (QCM) ___________________________________________________________________________
16
3.3. The Butterworth-van-Dyke electromechanical
equivalent circuit
An equivalent circuit is a simple graphical representation of the QCM. In physics,
scientists often deal with the different kinds of waves. These can be electrical or mechanical
waves. The easiest resonator in electronics consist of a capacitance, a resistor and a
inductance placed in the series. To describe such system we need to use the Kirchhoff laws.
In mechanics, the equivalent elements for the capacitor, the inductance and the resistor
are the spring, the mass and the dash pot. The ratio of force and speed (speed of the
displacement) is the mechanical impedance.
Using equivalent circuits, we can understand how acoustic phenomena can be
described with the electrical circuit. The force is represented by a voltage and the speed by a
current. The ratio of force and speed is the mechanical impedance.
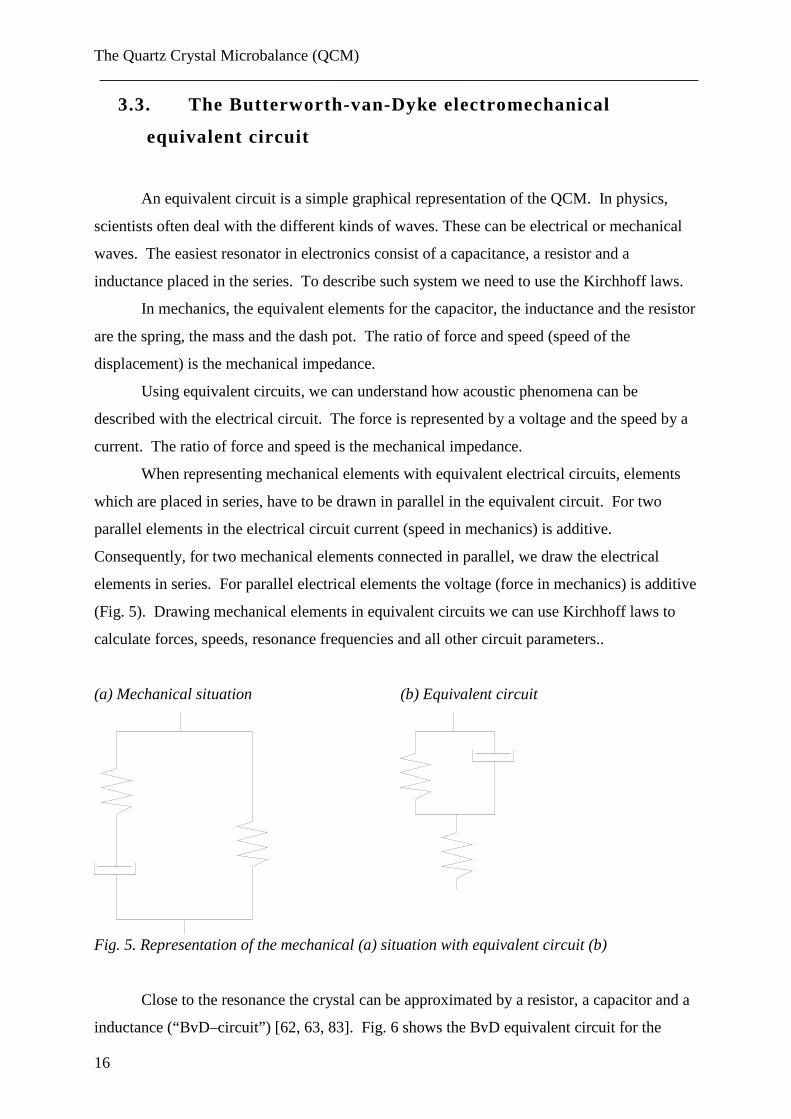
When representing mechanical elements with equivalent electrical circuits, elements
which are placed in series, have to be drawn in parallel in the equivalent circuit. For two
parallel elements in the electrical circuit current (speed in mechanics) is additive.
Consequently, for two mechanical elements connected in parallel, we draw the electrical
elements in series. For parallel electrical elements the voltage (force in mechanics) is additive
(Fig. 5). Drawing mechanical elements in equivalent circuits we can use Kirchhoff laws to
calculate forces, speeds, resonance frequencies and all other circuit parameters..
(a) Mechanical situation
(b) Equivalent circuit
Fig. 5. Representation of the mechanical (a) situation with equivalent circuit (b)
Close to the resonance the crystal can be approximated by a resistor, a capacitor and a
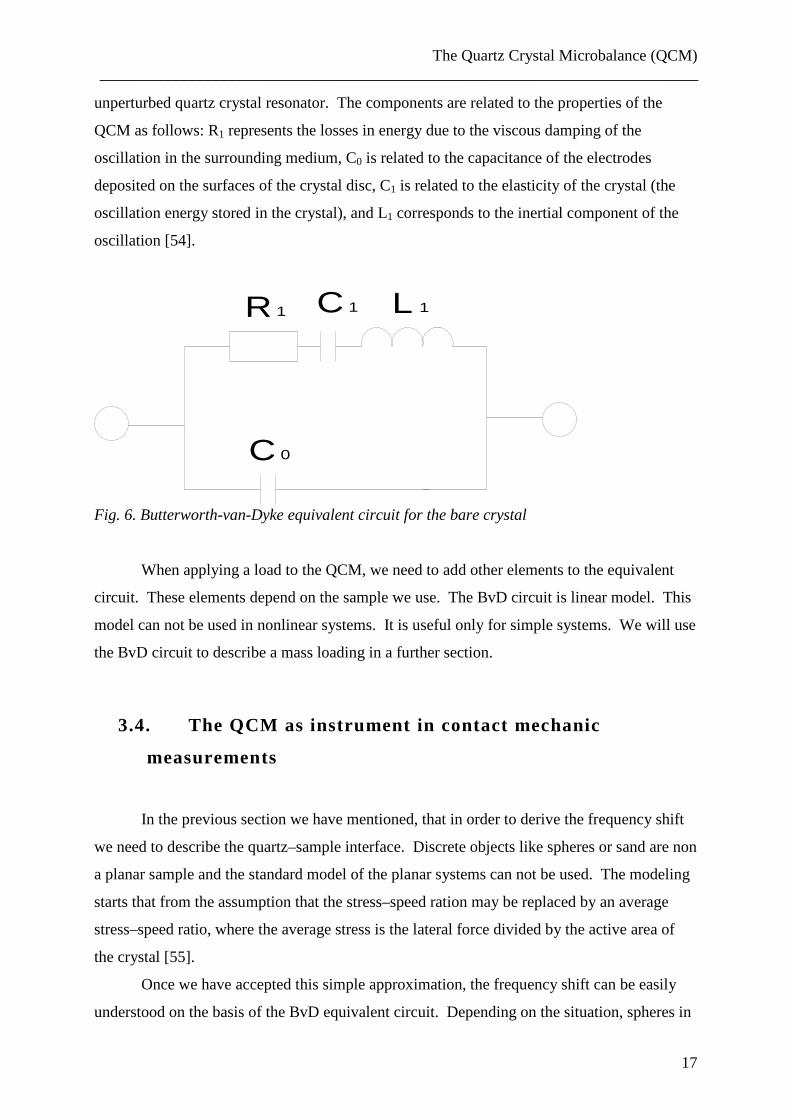
inductance (“BvD–circuit”) [62, 63, 83]. Fig. 6 shows the BvD equivalent circuit for the
The Quartz Crystal Microbalance (QCM) ___________________________________________________________________________
17
unperturbed quartz crystal resonator. The components are related to the properties of the
QCM as follows: R1 represents the losses in energy due to the viscous damping of the
oscillation in the surrounding medium, C0 is related to the capacitance of the electrodes
deposited on the surfaces of the crystal disc, C1 is related to the elasticity of the crystal (the
oscillation energy stored in the crystal), and L1 corresponds to the inertial component of the
oscillation [54].
C 0
R 1 C 1 L 1
Fig. 6. Butterworth-van-Dyke equivalent circuit for the bare crystal
When applying a load to the QCM, we need to add other elements to the equivalent
circuit. These elements depend on the sample we use. The BvD circuit is linear model. This
model can not be used in nonlinear systems. It is useful only for simple systems. We will use
the BvD circuit to describe a mass loading in a further section.
3.4. The QCM as instrument in contact mechanic
measurements
In the previous section we have mentioned, that in order to derive the frequency shift
we need to describe the quartz–sample interface. Discrete objects like spheres or sand are non
a planar sample and the standard model of the planar systems can not be used. The modeling
starts that from the assumption that the stress–speed ration may be replaced by an average
stress–speed ratio, where the average stress is the lateral force divided by the active area of
the crystal [55].
Once we have accepted this simple approximation, the frequency shift can be easily
understood on the basis of the BvD equivalent circuit. Depending on the situation, spheres in
The Quartz Crystal Microbalance (QCM) ___________________________________________________________________________
18
contact with the quartz crystal can be represented with a mass, a spring, a dash pot or with a
combination of these elements. More information about the sphere–plate contact are given in
reference [55]. There we are only interested in heavy objects in contact with the crystal.
Such systems can be described with the Dybwad model [57]. This is the model of a spring in
parallel with dashpot attached to a solid wall. The heavy mass behaves like a solid wall in
this model. One more model will be used to describe the sphere–plate contact. This is the
Mindlin model of partial slip. Actually, this is a nonlinear model and cannot be described in
terms of BvD circuit. It is impossible to describe nonlinear behavior with such simple
elements like the spring, the dash pot or the mass.
3.5. Dybwad model
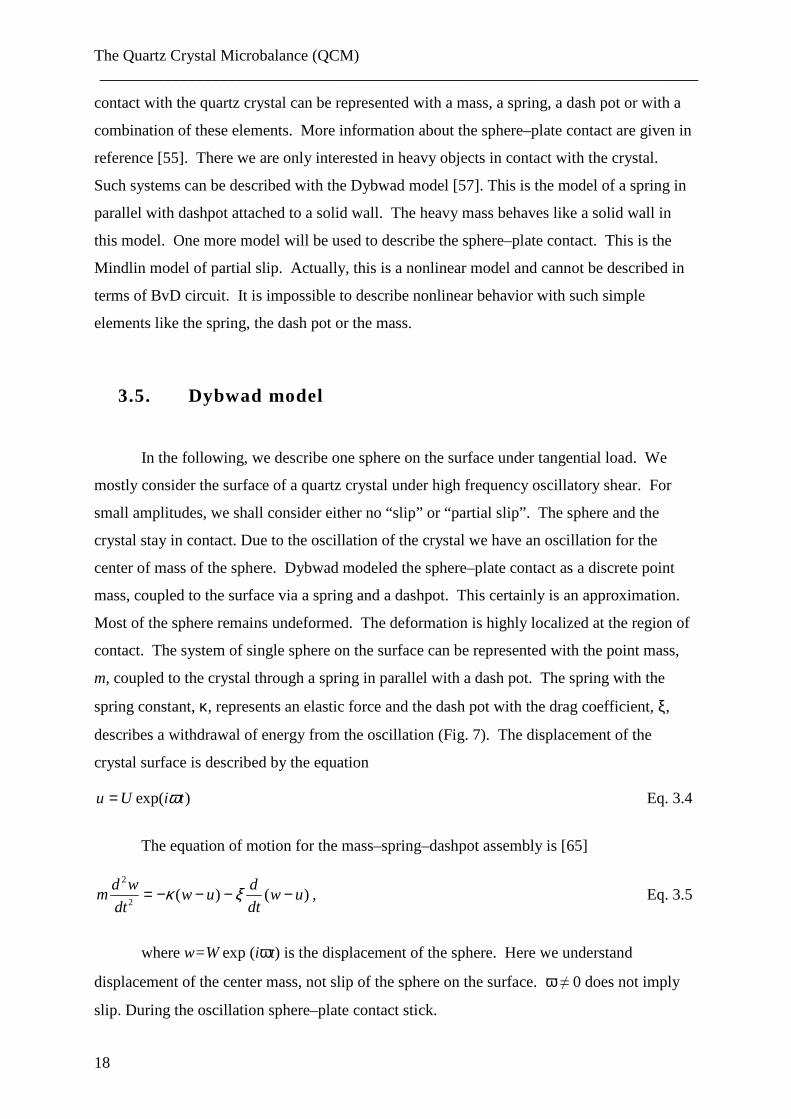
In the following, we describe one sphere on the surface under tangential load. We
mostly consider the surface of a quartz crystal under high frequency oscillatory shear. For
small amplitudes, we shall consider either no “slip” or “partial slip”. The sphere and the
crystal stay in contact. Due to the oscillation of the crystal we have an oscillation for the
center of mass of the sphere. Dybwad modeled the sphere–plate contact as a discrete point
mass, coupled to the surface via a spring and a dashpot. This certainly is an approximation.
Most of the sphere remains undeformed. The deformation is highly localized at the region of
contact. The system of single sphere on the surface can be represented with the point mass,
m, coupled to the crystal through a spring in parallel with a dash pot. The spring with the
spring constant, κ, represents an elastic force and the dash pot with the drag coefficient, ξ,
describes a withdrawal of energy from the oscillation (Fig. 7). The displacement of the
crystal surface is described by the equation
exp( )u U i tω= Eq. 3.4
The equation of motion for the mass–spring–dashpot assembly is [65]
2
2( ) ( )
d w dm w u w u
dtdtκ ξ= − − − − , Eq. 3.5
where w=W exp (iωt) is the displacement of the sphere. Here we understand
displacement of the center mass, not slip of the sphere on the surface. ω ≠ 0 does not imply
slip. During the oscillation sphere–plate contact stick.
The Quartz Crystal Microbalance (QCM) ___________________________________________________________________________
19
(a)
u(t)
w(t)m
(b)
m
κξ
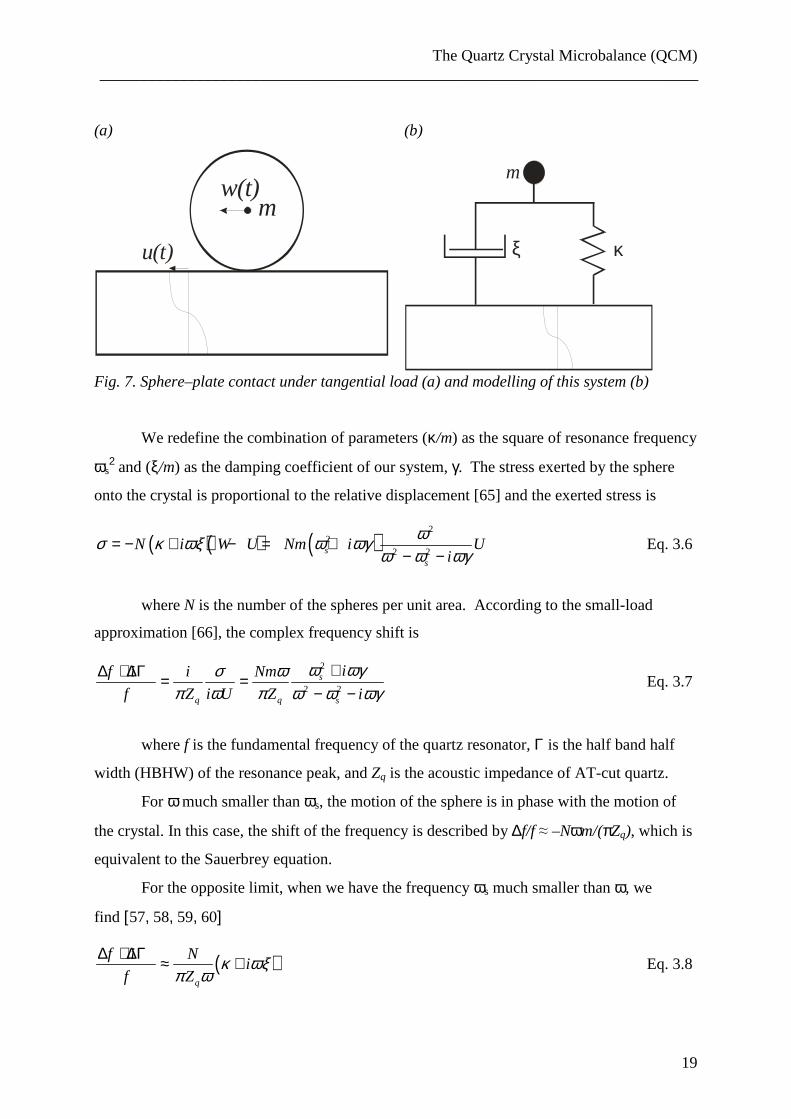
Fig. 7. Sphere–plate contact under tangential load (a) and modelling of this system (b)
We redefine the combination of parameters (κ/m) as the square of resonance frequency
ωs2 and (ξ/m) as the damping coefficient of our system, γ. The stress exerted by the sphere
onto the crystal is proportional to the relative displacement [65] and the exerted stress is
( ) ( ) ( )2
22 2s
s
N i W U Nm i Ui
ωσ κ ωξ ω ωγω ω ωγ
= − + − = +− −
Eq. 3.6
where N is the number of the spheres per unit area. According to the small-load
approximation [66], the complex frequency shift is
2
2 2s
q q s
if i i Nm
f Z i U Z i
ω ωγσ ωπ ω π ω ω ωγ
+∆ + ∆Γ = =− −
Eq. 3.7
where f is the fundamental frequency of the quartz resonator, Γ is the half band half
width (HBHW) of the resonance peak, and Zq is the acoustic impedance of AT-cut quartz.
For ω much smaller than ωs, the motion of the sphere is in phase with the motion of
the crystal. In this case, the shift of the frequency is described by ∆f/f ≈ –Nωm/(πZq), which is
equivalent to the Sauerbrey equation.
For the opposite limit, when we have the frequency ωs much smaller than ω, we
find [57, 58, 59, 60]
( )q
f i Ni
f Zκ ωξ
π ω∆ + ∆Γ ≈ + Eq. 3.8
The Quartz Crystal Microbalance (QCM) ___________________________________________________________________________
20
For ωs<<ω, the mass is too large to move with the crystal. The center of the mass
nearly stays in place and does not take part in the oscillation. Frequency shift and HBHW are
proportional to the spring and drag coefficient, respectively. Equation Eq. 3.8 predicts a
positive frequency shift and a positive shift of the bandwidth.
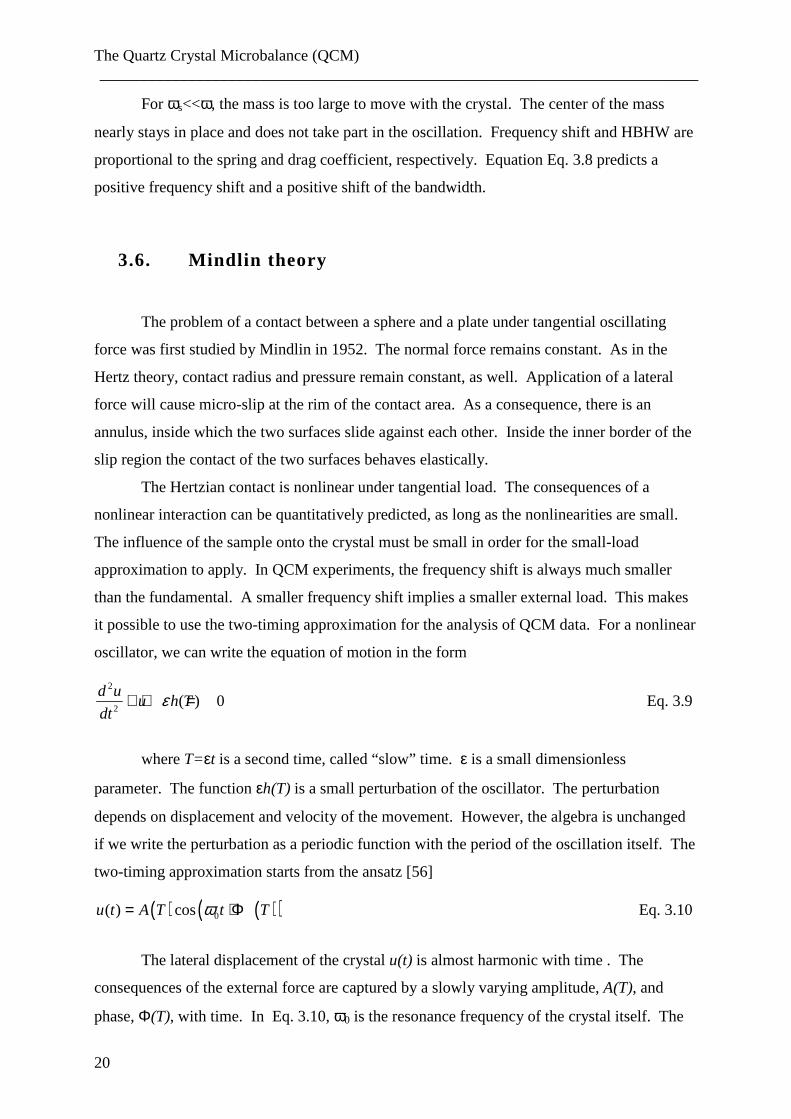
3.6. Mindlin theory
The problem of a contact between a sphere and a plate under tangential oscillating
force was first studied by Mindlin in 1952. The normal force remains constant. As in the
Hertz theory, contact radius and pressure remain constant, as well. Application of a lateral
force will cause micro-slip at the rim of the contact area. As a consequence, there is an
annulus, inside which the two surfaces slide against each other. Inside the inner border of the
slip region the contact of the two surfaces behaves elastically.
The Hertzian contact is nonlinear under tangential load. The consequences of a
nonlinear interaction can be quantitatively predicted, as long as the nonlinearities are small.
The influence of the sample onto the crystal must be small in order for the small-load
approximation to apply. In QCM experiments, the frequency shift is always much smaller
than the fundamental. A smaller frequency shift implies a smaller external load. This makes
it possible to use the two-timing approximation for the analysis of QCM data. For a nonlinear
oscillator, we can write the equation of motion in the form
2
2( ) 0
d uu h T
dtε+ + = Eq. 3.9
where T=εt is a second time, called “slow” time. ε is a small dimensionless
parameter. The function εh(T) is a small perturbation of the oscillator. The perturbation
depends on displacement and velocity of the movement. However, the algebra is unchanged
if we write the perturbation as a periodic function with the period of the oscillation itself. The
two-timing approximation starts from the ansatz [56]
( ) ( )( )0( ) cosu t A T t Tω= + Φ Eq. 3.10
The lateral displacement of the crystal u(t) is almost harmonic with time . The
consequences of the external force are captured by a slowly varying amplitude, A(T), and
phase, Φ(T), with time. In Eq. 3.10, ω0 is the resonance frequency of the crystal itself. The
The Quartz Crystal Microbalance (QCM) ___________________________________________________________________________
21
shift in the bandwidth is proportional to the “slow” time derivative of the amplitude and the
frequency shift is proportional to the “slow” time derivative of the phase. Using perturbation
theory, one arrives at the following time–averaged equations [59, 61]
( )
( )
02
02
1 1( )cos( )
2 ( )
1 1( )sin( )
2 ( ) ( )
eff q
eff q
d Tf h t t
dT A T A Z
dA Th t t
A T dT A T A Z
ωπ π
ωπ π
Φ∆ = = −
∆Γ = − = − Eq. 3.11
The angular brackets denote that the average over an entire period of oscillation. We
shall consider an oscillating tangential force of amplitude ±F applied to our sphere in contact.
The first application of normal force in a positive direction will cause micro-slip in the rim
c ≤ r ≤ a of the sphere plate contact. a is the Hertz radius of contact. The parameter c is given
by [67]
1/ 3
1s
c F
a Pµ
= −
Eq. 3.12
with µs the static friction coefficient and P normal force. The tangential displacement,
u(t), during unloading is given by [67]
( ) ( )
( )
2 23 3
2 23 3
32 1 1 1
8 2
32 1 1 1
2 2
S
eff S S
SS S
F F tµ P Fu t
aG µ P µ P
F F t F
µ P µ P
− = − − − −
− = λ − − − −
Eq. 3.13
where Geff=2((2-ν1)/G1+(2-ν2)/G2))-1 is an effective modulus. G and ν are the shear
modulus and Poisson ratio, respectively. When the tangential force is completely reversed, (F
= –F in equation Eq. 3.13) the relative displacement changes sign. The characteristic length
λs=µsP/(4aGeff), is defined in analogy to the elastic length used by Paris group to describe
multiasperity contacts. The elastic length is λ=P/κ [70, 71, 72]. The tangential displacement
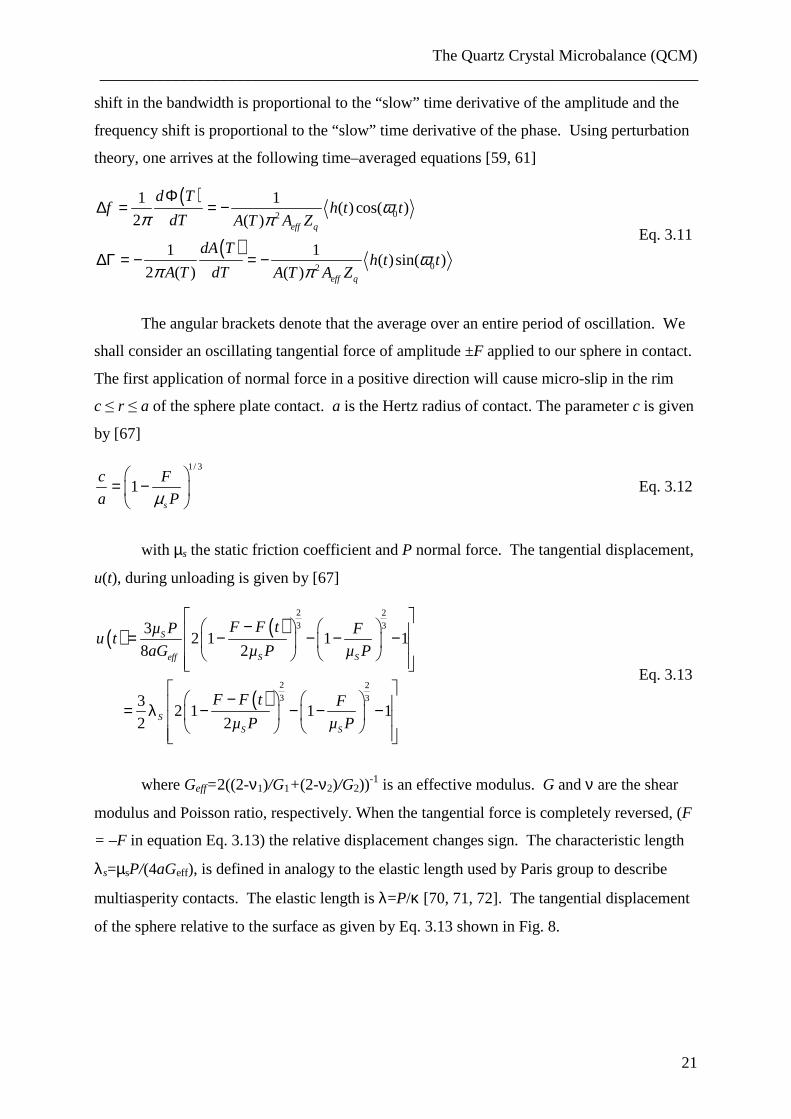
of the sphere relative to the surface as given by Eq. 3.13 shown in Fig. 8.
The Quartz Crystal Microbalance (QCM) ___________________________________________________________________________
22
F
u
Fig. 8. Load–displacement cycle of the sphere–plate contact under oscillating tangential
load.
The energy dissipation per cycle is the area inside the hysteretic loop. This energy
does not depend on the frequency. However, it does depend on the amplitude of motion.
Since we are working in small load regime, the force in the contact area only weakly
perturbs the motion of the quartz crystal surface. The displacement, u(t), is sinusoidal with
time and mainly governed by the dynamics of the crystal. The lateral force, F(t), can be
calculated by inversion of Eq. 3.13 and we obtain:
( )3
2 231 2 ( )
2 1 132S S S S
F t F u t F
µ P µ P µ P
= − + + + − λ
Eq. 3.14
Substituting Eq. 3.14 into Eq. 3.11 and performing the integration, we find frequency
shift, ∆f, and HBHW, ∆Γ, as a function of the amplitude of motion:
0,41 1 1 11 1
6 6eff M
f eff q S eff q S
aGf A A
f A Z A Z
κ ∆ ≈ − = − π ω λ π ω λ Eq. 3.15
0,1 2
9M
soundf eff q S
A
f A Z
κ∆Γ ≈ ∆Γ +π ω π λ
Eq. 3.16
To perform the analytical integration, we have use the small amplitude limit
(u(t)<<λs). The details of these calculations can be found in reference [73].
Value of 4aGeff can be defined as the spring constant in the small amplitude limit κ0,M.
κ0,M is experimentally available via the frequency shift, ∆f. Making assumption on Geff, one
The Quartz Crystal Microbalance (QCM) ___________________________________________________________________________
23
calculates a contact radius based on this relation. This radius is termed “Mindlin radius”,
RMindlin, in the results section (see, for example, Table 2 in section 4.34.6). ∆Γsound is the
dissipation caused by radiation of the sound into the sphere. Frequency shift and bandwidth
vary linear with the amplitude. The system can not be represented with discrete elements like
a spring or a dashpot.
In the low amplitude limit the slope in the plot of ∆f versus amplitude A is given by
ffκ0,M/(6AeffZqπωλs). λs, in turn, is given by µsP/(4aGeff). Science all parameters other than µs
are known, one can calculate the static friction coefficient, µs, from the plot of ∆f vs A (see,
for example, Table 2 in section 4.7).
As Bowden and Tabor have emphasized, an understanding of friction phenomena must
include the microscopic scale [77]. Since the contact is usually made across small asperities,
the true contact area is much smaller than the apparent contact area. What appears as steady
sliding, macroscopically, may be a succession of sticking and detachment events on the local
scale. Following Boden and Tabor, one expresses the friction force F|| as F|| = σ|| Σr, where σ||
is a critical stress and Σr is the real area of contact. In particular, the static friction coefficient
describing the onset of sliding is higher than the dynamic friction coefficient.
The static friction coefficient as derived with the Mindlin model is µs=λs 4 a Geff /
Fnormal , where a is radius of the contact and proportional to the frequency shift, ∆f0. λs does
not depend from the amplitude. It is calculated from the linear fit to the experimental data.
Obviously, it depends on the slope of the frequency shift curve (see, for example, Fig. 10).
Hence, the static friction coefficient depends on the square root on the area of contact, not on
the area itself. Therefore, this is in discrepancy with the model of Bowden and Tabor.
Contact mechanics measurements via the drive level dependence of ∆f and ∆Γ ___________________________________________________________________________
24
4. Contact mechanics measurements via the drive level
dependence of ∆∆∆∆f and ∆Γ∆Γ∆Γ∆Γ
4.1. Introduction
Contact mechanics has been studied for a long time. Understanding and controlling
friction and adhesion between the solids has been a topic of research for hundreds of years. In
the last years we have seen a great development in nano techniques. On the nanoscale or the
atomic scale, physical properties have a different character in the bulk.
This study is primary motivated by the interest in the fundamentals of friction and it
dependence on humidity. We study sphere plate contacts under high frequency oscillatory
shear. Small spheres were placed onto the front electrode of a quartz crystal resonator. The
Mindlin model of partial slip is in a good agreement with the results which we find in drive
level experiments. In this model the transition from static friction to sliding is continuous.
Application of a tangential oscillatory force, induces a stress concentration at the rim of the
contact area. As a consequence, there is the area at the rim of contact, in which two surfaces
slide against each other. This phenomenon is called “partial slip”.
In this part of the work we compare the experimental results, analyzed in the
framework of Mindlin model, with the Hertz model of elastic contact between sphere and
plate. The Mindlin model predicts real area of the sphere plate contact from the experimental
data. From our results section the real area is always smaller than what one calculates from
the Hertz theory. In the results we the describe influence of the high frequency oscillatory
motion onto the strength of the sphere–plate contact.
As a new effect, we describe the strengthening of the contact after dry–humid–dry
cycle. This effect is termed sandcastle effect. In the sandcastle effect, menisci form in the
contact area in high humidity. Finally, with the drying of the liquid, capillary forces
elastically deform the surfaces. The area of the contact becomes much larger it was initially.
The sandcastle effect was observed for the different environments.
Contact mechanics measurements via the drive level dependence of ∆f and ∆Γ ___________________________________________________________________________
25
4.2. Experimental details
The experiments were performed with AT-cut quartz crystals with a size of 1 inch and
a fundamental frequency of 5 MHz (Maxtek Inc., Santa Fe Springs, CA). The crystals were
coated with gold electrodes and mounted in a home-built holder. Frequency and bandwidth
were determined by impedance analysis with an accuracy in the determination of the
resonance frequency below 1 Hz. The coupling between mechanical displacement and
electrical potential in the piezoelectric quartz makes it possible to measure the current through
the electrodes (that is, the conductance) instead of measuring mechanical oscillations. It is
convenient to use an equivalent circuit model to describe the electrical behavior of the QCM.
In our experiments, a network analyser (HP E5100A, HEWLETT PACKARD) sweeps the
frequency across the resonance and determines the admittance, Y(ω). With impedance
analysis, both frequency and bandwidth were determined for the different overtones. Usually,
no more than two overtones were used. All experiments were conducted at room temperature
without temperature control.
The drive level dependence (DLD) measurements were performed in the range of
drive power from –55 dBm to the +22 dBm (where 0 dBm corresponds to a power of 1mW).
The conversion between electrical power in units of dBm to the driving voltage across the
electrodes is Uel=0.317 10(power[dBm]/20) [40]. The relation between the amplitude, A, of
oscillation and driving voltage is given by
262
4
( ) eld QUn
Aπ
= Eq. 4.1
where n is the overtone order, d26 is the piezoelectric coefficient, and Q is the quality
factor (Eq. 3.3). To control the humidity, the quartz crystal was placed inside a plastic box.
The humidity was measured with a portable humidity temperature sensor (Rotronic A1H,
HYGROMETER). To increase the humidity inside the plastic box, we used wet filter paper
soaked in water. A fan was used to induce convection. A powder of phosphorous pentoxide
(P2O5) was used to induce dry conditions inside the plastic box.
As samples for the DLD measurements we used glass spheres. The spheres used in
the experiments had four different ranges of diameter (100–112µm, 193–225 µm, and
674–746 µm). The spheres were mounted to a metal substrate with the double sided tape (see
Fig. 9). The soft backing ensures that all spheres come into contact with the crystal, when this
assembly is placed onto the crystal. The number of spheres depends on their size. For the
Contact mechanics measurements via the drive level dependence of ∆f and ∆Γ ___________________________________________________________________________
26
biggest one we have used fewer spheres than for the smaller glass spheres. The mass of such
a system is about 1g.
Fig. 9. Schematic image of the sample with the spheres.
To understand the behavior of the assembly of the spheres, we have performed a series
of experiments with a single Si3N4 sphere. We have used spheres with a size of 4.76 mm and
6 mm.
In our experiments we have made drive level measurements in a dry–humid–dry cycle.
Dry–humid–dry cycle means that we have three stage of our experiment:
� Three or four drive level measurements in dry conditions. The humidity inside
the plastic box with quartz crystal and sample is lower that 15 %rH. These
experiments are performed with increasing maximal drive level.
� Two or three experiments under high humidity conditions (> 70 %rH ). These
two or three experiments are performed with the different maximum drive
levels and, as a consequence, different maximum amplitudes.
� Drying the plastic box with quartz crystal and sample. The humidity is lower
than 30 %rH. Several experiments with the different maximum amplitude are
performed.
The most interesting effect takes place during drying of the sphere–plate contact. For
this reason we have made several experiments, where we have placed a liquid droplet on the
top of quartz crystal surface. Afterwards we immersed the sample into this droplet. In this
way, the sphere–plate contact is totally wet. Drive level measurements were performed from
wet conditions until the sphere–plate contact was totally dry.
In our experiments we have used water and organic liquids such as acetone and
ethanol to create a wet sphere–plate contact.
Contact mechanics measurements via the drive level dependence of ∆f and ∆Γ ___________________________________________________________________________
27
4.3. Single sphere contact
In order to better understand the mechanism of partial slip and the sandcastle effect,
we have performed a series of measurements with a single Si3N4 sphere. We have used
spheres with a diameter of 4.76 mm and 6 mm. For reasons of cleanliness, thermal stability,
and control of humidity, the setup was enclosed in a plastic box.
Before the start of the measurement, we determined the reference state for the bare
crystal at a drive level 0 dBm. The relative humidity inside the box was about 9%.
Then we placed a single sphere on the top of crystal surface and waited for 12 hours,
before we started the measurements. The reason for this was to exclude a time dependence of
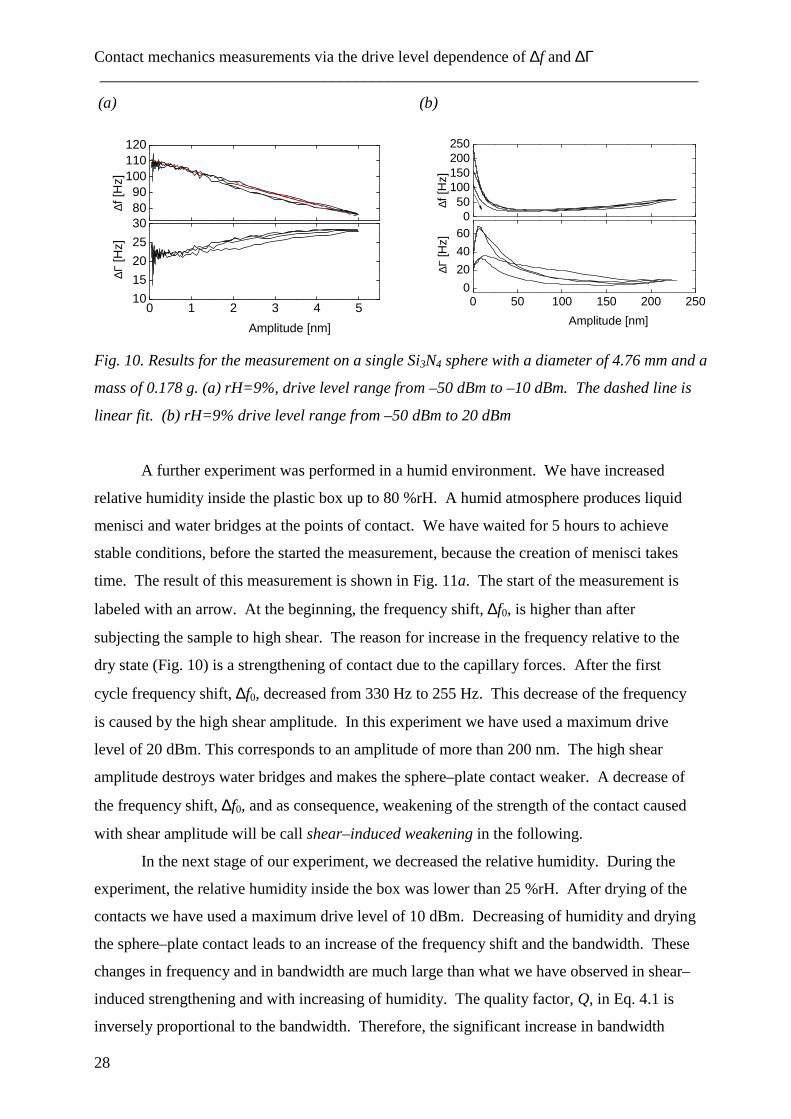
contact strengthening. Fig. 10a and b show the result. These two measurements differ in the
maximum drive level. In the experiments shown in Fig. 10a we have used a maximum drive
level of –10 dBm. This drive level corresponds to the maximum amplitude about 5 nm. With
this amplitude, there is no increase in frequency shift, ∆f0, during the drive level cycle. In the
case of a maximal drive level of 20 dBm, we reach an amplitude of shear motion of more than
200 nm. After the first cycle, the frequency shift, ∆f0, increases from 100 Hz to 225 Hz. The
results are shown Fig. 10b. The arrow labels the direction of the drive level sweep. An
increase in the frequency shift, ∆f0, corresponds to an increase of the Mindlin radius of contact
and, as a consequence, an increase of strength of the sphere–plate contact. This strengthening
is caused by the high-amplitude shear motion. In the following we will call this effect shear-
induced strengthening of the contact.
Contact mechanics measurements via the drive level dependence of ∆f and ∆Γ ___________________________________________________________________________
28
(a)
8090
100110120
0 1 2 3 4 510
15
20
25
30
∆f [H
z]
∆Γ [H
z]
Amplitude [nm]
(b)
050
100150200250
0 50 100 150 200 2500
20
40
60
∆f [H
z]
∆Γ [H
z]
Amplitude [nm]
Fig. 10. Results for the measurement on a single Si3N4 sphere with a diameter of 4.76 mm and a
mass of 0.178 g. (a) rH=9%, drive level range from –50 dBm to –10 dBm. The dashed line is
linear fit. (b) rH=9% drive level range from –50 dBm to 20 dBm
A further experiment was performed in a humid environment. We have increased
relative humidity inside the plastic box up to 80 %rH. A humid atmosphere produces liquid
menisci and water bridges at the points of contact. We have waited for 5 hours to achieve
stable conditions, before the started the measurement, because the creation of menisci takes
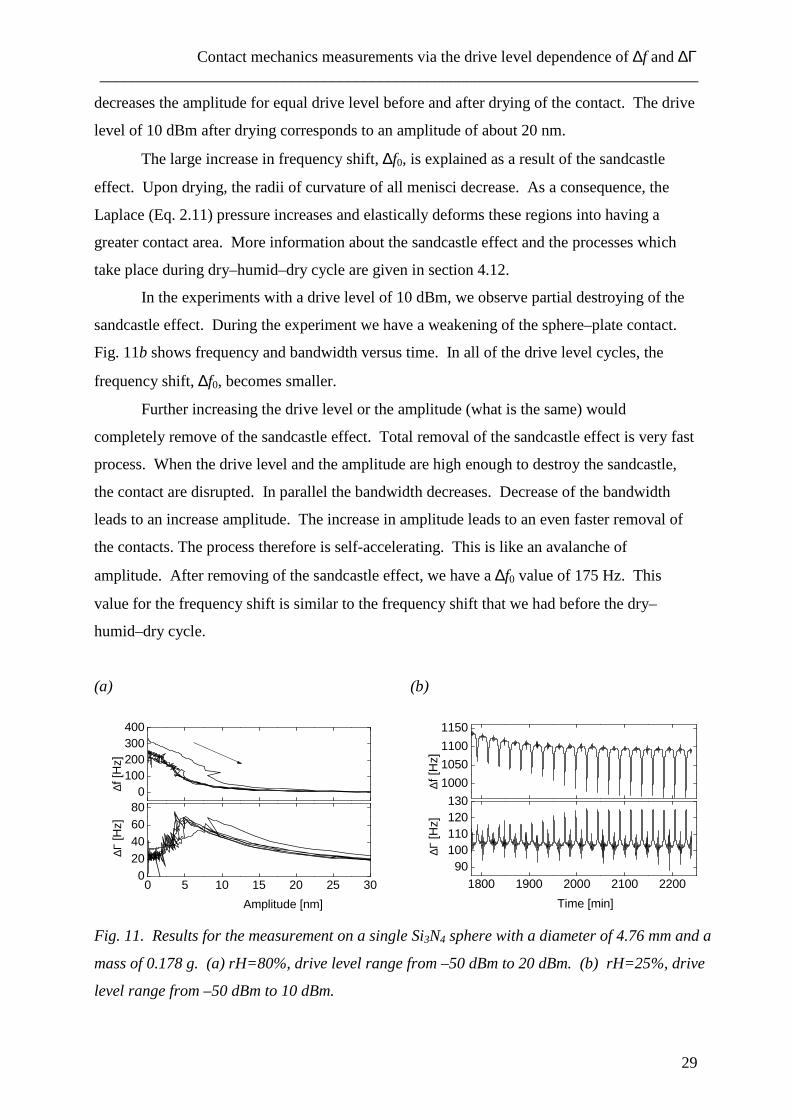
time. The result of this measurement is shown in Fig. 11a. The start of the measurement is
labeled with an arrow. At the beginning, the frequency shift, ∆f0, is higher than after
subjecting the sample to high shear. The reason for increase in the frequency relative to the
dry state (Fig. 10) is a strengthening of contact due to the capillary forces. After the first
cycle frequency shift, ∆f0, decreased from 330 Hz to 255 Hz. This decrease of the frequency
is caused by the high shear amplitude. In this experiment we have used a maximum drive
level of 20 dBm. This corresponds to an amplitude of more than 200 nm. The high shear
amplitude destroys water bridges and makes the sphere–plate contact weaker. A decrease of
the frequency shift, ∆f0, and as consequence, weakening of the strength of the contact caused
with shear amplitude will be call shear–induced weakening in the following.
In the next stage of our experiment, we decreased the relative humidity. During the
experiment, the relative humidity inside the box was lower than 25 %rH. After drying of the
contacts we have used a maximum drive level of 10 dBm. Decreasing of humidity and drying
the sphere–plate contact leads to an increase of the frequency shift and the bandwidth. These
changes in frequency and in bandwidth are much large than what we have observed in shear–
induced strengthening and with increasing of humidity. The quality factor, Q, in Eq. 4.1 is
inversely proportional to the bandwidth. Therefore, the significant increase in bandwidth
Contact mechanics measurements via the drive level dependence of ∆f and ∆Γ ___________________________________________________________________________
29
decreases the amplitude for equal drive level before and after drying of the contact. The drive
level of 10 dBm after drying corresponds to an amplitude of about 20 nm.
The large increase in frequency shift, ∆f0, is explained as a result of the sandcastle
effect. Upon drying, the radii of curvature of all menisci decrease. As a consequence, the
Laplace (Eq. 2.11) pressure increases and elastically deforms these regions into having a
greater contact area. More information about the sandcastle effect and the processes which
take place during dry–humid–dry cycle are given in section 4.12.
In the experiments with a drive level of 10 dBm, we observe partial destroying of the
sandcastle effect. During the experiment we have a weakening of the sphere–plate contact.
Fig. 11b shows frequency and bandwidth versus time. In all of the drive level cycles, the
frequency shift, ∆f0, becomes smaller.
Further increasing the drive level or the amplitude (what is the same) would
completely remove of the sandcastle effect. Total removal of the sandcastle effect is very fast
process. When the drive level and the amplitude are high enough to destroy the sandcastle,
the contact are disrupted. In parallel the bandwidth decreases. Decrease of the bandwidth
leads to an increase amplitude. The increase in amplitude leads to an even faster removal of
the contacts. The process therefore is self-accelerating. This is like an avalanche of
amplitude. After removing of the sandcastle effect, we have a ∆f0 value of 175 Hz. This
value for the frequency shift is similar to the frequency shift that we had before the dry–
humid–dry cycle.
(a)
0100200300400
0 5 10 15 20 25 300
20406080
∆f [H
z]
∆Γ [H
z]
Amplitude [nm]
(b)
1000
1050
1100
1150
1800 1900 2000 2100 220090
100110120130
∆f [H
z]
∆Γ [H
z]
Time [min]
Fig. 11. Results for the measurement on a single Si3N4 sphere with a diameter of 4.76 mm and a
mass of 0.178 g. (a) rH=80%, drive level range from –50 dBm to 20 dBm. (b) rH=25%, drive
level range from –50 dBm to 10 dBm.
Contact mechanics measurements via the drive level dependence of ∆f and ∆Γ ___________________________________________________________________________
30
A summary of the quantitative analysis of these results is shown in Table 1. In this
table we can see experimental data and data from the calculations based on the Hertz theory
of elastic contact and on the Mindlin theory of elastic contact under tangential shear force. For
the calculation we have used values 310 GPa and 72 GPa for the Young modules, 0.27 and
0.23 for the Poisson ration for the Si3N4 and the quartz surface respectively. We have
neglected the gold electrode since it is much thinner than the contact radius.
The “Hertz radius” of the elastic sphere–plate contact, RHertz, was calculated from
Eq. 2.2. In the Mindlin theory, the frequency shift, ∆f, is a linear function of amplitude
(Eq. 3.15). In our results, we often have a plateau at very small amplitudes and a linear
decrease at somewhat higher amplitudes. The plateau at the lowest amplitudes will be
discussed later in this chapter. Here, we are interested the region of amplitudes where we
have linear decrease of the frequency with increasing amplitude. This behavior is predicted
by the Mindlin theory.
Applying a linear fit to the experimental results in the small amplitude range, we find
two parameters of linear function. A typical linear fit is shown in Fig. 10a. The Mindlin
theory is only correct in the small amplitude limit. Comparing the coefficient from the fit
function with theEq. 3.15, we find a spring constant, κ0,M, and characteristic length, λs.
λs was defined as µsP/κ0,M . From the value of λs we can derive the static friction coefficient
µs. κ0,M was defined as 4aGeff where a is the radius of the contact. We will call this radius of
contact (calculated from Mindlin theory) Mindlin radius of the sphere–plate contact, RMindlin.
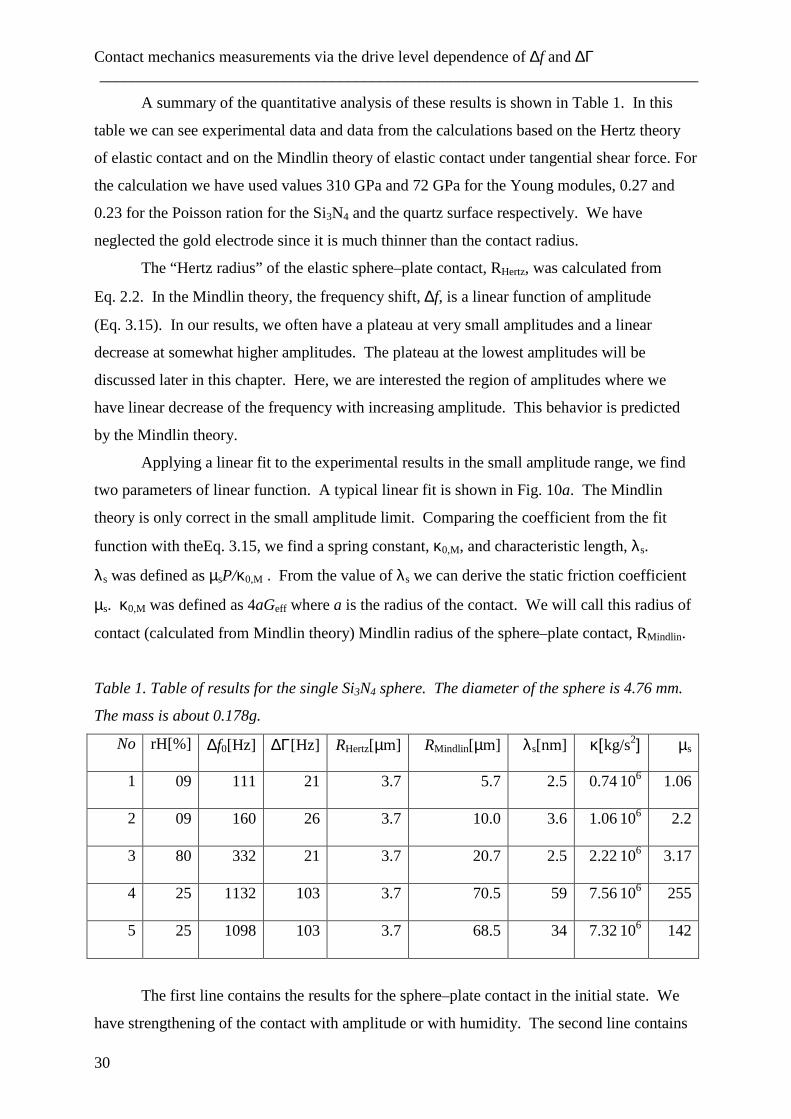
Table 1. Table of results for the single Si3N4 sphere. The diameter of the sphere is 4.76 mm.
The mass is about 0.178g.
No rH[%] ∆f0[Hz] ∆Γ[Hz] RHertz[µm] RMindlin[µm] λs[nm] κ[kg/s2] µs
1 09 111 21 3.7 5.7 2.5 0.74 106 1.06
2 09 160 26 3.7 10.0 3.6 1.06 106 2.2
3 80 332 21 3.7 20.7 2.5 2.22 106 3.17
4 25 1132 103 3.7 70.5 59 7.56 106 255
5 25 1098 103 3.7 68.5 34 7.32 106 142
The first line contains the results for the sphere–plate contact in the initial state. We
have strengthening of the contact with amplitude or with humidity. The second line contains
Contact mechanics measurements via the drive level dependence of ∆f and ∆Γ ___________________________________________________________________________
31
the results obtained after shear-induced strengthening. In the third line we show the obtained
results after increasing the humidity in the box. In the next part of our experiment, we have a
dry box (humidity decreased to 25 %rH). With drying of the sphere–plate contact, the
sandcastle effect takes place. In the table, we see a large increase in frequency shift, ∆f0. This
result is shown find in the fourth line. Then, we have tried to destroy the sandcastle effect by
high amplitude oscillations. Partial destroying or weakening of the sandcastle effect occurs at
an amplitude of about 20 nm. The results of our experiments after we have partial weakening
of the sphere–plate contact are shown in the fifth line of the Table 1.
From Table 1 we see that the Mindlin radius is larger than the Hertz radius of elastic
contact. We will see later for the glass spheres that the Mindlin radius before strengthening is
smaller than the Hertz radius. An increase of the Mindlin radius is in good agreement with
the theory of the sandcastle effect. This in more details discussed in section 4.12, where we in
describe the processes that take place in all stages of the experiment.
The static friction coefficient, µs, after drying of the contact increases by two orders of
magnitude. This value is much higher than predicted by the other experiment and theories. In
these results, the high frequency of our experimental setup also plays a significant role. After
weakening of the contact, the Mindlin radius of contact decrease to a small value. The static
friction coefficient also decreases by a factor of 2.
In the previous discussion, we have dealt with those parts of the results, where we
have a linear decrease of the frequency shift, ∆f, with increasing of the shear amplitude. This
part is in good agreement with the Mindlin theory. The decrease is a consequence of partial
slip.
Interestingly, we sometimes observe plateau at the smallest amplitudes (amplitudes
smaller than 5 nm). There is no dependence of the frequency shift, ∆f0, on amplitude. This
plateau means that we are in the point contact regime where no partial slip occurs in the
sphere – plate contact.
In the following, we examine the experimental results in the amplitude range smaller
that 5 nm. In this range of amplitudes, we observe a plateau. At these amplitudes there is no
partial slip. Frequency shift and bandwidth are independent from amplitude. Frequency shift
and bandwidth shift in this case are described by Eq. 3.8.
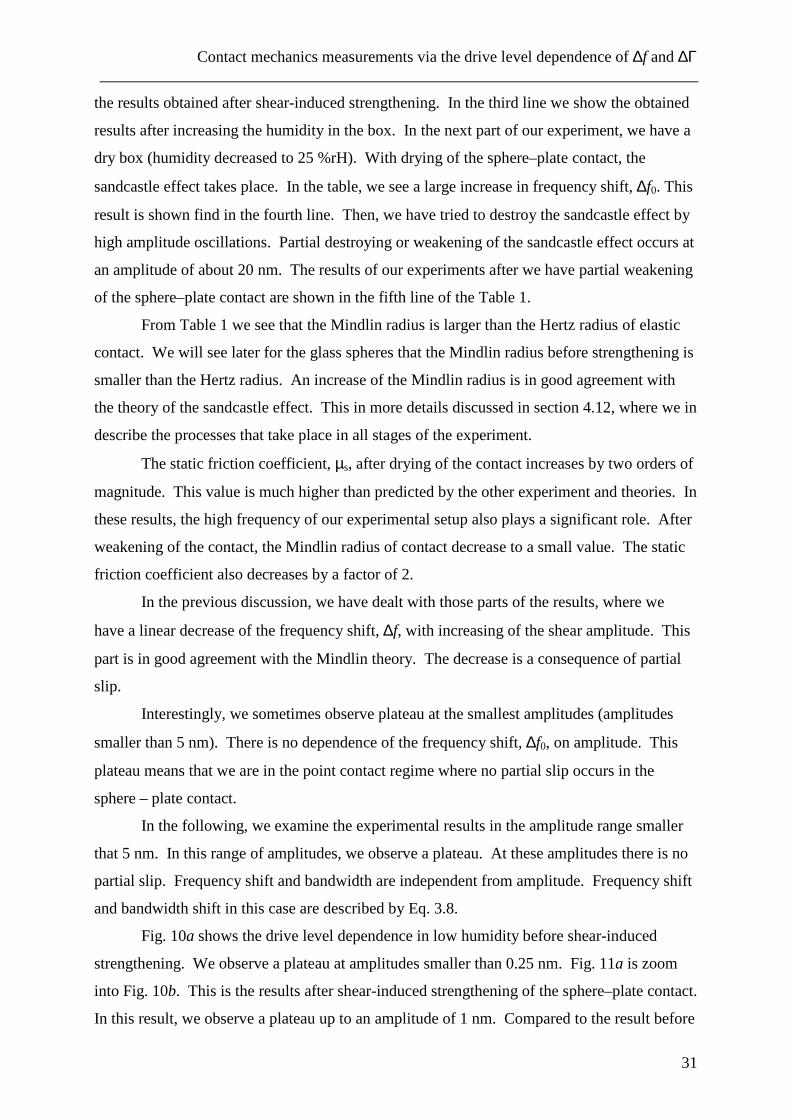
Fig. 10a shows the drive level dependence in low humidity before shear-induced
strengthening. We observe a plateau at amplitudes smaller than 0.25 nm. Fig. 11a is zoom
into Fig. 10b. This is the results after shear-induced strengthening of the sphere–plate contact.
In this result, we observe a plateau up to an amplitude of 1 nm. Compared to the result before
Contact mechanics measurements via the drive level dependence of ∆f and ∆Γ ___________________________________________________________________________
32
strengthening, the plateau has increased. With increasing contact strength, the plateau
becomes wider.
(a)
160180200220240
0 2 43040506070
∆f [H
z]
∆Γ [H
z]
Amplitude [nm]
(b)
1100
1120
1140
0 1 2 3 4 5 6 7 8 9 1090
100110120130
∆f [H
z]
∆Γ [H
z]
Amplitude [nm]
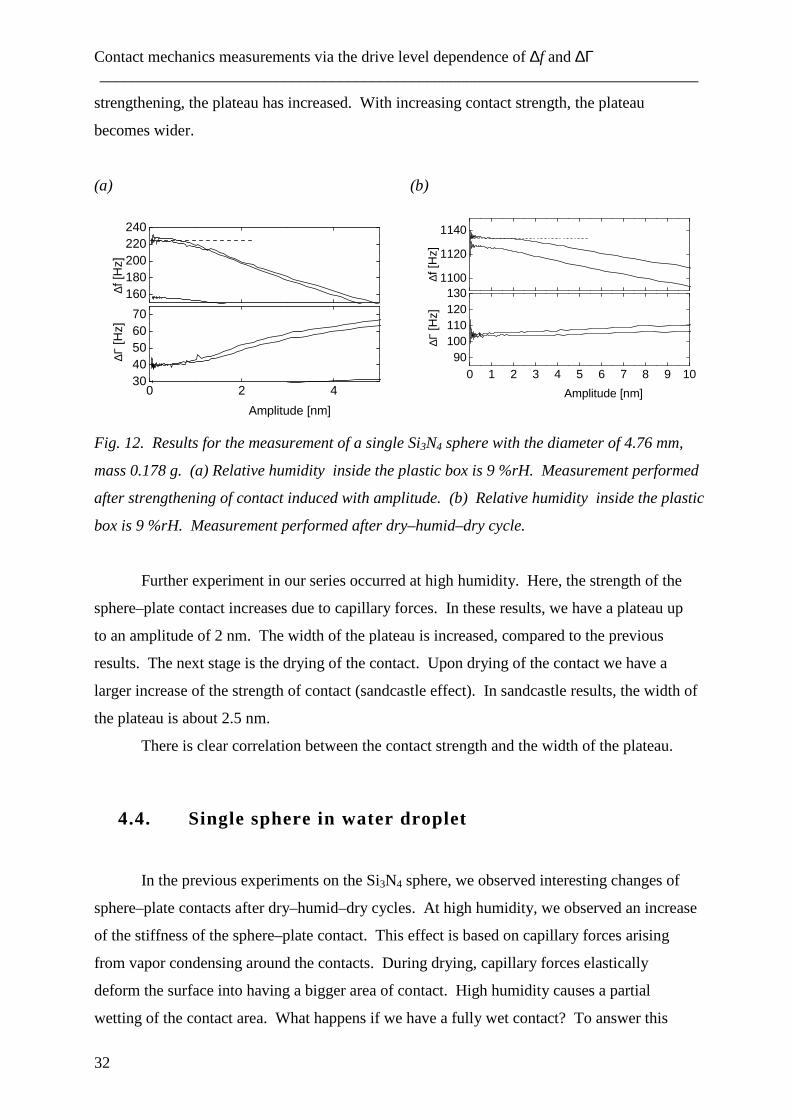
Fig. 12. Results for the measurement of a single Si3N4 sphere with the diameter of 4.76 mm,
mass 0.178 g. (a) Relative humidity inside the plastic box is 9 %rH. Measurement performed
after strengthening of contact induced with amplitude. (b) Relative humidity inside the plastic
box is 9 %rH. Measurement performed after dry–humid–dry cycle.
Further experiment in our series occurred at high humidity. Here, the strength of the
sphere–plate contact increases due to capillary forces. In these results, we have a plateau up
to an amplitude of 2 nm. The width of the plateau is increased, compared to the previous
results. The next stage is the drying of the contact. Upon drying of the contact we have a
larger increase of the strength of contact (sandcastle effect). In sandcastle results, the width of
the plateau is about 2.5 nm.
There is clear correlation between the contact strength and the width of the plateau.
4.4. Single sphere in water droplet
In the previous experiments on the Si3N4 sphere, we observed interesting changes of
sphere–plate contacts after dry–humid–dry cycles. At high humidity, we observed an increase
of the stiffness of the sphere–plate contact. This effect is based on capillary forces arising
from vapor condensing around the contacts. During drying, capillary forces elastically
deform the surface into having a bigger area of contact. High humidity causes a partial
wetting of the contact area. What happens if we have a fully wet contact? To answer this
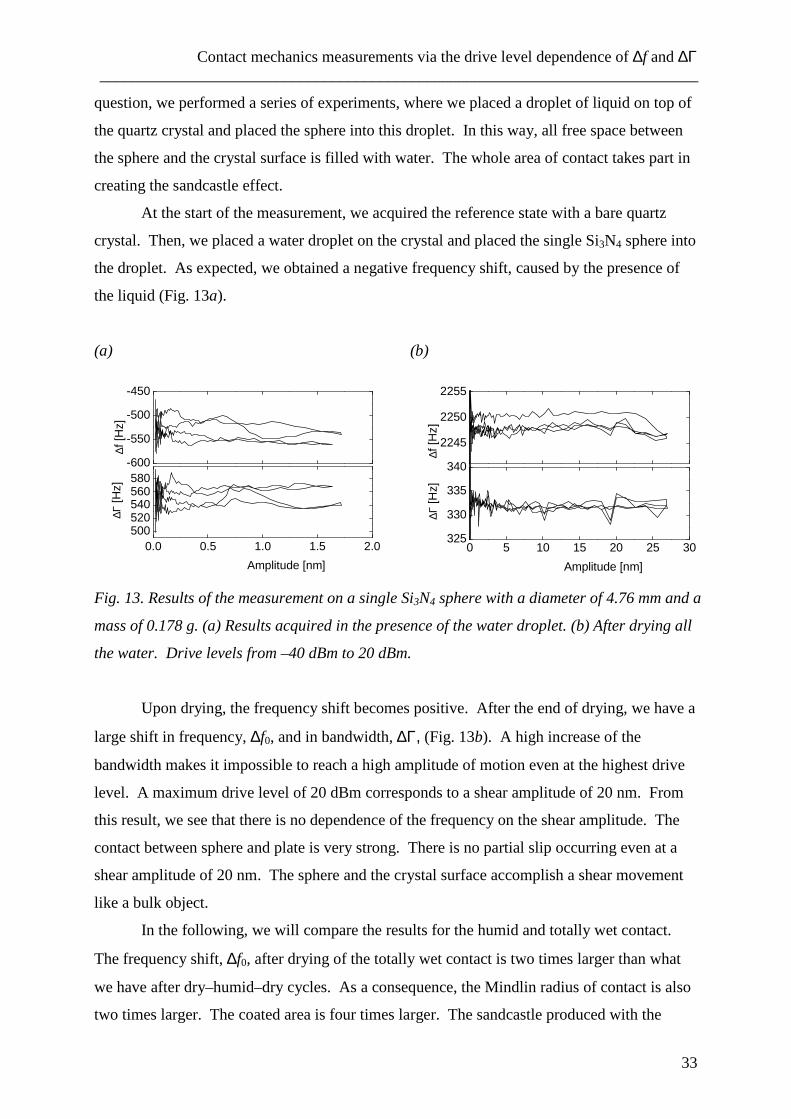
Contact mechanics measurements via the drive level dependence of ∆f and ∆Γ ___________________________________________________________________________
33
question, we performed a series of experiments, where we placed a droplet of liquid on top of
the quartz crystal and placed the sphere into this droplet. In this way, all free space between
the sphere and the crystal surface is filled with water. The whole area of contact takes part in
creating the sandcastle effect.
At the start of the measurement, we acquired the reference state with a bare quartz
crystal. Then, we placed a water droplet on the crystal and placed the single Si3N4 sphere into
the droplet. As expected, we obtained a negative frequency shift, caused by the presence of
the liquid (Fig. 13a).
(a)
-600
-550
-500
-450
0.0 0.5 1.0 1.5 2.0500520540560580
∆f [H
z]
∆Γ [H
z]
Amplitude [nm]
(b)
2245
2250
2255
0 5 10 15 20 25 30325
330
335
340
∆f [H
z]
∆Γ [H
z]
Amplitude [nm]
Fig. 13. Results of the measurement on a single Si3N4 sphere with a diameter of 4.76 mm and a
mass of 0.178 g. (a) Results acquired in the presence of the water droplet. (b) After drying all
the water. Drive levels from –40 dBm to 20 dBm.
Upon drying, the frequency shift becomes positive. After the end of drying, we have a
large shift in frequency, ∆f0, and in bandwidth, ∆Γ, (Fig. 13b). A high increase of the
bandwidth makes it impossible to reach a high amplitude of motion even at the highest drive
level. A maximum drive level of 20 dBm corresponds to a shear amplitude of 20 nm. From
this result, we see that there is no dependence of the frequency on the shear amplitude. The
contact between sphere and plate is very strong. There is no partial slip occurring even at a
shear amplitude of 20 nm. The sphere and the crystal surface accomplish a shear movement
like a bulk object.
In the following, we will compare the results for the humid and totally wet contact.
The frequency shift, ∆f0, after drying of the totally wet contact is two times larger than what
we have after dry–humid–dry cycles. As a consequence, the Mindlin radius of contact is also
two times larger. The coated area is four times larger. The sandcastle produced with the
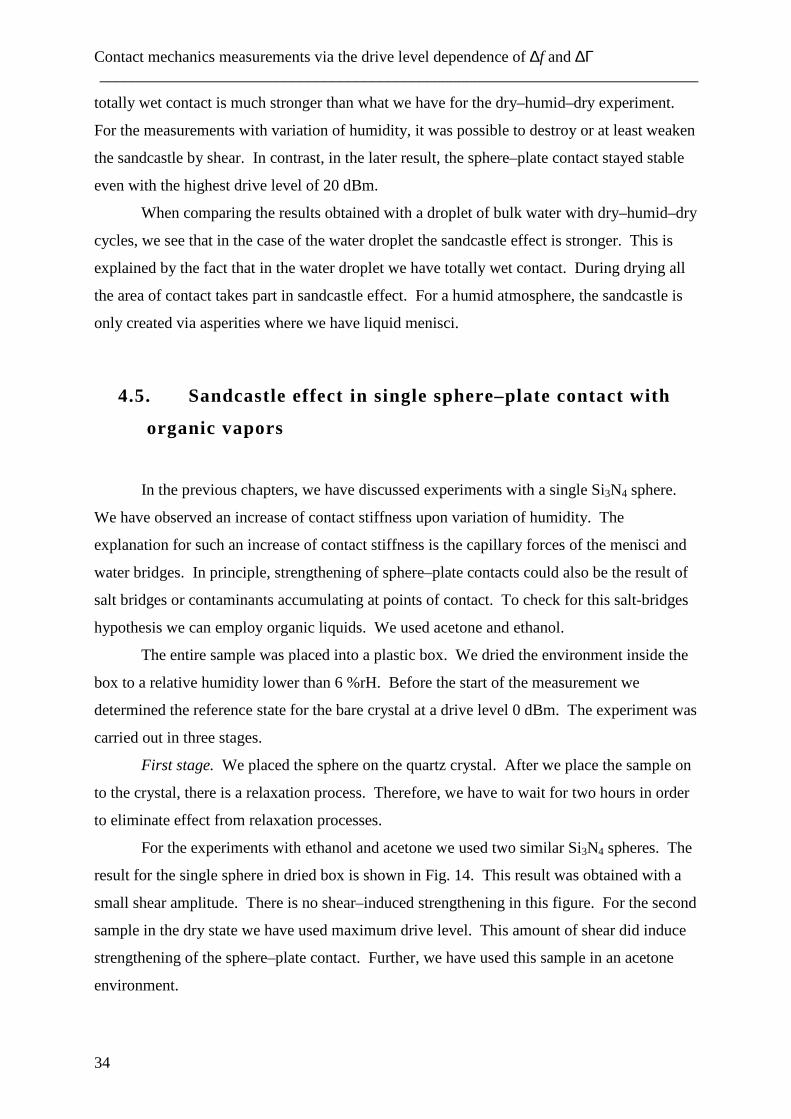
Contact mechanics measurements via the drive level dependence of ∆f and ∆Γ ___________________________________________________________________________
34
totally wet contact is much stronger than what we have for the dry–humid–dry experiment.
For the measurements with variation of humidity, it was possible to destroy or at least weaken
the sandcastle by shear. In contrast, in the later result, the sphere–plate contact stayed stable
even with the highest drive level of 20 dBm.
When comparing the results obtained with a droplet of bulk water with dry–humid–dry
cycles, we see that in the case of the water droplet the sandcastle effect is stronger. This is
explained by the fact that in the water droplet we have totally wet contact. During drying all
the area of contact takes part in sandcastle effect. For a humid atmosphere, the sandcastle is
only created via asperities where we have liquid menisci.
4.5. Sandcastle effect in single sphere–plate contact with
organic vapors
In the previous chapters, we have discussed experiments with a single Si3N4 sphere.
We have observed an increase of contact stiffness upon variation of humidity. The
explanation for such an increase of contact stiffness is the capillary forces of the menisci and
water bridges. In principle, strengthening of sphere–plate contacts could also be the result of
salt bridges or contaminants accumulating at points of contact. To check for this salt-bridges
hypothesis we can employ organic liquids. We used acetone and ethanol.
The entire sample was placed into a plastic box. We dried the environment inside the
box to a relative humidity lower than 6 %rH. Before the start of the measurement we
determined the reference state for the bare crystal at a drive level 0 dBm. The experiment was
carried out in three stages.
First stage. We placed the sphere on the quartz crystal. After we place the sample on
to the crystal, there is a relaxation process. Therefore, we have to wait for two hours in order
to eliminate effect from relaxation processes.
For the experiments with ethanol and acetone we used two similar Si3N4 spheres. The
result for the single sphere in dried box is shown in Fig. 14. This result was obtained with a
small shear amplitude. There is no shear–induced strengthening in this figure. For the second
sample in the dry state we have used maximum drive level. This amount of shear did induce
strengthening of the sphere–plate contact. Further, we have used this sample in an acetone
environment.
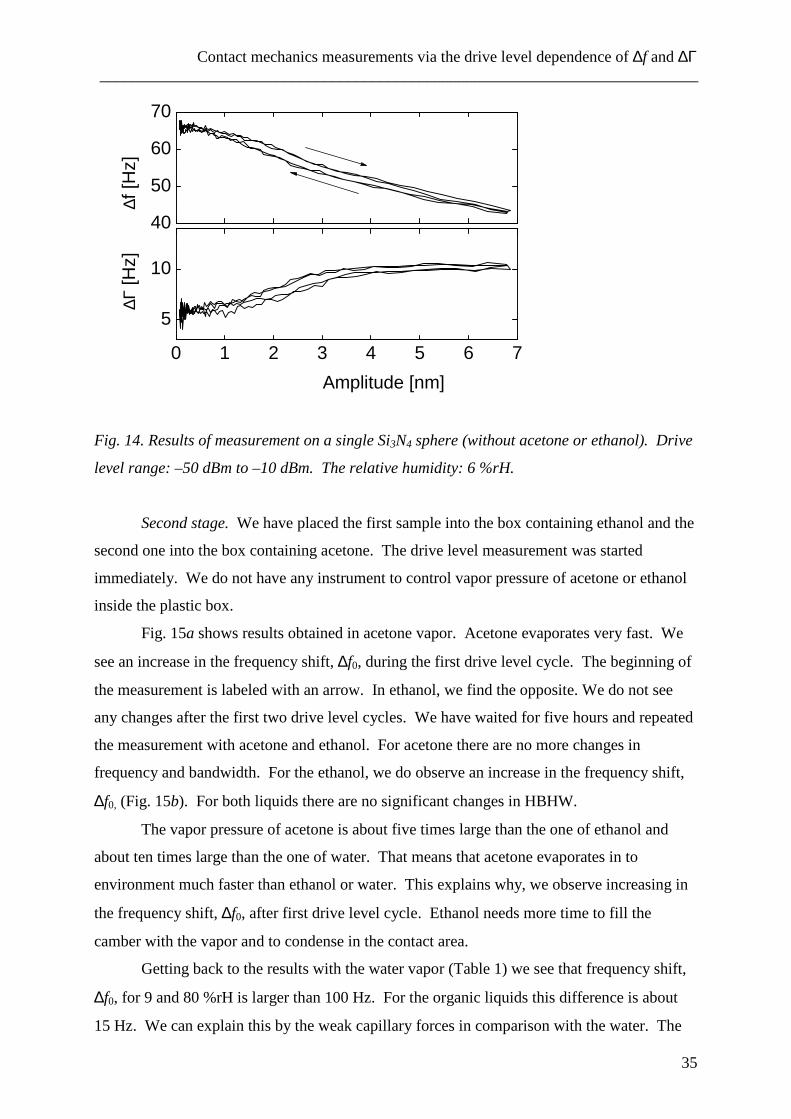
Contact mechanics measurements via the drive level dependence of ∆f and ∆Γ ___________________________________________________________________________
35
Second stage. We have placed the first sample into the box containing ethanol and the
second one into the box containing acetone. The drive level measurement was started
immediately. We do not have any instrument to control vapor pressure of acetone or ethanol
inside the plastic box.
Fig. 15a shows results obtained in acetone vapor. Acetone evaporates very fast. We
see an increase in the frequency shift, ∆f0, during the first drive level cycle. The beginning of
the measurement is labeled with an arrow. In ethanol, we find the opposite. We do not see
any changes after the first two drive level cycles. We have waited for five hours and repeated
the measurement with acetone and ethanol. For acetone there are no more changes in
frequency and bandwidth. For the ethanol, we do observe an increase in the frequency shift,
∆f0, (Fig. 15b). For both liquids there are no significant changes in HBHW.
The vapor pressure of acetone is about five times large than the one of ethanol and
about ten times large than the one of water. That means that acetone evaporates in to
environment much faster than ethanol or water. This explains why, we observe increasing in
the frequency shift, ∆f0, after first drive level cycle. Ethanol needs more time to fill the
camber with the vapor and to condense in the contact area.
Getting back to the results with the water vapor (Table 1) we see that frequency shift,
∆f0, for 9 and 80 %rH is larger than 100 Hz. For the organic liquids this difference is about
15 Hz. We can explain this by the weak capillary forces in comparison with the water. The
40
50
60
70
0 1 2 3 4 5 6 7
5
10
∆f [H
z]
∆Γ [H
z]
Amplitude [nm]
Fig. 14. Results of measurement on a single Si3N4 sphere (without acetone or ethanol). Drive
level range: –50 dBm to –10 dBm. The relative humidity: 6 %rH.
Contact mechanics measurements via the drive level dependence of ∆f and ∆Γ ___________________________________________________________________________
36
high vapor pressure of acetone and ethanol is the reason that we have a small number of
menisci and liquid bridges in the area of contact.
The difference in the frequency shift, ∆f0, in Fig. 15 for the measurements in acetone
and ethanol atmosphere is the reason of shear-induced strengthening. As we mentioned
before, one of the sample was a subject of high shear. This sample we are using with an
acetone. And for this sample we have higher frequency shift, ∆f0.
Third stage. In this stage, we dried the plastic box from vapors of acetone or ethanol.
With the drying of ethanol and acetone we expect to observe the sandcastle effect.
Fig. 16 shows the results after drying of the chamber. Fig. 16a corresponds to the
sandcastle effect after a dry–humid–dry cycle in acetone environment. Fig. 16b shows the
same data for ethanol. The sandcastle effect that takes place after dry–humid–dry cycle with
organic environment. But it is weak. As discussed before, ethanol and acetone have smaller
capillary forces in comparison with the water. High vapor pressure makes it possible only for
a small amount of the asperities to take part in sandcastle effect.
Still, we have observed the sandcastle effect in our experiment. This makes us
conclude that in the experiments with the water salt plays minor role.
(a)
100
150
200
0 1 2 3 4 5
10
20
30
40
∆f [H
z]
∆Γ [H
z]
Amplitude [nm]
(b)
40
50
60
70
0 1 2 3 4 5 6 70
10∆f
[Hz]
∆Γ [H
z]
Amplitude [nm]
Fig. 15. Results of the measurement on the single Si3N4 sphere. Drive level from –50 dBm to –
10 dBm. relative humidity is 6 %rH. (a) After we have placed a vessel with acetone inside the
box. (b) Measurement five hours after we placed vessel with ethanol inside the plastic box .
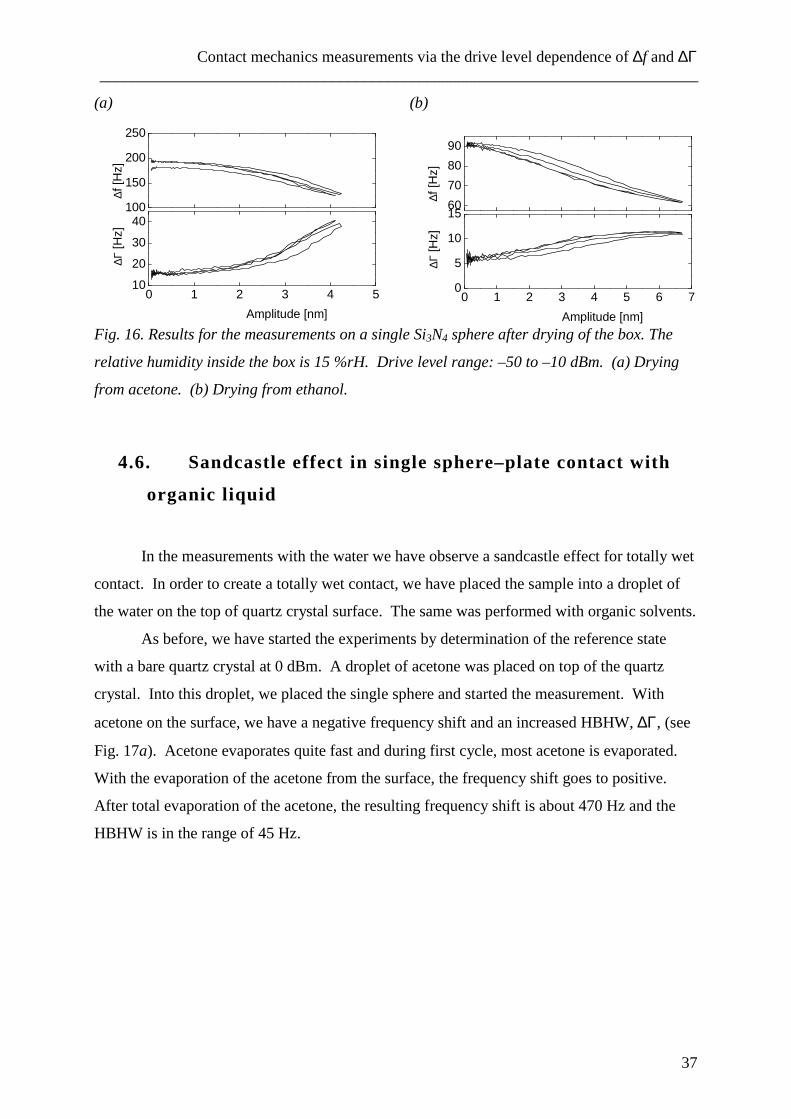
Contact mechanics measurements via the drive level dependence of ∆f and ∆Γ ___________________________________________________________________________
37
(a)
100
150
200
250
0 1 2 3 4 510
20
30
40
∆f [H
z]
∆Γ [H
z]
Amplitude [nm]
(b)
60
70
80
90
0 1 2 3 4 5 6 70
5
10
15
∆f [H
z]
∆Γ [H
z]
Amplitude [nm] Fig. 16. Results for the measurements on a single Si3N4 sphere after drying of the box. The
relative humidity inside the box is 15 %rH. Drive level range: –50 to –10 dBm. (a) Drying
from acetone. (b) Drying from ethanol.
4.6. Sandcastle effect in single sphere–plate contact with
organic liquid
In the measurements with the water we have observe a sandcastle effect for totally wet
contact. In order to create a totally wet contact, we have placed the sample into a droplet of
the water on the top of quartz crystal surface. The same was performed with organic solvents.
As before, we have started the experiments by determination of the reference state
with a bare quartz crystal at 0 dBm. A droplet of acetone was placed on top of the quartz
crystal. Into this droplet, we placed the single sphere and started the measurement. With
acetone on the surface, we have a negative frequency shift and an increased HBHW, ∆Γ, (see
Fig. 17a). Acetone evaporates quite fast and during first cycle, most acetone is evaporated.
With the evaporation of the acetone from the surface, the frequency shift goes to positive.
After total evaporation of the acetone, the resulting frequency shift is about 470 Hz and the
HBHW is in the range of 45 Hz.
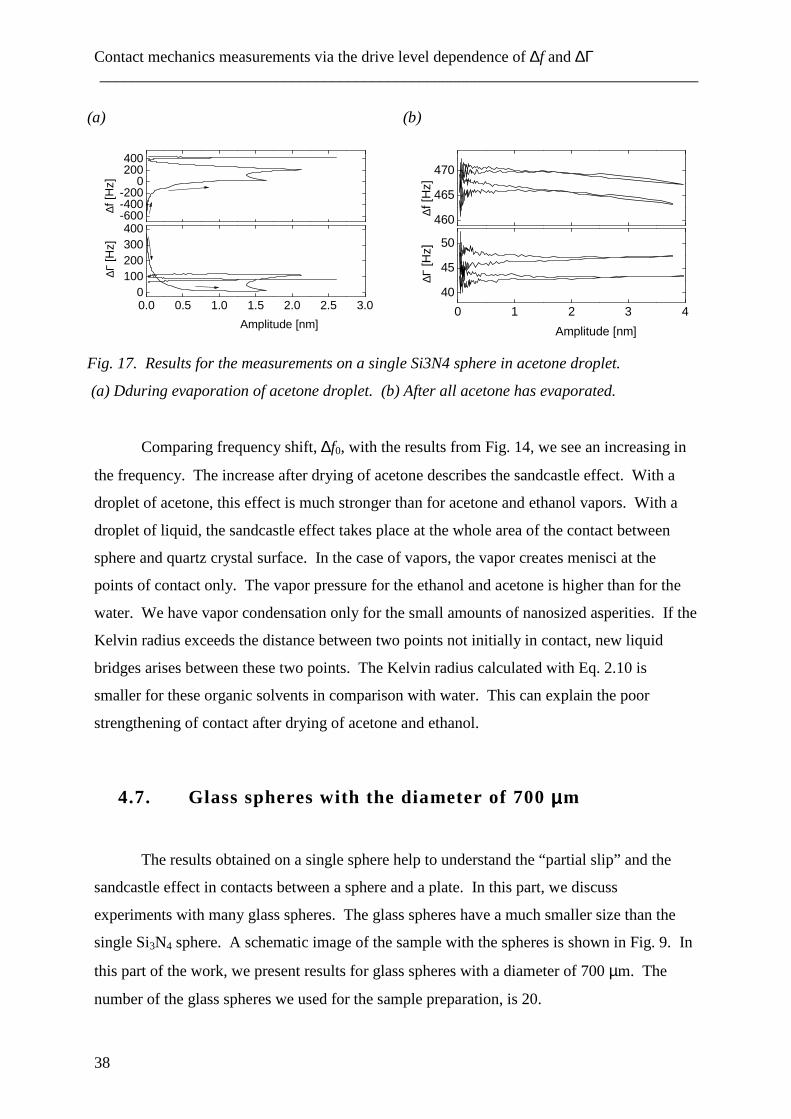
Contact mechanics measurements via the drive level dependence of ∆f and ∆Γ ___________________________________________________________________________
38
Comparing frequency shift, ∆f0, with the results from Fig. 14, we see an increasing in
the frequency. The increase after drying of acetone describes the sandcastle effect. With a
droplet of acetone, this effect is much stronger than for acetone and ethanol vapors. With a
droplet of liquid, the sandcastle effect takes place at the whole area of the contact between
sphere and quartz crystal surface. In the case of vapors, the vapor creates menisci at the
points of contact only. The vapor pressure for the ethanol and acetone is higher than for the
water. We have vapor condensation only for the small amounts of nanosized asperities. If the
Kelvin radius exceeds the distance between two points not initially in contact, new liquid
bridges arises between these two points. The Kelvin radius calculated with Eq. 2.10 is
smaller for these organic solvents in comparison with water. This can explain the poor
strengthening of contact after drying of acetone and ethanol.
4.7. Glass spheres with the diameter of 700 µµµµm
The results obtained on a single sphere help to understand the “partial slip” and the
sandcastle effect in contacts between a sphere and a plate. In this part, we discuss
experiments with many glass spheres. The glass spheres have a much smaller size than the
single Si3N4 sphere. A schematic image of the sample with the spheres is shown in Fig. 9. In
this part of the work, we present results for glass spheres with a diameter of 700 µm. The
number of the glass spheres we used for the sample preparation, is 20.
(a)
-600-400-200
0200400
0.0 0.5 1.0 1.5 2.0 2.5 3.00
100200300400
∆f [H
z]
∆Γ [H
z]
Amplitude [nm]
(b)
460
465
470
0 1 2 3 4
40
45
50
∆f [H
z]
∆Γ [H
z]
Amplitude [nm]
Fig. 17. Results for the measurements on a single Si3N4 sphere in acetone droplet.
(a) Dduring evaporation of acetone droplet. (b) After all acetone has evaporated.
Contact mechanics measurements via the drive level dependence of ∆f and ∆Γ ___________________________________________________________________________
39
Before the start of the measurement we placed the QCM and the sample inside the
plastic box and dried the box to a relative humidity lower than 9 %rH. After drying, we
determined the reference state for a bare crystal at a drive level 0 dBm.
After having placed the sample on the quartz crystal surface, we waited for 12 hours
before the start of first measurement. The reason for this was to exclude an influence of
relaxation processes from experiment. The first measurement was performed with a maximal
drive level of –10 dBm. The result for this measurement you is shown in Fig. 18a. There is
no increase in the frequency shift, ∆f0, with the drive level cycles. The contacts between the
spheres and quartz crystal stay stable at this shear amplitude. Also, the behavior is almost
reversible with increasing and decreasing shear amplitude. The next measurement (Fig. 18b)
was performed with a maximum drive level of 20 dBm. With a drive level of 20 dBm, we
reach an amplitude of shear motion above 200 nm. With such a high amplitude of
oscillations, we observe shear-induced strengthening of the contact between the spheres and
the quartz crystal surface. In Fig. 18b, we observe an increase of the frequency shift, ∆f0,
during the drive level cycles. The arrow shows the direction of the first drive level sweep. At
the beginning, the frequency shift, ∆f0, is about 95 Hz. According to the Mindlin theory, this
frequency shift corresponds to a radius of contact for a single glass sphere of about 500 nm.
After the first cycle, ∆f0 is increased to the value of about 400 Hz. The Mindlin radius of
contact increases about 2.1 µm. After shear-induced strengthening, the contact behavior
during decrease and increase of the amplitude turns hysteretic. This effect is clearly visible in
Fig. 19a and b. Arrows display direction of the drive level sweep.
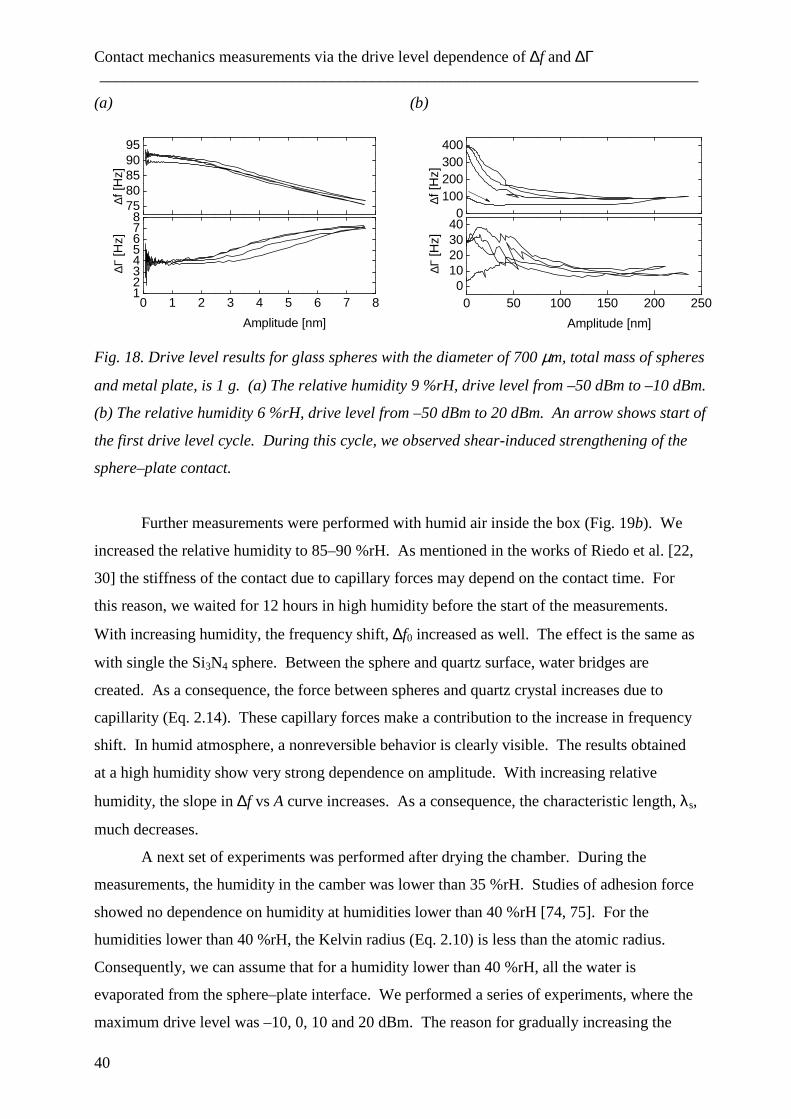
Contact mechanics measurements via the drive level dependence of ∆f and ∆Γ ___________________________________________________________________________
40
(a)
7580859095
0 1 2 3 4 5 6 7 812345678
∆f [H
z]
∆Γ [H
z]
Amplitude [nm]
(b)
0100200300400
0 50 100 150 200 2500
10203040
∆f [H
z]
∆Γ [H
z]
Amplitude [nm]
Fig. 18. Drive level results for glass spheres with the diameter of 700 µm, total mass of spheres
and metal plate, is 1 g. (a) The relative humidity 9 %rH, drive level from –50 dBm to –10 dBm.
(b) The relative humidity 6 %rH, drive level from –50 dBm to 20 dBm. An arrow shows start of
the first drive level cycle. During this cycle, we observed shear-induced strengthening of the
sphere–plate contact.
Further measurements were performed with humid air inside the box (Fig. 19b). We
increased the relative humidity to 85–90 %rH. As mentioned in the works of Riedo et al. [22,
30] the stiffness of the contact due to capillary forces may depend on the contact time. For
this reason, we waited for 12 hours in high humidity before the start of the measurements.
With increasing humidity, the frequency shift, ∆f0 increased as well. The effect is the same as
with single the Si3N4 sphere. Between the sphere and quartz surface, water bridges are
created. As a consequence, the force between spheres and quartz crystal increases due to
capillarity (Eq. 2.14). These capillary forces make a contribution to the increase in frequency
shift. In humid atmosphere, a nonreversible behavior is clearly visible. The results obtained
at a high humidity show very strong dependence on amplitude. With increasing relative
humidity, the slope in ∆f vs A curve increases. As a consequence, the characteristic length, λs,
much decreases.
A next set of experiments was performed after drying the chamber. During the
measurements, the humidity in the camber was lower than 35 %rH. Studies of adhesion force
showed no dependence on humidity at humidities lower than 40 %rH [74, 75]. For the
humidities lower than 40 %rH, the Kelvin radius (Eq. 2.10) is less than the atomic radius.
Consequently, we can assume that for a humidity lower than 40 %rH, all the water is
evaporated from the sphere–plate interface. We performed a series of experiments, where the
maximum drive level was –10, 0, 10 and 20 dBm. The reason for gradually increasing the
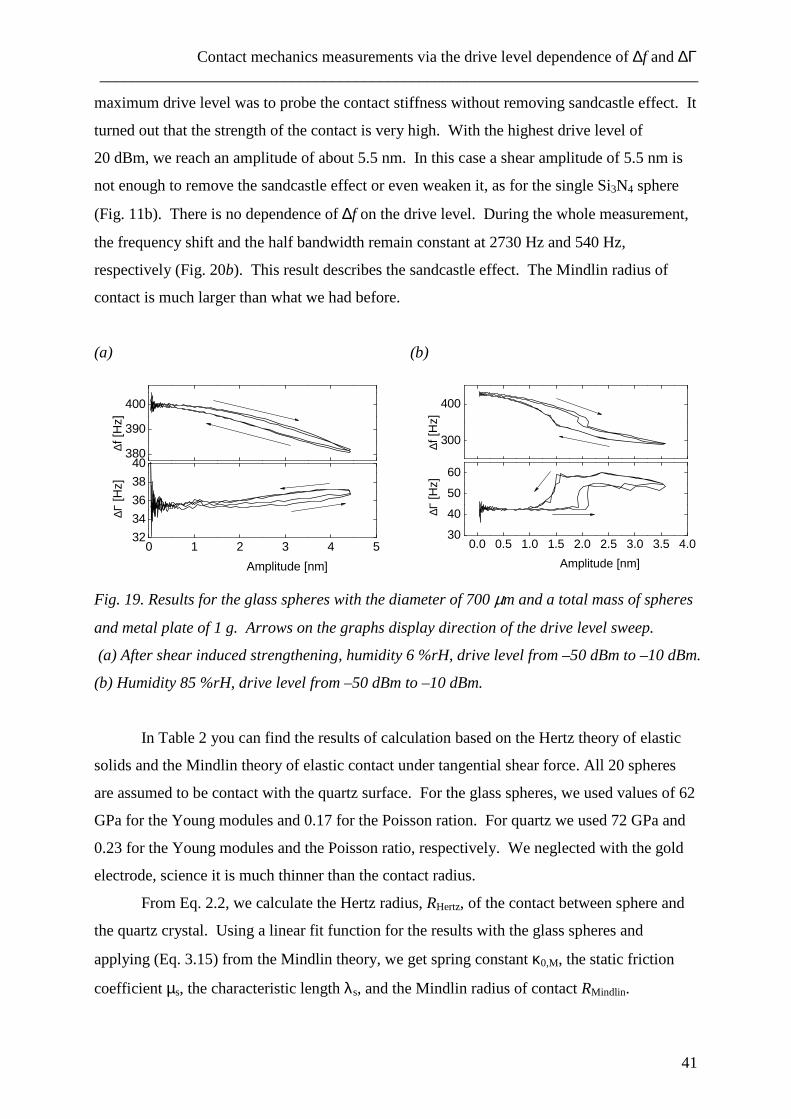
Contact mechanics measurements via the drive level dependence of ∆f and ∆Γ ___________________________________________________________________________
41
maximum drive level was to probe the contact stiffness without removing sandcastle effect. It
turned out that the strength of the contact is very high. With the highest drive level of
20 dBm, we reach an amplitude of about 5.5 nm. In this case a shear amplitude of 5.5 nm is
not enough to remove the sandcastle effect or even weaken it, as for the single Si3N4 sphere
(Fig. 11b). There is no dependence of ∆f on the drive level. During the whole measurement,
the frequency shift and the half bandwidth remain constant at 2730 Hz and 540 Hz,
respectively (Fig. 20b). This result describes the sandcastle effect. The Mindlin radius of
contact is much larger than what we had before.
(a)
380
390
400
0 1 2 3 4 532
34
36
38
40
∆f [H
z]
∆Γ [H
z]
Amplitude [nm]
(b)
300
400
0.0 0.5 1.0 1.5 2.0 2.5 3.0 3.5 4.030
40
50
60
∆f [H
z]
∆Γ [H
z]
Amplitude [nm]
Fig. 19. Results for the glass spheres with the diameter of 700 µm and a total mass of spheres
and metal plate of 1 g. Arrows on the graphs display direction of the drive level sweep.
(a) After shear induced strengthening, humidity 6 %rH, drive level from –50 dBm to –10 dBm.
(b) Humidity 85 %rH, drive level from –50 dBm to –10 dBm.
In Table 2 you can find the results of calculation based on the Hertz theory of elastic
solids and the Mindlin theory of elastic contact under tangential shear force. All 20 spheres
are assumed to be contact with the quartz surface. For the glass spheres, we used values of 62
GPa for the Young modules and 0.17 for the Poisson ration. For quartz we used 72 GPa and
0.23 for the Young modules and the Poisson ratio, respectively. We neglected with the gold
electrode, science it is much thinner than the contact radius.
From Eq. 2.2, we calculate the Hertz radius, RHertz, of the contact between sphere and
the quartz crystal. Using a linear fit function for the results with the glass spheres and
applying (Eq. 3.15) from the Mindlin theory, we get spring constant κ0,M, the static friction
coefficient µs, the characteristic length λs, and the Mindlin radius of contact RMindlin.
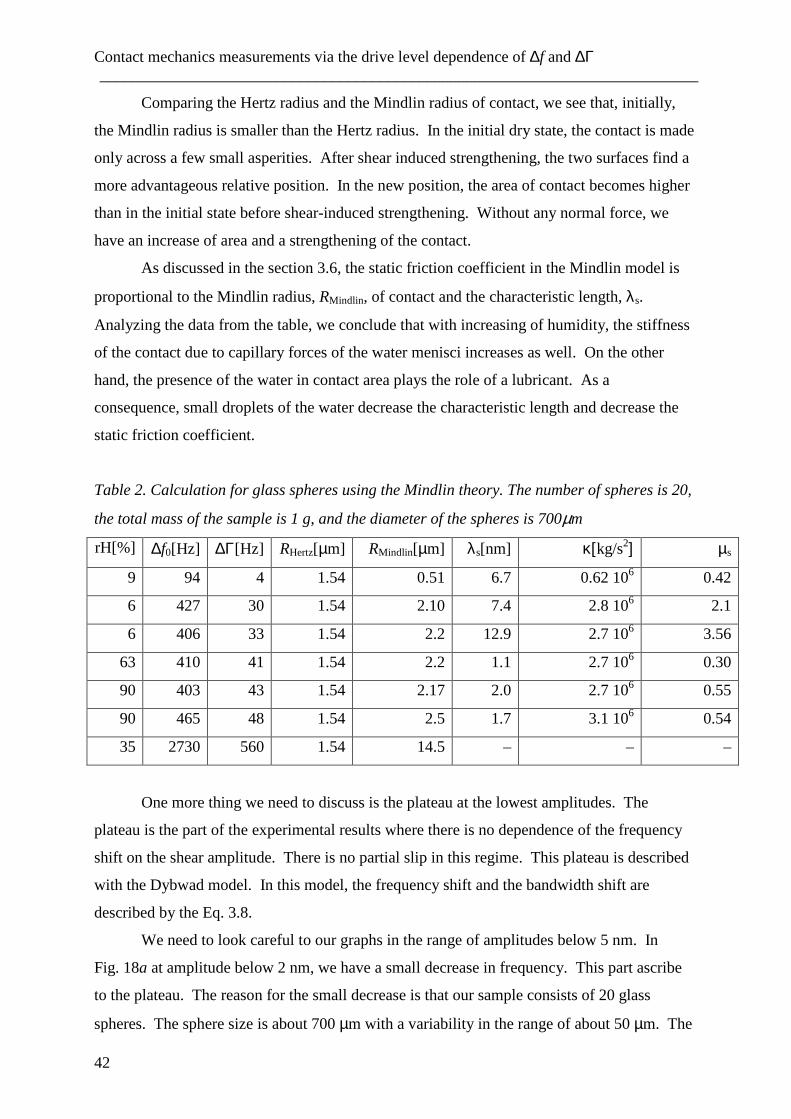
Contact mechanics measurements via the drive level dependence of ∆f and ∆Γ ___________________________________________________________________________
42
Comparing the Hertz radius and the Mindlin radius of contact, we see that, initially,
the Mindlin radius is smaller than the Hertz radius. In the initial dry state, the contact is made
only across a few small asperities. After shear induced strengthening, the two surfaces find a
more advantageous relative position. In the new position, the area of contact becomes higher
than in the initial state before shear-induced strengthening. Without any normal force, we
have an increase of area and a strengthening of the contact.
As discussed in the section 3.6, the static friction coefficient in the Mindlin model is
proportional to the Mindlin radius, RMindlin, of contact and the characteristic length, λs.
Analyzing the data from the table, we conclude that with increasing of humidity, the stiffness
of the contact due to capillary forces of the water menisci increases as well. On the other
hand, the presence of the water in contact area plays the role of a lubricant. As a
consequence, small droplets of the water decrease the characteristic length and decrease the
static friction coefficient.
Table 2. Calculation for glass spheres using the Mindlin theory. The number of spheres is 20,
the total mass of the sample is 1 g, and the diameter of the spheres is 700µm
rH[%] ∆f0[Hz] ∆Γ[Hz] RHertz[µm] RMindlin[µm] λs[nm] κ[kg/s2] µs
9 94 4 1.54 0.51 6.7 0.62 106 0.42
6 427 30 1.54 2.10 7.4 2.8 106 2.1
6 406 33 1.54 2.2 12.9 2.7 106 3.56
63 410 41 1.54 2.2 1.1 2.7 106 0.30
90 403 43 1.54 2.17 2.0 2.7 106 0.55
90 465 48 1.54 2.5 1.7 3.1 106 0.54
35 2730 560 1.54 14.5 – – –
One more thing we need to discuss is the plateau at the lowest amplitudes. The
plateau is the part of the experimental results where there is no dependence of the frequency
shift on the shear amplitude. There is no partial slip in this regime. This plateau is described
with the Dybwad model. In this model, the frequency shift and the bandwidth shift are
described by the Eq. 3.8.
We need to look careful to our graphs in the range of amplitudes below 5 nm. In
Fig. 18a at amplitude below 2 nm, we have a small decrease in frequency. This part ascribe
to the plateau. The reason for the small decrease is that our sample consists of 20 glass
spheres. The sphere size is about 700 µm with a variability in the range of about 50 µm. The
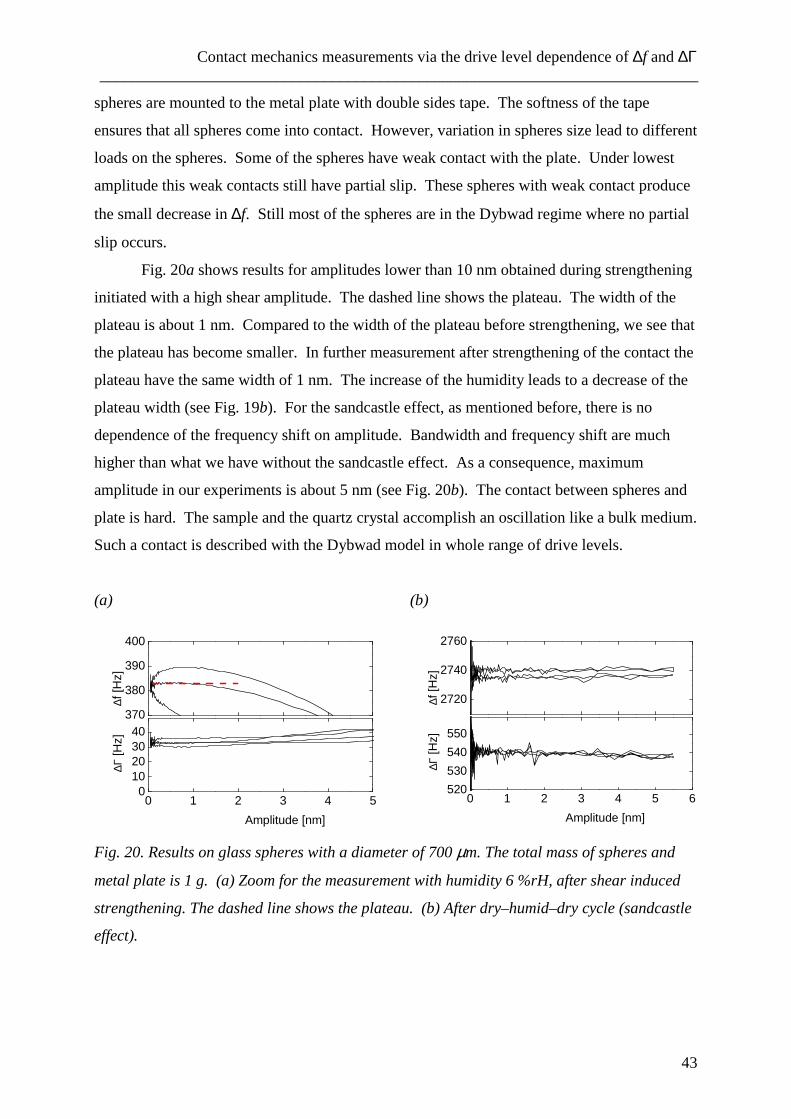
Contact mechanics measurements via the drive level dependence of ∆f and ∆Γ ___________________________________________________________________________
43
spheres are mounted to the metal plate with double sides tape. The softness of the tape
ensures that all spheres come into contact. However, variation in spheres size lead to different
loads on the spheres. Some of the spheres have weak contact with the plate. Under lowest
amplitude this weak contacts still have partial slip. These spheres with weak contact produce
the small decrease in ∆f. Still most of the spheres are in the Dybwad regime where no partial
slip occurs.
Fig. 20a shows results for amplitudes lower than 10 nm obtained during strengthening
initiated with a high shear amplitude. The dashed line shows the plateau. The width of the
plateau is about 1 nm. Compared to the width of the plateau before strengthening, we see that
the plateau has become smaller. In further measurement after strengthening of the contact the
plateau have the same width of 1 nm. The increase of the humidity leads to a decrease of the
plateau width (see Fig. 19b). For the sandcastle effect, as mentioned before, there is no
dependence of the frequency shift on amplitude. Bandwidth and frequency shift are much
higher than what we have without the sandcastle effect. As a consequence, maximum
amplitude in our experiments is about 5 nm (see Fig. 20b). The contact between spheres and
plate is hard. The sample and the quartz crystal accomplish an oscillation like a bulk medium.
Such a contact is described with the Dybwad model in whole range of drive levels.
(a)
370
380
390
400
0 1 2 3 4 50
10203040
∆f [H
z]
∆Γ [H
z]
Amplitude [nm]
(b)
2720
2740
2760
0 1 2 3 4 5 6520
530
540
550
∆f [H
z]
∆Γ [H
z]
Amplitude [nm]
Fig. 20. Results on glass spheres with a diameter of 700 µm. The total mass of spheres and
metal plate is 1 g. (a) Zoom for the measurement with humidity 6 %rH, after shear induced
strengthening. The dashed line shows the plateau. (b) After dry–humid–dry cycle (sandcastle
effect).
Contact mechanics measurements via the drive level dependence of ∆f and ∆Γ ___________________________________________________________________________
44
4.8. Glass spheres with a diameter of 225 µµµµm
The next sample we have used consisted of glass spheres with a diameter of 225 µm.
The number of glass spheres used to prepare the sample was 175.
We initially placed the QCM and the sample inside the plastic box and dried it to a
relative humidity of 6 %rH. The sample and the QCM are not in the contact at this time.
After drying we acquired the reference state for a bare crystal at a drive level 0 dBm.
Then, we placed the sample onto the quartz crystal and started the measurements. In
the previous measurements with the single Si3N4 sphere and with the 700 µm glass spheres
had we waited for 12 hours before starting the measurement. The reason for this was to
exclude an influence of strengthening of the contact with the time (“relaxation processes”).
The waiting time does not make any contribution to the strength of the sphere–plate contact
after 12 hours. The relaxation process taking place after we place the sample onto QCM is
much faster. It is enough to wait 30 min. The strength of the contact is constant after 30 min.
Relaxation phase is outside the scope of the following chapter. With a waiting time of
30 min, we can be sure to have aging excluded from the experimental results.
As before, the first measurement was performed with a drive level lower than
–10 dBm. With higher drive levels we would reach higher amplitudes and higher shear
amplitudes, which would lead to shear-induced strengthening. The results of this
measurement are shown in Fig. 21a. From 1 nm to 5 nm, the behavior is linear. This
behavior is predicted by the Mindlin theory. Also, we expect a plateau at the lowest
amplitudes. The discussion of the plateau at the lowest amplitudes follows later in this
chapter. Subsequently, we have preformed a measurement with a maximum drive level of
20 dBm (Fig. 21b). A drive level of 20 dBm corresponds to an amplitude of about 200 nm.
A shear amplitude of 200 nm initiates strengthening of the sphere–plate contact. The start of
the measurement is labeled with an arrow. At the end of the first drive level cycle, the
frequency shift, ∆f0, has increased from 155 Hz to 300 Hz. An increase of frequency shift,
∆f0, by two times corresponds to an increase of real contact area by a factor of 4 according to
the Mindlin model. As for the glass spheres with bigger size, we observe hysteretic behavior
during increase and decrease of the amplitude.
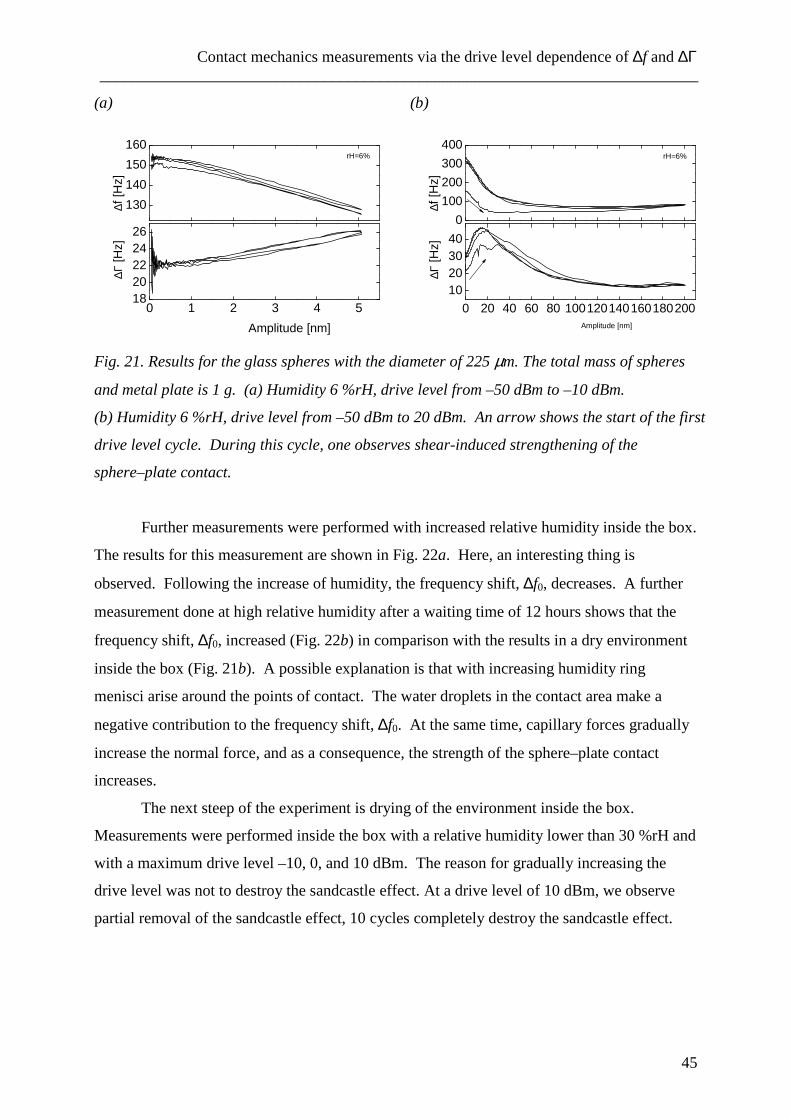
Contact mechanics measurements via the drive level dependence of ∆f and ∆Γ ___________________________________________________________________________
45
(a)
130
140
150
160
0 1 2 3 4 51820222426
∆f [H
z]
rH=6%
∆Γ [H
z]
Amplitude [nm]
(b)
0
100
200
300
400
0 20 40 60 80 100120140160180200
10203040
∆f [H
z]
rH=6%
∆Γ [H
z]
Amplitude [nm]
Fig. 21. Results for the glass spheres with the diameter of 225 µm. The total mass of spheres
and metal plate is 1 g. (a) Humidity 6 %rH, drive level from –50 dBm to –10 dBm.
(b) Humidity 6 %rH, drive level from –50 dBm to 20 dBm. An arrow shows the start of the first
drive level cycle. During this cycle, one observes shear-induced strengthening of the
sphere–plate contact.
Further measurements were performed with increased relative humidity inside the box.
The results for this measurement are shown in Fig. 22a. Here, an interesting thing is
observed. Following the increase of humidity, the frequency shift, ∆f0, decreases. A further
measurement done at high relative humidity after a waiting time of 12 hours shows that the
frequency shift, ∆f0, increased (Fig. 22b) in comparison with the results in a dry environment
inside the box (Fig. 21b). A possible explanation is that with increasing humidity ring
menisci arise around the points of contact. The water droplets in the contact area make a
negative contribution to the frequency shift, ∆f0. At the same time, capillary forces gradually
increase the normal force, and as a consequence, the strength of the sphere–plate contact
increases.
The next steep of the experiment is drying of the environment inside the box.
Measurements were performed inside the box with a relative humidity lower than 30 %rH and
with a maximum drive level –10, 0, and 10 dBm. The reason for gradually increasing the
drive level was not to destroy the sandcastle effect. At a drive level of 10 dBm, we observe
partial removal of the sandcastle effect, 10 cycles completely destroy the sandcastle effect.
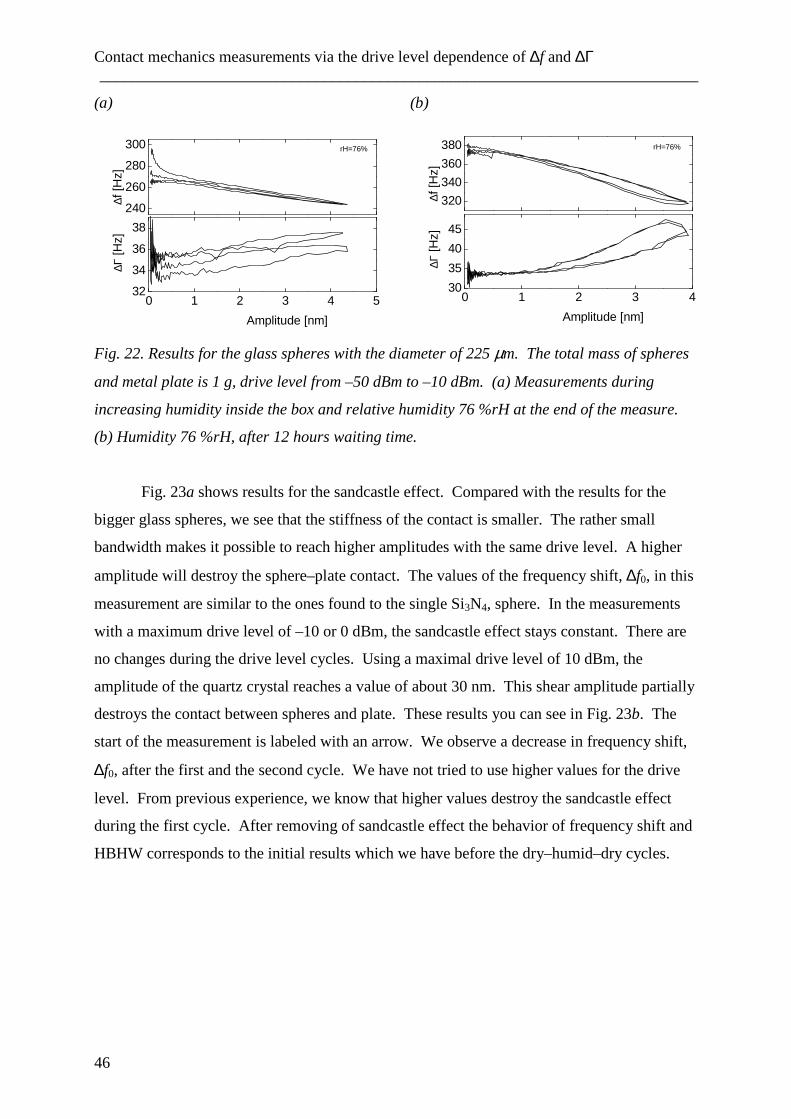
Contact mechanics measurements via the drive level dependence of ∆f and ∆Γ ___________________________________________________________________________
46
(a)
240
260
280
300
0 1 2 3 4 532
34
36
38
∆f [H
z]
rH=76%
∆Γ [H
z]
Amplitude [nm]
(b)
320
340
360
380
0 1 2 3 430
35
40
45
∆f [H
z]
rH=76%
∆Γ [H
z]
Amplitude [nm]
Fig. 22. Results for the glass spheres with the diameter of 225 µm. The total mass of spheres
and metal plate is 1 g, drive level from –50 dBm to –10 dBm. (a) Measurements during
increasing humidity inside the box and relative humidity 76 %rH at the end of the measure.
(b) Humidity 76 %rH, after 12 hours waiting time.
Fig. 23a shows results for the sandcastle effect. Compared with the results for the
bigger glass spheres, we see that the stiffness of the contact is smaller. The rather small
bandwidth makes it possible to reach higher amplitudes with the same drive level. A higher
amplitude will destroy the sphere–plate contact. The values of the frequency shift, ∆f0, in this
measurement are similar to the ones found to the single Si3N4, sphere. In the measurements
with a maximum drive level of –10 or 0 dBm, the sandcastle effect stays constant. There are
no changes during the drive level cycles. Using a maximal drive level of 10 dBm, the
amplitude of the quartz crystal reaches a value of about 30 nm. This shear amplitude partially
destroys the contact between spheres and plate. These results you can see in Fig. 23b. The
start of the measurement is labeled with an arrow. We observe a decrease in frequency shift,
∆f0, after the first and the second cycle. We have not tried to use higher values for the drive
level. From previous experience, we know that higher values destroy the sandcastle effect
during the first cycle. After removing of sandcastle effect the behavior of frequency shift and
HBHW corresponds to the initial results which we have before the dry–humid–dry cycles.
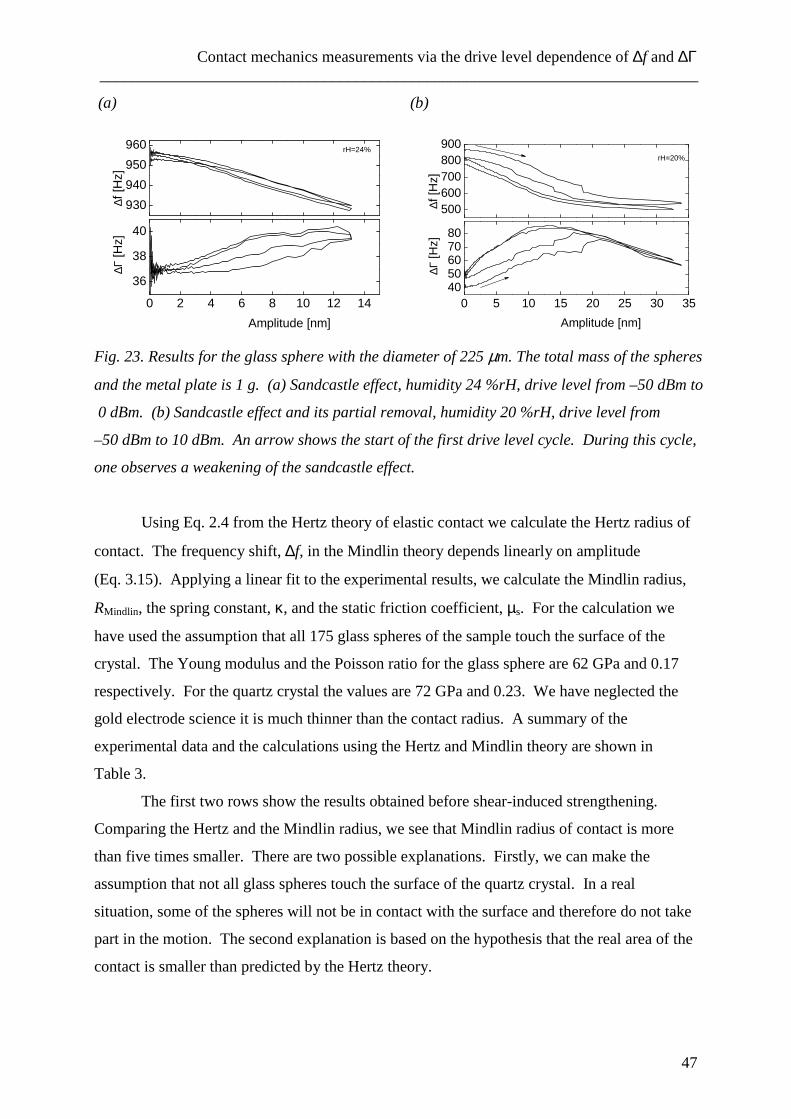
Contact mechanics measurements via the drive level dependence of ∆f and ∆Γ ___________________________________________________________________________
47
(a)
930
940
950
960
0 2 4 6 8 10 12 14
36
38
40
∆f [H
z]
rH=24%
∆Γ [H
z]
Amplitude [nm]
(b)
500600700800900
0 5 10 15 20 25 30 354050607080
∆f [H
z]
rH=20%
∆Γ [H
z]
Amplitude [nm]
Fig. 23. Results for the glass sphere with the diameter of 225 µm. The total mass of the spheres
and the metal plate is 1 g. (a) Sandcastle effect, humidity 24 %rH, drive level from –50 dBm to
0 dBm. (b) Sandcastle effect and its partial removal, humidity 20 %rH, drive level from
–50 dBm to 10 dBm. An arrow shows the start of the first drive level cycle. During this cycle,
one observes a weakening of the sandcastle effect.
Using Eq. 2.4 from the Hertz theory of elastic contact we calculate the Hertz radius of
contact. The frequency shift, ∆f, in the Mindlin theory depends linearly on amplitude
(Eq. 3.15). Applying a linear fit to the experimental results, we calculate the Mindlin radius,
RMindlin, the spring constant, κ, and the static friction coefficient, µs. For the calculation we
have used the assumption that all 175 glass spheres of the sample touch the surface of the
crystal. The Young modulus and the Poisson ratio for the glass sphere are 62 GPa and 0.17
respectively. For the quartz crystal the values are 72 GPa and 0.23. We have neglected the
gold electrode science it is much thinner than the contact radius. A summary of the
experimental data and the calculations using the Hertz and Mindlin theory are shown in
Table 3.
The first two rows show the results obtained before shear-induced strengthening.
Comparing the Hertz and the Mindlin radius, we see that Mindlin radius of contact is more
than five times smaller. There are two possible explanations. Firstly, we can make the
assumption that not all glass spheres touch the surface of the quartz crystal. In a real
situation, some of the spheres will not be in contact with the surface and therefore do not take
part in the motion. The second explanation is based on the hypothesis that the real area of the
contact is smaller than predicted by the Hertz theory.
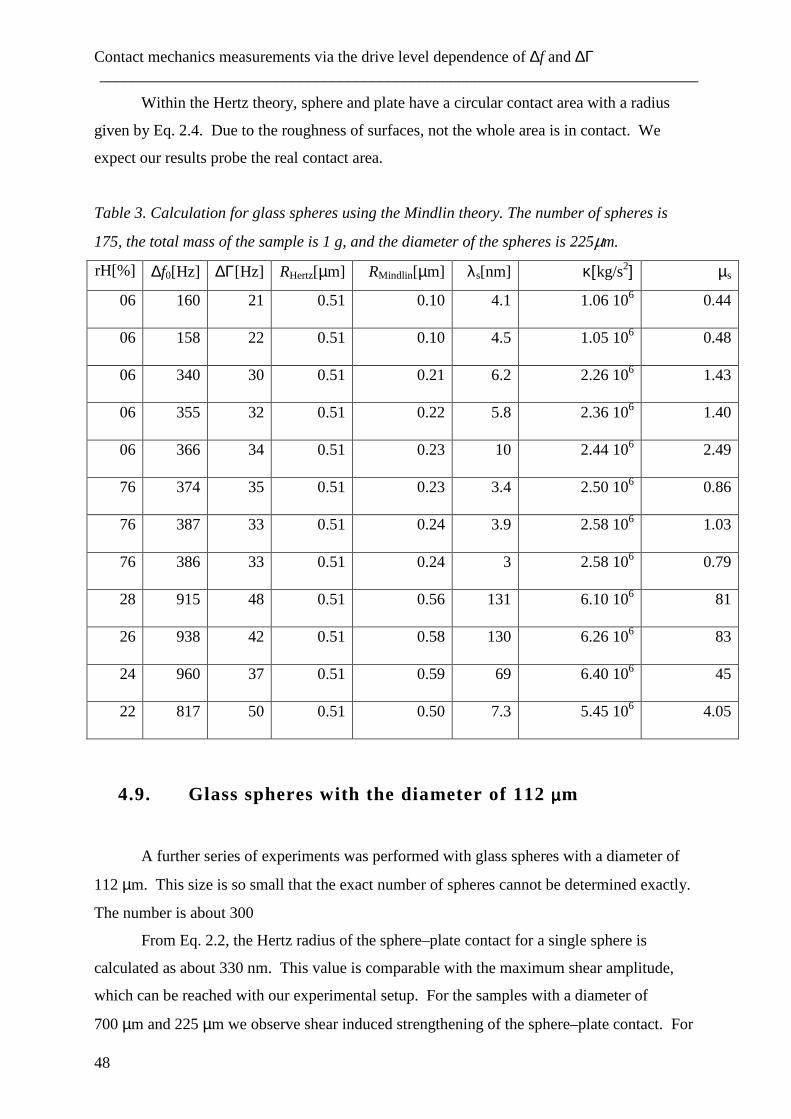
Contact mechanics measurements via the drive level dependence of ∆f and ∆Γ ___________________________________________________________________________
48
Within the Hertz theory, sphere and plate have a circular contact area with a radius
given by Eq. 2.4. Due to the roughness of surfaces, not the whole area is in contact. We
expect our results probe the real contact area.
Table 3. Calculation for glass spheres using the Mindlin theory. The number of spheres is
175, the total mass of the sample is 1 g, and the diameter of the spheres is 225µm.
rH[%] ∆f0[Hz] ∆Γ[Hz] RHertz[µm] RMindlin[µm] λs[nm] κ[kg/s2] µs
06 160 21 0.51 0.10 4.1 1.06 106 0.44
06 158 22 0.51 0.10 4.5 1.05 106 0.48
06 340 30 0.51 0.21 6.2 2.26 106 1.43
06 355 32 0.51 0.22 5.8 2.36 106 1.40
06 366 34 0.51 0.23 10 2.44 106 2.49
76 374 35 0.51 0.23 3.4 2.50 106 0.86
76 387 33 0.51 0.24 3.9 2.58 106 1.03
76 386 33 0.51 0.24 3 2.58 106 0.79
28 915 48 0.51 0.56 131 6.10 106 81
26 938 42 0.51 0.58 130 6.26 106 83
24 960 37 0.51 0.59 69 6.40 106 45
22 817 50 0.51 0.50 7.3 5.45 106 4.05
4.9. Glass spheres with the diameter of 112 µµµµm
A further series of experiments was performed with glass spheres with a diameter of
112 µm. This size is so small that the exact number of spheres cannot be determined exactly.
The number is about 300
From Eq. 2.2, the Hertz radius of the sphere–plate contact for a single sphere is
calculated as about 330 nm. This value is comparable with the maximum shear amplitude,
which can be reached with our experimental setup. For the samples with a diameter of
700 µm and 225 µm we observe shear induced strengthening of the sphere–plate contact. For
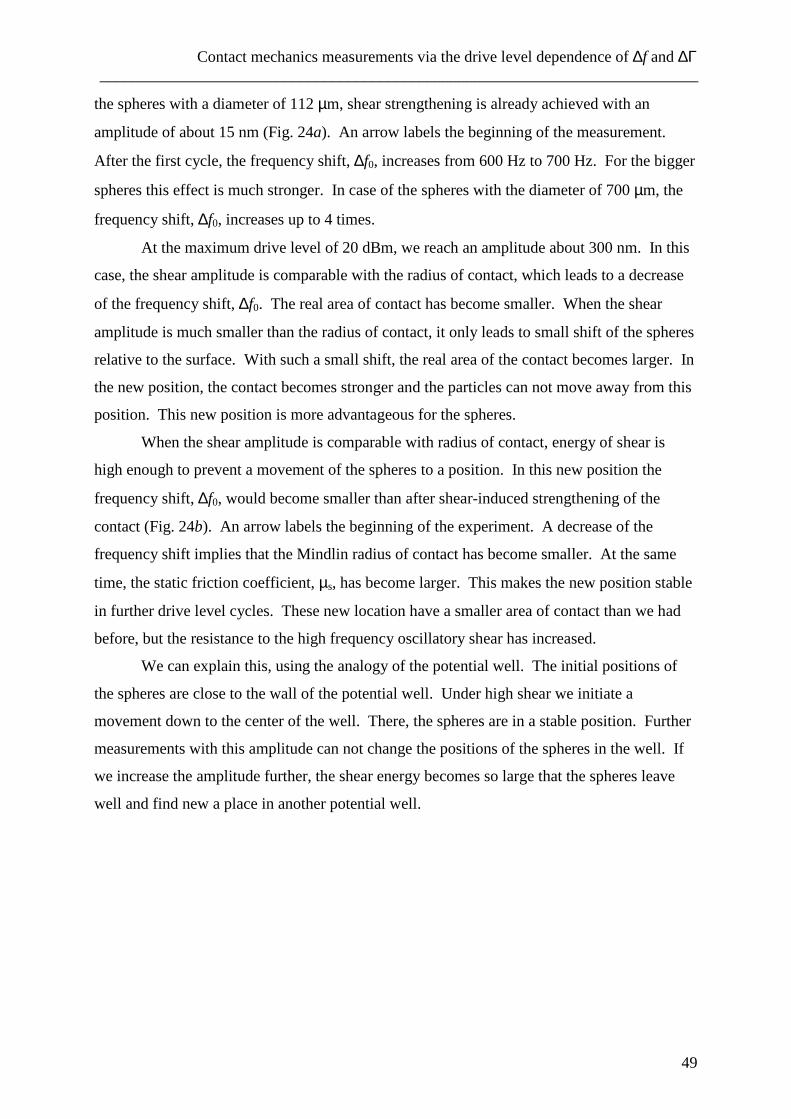
Contact mechanics measurements via the drive level dependence of ∆f and ∆Γ ___________________________________________________________________________
49
the spheres with a diameter of 112 µm, shear strengthening is already achieved with an
amplitude of about 15 nm (Fig. 24a). An arrow labels the beginning of the measurement.
After the first cycle, the frequency shift, ∆f0, increases from 600 Hz to 700 Hz. For the bigger
spheres this effect is much stronger. In case of the spheres with the diameter of 700 µm, the
frequency shift, ∆f0, increases up to 4 times.
At the maximum drive level of 20 dBm, we reach an amplitude about 300 nm. In this
case, the shear amplitude is comparable with the radius of contact, which leads to a decrease
of the frequency shift, ∆f0. The real area of contact has become smaller. When the shear
amplitude is much smaller than the radius of contact, it only leads to small shift of the spheres
relative to the surface. With such a small shift, the real area of the contact becomes larger. In
the new position, the contact becomes stronger and the particles can not move away from this
position. This new position is more advantageous for the spheres.
When the shear amplitude is comparable with radius of contact, energy of shear is
high enough to prevent a movement of the spheres to a position. In this new position the
frequency shift, ∆f0, would become smaller than after shear-induced strengthening of the
contact (Fig. 24b). An arrow labels the beginning of the experiment. A decrease of the
frequency shift implies that the Mindlin radius of contact has become smaller. At the same
time, the static friction coefficient, µs, has become larger. This makes the new position stable
in further drive level cycles. These new location have a smaller area of contact than we had
before, but the resistance to the high frequency oscillatory shear has increased.
We can explain this, using the analogy of the potential well. The initial positions of
the spheres are close to the wall of the potential well. Under high shear we initiate a
movement down to the center of the well. There, the spheres are in a stable position. Further
measurements with this amplitude can not change the positions of the spheres in the well. If
we increase the amplitude further, the shear energy becomes so large that the spheres leave
well and find new a place in another potential well.
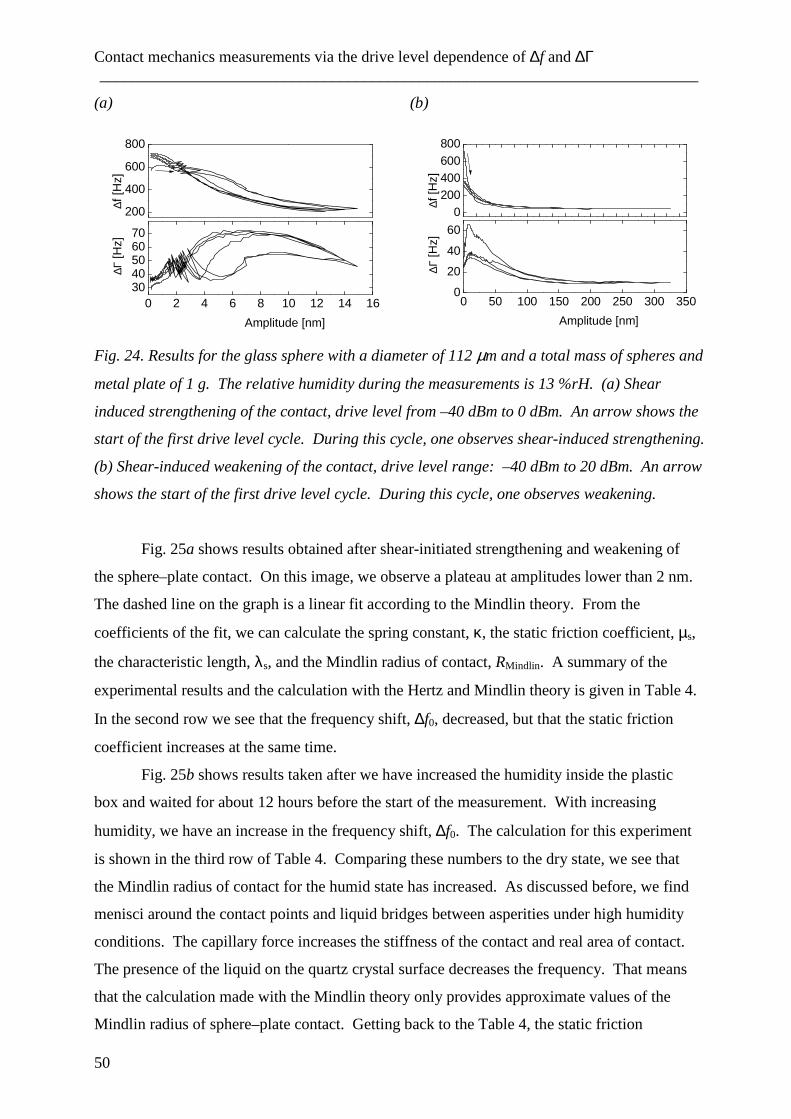
Contact mechanics measurements via the drive level dependence of ∆f and ∆Γ ___________________________________________________________________________
50
(a)
200
400
600
800
0 2 4 6 8 10 12 14 163040506070
∆f [H
z]
∆Γ [H
z]
Amplitude [nm]
(b)
0200400600800
0 50 100 150 200 250 300 3500
20
40
60
∆f [H
z]
∆Γ [H
z]
Amplitude [nm]
Fig. 24. Results for the glass sphere with a diameter of 112 µm and a total mass of spheres and
metal plate of 1 g. The relative humidity during the measurements is 13 %rH. (a) Shear
induced strengthening of the contact, drive level from –40 dBm to 0 dBm. An arrow shows the
start of the first drive level cycle. During this cycle, one observes shear-induced strengthening.
(b) Shear-induced weakening of the contact, drive level range: –40 dBm to 20 dBm. An arrow
shows the start of the first drive level cycle. During this cycle, one observes weakening.
Fig. 25a shows results obtained after shear-initiated strengthening and weakening of
the sphere–plate contact. On this image, we observe a plateau at amplitudes lower than 2 nm.
The dashed line on the graph is a linear fit according to the Mindlin theory. From the
coefficients of the fit, we can calculate the spring constant, κ, the static friction coefficient, µs,
the characteristic length, λs, and the Mindlin radius of contact, RMindlin. A summary of the
experimental results and the calculation with the Hertz and Mindlin theory is given in Table 4.
In the second row we see that the frequency shift, ∆f0, decreased, but that the static friction
coefficient increases at the same time.
Fig. 25b shows results taken after we have increased the humidity inside the plastic
box and waited for about 12 hours before the start of the measurement. With increasing
humidity, we have an increase in the frequency shift, ∆f0. The calculation for this experiment
is shown in the third row of Table 4. Comparing these numbers to the dry state, we see that
the Mindlin radius of contact for the humid state has increased. As discussed before, we find
menisci around the contact points and liquid bridges between asperities under high humidity
conditions. The capillary force increases the stiffness of the contact and real area of contact.
The presence of the liquid on the quartz crystal surface decreases the frequency. That means
that the calculation made with the Mindlin theory only provides approximate values of the
Mindlin radius of sphere–plate contact. Getting back to the Table 4, the static friction
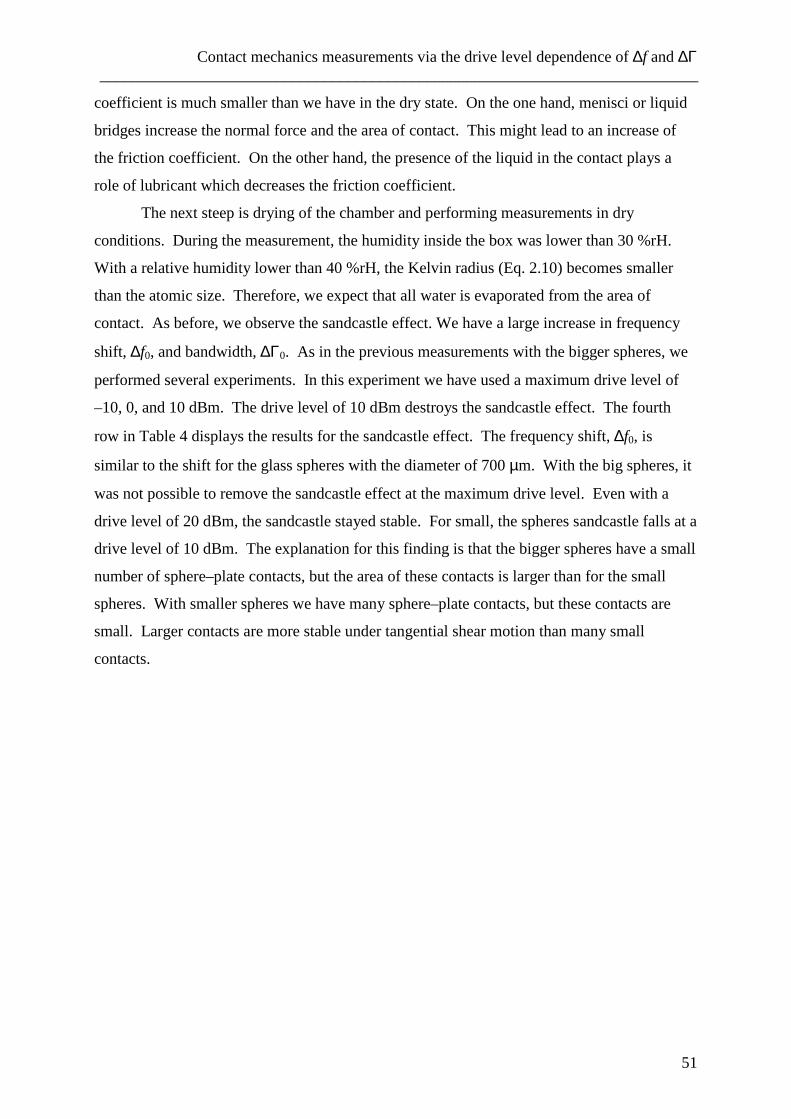
Contact mechanics measurements via the drive level dependence of ∆f and ∆Γ ___________________________________________________________________________
51
coefficient is much smaller than we have in the dry state. On the one hand, menisci or liquid
bridges increase the normal force and the area of contact. This might lead to an increase of
the friction coefficient. On the other hand, the presence of the liquid in the contact plays a
role of lubricant which decreases the friction coefficient.
The next steep is drying of the chamber and performing measurements in dry
conditions. During the measurement, the humidity inside the box was lower than 30 %rH.
With a relative humidity lower than 40 %rH, the Kelvin radius (Eq. 2.10) becomes smaller
than the atomic size. Therefore, we expect that all water is evaporated from the area of
contact. As before, we observe the sandcastle effect. We have a large increase in frequency
shift, ∆f0, and bandwidth, ∆Γ0. As in the previous measurements with the bigger spheres, we
performed several experiments. In this experiment we have used a maximum drive level of
–10, 0, and 10 dBm. The drive level of 10 dBm destroys the sandcastle effect. The fourth
row in Table 4 displays the results for the sandcastle effect. The frequency shift, ∆f0, is
similar to the shift for the glass spheres with the diameter of 700 µm. With the big spheres, it
was not possible to remove the sandcastle effect at the maximum drive level. Even with a
drive level of 20 dBm, the sandcastle stayed stable. For small, the spheres sandcastle falls at a
drive level of 10 dBm. The explanation for this finding is that the bigger spheres have a small
number of sphere–plate contacts, but the area of these contacts is larger than for the small
spheres. With smaller spheres we have many sphere–plate contacts, but these contacts are
small. Larger contacts are more stable under tangential shear motion than many small
contacts.
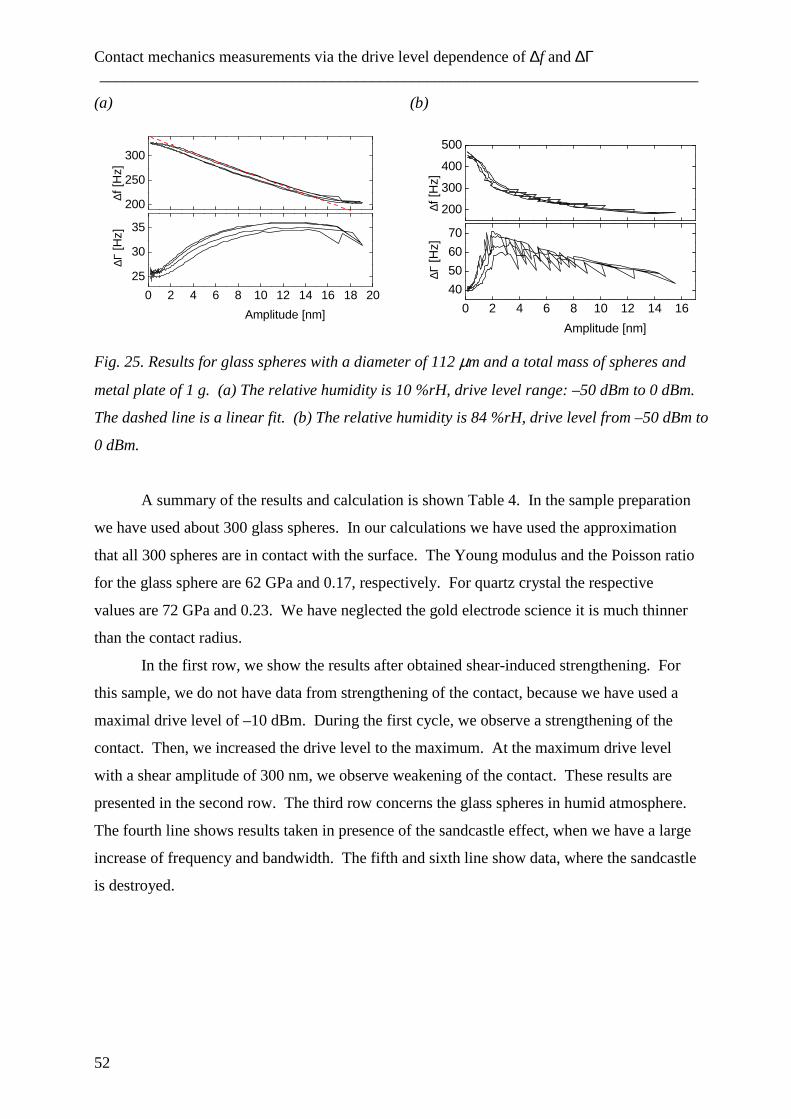
Contact mechanics measurements via the drive level dependence of ∆f and ∆Γ ___________________________________________________________________________
52
(a)
200
250
300
0 2 4 6 8 10 12 14 16 18 20
25
30
35
∆f [H
z]
∆Γ [H
z]
Amplitude [nm]
(b)
200
300
400
500
0 2 4 6 8 10 12 14 16
40
50
60
70
∆f [H
z]
∆Γ [H
z]
Amplitude [nm]
Fig. 25. Results for glass spheres with a diameter of 112 µm and a total mass of spheres and
metal plate of 1 g. (a) The relative humidity is 10 %rH, drive level range: –50 dBm to 0 dBm.
The dashed line is a linear fit. (b) The relative humidity is 84 %rH, drive level from –50 dBm to
0 dBm.
A summary of the results and calculation is shown Table 4. In the sample preparation
we have used about 300 glass spheres. In our calculations we have used the approximation
that all 300 spheres are in contact with the surface. The Young modulus and the Poisson ratio
for the glass sphere are 62 GPa and 0.17, respectively. For quartz crystal the respective
values are 72 GPa and 0.23. We have neglected the gold electrode science it is much thinner
than the contact radius.
In the first row, we show the results after obtained shear-induced strengthening. For
this sample, we do not have data from strengthening of the contact, because we have used a
maximal drive level of –10 dBm. During the first cycle, we observe a strengthening of the
contact. Then, we increased the drive level to the maximum. At the maximum drive level
with a shear amplitude of 300 nm, we observe weakening of the contact. These results are
presented in the second row. The third row concerns the glass spheres in humid atmosphere.
The fourth line shows results taken in presence of the sandcastle effect, when we have a large
increase of frequency and bandwidth. The fifth and sixth line show data, where the sandcastle
is destroyed.
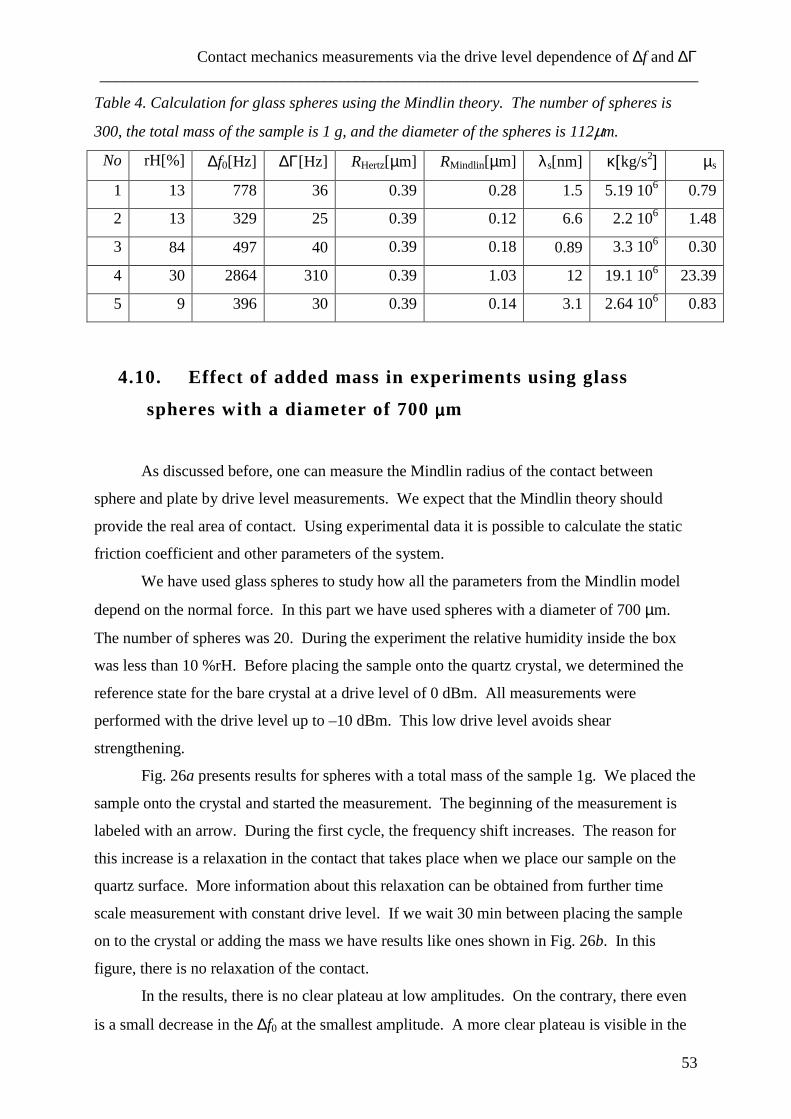
Contact mechanics measurements via the drive level dependence of ∆f and ∆Γ ___________________________________________________________________________
53
Table 4. Calculation for glass spheres using the Mindlin theory. The number of spheres is
300, the total mass of the sample is 1 g, and the diameter of the spheres is 112µm.
No rH[%] ∆f0[Hz] ∆Γ[Hz] RHertz[µm] RMindlin[µm] λs[nm] κ[kg/s2] µs
1 13 778 36 0.39 0.28 1.5 5.19 106 0.79
2 13 329 25 0.39 0.12 6.6 2.2 106 1.48
3 84 497 40 0.39 0.18 0.89 3.3 106 0.30
4 30 2864 310 0.39 1.03 12 19.1 106 23.39
5 9 396 30 0.39 0.14 3.1 2.64 106 0.83
4.10. Effect of added mass in experiments using glass
spheres with a diameter of 700 µµµµm
As discussed before, one can measure the Mindlin radius of the contact between
sphere and plate by drive level measurements. We expect that the Mindlin theory should
provide the real area of contact. Using experimental data it is possible to calculate the static
friction coefficient and other parameters of the system.
We have used glass spheres to study how all the parameters from the Mindlin model
depend on the normal force. In this part we have used spheres with a diameter of 700 µm.
The number of spheres was 20. During the experiment the relative humidity inside the box
was less than 10 %rH. Before placing the sample onto the quartz crystal, we determined the
reference state for the bare crystal at a drive level of 0 dBm. All measurements were
performed with the drive level up to –10 dBm. This low drive level avoids shear
strengthening.
Fig. 26a presents results for spheres with a total mass of the sample 1g. We placed the
sample onto the crystal and started the measurement. The beginning of the measurement is
labeled with an arrow. During the first cycle, the frequency shift increases. The reason for
this increase is a relaxation in the contact that takes place when we place our sample on the
quartz surface. More information about this relaxation can be obtained from further time
scale measurement with constant drive level. If we wait 30 min between placing the sample
on to the crystal or adding the mass we have results like ones shown in Fig. 26b. In this
figure, there is no relaxation of the contact.
In the results, there is no clear plateau at low amplitudes. On the contrary, there even
is a small decrease in the ∆f0 at the smallest amplitude. A more clear plateau is visible in the
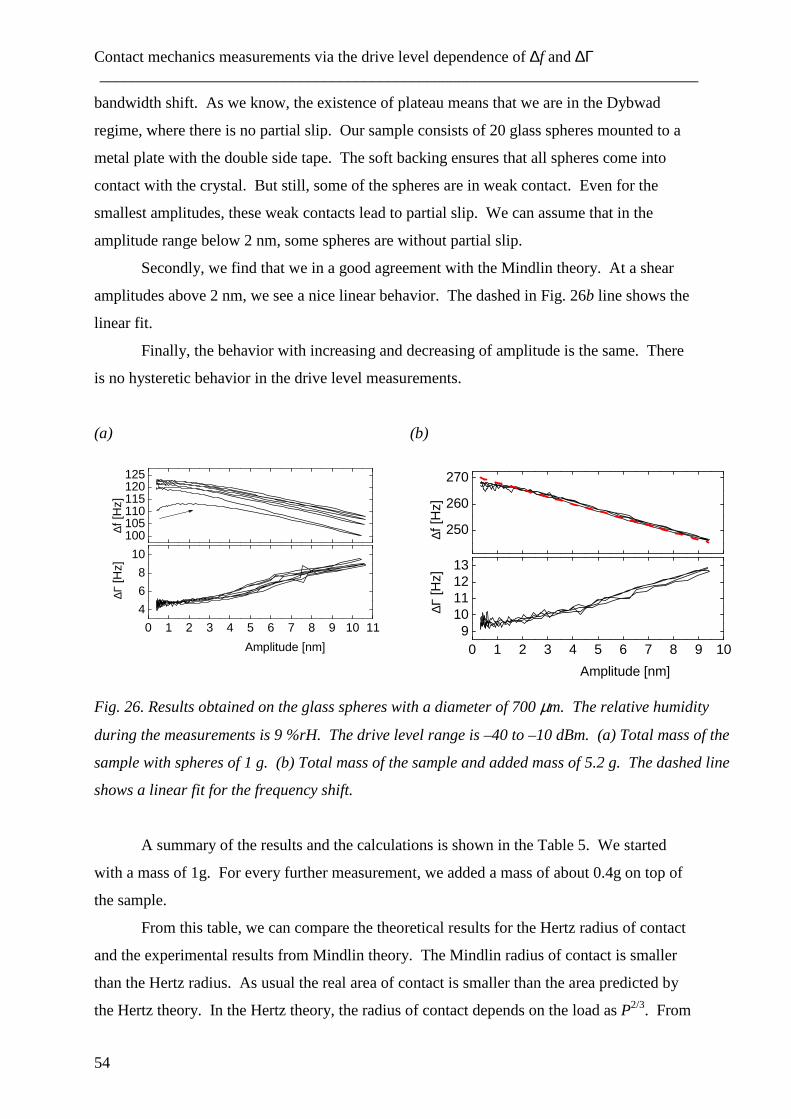
Contact mechanics measurements via the drive level dependence of ∆f and ∆Γ ___________________________________________________________________________
54
bandwidth shift. As we know, the existence of plateau means that we are in the Dybwad
regime, where there is no partial slip. Our sample consists of 20 glass spheres mounted to a
metal plate with the double side tape. The soft backing ensures that all spheres come into
contact with the crystal. But still, some of the spheres are in weak contact. Even for the
smallest amplitudes, these weak contacts lead to partial slip. We can assume that in the
amplitude range below 2 nm, some spheres are without partial slip.
Secondly, we find that we in a good agreement with the Mindlin theory. At a shear
amplitudes above 2 nm, we see a nice linear behavior. The dashed in Fig. 26b line shows the
linear fit.
Finally, the behavior with increasing and decreasing of amplitude is the same. There
is no hysteretic behavior in the drive level measurements.
(a)
100105110115120125
0 1 2 3 4 5 6 7 8 9 10 11
4
6
8
10
∆f [H
z]
∆Γ [H
z]
Amplitude [nm]
(b)
250
260
270
0 1 2 3 4 5 6 7 8 9 109
10111213
∆f [H
z]
∆Γ [H
z]
Amplitude [nm]
Fig. 26. Results obtained on the glass spheres with a diameter of 700 µm. The relative humidity
during the measurements is 9 %rH. The drive level range is –40 to –10 dBm. (a) Total mass of the
sample with spheres of 1 g. (b) Total mass of the sample and added mass of 5.2 g. The dashed line
shows a linear fit for the frequency shift.
A summary of the results and the calculations is shown in the Table 5. We started
with a mass of 1g. For every further measurement, we added a mass of about 0.4g on top of
the sample.
From this table, we can compare the theoretical results for the Hertz radius of contact
and the experimental results from Mindlin theory. The Mindlin radius of contact is smaller
than the Hertz radius. As usual the real area of contact is smaller than the area predicted by
the Hertz theory. In the Hertz theory, the radius of contact depends on the load as P2/3. From
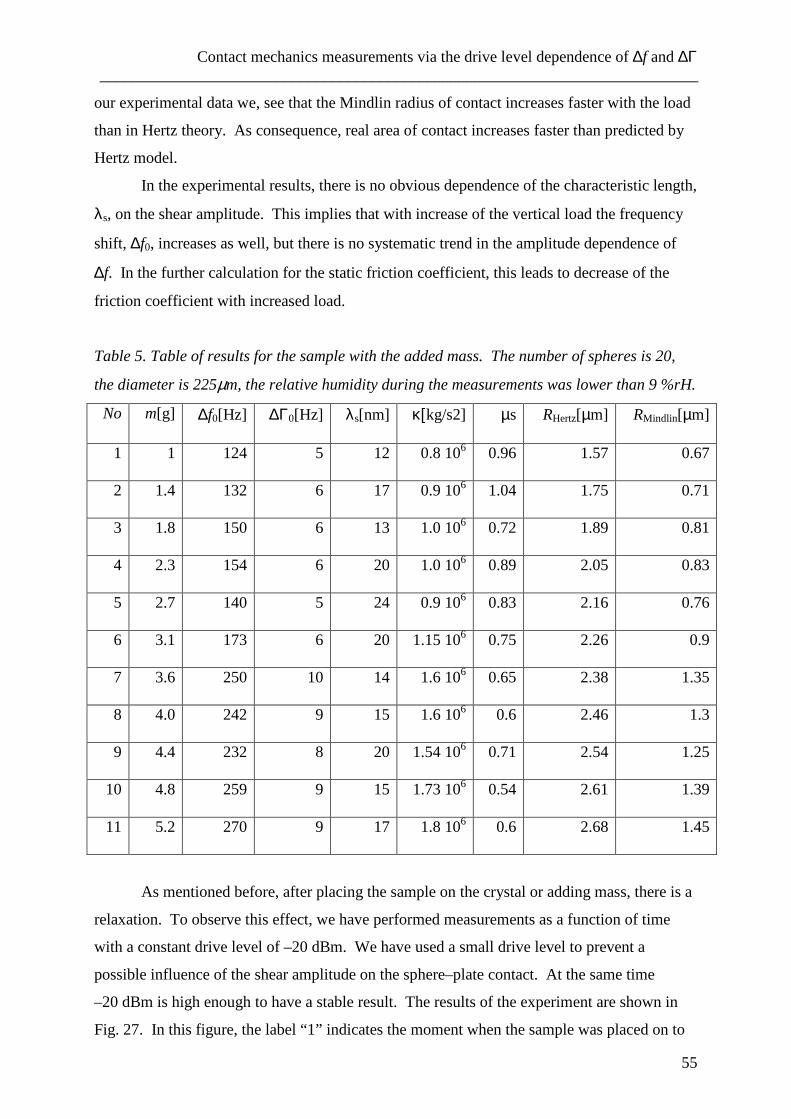
Contact mechanics measurements via the drive level dependence of ∆f and ∆Γ ___________________________________________________________________________
55
our experimental data we, see that the Mindlin radius of contact increases faster with the load
than in Hertz theory. As consequence, real area of contact increases faster than predicted by
Hertz model.
In the experimental results, there is no obvious dependence of the characteristic length,
λs, on the shear amplitude. This implies that with increase of the vertical load the frequency
shift, ∆f0, increases as well, but there is no systematic trend in the amplitude dependence of
∆f. In the further calculation for the static friction coefficient, this leads to decrease of the
friction coefficient with increased load.
Table 5. Table of results for the sample with the added mass. The number of spheres is 20,
the diameter is 225µm, the relative humidity during the measurements was lower than 9 %rH.
No m[g] ∆f0[Hz] ∆Γ0[Hz] λs[nm] κ[kg/s2] µs RHertz[µm] RMindlin[µm]
1 1 124 5 12 0.8 106 0.96 1.57 0.67
2 1.4 132 6 17 0.9 106 1.04 1.75 0.71
3 1.8 150 6 13 1.0 106 0.72 1.89 0.81
4 2.3 154 6 20 1.0 106 0.89 2.05 0.83
5 2.7 140 5 24 0.9 106 0.83 2.16 0.76
6 3.1 173 6 20 1.15 106 0.75 2.26 0.9
7 3.6 250 10 14 1.6 106 0.65 2.38 1.35
8 4.0 242 9 15 1.6 106 0.6 2.46 1.3
9 4.4 232 8 20 1.54 106 0.71 2.54 1.25
10 4.8 259 9 15 1.73 106 0.54 2.61 1.39
11 5.2 270 9 17 1.8 106 0.6 2.68 1.45
As mentioned before, after placing the sample on the crystal or adding mass, there is a
relaxation. To observe this effect, we have performed measurements as a function of time
with a constant drive level of –20 dBm. We have used a small drive level to prevent a
possible influence of the shear amplitude on the sphere–plate contact. At the same time
–20 dBm is high enough to have a stable result. The results of the experiment are shown in
Fig. 27. In this figure, the label “1” indicates the moment when the sample was placed on to
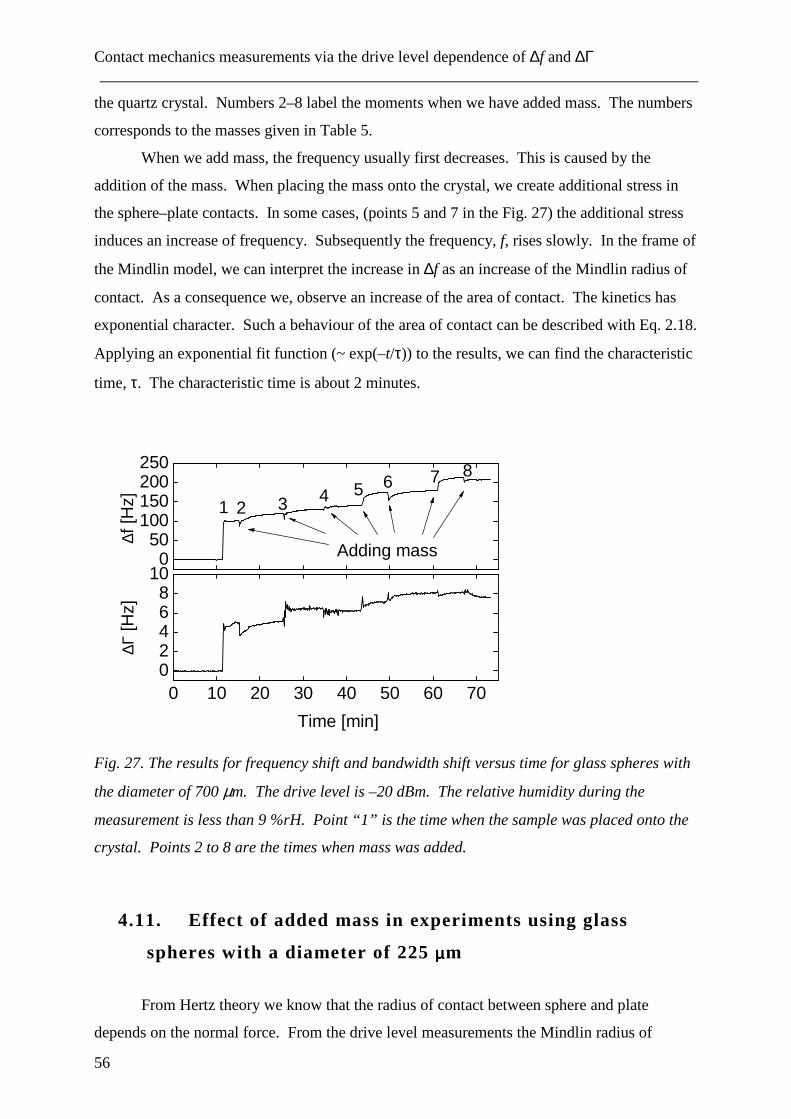
Contact mechanics measurements via the drive level dependence of ∆f and ∆Γ ___________________________________________________________________________
56
the quartz crystal. Numbers 2–8 label the moments when we have added mass. The numbers
corresponds to the masses given in Table 5.
When we add mass, the frequency usually first decreases. This is caused by the
addition of the mass. When placing the mass onto the crystal, we create additional stress in
the sphere–plate contacts. In some cases, (points 5 and 7 in the Fig. 27) the additional stress
induces an increase of frequency. Subsequently the frequency, f, rises slowly. In the frame of
the Mindlin model, we can interpret the increase in ∆f as an increase of the Mindlin radius of
contact. As a consequence we, observe an increase of the area of contact. The kinetics has
exponential character. Such a behaviour of the area of contact can be described with Eq. 2.18.
Applying an exponential fit function (~ exp(–t/τ)) to the results, we can find the characteristic
time, τ. The characteristic time is about 2 minutes.
050
100150200250
0 10 20 30 40 50 60 7002468
10
8765432
∆f [H
z]
Adding mass
1
∆Γ [H
z]
Time [min]
Fig. 27. The results for frequency shift and bandwidth shift versus time for glass spheres with
the diameter of 700 µm. The drive level is –20 dBm. The relative humidity during the
measurement is less than 9 %rH. Point “1” is the time when the sample was placed onto the
crystal. Points 2 to 8 are the times when mass was added.
4.11. Effect of added mass in experiments using glass
spheres with a diameter of 225 µµµµm
From Hertz theory we know that the radius of contact between sphere and plate
depends on the normal force. From the drive level measurements the Mindlin radius of
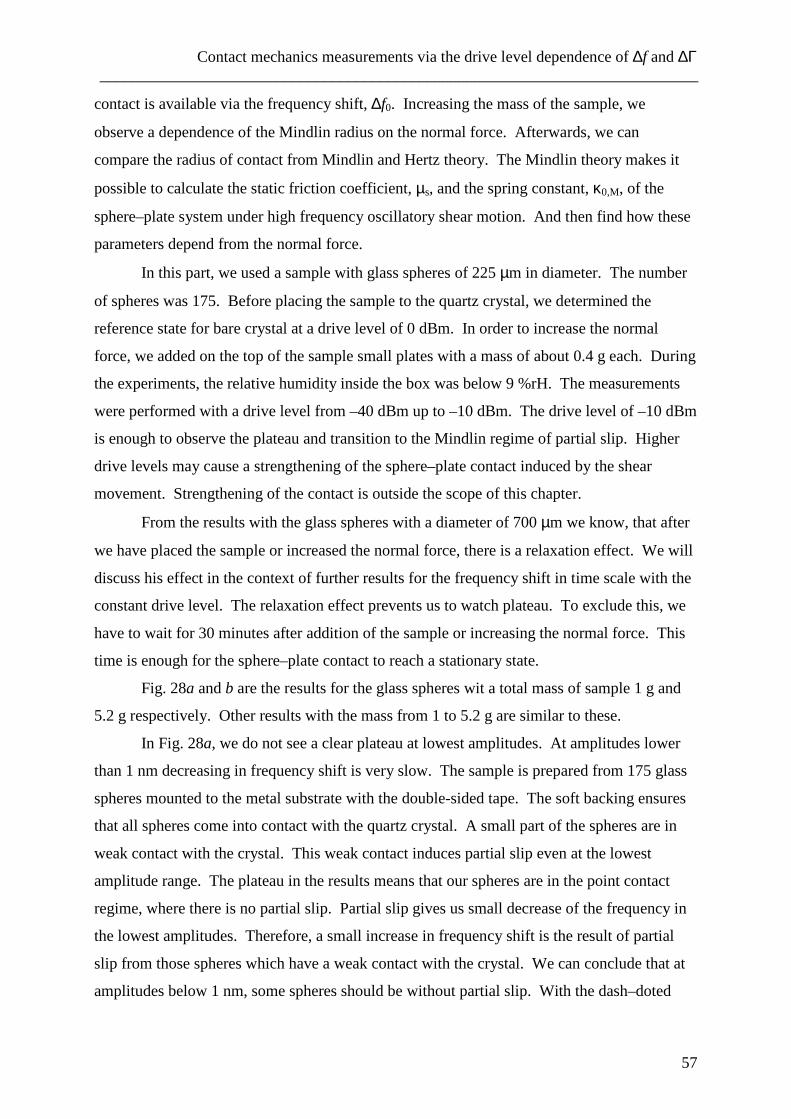
Contact mechanics measurements via the drive level dependence of ∆f and ∆Γ ___________________________________________________________________________
57
contact is available via the frequency shift, ∆f0. Increasing the mass of the sample, we
observe a dependence of the Mindlin radius on the normal force. Afterwards, we can
compare the radius of contact from Mindlin and Hertz theory. The Mindlin theory makes it
possible to calculate the static friction coefficient, µs, and the spring constant, κ0,M, of the
sphere–plate system under high frequency oscillatory shear motion. And then find how these
parameters depend from the normal force.
In this part, we used a sample with glass spheres of 225 µm in diameter. The number
of spheres was 175. Before placing the sample to the quartz crystal, we determined the
reference state for bare crystal at a drive level of 0 dBm. In order to increase the normal
force, we added on the top of the sample small plates with a mass of about 0.4 g each. During
the experiments, the relative humidity inside the box was below 9 %rH. The measurements
were performed with a drive level from –40 dBm up to –10 dBm. The drive level of –10 dBm
is enough to observe the plateau and transition to the Mindlin regime of partial slip. Higher
drive levels may cause a strengthening of the sphere–plate contact induced by the shear
movement. Strengthening of the contact is outside the scope of this chapter.
From the results with the glass spheres with a diameter of 700 µm we know, that after
we have placed the sample or increased the normal force, there is a relaxation effect. We will
discuss his effect in the context of further results for the frequency shift in time scale with the
constant drive level. The relaxation effect prevents us to watch plateau. To exclude this, we
have to wait for 30 minutes after addition of the sample or increasing the normal force. This
time is enough for the sphere–plate contact to reach a stationary state.
Fig. 28a and b are the results for the glass spheres wit a total mass of sample 1 g and
5.2 g respectively. Other results with the mass from 1 to 5.2 g are similar to these.
In Fig. 28a, we do not see a clear plateau at lowest amplitudes. At amplitudes lower
than 1 nm decreasing in frequency shift is very slow. The sample is prepared from 175 glass
spheres mounted to the metal substrate with the double-sided tape. The soft backing ensures
that all spheres come into contact with the quartz crystal. A small part of the spheres are in
weak contact with the crystal. This weak contact induces partial slip even at the lowest
amplitude range. The plateau in the results means that our spheres are in the point contact
regime, where there is no partial slip. Partial slip gives us small decrease of the frequency in
the lowest amplitudes. Therefore, a small increase in frequency shift is the result of partial
slip from those spheres which have a weak contact with the crystal. We can conclude that at
amplitudes below 1 nm, some spheres should be without partial slip. With the dash–doted
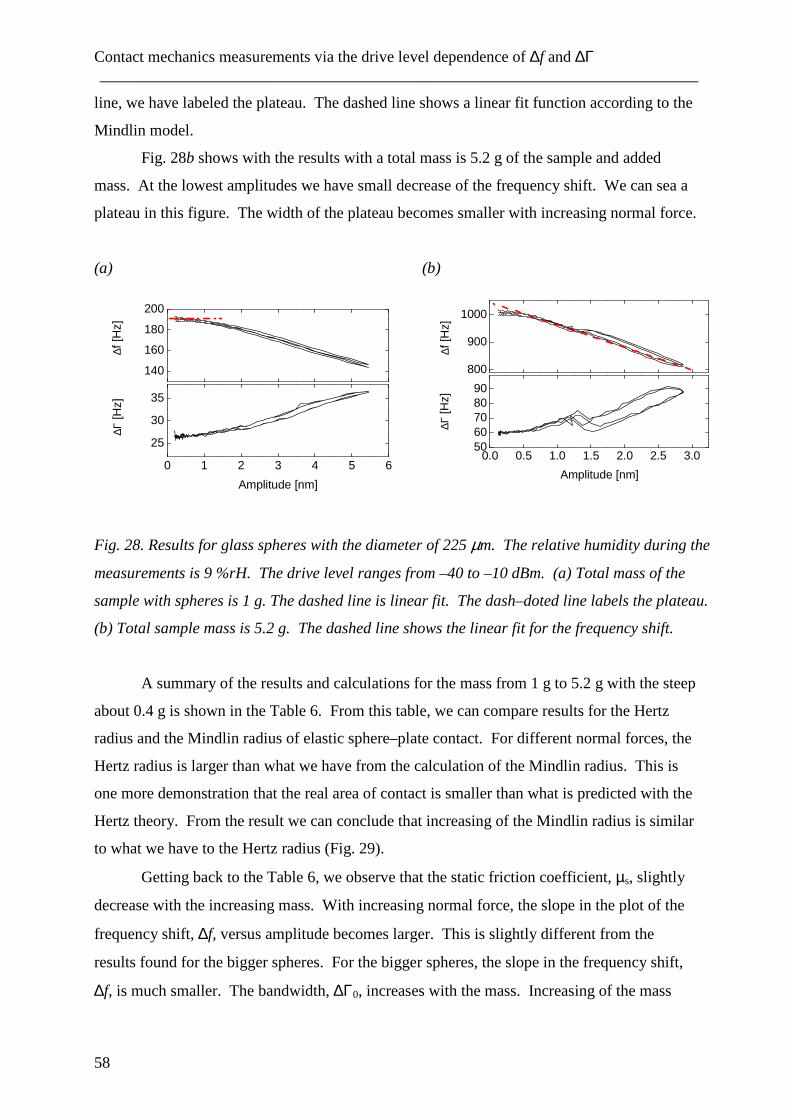
Contact mechanics measurements via the drive level dependence of ∆f and ∆Γ ___________________________________________________________________________
58
line, we have labeled the plateau. The dashed line shows a linear fit function according to the
Mindlin model.
Fig. 28b shows with the results with a total mass is 5.2 g of the sample and added
mass. At the lowest amplitudes we have small decrease of the frequency shift. We can sea a
plateau in this figure. The width of the plateau becomes smaller with increasing normal force.
(a)
140
160
180
200
0 1 2 3 4 5 6
25
30
35
∆f [H
z]
∆Γ [H
z]
Amplitude [nm]
(b)
800
900
1000
0.0 0.5 1.0 1.5 2.0 2.5 3.05060708090
∆f [H
z]
∆Γ [H
z]
Amplitude [nm]
Fig. 28. Results for glass spheres with the diameter of 225 µm. The relative humidity during the
measurements is 9 %rH. The drive level ranges from –40 to –10 dBm. (a) Total mass of the
sample with spheres is 1 g. The dashed line is linear fit. The dash–doted line labels the plateau.
(b) Total sample mass is 5.2 g. The dashed line shows the linear fit for the frequency shift.
A summary of the results and calculations for the mass from 1 g to 5.2 g with the steep
about 0.4 g is shown in the Table 6. From this table, we can compare results for the Hertz
radius and the Mindlin radius of elastic sphere–plate contact. For different normal forces, the
Hertz radius is larger than what we have from the calculation of the Mindlin radius. This is
one more demonstration that the real area of contact is smaller than what is predicted with the
Hertz theory. From the result we can conclude that increasing of the Mindlin radius is similar
to what we have to the Hertz radius (Fig. 29).
Getting back to the Table 6, we observe that the static friction coefficient, µs, slightly
decrease with the increasing mass. With increasing normal force, the slope in the plot of the
frequency shift, ∆f, versus amplitude becomes larger. This is slightly different from the
results found for the bigger spheres. For the bigger spheres, the slope in the frequency shift,
∆f, is much smaller. The bandwidth, ∆Γ0, increases with the mass. Increasing of the mass
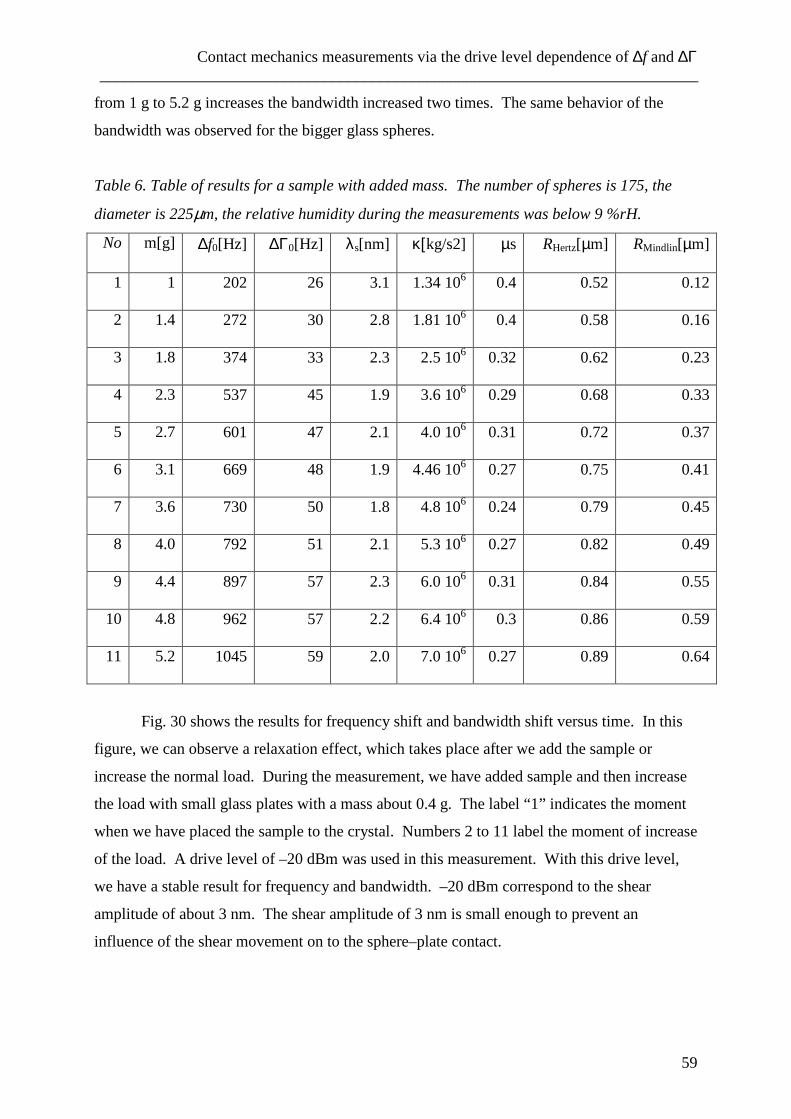
Contact mechanics measurements via the drive level dependence of ∆f and ∆Γ ___________________________________________________________________________
59
from 1 g to 5.2 g increases the bandwidth increased two times. The same behavior of the
bandwidth was observed for the bigger glass spheres.
Table 6. Table of results for a sample with added mass. The number of spheres is 175, the
diameter is 225µm, the relative humidity during the measurements was below 9 %rH.
No m[g] ∆f0[Hz] ∆Γ0[Hz] λs[nm] κ[kg/s2] µs RHertz[µm] RMindlin[µm]
1 1 202 26 3.1 1.34 106 0.4 0.52 0.12
2 1.4 272 30 2.8 1.81 106 0.4 0.58 0.16
3 1.8 374 33 2.3 2.5 106 0.32 0.62 0.23
4 2.3 537 45 1.9 3.6 106 0.29 0.68 0.33
5 2.7 601 47 2.1 4.0 106 0.31 0.72 0.37
6 3.1 669 48 1.9 4.46 106 0.27 0.75 0.41
7 3.6 730 50 1.8 4.8 106 0.24 0.79 0.45
8 4.0 792 51 2.1 5.3 106 0.27 0.82 0.49
9 4.4 897 57 2.3 6.0 106 0.31 0.84 0.55
10 4.8 962 57 2.2 6.4 106 0.3 0.86 0.59
11 5.2 1045 59 2.0 7.0 106 0.27 0.89 0.64
Fig. 30 shows the results for frequency shift and bandwidth shift versus time. In this
figure, we can observe a relaxation effect, which takes place after we add the sample or
increase the normal load. During the measurement, we have added sample and then increase
the load with small glass plates with a mass about 0.4 g. The label “1” indicates the moment
when we have placed the sample to the crystal. Numbers 2 to 11 label the moment of increase
of the load. A drive level of –20 dBm was used in this measurement. With this drive level,
we have a stable result for frequency and bandwidth. –20 dBm correspond to the shear
amplitude of about 3 nm. The shear amplitude of 3 nm is small enough to prevent an
influence of the shear movement on to the sphere–plate contact.
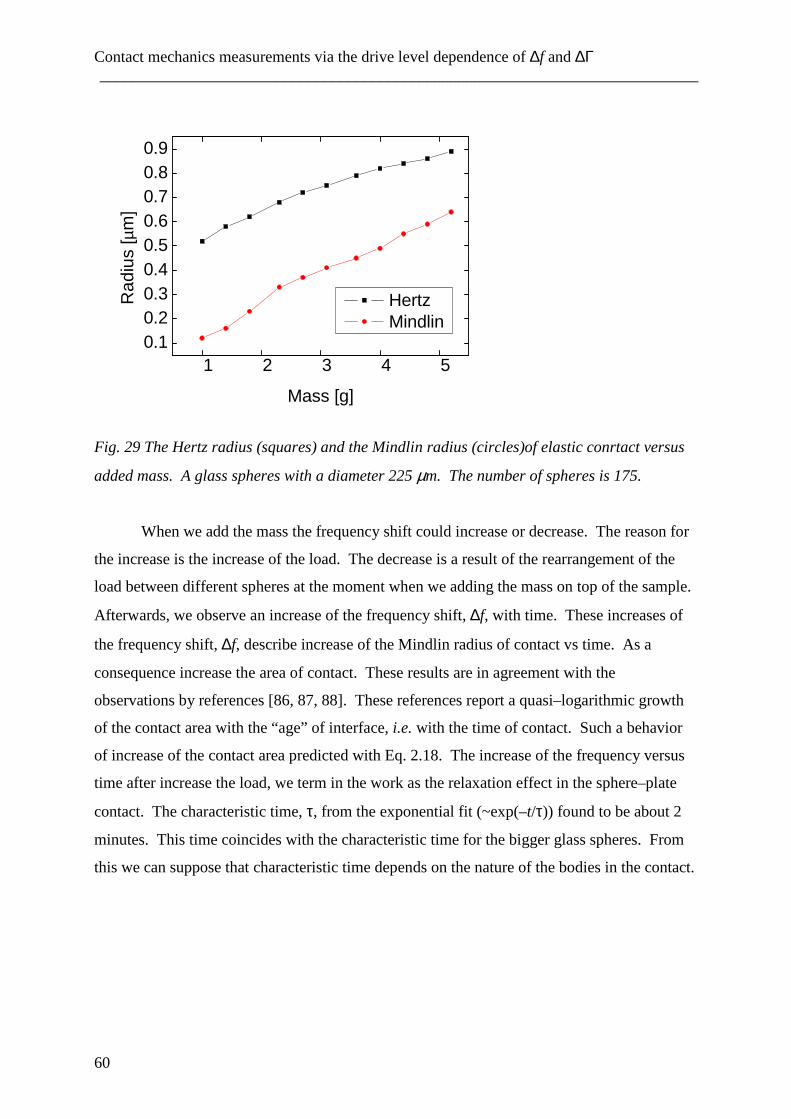
Contact mechanics measurements via the drive level dependence of ∆f and ∆Γ ___________________________________________________________________________
60
1 2 3 4 50.10.20.30.40.50.60.70.80.9
R
adiu
s [µ
m]
Mass [g]
Hertz Mindlin
Fig. 29 The Hertz radius (squares) and the Mindlin radius (circles)of elastic conrtact versus
added mass. A glass spheres with a diameter 225 µm. The number of spheres is 175.
When we add the mass the frequency shift could increase or decrease. The reason for
the increase is the increase of the load. The decrease is a result of the rearrangement of the
load between different spheres at the moment when we adding the mass on top of the sample.
Afterwards, we observe an increase of the frequency shift, ∆f, with time. These increases of
the frequency shift, ∆f, describe increase of the Mindlin radius of contact vs time. As a
consequence increase the area of contact. These results are in agreement with the
observations by references [86, 87, 88]. These references report a quasi–logarithmic growth
of the contact area with the “age” of interface, i.e. with the time of contact. Such a behavior
of increase of the contact area predicted with Eq. 2.18. The increase of the frequency versus
time after increase the load, we term in the work as the relaxation effect in the sphere–plate
contact. The characteristic time, τ, from the exponential fit (~exp(–t/τ)) found to be about 2
minutes. This time coincides with the characteristic time for the bigger glass spheres. From
this we can suppose that characteristic time depends on the nature of the bodies in the contact.
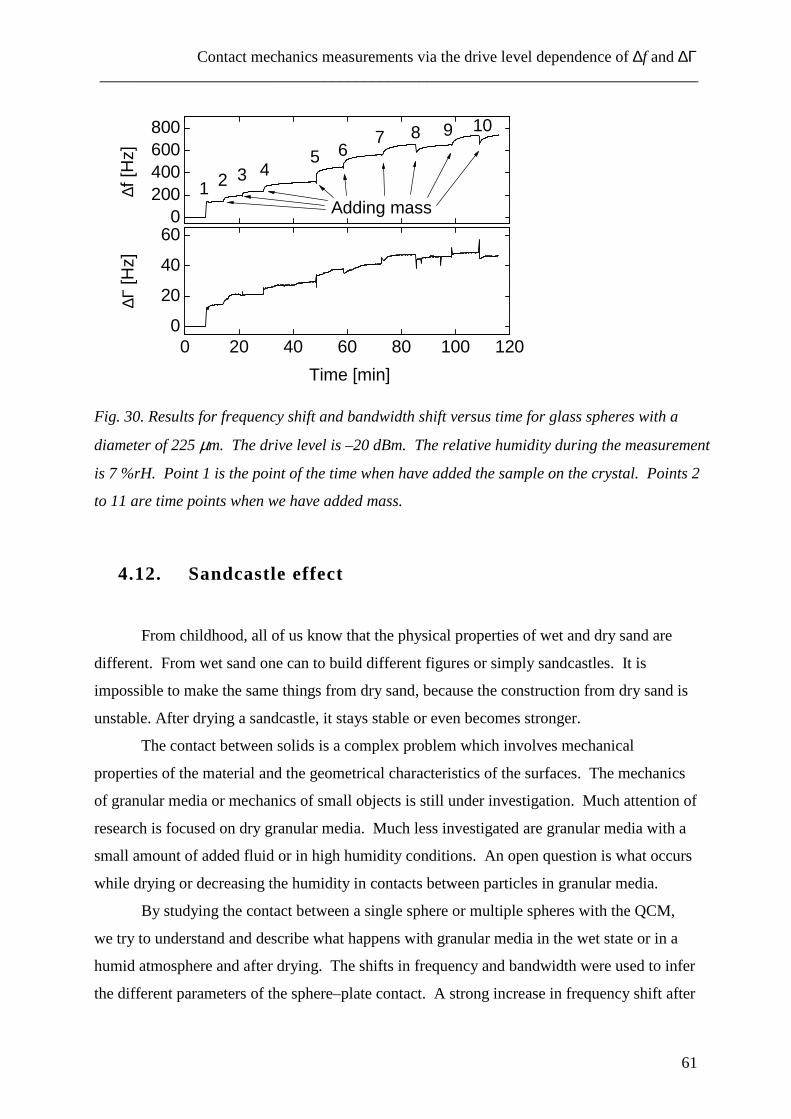
Contact mechanics measurements via the drive level dependence of ∆f and ∆Γ ___________________________________________________________________________
61
0200400600800
0 20 40 60 80 100 1200
20
40
60
10986
75
432
∆f [H
z]
1Adding mass
∆Γ [H
z]
Time [min]
Fig. 30. Results for frequency shift and bandwidth shift versus time for glass spheres with a
diameter of 225 µm. The drive level is –20 dBm. The relative humidity during the measurement
is 7 %rH. Point 1 is the point of the time when have added the sample on the crystal. Points 2
to 11 are time points when we have added mass.
4.12. Sandcastle effect
From childhood, all of us know that the physical properties of wet and dry sand are
different. From wet sand one can to build different figures or simply sandcastles. It is
impossible to make the same things from dry sand, because the construction from dry sand is
unstable. After drying a sandcastle, it stays stable or even becomes stronger.
The contact between solids is a complex problem which involves mechanical
properties of the material and the geometrical characteristics of the surfaces. The mechanics
of granular media or mechanics of small objects is still under investigation. Much attention of
research is focused on dry granular media. Much less investigated are granular media with a
small amount of added fluid or in high humidity conditions. An open question is what occurs
while drying or decreasing the humidity in contacts between particles in granular media.
By studying the contact between a single sphere or multiple spheres with the QCM,
we try to understand and describe what happens with granular media in the wet state or in a
humid atmosphere and after drying. The shifts in frequency and bandwidth were used to infer
the different parameters of the sphere–plate contact. A strong increase in frequency shift after
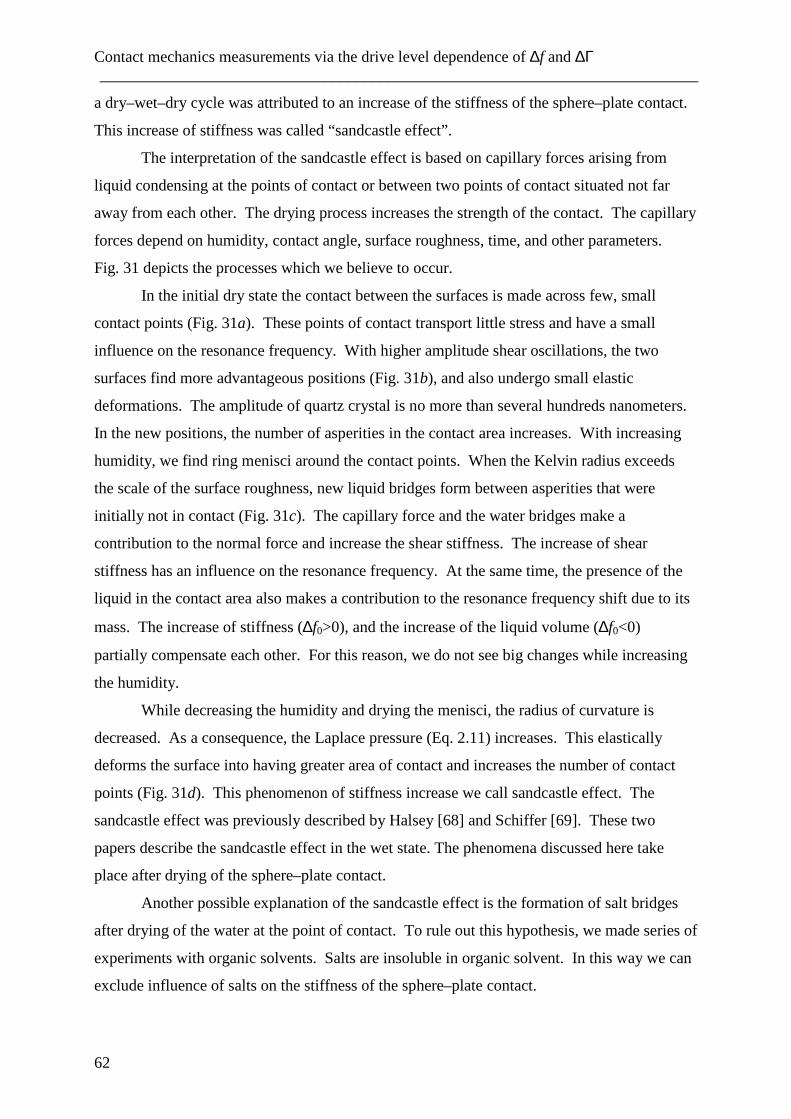
Contact mechanics measurements via the drive level dependence of ∆f and ∆Γ ___________________________________________________________________________
62
a dry–wet–dry cycle was attributed to an increase of the stiffness of the sphere–plate contact.
This increase of stiffness was called “sandcastle effect”.
The interpretation of the sandcastle effect is based on capillary forces arising from
liquid condensing at the points of contact or between two points of contact situated not far
away from each other. The drying process increases the strength of the contact. The capillary
forces depend on humidity, contact angle, surface roughness, time, and other parameters.
Fig. 31 depicts the processes which we believe to occur.
In the initial dry state the contact between the surfaces is made across few, small
contact points (Fig. 31a). These points of contact transport little stress and have a small
influence on the resonance frequency. With higher amplitude shear oscillations, the two
surfaces find more advantageous positions (Fig. 31b), and also undergo small elastic
deformations. The amplitude of quartz crystal is no more than several hundreds nanometers.
In the new positions, the number of asperities in the contact area increases. With increasing
humidity, we find ring menisci around the contact points. When the Kelvin radius exceeds
the scale of the surface roughness, new liquid bridges form between asperities that were
initially not in contact (Fig. 31c). The capillary force and the water bridges make a
contribution to the normal force and increase the shear stiffness. The increase of shear
stiffness has an influence on the resonance frequency. At the same time, the presence of the
liquid in the contact area also makes a contribution to the resonance frequency shift due to its
mass. The increase of stiffness (∆f0>0), and the increase of the liquid volume (∆f0<0)
partially compensate each other. For this reason, we do not see big changes while increasing
the humidity.
While decreasing the humidity and drying the menisci, the radius of curvature is
decreased. As a consequence, the Laplace pressure (Eq. 2.11) increases. This elastically
deforms the surface into having greater area of contact and increases the number of contact
points (Fig. 31d). This phenomenon of stiffness increase we call sandcastle effect. The
sandcastle effect was previously described by Halsey [68] and Schiffer [69]. These two
papers describe the sandcastle effect in the wet state. The phenomena discussed here take
place after drying of the sphere–plate contact.
Another possible explanation of the sandcastle effect is the formation of salt bridges
after drying of the water at the point of contact. To rule out this hypothesis, we made series of
experiments with organic solvents. Salts are insoluble in organic solvent. In this way we can
exclude influence of salts on the stiffness of the sphere–plate contact.
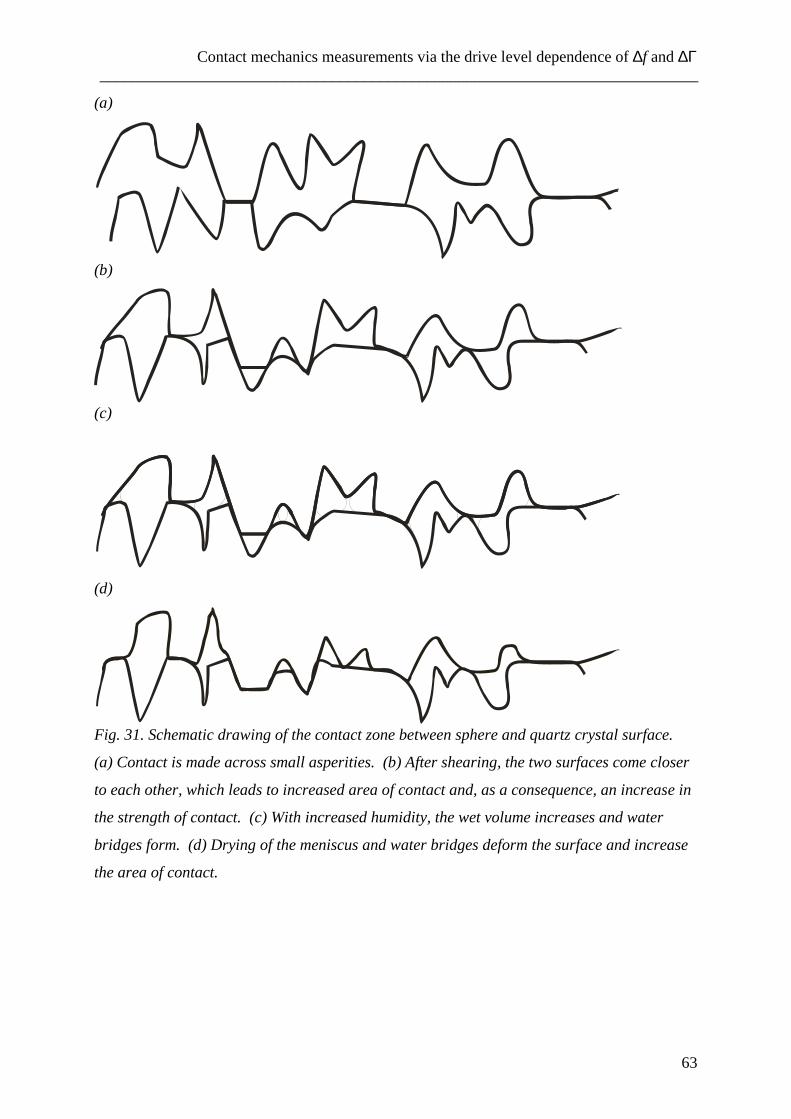
Contact mechanics measurements via the drive level dependence of ∆f and ∆Γ ___________________________________________________________________________
63
(a)
(b)
(c)
(d)
Fig. 31. Schematic drawing of the contact zone between sphere and quartz crystal surface.
(a) Contact is made across small asperities. (b) After shearing, the two surfaces come closer
to each other, which leads to increased area of contact and, as a consequence, an increase in
the strength of contact. (c) With increased humidity, the wet volume increases and water
bridges form. (d) Drying of the meniscus and water bridges deform the surface and increase
the area of contact.
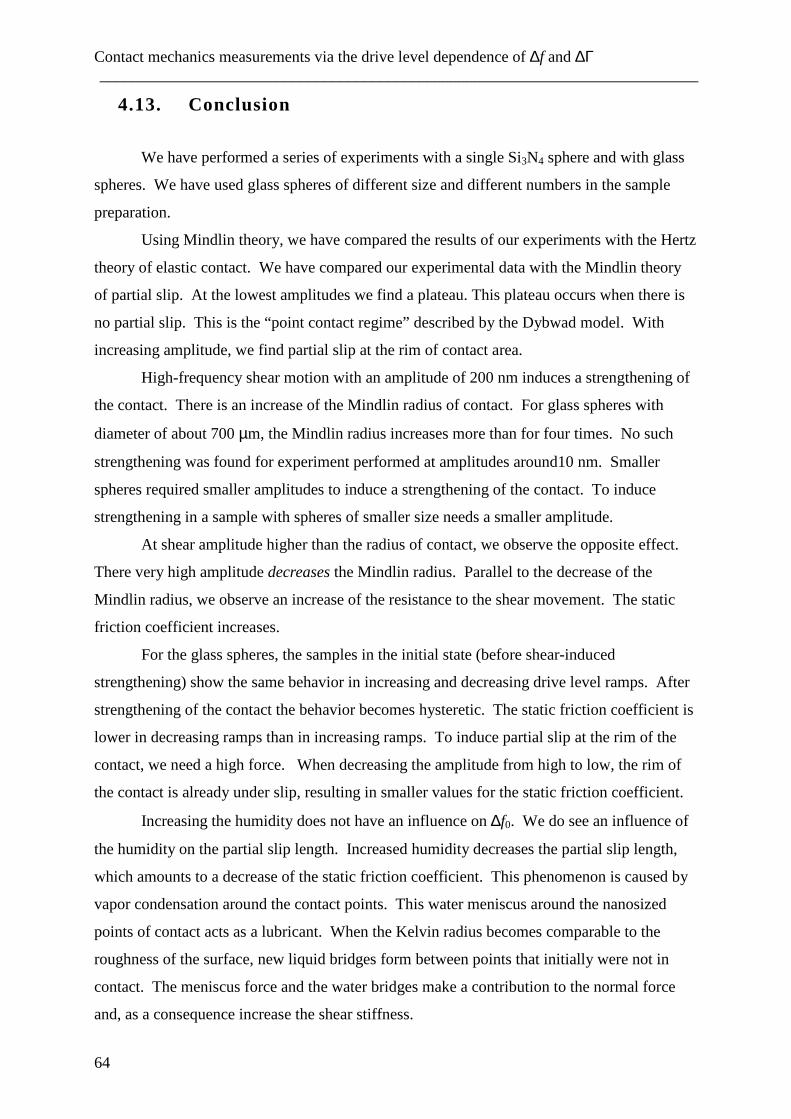
Contact mechanics measurements via the drive level dependence of ∆f and ∆Γ ___________________________________________________________________________
64
4.13. Conclusion
We have performed a series of experiments with a single Si3N4 sphere and with glass
spheres. We have used glass spheres of different size and different numbers in the sample
preparation.
Using Mindlin theory, we have compared the results of our experiments with the Hertz
theory of elastic contact. We have compared our experimental data with the Mindlin theory
of partial slip. At the lowest amplitudes we find a plateau. This plateau occurs when there is
no partial slip. This is the “point contact regime” described by the Dybwad model. With
increasing amplitude, we find partial slip at the rim of contact area.
High-frequency shear motion with an amplitude of 200 nm induces a strengthening of
the contact. There is an increase of the Mindlin radius of contact. For glass spheres with
diameter of about 700 µm, the Mindlin radius increases more than for four times. No such
strengthening was found for experiment performed at amplitudes around10 nm. Smaller
spheres required smaller amplitudes to induce a strengthening of the contact. To induce
strengthening in a sample with spheres of smaller size needs a smaller amplitude.
At shear amplitude higher than the radius of contact, we observe the opposite effect.
There very high amplitude decreases the Mindlin radius. Parallel to the decrease of the
Mindlin radius, we observe an increase of the resistance to the shear movement. The static
friction coefficient increases.
For the glass spheres, the samples in the initial state (before shear-induced
strengthening) show the same behavior in increasing and decreasing drive level ramps. After
strengthening of the contact the behavior becomes hysteretic. The static friction coefficient is
lower in decreasing ramps than in increasing ramps. To induce partial slip at the rim of the
contact, we need a high force. When decreasing the amplitude from high to low, the rim of
the contact is already under slip, resulting in smaller values for the static friction coefficient.
Increasing the humidity does not have an influence on ∆f0. We do see an influence of
the humidity on the partial slip length. Increased humidity decreases the partial slip length,
which amounts to a decrease of the static friction coefficient. This phenomenon is caused by
vapor condensation around the contact points. This water meniscus around the nanosized
points of contact acts as a lubricant. When the Kelvin radius becomes comparable to the
roughness of the surface, new liquid bridges form between points that initially were not in
contact. The meniscus force and the water bridges make a contribution to the normal force
and, as a consequence increase the shear stiffness.
Contact mechanics measurements via the drive level dependence of ∆f and ∆Γ ___________________________________________________________________________
65
Upon drying of the meniscus, we observe a large strengthening of the contacts. We
termed this phenomenon sandcastle effect. As the sample dries, the radius of curvature
decreases. As a consequence, the Laplace pressure (Eq. 2.11) increases. This elastically
deforms surfaces into having greater area of contact and an increased number of contact
points.
The increase of the contact stiffness could also be a result of salt bridges. In order to
check for this hypothesis, we have made some experiments with organic solvents. The
sandcastle effect for organic solvents is rather weak. The vapor pressure for ethanol and
acetone is much high than for water. Therefore we have vapor condensation only for a few
nanosized asperities.
It is possible do destroy the sandcastle effect with high shear amplitudes. The shear
amplitudes that destroy the sphere–plate contacts depend on the size of small asperities. In
order to destroy sandcastle, the average radius of small asperities must be smaller than the
shear amplitude.
In some case, the stiffness of the contact was really high. A high stiffness of the
contact implies a high real area of contact. With our experimental setup we can only reach
small amplitudes for this sample due to the large bandwidth. We suppose that in this case of a
strong sandcastle effect, the average radius of the small asperities which creates a contact is
large than the maximal shear amplitude. Therefore, it is impossible to remove the sandcastle
effect.
We have also investigated the radius of contact, and the static friction coefficient as a
function of the normal load. There was a relaxation effect taking place after we increased the
load. The characteristic time for relaxation was of 2 min.
Effect of high-frequency shear in adhesion force measurements ___________________________________________________________________________
66
5. Effect of high-frequency shear in adhesion force
measurements
5.1. Introduction
The study of particle adhesion entered new phase with the development of the atomic
force microscope (AFM). This highly sensitive instrument makes it possible to measure
adhesion forces between a sharp AFM-cantilever and a surface. Attaching colloidal particles
to the cantilever makes it possible to investigate the adhesion between small well defined
objects and a surface.
In our work we have investigated the adhesion force with an AFM under high
frequency oscillatory shear. High frequencies significantly modify the adhesion forces. This
effect can not be described with the standard model. When employing high frequencies small
times come into play.
In our work we have studied the dependence of the adhesion force via the pull–off–
distance. We find a logarithmic dependence of the pull–off–distance while increasing the
amplitude of the high-frequency shear motion. Introduction of small amounts of liquid can
significantly change the physical properties of the system. Liquid increases the adhesion of
the contact. Understanding of interparticle interaction is a very important step in
understanding of the mechanics of the granular media.
5.2. Experimental details
The adhesion force measurements were performed by studying the detachment of an
AFM cantilever from a QCM surface at high frequency shear. The solid surface used in the
experiments is the gold surface of one of the electrodes of QCM or a mica sheet glued to the
quartz crystal surface.
The experiments were performed with AT-cut quartz crystals with a size of 1 inch and
a fundamental frequency of 5 MHz (Maxtek Inc., Santa Fe Springs, CA). The crystals were
coated with gold electrodes and mounted in a home-built holder. Frequency and bandwidth
were determined by the impedance analysis with an accuracy in the determination of the
resonance frequency below 1 Hz. The coupling between the mechanical displacement and the
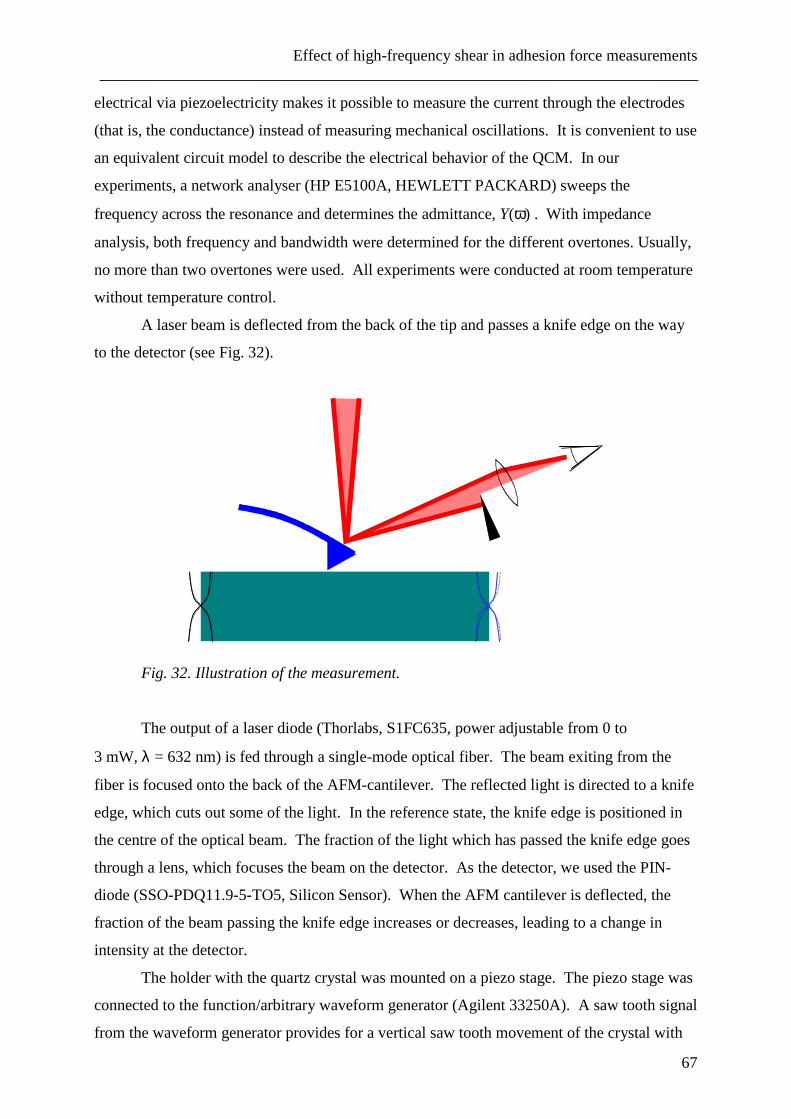
Effect of high-frequency shear in adhesion force measurements ___________________________________________________________________________
67
electrical via piezoelectricity makes it possible to measure the current through the electrodes
(that is, the conductance) instead of measuring mechanical oscillations. It is convenient to use
an equivalent circuit model to describe the electrical behavior of the QCM. In our
experiments, a network analyser (HP E5100A, HEWLETT PACKARD) sweeps the
frequency across the resonance and determines the admittance, Y(ω) . With impedance
analysis, both frequency and bandwidth were determined for the different overtones. Usually,
no more than two overtones were used. All experiments were conducted at room temperature
without temperature control.
A laser beam is deflected from the back of the tip and passes a knife edge on the way
to the detector (see Fig. 32).
Fig. 32. Illustration of the measurement.
The output of a laser diode (Thorlabs, S1FC635, power adjustable from 0 to
3 mW, λ = 632 nm) is fed through a single-mode optical fiber. The beam exiting from the
fiber is focused onto the back of the AFM-cantilever. The reflected light is directed to a knife
edge, which cuts out some of the light. In the reference state, the knife edge is positioned in
the centre of the optical beam. The fraction of the light which has passed the knife edge goes
through a lens, which focuses the beam on the detector. As the detector, we used the PIN-
diode (SSO-PDQ11.9-5-TO5, Silicon Sensor). When the AFM cantilever is deflected, the
fraction of the beam passing the knife edge increases or decreases, leading to a change in
intensity at the detector.
The holder with the quartz crystal was mounted on a piezo stage. The piezo stage was
connected to the function/arbitrary waveform generator (Agilent 33250A). A saw tooth signal
from the waveform generator provides for a vertical saw tooth movement of the crystal with
Effect of high-frequency shear in adhesion force measurements ___________________________________________________________________________
68
the frequency of 0.5 Hz and an amplitude of several µm. During this movement, the AFM-
cantilever detaches from the surface of the quartz crystal under high frequency oscillatory
shear. The pull–off–distance between the tip and the surface is the key parameter to
characterize the adhesion force between the AFM-cantilever and the surface. The resonance
parameters usually do not change upon contact because the tip is so small. Therefore, the
experiments can be performed at one fixed frequency on the centre of the resonance.
For this measurements, we normally used AFM-cantilevers as well as cantilevers with
a glass sphere glued to it. Thus, it is possible to characterize the adhesion force between the
glass sphere and the surface under high frequency oscillatory shear. The glass spheres we
have used had a diameter about 112 µm. It is not possible to use smaller spheres, because
gluing of the spheres was done by hand. The spheres smaller than 112 µm are difficult to
handle.
5.3. Mica sample preparation
In some measurements a mica sheet was glued to the top of the quartz crystal. Mica
was chosen as the substrate material because the mica surface is almost atomically smooth.
A prepared mica disc with the diameter of 13 mm was placed on a normal Scotch tape.
The thickness of the mica was no more than 100 µm. Before mica deposition on to the top of
the QCM, the crystal was cleaned in piranha solution, rinsed in distilled water and dried. In
the next steep, the crystal was heated to a temperature of ~50oC for half an hour. A droplet of
~0.2 µL undiluted epoxy glue was deposited in the center of the active electrode of the QCM
crystal [43] (see Fig. 33). The tape–mica sheet assembly was placed concentrically on top of
the droplet, the mica side facing the glue. Capillary forces ensured spreading of the glue
along the interface without entrapment of bubbles. The resin was polymerized under pressure
(metal plate with the mass of several kilos) at 150°C for 1 h, after which the system was
cooled overnight to room temperature and stored until use.
Before use, excess glue was scratched off around the mica sheet. The tape was peeled
off, uncovering a surface of freshly cleaved mica. If necessary, the mica sheet was
subsequently thinned by tape peeling until a stable oscillation of the mica-coated QCM could
be obtained at several overtones in air.
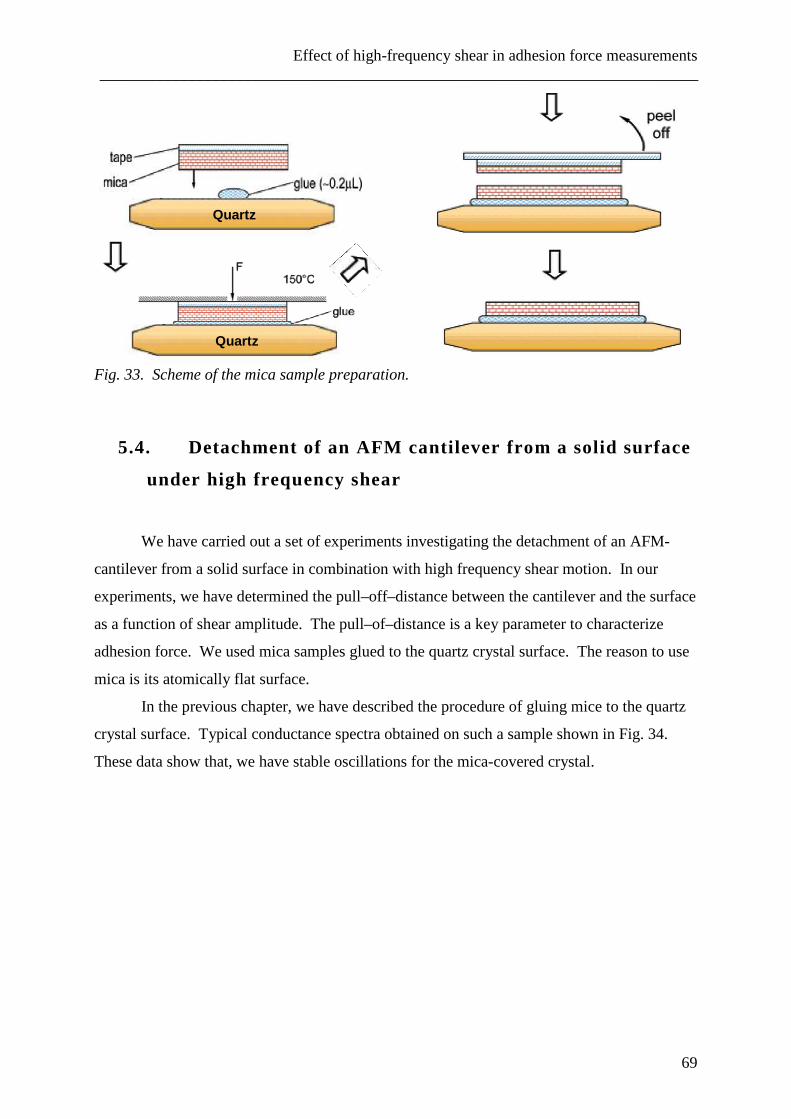
Effect of high-frequency shear in adhesion force measurements ___________________________________________________________________________
69
Quartz
Quartz
QuartzQuartz
QuartzQuartzQuartz
Fig. 33. Scheme of the mica sample preparation.
5.4. Detachment of an AFM cantilever from a solid surface
under high frequency shear
We have carried out a set of experiments investigating the detachment of an AFM-
cantilever from a solid surface in combination with high frequency shear motion. In our
experiments, we have determined the pull–off–distance between the cantilever and the surface
as a function of shear amplitude. The pull–of–distance is a key parameter to characterize
adhesion force. We used mica samples glued to the quartz crystal surface. The reason to use
mica is its atomically flat surface.
In the previous chapter, we have described the procedure of gluing mice to the quartz
crystal surface. Typical conductance spectra obtained on such a sample shown in Fig. 34.
These data show that, we have stable oscillations for the mica-covered crystal.
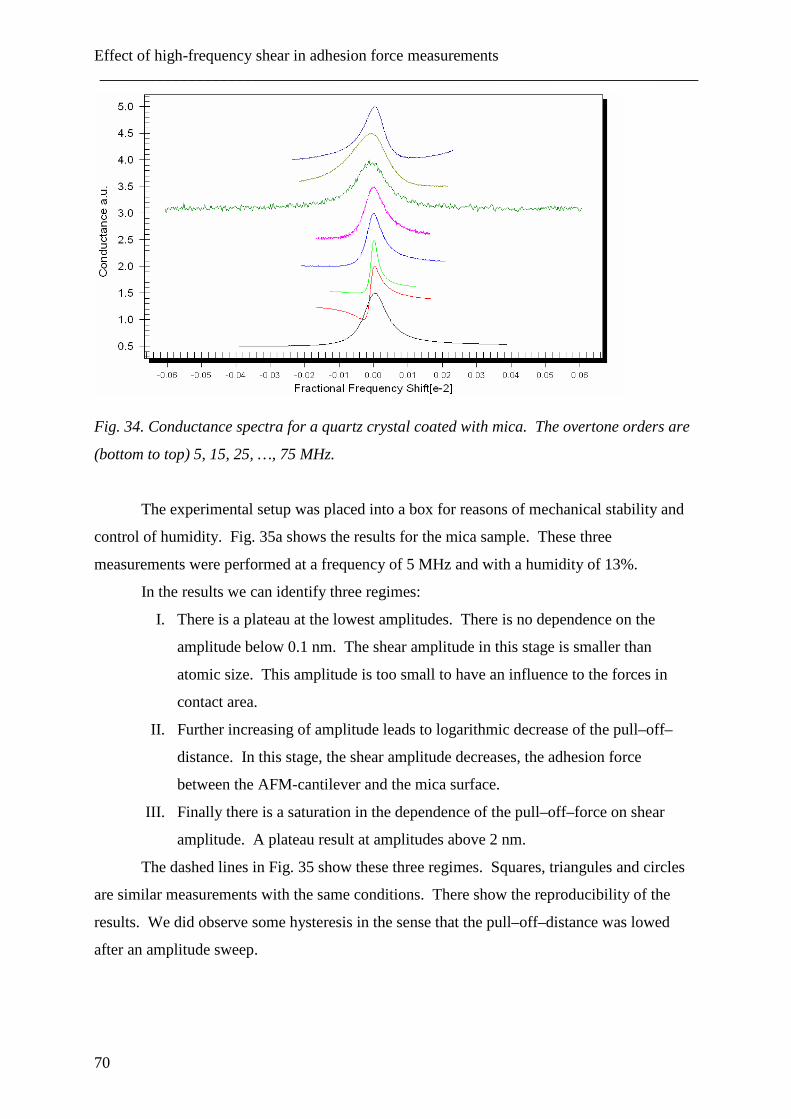
Effect of high-frequency shear in adhesion force measurements ___________________________________________________________________________
70
Fig. 34. Conductance spectra for a quartz crystal coated with mica. The overtone orders are
(bottom to top) 5, 15, 25, …, 75 MHz.
The experimental setup was placed into a box for reasons of mechanical stability and
control of humidity. Fig. 35a shows the results for the mica sample. These three
measurements were performed at a frequency of 5 MHz and with a humidity of 13%.
In the results we can identify three regimes:
I. There is a plateau at the lowest amplitudes. There is no dependence on the
amplitude below 0.1 nm. The shear amplitude in this stage is smaller than
atomic size. This amplitude is too small to have an influence to the forces in
contact area.
II. Further increasing of amplitude leads to logarithmic decrease of the pull–off–
distance. In this stage, the shear amplitude decreases, the adhesion force
between the AFM-cantilever and the mica surface.
III. Finally there is a saturation in the dependence of the pull–off–force on shear
amplitude. A plateau result at amplitudes above 2 nm.
The dashed lines in Fig. 35 show these three regimes. Squares, triangules and circles
are similar measurements with the same conditions. There show the reproducibility of the
results. We did observe some hysteresis in the sense that the pull–off–distance was lowed
after an amplitude sweep.
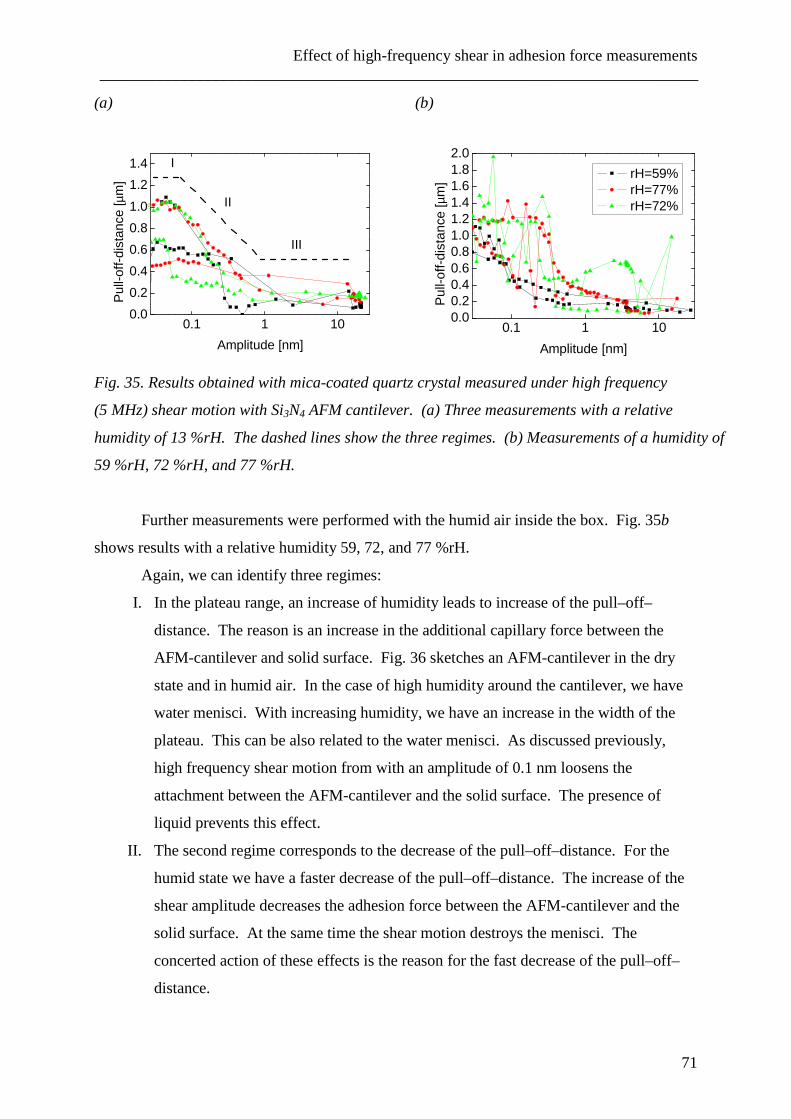
Effect of high-frequency shear in adhesion force measurements ___________________________________________________________________________
71
(a)
0.1 1 100.0
0.2
0.4
0.6
0.8
1.0
1.2
1.4
III
II
Pul
l-off-
dist
ance
[µm
]
Amplitude [nm]
I
(b)
0.1 1 100.00.20.40.60.81.01.21.41.61.82.0
Pul
l-off-
dist
ance
[µm
]
Amplitude [nm]
rH=59% rH=77% rH=72%
Fig. 35. Results obtained with mica-coated quartz crystal measured under high frequency
(5 MHz) shear motion with Si3N4 AFM cantilever. (a) Three measurements with a relative
humidity of 13 %rH. The dashed lines show the three regimes. (b) Measurements of a humidity of
59 %rH, 72 %rH, and 77 %rH.
Further measurements were performed with the humid air inside the box. Fig. 35b
shows results with a relative humidity 59, 72, and 77 %rH.
Again, we can identify three regimes:
I. In the plateau range, an increase of humidity leads to increase of the pull–off–
distance. The reason is an increase in the additional capillary force between the
AFM-cantilever and solid surface. Fig. 36 sketches an AFM-cantilever in the dry
state and in humid air. In the case of high humidity around the cantilever, we have
water menisci. With increasing humidity, we have an increase in the width of the
plateau. This can be also related to the water menisci. As discussed previously,
high frequency shear motion from with an amplitude of 0.1 nm loosens the
attachment between the AFM-cantilever and the solid surface. The presence of
liquid prevents this effect.
II. The second regime corresponds to the decrease of the pull–off–distance. For the
humid state we have a faster decrease of the pull–off–distance. The increase of the
shear amplitude decreases the adhesion force between the AFM-cantilever and the
solid surface. At the same time the shear motion destroys the menisci. The
concerted action of these effects is the reason for the fast decrease of the pull–off–
distance.
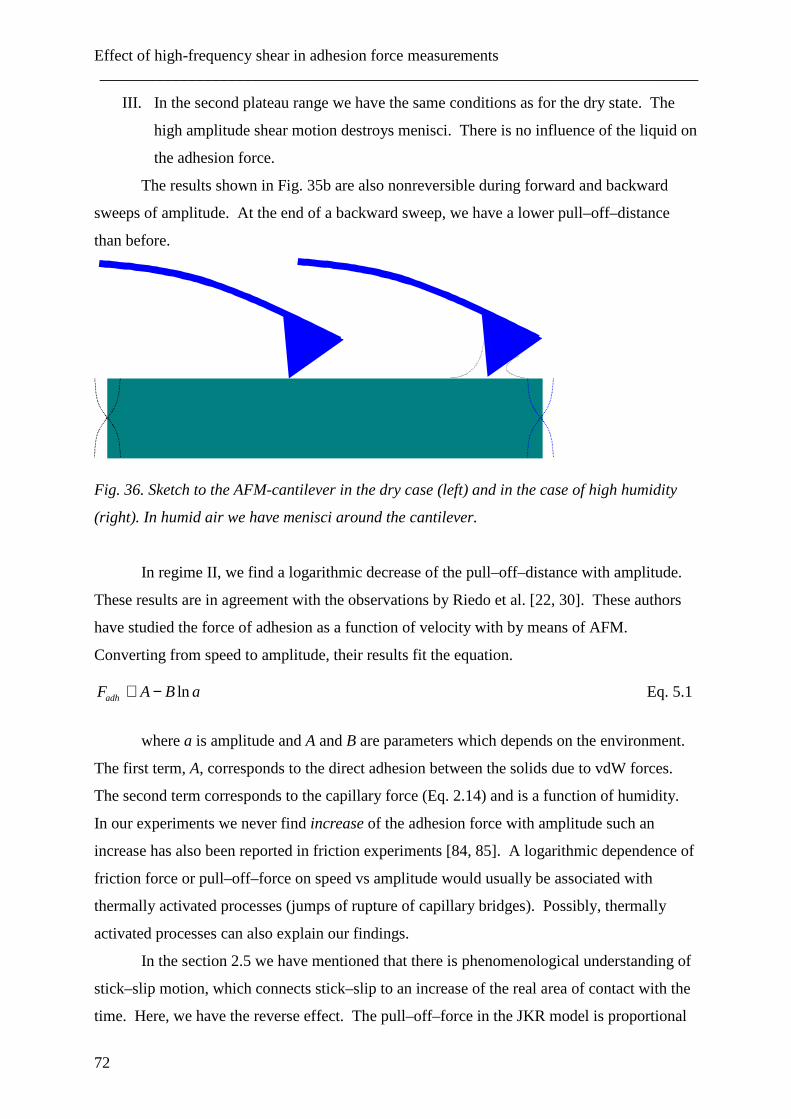
Effect of high-frequency shear in adhesion force measurements ___________________________________________________________________________
72
III. In the second plateau range we have the same conditions as for the dry state. The
high amplitude shear motion destroys menisci. There is no influence of the liquid on
the adhesion force.
The results shown in Fig. 35b are also nonreversible during forward and backward
sweeps of amplitude. At the end of a backward sweep, we have a lower pull–off–distance
than before.
Fig. 36. Sketch to the AFM-cantilever in the dry case (left) and in the case of high humidity
(right). In humid air we have menisci around the cantilever.
In regime II, we find a logarithmic decrease of the pull–off–distance with amplitude.
These results are in agreement with the observations by Riedo et al. [22, 30]. These authors
have studied the force of adhesion as a function of velocity with by means of AFM.
Converting from speed to amplitude, their results fit the equation.
lnadhF A B a≅ − Eq. 5.1
where a is amplitude and A and B are parameters which depends on the environment.
The first term, A, corresponds to the direct adhesion between the solids due to vdW forces.
The second term corresponds to the capillary force (Eq. 2.14) and is a function of humidity.
In our experiments we never find increase of the adhesion force with amplitude such an
increase has also been reported in friction experiments [84, 85]. A logarithmic dependence of
friction force or pull–off–force on speed vs amplitude would usually be associated with
thermally activated processes (jumps of rupture of capillary bridges). Possibly, thermally
activated processes can also explain our findings.
In the section 2.5 we have mentioned that there is phenomenological understanding of
stick–slip motion, which connects stick–slip to an increase of the real area of contact with the
time. Here, we have the reverse effect. The pull–off–force in the JKR model is proportional
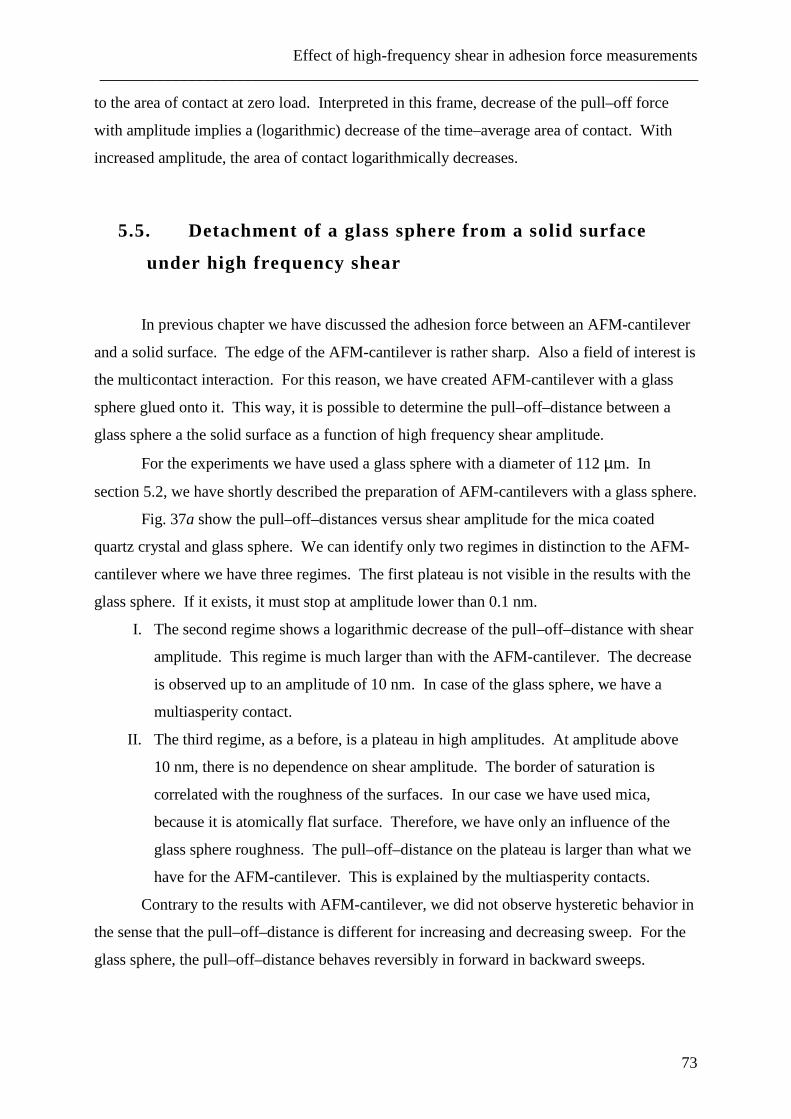
Effect of high-frequency shear in adhesion force measurements ___________________________________________________________________________
73
to the area of contact at zero load. Interpreted in this frame, decrease of the pull–off force
with amplitude implies a (logarithmic) decrease of the time–average area of contact. With
increased amplitude, the area of contact logarithmically decreases.
5.5. Detachment of a glass sphere from a solid surface
under high frequency shear
In previous chapter we have discussed the adhesion force between an AFM-cantilever
and a solid surface. The edge of the AFM-cantilever is rather sharp. Also a field of interest is
the multicontact interaction. For this reason, we have created AFM-cantilever with a glass
sphere glued onto it. This way, it is possible to determine the pull–off–distance between a
glass sphere a the solid surface as a function of high frequency shear amplitude.
For the experiments we have used a glass sphere with a diameter of 112 µm. In
section 5.2, we have shortly described the preparation of AFM-cantilevers with a glass sphere.
Fig. 37a show the pull–off–distances versus shear amplitude for the mica coated
quartz crystal and glass sphere. We can identify only two regimes in distinction to the AFM-
cantilever where we have three regimes. The first plateau is not visible in the results with the
glass sphere. If it exists, it must stop at amplitude lower than 0.1 nm.
I. The second regime shows a logarithmic decrease of the pull–off–distance with shear
amplitude. This regime is much larger than with the AFM-cantilever. The decrease
is observed up to an amplitude of 10 nm. In case of the glass sphere, we have a
multiasperity contact.
II. The third regime, as a before, is a plateau in high amplitudes. At amplitude above
10 nm, there is no dependence on shear amplitude. The border of saturation is
correlated with the roughness of the surfaces. In our case we have used mica,
because it is atomically flat surface. Therefore, we have only an influence of the
glass sphere roughness. The pull–off–distance on the plateau is larger than what we
have for the AFM-cantilever. This is explained by the multiasperity contacts.
Contrary to the results with AFM-cantilever, we did not observe hysteretic behavior in
the sense that the pull–off–distance is different for increasing and decreasing sweep. For the
glass sphere, the pull–off–distance behaves reversibly in forward in backward sweeps.
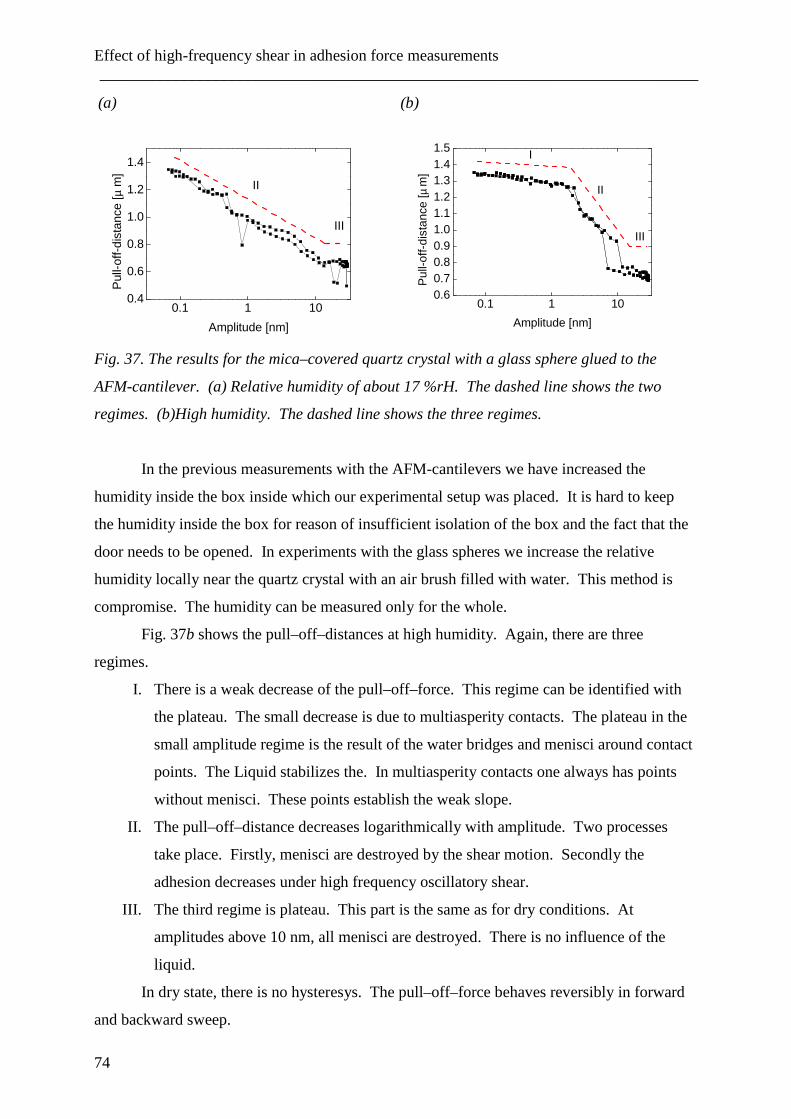
Effect of high-frequency shear in adhesion force measurements ___________________________________________________________________________
74
(a)
0.1 1 100.4
0.6
0.8
1.0
1.2
1.4
III
Pul
l-off-
dist
ance
[µ m
]
Amplitude [nm]
II
(b)
0.1 1 100.60.70.80.91.01.11.21.31.41.5
III
II
Pul
l-off-
dist
ance
[µm
]
Amplitude [nm]
I
Fig. 37. The results for the mica–covered quartz crystal with a glass sphere glued to the
AFM-cantilever. (a) Relative humidity of about 17 %rH. The dashed line shows the two
regimes. (b)High humidity. The dashed line shows the three regimes.
In the previous measurements with the AFM-cantilevers we have increased the
humidity inside the box inside which our experimental setup was placed. It is hard to keep
the humidity inside the box for reason of insufficient isolation of the box and the fact that the
door needs to be opened. In experiments with the glass spheres we increase the relative
humidity locally near the quartz crystal with an air brush filled with water. This method is
compromise. The humidity can be measured only for the whole.
Fig. 37b shows the pull–off–distances at high humidity. Again, there are three
regimes.
I. There is a weak decrease of the pull–off–force. This regime can be identified with
the plateau. The small decrease is due to multiasperity contacts. The plateau in the
small amplitude regime is the result of the water bridges and menisci around contact
points. The Liquid stabilizes the. In multiasperity contacts one always has points
without menisci. These points establish the weak slope.
II. The pull–off–distance decreases logarithmically with amplitude. Two processes
take place. Firstly, menisci are destroyed by the shear motion. Secondly the
adhesion decreases under high frequency oscillatory shear.
III. The third regime is plateau. This part is the same as for dry conditions. At
amplitudes above 10 nm, all menisci are destroyed. There is no influence of the
liquid.
In dry state, there is no hysteresys. The pull–off–force behaves reversibly in forward
and backward sweep.
Effect of high-frequency shear in adhesion force measurements ___________________________________________________________________________
75
The regime II is a logarithmic decrease of the pull–off distance with increase of shear
amplitude. As was mentioned in this section, this regime is larger than with the AFM-
cantilever. Decrease of the adhesion force between glass sphere and mica surface expressed
with Eq. 5.1.
A logarithmic dependence of friction force or pull–off–force on speed on amplitude
would usually be associated with thermally activated processes (jumps of rupture of capillary
bridges). Possibly, thermally activated processes can also explain our findings.
In the section 2.5 we have mentioned that there is phenomenological understanding of
stick–slip motion, which connects stick–slip to an increase of the real area of contact with
time. Here, we have the reverse effect. The pull–off–force in the JKR model is proportional
to the area of contact at zero load. Interpreted in this frame, decrease of the pull–off–force
with amplitude implies a (logarithmic) decrease of the time–average area of contact. With
increased amplitude, the area of contact logarithmically decreases.
The fact that regime II is larger for glass sphere, than for sharp cantilevers, may
related to the area of contact. For a cantilever, the contact area is in range of several atoms.
The contact between sphere and plate is made across many small asperities (multicontact
interface). The area of these small asperities is larger compared to the cantilever.
Consequently, the transition regime, where the true contact area decreases with amplitude can
be large, as well.
5.6. Conclusion
We have performed a set of adhesion force measurements via the detachment of an
Si3N4 AFM-cantilever from a QCM surface coated with the mica sheet. We have investigated
how pull–off–distance depends on high frequency oscillatory shear in dry and wet conditions.
The similar set of experiments was performed with a glass sphere glued to the AFM-
cantilever.
We have found three different regimes. At small amplitudes, there is no influence of
the oscillatory shear. The amplitude of shear movement is too small to have an influence on
the adhesion force. This range of an amplitudes is the same for cantilever and sphere.
Increasing of the humidity leads to an increase of the width of this region.
Afterwards we have a regime a decreasing adhesion force. This stage is differ out for
the AFM-cantilever and the glass sphere. For the glass sphere the slope is longer. The
Effect of high-frequency shear in adhesion force measurements ___________________________________________________________________________
76
explanation of this effect goes back to multiasperity contact. Asperities with a larger area of
contact need higher amplitudes detach force than smaller one. In high humidity, we also have
a contribution from capillary forces.
In the third and last regime further increase of the shear amplitude does not decrease
the adhesion force any more. The influence of the high frequency shear motion reaches a
maximum. There is no dependence on humidity at these amplitudes, because the shear
destroys menisci and water bridges.
Literature __________________________________________________________________________
77
6. Literature
1. D. Dowson, History of Tribology, Longman, London (1979).
2. Dahmen, S. R., H. Hinrichsen, et al. (2005). "Coupling between static friction force
and torque for a tripod." Journal of Statistical Mechanics-Theory and Experiment.
3. Gao, J. P., W. D. Luedtke, et al. (2004). "Frictional forces and Amontons' law: From
the molecular to the macroscopic scale." Journal of Physical Chemistry B 108(11):
3410-3425.
4. B.N.J. Persson, Sliding friction: Physical principles and applications, Springer-Verlag
Series, Berlin (1997), page 9.
5. Greenwood. Ja. and Williams.Jb (1966). "Contact of Nominally Flat Surfaces."
Proceedings of the Royal Society of London Series a-Mathematical and Physical
Sciences 295(1442): 300.
6. Bowden, F. P. and D. Tabor (1966). "Friction Lubrication and Wear - a Survey of
Work During Last Decade." British Journal of Applied Physics 17(12): 1521-&.
7. Krim, J., D. H. Solina, et al. (1991). "Nanotribology of a Kr Monolayer - a Quartz-
Crystal Microbalance Study of Atomic-Scale Friction." Physical Review Letters
66(2): 181-184.
8. Jacob Israelachvili, Intermolecular and Surface Forces, Academic Press (1985-2004)
9. Widom, A. and J. Krim (1986). "Q-Factors of Quartz Oscillator Modes as a Probe of
Submonolayer-Film Dynamics." Physical Review B 34(2): 1403-1404.
10. Daly, C., J. Krim, et al. (1992). "Applications of Atomic Scale Friction Measurements
with a Quartz Crystal Microbalance." Abstracts of Papers of the American Chemical
Society 203: 290-COLL.
11. Zhong, W. and D. Tomanek (1990). "First-Principles Theory of Atomic-Scale
Friction." Physical Review Letters 64(25): 3054-3057.
12. Weisenhorn, A. L., P. Maivald, et al. (1992). "Measuring Adhesion, Attraction, and
Repulsion between Surfaces in Liquids with an Atomic-Force Microscope." Physical
Review B 45(19): 11226-11232.
Literature ___________________________________________________________________________
78
13. Cappella, B. and G. Dietler (1999). "Force-distance curves by atomic force
microscopy." Surface Science Reports 34(1-3): 1-+.
14. Sugawara, Y., M. Ohta, et al. (1993). "Effects of Humidity and Tip Radius on the
Adhesive Force Measured with Atomic-Force Microscopy." Wear 168(1-2): 13-16.
15. Binggeli, M. and C. M. Mate (1994). "Influence of Capillary Condensation of Water
on Nanotribology Studied by Force Microscopy." Applied Physics Letters 65(4): 415-
417.
16. Luan, B. Q. and M. O. Robbins (2005). "The breakdown of continuum models for
mechanical contacts." Nature 435(7044): 929-932.
17. R. D. Mindlin and H. Deresiewicz, Journal of Applied Mechanics-Transactions of the
Asme 20, 327 (1953).
18. Johnson, K. L. Kendall, K. and Roberts, A. D. “Surface energy and the contact of
elastic solids”. Proc. Roy Soc., A324, pp301-320 (1971).
19. Gotzinger, M. and W. Peukert (2003). "Dispersive forces of particle-surface
interactions: direct AFM measurements and modelling." Powder Technology 130(1-
3): 102-109.
20. G.A. Tomlinson, Phil. Mag. 7 (1929) 905.
21. Maeda, N., J. N. Israelachvili, et al. (2003). "Evaporation and instabilities of
microscopic capillary bridges." Proceedings of the National Academy of Sciences of
the United States of America 100(3): 803-808.
22. Riedo, E., I. Pallaci, et al. (2004). "The 2/3 power law dependence of capillary force
on normal load in nanoscopic friction." Journal of Physical Chemistry B 108(17):
5324-5328.
23. Pakarinen, O. H., A. S. Foster, et al. (2005). "Towards an accurate description of the
capillary force in nanoparticle-surface interactions." Modelling and Simulation in
Materials Science and Engineering 13(7): 1175-1186.
24. Orr, F. M., L. E. Scriven, et al. (1975). "Pendular Rings between Solids - Meniscus
Properties and Capillary Force." Journal of Fluid Mechanics 67(FEB25): 723-742.
25. Fisher, L. R. and J. N. Israelachvili (1981). "Experimental Studies on the Applicability
of the Kelvin Equation to Highly Curved Concave Menisci." Journal of Colloid and
Interface Science 80(2): 528-541.
Literature __________________________________________________________________________
79
26. Gao, C., P. H. Dai, et al. (1998). "Meniscus forces and profiles: Theory and its
applications to liquid-mediated interfaces." Journal of Tribology-Transactions of the
Asme 120(2): 358-368.
27. Christenson, H. K. (1985). "Forces between Solid-Surfaces in a Binary Mixture of
Non-Polar Liquids." Chemical Physics Letters 118(5): 455-458.
28. Xiao, X. D. and L. M. Qian (2000). "Investigation of humidity-dependent capillary
force." Langmuir 16(21): 8153-8158.
29. Jones, R., H. M. Pollock, et al. (2002). "Adhesion forces between glass and silicon
surfaces in air studied by AFM: Effects of relative humidity, particle size, roughness,
and surface treatment." Langmuir 18(21): 8045-8055.
30. Riedo, E., F. Levy, et al. (2002). "Kinetics of capillary condensation in nanoscopic
sliding friction." Physical Review Letters 88(18).
31. Tocha, E., H. Schonherr, et al. (2005). "Influence of grain size and humidity on the
nanotribological properties of wear-resistant nanostructured ZrO2 coatings: An atomic
force microscopy study." Journal of the American Ceramic Society 88(9): 2498-2503.
32. Bocquet, L., E. Charlaix, et al. (1998). "Moisture-induced ageing in granular media
and the kinetics of capillary condensation." Nature 396(6713): 735-737.
33. Volokitin, A. I. and B. N. J. Persson (1998). "Theory of friction: Contribution from
fluctuating electromagnetic field." Physics of Low-Dimensional Structures 7-8: 17-28.
34. Persson, B. N. J. and Z. Y. Zhang (1998). "Theory of friction: Coulomb drag between
two closely spaced solids." Physical Review B 57(12): 7327-7334.
35. Persson, B. N. J. and A. I. Volokitin (1995). "Electronic Friction of Physisorbed
Molecules." Journal of Chemical Physics 103(19): 8679-8683.
36. Sokoloff, J. B. (1995). "Theory of the Contribution to Sliding Friction from Electronic
Excitations in the Microbalance Experiment." Physical Review B 52(7): 5318-5322.
37. Sokoloff, J. B. (1998). "Effects of stick-slip motion on energy dissipation in small
sliding solids." Journal of Physics-Condensed Matter 10(44): 9991-9998.
38. Mate, C. M., G. M. McClelland, et al. (1987). "Atomic-Scale Friction of a Tungsten
Tip on a Graphite Surface." Physical Review Letters 59(17): 1942-1945.
39. McMillan, A. J. (1997). "A non-linear friction model for self-excited vibrations."
Journal of Sound and Vibration 205(3): 323-335.
Literature ___________________________________________________________________________
80
40. Johannsmann, D. and L. O. Heim (2006). "A simple equation predicting the amplitude
of motion of quartz crystal resonators." Journal of Applied Physics 100(9).
41. K.L. Johnson: Contact Mechanics, Cambridge University Press 1985, chapter 4
42. K.L. Johnson: Contact Mechanics, Cambridge University Press 1985, chapter 7
43. Richter, R. P. and A. Brisson (2004). "QCM-D on mica for parallel QCM-D-AFM
studies." Langmuir 20(11): 4609-4613.
44. Lior Kogut and Izhak Etsion, Adhesion in elastic-plastic spherical microcontact,
Journal of Colloid and Interface Science 261(2003) 372-378
45. Curie J, Curie P. Développement, par pression, de l’électricité polaire dans les cristaux
hémièdres à faces inclinées. Comptes Rendus de l’Académie des Sciences
1880;91:294–5.
46. Curie J, Curie P. Sur l’électricité polaire dans les cristaux hémièdres à faces inclinées.
C R Acad Sci Gen 1880;91:383–6.
47. Curie J, Curie P. Contractions et dilatations produites par des tensions dans les
cristaux hémièdres à faces inclinées. C R Acad Sci Gen 1880;93:1137-40.
48. Sauerbrey, G. (1959). "Verwendung Von Schwingquarzen Zur Wagung Dunner
Schichten Und Zur Mikrowagung." Zeitschrift Fur Physik 155(2): 206-222.
49. Su, X. D. and H. Zhang (2004). "Comparison of surface plasmon resonance
spectroscopy and quartz crystal microbalance for human IgE quantification." Sensors
and Actuators B-Chemical 100(3): 309-314.
50. Bund, A., A. Baba, et al. (2003). "Combining surface plasmon resonance and quartz
crystal microbalance for the in situ investigation of the electropolymerization and
doping/dedoping of poly(pyrrole)." Journal of Physical Chemistry B 107(28): 6743-
6747.
51. Coffey, T., M. Abdelmaksoud, et al. (2001). "A scanning probe and quartz crystal
microbalance study of the impact of C-60 on friction at solid-liquid interfaces."
Journal of Physics-Condensed Matter 13(21): 4991-4999.
52. Berg, S., M. Ruths, et al. (2002). "High-frequency measurements of interfacial friction
using quartz crystal resonators integrated into a surface forces apparatus." Physical
Review E 65(2).
53. Torbjörn Tjärnhage and Michael Sharp "The use of a quartz crystal microbalance
Literature __________________________________________________________________________
81
combined with ellipsometry and cyclic voltammetry for determining some basic
characteristics of an electroactive polymer film" Electrochimica Acta 39 (1994) 623-
628.
54. Torbjörn Tjärnhage (1996) “Thin Polymer and Phospholipid Films for Biosensors.
Characterisation with Gravimetric, Electrochemical and Optical Methods”
55. Johannsamnn, D. „Studies of Viscoelasity and Micromechanics with the QCM“
56. Bae, S. (2005). "Long-term analysis of a swing using the two-timing method."
European Journal of Physics 26(5): 791-801.
57. Dybwad, G. L. (1985). "A Sensitive New Method for the Determination of Adhesive
Bonding between a Particle and a Substrate." Journal of Applied Physics 58(7): 2789-
2790.
58. Laschitsch, A. and D. Johannsmann (1999). "High frequency tribological
investigations on quartz resonator surfaces." Journal of Applied Physics 85(7): 3759-
3765.
59. Berg, S. and D. Johannsmann (2003). "High speed microtribology with quartz crystal
resonators." Physical Review Letters 91(14).
60. Berg, S., D. Johannsmann, et al. (2002). "Frequency response of quartz crystal shear-
resonator during an adhesive, elastic contact in a surface forces apparatus." Journal of
Applied Physics 92(11): 6905-6910.
61. Berg, S., M. Ruths, et al. (2003). "Quartz crystal resonators with atomically smooth
surfaces for use in contact mechanics." Review of Scientific Instruments 74(8): 3845-
3852.
62. J Arnau, A., T. Sogorb, et al. (2002). "Circuit for continuous motional series resonant
frequency and motional resistance monitoring of quartz crystal resonators by parallel
capacitance compensation." Review of Scientific Instruments 73(7): 2724-2737.
63. J Chen, P. C. and L. Wu (2000). "The equivalent circuit of an AT-cut quartz resonator
and its application." Japanese Journal of Applied Physics Part 1-Regular Papers Short
Notes & Review Papers 39(5A): 2710-2713.
64. Johannsmann, D. (1999). "Viscoelastic analysis of organic thin films on quartz
resonators." Macromolecular Chemistry and Physics 200(3): 501-516.
65. D'Amour, J. N., J. J. R. Stalgren, et al. (2006). "Capillary aging of the contacts
Literature ___________________________________________________________________________
82
between glass spheres and a quartz resonator surface." Physical Review Letters 96(5).
66. Johannsmann, D., K. Mathauer, et al. (1992). "Viscoelastic Properties of Thin-Films
Probed with a Quartz-Crystal Resonator." Physical Review B 46(12): 7808-7815.
67. K.L. Johnson: Contact Mechanics, Cambridge University Press 1985, chapter 7.4
68. Halsey, T. C. and A. J. Levine (1998). "How sandcastles fall." Physical Review
Letters 80(14): 3141-3144.
69. Hornbaker, D. J., R. Albert, et al. (1997). "What keeps sandcastles standing?" Nature
387(6635): 765-765.
70. Berthoud, P. and T. Baumberger (1998). "Shear stiffness of a solid-solid multicontact
interface." Proceedings of the Royal Society A: Mathematical, Physical and
Engineering Sciences 454(1974): 1615-1634.
71. Bureau, L., T. Baumberger, et al. (2000). "Shear response of a frictional interface to a
normal load modulation." Physical Review E 62(5): 6810-6820.
72. Bureau, L., T. Baumberger, et al. (2001). "Low-velocity friction between macroscopic
solids." Comptes Rendus De L Academie Des Sciences Serie Iv Physique
Astrophysique 2(5): 699-707.
73. B. Du, D. Johannsmann, et al. “Partial Slip at Sphere–Plate Contacts Under MHz
Oscillatory Shear” in preparation.
74. He, M. Y., A. S. Blum, et al. (2001). "Critical phenomena of water bridges in
nanoasperity contacts." Journal of Chemical Physics 114(3): 1355-1360.
75. Jones, R., H. M. Pollock, et al. (2002). "Adhesion forces between glass and silicon
surfaces in air studied by AFM: Effects of relative humidity, particle size, roughness,
and surface treatment." Langmuir 18(21): 8045-8055.
76. Maugis D.: Contact, Adhesion and Rupture of Elastic Solids. Springer-Verlag, Berlin,
2000.
77. F.P. Bowden, D. Tabor, Friction and Lubrication, Methuen, London, 1967
78. Braun, O. M. and A. G. Naumovets (2006). "Nanotribology: Microscopic mechanisms
of friction." Surface Science Reports 60(6-7): 79-158.
79. Heslot, F., T. Baumberger, et al. (1994). "Creep, Stick-Slip, and Dry-Friction
Dynamics - Experiments and a Heuristic Model." Physical Review E 49(6): 4973-
Literature __________________________________________________________________________
83
4988.
80. Baumberger, T., F. Heslot, et al. (1994). "Crossover from Creep to Inertial Motion in
Friction Dynamics." Nature 367(6463): 544-546.
81. Baumberger, T., C. Caroli, et al. (1995). "Nonlinear-Analysis of the Stick-Slip
Bifurcation in the Creep-Controlled Regime of Dry Friction." Physical Review E
51(5): 4005-4010.
82. Greenwoo.Ja and Williams.Jb (1966). "Contact of Nominally Flat Surfaces."
Proceedings of the Royal Society of London Series a-Mathematical and Physical
Sciences 295(1442): 300-&.
83. Flanigan, C. M., M. Desai, et al. (2000). "Contact mechanics studies with the quartz
crystal microbalance." Langmuir 16(25): 9825-9829.
84. Gnecco, E., R. Bennewitz, et al. (2000). "Velocity dependence of atomic friction."
Physical Review Letters 84(6): 1172-1175.
85. Riedo, E., E. Gnecco, et al. (2003). "Interaction potential and hopping dynamics
governing sliding friction." Physical Review Letters 91(8).
86. Berthoud, P., T. Baumberger, et al. (1999). "Physical analysis of the state- and rate-
dependent friction law: Static friction." Physical Review B 59(22): 14313-14327.
87. Bureau, L., C. Caroli, et al. (2006). "Frictional dissipation and interfacial glass
transition of polymeric solids." Physical Review Letters 97(22).
88. Dieterich, J. H. and B. D. Kilgore (1994). "Direct Observation of Frictional Contacts -
New Insights for State-Dependent Properties." Pure and Applied Geophysics 143
(1-3): 283-302.
89. Baumberger, T. and C. Caroli (2006). "Solid friction from stick-slip down to pinning
and aging." Advances in Physics 55(3-4): 279-348.
CURRICULUM VITAE ___________________________________________________________________________
84
CURRICULUM VITAE
Rudenkiy S. Sergiy
Sägemüllerstr 71
Claushal-Zellerfeld 38678
Germamy
27 years old, single
Tel: +49-5323-72-2635 (work)
e-mail: [email protected]
EDUCATION
1997-2003 Student of the Kharkov National University, Physical-
Technical Faculty, majoring in EXPERIMENTAL NUCLEAR
PHYSICS AND PLASMA PHYSICS.
2001 July 14 - 28, 2001 Summer School 2001, Institute for Nuclear Physics,
Darmstadt University of Technology, Germany.
1987 - 1997 Kharkov Secondary School #62 with advanced learning of physic,
mathematics and English language
Professional experience
2000 - 2003 Scientific and technological centre of Electrophysics National Academy
of Sciences of Ukraine (28 Chernyshovsky Street, P.O.Box8812 UA-
61002, Kharkov, Ukraine)
2003-2005 Department of Atom and Molecular physics of surface, Institut of
physics
and physical technology TU Clausthal Germany (AG-Kempter, IPPT TU
Clausthal, Leibnizstrasse 4, Clausthal-Zellerfeld D-38678, Germany
http://www.pe.tu-clausthal.de/IPPT/ ).“ Elektronenspektroskopische
(MIES, UPS (HeI und II)) und elektronen-mikroskopische (LEEM,
PEEM, STM/AFM) Untersuchungen an organisierten Nanostrukturen“
Working experience with AFM/STM, MIES/UPS.
CURRICULUM VITAE __________________________________________________________________________
85
2005-2007 Department of Polymer Interfaces, Institute of Physical Chemistry TU
Clausthal Germany (Johannsmann Group, IPC TU
Clausthal, Arnold-Sommerfeld-Str. 4, Clausthal-Zellerfeld D-38678,
Germany http://www.pc.tu-clausthal.de/forschung/ak-johannsmann/).
“High frequency contact mechanics“
PUBLICATIONS
Formation and Characterization of Pt Nanoparticle Networks
Fei Wen, Norbert Waldöfner, Wolfgang Schmidt, Klaus Angermund, Helmut Bönnemann,
Stephanie Modrow, Svetlana Zinoveva, Hartwig Modrow, Josef Hormes, Lars Beuermann,
Sergiy Rudenkiy, Wolfgang Maus-Friedrichs, Volker Kempter, Thomas Vad and Heinz-
Günter Haubold European Journal of Inorganic Chemistry 18, 3625-3640
Interaction of O2, CO and CO2 with Co films
M. Frerichs, F.X. Schweiger, F. Voigts, S. Rudenkiy, W. Maus-Friedrichs and V. Kempter,
Surface and Interface Analysis (2005)
Study of the Structure and Stability of Co Nanoparticles for Ferrofluidic Applications
S. Rudenkiy, M. Frerichs, F. Voigts, W. Maus-Friedrichs, V. Kempter et al., at Applied
Organometallic Chemistry(2004)
LANGUAGES
Russian, Ukrainian – native
English – good
German – basic