Embed Size (px)
Citation preview
Debt Investor Presentation
PREPARED AUGUST 15, 2017FIGURES JUNE 30, 2017
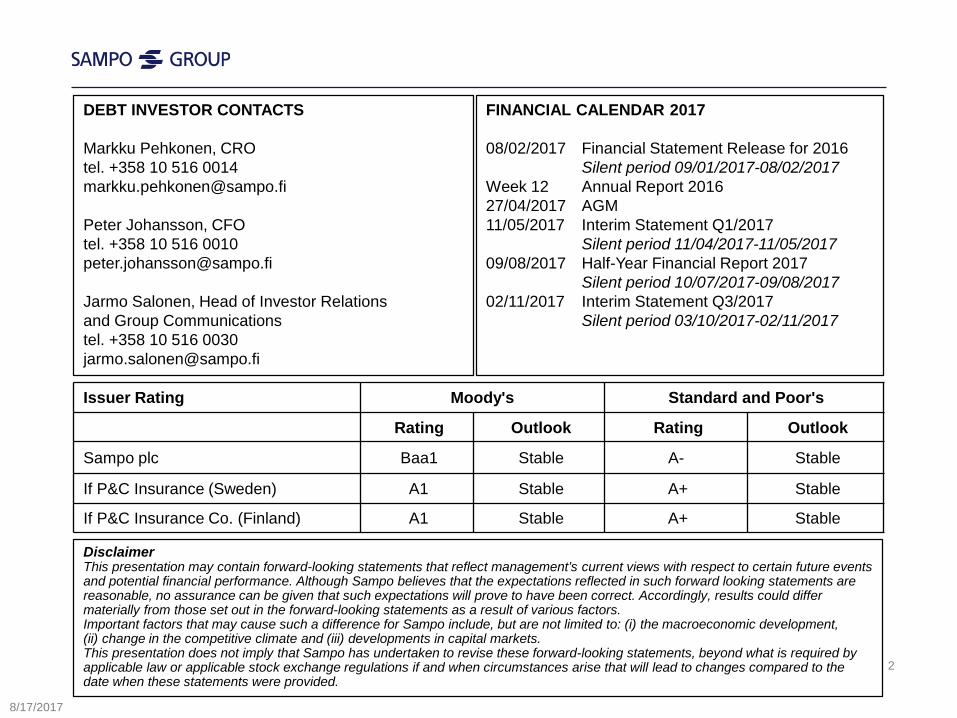
DEBT INVESTOR CONTACTS
Markku Pehkonen, CROtel. +358 10 516 [email protected]
Peter Johansson, CFOtel. +358 10 516 [email protected]
Jarmo Salonen, Head of Investor Relations and Group Communicationstel. +358 10 516 [email protected]
FINANCIAL CALENDAR 2017
08/02/2017 Financial Statement Release for 2016Silent period 09/01/2017-08/02/2017
Week 12 Annual Report 201627/04/2017 AGM11/05/2017 Interim Statement Q1/2017
Silent period 11/04/2017-11/05/201709/08/2017 Half-Year Financial Report 2017
Silent period 10/07/2017-09/08/201702/11/2017 Interim Statement Q3/2017
Silent period 03/10/2017-02/11/2017
Issuer Rating Moody's Standard and Poor's
Rating Outlook Rating Outlook
Sampo plc Baa1 Stable A- Stable
If P&C Insurance (Sweden) A1 Stable A+ Stable
If P&C Insurance Co. (Finland) A1 Stable A+ Stable
DisclaimerThis presentation may contain forward-looking statements that reflect management’s current views with respect to certain future events and potential financial performance. Although Sampo believes that the expectations reflected in such forward looking statements are reasonable, no assurance can be given that such expectations will prove to have been correct. Accordingly, results could differ materially from those set out in the forward-looking statements as a result of various factors.Important factors that may cause such a difference for Sampo include, but are not limited to: (i) the macroeconomic development,(ii) change in the competitive climate and (iii) developments in capital markets.This presentation does not imply that Sampo has undertaken to revise these forward-looking statements, beyond what is required by applicable law or applicable stock exchange regulations if and when circumstances arise that will lead to changes compared to the date when these statements were provided.
2
8/17/2017
3
17 August 2017
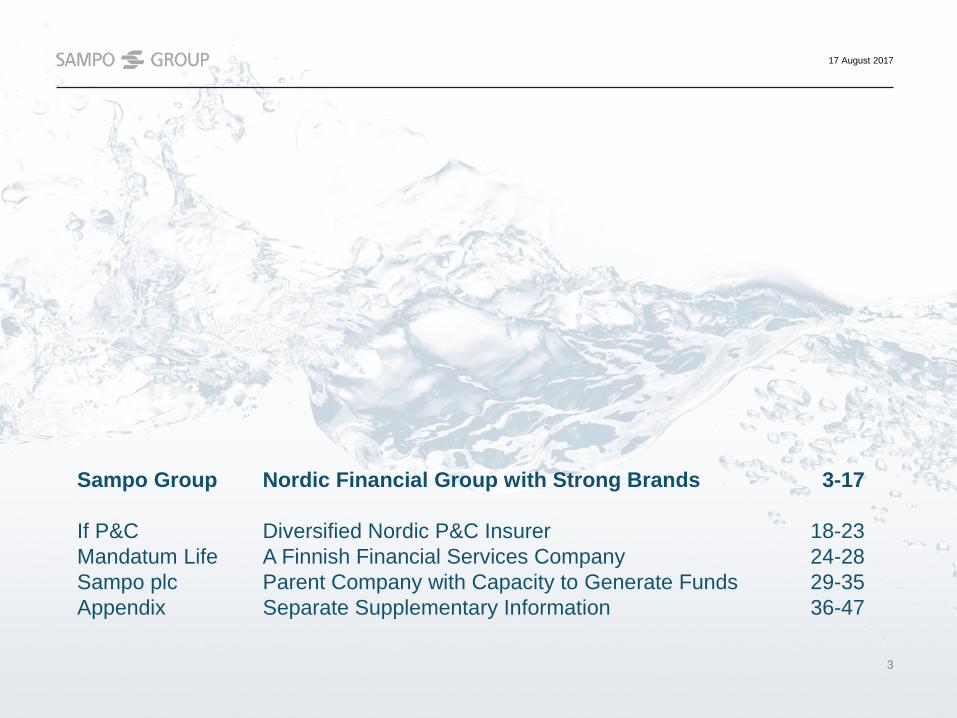
Sampo Group Nordic Financial Group with Strong Brands 3-17
If P&C Diversified Nordic P&C Insurer 18-23Mandatum Life A Finnish Financial Services Company 24-28Sampo plc Parent Company with Capacity to Generate Funds 29-35Appendix Separate Supplementary Information 36-47
4
Sampo Group ― Nordic Financial Group with Strong Brands
8/17/2017
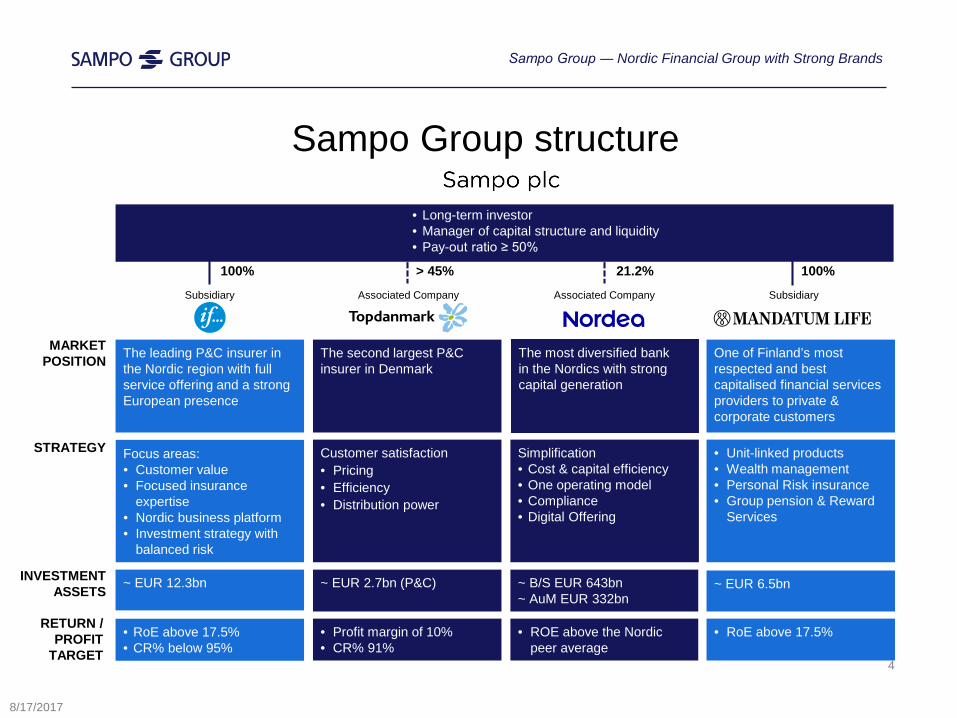
21.2%
Simplification• Cost & capital efficiency• One operating model• Compliance• Digital Offering
The most diversified bankin the Nordics with strong capital generation
~ B/S EUR 643bn~ AuM EUR 332bn
• ROE above the Nordic peer average
The second largest P&C insurer in Denmark
Customer satisfaction• Pricing• Efficiency• Distribution power
~ EUR 2.7bn (P&C)
• Profit margin of 10%• CR% 91%
> 45% 100% 100%
One of Finland’s most respected and best capitalised financial services providers to private & corporate customers
• Unit-linked products• Wealth management• Personal Risk insurance • Group pension & Reward
Services
~ EUR 6.5bn
• RoE above 17.5%
The leading P&C insurer in the Nordic region with full service offering and a strong European presence
Focus areas:• Customer value• Focused insurance
expertise• Nordic business platform• Investment strategy with
balanced risk
~ EUR 12.3bn
• RoE above 17.5%• CR% below 95%
MARKETPOSITION
STRATEGY
INVESTMENTASSETS
RETURN /PROFIT
TARGET
Associated CompanySubsidiary SubsidiaryAssociated Company
• Long-term investor• Manager of capital structure and liquidity• Pay-out ratio ≥ 50%
Sampo Group structure
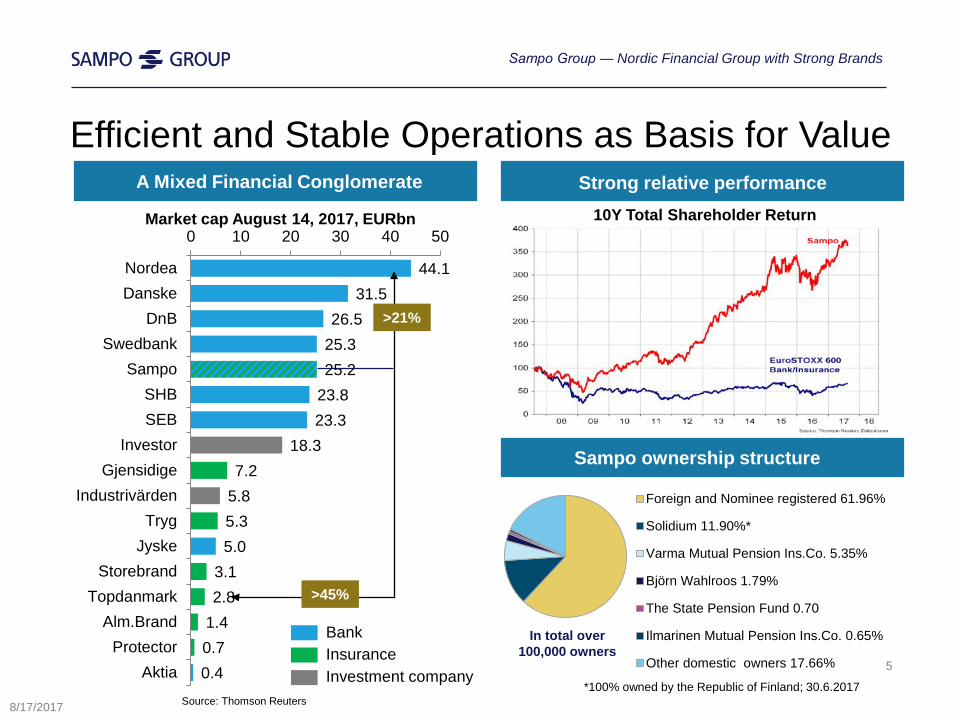
44.131.5
26.525.325.2
23.823.3
18.37.2
5.85.35.0
3.12.8
1.40.70.4
0 10 20 30 40 50
NordeaDanske
DnBSwedbank
SampoSHBSEB
InvestorGjensidige
IndustrivärdenTryg
JyskeStorebrand
TopdanmarkAlm.Brand
ProtectorAktia
Efficient and Stable Operations as Basis for Value
Source: Thomson Reuters
>45%
Sampo ownership structure
*100% owned by the Republic of Finland; 30.6.2017
Market cap August 14, 2017, EURbn
Strong relative performance 10Y Total Shareholder Return
A Mixed Financial Conglomerate
BankInsuranceInvestment company
Foreign and Nominee registered 61.96%
Solidium 11.90%*
Varma Mutual Pension Ins.Co. 5.35%
Björn Wahlroos 1.79%
The State Pension Fund 0.70
Ilmarinen Mutual Pension Ins.Co. 0.65%
Other domestic owners 17.66% 5
>21%
8/17/2017
Sampo Group ― Nordic Financial Group with Strong Brands
In total over100,000 owners
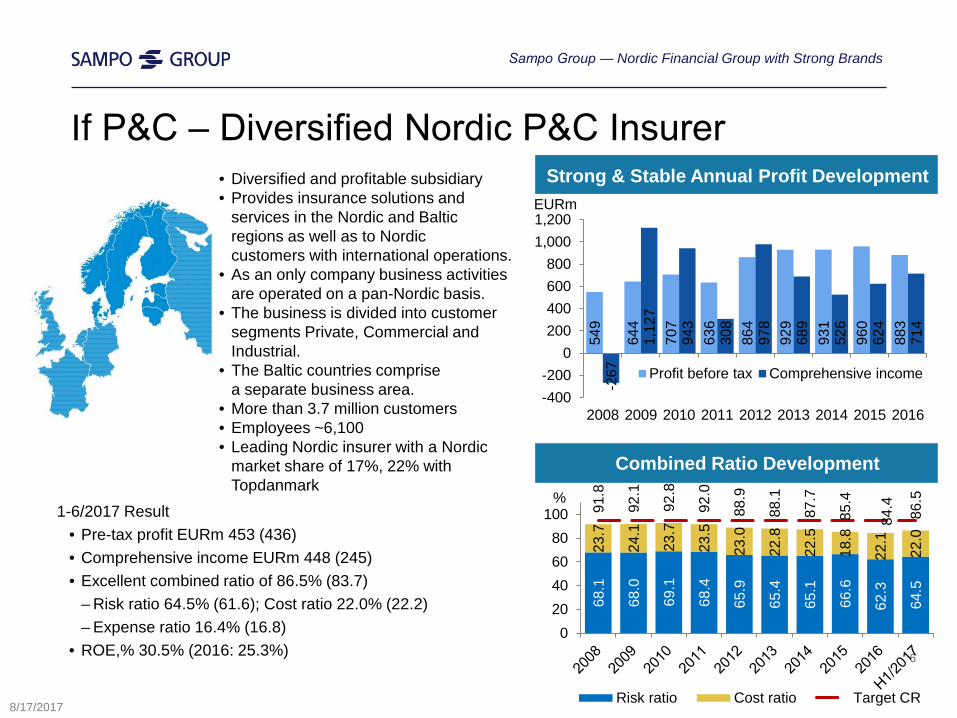
1-6/2017 Result • Pre-tax profit EURm 453 (436)• Comprehensive income EURm 448 (245)• Excellent combined ratio of 86.5% (83.7)
– Risk ratio 64.5% (61.6); Cost ratio 22.0% (22.2)– Expense ratio 16.4% (16.8)
• ROE,% 30.5% (2016: 25.3%)
If P&C ‒ Diversified Nordic P&C Insurer
6
• Diversified and profitable subsidiary• Provides insurance solutions and
services in the Nordic and Balticregions as well as to Nordic customers with international operations.
• As an only company business activities are operated on a pan-Nordic basis.
• The business is divided into customer segments Private, Commercial and Industrial.
• The Baltic countries comprisea separate business area.
• More than 3.7 million customers• Employees ~6,100• Leading Nordic insurer with a Nordic
market share of 17%, 22% withTopdanmark
8/17/2017
549
644
707
636
864
929
931
960
883
-267
1,12
7
943
308
978
689
526
624
714
-400-200
0200400600800
1,0001,200
2008 2009 2010 2011 2012 2013 2014 2015 2016
Profit before tax Comprehensive income
Strong & Stable Annual Profit DevelopmentEURm
68.1
68.0
69.1
68.4
65.9
65.4
65.1
66.6
62.3
64.5
23.7
24.1
23.7
23.5
23.0
22.8
22.5
18.8
22.1
22.0
91.8
92.1
92.8
92.0
88.9
88.1
87.7
85.4
84.4
86.5
020406080
100%
Risk ratio Cost ratio Target CR
Combined Ratio Development
Sampo Group ― Nordic Financial Group with Strong Brands
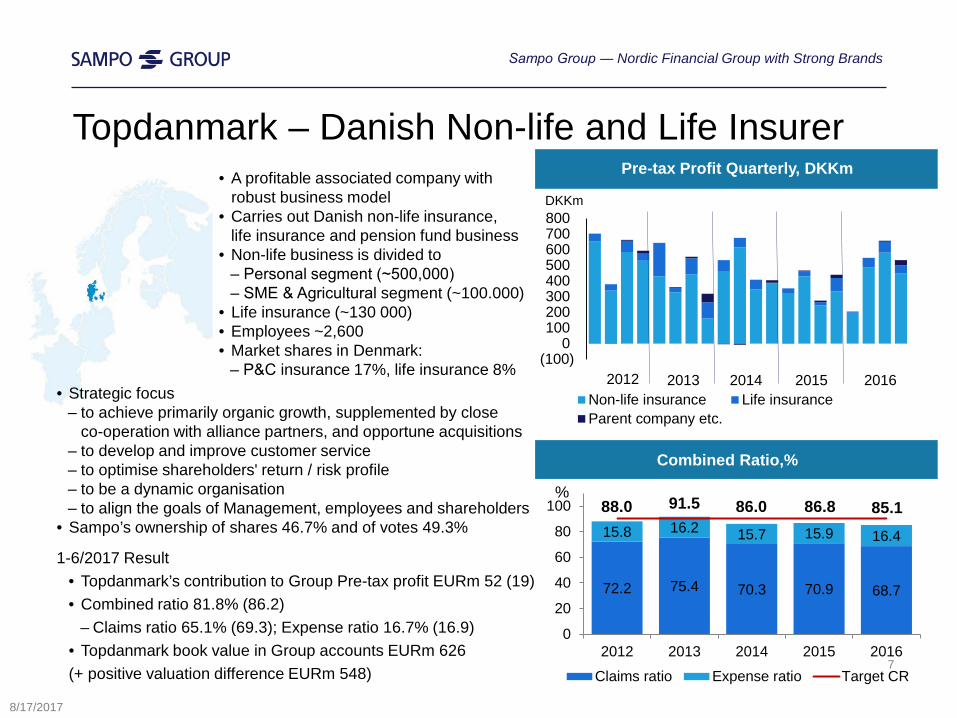
Topdanmark – Danish Non-life and Life Insurer
7
1-6/2017 Result• Topdanmark’s contribution to Group Pre-tax profit EURm 52 (19)• Combined ratio 81.8% (86.2)
– Claims ratio 65.1% (69.3); Expense ratio 16.7% (16.9)• Topdanmark book value in Group accounts EURm 626 (+ positive valuation difference EURm 548)
• A profitable associated company withrobust business model
• Carries out Danish non-life insurance, life insurance and pension fund business
• Non-life business is divided to ‒ Personal segment (~500,000)‒ SME & Agricultural segment (~100.000)
• Life insurance (~130 000)• Employees ~2,600• Market shares in Denmark:
‒ P&C insurance 17%, life insurance 8% (100)
0 100 200 300 400 500 600 700 800
Non-life insurance Life insuranceParent company etc.
2012 2013 2014 2015 2016
Pre-tax Profit Quarterly, DKKm
DKKm
Combined Ratio,%
72.2 75.4 70.3 70.9 68.7
15.8 16.2 15.7 15.9 16.4
0
20
40
60
80
100
2012 2013 2014 2015 2016
%
Claims ratio Expense ratio Target CR
85.186.886.091.588.0
Sampo Group ― Nordic Financial Group with Strong Brands
8/17/2017
• Strategic focus‒ to achieve primarily organic growth, supplemented by close
co-operation with alliance partners, and opportune acquisitions‒ to develop and improve customer service‒ to optimise shareholders' return / risk profile ‒ to be a dynamic organisation‒ to align the goals of Management, employees and shareholders
• Sampo’s ownership of shares 46.7% and of votes 49.3%
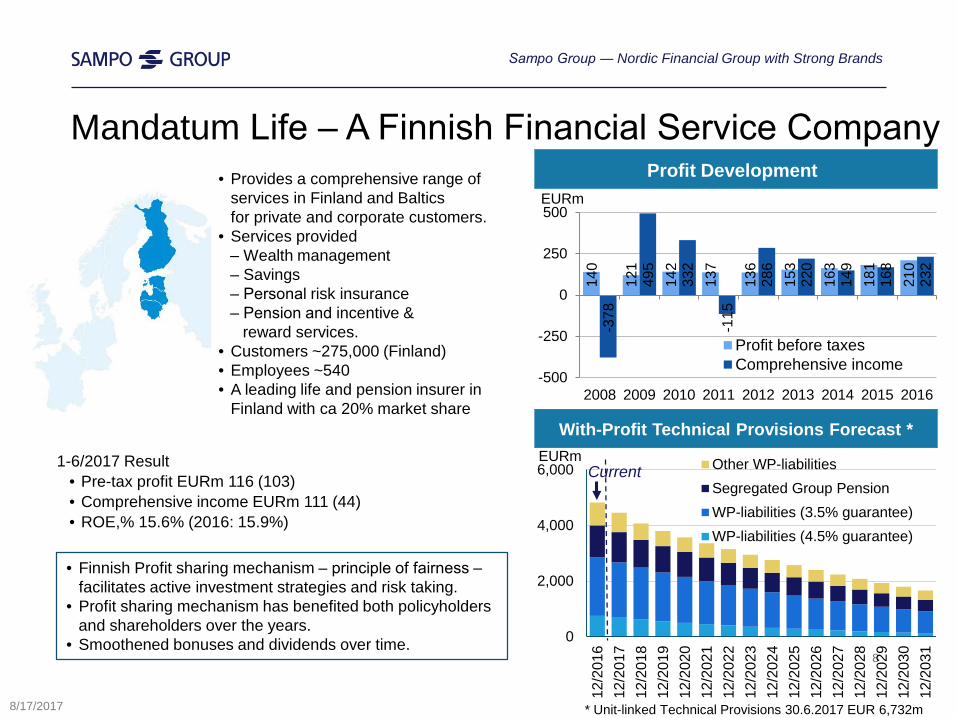
Mandatum Life ‒ A Finnish Financial Service Company
1-6/2017 Result• Pre-tax profit EURm 116 (103) • Comprehensive income EURm 111 (44)• ROE,% 15.6% (2016: 15.9%)
8
• Provides a comprehensive range of services in Finland and Balticsfor private and corporate customers.
• Services provided‒ Wealth management‒ Savings‒ Personal risk insurance‒ Pension and incentive &
reward services.• Customers ~275,000 (Finland)• Employees ~540• A leading life and pension insurer in
Finland with ca 20% market share
8/17/2017
140
121
142
137
136
153
163
181
210
-378
495
332
-115
286
220
149
168
232
-500
-250
0
250
500
2008 2009 2010 2011 2012 2013 2014 2015 2016
EURm
Profit before taxesComprehensive income
Profit Development
• Finnish Profit sharing mechanism – principle of fairness ‒ facilitates active investment strategies and risk taking.
• Profit sharing mechanism has benefited both policyholdersand shareholders over the years.
• Smoothened bonuses and dividends over time. 0
2,000
4,000
6,000
12/2
016
12/2
017
12/2
018
12/2
019
12/2
020
12/2
021
12/2
022
12/2
023
12/2
024
12/2
025
12/2
026
12/2
027
12/2
028
12/2
029
12/2
030
12/2
031
Other WP-liabilitiesSegregated Group PensionWP-liabilities (3.5% guarantee)WP-liabilities (4.5% guarantee)
With-Profit Technical Provisions Forecast *EURm
Sampo Group ― Nordic Financial Group with Strong Brands
Current
* Unit-linked Technical Provisions 30.6.2017 EUR 6,732m
Nordea – A Nordic Banking Group
9
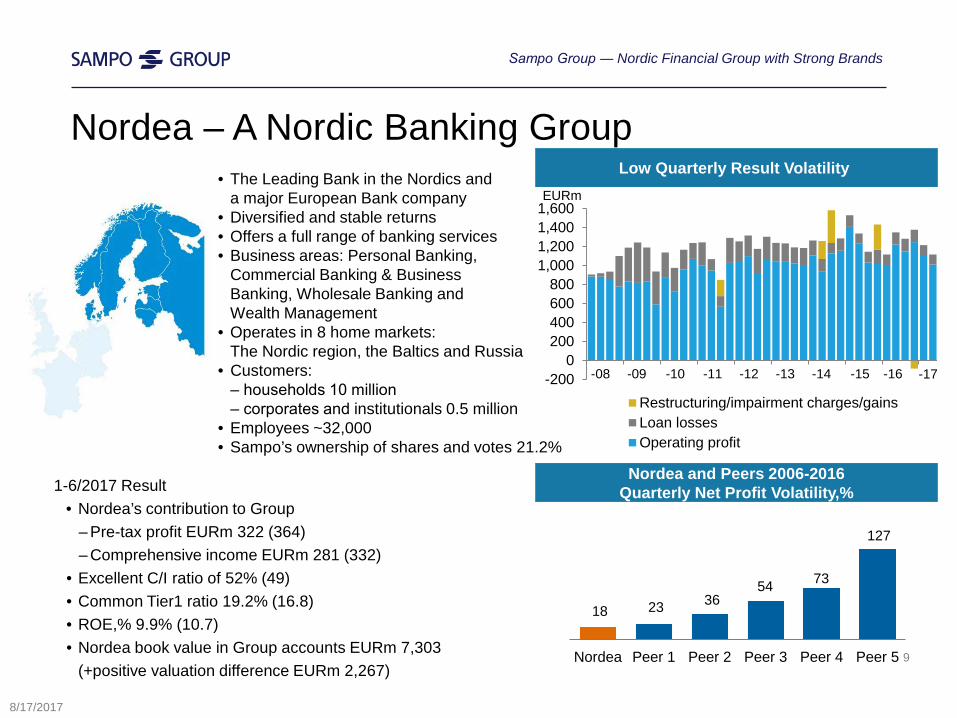
• The Leading Bank in the Nordics anda major European Bank company
• Diversified and stable returns• Offers a full range of banking services• Business areas: Personal Banking,
Commercial Banking & BusinessBanking, Wholesale Banking and Wealth Management
• Operates in 8 home markets: The Nordic region, the Baltics and Russia
• Customers:‒ households 10 million‒ corporates and institutionals 0.5 million
• Employees ~32,000• Sampo’s ownership of shares and votes 21.2%
1-6/2017 Result• Nordea’s contribution to Group
‒ Pre-tax profit EURm 322 (364)‒ Comprehensive income EURm 281 (332)
• Excellent C/I ratio of 52% (49)• Common Tier1 ratio 19.2% (16.8)• ROE,% 9.9% (10.7)• Nordea book value in Group accounts EURm 7,303
(+positive valuation difference EURm 2,267)
-2000
200400600800
1,0001,2001,4001,600EURm
Restructuring/impairment charges/gainsLoan lossesOperating profit
-08 -09 -10 -11 -12 -13 -14 -15 -16
18 23 36 54 73
127
Nordea Peer 1 Peer 2 Peer 3 Peer 4 Peer 5
Nordea and Peers 2006-2016Quarterly Net Profit Volatility,%
Low Quarterly Result Volatility
Sampo Group ― Nordic Financial Group with Strong Brands
-17
8/17/2017
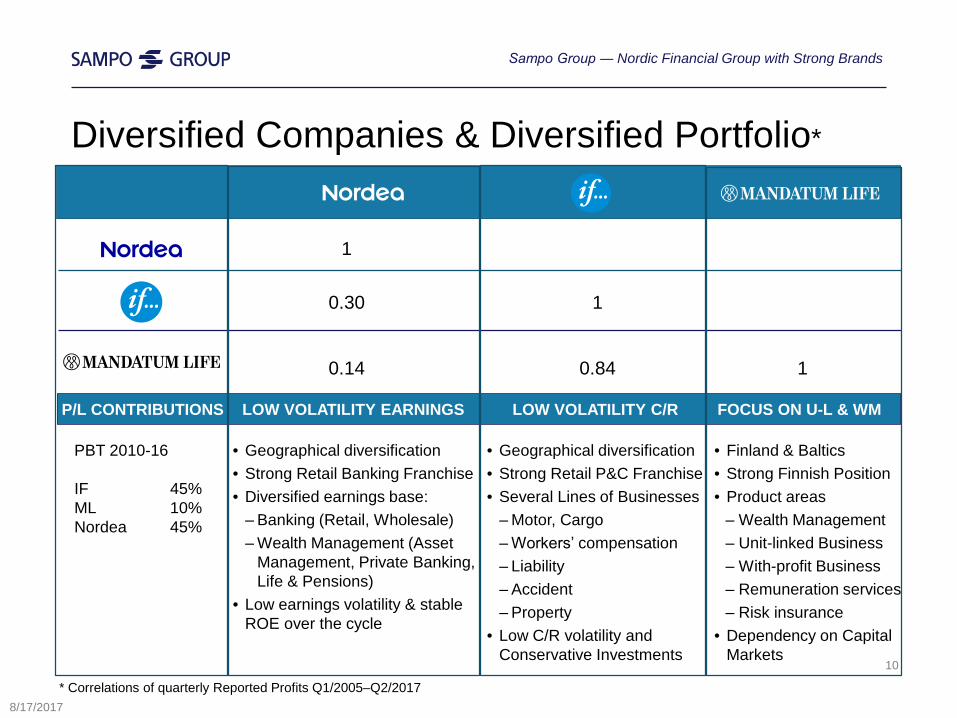
• Geographical diversification• Strong Retail P&C Franchise• Several Lines of Businesses
‒ Motor, Cargo‒ Workersʼ compensation‒ Liability ‒ Accident‒ Property
• Low C/R volatility and Conservative Investments
Diversified Companies & Diversified Portfolio*
• Geographical diversification• Strong Retail Banking Franchise• Diversified earnings base:
‒ Banking (Retail, Wholesale)‒ Wealth Management (Asset
Management, Private Banking, Life & Pensions)
• Low earnings volatility & stableROE over the cycle
• Finland & Baltics• Strong Finnish Position• Product areas
‒ Wealth Management‒ Unit-linked Business‒ With-profit Business ‒ Remuneration services‒ Risk insurance
• Dependency on Capital Markets
* Correlations of quarterly Reported Profits Q1/2005–Q2/2017
PBT 2010-16
IF 45%ML 10%Nordea 45%
P/L CONTRIBUTIONS
10
LOW VOLATILITY EARNINGS LOW VOLATILITY C/R FOCUS ON U-L & WM
0.30
0.14
1
0.84 1
1
8/17/2017
Sampo Group ― Nordic Financial Group with Strong Brands
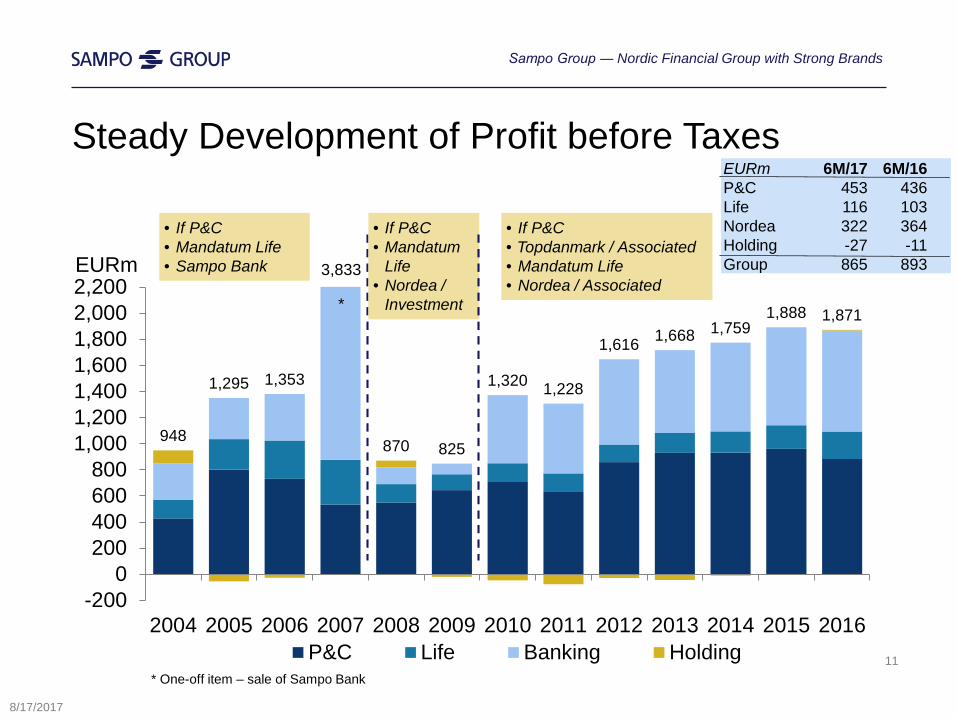
948
1,295 1,353
870 825
1,320 1,228
1,616 1,668 1,7591,888 1,871
-2000
200400600800
1,0001,2001,4001,6001,8002,0002,200
2004 2005 2006 2007 2008 2009 2010 2011 2012 2013 2014 2015 2016P&C Life Banking Holding
Steady Development of Profit before Taxes
* One-off item – sale of Sampo Bank
EURm
*
• If P&C• Mandatum Life• Sampo Bank
• If P&C• Mandatum
Life• Nordea /
Investment
• If P&C• Topdanmark / Associated• Mandatum Life • Nordea / Associated
3,833
11
8/17/2017
Sampo Group ― Nordic Financial Group with Strong Brands
EURm 6M/17 6M/16P&C 453 436Life 116 103 Nordea 322 364 Holding -27 -11Group 865 893
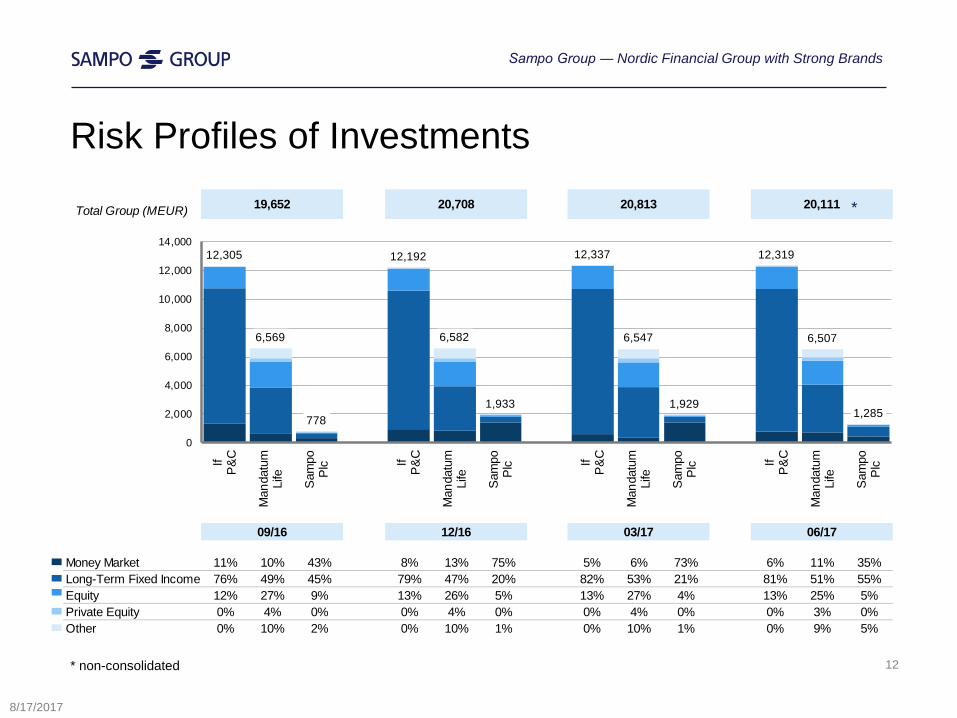
Risk Profiles of Investments
12
8/17/2017
* non-consolidated
Sampo Group ― Nordic Financial Group with Strong Brands
Total Group (MEUR) 19,652 20,708 20,813 20,111
09/16 12/16 03/17 06/17
Money Market 11% 10% 43% 8% 13% 75% 5% 6% 73% 6% 11% 35%Long-Term Fixed Income 76% 49% 45% 79% 47% 20% 82% 53% 21% 81% 51% 55%Equity 12% 27% 9% 13% 26% 5% 13% 27% 4% 13% 25% 5%Private Equity 0% 4% 0% 0% 4% 0% 0% 4% 0% 0% 3% 0%Other 0% 10% 2% 0% 10% 1% 0% 10% 1% 0% 9% 5%
12,305
6,569
778
12,192
6,582
1,933
12,337
6,547
1,929
12,319
6,507
1,285
0
2,000
4,000
6,000
8,000
10,000
12,000
14,000
IfP
&C
Man
datu
mLi
fe
Sam
poPl
c IfP
&C
Man
datu
mLi
fe
Sam
poPl
c IfP
&C
Man
datu
mLi
fe
Sam
poPl
c IfP
&C
Man
datu
mLi
fe
Sam
poPl
c
*
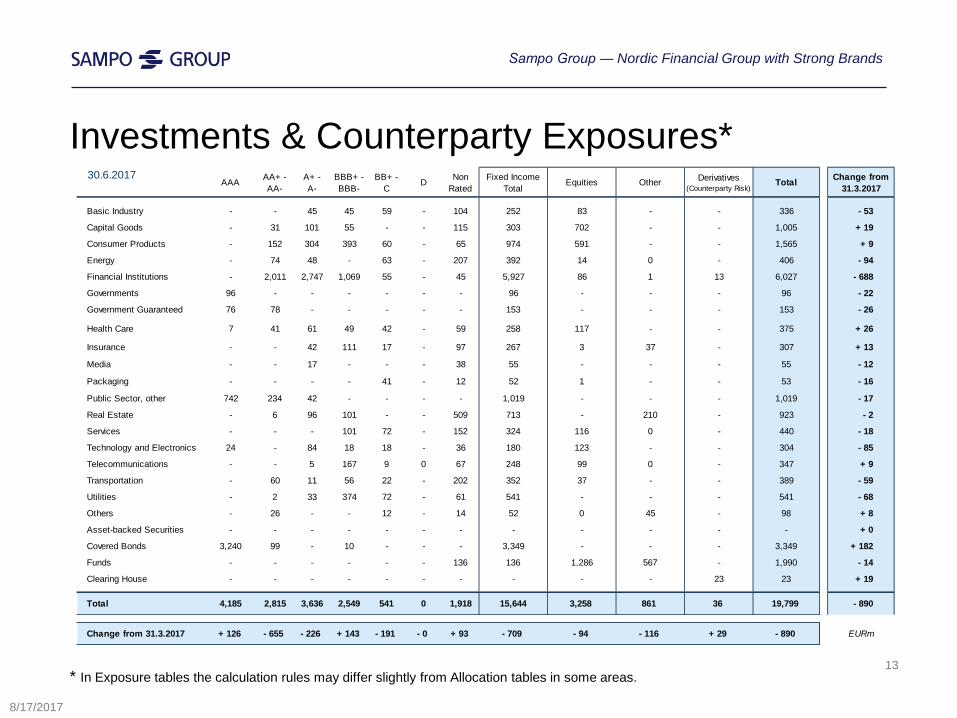
Investments & Counterparty Exposures*
* In Exposure tables the calculation rules may differ slightly from Allocation tables in some areas.13
8/17/2017
Sampo Group ― Nordic Financial Group with Strong Brands
30.6.2017AAA AA+ -
AA-A+ - A-
BBB+ - BBB-
BB+ - C
D NonRated
Fixed Income Total
Equities Other Derivatives (Counterparty Risk)
Total Change from 31.3.2017
Basic Industry - - 45 45 59 - 104 252 83 - - 336 - 53
Capital Goods - 31 101 55 - - 115 303 702 - - 1,005 + 19
Consumer Products - 152 304 393 60 - 65 974 591 - - 1,565 + 9
Energy - 74 48 - 63 - 207 392 14 0 - 406 - 94
Financial Institutions - 2,011 2,747 1,069 55 - 45 5,927 86 1 13 6,027 - 688
Governments 96 - - - - - - 96 - - - 96 - 22
Government Guaranteed 76 78 - - - - - 153 - - - 153 - 26
Health Care 7 41 61 49 42 - 59 258 117 - - 375 + 26
Insurance - - 42 111 17 - 97 267 3 37 - 307 + 13
Media - - 17 - - - 38 55 - - - 55 - 12
Packaging - - - - 41 - 12 52 1 - - 53 - 16
Public Sector, other 742 234 42 - - - - 1,019 - - - 1,019 - 17
Real Estate - 6 96 101 - - 509 713 - 210 - 923 - 2
Services - - - 101 72 - 152 324 116 0 - 440 - 18
Technology and Electronics 24 - 84 18 18 - 36 180 123 - - 304 - 85
Telecommunications - - 5 167 9 0 67 248 99 0 - 347 + 9
Transportation - 60 11 56 22 - 202 352 37 - - 389 - 59
Utilities - 2 33 374 72 - 61 541 - - - 541 - 68
Others - 26 - - 12 - 14 52 0 45 - 98 + 8
Asset-backed Securities - - - - - - - - - - - - + 0
Covered Bonds 3,240 99 - 10 - - - 3,349 - - - 3,349 + 182
Funds - - - - - - 136 136 1,286 567 - 1,990 - 14
Clearing House - - - - - - - - - - 23 23 + 19
Total 4,185 2,815 3,636 2,549 541 0 1,918 15,644 3,258 861 36 19,799 - 890
Change from 31.3.2017 + 126 - 655 - 226 + 143 - 191 - 0 + 93 - 709 - 94 - 116 + 29 - 890 EURm
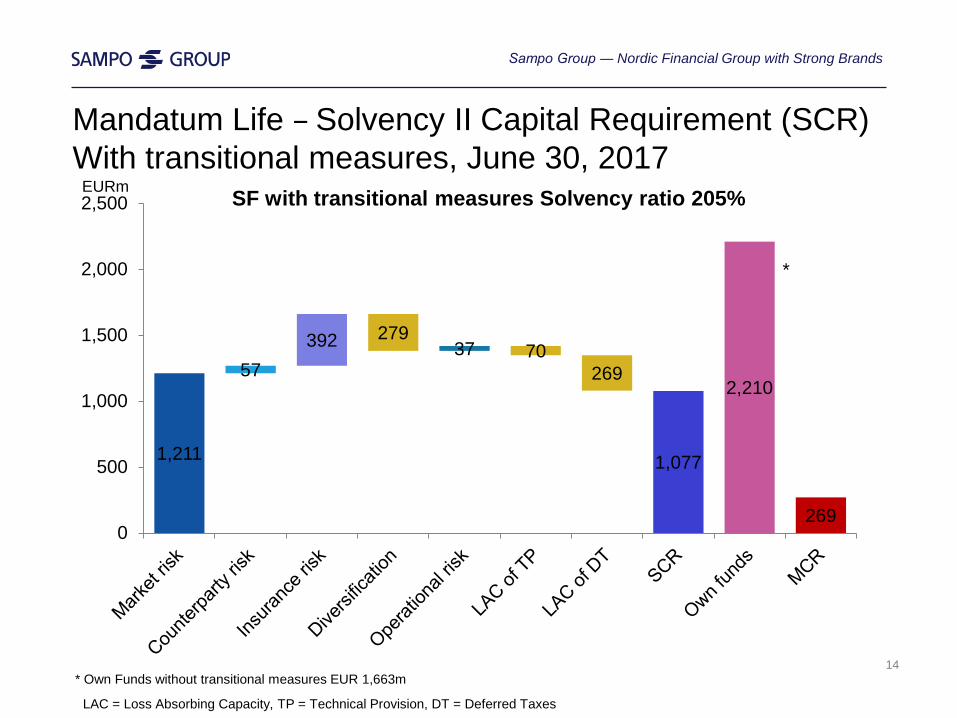
Mandatum Life – Solvency II Capital Requirement (SCR)With transitional measures, June 30, 2017
LAC = Loss Absorbing Capacity, TP = Technical Provision, DT = Deferred Taxes
*
* Own Funds without transitional measures EUR 1,663m
EURm
14
SF with transitional measures Solvency ratio 205%
1,211
57392 279
37 70269
1,077
269
2,210
0
500
1,000
1,500
2,000
2,500
Sampo Group ― Nordic Financial Group with Strong Brands
EURm
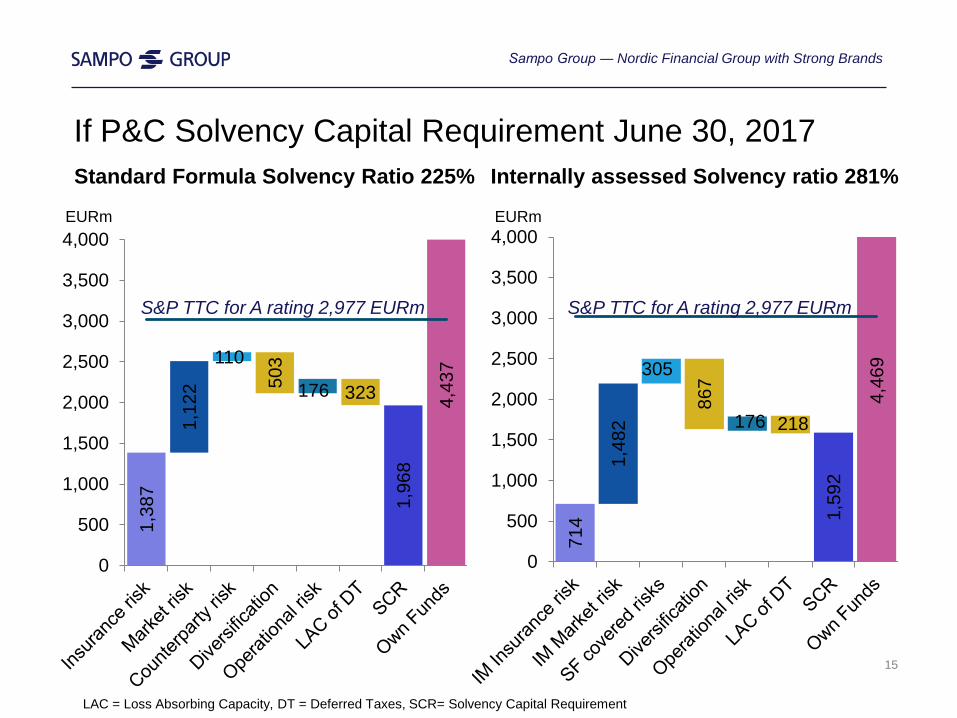
714
1,48
2
305
867
176 218
1,59
2
4,46
9
0
500
1,000
1,500
2,000
2,500
3,000
3,500
4,000
1,38
7
1,12
2
110
503
176 3231,
968
4,43
7
0
500
1,000
1,500
2,000
2,500
3,000
3,500
4,000
Internally assessed Solvency ratio 281%Standard Formula Solvency Ratio 225%
LAC = Loss Absorbing Capacity, DT = Deferred Taxes, SCR= Solvency Capital Requirement
EURm
15
S&P TTC for A rating 2,977 EURm S&P TTC for A rating 2,977 EURm
If P&C Solvency Capital Requirement June 30, 2017
Sampo Group ― Nordic Financial Group with Strong Brands
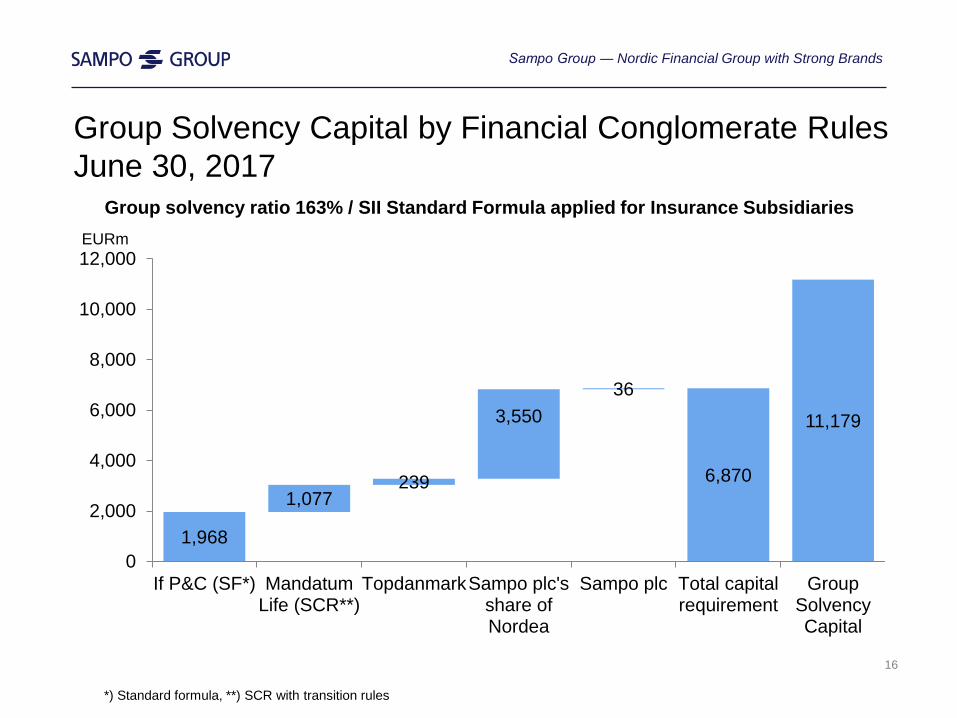
1,968
1,077239
3,55036
6,870
11,179
0
2,000
4,000
6,000
8,000
10,000
12,000
If P&C (SF*) MandatumLife (SCR**)
TopdanmarkSampo plc'sshare ofNordea
Sampo plc Total capitalrequirement
GroupSolvencyCapital
Group Solvency Capital by Financial Conglomerate Rules June 30, 2017
EURm
Group solvency ratio 163% / SII Standard Formula applied for Insurance Subsidiaries
16
*) Standard formula, **) SCR with transition rules
Sampo Group ― Nordic Financial Group with Strong Brands
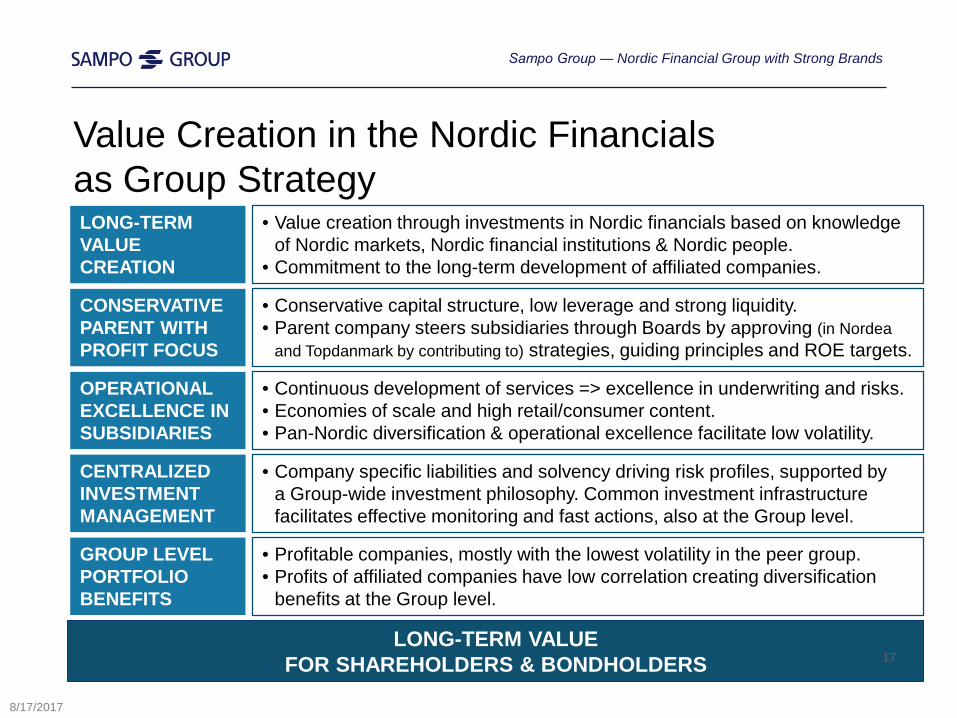
Value Creation in the Nordic Financialsas Group StrategyLONG-TERM VALUE CREATION
• Value creation through investments in Nordic financials based on knowledge of Nordic markets, Nordic financial institutions & Nordic people.
• Commitment to the long-term development of affiliated companies.
OPERATIONAL EXCELLENCE IN SUBSIDIARIES
• Continuous development of services => excellence in underwriting and risks.• Economies of scale and high retail/consumer content.• Pan-Nordic diversification & operational excellence facilitate low volatility.
CONSERVATIVE PARENT WITH PROFIT FOCUS
• Conservative capital structure, low leverage and strong liquidity.• Parent company steers subsidiaries through Boards by approving (in Nordea
and Topdanmark by contributing to) strategies, guiding principles and ROE targets.
GROUP LEVEL PORTFOLIO BENEFITS
• Profitable companies, mostly with the lowest volatility in the peer group.• Profits of affiliated companies have low correlation creating diversification
benefits at the Group level.
LONG-TERM VALUE FOR SHAREHOLDERS & BONDHOLDERS
CENTRALIZEDINVESTMENT MANAGEMENT
• Company specific liabilities and solvency driving risk profiles, supported bya Group-wide investment philosophy. Common investment infrastructure facilitates effective monitoring and fast actions, also at the Group level.
17
8/17/2017
Sampo Group ― Nordic Financial Group with Strong Brands
18
17 August 2017
Sampo Group Nordic Financial Group with Strong Brands 3-17
If P&C Diversified Nordic P&C Insurer 18-23Mandatum Life A Finnish Financial Services Company 24-28Sampo plc Parent Company with Capacity to Generate Funds 29-35Appendix Separate Supplementary Information 36-47
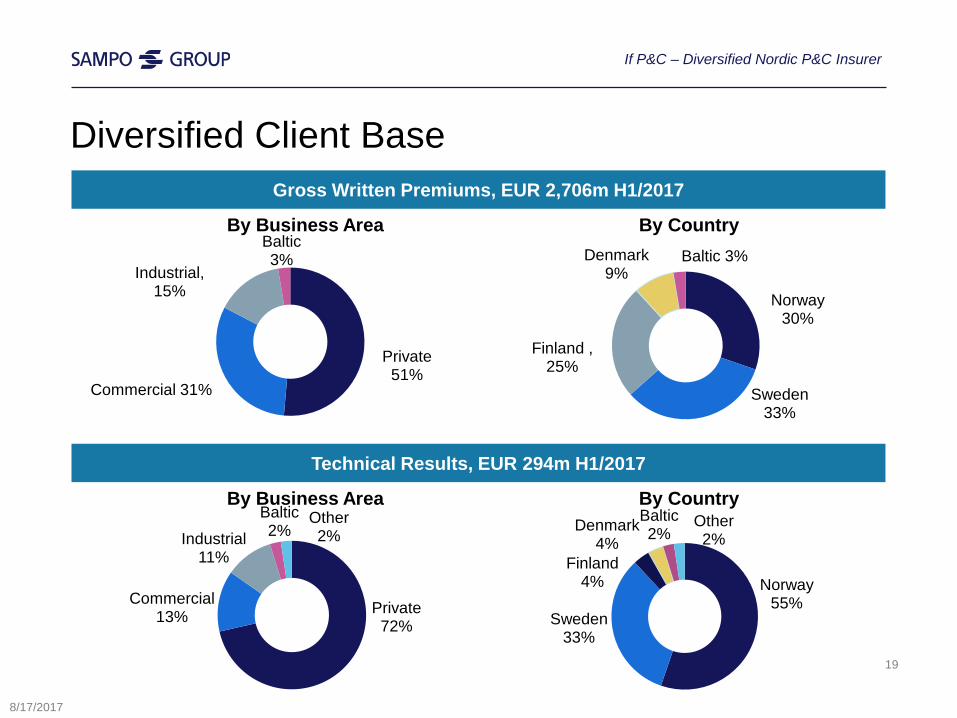
By Business Area By Country
Private72%
Commercial13%
Industrial11%
Baltic2%
Other2%
Technical Results, EUR 294m H1/2017
Norway55%
Sweden33%
Finland4%
Denmark4%
Baltic2%
Other2%
Gross Written Premiums, EUR 2,706m H1/2017
By Business Area By Country
Private51%
Commercial 31%
Industrial, 15%
Baltic3%
Norway30%
Sweden33%
Finland , 25%
Denmark9%
Baltic 3%
If P&C – Diversified Nordic P&C Insurer
Diversified Client Base
19
8/17/2017
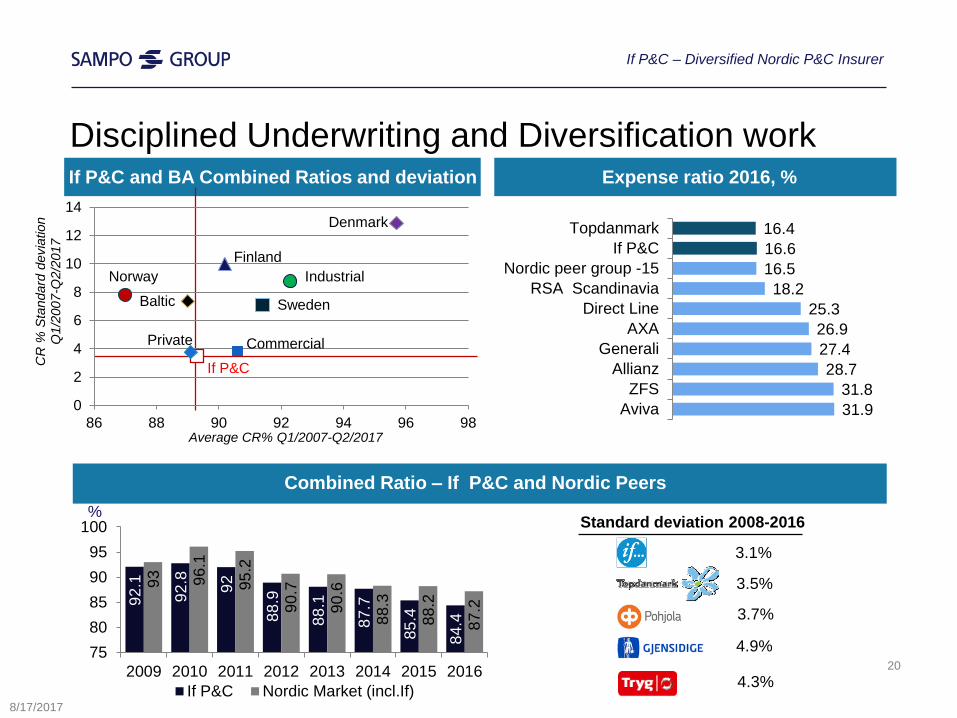
Expense ratio 2016, %
Combined Ratio ‒ If P&C and Nordic Peers
If P&C and BA Combined Ratios and deviation
Standard deviation 2008-2016
3.1%
4.3%
4.9%
3.7%
3.5%
92.1
92.8 92
88.9
88.1
87.7
85.4
84.4
93 96.1
95.2
90.7
90.6
88.3
88.2
87.2
7580859095
100
2009 2010 2011 2012 2013 2014 2015 2016If P&C Nordic Market (incl.If)
Disciplined Underwriting and Diversification work
20
%
8/17/2017
16.416.616.518.2
25.326.927.428.7
31.831.9
TopdanmarkIf P&C
Nordic peer group -15RSA Scandinavia
Direct LineAXA
GeneraliAllianz
ZFSAviva
If P&C – Diversified Nordic P&C Insurer
Private Commercial
Industrial
Baltic
If P&C
Norway
Sweden
Finland
Denmark
0
2
4
6
8
10
12
14
86 88 90 92 94 96 98
CR
% S
tand
ard
devi
atio
n Q
1/20
07-Q
2/20
17
Average CR% Q1/2007-Q2/2017
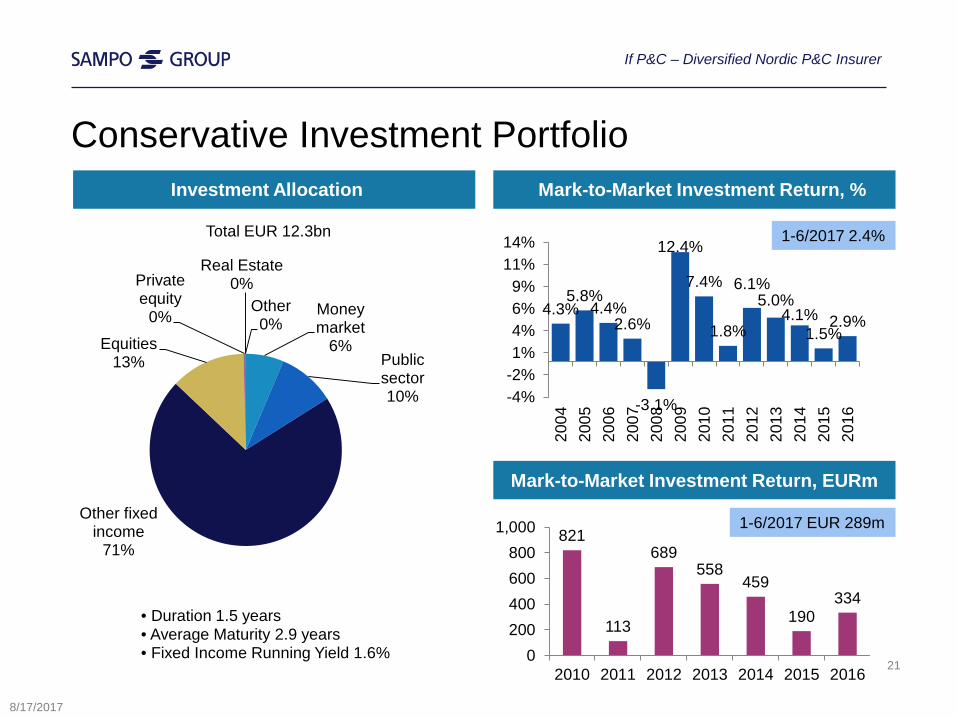
Conservative Investment Portfolio
• Duration 1.5 years• Average Maturity 2.9 years• Fixed Income Running Yield 1.6%
Mark-to-Market Investment Return, %Investment Allocation
4.3%5.8%
4.4%2.6%
-3.1%
12.4%
7.4%
1.8%
6.1%5.0%
4.1%1.5%
2.9%
-4%-2%1%4%6%9%
11%14%
2004
2005
2006
2007
2008
2009
2010
2011
2012
2013
2014
2015
2016
Mark-to-Market Investment Return, EURm
821
113
689558
459
190334
0200400600800
1,000
2010 2011 2012 2013 2014 2015 2016 21
Total EUR 12.3bn
8/17/2017
1-6/2017 EUR 289m
1-6/2017 2.4%
If P&C – Diversified Nordic P&C Insurer
Money market
6%Public sector10%
Other fixed income
71%
Equities13%
Private equity
0%
Real Estate0%
Other0%
0
50
100
150
200
250
300
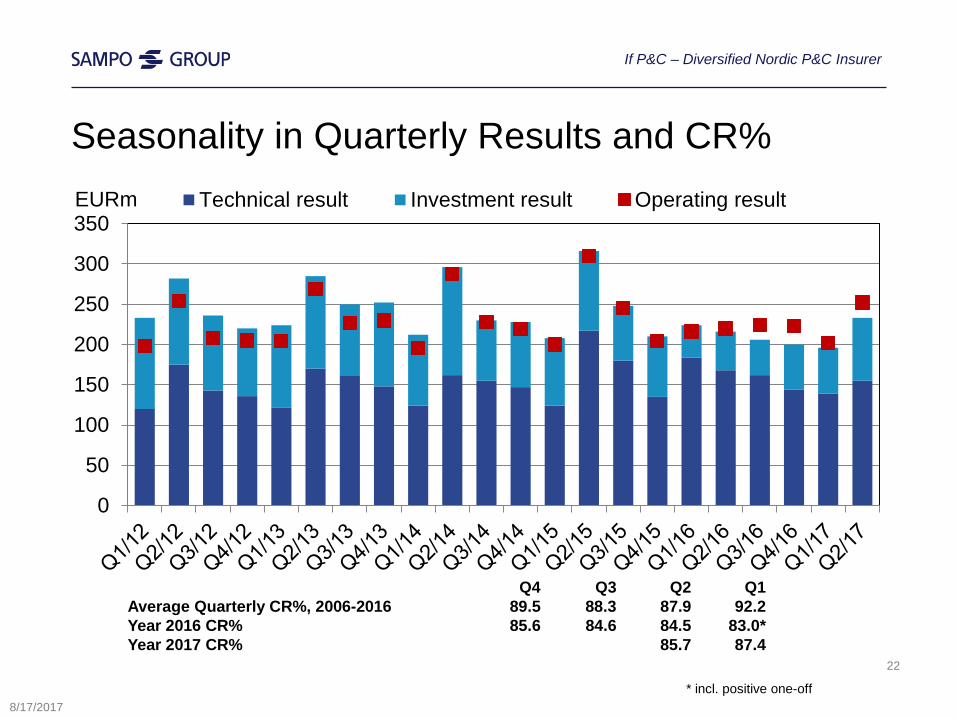
350Technical result Investment result Operating result
Seasonality in Quarterly Results and CR%
Q4 Q3 Q2 Q1Average Quarterly CR%, 2006-2016 89.5 88.3 87.9 92.2Year 2016 CR% 85.6 84.6 84.5 83.0*Year 2017 CR% 85.7 87.4
EURm
22
* incl. positive one-off8/17/2017
If P&C – Diversified Nordic P&C Insurer
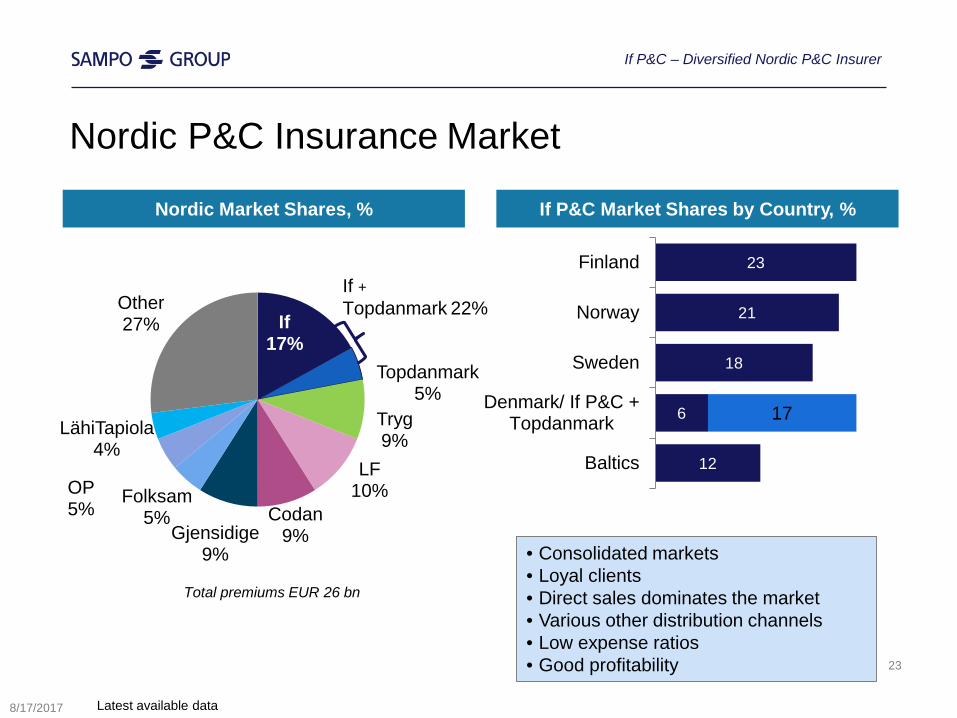
Nordic P&C Insurance Market
23
21
18
6
12
17
Finland
Norway
Sweden
Denmark/ If P&C +Topdanmark
Baltics
If17%
Topdanmark5%
Tryg9%
LF10%
Codan9%Gjensidige
9%
Folksam5%
OP5%
LähiTapiola4%
Other27%
If + Topdanmark 22%
Total premiums EUR 26 bn
23
• Consolidated markets• Loyal clients• Direct sales dominates the market• Various other distribution channels• Low expense ratios• Good profitability
If P&C – Diversified Nordic P&C Insurer
Latest available data
Nordic Market Shares, % If P&C Market Shares by Country, %
8/17/2017
24
17 August 2017
Sampo Group Nordic Financial Group with Strong Brands 3-17
If P&C Diversified Nordic P&C Insurer 18-23Mandatum Life A Finnish Financial Services Company 24-28Sampo plc Parent Company with Capacity to Generate Funds 29-35Appendix Separate Supplementary Information 36-47
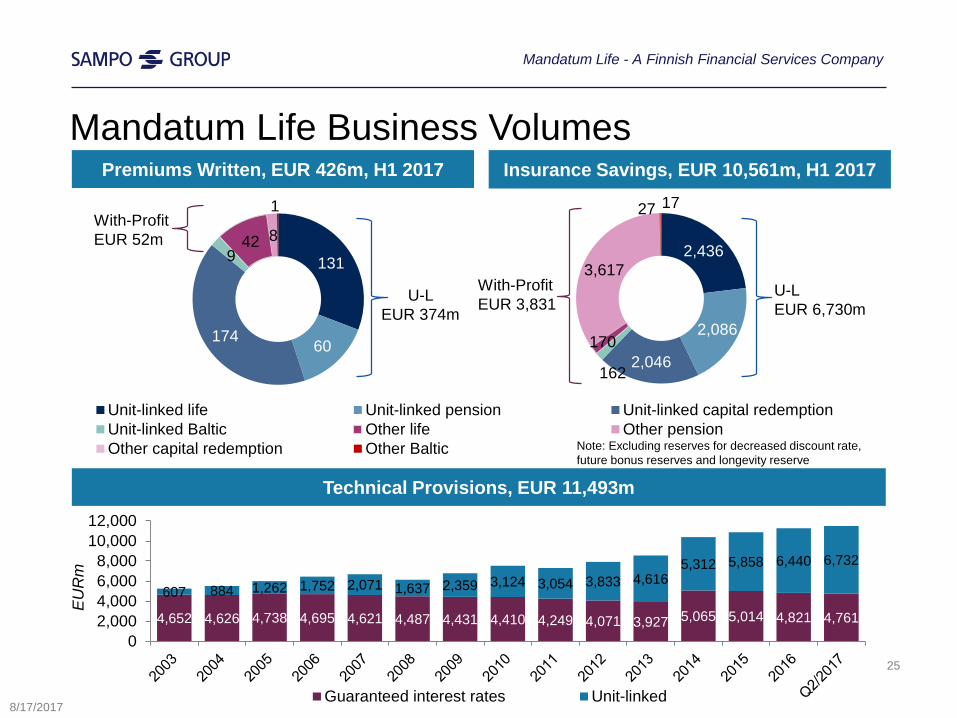
Premiums Written, EUR 426m, H1 2017 Insurance Savings, EUR 10,561m, H1 2017
131
60174
942 8
1
Unit-linked life Unit-linked pension Unit-linked capital redemptionUnit-linked Baltic Other life Other pensionOther capital redemption Other Baltic
2,436
2,086
2,046162
170
3,617
27 17
Mandatum Life Business Volumes
U-LEUR 6,730m
With-ProfitEUR 3,831U-L
EUR 374m
With-ProfitEUR 52m
4,652 4,626 4,738 4,695 4,621 4,487 4,431 4,410 4,249 4,071 3,927 5,065 5,014 4,821 4,761
607 884 1,262 1,752 2,071 1,637 2,359 3,124 3,054 3,833 4,6165,312 5,858 6,440 6,732
02,0004,0006,0008,000
10,00012,000
Guaranteed interest rates Unit-linked
Technical Provisions, EUR 11,493m
EU
Rm
Mandatum Life - A Finnish Financial Services Company
25
8/17/2017
Note: Excluding reserves for decreased discount rate, future bonus reserves and longevity reserve
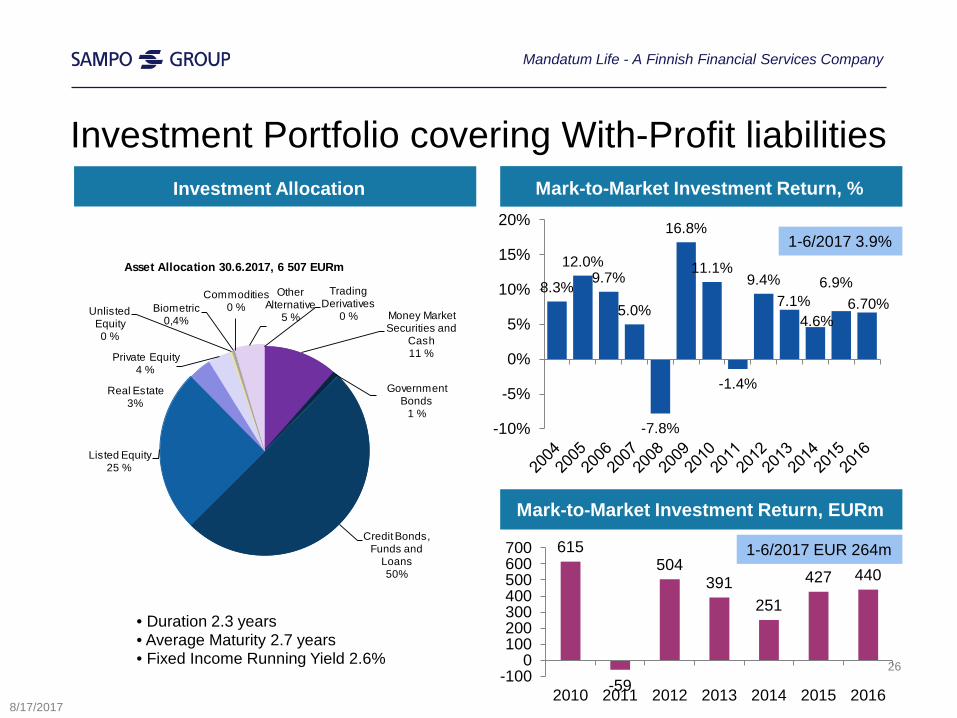
Investment Portfolio covering With-Profit liabilitiesMark-to-Market Investment Return, %Investment Allocation
8.3%
12.0%9.7%
5.0%
-7.8%
16.8%
11.1%
-1.4%
9.4%7.1%
4.6%
6.9%6.70%
-10%
-5%
0%
5%
10%
15%
20%
615
-59
504391
251
427 440
-1000
100200300400500600700
2010 2011 2012 2013 2014 2015 2016
26
• Duration 2.3 years• Average Maturity 2.7 years• Fixed Income Running Yield 2.6%
Mark-to-Market Investment Return, EURm
8/17/2017
Mandatum Life - A Finnish Financial Services Company
1-6/2017 EUR 264m
1-6/2017 3.9%Asset Allocation 30.6.2017, 6 507 EURm
Money Market Securities and
Cash11 %
Government Bonds
1 %
Credit Bonds, Funds and
Loans50%
Listed Equity25 %
Real Estate3%
Private Equity4 %
Unlisted Equity0 %
Biometric0,4%
Commodities0 %
Other Alternative
5 %
Trading Derivatives
0 %
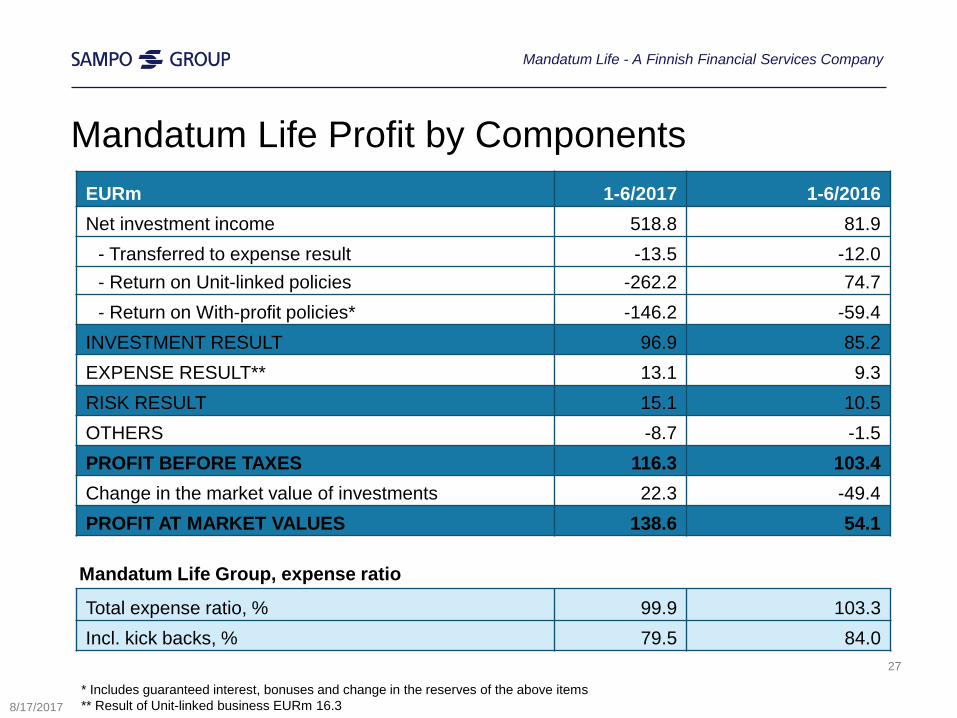
Mandatum Life Profit by Components
Total expense ratio, % 99.9 103.3Incl. kick backs, % 79.5 84.0
EURm 1-6/2017 1-6/2016Net investment income 518.8 81.9
- Transferred to expense result -13.5 -12.0- Return on Unit-linked policies -262.2 74.7- Return on With-profit policies* -146.2 -59.4
INVESTMENT RESULT 96.9 85.2EXPENSE RESULT** 13.1 9.3RISK RESULT 15.1 10.5OTHERS -8.7 -1.5PROFIT BEFORE TAXES 116.3 103.4Change in the market value of investments 22.3 -49.4PROFIT AT MARKET VALUES 138.6 54.1
Mandatum Life Group, expense ratio
* Includes guaranteed interest, bonuses and change in the reserves of the above items** Result of Unit-linked business EURm 16.3
27
8/17/2017
Mandatum Life - A Finnish Financial Services Company
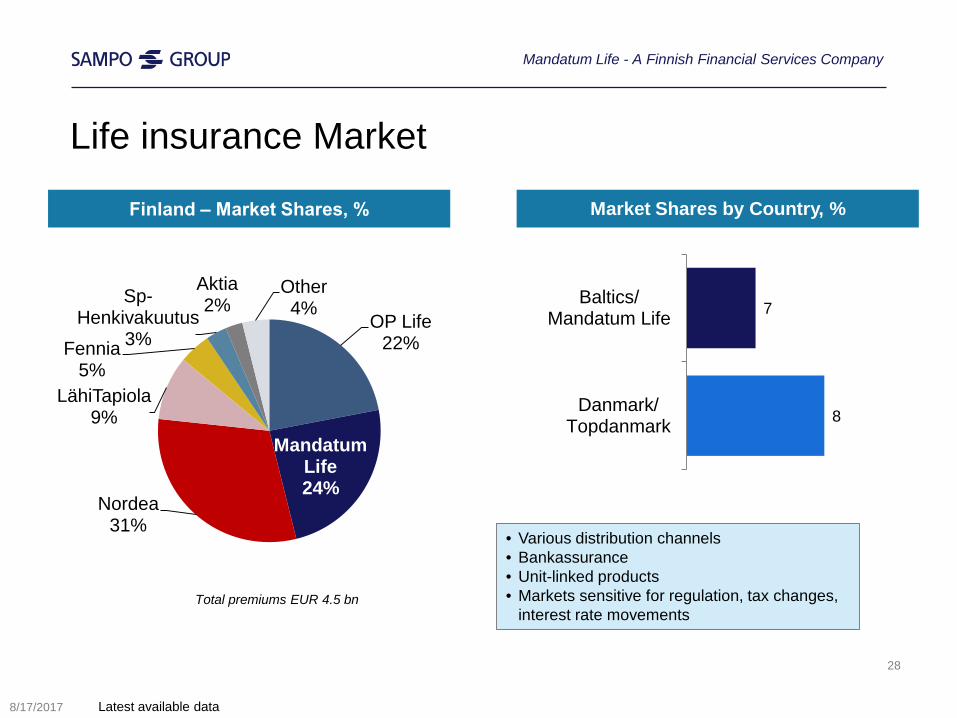
Life insurance Market
OP Life22%
Mandatum Life24%
Nordea31%
LähiTapiola9%
Fennia5%
Sp-Henkivakuutus
3%
Aktia 2%
Other4%
Total premiums EUR 4.5 bn
28
• Various distribution channels• Bankassurance• Unit-linked products• Markets sensitive for regulation, tax changes,
interest rate movements
Mandatum Life - A Finnish Financial Services Company
7
8
Baltics/Mandatum Life
Danmark/Topdanmark
Latest available data
Finland ‒ Market Shares, % Market Shares by Country, %
8/17/2017
29
17 August 2017
Sampo Group Nordic Financial Group with Strong Brands 3-17
If P&C Diversified Nordic P&C Insurer 18-23Mandatum Life A Finnish Financial Services Company 24-28Sampo plc Parent Company with Capacity to Generate Funds 29-35Appendix Separate Supplementary Information 36-47
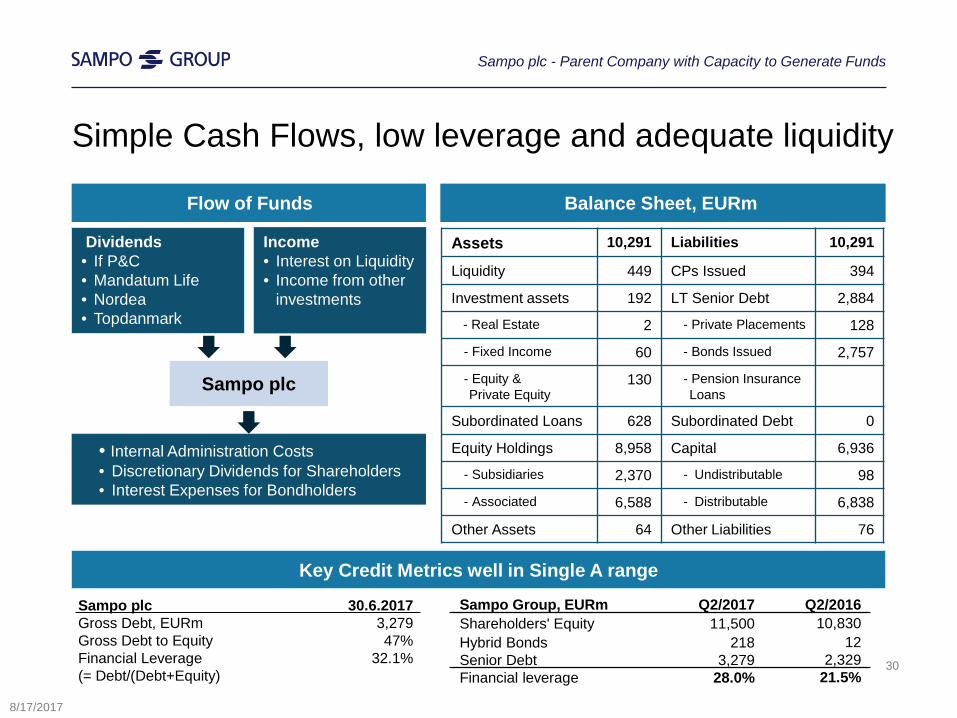
Simple Cash Flows, low leverage and adequate liquidity
Dividends • If P&C• Mandatum Life• Nordea• Topdanmark
• Internal Administration Costs• Discretionary Dividends for Shareholders• Interest Expenses for Bondholders
Income• Interest on Liquidity • Income from other
investments
Sampo plc
Assets 10,291 Liabilities 10,291
Liquidity 449 CPs Issued 394
Investment assets 192 LT Senior Debt 2,884
- Real Estate 2 - Private Placements 128
- Fixed Income 60 - Bonds Issued 2,757
- Equity & Private Equity
130 - Pension Insurance Loans
Subordinated Loans 628 Subordinated Debt 0
Equity Holdings 8,958 Capital 6,936
- Subsidiaries 2,370 - Undistributable 98
- Associated 6,588 - Distributable 6,838
Other Assets 64 Other Liabilities 76
Flow of Funds Balance Sheet, EURm
Key Credit Metrics well in Single A range
Sampo plc 30.6.2017Gross Debt, EURm 3,279Gross Debt to Equity 47%Financial Leverage 32.1% (= Debt/(Debt+Equity)
Sampo Group, EURm Q2/2017 Q2/2016 Shareholders' Equity 11,500 10,830 Hybrid Bonds 218 12 Senior Debt 3,279 2,329Financial leverage 28.0% 21.5%
30
Sampo plc - Parent Company with Capacity to Generate Funds
8/17/2017
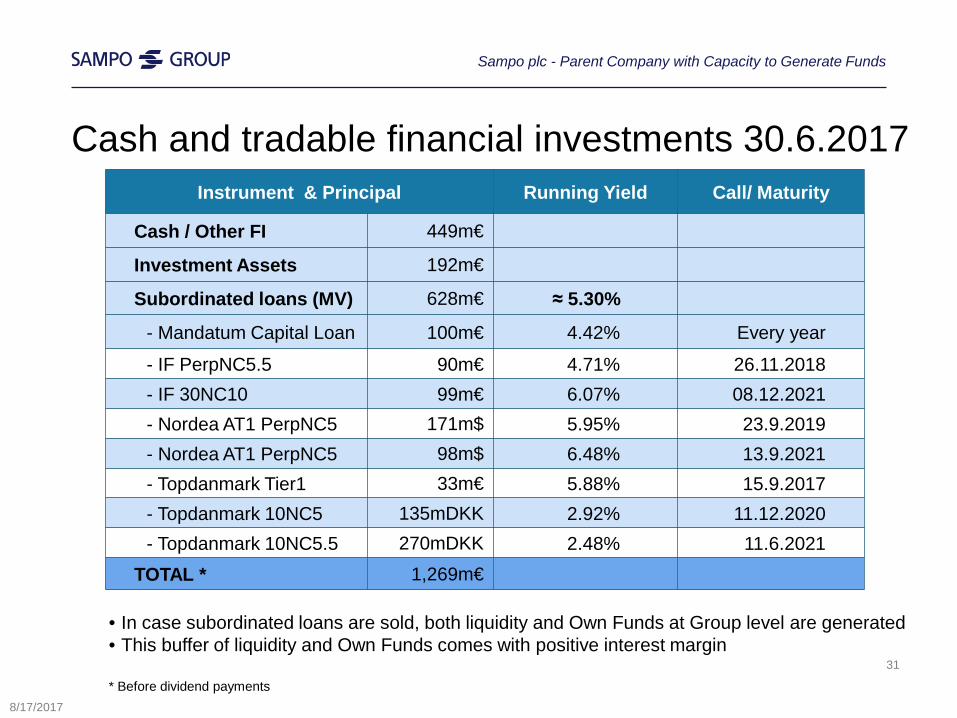
Cash and tradable financial investments 30.6.2017
31
Instrument & Principal Running Yield Call/ Maturity
Cash / Other FI 449m€
Investment Assets 192m€
Subordinated loans (MV) 628m€ ≈ 5.30%
- Mandatum Capital Loan 100m€ 4.42% Every year
- IF PerpNC5.5 90m€ 4.71% 26.11.2018- IF 30NC10 99m€ 6.07% 08.12.2021- Nordea AT1 PerpNC5 171m$ 5.95% 23.9.2019- Nordea AT1 PerpNC5 98m$ 6.48% 13.9.2021- Topdanmark Tier1 33m€ 5.88% 15.9.2017- Topdanmark 10NC5 135mDKK 2.92% 11.12.2020- Topdanmark 10NC5.5 270mDKK 2.48% 11.6.2021
TOTAL * 1,269m€
• In case subordinated loans are sold, both liquidity and Own Funds at Group level are generated• This buffer of liquidity and Own Funds comes with positive interest margin
* Before dividend payments8/17/2017
Sampo plc - Parent Company with Capacity to Generate Funds
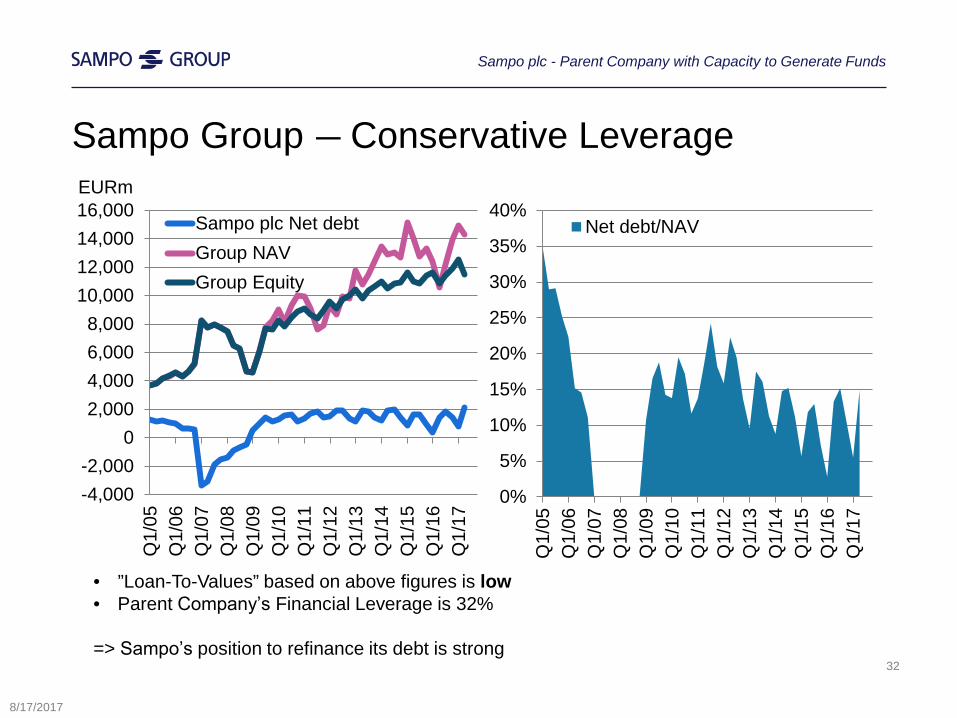
Sampo Group ― Conservative Leverage
-4,000-2,000
02,0004,0006,0008,000
10,00012,00014,00016,000
Q1/
05Q
1/06
Q1/
07Q
1/08
Q1/
09Q
1/10
Q1/
11Q
1/12
Q1/
13Q
1/14
Q1/
15Q
1/16
Q1/
17
Sampo plc Net debtGroup NAVGroup Equity
EURm
0%
5%
10%
15%
20%
25%
30%
35%
40%
Q1/
05Q
1/06
Q1/
07Q
1/08
Q1/
09Q
1/10
Q1/
11Q
1/12
Q1/
13Q
1/14
Q1/
15Q
1/16
Q1/
17
Net debt/NAV
32
• ”Loan-To-Values” based on above figures is low• Parent Companyʼs Financial Leverage is 32%
=> Sampoʼs position to refinance its debt is strong
8/17/2017
Sampo plc - Parent Company with Capacity to Generate Funds
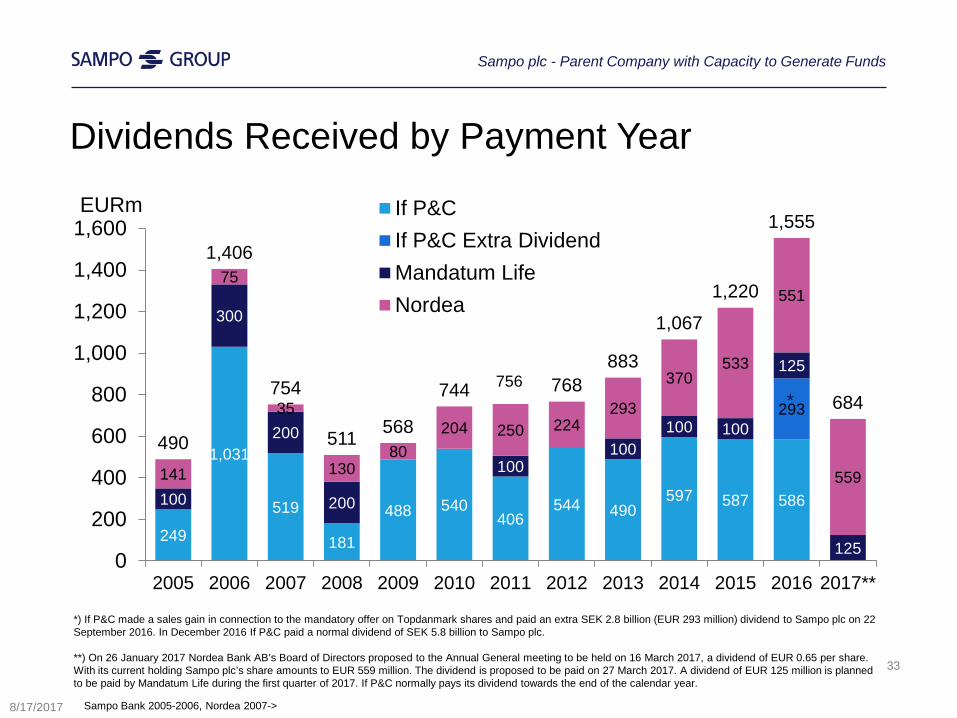
Dividends Received by Payment Year
EURm
249
1,031
519
181
488 540406
544 490597 587 586
293
100
300
200
200
100100
100 100
125
125
141
75
35
13080
204 250 224293
370533
551
559
490
1,406
754
511 568
744 756 768883
1,067
1,220
1,555
684
0
200
400
600
800
1,000
1,200
1,400
1,600
2005 2006 2007 2008 2009 2010 2011 2012 2013 2014 2015 2016 2017**
If P&CIf P&C Extra DividendMandatum LifeNordea
Sampo Bank 2005-2006, Nordea 2007->
33
8/17/2017
*
*) If P&C made a sales gain in connection to the mandatory offer on Topdanmark shares and paid an extra SEK 2.8 billion (EUR 293 million) dividend to Sampo plc on 22 September 2016. In December 2016 If P&C paid a normal dividend of SEK 5.8 billion to Sampo plc.
**) On 26 January 2017 Nordea Bank AB’s Board of Directors proposed to the Annual General meeting to be held on 16 March 2017, a dividend of EUR 0.65 per share. With its current holding Sampo plc’s share amounts to EUR 559 million. The dividend is proposed to be paid on 27 March 2017. A dividend of EUR 125 million is planned to be paid by Mandatum Life during the first quarter of 2017. If P&C normally pays its dividend towards the end of the calendar year.
Sampo plc - Parent Company with Capacity to Generate Funds
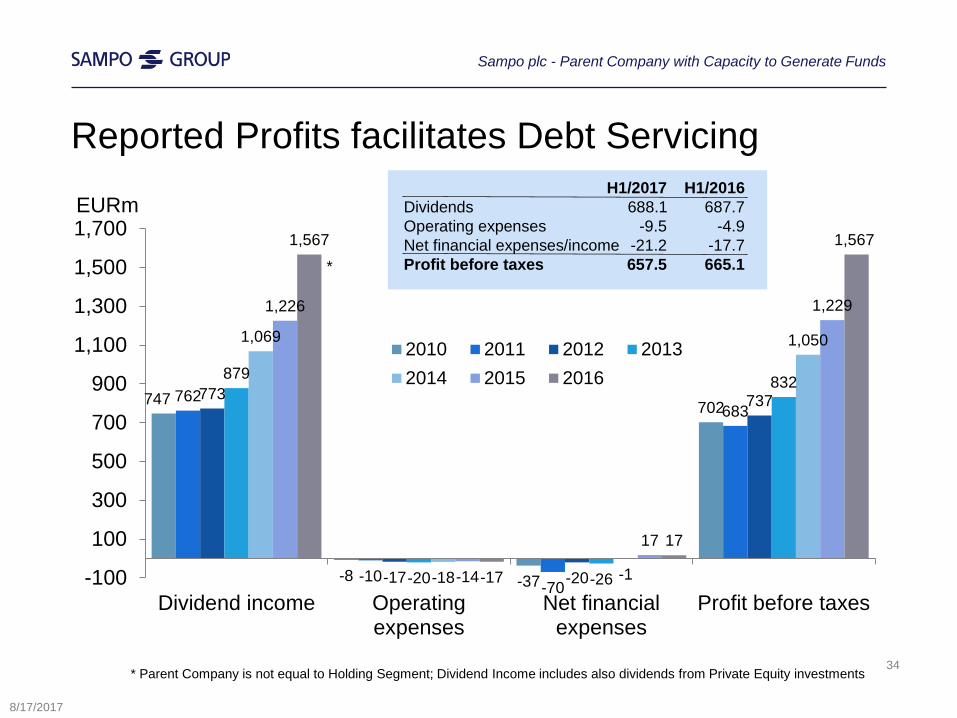
Reported Profits facilitates Debt Servicing
* Parent Company is not equal to Holding Segment; Dividend Income includes also dividends from Private Equity investments
747
-8 -37
702762
-10-70
683773
-17 -20
737
879
-20 -26
832
1,069
-18 -1
1,050
1,226
-14
17
1,229
1,567
-17
17
1,567
-100
100
300
500
700
900
1,100
1,300
1,500
1,700
Dividend income Operatingexpenses
Net financialexpenses
Profit before taxes
2010 2011 2012 20132014 2015 2016
*
EURm
34
8/17/2017
H1/2017 H1/2016Dividends 688.1 687.7Operating expenses -9.5 -4.9Net financial expenses/income -21.2 -17.7Profit before taxes 657.5 665.1
Sampo plc - Parent Company with Capacity to Generate Funds
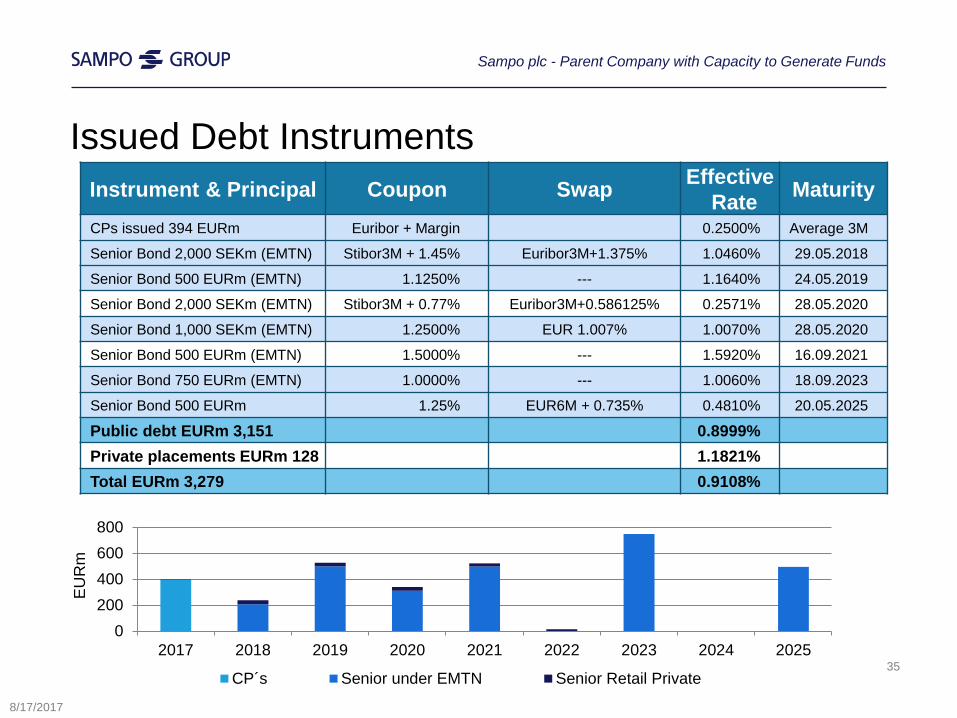
Issued Debt Instruments
EU
Rm
Instrument & Principal Coupon Swap Effective Rate Maturity
CPs issued 394 EURm Euribor + Margin 0.2500% Average 3M
Senior Bond 2,000 SEKm (EMTN) Stibor3M + 1.45% Euribor3M+1.375% 1.0460% 29.05.2018
Senior Bond 500 EURm (EMTN) 1.1250% --- 1.1640% 24.05.2019
Senior Bond 2,000 SEKm (EMTN) Stibor3M + 0.77% Euribor3M+0.586125% 0.2571% 28.05.2020
Senior Bond 1,000 SEKm (EMTN) 1.2500% EUR 1.007% 1.0070% 28.05.2020
Senior Bond 500 EURm (EMTN) 1.5000% --- 1.5920% 16.09.2021
Senior Bond 750 EURm (EMTN) 1.0000% --- 1.0060% 18.09.2023
Senior Bond 500 EURm 1.25% EUR6M + 0.735% 0.4810% 20.05.2025
Public debt EURm 3,151 0.8999% Private placements EURm 128 1.1821%Total EURm 3,279 0.9108%
35
8/17/2017
Sampo plc - Parent Company with Capacity to Generate Funds
0200400600800
2017 2018 2019 2020 2021 2022 2023 2024 2025
CP´s Senior under EMTN Senior Retail Private
36
17 August 2017
Sampo Group Nordic Financial Group with Strong Brands 3-17
If P&C Diversified P&C Insurer 18-23Mandatum Life A Finnish Financial Services Company 24-28Sampo plc Parent Company with Capacity to Generate Funds 29-35Appendix Separate Supplementary Information 36-47
Sampo Group’s Outlook for 2017
37
8/17/2017
Appendix – Separate Supplementary Information
Sampo Group’s business areas are expected to report good operating results for 2017.
However, the mark-to-market results are, particularly in life insurance, highly dependent on capital market developments. The continuing low interest rate level also creates a challenging environment for reinvestment in fixed income instruments.
The P&C insurance operations are expected to reach a combined ratio of 86-89 per cent for the full-year 2017.
Nordea’s contribution to the Group’s profit is expected to be significant.
38
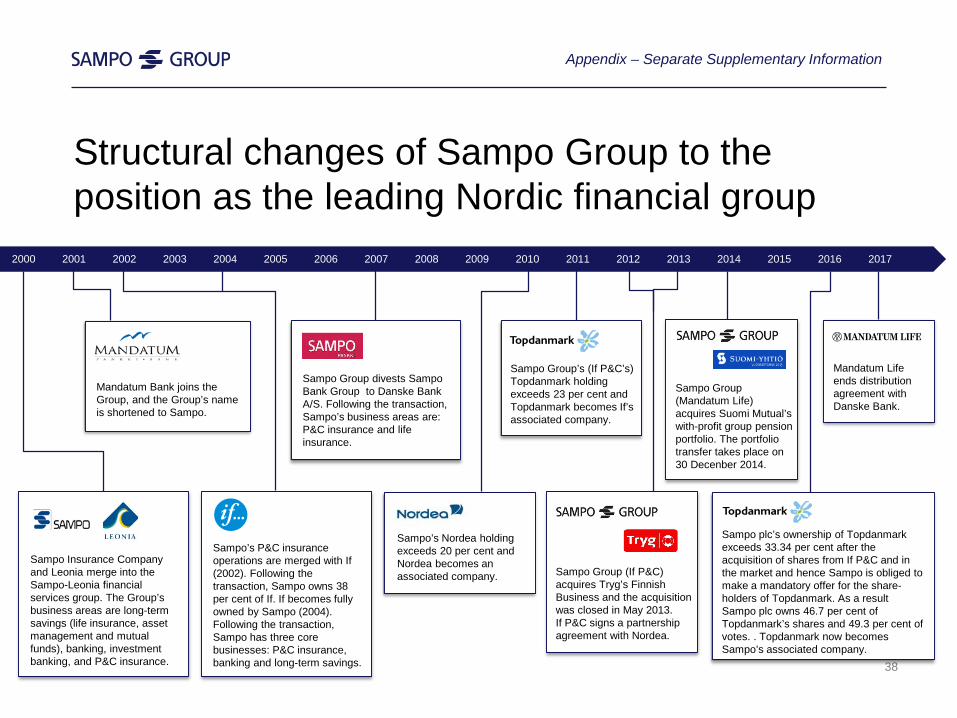
Structural changes of Sampo Group to the position as the leading Nordic financial group
Sampo Group’s (If P&C’s) Topdanmark holding exceeds 23 per cent and Topdanmark becomes If’s associated company.
Sampo Group (Mandatum Life) acquires Suomi Mutual’swith-profit group pension portfolio. The portfolio transfer takes place on 30 Decenber 2014.
Mandatum Life ends distribution agreement with Danske Bank.
Sampo Insurance Company and Leonia merge into the Sampo-Leonia financial services group. The Group’s business areas are long-term savings (life insurance, asset management and mutual funds), banking, investment banking, and P&C insurance.
Sampo’s P&C insurance operations are merged with If (2002). Following the transaction, Sampo owns 38 per cent of If. If becomes fully owned by Sampo (2004). Following the transaction, Sampo has three core businesses: P&C insurance, banking and long-term savings.
Sampo’s Nordea holding exceeds 20 per cent and Nordea becomes an associated company. Sampo Group (If P&C)
acquires Tryg’s Finnish Business and the acquisition was closed in May 2013.If P&C signs a partnership agreement with Nordea.
Sampo plc’s ownership of Topdanmarkexceeds 33.34 per cent after the acquisition of shares from If P&C and in the market and hence Sampo is obliged to make a mandatory offer for the share-holders of Topdanmark. As a result Sampo plc owns 46.7 per cent of Topdanmark’s shares and 49.3 per cent of votes. . Topdanmark now becomesSampo’s associated company.
Sampo Group divests SampoBank Group to Danske Bank A/S. Following the transaction, Sampo’s business areas are: P&C insurance and life insurance.
20052003200220012000 2008 2011 2012 2013 2014 2016 20172004 20072006 20102009 2015
Mandatum Bank joins the Group, and the Group’s name is shortened to Sampo.
Appendix – Separate Supplementary Information
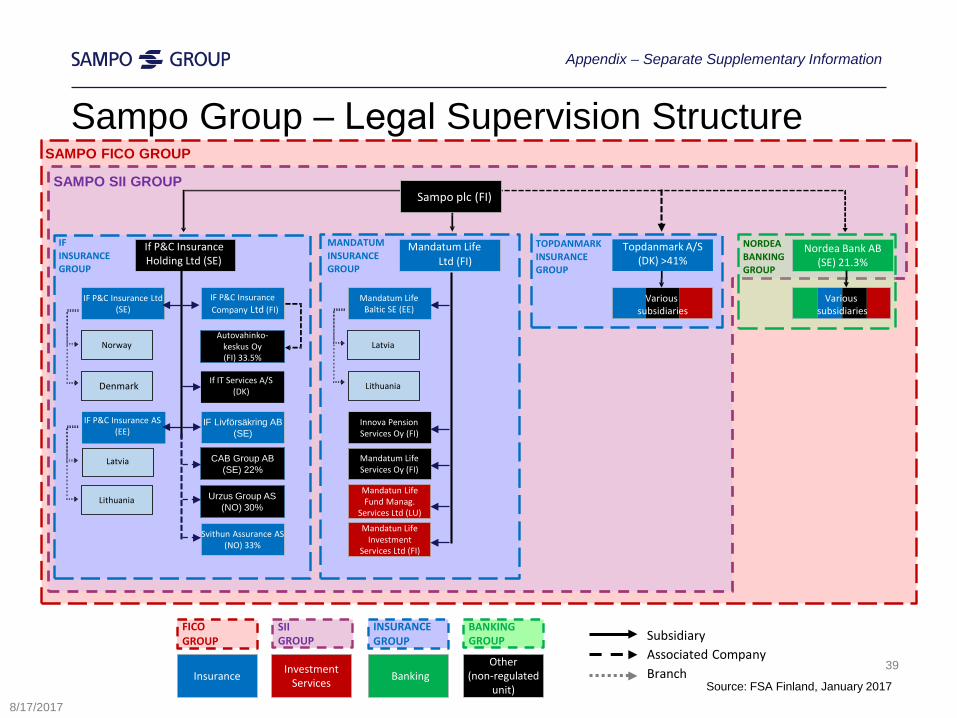
SAMPO FICO GROUP
NORDEABANKINGGROUP
TOPDANMARK INSURANCEGROUP
Nordea Bank AB(SE) 21.3%
SIIGROUP
BANKINGGROUP
FICO GROUP
INSURANCE GROUP
Insurance BankingInvestmentServices
Other(non-regulated
unit)
Topdanmark A/S(DK) >41%
If IT Services A/S(DK)
IF P&C Insurance AS(EE)
IFINSURANCE GROUP
If P&C InsuranceHolding Ltd (SE)
IF P&C Insurance Ltd(SE)
IF P&C InsuranceCompany Ltd (FI)
Svithun Assurance AS(NO) 33%
Autovahinko-keskus Oy(FI) 33.5%
Latvia
Lithuania
Denmark
Norway
MANDATUMINSURANCE GROUP
Mandatum LifeServices Oy (FI)
Innova PensionServices Oy (FI)
Mandatum LifeLtd (FI)
Mandatum LifeBaltic SE (EE)
Mandatun LifeInvestment
Services Ltd (FI)
Mandatun LifeFund Manag.
Services Ltd (LU)
Latvia
Lithuania
IF Livförsäkring AB(SE)
CAB Group AB (SE) 22%
Urzus Group AS(NO) 30%
Various subsidiaries
Various subsidiaries
SAMPO SII GROUP
Source: FSA Finland, January 2017
Sampo Group ‒ Legal Supervision Structure
Sampo plc (FI)
Subsidiary Associated CompanyBranch 39
8/17/2017
Appendix – Separate Supplementary Information
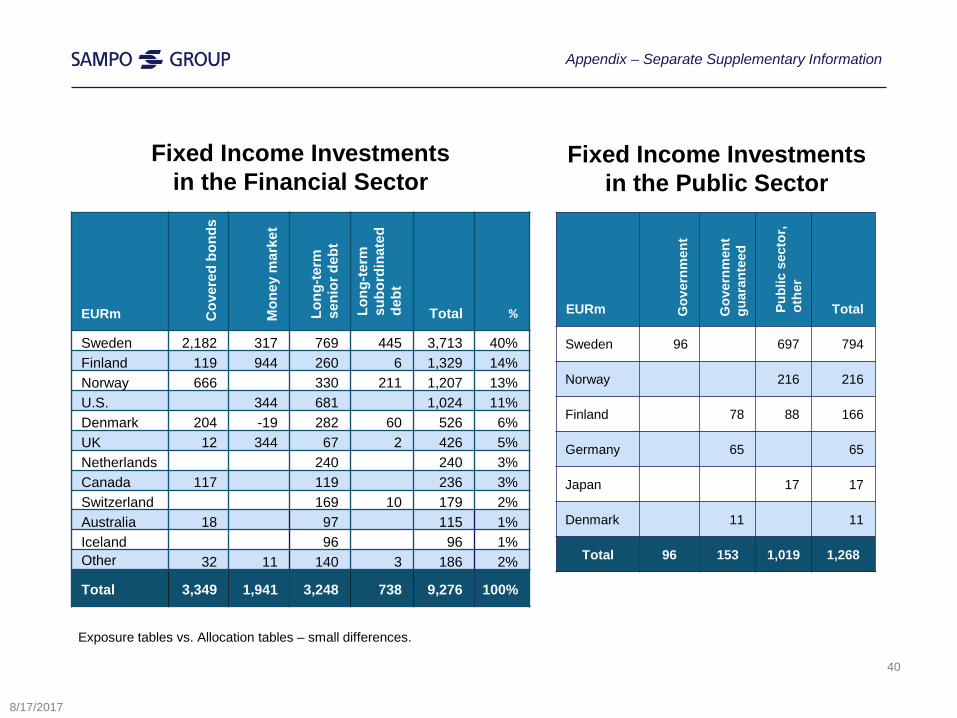
Fixed Income Investmentsin the Financial Sector
Exposure tables vs. Allocation tables – small differences.
EURm Cov
ered
bon
ds
Mon
ey m
arke
t
Long
-term
se
nior
deb
t
Long
-term
su
bord
inat
edde
bt
Total %
Sweden 2,182 317 769 445 3,713 40%Finland 119 944 260 6 1,329 14%Norway 666 330 211 1,207 13%U.S. 344 681 1,024 11%Denmark 204 -19 282 60 526 6%UK 12 344 67 2 426 5%Netherlands 240 240 3%Canada 117 119 236 3%Switzerland 169 10 179 2%Australia 18 97 115 1%Iceland 96 96 1%Other 32 11 140 3 186 2%
Total 3,349 1,941 3,248 738 9,276 100%
40
8/17/2017
EURm Gov
ernm
ent
Gov
ernm
ent
guar
ante
ed
Publ
ic s
ecto
r,ot
her
Total
Sweden 96 697 794
Norway 216 216
Finland 78 88 166
Germany 65 65
Japan 17 17
Denmark 11 11
Total 96 153 1,019 1,268
Fixed Income Investments in the Public Sector
Appendix – Separate Supplementary Information
Sampo Group Steering Model and Principles
• Four separate and independent business areas and Sampo plc an active owner
• General Principles of Business activities – Straightforward and transparent legal structure combined with limited intragroup exposures – Clear responsibilities– Simple and flat operational structures– Personnel incentivized to increase shareholder value and guard profitability
• Parent company gives guidance to the subsidiaries by setting – Strategy – Targets for their capitalization and return on equity (RoE) – Group-wide principles for Risk Management, Remuneration, Compliance, Code of Conduct
and HR framework
• Subsidiaries organize underwriting activities independently taking into account– The specific characteristics of their operations– The above guidance from the parent company– The stakeholders’ expectations and external regulations
41
8/17/2017
Appendix – Separate Supplementary Information
Principles of Investment Management
• Company specific needs form the basis for all investments– Liabilities intensively analysed and modelled– Regulatory requirements
• Strategy– Absolute Return targets taking into account the liabilities and general
business targets– Direct Investments into Nordic countries mainly, outside Nordics mainly Funds– No diversification for the sake of diversification
• Centrally Managed – Sampo plc Chief Investment Officer is responsible for all investments, all portfolio managers
have a direct reporting line to him– Common infrastructure for investment administration and reporting– Investment strategies coordinated and streamlined, no overlapping activities
to prevent Group-wide concentrations
42
8/17/2017
Appendix – Separate Supplementary Information
Principles of Capital Management
• Subgroups are adequately capitalized to ensure normal business operations
• At Group level the following issues are managed/monitored – Direct risk concentrations– Correlations of the subgroupsʼ profits – Sub-groups do not cross-capitalize each others, parent is the source of capital – The funds generating capacity of the parent company is maintained by having low leverage
and adequate liquidity buffers in normal situations
1 + 2 => Sampo Group is well-capitalized
43
8/17/2017
Appendix – Separate Supplementary Information
Calculation Principles of Sampo Group Solvency
• Group Solvency Capital– Under FICOD rules, capital is Group equity with some additional items added or deducted
(subordinated loans, deferred tax assets, planned dividends…)– Under SII rules capital – referred to as Own funds (OF) – consists mainly of excess of assets
over liabilities – Under normal circumstances Group OF by Solvency II and FICOD rules are close to
each other
• SCR by Financial Conglomerate Rules– The Group’s SCR is the sum of the separate sub-groups’ requirements (sectoral rules)– Banking rules are applied for the parent company – No diversification effect between the companies
• SCR by Solvency II rules – One capital requirement is calculated for the insurance group including the parent company
Sampo plc, If P&C and Mandatum Life. This includes diversification effects and also capital requirement for the translation risk related to SEK denominated equity of If P&C
– Nordea’s and Topdanmark’s capital requirements are added to the requirement – The SII SCR takes into account diversification only within the insurance group
=> Sampo Group Solvency Ratios are not comparable with most Insurance Groupsʼ solvency ratios44
8/17/2017
Appendix – Separate Supplementary Information
Risk Management Principles
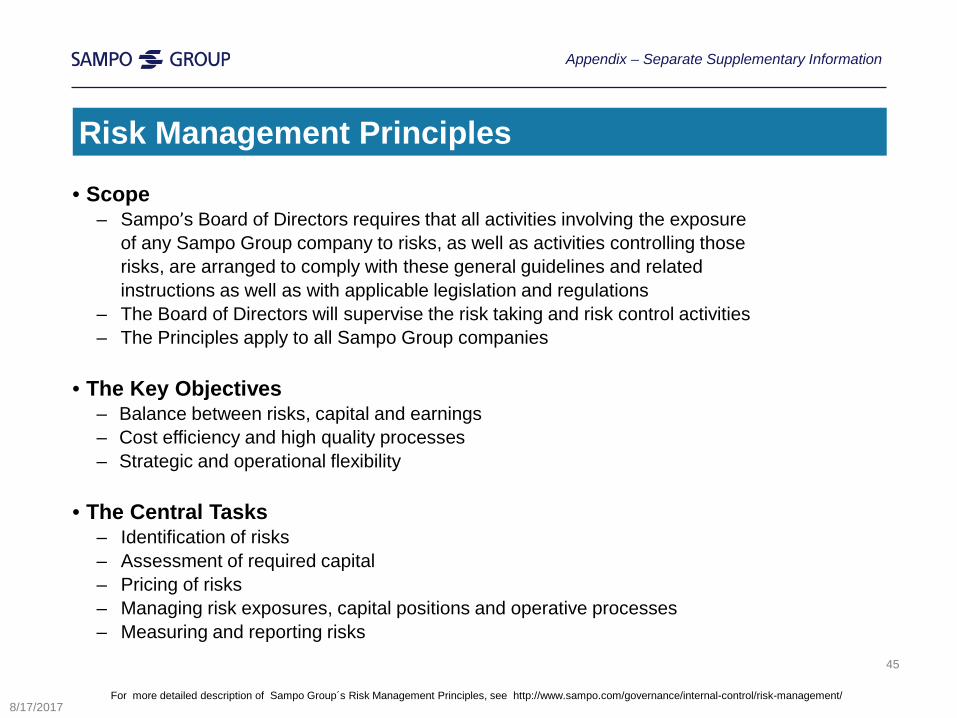
• Scope– Sampo’s Board of Directors requires that all activities involving the exposure
of any Sampo Group company to risks, as well as activities controlling those risks, are arranged to comply with these general guidelines and related instructions as well as with applicable legislation and regulations
– The Board of Directors will supervise the risk taking and risk control activities – The Principles apply to all Sampo Group companies
• The Key Objectives – Balance between risks, capital and earnings– Cost efficiency and high quality processes– Strategic and operational flexibility
• The Central Tasks – Identification of risks– Assessment of required capital– Pricing of risks– Managing risk exposures, capital positions and operative processes– Measuring and reporting risks
For more detailed description of Sampo Group´s Risk Management Principles, see http://www.sampo.com/governance/internal-control/risk-management/
45
8/17/2017
Appendix – Separate Supplementary Information
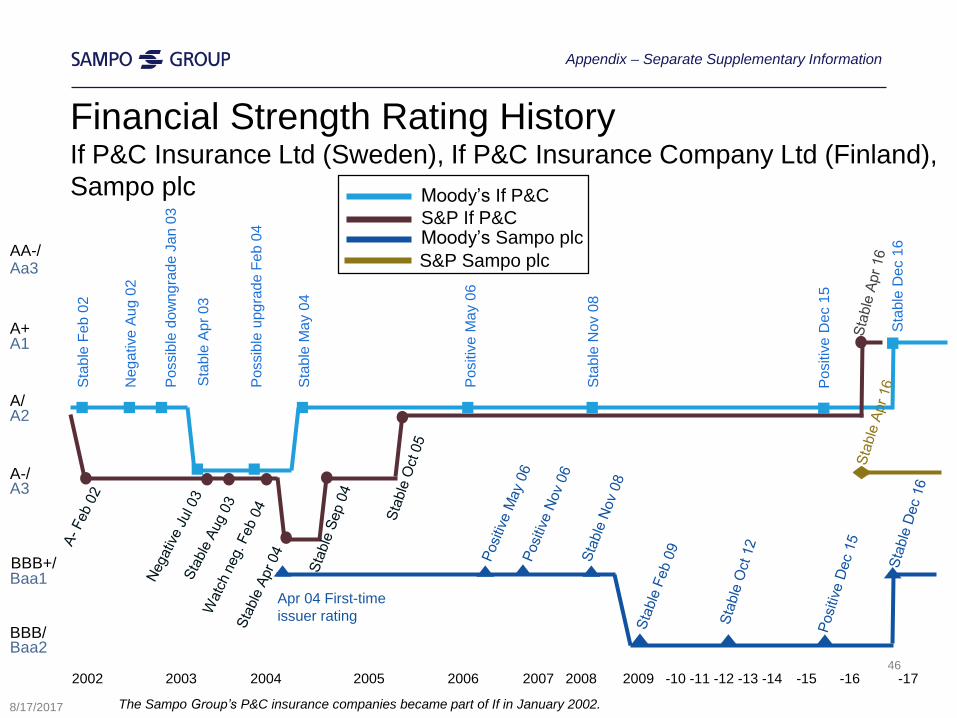
Financial Strength Rating HistoryIf P&C Insurance Ltd (Sweden), If P&C Insurance Company Ltd (Finland),Sampo plc
The Sampo Groupʼs P&C insurance companies became part of If in January 2002.
2002 2003 2004 2005 2006 2007 2008 2009 -10 -11 -12 -13 -14 -15 -16 -17
Poss
ible
dow
ngra
de J
an 0
3
Stab
le F
eb 0
2
Neg
ativ
e Au
g 02
Stab
le A
pr 0
3
Poss
ible
upg
rade
Feb
04
Stab
le M
ay 0
4
Posi
tive
May
06
Stab
le N
ov 0
8Apr 04 First-time issuer rating
Aa3
A1
A2
A3
Baa1
Baa246
Posi
tive
Dec
15
Moodyʼs If P&CS&P If P&CMoodyʼs Sampo plcS&P Sampo plc
8/17/2017
Stab
le D
ec 1
6AA-/
A+
A/
A-/
BBB+/
BBB/
Appendix – Separate Supplementary Information
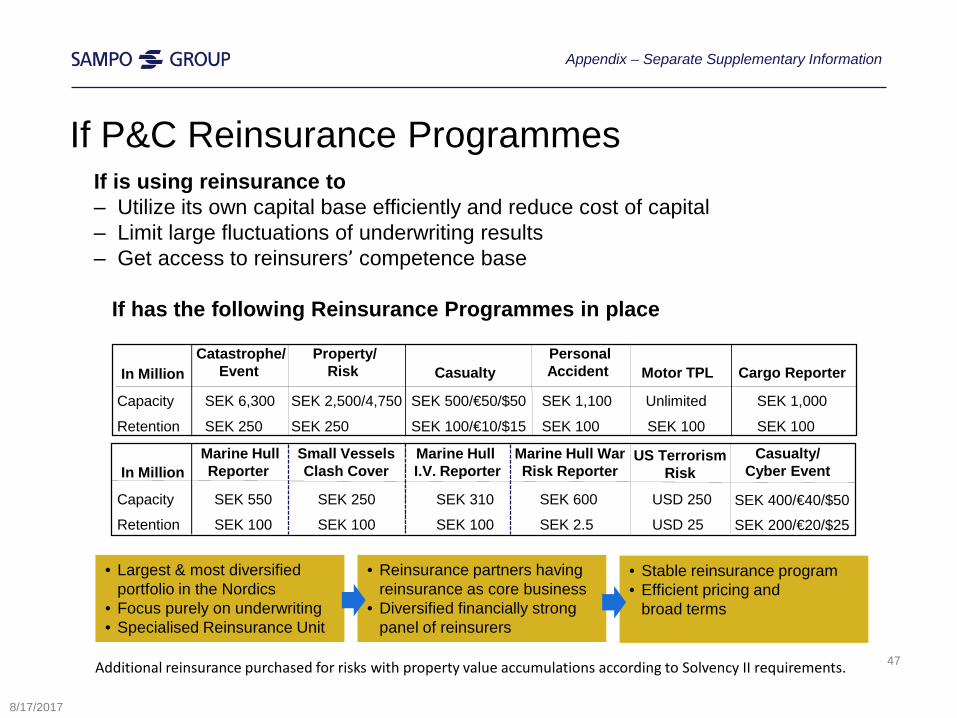
If P&C Reinsurance ProgrammesIf is using reinsurance to‒ Utilize its own capital base efficiently and reduce cost of capital‒ Limit large fluctuations of underwriting results‒ Get access to reinsurers’ competence base
If has the following Reinsurance Programmes in place
• Largest & most diversifiedportfolio in the Nordics
• Focus purely on underwriting• Specialised Reinsurance Unit
• Reinsurance partners having reinsurance as core business
• Diversified financially strong panel of reinsurers
• Stable reinsurance program • Efficient pricing and
broad terms
47Additional reinsurance purchased for risks with property value accumulations according to Solvency II requirements.
8/17/2017
In MillionCatastrophe/
EventProperty/
Risk CasualtyPersonalAccident Motor TPL Cargo Reporter
Capacity SEK 6,300 SEK 2,500/4,750 SEK 500/€50/$50 SEK 1,100 Unlimited SEK 1,000
Retention SEK 250 SEK 250 SEK 100/€10/$15 SEK 100 SEK 100 SEK 100
In MillionMarine HullReporter
Small VesselsClash Cover
Marine Hull I.V. Reporter
Marine Hull WarRisk Reporter
US TerrorismRisk
Capacity SEK 550 SEK 250 SEK 310 SEK 600 USD 250
Retention SEK 100 SEK 100 SEK 100 SEK 2.5 USD 25
Casualty/Cyber Event
SEK 400/€40/$50
SEK 200/€20/$25
Appendix – Separate Supplementary Information