Embed Size (px)
Citation preview
MAGISTERARBEIT
Titel der Magisterarbeit
„Determinants of knowledge transfer mechanisms: an empirical study on Italian industrial districts in the
fashion and textile sector“
Verfasserin
Susanna Ender
angestrebter akademischer Grad
Magistra der Sozial- und Wirtschaftswissenschaften (Mag. rer. soc. oec.)
Wien, 2012 Studienkennzahl lt. Studienblatt: A 066 914 Studienrichtung lt. Studienblatt: Magisterstudium Internationale Betriebswirtschaft Betreuer: Ao. Univ.-Prof. Mag. Dr. Josef Windsperger

Ich versichere in der vorliegenden Magisterarbeit nur die angeführten Quellen
verwendet und die Arbeit an keiner anderen Universität als Prüfungsarbeit
eingereicht zu haben.
Wien, 2012
Susanna Ender

ACKNOWLEDEMENTS
I owe my deepest gratitude to all those whose assistance and guidance
supported the graduation of my postgraduate studies and the final completion of
my master thesis. In particular, I wish to express my sincere thanks to Univ. Prof.
Dr. Josef Windsperger, whose sympathy and guidance decisively facilitated the
development of this diploma thesis.
I am heartily thankful to my family – foremost to my father, who, despite the most
difficult times of bereavement, never ceased to extend to me his patience and
unvarying and unremitting help and encouragement – and to all those closest
friends who demonstrated to me in any respect and without reserve their support.
To the memory of my beloved mother and my sister Christina
who both died in the Spring of 2010

i
TABLE OF CONTENTS
INTRODUCTION .................................................................................................. 1
1 ITALIAN INDUSTRIAL DISTRICTS ............................................................... 3
1.1 Concepts of industrial districts ................................................................. 3
1.2 Knowledge-based classification of Italian industrial districts .................... 7
1.3 Competitive advantage of Italian industrial districts ................................. 8
1.4 Importance of industrial districts to the Italian economy .......................... 9
2 KNOWLEDGE MANAGEMENT ................................................................... 11
2.1 Theoretical background on knowledge management ............................ 11
2.2 Theoretical background on knowledge .................................................. 11
2.2.1 Definition of knowledge ................................................................... 11
2.2.2 Dimensions and types of knowledge ............................................... 13
2.2.3 Knowledge attributes ....................................................................... 16
2.3 Knowledge creation and knowledge transfer ......................................... 16
2.3.1 Knowledge creation ......................................................................... 16
2.3.2 Knowledge transfer ......................................................................... 17
2.4 Knowledge management in industrial districts ....................................... 22
2.4.1 General characteristics .................................................................... 22
2.4.2 Public knowledge pool ..................................................................... 22
2.4.3 Localized knowledge spillovers ....................................................... 23
2.4.4 Learning in industrial districts .......................................................... 24
2.4.5 Private and public drivers of knowledge production ........................ 24
2.5 Knowledge transfer mechanisms ........................................................... 25
2.5.1 Types of knowledge transfer mechanisms ...................................... 25
2.5.2 Media richness and knowledge transfer mechanisms ..................... 27
2.5.3 Choice of knowledge transfer mechanisms ..................................... 30
3 INNOVATION .............................................................................................. 37
3.1 Innovation diffusion and innovation adoption ......................................... 37
3.2 Concept of innovation ............................................................................ 38
3.2.1 Definition of innovation .................................................................... 38
ii
3.2.2 Taxonomy of innovation................................................................... 39
3.3 Innovation and knowledge management ................................................ 42
3.4 Innovation and Italian industrial districts ................................................. 43
3.5 Innovativeness and determination of adopter categories ....................... 45
3.6 Communication channels and innovation diffusion ................................ 49
4 TRUST ......................................................................................................... 50
4.1 Definition and importance of trust ........................................................... 50
4.2 Trust in Italian industrial districts ............................................................ 51
4.3 Trust and knowledge transfer ................................................................. 53
5 EMPIRICAL STUDY ..................................................................................... 55
5.1 Research questions and hypotheses ..................................................... 55
5.2 Methodology........................................................................................... 58
5.2.1 Survey instrument ............................................................................ 58
5.2.2 Sample and data collection .............................................................. 59
5.3 Descriptive statistics ............................................................................... 60
5.3.1 Business sector ............................................................................... 61
5.3.2 Sales distribution 2010 .................................................................... 62
5.3.3 Number of employees / company size ............................................. 62
5.3.4 Company Age .................................................................................. 63
5.3.5 Knowledge transfer mechanisms ..................................................... 64
5.3.6 Knowledge transfer .......................................................................... 65
5.3.7 Complexity ....................................................................................... 66
5.3.8 Trust ................................................................................................ 67
5.3.9 Orientation towards innovation ........................................................ 68
5.4 Reliability analyses ................................................................................. 70
5.4.1 Knowledge transfer mechanisms ..................................................... 71
5.4.2 Knowledge attributes − tacitness of knowledge ............................... 74
5.4.3 Scale TRUST ................................................................................... 78
5.4.4 Scale INNO ...................................................................................... 79
5.5 Hypothesis testing .................................................................................. 80
5.5.1 Variables .......................................................................................... 80
5.5.2 Multiple regression: model assumptions .......................................... 81
5.5.3 Hypothesis 1 .................................................................................... 85
5.5.4 Hypothesis 2 .................................................................................... 87
iii
5.5.5 Hypothesis 3 ................................................................................... 89
5.5.6 Hypothesis 4 ................................................................................... 92
CONCLUSIONS................................................................................................ 103
BIBLIOGRAPHY ............................................................................................... 107
Sources from the literature ............................................................................ 107
Internet sources ............................................................................................. 119
APPENDICES ................................................................................................... 121
APPENDIX A: CURRICULUM VITAE ........................................................... 121
APPENDIX B: ABSTRACTS ......................................................................... 123
English abstract ......................................................................................... 123
German abstract ........................................................................................ 124
APPENDIX C: ADDITIONAL INFORMATION ............................................... 125
Data and information ................................................................................. 125
Knowledge creation processes .................................................................. 126
Alternative models of innovation adopters ................................................. 128
Additional concepts of Rogers’ innovation diffusion theory ........................ 129
APPENDIX D: QUESTIONNAIRES ............................................................... 133
Original German questionnaire .................................................................. 133
Final Italian questionnaire .......................................................................... 139
APPENDIX E: ADDITIONAL SPSS OUTPUTS ............................................. 143
Description of variables ............................................................................. 143
Comparison between two samples ............................................................ 146
Variable INNO_GROUP ............................................................................ 148
KTM versus INNO_GROUP ...................................................................... 149
iv
List of abbreviations used
Asymp. Sig. asymptotic significance
DW Durbin Watson statistic
IA innovation adoption
ID industrial district
ITC information and technology communication
KM knowledge management
KTM knowledge transfer mechanisms
KTM_HIR knowledge transfer mechanisms
with higher degree of information richness
KTM_LIR knowledge transfer mechanisms
with lower degree of information richness
R&D research and development
SME small and medium-sized enterprise
Std. Err. standard error
Std. Dev. standard deviation
VIF variance inflation factor
v
List of figures
Figure 1: Hierarchy of data–information–knowledge ........................................... 12
Figure 2: Basic stages of knowledge transfer ..................................................... 19
Figure 3: Media richness and media scope ........................................................ 32
Figure 4: Rogers’ innovation adopter categories ................................................ 46
Figure 5: Descriptive statistics of variable BUSINESS SECTOR ........................ 61
Figure 6: Descriptive statistics of variable SALES .............................................. 62
Figure 7: Descriptive statistics of variable SIZE .................................................. 63
Figure 8: Descriptive statistics of variable COMPANY AGE ............................... 64
Figure 9: Descriptive statistics of variable KTM .................................................. 65
Figure 10: Descriptive statistics – knowledge transfer to other firms .................. 66
Figure 11: Descriptive statistics – knowledge acquisition from other firms ......... 66
Figure 12: Descriptive statistics of variable COMPLEX ...................................... 67
Figure 13: Descriptive statistics of variable TRUST ............................................ 68
Figure 14: Descriptive statistics of variable INNO ............................................... 69
Figure 15: Innovation adopters and usage of KTMs ........................................... 99
vi
List of tables
Table 1: Definitions of organizational knowledge ................................................ 13
Table 2: Definitions of knowledge attributes ........................................................ 16
Table 3: Knowledge transfer mechanisms .......................................................... 25
Table 4: Social media and information richness .................................................. 30
Table 5: Recent definitions of innovation ............................................................. 39
Table 6: Differences between “earlier adopters” and “later adopters” ................. 48
Table 7: KTMs according to the degree of information richness ......................... 72
Table 8: Reliability of the scale KTM_HIR ........................................................... 73
Table 9: Reliability of the scale KTM_LIR ............................................................ 74
Table 10: Reliability of the scale COD ................................................................. 75
Table 11: Reliability of the scale TEACH ............................................................. 76
Table 12: Reliability of the scale COMPLEX ....................................................... 78
Table 13: Reliability of the scale TRUST ............................................................. 79
Table 14: Reliability of the scale INNO ................................................................ 80
Table 15: Correlations of variables ...................................................................... 83
Table 16: SPSS output - H1A .............................................................................. 85
Table 17: SPSS output - H1B .............................................................................. 86
Table 18: SPSS output - H2A .............................................................................. 87
Table 19: SPSS output – H2B ............................................................................. 88
Table 20: SPSS output – H3A ............................................................................. 90
Table 21: SPSS output – H3B ............................................................................. 91
Table 22: Examination of normal distribution (K-S Test) ..................................... 93
Table 23: Comparison of means of variable SALES ........................................... 93
Table 24: Comparison of means of variable SIZE ............................................... 94
Table 25 Comparison of means of variable AGE ................................................ 95
Table 26: Comparison of means of variable TRUST ........................................... 95
Table 27: SPSS output H4A ................................................................................ 96
Table 28: SPSS output H4B ................................................................................ 97
Table 29: SPSS output H4A and H4B ............................................................... 100
Table 30: SPSS output H4C .............................................................................. 101
Table 31: SPSS output H4D .............................................................................. 102
1
INTRODUCTION
Knowledge management is a well-known economic concept that is broadly
discussed by both practitioners and scientists.1 Efficient knowledge management
is a crucial driver of the innovativeness of companies.2 Knowledge management
is in particular crucial in innovative contexts, such as in industrial districts. In fact,
many scientists consider knowledge acquisition and innovation as the basis of
industrial districts’ competitiveness.3 Over the last decades Italian industrial
districts have been subject to numerous studies, representing leading examples
of local manufacturing systems that have demonstrated incommensurable
economic performance after the Second World War.4 Nowadays, most Italian
industrial districts, especially those operating in the textile and fashion sector,
suffer from the worldwide financial crisis.5 Today, the preservation of knowledge-
based competitive advantage of Italian industrial districts through collaboration
with universities and research centers,6 as well as through investments in
information and communication technology, is becoming increasingly important.7
These strategies are fostered, among others, by fashion brands such as the
Benetton Group, Diesel, Armani, Siggi Spa and New Mill Spa.8
Although knowledge management is of fundamental strategic importance for
organizations, only a limited number of studies have investigated determinants
that influence the choice of knowledge transfer mechanisms (e.g., Murray and
Peyrefitte, 2007; Hong and Nguyen, 2009). Most recent contributions focusing on
clusters were derived from Windsperger and Gorovaia (2010) as well as from
Srećković and Windsperger (2011). These authors have investigated knowledge
transfer mechanisms from the knowledge-based view and the relational
governance view. Surveys that are directed at industrial districts are
1 Birkinshaw, 2001, p. 1 2 Du Plessis, 2007, pp. 22-23 3 Inken/Tsang, 2005, p. 150 4 Becattini, 1991, p. 83; Boschma, 1998, pp. 7 5 Distretti Italiani, 2001, p. 30 6 Intesa Sanpaolo, 2010, p. 63 7 Intesa Sanpaolo, 2010, p. 65 8 Intesa Sanpaolo, 2010, p. 65
2
underrepresented so far, hereby, almost neglecting the role of the innovative
strategy of companies. Existing literature focuses basically on the usage of
information and technology communication (e.g., Belussi, 2005; Gottardi, 2003).
The purpose of the present paper is therefore to find answers to the following
questions:
• Which determinants have an impact on the choice of knowledge transfer
mechanisms in Italian industrial districts?
• If the selection of knowledge transfer media is determined by factors such as
knowledge attributes, organizational trust and companies’ orientation towards
innovation adoption, is it possible to draw any recommendations for local
managers that could lead to an amelioration of the sharing of knowledge, thus
strengthening the knowledge-based competitive advantage of district players
in the future?
The present paper consists of two parts, namely (1) a review of the literature and
(2) an empirical study. The first part provides an overview of the four
cornerstones of the present work, summarizing the main contributions in the
literature on industrial districts, knowledge management, innovation and trust.
Chapter 1 is dedicated to the concept of industrial districts, paying particular
attention to Italian contributions to this topic, and highlighting the importance of
industrial districts for the Italian economy. Chapter 2 presents a review of the
existing literature on knowledge management. Hereby, concepts, such as forms
and attributes of knowledge, knowledge transfer processes and knowledge
transfer mechanisms as well as general determinants that have an impact on
knowledge management, are described. Chapter 3 offers a brief review of the
theory of innovation, focusing primarily on Rogers’ (1995, 2003) contributions to
innovation diffusion and innovation adoption. Chapter 4 focuses on the concept of
trust, highlighting the role trustful ties play in industrial districts as well as in
knowledge transfer processes. Theoretical insights serve then as starting point
for the second part of the paper. In Chapter 5, research questions and
hypotheses are formulated, and data collection and the characteristics of the
questionnaire on which the research was based are described. After a
presentation of the statistical methods used for testing of the various hypotheses,
descriptive statistics and empirical analyses follow.
3
1 ITALIAN INDUSTRIAL DISTRICTS
1.1 Concepts of industrial districts
The original notion of industrial districts roots back to Alfred Marshall, who after
his “Wanderjahre among factories”9 changed the common view on industrial
systems by publishing two outstanding works, namely “Principles of Economics”
(1920) and “Elements of Economics of Industry” (2006).10 These books are
considered cornerstones of succeeding studies after the 1870s.11
The scientist considers industrial districts as “localized industries” that evolve in a
delineated geographic zone because of the availability of favorable climate,
natural resources, infrastructure, and the existence of a local “patronage of court”
that attracts external workers, fosters demand for high quality goods, and
encourages continuous formation of local labor.12 Further, the author highlights
that over the years clustering leads to significant advantages13, such as the
development of subsidiary trades, the evolvement of hereditary skills, the usage
of modern machinery, and the intensification of a local market of skill. Lastly, a
particular atmosphere develops inside the community, representing the engine
for innovativeness of the whole system. According to this, Marshall (2006) cites:
“The mysteries of trade become no mysteries; but are as it were in the air, and
children learn many of them unconsciously”14 and “if one man starts a new idea, it
is taken up by others and combined with suggestions of their own; and thus it
becomes the source of new ideas.”15
In Italy the concept of industrial districts attracts particular attention after the
Second World War. In fact, according to Becattini (1991) and Boschma (1998),
this is the moment when formerly successful Italian regions based on large-scale
production suffer from inefficiency, while regions dominated by industrial districts
9 Belussi/Caldari, 2009, p. 336 10 First volume published in 1899 11 Raffaelli, 2009, p. 69 12 Marshall, 2006, pp. 151-152 13 Marshall, 2006, pp. 152-153 14 Marshall, 2006, p. 152 15 Marshall, 2006, p. 153
4
– the so-called “third Italy” (central and northeastern) regions – demonstrate
unforeseen prosperity.16 Most important contributions to Italian industrial districts
derive from Giacomo Becattini17 – a professor of the Business University of
Florence and pioneer of this model. Becattini’s main contribution to Italian
industrial districts is twofold. First, he analyses Marshall’s notion on industrial
districts, by then investigating in practice the phenomenon of Italian industrial
districts in the Tuscan region.18 His findings are illustrated, among others, in his
famous works, namely “Mercato e forze locali: il distretto industriale” (1987) and
“Dal ‘settore’ industriale al ‘distretto’ industriale” (1979).19 Becattini defines
industrial districts similar to Marshall. In fact, the scientist defines them as socio-
economic systems, where SMEs are specialized in one single industry sector,
settle down in one common place, and cooperate basically on vertical
integration.20 But, in contrast to Marshall’s view, the Italian concept has a distinct
socio-territorial nature. According to this, Becattini (2004) points out that “in the
district – and unlike in other environments, such as the manufacturing town – the
community and the firms tend, as it were, to merge.”21 Hereby, the business and
personal lives are interconnected, and the “coordination and control of the normal
functioning of the different production and selling phases do not follow
administrative rules and are not performed by hierarchical mechanisms.”22
According to Markusen (1996), additional distinctive features of Italian industrial
districts refer to the existence of (1) frequent labor exchange, (2) inter-company
cooperation, enhancing risk dispersion, innovation sharing and market
stabilization, (3) many workers occupied in creative and innovative activities, and
(4) powerful trade associations and local authorities.23
After having delineated the main differences between Marshall’s and Becattini’s
concept, the following paragraphs are dedicated to the main features of Italian
16 Becattini, 1991, p. 83; Boschma, 1998, p. 7 17 For further reading see Landström, 2005 18 Sforzi, 2009, p. 327 19 Landström, 2005, p. 235; Bianchi, 2009, p. 103 20 Becattini, 2004, pp. 21-22 21 Becattini, 2004, p. 19 22 Becattini, 1991, p. 85 23 Markusen, 1996, p. 298
5
industrial districts, considering in particular (1) local community, (2) local market,
(3) local governance, (4) local cooperation and rivalry, (5) local labor market, and
(6) local credit systems.
First, according to Becattini (2004), in Italian industrial districts the local
community and its social dynamics directly influence manufacturing, business
and political processes.24 Italian industrial districts develop a unique culture that
influences the mode in which district players share common morals, life styles
and consumption models. Local authorities, considering the local identity as a
crucial basis of future local development, continuously support the transfer of the
districts’ specific spirit.
Second, Becattini (2004), highlights that the local market of Italian industrial
districts is not primarily dominated by global market prices.25 Instead,
competitiveness is impacted by their ability to assimilate local quality standards
and transaction practices.
Third, according to Markusen (1964), local governance in Italian industrial
districts is characterized by district-specific political circumstances.26 Local
authorities (political parties, associations and unions) are highly influential,
ameliorating on regular basis local infrastructures, and supporting workers’
formation and marketing activities with the aim to boost the system’s further
development.
Fourth, according to Markusen (1996), local cooperation and competition are
handled in a more prudent way than in other industry systems, because
collaboration and trustful interaction are directed “to share risk, stabilize markets,
and share innovation.”27 Becattini (2004) further states that domestic rivalry is
characterized by a strong spirit of solidarity.28 According to him, local firms focus
less on price battles rather than on balanced price systems and informal
regulations that guarantee to almost all district players fair and stable earnings
and expenses.
24 Becattini, 2004, p. 20; Sforzi, 2003, p. 158 25 Becattini, 2004, pp. 25-26 26 Markusen, 1996, p. 301 27 Markusen, 1996, p. 301 28 Becattini, 2004, pp. 27-28
6
Fifth, Italian industrial districts’ labor markets have particular characteristics. They
incorporate a district-specific working ethic that constantly fosters local
enhancement.29 Local workers are extremly mobile and switch between different
job types.30 According to Becattini and Musotti (2003), strong orientation towards
freelancing is highly appreciated.31 Most people with aged between 36 and 40
found their own company after having collected a lot of district-specific
experience.32 According to Becattini (2004), two forms of human resources exist,
namely the so-called “impannatore pratese”, on the one hand, and the
“secondary industry” on the other hand.33
• The “impannatore pratese” is one of the most important members in the textile
district of Prato.34 He is a “pure entrepreneur” that does not employ any
employees, monitoring market trends all over the world. His livelihood is his
warehouse, where he hoards raw materials and final goods. His main aim is
to realize so-called “product projects” that can be marketed outside district
boarders.
• The second category refers to people that operate exclusively part-time or
from home. This group is called “secondary industry”. It is the “glue” that holds
business and family together, and warrants the balance of local workforce.
Sixth, according to Becattini (2004), there are unique forms of credit systems in
Italian industrial districts.35 In contrast to banks in other industrial systems,
domestic banks are active parts of social life. The decision whether to support a
local firm does not depend exclusively on economic determinants. Honesty and
trust are crucial decision factors as well. This modus operandi is not always
advantageous. In fact, banks must consider more interdependencies and
incidents than banks in other industry systems. They must understand that the
29 Sforzi, 2003, p. 158 30 Becattini, 2004, pp. 23-24 31 Sforzi, 2003, p. 158 32 Becattini/Musotti, 2003, pp. 278-279 33 Becattini, 2004, p. 24 34 For further information see: Unione Industriale Pratese, Il distretto pratese: una breve sintesi
della sua evoluzione, http://www.ui.prato.it/unionedigitale/v2/areastudi/Presentazione-
distretto.pdf (03/10/2011) 35 Becattini, 2004, pp. 29, 39
7
underperformance of one company possibly harms the well-being of other district
players or in worst case destabilize the whole system itself.
1.2 Knowledge-based classification of Italian industrial districts
According to Belussi and Pilotti (2002), it is possible to distinguish between three
different learning systems, and to define according to this knowledge-based
categorizations of Italian industrial districts, namely (1) “weak learning systems”,
(2) “systems characterized by significant absorptive capability from the outside
circuits of knowledge matched with incremental innovations” and (3) “dynamic
evolutionary systems.”36
• “Weak learning systems”37
In this type of industrial districts companies are relatively less inventive and
have less access to new technologies compared to other district forms. In
these strongly fragmentized systems, economic activity is based on craft-
based manufacturing of traditional products and historically-grown knowledge.
System barriers consist in limited economies of scale as well as on restricted
product and process advancement. Knowledge transfer and learning is based
on traditional skills and tacit knowledge accumulated by routine activities and
by observation. Individuals often lack sufficient understanding of transferred
knowledge inputs. Many of these districts operate in the Italian textile and
clothing sector, such as, for example, the district of Murano.
• “Systems characterized by significant absorptive capability from the outside
circuits of knowledge matched with incremental innovations”38
Companies in this kind of industrial districts access knowledge intensively
from external sources with the aim to improve in terms of product
development and process optimization. Local firms are more innovative than
enterprises in other industrial systems. In this context, learning is based on “a
36 Belussi/Pilotti, 2002, pp. 130 37 Belussi/Pilotti, 2002, pp. 130,132 38 Belussi/Pilotti, 2002, pp. 130-134
8
passive process of copying”.39 Localized knowledge transfer is highly complex
and informal. The efficiency of learning depends for a major part on local
agents that are responsible for the governance of information flows inside the
system. Local learning is defined as an “interactive process”, as active
cooperation and interaction among district players is considered as
cornerstone of local development. In the fashion sector the district of Carpi
and the district of Vincenza are important examples of this kind of industrial
districts.
• “Dynamic evolutionary systems”40
This system is considered as one of the most innovative forms. Companies
focus on manufacturing specialization, knowledge exchange and constant
investments in research and development activities. This spirit makes the
development of radical innovations possible. Local innovativeness is based on
“generative learning”. Hereby, local agents play a fundamental role facilitating
generative interaction and multiple knowledge consolidation among district
firms as well as supporting all these organizational structures that are able to
boost local innovative capabilities. Well known examples of this kind of
system in the fashion sector are the district of Montebelluna, the district of
Cadore, and the district of Matera-Altamura-Santeramo.
1.3 Competitive advantage of Italian industrial districts
First of all, according to Bertini (2000), district firms profit primarily from (1) rapid
industrialization, (2) stimulation of knowledge exchange, (3) low market entry
barriers, and (4) common spirit of constant development.41
Further, according to Becattini and Musotti (2003), the competitive advantage of
Italian industrial districts is based above all on the so-called “district effect” that
emerges due to (1) economies of organization, (2) economies of training, (4)
economies of transaction, and (5) economies of adaption to change.42 First,
“economies of organization” are advantages that derive from localized productive 39 Belussi/Pilotti, 2002, p. 130 40 Belussi/Pilotti, 2002, pp. 130, 134, 135 41 Bertini, 2000, pp.107-108 42 Becattini/Musotti, 2003, pp. 270-272
9
specialization and division of labor, facilitating the production of both
standardized and differentiated goods. Second, the “economies of concentration”
emerge when higher order volumes of collaborating intermediate firms result in
discounts of costs. Third, “economies of training” refer to lower training expenses
through specialization and division of labor. Fourth, “economies of transaction
costs” occur due to decreased information asymmetries inside district borders. In
fact, as private and business life merges in Italian industrial districts, locals have
more informal information at their disposal than non-locals. Lastly, the
“economies of adaption to change” refer to the common desire of district players
to support their industrial district, opening themselves towards transformation and
sacrifices whenever it is required for the well-being of the whole community.
Lastly, this paper considers that further crucial sources of Italy’s competitiveness
are those related to knowledge and innovation. A detailed description of the role
knowledge and innovation play in the Italian industrial districts is elaborated in
detail in chapters 2 and chapter 3.
1.4 Importance of industrial districts to the Italian economy
Italian population accounted for 60,340,328 inhabitants in 2010.43 In total 156
Italian industrial districts exist.44 The textile and fashion sector employs about
537,435 people.45 The four leading districts, operating in the textile and clothing
sectors employ more workers than international companies, such as BMW, Royal
Shell or Pfizer.46 Leading Italian fashion companies are Valentino, Armani,
Versace, Gianfranco Ferré, Krizia and Benetton that base their competitive
advantage on excellent design, good price-quality relation as well as on efficient
and flexible distribution.47
Most Italian districts are located in the North, while the remaining ones are
located in the Central (49) and in the South (26).48 The geographic distribution is
43 http://demo.istat.it/bil2010/index.html (14/07/2011) 44 Istat, 2006, p. 29 45 Istat, 2011, p.30 46 Fortis/Carminati, 2009, p. 418 47 http://www.nationsencyclopedia.com/economies/Europe/Italy.html (04/10/2011) 48 Istat, 2006, p. 29
10
most intense in the regions of Marche, Veneto, and Lombardy.49 The Southern
parts of Italy are less industrialized.50 Most of the textile and fashion companies
are placed in the North, Tuscany and Campania.51
In 2010 exports accounted for € 63.7 billion.52 In 2008 total export generated by
Italian industrial districts amounted for € 70.2 billion, representing 20.2 per cent of
Italian manufacturing system and 19.2 per cent of total export volume.53 Italy is
after China one of the leading exporting countries in the fashion and textile
sector.54 22,000 exporting enterprises, operating in these sectors, target
European, American and Japanese markets as well as emerging markets (e.g.,
Russia and China).55
49 Sforzi, 2009, p. 340 50 Sforzi, 2009, p. 340 51 Confindustria, 2011 52 Fondazione Edison, 2010, p. 2 53 Fondazione Edison, 2010, p. 1 54 http://mefite.ice.it/settori/Tessile.aspx?idSettore=02000000 (14/07/2011) 55 http://mefite.ice.it/settori/Tessile.aspx?idSettore=02000000 (14/07/2011)
11
2 KNOWLEDGE MANAGEMENT
2.1 Theoretical background on knowledge management
Investigations on knowledge management date back to the 1960s and have their
peak in the 1990s.56 On the basis of an extensive literature review, Du Plessis
(2007) defines knowledge management basically as a “planned, structured
approach to manage the creation, sharing, harvesting and leveraging of
knowledge as an organizational asset.”57 According to Allee (1997), knowledge
management is “much more than managing the flow of information. It means
nothing less than setting knowledge free to find its own paths. It means fueling
the creative fire of self-questioning in organizations.”58
Knowledge management has diverse functions. This paper focuses on those
functions of knowledge management that have an impact on companies’
innovative strategy. Referring to Du Plessis (2007), the aim of knowledge
management is (1) the procurement of tools, organizational settings and cultures
that facilitate the creation, conversion, transfer and integration of new knowledge,
(2) the facilitation of access to internal and external knowledge sources, (3) the
enhancement of internal and external cooperation, and (4) the facilitation of the
development of skills that are required in innovative activities.59
2.2 Theoretical background on knowledge
2.2.1 Definition of knowledge
Knowledge, its creation and its transfer are driving forces of organizational
competitiveness.60 Since the Greek age debates emerge on the concept of
knowledge, considering it as a very complex phenomenon.61 Many scholars
assume that before defining knowledge itself, it is necessary to distinguish
56 Lehner, 2009, p. 30 57 Du Plessis, 2007, p. 22 58 Desouza/Evaristo, 2003, p. 62 59 Du Plessis, 2007, pp. 26-28 60 Argote/Ingram, 2000, p. 150 61 Nonaka, 1994, p. 15
12
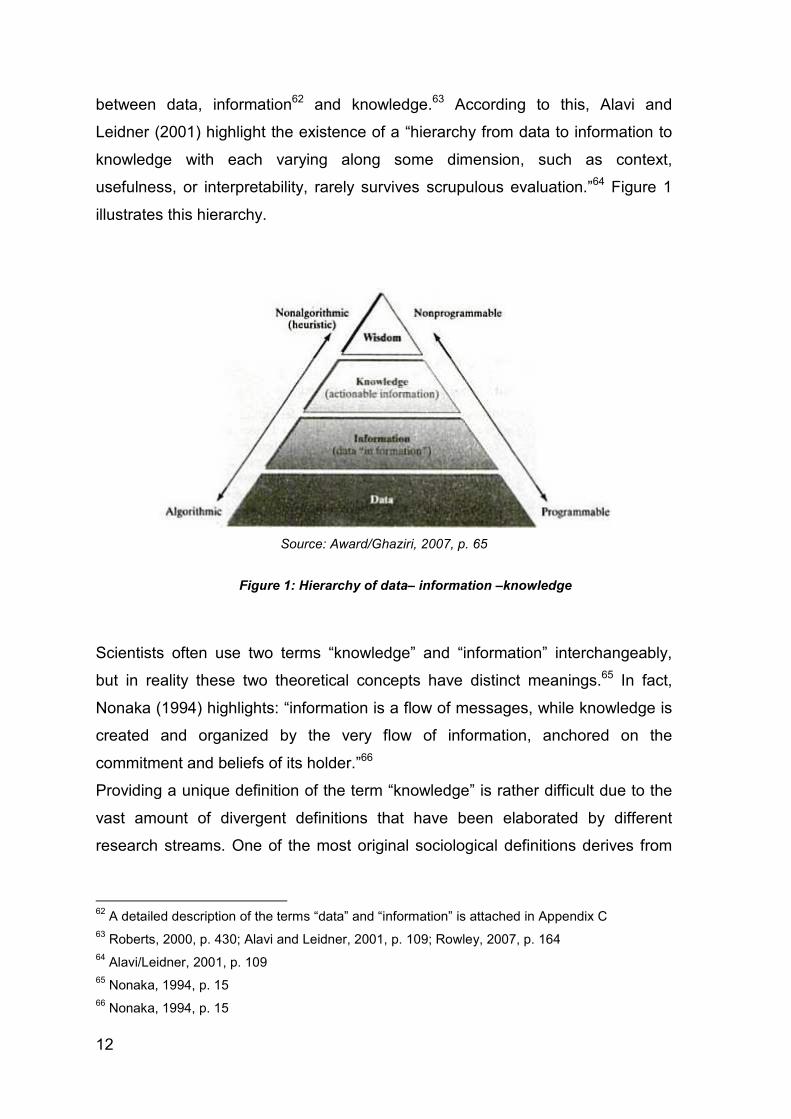
between data, information62 and knowledge.63 According to this, Alavi and
Leidner (2001) highlight the existence of a “hierarchy from data to information to
knowledge with each varying along some dimension, such as context,
usefulness, or interpretability, rarely survives scrupulous evaluation.”64 Figure 1
illustrates this hierarchy.
Source: Award/Ghaziri, 2007, p. 65
Figure 1: Hierarchy of data– information –knowledge
Scientists often use two terms “knowledge” and “information” interchangeably,
but in reality these two theoretical concepts have distinct meanings.65 In fact,
Nonaka (1994) highlights: “information is a flow of messages, while knowledge is
created and organized by the very flow of information, anchored on the
commitment and beliefs of its holder.”66
Providing a unique definition of the term “knowledge” is rather difficult due to the
vast amount of divergent definitions that have been elaborated by different
research streams. One of the most original sociological definitions derives from
62 A detailed description of the terms “data” and “information” is attached in Appendix C 63 Roberts, 2000, p. 430; Alavi and Leidner, 2001, p. 109; Rowley, 2007, p. 164 64 Alavi/Leidner, 2001, p. 109 65 Nonaka, 1994, p. 15 66 Nonaka, 1994, p. 15
13
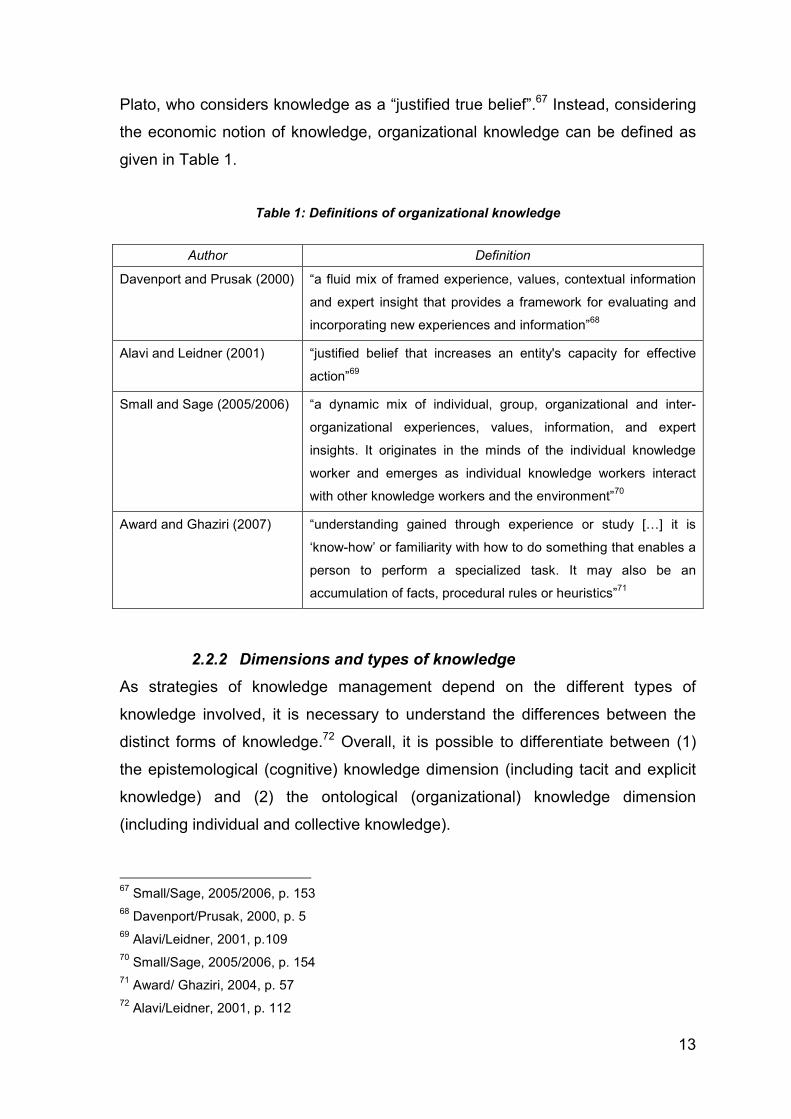
Plato, who considers knowledge as a “justified true belief”.67 Instead, considering
the economic notion of knowledge, organizational knowledge can be defined as
given in Table 1.
Table 1: Definitions of organizational knowledge
Author
Definition
Davenport and Prusak (2000)
“a fluid mix of framed experience, values, contextual information
and expert insight that provides a framework for evaluating and
incorporating new experiences and information”68
Alavi and Leidner (2001)
“justified belief that increases an entity's capacity for effective
action”69
Small and Sage (2005/2006)
“a dynamic mix of individual, group, organizational and inter-
organizational experiences, values, information, and expert
insights. It originates in the minds of the individual knowledge
worker and emerges as individual knowledge workers interact
with other knowledge workers and the environment”70
Award and Ghaziri (2007)
“understanding gained through experience or study [[] it is
‘know-how’ or familiarity with how to do something that enables a
person to perform a specialized task. It may also be an
accumulation of facts, procedural rules or heuristics”71
2.2.2 Dimensions and types of knowledge
As strategies of knowledge management depend on the different types of
knowledge involved, it is necessary to understand the differences between the
distinct forms of knowledge.72 Overall, it is possible to differentiate between (1)
the epistemological (cognitive) knowledge dimension (including tacit and explicit
knowledge) and (2) the ontological (organizational) knowledge dimension
(including individual and collective knowledge).
67 Small/Sage, 2005/2006, p. 153 68 Davenport/Prusak, 2000, p. 5 69 Alavi/Leidner, 2001, p.109 70 Small/Sage, 2005/2006, p. 154 71 Award/ Ghaziri, 2004, p. 57 72 Alavi/Leidner, 2001, p. 112
14
Ontological knowledge dimension
The ontological knowledge model assumes that knowledge is not linked to
physical or contextual aspects of an individual; instead it presumes that reality
exists separately on the cognition of humans.73 Therefore, according to Hasler
Roumois (2007), knowledge can be transferred as a “package” from one
individual to the other (package model), augmented and stored (stock model) as
well as bargained (object model).
According to this view, two forms of knowledge exist, namely “individual
knowledge” and “social (or collective) knowledge”. Individual knowledge is formed
by single individuals, whereas collective knowledge is formed by more than one
person through social interaction inside a firm.74 In fact, individual knowledge is
defined as the total of “individuals' competencies, information, and knowledge”75,
while collective knowledge is considered as “accumulated knowledge of the
organization stored in its rules, procedures, routines and shared norms which
guide the problem-solving activities and patterns of interaction among its
members.”76
Epistemological knowledge dimension
The constructivist knowledge model defines reality as a “subjective construct”
and knowledge as a “subjective cognition”.77 According to this, Polanyi (1996)
points out that “we can know more than we can tell.”78 This notion is shared by
Nonaka (1994), who presumes that “knowledge that can be expressed in words
and numbers only represents the tip of the iceberg of the entire body of possible
knowledge.”79
73 Hasler Roumois, 2007, p. 62 74 Nonaka, 1994, p. 17 75 Zander/Kogut, 1995 in Matusik/Hill, 1998, p. 683 76 Lam, 2000, p. 491 77 Hasler Roumois, 2007, p. 62 78 Polanyi, 1966, p. 4 79 Nonaka, 1994,p. 16
15
Following this school of thought, traditional scholars (e.g., Nonaka, 1991, 1994;
Polanyi, 1996) differentiate between “explicit knowledge” and “tacit knowledge”.80
These two forms of knowing are distinctive, but mutually reliant to each other.81
On the one hand, explicit or codified knowledge refers to knowledge that is
generated without any direct personal experience.82 Transfer of codified
knowledge is not difficult, because once explicit knowledge is translated into
verbal codes83 it can be easily shared among individuals.84
On the other hand, tacit or implicit knowledge is highly personal know-how that
cannot be formalized or transferred easily.85 According to Nonaka (1994), tacit
knowledge incorporates two dimensions: (1) a technical dimension and (2) a
cognitive dimension.86 According to the scientist, technical knowledge is objective
and context-specific knowledge. It is based on peoples’ cognitions, informal
know-how and capabilities. In contrast, the cognitive dimension of implicit
knowledge is a result of individuals’ intuitive and personal “mental models”.
Combining both the cognitive (tacit-explicit) and organizational (individual-
collective) dimensions of knowledge, it is further possible to differentiate between:
(1) embrained knowledge (individual-explicit), (2) embodied knowledge
(individual-tacit), (3) encoded knowledge (collective-explicit), and (4) embedded
knowledge (collective-tacit).87 Lastly, it is also possible to classify knowledge into
(1) declarative knowledge (know-about), (2) procedural knowledge (know-how),
(3) causal knowledge (know-why), (4) conditional knowledge (know-when), (5)
relational knowledge (know-with), and (6) pragmatic knowledge.88
80 Howells, 2002, p. 872; Alavi/Leidner, 2001, p.110 81 Alavi/Leidner, 2001, p. 112 82 Howells, 2002, p. 872 83 Nonaka, 1994, p. 16 84 Howells, 2002, p. 872 85 Nonaka, 2007, p. 165 86 Nonaka, 1994, p. 16 87 Lam, 2000, pp. 492-493 88 Alavi/Leidner, 2001, p. 113
16
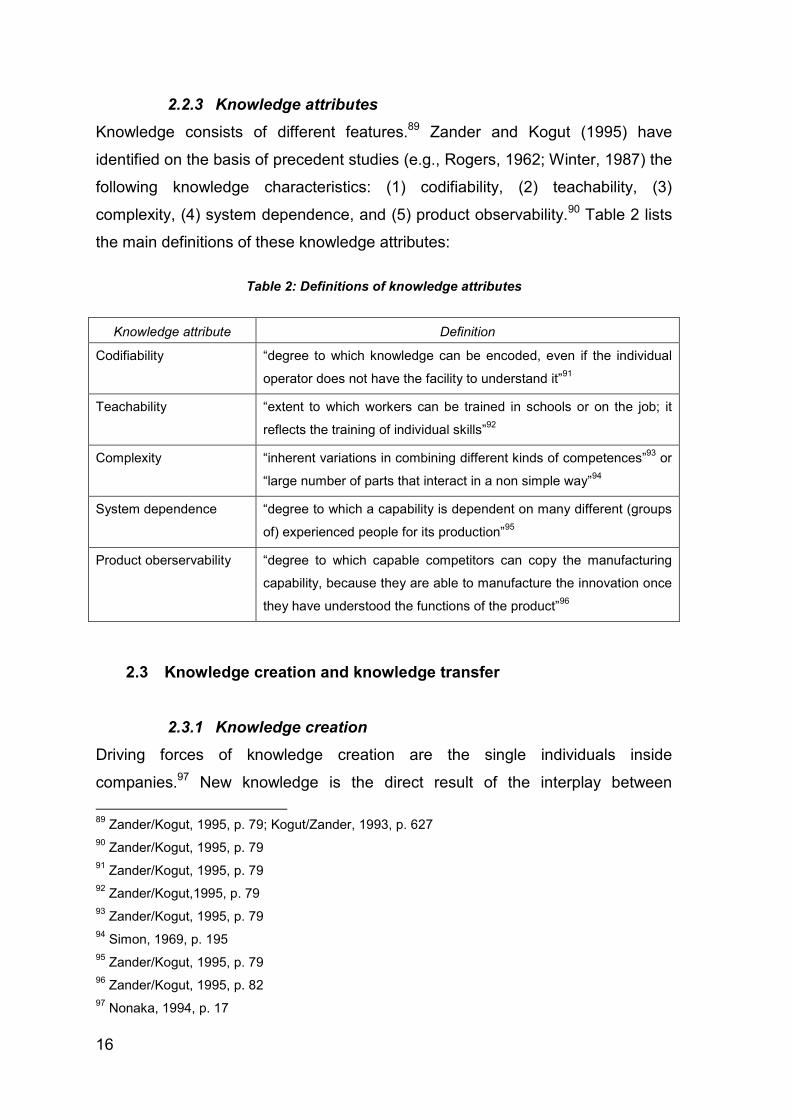
2.2.3 Knowledge attributes
Knowledge consists of different features.89 Zander and Kogut (1995) have
identified on the basis of precedent studies (e.g., Rogers, 1962; Winter, 1987) the
following knowledge characteristics: (1) codifiability, (2) teachability, (3)
complexity, (4) system dependence, and (5) product observability.90 Table 2 lists
the main definitions of these knowledge attributes:
Table 2: Definitions of knowledge attributes
Knowledge attribute
Definition
Codifiability
“degree to which knowledge can be encoded, even if the individual
operator does not have the facility to understand it”91
Teachability
“extent to which workers can be trained in schools or on the job; it
reflects the training of individual skills”92
Complexity
“inherent variations in combining different kinds of competences”93 or
“large number of parts that interact in a non simple way”94
System dependence
“degree to which a capability is dependent on many different (groups
of) experienced people for its production”95
Product oberservability
“degree to which capable competitors can copy the manufacturing
capability, because they are able to manufacture the innovation once
they have understood the functions of the product”96
2.3 Knowledge creation and knowledge transfer
2.3.1 Knowledge creation
Driving forces of knowledge creation are the single individuals inside
companies.97 New knowledge is the direct result of the interplay between
89 Zander/Kogut, 1995, p. 79; Kogut/Zander, 1993, p. 627 90 Zander/Kogut, 1995, p. 79 91 Zander/Kogut, 1995, p. 79 92 Zander/Kogut,1995, p. 79 93 Zander/Kogut, 1995, p. 79 94 Simon, 1969, p. 195 95 Zander/Kogut, 1995, p. 79 96 Zander/Kogut, 1995, p. 82 97 Nonaka, 1994, p. 17
17
employees’ know-how and abilities (human capital), firms’ ability to respond to
changes in marketplaces (structural capital) and clienteles’ features (customer
capital)98. Hereby, Nonaka (1991, 1994) highlights that the successful knowledge
creation depends on the commitment and willingness to communicate.99 Three
different models of knowledge creation exist, namely (1) the SECI model, (2) the
“Ba” model, and (3) the leadership model.100 As the focus of the present paper is
primarily directed to the knowledge transfer processes, the knowledge creation
processes are not explained in detail in this chapter, but, instead, they are
described in the Appendix C.
2.3.2 Knowledge transfer
First theoretical contributions on knowledge transfer date back to the 1980s with
the elaboration of the information richness theory.101 According to Argote et al.
(2000), the knowledge transfer process can be defined as “the process through
which one unit (e.g., individual, group, department, division) is affected by the
experience of another [[] Thus, organizations can learn not only directly from
their own experience, but also indirectly from the experience of other
organizations.”102 Knowledge can be diffused by purpose or by accident through
socialization, education and learning.103
2.3.2.1 Types of knowledge transfer processes
Scientists distinguish between different types of knowledge transfer processes.
This sub-subsection focuses on (1) the classifications of Chen and McQueen
(2010), including structured and unstructured knowledge transfer processes,104
as well as on (2) Dixon’s (2000) taxonomy, focusing on serial, near, far, strategic,
and expert transfer processes.105
98 Kakabadse et al., 2001, p. 144 99 Nonaka, 1994, pp. 14, 17; Nonaka, 1991, p. 97 100 Nonaka et al., 2000, p. 5 101 Srećković/Windsperger, 2011, p. 319 102 Argote et al., 2000, p. 3 103 Roberts, 2000, p. 432 104 Chen/McQueen, 2010, pp. 57-59 105 Dixon, 2000, pp. 29-30
18
• First, when organizations decide to transfer knowledge purposely in a formal
and planned manner, then one can speak of a structured knowledge transfer
process. Whenever companies transfer knowledge spontaneously, in an
informal and unplanned manner, it would be referred to as a unstructured
knowledge transfer process. While the structured transfer process precedes
along four stages106 in a strictly sequential manner, the unstructured transfer
process possibly skips from one stage to the other. In workaday life three
different forms of unstructured transfer processes can take place: (1)
unstructured copy, (2) unstructured adoption, and (3) unstructured fusion.
“Unstructured copy” refers to copying. Efficiency of this process depends on
individuals’ motivation and their access to knowledge as well as on their
absorptive capacity. “Unstructured adoption" is a more advanced type of
knowledge transfer, involving more implicit knowledge. Here, individuals do
not have direct access to pools of knowledge, and they need to adapt
available knowledge to changing environmental conditions. “Unstructured
fusion” takes places when knowledge is available but inapplicable, or when
useful information cannot be deduced from them. Therefore individuals need
to combine new knowledge inputs with already experienced knowledge pools.
• Second, according to Dixon (2000), serial knowledge transfer happens when
a team reuses knowledge that has been acquired through repeated
completion of tasks in different settings. Near knowledge transfer is related to
routinized knowledge, and occurs when a team uses knowledge inputs that
other teams have previously collected in identical situations. Far knowledge
transfer happens when one team adapts another team’s tacit knowledge
(created during the accomplishment of different tasks) to its own activity. One
refers to strategic knowledge transfer when individuals gain complex
knowledge (in terms of temporal and spatial differences) from other persons.
Expert knowledge transfer occurs when individuals focus on the support of
more experienced individuals, benefitting from the transfer of their codified
knowledge.
106 (1) initiation stage, (2) implementation stage, (3) ramp-up stage, and (4) integration stage
19
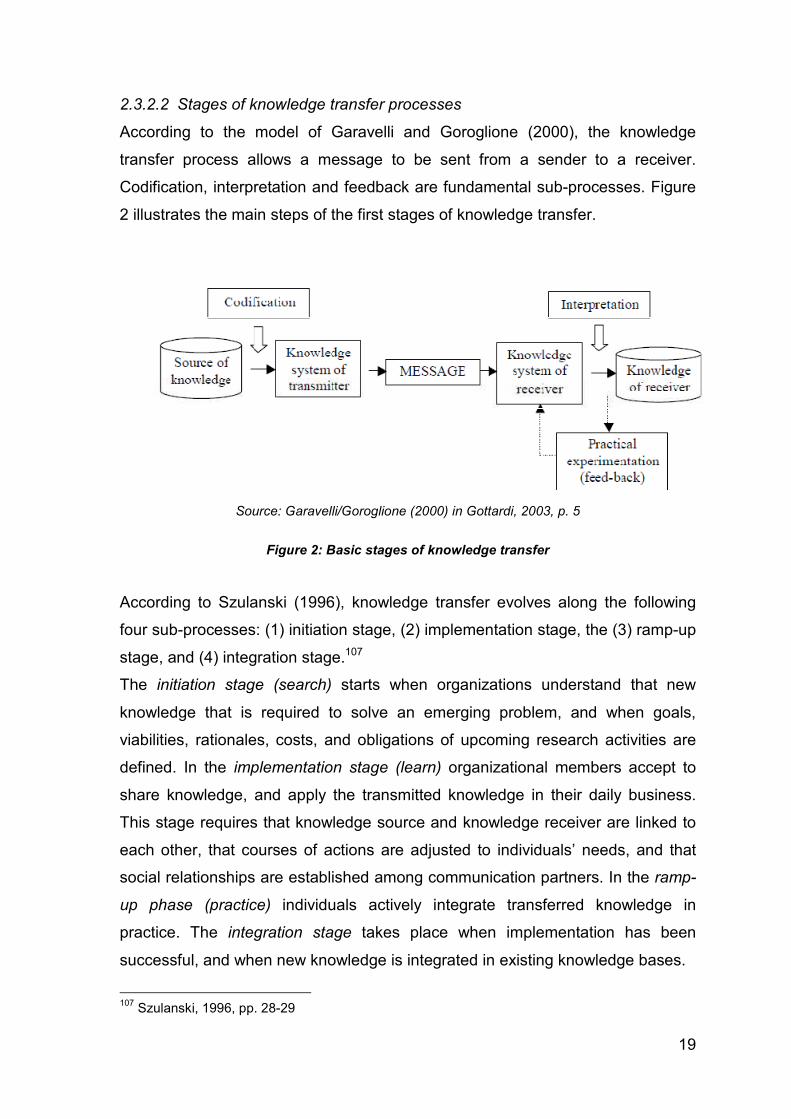
2.3.2.2 Stages of knowledge transfer processes
According to the model of Garavelli and Goroglione (2000), the knowledge
transfer process allows a message to be sent from a sender to a receiver.
Codification, interpretation and feedback are fundamental sub-processes. Figure
2 illustrates the main steps of the first stages of knowledge transfer.
Source: Garavelli/Goroglione (2000) in Gottardi, 2003, p. 5
Figure 2: Basic stages of knowledge transfer
According to Szulanski (1996), knowledge transfer evolves along the following
four sub-processes: (1) initiation stage, (2) implementation stage, the (3) ramp-up
stage, and (4) integration stage.107
The initiation stage (search) starts when organizations understand that new
knowledge that is required to solve an emerging problem, and when goals,
viabilities, rationales, costs, and obligations of upcoming research activities are
defined. In the implementation stage (learn) organizational members accept to
share knowledge, and apply the transmitted knowledge in their daily business.
This stage requires that knowledge source and knowledge receiver are linked to
each other, that courses of actions are adjusted to individuals’ needs, and that
social relationships are established among communication partners. In the ramp-
up phase (practice) individuals actively integrate transferred knowledge in
practice. The integration stage takes place when implementation has been
successful, and when new knowledge is integrated in existing knowledge bases.
107 Szulanski, 1996, pp. 28-29
20
2.3.2.3 Positive and negative influencing factors of knowledge transfer
Argote et al. (2003) highlight three different barriers of knowledge management
cited in the literature, namely the abilities and motivation of employees as well as
the performance opportunities and environmental conditions of the organizations
themselves.108 First, the author highlights, among others, the positive impact of
organizational learning,109 task similarity,110 and previous personal experience111
on efficient knowledge transfer. Second, he underlines the power of intrinsic and
extrinsic incentives that encourage company members to support knowledge
transfer.112 Extrinsic motivation consists in monetary compensation, while intrinsic
motivation refers to non-monetary recompenses.113 The right mix of these two
forms of gratification is crucial in determining a strong competitive advantage
through knowledge management.114 Third, knowledge management is influenced
by the environment, in which organizations are emerged. According to this,
knowledge managers should invest in the establishment of a knowledge-driven
organizational culture by supporting internal learning processes, by reducing
physical and psychological distances among individuals, and by supporting
informal networks (internal and external to the organization).115
Considering factors that have a negative impact on efficient knowledge
management, it is further possible to distinguish between (1) individual barriers
and (2) social barriers116 or between limitations regarding to (1) people, (2)
management, and (3) organizational structures.117 On the one hand, individual
barriers refer to people’s indifference to share their know-how. Possible reasons
for such an attitude can be: disinterest to change, lack of time, anxiety to weaken
their own position, unwillingness to invest extra working hours, or constantly 108 Argote et al., 2003, pp. 575-576 109 Nadler et al.,2003, p. 530 110 Darr/Kurtzberg, 2000, p. 32 111 Cohen/Levinthal, 1990, p. 130 112 Argote et al., 2003, p. 575; Osterloh/Frey, 2000, p.539 113 Osterloh/Frey, 2000, p.539 114 Osterloh/Frey, 2000, p.544 115 Argote et al., 2003, p. 575 116 Disterer, 2001, pp. 2-3 117 Kakabadse et al., 2001, p.148
21
changing composition of employees.118 On the other hand, social barriers occur,
when organizational structures and/or processes are highly bureaucratic and
inflexible or when thinking patterns of the organization are not coherent with
those of the people working in it.119
In order to understand why tacit knowledge transfer is more complex than
codified knowledge transfer, Joia and Lemos (2010), reviewing past literature,
highlight, among others, the following indicators:120
• Time: The transfer of tacit knowledge requires more time than the transfer of
codified knowledge because contracts need to be formalized, social
interactions need to be established, and transferred knowledge needs to be
reflected and experienced.
• Common language: Universal terminology is a precondition for a better
understanding of transferred knowledge. Most individuals have difficulties to
express their personal know-how because it is accumulated over time through
direct personal experience.
• Relationship network: Another prerequisite for successful transfer of implicit
knowledge refers to ability of organizations to identify knowledge that is
actually lacking, and to identify those individuals that are able to procure
required knowledge. In this context, according to Disterer (2003), individuals’
unawareness of the value of their personal knowledge is problematic.
• Type of training: Efficient knowledge transfer depends also on the
prioritization of training inside firms. While, according to Murray and Peyrefitte
(2007), explicit knowledge can be transferred easily through formal education,
tacit knowledge exchange, according to Disterer (2003), requires time-
consuming programmes (e.g., coaching and mentoring sessions).
• Transfer and storage of knowledge: According to Joia (2007), companies
need to ensure that codified knowledge is stored in databases and transferred
through social interaction in order to induce efficient knowledge transfer.
118 Disterer, 2001, p. 2; Kakabadse et al., 2001, p.148 119 Disterer, 2001, p. 3; Kakabadse et al., 2001, p.148 120 Joia/Lemos, 2010, pp. 413-417
22
2.4 Knowledge management in industrial districts
Research of industrial districts has demonstrated that efficient knowledge
creation and innovation are fundamental drivers for the competitive advantage of
district firms.121 Some of the major drivers of the knowledge-based advantages of
industrial districts can be summarized as follows:
2.4.1 General characteristics, favouring the creation and transfer
of knowledge
Malmberg and Power (2005), referring to recent contributions in the literature,
highlight that knowledge management in industrial districts is facilitated by
diverse district-specific characteristics. The most important determinants are: (1)
sophisticated cooperation among local firms, (2) intense local rivalry, (3)
enhanced professional mobility, and (4) spillovers fostered by the mobility and
tense social ties of locals.122 According to the authors, these factors facilitate both
knowledge creation and transfer, and contribute to the ability of local firms to
market innovative goods. Actually, professional mobility, tight social ties and
increased social interaction make knowledge transfer less complex and quicker.
In particular local competition boosts the production of knowledge. In fact,
consistent visibility, strong focus on continuous improvement and openness
towards new technologies forces locals to constantly upgrade shared knowledge
pools.
2.4.2 Public knowledge pool
In industrial districts a “localized pool of specific knowledge” which is only
available for district players exists.123 This knowledge pool incorporates mainly
contextualized knowledge.124 Contextual knowledge is defined as “socially
embedded knowledge in a territory”125 that is composed of both codified
knowledge (delivered from sources outside the district) and tacit knowledge
121 Inken/Tsang, 2005, p. 150 122 Malmberg/Power, 2005, pp. 411-412 123 Muscio, 2006, p. 303 124 Carbonara, 2004 in Albino et al., 2006, p. 33 125 Belussi/Pilotti, 2002, p. 128
23
(developed inside district boarders slowly over time).126 This kind of knowledge is
considered as a “collective good” rather than a “public good”127 that is constantly
improved via “local communication processes and local knowledge spillovers”,128
influencing directly manufacturing and research activities.129 This form of
knowledge is further considered as a “collective model of innovation”, making
additional internal research bases and external knowledge sources less
important.130
2.4.3 Localized knowledge spillovers
As already mentioned before, industrial districts are leading examples of
industrial systems, where knowledge spillovers take place.131 In fact, Keilbach
(2000) highlights that “knowledge spillovers can be considered as one of the
driving forces in the formation of industrial districts.”132 Referring to Breschi and
Lissoni (2001), knowledge spillovers can be considered as “‘knowledge
externalities bounded in space’, which allow companies operating nearby key
knowledge sources to introduce innovations at a faster rate than rival firms
located elsewhere.”133 Knowledge spillovers contribute fundamentally to positive
returns and economic development,134 and represent a key source for
innovation.135 This notion is shared also by Carlino (2001) who highlights the
importance of knowledge spillovers in the context of “exchange of ideas among
individuals”, when “a given company’s innovation may stimulate a flood of related
inventions and technical improvements by other companies.”136 The positive
influence of knowledge spillovers on the innovative capabilities of districts is a
result of tense social relationships between district members that enhance
126 Belussi/Pilotti, 2002, p. 128 127 Antonelli et al., 2008, p. 480 128 Muscio, 2006, p. 303 129 Muscio, 2006, p. 303 130 Muscio, 2006, p. 303 131 Keilbach, 2000, p. 3; Cainelli/De Liso, 2005, pp. 4-5 132 Keilbach, 2000, p. 3 133 Breschi /Lissoni, 2001, p. 258 134 Keilbach, 2000, p. 3 135 Breschi/Lissoni, 2001, p. 257 136 Carlino, 2001, p. 7
24
“reciprocal trust and frequent face-to-face contacts.”137 They are a result of the
particular nature of (1) local tacit knowledge, (2) local environmental
characteristics, (3) local social relationships, and (4) local cooperation among
private and public institutions.138
2.4.4 Learning in industrial districts
Especially in the case of design-focused sectors (e.g., fashion sector), both
knowledge economies and learning economies play a fundamental role.139 In
fact, local innovativeness depends on two different forms of learning (“learning by
R&D” and “learning by interaction”).140 Thus, the education of one district firm has
an impact on the accumulation of knowledge and resulting knowledge spillovers
of other district firms.141 Unfortunately, district-specific learning processes are
inappropriate for global marketplaces, where demand is less stable and less
sophisticated than in industrial districts.142
2.4.5 Private and public drivers of knowledge production143
According to Belussi and Gottardi (2000), in Italian industrial districts there are
both public and private drivers of knowledge production. In general, one of the
main aims is to create public knowledge that can be shared and debated on
regular bases exclusively among district players. On the one hand, public entities
habitually sustain the creation of localized knowledge. They financially support
research centers, universities and advanced training courses for local workers.
On the other hand, the private sector enhances the production of knowledge by
directing funds to research and development as well as by boosting internal
learning (through experimentation of new technologies) and external learning
(through monitoring of district members).
137 Breschi /Lissoni, 2001 138 Landabaso/Rosenfeld, 2009, p. 744 139 Becattini/Musotti, 2003, p. 270 140 Albino et al., 2006, p. 33 141 Cainelli/De Liso, 2005, pp. 4-5 142 Albino et al. 2006, p. 33 143 Belussi/Gottardi, 2000, pp. 29-31
25
2.5 Knowledge transfer mechanisms
The present paper uses the term knowledge transfer mechanisms in accordance
with the definition of Gorovaia and Windsperger (2010), and defines knowledge
transfer mechanisms as all those “organizational routines that enable the transfer
of explicit and tacit knowledge.”144 The following subsection explains the main
types of knowledge transfer mechanisms used in organizations and their role in
knowledge transfer processes.
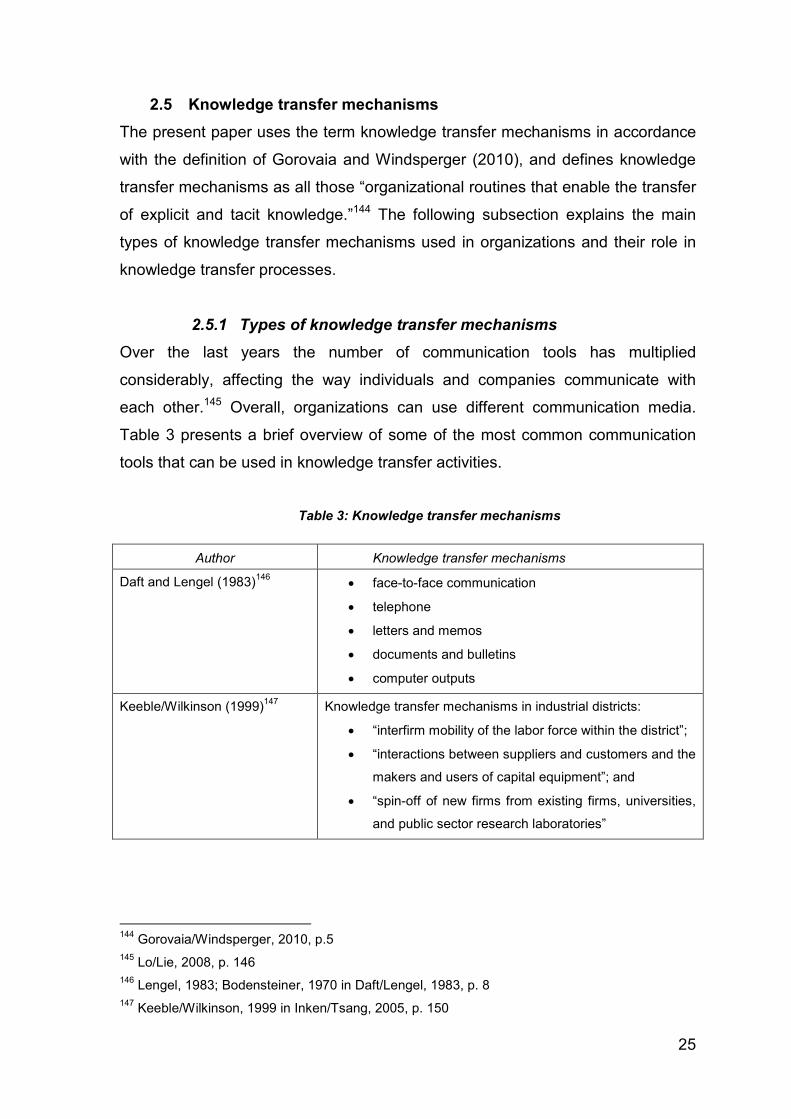
2.5.1 Types of knowledge transfer mechanisms
Over the last years the number of communication tools has multiplied
considerably, affecting the way individuals and companies communicate with
each other.145 Overall, organizations can use different communication media.
Table 3 presents a brief overview of some of the most common communication
tools that can be used in knowledge transfer activities.
Table 3: Knowledge transfer mechanisms
Author
Knowledge transfer mechanisms
Daft and Lengel (1983)146
• face-to-face communication
• telephone
• letters and memos
• documents and bulletins
• computer outputs
Keeble/Wilkinson (1999)147
Knowledge transfer mechanisms in industrial districts:
• “interfirm mobility of the labor force within the district”;
• “interactions between suppliers and customers and the
makers and users of capital equipment”; and
• “spin-off of new firms from existing firms, universities,
and public sector research laboratories”
144 Gorovaia/Windsperger, 2010, p.5 145 Lo/Lie, 2008, p. 146 146 Lengel, 1983; Bodensteiner, 1970 in Daft/Lengel, 1983, p. 8 147 Keeble/Wilkinson, 1999 in Inken/Tsang, 2005, p. 150
26
Table 3: Knowledge transfer mechanisms (continued)
Author
Knowledge transfer mechanisms
Büchel and Raub (2001)148
• videoconferences
• electronic communication
• tele-conferences
• voice mails
• faxes
• formal letters
Roberts (2000)149
• voice mail
• teleconferencing
• CAD and CAM
• information databases
• groupware
Argote et al. (2000)150
• movement of employees
• transfer of technology
• reproduction of routine processes
• reverse engineering
• scientific papers
Murray and Peyrefitte (2007)151
• technology assisted communication
• meetings
• trainings
148 Büchel/Raub, 2001, p. 523 149 Roberts, 2000, p. 435 150 Argote et al., 2000, p. 3 151 Murray/Peyrefitte, 2007, p. 115
27
2.5.2 Media richness and knowledge transfer mechanisms
Examinations on knowledge transfer begin with the identification of the media
richness theory.152 According to the media richness theory (e.g., Daft and Lengel,
1983, 1984, 1986; Trevino et al., 1987; Lengel and Daft, 1988; Büchel and Raub,
2001; Sheer/Chen, 2004), communication media can be classified according to
their “information richness” or “media richness”. The term “information richness”
can be interpreted as “the potential information carrying capacity of data”.153
Based, for example, on Bodensteiner (1970), Lengel (1983) notes that every
single transfer mechanism incorporates a mix of four sub-characteristics that
reflect their degree of media richness.154 According to this, it is assumed that the
higher the degree of “(a) the availability of instant feedback; (b) the use of
multiple cues, such as physical presence, voice inflection, body gestures, and
graphic symbols, and so forth; (c) the use of natural language for conveying a
broad set of concepts and ideas; and (d) the personal focus of the medium”,155
the higher is the degree of information richness.156 Based on this assumption, the
present paper classifies knowledge transfer mechanisms into: (1) knowledge
transfer mechanisms with higher degree information richness (KTM_HIR) and (2)
knowledge transfer mechanisms with lower degree information richness
(KTM_LIR). The following paragraphs describe those knowledge transfer
mechanisms that are used in the empirical survey of the present study.
Face-to-face communication157
According to Lengel and Daft (1984), direct personal dialogue incorporates the
highest grade of information richness. This form of knowledge transfer
mechanisms allows individuals to give instant feedbacks and to use non-verbal
communication, reducing misunderstandings and equivocality linked to
communication contents.
152 Gorovaia/Windsperger, 2010, p.3; Srećković/Windsperger, 2011, p. 319 153 Daft/Lengel, 1983, p. 7 154 Daft/Lengel, 1983, p. 7 155 Sheer/Chen, 2004, p. 77 156 Sheer/Chen, 2004, p. 77 157 Daft/Lengel, 1986, p. 560

28
Telephone158
In contrast to direct and personal dialogue, communication via telephone is
considered as a knowledge transfer mechanism with lower media richness. In
fact, the mimic, gestures or/and other visual support cannot be used. Instead,
individuals focus primarily on language contents and pitches of voice.
Written and directed documents (letters, fax, memos)159
Written and directed documents have a lower degree of information richness.
These kinds of communication are usually directed to one or more receivers,
making them more or less personal. Nevertheless, they do not have fast
feedback capabilities, and non-verbal messages are not possible.
Written and formal documents (bulletins, reports, existing documents)160
These lean forms of communication media are anonymous and not personal at
all. They can be used when receivers fully understand the main subjects of
communication content.
Formal and numeric documents (computer outputs)161
These forms of documents have the lowest degree of media richness, lacking all
previously cited features of information richness. Therefore, these communication
tools are appropriate exclusively for uncomplicated and quantifiable knowledge
inputs.
Formal and informal meetings162
Referring to Murray and Peyrefitte (2007), the level of informality determines the
degree of richness of knowledge transfer mechanisms. According to this, informal
meetings, including “face-to-face retreats and after-work socials”163 are richer
158 Daft et al., 1987, p. 359 159 Daft et al., 1987, p. 359 160 Daft/Lengel, 1983, pp. 9, 50 161 Daft/Lengel, 1983, p. 9 162 Murray/Peyrefitte, 2007, p. 116 163 Murray/Peyrefitte, 2007, p. 116
29
knowledge transfer mechanisms, while informal meetings, including seminars
and conferences, are leaner knowledge transfer mechanisms.
New electronic media (e-mail, electronic data interchange, databanks,
videoconferences, newsgroups, chat systems, social media)
Vickery et al. (2004), studying the usage of communication channels in business
to business relationships, add new forms of communication media to those cited
originally by Daft and Lengel.164 They assume that the degree of information
richness of communication media depends on how much organizations know
about their business partners. According to this, if companies know (or do not
know) each other very well, electronic media are considered to have higher (or
lower) degrees of information richness.165
Although internet is one of the most crucial interventions of this century, it has yet
not been extensively studied as an interpersonal communication tool.166
According to Burnett (2000), the internet facilitates the circulation of information,
and enhances communication among individuals.167 Windsperger and Gorovaia
(2010) consider electronic media, in particular the intra- and internet, as
knowledge transfer mechanisms with lower degree of media richness.168 Murray
and Peyrefitte (2007) agree to this assumption, and highlight that modern
electronic communication and databanks can be considered as lean
communication tools because they are “non-interactive, impersonal, and are
good for transferring less complex knowledge such as rules, forms, and
procedures.”169 In contrast, videoconferences, according to Murray and Peyrefitte
(2007), are richer knowledge transfer mechanisms as they make technology-
assisted face-to-face communication possible.170 Lastly, social media are added
to the survey, as they are “top of the agenda for many business executives
164 Vickery et al., 2004, p. 1108 165 Vickery et al., 2004, pp. 1116-1117 166 Herring, 2002, p. 126 167 Herring, 2002, p. 134 168 Windsperger/Gorovaia, 2010, p. 2 169 Murray/Peyrefitte, 2007, p. 116 170 Murray/Peyrefitte, 2007, p. 116
30
today.”171 Table 4 illustrates a possible classification of social media channels in
relation to media richness theory elaborated by Kaplan and Haenlein (2010).
Table 4: Social media and information richness
Source: Kaplan/Haenlein, 2010, p. 62
2.5.3 Choice of knowledge transfer mechanisms
Which variables impact the choice of knowledge transfer mechanisms in
organizations? In general, according to Lo and Lie’s (2008) literature review, the
usage of communication technology depends on variables such as (1) user
friendliness, (2) perceived helpfulness, (3) network externalities, (4) capacity to
ease the formation of social ties, and (5) the extent to which personal messaging
is possible.172
Furthermore, the present paper analyzes the choice of knowledge transfer
mechanisms on the basis of (1) the media richness theory, (2) the knowledge-
based theory, (3) the trust-based theory, and (4) the innovation adoption theory of
companies.
2.5.3.1 Knowledge transfer mechanisms and media richness theory
According to Daft and Lengel (1986), the origins of information processing in
organizations are uncertainty and equivocality.173 Uncertainty is defined as the
“absence of information” and increases when information decreases.174 In order
to overcome uncertainty, companies need to acquire information through
171 Kaplan/Haenlein, 2010, p. 59 172 Lo/Lie, 2008, pp. 146-147 173 Daft/Lengel, 1986, p. 557 174 Daft/Lengel, 1986, p. 556
31
“periodic reports, rules and procedures, or group meetings.”175 In contrast,
equivocality (or ambiguity) is defined as “confusion and lack of understanding”176
due to the “existence of multiple and conflicting interpretations about an
organizational situation.”177 It occurs when “asking a yes-no question is not
feasible”.178 In order to reduce ambiguity, managers facilitate mutual
understanding by focusing increasingly on social interaction.179 Managers select
communication channels that fit best to the level of perceived uncertainty and
ambiguity.180 According to Daft and Lengel (1983), it is assumed that higher (or
lower) levels of uncertainty and complexity require richer (or leaner)
communication channels.181 Likewise, a high (or low) degree of equivocality
necessitates richer (or leaner) communication media.182
Further, referring to Büchel and Raub (2001), the usage of knowledge transfer
mechanisms depends on (1) the perception of media and (2) the scope of media
as well. The authors assume that the choice of communication media depends
on the form of information-processing activities related to organizational learning
processes, and that “a match between learning process and media richness and
scope is necessary in order to foster learning within organizations.”183 On the one
hand, referring to the concept of media perception, the choice of communication
tools is impacted by individuals’ cognitions, attitudes and codes of conduct as
well as by firm-specific cultures, use patterns, and regulations.184 On the other
hand, considering the concept of media scope, the selection of communication
technology depends on storage capacity and range of coverage of the
medium.185 In this context, the choice of media used is considered a complex
175 Daft et al., 1987, p. 357 176 Daft/Lengel, 1986, p. 556 177 Daft et al., 1987, p. 357 178 Daft/Lengel, 1986, p. 556 179 Daft et al., 1987, p. 357 180 Murray/Peyrefitte, 2007, p. 114 181 Daft/Lengel, 1983, p. 13 182 Daft/Lengel, 1983, p. 51 183 Büchel/Raub, 2001, p. 531 184 Büchel/Raub, 2001, pp. 523-524 185 Büchel/Raub, 2001, p. 522
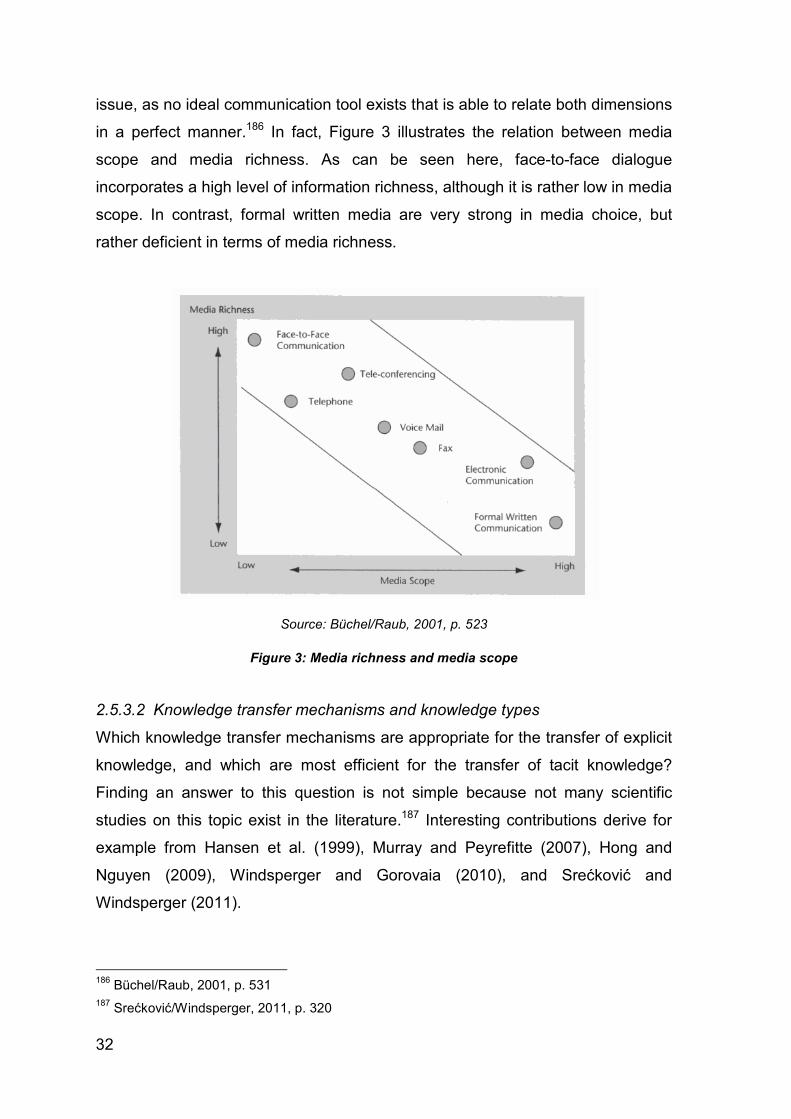
32
issue, as no ideal communication tool exists that is able to relate both dimensions
in a perfect manner.186 In fact, Figure 3 illustrates the relation between media
scope and media richness. As can be seen here, face-to-face dialogue
incorporates a high level of information richness, although it is rather low in media
scope. In contrast, formal written media are very strong in media choice, but
rather deficient in terms of media richness.
Source: Büchel/Raub, 2001, p. 523
Figure 3: Media richness and media scope
2.5.3.2 Knowledge transfer mechanisms and knowledge types
Which knowledge transfer mechanisms are appropriate for the transfer of explicit
knowledge, and which are most efficient for the transfer of tacit knowledge?
Finding an answer to this question is not simple because not many scientific
studies on this topic exist in the literature.187 Interesting contributions derive for
example from Hansen et al. (1999), Murray and Peyrefitte (2007), Hong and
Nguyen (2009), Windsperger and Gorovaia (2010), and Srećković and
Windsperger (2011).
186 Büchel/Raub, 2001, p. 531 187 Srećković/Windsperger, 2011, p. 320
33
According to Hansen et al. (1999), there are two basic knowledge management
strategies that have an impact on the selection of communication technology,
namely (1) the codification strategy (“people-to-documents” approach) and (2) the
personalization strategy (“dialogue-between-individuals” approach).188
Companies adopting the codification strategy invest in information technologies
and electronic document systems that facilitate the sharing of explicit knowledge,
while firms, focusing on the personalization strategy, prefer computers as
communication tools, investing in the formation of networks that facilitate sharing
of implicit knowledge.
Among others, Cavusgil et al. (2003) recently state that the efficiency of
knowledge transfer depends on the degree of tacitness of knowledge. In fact, the
author highlight that decreasing explicitness of knowledge makes knowledge
transfer easier, while increasing tacitness of knowledge makes knowledge
transfer more difficult.189 Murray and Peyrefitte (2007) assume that media with
higher degree of information richness are appropriate for know-how exchange,
while media with lower degree of information richness are more appropriate for
information sharing.190 In other words, lean modes of knowledge transfer
mechanisms are adopted to transfer explicit knowledge, while rich forms of
knowledge transfer mechanisms are used to share tacit knowledge.191
2.5.3.3 Knowledge transfer mechanisms and trust
As described in section 4.3, trust has an impact on both knowledge transfer and
knowledge sharing. According to Srećković and Windsperger (2011),
organizational trust determines the choice of knowledge transfer media according
to two approaches, namely according to (1) the substitutability view, and (2) the
complementary view of trust.192
188 Hansen et al., 1999, pp. 107-109 189 Cavusgil et al., 2003, p. 7 190 Murray/Peyrefitte, 2007, p. 124 191 Murray/Peyrefitte, 2007, p. 124; Windsperger/Gorovaia, 2010, p. 5;
Srećković/Windsperger, 2011, p. 321 192 Srećković/Windsperger, 2011, p. 326
34
• Substitutability view of trust193
In this context, Srećković and Windsperger (2011) underline the impact of
trust on knowledge transfer mechanisms on the basis of the following
assumptions: On the one hand, referring to Roberts (2000), trust dilutes risks
related to knowledge transfer. On the other hand, according to Yu et al.
(2006), trust compensates formal forms of knowledge transfer media. Lastly,
considering Lo and Lie (2008), trust reduces the degree to which formal
knowledge transfer mechanisms are used. According to these findings, it is
assumed that trust in clusters enhances (and reduces) the use of leaner (and
richer) knowledge transfer mechanisms, while mistrust augments (and
decreases) the use of richer (leaner) knowledge transfer mechanisms.
• Complementary view of trust194
Srećković and Windsperger (2011), referring among others to Seppänen et al.
(2007) and Blomquist et al. (2005), further believe that when cluster firms
strongly trust each other, both rich and lean knowledge transfer mechanisms
are used more intensively, because trustful relationships enhance the
intensity and openness of dialogue among cluster members, and mitigate
communication barriers.
2.5.3.4 Knowledge transfer mechanisms and innovation adoption
As it is described in chapter 3, Rogers (1995, 2003) defines the diffusion of
innovation as a communication process in which different types of communication
media are adopted.195 In his famous book “Diffusion of innovations” the scientist
describes how innovation adopter categories (ranging from earlier adopters to
later adopters) accumulate knowledge about innovations, differentiating between
two types of knowledge sources, namely (1) interpersonal communication
channels and (2) mass media communication channels.196 In this context,
research focuses mainly on earlier adopters because they are crucial key figures
193 Srećković/Windsperger, 2011, p. 326 194 Srećković/Windsperger, 2011, p. 326 195 Rogers, 1995, p. 5 196 Rogers, 1995, p. 194
35
in knowledge exchange, communicating their personal experience and opinions
to other community members.197
In general, according to Rogers (1995), it is assumed that impersonal
communication tools are usually selected by earlier adopters198 in the earlier
knowledge stage199, while interpersonal communication tools are adopted by later
adopters200 in the persuasion stage.201
In contrast to Rogers, who focuses primarily on agricultural sectors, Price et al.
(1986) find out that interpersonal communication channels have a contrasting
value for early adopters, particularly as they concern consumer goods.202 They
highlight that in this market sector earlier adopters prefer interpersonal
communication modes, being more exposed to information environments, and
being more conscious of innovations than later adopters.
Lee et al. (2002) assume that the “conversational mode rather than the written
mode may increase the perceived usefulness of the information,”203 and advise
the use of richer communication channels in front of innovations, especially if
they incorporate difficult assets of information.204 Further, they assume that
written forms of communication used by financial institutions are effective tools to
induce adoption of innovations.205
Burdett (2003), who analyzes the usage of information and communication
technology in the academic field, finds out that earlier adopters are more active
and experimental users of those media, and basically prefer the most modern
communication tools.206
Gottardi (2003), investigating communication and knowledge transfer in industrial
districts, points out that network technologies are scarcely used inside industrial
districts, “even considering the more dynamic districts [[] communication 197 Price et al., 1986 198 Rogers, 1995, p. 197 199 Rogers, 1995, p. 195 200 Rogers, 1995, p. 197 201 Rogers, 1995, p. 195 202 Price et al., 1986 203 Lee et al., 2002, p. 6 204 Lee et al., 2002, p. 6 205 Lee et al., 2002, p. 2 206 Burdett, 2003, p. 91
36
technologies are used in a ‘conservative’ mode: the more diffused are those
which are simple to use and do not require reorganisation of the firm’s work
processes and relationships.”207
Lastly, Belussi (2005), analyzing the adoption and innovation diffusion of
information communication technology in two Italian industrial districts, points out
that district companies usually do not use extensively these kinds of media, and
that local firms basically prefer communication via e-mail, internet and CAD-CAM,
mostly neglecting videoconferences.208
207 Gottardi, 2003, p.10 208 Belussi, 2005, pp. 264-265
37
3 INNOVATION
3.1 Innovation diffusion and innovation adoption
Innovation diffusion is a leading topic in many different research streams, and it
has been investigated, among others, in sociological, business, geographic, and
communication studies.209 The most important models were developed in the
1970s.210 Most scientific contributions before 1962 are elaborated in Europe and
in the United States.211 In Europe research takes off in the 20th century with the
contributions of Gabriel Tarde (1890), who analyses innovation diffusion on the
basis the “laws of imitation”.212 During the 1960s increasing attention on this topic
emerges also in developing countries.213 Most widely used diffusion models are
elaborated, among others, by Bass (1969), Fourt and Woodlock (1960) and
Mansfield (1961)214 as well as, according to Kroeber-Riel and Weinberg (2003),
by Rogers (1962, 2003) and Davis (1986, 1989).215 Past contributions add to the
original notion findings on marketing factors, cultural differences, and new
technologies.216 According to Rogers (1995), innovation diffusion refers to all the
processes “by which an innovation is communicated through certain channels
over time among the members of a social system. It is a special type of
communication, in that the messages are concerned with new ideas.”217
Therefore, diffusion theory analyses the diffusion of innovation in time and space,
and describes the outstanding role of innovators (earliest individuals that utilize
an innovation) and later adopters (individuals that adopt an innovation because
they are influenced by word of mouth propaganda and imitate earlier
adopters).218
209 Rogers, 1995, p. 42 210 Meade/Islam, 2006, p.519 211 Rogers, 2003, p. xv 212 Rogers, 2003, pp. 39-40 213 Rogers, 2003, p. xvi 214 Meade/Islam, 2006, p. 520 215 Kroeber-Riel/Weinberg, 2003, p. 677 216 Meade/Islam, 2006, p. 520 217 Rogers, 1995, p. 5 218 Mahajan et al., 2000, ix
38
According to Rogers (1995), the fundamental elements of innovation diffusion are
(1) innovation, (2) communication channels, (3) time, and (4) social systems.219 In
the following the theoretical constructs of innovation and communication
channels as well as the innovation adopter categories identified by Rogers (1995,
2003) are described in detail. Concepts, such as time and social systems are
described in Appendix C.
3.2 Concept of innovation
3.2.1 Definition of innovation
Literature on this topic extends over many diverse research disciplines, and
incorporates various different approaches.220 Baregh et al. (2009) highlight that
about 60 distinct definitions of the term “innovation” exist.221 One of the first
definitions dates back to the 1930s. Schumpeter (1931) is the first who
elaborates a description of the present concept, neglecting the usage of the word
“innovation”.222 Years later the term “innovation” is cited in literature.223
Afterwards more precise definitions of the term are elaborated in the1980s.224
One leading scientist of innovation theory is Everett M. Rogers – the author of the
pioneer work “Diffusion of Innovations”. According to him, innovation can be
described as “an idea, or object that is perceived as new by an individual or other
unit of adoption.”225 Recent definitions elaborated in the last 7 years are
presented below in Table 5:
219 Rogers, 1995, p. 10 220 McFadzean et al., 2005, p. 353 221 Baregh et al., 2009, p. 1325 222 Albers/Gassmann, 2005, p. 25 223 Albers/Gassmann, 2005, p. 25 224 Hausschildt, 2004, p. 3 in Albers/Gassmann, 2005, p. 25 225 Rogers, 1995, p. 11
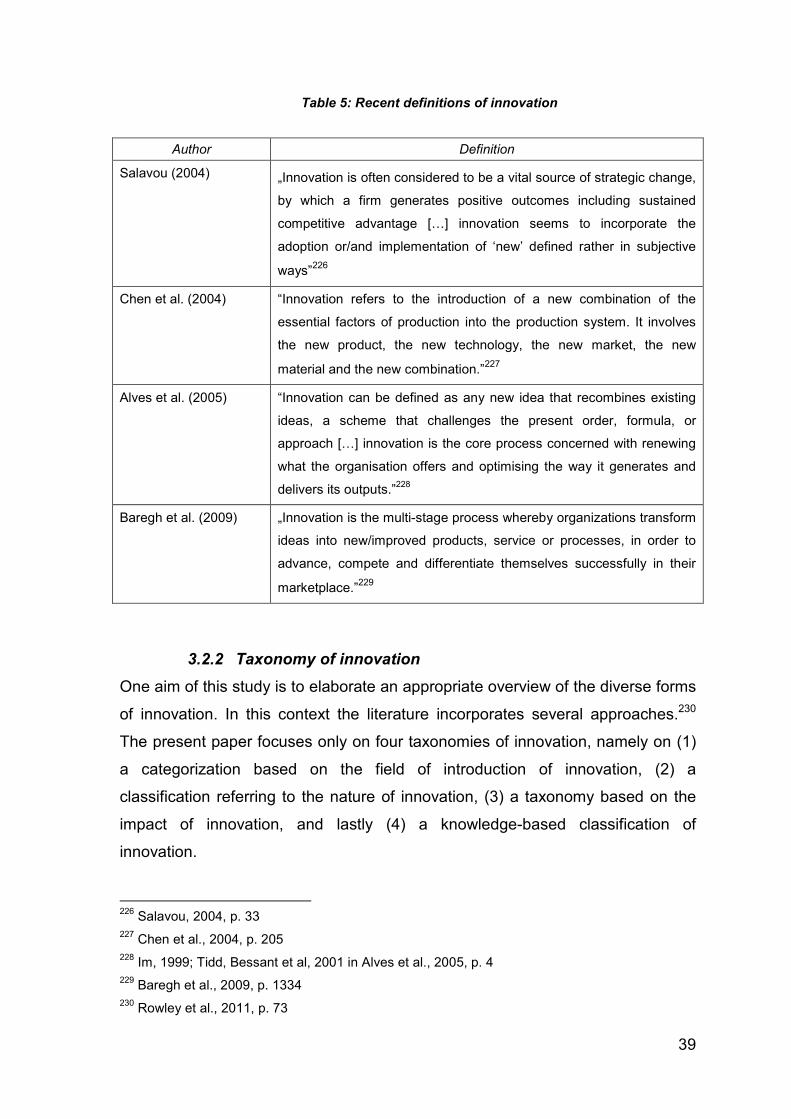
39
Table 5: Recent definitions of innovation
Author
Definition
Salavou (2004)
„Innovation is often considered to be a vital source of strategic change,
by which a firm generates positive outcomes including sustained
competitive advantage [[] innovation seems to incorporate the
adoption or/and implementation of ‘new’ defined rather in subjective
ways”226
Chen et al. (2004)
“Innovation refers to the introduction of a new combination of the
essential factors of production into the production system. It involves
the new product, the new technology, the new market, the new
material and the new combination.”227
Alves et al. (2005)
“Innovation can be defined as any new idea that recombines existing
ideas, a scheme that challenges the present order, formula, or
approach [[] innovation is the core process concerned with renewing
what the organisation offers and optimising the way it generates and
delivers its outputs.”228
Baregh et al. (2009)
„Innovation is the multi-stage process whereby organizations transform
ideas into new/improved products, service or processes, in order to
advance, compete and differentiate themselves successfully in their
marketplace.”229
3.2.2 Taxonomy of innovation
One aim of this study is to elaborate an appropriate overview of the diverse forms
of innovation. In this context the literature incorporates several approaches.230
The present paper focuses only on four taxonomies of innovation, namely on (1)
a categorization based on the field of introduction of innovation, (2) a
classification referring to the nature of innovation, (3) a taxonomy based on the
impact of innovation, and lastly (4) a knowledge-based classification of
innovation.
226 Salavou, 2004, p. 33 227 Chen et al., 2004, p. 205 228 Im, 1999; Tidd, Bessant et al, 2001 in Alves et al., 2005, p. 4 229 Baregh et al., 2009, p. 1334 230 Rowley et al., 2011, p. 73
40
• Taxonomy of innovation according to its field of introduction
The first categorization refers to the field of introduction of innovation, and
includes concepts, such as (1) product innovation, (2) process innovation, (3)
market innovation, (4) structural innovation, and (5) social innovation.231
First, product innovation is one of the most widespread types of innovation.232
It refers to the introduction of new and improved goods and services.233 The
“newness” of an innovation is hereby crucial.234 Second, process innovation
consists in improvements in manufacturing, service or organization.235
Hereby, innovative changes refer, among others, to technological, program-
specific and/or system design-specific advancements.236 Third, market
innovation induces ameliorations of the market mix or of the modus operandi
in which consumers are targeted.237 Fourth, structural innovation occurs, if a
company introduces structural changes in organizational subdivisions (e.g.,
enhancement of working-time schedules, labor environment, and HR
development).238 Lastly, social innovation is the result of the adoption of an
innovation that leads to an amelioration of the lives and the satisfaction of
individuals.239
• Taxonomy of innovation based on the nature of innovation
The second categorization refers to the nature of innovation, and includes
open and closed innovation. Closed innovation is the conventional concept of
the 20thcentury, and refers to all those innovative strategies that are realized
solely with firm-internal assets.240 Today, this form of innovation is no longer a
231 Stummer et al., 2010, pp.14-16; Disselkamp, 2005, p. 20 232 Oke et al., 2007, p. 738 233 OECD/Eurostat, 2005, p. 53; Oke/ Burke/Myers, 2007, p. 738 234 Disselkamp, 2005, p. 21 235 Khazanchi et al., 2007, p. 871 236 Khazanchi et al., 2007, p. 872 237 Johne, 1999, p. 7 238 Disselkamp, 2005, pp. 26-27 239 Stummer et al., 2010, pp. 16-17 240 Fasnacht, 2009, p. 91-92
41
reasonable strategy because markets require more and more open forms of
innovation, where companies focus on foreign resources as well.241
• Taxonomy of innovation based on its impact
The third classification of innovation incorporates (1) radical innovation, (2)
incremental innovation, (3) modular innovation, and (4) architectural
innovation.242
First, radical innovation occurs when the design or construction of a product is
renewed.243 This form of innovation can cause also significant disadvantages.
In fact, radical innovation “are likely to be competence-destroying, often
making existing skills and knowledge redundant”.244 Furthermore, their
commercialization is rather complex.245 Second, incremental innovation builds
on companies’ common know-how, and consists in the adjustment or
extension of single parts of goods and/or product lines.246 Third, modular
innovation changes core modules of present offerings.247 Lastly, architectural
innovation rearranges the way in which single parts of goods are linked,
without altering the general design of goods.248
• Knowledge-based taxonomy of innovation
Gopalakrishnan and Bierly (2001) assume that the character of knowledge
related to new products and technologies has an impact on “the sourcing
decisions, the cost of implementation, and the perceived effectiveness of the
innovation.”249 According to this, the authors (reviewing previous studies)
identify three different forms of innovation, focusing on (1) tacit and explicit
241 Chesbrough, 2004, p. 23 242 Henderson/Clark, 1990, pp. 11-12 243 Henderson/Clark, 1990, pp. 11-12 244 Du Plessis, 2007, p. 21 245 Du Plessis, 2007, p. 21 246 Du Plessis, 2007, p.21 247 Henderson/Clark, 1990, pp. 11-12 248 Henderson/Clark, 1990, pp. 11-12 249 Gopalakrishnan/Bierly, 2001, p. 123
42
knowledge, (2) systematic and autonomous knowledge, and (3) complex and
simple knowledge.
Innovation and tacit/explicit knowledge250
Innovations based on explicit knowledge are less efficient and less
competitively advantageous than innovations based on implicit knowledge. If
firms’ innovative strategy is based on tacit knowledge, both the transfer and
adoption of knowledge is difficult because higher degrees of knowledge
tacitness require the implementation of informal knowledge transfer
mechanisms, the development of a common language (facilitating the
understanding of new tacit knowledge inputs), as well as expensive
investments in training programmes.
Innovation and systematic/autonomous knowledge251
Autonomous innovations are innovations that “can be developed and
implemented independently from other innovations and organizational
processes.”252 Systematic innovations are more expensive that autonomous
innovations, because they require more investments, supporting the free
circulation and integration of transferred knowledge.
Innovation and simple/complex knowledge253
In contrast to simple innovations, complex innovations are considered as
more “original”. They are created in-house, and are a result of active research
activities, experiments and clienteles’ acknowledgments. The more complex
innovations are, the more expensive and the less imitable they become.
3.3 Innovation and knowledge management
The main functions of knowledge management (see also section 2.1) provide the
basis of firms’ innovation programmes, and lead to significant competitive
250 Gopalakrishnan/Bierly, 2001, pp. 111-112 251 Gopalakrishnan/Bierly, 2001, pp. 112-113 252 Gopalakrishnan/Bierly, 2001, p. 112 253 Gopalakrishnan/Bierly, 2001, pp. 114-115
43
advantages.254 In this context, Du Plessis (2007), reviewing recent contributions
in literature, summarizes three functions of knowledge management:255 First,
knowledge management creates competitive advantages deriving from the
efficient use of knowledge and from cooperation. Second, knowledge
management aims to decrease the complexity of activities related to innovation.
Third, knowledge management supports the creation of both internal and external
sources of knowledge, and makes them obtainable and accessible.
Therefore, it is assumed that the better managers optimize knowledge
management practices, the stronger will be firms’ innovative capabilities.256
Lastly, one needs to consider that explicit knowledge plays a less crucial role in
innovative processes than implicit knowledge.257 Accordingly, the more efficient
the usage of implicit knowledge, the more likely firms can benefit from
innovativeness and competitiveness because innovations deriving from tacit
knowledge cannot be imitated easily by competitors, and, therefore consumers
are willed to pay higher prices when purchasing these products.258
3.4 Innovation and Italian industrial districts
Italian contributions, relating the concepts of innovation and industrial districts,
investigate, among others, the innovative capabilities, the diffusion of innovation
and the driving factors of innovative competitiveness in clusters.259 Overall,
scientists agree upon the role industrial districts play in the economy, considering
them as beneficial systems that facilitate both the development of innovations
and the adoption of innovation.260 According to this, Carbonara (2004) highlights
that district-specific “innovation mechanisms, known as ‘widespread innovative
capacity’ or ‘innovative capability without research’, have been the main
254 Du Plessis, 2007, pp. 22-23 255 Du Plessis, 2007, pp. 22-23 256 Cavusgil et al., 2003, p. 20 257 Du Plessis, 2007, p. 24 258 Cavusgil et al., 2003, p. 20 259 Muscio, 2006, p. 291 260 Muscio, 2006, p. 293
44
ingredients of the innovative capability of clusters in the early phases of their
evolutionary process.“261
But why do innovations take place easier in industrial districts than in other
industry systems? Finding an answer to this question is not as easy as expected,
because until now only a limited amount of studies explore the relation between
innovation and localized processes.262 Therefore, the following paragraphs
describe in particular those determinants that illustrate why the concepts of
industrial districts and innovation are assumed to be inter-related. Hereby, main
attention is laid on the role of (1) final assemblers, (2) domestic rivalry and
collaboration, (3) imitation, (4) domestic knowledge sources, and (5) local
learning play in regional innovation literature.
• According to Belussi and Gottardi (2000), final assemblers are key players in
industrial districts, and are the axis of knowledge-based division of labor.263
The authors highlight that the local innovative strategy depends particularly on
these figures because they are responsible for those parts of production that
are less of routine.
• As already described in chapter 1, features of industrial districts are the
division of labor and productive specialization. These particular characteristics
make the right balance between prudent competitive and cooperative
behaviour necessary.264 Both local rivalry and collaboration have a positive
impact on the innovative capabilities of local firms.265 Further, according to
Muscio (2006), collaboration facilitates the realization of joint innovation, while
the monitory of rivalry boosts constant local advancement.266
• According to Bonomi (2001), local innovativeness in terms of incremental
innovation is fostered by imitative processes inside industrial districts.267 Only
a small number of companies (mainly the larger-sized ones) are actually
innovative leaders. Instead, the major part of local firms focuses on imitating
261 Carbonara, 2004, p. 26 262 Muscio, 2006, p. 292 263 Belussi/Gottardi, 2000, p. 14 264 Bonomi, 2001, p. 4 265 Bonomi, 2001, p. 4 266 Muscio, 2006, p. 303 267 Bonomi, 2001, p. 4
45
innovators in order to reduce expenditures in terms of time and money. By
doing so, imitators can market meliorated versions of original innovations.
• Innovation is facilitated by a communal knowledge pool as well. According to
Muscio (2006), the usage of this knowledge base in combination with
collective cooperation facilitates and boosts product innovation.268
• Lastly, it is assumed that the most successful industrial districts are those that
focus on radical innovations.269 According to Albino et al. (2006), there are
two different forms of learning that district firms use to realize this kind of
innovation:270 (1) “learning by R&D” and (2) “learning by interaction”. The first
learning strategy requests investments in research and development
programmes, and is activated exclusively by leading district companies. The
second strategy is based on cooperation with external district partners, and is
adopted by the most dynamic firms.
3.5 Innovativeness and determination of adopter categories
The exploration innovation diffusion requires two prerequisites, namely (1) the
identification of a technique to determine innovation adopter categories, and (2)
the determination of the exact absolute and relative number of adopter types.271
One of the most important categorization is elaborated by Rogers (1995).272
According to Rogers (2003), it is possible to classify individuals into distinct forms
of innovation adopter categories according to their level of innovativeness.273
Innovativeness is considered in this context as the “degree to which an individual
or other unit of adoption is relatively earlier in adopting new ideas than the other
members of a social system.”274 The scientist distinguishes between (1)
innovators, (2) early adopters, (3) early majority, (4) late majority, and (5)
268 Muscio, 2006, p. 303 269 Albino et al., 2006, p. 33 270 Albino et al., 2006, p. 33 271 Rogers, 1983, p. 245 in Mahajan et al., 1990, p. 37 272 Mahajan et al., 1990, p. 37; Peterson, 1973, p. 325 273 Rogers, 2003, p. 281 274 Rogers, 1995, p. 22
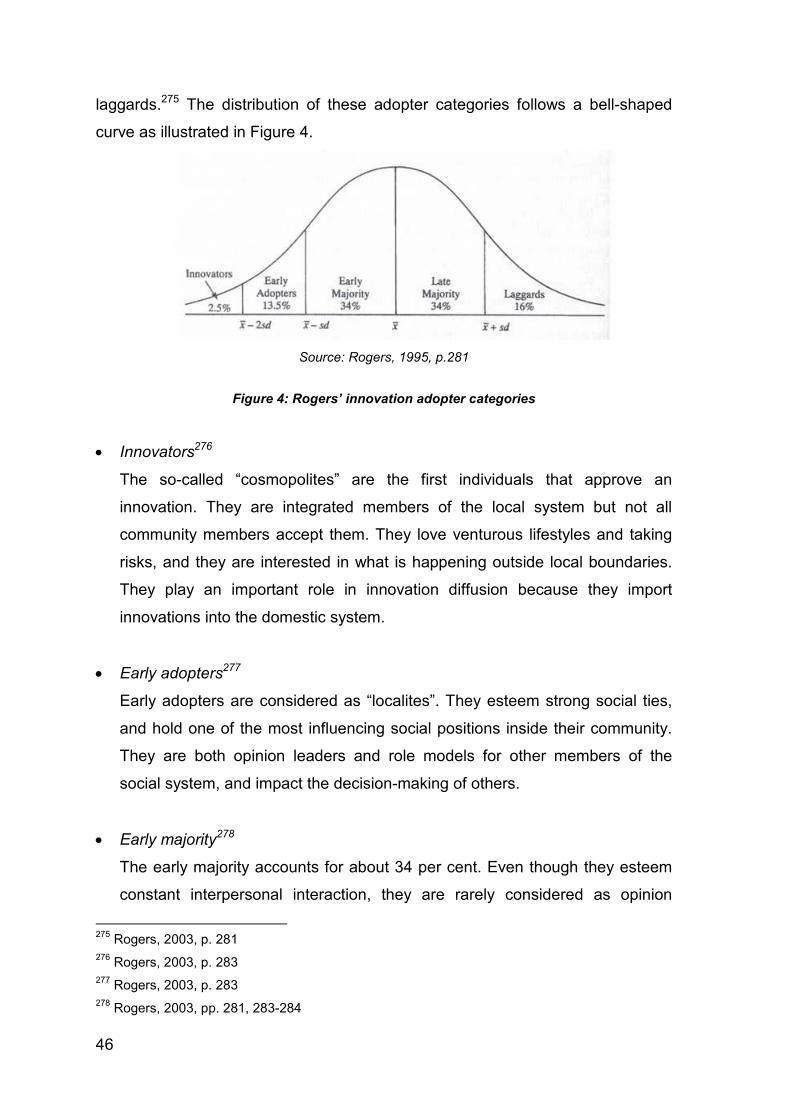
46
laggards.275 The distribution of these adopter categories follows a bell-shaped
curve as illustrated in Figure 4.
Source: Rogers, 1995, p.281
Figure 4: Rogers’ innovation adopter categories
• Innovators276
The so-called “cosmopolites” are the first individuals that approve an
innovation. They are integrated members of the local system but not all
community members accept them. They love venturous lifestyles and taking
risks, and they are interested in what is happening outside local boundaries.
They play an important role in innovation diffusion because they import
innovations into the domestic system.
• Early adopters277
Early adopters are considered as “localites”. They esteem strong social ties,
and hold one of the most influencing social positions inside their community.
They are both opinion leaders and role models for other members of the
social system, and impact the decision-making of others.
• Early majority278
The early majority accounts for about 34 per cent. Even though they esteem
constant interpersonal interaction, they are rarely considered as opinion
275 Rogers, 2003, p. 281 276 Rogers, 2003, p. 283 277 Rogers, 2003, p. 283 278 Rogers, 2003, pp. 281, 283-284
47
leaders or role models. Further, even though they are very open-minded and
willed to adopt new ideas, they rarely lead innovation diffusion. Nevertheless,
this group plays a fundamental role because they can be considered as the
“glue” that holds community members together.
• Late majority279
The early majority accounts for 34 per cent. These individuals are very
skeptical, and prefer not to adopt an innovation as long as other community
members have successfully integrated it in daily routine. Thus, their decision
to adopt of reject an innovation depends on the power of peer pressure.
• Laggards280
The so-called “traditionalists” are the last ones that introduce an innovation.
Usually, they are isolated community members without any notable opinion
leadership position. Instead, they interact primarily with those individuals that
share comparable attitudes and values. Their decisions are in line with their
previous experience, and they prefer not to change their actions significantly
from those in earlier periods. Innovation adaption occurs only if there are no
doubts about its future success.
To sum up, it is possible to differentiate between “earlier adopters” and “later
adopters”. Both adopter categories do not differ significantly in age.281 Instead,
they differ in terms of (1) socio-economic variables, (2) personality variables, and
(3) communication behaviour.282 The main differences between these two forms
of innovation adopters are summarized in Table 6 below.
279 Rogers, 2003, pp. 281, 284 280 Rogers, 2003, pp. 284-285 281 Rogers, 2003, p. 298 282 Rogers, 2003, p. 298
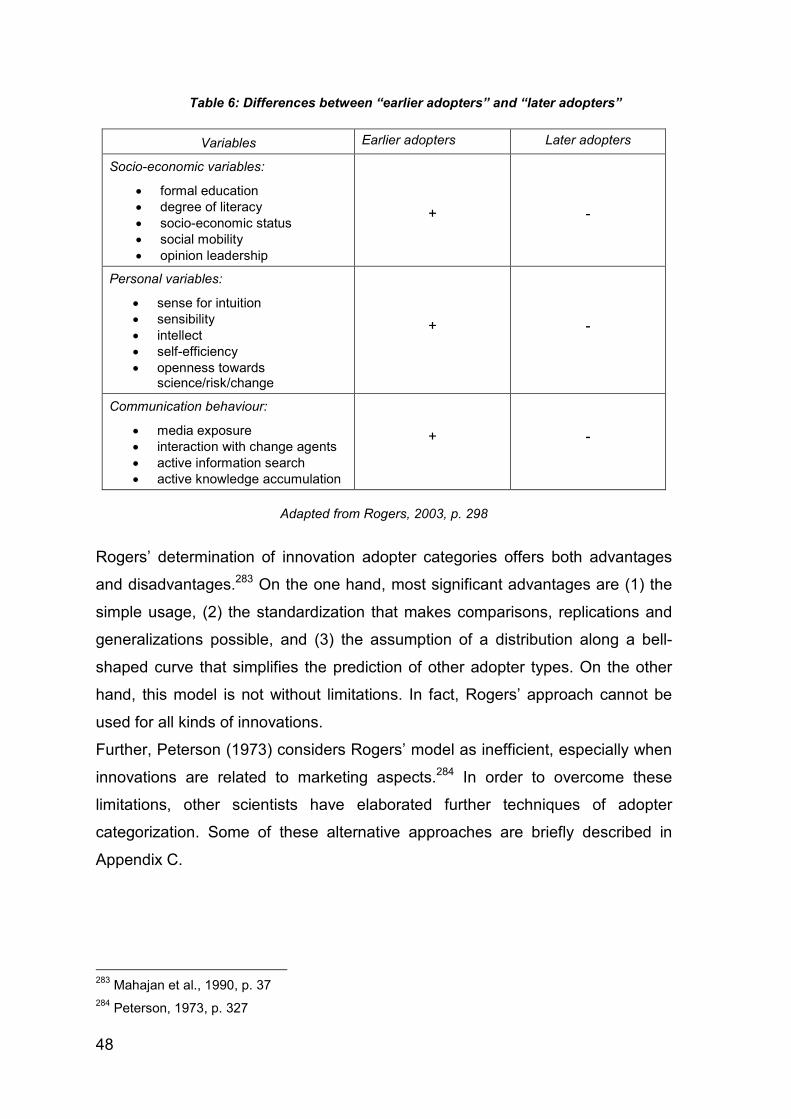
48
Table 6: Differences between “earlier adopters” and “later adopters”
Variables
Earlier adopters
Later adopters
Socio-economic variables:
• formal education • degree of literacy • socio-economic status • social mobility • opinion leadership
+
-
Personal variables:
• sense for intuition • sensibility • intellect • self-efficiency • openness towards
science/risk/change
+
-
Communication behaviour:
• media exposure • interaction with change agents • active information search • active knowledge accumulation
+
-
Adapted from Rogers, 2003, p. 298
Rogers’ determination of innovation adopter categories offers both advantages
and disadvantages.283 On the one hand, most significant advantages are (1) the
simple usage, (2) the standardization that makes comparisons, replications and
generalizations possible, and (3) the assumption of a distribution along a bell-
shaped curve that simplifies the prediction of other adopter types. On the other
hand, this model is not without limitations. In fact, Rogers’ approach cannot be
used for all kinds of innovations.
Further, Peterson (1973) considers Rogers’ model as inefficient, especially when
innovations are related to marketing aspects.284 In order to overcome these
limitations, other scientists have elaborated further techniques of adopter
categorization. Some of these alternative approaches are briefly described in
Appendix C.
283 Mahajan et al., 1990, p. 37 284 Peterson, 1973, p. 327
49
3.6 Communication channels and innovation diffusion
Rogers (1995) defines communication as a “process in which participants create
and share information with one another in order to reach a mutual
understanding.”285 He differentiates between two distinct types of communication
tools that support the circulation of knowledge inside the community, namely (1)
interpersonal channels, and (2) mass media channels.286 Mass media, although
facilitating quick knowledge transfer among many individuals, cannot alter
gridlocked attitudes, and cannot change individuals’ decisions.287 Impersonal
communication mechanisms are preferred by earlier adopters,288 and are useful
in the earlier knowledge stages.289 In contrast, interpersonal media are
appropriate for changing attitudes towards an innovation, because interpersonal
dialogue reduces emerging misunderstandings and social-psychological
resistances.290 Interpersonal channels are preferred by later adopters,291 and are
useful during persuasion stages.292
Further, Rogers (1995) differentiates between cosmopolite channels (outside
communication sources) and localite channels (inside communication
sources).293 Interpersonal communication channels can either be cosmopolite or
localite channels, while mass media channels are always cosmopolite channels.
Outside communication sources are basically more central in knowledge stages,
while local communication sources are more crucial in persuasion stages.
285 Rogers, 1995, pp. 5-6 286 Rogers, 1995, p. 194 287 Rogers, 1995, p. 194 288 Rogers, 1995, p. 197 289 Rogers, 1995, p. 195 290 Rogers, 1995, p. 194 291 Rogers, 1995, p. 197 292 Rogers, 1995, p. 195 293 Rogers, 1995, pp. 196-197
50
4 TRUST
4.1 Definition and importance of trust
Organizational trust is a complex concept because, on the one hand, it
incorporates numerous definitions, scientific approaches and methodologies.294
On the other hand, a vast amount of studies, investigating antecedents,
components, and consequences of trust have been elaborated over the last
years.295 Further, literature cites expressions, such as “cooperation”,
“confidence”, or “predictability” as synonyms for the term “trust”, causing
confusion and misunderstandings.296
Among diverse driving forces in organizational cooperation, trust is one of the
most quoted concepts in literature.297 Since the 1990s researchers agree upon
one fact: Trust is one of the most crucial determinants in successful inter-firm
exchange.298 In fact, trust is a crucial precondition of successful inter-
organizational cooperation,299 because it impacts both the organizational
structure as well as the extent of economic prosperity.300 These positive effects
can develop because between trusting parties because no one misuses others’
vulnerability.301 According to Lie and Fang (2005), trust is in particular essential
whenever uncertainty and opportunistic behaviour is present.302 Then trust
becomes an important managerial commodity that cannot be “purchased” easily
in the marketplace, but, instead, needs to be developed though long-term
strategic engagement.303
294 An overview provides Seppänen et al., 2007, p. 252 295 Seppänen et al., 2007, p. 256 296 Mayer et al., 1995, p. 712 297 Seppänen et al., 2007, p. 249 298 Seppänen et al., 2007, p. 249 299 Blomquist et al., 2004, p. 502
300 Roberts, 2000, p. 434
301 Dei Ottati, 2004, p. 3
302 Lo/Tie, 2008, p. 148
303 Roberts, 2000, p. 434
51
4.2 Trust in Italian industrial districts
In recent years some surveys have investigated trust in industrial districts (e.g.,
Dei Ottati 1994, 2003, 2004; Oba and Semerciöz, 2005). Unfortunately, only a
limited number of articles explain the fundamental role that trust plays in Italian
industrial districts.304 Nevertheless, there is no doubt that trust is particularly
relevant in vibrant Italian industrial districts.305 In fact, Dei Ottati (2004) cites that
the three crucial district-specific processes, namely (1) the “process of the
localized social division of labor”, (2) the “process of its flexible integration”, and
(3) the “process of localized learning and innovation”, “need trust to be
widespread among individuals and organizations.”306 Abrams et al. (2003) point
out that in networks two different variants of trust are important, namely the trust
in peoples’ competency and the trust in peoples’ benevolence.307
The following paragraphs re-examine some of the most crucial characteristics of
Italian industrial districts, such as (1) the local social system, (2) the local
manufacturing system, (3) the subtracting relations and local cooperation as well
as (4) the local norms of business behaviour on the basis of the trust-based view.
Local social system and trust308
Taking into account the societal background of Italian industrial districts, trust can
be considered as “collective capital” that is strictly linked to the particular
characteristics of the local society. Above all, according to Dei Ottati (2004), trust
can be analyzed from two distinct directions, namely from (1) the social capital
view, and from (2) the personal capital view. According to this, the author
distinguishes between two categories of social ties: On the one hand,
relationships between district players exist, and, on the other hand, relations
between district members and non-district members exist. In the first case social
life is regulated through common values, norms, and principles of conduct. In this
context trust is considered as “social capital”, which develops naturally through
the compliance of formal and informal social principles. In the second case trust
304 Dei Ottati, 2003, p. 82 305 Dei Ottati, 2003, p. 82 306 Dei Ottati, 2004, pp. 2-3 307 Abrams et al., 2003, p. 63 308 Dei Ottati, 2004, p. 3
52
is considered as “personal capital”, which develops step by step over time.
Hereby, district firms’ judgment of whom or how much to trust depends on the
partners’ potential in terms of future benefits, resulting from the collaboration.
Local manufacturing system and trust
According to Dei Ottati (2004), in order to be successful in industrial districts,
firms need to exhibit not only a positive reputation in terms of expertise, but,
moreover, they also need to be appreciated as trustful business partners.309
Trustworthiness is crucial especially for small-sized companies and start-up
businesses; because, lacking abundant financial resources, being trusted is one
of the most central sources of competitive advantage of these firms.310
Referring to Dei Ottati (1994), local reputation of trustworthiness develops over
time, and companies need to constantly invest into their reputation.311 According
to this, on the one hand, companies have to deliver constantly high quality
offerings and consistent performance, regardless of how exigent market
conditions are.312 On the other hand, district firms need to satisfy the interests
business partners in every single moment; even if this leads to significant
disadvantages on their behalf, and even if no lucrative transactions are
guaranteed in future. 313
Subtracting and cooperation and trust
As already mentioned in chapter 1, one of the fundamental characteristics of
Italian industrial districts is the localized division of labor. High amounts of
subtracting enterprises are resulting from this – this is in particular the case in the
textile district of Prato, where 83 per cent of companies are subtracting firms.314
According to Dei Ottati (2004), trust in industrial districts is limited to district
boarders, and trust is on the long run considerably stronger and easier to be
309 Dei Ottati, 2004, p. 3 310 Dei Ottati, 2004, p. 3 311 Dei Ottati, 1994, p. 533 312 Dei Ottati, 1994, p. 533 313 Dei Ottati, 1994, p. 533 314 Die Ottati, 2004, p.6
53
cultivated than in other industry systems.315 This is because, according to the
author, local institutions constantly safeguard trust as a “collective capital”,
supporting trust to “reproduce” locally, and to mitigate “substitutes of trust”.
Local norms of business behaviour and trust
In Italian industrial districts trust is based on strict codes of business behaviour.
According to Brusco (1999), shared common rules of conduct are for example:316
• “It is a good thing to trust those who deserve it, even though prudent attitudes
are legitimate and allowed. These attitudes[represent cautions, typical of
any careful entrepreneur.” 317
• “Two agents who work together on a continuous basis will never fully take
advantage of the market power that is available to them, owing to their
reciprocal interdependence[ Each of them will take into consideration the
survival needs and the success opportunities of the other.” 318
• “It is wrong and shameful for a client, a consultant, a subcontractor or an
employee to use information, knowledge, or a network of relationships for
personal gain to the detriment of the firm that has involved them in specific
initiatives with good faith.” 319
4.3 Trust and knowledge transfer
Trust is the “magic ingredient that links strong ties and knowledge.”320 Trust
diminishes the perceived risks and uncertainties that are associated with
knowledge transfer.321 Further, calculative trust reduces formal governance, and
alleviates costs related to knowledge transfer.322 Thus, trust has a positive impact
on knowledge creation,323 knowledge sharing,324 and knowledge transfer.325
315 Die Ottati, 2004, p.532 316 Dei Ottati, 2004, p.8 317 Brusco 1999, p.21 in Dei Ottati, 2004, p.8 318 Brusco 1999, p.22 in Dei Ottati, 2004, p.8 319 Brusco 1999, p.24 in Dei Ottati, 2004, p.8 320 Levin et al., 2011, p. 2 321 Davenport/Prusak, 2003; Roberts, 2000, p. 433 in Joia/Lemos, 2010, p. 413 322 Yu et al., 2006, p. 137 323 Abrams et al., 2003, p. 64
54
In order to build and maintain trust in knowledge transfer activities, it is necessary
to establish face-to-face contacts and opportunities of socialization.326 Abrams et
al. (2003) advise the following trust building strategies in knowledge sharing
activities: (1)“act with discretion”, (2) “be consistent between word and deed”, (3)
“ensure frequent and rich communication”, (4) “engage in collaborative
communication”, (5) “ensure that decisions are fair and transparent”, (6)
“establish and ensure shared vision and language”, (7) “hold people accountable
for trust”, (8) “create personal connections”, (9) “give away something of value”,
and (19) “disclose your expertise and limitations.” 327
The trustworthiness of the knowledge source depends on (1) the extent to which
knowledge sender and knowledge receiver share common languages, goals and
concerns, and (2) how the knowledge seeker evaluates the confidentiality,
discretion, receptivity, and the strength of relationship of the knowledge
source.328 In that context, Szulanski et al. (2004) find out that when causal
ambiguity “increases, the effect of the perceived trustworthiness of the source on
the accuracy of transfer weakens progressively and then becomes negative.”329
Lastly, the role trust plays in knowledge transfer processes depends on the
nature of knowledge. Levin et al. (2001) note that the degree of tacitness affects
the role trust plays in knowledge transfer.330 In fact, according to the authors,
competence-based trust is essential for tacit knowledge transfer, while
benevolence-based trust enhances the utility of both tacit and codified
knowledge.331 The authors further highlight that (1) both benevolence- and
competence based trust are mediators between strong ties and delivery of usable
knowledge, and (2) weak ties deliver accurate knowledge as well.332
324 Andrews/Delahaye, 2002, p. 797 325 Levin et al., 2002, p. 22 326 Roberts, 2000, p. 434 327 Abrams et al., 2003, p. 67 328 Levin et al., 2011, p. 5 329 Szulanski, 2004, p. 608 330 Levin et al., 2011, p. 3 331 Levin et al., 2002, p. 22; Levin, 2011, p. 3 332 Levin et al., 2002, pp. 22
55
5 EMPIRICAL STUDY
5.1 Research questions and hypotheses
After the presentation of main theoretical concepts, the following chapter is
dedicated to the elaboration of an empirical survey. The main aim of this study is
to understand how knowledge transfer is conducted among Italian small and
medium-sized companies that operate exclusively in fashion and textile districts,
and to figure out how knowledge characteristics, such as explicit and tacit
knowledge, trust, and the orientation towards innovation adoption of companies
have an impact on the choice of knowledge transfer mechanisms. At this point,
after a brief overview of the theoretical concepts summarized in previous
chapters, hypotheses are formulated and the research techniques are presented.
Subsequent to descriptive statistics and the illustration of the applied statistical
methodology, the formulated hypotheses will be tested empirically.
Research question 1:
Which role does tacitness of knowledge play in the choice of knowledge
transfer mechanisms?
The first aim of this study is to link the two following two concepts: On the one
hand, the knowledge-based theory that differentiates between diverse types of
knowledge (see subsection 2.2.2) and knowledge attributes (see chapter 2.2.3).
On the other hand, the media richness theory (see chapter 2.5.2) that assumes
that communication media can be categorized according to their degree of media
richness, differentiating between media with higher and lower degrees of
information richness. The examination of the first hypothesis is aimed at testing
already existing theories on this topic in the context of knowledge transfer
mechanisms in Italian industrial districts (see subsection 2.5.3).
In detail, this study focuses basically on tacit knowledge and codified knowledge.
It is assumed that the efficiency of knowledge transfer is impacted by the degree
of tacitness of knowledge. In this survey the degree of tacitness is
operationalized in accordance with the knowledge attributes identified by Kogut
and Zander (1995): codifiability, teachability, and complexity. The authors
assume that codifiability and teachability are “negatively related to the choice of
56
transfer [[]; complexity should be positively related.”333 This knowledge-based
theory is then linked to the information richness theory.
As already described in subsection 2.5.3, recent studies, such as those, for
example, of Murray and Peyrefitte (2007), Windsperger and Gorovaia (2010) as
well as Srećković and Windsperger (2011), assume that knowledge transfer
mechanisms with lower degree of information richness are more likely used for
the transfer of explicit knowledge, while knowledge transfer mechanisms with
higher degree of information richness are more likely adopted for the transfer of
tacit knowledge. According to this, the following two hypotheses are formulated:
H1A: The more tacit the shared knowledge, the more likely Italian district firms use rich knowledge transfer mechanisms (KTM_HIR).
H1B: The less tacit the shared knowledge, the more likely Italian district firms
use lean knowledge transfer mechanisms (KTM_LIR).
Research question 2:
Which impact has trust on the choice of knowledge transfer mechanisms?
The second goal of this survey is to understand whether it makes a difference in
the choice of knowledge transfer mechanisms if district members trust each other
or not. As already highlighted in section 4.3, trust has a positive impact on
knowledge transfer, and is in particular important when knowledge is tacit. The
present study focuses on the substitutability approach of trust (see sub-
subsection 2.5.3.3), and tries to enrich previous studies, such as, for example,
from Lo and Lie (2008) and Srećković and Windsperger (2011). Accordingly, the
following hypotheses are formulated:
H2A: The more district firms trust each other, the more likely they use lean knowledge transfer mechanisms (KTM_LIR).
H2B: The less district firms trust each other, the more likely they use rich
knowledge transfer mechanisms (KTM_HIR).
333 Kogut/Zander, 1993, p. 633
57
Research question 3:
Which impact has tacitness of knowledge in combination with trust on the
choice of knowledge transfer mechanisms?
As already described in the section 4.3, the degree of tacitness affects the role
trust plays in knowledge transfer, in particular when knowledge is tacit. So, if a
relation between trust and knowledge characteristics exists, does trust in
combination with tacitness of knowledge also have an impact on the selection of
knowledge transfer mechanisms in Italian industrial districts? To find an answer
to this question, the following hypotheses are formulated and tested empirically:
H3A: The positive influence of tacitness on the choice of rich knowledge transfer mechanisms (KTM_HIR) decreases with trust.
H3B: The negative influence of tacitness on the choice of lean knowledge
transfer mechanisms (KTM_LIR) decreases with trust.
Research question 4:
Which role plays the orientation towards innovation adoption of companies
in the choice of knowledge transfer mechanisms?
As explained in chapter 3, knowledge and innovations are highly dependent on
each other. But which role does the orientation of district firms towards innovation
adoption play? As already mentioned in sub-subsection 2.5.3.4, literature does
not offer many insights on innovation adopter categories in relation to the usage
of knowledge transfer media, in particular not in the context of industrial districts.
In order to give an answer to this question, this work focuses on Rogers’ (1995,
2003) theory of innovation adopter categories, differentiating between “earlier
adopters” and “later adopters”, and tests the following hypotheses:
H4A: Later adopters use rich knowledge transfer mechanisms (KTM_HIR) more likely than later adopters. H4B: Earlier adopters use lean knowledge transfer mechanisms (KTM_LIR)
more likely than later adopters. H4C: The positive impact of openness towards innovation on the use of rich
knowledge transfer mechanisms (KTM_HIR) increases with trust. H4D: The positive impact of openness towards innovation on the use of lean
knowledge transfer mechanisms (KTM_LIR) increases with trust.
58
5.2 Methodology
After having formulated four different types of hypotheses, the aim of this paper is
to describe particularities of the survey instrument, the sample, and the data
collection of the present study. In the following, empirical analyses and
interpretation of research findings are given.
5.2.1 Survey instrument
Data was collected by using an already existing questionnaire. The original
questionnaire was developed by Edwin Wiesinger (2008) in German language,
and was recommended by Univ. Prof. Dr. Josef Windsperger in March 2010. This
survey analyzed diverse determinants of knowledge transfer mechanisms in an
Austrian business cluster. The present survey adds to this an additional item
battery, investigating the role innovation adoption theory plays in the choice of
knowledge transfer mechanisms in Italian industrial districts.
First, it was necessary to translate the original German questionnaire into Italian.
The translation was realized accordingly to standard rules of the so-called ASQ
model (ask-the-same-question approach) recommended by Harkness (2003).
The first translation (one-to-one translation) was realized simultaneously by the
author of the present study and by a German graduate of economics with fluent
Italian language skills. It focused in particular on a literal translation of the original
version. After that an Italian graduate of economics with good German language
skills re-translated the Italian version into German. Consequently, comparing the
different versions, those translations that reflected best the original wording were
adopted. The final questionnaire was further reviewed by native speakers. For
this purpose, people of different age, academic background, business
background, and gender were contacted. Lastly, the final Italian questionnaire
was conveyed into an electronic questionnaire.
The final questionnaire is divided into eleven question batteries and consists of
two parts. The first part of the questionnaire aims at exploring general
characteristics of Italian district firms in the fashion and textile business, asking
for (1) contact details, (2) business sector, (3) sales, (4) number of employees,
and (5) founding year. In order to assure the respondents’ anonymity and their
voluntariness it was not obligatory for them to respond to these introductory
questions. The second part of the questionnaire refers to more specific questions,
59
asking respondents (1) which knowledge transfer mechanisms they use in inter-
company interaction, (2) how they transfer knowledge to other district members,
(3) how they acquire new knowledge from other district partners, (4) which
degree of trust they perceive between district companies, (5) how they evaluate
the degree of knowledge complexity, and (6) how innovative they consider
themselves to be. The questionnaire was retrievable online from May to July
2011, and its completion required approximately ten minutes. Both the Italian and
the original German questionnaire are attached in Appendix D.
5.2.2 Sample and data collection
The target population of this study consists of fashion and textile companies in
Italian industrial districts. The first strategy was to contact exclusively companies
from the district of Prato which is, as already mentioned before, one of the
leading textile clusters worldwide.334 The identification of district firms was based
on two sources: (1) online data bases (e.g., “Unione Industriale Pratese”)335 and
(2) the Italian Chamber of Commerce. In total, 485 residential district firms were
contacted by mail. In total 144 companies accessed the online questionnaire, but
only 34 firms answered at least most of the questions. In order to increase the
response rate, diverse actions were set, ranging from multiple reminders to non-
respondents and personal contacting via telephone as well as using a “Sacher
cake lottery” as an incentive. Despite those attempts, the response rate still
remained very low, and thus the sample size was too small to allow profound
multivariate data analyses. This high non-response rate was also problematic
because it leads to the question “whether the respondents are somehow different
from those who didn’t respond.”336 In fact, it can be assumed that it is critical to
presuppose that the two groups (respondents and non-respondents) are
identical.337 In order to understand the reason why so many firms did not
complete the questionnaire, even though they had agreed in a previous phone
334
http://www.osservatoriodistretti.org/node/282/distretto-del-tessile-abbigliamento-di-prato
(13/09/2011)
335 http://www.ui.prato.it/unionedigitale/v2/default.asp (13/09/2011) 336 Curchill/Iacobucci, 2005, p. 382 337 Curchill/Iacobucci, 2005, p. 382
60
call to participate in the survey, some randomly selected companies were
contacted personally in a second phone call session. Hereby, it resulted that the
major reason for non-response was the critical economic situation that many local
firms have to cope with during the present worldwide financial crisis.
This situation made it necessary to enlarge the sample, and to contact firms from
other industrial districts. For this purpose, the so-called “snowball technique”338
was used. A leading multinational fashion corporate group which stands in
constant contact with retailers and producers in the Italian industrial districts was
contacted. Managers of the single affiliates were asked to contact exclusively
executive directors of target district firms, and to spread the questionnaire among
district partners who might be interested in cooperating. This procedure resulted
in an additional 131 usable questionnaires, i.e., questionnaires in which the
majority of questions apart from the general company description have been
answered. Unfortunately, the online questionnaire tool allowed skipping single
questions or question batteries, thus the problem occurred that some
respondents answered the questionnaire only in parts. However, the extension of
the sample led to a satisfying sample size for all analyses.
Before pooling both samples, a structural comparison was made in order to
understand whether the two samples are too different (see Appendix E). This
comparison showed that the companies of the two samples differ significantly in
term of company size and sales, as these two variables resulted highly inter-
related. This fact has been dealt with by including sales as a control variable in
the following statistical analyses. But as the two samples are structurally
comparable rather similar with respect to their business experience (age), and in
particular in their use of knowledge transfer mechanisms, it has been considered
legitimate to merge all companies into one single sample, including in total 165
district firms.
5.3 Descriptive statistics
The following sections present the applied statistical techniques and the results.
All data analyses were realized with SPSS. The theoretical description of
statistical methods used in this study is based on commonly known existing
338 Curchill/Iacobucci, 2005, p. 327
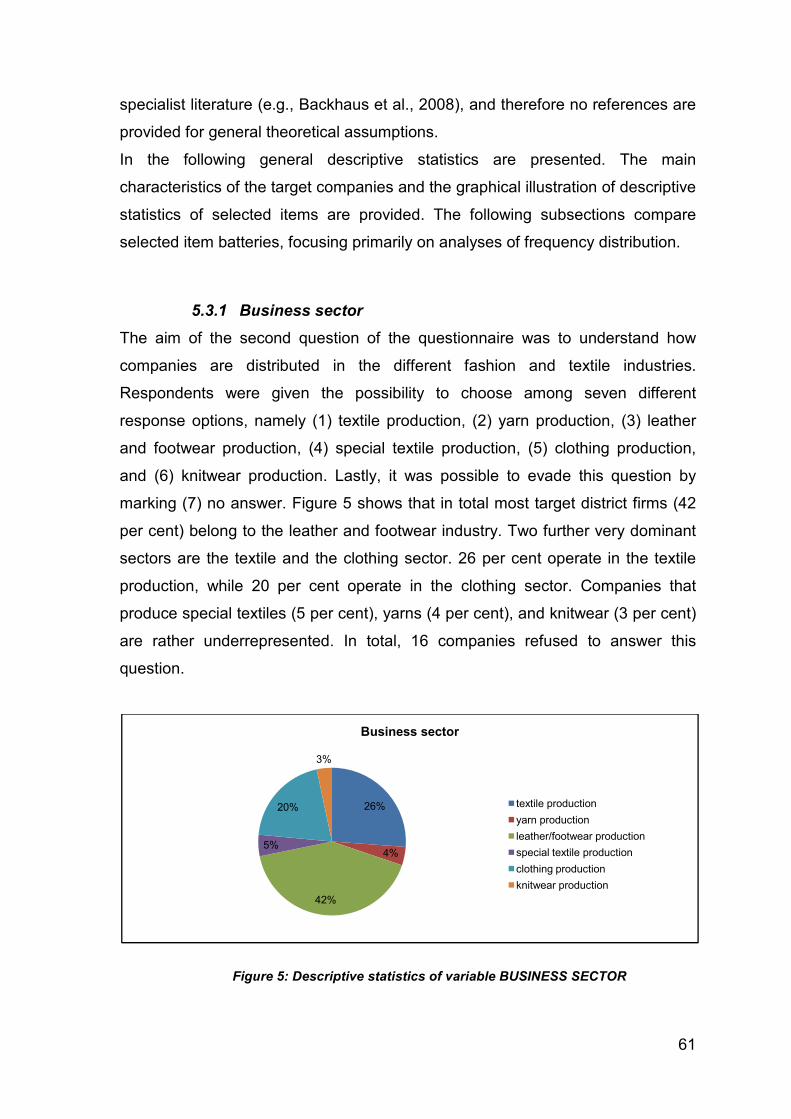
61
specialist literature (e.g., Backhaus et al., 2008), and therefore no references are
provided for general theoretical assumptions.
In the following general descriptive statistics are presented. The main
characteristics of the target companies and the graphical illustration of descriptive
statistics of selected items are provided. The following subsections compare
selected item batteries, focusing primarily on analyses of frequency distribution.
5.3.1 Business sector
The aim of the second question of the questionnaire was to understand how
companies are distributed in the different fashion and textile industries.
Respondents were given the possibility to choose among seven different
response options, namely (1) textile production, (2) yarn production, (3) leather
and footwear production, (4) special textile production, (5) clothing production,
and (6) knitwear production. Lastly, it was possible to evade this question by
marking (7) no answer. Figure 5 shows that in total most target district firms (42
per cent) belong to the leather and footwear industry. Two further very dominant
sectors are the textile and the clothing sector. 26 per cent operate in the textile
production, while 20 per cent operate in the clothing sector. Companies that
produce special textiles (5 per cent), yarns (4 per cent), and knitwear (3 per cent)
are rather underrepresented. In total, 16 companies refused to answer this
question.
Figure 5: Descriptive statistics of variable BUSINESS SECTOR
26%
4%
42%
5%
20%
3%
Business sector
textile production
yarn production
leather/footwear production
special textile production
clothing production
knitwear production
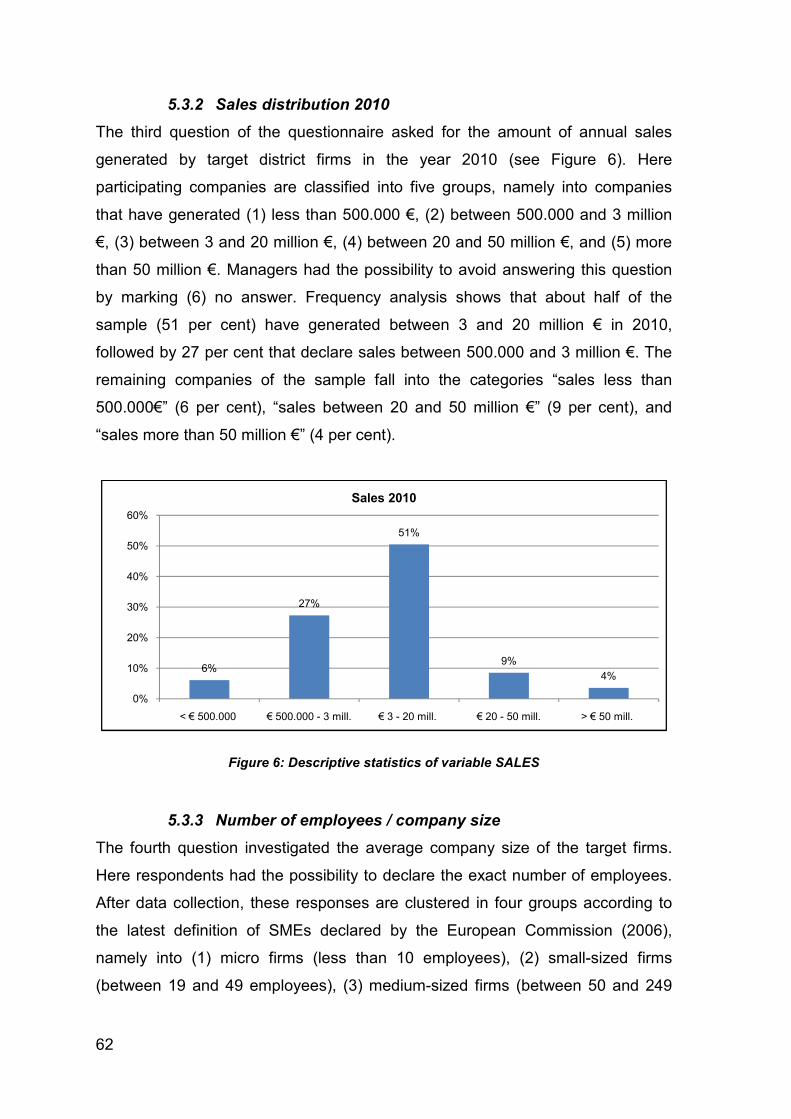
62
5.3.2 Sales distribution 2010
The third question of the questionnaire asked for the amount of annual sales
generated by target district firms in the year 2010 (see Figure 6). Here
participating companies are classified into five groups, namely into companies
that have generated (1) less than 500.000 €, (2) between 500.000 and 3 million
€, (3) between 3 and 20 million €, (4) between 20 and 50 million €, and (5) more
than 50 million €. Managers had the possibility to avoid answering this question
by marking (6) no answer. Frequency analysis shows that about half of the
sample (51 per cent) have generated between 3 and 20 million € in 2010,
followed by 27 per cent that declare sales between 500.000 and 3 million €. The
remaining companies of the sample fall into the categories “sales less than
500.000€” (6 per cent), “sales between 20 and 50 million €” (9 per cent), and
“sales more than 50 million €” (4 per cent).
Figure 6: Descriptive statistics of variable SALES
5.3.3 Number of employees / company size
The fourth question investigated the average company size of the target firms.
Here respondents had the possibility to declare the exact number of employees.
After data collection, these responses are clustered in four groups according to
the latest definition of SMEs declared by the European Commission (2006),
namely into (1) micro firms (less than 10 employees), (2) small-sized firms
(between 19 and 49 employees), (3) medium-sized firms (between 50 and 249
6%
27%
51%
9%
4%
0%
10%
20%
30%
40%
50%
60%
< € 500.000 € 500.000 - 3 mill. € 3 - 20 mill. € 20 - 50 mill. > € 50 mill.
Sales 2010
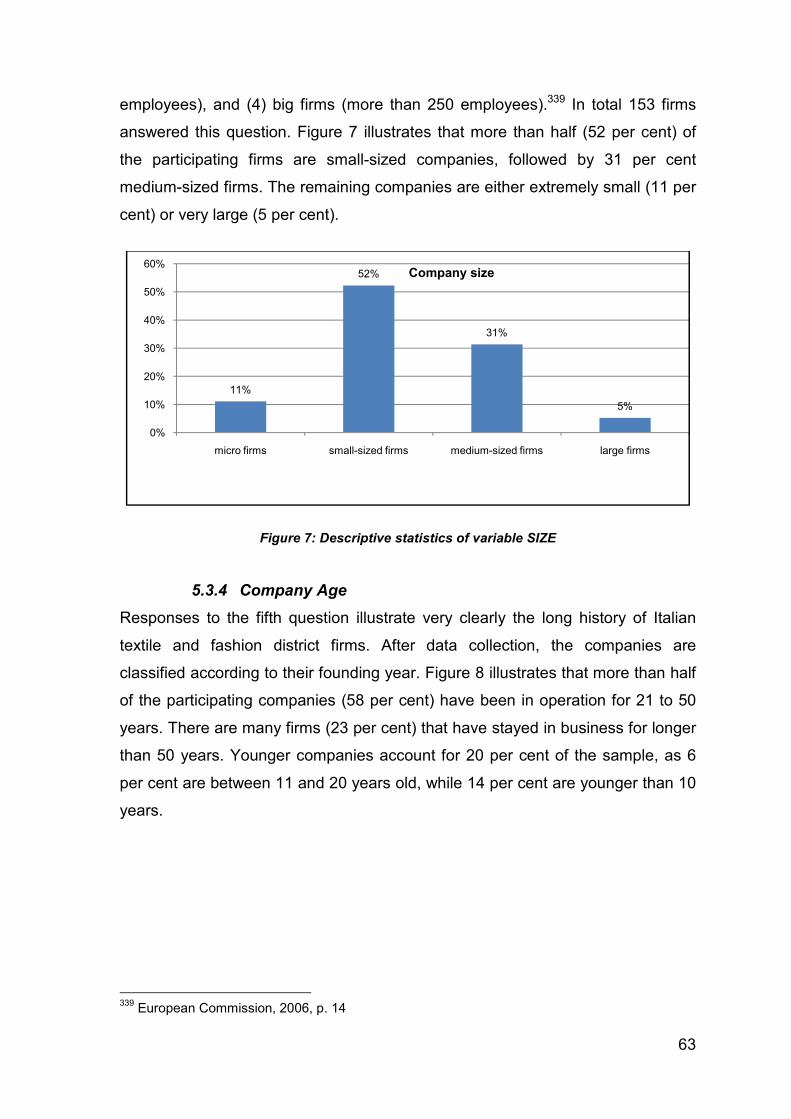
63
employees), and (4) big firms (more than 250 employees).339 In total 153 firms
answered this question. Figure 7 illustrates that more than half (52 per cent) of
the participating firms are small-sized companies, followed by 31 per cent
medium-sized firms. The remaining companies are either extremely small (11 per
cent) or very large (5 per cent).
Figure 7: Descriptive statistics of variable SIZE
5.3.4 Company Age
Responses to the fifth question illustrate very clearly the long history of Italian
textile and fashion district firms. After data collection, the companies are
classified according to their founding year. Figure 8 illustrates that more than half
of the participating companies (58 per cent) have been in operation for 21 to 50
years. There are many firms (23 per cent) that have stayed in business for longer
than 50 years. Younger companies account for 20 per cent of the sample, as 6
per cent are between 11 and 20 years old, while 14 per cent are younger than 10
years.
339 European Commission, 2006, p. 14
11%
52%
31%
5%
0%
10%
20%
30%
40%
50%
60%
micro firms small-sized firms medium-sized firms large firms
Company size
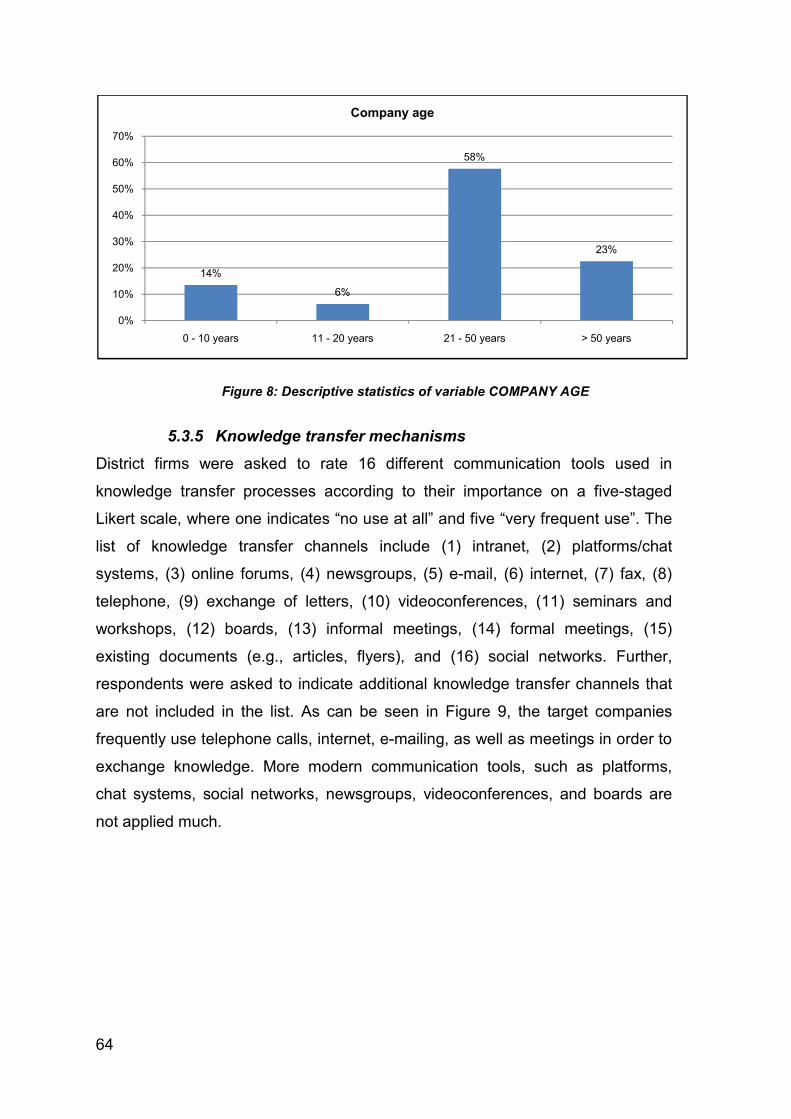
64
Figure 8: Descriptive statistics of variable COMPANY AGE
5.3.5 Knowledge transfer mechanisms
District firms were asked to rate 16 different communication tools used in
knowledge transfer processes according to their importance on a five-staged
Likert scale, where one indicates “no use at all” and five “very frequent use”. The
list of knowledge transfer channels include (1) intranet, (2) platforms/chat
systems, (3) online forums, (4) newsgroups, (5) e-mail, (6) internet, (7) fax, (8)
telephone, (9) exchange of letters, (10) videoconferences, (11) seminars and
workshops, (12) boards, (13) informal meetings, (14) formal meetings, (15)
existing documents (e.g., articles, flyers), and (16) social networks. Further,
respondents were asked to indicate additional knowledge transfer channels that
are not included in the list. As can be seen in Figure 9, the target companies
frequently use telephone calls, internet, e-mailing, as well as meetings in order to
exchange knowledge. More modern communication tools, such as platforms,
chat systems, social networks, newsgroups, videoconferences, and boards are
not applied much.
14%
6%
58%
23%
0%
10%
20%
30%
40%
50%
60%
70%
0 - 10 years 11 - 20 years 21 - 50 years > 50 years
Company age
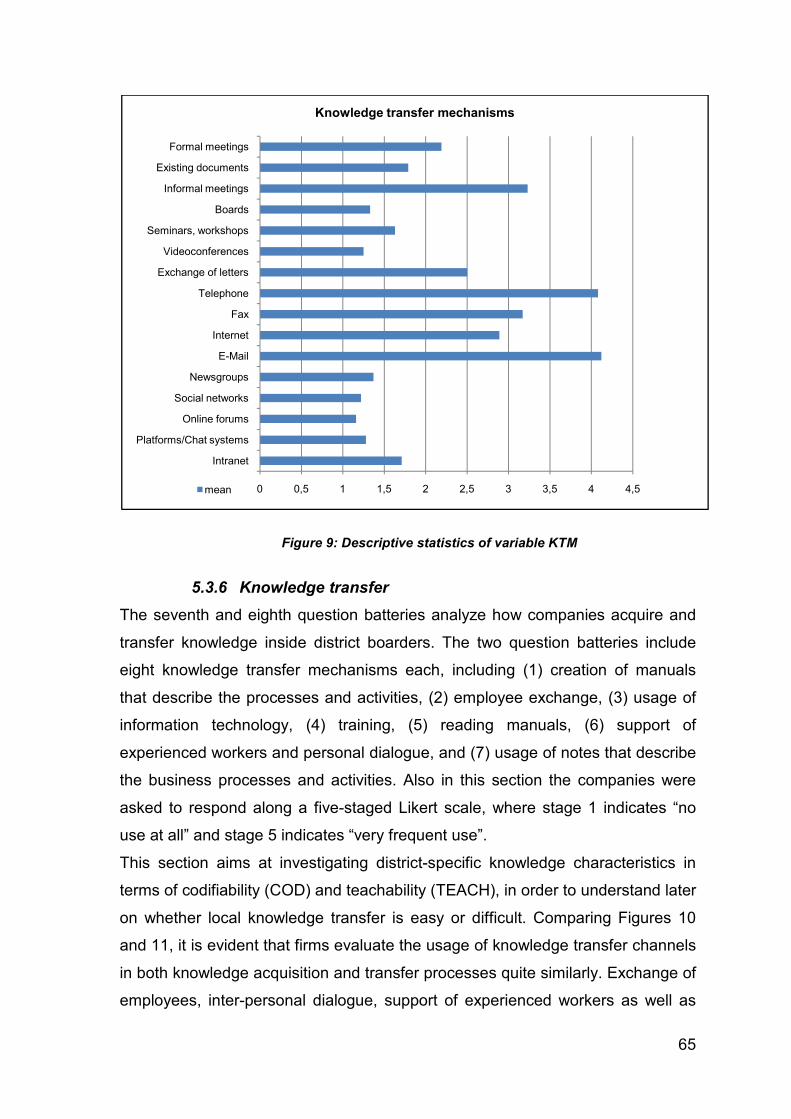
65
Figure 9: Descriptive statistics of variable KTM
5.3.6 Knowledge transfer
The seventh and eighth question batteries analyze how companies acquire and
transfer knowledge inside district boarders. The two question batteries include
eight knowledge transfer mechanisms each, including (1) creation of manuals
that describe the processes and activities, (2) employee exchange, (3) usage of
information technology, (4) training, (5) reading manuals, (6) support of
experienced workers and personal dialogue, and (7) usage of notes that describe
the business processes and activities. Also in this section the companies were
asked to respond along a five-staged Likert scale, where stage 1 indicates “no
use at all” and stage 5 indicates “very frequent use”.
This section aims at investigating district-specific knowledge characteristics in
terms of codifiability (COD) and teachability (TEACH), in order to understand later
on whether local knowledge transfer is easy or difficult. Comparing Figures 10
and 11, it is evident that firms evaluate the usage of knowledge transfer channels
in both knowledge acquisition and transfer processes quite similarly. Exchange of
employees, inter-personal dialogue, support of experienced workers as well as
0 0,5 1 1,5 2 2,5 3 3,5 4 4,5
Intranet
Platforms/Chat systems
Online forums
Social networks
Newsgroups
Internet
Fax
Telephone
Exchange of letters
Videoconferences
Seminars, workshops
Boards
Informal meetings
Existing documents
Formal meetings
Knowledge transfer mechanisms
mean
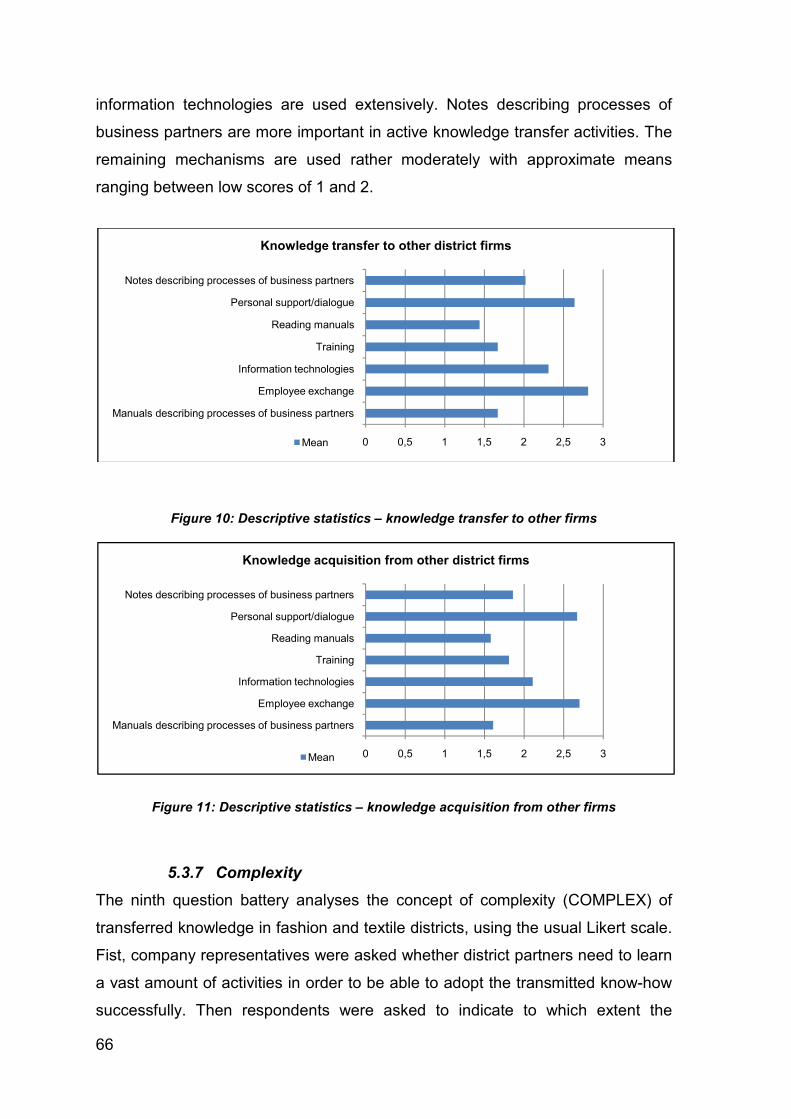
66
information technologies are used extensively. Notes describing processes of
business partners are more important in active knowledge transfer activities. The
remaining mechanisms are used rather moderately with approximate means
ranging between low scores of 1 and 2.
Figure 10: Descriptive statistics – knowledge transfer to other firms
Figure 11: Descriptive statistics – knowledge acquisition from other firms
5.3.7 Complexity
The ninth question battery analyses the concept of complexity (COMPLEX) of
transferred knowledge in fashion and textile districts, using the usual Likert scale.
Fist, company representatives were asked whether district partners need to learn
a vast amount of activities in order to be able to adopt the transmitted know-how
successfully. Then respondents were asked to indicate to which extent the
0 0,5 1 1,5 2 2,5 3
Manuals describing processes of business partners
Employee exchange
Information technologies
Training
Reading manuals
Personal support/dialogue
Notes describing processes of business partners
Knowledge transfer to other district firms
Mean
0 0,5 1 1,5 2 2,5 3
Manuals describing processes of business partners
Employee exchange
Information technologies
Training
Reading manuals
Personal support/dialogue
Notes describing processes of business partners
Knowledge acquisition from other district firms
Mean
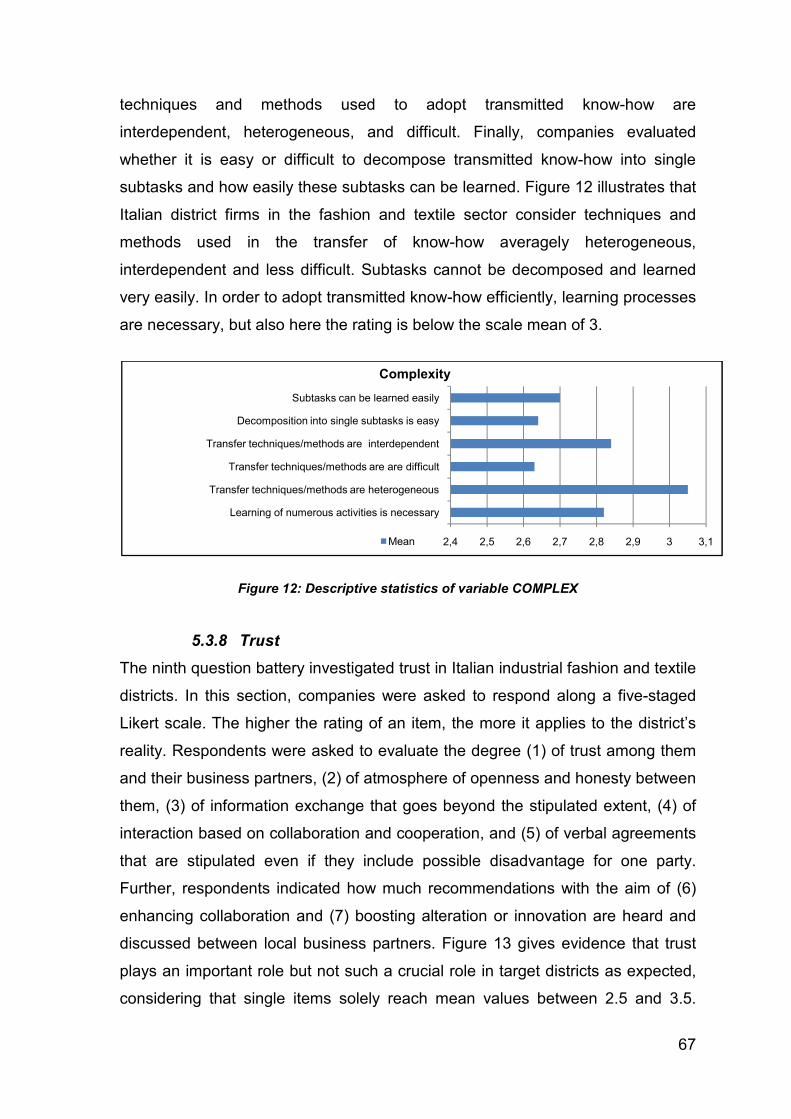
67
techniques and methods used to adopt transmitted know-how are
interdependent, heterogeneous, and difficult. Finally, companies evaluated
whether it is easy or difficult to decompose transmitted know-how into single
subtasks and how easily these subtasks can be learned. Figure 12 illustrates that
Italian district firms in the fashion and textile sector consider techniques and
methods used in the transfer of know-how averagely heterogeneous,
interdependent and less difficult. Subtasks cannot be decomposed and learned
very easily. In order to adopt transmitted know-how efficiently, learning processes
are necessary, but also here the rating is below the scale mean of 3.
Figure 12: Descriptive statistics of variable COMPLEX
5.3.8 Trust
The ninth question battery investigated trust in Italian industrial fashion and textile
districts. In this section, companies were asked to respond along a five-staged
Likert scale. The higher the rating of an item, the more it applies to the district’s
reality. Respondents were asked to evaluate the degree (1) of trust among them
and their business partners, (2) of atmosphere of openness and honesty between
them, (3) of information exchange that goes beyond the stipulated extent, (4) of
interaction based on collaboration and cooperation, and (5) of verbal agreements
that are stipulated even if they include possible disadvantage for one party.
Further, respondents indicated how much recommendations with the aim of (6)
enhancing collaboration and (7) boosting alteration or innovation are heard and
discussed between local business partners. Figure 13 gives evidence that trust
plays an important role but not such a crucial role in target districts as expected,
considering that single items solely reach mean values between 2.5 and 3.5.
2,4 2,5 2,6 2,7 2,8 2,9 3 3,1
Learning of numerous activities is necessary
Transfer techniques/methods are heterogeneous
Transfer techniques/methods are are difficult
Transfer techniques/methods are interdependent
Decomposition into single subtasks is easy
Subtasks can be learned easily
Complexity
Mean
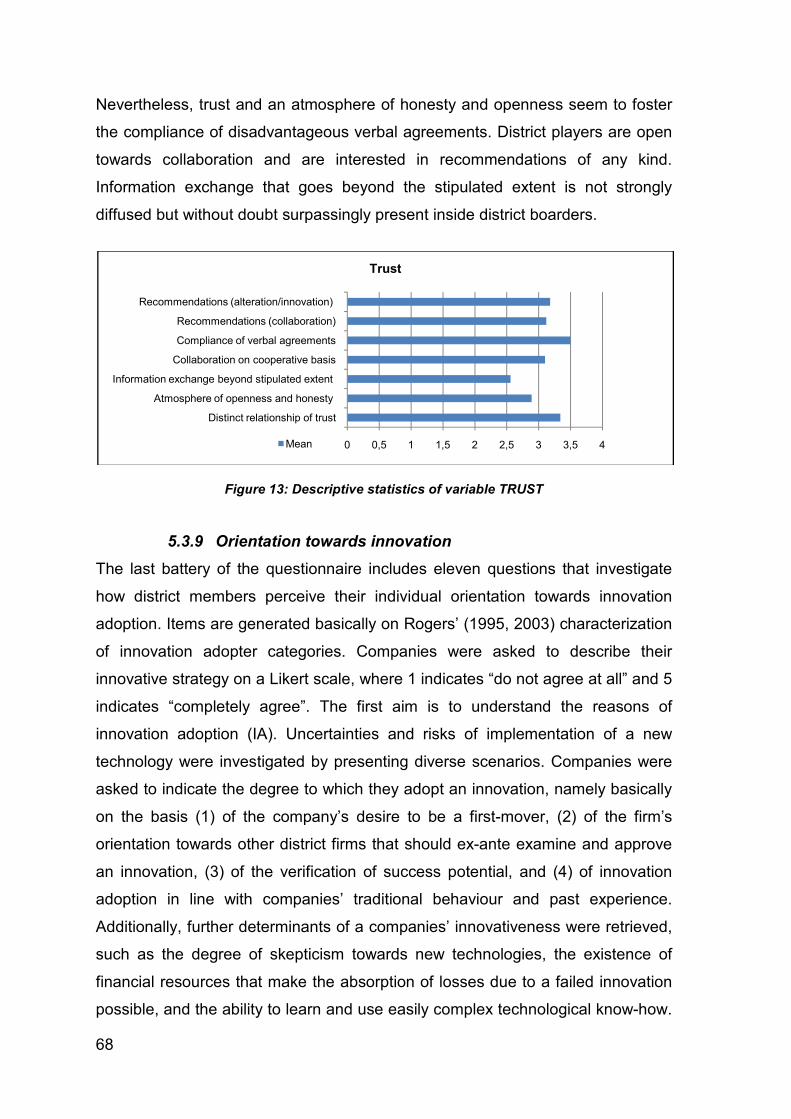
68
Nevertheless, trust and an atmosphere of honesty and openness seem to foster
the compliance of disadvantageous verbal agreements. District players are open
towards collaboration and are interested in recommendations of any kind.
Information exchange that goes beyond the stipulated extent is not strongly
diffused but without doubt surpassingly present inside district boarders.
Figure 13: Descriptive statistics of variable TRUST
5.3.9 Orientation towards innovation
The last battery of the questionnaire includes eleven questions that investigate
how district members perceive their individual orientation towards innovation
adoption. Items are generated basically on Rogers’ (1995, 2003) characterization
of innovation adopter categories. Companies were asked to describe their
innovative strategy on a Likert scale, where 1 indicates “do not agree at all” and 5
indicates “completely agree”. The first aim is to understand the reasons of
innovation adoption (IA). Uncertainties and risks of implementation of a new
technology were investigated by presenting diverse scenarios. Companies were
asked to indicate the degree to which they adopt an innovation, namely basically
on the basis (1) of the company’s desire to be a first-mover, (2) of the firm’s
orientation towards other district firms that should ex-ante examine and approve
an innovation, (3) of the verification of success potential, and (4) of innovation
adoption in line with companies’ traditional behaviour and past experience.
Additionally, further determinants of a companies’ innovativeness were retrieved,
such as the degree of skepticism towards new technologies, the existence of
financial resources that make the absorption of losses due to a failed innovation
possible, and the ability to learn and use easily complex technological know-how.
0 0,5 1 1,5 2 2,5 3 3,5 4
Distinct relationship of trust
Atmosphere of openness and honesty
Information exchange beyond stipulated extent
Collaboration on cooperative basis
Compliance of verbal agreements
Recommendations (collaboration)
Recommendations (alteration/innovation)
Trust
Mean
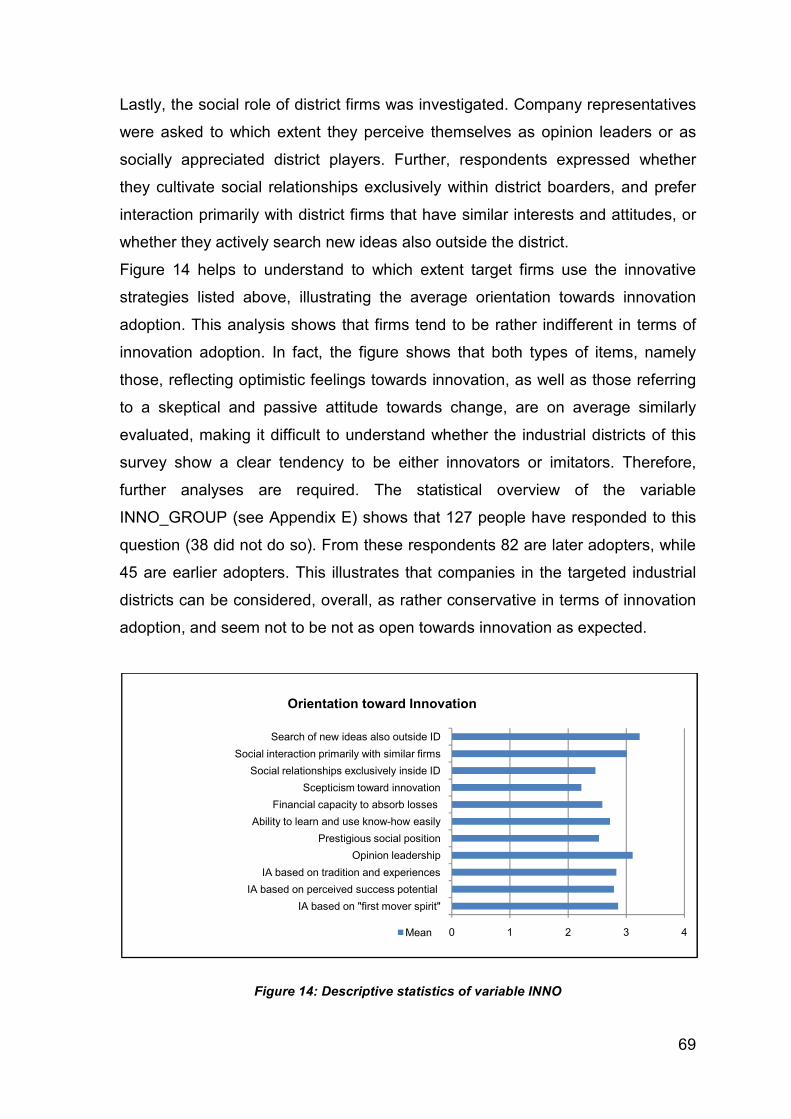
69
Lastly, the social role of district firms was investigated. Company representatives
were asked to which extent they perceive themselves as opinion leaders or as
socially appreciated district players. Further, respondents expressed whether
they cultivate social relationships exclusively within district boarders, and prefer
interaction primarily with district firms that have similar interests and attitudes, or
whether they actively search new ideas also outside the district.
Figure 14 helps to understand to which extent target firms use the innovative
strategies listed above, illustrating the average orientation towards innovation
adoption. This analysis shows that firms tend to be rather indifferent in terms of
innovation adoption. In fact, the figure shows that both types of items, namely
those, reflecting optimistic feelings towards innovation, as well as those referring
to a skeptical and passive attitude towards change, are on average similarly
evaluated, making it difficult to understand whether the industrial districts of this
survey show a clear tendency to be either innovators or imitators. Therefore,
further analyses are required. The statistical overview of the variable
INNO_GROUP (see Appendix E) shows that 127 people have responded to this
question (38 did not do so). From these respondents 82 are later adopters, while
45 are earlier adopters. This illustrates that companies in the targeted industrial
districts can be considered, overall, as rather conservative in terms of innovation
adoption, and seem not to be not as open towards innovation as expected.
Figure 14: Descriptive statistics of variable INNO
0 1 2 3 4
IA based on "first mover spirit"
IA based on perceived success potential
IA based on tradition and experiences
Opinion leadership
Prestigious social position
Ability to learn and use know-how easily
Financial capacity to absorb losses
Scepticism toward innovation
Social relationships exclusively inside ID
Social interaction primarily with similar firms
Search of new ideas also outside ID
Orientation toward Innovation
Mean
70
5.4 Reliability analyses
After having presented general descriptive statistics, statistical methods used to
test the formulated hypotheses are described. The following statistical approach
was used for testing the hypothesis: First, previously constructed scales are
tested on reliability. The paper proceeds with the adoption of multiple regression
analyses and comparison of means in order to test the formulated hypotheses.
The present work ends with an interpretation of the final results. Additional SPSS
outputs and variable descriptions are given in Appendix E.
Preliminary to hypotheses testing, scales for the elements of tacit knowledge
(codiafiability, teachability, and complexity), as well as for trust and
innovativeness need to be designed and tested for reliability. Items for the scales
related to knowledge transfer are elaborated according to past contributions of
Nonaka and Takeuchi (1995). In order to differentiate between leaner and richer
knowledge transfer mechanisms, the scales KTM_HIR (knowledge transfer
mechanism with higher degree of information richness) and KTM_LIR
(knowledge transfer mechanism with lower degree of information richness) are
based on the works of Daft and Lengel (1983, 1986), Daft et al., (1987) Büchel
and Raub (2001), Vickery et al. (2004) as well as of Kaplan and Haenlein (2010).
The composition of the scales of knowledge attributes refers to Kogut and
Zander’s (1995) original theory, who have identified on the basis of precedent
studies (e.g., Rogers, 1962; Winter, 1987) the following three knowledge
characteristics codifiability, (2) teachability, (3) complexity. The scale measuring
respondents orientation towards innovation adoption is based on Rogers’ (1995,
2003) theory on innovation diffusion.
First, factor analysis is the starting point of scale construction, detecting the factor
dimensions in sets of variables. As the scales used in this work are based on
those used in previous diploma theses (e.g., Kotzian, 2008; Zwazl, 2008;
Schwaiger, 2009; Hollnthoner, 2010), factor analyses are skipped as the content
validity of the scales is assumed to be appropriate also for the present study.
Second, reliability analysis is necessary to test whether the survey instrument is
reliable in terms of consistent results when measurement is repeated.340 The
main goal, hereby, is to make sure that scales used in the questionnaire are
340
Reis/Judd, 2000, p. 297
71
reliable and appropriate for further statistical analyses. The internal consistency
of scales is most commonly tested by using the Cronbach’s Alpha coefficient.341
For calculation of this coefficient, variables need to be metric or dichotomous.
Low Alpha values (closer to 0 than to 1) indicate that “the sample of items
performs poorly in capturing the construct which motivated the measure.”342
Alpha values greater than 0.80 are considered good values. However, in
empirical practice also smaller values can be acceptable.343 Nunnualy (1976), for
example, highlights that in earlier stages of basic studies values between 0.50
and 0.60 are still tolerable.344
5.4.1 Knowledge transfer mechanisms
As already mentioned, referring to the information richness theory, it is possible
to differentiate communication channels according to their degree of information
(media) richness. Therefore, it is first necessary to categorize knowledge transfer
mechanisms into knowledge transfer mechanisms with higher degree of
information richness (KTM_HIR) and into knowledge transfer mechanisms with
lower degree of information richness (KTM_HIR).The theoretical basis of the
consequent classification of knowledge transfer mechanisms is based on
previous studies described in detail in 2.5.2. In this study, direct personal
communication is defined as a communication channel with higher degree of
HIR. On the basis of this assumption, meetings, seminars, workshops,
videoconferences, and boards can be considered as knowledge transfer
mechanisms with high information richness (KTM_HIR). In contrast,
communication media with slow feedback capacity and limited capacity to use
mimics, gestures, and language cues, are considered as leaner knowledge
transfer mechanisms (KTM_LIR). This category includes telephone, fax,
exchange of letters, documents, as well as internet, intranet, e-mail, platforms,
chat systems, online forums, and newsgroups. This study aims at investigating
also the usage of social media in industrial districts, as this new form of
341
Cortina, 1993, p. 98
342 Churchill, 1979, p. 68
343 Raithel, 2008, p. 115
344 Churchill, 1979, p. 68
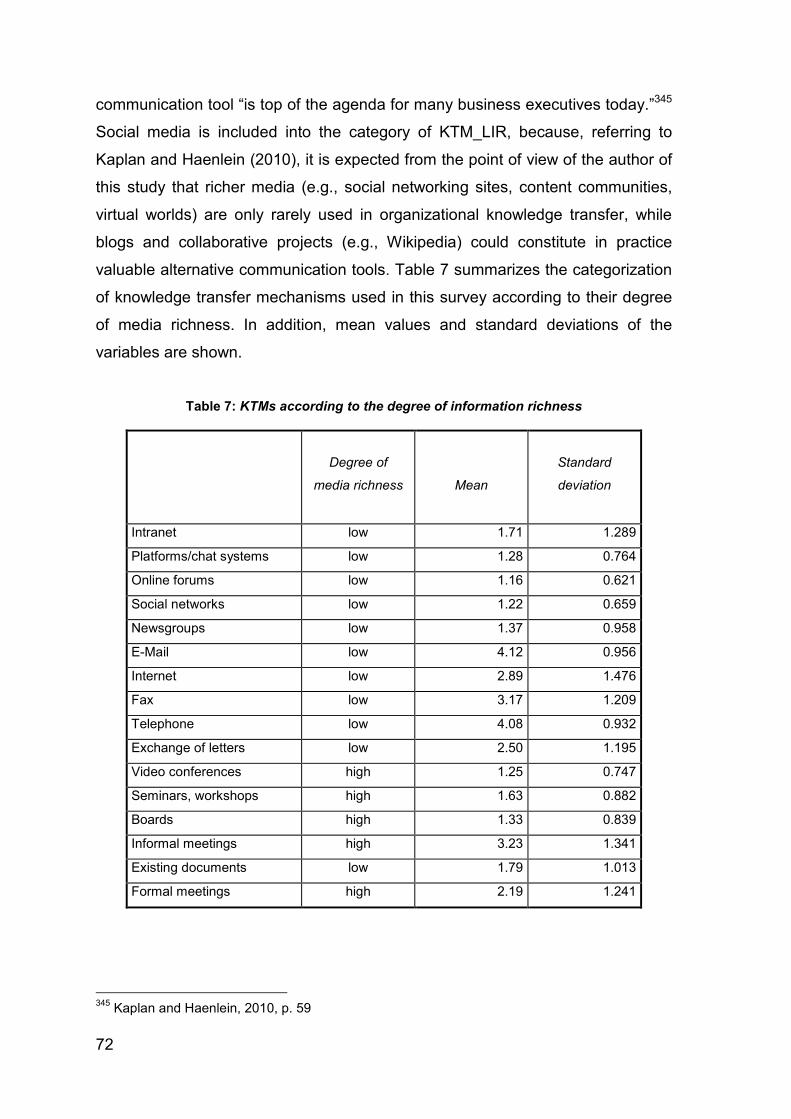
72
communication tool “is top of the agenda for many business executives today.”345
Social media is included into the category of KTM_LIR, because, referring to
Kaplan and Haenlein (2010), it is expected from the point of view of the author of
this study that richer media (e.g., social networking sites, content communities,
virtual worlds) are only rarely used in organizational knowledge transfer, while
blogs and collaborative projects (e.g., Wikipedia) could constitute in practice
valuable alternative communication tools. Table 7 summarizes the categorization
of knowledge transfer mechanisms used in this survey according to their degree
of media richness. In addition, mean values and standard deviations of the
variables are shown.
Table 7: KTMs according to the degree of information richness
Degree of
media richness
Mean
Standard
deviation
Intranet low 1.71 1.289
Platforms/chat systems low 1.28 0.764
Online forums low 1.16 0.621
Social networks low 1.22 0.659
Newsgroups low 1.37 0.958
E-Mail low 4.12 0.956
Internet low 2.89 1.476
Fax low 3.17 1.209
Telephone low 4.08 0.932
Exchange of letters low 2.50 1.195
Video conferences high 1.25 0.747
Seminars, workshops high 1.63 0.882
Boards high 1.33 0.839
Informal meetings high 3.23 1.341
Existing documents low 1.79 1.013
Formal meetings high 2.19 1.241
345 Kaplan and Haenlein, 2010, p. 59
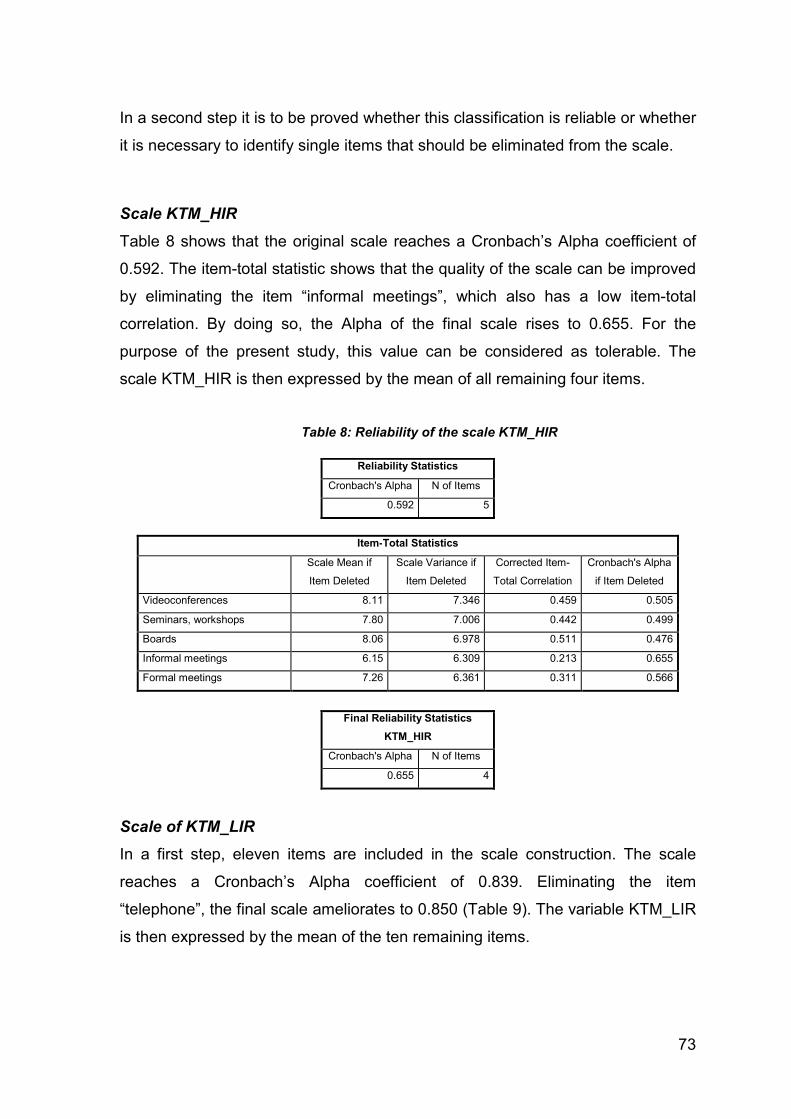
73
In a second step it is to be proved whether this classification is reliable or whether
it is necessary to identify single items that should be eliminated from the scale.
Scale KTM_HIR
Table 8 shows that the original scale reaches a Cronbach’s Alpha coefficient of
0.592. The item-total statistic shows that the quality of the scale can be improved
by eliminating the item “informal meetings”, which also has a low item-total
correlation. By doing so, the Alpha of the final scale rises to 0.655. For the
purpose of the present study, this value can be considered as tolerable. The
scale KTM_HIR is then expressed by the mean of all remaining four items.
Table 8: Reliability of the scale KTM_HIR
Reliability Statistics
Cronbach's Alpha N of Items
0.592 5
Item-Total Statistics
Scale Mean if
Item Deleted
Scale Variance if
Item Deleted
Corrected Item-
Total Correlation
Cronbach's Alpha
if Item Deleted
Videoconferences 8.11 7.346 0.459 0.505
Seminars, workshops 7.80 7.006 0.442 0.499
Boards 8.06 6.978 0.511 0.476
Informal meetings 6.15 6.309 0.213 0.655
Formal meetings 7.26 6.361 0.311 0.566
Final Reliability Statistics
KTM_HIR
Cronbach's Alpha N of Items
0.655 4
Scale of KTM_LIR
In a first step, eleven items are included in the scale construction. The scale
reaches a Cronbach’s Alpha coefficient of 0.839. Eliminating the item
“telephone”, the final scale ameliorates to 0.850 (Table 9). The variable KTM_LIR
is then expressed by the mean of the ten remaining items.
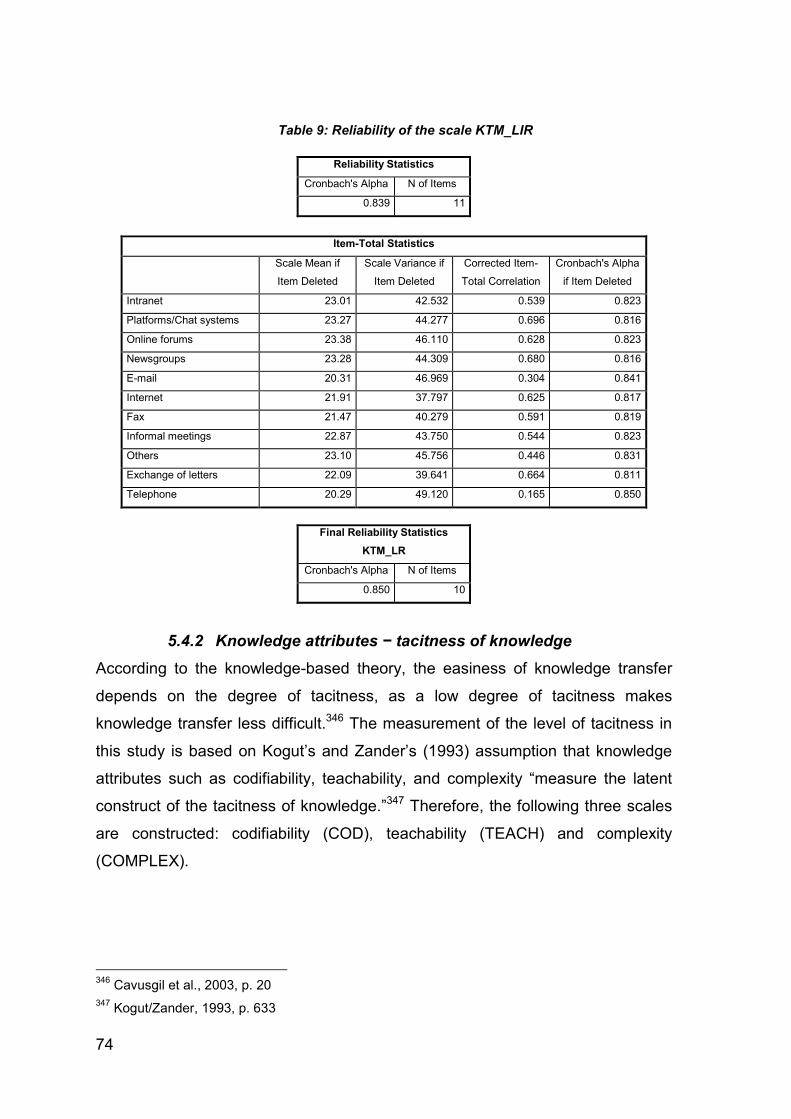
74
Table 9: Reliability of the scale KTM_LIR
Reliability Statistics
Cronbach's Alpha N of Items
0.839 11
Item-Total Statistics
Scale Mean if
Item Deleted
Scale Variance if
Item Deleted
Corrected Item-
Total Correlation
Cronbach's Alpha
if Item Deleted
Intranet 23.01 42.532 0.539 0.823
Platforms/Chat systems 23.27 44.277 0.696 0.816
Online forums 23.38 46.110 0.628 0.823
Newsgroups 23.28 44.309 0.680 0.816
E-mail 20.31 46.969 0.304 0.841
Internet 21.91 37.797 0.625 0.817
Fax 21.47 40.279 0.591 0.819
Informal meetings 22.87 43.750 0.544 0.823
Others 23.10 45.756 0.446 0.831
Exchange of letters 22.09 39.641 0.664 0.811
Telephone 20.29 49.120 0.165 0.850
Final Reliability Statistics
KTM_LR
Cronbach's Alpha N of Items
0.850 10
5.4.2 Knowledge attributes − tacitness of knowledge
According to the knowledge-based theory, the easiness of knowledge transfer
depends on the degree of tacitness, as a low degree of tacitness makes
knowledge transfer less difficult.346 The measurement of the level of tacitness in
this study is based on Kogut’s and Zander’s (1993) assumption that knowledge
attributes such as codifiability, teachability, and complexity “measure the latent
construct of the tacitness of knowledge.”347 Therefore, the following three scales
are constructed: codifiability (COD), teachability (TEACH) and complexity
(COMPLEX).
346 Cavusgil et al., 2003, p. 20 347 Kogut/Zander, 1993, p. 633
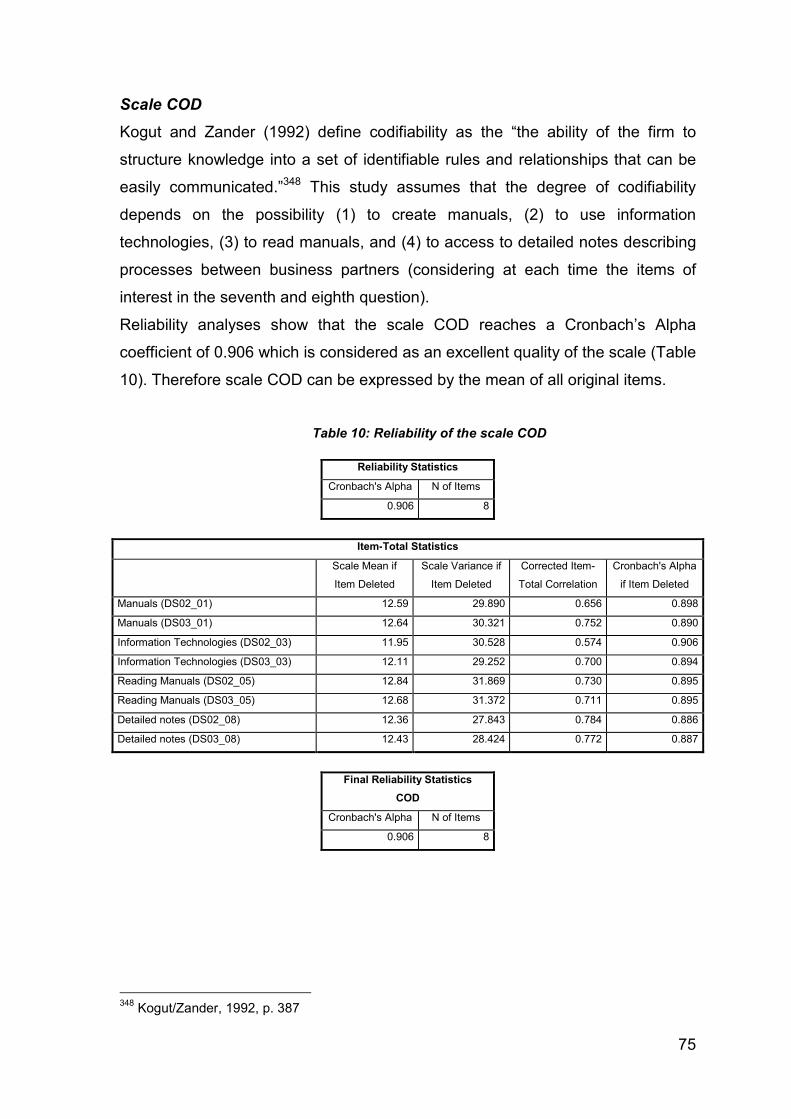
75
Scale COD
Kogut and Zander (1992) define codifiability as the “the ability of the firm to
structure knowledge into a set of identifiable rules and relationships that can be
easily communicated.”348 This study assumes that the degree of codifiability
depends on the possibility (1) to create manuals, (2) to use information
technologies, (3) to read manuals, and (4) to access to detailed notes describing
processes between business partners (considering at each time the items of
interest in the seventh and eighth question).
Reliability analyses show that the scale COD reaches a Cronbach’s Alpha
coefficient of 0.906 which is considered as an excellent quality of the scale (Table
10). Therefore scale COD can be expressed by the mean of all original items.
Table 10: Reliability of the scale COD
Reliability Statistics
Cronbach's Alpha N of Items
0.906 8
Item-Total Statistics
Scale Mean if
Item Deleted
Scale Variance if
Item Deleted
Corrected Item-
Total Correlation
Cronbach's Alpha
if Item Deleted
Manuals (DS02_01) 12.59 29.890 0.656 0.898
Manuals (DS03_01) 12.64 30.321 0.752 0.890
Information Technologies (DS02_03) 11.95 30.528 0.574 0.906
Information Technologies (DS03_03) 12.11 29.252 0.700 0.894
Reading Manuals (DS02_05) 12.84 31.869 0.730 0.895
Reading Manuals (DS03_05) 12.68 31.372 0.711 0.895
Detailed notes (DS02_08) 12.36 27.843 0.784 0.886
Detailed notes (DS03_08) 12.43 28.424 0.772 0.887
Final Reliability Statistics
COD
Cronbach's Alpha N of Items
0.906 8
348 Kogut/Zander, 1992, p. 387
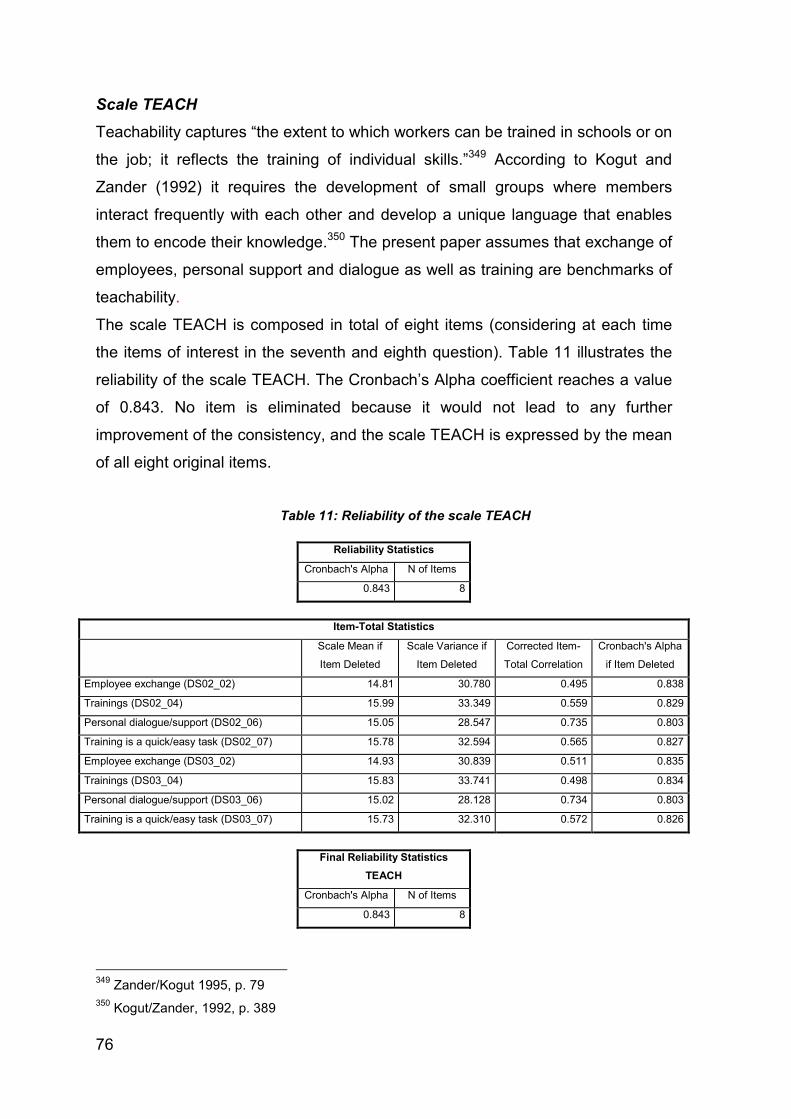
76
Scale TEACH
Teachability captures “the extent to which workers can be trained in schools or on
the job; it reflects the training of individual skills.”349 According to Kogut and
Zander (1992) it requires the development of small groups where members
interact frequently with each other and develop a unique language that enables
them to encode their knowledge.350 The present paper assumes that exchange of
employees, personal support and dialogue as well as training are benchmarks of
teachability.
The scale TEACH is composed in total of eight items (considering at each time
the items of interest in the seventh and eighth question). Table 11 illustrates the
reliability of the scale TEACH. The Cronbach’s Alpha coefficient reaches a value
of 0.843. No item is eliminated because it would not lead to any further
improvement of the consistency, and the scale TEACH is expressed by the mean
of all eight original items.
Table 11: Reliability of the scale TEACH
Reliability Statistics
Cronbach's Alpha N of Items
0.843 8
Item-Total Statistics
Scale Mean if
Item Deleted
Scale Variance if
Item Deleted
Corrected Item-
Total Correlation
Cronbach's Alpha
if Item Deleted
Employee exchange (DS02_02) 14.81 30.780 0.495 0.838
Trainings (DS02_04) 15.99 33.349 0.559 0.829
Personal dialogue/support (DS02_06) 15.05 28.547 0.735 0.803
Training is a quick/easy task (DS02_07) 15.78 32.594 0.565 0.827
Employee exchange (DS03_02) 14.93 30.839 0.511 0.835
Trainings (DS03_04) 15.83 33.741 0.498 0.834
Personal dialogue/support (DS03_06) 15.02 28.128 0.734 0.803
Training is a quick/easy task (DS03_07) 15.73 32.310 0.572 0.826
Final Reliability Statistics
TEACH
Cronbach's Alpha N of Items
0.843 8
349 Zander/Kogut 1995, p. 79 350 Kogut/Zander, 1992, p. 389
77
Scale COMPLEX
According to Dennis and Kinney (1998), Daft and Lengel (1963, 1986) originally
do not clearly differentiate between equivocality and complexity but often use the
two concepts interchangeably.351 Equivocality is defined as “confusion and lack of
understanding”352 due to “existence of multiple and conflicting interpretations
about an organizational situation”.353 According to Kogut and Zander (1992),
codifiability and complexity are related but they are two contrasting concepts.354
Complexity refers to “the inherent variations in combining different kinds of
competences”355, or “a large number of parts that interact in a non simple way.”356
Complexity further depends on “the number of operations required to solve a
task.”357 Moreover, Simonin (1999) assumes that complexity depends on “the
number of interdependent technologies, routines, individuals, and resources
linked to a particular knowledge or asset.”358 Lastly, Sorenson et al. (2005) advise
to measure complexity by analyzing the level of interdependence between
components that a technology incorporates.359
Therefore, this study states that complexity results from the necessity to learn
vast amount of activities in order to be able to adopt the transferred knowledge
successfully. Furthermore, it assumes that techniques and methods used to
adopt transmitted know-how are heterogeneous, very difficult and highly
interdependent. Lastly, it presupposes that complexity increases when it is
difficult to decompose transmitted know-how into single subtasks, and when it is
difficult to learn subtasks.
351
Sheer/Chen, 2004, p. 79
352 Daft/Lengel, 1986, p. 556
353 Daft et al., 1987, p. 357
354 Kogut/Zander, 1992, p. 388
355 Zander/Kogut, 1995, p. 79
356 Simon, 1969, p. 195
357 Kogut/Zander, 1992, p. 388
358 Simonin, 1999, p. 600
359 Sorenson et al., 2005, p. 2
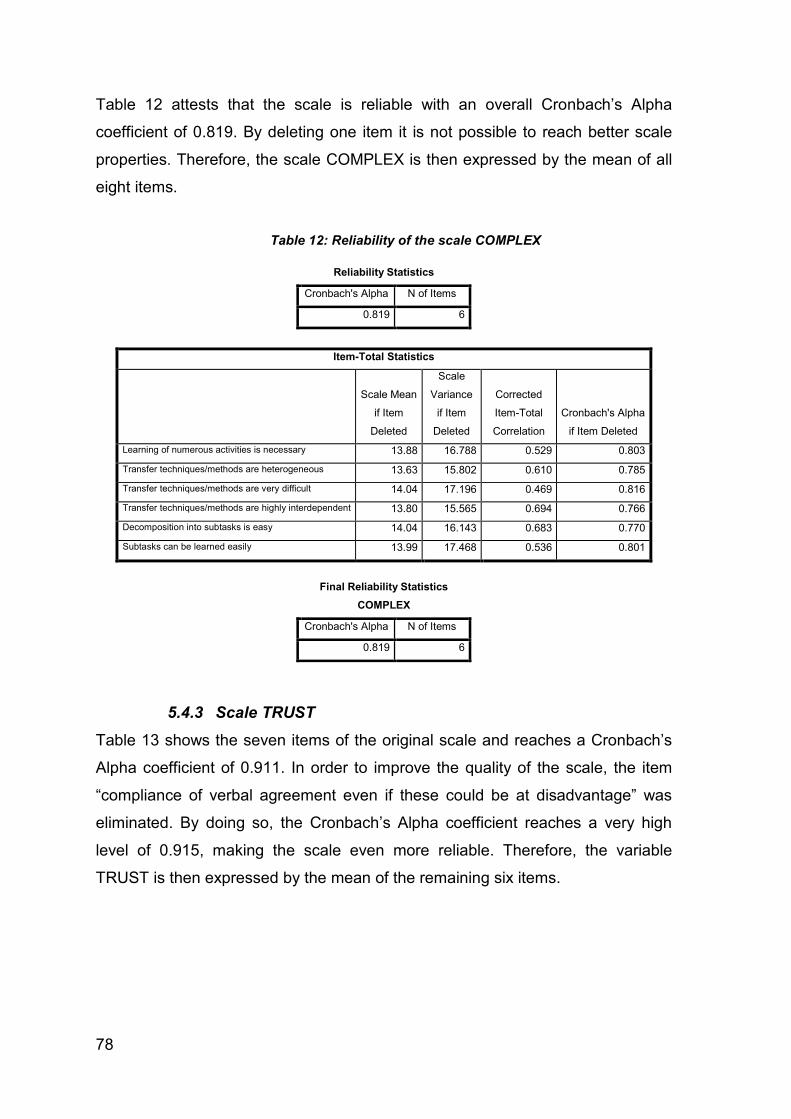
78
Table 12 attests that the scale is reliable with an overall Cronbach’s Alpha
coefficient of 0.819. By deleting one item it is not possible to reach better scale
properties. Therefore, the scale COMPLEX is then expressed by the mean of all
eight items.
Table 12: Reliability of the scale COMPLEX
Reliability Statistics
Cronbach's Alpha N of Items
0.819 6
Item-Total Statistics
Scale Mean
if Item
Deleted
Scale
Variance
if Item
Deleted
Corrected
Item-Total
Correlation
Cronbach's Alpha
if Item Deleted
Learning of numerous activities is necessary 13.88 16.788 0.529 0.803
Transfer techniques/methods are heterogeneous 13.63 15.802 0.610 0.785
Transfer techniques/methods are very difficult 14.04 17.196 0.469 0.816
Transfer techniques/methods are highly interdependent 13.80 15.565 0.694 0.766
Decomposition into subtasks is easy 14.04 16.143 0.683 0.770
Subtasks can be learned easily 13.99 17.468 0.536 0.801
Final Reliability Statistics
COMPLEX
Cronbach's Alpha N of Items
0.819 6
5.4.3 Scale TRUST
Table 13 shows the seven items of the original scale and reaches a Cronbach’s
Alpha coefficient of 0.911. In order to improve the quality of the scale, the item
“compliance of verbal agreement even if these could be at disadvantage” was
eliminated. By doing so, the Cronbach’s Alpha coefficient reaches a very high
level of 0.915, making the scale even more reliable. Therefore, the variable
TRUST is then expressed by the mean of the remaining six items.
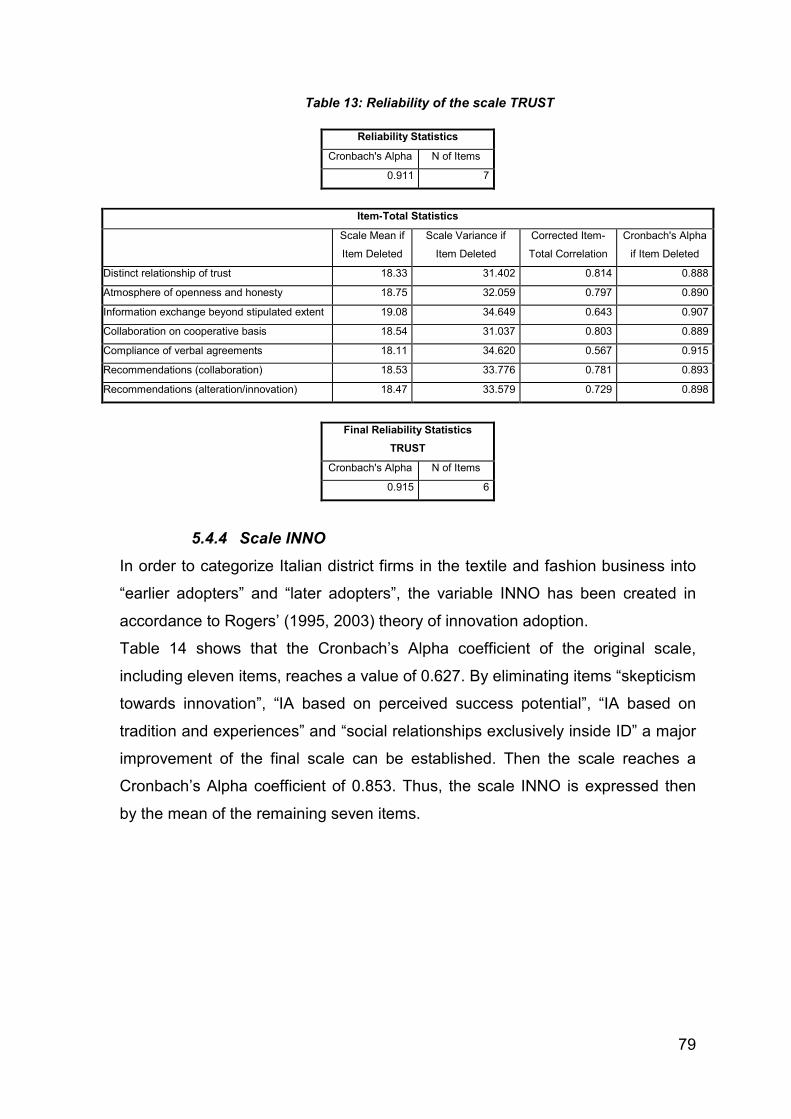
79
Table 13: Reliability of the scale TRUST
Reliability Statistics
Cronbach's Alpha N of Items
0.911 7
Item-Total Statistics
Scale Mean if
Item Deleted
Scale Variance if
Item Deleted
Corrected Item-
Total Correlation
Cronbach's Alpha
if Item Deleted
Distinct relationship of trust 18.33 31.402 0.814 0.888
Atmosphere of openness and honesty 18.75 32.059 0.797 0.890
Information exchange beyond stipulated extent 19.08 34.649 0.643 0.907
Collaboration on cooperative basis 18.54 31.037 0.803 0.889
Compliance of verbal agreements 18.11 34.620 0.567 0.915
Recommendations (collaboration) 18.53 33.776 0.781 0.893
Recommendations (alteration/innovation) 18.47 33.579 0.729 0.898
Final Reliability Statistics
TRUST
Cronbach's Alpha N of Items
0.915 6
5.4.4 Scale INNO
In order to categorize Italian district firms in the textile and fashion business into
“earlier adopters” and “later adopters”, the variable INNO has been created in
accordance to Rogers’ (1995, 2003) theory of innovation adoption.
Table 14 shows that the Cronbach’s Alpha coefficient of the original scale,
including eleven items, reaches a value of 0.627. By eliminating items “skepticism
towards innovation”, “IA based on perceived success potential”, “IA based on
tradition and experiences” and “social relationships exclusively inside ID” a major
improvement of the final scale can be established. Then the scale reaches a
Cronbach’s Alpha coefficient of 0.853. Thus, the scale INNO is expressed then
by the mean of the remaining seven items.
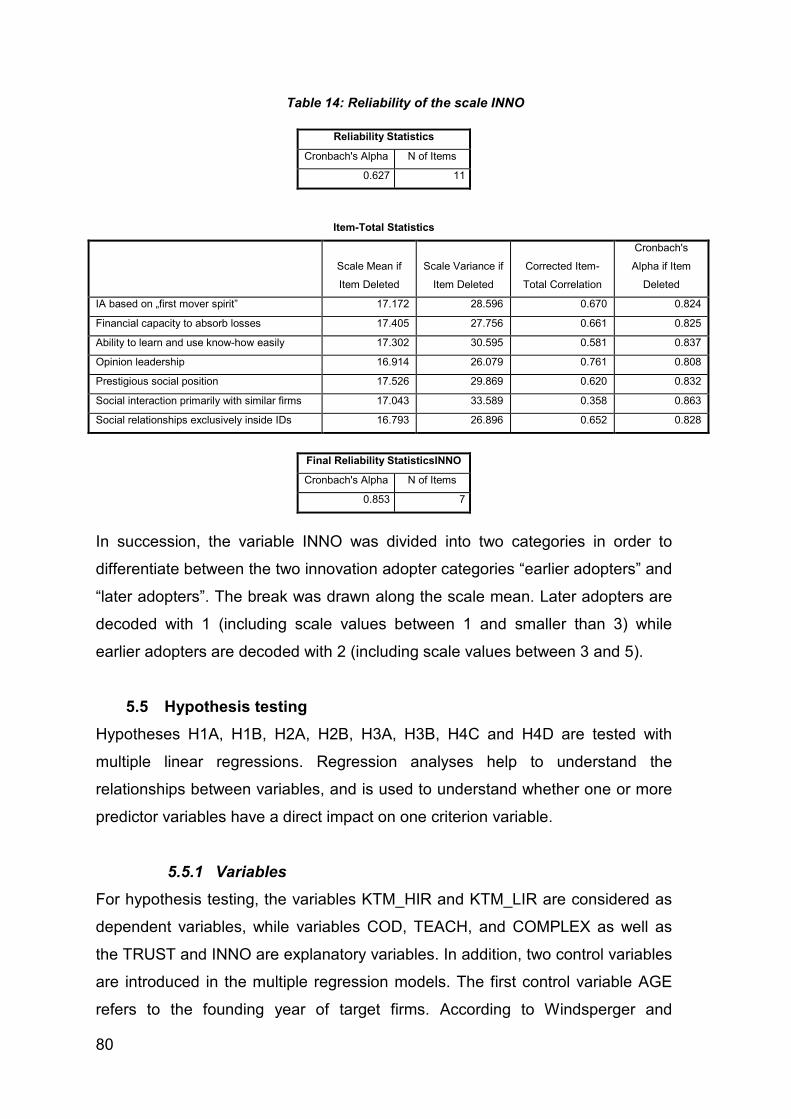
80
Table 14: Reliability of the scale INNO
Reliability Statistics
Cronbach's Alpha N of Items
0.627 11
Item-Total Statistics
Scale Mean if
Item Deleted
Scale Variance if
Item Deleted
Corrected Item-
Total Correlation
Cronbach's
Alpha if Item
Deleted
IA based on „first mover spirit” 17.172 28.596 0.670 0.824
Financial capacity to absorb losses 17.405 27.756 0.661 0.825
Ability to learn and use know-how easily 17.302 30.595 0.581 0.837
Opinion leadership 16.914 26.079 0.761 0.808
Prestigious social position 17.526 29.869 0.620 0.832
Social interaction primarily with similar firms 17.043 33.589 0.358 0.863
Social relationships exclusively inside IDs 16.793 26.896 0.652 0.828
Final Reliability StatisticsINNO
Cronbach's Alpha N of Items
0.853 7
In succession, the variable INNO was divided into two categories in order to
differentiate between the two innovation adopter categories “earlier adopters” and
“later adopters”. The break was drawn along the scale mean. Later adopters are
decoded with 1 (including scale values between 1 and smaller than 3) while
earlier adopters are decoded with 2 (including scale values between 3 and 5).
5.5 Hypothesis testing
Hypotheses H1A, H1B, H2A, H2B, H3A, H3B, H4C and H4D are tested with
multiple linear regressions. Regression analyses help to understand the
relationships between variables, and is used to understand whether one or more
predictor variables have a direct impact on one criterion variable.
5.5.1 Variables
For hypothesis testing, the variables KTM_HIR and KTM_LIR are considered as
dependent variables, while variables COD, TEACH, and COMPLEX as well as
the TRUST and INNO are explanatory variables. In addition, two control variables
are introduced in the multiple regression models. The first control variable AGE
refers to the founding year of target firms. According to Windsperger and
81
Gorovaia (2010), the age of companies is an appropriate control variable to test
knowledge transfer mechanisms because, according to Inkpen (2000), learning
and standardization of “system-specific know-how” application increases over
time.360 Cavusgil et al. (2003) further highlight that experience of cooperation
increases companies’ ability to “recognize and to understand proper mechanisms
of information gathering, interpretation and diffusion.”361 Consequently, it is
assumed that longer years of experience lead to an increased use of lean
transfer mechanisms rather than of rich transfer mechanisms.362 The second
control variable refers to the SALES that target companies have generated in the
year 2010.
5.5.2 Multiple regression: model assumptions
The efficiency of regression analyses depends on the examination of the
following model assumptions: (1) linearity of the relationship between
independent and dependent variable, (2) normal error distribution, (3) absence of
heteroscedasticity, (4) absence of autocorrelation, and (5) absence of
multicollinearity.
• Examination of linearity and normal error distribution
Regression analyses require a linear relation between dependent and
independent variables. Linearity can be controlled with the help of scatter
plots. A basic requisite for regression analyses is further the normal
distribution of both estimated regression parameters and residuals. Violation
of this premise leads to invalid significance tests (F-tests or T-tests) and
misleading results. Testing of violation of normal error distribution is based on
a preliminary examination of scatter plots and Kolmogorow-Smirnow (K-S)
tests.
In this survey, first tests made clear that both dependent variables KTM_HIR
and KTM_LIR show significant obliquity and non-normal distribution of
residuals (see Appendix E). In order to meet the general premises of
regression analyses, a transformation was necessary. After some tests, a 360
Windsperger/Gorovaia, 2010, p. 11
361 Cavusgil et al., 2003, p. 20
362 Windsperger/Gorovaia, 2010, p. 11
82
transformation based on the natural logarithm was identified as the most
appropriate one. The transformed variables are consequently named HIR_ln
and LIR_ln.
• Examination of heteroscedasticity
Another fundamental premise of regression analysis is homoscedasticity
(homogeneous variance of the errors). Heteroscedasticity is the
complementary case, leading to inefficiency of estimates and biases in the
relative standard error of regression coefficients or in confidence intervals. In
order to test for heteroscedasticity it is advised to control residuals visually by
plotting estimated values. When residuals appear in the form of a triangular
distribution, then heteroscedasticity can be assumed.
• Examination of autocorrelation
Autocorrelation violates the fundamental basis of regression analysis as well.
In this case residuals appear uncorrelated in time series. This leads to
underestimation of standard errors and to biases in confidence intervals. In
this case a Durbin-Watson (D-W) test shows whether regression analysis can
be conducted or not. This statistic evaluates the correlation between two
residuals, assuming that the observed values are not autocorrelated. Usually
values range between 0 and 4. Values closer to 0 indicate that a positive
autocorrelation may exist. Values closer to 4 indicate a negative
autocorrelation. As a thumb rule, values between 1.5 and 2.5 can be
considered as unproblematic.
• Examination of multicollinearity
A further prerequisite of regression analysis is the exposure of
multicollinearity. Multicollinearity affects regression outcomes negatively,
whenever exactly linear dependency emerges. First evidence of
multicollinearity is the correlation matrix of the independent variables. Hereby,
high values of correlation coefficients (close to 1) are considered as
problematic. Further, it is necessary to check the R2. The more the R2 reaches
values close to 1, the more likely a variable can be considered as redundant.
Lastly, it is necessary to examine the variance inflation factors (VIF). It is
assumed that the higher the VIF values, the higher multicollinearity. Most
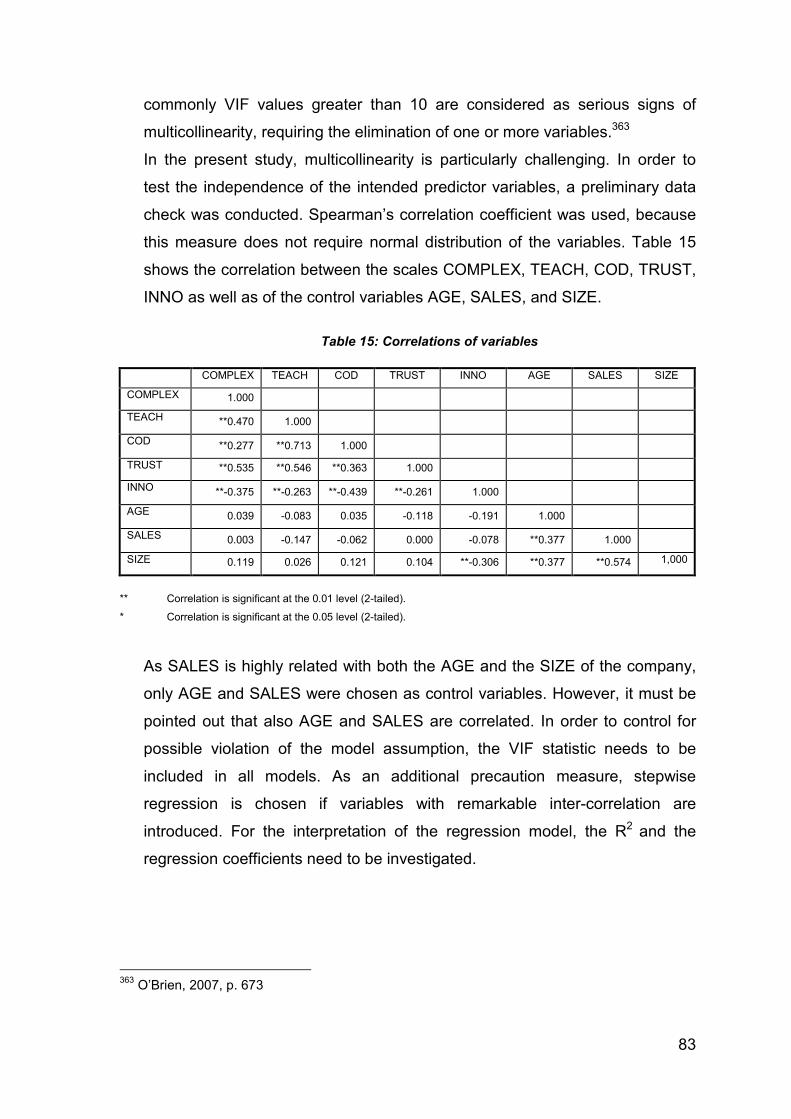
83
commonly VIF values greater than 10 are considered as serious signs of
multicollinearity, requiring the elimination of one or more variables.363
In the present study, multicollinearity is particularly challenging. In order to
test the independence of the intended predictor variables, a preliminary data
check was conducted. Spearman’s correlation coefficient was used, because
this measure does not require normal distribution of the variables. Table 15
shows the correlation between the scales COMPLEX, TEACH, COD, TRUST,
INNO as well as of the control variables AGE, SALES, and SIZE.
Table 15: Correlations of variables
COMPLEX TEACH COD TRUST INNO AGE SALES SIZE
COMPLEX 1.000
TEACH **0.470 1.000
COD **0.277 **0.713 1.000
TRUST **0.535 **0.546 **0.363 1.000
INNO **-0.375 **-0.263 **-0.439 **-0.261 1.000
AGE 0.039 -0.083 0.035 -0.118 -0.191 1.000
SALES 0.003 -0.147 -0.062 0.000 -0.078 **0.377 1.000
SIZE 0.119 0.026 0.121 0.104 **-0.306 **0.377 **0.574 1,000
** Correlation is significant at the 0.01 level (2-tailed).
* Correlation is significant at the 0.05 level (2-tailed).
As SALES is highly related with both the AGE and the SIZE of the company,
only AGE and SALES were chosen as control variables. However, it must be
pointed out that also AGE and SALES are correlated. In order to control for
possible violation of the model assumption, the VIF statistic needs to be
included in all models. As an additional precaution measure, stepwise
regression is chosen if variables with remarkable inter-correlation are
introduced. For the interpretation of the regression model, the R2 and the
regression coefficients need to be investigated.
363 O’Brien, 2007, p. 673
84
• Examination of R-square
A fundamental measure of quality of the regression function is the coefficient
of determination R-Square (R2). It is a measure of “goodness of fit” and
indicates how well the criterion variable is explained by the predictor
variable(s). It illustrates the percentage of original variability of the dependent
variable that can be explained by the regression model. The higher the value
of the determination coefficient, the better the model fits to the data. The F-
test statistic makes clear whether the obtained R2 can be considered as
significant.
• Examination of regression coefficients
The regression coefficient is the slope of the regression function. It expresses
the extent to which the dependent variable changes when the dependent
variable alters. In order to understand which direction the relationship
between both variables types takes it is necessary to consider the signs of the
standardized regression coefficients (Beta values). Positive signs indicate a
positive relationship, while negative signs indicate a negative relationship.
When Beta is zero, no perfectly linear relationship exists.
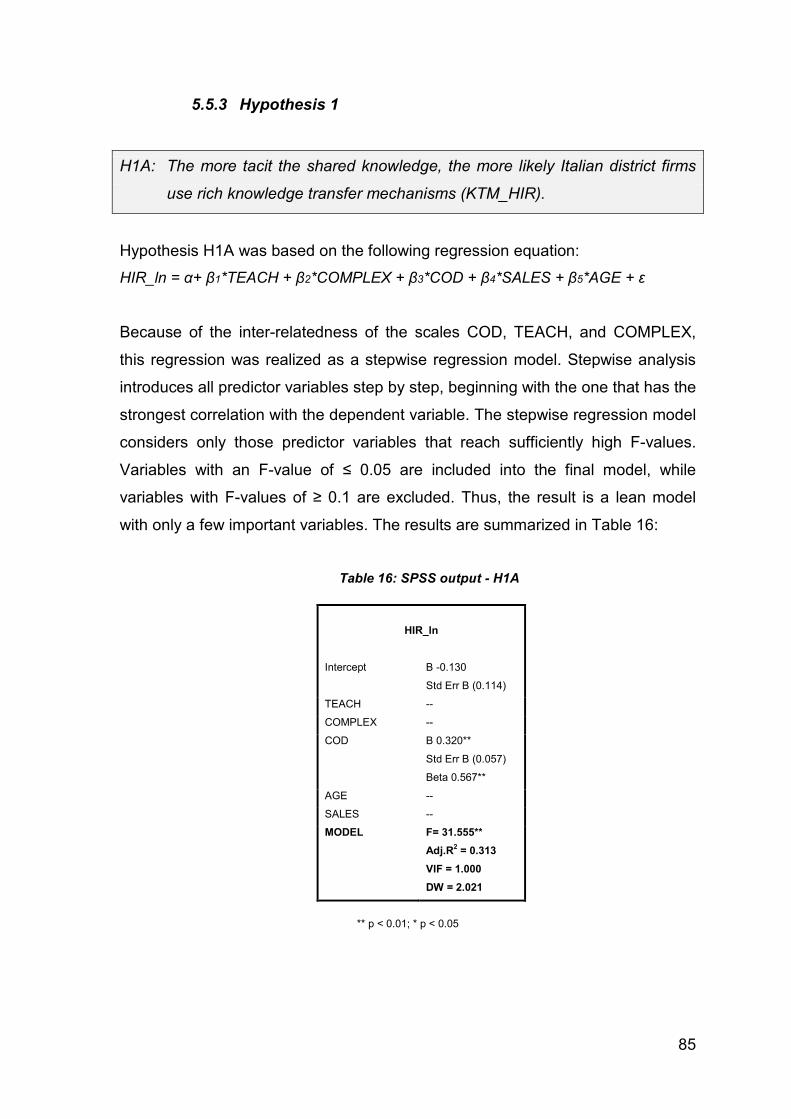
85
5.5.3 Hypothesis 1
H1A: The more tacit the shared knowledge, the more likely Italian district firms
use rich knowledge transfer mechanisms (KTM_HIR).
Hypothesis H1A was based on the following regression equation:
HIR_ln = α+ β1*TEACH + β2*COMPLEX + β3*COD + β4*SALES + β5*AGE + ε
Because of the inter-relatedness of the scales COD, TEACH, and COMPLEX,
this regression was realized as a stepwise regression model. Stepwise analysis
introduces all predictor variables step by step, beginning with the one that has the
strongest correlation with the dependent variable. The stepwise regression model
considers only those predictor variables that reach sufficiently high F-values.
Variables with an F-value of ≤ 0.05 are included into the final model, while
variables with F-values of ≥ 0.1 are excluded. Thus, the result is a lean model
with only a few important variables. The results are summarized in Table 16:
Table 16: SPSS output - H1A
HIR_ln
Intercept B -0.130
Std Err B (0.114) TEACH -- COMPLEX -- COD B 0.320**
Std Err B (0.057)
Beta 0.567**
AGE --
SALES --
MODEL F= 31.555**
Adj.R2 = 0.313
VIF = 1.000
DW = 2.021
** p < 0.01; * p < 0.05
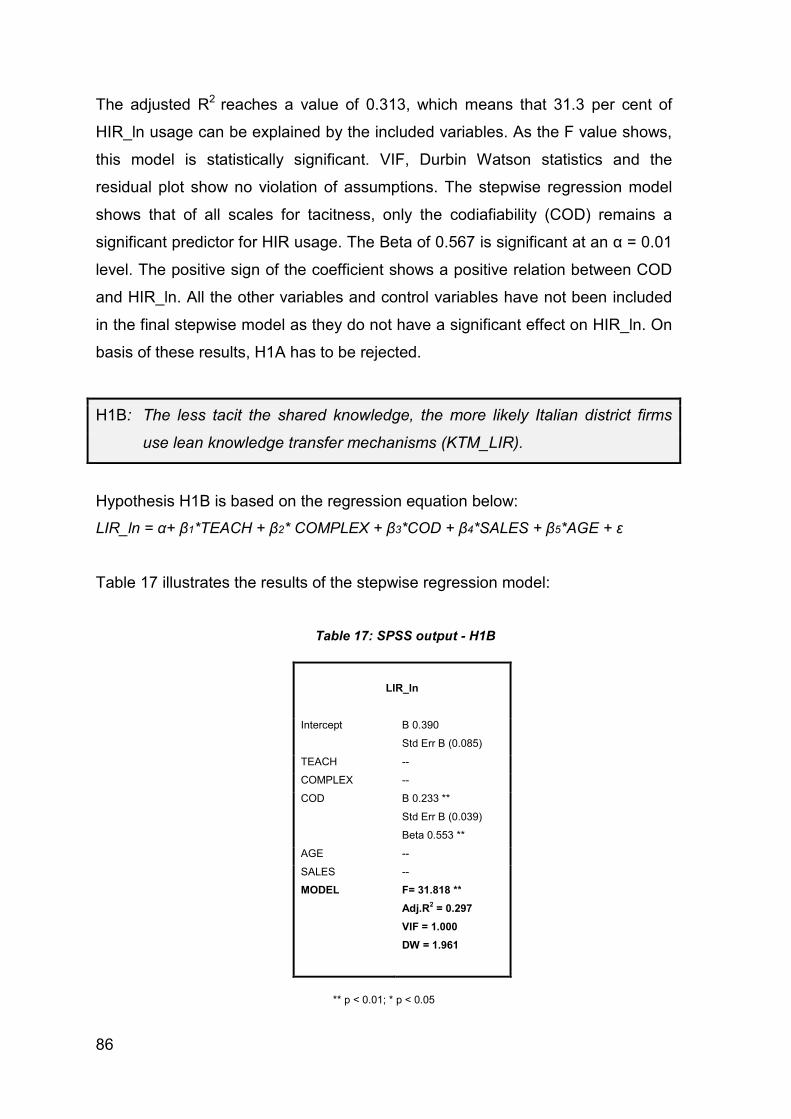
86
The adjusted R2 reaches a value of 0.313, which means that 31.3 per cent of
HIR_ln usage can be explained by the included variables. As the F value shows,
this model is statistically significant. VIF, Durbin Watson statistics and the
residual plot show no violation of assumptions. The stepwise regression model
shows that of all scales for tacitness, only the codiafiability (COD) remains a
significant predictor for HIR usage. The Beta of 0.567 is significant at an α = 0.01
level. The positive sign of the coefficient shows a positive relation between COD
and HIR_ln. All the other variables and control variables have not been included
in the final stepwise model as they do not have a significant effect on HIR_ln. On
basis of these results, H1A has to be rejected.
H1B: The less tacit the shared knowledge, the more likely Italian district firms
use lean knowledge transfer mechanisms (KTM_LIR).
Hypothesis H1B is based on the regression equation below:
LIR_ln = α+ β1*TEACH + β2* COMPLEX + β3*COD + β4*SALES + β5*AGE + ε
Table 17 illustrates the results of the stepwise regression model:
Table 17: SPSS output - H1B
LIR_ln
Intercept B 0.390
Std Err B (0.085)
TEACH --
COMPLEX --
COD B 0.233 **
Std Err B (0.039)
Beta 0.553 **
AGE --
SALES --
MODEL F= 31.818 **
Adj.R2 = 0.297
VIF = 1.000
DW = 1.961
** p < 0.01; * p < 0.05
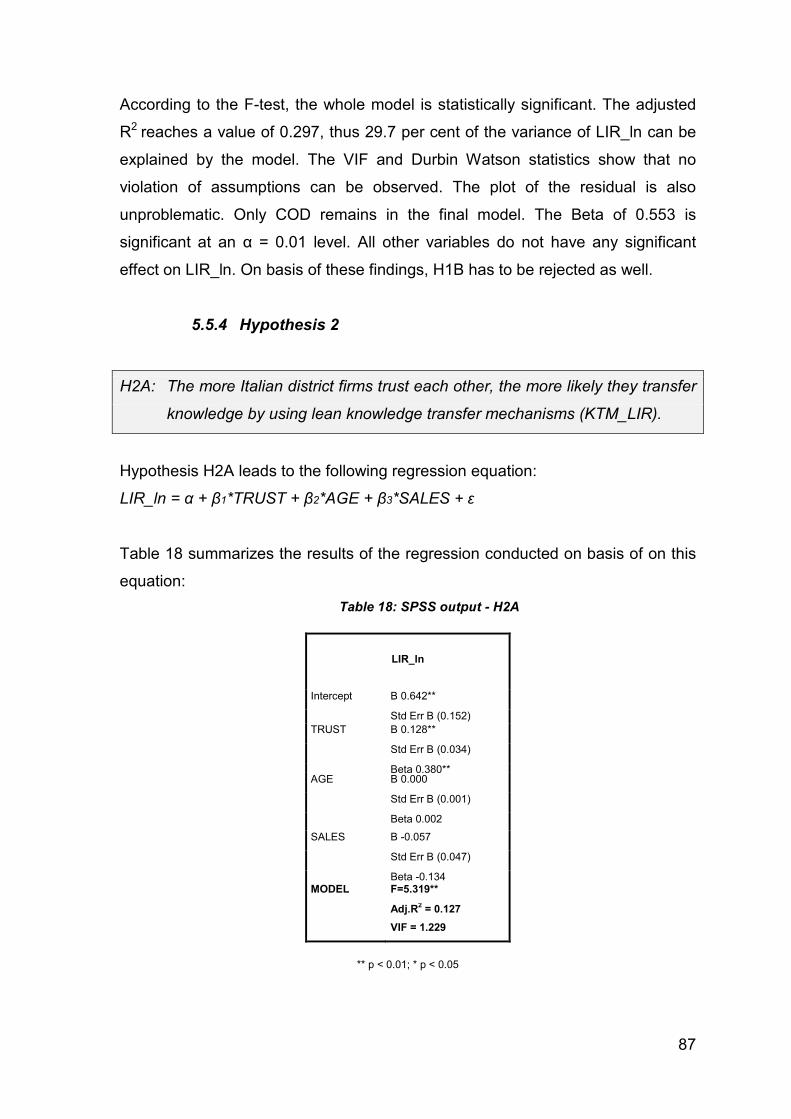
87
According to the F-test, the whole model is statistically significant. The adjusted
R2 reaches a value of 0.297, thus 29.7 per cent of the variance of LIR_ln can be
explained by the model. The VIF and Durbin Watson statistics show that no
violation of assumptions can be observed. The plot of the residual is also
unproblematic. Only COD remains in the final model. The Beta of 0.553 is
significant at an α = 0.01 level. All other variables do not have any significant
effect on LIR_ln. On basis of these findings, H1B has to be rejected as well.
5.5.4 Hypothesis 2
H2A: The more Italian district firms trust each other, the more likely they transfer
knowledge by using lean knowledge transfer mechanisms (KTM_LIR).
Hypothesis H2A leads to the following regression equation:
LIR_ln = α + β1*TRUST + β2*AGE + β3*SALES + ε
Table 18 summarizes the results of the regression conducted on basis of on this
equation:
Table 18: SPSS output - H2A
LIR_ln
Intercept B 0.642**
Std Err B (0.152) TRUST B 0.128**
Std Err B (0.034)
Beta 0.380** AGE B 0.000
Std Err B (0.001)
Beta 0.002
SALES B -0.057
Std Err B (0.047)
Beta -0.134 MODEL F=5.319**
Adj.R2 = 0.127
VIF = 1.229
DW =2.277
** p < 0.01; * p < 0.05
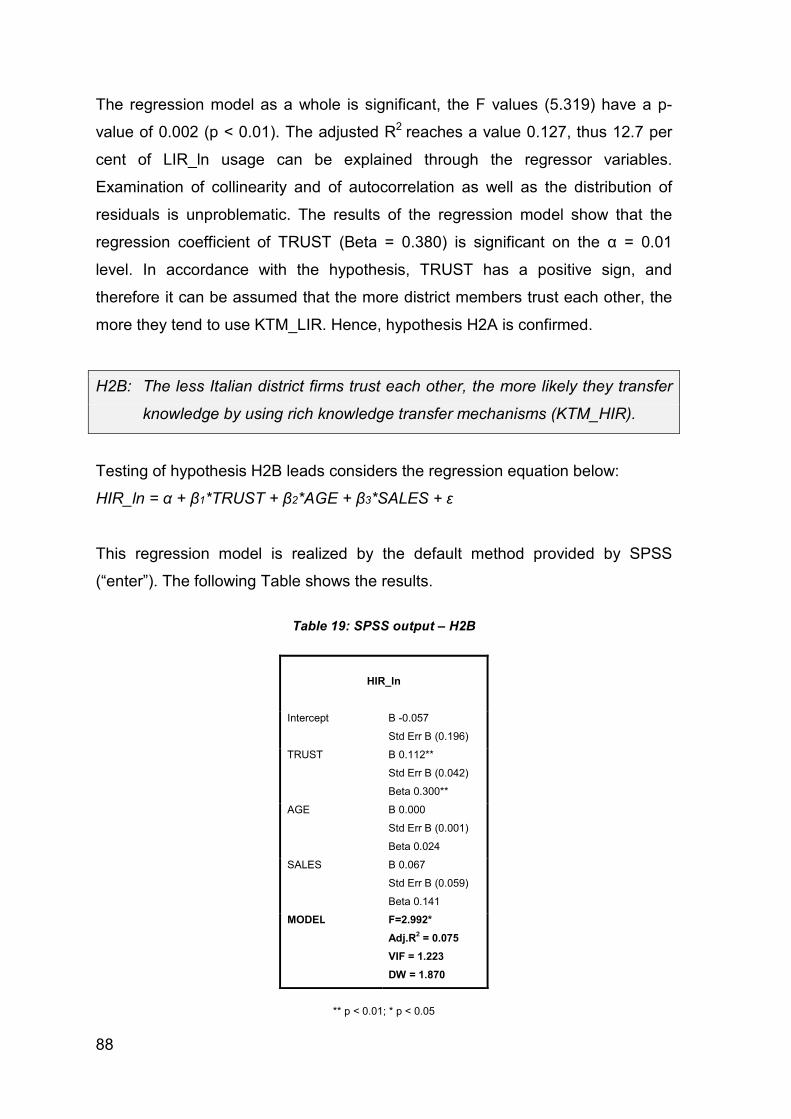
88
The regression model as a whole is significant, the F values (5.319) have a p-
value of 0.002 (p < 0.01). The adjusted R2 reaches a value 0.127, thus 12.7 per
cent of LIR_ln usage can be explained through the regressor variables.
Examination of collinearity and of autocorrelation as well as the distribution of
residuals is unproblematic. The results of the regression model show that the
regression coefficient of TRUST (Beta = 0.380) is significant on the α = 0.01
level. In accordance with the hypothesis, TRUST has a positive sign, and
therefore it can be assumed that the more district members trust each other, the
more they tend to use KTM_LIR. Hence, hypothesis H2A is confirmed.
H2B: The less Italian district firms trust each other, the more likely they transfer
knowledge by using rich knowledge transfer mechanisms (KTM_HIR).
Testing of hypothesis H2B leads considers the regression equation below:
HIR_ln = α + β1*TRUST + β2*AGE + β3*SALES + ε
This regression model is realized by the default method provided by SPSS
(“enter”). The following Table shows the results.
Table 19: SPSS output – H2B
HIR_ln
Intercept B -0.057
Std Err B (0.196)
TRUST B 0.112**
Std Err B (0.042)
Beta 0.300**
AGE B 0.000
Std Err B (0.001)
Beta 0.024
SALES B 0.067
Std Err B (0.059)
Beta 0.141
MODEL F=2.992*
Adj.R2 = 0.075
VIF = 1.223
DW = 1.870
** p < 0.01; * p < 0.05
89
The adjusted R2 reaches a value 0.075, thus 7.5 per cent of HIR_ln usage can be
explained through the included regressor variables. This seems to be a low
value, however, at a significance level of α = 0.05, the F value of the whole
regression model (2.992) is significant with a p-value < 0.05. Thus, the model can
be interpreted. Both examinations of collinearity and of autocorrelation of
residuals show no violation of model assumptions. The same is true for the visual
control of normal distribution of residuals. The results of the regression analysis
show that TRUST has a significant influence on the choice of KTM_HIR. The
regression coefficient of TRUST (Beta 0.300) is significant on the α = 0.01 level.
TRUST has a positive sign, and, therefore, it can be assumed that the more
district members trust each other, the more they tend to use KTM_HIR. Hence,
hypothesis H2B is rejected.
5.5.5 Hypothesis 3
H3A: The positive influence of tacitness on the choice of richer knowledge
transfer mechanisms decreases (KTM_HIR) with trust.
This assumption is transferred into a complex regression equation which
considers also possible interaction effects:
HIR_LN = α + β1*TEACH + β2*COMPLEX + β3*COD + β4*TRUST +
β5*TRUST*TEACH + β6*TRUST*COMPLEX + β7*TRUST*COD + β8*AGE +
β9*SALES + ε
In SPSS, this equation is realized as stepwise regression model. Table 20
displays the results:
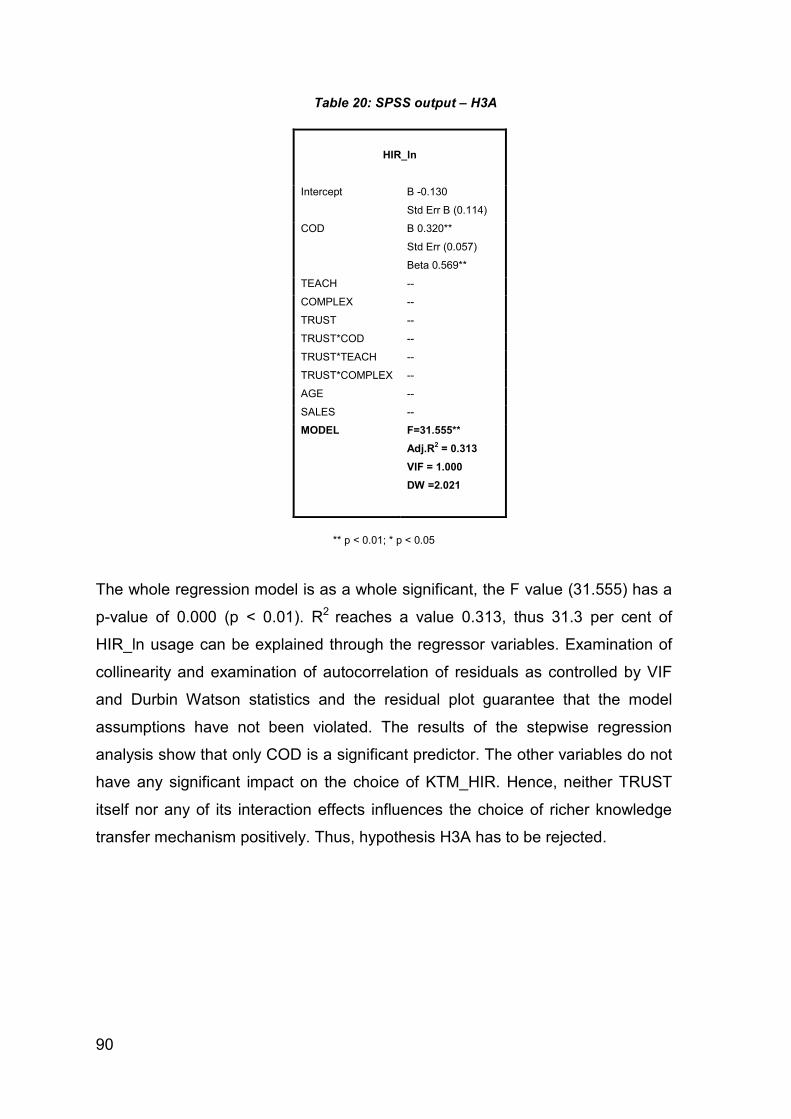
90
Table 20: SPSS output – H3A
HIR_ln
Intercept B -0.130
Std Err B (0.114)
COD B 0.320**
Std Err (0.057)
Beta 0.569**
TEACH --
COMPLEX --
TRUST --
TRUST*COD --
TRUST*TEACH --
TRUST*COMPLEX --
AGE --
SALES --
MODEL F=31.555**
Adj.R2 = 0.313
VIF = 1.000
DW =2.021
** p < 0.01; * p < 0.05
The whole regression model is as a whole significant, the F value (31.555) has a
p-value of 0.000 (p < 0.01). R2 reaches a value 0.313, thus 31.3 per cent of
HIR_ln usage can be explained through the regressor variables. Examination of
collinearity and examination of autocorrelation of residuals as controlled by VIF
and Durbin Watson statistics and the residual plot guarantee that the model
assumptions have not been violated. The results of the stepwise regression
analysis show that only COD is a significant predictor. The other variables do not
have any significant impact on the choice of KTM_HIR. Hence, neither TRUST
itself nor any of its interaction effects influences the choice of richer knowledge
transfer mechanism positively. Thus, hypothesis H3A has to be rejected.
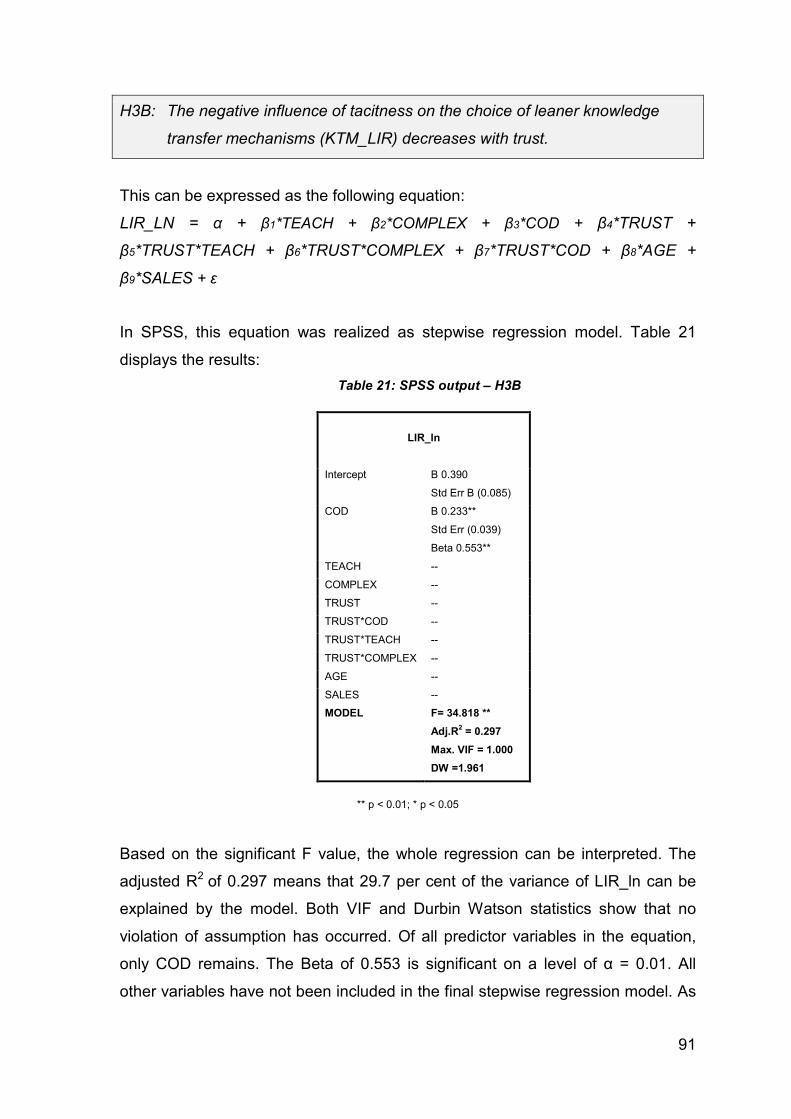
91
H3B: The negative influence of tacitness on the choice of leaner knowledge
transfer mechanisms (KTM_LIR) decreases with trust.
This can be expressed as the following equation:
LIR_LN = α + β1*TEACH + β2*COMPLEX + β3*COD + β4*TRUST +
β5*TRUST*TEACH + β6*TRUST*COMPLEX + β7*TRUST*COD + β8*AGE +
β9*SALES + ε
In SPSS, this equation was realized as stepwise regression model. Table 21
displays the results:
Table 21: SPSS output – H3B
LIR_ln
Intercept B 0.390
Std Err B (0.085)
COD B 0.233**
Std Err (0.039)
Beta 0.553**
TEACH --
COMPLEX --
TRUST --
TRUST*COD --
TRUST*TEACH --
TRUST*COMPLEX --
AGE --
SALES --
MODEL F= 34.818 **
Adj.R2 = 0.297
Max. VIF = 1.000
DW =1.961
** p < 0.01; * p < 0.05
Based on the significant F value, the whole regression can be interpreted. The
adjusted R2 of 0.297 means that 29.7 per cent of the variance of LIR_ln can be
explained by the model. Both VIF and Durbin Watson statistics show that no
violation of assumption has occurred. Of all predictor variables in the equation,
only COD remains. The Beta of 0.553 is significant on a level of α = 0.01. All
other variables have not been included in the final stepwise regression model. As
92
neither TRUST itself nor any of its interaction effects influences the choice of lean
knowledge transfer mechanisms, hypothesis H3B has to be rejected as well.
5.5.6 Hypothesis 4
The last part of the survey investigates the differences between earlier and later
innovation adopters in Italian fashion and textile districts. First, before testing H4,
it is investigated whether adopter categories differ in terms of general
characteristics, including annual sales 2010, company size, and business
experience in terms of number of years since year of foundation. Consequently,
later innovation adopters and earlier adopters are analyzed on the basis of their
usage of knowledge transfer mechanisms. The overall null hypothesis is: “Earlier
adopters do not differ from later adopters in terms of trust, age, sales, size, and
usage of knowledge transfer mechanisms.”
Two independent groups of companies − earlier and late adopters − were created
based on the scale of innovativeness (INNO). Firms with an innovativeness score
below the median were considered to be later adopters, firms with a score above
the median as earlier adopters. In order to understand to which extent earlier
adopters differ from later adopters, comparison of means was conducted.
Comparison of means is used to test whether differences between statistical
groups or samples exist. A preliminary Kolmogorov-Smirnov-Test is conducted in
order to analyze whether the included variables are normally distributed, and to
choose the appropriate test. If the variables show a normal distribution,
comparison of means in two independent groups can be conducted with T-Tests,
while if variables are not normally distributed, comparison of means must be
conducted with the non-parametric Mann Whitney U-Test (M-W).
Table 22 below summarizes the results of the Kolmogorov-Smirnov test on
normal distribution for selected variables. A significant result (significance values
smaller than 0.05) shows that the distribution of variable differs significantly from
the normal distribution.
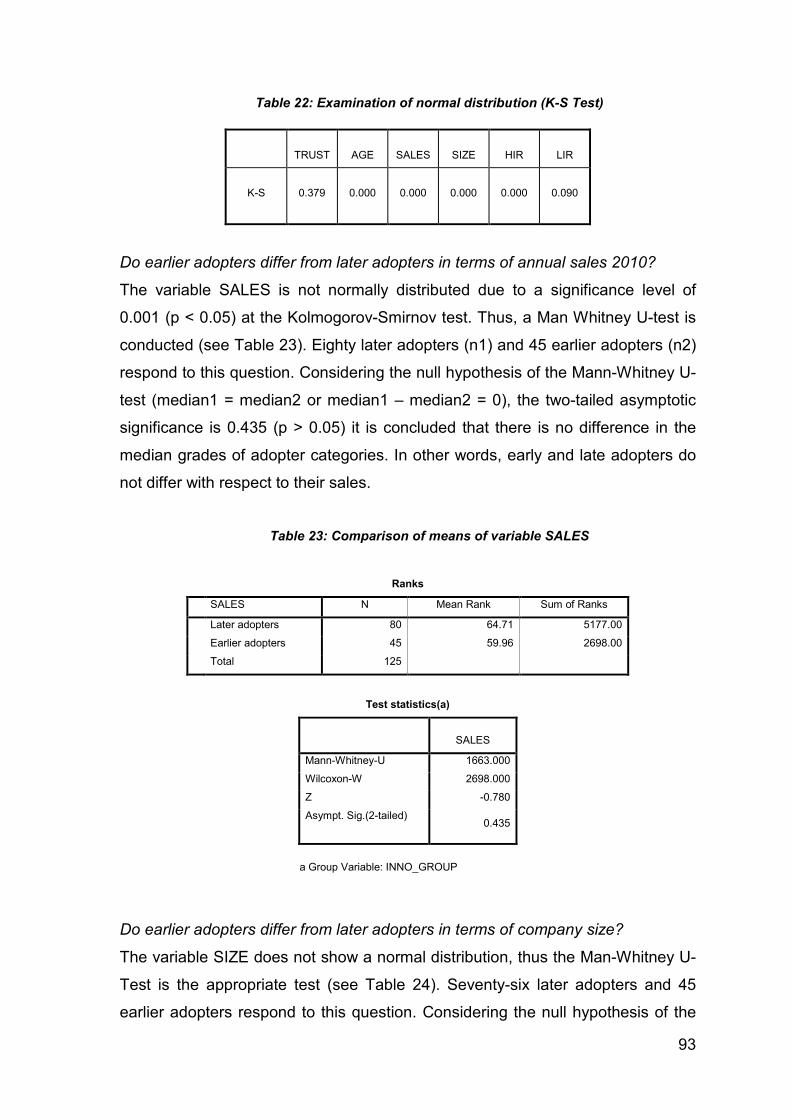
93
Table 22: Examination of normal distribution (K-S Test)
TRUST
AGE
SALES
SIZE
HIR
LIR
K-S
0.379
0.000
0.000
0.000
0.000
0.090
Do earlier adopters differ from later adopters in terms of annual sales 2010?
The variable SALES is not normally distributed due to a significance level of
0.001 (p < 0.05) at the Kolmogorov-Smirnov test. Thus, a Man Whitney U-test is
conducted (see Table 23). Eighty later adopters (n1) and 45 earlier adopters (n2)
respond to this question. Considering the null hypothesis of the Mann-Whitney U-
test (median1 = median2 or median1 – median2 = 0), the two-tailed asymptotic
significance is 0.435 (p > 0.05) it is concluded that there is no difference in the
median grades of adopter categories. In other words, early and late adopters do
not differ with respect to their sales.
Table 23: Comparison of means of variable SALES
Ranks
SALES N Mean Rank Sum of Ranks
Later adopters 80 64.71 5177.00
Earlier adopters 45 59.96 2698.00
Total 125
Test statistics(a)
SALES
Mann-Whitney-U 1663.000
Wilcoxon-W 2698.000
Z -0.780
Asympt. Sig.(2-tailed) 0.435
a Group Variable: INNO_GROUP
Do earlier adopters differ from later adopters in terms of company size?
The variable SIZE does not show a normal distribution, thus the Man-Whitney U-
Test is the appropriate test (see Table 24). Seventy-six later adopters and 45
earlier adopters respond to this question. Considering the null hypothesis of the
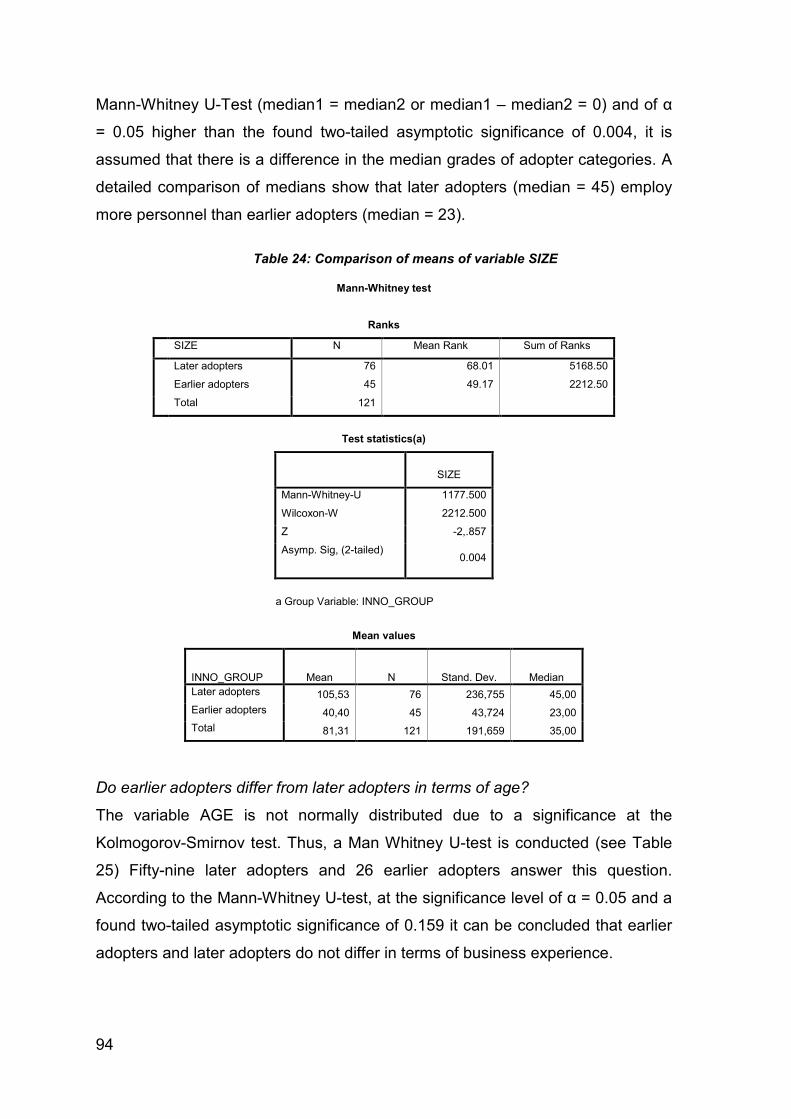
94
Mann-Whitney U-Test (median1 = median2 or median1 – median2 = 0) and of α
= 0.05 higher than the found two-tailed asymptotic significance of 0.004, it is
assumed that there is a difference in the median grades of adopter categories. A
detailed comparison of medians show that later adopters (median = 45) employ
more personnel than earlier adopters (median = 23).
Table 24: Comparison of means of variable SIZE
Mann-Whitney test
Ranks
SIZE N Mean Rank Sum of Ranks
Later adopters 76 68.01 5168.50
Earlier adopters 45 49.17 2212.50
Total 121
Test statistics(a)
SIZE
Mann-Whitney-U 1177.500
Wilcoxon-W 2212.500
Z -2,.857
Asymp. Sig, (2-tailed) 0.004
a Group Variable: INNO_GROUP
Mean values
INNO_GROUP Mean N Stand. Dev. Median Later adopters 105,53 76 236,755 45,00
Earlier adopters 40,40 45 43,724 23,00
Total 81,31 121 191,659 35,00
Do earlier adopters differ from later adopters in terms of age?
The variable AGE is not normally distributed due to a significance at the
Kolmogorov-Smirnov test. Thus, a Man Whitney U-test is conducted (see Table
25) Fifty-nine later adopters and 26 earlier adopters answer this question.
According to the Mann-Whitney U-test, at the significance level of α = 0.05 and a
found two-tailed asymptotic significance of 0.159 it can be concluded that earlier
adopters and later adopters do not differ in terms of business experience.
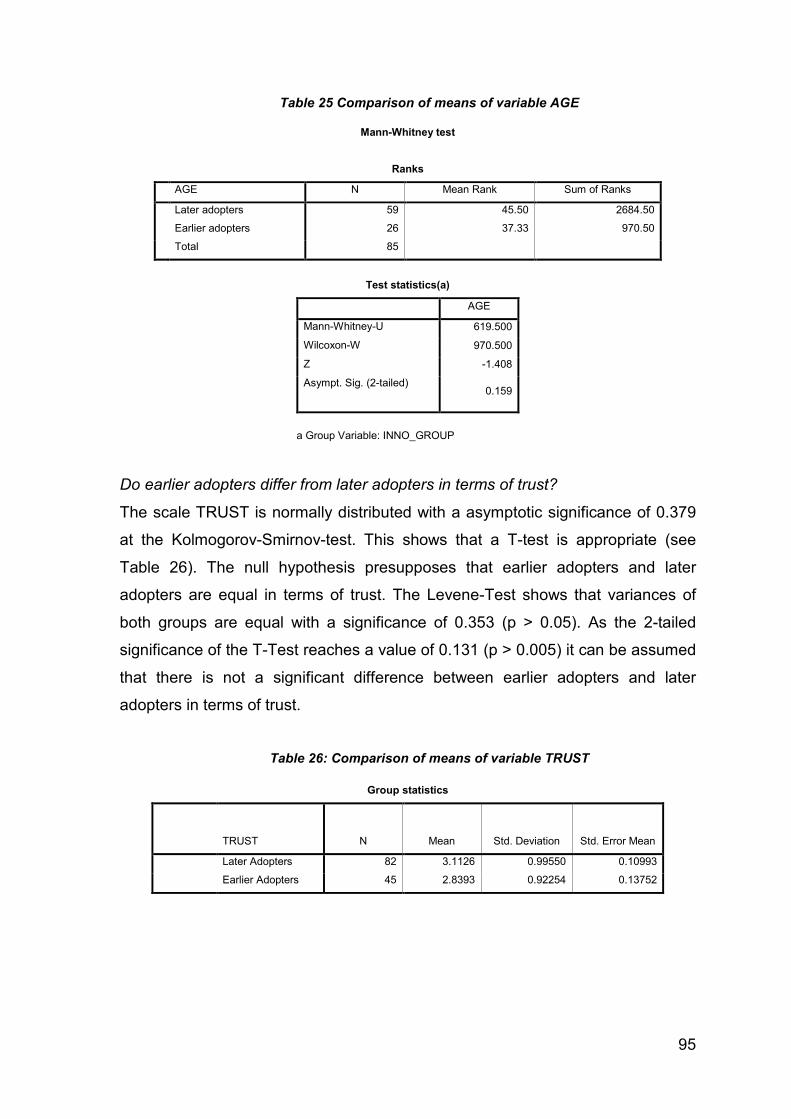
95
Table 25 Comparison of means of variable AGE
Mann-Whitney test
Ranks
AGE N Mean Rank Sum of Ranks
Later adopters 59 45.50 2684.50
Earlier adopters 26 37.33 970.50
Total 85
Test statistics(a)
AGE
Mann-Whitney-U 619.500
Wilcoxon-W 970.500
Z -1.408
Asympt. Sig. (2-tailed) 0.159
a Group Variable: INNO_GROUP
Do earlier adopters differ from later adopters in terms of trust?
The scale TRUST is normally distributed with a asymptotic significance of 0.379
at the Kolmogorov-Smirnov-test. This shows that a T-test is appropriate (see
Table 26). The null hypothesis presupposes that earlier adopters and later
adopters are equal in terms of trust. The Levene-Test shows that variances of
both groups are equal with a significance of 0.353 (p > 0.05). As the 2-tailed
significance of the T-Test reaches a value of 0.131 (p > 0.005) it can be assumed
that there is not a significant difference between earlier adopters and later
adopters in terms of trust.
Table 26: Comparison of means of variable TRUST
Group statistics
TRUST N Mean Std. Deviation Std. Error Mean
Later Adopters 82 3.1126 0.99550 0.10993
Earlier Adopters 45 2.8393 0.92254 0.13752
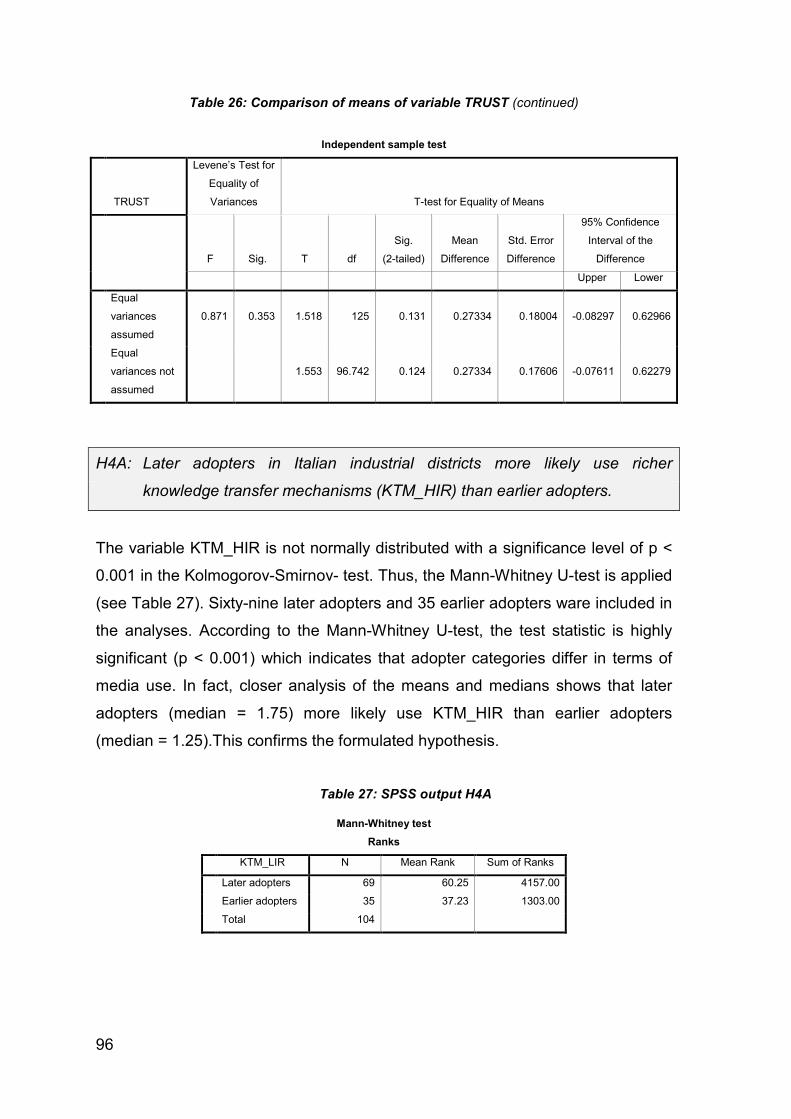
96
Table 26: Comparison of means of variable TRUST (continued)
Independent sample test
TRUST
Levene’s Test for
Equality of
Variances T-test for Equality of Means
F Sig. T df
Sig.
(2-tailed)
Mean
Difference
Std. Error
Difference
95% Confidence
Interval of the
Difference
Upper Lower
Equal
variances
assumed
0.871 0.353 1.518 125 0.131 0.27334 0.18004 -0.08297 0.62966
Equal
variances not
assumed
1.553 96.742 0.124 0.27334 0.17606 -0.07611 0.62279
H4A: Later adopters in Italian industrial districts more likely use richer
knowledge transfer mechanisms (KTM_HIR) than earlier adopters.
The variable KTM_HIR is not normally distributed with a significance level of p <
0.001 in the Kolmogorov-Smirnov- test. Thus, the Mann-Whitney U-test is applied
(see Table 27). Sixty-nine later adopters and 35 earlier adopters ware included in
the analyses. According to the Mann-Whitney U-test, the test statistic is highly
significant (p < 0.001) which indicates that adopter categories differ in terms of
media use. In fact, closer analysis of the means and medians shows that later
adopters (median = 1.75) more likely use KTM_HIR than earlier adopters
(median = 1.25).This confirms the formulated hypothesis.
Table 27: SPSS output H4A
Mann-Whitney test
Ranks
KTM_LIR N Mean Rank Sum of Ranks
Later adopters 69 60.25 4157.00
Earlier adopters 35 37.23 1303.00
Total 104
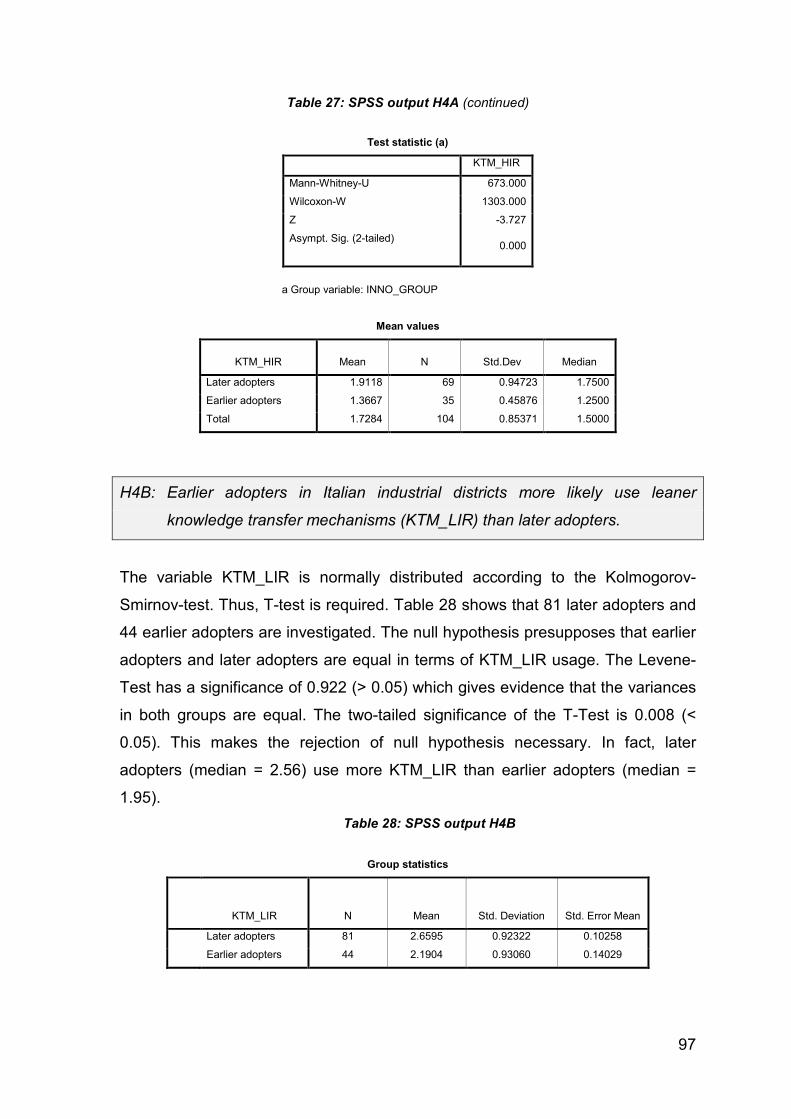
97
Table 27: SPSS output H4A (continued)
Test statistic (a)
KTM_HIR
Mann-Whitney-U 673.000
Wilcoxon-W 1303.000
Z -3.727
Asympt. Sig. (2-tailed) 0.000
a Group variable: INNO_GROUP
Mean values
KTM_HIR Mean N Std.Dev Median
Later adopters 1.9118 69 0.94723 1.7500
Earlier adopters 1.3667 35 0.45876 1.2500
Total 1.7284 104 0.85371 1.5000
H4B: Earlier adopters in Italian industrial districts more likely use leaner
knowledge transfer mechanisms (KTM_LIR) than later adopters.
The variable KTM_LIR is normally distributed according to the Kolmogorov-
Smirnov-test. Thus, T-test is required. Table 28 shows that 81 later adopters and
44 earlier adopters are investigated. The null hypothesis presupposes that earlier
adopters and later adopters are equal in terms of KTM_LIR usage. The Levene-
Test has a significance of 0.922 (> 0.05) which gives evidence that the variances
in both groups are equal. The two-tailed significance of the T-Test is 0.008 (<
0.05). This makes the rejection of null hypothesis necessary. In fact, later
adopters (median = 2.56) use more KTM_LIR than earlier adopters (median =
1.95).
Table 28: SPSS output H4B
Group statistics
KTM_LIR N Mean Std. Deviation Std. Error Mean
Later adopters 81 2.6595 0.92322 0.10258
Earlier adopters 44 2.1904 0.93060 0.14029
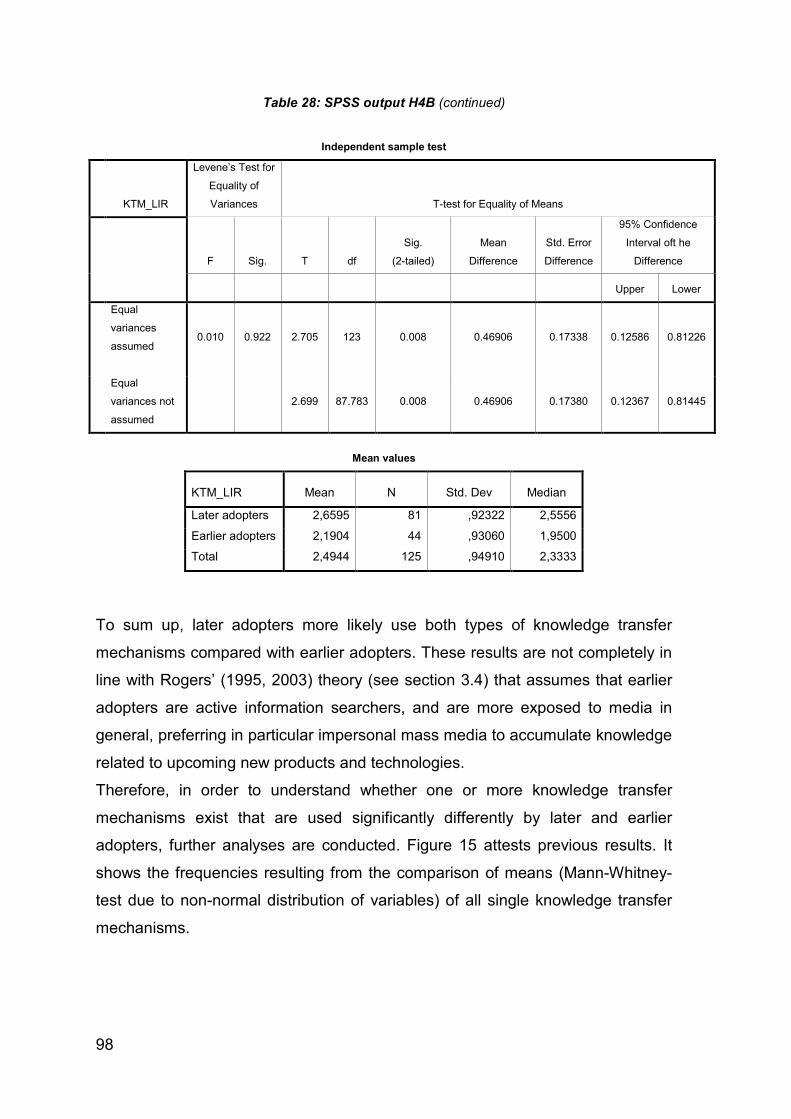
98
Table 28: SPSS output H4B (continued)
Independent sample test
KTM_LIR
Levene’s Test for
Equality of
Variances T-test for Equality of Means
F Sig. T df
Sig.
(2-tailed)
Mean
Difference
Std. Error
Difference
95% Confidence
Interval oft he
Difference
Upper Lower
Equal
variances
assumed
0.010 0.922 2.705 123 0.008 0.46906 0.17338 0.12586 0.81226
Equal
variances not
assumed
2.699 87.783 0.008 0.46906 0.17380 0.12367 0.81445
Mean values
KTM_LIR Mean N Std. Dev Median
Later adopters 2,6595 81 ,92322 2,5556
Earlier adopters 2,1904 44 ,93060 1,9500
Total 2,4944 125 ,94910 2,3333
To sum up, later adopters more likely use both types of knowledge transfer
mechanisms compared with earlier adopters. These results are not completely in
line with Rogers’ (1995, 2003) theory (see section 3.4) that assumes that earlier
adopters are active information searchers, and are more exposed to media in
general, preferring in particular impersonal mass media to accumulate knowledge
related to upcoming new products and technologies.
Therefore, in order to understand whether one or more knowledge transfer
mechanisms exist that are used significantly differently by later and earlier
adopters, further analyses are conducted. Figure 15 attests previous results. It
shows the frequencies resulting from the comparison of means (Mann-Whitney-
test due to non-normal distribution of variables) of all single knowledge transfer
mechanisms.
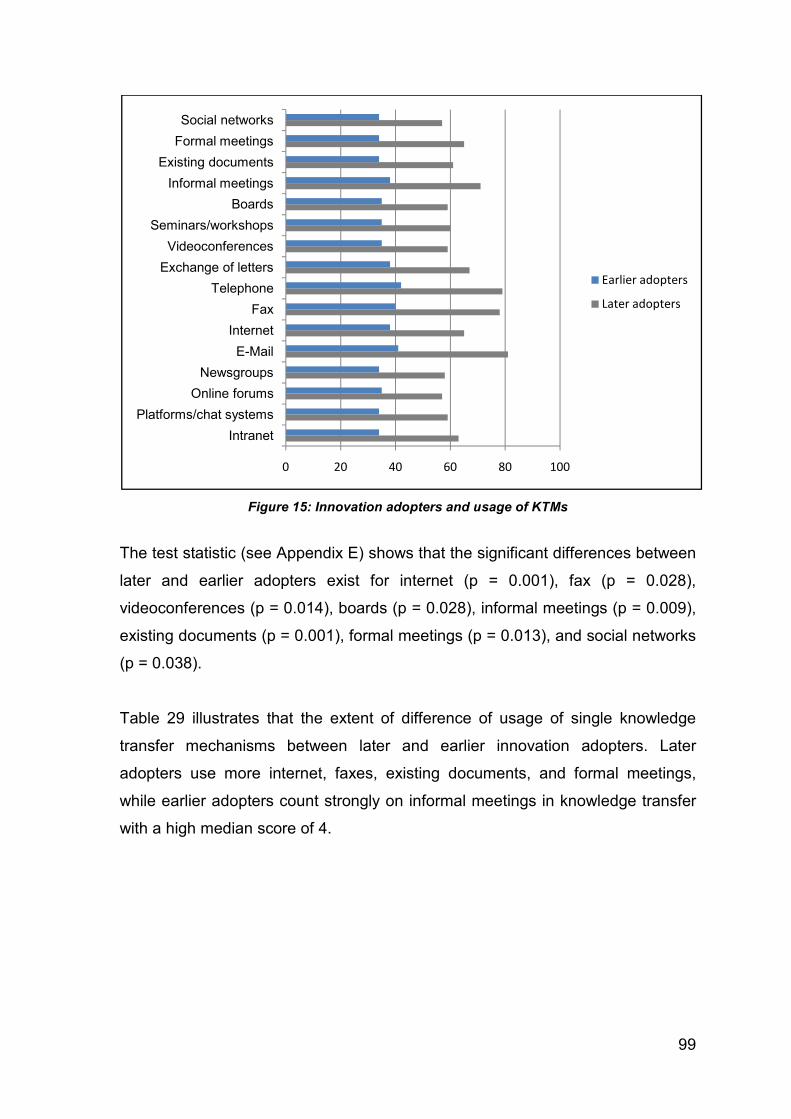
99
Figure 15: Innovation adopters and usage of KTMs
The test statistic (see Appendix E) shows that the significant differences between
later and earlier adopters exist for internet (p = 0.001), fax (p = 0.028),
videoconferences (p = 0.014), boards (p = 0.028), informal meetings (p = 0.009),
existing documents (p = 0.001), formal meetings (p = 0.013), and social networks
(p = 0.038).
Table 29 illustrates that the extent of difference of usage of single knowledge
transfer mechanisms between later and earlier innovation adopters. Later
adopters use more internet, faxes, existing documents, and formal meetings,
while earlier adopters count strongly on informal meetings in knowledge transfer
with a high median score of 4.
0 20 40 60 80 100
Intranet
Platforms/chat systems
Online forums
Newsgroups
Internet
Fax
Telephone
Exchange of letters
Videoconferences
Seminars/workshops
Boards
Informal meetings
Existing documents
Formal meetings
Social networks
Earlier adopters
Later adopters
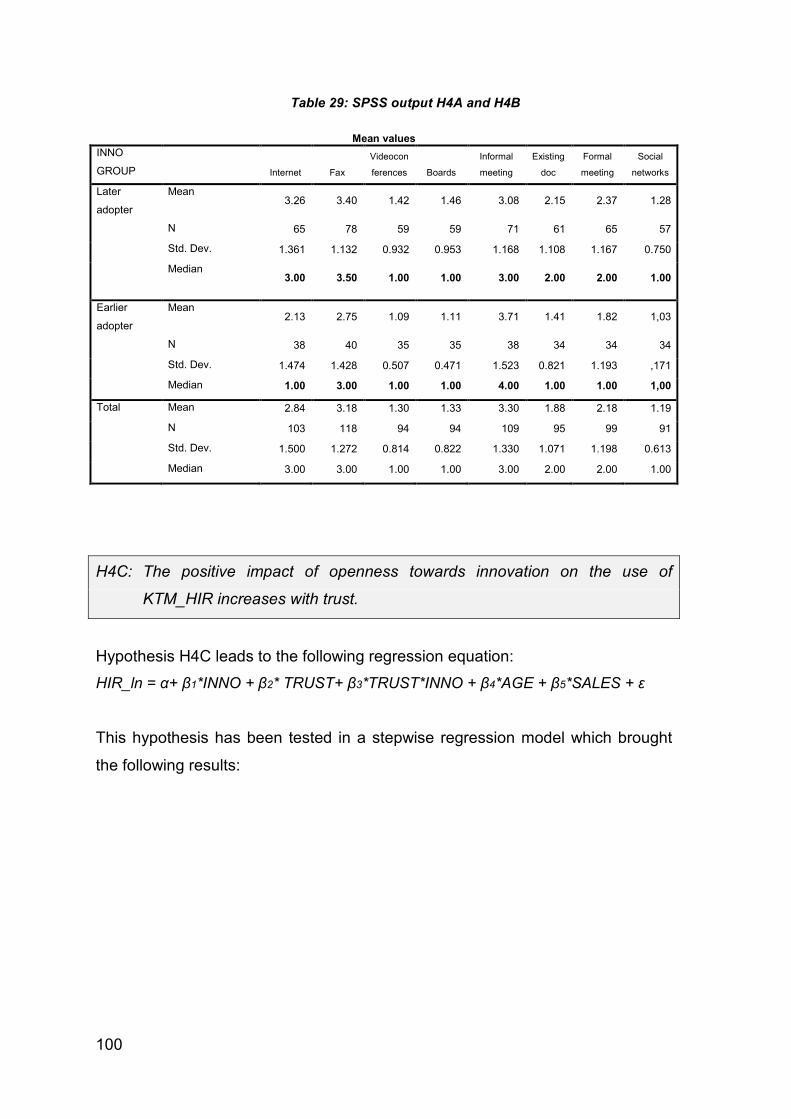
100
Table 29: SPSS output H4A and H4B
Mean values
INNO
GROUP Internet Fax
Videocon
ferences Boards
Informal
meeting
Existing
doc
Formal
meeting
Social
networks
Later
adopter
Mean 3.26 3.40 1.42 1.46 3.08 2.15 2.37 1.28
N 65 78 59 59 71 61 65 57
Std. Dev. 1.361 1.132 0.932 0.953 1.168 1.108 1.167 0.750
Median
3.00 3.50 1.00 1.00 3.00 2.00 2.00 1.00
Earlier
adopter
Mean 2.13 2.75 1.09 1.11 3.71 1.41 1.82 1,03
N 38 40 35 35 38 34 34 34
Std. Dev. 1.474 1.428 0.507 0.471 1.523 0.821 1.193 ,171
Median 1.00 3.00 1.00 1.00 4.00 1.00 1.00 1,00
Total Mean 2.84 3.18 1.30 1.33 3.30 1.88 2.18 1.19
N 103 118 94 94 109 95 99 91
Std. Dev. 1.500 1.272 0.814 0.822 1.330 1.071 1.198 0.613
Median 3.00 3.00 1.00 1.00 3.00 2.00 2.00 1.00
H4C: The positive impact of openness towards innovation on the use of
KTM_HIR increases with trust.
Hypothesis H4C leads to the following regression equation:
HIR_ln = α+ β1*INNO + β2* TRUST+ β3*TRUST*INNO + β4*AGE + β5*SALES + ε
This hypothesis has been tested in a stepwise regression model which brought
the following results:
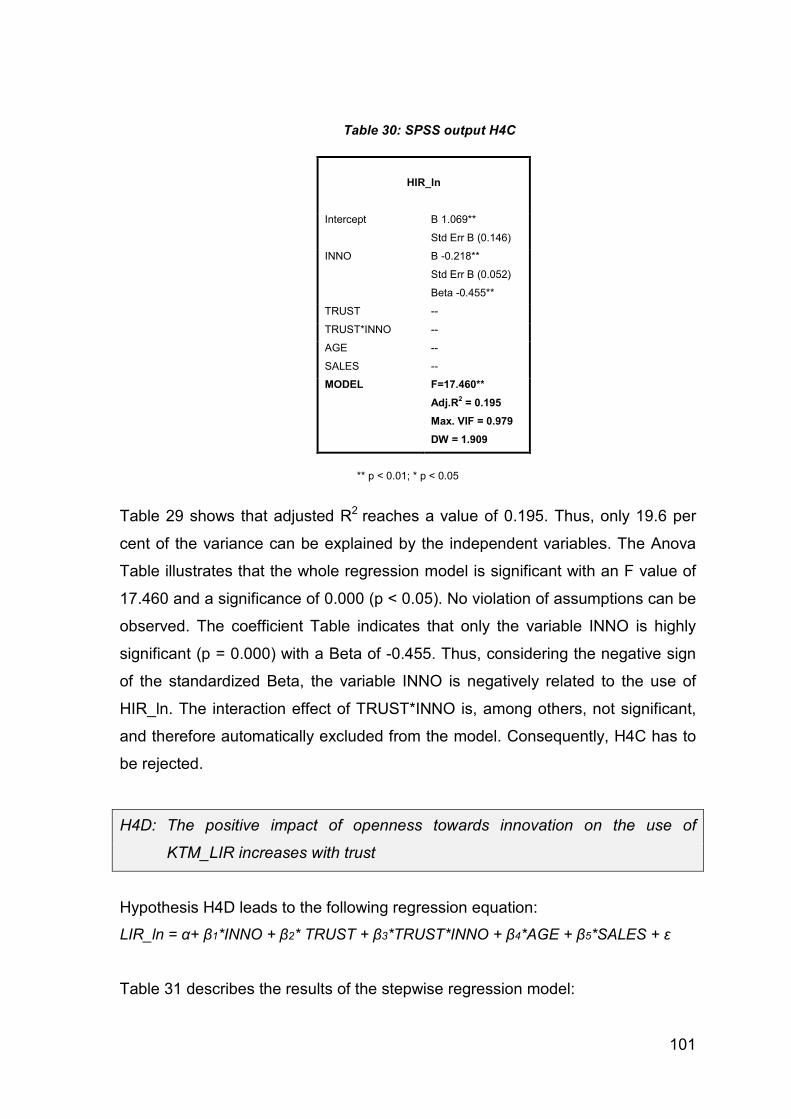
101
Table 30: SPSS output H4C
HIR_ln
Intercept B 1.069**
Std Err B (0.146)
INNO B -0.218**
Std Err B (0.052)
Beta -0.455**
TRUST --
TRUST*INNO --
AGE --
SALES --
MODEL F=17.460**
Adj.R2 = 0.195
Max. VIF = 0.979
DW = 1.909
** p < 0.01; * p < 0.05
Table 29 shows that adjusted R2 reaches a value of 0.195. Thus, only 19.6 per
cent of the variance can be explained by the independent variables. The Anova
Table illustrates that the whole regression model is significant with an F value of
17.460 and a significance of 0.000 (p < 0.05). No violation of assumptions can be
observed. The coefficient Table indicates that only the variable INNO is highly
significant (p = 0.000) with a Beta of -0.455. Thus, considering the negative sign
of the standardized Beta, the variable INNO is negatively related to the use of
HIR_ln. The interaction effect of TRUST*INNO is, among others, not significant,
and therefore automatically excluded from the model. Consequently, H4C has to
be rejected.
H4D: The positive impact of openness towards innovation on the use of
KTM_LIR increases with trust
Hypothesis H4D leads to the following regression equation:
LIR_ln = α+ β1*INNO + β2* TRUST + β3*TRUST*INNO + β4*AGE + β5*SALES + ε
Table 31 describes the results of the stepwise regression model:
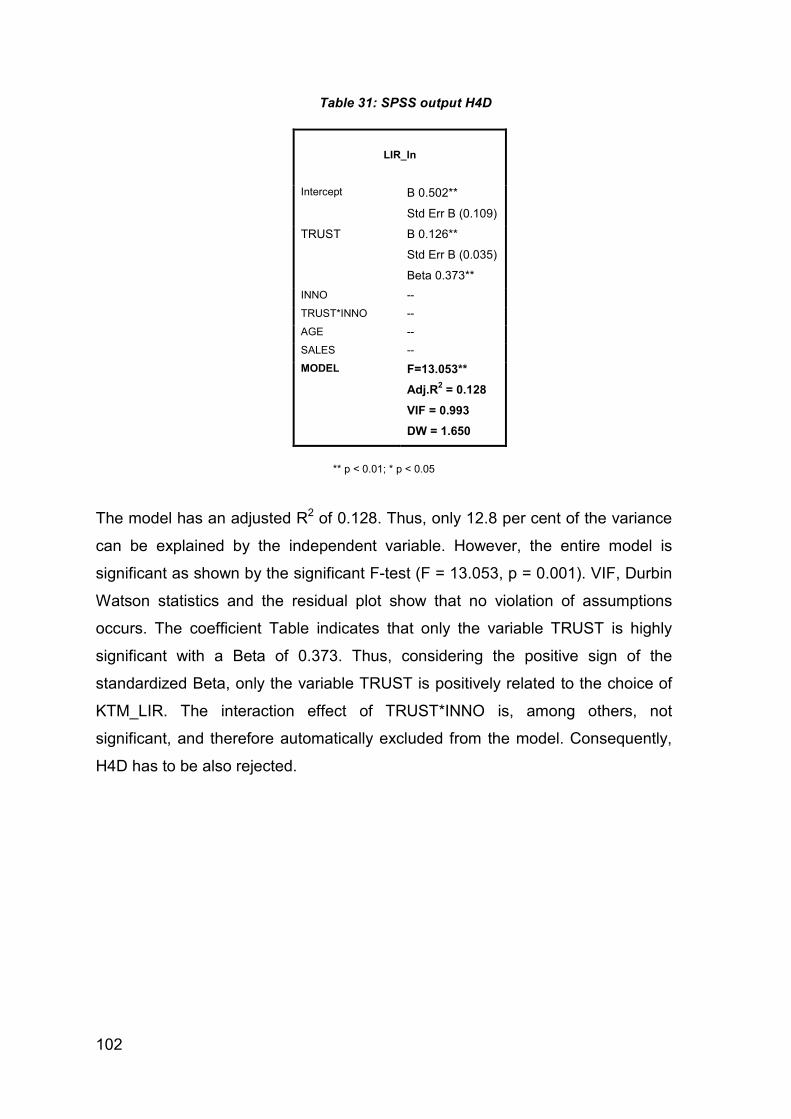
102
Table 31: SPSS output H4D
LIR_ln
Intercept B 0.502**
Std Err B (0.109)
TRUST B 0.126**
Std Err B (0.035)
Beta 0.373**
INNO --
TRUST*INNO --
AGE --
SALES --
MODEL F=13.053**
Adj.R2 = 0.128
VIF = 0.993
DW = 1.650
** p < 0.01; * p < 0.05
The model has an adjusted R2 of 0.128. Thus, only 12.8 per cent of the variance
can be explained by the independent variable. However, the entire model is
significant as shown by the significant F-test (F = 13.053, p = 0.001). VIF, Durbin
Watson statistics and the residual plot show that no violation of assumptions
occurs. The coefficient Table indicates that only the variable TRUST is highly
significant with a Beta of 0.373. Thus, considering the positive sign of the
standardized Beta, only the variable TRUST is positively related to the choice of
KTM_LIR. The interaction effect of TRUST*INNO is, among others, not
significant, and therefore automatically excluded from the model. Consequently,
H4D has to be also rejected.
103
CONCLUSIONS
The present thesis focuses on the fundamental role effective knowledge
management plays in organizations, and aims at explaining how knowledge
transfer mechanisms are used in industrial districts. The main goal of this work is
to understand which knowledge transfer mechanisms are preferred by Italian
district firms that operate in the fashion and textile business. This conclusion
discusses the main findings of the present empirical analyses. Hereby, the main
aim is to link general contributions on knowledge management summarized in
previous chapters with the resulting findings of empirical investigation. Finally,
emerging limitations of the present survey are cited, and possible
recommendations for further consecutive studies are highlighted.
The first goal of this work is to statistically describe the characteristics of the
companies surveyed in the sample. The major part of respondents has been
operating in the leather/footwear, textile and clothing industry for more than 20
years. About half of that district firms that are used in the sample are small and
medium-sized companies. Most of them have on average generated annual sales
between 3 and 20 millions of Euro in 2010.
Consequently, it is described how knowledge is transferred among district firms.
Italian district players acquire and transfer knowledge preferably through personal
dialogue, exchange of employees, and information technologies. Closer
examination of local knowledge transfer mechanisms makes it quite clear that
district members share knowledge primarily by e-mail and telephone or in
informal meetings. In contrast, modern communication media, such as
videoconferences, newsgroups, online forums, platforms, chat systems, and
intranet are less appreciated. These findings are in line with those of Belussi
(2005) and Gottardi (2003). The reasons why direct and personal communication
is preferred in knowledge transfer rather than modern and less personal
communication may be the following: First, Italian district firms prefer “relatively
low-cost ready-made” technologies rather than complex communication tools.364
Second, they prefer conservative communication tools that are easy to use and
364 Belussi, 2005, p. 263
104
do not necessitate many investments in reorganization of local procedures and
relations.365
Apart from the descriptive part of this paper, this study aims at understanding the
district-specific particularities of knowledge transfer, investigating the impact of
knowledge characteristics, trust, and companies’ orientation towards innovation
adoption on the choice of knowledge transfer mechanisms.
• H1A and H2B are directed to understand whether the degree of knowledge
tacitness, has an impact on the use of knowledge transfer mechanisms.
Surprisingly, they show contradicting results, in contrast to previous studies.
In fact, multiple regression in this case indicates that only codifiability of
knowledge has a positive impact on the use of both types of knowledge
transfer mechanisms. Thus codifiability of transferred knowledge evidently
increases the disposition to communicate inside the districts. This is in line
with Gottardi (2003), who states that language and knowledge codification is
rarely standardized in industrial districts.366 Thus, from the point of view of the
author of this study, it makes inter-personal interaction and dialogue among
district players indispensable.
• H2A and H2B examine the relation between trust and knowledge transfer
mechanisms. Statistical results indicate that the more Italian district firms trust
each other, the more likely they use both forms of knowledge transfer
mechanisms. This finding is in line with the complementary view of trust.
• H3A and H3B investigate the interactive effect between tacitness of
knowledge and trust. It is assumed that the effect of tacitness on the choice
knowledge transfer mechanisms is positively impacted by trust. Statistical
results of this study indicate that none of these assumptions can be applied to
Italian district firms that operate in the fashion and textile industry.
• H4A, H4B, H4C, and H4D focus on the impact of firms’ attitude towards
innovation adoption on the selection of knowledge transfer mechanisms.
Hereby, Italian district firms are categorized into earlier and later innovation
365 Chiarvesio and Micelli, 2000; Di Maria, 2000; Chiarvesio, 2001; Capitani and Di Maria, 2000 in
Gottardi, 2003, p. 10 366 Gottardi, 2003, p. 10 referring to Chiarvesio and Micelli, 2000; Di Maria, 2000; Chiarvesio,
2001; Capitani and Di Maria, 2000
105
adopters. It is tested whether these two groups differ in terms of sales,
company size, age, and trust, as well as in the usage of knowledge transfer
mechanisms. Preliminary analyses show that earlier adopters do not differ
from later adopters in terms of sales, age, and trust, but vary indeed in
company size. In fact, later adopters employ on average more personnel than
earlier adopters. After this examination, it is assumed that later adopters,
usually preferring personal communication, may prefer knowledge transfer
mechanisms with richer more personal knowledge transfer mechanisms
(H4A), while earlier adopters, habitually preferring impersonal mass media,
may use also more likely leaner knowledge transfer mechanisms (H4B). Only
H4A can be approved in this study. It is therefore considered that
communication behaviour in highly creative and vibrant sectors, such as the
fashion and textile sector, may differ significantly to traditional and less
dynamic sectors, such as the agricultural sectors, investigated by Rogers
(1995, 2003).
• Lastly, H4C and H4D investigate the interaction effect between openness
towards innovation adoption and trust. Unfortunately, statistical results
indicate that no interaction affects of such kind exist.
How does the present work extend already existing contributions on knowledge
management in the literature? First, this thesis links diverse theoretical concepts
that have been already broadly discussed in the literature, but that have been
rarely analyzed in interconnection to each other. In fact, the main aim has been to
link the knowledge-based theory, the trust-based theory, as well as the innovation
diffusion theory of organizations with the media richness theory. Second, existing
literature on determinants, influencing the choice of knowledge transfer
mechanisms, has focused basically on cluster firms in technical sectors, while the
present survey focuses in particular on companies operating in more vital and
creative sectors.
Revealed findings of the empirical research are of practical relevance for
scientists and practitioners. On the one hand, results illustrate well district firms’
day-to-day experiences in knowledge transfer processes and the crucial role of
trust in local cooperation. On the other hand, the study describes local
companies’ attitude towards the adoption of new ideas and technologies. It helps
106
to understand how district firms, categorized in later and earlier innovation
adopters, differ in terms of general demographic factors, trust, and in particular in
terms of the usage of knowledge transfer mechanisms.
Nevertheless, this work is not without limitations. First, although the present
thesis considers a not insignificant number of determinants, influencing the
choice of knowledge transfer mechanisms, only a limited insight on knowledge
transfer is presented. In fact, there are many other environmental, organizational,
and social conditions that empirical research could investigate in future. Second,
the survey focuses exclusively on fashion and textile companies, operating in
industrial districts. Therefore, if the same research would be realized in other
industry systems or branches, results may vary. Further, this study includes
principally Italian small and medium-sized companies into the sample. Thus, it
would be interesting to find out whether the selection of knowledge transfer
mechanisms of smaller companies may differ in comparison to large enterprises.
Moreover, it is questionable whether country-specific characteristics may
influence the selection of knowledge transfer mechanisms. Last, considering the
determination of adopter categories based on Rogers (1995, 2003), some
resulting limitations have to be highlighted: On the one hand, as already
described in chapter 3, Rogers assumes that the distribution of innovation
diffusion is normally distributed, but in practice, according to Mahajan et al.
(1990), this presumption is doubtful.367 On the other hand, disregarding the
simpleness of Rogers’ method, Rogers cannot prove that his technique is
applicable for all forms of innovations.368 In fact, according to Price et al. (1986),
Rogers’ research is directed primarily at agricultural companies, and involves first
and foremost discrete innovations and common communication media (mass
media and interpersonal communication) that are atypical compared to those in
consumer product sectors,369 such as the fashion and textile sector.
367 Mahajan et al., 1990, p. 37 368 Mahajan et al., 1990, p. 37 369 Price et al., 1986
107
BIBLIOGRAPHY
Sources from the literature
Abrams, L. C., Cross, R., Lesser, E., & Levin, D. Z. (2003). Nurturing interpersonal trust in knowledge-sharing networks. Academy of Management Executive, 17 (4), 64-77. Alavi, M., & Leidner, D. E. (2001). Knowledge Management and Knowledge Management Systems: Conceptual Foundations and Research Issues. MIS Quarterly, 25 (1), pp. 107-136. Albers, S., & Gassmann, O. (2005). Handbuch Technologie- und Innovationsmanagement. Wiesbaden: Gabler Verlag. Albino, V., Carbonara, C., & Giannoccaro, I. (2006). Innovation within Industrial Districts: An Agent-Based Model. International Journal of Production Economics, 104 (1), 30-45. Allee, V. (1997). The Knowledge Evolution: Expanding Organizational Intelligence. Boston: Butterworth-Heinemann. Almirall, E., & Casadesus-Masanell, R. (2010). Open versus closed innovation: a model of discovery and divergence. Academy of Management Review, 35 (1), 27-47. Alves, J., Marques, M. J., & Marques, P. (2005). Building Creative Ideas for Successful New
Product Development. Retrieved 11/09/2011 from http://www.casadofuturo.ua.pt/Papers/Building %20creative%20ideas%2030Junh05.pdf Andrews, K. M., & Delahaye, B. L. (2000). Influence on Knowledge Processes in Organizational Learning: The Psychosocial Filter. Journal of Management Studies, 37 (6), 797-810. Antonelli, C., Patrucco, P. P., & Quatraro, F. (2008). The governance of localized knowledge externalities. International Review of Applied Economics, 22 (4), 479-498. Argote, L., & Ingram, P. (2000). Knowledge Transfer: A Basis for Competitive Advantage in Firms. Organizational Behavior and Human Decision Processes, 82 (1), 150–169. Argote, L., Levine, J. M., & Moreland, R. L. (2000). Knowledge Transfer in Organizations: Learning from the Experience of Others. Organizational Behavior and Human Decision
Processes, 82 (1), 1-8. Argote, L., McEvily, B., & Reagans, R. (2003). Managing knowledge in organizations: an integrative. Managment Science, 49 (4), 571-582. Award, E. M., & Ghaziri, H. M. (2004). Knowledge Management. Upper Saddle River: Prentice Hall. Backhaus, K., Erichson, B. E., Plinke, W., & Weiber, R. (2008). Multivariate Analysemethoden:
Eine anwendungsorientierte Einführung. Berlin/Heidelberg: Springer Verlag. Baregheh, A., Rowley, J., & Sambrook, S. (2009). Towards a Multidisciplinary Definition of Innovation. Management Decision, 47 (8), 1323-1339. Bass, F. M. (1969). A new product growth model for consumer. Management Science, 15, 215-227.
108
Becattini, G. (2004). Industrial Districts. A new Approach to Industrial Change. Cheltenham : Edward Elgar. Becattini, G. (1991). Italian Industrial Districts: Problems and Perspectives. International Studies
of Management & Organization, 21 (1), 83-90. Becattini, G. (1987). Mercato e forzi locali: il distretto industriale. Bologna: Il Mulino. Becattini, G., & Musotti, F. (2003). Measuring the District Effect. Reflections on the Literature. Banca Nazionale der Lavoro Quarterly Review, 56 (226), 259-290. Becattini, G., Bellandi, M., & De Propris, L. (2009). A Handbook of Industrial Districts. Cheltenham/Northampton: Edward Elgar Publishing Limited, Inc. Becattini, G., Dei Ottati, G., & Sforzi, F. (2003). From industrial districts to local development: an
itinerary of research. Northampton: Edward Elgar Publishing, Inc. Becctini, G. (1979). Dal ‘settore’ industriale al ‘distretto’ industriale. Alcune considerazioni sull'unitá di indagine dell'economia industriale. Economia e Politica Industriale (1), 7-21. Belussi, F. (2005). Are Industrial Districts Formed by Networks Without Technologies? The Diffusion of Internet Applications in Three Italian Clusters. European Urban and Regional Studies, 12 (3), 247–268. Belussi, F., & Caldari, K. (2009). At the Origin of the Industrial District: Alfred Marshall and the Cambridge School. Camb. J. Econ, 33 (2), 335-355. Belussi, F., & Gottardi, G. (2000). Evolutionary Patterns of Local Industrial Systems: Towards a
Cognitive Approach to the Industrial District. Aldershot: Ashgate. Belussi, F., & Pilotti, L. (2002). Knowledge Creation, Learning and Innovation in Italian Industrial Districts. Geografiska Annaler 84 B (2), 125-139. Bertini, S. (2000). Endogeneous Development of Local Systems of SMEs: Lessons From Practical Experience. In: F. Belussi, & G. Gottardi, Evolutionary Patterns of Local Industrial
Systems: Toward a Cognitive Approach to the Industrial District (pp. 91-113). Ashgate. Bettiol, M., & Micelli, S. (2006). The Strategic Role of Design for the Competitiveness of Italian
Industrial System. Retrieved 20/10/2011 from http://www.cggc.duke.edu/pdfs/workshop/design%2 0and%20Italian%20industrial%20system.pdf Bianchi, R. (2009). The Italian revival of industrial districts and the foundation of political economy. In: G. Becattini, G. Bellandi, & L. De Propris, A Handbook of Industrial Districts (pp. 103-110). Cheltenham/Northampton: Edward Elgar Publishing Limited, Inc. Birkinshaw, J. (2001). Why is Knowledge Management So Difficult? Business Strategy Review, 12 (1), 11-18. Blomqvist, K., Hurmelinna, P., & Seppänen, R. (2005). Playing the collaboration game right – balancing trust and contracting. Technovation (25), pp. 497–504. Bodensteiner, W. D. (1970). Information Channel Utilization Under Varying Research and Development Project Conditions: An Aspect of Inter-Organizational Communication and Channel Usages. PhD Dissertation . University of Texas, Austin. Bonomi, A. (2001). Innovazione Tecnologica e Distretti Industriali. Abgerufen am 28/09/2011 von http://www.complexitec.org/doc/ITDL/InnovazioneTDI.pdf
109
Boschma, R. A. (1998). The industrial rise of the Third Italy: open window of locational
opportunity? Retrieved 30/06/2011 from http://www.entreprenorsregionen.se/res/pub/1497/Riseof ThirdItaly.pdf Bowden, J., & Corkindale, D. (2005). Identifying the Initial Target Consumer for Innovations: An Integrative Approach. Marketing Intelligence & Planning, 6, 562-573. Breschi, S., & Lissoni, F. (2001). Localised Knowledge Spillovers vs. Innovative Milieux:. Papers
Reg. Sci., 80, 255–273. Brusco, S. (1999). The Rules of the Game in Industrial Districts. In A. Grandori, Inter-Firm
Networks organization and industrial competitiveness (pp. 17-40). London: Routledge. Büchel, B., & Raub, S. (2001). Media Choice and Organizational Learning. In: M. Dierkes, A. Berthoin Antal, J. Child, & I. Nonaka, Handbook of Organizational Learning and Knowledge. New York: Oxford University Press, Inc., pp. 518-534. Burdett, J. (2003). Academics' Experiences of ICT Innovation. Proceedings of the 20th Annual Conference of Australasian Society for Computers in Learning Tertiary Education (ASCILITE). Retrieved 11/10/2011 http://www.ascilite.org.au/conferences/ adelaide03/docs/pdf/84.pdf Cainelli, G., & De Liso, N. (2005). Innovation in Industrial Districts: Evidence from Italy. Industry
and Innovation, 12 (3), 383-398. Capitani, G., & Di Maria, E. (2000). Le nuove tecnologie dell'informazione e della. In: S. Micelli, & E. Di Maria, Distretti industriali e tecnologie di rete, progettare la convergenza. Milan: Franco Angeli. Carbonara, N. (2004). Innovation Processes Within Geographical Clusters: A Cognitive Approach. (24), 17–28. Carlino, G. A. (2001). Knowledge Spillovers: Cities’ Role in the New Economy. Business Review
Q4, 17-26. Cavusgil, S. T., Calantone, R. J., & Zhao, Y. (2003). Tacit Knowledge Transfer and Firm Innovation Capability. Journal of Business and Industrial Marketing, 18 (1), 6-21. Chen, J., & McQueen, R. J. (2010). Knowledge Transfer Processes for Different Experience Levels of Knowledge Recipients at an Offshore Technical Support Center. Information
Technology & People, 23 (1), 54-79. Chen, J., Zhu, Z., & Xie, H. Y. (2004). Measuring Intellectual Capital: A New Model and Empirical Study. Journal of Intellectual Capital, 5 (1), 195-212. Chesbrough, N. (2004). Managing Open Innovation. Research Technology Management, 47 (1), 23-26. Chiaravesio, M., & Micelli, S. (2000). Reti e nuove tecnologie nei distretti industriali del Nord-Est. Risultati dell'osservatorio Tedis. In: S. Micelli, & E. Di Maria, Distretti industriali e tecnologie di
rete, progettare la convergenza. Milan: Franco Angeli. Chiarvesio, M. (2001). Un portale per il distretto industriale della sedia. In: A. De Toni, & R. Grandinetti, Conoscenze, relazioni e technologie di rete nelle filiere distrettuali. Milan: Franco Angeli. Chiarvesio, M., & Micelli, S. Reti e nuove tecnologie nei distretti industriali del Nord-Est. In: S. Micelli, & D. M. E, Distretti industriali e tecnologie di rete, progettare la convergenza. Milan: Franco Angeli.
110
Churchill, G. (1979). A paradigm for developing better measures of marketing constructs. Journal
of Marketing Research, 16 (1), 64-73. Churchill, G., & Iacobucci. (2005). Marketing Research. South-Western: Thomson. Claro, D. P., Hagelaar, G., & Omta, O. (2003). The Determinants of Relational Governance and Performance: How to Management Business. Industrial Marketing Management, 32 (8), 703-716. Cohen, W. M., & Levintha, D. A. (1990). Absorptive Capacity: A New Perspective on Learning and Innovation. Administrative Science Quarterly, 35 (1), 128-152. Confindustria. (2011). Ricerca industriale, le perle d'Italia. Retrieved 11/07/2011 from http://rasseg na.governo.it/testo.asp?d=63747298 Cortina, J. M. (1993). What is Coefficient Alpha? An Examination of Theory and Applications. Journal of Applied Psychology, 78 (1), pp. 98-104. Cummings, L. L., & Staw, B. M. (1984). Research in organizational behavior. Homewood, IL: JAI Press. Daft, L. R., & Lengel, H. R. (1986). Organizational Information Requirements, Media Richness and Structural Design. Management Science, 32 (5), 554-571. Daft, R. L., & Lengel, R. H. (1983). Information Richness: A New Approach to Managerial
Behavior and Organization Design. Retrieved 12/08/2011 from http://www.dtic.mil/cgibin/GetTRD oc?AD=ADA128980&Location=U2&doc=GetTRDoc.pdf Daft, R. L., & Lengel, R. H. (1984). Information richness: a new approach to managerial behavior and organizational design. In: L. Cummings, & B. Staw, Research in organizational behavior (pp. 191–233). Homewood, IL: JAI Press. Daft, R. L., & Lengel, R. H. (1983). Information Richness: A New Approach to Managerial
Behaviour and Organization Design. Retrieved 20/08/2011, from http://www.dtic.mil/dtic/tr/fulltext/ u2/a128980.pdf Daft, R. L., & Macintosh, N. B. (1981). A tentative exploration into the amount and equivocality of information processing in organizational work units. Adm Sci Q, 26 (2), 207–224. Daft, R. L., Lengel, R. H., & Trevino, L. K. (1987). Message Equivocality, Media Selection, and Manager Performance: Implications for Information Systems. MIS Quarterly, 11 (3), 355-366. Darr, E. D., & Kurtzberg, T. R. (2000). An Investigation of Partner Similarity Dimensions on Knowledge Transfer. Organizational Behavior and Human Decision Processes, 82 (1), 28–44. Davenport, T. H., & Prusak, L. (2000). Working Knowledge: How Organizations Manage What
They Know. USA: Harvard Business School Press. Davis, F. D. (1989). A technology acceptance model for empirically testing new end-user
information systems. Theory and results. Dissertation. Betreut von John C. Henderson.
Massachusetts Institute of Technology, Sloan School of Management. Retrieved from http://hdl.handle.net/1721.1/15192 De Toni, A., & Grandinetti, R. (2001). Conoscenze, relazioni e tecnologie di rete nelle filiere
distrettuali. Milan: Franco Angeli. Dei Ottati, G. (2003). Fiducia e cambiamento economico nei distretti industriali. Il caso del distretto di Prato. Sviluppo Locale, X (23-24), 82-105.
111
Dei Ottati, G. (2004). Global Competition and Entrepreneurial Behaviour in Industrial Districts:
Trust Relations in an Italian Industrial District. Paper presented at the Conference on Clusters,
Industrial Districts and Firms: the Challenges of Globalization. Retrieved 16/08/2011 from http://www.economia.unimo.it/convegni_seminari/CG_sept03/no/Papers%20per%20CD%20proceedings/Knowledge%20and%20cluster%20dynamics/Dei%20Ottati.pdf Dei Ottati, G. (1994). Trust, interlinking transaction and credit in the industrial district. Cambridge
Journal of Economics, 18, 529-546. Dennis, A. R., & Kinney, S. T. (1998). Testing media richness theory in the new media: The effects of cues, feedback, and task equivocality. Information Systems Research (9), 256-274. Deroian, F. (2002). Formation of Social Networks and Diffusion of Innovations. Research Policy, 31, 835–846. Desouza, K., & Evaristo, R. (2003). Global Knowledge Management Strategies. European
Management Journal, 21 (1), 62–67. Di Maria, E. (2000). Vertical Communities e distretti virtuali. In: S. Micelli, & E. Di Maria, Distretti
industriali e tecnologie di rete, progettare la convergenza. Milan: Franco Angeli. Dirks, K. T., & Ferrin, D. L. (2001). The Role of Trust in Organizational Settings. Organizatio
Science, 12 (4), 450-467. Disselkamp, M. (2005). Innovationsmanagement: Instrumente und Methoden zur Umsetzung im
Unternehmen. Wiesbaden: Gabler. Disterer, G. (2003). Fostering knowledge sharing: why and how. In: A. Reis, & P. Isaias, Proceedings of the IADIS International Conference e-Society 2003 (pp. 219-26). Lisbon. Disterer, G. (2001). Individual and Social Barriers to Knowledge Transfer. Proceedings of the 34th Hawaii International Conference on System Sciences Retrieved 18/11/2011 from http://citeseerx.i st.psu.edu/viewdoc/download?doi=10.1.1.97.6417&rep=rep1&type=pdf Distretti Italiani (2011). Osservatorio Nazionale Distretti Italiani: II Osservatorio. Retrieved 11/07/2011 from http://www.osservatoriodistretti.org/sites/default/files/distretti_2rapporto_ media.pdf Dixon, N. M. (2000). Common Knowledge: How Companies Thrive by Sharing What They Know. Boston: Harvard Business School Press. Downes, M., & Thomas, A. S. (2000). Knowledge Transfer Through Expatriation: The U-curve Approach to Overseas Staffing. Journal of Managerial Issues, 12 (2), 131-151. Du Plessis, M. (2007). The role of knowledge management in innovation. Journal of Knowledge
Management, 11 (4), 20-29. European Commission. (2006). La nuova definizione di PMI: Guida dell’utente e modello di
dichiarazione. Retrieved 14/10/2011 from http://ec.europa.eu/enterprise/policies/sme/files/sme_de finition/sme_user_guide_it.pdf Fasnacht, A. (2009). Open Innovation in the Financial Services. Berlin/Heidelberg: Springer-Verlag. Fondazione Edison. (2010). Analisi dell´export distrettuale italiano:IV trimestre e anno 2010. Retrieved 11/07/2011 from http://www.osservatoriodistretti.org/sites/default/files/ analisi_dell_export_iv_trimestre_2010.pdf
112
Foos, T., Schum, G., & Rothenberg, S. (2006). Tacit knowledge transfer and the knowledge disconnect. Journal of Knowledge Management, 10 (1), 6-18. Fortis, M., & Carminati, M. (2007). Industrial Districts: The Economic Reality and Legislative
Framework in Italy. Retrieved 12/07/2011 from http://www.unicreditreviews.eu/ uploads/01_fortis-carminatir_rev.pdf Fortis, M., & Carminati, M. (2009). Sectors of Excellence in the Italian Industrial Districts. In: G. Becattini, M. Bellandi, & L. De Propris, A Handbook of Italian Industrial Districts (pp. 417-428). Fourth, L. A., & Woodlock, J. W. (1960). Early Prediction of Market Success for New Grocery Products. Journal of Marketing, 25, 31-38. Garavelli, A. C., & Gorgoglione, M. (2000). Attori processi e tecnologie del trasferimento di sapere
e saper fare nelle imprese: un modello di analisi. Turin, 10 November. Gassmann, O., & Enkel, E. (2006). Open Innovation: Die Öffnung des Innovationsprozesses erhöht das Innovationspotenzial. Zeitschrift Führung und Organisation (3), pp. 132–38. Gopalakrishnan, S., & Bierly, P. (2001). Analyzing Innovation Adoption Using a Knowledge-Based Approach. J. Eng. Technol. Manage., 18, 107–130. Gottardi, G. (2003). Why do Ict technologies and the Internet find it hard to spread into industrial
districts (IDs) and favour knowledge exchange? Retrieved 13/10/2011 from http://www.decon.unipd.it/info/sid/materiale3/bel-AAAA-Gottardi.pdf Grandori, A. (1999). Inter-Firm Organization and Industrial Competitiveness. London: Routledge. Gulati, R. (1995). Does Familiarity Breed Trust? The Implcations of Repeated Ties for Contractual Choice in Alliances. Academy of Management Journal, 38, 85-112. Hansen, M. T., Nohria, N., & Tierney, T. (1999). What's Your Strategy to Manage Knowledge? Harvard Business Review, March-April, 106–116. Harkness, J. (2003). Questionnaire Translation. Retrieved 05/11/2011 from http://www.odum.unc. edu/odum/content/pdf/harkness%20chapter%203%20%20questionnnaire20translation.pdf Hasler Roumois, U. (2007). Studienbuch Wissensmanagement: Grundlagen der Wissensarbeit. Zürich: Orell Füssli Verlag. Hausschildt, J. (2004). Innovationsmanagement (Vol. 3.edition). München: Verlag Vahlen. Henderson, R. M., & Clark, K. B. (1990). Architectural Innovation: The Reconfiguration of Existing Product Technologies and the Failure of Established Firms. Administrative Science Quarterly, 35 (1), 9-30. Herring, S. C. (2002). Computer-Mediated Communication on the Internet. Annual Review of
Information Science and Technology, 36 (1), 109-168. Hollnthoner, M. (2010). Knowledge Transfer and Trust in Networks: The Case of the Mechatronics Cluster Upper Austria“. Diploma thesis, University of Vienna. Hong, J. F., & Nguyen, T. V. (2009). Knowledge embeddedness and the transfer mechanisms in multinational corporations. Journal of World Business (44), 47–356. Howells, J. R. (2002). Tacit Knowledge, Innovation and Economic Geography. Urban Studies, 39 (5-6), 871–884.
113
Huff, L., & Kelley, L. (2003). Levels of Organizational Trust in Individualist versus Collectivist Societies: A Seven-Nation Study. Organization Science, 14 (1), 81-90. Im, S. (1999). The model of effect of Creativity on new product success, PhD Dissertation. Kenan-Flagler Business School, University of North Carolina. Inken, A. C., & Tsang, W. K. (2005). Social Capital, Networks, and Knowledge Transfer. Academy
of Management Review, 30 (1), 146–165. Intesa Sanpaolo. (2010). Economia e finanza dei distretti industriali. Rapporto Annuale-n.3. Retrieved 14/07/2011 from http://www.group.intesasanpaolo.com/scriptIsir0/si09/contentData/vie w/EconomiaFinanzaDistretti.pdf?id=CNT-04-000000001F6D4&ct=application/pdf Istat. (2001). Distretti industriali e sistemi locali del lavoro 2001 in versione elettronica. Retrieved 10/07/2011 from http://www.istat.it/salastampa/comunicati/non_calendario/20051216_00/Volume_ Distretti.pdf Istat. (2011). Foreign Trade: Export of Italian regions (January-December 2010). Retrieved 11/07/2011 from http://en.istat.it/salastampa/comunicati/in_calendario/exporegio/20110314_00/for eign_trade_14_03_11.pdf Johne, A. (1999). Successful Market Innovation. European Journal of Innovation Management 6–
11, 2 (1). Joia, A., & Lemos, B. (2010). Relevant Factors for Tacit Knowledge Transfer within Organisations. Journal of Knowledge Management, 14 (3), 410-427,. Joia, L. A. (2006). Distributive knowledge transfer processes in G2G endeavours: a heuristic frame’’. In: R. Traunmüller, Knowledge Transfer for eGovernment: Seeking Better eGovernment
Solutions (pp. 179-183). Universität Linz: Trauner Verlag. Kakabadse, N. K., Kouzmin, A., & Kakabadse, A. (2001). From Tacit Knowledge to Knowledge Management: Leveraging Invisible Assets. Knowledge and Process Management, 8 (3), 137–154. Kaplan, M. A., & Haenlein, M. (2010). Users of the world, unite! The challenges and opportunities of Social Media. Business Horizons, 53, 9-68. Katz, E. (1992). Wird das Fernsehen überschätzt? Konzepte der Medienwirkungsforschung. In: W. Fröhlich, N. Postman, & H. Hoffmann, Die verstellte Welt. Beiträge zur Medienökologie (pp. 190-221). Weinheim: Beltz Stiftung Lesen. Keeble, D., & Wilkinson, F. (1999). Collective learning and knowledge development in the evolution of regional clusters of high technology SMEs in Europe. Regional Studies (33), pp. 295-303. Keilbach, M. (2000). Spatial Knowledge Spillovers and the Dynamics of Agglomeration and
Regional Growth. Heidelberg/New York: Physica Verlag. Khazanchi, S., Lewis, M. W., & Boyer, K. K. (2007). Innovation-supportive culture: The impact of organizational values on process innovation. Journal of Operations Management, 25, 871–884. Kogut, B., & Zander, U. (1993). Knowledge of the Firm and the Evolutionary Theory of the Multinational Corporation. Journal of International Business Studies, 24 (4), 625-645. Kogut, B., & Zander, U. (1992). Knowledge of the firm, combinative capabilities, and the replication of technology. Organization Science, 3 (3), 383-396.
114
Kotzian, A. (2008). Wissensmanagement in Netzwerkbeziehungen: Fallbeispiel Gesundheitscluster OOE. Diploma thesis, University of Vienna. Krishnan, R., Martin, X., & Noorderhaven, N. G. When does trust matter to alliance performance? Academy of Management Journal, 49 (5), 894-917. Kroeber-Riel, W., & Weinberg, P. (2003). Konsumentenverhalten. München: Verlag Franz Vahlen. Lam, A. (2000). Tacit Knowledge, Organizational Learning and Societal Institutions: An Integrated Framework. Organization Studies, 21 (3), 487-513. Landabaso, M., & Rosenfeld, S. (2009). Public policies for industrial districts and clusters. In: G. Becattini, M. Bellandi, & L. De Propris, A Handbook of Industrial Distructs (pp. 793-753). Cheltenham/Northampton: Edward Elgar Publiching, Inc. Landström, H. (2005). Pioneers in Entrepreneurship and Small Business Research. International
Studies in Entrepreneurship, 8 (2), 235-259. Lee, E. K., Lee, J., & Schumann, D. W. (2002). The Influence of Communication Source and Mode on Consumer Adoption of Technological Innovations. The Journal of Consumer Affairs, 36 (1), 1-27. Lehner, F. (2009). Wissensmanagement: Grundlagen, Methoden und technische Unterstützung. München/Wien: Carl Hanser Verlag. Lengel, R. H. (1983). Managerial information processing and communicationmedia. Unpublished
PhD Dissertation . Texas A&M University, College Station. Lengel, R. H., & Daft, R. L. (1988). The selection of communication media as an executive skill. Academy of Management Executive, 2 (3), 225-232. Levin, D. Z., Cross, B., & Abrams, L. C. (2002). The strength of weak ties you can trust:The
mediating role of trust in effective knowledge transfer (Under review, Academy of Management
Journal). Retrieved 15/08/2011 from http://citeseerx.ist.psu.edu/viewdoc/download?doi=10.1.1.13 2.9861&rep=rep1&type=pdf Levin, D. Z., Cross, R., Abrams, L. C., & Lesser, E. L. (2011). Trust and knowledge sharing: A
critical combination. Retrieved 09/10/2011 from http://www-935.ibm.com/services/in/igs/pdf/g510-1693-00-cpov-trust-and-knowledgesharing.pdf Lie, T., & Fang, W. C. (2005). The impact of cultural values in electronic commerce trust building mechanism. International Journal of Education and Information Technologies, 2 (1), 36-44. Lo, S.-K., & Lie, T. (2008). Selection of communication technologies—A perspective based on information richness theory and trust. Technovation, 28, 146–153. Lombardi, M. (2000). In: F. Belussi, & G. Gottardi, Evolutionary Patterns of Local Industrial
Systems: Towards a Cognitive Approach to the Industrial District (pp. 71-87). Aldershot: Ashgate. M. Dierkes, A. B., Berthoin Antal, A., Child, J. & Nonaka, I. (2001). Handbook of Organizational
Learning and Knowledge. New York: Oxford University Press, Inc. Mahajan, V., Muller, E., & Srivasta, R. K. (1990). Determination of Adopter Categories by Using Innovation Diffusion Models. Journal of Marketing Research, XXVII, 37-50. Mahajan, V., Muller, E., & Wind, Y. New Product Diffusion Models. Springer Science Business Media, Inc.
115
Malmberg, A., & Power, D. (2005). (How) Do (Firms in) Clusters Create Knowledge? Industry and
Innovation, 124, 409–431. Mansfield, E. (1961). Technical Change and the Rate of Imitation. Econometrica, 29, 741-766. Markusen, A. (1996). Sticky Places in Slippery Space: A Typology of Industrial Districts. Economic Geography, 72 (3), 293-313. Marshall, A. (2006). Elements of Economics of Industry. New York: Cosimo, Inc. Marshall, A. (1920). Principles of Economics. London : Macmillan. Martin, X., & Salomon, R. (2003). Knowledge Transfer Capacity and Its Implications for the Theory of the Multinational. Journal of International Business Studies, 34 (4), 356-373. Matusik, S. F., & Hill, C. W. (1998). The Utilization of Contingent Work, Knowledge Creation, and Competitive Advantage. The Academy of Management Review, 23 (4), 680-697. Mayer, R. C., Davis, J. H., & Schoorman, F. D. (1995). An Integrative Model of Organizational Trust. The Academy of Management Review, 20 (3), 709-734. McFadzean, E., O'Loughlin, A., & Shaw, E. (2005). Corporate entrepreneurship and innovation part 1: the missing link. European Journal of Innovation Management, 8 (3), 350-372. Meade, N., & Islam, T. (2006). Modelling and forecasting the diffusion of innovation – A 25-year review. International Journal of Forecasting, 22, 519- 545. Micelli, S., & Di Maria, E. (2000). Distretti industriali e technologie di rete, progettare la
convergenza. Milan: Franco Angeli. Morone, P., & Tylor, R. (2010). Knowledge diffusion and innovation: modelling complex
entrepreneurial behaviours. Cheltenham/Northampton: Edward Elgar Publishing, Inc. Murray, S. R., & Peyrefitte, J. (2007). Knowledge type and communication media choice in the knowledge transfer process. Journal of Managerial Issues, 19 (1), 111-133. Muscio, A. (2006). Patterns of Innovation in Industrial Districts: An Empirical Analysis. Industry
and Innovation, 3, 291-312. Nadler, J., Thompson, L., & Van Boven, L. (2003). Learning Negotiation Skills: Four Models of Knowledge Creation and Transfer. Management Science, 49 (4), 529-540. Nonaka, I. (1994). A Dynamic Theory of Organizational Knowledge Creation. Organization
Science, 5 (1), 14-37. Nonaka, I. (1991). The Knowledge Creating Company. Harvard Business Review, 96-104. Nonaka, I. (2007). The Knowledge-Creating Company. Harvard Business Review, pp. 162-171. Nonaka, I., & Konno, N. (1998). The Concept of "Ba": Building a Foundation for Knowledge Creation. California Management Review, 3, 40-54. Nonaka, I., & Takeuchi, H. (1995). The Knowledge-Creating Company – How Japanese
Companies Create the Dynamics of Innovation . New York: Oxford University Press. Nonaka, I., & Toyama, R. (2003). The knowledge-creating theory revisited: knowledge creation as a synthesizing process. Knowledge Management Research & Practice, 2–10.
116
Nonaka, I., & Toyama, R. (2003). The knowledge-creating theory revisited: knowledge creation as a synthesizing process. Knowledge Management Research & Practice (1), 2–10. Nonaka, I., Toyama, R., & Konno, N. (2000). SECI, Ba and Leadership: a Unified Model of Dynamic Knowledge Creation. Long Range Planning, 33, 5-34. Nunnualy, J. C. (1967). Psychometric Theory. New York: Mc-Graw-Hill Book Company. O´Brien, M. R. (2007). A Caution Regarding Rules of Thumb for Variance Inflation Factors. Quality & Quantity, 41, 673-690. Oba, B., & Semerciöz, F. (2005). Antecedents of trust in industrial districts: an empirical analysis of inter-firm relations in a Turkish industrial district. Entrepreneurship & Regional Development, 17 (3), 163-182. OECD, & Eurostat. (2005). Oslo Manual. Retrieved July 20, 2011, from http://epp.eurostat.ec.euro pa.eu/cache/ITY_PUBLIC/OSLO/EN/OSLO-EN.PDF Oke, A., Burke, G., & Myers, A. (2007). Innovation types and performance in growing UK SMEs. International Journal of Operations & Production Management, 27 (7), 735-753. Osterloh, M., & Frey, B. S. (2000). Motivation, Knowledge Transfer, and Organizational Forms. Organization Science, 11 (5), 538-550. Peterson, R. A. (1973). A Note on Optimal Adopter Category Determination. Journal of Marketing
Research, 10 (3), 325-329. Polanyi, M. (1966). The Tacit Dimension. Garden City, New York: Double Day & Company, Inc. Popp, L., & Zenger, T. (2002). Do Formal Contracts and Relational Governance Function as Substitutes or Complements. Strategic Management Journal, 23, 707-725. Porter, M. E. (2000). Location, Competition, and Economic Development: Local Clusters in a Global Economy. Economic Development Quarterly, 14 (15), 15-34. Porter, M., & Ketels, C. (2009). Ketels,Clusters and industrial districts: Common roots, different perspectives. In: G. Becattini, M. Bellandi, & L. De Propris, A Handbook of Industrial Districts (pp. 172-186). Cheltenham/Northampton: Edward Elgar Publishing,Inc. Pot, F., & Vaas, F. (2008). Sociall innovation, the new challenges for Europe. International
Journal of Productivity and Performance Management, 57 (6), 468 - 473. Price, L. L., Feick, L. F., & Smith, D. C. (1986). A Re-Examination of Communication Channel
Usage by Adopter Categories. Retrieved 11/10/2011 from http://www.acrwebsite.org/volumes/dis play.asp?id=5957 Raffaelli, T. (2009). From the English Roots to the Italian Revival. In: G. Becattini, M. Bellandi, & L. De Propris, A Handbook of Industrial Distrcits (pp. 69-72). Cheltenham/Northampton: Edward Elgar Publishing Limited, Inc. Raithel, J. (2008). Quantitative Forschung: Ein Praxiskurs. Wiesbaden: VS Verlag für Sozialwissenschaften. Reis, A., & Isaias, P. (2003). Proceedings of the IADIS International Conference e-Society 2003. Lisbon. Reis, H. T., & Judd, G. M. (2000). HT Reis,CM Judd, Handbook of Research: Method in Social
and Personality Psychology, Cambridge University Press (2000). Cambridge University Press.
117
Roberts, J. (2000). From know-how to show-how? Questioning the Role of Information and Communication Technologies in Knowledge Transfer. Technology Analysis & Strategic
Management, 12 (4), 429-443. Robertson, T. S. (1971). Innovative behavior and communication. New York. Rogers, E. M. (1962, 1983, 1995, 2003). Diffusion of Innovations. New York: The Free Press. Rowley, J. (2007). The wisdom hierarchy: representations of the DIKW hierarchy. Journal of
Information Science, 33 (2), 163–180. Rowley, J., Baregheh, A., & Sambrook, S. (2011). Towards an innovation-type mapping tool. Management Decision, 1, 73-86. Russ, G. S., Daft, R. L., & Lengel, R. H. (1990). Media selection and managerial characteristics in organizational communications. Manag Commun Q, 4 (2), 151-175. Salavou, H. (2004). The Concept of Innovativeness: Should We Need to Focus? European
Journal of Innovation Management, 1, 33-44. Schmitz, H. (1995). Collective efficiency: Growth path for small-scale industry. The Journal of
Development, 31 (4), pp. 529-566. Schmitz, H. (1999). From ascribed to earned trust in exporting clusters. Journal of International
Economics, 48, 139–150. Schumpeter, J. A. (1931). Theorie der wirtschaftlichen Entwicklung. Eine Untersuchung über
Unternehmensgewinn, Kapital, Kredit, Zins und den Konjunkturzyklus. Leipzig. Schwaiger, S. (2009). Organisation des Wissenstransfers in Clusterbeziehungen: Eine empirische Studie am Beispiel Holzcluster Steiermark. Diploma thesis, University of Vienna. Seppänen, R., Blomqvist, K., & Sundqvist, S. (2007). Measuring inter-organizational trust—a critical review of the empirical research in 1990–2003. Industrial Marketing Management (36), 249-265. Sforzi, F. (2003). Local development in the experience of Italian industrial districts. In: G. Becattini, G. Dei Ottati, & F. Sforzi, From Industrial Districts to Local Development: An Intinerary
Research (pp. 157-183). Nothampton: Edward Elgar Publishing, Inc. Sforzi, F. (2009). The empirical evidence of industrial districts in Italy. In: G. Becattini, M. Bellandi, & L. De Propris, A Handbook of Industrial Districts (pp. 327-342). Cheltenham/Northampton: Edward Elgar Publishing, Inc. Sheer, V. C., & Chen, L. (2004). Improving Media Richness Theory: A Study of Interaction Goals, Message Valence, and Task Complexity in Manager-Subordinate Communication. Management
Communication Quarterly, 18 (1), 76-93. Simon, H. A. (1969). The Sciences of the Artificial. Cambridge: MIT Press. Simonin, B. L. (1999). Ambiguity and the Process of Knowledge Transfer in Strategic Alliances. Strategic Management Journal, 20 (7), 595-623. Sinaceur, M. (2010). Suspending judgment to create value: Suspicion and trust in negotiation. Journal of Experimental Social Psychology, 46, 543-550.
118
Small, C. T., & Sage, A. P. (2005/2006). Knowledge management and knowledge sharing: A review. Information Knowledge Systems Management, 5, 153-169. Sorenson, O., Rivkin, J. W., & Fleming, L. (2005). Complexity, nezworks and knowledge flow.
Paper to be presented at the DRUID Tenth Anniversary Summer Conference 2005 on dynamics
of industry and innovation: organizations, networks and systems,Copenhagen, Denmark. Retrieved 11/09/2011 from http://citeseerx.ist.psu.edu/viewdoc/download?doi=10.1.1.115.7069&r ep=rep1&type=pdf Srećković, M., & Windsperger, J. (2011). Organization of Knowledge Transfer in Clusters: A Knowledge-Based View (uncorrected proof). In M. Tuunanen, J. Windsperger, G. Cliquet, & H. G, New Developments in the Theory of Networks.Franchising, Alliances and Cooperatives (pp. 318-334). Berlin Heidelberg: Springer Verlag. Stummer, C., Günther, M., & Köck, A. M. (2010). Grundzüge des Innovations- und
Technologiemanagements. Wien: facultas.Wuv. Sull, D. N. (2003). The co-evolution of technology and industrial clusters: The rise and fall of the Akron tire cluster (Working Paper). Harvard Business School. Szulanski, G. (1996). Exploring Internal Stickiness:Impediments to the Transfer of Best Practice Within the Firm. Strategic Management Journal, 17, Special Issue: Knowledge and the Firm
(Winter, 1996), 27-43. Szulanski, G. (1999). The process of knowledge transfer: A diachronic analysis of stickiness.
Retrieved 14/08/2010 from http://knowledge.emory.edu/papers/914.pdf Szulanski, G., Cappetta, R., & Jensen, R. J. (2004). When and How Trustworthiness Matters: Knowledge Transfer and the Moderating Effect of Casual Ambiguity. Organization Science, 600-613. Tarde, G. (1890). Les Lois de l’imitation. Paris: Alcan. Tidd, J., & Bessant, J. (2001). Managing Innovation: Integrating Technological, Market and Organizational Change. John Wiley & Sons (Managing Innovation), 464 . Traunmüller, R. (2006). Knowledge Transfer for eGovernment: Seeking Better eGovernment
Solutions. Universität Linz: Trauner Verlag. Trevino, L. K., Daft, R. L., & Lengel, R. H. (1990). Understanding Managers Media Choices: A Symbolic Interactionist Perspective. In: J. Fulk, & C. Steinfeld, Organizations and Communication
Technologies (pp. 71-94). Newbury Park. Trevino, L. K., Lengel, R. H., & Daft, R. L. (1987). Media Symbolism, Media Richness, and Media Choice in Organizations: A Symbolic Interactionist Perspective. Communication Research, 14 (5), 553-574. Tuunanen, M., Windsperger, J., Cliquet, G., & Hendrikse, G. (2001). New Developments in the
Theory of Networks. Franchising, Alliances and Cooperatives. Berlin Heidelberg: Springer Verlag. Vickery, S. K., Droge, C., Stank, T. P., Goldsby, T. J., & Markland, R. E. (2004). The Performance Implications of Media Richness in a Business-to-Business Service Environment: Direct versus Indirect Effects. Management Science, 50 (8), 1106-1119. Walther, J. B., & Bunz, U. (2005). The Rules of Virtual Groups: Trust, Liking, and Performance in
Computer-Mediated Communication. Retrieved 20/09/2011 from http://bunz.comm.fsu.edu/JoC20 05_55_4_virtual.pdf
119
Wang, Y., & Nicholas, S. (2005). Knowledge Transfer, Knowledge Replication and Learning in Non-equity Alliances: Operating Contractual Joint Ventures in China. Management International
Review, 54 (1), 99-118. Whitford, J. (2001). The Decline of a Model? Challenge and Response in the Italian. Economy
and Society, 30 (1), 38-65. Windsperger, J., & Gorovaia, N. (2010). Knowledge attributes and the choice of knowledge
transfer mechanism in networks: the case of franchising. Retrieved 13/09/2011 from http://im.uni vie.ac.at/fileadmin/user_upload/proj_windsperger/Publikationen/WindspergerGorovaia2010.pdf Yu, C.-M. J., Liao, T. J., & Lin, Z. D. (2006). Formal governance mechanisms, relational governance mechanisms, and transaction-specific investments in supplier-manufacturer relationships. Market Manag (35), 128-139 Zander, U., & Kogut, B. (1995). Knowledge and the Speed of the Transfer and Imitation of Organizational Capabilities: An Empirical Test. Organization Science, 6 (1), 76-92. Zwazl, A. (2008). Wissensmanagement und Wissenstransfer zwischen Clusterunternehmen anhand des Beispiels Automobilcluster Steiermark. Diploma thesis, University of Vienna.
Internet sources
http://www.ui.prato.it http://www.demo.istat.it http://www.erim.eur.nl http://www.ec.europa.eu http://www.osservatoriodistretti.org http://rassegna.governo.it

120

121
APPENDICES
APPENDIX A: CURRICULUM VITAE
PPEERRSSOONNAALL IINNFFOORRMMAATTIIOONN:: NNAAMMEE:: SSuussaannnnaa EEnnddeerr DDAATTEE OOFF BBIIRRTTHH:: 3311//1100//11998800 PPLLAACCEE OOFF BBIIRRTTHH:: VViieennnnaa NNAATTIIOONNAALLIITTYY:: AAuussttrriiaa EEDDUUCCAATTIIOONN // TTRRAAIINNIINNGG:: SSiinnccee 1100//22000088:: UUNNIIVVEERRSSIITTYY OOFF VVIIEENNNNAA,, VViieennnnaa M.Sc.: International Business Studies 0099//22000033 –– 1100//22000077:: FFAACCOOLLTTÀÀ DDII EECCOONNOOMMIIAA DDEELLLL’’UUNNIIVVEERRSSIITTÀÀ DDII FFIIRREENNZZEE,, FFlloorreennccee B.Sc.: International Business and Marketing 0099//11999999 –– 1100//22000022:: FFAASSHHIIOONN IINNSSTTIITTUUTTEE VVIIEENNNNAA,, VViieennnnaa
Specialized Diploma Course: “Fashion Design and Product Development”
0099//11998877 –– 1100//11999999:: SSCCHHUULLZZEENNTTRRUUMM MMAARRIIAA RREEGGIINNAA, Vienna Elementary school and grammar school (A-levels, “Matura”) WWOORRKK EEXXPPEERRIIEENNCCEE:: 0066//22000099 -- 0099//22000099:: GGUUCCCCII GGRROOUUPP NN..VV..,, PPaarriiss
IInntteerrnnsshhiipp 0011//22000088 –– 0066//22000088:: HHEENNKKEELL CCEENNTTRRAALL EEAASSTTEERRNN EEUURROOPPEE GGmmbbHH,, VViieennnnaa
Marketing Assistant 0077//22000077 –– 1122//22000077:: DDOOUUGGLLAASS CCOOSSMMEETTIICCSS GGmmbbHH,, HHaaggeenn
Internship – International Brand Management 1122//22000044 –– 0022//22000055:: KKOOSSTTEELLIIAA SSRRLL,, FFlloorreennccee
Project related assistance 0088//22000011 –– 0011//22000033:: KKAAYYIIKKOO –– TThhee PPrriivvaattee LLuuxxuurryy LLaabbeell KKGG,, VViieennnnaa
Marketing assistant and freelance designer 1100//22000022 –– 1122//22000022:: MM..LLIISSKKAA && CCoo GGmmbbHH,, VViieennnnaa
Collaboration for the “Austrian Creative Fur Contest 2002”.
0033//22000022 –– 0099//22000022:: TTHHAANNGG DDEE HHOOOO,, VViieennnnaa Personal assistant
0066//22000011 –– 0077//22000011:: AALLTTAA MMOODDAA RROOMMAA 22000011,, RRoommee
Internship 0066//22000000 –– 0077//22000000:: HHUUGGOO BBOOSSSS aanndd SSOONNIIAA RRYYKKIIEELL,, VViieennnnaa Sales assistant 1100//11999966-- 0044//11999988:: MMAARRKKEETT RREESSEEAARRCCHH IINNSSTTIITTUUTTEE,, VViieennnnaa Freelancer

122
LLAANNGGUUAAGGEE SSKKIILLLLSS:: GERMAN: First language ENGLISH: Proficient user ITALIAN: Proficient user FRENCH: Basic user CCOOMMPPUUTTEERR SSKKIILLLLSS::
Excel Lotus Notes Photoshop Powerpoint R version 2.4.1 SAP Word
123
APPENDIX B: ABSTRACTS
English abstract
In Italy industrial districts are known as particularly vital places of innovation, where localized knowledge spillovers and trust among district firms play a fundamental role. Even though literature on industrial districts, knowledge transfer, organizational trust, and innovation adoption exists, there is a general lack of contributions that link all these concepts. In fact, up to now only a very limited number of researchers have investigated the determinants that have an impact on the selection of knowledge transfer mechanisms. Therefore, after an extensive literature review, an online survey has been conducted, targeting exclusively at Italian district firms that operate in the fashion and textile sector. Consequently, based on the findings of 165 completed questionnaires an empirical survey has been undertaken. This work focused on the theory of knowledge transfer mechanisms, using the media richness theory. According to this theory, two types of communication media exist, namely communication channels with lower degrees of media richness (e.g., e-mail, fax, letters) or communication channels with higher degree of media richness (e.g., face-to-face dialogue, meetings). This concept has then been linked with: • the knowledge-based theory of companies, investigating the impact that
knowledge characteristics (codifiability, teachability, complexity) have on the choice of knowledge transfer mechanisms. It has been assumed that explicit knowledge, as being less complex and highly codifiable and teachable, is transferred easier than tacit knowledge. Consequently, it has been hypothesized that the tacitness of knowledge is positively related to the choice of knowledge transfer mechanisms with higher degrees of media richness. The present study has found out that only codifiability of knowledge has a positive impact on the use of both types of knowledge transfer mechanisms.
• the concept of trust. It has been assumed that trust (or distrust) increases the usage of knowledge transfer mechanisms with lower (or higher) degrees of information richness. Empirical examination has shown that trust impacts positively the use of both forms of knowledge transfer mechanisms.
• the theory of innovation adopter categories identified by Rogers – the author of the book “Diffusion of innovations”. In this context, it has been analyzed whether innovator adopters (earlier and later adopters) differ in terms of sales, size, age, and trust. Hereby, it has become clear that adopter categories differ only according to company size. Furthermore, it has been assumed that later adopters, preferring personal communication, adopt more likely richer knowledge transfer mechanisms, while earlier adopters, habitually focusing on impersonal mass media, use more likely leaner knowledge transfer mechanisms. Empirical results suggest the partial rejection of these hypotheses.
To complete, it has been investigated whether the choice of knowledge transfer mechanisms on the basis of the tacitness of knowledge or on the basis of the form of innovation adoption varies when trust comes into play. In this case it has emerged that no significant interaction effects exist.
124
German abstract
Italienische Industriedistrikte sind Beispiele besonders innovationsfreudiger, regionaler Produktionsnetzwerke, in denen sowohl ein effizienter Austausch kontextuellen Wissens als auch ausgeprägte Vertauensbeziehungen maßgeblich zum Wettbewerbsvorteil der lokalen Unternehmen beitragen. Obwohl es in der Literatur zahlreiche Untersuchungen zu Themen wie Wissensaustausch, Vertrauen und Innovation in Industriedistrikten gibt, sind es nur wenige Studien, die all diese Themenbereiche miteinander verknüpfen. So existiert nur eine limitierte Anzahl von Untersuchungen, die die Einflussfaktoren von Wissenstransfermechanismen untersuchen. Ziel der vorliegenden Arbeit ist es daher, auf der Basis einer ausführlichen Literaturrecherche genau diesen Aspekt des Wissensmanagements näher zu durchleuchten. Die vorliegende empirische Studie bezieht sich ausschließlich auf italienische Unternehmen, die im Mode- und Textilsektor tätig sind. Insgesamt konnten mit Hilfe einer Online-Befragung 165 ausgefüllte Fragebögen ausgewertet werden. Die vorliegende Arbeit analysiert Wissenstransfermechanismen im Hinblick auf die Medienreichhaltigkeitstheorie, die zwischen wenig reichhaltigen Medien (E-mail, Fax, Briefe) und stark reichhaltigen Medien (persönliche Kommunikation, Meetings) unterscheidet. Diese Theorie wird in Beziehung gesetzt zu • der Theorie der Wissensattribute (Kodifizierbarkeit, Lehrbarkeit, Komplexität),
welche davon ausgeht, dass explizites Wissen aufgrund seiner geringen Komplexität und einfachen Kodifizierbarkeit und Lehrbarkeit leichter ausgetauscht werden kann als implizites Wissen. Die vorliegende Arbeit analysiert inwieweit der Transfer von impliziertem (oder explizitem) Wissen in einem verstärkten Gebrauch sehr (oder weniger) reichhaltiger Wissens-transfermechanismen resultiert. Die empirische Studie zeigt, dass nur Kodifizierbarkeit des Wissens einen signifikanten positiven Einfluss auf beide Formen von Wissenstransfermechanismen hat.
• dem Konzept des Vertrauens in Unternehmen. Es wird angenommen, dass Vertrauen (oder Misstrauen) den Gebrauch von weniger (oder sehr) reichhaltigen Transfermechanismen impliziert. Die Studie konnte aufgrund signifikanter Ergebnisse untermauern, dass Vertrauen einen positiven Einfluss auf beide Transfermechanismen ausübt.
• der Theorie der Innovationsadoption von Rogers, dem Autor des Buches „Diffusion of innovations“, der diverse Formen von Innovationsadoptionstypen aufzeigte. Die vorliegende Arbeit untersucht ob Unternehmen, die Innovationen sehr früh (oder spät) annehmen, eher zu gering (oder stark) reichhaltigen Wissenstransfermechanismen greifen. Die Untersuchung zeigte, dass späte Adoptoren beide Wissenstransfermechanismen verstärkt benutzen.
Abschließend wurde untersucht ob der Einfluss der Art des Wissens oder der Form der Innovationsadotion durch Vertrauen verstärkt wird. Die vorliegende Studie konnte keinerlei signifikante Beweise für die Existenz solcher Interaktionseffekte generieren.
125
APPENDIX C: ADDITIONAL INFORMATION
Data and information
Data370 can be defined as “raw material”, representing the precondition of
information production and has been considered as “a set of discrete, objective
facts about events [...] most usefully described as structured records of
transactions.”371 With the help of technology systems data can be collected,
stored and organized.
Information is defined as “a message usually in the form of a document or an
audible or visible communication”, and is destined “to shape the person who gets it,
to make some difference in his outlook or insight.”372
In industrial districts two different forms of information exist: (1) system
information and (2) task information.373 System information describes conditions
of market demand, while task information pictures local manufacturing cycles and
technological requirements inside a district. The right employment of these types
of information is fundamental for the constant adaption of district firms to local
environmental changes.
In respect to literature on innovation, Rogers (1995) distinguishes between two
distinct forms of information, namely: (1) software information and (2) information
on innovation evaluation.374 While software information is incorporated in a
technology and helps to decrease uncertainty about the “cause-effect
relationships in achieving a desired outcome”375, information on innovation
evaluation is needed to reduce uncertainty about the introduction of an innovative
technology.
370 Davenport/Prusak, 2000, pp. 2-3 371 Davenport/Prusak, 2000, p. 2 372 Davenport/Prusak, 2000, p. 3 373 Lombardi, 2000, p. 77 374 Rogers, 1995, p. 14 375 Rogers, 1995, p. 14
126
Knowledge creation processes
The SECI model
The so-called SECI model includes four knowledge creation processes, namely
(1) socialization, (2) externalization, (3) internalization and (4) combination.376
Dynamic engagement of these processes and social interaction among
organizational members bring into action the so-called “spiral of knowledge
creation”.377 According to Nonaka and Toyama (2003), the SECI processes can
be described as follows:378
• The first way of knowledge creation consists in socialization. This model
consists of “converting new tacit knowledge through shared experiences in
day-to-day social interaction.”379 Hereby, individuals convert tacit knowledge
into tacit knowledge by observing and imitating other individuals and
“socialize” knowledge by practicing new knowledge inputs.
• The model referred to as externalization transforms tacit knowledge into
codified knowledge and makes it thus transferable among organizational
members by using, for example, images or codes.
• The third model consists in exchanging explicit knowledge among
organizational members throughout diverse knowledge transfer mechanisms.
Typical transfer mechanisms used in this process (referred to as combination)
are computerized communication systems and databases.
• The model of knowledge creation is called internalization. In this model
codified knowledge is transformed into tacit knowledge, for which training
programmes, manuals and documents are common transfer mechanisms.
Once knowledge has been transferred and understood by individuals, it is
internalized. Then new knowledge can have an impact on the perception and
behaviour of organizational members.
376 Nonaka, 1991, pp. 98-99; Nonaka, 1994, pp. 18-20; Nonaka/Kono, 1998, pp. 42-45; Nonaka et
al., 2000, pp. 9.-12; Nonaka/Toyama, 2003, pp.4-6; 377 Nonaka, 1991, p. 99; Nonaka, 1994, p. 18 378 Nonaka/Toyama, 2003, pp.4 - 6 379 Nonaka/Toyama, 2003, p.4
127
The “Ba” model
Another model on knowledge creation has been elaborated by Nonaka and
Konno (1998), the so-called concept of “Ba”. According to the authors, the
Japanese term “ba” can be translated as “a shared space for emerging
relationships [[] a platform for advancing individual and/or collective knowledge
[[] This space can be physical (e.g., office, dispersed business space), virtual
(e.g., e-mail, teleconference), mental (e.g., shared experience, ideas, ideals) or
any combination of them.”380 It is possible to differentiate between four different
forms of “Ba”, namely (1) originating Ba, (2) interacting Ba, (3) exercising Ba and
(4) cyber Ba.381
• The originating Ba is the optimal place for socialization characterized by “care,
love, trust, and commitment.”382 In this place individuals share common
emotions, experiences and attitudes.
• The interacting Ba is similar to the externalization concept of the SECI model.
It is a place where individuals share mental models through personal
dialogue. Here tacit knowledge is transformed into explicit knowledge.
• The exercising Ba refers to the internalization stage of the SECI model. In this
space, explicit knowledge is converted into tacit knowledge by “learning by
doing”.
• The cyber Ba corresponds to the combination model of the SECI process. It is
a place where social interaction is not experienced in a real environment but
in a virtual environment by using information technology systems.
The leadership model
According to this approach, distinct company-specific knowledge assets exist,
representing the fundamental basis of any knowledge creation activity.383
Knowledge assets are defined as “inputs, outputs and operating factors of
knowledge-creating processes”.384 Nonaka et al. (2000) name four different types
380 Nonaka/Konno, 1998, p. 40 381 Nonaka/Konno, 1998, pp. 45-47; Nonaka et al., 2000, pp. 13-19;
Nonaka/Toyama, 2003, pp. 6-9 382 Nonaka/Konno, 1998, p. 46 383 Nonaka et al., 2000, p. 20 384 Nonaka et al., 2000, p. 20
128
of assets, namely (1) experiential knowledge assets, (2) conceptual knowledge
assets, (3) routing knowledge assets, and (4) systematic knowledge assets.385
• “Experiential knowledge assets” refer to tacit assets that are generated
through firsthand experience of internal and external organizational units. This
asset category constitutes a crucial source of competitive advantage of
companies, and includes five distinct types of knowledge, such as work-
related knowledge (e.g., abilities and know-how), emotional knowledge (e.g.,
love and relief), physical knowledge (e.g., mimics and gestures), energetic
knowledge (e.g., sense of enthusiasm and/or of existence), and rhythmic
knowledge (e.g., improvisation and entrainment).
• “Conceptual knowledge” assets refer to explicit knowledge assets. They can
be expressed in a direct way through language and/or in an indirect way
through symbols and imagery.
• “Routine knowledge assets” are represented by systemized, documented and
practice-oriented knowledge about goods, technologies, clientele and
suppliers. Hereby, manuals, licenses and patents play a fundamental role in
the creation of knowledge.
• “Systematic knowledge assets” incorporate tacit knowledge that has become
routine in daily working life through shared culture, routines and patterns of
thought.
Alternative models of innovation adopters
Apart from Rogers (1995), Peterson (1973) elaborates an alternative approach of
innovation adopter categories.386 It can be used when specific adoption dates are
known. The scientist assumes that “adopters are permitted to ‘determine’ their
own ‘natural’ categories, unconstrained by the imposition of some preconceived
artificial or external framework.”387 This model incorporates both advantages and
disadvantages. It is possible to identify exclusive and complete adopter types that
are classified according to way they perceive themselves to be innovative. This
385 Nonaka et al., 2000, pp. 21-22 386 Peterson, 1973, p. 326 387 Peterson, 1973, p. 326
129
model does not consider at all the form of diffusion distribution. Another
advantage of this approach refers to the determination of a correct number of
adopter categories, making this model suitable for all possible forms of
innovations. But apart from these advantages there exist also limitations. In fact,
Peterson (1973) points out that it is difficult to replicate and compare adopter
categories across different types of innovation because of the intrinsic situation-
specific nature of his model.
A more modern approach of adopter categorization is the technological readiness
index (TRI). According to Parasuraman (2000), this index measures the
readiness of individuals to use and adopt innovations, assuming that innovation
and adoption depends on the perceived benefits of innovations, and on peoples’
general predispositon to innovative technologies.388
Additional concepts of Rogers’ innovation diffusion theory
Time
Diffusion theory has integrated the concept of time as an influencing factor in
communication research.389 Its importance is determined by the fact that the time
an innovation needs to diffuse in a social system is determined by the
characteristics of social forces inside the system that either accelerate or restrain
the utilization of innovation.390 Furthermore, time influences (1) the decision
process related to innovation, (2) the degree of innovativeness of every single
member of the social system, and (3) the adoption rate of an innovation itself.391
Innovation decision phases
Time plays thus a vital role in deciding whether or not to use innovation. This
decision evolves along a five-stage-long process,392 in which the individual
judges step by step the newness and uncertainty related to a new technology.393
388 Bowden/Corkindale, 2005, p. 565 389 Kroeber-Riel/Weinberg, 2003, p. 678 390 Katz, 1992, p. 195 in: Kroeber-Riel/Weinberg, 2003, p. 678 391 Rogers, 1995, p. 20 392 Rogers, 1995, p. 163 393 Rogers, 1995, p. 161
130
These stages are (1) the knowledge phase, (2) the persuasion phase, (3) the
decision phase, (4) the implementation phase, and (5) the confirmation phase.394
• During the knowledge phase395 potential adopters get to know about the
existence of an innovation. This phase can be either an accidental or an
actively planned research process. When uncertainty is high, individuals tend
to increase information research, trying to find satisfying answers to
questions, such as: What is this innovation? How does it work? Why does it
work? How can it be used?
• In the persuasion phase396 individuals build up their own attitude towards the
new product. Hereby, people judge the relative advantage, the compatibility,
and the complexity of an innovation, by then comparing their opinions with
those of other people. Finally, consequences of innovation adoption are
evaluated. At his moment exchange of knowledge through interpersonal
dialogue is preferred to impersonal mass media.
• In the decision phase397 individuals evaluate the convenience of adopting an
innovation, using diverse trial strategies, and focusing on opinion leaders and
visual demonstrations.
• In the implementation phase398 individuals want to adopt an innovation, they
ask themselves: “Where do I obtain the innovation?”, “How do I use it?”, “How
does it work?”, “What operational problems am I likely to encounter?”, “How
can I solve them?”399
• The confirmation stage:400 After the implementation of an innovation, some
individuals need to reinforce their final decision. These individuals try to find
further affirmative information.
394 Rogers, 1995, p. 163 395Rogers, 1995, pp. 162-167 396Rogers, 1995, pp. 167-171 397 Rogers, 1995, pp. 171-172 398 Rogers, 1995, pp. 172-180 399 Rogers, 1995, p. 173 400 Rogers, 1995, pp. 180-185
131
Rate of adoption
The adoption rate of an innovation is defined as “the relative speed with which an
innovation is adopted by members of a social system.”401 In general, it is
assumed that if the rate of adoption of a successful innovation is graphically
visualized, it has the form of a S-shaped curve.402 In praxis, adoption rates vary
also according to the different characteristics that every single innovation
incorporates.403 Hereby, Rogers (1995) describes five particular features of
innovation, each of them appreciated differently by innovation adopters, namely
(1) relative advantage, (2) compatibility, (3) complexity, (4) triability, and (5)
observability.404 According to this, the author states that the increase of the
perceived degree of complexity of an innovation accelerates the adoption of an
innovation.405 Usually, the adoption of a new technology can be facilitated by
offering customers innovations at reduced prices.406 But apart from the economic
factor price, also other factors such as observability, profitability, and social status
have an impact on the rate of adoption.407 In fact, especially in the fashion sector
the social prestige of latest trends influences purchase decisions positively.408 A
new fashion trend is considered as a so-called “fad” - an innovation “that
represents a relatively unimportant aspect of culture, which diffuses very rapidly,
mainly for status reasons, and then is rapidly discontinued.”409
Social system
A social system can be defined as “a set of interrelated units that are engaged in
joint problem-solving to accomplish a common goal”410, whose members are
401 Rogers, 2003, p. 221 402 Rogers, 2003, p. 298 403 Rogers, 1995, p. 15 404 Rogers, 1995, pp. 15-16 405 Rogers, 1995, pp. 15-16 406 Rogers, 1995, p. 213 407 Rogers, 1995, p. 214 408 Rogers, 1995, p. 214 409 Rogers, 1995, p. 214 410 Rogers, 1995, p. 23
132
“individuals, informal groups, organizations, and/or subsystems”.411 The structure
and particular characteristics of a social system have an impact on the diffusion
of innovation in diverse modes. In fact, innovation adoption is impacted by shared
communication practices and social regulations412 as well as by opinion leaders
and change agents.413 In addition, different forms of decision-making can
influence the diffusion progress, namely (1) optional decisions (independent
decisions of single people), (2) collective decisions (consensual decisions of a
group of people, (3) authority decisions (decisions made by people with high
social position or technical expertise), and (4) contingent decisions (sequential
decisions).414 Lastly, innovation decision is impacted by the resulting
consequences of innovations. In this sense Rogers (1995) differentiates between
(1) desirable and undesirable415, (2) direct and indirect416, and (3) anticipated and
unanticipated changes.417
411 Rogers, 1995, p. 23 412 Rogers, 1995, p. 24 413 Rogers, 1995, pp. 26-28 414 Rogers, 1995, pp. 28-30 415 Rogers, 1995, p. 412 416 Rogers, 1995, p. 415 417 Rogers, 1995, p. 419
133
APPENDIX D: QUESTIONNAIRES
Original German questionnaire
134
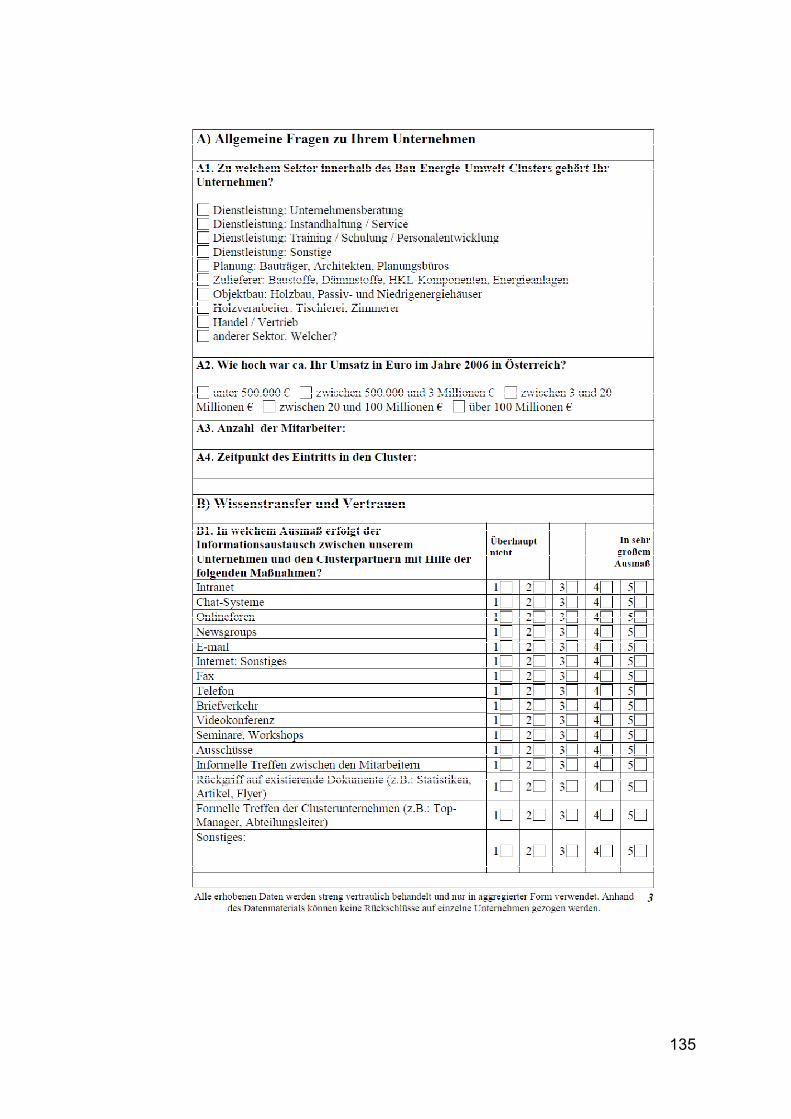
135
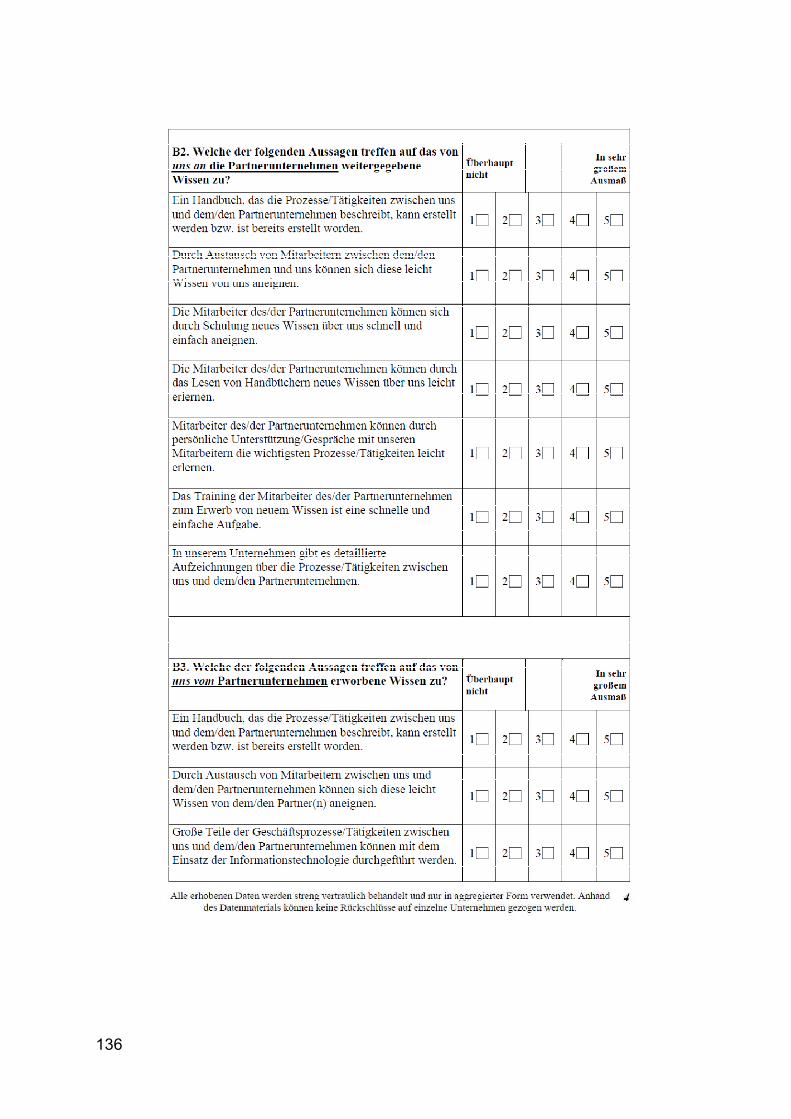
136
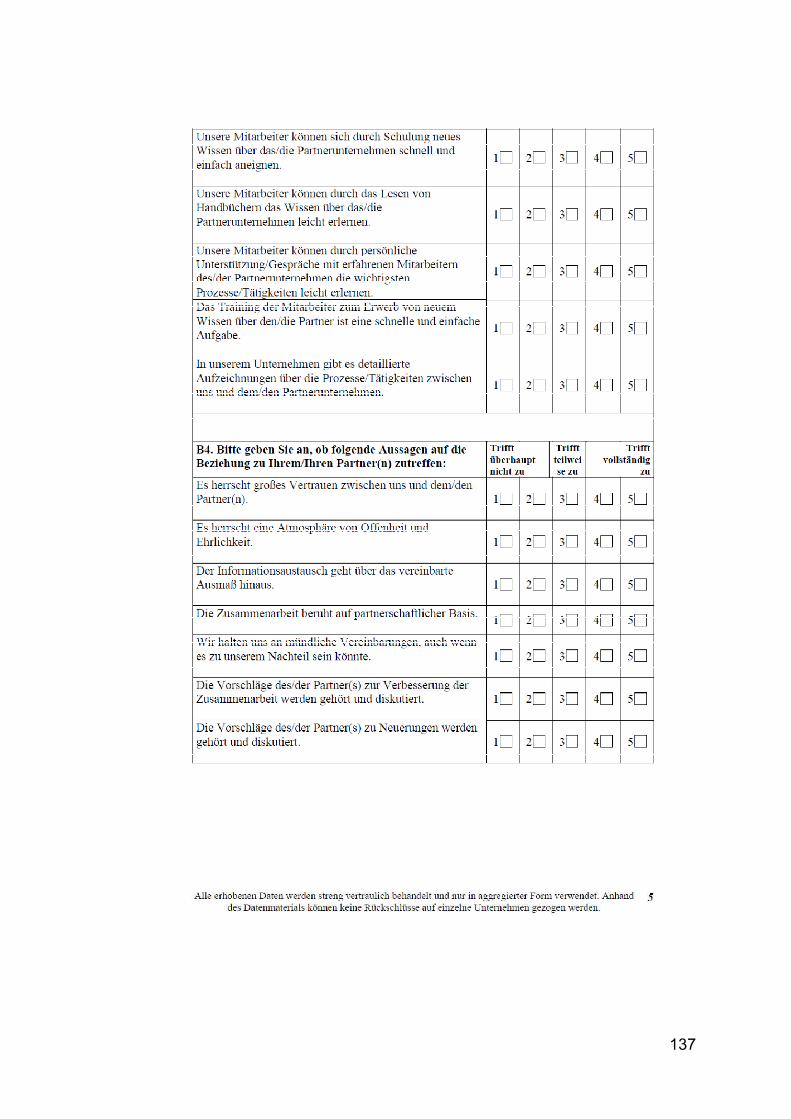
137
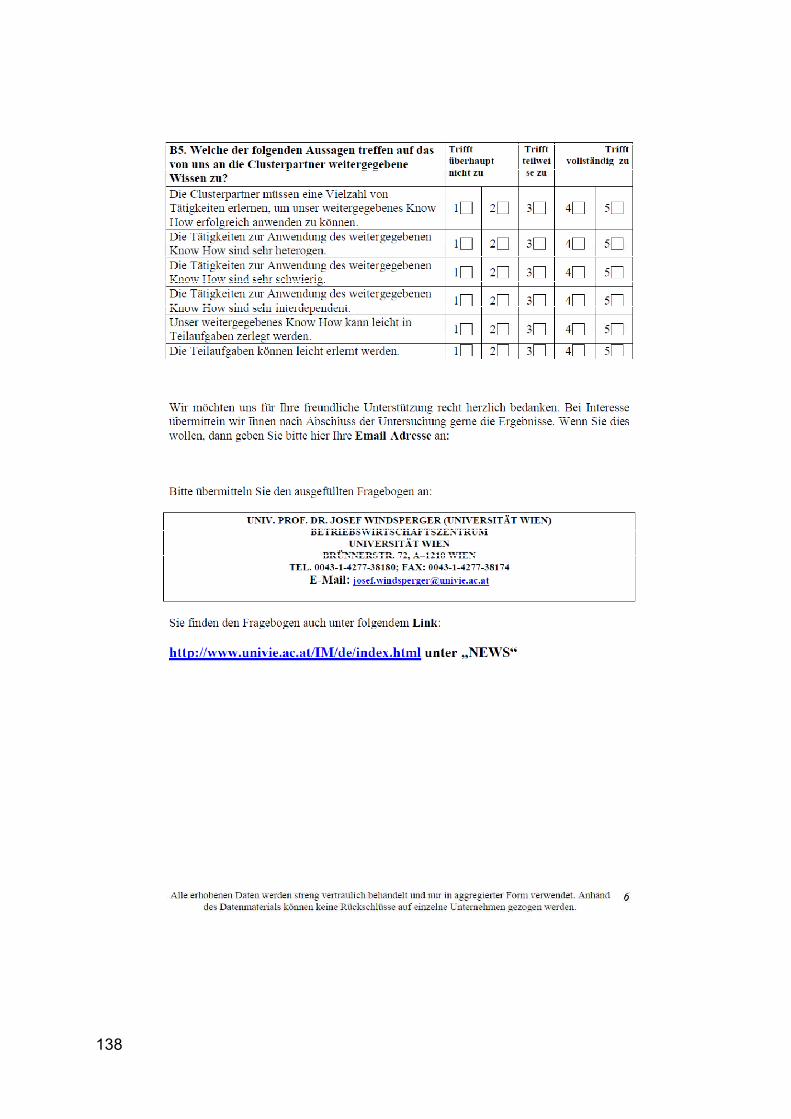
138
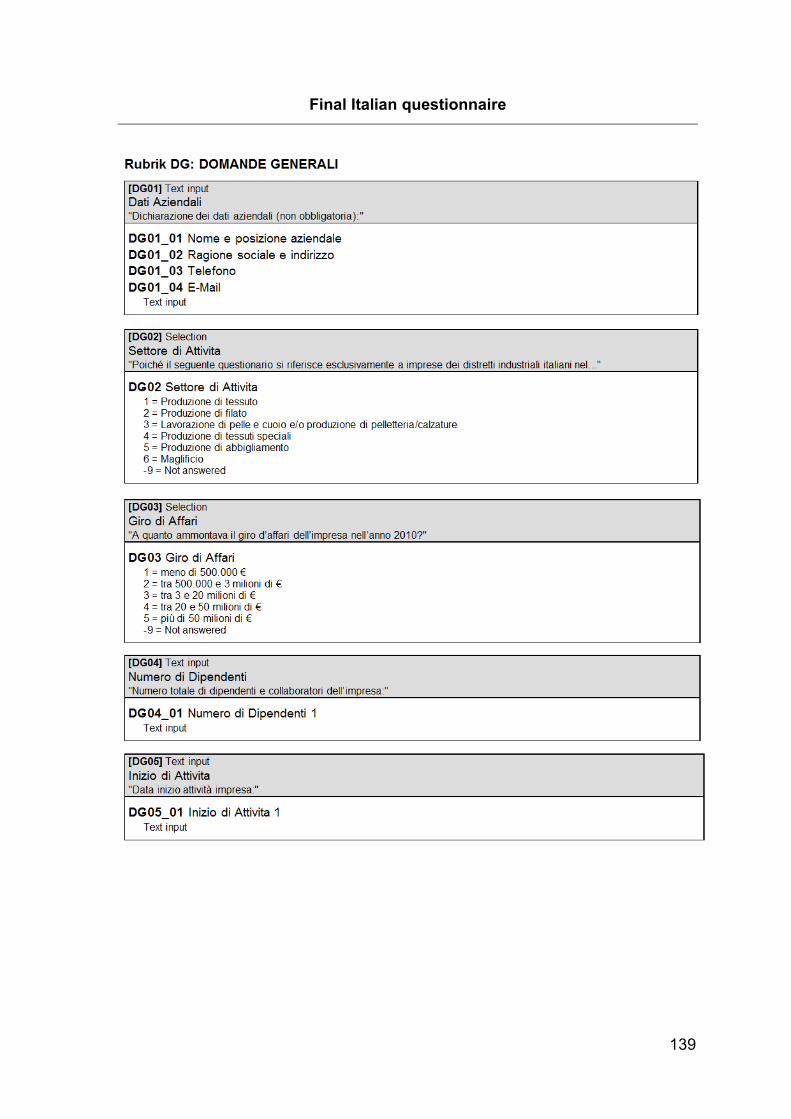
139
Final Italian questionnaire
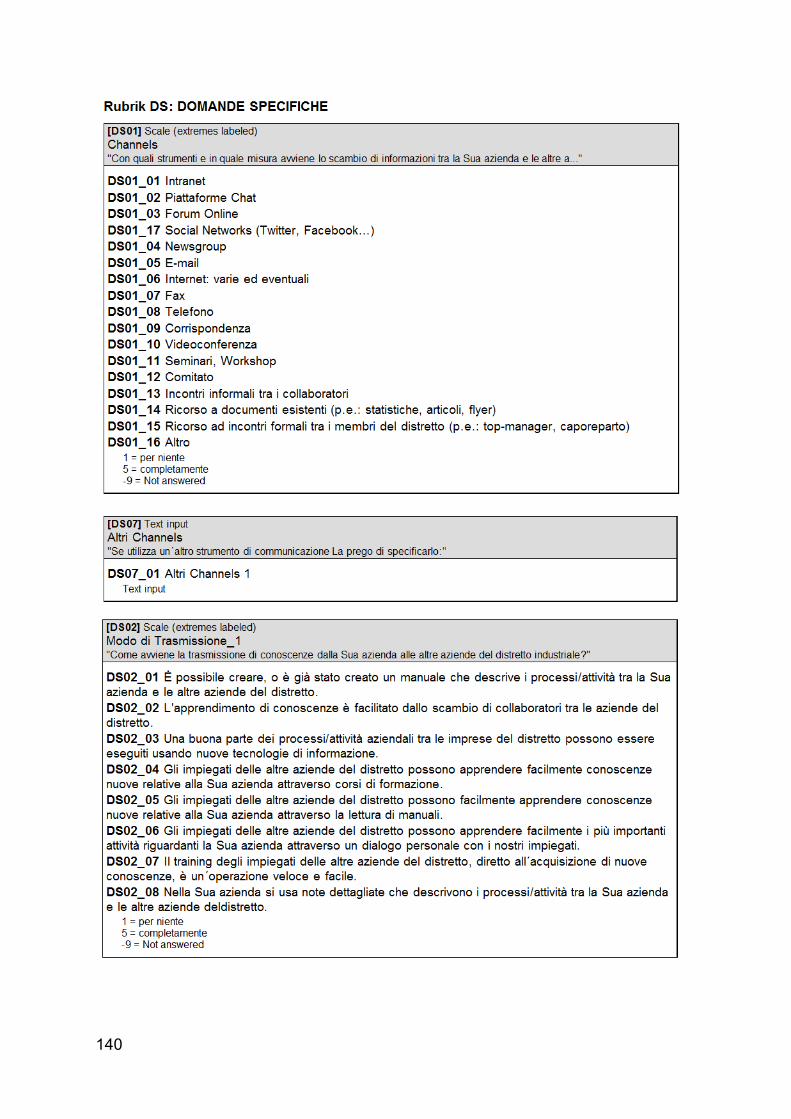
140
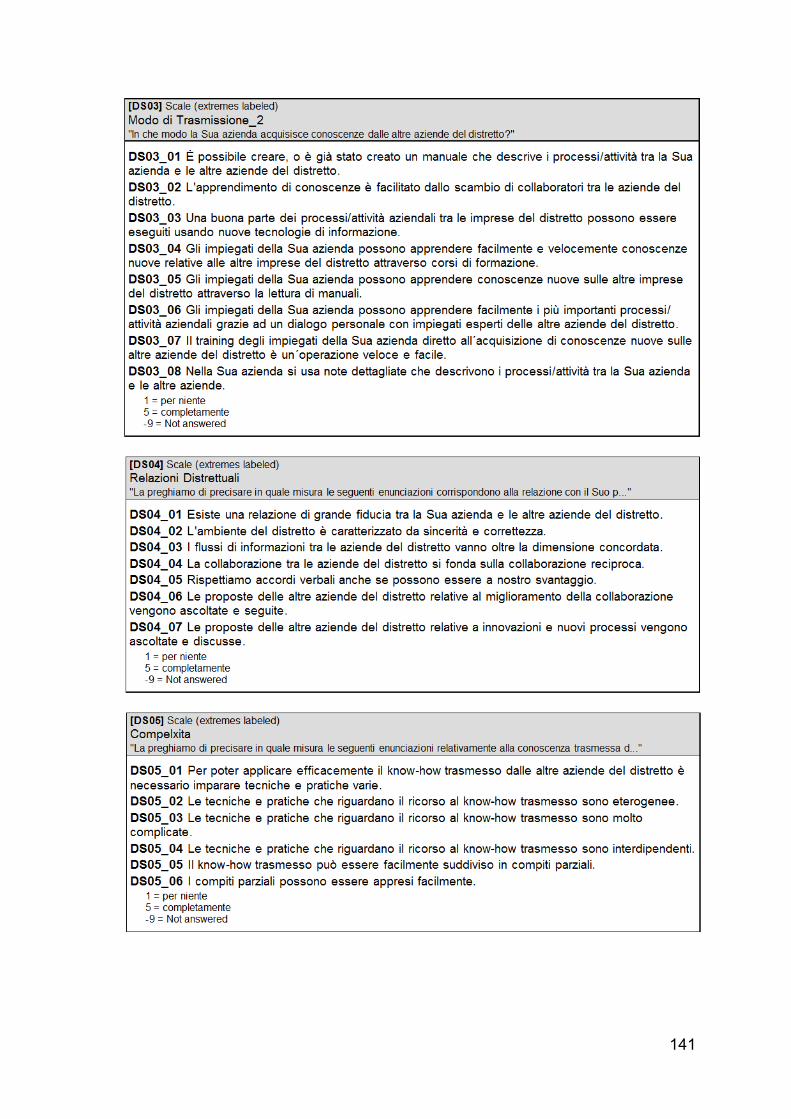
141
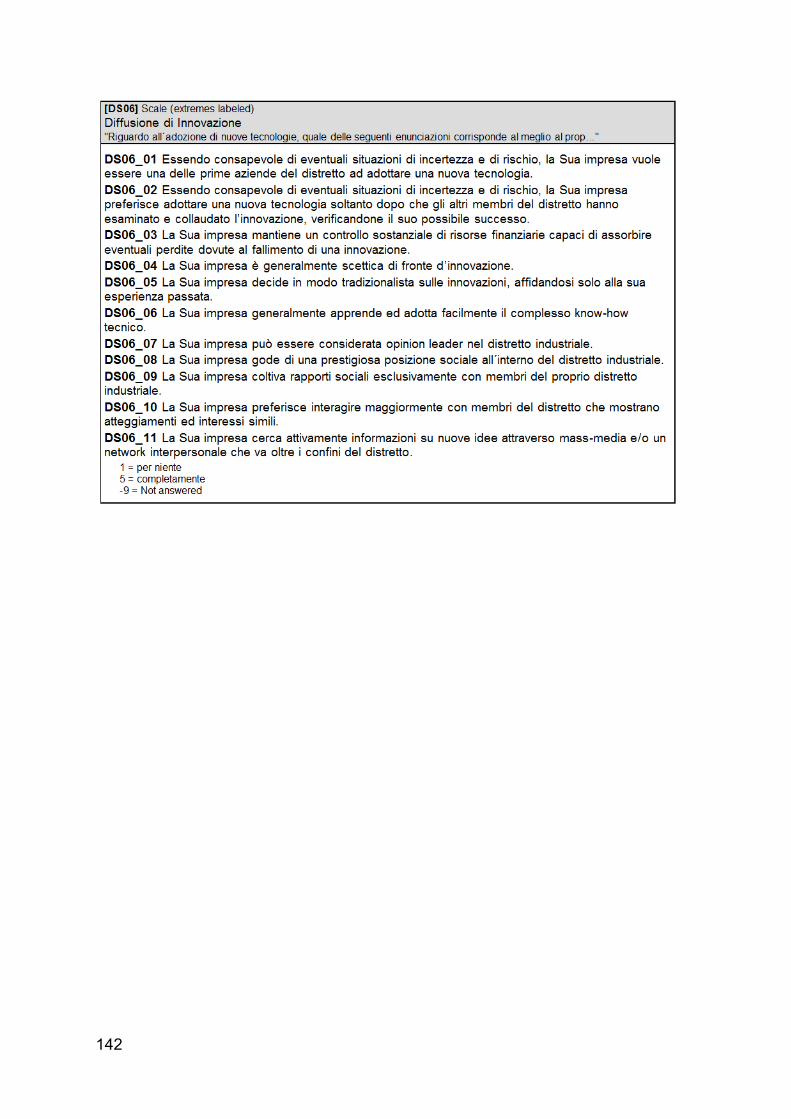
142
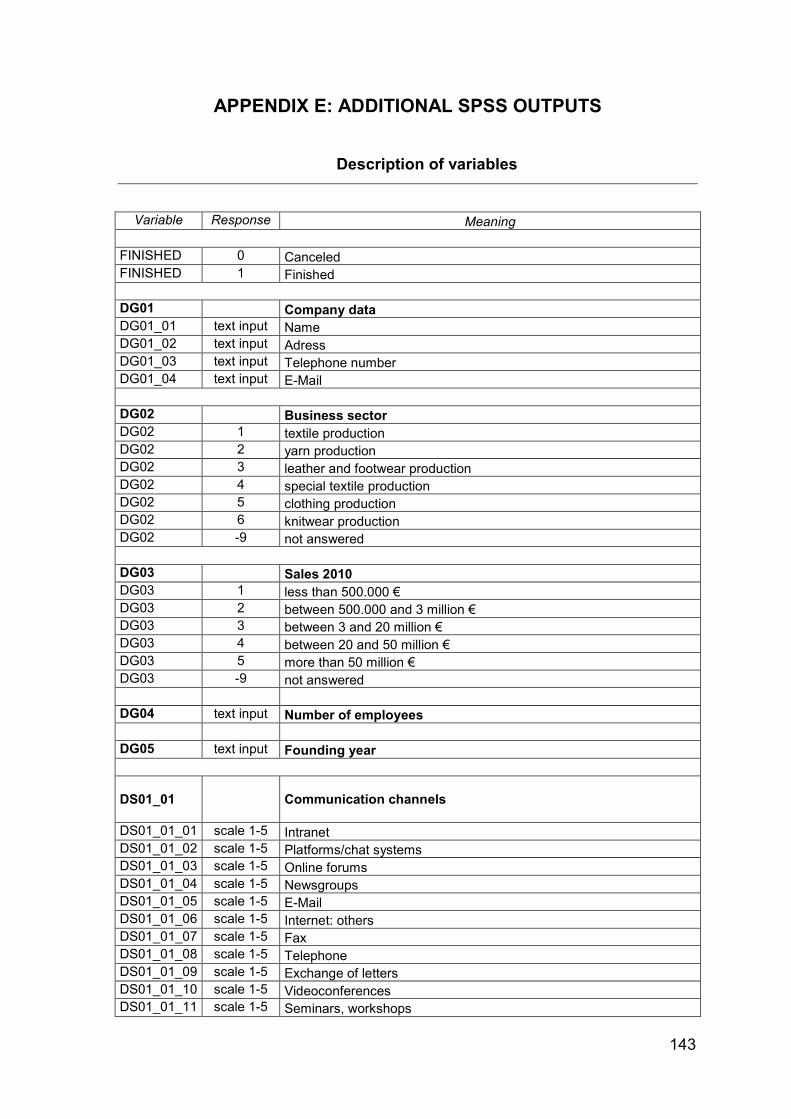
143
APPENDIX E: ADDITIONAL SPSS OUTPUTS
Description of variables
Variable Response Meaning
FINISHED 0 Canceled FINISHED 1 Finished DG01 Company data DG01_01 text input Name DG01_02 text input Adress DG01_03 text input Telephone number DG01_04 text input E-Mail DG02 Business sector DG02 1 textile production DG02 2 yarn production DG02 3 leather and footwear production DG02 4 special textile production DG02 5 clothing production DG02 6 knitwear production DG02 -9 not answered DG03 Sales 2010 DG03 1 less than 500.000 € DG03 2 between 500.000 and 3 million € DG03 3 between 3 and 20 million € DG03 4 between 20 and 50 million € DG03 5 more than 50 million € DG03 -9 not answered DG04 text input Number of employees
DG05 text input Founding year DS01_01
Communication channels
DS01_01_01 scale 1-5 Intranet DS01_01_02 scale 1-5 Platforms/chat systems DS01_01_03 scale 1-5 Online forums DS01_01_04 scale 1-5 Newsgroups DS01_01_05 scale 1-5 E-Mail DS01_01_06 scale 1-5 Internet: others DS01_01_07 scale 1-5 Fax DS01_01_08 scale 1-5 Telephone DS01_01_09 scale 1-5 Exchange of letters DS01_01_10 scale 1-5 Videoconferences DS01_01_11 scale 1-5 Seminars, workshops
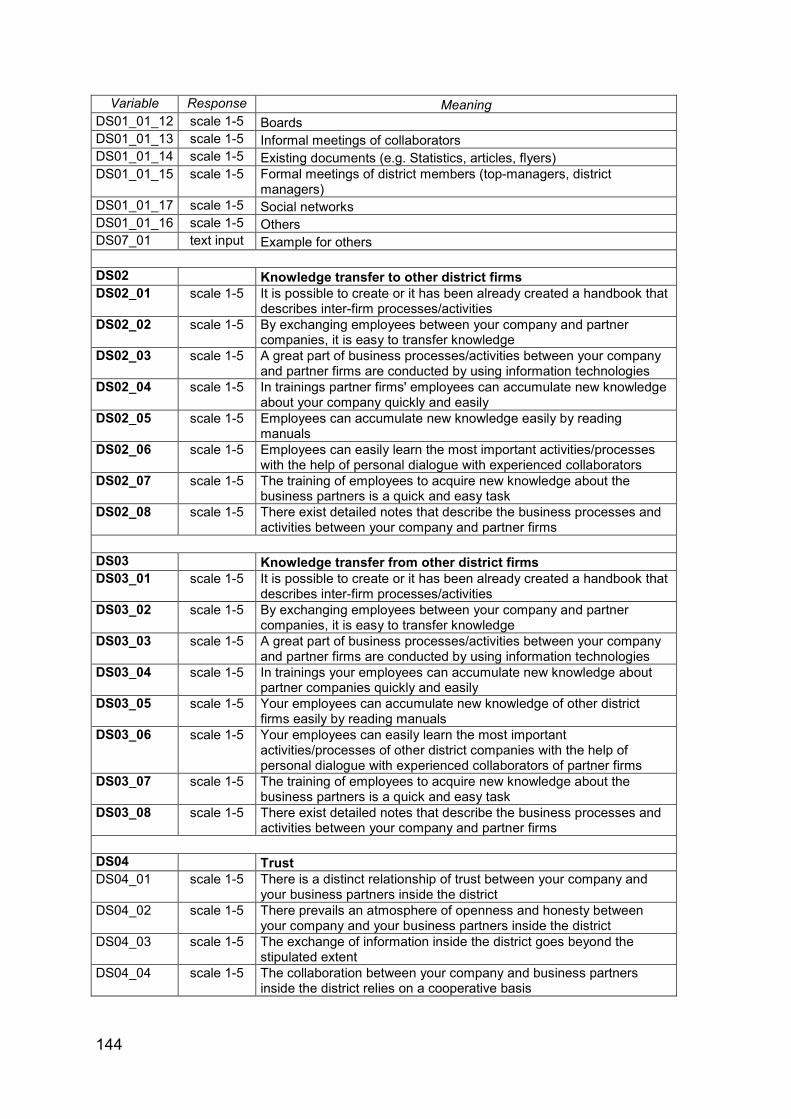
144
Variable Response Meaning
DS01_01_12 scale 1-5 Boards DS01_01_13 scale 1-5 Informal meetings of collaborators DS01_01_14 scale 1-5 Existing documents (e.g. Statistics, articles, flyers) DS01_01_15 scale 1-5 Formal meetings of district members (top-managers, district
managers) DS01_01_17 scale 1-5 Social networks DS01_01_16 scale 1-5 Others DS07_01 text input Example for others DS02 Knowledge transfer to other district firms DS02_01 scale 1-5 It is possible to create or it has been already created a handbook that
describes inter-firm processes/activities DS02_02 scale 1-5 By exchanging employees between your company and partner
companies, it is easy to transfer knowledge DS02_03 scale 1-5 A great part of business processes/activities between your company
and partner firms are conducted by using information technologies DS02_04 scale 1-5 In trainings partner firms' employees can accumulate new knowledge
about your company quickly and easily DS02_05 scale 1-5 Employees can accumulate new knowledge easily by reading
manuals DS02_06 scale 1-5 Employees can easily learn the most important activities/processes
with the help of personal dialogue with experienced collaborators DS02_07 scale 1-5 The training of employees to acquire new knowledge about the
business partners is a quick and easy task DS02_08 scale 1-5 There exist detailed notes that describe the business processes and
activities between your company and partner firms DS03 Knowledge transfer from other district firms DS03_01 scale 1-5 It is possible to create or it has been already created a handbook that
describes inter-firm processes/activities DS03_02 scale 1-5 By exchanging employees between your company and partner
companies, it is easy to transfer knowledge DS03_03 scale 1-5 A great part of business processes/activities between your company
and partner firms are conducted by using information technologies DS03_04 scale 1-5 In trainings your employees can accumulate new knowledge about
partner companies quickly and easily DS03_05 scale 1-5 Your employees can accumulate new knowledge of other district
firms easily by reading manuals DS03_06 scale 1-5 Your employees can easily learn the most important
activities/processes of other district companies with the help of personal dialogue with experienced collaborators of partner firms
DS03_07 scale 1-5 The training of employees to acquire new knowledge about the business partners is a quick and easy task
DS03_08 scale 1-5 There exist detailed notes that describe the business processes and activities between your company and partner firms
DS04 Trust DS04_01 scale 1-5 There is a distinct relationship of trust between your company and
your business partners inside the district DS04_02 scale 1-5 There prevails an atmosphere of openness and honesty between
your company and your business partners inside the district DS04_03 scale 1-5 The exchange of information inside the district goes beyond the
stipulated extent DS04_04 scale 1-5 The collaboration between your company and business partners
inside the district relies on a cooperative basis
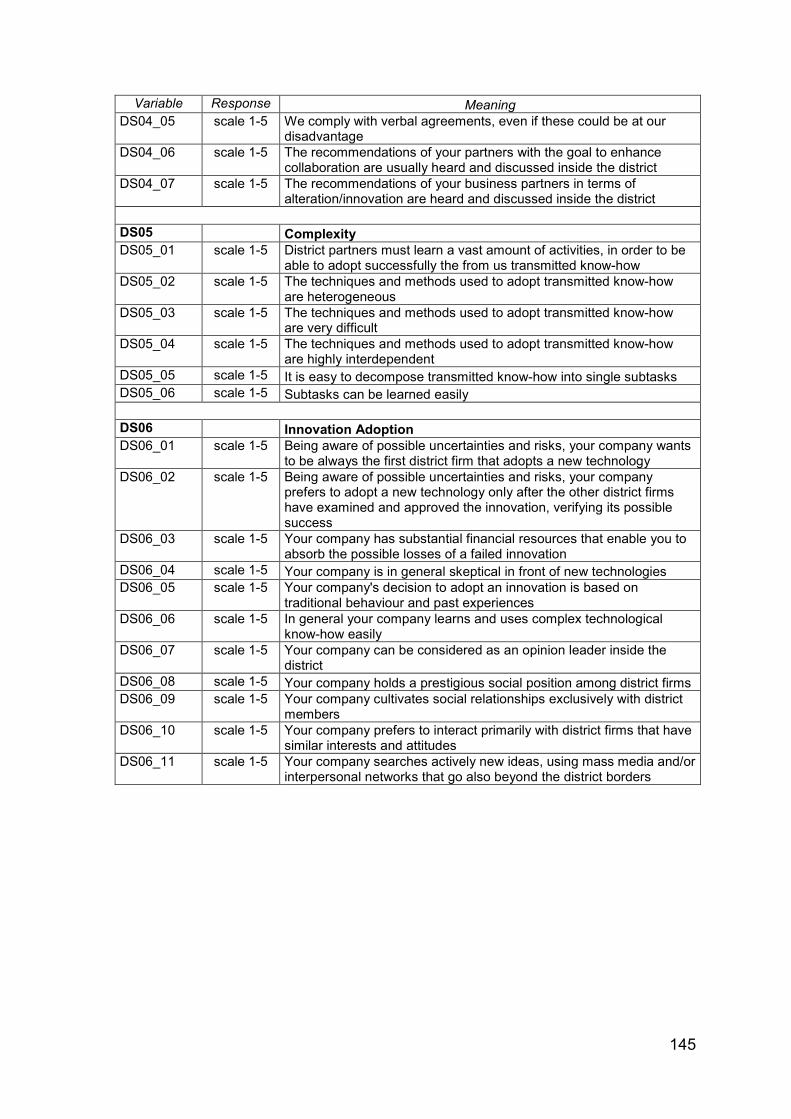
145
Variable Response Meaning
DS04_05 scale 1-5 We comply with verbal agreements, even if these could be at our disadvantage
DS04_06 scale 1-5 The recommendations of your partners with the goal to enhance collaboration are usually heard and discussed inside the district
DS04_07 scale 1-5 The recommendations of your business partners in terms of alteration/innovation are heard and discussed inside the district
DS05 Complexity DS05_01 scale 1-5 District partners must learn a vast amount of activities, in order to be
able to adopt successfully the from us transmitted know-how DS05_02 scale 1-5 The techniques and methods used to adopt transmitted know-how
are heterogeneous DS05_03 scale 1-5 The techniques and methods used to adopt transmitted know-how
are very difficult DS05_04 scale 1-5 The techniques and methods used to adopt transmitted know-how
are highly interdependent DS05_05 scale 1-5 It is easy to decompose transmitted know-how into single subtasks DS05_06 scale 1-5 Subtasks can be learned easily DS06 Innovation Adoption DS06_01 scale 1-5 Being aware of possible uncertainties and risks, your company wants
to be always the first district firm that adopts a new technology DS06_02 scale 1-5 Being aware of possible uncertainties and risks, your company
prefers to adopt a new technology only after the other district firms have examined and approved the innovation, verifying its possible success
DS06_03 scale 1-5 Your company has substantial financial resources that enable you to absorb the possible losses of a failed innovation
DS06_04 scale 1-5 Your company is in general skeptical in front of new technologies DS06_05 scale 1-5 Your company's decision to adopt an innovation is based on
traditional behaviour and past experiences DS06_06 scale 1-5 In general your company learns and uses complex technological
know-how easily DS06_07 scale 1-5 Your company can be considered as an opinion leader inside the
district DS06_08 scale 1-5 Your company holds a prestigious social position among district firms DS06_09 scale 1-5 Your company cultivates social relationships exclusively with district
members DS06_10 scale 1-5 Your company prefers to interact primarily with district firms that have
similar interests and attitudes DS06_11 scale 1-5 Your company searches actively new ideas, using mass media and/or
interpersonal networks that go also beyond the district borders
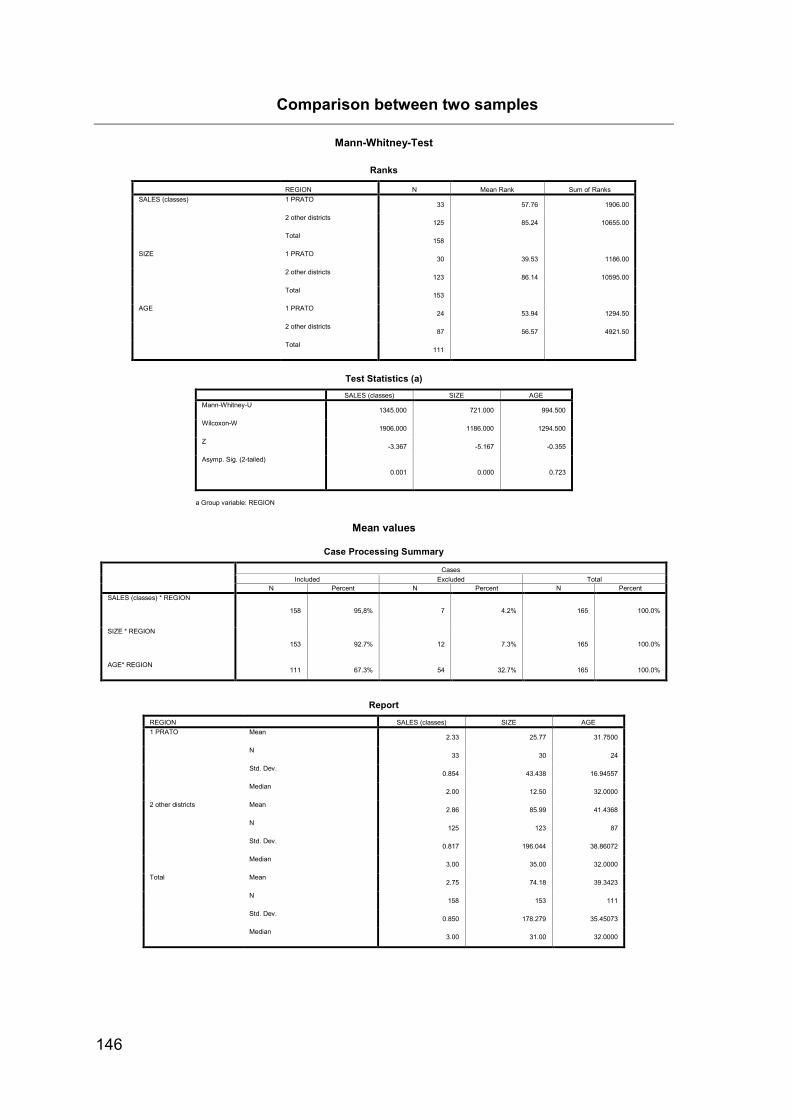
146
Comparison between two samples
Mann-Whitney-Test
Ranks
REGION N Mean Rank Sum of Ranks
SALES (classes) 1 PRATO 33 57.76 1906.00
2 other districts 125 85.24 10655.00
Total 158
SIZE 1 PRATO 30 39.53 1186.00
2 other districts 123 86.14 10595.00
Total 153
AGE 1 PRATO 24 53.94 1294.50
2 other districts 87 56.57 4921.50
Total 111
Test Statistics (a)
SALES (classes) SIZE AGE
Mann-Whitney-U 1345.000 721.000 994.500
Wilcoxon-W 1906.000 1186.000 1294.500
Z -3.367 -5.167 -0.355
Asymp. Sig. (2-tailed)
0.001 0.000 0.723
a Group variable: REGION
Mean values
Case Processing Summary
Cases
Included Excluded Total N Percent N Percent N Percent
SALES (classes) * REGION
158 95,8% 7 4.2% 165 100.0%
SIZE * REGION
153 92.7% 12 7.3% 165 100.0%
AGE* REGION 111 67.3% 54 32.7% 165 100.0%
Report
REGION SALES (classes) SIZE AGE
1 PRATO Mean 2.33 25.77 31.7500
N 33 30 24
Std. Dev. 0.854 43.438 16.94557
Median 2.00 12.50 32.0000
2 other districts Mean 2.86 85.99 41.4368
N 125 123 87
Std. Dev. 0.817 196.044 38.86072
Median 3.00 35.00 32.0000
Total Mean 2.75 74.18 39.3423
N 158 153 111
Std. Dev. 0.850 178.279 35.45073
Median 3.00 31.00 32.0000
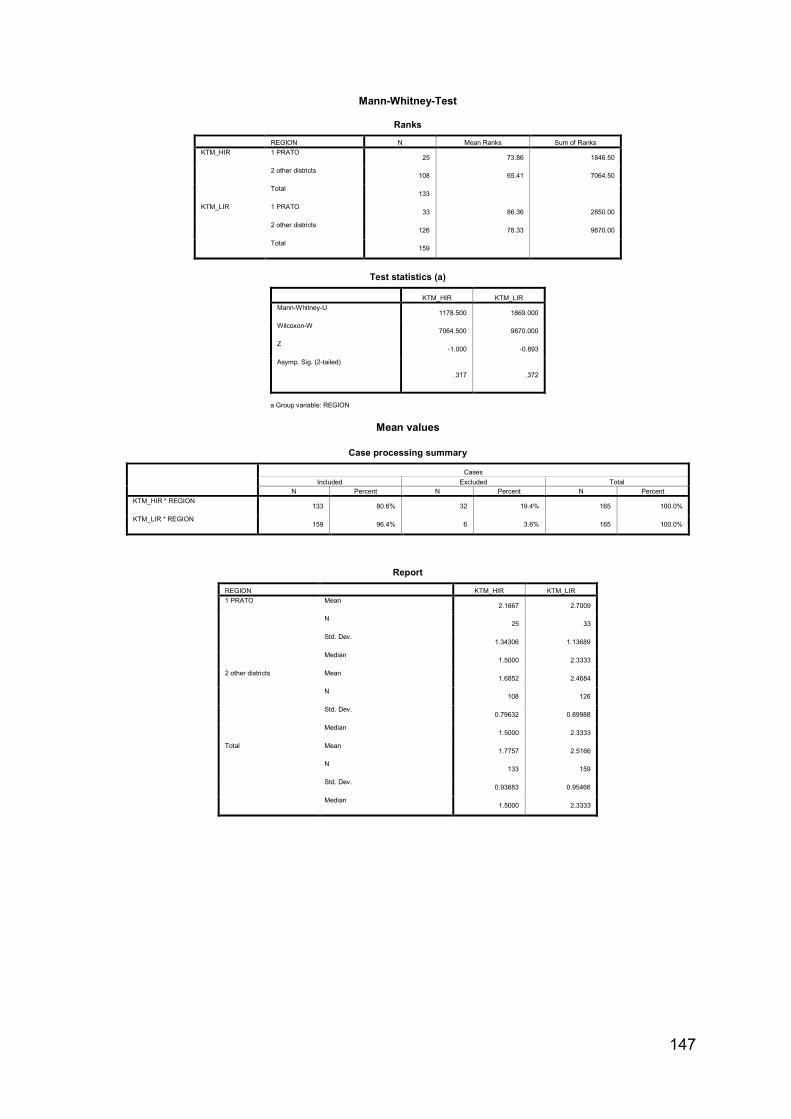
147
Mann-Whitney-Test
Ranks
REGION N Mean Ranks Sum of Ranks
KTM_HIR 1 PRATO 25 73.86 1846.50
2 other districts 108 65.41 7064.50
Total 133
KTM_LIR 1 PRATO 33 86.36 2850.00
2 other districts 126 78.33 9870.00
Total 159
Test statistics (a)
KTM_HIR KTM_LIR
Mann-Whitney-U 1178.500 1869.000
Wilcoxon-W 7064.500 9870.000
Z -1.000 -0.893
Asymp. Sig. (2-tailed)
.317 .372
a Group variable: REGION
Mean values
Case processing summary
Cases
Included Excluded Total
N Percent N Percent N Percent
KTM_HIR * REGION 133 80.6% 32 19.4% 165 100.0%
KTM_LIR * REGION 159 96.4% 6 3.6% 165 100.0%
Report
REGION KTM_HIR KTM_LIR
1 PRATO Mean 2.1667 2.7009
N 25 33
Std. Dev. 1.34306 1.13689
Median 1.5000 2.3333
2 other districts Mean 1.6852 2.4684
N 108 126
Std. Dev. 0.79632 0.89988
Median 1.5000 2.3333
Total Mean 1.7757 2.5166
N 133 159
Std. Dev. 0.93683 0.95466
Median 1.5000 2.3333
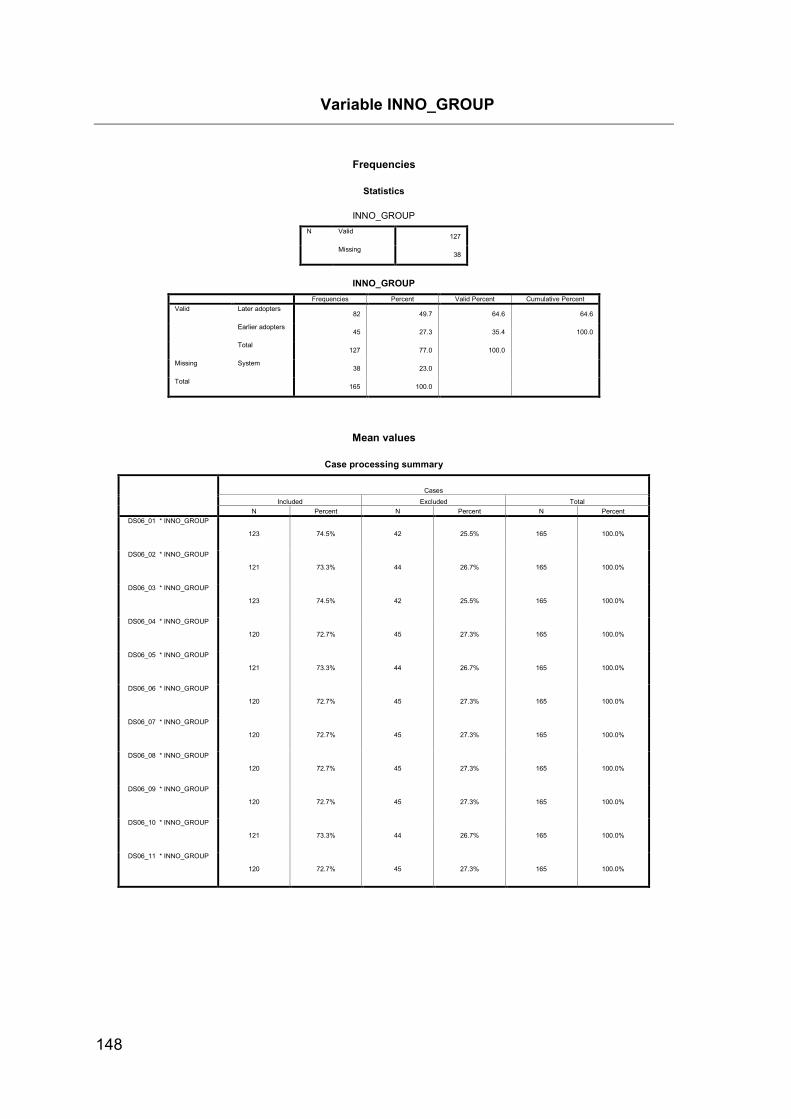
148
Variable INNO_GROUP
Frequencies
Statistics
INNO_GROUP
N Valid 127
Missing 38
INNO_GROUP
Frequencies Percent Valid Percent Cumulative Percent
Valid Later adopters 82 49.7 64.6 64.6
Earlier adopters 45 27.3 35.4 100.0
Total 127 77.0 100.0
Missing System 38 23.0
Total 165 100.0
Mean values
Case processing summary
Cases
Included Excluded Total
N Percent N Percent N Percent
DS06_01 * INNO_GROUP
123 74.5% 42 25.5% 165 100.0%
DS06_02 * INNO_GROUP
121 73.3% 44 26.7% 165 100.0%
DS06_03 * INNO_GROUP
123 74.5% 42 25.5% 165 100.0%
DS06_04 * INNO_GROUP
120 72.7% 45 27.3% 165 100.0%
DS06_05 * INNO_GROUP
121 73.3% 44 26.7% 165 100.0%
DS06_06 * INNO_GROUP
120 72.7% 45 27.3% 165 100.0%
DS06_07 * INNO_GROUP
120 72.7% 45 27.3% 165 100.0%
DS06_08 * INNO_GROUP
120 72.7% 45 27.3% 165 100.0%
DS06_09 * INNO_GROUP
120 72.7% 45 27.3% 165 100.0%
DS06_10 * INNO_GROUP
121 73.3% 44 26.7% 165 100.0%
DS06_11 * INNO_GROUP
120 72.7% 45 27.3% 165 100.0%
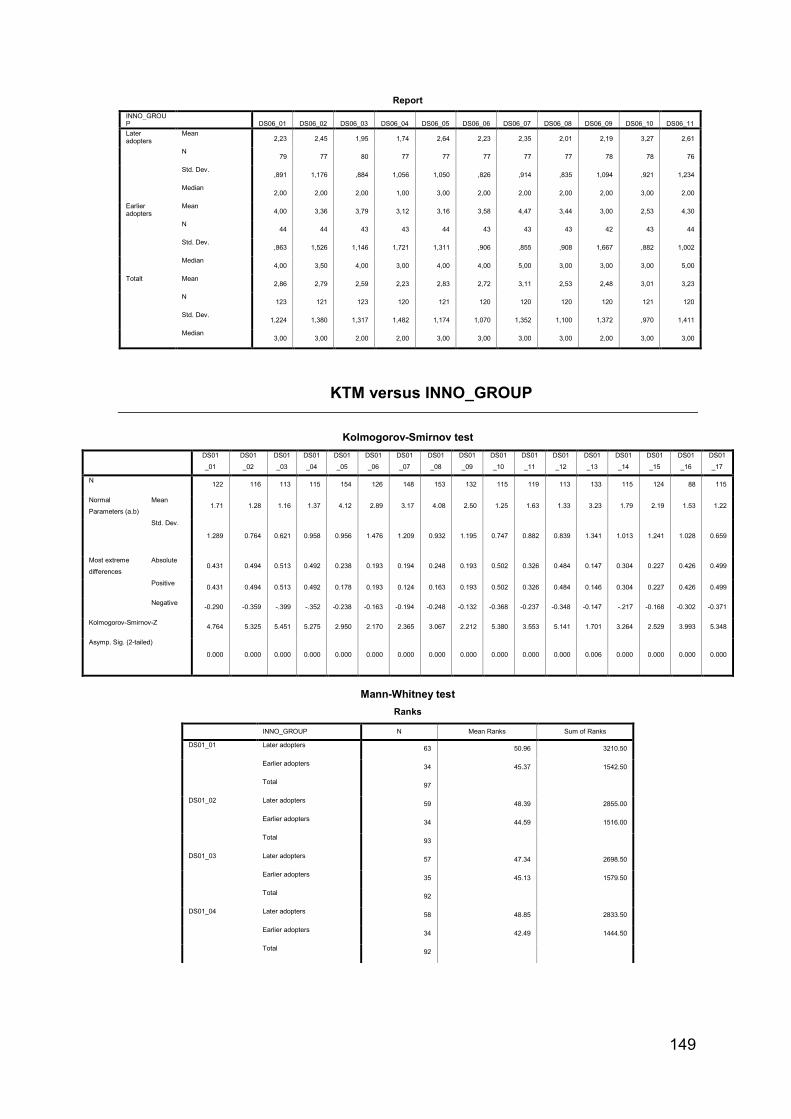
149
Report
INNO_GROUP DS06_01 DS06_02 DS06_03 DS06_04 DS06_05 DS06_06 DS06_07 DS06_08 DS06_09 DS06_10 DS06_11
Later adopters
Mean 2,23 2,45 1,95 1,74 2,64 2,23 2,35 2,01 2,19 3,27 2,61
N 79 77 80 77 77 77 77 77 78 78 76
Std. Dev. ,891 1,176 ,884 1,056 1,050 ,826 ,914 ,835 1,094 ,921 1,234
Median 2,00 2,00 2,00 1,00 3,00 2,00 2,00 2,00 2,00 3,00 2,00
Earlier adopters
Mean 4,00 3,36 3,79 3,12 3,16 3,58 4,47 3,44 3,00 2,53 4,30
N 44 44 43 43 44 43 43 43 42 43 44
Std. Dev. ,863 1,526 1,146 1,721 1,311 ,906 ,855 ,908 1,667 ,882 1,002
Median 4,00 3,50 4,00 3,00 4,00 4,00 5,00 3,00 3,00 3,00 5,00
Totalt Mean 2,86 2,79 2,59 2,23 2,83 2,72 3,11 2,53 2,48 3,01 3,23
N 123 121 123 120 121 120 120 120 120 121 120
Std. Dev. 1,224 1,380 1,317 1,482 1,174 1,070 1,352 1,100 1,372 ,970 1,411
Median 3,00 3,00 2,00 2,00 3,00 3,00 3,00 3,00 2,00 3,00 3,00
KTM versus INNO_GROUP
Kolmogorov-Smirnov test
DS01
_01
DS01
_02
DS01
_03
DS01
_04
DS01
_05
DS01
_06
DS01
_07
DS01
_08
DS01
_09
DS01
_10
DS01
_11
DS01
_12
DS01
_13
DS01
_14
DS01
_15
DS01
_16
DS01
_17
N 122 116 113 115 154 126 148 153 132 115 119 113 133 115 124 88 115
Normal
Parameters (a.b)
Mean 1.71 1.28 1.16 1.37 4.12 2.89 3.17 4.08 2.50 1.25 1.63 1.33 3.23 1.79 2.19 1.53 1.22
Std. Dev.
1.289 0.764 0.621 0.958 0.956 1.476 1.209 0.932 1.195 0.747 0.882 0.839 1.341 1.013 1.241 1.028 0.659
Most extreme
differences
Absolute 0.431 0.494 0.513 0.492 0.238 0.193 0.194 0.248 0.193 0.502 0.326 0.484 0.147 0.304 0.227 0.426 0.499
Positive 0.431 0.494 0.513 0.492 0.178 0.193 0.124 0.163 0.193 0.502 0.326 0.484 0.146 0.304 0.227 0.426 0.499
Negative -0.290 -0.359 -.399 -.352 -0.238 -0.163 -0.194 -0.248 -0.132 -0.368 -0.237 -0.348 -0.147 -.217 -0.168 -0.302 -0.371
Kolmogorov-Smirnov-Z 4.764 5.325 5.451 5.275 2.950 2.170 2.365 3.067 2.212 5.380 3.553 5.141 1.701 3.264 2.529 3.993 5.348
Asymp. Sig. (2-tailed)
0.000 0.000 0.000 0.000 0.000 0.000 0.000 0.000 0.000 0.000 0.000 0.000 0.006 0.000 0.000 0.000 0.000
Mann-Whitney test
Ranks
INNO_GROUP N Mean Ranks Sum of Ranks
DS01_01 Later adopters 63 50.96 3210.50
Earlier adopters 34 45.37 1542.50
Total 97
DS01_02 Later adopters 59 48.39 2855.00
Earlier adopters 34 44.59 1516.00
Total 93
DS01_03 Later adopters 57 47.34 2698.50
Earlier adopters 35 45.13 1579.50
Total 92
DS01_04 Later adopters 58 48.85 2833.50
Earlier adopters 34 42.49 1444.50
Total 92
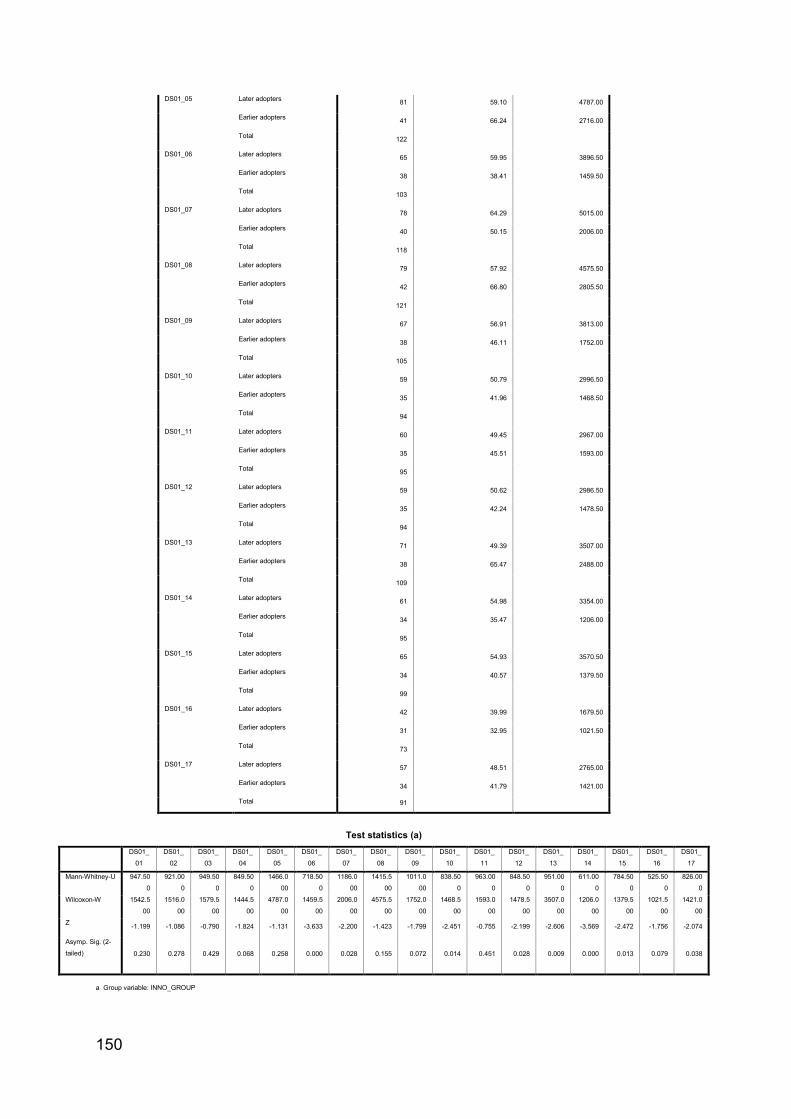
150
DS01_05 Later adopters 81 59.10 4787.00
Earlier adopters 41 66.24 2716.00
Total 122
DS01_06 Later adopters 65 59.95 3896.50
Earlier adopters 38 38.41 1459.50
Total 103
DS01_07 Later adopters 78 64.29 5015.00
Earlier adopters 40 50.15 2006.00
Total 118
DS01_08 Later adopters 79 57.92 4575.50
Earlier adopters 42 66.80 2805.50
Total 121
DS01_09 Later adopters 67 56.91 3813.00
Earlier adopters 38 46.11 1752.00
Total 105
DS01_10 Later adopters 59 50.79 2996.50
Earlier adopters 35 41.96 1468.50
Total 94
DS01_11 Later adopters 60 49.45 2967.00
Earlier adopters 35 45.51 1593.00
Total 95
DS01_12 Later adopters 59 50.62 2986.50
Earlier adopters 35 42.24 1478.50
Total 94
DS01_13 Later adopters 71 49.39 3507.00
Earlier adopters 38 65.47 2488.00
Total 109
DS01_14 Later adopters 61 54.98 3354.00
Earlier adopters 34 35.47 1206.00
Total 95
DS01_15 Later adopters 65 54.93 3570.50
Earlier adopters 34 40.57 1379.50
Total 99
DS01_16 Later adopters 42 39.99 1679.50
Earlier adopters 31 32.95 1021.50
Total 73
DS01_17 Later adopters 57 48.51 2765.00
Earlier adopters 34 41.79 1421.00
Total 91
Test statistics (a)
DS01_
01
DS01_
02
DS01_
03
DS01_
04
DS01_
05
DS01_
06
DS01_
07
DS01_
08
DS01_
09
DS01_
10
DS01_
11
DS01_
12
DS01_
13
DS01_
14
DS01_
15
DS01_
16
DS01_
17
Mann-Whitney-U 947.50
0
921.00
0
949.50
0
849.50
0
1466.0
00
718.50
0
1186.0
00
1415.5
00
1011.0
00
838.50
0
963.00
0
848.50
0
951.00
0
611.00
0
784.50
0
525.50
0
826.00
0
Wilcoxon-W 1542.5
00
1516.0
00
1579.5
00
1444.5
00
4787.0
00
1459.5
00
2006.0
00
4575.5
00
1752.0
00
1468.5
00
1593.0
00
1478.5
00
3507.0
00
1206.0
00
1379.5
00
1021.5
00
1421.0
00
Z -1.199 -1.086 -0.790 -1.824 -1.131 -3.633 -2.200 -1.423 -1.799 -2.451 -0.755 -2.199 -2.606 -3.569 -2.472 -1.756 -2.074
Asymp. Sig. (2-
tailed) 0.230 0.278 0.429 0.068 0.258 0.000 0.028 0.155 0.072 0.014 0.451 0.028 0.009 0.000 0.013 0.079 0.038
a Group variable: INNO_GROUP
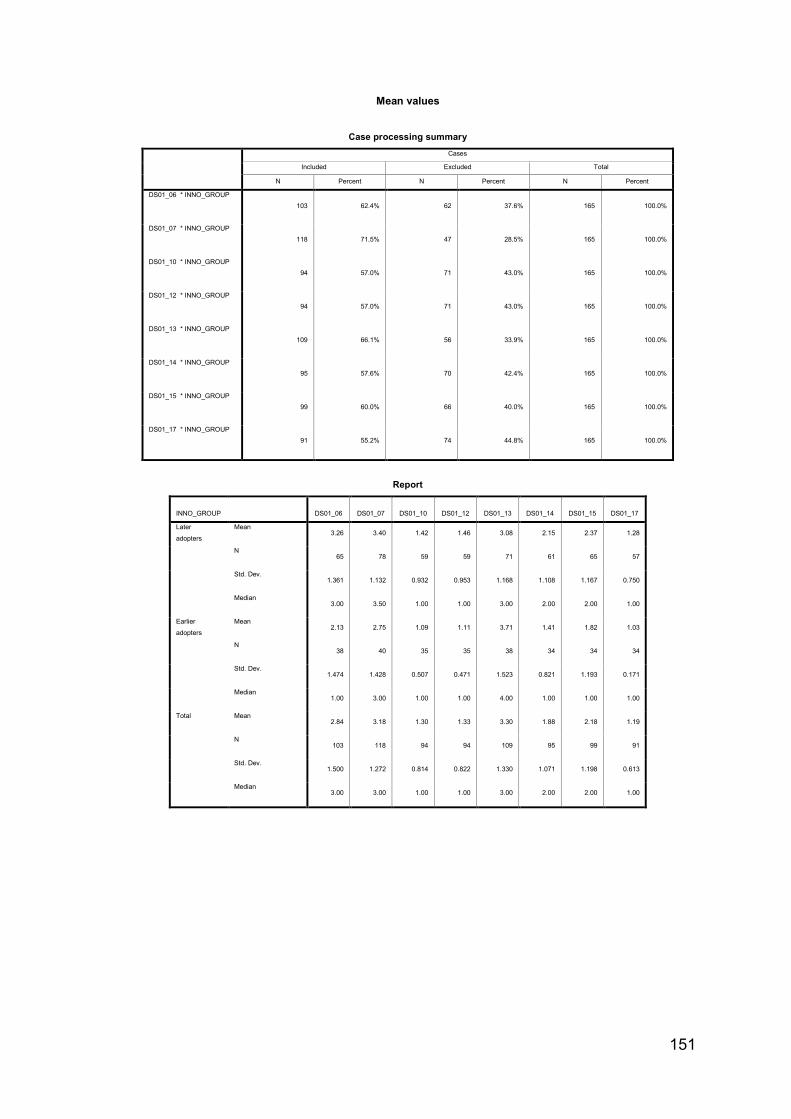
151
Mean values
Case processing summary
Cases
Included Excluded Total
N Percent N Percent N Percent
DS01_06 * INNO_GROUP
103 62.4% 62 37.6% 165 100.0%
DS01_07 * INNO_GROUP
118 71.5% 47 28.5% 165 100.0%
DS01_10 * INNO_GROUP
94 57.0% 71 43.0% 165 100.0%
DS01_12 * INNO_GROUP
94 57.0% 71 43.0% 165 100.0%
DS01_13 * INNO_GROUP
109 66.1% 56 33.9% 165 100.0%
DS01_14 * INNO_GROUP
95 57.6% 70 42.4% 165 100.0%
DS01_15 * INNO_GROUP
99 60.0% 66 40.0% 165 100.0%
DS01_17 * INNO_GROUP
91 55.2% 74 44.8% 165 100.0%
Report
INNO_GROUP DS01_06 DS01_07 DS01_10 DS01_12 DS01_13 DS01_14 DS01_15 DS01_17
Later
adopters
Mean 3.26 3.40 1.42 1.46 3.08 2.15 2.37 1.28
N 65 78 59 59 71 61 65 57
Std. Dev. 1.361 1.132 0.932 0.953 1.168 1.108 1.167 0.750
Median 3.00 3.50 1.00 1.00 3.00 2.00 2.00 1.00
Earlier
adopters
Mean 2.13 2.75 1.09 1.11 3.71 1.41 1.82 1.03
N 38 40 35 35 38 34 34 34
Std. Dev. 1.474 1.428 0.507 0.471 1.523 0.821 1.193 0.171
Median 1.00 3.00 1.00 1.00 4.00 1.00 1.00 1.00
Total Mean 2.84 3.18 1.30 1.33 3.30 1.88 2.18 1.19
N 103 118 94 94 109 95 99 91
Std. Dev. 1.500 1.272 0.814 0.822 1.330 1.071 1.198 0.613
Median 3.00 3.00 1.00 1.00 3.00 2.00 2.00 1.00