Embed Size (px)
Citation preview

Abd Al - Mageed et al. Iraqi Journal of Science, 2015, Vol 56, No.4A, pp: 2902-2914
_____________________________
*Email: [email protected]
2902
Determination of Destruction Levels Caused by Earthquakes Using Grip
RADIUS 99 Program
Tahrer Adnan Abd Al – Mageed*, Maath Ismail Mahmood, Baker Hamoody Saloom,
Dalya Mageed Hmeed, Hamad Jassim Mohamed Ministry of Science and Technology, Directorate of Space and Communication,
Center of Disaster Informations Management and space data archives, Baghdad, Iraq
Abstract
The most universal and basic damages caused by an earthquakes are buildings
damage and human casualties. A simplified method, the RADIUS 99 Tool is used to
calculate seismic intensity (shaking) distribution, buildings damage, number of
casualties and lifelines damage, due to assumed earthquake scenario. In this study,
Al - Kadhmiya sector in Baghdad city was chosen for assessing seismic risk, for this
purpose, this area was divided into mesh of 1*1 km2 cell size, and a scenario of
(Manjil) earthquake (that struck Iran in 1990) was utilized with following
earthquake magnitudes (5 and 7), with epicenter distance (3, 10 and 100 km), and
depths (2 and 5 km). It was found that, the best soil types for constructions are those with medium and hard soils, where they can resist the earthquake. The areas with
soft soils should be avoided when we want to choose the sites to build the life saving
establishments and general public buildings like schools and hospitals, in addition,
the seismic building code should be followed for structures to be built on soft soils
areas.
Keywords: Al – Kadhmiya, Earthquake hazard, RADIUS 99, PGA.
Grip RADIUS 99 تحديد مستويات الدمار الناتج عن الزالزل باستخدام برنامج
حمد جاسم محمد، داليا مجيد حميد، بكر حمودي سلوم، معاذ اسماعيل محمود، *تحرير عدنان عبد المجيد , بغداد, العراقمركز ادارة معلومات الكوارث واالرشيف الفضائي, رة تكنولوجيا الفضاء واالتصاالتدائ, وزارة العلوم والتكنولوجيا
خالصةال
الخسائر وقوع و المبانيفي ضرار الأهي زل الالز حدوث واألساسية الناجمة عن شيوعا األضرار األكثر ان و االهتزاز( شدة الزالزل ) لحساب كوسيلة مبسطة RADIUS 99 برنامجاستخدم في هذه الدراسة . البشريةتم قد و . ولتقييم المخاطر الزلزالية ,تحطم خطوط مرافق الحياةو عدد اإلصابات المباني, و وتضرر ,توزيعها
ببعد خاليا تم تقسيم هذه المنطقة إلى شبكةكموقع لهذه الدراسة حيث في مدينة بغداد الكاظمية اختيار قضاء زلزالية مقاديرب( 1991) الذي حدث في ايران نجل ام, واستخدم سيناريو زلزال للخلية الواحدة ( 2كم 1* 1 ) أن أفضل المناطق وقد وجد .كم (5و 2) بؤرة , وأعماقكم (111و 11و 3ؤرة )ابعاد ب(, وعلى 7 و 5)
على مقاومة ةقادر ها , حيث أنالصلبة و الصالبة متوسطة الالتربة ذات :المناطق هي لألعمار الصالحة العامة المباني و عندما نريد اختيار مواقع لبناء المؤسسات لمناطق ذات التربة الهشةيجب تجنب اكما ,الزلزال
للمنشآت في البناء الزلزالي) المدونة ( كودال إتباعمثل المدارس والمستشفيات, وباإلضافة إلى ذلك, ينبغي .الهشة م بناؤها في مناطق التربةالتي سيت
ISSN: 0067-2904 GIF: 0.851
Abd Al - Mageed et al. Iraqi Journal of Science, 2015, Vol 56, No.4A, pp: 2902-2914
3092
Introduction:
In order to establish proper management plans for earthquake disaster reduction, it is imperative
that city planners have an understanding of the extent of possible damage to their city in the event of a
future earthquake. The first step in ensuring the safety of cities against earthquake disaster is to have an understanding of the susceptibility of the area or city under consideration to future earthquakes [1].
A large scale earthquake can affect a wide area in many different aspects. In such an earthquake,
for example, the area near the epicenter will be shaken severely and some slopes may fail. The direct disaster of the ground shaking caused by earthquakes is called Earthquake Hazard. Earthquake
Hazard can inflict damage on a wide variety of structures. The damage to buildings is the most
obvious. Casualties can be a result of building damage as well as fires which may ignite after an earthquake. The main cause of deaths during earthquakes is building collapse.
Earthquake Hazard also affects lifeline facilities such as railroads, highways, bridges and water,
sewage, electric power and gas networks. Lifeline damages can significantly hamper recovery efforts
aimed at the damaged area. Moreover, damage sometimes causes indirect economical losses in addition to direct physical damage [2].
Previous works:
An evaluation of seismic zoning of Iraq is carried out by Alsiniwai and Almosawi in (1980) [3]. Also Al- Alabasy and Fahmi used in (1985) an extreme value statistic for the estimation of maximum
magnitude of earthquake in Iraq [4]. In addition to, Mahmood & Alomary in (1985) used probabilitic
methods for evaluating the seismic design parameters for Baghdad city [5], and they carried out in (1986) a preliminary estimation of earthquake probable zone for Iraq , where the geological
arrangements , longitudinal faults ,transverse faults, crossing roads and earthquake occurrences [6].
Data sources and methodology:
The RADIUS 99 program [2] is executed by choosing scenarios of an earthquake that had taken place in Iran in (1990) called Manjil earthquake, where different epicenter location, focal depth,
direction, magnitude values and occurrence time (day or night) are given. Al - Kadhmiya area in
Baghdad city / Al-Karkh has been chosen as a target for such earthquake senarios. Data required to carry out the seismic risk analysis were obtained from Ministry of Planning [7],
they include: statistics of Population distribution, lifeline distribution, buildings types distribution and
industrial facilities. Al –Kadhmiya area has been gridded into a mesh of (41) cells of (1) km squared
Figure-1.
Figure 1- Study area of Al – Kadhmiya Qadha

Abd Al - Mageed et al. Iraqi Journal of Science, 2015, Vol 56, No.4A, pp: 2902-2914
3092
Each sector was coded from 1 to 6 as follows: AL-Hurriya (1), Al-Zahraa (2), Al-Kadhmiya (3), Al –
Salam (4) , AL- Utaifiya (5) , Al- Fager (6), Figure-2.
Figure 2- Area ID distribution map
The grid units of the area are often zoned according to existing ground conditions (soil type) and administration boundaries (city block, city sector, etc.). Thus, Earthquake Hazard will be estimated
from the parameters of the scenario earthquake and ground conditions [2]. Al-Kadhmiya area lies in
the north western part of Baghdad city , to west of Tigris river where it's soil type ranged between soft and medium soil, the eastern regions have soft soil because it is near the river, such as in the sectors
of Al-Kadhmiya ,Al –Salam, AL- Utaifiya, Al- Fager, while the western regions has a medium soils
such as the sectors of AL-Hurriya, Al-Zahraa, Figure-3.
Figure 3- Soil Type Distribution Map of Al – Kadhmiya area, numbers refer to area ID
In addition to soil type, Al –Kadhmiya statistical data were used (that were obtained from the
ministry of planning)[4] which include the population, numbers and distribution of lifelines facilities (roads (local and highway), bridges, tunnels, electrical and telecommunication supply (towers
and sub-stations), water supply and sewage (trunk and distribution lines, pumping stations and
treatment plants), reservoirs, dams and tanks, and gasoline stations), numbers of different types of
building (residential, industrial, commercial, schools, hospitals) and their distribution in the area. Buildings may be also classified according to various parameters such as, their material types, usage,
age, structural types and local building codes, because earthquake damage to buildings is greatly
influenced by the types of buildings, we also specify the "Mesh Weight," which is defined as the relative density of buildings in each mesh unit. Thus, combining the above factors with the estimated
seismic intensity distribution, building damage can be estimated. By using the maps of main and
secondary roads in Al- Kadhmyia area, the types and the lengths of the roads were determined utilizing the GIS and Global Mapper programs. These data were used as input for executing the
RADIUS 99 program. It was noted that the building distribution is concentrated in the central parts of
the area especially the areas of medium soils and it is found in less concentration in regions of soft
soils while it is not found in the outside regions of the area, so the building distribution varies in each neighborhood according to its soil condition, Figure-4.
Color ID Area Name
1 Al huria
2 Al zahraa
3 Al kadhima
4 Al salam
5 Al utaifya
6 Al fajer
2 3 3 3 3
1 1 2 3 3 3
1 1 1 2 2 5
1 1 1 1 2 5 5 5
1 1 1 1 4 6 5 5
1 1 1 4 4 6
1 4
2 3 3 3 3
1 1 2 3 3 3
1 1 1 2 2 5
1 1 1 1 2 5 5 5
1 1 1 1 4 6 5 5
1 1 1 4 4 6
1 4
Color Description
Unknown
Hard Rock
Soft Rock
Medium Soil
Soft Soil

Abd Al - Mageed et al. Iraqi Journal of Science, 2015, Vol 56, No.4A, pp: 2902-2914
3092
To understand the effect of the earthquake and to determine which scenario is the most causative of
damages and destructions according to the input parameters of the area, Manjil earthquake scenario
was simulated by using the Joyner & Boore (1981) [8] attenuation equation of seismic magnitude and
with different directions, distances, depths of the epicenters and time of happening. The following input parameters were used to simulate the effect of earthquakes at different
magnitudes (5, 7) and distances (3, 10 and 100) km and epicenter's.
Figure 4 - Mesh Weight Distribution Map
Results and Discussion: Analysis and Interpretation of results depend mainly on the accuracy of the input data for executing
the RADIUS 99 program, in spite of that, the results are still approximate due to the presence of many
variable factors and inputs that could not be obtained accurately like population and their presence
during day and night, as well as the accurate engineering characteristics of buildings. The average of Modified Mercalli Intensity ) MMI ) which is one of the most widely used
definitions of the severity of an earthquake and is used as an earthquake damage scale, the Mesh
Damage Ratio (MDR%) which is defined as the percentage of damage building in each mesh , the (PGA) (Peak Ground Acceleration) which represents the ground shaking acceleration , the suspected
numbers of people injuries and deaths and the ratio of lifelines damage, can be determined by
running the program with many scenarios with variable (Earthquake magnitude, depth, distance and direction) , which could help in the analysis and evaluating the destruction that was caused due to
earthquake.
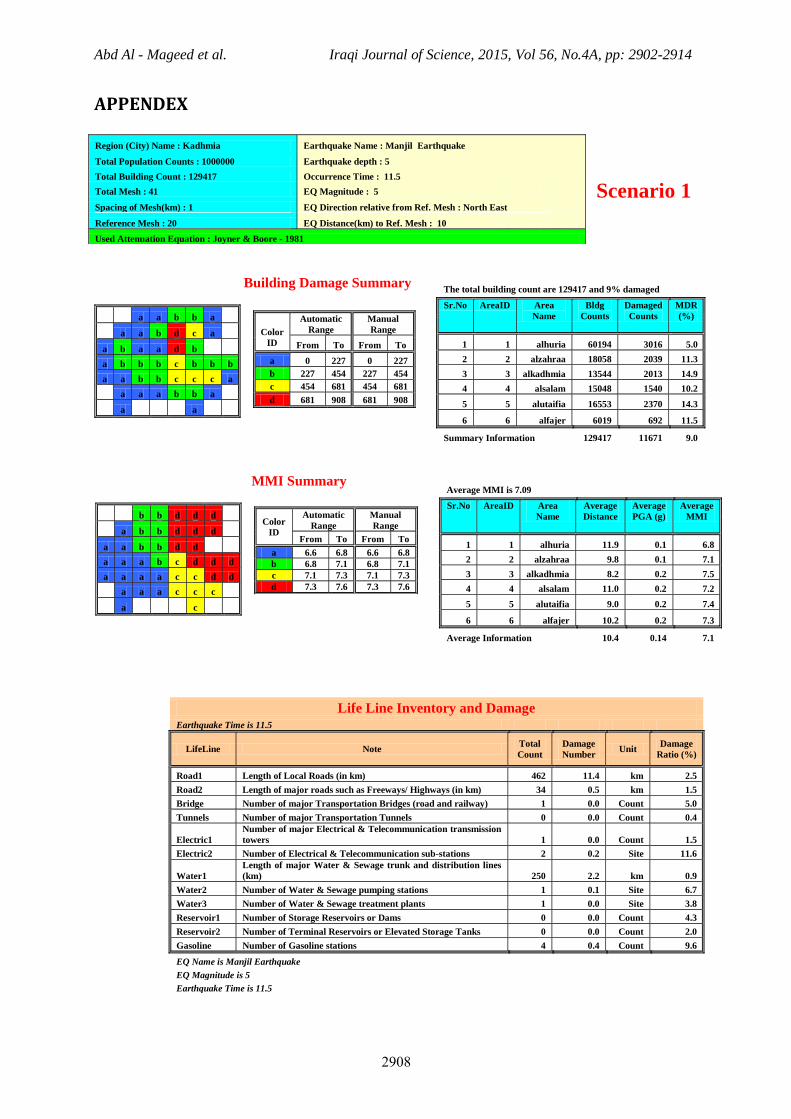
Input data and results are shown in Appendix. Summary of all results is given in Table-1. It is clear
that the most susceptible areas by the earthquake magnitude are the areas with soft soils such as Al-Kadhmyia, Al – Salam, AL- Utaifiya, Al- Fager sectors where the values of MMI are higher in the
areas of medium soils such as AL-Hurriya and Al-Zahraa. For example, in scenario (1), Table-1, the
MMI values range between (6.8- 7.1) in soft soil areas and range between (7.2-7.5) in medium soil areas. The (MDR%) value entirely depends on soil's condition . It's found that central part area has
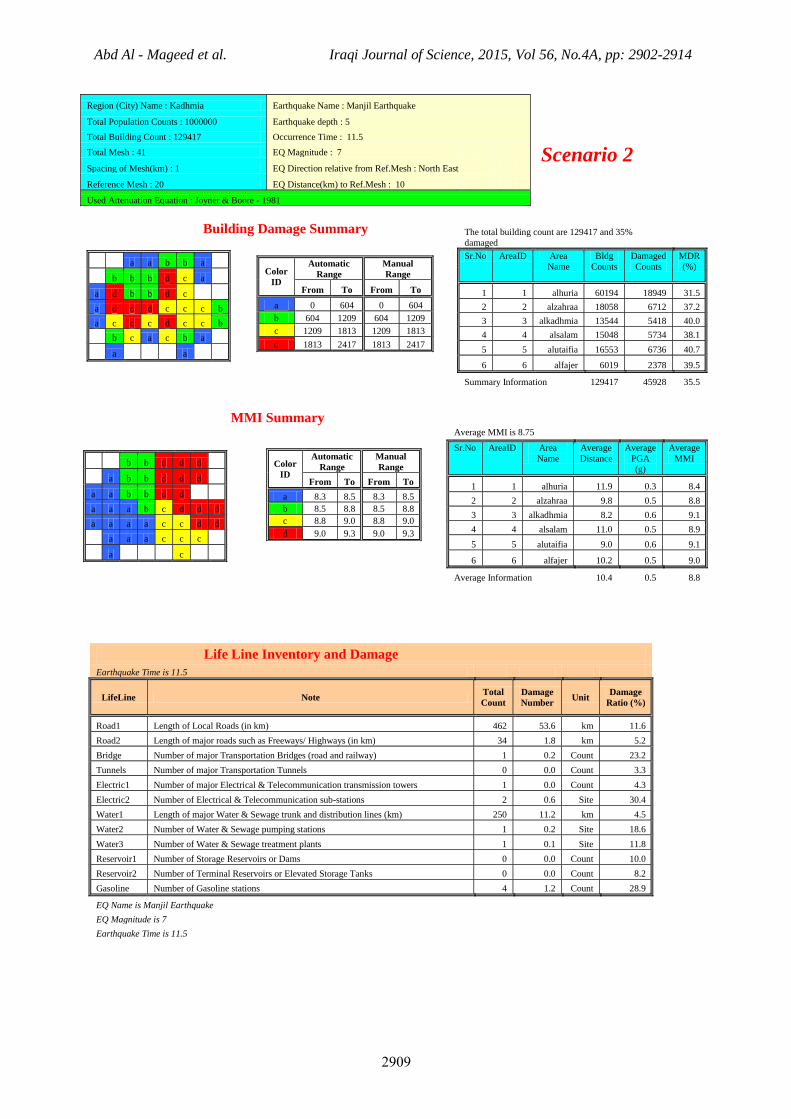
the highest MDR% Values, Figure-4, that is directly correlated with soft soils areas. For example, in
scenario (2), Table-1, these values range between (38.1- 40.7) while it's between (31.5- 40.7) in medium soils areas. As the population number is proportional to building density, the number of
casualties will increase where the MDR% value will increase. The lifelines will, also, be affected
proportionally with the earthquake magnitude, depth and distance. The values of peak ground
acceleration (PGA) increase also by increasing of earthquake magnitude and their value vary according to variation in other seismic parameters.
2 3 3 3 3
1 1 2 3 3 3
1 1 1 2 2 5
1 1 1 1 2 5 5 5
1 1 1 1 4 6 5 5
1 1 1 4 4 6
1 4
Color Mesh Weight
None
Low
Average
High
Very High

Abd Al - Mageed et al. Iraqi Journal of Science, 2015, Vol 56, No.4A, pp: 2902-2914
3092
From Table-1, scenario (1 and 2), it can be noted that as earthquake Magnitude increases, the
(PGA) value increases and the human sensing for it increases , so the average of (MMI) value will be
greater, and the average of (MDR%) with the lifelines ratio and injuries will be proportionally increased. It can be noted also that as average of (MMI) value increases as the earthquake depth
decreases ,where the effect of the surface seismic waves increases, scenario (1,6,7 and 3), the average
of (MDR%) and the lifeline ratio and injuries will be increased when the earthquake depth is shallow (near the surface). While these averages and ratios will decrease as distance between the earthquake
location and the affected area increase, in which the seismic waves intensity decreases because of
attenuation, as a result of the reflections and refractions of seismic waves along path, scenario (1, 4
and 5).
Abd Al - Mageed et al. Iraqi Journal of Science, 2015, Vol 56, No.4A, pp: 2902-2914
3092
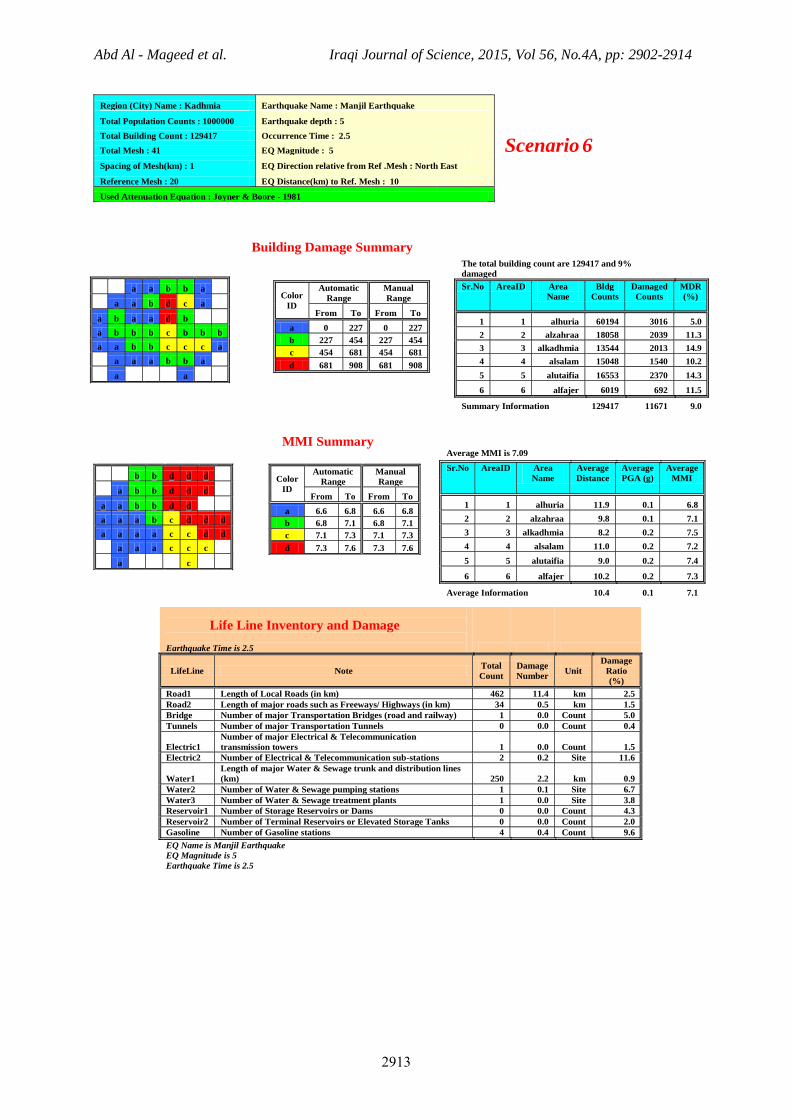
Values of (MMI) are equal when the area is attacked by earthquake at day time (6:00 am – 18:00
pm ) or attacked by earthquake with a same magnitude at night time ( 18:00 pm – 6:00 am ), as the
time has no effect on the MMI , but the effect of time manifest itself only in the number of injuries
and deaths, where the deaths number increases when the earthquake happened at night in which the night population is higher than day population in residential buildings. As school and office
populations are higher during the day and almost non-existent during the night so the deaths number is
lower in comparison with at night earthquake, while the injuries are higher at day time, scenario (1 and 6). In addition , the change of earthquake direction has no effect on the averages of (MMI) values ,
because it depends on the nature of the wave path, while the (MDR%) ratio change depending on the
direction of building distribution relative to the earthquake direction, in which the ratio increase, when the two directions are parallel . For example, buildings in Al utaifya and Al – Salam sectors are
in SE direction, so the (MDR%) as shown in scenario (7) where the earthquake direction is SE is
greater than it's ratio in scenario (1) where the earthquake direction is NE scenario (1 and 7).
From above results, it can be concluded that the best areas for construction are those with medium soils.
Conclusions:
For the study area ( al-kathmia ), the followimg conclusion has been found : 1. The (MMI) value increases ( ftom 6.8 to 7.1 ) in soft soils areas in comparison with other soil
types ( medium and hard soil ) that range between ( 7.2 – 7.5 ) .
2. For the same earthquake magnitude (5 Richter scale) and earthquake distance (10 km), the average (MMI) value increases (from 7.0 to 7.2) as the earthquake depth decreases for all soil
types.
3. The Life line destruction ratios increase as the earthquake magnitude increases, scenario (1 &2) in
appendex. 4. The injury and death number during any earthquake magnitude is higher at night than at day.
5. The best areas for constructions are those that have medium and hard soils, where it can resist the
earthquake. Area with soft soils should be avoided when we want to choose the sites to build the life saving establishments and general public buildings, like schools and hospitals.
6. The seismic building code should be followed for structures to be built on soft soils areas.
References: 1. OYO Group. 2000 . Simplified Tool for Earthquake Damage Estimation, Japan.
2. OYO Group. 2000. Methodology, Japan.
3. Alsinawi , S.A., and Almosawi, H.A. 1980. Seismic zoning and other seismic consideration for Iraq , 7
th HCEE Proc ., V.I. pp:185-192
4. ALabasi, J.N., and Fahmi, K.J.1985. Estimation maximum magnitude earthquakes in Iraq using
extreme value ststistics, Geophys J.R.ast.Soc., 82(3), pp: 535-548 5. Mahmood, D.S. and Alomary, M.I., Alridha, N.A. 1985. Seismic hazard and seismic design
parameters for Baghdad city. Journal of building research, council for scientific
research ,Baghdad, 4( 2), pp: 95- 111.
6. Mahmood D.S. and ALomary, M.I. 1986. A preliminary Estimation of earthquake probable zones in Iraq. Fourth scientific conference, scientific research council. Proceedings of civil &
architectural engineering and geophysics, 4 (2), pp: 951-957.
7. Statistical consensus data for Iraq .2013. Ministry of Planning, Iraq. 8. Joyner, W. B. and D. M. Boore. 1981. Peak horizontal acceleration and velocity from strong
motion records including records from the 1979 Imperial Valley, California, earthquake, Bull.
Seism. Soc. Am. 71, 2011-2038.
Abd Al - Mageed et al. Iraqi Journal of Science, 2015, Vol 56, No.4A, pp: 2902-2914
3092
APPENDEX
Scenario 1
Building Damage Summary
a a b b a
a a b d c a
a b a a d b
a b b b c b b b
a a b b c c c a
a a a b b a
a a
MMI Summary
b b d d d
a b b d d d
a a b b d d
a a a b c d d d
a a a a c c d d
a a a c c c
a c
Life Line Inventory and Damage Earthquake Time is 11.5
LifeLine Note Total
Count
Damage
Number Unit
Damage
Ratio (%)
Road1 Length of Local Roads (in km) 462 11.4 km 2.5
Road2 Length of major roads such as Freeways/ Highways (in km) 34 0.5 km 1.5
Bridge Number of major Transportation Bridges (road and railway) 1 0.0 Count 5.0
Tunnels Number of major Transportation Tunnels 0 0.0 Count 0.4
Electric1
Number of major Electrical & Telecommunication transmission
towers 1 0.0 Count 1.5
Electric2 Number of Electrical & Telecommunication sub-stations 2 0.2 Site 11.6
Water1
Length of major Water & Sewage trunk and distribution lines
(km) 250 2.2 km 0.9
Water2 Number of Water & Sewage pumping stations 1 0.1 Site 6.7
Water3 Number of Water & Sewage treatment plants 1 0.0 Site 3.8
Reservoir1 Number of Storage Reservoirs or Dams 0 0.0 Count 4.3
Reservoir2 Number of Terminal Reservoirs or Elevated Storage Tanks 0 0.0 Count 2.0
Gasoline Number of Gasoline stations 4 0.4 Count 9.6
EQ Name is Manjil Earthquake
EQ Magnitude is 5
Earthquake Time is 11.5
Region (City) Name : Kadhmia Earthquake Name : Manjil Earthquake
Total Population Counts : 1000000 Earthquake depth : 5
Total Building Count : 129417 Occurrence Time : 11.5
Total Mesh : 41 EQ Magnitude : 5
Spacing of Mesh(km) : 1 EQ Direction relative from Ref. Mesh : North East
Reference Mesh : 20 EQ Distance(km) to Ref. Mesh : 10
Used Attenuation Equation : Joyner & Boore - 1981
The total building count are 129417 and 9% damaged
Sr.No AreaID Area
Name
Bldg
Counts
Damaged
Counts
MDR
(%)
1 1 alhuria 60194 3016 5.0
2 2 alzahraa 18058 2039 11.3
3 3 alkadhmia 13544 2013 14.9
4 4 alsalam 15048 1540 10.2
5 5 alutaifia 16553 2370 14.3
6 6 alfajer 6019 692 11.5
Summary Information 129417 11671 9.0
Color
ID
Automatic
Range
Manual
Range
From To From To
a 0 227 0 227
b 227 454 227 454
c 454 681 454 681
d 681 908 681 908
Average MMI is 7.09
Sr.No AreaID Area
Name
Average
Distance
Average
PGA (g)
Average
MMI
1 1 alhuria 11.9 0.1 6.8
2 2 alzahraa 9.8 0.1 7.1
3 3 alkadhmia 8.2 0.2 7.5
4 4 alsalam 11.0 0.2 7.2
5 5 alutaifia 9.0 0.2 7.4
6 6 alfajer 10.2 0.2 7.3
Average Information 10.4 0.14 7.1
Color
ID
Automatic
Range
Manual
Range
From To From To
a 6.6 6.8 6.6 6.8
b 6.8 7.1 6.8 7.1
c 7.1 7.3 7.1 7.3
d 7.3 7.6 7.3 7.6
Abd Al - Mageed et al. Iraqi Journal of Science, 2015, Vol 56, No.4A, pp: 2902-2914
3090
Scenario 2
Building Damage Summary
a a b b a
b b b d c a
a d b b d c
a d d d c c c b
a c d c d c c b
b c a c b a
a a
MMI Summary
Life Line Inventory and Damage
Earthquake Time is 11.5
LifeLine Note Total
Count
Damage
Number Unit
Damage
Ratio (%)
Road1 Length of Local Roads (in km) 462 53.6 km 11.6
Road2 Length of major roads such as Freeways/ Highways (in km) 34 1.8 km 5.2
Bridge Number of major Transportation Bridges (road and railway) 1 0.2 Count 23.2
Tunnels Number of major Transportation Tunnels 0 0.0 Count 3.3
Electric1 Number of major Electrical & Telecommunication transmission towers 1 0.0 Count 4.3
Electric2 Number of Electrical & Telecommunication sub-stations 2 0.6 Site 30.4
Water1 Length of major Water & Sewage trunk and distribution lines (km) 250 11.2 km 4.5
Water2 Number of Water & Sewage pumping stations 1 0.2 Site 18.6
Water3 Number of Water & Sewage treatment plants 1 0.1 Site 11.8
Reservoir1 Number of Storage Reservoirs or Dams 0 0.0 Count 10.0
Reservoir2 Number of Terminal Reservoirs or Elevated Storage Tanks 0 0.0 Count 8.2
Gasoline Number of Gasoline stations 4 1.2 Count 28.9
EQ Name is Manjil Earthquake
EQ Magnitude is 7
Earthquake Time is 11.5
Region (City) Name : Kadhmia Earthquake Name : Manjil Earthquake
Total Population Counts : 1000000 Earthquake depth : 5
Total Building Count : 129417 Occurrence Time : 11.5
Total Mesh : 41 EQ Magnitude : 7
Spacing of Mesh(km) : 1 EQ Direction relative from Ref.Mesh : North East
Reference Mesh : 20 EQ Distance(km) to Ref.Mesh : 10
Used Attenuation Equation : Joyner & Boore - 1981
The total building count are 129417 and 35%
damaged
Sr.No AreaID Area
Name
Bldg
Counts
Damaged
Counts
MDR
(%)
1 1 alhuria 60194 18949 31.5
2 2 alzahraa 18058 6712 37.2
3 3 alkadhmia 13544 5418 40.0
4 4 alsalam 15048 5734 38.1
5 5 alutaifia 16553 6736 40.7
6 6 alfajer 6019 2378 39.5
Summary Information 129417 45928 35.5
Color
ID
Automatic
Range
Manual
Range
From To From To
a 0 604 0 604
b 604 1209 604 1209
c 1209 1813 1209 1813
d 1813 2417 1813 2417
Average MMI is 8.75
Sr.No AreaID Area
Name
Average
Distance
Average
PGA (g)
Average
MMI
1 1 alhuria 11.9 0.3 8.4
2 2 alzahraa 9.8 0.5 8.8
3 3 alkadhmia 8.2 0.6 9.1
4 4 alsalam 11.0 0.5 8.9
5 5 alutaifia 9.0 0.6 9.1
6 6 alfajer 10.2 0.5 9.0
Average Information 10.4 0.5 8.8
Color
ID
Automatic
Range
Manual
Range
From To From To
a 8.3 8.5 8.3 8.5
b 8.5 8.8 8.5 8.8
c 8.8 9.0 8.8 9.0
d 9.0 9.3 9.0 9.3
b b d d d
a b b d d d
a a b b d d
a a a b c d d d
a a a a c c d d
a a a c c c
a c

Abd Al - Mageed et al. Iraqi Journal of Science, 2015, Vol 56, No.4A, pp: 2902-2914
3099
Scenario 3
Building Damage Summary
MMI Summary
Region (City) Name : Kadhmia Earthquake Name : Manjil Earthquake
Total Population Counts : 1000000 Earthquake depth : 2
Total Building Count : 129417 Occurrence Time : 11.5
Total Mesh : 41 EQ Magnitude : 5
Spacing of Mesh(km) : 1 EQ Direction relative from Ref. Mesh : North East
Reference Mesh : 20 EQ Distance(km) to Ref. Mesh : 10
Used Attenuation Equation : Joyner & Boore - 1981
Color
ID
Automatic
Range
Manual
Range
From To From To
a 0 261 0 261
b 261 522 261 522
c 522 783 522 783
d 783 1044 783 1044
a a b b a
a a b d c a
A b a a d c
A b b b c b b b
A a b a c c c a
a a a b b a
a a
The total building count are 129417 and 10%
damaged
Sr.No AreaID Area
Name
Bldg
Counts
Damaged
Counts
MDR
(%)
1 1 alhuria 60194 3216 5.3
2 2 alzahraa 18058 2381 13.2
3 3 alkadhmia 13544 2332 17.2
4 4 alsalam 15048 1831 12.2
5 5 alutaifia 16553 2761 16.7
6 6 alfajer 6019 826 13.7
Summary Information 129417 13346 10.3
Average MMI is 7.2
Sr.No AreaID Area
Name
Average
Distance
Average
PGA (g)
Average
MMI
1 1 alhuria 11.0 0.1 6.9
2 2 alzahraa 8.6 0.2 7.2
3 3 alkadhmia 6.8 0.2 7.6
4 4 alsalam 10.0 0.2 7.3
5 5 alutaifia 7.8 0.2 7.6
6 6 alfajer 9.1 0.2 7.4
Average Information 9.3 0.15 7.2
b b d d d
a b b d d d
A a b b d d
A a a b c d d d
A a a a c c c d
a a a c c c
a c
Color
ID
Automatic
Range
Manual
Range
From To From To
a 6.7 6.9 6.7 6.9
b 6.9 7.2 6.9 7.2
c 7.2 7.5 7.2 7.5
d 7.5 7.8 7.5 7.8
Life Line Inventory and Damage Earthquake Time is 11.5
LifeLine Note Total
Count
Damage
Number Unit
Damage
Ratio
(%)
Road1 Length of Local Roads (in km) 462 12.8 km 2.8
Road2
Length of major roads such as Freeways/ Highways (in
km) 34 0.6 km 1.7
Bridge
Number of major Transportation Bridges (road and
railway) 1 0.1 Count 5.5
Tunnels Number of major Transportation Tunnels 0 0.0 Count 0.5
Electric1
Number of major Electrical & Telecommunication
transmission towers 1 0.0 Count 1.6
Electric2 Number of Electrical & Telecommunication sub-stations 2 0.3 Site 12.6
Water1
Length of major Water & Sewage trunk and distribution
lines (km) 250 2.5 km 1.0
Water2 Number of Water & Sewage pumping stations 1 0.1 Site 7.2
Water3 Number of Water & Sewage treatment plants 1 0.0 Site 4.1
Reservoir1 Number of Storage Reservoirs or Dams 0 0.0 Count 4.6
Reservoir2
Number of Terminal Reservoirs or Elevated Storage
Tanks 0 0.0 Count 2.2
Gasoline Number of Gasoline stations 4 0.4 Count 10.8
EQ Name is Manjil Earthquake
EQ Magnitude is 5
Earthquake Time is 11.5

Abd Al - Mageed et al. Iraqi Journal of Science, 2015, Vol 56, No.4A, pp: 2902-2914
3099
Scenario 4
Building Damage Summary
MMI Summary
Region (City) Name : Kadhmia Earthquake Name : Manjil Earthquake
Total Population Counts : 1000000 Earthquake depth : 5
Total Building Count : 129417 Occurrence Time : 11.5
Total Mesh : 41 EQ Magnitude : 5
Spacing of Mesh(km) : 1 EQ Direction relative from Ref. Mesh : North East
Reference Mesh : 20 EQ Distance(km) to Ref. Mesh : 100
Used Attenuation Equation : Joyner & Boore - 1981
The total building count are 129417 and 0%
damaged
Sr.No AreaID Area
Name
Bldg
Counts
Damaged
Counts
MDR
(%)
1 1 alhuria 60194 -72 0
2 2 alzahraa 18058 13 0.07
3 3 alkadhmia 13544 22 0.2
4 4 alsalam 15048 12 0.08
5 5 alutaifia 16553 24 0.14
6 6 alfajer 6019 4 0.07
Summary Information 129417 4 0.003
Color
ID
Automatic
Range
Manual
Range
From To From To
a 0 -3 0 -3
b -3 2 -3 2
c 2 6 2 6
d 6 11 6 11
b b c c b
b d c b
b b d c
b d c c c
b c c c c
b c c b
b b
Average MMI is 3.38
Sr.No AreaID Area
Name
Average
Distance
Average
PGA (g)
Average
MMI
1 1 alhuria 100.8 0.009 3.2
2 2 alzahraa 98.3 0.01 3.4
3 3 alkadhmia 96.4 0.01 3.6
4 4 alsalam 99.8 0.01 3.6
5 5 alutaifia 97.4 0.01 3.6
6 6 alfajer 98.7 0.01 3.6
Average Information 99.0 0.01 3.4
Color
ID
Automatic
Range
Manual
Range
From To From To
a 3.1 3.3 3.1 3.3
b 3.3 3.4 3.3 3.4
c 3.4 3.5 3.4 3.5
d 3.5 3.7 3.5 3.7
a a d d d
a a a d d d
a a a a d d
a a a a d d d d
a a a a d d d d
a a a d d d
a d
Life Line Inventory and damage
Earthquake Time is 11.5
LifeLine Note Total
Count
Damage
Number Unit
Damage
Ratio (%)
Road1 Length of Local Roads (in km) 462 0.0 km 0.0
Road2 Length of major roads such as Freeways/ Highways (in km) 34 0.0 km 0.0
Bridge Number of major Transportation Bridges (road and railway) 1 0.0 Count 0.0
Tunnels Number of major Transportation Tunnels 0 0.0 Count 0.0
Electric1
Number of major Electrical & Telecommunication transmission
towers 1 0.0 Count 0.0
Electric2 Number of Electrical & Telecommunication sub-stations 2 0.0 Site -0.1
Water1 Length of major Water & Sewage trunk and distribution lines (km) 250 0.0 km 0.0
Water2 Number of Water & Sewage pumping stations 1 0.0 Site -0.2
Water3 Number of Water & Sewage treatment plants 1 0.0 Site -0.1
Reservoir1 Number of Storage Reservoirs or Dams 0 0.0 Count 0.0
Reservoir2 Number of Terminal Reservoirs or Elevated Storage Tanks 0 0.0 Count 0.0
Gasoline Number of Gasoline stations 4 0.0 Count 0.0
EQ Name is Manjil Earthquake
EQ Magnitude is 5
Earthquake Time is 11.5

Abd Al - Mageed et al. Iraqi Journal of Science, 2015, Vol 56, No.4A, pp: 2902-2914
3093
Scenario 5
Building Damage Summary
MMI Summary
Region (City) Name : Kadhmia Earthquake Name : Manjil Earthquake
Total Population Counts : 1000000 Earthquake depth : 5
Total Building Count : 129417 Occurrence Time : 11.5
Total Mesh : 41 EQ Magnitude : 5
Spacing of Mesh(km) : 1 EQ Direction relative from Ref.Mesh : North East
Reference Mesh : 20 EQ Distance(km) to Ref.Mesh : 3
Used Attenuation Equation : Joyner & Boore - 1981
The total building count are 129417 and 16%
damaged
Sr.No AreaID Area
Name
Bldg
Counts
Damaged
Counts
MDR
(%)
1 1 alhuria 60194 7278 12.1
2 2 alzahraa 18058 3417 18.9
3 3 alkadhmia 13544 2795 20.6
4 4 alsalam 15048 3046 20.2
5 5 alutaifia 16553 3565 21.5
6 6 alfajer 6019 1252 20.8
Summary Information 129417 21353 16.5
Color
ID
Automatic
Range
Manual
Range
From To From To
a 0 332 0 332
b 332 664 332 664
c 664 996 664 996
d 996 1328 996 1328
a a a a a
b b b d b a
a c b b d c
a c c c c b b a
a b c b d c c a
a b a c b a
a a
Average MMI is 7.55
Sr.No AreaID Area
Name
Average
Distance
Average
PGA (g)
Average
MMI
1 1 alhuria 6.6 0.2 7.3
2 2 alzahraa 5.5 0.2 7.6
3 3 alkadhmia 5.3 0.2 7.8
4 4 alsalam 6.0 0.2 7.8
5 5 alutaifia 5.3 0.2 7.8
6 6 alfajer 5.7 0.2 7.8
Average Information 5.9 0.2 7.6
Color
ID
Automatic
Range
Manual
Range
From To From To
a 7.2 7.3 7.2 7.3
b 7.3 7.5 7.3 7.5
c 7.5 7.7 7.5 7.7
d 7.7 7.8 7.7 7.8
a b d d d
a b b d d d
a a b b d d
a a b b d d d d
a a a b d d d d
a a a d d d
a d
Life Line Inventory and Damage
Earthquake Time is 11.5
LifeLine Note Total
Count
Damage
Number Unit
Damage
Ratio (%)
Road1 Length of Local Roads (in km) 462 17.9 km 3.9
Road2 Length of major roads such as Freeways/ Highways (in km) 34 0.8 km 2.2
Bridge Number of major Transportation Bridges (road and railway) 1 0.1 Count 7.2
Tunnels Number of major Transportation Tunnels 0 0.0 Count 1.0
Electric1
Number of major Electrical & Telecommunication transmission
towers 1 0.0 Count 2.1
Electric2 Number of Electrical & Telecommunication sub-stations 2 0.3 Site 15.8
Water1 Length of major Water & Sewage trunk and distribution lines (km) 250 3.6 km 1.4
Water2 Number of Water & Sewage pumping stations 1 0.1 Site 9.1
Water3 Number of Water & Sewage treatment plants 1 0.1 Site 5.2
Reservoir1 Number of Storage Reservoirs or Dams 0 0.0 Count 5.4
Reservoir2 Number of Terminal Reservoirs or Elevated Storage Tanks 0 0.0 Count 3.2
Gasoline Number of Gasoline stations 4 0.6 Count 14.7
EQ Name is Manjil Earthquake
EQ Magnitude is 5
Earthquake Time is 11.5
Abd Al - Mageed et al. Iraqi Journal of Science, 2015, Vol 56, No.4A, pp: 2902-2914
3092
Scenario 6
Building Damage Summary
MMI Summary
Life Line Inventory and Damage
Earthquake Time is 2.5
LifeLine Note Total
Count
Damage
Number Unit
Damage
Ratio
(%)
Road1 Length of Local Roads (in km) 462 11.4 km 2.5
Road2 Length of major roads such as Freeways/ Highways (in km) 34 0.5 km 1.5
Bridge Number of major Transportation Bridges (road and railway) 1 0.0 Count 5.0
Tunnels Number of major Transportation Tunnels 0 0.0 Count 0.4
Electric1
Number of major Electrical & Telecommunication
transmission towers 1 0.0 Count 1.5
Electric2 Number of Electrical & Telecommunication sub-stations 2 0.2 Site 11.6
Water1
Length of major Water & Sewage trunk and distribution lines
(km) 250 2.2 km 0.9
Water2 Number of Water & Sewage pumping stations 1 0.1 Site 6.7
Water3 Number of Water & Sewage treatment plants 1 0.0 Site 3.8
Reservoir1 Number of Storage Reservoirs or Dams 0 0.0 Count 4.3
Reservoir2 Number of Terminal Reservoirs or Elevated Storage Tanks 0 0.0 Count 2.0
Gasoline Number of Gasoline stations 4 0.4 Count 9.6
EQ Name is Manjil Earthquake
EQ Magnitude is 5
Earthquake Time is 2.5
Region (City) Name : Kadhmia Earthquake Name : Manjil Earthquake
Total Population Counts : 1000000 Earthquake depth : 5
Total Building Count : 129417 Occurrence Time : 2.5
Total Mesh : 41 EQ Magnitude : 5
Spacing of Mesh(km) : 1 EQ Direction relative from Ref .Mesh : North East
Reference Mesh : 20 EQ Distance(km) to Ref. Mesh : 10
Used Attenuation Equation : Joyner & Boore - 1981
The total building count are 129417 and 9%
damaged
Sr.No AreaID Area
Name
Bldg
Counts
Damaged
Counts
MDR
(%)
1 1 alhuria 60194 3016 5.0
2 2 alzahraa 18058 2039 11.3
3 3 alkadhmia 13544 2013 14.9
4 4 alsalam 15048 1540 10.2
5 5 alutaifia 16553 2370 14.3
6 6 alfajer 6019 692 11.5
Summary Information 129417 11671 9.0
a a b b a
a a b d c a
a b a a d b
a b b b c b b b
a a b b c c c a
a a a b b a
a a
Color
ID
Automatic
Range
Manual
Range
From To From To
a 0 227 0 227
b 227 454 227 454
c 454 681 454 681
d 681 908 681 908
Average MMI is 7.09
Sr.No AreaID Area
Name
Average
Distance
Average
PGA (g)
Average
MMI
1 1 alhuria 11.9 0.1 6.8
2 2 alzahraa 9.8 0.1 7.1
3 3 alkadhmia 8.2 0.2 7.5
4 4 alsalam 11.0 0.2 7.2
5 5 alutaifia 9.0 0.2 7.4
6 6 alfajer 10.2 0.2 7.3
Average Information 10.4 0.1 7.1
b b d d d
a b b d d d
a a b b d d
a a a b c d d d
a a a a c c d d
a a a c c c
a c
Color
ID
Automatic
Range
Manual
Range
From To From To
a 6.6 6.8 6.6 6.8
b 6.8 7.1 6.8 7.1
c 7.1 7.3 7.1 7.3
d 7.3 7.6 7.3 7.6

Abd Al - Mageed et al. Iraqi Journal of Science, 2015, Vol 56, No.4A, pp: 2902-2914
3092
Scenario 7
Building Damage Summary
MMI Summary
Region (City) Name : Kadhmia Earthquake Name : Manjil Earthquake
Total Population Counts : 1000000 Earthquake depth : 5
Total Building Count : 129417 Occurrence Time : 11.5
Total Mesh : 41 EQ Magnitude : 5
Spacing of Mesh(km) : 1 EQ Direction relative from Ref.Mesh : South East
Reference Mesh : 20 EQ Distance(km) to Ref.Mesh : 10
Used Attenuation Equation : Joyner & Boore - 1981
The total building count are 129417 and 7% damaged
Sr.No AreaID Area
Name
Bldg
Counts
Damaged
Counts
MDR
(%)
1 1 alhuria 60194 2839 4.7
2 2 alzahraa 18058 1549 8.6
3 3 alkadhmia 13544 1111 8.2
4 4 alsalam 15048 1817 12.1
5 5 alutaifia 16553 2011 12.1
6 6 alfajer 6019 737 12.2
Summary Information 129417 10065 7.8
Color
ID
Automatic
Range
Manual
Range
From To From To
a 0 164 0 164
b 164 327 164 327
c 327 491 327 491
d 491 655 491 655
a a a a a
a a b d b a
a b a b d b
a b b b d c c b
a b b b d d d b
a b a d c b
a b
Average MMI is 6.95
Sr.No AreaID Area
Name
Average
Distance
Average
PGA (g)
Average
MMI
1 1 alhuria 12.7 0.1 6.7
2 2 alzahraa 12.7 0.1 6.8
3 3 alkadhmia 13.0 0.1 7.0
4 4 alsalam 9.7 0.2 7.4
5 5 alutaifia 10.2 0.2 7.3
6 6 alfajer 9.4 0.2 7.4
Average Information 11.9 0.13 7.0
a a c c c
a a a c c c
a a a a c c
a a a b c d d d
a a b b d d d d
b b b d d d
b d
Color
ID
Automatic
Range
Manual
Range
From To From To
a 6.5 6.8 6.5 6.8
b 6.8 7.0 6.8 7.0
c 7.0 7.2 7.0 7.2
d 7.2 7.5 7.2 7.5
Life Line Inventory and Damage
Earthquake Time is 11.5
LifeLine Note Total
Count
Damage
Number Unit
Damage
Ratio (%)
Road1 Length of Local Roads (in km) 462 9.6 km 2.1
Road2 Length of major roads such as Freeways/ Highways (in km) 34 0.4 km 1.3
Bridge Number of major Transportation Bridges (road and railway) 1 0.0 Count 4.3
Tunnels Number of major Transportation Tunnels 0 0.0 Count 0.2
Electric1
Number of major Electrical & Telecommunication transmission
towers 1 0.0 Count 1.3
Electric2 Number of Electrical & Telecommunication sub-stations 2 0.2 Site 10.5
Water1 Length of major Water & Sewage trunk and distribution lines (km) 250 1.8 km 0.7
Water2 Number of Water & Sewage pumping stations 1 0.1 Site 6.0
Water3 Number of Water & Sewage treatment plants 1 0.0 Site 3.4
Reservoir1 Number of Storage Reservoirs or Dams 0 0.0 Count 3.9
Reservoir2 Number of Terminal Reservoirs or Elevated Storage Tanks 0 0.0 Count 1.6
Gasoline Number of Gasoline stations 4 0.3 Count 8.2
EQ Name is Manjil Earthquake
EQ Magnitude is 5
Earthquake Time is 11.5