Embed Size (px)
Citation preview
Development, investigation and modelling of a micro reformer as
part of a system for off-grid power supply with PEM fuel cells
Entwicklung, Untersuchung und Modellierung eines Mikroreformers
als Teil eines Systems zur netzfernen Stromversorgung mit PEM-
Brennstoffzellen
Von der Fakultät für Maschinenbau, Elektrotechnik und Wirtschaftsingenieurwesen der
Brandenburgischen Technischen Universität Cottbus zur Erlangung des akademischen Grades
Doktor-Ingenieur
genehmigte
Dissertation
von
Dipl.-Ing. Lisbeth Rochlitz
geboren am 16.03.1977 in Hamburg
Vorsitzender: Prof. Dr.-Ing. H. Schwarz
Gutachter: Prof. Dr.-Ing. H. J. Krautz
Gutachter: Prof. Dr.-Ing. W. Witt
Tag der mündlichen Prüfung: 18.11.2008

Abstract
I
Abstract
In this thesis a micro reformer fuel cell system (μRFCS) for 300 Wel off-grid power supply, fuelled
with bioethanol, was simulated, designed, developed and investigated in a test-rig.
First a literature study was carried through to point out the specific characteristics of micro
reforming, the most important being heat transfer, and present the systems currently under
research and already on the market.
As a next step, the processes of the RFCS were simulated with the commercial simulation tool
CHEMCAD. This comprised thermodynamic equilibrium simulations for the separate reactions of
steam reforming, water gas shift and selective methanation. It also included a simulation of the
complete μRFCS with thermodynamic equilibrium for all reactors and assumed values for heat
loss and fuel cell efficiency. The resulting net electrical efficiency was 24%.
As a third step, a reaction pathway scheme with parallel and serial reactions for the steam
reforming reaction of ethanol was simulated, developed, evaluated and proven plausible by
matching the simulation to experimental results obtained in the μRFCS test rig.
The equilibrium simulations were used to evaluate the catalyst screening carried through for
reformer, water gas shift and selective methanation catalysts. The catalysts for the μRFCS were
chosen and the optimum operating conditions determined by the screening tests.
Having accomplished the simulation and design of the system, the largest proportion of this
work was spent on the construction, set-up, testing and evaluation of the complete μRFCS. The
focus for the evaluations lay on the reformer side of the system. The technical feasibility was
demonstrated for an ethanol/water mix of 3 ml/min at S/C 3. The first tests without optimized
heat and water management between the reformer system and the fuel cell system resulted in
power output of around 115 Wel, at a total electrical efficiency of 31%.

Zusammenfassung
III
Zusammenfassung
In der vorliegenden Arbeit wurde ein Mikroreformer Brennstoffzellen System (μRBZS) zur
netzfernen Stromversorgung mit 300 W elektrischer Leistung, das mit Bioethanol betrieben
wird, entwickelt, simuliert, konstruiert und im Laborteststand untersucht.
Zunächst wurde eine Literaturrecherche durchgeführt, um die speziellen Charakteristika von
Mikroreformern darzustellen und die derzeit in der Forschung befindlichen, ferner die ersten
kommerziellen Systeme zu präsentieren. Das Hauptcharakteristikum ist dabei die
Wärmeübertragung.
Im nächsten Schritt wurden die Verfahrensschritte des μRBZS mit dem kommerziellen Prozess-
simulationstool CHEMCAD nachgebildet. Dies beinhaltete thermodynamische Gleichgewichts-
simulationen für die Reaktionen der Dampfreformierung, Wasser-Gas-Shift und selektiven
Methanisierung. Des Weiteren wurde das komplette μRBZS mit thermodynamischen
Gleichgewichtsreaktoren simuliert, mit geschätzten Wärmeverlusten und Wirkungsgraden für
die Brennstoffzelle. Der dabei berechnete elektrische Netto-Wirkungsgrad des Systems beträgt
24%. In einem dritten Schritt wurde ein Reaktionsschema aus Parallel- und Folgereaktionen für
die Dampfreformierung von Ethanol entwickelt und simuliert. Zur Bewertung wurden
experimentelle Ergebnisse des μRBZS herangezogen und nachgewiesen, dass die gemessenen
Gaszusammensetzungen mit dem Reaktionsschema beschrieben werden können.
Die Gleichgewichtssimulationen wurden für die Beurteilung der durchgeführten Screenings von
Katalysatoren zur Dampfreformierung, Wasser-Gas-Shift und zur selektiven Methanisierung
verwendet. Mit Hilfe der Screenings wurden die Katalysatoren für das μRFCS ausgesucht und
ihre optimalen Betriebsparameter bestimmt.
Die Konstruktion, der Aufbau des Teststandes, die Messungen und die Auswertung der
Ergebnisse für das komplette μRBZS machten den überwiegenden Teil der Zeit aus, den die
Verfasserin für diese Arbeit aufgewendet hat, nachdem die Simulations- und Designphase des
Systems abgeschlossen war. Dabei lag der Schwerpunkt auf der Seite des Reformersystems. Die
technische Machbarkeit und die Funktionstüchtigkeit aller Komponenten wurden mit einem
Ethanol/ Wasser-Gemisch von 3 ml/min bei S/C 3 demonstriert. Die ersten Tests ohne
optimiertes Wärme- und Wassermanagement zwischen dem Reformersystem und dem
Brennstoffzellensystem erzielten Leistungen von ca. 115 W und damit einen elektrischen
Gesamtwirkungsgrad von 31 %.

Contents
V
Contents
Acknowledgements............................................................................................................... X
Nomenclature........................................................................................................................ XI
1. Introduction .....................................................................................................................1
1.1. Hydrogen Generation for Fuel Cell Systems..................................................................3
1.2. State-of-the-art of Science and Technology and Aims of this Thesis..............................4
1.3. Bioethanol ...................................................................................................................7
2. Fundamentals of Hydrogen Generation for PEM Fuel Cells .......................................10
2.1. GHSV and S/C ratio ...................................................................................................10
2.2. Different Principles of Hydrogen Generation ..............................................................11
2.2.1. Partial Oxidation (POX) ...................................................................................11
2.2.2. Steam Reforming (STR)...................................................................................12
2.2.3. Autothermal Reforming (ATR) ........................................................................13
2.2.4. Thermal Cracking (PYROLYSIS) .......................................................................14
2.2.5. Comparison of the different Principles............................................................14
2.3. Gas Cleaning .............................................................................................................16
2.3.1. Water Gas Shift Reaction................................................................................17
2.3.2. CO Purification...............................................................................................17
2.4. PEM Fuel Cell.............................................................................................................18
3. Literature Overview on Microreforming .....................................................................19
3.1. Microreactors with mm-scale Channels and innovative Design ...................................21
3.1.1. Research ........................................................................................................21
Co-current, Counter-current and Reverse-flow Reactor Concepts ...................21
Catalytic Wall Reactor ....................................................................................25
Contents
VI
Micro Reactor and Micro Heat Exchanger .......................................................27
Microlith Catalytic Reactors ............................................................................27
Multi-layer μ-Reactor......................................................................................29
Propane Cracking 130 We ..............................................................................31
Portable Reformer fuel cell system, 300 We ....................................................32
3.1.2. Reformer fuel cell systems available on the market .........................................34
UltraCell Corporation .....................................................................................34
Voller Energy..................................................................................................34
IdaTech ........................................................................................................35
3.2. Microreactors with Microchannels .............................................................................35
4. Process- and System Simulation ...................................................................................37
4.1. Introduction to CHEMCAD and Assumptions for the Simulations ...............................37
4.2. Thermodynamic Model for the Simulations ................................................................38
4.3. Simulation of the Chemical Equilibrium for Catalyst Screening ...................................42
4.4. Development of the Simulation and calculating scheme for the complete Reformer
Fuel Cell System.........................................................................................................43
4.5. Development of a Reaction Pathway Scheme simulating the Reforming Process .........47
4.5.1. Relevant Reactions and Design of the Simulation............................................50
4.5.2. Simulation Results and Assessment – Comparison with Experimental Results ..53
4.5.3. Conclusions of Simulation of the Reforming Process.......................................55
5. Development of and Experimental Results from a Catalyst Investigation Test Rig .57
5.1. Test Rigs for Catalyst Screening..................................................................................57
5.1.1. Equilibrium Test Rig for Steam Reforming.......................................................58
5.1.2. Equilibrium Test Rig for Water Gas Shift and Methanation..............................58
5.2. Experimental Results and Discussion...........................................................................60
5.2.1. Steam Reforming ...........................................................................................60
Contents
VII
5.2.2. Comparison Steam Reforming with Data from Literature................................64
5.2.3. Water Gas Shift..............................................................................................65
5.2.3.1. HTS Catalyst no. 1............................................................................65
5.2.3.2. MTS Catalyst no. 7 ...........................................................................68
5.2.3.3. Long-Term Tests with HTS Catalysts no. 3 and 6...............................71
5.2.4. Conclusions for Water Gas Shift .....................................................................74
5.2.5. Selective Methanation....................................................................................75
6. Concept and Design of the Reformer Fuel Cell System ..............................................76
6.1. Development Steps of the Reformer Reactor Design...................................................76
6.2. Reformer Reactor 5 for the Micro RFCS Test Rig.........................................................79
6.3. Description of the Micro RFCS Test Rig.......................................................................81
6.3.1. Feed Streams and Feed Control ......................................................................81
6.3.2. Evaporator .....................................................................................................81
6.3.3. Reformer........................................................................................................82
6.3.4. Water Gas Shift..............................................................................................83
6.3.5. Selective Methanation....................................................................................84
6.3.6. PEM Fuel Cell .................................................................................................84
6.3.7. Burner............................................................................................................85
6.3.8. Temperature and Pressure Logging.................................................................85
6.3.9. Process Control ..............................................................................................87
6.3.10. Gas Analysis ...................................................................................................89
6.3.11. Gas Chromatography.....................................................................................90
6.4. Basic Experimental Procedure and Set-up Features .....................................................90
7. Investigation of the Micro Reformer Fuel Cell System: Experiments and Results ....92
7.1. Burner .......................................................................................................................92
7.1.1. Burner Tests with Hydrogen: Experiments and Results ....................................93
Contents
VIII
7.1.2. Burner Tests with Ethanol: Experiments and Results........................................94
7.1.3. Conclusions for Burner Design .......................................................................95
7.1.4. Burner Tests with Hydrogen and Final Design: Experiments and Results ..........95
7.2. Reformer and Gas Cleaning .......................................................................................96
7.2.1. Operating Procedures and Parameters ............................................................97
7.2.2. Results and Discussion of Reformer and Gas Cleaning ....................................98
7.2.2.1. Temperature Distribution and Gas Composition of Reformer ............98
7.2.2.2. Temperature Distribution and Gas Composition of Water Gas
Shift Reactor ..................................................................................104
7.2.2.3. Temperature Distribution and Gas Composition of
Methanation Reactor......................................................................106
7.2.2.4. Temperature Distribution and Gas Composition of
Reformer/HTS/LTS/SelMet ...............................................................107
7.3. Complete Reformer Fuel Cell System: Experiments and Results.................................109
7.4. Comparison of Experimental Results with Literature Data and Commercial Systems .112
7.5. Conclusions for the μRFCS Test Rig ..........................................................................113
8. Results of this Work ....................................................................................................115
9. Summary and Outlook ................................................................................................118
10. References ....................................................................................................................120
11. Author's Publications and Oral Contributions at Conferences.................................126
Contents
IX
A Appendix ....................................................................................................................... A1
A.1. Small Energy Generator Systems Currently on the Market ..........................................A1
A.2. UNIFAC Model for CHEMCAD Simulations.................................................................A2
A.3. Components for CHEMCAD Simulations....................................................................A3
A.4. Results of CHEMCAD Equilibrium Simulation Reforming Reaction ..............................A4
A.5. Results of CHEMCAD RFCS Simulation.......................................................................A4
A.6. Set-up and Calculations for STR Catalyst Screening....................................................A6
A.7. Set-up and Calculations for WGS and SelMet Catalyst Screening ...............................A8
A.8. Calculations for Reformer/Burner Design..................................................................A11
A.9. Process Flow Diagram for the RFCS Test Rig .............................................................A14
A.10. Feed Flows for the Reformer Fuel Cell System Test Rig ......................................A15
A.11. Calculation of Heat Flow for Reformer/Burner Design no. 5...............................A17
A.12. Concept, Design and Calculations of the new cylindrical Reactor ......................A18
Acknowledgements
X
Acknowledgements
The work for this thesis was carried through in the Department of Energy Technology of the Fraunhofer Institute for Solar Energy Systems ISE in Freiburg, Germany, from January 2005 to March 2008. It was set in the framework of two projects, first the internally funded "Mikroreformer II" and then starting from April 2006 the "RBZ-Modul" (Reformer Fuel Cell Module) project, funded by the InnoNet programme from the German Federal Ministry of Economics and Technology. Personally, my work was funded by a PhD scholarship first from the German Federal Environmental Foundation DBU and then from the Freiburg Materials Research Center FMF of the Albert-Ludwigs-University Freiburg, both of which I would like to thank for the financial support and the freedom this gave me regarding my daily work schedule. My thanks go to Professor Dr.-Ing. H.J. Krautz from the Institute for Energy Technology of the Brandenburg Technical University in Cottbus for supervising my PhD thesis work right from when I left his work group after my diploma in 2002. I would also like to thank Prof. Dr.-Ing. W. Witt, also from BTU Cottbus, for his contribution as the second reviewer. I thank Dr. rer. nat. Christopher Hebling, Head of Department of Energy Technology, for the freedom, the excellent atmosphere and encouragement I experienced during my years at Fraunhofer ISE. Dr.-Ing. Thomas Aicher, Head of the Hydrogen Generation and Storage Group showed a lot of creativity and support when it came to organizing the work in the project and trying out new approaches to micro reforming. He and all the colleagues of the group are one of the reasons this thesis came to a completion within an enjoyable three years. Special thanks go to the excellent project leaders and competent colleagues Dr.-Ing. Achim Schaadt and Dipl.-Ing. Johannes Full for keeping a lot of administrative work of the project away from me. For their unceasing technical and personal support I would like to thank my colleagues Dipl.-Ing.s Peter Gesikiewicz, Jan Herr, Johannes Kostka, Hanno Luttermann, Gerd Schmid, Robert Szolak, Christoph Weuffen, Konstantinos Zonaras and Dr.-Ing. Bettina Lenz, Dr. rer. nat. Tom Smolinka and Dr. Alexander Susdorf. Thanks also to former colleagues Jochen Behrens, Julien Rayer, M.Sc. Raul Torne Campo and Dipl.-Ing. Philipp Wemhöner and to my colleagues from the Fuel Cell Systems Group, whose help I greatly value. The welding work of all reactors, carried through by Radhouane Frad from the mechanical workshop at Fraunhofer ISE and Zentner Elektrik – Mechanik GmbH is greatly appreciated, as is the invaluable information and advice and the catalyst samples I obtained from Dipl.-Ing. Hans-Georg Anfang from Süd-Chemie, Dr. Thorsten von Fehren from BASF and Dr. Matthias Duisberg from Umicore. Thanks to Dr.-Ing. Thomas Aicher, Emily Jordening, Dr. Burkhard Rochlitz, Daniel Simon and Christopher Voglstätter for correcting this thesis. Thanks to my family and friends in and outside Freiburg, for their unconditional support and for accompanying me in enjoying life outside work.
Nomenclature
XI
Nomenclature
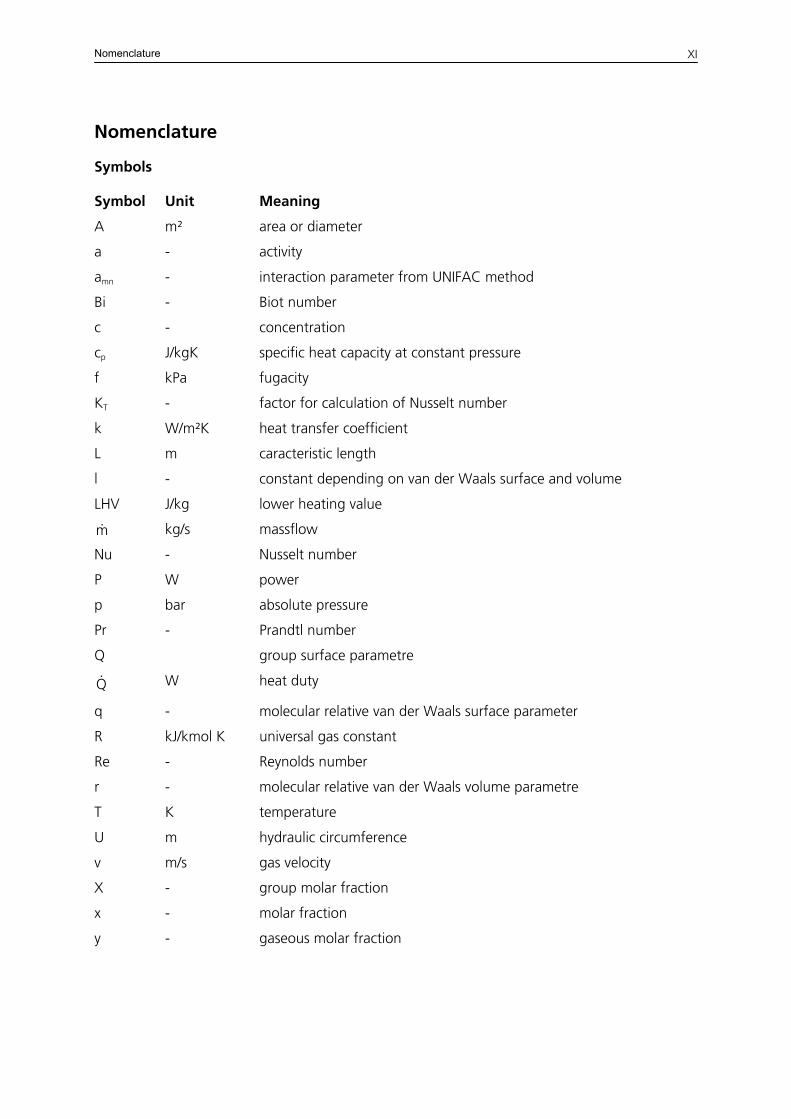
Symbols
Symbol Unit Meaning
A m² area or diameter
a - activity
amn - interaction parameter from UNIFAC method
Bi - Biot number
c - concentration
cp J/kgK specific heat capacity at constant pressure
f kPa fugacity
KT - factor for calculation of Nusselt number
k W/m²K heat transfer coefficient
L m caracteristic length
l - constant depending on van der Waals surface and volume
LHV J/kg lower heating value
m& kg/s massflow
Nu - Nusselt number
P W power
p bar absolute pressure
Pr - Prandtl number
Q group surface parametre
Q& W heat duty
q - molecular relative van der Waals surface parameter
R kJ/kmol K universal gas constant
Re - Reynolds number
r - molecular relative van der Waals volume parametre
T K temperature
U m hydraulic circumference
v m/s gas velocity
X - group molar fraction
x - molar fraction
y - gaseous molar fraction
Nomenclature
XII
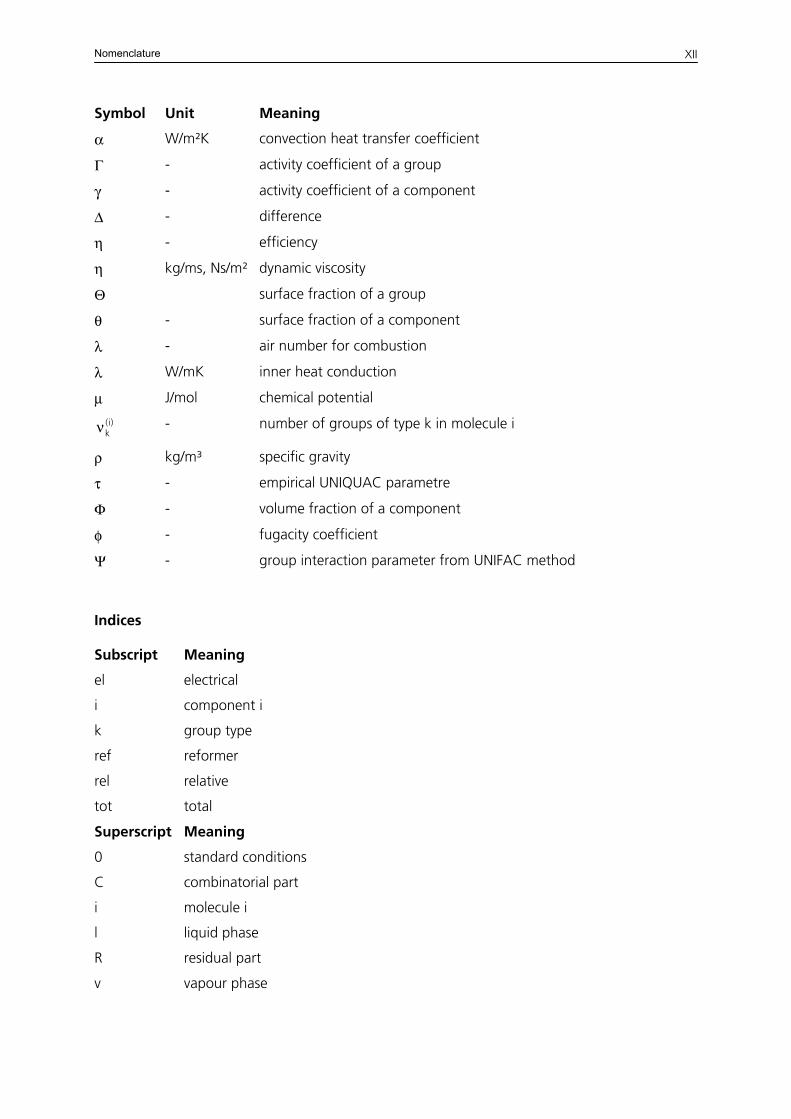
Symbol Unit Meaning
α W/m²K convection heat transfer coefficient
Γ - activity coefficient of a group
γ - activity coefficient of a component
Δ - difference
η - efficiency
η kg/ms, Ns/m² dynamic viscosity
Θ surface fraction of a group
θ - surface fraction of a component
λ - air number for combustion
λ W/mK inner heat conduction
μ J/mol chemical potential
)i(kν - number of groups of type k in molecule i
ρ kg/m³ specific gravity
τ - empirical UNIQUAC parametre
Φ - volume fraction of a component
φ - fugacity coefficient
Ψ - group interaction parameter from UNIFAC method
Indices
Subscript Meaning
el electrical
i component i
k group type
ref reformer
rel relative
tot total
Superscript Meaning
0 standard conditions
C combinatorial part
i molecule i
l liquid phase
R residual part
v vapour phase
Nomenclature
XIII
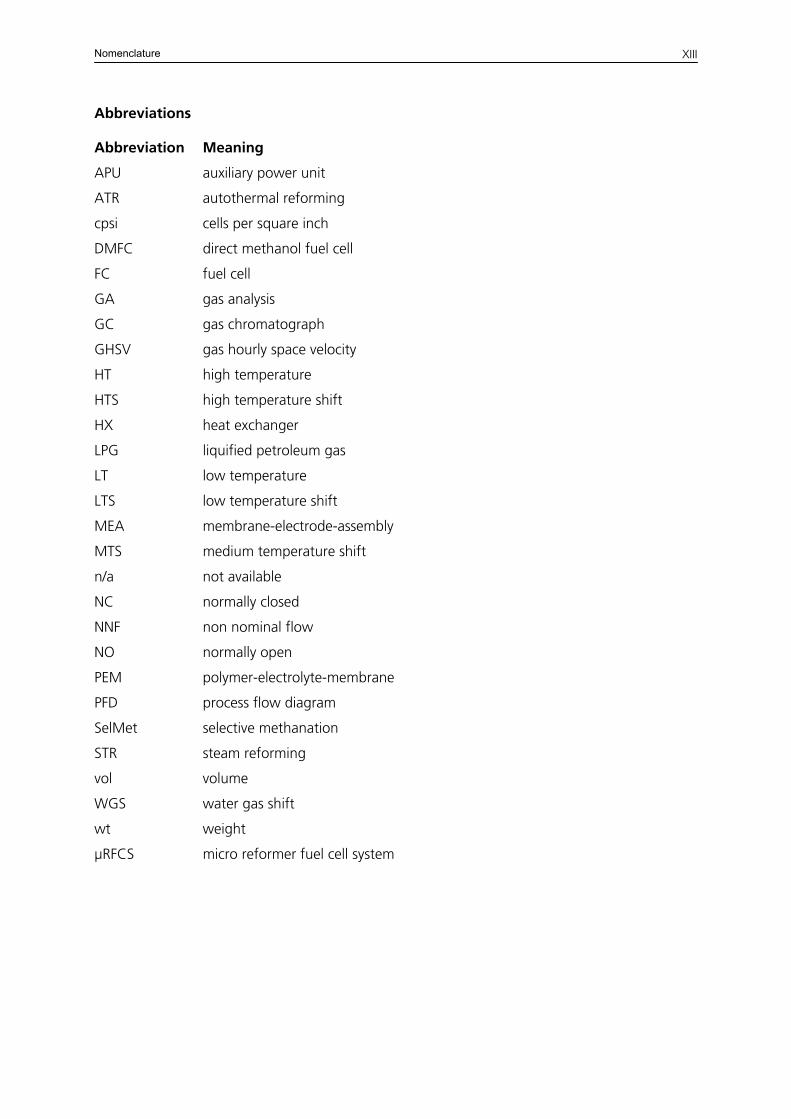
Abbreviations
Abbreviation Meaning
APU auxiliary power unit
ATR autothermal reforming
cpsi cells per square inch
DMFC direct methanol fuel cell
FC fuel cell
GA gas analysis
GC gas chromatograph
GHSV gas hourly space velocity
HT high temperature
HTS high temperature shift
HX heat exchanger
LPG liquified petroleum gas
LT low temperature
LTS low temperature shift
MEA membrane-electrode-assembly
MTS medium temperature shift
n/a not available
NC normally closed
NNF non nominal flow
NO normally open
PEM polymer-electrolyte-membrane
PFD process flow diagram
SelMet selective methanation
STR steam reforming
vol volume
WGS water gas shift
wt weight
μRFCS micro reformer fuel cell system

1. Introduction
1
1. Introduction
"We have come a long way since the first intentional fire threw dancing shadows on the walls of
a cave. […] By using energy, we humans have transformed much of the natural world to suit
ourselves. We do not, however, know as much about using electricity as we thought we did.
[…] Playing with fire can be dangerous. Indeed it is now endangering our entire planet. We
need to re-examine urgently this unique human ability, the ability to start a fire – that is, the
ability to use energy on purpose. If we do not, it may soon be terminally out of control."
Walt Patterson
Keeping the Lights on: Towards Sustainable Electricity
[Patterson 2004, p.17]
The CO2 content in the atmosphere has increased by more than 25% since the 1850s [Patterson
2004, p. 39]. Since the publication of the Stern Review on the Economics of Climate Change,
published in October 2006 by Sir Nicholas Stern [Stern 27], no doubt remains in the public
opinion that CO2 emissions caused by the use of fossil fuels are a direct cause for climate
change. What is more, no doubt remains that CO2 emissions will also have a negative impact on
the world economy and must therefore be reduced. The challenge here does not lie in reducing
the use of energy but in reducing the use of fuel [Patterson 2004, p. 67]. Of course, the
reduction of both leads to a sustainable electricity supply and thus a sustainable environment
and climate, considering the way electricity is currently produced. However, electricity can be
produced and used without fuel, it only needs infrastructure. There will always be the grid or at
least some means of transfer for the electrons to pass from the point of generation to the load
where electricity is needed. So energy policy is really about what Patterson calls the "energy
service infrastructure" [Patterson 2004, p. 131].
Nowadays we take energy for granted and we use electricity produced at low efficiencies
because of the single underlying reason that "most of us can't be bothered" [Patterson 2004, p.
12]. The traditional taxation system "encourages investment that makes money, rather than in
infrastructure that delivers the energy services we citizens want" [Patterson 2004, p. 13]. What
we want and care about is not the infrastructure of electricity but rather the services it can
deliver, i.e., the heating, cooling, lighting, power for machines or transportation. We see the
1. Introduction
2
supply of energy as someone else's or maybe the government's problem. We "have little idea of
the unit price of electricity, nor do we much care. What we want is not a lower unit price but a
lower bill" [Patterson 2004, p. 109].
In this context, it is a prevailing assumption that governmental support for renewable energies
will make electricity more expensive. However, this is not the case if the risk of rising fossil fuel
prices leads to higher investment cost for systems running on these fuels. Consequently,
technologies that employ renewable energies are free of fuel-price risk and can therefore
"reduce the overall investment cost of [electricity] generation on systems" [Patterson 2007,
p.88]. The risk-cost can be widened to include environmental hazard and the struggle for a
sustainable environment. Higher costs can then be calculated for technologies with higher risk
for the environment. Patterson concludes that "as far as comparative costs are concerned, the
choice of generation is political, not economic" [Patterson 2007, p.89].
There are different approaches to shifting towards sustainable electricity and, in the course of
this, implementing technologies which generate electricity from renewable energies. Bill
McKibben puts it like this: "It's as if NASA's goal had been to put all of us on the moon"
[McKibben 2007]. We have to concentrate all our knowledge on actually using in larger
numbers and world-wide what we already know works sustainably. Stephen Pacala and Robert
Socolow talk about 15 stabilization wedges. The wedges involve a whole portfolio of new
technologies, of which every element has already been demonstrated and many have been
implemented at large scale. The contribution of each wedge is small but if implemented all
together this will lead to drastic reduction of CO emission while at the same time meeting the
world's needs for energy use [Pacala 2004].
2
This thesis takes this line of thought, vision and motivation for a project to develop a
sustainable, off-grid power supply fuelled with renewable energy. Many small wedges taken
together can in the end make a big difference.
In this first chapter the introduction to the project will be given. First, the context of the project,
i.e., hydrogen generation for fuel cells, will be discussed, followed by a short summary of state-
of-the-art of science and technology. Finally, after a review of bioethanol, the fuel of choice for
the project, the aims of this thesis will be outlined.
1. Introduction
3
1.1. Hydrogen Generation for Fuel Cell Systems
As a sustainable means to reduce CO2 emissions, renewable energies have become more and
more significant in research over the past three decades. Hydrogen technology in combination
with fuel cells is one of the research foci. Although in the fuel cell reaction hydrogen and
oxygen are converted into water, electricity and heat only, so theoretically there is no pollution,
it is important to look at where the hydrogen supply is coming from. In case of a hydrocarbon or
alcoholic fuel, the conversion process will release CO2, be it derived from a renewable or a fossil
fuel. Until now hydrogen supply for PEM fuel cells has been realized through pressurized gas
bottles or metal hydride storages. This means that there is no pollution at the actual fuel cell
site. However, due to the low volumetric energy density, the fuelling with gas bottles is inferior
to a system with a liquid fuel tank. Furthermore, liquid fuel is easier to transport and
commercially available world-wide.
Despite great efforts to create a hydrogen supply- and fuelling infrastructure, mobile fuel cell
applications for buses or cars are unlikely to achieve significant penetration of commercial
vehicles in the next five years. The reasons are remaining technical challenges and the need of
drastic cost reduction. Stationary fuel cells for combined heat and power production, such as
systems for residential buildings, are currently being tested in pilot projects. A large-scale
introduction to the market is not expected before the end of this decade.
The most likely initial commercial products will be niche markets, such as off-grid power supply,
which can be realized through reformer fuel cell systems (RFCS). In the reformer, hydrocarbons
or alcohols are catalytically converted into a hydrogen rich gas which is then fed to the fuel cell.
In some cases an (RFCS) has advantages over conventional energy supply as well as over other
renewable energy generation. An RFCS is advantageous over a photovoltaic system when the
required electric power would demand large PV modules and there is insufficient room or the
system must be portable and therefore size is critical. Furthermore, a RFCS is advantageous over
batteries when the electricity must be available for extended periods of time which would
otherwise result in rapid battery discharge. An RFCS can load rechargeable batteries many times
without servicing and is thus cheaper for longer runtimes, especially if located in a remote place,
where frequent battery replacement can be avoided.
1. Introduction
4
Fuel cell systems can also be fuelled directly with methanol (DMFC) or even ethanol (DEFC). The
DMFC can be considered as state-of-the-art, with lower electrical efficiencies but a simpler
system-design than the RFCS. DEFCs still face several problems, e.g., membrane fuel crossover
and therefore lower conversion rates than for DMFC systems as well as incomplete conversion of
ethanol. Depending on the application and its restricting boundary conditions, an integrated
hydrogen generation device can be what makes the system technically and/or economically
feasible.
The spectrum for RFCS applications ranges from portable power to decentralized small scale
power generation. They include, for example consumer devices (battery chargers for portable
electronic devices), traction for small vehicles (bicycles, golf carts), camping/leisure facilities
(mobile homes, yachts, mountain refuges), telecommunications equipment (repeater- or base
stations), cooling units, medical applications and remote sensors (pipelines, traffic control,
environmental measurement stations). So far research for small portable RFCS has been minimal
and with negligible commercial success. This thesis aspires to bring the technology closer to
commercialisation. To combine high efficiency with CO2 reduction, bioethanol was chosen as a
renewable fuel to power the system. This fuel and its characteristics are presented in chapter
1.3.
Much research relies on methanol as a fuel, for it has the advantages of high volumetric energy
density and lower reforming temperatures versus ethanol. However, methanol is considered
unsuitable for some applications due to its toxicity, and, unlike ethanol, not available world-
wide. These are two reasons why in the project presented in this thesis bioethanol is chosen as a
fuel.
1.2. State-of-the-art of Science and Technology and Aims of this Thesis
There are very few reformer fuel cell systems already available on the market, but an increasing
number of research institutions and companies are working on their development. More systems
are expected to achieve commercialisation over the next few years. A search for patents about
reformers and micro reformers, carried out in August 2007, shows that starting from 1999 the
number of patent applications in this field increased considerably. In the mid-1980s the number
had been well below ten per year and had stayed at a low level until in 1999 there were 54
1. Introduction
5
relevant applications and the number went up to 123 in 2002 and in 2005 was still above 100.
The largest fraction of the patents are for reactor design (reforming reactor and heat
exchanger/evaporator being of major interest), followed by materials, i.e., inventions including
catalysts, catalyst supports and other structures within reactors.
Most research today is carried out in three different categories:
(1) Large-scale systems for traction and auxiliary power units (APU) of cars, ships and aircraft. For
aircraft a reformer fuel cell system can replace the gas turbine APU which is always running even
when the aircraft is on the ground, causing large noise emissions. During the flight the RFCS will
be used for electricity generation, especially in the new "more electric aircraft" where electricity
will replace hydraulic and pneumatic energy. Another objective is to use the water the RFCS
produces. As a result, less water need be stored in tanks, reducing the weight and fuel
consumption of the aircraft [Lenz 2007]. For cars and ships both the APU and traction power are
possible applications for a RFCS. This reduces emissions because of the higher electrical
efficiencies that can be achieved. A reduction of noise is another big advantage. The largest
application for a RFCS based on power requirements is to provide traction for submarines.
(2) In the range of a few hundred watts to a few kWel, the focus lies on small stationary or even
portable power supply for off-grid applications or uninterruptible power supply. Here the R&D
focus lies on instant power supply through batteries charged with an RFCS, with reliability and
optimized control of the system being the main features. As to which applications will be on the
market in the near future, traction for bicycles and camping/leisure applications seem most
promising, followed by telecommunications' applications, especially in countries where reliability
of the electricity grid is low. Since this power range is the one researched in this thesis, the
ongoing research and systems available on the market will be presented in a literature study in
chapter 3. The specific characteristics that distinguish the worlds of macro and micro reaction
technology will be explained in detail in this chapter as well.
(3) In the power range of a few watts to milliwatts, portable soldier power, consumer
applications and small sensors are most likely to be produced commercially in the near term.
Despite several press releases declaring that prototypes of these systems have been produced,
none are mass produced yet. For more details of ongoing research in this power range see also
chapter 3.2.
1. Introduction
6
In this thesis the research carried out for the 300 Wel micro reformer fuel cell system (μRFCS)
operated with bioethanol will be presented. The overall aim is to demonstrate the functioning of
the complete system as a laboratory prototype. This means that some parts will not have been
optimized with respect to size and weight yet and the system is not yet controlled by a
microcontroller but rather by commercial control software on a personal computer.
The various steps taken until the system was finally set up, i.e., a thorough literature study of the
current research activities, process simulation, catalyst screening and reactor design, will be
explained in detail and the current stage of the project will be presented and evaluated. This
thesis has its focus on the reformer. This includes the catalysts and reactors of the reformer and
gas cleaning reactors. The simulation of the whole system is also part of this thesis.
The thesis will set off with a short introduction to reforming and fuel cells (chapter 2).
There follows a literature overview (chapter 3) introducing ongoing research in the community
and common challenges of and solutions for micro reforming systems.
In chapter 4, the process and system simulation of the different equilibrium reactions in the
reformer and gas cleaning reactors is presented. One simulation type uses chemical equilibrium
data only, a second includes a heat and mass balance of the complete system. The third
simulation comprises a reaction pathway scheme developed for this thesis to draw conclusions
with regards to the conversion fractions and proportions of the reaction pathways and within
the reformer.
The simulation part is followed by the catalyst investigation (chapter 5). Here, the aim is to
choose the catalysts and determine the corresponding optimum operating parameters for the
μRFCS.
The concept and design of the reforming system are explained (chapter 6). All reactors and
balance of plant components of the system, including the measurement and control and gas
analyzing equipment are presented. The fuel cell part of the system is also described briefly.
Finally, in chapter 7, the experimental setup of the μRFCS and experimental results are
presented, discussed and evaluated. This includes a short presentation of the development steps
taken with various re-designed reactors. The development of and experiments with this last
reactor required the greatest proportion of time during this thesis. It also incorporates the total
accumulated technical know-how acquired during the development of the μRFCS.
1. Introduction
7
The thesis concludes with a chapter in which all results are summarized (chapter 8), followed by
a short summery and outlook (chapter 9).
All relevant data from simulation and experimental results, including the design criteria and
dimensioning of reactors, can be found in the appendix.
1.3. Bioethanol
In this chapter, bioethanol, the fuel chosen for the μreformer fuel cell system of this thesis, will
be presented.
Bioethanol is ethanol derived from biomass. It is typically obtained through anaerobic
fermentation of corn, wheat, rye, sugar beet or sugar cane, followed by distillation. Bioethanol
can also be derived from cellulose and hemicellulose, but this needs pre-treatment to break up
the long cellulose chains of glucose molecules before fermentation is possible. Thus, the
production process is more expensive. This type of bioethanol is called a "second generation
fuel" and the conversion pathway "biomass to liquid" (BTL). Being a non-food fuel which does
not need to consume arable land, it is often favoured over directly fermentable biomass.
However, energy consumption for the production process can be higher than the final net
bioethanol energy but most of the energy needed for production can be derived from the gross
energy of the biomass itself.
Figures of how much energy is needed to produce one litre of ethanol vary greatly depending
on the biomass and its production and on the system boundaries and assumptions made for the
calculations. Assumed efficiencies for the energy conversion methods following the production
process (e.g., combustion engine with electricity generation or for propulsion) vary also. It is
therefore difficult to determine energy and greenhouse gas emissions savings by using
bioethanol instead of fossil fuels or ethanol derived therefrom. According to calculations from
the U.S. Department of Energy, the U.S. Environmental Protection Agency, the Renewable Fuels
Association, the Energy Future Coalition and the Worldwatch Institute, presented in [Bourne
2007], 1 kW of fossil fuels can produce 1.3 kW of corn ethanol in the U.S.A., 8 kW of
sugarcane ethanol in Brazil and 2 to 36 kW of cellulosic ethanol (depending on the production
method). Thus, corn ethanol used for cars in E85 (85% ethanol in gasoline) can save 22%
greenhouse gas emissions for production and use compared to gasoline. Sugarcane ethanol can
1. Introduction
8
save 56% and cellulosic up to 91% of emissions. Other, lower figures for efficiencies and
greenhouse gas savings are presented by the IEA in a summary of publications between 1991
and 2001 [IEA 2004 a]. The rise in estimated savings compared to [Bourne 2007] results from
the advance in technology over the years.
Alongside the competition for food, the following barriers for bioethanol production need to be
considered: production "cost, regional market structure, biomass transport, lack of well-
managed agricultural practices in emerging economies, water and fertiliser use, conservation of
bio-diversity, logistics and distribution networks" [IEA 2007]. All barriers need to be critically
analysed and evaluated because they might be avoided or turned into opportunities. A new
market structure and logistics networks can be helpful for other branches of the economy of a
region as well. Production cost needs to be compared to other fuel options and the rising oil
price also needs to be taken into account. Predictions from [IEA 2004 b] for post-2010 show
that ethanol from cellulose will soon be produced at costs similar to gasoline.
Estimates for future biomass potential are very sensitive to the assumptions made for land use
and crop yield. "The IEA’s World Energy Outlook 2006 Reference Scenario projects the world
biofuels output to climb at a rate of 7% per year to meet 4% of road transport fuel demand by
2030. In the WEO Alternative Scenario, annual growth is 9% and output reaches 7% of road-
fuel use in 2030. The IEA’s Energy Technology Perspectives (2006) suggests bioethanol and
biodiesel could meet some 13% of global transport fuel demand and contribute some 6% of
global emission reductions by 2050" [IEA 2007]. Even in the highest estimate bioethanol can
only replace a small fraction of transport fuels. Therefore, it is not considered as a replacement
but rather a supplementary transport fuel. It seems more reasonable to use bioethanol in
applications which need little electrical power and possibly have a smaller market. The micro
reformer fuel cell system presented in this work meets these requirements.
As opposed to methanol, ethanol has a lower H/C content, which results in a higher risk of
carbon formation. Therefore reforming temperature needs to be higher (above 600 °C for full
conversion without undesired side products as opposed to ~ 280 °C for methanol STR).
1. Introduction
9
The following advantages make bioethanol the fuel of choice for an electricity generation of a
few 100 Watts:
- renewable, CO2-neutral fuel
- liquid fuel, thus easy transport and refuelling
- less toxic than methanol or gasoline
- bio-degradable and thus not dangerous for ground water or soil
- cheap
- commercially available world-wide
- miscible with water
- sulphur-content lower than detectable (< 1 mg/100ml)
The bioethanol used for the experiments in this thesis consists of a >99.9% ethanol solution
which is denatured with 1 vol-% methyl ethyl ketone and 10 ppm denatoniumbenzoate (Bitrex)
to avoid alcohol tax. It has a melting point of -114.5°C, boiling point is 78.32°C, specific gravity
at 20°C is 0,789 g/cm3 and weight 46 g/mol. Explosion limits are 1.3 to 15 vol-%, ignition
temperature is 425 °C and flashpoint 12 °C.
2. Fundamentals of Hydrogen Generation for PEM Fuel Cells
10
2. Fundamentals of Hydrogen Generation for PEM Fuel Cells
In this chapter the fundamentals of the different types of hydrogen generation will be
presented, including a comparison between the technologies. This is followed by the
fundamentals of gas cleanup systems and a short description of a polymer-electrolyte-
membrane (PEM) fuel cell.
2.1. GHSV and S/C ratio
Two important parameters for catalysts and reforming reactions are the gas hourly space
velocity (GHSV) and the steam/carbon ratio S/C. They will be explained in this section.
GHSV is defined as how often the reactor volume is refilled with reactants over time, i.e.,
inverted residence time:
tot,catalyst
feed
V
VGHSV
&= (1)
for 0 °C and 1.01352 bar. Vcatalyst, the catalyst volume, is defined as the total catalyst volume,
including the open flow paths, i.e., the total reactor volume in which the catalyst is placed. Since
porosity varies greatly, depending on whether the catalyst is a honeycomb or a pellets bed,
GHSV also varies for these two different kinds of catalyst. Usually, GHSV needs to be lower for a
pellets bed to allow for sufficiently long residence time for diffusion of the reactants from the
catalyst surface to the active site and back out to the catalyst surface. In a thin honeycomb
structure, mass transport to and from the active sites is faster and the frequency of an active site
being occupied by new reactants is higher.
The second important variable, commonly used in steam reforming and autothermal reforming,
is the S/C ratio. It is defined by the molar ratio of water to the reactive carbon atoms contained
in the hydrocarbon:
C
OH
n
n
CS 2
&
&= (2)
2. Fundamentals of Hydrogen Generation for PEM Fuel Cells
11
Depending on the desired reaction, a minimum S/C can be determined to avoid carbon
formation by sub-stoichiometric reaction. For details about the S/C ratio for steam reforming of
ethanol see chapter 5.2.1.
2.2. Different Principles of Hydrogen Generation
Hydrogen can be produced by both electrolysis from hydrogen-containing chemical substances,
of which water is the most common for large-scale applications, and reforming. The three most
common types of reforming, autothermal, steam reforming and partial oxidation, are usually
catalyzed and will be explained below.
S. Ahmed and M. Krumpelt give a good overview of fuel processing for hydrogen generation
[Ahmed, 2001].
Other processes are plasma reforming and super critical reforming. They have specific
requirements which lead to more complex systems than the project of this thesis is aiming for.
Thus, they are not explained further. Also, electrolysis is not presented, because it requires
electricity input to produce hydrogen. Even if electricity were available at a certain location, the
hydrogen produced by electrolysis would then have to be transported to the site at which off-
grid electricity is needed. This would require a hydrogen distribution infrastructure, which does
not exist world-wide.
2.2.1. Partial Oxidation (POX)
Partial oxidation reformers react the fuel with a substoichiometric amount of oxygen. The initial
oxidation reaction results in heat generation and high temperatures:
22yx H2y
COxO2x
HC +⇒+ ΔHR < 0 (3)
The heat generated from the oxidation reaction raises the gas temperature to over 1000 °C for
a non-catalytic reaction. With a catalyst, the process is usually run at around 1000 °C, the inlet
temperature being much lower (around 650 °C for an ethanol POX). At this temperature, steam
can be injected according to need to steam-reform the remaining or added hydrocarbons or
oxygenates.
2. Fundamentals of Hydrogen Generation for PEM Fuel Cells
12
2.2.2. Steam Reforming (STR)
According to [Ahmed 2001], steam reforming is the most common method for producing
hydrogen in the chemical process industry. It is well suited for long periods of steady-state
operation.
The following main reactions occur:
22yx H2y
xCOxOHxHC ⎟⎠⎞
⎜⎝⎛ ++⇒+ ΔHR > 0 (4)
222yx H2y
x2COxOHx2HC ⎟⎠⎞
⎜⎝⎛ ++⇒+ ΔHR > 0 (5)
Since the reactions are endothermic, energy needs to be supplied. This is done through a
burner. System efficiency rises in a reformer fuel cell system when the anode offgas is recycled
and fed to the burner. Reactor designs are typically limited by heat transfer, rather than by
reaction kinetics. Indirect heat transfer from the burner to the reformer does not allow fast start-
up. It also leads to less flexible temperature control. To promote the reaction and force the
equilibrium to the right side, excess water can be added, thus, a very high H2 product gas
concentration (above 70% on a dry basis for ethanol reforming) can be achieved. On the down-
side, extra energy is needed for the evaporation of the water.
With ethanol, the main desired steam reforming reaction is:
22252 CO2H6OH3OHHC +⇒+ ΔHR = 173.1 kJ/mol (6)
[Auprêtre 2002]. Other occurring reactions that are less desired, due to their production of CO,
no H2 or consumption of H2 are:
CO2H4OHOHHC 2252 +⇒+ ΔHR > 0 (7)
2452 HCOCHOHHC ++⇒ ΔHR > 0 (8)
4252 CH3COOHHC2 +⇒ ΔHR > 0 (9)
OHCHH3CO 242 +⇔+ (CO-methanation) ΔHR < 0 (10)
2. Fundamentals of Hydrogen Generation for PEM Fuel Cells
13
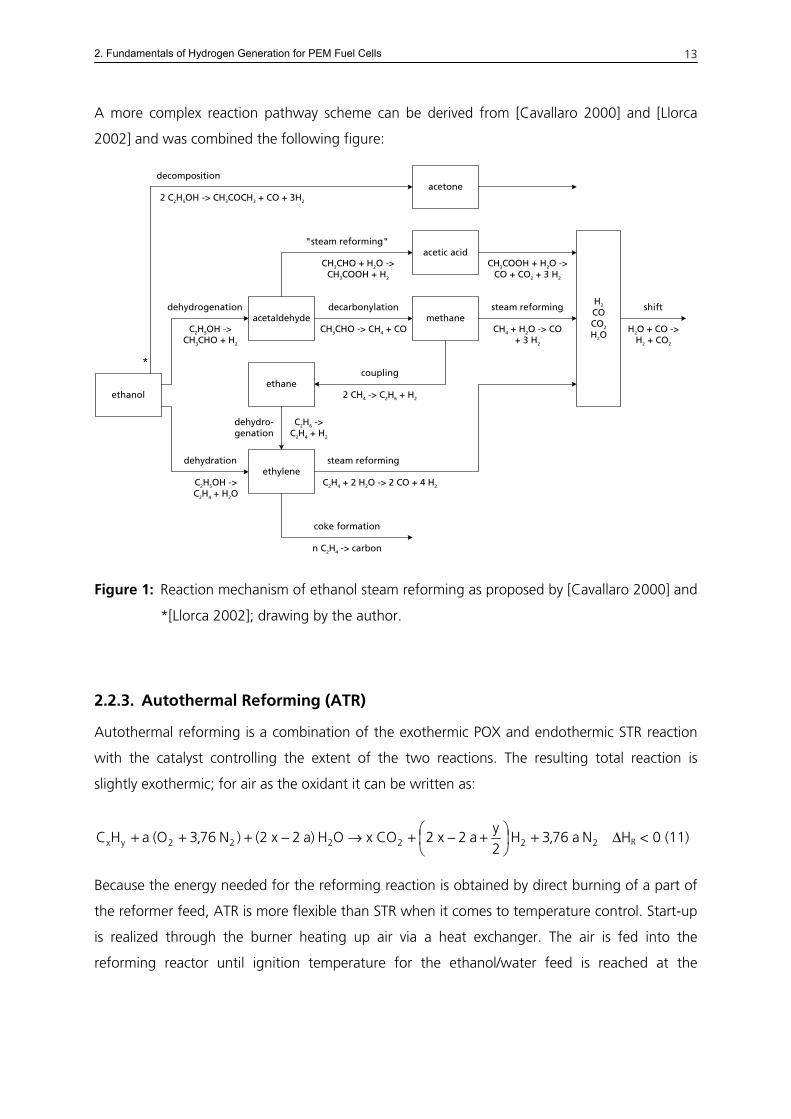
A more complex reaction pathway scheme can be derived from [Cavallaro 2000] and [Llorca
2002] and was combined the following figure:
ethanol
dehydration
dehydrogenation
C2H5OH -> CH3CHO + H2
C2H5OH -> C2H4 + H2O
acetaldehyde
ethylene
decarbonylation
CH3CHO -> CH4 + COmethane
acetic acidCH3CHO + H2O ->
CH3COOH + H2
CH3COOH + H2O -> CO + CO2 + 3 H2
steam reforming
CH4 + H2O -> CO + 3 H2
couplingethane
2 CH4 -> C2H6 + H2
dehydro-genation
C2H6 -> C2H4 + H2
steam reforming
C2H4 + 2 H2O -> 2 CO + 4 H2
coke formation
n C2H4 -> carbon
H2
COCO2
H2O
shift
H2O + CO -> H2 + CO2
"steam reforming"
acetone2 C2H5OH -> CH3COCH3 + CO + 3H2
*
decomposition
Figure 1: Reaction mechanism of ethanol steam reforming as proposed by [Cavallaro 2000] and
*[Llorca 2002]; drawing by the author.
2.2.3. Autothermal Reforming (ATR)
Autothermal reforming is a combination of the exothermic POX and endothermic STR reaction
with the catalyst controlling the extent of the two reactions. The resulting total reaction is
slightly exothermic; for air as the oxidant it can be written as:
222222yx Na76,3H2y
a2x2COxOH)a2x2()N76,3O(aHC +⎟⎠⎞
⎜⎝⎛ +−+→−+++ ΔHR < 0 (11)
Because the energy needed for the reforming reaction is obtained by direct burning of a part of
the reformer feed, ATR is more flexible than STR when it comes to temperature control. Start-up
is realized through the burner heating up air via a heat exchanger. The air is fed into the
reforming reactor until ignition temperature for the ethanol/water feed is reached at the
2. Fundamentals of Hydrogen Generation for PEM Fuel Cells
14
reforming catalyst (~350 °C for ethanol reforming). Depending on the burner, start-up can be
realized within a few minutes.
2.2.4. Thermal Cracking (PYROLYSIS)
Apart from the reforming technologies, there is also the pyrolysis process in which no oxygen is
provided to the fuel so it can be split directly into hydrogen and carbon. The main reaction takes
place at temperatures above 800 °C:
2yx H2y
CxHC +⇔ (12) 0HR <Δ
The disadvantages lie in the formation of carbon, which has to be removed in a batch process
and also the efficiency which lies below that of steam reforming [Ledjeff-Hey, 2000]. The most
common fuel for pyrolysis is propane. When comparing the theoretical ratio of H2 that can be
produced per mole of fuel, pyrolysis gives only 4, whereas STR has a ratio of 7 (for total
conversion of C in to CO) to 10 (for total conversion of C into CO2). However, since no air or
steam are involved in the reaction, the product gas H2 concentration can be as high as 80 vol-%.
In pyrolysis, the theoretically simple system is traded for overall electrical energy efficiency, which
is lower for pyrolysis than for steam reforming. Still, if the heat that is set free during the carbon
removal (burning) can be used, the total efficiency rises considerably. If it cannot be used,
dealing with the excess heat is a major issue, for it is about four times as much as the energy of
the H2 produced.
2.2.5. Comparison of the different Principles
To choose the appropriate hydrogen generation process, the aims of the system need to be well
defined, then all points need to be prioritized and finally the system chosen according to needs.
Important issues are size, weight, efficiency and power density, product gas quality and resulting
purification systems needed, complexity of the system and its manufacturing processes and, last
but not least, cost. Due to the poor electrical efficiency of pyrolysis, this process was not
considered for the system.
The three different technologies result in different product gases, as shown in the table below:
2. Fundamentals of Hydrogen Generation for PEM Fuel Cells
15
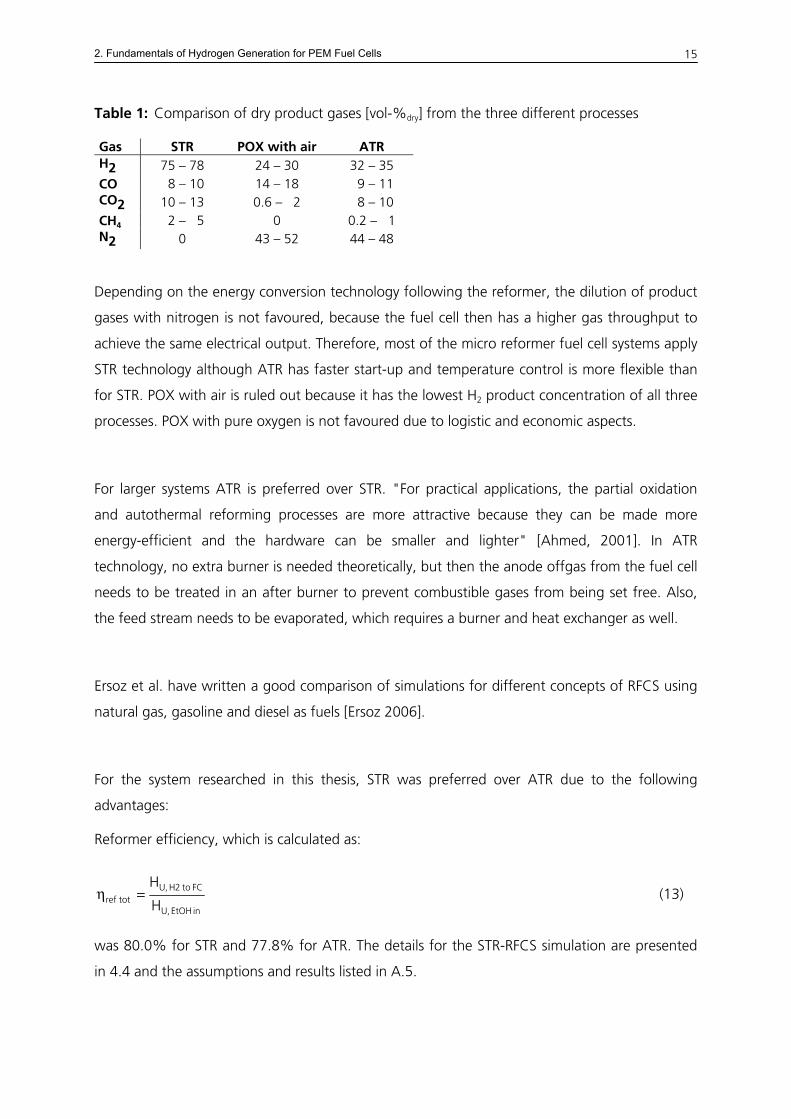
Table 1: Comparison of dry product gases [vol-%dry] from the three different processes
Gas STR POX with air ATR H2 75 – 78 24 – 30 32 – 35 CO 08 – 10 14 – 18 09 – 11 CO2 10 – 13 0.6 – 02 08 – 10 CH4 02 – 05 0 0.2 – 01 N2 0 43 – 52 44 – 48
Depending on the energy conversion technology following the reformer, the dilution of product
gases with nitrogen is not favoured, because the fuel cell then has a higher gas throughput to
achieve the same electrical output. Therefore, most of the micro reformer fuel cell systems apply
STR technology although ATR has faster start-up and temperature control is more flexible than
for STR. POX with air is ruled out because it has the lowest H2 product concentration of all three
processes. POX with pure oxygen is not favoured due to logistic and economic aspects.
For larger systems ATR is preferred over STR. "For practical applications, the partial oxidation
and autothermal reforming processes are more attractive because they can be made more
energy-efficient and the hardware can be smaller and lighter" [Ahmed, 2001]. In ATR
technology, no extra burner is needed theoretically, but then the anode offgas from the fuel cell
needs to be treated in an after burner to prevent combustible gases from being set free. Also,
the feed stream needs to be evaporated, which requires a burner and heat exchanger as well.
Ersoz et al. have written a good comparison of simulations for different concepts of RFCS using
natural gas, gasoline and diesel as fuels [Ersoz 2006].
For the system researched in this thesis, STR was preferred over ATR due to the following
advantages:
Reformer efficiency, which is calculated as:
inEtOH,U
FCto2H,Utotref H
H=η (13)
was 80.0% for STR and 77.8% for ATR. The details for the STR-RFCS simulation are presented
in 4.4 and the assumptions and results listed in A.5.
2. Fundamentals of Hydrogen Generation for PEM Fuel Cells
16
For the reforming process alone, efficiency is calculated for the H2 produced directly after the
reforming reactor:
inEtOH,U
refafter2H,Uref H
H=η (14)
The results of the CHEMCAD simulation were 72.5% for STR and 68.2% for ATR.
Since ATR is usually run with air, the nitrogen will lead to a higher product gas flow in the
reactors and thus also to a larger overall volume. This may be partially compensated by GHSV
being higher in ATR than in STR. However, the gas cleaning steps have the same GHSV,
regardless of the reforming technology.
Depending on the exact system design and the application and resulting requirements, STR can
have as many advantages as ATR. For some applications, especially if the system does not need
to be moved or carried very often, efficiency is allowed to be traded for a simpler and maybe
even larger system design if this leads to cheaper manufacturing. Therefore, both systems were
tested at Fraunhofer ISE but only the STR results are presented in this thesis.
2.3. Gas Cleaning
To enter the low temperature PEM fuel cell, the reformate gas must not contain more than
20 vol-ppmdry CO, otherwise the cell's Pt-electrodes will be poisoned and the cell cannot work
any more. This poisoning is reversible but significantly lowers cell performance [Narusawa 2003].
Gas cleaning is therefore needed after the reforming step. This is usually achieved by a water
gas shift reaction, pressure swing adsorption or a hydrogen separating membrane. For non-
industrial scale, water gas shift is most common, needing no pressure drop within the reactor to
function. It is then followed by CO purification, which is usually a selective oxidation or
methanation. Both need a catalyst but methanation does not need extra water as a reactant and
is therefore used in the system described in this thesis. As shown by [Narusawa 2003], methane
does not have an influence on PEMFC performance.
2. Fundamentals of Hydrogen Generation for PEM Fuel Cells
17
2.3.1. Water Gas Shift Reaction
The water gas shift reaction is the following slightly exothermal reaction:
222 HCOOHCO +↔+ , (15) mol/kJ41H0R −=Δ
For the catalysed reaction, temperatures range from 150 °C to 500 °C. According to the
temperature window in which the catalyst works best and CO is lowest, the reaction is divided
into low temperature shift (LTS, 150 – 250 °C), middle temperature shift (MTS, 250 – 350 °C)
and high temperature shift (HTS, 350 – 500 °C). Generally speaking, the CO content can be
lowered to around 0.5 vol-%dry after water gas shift. This is sufficient for a HT PEM FC, which
tolerates CO contents of 1 to above 3 vol-% [PEMEAS 2007]. For a normal LT PEM FC, a further
purification step needs to be added.
2.3.2. CO Purification
Two reactions are most common for small to medium scale catalysed CO purification:
In selective oxidation, air is added directly before the reactor to oxidise the remaining CO
content of the reformate gas.
For selective methanation no additional components need to be added before the reactor. It is
therefore the preferred method for a simple reforming system. The following reaction takes
place:
OHCHH3CO 242 +→+ , (16) mol/kJ206H0R −=Δ
The CO-methanation competes with the CO2 methanation, which should be suppressed by the
catalyst but always occurs to a certain extent, because selectivity will not reach 100% for CO
methanation. The reaction for CO2 methanation is:
OH2CHH4CO 2422 +→+ (17) mol/kJ165H0R −=Δ
2. Fundamentals of Hydrogen Generation for PEM Fuel Cells
18
2.4. PEM Fuel Cell
The polymer-electrolyte-membrane (PEM) fuel cell is a low temperature device working at
around 60 °C. Its main feature is the membrane-electrode-assembly (MEA), which is positioned
between two gas diffusion layers that allow the feed and transport of the reactants to and from
the MEA. The PEM produces electricity and heat in equal shares and water, the product of the
chemical reaction, as described as follows:
On the anode side, the hydrogen rich reformate is transported to and from the MEA. Each of
the hydrogen molecules are catalytically split into two H+ and e- each. The protons are able to
penetrate through the membrane, thereby creating an electrochemical potential difference. To
compensate this difference, the electrons move towards the cathode side, passing the electrical
load connected to the cell. On the cathode side, the oxygen molecules of the provided air are
catalytically split into two atoms of O which are then reduced to O2- and each react with two
hydrogen protons, recombining to a water molecule. The theoretical potential of a single cell is
1.23 V. In reality only 0.6 – 0.9 V can be reached, due to various losses.

3. Literature Overview on Microreforming
19
3. Literature Overview on Microreforming
This chapter will first of all give an overview about the specific characteristics of micro reforming
technology, followed by a literature overview of micro reforming systems which are currently
being developed or already available on the market in 2007.
Generally speaking, "the word "micro system" is used for a miniaturized integrated system with
integrated sensors, controllers and actors whose characteristic dimensions are on the
micrometer scale" [Kasper 1999]. The word "macro system" is used for systems with
characteristical dimensions over 1 cm. A general comparison between the micro and macro
worlds is given for instance by Hessel et al. [Hessel 2005].
Advantages due to smaller size:
With decreasing dimensions, the gradients of physical parameters such as temperature, pressure
and density, representing the driving force for heat and mass transfer, and diffusion, increase.
This results in improved heat and mass transfer, known from higher heat transfer coefficients in
micro heat exchangers and shorter mixing times in micro mixers. Thus, in micro applications with
exothermal reactions, local hotspots are avoided through improved heat transfer.
Larger surface area-to-volume ratio:
The maximum surface area to volume ratio in macro reactors from the production industry is
100 m2/m3, whereas in micro-channels values as high as 50,000 m2/m3 can be achieved. This is
an advantage for all catalytic reactions, for the active area increases noticeably. The change in
surface area to volume ratio results in a limit for small dimensional combustion [Peterson 2003].
This is due to the surface area decreasing to the square and the volume decreasing to the cube
with decreasing length. Fast thermal losses of a forming nucleus of combustion require a
minimum surface area to volume ratio. These correlations are also found in nature in the limits
in the size of warm-blooded animals.
On the other hand, the increase of surface area-to-volume ratio also leads to an increase of heat
losses [Kawamura 2006].
3. Literature Overview on Microreforming
20
Analogies in the micro and macro worlds:
According to Amador, to calculate the behaviour of gases and liquids in micro-channels, the
Navier-Stokes equations seem to be applicable. Calculated friction coefficients in laminar flows
show good accordance with those of the macro world. Small deviations can result from
measurement errors which occur when experiments are carried out in this small scale [Amador
2004].
Generally speaking, it can be stated that there will nearly always be laminar flow conditions in
micro-channels. Although in the micro world the critical Reynolds numbers for laminar flow lie
between 200 and 900, i.e., lower than in the macro world, occurring Reynolds numbers mostly
lie far below this limit. The critical Reynolds number changes due to a higher sensitivity towards
surface roughness [Ducrée 2005].
Differences between the micro and macro worlds:
When placing a solid state body in a cooler or hotter environment, it cools down or heats up,
resulting in an inner temperature gradient, represented by the dimensionless Biot number
λα= L
Bi , (18)
which describes the ratio of heat transfer α on the outer surface to inner heat conduction λ over
a certain characteristic length L.
As L decreases, the Biot number decreases. For Bi << 1 the internal temperature-gradient
becomes very small, so homogeneous temperatures can be assumed. Therefore, smaller reactors
are less affected by thermal tension and can tolerate faster temperature changes [Madou 1997].
Classification of micro reformers:
Most conventional micro reformers are manufactured using conventional welding techniques,
the catalysts being inserted as pellets or honeycombs or sometimes directly applied onto the
reactor surface of heat exchangers, if they are used as reactors. These micro reformers produce
power in the range of one to 100 Wel. Another concept is the use of micro-channels reactors for
micro reformers. In these reformers, dimensions of flow channels and other reactor internals
such as packed beds of catalyst particles, flow distributors, and mixing devices are in the order
of hundreds of micro meters or even below. They will be called "micro-channel" reformers in
3. Literature Overview on Microreforming
21
the following. This overview of micro reformers will be divided into conventional micro
reformers and micro-channel reformers.
3.1. Microreactors with mm-scale Channels and innovative Design
In the following section, hydrogen generators based on conventional fabrication techniques for
applications ranging from 1 to 100 Wel will be presented. The section is divided into research
results (3.1.1), followed by a brief presentation of systems available on the market in 2007
(3.1.2). Since this is the range of the μRBZS presented in this thesis, this chapter will be
presented in greater detail than the following one for research and development of systems at a
smaller scale.
3.1.1. Research
Co-current, Counter-current and Reverse-flow Reactor Concepts
At the Institute for Chemical Process Engineering, ICVT, from the University of Stuttgart,
Eigenberger, Nieken and co-workers are and have been researching several different concepts
for reactors with optimized heat transfer through optimized flow concepts. Although the work
is also applicable to large scale systems, it is very important for micro scale, considering that
unnecessary temperature gradients and heat loss are even more apparent here and thus have a
high impact on efficiency.
The occurrence of excessive hot spots is presently the main obstacle in the design of counter
current reactors for the autothermal coupling of endothermic and exothermic reactions.
Therefore, Kolios et al. established a simplified reactor model for methane steam reforming
coupled with methane combustion [Kolios 2001].
The model was based on earlier studies about heat transfer in autothermal concepts for
endothermic high temperature reactions [Gritsch 2004]. The two alternatives for the efficient
coupling of exothermic and endothermic reactions studied are a counter-current reactor with
axially distributed fuel injection and a reactor where co-current occurs in the area of reaction.
3. Literature Overview on Microreforming
22
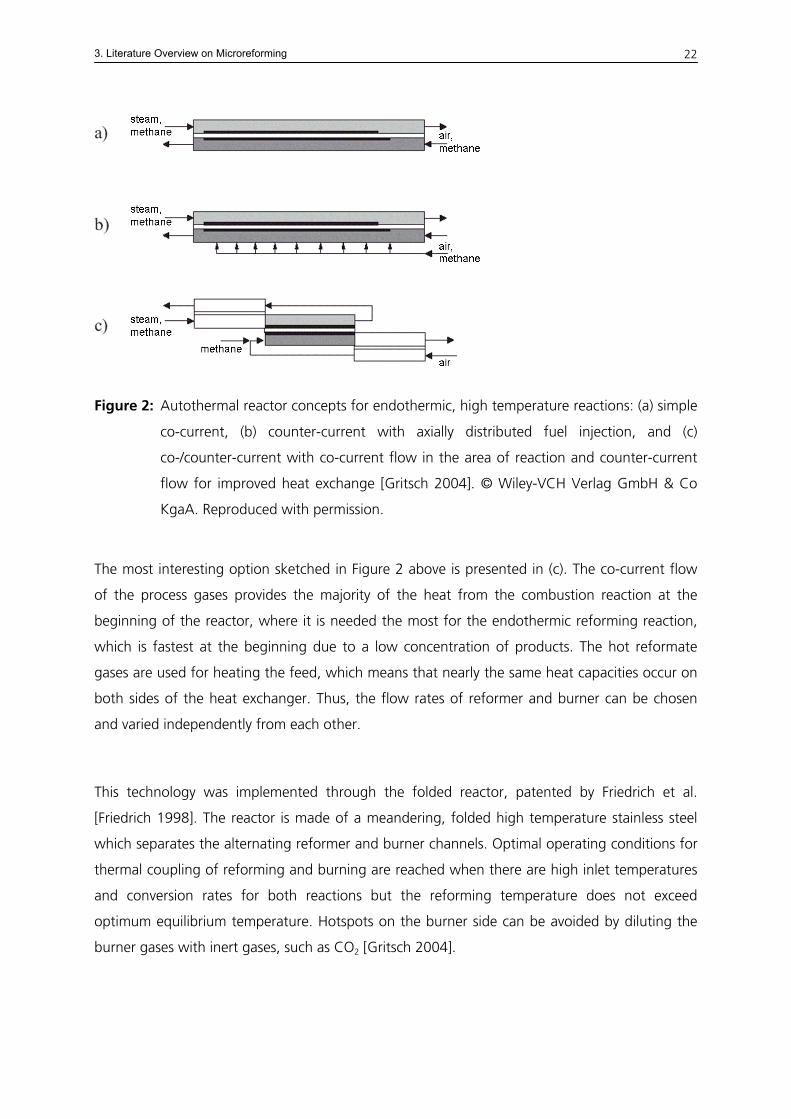
Figure 2: Autothermal reactor concepts for endothermic, high temperature reactions: (a) simple
co-current, (b) counter-current with axially distributed fuel injection, and (c)
co-/counter-current with co-current flow in the area of reaction and counter-current
flow for improved heat exchange [Gritsch 2004]. © Wiley-VCH Verlag GmbH & Co
KgaA. Reproduced with permission.
The most interesting option sketched in Figure 2 above is presented in (c). The co-current flow
of the process gases provides the majority of the heat from the combustion reaction at the
beginning of the reactor, where it is needed the most for the endothermic reforming reaction,
which is fastest at the beginning due to a low concentration of products. The hot reformate
gases are used for heating the feed, which means that nearly the same heat capacities occur on
both sides of the heat exchanger. Thus, the flow rates of reformer and burner can be chosen
and varied independently from each other.
This technology was implemented through the folded reactor, patented by Friedrich et al.
[Friedrich 1998]. The reactor is made of a meandering, folded high temperature stainless steel
which separates the alternating reformer and burner channels. Optimal operating conditions for
thermal coupling of reforming and burning are reached when there are high inlet temperatures
and conversion rates for both reactions but the reforming temperature does not exceed
optimum equilibrium temperature. Hotspots on the burner side can be avoided by diluting the
burner gases with inert gases, such as CO2 [Gritsch 2004].
3. Literature Overview on Microreforming
23
Detailed simulations for the exact temperatures along the reactor bed were set up. "The results
show that an optimal overlapping of the reaction zones is needed in order to control the
reaction temperature. In counter-current operation an essential feature for a successful solution
is to raise the temperature of the exothermic reaction in the reaction zone quickly above the
temperature of the endothermic reaction in order to avoid reverse heat flux within the main
reaction zone. A verification of the predictions of the simplified model by a detailed reactor
model using more realistic conditions has shown that the optimal temperature profile is
attainable and stable" [Kolios 2001].
For efficient heat recuperation in the heat exchanger zones, the temperature gradient between
the inlet and outlet can be 100 to 150 K. Experiments were carried out where more than 80%
of the heat of combustion were used for reforming [Gritsch 2004].
The same group of researchers from the University of Stuttgart widened their approaches to
energy supply for strongly endothermic reactions into the field of reverse-flow reactors. In their
opinion, "the key to an optimal process with high productivity is a periodic reheating of the
fixed-bed to a favourable temperature profile avoiding hotspots by homogeneous ignition"
[Glöckler 2006]. This process was tested for methane reforming and will be described more
closely.
It "is divided into at least two steps: during the first half of the cycle (production), reforming is
carried out which cools down the fixed-bed, and in the second half of the cycle (heat
regeneration), the bed is reheated by combustion. In such an operation mode, the fixed-bed has
multiple functionalities: besides catalyzing the reforming process (and combustion) it serves as
regenerative heat exchanger transferring heat from combustion to reforming. Both end sections
of the fixed-bed are utilized as regenerators recovering heat from the hot product gas stream of
one halfcycle to heat up the feed gas stream of the subsequent cycle. A favourable temperature
profile along the reactor is therefore characterized by low temperatures at both reactor ends
and a hot central section where the temperature corresponds to the desired conversion of the
reforming reaction" [Glöckler 2006].
The figure below represents the process:
3. Literature Overview on Microreforming
24
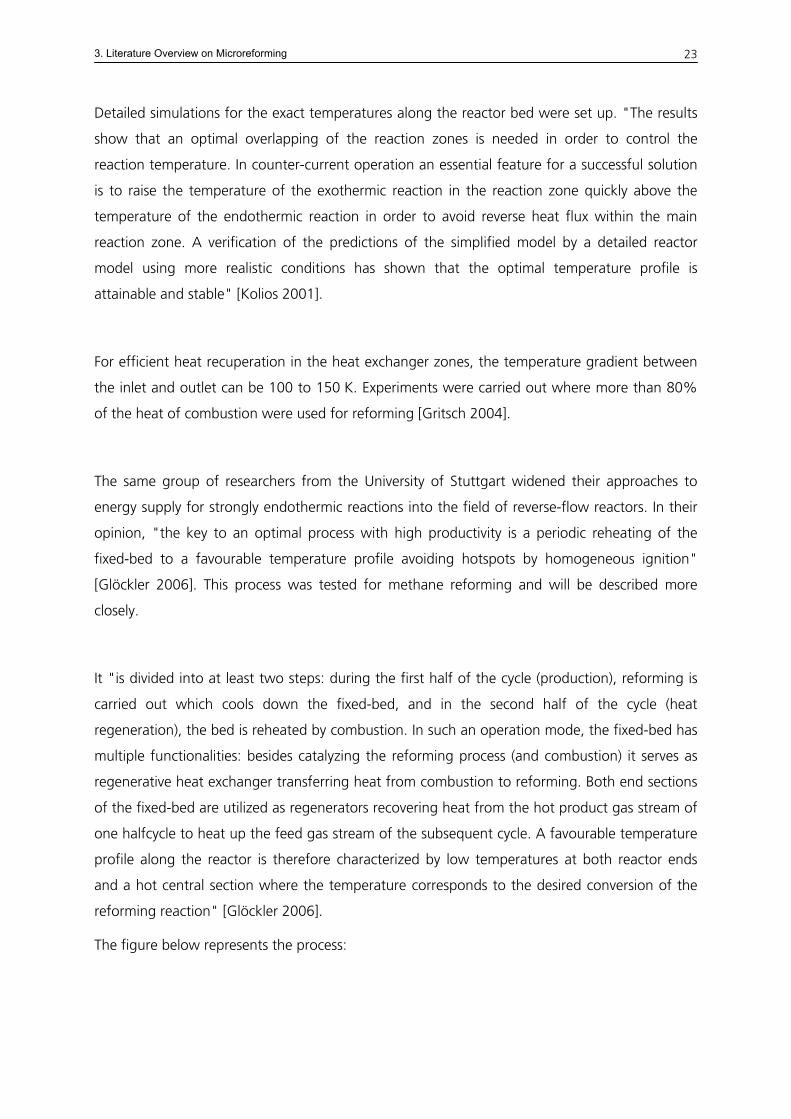
Figure 3: "Top: Schematic of a fixed-bed reformer operated in asymmetric operation mode.
Methane steam reforming takes place during production (left), the fixed-bed is
reheated during heat regeneration through flow reversal and combustion (right).
Bottom: Process design with a simplified model [Glöckler 2003]: temperature and
conversion profiles during production (left), evolution of the temperature profile
during heat regeneration (right)." [Glöckler 2006]. © Elsevier, reproduced with
permission.
"The regenerative autothermal concept for endothermic reactions sounds simple. However, a
straightforward implementation of the asymmetric operation is hindered by the fact that the
reaction zones of the endothermic and exothermic reactions tend to separate under counter-
current operation or periodic flow reversal" [Glöckler 2006].
The focus for the experiments therefore lay on avoiding temperature peaks and trying to achieve
optimum temperature profiles.
"It could be shown that homogeneous ignition with H2/N2 can be avoided as long as the
temperature at the second side feed (located in the middle of the bed) is kept below 600 °C.
However, a temperature in the range of 850–900 °C is essential for regeneration in order to
attain sufficient conversion during the subsequent production step. […] In separate combustion
experiments, homogeneous ignition of fuel gas containing hydrogen could safely be avoided at
the feed points by providing inert mixing sections and adding CO2 or steam. […] For low
reforming loads, i.e., low heat demand during regeneration, the maximum temperature could
3. Literature Overview on Microreforming
25
be kept below 1100 °C. […] Since the maximum temperatures behind the air ignition points
steadily increased over the regeneration period, one obvious approach to limit the local
temperatures is a corresponding decrease of the air and fuel feed during the regeneration. This
results in a time-variant air feed control (air side-feed over time), by which a periodic steady state
with limited maximum temperature was reproducibly established" [Glöckler 2006].
Catalytic Wall Reactor
E.C. Wanat and K. Venkataraman from the Department of Chemical Engineering and Materials
Science of the University of Minnesota have developed an autothermal flat plate catalytic wall
reactor (CWR) for steam reforming of ethanol [Wanat 2004]. Using a Rh catalyst for steam
reforming and Pt–Ce catalyst for water gas shift, an effluent stream with an H2/CO ratio of 42/1
was obtained [Venkataraman 2003 b]. Since a flat multilayer reactor design is easy to scale
down, this work is of great importance for micro reactors.
A CWR increases the heat transfer coefficient by about 200 times when compared to traditional
steam reforming reactor [Venkataraman 2003 a]. Heat transfer boundaries are eliminated "by
coupling combustion and reforming reactions catalytically on the opposite sides of a thin wall.
[…] This reduces the required residence time for steam reforming by a large factor.
"Lower catalytic combustion temperatures of ~1000 °C in the CWR eliminate the formation of
NOx. Finally, the flat plate CWR allows easy scaling because exothermic and endothermic
channels can be alternated to produce a desired amount of hydrogen" [Wanat 2004].
3. Literature Overview on Microreforming
26
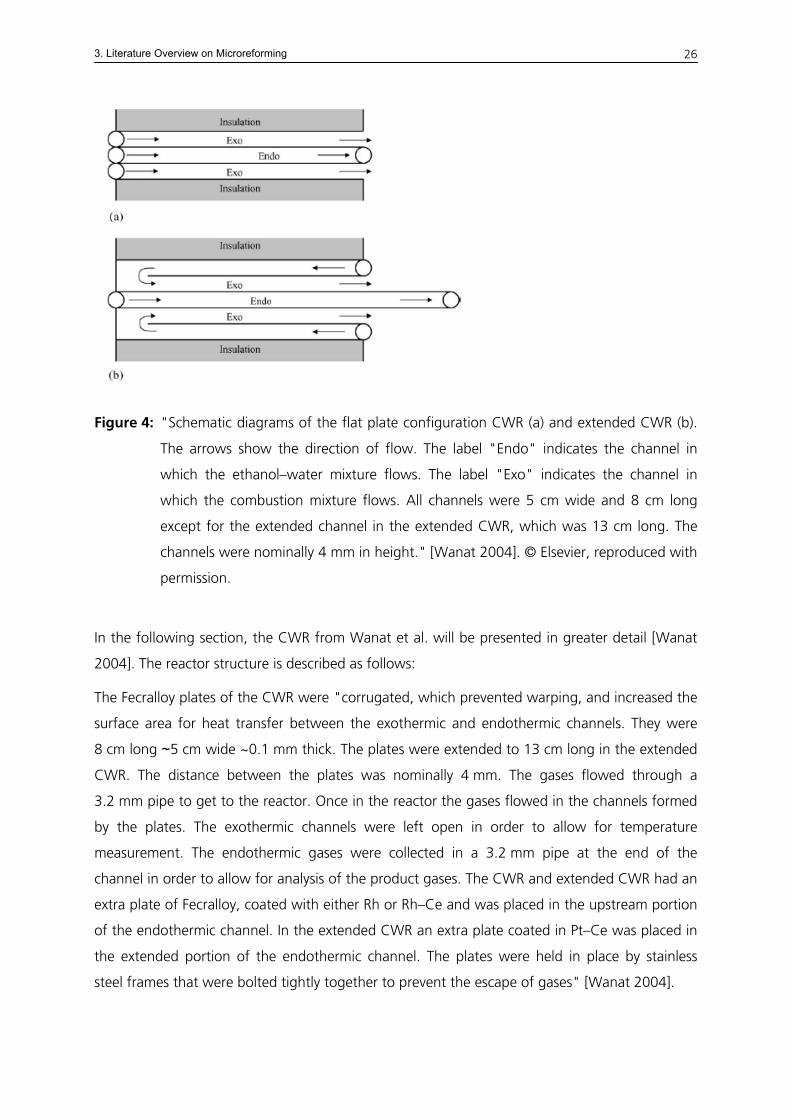
Figure 4: "Schematic diagrams of the flat plate configuration CWR (a) and extended CWR (b).
The arrows show the direction of flow. The label "Endo" indicates the channel in
which the ethanol–water mixture flows. The label "Exo" indicates the channel in
which the combustion mixture flows. All channels were 5 cm wide and 8 cm long
except for the extended channel in the extended CWR, which was 13 cm long. The
channels were nominally 4 mm in height." [Wanat 2004]. © Elsevier, reproduced with
permission.
In the following section, the CWR from Wanat et al. will be presented in greater detail [Wanat
2004]. The reactor structure is described as follows:
The Fecralloy plates of the CWR were "corrugated, which prevented warping, and increased the
surface area for heat transfer between the exothermic and endothermic channels. They were
8 cm long ~5 cm wide ~0.1 mm thick. The plates were extended to 13 cm long in the extended
CWR. The distance between the plates was nominally 4 mm. The gases flowed through a
3.2 mm pipe to get to the reactor. Once in the reactor the gases flowed in the channels formed
by the plates. The exothermic channels were left open in order to allow for temperature
measurement. The endothermic gases were collected in a 3.2 mm pipe at the end of the
channel in order to allow for analysis of the product gases. The CWR and extended CWR had an
extra plate of Fecralloy, coated with either Rh or Rh–Ce and was placed in the upstream portion
of the endothermic channel. In the extended CWR an extra plate coated in Pt–Ce was placed in
the extended portion of the endothermic channel. The plates were held in place by stainless
steel frames that were bolted tightly together to prevent the escape of gases" [Wanat 2004].
3. Literature Overview on Microreforming
27
In "the first reactor built, while successfully reforming ethanol, little water gas shift occurred as
H2/CO ratios were ~3/1. Extending the length of the endothermic channel enhanced water gas
shift. The extended portion of the reactor was coated with water gas shift catalyst (Pt–Ce) but
no combustion catalyst. The extended CWR with Pt–Ce water gas shift catalyst was able to
increase the H2/CO ratio to ~30/1" [Wanat 2004].
"Further results show that at a steam/carbon ratio of 3/1 the reactor gave >99% conversion of
ethanol. An H2/CO ratio of 3/1 was obtained at a residence time of ~100 ms and an upstream
temperature of ~800 °C. […] The reactor was stable for at least 100 h with no detectable
degradation in performance. No carbon formation was observed at S/C ratios of 2/1 to 4/1"
[Wanat 2004].
Micro Reactor and Micro Heat Exchanger
A similar approach (compared with E.C. Wanat and K. Venkataraman) to achieve higher heat
transfer was researched by P.J. de Wild and M.J.F.M Verhaak from the Netherlands Energy
Research Foundation ECN in Petten [de Wild 2000]. Heat exchangers were washcoated
successfully onto aluminium substrates and then used for methanol steam reforming.
"Metal-supported catalyst systems that integrate the endothermic methanol steam reforming
with the exothermic combustion of methanol or hydrogen containing gas from the fuel cell offer
good heat transfer characteristics" [de Wild 2000]. Therefore, "for methanol steam reforming,
the concept of a washcoated heat exchanger shows better performance compared to
washcoated foam and packed beds" [de Wild 2000]. It "shows the highest activity per gram of
catalyst" [de Wild, 2000]. As a drawback, "mainly due to the lower catalyst load, the coated
aluminium structures deactivate at a higher rate than the packed bed of pure catalyst pellets"
[de Wild 2000].
The dimensions of the reactors are not given, so the limit in downscaling this technology is not
mentioned.
Microlith Catalytic Reactors
S. Roychoudhury and M. Castaldi from the Precision Combustion Inc. (PCI), North Haven, and
M. Lyubovsky et al. from the Chemical Engineering Division of the Argonne National Laboratory
have developed and patented a short contact time reactor (SCT), which will be presented in the
following section.
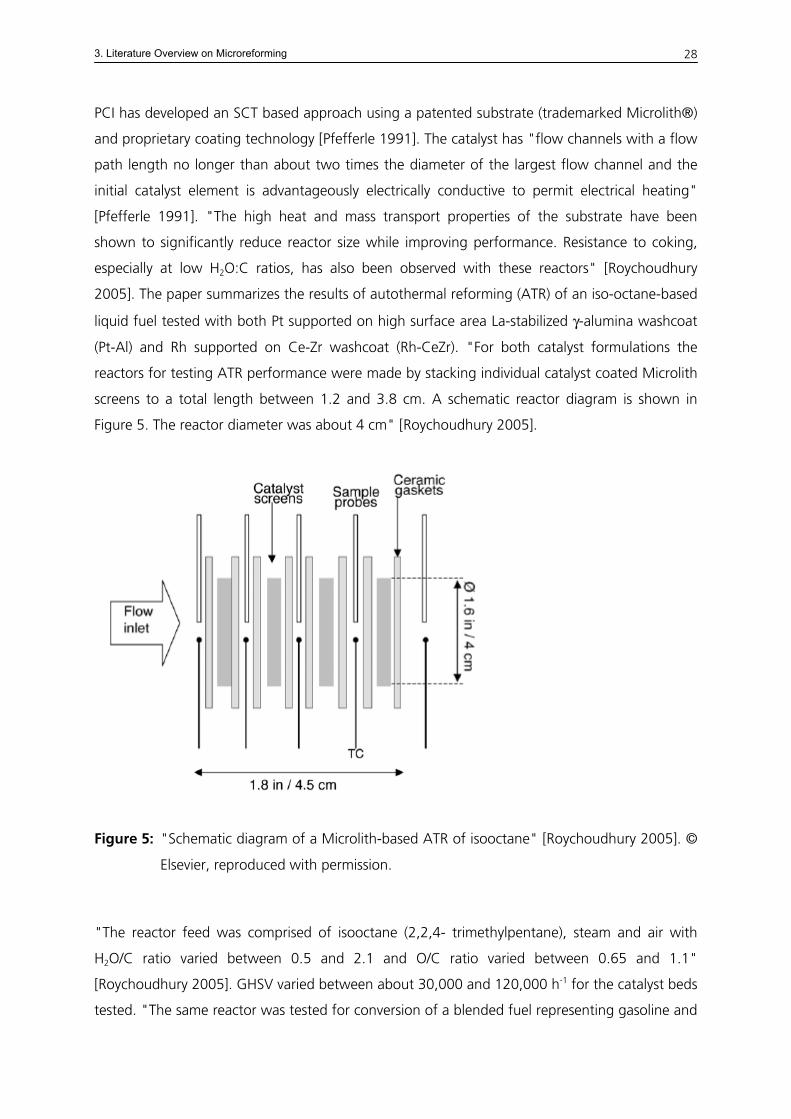
3. Literature Overview on Microreforming
28
PCI has developed an SCT based approach using a patented substrate (trademarked Microlith®)
and proprietary coating technology [Pfefferle 1991]. The catalyst has "flow channels with a flow
path length no longer than about two times the diameter of the largest flow channel and the
initial catalyst element is advantageously electrically conductive to permit electrical heating"
[Pfefferle 1991]. "The high heat and mass transport properties of the substrate have been
shown to significantly reduce reactor size while improving performance. Resistance to coking,
especially at low H2O:C ratios, has also been observed with these reactors" [Roychoudhury
2005]. The paper summarizes the results of autothermal reforming (ATR) of an iso-octane-based
liquid fuel tested with both Pt supported on high surface area La-stabilized γ-alumina washcoat
(Pt-Al) and Rh supported on Ce-Zr washcoat (Rh-CeZr). "For both catalyst formulations the
reactors for testing ATR performance were made by stacking individual catalyst coated Microlith
screens to a total length between 1.2 and 3.8 cm. A schematic reactor diagram is shown in
Figure 5. The reactor diameter was about 4 cm" [Roychoudhury 2005].
Figure 5: "Schematic diagram of a Microlith-based ATR of isooctane" [Roychoudhury 2005]. ©
Elsevier, reproduced with permission.
"The reactor feed was comprised of isooctane (2,2,4- trimethylpentane), steam and air with
H2O/C ratio varied between 0.5 and 2.1 and O/C ratio varied between 0.65 and 1.1"
[Roychoudhury 2005]. GHSV varied between about 30,000 and 120,000 h-1 for the catalyst beds
tested. "The same reactor was tested for conversion of a blended fuel representing gasoline and
3. Literature Overview on Microreforming
29
consisting of 5 wt.% methylcyclohexane, 20 wt.% of xylene and 75 wt.% of iso-octane. […]
The addition of the various hydrocarbons to the fuel did not significantly change the operating
properties of the reactor" [Roychoudhury 2005].
"The reaction is very fast at the front of the catalyst bed where temperature rapidly rises from
an inlet of about 200 °C to a peak temperature of about 800 °C. All molecular oxygen is rapidly
consumed over the first millimetre of the bed length, which causes sharp gradients in all species
concentrations. […] Essentially the front 20 elements provide more than 90% of the conversion,
while the rest of the reactor may add less than 10%. […] Optimization of the process in this
front region leading to higher selectivity of oxidation reactions to partial oxidation products may
increase the overall conversion and efficiency of the process, such that under same inlet
conditions 100% fuel conversion is achieved at shorter bed length without increasing the overall
size of the reactor.
"A complete reformer system with Microlith ATR, WGS and PROX reactors has been identified.
Complete conversion of fuel to C1 products with efficiencies as high as 80% compared to the
thermodynamically predicted maximum value of 91% (assuming downstream conversion of CO
into H2), at an O:C ratio of about 1 and an H2O:C ratio of about 2 was demonstrated. The
results were obtained at space velocities of up to 185,000 h-1" [Roychoudhury 2005].
Multi-layer μ-Reactor
P. Irving et al. from InnovaTek, Inc., Richland, have developed the portable H2GEN™ fuel
processor which can generate enough hydrogen for a 100 W fuel cell [Irving 2001]. It uses micro
reactors and micro heat exchanger components and can reform gasoline, diesel, methanol and
natural gas. Through the utilization of micro-technology, which leads to optimized thermal
management and fluid dynamics, the system efficiency is greatly improved. Other milestones
achieved include catalyst testing with sulphur present in the fuel and fabrication of a hydrogen-
permeable membrane that is less than 10 μm thick.
The following critical technologies were researched:
"- Sulphur-tolerant reforming catalyst that eliminates the requirement for extra components for
sulphur removal
- Fuel Injector Micro-Nozzle that eliminates catalyst coking
- Microchannel reactor and heat exchanger for compact high-efficiency system design.
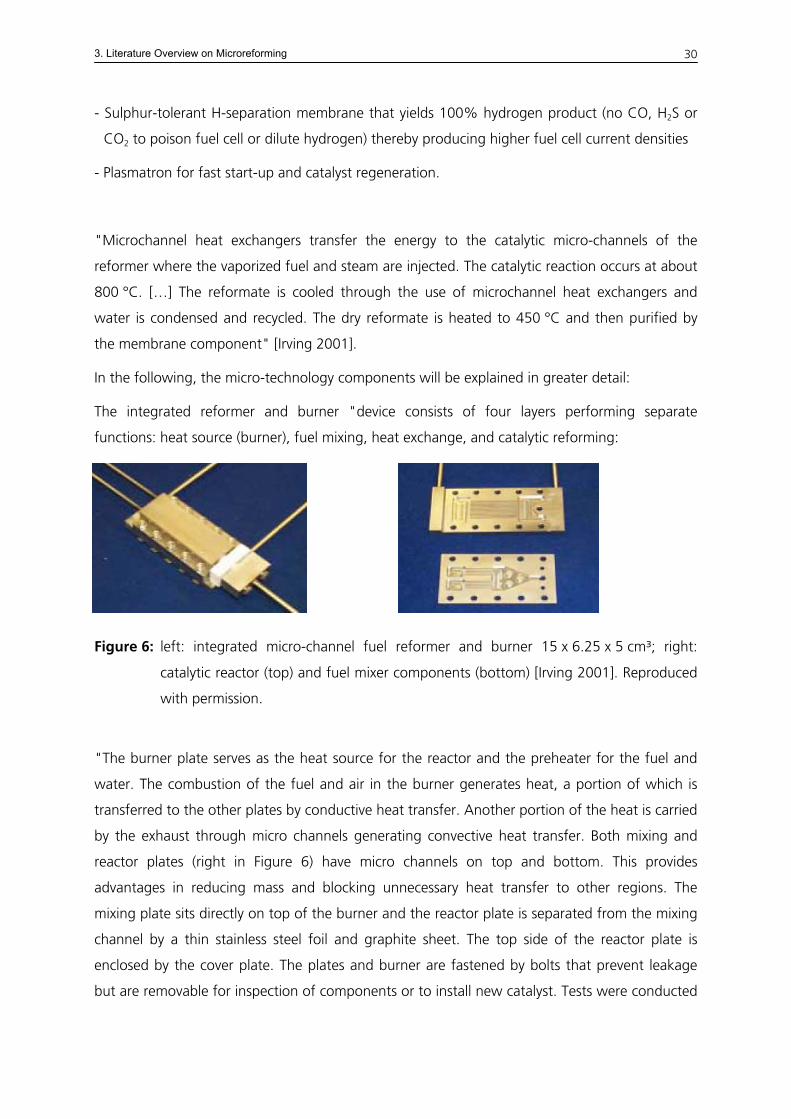
3. Literature Overview on Microreforming
30
- Sulphur-tolerant H-separation membrane that yields 100% hydrogen product (no CO, H2S or
CO2 to poison fuel cell or dilute hydrogen) thereby producing higher fuel cell current densities
- Plasmatron for fast start-up and catalyst regeneration.
"Microchannel heat exchangers transfer the energy to the catalytic micro-channels of the
reformer where the vaporized fuel and steam are injected. The catalytic reaction occurs at about
800 °C. […] The reformate is cooled through the use of microchannel heat exchangers and
water is condensed and recycled. The dry reformate is heated to 450 °C and then purified by
the membrane component" [Irving 2001].
In the following, the micro-technology components will be explained in greater detail:
The integrated reformer and burner "device consists of four layers performing separate
functions: heat source (burner), fuel mixing, heat exchange, and catalytic reforming:
Figure 6: left: integrated micro-channel fuel reformer and burner 15 x 6.25 x 5 cm³; right:
catalytic reactor (top) and fuel mixer components (bottom) [Irving 2001]. Reproduced
with permission.
"The burner plate serves as the heat source for the reactor and the preheater for the fuel and
water. The combustion of the fuel and air in the burner generates heat, a portion of which is
transferred to the other plates by conductive heat transfer. Another portion of the heat is carried
by the exhaust through micro channels generating convective heat transfer. Both mixing and
reactor plates (right in Figure 6) have micro channels on top and bottom. This provides
advantages in reducing mass and blocking unnecessary heat transfer to other regions. The
mixing plate sits directly on top of the burner and the reactor plate is separated from the mixing
channel by a thin stainless steel foil and graphite sheet. The top side of the reactor plate is
enclosed by the cover plate. The plates and burner are fastened by bolts that prevent leakage
but are removable for inspection of components or to install new catalyst. Tests were conducted
3. Literature Overview on Microreforming
31
with the catalyst packed into the microchannel reactor that had heat supplied to it by an
integrated micro-burner. The burner supplied heat, steam and vaporized fuel to the micro-
channel reactor. […]
"Counter-flow micro-channel heat exchangers made of 316 SS were tested to determine
efficiency and effectiveness. Heat exchanger size for a gas flow rate up to 9 l/min is
approximately 12.3 x 1.4 x 0.9 cm³, the core volume of the device being approximately 12 cm³.
Pressure drop at 5 l/min was 40 mbar. Results indicate that at 400 °C heat exchange efficiency
was greater than 80% and decreased to about 50% as flow rates were reduced to 2 l/min. […]
"The membrane was fabricated on the inner surface of a support structure with 7 mm inner
diameter and 22 cm in length, with an effective surface of about 53 cm2 and a membrane
thickness of about 10 μm. […] Composition of the membrane permeate stream (which is the
system output) is pure hydrogen with >80% recovery at a temperature of 450 °C and pressure
of 4.1 bar. The reject gas stream is recycled to the system burner to vaporize fuel and water for
the reformer and achieve the temperatures needed for catalytic reforming." [Irving 2001]
The system was further developed, now including micro-channels, and is presented in a more
recent publication by Pickles and Irving. The system with dimensions of 10.2 x 10.2 x 25.4 cm³
produces 12 l/min hydrogen for a 1 kWel PEM fuel cell. Compared to a conventional tube reactor
the InnovaTek microchannel reactor has greatly improved specific power with 1000 W/kg and a
power density of 667 W/l [Pickles 2007].
Propane Cracking 130 We
K. Ledjeff-Hey et al. from the Department of Mechanical Engineering, Energy Technology of the
Gerhard-Mercator-University of Duisburg have carried out research on the production of
hydrogen via cracking of propane [Ledjeff-Hey 2000].
"Due to the increase of volume during propane cracking, the decomposition is favoured by
decreasing pressure. This process yields high hydrogen concentrations at ambient pressure and
temperatures of 800 °C or higher.
"The key elements of the proposed system are an appropriate catalyst and a suitable reactor
design. The overall portable fuel cell system consisting of a propane cracking batch reactor, a
methanation reactor, a burner, an air blower, a propane container, eight magnetic valves, a
control unit, a polymer electrolyte fuel cell, an accumulator and a charge controller.
3. Literature Overview on Microreforming
32
"The reactor material has to withstand high thermal loading with temperatures in excess of
1200 °C during regeneration by burning off the deposited carbon. Therefore a high
temperature alloy with a high Ni-content has been chosen as reactor material.
"About 55% of the lower heating value of the cracking products are stored in the deposited
carbon. At 900 °C the energy released from the burning of carbon is 7 times higher than the
energy needed for the thermal decomposition. So, neglecting heat losses, a maximum
conversion efficiency, defined as lower heating value of the produced hydrogen in relation to
that of the cracking propane feed, is given by ηconv. = 47%. Assuming that the fuel cell has an
electric power output of 200 Wel and with a maximum demand of electrical power for the
peripheral components of about 70 Wel" (worst case scenario), "a propane feedgas stream
corresponding to 1000 W, a power demand of 400 Wth to heat up the feed gas to cracking
temperature and to compensate the necessary cracking energy and heat losses, the overall net
electrical efficiency of the presented laboratory system amounts to ηnet = 9%," if a fuel cell
efficiency of 50% is premised. Therefore, the net electrical energy output is 90 Wel. "The
catalyst should be able to sustain a few hundred cycles.
"Main points of further development and optimization will be to use balance of plant
components (esp. valves) with less energy consumption and using the exothermic combustion
energy of carbon during regeneration for the cracking process. So a theoretical maximum
electrical efficiency of about 23% can be achieved assuming a fuel cell efficiency of 50%. In
case of increasing the power output of such a system for stationary applications the energy
content of the carbon should be recovered as high quality heat from burning the CO-rich gas
outside the chambers or by integrating heat exchangers into the reactors. This could lead to a
higher fuel utilization of the propane" [Ledjeff-Hey 2000].
Portable Reformer fuel cell system, 300 We
At the Centre for Fuel Cell Technology (Zentrum für Brennstoffzellen Technik, ZBT GmbH) in
Duisburg/Germany a 300 Wel fuel cell system of liquid gas-powered operation was developed
with a focus on leisure boats [Beckhaus 2005]. "On sailing yachts the consumption of electrical
power is very restricted during long cruises because of low battery capacities. In this case an
additional power supply based on the noiseless fuel cell technology promises an essential
comfort increase without disturbing emissions". Both system simulation and reactor design for
the gas process and fuel cell technology were carried out.
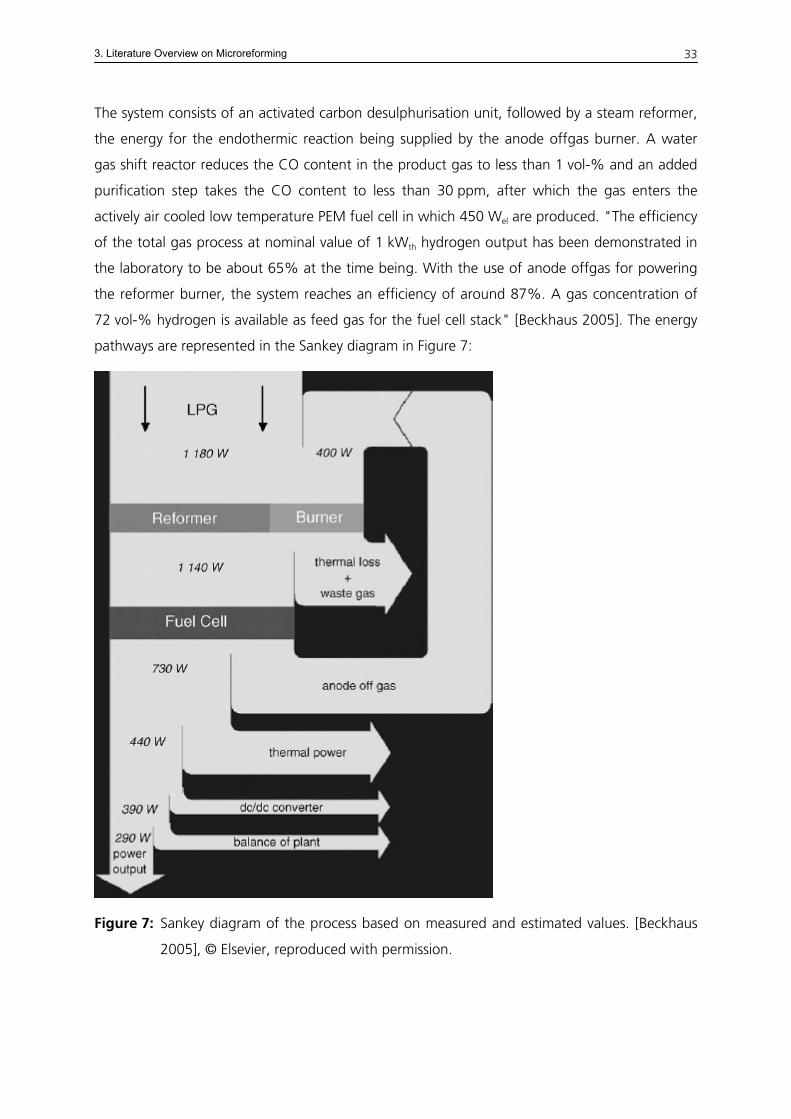
3. Literature Overview on Microreforming
33
The system consists of an activated carbon desulphurisation unit, followed by a steam reformer,
the energy for the endothermic reaction being supplied by the anode offgas burner. A water
gas shift reactor reduces the CO content in the product gas to less than 1 vol-% and an added
purification step takes the CO content to less than 30 ppm, after which the gas enters the
actively air cooled low temperature PEM fuel cell in which 450 Wel are produced. "The efficiency
of the total gas process at nominal value of 1 kWth hydrogen output has been demonstrated in
the laboratory to be about 65% at the time being. With the use of anode offgas for powering
the reformer burner, the system reaches an efficiency of around 87%. A gas concentration of
72 vol-% hydrogen is available as feed gas for the fuel cell stack" [Beckhaus 2005]. The energy
pathways are represented in the Sankey diagram in Figure 7:
Figure 7: Sankey diagram of the process based on measured and estimated values. [Beckhaus
2005], © Elsevier, reproduced with permission.
3. Literature Overview on Microreforming
34
The overall net electrical efficiency then reaches 24.6%, as can be deducted from the Sankey
diagram.
3.1.2. Reformer fuel cell systems available on the market
There are very few reformer fuel cell systems already available on the market, but since a
number of research institutions and companies are working on this subject, more systems are
expected to reach commercial stage over the next few years. Most of the fuel cell systems still
use hydrogen as a fuel, which is provided in tanks in which it is stored in various ways. A short
overview of the reformer fuel cell systems below 100 Wel is given below. There are a few more
small systems with above 300 Wel power output, but since this section deals with micro
reforming only, they are not taken into account. A comparison to the μRFCS from this work can
be found in 4.4 and a comparison of system efficiencies is shown in Table 19 and Table 20.
UltraCell Corporation
UltraCell Corporation [UltraCell 2005] offers small, lightweight power supply of 25 Wel (XX25
system for military use and UltraCell25™ for commercial use; overall system volume 1.5 l with
fuel cartridge, energy density 340 Wh/kg, start-up time < 2 minutes, operating temperature -20
to +40 °C) and 45 Wel continuous power (XX90 system; overall system volume 1.4 l without fuel
cartridge, energy density 550 Wh/kg) based on reformed methanol fuel cell (RMFC) technology.
The fuel is supplied in cartridges containing a methanol solution and cartridges can be swapped
while the system is running. The PEM fuel cell uses high temperature membrane electrode
assemblies (PBI) provided by Pemeas, which have a high tolerance towards CO and impurities.
UltraCell has an exclusive licence with Lawrence Livermore National Laboratories for micro fuel
cell technology.
Voller Energy
Voller Energy [Voller 2007] are currently developing a system which will run from LPG, propane
or butane (bbq gas) and which will provide the functional equivalent of a 5 kVA petrol or diesel
generator. This product will be aimed at the leisure industry initially, for "powering the 12 V or
24 V circuits on board yachts and in motorhomes & caravans, by using the cooking gas already
on board" [Voller 2007]. Furthermore, a military application is being developed, to power
3. Literature Overview on Microreforming
35
equipment used by a foot soldier when out on missions. Products from Voller Energy that are
already on the market in 2007 all use hydrogen storage tanks for fuelling their fuel cells.
IdaTech
IdaTech have developed a system that is designed for no planned maintenance and operates
independently of sun or wind energy. The iGen™ system is an easily transportable solution
designed to provide 250 We over an extended period of time. It has a fuel consumption of about
500 ml/h and a total size of 36 x 50 x 17 cm³ [IdaTech 2007]. It operates on pre-mixed water-
methanol fuel utilizing an integrated, on-board fuel processor that vaporizes and reforms the
mixture, then purifies the hydrogen using IdaTech's HyPurium™ membrane technology and
feeds the gas to the PEM fuel cell stack [Edlund 2005]. IdaTech offers several other systems with
power output above 1 kWe.
3.2. Microreactors with Microchannels
In this section a short summary of the current work on micro-channel reactors is given. More
detailed information can be obtained from [Hebling 2007], a publication by the same
Fraunhofer ISE group as the micro reformer fuel cell system project presented in this thesis. It
includes a table summarizing the developments reported in recent papers (up to Feb. 2007).
Microreactors with micro-channels for reforming are being researched and developed by various
groups around the globe. Key players are companies such as Motorola Labs (USA), InnovaTek,
Inc. (USA), Samsung (Korea), Matsushita Electric Works (Japan), Casio (Japan), research institutes
such as Battelle (USA), Korea Inst. Of Energy Research (Korea), IMM GmbH (Germany), FZK-IMVT
(Germany), EPFL (Switzerland), and universities such as Univ. Michigan (Dept. Chem. Eng.),
Lehigh Univ. (USA), Dalian Inst. Of Chemical Physics (China), Yonsei Univ. (Korea), Korea Univ.
(Korea), Sungkyunkwan Univ. (Korea), Seoul Nat. Univ. (Korea), Kyoto Univ. (Japan), Tohoku
Univ. (Japan), Kogakuin Univ. (Japan). This is and cannot be a complete list, for the research
activities are very broad and often one application is adapted to reforming technology over time.
A good overview over the literature on micro-channel reformer development up to 2002 is given
by Gavriilidis et al. [Gavriilidis, 2002]. More current developments are summarized in a book by
3. Literature Overview on Microreforming
36
Hessel et al. where the authors describe various kinds of micro-channel reformers, gas clean-up
concepts, catalytic combustor design, and fully integrated systems [Hessel, 2005].
Micro-channel reformer capacities range from several hundred milliwatts to one hundred watts,
based on the electric power output a fuel cell could generate with the reformer product gas
flow. With parallel installation of several micro-channel reformers capacities can go up into the
several kilowatt range [Tonkovich 2004]. Fuels commonly used in micro reformers are liquid
fuels such as methanol, ethanol, gasoline, iso-octane, diesel, diesel surrogates, and gaseous
fuels like LPG, and natural gas (methane).
Most researchers focus on the design, fabrication and test of the micro-channel reactors only,
with integrated catalytic burners or electric heaters for heat supply to vaporizer and endothermic
steam reforming reactor. A few teams, mainly with a more industrial background, develop
complete integrated reformer systems with heat exchangers, preheaters, vaporizers and catalytic
combustors [Holladay 2002, 2004, Hallmark 2006, Shin 2006, Kwon 2006, 2007].
Typical dimensions of micro-channels reported are in the order of 100-500 μm wide, 100-300
μm deep, and 20-60 mm long. Many times the reformer and gas clean-up reactors are
integrated in plate heat exchangers with counter current, co-current, and cross flow. Also, single
flow channels meandering are investigated [Kawamura 2006, Shin 2006]. Double meanders of
reformer and vaporizer with catalytic combustor on the backside of the plate have been
reported as well [Park 2006].
For more fundamental investigations some authors use electric heaters on the back side of the
patterned micro-channel plates for defined heat input [Kundu 2006, 2007, Tadd 2005,
Kawamura 2006, Kwon 2006, 2007, Shin 2006].
Materials used for micro-channel reactors typically are metal foils and plates (stainless steel,
Inconel, Fecralloy), silicon in combination with Pyrex glass, and ceramic (LTCC). The different
materials require different micro reactor fabrication procedures.
The balance of plant components are developed by many researchers during the development
of micro-channel reformers: catalytic burners [Park 2005, Ryi 2005], micro heat exchangers [Ryi
2006], evaporators [Yoshida 2006], and micro ejectors [Tanaka 2004]. Also, system insulation is
of importance [Tanaka 2004, Kawamura 2006]. Furthermore, system control is a topic that a
few researchers address.
4. Process- and System Simulation
37
4. Process- and System Simulation
To help design the reformer fuel cell system (RFCS) and evaluate the experimental results,
simulation of the chemical equilibrium of the reactions involved in the system was carried out.
In this chapter, three different kinds of simulations will be presented:
- Simulation of the theoretically achievable chemical equilibrium concentrations for
catalyst screening, using thermodynamic equilibrium data only.
- Simulation of the whole RFCS, using thermodynamic equilibrium data, heat and mass
balances and assumed efficiencies for certain reactors.
- Simulation for the reforming reactor only, using a reaction pathway scheme on the basis
of literature data with extensions by the author.
The components used in the simulation and simulation results can be found in the appendix. For
the simulation, the commercial process simulation tool CHEMCAD, developed by Chemstations,
Houston, USA, was used. A short summary of the simulation tool is given below, including
assumptions made for using it for this thesis. This is followed by explanations regarding the
choice of the thermodynamic model. Finally, the three types of simulations carried through are
presented.
4.1. Introduction to CHEMCAD and Assumptions for the Simulations
In CHEMCAD, the feed streams are defined by their composition, temperature and pressure.
Reactors, heat exchangers, phase separators (flash), mixers and dividers are defined as unit
operations. Furthermore, there are virtual separators, which facilitate the display of the dry gas
streams and can also represent the hydrogen sink of the fuel cell within the RFCS, and
controllers for automatically adjusting the water feed to a defined S/C ratio, according to the
given ethanol stream.
Two different types of reactors are used in the simulation. Both reactors can operate in either
isothermal or adiabatic mode or alternatively the heat duty of the reactor can be defined.
In the Gibbs reactor the composition of the product gases is varied so as to minimize the Gibbs
reaction enthalpy, while keeping up the mass balance of the reactor. Thus, the gas composition
4. Process- and System Simulation
38
represents the thermodynamic equilibrium. If desired, solids in the product gas, i.e., carbon, can
be defined. Also, inert components can be defined for the reactor.
In the stoichiometric reactor, the desired reactions are defined with the stoichiometric
coefficients of the reactants and products, along with the conversion fraction of the key
component. Alternatively to the conversion fraction, the heat of the reaction can be entered.
Kinetics are assumed to be non-limiting, i.e., as soon as a molecule reaches the catalyst surface,
it will react to the product gas composition. This is true for the catalyst screening test rigs where,
due to the cylindrical reactor and long inlet zone, flow and temperature distribution can be
assumed to be ideal. For non-cylindrical reactors with shorter inlet and flow-distribution zones,
this assumption is critical. Also, when there is a bypass of feed stream, full conversion cannot be
reached.
4.2. Thermodynamic Model for the Simulations
In all simulations, UNIFAC (Universal Quasichemical Functional Group Activity Coefficients) was
chosen as the thermodynamic model. The use of the UNIFAC model was determined by the
thermodynamics wizard of the CHEMCAD programme, which suggests the use of a
thermodynamic model after the user has entered the components, temperature and pressure
range of the process into the simulation programme. The suggestion, of course, must be
thoroughly investigated before deciding which model to use.
In the UNIFAC model, it is assumed that systems with the same functional groups will behave
similarly. Thus, the activity coefficients for one system can be used to predict those for other
systems with the same functional groups [Poling 2001]. It is thus not necessary to have detailed
measurement data for each species used in the simulation, as long as data for species with the
same structural groups are present in the component data base. The UNIFAC method includes
binary parameters obtained from measurement data. These parameters account for the non-
ideal behaviour of the vapour-liquid equilibrium of real components, based on the interaction of
structural groups. The interactions of structural groups in the liquid phase are represented by
the activity coefficient γ with:
4. Process- and System Simulation
39
i
ii c
a=γ (19)
where ai is the activity and ci the molar fraction of species i.
For the gaseous phase the deviation from the ideal gas condition is described by the fugacity
coefficient φi with:
sii
i
i
vi
ipc
f
p
f==φ (20)
where fi is fugacity and pi the partial pressure of species i. Superscript v stands for vapour and s
for saturation.
For the liquid phase activity, ai is used to describe the interaction in non-ideal mixtures. Activity
and fugacity are connected via the fugacity with:
l,0i
li
if
fa = , (21)
the superscript 0 indicating standard conditions, l indicating the liquid phase.
The fugacity fi is the pressure value needed at a certain temperature to make the properties of a
non-ideal gas satisfy the equation for an ideal gas. Introducing the fugacity into the equation for
the chemical potential μi of a species i, which for ideal gas is:
0i
i0ii
p
plnTR=μ−μ (22)
yields the chemical potential for a real gas:
)c,p,T(f
)c,p,T(flnTR)c,p,T()c,p,T(
0v,0i
vi000
ii =μ−μ . (23)
Only if there is no interaction between the molecules within both the vapour and the liquid
phase the activity coefficient γ and the fugacity φ coefficient equal 1. This means Raoult's law
can be applied and the partial pressure of component i is:
totisiii pypcp == , (24)
4. Process- and System Simulation
40
with ci and yi being the molar fraction of component i in the liquid and gaseous phase,
respectively, and the superscript s indicating saturation condition.
The activity coefficient γi is usually written as a logarithmic function, with a combinatorial
(marked C) and a residual part (marked R):
Ri
Cii lnlnln γ+γ=γ . (25)
The combinatorial part accounts for differences in size and shape in the mixtures, the residual
part for the energy interactions, functional group sizes and interaction surfaces [Poling 2001,
p. 8.75]. This method is elaborated in the UNIQUAC (Universal Quasichemical) model.
UNIQUAC is a rigorous model with very specific equations and binary parameters for all
interactions between components [Poling 2001, p 8.76]. Thus, experimental data is needed for
the parameters of the residual part. The system must be completely defined and no parameters
must be unknown. Since for many systems these parameters are not determined, the UNIFAC
method, in which the residual part of the activity coefficient is replaced by the solution-of-
groups concept, is introduced. The concept regards the structural groups present in the system's
species only. Thus, experimental data is not needed anymore. This method is more accurate than
UNIQUAC when experimental parameters are lacking and therefore would be set to a default
value.
The detailed description of the model parameters and equations can be found in A.2.
In the thermodynamics section, after choosing the global K value option of the CHEMCAD
simulations, no extra vapour phase association was added for adaption of the simulation to
account for real gas instead of ideal gas conditions. There was also no extra vapour fugacity of
Poynting correction chosen.
A comparison between different simulations for the STR equilibrium (see chapter 4.3) resulted in
the highest relative difference in product gas concentration between UNIFAC without vapour
phase association and UNIQUAC with vapour phase association being 0.04%, the smallest being
0. The UNIFAC method results were the same as the SRK (Soave-Redlich-Kwong) method, which
includes binary interaction parameters. In comparison to the Peng-Robinson method, without
vapour phase association, the greatest deviation to UNIFAC was 0.05%, the smallest 0.0002%.
Peng-Robinson is very effective for predicting K-values for hydrocarbon systems at medium to
4. Process- and System Simulation
41
high pressures. However, it was developed for non-polar components and is thus not as suitable
as UNIFAC.
For further validation, simulations were also carried through with the process simulation tool
Pro/II by Invensys Systems GmbH. Here, only the UNIFAC model without vapour phase
association was used for the simulation of ethanol STR. The results are shown in Table 2.
Table 2: Results of product gas composition in a comparison between the CHEMCAD (CC)
and Pro/II simulation for ethanol STR at S/C 3 with the UNIFAC model.
Temp H2 [vol-%dry] CO [vol-%dry] CO2 [vol-%dry] CH4 [vol-%dry] [°C] CC Pro/II CC Pro/II CC Pro/II CC Pro/II 650 70.7 72.1 10.5 11.5 17.1 16.4 1.671 0.009 700 71.4 71.7 12.5 13.0 15.6 15.2 0.476 0.002 750 71.3 71.4 14.1 14.4 14.4 14.2 0.133 0.001 800 71.1 71.1 15.4 15.6 13.4 13.3 0.040 0.000 850 70.8 70.8 16.6 16.8 12.6 12.4 0.013 0.000 900 70.6 70.5 17.6 17.8 11.8 11.6 0.005 0.000
Because all experiments for ethanol STR are carried out at temperatures above 600 °C, the
simulation results displayed here start at a temperature of 650 °C. For H2, CO and CO2, the
relative deviations between the predictions of both programmes are too small to rule out one of
the programmes by comparing the simulation results to experimental results. To decide which
one of the two simulation programmes best represents reality, the dry product gas
concentrations of CH4 are compared. The Pro/II model predicts less than 0.01 vol-%dry CH4 for all
temperatures shown here, whereas CHEMCAD predicts significantly higher values. It is not clear
why for CH4 the two programmes differ so much in their predicted results. During the catalyst
screenings carried out for this work, there was always at least 0.3 vol-%dry CH4 in the product
gas. Thus, for CH4, the concentration predicted by the CHEMCAD simulation comes closer to
the experimental results. Therefore CHEMCAD is favoured over Pro/II for the simulations.
Another reason to choose CHEMCAD is that in past projects the CHEMCAD simulations have
lead to good results for the dimensioning of reactor systems, whereas little experience had been
gained with Pro/II before starting this work. Therefore, CHEMCAD was chosen for all further
simulations.
4. Process- and System Simulation
42
Apart from the comparison of simulated CHEMCAD results from the STR equilibrium, in the STR
test rig the experimental results came very close to the simulated values, the differences
resulting from measurement errors only (see chapter 5.2.1). Thus, it was decided that the
UNIFAC model is sufficiently correct for the simulations. It is also probably most accurate
because it considers the interactions of structural groups of the components instead of using
specific experimental data for all components. Thus, default values which are used in case not all
parameters for all components are present in the data base are avoided.
4.3. Simulation of the Chemical Equilibrium for Catalyst Screening
For the STR simulation with CHEMCAD, a Gibbs reactor with carbon as a possible solid in the
product stream was chosen. The simulations were carried out at 1.3 bar, allowing for a pressure
drop from the reformer through the gas cleaning stages, the fuel cell and the offgas burner. S/C
ratio and the reactor temperature were varied.
For the WGS simulation a Gibbs reactor was used in which all components but CO, H2O, H2 and
CO2 were defined as inert. The reactor temperature was varied.
For the SelMet simulation, a stoichiometric reactor was used for CO-methanation, followed by
another stoichiometric reactor for CO2-methanation, the non-desired parallel reaction. The
experiments which served as a comparison for the simulation were carried out with a humidified
mixed reformate gas from a gas bottle, which was fed into a WGS reactor and then into the
SelMet reactor (see A.7 for details). The feed water content of the SelMet was not measured.
Therefore, in the simulation, the defined reformate gas feed was used as input for the WGS, the
temperature of the WGS reactor was altered until it reached the measured dry gas composition
of the SelMet feed. This was then taken as an input for the SelMet simulation. Assuming that
the catalyst would show ideal performance, the conversion fraction of CO in the CO-
methanation reactor was set to 100% and the one in the CO2-methanation reactor to 0%. To
evaluate the experimental results, these two conversion fractions were altered until the product
gas composition was achieved, while keeping the temperature constant at the value measured
during the experiments.
The results of the equilibrium simulations are shown in A.4.
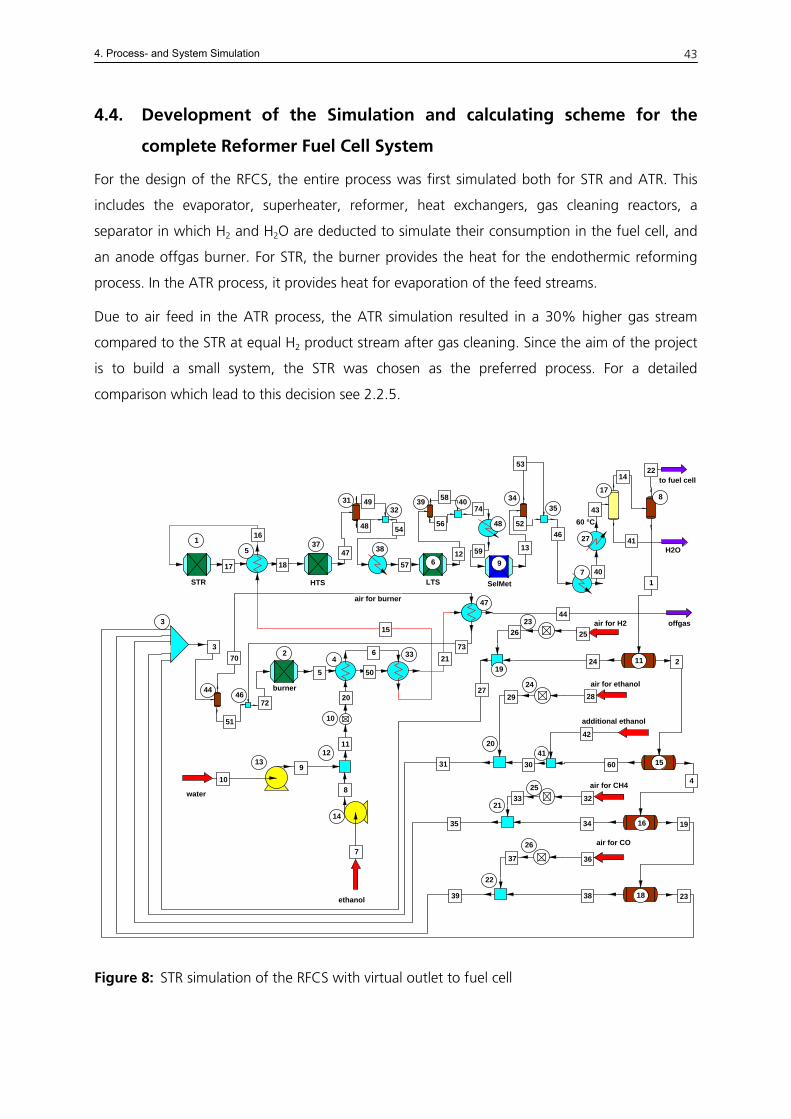
4. Process- and System Simulation
43
4.4. Development of the Simulation and calculating scheme for the
complete Reformer Fuel Cell System
For the design of the RFCS, the entire process was first simulated both for STR and ATR. This
includes the evaporator, superheater, reformer, heat exchangers, gas cleaning reactors, a
separator in which H2 and H2O are deducted to simulate their consumption in the fuel cell, and
an anode offgas burner. For STR, the burner provides the heat for the endothermic reforming
process. In the ATR process, it provides heat for evaporation of the feed streams.
Due to air feed in the ATR process, the ATR simulation resulted in a 30% higher gas stream
compared to the STR at equal H2 product stream after gas cleaning. Since the aim of the project
is to build a small system, the STR was chosen as the preferred process. For a detailed
comparison which lead to this decision see 2.2.5.
1
2
3
burner
STR
4
56
8
5
1213
14
7
8
910
ethanol
water
LTS
10
22
11
15
16
18
4
19
19
20
21
22
24
232526
242829
31
253233
3435
26
3637
3839 23
air for H2
air for ethanol
air for CH4
air for CO
336
50
SelMet
9
3435
52
53
37
HTS
16
17 18
13
3132
47
48
49 39 40
56
58
additional ethanol
4130 60
2
42
H2O
17
27
43
14
1
44 46
38
54
577
46
40
3
offgas
27
4744
11
20
15
21
51
72
7073
60 °C
air for burner
41
48
12 59
74
to fuel cell
Figure 8: STR simulation of the RFCS with virtual outlet to fuel cell
4. Process- and System Simulation
44
Figure 8 shows the complete STR simulation of the RFCS with a virtual outlet to the fuel cell. The
numbers in circles represent the unit operations, in the following represented by "( )", for
example (2) for unit operation number two. Streams are shown as squares, in the following
represented by "[ ]", for example [2] for stream number two. The process flow and heat
integration will be described briefly:
Ethanol [7] and water [10] are fed into the system; the pressure can be varied by entering data
in the two pumps' specification menues (13, 14). The S/C ratio is varied in the controller (10).
The feed is heated up to boiling temperature by the burner offgas [6] in (4) and then evaporated
in heat exchanger (33) and superheated by the reformate gas [17] in heat exchanger (5). It is
then fed into the STR Gibbs reactor and cooled down before entering the HTS Gibbs reactor
(37). Unit operations (31) and (32) are added for better assessment of the experimental results.
(31) splits the HTS product gas into water [48] and a dry gas stream [49], after which the two
streams are reunited in the mixer (32). Then follows a virtual heat exchanger (38) to determine
the heat loss to obtain the desired LTS feed temperature for stream [57]. The LTS (6) is another
Gibbs reactor, the SelMet (9) a stoichiometric reactor for CO-methanation only. Both are
followed by virtual stream splitters for easy identification of the dry product gas composition and
a heat exchanger. In (7) the gas can be cooled down to dew point temperature and there is a
second heat exchanger (27) attached which cools stream [40] down to 60 °C, the desired feed
temperature for the fuel cell. In the flash drum (17) the liquid water is removed from the system.
Separator (8) represents the anode of the fuel cell: The fraction of water that is not released
with the anode offgas but crosses the membrane to the cathode side and the fraction of
hydrogen that is converted into water in the fuel cell are taken out of the system with stream
[22]. The remaining H2O and H2 and all the species that are not converted in the fuel cell are fed
to the offgas burner (2).
None of the reactors of the simulation have an option for programming heat loss in addition to
the heat duty obtained by the chemical reaction. However, heat loss occurs in a real system. To
allow for heat losses within the system, the heating value of the burner feed stream is
programmed to be variable. This is realized by adding extra ethanol [42] to the burner feed. By
this way, it is possible to choose a percentage of heat loss from the burner to the reformer,
determine the heat duty needed for the STR reaction and then add the amount of additional
ethanol required to obtain the heat duty required for the reforming reaction plus the heat duty
for heat loss. For better regulation of the air number λ in the burner, the combustible gases
from stream [1] must be split up, so air can be added for each species at a chosen λ in the
4. Process- and System Simulation
45
controllers (23 – 26). The streams are recombined in the mixer (3). This method results in
additional unit operations, but is easy to program and work with. In separator (44) the air that
has been added according to the chosen λ is separated from the other gases again to preheat
with the burner offgas in heat exchanger (47). In mixer (46) the air is added to the burner gas
again and fed into the burner (2).
Various kinds of heat integration were simulated before the first reactor was actually designed
and built. In a different option, the ethanol and water feed is partially evaporated by the
reformate stream first and then superheated by the burner offgas.
The most important results from the simulation and the feed conditions are shown in A.5.
For this simulation the following assumptions were made:
Kinetics are non-limiting, conversion fraction is 1 for stoichiometric reactors and chemical
equilibrium can be reached in the Gibbs reactor. However, in the RFCS, uneven flow distribution
can lead to mass transfer limitations, which then results in incomplete conversion. This was
neglected for the design of the RFCS.
S/C ratio is chosen to be 3 (see A.5 for explanation of this decision). Heat loss between burner
and reformer is chosen as 15%. This number was obtained by experience from other reforming
systems built at Fraunhofer ISE. Therefore, extra ethanol needs to be added to the anode offgas
stream for the burner. The heat of the HTS, LTS and SelMet product stream which is set free in
heat exchangers (38, 48, 7, 27) is not used for heat integration. Temperature control between
HTS and LTS and between LTS and SelMet will be realized by fans because the heat duties are
relatively small and the fans will allow for smaller total system volume and simple design. Heat
exchangers (7) and (27) have a higher total heat duty. Therefore, they will eventually be used for
pre-heating the ethanol/water mix but this was not yet decided when the simulation was set up.
Only 80% of the H2 produced in the reformer are converted in the fuel cell. The remaining 20%
go to the anode offgas burner. 50% of the water cross over to the cathode and therefore are
added to the H2 stream [22] which is simulated as a product stream going to the fuel cell,
leaving the reformer system. Electrical efficiency of the fuel cell is 50%, which means that of the
80% of the H2 produced in the reformer 50% are converted to electricity and 50% to heat.
Thus, the total electrical efficiency of the fuel cell is 40%.
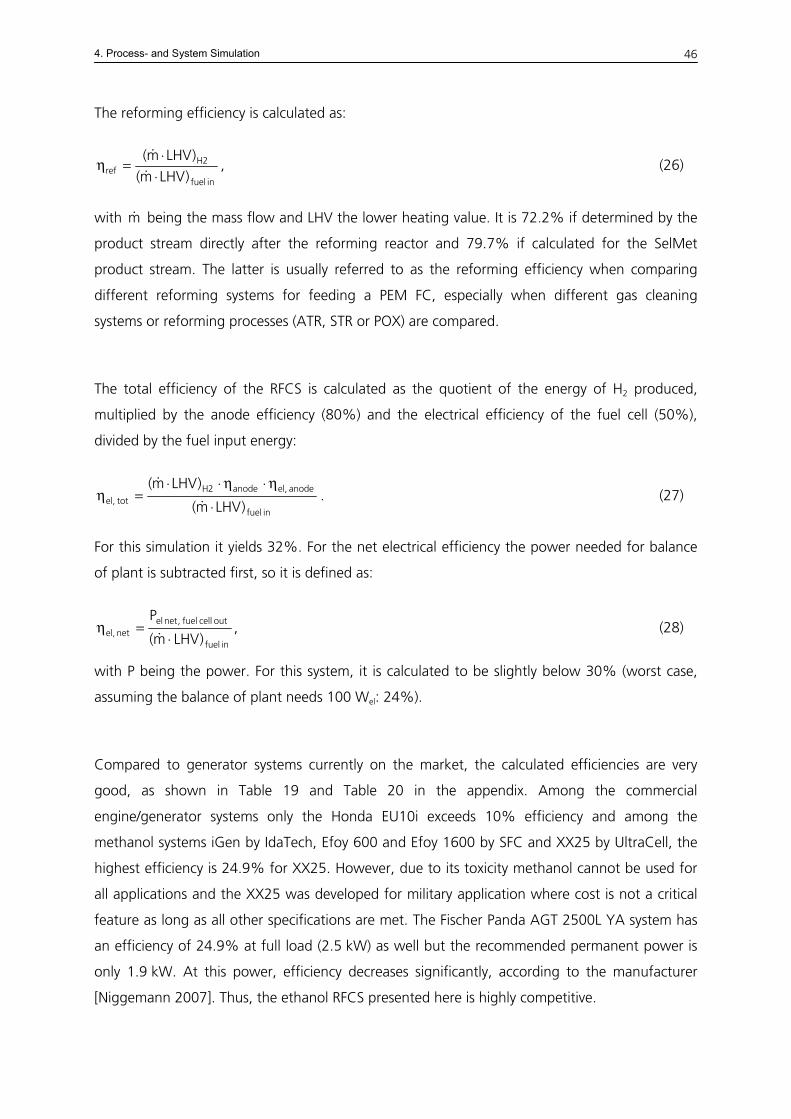
4. Process- and System Simulation
46
The reforming efficiency is calculated as:
infuel
2Href )LHVm(
)LHVm(
⋅⋅
=η&
&, (26)
with being the mass flow and LHV the lower heating value. It is 72.2% if determined by the
product stream directly after the reforming reactor and 79.7% if calculated for the SelMet
product stream. The latter is usually referred to as the reforming efficiency when comparing
different reforming systems for feeding a PEM FC, especially when different gas cleaning
systems or reforming processes (ATR, STR or POX) are compared.
m&
The total efficiency of the RFCS is calculated as the quotient of the energy of H2 produced,
multiplied by the anode efficiency (80%) and the electrical efficiency of the fuel cell (50%),
divided by the fuel input energy:
infuel
anode,elanode2Htot,el )LHVm(
)LHVm(
⋅η⋅η⋅⋅
=η&
&. (27)
For this simulation it yields 32%. For the net electrical efficiency the power needed for balance
of plant is subtracted first, so it is defined as:
infuel
outcellfuel,netelnet,el )LHVm(
P
⋅=η
&, (28)
with P being the power. For this system, it is calculated to be slightly below 30% (worst case,
assuming the balance of plant needs 100 Wel: 24%).
Compared to generator systems currently on the market, the calculated efficiencies are very
good, as shown in Table 19 and Table 20 in the appendix. Among the commercial
engine/generator systems only the Honda EU10i exceeds 10% efficiency and among the
methanol systems iGen by IdaTech, Efoy 600 and Efoy 1600 by SFC and XX25 by UltraCell, the
highest efficiency is 24.9% for XX25. However, due to its toxicity methanol cannot be used for
all applications and the XX25 was developed for military application where cost is not a critical
feature as long as all other specifications are met. The Fischer Panda AGT 2500L YA system has
an efficiency of 24.9% at full load (2.5 kW) as well but the recommended permanent power is
only 1.9 kW. At this power, efficiency decreases significantly, according to the manufacturer
[Niggemann 2007]. Thus, the ethanol RFCS presented here is highly competitive.
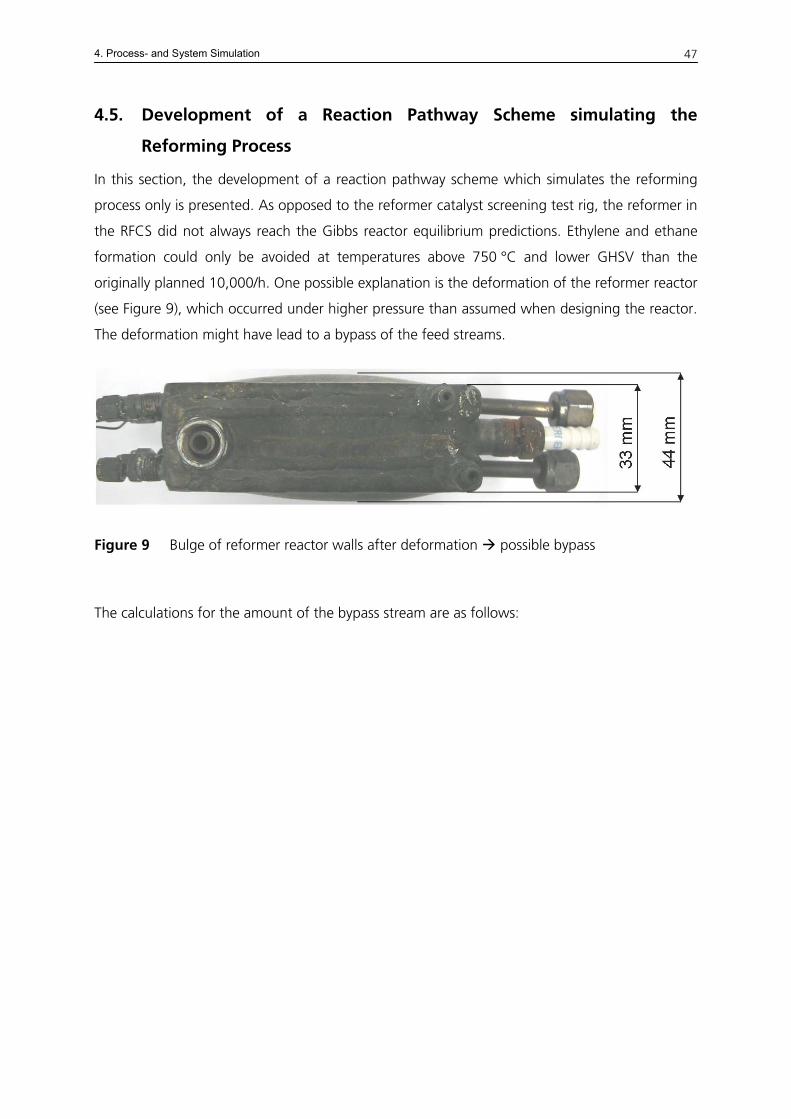
4. Process- and System Simulation
47
4.5. Development of a Reaction Pathway Scheme simulating the
Reforming Process
In this section, the development of a reaction pathway scheme which simulates the reforming
process only is presented. As opposed to the reformer catalyst screening test rig, the reformer in
the RFCS did not always reach the Gibbs reactor equilibrium predictions. Ethylene and ethane
formation could only be avoided at temperatures above 750 °C and lower GHSV than the
originally planned 10,000/h. One possible explanation is the deformation of the reformer reactor
(see Figure 9), which occurred under higher pressure than assumed when designing the reactor.
The deformation might have lead to a bypass of the feed streams.
Figure 9 Bulge of reformer reactor walls after deformation possible bypass
The calculations for the amount of the bypass stream are as follows:
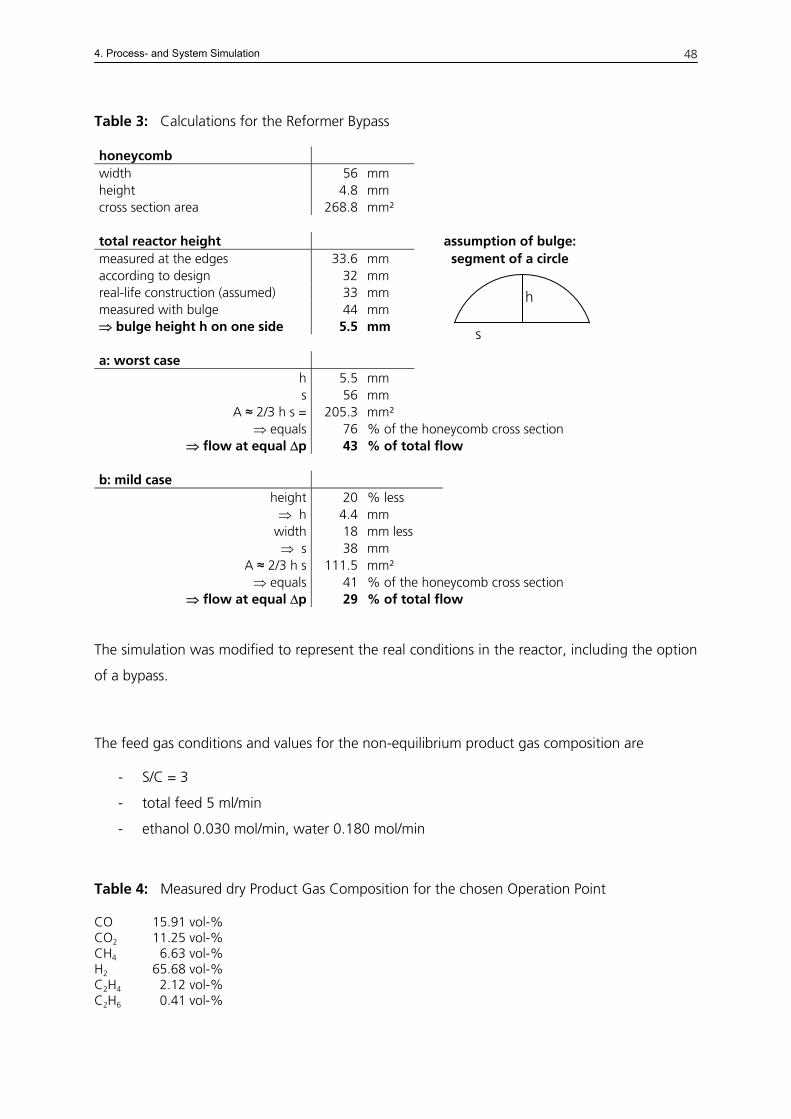
4. Process- and System Simulation
48
Table 3: Calculations for the Reformer Bypass
honeycomb width 56 mm height 4.8 mm cross section area 268.8 mm² total reactor height assumption of bulge: measured at the edges 33.6 mm segment of a circle according to design 32 mm real-life construction (assumed) 33 mm measured with bulge 44 mm ⇒ bulge height h on one side 5.5 mm a: worst case
h 5.5 mm s 56 mm
A ≈ 2/3 h s = 205.3 mm² ⇒ equals 76 % of the honeycomb cross section
⇒ flow at equal Δp 43 % of total flow
b: mild case height 20 % less ⇒ h 4.4 mm
width 18 mm less ⇒ s 38 mm
A ≈ 2/3 h s 111.5 mm² ⇒ equals 41 % of the honeycomb cross section
⇒ flow at equal Δp 29 % of total flow
h
s
The simulation was modified to represent the real conditions in the reactor, including the option
of a bypass.
The feed gas conditions and values for the non-equilibrium product gas composition are
- S/C = 3
- total feed 5 ml/min
- ethanol 0.030 mol/min, water 0.180 mol/min
Table 4: Measured dry Product Gas Composition for the chosen Operation Point
CO 15.91 vol-% CO2 11.25 vol-% CH4 06.63 vol-% H2 65.68 vol-% C2H4 02.12 vol-% C2H6 00.41 vol-%
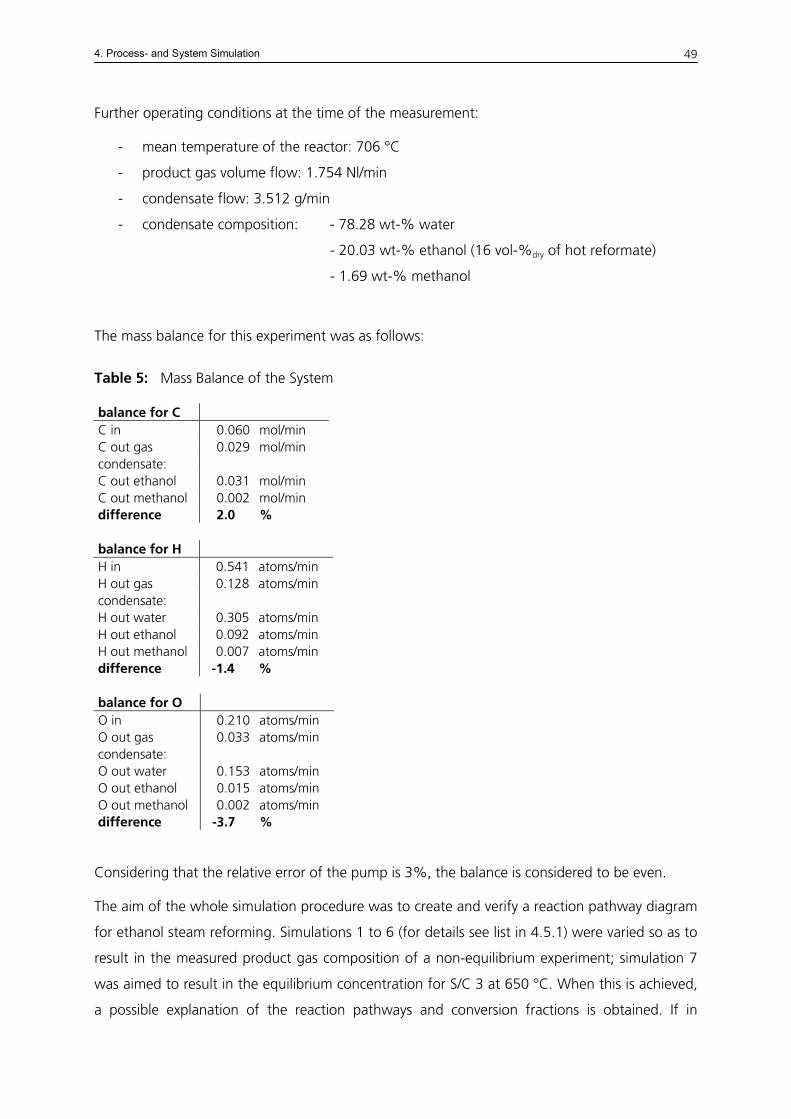
4. Process- and System Simulation
49
Further operating conditions at the time of the measurement:
- mean temperature of the reactor: 706 °C
- product gas volume flow: 1.754 Nl/min
- condensate flow: 3.512 g/min
- condensate composition: - 78.28 wt-% water
- 20.03 wt-% ethanol (16 vol-%dry of hot reformate)
- 1.69 wt-% methanol
The mass balance for this experiment was as follows:
Table 5: Mass Balance of the System
balance for C C in 0.060 mol/min C out gas 0.029 mol/min condensate: C out ethanol 0.031 mol/min C out methanol 0.002 mol/min difference 2.000 % balance for H H in 0.541 atoms/min H out gas 0.128 atoms/min condensate: H out water 0.305 atoms/min H out ethanol 0.092 atoms/min H out methanol 0.007 atoms/min difference -1.400 % balance for O O in 0.210 atoms/min O out gas 0.033 atoms/min condensate: O out water 0.153 atoms/min O out ethanol 0.015 atoms/min O out methanol 0.002 atoms/min difference -3.700 %
Considering that the relative error of the pump is 3%, the balance is considered to be even.
The aim of the whole simulation procedure was to create and verify a reaction pathway diagram
for ethanol steam reforming. Simulations 1 to 6 (for details see list in 4.5.1) were varied so as to
result in the measured product gas composition of a non-equilibrium experiment; simulation 7
was aimed to result in the equilibrium concentration for S/C 3 at 650 °C. When this is achieved,
a possible explanation of the reaction pathways and conversion fractions is obtained. If in
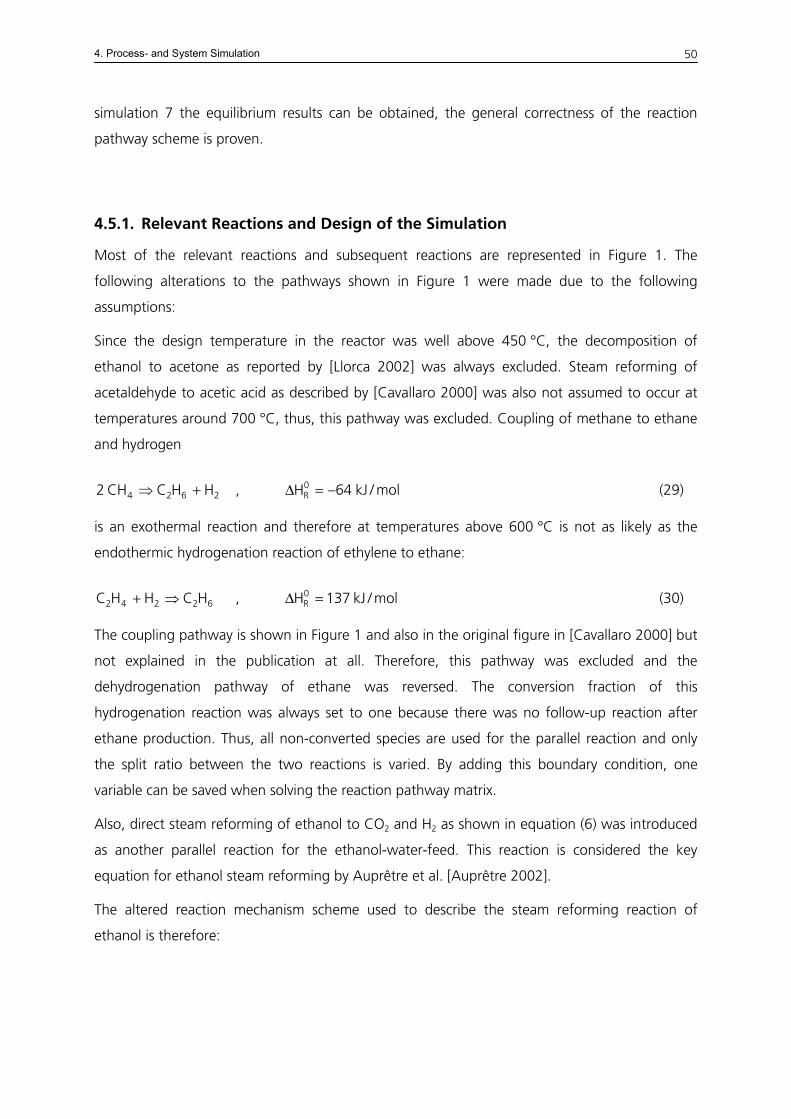
4. Process- and System Simulation
50
simulation 7 the equilibrium results can be obtained, the general correctness of the reaction
pathway scheme is proven.
4.5.1. Relevant Reactions and Design of the Simulation
Most of the relevant reactions and subsequent reactions are represented in Figure 1. The
following alterations to the pathways shown in Figure 1 were made due to the following
assumptions:
Since the design temperature in the reactor was well above 450 °C, the decomposition of
ethanol to acetone as reported by [Llorca 2002] was always excluded. Steam reforming of
acetaldehyde to acetic acid as described by [Cavallaro 2000] was also not assumed to occur at
temperatures around 700 °C, thus, this pathway was excluded. Coupling of methane to ethane
and hydrogen
2624 HHCCH2 +⇒ , (29) mol/kJ64H0R −=Δ
is an exothermal reaction and therefore at temperatures above 600 °C is not as likely as the
endothermic hydrogenation reaction of ethylene to ethane:
62242 HCHHC ⇒+ , (30) mol/kJ137H0R =Δ
The coupling pathway is shown in Figure 1 and also in the original figure in [Cavallaro 2000] but
not explained in the publication at all. Therefore, this pathway was excluded and the
dehydrogenation pathway of ethane was reversed. The conversion fraction of this
hydrogenation reaction was always set to one because there was no follow-up reaction after
ethane production. Thus, all non-converted species are used for the parallel reaction and only
the split ratio between the two reactions is varied. By adding this boundary condition, one
variable can be saved when solving the reaction pathway matrix.
Also, direct steam reforming of ethanol to CO2 and H2 as shown in equation (6) was introduced
as another parallel reaction for the ethanol-water-feed. This reaction is considered the key
equation for ethanol steam reforming by Auprêtre et al. [Auprêtre 2002].
The altered reaction mechanism scheme used to describe the steam reforming reaction of
ethanol is therefore:
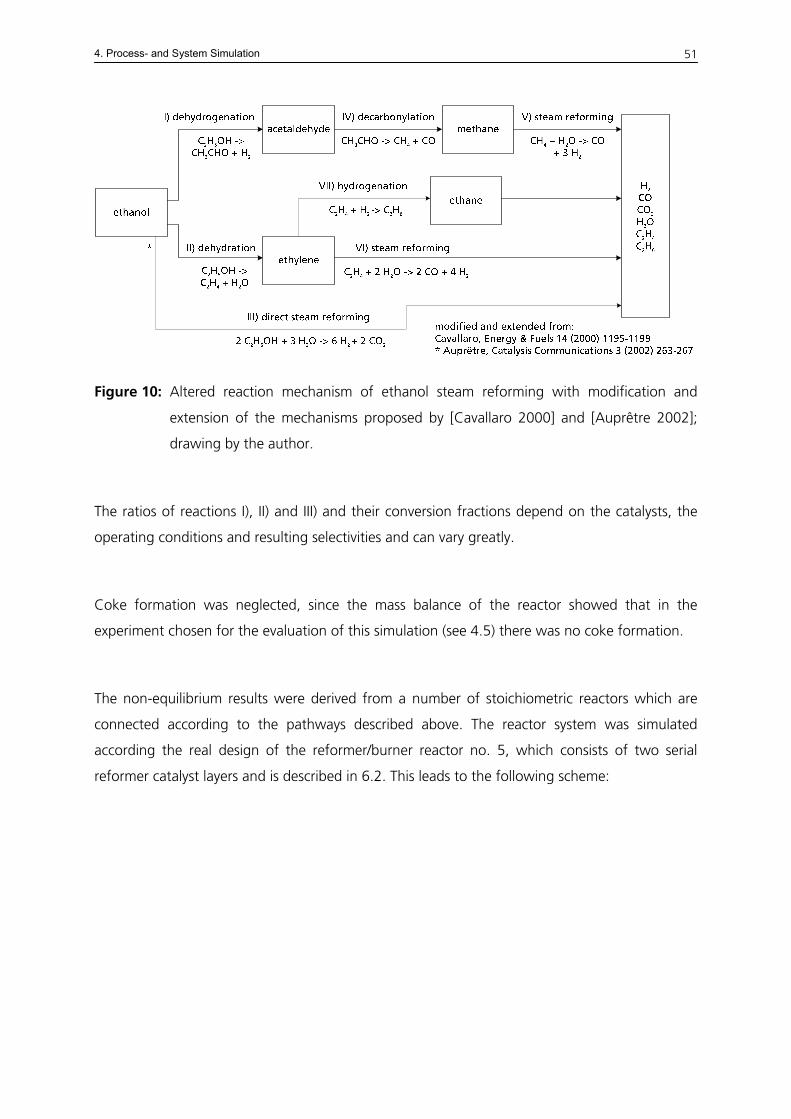
4. Process- and System Simulation
51
Figure 10: Altered reaction mechanism of ethanol steam reforming with modification and
extension of the mechanisms proposed by [Cavallaro 2000] and [Auprêtre 2002];
drawing by the author.
The ratios of reactions I), II) and III) and their conversion fractions depend on the catalysts, the
operating conditions and resulting selectivities and can vary greatly.
Coke formation was neglected, since the mass balance of the reactor showed that in the
experiment chosen for the evaluation of this simulation (see 4.5) there was no coke formation.
The non-equilibrium results were derived from a number of stoichiometric reactors which are
connected according to the pathways described above. The reactor system was simulated
according the real design of the reformer/burner reactor no. 5, which consists of two serial
reformer catalyst layers and is described in 6.2. This leads to the following scheme:
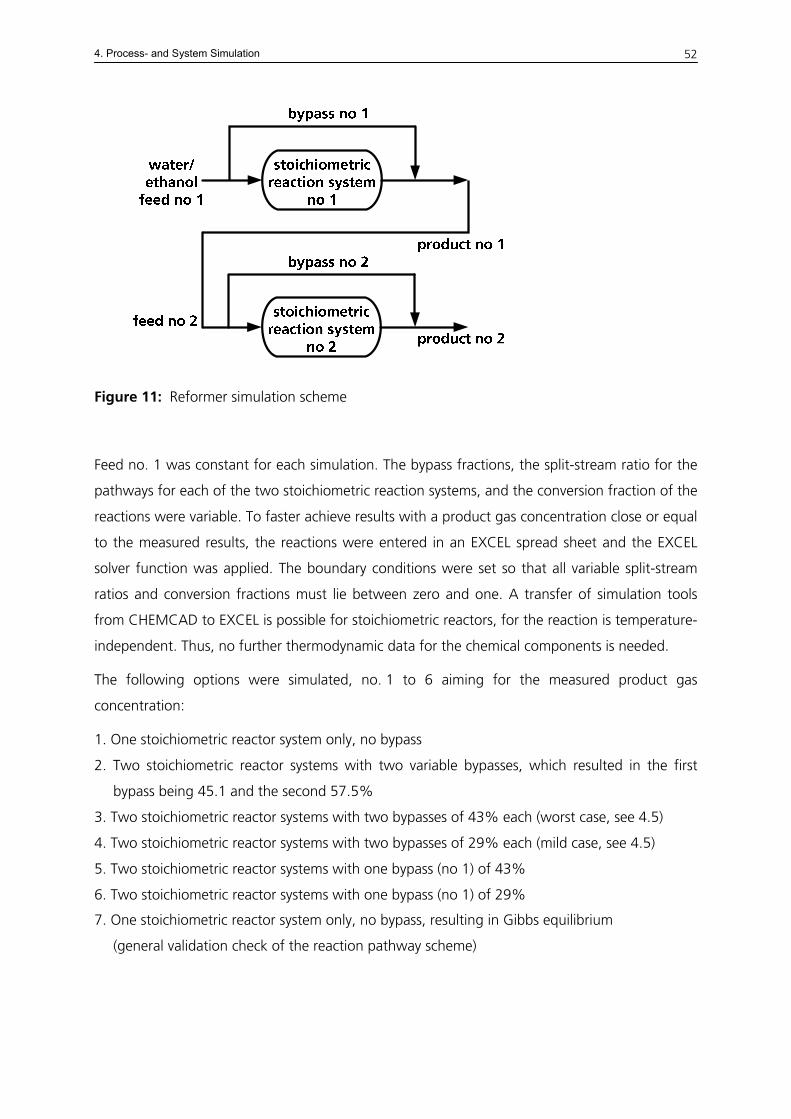
4. Process- and System Simulation
52
Figure 11: Reformer simulation scheme
Feed no. 1 was constant for each simulation. The bypass fractions, the split-stream ratio for the
pathways for each of the two stoichiometric reaction systems, and the conversion fraction of the
reactions were variable. To faster achieve results with a product gas concentration close or equal
to the measured results, the reactions were entered in an EXCEL spread sheet and the EXCEL
solver function was applied. The boundary conditions were set so that all variable split-stream
ratios and conversion fractions must lie between zero and one. A transfer of simulation tools
from CHEMCAD to EXCEL is possible for stoichiometric reactors, for the reaction is temperature-
independent. Thus, no further thermodynamic data for the chemical components is needed.
The following options were simulated, no. 1 to 6 aiming for the measured product gas
concentration:
1. One stoichiometric reactor system only, no bypass
2. Two stoichiometric reactor systems with two variable bypasses, which resulted in the first
bypass being 45.1 and the second 57.5%
3. Two stoichiometric reactor systems with two bypasses of 43% each (worst case, see 4.5)
4. Two stoichiometric reactor systems with two bypasses of 29% each (mild case, see 4.5)
5. Two stoichiometric reactor systems with one bypass (no 1) of 43%
6. Two stoichiometric reactor systems with one bypass (no 1) of 29%
7. One stoichiometric reactor system only, no bypass, resulting in Gibbs equilibrium
(general validation check of the reaction pathway scheme)
4. Process- and System Simulation
53
Since it was not clear which one of simulations 1 to 6 represented reality, all simulations were
carried through. The solver was set to aim for the lowest total deviation of the simulated from
the measured results, this deviation being calculated as the sum of all relative deviations. Ethanol
and acetaldehyde were excluded from comparison of the simulated total product gas
composition because they could not be detected in the gas stream with the GC during the
measurement. The sum of the remaining dry gases was compared to the measured dry gas
stream. The results can be assessed by taking into account the remaining ethanol from the
condensate: If the simulated resulting gas composition is as measured but the remaining ethanol
in the simulated condensate does not match the measured amount, the simulation is regarded
as invalid.
The method of minimizing the deviation is considered to be sufficiently accurate for this
simulation because the sum of all relative deviations is always below 0.2%.
4.5.2. Simulation Results and Assessment – Comparison with Experimental
Results
All six simulations (1 to 6) yielded results which exactly represented the measured product gas
concentration and simulation 7 produced the equilibrium gas concentration, the sum of all
relative deviations being below 0.2% for all cases.
The reaction pathways are split into the parallel reactions I) of dehydrogenation to acetaldehyde,
II) dehydration to ethylene and III) direct STR. After dehydrogenation follows IV) decarbonylation
to methane, followed by V) STR of methane. After dehydration, there is the possibility of either
VI) STR of ethylene or VII) hydrogenation of ethylene to ethane. The distribution of the reaction
pathways for the bypass and reactions I) through III) are shown in the table below; also the
distribution between reactions VI) and VII).
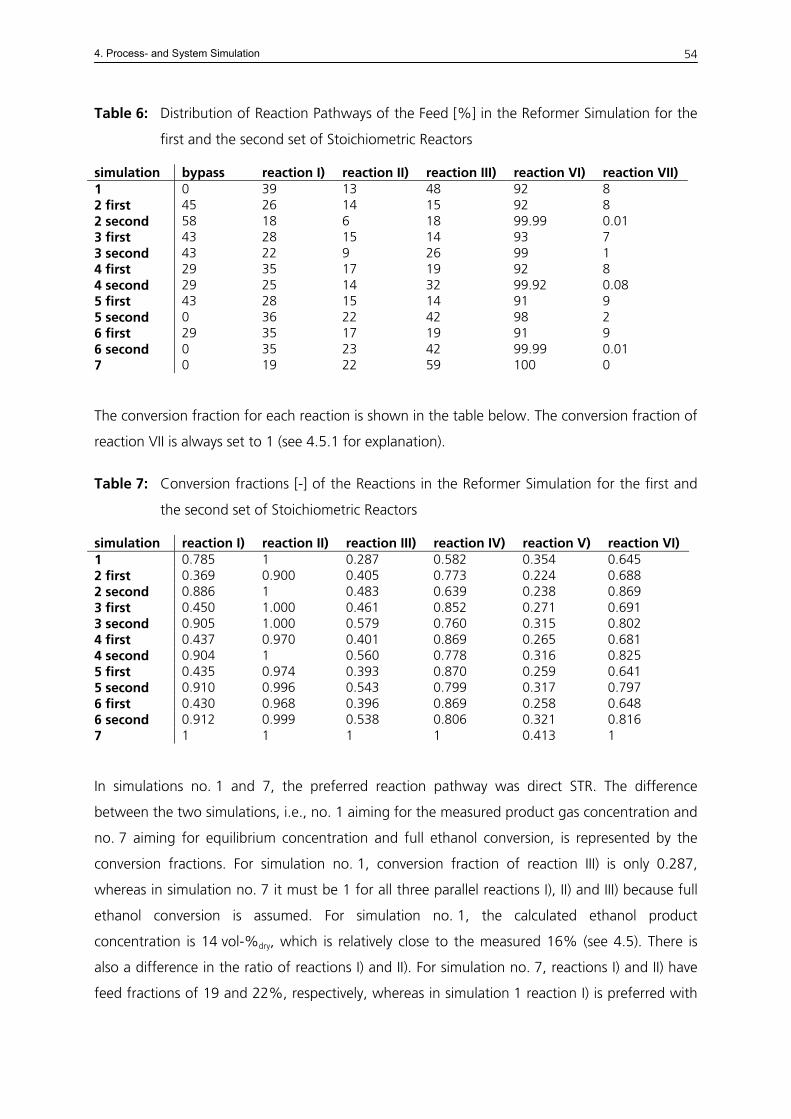
4. Process- and System Simulation
54
Table 6: Distribution of Reaction Pathways of the Feed [%] in the Reformer Simulation for the
first and the second set of Stoichiometric Reactors
simulation bypass reaction I) reaction II) reaction III) reaction VI) reaction VII) 1 0 39 13 48 92 8 2 first 45 26 14 15 92 8 2 second 58 18 6 18 99.99 0.01 3 first 43 28 15 14 93 7 3 second 43 22 9 26 99 1 4 first 29 35 17 19 92 8 4 second 29 25 14 32 99.92 0.08 5 first 43 28 15 14 91 9 5 second 0 36 22 42 98 2 6 first 29 35 17 19 91 9 6 second 0 35 23 42 99.99 0.01 7 0 19 22 59 100 0
The conversion fraction for each reaction is shown in the table below. The conversion fraction of
reaction VII is always set to 1 (see 4.5.1 for explanation).
Table 7: Conversion fractions [-] of the Reactions in the Reformer Simulation for the first and
the second set of Stoichiometric Reactors
simulation reaction I) reaction II) reaction III) reaction IV) reaction V) reaction VI) 1 0.785 1 0.287 0.582 0.354 0.645 2 first 0.369 0.900 0.405 0.773 0.224 0.688 2 second 0.886 1 0.483 0.639 0.238 0.869 3 first 0.450 1.000 0.461 0.852 0.271 0.691 3 second 0.905 1.000 0.579 0.760 0.315 0.802 4 first 0.437 0.970 0.401 0.869 0.265 0.681 4 second 0.904 1 0.560 0.778 0.316 0.825 5 first 0.435 0.974 0.393 0.870 0.259 0.641 5 second 0.910 0.996 0.543 0.799 0.317 0.797 6 first 0.430 0.968 0.396 0.869 0.258 0.648 6 second 0.912 0.999 0.538 0.806 0.321 0.816 7 1 1 1 1 0.413 1
In simulations no. 1 and 7, the preferred reaction pathway was direct STR. The difference
between the two simulations, i.e., no. 1 aiming for the measured product gas concentration and
no. 7 aiming for equilibrium concentration and full ethanol conversion, is represented by the
conversion fractions. For simulation no. 1, conversion fraction of reaction III) is only 0.287,
whereas in simulation no. 7 it must be 1 for all three parallel reactions I), II) and III) because full
ethanol conversion is assumed. For simulation no. 1, the calculated ethanol product
concentration is 14 vol-%dry, which is relatively close to the measured 16% (see 4.5). There is
also a difference in the ratio of reactions I) and II). For simulation no. 7, reactions I) and II) have
feed fractions of 19 and 22%, respectively, whereas in simulation 1 reaction I) is preferred with
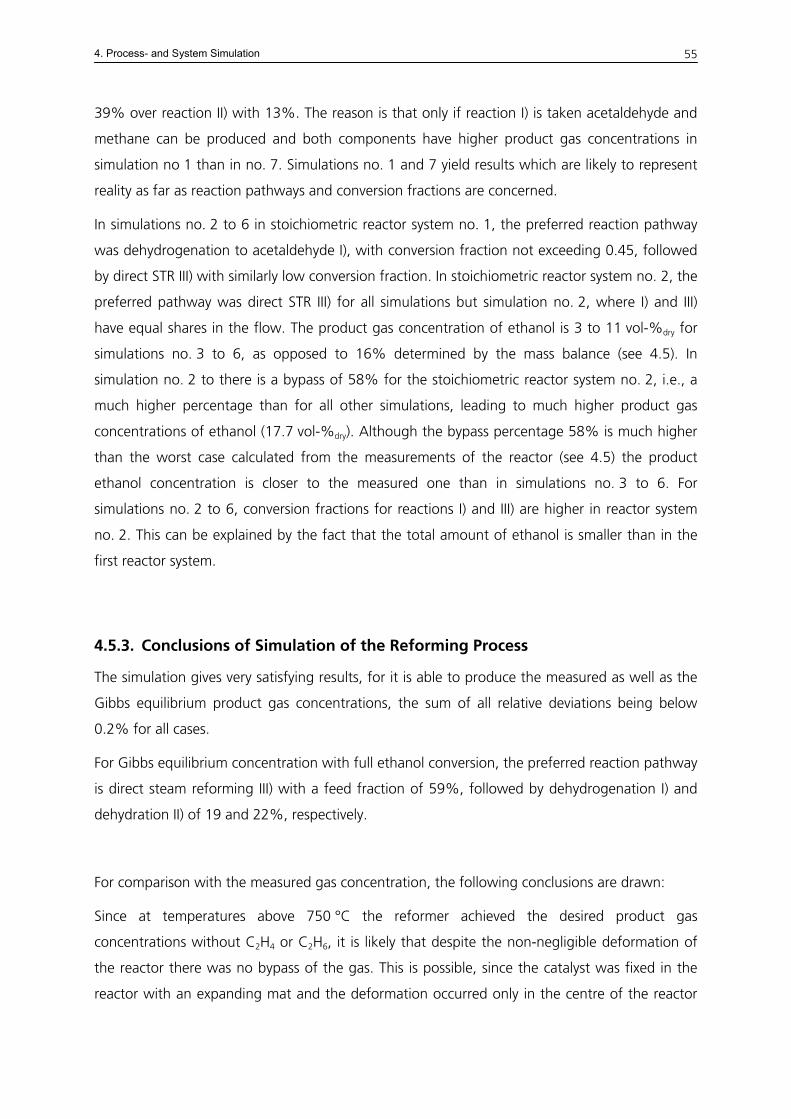
4. Process- and System Simulation
55
39% over reaction II) with 13%. The reason is that only if reaction I) is taken acetaldehyde and
methane can be produced and both components have higher product gas concentrations in
simulation no 1 than in no. 7. Simulations no. 1 and 7 yield results which are likely to represent
reality as far as reaction pathways and conversion fractions are concerned.
In simulations no. 2 to 6 in stoichiometric reactor system no. 1, the preferred reaction pathway
was dehydrogenation to acetaldehyde I), with conversion fraction not exceeding 0.45, followed
by direct STR III) with similarly low conversion fraction. In stoichiometric reactor system no. 2, the
preferred pathway was direct STR III) for all simulations but simulation no. 2, where I) and III)
have equal shares in the flow. The product gas concentration of ethanol is 3 to 11 vol-%dry for
simulations no. 3 to 6, as opposed to 16% determined by the mass balance (see 4.5). In
simulation no. 2 to there is a bypass of 58% for the stoichiometric reactor system no. 2, i.e., a
much higher percentage than for all other simulations, leading to much higher product gas
concentrations of ethanol (17.7 vol-%dry). Although the bypass percentage 58% is much higher
than the worst case calculated from the measurements of the reactor (see 4.5) the product
ethanol concentration is closer to the measured one than in simulations no. 3 to 6. For
simulations no. 2 to 6, conversion fractions for reactions I) and III) are higher in reactor system
no. 2. This can be explained by the fact that the total amount of ethanol is smaller than in the
first reactor system.
4.5.3. Conclusions of Simulation of the Reforming Process
The simulation gives very satisfying results, for it is able to produce the measured as well as the
Gibbs equilibrium product gas concentrations, the sum of all relative deviations being below
0.2% for all cases.
For Gibbs equilibrium concentration with full ethanol conversion, the preferred reaction pathway
is direct steam reforming III) with a feed fraction of 59%, followed by dehydrogenation I) and
dehydration II) of 19 and 22%, respectively.
For comparison with the measured gas concentration, the following conclusions are drawn:
Since at temperatures above 750 °C the reformer achieved the desired product gas
concentrations without C2H4 or C2H6, it is likely that despite the non-negligible deformation of
the reactor there was no bypass of the gas. This is possible, since the catalyst was fixed in the
reactor with an expanding mat and the deformation occurred only in the centre of the reactor
4. Process- and System Simulation
56
surface, the edges being geometrically fixed by the welding seams. Thus, simulation no. 1 is
favoured to represent the actual reaction pathways. Its ethanol product concentration of
14 vol-%dry also matches the measured 16% relatively well.
In case a bypass occurred, it would probably have been the mild case with 29% in both layers,
represented by simulation no. 4. However, this would yield an ethanol product concentration of
8 vol-%dry only. The preferred pathways would then be dehydrogenation in reactor system
no. 1, followed by direct STR in system no 2. Although a better match for ethanol product can
be achieved with simulation no 2, this simulation is discarded due to its bypass resulting in
unrealistically high 58%.
5. Development of and Experimental Results from a Catalyst Investigation Test Rig
57
5. Development of and Experimental Results from a Catalyst
Investigation Test Rig
A variety of commercial catalysts were investigated in separate catalyst screening test rigs. The
objective was to find the optimum catalyst for the reforming, water gas shift and selective
methanation reaction, i.e., the one that came closest to the simulated equilibrium and at the
same time the highest gas hourly space velocity (GHSV), resulting in the smallest reactor volume.
Each catalyst was tested at different temperatures with different GHSV and different feed
streams so that for each reaction the optimum operation point would be found.
This section is a summary of a publication about the reforming and water gas shift reaction,
extended by the methanation experiments. The full publication is [Rochlitz 2008] for WGS and
the STR results are summarized in [Aicher 2008].
5.1. Test Rigs for Catalyst Screening
The test rigs are built in such a way that flow distribution within the catalyst can be guaranteed
to be equal, the reactors being of cylindrical shape with a sufficiently long inlet and distribution
chamber and a length/diameter ratio of at least 2. Furthermore, the feed streams are of a clearly
defined composition and inlet temperature, which are held constant throughout the
experiment, so there are no uncertainties about any of the parameters. The reactor diameters
are small enough so that the temperature gradient over the radius is negligible.
The only aspect where uncertainty remains is the temperature measurement in the catalyst.
Although in most experiments the catalyst temperatures were measured at several different axial
and radial locations, it cannot be guaranteed that the thermocouples were in the same position
for each catalyst. Furthermore, when comparing the experimental results to the simulation, it is
important to keep in mind that the temperature is not uniform within the catalyst. Typical
temperature deviations between the different locations are no more than 5 K. It can be assumed
that the relevant temperature is the one at the outlet of the catalyst, for this is the last place at
which a reaction can take place. For endothermic reactions, it is likely that the outlet
temperature is lower than the one at which the majority of the feed conversion occurs. Thus,
the product gas composition may be "beyond" the thermodynamically possible equilibrium
5. Development of and Experimental Results from a Catalyst Investigation Test Rig
58
calculated for the outlet temperature. This means that, for example, a species which is produced
during a reaction might exceed the value predicted by the simulation because the temperature
measured during the experiment does not match the temperature at which the largest part of
the conversion takes place. For exothermal reactions, a reverse reaction may occur towards the
reactor outlet.
5.1.1. Equilibrium Test Rig for Steam Reforming
The test rig for the steam reforming reaction was set up as shown in the simplified process flow
diagram shown and explained in A.6.
In order to avoid the undesirable carbon deposition, an S/C ratio of 3.0 was used. This number is
supported by the available theory and past experience obtained at Fraunhofer ISE. The
CHEMCAD simulation shows the chosen ratio as favourable due to the low levels of CO
formation compared to lower S/C and at the same time less required energy for the water-fuel
mix evaporation compared to higher S/C. However, an S/C of 2 was also tested in some
experiments.
Amongst many others, the following tests which were relevant to this work were carried out:
Table 8: Feed streams and GHSV for steam reforming catalysts. No. 1 and 2 are honeycombs,
no. 3 pellets. All experiments are carried through at ambient pressure.
catalyst no. 1 1 2 2 2 3 S/C 3 3 3 2 2 3 GHSV [1/h] 10,000 13,000 10,000 7000 11,700 1650
All catalysts are commercial precious metal catalysts (Pt, Ru and Rh) on a ceramic support. The
exact composition was not disclosed by the manufacturer. The honeycombs have 600 cpsi (cells
per in²) and the pellets are spheres with a 2 mm diameter.
5.1.2. Equilibrium Test Rig for Water Gas Shift and Methanation
The test rig for water gas shift reaction was set up as shown in the simplified process flow
diagram shown and explained in A.7.
For HTS catalysts, two types of tests were carried out:
5. Development of and Experimental Results from a Catalyst Investigation Test Rig
59
a) Catalyst temperature screening with constant flow, S/C ratio and space velocity.
b) Long term tests at the point of lowest CO content in the product gas, determined during
the temperature screening tests.
For the LTS catalyst, only screening was carried out, with:
a) varying temperatures and constant feed and
b) varying feed gas composition and constant LTS temperature
In this work, only the following catalyst screenings will be presented:
Table 9: Feed streams, dimensions and GHSV for water gas shift catalysts. All experiments are
carried out at ambient pressure.
catalyst type HTS HTS HTS HTS MTS MTS catalyst no. 3 6 1 1 (+CO) 7 7 component fraction fraction fraction fraction fraction fraction [vol-%] [vol-%] [vol-%] [vol-%] [vol-%] [vol-%] CO 04.1 04.0 04.2 11.0 04.2 04.1 CO2 11.8 11.3 11.9 09.3 11.9 11.6 CH4 03.6 03.4 03.6 03.3 03.6 03.5 H2 39.7 37.9 39.9 36.5 39.9 38.9 C2H4 00 02.7 00 00 00 02.5 H2O 40.8 40.8 40.5 40.5 40.5 39.4 material comb comb pellets pellets comb comb dimensions length [mm] 40 40 20 20 40 40 diameter [mm] 14 14 20 20 14 14 GHSV [1/h] 7500 7500 7350 7500 7500 7690
The honeycombs have 600 cpsi and the pellets are cylinders of 1.5 x 10 mm.
For the high temperature shift pellets (catalyst no. 1), extra CO was added in some experiments
to create a reformate which came closer to the measured reformate product gas composition
from other laboratory test runs at the Fraunhofer ISE.
The medium temperature shift comb can be used for medium (about 250 to 300 °C) and high
temperatures (300 – 500 °C) but in this paper is referred to as MTS for better distinction.
Catalysts no. 1, 3 & 6 are made of Pt on high active mixed oxide carrier. Catalyst no. 7 is
precious metal on ceramic support.
5. Development of and Experimental Results from a Catalyst Investigation Test Rig
60
A number of experiments were carried out with the selective methanation catalyst, with
variation of GHSV and CO feed concentration. In this work, one screening test is presented:
Table 10: Feed stream, dimensions and GHSV for methanation catalyst at ambient pressure
component fraction [vol-%dry] CO 00.6 CO2 24.0 CH4 05.4 H2 70.0 material granulate, average size 1.5 mm bed dimensions length [mm] 31 diameter [mm] 20 GHSV [1/h] 5200
The catalyst has a support of synthetic alumosilicate, coated with precious metal. The exact
composition is undisclosed by the catalyst supplier.
5.2. Experimental Results and Discussion
In the following sections, the experimental results of the catalyst screenings for STR, WGS and
SelMet will be presented and discussed. The molar fractions of the product gases of the
different catalysts are compared with each other and with the simulated thermodynamic
equilibrium composition.
5.2.1. Steam Reforming
For the STR reaction, the simulated equilibrium concentrations of the product gases are
displayed in the left part of Figure 12. On the right side, the measurements for three different
temperatures of catalyst no. 2, at S/C = 3 and GHSV 10,000/h are compared to these simulated
concentrations.
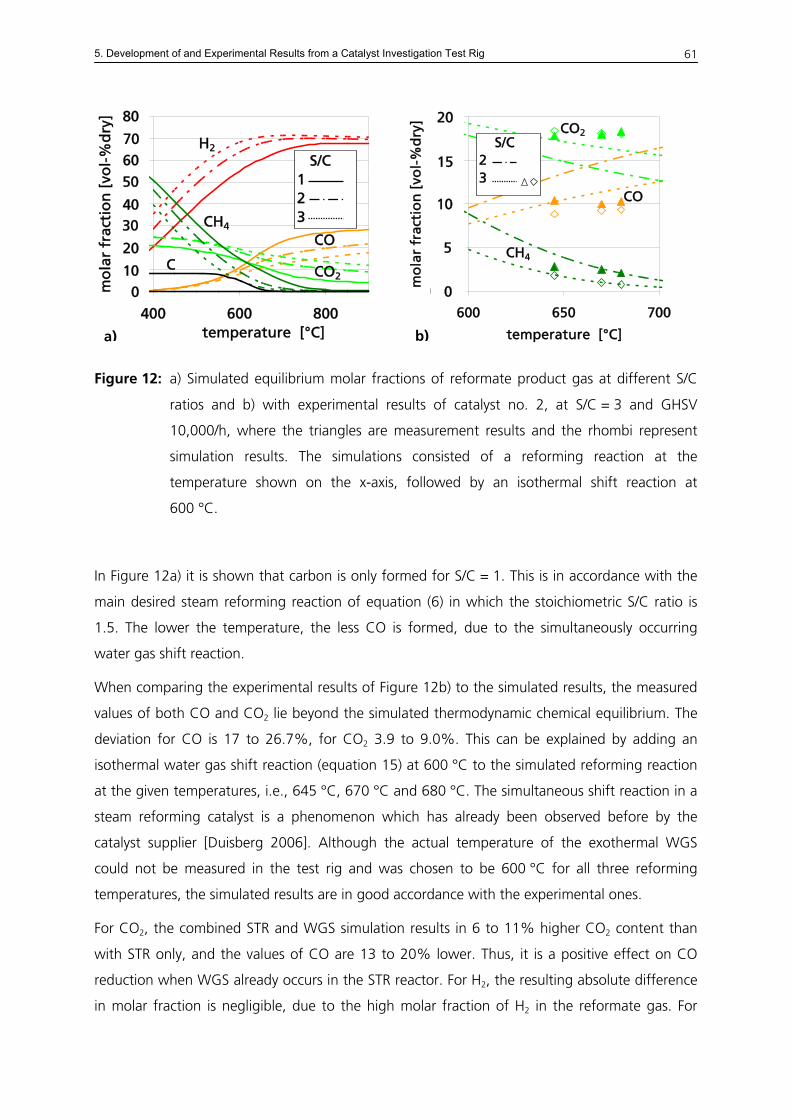
5. Development of and Experimental Results from a Catalyst Investigation Test Rig
61
0.00.10.20.30.40.50.60.70.8
400 600 800temperature [°C]
mo
lar
frac
tio
n [
vol-
%d
ry]
S/C 12 3
H2
CO
CO2
CH4
C
0.00
0.05
0.10
0.15
0.20
600 650 700
temperature [°C]
mo
lar
frac
tio
n [
vol-
%d
ry]
CO
CO2
CH4
S/C 2 3
40
50 60
80
70
30
20
10 0
20
15
10
5
0
b)a)
Figure 12: a) Simulated equilibrium molar fractions of reformate product gas at different S/C
ratios and b) with experimental results of catalyst no. 2, at S/C = 3 and GHSV
10,000/h, where the triangles are measurement results and the rhombi represent
simulation results. The simulations consisted of a reforming reaction at the
temperature shown on the x-axis, followed by an isothermal shift reaction at
600 °C.
In Figure 12a) it is shown that carbon is only formed for S/C = 1. This is in accordance with the
main desired steam reforming reaction of equation (6) in which the stoichiometric S/C ratio is
1.5. The lower the temperature, the less CO is formed, due to the simultaneously occurring
water gas shift reaction.
When comparing the experimental results of Figure 12b) to the simulated results, the measured
values of both CO and CO2 lie beyond the simulated thermodynamic chemical equilibrium. The
deviation for CO is 17 to 26.7%, for CO2 3.9 to 9.0%. This can be explained by adding an
isothermal water gas shift reaction (equation 15) at 600 °C to the simulated reforming reaction
at the given temperatures, i.e., 645 °C, 670 °C and 680 °C. The simultaneous shift reaction in a
steam reforming catalyst is a phenomenon which has already been observed before by the
catalyst supplier [Duisberg 2006]. Although the actual temperature of the exothermal WGS
could not be measured in the test rig and was chosen to be 600 °C for all three reforming
temperatures, the simulated results are in good accordance with the experimental ones.
For CO2, the combined STR and WGS simulation results in 6 to 11% higher CO2 content than
with STR only, and the values of CO are 13 to 20% lower. Thus, it is a positive effect on CO
reduction when WGS already occurs in the STR reactor. For H2, the resulting absolute difference
in molar fraction is negligible, due to the high molar fraction of H2 in the reformate gas. For
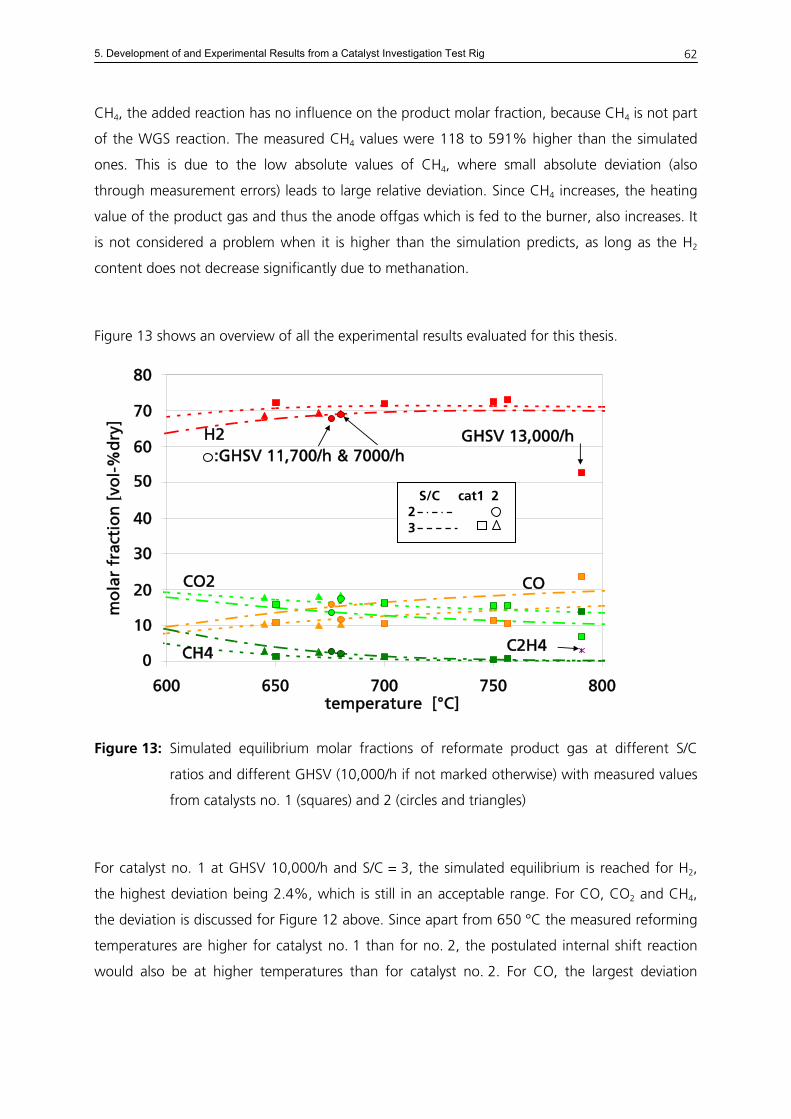
5. Development of and Experimental Results from a Catalyst Investigation Test Rig
62
CH4, the added reaction has no influence on the product molar fraction, because CH4 is not part
of the WGS reaction. The measured CH4 values were 118 to 591% higher than the simulated
ones. This is due to the low absolute values of CH4, where small absolute deviation (also
through measurement errors) leads to large relative deviation. Since CH4 increases, the heating
value of the product gas and thus the anode offgas which is fed to the burner, also increases. It
is not considered a problem when it is higher than the simulation predicts, as long as the H2
content does not decrease significantly due to methanation.
Figure 13 shows an overview of all the experimental results evaluated for this thesis.
0,0
0,1
0,2
0,3
0,4
0,5
0,6
0,7
0,8
600 650 700 750 800temperature [°C]
mo
lar
frac
tio
n [
vol-
%d
ry]
H2
COCO2
CH4
GHSV 13,000/h:GHSV 11,700/h & 7000/h
C2H4 0
10
20
30
40
50
60
70
80
3 2 S/C cat1 2
Figure 13: Simulated equilibrium molar fractions of reformate product gas at different S/C
ratios and different GHSV (10,000/h if not marked otherwise) with measured values
from catalysts no. 1 (squares) and 2 (circles and triangles)
For catalyst no. 1 at GHSV 10,000/h and S/C = 3, the simulated equilibrium is reached for H2,
the highest deviation being 2.4%, which is still in an acceptable range. For CO, CO2 and CH4,
the deviation is discussed for Figure 12 above. Since apart from 650 °C the measured reforming
temperatures are higher for catalyst no. 1 than for no. 2, the postulated internal shift reaction
would also be at higher temperatures than for catalyst no. 2. For CO, the largest deviation
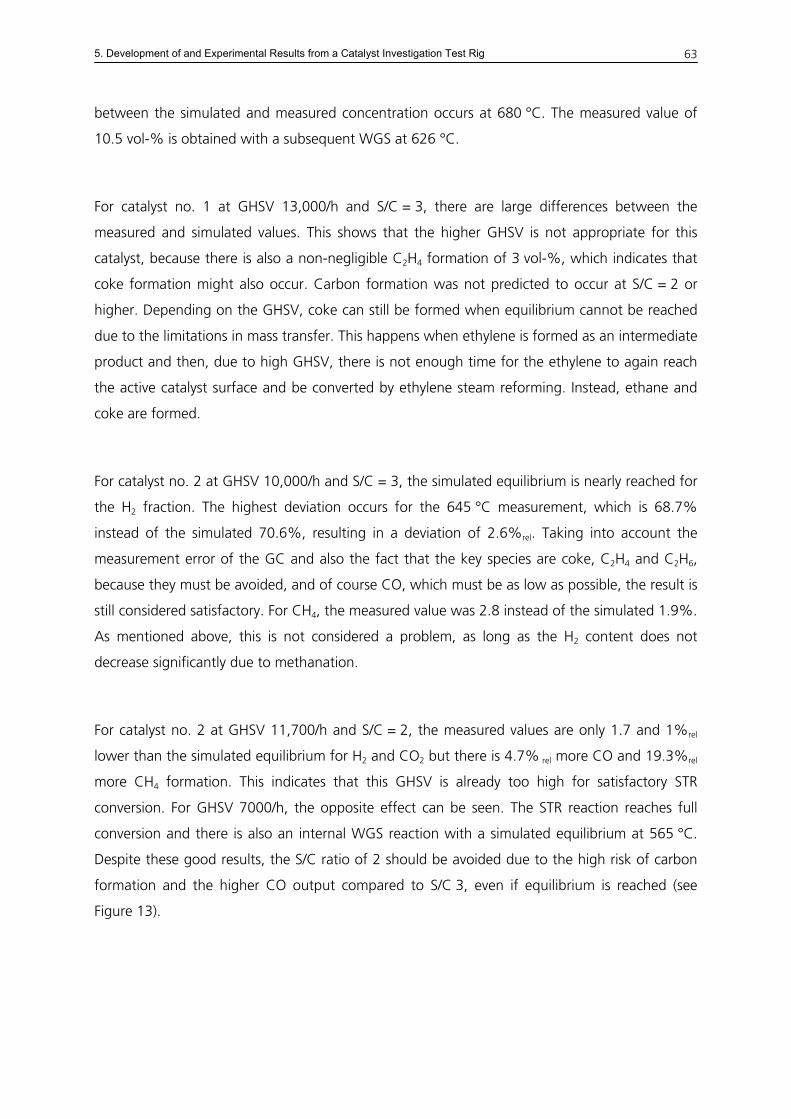
5. Development of and Experimental Results from a Catalyst Investigation Test Rig
63
between the simulated and measured concentration occurs at 680 °C. The measured value of
10.5 vol-% is obtained with a subsequent WGS at 626 °C.
For catalyst no. 1 at GHSV 13,000/h and S/C = 3, there are large differences between the
measured and simulated values. This shows that the higher GHSV is not appropriate for this
catalyst, because there is also a non-negligible C2H4 formation of 3 vol-%, which indicates that
coke formation might also occur. Carbon formation was not predicted to occur at S/C = 2 or
higher. Depending on the GHSV, coke can still be formed when equilibrium cannot be reached
due to the limitations in mass transfer. This happens when ethylene is formed as an intermediate
product and then, due to high GHSV, there is not enough time for the ethylene to again reach
the active catalyst surface and be converted by ethylene steam reforming. Instead, ethane and
coke are formed.
For catalyst no. 2 at GHSV 10,000/h and S/C = 3, the simulated equilibrium is nearly reached for
the H2 fraction. The highest deviation occurs for the 645 °C measurement, which is 68.7%
instead of the simulated 70.6%, resulting in a deviation of 2.6%rel. Taking into account the
measurement error of the GC and also the fact that the key species are coke, C2H4 and C2H6,
because they must be avoided, and of course CO, which must be as low as possible, the result is
still considered satisfactory. For CH4, the measured value was 2.8 instead of the simulated 1.9%.
As mentioned above, this is not considered a problem, as long as the H2 content does not
decrease significantly due to methanation.
For catalyst no. 2 at GHSV 11,700/h and S/C = 2, the measured values are only 1.7 and 1%rel
lower than the simulated equilibrium for H2 and CO2 but there is 4.7% rel more CO and 19.3%rel
more CH4 formation. This indicates that this GHSV is already too high for satisfactory STR
conversion. For GHSV 7000/h, the opposite effect can be seen. The STR reaction reaches full
conversion and there is also an internal WGS reaction with a simulated equilibrium at 565 °C.
Despite these good results, the S/C ratio of 2 should be avoided due to the high risk of carbon
formation and the higher CO output compared to S/C 3, even if equilibrium is reached (see
Figure 13).
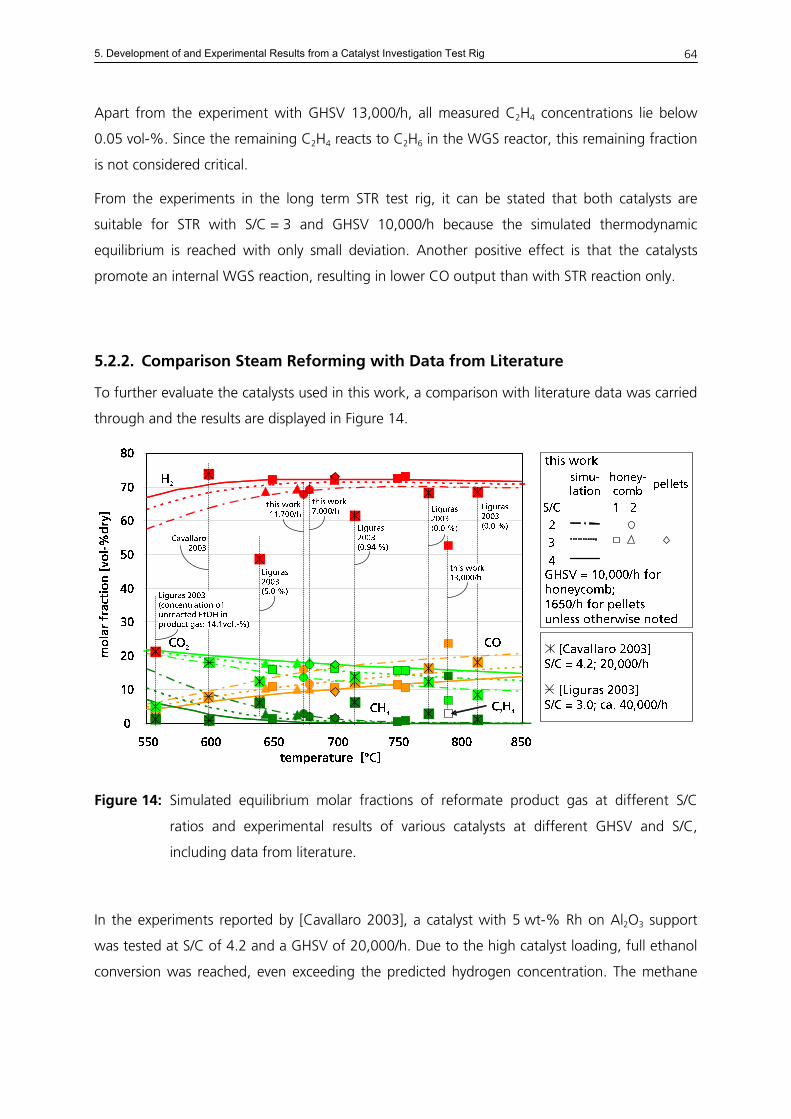
5. Development of and Experimental Results from a Catalyst Investigation Test Rig
64
Apart from the experiment with GHSV 13,000/h, all measured C2H4 concentrations lie below
0.05 vol-%. Since the remaining C2H4 reacts to C2H6 in the WGS reactor, this remaining fraction
is not considered critical.
From the experiments in the long term STR test rig, it can be stated that both catalysts are
suitable for STR with S/C = 3 and GHSV 10,000/h because the simulated thermodynamic
equilibrium is reached with only small deviation. Another positive effect is that the catalysts
promote an internal WGS reaction, resulting in lower CO output than with STR reaction only.
5.2.2. Comparison Steam Reforming with Data from Literature
To further evaluate the catalysts used in this work, a comparison with literature data was carried
through and the results are displayed in Figure 14.
Figure 14: Simulated equilibrium molar fractions of reformate product gas at different S/C
ratios and experimental results of various catalysts at different GHSV and S/C,
including data from literature.
In the experiments reported by [Cavallaro 2003], a catalyst with 5 wt-% Rh on Al2O3 support
was tested at S/C of 4.2 and a GHSV of 20,000/h. Due to the high catalyst loading, full ethanol
conversion was reached, even exceeding the predicted hydrogen concentration. The methane
5. Development of and Experimental Results from a Catalyst Investigation Test Rig
65
concentration, on the other hand, seems quite low compared to the thermodynamic
equilibrium.
Liguras et al. [Liguras 2003] tested several different precious metal catalysts and found that Rh
was more active and selective toward H2 formation than Ru, Pt and Pd. The results of the testing
of a catalyst with 1 wt-% Rh on Al2O3/MgO at S/C 3 are displayed in Figure 14. GHSV can be
estimated based on data from an earlier publication (see [Fatsikostas 2002]). Due to the low
catalyst loading, complete conversion of ethanol is only reached at temperatures above about
750 °C. Even at full conversion equilibrium cannot be reached.
5.2.3. Water Gas Shift
In the following, experimental results with the various shift catalysts are presented and
discussed.
5.2.3.1. HTS Catalyst no. 1
The results of the catalyst screening for HTS catalyst no. 1 are shown in Figure 15.
0
0.5
1
1.5
2
2.5
200 250 300 350 400outlet temperature [°C]
mol
ar fr
actio
n C
O [v
ol-%
dry] measured
simulated equilibrium
Figure 15: Temperature screening for water gas shift catalyst no. 1. Gas inlet concentration
and GHSV see Table 9.
Optimum working conditions were reached at 280 °C where CO was just under 0.72 vol-%dry.
Compared with the simulation, which was carried through for a water gas shift reaction after
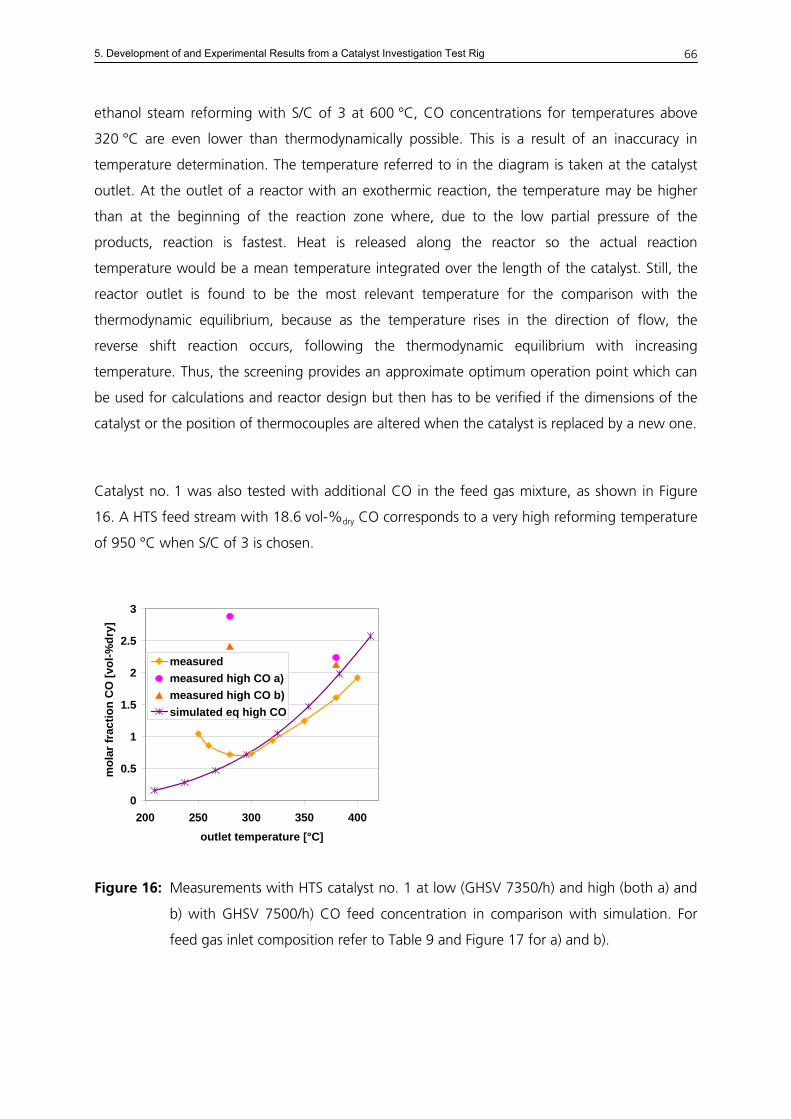
5. Development of and Experimental Results from a Catalyst Investigation Test Rig
66
ethanol steam reforming with S/C of 3 at 600 °C, CO concentrations for temperatures above
320 °C are even lower than thermodynamically possible. This is a result of an inaccuracy in
temperature determination. The temperature referred to in the diagram is taken at the catalyst
outlet. At the outlet of a reactor with an exothermic reaction, the temperature may be higher
than at the beginning of the reaction zone where, due to the low partial pressure of the
products, reaction is fastest. Heat is released along the reactor so the actual reaction
temperature would be a mean temperature integrated over the length of the catalyst. Still, the
reactor outlet is found to be the most relevant temperature for the comparison with the
thermodynamic equilibrium, because as the temperature rises in the direction of flow, the
reverse shift reaction occurs, following the thermodynamic equilibrium with increasing
temperature. Thus, the screening provides an approximate optimum operation point which can
be used for calculations and reactor design but then has to be verified if the dimensions of the
catalyst or the position of thermocouples are altered when the catalyst is replaced by a new one.
Catalyst no. 1 was also tested with additional CO in the feed gas mixture, as shown in Figure
16. A HTS feed stream with 18.6 vol-%dry CO corresponds to a very high reforming temperature
of 950 °C when S/C of 3 is chosen.
0
0.5
1
1.5
2
2.5
3
200 250 300 350 400outlet temperature [°C]
mol
ar fr
actio
n C
O [v
ol-%
dry]
measuredmeasured high CO a)measured high CO b)simulated eq high CO
Figure 16: Measurements with HTS catalyst no. 1 at low (GHSV 7350/h) and high (both a) and
b) with GHSV 7500/h) CO feed concentration in comparison with simulation. For
feed gas inlet composition refer to Table 9 and Figure 17 for a) and b).
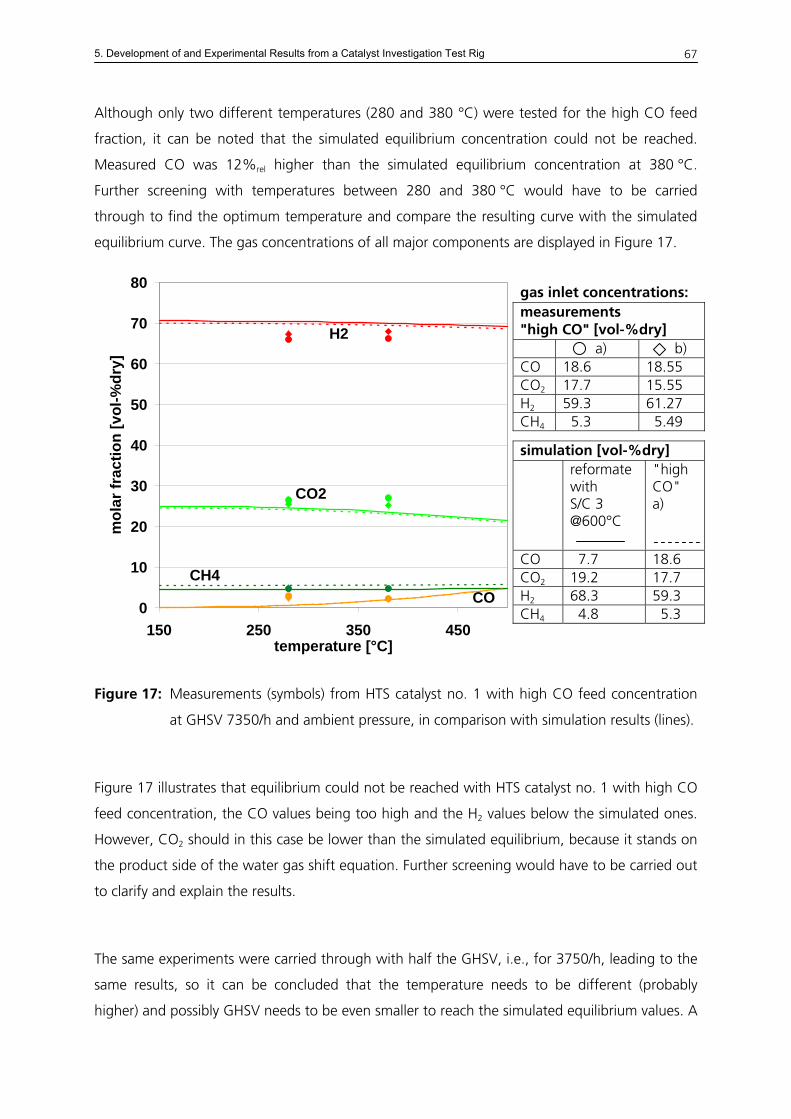
5. Development of and Experimental Results from a Catalyst Investigation Test Rig
67
Although only two different temperatures (280 and 380 °C) were tested for the high CO feed
fraction, it can be noted that the simulated equilibrium concentration could not be reached.
Measured CO was 12%rel higher than the simulated equilibrium concentration at 380 °C.
Further screening with temperatures between 280 and 380 °C would have to be carried
through to find the optimum temperature and compare the resulting curve with the simulated
equilibrium curve. The gas concentrations of all major components are displayed in Figure 17.
Figure 17: Measurements (symbols) from HTS catalyst no. 1 with high CO feed concentration
at GHSV 7350/h and ambient pressure, in comparison with simulation results (lines).
Figure 17 illustrates that equilibrium could not be reached with HTS catalyst no. 1 with high CO
feed concentration, the CO values being too high and the H2 values below the simulated ones.
However, CO2 should in this case be lower than the simulated equilibrium, because it stands on
the product side of the water gas shift equation. Further screening would have to be carried out
to clarify and explain the results.
The same experiments were carried through with half the GHSV, i.e., for 3750/h, leading to the
same results, so it can be concluded that the temperature needs to be different (probably
higher) and possibly GHSV needs to be even smaller to reach the simulated equilibrium values. A
gas inlet concentrations: measurements "high CO" [vol-%dry] a) b) CO 18.6 18.55 CO2 17.7 15.55 H2 59.3 61.27 CH4 05.3 05.49
simulation [vol-%dry] reformate
with S/C 3 @600°C
"high CO" a)
CO 07.7 18.6 CO2 19.2 17.7 H2 68.3 59.3 CH4 04.8 05.3 0
10
20
30
40
50
60
70
80
150 250 350 450temperature [°C]
mol
ar fr
actio
n [v
ol-%
dry]
H2
COCH4
CO2
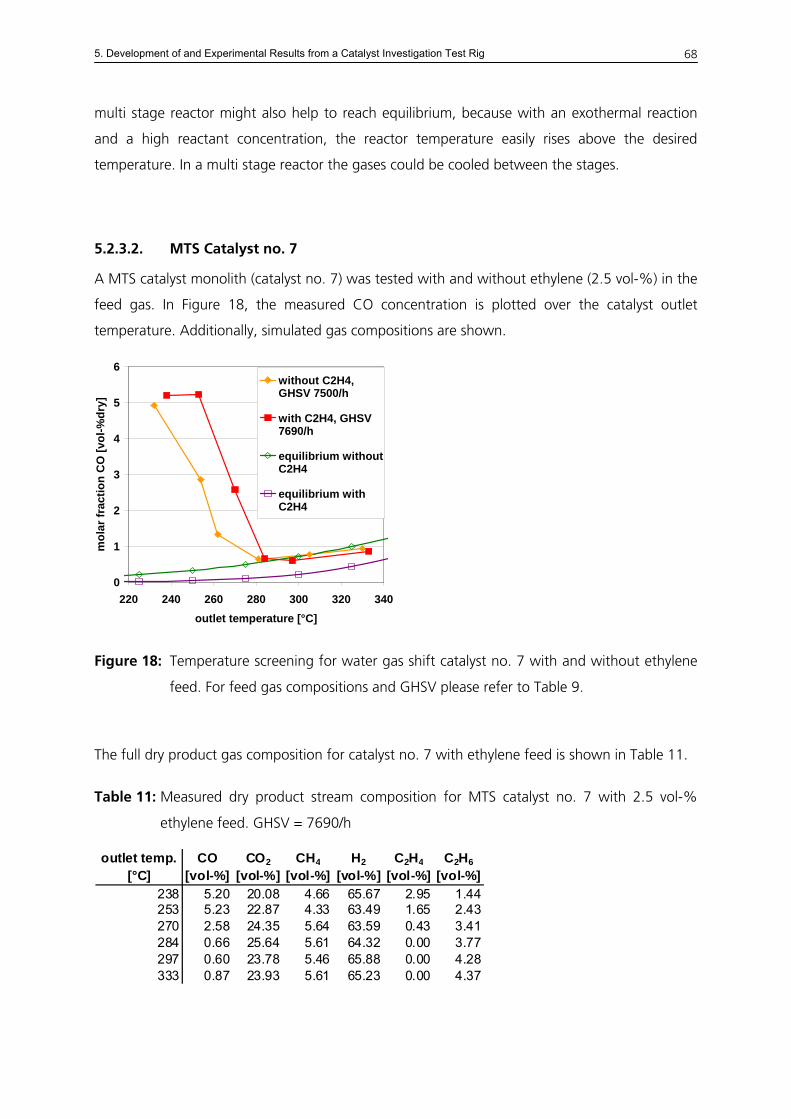
5. Development of and Experimental Results from a Catalyst Investigation Test Rig
68
multi stage reactor might also help to reach equilibrium, because with an exothermal reaction
and a high reactant concentration, the reactor temperature easily rises above the desired
temperature. In a multi stage reactor the gases could be cooled between the stages.
5.2.3.2. MTS Catalyst no. 7
A MTS catalyst monolith (catalyst no. 7) was tested with and without ethylene (2.5 vol-%) in the
feed gas. In Figure 18, the measured CO concentration is plotted over the catalyst outlet
temperature. Additionally, simulated gas compositions are shown.
0
1
2
3
4
5
6
220 240 260 280 300 320 340outlet temperature [°C]
mol
ar fr
actio
n C
O [v
ol-%
dry]
without C2H4,GHSV 7500/h
with C2H4, GHSV7690/h
equilibrium withoutC2H4
equilibrium withC2H4
Figure 18: Temperature screening for water gas shift catalyst no. 7 with and without ethylene
feed. For feed gas compositions and GHSV please refer to Table 9.
The full dry product gas composition for catalyst no. 7 with ethylene feed is shown in Table 11.
Table 11: Measured dry product stream composition for MTS catalyst no. 7 with 2.5 vol-%
ethylene feed. GHSV = 7690/h
outlet temp. CO CO2 CH4 H2 C2H4 C2H6[°C] [vol-%] [vol-%] [vol-%] [vol-%] [vol-%] [vol-%]
238 5.20 20.08 4.66 65.67 2.95 1.44253 5.23 22.87 4.33 63.49 1.65 2.43270 2.58 24.35 5.64 63.59 0.43 3.41284 0.66 25.64 5.61 64.32 0.00 3.77297 0.60 23.78 5.46 65.88 0.00 4.28333 0.87 23.93 5.61 65.23 0.00 4.37
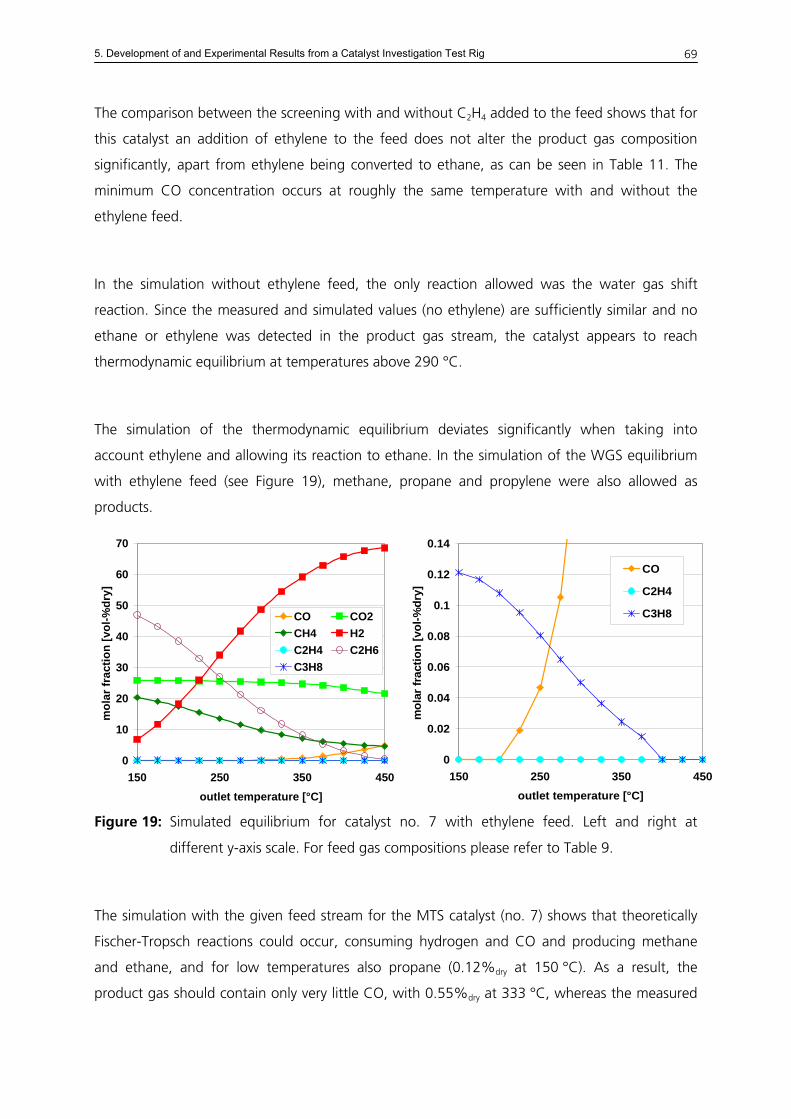
5. Development of and Experimental Results from a Catalyst Investigation Test Rig
69
The comparison between the screening with and without C2H4 added to the feed shows that for
this catalyst an addition of ethylene to the feed does not alter the product gas composition
significantly, apart from ethylene being converted to ethane, as can be seen in Table 11. The
minimum CO concentration occurs at roughly the same temperature with and without the
ethylene feed.
In the simulation without ethylene feed, the only reaction allowed was the water gas shift
reaction. Since the measured and simulated values (no ethylene) are sufficiently similar and no
ethane or ethylene was detected in the product gas stream, the catalyst appears to reach
thermodynamic equilibrium at temperatures above 290 °C.
The simulation of the thermodynamic equilibrium deviates significantly when taking into
account ethylene and allowing its reaction to ethane. In the simulation of the WGS equilibrium
with ethylene feed (see Figure 19), methane, propane and propylene were also allowed as
products.
0
0.02
0.04
0.06
0.08
0.1
0.12
0.14
150 250 350 450outlet temperature [°C]
mol
ar fr
actio
n [v
ol-%
dry]
CO
C2H4
C3H8
0
10
20
30
40
50
60
70
150 250 350 450outlet temperature [°C]
mol
ar fr
actio
n [v
ol-%
dry]
CO CO2CH4 H2C2H4 C2H6C3H8
Figure 19: Simulated equilibrium for catalyst no. 7 with ethylene feed. Left and right at
different y-axis scale. For feed gas compositions please refer to Table 9.
The simulation with the given feed stream for the MTS catalyst (no. 7) shows that theoretically
Fischer-Tropsch reactions could occur, consuming hydrogen and CO and producing methane
and ethane, and for low temperatures also propane (0.12%dry at 150 °C). As a result, the
product gas should contain only very little CO, with 0.55%dry at 333 °C, whereas the measured
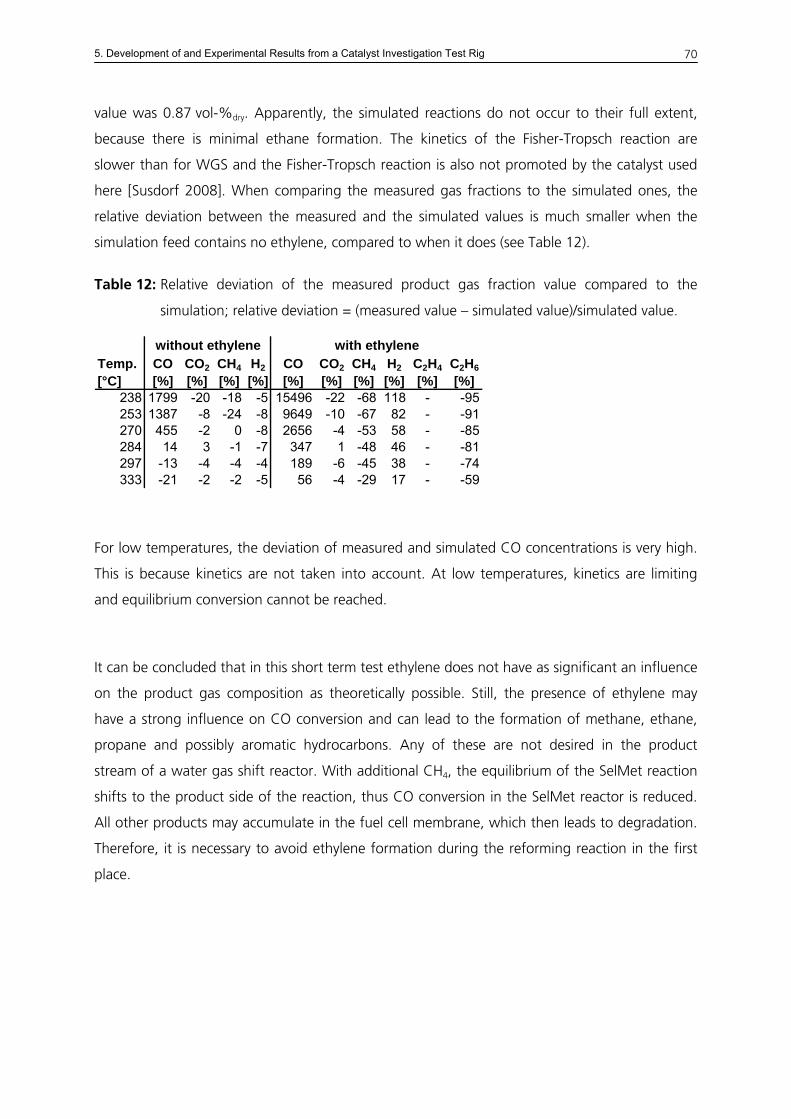
5. Development of and Experimental Results from a Catalyst Investigation Test Rig
70
value was 0.87 vol-%dry. Apparently, the simulated reactions do not occur to their full extent,
because there is minimal ethane formation. The kinetics of the Fisher-Tropsch reaction are
slower than for WGS and the Fisher-Tropsch reaction is also not promoted by the catalyst used
here [Susdorf 2008]. When comparing the measured gas fractions to the simulated ones, the
relative deviation between the measured and the simulated values is much smaller when the
simulation feed contains no ethylene, compared to when it does (see Table 12).
Table 12: Relative deviation of the measured product gas fraction value compared to the
simulation; relative deviation = (measured value – simulated value)/simulated value.
Temp. CO CO2 CH4 H2 CO CO2 CH4 H2 C2H4 C2H6[°C] [%] [%] [%] [%] [%] [%] [%] [%] [%] [%]
238 1799 -20 -18 -5 15496 -22 -68 118 - -95253 1387 -8 -24 -8 9649 -10 -67 82 - -91270 455 -2 0 -8 2656 -4 -53 58 - -85284 14 3 -1 -7 347 1 -48 46 - -81297 -13 -4 -4 -4 189 -6 -45 38 - -74333 -21 -2 -2 -5 56 -4 -29 17 - -59
with ethylenewithout ethylene
For low temperatures, the deviation of measured and simulated CO concentrations is very high.
This is because kinetics are not taken into account. At low temperatures, kinetics are limiting
and equilibrium conversion cannot be reached.
It can be concluded that in this short term test ethylene does not have as significant an influence
on the product gas composition as theoretically possible. Still, the presence of ethylene may
have a strong influence on CO conversion and can lead to the formation of methane, ethane,
propane and possibly aromatic hydrocarbons. Any of these are not desired in the product
stream of a water gas shift reactor. With additional CH4, the equilibrium of the SelMet reaction
shifts to the product side of the reaction, thus CO conversion in the SelMet reactor is reduced.
All other products may accumulate in the fuel cell membrane, which then leads to degradation.
Therefore, it is necessary to avoid ethylene formation during the reforming reaction in the first
place.
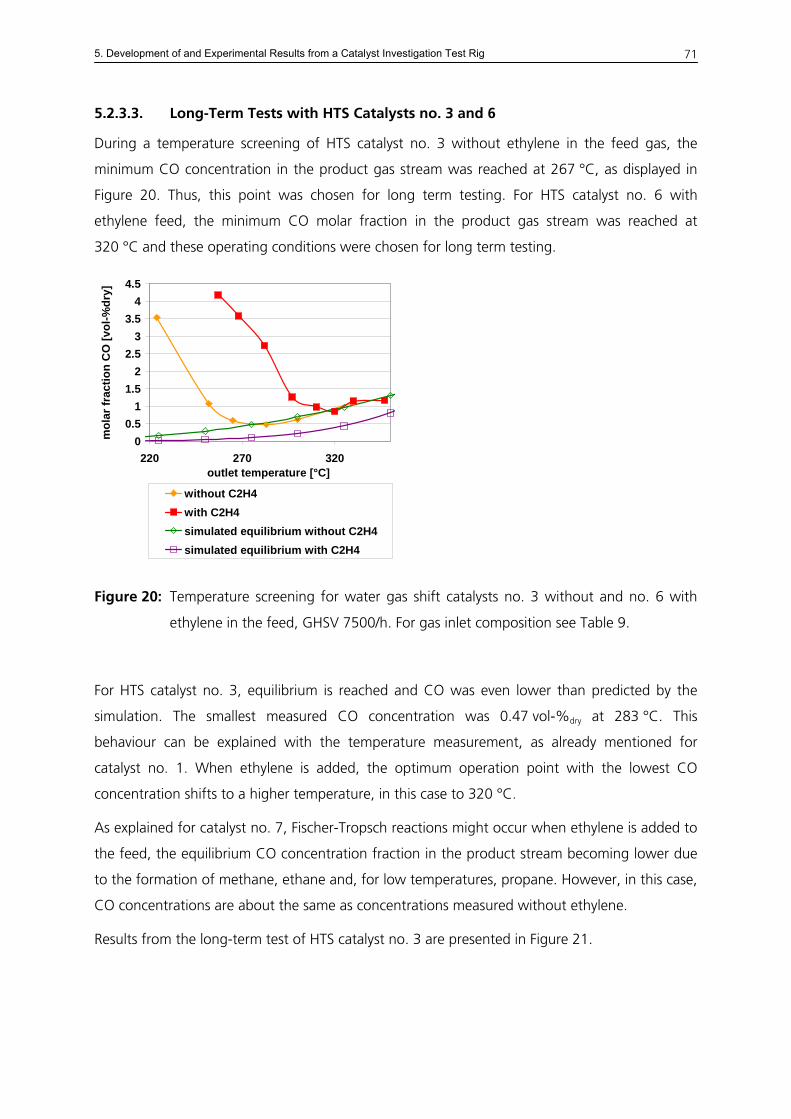
5. Development of and Experimental Results from a Catalyst Investigation Test Rig
71
5.2.3.3. Long-Term Tests with HTS Catalysts no. 3 and 6
During a temperature screening of HTS catalyst no. 3 without ethylene in the feed gas, the
minimum CO concentration in the product gas stream was reached at 267 °C, as displayed in
Figure 20. Thus, this point was chosen for long term testing. For HTS catalyst no. 6 with
ethylene feed, the minimum CO molar fraction in the product gas stream was reached at
320 °C and these operating conditions were chosen for long term testing.
00.5
11.5
22.5
33.5
44.5
220 270 320outlet temperature [°C]
mol
ar fr
actio
n C
O [v
ol-%
dry]
without C2H4with C2H4simulated equilibrium without C2H4simulated equilibrium with C2H4
Figure 20: Temperature screening for water gas shift catalysts no. 3 without and no. 6 with
ethylene in the feed, GHSV 7500/h. For gas inlet composition see Table 9.
For HTS catalyst no. 3, equilibrium is reached and CO was even lower than predicted by the
simulation. The smallest measured CO concentration was 0.47 vol-%dry at 283 °C. This
behaviour can be explained with the temperature measurement, as already mentioned for
catalyst no. 1. When ethylene is added, the optimum operation point with the lowest CO
concentration shifts to a higher temperature, in this case to 320 °C.
As explained for catalyst no. 7, Fischer-Tropsch reactions might occur when ethylene is added to
the feed, the equilibrium CO concentration fraction in the product stream becoming lower due
to the formation of methane, ethane and, for low temperatures, propane. However, in this case,
CO concentrations are about the same as concentrations measured without ethylene.
Results from the long-term test of HTS catalyst no. 3 are presented in Figure 21.
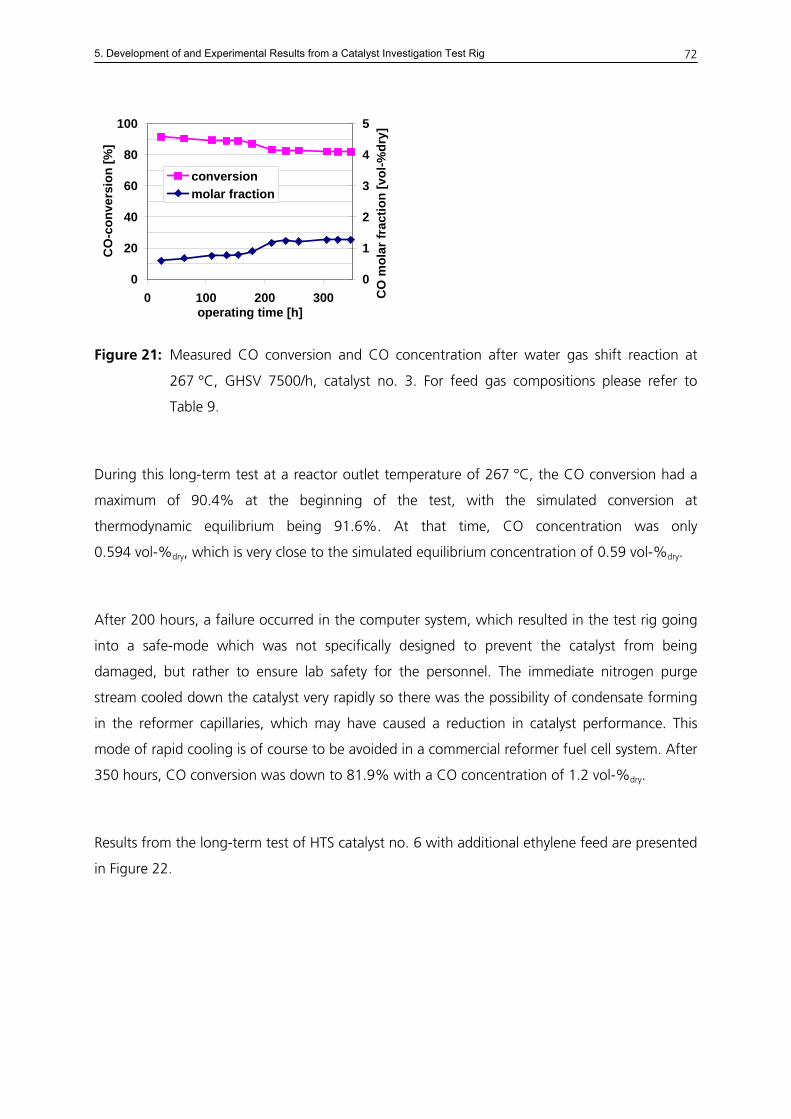
5. Development of and Experimental Results from a Catalyst Investigation Test Rig
72
0
20
40
60
80
100
0 100 200 300operating time [h]
CO
-con
vers
ion
[%]
0
1
2
3
4
5
CO
mol
ar fr
actio
n [v
ol-%
dry]
conversionmolar fraction
Figure 21: Measured CO conversion and CO concentration after water gas shift reaction at
267 °C, GHSV 7500/h, catalyst no. 3. For feed gas compositions please refer to
Table 9.
During this long-term test at a reactor outlet temperature of 267 °C, the CO conversion had a
maximum of 90.4% at the beginning of the test, with the simulated conversion at
thermodynamic equilibrium being 91.6%. At that time, CO concentration was only
0.594 vol-%dry, which is very close to the simulated equilibrium concentration of 0.59 vol-%dry.
After 200 hours, a failure occurred in the computer system, which resulted in the test rig going
into a safe-mode which was not specifically designed to prevent the catalyst from being
damaged, but rather to ensure lab safety for the personnel. The immediate nitrogen purge
stream cooled down the catalyst very rapidly so there was the possibility of condensate forming
in the reformer capillaries, which may have caused a reduction in catalyst performance. This
mode of rapid cooling is of course to be avoided in a commercial reformer fuel cell system. After
350 hours, CO conversion was down to 81.9% with a CO concentration of 1.2 vol-%dry.
Results from the long-term test of HTS catalyst no. 6 with additional ethylene feed are presented
in Figure 22.
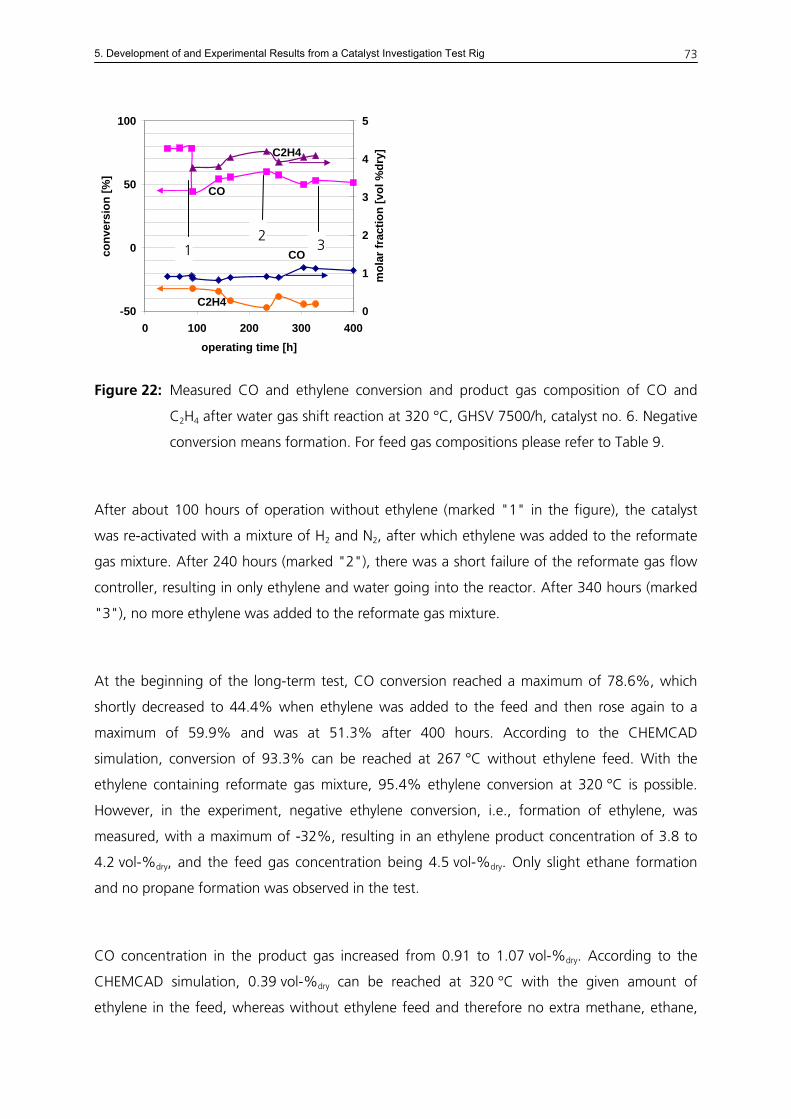
5. Development of and Experimental Results from a Catalyst Investigation Test Rig
73
-50
0
50
100
0 100 200 300 400operating time [h]
conv
ersi
on [%
]
0
1
2
3
4
5
mol
ar fr
actio
n [v
ol %
dry]
CO
CO
C2H4
C2H4
2 3 1
Figure 22: Measured CO and ethylene conversion and product gas composition of CO and
C2H4 after water gas shift reaction at 320 °C, GHSV 7500/h, catalyst no. 6. Negative
conversion means formation. For feed gas compositions please refer to Table 9.
After about 100 hours of operation without ethylene (marked "1" in the figure), the catalyst
was re-activated with a mixture of H2 and N2, after which ethylene was added to the reformate
gas mixture. After 240 hours (marked "2"), there was a short failure of the reformate gas flow
controller, resulting in only ethylene and water going into the reactor. After 340 hours (marked
"3"), no more ethylene was added to the reformate gas mixture.
At the beginning of the long-term test, CO conversion reached a maximum of 78.6%, which
shortly decreased to 44.4% when ethylene was added to the feed and then rose again to a
maximum of 59.9% and was at 51.3% after 400 hours. According to the CHEMCAD
simulation, conversion of 93.3% can be reached at 267 °C without ethylene feed. With the
ethylene containing reformate gas mixture, 95.4% ethylene conversion at 320 °C is possible.
However, in the experiment, negative ethylene conversion, i.e., formation of ethylene, was
measured, with a maximum of -32%, resulting in an ethylene product concentration of 3.8 to
4.2 vol-%dry, and the feed gas concentration being 4.5 vol-%dry. Only slight ethane formation
and no propane formation was observed in the test.
CO concentration in the product gas increased from 0.91 to 1.07 vol-%dry. According to the
CHEMCAD simulation, 0.39 vol-%dry can be reached at 320 °C with the given amount of
ethylene in the feed, whereas without ethylene feed and therefore no extra methane, ethane,
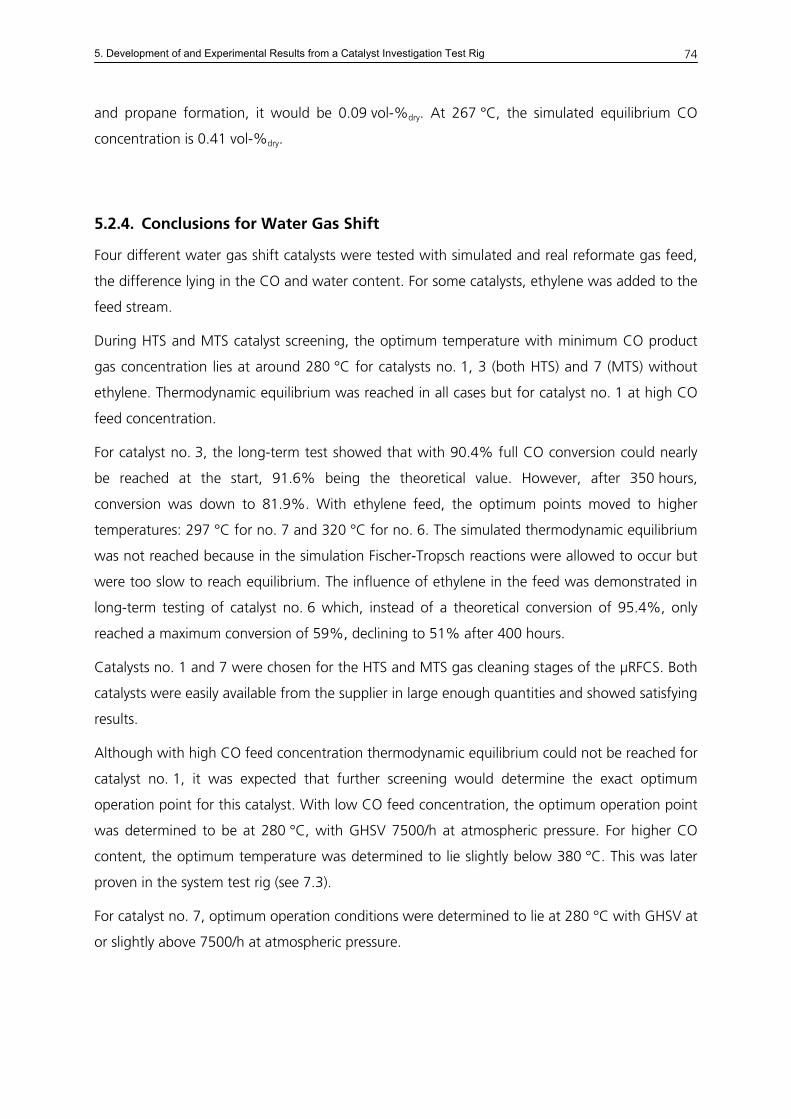
5. Development of and Experimental Results from a Catalyst Investigation Test Rig
74
and propane formation, it would be 0.09 vol-%dry. At 267 °C, the simulated equilibrium CO
concentration is 0.41 vol-%dry.
5.2.4. Conclusions for Water Gas Shift
Four different water gas shift catalysts were tested with simulated and real reformate gas feed,
the difference lying in the CO and water content. For some catalysts, ethylene was added to the
feed stream.
During HTS and MTS catalyst screening, the optimum temperature with minimum CO product
gas concentration lies at around 280 °C for catalysts no. 1, 3 (both HTS) and 7 (MTS) without
ethylene. Thermodynamic equilibrium was reached in all cases but for catalyst no. 1 at high CO
feed concentration.
For catalyst no. 3, the long-term test showed that with 90.4% full CO conversion could nearly
be reached at the start, 91.6% being the theoretical value. However, after 350 hours,
conversion was down to 81.9%. With ethylene feed, the optimum points moved to higher
temperatures: 297 °C for no. 7 and 320 °C for no. 6. The simulated thermodynamic equilibrium
was not reached because in the simulation Fischer-Tropsch reactions were allowed to occur but
were too slow to reach equilibrium. The influence of ethylene in the feed was demonstrated in
long-term testing of catalyst no. 6 which, instead of a theoretical conversion of 95.4%, only
reached a maximum conversion of 59%, declining to 51% after 400 hours.
Catalysts no. 1 and 7 were chosen for the HTS and MTS gas cleaning stages of the μRFCS. Both
catalysts were easily available from the supplier in large enough quantities and showed satisfying
results.
Although with high CO feed concentration thermodynamic equilibrium could not be reached for
catalyst no. 1, it was expected that further screening would determine the exact optimum
operation point for this catalyst. With low CO feed concentration, the optimum operation point
was determined to be at 280 °C, with GHSV 7500/h at atmospheric pressure. For higher CO
content, the optimum temperature was determined to lie slightly below 380 °C. This was later
proven in the system test rig (see 7.3).
For catalyst no. 7, optimum operation conditions were determined to lie at 280 °C with GHSV at
or slightly above 7500/h at atmospheric pressure.
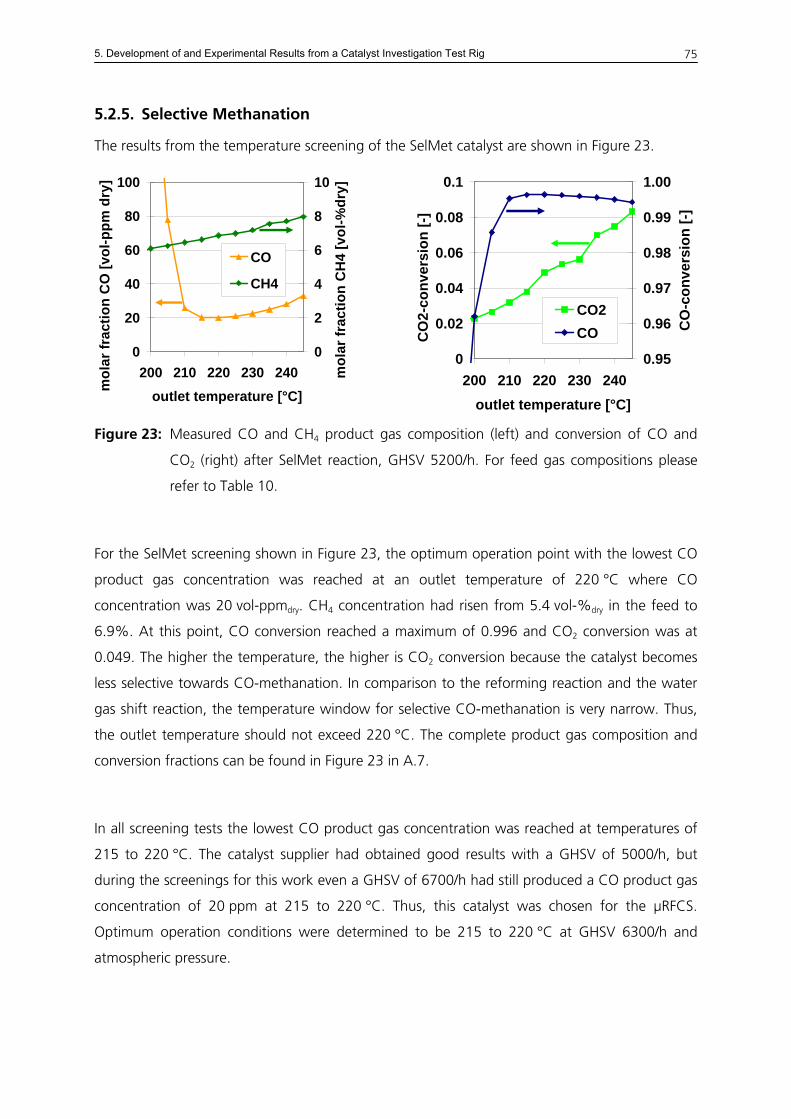
5. Development of and Experimental Results from a Catalyst Investigation Test Rig
75
5.2.5. Selective Methanation
The results from the temperature screening of the SelMet catalyst are shown in Figure 23.
0
20
40
60
80
100
200 210 220 230 240outlet temperature [°C]
mol
ar fr
actio
n C
O [v
ol-p
pm d
ry]
0
2
4
6
8
10
mol
ar fr
actio
n C
H4
[vol
-%dr
y]
CO
CH4
0
0.02
0.04
0.06
0.08
0.1
200 210 220 230 240outlet temperature [°C]
CO
2-co
nver
sion
[-]
0.95
0.96
0.97
0.98
0.99
1.00
CO
-con
vers
ion
[-]
CO2CO
Figure 23: Measured CO and CH4 product gas composition (left) and conversion of CO and
CO2 (right) after SelMet reaction, GHSV 5200/h. For feed gas compositions please
refer to Table 10.
For the SelMet screening shown in Figure 23, the optimum operation point with the lowest CO
product gas concentration was reached at an outlet temperature of 220 °C where CO
concentration was 20 vol-ppmdry. CH4 concentration had risen from 5.4 vol-%dry in the feed to
6.9%. At this point, CO conversion reached a maximum of 0.996 and CO2 conversion was at
0.049. The higher the temperature, the higher is CO2 conversion because the catalyst becomes
less selective towards CO-methanation. In comparison to the reforming reaction and the water
gas shift reaction, the temperature window for selective CO-methanation is very narrow. Thus,
the outlet temperature should not exceed 220 °C. The complete product gas composition and
conversion fractions can be found in Figure 23 in A.7.
In all screening tests the lowest CO product gas concentration was reached at temperatures of
215 to 220 °C. The catalyst supplier had obtained good results with a GHSV of 5000/h, but
during the screenings for this work even a GHSV of 6700/h had still produced a CO product gas
concentration of 20 ppm at 215 to 220 °C. Thus, this catalyst was chosen for the μRFCS.
Optimum operation conditions were determined to be 215 to 220 °C at GHSV 6300/h and
atmospheric pressure.
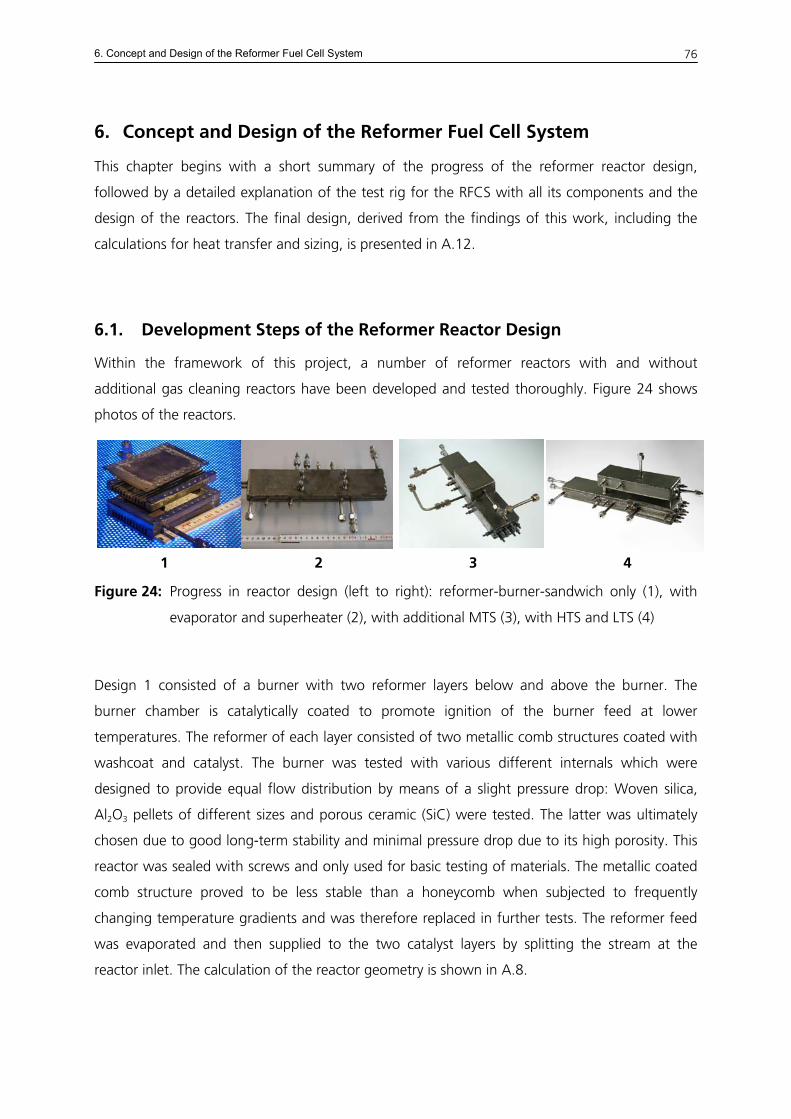
6. Concept and Design of the Reformer Fuel Cell System
76
6. Concept and Design of the Reformer Fuel Cell System
This chapter begins with a short summary of the progress of the reformer reactor design,
followed by a detailed explanation of the test rig for the RFCS with all its components and the
design of the reactors. The final design, derived from the findings of this work, including the
calculations for heat transfer and sizing, is presented in A.12.
6.1. Development Steps of the Reformer Reactor Design
Within the framework of this project, a number of reformer reactors with and without
additional gas cleaning reactors have been developed and tested thoroughly. Figure 24 shows
photos of the reactors.
1 2 3 4
Figure 24: Progress in reactor design (left to right): reformer-burner-sandwich only (1), with
evaporator and superheater (2), with additional MTS (3), with HTS and LTS (4)
Design 1 consisted of a burner with two reformer layers below and above the burner. The
burner chamber is catalytically coated to promote ignition of the burner feed at lower
temperatures. The reformer of each layer consisted of two metallic comb structures coated with
washcoat and catalyst. The burner was tested with various different internals which were
designed to provide equal flow distribution by means of a slight pressure drop: Woven silica,
Al2O3 pellets of different sizes and porous ceramic (SiC) were tested. The latter was ultimately
chosen due to good long-term stability and minimal pressure drop due to its high porosity. This
reactor was sealed with screws and only used for basic testing of materials. The metallic coated
comb structure proved to be less stable than a honeycomb when subjected to frequently
changing temperature gradients and was therefore replaced in further tests. The reformer feed
was evaporated and then supplied to the two catalyst layers by splitting the stream at the
reactor inlet. The calculation of the reactor geometry is shown in A.8.
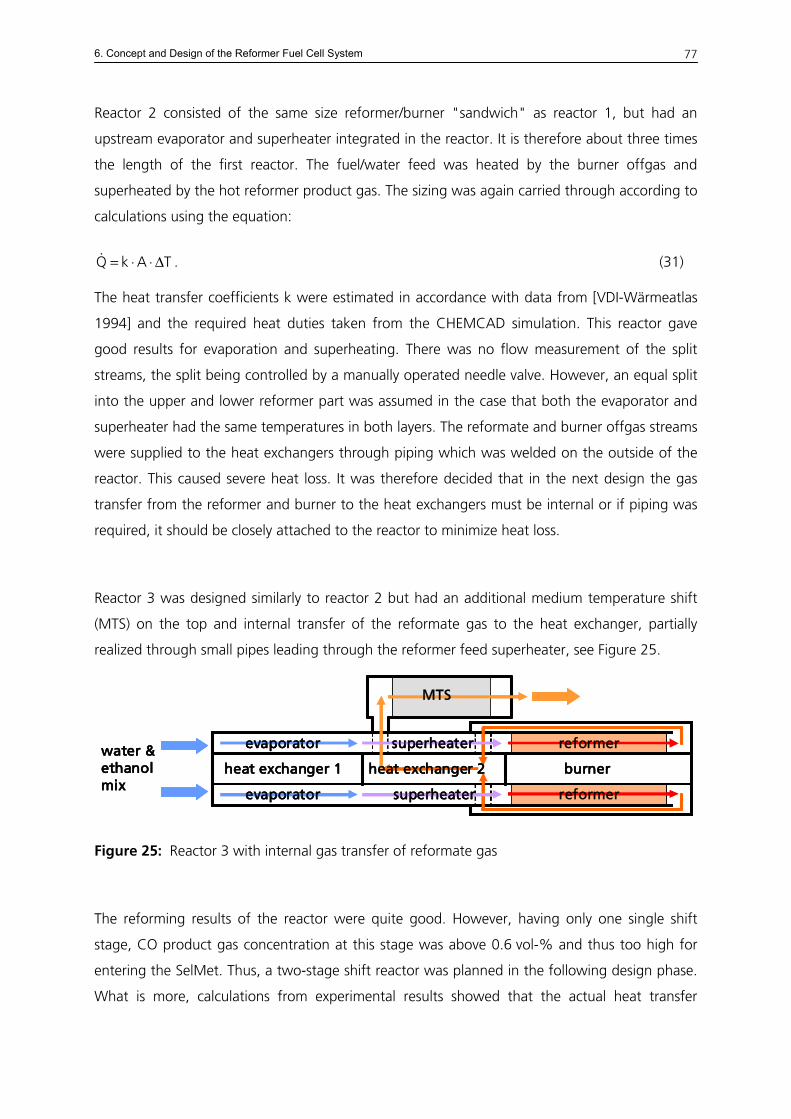
6. Concept and Design of the Reformer Fuel Cell System
77
Reactor 2 consisted of the same size reformer/burner "sandwich" as reactor 1, but had an
upstream evaporator and superheater integrated in the reactor. It is therefore about three times
the length of the first reactor. The fuel/water feed was heated by the burner offgas and
superheated by the hot reformer product gas. The sizing was again carried through according to
calculations using the equation:
TAkQ Δ⋅⋅=& . (31)
The heat transfer coefficients k were estimated in accordance with data from [VDI-Wärmeatlas
1994] and the required heat duties taken from the CHEMCAD simulation. This reactor gave
good results for evaporation and superheating. There was no flow measurement of the split
streams, the split being controlled by a manually operated needle valve. However, an equal split
into the upper and lower reformer part was assumed in the case that both the evaporator and
superheater had the same temperatures in both layers. The reformate and burner offgas streams
were supplied to the heat exchangers through piping which was welded on the outside of the
reactor. This caused severe heat loss. It was therefore decided that in the next design the gas
transfer from the reformer and burner to the heat exchangers must be internal or if piping was
required, it should be closely attached to the reactor to minimize heat loss.
Reactor 3 was designed similarly to reactor 2 but had an additional medium temperature shift
(MTS) on the top and internal transfer of the reformate gas to the heat exchanger, partially
realized through small pipes leading through the reformer feed superheater, see Figure 25.
water & ethanolmix
evaporator
evaporator
MTS
burnerheat exchanger 1 heat exchanger 2
superheater
superheater
reformer
reformer
water & ethanolmix
evaporator
evaporator
MTS
burnerheat exchanger 1 heat exchanger 2
superheater
superheater
reformer
reformer
Figure 25: Reactor 3 with internal gas transfer of reformate gas
The reforming results of the reactor were quite good. However, having only one single shift
stage, CO product gas concentration at this stage was above 0.6 vol-% and thus too high for
entering the SelMet. Thus, a two-stage shift reactor was planned in the following design phase.
What is more, calculations from experimental results showed that the actual heat transfer
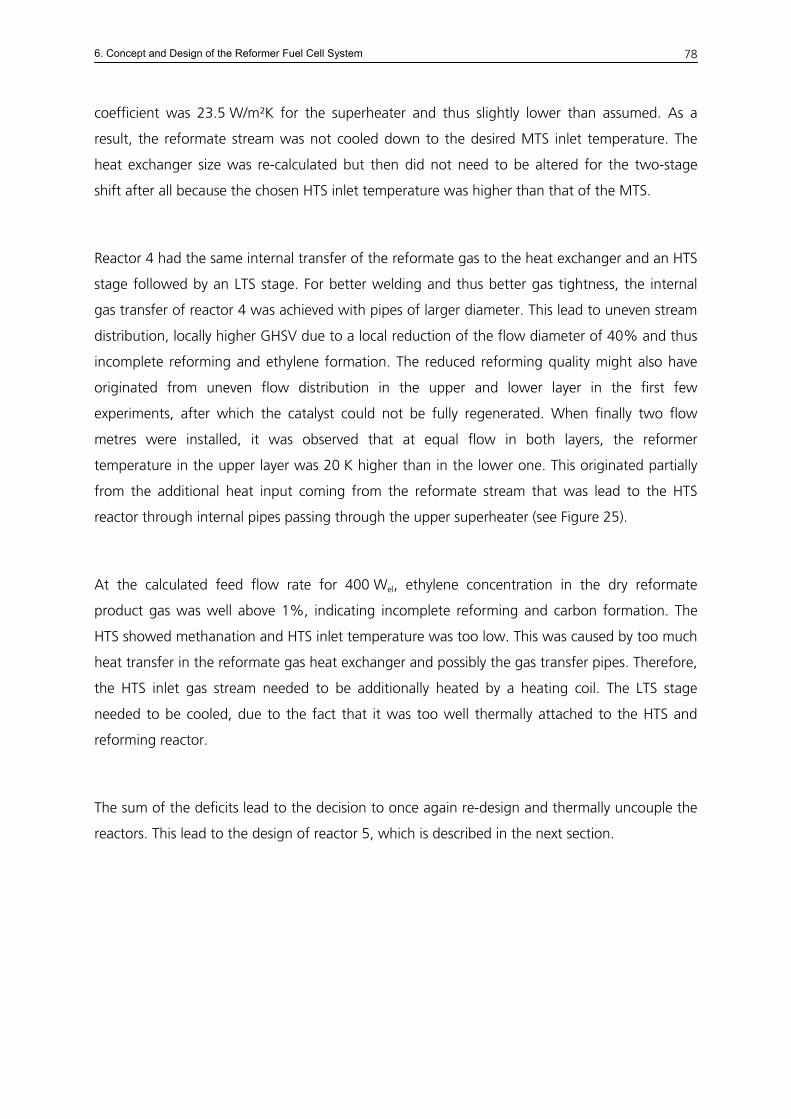
6. Concept and Design of the Reformer Fuel Cell System
78
coefficient was 23.5 W/m²K for the superheater and thus slightly lower than assumed. As a
result, the reformate stream was not cooled down to the desired MTS inlet temperature. The
heat exchanger size was re-calculated but then did not need to be altered for the two-stage
shift after all because the chosen HTS inlet temperature was higher than that of the MTS.
Reactor 4 had the same internal transfer of the reformate gas to the heat exchanger and an HTS
stage followed by an LTS stage. For better welding and thus better gas tightness, the internal
gas transfer of reactor 4 was achieved with pipes of larger diameter. This lead to uneven stream
distribution, locally higher GHSV due to a local reduction of the flow diameter of 40% and thus
incomplete reforming and ethylene formation. The reduced reforming quality might also have
originated from uneven flow distribution in the upper and lower layer in the first few
experiments, after which the catalyst could not be fully regenerated. When finally two flow
metres were installed, it was observed that at equal flow in both layers, the reformer
temperature in the upper layer was 20 K higher than in the lower one. This originated partially
from the additional heat input coming from the reformate stream that was lead to the HTS
reactor through internal pipes passing through the upper superheater (see Figure 25).
At the calculated feed flow rate for 400 Wel, ethylene concentration in the dry reformate
product gas was well above 1%, indicating incomplete reforming and carbon formation. The
HTS showed methanation and HTS inlet temperature was too low. This was caused by too much
heat transfer in the reformate gas heat exchanger and possibly the gas transfer pipes. Therefore,
the HTS inlet gas stream needed to be additionally heated by a heating coil. The LTS stage
needed to be cooled, due to the fact that it was too well thermally attached to the HTS and
reforming reactor.
The sum of the deficits lead to the decision to once again re-design and thermally uncouple the
reactors. This lead to the design of reactor 5, which is described in the next section.
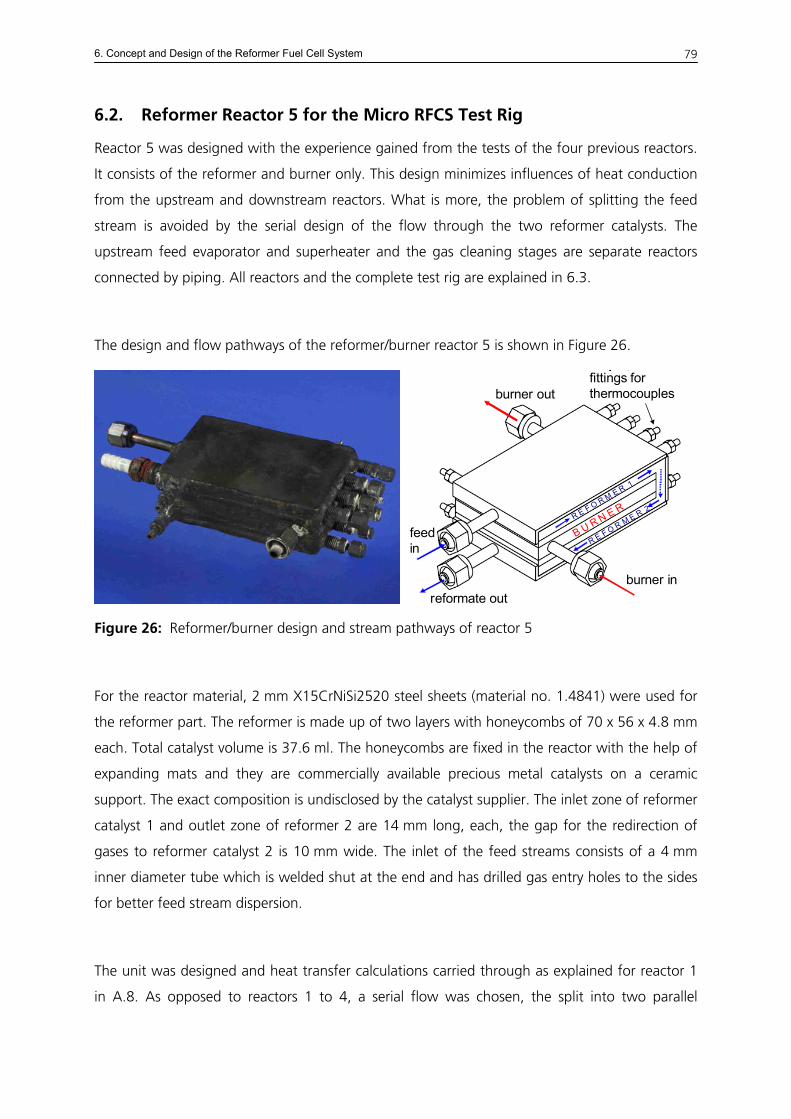
6. Concept and Design of the Reformer Fuel Cell System
79
6.2. Reformer Reactor 5 for the Micro RFCS Test Rig
Reactor 5 was designed with the experience gained from the tests of the four previous reactors.
It consists of the reformer and burner only. This design minimizes influences of heat conduction
from the upstream and downstream reactors. What is more, the problem of splitting the feed
stream is avoided by the serial design of the flow through the two reformer catalysts. The
upstream feed evaporator and superheater and the gas cleaning stages are separate reactors
connected by piping. All reactors and the complete test rig are explained in 6.3.
The design and flow pathways of the reformer/burner reactor 5 is shown in Figure 26.
feedin
reformate outburner in
burner outfittings forthermocouples
B U R N E RR E F O R M E R 1
R E F O R M E R 2
feedin
reformate outburner in
burner outfittings forthermocouples
R E F O R M E R 1
B U R N E R
R E F O R M E R 2
Figure 26: Reformer/burner design and stream pathways of reactor 5
For the reactor material, 2 mm X15CrNiSi2520 steel sheets (material no. 1.4841) were used for
the reformer part. The reformer is made up of two layers with honeycombs of 70 x 56 x 4.8 mm
each. Total catalyst volume is 37.6 ml. The honeycombs are fixed in the reactor with the help of
expanding mats and they are commercially available precious metal catalysts on a ceramic
support. The exact composition is undisclosed by the catalyst supplier. The inlet zone of reformer
catalyst 1 and outlet zone of reformer 2 are 14 mm long, each, the gap for the redirection of
gases to reformer catalyst 2 is 10 mm wide. The inlet of the feed streams consists of a 4 mm
inner diameter tube which is welded shut at the end and has drilled gas entry holes to the sides
for better feed stream dispersion.
The unit was designed and heat transfer calculations carried through as explained for reactor 1
in A.8. As opposed to reactors 1 to 4, a serial flow was chosen, the split into two parallel
6. Concept and Design of the Reformer Fuel Cell System
80
streams having proven to be too challenging. The dimensions of the catalysts were chosen
according to a GHSV of 10,000/h at the required ethanol/water feed. However, the first
assumption of the required feed stream had been lower than the one finally calculated through
the simulation for a 400 Wel, tot system. This is because too little power had been assumed to be
needed to provide the energy for balance of plant components of a 300 Wel system. Thus, the
resulting GHSV for the 400 Wel, tot system was 12,700/h.
Heat flux from the burner to the reformer was calculated to be sufficient, according to the
calculation method shown in A.8. However, the temperature gradient between the inside
(facing the burner) and outside flow channels of the comb was higher than expected and thus
the temperature in the outer channels too low to reach a satisfactory product gas composition
(see 7.2.2.1). Therefore, after the first experiments, an external heating coil was wrapped
around the reactor. Apart from the first two experiments shown in 7.2.2 (Figure 32 and Figure
33) all further experiments were carried out with the added external heating.
The mechanical strength of the burner/reformer reactor was calculated for gauge pressures of
both 600 mbar and 2 bar according to [AD-Merkblatt 1997]. The calculating methods were
developed for pressurized vessels, which are:
l/bar50]l[vesselofvolume]bar[pressuregauge >⋅ (32)
for category A, the smallest category [Richtlinie 87/404/EWG 1987]. Due to the low volume of
the RFCS vessels, expression (32) does not apply here. However, the results are used as a
guideline for defining the necessary material thickness for the reactors. For the 600 mbar case, a
material thickness of 2.3 mm was found to be sufficient for the reformer but the burner needs
to have a thickness of 5.4 mm. The operating gauge pressure of the reformer should be below
600 mbar, with 300 mbar as the goal. The burner gauge pressure should be 30 to 20 mbar
only. Thus, the chosen material thickness was found to result in sufficiently strong reactors.
6. Concept and Design of the Reformer Fuel Cell System
81
6.3. Description of the Micro RFCS Test Rig
In this section, the test rig of the μRFCS is presented. A process flow diagram and stream data
can be found in A.9. The explanations include the design of the reactors.
6.3.1. Feed Streams and Feed Control
An ethanol and water mixture of the desired S/C is stored in a tank and pumped to the
evaporator by means of a CAT HPLH200 micro dosing piston pump. The pump is suitable for
micro-dosing of small volumes (1 μl per step). The desired feed stream for 400 Wel, tot is
8.457 ml/min at S/C = 3. The relative error is 2 to 3%, which is tolerable for the system, even
more so, when ethanol and water are pre-mixed so no error in S/C can occur. In this case, coke
formation in the reformer will only occur at significantly higher GHSV and/or temperatures
below 600 °C.
To measure and control the flow of H2, air and N2 directed to the burner, MKS Instruments
thermal mass flow controllers of type 1479A are utilised. The flow meters work under the
principle of temperature differential between two thermo-resistances. The internal hardware
and software converts mass flow into volume flow at normal conditions. The signal is compared
with the set point given to the mass flow controller. The resulting error between set point and
signal is utilised to direct a control valve in order to keep the volume flow at the set point level.
The relative error is 1% [MKS 2006].
6.3.2. Evaporator
For the evaporator and superheater, a multi-path plate heat exchanger prototype was provided
by the Institute for Micro Process Engineering IMVT of the Forschungszentrum Karlsruhe. A
photo of the heat exchanger is shown in Figure 27.
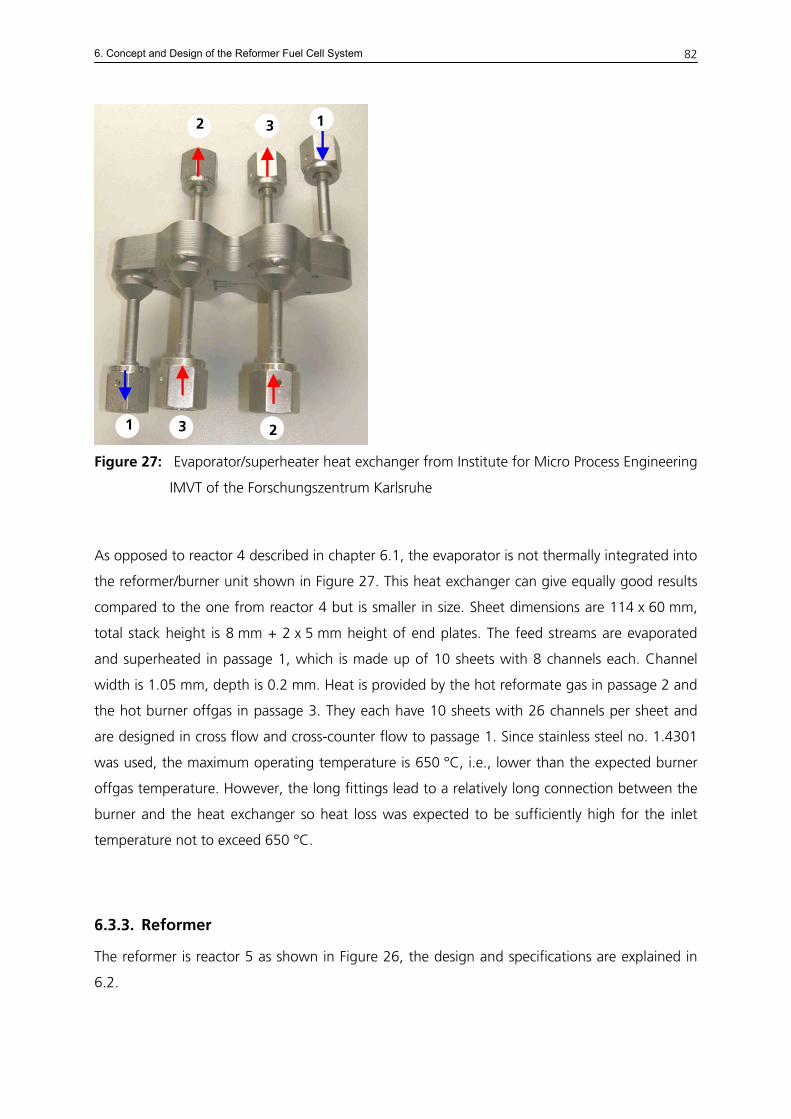
6. Concept and Design of the Reformer Fuel Cell System
82
1 3 2
1 3 2
Figure 27: Evaporator/superheater heat exchanger from Institute for Micro Process Engineering
IMVT of the Forschungszentrum Karlsruhe
As opposed to reactor 4 described in chapter 6.1, the evaporator is not thermally integrated into
the reformer/burner unit shown in Figure 27. This heat exchanger can give equally good results
compared to the one from reactor 4 but is smaller in size. Sheet dimensions are 114 x 60 mm,
total stack height is 8 mm + 2 x 5 mm height of end plates. The feed streams are evaporated
and superheated in passage 1, which is made up of 10 sheets with 8 channels each. Channel
width is 1.05 mm, depth is 0.2 mm. Heat is provided by the hot reformate gas in passage 2 and
the hot burner offgas in passage 3. They each have 10 sheets with 26 channels per sheet and
are designed in cross flow and cross-counter flow to passage 1. Since stainless steel no. 1.4301
was used, the maximum operating temperature is 650 °C, i.e., lower than the expected burner
offgas temperature. However, the long fittings lead to a relatively long connection between the
burner and the heat exchanger so heat loss was expected to be sufficiently high for the inlet
temperature not to exceed 650 °C.
6.3.3. Reformer
The reformer is reactor 5 as shown in Figure 26, the design and specifications are explained in
6.2.
6. Concept and Design of the Reformer Fuel Cell System
83
6.3.4. Water Gas Shift
As opposed to the design in reformer reactors 3 and 4, the HTS and LTS reactors were chosen to
be of cylindrical design for the μRFCS test rig. The cylindrical design leads to a more uniform gas
distribution in the reaction zone. Thus, non-equilibrium conversion fractions which result from
uneven gas distribution can be excluded. The requirement for the catalyst dimensions was
L/D >1, preferably L/D >2. For better gas flow distribution, the inner diameter was chosen to be
considerably smaller, i.e., 28 mm, the length being 100 mm for HTS and 152.4 mm for the LTS
catalyst. Total catalyst volume is 61.6 ml for the HTS and 77.2 ml for the LTS. In both reactors,
the inlet and outlet stream are conducted through a centred 4 mm hole. The reactors are
connected by tubing with 4 mm inner diameter. Stainless steel (material no. 1.4541) of 1.5 mm
thickness is used for reactor material. The HTS catalyst is made from 1.5 mm extrudates of Pt on
high active mixed oxide carrier. The LTS catalyst is precious metal on a ceramic honeycomb
support. Both reactors have a layer of silica wool at the inlet and outlet to hold the catalyst in
place. This also elongates the inlet zone, promoting equal gas distribution. In the inlet of the
HTS reactor, the silica wool section is 15 mm long, followed by 20 mm of inert Al2O3 bed for
better gas distribution. The outlet silica wool section is 25 mm long, the LTS inlet and outlet
silica wool sections are 30 mm long.
GHSV for the 400 Wel, tot system is 11,600/h for the HTS and 9300/h for the LTS. The GHSV limit
for HTS was determined at 12,500/h for catalyst beds (pellets) by the catalyst supplier but this
was tested by the supplier at CO inlet concentrations of 14 vol-%dry and CO2 inlet
concentrations of 8 vol-%dry, i.e., both lower than in the RFCS. Therefore, a maximum GHSV of
10,000/h was chosen for the HTS of the RFCS. The GHSV for LTS is 10,000/h, as given by the
catalyst supplier. Both GHSV are higher than in the screening tests, where the highest GHSV
was 7500/h. However, according to the catalyst suppliers, the higher GHSV should lead to good
catalyst performance as well, thus the reactors were designed for it and later on this prediction
was proven correct by the experiments.
The HTS is connected to the heat exchanger by a cross-piece fitting for 6 mm outer diameter
tubing welded to the reactor. This allows for the connection of a thermocouple to measure the
HTS inlet temperature and a path for HTS bypass for experiments with the reformer only or for
analysis of the reformer product gas. The HTS and LTS are welded together at a 90° angle by a
cross-piece fitting for 6 mm outer diameter tubing, allowing for the connection of
thermocouples to measure the HTS outlet and LTS inlet temperature and a bypass. The length of
6. Concept and Design of the Reformer Fuel Cell System
84
the connectors and tubing leads to heat losses. In this test rig, the reformate temperature after
the heat exchanger was lower than the optimum HTS inlet temperature so the HTS feed had to
be re-heated. The same occurred between HTS and LTS. Therefore, heating coils 172 and 173
(see A.9) had to be added to the connecting tubing before each reactor. In the actual prototype
system, the reactors will be positioned more closely, so there will be only negligible heat loss. As
a result, the heating coils will be replaced by fans to allow for the necessary temperature drop
between the stages.
6.3.5. Selective Methanation
The SelMet reactor was designed similar to the HTS, with stainless steel (material no. 1.4541) of
1.5 mm thickness and 28 mm inner diameter. The catalyst consists of a 1.5 mm granular
support of synthetic alumosilicate, coated with precious metal. The exact composition is
undisclosed by the catalyst supplier. The inlet is filled with 10 mm of silica wool, followed by a
20 mm inert Al2O3 bed, followed by the catalyst bed of 185 mm length and finally 20 mm of
silica wool. The total catalyst volume is 113.9 ml. The gas inlet and outlet stream are conducted
through centred holes of 4 mm diameter.
GHSV for the 400 Wel, tot system is 6300/h. The catalyst supplier had obtained good results with
a GHSV of 5000/h but a SelMet screening had shown that 6300/h was tolerable.
The connection to the LTS was achieved through tubing, allowing for the installation of
thermocouples and a bypass. The SelMet inlet temperature was controlled by heating coil 174,
which will be replaced by a fan in the prototype. See 6.3.4 for further explanation.
6.3.6. PEM Fuel Cell
For the fuel cell tests a FC-40/RLC Staxon PEM FC stack by Schunk is used. It consists of 40 cells
with 25 cm² each. It is a liquid cooled reformate feed stack. The operating ambient temperature
of the stack is 5 to 70 °C [Schunk 2006]. The cooling is achieved by a water circuit with a
cryostat. A Rietschle Thomas series 6025 compressor supplies the cathode air. It was tested
satisfactorily for the fuel cell stack with a maximum air flow of 40 l/min. An electronic load is
connected to the stack so either current or voltage can be controlled, the other resulting from
6. Concept and Design of the Reformer Fuel Cell System
85
the cell performance. Single cell voltage cannot be measured in the stack with the Schunk
design. However, after consulting Schunk, five cells were contacted by drilling holes into the
stack, contacting specific plates. With the help of the single cell voltage measurement, closer
observance of the stack performance was possible. Effects of flooding and drying out of the cells
can be detected and the stack temperature adjusted according to the needs: hotter to prevent
flooding, which hinders gas transport in the gas diffusion layer, cooler when drying occurs,
which hinders proton transport across the membrane. As a result, stack performance improves.
During the first tests with pure H2 these ports still gave single cell voltages. Later when the cell
was operated on reformate gas, the contacting ports failed one after the other, probably due to
local thermal expansion of the stack material.
6.3.7. Burner
The burner is made of a rectangular chamber with a porous SiC ceramic internal which provides
a slight pressure drop of 10 to 20 mbar and thus allows equal flow distribution of the gases.
Furthermore, it stabilizes the reaction zone in the ceramic. For the tests performed for this work,
the burner was fed with a mixture of air, N2 and H2, representing the simulated anode offgas
mixture. It was ignited with the help of a sparkplug. The burner is made of 4 mm
X20NiCr25FeAlY steel (material no. 2.4633), which has good mechanical strength even above
1000 °C. See 6.2 (explanation of the reformer design) and A.8 for sizing details.
The sparkplug is operated manually for ignition and burner temperature is controlled by altering
the feed composition and mass flow.
In the prototype system, the burner needs to start with ethanol, making it a multi-fuel burner.
This is not yet included in the system presented in this thesis. For further explanations see 7.2.1.
6.3.8. Temperature and Pressure Logging
Temperature is measured by thermocouples (type K). This type of sensor can work in chemically
aggressive environments with temperatures of up to 1200 °C. Its accuracy is ±0.1 K. However,
the measured temperatures might not be the actual gas temperatures because the
thermocouple might be blocking the channel in which it is positioned so that no gas flow passes
through it. Thus, the resulting measured outlet temperature might not be equal to the actual
gas temperature in the rest of the diameter. Although for scientific research this inaccuracy
seems unsatisfactory, this positioning of the thermocouples is still the most practicable method
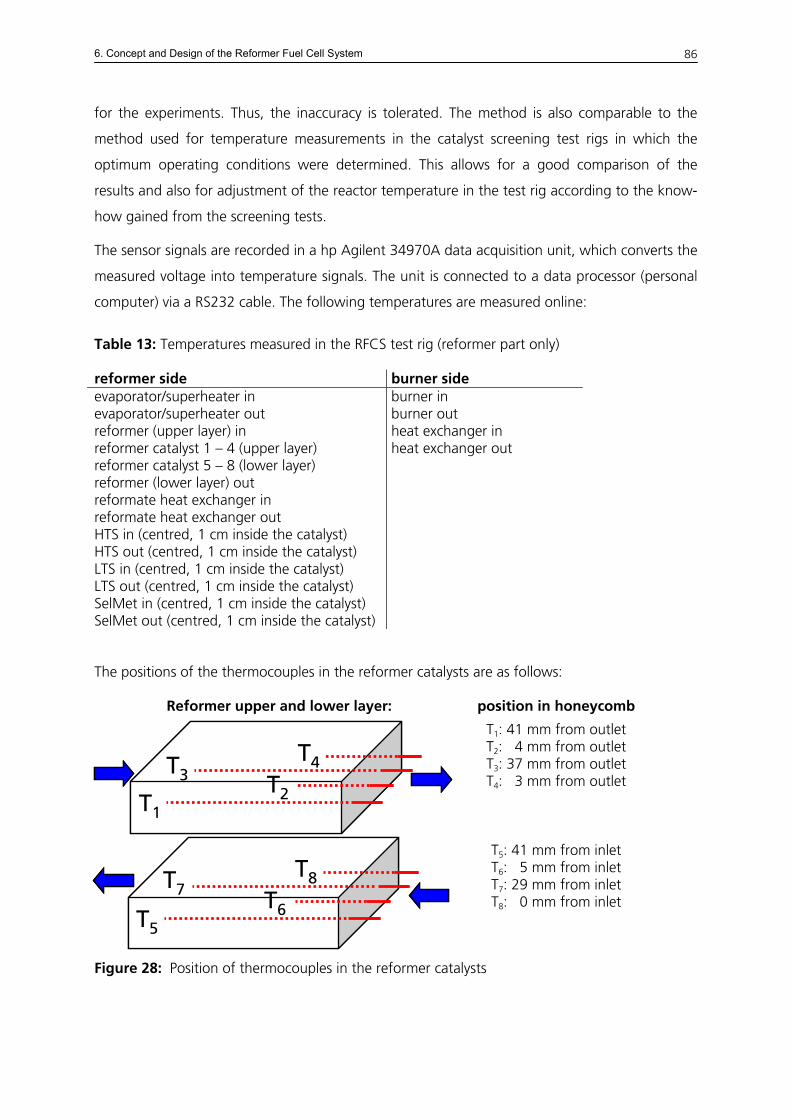
6. Concept and Design of the Reformer Fuel Cell System
86
for the experiments. Thus, the inaccuracy is tolerated. The method is also comparable to the
method used for temperature measurements in the catalyst screening test rigs in which the
optimum operating conditions were determined. This allows for a good comparison of the
results and also for adjustment of the reactor temperature in the test rig according to the know-
how gained from the screening tests.
The sensor signals are recorded in a hp Agilent 34970A data acquisition unit, which converts the
measured voltage into temperature signals. The unit is connected to a data processor (personal
computer) via a RS232 cable. The following temperatures are measured online:
Table 13: Temperatures measured in the RFCS test rig (reformer part only)
reformer side burner side evaporator/superheater in evaporator/superheater out reformer (upper layer) in reformer catalyst 1 – 4 (upper layer) reformer catalyst 5 – 8 (lower layer) reformer (lower layer) out reformate heat exchanger in reformate heat exchanger out HTS in (centred, 1 cm inside the catalyst) HTS out (centred, 1 cm inside the catalyst) LTS in (centred, 1 cm inside the catalyst) LTS out (centred, 1 cm inside the catalyst) SelMet in (centred, 1 cm inside the catalyst) SelMet out (centred, 1 cm inside the catalyst)
burner in burner out heat exchanger in heat exchanger out
The positions of the thermocouples in the reformer catalysts are as follows:
Reformer upper and lower layer: position in honeycomb
T1: 41 mm from outlet T2: 04 mm from outlet T3: 37 mm from outlet T4: 03 mm from outlet
T5: 41 mm from inlet T6: 05 mm from inlet T7: 29 mm from inlet
T4T3
T1
T2
T8T7
T5
T6
T4T3
T1
T2
T8T7
T5
T6 T8: 00 mm from inlet
Figure 28: Position of thermocouples in the reformer catalysts
6. Concept and Design of the Reformer Fuel Cell System
87
All three gas cleaning stages have thermocouples placed at the centre of the catalyst
bed/honeycomb, 10 mm inside the catalyst at the inlet and outlet, respectively.
The following pressures are measured by Jumo Midas pressure gauges (0 to 2.5 bar):
feed streams (additionally as analogue display) before burner reformate after heat exchanger fuel cell in
The current signal is amplified to a 4 to 20 mA signal and logged on a National Instruments
DAQ (data acquisition) board and then transferred to the data processor.
6.3.9. Process Control
The RFCS test rig is controlled by LabVIEW® which is installed on a personal computer and
allows for easy integration of measurement data, control parameters and hardware. All data is
saved to hard disk by the programme.
The design of the front panel is shown in Figure 29.
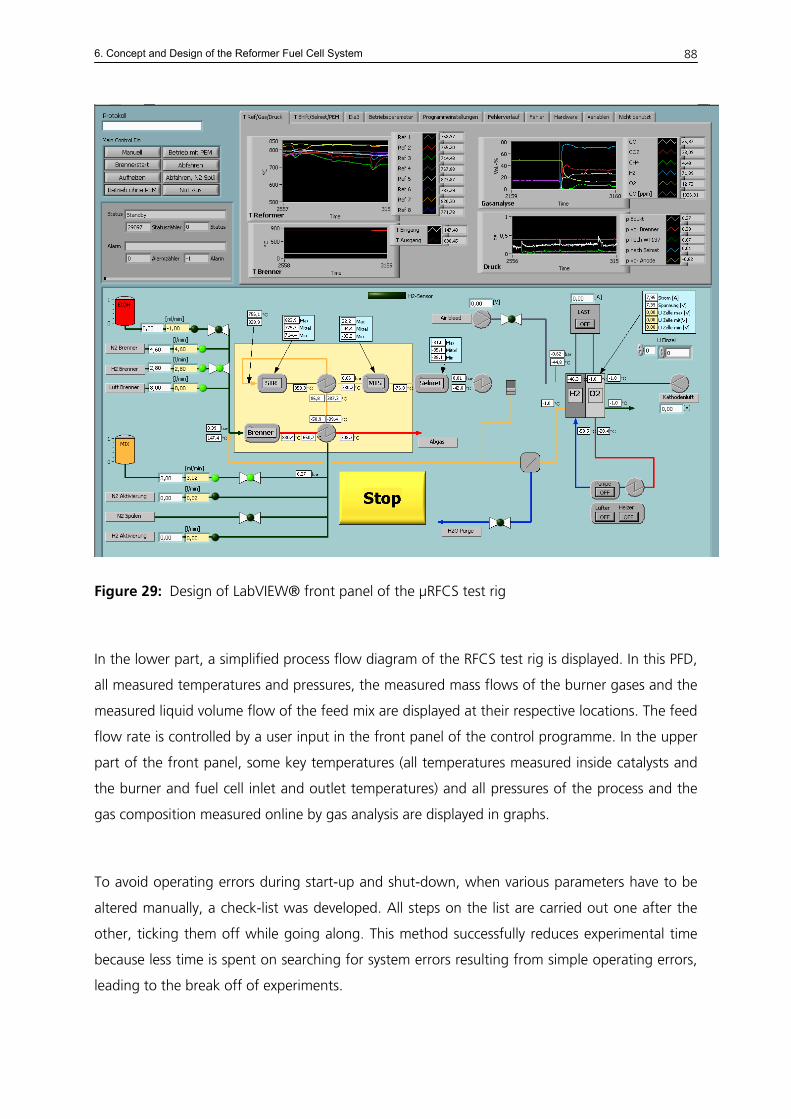
6. Concept and Design of the Reformer Fuel Cell System
88
Figure 29: Design of LabVIEW® front panel of the μRFCS test rig
In the lower part, a simplified process flow diagram of the RFCS test rig is displayed. In this PFD,
all measured temperatures and pressures, the measured mass flows of the burner gases and the
measured liquid volume flow of the feed mix are displayed at their respective locations. The feed
flow rate is controlled by a user input in the front panel of the control programme. In the upper
part of the front panel, some key temperatures (all temperatures measured inside catalysts and
the burner and fuel cell inlet and outlet temperatures) and all pressures of the process and the
gas composition measured online by gas analysis are displayed in graphs.
To avoid operating errors during start-up and shut-down, when various parameters have to be
altered manually, a check-list was developed. All steps on the list are carried out one after the
other, ticking them off while going along. This method successfully reduces experimental time
because less time is spent on searching for system errors resulting from simple operating errors,
leading to the break off of experiments.
6. Concept and Design of the Reformer Fuel Cell System
89
The test rig cannot run unsupervised. For safety reasons, the following devices are integrated: A
"fail closed" magnetic valve shuts down the H2 supply in case of electrical power outage. A
safety valve which opens at pressures above 3 bar is placed after the ethanol/water mix feed
pump and before the burner inlet. The H2 and air pathways have flame arrestor valves.
6.3.10. Gas Analysis
For online analysis of the dry product gases, an ABB Advance Optima AO2000 gas analysis is
used. It is a modular analyser made up of three different units. First, the gases are cooled to
4 °C by a Hartmann & Braun (ABB) Advance SSC gas cooler unit to make sure that only dry gas
enters the analysers. It then flows through the Uras 14 module which employs the non-
dispersive infrared absorption (NDIR) measurement principle in the wave length range of 2.5 to
8.0 μm and can detect CO, CO2 and CH4 [ABB 1999]. The range is 0 to 30 vol-%dry with an
additional CO fine measurement with 0 to 500 vol-ppm. In this module, a chemical sensor for
O2 detection, range 0 to 30 vol-%dry is included. The hydrogen concentration (range 0 to
100 vol-%dry) is analysed through the last module, a Caldos 17, which uses a thermal
conductivity detector. This measuring principle is non-selective and therefore influenced by other
gases, especially CO. The resulting measurement error can be determined and is corrected by
internal calculations, depending on the concentration of the gases measured by Uras 14. Higher
hydrocarbons are assigned to the CH4 concentration. Thus, the difference between 100% and
the total sum of the gases analysed by Uras 14 and Caldos 17 is the N2 concentration.
Accuracy is 1% of the range for all gases except CO fine, which has an accuracy of ±5 ppm.
However, from experience it can be concluded that accuracy is better. Calibration mostly
showed an accuracy of ±0.1 vol-%. Adding the error of the calibration gas, which is ±0.15%abs
for CO, CO2 and CH4 and ±0.75%abs for H2, the total error is then slightly higher. The accuracy
is also dependent on the flow at which it is calibrated. At Fraunhofer ISE, this was usually 60 l/h;
a flow deviation of more than 20 l/h from this value might lead to additional errors. For
comparison of GA and GC measurement accuracy see 6.3.11.
6. Concept and Design of the Reformer Fuel Cell System
90
6.3.11. Gas Chromatography
For offline measurement of moist or dry gases, an Agilent Gas Chromatograph 6890 is used. It
can detect the following gases within an 11 minute measuring procedure:
C6+ (hydrocarbons with six and more carbon atoms, detected as one pseudo-species), i-butane,
n-butane, i-pentane, n-pentane, CO2, C2H4, C2H6, H2O, propene, propane, O2, N2, CH4, CO and
H2. The gases are fed to the GC continuously but a sample is drawn into the columns at the start
of the measurement only. Detection limit is 10 ppm and accuracy is 1% of the calibrated value
(i.e., 0.1%abs for CO2, 0.15%abs for CO and CH4, 0.3%abs for H2, 0.22%abs for N2 and 0.01%abs
for all others).
The gas chromatograph is also calibrated to measure water and ethanol in a liquid phase, with
acetaldehyde as a third species, whose concentration can be calculated by using a factor in
correlation to the measured ethanol signal. With this method, the condensate from the reformer
system can be analysed. The liquid phase is injected into the system through a μl-syringe.
For the evaluation of the experiments it is important to note that GC is more accurate. This is
because its measuring principle is based on the mass of actual gas flow rather than on indirect
measuring principles which require a conversion from the measured signal into mass or volume
to identify the volume fraction of the gas. Also, the GC used at Fraunhofer ISE is more reliable
than the GA, which has undergone more maintenance throughout the years than the GC.
Calibration and drift of the GC are also more reliable, the GA needing re-calibration about every
2 to 3 weeks.
6.4. Basic Experimental Procedure and Set-up Features
In the RFCS test rig, the burner is started with H2, N2 and air. When the lowest reformer
temperature has reached 600 °C, the water/ethanol feed stream is started.
A manually operated 4-way valve controls whether the gases flow to a plate heat exchanger and
condenser for cooling and drying of the gas stream directly downstream of the reformer or of
the HTS, the LTS or the SelMet. The gases then leave the reformer system and are analysed. The
reactors can be connected to the gas flow one by one or all at once. The PEM fuel cell can be
connected as soon as the gas quality meets the given requirements, i.e., no ethylene, no ethane,
CO below 20 vol-ppmdry. At the time of the experiments shown in chapter 7, no gas analysis
6. Concept and Design of the Reformer Fuel Cell System
91
was possible during fuel cell operation. This was modified later on by adding a bypass to the
GA, which has only minimal flow.
A mass balance for C, H and O can be achieved by simultaneously measuring the product gas
and condensate flow. The gas is supplied to a drum-type gas meter (accuracy ±0.5%). The
condensate is collected in a small condenser which is placed between the plate heat exchanger
and the actual condenser and usually bypassed. At the beginning of the gas flow measurement,
the bypass valve is opened and the gas directed through the small condenser and condensate
collected here. At the end of the measuring interval the condensate is let out through a purge
valve, weighed and then analysed in the GC for water, remaining ethanol and acetaldehyde.
The measuring time is approximately 10 min and the measurement repeated at least twice to
avoid parallax and transfer errors. An example of a mass balance calculation of the system is
shown in 4.5. The relative deviation between output and input was 2.0% for C (i.e., more C in
the product than was fed to the reactor), -1.4% for H and -3.7% for O. Considering that the
relative error of the pump is 3%, the balance is considered to be even.
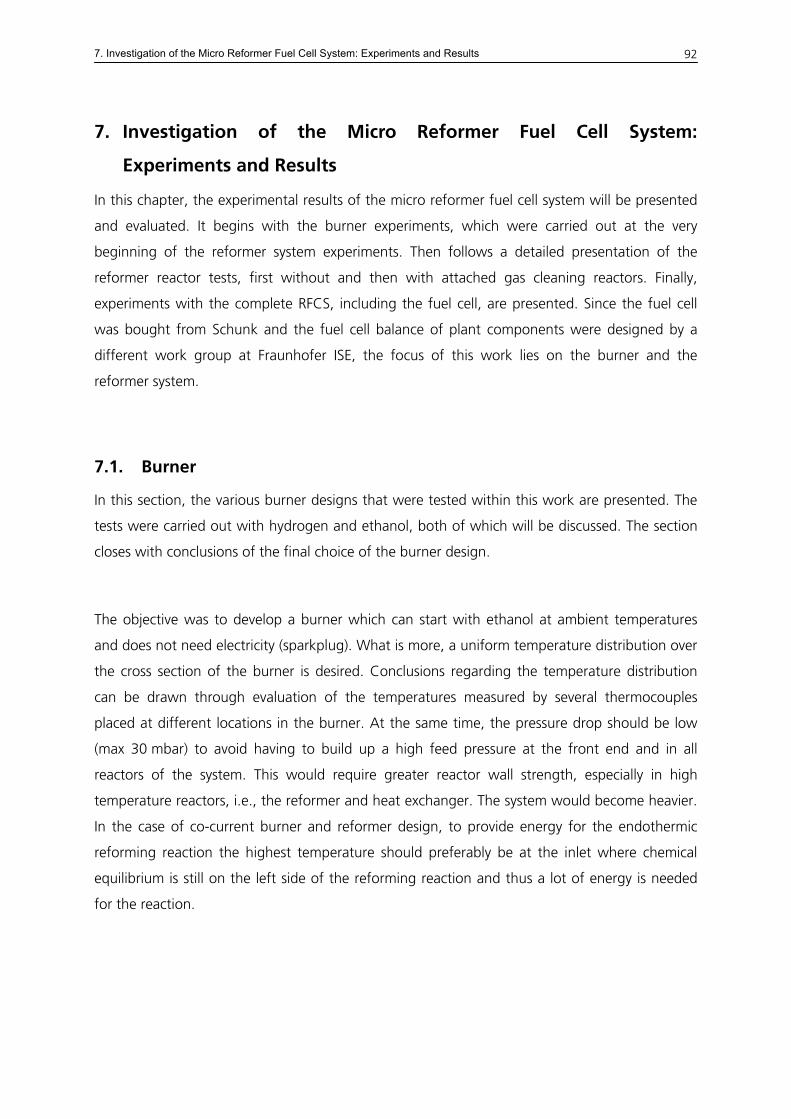
7. Investigation of the Micro Reformer Fuel Cell System: Experiments and Results
92
7. Investigation of the Micro Reformer Fuel Cell System:
Experiments and Results
In this chapter, the experimental results of the micro reformer fuel cell system will be presented
and evaluated. It begins with the burner experiments, which were carried out at the very
beginning of the reformer system experiments. Then follows a detailed presentation of the
reformer reactor tests, first without and then with attached gas cleaning reactors. Finally,
experiments with the complete RFCS, including the fuel cell, are presented. Since the fuel cell
was bought from Schunk and the fuel cell balance of plant components were designed by a
different work group at Fraunhofer ISE, the focus of this work lies on the burner and the
reformer system.
7.1. Burner
In this section, the various burner designs that were tested within this work are presented. The
tests were carried out with hydrogen and ethanol, both of which will be discussed. The section
closes with conclusions of the final choice of the burner design.
The objective was to develop a burner which can start with ethanol at ambient temperatures
and does not need electricity (sparkplug). What is more, a uniform temperature distribution over
the cross section of the burner is desired. Conclusions regarding the temperature distribution
can be drawn through evaluation of the temperatures measured by several thermocouples
placed at different locations in the burner. At the same time, the pressure drop should be low
(max 30 mbar) to avoid having to build up a high feed pressure at the front end and in all
reactors of the system. This would require greater reactor wall strength, especially in high
temperature reactors, i.e., the reformer and heat exchanger. The system would become heavier.
In the case of co-current burner and reformer design, to provide energy for the endothermic
reforming reaction the highest temperature should preferably be at the inlet where chemical
equilibrium is still on the left side of the reforming reaction and thus a lot of energy is needed
for the reaction.
7. Investigation of the Micro Reformer Fuel Cell System: Experiments and Results
93
The burner chamber walls were coated with precious metal catalyst to lower the activation
energy for ignition and tested with the following additional internals (see Figure 30):
- no internals - ceramic pellets - woven silica fibre - porous ceramic, completely filled - porous ceramic, partially filled
Figure 30: Burner with ceramic pellets (left), woven silica fibre (middle) and porous ceramic
(right). Gas flows from bottom left to top right.
The results of the experiments will be presented and discussed below.
7.1.1. Burner Tests with Hydrogen: Experiments and Results
To concentrate on the task of equal gas phase distribution without having to consider
evaporation of a liquid fuel, the burner was first tested with hydrogen. Its ignition temperature is
560 °C, explosion limits at 1.013 bar in air are 4 to 75 vol-% [Linde 2002].
The CHEMCAD simulation of the RFCS was used to determine a potential anode offgas
concentration with hydrogen as the main combustible gas. Extra N2 was added in the
experiments to represent the inert gas fraction, i.e., CO2. The chosen burner feed is shown in
Table 14:
Table 14: Burner feed gas flows and composition according to CHEMCAD simulation
component flow at MKS fraction species fraction [Nl/min] [vol-%] [vol-%]
H2 1.69 17.4 H2 17.4 air 5.23 53.9 O2 11.3 N2 2.79 28.7 N2 71.3
Results from the burner tests were as follows:
7. Investigation of the Micro Reformer Fuel Cell System: Experiments and Results
94
Without further internals, i.e., an empty burner with catalytically coated walls, the gas flow
distribution was unequal, which could be concluded from an uneven temperature distribution.
The highest temperature was measured at the burner outlet.
With the woven silica fibre, pressure drop over the burner was 280 mbar and combustion took
place at the burner entrance only. This was clearly visible after the experiment because the fibres
had turned to clear glass at the hot spot. Due to the pressure build-up, the temperature at the
burner entrance rose considerably, which indicates flashback of the flame into the feed pipes.
This design was then ruled out.
Similar results were obtained with a porous ceramic which completely filled the burner chamber.
The pressure drop was too high and the combustion zone lay at the burner entrance or even in
the feed pipe.
Thus, the porous ceramic was reduced to fill only half the burner chamber (see Figure 30, right,
gas flows from bottom left to top right).
This design lead to a burner pressure drop of 25 to 35 mbar.
7.1.2. Burner Tests with Ethanol: Experiments and Results
Burner tests with ethanol were carried out with the porous ceramic which completely filled the
burner chamber. This test was carried out before the same internal was tested with H2 as the
burner feed. The feed was 1.928 g/min for ethanol and 15.63 to 20.32 Nl/min air (resulting air
number λ of 1.0 to 1.3). The air was pre-heated by a heating coil wrapped around the air feed
tube. The ethanol/air mix ignited at an inlet temperature of 165 °C at λ 1.0. However, pressure
drop across the burner was 250 mbar, combustion took place at the inlet and there was a risk
of flashback into the feed tube. N2 was added when the highest burner temperature reached
800 °C because of a very steep temperature gradient. Temperature peaks of 1200 °C (maximum
thermocouple measuring value) occurred when λ was 1.0 and N2 was added. At λ 1.3 the
highest burner temperature was 780 °C.
Since the high pressure drop and risk of flashback occurred for ethanol as well as for H2, the
porous ceramic was reduced to fill only half the burner chamber. The tests were continued with
H2 and a satisfactory pressure drop of 25 to 35 mbar could be reached.
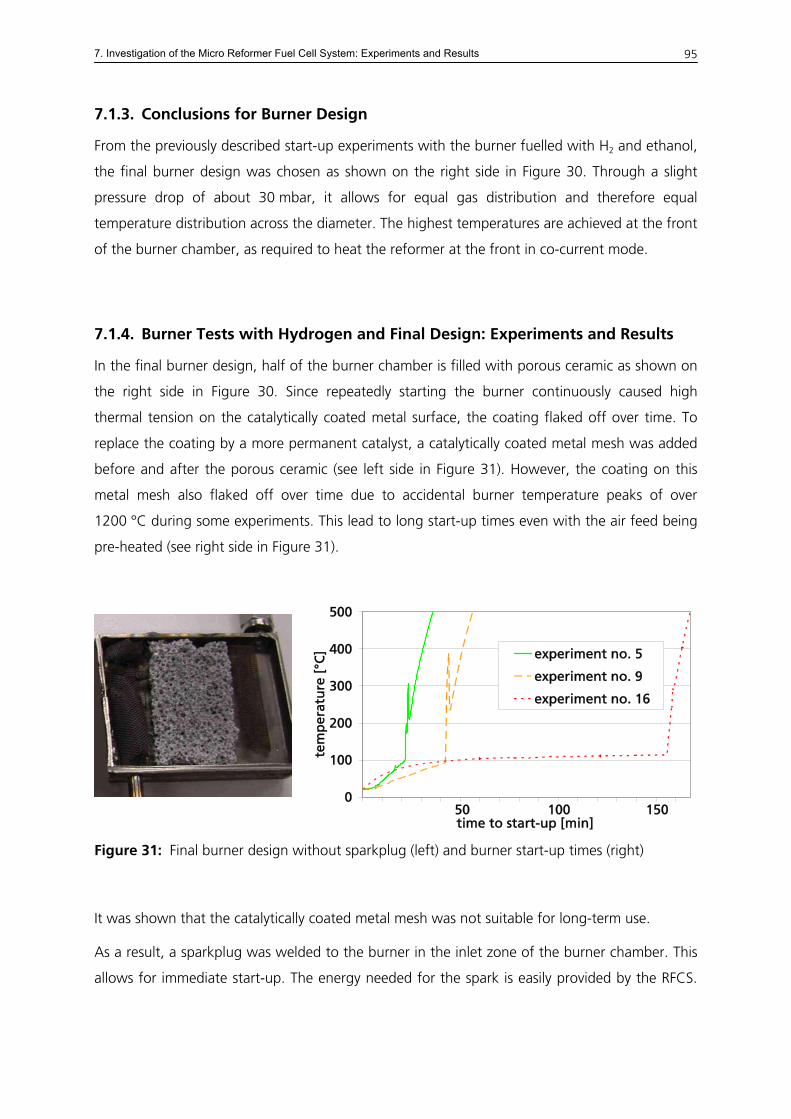
7. Investigation of the Micro Reformer Fuel Cell System: Experiments and Results
95
7.1.3. Conclusions for Burner Design
From the previously described start-up experiments with the burner fuelled with H2 and ethanol,
the final burner design was chosen as shown on the right side in Figure 30. Through a slight
pressure drop of about 30 mbar, it allows for equal gas distribution and therefore equal
temperature distribution across the diameter. The highest temperatures are achieved at the front
of the burner chamber, as required to heat the reformer at the front in co-current mode.
7.1.4. Burner Tests with Hydrogen and Final Design: Experiments and Results
In the final burner design, half of the burner chamber is filled with porous ceramic as shown on
the right side in Figure 30. Since repeatedly starting the burner continuously caused high
thermal tension on the catalytically coated metal surface, the coating flaked off over time. To
replace the coating by a more permanent catalyst, a catalytically coated metal mesh was added
before and after the porous ceramic (see left side in Figure 31). However, the coating on this
metal mesh also flaked off over time due to accidental burner temperature peaks of over
1200 °C during some experiments. This lead to long start-up times even with the air feed being
pre-heated (see right side in Figure 31).
0
100
200
300
400
500
time to start-up [min]
tem
per
atu
re [
°C] experiment no. 5
experiment no. 9
experiment no. 16
50 100 150
Figure 31: Final burner design without sparkplug (left) and burner start-up times (right)
It was shown that the catalytically coated metal mesh was not suitable for long-term use.
As a result, a sparkplug was welded to the burner in the inlet zone of the burner chamber. This
allows for immediate start-up. The energy needed for the spark is easily provided by the RFCS.
7. Investigation of the Micro Reformer Fuel Cell System: Experiments and Results
96
The only drawback is an additional component in the system burner. However, in this way
reliable and fast start-up is ensured for long-term use.
7.2. Reformer and Gas Cleaning
In this section, the results of the reformer and gas cleaning units will be presented. First, the
operating parameters and procedures of the experiments in the μRFCS test rig are explained.
Then follows a detailed description and interpretation of the experimental results which were
obtained with the reformer alone and afterwards with the reformer and attached HTS, LTS and
SelMet. The experiments with attached PEM FC are presented in chapter 7.3.
The objective of the reformer experiments is to determine the optimum operation temperature
of the reformer and gas cleaning stages by obtaining the highest H2 yield at the same time.
The performance of the reforming reactor is evaluated with the help of the following three
criteria:
- Temperature distribution over the reformer honeycomb cross section should be as uniform
as possible. This would ensure equal reaction conditions in all channels of the honeycomb.
- The axial heat transfer from the burner along the reformer catalyst should have its maximum
at the inlet because here the reaction is fastest due to the maximum of concentration
difference between feed species and product species. Thus, the front part of the catalyst
requires the most energy for the endothermic reaction. By having chosen co-current design
of burner and reformer, the prerequisites for such a temperature profile are met, for the
burner gives off most of its heat at the front of the burner chamber, too.
- Gas composition should be as close to the CHEMCAD simulation results as possible. This
leads to high reforming and thus high system efficiency.
The evaluation of the experimental results shown in this section will be presented below. In case
of unsatisfactory results, the obtained know-how is used to draw conclusions for future re-
design.
7. Investigation of the Micro Reformer Fuel Cell System: Experiments and Results
97
7.2.1. Operating Procedures and Parameters
Start-up of the reformer system is carried out according to the following procedure:
First the burner is started by feeding H2, N2 and air to the reactor and switching on the
sparkplug until ignition takes place (typically immediately after switching-on). For an
ethanol/water feed of 3 ml/min at S/C 3, the optimal parameters for the burner temperature to
be stable around 800 °C are: H2 2.1 lN/min; air 6.0 lN/min and N2 3.45 lN/min. These values are
defined to be 100% burner duty (see Table 29). With the heating value of H2 being
239.94 kJ/mol, the burner heat duty is 375 W and allows for heat loss. The isothermal heat duty
of the reforming reaction for an ethanol/water feed of 3 ml/min at S/C 3 at 700 °C is 70 W only.
As opposed to the future prototype system, the burner is not started with ethanol because the
main focus lies on the development and design of the reforming reactor and the following gas
cleaning stages. The burner design, start-up procedures and anode-offgas recycling are part of
the project in whose framework this thesis is carried out. However, the latter two points will
only be addressed in greater depth after a successful commissioning of the μRFCS. To accelerate
the work progress on the μRFCS, it was decided that the burner should be fuelled with H2 only,
research of the multi-fuel burner being carried out parallel to the development of the RFCS in a
separate test rig. Results from this test rig are not part of this work.
As soon as all reformer catalyst temperatures are above 600 °C, the ethanol/water mix pump is
started. The reforming reaction then starts as soon as the feed reaches the catalyst. All
experiments are carried out with S/C 3.
The burner and reactor temperatures and heat duties and the feed streams of the 400 Wel, tot
simulation are shown in Table 15.
Table 15: Simulated temperatures, heat duties and feed streams @S/C 3 for 400 Wel, tot
reactor T [°C]
heat duty [W]
feed stream [mg/s]
reformer 610 -281 130.41 HTS 378 -000 (adiabatic) 130.41 LTS 230 00-4 130.41 SelMet 210 00-3 130.41 burner 700 -331 349.18
The reformer system is not tested at full load because the common strategy is to start with low
feed streams and low resulting GHSV to avoid immediate coking and deactivation of catalysts in
7. Investigation of the Micro Reformer Fuel Cell System: Experiments and Results
98
case of the flow distribution being not as good as expected. Only when all reactor stages give
reproducible and satisfactory results can the feed flow be increased. Resulting heat duties
needed for the reaction at varying feed streams are shown in Table 16.
Table 16: Heat duties of the reforming reaction at varying feed flows
STR temp. heat duty of reaction [W] for feed flow V* [ml/min] @ S/C = 3 [°C] V* = 1 V* = 3 V* = 5 V* = 7 V* = 8.547 610 17.6 52.8 88.0 123.2 369.6
The full table including varying temperature is presented in Table 31 in A.10.
To determine the quality of gas distribution in the reactors and the resulting catalyst
performance, the following parameters are varied: ethanol/water mix feed, burner feed
composition and flow, influencing the reformer temperature, and heating coil temperatures,
influencing the reformer and gas cleaning reactor temperatures.
With the help of a manually operated 4-way valve the gas flow path through the test rig can be
varied. The gas cleaning stages can be bypassed so the reformer product or any gas cleaning
stage product can enter the gas analysis equipment or the fuel cell.
7.2.2. Results and Discussion of Reformer and Gas Cleaning
In the following section, some significant experimental results will be presented. For better
comparison of the results with the notes from the laboratory journal, all measured values are
logged and displayed over actual time, and not over the running time of a specific experiment.
7.2.2.1. Temperature Distribution and Gas Composition of Reformer
In this first section, the reformer will be presented. The measured temperature profile and the
gas composition at varying feed flux will be discussed and evaluated.
The first two experiments shown here were obtained with the original reformer/burner design
without extra external heating.
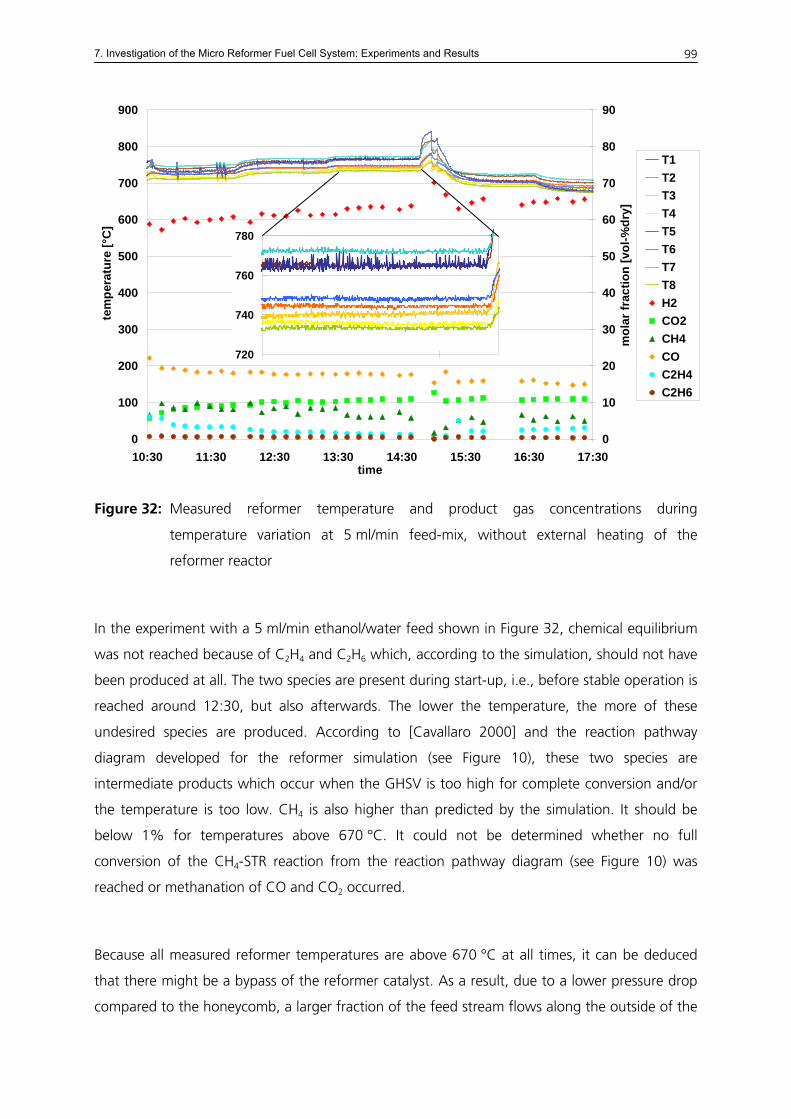
7. Investigation of the Micro Reformer Fuel Cell System: Experiments and Results
99
0
100
200
300
400
500
600
700
800
900
10:30 11:30 12:30 13:30 14:30 15:30 16:30 17:30time
tem
pera
ture
[°C
]
0
10
20
30
40
50
60
70
80
90
mol
ar fr
actio
n [v
ol-%
dry]
T1T2T3T4T5
720
740
760
780T6T7T8H2CO2CH4COC2H4C2H6
Figure 32: Measured reformer temperature and product gas concentrations during
temperature variation at 5 ml/min feed-mix, without external heating of the
reformer reactor
In the experiment with a 5 ml/min ethanol/water feed shown in Figure 32, chemical equilibrium
was not reached because of C2H4 and C2H6 which, according to the simulation, should not have
been produced at all. The two species are present during start-up, i.e., before stable operation is
reached around 12:30, but also afterwards. The lower the temperature, the more of these
undesired species are produced. According to [Cavallaro 2000] and the reaction pathway
diagram developed for the reformer simulation (see Figure 10), these two species are
intermediate products which occur when the GHSV is too high for complete conversion and/or
the temperature is too low. CH4 is also higher than predicted by the simulation. It should be
below 1% for temperatures above 670 °C. It could not be determined whether no full
conversion of the CH4-STR reaction from the reaction pathway diagram (see Figure 10) was
reached or methanation of CO and CO2 occurred.
Because all measured reformer temperatures are above 670 °C at all times, it can be deduced
that there might be a bypass of the reformer catalyst. As a result, due to a lower pressure drop
compared to the honeycomb, a larger fraction of the feed stream flows along the outside of the
7. Investigation of the Micro Reformer Fuel Cell System: Experiments and Results
100
catalyst. Consequently, GHSV in this bypass stream is higher than originally calculated for each
channel of the reformer catalyst. However, when the reformer was equipped with an extra
heating coil on the outside walls of the reformer/burner reactor, the C2H4 and C2H6 production
was avoided (see explanations to Figure 34). This leads to the conclusion that the temperature
gradient from the burner through the reformer catalyst to the outside wall of the reactor was
higher than expected and temperatures at the outmost layer of the honeycomb were lower than
the ones measured by the thermocouples placed in the middle of the comb.
The short rise in temperature occurring at 14:47 is brought about by a balance measurement in
which all gas had to pass through the gas analysis (GA). It also lead to a rise in pressure and in
flow through the GA, leading to a deviation from the flow for which the GA had been
calibrated. Due to small flows in the tubing to the GA and GC, the product gas concentrations
measured directly after a mass balance measurement must also be questioned. The gas flow was
later modified with the help of a bypass around the GA so temperature and pressure peaks
could be avoided.
The temperature distribution in the two reformer catalyst layers is enlarged for a stationary
operation point between 13:30 and 14:15. For the endothermic reforming reaction, the biggest
heat sink appears at the front of the reformer catalyst, where chemical equilibrium is still on the
left side of the reforming reaction and thus a lot of energy is needed for the reaction. According
to the placement of the reformer thermocouples (see Figure 28 in 6.3.8) and the burner heat
input, which is higher at the front of the burner chamber, the measured temperatures should
rise in the following order: T1 & T3 lowest, due to endothermic reforming reaction, followed by
T2 & T4 and next T6 & T8, T5 & T7 highest. The enlargement in Figure 32 shows that the
absolute temperature spread is 40 K. The highest temperature is indeed T7, closely followed by
T5, which is 0 to 9 K lower than T7. T2, T4, T6 and T8 are all within a range of 17 K (733 to
750 °C), T6 being the highest of the four and 14 K below T5. As opposed to the expectations,
T3 is not the lowest but 6 K higher than the lowest temperature on average, which, again not
according to the expectations, is T8. T1, which is expected to have the lowest temperature, is
only slightly below or as high as T5. T1 is higher than expected in all experiments. This probably
results from the placement of the thermocouples in the reformer catalyst. Since holes had to be
drilled which widened the channels of the honeycomb to position the thermocouples, the exact
distance from the burner wall could not be determined and might therefore vary slightly
between the different thermocouples.
7. Investigation of the Micro Reformer Fuel Cell System: Experiments and Results
101
All in all, it can be concluded that apart from T1 & T3, the temperatures are sufficiently close for
equal axial position within the honeycombs. Thus, for the channels in the centre between the
burner side and the outside of the honeycombs, an even flow distribution across the catalyst
diameter is assumed to have been reached. The expected axial temperature profile was achieved
within a 17 K tolerance. Therefore, the required heat transfer profile from the burner to the
reformer is realized as well.
A short heat balance obtained with simulated values from CHEMCAD and measured
temperatures (see A.11 for details) leads to the following results:
For a burner heat input of 462 W and 5 ml/min ethanol/water feed mix of S/C 3, the mean
reformer temperature reached 751 °C. When the heat duty for pre-heating, evaporating and
superheating the feed stream (277 W) and the reformer heat duty for the STR reaction (121 W)
are subtracted from the burner duty, a rest of 64 W remains, which equals 13.9% heat losses.
For this operation point the burner heat transfer efficiency is thus 86%. This is a conservative
estimate, because LHV was used for burner heat duty although the burner product gases are
not cooled down to 25 °C. Also, the mean reformer temperature is the temperature measured
after the heat duty which was used up by the reaction has been deducted from the system. For
endothermic reactions, the higher the reforming temperature, the less heat duty is needed for
the reaction to take place.
The burner heat transfer efficiency of at least 86% meets expectations and is in accordance with
the assumptions made for the RFCS CHEMCAD simulations. However, the non-equilibrium
product gas concentration shows that heat transfer across the honeycomb layers is insufficient.
To further investigate the reason for the C2H4 and C2H6 formation, the same experiment of
reformer temperature variation was carried out for a feed stream of 3 ml/min. The objective was
to find out if less C2H4 and C2H6 would be produced at lower GHSV and with different flow
distribution due to lower velocity at lower feed.
At a feed of 3 ml/min the C2H4 and C2H6 production was less than at 5 ml/min feed but still
present, especially for low reformer temperatures.
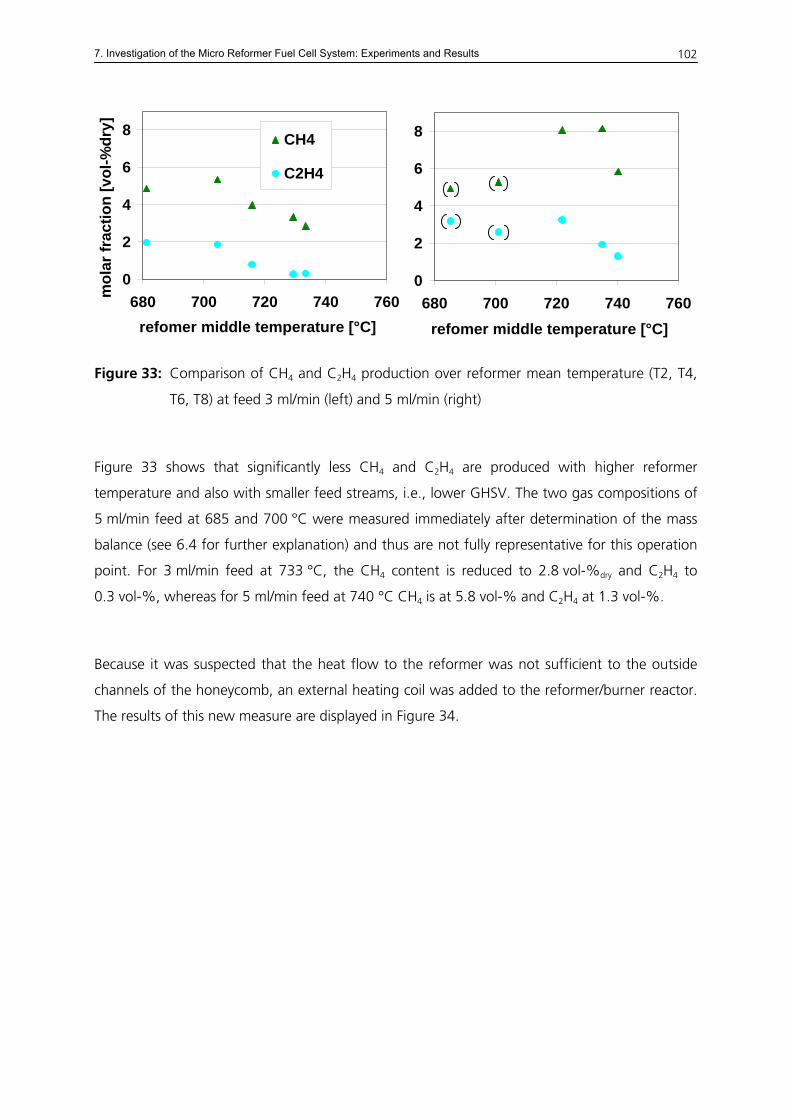
7. Investigation of the Micro Reformer Fuel Cell System: Experiments and Results
102
0
2
4
6
8
680 700 720 740 760refomer middle temperature [°C]
mol
ar fr
actio
n [v
ol-%
dry]
CH4
C2H4
0
2
4
6
8
680 700 720 740 760refomer middle temperature [°C]
Figure 33: Comparison of CH4 and C2H4 production over reformer mean temperature (T2, T4,
T6, T8) at feed 3 ml/min (left) and 5 ml/min (right)
Figure 33 shows that significantly less CH4 and C2H4 are produced with higher reformer
temperature and also with smaller feed streams, i.e., lower GHSV. The two gas compositions of
5 ml/min feed at 685 and 700 °C were measured immediately after determination of the mass
balance (see 6.4 for further explanation) and thus are not fully representative for this operation
point. For 3 ml/min feed at 733 °C, the CH4 content is reduced to 2.8 vol-%dry and C2H4 to
0.3 vol-%, whereas for 5 ml/min feed at 740 °C CH4 is at 5.8 vol-% and C2H4 at 1.3 vol-%.
Because it was suspected that the heat flow to the reformer was not sufficient to the outside
channels of the honeycomb, an external heating coil was added to the reformer/burner reactor.
The results of this new measure are displayed in Figure 34.
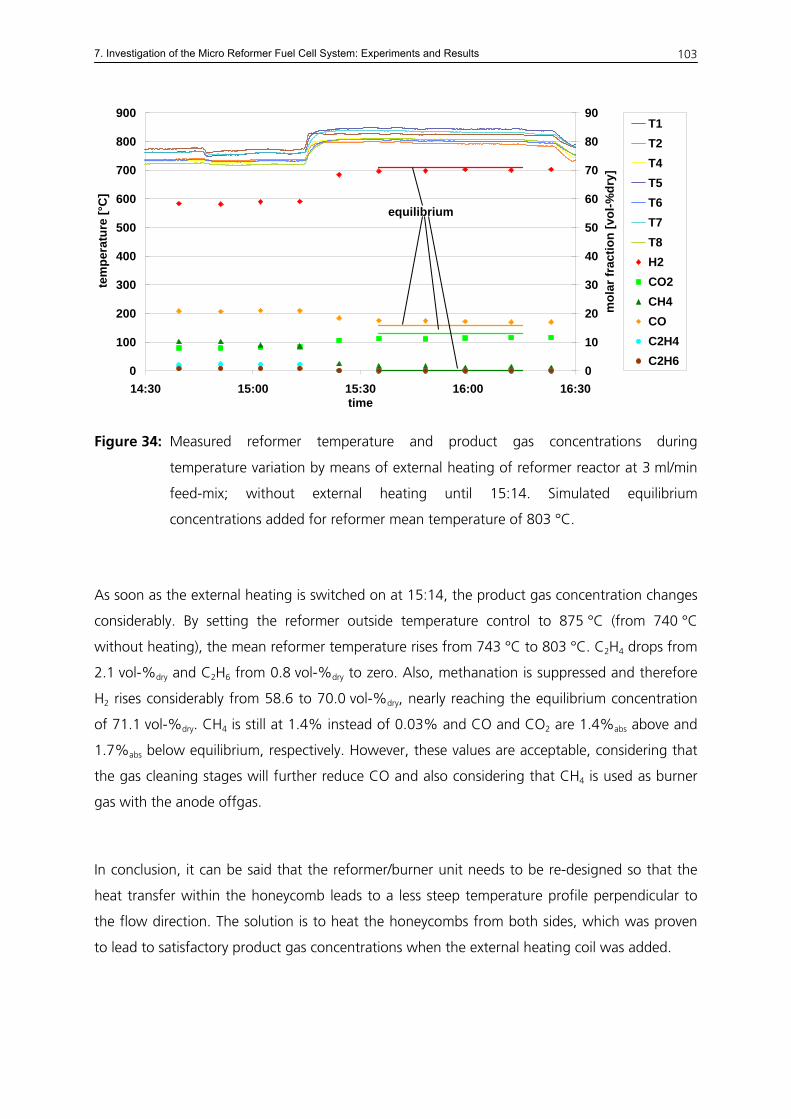
7. Investigation of the Micro Reformer Fuel Cell System: Experiments and Results
103
0
100
200
300
400
500
600
700
800
900
14:30 15:00 15:30 16:00 16:30time
tem
pera
ture
[°C
]
0
10
20
30
40
50
60
70
80
90
mol
ar fr
actio
n [v
ol-%
dry]
T1T2T4T5T6T7T8H2CO2CH4COC2H4C2H6
equilibrium
Figure 34: Measured reformer temperature and product gas concentrations during
temperature variation by means of external heating of reformer reactor at 3 ml/min
feed-mix; without external heating until 15:14. Simulated equilibrium
concentrations added for reformer mean temperature of 803 °C.
As soon as the external heating is switched on at 15:14, the product gas concentration changes
considerably. By setting the reformer outside temperature control to 875 °C (from 740 °C
without heating), the mean reformer temperature rises from 743 °C to 803 °C. C2H4 drops from
2.1 vol-%dry and C2H6 from 0.8 vol-%dry to zero. Also, methanation is suppressed and therefore
H2 rises considerably from 58.6 to 70.0 vol-%dry, nearly reaching the equilibrium concentration
of 71.1 vol-%dry. CH4 is still at 1.4% instead of 0.03% and CO and CO2 are 1.4%abs above and
1.7%abs below equilibrium, respectively. However, these values are acceptable, considering that
the gas cleaning stages will further reduce CO and also considering that CH4 is used as burner
gas with the anode offgas.
In conclusion, it can be said that the reformer/burner unit needs to be re-designed so that the
heat transfer within the honeycomb leads to a less steep temperature profile perpendicular to
the flow direction. The solution is to heat the honeycombs from both sides, which was proven
to lead to satisfactory product gas concentrations when the external heating coil was added.
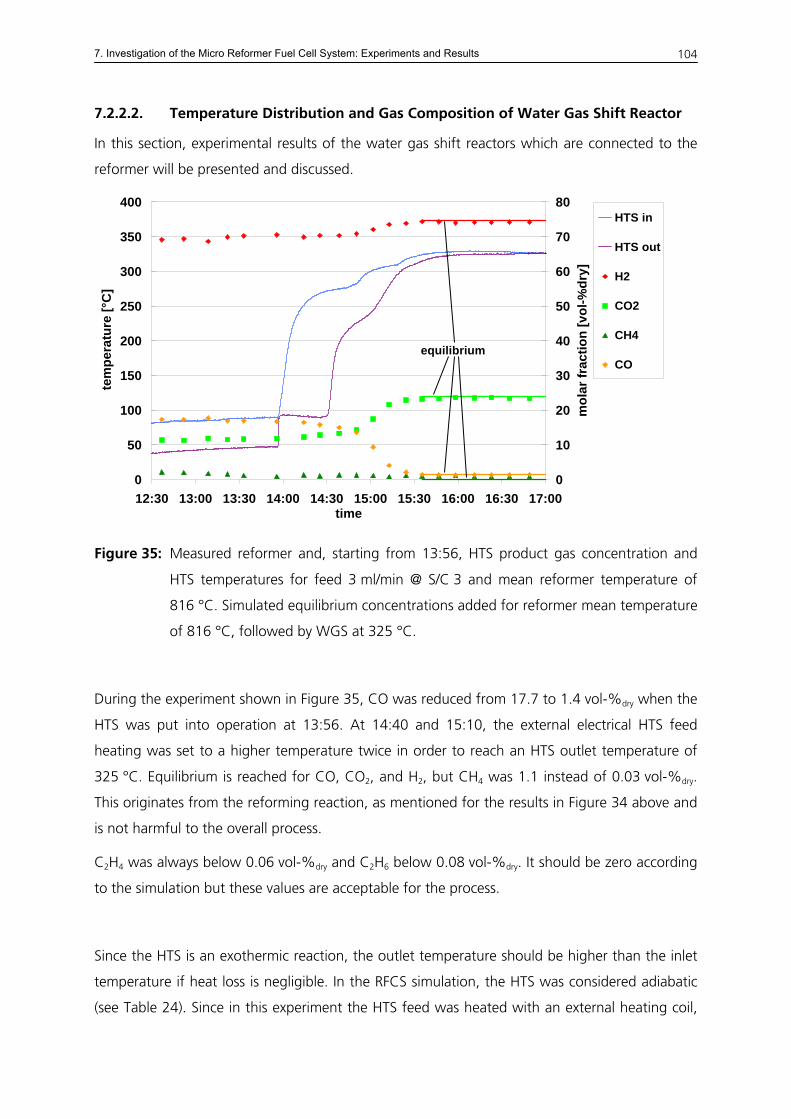
7. Investigation of the Micro Reformer Fuel Cell System: Experiments and Results
104
7.2.2.2. Temperature Distribution and Gas Composition of Water Gas Shift Reactor
In this section, experimental results of the water gas shift reactors which are connected to the
reformer will be presented and discussed.
0
50
100
150
200
250
300
350
400
12:30 13:00 13:30 14:00 14:30 15:00 15:30 16:00 16:30 17:00time
tem
pera
ture
[°C
]
0
10
20
30
40
50
60
70
80
mol
ar fr
actio
n [v
ol-%
dry]
HTS in
HTS out
H2
CO2
CH4
COequilibrium
Figure 35: Measured reformer and, starting from 13:56, HTS product gas concentration and
HTS temperatures for feed 3 ml/min @ S/C 3 and mean reformer temperature of
816 °C. Simulated equilibrium concentrations added for reformer mean temperature
of 816 °C, followed by WGS at 325 °C.
During the experiment shown in Figure 35, CO was reduced from 17.7 to 1.4 vol-%dry when the
HTS was put into operation at 13:56. At 14:40 and 15:10, the external electrical HTS feed
heating was set to a higher temperature twice in order to reach an HTS outlet temperature of
325 °C. Equilibrium is reached for CO, CO2, and H2, but CH4 was 1.1 instead of 0.03 vol-%dry.
This originates from the reforming reaction, as mentioned for the results in Figure 34 above and
is not harmful to the overall process.
C2H4 was always below 0.06 vol-%dry and C2H6 below 0.08 vol-%dry. It should be zero according
to the simulation but these values are acceptable for the process.
Since the HTS is an exothermic reaction, the outlet temperature should be higher than the inlet
temperature if heat loss is negligible. In the RFCS simulation, the HTS was considered adiabatic
(see Table 24). Since in this experiment the HTS feed was heated with an external heating coil,
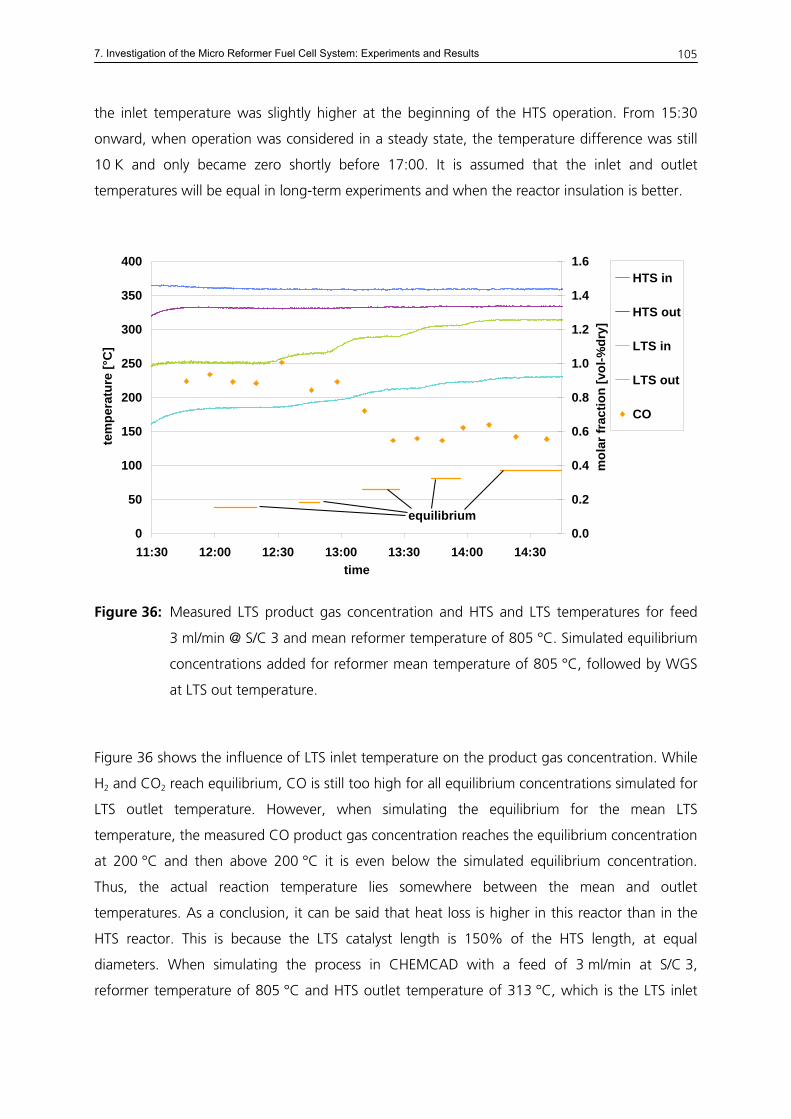
7. Investigation of the Micro Reformer Fuel Cell System: Experiments and Results
105
the inlet temperature was slightly higher at the beginning of the HTS operation. From 15:30
onward, when operation was considered in a steady state, the temperature difference was still
10 K and only became zero shortly before 17:00. It is assumed that the inlet and outlet
temperatures will be equal in long-term experiments and when the reactor insulation is better.
0
50
100
150
200
250
300
350
400
11:30 12:00 12:30 13:00 13:30 14:00 14:30time
tem
pera
ture
[°C
]
0.0
0.2
0.4
0.6
0.8
1.0
1.2
1.4
1.6
mol
ar fr
actio
n [v
ol-%
dry]
HTS in
HTS out
LTS in
LTS out
CO
equilibrium
Figure 36: Measured LTS product gas concentration and HTS and LTS temperatures for feed
3 ml/min @ S/C 3 and mean reformer temperature of 805 °C. Simulated equilibrium
concentrations added for reformer mean temperature of 805 °C, followed by WGS
at LTS out temperature.
Figure 36 shows the influence of LTS inlet temperature on the product gas concentration. While
H2 and CO2 reach equilibrium, CO is still too high for all equilibrium concentrations simulated for
LTS outlet temperature. However, when simulating the equilibrium for the mean LTS
temperature, the measured CO product gas concentration reaches the equilibrium concentration
at 200 °C and then above 200 °C it is even below the simulated equilibrium concentration.
Thus, the actual reaction temperature lies somewhere between the mean and outlet
temperatures. As a conclusion, it can be said that heat loss is higher in this reactor than in the
HTS reactor. This is because the LTS catalyst length is 150% of the HTS length, at equal
diameters. When simulating the process in CHEMCAD with a feed of 3 ml/min at S/C 3,
reformer temperature of 805 °C and HTS outlet temperature of 313 °C, which is the LTS inlet
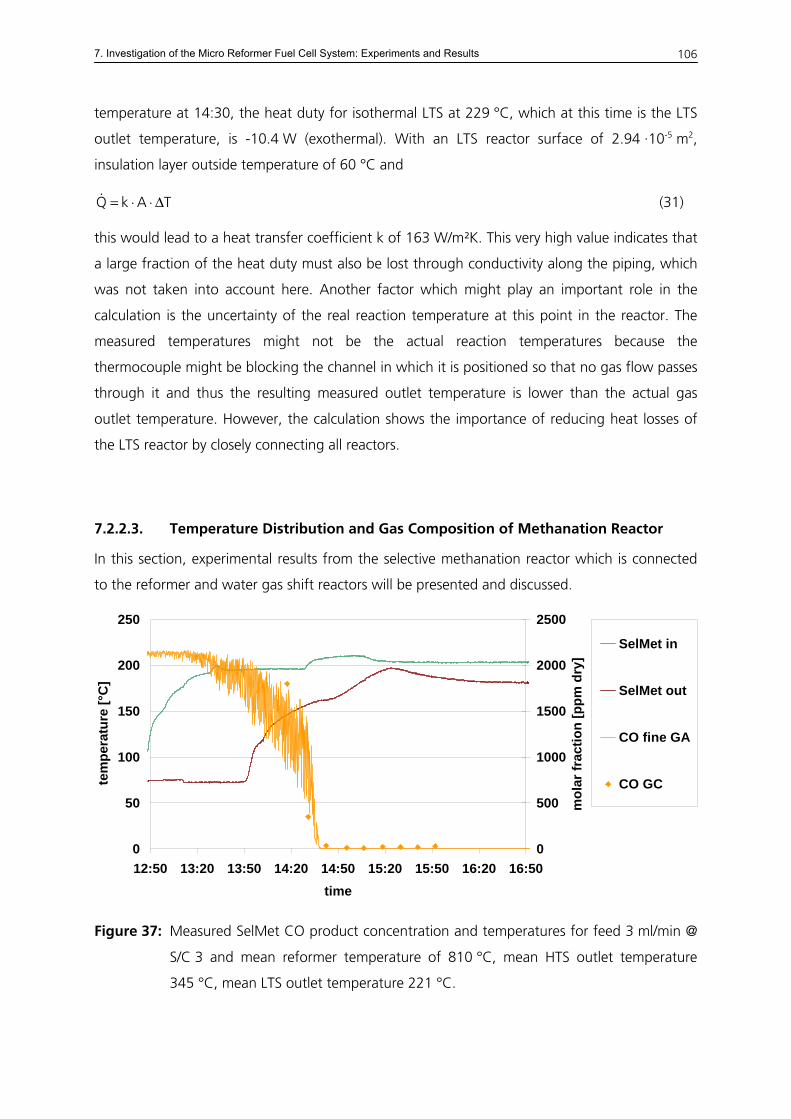
7. Investigation of the Micro Reformer Fuel Cell System: Experiments and Results
106
temperature at 14:30, the heat duty for isothermal LTS at 229 °C, which at this time is the LTS
outlet temperature, is -10.4 W (exothermal). With an LTS reactor surface of 2.94 ·10-5 m2,
insulation layer outside temperature of 60 °C and
TAkQ Δ⋅⋅=& (31)
this would lead to a heat transfer coefficient k of 163 W/m²K. This very high value indicates that
a large fraction of the heat duty must also be lost through conductivity along the piping, which
was not taken into account here. Another factor which might play an important role in the
calculation is the uncertainty of the real reaction temperature at this point in the reactor. The
measured temperatures might not be the actual reaction temperatures because the
thermocouple might be blocking the channel in which it is positioned so that no gas flow passes
through it and thus the resulting measured outlet temperature is lower than the actual gas
outlet temperature. However, the calculation shows the importance of reducing heat losses of
the LTS reactor by closely connecting all reactors.
7.2.2.3. Temperature Distribution and Gas Composition of Methanation Reactor
In this section, experimental results from the selective methanation reactor which is connected
to the reformer and water gas shift reactors will be presented and discussed.
0
50
100
150
200
250
12:50 13:20 13:50 14:20 14:50 15:20 15:50 16:20 16:50time
tem
pera
ture
[°C
]
0
500
1000
1500
2000
2500
mol
ar fr
actio
n [p
pm d
ry]
SelMet in
SelMet out
CO fine GA
CO GC
Figure 37: Measured SelMet CO product concentration and temperatures for feed 3 ml/min @
S/C 3 and mean reformer temperature of 810 °C, mean HTS outlet temperature
345 °C, mean LTS outlet temperature 221 °C.
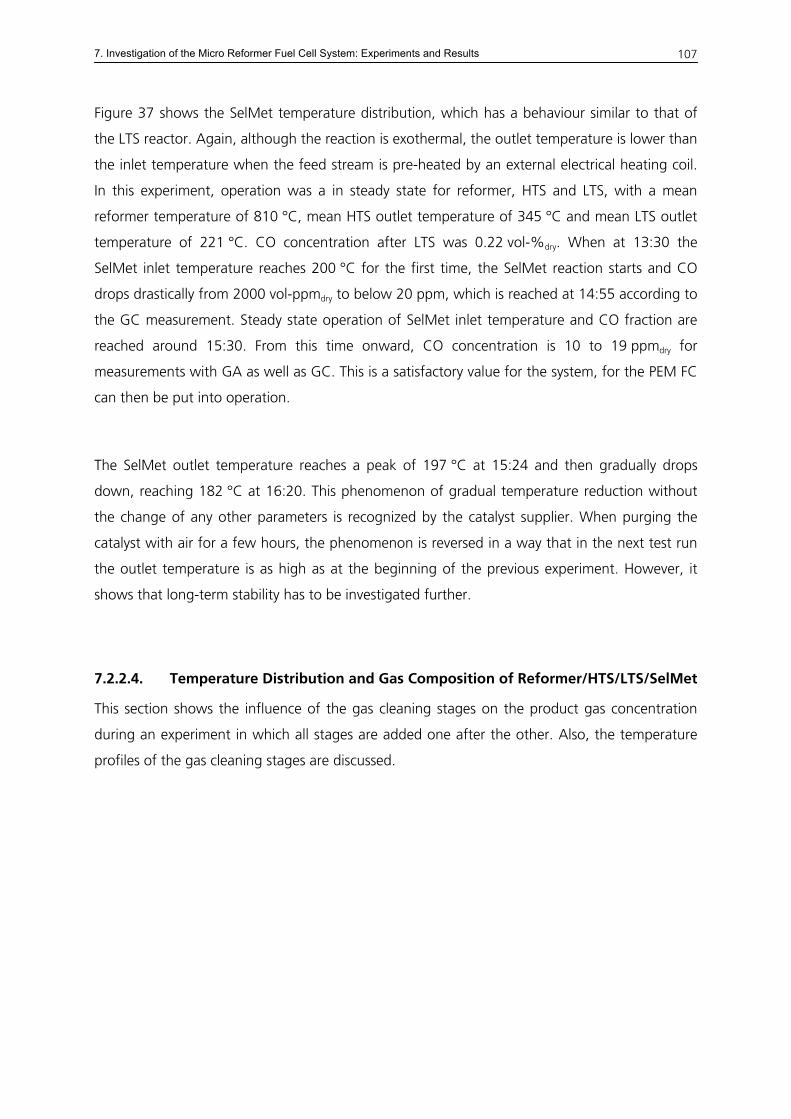
7. Investigation of the Micro Reformer Fuel Cell System: Experiments and Results
107
Figure 37 shows the SelMet temperature distribution, which has a behaviour similar to that of
the LTS reactor. Again, although the reaction is exothermal, the outlet temperature is lower than
the inlet temperature when the feed stream is pre-heated by an external electrical heating coil.
In this experiment, operation was a in steady state for reformer, HTS and LTS, with a mean
reformer temperature of 810 °C, mean HTS outlet temperature of 345 °C and mean LTS outlet
temperature of 221 °C. CO concentration after LTS was 0.22 vol-%dry. When at 13:30 the
SelMet inlet temperature reaches 200 °C for the first time, the SelMet reaction starts and CO
drops drastically from 2000 vol-ppmdry to below 20 ppm, which is reached at 14:55 according to
the GC measurement. Steady state operation of SelMet inlet temperature and CO fraction are
reached around 15:30. From this time onward, CO concentration is 10 to 19 ppmdry for
measurements with GA as well as GC. This is a satisfactory value for the system, for the PEM FC
can then be put into operation.
The SelMet outlet temperature reaches a peak of 197 °C at 15:24 and then gradually drops
down, reaching 182 °C at 16:20. This phenomenon of gradual temperature reduction without
the change of any other parameters is recognized by the catalyst supplier. When purging the
catalyst with air for a few hours, the phenomenon is reversed in a way that in the next test run
the outlet temperature is as high as at the beginning of the previous experiment. However, it
shows that long-term stability has to be investigated further.
7.2.2.4. Temperature Distribution and Gas Composition of Reformer/HTS/LTS/SelMet
This section shows the influence of the gas cleaning stages on the product gas concentration
during an experiment in which all stages are added one after the other. Also, the temperature
profiles of the gas cleaning stages are discussed.
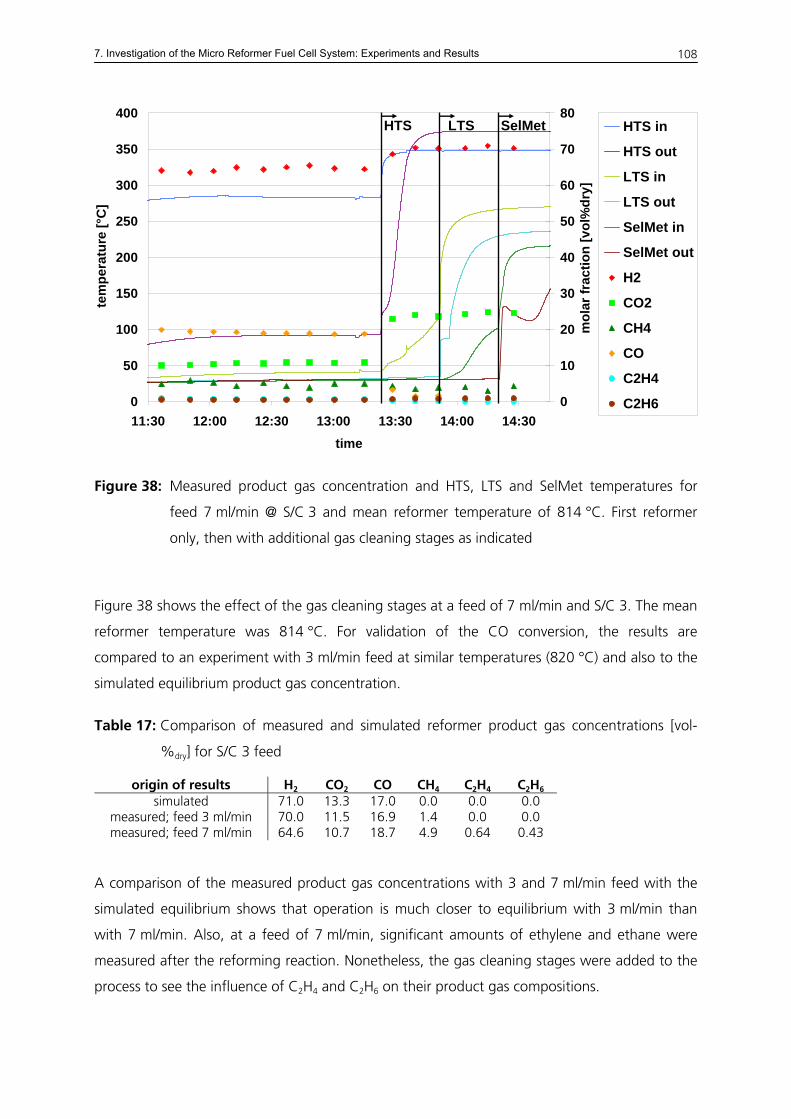
7. Investigation of the Micro Reformer Fuel Cell System: Experiments and Results
108
0
50
100
150
200
250
300
350
400
11:30 12:00 12:30 13:00 13:30 14:00 14:30time
tem
pera
ture
[°C
]
0
10
20
30
40
50
60
70
80
mol
ar fr
actio
n [v
ol%
dry]
HTS in
HTS out
LTS in
LTS out
SelMet in
SelMet out
H2
CO2
CH4
CO
C2H4
C2H6
HTS LTS SelMet
Figure 38: Measured product gas concentration and HTS, LTS and SelMet temperatures for
feed 7 ml/min @ S/C 3 and mean reformer temperature of 814 °C. First reformer
only, then with additional gas cleaning stages as indicated
Figure 38 shows the effect of the gas cleaning stages at a feed of 7 ml/min and S/C 3. The mean
reformer temperature was 814 °C. For validation of the CO conversion, the results are
compared to an experiment with 3 ml/min feed at similar temperatures (820 °C) and also to the
simulated equilibrium product gas concentration.
Table 17: Comparison of measured and simulated reformer product gas concentrations [vol-
%dry] for S/C 3 feed
origin of results H2 CO2 CO CH4 C2H4 C2H6
simulated 71.0 13.3 17.0 0.0 0.0 0.0 measured; feed 3 ml/min 70.0 11.5 16.9 1.4 0.0 0.0 measured; feed 7 ml/min 64.6 10.7 18.7 4.9 0.64 0.43
A comparison of the measured product gas concentrations with 3 and 7 ml/min feed with the
simulated equilibrium shows that operation is much closer to equilibrium with 3 ml/min than
with 7 ml/min. Also, at a feed of 7 ml/min, significant amounts of ethylene and ethane were
measured after the reforming reaction. Nonetheless, the gas cleaning stages were added to the
process to see the influence of C2H4 and C2H6 on their product gas compositions.
7. Investigation of the Micro Reformer Fuel Cell System: Experiments and Results
109
With added HTS, the CO concentration goes down to 1.6 vol-%dry (simulated: 2.6%), CO2 is at
23.6% and reaches equilibrium (23.1%), but at 3.8% CH4 is higher than equilibrium (0.03%)
and H2 at 70.2% lower than equilibrium (74.3%). C2H4 and C2H6 are at 0.1 and 0.8%,
respectively. As in the screening tests with added ethylene (see 5.2.3.2), ethylene is converted to
ethane, which then does not react further. This effect is also still present when the LTS is added.
Here, a slight rise of H2 concentration to 70.9% and CO2 to 24.7%, accompanied by another
reduction of CO to 0.5%, is visible and even more ethane is produced, now 0.9%, with
ethylene decreasing to 0.01%. When the SelMet reactor was finally put into operation, CO was
reduced to 0.2%, H2 being simultaneously lowered to 70.2% and CH4 rising to 4.2%. At this
point, the experiment was stopped because it was apparent that the reforming reaction was not
achieving the full conversion of ethanol into the desired gases only. Thus, the fuel cell could not
be added to the process at this flow rate. This could only be achieved with lower feed streams,
which will be shown in the following chapter.
For LTS and SelMet, as discussed in chapters 7.2.2.2 and 7.2.2.3 which dealt with the gas
cleaning stages, the inlet temperatures of the electrically heated feed streams of the stages are
higher than the outlet temperatures. For the HTS, however, the outlet temperature at steady
state operation is 26 K higher than the inlet temperature. This is because at higher throughput
the total heat duty of the reaction is higher than the heat losses through convection along the
reactor wall and insulation. The LTS and SelMet catalysts are longer than the HTS catalyst and
heat duty is about as high for LTS as for HTS and even lower for SelMet so heat losses play a
larger role in these two reactors. This shows that insulation is a very important issue for a μRFCS,
and even more so at lower throughputs.
7.3. Complete Reformer Fuel Cell System: Experiments and Results
This section will show the results of the combined reformer fuel cell system. It is thus the
demonstration of the feasibility of the simulation, design, calculations and know-how
accumulated over the years within the project described in this work.
Conclusions will focus on the reformer of the system. However, the fuel cell results will also be
presented briefly.
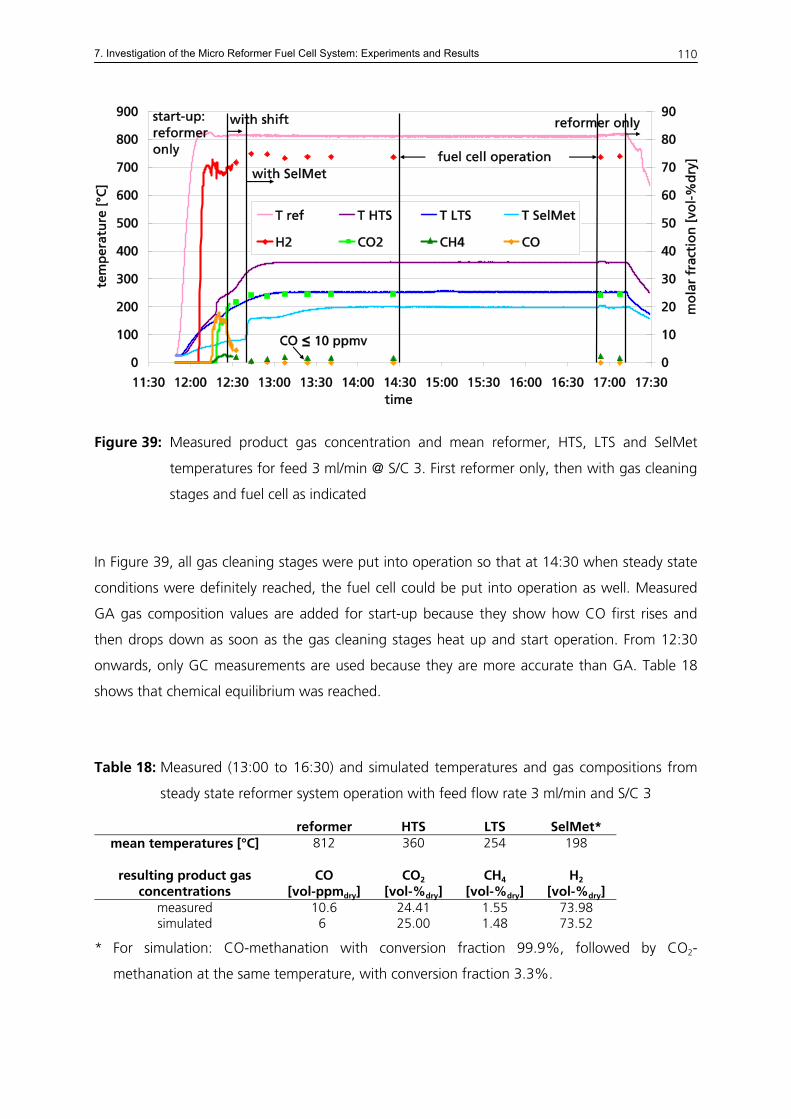
7. Investigation of the Micro Reformer Fuel Cell System: Experiments and Results
110
0
100
200
300
400
500
600
700
800
900
11:30 12:00 12:30 13:00 13:30 14:00 14:30 15:00 15:30 16:00 16:30 17:00 17:30time
tem
per
atu
re [
°C]
0
10
20
30
40
50
60
70
80
90
mo
lar
frac
tio
n [
vol-
%d
ry]
T ref T HTS T LTS T SelMet
H2 CO2 CH4 CO
fuel cell operation
start-up:reformeronly
with shift
with SelMet
CO ≤ 10 ppmv
reformer only
Figure 39: Measured product gas concentration and mean reformer, HTS, LTS and SelMet
temperatures for feed 3 ml/min @ S/C 3. First reformer only, then with gas cleaning
stages and fuel cell as indicated
In Figure 39, all gas cleaning stages were put into operation so that at 14:30 when steady state
conditions were definitely reached, the fuel cell could be put into operation as well. Measured
GA gas composition values are added for start-up because they show how CO first rises and
then drops down as soon as the gas cleaning stages heat up and start operation. From 12:30
onwards, only GC measurements are used because they are more accurate than GA. Table 18
shows that chemical equilibrium was reached.
Table 18: Measured (13:00 to 16:30) and simulated temperatures and gas compositions from
steady state reformer system operation with feed flow rate 3 ml/min and S/C 3
reformer HTS LTS SelMet* mean temperatures [°C] 812 360 254 198
resulting product gas
concentrations CO
[vol-ppmdry] CO2
[vol-%dry] CH4
[vol-%dry] H2
[vol-%dry] measured 10.6 24.41 1.55 73.98 simulated 06.0 25.00 1.48 73.52
* For simulation: CO-methanation with conversion fraction 99.9%, followed by CO2-
methanation at the same temperature, with conversion fraction 3.3%.
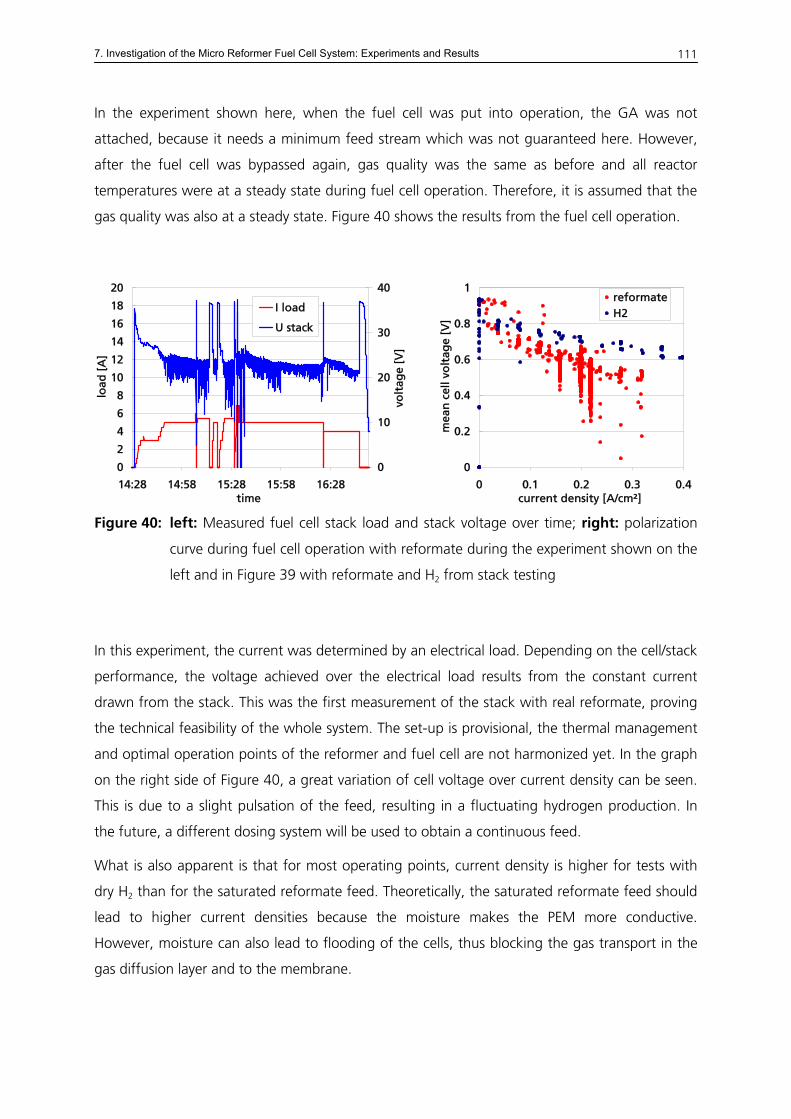
7. Investigation of the Micro Reformer Fuel Cell System: Experiments and Results
111
In the experiment shown here, when the fuel cell was put into operation, the GA was not
attached, because it needs a minimum feed stream which was not guaranteed here. However,
after the fuel cell was bypassed again, gas quality was the same as before and all reactor
temperatures were at a steady state during fuel cell operation. Therefore, it is assumed that the
gas quality was also at a steady state. Figure 40 shows the results from the fuel cell operation.
0
0.2
0.4
0.6
0.8
1
0 0.1 0.2 0.3 0.4current density [A/cm²]
mea
n c
ell v
olt
age
[V]
reformateH2
0
2
4
6
8
10
12
14
16
18
20
14:28 14:58 15:28 15:58 16:28time
load
[A
]
0
10
20
30
40
volt
age
[V]
I load
U stack
Figure 40: left: Measured fuel cell stack load and stack voltage over time; right: polarization
curve during fuel cell operation with reformate during the experiment shown on the
left and in Figure 39 with reformate and H2 from stack testing
In this experiment, the current was determined by an electrical load. Depending on the cell/stack
performance, the voltage achieved over the electrical load results from the constant current
drawn from the stack. This was the first measurement of the stack with real reformate, proving
the technical feasibility of the whole system. The set-up is provisional, the thermal management
and optimal operation points of the reformer and fuel cell are not harmonized yet. In the graph
on the right side of Figure 40, a great variation of cell voltage over current density can be seen.
This is due to a slight pulsation of the feed, resulting in a fluctuating hydrogen production. In
the future, a different dosing system will be used to obtain a continuous feed.
What is also apparent is that for most operating points, current density is higher for tests with
dry H2 than for the saturated reformate feed. Theoretically, the saturated reformate feed should
lead to higher current densities because the moisture makes the PEM more conductive.
However, moisture can also lead to flooding of the cells, thus blocking the gas transport in the
gas diffusion layer and to the membrane.
7. Investigation of the Micro Reformer Fuel Cell System: Experiments and Results
112
It can be concluded that the whole micro reformer fuel cell system works successfully, but the
following few aspects still need to be optimized: reformer feed pump (must be free of
fluctuation), heat integration and insulation of gas cleaning stages, thermal and water
management of the fuel cell when attached to the reformer system. What is more, the start-up
of the reformer system needs to be reproducible and thus standardized so that the feed gas for
the fuel cell is of reproducible quality at any chosen point of time during start-up. As a result,
thermal and water management in the cell can be realized more easily.
The overall system efficiency is not calculated for the test rig because not all components are
optimized yet. The burner is not run on ethanol for start-up, there is no housing and some
balance of plant components will be replaced by other, smaller types which will use less parasitic
power (e.g., the feed pump) or even be left out in the prototype system (e.g., electrical heating
coils, burner feed mass flow controllers). Also, the reformer/burner unit was re-designed after
the experiments presented in this section. It is assumed that the new reactor will have a more
even temperature profile perpendicular to the flow direction of the reformer reactor and that,
due to cylindrical design, the GHSV will be equal at all locations of the reactor and thus full
conversion into the desired products will be achieved at higher feed flows than presented in the
experiments of this thesis.
7.4. Comparison of Experimental Results with Literature Data and
Commercial Systems
It is not yet possible to compare the experimental results from the μRFCS of this thesis to
literature or market data. However, the preliminary calculations which are based on simulations
and conservative consumptions, as far as heat losses are concerned, show promising results
which will have to be proven during the continuation of the work.
The comparison of experimental results from this thesis with literature data that can be made up
to this point is the comparison from the screening tests. The results are discussed in 5.2.2.
When comparing the results to those from other reformer fuel cell systems, it is very important
to know what assumptions are made for other systems and how efficiencies are defined.
Another aspect which plays an important role when it comes to system design is for what
7. Investigation of the Micro Reformer Fuel Cell System: Experiments and Results
113
applications the system is developed. Different applications lead to a different ranking in key
criteria such as weight, size, fuel choice, fuelling, start-up time, run-time, complexity and, last
but not least, cost.
On the market, there is currently no other comparable μRFCS which is run by ethanol. The three
systems which have so far been developed and are for sale according to the information shown
on the respective websites (see 3.1.2) are fuelled with methanol (UltraCell Corporation and
IdaTech) and LPG (Voller Energy). These fuels have their specific advantages and disadvantages
over ethanol. LPG was not considered an option for the project of this thesis because it is a fossil
fuel. Methanol was ruled out because of toxicity. It is also not as widely available as ethanol.
Total efficiency of the μRFCS from this thesis can only be calculated when the system is put into
proper housing, because up to now not all components have been optimised, the objective of
the test rig being to demonstrate feasibility and functioning of the sum of components and also
to acquire know-how of the operation and control specific for an ethanol reforming system.
However, the theoretical efficiency of this system was calculated and compared to off-grid
power generators currently on the market (see 4.4 and Table 19 & Table 20). Here, it became
clear that the μRFCS presented in this thesis has great advantages over those systems. The only
system with comparable efficiency is the UltraCell XX25, which has 25 W rated power and runs
on methanol.
7.5. Conclusions for the μRFCS Test Rig
In this chapter, the experiments carried out with the complete micro reformer fuel cell system
were shown and explained in detail. The following conclusions are drawn from the experiments:
The burner works well with the porous ceramic internal and the designed size. Heat transfer to
the reformer is efficient. Axial temperature distribution in the reformer is as desired, the most
heat being transferred at the inlet of the honeycomb where the reaction has its highest heat
demand. However, temperature distribution perpendicular to the flow direction in the reformer
is unsatisfactory. The outsides of the reactor are too cold, which leads to incomplete conversion
of the intermediate reforming product ethylene and also ethane production. Thus, a new
reformer/burner design was developed (see A.12).
7. Investigation of the Micro Reformer Fuel Cell System: Experiments and Results
114
The gas cleaning stages work satisfactorily at the GHSV tested in the system when the reformate
is free of ethylene. Due to the small feed, the resulting exothermic heat duty of the gas cleaning
stages is low. The assembly of the gas cleaning stages is also not optimised yet, the construction
is not compact. Therefore, heat loss is considerable in the HTS, LTS and SelMet. This leads to all
three stages having higher inlet than outlet temperatures. In the geometrically optimised
assembly, the stages will be directly connected to each other. There will be no long tubing and
fittings for thermocouples, better insulation of all three stages together, with fans for
temperature adjustment in between.
For a feed of 3 ml/min at S/C 3, the technical feasibility of the complete reformer system was
demonstrated, the resulting product gas composition reaching the simulated thermodynamic
equilibrium values.
The fuel cell operation with reformate feed was demonstrated but needs to be optimized as far
as water and thermal management between the reformer and the fuel cell system are
concerned. Therefore, it is important to introduce a reproducible procedure which goes from
start-up to steady state operation. Then, a water and heat management strategy can be
contrived with the help of the data obtained from such reproducible start-ups.
Shut-down was always done through N2-purging. Since N2 will not be available in the prototype
system, it will be replaced by air. The optimum flow will have to be determined by further
experiments.
All experiments were carried out with hydrogen as the burner fuel. Ethanol will be used in the
new reactor with the new reformer/burner design. See outlook in chapter 9 for further details.
8. Results of this Work
115
8. Results of this Work
In this chapter, the main results of this work will be summarised.
From the literature study which was carried through to determine the significant characteristics
of micro reforming technology it became apparent that the most important point here is heat
transfer. In micro systems it is much greater compared to large systems, due to larger
temperature, pressure and density gradients.
Micro reformer fuel cell systems which are currently on the market were evaluated and the
efficiencies of these systems were used as bench marks for the μRFCS of this thesis. According
to the simulation carried out with CHEMCAD, a commercial process simulation tool, only
UltraCell's XX25 has equally high electrical efficiencies (24.9%). All others do not exceed
10.7%.
In a thermodynamic equilibrium simulation carried out with CHEMCAD, the product gas
concentration of the reformer, HTS, LTS and SelMet gas cleaning stages was determined as a
function of the reaction temperature. The results were compared to screening tests of these
catalysts and are as follows:
All three tested STR catalysts are suitable for STR with S/C = 3 and GHSV 10,000/h for the
honeycombs and 1650/h for the pellets because the simulated thermodynamic equilibrium is
reached with only small deviation. The catalytic coating of the honeycombs also tends to
promote an internal WGS reaction.
During HTS and MTS catalyst screening, the optimum temperature with minimum CO product
gas concentration lies at around 280 °C for catalysts no. 1, 3 (both HTS) and 7 (MTS) without
ethylene present. Thermodynamic equilibrium was reached in all cases. For catalyst no. 3, the
long-term test showed that with 90.4% full CO conversion could nearly be reached at the start,
91.6% being the theoretical value. However, after 350 hours conversion was down to 81.9%
due to deactivation of the catalyst. With ethylene in the feed, the optimum points moved to
higher temperatures: 297 °C for no. 7 and 320 °C for no. 6. The simulated thermodynamic
equilibrium was not reached. This is because in the simulation Fischer-Tropsch reactions were
8. Results of this Work
116
allowed to occur. They have slower kinetics than the water gas shift reaction and are also not
promoted by the catalysts used here.
The influence of ethylene in the feed was demonstrated in long-term testing of catalyst no. 6
which, instead of a theoretical conversion of 95.4%, only reached a maximum conversion of
59%, declining to 51% after 400 hours.
Catalyst no. 1 with optimum operating conditions at 380 °C and GHSV 7500/h at atmospheric
pressure was chosen for the HTS gas cleaning stage of the μRFCS. Catalyst no. 7 with optimum
operating conditions at 280 °C and GHSV 7500/h or slightly higher at atmospheric pressure was
chosen for the MTS stage.
SelMet catalyst screening showed that the catalyst tested has the lowest CO product gas
concentration at 220 °C where CO conversion is 99.64%.
In a second simulation, the complete μRFCS was modelled, the objective being to optimise heat
integration of all reactors and to determine the necessary feed flow of the ethanol/water mix
and the burner heat duty. The result was that for S/C 3 and a 400 Wel, tot system, a feed mix of
8.48 ml/min is needed. With an electrical efficiency of the fuel cell of 40%, an estimated heat
loss in heat transfer from the burner to the reformer of 15% and a worst-case assumption that
100 Wel will be needed for balance of plant equipment, the net electrical efficiency of the μRFCS
will be 24%, the total electrical efficiency being 32%. This is a very good result compared to the
competitive systems which are currently on the market, of which only the UltraCell XX25 has an
equally high efficiency, operating on methanol though.
A third simulation was set up to elucidate what reaction pathways are taken during the
reforming reaction. The reaction pathway scheme is based on literature and was further
developed during this thesis. When measured gas compositions from the reforming system are
entered into the simulation and the resulting pathways and conversion fractions are evaluated,
plausible results can be achieved. This proved the reaction pathway scheme set up is correct. For
Gibbs equilibrium concentration with full ethanol conversion, the preferred reaction pathway is
direct steam reforming with a feed fraction of 59%, followed by dehydrogenation and
8. Results of this Work
117
dehydration of 19 and 22%, respectively. For the simulation which was used to represent the
measured non-equilibrium concentration, the order of flow distribution was the same, but the
amounts and conversion fractions were 48% for direct STR, with conversion fraction 0.29 and
39% for dehydrogenation with conversion fraction 0.79 and 13% dehydration with conversion
fraction 1.
After simulating, designing and constructing the complete micro reformer fuel cell system, it
was set up as a laboratory test rig to prove the integration of all components. The following
results were obtained with the most recent test rig of this work:
The burner works well with a porous ceramic internal and the designed size. Heat transfer to the
reformer is efficient. Axial temperature distribution in the reformer is as desired, the most heat
being transferred at the inlet of the honeycomb where the reaction has its highest heat
demand. However, temperature distribution perpendicular to the flow direction in the reformer
is unsatisfactory. The outsides of the reactor are too cold, which leads to incomplete conversion
of the intermediate reforming product ethylene and also ethane production if the feed flow is
above 3 ml/min. Thus, a new reformer/burner design was developed.
For a feed of 3 ml/min at S/C 3, the successful operation of the complete reformer system was
demonstrated, the resulting product gas composition reaching the simulated thermodynamic
equilibrium values.
The fuel cell operation on reformate feed was demonstrated at 115 Wel power output, which
leads to a fuel efficiency, i.e., electrical power output per heat duty of the fuel input, of 31%.
Along with the know-how of the separate reactor stages and a deeper understanding of the
reforming process through simulation, catalyst screening and system tests, a list of criteria for
reformer system design has been obtained (Table 33). This list is very valuable for future reactor
design.
9. Summary and Outlook
118
9. Summary and Outlook
In this thesis, a micro reformer fuel cell system (μRFCS) for 300 Wel off-grid power supply,
fuelled with bioethanol, was modelled, designed, developed, operated and investigated in a
test-rig.
First of all, a literature study of current research in the field of micro reforming was carried
through to determine the significant characteristics of micro reforming technology. The most
important point here is heat transfer. Also, micro reformer fuel cell systems which are currently
on the market were presented and evaluated. According to the simulation carried out with
CHEMCAD, a commercial process simulation tool, the μRFCS of this thesis has an electrical
efficiency of 32 %. Only UltraCell's XX25 has equally high electrical efficiencies (24.9%).
The following three different types of simulations were developed and carried through with
CHEMCAD:
In a thermodynamic equilibrium simulation the product gas concentration of the reformer, HTS,
LTS and SelMet gas cleaning stages was determined as a function of the reaction temperature.
The results were compared to screening tests of these catalysts and are as follows:
All three tested STR catalysts are suitable for STR with S/C = 3 and GHSV 10,000/h for the
honeycombs and 1650/h for the pellets. HTS catalyst no. 1 with optimum operating conditions
at 380 °C and GHSV 7500/h at atmospheric pressure was chosen for the HTS gas cleaning stage
of the μRFCS. Catalyst no. 7 with optimum operating conditions at 280 °C and GHSV 7500/h or
slightly higher at atmospheric pressure was chosen for the MTS stage. SelMet catalyst screening
showed that the catalyst tested has the lowest CO product gas concentration at 220 °C where
CO conversion is 99.64%.
In a second simulation, the complete μRFCS was modelled. As a result for S/C 3 and a 400 Wel, tot
system, the required feed mix is 8.48 ml/min. The calculated net electrical efficiency of this
μRFCS will be 24%, the total electrical efficiency being 32%.
A third simulation was set up to elucidate what reaction pathways are taken during the
reforming reaction. The preferred reaction pathway is direct steam reforming, followed by
dehydrogenation and dehydration.
9. Summary and Outlook
119
After simulating, designing and constructing the complete micro reformer fuel cell system, it
was set up as a laboratory test rig. Several different degrees of integration of all components
were designed, set up and tested until the set-up described in detail in this thesis was
constructed. The following results were obtained with this test rig:
The burner works well with a porous ceramic internal and the designed size. Heat transfer to the
reformer is efficient and axial temperature distribution in the reformer as desired. For a feed of
3 ml/min at S/C 3, the successful operation of the complete reformer system was demonstrated,
the resulting product gas composition reaching the simulated thermodynamic equilibrium
values. The fuel cell operation on reformate feed was demonstrated at 115 Wel power output,
which leads to a fuel efficiency, i.e., electrical power output per heat duty of the fuel input, of
31%. However, for feed flows above 3 ml/min, temperature distribution perpendicular to the
flow direction in the reformer is unsatisfactory, resulting in ethylene and ethane production.
Thus, a new reformer/burner design was developed. This was achieved according to the list of
criteria for reformer system design which has been obtained during this work.
The following optimisations of the μRFCS will be carried through in the further course of the
project:
The new reformer/burner design needs to be experimentally evaluated and then integrated into
the test rig. So far, all experiments were carried out with hydrogen as burner fuel. Ethanol will
be used in the new reactor with the new reformer/burner design.
The fuel cell needs to be optimized as far as water and thermal management between the
reformer and the fuel cell system are concerned. Therefore a standard start-up procedure, until
steady state operation is reached, should be introduced, from which a water and heat
management strategy can be contrived.
When all components run satisfactorily and standard start-up and shut-down procedures have
been established, the complete system will be put into housing. Furthermore, the system control
will be programmed onto a micro controller. Thus, a potentially commercialisable prototype will
be obtained.
10. References
120
10. References
ABB Automation, Analytical Division. Product information: Advance Optima - High Performance
Measurement Technology Infrared Analyser Module Uras 14. 50/24-02 EN 10.99,
http://www.kinetic.com.tw/product/ABB/Uras%2014.pdf, 11.03.2008
AD-Merkblatt B0 and B5, Verband der Technischen Überwachungs-Vereine (VdTÜV) (editor).
Carl Heymanns, Köln & Beuth, Berlin, paper back edition 1997
Ahmed S., Krumpelt M.: Hydrogen from hydrocarbon fuels for fuel cells. International Journal of
Hydrogen Energy 26 (2001) 291–301
Aicher T., Rochlitz L.: Investigation of Noble Metal Catalysts for Ethanol Steam Reforming.
Submitted for publication in Applied Catalysis A: General, April 2008
Amador C., Gavriilidis P., Angeli P.: Flow distribution in different microreactor scale-out
geometries and the effect of manufacturing tolerances and channel blockage. Chemical
Engineering Journal, 101 (2004) 379-390
Auprêtre F., Descorme C., Duprez D.: Bio-ethanol catalytic steam reforming over supported
metal catalysts. Catalysis Communications 3 (2002) 263-267
Beckhaus P.: On-board fuel cell power supply for sailing yachts. Journal of Power Sources 145
(2005) 639-643
Bourne J.K.: Green Dreams. National Geographic Magazine, Oct. 2007
CAT Pistonpumps Product information. http://www.cat-ing.de/cat_pistonpumps_hplh.htm,
consulted 10.10.2005
Cavallaro S.: Ethanol Steam Reforming on Rh/Al2O3 Catalysts. Energy & Fuels, 14 (2000), 1195 –
1199
Cavallaro S., Chiodo V., Freni S., Mondello N., Frusteri F.: Performance of Rh/Al O catalyst in the
steam reforming of ethanol: H production for MCFC
2 3
2 . Applied Catalysis A: General 249
(2003) 119-128. Private communication of measurement data which was the basis for
this publication.
Chemstations Inc.: CHEMCAD version 5 user manual, Houston, Oct. 2002
De Wild P.J., Verhaak M.J.F.M.: Catalytic production of hydrogen from methanol. Catalysis
Today 60 (2000) 3-10
10. References
121
Ducrée J.: Centrifugal microfluidics for lab-on-a-chip and micro process engineering.
Postdoctoral Thesis. University of Freiburg. Freiburg, June 16, 2005
Dubbel H. (editor): Taschenbuch für den Maschinenbau. 17th revised edition, Springer, Berlin
1990
Duisberg M.: Personal communication. Umicore AG & Co. KG, Hanau-Wolfgang, Aug. 2006
Edlund D.: Development of a compact 250W portable power supply for commercial and military
markets. 2005 Fuel Cell Seminar, Palm Springs, Nov. 14-18 2005, Abstract 554
Einhell product information: Art.-Nr.: 41.512.10, Stromerzeuger STE 800 EAN-Code:
006825412833. released 07.04.2003, updated 19.05.2003
Ersoz A., Olgun H., Ozdogan S.: Reforming options for hydrogen production from fossil fuels for
PEM fuel cells. Journal of Power Sources 154 (2006) 67-73
Fatsikostas A.N., Kondarides D.I., Verykios X.E.: Production of hydrogen for fuel cells by
reformation of biomass-derived ethanol. Catalysis Today 75 (2002) 145-155
Fischer Panda product info, Panda AGT 2500L YA – Chapter D: Appendix. Additional
information about fuel use sent by Josef Niggemann, Sales at Fischer Panda, Dec. 19
2007
Friedrich G., Opferkuch F., Galser G., Kolios G., Eigenberger G.: Compact fixed bed reactor for
catalytic reactions with integral heat exchange. Patent EP085653, 08.06.1998
Gavriilidis A., Angeli P., Cao E., Yeong K., Wan Y.: Technology and Applications of
Microengineered Reactors. Transactions of Institution of Chemical Engineers 80 (Part A),
2002, 3-30
Glöckler B., Kolios G., Eigenberger G.: Autothermal reactor concepts for endothermic fixed-bed
reactions. Chemical Engineering Science 58 (2003) 593-601
Glöckler B., Dieter H., Eigenberger G., Nieken U.: Efficient reheating of a reverse-flow reformer –
An experimental study. Chemical Engineering Science (2006), DOI:
10.1016/j.ces.2006.11.036
Gritsch A., Kolios G., Eigenberger G.: Reaktorkonzepte zur autothermen Führung endothermer
Hochtemperaturreaktionen. Chemie Ingenieur Technik 76, No. 6 (2004) 722-725
Hallmark J., Samms S., Castellano C., Liu Y.: Development of a Ceramic Wall-Coated Methanol
Fuel Processor Utilizing Novel Co-Fireable Steam-Reformation Catalyst. Abstr. 2006 Fuel
Cell Seminar, Honolulu, Hawaii, Nov. 13-17 2006, 67-70
10. References
122
Hebling C., Aicher T., Rochlitz L.: Micro-Fuel Cells. In: Gianchandani Y.B., Tabata O., Zappe H.
(editors): Comprehensive Microsystems. Vol. 3.19. Elsevier BV, Oxford, 2007
Hessel V., Löwe H., Müller A., Kolb G.: Chemical Micro Process Engineering. Wiley-VCH,
Weinheim, 2005
Holladay J.D., Jones E.O., Phelps M., Hu J.: Microfuel processor for use in a miniature power
supply. J. Power Sources 108 (2002) 21-27
Holladay J.D., Jones E.O., Dagle R.A., Xia G.G., Cao C., Wang Y.: High efficiency and low
carbon monoxide micro-scale methanol processors. J. Power Sources, 131 (2004) 69-72
Holladay J.D., Wainright J.S., Jones E.O., Gano S.R.: Power generation using a mesoscale fuel
cell integrated with a microscale fuel processor. J. Power Sources 130 (2004) 111-118
Honda product info EU10i: http://www.justgenerators.co.uk/pages/HondaEU10i.htm, 11.12.07
Honda product info EX7: http://www.justgenerators.co.uk/pages/HondaEX7.htm, 11.12.07
IdaTech product info: http://www.idatech.com/uploadDocs/iGenProductSheet_Reduced.pdf,
11.12.07
IdaTech: www.idatech.com/media/pdf/iGen_US.pdf, 21.02.07
IEA: Biofuels for Transport. An international Perspective. Paris, April 2004; a) Table 3.1, p. 53; b)
Fig. 2, p. 16 and Table 4.6, p. 79
IEA Energy Tehnology Essentials: ETE02: Biofuel Production. Jan. 2007,
http://www.iea.org/textbase/techno/essentials2.pdf, 29.02.08
Irving P., Allen W.L., Ming Q., Healey T.: Novel Catalytic Fuel Reforming with Advanced
Membrane Technology. Proceedings of the 2001 DOE Hydrogen Program Review
NREL/CP-570-30535
Kasper M.: Mikrosystementwurf. Springer, Berlin, 1999, p. 5
Kawamura Y., Ogura N., Yamamoto T., Igarashi A.: A miniaturized methanol reformer with Si-
based microreactor for a small PEMFC. Chem. Eng. Sci., 61 (2006) 1092-1101
Kolios G., Frauhammer J., Eigenberger G.: A simplified procedure for the optimal design of
autothermal reactors for endothermic high-temperature reactions. Chemical Engineering
Science 56 (2001) 351-357
Krupp VDM GmbH: Material data sheet no. 4137, March 2001
10. References
123
Kundu A., Jang J.H., Lee H.R., Kim S.H., Gil J.H., Jung C.R., Oh Y.S.: MEMS-based micro-fuel
processor for application in a cell phone. J. Power Sources, 162 (2006) 572-578
Kundu A., Park J.M., Ahn J.E., Park S.S., Shul Y.G., Han H.S.: Micro-channel reactor for steam
reforming of methanol. Fuel 86 (2007) 1331-1336
Kwon O.J., Hwang S.-M., Ahn J.-G., Kim J.J.: Silicon-based miniaturized-reformer for portable
fuel cell applications. J. Power Sources, 156 (2006) 253-259
Kwon O.J., Hwang S.-M., Chae J.H., Kang M.S., Kim J.J.: Performance of a miniaturized silicon
reformer-PrOx-fuel cell system. J. Power Sources 165 (2007) 342-346
Ledjeff-Hey K., Kalk T., Mahlendorf F., Niemzig O., Trautmann A., Roes J.: Portable PEFC
generator with propane as fuel. Journal of Power Sources 86 (2000) 166-172
Lenz B.: Untersuchungen zur autothermen Reformierung von Kerosin Jet A-1 zur Versorgung
oxidkeramischer Festelektrolyt-Brennstoffzellen (SOFC). PhD dissertation, Fraunhofer ISE,
Freiburg, 2007
Liguras D.K., Kondarides D.I., Verykios X.E.: Production of hydrogen for fuel cells by steam
reforming of ethanol over supported noble metal catalysts. Applied Catalysis B:
Environmental, 43 (2003) 345-354
Linde safety data sheet for hydrogen: EG-Sicherheitsdatenblatt nach TRGS 220, Wasserstoff,
verdichtet. 15.07.2002
Llorca J., Homs N., Sales J., Ramírez de la Piscina P.: Efficient Production of Hydrogen over
Supported Cobalt Catalysts from Ethanol Steam Reforming. Journal of Catalysts 209
(2002) 306 – 317
Madou M.: Fundamentals of Microfabrication. CRC Press, New York, 1997
McKibben B.: Carbon's New Math. To deal with global warming, the first step is to do the
numbers. National Georgaphic Magazine, Oct. 2007, 33-37
Merck safety data sheet for ethanol: Sicherheitsdatenblatt nach EG-Richtlinie 91/155/EWG
Ethanol vergällt mit ca. 1% Methylethylketon. 21.03.2003
MKS Instruments, Inc. Product data sheet for 1479A Mass-Flo® Metal-Sealed Mass Flow
Controller (MFC), Aug. 2006, http://www.mksinst.com/docs/UR/1479.pdf, 07.03.2008
Narusawa K., Hayashida M., Kamiya Y., Roppongi H., Kurashima D., Wakabayashi K.:
Deterioration in fuel cell performance resulting from hydrogen fuel containing impurities:
poisoning effects by CO, CH4, HCHO and HCOOH. JSAE Review 24 (2003) 41-46
10. References
124
Niggemann J.: Personal communication. Fischer Panda GmbH, Paderborn, Dec. 2007
Pacala S., Socolow R.: Stabilization Wedges: Solving the Climate Problem for the Next 50 Years
with Current Technologies. Science 305 (2004) no. 5686, 968 - 972
Park G.-G., Yim S.-D., Yoon Y.-G., Kim C.-S., Seo D.-J., Eguchi K.: Hydrogen production with
integrated microchannel fuel processor using methanol for portable fuel cell systems.
Catalysis Today 110 (2005) 108-113
Patterson W.: Keeping the Lights on: Towards Sustainable Electricity. Earthscan, London, 2007
PEMEAS Product information Celtec®-P 1000 MEA for high temperature PEM fuel cells,
http://www2.pemeas.de/documents/celtecP1000MEA.i.de.pdf, 07.11.2007
Peterson R.B.: Miniature and microscale energy systems. 2003. In: Fahgri M., Sunden B. (ed.).
Heat and Fluid Flow in Microscale and Nanoscale Structures. WIT Press, Southampton,
2004, p. 1-37
Pfefferle W.C.: Microlith Catalytic Reaction System. Patent 5,051,241 (1991)
Pickles J.S., Irving, P.M.: Low Cost InnovaGen® Micro-Channel Fuel Processing System. Prepr.
Pap.-Am. Chem. Soc., Div. Fuel Chem. 52 (2) (2007)
Poling B.E., Prausnitz J.M., O'Connell J.P.: The Properties of Gases and Liquids. 5th edition, The
McGraw-Hill Companies, Inc., Boston, 2001
Richtlinie 87/404/EWG des Rates vom 25. Juni 1987 zur Angleichung der Rechtsvorschriften der
Mitgliedstaaten für einfache Druckbehälter, Amtsblatt Nr. L 220, 08.08.1987, p. 0048 -
0059
Rochlitz L., Aicher T.: Investigation of Water Gas Shift Catalysts for Reformate Gas Treatment in
Ethanol Fuel Processors. Submitted for publication in Applied Catalysis A: General, April
2008
Roychoudhury S., Castaldi M., Lyubovsky M., Ahmed S.: Microlith catalytic reactors for
reforming iso-octane-based fuels into hydrogen. Journal of Power Sources 152 (2005)
75-86
Ryi S.K., Park J.S., Choi S.H., Cho S.H., Kim S.H.: Novel micro fuel processor for PEMFCs with
heat generation by catalytic combustion. Chem. Eng. J. 113 (2005) 47-53
Ryi S.K., Park J.S., Cho S.H., Kim S.H.: Fast start-up of microchannel fuel processor integrated
with an igniter for hydrogen combustion. J. Power Sources 161 (2006) 1234-1240
Schunk Kohlenstofftechnik GmbH: Bedienungshinweise und Datenblatt. 1st edition, Aug. 2006
10. References
125
Shin Y., Kim O., Hong J.-C., Oh J.-H., Kim W.-J., Haam S., Chung C.-H.: The development of
micro-fuel processor using low temperature co-fired ceramic (LTCC). Int. J. Hydr. Energy
31 (2006) 1925-1933
Smart Fuel Cell product info: http://www.efoy.de/index.php?option=com_content&task=view&
id=117&Itemid=163, 25.03.08
Stern N.: The Economics of Climate Change. The Stern Review. Cambridge University Press,
Cambridge, Jan. 2007
Susdorf A.: Personal communication. Fraunhofer ISE, Freiburg, March 2008
Szolak R.: Personal communication. Fraunhofer ISE, Freiburg, Oct. 2007
Tadd A.R., Gould B.D., Schwank J.W.: Packed bed versus microreactor performance in
autothermal reforming of isooctane. Catalysis Today 110 (2005) 68-75
Tanaka S., Chang K.S., Min K.B., Satoh D., Yoshida K., Esashi M.: MEMS-based components of
a miniature fuel cell/fuel reformer system. Chem. Eng. J. 101 (2004) 143-149
Tonkovich A.Y., Perry S., Wang Y., Qiu D., LaPLante T., Rogers W.A.: Microchannel process
technology for compact methane steam reforming. Chem. Eng. Sci. 59 (2004) 4819-
4828
UltraCell Corporation: www.ultracellpower.com, 29.11.05
UltraCell product info: http://www.ultracellpower.com/assets/UC_Datasheet_Final_09-19.pdf,
11.12.07
VDI-Wärmeatlas. V.D.I.V.-G.V.u. Chemieingenieurwesen (editors). 7th edition, Springer, Berlin,
1994. Mb1 and Mb2
Venkataraman K.: Thesis, University of Minnesota, 2003, a
Venkataraman K., Wanat E.C., Schmidt L.D.: Steam Reforming of Methane and Water-Gas Shift
in Catalytic Wall Reactors. AIChE Journal 49 No. 5 (2003) 1277-1284, b
Voller Energy: www.voller-energy.com/products.asp, 21.02.07
Wanat E.C., Venkataraman K., Schmidt L.D.: Steam reforming and water-gas shift of ethanol on
Rh and Rh-Ce catalysts in a catalytic wall reactor. Applied Catalysis A: General 276
(2004) 155–162
Yoshida K., Tanaka S., Hiraki H., Esashi M.: A Micro Fuel Reformer Integrated with a Combustor
and a Microchannel Evaporator. J. Micromech. Microeng. 16 (2006) S191-S197
11. Author's Publications
126
11. Author's Publications and Oral Contributions at Conferences
Aicher T., Rochlitz L.: Investigation of Noble Metal Catalysts for Ethanol Steam Reforming.
Submitted for publication in Applied Catalysis A: General, April 2008
Rochlitz L., Aicher T.: Investigation of Water Gas Shift Catalysts for Reformate Gas Treatment in
Ethanol Fuel Processors. Submitted for publication in Applied Catalysis A: General, April
2008
Rochlitz L., Krautz H.J.: Entwicklung, Untersuchung und Modellierung eines Mikroreformers als
Teil eines Systems zur netzfernen Stromversorgung mit PEM-Brennstoffzellen im Bereich
einiger 100 Watt. Forum der Forschung 20, BTU Cottbus, 2007, 55-62
Hebling C., Aicher T., Rochlitz L.: Micro-Fuel Cells. In: Gianchandani Y.B., Tabata O., Zappe H.
(editors): Comprehensive Microsystems. Vol. 3.19. Elsevier BV, Oxford, 2007
Rochlitz L., Martin J.: Patent DE10 2004 024 672 B4: Vorrichtung und Verfahren zur Erzeugung
eines teerfreien Schwachgases durch Vergasung von Biomasse. 14.06.2007
Oral Contribution: Mikroreformer – Wie aus Alkohol Strom wird. 6. Riesaer Brennstoffzellen-
Workshop, TGZ Glaubitz, 26.02.2007
Poster: Micro Reformer Fuel Cell System for 300 Wel. 10th Grove Fuel Cell Symposium. London,
25. – 27.9.2007
Oral Contribution: Design und Test eines Bioethanol Reformer Systems. 58. Berg- und
Hüttenmännischer Tag. TU Bergakademie Freiberg, 14.06.2007
Oral Contribution: Development of a micro reformer for PEMFC with a few hundred Watts
power output. Fuel Cells Science and Technology 2006 Conference. Torino,
13.&14.09.2006
Oral Contribution: Micro Reformer Fuel Cell System of a few 100 Watts. ACHEMA 2006.
Frankfurt/M. 15.-19.05.2006
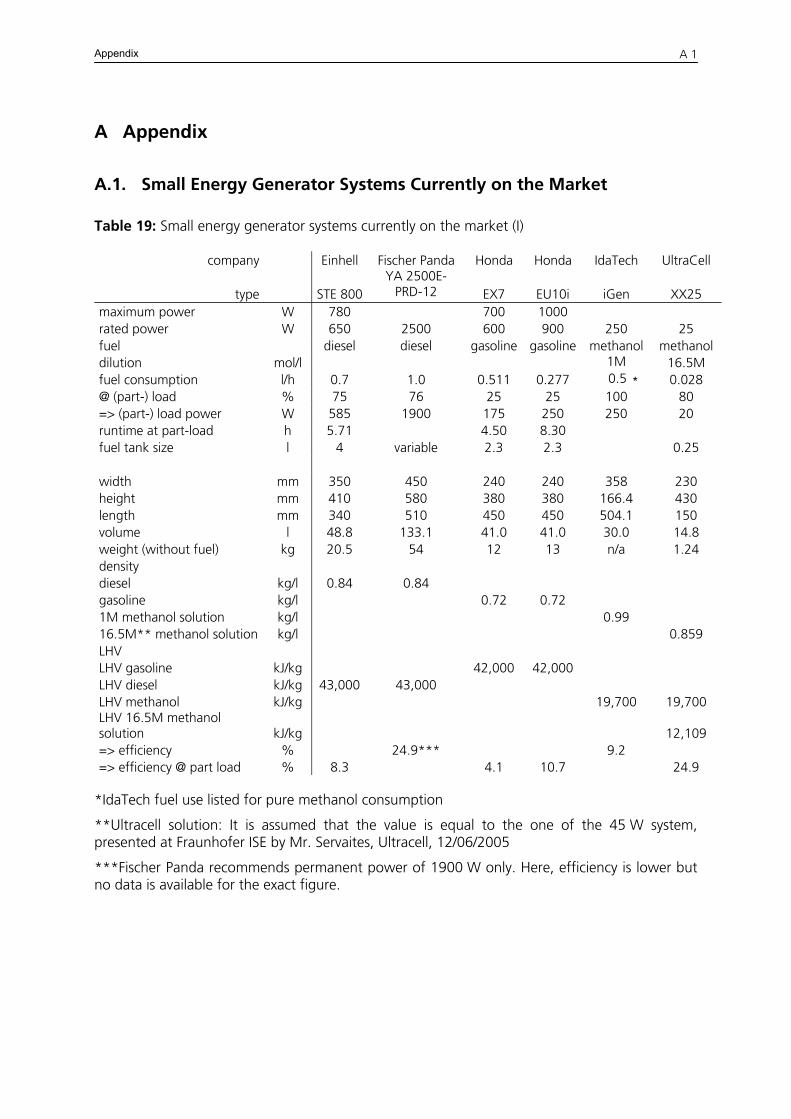
Appendix
A 1
A Appendix
A.1. Small Energy Generator Systems Currently on the Market
Table 19: Small energy generator systems currently on the market (I)
company Einhell Fischer Panda Honda Honda IdaTech UltraCell
type STE 800YA 2500E-
PRD-12 EX7 EU10i iGen XX25 maximum power W 780 700 1000 rated power W 650 2500 600 900 250 25 fuel diesel diesel gasoline gasoline methanol methanol dilution mol/l 1M 16.5M fuel consumption l/h 0.7 1.0 0.511 0.277 0.5 0.028 @ (part-) load % 75 76
25 25 100 80 => (part-) load power W 585 1900 175 250 250 20 runtime at part-load h 5.71
*
4.50 8.30 fuel tank size l 4 variable 2.3 2.3 0.25 width mm 350 450 240 240 358 230 height mm 410 580 380 380 166.4 430 length mm 340 510 450 450 504.1 150 volume l 48.8 133.1 41.0 41.0 30.0 14.8 weight (without fuel) kg 20.5 54 12 13 n/a 1.24 density diesel kg/l 0.84 0.84 gasoline kg/l 0.72 0.72 1M methanol solution kg/l 0.99 16.5M** methanol solution kg/l 0.859 LHV LHV gasoline kJ/kg 42,000 42,000 LHV diesel kJ/kg 43,000 43,000 LHV methanol kJ/kg 19,700 19,700 LHV 16.5M methanol solution kJ/kg 12,109 => efficiency % 24.9*** 9.2 => efficiency @ part load % 8.3 4.1 10.7 24.9
*IdaTech fuel use listed for pure methanol consumption
**Ultracell solution: It is assumed that the value is equal to the one of the 45 W system, presented at Fraunhofer ISE by Mr. Servaites, Ultracell, 12/06/2005
***Fischer Panda recommends permanent power of 1900 W only. Here, efficiency is lower but no data is available for the exact figure.
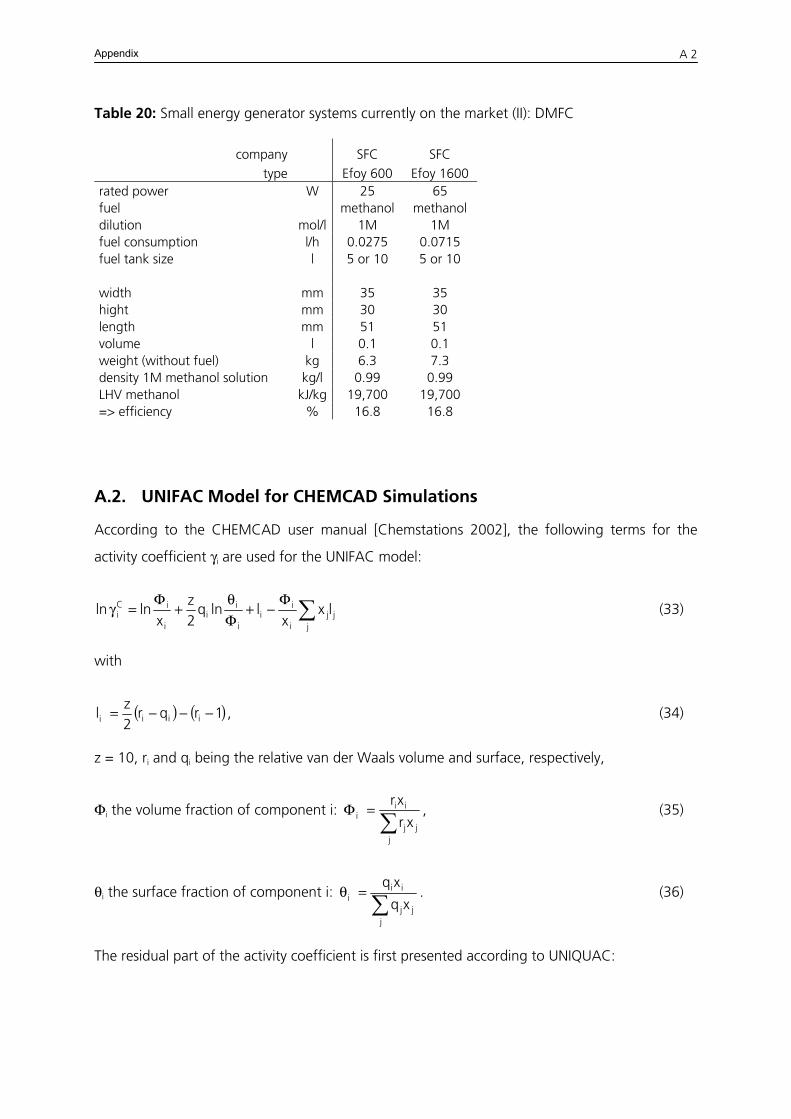
Appendix
A 2
Table 20: Small energy generator systems currently on the market (II): DMFC
company SFC SFC type Efoy 600 Efoy 1600
rated power W 25 65 fuel methanol methanol dilution mol/l 1M 1M fuel consumption l/h 0.0275 0.0715 fuel tank size l 5 or 10 5 or 10 width mm 35 35 hight mm 30 30 length mm 51 51 volume l 0.1 0.1 weight (without fuel) kg 6.3 7.3 density 1M methanol solution kg/l 0.99 0.99 LHV methanol kJ/kg 19,700 19,700 => efficiency % 16.8 16.8
A.2. UNIFAC Model for CHEMCAD Simulations
According to the CHEMCAD user manual [Chemstations 2002], the following terms for the
activity coefficient γi are used for the UNIFAC model:
∑Φ−+
Φθ
+Φ
=γj
jji
ii
i
ii
i
iCi lx
xllnq
2z
xlnln (33)
with
( ) ( 1rqr2z
l iiii −−−= ) , (34)
z = 10, ri and qi being the relative van der Waals volume and surface, respectively,
Φi the volume fraction of component i: ∑
=Φ
jjj
iii xr
xr, (35)
θi the surface fraction of component i: ∑
=θ
jjj
iii xq
xq. (36)
The residual part of the activity coefficient is first presented according to UNIQUAC:
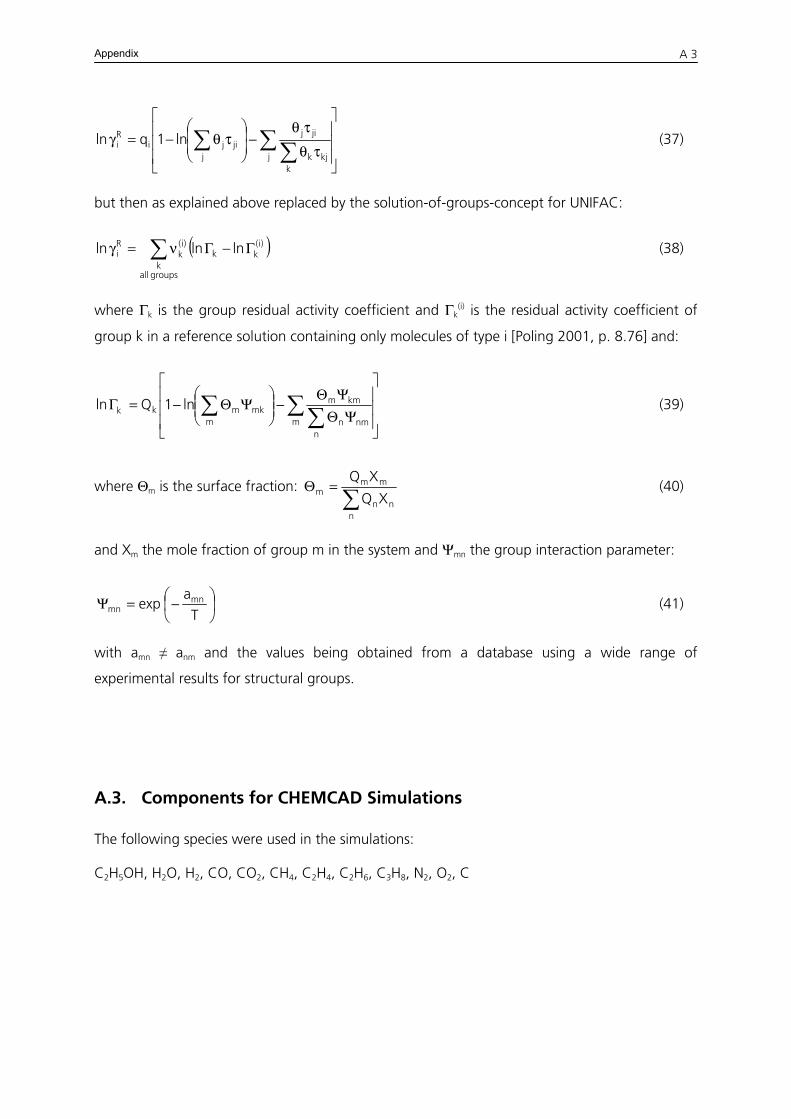
Appendix
A 3
⎥⎥⎥
⎦
⎤
⎢⎢⎢
⎣
⎡
τθ
τθ−⎟
⎟⎠
⎞⎜⎜⎝
⎛τθ−=γ ∑∑∑
jk
kjk
jij
jjiji
Ri ln1qln (37)
but then as explained above replaced by the solution-of-groups-concept for UNIFAC:
(∑ Γ−Γν=γ
groupsallk
)i(kk
)i(k
Ri lnlnln ) (38)
where Γk is the group residual activity coefficient and Γk(i) is the residual activity coefficient of
group k in a reference solution containing only molecules of type i [Poling 2001, p. 8.76] and:
⎥⎥⎥
⎦
⎤
⎢⎢⎢
⎣
⎡
ΨΘΨΘ
−⎟⎟⎠
⎞⎜⎜⎝
⎛ΨΘ−=Γ ∑∑∑
mn
nmn
kmm
mmkmkk ln1Qln (39)
where Θm is the surface fraction: ∑
=Θ
nnn
mmm
XQ
XQ (40)
and Xm the mole fraction of group m in the system and Ψmn the group interaction parameter:
⎟⎠⎞
⎜⎝⎛−=Ψ
Ta
exp mnmn (41)
with amn ≠ anm and the values being obtained from a database using a wide range of
experimental results for structural groups.
A.3. Components for CHEMCAD Simulations
The following species were used in the simulations:
C2H5OH, H2O, H2, CO, CO2, CH4, C2H4, C2H6, C3H8, N2, O2, C
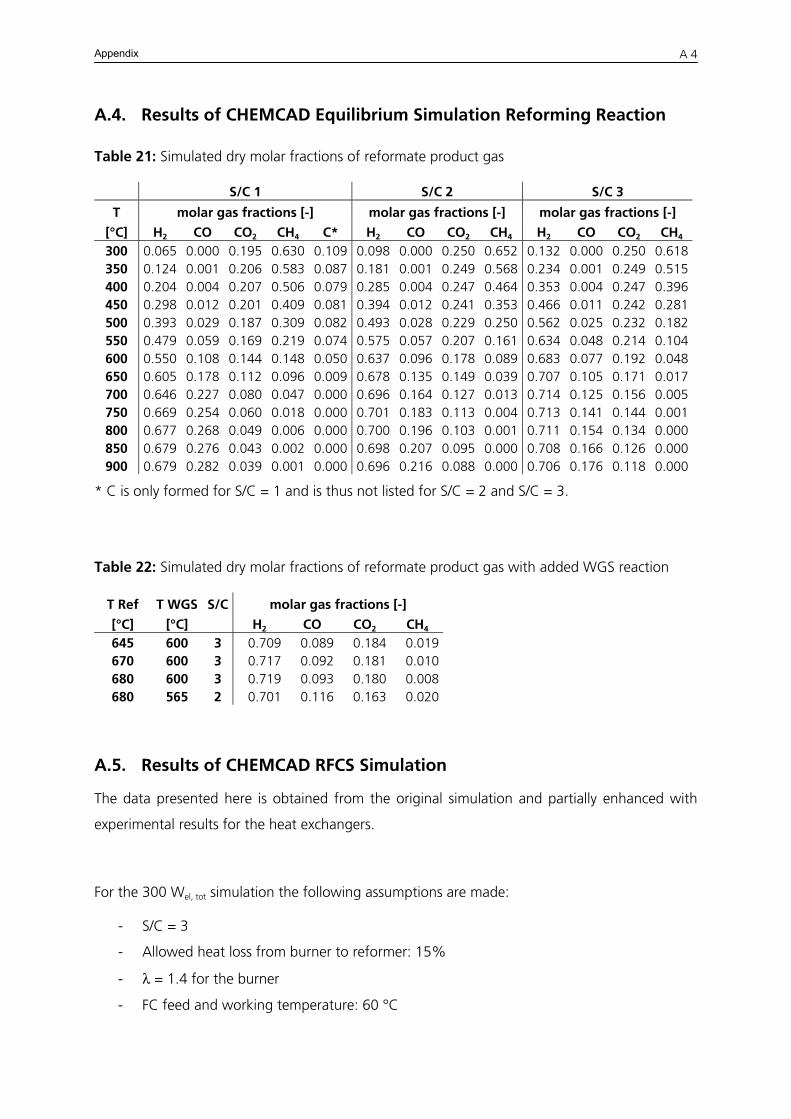
Appendix
A 4
A.4. Results of CHEMCAD Equilibrium Simulation Reforming Reaction
Table 21: Simulated dry molar fractions of reformate product gas
S/C 1 S/C 2 S/C 3
T molar gas fractions [-] molar gas fractions [-] molar gas fractions [-]
[°C] H2 CO CO2 CH4 C* H2 CO CO2 CH4 H2 CO CO2 CH4
300 0.065 0.000 0.195 0.630 0.109 0.098 0.000 0.250 0.652 0.132 0.000 0.250 0.618350 0.124 0.001 0.206 0.583 0.087 0.181 0.001 0.249 0.568 0.234 0.001 0.249 0.515400 0.204 0.004 0.207 0.506 0.079 0.285 0.004 0.247 0.464 0.353 0.004 0.247 0.396450 0.298 0.012 0.201 0.409 0.081 0.394 0.012 0.241 0.353 0.466 0.011 0.242 0.281500 0.393 0.029 0.187 0.309 0.082 0.493 0.028 0.229 0.250 0.562 0.025 0.232 0.182550 0.479 0.059 0.169 0.219 0.074 0.575 0.057 0.207 0.161 0.634 0.048 0.214 0.104600 0.550 0.108 0.144 0.148 0.050 0.637 0.096 0.178 0.089 0.683 0.077 0.192 0.048650 0.605 0.178 0.112 0.096 0.009 0.678 0.135 0.149 0.039 0.707 0.105 0.171 0.017700 0.646 0.227 0.080 0.047 0.000 0.696 0.164 0.127 0.013 0.714 0.125 0.156 0.005750 0.669 0.254 0.060 0.018 0.000 0.701 0.183 0.113 0.004 0.713 0.141 0.144 0.001800 0.677 0.268 0.049 0.006 0.000 0.700 0.196 0.103 0.001 0.711 0.154 0.134 0.000850 0.679 0.276 0.043 0.002 0.000 0.698 0.207 0.095 0.000 0.708 0.166 0.126 0.000900 0.679 0.282 0.039 0.001 0.000 0.696 0.216 0.088 0.000 0.706 0.176 0.118 0.000
* C is only formed for S/C = 1 and is thus not listed for S/C = 2 and S/C = 3.
Table 22: Simulated dry molar fractions of reformate product gas with added WGS reaction
T Ref T WGS S/C molar gas fractions [-]
[°C] [°C] H2 CO CO2 CH4
645 600 3 0.709 0.089 0.184 0.019670 600 3 0.717 0.092 0.181 0.010680 600 3 0.719 0.093 0.180 0.008680 565 2 0.701 0.116 0.163 0.020
A.5. Results of CHEMCAD RFCS Simulation
The data presented here is obtained from the original simulation and partially enhanced with
experimental results for the heat exchangers.
For the 300 Wel, tot simulation the following assumptions are made:
- S/C = 3
- Allowed heat loss from burner to reformer: 15%
- λ = 1.4 for the burner
- FC feed and working temperature: 60 °C
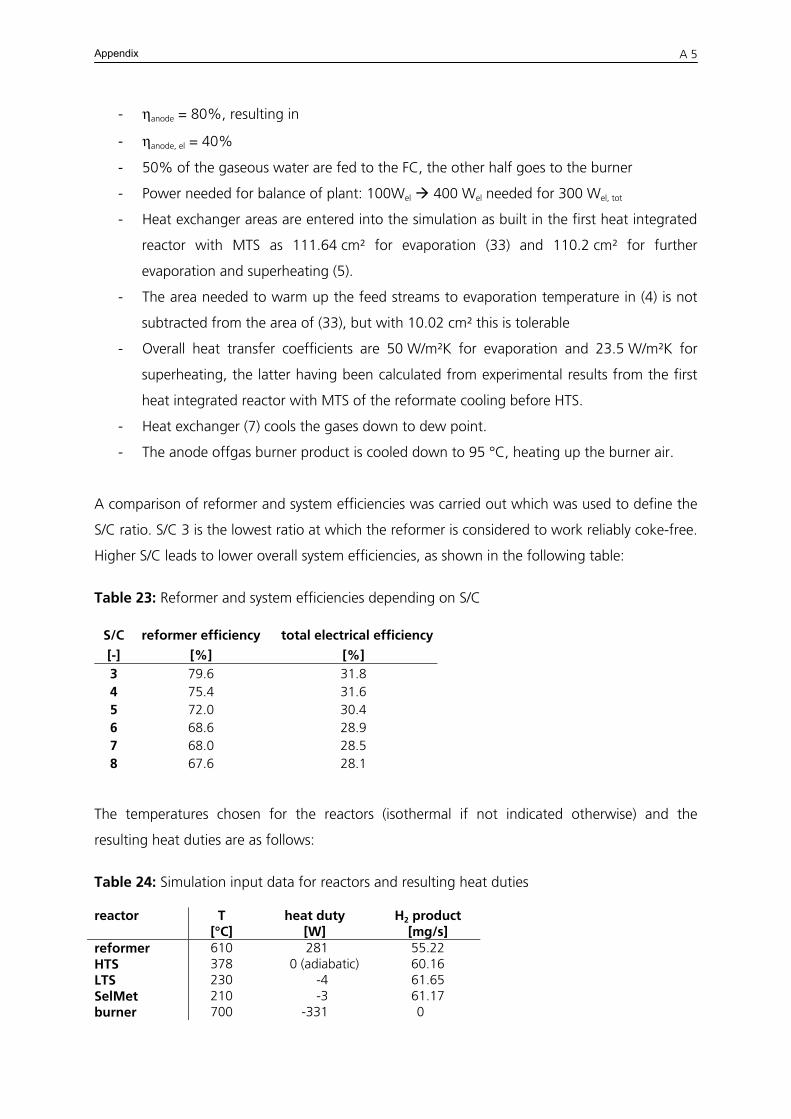
Appendix
A 5
- ηanode = 80%, resulting in
- ηanode, el = 40%
- 50% of the gaseous water are fed to the FC, the other half goes to the burner
- Power needed for balance of plant: 100Wel 400 Wel needed for 300 Wel, tot
- Heat exchanger areas are entered into the simulation as built in the first heat integrated
reactor with MTS as 111.64 cm² for evaporation (33) and 110.2 cm² for further
evaporation and superheating (5).
- The area needed to warm up the feed streams to evaporation temperature in (4) is not
subtracted from the area of (33), but with 10.02 cm² this is tolerable
- Overall heat transfer coefficients are 50 W/m²K for evaporation and 23.5 W/m²K for
superheating, the latter having been calculated from experimental results from the first
heat integrated reactor with MTS of the reformate cooling before HTS.
- Heat exchanger (7) cools the gases down to dew point.
- The anode offgas burner product is cooled down to 95 °C, heating up the burner air.
A comparison of reformer and system efficiencies was carried out which was used to define the
S/C ratio. S/C 3 is the lowest ratio at which the reformer is considered to work reliably coke-free.
Higher S/C leads to lower overall system efficiencies, as shown in the following table:
Table 23: Reformer and system efficiencies depending on S/C
S/C reformer efficiency total electrical efficiency
[-] [%] [%] 3 79.6 31.8 4 75.4 31.6 5 72.0 30.4 6 68.6 28.9 7 68.0 28.5 8 67.6 28.1
The temperatures chosen for the reactors (isothermal if not indicated otherwise) and the
resulting heat duties are as follows:
Table 24: Simulation input data for reactors and resulting heat duties
reactor T [°C]
heat duty [W]
H2 product [mg/s]
reformer 610 -281 55.22 HTS 378 -000 (adiabatic) 60.16 LTS 230 00-4 61.65 SelMet 210 00-3 61.17
burner 700 -331 000
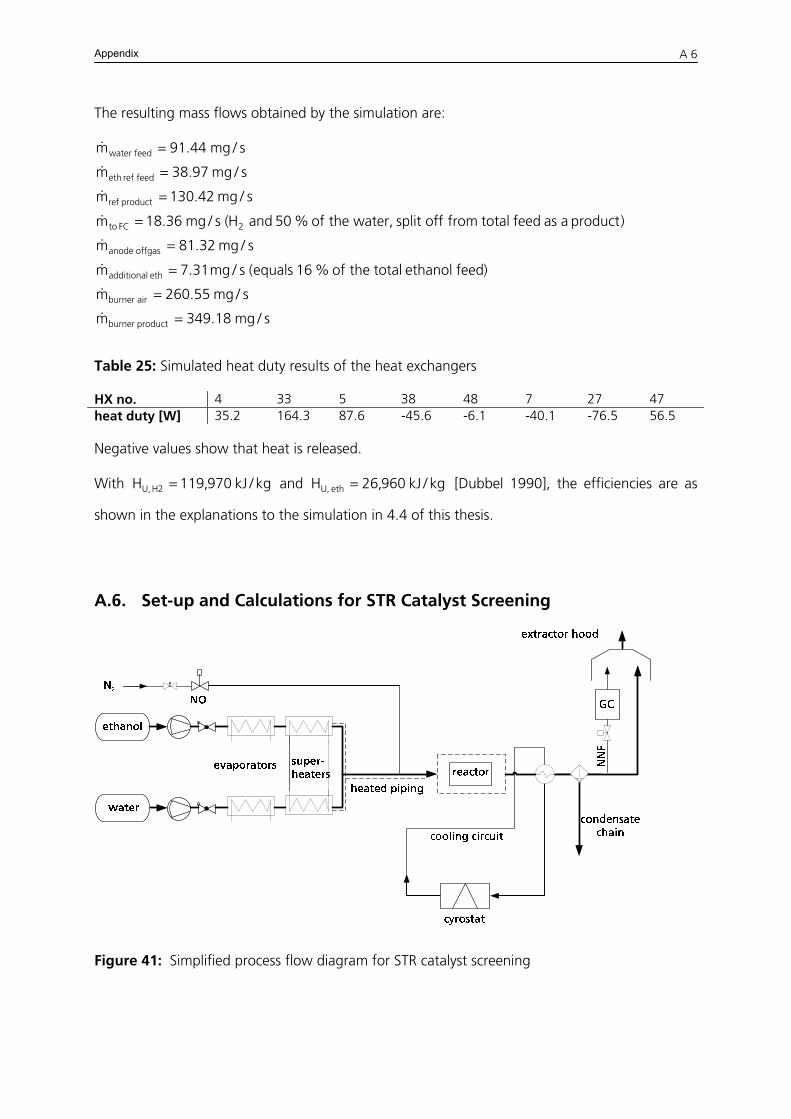
Appendix
A 6
The resulting mass flows obtained by the simulation are:
s/mg349.18m
s/mg260.55m
)feedethanoltotaltheof%16equals(s/mg7.31m
s/mg81.32m
)productaasfeedtotalfromoffsplit,watertheof%50andH(s/mg18.36m
s/mg130.42m
s/mg38.97m
s/mg91.44m
productburner
airburner
ethadditional
offgasanode
2FCto
productref
feedrefeth
feedwater
=
=
=
=
=
=
=
=
&
&
&
&
&
&
&
&
Table 25: Simulated heat duty results of the heat exchangers
HX no. 4 33 5 38 48 7 27 47 heat duty [W] 35.2 164.3 87.6 -45.6 -6.1 -40.1 -76.5 56.5
Negative values show that heat is released.
With and [Dubbel 1990], the efficiencies are as
shown in the explanations to the simulation in
kg/kJ970,119H 2H,U = kg/kJ960,26H eth,U =
4.4 of this thesis.
A.6. Set-up and Calculations for STR Catalyst Screening
Figure 41: Simplified process flow diagram for STR catalyst screening
Appendix
A 7
Ethanol and water are pumped from two tanks by a micro-cogwheel pump (ethanol) and a
HPLH pump (water). Both liquid feed streams are evaporated in two separate evaporators,
superheated, and mixed in heated lines. They are then supplied to the reactor, which is heated
by a high temperature heating cable from the outside. The reactor temperature is measured by a
thermocouple and controlled to ensure isothermal conditions inside the reactor. Downstream of
the reactor, the product gas is cooled down in a water-cooled double pipe heat exchanger, the
condensate separated in a flash drum and the remaining gas stream lead to an extractor hood.
A small sample line is connected to a gas chromatograph for gas analysis.
The test rig operation is controlled by a LabVIEW® programme, monitoring and recording
temperatures, feed flow rates and pressures. The test rig is equipped with a hardware
emergency shut-down system and, therefore, can run without unattended. As soon as certain
set temperature and pressure thresholds are exceeded, the feed streams are shut down by
closing magnetic valves and the unit is purged with nitrogen.
The catalysts were honeycombs with a length of 28 mm and a diameter of 18 mm. Thus, the
length/diameter ratio was 7.2, as opposed to 14 in the complete system test rig, but this is still
considered as being comparable. The catalyst was held in place by an expanding mat wrapped
around the honeycomb.
All tested catalysts are commercial precious metal catalysts (Pt, Ru and Rh) on a ceramic support.
The exact composition was not disclosed by the manufacturer. Catalysts no. 1 and 2 are
honeycombs with 600 cpsi (cells per in²). No. 3 are spherical pellets with 2 mm diameter. The
testing parameters and results are shown in Table 26.
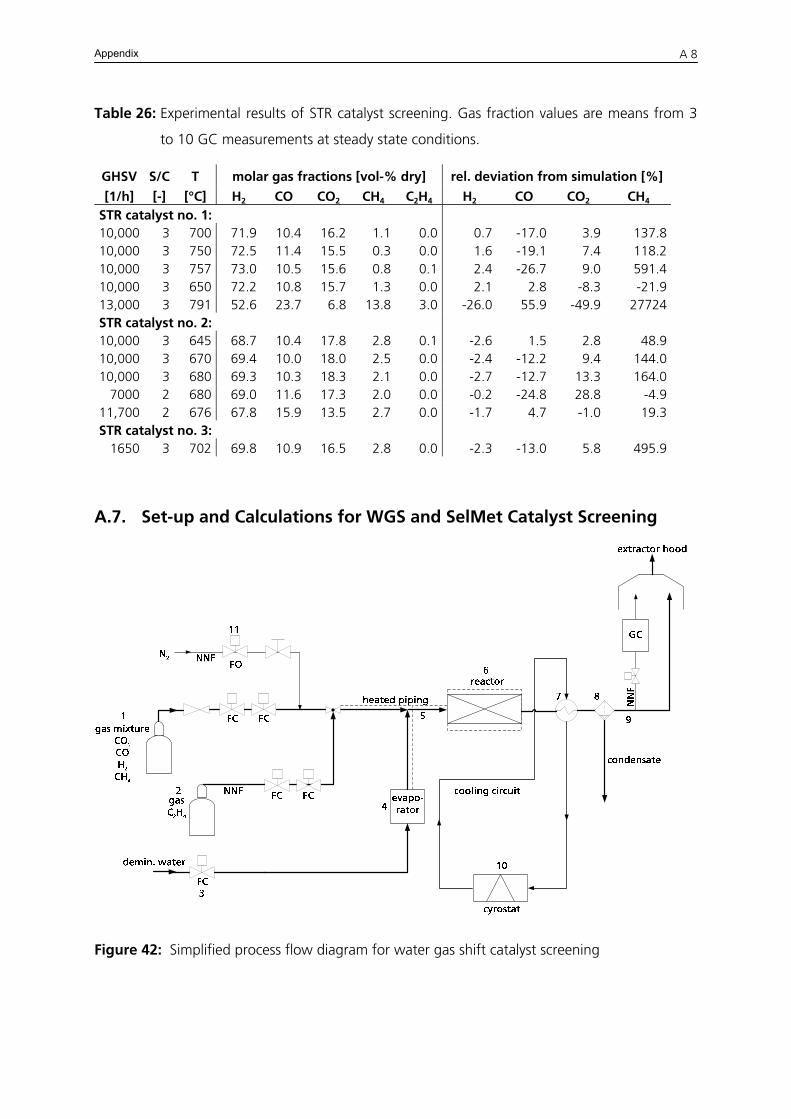
Appendix
A 8
Table 26: Experimental results of STR catalyst screening. Gas fraction values are means from 3
to 10 GC measurements at steady state conditions.
GHSV S/C T molar gas fractions [vol-% dry] rel. deviation from simulation [%]
[1/h] [-] [°C] H2 CO CO2 CH4 C2H4 H2 CO CO2 CH4
STR catalyst no. 1: 10,000 3 700 71.9 10.4 16.2 1.1 0.0 0.7 -17.0 3.9 137.810,000 3 750 72.5 11.4 15.5 0.3 0.0 1.6 -19.1 7.4 118.210,000 3 757 73.0 10.5 15.6 0.8 0.1 2.4 -26.7 9.0 591.410,000 3 650 72.2 10.8 15.7 1.3 0.0 2.1 2.8 -8.3 -21.913,000 3 791 52.6 23.7 6.8 13.8 3.0 -26.0 55.9 -49.9 27724STR catalyst no. 2: 10,000 3 645 68.7 10.4 17.8 2.8 0.1 -2.6 1.5 2.8 48.910,000 3 670 69.4 10.0 18.0 2.5 0.0 -2.4 -12.2 9.4 144.010,000 3 680 69.3 10.3 18.3 2.1 0.0 -2.7 -12.7 13.3 164.0
7000 2 680 69.0 11.6 17.3 2.0 0.0 -0.2 -24.8 28.8 -4.911,700 2 676 67.8 15.9 13.5 2.7 0.0 -1.7 4.7 -1.0 19.3STR catalyst no. 3:
1650 3 702 69.8 10.9 16.5 2.8 0.0 -2.3 -13.0 5.8 495.9
A.7. Set-up and Calculations for WGS and SelMet Catalyst Screening
Figure 42: Simplified process flow diagram for water gas shift catalyst screening
Appendix
A 9
A simulated ethanol reforming product gas mixture is supplied through a mass flow controller
(1). An additional flow controller (2) can feed another gaseous component into the system. This
flow controller is driven by its own control unit. Demineralized water taken from a separate
water line is controlled by a LIQUI−FLOW® (3). The dosed water reaches the pulsation-free
evaporator (4), designed and built by ICVT, University of Stuttgart. After the evaporation, the
steam is merged with the gas mixture in a heated line (5) in order to avoid liquefaction.
Subsequently, the steam and gas mixture enter the reactor (6) which is heated by a heating cord
and contains the WGS catalyst. The heating cord insures a uniform temperature along the
reactor wall. For selective methanation, this reactor is followed by a second reactor, also
equipped with a separate heating coil to maintain a uniform reactor temperature which can be
controlled independently from the WGS reactor temperature. After leaving the reactor, the
products are cooled down in a double pipe heat exchanger (7) which is operated in reverse flow.
The cooled mixture of condensate and gaseous components is supplied to a condenser (8). The
condensate is drained as there is no further utilization for it. This is possible because the
condensate only contains water and no hazardous compounds. The product gas leaves the
setup at the exit (9) where a line to the GC can be connected when a measurement of the
product gas is requested. The products are cooled with a separate cooling circuit. The heat is
removed by a cryostat (temperature regulating device) (10).
All required temperatures and the system pressure are processed by the data logger and passed
on to the personal computer where data is saved by means of a LabVIEW® programme. A gas
warning system is available in this setup, which includes a hydrogen sensor. With this feature, it
was safe to run the setup unattended over night. The setup is run by a separate control unit.
The solenoid−controlled valve (11) will open in case of a system failure. The system shuts down
if a safety parameter is exceeded and the whole setup will be rinsed thoroughly with nitrogen.
The feed streams for the high temperature water gas shift reaction were taken from a
CHEMCAD®-simulation, based on a reforming reaction with an S/C ratio of 3 with ethanol as
fuel. Although the simulation results after the reformer screening did not show any ethylene
formation, ethylene was detected in the product gas stream of a reformer from an integrated
reformer system in the reformer laboratory test rig, consisting of evaporator, super-heater,
reformer and burner. Therefore, the screening of the water gas shift catalyst was carried out
with two different feed streams, with and without ethylene.
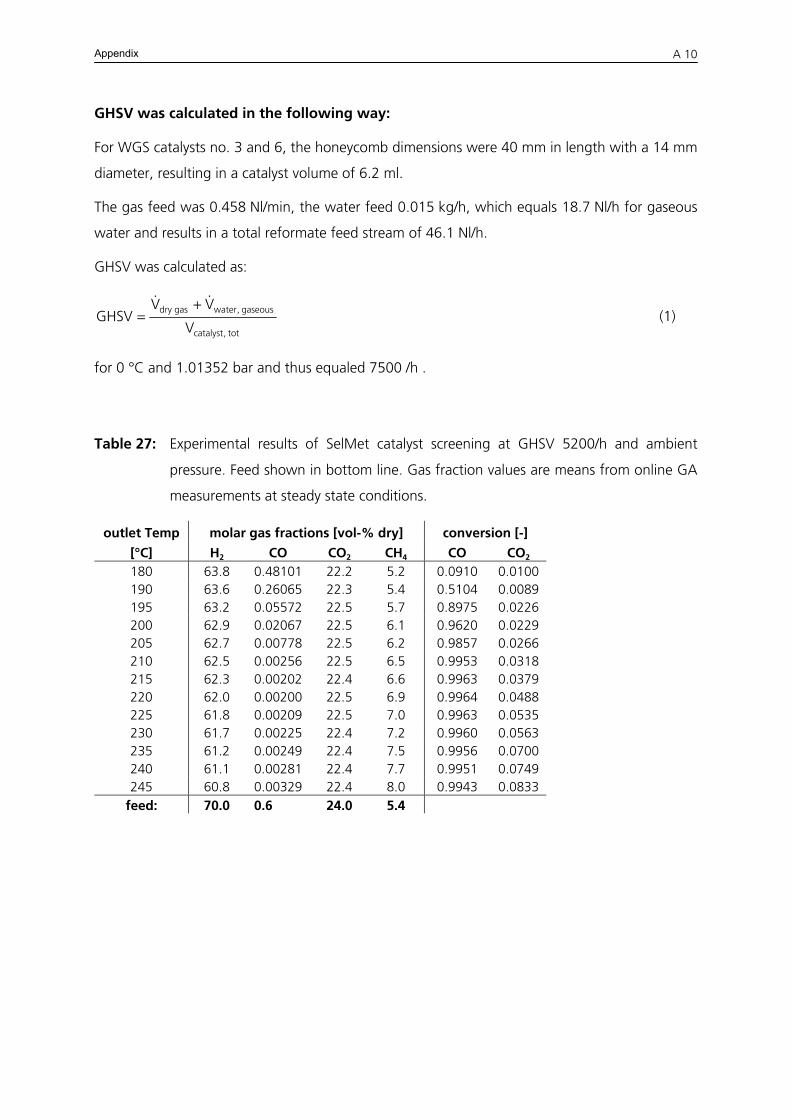
Appendix
A 10
GHSV was calculated in the following way:
For WGS catalysts no. 3 and 6, the honeycomb dimensions were 40 mm in length with a 14 mm
diameter, resulting in a catalyst volume of 6.2 ml.
The gas feed was 0.458 Nl/min, the water feed 0.015 kg/h, which equals 18.7 Nl/h for gaseous
water and results in a total reformate feed stream of 46.1 Nl/h.
GHSV was calculated as:
tot,catalyst
gaseous,watergasdry
V
VVGHSV
&& += (1)
for 0 °C and 1.01352 bar and thus equaled 7500 /h .
Table 27: Experimental results of SelMet catalyst screening at GHSV 5200/h and ambient
pressure. Feed shown in bottom line. Gas fraction values are means from online GA
measurements at steady state conditions.
outlet Temp molar gas fractions [vol-% dry] conversion [-]
[°C] H2 CO CO2 CH4 CO CO2
180 63.8 0.48101 22.2 5.2 0.0910 0.0100 190 63.6 0.26065 22.3 5.4 0.5104 0.0089 195 63.2 0.05572 22.5 5.7 0.8975 0.0226 200 62.9 0.02067 22.5 6.1 0.9620 0.0229 205 62.7 0.00778 22.5 6.2 0.9857 0.0266 210 62.5 0.00256 22.5 6.5 0.9953 0.0318 215 62.3 0.00202 22.4 6.6 0.9963 0.0379 220 62.0 0.00200 22.5 6.9 0.9964 0.0488 225 61.8 0.00209 22.5 7.0 0.9963 0.0535 230 61.7 0.00225 22.4 7.2 0.9960 0.0563 235 61.2 0.00249 22.4 7.5 0.9956 0.0700 240 61.1 0.00281 22.4 7.7 0.9951 0.0749 245 60.8 0.00329 22.4 8.0 0.9943 0.0833
feed: 70.0 0.60000 24.0 5.4
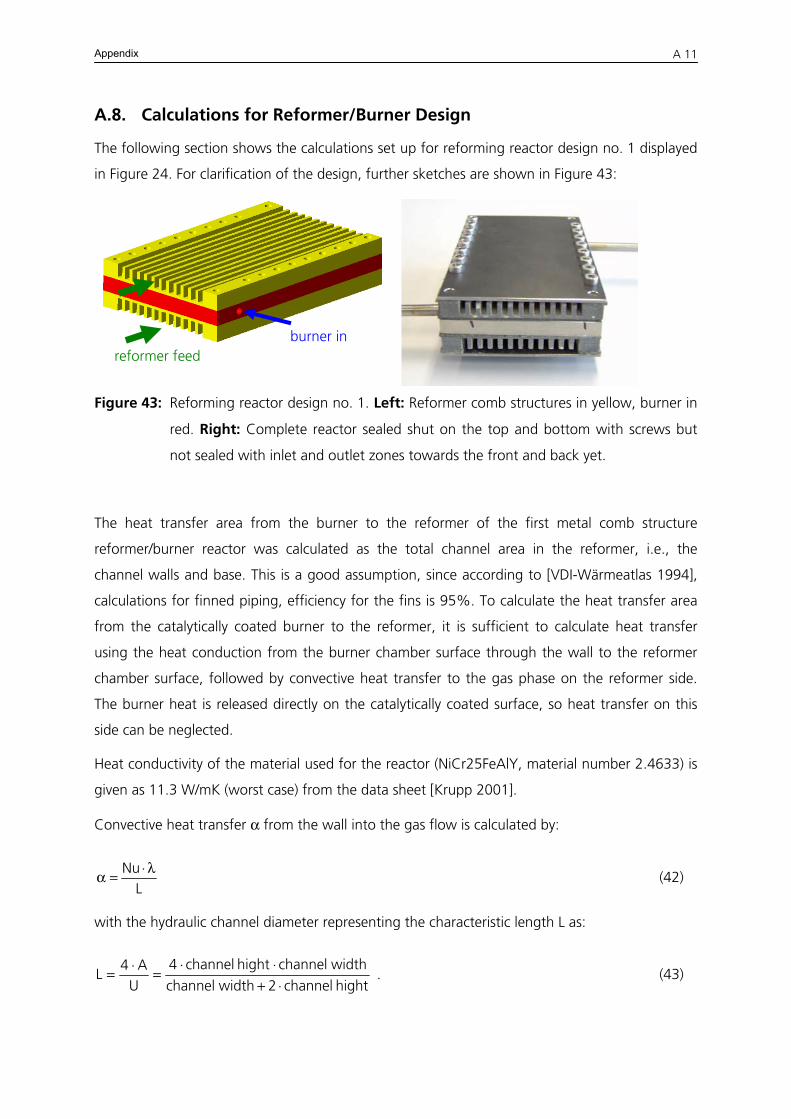
Appendix
A 11
A.8. Calculations for Reformer/Burner Design
The following section shows the calculations set up for reforming reactor design no. 1 displayed
in Figure 24. For clarification of the design, further sketches are shown in Figure 43:
burner inreformer feed
Figure 43: Reforming reactor design no. 1. Left: Reformer comb structures in yellow, burner in
red. Right: Complete reactor sealed shut on the top and bottom with screws but
not sealed with inlet and outlet zones towards the front and back yet.
The heat transfer area from the burner to the reformer of the first metal comb structure
reformer/burner reactor was calculated as the total channel area in the reformer, i.e., the
channel walls and base. This is a good assumption, since according to [VDI-Wärmeatlas 1994],
calculations for finned piping, efficiency for the fins is 95%. To calculate the heat transfer area
from the catalytically coated burner to the reformer, it is sufficient to calculate heat transfer
using the heat conduction from the burner chamber surface through the wall to the reformer
chamber surface, followed by convective heat transfer to the gas phase on the reformer side.
The burner heat is released directly on the catalytically coated surface, so heat transfer on this
side can be neglected.
Heat conductivity of the material used for the reactor (NiCr25FeAlY, material number 2.4633) is
given as 11.3 W/mK (worst case) from the data sheet [Krupp 2001].
Convective heat transfer α from the wall into the gas flow is calculated by:
LNu λ⋅=α (42)
with the hydraulic channel diameter representing the characteristic length L as:
hightchannel2widthchannel
widthchannelhightchannel4
UA4
L⋅+
⋅⋅=⋅= . (43)
Appendix
A 12
Channel width has a factor one, for the side not facing the burner cannot be used as heat
transfer area. This part faces the reactor outside wall. The Nusselt number represents the ratio of
heat transfer through convection to heat transfer through conduction. For its calculation, the
Reynolds number Re, Prandtl number Pr and the factor KT are needed:
ηρ⋅⋅= Lv
Re (44)
λ⋅η
= pcPr (45)
25,0
wallT Pr
PrK ⎟⎟
⎠
⎞⎜⎜⎝
⎛= (46)
For laminar flow, which can be assumed here because Re is in the order of magnitude of 100 in
each channel, the Nusselt number is calculated as:
T31
21
KPrRe644,0Nu ⋅⋅⋅= (47)
It is assumed that KT=1. The Prandtl number, dynamic viscosity and heat conduction coefficient
are taken from reformate stream of the CHEMCAD simulation.
The heat transfer coefficient k is calculated as:
reformatesteel
steel 11
k
α+
λδ
= . (48)
The height δ is the smallest distance between reformer and burner. This assumption is tolerable,
for in this case heat transfer through heat conduction is two orders of magnitude higher than
convection heat transfer into the gas phase, the latter being the limiting part.
The actually transferred heat duty is calculated as: Q&
TAkQ Δ⋅⋅=& . (31)
The size of the reactor was determined through variation of the geometrical input parameters
for the calculations shown above. The final choice was a channel height of 6 mm, width of
3.3 mm. Channel number was 12 and length 120 mm.

Appendix
A 13
For the reactor size designed here, it was possible to transfer enough heat from the burner to
the reformer, even when assuming a temperature difference of only 100 K, i.e., from 700 °C on
the burner side to 600 °C inlet temperature on the reformer side. The surface areas were chosen
large enough to allow for a heat loss of 15%.
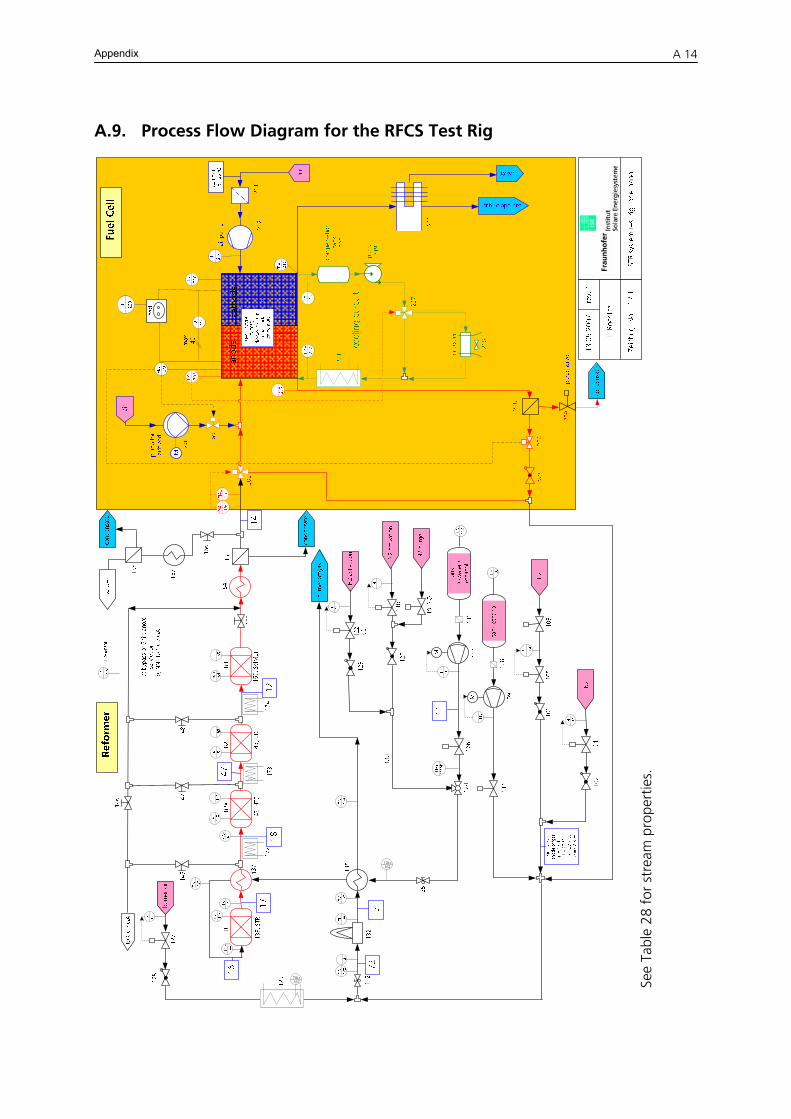
Appendix
A 14
A.9. Process Flow Diagram for the RFCS Test Rig
TIA+167
TIA+162
See
Tabl
e 28
for
str
eam
pro
pert
ies.
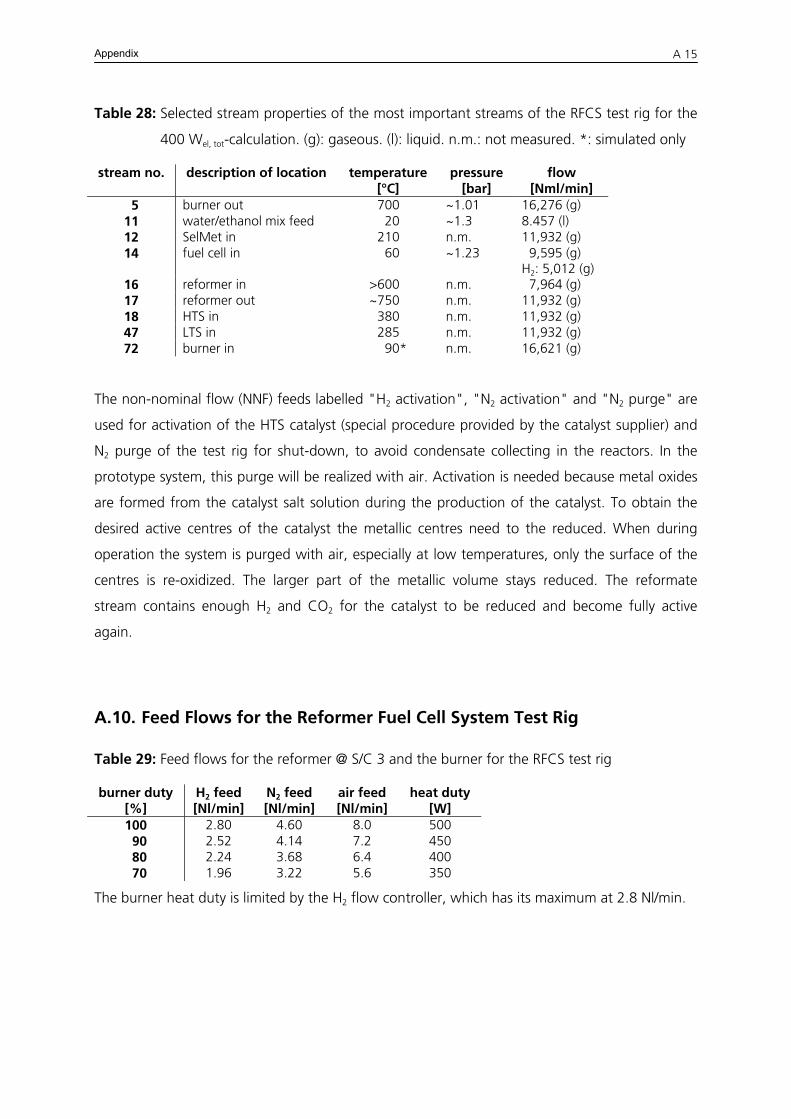
Appendix
A 15
Table 28: Selected stream properties of the most important streams of the RFCS test rig for the
400 Wel, tot-calculation. (g): gaseous. (l): liquid. n.m.: not measured. *: simulated only
stream no. description of location temperature [°C]
pressure [bar]
flow [Nml/min]
05 burner out >700* ~1.01 16,276 (g) 11 water/ethanol mix feed >020* ~1.3 8.457 (l) 12 SelMet in >210* n.m. 11,932 (g) 14 fuel cell in >060* ~1.23 09,595 (g)
H2: 5,012 (g) 16 reformer in >600* n.m. 07,964 (g) 17 reformer out ~750* n.m. 11,932 (g) 18 HTS in >380* n.m. 11,932 (g) 47 LTS in >285* n.m. 11,932 (g) 72 burner in >090* n.m. 16,621 (g)
The non-nominal flow (NNF) feeds labelled "H2 activation", "N2 activation" and "N2 purge" are
used for activation of the HTS catalyst (special procedure provided by the catalyst supplier) and
N2 purge of the test rig for shut-down, to avoid condensate collecting in the reactors. In the
prototype system, this purge will be realized with air. Activation is needed because metal oxides
are formed from the catalyst salt solution during the production of the catalyst. To obtain the
desired active centres of the catalyst the metallic centres need to the reduced. When during
operation the system is purged with air, especially at low temperatures, only the surface of the
centres is re-oxidized. The larger part of the metallic volume stays reduced. The reformate
stream contains enough H2 and CO2 for the catalyst to be reduced and become fully active
again.
A.10. Feed Flows for the Reformer Fuel Cell System Test Rig
Table 29: Feed flows for the reformer @ S/C 3 and the burner for the RFCS test rig
burner duty [%]
H2 feed [Nl/min]
N2 feed [Nl/min]
air feed [Nl/min]
heat duty [W]
100 2.80 4.60 8.0 500 090 2.52 4.14 7.2 450 080 2.24 3.68 6.4 400 070 1.96 3.22 5.6 350
The burner heat duty is limited by the H2 flow controller, which has its maximum at 2.8 Nl/min.

Appendix
A 16
Table 30: Calorific heat input at varying feed flows
reformer feed mix [ml/min]
calorific heat input[W]
3 373 5 621 7 869
Table 31: Heat duties of reforming reaction at varying temperatures and feed flows
STR temp. heat duty of reaction [W] for feed V* [ml/min] @ S/C = 3 [°C] V* = 1 V* = 3 V* = 5 V* = 7 V* = 8.547 610 17.6 52.8 88.0 123.2 369.6 620 18.6 55.7 92.9 130.1 390.2 630 19.5 58.4 97.4 136.4 409.1 640 20.3 60.8 101.4 142.0 425.9 650 21.0 62.9 104.9 146.9 440.6 660 21.6 64.7 107.9 151.1 453.2 670 22.1 66.3 110.5 154.6 463.9 680 22.5 67.5 112.6 157.6 472.8 690 22.9 68.6 114.3 160.1 480.2 700 23.2 69.5 115.8 162.1 486.4 710 23.4 70.2 117.0 163.8 491.5 720 23.6 70.8 118.1 165.3 495.8 730 23.8 71.4 118.9 166.5 499.5 740 23.9 71.8 119.7 167.5 502.6 750 24.1 72.2 120.3 168.4 505.3 760 24.2 72.5 120.9 169.2 507.7 770 24.3 72.8 121.4 169.9 509.8 780 24.4 73.1 121.8 170.6 511.8 790 24.5 73.4 122.3 171.2 513.5 800 24.5 73.6 122.6 171.7 515.1 810 24.6 73.8 123.0 172.2 516.6 820 24.7 74.0 123.3 172.7 518.0 830 24.7 74.2 123.6 173.1 519.3 840 24.8 74.4 123.9 173.5 520.5 850 24.8 74.5 124.2 173.9 521.7 860 24.9 74.7 124.5 174.3 522.8 870 24.9 74.8 124.7 174.6 523.9 880 25.0 75.0 125.0 175.0 524.9 890 25.0 75.1 125.2 175.3 525.9 900 25.1 75.3 125.4 175.6 526.8
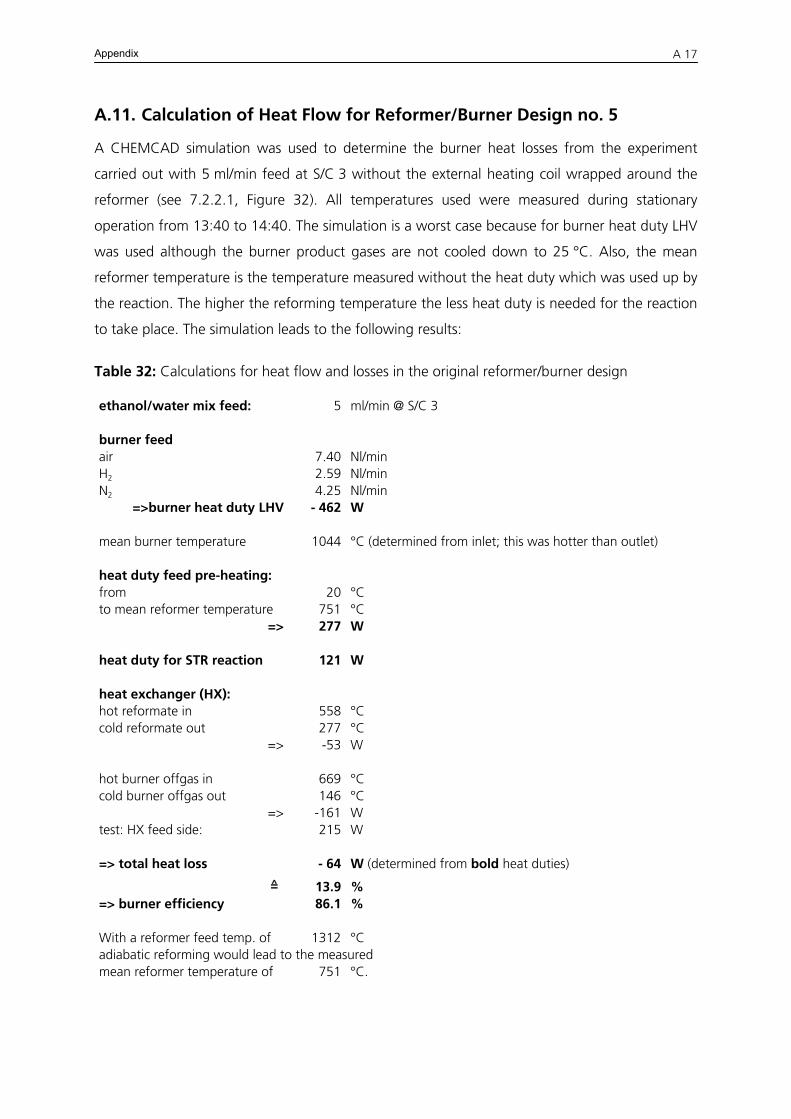
Appendix
A 17
A.11. Calculation of Heat Flow for Reformer/Burner Design no. 5
A CHEMCAD simulation was used to determine the burner heat losses from the experiment
carried out with 5 ml/min feed at S/C 3 without the external heating coil wrapped around the
reformer (see 7.2.2.1, Figure 32). All temperatures used were measured during stationary
operation from 13:40 to 14:40. The simulation is a worst case because for burner heat duty LHV
was used although the burner product gases are not cooled down to 25 °C. Also, the mean
reformer temperature is the temperature measured without the heat duty which was used up by
the reaction. The higher the reforming temperature the less heat duty is needed for the reaction
to take place. The simulation leads to the following results:
Table 32: Calculations for heat flow and losses in the original reformer/burner design
ethanol/water mix feed: 5 ml/min @ S/C 3
burner feed air 7.40 Nl/min H2 2.59 Nl/min N2 4.25 Nl/min
=>burner heat duty LHV - 462 W
mean burner temperature 1044 °C (determined from inlet; this was hotter than outlet) heat duty feed pre-heating: from 20 °C to mean reformer temperature 751 °C
=> 277 W
heat duty for STR reaction 121 W heat exchanger (HX): hot reformate in 558 °C cold reformate out 277 °C
=> -53 W
hot burner offgas in 669 °C cold burner offgas out 146 °C
=> -161 W test: HX feed side: 215 W => total heat loss - 64 W (determined from bold heat duties)
≙ 13.9 % => burner efficiency 86.1 % With a reformer feed temp. of 1312 °C adiabatic reforming would lead to the measured mean reformer temperature of 751 °C.
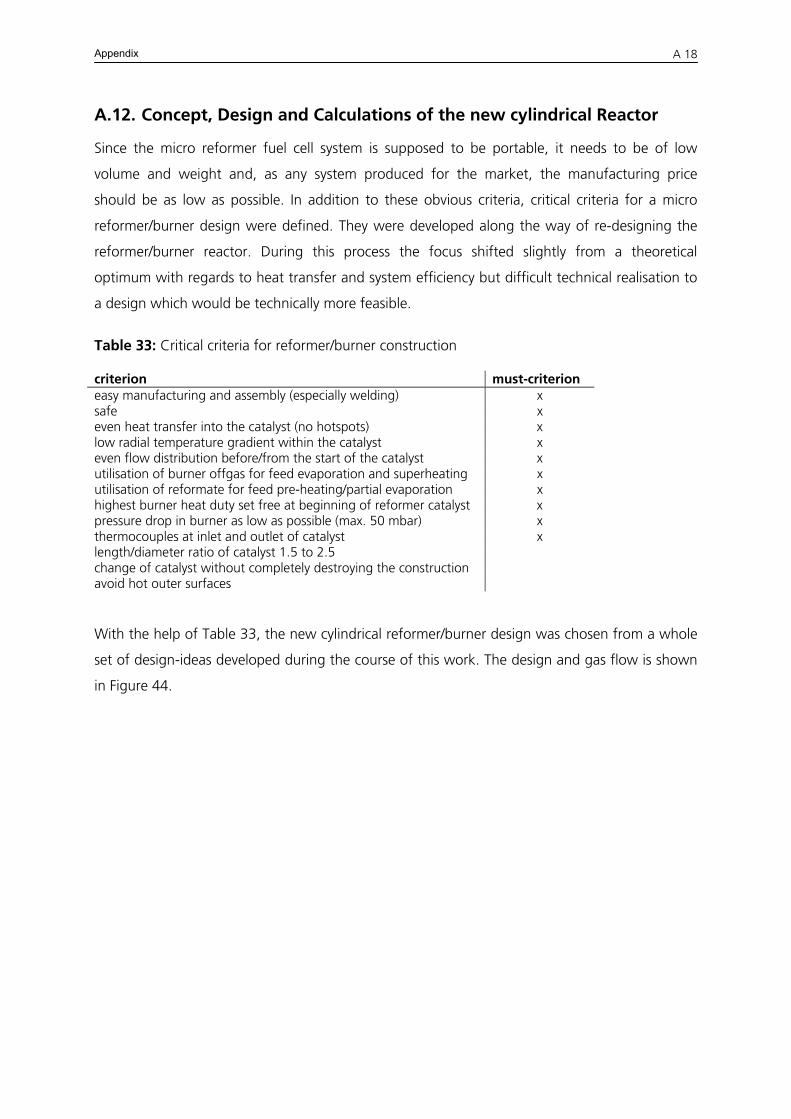
Appendix
A 18
A.12. Concept, Design and Calculations of the new cylindrical Reactor
Since the micro reformer fuel cell system is supposed to be portable, it needs to be of low
volume and weight and, as any system produced for the market, the manufacturing price
should be as low as possible. In addition to these obvious criteria, critical criteria for a micro
reformer/burner design were defined. They were developed along the way of re-designing the
reformer/burner reactor. During this process the focus shifted slightly from a theoretical
optimum with regards to heat transfer and system efficiency but difficult technical realisation to
a design which would be technically more feasible.
Table 33: Critical criteria for reformer/burner construction
criterion must-criterion easy manufacturing and assembly (especially welding) x safe x even heat transfer into the catalyst (no hotspots) x low radial temperature gradient within the catalyst x even flow distribution before/from the start of the catalyst x utilisation of burner offgas for feed evaporation and superheating x utilisation of reformate for feed pre-heating/partial evaporation x highest burner heat duty set free at beginning of reformer catalyst x pressure drop in burner as low as possible (max. 50 mbar) x thermocouples at inlet and outlet of catalyst x length/diameter ratio of catalyst 1.5 to 2.5 change of catalyst without completely destroying the construction avoid hot outer surfaces
With the help of Table 33, the new cylindrical reformer/burner design was chosen from a whole
set of design-ideas developed during the course of this work. The design and gas flow is shown
in Figure 44.
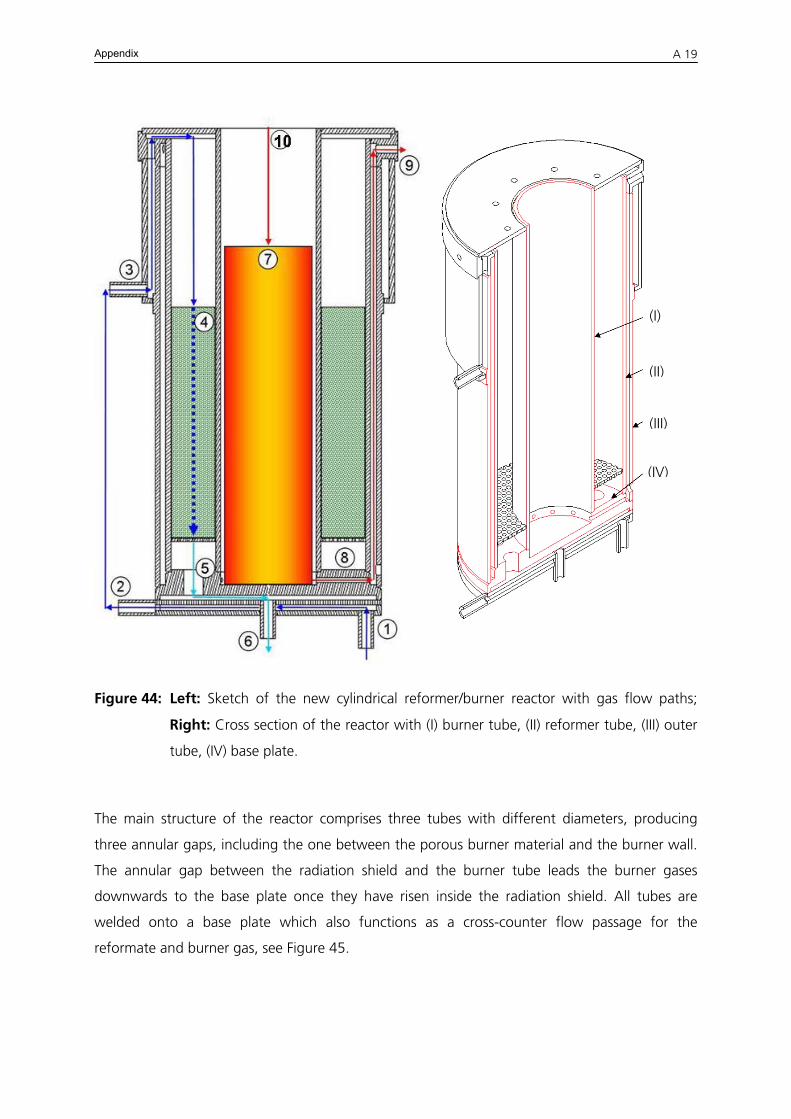
Appendix
A 19
(I)
(II)
(III)
(IV)
Figure 44: Left: Sketch of the new cylindrical reformer/burner reactor with gas flow paths;
Right: Cross section of the reactor with (I) burner tube, (II) reformer tube, (III) outer
tube, (IV) base plate.
The main structure of the reactor comprises three tubes with different diameters, producing
three annular gaps, including the one between the porous burner material and the burner wall.
The annular gap between the radiation shield and the burner tube leads the burner gases
downwards to the base plate once they have risen inside the radiation shield. All tubes are
welded onto a base plate which also functions as a cross-counter flow passage for the
reformate and burner gas, see Figure 45.
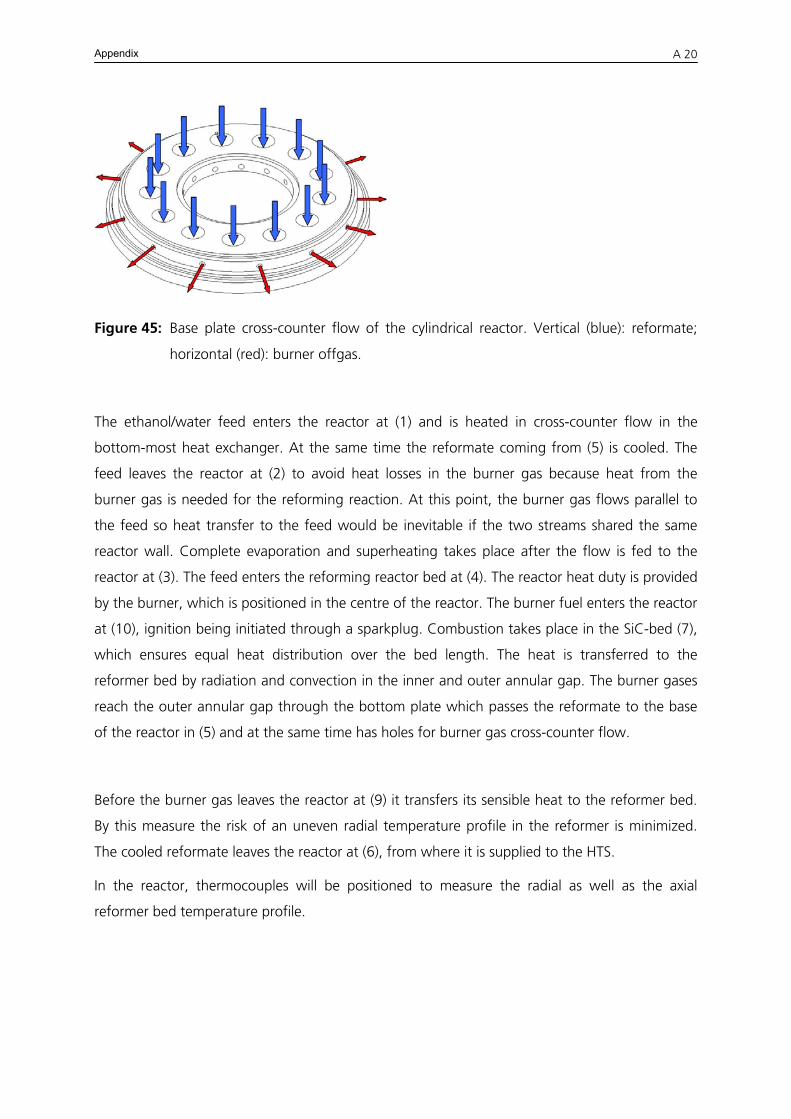
Appendix
A 20
Figure 45: Base plate cross-counter flow of the cylindrical reactor. Vertical (blue): reformate;
horizontal (red): burner offgas.
The ethanol/water feed enters the reactor at (1) and is heated in cross-counter flow in the
bottom-most heat exchanger. At the same time the reformate coming from (5) is cooled. The
feed leaves the reactor at (2) to avoid heat losses in the burner gas because heat from the
burner gas is needed for the reforming reaction. At this point, the burner gas flows parallel to
the feed so heat transfer to the feed would be inevitable if the two streams shared the same
reactor wall. Complete evaporation and superheating takes place after the flow is fed to the
reactor at (3). The feed enters the reforming reactor bed at (4). The reactor heat duty is provided
by the burner, which is positioned in the centre of the reactor. The burner fuel enters the reactor
at (10), ignition being initiated through a sparkplug. Combustion takes place in the SiC-bed (7),
which ensures equal heat distribution over the bed length. The heat is transferred to the
reformer bed by radiation and convection in the inner and outer annular gap. The burner gases
reach the outer annular gap through the bottom plate which passes the reformate to the base
of the reactor in (5) and at the same time has holes for burner gas cross-counter flow.
Before the burner gas leaves the reactor at (9) it transfers its sensible heat to the reformer bed.
By this measure the risk of an uneven radial temperature profile in the reformer is minimized.
The cooled reformate leaves the reactor at (6), from where it is supplied to the HTS.
In the reactor, thermocouples will be positioned to measure the radial as well as the axial
reformer bed temperature profile.
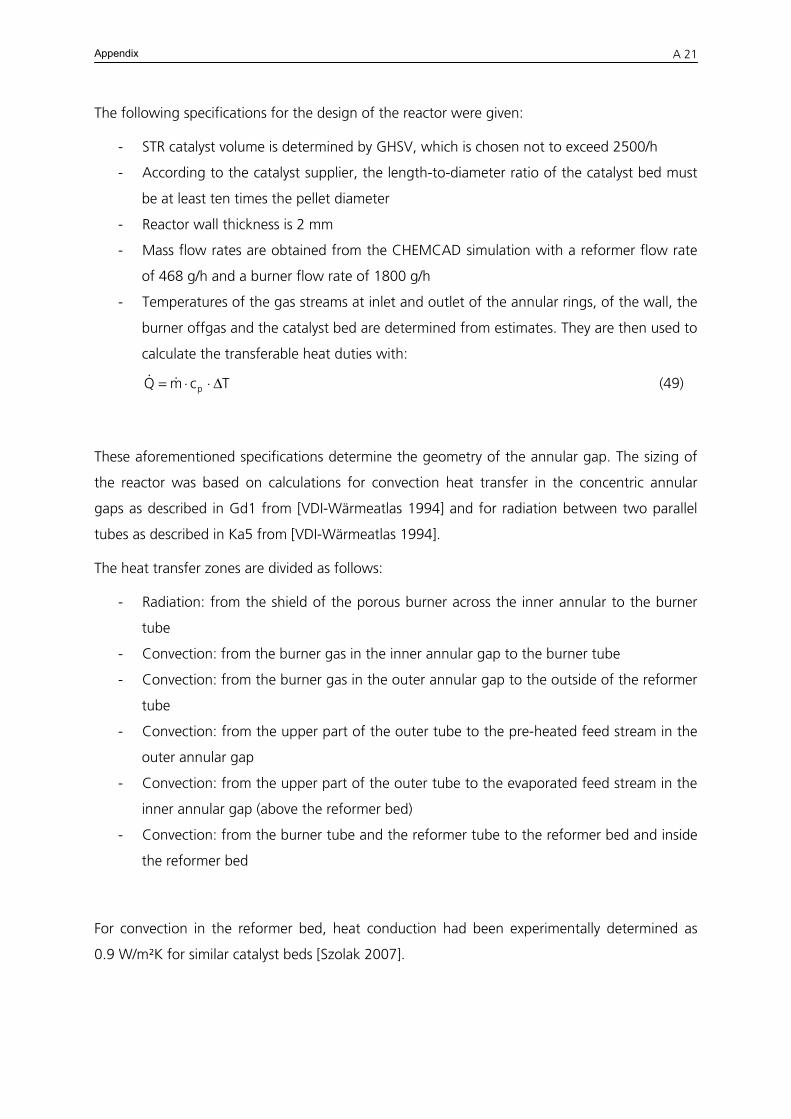
Appendix
A 21
The following specifications for the design of the reactor were given:
- STR catalyst volume is determined by GHSV, which is chosen not to exceed 2500/h
- According to the catalyst supplier, the length-to-diameter ratio of the catalyst bed must
be at least ten times the pellet diameter
- Reactor wall thickness is 2 mm
- Mass flow rates are obtained from the CHEMCAD simulation with a reformer flow rate
of 468 g/h and a burner flow rate of 1800 g/h
- Temperatures of the gas streams at inlet and outlet of the annular rings, of the wall, the
burner offgas and the catalyst bed are determined from estimates. They are then used to
calculate the transferable heat duties with:
(49) TcmQ p Δ⋅⋅= &&
These aforementioned specifications determine the geometry of the annular gap. The sizing of
the reactor was based on calculations for convection heat transfer in the concentric annular
gaps as described in Gd1 from [VDI-Wärmeatlas 1994] and for radiation between two parallel
tubes as described in Ka5 from [VDI-Wärmeatlas 1994].
The heat transfer zones are divided as follows:
- Radiation: from the shield of the porous burner across the inner annular to the burner
tube
- Convection: from the burner gas in the inner annular gap to the burner tube
- Convection: from the burner gas in the outer annular gap to the outside of the reformer
tube
- Convection: from the upper part of the outer tube to the pre-heated feed stream in the
outer annular gap
- Convection: from the upper part of the outer tube to the evaporated feed stream in the
inner annular gap (above the reformer bed)
- Convection: from the burner tube and the reformer tube to the reformer bed and inside
the reformer bed
For convection in the reformer bed, heat conduction had been experimentally determined as
0.9 W/m²K for similar catalyst beds [Szolak 2007].
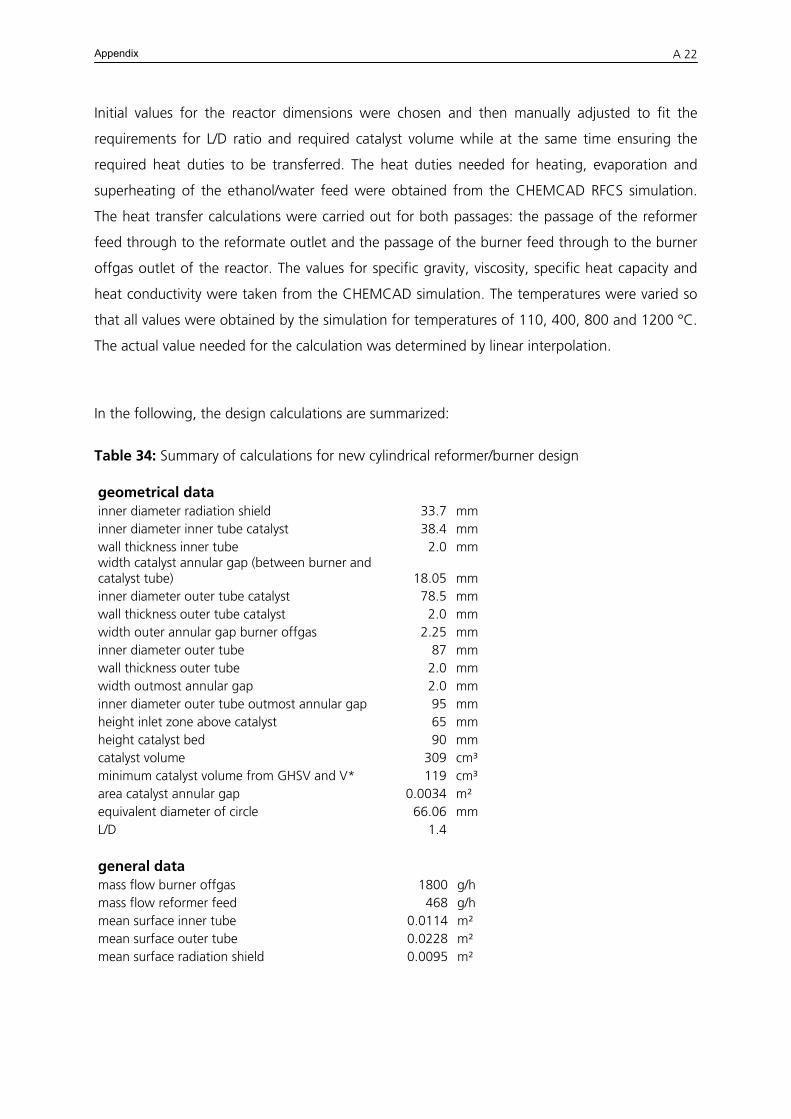
Appendix
A 22
Initial values for the reactor dimensions were chosen and then manually adjusted to fit the
requirements for L/D ratio and required catalyst volume while at the same time ensuring the
required heat duties to be transferred. The heat duties needed for heating, evaporation and
superheating of the ethanol/water feed were obtained from the CHEMCAD RFCS simulation.
The heat transfer calculations were carried out for both passages: the passage of the reformer
feed through to the reformate outlet and the passage of the burner feed through to the burner
offgas outlet of the reactor. The values for specific gravity, viscosity, specific heat capacity and
heat conductivity were taken from the CHEMCAD simulation. The temperatures were varied so
that all values were obtained by the simulation for temperatures of 110, 400, 800 and 1200 °C.
The actual value needed for the calculation was determined by linear interpolation.
In the following, the design calculations are summarized:
Table 34: Summary of calculations for new cylindrical reformer/burner design
geometrical data inner diameter radiation shield 33.7 mm inner diameter inner tube catalyst 38.4 mm wall thickness inner tube 2.0 mm width catalyst annular gap (between burner and catalyst tube) 18.05 mm inner diameter outer tube catalyst 78.5 mm wall thickness outer tube catalyst 2.0 mm width outer annular gap burner offgas 2.25 mm inner diameter outer tube 87 mm wall thickness outer tube 2.0 mm width outmost annular gap 2.0 mm inner diameter outer tube outmost annular gap 95 mm height inlet zone above catalyst 65 mm height catalyst bed 90 mm catalyst volume 309 cm³ minimum catalyst volume from GHSV and V* 119 cm³ area catalyst annular gap 0.0034 m² equivalent diameter of circle 66.06 mm L/D 1.4 general data mass flow burner offgas 1800 g/h mass flow reformer feed 468 g/h mean surface inner tube 0.0114 m² mean surface outer tube 0.0228 m² mean surface radiation shield 0.0095 m²
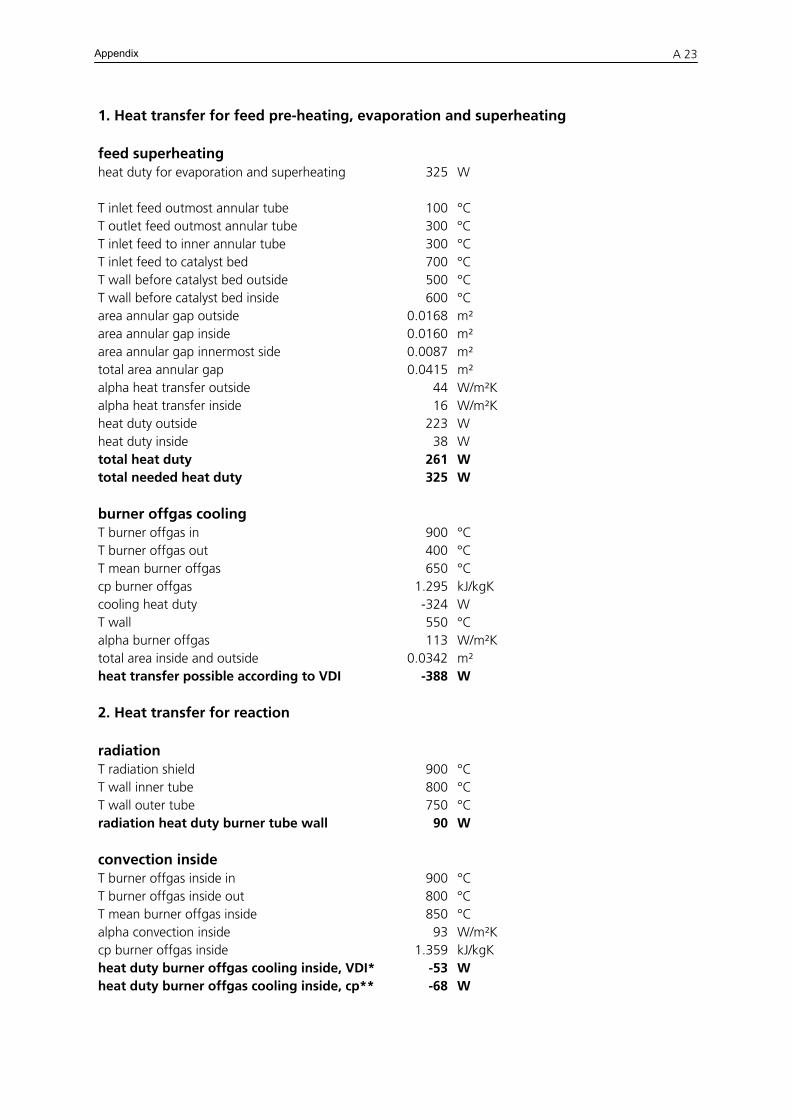
Appendix
A 23
1. Heat transfer for feed pre-heating, evaporation and superheating
feed superheating heat duty for evaporation and superheating 325 W T inlet feed outmost annular tube 100 °C T outlet feed outmost annular tube 300 °C T inlet feed to inner annular tube 300 °C T inlet feed to catalyst bed 700 °C T wall before catalyst bed outside 500 °C T wall before catalyst bed inside 600 °C area annular gap outside 0.0168 m² area annular gap inside 0.0160 m² area annular gap innermost side 0.0087 m² total area annular gap 0.0415 m² alpha heat transfer outside 44 W/m²Kalpha heat transfer inside 16 W/m²Kheat duty outside 223 W heat duty inside 38 W total heat duty 261 W total needed heat duty 325 W burner offgas cooling T burner offgas in 900 °C T burner offgas out 400 °C T mean burner offgas 650 °C cp burner offgas 1.295 kJ/kgK cooling heat duty -324 W T wall 550 °C alpha burner offgas 113 W/m²Ktotal area inside and outside 0.0342 m² heat transfer possible according to VDI -388 W 2. Heat transfer for reaction
radiation T radiation shield 900 °C T wall inner tube 800 °C T wall outer tube 750 °C radiation heat duty burner tube wall 90 W convection inside T burner offgas inside in 900 °C T burner offgas inside out 800 °C T mean burner offgas inside 850 °C alpha convection inside 93 W/m²Kcp burner offgas inside 1.359 kJ/kgK heat duty burner offgas cooling inside, VDI* -53 W heat duty burner offgas cooling inside, cp** -68 W
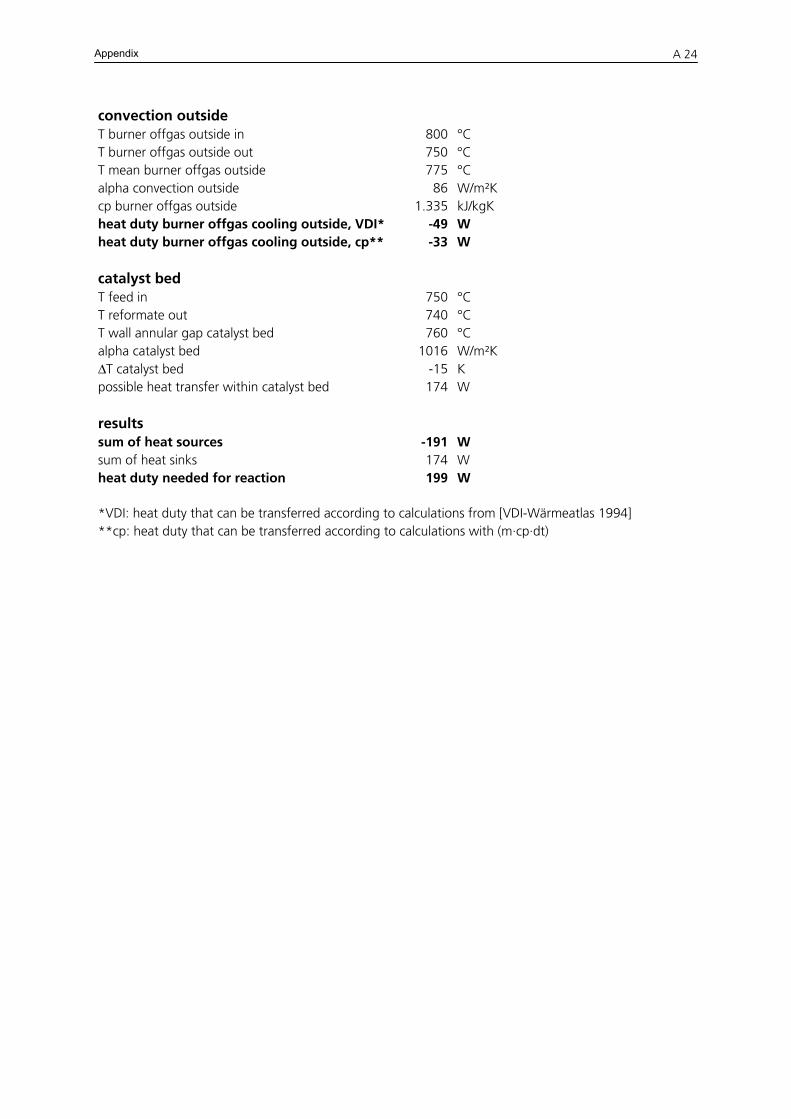
Appendix
A 24
convection outside T burner offgas outside in 800 °C T burner offgas outside out 750 °C T mean burner offgas outside 775 °C alpha convection outside 86 W/m²Kcp burner offgas outside 1.335 kJ/kgK heat duty burner offgas cooling outside, VDI* -49 W heat duty burner offgas cooling outside, cp** -33 W catalyst bed T feed in 750 °C T reformate out 740 °C T wall annular gap catalyst bed 760 °C alpha catalyst bed 1016 W/m²KΔT catalyst bed -15 K possible heat transfer within catalyst bed 174 W results sum of heat sources -191 W sum of heat sinks 174 W heat duty needed for reaction 199 W *VDI: heat duty that can be transferred according to calculations from [VDI-Wärmeatlas 1994] **cp: heat duty that can be transferred according to calculations with (m·cp·dt)


![Don’t gamble with physical properties – Kein Glücksspiel ... · AspenTech, CHEMCAD ... x HCl [mol/mol] VLE HCl-H2O, Aspen V7.2 Aspen V7.2 Aspen V7.2 Othmer,D.F, Ind. Eng. Chem](https://img.pdfslide.org/doc/110x75/5b58ae057f8b9a4e1b8c50a7/dont-gamble-with-physical-properties-kein-gluecksspiel-aspentech.jpg)