Embed Size (px)
Citation preview
Development of fluorescent biosensors
probing RNA function
Dissertation
der Fakultät für Biologie
der Ludwig-Maximilians-Universität
München
vorgelegt von
Martina Schifferer-Waritschlager
München, den 15.09.2011

2 Contents
Betreuer: Dr. Oliver Griesbeck
Erstgutachter: Prof. Dr. Alexander Borst
Zweitgutachter: Prof. Dr. Charles David
Tag der mündlichen Prüfung: 08.12.2011

3 Contents
“Hier treffen wir nun auf die eigene Schwierigkeit, die nicht immer klar ins Bewusstsein tritt,
dass zwischen Idee und Erfahrung eine gewisse Kluft befestigt scheint, die zu überschreiten
unsere ganze Kraft sich vergeblich bemüht. Demohngeachtet bleibt unser ewiges Bestreben,
diesen Hiatus mit Vernunft, Verstand, Einbildungskraft, Glauben, Gefühl, Wahn und, wenn
wir sonst nichts vermögen, mit Albernheit zu überwinden.“
J.W. Goethe
Bedenken und Ergebung (1823)

4 Contents
Contents
Contents ..................................................................................................................................... 4
Table of figures .......................................................................................................................... 9
Abbreviations ........................................................................................................................... 12
Abstract .................................................................................................................................... 14
1. Introduction ......................................................................................................................... 16
1.1. RNA characteristics ....................................................................................................... 16
1.1.1 RNA structure .......................................................................................................... 16
1.1.2 RNA classification .................................................................................................... 16
1.2. mRNA fate in eukaryotic cells ....................................................................................... 17
1.2.1 mRNA transcription and processing ....................................................................... 17
1.2.2 mRNA subcellular localization ................................................................................ 19
1.2.3 mRNA turnover ....................................................................................................... 27
1.3. viral RNA-protein interactions ...................................................................................... 30
1.3.1 Arginine-rich motif (ARM) peptides ........................................................................ 30
1.3.2 HIV RRE aptamer ..................................................................................................... 31
1.3.3 Rsg1.2 –RRE interaction .......................................................................................... 33
1.4. Fluorescence imaging ................................................................................................... 34
1.4.1 Fluorescent proteins ............................................................................................... 34
1.4.2 Genetically encoded fluorescent biosensors .......................................................... 36
1.5. RNA imaging .................................................................................................................. 40
1.5.1 Chemical RNA dyes ................................................................................................. 40
1.5.2 Molecular beacons .................................................................................................. 42
1.5.3 Genetically encoded FP-based RNA labels ............................................................. 42

5 Contents
1.5.4 Recent advances in imaging technology ................................................................. 47
1.6 Project goal .................................................................................................................... 49
2. Materials and Methods ........................................................................................................ 52
2.1. DNA molecular biology ................................................................................................. 52
2.1.1 Polymerase Chain Reaction (PCR) ........................................................................... 52
2.1.2 Error-prone PCR ...................................................................................................... 53
2.1.3 Site-directed mutagenesis via PCR ......................................................................... 54
2.1.4 DNA purification...................................................................................................... 56
2.1.5 Restriction digest of DNA ........................................................................................ 56
2.1.6 Dephosphorylation of vector DNA .......................................................................... 57
2.1.7 Ligation of DNA fragments ...................................................................................... 58
2.1.8 Preparation of chemically-competent E. coli .......................................................... 58
2.1.9 Transformation of chemically-competent E. coli .................................................... 59
2.1.10 Bacterial DNA purification .................................................................................... 59
2.2. RNA molecular biology .................................................................................................. 59
2.2.1 In vitro transcription ............................................................................................... 60
2.2.2 Reverse transcription (RT) ...................................................................................... 61
2.2.3 Systematic Evolution of Ligands by Exponential Enrichment (SELEX) .................... 62
2.3 Protein Biochemistry...................................................................................................... 64
2.3.1 Protein expression using the E. coli BL21 strain ..................................................... 64
2.3.2 Affinity purification of recombinantly expressed proteins ..................................... 65
2.3.3 Size exclusion chromatography of recombinantly expressed proteins .................. 65
2.3.4 ATPase assay ........................................................................................................... 66
2.4 Spectroscopy .................................................................................................................. 66
2.4.1 Testing for in vitro ratio change of FRET RNA sensors............................................ 66

6 Contents
2.4.2 Spectroscopic determination of KD-value ............................................................... 67
2.4.3 pH titration .............................................................................................................. 67
2.4.4 In vitro transcription assay ...................................................................................... 67
2.4.5 Spectroscopic REFlex FRET assay ............................................................................ 67
2.5 Bacterial screening ......................................................................................................... 68
2.5.1 Sensor library generation ....................................................................................... 68
2.5.2 Bacterial colony selection ....................................................................................... 68
2.6 Cellular biology............................................................................................................... 70
2.6.1 Preparation of dissociated hippocampal neuronal culture .................................... 70
2.6.2 Immuncytochemistry .............................................................................................. 72
2.6.3 Fluorescence in situ hybridization (FISH) ................................................................ 73
2.6.4 Isolation of DNA and RNA from cell lysates ............................................................ 74
2.6.5 Transfection methods ............................................................................................. 75
2.6.6 Cellular assays and imaging .................................................................................... 77
2.7 Materials ........................................................................................................................ 79
2.7.1 Instruments ............................................................................................................. 79
2.7.2 Consumables ........................................................................................................... 79
2.7.3 Buffers, solutions and media .................................................................................. 80
2.7.4 Chemicals ................................................................................................................ 82
2.7.5. Plasmids, bacterial strains, cell-lines and flies ....................................................... 84
3. Results .................................................................................................................................. 86
3.1 Application of genetically encodable RNA labels for imaging of neuronal RNAs .......... 86
3.1.1. Dual RNA imaging in neurons ................................................................................ 86
3.1.2. NMDAR1 splicing reporter ..................................................................................... 88
3.2. RNA imaging using an on-off chemical dye .................................................................. 90

7 Contents
3.2.1 In vitro development of the on-off dye – aptamer pair ......................................... 91
3.2.2 On-off dye performance in mammalian cell lines .................................................. 92
3.3. Development of a genetically encodable dynamic single fluorophore RNA sensor .... 94
3.3.1 FP emission change upon direct aptamer interaction ............................................ 94
3.3.2 Aptamer-dependent emission change in a FP-peptide hybrid ............................... 96
3.4 Engineering of the FRET-based RNA biosensor VAmPIRe ............................................. 99
3.4.1 Aptamer-peptide pair selection for the FRET biosensor ........................................ 99
3.4.2 Rational engineering of FR-Rsg1.2 ........................................................................ 102
3.4.3 Development of a functional screen for FRET sensor performance in bacteria .. 107
3.4.4 VAmPIRe in vitro characterization ........................................................................ 111
3.4.5 Aptamer engineering ............................................................................................ 114
3.4.6 Cellular RNA imaging using VAmPIRe ................................................................... 116
3.5. Development of the EJC FRET sensor REFlex .............................................................. 120
3.5.1 eIF4AIII FRET biosensor design and incorporation into the EJC ........................... 120
3.5.2 ATP and RNA are necessary for REFlex FRET change. .......................................... 121
3.5.3 PYM or Imp13 binding to MAGO-Y14 results in EJC disassembly. ....................... 122
3.5.4 Monitoring RNA binding to eIF4AIII by FRET ........................................................ 124
4. Discussion ........................................................................................................................... 125
4.1 Evaluation of dual FP-based RNA labeling using MS2 and λN22 ................................. 126
4.2 Imaging cellular RNAs by synthetic on-off ASR dyes ................................................... 127
4.3 Performance and potential of single fluorophore RNA sensors .................................. 128
4.3.1 Aptamer-induced FP emission .............................................................................. 129
4.3.2 RNA binding peptide-EGFP hybrid ........................................................................ 131
4.3.3 Design of novel single fluorophore sensor ........................................................... 133
4.4 VAmPIRe sensor performance ..................................................................................... 133

8 Contents
4.4.1 VAmPIRe in vitro performance ............................................................................. 133
4.4.2 FRET RNA sensor engineering ............................................................................... 135
4.4.3 Cellular performance ............................................................................................ 144
4.4.4 Screening for FRET sensor performance............................................................... 154
4.5 REFlex sensor performance ......................................................................................... 159
4.5.1 REFlex assay in vitro application ........................................................................... 159
4.5.2 REFlex application for cellular imaging ................................................................. 160
4.6 Conclusion .................................................................................................................... 163
References ............................................................................................................................. 165
Acknowledgements ................................................................................................................ 190
Curriculum Vitae .................................................................................................................... 192
Versicherung .......................................................................................................................... 194

9 Table of figures
Table of figures
Figure 1 RNA structure and processing................................................................................................. 19
Figure 2 Subcellular localization of mRNAs........................................................................................... 20
Figure 3 Regulation of neuronal functions by localized mRNAs. .......................................................... 24
Figure 4 Dendritic CaMKIIα mRNA. ....................................................................................................... 25
Figure 5 NMDAR1 exon 21 splicing. ...................................................................................................... 27
Figure 6 Structure and function of the EJC. .......................................................................................... 29
Figure 7 Structure of aptamer-ARM peptide coplexes.. ....................................................................... 30
Figure 8 Structure and function of the HIV RRE RNA.. .......................................................................... 32
Figure 9 Comparison of the RRE RNA interaction with Rev and Rsg 1.2. ............................................. 33
Figure 10 Fluorescent proteins. ............................................................................................................ 36
Figure 11 FRET principle. ....................................................................................................................... 38
Figure 12 FRET biosensor strategies. .................................................................................................... 39
Figure 13 Orbital energy diagram for fluorescent PET sensors before and after cation binding. ........ 41
Figure 14 Functinal principle of FP-mediated RNA labeling. ................................................................ 43
Figure 15 Dynamics of mRNA molecules in the cytoplasm of mammalian cells. ................................. 45
Figure 16 Functional principle of split YFP mediated RNA visualization ............................................... 46
Figure 17 Strategies for RNA labeling and dynamic RNA reporters. ..................................................... 50
Figure 18 Workflow for biosensor engineering. ................................................................................... 51
Figure 19 Concepts of visualizing RNA-mediated processes. ............................................................... 51
Figure 20 SELEX procedure for the selection of a trGFP binding RNA aptamer. .................................. 64
Figure 21 Bacterial colony screening procedure. ................................................................................. 70
Figure 22 Hippocampal dissection. ....................................................................................................... 72
Figure 23 MS2 and λN22 labeling in rat hippocampal neurons. ........................................................... 87
Figure 24 NMDAR1 splicing reporter strategy. ..................................................................................... 88
Figure 25 NMDAR1 splice reporter granule characterization. .............................................................. 89
Figure 26 NMDAR1 exon21 alternative splice variant imaging in hippocampal neurons. ................... 90
Figure 27 Principle of aptamer-induced fluorescence of a chemical compound. ................................ 91
Figure 28 Chemical compound approach performance in HeLa cells. ................................................. 92
Figure 29 Staining of HeLa cells with a tat-conjugated on-off RNA dye. .............................................. 93
Figure 30 Design principles of dynamic single-FP RNA sensors. ........................................................... 94
Figure 31 Strategy for engineering aptamer-induced protein fluorescence. ....................................... 95
Figure 32 λN22 peptide insertion into EGFP. ........................................................................................ 97
10 Table of figures
Figure 33 Aptamer-dependent fluorescence of a cpEGFP-viral peptid hybrid. .................................... 98
Figure 34 FRET RNA biosensor principle. .............................................................................................. 99
Table 1: Ratio change in FRET biosensor constructs using selected ARM peptides as sensing moiety.
.................................................................................................................................................... 100
Figure 35 FRET YFP/CFP measurements in the cuvette. ..................................................................... 101
Figure 36 FR-Rsg1.2 RNA aptamer specificity. .................................................................................... 102
Figure 37 Peptide multiplication and rational linker design. .............................................................. 103
Figure 38 Ratio change of a spectrally shifted RNA FRET sensor. ....................................................... 105
Figure 39 Rsg1.2 peptide Proline 12 mutagenesis. ............................................................................. 106
Figure 40 FR-Rsg1.2 ph-sensitivity engineering by Arginine substitution. ......................................... 107
Figure 41 FR-Rsg1.2 7A8Q performance in bacteria.. ......................................................................... 108
Figure 42 Screening for aptamer-induced FRET ratio change in bacteria. ......................................... 110
Figure 43 Performance of selected sensor variants. .......................................................................... 111
Figure 44 VAmPIRe FRET characteristics............................................................................................. 112
Figure 45 VAmPIRe in vitro properties. ............................................................................................... 113
Figure 46 Dynamic and reversible imaging of RNA transcription and decay in vitro. . ...................... 114
Figure 47 RRE aptamer multimerization. ............................................................................................ 115
Figure 48 VAmPIRe performance in living mammalian cells. ............................................................. 116
Figure 49 Imaging temporal RNA dynamics. ....................................................................................... 117
Figure 50 Intracellular RNA localization in fibroblasts. ....................................................................... 118
Figure 51 Stress granule formation in fibroblasts. .............................................................................. 119
Figure 52 REFlex engineering and performance.. ............................................................................... 121
Figure 53 REFlex FRET change reports assembly of the EJC and requires ATP and RNA. ................... 122
Figure 54 REFlex reports EJC disassembly by PYM and Imp13. .......................................................... 124
Figure 55 REFlex sensitivity for different RNA targets. ....................................................................... 125
Figure 56 Two-plasmid KAN antitermination assay. ........................................................................... 130
Figure 57 Single fluorophore RNA sensor strategies. ......................................................................... 132
Figure 58 Design of novel RNA biosensors. ........................................................................................ 133
Figure 59 Aptamer linker design. ........................................................................................................ 136
Figure 60 RRE aptamer mutants. ........................................................................................................ 137
Figure 61 Rsg1.2 peptide functional assignment of amino acids. ...................................................... 138
Figure 62 FRET efficiency for linked donor-acceptor pairs distributed in three dimensions. ............ 139
Figure 63 Charge effect on the interaction of vampire components. ................................................ 140
Figure 65 FRET pair dimer interface engineering. .............................................................................. 143

11 Table of figures
Figure 66 FRET efficiency in dependence of distance. ........................................................................ 144
Table 2 Comparison of vampire with the MS2/λN22 systems. .......................................................... 148
Figure 67 Design of novel RNA biosensors. ........................................................................................ 148
Figure 68 Rev sensor strategy. ............................................................................................................ 150
Table 3 Comparison of VAmPIRe to the Rev sensor. .......................................................................... 150
Figure 69 Comparison of confocal and STED microscopy in spines. ................................................... 152
Figure 70 Ectopic spine targeting by Lifeact.. ..................................................................................... 153
Figure 71 RNA induction in bacteria using the TetON system. ........................................................... 155
Figure 72 The effect of acrAB efflux pumps on RNA induction by TC. ................................................ 156
Figure 73 Workflow for the cellular screening of FRET sensors. ........................................................ 158
Figure 74 Oskar mRNA and the EJC in Drosophila oogenesis. ............................................................ 161
Figure 75 eIF4AIII in neurons. ............................................................................................................. 162
12 Abbreviations
Abbreviations
aa amino acid APS ammonium persulfate Arc activity-regulated cytoskeleton-associated protein ASR fluorescently quenched sulforhodamine dye ATP adenosine 5'-triphosphate BDNF brain-derived neurotrophic factor BFP blue mutant of GFP bp base pairs BIV bovine immunodeficiency virus BSA bovine serum albumin Btz Barentsz CaMKIIα Calcium/Calmodulin-dependent Protein Kinase II CCD charge-coupled device CFP cyan fluorescent protein CMV cytomegalovirus CP circularly permuted Da Dalton DIV days in vitro DMEM Dulbecco’s Modified Eagle Medium DMSO dimethylsulfoxid DNA desoxyribonucleic acid dNTP deoxyribonucleotid-triphosphate E18 embryonic day 18 EDTA ethylenediamine tetraacetic acid eGFP Enhanced green fluorescent protein EJC exon junction complex eIF4AIII eukaryotic initiation factor 4AIII Eppi eppendorf 1.5 / 2 ml vial ESPT excited state proton transfer FCS fetal calf serum FISH fluorescence in vitro hybridization FMRP fragile X mental retardation protein FP fluorescent protein FRET fluorescence or förster resonance energy transfer GFP green fluorescent protein HBSS Hanks’ balanced salt solution HEK human embryonic kidney HeLa Henrietta Lacks HIV human immunodeficiency virus Imp13 Importin 13 IPTG isopropyl-β-D-thiogalactopyranoside KD dissociation constant λN22 Lambda-N22 protein LB Luria-Bertani broth M molar MB molecular beacon miRNA micro RNA mKO2 monomeric Kusabira Orange2
13 Abbreviations
MOPS 3-(N-morpholino)propanesulfonic acid mRNA messenger RNA mTFP monomeric teal fluorescent protein MTRIP multiply labeled tetravalent RNA imaging probes MW molecular weight ncRNA noncoding RNA NLS nuclear localization signal NMDA(R) N-methyl D-aspartate (receptor) nt nucleotides NTA nitriloacetic acid ODx optical density at x nm ORF open reading frame PAGE polyacrylamide gel electrophoresis PALM photoactivated localization microscopy PBS phosphate-buffered saline PCR polymerase chain reaction PET photoinduced electron transfer pH reverse logarithmic representation of relative H+ concentration PMSF phenylmethylsulfonylfluoride R ratio, fluorescence intensity of acceptor emission over donor emission ΔR difference of ratio R REFlex reporter of eIF4AIII flexure Rev regulator of virion expression RBP RNA binding protein RNA ribonucleic acid RNAi RNA interference RNP ribonucleoprotein ROI region of interest RRE Rev responsive element RT room temperature SDS sodium dodecyl sulfate SELEX systematic evolution of ligands by exponential enrichment SFV semliki forest virus STED stimulated emission depletion TAE tris-acetate-EDTA electrophoresis buffer TE tris-EDTA buffer TEMED N,N,N´,N´-Tetramethyl-ethylendiamine tRNA transfer RNA YFP yellow fluorescent protein WT wildtype ZBP1 zipcode binding protein 1
14 Abstract
Abstract
Live cell imaging of RNA or their protein binding partners is crucial to obtain an authentic
picture of RNA transcription, processing and trafficking. The development of methods for
tracking of specific target RNAs in diverse cellular systems has been approached by different
strategies including synthetic dyes, molecular beacons and genetically encoded RNA labels.
In this work, we challenged current fluorescent protein RNA labeling methods by testing
their performance for RNA visualization in neurons. Lack of dynamic behavior revealed the
limitations of these current approaches and subsequently the need for novel on-off RNA
reporters. Consequently, we designed synthetic and genetically encodable RNA biosensors
with an RNA-dependent signal output and established tests suitable for analyzing their
performance in vitro, in bacterial and eukaryotic systems. Application of synthetic on-off
RNA dyes was hampered by impermeability or low specificity within the cellular
environment.
We engineered genetically encoded FRET RNA reporters based on the interaction of viral or
synthetic RNA-peptide binding partners. Intramolecular FRET between two fluorescent
proteins occurs only if the interspaced peptide undergoes a conformational change upon
high-affine RNA aptamer binding. One of the identified sensors based on the Rsg1.2 peptide
and the HIV Rev Responsive Element (RRE) RNA aptamer was called VAmPIRe (Viral
Aptamer binding Peptide based Indicator for RNA detection). Its dynamic range was
improved by engineering both the RNA aptamer tag and the fusion protein by random linker
insertion and targeted mutagenesis. We demonstrate that the system is quantitative,
reversible and can be used to tag RNAs of interest with high specificity in vitro and in living
bacteria and mammalian cells.
Besides tracking of specific RNAs, biosensors studying the function of RNA binding proteins
like RNA helicases can provide further insights into RNA-based processes. Particularly
interesting, the RNA helicase eIF4AIII is situated at the core of the Exon Junction Complex
(EJC), a multi-protein complex involved in splicing, translation and RNA quality surveillance.
We have designed the FRET-based fluorescent biosensor REFlex (Reporter of eIF4AIII
Flexure) that monitors the conformational change of eIF4AIII underlying its transition from
the open to the closed state. Generally, in vitro FRET monitoring using REFlex can be applied
to reveal components that modulate EJC complex stability. More specifically, we have

15 Abstract
identified Importin 13 as a novel protein that is necessary and sufficient for EJC complex
disassembly. Furthermore, REFlex can be used to analyze the specificity of eIF4AIII for
different RNAs. This genetically encodable FRET sensor enables in vitro biochemical and
biophysical studies of eIF4AIII-related factors and can potentially be applied for functional
live-cell imaging.
Assisting general sensor engineering, we established the first method for functional
screening for FRET performance in bacterial colonies. The prokaryotic system combines
simple generation and testing of large libraries with the functionality of a living organism.
Bacterial screening was applied to improve VAmPIRe performance and provides a powerful
tool for the engineering of many kinds of genetically encoded biosensors.
16 1. Introduction
1. Introduction
1.1. RNA characteristics
According to the RNA (ribonucleic acid) world hypothesis (Gilbert 1986), pre-cellular life was
based on RNA. RNA is both able to encode and store genetic information and to catalyze
reactions comparable to proteins.
1.1.1 RNA structure
The polymer consists of four different nucleotides adenine, cytosine, guanine and uracil
(instead of thymidine for DNA) composed of a ribose sugar, a phosphate group and a
nucleobase. Genetic information encoded by the RNA nucleotide sequence serves either as
a mobile messenger RNA (mRNA) or replaces DNA in some viral genomes.
Inter- and intra-molecular Watson-Crick pairing (A with U and C with G) as well as non-
canonical base pairing allows the formation of discrete structural motifs. The single-
stranded RNA helix displays a stable A-type configuration (Salazar et al. 1993) with a narrow
major and a shallow minor groove due to constraints originating from the ribose 2’-OH. Base
stacking by van der Waals interactions further contributes to a high enthalpy. While RNAs,
especially RNA modules and motifs, are thermodynamically stable, chemical stability is low
compared do DNA as the ribose 2’-OH can attack the phosphodiester bond to cleave the
backbone.
The interaction of secondary structural elements like hairpin loops and bulges leads to the
formation of a unique tertiary structure (Figure 1). The characteristic folding with its
flexibility permit RNA-based molecular recognition (Hermann and Patel 2000) as well as
catalytic activities.
1.1.2 RNA classification
Only 3% of eukaryotic RNAs are mRNAs while the majority does not code for proteins.
Unexpectedly, the repertoire of RNAs found in living cells is exceedingly complex, with large
regions of the genome being transcribed into non-coding RNAs (ncRNA) that are involved in
17 1. Introduction
gene expression. During protein translation, transfer RNAs (tRNA) act as adaptors linking the
respective amino acid with its nucleotide coding sequence. Fine-tuning and networking
functions in gene expression have been assigned to small ncRNAs including micro RNAs
(miRNAs), small interfering RNAs (siRNAs) and Piwi-interacting RNAs (piRNA). In a
mechanism called RNA silencing, these short RNAs bind to their complementary target RNA
thereby blocking translation and inducing its degradation (Wu and Belasco 2008).
RNA folding into intricate secondary and tertiary structures adds another important facet.
Short RNA strands called aptamers (“aptus” = to fit) are recognized and bound with high
affinity by specific ligands including peptides. Systematic evolution of ligands by exponential
enrichment (SELEX) (Tuerk and Gold 1990) (Ellington and Szostak 1990) has been used to
screen for aptamers from randomized RNA pools. So-called ribozymes are even able to
catalyze specific chemical reactions (Kruger et al. 1982). Similarly, ribosomal RNAs (rRNA)
constitute the catalytic component of the ribosome. Another RNA class called riboswitches
undergoes regulated conformational change after recognition of a certain metabolite
leading to altered RNA processing (N. Sudarsan et al. 2008).
1.2. mRNA fate in eukaryotic cells
The richness of mRNA dynamics is evident in the exquisitely timed and tightly controlled
processes by which mRNAs from different genes are produced and degraded, in their export
from the nucleus to the cytoplasm, and in their sorting and localization into different
regions of the cytoplasm.
1.2.1 mRNA transcription and processing
Transcription relies on RNA synthesis on the DNA template and is the first and most highly
regulated step in gene expression. Eukaryotic mRNAs are transcribed in the nucleus by RNA
polymerase II. The mRNA coding region consists of exons that are interrupted by noncoding
introns. Pre-mRNAs contain untranslated regions (UTR) at both ends of the coding region
(Figure 1). Both UTRs determine translational efficiency and mediate the interaction with
18 1. Introduction
ribonucleases. The 3’UTR contains transport signals and can be bound by miRNAs that
regulate translation and degradation of the mRNA.
In most eukaryotic organisms the synthesized pre-mRNA transcripts undergo a series of
processing reactions required to produce a functional RNA (Figure 1). Eukaryotic mRNA
processing takes place before the transport from the nucleus to the cytoplasm, where
protein synthesis occurs.
The 5′ end of pre-mRNAs is stabilized by the addition of a 7-methylguanosine cap that
protects the transcript from exonuclease attack, facilitates RNA splicing and transport from
the nucleus to the cytoplasm. The 3’ end of most eukaryotic mRNAs is defined by cleavage
of the primary transcript and addition of a poly-A tail during polyadenylation. Poly(A)
polymerase recognizes an AAUAAA sequence and subsequently adds about 200 adenylate
(AMP) residues to the 3′ end of mRNA. The poly(A) tail facilitates mRNA transport to the
cytoplasm as well as translation. mRNA molecules form circular structures due to an
interaction between the cap binding complex and poly(A)-binding protein. Circularization is
thought to promote recycling of ribosomes on the same message leading to efficient
translation.
During a multi-step reaction called splicing introns are precisely excised from the mature
mRNA by an RNA-protein complex called spliceosome. Mutually exclusive inclusion of
different exons is called alternative splicing and allows the production of different mRNAs
from the same pre-mRNA. The RNA processing event, called RNA editing, occurs in some
mRNAs and alters the protein-coding sequences.
19 1. Introduction
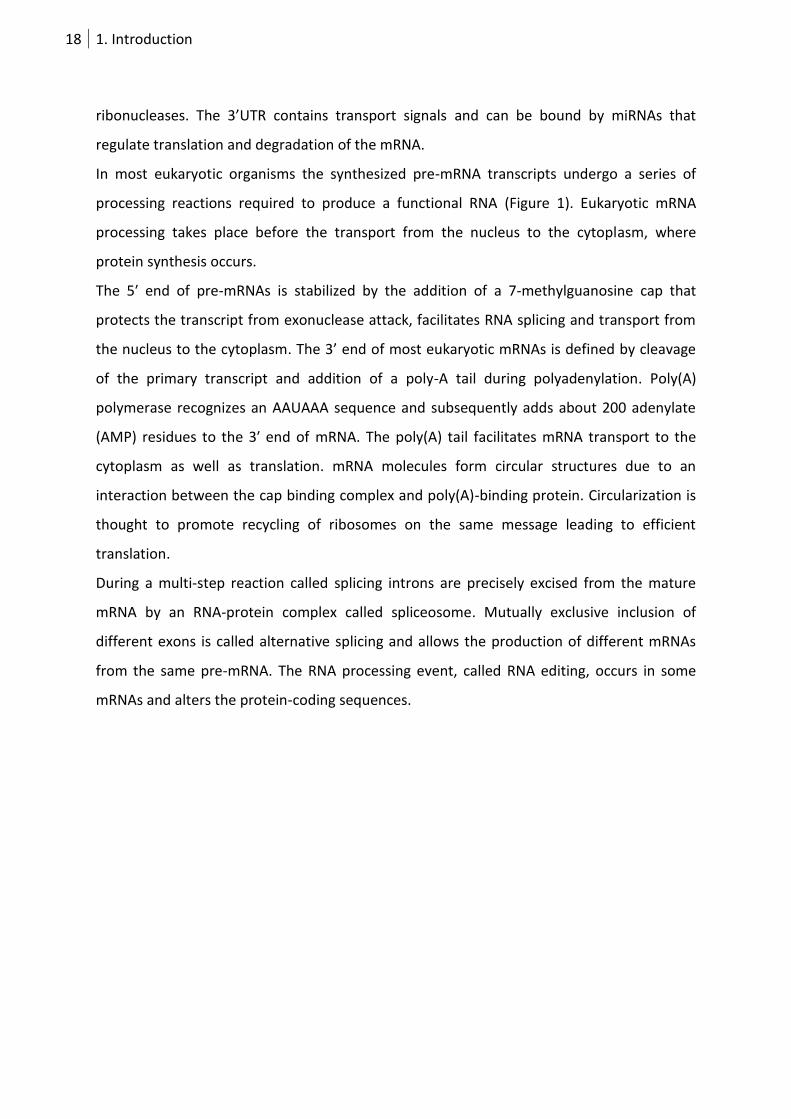
Figure 1 RNA structure and processing. (A) RNA structure principle including nucleotide building blocks, primary, secondary and tertiary structure. (B) mRNA functional parts: 5’cap, 5’UTR, coding region, 3’UTR and poly(A) tail. RNA binding proteins contact conserved regions mainly within the UTRs. (C) mRNA processing starting from transcription, processing including splicing, nuclear export, transport, translation and degradation.
1.2.2 mRNA subcellular localization
1.2.2.1 mRNAs local translation
As eukaryotic transcription and translation is compartmentally separated, eukaryotic
processed mRNA has to be transported to the cytoplasm. Transport is also required for
mRNA targeting to free-floating or ER-associated ribosomes assuring appropriate protein
distribution within the cell. Beyond that, transport to and translation at specific subcellular
locations allows autonomous spatio-temporal control of gene expression and saves energy
in cellular transport (Nasmyth and RP Jansen 1997) (BASSELL et al. 1999).
Local translation is particularly important for cells with complex architectures or
pronounced polarization (Figure 2A). A locally specific mRNA repertoire is needed for
20 1. Introduction
patterning of the Drosophila embryo by establishing polarity of morphogenetic gradients in
oocytes (Ferrandon, Elphick, Nüsslein-Volhard, et al. 1994). Both bicoid and oskar mRNAs
are specifically transported to the anterior or posterior pole, respectively (Kim-Ha et al.
1991). A similar system of cell fate determination through asymmetric cell division has been
observed in budding yeast, where Ash1 protein, the determinant for mating type is localized
to the daughter cell (Sil and Herskowitz 1996).
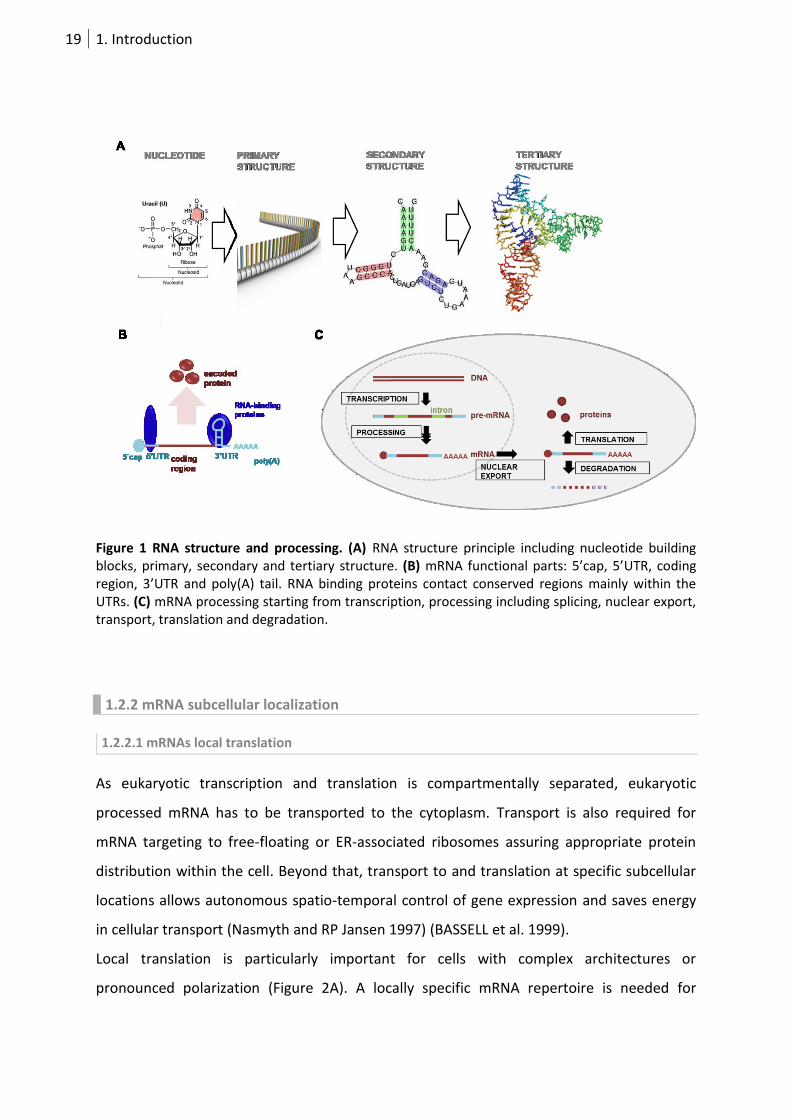
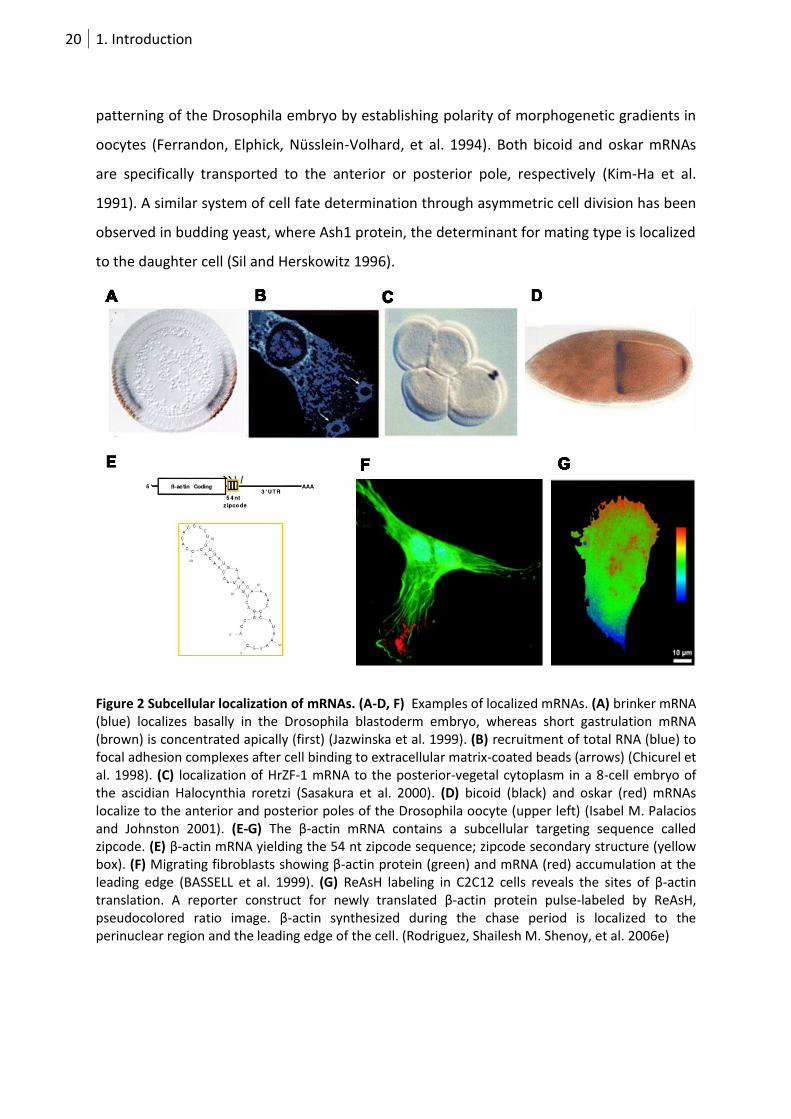
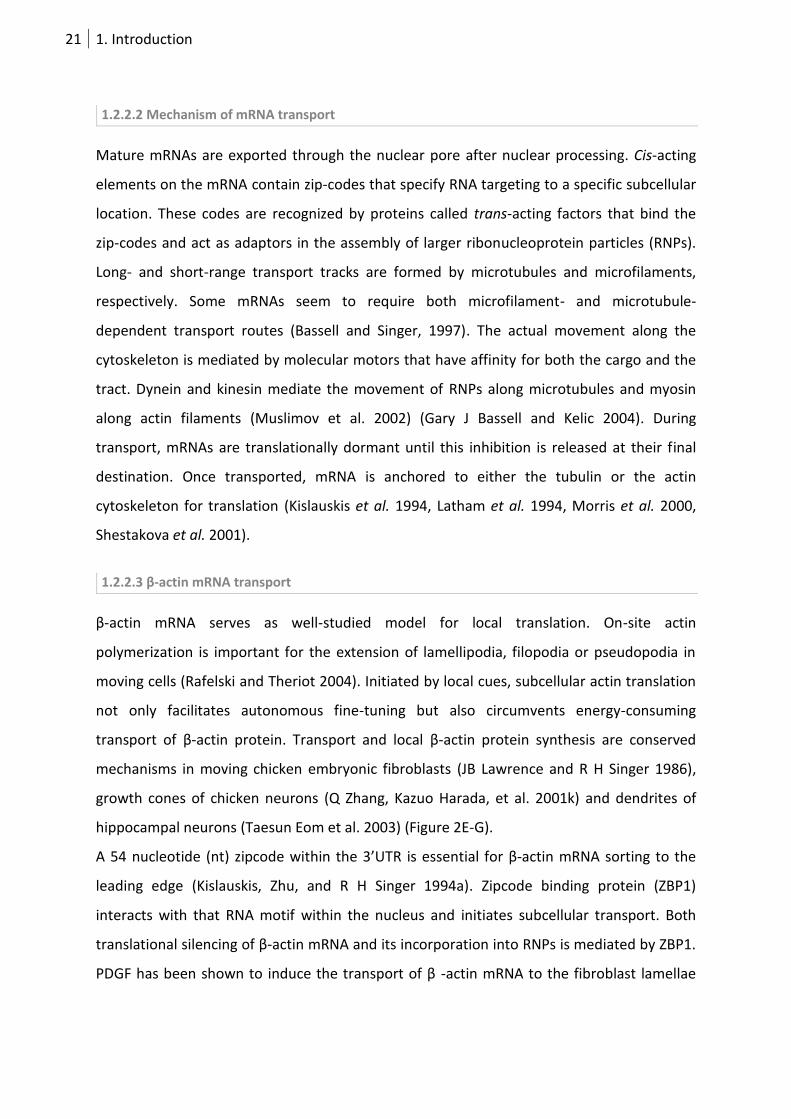
Figure 2 Subcellular localization of mRNAs. (A-D, F) Examples of localized mRNAs. (A) brinker mRNA (blue) localizes basally in the Drosophila blastoderm embryo, whereas short gastrulation mRNA (brown) is concentrated apically (first) (Jazwinska et al. 1999). (B) recruitment of total RNA (blue) to focal adhesion complexes after cell binding to extracellular matrix-coated beads (arrows) (Chicurel et al. 1998). (C) localization of HrZF-1 mRNA to the posterior-vegetal cytoplasm in a 8-cell embryo of the ascidian Halocynthia roretzi (Sasakura et al. 2000). (D) bicoid (black) and oskar (red) mRNAs localize to the anterior and posterior poles of the Drosophila oocyte (upper left) (Isabel M. Palacios and Johnston 2001). (E-G) The β-actin mRNA contains a subcellular targeting sequence called zipcode. (E) β-actin mRNA yielding the 54 nt zipcode sequence; zipcode secondary structure (yellow box). (F) Migrating fibroblasts showing β-actin protein (green) and mRNA (red) accumulation at the leading edge (BASSELL et al. 1999). (G) ReAsH labeling in C2C12 cells reveals the sites of β-actin translation. A reporter construct for newly translated β-actin protein pulse-labeled by ReAsH, pseudocolored ratio image. β-actin synthesized during the chase period is localized to the perinuclear region and the leading edge of the cell. (Rodriguez, Shailesh M. Shenoy, et al. 2006e)
21 1. Introduction
1.2.2.2 Mechanism of mRNA transport
Mature mRNAs are exported through the nuclear pore after nuclear processing. Cis-acting
elements on the mRNA contain zip-codes that specify RNA targeting to a specific subcellular
location. These codes are recognized by proteins called trans-acting factors that bind the
zip-codes and act as adaptors in the assembly of larger ribonucleoprotein particles (RNPs).
Long- and short-range transport tracks are formed by microtubules and microfilaments,
respectively. Some mRNAs seem to require both microfilament- and microtubule-
dependent transport routes (Bassell and Singer, 1997). The actual movement along the
cytoskeleton is mediated by molecular motors that have affinity for both the cargo and the
tract. Dynein and kinesin mediate the movement of RNPs along microtubules and myosin
along actin filaments (Muslimov et al. 2002) (Gary J Bassell and Kelic 2004). During
transport, mRNAs are translationally dormant until this inhibition is released at their final
destination. Once transported, mRNA is anchored to either the tubulin or the actin
cytoskeleton for translation (Kislauskis et al. 1994, Latham et al. 1994, Morris et al. 2000,
Shestakova et al. 2001).
1.2.2.3 β-actin mRNA transport
β-actin mRNA serves as well-studied model for local translation. On-site actin
polymerization is important for the extension of lamellipodia, filopodia or pseudopodia in
moving cells (Rafelski and Theriot 2004). Initiated by local cues, subcellular actin translation
not only facilitates autonomous fine-tuning but also circumvents energy-consuming
transport of β-actin protein. Transport and local β-actin protein synthesis are conserved
mechanisms in moving chicken embryonic fibroblasts (JB Lawrence and R H Singer 1986),
growth cones of chicken neurons (Q Zhang, Kazuo Harada, et al. 2001k) and dendrites of
hippocampal neurons (Taesun Eom et al. 2003) (Figure 2E-G).
A 54 nucleotide (nt) zipcode within the 3’UTR is essential for β-actin mRNA sorting to the
leading edge (Kislauskis, Zhu, and R H Singer 1994a). Zipcode binding protein (ZBP1)
interacts with that RNA motif within the nucleus and initiates subcellular transport. Both
translational silencing of β-actin mRNA and its incorporation into RNPs is mediated by ZBP1.
PDGF has been shown to induce the transport of β -actin mRNA to the fibroblast lamellae

22 1. Introduction
(Latham et al. 1994), and cAMP-PKA pathway has been suggested to be involved in
regulating the localization of the β -actin mRNA in cultured neurons (Bassell et al. 1998).
1.2.2.4 Local translation of neuronal mRNAs
As neurons are unique among cells regarding their extreme functional and morphological
polarity, decentralization of gene expression control has proven particularly important. The
ability of each synaptic terminal to change strength of their connection with experience is
known as the cellular mechanism underlying learning and memory (Bliss and Collingridge
1993). The long-lasting form of synaptic plasticity is dependent on protein synthesis (JB
Flexner et al. 1963). Therefore, it was hypothesized that mRNA transport and local
translation could function as a “synaptic tag” that dynamically and specifically responds to
stimulation driving the establishment and/or the maintenance of synaptic connections (Uwe
Frey and Morris 1997). Further indication for dendritic protein expression came from the
detection of components of the translation machinery and several mRNAs in post-synaptic
compartments of vertebrate and invertebrate neurons (O Steward and Levy 1982) (Feig and
Lipton 1993). The first direct functional link was shown with the requirement of dendritic
protein synthesis for the rapid enhancement of synaptic transmission induced by brain
derived neurotrophic factor (BDNF) in hippocampal Schaeffer collateral synapses (Kang and
Schuman 1996). In line with activity-induced changes in spine morphology, proteins
encoded by activity-regulated mRNAs alter actin dynamics or spine size including ARC, actin
and LIMK1 (Oswald Steward and Worley 2001) (Schratt et al. 2006). Other dendritically
localized mRNAs play a role in receptor trafficking and regulation as well as extracellular
secretion.
Activity can alter both mRNA transport and dendritic translation. Specific mRNAs including
ARC and CaMKIIα are labeled for transport via their dendritic targeting elements (DTEs)
within the 3’UTR (W Link et al. 1995) (Mori et al. 2000) (S Miller, Yasuda, Coats, Y Jones,
Martone, and Mayford 2002a). RNA-binding proteins like Staufen, ZBP1 and fragile X mental
retardation protein (FMRP) recognize these elements and form RNA protein particles (RNPs)
that are sent to the dendrite (Köhrmann et al. 1999) (HL Zhang et al. 2001) (JC Darnell et al.
2001). Neuronal RNPs are transported by the kinesin KIF5 along microtubules and finally are

23 1. Introduction
translocated into spines by the actin-based motor myosin Va (Kanai et al. 2004) (Yoshimura
et al. 2006).
Translation at the synapse is regulated by diverse mechanisms that either target all RNAs
present or a certain subset of transcripts. General regulators including translation initiation
or elongation factors and the synthesis of ribosomal proteins are controlled via the same
pathway. Both FMRP and CPEB1 bind to certain 3’UTRs, recruit a protein complex and
transiently inhibit the target RNA translation until activity-dependent phosphorylation
(Mendez and Richter 2001) (Garber et al. 2006). Even more specific inhibition is mediated by
local miRNAs including BDNF-induced silencing of LIMK1 mRNA by miR134 (Schratt et al.
2006).
Despite recent success in determining identity and function of dendritic mRNAs very little is
known about how the molecular identity of individual synapses is set up or maintained.
Another unresolved question includes the mechanisms for mRNA recruitment to and
anchoring at the activated synapse which determines spatial specificity. Insights into
molecular mechanisms will allow the examination of the popular molecular model for
memory formation which involves a master protein that is highly regulated on the mRNA
level (Kang and Schuman 1996).
Similarly to local dendritic translation, presynaptic protein synthesis plays a role in the
navigation of axonal growth cones in developing neurons, during regeneration of injured
axons and in specific classes of vertebrate and invertebrate neurons (X-hui Zhang and Poo
2002) (Brittis et al. 2002) (Ming, Wong, Henley, et al. 2002).
24 1. Introduction
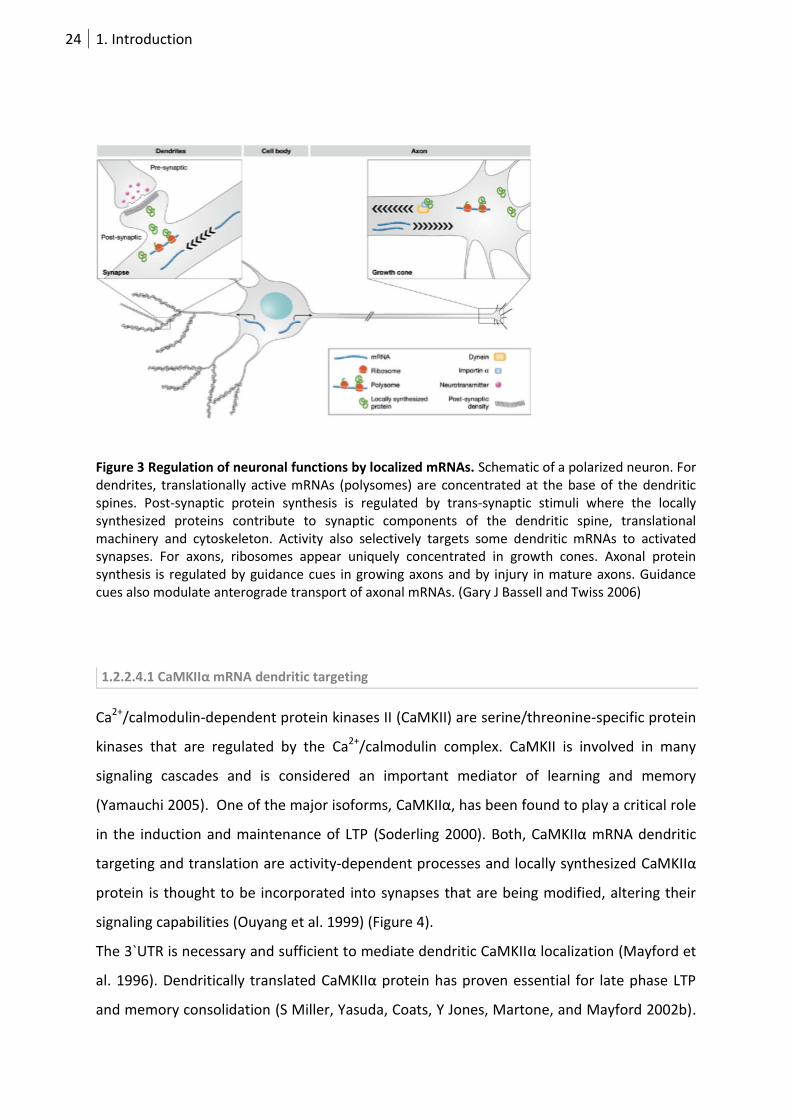
Figure 3 Regulation of neuronal functions by localized mRNAs. Schematic of a polarized neuron. For dendrites, translationally active mRNAs (polysomes) are concentrated at the base of the dendritic spines. Post-synaptic protein synthesis is regulated by trans-synaptic stimuli where the locally synthesized proteins contribute to synaptic components of the dendritic spine, translational machinery and cytoskeleton. Activity also selectively targets some dendritic mRNAs to activated synapses. For axons, ribosomes appear uniquely concentrated in growth cones. Axonal protein synthesis is regulated by guidance cues in growing axons and by injury in mature axons. Guidance cues also modulate anterograde transport of axonal mRNAs. (Gary J Bassell and Twiss 2006)
1.2.2.4.1 CaMKIIα mRNA dendritic targeting
Ca2+/calmodulin-dependent protein kinases II (CaMKII) are serine/threonine-specific protein
kinases that are regulated by the Ca2+/calmodulin complex. CaMKII is involved in many
signaling cascades and is considered an important mediator of learning and memory
(Yamauchi 2005). One of the major isoforms, CaMKIIα, has been found to play a critical role
in the induction and maintenance of LTP (Soderling 2000). Both, CaMKIIα mRNA dendritic
targeting and translation are activity-dependent processes and locally synthesized CaMKIIα
protein is thought to be incorporated into synapses that are being modified, altering their
signaling capabilities (Ouyang et al. 1999) (Figure 4).
The 3`UTR is necessary and sufficient to mediate dendritic CaMKIIα localization (Mayford et
al. 1996). Dendritically translated CaMKIIα protein has proven essential for late phase LTP
and memory consolidation (S Miller, Yasuda, Coats, Y Jones, Martone, and Mayford 2002b).
25 1. Introduction
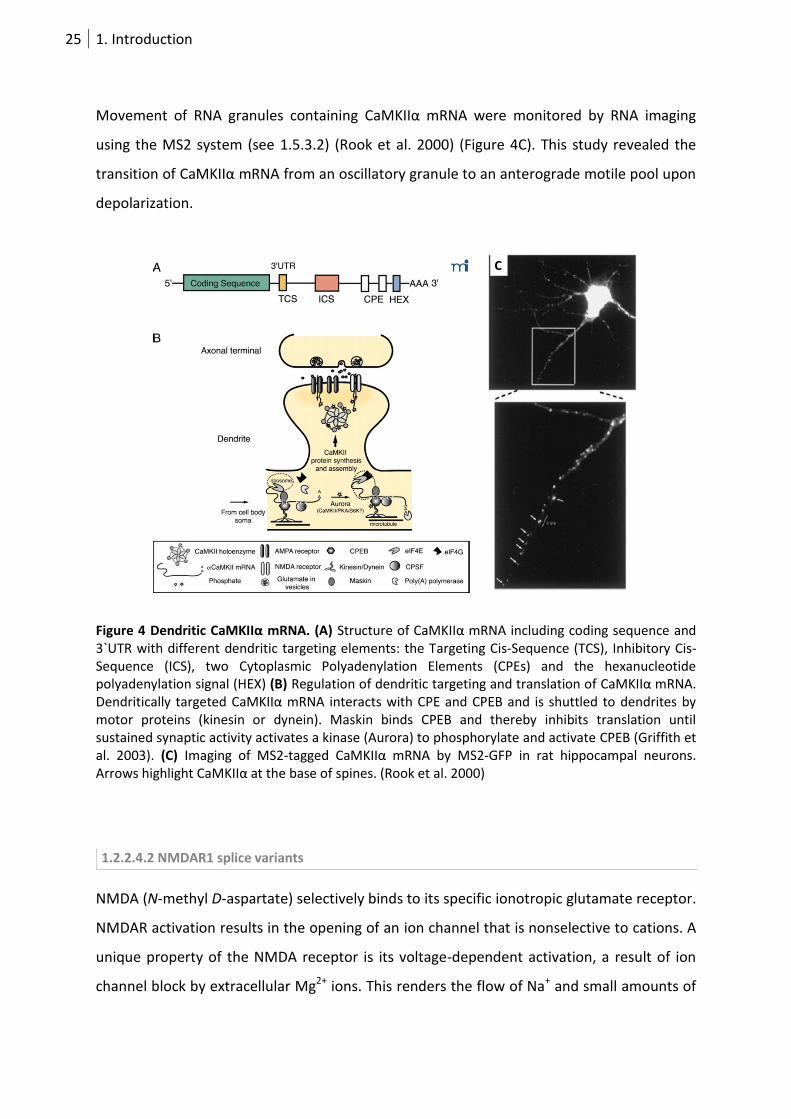
Movement of RNA granules containing CaMKIIα mRNA were monitored by RNA imaging
using the MS2 system (see 1.5.3.2) (Rook et al. 2000) (Figure 4C). This study revealed the
transition of CaMKIIα mRNA from an oscillatory granule to an anterograde motile pool upon
depolarization.
Figure 4 Dendritic CaMKIIα mRNA. (A) Structure of CaMKIIα mRNA including coding sequence and 3`UTR with different dendritic targeting elements: the Targeting Cis-Sequence (TCS), Inhibitory Cis-Sequence (ICS), two Cytoplasmic Polyadenylation Elements (CPEs) and the hexanucleotide polyadenylation signal (HEX) (B) Regulation of dendritic targeting and translation of CaMKIIα mRNA. Dendritically targeted CaMKIIα mRNA interacts with CPE and CPEB and is shuttled to dendrites by motor proteins (kinesin or dynein). Maskin binds CPEB and thereby inhibits translation until sustained synaptic activity activates a kinase (Aurora) to phosphorylate and activate CPEB (Griffith et al. 2003). (C) Imaging of MS2-tagged CaMKIIα mRNA by MS2-GFP in rat hippocampal neurons. Arrows highlight CaMKIIα at the base of spines. (Rook et al. 2000)
1.2.2.4.2 NMDAR1 splice variants
NMDA (N-methyl D-aspartate) selectively binds to its specific ionotropic glutamate receptor.
NMDAR activation results in the opening of an ion channel that is nonselective to cations. A
unique property of the NMDA receptor is its voltage-dependent activation, a result of ion
channel block by extracellular Mg2+ ions. This renders the flow of Na+ and small amounts of
26 1. Introduction
Ca2+ ions into the cell and K+ out of the cell voltage-dependent (Cull-Candy et al. 2001).
Calcium flux through NMDARs plays a critical role in synaptic plasticity.
The NMDAR forms a heterotetramer between two NMDAR1 and two NMDAR2 subunits.
The modular composition of NMDAR1 includes an extracellular agonist binding domain, a
transmembrane and a cytoplasmic domain containing a phosphorylation and protein
interaction sites.
NMDAR1 splicing is a well-studied example for the link between splicing and synaptic
plasticity. NMDAR1 mRNA contains 3 alternatively spliced exons 5, 21 and 22 which results
in at least seven mRNA isoforms that differ in their physiological properties or subcellular
distribution (Zukin and Bennett 1995).
Exon 21 encodes for the cytoplasmic C1 peptide cassette that is important for NMDAR1
membrane trafficking, phosphorylation by protein kinases C and A, protein interaction and
NMDAR1-induced gene expression (Bradley, Carter, et al. 2006b) (Ehlers et al. 1998) (S
Okabe et al. 1999) (Scott et al. 2001) (Tingley et al. 1993) (Standley et al. 2000). Exon 21
inclusion is favored after KCl-induced polarization in several neuronal cell types (J-A Lee et
al. 2007). Highly dynamically regulated splicing is mediated by 3 KCl-responsive elements
within exon 21. Two elements are responsive to CaMKIV and one constitutes a binding site
for the splicing repressor heterogeneous nuclear ribonucleoprotein A1 (hnRNP A1) (An and
Grabowski 2007). Further regulators include NOVA1 and 2, hnRNP H and NAPOR with
binding sites located within the intron between exons 21 and 22 (L ZHANG et al. 1999) (J
Han 2005)(J Ule et al. 2005) (W ZHANG et al. 2002) (YYL Yang et al. 1998).
27 1. Introduction
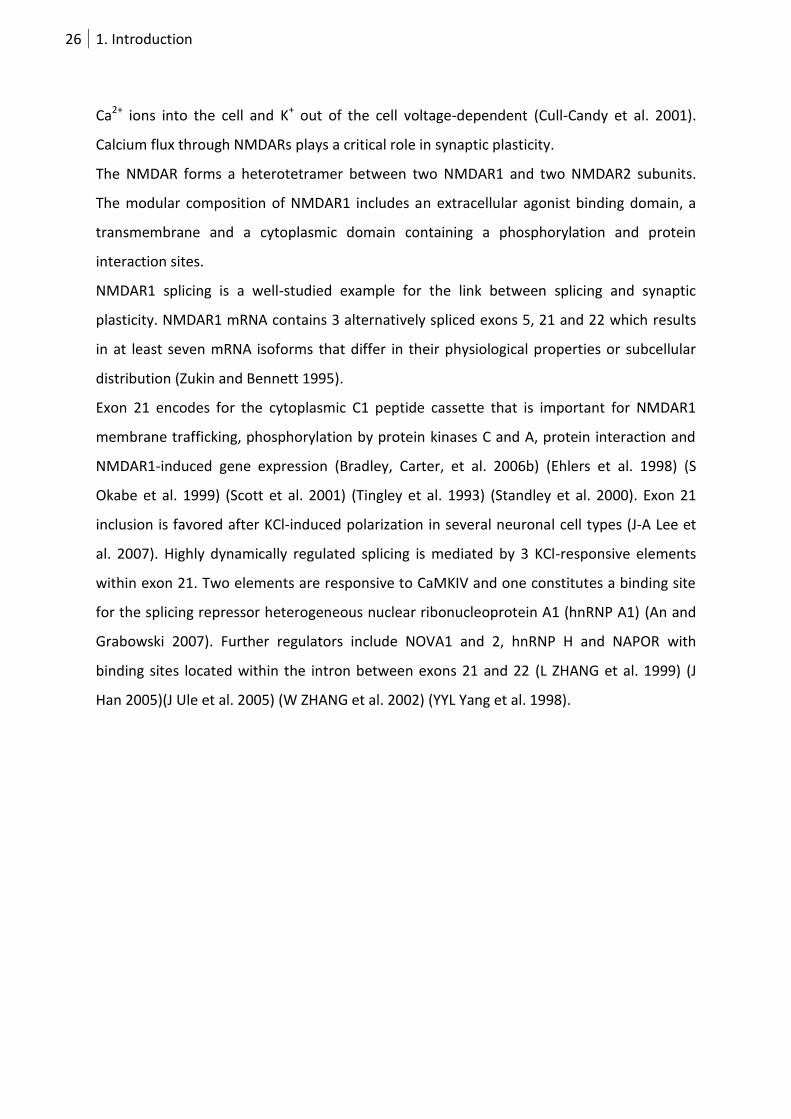
Figure 5 NMDAR1 exon 21 splicing. (A) NMDAR1 protein domains (Zukin and Bennett 1995) (B) and depolarization-dependent splicing of NMDAR1 exon 21 (C1 protein domain) in neurons (An and Grabowski 2007). (C) NMDAR1 in situ hybridization revealing somatic an dendritic (arrowheads) localization in rat hippocampal neurons. (Gazzaley et al. 1997)
1.2.3 mRNA turnover
mRNA turnover is determined by the rate of transcription versus degradation and varies in a
range of minutes to days among different mRNAs. The shorter the lifetime the more flexible
is the cellular protein expression to altering needs.
1.2.3.1 Balancing translation and mRNA degradation
Both ends of actively translated transcripts are bound by ribosomes, the eukaryotic
initiation factors eIF-4E and eIF-4G, and poly(A)-binding protein. Thereby, it is protected
from 5` end decapping by DCP2 and exonuclease digestion of the 3`end. Poly(A) tail removal
would disrupt the circular structure, destabilize the cap binding complex leading to the
degradation by the exosome or the decapping complex. mRNA degradation can furthermore
be initiated by RNA interference (RNAi) including the binding to siRNAs and miRNAs as well
as by internal AU-rich sequences. Processing bodies (P-bodies) are cytoplasmic foci for
target mRNA storage before degradation or translation. These subcellular RNP granules
contain proteins involved in decapping, storage and miRNA repression (Parker and Sheth
2007).
28 1. Introduction
1.2.3.2 Nonsense mediated decay and the exon junction complex
Eukaryotic messages are subjected to surveillance by nonsense mediated decay (NMD).
NMD is a mechanism to remove transcripts with premature termination codons (PTCs) in
the message. PTCs can arise via incomplete splicing, transcription errors or leaky scanning
by the ribosome causing a frame shift. Detection of a PTC triggers mRNA degradation by 5'
decapping, 3' poly(A) tail removal, or endonucleolytic cleavage (Isken and Maquat 2007).
As normal stop codons lie downstream of any splice site, aberrant stop codons are identified
by an upstream proximity to splice sites. Molecular recognition of NMD targets is mediated
by the exon junction complex (EJC). The EJC is deposited at each splice site during splicing in
the nucleus. Eukaryotic initiation factor 4AIII eIF4AIII is the first EJC component that binds to
mRNAs in a sequence-independent but position-specific way, 20 nt upstream of an exon-
exon junction (Gehring, Lamprinaki, Hentze, and Kulozik 2009a) (Herve Le Hir, Izaurralde, et
al. 2000i) (Tange, Nott, et al. 2004j). Recruitment of MAGO (Boswell et al. 1991) and Y14
(Hachet and Ephrussi 2001d) stabilizes eIF4AIII binding by inhibiting its ATPase activity. Thus,
MAGO-Y14 keeps eIF4AIII associated to the spliced mRNA during nuclear export (Reichert,
Genes Dev, 2002). In the cytoplasm, Barentsz (or MNL15) completes the EJC core (Degot et
al. 2004), (Van Eeden, I.M. Palacios, Petronczki, Weston, et al. 2001c) that constitutes a
platform for the binding of different other RNA-binding proteins involved in diverse RNA
processing steps (Hervé Le Hir and Séraphin 2008). The EJC is eventually released during
ribosome scanning during the pioneer round of translation (Dostie and Dreyfuss 2002) by
the ribosome-associated protein PYM (Bono, Ebert, Unterholzner, Güttler, et al. 2004a)
(Nielsen et al. 2009) (Bono et al. 2006) (Gehring, Lamprinaki, Kulozik, and Hentze 2009b).
Sharing the same binding site on MAGO-Y14, the nuclear import factor Importin 13 (Imp13)
replaces PYM (Bono, AG Cook, Grünwald, Ebert, and Conti 2010a) and reimports MAGO-Y14
into the nucleus (Mingot et al. 2001).
As soon as the translational machinery reaches a PTC, UPF1 is recruited to the site.
Interaction of UPF1 with a downstream EJC leads to the dissociation from the ribosome and
the rapid degradation of the mRNA.
The DEAD-box helicase eIF4AIII is mainly localized in the nucleus. Proteins of this
superfamily use the energy of ATP binding and hydrolysis for the unwinding of RNA duplexes
and the remodeling of RNA-protein complexes. DEAD-box proteins belong to the largest
29 1. Introduction
subfamily of RNA helicases called DExD/H-box proteins that possess eight conserved motifs
(Cordin et al. 2006).
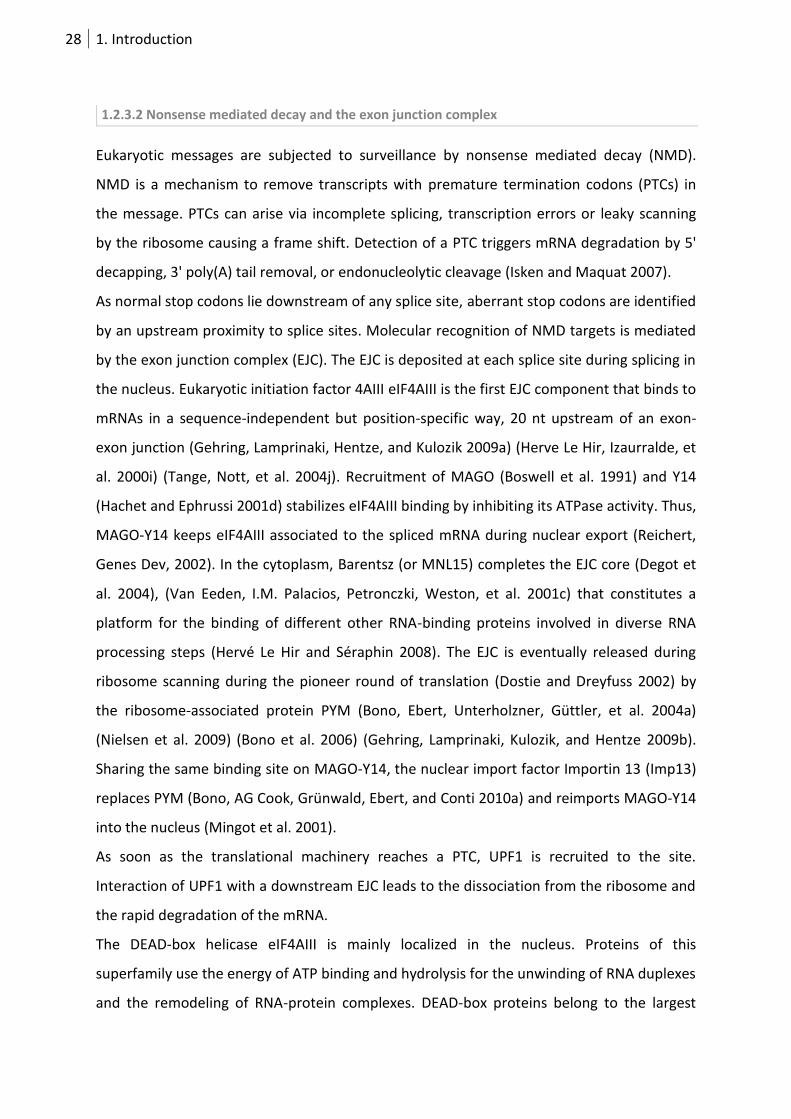
Figure 6 Structure and function of the EJC. (A) Upon splicing of nuclear pre-mRNAs splice factors are replaced by EJC that label exon-exon junctions. Transcripts with premature stop codons are targeted for NMD. exon (ex), intron (in), splice factors (SF), stopcodon (STOP) (B) Crystal structure of EJC-bound eIF4AIII (yellow) and free eIF4AIII (green), Barentsz (Btz) (red), MagoY14, ATP and RNA (grey). (Bono et al. 2006)
The crystal structure of the EJC has been solved (Bono et al. 2006). The eIF4AIII dumbbell-
like shape originates from two RecA-like domains that are linked by a 10 amino acid cleft-
forming linker. The conserved helicase motifs are carried by loop regions at the ends of the
RecA β-strands. Free eIF4AIII undergoes a large conformational change upon incorporation
into the EJC with the pivotal point for the 160° fold residing within the linker region (CBF
Andersen et al. 2006). The induced close proximity of the RecA domains is crucial for the
formation of an ATP- and RNA-binding site formed by the helicase motifs. This “on-” state is
characteristic for all DEAD-box family members (Tanner and Linder 2001). Both Barentsz and
MAGO-Y14 inhibit the eIF4AIII ATPase activity and thereby stabilize the ATP bound “on”-
state.
30 1. Introduction
1.3. viral RNA-protein interactions
1.3.1 Arginine-rich motif (ARM) peptides
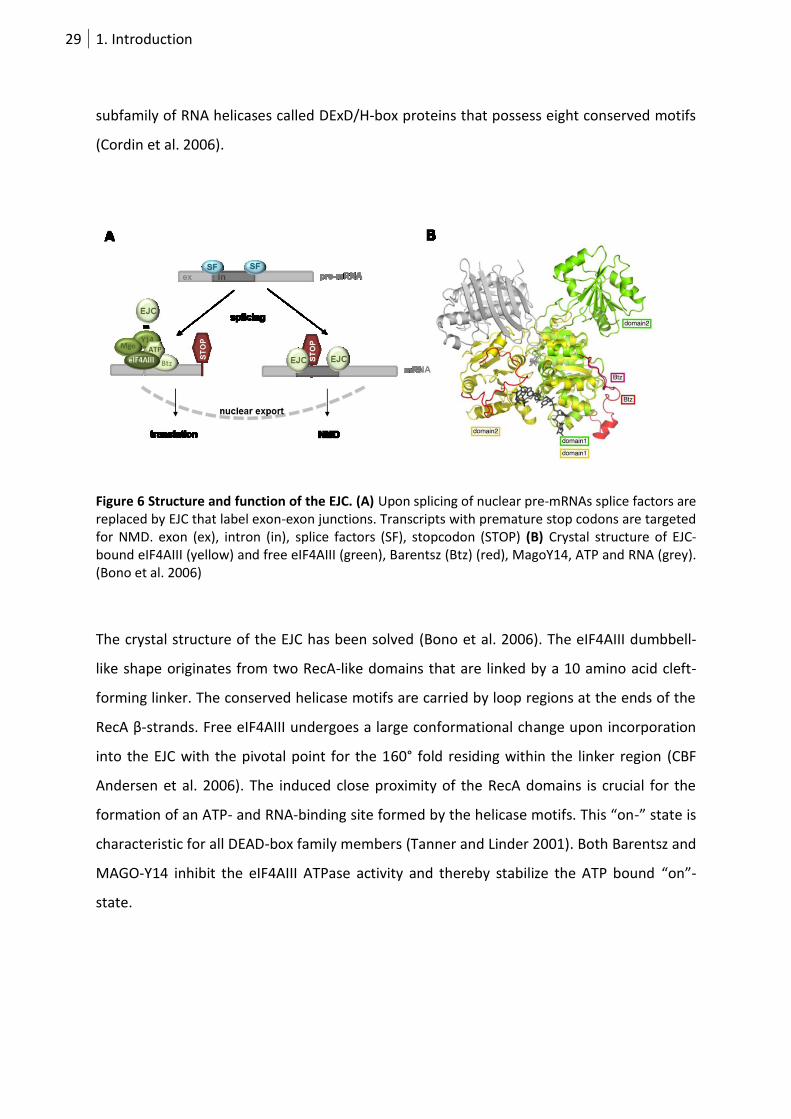
Regulation and assembly of RNP complexes relies on protein-RNA recognition mediated by
conserved sequence motifs. Proteins bearing an Arginine-rich motif (ARM) constitute a
prevalent class of RNA binding proteins (Weiss and Narayana 1998) (C A Smith et al. 2000).
All proteins share high Arginine prevalence but possess a diverse structural repertoire
including β-hairpin, α-helix, and helix–bend–helix. ARM peptides bind their target RNAs
with nanomolar affinity. The ARM-RNA interaction is characterized by adaptive
conformational transitions (BAYER et al. 2005). The RNA aptamer binding partners contain
non-canonical elements such as purine–purine mismatches, base triples, and flipped bases
which enlarge and extend the RNA major groove to create specific peptide-binding pocket.
Figure 7 Structure of aptamer-ARM peptide complexes. The RNA aptamers are shown in red and the corresponding peptides in blue. Names, amino acid or nucleotide lengths are indicated below. (PDB ID 1MNB, 1ETF, 1G70, 1EXY, 1A4T, 1NYB, 1QFQ). The affinity of interaction is indicated for each peptide-aptamer par.

31 1. Introduction
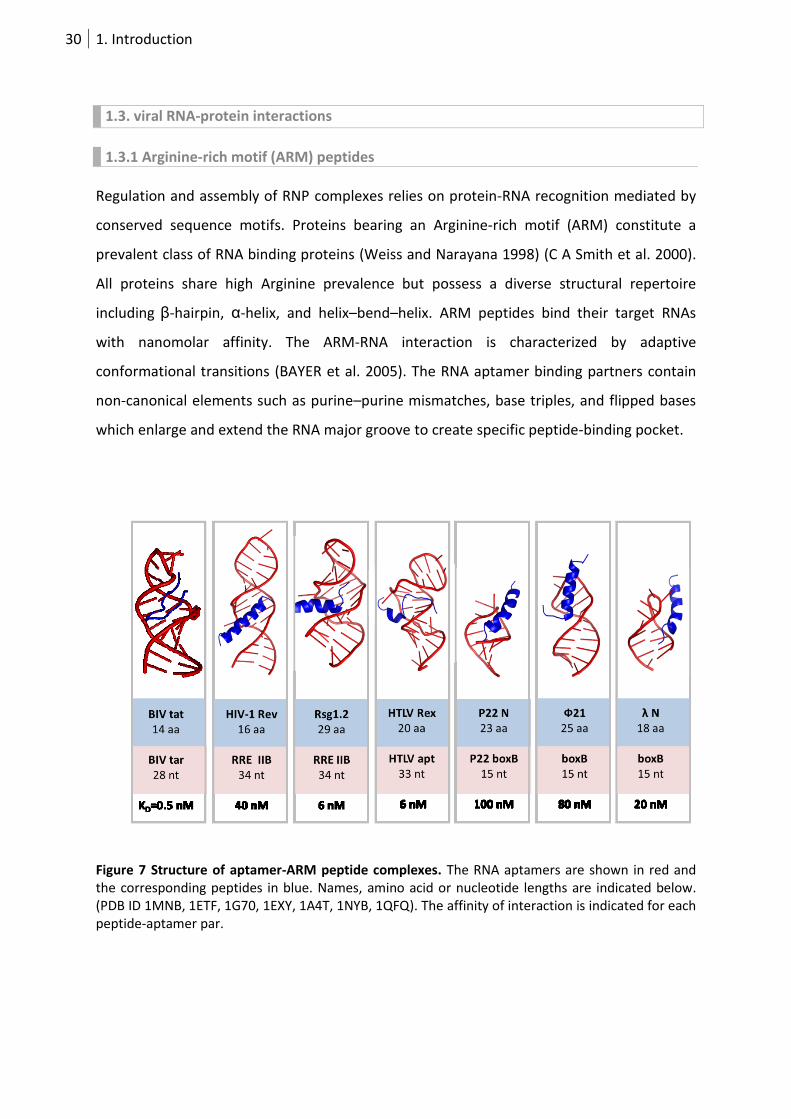
1.3.2 HIV RRE aptamer
Human immunodeficiency virus (HIV) kills human T-cells by taking over cellular processes to
make new viruses. Upon attachment to the cell, the virus inserts its RNA genome (
Figure 8A) and uses the host machinery to produce genomic copies that are incorporated
into new virus particles. The viral Rev protein prevents nuclear trapping of unspliced viral
RNA and initiates its nuclear export. The ARM-containing Rev peptide functions through
binding to a highly structured segment of HIV RNA called the Rev response element (RRE)
(Daly et al. 1989). The minimal RRE is a 234-nucleotide RNA sequence within the env-coding
region (Malim et al. 1990); more recent studies have suggested that an elongated 351-
nucleotide RRE provides optimal Rev function by allowing binding of more Rev molecules
(Mann et al. 1994) (
Figure 8B). The α-helical Rev peptide binding site is located within the 34-nucleotide stem-
loop IIB (Battiste, H Mao, et al. 1996a). Two non-canonical purine-purine pairs within the
internal bulge of stem-loop IIB widen the major groove of the A-form RNA double helix and
cause an S-shaped fold. Increased accessibility for the Arginine-rich, positively- charged Rev
peptide allows contacts to the phosphate backbone and with purine residues (Bartel et al.
1991) (JL Battiste, H Mao, et al. 1996a).
32 1. Introduction
Figure 8 Structure and function of the HIV RRE RNA. (A) Schematic of the HIV-1 genome, showing open reading frames as shaded rectangles and the LTRs as open rectangles. Schematic of the full-length genomic RNA with the position of the Rev-binding site RRE (blue box) (Groom et al. 2009). (B) Structure of the HIV RRE element with the Rev binding IIB stem loop (pink square) (homepage, Adriana Heguy) (C) HIV RNA export early and late phases. Spliced HIV RNA encoding Rev is exported and translated in the early phase. In the late phase, Rev is imported into the nucleus, where RNA binding and oligomerization occur, accompanied by the formation of an RNP that is a substrate for nuclear export via the Crm1 dependent pathway. Rev and the RRE dissociate in the cytoplasm, Rev shuttles back to the nucleus, and the viral mRNA is targeted for translation or packaging (en.wikipedia.org/wiki/HIV_Rev_response_element).
33 1. Introduction
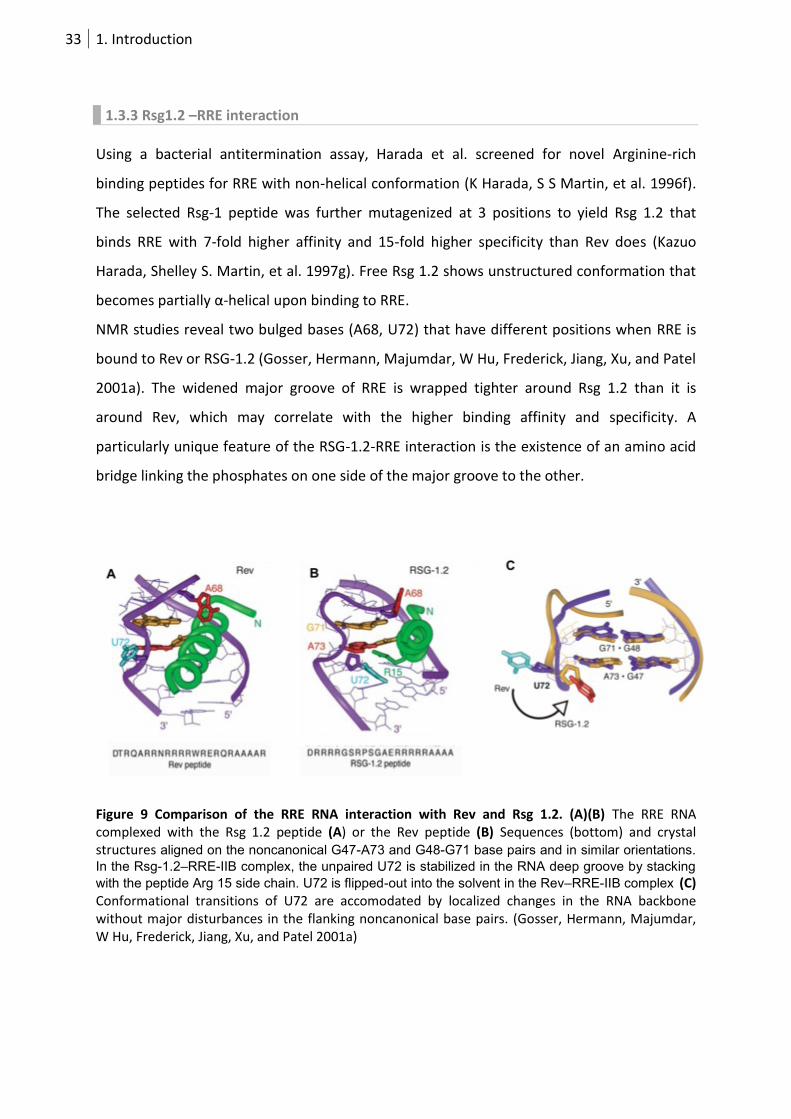
1.3.3 Rsg1.2 –RRE interaction
Using a bacterial antitermination assay, Harada et al. screened for novel Arginine-rich
binding peptides for RRE with non-helical conformation (K Harada, S S Martin, et al. 1996f).
The selected Rsg-1 peptide was further mutagenized at 3 positions to yield Rsg 1.2 that
binds RRE with 7-fold higher affinity and 15-fold higher specificity than Rev does (Kazuo
Harada, Shelley S. Martin, et al. 1997g). Free Rsg 1.2 shows unstructured conformation that
becomes partially α-helical upon binding to RRE.
NMR studies reveal two bulged bases (A68, U72) that have different positions when RRE is
bound to Rev or RSG-1.2 (Gosser, Hermann, Majumdar, W Hu, Frederick, Jiang, Xu, and Patel
2001a). The widened major groove of RRE is wrapped tighter around Rsg 1.2 than it is
around Rev, which may correlate with the higher binding affinity and specificity. A
particularly unique feature of the RSG-1.2-RRE interaction is the existence of an amino acid
bridge linking the phosphates on one side of the major groove to the other.
Figure 9 Comparison of the RRE RNA interaction with Rev and Rsg 1.2. (A)(B) The RRE RNA complexed with the Rsg 1.2 peptide (A) or the Rev peptide (B) Sequences (bottom) and crystal structures aligned on the noncanonical G47-A73 and G48-G71 base pairs and in similar orientations. In the Rsg-1.2–RRE-IIB complex, the unpaired U72 is stabilized in the RNA deep groove by stacking
with the peptide Arg 15 side chain. U72 is flipped-out into the solvent in the Rev–RRE-IIB complex (C) Conformational transitions of U72 are accomodated by localized changes in the RNA backbone without major disturbances in the flanking noncanonical base pairs. (Gosser, Hermann, Majumdar, W Hu, Frederick, Jiang, Xu, and Patel 2001a)
34 1. Introduction
1.4. Fluorescence imaging
Fluorescence imaging benefits from non-invasiveness and favourable signal-to-noise ratio.
This technique has proven suitable for detecting various biological and biochemical
processes and has become one of the most powerful tools in biology during the last few
decades.
1.4.1 Fluorescent proteins
The bioluminescent Aequorin of the jellyfish Aequorea victoria transfers blue light via
Resonance Energy Transfer (RET) to green fluorescent protein (GFP) which is expressed in
small granules around the rim of the jellyfish belt. Osamu Shimomura was the first to realize
that the fluorescent component in the bioluminescent organs of was actually a protein. 20
years later, Prasher cloned the cDNA encoding the 238 amino acids of GFP (Douglas C.
Prasher et al. 1992). The unique property of fluorescent proteins to form a visible
wavelength chromophore without the need of cofactors was initially shown by the
functional recombinant expression of GFP in E. coli and sensory neurons of C. elegans
(Inouye et al. 1985) (Chalfie et al. 1994). Marking a clearly discernible turning point, the
biological research community recognized the unique utility of a genetically encoded
fluorophore as a marker of gene expression and protein localization. Despite its enormous
impact as a tool, the natural purpose of both bioluminescence and GFP fluorescence in
jellyfish remains unknown.
X-ray crystal structures revealed that the protein is comprised of an 11-stranded β-sheet
wrapped into a cylindrical β-barrel protein, called a β-can (F Yang et al. 1996). The 4-(p-
hydroxybenzylidene)-5-imidazolidinone moiety that constitutes the actual chromophore
(Shimomura 1979) is covalently linked to the polypeptide chain and located near the center
of the β-barrel. Chromophore formation by 3 subsequent amino acids Ser 65, Tyr 66, Gly 67
includes cyclization of the main chain, dehydration and oxidation. This spontaneous reaction
is facilitated by steric constraints within the β-can and highly conserved residues (Glu 222
Arg 96) (Branchini et al. 1997). In wild type GFP the chromophore exists as an equilibrating
mixture of the neutral phenol and the deprotonated, anionic phenolate yielding different
absorbance characteristics. The two different protonation states give rise to two absorbance
35 1. Introduction
(at 395 nm and 475 nm) and emission (at 508 nm and 503 nm respectively) maxima (Morise
et al. 1974; Heim et al. 1994; Patterson et al. 1997). Excitation of the neutral phenol species
results in fast (tens of picoseconds) excited state proton transfer (ESPT) (Chattoraj et al.
1996) of the phenol proton to an internal hydrogen bond network (Brejc et al. 1997).
Therefore, regardless of which protonation state is excited, the fluorescence emission
spectrum is highly similar.
Structural information constitutes the basis for targeted mutagenesis to generate variants
with altered biophysical characteristics. Mutagenesis of the GFP wt includes increased
folding efficiency at 37 °C (Cormack et al. 1996) (Crameri et al. 1996) superfolder GFP 2006)
as well as reduced dimerization for GFP A206K (David A. Zacharias et al. 2002). Engineering
of the wt GFP chromophore resulted in two variants, eGFP (S65T) and Sapphire (T203I) that
stabilize the anionic or the neutral state, respectively (Roger Y. Tsien 1998) (Zapata-Hommer
and Oliver Griesbeck 2003). Replacing the Y66 by histidine or tryptophan resulted in an
imidazole or indole chromophore that emits blue (BFP = blue fluorescent protein) or cyan
light (CFP = cyan fluorescent protein) (R Heim et al. 1994) (R Heim and R Y Tsien 1996) (R
Heim et al. 1995). A red shift can be achieved by introduction of an aromatic tryptophan at
position 203 (T203Y) that creates a stacking interaction with the chromophore (YFP = yellow
fluorescent protein) (Ormö et al. 1996) (R M Wachter et al. 1998). As YFP suffers from pH
and halide sensitivity, engineering was necessary to yield the more stable variants Citrine
(V68L, Q69M, S72A) and Venus (F64L, M153T, V163A, S175G) (Oliver Griesbeck et al. 2001)
(Takeharu Nagai et al. 2002).
With the discovery and cloning of fluorescent proteins from reef Anthozoan species (Matz et
al. 1999) the FP spectrum could be further broadened. In one of the first examples, a
protein named Kusabira Orange (KO) from the mushroom coral Fungia concinna. The
sequence encoding KO was engineered to add ten amino acids to the N-terminus and
mutagenized, resulting in a monomeric version of Kusabira Orange (mKO, exmax=548 nm,
emmax=561 nm) (Karasawa et al. 2004). Recently, the fast-folding variant mKO2 containing 8
additional mutations, was developed for better performance in live cell imaging (Sakaue-
Sawano et al. 2008).
36 1. Introduction
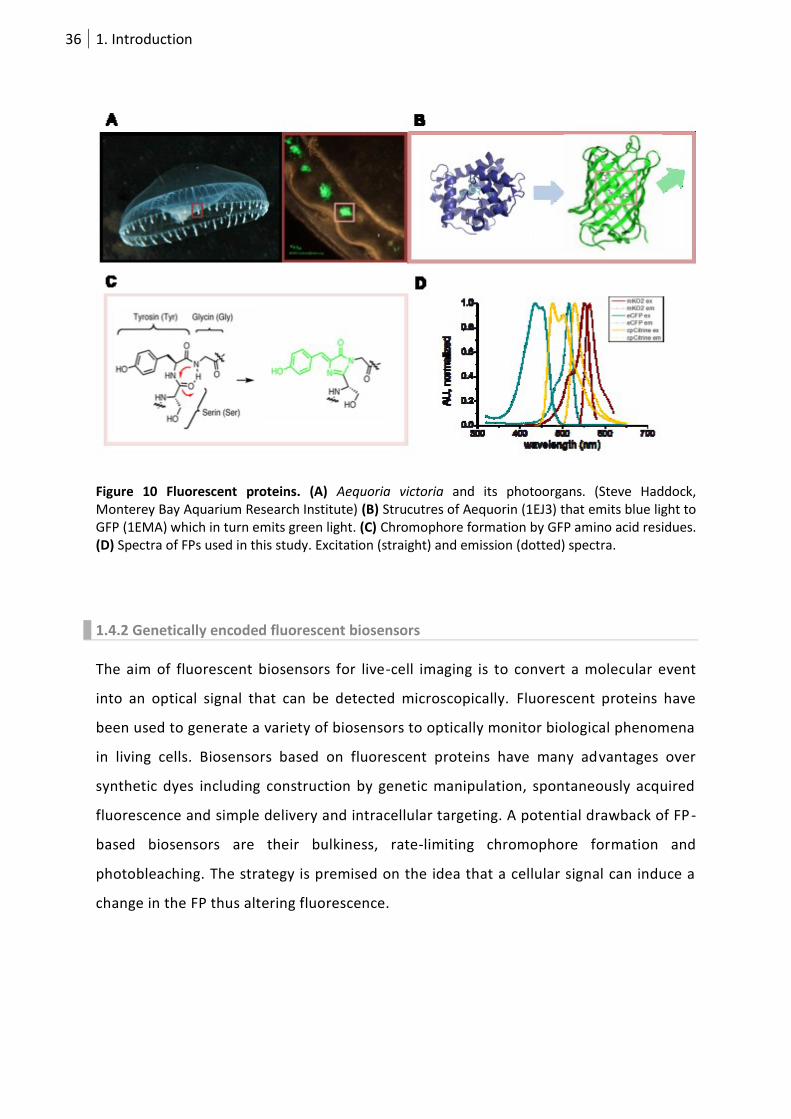
Figure 10 Fluorescent proteins. (A) Aequoria victoria and its photoorgans. (Steve Haddock, Monterey Bay Aquarium Research Institute) (B) Strucutres of Aequorin (1EJ3) that emits blue light to GFP (1EMA) which in turn emits green light. (C) Chromophore formation by GFP amino acid residues. (D) Spectra of FPs used in this study. Excitation (straight) and emission (dotted) spectra.
1.4.2 Genetically encoded fluorescent biosensors
The aim of fluorescent biosensors for live-cell imaging is to convert a molecular event
into an optical signal that can be detected microscopically. Fluorescent proteins have
been used to generate a variety of biosensors to optically monitor biological phenomena
in living cells. Biosensors based on fluorescent proteins have many advantages over
synthetic dyes including construction by genetic manipulation, spontaneously acquired
fluorescence and simple delivery and intracellular targeting. A potential drawback of FP-
based biosensors are their bulkiness, rate-limiting chromophore formation and
photobleaching. The strategy is premised on the idea that a cellular signal can induce a
change in the FP thus altering fluorescence.

37 1. Introduction
1.4.2.1 Single FP biosensors
The design of single fluorophore biosensors aims at reversibly destabilizing a bright
chromophore state. Single FPs exhibit natural pH sensitivity as the deprotonation of the
chromophore correlates with high fluorescence quantum yield and an absorption shift from
405 to 488 nm.
This direct correlation was exploited for the design of pH-sensors called pHluorins. The
engineering of the redox-sensor roGFP required mutagenesis that renders chromophore
protonation dependent on the redox status of the FP was used (Dooley et al. 2004). roGFP
contains two surface-exposed cysteines that form disulfide bonds which promote
chromophore protonation. Ratios from excitation at 405 and 488 nm indicate the extent of
roGFP protonation and oxidation.
In order to render biophysical properties dependent on an analyte molecule, e.g. H2O2 or
Calcium, a detecting protein is fused to an FP endowing the resulting biosensor with a
specific functionality. Detector proteins can be inserted into specific sites of the FP barrel
while preserving its fluorescent properties (G S Baird et al. 2000). Circularly permuted FPs
(cpFPs) have been opened at these positions and rejoined at the original N- and C-termini
thereby destabilizing the deprotonated state of the fluorophore (Nakai et al., 2001).
Chimeric proteins GCaMP and pericam contain a cpGFP fused to calmodulin (CaM) and its
target peptide, M13. Their spectral properties change reversibly with Ca2+ concentration
probably due to the interaction between CaM and M13, leading to an alteration of the
environment surrounding the chromophore.
1.4.2.2 FRET biosensors
A donor chromophore in its excited state can transfer energy to an acceptor chromophore
in a mechanism called Förster (or Fluorescence) Resonance Energy Transfer (FRET). This
non-radiative transfer can be described by a dipole-dipole coupling of the chromophores.
Effective energy transfer depends on the distance of the two chromophores (usually less
than 10 nm) and on the Förster Radius R0. R0 describes the distance between the donor and
acceptor at which 50% of the excited state energy is transferred from the donor to the
38 1. Introduction
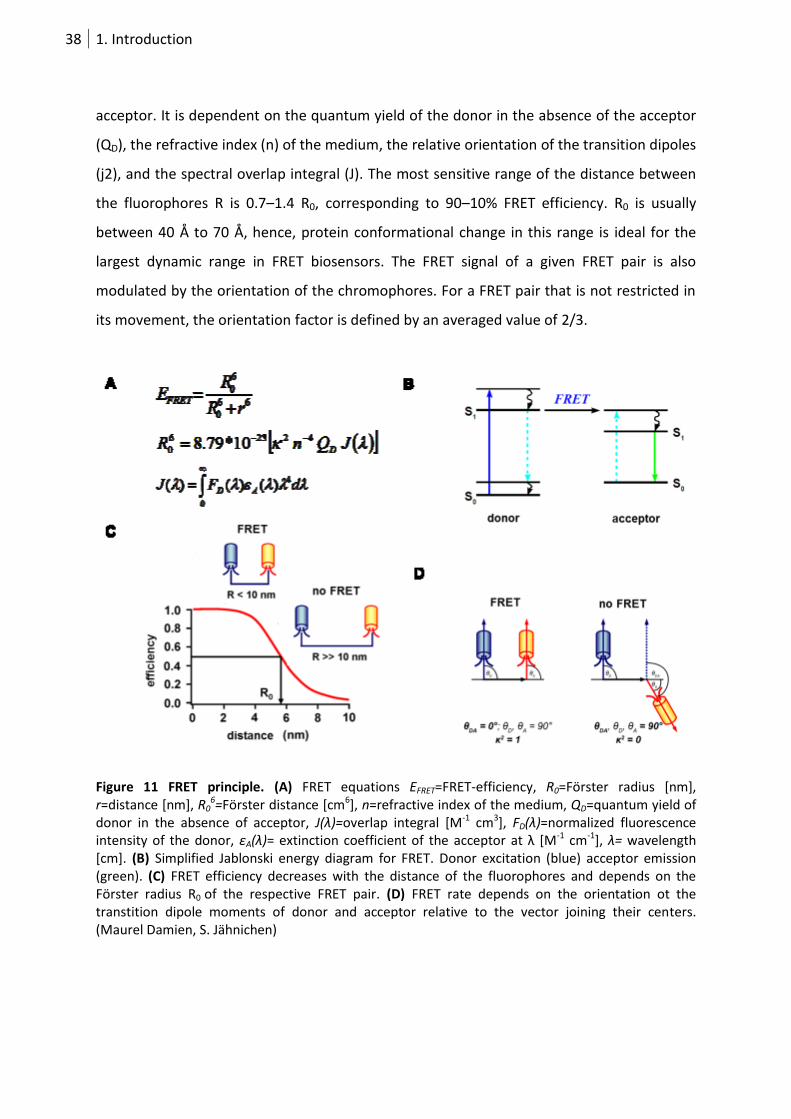
acceptor. It is dependent on the quantum yield of the donor in the absence of the acceptor
(QD), the refractive index (n) of the medium, the relative orientation of the transition dipoles
(j2), and the spectral overlap integral (J). The most sensitive range of the distance between
the fluorophores R is 0.7–1.4 R0, corresponding to 90–10% FRET efficiency. R0 is usually
between 40 Å to 70 Å, hence, protein conformational change in this range is ideal for the
largest dynamic range in FRET biosensors. The FRET signal of a given FRET pair is also
modulated by the orientation of the chromophores. For a FRET pair that is not restricted in
its movement, the orientation factor is defined by an averaged value of 2/3.
Figure 11 FRET principle. (A) FRET equations EFRET=FRET-efficiency, R0=Förster radius [nm], r=distance [nm], R0
6=Förster distance [cm6], n=refractive index of the medium, QD=quantum yield of donor in the absence of acceptor, J(λ)=overlap integral [M-1 cm3], FD(λ)=normalized fluorescence intensity of the donor, εA(λ)= extinction coefficient of the acceptor at λ *M-1 cm-1], λ= wavelength [cm]. (B) Simplified Jablonski energy diagram for FRET. Donor excitation (blue) acceptor emission (green). (C) FRET efficiency decreases with the distance of the fluorophores and depends on the Förster radius R0 of the respective FRET pair. (D) FRET rate depends on the orientation ot the transtition dipole moments of donor and acceptor relative to the vector joining their centers. (Maurel Damien, S. Jähnichen)
39 1. Introduction
Dependency of FRET efficiency on orientation and distance of the donor/acceptor couple
can be exploited for the design of biosensors if a detector protein is incorporated. FRET
biosensors have been engineered to detect a broad range of molecular events such as
protein-binding interactions, conformational changes, catalytic functions and concentration
of biomolecules including signaling molecules, cellular metabolites and nucleic acids.
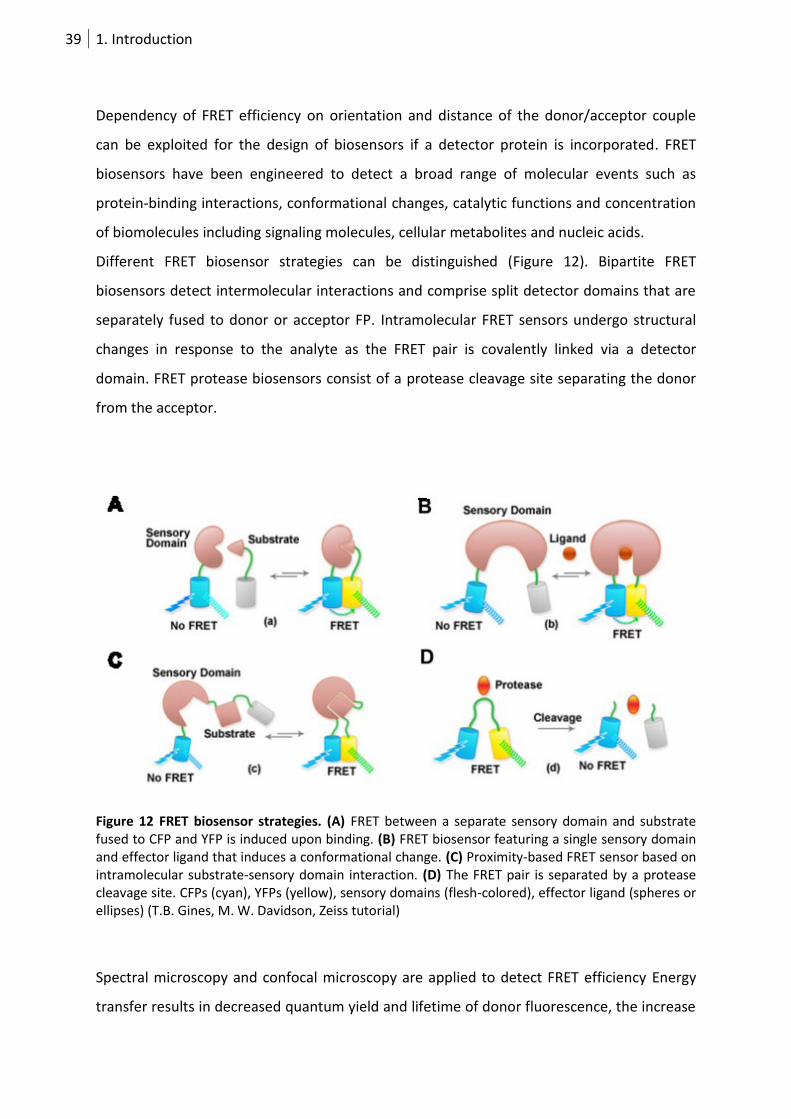
Different FRET biosensor strategies can be distinguished (Figure 12). Bipartite FRET
biosensors detect intermolecular interactions and comprise split detector domains that are
separately fused to donor or acceptor FP. Intramolecular FRET sensors undergo structural
changes in response to the analyte as the FRET pair is covalently linked via a detector
domain. FRET protease biosensors consist of a protease cleavage site separating the donor
from the acceptor.
Figure 12 FRET biosensor strategies. (A) FRET between a separate sensory domain and substrate fused to CFP and YFP is induced upon binding. (B) FRET biosensor featuring a single sensory domain and effector ligand that induces a conformational change. (C) Proximity-based FRET sensor based on intramolecular substrate-sensory domain interaction. (D) The FRET pair is separated by a protease cleavage site. CFPs (cyan), YFPs (yellow), sensory domains (flesh-colored), effector ligand (spheres or ellipses) (T.B. Gines, M. W. Davidson, Zeiss tutorial)
Spectral microscopy and confocal microscopy are applied to detect FRET efficiency Energy
transfer results in decreased quantum yield and lifetime of donor fluorescence, the increase
40 1. Introduction
of acceptor fluorescence brightness, and a loss of emission light polarization. These
parameters can be measured by stimulated emission (SE) and fluorescence lifetime imaging
(FLIM), respectively.
Desirable spectroscopic properties of the FRET pair include sufficient separation in
excitation spectra for selective stimulation of the donor GFP, an overlap between the
emission spectrum of the donor and the excitation spectrum of the acceptor to obtain
efficient energy transfer and reasonable separation in emission spectra between donor and
acceptor FPs. Regarding cellular sensor performance, parameters such as bleaching, tissue
autofluorescence and pH sensitivity have to be taken into account. Currently, CFP donor and
YFP acceptor are the most commonly used FPs to form a FRET pair.
1.5. RNA imaging
Much of the knowledge about intracellular RNA localization has come from RNA
visualization in fixed tissues by in situ hybridization methods. However, real time in vivo
imaging techniques are required in order to get insight into dynamics of specific RNAs. In
contrast to the protein world, there is no intrinsically fluorescent RNA or aptamer that could
be used as a tag for the RNA of interest. In order to render RNAs accessible to fluorescence
imaging techniques, several “adaptor technologies” linking both molecule species have been
developed. RNA tracking methods comprise labeled oligonucleotide probes, aptamer-
binding organic dyes and RNAs targeted by fluorescent proteins.
1.5.1 Chemical RNA dyes
Chemical on-off dyes bind their corresponding RNA aptamer, resulting in an increase in
fluorescence emission. RNAs of interest are fused to the aptamer on the DNA level and are
transfected and transcribed in cells where the tagged RNA can be visualized after exposure
to the dye.
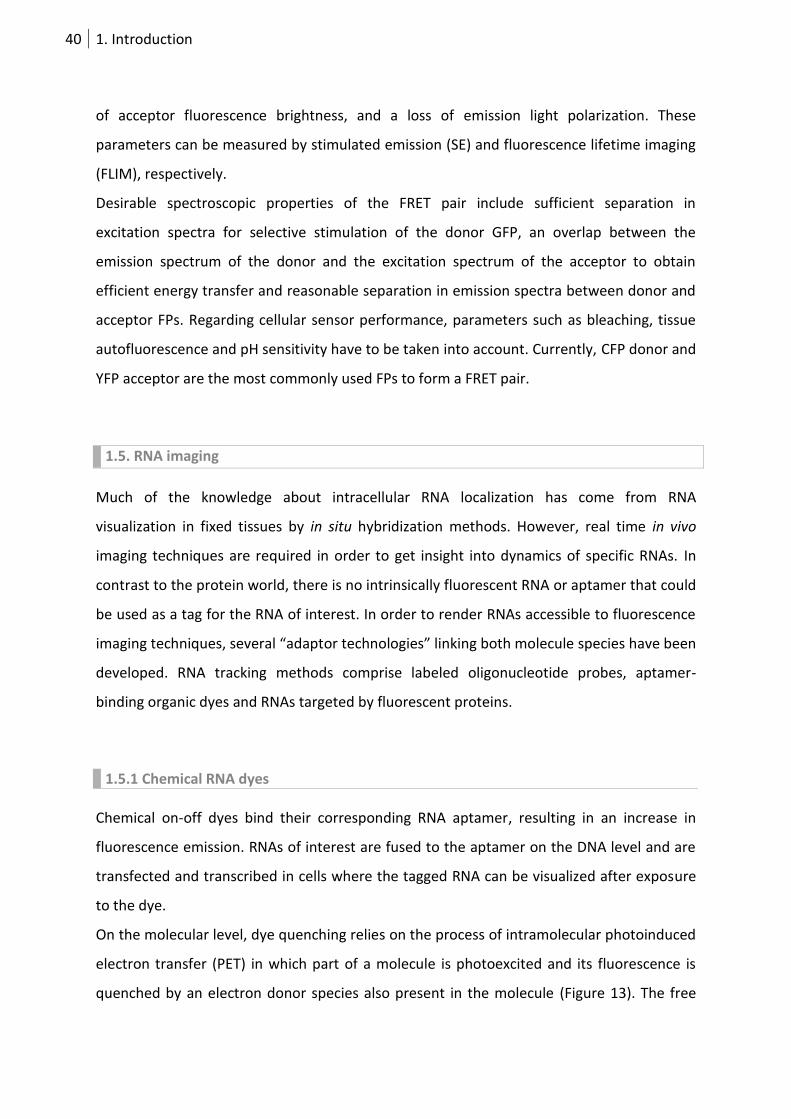
On the molecular level, dye quenching relies on the process of intramolecular photoinduced
electron transfer (PET) in which part of a molecule is photoexcited and its fluorescence is
quenched by an electron donor species also present in the molecule (Figure 13). The free
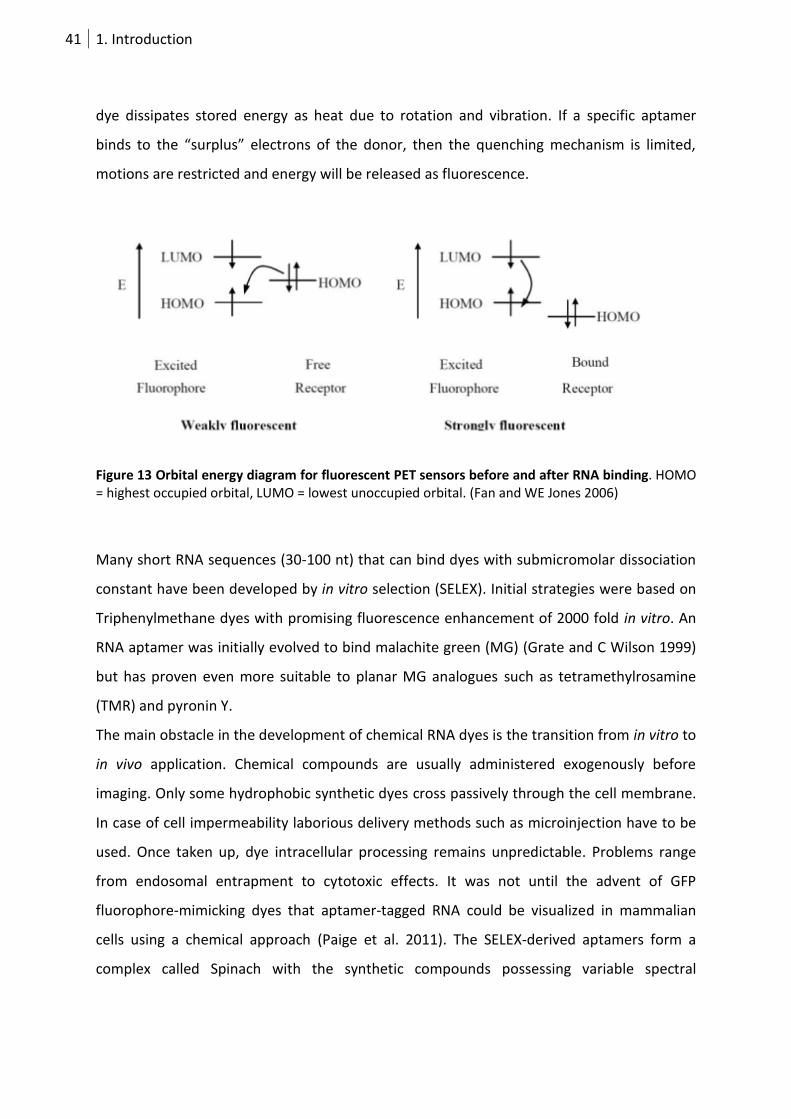
41 1. Introduction
dye dissipates stored energy as heat due to rotation and vibration. If a specific aptamer
binds to the “surplus” electrons of the donor, then the quenching mechanism is limited,
motions are restricted and energy will be released as fluorescence.
Figure 13 Orbital energy diagram for fluorescent PET sensors before and after RNA binding. HOMO = highest occupied orbital, LUMO = lowest unoccupied orbital. (Fan and WE Jones 2006)
Many short RNA sequences (30-100 nt) that can bind dyes with submicromolar dissociation
constant have been developed by in vitro selection (SELEX). Initial strategies were based on
Triphenylmethane dyes with promising fluorescence enhancement of 2000 fold in vitro. An
RNA aptamer was initially evolved to bind malachite green (MG) (Grate and C Wilson 1999)
but has proven even more suitable to planar MG analogues such as tetramethylrosamine
(TMR) and pyronin Y.
The main obstacle in the development of chemical RNA dyes is the transition from in vitro to
in vivo application. Chemical compounds are usually administered exogenously before
imaging. Only some hydrophobic synthetic dyes cross passively through the cell membrane.
In case of cell impermeability laborious delivery methods such as microinjection have to be
used. Once taken up, dye intracellular processing remains unpredictable. Problems range
from endosomal entrapment to cytotoxic effects. It was not until the advent of GFP
fluorophore-mimicking dyes that aptamer-tagged RNA could be visualized in mammalian
cells using a chemical approach (Paige et al. 2011). The SELEX-derived aptamers form a
complex called Spinach with the synthetic compounds possessing variable spectral
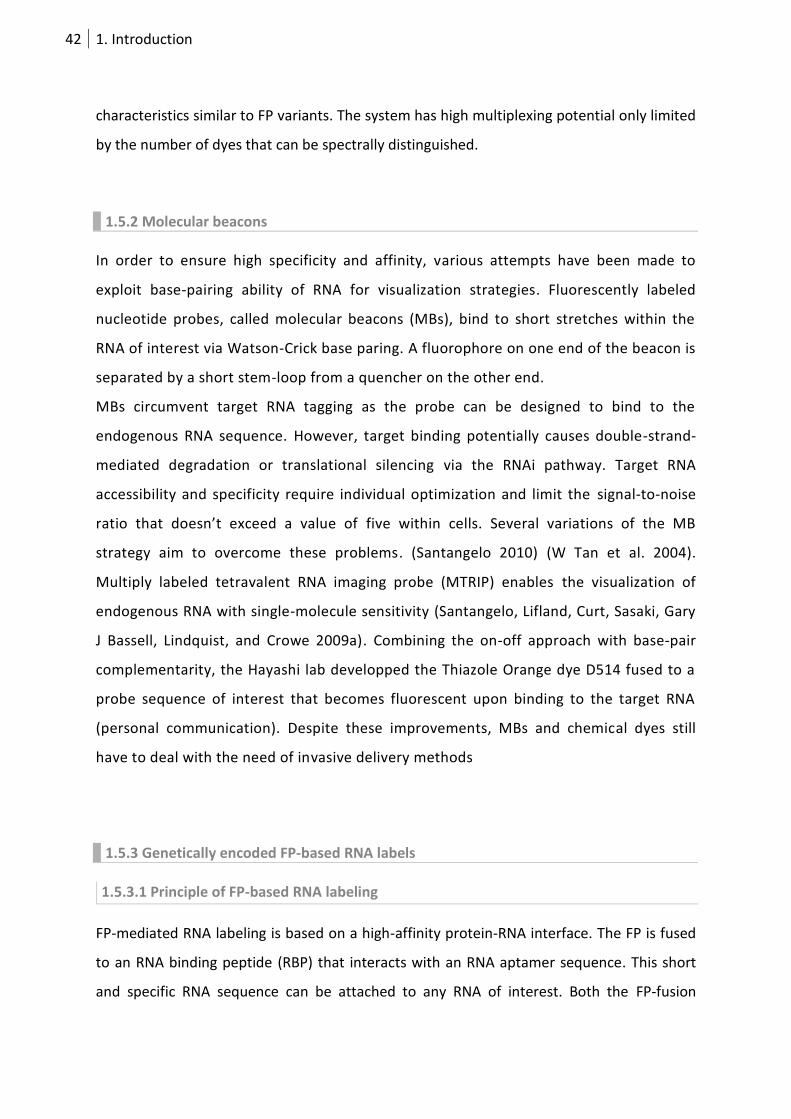
42 1. Introduction
characteristics similar to FP variants. The system has high multiplexing potential only limited
by the number of dyes that can be spectrally distinguished.
1.5.2 Molecular beacons
In order to ensure high specificity and affinity, various attempts have been made to
exploit base-pairing ability of RNA for visualization strategies. Fluorescently labeled
nucleotide probes, called molecular beacons (MBs), bind to short stretches within the
RNA of interest via Watson-Crick base paring. A fluorophore on one end of the beacon is
separated by a short stem-loop from a quencher on the other end.
MBs circumvent target RNA tagging as the probe can be designed to bind to the
endogenous RNA sequence. However, target binding potentially causes double-strand-
mediated degradation or translational silencing via the RNAi pathway. Target RNA
accessibility and specificity require individual optimization and limit the signal-to-noise
ratio that doesn’t exceed a value of five within cells. Several variations of the MB
strategy aim to overcome these problems. (Santangelo 2010) (W Tan et al. 2004).
Multiply labeled tetravalent RNA imaging probe (MTRIP) enables the visualization of
endogenous RNA with single-molecule sensitivity (Santangelo, Lifland, Curt, Sasaki, Gary
J Bassell, Lindquist, and Crowe 2009a). Combining the on-off approach with base-pair
complementarity, the Hayashi lab developped the Thiazole Orange dye D514 fused to a
probe sequence of interest that becomes fluorescent upon binding to the target RNA
(personal communication). Despite these improvements, MBs and chemical dyes still
have to deal with the need of invasive delivery methods
1.5.3 Genetically encoded FP-based RNA labels
1.5.3.1 Principle of FP-based RNA labeling
FP-mediated RNA labeling is based on a high-affinity protein-RNA interface. The FP is fused
to an RNA binding peptide (RBP) that interacts with an RNA aptamer sequence. This short
and specific RNA sequence can be attached to any RNA of interest. Both the FP-fusion
43 1. Introduction
protein and the tagged RNA are encoded within plasmids that have to be transfected into
the cell using standard transfection methods. High background signal caused by permanent
fluorescence of the FP-fusion protein demands for its subcellular entrapment. Thus, the FP
is fused to a nuclear localization signal (NLS) that causes its reimport into the nucleus.
Nuclear restriction is only suspended if an aptamer-tagged RNA is exported and transported
to more distal subcellular sites (Figure 14A). Non-nuclear FP is only observed if it is bound to
the aptamer-tagged RNA of interest which is exported from the nucleus. Consequently,
fluorescence in the cytoplasm ideally corresponds to FP-bound RNA of interest (Figure 14B).
Application of FP-mediated RNA imaging within the nucleoplasm suffers from a lack of
subcellular entrapment of the FP fusion protein. Consequently, high background noise has
to be reduced by saturating FP fusion proteins with the target RNA and suitable data
processing.
Figure 14 Functional principle of FP-mediated RNA labeling. (A) Schematic of the RNA labeling strategy. An RNA binding peptide is fused to an FP and a nuclear localization signal (NLS). The corresponding RNA aptamer is fused to an RNA of interest. (B) Schematic drawing of cells expressing a 3xGFP-4xlambda peptide-NLS fusion protein. In the absence of the aptamer, GFP fluorescence is detected exclusively within the nucleus. Interaction of 4 λN22 peptides with 4 boxB aptamer repeats indicates localization of boxB-tagged β-actin-zipcode RNA in cells transfected with both constructs (right). (C) Crystal structures of the phage MS2 peptide-aptamer complex. The aptamer is forming a hairpin (red) that interacts with a β-sheet structured peptide (PDB 1ZDH).
44 1. Introduction
Current FP-based RNA labeling methods take advantage of naturally evolved high affinity
aptamer-peptide pairs. So far, two phage-derived systems have been successfully used for
the visualization of RNAs in prokaryotic and eukaryotic cells.
The first genetically encodable RNA sensor for live cell imaging was developed and applied
to RNA labeling in S. cerevisiae by the lab of Robert Singer (E Bertrand, P Chartrand, et al.
1998a). A dimeric 129 amino acid (aa) MS2 coat protein binds with a KD of 1 nM to its RNA
target (Figure 14B). Affinity has been increased by mutation of both protein and RNA
(Peabody and Lim 1996) (Lowary and Uhlenbeck 1987). The MS2 RNA stem-loops are cloned
in 6 to 24 repeats in order to enhance signal intensity. Daigle and Ellenberg used a λN22
derived aptamer-peptide pair for RNA tracking in mammalian cells (Daigle and Ellenberg
2007). The 22 aa α-helix of the phage λN22 peptide binds to the 15 nt boxB RNA motif with
nanomolar affinity (KD = 22 nM) (Figure 7). Again, constructs consisting of 4 copies of the
peptide and 4-12 boxB stem-loops have been used. In both MS2 and λN22 based RNA
labeling, no cognate counterpart of the phage RNA aptamer exists in the eukaryotic cell
under investigation. Additionally, the two systems are able to discriminately bind in favor of
their own RNA by 1000-fold which has been exploited in double RNA labeling (Lange et al.
2008).
An important issue in RNA tagging is the site of aptamer insertion into the RNA of interest.
When designing the target RNA-aptamer fusion construct, disruption of important RNA
elements has to be avoided. Most established insertion sites are located between the 3’UTR
and the poly(A) site (Yamagishi et al. 2009) or between stop codon of the ORF and the 3’UTR
(Figure 1A) (E Bertrand, P Chartrand, et al. 1998a). Further undesired impact on RNA
function and localization might originate from the secondary structure of the aptamer tag.
1.5.3.2 Application of MS2-based RNA visualization
MS2-based RNA labeling has proven suitable for monitoring different stages of RNA
biosynthesis and function in various cell types.
In the first study using MS2, ASH1 mRNA was tagged to 12 MS2 repeats in order to detect
single RNA-containing particles transported to the bud tip of S. cerevisiae (E Bertrand, P
Chartrand, et al. 1998a). Single molecule detection in mammalian cells was not possible
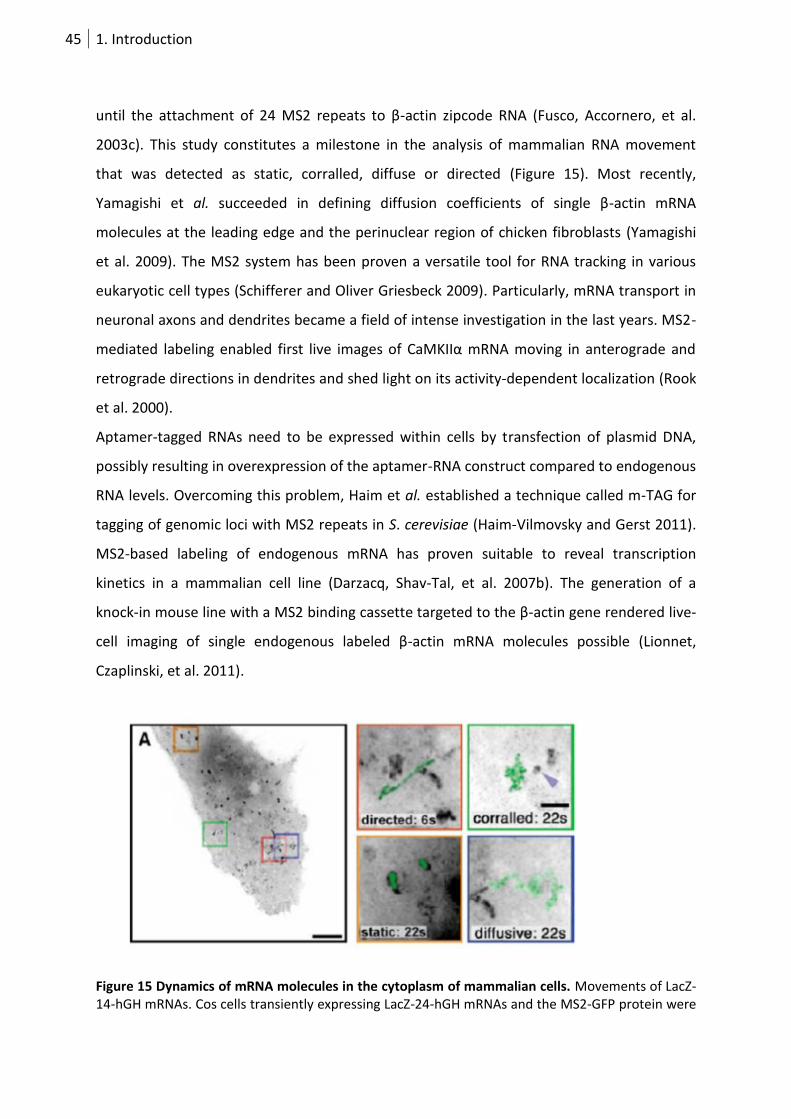
45 1. Introduction
until the attachment of 24 MS2 repeats to β-actin zipcode RNA (Fusco, Accornero, et al.
2003c). This study constitutes a milestone in the analysis of mammalian RNA movement
that was detected as static, corralled, diffuse or directed (Figure 15). Most recently,
Yamagishi et al. succeeded in defining diffusion coefficients of single β-actin mRNA
molecules at the leading edge and the perinuclear region of chicken fibroblasts (Yamagishi
et al. 2009). The MS2 system has been proven a versatile tool for RNA tracking in various
eukaryotic cell types (Schifferer and Oliver Griesbeck 2009). Particularly, mRNA transport in
neuronal axons and dendrites became a field of intense investigation in the last years. MS2-
mediated labeling enabled first live images of CaMKIIα mRNA moving in anterograde and
retrograde directions in dendrites and shed light on its activity-dependent localization (Rook
et al. 2000).
Aptamer-tagged RNAs need to be expressed within cells by transfection of plasmid DNA,
possibly resulting in overexpression of the aptamer-RNA construct compared to endogenous
RNA levels. Overcoming this problem, Haim et al. established a technique called m-TAG for
tagging of genomic loci with MS2 repeats in S. cerevisiae (Haim-Vilmovsky and Gerst 2011).
MS2-based labeling of endogenous mRNA has proven suitable to reveal transcription
kinetics in a mammalian cell line (Darzacq, Shav-Tal, et al. 2007b). The generation of a
knock-in mouse line with a MS2 binding cassette targeted to the β-actin gene rendered live-
cell imaging of single endogenous labeled β-actin mRNA molecules possible (Lionnet,
Czaplinski, et al. 2011).
Figure 15 Dynamics of mRNA molecules in the cytoplasm of mammalian cells. Movements of LacZ-14-hGH mRNAs. Cos cells transiently expressing LacZ-24-hGH mRNAs and the MS2-GFP protein were
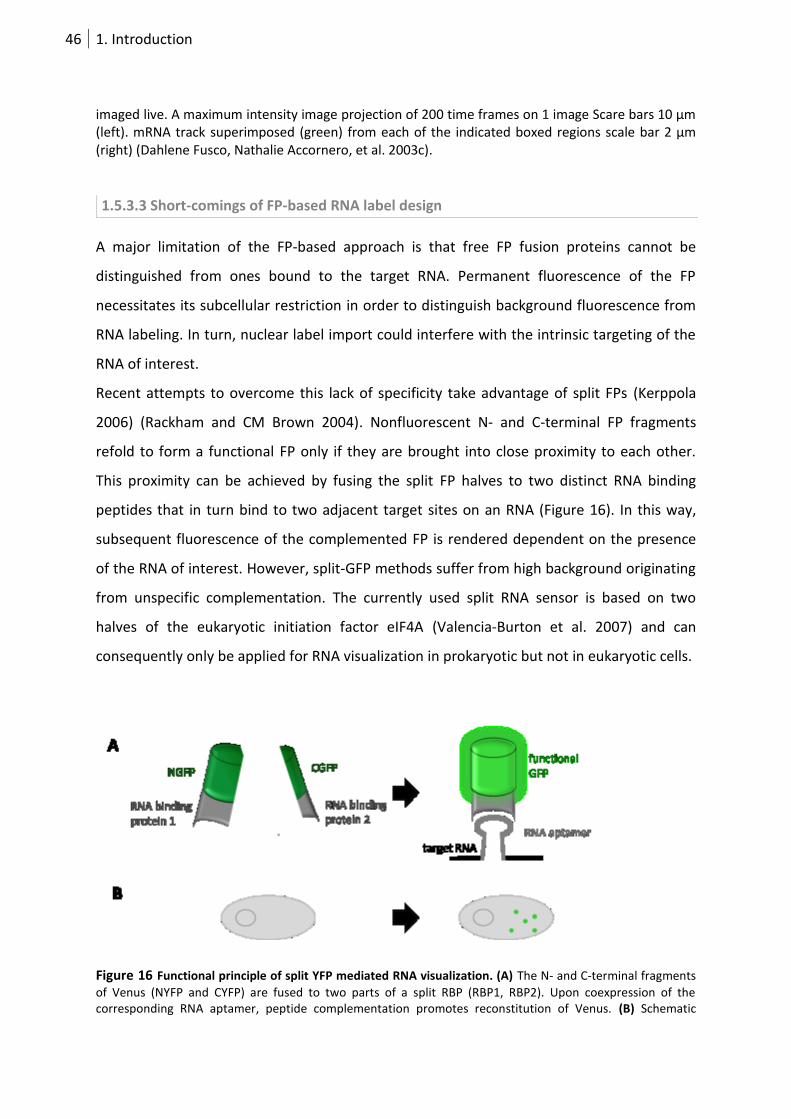
46 1. Introduction
imaged live. A maximum intensity image projection of 200 time frames on 1 image Scare bars 10 µm (left). mRNA track superimposed (green) from each of the indicated boxed regions scale bar 2 µm (right) (Dahlene Fusco, Nathalie Accornero, et al. 2003c).
1.5.3.3 Short-comings of FP-based RNA label design
A major limitation of the FP-based approach is that free FP fusion proteins cannot be
distinguished from ones bound to the target RNA. Permanent fluorescence of the FP
necessitates its subcellular restriction in order to distinguish background fluorescence from
RNA labeling. In turn, nuclear label import could interfere with the intrinsic targeting of the
RNA of interest.
Recent attempts to overcome this lack of specificity take advantage of split FPs (Kerppola
2006) (Rackham and CM Brown 2004). Nonfluorescent N- and C-terminal FP fragments
refold to form a functional FP only if they are brought into close proximity to each other.
This proximity can be achieved by fusing the split FP halves to two distinct RNA binding
peptides that in turn bind to two adjacent target sites on an RNA (Figure 16). In this way,
subsequent fluorescence of the complemented FP is rendered dependent on the presence
of the RNA of interest. However, split-GFP methods suffer from high background originating
from unspecific complementation. The currently used split RNA sensor is based on two
halves of the eukaryotic initiation factor eIF4A (Valencia-Burton et al. 2007) and can
consequently only be applied for RNA visualization in prokaryotic but not in eukaryotic cells.
Figure 16 Functional principle of split YFP mediated RNA visualization. (A) The N- and C-terminal fragments
of Venus (NYFP and CYFP) are fused to two parts of a split RBP (RBP1, RBP2). Upon coexpression of the corresponding RNA aptamer, peptide complementation promotes reconstitution of Venus. (B) Schematic
47 1. Introduction
drawing of a cell expressing the split-YFP label described in (A). In the absence of the aptamer, split YFP fragments are spatially separated and no YFP fluorescence is present (left). Coexpressing plasmids coding for split-YFP and the aptamer-tagged target RNA results in reconstituted YFP emission exclusively at sites where the aptamer-tagged RNA of interest is present (right).
The design of a FRET-based RNA sensor is a strategy to render the fluorescence signal
dependent on the presence of the aptamer. The HIV Rev peptide separates the FRET pair
only until binding to the target RRE aptamer that results in a conformational change within
Rev (Endoh et al. 2005). The induced proximity of donor and acceptor results in a FRET ratio
increase that is indicative for RRE-tagged RNAs. However, the first attempt to visualize
cellular RNAs failed to show significant signals (Endoh et al. 2008).
Recently, Ozawa et al designed an RNA label that circumvents aptamer attachment to the
RNA of interest and allows visualization of native RNA (Ozawa, Natori, et al. 2007d). This
approach takes advantage of unique characteristics of the RNA binding domain of human
Pumilio1 (PUMHD) (Spassov and Jurecic 2002). PUMHD consists of eight nucleotide contact
sites comprised of three crucial amino acids that each mediate high affinity binding to its
cognate target RNA. Due to its modular structure, PUMHD can potentially be engineered to
bind to any RNA sequence of choice (Cheong and Hall 2006). The main drawback is the
reduced affinity to new target RNA sequences even if they are highly similar to the cognate
RNA. Another problem of PUMHD-mediated RNA labeling originates from fluorescence
generation upon PUMHD fusion to FP fragments in the absence of target RNA resulting in
high background noise (Tilsner et al. 2009).
1.5.4 Recent advances in imaging technology
Suitable RNA life cell imaging approaches have to meet several requirements regarding
resolution, sensitivity and cytotoxic effects. Depending on the experimental approach, RNA
tracking involves long-term imaging of single transcripts of RNPs that move at a speed of up
to 3 µm/s.
If high sensitivity is required, wide-field microscopy with deconvolution using charge-
coupled device (CCD) detectors has proven suitable (Swedlow and Platani 2002). In order to
visualize several RNAs or RNA-binding proteins at once, multi-channel imaging with
appropriate filters is required (Weil, Parton, et al. 2010). Spearheading techniques including
48 1. Introduction
stimulated emission (STED) (Hell 2003) or photoactivated localization microscopy (PALM)
(Betzig et al. 2006)(Bates et al. 2007) allow for nanoscale fluorescence microscopy down to
20 nm lateral resolution that, in turn, shows that the diffraction limit of 200 nm as described
by E. Abbé in 1873 is no longer valid. High sensitivity is especially important for the precise
localization of low abundant RNAs, e.g. in dendritic spines.
Laser scanning confocal microscopy removes out-of focus light is used in thick tissue in order
to increase contrast. For highly dynamic processes, spinning disc confocal imaging is the
method of choice. Multiphoton microscopy like 2-photon-microscopy exploits longer
wavelength excitation light and therefore achieves larger penetration depths into biological
tissue by using a pulsed laser to excite a given chromophore in two steps (Denk et al. 1990).
Data analysis involves pre-processing including deconvolution, denoising and contrasting as
well as segmentation for object identification.
49 1. Introduction
1.6 Project goal
As RNAs play important roles in neuronal function, it is critical to follow RNA trafficking and
processing in real time in live cells and to assess their time-dependent and activity-
dependent localization and transport. Therefore, the major objective of this work was to
establish an RNA sensor suitale for live imaging of RNAs in neurons.
Even though FP-based RNA imaging methods have been used for RNA labeling in different
cell types, methodical obstacles obviate its routine application for dynamic RNA imaging. An
optimal protein-to-RNA ratio is essential and needs to be tested empirically. Further
background reduction requires nuclear entrapment of the FP reporter. In this configuration
the method is not suitable to study RNA trafficking within the nucleus. It is also unclear to
what extent the opposing forces of the nuclear localization signal within the FP label and the
RNA export mechanisms influence proper RNA sorting. Incomplete nuclear label entrapment
in the absence of tagged RNA constitutes a further source of background noise. As FP label
signals are not dependent on the presence of the RNA aptamer, it is not clear how aptamer-
bound labels respond after degradation of the aptamer-tagged target RNA.
Consequently, dynamic imaging requires an RNA-dependent reporter signal instead of an
inflexible labeling technique. In contrast to current split FP methods that stay in the
complemented or “on” state after the first aptamer contact, reversible RNA indicators
report both aptamer binding and dissociation. Practical insights into problems of static FP-
based RNA labels was the trigger to design several dynamic, aptamer-dependent RNA
reporters including a synthetic on-off dye a genetically encoded single fluorophore
aptamer sensor and FRET-based biosensors.
The synthetic RNA reporter system we aimed to develop consists of a cell-permeable small
molecule probe and a short RNA aptamer that can specifically bind the probe (Figure 17B).
The probe is not fluorescent but will become fluorescent upon the binding of the aptamer
(see 3.2).
As the need of microinjection and non-specific binding constitute a major problem of
chemical dye approaches, an analogous reversible FP-based approach would be the method
of choice (Figure 17C-E). The key challenge was to render the fluorescence signal dependent
on the presence of the aptamer-tagged RNA of interest. Starting with the simplest reporter
design, we speculated that RNA aptamer binding to a non-fluorescent protein could directly
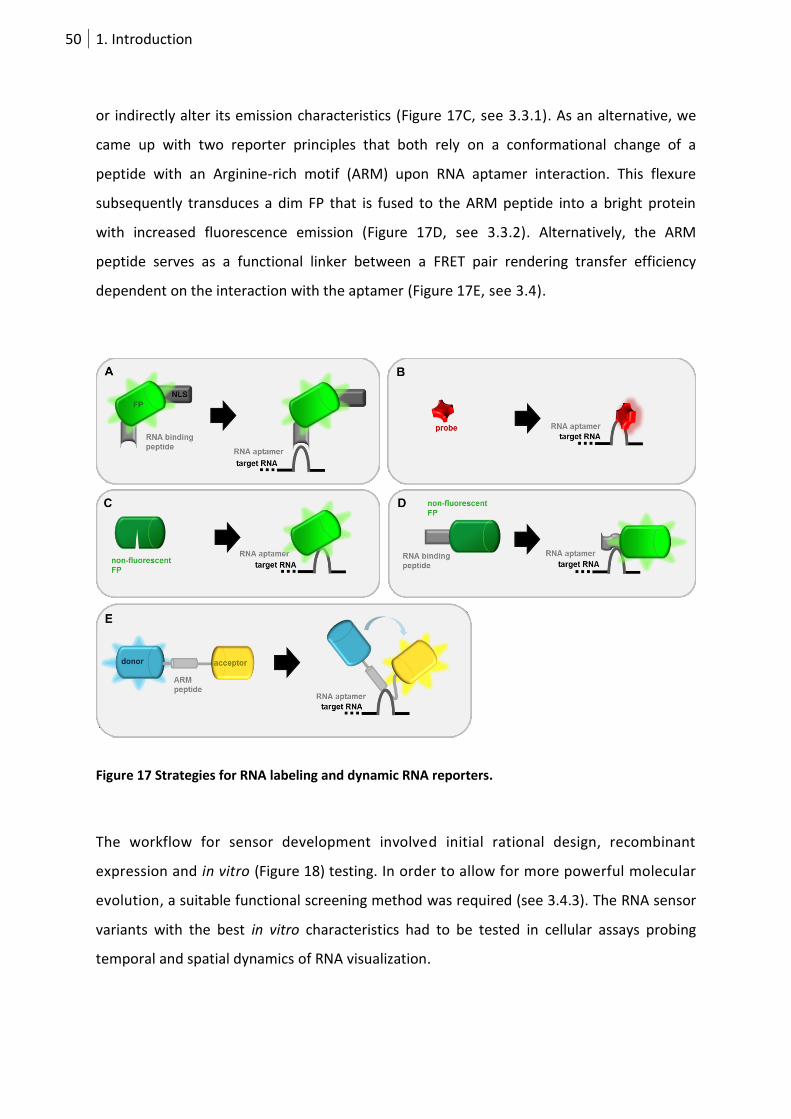
50 1. Introduction
or indirectly alter its emission characteristics (Figure 17C, see 3.3.1). As an alternative, we
came up with two reporter principles that both rely on a conformational change of a
peptide with an Arginine-rich motif (ARM) upon RNA aptamer interaction. This flexure
subsequently transduces a dim FP that is fused to the ARM peptide into a bright protein
with increased fluorescence emission (Figure 17D, see 3.3.2). Alternatively, the ARM
peptide serves as a functional linker between a FRET pair rendering transfer efficiency
dependent on the interaction with the aptamer (Figure 17E, see 3.4).
Figure 17 Strategies for RNA labeling and dynamic RNA reporters.
The workflow for sensor development involved initial rational design, recombinant
expression and in vitro (Figure 18) testing. In order to allow for more powerful molecular
evolution, a suitable functional screening method was required (see 3.4.3). The RNA sensor
variants with the best in vitro characteristics had to be tested in cellular assays probing
temporal and spatial dynamics of RNA visualization.

51 2. Materials and Methods
Figure 18 Workflow for biosensor engineering.
Complementing insights obtained from direct RNA tracking, there is a need for
fluorescent reporters of RNA binding proteins (RBPs) that control important steps in RNA
metabolism. As the EJC is a key player in RNA processing and decay we aimed at the
design of a FRET-based fluorescent biosensor that reports different states of the EJC
core component eIF4AIII (see 3.5). A FRET eIF4AIII reporter is supposed to allow in vitro
analysis of EJC formation and disassembly on mRNAs. As eIF4AIII contributes to dendritic
mRNA fate, functional imaging would be crucial to investigate its role in neuronal
function.
Figure 19 Concepts of visualizing RNA-mediated processes. (A) Tracking of specifically labeled RNAs (red). (B) Functional imaging of RNA-binding proteins (blue)
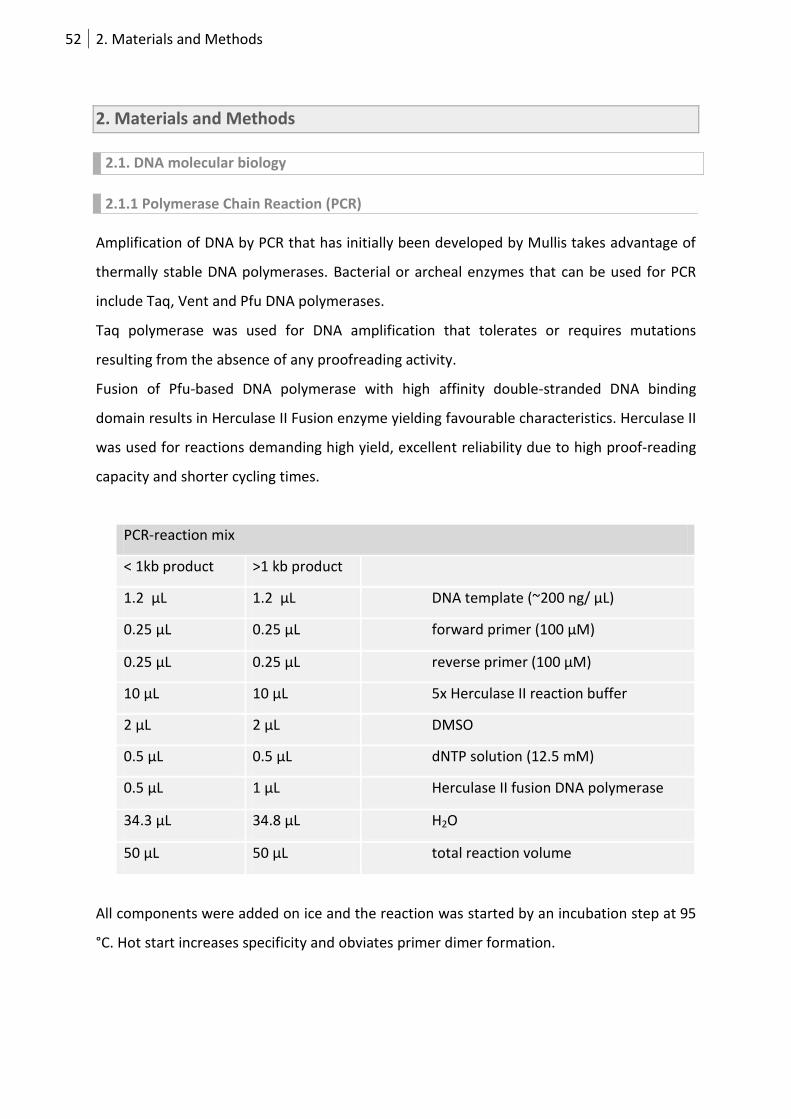
52 2. Materials and Methods
2. Materials and Methods
2.1. DNA molecular biology
2.1.1 Polymerase Chain Reaction (PCR)
Amplification of DNA by PCR that has initially been developed by Mullis takes advantage of
thermally stable DNA polymerases. Bacterial or archeal enzymes that can be used for PCR
include Taq, Vent and Pfu DNA polymerases.
Taq polymerase was used for DNA amplification that tolerates or requires mutations
resulting from the absence of any proofreading activity.
Fusion of Pfu-based DNA polymerase with high affinity double-stranded DNA binding
domain results in Herculase II Fusion enzyme yielding favourable characteristics. Herculase II
was used for reactions demanding high yield, excellent reliability due to high proof-reading
capacity and shorter cycling times.
PCR-reaction mix
< 1kb product >1 kb product
1.2 μL 1.2 μL DNA template (~200 ng/ μL)
0.25 μL 0.25 μL forward primer (100 μM)
0.25 μL 0.25 μL reverse primer (100 μM)
10 μL 10 μL 5x Herculase II reaction buffer
2 μL 2 μL DMSO
0.5 μL 0.5 μL dNTP solution (12.5 mM)
0.5 μL 1 μL Herculase II fusion DNA polymerase
34.3 μL 34.8 μL H2O
50 μL 50 μL total reaction volume
All components were added on ice and the reaction was started by an incubation step at 95
°C. Hot start increases specificity and obviates primer dimer formation.
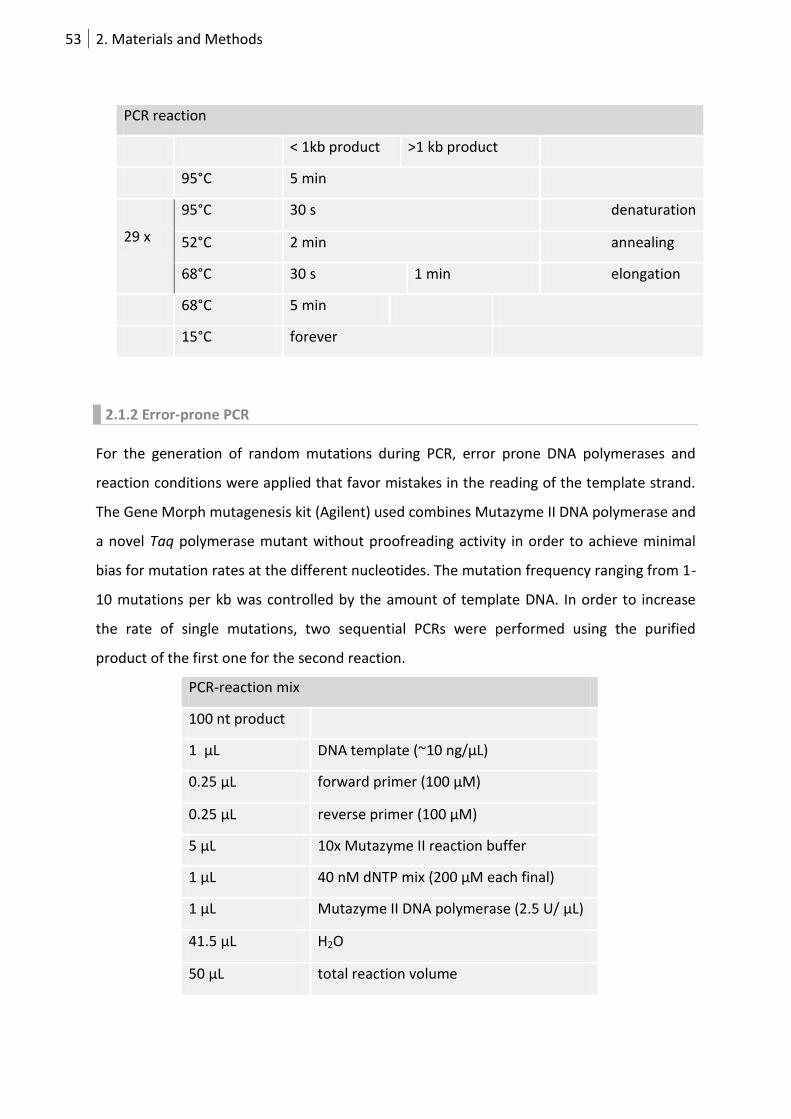
53 2. Materials and Methods
PCR reaction
< 1kb product >1 kb product
95°C 5 min
29 x
95°C 30 s denaturation
52°C 2 min annealing
68°C 30 s 1 min elongation
68°C 5 min
15°C forever
2.1.2 Error-prone PCR
For the generation of random mutations during PCR, error prone DNA polymerases and
reaction conditions were applied that favor mistakes in the reading of the template strand.
The Gene Morph mutagenesis kit (Agilent) used combines Mutazyme II DNA polymerase and
a novel Taq polymerase mutant without proofreading activity in order to achieve minimal
bias for mutation rates at the different nucleotides. The mutation frequency ranging from 1-
10 mutations per kb was controlled by the amount of template DNA. In order to increase
the rate of single mutations, two sequential PCRs were performed using the purified
product of the first one for the second reaction.
PCR-reaction mix
100 nt product
1 μL DNA template (~10 ng/μL)
0.25 μL forward primer (100 μM)
0.25 μL reverse primer (100 μM)
5 μL 10x Mutazyme II reaction buffer
1 μL 40 nM dNTP mix (200 μM each final)
1 μL Mutazyme II DNA polymerase (2.5 U/ μL)
41.5 μL H2O
50 μL total reaction volume
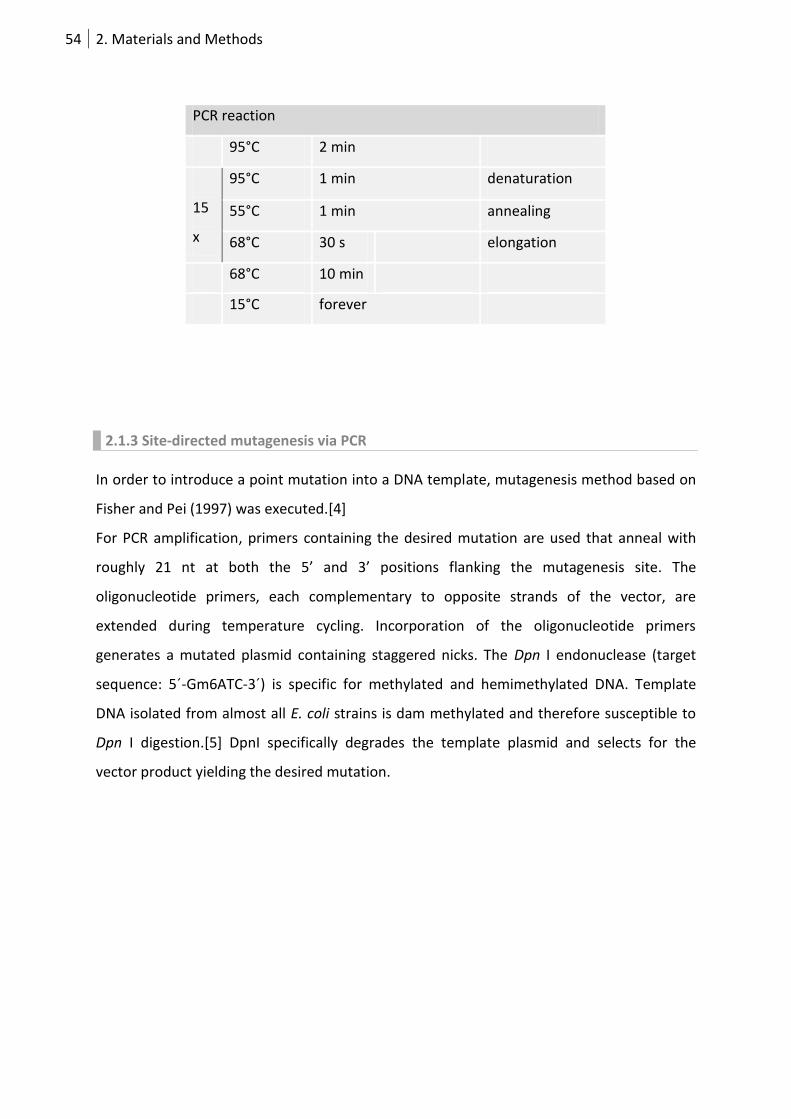
54 2. Materials and Methods
PCR reaction
95°C 2 min
15
x
95°C 1 min denaturation
55°C 1 min annealing
68°C 30 s elongation
68°C 10 min
15°C forever
2.1.3 Site-directed mutagenesis via PCR
In order to introduce a point mutation into a DNA template, mutagenesis method based on
Fisher and Pei (1997) was executed.[4]
For PCR amplification, primers containing the desired mutation are used that anneal with
roughly 21 nt at both the 5’ and 3’ positions flanking the mutagenesis site. The
oligonucleotide primers, each complementary to opposite strands of the vector, are
extended during temperature cycling. Incorporation of the oligonucleotide primers
generates a mutated plasmid containing staggered nicks. The Dpn I endonuclease (target
sequence: 5´-Gm6ATC-3´) is specific for methylated and hemimethylated DNA. Template
DNA isolated from almost all E. coli strains is dam methylated and therefore susceptible to
Dpn I digestion.[5] DpnI specifically degrades the template plasmid and selects for the
vector product yielding the desired mutation.
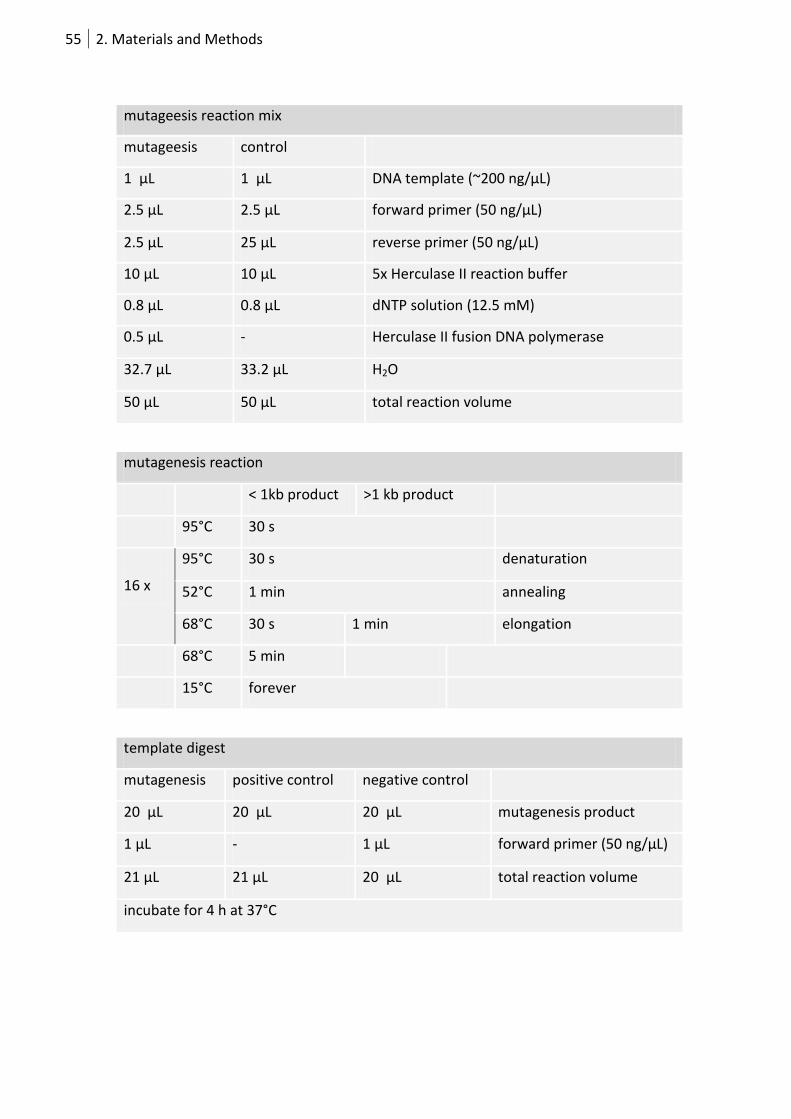
55 2. Materials and Methods
mutageesis reaction mix
mutageesis control
1 μL 1 μL DNA template (~200 ng/μL)
2.5 μL 2.5 μL forward primer (50 ng/μL)
2.5 μL 25 μL reverse primer (50 ng/μL)
10 μL 10 μL 5x Herculase II reaction buffer
0.8 μL 0.8 μL dNTP solution (12.5 mM)
0.5 μL - Herculase II fusion DNA polymerase
32.7 μL 33.2 μL H2O
50 μL 50 μL total reaction volume
mutagenesis reaction
< 1kb product >1 kb product
95°C 30 s
16 x
95°C 30 s denaturation
52°C 1 min annealing
68°C 30 s 1 min elongation
68°C 5 min
15°C forever
template digest
mutagenesis positive control negative control
20 μL 20 μL 20 μL mutagenesis product
1 μL - 1 μL forward primer (50 ng/μL)
21 μL 21 μL 20 μL total reaction volume
incubate for 4 h at 37°C
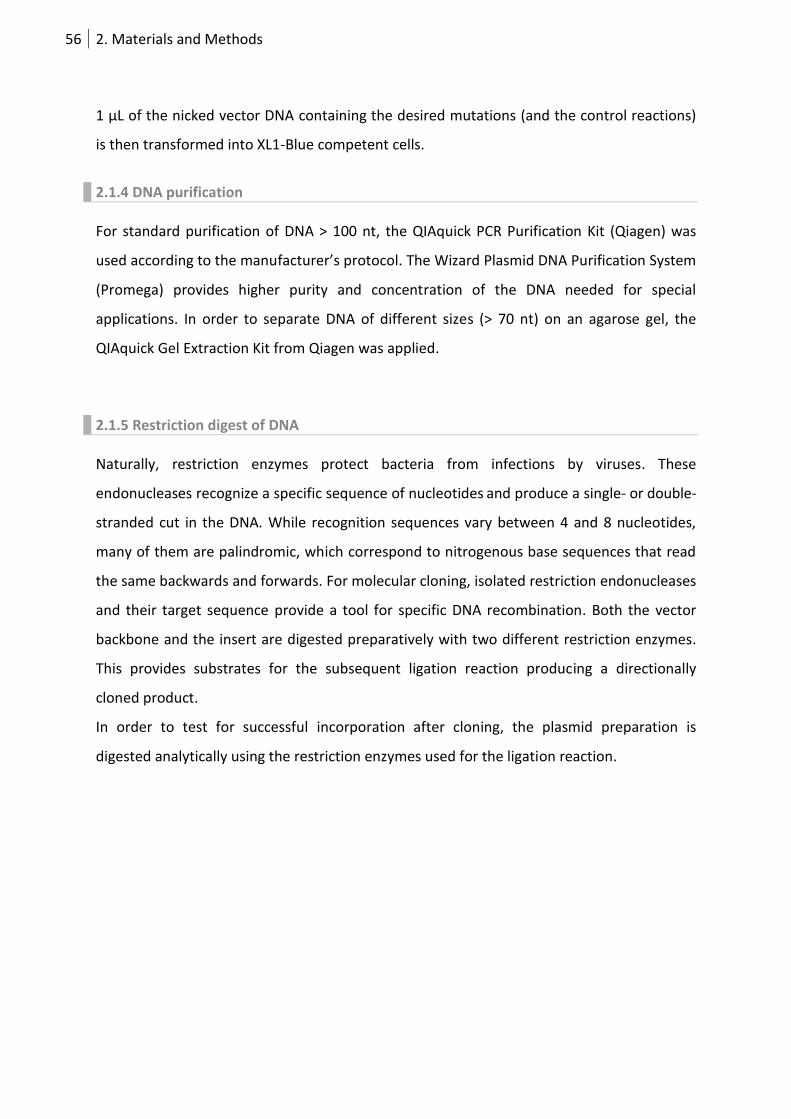
56 2. Materials and Methods
1 μL of the nicked vector DNA containing the desired mutations (and the control reactions)
is then transformed into XL1-Blue competent cells.
2.1.4 DNA purification
For standard purification of DNA > 100 nt, the QIAquick PCR Purification Kit (Qiagen) was
used according to the manufacturer’s protocol. The Wizard Plasmid DNA Purification System
(Promega) provides higher purity and concentration of the DNA needed for special
applications. In order to separate DNA of different sizes (> 70 nt) on an agarose gel, the
QIAquick Gel Extraction Kit from Qiagen was applied.
2.1.5 Restriction digest of DNA
Naturally, restriction enzymes protect bacteria from infections by viruses. These
endonucleases recognize a specific sequence of nucleotides and produce a single- or double-
stranded cut in the DNA. While recognition sequences vary between 4 and 8 nucleotides,
many of them are palindromic, which correspond to nitrogenous base sequences that read
the same backwards and forwards. For molecular cloning, isolated restriction endonucleases
and their target sequence provide a tool for specific DNA recombination. Both the vector
backbone and the insert are digested preparatively with two different restriction enzymes.
This provides substrates for the subsequent ligation reaction producing a directionally
cloned product.
In order to test for successful incorporation after cloning, the plasmid preparation is
digested analytically using the restriction enzymes used for the ligation reaction.
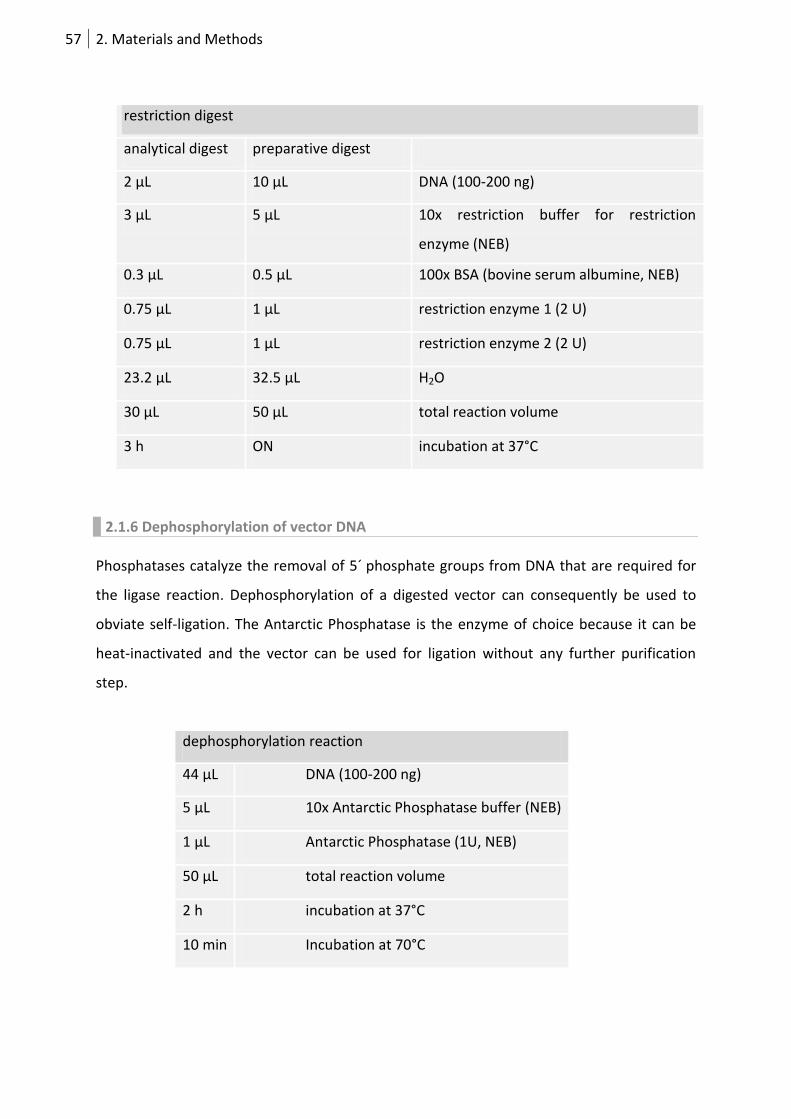
57 2. Materials and Methods
restriction digest
analytical digest preparative digest
2 μL 10 μL DNA (100-200 ng)
3 μL 5 μL 10x restriction buffer for restriction
enzyme (NEB)
0.3 μL 0.5 μL 100x BSA (bovine serum albumine, NEB)
0.75 μL 1 μL restriction enzyme 1 (2 U)
0.75 μL 1 μL restriction enzyme 2 (2 U)
23.2 μL 32.5 μL H2O
30 μL 50 μL total reaction volume
3 h ON incubation at 37°C
2.1.6 Dephosphorylation of vector DNA
Phosphatases catalyze the removal of 5´ phosphate groups from DNA that are required for
the ligase reaction. Dephosphorylation of a digested vector can consequently be used to
obviate self-ligation. The Antarctic Phosphatase is the enzyme of choice because it can be
heat-inactivated and the vector can be used for ligation without any further purification
step.
dephosphorylation reaction
44 μL DNA (100-200 ng)
5 μL 10x Antarctic Phosphatase buffer (NEB)
1 μL Antarctic Phosphatase (1U, NEB)
50 μL total reaction volume
2 h incubation at 37°C
10 min Incubation at 70°C
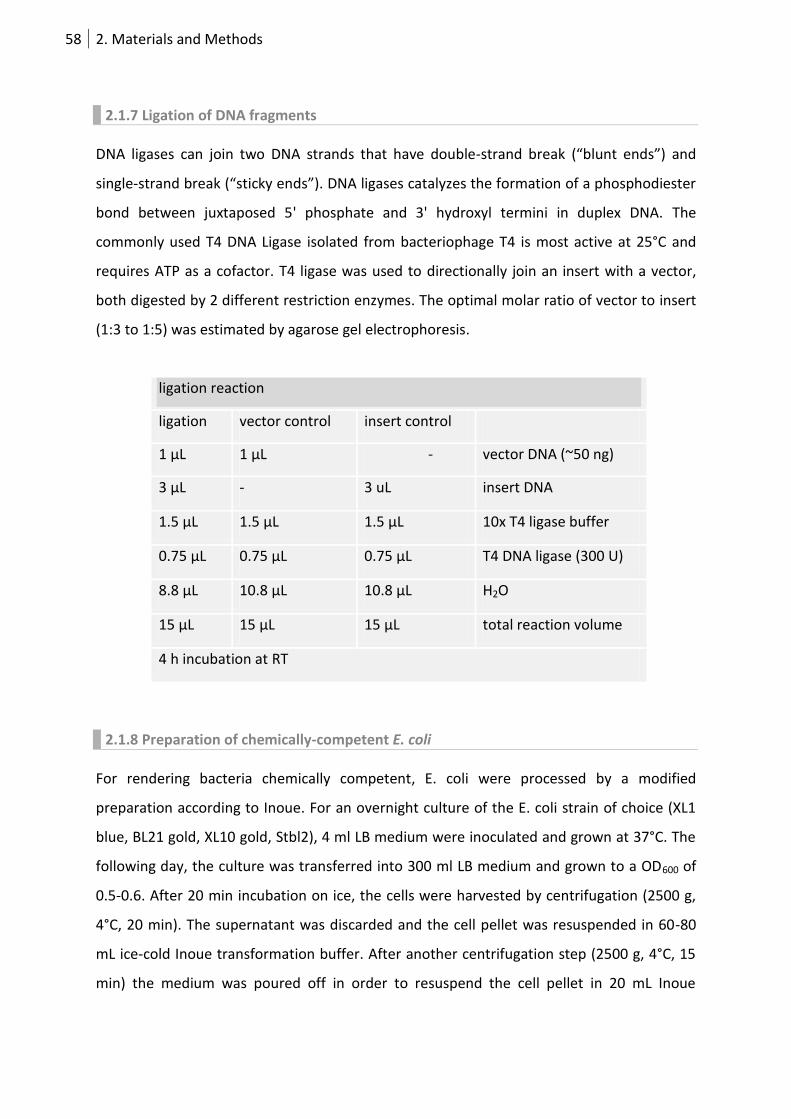
58 2. Materials and Methods
2.1.7 Ligation of DNA fragments
DNA ligases can join two DNA strands that have double-strand break (“blunt ends”) and
single-strand break (“sticky ends”). DNA ligases catalyzes the formation of a phosphodiester
bond between juxtaposed 5' phosphate and 3' hydroxyl termini in duplex DNA. The
commonly used T4 DNA Ligase isolated from bacteriophage T4 is most active at 25°C and
requires ATP as a cofactor. T4 ligase was used to directionally join an insert with a vector,
both digested by 2 different restriction enzymes. The optimal molar ratio of vector to insert
(1:3 to 1:5) was estimated by agarose gel electrophoresis.
ligation reaction
ligation vector control insert control
1 μL 1 μL - vector DNA (~50 ng)
3 μL - 3 uL insert DNA
1.5 μL 1.5 μL 1.5 μL 10x T4 ligase buffer
0.75 μL 0.75 μL 0.75 μL T4 DNA ligase (300 U)
8.8 μL 10.8 μL 10.8 μL H2O
15 μL 15 μL 15 μL total reaction volume
4 h incubation at RT
2.1.8 Preparation of chemically-competent E. coli
For rendering bacteria chemically competent, E. coli were processed by a modified
preparation according to Inoue. For an overnight culture of the E. coli strain of choice (XL1
blue, BL21 gold, XL10 gold, Stbl2), 4 ml LB medium were inoculated and grown at 37°C. The
following day, the culture was transferred into 300 ml LB medium and grown to a OD600 of
0.5-0.6. After 20 min incubation on ice, the cells were harvested by centrifugation (2500 g,
4°C, 20 min). The supernatant was discarded and the cell pellet was resuspended in 60-80
mL ice-cold Inoue transformation buffer. After another centrifugation step (2500 g, 4°C, 15
min) the medium was poured off in order to resuspend the cell pellet in 20 mL Inoue
59 2. Materials and Methods
transformation buffer supplemented with 1.5 mL DMSO. Competent E. coli were incubated
for 10 min on ice and 50 uL aliquots were stored at -80°C.
2.1.9 Transformation of chemically-competent E. coli
An aliquot of chemically competent cells (see 2.1.7) was thawed for 5 min on ice. Plasmid
DNA (5uL of a ligation reaction, 100 ng purified vector) was added and incubated for 20-30
min. After a 60 s heat-shock at 42°C, cells were again placed on ice for 2 min. For ampicillin
resistant bacteria, cells were directly plated on an agar plate supplemented with ampicillin.
All other antibiotic resistance genes overcome inhibition of protein synthesis. Therefore, a
further incubation step with 150 uL LB medium for 1 h at 37°C is required before plating on
the agar plate with the corresponding antibiotic.
2.1.10 Bacterial DNA purification
For purification of plasmids expressed by bacteria, mini or midi preparations were used for
the DNA yield and concentration required. For up to 10 μg DNA, 2 mL bacteria cultures were
processed by the QIAprep Miniprep Kit protocol (Qiagen). From 200 mL E. coli culture,
higher amounts of plasmid DNA were isolated using Promega’s Plasmid Purification Kit
(Midi). DNA was stored at -20 °C.
2.2. RNA molecular biology
For all experiments dealing with RNA, RNase-free water was used. Buffers were supplied
with DEPC. Absorption at 230, 260 and 280 nm were measured by a NanoDrop 2000
Spectrophotomer (Peqlab) and RNA purity an concentration were calculated according to
the formulas below.
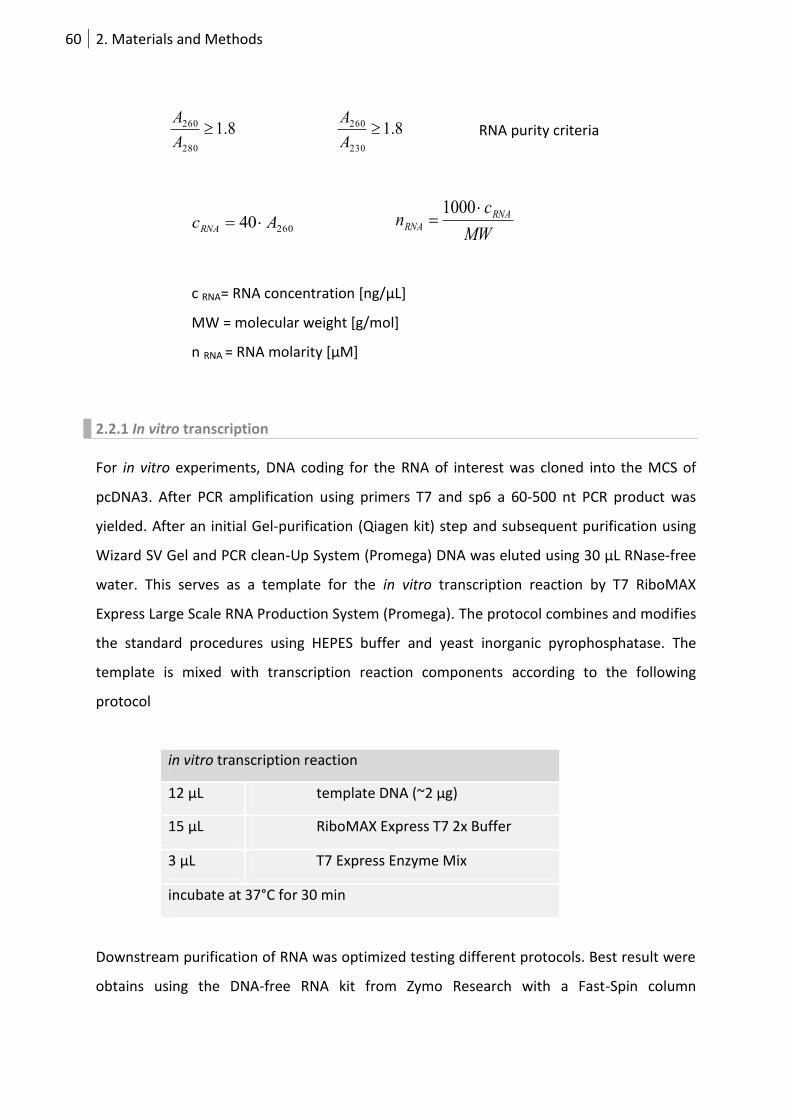
60 2. Materials and Methods
8.1280
260 A
A 8.1
230
260 A
A RNA purity criteria
26040 AcRNA MW
cn RNARNA
1000
c RNA= RNA concentration [ng/μL]
MW = molecular weight [g/mol]
n RNA = RNA molarity [μM]
2.2.1 In vitro transcription
For in vitro experiments, DNA coding for the RNA of interest was cloned into the MCS of
pcDNA3. After PCR amplification using primers T7 and sp6 a 60-500 nt PCR product was
yielded. After an initial Gel-purification (Qiagen kit) step and subsequent purification using
Wizard SV Gel and PCR clean-Up System (Promega) DNA was eluted using 30 μL RNase-free
water. This serves as a template for the in vitro transcription reaction by T7 RiboMAX
Express Large Scale RNA Production System (Promega). The protocol combines and modifies
the standard procedures using HEPES buffer and yeast inorganic pyrophosphatase. The
template is mixed with transcription reaction components according to the following
protocol
in vitro transcription reaction
12 μL template DNA (~2 μg)
15 μL RiboMAX Express T7 2x Buffer
3 μL T7 Express Enzyme Mix
incubate at 37°C for 30 min
Downstream purification of RNA was optimized testing different protocols. Best result were
obtains using the DNA-free RNA kit from Zymo Research with a Fast-Spin column
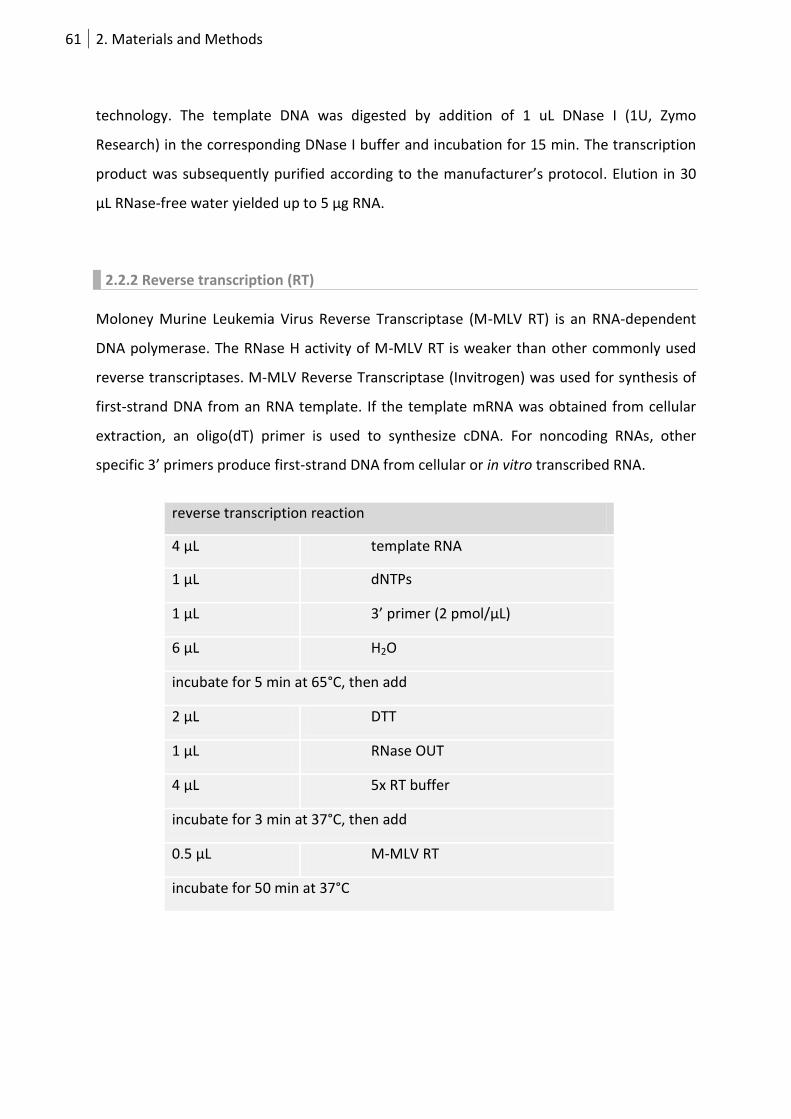
61 2. Materials and Methods
technology. The template DNA was digested by addition of 1 uL DNase I (1U, Zymo
Research) in the corresponding DNase I buffer and incubation for 15 min. The transcription
product was subsequently purified according to the manufacturer’s protocol. Elution in 30
μL RNase-free water yielded up to 5 μg RNA.
2.2.2 Reverse transcription (RT)
Moloney Murine Leukemia Virus Reverse Transcriptase (M-MLV RT) is an RNA-dependent
DNA polymerase. The RNase H activity of M-MLV RT is weaker than other commonly used
reverse transcriptases. M-MLV Reverse Transcriptase (Invitrogen) was used for synthesis of
first-strand DNA from an RNA template. If the template mRNA was obtained from cellular
extraction, an oligo(dT) primer is used to synthesize cDNA. For noncoding RNAs, other
specific 3’ primers produce first-strand DNA from cellular or in vitro transcribed RNA.
reverse transcription reaction
4 μL template RNA
1 μL dNTPs
1 μL 3’ primer (2 pmol/μL)
6 μL H2O
incubate for 5 min at 65°C, then add
2 μL DTT
1 μL RNase OUT
4 μL 5x RT buffer
incubate for 3 min at 37°C, then add
0.5 μL M-MLV RT
incubate for 50 min at 37°C
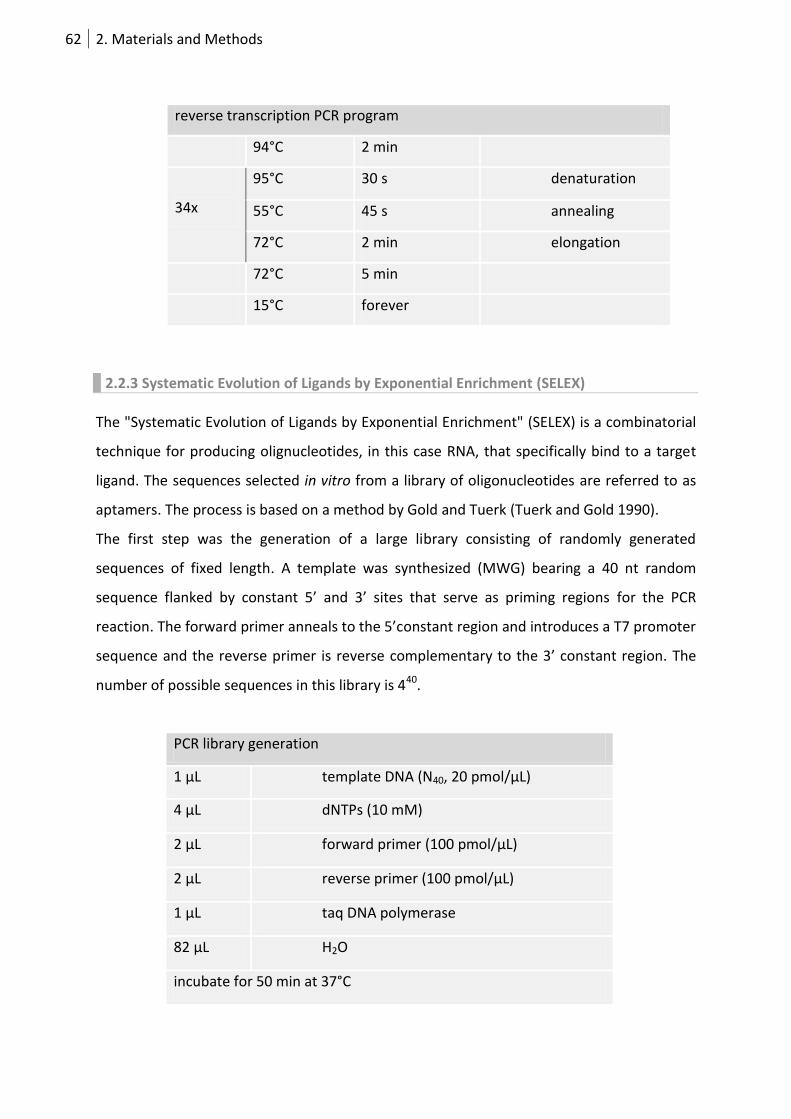
62 2. Materials and Methods
reverse transcription PCR program
94°C 2 min
34x
95°C 30 s denaturation
55°C 45 s annealing
72°C 2 min elongation
72°C 5 min
15°C forever
2.2.3 Systematic Evolution of Ligands by Exponential Enrichment (SELEX)
The "Systematic Evolution of Ligands by Exponential Enrichment" (SELEX) is a combinatorial
technique for producing olignucleotides, in this case RNA, that specifically bind to a target
ligand. The sequences selected in vitro from a library of oligonucleotides are referred to as
aptamers. The process is based on a method by Gold and Tuerk (Tuerk and Gold 1990).
The first step was the generation of a large library consisting of randomly generated
sequences of fixed length. A template was synthesized (MWG) bearing a 40 nt random
sequence flanked by constant 5’ and 3’ sites that serve as priming regions for the PCR
reaction. The forward primer anneals to the 5’constant region and introduces a T7 promoter
sequence and the reverse primer is reverse complementary to the 3’ constant region. The
number of possible sequences in this library is 440.
PCR library generation
1 μL template DNA (N40, 20 pmol/μL)
4 μL dNTPs (10 mM)
2 μL forward primer (100 pmol/μL)
2 μL reverse primer (100 pmol/μL)
1 μL taq DNA polymerase
82 μL H2O
incubate for 50 min at 37°C
63 2. Materials and Methods
PCR program library generation
95°C 2 min
19 x
92°C 30 s denaturation
54°C 20 s annealing
72°C 1 min elongation
72°C 10 min
15°C forever
The PCR-product was processed in two steps using gel- and PCR- purification (see 3.1.3).
Subsequently, DNA was in vitro transcribed (see 3.2.2) into an RNA library.
In the following affinity-selection, the aim was to find RNAs from the library that bind the
protein of interest. This recombinantly expressed protein is tagged by a His-rich sequence
that was immobilized on a Ni-NTA resin.
In a preincubation step, 10 μL Ni-NTA beads were supplied with 50 μL RNA-binding buffer
for 30 min at RT. 2 μL protein (5 uM) were added for 30 min on ice. The excess off unbound
proteins were removed by washing twice (100 μL RNA-binding buffer, 1000 g, 2 min).
Subsequently, 20 μL of the RNA pool and 1 uL RNase inhibitor were incubated for 30 min.
Unbound RNA was removed by 3 washing steps (100 μL RNA-binding buffer, 1000 g, 2 min).
Protein-bound RNA was eluted by addition of 1 μL trypsin (1mg/mL) and incubation for 5
min at 50°C.
The concentration of the selected RNA pool was increased by precipitation.
RNA precipitation
200 μL eluted RNA
1 μL RNase inhibitor
30 μL 3M NaAc pH 5.2
700 μL 95 % ethanol
incubation at -20°C for 1h
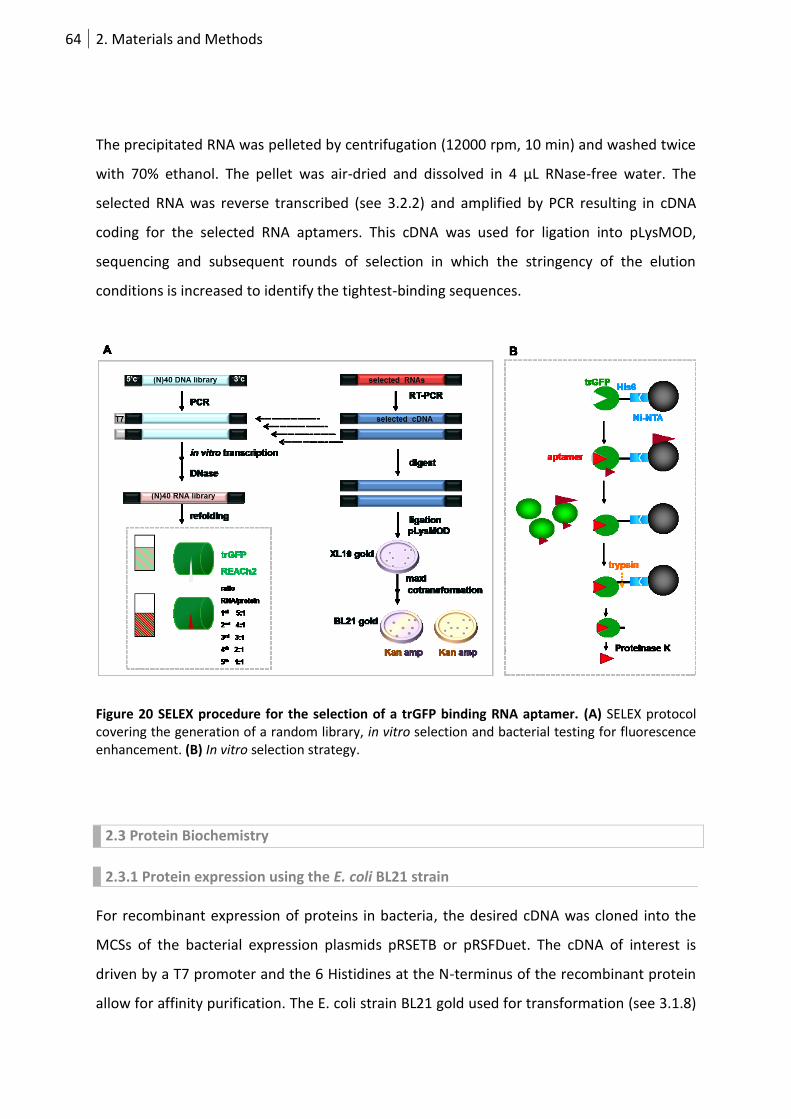
64 2. Materials and Methods
The precipitated RNA was pelleted by centrifugation (12000 rpm, 10 min) and washed twice
with 70% ethanol. The pellet was air-dried and dissolved in 4 μL RNase-free water. The
selected RNA was reverse transcribed (see 3.2.2) and amplified by PCR resulting in cDNA
coding for the selected RNA aptamers. This cDNA was used for ligation into pLysMOD,
sequencing and subsequent rounds of selection in which the stringency of the elution
conditions is increased to identify the tightest-binding sequences.
Figure 20 SELEX procedure for the selection of a trGFP binding RNA aptamer. (A) SELEX protocol covering the generation of a random library, in vitro selection and bacterial testing for fluorescence enhancement. (B) In vitro selection strategy.
2.3 Protein Biochemistry
2.3.1 Protein expression using the E. coli BL21 strain
For recombinant expression of proteins in bacteria, the desired cDNA was cloned into the
MCSs of the bacterial expression plasmids pRSETB or pRSFDuet. The cDNA of interest is
driven by a T7 promoter and the 6 Histidines at the N-terminus of the recombinant protein
allow for affinity purification. The E. coli strain BL21 gold used for transformation (see 3.1.8)
65 2. Materials and Methods
takes advantage of the lack of endogenous expression of some proteases and the T7 RNA
polymerase promoter to direct high-level expression. After ON inoculation of a 5 mL culture
containing the antibiotic (50 mg/ml, 1:1000), cells were grown in 200 mL medium with
antibiotics (1:1000) at 37°C to an OD600 of 0.8. In order to induce protein expression, 0.5 mM
IPTG (Isopropyl-β-D-thiogalactosid) was added and the culture was grown ON at RT with
additional antibiotics (1:1000). The next day, bacterial cells were harvested by
centrifugation (6000 g, 10 min, 4°C).
2.3.2 Affinity purification of recombinantly expressed proteins
The cell pellet obtained from the 200 mL culture (see 3.3.1) was resolved in 10 mL protein
resuspension buffer. In order to inhibit proteolytic degradation of the recombinant protein,
1 mM PMSF, 5 μg/ml Pepstatin and 1 μg/μL Leupeptin were added. Initiation of bacterial
cell lysis is facilitated by freezing the cell suspension at least 1 h at -80°C. After thawing on,
30 min on-ice incubation with lysozyme (1mg) causes the digest of the polysaccharide
component of the bacterial cell wall. Cell membranes were solubilized by addition of the
detergent Triton-X-100 (0.1%) and DNaseI (5 μg/mL, 50 μL). In a final lysis step, shear forces
were introduced by ultrasonification for 20 min. Centrifugation (13000 rpm, 30 min, 4°C)
separated the cell debris from the protein extract. His-tag containing recombinant proteins
within this supernatant were allowed to bind to Ni-NTA agarose beads (300 μL) for 2 h at
4°C. For separation of Ni-chelated recombinant proteins from endogenous bacterial
proteins, the suspension was put into a polypropylene column with a filter withholding the
Ni-NTA beads. After 2 washing steps with a resuspension buffer containing 10 mM imidazole
that competitively binds to Ni-NTA, recombinant proteins are eluted by the elution buffer
bearing an imidazole concentration of 150 mM. The protein was stored at 4°C, for long-term
storage -20°C the elution buffer was supplemented with glycerol.
2.3.3 Size exclusion chromatography of recombinantly expressed proteins
For high yield protein expression and purification, a 600 mL E. coli culture was inoculated as
described. For affinity chromatographic purification, a 5 mL HisTrap affinity column (GE) was
used. Gel filtration was performed using a Superdex 200 (GE) coupled to an ÄKTA-FPLC
device (GE Healthcare). The column was equilibrated with SEC buffer (40 mM Tris pH 7.5,
66 2. Materials and Methods
200 mM NaCl, 2 mM β-ME). For each run, 2 mL of sample was loaded and protein
separation was performed at 0.3 ml/min.
2.3.4 ATPase assay
ATPase activities of purified eIF4AIII and REFlex were quantified using an ATPase assay
according to the manufacturer`s protocol (Innova Biosciences).
2.4 Spectroscopy
Fluorescent spectra were taken using a fluorescent spectrophotometer (Varian).
cpCitrine/eCFP FRET constructs were diluted in a 100 µL volume and excited at 432 nm
(bandwidth 5 nm) and the emission was recorded from 450 nm to 600 nm (bandwidth 5
nm). To calculate the ΔR/R value elicited by a given ion the following formula was used:
100 Ratio
Ratio - Ratio % R/R
RNA no
RNA noboundRNA
with Ratio R = PeakYFP/PeakCFP (527nm/432nm).
2.4.1 Testing for in vitro ratio change of FRET RNA sensors
Purified proteins were diluted in 100 µL RNA binding buffer (20 mM HEPES (pH 7.25), 125
mM NaCl, 1 mM magnesium diacetate, 1 mM imidazole, 2 mM CaCl2, 1 mM DTT, 2.5% (v/v)
glycerol and 0.1% (w/v) Triton-X-100) and a spectrum was taken from the unbound protein.
Another spectrum was recorded after the addition of a molar excess of the corresponding
RNA to the RNA indicator.
67 2. Materials and Methods
2.4.2 Spectroscopic determination of KD-value
The experimental settings were as described in 2.4.1. Small aliquots of RNA were added to
the cuvette and a full fluorescence emission spectrum was taken after each addition. R/R
at distinct calcium concentrations was calculated. Extraction of the KD-value was achieved
by fitting a sigmoidal curve to the plotted log10 values of the RNA-free points (in M) versus
the normalized signal.
2.4.3 pH titration
For pH titration, we used buffers containing 125 mM NaCl, 1 mM magnesium diacetate, and
TRIS (pH 7.5, 7.75, 8.0, 8.25), MOPS (pH 6.5, 6.75, 7.0, 7.25, 7.5, 8.0), MES (5.5, 6.9, 6.5) or
citrate (4.5, 5.0, 5.5).
2.4.4 In vitro transcription assay
DNA encoding 10 repeats of the RRE aptamer were amplified by PCR using primers that
introduce a T7 promoter variant at the 5’ end (T7wt _10RRE_f
5'-TAATACGACTCACTATAGGATCCTGTACACGGCCGGGTCTG-3', T7 _A8C_10RRE_f
5'-TAATACGCCTCACTATAGGATCCTGTACACGGCCGGGTCTG-3', T7_A8G_10RRE_f
5' TAATACGGCTCACTATAGGATCCTGTACACGGCCGGGTCTG-3'). 1 µg of purified PCR product
was used as a template for the in vitro transcription reaction using the RiboMAX T7 Large
Scale RNA Production System (promega). RNA generation was monitored by spectroscopy.
After 60 min 1U RNAseI was added in order to digest the synthesized RNA.
2.4.5 Spectroscopic REFlex FRET assay
All purified EJC components as well as the in vitro transcribed RNA were mixed on ice in
equimolar amounts in RNA interaction buffer. Spectroscopy was performed at 30°C. The
reactions were supplied with 2 mM ATP when indicated. Emission spectra were recorded
before and after exposure of REFlex to different EJC components and RNAs as described in
2.4.
68 2. Materials and Methods
2.5 Bacterial screening
2.5.1 Sensor library generation
Different strategies for random mutagenesis were applied in order to create libraries with
RNA peptides bearing amino acid substitutions, deletions and insertions. The DNA encoding
the FRET sensor variant was subjected to an error-prone PCR (Gene Morph mutagenesis kit,
Agilent) using CFP Chr for (5'- CTGACCTGGGGCGTGCAGTGCTCC-3') and cpCit Chr rev (5'-
CGAAGCACCATCAGGCCGTAGCCG-3') primers. The mutation frequency ranging from 1-10
mutations per kb was controlled by the amount of template DNA. In order to increase the
rate of single mutations, two sequential PCRs were performed using the purified product of
the first one for the second reaction. The PCR product of the second reaction was digested
SphI/SacI and ligated into a pRSFDuet-1-VAmPIRe vector (modified from Novagen). In
another approach, degenerated primers (Eurofins) allowed the introduction of randomized
amino acids at defined positions either within the Rsg peptide or at the N- and C-termini
during normal PCR reaction.
The pRSFDuet sensor library was transformed into E. coli Xl1 blue and plated on agar plates
with kanamycin. The colonies were pooled and the sensor library DNA was retransformed
into E. coli Xl1 blue with 10 aptamer repeats (10xRRE) that are cloned into pMB133 (kind gift
of Natalie Broude) using HindIII/NotI. Each colony expresses one FRET sensor variant and
the pMB133-10xRRE vector yielding tetracycline-inducible aptamers. The transformations
were plated on a double (amp/kana) resistance agar plate, incubated over night at 37 °C and
for 24 h at 4°C in order to get full repression of aptamer transcription.
2.5.2 Bacterial colony selection
Plates were imaged at room temperature every 5 min and RNA aptamer transcription was
induced by addition of 20 ng/µL anhydrotetracycline (Sigma). A Lambda LS light source
(Sutter) was connected to a lambda 10-2 hardware (Sutter) by fiber optic light guides. The
excitation filter was D436/40x and the emission filter for CFP was D480/40m and for
cpCitrine HQ535/30m (all from Chroma). Images were detected by a CCD camera Coolsnap
ES2 (Sutter) and processing was done in MetaFluor software (Meta Imaging series version
7.7). For automated colony ROI selection we used Cell profiler version 10415. Data were
69 2. Materials and Methods
analyzed by Origin 8.1 by plotting the ratio change 200 min after anhydrotetracycline
addition over the starting FRET ratio. The selected colonies correspond to the ROIs with a
ratio change higher and a starting ratio lower than the average of 6 control colonies with
the wt sensor.
On average, 800 colonies were analyzed per plate and 5-20 colonies (1500 in total) selected
for minipreparation and subsequent in vitro validation. The pRSFDuet-1 vectors bearing the
selected VAmPIRe variants were transformed into BL21 and grown in 5 mL LB medium
overnight. The preculture was diluted in 12 mL LB medium supplemented with kanamycin
and 0.1 mM IPTG for small-scale protein expression. After 4 h, cells were harvested and
processed as described above but in a 1 mL volume format. For affinity purification, the
lysates were incubated with 25 µL His Mag Sepharose Ni magnetic beads (GE), processed
according to the manufacturer`s protocol and protein was eluted in 25 µL elution buffer. 1-5
µL of the 25 µL protein eluate were mixed with the RNA aptamer in 100 µL RNA binding
buffer and FRET ratio change was detected in a fluorescence spectrophotometer as
described. The variants with the highest ratio change upon RNA aptamer addition were
selected for sequencing and spectral analysis from larger culture volumes as described
above.
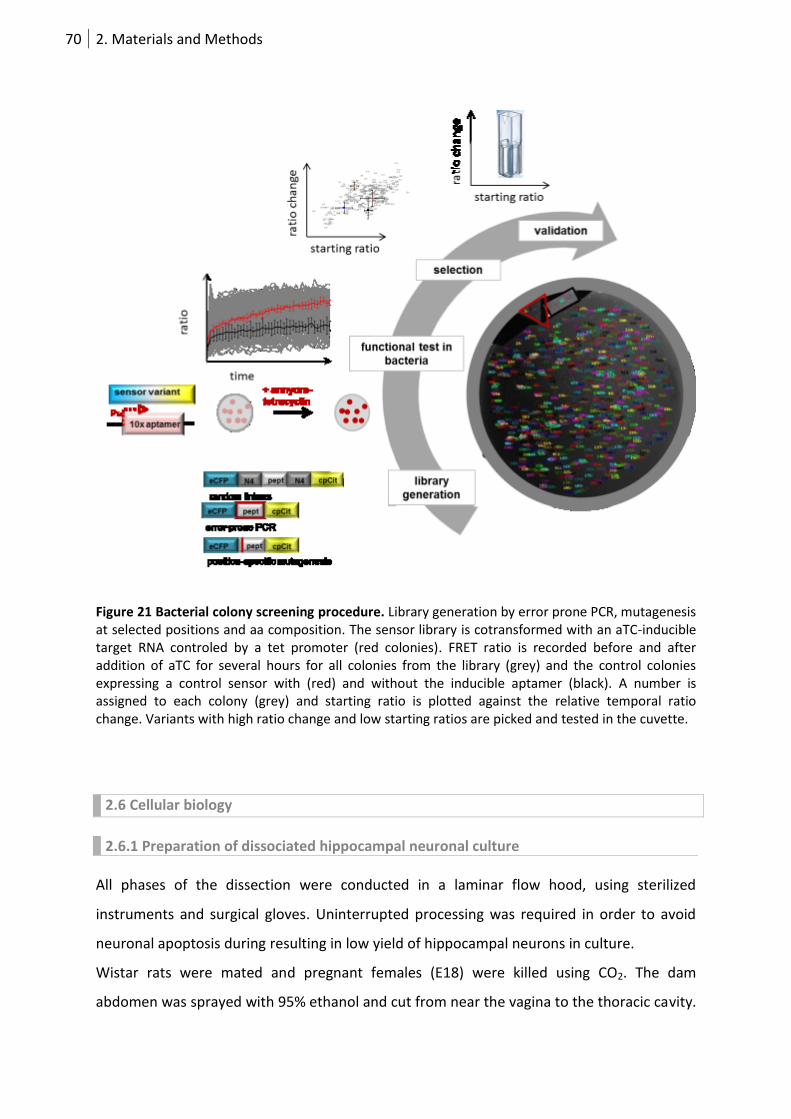
70 2. Materials and Methods
Figure 21 Bacterial colony screening procedure. Library generation by error prone PCR, mutagenesis at selected positions and aa composition. The sensor library is cotransformed with an aTC-inducible target RNA controled by a tet promoter (red colonies). FRET ratio is recorded before and after addition of aTC for several hours for all colonies from the library (grey) and the control colonies expressing a control sensor with (red) and without the inducible aptamer (black). A number is assigned to each colony (grey) and starting ratio is plotted against the relative temporal ratio change. Variants with high ratio change and low starting ratios are picked and tested in the cuvette.
2.6 Cellular biology
2.6.1 Preparation of dissociated hippocampal neuronal culture
All phases of the dissection were conducted in a laminar flow hood, using sterilized
instruments and surgical gloves. Uninterrupted processing was required in order to avoid
neuronal apoptosis during resulting in low yield of hippocampal neurons in culture.
Wistar rats were mated and pregnant females (E18) were killed using CO2. The dam
abdomen was sprayed with 95% ethanol and cut from near the vagina to the thoracic cavity.
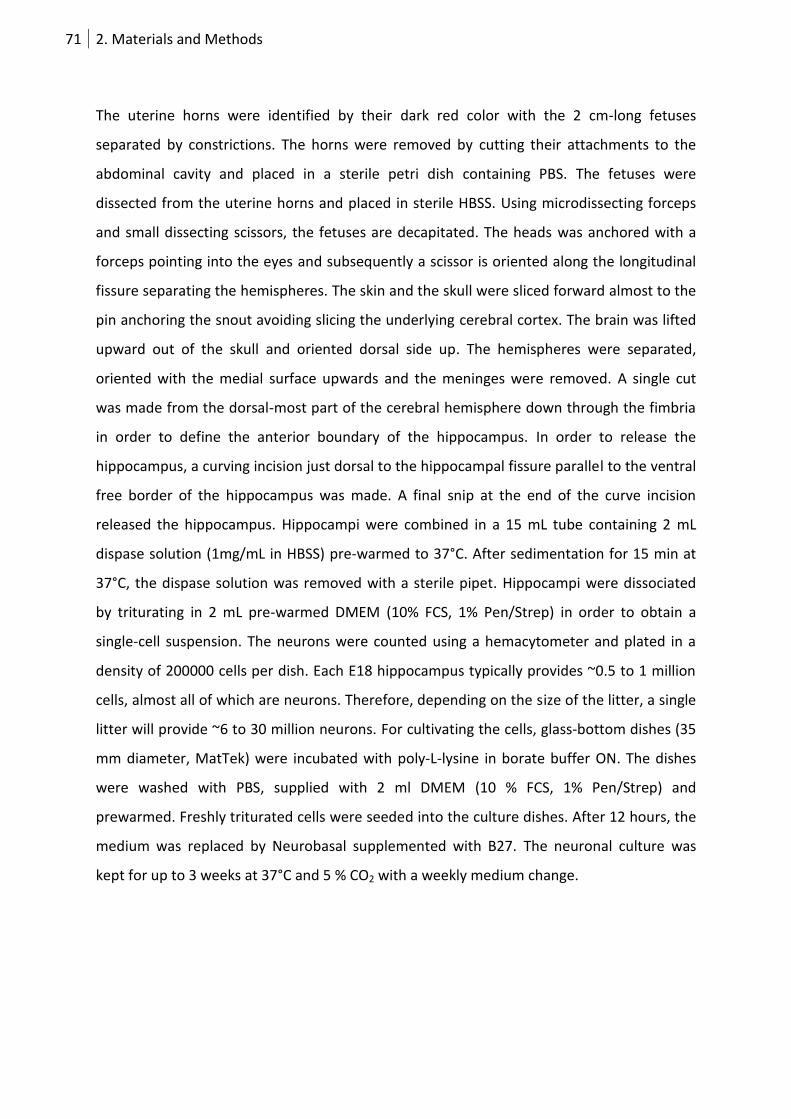
71 2. Materials and Methods
The uterine horns were identified by their dark red color with the 2 cm-long fetuses
separated by constrictions. The horns were removed by cutting their attachments to the
abdominal cavity and placed in a sterile petri dish containing PBS. The fetuses were
dissected from the uterine horns and placed in sterile HBSS. Using microdissecting forceps
and small dissecting scissors, the fetuses are decapitated. The heads was anchored with a
forceps pointing into the eyes and subsequently a scissor is oriented along the longitudinal
fissure separating the hemispheres. The skin and the skull were sliced forward almost to the
pin anchoring the snout avoiding slicing the underlying cerebral cortex. The brain was lifted
upward out of the skull and oriented dorsal side up. The hemispheres were separated,
oriented with the medial surface upwards and the meninges were removed. A single cut
was made from the dorsal-most part of the cerebral hemisphere down through the fimbria
in order to define the anterior boundary of the hippocampus. In order to release the
hippocampus, a curving incision just dorsal to the hippocampal fissure parallel to the ventral
free border of the hippocampus was made. A final snip at the end of the curve incision
released the hippocampus. Hippocampi were combined in a 15 mL tube containing 2 mL
dispase solution (1mg/mL in HBSS) pre-warmed to 37°C. After sedimentation for 15 min at
37°C, the dispase solution was removed with a sterile pipet. Hippocampi were dissociated
by triturating in 2 mL pre-warmed DMEM (10% FCS, 1% Pen/Strep) in order to obtain a
single-cell suspension. The neurons were counted using a hemacytometer and plated in a
density of 200000 cells per dish. Each E18 hippocampus typically provides ~0.5 to 1 million
cells, almost all of which are neurons. Therefore, depending on the size of the litter, a single
litter will provide ~6 to 30 million neurons. For cultivating the cells, glass-bottom dishes (35
mm diameter, MatTek) were incubated with poly-L-lysine in borate buffer ON. The dishes
were washed with PBS, supplied with 2 ml DMEM (10 % FCS, 1% Pen/Strep) and
prewarmed. Freshly triturated cells were seeded into the culture dishes. After 12 hours, the
medium was replaced by Neurobasal supplemented with B27. The neuronal culture was
kept for up to 3 weeks at 37°C and 5 % CO2 with a weekly medium change.
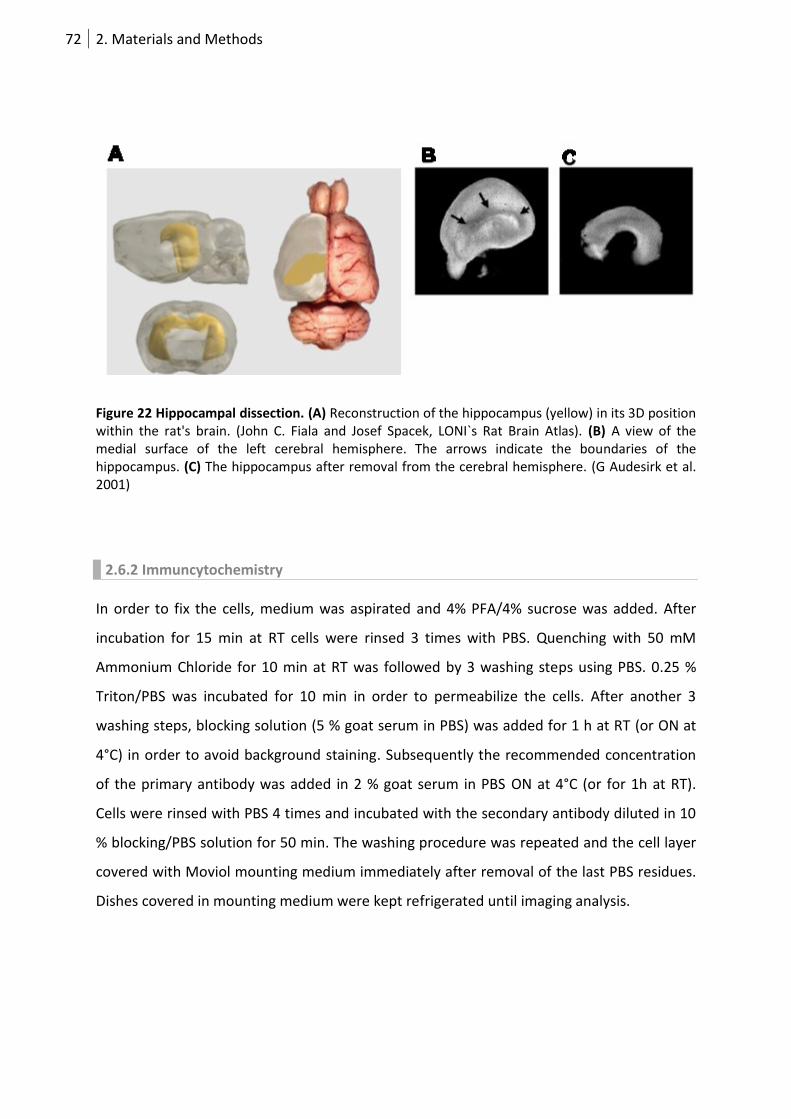
72 2. Materials and Methods
Figure 22 Hippocampal dissection. (A) Reconstruction of the hippocampus (yellow) in its 3D position within the rat's brain. (John C. Fiala and Josef Spacek, LONI`s Rat Brain Atlas). (B) A view of the medial surface of the left cerebral hemisphere. The arrows indicate the boundaries of the hippocampus. (C) The hippocampus after removal from the cerebral hemisphere. (G Audesirk et al. 2001)
2.6.2 Immuncytochemistry
In order to fix the cells, medium was aspirated and 4% PFA/4% sucrose was added. After
incubation for 15 min at RT cells were rinsed 3 times with PBS. Quenching with 50 mM
Ammonium Chloride for 10 min at RT was followed by 3 washing steps using PBS. 0.25 %
Triton/PBS was incubated for 10 min in order to permeabilize the cells. After another 3
washing steps, blocking solution (5 % goat serum in PBS) was added for 1 h at RT (or ON at
4°C) in order to avoid background staining. Subsequently the recommended concentration
of the primary antibody was added in 2 % goat serum in PBS ON at 4°C (or for 1h at RT).
Cells were rinsed with PBS 4 times and incubated with the secondary antibody diluted in 10
% blocking/PBS solution for 50 min. The washing procedure was repeated and the cell layer
covered with Moviol mounting medium immediately after removal of the last PBS residues.
Dishes covered in mounting medium were kept refrigerated until imaging analysis.
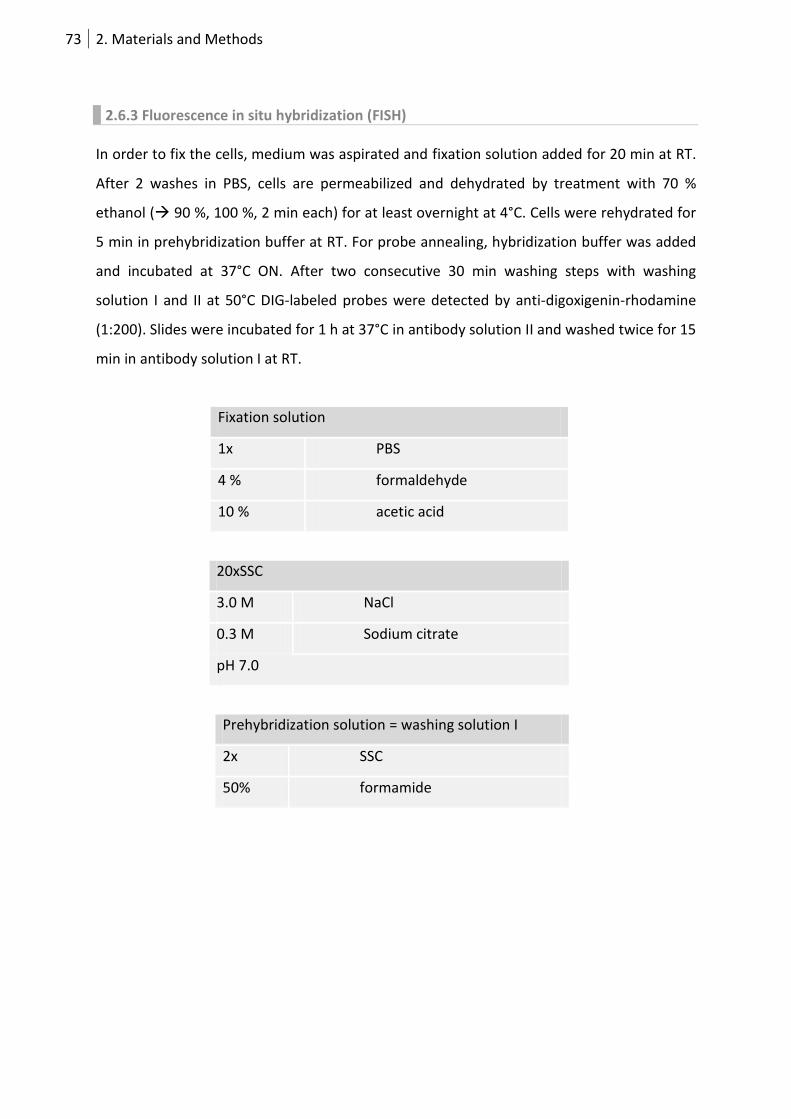
73 2. Materials and Methods
2.6.3 Fluorescence in situ hybridization (FISH)
In order to fix the cells, medium was aspirated and fixation solution added for 20 min at RT.
After 2 washes in PBS, cells are permeabilized and dehydrated by treatment with 70 %
ethanol ( 90 %, 100 %, 2 min each) for at least overnight at 4°C. Cells were rehydrated for
5 min in prehybridization buffer at RT. For probe annealing, hybridization buffer was added
and incubated at 37°C ON. After two consecutive 30 min washing steps with washing
solution I and II at 50°C DIG-labeled probes were detected by anti-digoxigenin-rhodamine
(1:200). Slides were incubated for 1 h at 37°C in antibody solution II and washed twice for 15
min in antibody solution I at RT.
Fixation solution
1x PBS
4 % formaldehyde
10 % acetic acid
20xSSC
3.0 M NaCl
0.3 M Sodium citrate
pH 7.0
Prehybridization solution = washing solution I
2x SSC
50% formamide
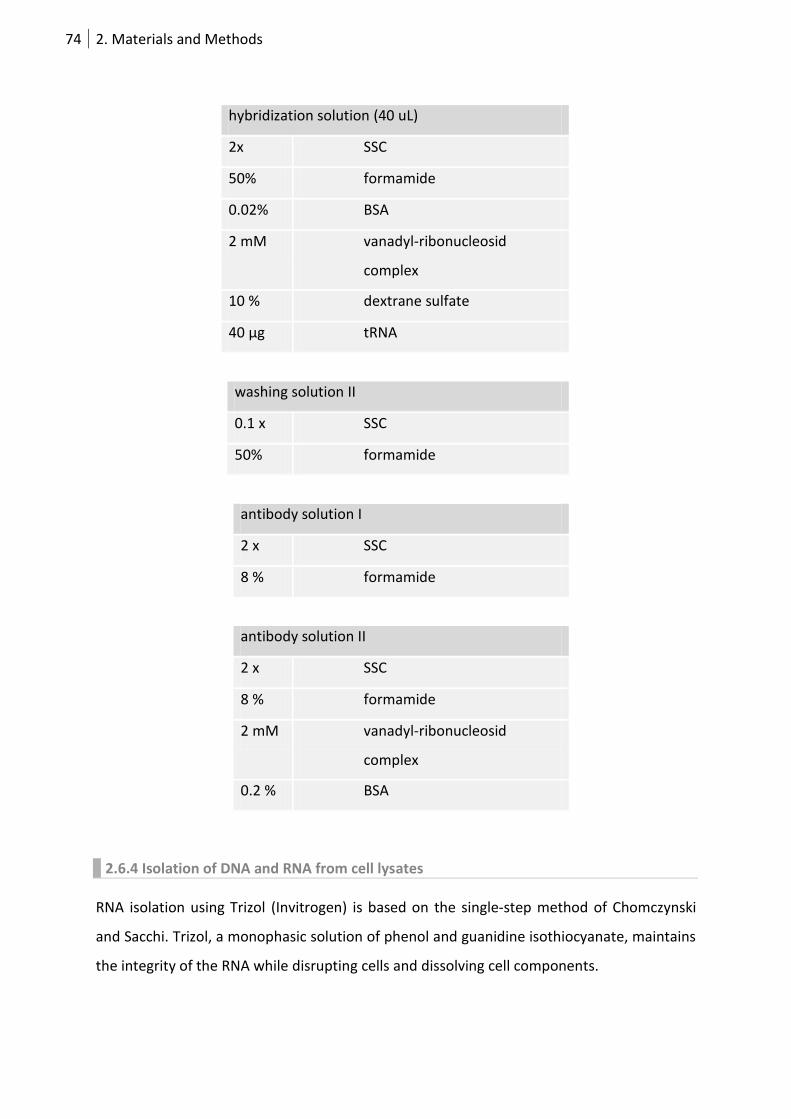
74 2. Materials and Methods
hybridization solution (40 uL)
2x SSC
50% formamide
0.02% BSA
2 mM vanadyl-ribonucleosid
complex
10 % dextrane sulfate
40 µg tRNA
washing solution II
0.1 x SSC
50% formamide
antibody solution I
2 x SSC
8 % formamide
antibody solution II
2 x SSC
8 % formamide
2 mM vanadyl-ribonucleosid
complex
0.2 % BSA
2.6.4 Isolation of DNA and RNA from cell lysates
RNA isolation using Trizol (Invitrogen) is based on the single-step method of Chomczynski
and Sacchi. Trizol, a monophasic solution of phenol and guanidine isothiocyanate, maintains
the integrity of the RNA while disrupting cells and dissolving cell components.
75 2. Materials and Methods
Medium was removed from a 3.5 cm diameter cell culture dish. Cells were resuspended in 1
mL Trizol and homogenized by pipetting. After incubation for 5 min at RT, 0.2 mL chloroform
was mixed with the homogenate by vigorous shaking. Centrifugation (12000 g, 15 min, 4°C)
caused the separation of an organic phase yielding DNA and protein and an upper aqueous
phase that was picked up for further isolation of cellular RNA. The RNA was precipitated by
addition of 0.5 mL isopropanol and incubation for 10 min at RT. The RNA precipitate was
pelleted by centrifugation (12000 g, 15 min, 4°C). After removal of the supernatant, the
pellet was washed with 1 mL 75% ethanol and centrifuged once more (7500 g, 5 min, 4°C).
The RNA pellet was air-dried for 10 min and dissolved in 50 uL RNase-free water by
incubating for 10 min at 60°C. The RNA was stored at -80°C until further usage.
2.6.5 Transfection methods
2.6.5.1 Lipofectamine transfection
Lipofection is a technique used to transfer genetic material into a cell by means of
liposomes, which are vesicles that can easily merge with the cell membrane since they are
both made of a phospholipid bilayer. The advantages of this lipid-based transfection
technology are its high efficiency, its ability to transfect all types of nucleic acids in a wide
range of cell types, its reproducibility and low toxicity. The reagent Lipofectamine 2000
(invitrogen) was used for transfecting both neurons and mammalian cell lines with DNA. For
a cell culture dish of 35 mm diameter 10 μL of Lipofectamine were mixed with 250 μL of
Opti-MEM I in order to allow preformation of lipid vesicles. After 5 min, 1-2 μg of plasmid
DNA in 250 μL of Opti-MEM I was added. Within 20 min incubation, DNA was allowed to
incorporate into the lipid vesicles. For the transfection of mammalian cells, medium
containing antibiotics was exchanged by Opti-MEM. For neuronal cultures, 500 μL medium
was retained before addition of 500 μL of the transfection mix. After incubation for 2-3 h
(37°C, 5% CO2) cells were washed twice with PBS. DMEM (10% FCS, 1% Pen/Strep) was
added to mammalian cell lines and neuronal cells were supplied with a mixture of fresh
Neurobasal (+B27, 1.5 mL) and the retained medium (500 μL).
76 2. Materials and Methods
2.6.5.2 Electroporation of hippocampal neurons
The Amaxa Nucleofector system is designed for electroporation of specific types. DNA is
directly introduced into the nucleus where it is incorporated into the cell independent of cell
division. After preparation of rat hippocampal neurons, 5x10⁵ dissociated cells were
immediately spun down (5 min, 630 rpm). After removal of the supernatant, neurons were
resuspended in 100 µL Amaxa Rat Neuron Nucleofector Solution and 1-3 µg DNA (1-3 µg
each plasmid for cotransfections) by careful repeated pipetting. Neurons were transferred
into a cuvette and put into the Nucleofector device. The program yielding electrical
parameters specifically designed for hippocampal neurons (program O-003) was started.
Directly after electroporation, 500 µL warm MEM-HS was added and cells were resuspended
using a small plastic Pasteur pipette. The transfected cell suspension was distributed to 2
poly-Lysine coated culture dishes (cell density of 2.5x10⁵) with 2 mL conditioned N2 medium
from astrocytes. Neurons were cultured for 1-4 days until image analysis.
2.6.5.3 Semliki Forest Virus infection
Alphaviruses including the Semliki Forest Virus (SFV) only require the host translational
machinery for replication. Engineered variants are used for the transduction of a target gene
into mammalian cells that results in an expression at a level of up to 25 % of the host’s total
cellular proteins. One component of a dual plasmid infection system is the helper plasmid
pSCAHelper that encodes SFV structural proteins. Virus production is dependent on the
presence of a second pSCAβ plasmid yielding the packaging signal as well as coding
sequences for the target protein and non-structural proteins driven by the CMV promoter.
HEK 293 T cells (60-70 % confluency) were transfected by the dual infection system
according to a varied lipofection protocol (see 3.5.2). Infectious virus can be obtained by co-
transfecting 6-8 µg of DNA pSCAβ with pSCAHelper (molar ratio of 1, 2:3 in µg) in culture
medium (DMEM + 10 X FCS + 1 % Pen/Strep) ON. The next morning, expression of the
transfected construct was checked by fluorescence microscopy and the medium was
changed. After 2 days, the supernatant was removed and cellular debris separated by
centrifugation (10 min, 2500 g, 4°C). The supernatant was filtered using a 0.45 µm or 0.22
µm syringe filter with low protein binding characteristics. For concentration and purification,
77 2. Materials and Methods
the virus suspension was ultracentrifuged (20000 rpm, 90 min, 4°C). The supernatant was
discarded and completely removed by putting the tube upside-down for 10 min. The
remaining virus pellet was resolved in 250 µL TBS (for slices or neurons) or medium (for cell
lines) ON at 4°C. Virus aliquots were stored at -80°C.
Mutations within the glycoprotein gene p62 prevent infection unless the virus is
proteolytically treated. In order to activate the SFV, an aliquot was defrozen and incubated
with 0.5 mg/mL α-chymotrypsin (1:20). After 45 min at RT, protease activity was stopped by
addition of 0.4 mg/mL aprotinin (1:15) for 10 min. The activated virus was stored at 4°C for
maximal 1 week before infection. The virus titer was determined by infection of HEK 293T
cells in wells of a 96 well plate using different dilutions.
2.6.6 Cellular assays and imaging
2.6.6.1 Fibroblast migration assay
The cDNAs encoding VAmPIRe or mKO2-20xRRE were cloned BamHI/EcoRI into pcDNA3. For
imaging experiments, cells were plated on a 35-mm glassbottom dish (MatTek) in culture
medium (Dulbecco`s modified Eagle`s medium containing 10% Fetal calf serum, 100 U/mL
penicillin and 100 µg/mL streptomycin). Confluent NIH 3T3 fibroblasts cells were transfected
with pcDNA3-VAmPIRe (0.5 µg) and pcDNA3-mKO2-20xRRE (2 µg) using Lipofectamine 2000
(Invitrogen). The fibroblast monolayer was scraped in a straight line using a scalpel to create
a scratch and migrating cells were imaged 2 h afterwards. The VAmPIRe (0.25 µg) and
pcDNA3-mKO2-20xRRE (1 µg) were transfected separately into HEK 293T cells. After 24 h,
images were taken using the Zeiss VisiScope Cell Explorer System as described.
2.6.6.2 TetOn assay
The T-REx HeLa cell line (Invitrogen) used for the TetOn experiments was expanded in
culture medium supplemented with 5 µg/mL blasticidin (Invitrogen). For tetracycline-
inducible expression of the aptamer fused to mKO2, mKO2-30xRRE was cloned HindIII/XbaI
into pcDNA4/TO (Invitrogen). T-Rex HeLa cells were transfected with pcDNA3-VAmPIRe
(0.25 µg) and pcDNA4/TO-mKO2-30xRRE (1 µg) using Lipofectamine and cultured for further
24 h. Before imaging, 0.1 µg/mL aTC was added to the medium to induce transcription from
78 2. Materials and Methods
pcDNA4/TO. Images were taken every 10 min at the Zeiss VisiScope Cell Explorer System as
described.
2.6.6.3 Stress assay
NIH 3T3 fibroblasts were plated on 35 mm imaging dishes (MatTek). Cells were
cotransfected with pcDNA3 plasmids yielding VAmPIRe and mKO2-10xRRE-zip or VAmPIRe,
10xRRE-zip and ZBP1-mRFP and incubated ON. DMEM was replaced by HBSS containing 2.5
mM arsenate. Stress granule formation was imaged every 5 min after 30-60 min.
2.6.6.4 Imaging Setup and image analysis
Confocal images were acquired at a Leica TCS SP2 confocal laser scanning microscope. We
used a 63X oil immersion objective and 488 nm excitation laser for EGFP as well as the 543
nm laser for RFPs.
For live cell imaging we used a Zeiss VisiScope Cell Explorer System with a plan-apochromat
63x/1.4 oil objective (Zeiss) and FRET (436/20x, 535/30M), CFP (436/20x, 480/40M) and RFP
(560/40x, 630/75M) filters (all from Chroma). Emitted light was detected by a Cool Snap HQ2
CCD camera (Visitron). Cells were maintained at 37°C (Tempcontrol 37-2 digital, heating
unit, Pecon) and the system was controlled and processed by MetaMorph software (Meta
Imaging Series 7.7). Fluorescence of the individual channels was collected subsequently
through two emission filters placed in a filterwheel. Acquisition time and frequency were
adjusted to the FPs.
Image J software was used for image analysis. Background was corrected by subtracting the
intensity of a region close to the cell of interest. FRET ratio was calculated by division of the
YFP by the CFP channel. Fluorescence intensity and FRET of a region of interest were
plotted.
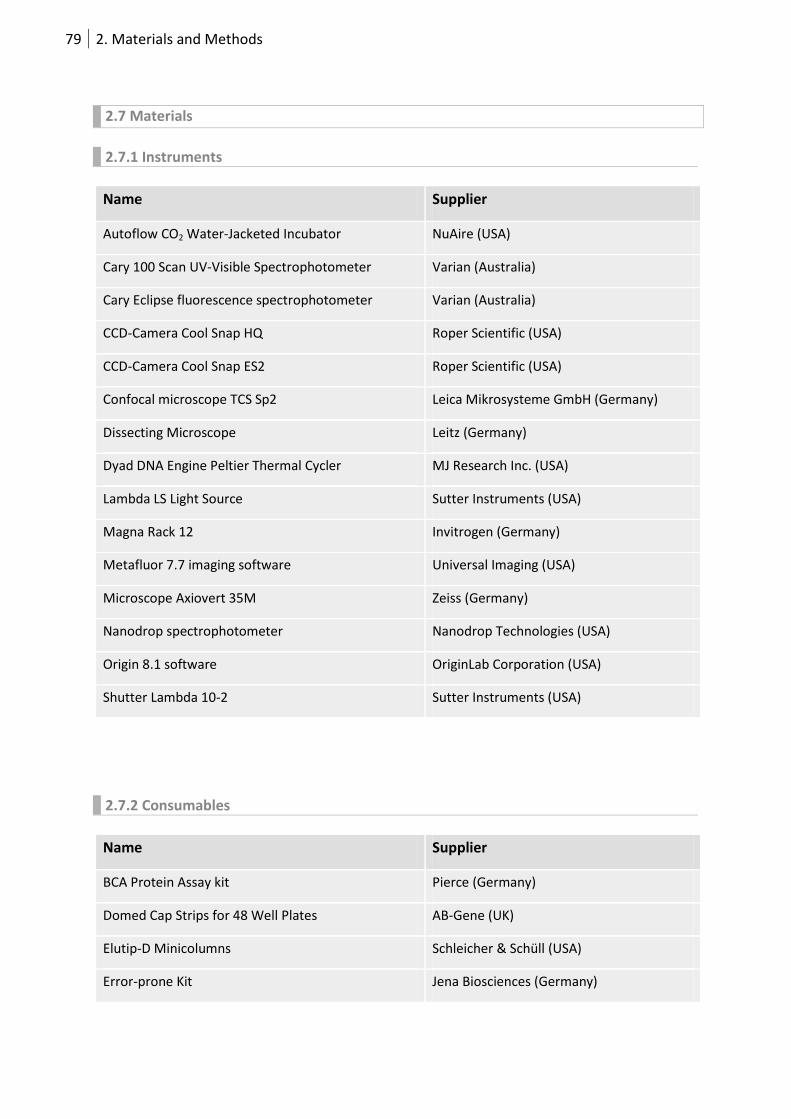
79 2. Materials and Methods
2.7 Materials
2.7.1 Instruments
Name Supplier
Autoflow CO2 Water-Jacketed Incubator NuAire (USA)
Cary 100 Scan UV-Visible Spectrophotometer Varian (Australia)
Cary Eclipse fluorescence spectrophotometer Varian (Australia)
CCD-Camera Cool Snap HQ Roper Scientific (USA)
CCD-Camera Cool Snap ES2 Roper Scientific (USA)
Confocal microscope TCS Sp2 Leica Mikrosysteme GmbH (Germany)
Dissecting Microscope Leitz (Germany)
Dyad DNA Engine Peltier Thermal Cycler MJ Research Inc. (USA)
Lambda LS Light Source Sutter Instruments (USA)
Magna Rack 12 Invitrogen (Germany)
Metafluor 7.7 imaging software Universal Imaging (USA)
Microscope Axiovert 35M Zeiss (Germany)
Nanodrop spectrophotometer Nanodrop Technologies (USA)
Origin 8.1 software OriginLab Corporation (USA)
Shutter Lambda 10-2 Sutter Instruments (USA)
2.7.2 Consumables
Name Supplier
BCA Protein Assay kit Pierce (Germany)
Domed Cap Strips for 48 Well Plates AB-Gene (UK)
Elutip-D Minicolumns Schleicher & Schüll (USA)
Error-prone Kit Jena Biosciences (Germany)
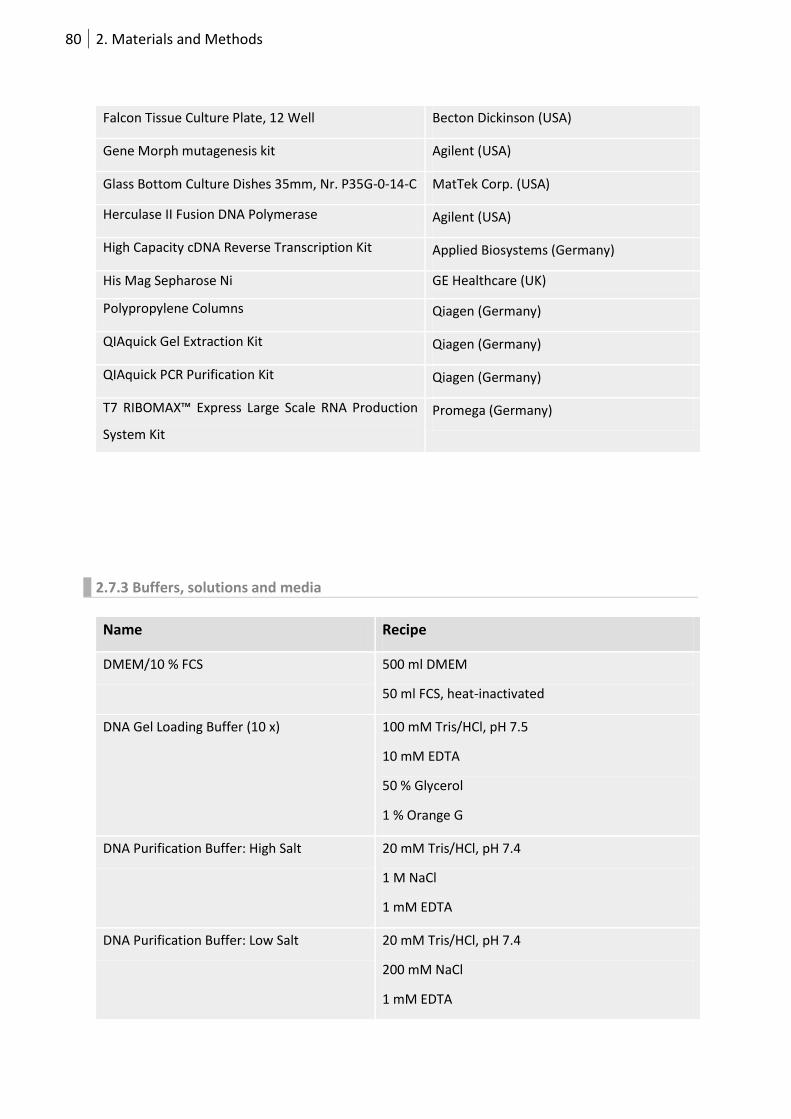
80 2. Materials and Methods
Falcon Tissue Culture Plate, 12 Well Becton Dickinson (USA)
Gene Morph mutagenesis kit Agilent (USA)
Glass Bottom Culture Dishes 35mm, Nr. P35G-0-14-C MatTek Corp. (USA)
Herculase II Fusion DNA Polymerase Agilent (USA)
High Capacity cDNA Reverse Transcription Kit Applied Biosystems (Germany)
His Mag Sepharose Ni GE Healthcare (UK)
Polypropylene Columns Qiagen (Germany)
QIAquick Gel Extraction Kit Qiagen (Germany)
QIAquick PCR Purification Kit Qiagen (Germany)
T7 RIBOMAX™ Express Large Scale RNA Production
System Kit
Promega (Germany)
2.7.3 Buffers, solutions and media
Name Recipe
DMEM/10 % FCS 500 ml DMEM
50 ml FCS, heat-inactivated
DNA Gel Loading Buffer (10 x) 100 mM Tris/HCl, pH 7.5
10 mM EDTA
50 % Glycerol
1 % Orange G
DNA Purification Buffer: High Salt 20 mM Tris/HCl, pH 7.4
1 M NaCl
1 mM EDTA
DNA Purification Buffer: Low Salt 20 mM Tris/HCl, pH 7.4
200 mM NaCl
1 mM EDTA
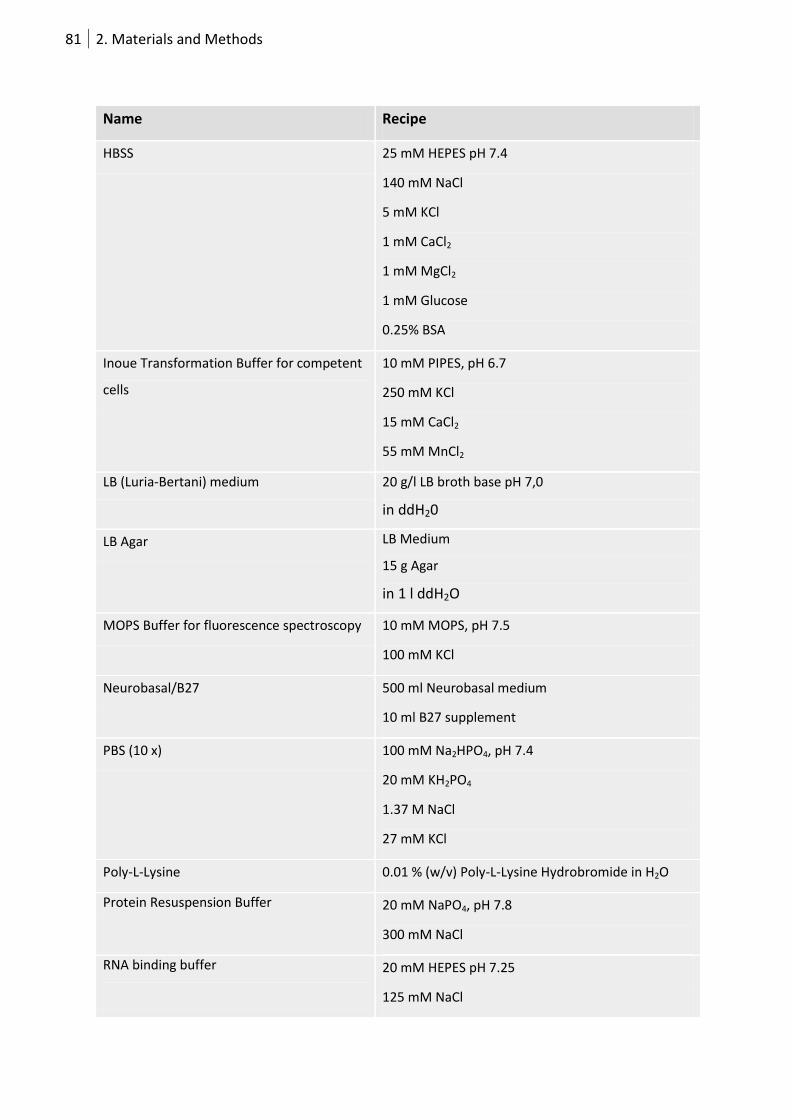
81 2. Materials and Methods
Name Recipe
HBSS 25 mM HEPES pH 7.4
140 mM NaCl
5 mM KCl
1 mM CaCl2
1 mM MgCl2
1 mM Glucose
0.25% BSA
Inoue Transformation Buffer for competent
cells
10 mM PIPES, pH 6.7
250 mM KCl
15 mM CaCl2
55 mM MnCl2
LB (Luria-Bertani) medium 20 g/l LB broth base pH 7,0
in ddH20
LB Agar LB Medium
15 g Agar
in 1 l ddH2O
MOPS Buffer for fluorescence spectroscopy 10 mM MOPS, pH 7.5
100 mM KCl
Neurobasal/B27 500 ml Neurobasal medium
10 ml B27 supplement
PBS (10 x) 100 mM Na2HPO4, pH 7.4
20 mM KH2PO4
1.37 M NaCl
27 mM KCl
Poly-L-Lysine 0.01 % (w/v) Poly-L-Lysine Hydrobromide in H2O
Protein Resuspension Buffer 20 mM NaPO4, pH 7.8
300 mM NaCl
RNA binding buffer
20 mM HEPES pH 7.25
125 mM NaCl
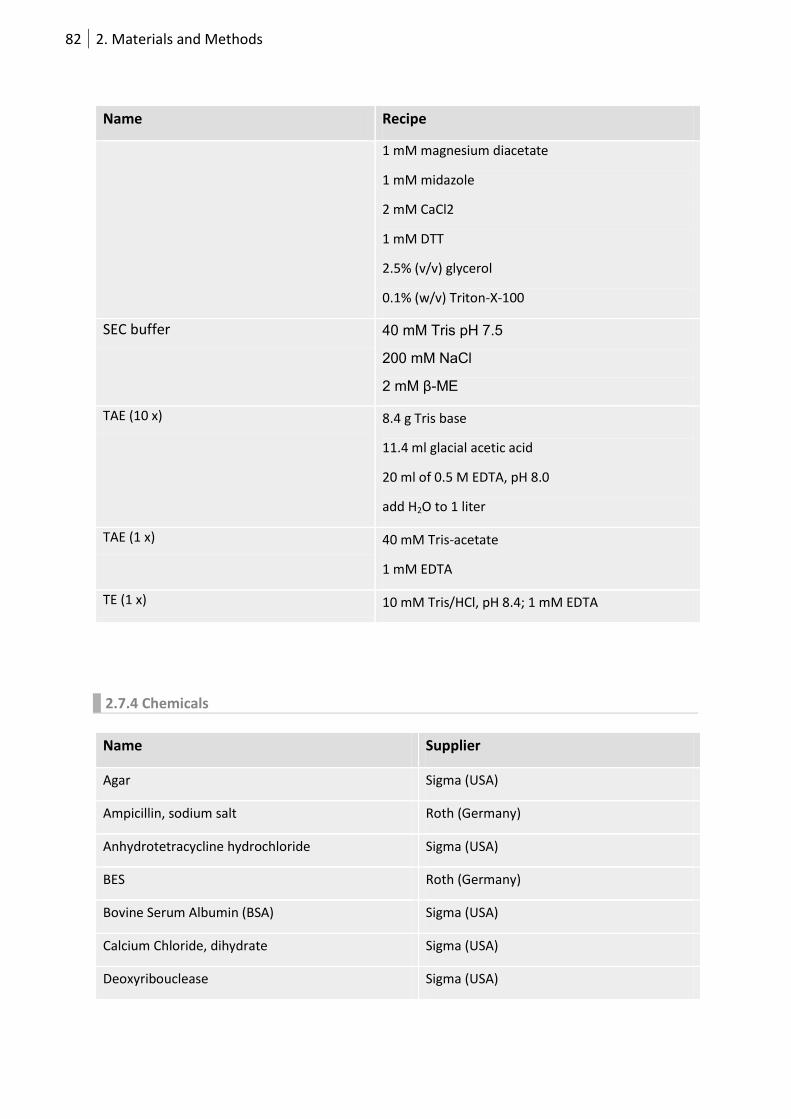
82 2. Materials and Methods
Name Recipe
1 mM magnesium diacetate
1 mM midazole
2 mM CaCl2
1 mM DTT
2.5% (v/v) glycerol
0.1% (w/v) Triton-X-100
SEC buffer 40 mM Tris pH 7.5
200 mM NaCl
2 mM β-ME
TAE (10 x) 8.4 g Tris base
11.4 ml glacial acetic acid
20 ml of 0.5 M EDTA, pH 8.0
add H2O to 1 liter
TAE (1 x) 40 mM Tris-acetate
1 mM EDTA
TE (1 x) 10 mM Tris/HCl, pH 8.4; 1 mM EDTA
2.7.4 Chemicals
Name Supplier
Agar Sigma (USA)
Ampicillin, sodium salt Roth (Germany)
Anhydrotetracycline hydrochloride Sigma (USA)
BES Roth (Germany)
Bovine Serum Albumin (BSA) Sigma (USA)
Calcium Chloride, dihydrate Sigma (USA)
Deoxyribouclease Sigma (USA)
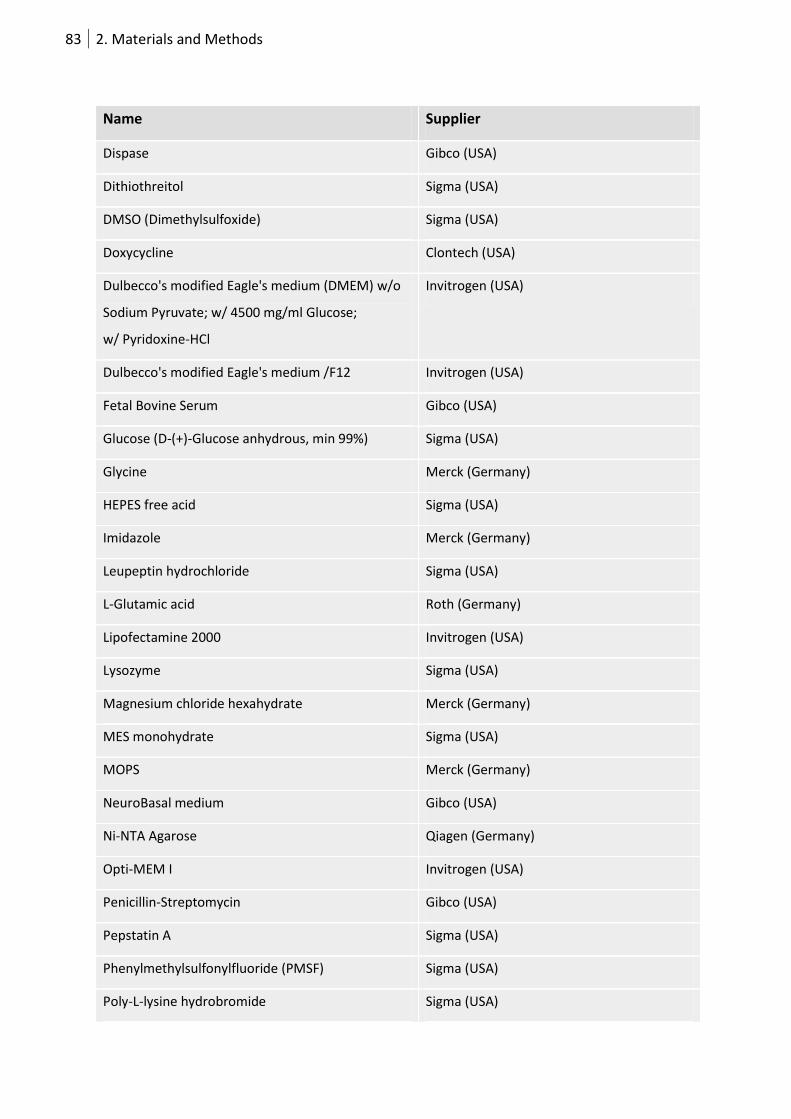
83 2. Materials and Methods
Name Supplier
Dispase Gibco (USA)
Dithiothreitol Sigma (USA)
DMSO (Dimethylsulfoxide) Sigma (USA)
Doxycycline Clontech (USA)
Dulbecco's modified Eagle's medium (DMEM) w/o
Sodium Pyruvate; w/ 4500 mg/ml Glucose;
w/ Pyridoxine-HCl
Invitrogen (USA)
Dulbecco's modified Eagle's medium /F12 Invitrogen (USA)
Fetal Bovine Serum Gibco (USA)
Glucose (D-(+)-Glucose anhydrous, min 99%) Sigma (USA)
Glycine Merck (Germany)
HEPES free acid Sigma (USA)
Imidazole Merck (Germany)
Leupeptin hydrochloride Sigma (USA)
L-Glutamic acid Roth (Germany)
Lipofectamine 2000 Invitrogen (USA)
Lysozyme Sigma (USA)
Magnesium chloride hexahydrate Merck (Germany)
MES monohydrate Sigma (USA)
MOPS Merck (Germany)
NeuroBasal medium Gibco (USA)
Ni-NTA Agarose Qiagen (Germany)
Opti-MEM I Invitrogen (USA)
Penicillin-Streptomycin Gibco (USA)
Pepstatin A Sigma (USA)
Phenylmethylsulfonylfluoride (PMSF) Sigma (USA)
Poly-L-lysine hydrobromide Sigma (USA)
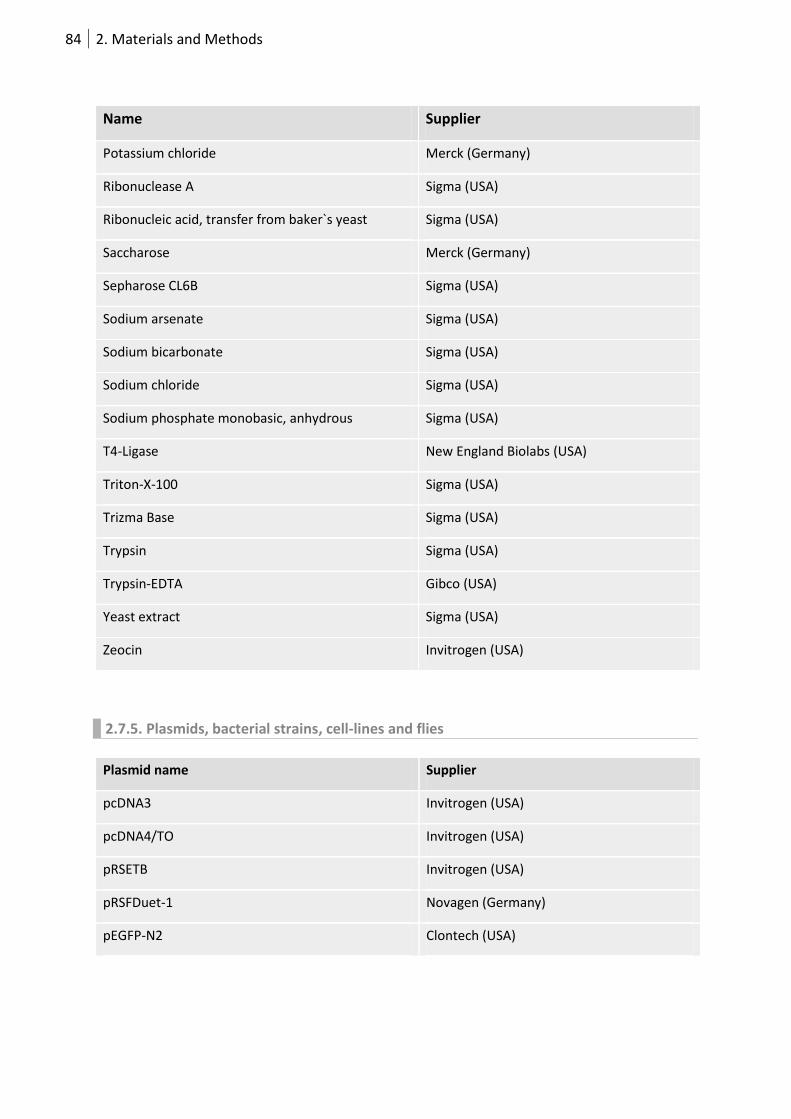
84 2. Materials and Methods
Name Supplier
Potassium chloride Merck (Germany)
Ribonuclease A Sigma (USA)
Ribonucleic acid, transfer from baker`s yeast Sigma (USA)
Saccharose Merck (Germany)
Sepharose CL6B Sigma (USA)
Sodium arsenate Sigma (USA)
Sodium bicarbonate Sigma (USA)
Sodium chloride Sigma (USA)
Sodium phosphate monobasic, anhydrous Sigma (USA)
T4-Ligase New England Biolabs (USA)
Triton-X-100 Sigma (USA)
Trizma Base Sigma (USA)
Trypsin Sigma (USA)
Trypsin-EDTA Gibco (USA)
Yeast extract Sigma (USA)
Zeocin Invitrogen (USA)
2.7.5. Plasmids, bacterial strains, cell-lines and flies
Plasmid name Supplier
pcDNA3 Invitrogen (USA)
pcDNA4/TO Invitrogen (USA)
pRSETB Invitrogen (USA)
pRSFDuet-1 Novagen (Germany)
pEGFP-N2 Clontech (USA)

85 2. Materials and Methods
Strain name Supplier
BL21(DE3) Invitrogen (USA)
Stbl-2 Invitrogen (USA)
T-REx-HeLa cell line Invitrogen (USA)
XL-1 Blue Invitrogen (USA)
XL-10 gold Invitrogen (USA)
Cell line Supplier
HEK 293T Invitrogen (USA)
HeLa Invitrogen (USA)
NIH 3T3 Invitrogen (USA)
T-REx-HeLa cell line Invitrogen (USA)
86 3. Results
3. Results
3.1 Application of genetically encodable RNA labels for imaging of neuronal RNAs
3.1.1. Dual RNA imaging in neurons
Fusion of fluorescent proteins (FPs) to the MS2 or the λN22 peptide, enables the
visualization of single RNAs in neurons. The modular character of AFP-based labeling
provides all prerequisites to track several specific RNAs at the same time. This has
proven possible for the first time by tagging two distinct mRNA in yeast in real time
(Lange et al. 2008).
In order to get insight into distribution and transport kinetics of several specific RNAs in
one cell we are taking advantage of these viral RNA reporters for the tagging of neuronal
RNAs of interest. We constructed a fusion protein yielding either the λN22 peptide or
the MS2 peptide, 3 copies of EGFP or mKO2, respectively, and the SV40 nuclear
localization signal (NLS) driven by the CMV promoter. Rat hippocampal neurons DIV10
transiently transfected with both RNA labels were stimulated using 40 mM KCl for 2 h
(Figure 23). We tagged several mRNAs including CaMKIIα with the corresponding
aptamers boxB or MS2. Nuclear export efficiency for the single labeling systems were
determined by counting cells with exclusive nuclear versus nuclear and dendritic
fluorescence signal (Figure 23B). In the presence of MS2-tagged CaMKIIα the MS2-
3xmKO2-NLS reporter was exported from the nucleus in 43% of the neurons compared
to 34% in the absence of any tagged RNA. For the λN22-3xEGFP-NLS construct the
difference was 38% with CaMKIIα-boxB cotransfection compared to 35% with the
reporter construct only. Double labeling using the MS2- and the λN22-systems showed
mainly nuclear localized fluorescence of both reporter without any transiently expressed
mRNA (Figure 23C). Serving as a direct comparison of the two labeling systems, 5 copies
of the boxb and 24 copies of MS2 aptamers were cloned between the CaMKIIα ORF and
the 5’UTR or 3’UTR. mKO2 and EGFP signals were detected at the dendrite with EGFP
showing a rather proximal and granular pattern compared to the mKO2-tagged MS2
peptide (Figure 23D). Expression of CaMKIIα tagged with boxB only resulted in dendritic
localization of λN22-3xEGFP-NLS but nuclear red fluorescence (Figure 23E). This
indicates the lack of interference of both labeling systems.
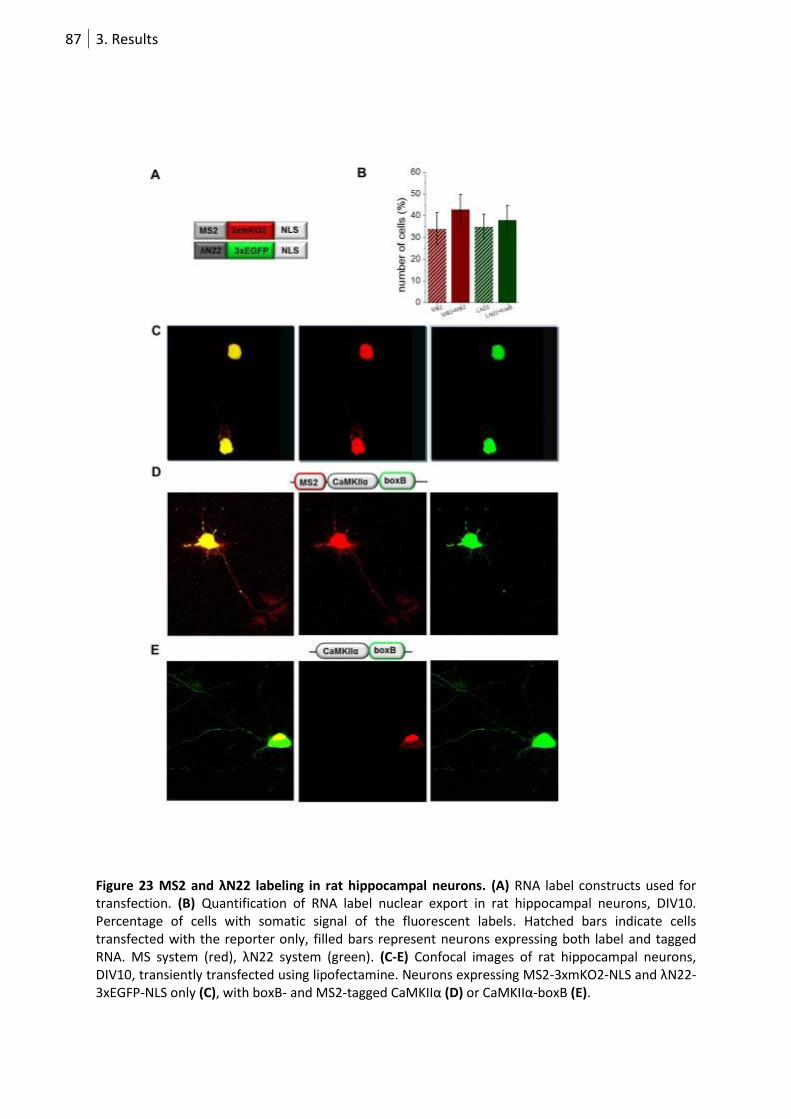
87 3. Results
Figure 23 MS2 and λN22 labeling in rat hippocampal neurons. (A) RNA label constructs used for transfection. (B) Quantification of RNA label nuclear export in rat hippocampal neurons, DIV10. Percentage of cells with somatic signal of the fluorescent labels. Hatched bars indicate cells transfected with the reporter only, filled bars represent neurons expressing both label and tagged RNA. MS system (red), λN22 system (green). (C-E) Confocal images of rat hippocampal neurons, DIV10, transiently transfected using lipofectamine. Neurons expressing MS2-3xmKO2-NLS and λN22-3xEGFP-NLS only (C), with boxB- and MS2-tagged CaMKIIα (D) or CaMKIIα-boxB (E).
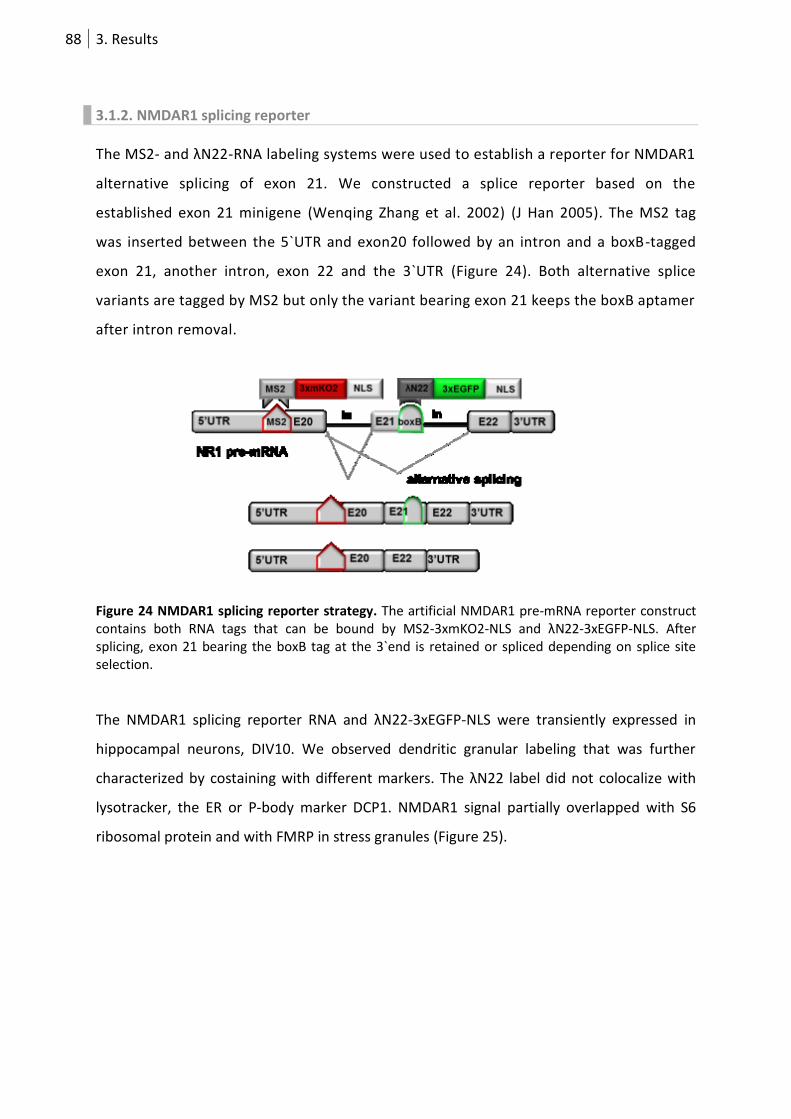
88 3. Results
3.1.2. NMDAR1 splicing reporter
The MS2- and λN22-RNA labeling systems were used to establish a reporter for NMDAR1
alternative splicing of exon 21. We constructed a splice reporter based on the
established exon 21 minigene (Wenqing Zhang et al. 2002) (J Han 2005). The MS2 tag
was inserted between the 5`UTR and exon20 followed by an intron and a boxB-tagged
exon 21, another intron, exon 22 and the 3`UTR (Figure 24). Both alternative splice
variants are tagged by MS2 but only the variant bearing exon 21 keeps the boxB aptamer
after intron removal.
Figure 24 NMDAR1 splicing reporter strategy. The artificial NMDAR1 pre-mRNA reporter construct contains both RNA tags that can be bound by MS2-3xmKO2-NLS and λN22-3xEGFP-NLS. After splicing, exon 21 bearing the boxB tag at the 3`end is retained or spliced depending on splice site selection.
The NMDAR1 splicing reporter RNA and λN22-3xEGFP-NLS were transiently expressed in
hippocampal neurons, DIV10. We observed dendritic granular labeling that was further
characterized by costaining with different markers. The λN22 label did not colocalize with
lysotracker, the ER or P-body marker DCP1. NMDAR1 signal partially overlapped with S6
ribosomal protein and with FMRP in stress granules (Figure 25).
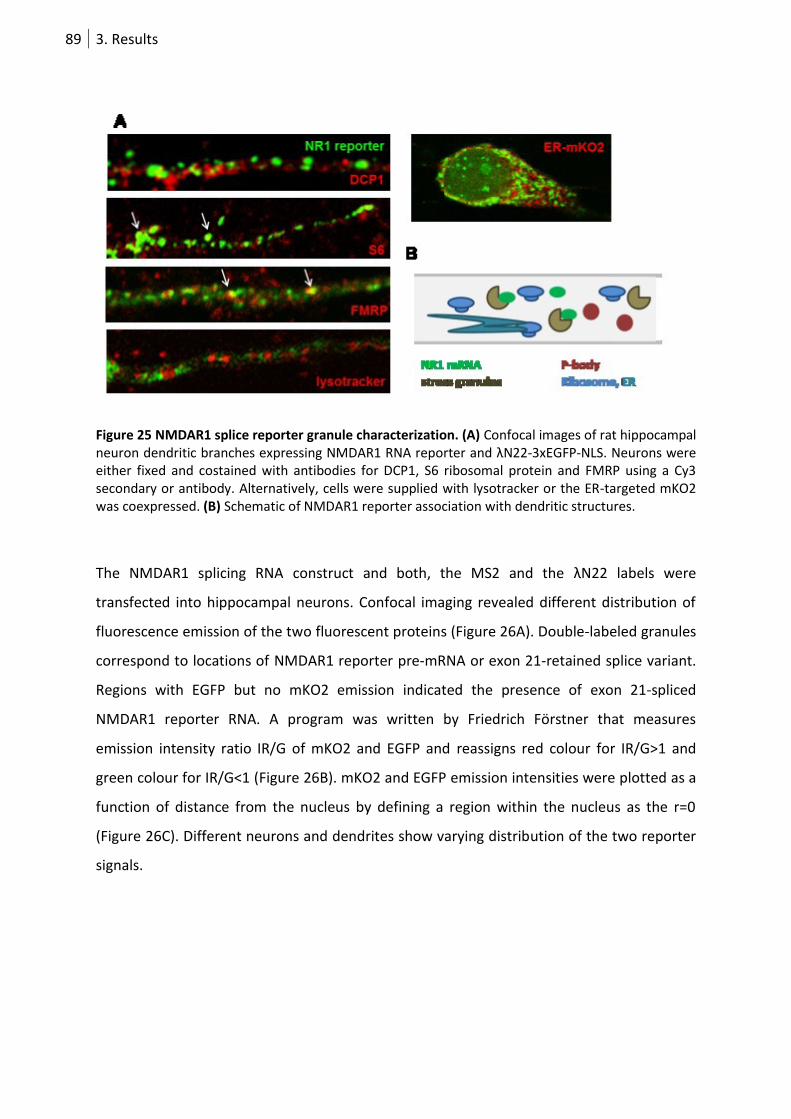
89 3. Results
Figure 25 NMDAR1 splice reporter granule characterization. (A) Confocal images of rat hippocampal neuron dendritic branches expressing NMDAR1 RNA reporter and λN22-3xEGFP-NLS. Neurons were either fixed and costained with antibodies for DCP1, S6 ribosomal protein and FMRP using a Cy3 secondary or antibody. Alternatively, cells were supplied with lysotracker or the ER-targeted mKO2 was coexpressed. (B) Schematic of NMDAR1 reporter association with dendritic structures.
The NMDAR1 splicing RNA construct and both, the MS2 and the λN22 labels were
transfected into hippocampal neurons. Confocal imaging revealed different distribution of
fluorescence emission of the two fluorescent proteins (Figure 26A). Double-labeled granules
correspond to locations of NMDAR1 reporter pre-mRNA or exon 21-retained splice variant.
Regions with EGFP but no mKO2 emission indicated the presence of exon 21-spliced
NMDAR1 reporter RNA. A program was written by Friedrich Förstner that measures
emission intensity ratio IR/G of mKO2 and EGFP and reassigns red colour for IR/G>1 and
green colour for IR/G<1 (Figure 26B). mKO2 and EGFP emission intensities were plotted as a
function of distance from the nucleus by defining a region within the nucleus as the r=0
(Figure 26C). Different neurons and dendrites show varying distribution of the two reporter
signals.
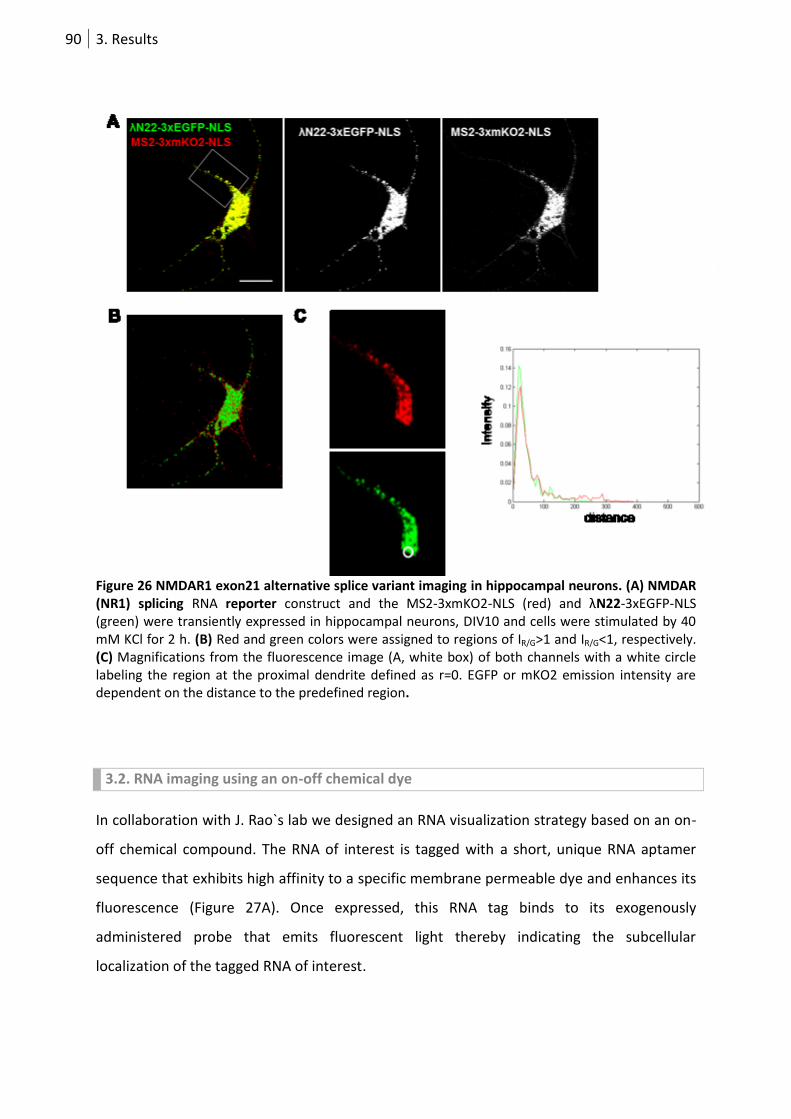
90 3. Results
Figure 26 NMDAR1 exon21 alternative splice variant imaging in hippocampal neurons. (A) NMDAR (NR1) splicing RNA reporter construct and the MS2-3xmKO2-NLS (red) and λN22-3xEGFP-NLS (green) were transiently expressed in hippocampal neurons, DIV10 and cells were stimulated by 40 mM KCl for 2 h. (B) Red and green colors were assigned to regions of IR/G>1 and IR/G<1, respectively. (C) Magnifications from the fluorescence image (A, white box) of both channels with a white circle labeling the region at the proximal dendrite defined as r=0. EGFP or mKO2 emission intensity are dependent on the distance to the predefined region.
3.2. RNA imaging using an on-off chemical dye
In collaboration with J. Rao`s lab we designed an RNA visualization strategy based on an on-
off chemical compound. The RNA of interest is tagged with a short, unique RNA aptamer
sequence that exhibits high affinity to a specific membrane permeable dye and enhances its
fluorescence (Figure 27A). Once expressed, this RNA tag binds to its exogenously
administered probe that emits fluorescent light thereby indicating the subcellular
localization of the tagged RNA of interest.
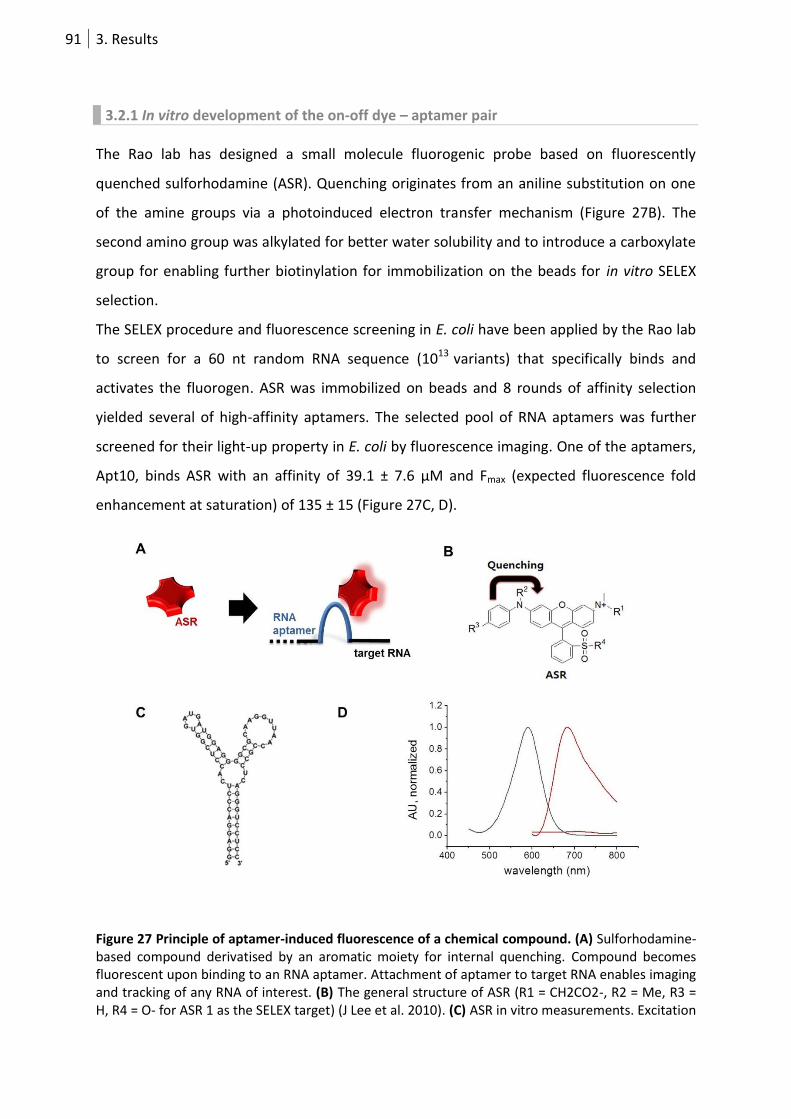
91 3. Results
3.2.1 In vitro development of the on-off dye – aptamer pair
The Rao lab has designed a small molecule fluorogenic probe based on fluorescently
quenched sulforhodamine (ASR). Quenching originates from an aniline substitution on one
of the amine groups via a photoinduced electron transfer mechanism (Figure 27B). The
second amino group was alkylated for better water solubility and to introduce a carboxylate
group for enabling further biotinylation for immobilization on the beads for in vitro SELEX
selection.
The SELEX procedure and fluorescence screening in E. coli have been applied by the Rao lab
to screen for a 60 nt random RNA sequence (1013 variants) that specifically binds and
activates the fluorogen. ASR was immobilized on beads and 8 rounds of affinity selection
yielded several of high-affinity aptamers. The selected pool of RNA aptamers was further
screened for their light-up property in E. coli by fluorescence imaging. One of the aptamers,
Apt10, binds ASR with an affinity of 39.1 ± 7.6 µM and Fmax (expected fluorescence fold
enhancement at saturation) of 135 ± 15 (Figure 27C, D).
Figure 27 Principle of aptamer-induced fluorescence of a chemical compound. (A) Sulforhodamine-based compound derivatised by an aromatic moiety for internal quenching. Compound becomes fluorescent upon binding to an RNA aptamer. Attachment of aptamer to target RNA enables imaging and tracking of any RNA of interest. (B) The general structure of ASR (R1 = CH2CO2-, R2 = Me, R3 = H, R4 = O- for ASR 1 as the SELEX target) (J Lee et al. 2010). (C) ASR in vitro measurements. Excitation
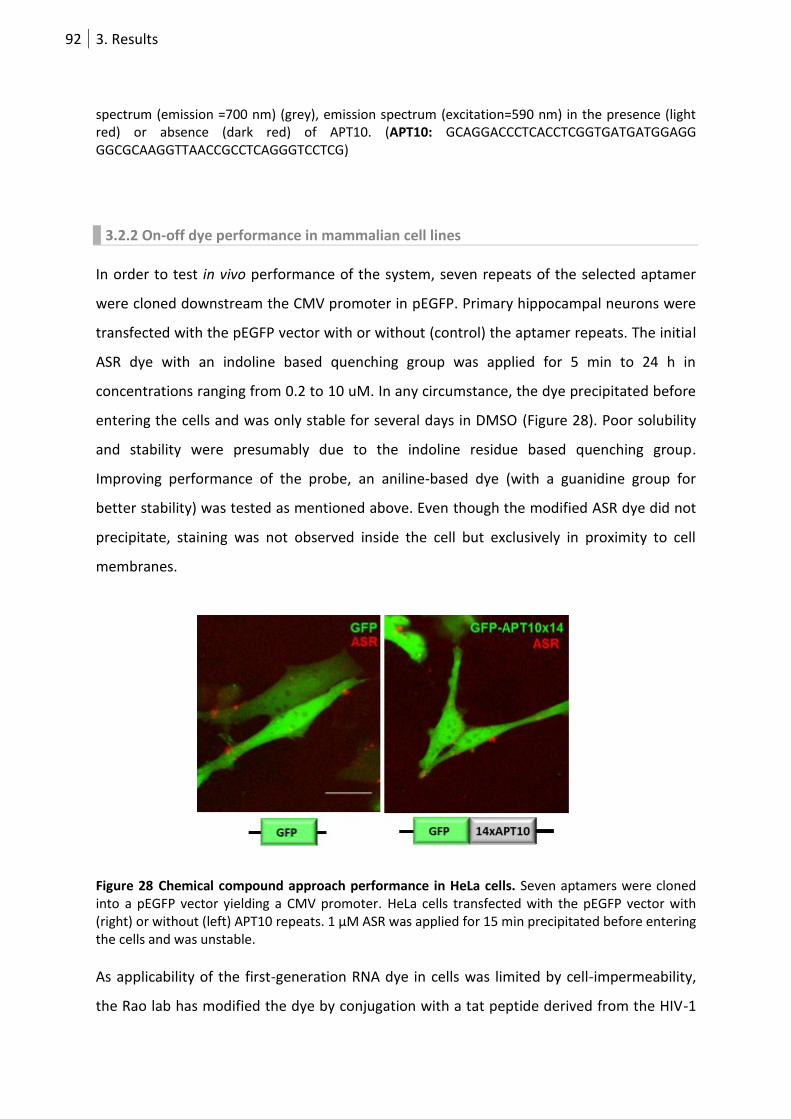
92 3. Results
spectrum (emission =700 nm) (grey), emission spectrum (excitation=590 nm) in the presence (light red) or absence (dark red) of APT10. (APT10: GCAGGACCCTCACCTCGGTGATGATGGAGG GGCGCAAGGTTAACCGCCTCAGGGTCCTCG)
3.2.2 On-off dye performance in mammalian cell lines
In order to test in vivo performance of the system, seven repeats of the selected aptamer
were cloned downstream the CMV promoter in pEGFP. Primary hippocampal neurons were
transfected with the pEGFP vector with or without (control) the aptamer repeats. The initial
ASR dye with an indoline based quenching group was applied for 5 min to 24 h in
concentrations ranging from 0.2 to 10 uM. In any circumstance, the dye precipitated before
entering the cells and was only stable for several days in DMSO (Figure 28). Poor solubility
and stability were presumably due to the indoline residue based quenching group.
Improving performance of the probe, an aniline-based dye (with a guanidine group for
better stability) was tested as mentioned above. Even though the modified ASR dye did not
precipitate, staining was not observed inside the cell but exclusively in proximity to cell
membranes.
Figure 28 Chemical compound approach performance in HeLa cells. Seven aptamers were cloned into a pEGFP vector yielding a CMV promoter. HeLa cells transfected with the pEGFP vector with (right) or without (left) APT10 repeats. 1 µM ASR was applied for 15 min precipitated before entering the cells and was unstable.
As applicability of the first-generation RNA dye in cells was limited by cell-impermeability,
the Rao lab has modified the dye by conjugation with a tat peptide derived from the HIV-1
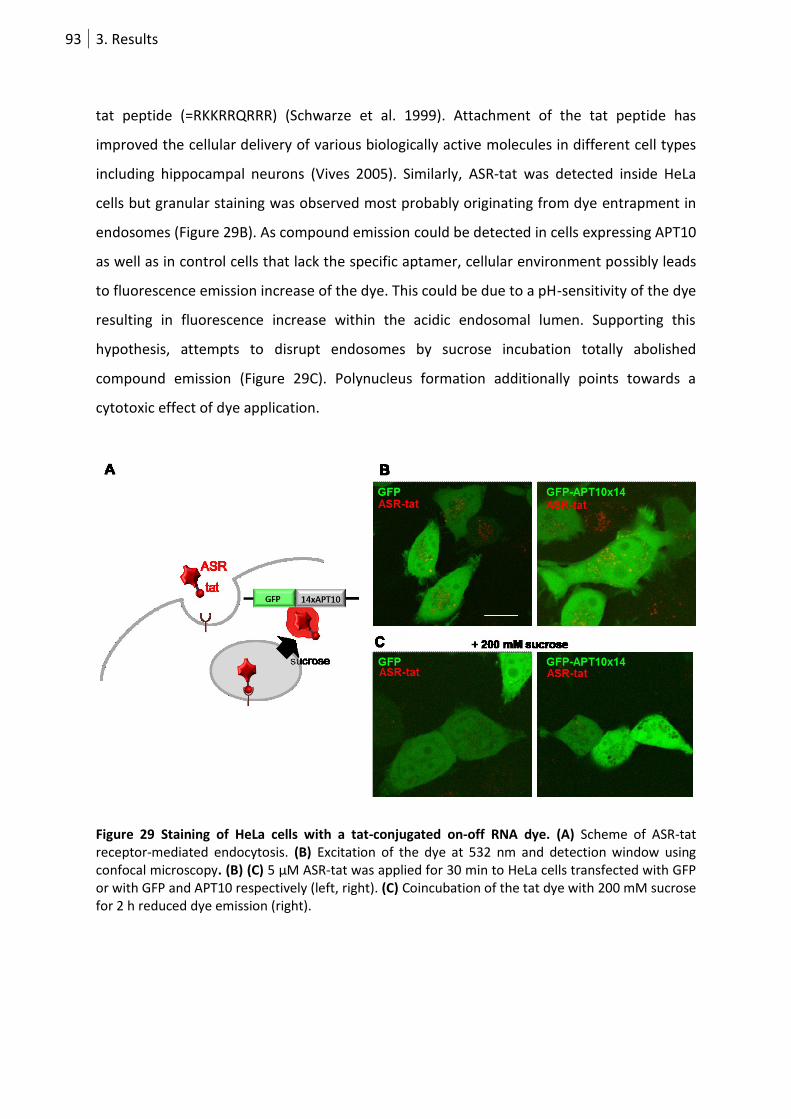
93 3. Results
tat peptide (=RKKRRQRRR) (Schwarze et al. 1999). Attachment of the tat peptide has
improved the cellular delivery of various biologically active molecules in different cell types
including hippocampal neurons (Vives 2005). Similarly, ASR-tat was detected inside HeLa
cells but granular staining was observed most probably originating from dye entrapment in
endosomes (Figure 29B). As compound emission could be detected in cells expressing APT10
as well as in control cells that lack the specific aptamer, cellular environment possibly leads
to fluorescence emission increase of the dye. This could be due to a pH-sensitivity of the dye
resulting in fluorescence increase within the acidic endosomal lumen. Supporting this
hypothesis, attempts to disrupt endosomes by sucrose incubation totally abolished
compound emission (Figure 29C). Polynucleus formation additionally points towards a
cytotoxic effect of dye application.
Figure 29 Staining of HeLa cells with a tat-conjugated on-off RNA dye. (A) Scheme of ASR-tat receptor-mediated endocytosis. (B) Excitation of the dye at 532 nm and detection window using confocal microscopy. (B) (C) 5 µM ASR-tat was applied for 30 min to HeLa cells transfected with GFP or with GFP and APT10 respectively (left, right). (C) Coincubation of the tat dye with 200 mM sucrose for 2 h reduced dye emission (right).
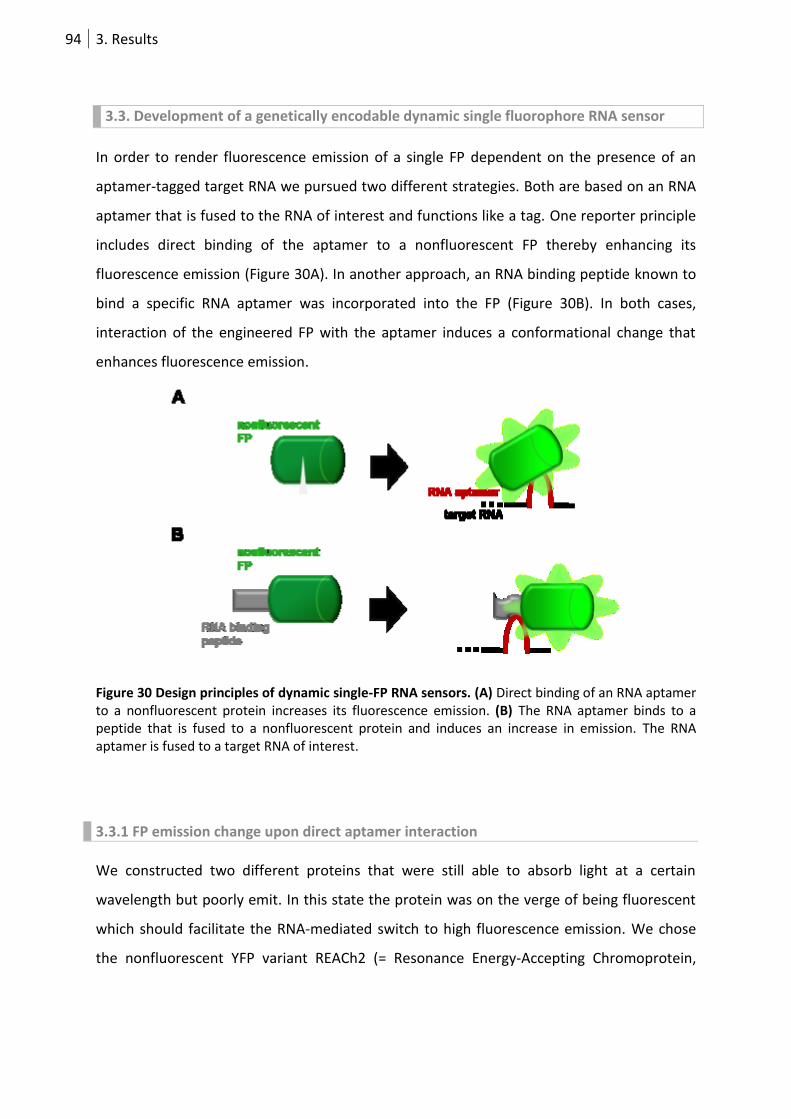
94 3. Results
3.3. Development of a genetically encodable dynamic single fluorophore RNA sensor
In order to render fluorescence emission of a single FP dependent on the presence of an
aptamer-tagged target RNA we pursued two different strategies. Both are based on an RNA
aptamer that is fused to the RNA of interest and functions like a tag. One reporter principle
includes direct binding of the aptamer to a nonfluorescent FP thereby enhancing its
fluorescence emission (Figure 30A). In another approach, an RNA binding peptide known to
bind a specific RNA aptamer was incorporated into the FP (Figure 30B). In both cases,
interaction of the engineered FP with the aptamer induces a conformational change that
enhances fluorescence emission.
Figure 30 Design principles of dynamic single-FP RNA sensors. (A) Direct binding of an RNA aptamer to a nonfluorescent protein increases its fluorescence emission. (B) The RNA aptamer binds to a peptide that is fused to a nonfluorescent protein and induces an increase in emission. The RNA aptamer is fused to a target RNA of interest.
3.3.1 FP emission change upon direct aptamer interaction
We constructed two different proteins that were still able to absorb light at a certain
wavelength but poorly emit. In this state the protein was on the verge of being fluorescent
which should facilitate the RNA-mediated switch to high fluorescence emission. We chose
the nonfluorescent YFP variant REACh2 (= Resonance Energy-Accepting Chromoprotein,
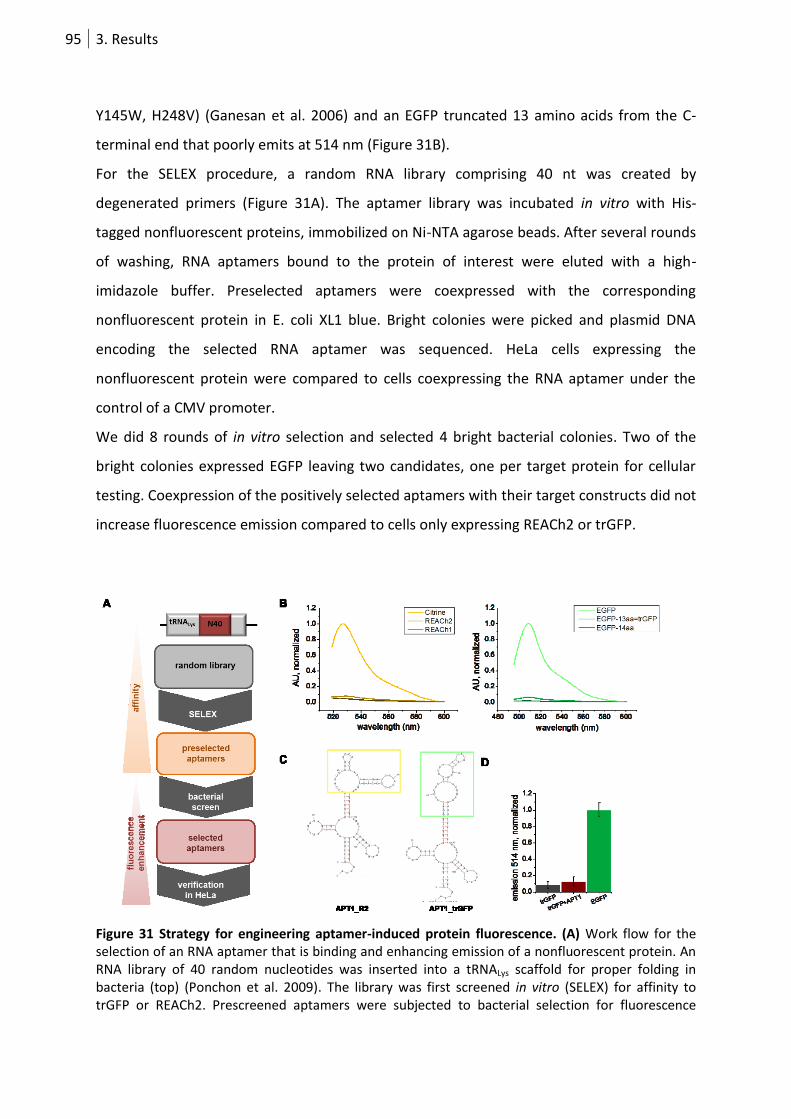
95 3. Results
Y145W, H248V) (Ganesan et al. 2006) and an EGFP truncated 13 amino acids from the C-
terminal end that poorly emits at 514 nm (Figure 31B).
For the SELEX procedure, a random RNA library comprising 40 nt was created by
degenerated primers (Figure 31A). The aptamer library was incubated in vitro with His-
tagged nonfluorescent proteins, immobilized on Ni-NTA agarose beads. After several rounds
of washing, RNA aptamers bound to the protein of interest were eluted with a high-
imidazole buffer. Preselected aptamers were coexpressed with the corresponding
nonfluorescent protein in E. coli XL1 blue. Bright colonies were picked and plasmid DNA
encoding the selected RNA aptamer was sequenced. HeLa cells expressing the
nonfluorescent protein were compared to cells coexpressing the RNA aptamer under the
control of a CMV promoter.
We did 8 rounds of in vitro selection and selected 4 bright bacterial colonies. Two of the
bright colonies expressed EGFP leaving two candidates, one per target protein for cellular
testing. Coexpression of the positively selected aptamers with their target constructs did not
increase fluorescence emission compared to cells only expressing REACh2 or trGFP.
Figure 31 Strategy for engineering aptamer-induced protein fluorescence. (A) Work flow for the selection of an RNA aptamer that is binding and enhancing emission of a nonfluorescent protein. An RNA library of 40 random nucleotides was inserted into a tRNALys scaffold for proper folding in bacteria (top) (Ponchon et al. 2009). The library was first screened in vitro (SELEX) for affinity to trGFP or REACh2. Prescreened aptamers were subjected to bacterial selection for fluorescence
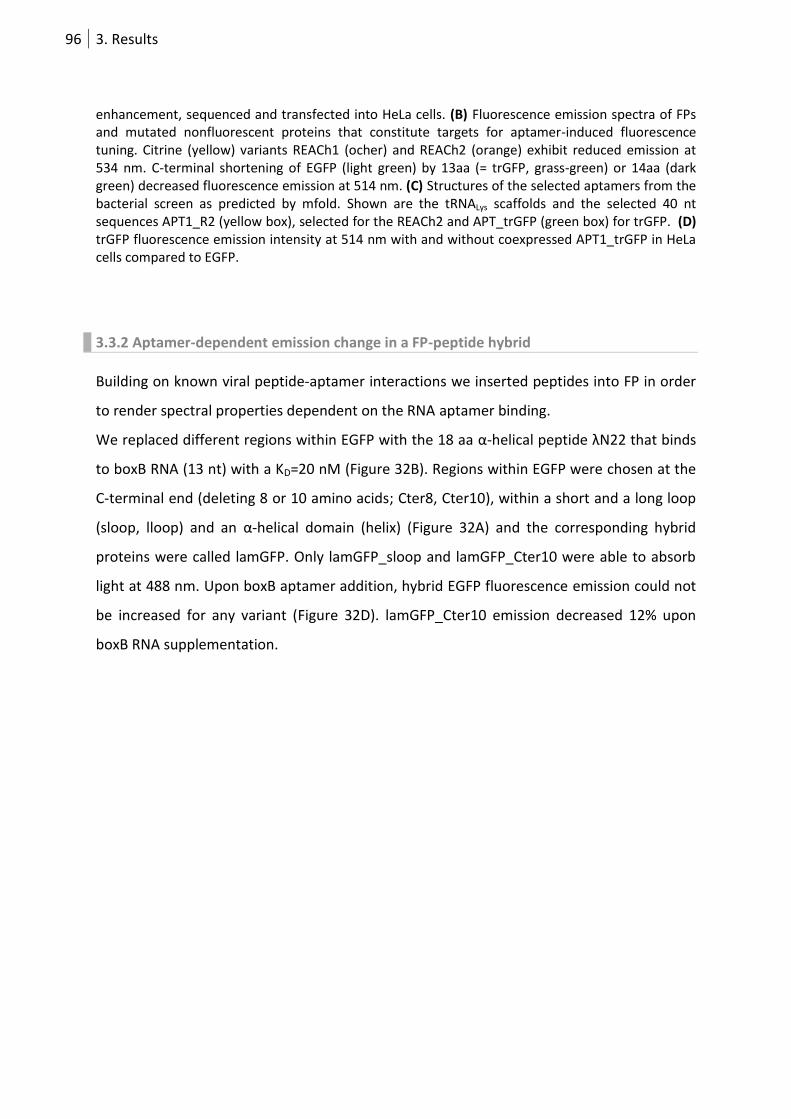
96 3. Results
enhancement, sequenced and transfected into HeLa cells. (B) Fluorescence emission spectra of FPs and mutated nonfluorescent proteins that constitute targets for aptamer-induced fluorescence tuning. Citrine (yellow) variants REACh1 (ocher) and REACh2 (orange) exhibit reduced emission at 534 nm. C-terminal shortening of EGFP (light green) by 13aa (= trGFP, grass-green) or 14aa (dark green) decreased fluorescence emission at 514 nm. (C) Structures of the selected aptamers from the bacterial screen as predicted by mfold. Shown are the tRNALys scaffolds and the selected 40 nt sequences APT1_R2 (yellow box), selected for the REACh2 and APT_trGFP (green box) for trGFP. (D) trGFP fluorescence emission intensity at 514 nm with and without coexpressed APT1_trGFP in HeLa cells compared to EGFP.
3.3.2 Aptamer-dependent emission change in a FP-peptide hybrid
Building on known viral peptide-aptamer interactions we inserted peptides into FP in order
to render spectral properties dependent on the RNA aptamer binding.
We replaced different regions within EGFP with the 18 aa α-helical peptide λN22 that binds
to boxB RNA (13 nt) with a KD=20 nM (Figure 32B). Regions within EGFP were chosen at the
C-terminal end (deleting 8 or 10 amino acids; Cter8, Cter10), within a short and a long loop
(sloop, lloop) and an α-helical domain (helix) (Figure 32A) and the corresponding hybrid
proteins were called lamGFP. Only lamGFP_sloop and lamGFP_Cter10 were able to absorb
light at 488 nm. Upon boxB aptamer addition, hybrid EGFP fluorescence emission could not
be increased for any variant (Figure 32D). lamGFP_Cter10 emission decreased 12% upon
boxB RNA supplementation.
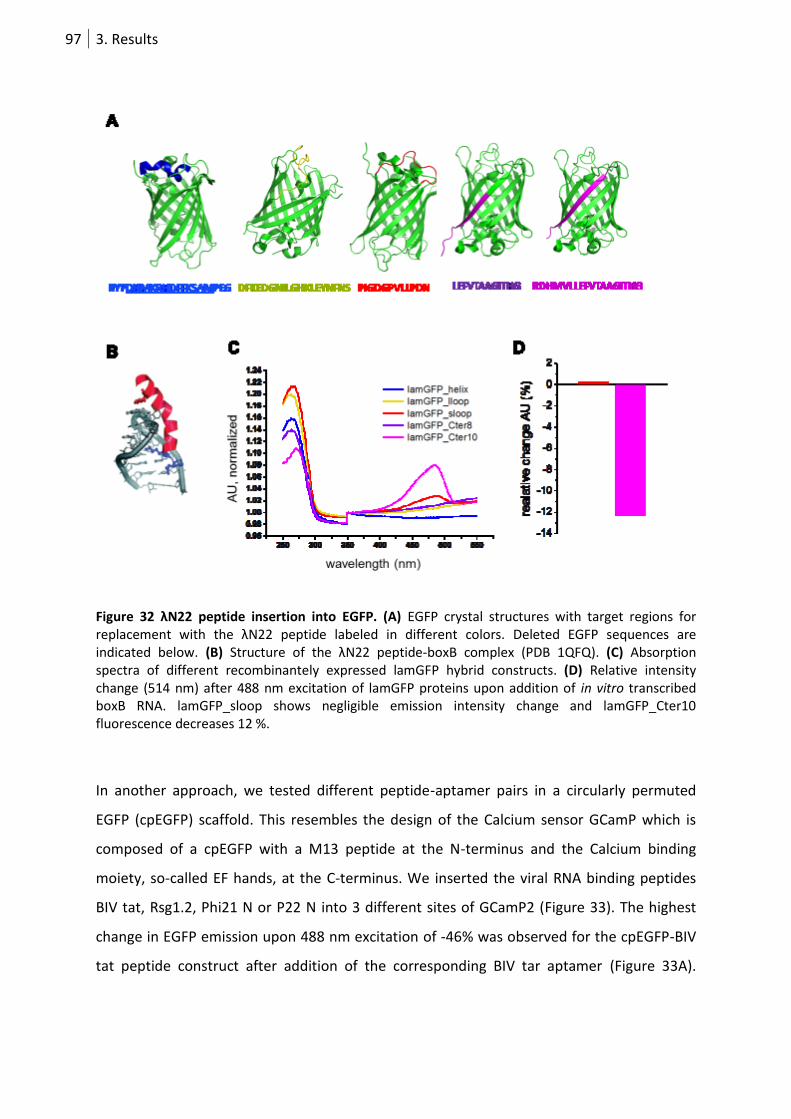
97 3. Results
Figure 32 λN22 peptide insertion into EGFP. (A) EGFP crystal structures with target regions for replacement with the λN22 peptide labeled in different colors. Deleted EGFP sequences are indicated below. (B) Structure of the λN22 peptide-boxB complex (PDB 1QFQ). (C) Absorption spectra of different recombinantely expressed lamGFP hybrid constructs. (D) Relative intensity change (514 nm) after 488 nm excitation of lamGFP proteins upon addition of in vitro transcribed boxB RNA. lamGFP_sloop shows negligible emission intensity change and lamGFP_Cter10 fluorescence decreases 12 %.
In another approach, we tested different peptide-aptamer pairs in a circularly permuted
EGFP (cpEGFP) scaffold. This resembles the design of the Calcium sensor GCamP which is
composed of a cpEGFP with a M13 peptide at the N-terminus and the Calcium binding
moiety, so-called EF hands, at the C-terminus. We inserted the viral RNA binding peptides
BIV tat, Rsg1.2, Phi21 N or P22 N into 3 different sites of GCamP2 (Figure 33). The highest
change in EGFP emission upon 488 nm excitation of -46% was observed for the cpEGFP-BIV
tat peptide construct after addition of the corresponding BIV tar aptamer (Figure 33A).
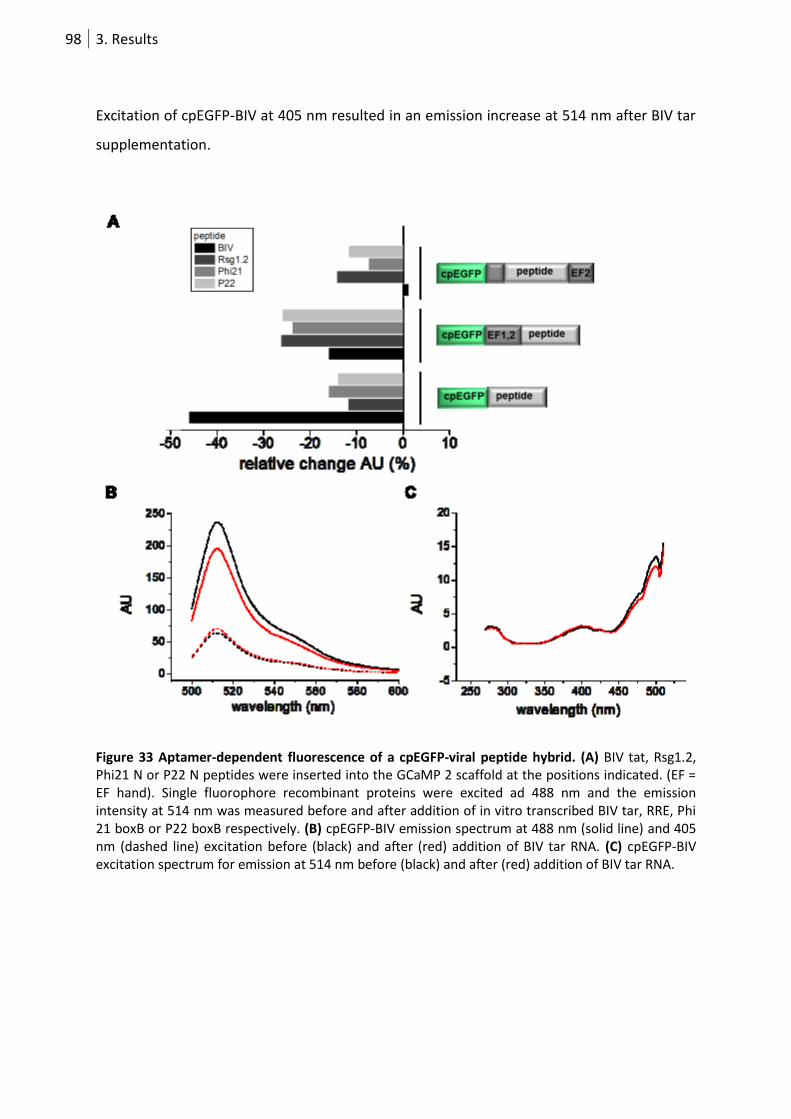
98 3. Results
Excitation of cpEGFP-BIV at 405 nm resulted in an emission increase at 514 nm after BIV tar
supplementation.
Figure 33 Aptamer-dependent fluorescence of a cpEGFP-viral peptide hybrid. (A) BIV tat, Rsg1.2, Phi21 N or P22 N peptides were inserted into the GCaMP 2 scaffold at the positions indicated. (EF = EF hand). Single fluorophore recombinant proteins were excited ad 488 nm and the emission intensity at 514 nm was measured before and after addition of in vitro transcribed BIV tar, RRE, Phi 21 boxB or P22 boxB respectively. (B) cpEGFP-BIV emission spectrum at 488 nm (solid line) and 405 nm (dashed line) excitation before (black) and after (red) addition of BIV tar RNA. (C) cpEGFP-BIV excitation spectrum for emission at 514 nm before (black) and after (red) addition of BIV tar RNA.
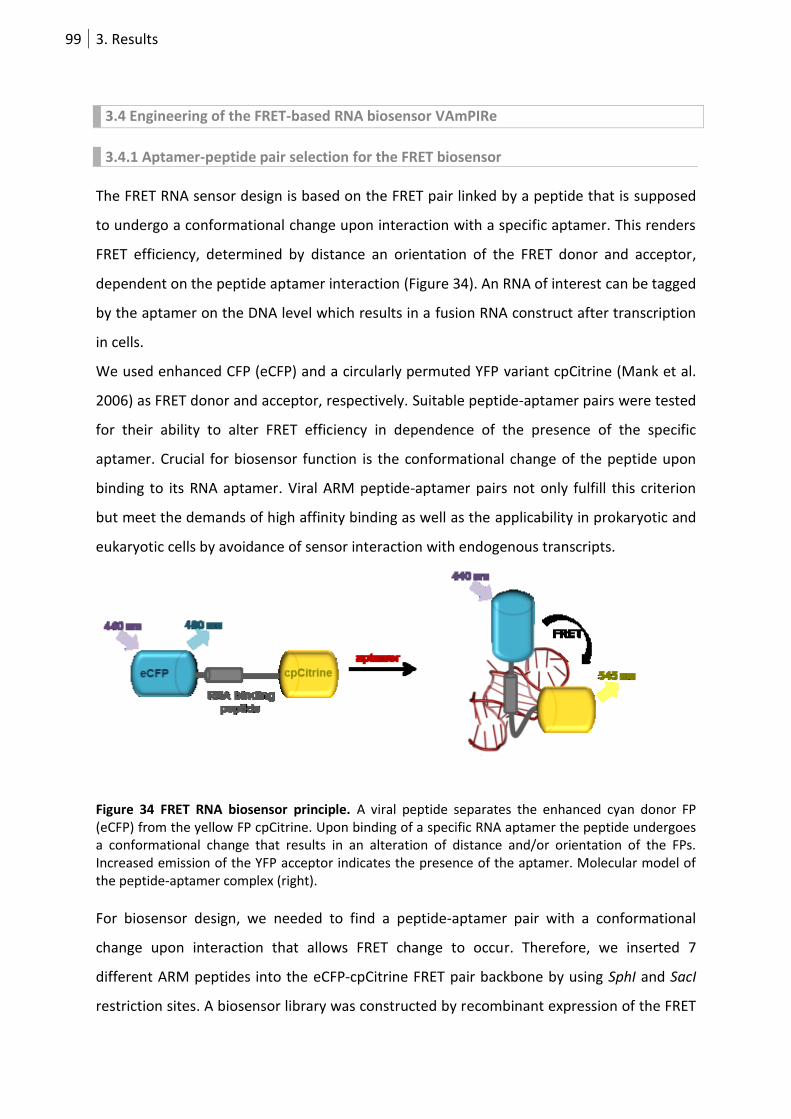
99 3. Results
3.4 Engineering of the FRET-based RNA biosensor VAmPIRe
3.4.1 Aptamer-peptide pair selection for the FRET biosensor
The FRET RNA sensor design is based on the FRET pair linked by a peptide that is supposed
to undergo a conformational change upon interaction with a specific aptamer. This renders
FRET efficiency, determined by distance an orientation of the FRET donor and acceptor,
dependent on the peptide aptamer interaction (Figure 34). An RNA of interest can be tagged
by the aptamer on the DNA level which results in a fusion RNA construct after transcription
in cells.
We used enhanced CFP (eCFP) and a circularly permuted YFP variant cpCitrine (Mank et al.
2006) as FRET donor and acceptor, respectively. Suitable peptide-aptamer pairs were tested
for their ability to alter FRET efficiency in dependence of the presence of the specific
aptamer. Crucial for biosensor function is the conformational change of the peptide upon
binding to its RNA aptamer. Viral ARM peptide-aptamer pairs not only fulfill this criterion
but meet the demands of high affinity binding as well as the applicability in prokaryotic and
eukaryotic cells by avoidance of sensor interaction with endogenous transcripts.
Figure 34 FRET RNA biosensor principle. A viral peptide separates the enhanced cyan donor FP (eCFP) from the yellow FP cpCitrine. Upon binding of a specific RNA aptamer the peptide undergoes a conformational change that results in an alteration of distance and/or orientation of the FPs. Increased emission of the YFP acceptor indicates the presence of the aptamer. Molecular model of the peptide-aptamer complex (right).
For biosensor design, we needed to find a peptide-aptamer pair with a conformational
change upon interaction that allows FRET change to occur. Therefore, we inserted 7
different ARM peptides into the eCFP-cpCitrine FRET pair backbone by using SphI and SacI
restriction sites. A biosensor library was constructed by recombinant expression of the FRET
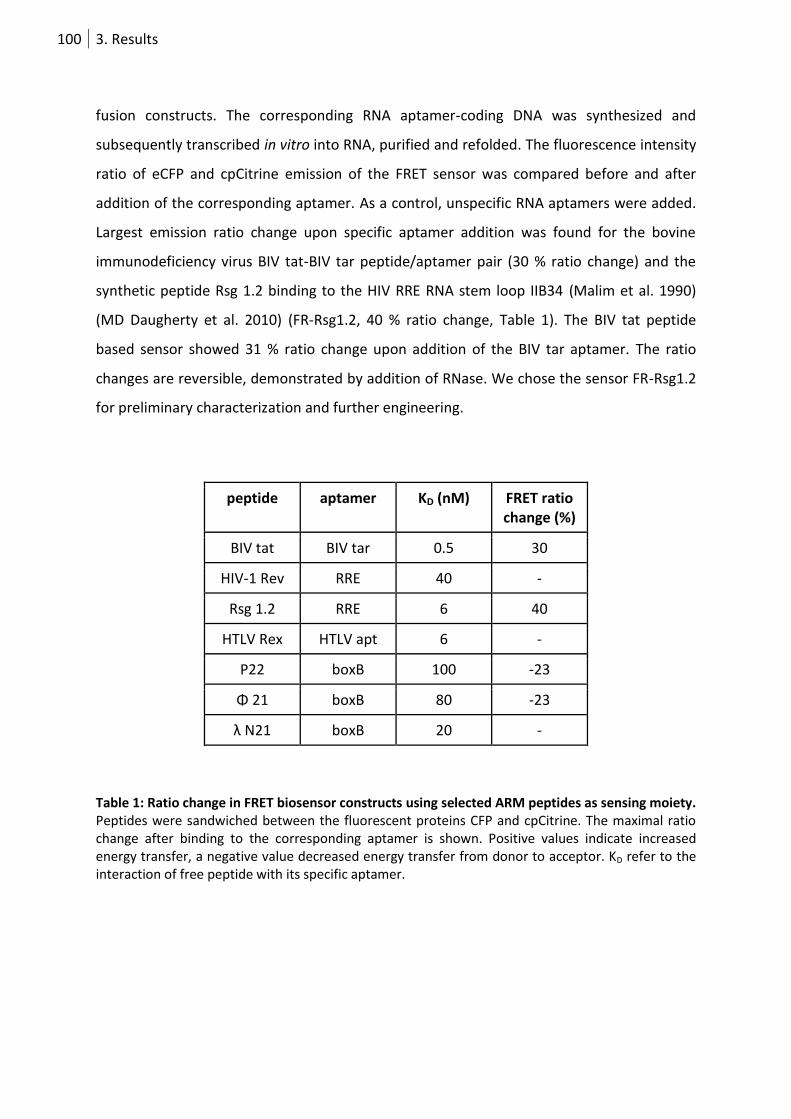
100 3. Results
fusion constructs. The corresponding RNA aptamer-coding DNA was synthesized and
subsequently transcribed in vitro into RNA, purified and refolded. The fluorescence intensity
ratio of eCFP and cpCitrine emission of the FRET sensor was compared before and after
addition of the corresponding aptamer. As a control, unspecific RNA aptamers were added.
Largest emission ratio change upon specific aptamer addition was found for the bovine
immunodeficiency virus BIV tat-BIV tar peptide/aptamer pair (30 % ratio change) and the
synthetic peptide Rsg 1.2 binding to the HIV RRE RNA stem loop IIB34 (Malim et al. 1990)
(MD Daugherty et al. 2010) (FR-Rsg1.2, 40 % ratio change, Table 1). The BIV tat peptide
based sensor showed 31 % ratio change upon addition of the BIV tar aptamer. The ratio
changes are reversible, demonstrated by addition of RNase. We chose the sensor FR-Rsg1.2
for preliminary characterization and further engineering.
peptide aptamer KD (nM) FRET ratio change (%)
BIV tat BIV tar 0.5 30
HIV-1 Rev RRE 40 -
Rsg 1.2 RRE 6 40
HTLV Rex HTLV apt 6 -
P22 boxB 100 -23
Φ 21 boxB 80 -23
λ N21 boxB 20 -
Table 1: Ratio change in FRET biosensor constructs using selected ARM peptides as sensing moiety. Peptides were sandwiched between the fluorescent proteins CFP and cpCitrine. The maximal ratio change after binding to the corresponding aptamer is shown. Positive values indicate increased energy transfer, a negative value decreased energy transfer from donor to acceptor. KD refer to the interaction of free peptide with its specific aptamer.
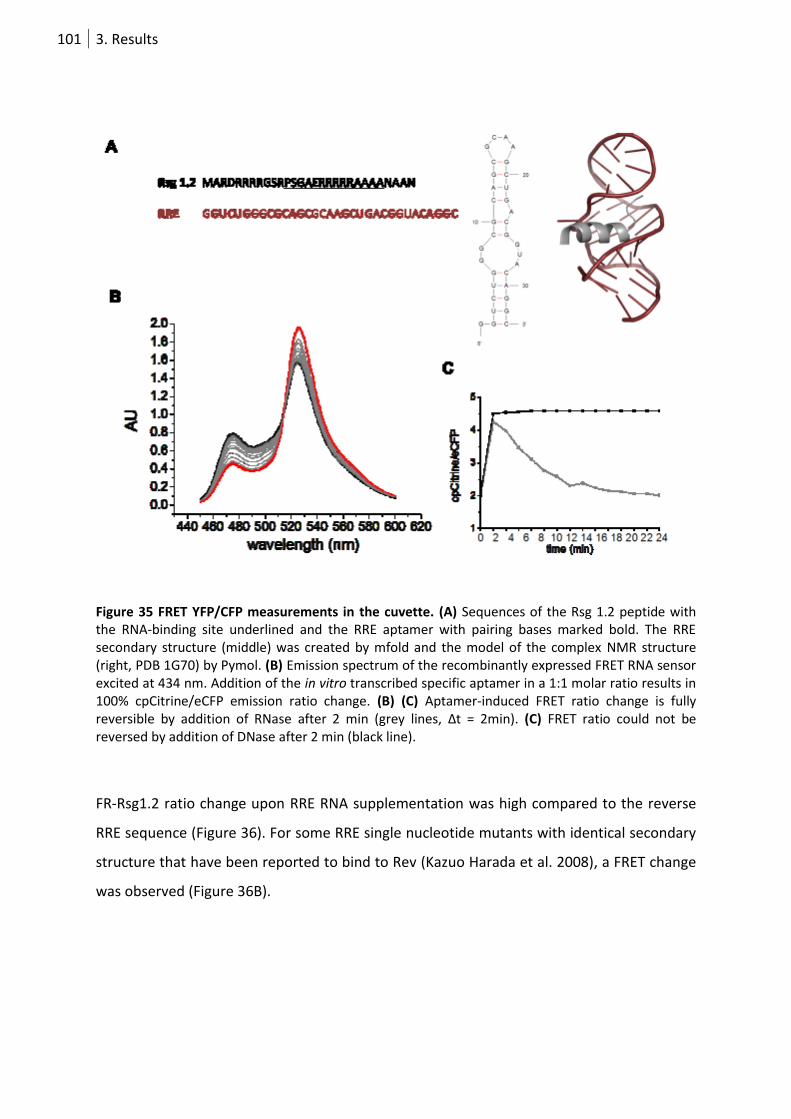
101 3. Results
Figure 35 FRET YFP/CFP measurements in the cuvette. (A) Sequences of the Rsg 1.2 peptide with the RNA-binding site underlined and the RRE aptamer with pairing bases marked bold. The RRE secondary structure (middle) was created by mfold and the model of the complex NMR structure (right, PDB 1G70) by Pymol. (B) Emission spectrum of the recombinantly expressed FRET RNA sensor excited at 434 nm. Addition of the in vitro transcribed specific aptamer in a 1:1 molar ratio results in 100% cpCitrine/eCFP emission ratio change. (B) (C) Aptamer-induced FRET ratio change is fully reversible by addition of RNase after 2 min (grey lines, Δt = 2min). (C) FRET ratio could not be reversed by addition of DNase after 2 min (black line).
FR-Rsg1.2 ratio change upon RRE RNA supplementation was high compared to the reverse
RRE sequence (Figure 36). For some RRE single nucleotide mutants with identical secondary
structure that have been reported to bind to Rev (Kazuo Harada et al. 2008), a FRET change
was observed (Figure 36B).
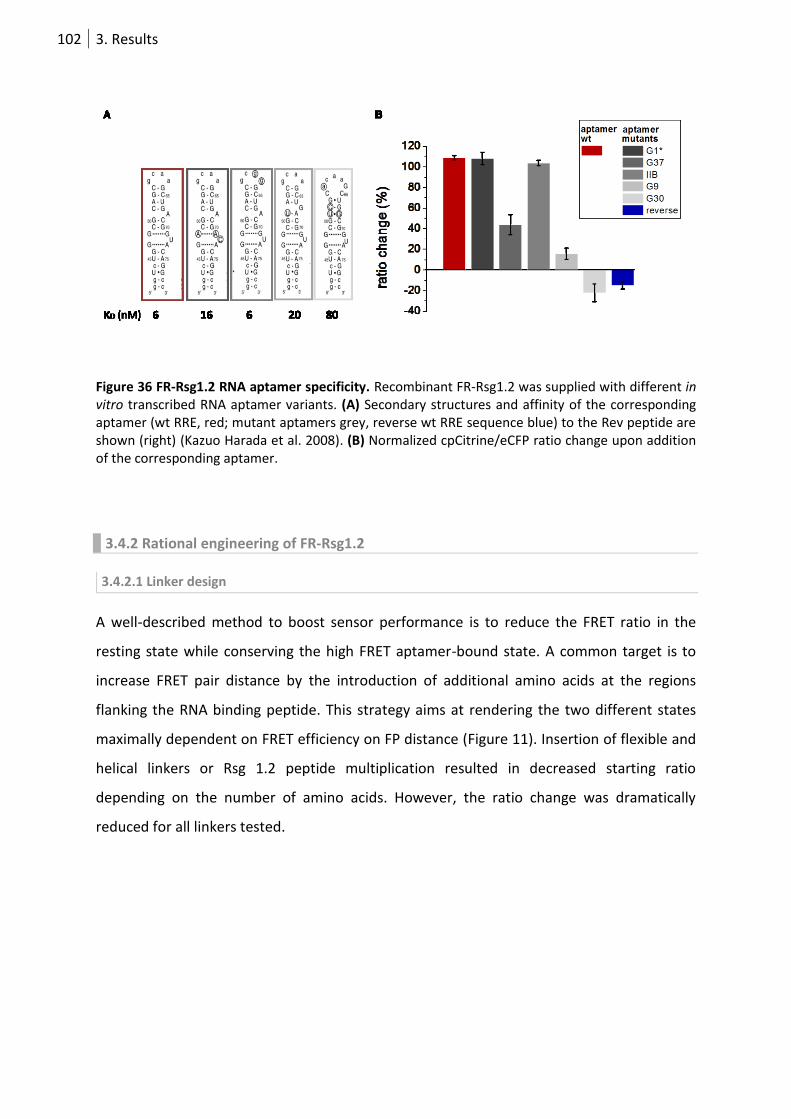
102 3. Results
Figure 36 FR-Rsg1.2 RNA aptamer specificity. Recombinant FR-Rsg1.2 was supplied with different in vitro transcribed RNA aptamer variants. (A) Secondary structures and affinity of the corresponding aptamer (wt RRE, red; mutant aptamers grey, reverse wt RRE sequence blue) to the Rev peptide are shown (right) (Kazuo Harada et al. 2008). (B) Normalized cpCitrine/eCFP ratio change upon addition of the corresponding aptamer.
3.4.2 Rational engineering of FR-Rsg1.2
3.4.2.1 Linker design
A well-described method to boost sensor performance is to reduce the FRET ratio in the
resting state while conserving the high FRET aptamer-bound state. A common target is to
increase FRET pair distance by the introduction of additional amino acids at the regions
flanking the RNA binding peptide. This strategy aims at rendering the two different states
maximally dependent on FRET efficiency on FP distance (Figure 11). Insertion of flexible and
helical linkers or Rsg 1.2 peptide multiplication resulted in decreased starting ratio
depending on the number of amino acids. However, the ratio change was dramatically
reduced for all linkers tested.
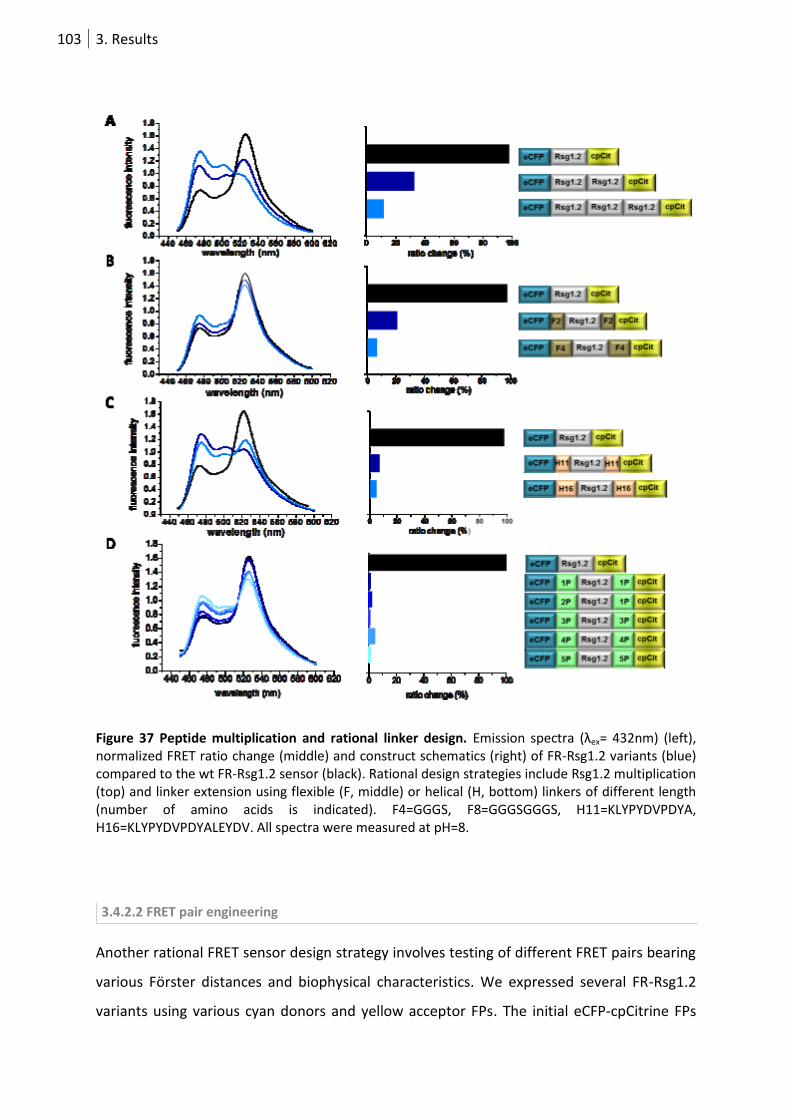
103 3. Results
Figure 37 Peptide multiplication and rational linker design. Emission spectra (λex= 432nm) (left), normalized FRET ratio change (middle) and construct schematics (right) of FR-Rsg1.2 variants (blue) compared to the wt FR-Rsg1.2 sensor (black). Rational design strategies include Rsg1.2 multiplication (top) and linker extension using flexible (F, middle) or helical (H, bottom) linkers of different length (number of amino acids is indicated). F4=GGGS, F8=GGGSGGGS, H11=KLYPYDVPDYA, H16=KLYPYDVPDYALEYDV. All spectra were measured at pH=8.
3.4.2.2 FRET pair engineering
Another rational FRET sensor design strategy involves testing of different FRET pairs bearing
various Förster distances and biophysical characteristics. We expressed several FR-Rsg1.2
variants using various cyan donors and yellow acceptor FPs. The initial eCFP-cpCitrine FPs
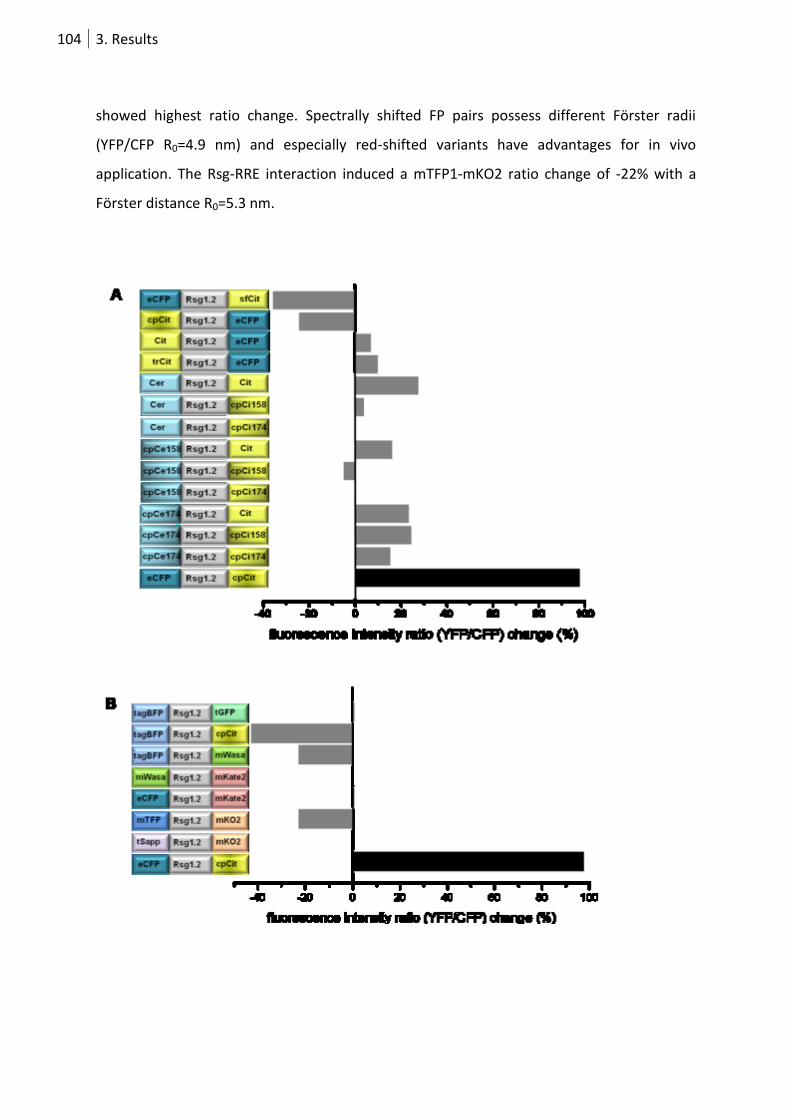
104 3. Results
showed highest ratio change. Spectrally shifted FP pairs possess different Förster radii
(YFP/CFP R0=4.9 nm) and especially red-shifted variants have advantages for in vivo
application. The Rsg-RRE interaction induced a mTFP1-mKO2 ratio change of -22% with a
Förster distance R0=5.3 nm.
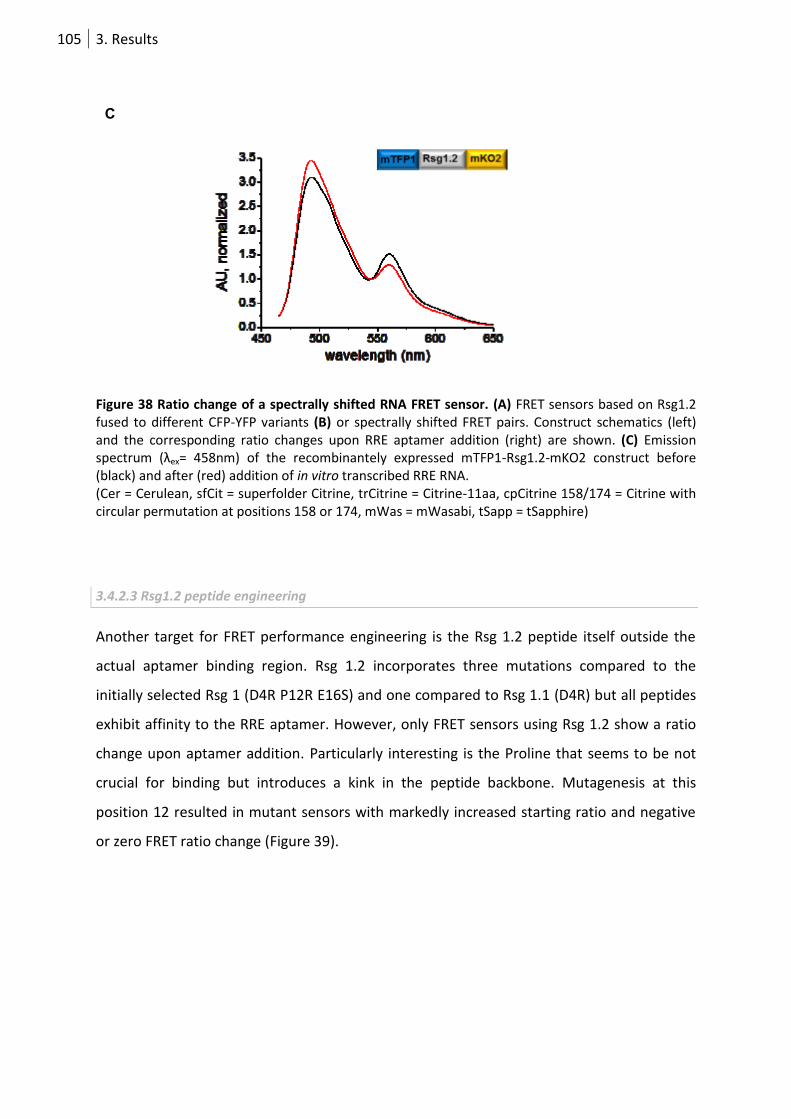
105 3. Results
C
Figure 38 Ratio change of a spectrally shifted RNA FRET sensor. (A) FRET sensors based on Rsg1.2 fused to different CFP-YFP variants (B) or spectrally shifted FRET pairs. Construct schematics (left) and the corresponding ratio changes upon RRE aptamer addition (right) are shown. (C) Emission spectrum (λex= 458nm) of the recombinantely expressed mTFP1-Rsg1.2-mKO2 construct before (black) and after (red) addition of in vitro transcribed RRE RNA. (Cer = Cerulean, sfCit = superfolder Citrine, trCitrine = Citrine-11aa, cpCitrine 158/174 = Citrine with circular permutation at positions 158 or 174, mWas = mWasabi, tSapp = tSapphire)
3.4.2.3 Rsg1.2 peptide engineering
Another target for FRET performance engineering is the Rsg 1.2 peptide itself outside the
actual aptamer binding region. Rsg 1.2 incorporates three mutations compared to the
initially selected Rsg 1 (D4R P12R E16S) and one compared to Rsg 1.1 (D4R) but all peptides
exhibit affinity to the RRE aptamer. However, only FRET sensors using Rsg 1.2 show a ratio
change upon aptamer addition. Particularly interesting is the Proline that seems to be not
crucial for binding but introduces a kink in the peptide backbone. Mutagenesis at this
position 12 resulted in mutant sensors with markedly increased starting ratio and negative
or zero FRET ratio change (Figure 39).
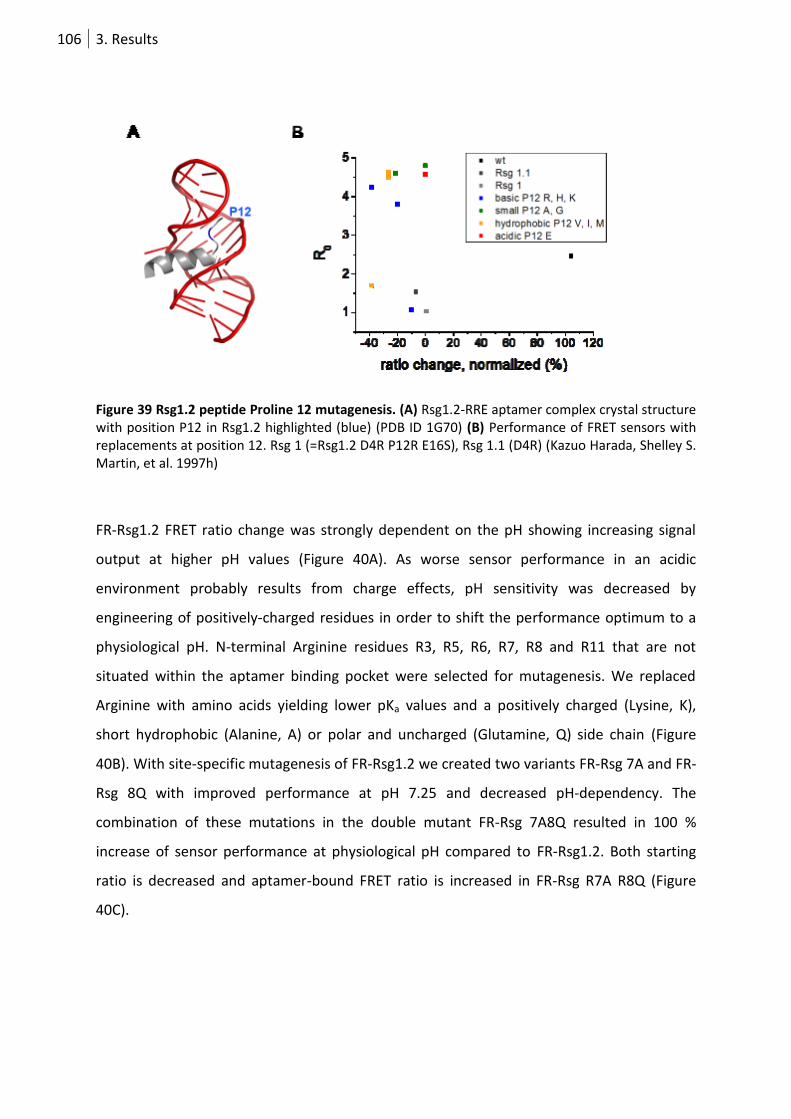
106 3. Results
Figure 39 Rsg1.2 peptide Proline 12 mutagenesis. (A) Rsg1.2-RRE aptamer complex crystal structure with position P12 in Rsg1.2 highlighted (blue) (PDB ID 1G70) (B) Performance of FRET sensors with replacements at position 12. Rsg 1 (=Rsg1.2 D4R P12R E16S), Rsg 1.1 (D4R) (Kazuo Harada, Shelley S. Martin, et al. 1997h)
FR-Rsg1.2 FRET ratio change was strongly dependent on the pH showing increasing signal
output at higher pH values (Figure 40A). As worse sensor performance in an acidic
environment probably results from charge effects, pH sensitivity was decreased by
engineering of positively-charged residues in order to shift the performance optimum to a
physiological pH. N-terminal Arginine residues R3, R5, R6, R7, R8 and R11 that are not
situated within the aptamer binding pocket were selected for mutagenesis. We replaced
Arginine with amino acids yielding lower pKa values and a positively charged (Lysine, K),
short hydrophobic (Alanine, A) or polar and uncharged (Glutamine, Q) side chain (Figure
40B). With site-specific mutagenesis of FR-Rsg1.2 we created two variants FR-Rsg 7A and FR-
Rsg 8Q with improved performance at pH 7.25 and decreased pH-dependency. The
combination of these mutations in the double mutant FR-Rsg 7A8Q resulted in 100 %
increase of sensor performance at physiological pH compared to FR-Rsg1.2. Both starting
ratio is decreased and aptamer-bound FRET ratio is increased in FR-Rsg R7A R8Q (Figure
40C).
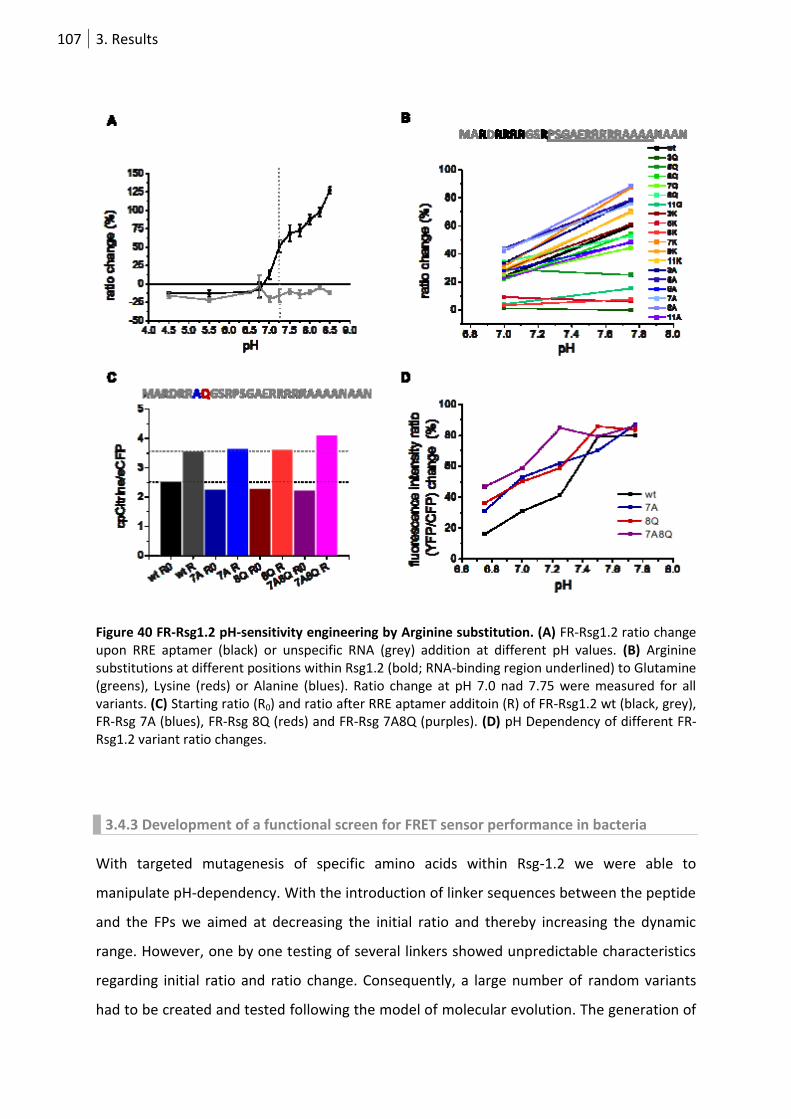
107 3. Results
Figure 40 FR-Rsg1.2 pH-sensitivity engineering by Arginine substitution. (A) FR-Rsg1.2 ratio change upon RRE aptamer (black) or unspecific RNA (grey) addition at different pH values. (B) Arginine substitutions at different positions within Rsg1.2 (bold; RNA-binding region underlined) to Glutamine (greens), Lysine (reds) or Alanine (blues). Ratio change at pH 7.0 nad 7.75 were measured for all variants. (C) Starting ratio (R0) and ratio after RRE aptamer additoin (R) of FR-Rsg1.2 wt (black, grey), FR-Rsg 7A (blues), FR-Rsg 8Q (reds) and FR-Rsg 7A8Q (purples). (D) pH Dependency of different FR-Rsg1.2 variant ratio changes.
3.4.3 Development of a functional screen for FRET sensor performance in bacteria
With targeted mutagenesis of specific amino acids within Rsg-1.2 we were able to
manipulate pH-dependency. With the introduction of linker sequences between the peptide
and the FPs we aimed at decreasing the initial ratio and thereby increasing the dynamic
range. However, one by one testing of several linkers showed unpredictable characteristics
regarding initial ratio and ratio change. Consequently, a large number of random variants
had to be created and tested following the model of molecular evolution. The generation of
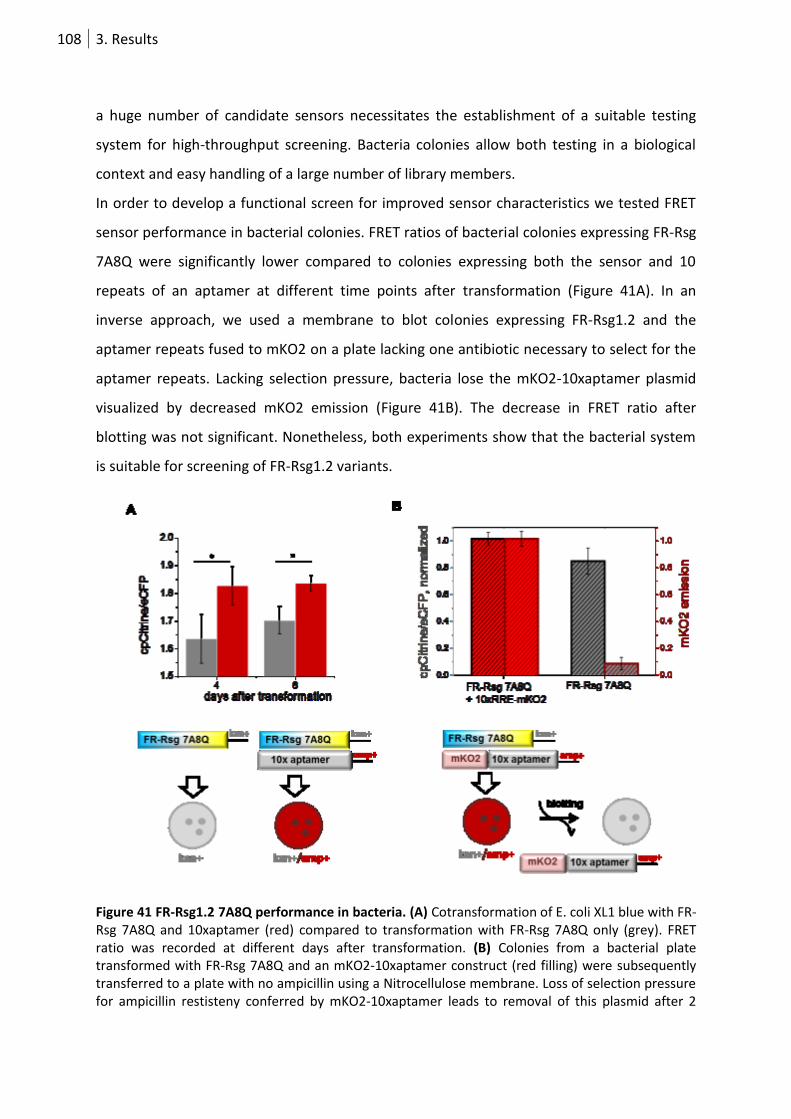
108 3. Results
a huge number of candidate sensors necessitates the establishment of a suitable testing
system for high-throughput screening. Bacteria colonies allow both testing in a biological
context and easy handling of a large number of library members.
In order to develop a functional screen for improved sensor characteristics we tested FRET
sensor performance in bacterial colonies. FRET ratios of bacterial colonies expressing FR-Rsg
7A8Q were significantly lower compared to colonies expressing both the sensor and 10
repeats of an aptamer at different time points after transformation (Figure 41A). In an
inverse approach, we used a membrane to blot colonies expressing FR-Rsg1.2 and the
aptamer repeats fused to mKO2 on a plate lacking one antibiotic necessary to select for the
aptamer repeats. Lacking selection pressure, bacteria lose the mKO2-10xaptamer plasmid
visualized by decreased mKO2 emission (Figure 41B). The decrease in FRET ratio after
blotting was not significant. Nonetheless, both experiments show that the bacterial system
is suitable for screening of FR-Rsg1.2 variants.
Figure 41 FR-Rsg1.2 7A8Q performance in bacteria. (A) Cotransformation of E. coli XL1 blue with FR-Rsg 7A8Q and 10xaptamer (red) compared to transformation with FR-Rsg 7A8Q only (grey). FRET ratio was recorded at different days after transformation. (B) Colonies from a bacterial plate transformed with FR-Rsg 7A8Q and an mKO2-10xaptamer construct (red filling) were subsequently transferred to a plate with no ampicillin using a Nitrocellulose membrane. Loss of selection pressure for ampicillin restisteny conferred by mKO2-10xaptamer leads to removal of this plasmid after 2

109 3. Results
blotting steps (grey filling). Average colony mKO2 emission (dark red stripes) and cpCitrine/eCFP ratio (black stripes) are plotted.
For the generation of a mutagenized sensor library we followed 3 different strategies (Figure
42A). In a random approach we performed error-prone PCR on the Rsg 7A8Q peptide using
CFP Chr for and cpCit Chr rev primers thereby introducing mutations at undefined sites.
Using another strategy, degenerated primers (Eurofins) allowed the introduction of
randomized amino acids at defined positions during normal PCR reaction (see 3.2.1). The
last library comprises linker constructs with random amino acids at both Rsg 7A8Q peptide-
FP junctions. The peptide was amplified using degenerated primers that introduce triplets
coding for 1, 2, 3, 4 or 8 amino acids. Resulting peptide elongation was supposed to
conserve peptide dynamics while increasing the distance between the FRET pair.
The mutagenized peptide libraries were digested cloned into SphI/SacI and ligated into a
pRSFDuet-eCFP-cpCit vector (Kana+) for weak protein expression. 10 aptamer repeats were
cloned using HindIII/NotI into pMB133 which is designed to turn off the expression of the
aptamer-containing RNA via TetR-tetO interactions in the promoter region (Valencia-Burton
et al. 2009). This inhibition is released in the presence of anhydrotetracycline (aTC) which
results in RNA aptamer expression. The sensor library was co-transformed into XL1 blue
together with the pMBα3-10xRRE plasmid (Amp+).
On every bacterial plate, we placed two control patches with colonies expressing FR-Rsg
7A8Q only or FR-Rsg 7A8Q and pMB133-10xRRE. Using wide field CCD camera imaging of
bacterial agar plates we were able to image simultaneously up to 1000 bacterial colonies
each harboring a diversified sensor and to follow FRET changes upon induction of aptamer
transcription (Figure 21) using 20 ng/µL aTC. For data analysis, one ROI per colony was
automatically selected by a program written by David Ng using Cell Profiler. Data were
analyzed by Origin 8.1 by plotting the ratio change 200 min after aTC induction over the
starting FRET ratio. The selected colonies correspond to the ROIs with a ratio change higher
and a starting ratio lower than the average of 6 control colonies.
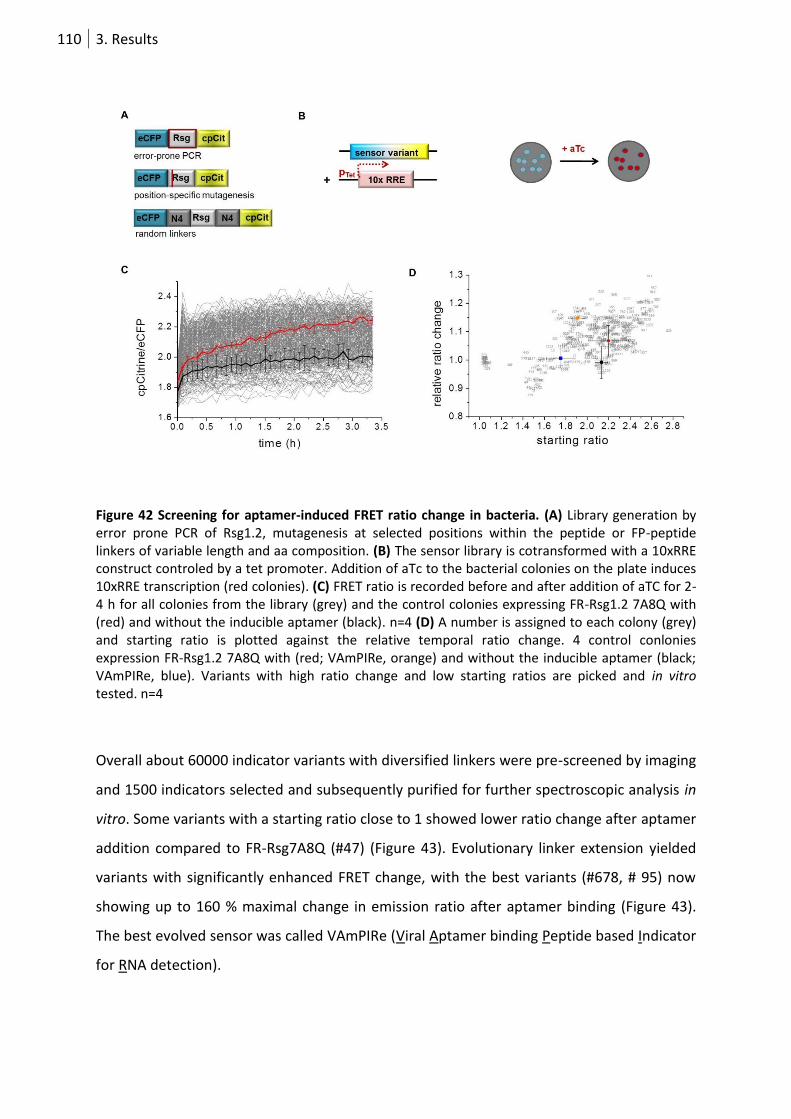
110 3. Results
Figure 42 Screening for aptamer-induced FRET ratio change in bacteria. (A) Library generation by error prone PCR of Rsg1.2, mutagenesis at selected positions within the peptide or FP-peptide linkers of variable length and aa composition. (B) The sensor library is cotransformed with a 10xRRE construct controled by a tet promoter. Addition of aTc to the bacterial colonies on the plate induces 10xRRE transcription (red colonies). (C) FRET ratio is recorded before and after addition of aTC for 2-4 h for all colonies from the library (grey) and the control colonies expressing FR-Rsg1.2 7A8Q with (red) and without the inducible aptamer (black). n=4 (D) A number is assigned to each colony (grey) and starting ratio is plotted against the relative temporal ratio change. 4 control conlonies expression FR-Rsg1.2 7A8Q with (red; VAmPIRe, orange) and without the inducible aptamer (black; VAmPIRe, blue). Variants with high ratio change and low starting ratios are picked and in vitro tested. n=4
Overall about 60000 indicator variants with diversified linkers were pre-screened by imaging
and 1500 indicators selected and subsequently purified for further spectroscopic analysis in
vitro. Some variants with a starting ratio close to 1 showed lower ratio change after aptamer
addition compared to FR-Rsg7A8Q (#47) (Figure 43). Evolutionary linker extension yielded
variants with significantly enhanced FRET change, with the best variants (#678, # 95) now
showing up to 160 % maximal change in emission ratio after aptamer binding (Figure 43).
The best evolved sensor was called VAmPIRe (Viral Aptamer binding Peptide based Indicator
for RNA detection).
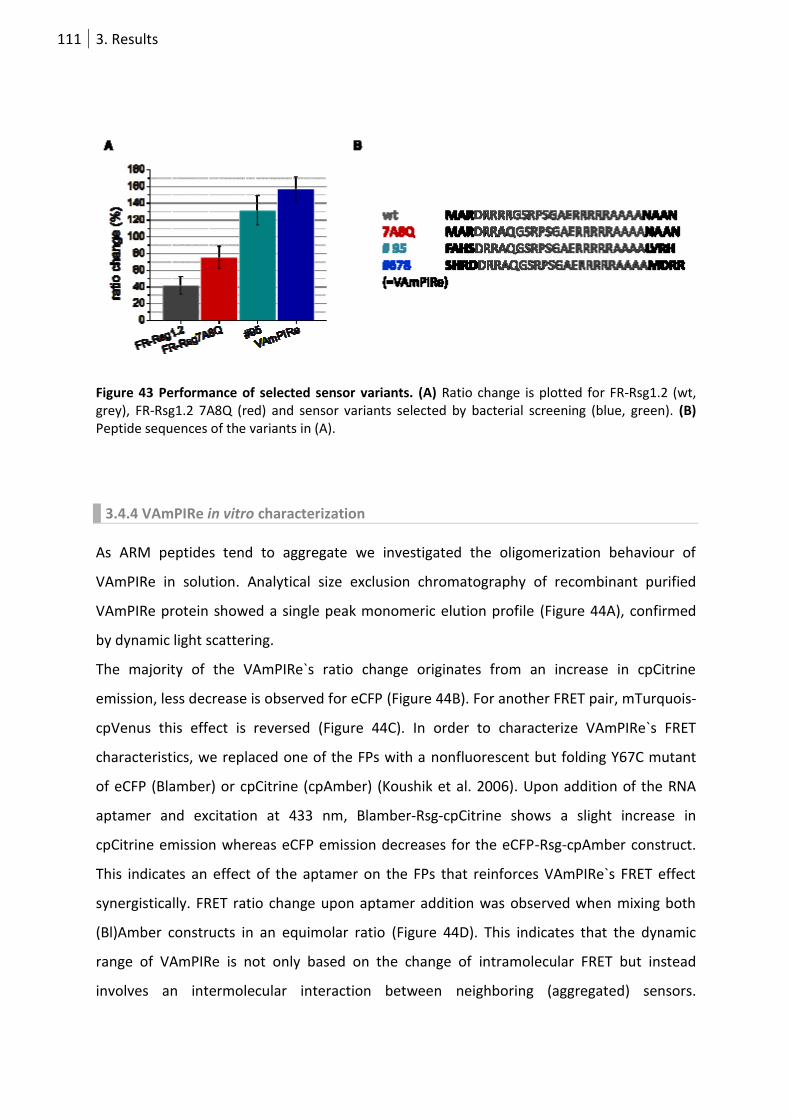
111 3. Results
Figure 43 Performance of selected sensor variants. (A) Ratio change is plotted for FR-Rsg1.2 (wt, grey), FR-Rsg1.2 7A8Q (red) and sensor variants selected by bacterial screening (blue, green). (B) Peptide sequences of the variants in (A).
3.4.4 VAmPIRe in vitro characterization
As ARM peptides tend to aggregate we investigated the oligomerization behaviour of
VAmPIRe in solution. Analytical size exclusion chromatography of recombinant purified
VAmPIRe protein showed a single peak monomeric elution profile (Figure 44A), confirmed
by dynamic light scattering.
The majority of the VAmPIRe`s ratio change originates from an increase in cpCitrine
emission, less decrease is observed for eCFP (Figure 44B). For another FRET pair, mTurquois-
cpVenus this effect is reversed (Figure 44C). In order to characterize VAmPIRe`s FRET
characteristics, we replaced one of the FPs with a nonfluorescent but folding Y67C mutant
of eCFP (Blamber) or cpCitrine (cpAmber) (Koushik et al. 2006). Upon addition of the RNA
aptamer and excitation at 433 nm, Blamber-Rsg-cpCitrine shows a slight increase in
cpCitrine emission whereas eCFP emission decreases for the eCFP-Rsg-cpAmber construct.
This indicates an effect of the aptamer on the FPs that reinforces VAmPIRe`s FRET effect
synergistically. FRET ratio change upon aptamer addition was observed when mixing both
(Bl)Amber constructs in an equimolar ratio (Figure 44D). This indicates that the dynamic
range of VAmPIRe is not only based on the change of intramolecular FRET but instead
involves an intermolecular interaction between neighboring (aggregated) sensors.
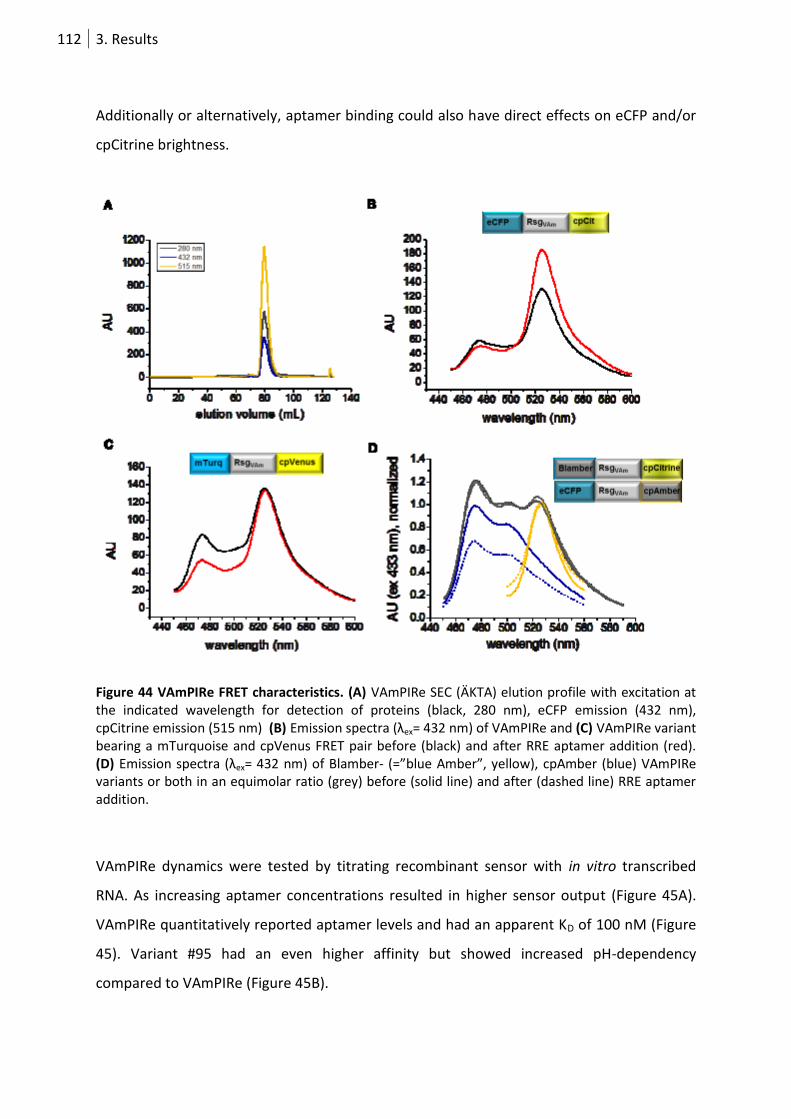
112 3. Results
Additionally or alternatively, aptamer binding could also have direct effects on eCFP and/or
cpCitrine brightness.
Figure 44 VAmPIRe FRET characteristics. (A) VAmPIRe SEC (ÄKTA) elution profile with excitation at the indicated wavelength for detection of proteins (black, 280 nm), eCFP emission (432 nm), cpCitrine emission (515 nm) (B) Emission spectra (λex= 432 nm) of VAmPIRe and (C) VAmPIRe variant bearing a mTurquoise and cpVenus FRET pair before (black) and after RRE aptamer addition (red). (D) Emission spectra (λex= 432 nm) of Blamber- (=”blue Amber”, yellow), cpAmber (blue) VAmPIRe variants or both in an equimolar ratio (grey) before (solid line) and after (dashed line) RRE aptamer addition.
VAmPIRe dynamics were tested by titrating recombinant sensor with in vitro transcribed
RNA. As increasing aptamer concentrations resulted in higher sensor output (Figure 45A).
VAmPIRe quantitatively reported aptamer levels and had an apparent KD of 100 nM (Figure
45). Variant #95 had an even higher affinity but showed increased pH-dependency
compared to VAmPIRe (Figure 45B).
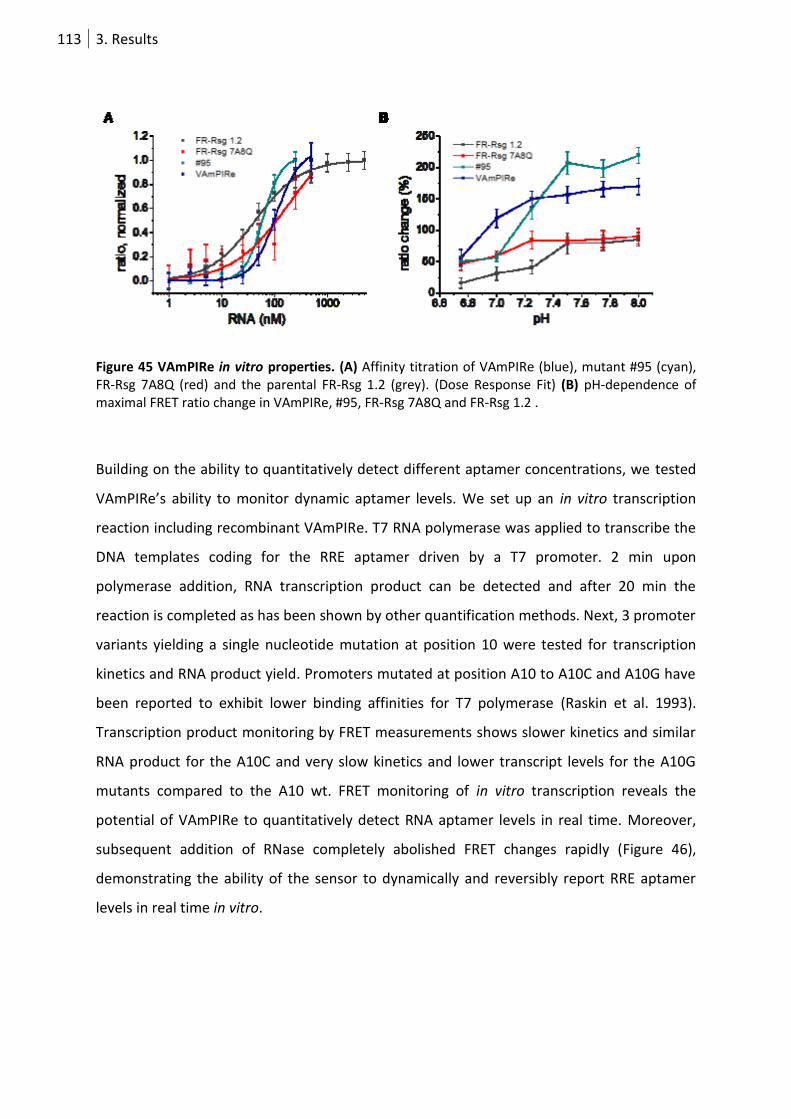
113 3. Results
Figure 45 VAmPIRe in vitro properties. (A) Affinity titration of VAmPIRe (blue), mutant #95 (cyan), FR-Rsg 7A8Q (red) and the parental FR-Rsg 1.2 (grey). (Dose Response Fit) (B) pH-dependence of maximal FRET ratio change in VAmPIRe, #95, FR-Rsg 7A8Q and FR-Rsg 1.2 .
Building on the ability to quantitatively detect different aptamer concentrations, we tested
VAmPIRe’s ability to monitor dynamic aptamer levels. We set up an in vitro transcription
reaction including recombinant VAmPIRe. T7 RNA polymerase was applied to transcribe the
DNA templates coding for the RRE aptamer driven by a T7 promoter. 2 min upon
polymerase addition, RNA transcription product can be detected and after 20 min the
reaction is completed as has been shown by other quantification methods. Next, 3 promoter
variants yielding a single nucleotide mutation at position 10 were tested for transcription
kinetics and RNA product yield. Promoters mutated at position A10 to A10C and A10G have
been reported to exhibit lower binding affinities for T7 polymerase (Raskin et al. 1993).
Transcription product monitoring by FRET measurements shows slower kinetics and similar
RNA product for the A10C and very slow kinetics and lower transcript levels for the A10G
mutants compared to the A10 wt. FRET monitoring of in vitro transcription reveals the
potential of VAmPIRe to quantitatively detect RNA aptamer levels in real time. Moreover,
subsequent addition of RNase completely abolished FRET changes rapidly (Figure 46),
demonstrating the ability of the sensor to dynamically and reversibly report RRE aptamer
levels in real time in vitro.
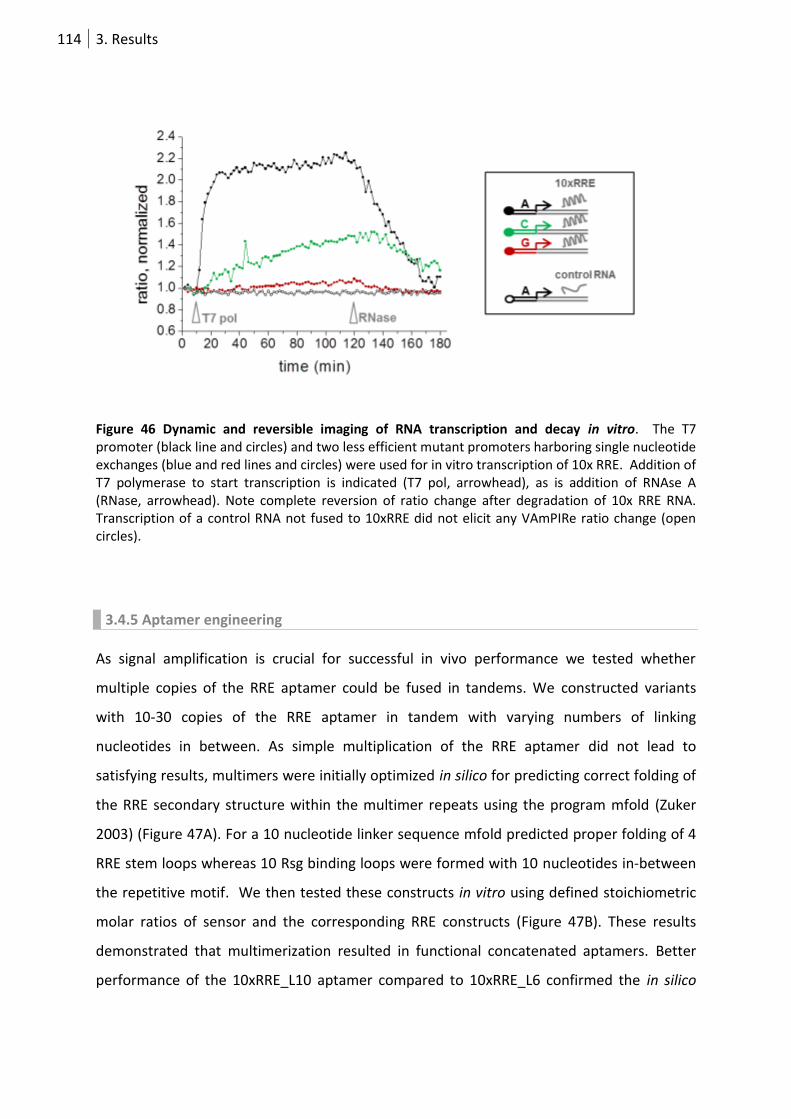
114 3. Results
Figure 46 Dynamic and reversible imaging of RNA transcription and decay in vitro. The T7 promoter (black line and circles) and two less efficient mutant promoters harboring single nucleotide exchanges (blue and red lines and circles) were used for in vitro transcription of 10x RRE. Addition of T7 polymerase to start transcription is indicated (T7 pol, arrowhead), as is addition of RNAse A (RNase, arrowhead). Note complete reversion of ratio change after degradation of 10x RRE RNA. Transcription of a control RNA not fused to 10xRRE did not elicit any VAmPIRe ratio change (open circles).
3.4.5 Aptamer engineering
As signal amplification is crucial for successful in vivo performance we tested whether
multiple copies of the RRE aptamer could be fused in tandems. We constructed variants
with 10-30 copies of the RRE aptamer in tandem with varying numbers of linking
nucleotides in between. As simple multiplication of the RRE aptamer did not lead to
satisfying results, multimers were initially optimized in silico for predicting correct folding of
the RRE secondary structure within the multimer repeats using the program mfold (Zuker
2003) (Figure 47A). For a 10 nucleotide linker sequence mfold predicted proper folding of 4
RRE stem loops whereas 10 Rsg binding loops were formed with 10 nucleotides in-between
the repetitive motif. We then tested these constructs in vitro using defined stoichiometric
molar ratios of sensor and the corresponding RRE constructs (Figure 47B). These results
demonstrated that multimerization resulted in functional concatenated aptamers. Better
performance of the 10xRRE_L10 aptamer compared to 10xRRE_L6 confirmed the in silico
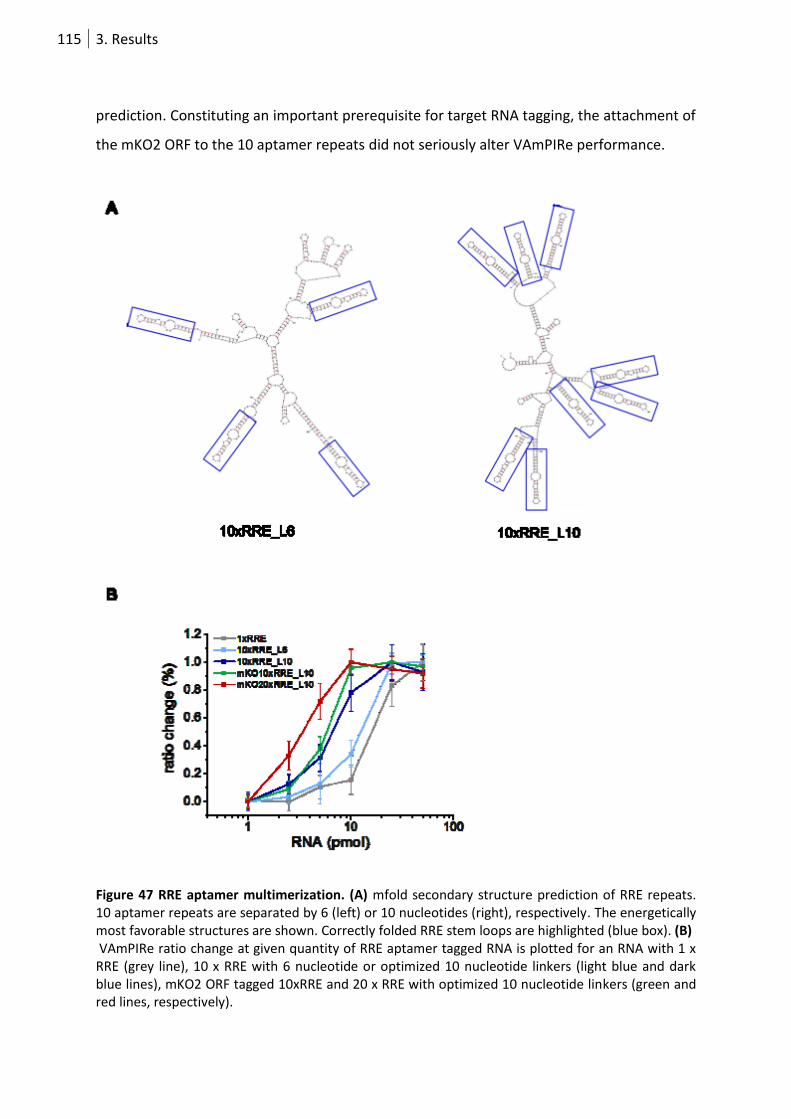
115 3. Results
prediction. Constituting an important prerequisite for target RNA tagging, the attachment of
the mKO2 ORF to the 10 aptamer repeats did not seriously alter VAmPIRe performance.
Figure 47 RRE aptamer multimerization. (A) mfold secondary structure prediction of RRE repeats. 10 aptamer repeats are separated by 6 (left) or 10 nucleotides (right), respectively. The energetically most favorable structures are shown. Correctly folded RRE stem loops are highlighted (blue box). (B) VAmPIRe ratio change at given quantity of RRE aptamer tagged RNA is plotted for an RNA with 1 x RRE (grey line), 10 x RRE with 6 nucleotide or optimized 10 nucleotide linkers (light blue and dark blue lines), mKO2 ORF tagged 10xRRE and 20 x RRE with optimized 10 nucleotide linkers (green and red lines, respectively).
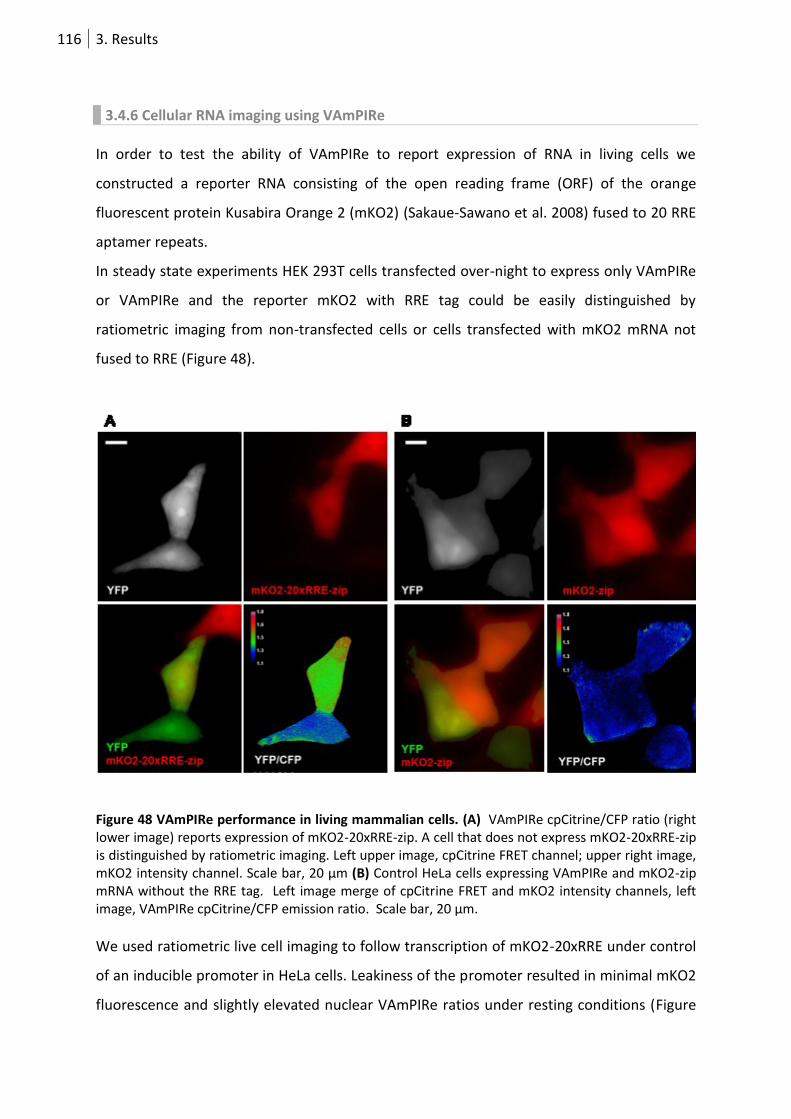
116 3. Results
3.4.6 Cellular RNA imaging using VAmPIRe
In order to test the ability of VAmPIRe to report expression of RNA in living cells we
constructed a reporter RNA consisting of the open reading frame (ORF) of the orange
fluorescent protein Kusabira Orange 2 (mKO2) (Sakaue-Sawano et al. 2008) fused to 20 RRE
aptamer repeats.
In steady state experiments HEK 293T cells transfected over-night to express only VAmPIRe
or VAmPIRe and the reporter mKO2 with RRE tag could be easily distinguished by
ratiometric imaging from non-transfected cells or cells transfected with mKO2 mRNA not
fused to RRE (Figure 48).
Figure 48 VAmPIRe performance in living mammalian cells. (A) VAmPIRe cpCitrine/CFP ratio (right lower image) reports expression of mKO2-20xRRE-zip. A cell that does not express mKO2-20xRRE-zip is distinguished by ratiometric imaging. Left upper image, cpCitrine FRET channel; upper right image, mKO2 intensity channel. Scale bar, 20 µm (B) Control HeLa cells expressing VAmPIRe and mKO2-zip mRNA without the RRE tag. Left image merge of cpCitrine FRET and mKO2 intensity channels, left image, VAmPIRe cpCitrine/CFP emission ratio. Scale bar, 20 µm.
We used ratiometric live cell imaging to follow transcription of mKO2-20xRRE under control
of an inducible promoter in HeLa cells. Leakiness of the promoter resulted in minimal mKO2
fluorescence and slightly elevated nuclear VAmPIRe ratios under resting conditions (Figure
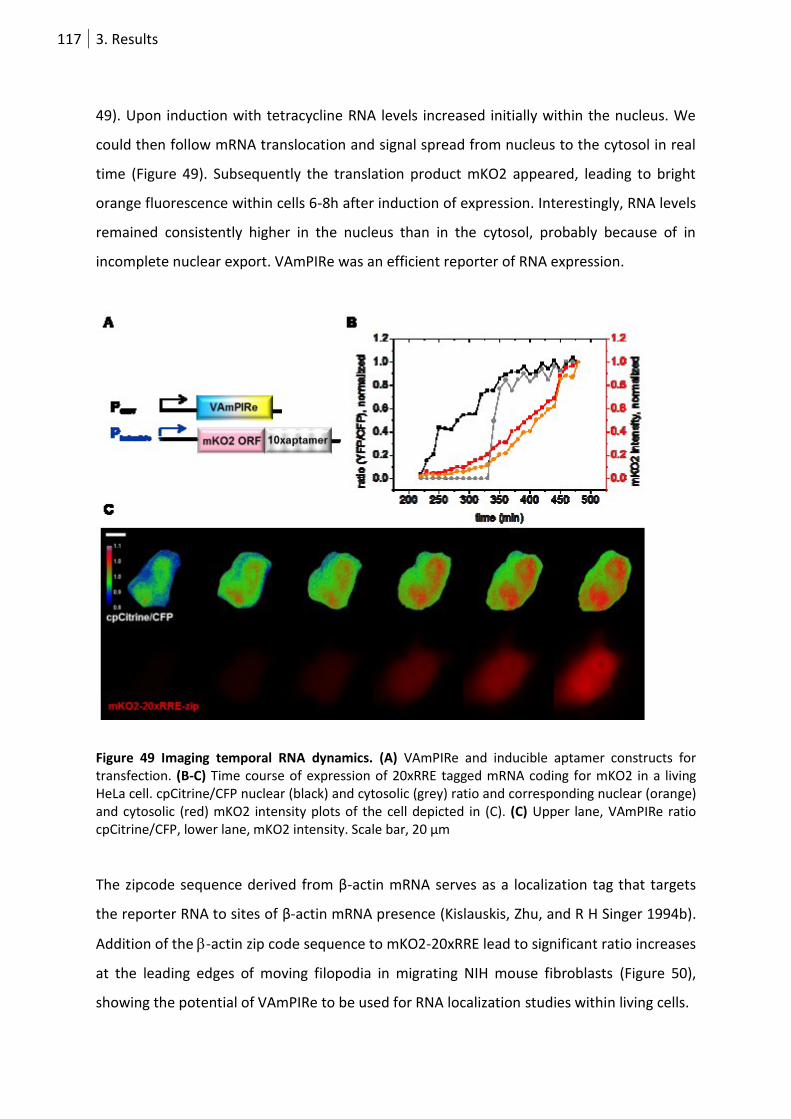
117 3. Results
49). Upon induction with tetracycline RNA levels increased initially within the nucleus. We
could then follow mRNA translocation and signal spread from nucleus to the cytosol in real
time (Figure 49). Subsequently the translation product mKO2 appeared, leading to bright
orange fluorescence within cells 6-8h after induction of expression. Interestingly, RNA levels
remained consistently higher in the nucleus than in the cytosol, probably because of in
incomplete nuclear export. VAmPIRe was an efficient reporter of RNA expression.
Figure 49 Imaging temporal RNA dynamics. (A) VAmPIRe and inducible aptamer constructs for transfection. (B-C) Time course of expression of 20xRRE tagged mRNA coding for mKO2 in a living HeLa cell. cpCitrine/CFP nuclear (black) and cytosolic (grey) ratio and corresponding nuclear (orange) and cytosolic (red) mKO2 intensity plots of the cell depicted in (C). (C) Upper lane, VAmPIRe ratio cpCitrine/CFP, lower lane, mKO2 intensity. Scale bar, 20 µm
The zipcode sequence derived from β-actin mRNA serves as a localization tag that targets
the reporter RNA to sites of β-actin mRNA presence (Kislauskis, Zhu, and R H Singer 1994b).
Addition of the -actin zip code sequence to mKO2-20xRRE lead to significant ratio increases
at the leading edges of moving filopodia in migrating NIH mouse fibroblasts (Figure 50),
showing the potential of VAmPIRe to be used for RNA localization studies within living cells.
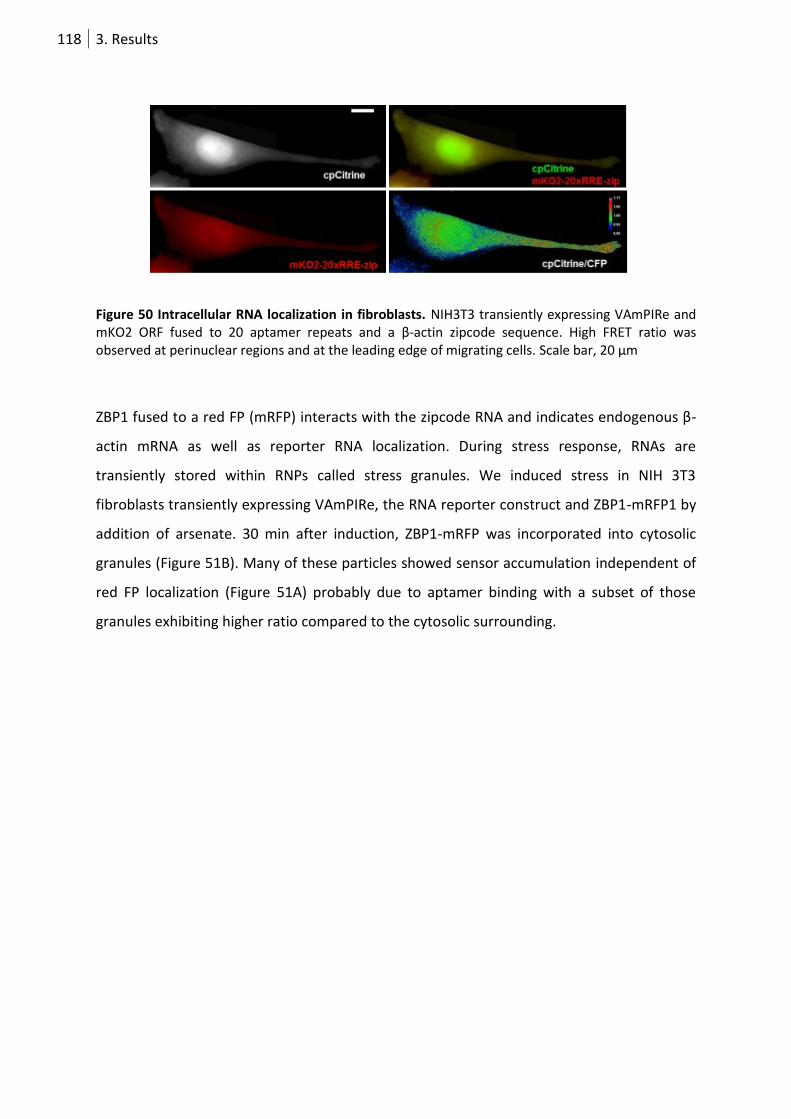
118 3. Results
Figure 50 Intracellular RNA localization in fibroblasts. NIH3T3 transiently expressing VAmPIRe and mKO2 ORF fused to 20 aptamer repeats and a β-actin zipcode sequence. High FRET ratio was observed at perinuclear regions and at the leading edge of migrating cells. Scale bar, 20 µm
ZBP1 fused to a red FP (mRFP) interacts with the zipcode RNA and indicates endogenous β-
actin mRNA as well as reporter RNA localization. During stress response, RNAs are
transiently stored within RNPs called stress granules. We induced stress in NIH 3T3
fibroblasts transiently expressing VAmPIRe, the RNA reporter construct and ZBP1-mRFP1 by
addition of arsenate. 30 min after induction, ZBP1-mRFP was incorporated into cytosolic
granules (Figure 51B). Many of these particles showed sensor accumulation independent of
red FP localization (Figure 51A) probably due to aptamer binding with a subset of those
granules exhibiting higher ratio compared to the cytosolic surrounding.
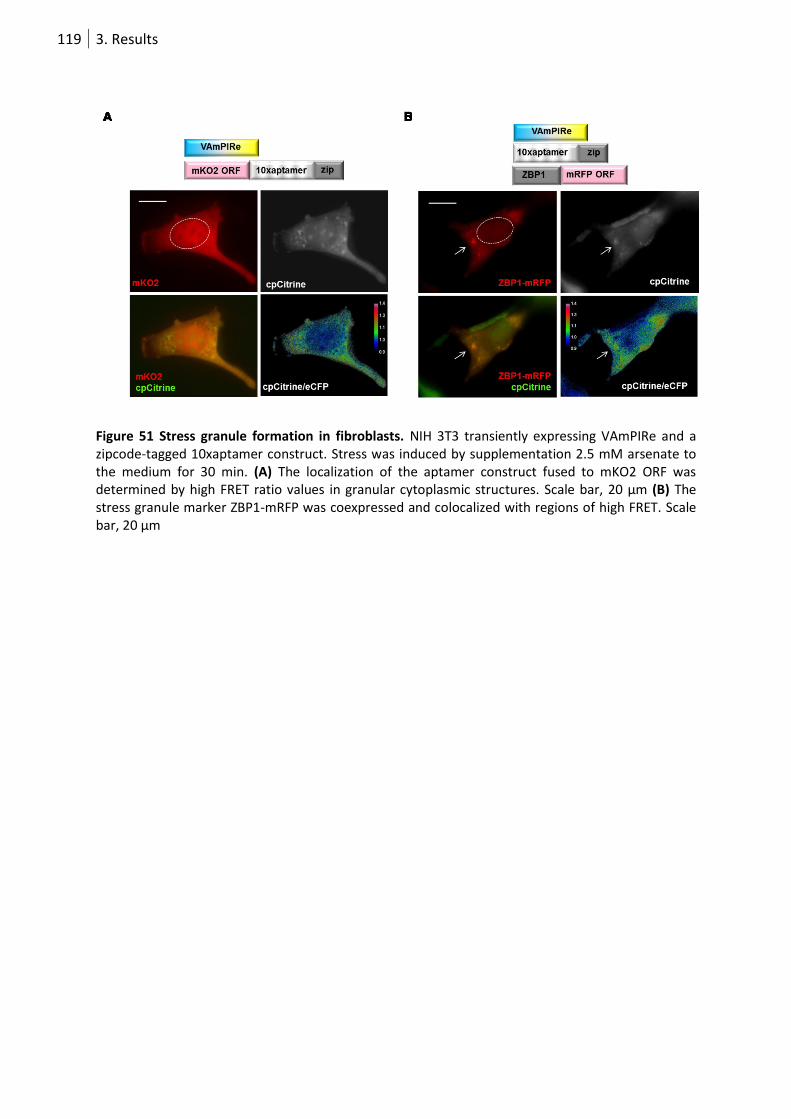
119 3. Results
Figure 51 Stress granule formation in fibroblasts. NIH 3T3 transiently expressing VAmPIRe and a zipcode-tagged 10xaptamer construct. Stress was induced by supplementation 2.5 mM arsenate to the medium for 30 min. (A) The localization of the aptamer construct fused to mKO2 ORF was determined by high FRET ratio values in granular cytoplasmic structures. Scale bar, 20 µm (B) The stress granule marker ZBP1-mRFP was coexpressed and colocalized with regions of high FRET. Scale bar, 20 µm
120 3. Results
3.5. Development of the EJC FRET sensor REFlex
3.5.1 eIF4AIII FRET biosensor design and incorporation into the EJC
The sensor named REFlex (reporter of eIF4AIII flexure) indicates the present conformational
status of eIF4AIII via fluorescence resonance energy transfer (FRET) change. The FRET donor,
an 11 amino-acid truncated enhanced Cyan Fluorescent Protein (eCFP) was fused to the
human eIF4AIII N-terminus. A circularly permuted variant of the yellow FP Citrine (cpCitrine)
(O Griesbeck et al. 2001) was attached to the C-terminus, downstream of the second RecA
domain (Figure 52A, B). REFlex shows slightly decreased ATPase activity compared to native
eIF4AIII (Figure 52C). In order to explore the FRET characteristics of this biosensor in the
open and closed state we set up an in vitro assembly of the EJC. It has been shown before
that EJC formation can be recapitulated in vitro in the presence of all constituent
components of the complex (TØ Tange, A Nott, et al. 2004j). In addition to the protein
components Barentsz and Mago-Y14, ATP and single stranded RNA without complicated
secondary structure were combined in a suitable buffer. cpCitrine emission decreased and
eCFP emission increased upon addition of all EJC core components to REFlex, reporting the
switch from open to closed conformation in eIF4AIII. We calculated a ~25% decrease in
cpCitrine/eCFP emission ratio change upon conversion to the ATP-bound closed state that
could be further enhanced by introducing 2 mutations at the surface of each of the FPs. We
substituted Serine 208 and Valine 224 with hydrophobic Phenylalanine and Leucine,
respectively (Vinkenborg et al. 2007). These mutations enhanced the change in
cpCitrine/eCFP emission ratio change to ~38% (Figure 52).
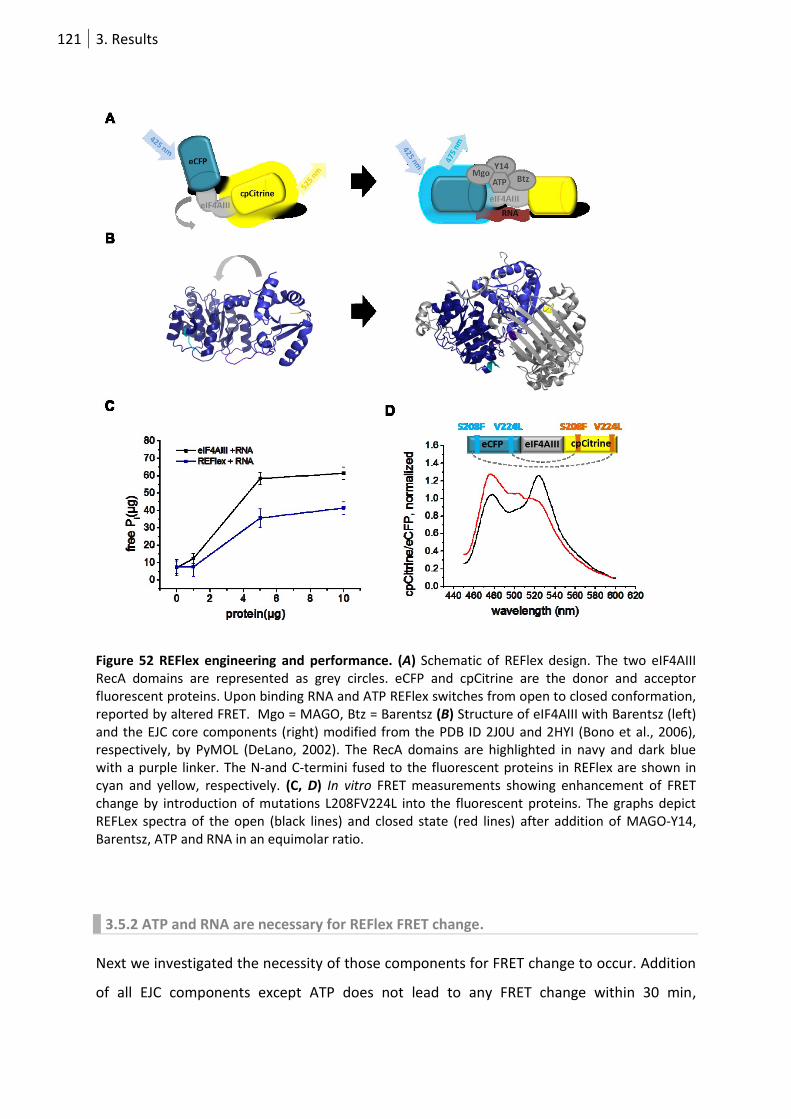
121 3. Results
Figure 52 REFlex engineering and performance. (A) Schematic of REFlex design. The two eIF4AIII RecA domains are represented as grey circles. eCFP and cpCitrine are the donor and acceptor fluorescent proteins. Upon binding RNA and ATP REFlex switches from open to closed conformation, reported by altered FRET. Mgo = MAGO, Btz = Barentsz (B) Structure of eIF4AIII with Barentsz (left) and the EJC core components (right) modified from the PDB ID 2J0U and 2HYI (Bono et al., 2006), respectively, by PyMOL (DeLano, 2002). The RecA domains are highlighted in navy and dark blue with a purple linker. The N-and C-termini fused to the fluorescent proteins in REFlex are shown in cyan and yellow, respectively. (C, D) In vitro FRET measurements showing enhancement of FRET change by introduction of mutations L208FV224L into the fluorescent proteins. The graphs depict REFLex spectra of the open (black lines) and closed state (red lines) after addition of MAGO-Y14, Barentsz, ATP and RNA in an equimolar ratio.
3.5.2 ATP and RNA are necessary for REFlex FRET change.
Next we investigated the necessity of those components for FRET change to occur. Addition
of all EJC components except ATP does not lead to any FRET change within 30 min,
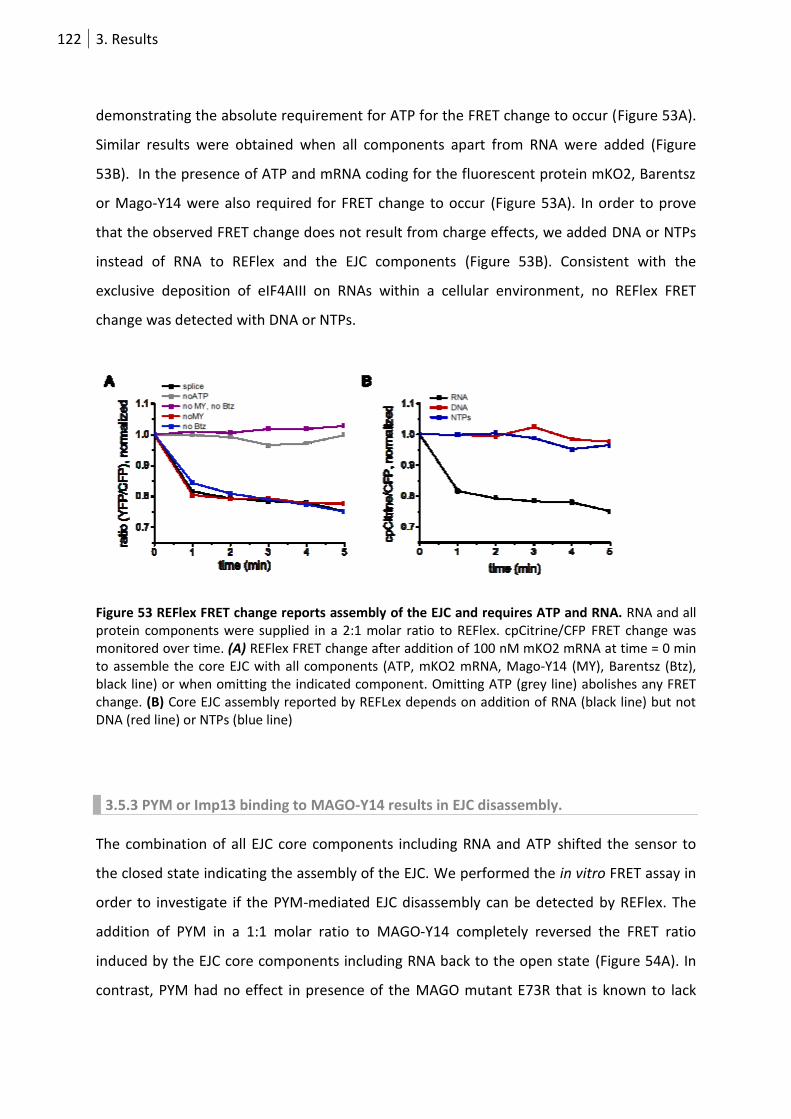
122 3. Results
demonstrating the absolute requirement for ATP for the FRET change to occur (Figure 53A).
Similar results were obtained when all components apart from RNA were added (Figure
53B). In the presence of ATP and mRNA coding for the fluorescent protein mKO2, Barentsz
or Mago-Y14 were also required for FRET change to occur (Figure 53A). In order to prove
that the observed FRET change does not result from charge effects, we added DNA or NTPs
instead of RNA to REFlex and the EJC components (Figure 53B). Consistent with the
exclusive deposition of eIF4AIII on RNAs within a cellular environment, no REFlex FRET
change was detected with DNA or NTPs.
Figure 53 REFlex FRET change reports assembly of the EJC and requires ATP and RNA. RNA and all protein components were supplied in a 2:1 molar ratio to REFlex. cpCitrine/CFP FRET change was monitored over time. (A) REFlex FRET change after addition of 100 nM mKO2 mRNA at time = 0 min to assemble the core EJC with all components (ATP, mKO2 mRNA, Mago-Y14 (MY), Barentsz (Btz), black line) or when omitting the indicated component. Omitting ATP (grey line) abolishes any FRET change. (B) Core EJC assembly reported by REFLex depends on addition of RNA (black line) but not DNA (red line) or NTPs (blue line)
3.5.3 PYM or Imp13 binding to MAGO-Y14 results in EJC disassembly.
The combination of all EJC core components including RNA and ATP shifted the sensor to
the closed state indicating the assembly of the EJC. We performed the in vitro FRET assay in
order to investigate if the PYM-mediated EJC disassembly can be detected by REFlex. The
addition of PYM in a 1:1 molar ratio to MAGO-Y14 completely reversed the FRET ratio
induced by the EJC core components including RNA back to the open state (Figure 54A). In
contrast, PYM had no effect in presence of the MAGO mutant E73R that is known to lack

123 3. Results
PYM binding ability (Gehring, Lamprinaki, Kulozik, and Hentze 2009b) (Figure 54C). This
suggests that PYM binding to MAGO-Y14 is able to disassemble the EJC indicated by eIF4AIII
conformational change. We thus confirm the ability of PYM to contact MAGO-Y14 within
fully assembled EJC. In contrast, immunoprecipitation experiments showed that EJC
intermediates are resistant to PYM disassembly (Gehring, Lamprinaki, Kulozik, and Hentze
2009b). It is unclear if this is due to a protective role of splicesosomal components, the
subcellular localization of PYM or an altered accessibility of the PYM-binding site of MAGO-
Y14 after spliceosome removal. We next pre-incubated all EJC components including ATP
and PYM for 30 min on ice. FRET monitoring showed a FRET ratio decrease upon subsequent
addition of RNA even in the presence of pre-incubated PYM (Figure 54B). However, the FRET
ratio slowly increased within a period of 30 min indicating EJC disassembly. This finding is in
line with observations of a PYM-MAGO-Y14 interaction that is dependent on its
incorporation into mature EJCs (Bono, AG Cook, Grünwald, Ebert, and Conti 2010a)
(Gehring, Lamprinaki, Kulozik, and Hentze 2009b). This specificity can be observed in the
absence of the spliceosome or any other cofactors. Our data suggest that the MAGO-Y14
binding site for PYM is directly modified upon its incorporation into the EJC, which enables
MAGO-Y14 uncoupling by PYM.
Nuclear import factors like Imp13 that binds MAGO-Y14 ensure EJC protein reimport into
the nucleus where they are reloaded onto mRNAs. We investigated if Imp13 is able to bind
to MAGO-Y14 and thereby disassemble the EJC. After complex formation monitored by FRET
we added Imp13 in equimolar ratio to MAGO-Y14. The subsequent FRET ratio increase
indicated that Imp13 is able to convert REFlex to the “off” state independent of PYM (Figure
54B). EJCs bearing a mutated Imp13-binding site of MAGO-Y14 (E73R) could not be
disassembled by the nuclear import factor (Figure 54B). This finding is in contrast to the
hypothesis stating that MAGO-Y14 incorporated in EJCs is sterically inaccessible to Imp13
(Bono, AG Cook, Grünwald, Ebert, and Conti 2010b).
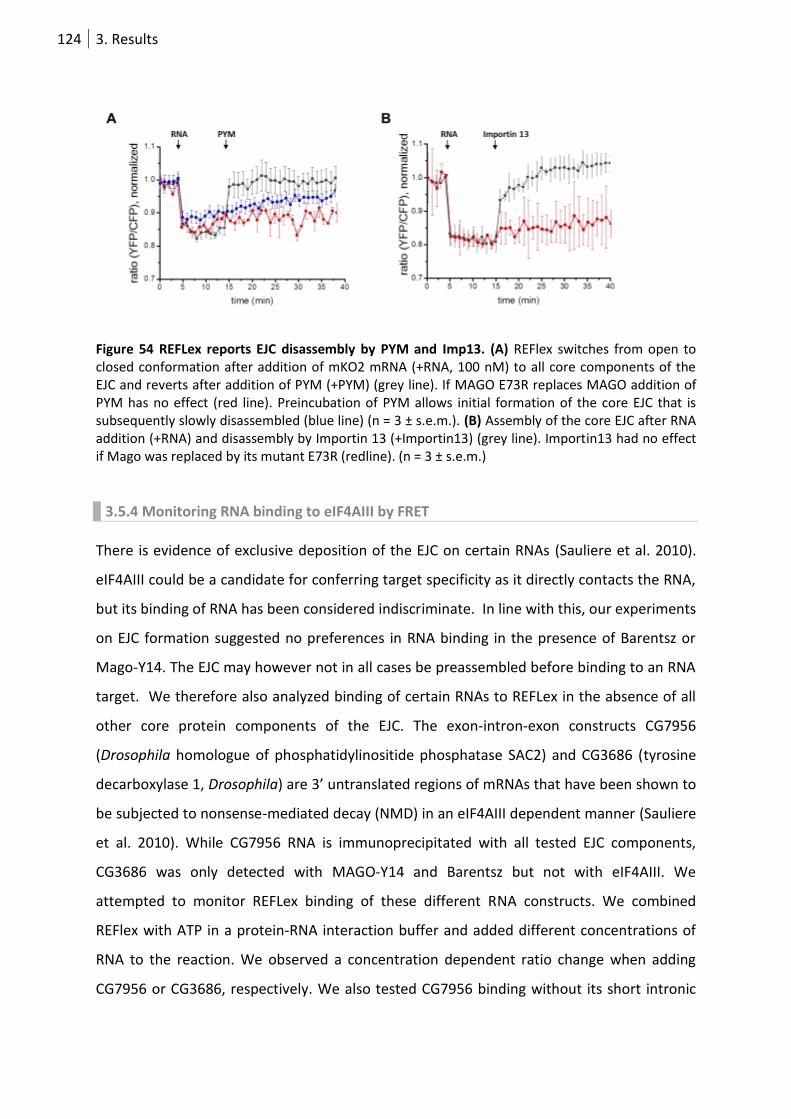
124 3. Results
Figure 54 REFLex reports EJC disassembly by PYM and Imp13. (A) REFlex switches from open to closed conformation after addition of mKO2 mRNA (+RNA, 100 nM) to all core components of the EJC and reverts after addition of PYM (+PYM) (grey line). If MAGO E73R replaces MAGO addition of PYM has no effect (red line). Preincubation of PYM allows initial formation of the core EJC that is subsequently slowly disassembled (blue line) (n = 3 ± s.e.m.). (B) Assembly of the core EJC after RNA addition (+RNA) and disassembly by Importin 13 (+Importin13) (grey line). Importin13 had no effect if Mago was replaced by its mutant E73R (redline). (n = 3 ± s.e.m.)
3.5.4 Monitoring RNA binding to eIF4AIII by FRET
There is evidence of exclusive deposition of the EJC on certain RNAs (Sauliere et al. 2010).
eIF4AIII could be a candidate for conferring target specificity as it directly contacts the RNA,
but its binding of RNA has been considered indiscriminate. In line with this, our experiments
on EJC formation suggested no preferences in RNA binding in the presence of Barentsz or
Mago-Y14. The EJC may however not in all cases be preassembled before binding to an RNA
target. We therefore also analyzed binding of certain RNAs to REFLex in the absence of all
other core protein components of the EJC. The exon-intron-exon constructs CG7956
(Drosophila homologue of phosphatidylinositide phosphatase SAC2) and CG3686 (tyrosine
decarboxylase 1, Drosophila) are 3’ untranslated regions of mRNAs that have been shown to
be subjected to nonsense-mediated decay (NMD) in an eIF4AIII dependent manner (Sauliere
et al. 2010). While CG7956 RNA is immunoprecipitated with all tested EJC components,
CG3686 was only detected with MAGO-Y14 and Barentsz but not with eIF4AIII. We
attempted to monitor REFLex binding of these different RNA constructs. We combined
REFlex with ATP in a protein-RNA interaction buffer and added different concentrations of
RNA to the reaction. We observed a concentration dependent ratio change when adding
CG7956 or CG3686, respectively. We also tested CG7956 binding without its short intronic
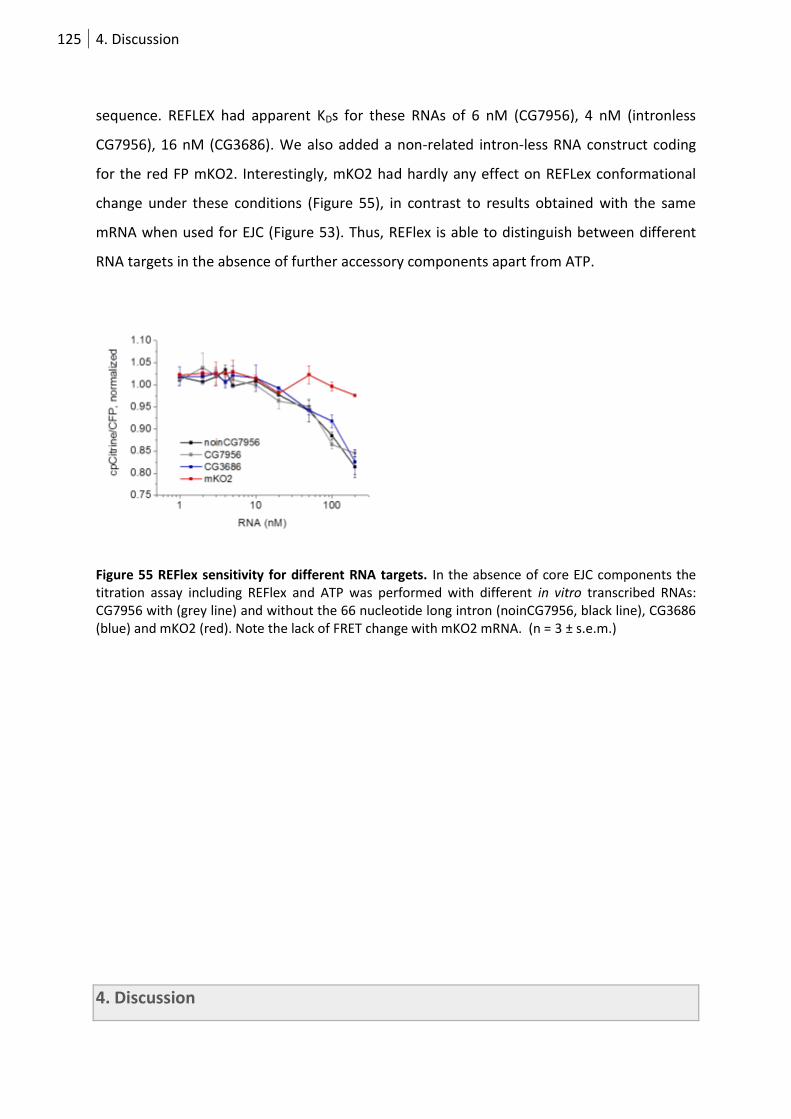
125 4. Discussion
sequence. REFLEX had apparent KDs for these RNAs of 6 nM (CG7956), 4 nM (intronless
CG7956), 16 nM (CG3686). We also added a non-related intron-less RNA construct coding
for the red FP mKO2. Interestingly, mKO2 had hardly any effect on REFLex conformational
change under these conditions (Figure 55), in contrast to results obtained with the same
mRNA when used for EJC (Figure 53). Thus, REFlex is able to distinguish between different
RNA targets in the absence of further accessory components apart from ATP.
Figure 55 REFlex sensitivity for different RNA targets. In the absence of core EJC components the titration assay including REFlex and ATP was performed with different in vitro transcribed RNAs: CG7956 with (grey line) and without the 66 nucleotide long intron (noinCG7956, black line), CG3686 (blue) and mKO2 (red). Note the lack of FRET change with mKO2 mRNA. (n = 3 ± s.e.m.)
4. Discussion
126 4. Discussion
4.1 Evaluation of dual FP-based RNA labeling using MS2 and λN22
Application of MS2 and λN22 systems revealed independent action enabling simultaneous
imaging of two different RNAs. Specificity of the respective aptamer-peptide interaction
seems high enough to allow exclusive labeling. Similar results have been obtained in an
attempt to label ASH1 and IST2 mRNAs in S. cerevisiae (Lange et al. 2008) and in a recent
study that investigates PSD95 and CaMKIIα mRNA localization in neurons (Subramanian et
al. 2011).
Both studies mention problems arising from the application of two different labeling
systems. Due to differences in affinity, specificity, number of aptamers and resulting
mobility of the labeled complex, the two reporters cannot be directly compared in a
quantitative manner. Another important point to consider is the expression levels of tagged
aptamer and FP construct. Due to natural but unpredictable amplification of fluorescent
fusion protein upon translation compared to the aptamer-tagged RNA, FP expression has to
be tightly restricted to reduce background signal. Even higher overexpression of the
fluorescent reporter can cause artifacts including aggregation and accumulation in granules.
Further concerns about the significance of the fluorescent signal include the reporter fate
after target mRNA degradation. The stem-loop structure of the aptamer could confer higher
stability compared to the RNA of interest. Even though the entire RNA construct is
degraded, the fate of the fluorescent label remains unclear. Turnover could be slower
compared to the lifetime of the RNA and the protein could be entrapped at the site of the
degraded RNA even though already degraded. This was the reason for the development of
dynamic RNA reporters with a fluorescent readout that depends on the presence of the
aptamer.
In this perspective, NMDAR1 splice reporter results have to be interpreted with caution. At
least, partial colocalization with FMRP indicates the labeling of real RNA transport granules
(Figure 25). Especially, many labs have tried the λN22 approach for localization experiments
in different cell types without success (EMBO referee report (Subramanian et al. 2011),
Edouard Bertrand, personal communications). In our hands, the MS2 system proved better
than the λN22 labeling but the difference was not significant (Figure 23B). The NMDAR1
reporter construct would have to be optimized for different cellular systems considering
that there are inter-lab differences for single labeling using the MS2 system. The RNA
127 4. Discussion
labeling seems to be especially sensitive in the neuronal context (Kevin Czaplinski, personal
communications). For example, attempts are made to improve the stringency of the NLS for
hippocampal neurons. On the other hand, a strong NLS could interfere with the targeting
signals of the aptamer-tagged RNA of interest. In our CaMKIIα experiments we observed
inefficient export of 40% for both systems (Figure 23B).
4.2 Imaging cellular RNAs by synthetic on-off ASR dyes
Chemical on-off RNA dyes aim at overcoming both bulkiness and the requirement of
subcellular FP label restriction. With our synthetic ASR dye approach we envisaged high
signal-to-noise while preserving the biological properties of the tagged RNA.
The SELEX strategy applied by Jianghong Rao`s lab was efficient for the selection of affine
(KD ~ 40 µM) RNA aptamers. There is room for improvement by further competitive rounds
and optimized strategies of in vitro selection. For example, the recently published Spinach
approach that is based on a GFP-mimicking dye binds its aptamer with 500 nM affinity
(Paige et al. 2011).
In bacteria, ASR fluorescence emission was increased 135 fold upon binding of the specific
aptamer, Apt10. Even though in vitro and bacterial performance showed promising results,
application in mammalian cells was hindered by several problems including unspecific
fluorescence emission and delivery.
In cells, we observed ASR fluorescence even in the absence of any aptamer (Figure 28,
Figure 29). Similar to other triphenylmethane dyes, ASR is nonfluorescent in water but can
be activated in a nonspecific manner within the cellular environment (Meech 2009).
Fluorescence increase originates from a transition from nonradiative decay pathways (e.g.
cis-trans isomerization) to radiative decay (Dugave and Demange 2003). This conversion can
be triggered by the specific RNA but also by macromolecule binding or increased solvent
viscosity (Ippen et al. 1976) (Sundstroem and Gillbro 1982). Another styryl dye, FM1-43
becomes fluorescent upon incorporation into membranes and is therefore used to monitor
endocytosis, exocytosis and vesicle trafficking in neurons (Cochilla et al. 1999). It has to be
investigated if the on-off mechanism underlying the fluorescence enhancement of ASR is
able to allow specific RNA detection in a cellular context. In contrast to ASR, the above-

128 4. Discussion
mentioned GFP-mimicking RNA fluorophore takes advantage of a dye that for the first time
overcomes this nonspecificity (Paige et al. 2011). Fluorescence emission is induced by
releasing restriction of intramolecular movements that are thought to be independent of
cellular constituents. Cellular RNA imaging by Spinach also benefits from low dye
cytotoxicity and resistance to photobleaching (Paige et al. 2011).
Cellular delivery is another major problem inherent to chemical approaches including the
ASR strategy. ASR permeability for HeLa cells was achieved by conjugation to the positively
charged tat peptide. Charge neutralization of anionic membranes with cationic peptides has
been shown to induce a lamellar to inverted hexagonal phase transition, resulting in
membrane translocation through inverted micelle formation (Ragin et al. 2002). Endocytotic
processing resulted in ASR dye entrapment within endosomes (Figure 29). Similar failure of
cytoplasmic or nuclear delivery by tat peptide-dependent endosomal entrapment has been
reported for tat-conjugated peptides and quantum dots (Tkachenko et al. 2004) (Ruan et al.
2007). We tried to release ASR from endosomes by sucrose which resulted in disappearance
of fluorescence emission (Figure 29). Similarly, chloroquine could be applied for
destabilization and swelling of endosomes (Turner et al. 2005). Dye lipofection provides
another possibility to circumvent the cellular endocytotic pathway. However, the design of
an RNA labeling method should be both as simple and as generalizable as possible. For every
cell type, different delivery protocols have to be elaborated due to differences in membrane
composition and small molecule uptake mechanisms.
For improved ASR dyes, we are aiming at the optimization of cellular testing. Repeats of the
Apt10 will be attached to subcellular targeting sequence (e.g. β-actin zipcode) to
concentrate the dye subcellularly which should increase signal-to-noise. Further
characteristics including pH-sensitivity and cytotoxic effects have to be considered (Liao et
al. 1994).
Only if these challenges are overcome, on-off chemical RNA dyes will allow dynamic RNA
imaging and profit by the inherent multiplexing potential. Especially imaging of short RNA,
including the neuronal activity-dependent noncoding BC1 RNA, could be facilitated by a
small-molecule approach (Schratt et al. 2006).
4.3 Performance and potential of single fluorophore RNA sensors
129 4. Discussion
Overcoming these problems of synthetic dyes we aimed at the design of genetically
encodable on-off RNA sensors based on FPs. Different strategies for reversible FP
destabilization were explored. We showed that it is possible to design single fluorophore
sensors but further engineering is needed for RNA imaging in cells.
4.3.1 Aptamer-induced FP emission
For the first single-FP approach we were aiming to find an RNA that would directly bind to
and induce fluorescence of a non-fluorescent FP. We constructed a non-fluorescent trGFP
and selected one affine RNA aptamer, APT1_trGFP that enhances trGFP fluorescence in
bacteria but not in mammalian cells (Figure 31).
The first step was to find a suitable FP that allows aptamer-dependent switching between a
dim and a bright state of the FP. Mechanistically, the engineered FP still absorbs light and is
on the edge of being fluorescent. We designed trGFP, a truncated FP that is non-fluorescent
in vitro, in prokaryotic and eukaryotic cells (Figure 31). TrGFP itself revealed interesting
features as repositioning of the His-tag from the N- to the C-terminus resulted in
fluorescence emission restoration of trGFP. This indicates that the GFP C-terminus is
susceptible for replacement with other amino acids sequences. Insertion of a protease
cleavage site at the C-terminus could be used for the design of biosensors that become dim
upon protease cleavage.
The second challenge for this RNA imaging approach was to find a suitable RNA aptamer.
The aptamer is supposed to either assist folding or to electrostatically or sterically change
the environment of the fluorophore and thereby increase the quantum yield. A well-studied
example includes the solvent channel to the GFP chromophore that can be exposed or
“sealed” (Tansila et al.). With the SELEX procedure we only selected for affinity of the
aptamer to the dim FP. The selected aptamer pool was subsequently tested in bacteria and
mammalian cells for fluorescence enhancement. However the aptamer selected in the
prokaryotic system was not able to enhance fluorescence in a cellular context. The cellular
testing can be improved by aptamer multimerization and subcellular RNA targeting, e.g.
using the β-actin zipcode sequence.
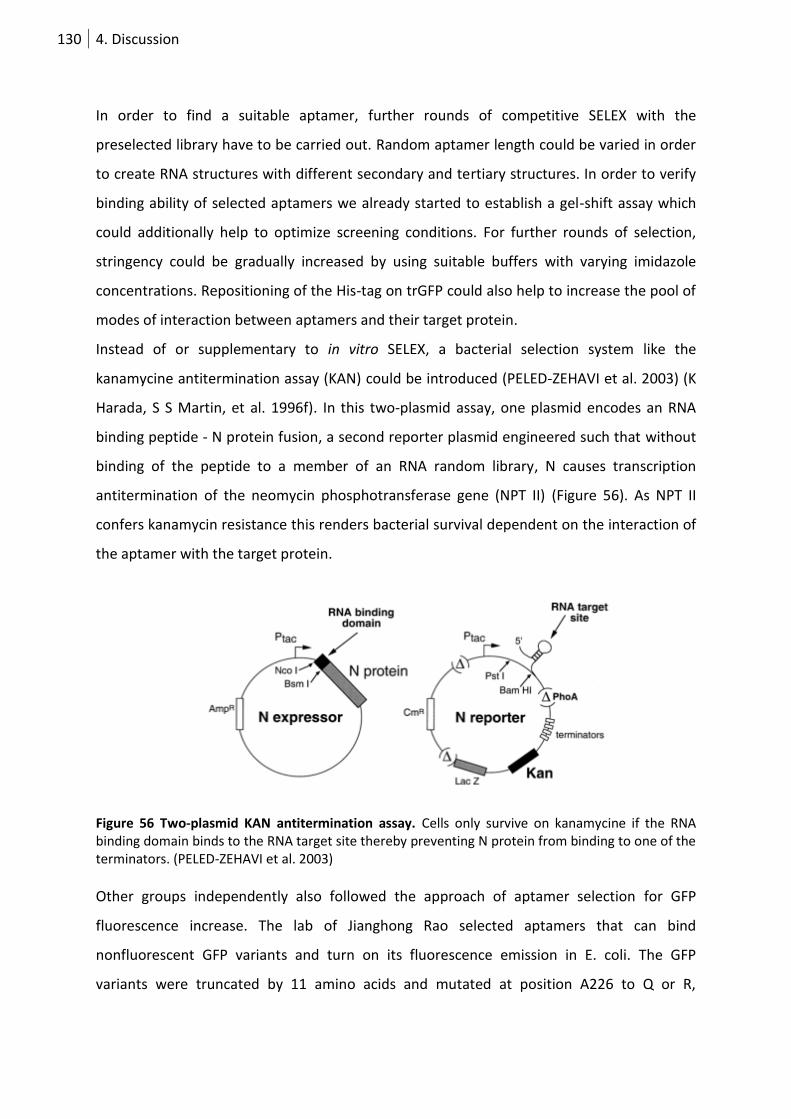
130 4. Discussion
In order to find a suitable aptamer, further rounds of competitive SELEX with the
preselected library have to be carried out. Random aptamer length could be varied in order
to create RNA structures with different secondary and tertiary structures. In order to verify
binding ability of selected aptamers we already started to establish a gel-shift assay which
could additionally help to optimize screening conditions. For further rounds of selection,
stringency could be gradually increased by using suitable buffers with varying imidazole
concentrations. Repositioning of the His-tag on trGFP could also help to increase the pool of
modes of interaction between aptamers and their target protein.
Instead of or supplementary to in vitro SELEX, a bacterial selection system like the
kanamycine antitermination assay (KAN) could be introduced (PELED-ZEHAVI et al. 2003) (K
Harada, S S Martin, et al. 1996f). In this two-plasmid assay, one plasmid encodes an RNA
binding peptide - N protein fusion, a second reporter plasmid engineered such that without
binding of the peptide to a member of an RNA random library, N causes transcription
antitermination of the neomycin phosphotransferase gene (NPT II) (Figure 56). As NPT II
confers kanamycin resistance this renders bacterial survival dependent on the interaction of
the aptamer with the target protein.
Figure 56 Two-plasmid KAN antitermination assay. Cells only survive on kanamycine if the RNA binding domain binds to the RNA target site thereby preventing N protein from binding to one of the terminators. (PELED-ZEHAVI et al. 2003)
Other groups independently also followed the approach of aptamer selection for GFP
fluorescence increase. The lab of Jianghong Rao selected aptamers that can bind
nonfluorescent GFP variants and turn on its fluorescence emission in E. coli. The GFP
variants were truncated by 11 amino acids and mutated at position A226 to Q or R,
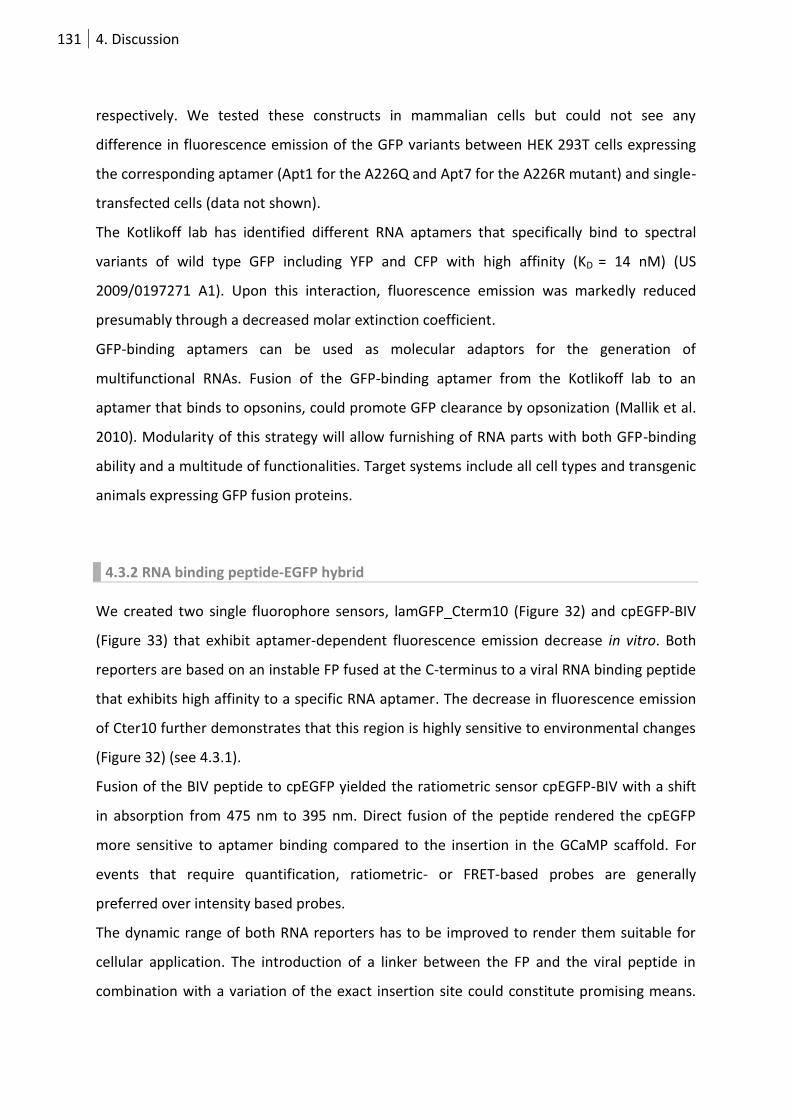
131 4. Discussion
respectively. We tested these constructs in mammalian cells but could not see any
difference in fluorescence emission of the GFP variants between HEK 293T cells expressing
the corresponding aptamer (Apt1 for the A226Q and Apt7 for the A226R mutant) and single-
transfected cells (data not shown).
The Kotlikoff lab has identified different RNA aptamers that specifically bind to spectral
variants of wild type GFP including YFP and CFP with high affinity (KD = 14 nM) (US
2009/0197271 A1). Upon this interaction, fluorescence emission was markedly reduced
presumably through a decreased molar extinction coefficient.
GFP-binding aptamers can be used as molecular adaptors for the generation of
multifunctional RNAs. Fusion of the GFP-binding aptamer from the Kotlikoff lab to an
aptamer that binds to opsonins, could promote GFP clearance by opsonization (Mallik et al.
2010). Modularity of this strategy will allow furnishing of RNA parts with both GFP-binding
ability and a multitude of functionalities. Target systems include all cell types and transgenic
animals expressing GFP fusion proteins.
4.3.2 RNA binding peptide-EGFP hybrid
We created two single fluorophore sensors, lamGFP_Cterm10 (Figure 32) and cpEGFP-BIV
(Figure 33) that exhibit aptamer-dependent fluorescence emission decrease in vitro. Both
reporters are based on an instable FP fused at the C-terminus to a viral RNA binding peptide
that exhibits high affinity to a specific RNA aptamer. The decrease in fluorescence emission
of Cter10 further demonstrates that this region is highly sensitive to environmental changes
(Figure 32) (see 4.3.1).
Fusion of the BIV peptide to cpEGFP yielded the ratiometric sensor cpEGFP-BIV with a shift
in absorption from 475 nm to 395 nm. Direct fusion of the peptide rendered the cpEGFP
more sensitive to aptamer binding compared to the insertion in the GCaMP scaffold. For
events that require quantification, ratiometric- or FRET-based probes are generally
preferred over intensity based probes.
The dynamic range of both RNA reporters has to be improved to render them suitable for
cellular application. The introduction of a linker between the FP and the viral peptide in
combination with a variation of the exact insertion site could constitute promising means.
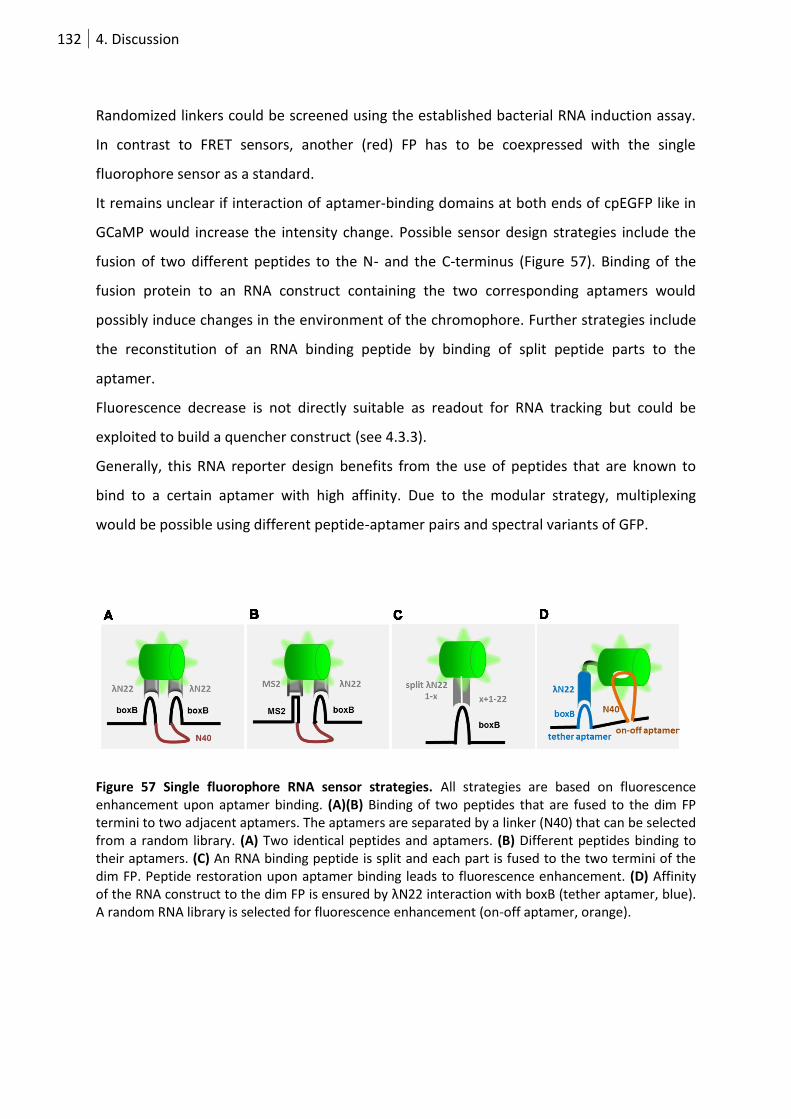
132 4. Discussion
Randomized linkers could be screened using the established bacterial RNA induction assay.
In contrast to FRET sensors, another (red) FP has to be coexpressed with the single
fluorophore sensor as a standard.
It remains unclear if interaction of aptamer-binding domains at both ends of cpEGFP like in
GCaMP would increase the intensity change. Possible sensor design strategies include the
fusion of two different peptides to the N- and the C-terminus (Figure 57). Binding of the
fusion protein to an RNA construct containing the two corresponding aptamers would
possibly induce changes in the environment of the chromophore. Further strategies include
the reconstitution of an RNA binding peptide by binding of split peptide parts to the
aptamer.
Fluorescence decrease is not directly suitable as readout for RNA tracking but could be
exploited to build a quencher construct (see 4.3.3).
Generally, this RNA reporter design benefits from the use of peptides that are known to
bind to a certain aptamer with high affinity. Due to the modular strategy, multiplexing
would be possible using different peptide-aptamer pairs and spectral variants of GFP.
Figure 57 Single fluorophore RNA sensor strategies. All strategies are based on fluorescence enhancement upon aptamer binding. (A)(B) Binding of two peptides that are fused to the dim FP termini to two adjacent aptamers. The aptamers are separated by a linker (N40) that can be selected from a random library. (A) Two identical peptides and aptamers. (B) Different peptides binding to their aptamers. (C) An RNA binding peptide is split and each part is fused to the two termini of the dim FP. Peptide restoration upon aptamer binding leads to fluorescence enhancement. (D) Affinity of the RNA construct to the dim FP is ensured by λN22 interaction with boxB (tether aptamer, blue). A random RNA library is selected for fluorescence enhancement (on-off aptamer, orange).
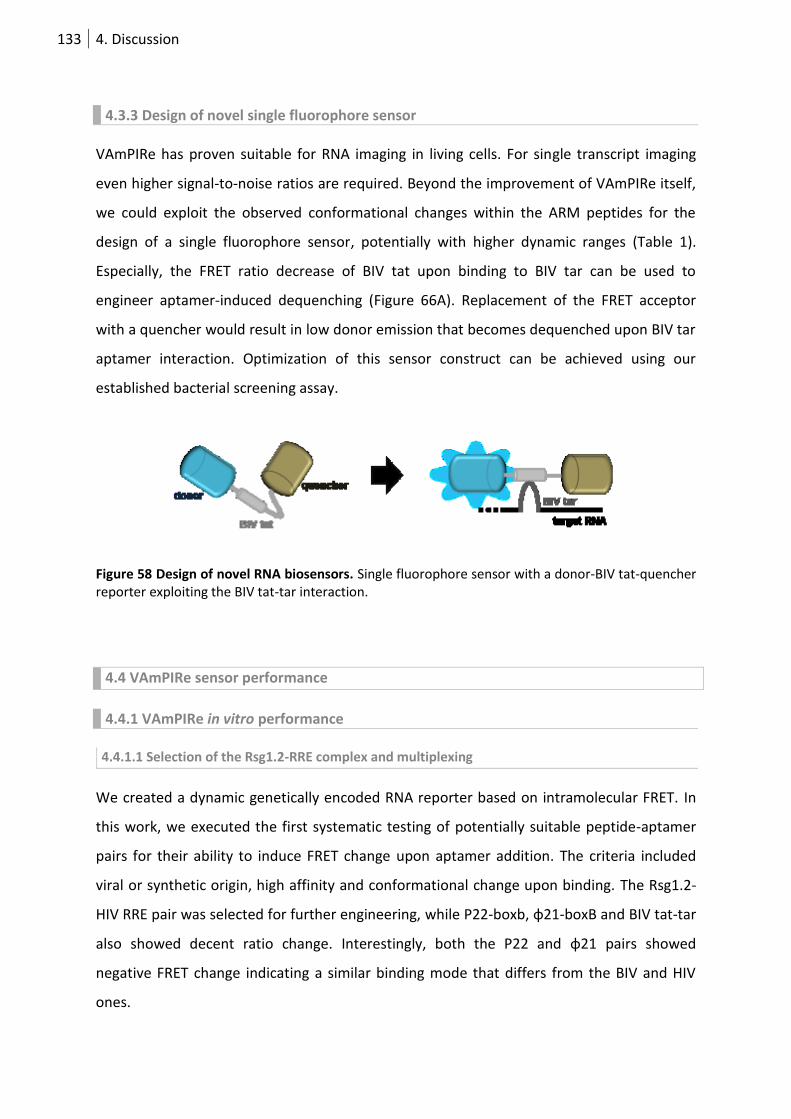
133 4. Discussion
4.3.3 Design of novel single fluorophore sensor
VAmPIRe has proven suitable for RNA imaging in living cells. For single transcript imaging
even higher signal-to-noise ratios are required. Beyond the improvement of VAmPIRe itself,
we could exploit the observed conformational changes within the ARM peptides for the
design of a single fluorophore sensor, potentially with higher dynamic ranges (Table 1).
Especially, the FRET ratio decrease of BIV tat upon binding to BIV tar can be used to
engineer aptamer-induced dequenching (Figure 66A). Replacement of the FRET acceptor
with a quencher would result in low donor emission that becomes dequenched upon BIV tar
aptamer interaction. Optimization of this sensor construct can be achieved using our
established bacterial screening assay.
Figure 58 Design of novel RNA biosensors. Single fluorophore sensor with a donor-BIV tat-quencher reporter exploiting the BIV tat-tar interaction.
4.4 VAmPIRe sensor performance
4.4.1 VAmPIRe in vitro performance
4.4.1.1 Selection of the Rsg1.2-RRE complex and multiplexing
We created a dynamic genetically encoded RNA reporter based on intramolecular FRET. In
this work, we executed the first systematic testing of potentially suitable peptide-aptamer
pairs for their ability to induce FRET change upon aptamer addition. The criteria included
viral or synthetic origin, high affinity and conformational change upon binding. The Rsg1.2-
HIV RRE pair was selected for further engineering, while P22-boxb, φ21-boxB and BIV tat-tar
also showed decent ratio change. Interestingly, both the P22 and φ21 pairs showed
negative FRET change indicating a similar binding mode that differs from the BIV and HIV
ones.
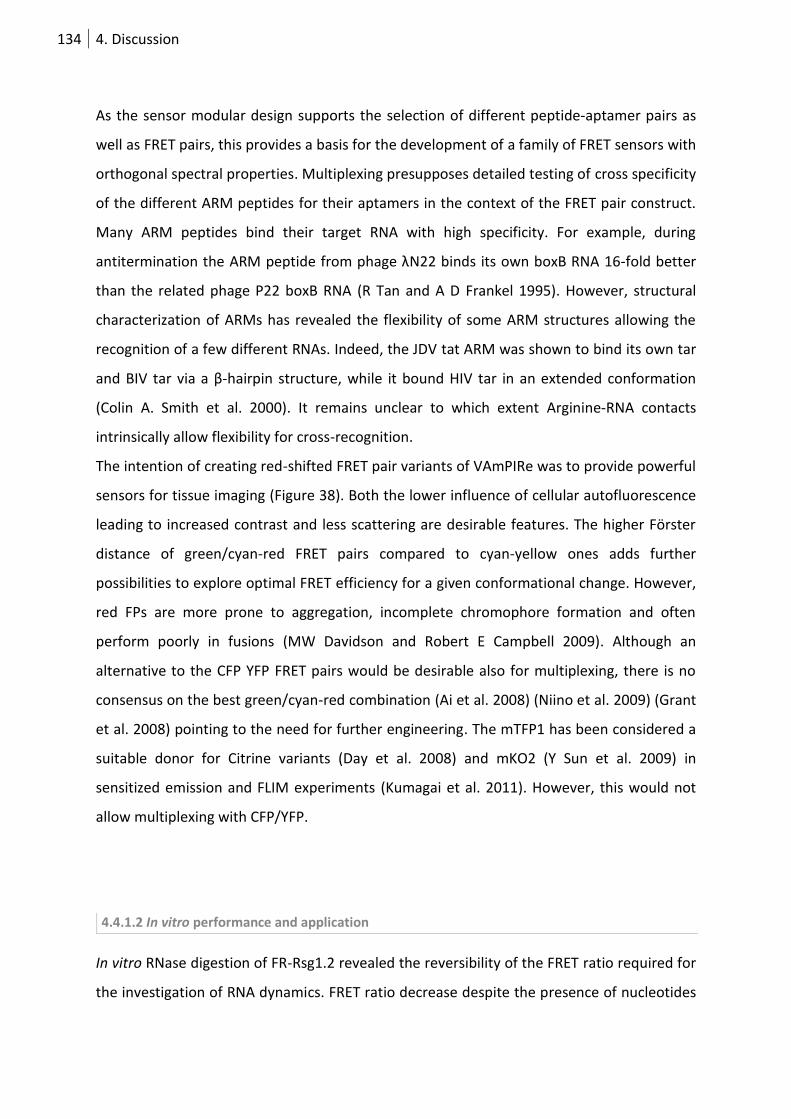
134 4. Discussion
As the sensor modular design supports the selection of different peptide-aptamer pairs as
well as FRET pairs, this provides a basis for the development of a family of FRET sensors with
orthogonal spectral properties. Multiplexing presupposes detailed testing of cross specificity
of the different ARM peptides for their aptamers in the context of the FRET pair construct.
Many ARM peptides bind their target RNA with high specificity. For example, during
antitermination the ARM peptide from phage λN22 binds its own boxB RNA 16-fold better
than the related phage P22 boxB RNA (R Tan and A D Frankel 1995). However, structural
characterization of ARMs has revealed the flexibility of some ARM structures allowing the
recognition of a few different RNAs. Indeed, the JDV tat ARM was shown to bind its own tar
and BIV tar via a β-hairpin structure, while it bound HIV tar in an extended conformation
(Colin A. Smith et al. 2000). It remains unclear to which extent Arginine-RNA contacts
intrinsically allow flexibility for cross-recognition.
The intention of creating red-shifted FRET pair variants of VAmPIRe was to provide powerful
sensors for tissue imaging (Figure 38). Both the lower influence of cellular autofluorescence
leading to increased contrast and less scattering are desirable features. The higher Förster
distance of green/cyan-red FRET pairs compared to cyan-yellow ones adds further
possibilities to explore optimal FRET efficiency for a given conformational change. However,
red FPs are more prone to aggregation, incomplete chromophore formation and often
perform poorly in fusions (MW Davidson and Robert E Campbell 2009). Although an
alternative to the CFP YFP FRET pairs would be desirable also for multiplexing, there is no
consensus on the best green/cyan-red combination (Ai et al. 2008) (Niino et al. 2009) (Grant
et al. 2008) pointing to the need for further engineering. The mTFP1 has been considered a
suitable donor for Citrine variants (Day et al. 2008) and mKO2 (Y Sun et al. 2009) in
sensitized emission and FLIM experiments (Kumagai et al. 2011). However, this would not
allow multiplexing with CFP/YFP.
4.4.1.2 In vitro performance and application
In vitro RNase digestion of FR-Rsg1.2 revealed the reversibility of the FRET ratio required for
the investigation of RNA dynamics. FRET ratio decrease despite the presence of nucleotides
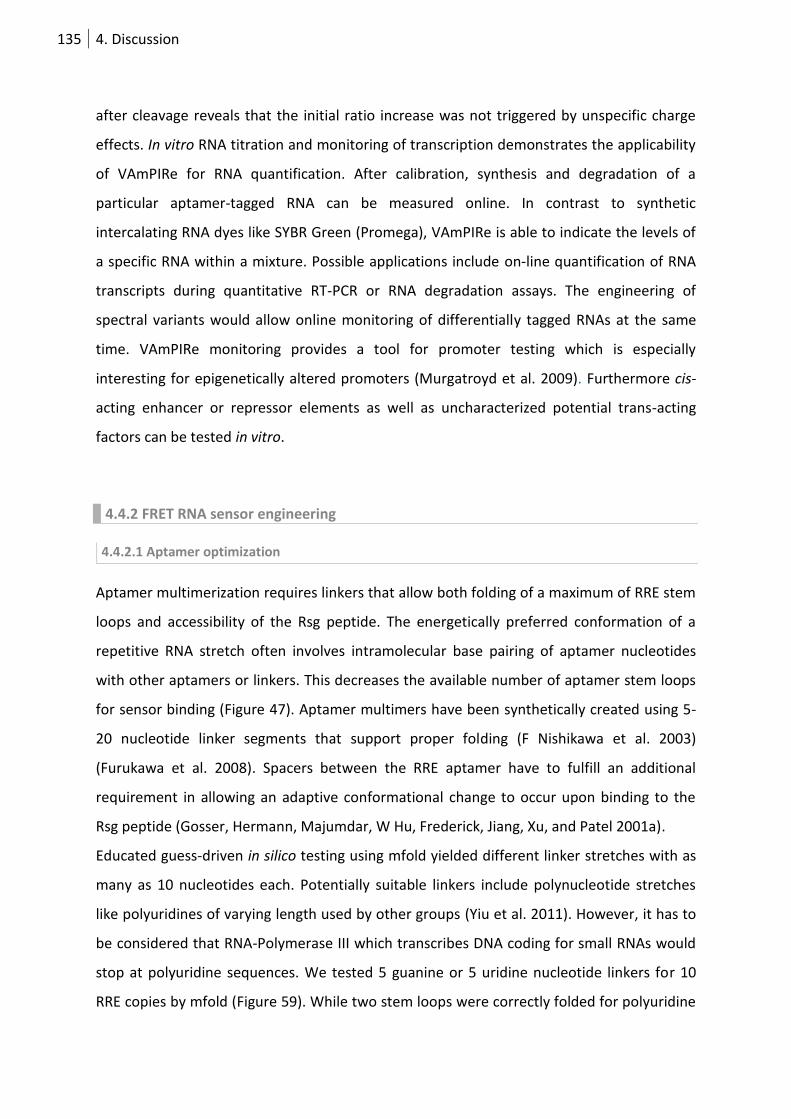
135 4. Discussion
after cleavage reveals that the initial ratio increase was not triggered by unspecific charge
effects. In vitro RNA titration and monitoring of transcription demonstrates the applicability
of VAmPIRe for RNA quantification. After calibration, synthesis and degradation of a
particular aptamer-tagged RNA can be measured online. In contrast to synthetic
intercalating RNA dyes like SYBR Green (Promega), VAmPIRe is able to indicate the levels of
a specific RNA within a mixture. Possible applications include on-line quantification of RNA
transcripts during quantitative RT-PCR or RNA degradation assays. The engineering of
spectral variants would allow online monitoring of differentially tagged RNAs at the same
time. VAmPIRe monitoring provides a tool for promoter testing which is especially
interesting for epigenetically altered promoters (Murgatroyd et al. 2009). Furthermore cis-
acting enhancer or repressor elements as well as uncharacterized potential trans-acting
factors can be tested in vitro.
4.4.2 FRET RNA sensor engineering
4.4.2.1 Aptamer optimization
Aptamer multimerization requires linkers that allow both folding of a maximum of RRE stem
loops and accessibility of the Rsg peptide. The energetically preferred conformation of a
repetitive RNA stretch often involves intramolecular base pairing of aptamer nucleotides
with other aptamers or linkers. This decreases the available number of aptamer stem loops
for sensor binding (Figure 47). Aptamer multimers have been synthetically created using 5-
20 nucleotide linker segments that support proper folding (F Nishikawa et al. 2003)
(Furukawa et al. 2008). Spacers between the RRE aptamer have to fulfill an additional
requirement in allowing an adaptive conformational change to occur upon binding to the
Rsg peptide (Gosser, Hermann, Majumdar, W Hu, Frederick, Jiang, Xu, and Patel 2001a).
Educated guess-driven in silico testing using mfold yielded different linker stretches with as
many as 10 nucleotides each. Potentially suitable linkers include polynucleotide stretches
like polyuridines of varying length used by other groups (Yiu et al. 2011). However, it has to
be considered that RNA-Polymerase III which transcribes DNA coding for small RNAs would
stop at polyuridine sequences. We tested 5 guanine or 5 uridine nucleotide linkers for 10
RRE copies by mfold (Figure 59). While two stem loops were correctly folded for polyuridine
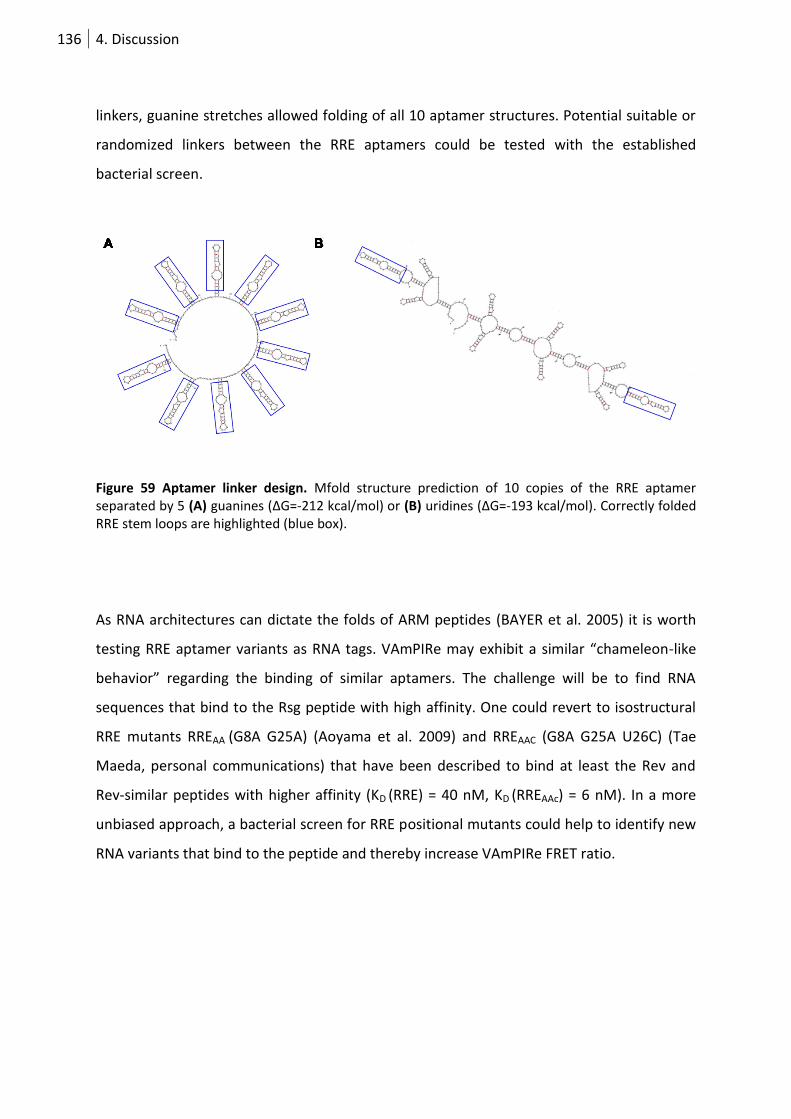
136 4. Discussion
linkers, guanine stretches allowed folding of all 10 aptamer structures. Potential suitable or
randomized linkers between the RRE aptamers could be tested with the established
bacterial screen.
Figure 59 Aptamer linker design. Mfold structure prediction of 10 copies of the RRE aptamer separated by 5 (A) guanines (ΔG=-212 kcal/mol) or (B) uridines (ΔG=-193 kcal/mol). Correctly folded RRE stem loops are highlighted (blue box).
As RNA architectures can dictate the folds of ARM peptides (BAYER et al. 2005) it is worth
testing RRE aptamer variants as RNA tags. VAmPIRe may exhibit a similar “chameleon-like
behavior” regarding the binding of similar aptamers. The challenge will be to find RNA
sequences that bind to the Rsg peptide with high affinity. One could revert to isostructural
RRE mutants RREAA (G8A G25A) (Aoyama et al. 2009) and RREAAC (G8A G25A U26C) (Tae
Maeda, personal communications) that have been described to bind at least the Rev and
Rev-similar peptides with higher affinity (KD (RRE) = 40 nM, KD (RREAAc) = 6 nM). In a more
unbiased approach, a bacterial screen for RRE positional mutants could help to identify new
RNA variants that bind to the peptide and thereby increase VAmPIRe FRET ratio.
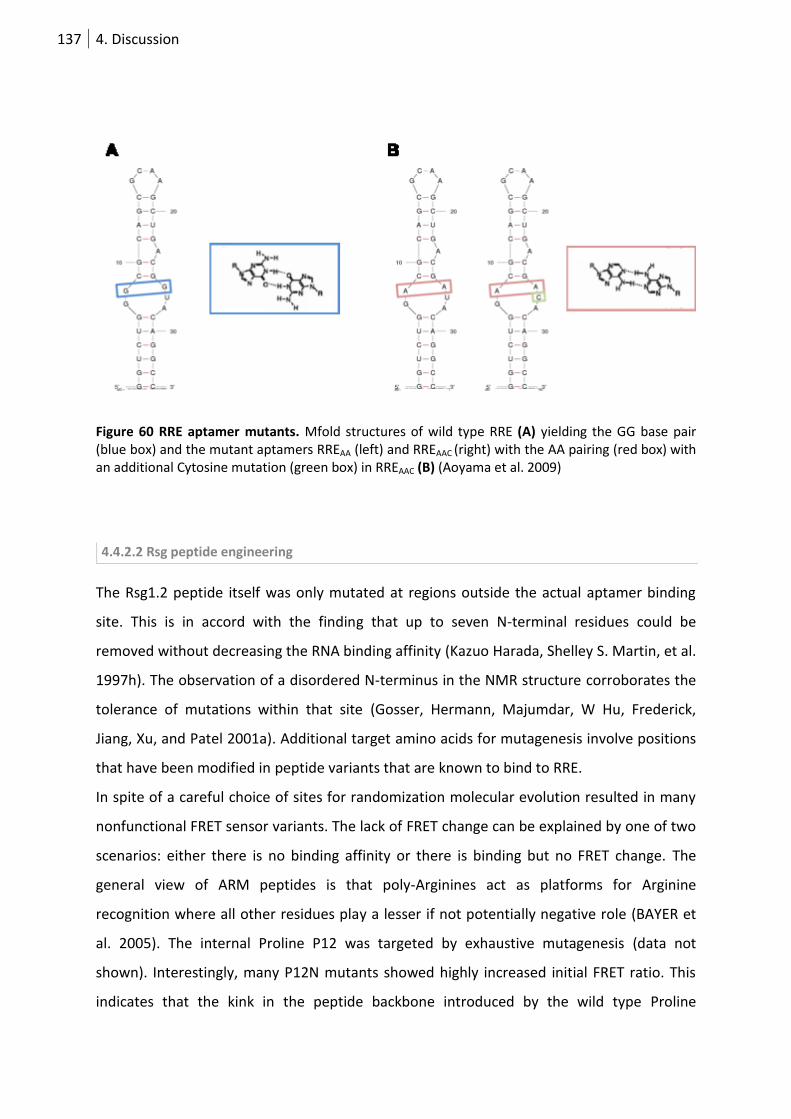
137 4. Discussion
Figure 60 RRE aptamer mutants. Mfold structures of wild type RRE (A) yielding the GG base pair (blue box) and the mutant aptamers RREAA (left) and RREAAC (right) with the AA pairing (red box) with an additional Cytosine mutation (green box) in RREAAC (B) (Aoyama et al. 2009)
4.4.2.2 Rsg peptide engineering
The Rsg1.2 peptide itself was only mutated at regions outside the actual aptamer binding
site. This is in accord with the finding that up to seven N-terminal residues could be
removed without decreasing the RNA binding affinity (Kazuo Harada, Shelley S. Martin, et al.
1997h). The observation of a disordered N-terminus in the NMR structure corroborates the
tolerance of mutations within that site (Gosser, Hermann, Majumdar, W Hu, Frederick,
Jiang, Xu, and Patel 2001a). Additional target amino acids for mutagenesis involve positions
that have been modified in peptide variants that are known to bind to RRE.
In spite of a careful choice of sites for randomization molecular evolution resulted in many
nonfunctional FRET sensor variants. The lack of FRET change can be explained by one of two
scenarios: either there is no binding affinity or there is binding but no FRET change. The
general view of ARM peptides is that poly-Arginines act as platforms for Arginine
recognition where all other residues play a lesser if not potentially negative role (BAYER et
al. 2005). The internal Proline P12 was targeted by exhaustive mutagenesis (data not
shown). Interestingly, many P12N mutants showed highly increased initial FRET ratio. This
indicates that the kink in the peptide backbone introduced by the wild type Proline
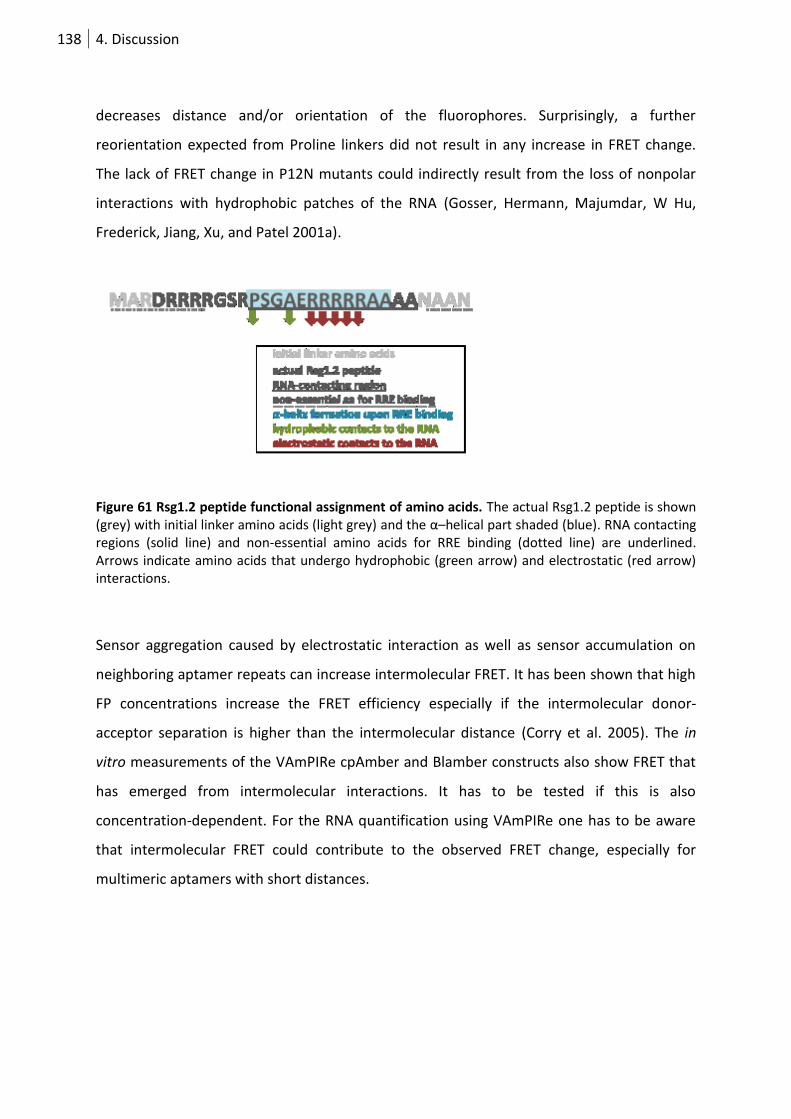
138 4. Discussion
decreases distance and/or orientation of the fluorophores. Surprisingly, a further
reorientation expected from Proline linkers did not result in any increase in FRET change.
The lack of FRET change in P12N mutants could indirectly result from the loss of nonpolar
interactions with hydrophobic patches of the RNA (Gosser, Hermann, Majumdar, W Hu,
Frederick, Jiang, Xu, and Patel 2001a).
Figure 61 Rsg1.2 peptide functional assignment of amino acids. The actual Rsg1.2 peptide is shown (grey) with initial linker amino acids (light grey) and the α–helical part shaded (blue). RNA contacting regions (solid line) and non-essential amino acids for RRE binding (dotted line) are underlined. Arrows indicate amino acids that undergo hydrophobic (green arrow) and electrostatic (red arrow) interactions.
Sensor aggregation caused by electrostatic interaction as well as sensor accumulation on
neighboring aptamer repeats can increase intermolecular FRET. It has been shown that high
FP concentrations increase the FRET efficiency especially if the intermolecular donor-
acceptor separation is higher than the intermolecular distance (Corry et al. 2005). The in
vitro measurements of the VAmPIRe cpAmber and Blamber constructs also show FRET that
has emerged from intermolecular interactions. It has to be tested if this is also
concentration-dependent. For the RNA quantification using VAmPIRe one has to be aware
that intermolecular FRET could contribute to the observed FRET change, especially for
multimeric aptamers with short distances.
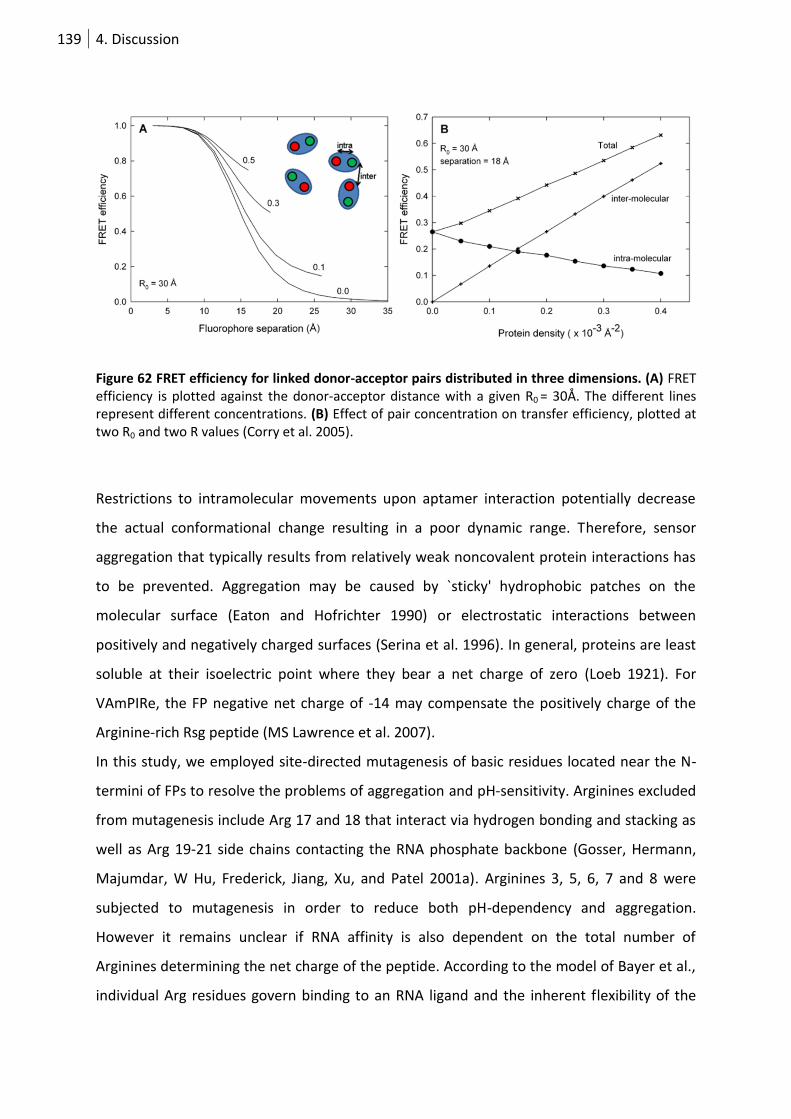
139 4. Discussion
Figure 62 FRET efficiency for linked donor-acceptor pairs distributed in three dimensions. (A) FRET efficiency is plotted against the donor-acceptor distance with a given R0 = 30Å. The different lines represent different concentrations. (B) Effect of pair concentration on transfer efficiency, plotted at two R0 and two R values (Corry et al. 2005).
Restrictions to intramolecular movements upon aptamer interaction potentially decrease
the actual conformational change resulting in a poor dynamic range. Therefore, sensor
aggregation that typically results from relatively weak noncovalent protein interactions has
to be prevented. Aggregation may be caused by `sticky' hydrophobic patches on the
molecular surface (Eaton and Hofrichter 1990) or electrostatic interactions between
positively and negatively charged surfaces (Serina et al. 1996). In general, proteins are least
soluble at their isoelectric point where they bear a net charge of zero (Loeb 1921). For
VAmPIRe, the FP negative net charge of -14 may compensate the positively charge of the
Arginine-rich Rsg peptide (MS Lawrence et al. 2007).
In this study, we employed site-directed mutagenesis of basic residues located near the N-
termini of FPs to resolve the problems of aggregation and pH-sensitivity. Arginines excluded
from mutagenesis include Arg 17 and 18 that interact via hydrogen bonding and stacking as
well as Arg 19-21 side chains contacting the RNA phosphate backbone (Gosser, Hermann,
Majumdar, W Hu, Frederick, Jiang, Xu, and Patel 2001a). Arginines 3, 5, 6, 7 and 8 were
subjected to mutagenesis in order to reduce both pH-dependency and aggregation.
However it remains unclear if RNA affinity is also dependent on the total number of
Arginines determining the net charge of the peptide. According to the model of Bayer et al.,
individual Arg residues govern binding to an RNA ligand and the inherent flexibility of the
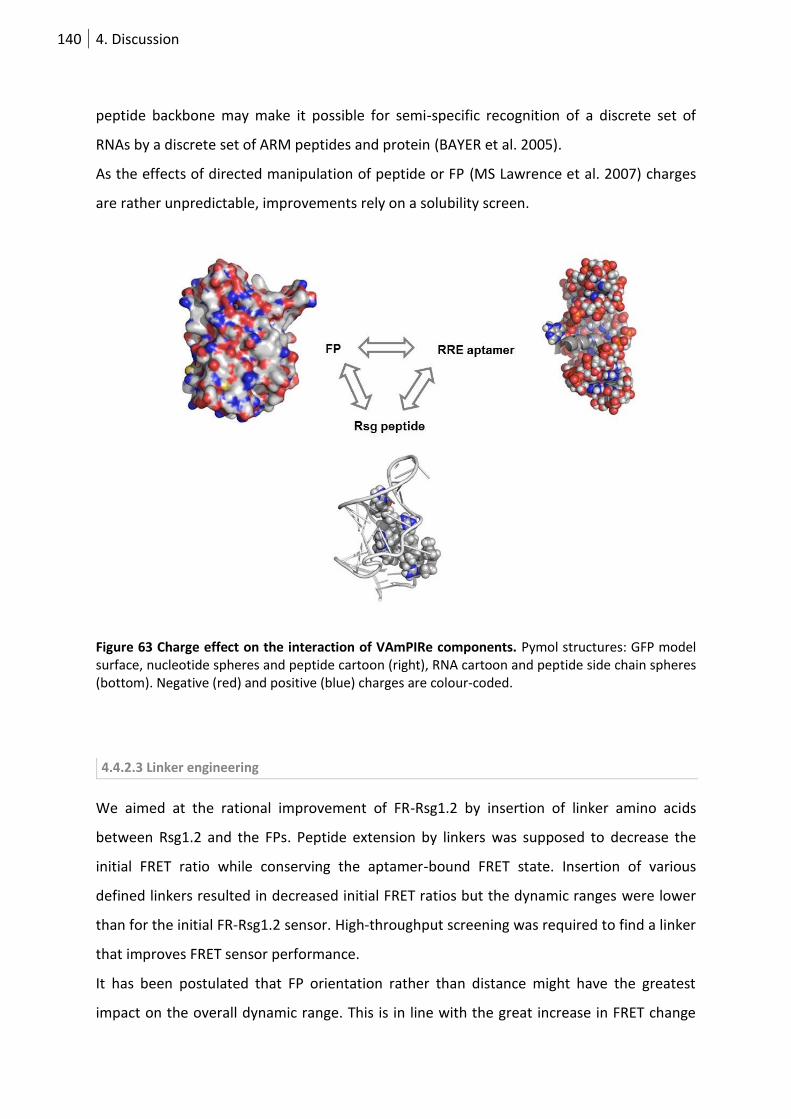
140 4. Discussion
peptide backbone may make it possible for semi-specific recognition of a discrete set of
RNAs by a discrete set of ARM peptides and protein (BAYER et al. 2005).
As the effects of directed manipulation of peptide or FP (MS Lawrence et al. 2007) charges
are rather unpredictable, improvements rely on a solubility screen.
Figure 63 Charge effect on the interaction of VAmPIRe components. Pymol structures: GFP model surface, nucleotide spheres and peptide cartoon (right), RNA cartoon and peptide side chain spheres (bottom). Negative (red) and positive (blue) charges are colour-coded.
4.4.2.3 Linker engineering
We aimed at the rational improvement of FR-Rsg1.2 by insertion of linker amino acids
between Rsg1.2 and the FPs. Peptide extension by linkers was supposed to decrease the
initial FRET ratio while conserving the aptamer-bound FRET state. Insertion of various
defined linkers resulted in decreased initial FRET ratios but the dynamic ranges were lower
than for the initial FR-Rsg1.2 sensor. High-throughput screening was required to find a linker
that improves FRET sensor performance.
It has been postulated that FP orientation rather than distance might have the greatest
impact on the overall dynamic range. This is in line with the great increase in FRET change

141 4. Discussion
upon exchange of the acceptor FP by the corresponding cp variant (T. Nagai 2004) (Palmer
et al. 2006) (Mank et al. 2006). Other studies show that number and identity of amino acids
between the FPs have profound impact on the FRET change (Miyawaki and Roger Y. Tsien
2000). Optimal linkers potentially increase distance, alter orientation and reduce
interference of the fluorophores.
Peptide linkers consisting of glycine and serine amino acids are considered as flexible due to
their small side chain. We tested flexible linkers like the commonly used GGGS motif of
different length which dramatically reduced the FRET ratio change (Figure 37B). Flexible
linkers may allow two FPs to interact with each other. This property of glycine-rich regions is
evident in many natural systems, e.g. the NFκB glycine-rich hinge allows one terminus to
fold back on to the other (Henkel et al. 1992). The fold-back property of polyglycine has
been shown empirically in pulse-radiolysis experiments (Bobrowski et al. 1990). This
possibly indicates that flexible linkers did not rigidly fix distance and orientation of FRET RNA
sensor FPs. Instead, the on- and off-states were defined by multiple conformations resulting
in an average FRET ratio value.
In contrast to glycine homopolymers, Prolines maintain a predictable end-to-end distance
over a length of more than 100 residues (Schimmel and Flory 1967). High steric restriction
about the peptide φ and ψ and bonds and the almost exclusive trans conformation reduce
the rotational freedom in Proline polymers. Consequently, poly-L-Proline spectroscopic has
been used a ruler to measure distances of energy transfer between attached moieties
ranging from 12 to 46 Å (Stryer and Haugland 1967) (Isied et al. 1992). We observed
predictable separation distances between the FPs based on the number of Proline residues
inserted (Figure 37D). This contradicts the ability of Proline to introduce kinks in the peptide
backbone and thereby alter not only distance but also orientation of the FRET pair. Prolines
are also favoured because of their inability to donate hydrogen bonds or participate
comfortably in any regular secondary structure conformation (George and Heringa 2002). In
spite of this predicted rigid separation, the introduction of Proline linkers dramatically
reduced the dynamic range of the sensor (Figure 37D).
So-called molecular rulers have proven suitable to render linkers more rigid without
changing FP orientation. Most commonly, stable helices have been used to measure the
effect of different depths of binding pockets on various properties of proteins of interest
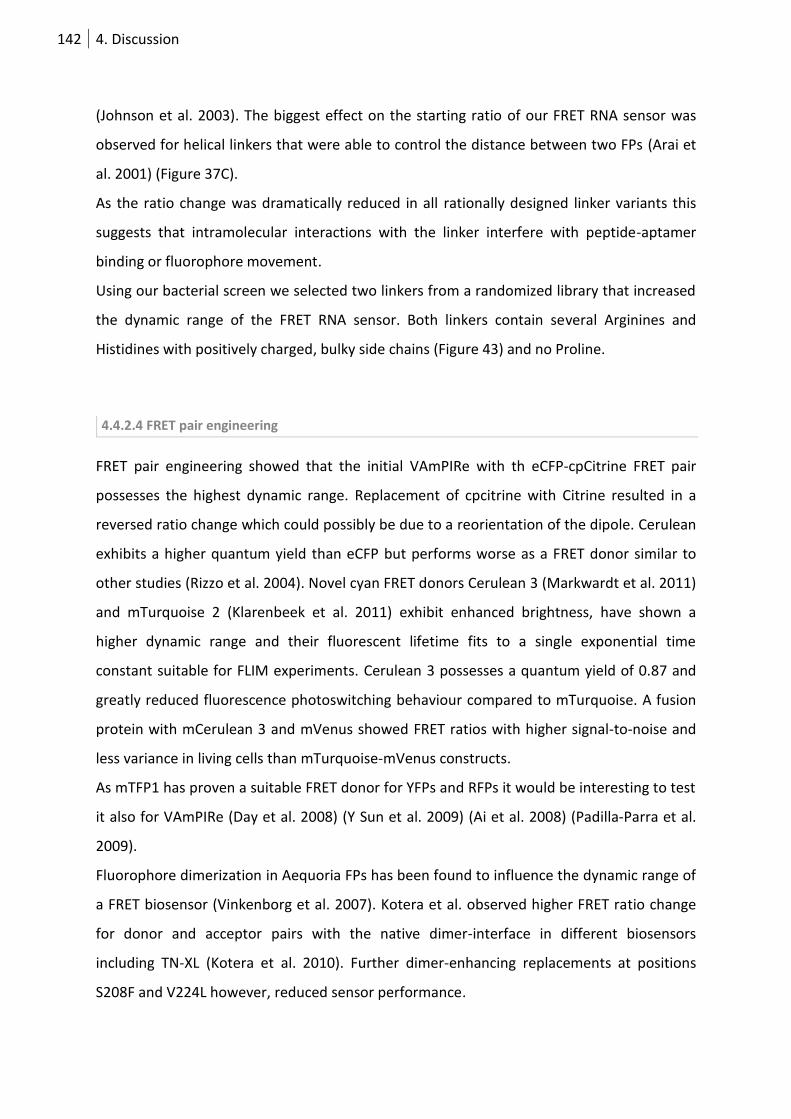
142 4. Discussion
(Johnson et al. 2003). The biggest effect on the starting ratio of our FRET RNA sensor was
observed for helical linkers that were able to control the distance between two FPs (Arai et
al. 2001) (Figure 37C).
As the ratio change was dramatically reduced in all rationally designed linker variants this
suggests that intramolecular interactions with the linker interfere with peptide-aptamer
binding or fluorophore movement.
Using our bacterial screen we selected two linkers from a randomized library that increased
the dynamic range of the FRET RNA sensor. Both linkers contain several Arginines and
Histidines with positively charged, bulky side chains (Figure 43) and no Proline.
4.4.2.4 FRET pair engineering
FRET pair engineering showed that the initial VAmPIRe with th eCFP-cpCitrine FRET pair
possesses the highest dynamic range. Replacement of cpcitrine with Citrine resulted in a
reversed ratio change which could possibly be due to a reorientation of the dipole. Cerulean
exhibits a higher quantum yield than eCFP but performs worse as a FRET donor similar to
other studies (Rizzo et al. 2004). Novel cyan FRET donors Cerulean 3 (Markwardt et al. 2011)
and mTurquoise 2 (Klarenbeek et al. 2011) exhibit enhanced brightness, have shown a
higher dynamic range and their fluorescent lifetime fits to a single exponential time
constant suitable for FLIM experiments. Cerulean 3 possesses a quantum yield of 0.87 and
greatly reduced fluorescence photoswitching behaviour compared to mTurquoise. A fusion
protein with mCerulean 3 and mVenus showed FRET ratios with higher signal-to-noise and
less variance in living cells than mTurquoise-mVenus constructs.
As mTFP1 has proven a suitable FRET donor for YFPs and RFPs it would be interesting to test
it also for VAmPIRe (Day et al. 2008) (Y Sun et al. 2009) (Ai et al. 2008) (Padilla-Parra et al.
2009).
Fluorophore dimerization in Aequoria FPs has been found to influence the dynamic range of
a FRET biosensor (Vinkenborg et al. 2007). Kotera et al. observed higher FRET ratio change
for donor and acceptor pairs with the native dimer-interface in different biosensors
including TN-XL (Kotera et al. 2010). Further dimer-enhancing replacements at positions
S208F and V224L however, reduced sensor performance.
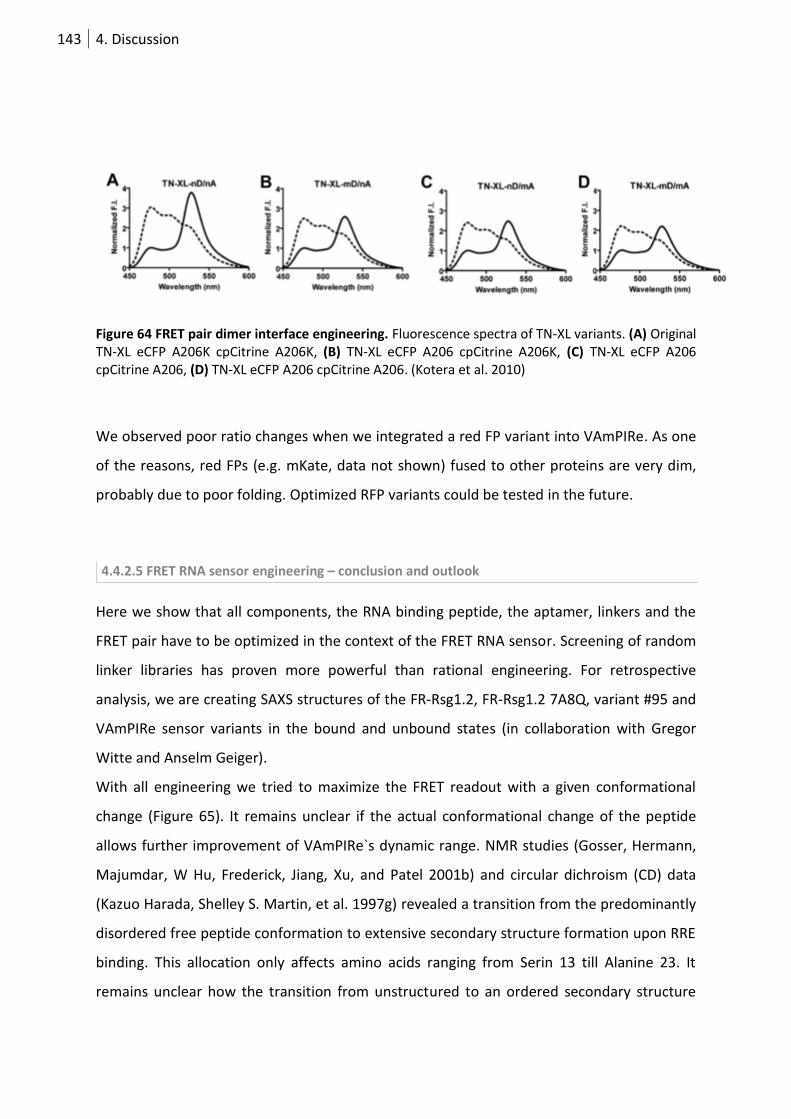
143 4. Discussion
Figure 64 FRET pair dimer interface engineering. Fluorescence spectra of TN-XL variants. (A) Original TN-XL eCFP A206K cpCitrine A206K, (B) TN-XL eCFP A206 cpCitrine A206K, (C) TN-XL eCFP A206 cpCitrine A206, (D) TN-XL eCFP A206 cpCitrine A206. (Kotera et al. 2010)
We observed poor ratio changes when we integrated a red FP variant into VAmPIRe. As one
of the reasons, red FPs (e.g. mKate, data not shown) fused to other proteins are very dim,
probably due to poor folding. Optimized RFP variants could be tested in the future.
4.4.2.5 FRET RNA sensor engineering – conclusion and outlook
Here we show that all components, the RNA binding peptide, the aptamer, linkers and the
FRET pair have to be optimized in the context of the FRET RNA sensor. Screening of random
linker libraries has proven more powerful than rational engineering. For retrospective
analysis, we are creating SAXS structures of the FR-Rsg1.2, FR-Rsg1.2 7A8Q, variant #95 and
VAmPIRe sensor variants in the bound and unbound states (in collaboration with Gregor
Witte and Anselm Geiger).
With all engineering we tried to maximize the FRET readout with a given conformational
change (Figure 65). It remains unclear if the actual conformational change of the peptide
allows further improvement of VAmPIRe`s dynamic range. NMR studies (Gosser, Hermann,
Majumdar, W Hu, Frederick, Jiang, Xu, and Patel 2001b) and circular dichroism (CD) data
(Kazuo Harada, Shelley S. Martin, et al. 1997g) revealed a transition from the predominantly
disordered free peptide conformation to extensive secondary structure formation upon RRE
binding. This allocation only affects amino acids ranging from Serin 13 till Alanine 23. It
remains unclear how the transition from unstructured to an ordered secondary structure
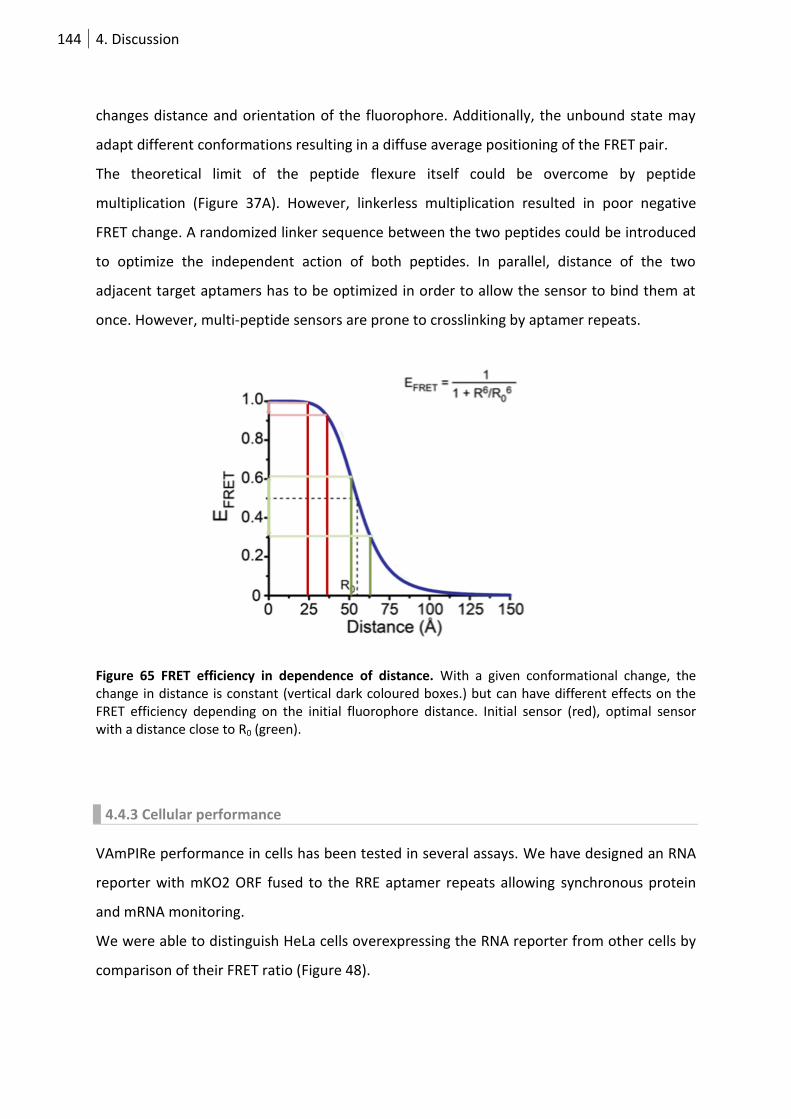
144 4. Discussion
changes distance and orientation of the fluorophore. Additionally, the unbound state may
adapt different conformations resulting in a diffuse average positioning of the FRET pair.
The theoretical limit of the peptide flexure itself could be overcome by peptide
multiplication (Figure 37A). However, linkerless multiplication resulted in poor negative
FRET change. A randomized linker sequence between the two peptides could be introduced
to optimize the independent action of both peptides. In parallel, distance of the two
adjacent target aptamers has to be optimized in order to allow the sensor to bind them at
once. However, multi-peptide sensors are prone to crosslinking by aptamer repeats.
Figure 65 FRET efficiency in dependence of distance. With a given conformational change, the change in distance is constant (vertical dark coloured boxes.) but can have different effects on the FRET efficiency depending on the initial fluorophore distance. Initial sensor (red), optimal sensor with a distance close to R0 (green).
4.4.3 Cellular performance
VAmPIRe performance in cells has been tested in several assays. We have designed an RNA
reporter with mKO2 ORF fused to the RRE aptamer repeats allowing synchronous protein
and mRNA monitoring.
We were able to distinguish HeLa cells overexpressing the RNA reporter from other cells by
comparison of their FRET ratio (Figure 48).
145 4. Discussion
For the TetON experiment (Figure 49), the RNA reporter was controlled by an inducible
promoter. Increasing RNA and protein levels upon induction could be monitored by FRET
change and mKO2 emission, respectively. Time-delayed increase of mKO2 emission is due to
time needed for translation, folding and oxidation of mKO2. FRET ratio increases first in the
nucleus and subsequently spreads to the cytoplasm (Figure 49B) which probably reflects
nuclear transcription and subsequent export to the cytoplasm.
VAmPIRe is also suitable to monitor the subcellular distribution of overexpressed β–actin
mRNA in fibroblasts (Figure 50). High FRET ratio in perinuclear regions and the leading edge
nicely corresponds to RNA localization detected by other approaches (Figure 2G).
Subcellular RNA dynamics can be tested in a migration assay.
Upon induction of stress, high FRET ratios compared to the surroundings were observed in
cytoplasmic particles (Figure 51). Particles with increased FRET ratio likely originate from
cytosolic VAmPIRe bound by the aptamer repeats and incorporated into stress granules via
the zipcode. These particles were characterized as stress granules due to their colocalization
with ZBP1. Timelapse imaging will provide an insight into spatial dynamics of stress granule
formation.
This reveals the potential of VAmPIRe to resolve spatial and temporal dynamics of aptamer-
tagged RNAs.
4.4.3.1 Aptamer-tagging of the RNA of interest
For our FRET reporter approach aptamer attachment to the RNA of interest is essential.
However, this harbors the danger of disturbance of the RNA of interest regarding folding,
transport, translation and stability. FR-Rsg1.2 in vitro measurements show that attachment
of 10 RRE repeats to the mKO2 ORF did not significantly alter the FRET signal. Target RNA
functionality after aptamer fusion has to be considered for each RNA of interest. The site of
aptamer insertion has to be chosen with the aim to minimally interfere with coding, stability
or localization elements. For other aptamer tagging strategies, the site between ORF and
3`UTR has proven most suitable (Rook et al. 2000).
146 4. Discussion
4.4.3.2 VAmPIRe RNA specificity
Coexpression experiments with aptamer-tagged and unlabeled mKO2 RNA clearly showed
the specificity of VAmPIRe for the RRE aptamer in cells.
Investigation of in vitro specificity showed that some RRE aptamer mutants that are known
to bind Rev still induce a FRET ratio change. A reverse complementary RNA that is similar in
nucleotide composition and length slightly decreased the FRET ratio. However, the absence
of endogenous RNA stretches similar to RRE has to be assured. Considering the functionality
of HIV assembly in eukaryotic cells that relies on the RRE recognition by Rev, any
crossreactivity seems unlikely.
4.4.3.3 VAmPIRe pH sensitivity
Beyond the known pH sensitivity of FPs, VAmPIRe starting ratio and dynamic range are pH-
dependent. This probably originates from the Arginine-rich Rsg peptide. Better performance
at basic pH values renders the sensor suitable for applications in mitochondria.
Mitochondrial targeting of a FRET RNA sensor has been tested in cell culture (data not
shown). The higher pH within bacterial cells contributes to the differences in sensor
performance in prokaryotic and eukaryotic systems. For cell experiments unspecific signal
caused by pH changes have to be taken into account.
4.4.3.4 Comparison of VAmPIRe to the MS2/λN22 system
The aim of this study was to create a novel, aptamer-dependent RNA reporter that is
genetically encoded. Currently, the MS2 and the λN22 systems are the methods of choice
for live cell RNA imaging. Mainly MS2 but also λN22 tagging has proven valuable for
different mRNAs in various cell types (Schifferer and Oliver Griesbeck 2009) including the
use of endogenous promoters. Therefore, VAmPIRe`s performance can be best evaluated by
a comparison to these state-of-the-art techniques.
An important criterion for a reporter is a high affinity to the specifically tagged RNA of
interest. Optimally, the apparent dissociation constant is at or near the expected
concentration. As changes in concentration are most efficiently detected within +/- 5 x KD a
147 4. Discussion
high reporter sensitivity also assures a favourable dynamic range. The MS2 peptide binds to
the MS2 RNA motif with a dissociation constant of 39 nM (Lago et al. 1998). The Rsg1.2-RRE
interaction possesses similar affinity (KD = 6 nM) but the KD for the isolated mutated
VAmPIRe peptide has not been determined. A direct comparison of the affinities of the
actual fusion proteins (KD(VAmPIRe) = 100 nM) is not possible as the value for the MS2 label
is missing. The FRET sensor variant #95 performed better than VAmPIRe regarding affinity
and therefore will also be tested in cells.
The MS2/λN22 systems rely on accumulation of the MS2-labelled GFP on the aptamer
repeats. Signal-to-noise ratio is increased by subcellular restriction which has been shown
by us and others to be inefficient in certain cell types and might interfere with the targeting
of the RNA of interest. VAmPIRe circumvents the need of subcellular restriction although a
NLS could be beneficially introduced for background reduction in some contexts. In contrast
to a simple GFP label this dynamic visualization strategy allows imaging in the nucleus.
Instability of implementation of the MS2 system forcedly includes a tight control regarding
leakiness of the subcellular restriction and RNP-like aggregate formation (see 3.4.1, Figure
23).
Every MS2 aptamer can be contacted by two MS2-GFP labels. Up to 30 MS2 reporter
molecules bind to 24 MS2 aptamer repeats (S. Hüttelmaier, personal communication). For
the detection of mRNAs that are less abundant than β-actin, 3 copies of GFP have to be
fused to the MS2 peptide to assure proper fluorescence emission. The number of aptamer
repeats can also be adapted to the desired sensitivity depending on the prevalence of the
RNA of interest. For most MS2 experiments 24 repeats similar to the 20 RRE multimer were
applied, however as few as 6 MS2 repeats were sufficient for imaging of ASH1 RNPs in S.
cerevisiae (E Bertrand, P Chartrand, et al. 1998a). There is also a limit on the number of
loops that can be introduced into the endogenous mRNA because of the difficulty in cloning
repeats and the effect of increasing the size of the RNA considerably. For some applications
long aptamer stretches bear a high potential of interference with the tagged RNA of
interest. This was the reason for insertion of as few as 4 MS2 aptamers into the intron of an
RNA construct that was used to report splicing by the absence of the MS2 tag (E. Bertrand,
personal communication).
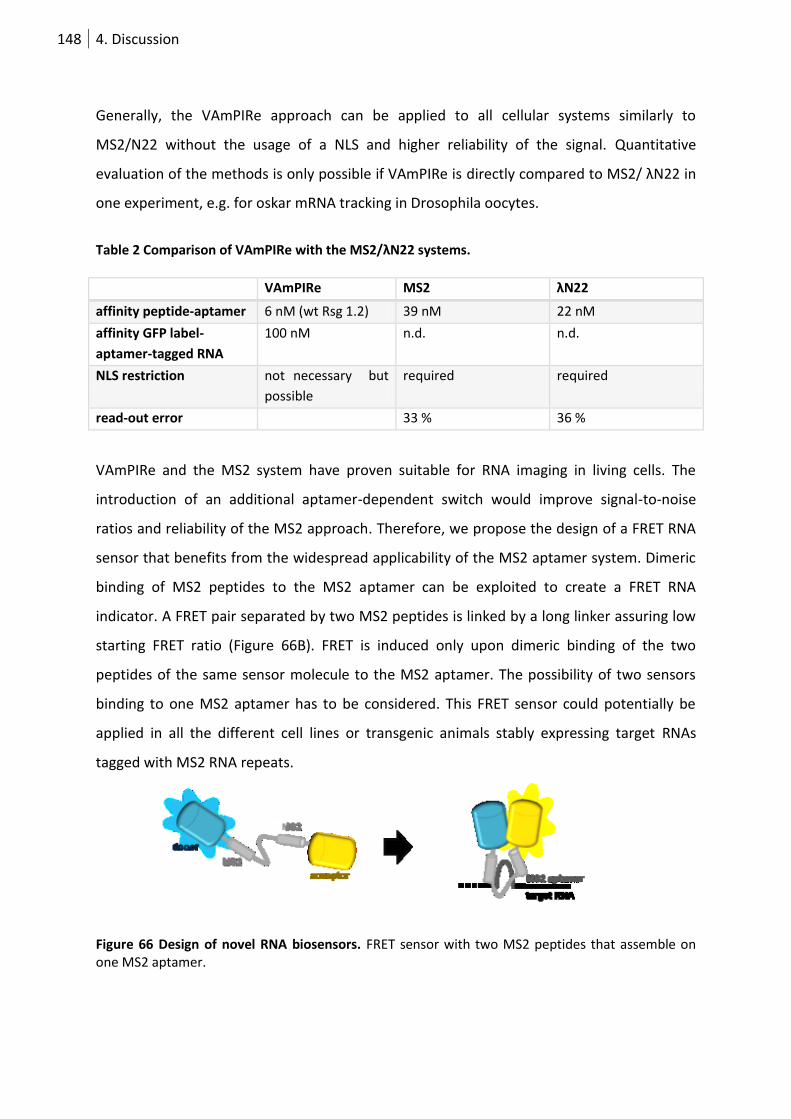
148 4. Discussion
Generally, the VAmPIRe approach can be applied to all cellular systems similarly to
MS2/N22 without the usage of a NLS and higher reliability of the signal. Quantitative
evaluation of the methods is only possible if VAmPIRe is directly compared to MS2/ λN22 in
one experiment, e.g. for oskar mRNA tracking in Drosophila oocytes.
Table 2 Comparison of VAmPIRe with the MS2/λN22 systems.
VAmPIRe MS2 λN22
affinity peptide-aptamer 6 nM (wt Rsg 1.2) 39 nM 22 nM
affinity GFP label-
aptamer-tagged RNA
100 nM n.d. n.d.
NLS restriction not necessary but
possible
required required
read-out error 33 % 36 %
VAmPIRe and the MS2 system have proven suitable for RNA imaging in living cells. The
introduction of an additional aptamer-dependent switch would improve signal-to-noise
ratios and reliability of the MS2 approach. Therefore, we propose the design of a FRET RNA
sensor that benefits from the widespread applicability of the MS2 aptamer system. Dimeric
binding of MS2 peptides to the MS2 aptamer can be exploited to create a FRET RNA
indicator. A FRET pair separated by two MS2 peptides is linked by a long linker assuring low
starting FRET ratio (Figure 66B). FRET is induced only upon dimeric binding of the two
peptides of the same sensor molecule to the MS2 aptamer. The possibility of two sensors
binding to one MS2 aptamer has to be considered. This FRET sensor could potentially be
applied in all the different cell lines or transgenic animals stably expressing target RNAs
tagged with MS2 RNA repeats.
Figure 66 Design of novel RNA biosensors. FRET sensor with two MS2 peptides that assemble on one MS2 aptamer.
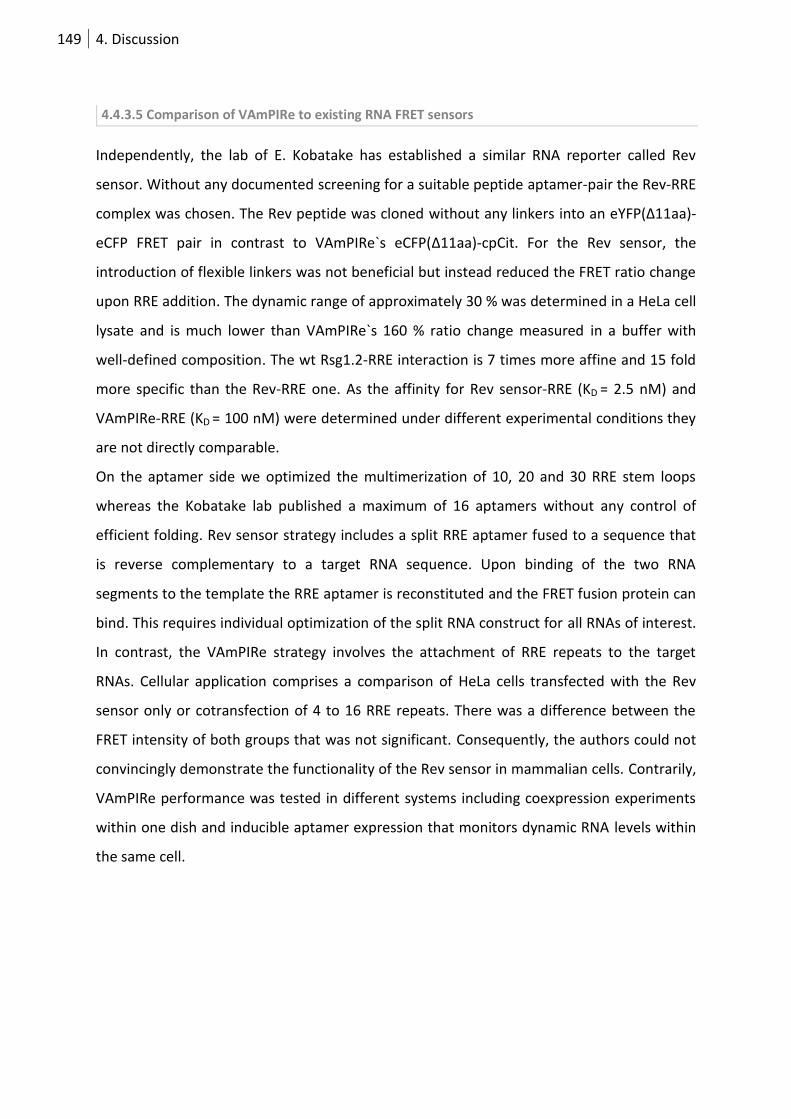
149 4. Discussion
4.4.3.5 Comparison of VAmPIRe to existing RNA FRET sensors
Independently, the lab of E. Kobatake has established a similar RNA reporter called Rev
sensor. Without any documented screening for a suitable peptide aptamer-pair the Rev-RRE
complex was chosen. The Rev peptide was cloned without any linkers into an eYFP(Δ11aa)-
eCFP FRET pair in contrast to VAmPIRe`s eCFP(Δ11aa)-cpCit. For the Rev sensor, the
introduction of flexible linkers was not beneficial but instead reduced the FRET ratio change
upon RRE addition. The dynamic range of approximately 30 % was determined in a HeLa cell
lysate and is much lower than VAmPIRe`s 160 % ratio change measured in a buffer with
well-defined composition. The wt Rsg1.2-RRE interaction is 7 times more affine and 15 fold
more specific than the Rev-RRE one. As the affinity for Rev sensor-RRE (KD = 2.5 nM) and
VAmPIRe-RRE (KD = 100 nM) were determined under different experimental conditions they
are not directly comparable.
On the aptamer side we optimized the multimerization of 10, 20 and 30 RRE stem loops
whereas the Kobatake lab published a maximum of 16 aptamers without any control of
efficient folding. Rev sensor strategy includes a split RRE aptamer fused to a sequence that
is reverse complementary to a target RNA sequence. Upon binding of the two RNA
segments to the template the RRE aptamer is reconstituted and the FRET fusion protein can
bind. This requires individual optimization of the split RNA construct for all RNAs of interest.
In contrast, the VAmPIRe strategy involves the attachment of RRE repeats to the target
RNAs. Cellular application comprises a comparison of HeLa cells transfected with the Rev
sensor only or cotransfection of 4 to 16 RRE repeats. There was a difference between the
FRET intensity of both groups that was not significant. Consequently, the authors could not
convincingly demonstrate the functionality of the Rev sensor in mammalian cells. Contrarily,
VAmPIRe performance was tested in different systems including coexpression experiments
within one dish and inducible aptamer expression that monitors dynamic RNA levels within
the same cell.
150 4. Discussion
Figure 67 Rev sensor strategy. (A) Principle of target nucleic acid detection by FRET signal change. In the presence of target nucleic acids, two synthetic oligonucleotides hybridize to the adjacent region of the target nucleic acids and reform a Rev-peptide binding site on the hybridized complex. Then the YRG0C-11ad binds to the hybridized complex with a FRET increase mediated by Rev-peptide conformational change. (B) Secondary structure and sequence of the hybridized complex. Minimal RRE-RNA element necessary for Rev-peptide binding was surrounded. (Endoh et al. 2005)
Table 3 Comparison of VAmPIRe to the Rev sensor.
Rev sensor VAmPIRe
FRET pair eYFP(Δ11aa)-eCFP eCFP(Δ11aa)-cpCit
peptide Rev Rsg 1.2 7A8Q, linkers
aptamer split RRE
1x, 4x, 16x RRE
RRE
1x, 5x, 10x, 20x, (30x) RRE
mechanism split aptamer complementary
binding to target RNA
aptamer fusion to target RNA
ratio
change
~ 30%
(HeLa cell lysate)
160 %
(recombinantly expressed, purified pH 7.25)
affinity
sensor
2.5 nM 100 nM
affinity
peptide
40 nM 6 nM (Rsg1.2)
specificity negative ratio change for one
unspecific RNA
negative ratio change for unspecific RNAs
Rsg 1.2 (wt) 15 fold higher specificity than
Rev
151 4. Discussion
4.4.3.6 Imaging of dendritic mRNAs
Imaging of single transcripts in neuronal dendrites requires high sensitivity. On the sensor
part, improvements include the increase of the dynamic range and the addition of more and
optimized aptamer repeats.
A further requirement for RNA imaging involves a microscopy technique that is able to
detect single labeled RNA molecules in light-scattering brain slices. Spine size varies from 0.2
to 2 µm in length which can be resolved by confocal or two-photon microscopy with a
lateral resolution of 200 nm. However, imaging of submicron RNA particles will be restricted
by diffraction-limited resolution. Recently, STED (stimulated emission depletion)
microscopy, a far-field optical technique with subdiffraction resolution was used to monitor
morphological plasticity of dendritic spines (Nägerl et al. 2008). In this study, Lifeact-YFP was
used to image actin structures inside dendritic spines of hippocampal neurons in
organotypic slices (Figure 68).
FLIM is an imaging technique for producing an image based on the differences in the
exponential decay rate of the fluorescence from a fluorescent sample. It can be used as an
imaging technique in confocal microscopy and Two-photon excitation microscopy. The
lifetime of the fluorophore signal is used to create the image in FLIM. Energy transfer from
the donor molecule to the acceptor molecule will decrease the lifetime of the donor. Thus,
FRET measurements using FLIM can provide a method to discriminate between the states of
the fluorophore. In contrast to intensity-based FRET measurements, the FLIM-based FRET
measurements are insensitive to the concentration of fluorophores and can thus filter out
artifacts introduced by variations in the concentration and emission intensity across the
sample. Furthermore, FLIM minimizes the effect of photon scattering in thick layers of
sample. We are planning to apply VAmPIRe in FLIM imaging. Therefore, the eCFP is replaced
by a donor with single exponential decay including Cerulean 3 and Turquoise 2.
As bleaching will be limiting for following the fate of single localizing transcripts from
transcription to degradation the FRET pair has to be optimized regarding photostability. The
availability of backup-biosensor for bleached areas will have to be balanced with high signal-
to-noise ratio that requires low reporter expression. Generally, this could be an advantage
of VAmPIRe compared to the MS2 system as the dynamic FRET signal allows for high
background expression in the surrounding of the aptamer-tagged RNA of interest.
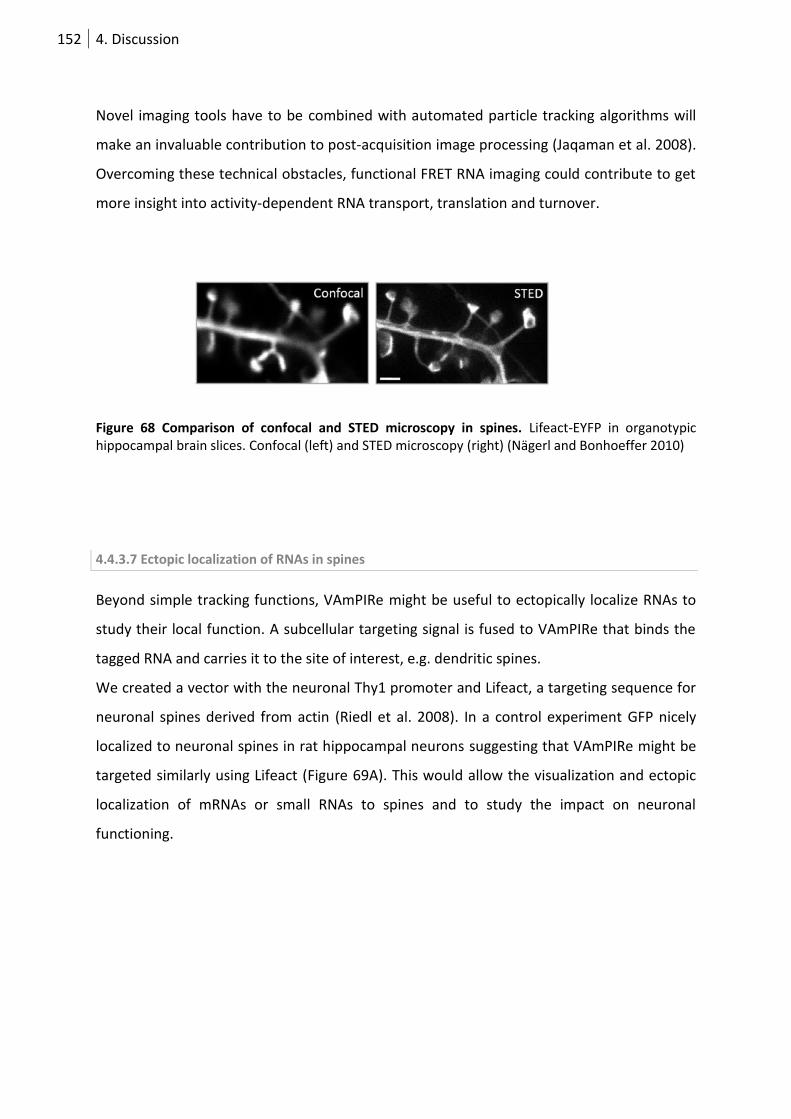
152 4. Discussion
Novel imaging tools have to be combined with automated particle tracking algorithms will
make an invaluable contribution to post-acquisition image processing (Jaqaman et al. 2008).
Overcoming these technical obstacles, functional FRET RNA imaging could contribute to get
more insight into activity-dependent RNA transport, translation and turnover.
Figure 68 Comparison of confocal and STED microscopy in spines. Lifeact-EYFP in organotypic hippocampal brain slices. Confocal (left) and STED microscopy (right) (Nägerl and Bonhoeffer 2010)
4.4.3.7 Ectopic localization of RNAs in spines
Beyond simple tracking functions, VAmPIRe might be useful to ectopically localize RNAs to
study their local function. A subcellular targeting signal is fused to VAmPIRe that binds the
tagged RNA and carries it to the site of interest, e.g. dendritic spines.
We created a vector with the neuronal Thy1 promoter and Lifeact, a targeting sequence for
neuronal spines derived from actin (Riedl et al. 2008). In a control experiment GFP nicely
localized to neuronal spines in rat hippocampal neurons suggesting that VAmPIRe might be
targeted similarly using Lifeact (Figure 69A). This would allow the visualization and ectopic
localization of mRNAs or small RNAs to spines and to study the impact on neuronal
functioning.
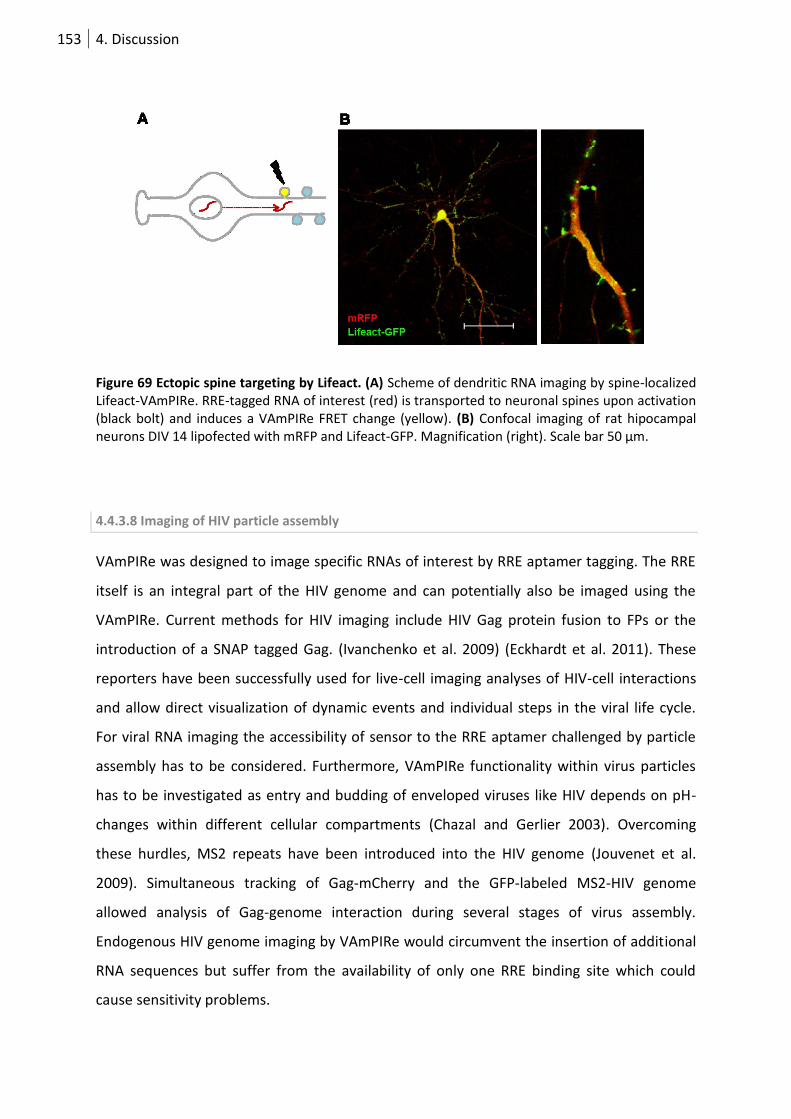
153 4. Discussion
Figure 69 Ectopic spine targeting by Lifeact. (A) Scheme of dendritic RNA imaging by spine-localized Lifeact-VAmPIRe. RRE-tagged RNA of interest (red) is transported to neuronal spines upon activation (black bolt) and induces a VAmPIRe FRET change (yellow). (B) Confocal imaging of rat hipocampal neurons DIV 14 lipofected with mRFP and Lifeact-GFP. Magnification (right). Scale bar 50 µm.
4.4.3.8 Imaging of HIV particle assembly
VAmPIRe was designed to image specific RNAs of interest by RRE aptamer tagging. The RRE
itself is an integral part of the HIV genome and can potentially also be imaged using the
VAmPIRe. Current methods for HIV imaging include HIV Gag protein fusion to FPs or the
introduction of a SNAP tagged Gag. (Ivanchenko et al. 2009) (Eckhardt et al. 2011). These
reporters have been successfully used for live-cell imaging analyses of HIV-cell interactions
and allow direct visualization of dynamic events and individual steps in the viral life cycle.
For viral RNA imaging the accessibility of sensor to the RRE aptamer challenged by particle
assembly has to be considered. Furthermore, VAmPIRe functionality within virus particles
has to be investigated as entry and budding of enveloped viruses like HIV depends on pH-
changes within different cellular compartments (Chazal and Gerlier 2003). Overcoming
these hurdles, MS2 repeats have been introduced into the HIV genome (Jouvenet et al.
2009). Simultaneous tracking of Gag-mCherry and the GFP-labeled MS2-HIV genome
allowed analysis of Gag-genome interaction during several stages of virus assembly.
Endogenous HIV genome imaging by VAmPIRe would circumvent the insertion of additional
RNA sequences but suffer from the availability of only one RRE binding site which could
cause sensitivity problems.
154 4. Discussion
4.4.3.9 Visualization of endogenous RNA
Aptamer-tagged RNAs need to be expressed within cells by transfection of plasmid DNA,
possibly resulting in overexpression of the aptamer-RNA construct compared to endogenous
RNA levels.
Overcoming this problem, cell lines that stably express an aptamer-tagged RNA of interest
have to be established. Single human osteosarcoma cells (U2OS) have proven suitable to
tolerate the stable integration of DNA and RNA repeats into a single locus (Xavier Darzacq,
Yaron Shav-Tal, et al. 2007b). The technique called m-TAG was established for tagging of
genomic loci with MS2 repeats in S. cerevisiae by homologous recombination (Haim-
Vilmovsky and Gerst 2011). Recently, a knock-in mouse expressing 24 MS2 repeats attached
to the actin mRNA has been generated (Timothee Lionnet, Kevin Czaplinski, et al. 2011). Cell
isolation and transient transfection with the MS2-GFP-NLS label allows the visualization of
endogenous actin transcripts in primary cells.
4.4.4 Screening for FRET sensor performance
Improvement of VAmPIRe`s dynamic range by rational engineering is limited by the lack of
structural information. Molecular evolution by random mutagenesis has proven powerful
for engineering of enzymes and fluorescent proteins (Goedhart et al. 2010) (Shaner et al.
2008) (Ai et al. 2006) (Bevis and Glick 2002). With the initial aim to increase VAmPIRe`s
dynamic range, we established the first functional screen that allows high-throughput
testing of fluorescent sensor variant libraries in bacterial colonies.
4.4.4.1 Bacterial FRET screen
With a major contribution of Julia Litzlbauer, we designed the first functional bacterial
colony assay for the directed evolution of FRET sensors. Colony imaging during induction of
aptamer transcription allows to detect the off and the on state of the biosensor. Selection
criteria included both the initial FRET ratio and the dynamic range.
We tested different induction reagents including tetracycline (TC), doxycycline and
anhydrotetracycline (aTC) in various concentrations and observed the best induction with
aTC. aTC is known to be more stable and bind the Tet repressor more efficiently than TC
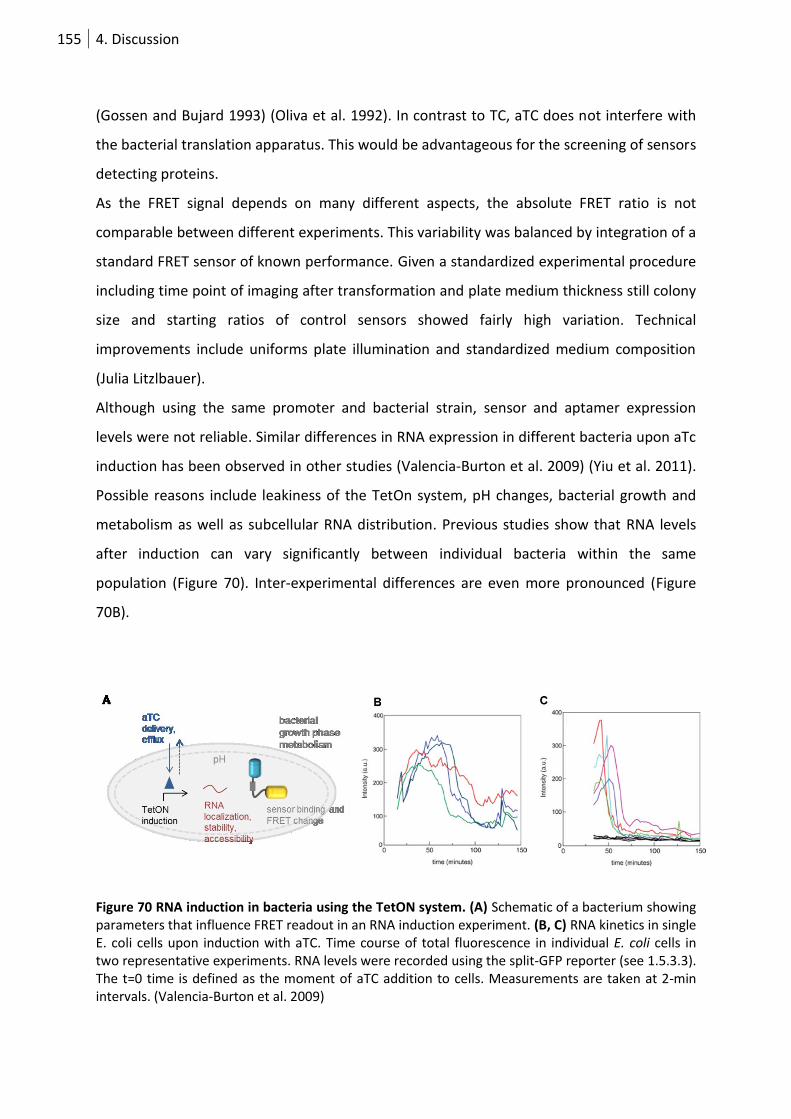
155 4. Discussion
(Gossen and Bujard 1993) (Oliva et al. 1992). In contrast to TC, aTC does not interfere with
the bacterial translation apparatus. This would be advantageous for the screening of sensors
detecting proteins.
As the FRET signal depends on many different aspects, the absolute FRET ratio is not
comparable between different experiments. This variability was balanced by integration of a
standard FRET sensor of known performance. Given a standardized experimental procedure
including time point of imaging after transformation and plate medium thickness still colony
size and starting ratios of control sensors showed fairly high variation. Technical
improvements include uniforms plate illumination and standardized medium composition
(Julia Litzlbauer).
Although using the same promoter and bacterial strain, sensor and aptamer expression
levels were not reliable. Similar differences in RNA expression in different bacteria upon aTc
induction has been observed in other studies (Valencia-Burton et al. 2009) (Yiu et al. 2011).
Possible reasons include leakiness of the TetOn system, pH changes, bacterial growth and
metabolism as well as subcellular RNA distribution. Previous studies show that RNA levels
after induction can vary significantly between individual bacteria within the same
population (Figure 70). Inter-experimental differences are even more pronounced (Figure
70B).
Figure 70 RNA induction in bacteria using the TetON system. (A) Schematic of a bacterium showing parameters that influence FRET readout in an RNA induction experiment. (B, C) RNA kinetics in single E. coli cells upon induction with aTC. Time course of total fluorescence in individual E. coli cells in two representative experiments. RNA levels were recorded using the split-GFP reporter (see 1.5.3.3). The t=0 time is defined as the moment of aTC addition to cells. Measurements are taken at 2-min intervals. (Valencia-Burton et al. 2009)
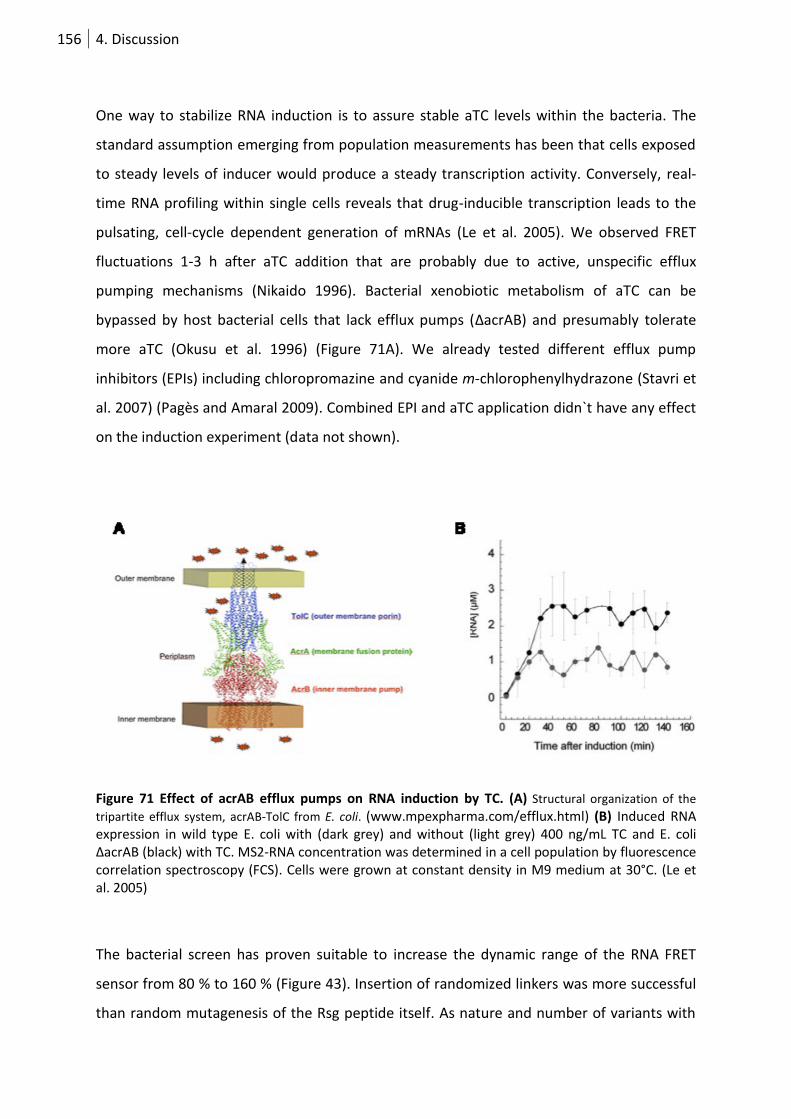
156 4. Discussion
One way to stabilize RNA induction is to assure stable aTC levels within the bacteria. The
standard assumption emerging from population measurements has been that cells exposed
to steady levels of inducer would produce a steady transcription activity. Conversely, real-
time RNA profiling within single cells reveals that drug-inducible transcription leads to the
pulsating, cell-cycle dependent generation of mRNAs (Le et al. 2005). We observed FRET
fluctuations 1-3 h after aTC addition that are probably due to active, unspecific efflux
pumping mechanisms (Nikaido 1996). Bacterial xenobiotic metabolism of aTC can be
bypassed by host bacterial cells that lack efflux pumps (ΔacrAB) and presumably tolerate
more aTC (Okusu et al. 1996) (Figure 71A). We already tested different efflux pump
inhibitors (EPIs) including chloropromazine and cyanide m-chlorophenylhydrazone (Stavri et
al. 2007) (Pagès and Amaral 2009). Combined EPI and aTC application didn`t have any effect
on the induction experiment (data not shown).
Figure 71 Effect of acrAB efflux pumps on RNA induction by TC. (A) Structural organization of the
tripartite efflux system, acrAB-TolC from E. coli. (www.mpexpharma.com/efflux.html) (B) Induced RNA expression in wild type E. coli with (dark grey) and without (light grey) 400 ng/mL TC and E. coli ΔacrAB (black) with TC. MS2-RNA concentration was determined in a cell population by fluorescence correlation spectroscopy (FCS). Cells were grown at constant density in M9 medium at 30°C. (Le et al. 2005)
The bacterial screen has proven suitable to increase the dynamic range of the RNA FRET
sensor from 80 % to 160 % (Figure 43). Insertion of randomized linkers was more successful
than random mutagenesis of the Rsg peptide itself. As nature and number of variants with
157 4. Discussion
better characteristics remains unpredictable, further rounds of screening have to follow.
High throughput screening requires automated colony analysis. Elisabeth Hopp (Department
Borst) developed a program (Matlab) that selects colonies according to fixed criteria. This
program is also applied for the screening of Calcium sensors. Further optimization includes
the format of high-throughput protein expression and in vitro test measurements which
could be performed in 96-well plates.
It remains unclear if most of the variants bind without changing their FRET signal or if linker
insertion also modulates peptide-aptamer affinity. In the latter case, an additional bacterial
antitermination assay (see 4.3.1) could preselect for sensors that still interact with the RRE
aptamer.
Evolutionary methods such as the one introduced and used here, although not exhaustively,
may become increasingly important in optimizing performance of many biosensors relying
on FRET between fluorescent proteins.
4.4.4.2 Cellular screening
Bacterial screening profits from ease of manipulation resulting in a big library size that can
be screened. So far, we validated sensors from the bacterial screen first in vitro and
afterwards in a cellular assay. Screening in mammalian cells is more expensive and allows a
lower number of variants to be screened but would meet the demands of functionality for
live cell imaging. Especially aptamer folding and affinity of reporter and RNA construct can
vary in different systems. A recently introduced method combines generation and cellular
analysis (Piljid et al. 2011) of a set of 36 different FRET reporters. The cloned variants were
spotted on DNA arrays serving as a platform for reverse transfection of and subsequent
semiautomated microscopy of HEK-293 cells.
There are several ways of testing cellular sensor performance. The first possibility requires a
sensor library that is expressed transiently in a mammalian cell line expressing the aptamer
under the control of an inducible promoter, similar to the bacterial screen. In another
approach, a stable cell line permanently expressing the aptamer could be transiently
transfected with the sensor library and stressed resulting in stress granule formation. A third
way of testing library reporters consists of infection by viruses with an aptamer-tagged RNA
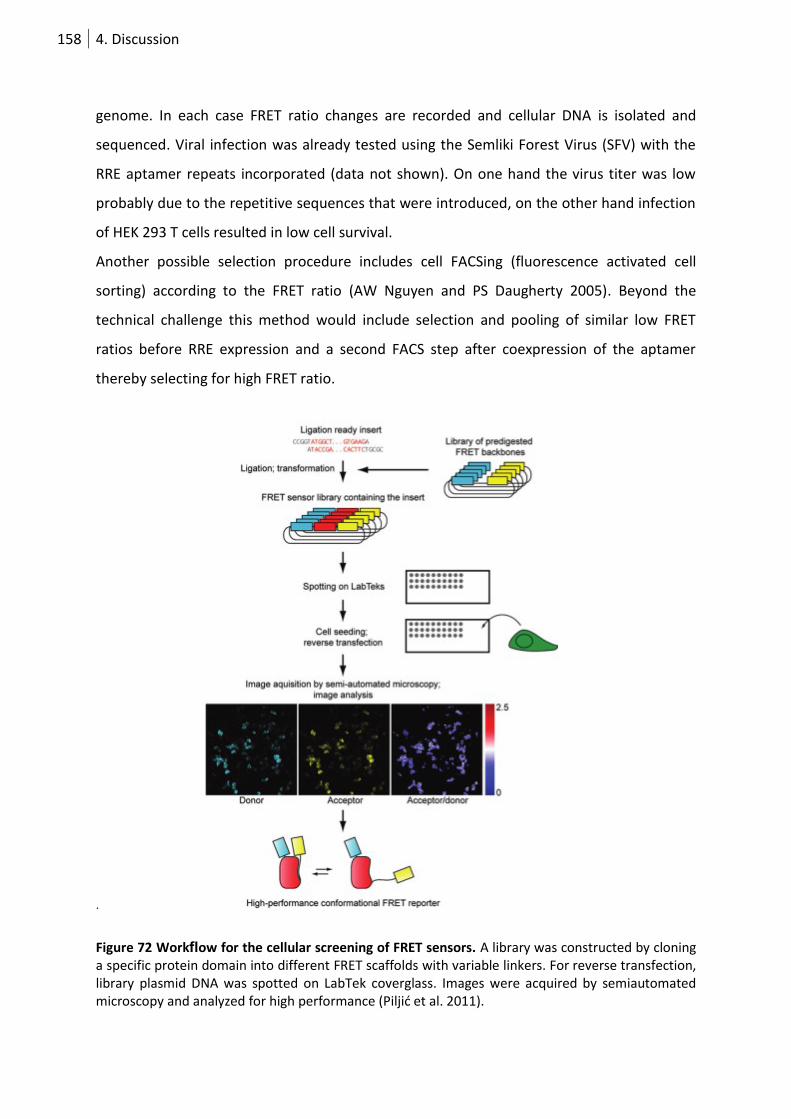
158 4. Discussion
genome. In each case FRET ratio changes are recorded and cellular DNA is isolated and
sequenced. Viral infection was already tested using the Semliki Forest Virus (SFV) with the
RRE aptamer repeats incorporated (data not shown). On one hand the virus titer was low
probably due to the repetitive sequences that were introduced, on the other hand infection
of HEK 293 T cells resulted in low cell survival.
Another possible selection procedure includes cell FACSing (fluorescence activated cell
sorting) according to the FRET ratio (AW Nguyen and PS Daugherty 2005). Beyond the
technical challenge this method would include selection and pooling of similar low FRET
ratios before RRE expression and a second FACS step after coexpression of the aptamer
thereby selecting for high FRET ratio.
.
Figure 72 Workflow for the cellular screening of FRET sensors. A library was constructed by cloning a specific protein domain into different FRET scaffolds with variable linkers. For reverse transfection, library plasmid DNA was spotted on LabTek coverglass. Images were acquired by semiautomated microscopy and analyzed for high performance (Piljid et al. 2011).

159 4. Discussion
4.5 REFlex sensor performance
4.5.1 REFlex assay in vitro application
Using REFlex we were able to monitor assembly and disassembly of the EJC in solution. In
vitro REFlex assay provides a fast and conveniently tool to test candidates or screen for
factors stabilizing or destabilizing the EJC. Single molecule FRET studies on RNA helicase
conformational change as performed on the helicase YxiN are shedding light on the
switching behaviour and function of these proteins (Theissen et al. 2008). Our FRET sensor
REFlex might be a useful complementation to biochemical and structural studies in gaining
more insight into the eIF4AIII interactome and elucidating its function in RNA regulation.
The design principle can be applied to other members of the RNA helicase family.
In particular, we verified that PYM is only able to bind MAGO-Y14 if it is incorporated in the
EJC. Our data support the hypothesis that this is due to conformational changes of MAGO-
Y14 and does not depend on the subcellular separation of free cytosolic PYM and nuclear
MAGO-Y14 (Gehring, Lamprinaki, Kulozik, and Hentze 2009c). FRET monitoring by REFlex
demonstrates that Imp13 is sufficient to induce the transition of eIF4AIII to the open state in
the absence of PYM. It will be interesting to study the relevance of this finding in the cellular
context, in particular if one considers that Imp13 has a higher affinity for MAGO compared
to PYM (Budiman et al. 2009).
RNA binding of REFLex in the presence of EJC core components was found to be unspecific.
In the absence of these EJC components, however, in minimal assays employing only REFLex
and ATP, a higher selectivity for a given RNA target was found. While RNAs representing the
3’ UTRs of two mRNAs subject to EJC related NMD (Sauliere et al. 2010) proved efficient
targets for REFLex, no FRET change could be seen when an unrelated intronless mRNA
coding for the fluorescent protein mKO2 was used in concentrations that were efficient in
promoting EJC assembly in the presence of MAGO-Y14 and Barentsz. This suggests a
reduced RNA selectivity of eIF4AIII when situated within the EJC core, while free eIF4AIII
apparently retains preference for some RNA motifs over others. Along these lines, free
eIF4AIII was reported to preferentially bind certain RNA loop structures within mRNAs
coding for selenoproteins (Budiman et al. 2009). However, there is also recent evidence for
RNA sequence-specific deposition of the EJC (Sauliere et al. 2010). In view of our data this
160 4. Discussion
could be explained by an initial binding of preferred sites by free eIF4AIII, which is
subsequently stabilized and complemented by the other components of the EJC. It will be
interesting to repeat the REFlex specificity test with a nuclear extract supplement including
splice factors.
4.5.2 REFlex application for cellular imaging
4.5.2.1 REFlex function in cells
REFlex is a genetically encoded FRET sensor that is potentially suitable to study eIF4AIII in its
two different states in living cells. Assigning the subcellular FRET signals to either the
eIF4AIII bound or unbound form would provide a powerful tool to get functional insights.
REFlex was transiently expressed under the control of a CMV promoter in HEK 293T cells as
well as neurons. Within the endogenous cellular context, EJC components are expressed at a
specific ratio (Gehring, Lamprinaki, Kulozik, and Hentze 2009b). Consequently, cellular
REFlex as well as endogenous EJC component expression levels will be crucial for the study
of eIF4AIII function. Particularly, endogenous eIF4AIII replacement by REFlex using a knock-
in strategy would ensure usual cellular protein levels.
As live cell application requires high reporter sensitivity, sensor engineering is required.
REFlex performance has been improved by insertion of mutations that favor FP
dimerization. Targeted mutagenesis of amino acids at the dimer interface (Kotera et al.
2010), random linker insertion or random mutagenesis provide further means to improve
the dynamic range even further.
4.5.2.2 Future application of REFlex for cellular imaging
In Drosophila oocytes, localization of oskar mRNA to the posterior pole is dependent on the
nuclear formation of an RNP including the EJC. Another prerequisite for proper oskar mRNA
targeting is splicing of the first intron. In the absence of eIF4AIII, oskar mRNA is evenly
distributed in the oocyte. Labeling of oskar mRNA and REFlex coexpression would allow to
subcellularly determine the pool of eIF4AIII-bound oskar mRNA compared to the dissociated
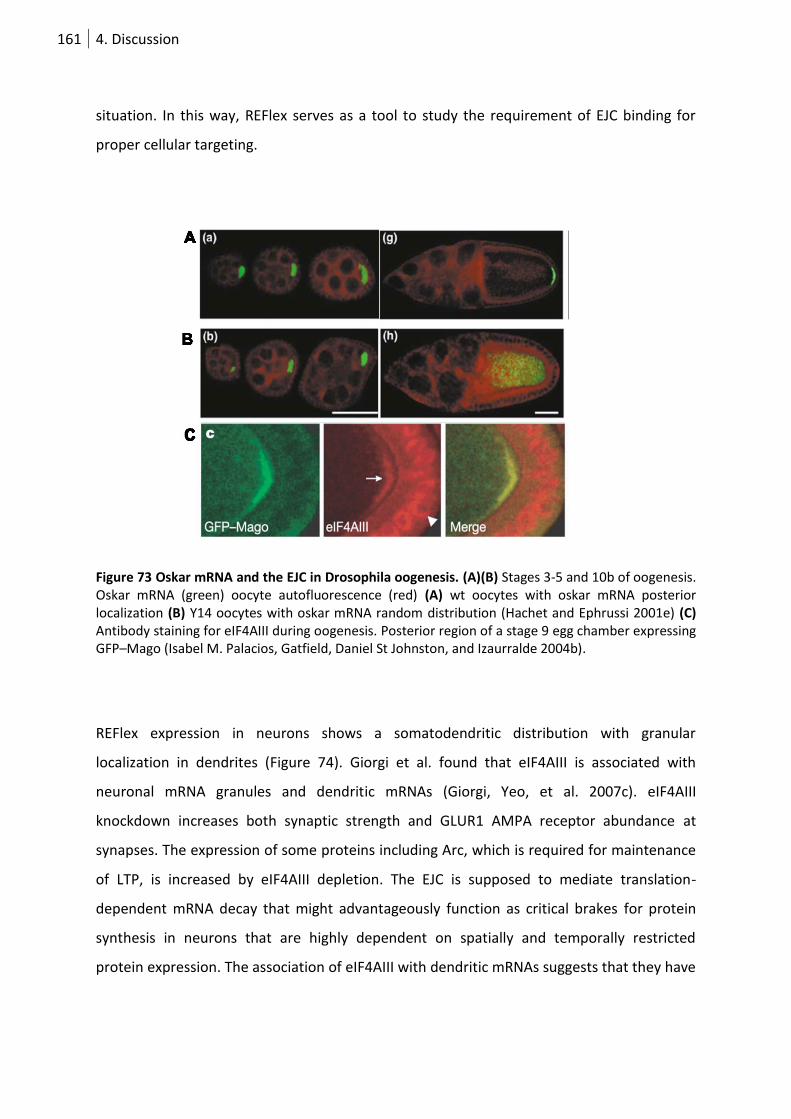
161 4. Discussion
situation. In this way, REFlex serves as a tool to study the requirement of EJC binding for
proper cellular targeting.
Figure 73 Oskar mRNA and the EJC in Drosophila oogenesis. (A)(B) Stages 3-5 and 10b of oogenesis. Oskar mRNA (green) oocyte autofluorescence (red) (A) wt oocytes with oskar mRNA posterior localization (B) Y14 oocytes with oskar mRNA random distribution (Hachet and Ephrussi 2001e) (C) Antibody staining for eIF4AIII during oogenesis. Posterior region of a stage 9 egg chamber expressing GFP–Mago (Isabel M. Palacios, Gatfield, Daniel St Johnston, and Izaurralde 2004b).
REFlex expression in neurons shows a somatodendritic distribution with granular
localization in dendrites (Figure 74). Giorgi et al. found that eIF4AIII is associated with
neuronal mRNA granules and dendritic mRNAs (Giorgi, Yeo, et al. 2007c). eIF4AIII
knockdown increases both synaptic strength and GLUR1 AMPA receptor abundance at
synapses. The expression of some proteins including Arc, which is required for maintenance
of LTP, is increased by eIF4AIII depletion. The EJC is supposed to mediate translation-
dependent mRNA decay that might advantageously function as critical brakes for protein
synthesis in neurons that are highly dependent on spatially and temporally restricted
protein expression. The association of eIF4AIII with dendritic mRNAs suggests that they have
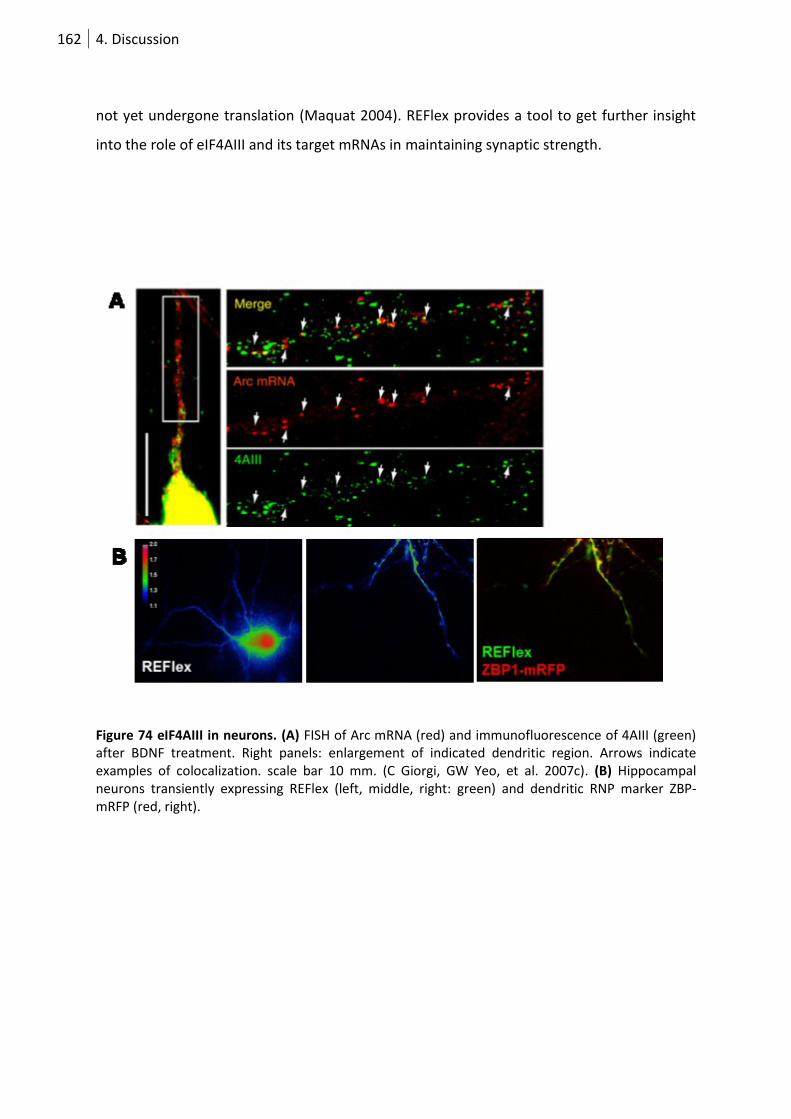
162 4. Discussion
not yet undergone translation (Maquat 2004). REFlex provides a tool to get further insight
into the role of eIF4AIII and its target mRNAs in maintaining synaptic strength.
Figure 74 eIF4AIII in neurons. (A) FISH of Arc mRNA (red) and immunofluorescence of 4AIII (green) after BDNF treatment. Right panels: enlargement of indicated dendritic region. Arrows indicate examples of colocalization. scale bar 10 mm. (C Giorgi, GW Yeo, et al. 2007c). (B) Hippocampal neurons transiently expressing REFlex (left, middle, right: green) and dendritic RNP marker ZBP-mRFP (red, right).

163 4. Discussion
4.6 Conclusion
The studies presented here reveal the necessity of a sensitive and dynamic RNA imaging
approach. For live cell imaging, genetically encodable FP-based RNA reporters are preferred
over chemical on-off compounds that hamper cellular application because of ineffective dye
delivery and insufficient specificity.
Our FRET RNA sensor VAmPIRe provides a tool for the dynamic detection of RNAs in vitro
and in living cells.
Circumventing the need of an NLS, VAmPIRe will be especially useful for the visualization of
nuclear processes including transcription and splicing. Exceeding the claims for ion or small
molecule sensors, long-term RNA visualization of specific single transcripts within the
cellular transcriptome requires high sensitivity and specificity of the RNA indicator. Proper
aptamer repeat folding and accessibility within the context of a RNP are prerequisites to
high intracellular affinity and sensitivity. Further improvement of VAmPIRe`s dynamic range
is desirable for advanced applications like the long-term visualization of single transcripts in
primary neurons. Biosensor design and novel imaging and data processing techniques have
to converge to render RNA tracking possible.
Regarding sensor design we revealed benefits and problems of using ARM peptides. On the
one hand affinity, small sizing and non-eukaryotic origin is desirable on the other hand,
inherent cross-specificity and charge effects complicate FRET sensor design. It remains
unclear if the small conformational change upon RNA binding constitutes a limiting factor
for further sensor improvement.
We showed that random approaches are more powerful than rational engineering as long as
detailed structural information is missing. Combining the established high-throughput
bacterial screen with large-scale cellular testing will technically allow further sensor
improvement. With further automation this method will be powerful for high-throughput
testing of novel fluorescent biosensors in a biological context.
We identified further suitable peptides for the FRET approach as well as single-fluorophore
RNA sensors with lower dynamic range. This may allow the development of a range of
conditional aptamer reporters with orthogonal spectral properties. We are also planning to
design single fluorophore sensors based on a donor-quencher principle that holds the
promise of a high dynamic range.

164 References
With REFlex we established a new sensor design principle that can potentially be applied to
many other RNA helicases. Suitability for in vitro studies has been shown but has to
compete with existing single molecule techniques. As soon as sensitivity is improved,
genetic encodablitiy of REFlex can be exploited for functional imaging of eIF4AIII in living
cells.

165 References
References
Ai, H.-wang, Hazelwood, K.L., Davidson, M.W., and Campbell, Robert E. 2008. Fluorescent
protein FRET pairs for ratiometric imaging of dual biosensors. Nat Meth 5: 401-403.
Ai, H.-wang, Henderson, J.N., Remington, S James, and Campbell, Robert E. 2006. Directed
evolution of a monomeric, bright and photostable version of Clavularia cyan
fluorescent protein: structural characterization and applications in fluorescence
imaging. The Biochemical Journal 400: 531-540.
An, P., and Grabowski, P.J. 2007. Exon Silencing by UAGG Motifs in Response to Neuronal
Excitation. PLoS Biol 5: e36.
Andersen, C.B.F. et al. 2006. Structure of the Exon Junction Core Complex with a Trapped
DEAD-Box ATPase Bound to RNA. Science 313: 1968 -1972.
Aoyama, S., Sugaya, M., Kobayashi, C., Masuda, K., Maeda, T., Sakamoto, T., Kawai, G.,
Katoh, A., and Harada, Kazuo. 2009. An isostructural G-G to A-A substitution within
the HIV RRE RNA switches the specificity towards arginine-rich peptides. Nucleic
Acids Symposium Series (2004) 271-272.
Arai, R., Ueda, H., Kitayama, A., Kamiya, N., and Nagamune, T. 2001. Design of the linkers
which effectively separate domains of a bifunctional fusion protein. Protein
Engineering 14: 529 -532.
Audesirk, G., Audesirk, T., and Ferguson, C. 2001. Culturing Rat Hippocampal Neurons. In
Current Protocols in Toxicology (eds. L.G. Costa, E. Hodgson, D.A. Lawrence, and D.J.
Reed), John Wiley & Sons, Inc., Hoboken, NJ, USA
http://www.currentprotocols.com/protocol/tx1203 (Accessed August 17, 2011).
BASSELL, G.J., OLEYNIKOV, Y., and SINGER, R.H. 1999. The travels of mRNAs through all cells
large and small. The FASEB Journal 13: 447 -454.
BAYER, T.S., BOOTH, L.N., KNUDSEN, S.M., and ELLINGTON, A.D. 2005. Arginine-rich motifs
present multiple interfaces for specific binding by RNA. RNA 11: 1848 -1857.
Baird, G S, Zacharias, D A, and Tsien, R Y. 2000. Biochemistry, mutagenesis, and
oligomerization of DsRed, a red fluorescent protein from coral. Proceedings of the
National Academy of Sciences of the United States of America 97: 11984-11989.
Bartel, D.P., Zapp, M.L., Green, M.R., and Szostak, J.W. 1991. HIV-1 rev regulation involves
recognition of non-Watson-Crick base pairs in viral RNA. Cell 67: 529-536.

166 References
Bassell, Gary J, and Kelic, S. 2004. Binding proteins for mRNA localization and local
translation, and their dysfunction in genetic neurological disease. Current Opinion in
Neurobiology 14: 574-581.
Bassell, Gary J, and Twiss, J.L. 2006. RNA exodus to Israel: RNA controlling function in the far
reaches of the neuron. EMBO reports 7: 31-35.
Bates, M., Huang, B., Dempsey, G.T., and Zhuang, X. 2007. Multicolor Super-Resolution
Imaging with Photo-Switchable Fluorescent Probes. Science 317: 1749 -1753.
Battiste, J.L., Mao, H., Rao, N.S., Tan, Ruoying, Muhandiram, D.R., Kay, L.E., Frankel, Alan D.,
and Williamson, J.R. 1996. α Helix-RNA Major Groove Recognition in an HIV-1 Rev
Peptide-RRE RNA Complex. Science 273: 1547 -1551.
Bertrand, E, Chartrand, P., Schaefer, M., Shenoy, S M, Singer, R H, and Long, R.M. 1998.
Localization of ASH1 mRNA particles in living yeast. Molecular Cell 2: 437-445.
Betzig, E., Patterson, G.H., Sougrat, R., Lindwasser, O.W., Olenych, S., Bonifacino, J.S.,
Davidson, M.W., Lippincott-Schwartz, J., and Hess, H.F. 2006. Imaging Intracellular
Fluorescent Proteins at Nanometer Resolution. Science 313: 1642 -1645.
Bevis, B.J., and Glick, B.S. 2002. Rapidly maturing variants of the Discosoma red fluorescent
protein (DsRed). Nature Biotechnology 20: 83-87.
Bliss, T.V.P., and Collingridge, G.L. 1993. A synaptic model of memory: long-term
potentiation in the hippocampus. Nature 361: 31-39.
Bobrowski, K., Wierzchowski, K.L., Holcman, J., and Ciurak, M. 1990. Intramolecular Electron
Transfer in Peptides Containing Methionine, Tryptophan and Tyrosine: A Pulse
Radiolysis Study. International Journal of Radiation Biology 57: 919-932.
Bono, F., Cook, A.G., Grünwald, M., Ebert, J., and Conti, E. 2010a. Nuclear Import
Mechanism of the EJC Component Mago-Y14 Revealed by Structural Studies of
Importin 13. Molecular Cell 37: 211-222.
Bono, F., Cook, A.G., Grünwald, M., Ebert, J., and Conti, E. 2010b. Nuclear Import
Mechanism of the EJC Component Mago-Y14 Revealed by Structural Studies of
Importin 13. Molecular Cell 37: 211-222.
Bono, F., Ebert, J., Lorentzen, E., and Conti, E. 2006. The Crystal Structure of the Exon
Junction Complex Reveals How It Maintains a Stable Grip on mRNA. Cell 126: 713-
725.

167 References
Bono, F., Ebert, J., Unterholzner, L., Güttler, T., Izaurralde, E., and Conti, E. 2004. Molecular
insights into the interaction of PYM with the Mago–Y14 core of the exon
junction complex. EMBO reports 5: 304-310.
Boswell, R.E., Prout, M.E., and Steichen, J.C. 1991. Mutations in a newly identified
Drosophila melanogaster gene, mago nashi, disrupt germ cell formation and result in
the formation of mirror-image symmetrical double abdomen embryos. Development
113: 373-384.
Bradley, J., Carter, S.R., Rao, V.R., Wang, J., and Finkbeiner, S. 2006. Splice Variants of the
NR1 Subunit Differentially Induce NMDA Receptor-Dependent Gene Expression. The
Journal of Neuroscience 26: 1065 -1076.
Branchini, B.R., Lusins, J.O., and Zimmer, M. 1997. A molecular mechanics and database
analysis of the structural preorganization and activation of the chromophore-
containing hexapeptide fragment in green fluorescent protein. Journal of
Biomolecular Structure & Dynamics 14: 441-448.
Brejc, K., Sixma, T.K., Kitts, P.A., Kain, S.R., Tsien, R Y, Ormö, M., and Remington, S J. 1997.
Structural basis for dual excitation and photoisomerization of the Aequorea victoria
green fluorescent protein. Proceedings of the National Academy of Sciences of the
United States of America 94: 2306-2311.
Brittis, P.A., Lu, Q., and Flanagan, J.G. 2002. Axonal Protein Synthesis Provides a Mechanism
for Localized Regulation at an Intermediate Target. Cell 110: 223-235.
Budiman, M.E., Bubenik, J.L., Miniard, A.C., Middleton, L.M., Gerber, C.A., Cash, A., and
Driscoll, D.M. 2009. Eukaryotic Initiation Factor 4a3 Is a Selenium-Regulated RNA-
Binding Protein that Selectively Inhibits Selenocysteine Incorporation. Molecular Cell
35: 479-489.
Chalfie, M., Tu, Y., Euskirchen, G., Ward, W., and Prasher, D. 1994. Green fluorescent
protein as a marker for gene expression. Science 263: 802 -805.
Chattoraj, M., King, B.A., Bublitz, G.U., and Boxer, S.G. 1996. Ultra-fast excited state
dynamics in green fluorescent protein: multiple states and proton transfer.
Proceedings of the National Academy of Sciences of the United States of America 93:
8362-8367.

168 References
Chazal, N., and Gerlier, D. 2003. Virus Entry, Assembly, Budding, and Membrane Rafts.
Microbiol. Mol. Biol. Rev. 67: 226-237.
Cheong, C.-G., and Hall, T.M.T. 2006. Engineering RNA sequence specificity of Pumilio
repeats. Proceedings of the National Academy of Sciences 103: 13635 -13639.
Chicurel, M.E., Singer, Robert H., Meyer, C.J., and Ingber, D.E. 1998. Integrin binding and
mechanical tension induce movement of mRNA and ribosomes to focal adhesions.
Nature 392: 730-733.
Cochilla, A.J., Angleson, J.K., and Betz, W.J. 1999. MONITORING SECRETORY MEMBRANE
WITH FM1-43 FLUORESCENCE. Annual Review of Neuroscience 22: 1-10.
Cordin, O., Banroques, J., Tanner, N.K., and Linder, P. 2006. The DEAD-box protein family of
RNA helicases. Gene 367: 17-37.
Cormack, B.P., Valdivia, R.H., and Falkow, S. 1996. FACS-optimized mutants of the green
fluorescent protein (GFP). Gene 173: 33-38.
Corry, B., Jayatilaka, D., and Rigby, P. 2005. A Flexible Approach to the Calculation of
Resonance Energy Transfer Efficiency between Multiple Donors and Acceptors in
Complex Geometries. Biophysical Journal 89: 3822-3836.
Crameri, A., Whitehorn, E.A., Tate, E., and Stemmer, W.P. 1996. Improved green fluorescent
protein by molecular evolution using DNA shuffling. Nature Biotechnology 14: 315-
319.
Cull-Candy, S., Brickley, S., and Farrant, M. 2001. NMDA receptor subunits: diversity,
development and disease. Current Opinion in Neurobiology 11: 327-335.
Daigle, N., and Ellenberg, J. 2007. LambdaN-GFP: an RNA reporter system for live-cell
imaging. Nature Methods 4: 633-636.
Daly, T.J., Cook, K.S., Gray, G.S., Maione, T.E., and Rusche, J R. 1989. Specific binding of HIV-
1 recombinant Rev protein to the Rev-responsive element in vitro. Nature 342: 816-
819.
Darnell, J.C., Jensen, K.B., Jin, P., Brown, V., Warren, S.T., and Darnell, R.B. 2001. Fragile X
Mental Retardation Protein Targets G Quartet mRNAs Important for Neuronal
Function. Cell 107: 489-499.

169 References
Darzacq, X., Shav-Tal, Y., de Turris, V., Brody, Y., Shenoy, Shailesh M, Phair, R.D., and Singer,
Robert H. 2007. In vivo dynamics of RNA polymerase II transcription. Nat Struct Mol
Biol 14: 796-806.
Daugherty, M.D., Liu, B., and Frankel, Alan D. 2010. Structural basis for cooperative RNA
binding and export complex assembly by HIV Rev. Nat Struct Mol Biol 17: 1337-1342.
Davidson, M.W., and Campbell, Robert E. 2009. Engineered fluorescent proteins:
innovations and applications. Nat Meth 6: 713-717.
Day, R.N., Booker, C.F., and Periasamy, A. 2008. Characterization of an improved donor
fluorescent protein for Förster resonance energy transfer microscopy. Journal of
biomedical optics 13: 031203-031203.
Degot, S., Le Hir, Hervé, Alpy, F., Kedinger, V., Stoll, I., Wendling, C., Seraphin, B., Rio, M.-C.,
and Tomasetto, C. 2004. Association of the Breast Cancer Protein MLN51 with the
Exon Junction Complex via Its Speckle Localizer and RNA Binding Module. Journal of
Biological Chemistry 279: 33702 -33715.
Denk, W., Strickler, J., and Webb, W. 1990. Two-photon laser scanning fluorescence
microscopy. Science 248: 73 -76.
Dooley, C.T., Dore, T.M., Hanson, George T., Jackson, W.C., Remington, S. James, and Tsien,
Roger Y. 2004. Imaging Dynamic Redox Changes in Mammalian Cells with Green
Fluorescent Protein Indicators. Journal of Biological Chemistry 279: 22284 -22293.
Dostie, J., and Dreyfuss, G. 2002. Translation Is Required to Remove Y14 from mRNAs in the
Cytoplasm. Current Biology 12: 1060-1067.
Dugave, C., and Demange, L. 2003. Cis−Trans Isomerization of Organic Molecules and
Biomolecules: Implications and Applications†. Chemical Reviews 103: 2475-2532.
Eaton, W.A., and Hofrichter, J. 1990. Sickle Cell Hemoglobin Polymerization. Vol. Volume 40
of, pp. 63-279, Academic Press
http://www.sciencedirect.com/science/article/pii/S0065323308602879 (Accessed
August 8, 2011).
Eckhardt, M., Anders, M., Muranyi, W., Heilemann, M., Krijnse-Locker, J., and Müller, B.
2011. A SNAP-Tagged Derivative of HIV-1—A Versatile Tool to Study Virus-Cell
Interactions. PLoS ONE 6: e22007.

170 References
Ehlers, M.D., Fung, E.T., O’Brien, R.J., and Huganir, R L. 1998. Splice variant-specific
interaction of the NMDA receptor subunit NR1 with neuronal intermediate
filaments. The Journal of Neuroscience: The Official Journal of the Society for
Neuroscience 18: 720-730.
Ellington, A.D., and Szostak, J.W. 1990. In vitro selection of RNA molecules that bind specific
ligands. Nature 346: 818-822.
Endoh, T., Funabashi, H., Mie, M., and Kobatake, E. 2005. Method for Detection of Specific
Nucleic Acids by Recombinant Protein with Fluorescent Resonance Energy Transfer.
Analytical Chemistry 77: 4308-4314.
Endoh, T., Mie, M., and Kobatake, E. 2008. Direct detection of RNA transcription by FRET
imaging using fluorescent protein probe. Journal of Biotechnology 133: 413-417.
Eom, Taesun, Antar, L.N., Singer, Robert H, and Bassell, Gary J. 2003. Localization of a beta-
actin messenger ribonucleoprotein complex with zipcode-binding protein modulates
the density of dendritic filopodia and filopodial synapses. The Journal of
Neuroscience: The Official Journal of the Society for Neuroscience 23: 10433-10444.
Fan, L.-J., and Jones, W.E. 2006. Studies of Photoinduced Electron Transfer (PET) and Energy
Migration in a Conjugated Polymer System for Fluorescence “Turn-on” Chemosensor
Applications. The journal of physical chemistry. B 110: 7777-7782.
Feig, S., and Lipton, P. 1993. Pairing the cholinergic agonist carbachol with patterned
Schaffer collateral stimulation initiates protein synthesis in hippocampal CA1
pyramidal cell dendrites via a muscarinic, NMDA-dependent mechanism. Journal of
Neuroscience 13: 1010-1021.
Ferrandon, D., Elphick, L., Nüsslein-Volhard, C., and St Johnston, D. 1994. Staufen protein
associates with the 3’UTR of bicoid mRNA to form particles that move in a
microtubule-dependent manner. Cell 79: 1221-1232.
Filonov, G.S., Piatkevich, K.D., Ting, L.-M., Zhang, J., Kim, K., and Verkhusha, V.V. 2011. Bright
and stable near-infrared fluorescent protein for in vivo imaging. Nat Biotech 29: 757-
761.
Flexner, J.B., Flexner, L.B., and Stellar, E. 1963. Memory in Mice as Affected by Intracerebral
Puromycin. Science 141: 57 -59.

171 References
Frey, Uwe, and Morris, R.G.M. 1997. Synaptic tagging and long-term potentiation. Nature
385: 533-536.
Furukawa, K., Abe, H., Abe, N., Harada, M., Tsuneda, S., and Ito, Y. 2008. Fluorescence
generation from tandem repeats of a malachite green RNA aptamer using rolling
circle transcription. Bioorganic & Medicinal Chemistry Letters 18: 4562-4565.
Fusco, D., Accornero, N., Lavoie, B., Shenoy, Shailesh M., Blanchard, J.-M., Singer, Robert H.,
and Bertrand, Edouard. 2003. Single mRNA Molecules Demonstrate Probabilistic
Movement in Living Mammalian Cells. Current Biology 13: 161-167.
Ganesan, S., Ameer-beg, S.M., Ng, T.T.C., Vojnovic, B., and Wouters, F.S. 2006. A dark yellow
fluorescent protein (YFP)-based Resonance Energy-Accepting Chromoprotein
(REACh) for Förster resonance energy transfer with GFP. Proceedings of the National
Academy of Sciences of the United States of America 103: 4089 -4094.
Garber, K., Smith, K.T., Reines, D., and Warren, S.T. 2006. Transcription, translation and
fragile X syndrome. Current Opinion in Genetics & Development 16: 270-275.
Gazzaley, A.H., Benson, D.L., Huntley, G.W., and Morrison, J.H. 1997. Differential Subcellular
Regulation of NMDAR1 Protein and mRNA in Dendrites of Dentate Gyrus Granule
Cells after Perforant Path Transection. The Journal of Neuroscience 17: 2006 -2017.
Gehring, N.H., Lamprinaki, S., Hentze, M.W., and Kulozik, A.E. 2009a. The Hierarchy of Exon-
Junction Complex Assembly by the Spliceosome Explains Key Features of Mammalian
Nonsense-Mediated mRNA Decay. PLoS Biol 7: e1000120.
Gehring, N.H., Lamprinaki, S., Kulozik, A.E., and Hentze, M.W. 2009b. Disassembly of Exon
Junction Complexes by PYM. Cell 137: 536-548.
Gehring, N.H., Lamprinaki, S., Kulozik, A.E., and Hentze, M.W. 2009c. Disassembly of Exon
Junction Complexes by PYM. Cell 137: 536-548.
George, R.A., and Heringa, J. 2002. An analysis of protein domain linkers: their classification
and role in protein folding. Protein Engineering 15: 871 -879.
Gilbert, W. 1986. Origin of life: The RNA world. Nature 319: 618.
Giorgi, C., Yeo, G.W., Stone, M.E., Katz, D.B., Burge, C., Turrigiano, G., and Moore, M.J. 2007.
The EJC Factor eIF4AIII Modulates Synaptic Strength and Neuronal Protein
Expression. Cell 130: 179-191.

172 References
Goedhart, J., van Weeren, L., Hink, M.A., Vischer, N.O.E., Jalink, K., and Gadella, T.W.J. 2010.
Bright cyan fluorescent protein variants identified by fluorescence lifetime screening.
Nat Meth 7: 137-139.
Gossen, M., and Bujard, H. 1993. Anhydrotetracycline, a novel effector for tetracycline
controlled gene expression systems in eukaryotic cells. Nucleic Acids Research 21:
4411-4412.
Gosser, Y., Hermann, T., Majumdar, A., Hu, W., Frederick, R., Jiang, F., Xu, W., and Patel, D.J.
2001a. Peptide-triggered conformational switch in HIV-1 RRE RNA complexes. Nat
Struct Mol Biol 8: 146-150.
Gosser, Y., Hermann, T., Majumdar, A., Hu, W., Frederick, R., Jiang, F., Xu, W., and Patel, D.J.
2001b. Peptide-triggered conformational switch in HIV-1 RRE RNA complexes. Nat
Struct Mol Biol 8: 146-150.
Grant, D.M. et al. 2008. Multiplexed FRET to Image Multiple Signaling Events in Live Cells.
Biophysical Journal 95: L69-L71.
Grate, D., and Wilson, C. 1999. Laser-mediated, site-specific inactivation of RNA transcripts.
Proceedings of the National Academy of Sciences 96: 6131 -6136.
Griesbeck, O, Baird, G S, Campbell, R E, Zacharias, D A, and Tsien, R Y. 2001. Reducing the
environmental sensitivity of yellow fluorescent protein. Mechanism and applications.
The Journal of Biological Chemistry 276: 29188-29194.
Griesbeck, Oliver, Baird, Geoffrey S., Campbell, Robert E., Zacharias, David A., and Tsien,
Roger Y. 2001. Reducing the Environmental Sensitivity of Yellow Fluorescent Protein.
Journal of Biological Chemistry 276: 29188 -29194.
Griffith, L.C., Lu, C.S., and Sun, X.X. 2003. CaMKII, an Enzyme on the Move: Regulation of
Temporospatial Localization. Molecular Interventions 3: 386 -403.
Groom, H.C.T., Anderson, E.C., and Lever, A.M.L. 2009. Rev: beyond nuclear export. The
Journal of General Virology 90: 1303-1318.
Gurskaya, N.G., Fradkov, A F, Terskikh, A., Matz, M.V., Labas, Y.A., Martynov, V.I.,
Yanushevich, Y.G., Lukyanov, K A, and Lukyanov, S.A. 2001. GFP-like chromoproteins
as a source of far-red fluorescent proteins. FEBS Letters 507: 16-20.
Hachet, O., and Ephrussi, A. 2001a. Drosophila Y14 shuttles to the posterior of the oocyte
and is required for oskar mRNA transport. Current Biology 11: 1666-1674.

173 References
Hachet, O., and Ephrussi, A. 2001b. Drosophila Y14 shuttles to the posterior of the oocyte
and is required for oskar mRNA transport. Current Biology 11: 1666-1674.
Haim-Vilmovsky, L., and Gerst, J.E. 2011. Visualizing endogenous mRNAs in living yeast using
m-TAG, a PCR-based RNA aptamer integration method, and fluorescence
microscopy. Methods in Molecular Biology (Clifton, N.J.) 714: 237-247.
Han, J. 2005. Identification of CELF splicing activation and repression domains in vivo.
Nucleic Acids Research 33: 2769-2780.
Harada, K, Martin, S S, and Frankel, A D. 1996. Selection of RNA-binding peptides in vivo.
Nature 380: 175-179.
Harada, Kazuo, Martin, Shelley S., Tan, Ruoying, and Frankel, Alan D. 1997a. Molding a
peptide into an RNA site by in vivo peptide evolution. Proceedings of the National
Academy of Sciences of the United States of America 94: 11887-11892.
Harada, Kazuo, Martin, Shelley S., Tan, Ruoying, and Frankel, Alan D. 1997b. Molding a
peptide into an RNA site by in vivo peptide evolution. Proceedings of the National
Academy of Sciences of the United States of America 94: 11887-11892.
Harada, Kazuo, Sugaya, M., Nishimura, F., and Katoh, A. 2008. Manipulation of the peptide-
binding specificity of an RNA in a rational manner by combinations of specificity-
altering mutations. Nucleic Acids Symposium Series 52: 13 -14.
Heim, R., Cubitt, A.B., and Tsien, R Y. 1995. Improved green fluorescence. Nature 373: 663-
664.
Heim, R., Prasher, D C, and Tsien, R Y. 1994. Wavelength mutations and posttranslational
autoxidation of green fluorescent protein. Proceedings of the National Academy of
Sciences of the United States of America 91: 12501-12504.
Heim, R., and Tsien, R Y. 1996. Engineering green fluorescent protein for improved
brightness, longer wavelengths and fluorescence resonance energy transfer. Current
Biology: CB 6: 178-182.
Hell, S.W. 2003. Toward fluorescence nanoscopy. Nat Biotech 21: 1347-1355.
Henkel, T., Zabel, U., van Zee, K., Müller, J.M., Fanning, E., and Baeuerle, P.A. 1992.
Intramolecular masking of the nuclear location signal and dimerization domain in the
precursor for the p50 NF-[kappa]B subunit. Cell 68: 1121-1133.

174 References
Hermann, T., and Patel, D.J. 2000. RNA bulges as architectural and recognition motifs.
Structure 8: R47-R54.
Inouye, S., Noguchi, M., Sakaki, Y., Takagi, Y., Miyata, T, Iwanaga, S., Miyata, T, and Tsuji, F.I.
1985. Cloning and sequence analysis of cDNA for the luminescent protein aequorin.
Proceedings of the National Academy of Sciences of the United States of America 82:
3154-3158.
Ippen, E.P., Shank, C.V., and Bergman, A. 1976. Picosecond recovery dynamics of malachite
green. Chemical Physics Letters 38: 611-614.
Isied, S.S., Ogawa, M.Y., and Wishart, J.F. 1992. Peptide-mediated intramolecular electron
transfer: long-range distance dependence. Chemical Reviews 92: 381-394.
Isken, O., and Maquat, L.E. 2007. Quality control of eukaryotic mRNA: safeguarding cells
from abnormal mRNA function. Genes & Development 21: 1833 -3856.
Ivanchenko, S., Godinez, W.J., Lampe, M., Kräusslich, H.-G., Eils, R., Rohr, K., Bräuchle, C.,
Müller, B., and Lamb, D.C. 2009. Dynamics of HIV-1 Assembly and Release. PLoS
Pathog 5: e1000652.
Jaqaman, K., Loerke, D., Mettlen, M., Kuwata, H., Grinstein, S., Schmid, S.L., and Danuser, G.
2008. Robust single-particle tracking in live-cell time-lapse sequences. Nat Meth 5:
695-702.
Jazwinska, A., Kirov, N., Wieschaus, E., Roth, S., and Rushlow, C. 1999. The Drosophila Gene
brinker Reveals a Novel Mechanism of Dpp Target Gene Regulation. Cell 96: 563-573.
Johnson, J.L., Cusack, B., Hughes, T.F., McCullough, E.H., Fauq, A., Romanovskis, P., Spatola,
A.F., and Rosenberry, T.L. 2003. Inhibitors tethered near the acetylcholinesterase
active site serve as molecular rulers of the peripheral and acylation sites. The Journal
of Biological Chemistry 278: 38948-38955.
Jouvenet, N., Simon, S.M., and Bieniasz, P.D. 2009. Imaging the interaction of HIV-1
genomes and Gag during assembly of individual viral particles. Proceedings of the
National Academy of Sciences 106: 19114 -19119.
Köhrmann, M., Luo, M., Kaether, C., DesGroseillers, L., Dotti, C.G., and Kiebler, M.A. 1999.
Microtubule-dependent recruitment of Staufen-green fluorescent protein into large
RNA-containing granules and subsequent dendritic transport in living hippocampal
neurons. Molecular Biology of the Cell 10: 2945-2953.

175 References
Kanai, Y., Dohmae, N., and Hirokawa, N. 2004. Kinesin Transports RNA. Neuron 43: 513-525.
Kang, H., and Schuman, E.M. 1996. A Requirement for Local Protein Synthesis in
Neurotrophin-Induced Hippocampal Synaptic Plasticity. Science 273: 1402 -1406.
Karasawa, S., Araki, T., Nagai, Takeharu, Mizuno, H., and Miyawaki, A. 2004. Cyan-emitting
and orange-emitting fluorescent proteins as a donor/acceptor pair for fluorescence
resonance energy transfer. Biochemical Journal 381: 307-312.
Kerppola, T.K. 2006. Visualization of molecular interactions by fluorescence
complementation. Nat Rev Mol Cell Biol 7: 449-456.
Kim-Ha, J., Smith, J.L., and Macdonald, P.M. 1991. oskar mRNA is localized to the posterior
pole of the Drosophila oocyte. Cell 66: 23-35.
Kislauskis, E.H., Zhu, X., and Singer, R H. 1994a. Sequences responsible for intracellular
localization of beta-actin messenger RNA also affect cell phenotype. The Journal of
Cell Biology 127: 441-451.
Kislauskis, E.H., Zhu, X., and Singer, R H. 1994b. Sequences responsible for intracellular
localization of beta-actin messenger RNA also affect cell phenotype. The Journal of
Cell Biology 127: 441 -451.
Klarenbeek, J.B., Goedhart, J., Hink, M.A., Gadella, T.W.J., and Jalink, K. 2011. A mTurquoise-
Based cAMP Sensor for Both FLIM and Ratiometric Read-Out Has Improved Dynamic
Range. PLoS ONE 6: e19170.
Kotera, I., Iwasaki, T., Imamura, H., Noji, H., and Nagai, Takeharu. 2010. Reversible
Dimerization of Aequorea victoria Fluorescent Proteins Increases the Dynamic Range
of FRET-Based Indicators. ACS Chemical Biology 5: 215-222.
Kruger, K., Grabowski, P.J., Zaug, A.J., Sands, J., Gottschling, D.E., and Cech, T.R. 1982. Self-
splicing RNA: Autoexcision and autocyclization of the ribosomal RNA intervening
sequence of tetrahymena. Cell 31: 147-157.
Kumagai, Y., Kamioka, Y., Yagi, S., Matsuda, M., and Kiyokawa, E. 2011. A genetically
encoded Förster resonance energy transfer biosensor for two-photon excitation
microscopy. Analytical Biochemistry 413: 192-199.
Lago, H., Fonseca, S.A., Murray, J.B., Stonehouse, N.J., and Stockley, P.G. 1998. Dissecting
the key recognition features of the MS2 bacteriophage translational repression
complex. Nucleic Acids Research 26: 1337 -1344.

176 References
Lange, S., Katayama, Y., Schmid, M., Burkacky, O., Bruchle, C., Lamb, D.C., and Jansen, R.-P.
2008. Simultaneous Transport of Different Localized mRNA Species Revealed by Live-
Cell Imaging. Traffic 9: 1256-1267.
Lawrence, J.B., and Singer, R H. 1986. Intracellular localization of messenger RNAs for
cytoskeletal proteins. Cell 45: 407-415.
Lawrence, M.S., Phillips, K.J., and Liu, D.R. 2007. Supercharging Proteins Can Impart Unusual
Resilience. Journal of the American Chemical Society 129: 10110.
Le Hir, Hervé, and Séraphin, B. 2008. EJCs at the Heart of Translational Control. Cell 133:
213-216.
Le Hir, Herve, Izaurralde, E., Maquat, L.E., and Moore, M.J. 2000. The spliceosome deposits
multiple proteins 20-24 nucleotides upstream of mRNA exon-exon junctions. EMBO J
19: 6860-6869.
Le, T.T., Harlepp, S., Guet, C.C., Dittmar, K., Emonet, T., Pan, T., and Cluzel, P. 2005. Real-
time RNA profiling within a single bacterium. Proceedings of the National Academy
of Sciences of the United States of America 102: 9160 -9164.
Lee, J.-A., Xing, Y., Nguyen, D., Xie, J., Lee, C.J., and Black, D.L. 2007. Depolarization and CaM
Kinase IV Modulate NMDA Receptor Splicing through Two Essential RNA Elements.
PLoS Biol 5: e40.
Lee, J., Lee, K.H., Jeon, J., Dragulescu-Andrasi, A., Xiao, F., and Rao, J. 2010. Combining SELEX
screening and rational design to develop light-up fluorophore-RNA aptamer pairs for
RNA tagging. ACS Chemical Biology 5: 1065-1074.
Liao, J.C., Roider, J., and Jay, D.G. 1994. Chromophore-assisted laser inactivation of proteins
is mediated by the photogeneration of free radicals. Proceedings of the National
Academy of Sciences 91: 2659 -2663.
Link, W., Konietzko, U., Kauselmann, G., Krug, M., Schwanke, B., Frey, U, and Kuhl, D. 1995.
Somatodendritic expression of an immediate early gene is regulated by synaptic
activity. Proceedings of the National Academy of Sciences of the United States of
America 92: 5734-5738.
Lionnet, T. et al. 2011. A transgenic mouse for in vivo detection of endogenous labeled
mRNA. Nat Meth 8: 165-170.

177 References
Loeb, J. 1921. CHEMICAL AND PHYSICAL BEHAVIOR OF CASEIN SOLUTIONS. The Journal of
General Physiology 3: 547-555.
Lowary, P.T., and Uhlenbeck, O.C. 1987. An RNA mutation that increases the affinity of an
RNA-protein interaction. Nucleic Acids Research 15: 10483-10493.
Malim, M.H., Tiley, L.S., McCarn, D.F., Rusche, James R., Hauber, J., and Cullen, B.R. 1990.
HIV-1 structural gene expression requires binding of the rev trans-activator to its
RNA target sequence. Cell 60: 675-683.
Mallik, P.K., Nishikawa, K., Millis, A.J.T., and Shi, H. 2010. Commandeering a biological
pathway using aptamer-derived molecular adaptors. 38: e93-e93.
Mank, M., Reiff, D.F., Heim, N., Friedrich, M.W., Borst, A., and Griesbeck, Oliver. 2006. A
FRET-Based Calcium Biosensor with Fast Signal Kinetics and High Fluorescence
Change. Biophysical Journal 90: 1790-1796.
Mann, D.A. et al. 1994. A molecular rheostat. Co-operative rev binding to stem I of the rev-
response element modulates human immunodeficiency virus type-1 late gene
expression. Journal of Molecular Biology 241: 193-207.
Maquat, L.E. 2004. Nonsense-mediated mRNA decay: splicing, translation and mRNP
dynamics. Nat Rev Mol Cell Biol 5: 89-99.
Markwardt, M.L. et al. 2011. An Improved Cerulean Fluorescent Protein with Enhanced
Brightness and Reduced Reversible Photoswitching. PLoS ONE 6: e17896.
Matz, M.V., Fradkov, A F, Labas, Y.A., Savitsky, A.P., Zaraisky, A G, Markelov, M.L., and
Lukyanov, S.A. 1999. Fluorescent proteins from nonbioluminescent Anthozoa
species. Nature Biotechnology 17: 969-973.
Mayford, M., Baranes, D., Podsypanina, K., and Kandel, E.R. 1996. The 3′-untranslated region
of CaMKIIα is a cis-acting signal for the localization and translation of mRNA
in dendrites. Proceedings of the National Academy of Sciences of the United States of
America 93: 13250-13255.
Meech, S.R. 2009. Excited state reactions in fluorescent proteins. Chemical Society Reviews
38: 2922.
Mendez, R., and Richter, J.D. 2001. Translational control by CPEB: a means to the end. Nat
Rev Mol Cell Biol 2: 521-529.
178 References
Miller, S., Yasuda, M., Coats, J.K., Jones, Y., Martone, M.E., and Mayford, M. 2002a.
Disruption of Dendritic Translation of CaMKII[alpha] Impairs Stabilization of Synaptic
Plasticity and Memory Consolidation. Neuron 36: 507-519.
Miller, S., Yasuda, M., Coats, J.K., Jones, Y., Martone, M.E., and Mayford, M. 2002b.
Disruption of Dendritic Translation of CaMKIIα Impairs Stabilization of Synaptic
Plasticity and Memory Consolidation. Neuron 36: 507-519.
Ming, G.-li, Wong, S.T., Henley, J., Yuan, X.-bing, Song, H.-jun, Spitzer, N.C., and Poo, M.-
ming. 2002. Adaptation in the chemotactic guidance of nerve growth cones. Nature
417: 411-418.
Mingot, J.-M., Kostka, S., Kraft, R., Hartmann, E., and Gorlich, D. 2001. Importin 13: a novel
mediator of nuclear import and export. EMBO J 20: 3685-3694.
Miyawaki, A., and Tsien, Roger Y. 2000. Monitoring protein conformations and interactions
by fluorescence resonance energy transfer between mutants of green fluorescent
protein. In Applications of Chimeric Genes and Hybrid Proteins - Part B: Cell Biology
and Physiology, Vol. Volume 327 of, pp. 472-500, Academic Press
http://www.sciencedirect.com/science/article/pii/S0076687900272972 (Accessed
June 9, 2011).
Mori, Y., Imaizumi, K., Katayama, T., Yoneda, T., and Tohyama, M. 2000. Two cis-acting
elements in the 3’ untranslated region of alpha-CaMKII regulate its dendritic
targeting. Nature Neuroscience 3: 1079-1084.
Murgatroyd, C. et al. 2009. Dynamic DNA methylation programs persistent adverse effects
of early-life stress. Nat Neurosci 12: 1559-1566.
Muslimov, I.A., Titmus, M., Koenig, E., and Tiedge, H. 2002. Transport of Neuronal BC1 RNA
in Mauthner Axons. The Journal of neuroscience : the official journal of the Society
for Neuroscience 22: 4293-4301.
Nägerl, U.V., and Bonhoeffer, T. 2010. Imaging Living Synapses at the Nanoscale by STED
Microscopy. The Journal of Neuroscience 30: 9341 -9346.
Nägerl, U.V., Willig, K.I., Hein, B., Hell, S.W., and Bonhoeffer, T. 2008. Live-cell imaging of
dendritic spines by STED microscopy. Proceedings of the National Academy of
Sciences 105: 18982 -18987.
179 References
Nagai, T. 2004. Expanded dynamic range of fluorescent indicators for Ca2+ by circularly
permuted yellow fluorescent proteins. Proceedings of the National Academy of
Sciences 101: 10554-10559.
Nagai, Takeharu, Ibata, K., Park, E.S., Kubota, M., Mikoshiba, K., and Miyawaki, A. 2002. A
variant of yellow fluorescent protein with fast and efficient maturation for cell-
biological applications. Nat Biotech 20: 87-90.
Nasmyth, K., and Jansen, R.P. 1997. The cytoskeleton in mRNA localization and cell
differentiation. Current Opinion in Cell Biology 9: 396-400.
Nguyen, A.W., and Daugherty, P.S. 2005. Evolutionary optimization of fluorescent proteins
for intracellular FRET. Nat Biotech 23: 355-360.
Nielsen, K.H., Chamieh, H., Andersen, C.B.F., Fredslund, F., Hamborg, K., Le Hir, Hervé, and
Andersen, Gregers R. 2009. Mechanism of ATP turnover inhibition in the EJC. RNA
15: 67-75.
Niino, Y., Hotta, K., and Oka, K. 2009. Simultaneous Live Cell Imaging Using Dual FRET
Sensors with a Single Excitation Light. PLoS ONE 4: e6036.
Nikaido, H. 1996. Multidrug efflux pumps of gram-negative bacteria. Journal of Bacteriology
178: 5853-5859.
Nishikawa, F., Kakiuchi, N., Funaji, K., Fukuda, K., Sekiya, S., and Nishikawa, S. 2003.
Inhibition of HCV NS3 protease by RNA aptamers in cells. Nucleic Acids Research 31:
1935-1943.
Okabe, S, Miwa, A., and Okado, H. 1999. Alternative splicing of the C-terminal domain
regulates cell surface expression of the NMDA receptor NR1 subunit. The Journal of
Neuroscience: The Official Journal of the Society for Neuroscience 19: 7781-7792.
Okusu, H., Ma, D., and Nikaido, H. 1996. AcrAB efflux pump plays a major role in the
antibiotic resistance phenotype of Escherichia coli multiple-antibiotic-resistance
(Mar) mutants. Journal of Bacteriology 178: 306-308.
Oliva, B., Gordon, G., McNicholas, P., Ellestad, G., and Chopra, I. 1992. Evidence that
tetracycline analogs whose primary target is not the bacterial ribosome cause lysis of
Escherichia coli. Antimicrob. Agents Chemother. 36: 913-919.

180 References
Ormö, M., Cubitt, A.B., Kallio, K., Gross, L.A., Tsien, R Y, and Remington, S J. 1996. Crystal
structure of the Aequorea victoria green fluorescent protein. Science (New York,
N.Y.) 273: 1392-1395.
Ouyang, Y., Rosenstein, A., Kreiman, G., Schuman, E.M., and Kennedy, M.B. 1999. Tetanic
Stimulation Leads to Increased Accumulation of Ca2+/Calmodulin-Dependent
Protein Kinase II via Dendritic Protein Synthesis in Hippocampal Neurons. The Journal
of Neuroscience 19: 7823 -7833.
Ozawa, T., Natori, Y., Sato, M., and Umezawa, Y. 2007. Imaging dynamics of endogenous
mitochondrial RNA in single living cells. Nat Meth 4: 413-419.
PELED-ZEHAVI, H., HORIYA, S., DAS, C., HARADA, K., and FRANKEL, A.D. 2003. Selection of
RRE RNA binding peptides using a kanamycin antitermination assay. RNA 9: 252 -261.
Padilla-Parra, S., Audugé, N., Lalucque, H., Mevel, J.-C., Coppey-Moisan, M., and Tramier, M.
2009. Quantitative comparison of different fluorescent protein couples for fast FRET-
FLIM acquisition. Biophysical Journal 97: 2368-2376.
Pagès, J.-M., and Amaral, L. 2009. Mechanisms of drug efflux and strategies to combat
them: Challenging the efflux pump of Gram-negative bacteria. Biochimica et
Biophysica Acta (BBA) - Proteins & Proteomics 1794: 826-833.
Paige, J.S., Wu, K.Y., and Jaffrey, S.R. 2011. RNA Mimics of Green Fluorescent Protein.
Science 333: 642 -646.
Palacios, Isabel M., Gatfield, D., St Johnston, Daniel, and Izaurralde, E. 2004. An eIF4AIII-
containing complex required for mRNA localization and nonsense-mediated mRNA
decay. Nature 427: 753-757.
Palacios, Isabel M., and Johnston, D.S. 2001. G <scp>ETTING THE</scp> M
<scp>ESSAGE</scp> A <scp>CROSS</scp> : The Intracellular Localization of mRNAs
in Higher Eukaryotes. Annual Review of Cell and Developmental Biology 17: 569-614.
Palmer, A.E., Giacomello, M., Kortemme, T., Hires, S.A., Lev-Ram, V., Baker, D., and Tsien,
Roger Y. 2006. Ca2+ Indicators Based on Computationally Redesigned Calmodulin-
Peptide Pairs. Chemistry & Biology 13: 521-530.
Parker, R., and Sheth, U. 2007. P Bodies and the Control of mRNA Translation and
Degradation. Molecular Cell 25: 635-646.

181 References
Peabody, D.S., and Lim, F. 1996. Complementation of RNA binding site mutations in MS2
coat protein heterodimers. Nucleic Acids Research 24: 2352-2359.
Piljid, A., de Diego, I., Wilmanns, M., and Schultz, C. 2011. Rapid Development of Genetically
Encoded FRET Reporters. ACS Chemical Biology 6: 685-691.
Ponchon, L., Beauvais, G., Nonin-Lecomte, S., and Dardel, F. 2009. A generic protocol for the
expression and purification of recombinant RNA in Escherichia coli using a tRNA
scaffold. Nat. Protocols 4: 947-959.
Prasher, Douglas C., Eckenrode, V.K., Ward, W.W., Prendergast, F.G., and Cormier, M.J.
1992. Primary structure of the Aequorea victoria green-fluorescent protein. Gene
111: 229-233.
Rackham, O., and Brown, C.M. 2004. Visualization of RNA-protein interactions in living cells:
FMRP and IMP1 interact on mRNAs. EMBO J 23: 3346-3355.
Rafelski, S.M., and Theriot, J.A. 2004. Crawling toward a unified model of cell mobility:
spatial and temporal regulation of actin dynamics. Annual Review of Biochemistry 73:
209-239.
Ragin, A.D., Morgan, R.A., and Chmielewski, J. 2002. Cellular Import Mediated by Nuclear
Localization Signal Peptide Sequences. Chemistry & Biology 9: 943-948.
Raskin, C.A., Diaz, G.A., and McAllister, W.T. 1993. T7 RNA polymerase mutants with altered
promoter specificities. Proceedings of the National Academy of Sciences of the
United States of America 90: 3147-3151.
Riedl, J. et al. 2008. Lifeact: a versatile marker to visualize F-actin. Nat Meth 5: 605-607.
Rizzo, M.A., Springer, G.H., Granada, B., and Piston, D.W. 2004. An improved cyan
fluorescent protein variant useful for FRET. Nat Biotech 22: 445-449.
Rodriguez, A.J., Shenoy, Shailesh M., Singer, Robert H., and Condeelis, J. 2006. Visualization
of mRNA translation in living cells. The Journal of Cell Biology 175: 67 -76.
Rook, M.S., Lu, M., and Kosik, K.S. 2000. CaMKIIα 3′ Untranslated Region-Directed mRNA
Translocation in Living Neurons: Visualization by GFP Linkage. The Journal of
Neuroscience 20: 6385 -6393.
Ruan, G., Agrawal, A., Marcus, A.I., and Nie, S. 2007. Imaging and Tracking of Tat Peptide-
Conjugated Quantum Dots in Living Cells: New Insights into Nanoparticle Uptake,

182 References
Intracellular Transport, and Vesicle Shedding. Journal of the American Chemical
Society 129: 14759-14766.
Sakaue-Sawano, A. et al. 2008. Visualizing Spatiotemporal Dynamics of Multicellular Cell-
Cycle Progression. Cell 132: 487-498.
Salazar, M., Fedoroff, O.Y., Miller, J.M., Ribeiro, N.S., and Reid, B.R. 1993. The DNA strand in
DNA.cntdot.RNA hybrid duplexes is neither B-form nor A-form in solution.
Biochemistry 32: 4207-4215.
Santangelo, P.J., Lifland, A.W., Curt, P., Sasaki, Y., Bassell, Gary J, Lindquist, M.E., and Crowe,
J.E. 2009. Single molecule-sensitive probes for imaging RNA in live cells. Nat Meth 6:
347-349.
Santangelo, P.J. 2010. Molecular beacons and related probes for intracellular RNA imaging.
Wiley Interdisciplinary Reviews: Nanomedicine and Nanobiotechnology 2: 11-19.
Sasakura, Y., Ogasawara, M., and Makabe, K.W. 2000. Two Pathways of Maternal RNA
Localization at the Posterior-Vegetal Cytoplasm in Early Ascidian Embryos.
Developmental Biology 220: 365-378.
Sauliere, J., Haque, N., Harms, S., Barbosa, I., Blanchette, M., and Le Hir, Herve. 2010. The
exon junction complex differentially marks spliced junctions. Nat Struct Mol Biol 17:
1269-1271.
Schifferer, M., and Griesbeck, Oliver. 2009. Application of aptamers and autofluorescent
proteins for RNA visualization. Integrative Biology 1: 499.
Schimmel, P.R., and Flory, P.J. 1967. Conformational energy and configurational statistics of
poly-L-proline. Proceedings of the National Academy of Sciences of the United States
of America 58: 52-59.
Schratt, G.M., Tuebing, F., Nigh, E.A., Kane, C.G., Sabatini, M.E., Kiebler, M., and Greenberg,
M.E. 2006. A brain-specific microRNA regulates dendritic spine development. Nature
439: 283-289.
Schwarze, S.R., Ho, A., Vocero-Akbani, A., and Dowdy, S.F. 1999. In Vivo Protein
Transduction: Delivery of a Biologically Active Protein into the Mouse. Science 285:
1569 -1572.
Scott, D.B., Blanpied, T.A., Swanson, G.T., Zhang, C., and Ehlers, M.D. 2001. An NMDA
receptor ER retention signal regulated by phosphorylation and alternative splicing.
183 References
The Journal of Neuroscience: The Official Journal of the Society for Neuroscience 21:
3063-3072.
Serina, L. et al. 1996. Structural Properties of UMP-Kinase from Escherichia coli: Modulation
of Protein Solubility by pH and UTP†. Biochemistry 35: 7003-7011.
Shaner, N.C., Campbell, Robert E, Steinbach, P.A., Giepmans, B.N.G., Palmer, A.E., and Tsien,
Roger Y. 2004. Improved monomeric red, orange and yellow fluorescent proteins
derived from Discosoma sp. red fluorescent protein. Nature Biotechnology 22: 1567-
1572.
Shaner, N.C., Lin, M.Z., McKeown, M.R., Steinbach, P.A., Hazelwood, K.L., Davidson, M.W.,
and Tsien, Roger Y. 2008. Improving the photostability of bright monomeric orange
and red fluorescent proteins. Nature Methods 5: 545-551.
Shcherbo, D. et al. 2007. Bright far-red fluorescent protein for whole-body imaging. Nat
Meth 4: 741-746.
Shimomura, O. 1979. Structure of the chromophore of Aequorea green fluorescent protein.
FEBS Letters 104: 220-222.
Sil, A., and Herskowitz, I. 1996. Identification of asymmetrically localized determinant,
Ash1p, required for lineage-specific transcription of the yeast HO gene. Cell 84: 711-
722.
Smith, C A, Chen, L., and Frankel, A D. 2000. Using peptides as models of RNA-protein
interactions. Methods in Enzymology 318: 423-438.
Smith, Colin A., Calabro, V., and Frankel, Alan D. 2000. An RNA-Binding Chameleon.
Molecular Cell 6: 1067-1076.
Soderling, T.R. 2000. CaM-kinases: modulators of synaptic plasticity. Current Opinion in
Neurobiology 10: 375-380.
Spassov, D.S., and Jurecic, R. 2002. Cloning and comparative sequence analysis of PUM1 and
PUM2 genes, human members of the Pumilio family of RNA-binding proteins. Gene
299: 195-204.
Standley, S., Roche, K.W., McCallum, J., Sans, N., and Wenthold, R.J. 2000. PDZ Domain
Suppression of an ER Retention Signal in NMDA Receptor NR1 Splice Variants.
Neuron 28: 887-898.

184 References
Stavri, M., Piddock, L.J.V., and Gibbons, S. 2007. Bacterial efflux pump inhibitors from
natural sources. Journal of Antimicrobial Chemotherapy 59: 1247 -1260.
Steward, O, and Levy, W. 1982. Preferential localization of polyribosomes under the base of
dendritic spines in granule cells of the dentate gyrus. The Journal of Neuroscience 2:
284 -291.
Steward, Oswald, and Worley, P.F. 2001. Selective Targeting of Newly Synthesized Arc
mRNA to Active Synapses Requires NMDA Receptor Activation. Neuron 30: 227-240.
Stryer, L., and Haugland, R.P. 1967. Energy transfer: a spectroscopic ruler. Proceedings of
the National Academy of Sciences of the United States of America 58: 719-726.
Subramanian, M., Rage, F., Tabet, R., Flatter, E., Mandel, J.-L., and Moine, H. 2011. G-
quadruplex RNA structure as a signal for neurite mRNA targeting. EMBO Rep 12: 697-
704.
Sudarsan, N., Lee, E.R., Weinberg, Z., Moy, R.H., Kim, J.N., Link, K.H., and Breaker, R.R. 2008.
Riboswitches in Eubacteria Sense the Second Messenger Cyclic Di-GMP. Science 321:
411 -413.
Sun, Y., Booker, C.F., Kumari, S., Day, R.N., Davidson, M., and Periasamy, A. 2009.
Characterization of an orange acceptor fluorescent protein for sensitized spectral
fluorescence resonance energy transfer microscopy using a white-light laser. Journal
of Biomedical Optics 14: 054009.
Sundstroem, V., and Gillbro, T. 1982. Viscosity-dependent isomerization yields of some
cyanine dyes. A picosecond laser spectroscopy study. The Journal of Physical
Chemistry 86: 1788-1794.
Swedlow, J.R., and Platani, M. 2002. Cell Structure and Function 27: 335-341.
Tan, R, and Frankel, A D. 1995. Structural variety of arginine-rich RNA-binding peptides.
Proceedings of the National Academy of Sciences 92: 5282 -5286.
Tan, W., Wang, K., and Drake, T.J. 2004. Molecular beacons. Current Opinion in Chemical
Biology 8: 547-553.
Tange, T.Ø., Nott, A., and Moore, M.J. 2004. The ever-increasing complexities of the exon
junction complex. Current Opinion in Cell Biology 16: 279-284.
Tanner, N.K., and Linder, P. 2001. DExD/H Box RNA HelicasesFrom Generic Motors to
Specific Dissociation Functions. Molecular Cell 8: 251-262.

185 References
Tansila, N., Tantimongcolwat, T., Isarankura-Na-Ayudhya, C., Nantasenamat, C., and
Prachayasittikul, V. Rational Design of Analyte Channels of the Green Fluorescent
Protein for Biosensor Applications. International Journal of Biological Sciences 3: 463-
470.
Theissen, B., Karow, A.R., Köhler, J., Gubaev, A., and Klostermeier, D. 2008. Cooperative
binding of ATP and RNA induces a closed conformation in a DEAD box RNA helicase.
Proceedings of the National Academy of Sciences of the United States of America
105: 548-553.
Tilsner, J., Linnik, O., Christensen, N.M., Bell, K., Roberts, I.M., Lacomme, C., and Oparka, K.J.
2009. Live-cell imaging of viral RNA genomes using a Pumilio-based reporter. The
Plant Journal 57: 758-770.
Tingley, W.G., Roche, K.W., Thompson, A.K., and Huganir, Richard L. 1993. Regulation of
NMDA receptor phosphorylation by alternative splicing of the C-terminal domain.
Nature 364: 70-73.
Tkachenko, A.G., Xie, H., Liu, Y., Coleman, D., Ryan, J., Glomm, W.R., Shipton, M.K., Franzen,
S., and Feldheim, D.L. 2004. Cellular Trajectories of Peptide-Modified Gold Particle
Complexes: Comparison of Nuclear Localization Signals and Peptide Transduction
Domains. Bioconjugate Chemistry 15: 482-490.
Tsien, Roger Y. 1998. THE GREEN FLUORESCENT PROTEIN. Annual Review of Biochemistry
67: 509-544.
Tuerk, C., and Gold, L. 1990. Systematic evolution of ligands by exponential enrichment:
RNA ligands to bacteriophage T4 DNA polymerase. Science 249: 505 -510.
Turner, J.J., Ivanova, G.D., Verbeure, B., Williams, D., Arzumanov, A.A., Abes, S., Lebleu, B.,
and Gait, Michael J. 2005. Cell-penetrating peptide conjugates of peptide nucleic
acids (PNA) as inhibitors of HIV-1 Tat-dependent trans-activation in cells. Nucleic
Acids Research 33: 6837-6849.
Ule, J. et al. 2005. Nova regulates brain-specific splicing to shape the synapse. Nat Genet 37:
844-852.
Valencia-Burton, M., McCullough, R.M., Cantor, C.R., and Broude, N.E. 2007. RNA
visualization in live bacterial cells using fluorescent protein complementation.
Nature Methods 4: 421-427.

186 References
Valencia-Burton, M., Shah, A., Sutin, J., Borogovac, A., McCullough, R.M., Cantor, C.R.,
Meller, A., and Broude, N.E. 2009. Spatiotemporal patterns and transcription kinetics
of induced RNA in single bacterial cells. 106: 16399-16404.
Van Eeden, F.J.M., Palacios, I.M., Petronczki, M., Weston, M.J.D., and St. Johnston, D.S.
2001. Barentsz is essential for the posterior localization of oskar mRNA and
colocalizes with it to the posterior pole. Journal of Cell Biology 154: 511-523.
Vinkenborg, J.L., Evers, T.H., Reulen, S.W.A., Meijer, E.W., and Merkx, M. 2007. Enhanced
Sensitivity of FRET-Based Protease Sensors by Redesign of the GFP Dimerization
Interface. ChemBioChem 8: 1119-1121.
Vives, E. 2005. Present and future of cell-penetrating peptide mediated delivery systems: “Is
the Trojan horse too wild to go only to Troy?” Journal of Controlled Release 109: 77-
85.
Wachter, R M, Elsliger, M.A., Kallio, K., Hanson, G T, and Remington, S J. 1998. Structural
basis of spectral shifts in the yellow-emission variants of green fluorescent protein.
Structure (London, England: 1993) 6: 1267-1277.
Weil, T.T., Parton, R.M., and Davis, I. 2010. Making the message clear: visualizing mRNA
localization. Trends in Cell Biology 20: 380-390.
Weiss, M.A., and Narayana, N. 1998. RNA recognition by arginine-rich peptide motifs.
Biopolymers 48: 167-180.
Wriggers, W., Chakravarty, S., and Jennings, P.A. 2005. Control of protein functional
dynamics by peptide linkers. Biopolymers 80: 736-746.
Wu, L., and Belasco, J.G. 2008. Let Me Count the Ways: Mechanisms of Gene Regulation by
miRNAs and siRNAs. Molecular Cell 29: 1-7.
Yamagishi, M., Ishihama, Y., Shirasaki, Y., Kurama, H., and Funatsu, T. 2009. Single-molecule
imaging of beta-actin mRNAs in the cytoplasm of a living cell. Experimental Cell
Research 315: 1142-1147.
Yamauchi, T. 2005. Biological & Pharmaceutical Bulletin 28: 1342-1354.
Yang, F., Moss, L.G., and Phillips, G.N. 1996. The molecular structure of green fluorescent
protein. Nat Biotech 14: 1246-1251.
187 References
Yang, Y.Y.L., Yin, G.L., and Darnell, R.B. 1998. The neuronal RNA-binding protein Nova-2 is
implicated as the autoantigen targeted in POMA patients with dementia.
Proceedings of the National Academy of Sciences 95: 13254 -13259.
Yiu, H.-W., Demidov, V.V., Toran, P., Cantor, C.R., and Broude, N.E. 2011. RNA Detection in
Live Bacterial Cells Using Fluorescent Protein Complementation Triggered by
Interaction of Two RNA Aptamers with Two RNA-Binding Peptides. Pharmaceuticals
4: 494-508.
Yoshimura, A., Fujii, R., Watanabe, Y., Okabe, Shigeo, Fukui, K., and Takumi, T. 2006. Myosin-
Va Facilitates the Accumulation of mRNA/Protein Complex in Dendritic Spines.
Current Biology 16: 2345-2351.
ZHANG, L., LIU, W., and GRABOWSKI, P.J. 1999. Coordinate Repression of a Trio of Neuron-
Specific Splicing Events by the Splicing Regulator PTB. RNA 5: 117-130.
ZHANG, W., LIU, H., HAN, K., and GRABOWSKI, P.J. 2002. Region-Specific Alternative Splicing
in the Nervous System: Implications for Regulation by the RNA-Binding Protein
NAPOR. RNA 8: 671-685.
Zacharias, David A., Violin, J.D., Newton, A.C., and Tsien, Roger Y. 2002. Partitioning of Lipid-
Modified Monomeric GFPs into Membrane Microdomains of Live Cells. Science 296:
913 -916.
Zapata-Hommer, O., and Griesbeck, Oliver. 2003. Efficiently folding and circularly permuted
variants of the Sapphire mutant of GFP. BMC Biotechnology 3: 5.
Zhang, H.L., Eom, T., Oleynikov, Y., Shenoy, S.M., Liebelt, D.A., Dictenberg, J.B., Singer, R.H.,
and Bassell, G.J. 2001. Neurotrophin-Induced Transport of a [beta]-Actin mRNP
Complex Increases [beta]-Actin Levels and Stimulates Growth Cone Motility. Neuron
31: 261-275.
Zhang, Q., Harada, Kazuo, Cho, H.S., Frankel, Alan D., and Wemmer, D.E. 2001. Structural
characterization of the complex of the Rev response element RNA with a selected
peptide. Chemistry & Biology 8: 511-520.
Zhang, Wenqing, Liu, H., Han, K., and Grabowski, P.J. 2002. Region-specific alternative
splicing in the nervous system: implications for regulation by the RNA-binding
protein NAPOR. RNA 8: 671-685.

188 References
Zhang, X.-hui, and Poo, M.-ming. 2002. Localized Synaptic Potentiation by BDNF Requires
Local Protein Synthesis in the Developing Axon. Neuron 36: 675-688.
Zuker, M. 2003. Mfold web server for nucleic acid folding and hybridization prediction.
Nucleic Acids Research 31: 3406 -3415.
Zukin, R.S., and Bennett, M.V. 1995. Alternatively spliced isoforms of the NMDARI receptor
subunit. Trends in Neurosciences 18: 306-313.
189 References

190 Acknowledgements
Acknowledgements
First and foremost I would like to thank my supervisor Oliver Griesbeck for consigning this
interesting and challenging topic to me. His faith in the project and in my abilities to
overcome all the problems always exceeded mine. Endless creative discussions, an
independent working atmosphere and his optimistic, sisyphean attitude towards science left
permanent impression. "The struggle itself...is enough to fill a man's heart. One must
imagine Sisyphus happy." (Albert Camus)
I`d like to express my gratitude to Axel Borst for his willingness to be the “Doktorvater” of an
RNA project and for his valuable outside the box advice during my Thesis Committees.
I would like to thank the whole Griesbeck group for the most free, entertaining and creative
working atmosphere I could think of, especially for all the odds and ends of every-day lab
life rendered my time here so special. I very much appreciate the 4 years I spent with you.
Many thanks to Steph for facilitating my start in the group, for nice neighbourhood in P1
and all his help especially regarding imaging. Many thanks to my bench neighbor and IPP
colleague Jonny for mental, practical and very British support. Gayane was always there for
girl`s distractions not only in the lab. Working back-to-back with Dane was among the most
entertaining lab times. Thanks to Anselm for as controversial as exciting discussions, his
chemist`s help and the support with the SAXS experiments. I`m especially grateful for Julia`s
enthusiasm to get the screening done and for being a great friend. Recently, David and
Michael nicely amended our group.
Anja Moritz and her labbrain facilitated my start in lab work and she was a great help for the
screening. Many thanks to our lab mum Birgit Kunkel for fostering cells, mice and PhD
students and for doing everything I wouldn`t have dared or forgot to ask for.
Special thanks to Marco for facilitating a smooth start, realistic and elaborated discussions
and his continuous support even until now. Thanks also to current and former lab- or P1-
members Adrian, Amrita, Chris, Martina, Matthias, Nina and Vroni for a nice atmosphere.
The practical students John and Lydia kindly contributed to this work. Mille Grazie to
Giovanni for emergency first-aid supplies.
Many thanks to the whole Borst Group for the exceptionally nice atmosphere, especially to
Dierck and everybody who had an open ear also in hard times.

191 Acknowledgements
Many thanks to my third Thesis committee member Gunter Meister and his students for
contributing with his RNA biology knowledge. I would like to thank Jianghong Rao for being
an inspiring lab host and Anca for sharing ideas on the ASR approach. Fei not only
introduced me into the SELEX technology but, together with his wife, he was also a
courteous host in Palo Alto. I`m indebted to Elena Conti and her lab, especially Atlanta,
Sutapa and Gretel for helpful comments on and material for the REFlex project. Many
thanks to Gregor for starting a collaboration on the SAXS experiments. Last but not least, I
am grateful for the cooperative and inspiring atmosphere I enjoyed at the MPI of
Neurobiology. Special thanks to Elena, Marsilius, Wolfgang, “Bradkes” and “Kleins” and all
the MPI staff.
Finally I have to express my gratitude to my parents, Bernhard and my friends for tolerating
long evening lab-sessions and above all for supporting me in whatever I was doing.

192 Curriculum Vitae
192 | P a g e
Curriculum Vitae
Personal information
Name Martina Schifferer-Waritschlager
Date of birth 16th August 1982
Nationality German
Education
Since 07/2007 PhD thesis at the Max-Planck-Institute of Neurobiology, Martinsried,
Germany (Dr. O. Griesbeck): “Development of a dynamic RNA sensor”
02/2007 - 06/2007 Graduate studies at the Max Planck Institute of Psychiatry, Munich (Prof.
Dr. R. Landgraf): “Epigenetics in a mouse model for high and low anxiety”
09/2006 - 07/2007 Undergraduate studies at the Hochschule für Philosophie, Munich
09/2004 - 09/2006 Master studies in Molecular Biotechnology at the Technical University
Munich, Germany
Master thesis at the Max Planck Institute of Biochemistry (Prof. Dr. R.
Fässler): “Analysis of Kindlin-2 knock-out mice”
09/2001 - 07/2004 Bachelor studies in Molecular Biotechnology at the Technical University
Munich, Germany
Bachelor thesis at the Technical University Munich (Prof. Dr. A. Skerra):
“Structural and functional analysis of the Skp protein”
06/2001 Graduation from High School (Gymnasium der Maria-Ward Schulstiftung,
Altötting, Germany)

193 Curriculum Vitae
193 | P a g e
Publications
Montanez E, Ussar S, Schifferer M, Bösl M, Zent R, Moser M, Fässler R (2008) Kindlin-2
controls bidirectional signaling of integrins. Genes & Development 22(10): 1325-1330
Schifferer M, Griesbeck O (2009) Application of aptamers and autofluorescent proteins
for RNA visualization. Integrative Biology 1(8-9): 499.
Schifferer M, MacKinnon J, Rao J, Griesbeck O. Probing eIF4AIII Function With
Fluorescence Resonance Energy Transfer. (submitted)
Schifferer M, Griesbeck O. An Engineered Biosensor-Aptamer Pair to Image RNA
Expression in Living Cells. (submitted)
Conferences
Gordon conference “Basement membranes”, Il Giocco, Italy, 2007 (poster)
EMBO conference “The complex life of RNA”, Heidelberg, Germany, 2010 (poster)
RNA society conference, Kyoto, Japan, 2011 (poster)

194 Versicherung
194 | P a g e
Versicherung
Ehrenwörtliche Versicherung
Ich versichere hiermit ehrenwörtlich, dass die vorgelegte Dissertation von mir selbständig und
ohne unerlaubte Hilfe angefertigt ist.
München, 15.09.2011
Martina Schifferer-Waritschlager
Erklärung
Hiermit erkläre ich, dass die Dissertation nicht ganz oder in wesentlichen Teilen einer anderen
Prüfungskommission vorgelegt worden ist und dass ich mich anderweitig einer Doktorprüfung
ohne Erfolg nicht unterzogen habe.
München, 15.09.2011
Martina Schifferer-Waritschlager