Embed Size (px)
Citation preview

9. NOVEMBER 2015
WACHSTUMSMARKT APOTHEKENVERSANDHANDEL
– Eine europäische Perspektive –
AGENDA
• EINFLUSSGRÖSSEN & SCOPE
• MARKTENTWICKLUNG BIS 2018
• EINORDNUNG DER EUROPÄISCHEN MÄRKTE
- Beispiel Deutschland
- Beispiel Österreich
- Beispiel Frankreich
• FAZIT
© 2015 by SEMPORA Consulting GmbH. All rights reserved. Proprietary and confidential.
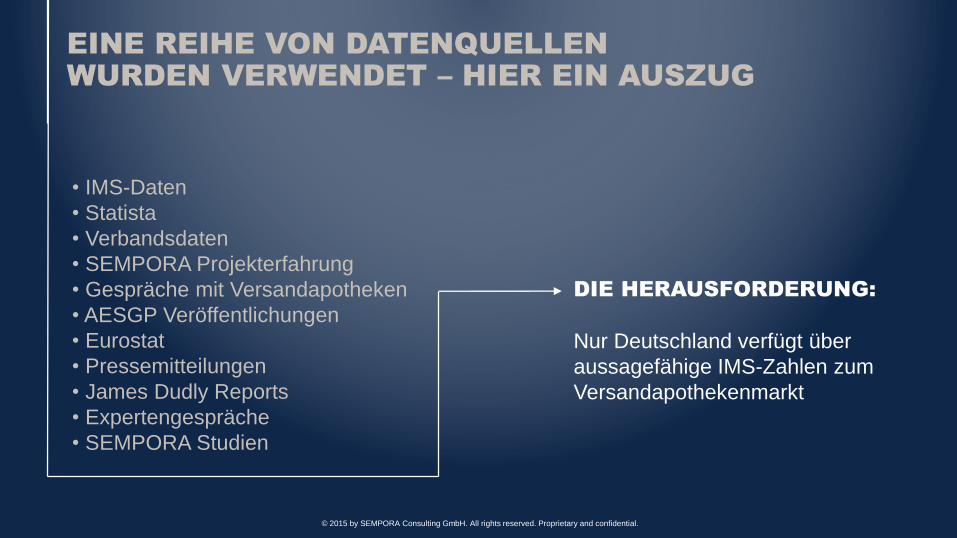
EINE REIHE VON DATENQUELLEN
WURDEN VERWENDET – HIER EIN AUSZUG
• IMS-Daten• Statista• Verbandsdaten• SEMPORA Projekterfahrung• Gespräche mit Versandapotheken• AESGP Veröffentlichungen• Eurostat• Pressemitteilungen• James Dudly Reports• Expertengespräche• SEMPORA Studien
DIE HERAUSFORDERUNG:
Nur Deutschland verfügt über aussagefähige IMS-Zahlen zum Versandapothekenmarkt
© 2015 by SEMPORA Consulting GmbH. All rights reserved. Proprietary and confidential.
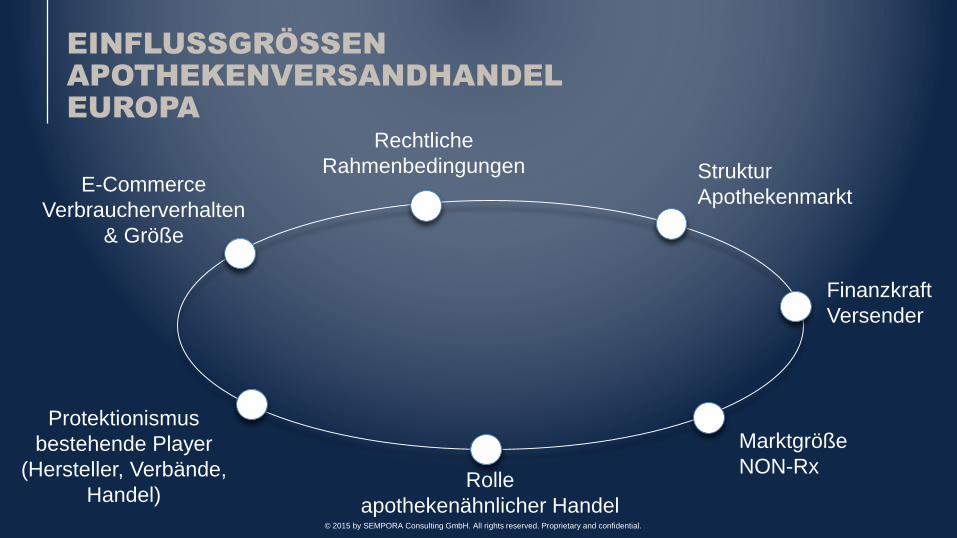
EINFLUSSGRÖSSEN
APOTHEKENVERSANDHANDEL
EUROPA
Rechtliche Rahmenbedingungen Struktur
Apothekenmarkt
Finanzkraft Versender
Marktgröße NON-Rx
Rolle apothekenähnlicher Handel
Protektionismusbestehende Player
(Hersteller, Verbände, Handel)
E-Commerce Verbraucherverhalten
& Größe
© 2015 by SEMPORA Consulting GmbH. All rights reserved. Proprietary and confidential.
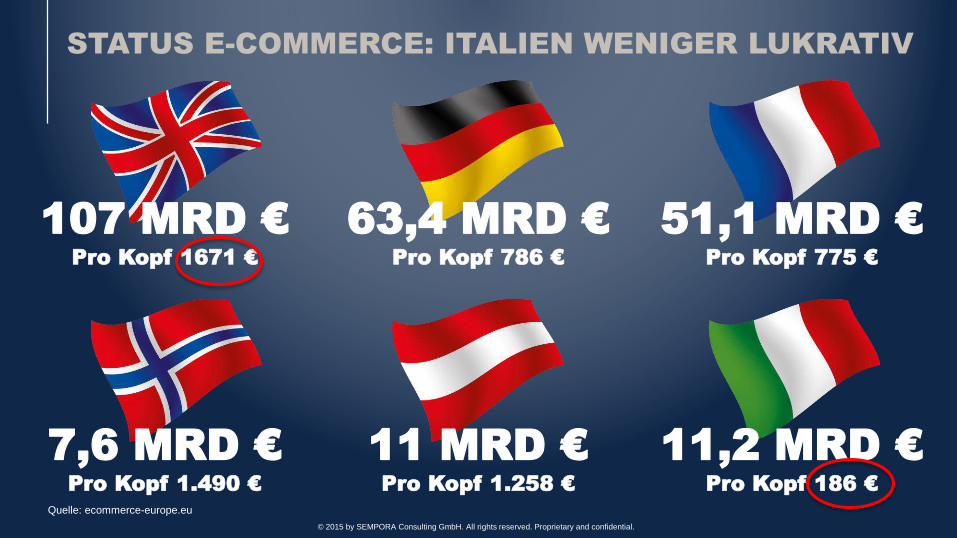
107 MRD €
Pro Kopf 1671 €
STATUS E-COMMERCE: ITALIEN WENIGER LUKRATIV
63,4 MRD €
Pro Kopf 786 €
51,1 MRD €
Pro Kopf 775 €
7,6 MRD €
Pro Kopf 1.490 €
11 MRD €
Pro Kopf 1.258 €
11,2 MRD €
Pro Kopf 186 €
Quelle: ecommerce-europe.eu
© 2015 by SEMPORA Consulting GmbH. All rights reserved. Proprietary and confidential.
NON-RX
© 2015 by SEMPORA Consulting GmbH. All rights reserved. Proprietary and confidential.
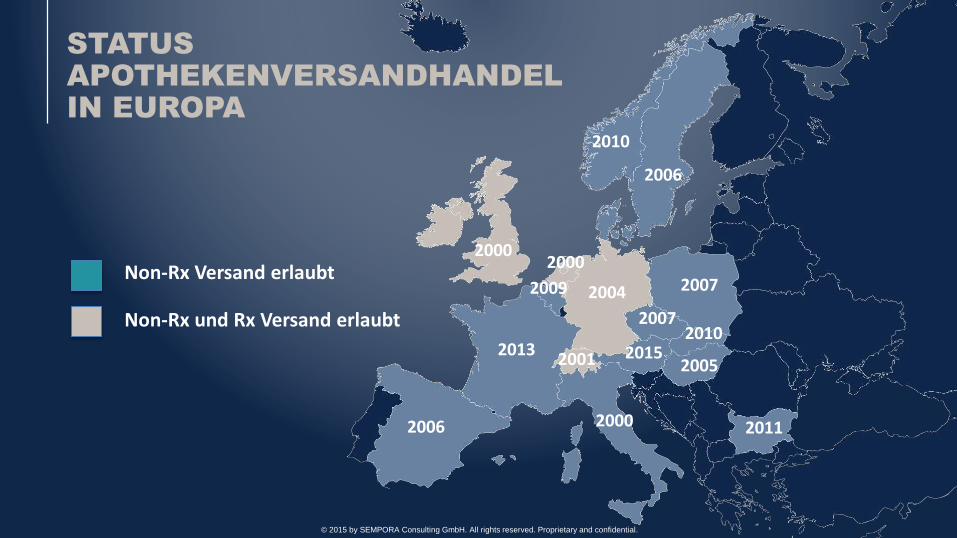
Non-Rx Versand erlaubt
Non-Rx und Rx Versand erlaubt
2010
2006
20002000
20042009
2013
2006 2000
2001 2015
2007
2007
2005
2011
2010
STATUS
APOTHEKENVERSANDHANDEL
IN EUROPA
© 2015 by SEMPORA Consulting GmbH. All rights reserved. Proprietary and confidential.
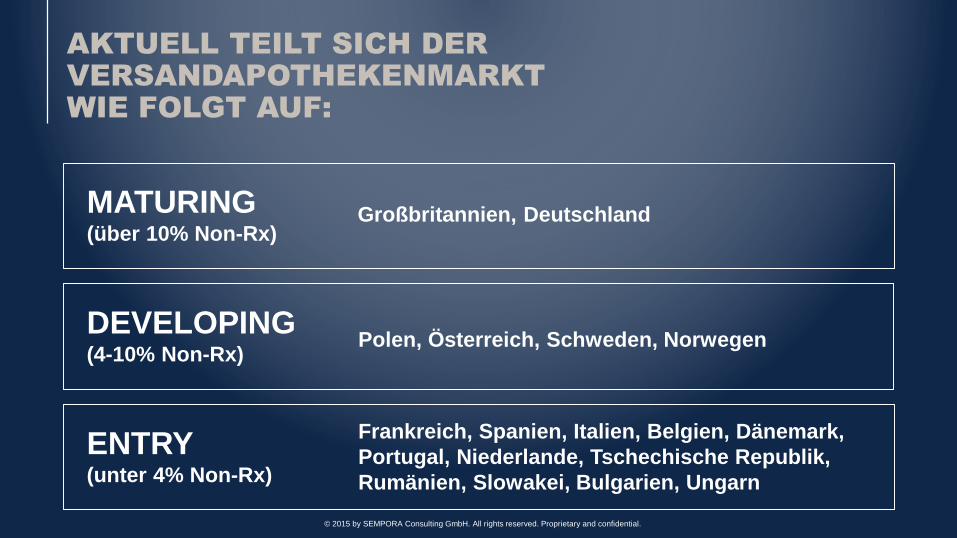
AKTUELL TEILT SICH DER
VERSANDAPOTHEKENMARKT
WIE FOLGT AUF:
Frankreich, Spanien, Italien, Belgien, Dänemark, Portugal, Niederlande, Tschechische Republik, Rumänien, Slowakei, Bulgarien, Ungarn
ENTRY(unter 4% Non-Rx)
Polen, Österreich, Schweden, NorwegenDEVELOPING(4-10% Non-Rx)
Großbritannien, DeutschlandMATURING(über 10% Non-Rx)
© 2015 by SEMPORA Consulting GmbH. All rights reserved. Proprietary and confidential.
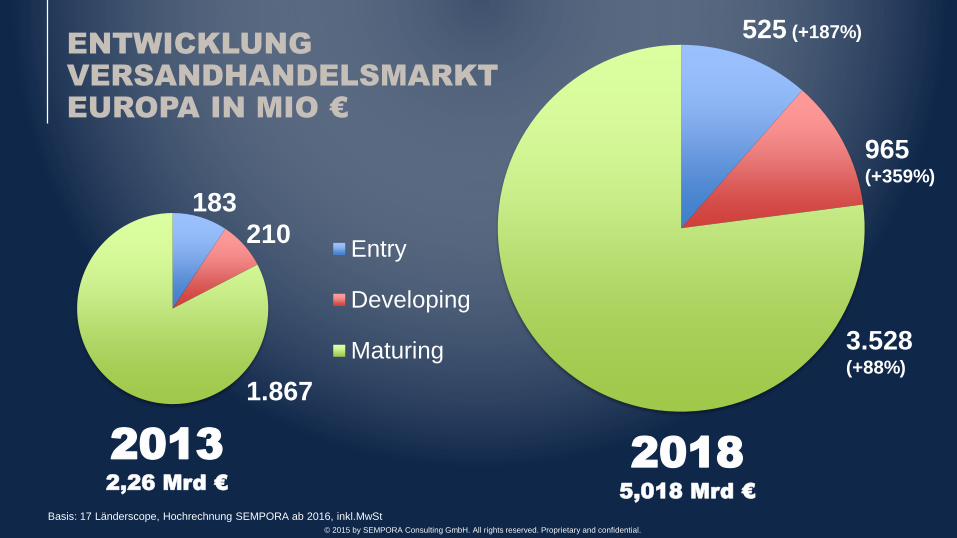
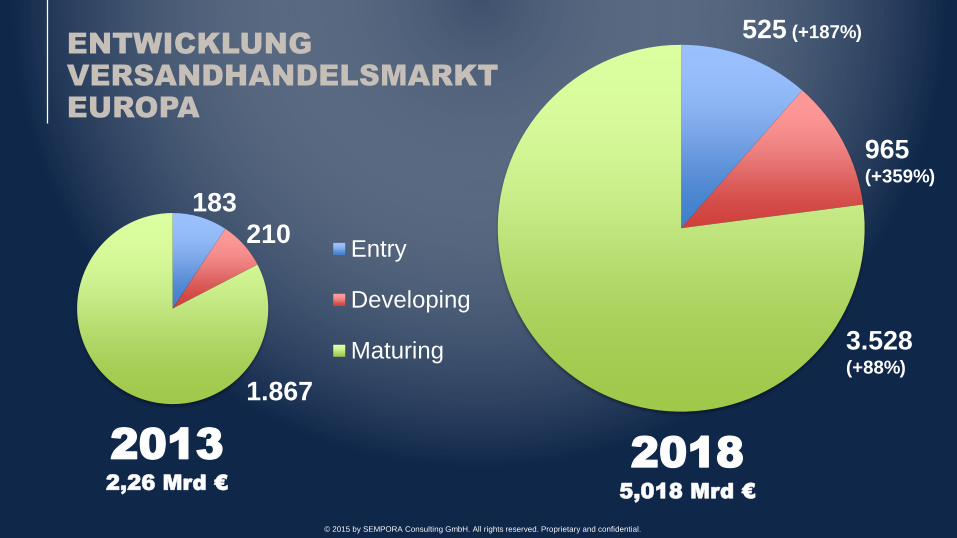
ENTWICKLUNG
VERSANDHANDELSMARKT
EUROPA IN MIO €
2013
2,26 Mrd €
2018
5,018 Mrd €
Entry
Developing
Maturing
183210
1.867
525 (+187%)
965(+359%)
3.528(+88%)
Basis: 17 Länderscope, Hochrechnung SEMPORA ab 2016, inkl.MwSt© 2015 by SEMPORA Consulting GmbH. All rights reserved. Proprietary and confidential.
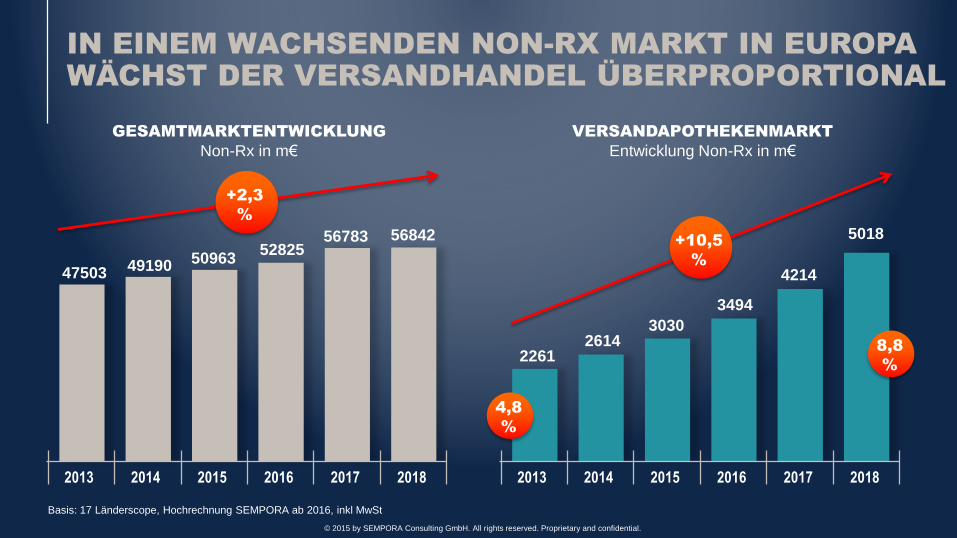
IN EINEM WACHSENDEN NON-RX MARKT IN EUROPA
WÄCHST DER VERSANDHANDEL ÜBERPROPORTIONAL
2013 2014 2015 2016 2017 2018
Basis: 17 Länderscope, Hochrechnung SEMPORA ab 2016, inkl MwSt
56842
VERSANDAPOTHEKENMARKT
Entwicklung Non-Rx in m€
GESAMTMARKTENTWICKLUNG
Non-Rx in m€
5678352825509634919047503
2013 2014 2015 2016 2017 2018
5018
4214
34943030
26142261
+2,3
%
+10,5
%
4,8
%
8,8
%
© 2015 by SEMPORA Consulting GmbH. All rights reserved. Proprietary and confidential.
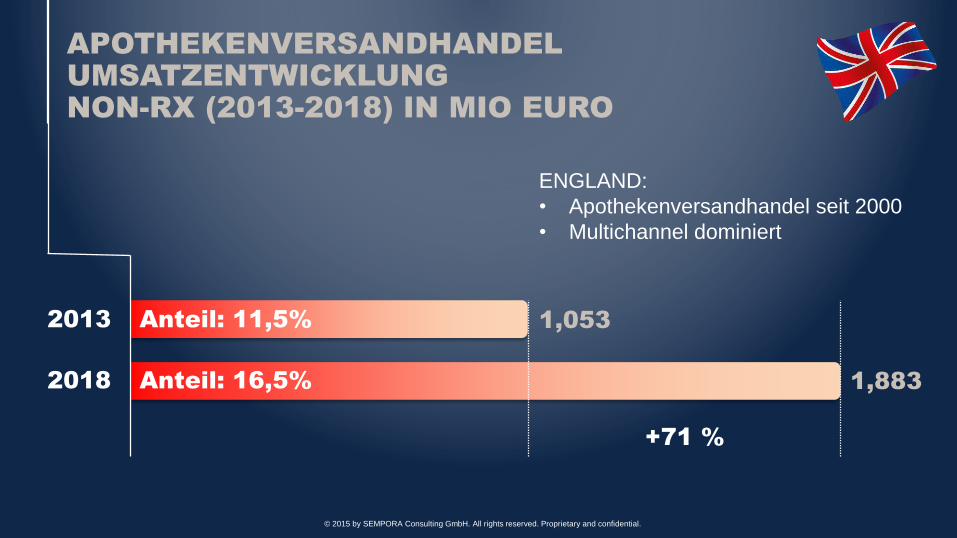
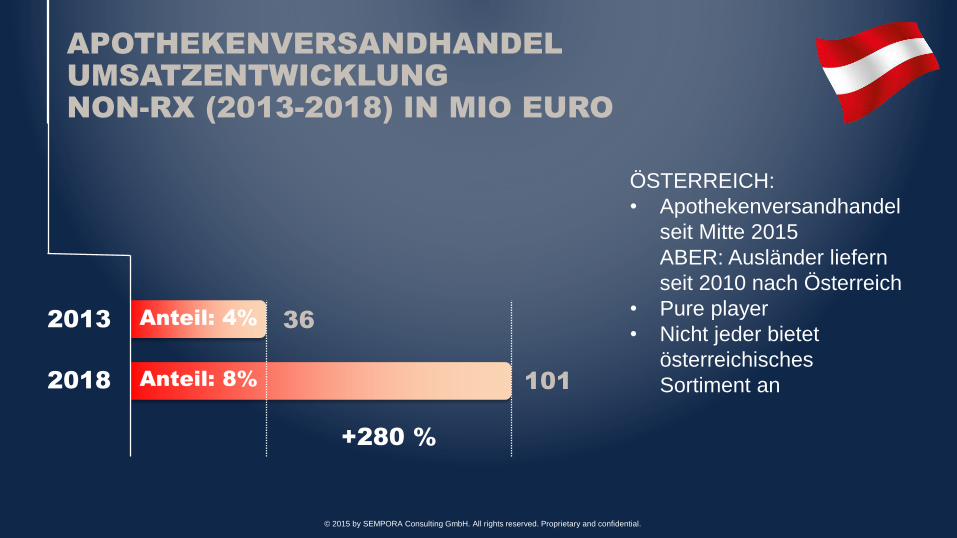
APOTHEKENVERSANDHANDEL
UMSATZENTWICKLUNG
NON-RX (2013-2018) IN MIO EURO
2018
Anteil: 11,5%
+71 %
Anteil: 16,5%
2013 1,053
1,883
ENGLAND:• Apothekenversandhandel seit 2000• Multichannel dominiert
© 2015 by SEMPORA Consulting GmbH. All rights reserved. Proprietary and confidential.
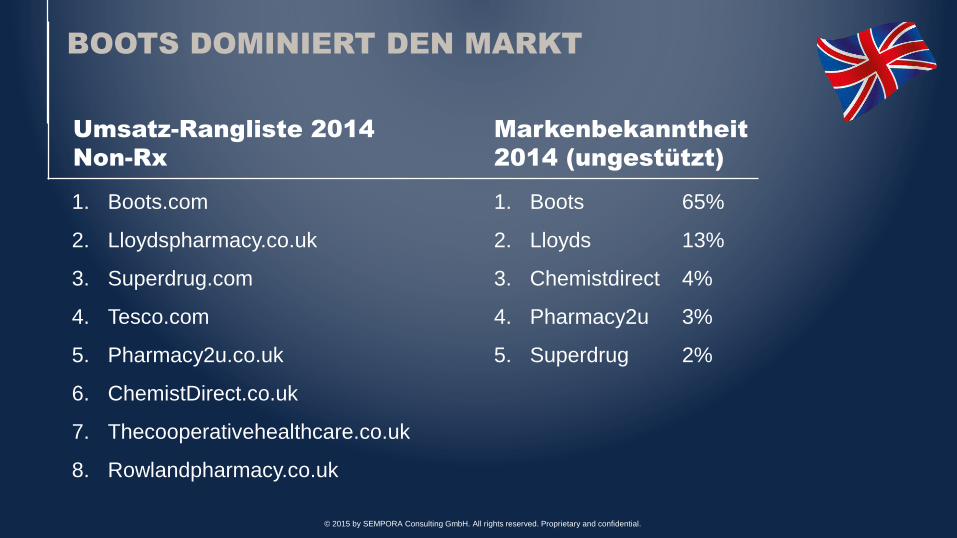
BOOTS DOMINIERT DEN MARKT
1. Boots.com
2. Lloydspharmacy.co.uk
3. Superdrug.com
4. Tesco.com
5. Pharmacy2u.co.uk
6. ChemistDirect.co.uk
7. Thecooperativehealthcare.co.uk
8. Rowlandpharmacy.co.uk
Umsatz-Rangliste 2014
Non-Rx
1. Boots 65%
2. Lloyds 13%
3. Chemistdirect 4%
4. Pharmacy2u 3%
5. Superdrug 2%
Markenbekanntheit
2014 (ungestützt)
© 2015 by SEMPORA Consulting GmbH. All rights reserved. Proprietary and confidential.
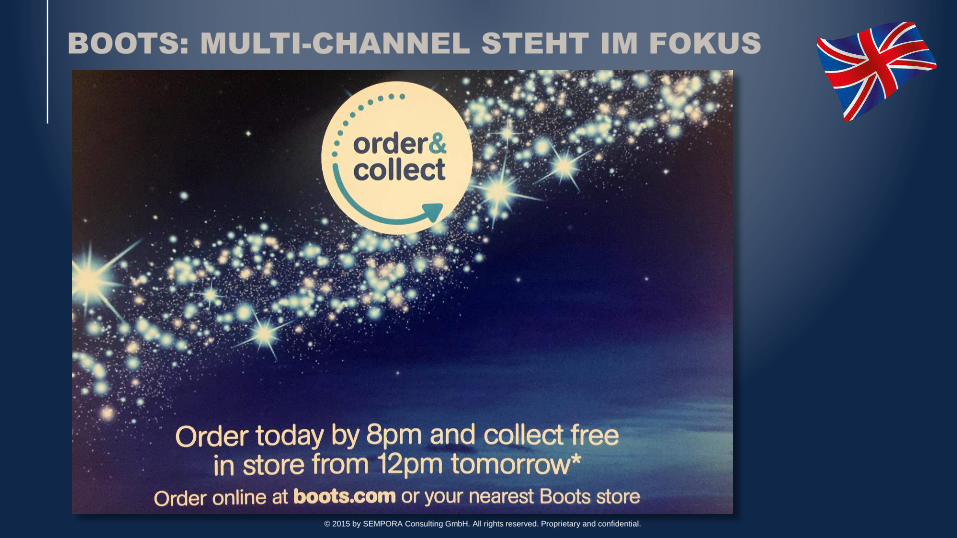
BOOTS: MULTI-CHANNEL STEHT IM FOKUS
© 2015 by SEMPORA Consulting GmbH. All rights reserved. Proprietary and confidential.
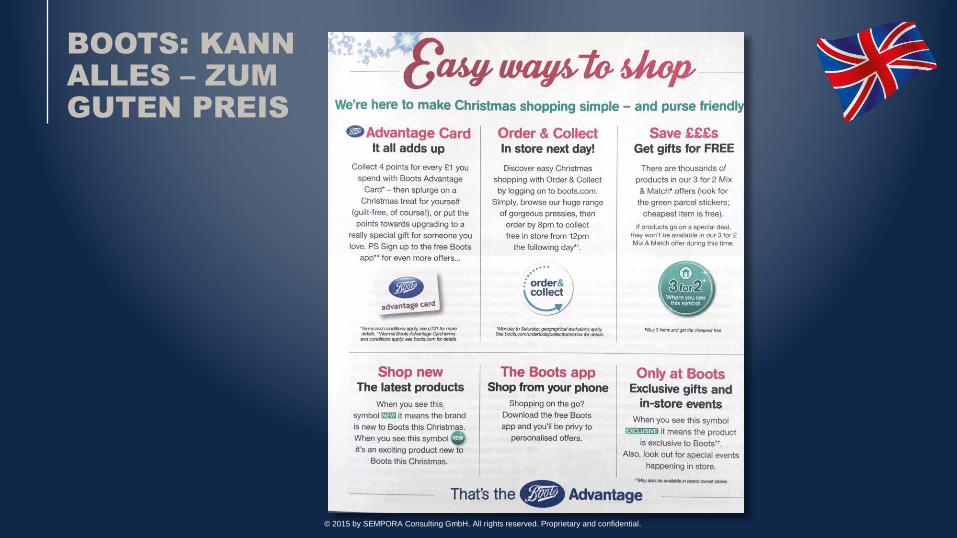
BOOTS: KANN
ALLES – ZUM
GUTEN PREIS
© 2015 by SEMPORA Consulting GmbH. All rights reserved. Proprietary and confidential.
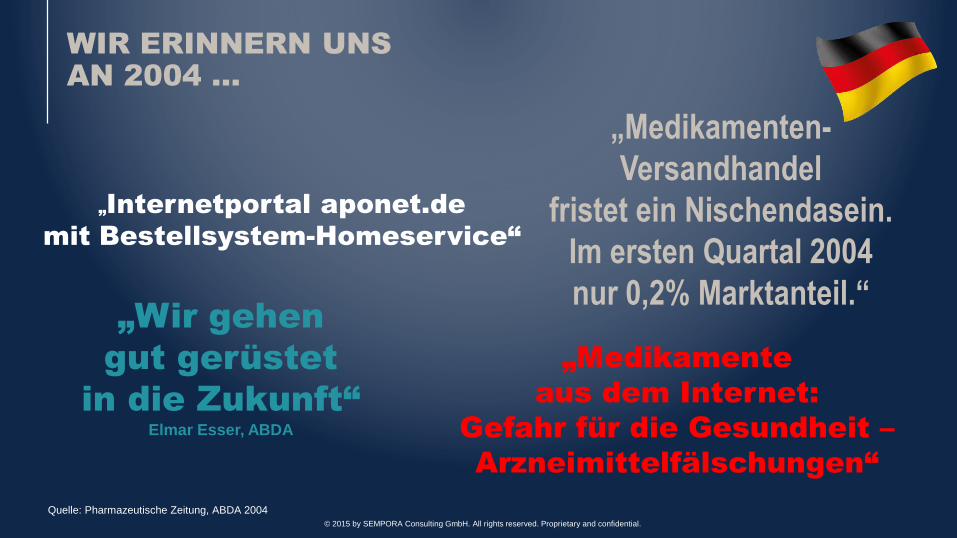
WIR ERINNERN UNS
AN 2004 ...
Quelle: Pharmazeutische Zeitung, ABDA 2004
„Medikamenten-
Versandhandel
fristet ein Nischendasein.
Im ersten Quartal 2004
nur 0,2% Marktanteil.“
„Internetportal aponet.de
mit Bestellsystem-Homeservice“
„Wir gehen
gut gerüstet
in die Zukunft“
Elmar Esser, ABDA
„Medikamente
aus dem Internet:
Gefahr für die Gesundheit –
Arzneimittelfälschungen“
© 2015 by SEMPORA Consulting GmbH. All rights reserved. Proprietary and confidential.
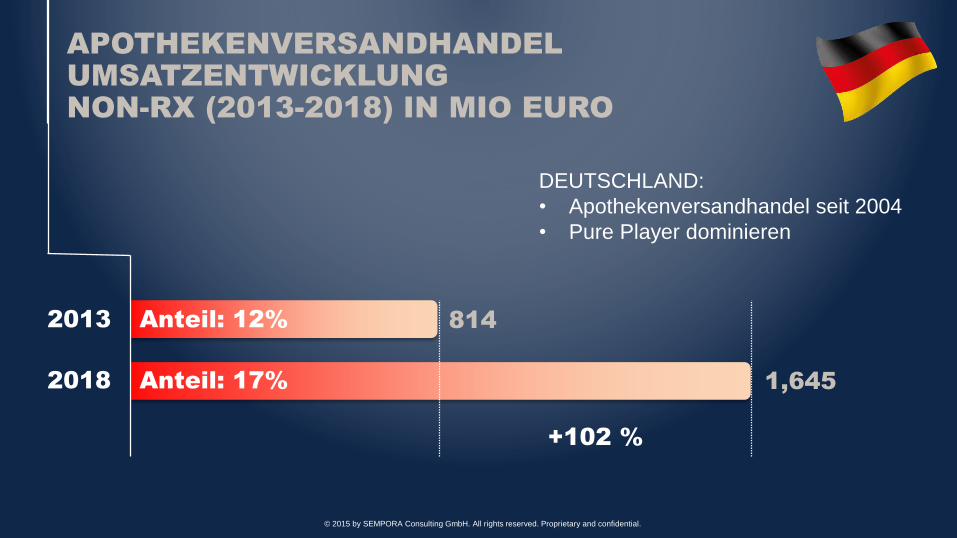
APOTHEKENVERSANDHANDEL
UMSATZENTWICKLUNG
NON-RX (2013-2018) IN MIO EURO
2018
Anteil: 12%
+102 %
Anteil: 17%
2013 814
1,645
DEUTSCHLAND:• Apothekenversandhandel seit 2004• Pure Player dominieren
© 2015 by SEMPORA Consulting GmbH. All rights reserved. Proprietary and confidential.
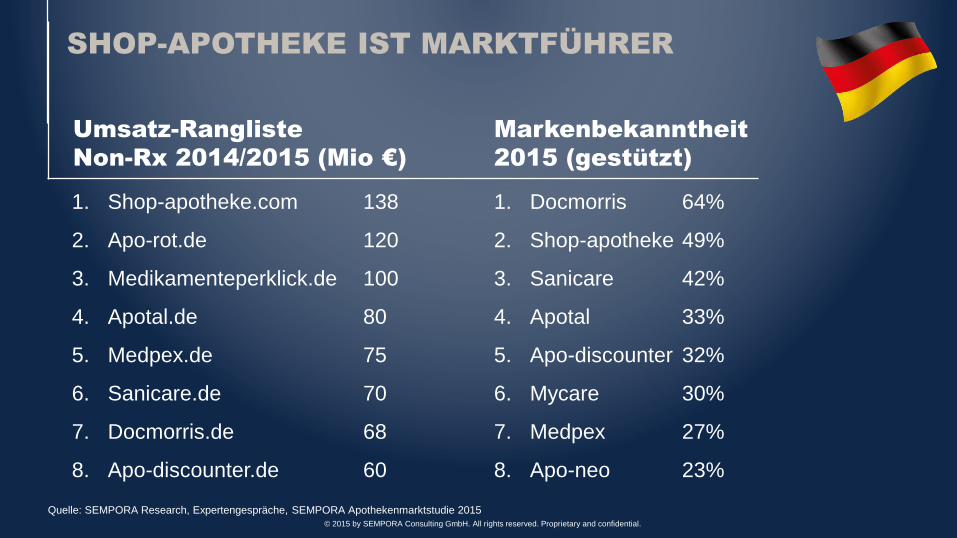
SHOP-APOTHEKE IST MARKTFÜHRER
1. Shop-apotheke.com 138
2. Apo-rot.de 120
3. Medikamenteperklick.de 100
4. Apotal.de 80
5. Medpex.de 75
6. Sanicare.de 70
7. Docmorris.de 68
8. Apo-discounter.de 60
Umsatz-Rangliste
Non-Rx 2014/2015 (Mio €)
1. Docmorris 64%
2. Shop-apotheke 49%
3. Sanicare 42%
4. Apotal 33%
5. Apo-discounter 32%
6. Mycare 30%
7. Medpex 27%
8. Apo-neo 23%
Markenbekanntheit
2015 (gestützt)
Quelle: SEMPORA Research, Expertengespräche, SEMPORA Apothekenmarktstudie 2015© 2015 by SEMPORA Consulting GmbH. All rights reserved. Proprietary and confidential.
APOTHEKENVERSANDHANDEL
UMSATZENTWICKLUNG
NON-RX (2013-2018) IN MIO EURO
2018
Anteil: 4%
+280 %
Anteil: 8%
2013 36
101
ÖSTERREICH:• Apothekenversandhandel
seit Mitte 2015ABER: Ausländer liefern seit 2010 nach Österreich
• Pure player• Nicht jeder bietet
österreichisches Sortiment an
© 2015 by SEMPORA Consulting GmbH. All rights reserved. Proprietary and confidential.
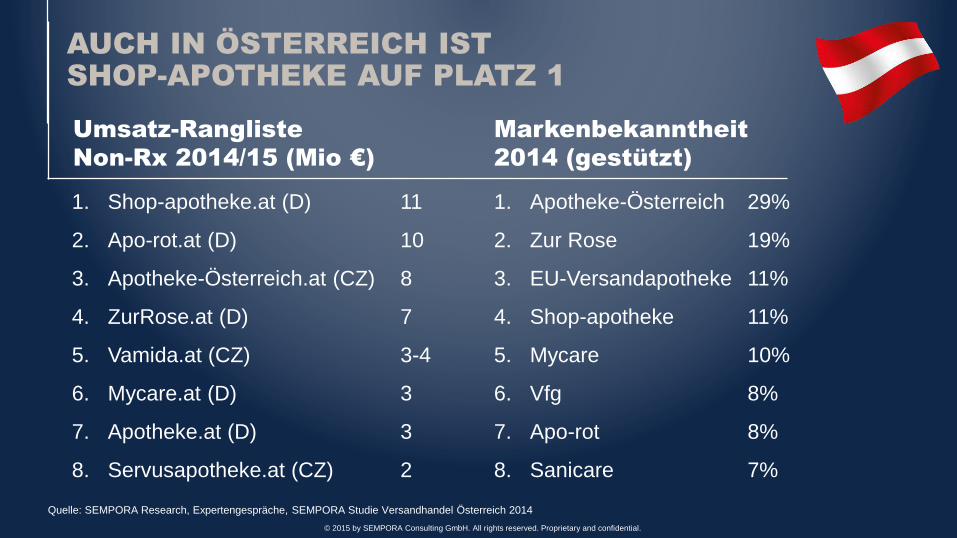
AUCH IN ÖSTERREICH IST
SHOP-APOTHEKE AUF PLATZ 1
1. Shop-apotheke.at (D) 11
2. Apo-rot.at (D) 10
3. Apotheke-Österreich.at (CZ) 8
4. ZurRose.at (D) 7
5. Vamida.at (CZ) 3-4
6. Mycare.at (D) 3
7. Apotheke.at (D) 3
8. Servusapotheke.at (CZ) 2
Umsatz-Rangliste
Non-Rx 2014/15 (Mio €)
1. Apotheke-Österreich 29%
2. Zur Rose 19%
3. EU-Versandapotheke 11%
4. Shop-apotheke 11%
5. Mycare 10%
6. Vfg 8%
7. Apo-rot 8%
8. Sanicare 7%
Markenbekanntheit
2014 (gestützt)
Quelle: SEMPORA Research, Expertengespräche, SEMPORA Studie Versandhandel Österreich 2014
© 2015 by SEMPORA Consulting GmbH. All rights reserved. Proprietary and confidential.
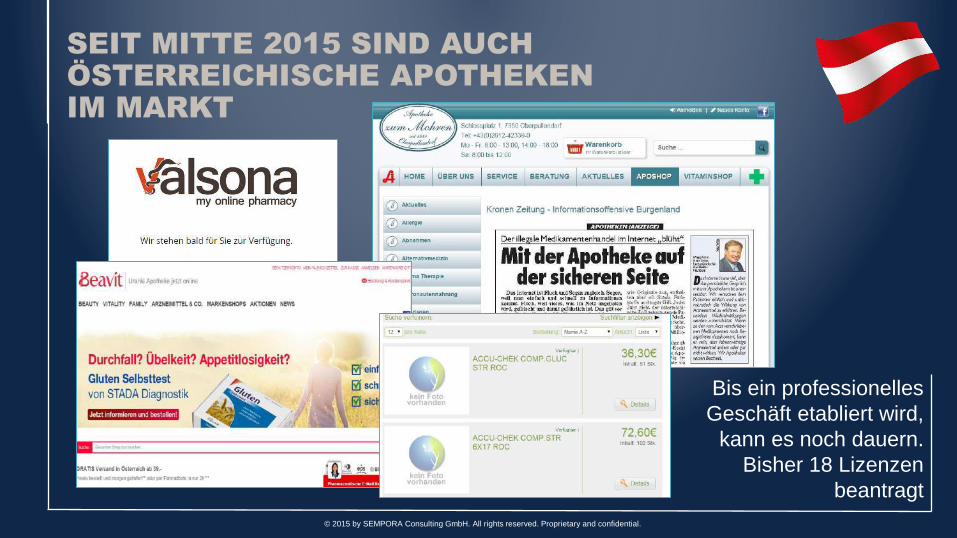
SEIT MITTE 2015 SIND AUCH
ÖSTERREICHISCHE APOTHEKEN
IM MARKT
Bis ein professionelles Geschäft etabliert wird,
kann es noch dauern.Bisher 18 Lizenzen
beantragt© 2015 by SEMPORA Consulting GmbH. All rights reserved. Proprietary and confidential.
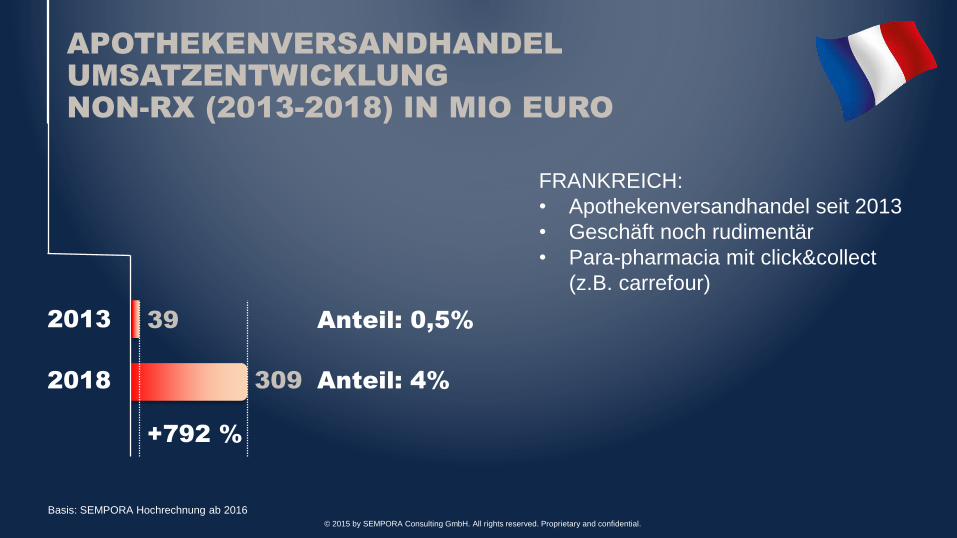
APOTHEKENVERSANDHANDEL
UMSATZENTWICKLUNG
NON-RX (2013-2018) IN MIO EURO
Anteil: 0,5%
+792 %
Anteil: 4%
2013 39
309
FRANKREICH:• Apothekenversandhandel seit 2013• Geschäft noch rudimentär• Para-pharmacia mit click&collect
(z.B. carrefour)
2018
Basis: SEMPORA Hochrechnung ab 2016© 2015 by SEMPORA Consulting GmbH. All rights reserved. Proprietary and confidential.
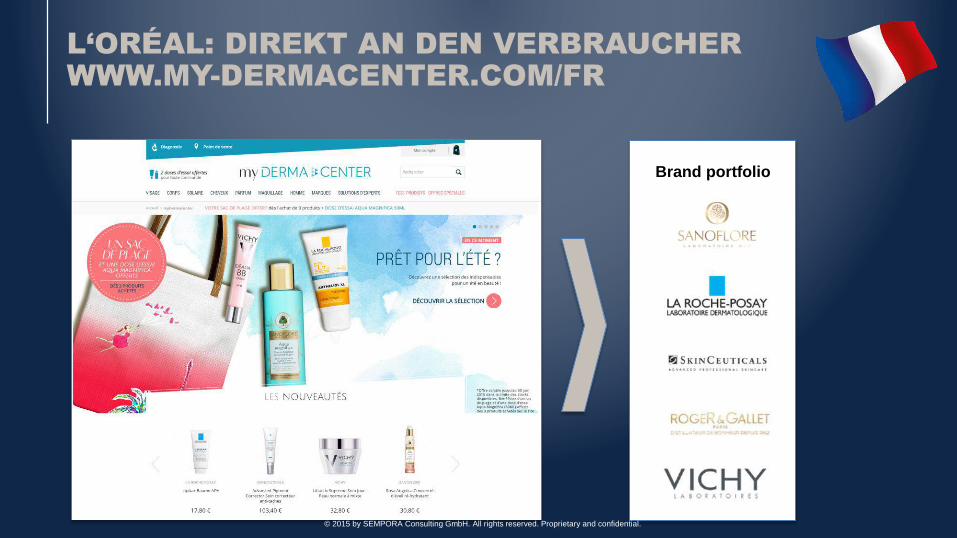
L‘ORÉAL: DIREKT AN DEN VERBRAUCHER
WWW.MY-DERMACENTER.COM/FR
Brand portfolio
© 2015 by SEMPORA Consulting GmbH. All rights reserved. Proprietary and confidential.
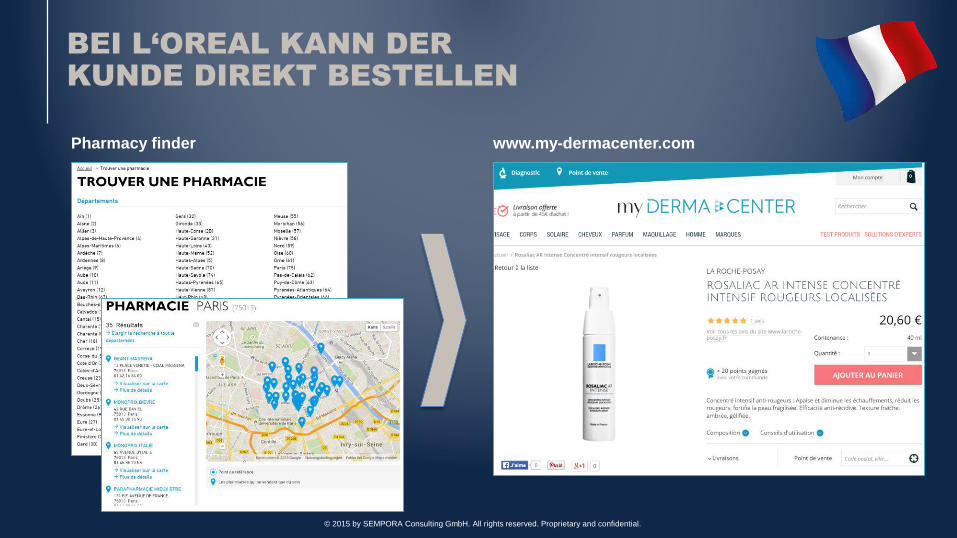
BEI L‘OREAL KANN DER
KUNDE DIREKT BESTELLEN
Pharmacy finder www.my-dermacenter.com
© 2015 by SEMPORA Consulting GmbH. All rights reserved. Proprietary and confidential.
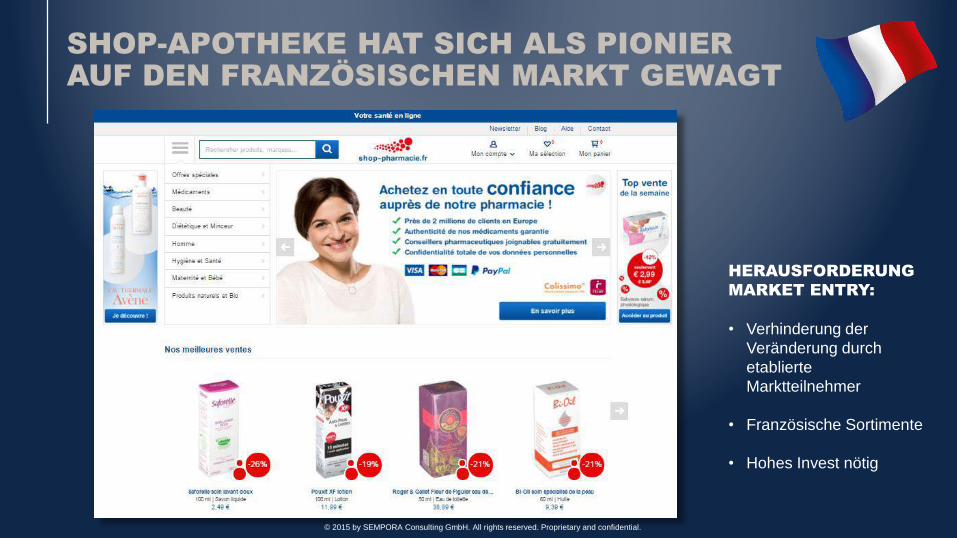
SHOP-APOTHEKE HAT SICH ALS PIONIER
AUF DEN FRANZÖSISCHEN MARKT GEWAGT
HERAUSFORDERUNG
MARKET ENTRY:
• Verhinderung der Veränderung durch etablierte Marktteilnehmer
• Französische Sortimente
• Hohes Invest nötig
© 2015 by SEMPORA Consulting GmbH. All rights reserved. Proprietary and confidential.
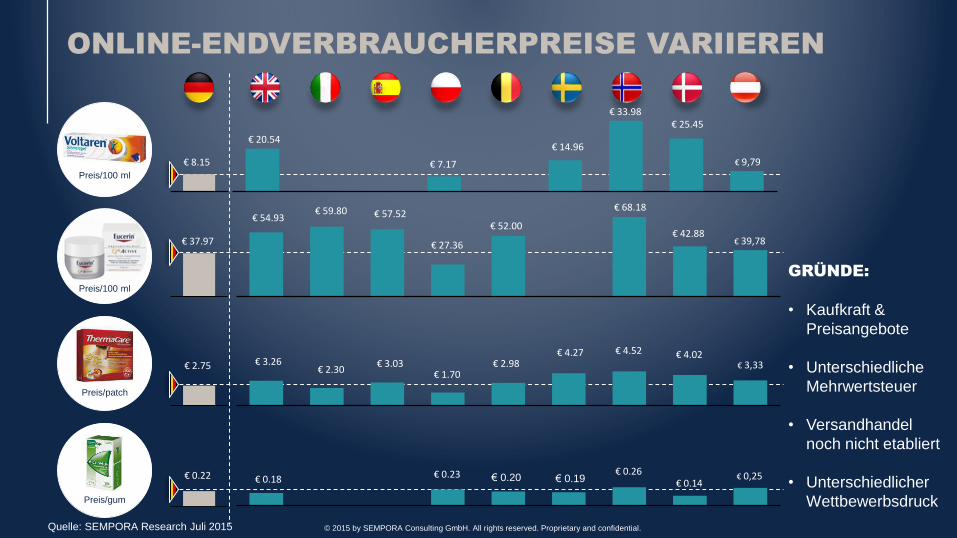
ONLINE-ENDVERBRAUCHERPREISE VARIIEREN
€ 25.45
€ 14.96
€ 7.17
€ 20.54
€ 33.98
€ 8.15
€ 42.88€ 27.36
€ 68.18€ 54.93 € 57.52
€ 52.00
€ 59.80
€ 37.97
€ 3.26€ 4.02
€ 2.98€ 4.52
€ 1.70€ 3.03
€ 4.27
€ 2.30€ 2.75
€ 0.26€ 0.20
€ 0.14€ 0.19€ 0.18 € 0.23€ 0.22
Preis/100 ml
Preis/100 ml
Preis/patch
Preis/gum
€ 9,79
€ 39,78
€ 3,33
€ 0,25
GRÜNDE:
• Kaufkraft & Preisangebote
• Unterschiedliche Mehrwertsteuer
• Versandhandel noch nicht etabliert
• Unterschiedlicher Wettbewerbsdruck
Quelle: SEMPORA Research Juli 2015 © 2015 by SEMPORA Consulting GmbH. All rights reserved. Proprietary and confidential.
ENTWICKLUNG
VERSANDHANDELSMARKT
EUROPA
2013
2,26 Mrd €
2018
5,018 Mrd €
Entry
Developing
Maturing
183210
1.867
525 (+187%)
965(+359%)
3.528(+88%)
© 2015 by SEMPORA Consulting GmbH. All rights reserved. Proprietary and confidential.
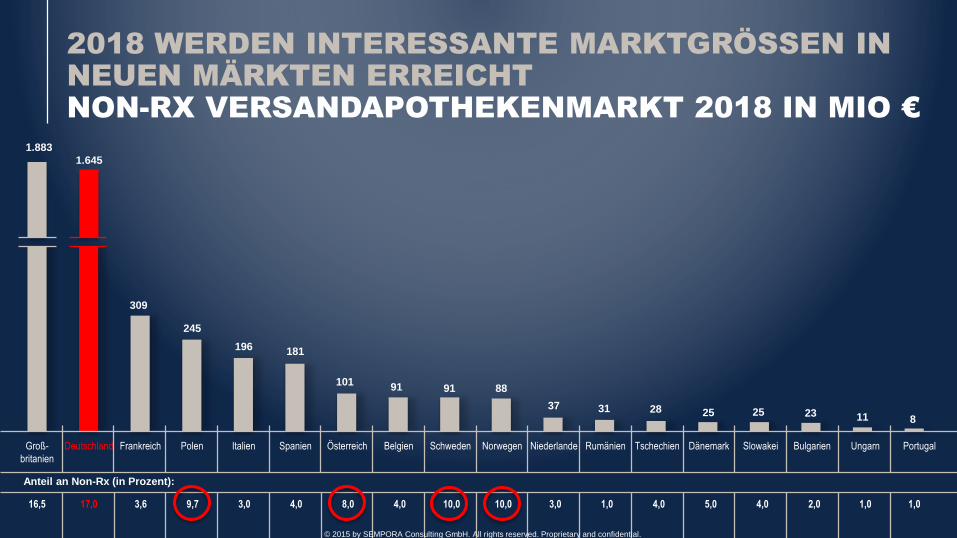
2018 WERDEN INTERESSANTE MARKTGRÖSSEN IN
NEUEN MÄRKTEN ERREICHT
NON-RX VERSANDAPOTHEKENMARKT 2018 IN MIO €
Groß-
britanien
Deutschland Frankreich Polen Italien Spanien Österreich Belgien Schweden Norwegen Niederlande Rumänien Tschechien Dänemark Slowakei Bulgarien Ungarn Portugal
16,5 17,0 3,6 9,7 3,0 4,0 8,0 4,0 10,0 10,0 3,0 1,0 4,0 5,0 4,0 2,0 1,0 1,0
Anteil an Non-Rx (in Prozent):
1.8831.645
309
245
196 181
101 91 91 88
37 31 28 25 25 23 11 8
© 2015 by SEMPORA Consulting GmbH. All rights reserved. Proprietary and confidential.
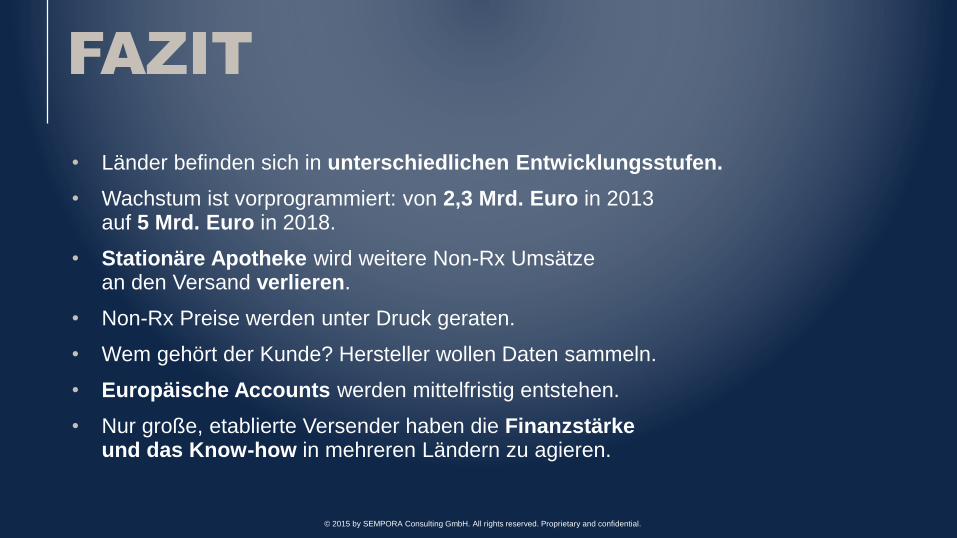
FAZIT
• Länder befinden sich in unterschiedlichen Entwicklungsstufen.
• Wachstum ist vorprogrammiert: von 2,3 Mrd. Euro in 2013 auf 5 Mrd. Euro in 2018.
• Stationäre Apotheke wird weitere Non-Rx Umsätze an den Versand verlieren.
• Non-Rx Preise werden unter Druck geraten.
• Wem gehört der Kunde? Hersteller wollen Daten sammeln.
• Europäische Accounts werden mittelfristig entstehen.
• Nur große, etablierte Versender haben die Finanzstärke und das Know-how in mehreren Ländern zu agieren.
© 2015 by SEMPORA Consulting GmbH. All rights reserved. Proprietary and confidential.
QUELLEN
• ABDA Germany
• AESGP
• Agencia Española de Medicamentos y ProductosSanitarios
• Algemene PharmaceutischeBond
• AOK Bundesverband (2015)
• Apotekforeningen 2015
• BPI: Erstattungszentren in Europa und den USA (2010)
• Catena Farmaceutica
• CEF Farmaciainsieme
• CIA World Factbook
• CNGPO
• commonwealthfund.org
• Croatian Medical Journal (2012)
• Eminet www.ec.europa.eu
• EUAV (Les Echos Etudes)
• European Observatory on Health Systems and Policies
• European Pharmacists Forum
• Eurostat
• Farma Campania
• Farmatua
• FECOFAR
• Federazione Nazionale UnitariaTitolari di Farmacia
• FederFARMA.CO S.p.A
• Föderaler Öffentlicher Dienst Belgien (2015)
• GIRP
• Google Our Mobile Planet
• HSCIC
• Hungarian Central Statistical Office (2015)
• IMS Health Data
• IMS Health Retail & Hospital Audits Synopsis 2012
• IMS Pharmaceutical Pricing & Reimbursement Concise Guide
• IMS Report
• INFARMED
• Institut nationale de la statistique et des étudeséconomiques
• ISPOR
• James Dudley – Entering thedigital battleground (2015)
• James Dudley – Management Pharmacy Survey (2014)
• Ministére des Affaires Socialesde la Santé et des Droites des Femmes
• Ministry of Foreign Affairs ofDenmark
• National Institute for Quality-and OrganizationalDevelopment in Healthcare andMedicine (2015)
• Norwegian Medicines Agency
• OECD
• Ordem dos farmacêuticos
• PPRI
• Sector Report 2013 –Pharmaceutical and HealthcareSector Bulgaria
• SEMPORA Marktreport Französischer Apothekenmarkt
• SEMPORA Study: The UK Pharmacy Market 2014
• SIMV – French association ofhealth animal industry
• Sinfarma Soc. Coop
• Statista
• The World Bank
• WHO
© 2015 by SEMPORA Consulting GmbH. All rights reserved. Proprietary and confidential.

Ansprechpartner für weitere Details der Studie:Tobias BrodtkorbManaging Partner
[email protected] 45349-30