Embed Size (px)
Citation preview
Forest diversity in fragmented landscapes of northern Ethiopia and
implications for conservation.
Dissertation
zur
Erlangung des Doktorgrades (Dr. rer. nat)
der
Mathematisch-Naturwissenschaftlichen Fakultät
der
Rheinischen Friedrich-Wilhelms-Universität Bonn
vorgelegt von
ERMIAS AYNEKULU BETEMARIAM
aus
ADDIS ABABA
Bonn 2011

1. Referent: PD Dr. H.J. Boehmer 2. Referent: Prof. Dr. P.L.G. Vlek Tag der Promotion: 30.09.2010
Erscheinungsjahr: 2011 Diese Dissertation ist auf dem Hochschulschriftenserver der ULB Bonn http://hss.ulb.uni-bonn.de/diss_online elektronisch publiziert
ABSTRACT Deforestation and habitat fragmentation that arise largely due to the conversion of forests to other agricultural land-use types and over-utilization of forest resources to satisfy the food and energy requirements of the increasing population are major environmental concerns in northern Ethiopia. Understanding plant species diversity and spatial distribution along environmental gradients is crucial in the management of the remnant forest ecosystems. However, the ecology of the forest remnants in northern Ethiopia is poorly studied. The purpose of this study is therefore to (i) investigate plant species diversity and natural regeneration in relation to selected environmental factors, (ii) quantify the elevation patterns of species diversity and community composition, (iii) examine the extent and spatial distribution pattern of standing dead stems and the effect of mass tree dieback on forest structure and diversity, and (iv) compare the regeneration response of Juniperus procera and Olea europaea subsp. cuspidata in an open-access forest area to a closed forest management system. The study was conducted in the Desa’a and Hugumburda Afromontane forest remnants, which are the largest forest fragments in northern Ethiopia and are national forest priority areas.
A total of 153 species belonging to 63 families was found in the study area; shrub and herb species dominate (ca. 70 %). The vegetation is mainly a dry Afromontane forest type with Juniperus and Olea as the dominant species; a riverine plant community in Hugumburda forest represents a moist forest type. Elevation, slope, soil depth, distance to the nearest stream, soil moisture, and forest disturbance are the main environmental factors influencing species distribution and partitioned plant communities.
The diversity of species and the composition of plant communities in Desa’a forest significantly respond to elevation. Species richness and diversity show a unimodal, hump-shaped relationship with elevation that peaked at mid elevation (1900 – 2200 m). The beta diversity values indicate medium species turnover along an elevational gradient. The percentages of dead standing trees (snags) due to natural disturbance at Desa’a forest are high for both J. procera (57 7 %) and O. europaea subsp. cuspidata (60 5 %), but show a decreasing trend with increasing elevation suggesting that restoration is more urgent at the lower elevations. Higher tree dieback at the lower elevation has pushed the tree species to the higher elevation by about 500 m, and this can lead to a shift in the forest-shrubland ecotone to higher elevations. Total stand density and basal area are reduced by 30 and 44 % when excluding snags of the two species, respectively. Thus, mass tree dieback of the two key species strongly influences the forest structure. High amounts of dead standing biomass are a particular risk in a fire-prone semi-arid forest environment, and controlling snag densities is of critical concern in the management of the remaining dry Afromontane forests in northern Ethiopia.
The natural regeneration of native tree species in both forest remnants is low. Exclosure was found to be an effective management option to improve the regeneration of O. europaea, but it does not improve the regeneration of J. procera. Thus, a closed management system in the open-access and degraded forests may not guarantee a successful regeneration of native woody species. It rather favors grass and herbaceous species and can lead to a gradual conversion of the forest land to wooded grassland. Most of the seedlings in forest remnants are shrubs, while tree species are less diverse and abundant. The standing vegetation is only partly represented in the seedling bank and many of the rare tree species, e.g. Afrocarpus falcatus, show poor or no regeneration. A smaller number of saplings than mature individuals suggest that locally some forest species are experiencing extinction. Thus, it is important to give conservation priority to the last Afromontane forest remnants in northern Ethiopia to achieve local, national and international biodiversity conservation goals.
KURZFASSUNG
Biodiversität in den Wäldern der fragmentierten Landchaften von Nordäthiopien und die Folgerungen für ihren Schutz Abholzung und die Fragmentierung der Lebensräume, hauptsächlich als Folge der Umwandlung der Wälder in andere landwirtschaftliche Nutzungen sowie die Ausbeutung der Waldressourcen, um den Nahrungsmittel- und Energiebedarf der wachsenden Bevölkerung zu befriedigen, verursachen erhebliche Umweltprobleme in Nordäthiopien. Kenntnisse der Pflanzenvielfalt und räumlichen Verteilung entlang Umweltgradienten ist entscheidend bei der Bewirtschaftung der verbleibenden Waldökosysteme. Jedoch ist die Ökologie der noch vorhandenen Waldfragmente in Nordäthiopien nur wenig untersucht. Das Ziel dieser Studie ist daher (i) die Vielfalt der Pflanzenarten und ihre natürliche Regeneration im Zusammenhang mit ausgewählten Umweltfaktoren zu untersuchen, (ii) die höhenabhängige Verteilung der Artenvielfalt und die Zusammensetzung der Pflanzengemeinschaften zu quantifizieren, (iii) das Ausmaß und die räumliche Verteilung stehender toter Baumstämme sowie die Auswirkungen eines Baumsterbens auf die Waldstruktur und -vielfalt zu untersuchen, und (iv) den Einfluss eines geschlossenen Waldbewirtschaftungssystems mit dem eines zugänglichen Waldes auf die Regeneration von Juniperus procera und Olea europaea subsp. cuspidata zu vergleichen. Die Studie wurde in den afromontanen Wäldern Desa’a und Hugumburda, die größten Waldfragmente in Nordäthiopien und mit nationaler Schutzpriorität, durchgeführt.
Insgesamt 153 Arten aus 63 Familien kommen im Untersuchungsgebiet vor; Strauch- und Kräuterarten dominieren (ca. 70 %). Die Vegetation ist hauptsächlich vom trockenen afromontanen Waldtyp mit den dominierenden Arten Juniperus und Olea; eine gewässernahe Pflanzengesellschaft im Hugumburda Wald ist vom Typ Feuchtwald. Höhenlage, Hangneigung, Bodentiefe, Nähe zum nächsten Kleingewässer, Bodenfeuchte und anthropogene Störungen sind die wichtigsten Umweltfaktoren, die die Artenverteilung und die Zusammensetzung der Pflanzengesellschaften beeinflussen.
Die Artenvielfalt und die Zusammensetzung der Pflanzengesellschaften in Desa’a Wald sind signifikant abhängig von der Höhenlage. Artenreichtum und Diversität bilden eine unimodale Beziehung mit der Höhenlage; der höchste Wert ist bei einer mittleren Höhenlage (1900 - 2200 m). Die Betadiversitätswerte deuten auf einen mittleren Artenwechsel entlang eines Höhengradienten hin. Die Anteile stehender toter Baumstämme als Folge natürlicher Störungen im Desa’a Wald sind hoch, sowohl für J. procera (57 7 %) als auch für O. europaea subsp. cuspidata (60 5 %), zeigen jedoch einen abnehmenden Trend mit zunehmender Höhenlage, was darauf hindeutet, dass Rekultivierungsmaßnahmen in den unteren Höhenlagen dringender sind als in höheren. Das stärkere Baumsterben in den unteren Höhenlagen hat dazu geführt, dass das Vorkommen der betroffenen Baumarten sich um ca. 500 m nach oben verschoben hat. Dies kann auch zu einer Verschiebung der Wald-Buschland-Vegetation in höhere Lagen führen. Bestandsdichte bzw. Basalfläche sind um 30 bzw. 44 % reduziert wenn die stehenden toten Individuen der beiden Arten nicht berücksichtigt werden; das Absterben der beiden Hauptbaumarten beeinflusst also stark die Waldstruktur. Große Mengen toter Baumbiomasse sind ein besonderes Waldbrandrisiko in einem semi-
ariden Wald und die Kontrolle der Dichte des Totholzes ist von entscheidender Bedeutung bei der Bewirtschaftung der noch verbleibenden trockenen afromontanen Wälder in Nordäthiopien.
Die natürliche Regeneration der einheimischen Baumarten in den beiden untersuchten Waldfragmenten ist niedrig. Es zeigt sich, dass eingezäunte Flächen eine wirksame Bewirtschaftungsoption sind, um die Regeneration von O. europaea zu begünstigen. Diese Maßnahme bleibt jedoch ohne Wirkung auf J. procera. Daher würde ein Bewirtschaftungssystem mit Zugangsbeschränkungen in den offenen, degradierten Wäldern eine erfolgreiche Regeneration der einheimischen Holzgewächse nicht garantieren. Es werden eher Gras- und Kräuterarten begünstigt, was zu einer langsamen Umwandlung des Waldes in Grasland mit Gehölzen führen kann. Die meisten Keimlinge in den Waldfragmenten sind von Straucharten, während Baumarten weniger vielfältig bzw. zahlreich sind. Die bestandsbildenden Arten sind nur zum Teil in der Samenbank vertreten, und viele der seltenen Arten, z. B. Afrocarpus falcatus, zeigen wenig bzw. gar keine Regeneration. Die geringe Bedeutung von Jungwuchs im Vergleich zu den voll ausgewachsenen Baumindividuen deutet daraufhin, dass lokal einige bestandsbildenden Baumarten aussterben könnten. Daher muss den letzten afromontanen Waldfragmenten in Nordäthiopien eine hohe Schutzpriorität eingeräumt werden, auch um die lokalen, nationalen und internationalen Ziele zum Schutze der Artenvielfalt zu erreichen.
TABLE OF CONTENTS
1 GENERAL INTRODUCTION ....................................................................... 1
1.1 Background ...................................................................................................... 1
1.2 Problem statement ........................................................................................... 4
1.3 Objectives ........................................................................................................ 6
1.4 Thesis layout .................................................................................................... 7
2 DRIVERS AND MEASUREMENTS OF SPECIES DIVERSITY AND VEGETATION TYPES OF ETHIOPIA: AN OVERVIEW ........................... 8
2.1 Determinants of biodiversity ........................................................................... 8
2.2 Plant communities ......................................................................................... 12 2.2.1 Classification and ordination ......................................................................... 13 2.2.2 Measures of species diversity ........................................................................ 14
2.3 Vegetation types of Ethiopia ......................................................................... 16
3 STUDY SITES AND GENERAL METHODS ............................................ 19
3.1 Study area ...................................................................................................... 19 3.1.1 Socio-economic context of Ethiopia ............................................................. 19 3.1.2 Location ......................................................................................................... 19 3.1.3 Geology and soils .......................................................................................... 20 3.1.4 Topography .................................................................................................... 21 3.1.5 Climate .......................................................................................................... 21 3.1.6 Vegetation ...................................................................................................... 23
3.2 General methods ............................................................................................ 25 3.2.1 Site selection .................................................................................................. 25 3.2.2 Sampling design ............................................................................................ 26 3.2.3 Vegetation data .............................................................................................. 27 3.2.4 Environmental data ........................................................................................ 27
4 PLANT SPECIES DIVERSITY AND NATURAL REGENERATION IN AN ISOLATED AFROMONTANE FOREST, NORTHERN ETHIOPIA ..................................................................................................... 28
4.1 Introduction ................................................................................................... 28
4.2 Material and methods .................................................................................... 29 4.2.1 Study site ....................................................................................................... 29 4.2.2 Data collection ............................................................................................... 30 4.2.3 Data analysis .................................................................................................. 31
4.3 Results ........................................................................................................... 33 4.3.1 Floristic composition and diversity ............................................................... 33 4.3.2 Species-area relationship ............................................................................... 37 4.3.3 Plant communities ......................................................................................... 38
4.3.4 Ordination ...................................................................................................... 40 4.3.5 Natural regeneration and diameter class distribution .................................... 43
4.4 Discussion ...................................................................................................... 47 4.4.1 Floristic composition and diversity ............................................................... 47 4.4.2 Plant communities ......................................................................................... 48 4.4.3 Ordination ...................................................................................................... 49 4.4.4 Natural regeneration ...................................................................................... 51
4.5 Implications for conservation ........................................................................ 52
5 PLANT SPECIES DIVERSITY PATTERN ALONG AN ELEVATIONAL GRADIENT ON THE WESTERN ESCARPMENT OF THE GREAT RIFT VALLEY, NORTHERN ETHIOPIA ..................... 53
5.1 Introduction ................................................................................................... 53
5.2 Material and methods .................................................................................... 54 5.2.1 Study site ....................................................................................................... 54 5.2.2 Data collection ............................................................................................... 56 5.2.3 Data analyses ................................................................................................. 57
5.3 Results ........................................................................................................... 58 5.3.1 Species composition and diversity along the elevational gradient ................ 58 5.3.2 Species turnover along an elevational gradient ............................................. 63 5.3.3 Plant communities ......................................................................................... 65
5.4 Discussion ...................................................................................................... 73 5.4.1 Species composition and diversity along an elevational gradient ................. 73 5.4.2 Species turnover along an elevational gradient ............................................. 74 5.4.3 Plant communities ......................................................................................... 75
5.5 Implications for conservation ........................................................................ 76
6 EFFECTS OF MASS TREE DIEBACK ON STAND STRUCTURE AND DIVERSITY IN A DRY AFROMONTANE FOREST, NORTHERN ETHIOPIA .............................................................................. 78
6.1 Introduction ................................................................................................... 78
6.2 Material and methods .................................................................................... 79 6.2.1 Study site ....................................................................................................... 79 6.2.2 Data collection ............................................................................................... 81 6.2.3 Data analyses ................................................................................................. 82
6.3 Results ........................................................................................................... 82 6.3.1 Extent and spatial patterns of tree dieback .................................................... 82 6.3.2 Estimation of mass tree dieback using NDVI ............................................... 85 6.3.3 Mass tree dieback, stand structure and species diversity............................... 87
6.4 Discussion ...................................................................................................... 90 6.4.1 Extent and spatial patterns of tree dieback .................................................... 90 6.4.2 Mass tree dieback, stand structure and species diversity............................... 92
6.5 Conclusions and management implications .................................................. 93

7 REGENERATION RESPONSE OF NATIVE TREE SPECIES TO EXCLOSURE IN A DRY AFROMONTANE FOREST, NORTHERN ETHIOPIA ..................................................................................................... 95
7.1 Introduction ................................................................................................... 95
7.2 Material and methods .................................................................................... 96 7.2.1 Study site ....................................................................................................... 96 7.2.2 Study species ................................................................................................. 97 7.2.3 Sampling design ............................................................................................ 98 7.2.4 Data analysis .................................................................................................. 98
7.3 Results ........................................................................................................... 99 7.3.1 Floristic composition ..................................................................................... 99 7.3.2 Structure ...................................................................................................... 102 7.3.3 Natural regeneration .................................................................................... 103
7.4 Discussion .................................................................................................... 104
7.5 Implications for conservation and management .......................................... 107
8 FOREST DIVERSITY IN FRAGMENTED LANDSCAPES IN NORTHERN ETHIOPIA: SYNTHESIS, IMPLICATIONS FOR CONSERVATION, AND FURTHER STUDIES ....................................... 108
9 REFERENCES ............................................................................................ 112
10 APPENDIX ................................................................................................. 128
General introduction
1
1 GENERAL INTRODUCTION
1.1 Background
Biological diversity is the diversity of life at genetic, organism and ecological levels,
and there have been attempts to include cultural biodiversity as a fourth component
(Jeffries 2005). The various definitions of biodiversity are partly reviewed by Sanderson
and Redford (1997), and a more comprehensive definition is given in the Convention on
Biological Diversity (CBD 1992) where diversity is "the variability among living
organisms from all sources including, inter alia, terrestrial, marine and other aquatic
ecosystems and the ecological complexes of which they are part; this includes diversity
within species, between species and of ecosystems". In this thesis, diversity is
considered at species level.
The roles of biodiversity are documented by many authors (Naeem et al. 1974;
Loreau et al. 2001; Cardinale et al. 2006). Biodiversity plays a key role in ecosystem
functioning and has been widely used as an indicator of ecosystem health (FAO 2005).
According to the millennium ecosystem assessment (MA 2005), biodiversity provides
four main services: (1) supporting (nutrient cycling, soil formation, primary production,
etc.), (2) provisioning (food, fresh water, wood and fiber, fuel, etc.), (3); regulating
(climate regulation, flood regulation, disease regulation, water purification, etc.), and (4)
cultural (aesthetic, spiritual, educational, recreational, etc.).
Although biodiversity is understood as a key factor for the sustainability of
life, biodiversity loss is one of the greatest environmental crises. The growing human
population and the demand for natural resources have put great pressure on the
biodiversity wealth of the world through deforestation, habitat fragmentation, and over-
exploitation of species (Terborgh and van Schaik 1997; Noss 1999). Habitat loss and
change, over-harvesting, pollution, and climate change have been the direct causes of
global biodiversity loss (Wood et al. 2000), while population growth, changes in
economic activities, socio-political factors, cultural factors, and technological change
are indirect drivers (MA 2005). Besides these global factors, lack of technical
knowledge and awareness, and political instability have exacerbated the problem in
many developing countries (Ayyad 2003). Forest degradation in Sub-Saharan Africa,
General introduction
2
for instance, has widely taken place because people gain immediate economic benefits
from the forest -related economic activities (Mogaka et al. 2001).
Similarly, accelerated deforestation and habitat fragmentation that arise largely
due to the conversion of forests to other agricultural land-use types and the over-
utilization of forest resources to satisfy the food and energy requirements of the
increasing population are major environmental concerns in Ethiopia (Machado et al.
1998; Tekle and Hedlund 2000; Friis et al. 2001; Taddese 2001; Teketay 2001; Zeleke
and Hurni 2001; Dessie and Kleman 2007). With annual forest clearance of about
150,000 to 200,000 ha (Mogaka et al. 2001), the forest cover of Ethiopia was reduced to
16 % during the 1950s, and to 2.7 % by 1989 (Campbell 1991; EFAP 1994). The
average forest decline between 1990 and 2000 in Ethiopia was 1 % (FAO 2007).
Between 2000 and 2005, this value declined by 1.1 %, which exceeds the average value
of east Africa (0.97), total Africa (0.62), and the world (0.18 %) (FAO 2007). Currently,
natural forests in Ethiopia mainly occur in the south-western part of the country, while
the forests that originally existed in central and northern Ethiopia have almost
disappeared (EFAP 1994; Feoli et al. 2002; Bekele 2003).
According to pollen and charcoal studies in northern Ethiopia, forest
disturbance has a 3000-year history (Darbyshire et al. 2003), and soil erosion following
vegetation clearance in Tigray occurred in the middle Holocene (Bard et al. 2000).
Around 50 BC, the pre-disturbance Podocarpus-Juniperus forest was converted into a
secondary vegetation of Dodonaea scrub and grasslands that dominated the northern
Ethiopia for 1800 years while Juniperus, Olea and Celtis spread around AD 1400 to
1700 (Darbyshire et al. 2003). The travertine deposition in the plateau of Tigray
indicates the dense forest cover that once covered northern Ethiopia during the middle
Holocene (Bard et al. 2000).
In 2003, the natural forest cover in Tigray was only 0.2 % of the total land
mass of the region (Ministry of Agriculture 2003), indicating the severe forest
degradation in the region. Currently, the western escarpment of the Great Rift Valley is
the only site with an intact Afromontane forest cover in northern Ethiopia. The present
study was therefore carried out on this escarpment which includes Desa’a and
Hugumburda forests; these are national forest priority areas in Ethiopia. Conversion of
forests to agricultural land (Nyssen et al. 2004), high dependency on biomass energy
General introduction
3
(Hagos et al. 1999; Gebreegziabher 2007) and free grazing (EFAP 1994; Worku 1998;
Feoli et al. 2002) are the major causes of forest degradation in northern Ethiopia.
According to the Ministry of Agriculture (2003), fuel wood and charcoal contribute
69.2 and 2.5 % of the household energy consumption in Tigray, respectively.
Forest degradation and deforestation in Ethiopia entails several socio-
economic and environmental challenges that have strongly affected the capacity of
forests to provide ecosystem services (Badege 2001; Teketay 2001). Shortage of fuel
wood is a serious problem in the region, and the use of animal dung and agricultural
residues as household fuels has increased, which otherwise could be used as organic
fertilizer (Gebreegziabher 2007). Deforestation is also a major reason for the accelerated
soil erosion in the highlands of Ethiopia (Hurni 1988), where the annual soil loss is
estimated to be 1493 million tons (Zeleke and Hurni 2001). This again causes an
estimated annual grain yield loss of 1-1.5 million tons (Taddese 2001). Following early
human settlements, the extent of soil degradation in northern and eastern Ethiopia is
higher than in other parts of the country (Zeleke and Hurni 2001). Tamene and Vlek
(2007) report a mean annual soil loss of 19 tons ha-1 year-1 in Tigray, which exceeds the
mean values of Africa and the world. Large-scale degradation of forests has affected the
natural regeneration of key native tree species in northern Ethiopia (Aynekulu et al.
2009; Wassie et al. 2009a), while favoring shrub and herb colonizers (Feoli et al. 2002).
Following the long history of land degradation, many land rehabilitation and
conservation programs have been carried out in northern Ethiopia. A historical
vegetation cover change study by Nyssen et al. (2009) indicates that the vegetation
cover in northern Ethiopia has improved during the last century through land
rehabilitation programs. Community woodlots and household tree plantations have also
contributed to the improvement of the vegetation cover in northern Ethiopia (Jagger and
Pender 2003). However, in relation to the scale of land degradation in the region,
conservation efforts could not significantly contribute to reversing the land degradation
process (Teketay 2001). The major drawbacks in the conservation efforts are related to
policy setting and implementation, which are often criticized for lacking an active
participation of the local people (Campbell 1991; Hagos et al. 1999). State ownership of
land and forests and lack of forest property rights are also identified as causes of forest
degradation in Ethiopia (Bekele 2003).
General introduction
4
Many degraded sites have been managed as exclosures, and attempts have been made to
document the regeneration and ecology of the plants in these exclosures. Exclosure is an
assisted natural regeneration strategy to restore degraded forests by protecting areas
from livestock intervention (Parrotta et al. 1997; Shono et al. 2007). Studies have
indicated that vegetation recovery in the exclosures is quick, particularly in the younger
stages (Mengistu et al. 2005; Abebe et al. 2006). Many of the exclosures on the
degraded hillsides are covered with pioneer shrubs like Acacia etbaica, Euclea
racemosa subsp. schimperi, Dodonaea viscosa, and grass and herb species. However,
no significant improvements in species diversity and biomass production were found
after a decade of closing (Asefa et al. 2003; Yayneshet et al. 2009), suggesting the need
to introduce additional management measures to restore native key species.
Studies elsewhere indicate that restoration of the original flora may not be
achievable for centuries, particularly in dry climates where moisture is a limiting factor
(Woodwell 1994). Although exclosures in the degraded sites have shown promising
results, the natural forest remnants are experiencing a retrogressive succession. For
instance, in Desa’a forest, the originally dominating J. procera and O. europaea, have
been gradually been replaced by encroaching light-demanding shrubs such as Cadia
purpurea and Tarchonanthus camphoratus with increasing deforestation and forest
degradation (Gebreegziabher 1999). This indicates that the natural forest remnants,
which are expected to serve as sources of propagules (Aerts et al. 2006c) for the
restoration of the native species in the degraded sites, are not able to sustain the
populations of the relevant forest species. Thus, conserving the existing natural forest
remnants needs conservation priority, otherwise a local extinction of plant species and
their associated fauna may occur.
1.2 Problem statement
The dry lands constitute almost 50 % of the landmass, but they are fragile ecosystems
mainly due to erratic rainfall (CBD 1992). Recently, conservation of biodiversity in the
dryland ecosystems has been receiving greater international attention. Accordingly, the
Convention on Biological Diversity has set goals to promote the conservation of the
biological diversity of ecosystems, habitats and biomes (goal 1) and promote the
General introduction
5
conservation of species diversity (goal 2) of the drylands by 2010 (UNEP/CBD 2006).
This convention is relevant to Ethiopia where drylands constitute about 65 % of the
landmass and forest habitat deterioration is high (Teketay 2001; Yirdaw 2001).
However, lack of adequate understanding of biological resources and their interaction
with the environment is among the major challenges when defining and implementing
effective policies for the sustainable utilization and conservation of biodiversity
resources in Ethiopia (EFAP 1994; Teketay 2001).
The study site is part of the eastern Afromontane (Tigray highlands) and the
arid Horn of Africa (Afar lowlands) global diversity hotspots (Conservation
International 2007). Despite the high conservation values of the natural forest remnants
in northern Ethiopia, they are poorly studied (Friis 1992; Aerts et al. 2006c). Recently,
studies have given emphasis to the restoration ecology in the exclosures (Mengistu et
al. 2005; Abebe et al. 2006; Descheemaeker et al. 2006; Mekuria et al. 2007; Aerts et al.
2008; Yayneshet et al. 2009). However, except for a few management plans (BoANR
and IDC 1997; Worku 1998), reports (e.g., TFAP 1996; Gebreegziabher 1999), and
unpublished MSc theses (Hadera 2000; Janssen 2009), no detailed scientific
investigation has been carried out in the large forest remnants in Tigray. To my
knowledge no work has been published to date on the ecology of these forests. As a
result, historical comparisons of the vegetation composition in northern Ethiopia relies
more on paleo-botanical studies (Bard et al. 2000). Thus, a detailed study on the
ecology of the existing forest remnants is the basis for defining appropriate conservation
strategies before these lose their potential to provide ecosystem services. Income from
forest-related economic activities account for the second largest share of the average
total household income in Tigray (Babulo et al. 2009). Thus, it is important to develop
the forestry sector to improve the rural livelihoods in northern Ethiopia.
The study focuses on two national forest priority areas in northern Ethiopia.
The first study site covers large parts of Desa’a forest, which mainly occurs largely
found on the western escarpment of the Great Rift Valley in northern Ethiopia. The
second site covers Hugumburda forest, which is an isolated forest not only because the
surrounding area has been cleared, but also because it is located in a secluded valley
next to the parallel rift of Lake Hashenge. In such isolated areas, limited cross-
pollination, inbreeding, and genetic drift are likely to negatively impact plant
General introduction
6
populations. This is expected to be observed in the population structure of the trees: low
numbers of seedlings, and smaller numbers of saplings than mature species. If so, the
forests are facing local extinction, i.e., some tree species are still present, but will
become locally extinct because there is no further regeneration. Thus, it is important to
know the natural regeneration potential in relation to the standing vegetation.
Understanding plant species distribution patterns and plant community
composition along environmental gradients also gives key information for effective
management of forest ecosystems (Naveh and Whittaker 1979; Noss 1999; Lovett et al.
2000). The concept of identifying areas with high biodiversity along environmental
gradients, for instance, has been used as a criterion for biodiversity conservation priority
setting (Rudel and Roper 1997; Myers et al. 2000; Mittelbach et al. 2001; Breshears et
al. 2005). Thus, it is important to identify plant species diversity and community
composition along environmental gradients.
Moreover, understanding the extent of tree dieback and spatial patterns of dead
standing trees (snags) is crucial in managing forest ecosystems (Craig and Friedland
1991; Gitlin et al. 2006). However, the status and roles of snags in the tropics have been
less studied (Grove 2001). Mass tree dieback occurred on the escarpments of Desa’a
forest, and the occurrence of large snags in the dry Afromontane forest is a clear sign of
forest degradation. For effective management of the existing forest remnants, it is
imperative to investigate the influence of such mass tree dieback on the forest structure
and diversity.
Natural regeneration is a site-specific ecological process, and it is usually
difficult to characterize the factors that control regeneration processes (Schupp 1988;
Khurana and Singh 2001). Studying the contribution of previous conservation efforts in
improving the restoration of native species is important to plan further conservation
strategies. This study thus assesses the regeneration response of key tree species to
exclosure.
1.3 Objectives
The main objective of this study is to investigate the plant species diversity and natural
regeneration in relation to selected environmental factors in two dry Afromontane forest
remnants in northern Ethiopia as a basis for biodiversity conservation.
General introduction
7
The specific objectives of the study are:
Assessment of plant species diversity and natural regeneration in relation to
selected environmental factors in Hugumburda forest;
Assessment of the distribution of plant species and communities along an
elevational gradient on the western escarpment of the Great Rift Valley;
Investigation of the extent and spatial patterns of dead standing trees (snags) and
effects of mass tree dieback on forest structure and diversity; and
Investigation of the regeneration response of Juniperus procera and Olea
europaea subsp. cuspidata to exclosure.
The findings of this research can serve as decision support for conservation
workers, policy makers, and other stakeholders when they develop appropriate measures
to protect the diminishing natural forest remnants in northern Ethiopia.
1.4 Thesis layout
The thesis is consists of eight chapters. Following the introduction, Chapter 2 provides
an overview of the determinants of species diversity, methods for studying species
diversity and the vegetation types of Ethiopia. Chapter 3 provides a brief description of
the socio-economic and bio-physical characteristics of the study area and the study
approach. Chapter 4 investigates (i) species and plant community compositions in
relation to the selected environmental factors, and (ii) composition of the seedling in
bank relation to standing vegetation. Chapter 5 examines (i) plant species and
community compositions, (ii) species turnover (Beta diversity), and (iii) identifies areas
with high species diversity for conservation priority setting along an elevational
gradient. Chapter 6 investigates (i) extent and spatial patterns of mass tree dieback of J.
procera and O. europaea subsp. cuspidata, (ii) applicability of NDVI of ASTER
imagery in estimating percentage of mass tree dieback, and (iii) influence of mass tree
dieback of the two species on the overall stand structure and species diversity. Chapter 7
investigates the regeneration response of J. procera and O. europaea subsp. cuspidata
in the dry forest remnants in northern Ethiopia. Chapter 8 synthesizes the major findings
of the research, the implications for conservation and management, and suggests further
areas of research.
Drivers and measurements of species diversity and vegetation types of Ethiopia: an overview
8
2 DRIVERS AND MEASUREMENTS OF SPECIES DIVERSITY AND
VEGETATION TYPES OF ETHIOPIA: AN OVERVIEW
2.1 Determinants of biodiversity
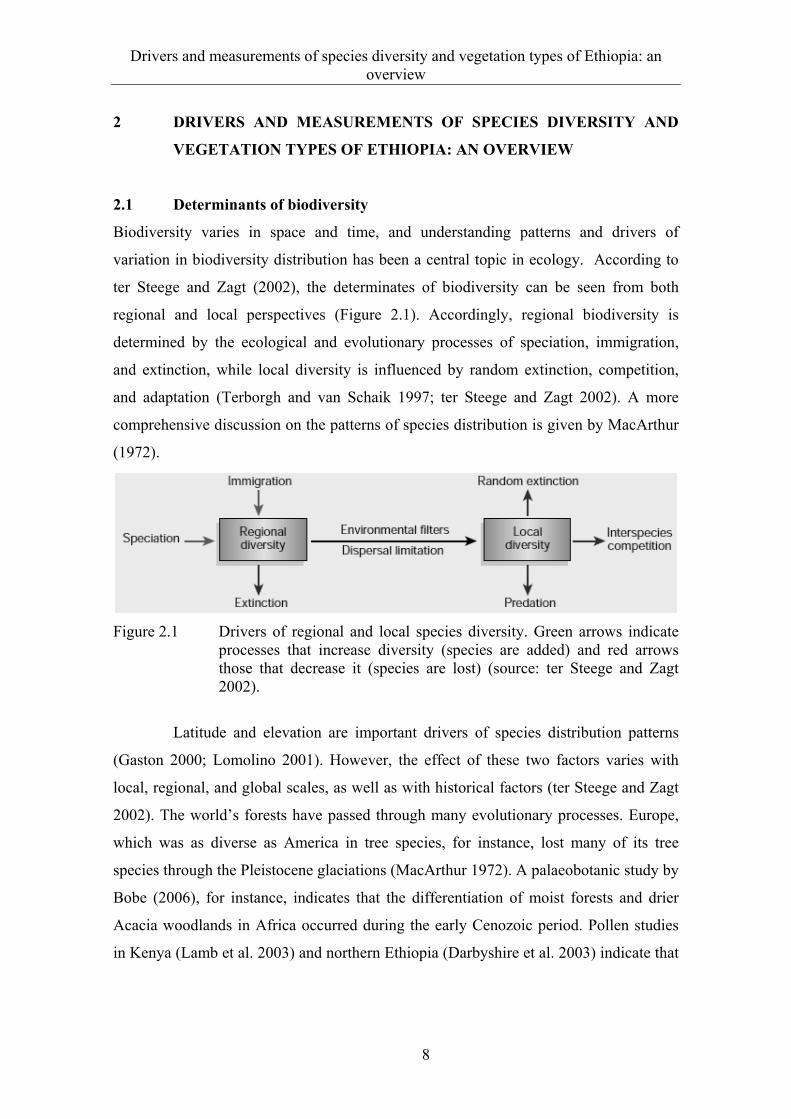
Biodiversity varies in space and time, and understanding patterns and drivers of
variation in biodiversity distribution has been a central topic in ecology. According to
ter Steege and Zagt (2002), the determinates of biodiversity can be seen from both
regional and local perspectives (Figure 2.1). Accordingly, regional biodiversity is
determined by the ecological and evolutionary processes of speciation, immigration,
and extinction, while local diversity is influenced by random extinction, competition,
and adaptation (Terborgh and van Schaik 1997; ter Steege and Zagt 2002). A more
comprehensive discussion on the patterns of species distribution is given by MacArthur
(1972).
Figure 2.1 Drivers of regional and local species diversity. Green arrows indicate processes that increase diversity (species are added) and red arrows those that decrease it (species are lost) (source: ter Steege and Zagt 2002).
Latitude and elevation are important drivers of species distribution patterns
(Gaston 2000; Lomolino 2001). However, the effect of these two factors varies with
local, regional, and global scales, as well as with historical factors (ter Steege and Zagt
2002). The world’s forests have passed through many evolutionary processes. Europe,
which was as diverse as America in tree species, for instance, lost many of its tree
species through the Pleistocene glaciations (MacArthur 1972). A palaeobotanic study by
Bobe (2006), for instance, indicates that the differentiation of moist forests and drier
Acacia woodlands in Africa occurred during the early Cenozoic period. Pollen studies
in Kenya (Lamb et al. 2003) and northern Ethiopia (Darbyshire et al. 2003) indicate that
Drivers and measurements of species diversity and vegetation types of Ethiopia: an overview
9
the flora of East Africa has experienced several changes due to climate change and
anthropogenic disturbances.
At a global scale, diversity decreases with increasing distance from the equator
(Gaston 2000; Mutke and Barthlott 2005; Kreft and Jetz 2007). However, the general
species-richness pattern along latitudinal gradients is sometimes reduced due to other
factors like longitude, elevation, topography, and aridity (Gaston 2000). There are
several reasons for the higher species diversity in the tropics compared to other regions,
one of which is the larger area of the tropics than of any other zone (Rosenzweig 1995).
Larger ranges contribute to diversity by supporting large populations, which favor
speciation through geographical barriers while reducing accidental extinction
(Rosenzweig 1995; Gaston 2000). The influence of area per se as a determinant of
diversity has however been doubted. Tokeshi (1999) argues that the area of the tropical
region is not as large as that of all non-tropical areas combined. Temperate and boreal
species seem to achieve large population sizes, and if evolutionary time scales are used,
comparisons should be based on the area of palaeotropical zones rather than on the
present day configuration of lands and climatic zones.
The other reason for large number of species in the tropics is the low
temperature variability in space and time that increases the probability of similar
habitats (Rosenzweig 1995). Constant and higher temperatures in the tropics also
contribute to higher species diversity by increasing the rate of metabolism, which
speeds up the passing of generations and increases the rate of mutation that again leads
to new species (Tokeshi 1999). Although the influence of site productivity on diversity
is debatable (MacArthur 1972; Gaston 2000), the higher productivity in the topics than
in the higher latitudes is often cited as a reason for the higher species richness in the
tropics (Rosenzweig 1995; Kreft and Jetz 2007). MacArthur (1972) supports this
assumption by stating that an area with zero production will not support any species and
that more productive sites are more stable with time. In contrast, Tokeshi (1999) argues
that site productivity does not have a direct effect on species richness, but should be
considered as a surrogate for habitat heterogeneity.
Elevation plays a major role in plant species diversity and floristic formations,
especially in mountainous areas (Gaston 2000; Kreft and Jetz 2007). Compared to
species-latitude and species-area relationships, the species-elevation relationship is less
Drivers and measurements of species diversity and vegetation types of Ethiopia: an overview
10
studied (Lomolino 2001). Elevation determines species distribution in montane systems
by influencing area, climate, geographical isolation of montane communities, and
feedback among zonal communities (Gaston 2000; Kreft and Jetz 2007). Species
richness in mountainous landscapes, for instance, decreases with increasing elevation
due to a decrease in land area per bioclimatic belt (Körner 2007). The effect of climate
on species distribution is similar to its effect along latitudinal gradients, whereas area
and geographical isolation can be explained by ‘island biogeography’ (Tokeshi 1999).
According to the theory of island biogeography, the number of species in undisturbed
islands is influenced by immigration, emigration and extinction (MacArthur and Wilson
1967). Immigration and emigration are influenced by distance from the main land,
while extinction is inversely related to area (MacArthur and Wilson 1967).
The response of plant species distribution to elevation varies among
ecosystems (Hegazy et al. 1998; Kessler 2000; Lovett et al. 2000; Sánchez-González
and López-Mata 2005; Grytnes and Beaman 2006). Different life forms may also
respond to elevation similarly (e.g., Sánchez-González and López-Mata 2005) or
differently (e.g., Ren et al. 2006). Species richness along elevational gradients also
depends on the scale of a study: A hump-shaped distribution pattern is commonly found
when data are taken from a large elevation range, while a monotonic pattern is common
with small elevation ranges (Nogues-Bravo et al. 2008). Generally, the hump-shaped
pattern is more common than the monotonic pattern (Rahbek 1995).
Generally, habitat diversity is a widely accepted determinant of species
diversity (Rosenzweig 1995; Pausas et al. 2003; Mutke and Barthlott 2005). The theory
of spatial heterogeneity (Pianka 1966) states that more heterogeneous and complex
physical environments support more diverse plant and animal communities. Kreft and
Jetz (2007) indicate potential evapotranspiration, the number of wet days per year, and
measurements of topographical and habitat heterogeneity are predictors of global
species richness. Similarly, Linder (2001) found a strong correlation between maximum
rainfall and species richness in Sub-Saharan tropical Africa. Similarly, species richness
and endemism decrease with increasing latitude from the southern to the northern
highlands of Ethiopia, which can be associated with a decline in precipitation (O'Brien
1993; Linder 2001).
Drivers and measurements of species diversity and vegetation types of Ethiopia: an overview
11
Besides environmental drivers of species diversity, anthropogenic disturbance affects
species diversity through habitat loss and habitat fragmentation (Rudel and Roper 1997;
Lyaruu et al. 2000; Pimm and Raven 2000; Brooks et al. 2002). Habitat loss is the
leading cause of species extinction (Pimm and Raven 2000). With the current rate of
habitat loss, the rate of species extinction is in order of a thousand species per decade
per million species (Pimm and Raven 2000). Biodiversity loss is more serious than
other environmental threats because it is irreversible (Mittermeier et al. 1998). Habitat
fragmentation affects biodiversity by reducing the area of a habitat, which reduces the
persistence of a species, and through the negative edge effect that increases mortality
while decreasing reproduction (Farhrig 2003). Forest disturbance also affects species
diversity by affecting certain species and size classes, and by changing the light
environment of the understory (Slik 2004; Engelbrecht et al. 2007). According to the
intermediate disturbance hypothesis (Connell 1978), intermediate disturbance promotes
species diversity by facilitating regeneration of many species (Denslow 1980; Bongers
et al. 2009). However, the influence of disturbance on species diversity is still a debate
among ecologists. Recently, Bongers et al. (2009) showed that diversity in dry forests
peaks more at a slight level of disturbance than at an intermediate level.
Identifying diversity hotspots can support conservation planning (Mittermeier
et al. 1998; Myers et al. 2000). Conservation International (2007), for instance, used the
world biodiversity hotspots to prioritize biodiversity conservation areas. The hotspot
concept is based on species richness, endemism and threat (Reid 1998; Myers et al.
2000). Studies at global scale have documented less overlap among the three criteria
(Stohlgren et al. 1997; Orme et al. 2005). Nearly half of the world’s vascular plant
species are endemic to 25 hotspots (Myers et al. 2000), of which 17 are in tropical
forests each having at least 1500 endemic plant species (Brooks et al. 2002). These
hotspots once covered 12 % of the land surface, but Brooks et al. (2002) reported that in
2002 such intact habitats were reduced to less than 1.4 % of the land largely due to
habitat loss. Tropical moist forest constitutes most (85 %) of the deforested lands
(Whitemore 1997). Despite the high expectation of extinction due to habitat
deterioration, Whitmore (1977) observed that a large proportion of plant species were
persistent in the remaining forests. However, many plant species have a too small
population sizes to be viable, and this may increase the rate of extinction in the long
Drivers and measurements of species diversity and vegetation types of Ethiopia: an overview
12
term (Whitemore 1997). The human population growth rate in the hotspots is higher
than the average rates worldwide, suggesting that human-induced habitat loss is still a
major threat (Cincotta et al. 2000). Mckee et al. (2004) found a strong relationship
between population growth and number of threatened species. This makes conservation
of biodiversity in the hotspots especially challenging.
The advancement in remote sensing and geo-information sciences has
contributed greatly to the organization of the fragmented knowledge of species
distribution and the determining factors. Recently, it has become possible to develop
more accurate biodiversity maps on continental and global scales (Linder 2001; Kier et
al. 2005; Mutke and Barthlott 2005). The global diversity map of Mutke (2005)
indicates that the Chocó-Costa Rica region, the tropical eastern Andes, and
northwestern Amazonia, eastern Brazil, northern Borneo, New Guinea, the South
African Cape region, southern Mexico, the eastern Himalaya region, western Sumatra,
Malaysia, and east Madagascar are major global centers of vascular plant diversity. Kier
et al. (2005) also indicated that the tropical and sub-tropical moist broadleaf forest
biomes are mega stores of global plant species diversity.
Recently, 9 new areas were included as part of the world biodiversity hotspots
(Conservation International 2007). Among these are the Horn of Africa and eastern
Afromontane hotspots that include large parts of the lowlands and the highlands of
Ethiopia, respectively. However, Africa has fewer endemic species and is less rich in
tropical species, which is probably due to the slow rate of geographical speciation
(Rosenzweig 1995). Large-scale vegetation changes in Africa occurred due to the
changes in the atmospheric moisture content driven by tropical sea surface temperature
changes in the mid-Pleistocene (Schefus et al. 2003).
2.2 Plant communities
A plant community is defined as the collection of plant species growing together in a
particular location that show a definite association or affinity with each other (Kent and
Coker 1992). Plant community level study is a useful approach in conservation planning
(Ferrier et al. 2009). The concept of plant community, for instance, provides useful
information on the underlying environmental drivers of species distribution, as plants
that live together have similar environmental requirements for their existence.
Drivers and measurements of species diversity and vegetation types of Ethiopia: an overview
13
The principles of plant communities are based on either the continuum or on
individualistic theories. Clements (1916) in his plant succession theory considered plant
communities as one big organ (organismic concept) composed of various species, which
repeats itself with regularity over a given region. In his holistic approach, forests,
scrubs, and grassland are considered as major groups of vegetation, which can develop
to climax communities with sufficient time and long-term stability. Gleason (1926) on
the other hand considered plant species distribution as a continuum. Gleason takes
environmental factors and tolerance ranges of species as determinants of the existence
and abundance of a species in a given region. This viewpoint is known as the
individualistic concept of the plant community.
Although differences still exist among ecologists on the concepts of plant
communities, the Gleason’s individualistic theory has been widely used (Callaway
1997). Plant ecologists who favor vegetation classification follow the approach of
Clements and group species into communities. Those ecologists who do not believe in
classification follow the continuum theory and arrange species along environmental
gradients as continua, using ordination methods (Kent and Coker 1992).
2.2.1 Classification and ordination
Classification is to group together a set of individuals on the basis of their attributes,
and is used to define plant communities. Hierarchical or non-hierarchical and the two-
way species indicator analysis (TWINSPAN) are the widely used quantitative
classification techniques. TWINSPAN operates on species presence-absence data, and
its use is more limited because it performs poorly with more than one environmental
gradient (McCune and Grace 2002). Cluster analyses group species using a distance
matrix. The distance measures used in linking similar groups are categorized as
Euclidean metrics (absolute and relative distance) or proportion coefficients (e.g.,
Sørrensen and Jacard) (McCune and Grace 2002).
Ordination simply means arranging items along a single or multiple axis, and
is often used to seek and describe patterns (McCune and Grace 2002). Ordination
involves the arrangement of vegetation samples in relation to each other in terms of
their similarity of species composition (species ordination) and/or their associated
environmental controls (sample units ordination). In gradient analysis, variations in
Drivers and measurements of species diversity and vegetation types of Ethiopia: an overview
14
species composition are related to variation in associated environmental factors, which
can usually be represented by environmental gradients. Correlation analyses between
environmental factors and ordination axes scores can be used to identify and describe
environmental factors that influence species distribution patterns (McCune and Grace
2002).
Ordination can be direct or indirect. With direct gradient analysis, sample units
(e.g., plots) are ordinated based on measured environmental factors in those sample
units (McCune and Grace 2002). Gradient analyses can be univariate where sample
units are ordinate along a single environmental factor or multivariate. Species
distribution along an elevational gradient, for instance, is a univariate gradient. Indirect
ordination ordinates sample units considering the variation within the vegetation
independently of the environmental data. Indirect gradient analyses are more widely
used than direct gradient analyses (Kent and Coker 1992).
Indirect ordination is performed in ordination methods like principal
component analysis, Bray-Curtis (polar) ordination, reciprocal averaging,
correspondence analysis, and detrended correspondence analyses, while non-metric
multi-dimensional scaling (NMS) and canonical correspondence analysis are rarely used
(Kent and Coker 1992; McCune and Grace 2002). Each of the above ordination
techniques has its pros and cons, and the choice of ordination method also depends on
the type of the data, the sampling effort, and the objectives of a study (Southwood and
Handerson 2000). Principal component analyses, for instance, require linear
relationships between variables and normal distribution of variables (McCune and
Grace 2002), which rarely occurs in vegetation data. McCune and Grace (2002)
recommend the use of NMS in community ecology because it can be used with non-
normal data and avoids the assumption of linear relationships between variables.
2.2.2 Measures of species diversity
Whittaker (1972) identifies alpha, beta, and gamma types of species diversity. Alpha
diversity (species richness) is the number of species per standard size or community.
Beta diversity is the difference in species diversity between areas or communities. It is
sometimes called habitat diversity because it represents differences in species
composition between different areas or environments (Whittaker 1972; Kent and Coker
Drivers and measurements of species diversity and vegetation types of Ethiopia: an overview
15
1992). Since communities and habitats are often difficult to delineate, beta-diversity is
measured among study plots (Mark 2001). The total or gamma diversity of a landscape,
or geographic area, is a product of the alpha diversity of its communities and the degree
of beta differentiation among them (Whittaker 1972). The difference between alpha and
gamma diversity is a matter of scale, which is often subjectively defined (Peet 1974).
A large number of diversity indices have been used to measure species
diversity. Magurran (2004) provided an in-depth review of concepts and measurements
of diversity. Species richness, meaning a count of the number of plant species in a
quadrat, area or community, is often equated with diversity. However, as Magurran
states, most methods used in measuring diversity actually consist of two components.
The first is species richness and the second is the relative abundance (evenness or
unevenness) of species within a sample or community.
Whittaker (1972) considers species richness as a strong measure of species
diversity. However, using species richness per se as a measure of diversity is criticized,
because species richness is just one component of species diversity (Hurlbert 1971;
Sanjit and Bhatt 2005). The Shannon index and Simpson’s index of diversity, which
combine species richness with relative abundance, are widely used in species diversity
studies (Kent and Coker 1992). The Shannon index expresses the relative evenness or
equitability of species, while Simpson’s index (Simpson 1949) gives weight to
dominant species (Whittaker 1972). The diversity indices are biased either on species
richness or species evenness, which makes it difficult to obtain one robust index of
diversify measurement (Magurran 2004). The Shannon index is insensitive to rare
species (Sanjit and Bhatt 2005). Hill (1973) introduces ratios of the Shannon and
Simpson’s indices. Though the Hill ratios are not widely used in ecological studies, they
describe community structures well (Peet 1974). They are relatively unaffected by
species richness and tend to be independent of sample size (Peet 1974), which makes
them desirable for comparison of diversity among groups. But they are sometimes
difficult to interpret due to the convergence of the Hill’s numbers to 1 with decreasing
diversity values (Peet 1974).
Drivers and measurements of species diversity and vegetation types of Ethiopia: an overview
16
2.3 Vegetation types of Ethiopia
Ethiopia has a complex relief and a variety of climates, and thus diverse habitats with
rich flora and fauna. The vegetation of Ethiopia is diverse and ranges from afro-alpine
vegetation to desert scrub. The total flora of Ethiopia consists of 6500 - 7000 species of
which 12 % are considered endemic (Gebre Egziabher 1991; Teketay 2004). However,
the flora of Ethiopia has not been exhaustively studied (Friis 1992). The recent
discovery of Acacia fumosa (Thulin 2007), and Asplenium balense (Chaerle and Viane
2007) as new plant species from Ethiopia is evidence of this. A large proportion of the
Eastern Afromontane and Horn of Africa biodiversity hotspots lie in Ethiopia, and the
country is one of the biodiversity centers of the world (Conservation International
2007). The Ethiopian vegetation is highly influenced by climate, which is associated
with elevation (Dugdale 1964). South-western Ethiopia receives more precipitation than
other parts of the country due to the humid air coming from the Congo basin (Dugdale
1964). This westerly wind, however, cannot penetrate further than 30o E and rarely
influences the Horn regions because the Ethiopian highlands act as barriers. The flora of
southern Ethiopia is more similar to that of Kenya and Uganda than the flora of northern
Ethiopia (Dugdale 1964). The vegetation on the Afromontane belt (900-3200 m) of
Ethiopia has been under tremendous pressure from human activities and over grazing,
which has led to the replacement of the evergreen forests by grasslands (Gebre
Egziabher 1988).
The vegetation maps of Ethiopia were reviewed by Friis and Demissew
(2001). The most frequently cited studies on the vegetation of Ethiopia include that of
Pichi-Sermolli (1957), Breitenbach (1963), White (1983), and Friis (1992).
The extent and delineation of the vegetation maps of Pichi-Sermolli (1957)
and Breitenbach (1963) are very similar, but differ in the descriptions and terminology
of the mapping units (Friis and Demissew 2001). According to Pichi-Sermolli (1957),
the vegetation of northern Ethiopia can be broadly classified as montane evergreen
thicket and savanna. The common species in this vegetation type include Juniperus
procera, Olea europaea subsp. cuspidata, Acokanthera schimperi, Carissa edulis, and
species of Euclea, Rhamnus, Rhus and Maythenus (Friis and Demissew 2001).
Breitenbach (1963) mapped the vegetation of Ethiopia and Eritrea into seven
basic categories using a physiognomic approach. The seven categories are Lowland
Drivers and measurements of species diversity and vegetation types of Ethiopia: an overview
17
steeps, Lowland savannahs, Lowland woodlands, Highland forests, Mountain
woodlands, Mountain savannahs, and Mountain stepps. The sub-categories are based on
local rainfall (arid, semi-arid, semi-humid, and humid) and stages of succession, which
range from pioneer to climax types (Friis and Demissew 2001). According to
Breitenbach’s vegetation map, the three dominating vegetation types in Ethiopia in a
decreasing order are Lowland steppes, Lowland woodlands, and Mountain savannahs
(Friis and Demissew 2001). The vegetation of the study site is mainly Highland forests
and Mountain savannahs. Highland forests are found between 1600 and 2600 m.a.s.l.
White (1983) classified the vegetation of Africa into 81 vegetation groups
using physiognomy and floristic composition. Accordingly, the dominant vegetation
types in Ethiopia are Forest transitions and mosaics, Woodland, Woodland mosaics and
transitions, Bushland and thicket, Semi-desert vegetation, Grassland, Edaphic grassland
mosaics, Altimontane vegetation, Azonal vegetation, and Desert. The vegetation on the
lower escarpment is classified as bushland and thicket and the vegetation on the Tigrean
plateau and the upper scarp as forest transition and mosaics.
Friis (1992) classifies the forests of the Horn of Africa into nine vegetation
types. He followed the classification and terminologies of White (1983) and added the
lowland semi-deciduous forest (dry peripheral semi-deciduous Guineo-Congolian
forest) and the altitudinally transitional forest (transitional rain forest), which were
identified after White’s vegetation map had been published. According to the
classification of the forests and forest trees of northeast tropical Africa (Friis 1992),
Desa’a and Hugumburda forests are broadly categorized as dry single-dominant
Afromontane forests, which are characterized by dry climate (annual precipitation less
less than 1000 mm) with Juniperus procera and Olea europaea subsp. cuspidata as
dominant species. This dry single-dominant Afromontane forest of the escarpment and
transition between single-dominant Afromontane forest and East African evergreen and
semi-evergreen bushland that occurs between 1500 and 2400 characterizes the
escarpments in northern Ethiopia.
The vegetation map of Ethiopia was later simplified into eight major
vegetation types by Demissew (1996) as Afroalpine and sub-Afroalpine zone, dry
evergreen mountain forest and grassland, moist evergreen mountain forest, evergreen
scrub, Combretum-Terminalia and savanna, Acacia-Comiphora woodland, lowland
Drivers and measurements of species diversity and vegetation types of Ethiopia: an overview
18
(semi-) evergreen forest, desert and semi-desert scrubland, and coastal vegetation
(Demissew et al. 1996). According to Demissew (1996), dry evergreen mountain forest
and grassland and evergreen scrub characterize the forest remnants in northern Ethiopia.
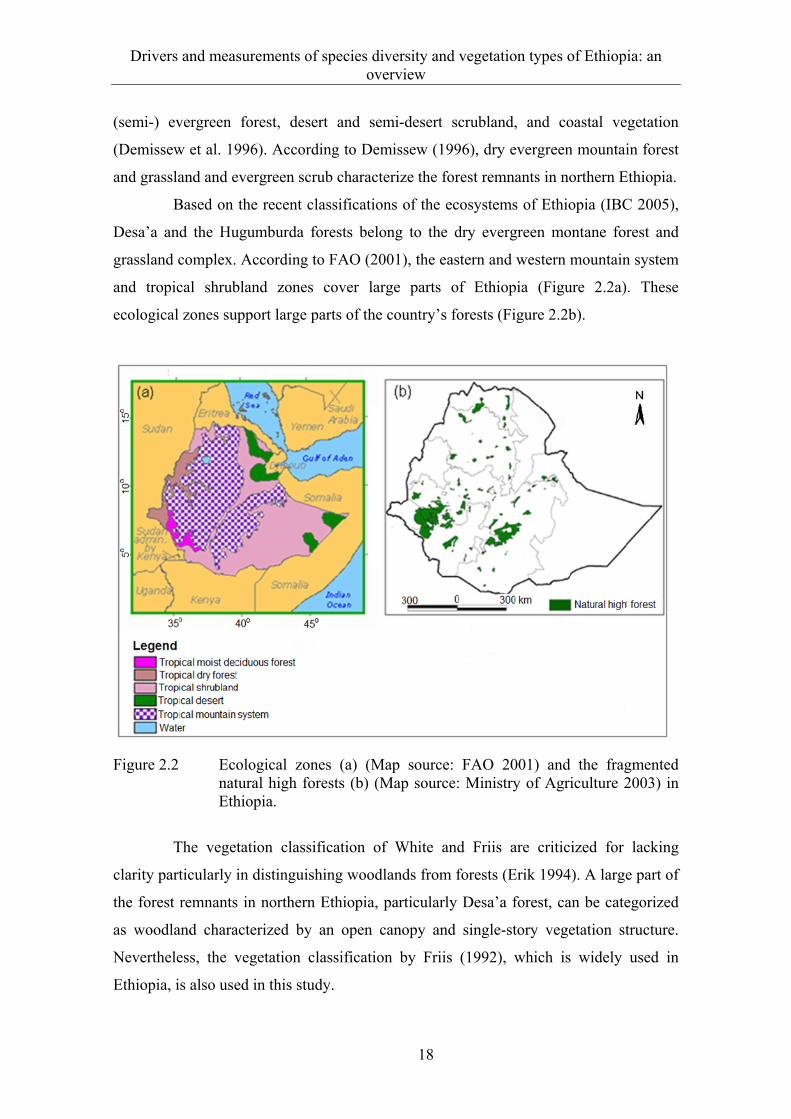
Based on the recent classifications of the ecosystems of Ethiopia (IBC 2005),
Desa’a and the Hugumburda forests belong to the dry evergreen montane forest and
grassland complex. According to FAO (2001), the eastern and western mountain system
and tropical shrubland zones cover large parts of Ethiopia (Figure 2.2a). These
ecological zones support large parts of the country’s forests (Figure 2.2b).
Figure 2.2 Ecological zones (a) (Map source: FAO 2001) and the fragmented natural high forests (b) (Map source: Ministry of Agriculture 2003) in Ethiopia.
The vegetation classification of White and Friis are criticized for lacking
clarity particularly in distinguishing woodlands from forests (Erik 1994). A large part of
the forest remnants in northern Ethiopia, particularly Desa’a forest, can be categorized
as woodland characterized by an open canopy and single-story vegetation structure.
Nevertheless, the vegetation classification by Friis (1992), which is widely used in
Ethiopia, is also used in this study.
Study sites and general methods
19
3 STUDY SITES AND GENERAL METHODS
3.1 Study area
3.1.1 Socio-economic context of Ethiopia
Ethiopia is an ancient agrarian country located between 3o and 15o N and 33o and 48o E
covering an area of 1.13 million km2. In 2007, the population of Ethiopia was 74.9
million and the annual growth rate 2.6 % (Federal Democratic Republic of Ethiopia
Population Census Commission 2008). This makes Ethiopia the second most populous
nation in Sub-Saharan Africa. The same report indicates that 84 % of the population
lives in rural areas and is engaged in subsistence agriculture. The economy of Ethiopia
is based on traditional subsistence agriculture, which suffers from frequent droughts.
Food security and natural resource degradation are among the major challenges that
Ethiopia has faced. A chronology of the droughts and famines in Ethiopia from 253 BC
to 1992 indicates that Ethiopia has faced more than 17 droughts or famines in the 20th
century, which were caused by either shortage or poor distribution of rainfall (Webb et
al. 1992). Despite its poor performance, the agriculture sector still contributes 46.6 % of
the GDP (NBE 2007) and 76.6 % of the exports, mostly coffee (EEA 2004).
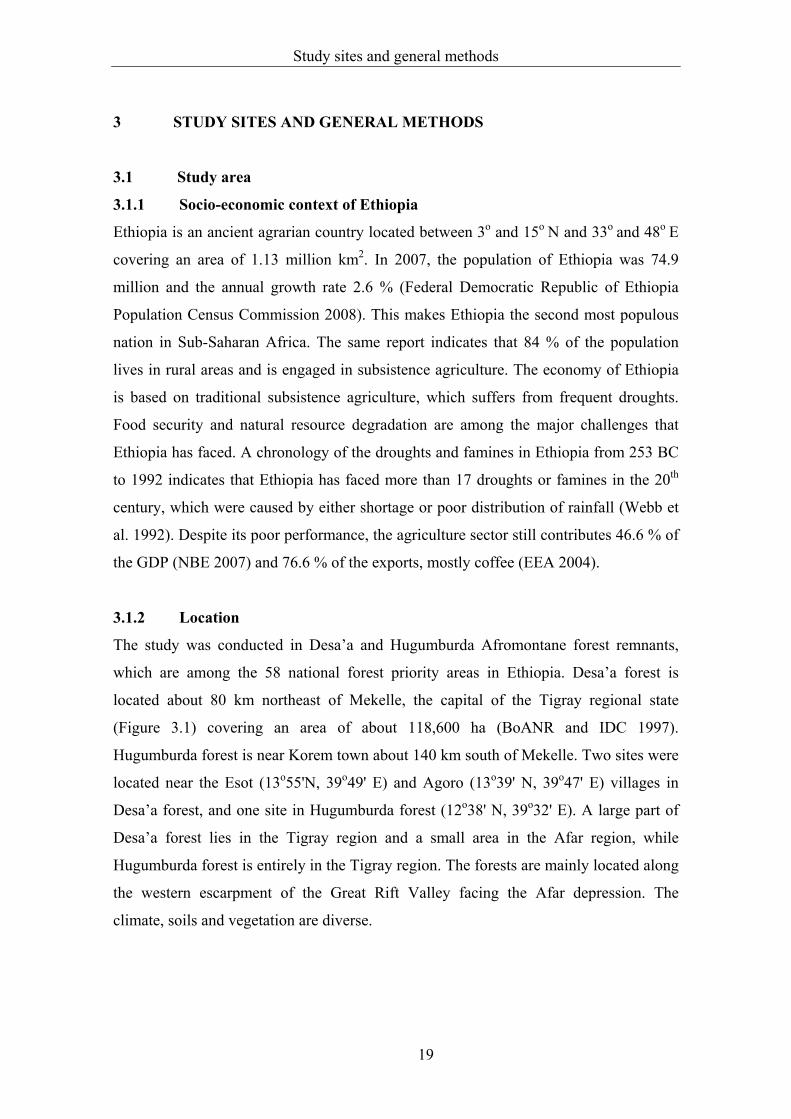
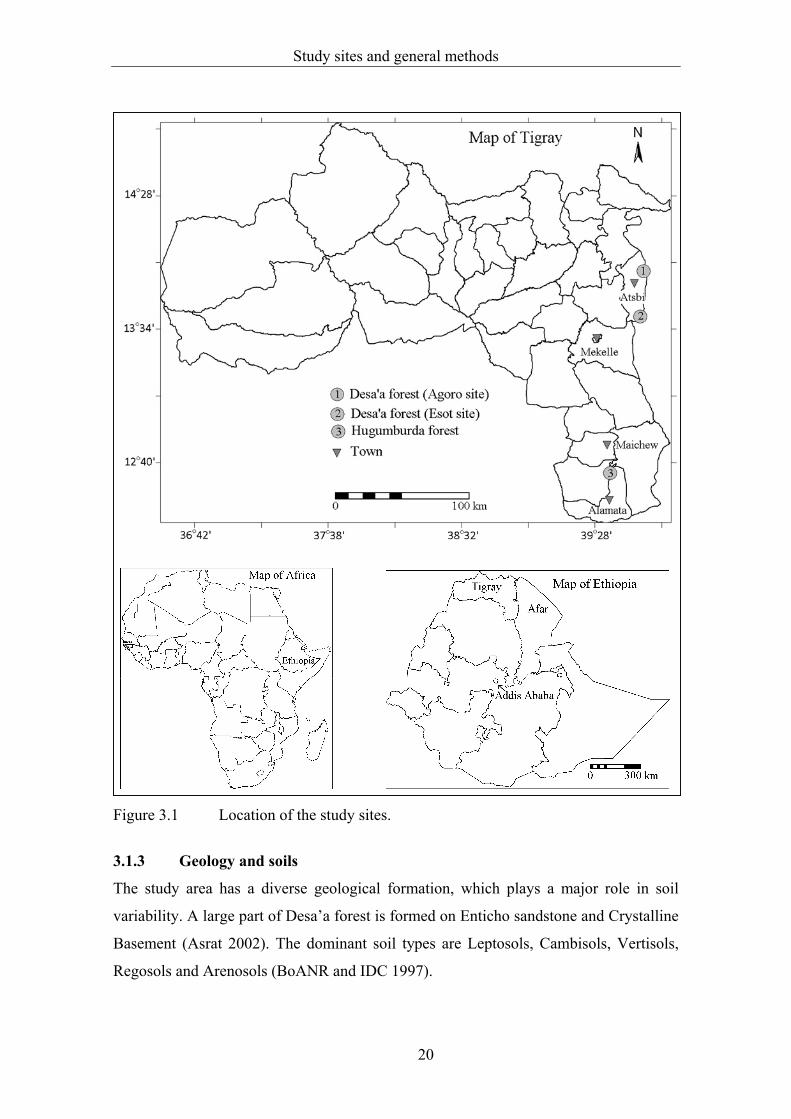
3.1.2 Location
The study was conducted in Desa’a and Hugumburda Afromontane forest remnants,
which are among the 58 national forest priority areas in Ethiopia. Desa’a forest is
located about 80 km northeast of Mekelle, the capital of the Tigray regional state
(Figure 3.1) covering an area of about 118,600 ha (BoANR and IDC 1997).
Hugumburda forest is near Korem town about 140 km south of Mekelle. Two sites were
located near the Esot (13o55'N, 39o49' E) and Agoro (13o39' N, 39o47' E) villages in
Desa’a forest, and one site in Hugumburda forest (12o38' N, 39o32' E). A large part of
Desa’a forest lies in the Tigray region and a small area in the Afar region, while
Hugumburda forest is entirely in the Tigray region. The forests are mainly located along
the western escarpment of the Great Rift Valley facing the Afar depression. The
climate, soils and vegetation are diverse.
Study sites and general methods
20
Figure 3.1 Location of the study sites.
3.1.3 Geology and soils
The study area has a diverse geological formation, which plays a major role in soil
variability. A large part of Desa’a forest is formed on Enticho sandstone and Crystalline
Basement (Asrat 2002). The dominant soil types are Leptosols, Cambisols, Vertisols,
Regosols and Arenosols (BoANR and IDC 1997).
Study sites and general methods
21
Hugumburda forest is formed on tertiary basalt, alkali-alluvial basalt and tuff (Worku
1998). The dominant soils are Leptosols and Regosols (Worku 1998). Large parts of the
undulating terrains in northern Ethiopia are characterized by shallow soils and frequent
rock outcrops, while relatively thick soils are found along valley bottoms.
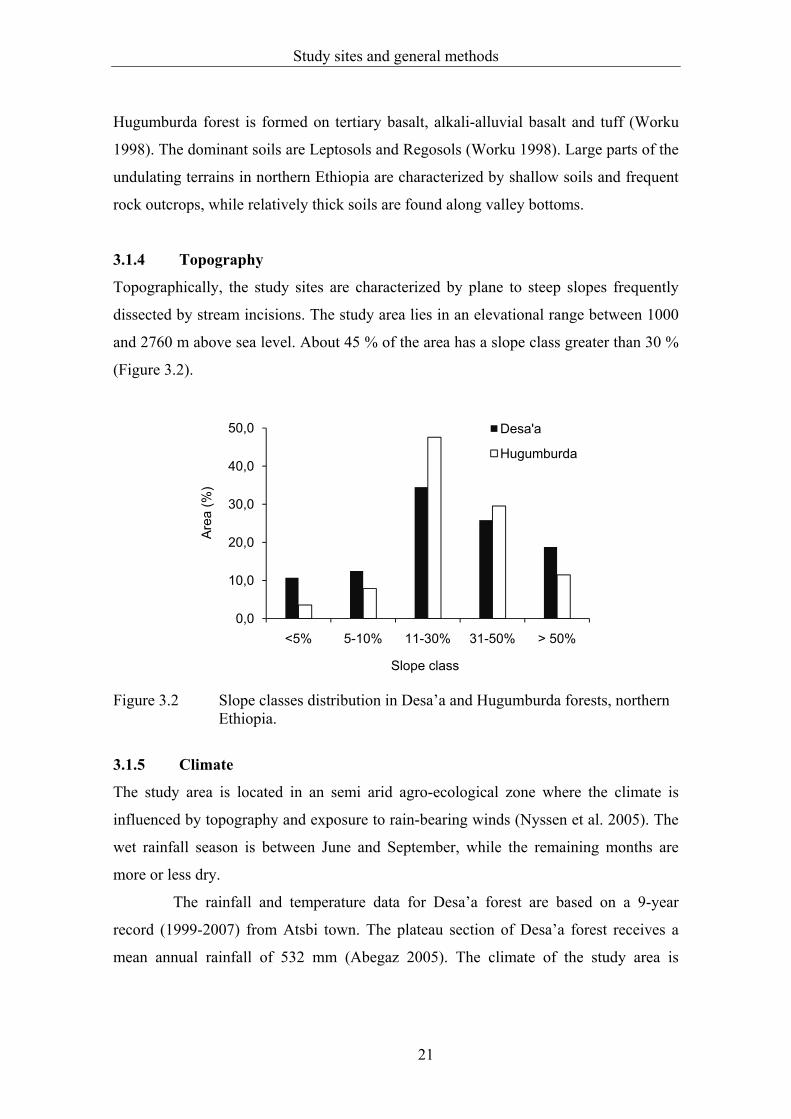
3.1.4 Topography
Topographically, the study sites are characterized by plane to steep slopes frequently
dissected by stream incisions. The study area lies in an elevational range between 1000
and 2760 m above sea level. About 45 % of the area has a slope class greater than 30 %
(Figure 3.2).
Figure 3.2 Slope classes distribution in Desa’a and Hugumburda forests, northern Ethiopia.
3.1.5 Climate
The study area is located in an semi arid agro-ecological zone where the climate is
influenced by topography and exposure to rain-bearing winds (Nyssen et al. 2005). The
wet rainfall season is between June and September, while the remaining months are
more or less dry.
The rainfall and temperature data for Desa’a forest are based on a 9-year
record (1999-2007) from Atsbi town. The plateau section of Desa’a forest receives a
mean annual rainfall of 532 mm (Abegaz 2005). The climate of the study area is
0,0
10,0
20,0
30,0
40,0
50,0
<5% 5-10% 11-30% 31-50% > 50%
Are
a (%
)
Slope class
Desa'a
Hugumburda
Study sites and general methods
22
influenced by elevation, where the decline in rainfall and increase in temperature from
the upland plateau to the eastern escarp slopes are sharp (Degefu 1987).
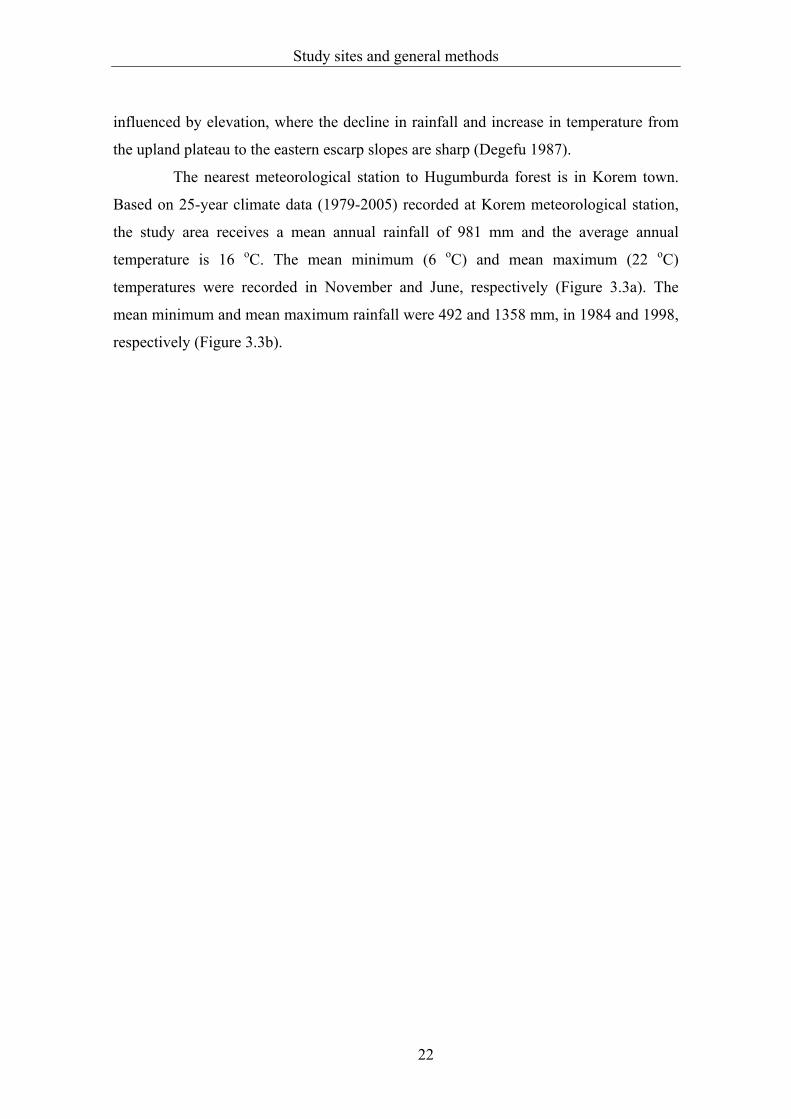
The nearest meteorological station to Hugumburda forest is in Korem town.
Based on 25-year climate data (1979-2005) recorded at Korem meteorological station,
the study area receives a mean annual rainfall of 981 mm and the average annual
temperature is 16 oC. The mean minimum (6 oC) and mean maximum (22 oC)
temperatures were recorded in November and June, respectively (Figure 3.3a). The
mean minimum and mean maximum rainfall were 492 and 1358 mm, in 1984 and 1998,
respectively (Figure 3.3b).
Study sites and general methods
23
Figure 3.3 (a) Mean monthly rainfall and mean monthly temperature, and (b) annual rainfall recorded at Atsbi (Desa’a forest) and at Korem meteorological station (Hugumburda forest), northern Ethiopia.
3.1.6 Vegetation
Based on the classification of the forests and forest trees of northeast tropical Africa
Friis (Friis 1992), Desa’a and Hugumburda forests are broadly categorized as dry
single-dominant Afromontane forests, which are characterized by dry climate (annual
precipitation less than 1000 mm) and with Juniperus procera in the canopy and Olea
europaea subsp. cuspidata as dominant tree species. The study area provides diverse
habitats for plants. The mesic Tigray highlands support species like Erica arborea. The
0
2
4
6
8
10
12
14
16
18
20
0
50
100
150
200
250
300
J F M A M J J A S O N D
Ave
rage
tem
pera
ture
( 0
C)
Ave
rage
rai
nfal
l (m
m)
Month
(a) Atsbi rainfall
Korem rainfall
Atsbi temp.
Korem temp.
0
200
400
600
800
1000
1200
1400
1600
1979
1981
1983
1985
1987
1989
1993
1995
1997
1999
2001
2003
2005
2007
Ann
ual r
ainf
all (
mm
)
Year
(b) Atsbi rainfall Korem rainfall
Study sites and general methods
24
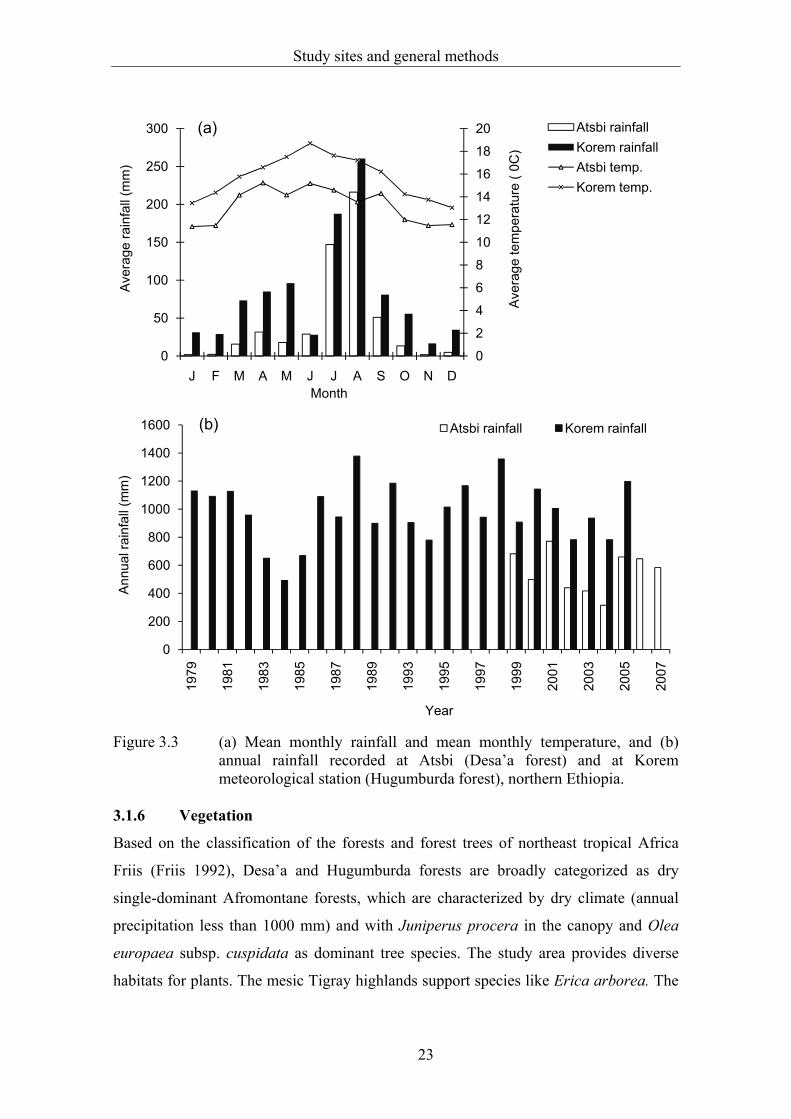
dry Afar lowlands with the Acacia woodlands are located at a short distance (ca. 5 km)
from the highlands. The diversity of the two forests is largely dominated by herb and
shrub species (ca. 70 %), while tree species contribute 30 % of the total vascular plant
species (Figure 3.4).
Figure 3.4 Life forms in Desa’a and Hugumburda forests, northern Ethiopia.
Hugumburda forest is the only more or less intact large forest with many
locally rare tree species from the pre-disturbance period. Afrocarpus falcatus and other
native tree species, which are rare in other parts of northern Ethiopia, are found in this
forest. It is more protected, and more enrichment plantation activities have been carried
out than in Desa’a forest.
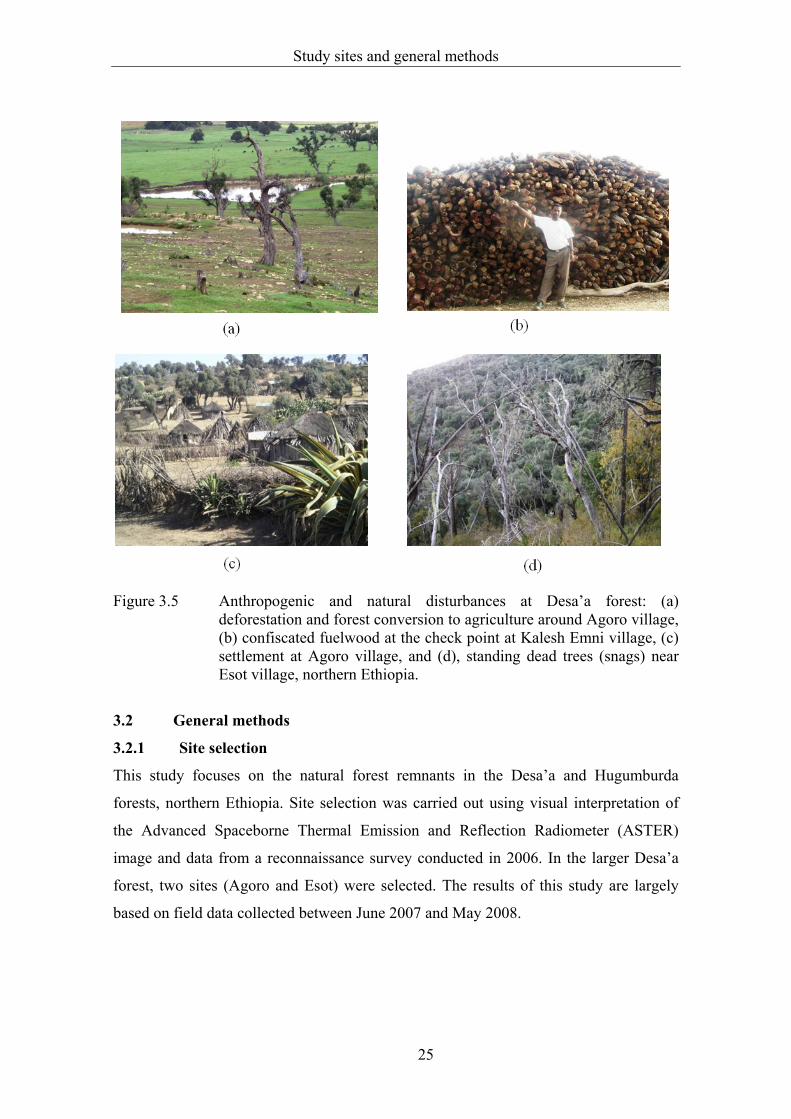
A large part of Desa’a forest has been converted into agricultural land and
grazing land. The scattered trees and stumps on the farm and grazing land are evidence
of the shrinking of this forest (Figure 3.5a). According to Gebreegziabher (1999), fire is
another major threat to the forest, where 1000 and 350 ha forest land was destroyed by
fire in 1970 and 1998, respectively. Although more attention has been given to the
anthropogenic cause of forest degradation, forest disturbance due to natural mass tree
dieback is commonly observed in Desa’a forest (Figure 3.5d).
0
10
20
30
40
50
60
Climber Herb Shrub Tree
%
Desa'a
Hugumburda
Study sites and general methods
25
Figure 3.5 Anthropogenic and natural disturbances at Desa’a forest: (a) deforestation and forest conversion to agriculture around Agoro village, (b) confiscated fuelwood at the check point at Kalesh Emni village, (c) settlement at Agoro village, and (d), standing dead trees (snags) near Esot village, northern Ethiopia.
3.2 General methods
3.2.1 Site selection
This study focuses on the natural forest remnants in the Desa’a and Hugumburda
forests, northern Ethiopia. Site selection was carried out using visual interpretation of
the Advanced Spaceborne Thermal Emission and Reflection Radiometer (ASTER)
image and data from a reconnaissance survey conducted in 2006. In the larger Desa’a
forest, two sites (Agoro and Esot) were selected. The results of this study are largely
based on field data collected between June 2007 and May 2008.
Study sites and general methods
26
3.2.2 Sampling design
Random selected plots are used to examine the role of exclosure on the seedling bank
(Chapter 7), while systematic sampling was used for determining plant species diversity
and natural regeneration, plant species diversity patterns along an elevational gradient
on the western escarpment of the Great Rift Valley, and the effects of mass tree dieback
on stand structure and diversity (Chapter 4, 5, and 6). Since the study sites are mainly
on hilly terrain, transects were established along elevation and plots were established at
100 m elevational intervals along a W-E direction. To adequately cover the two forests,
transects were established at 1-km intervals. A base map showing transects and plots
were produced using 1:50,000 scale topographic maps in a GIS environment, and a GPS
device was used to establish the plots in the field.
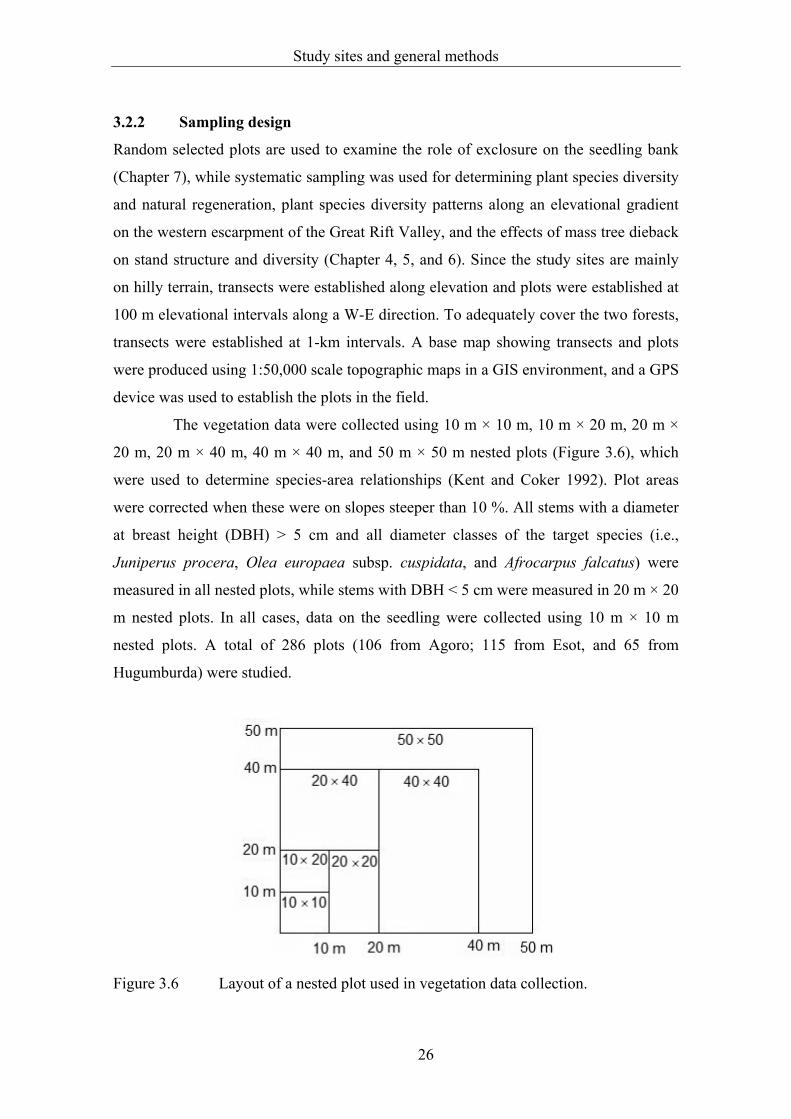
The vegetation data were collected using 10 m × 10 m, 10 m × 20 m, 20 m ×
20 m, 20 m × 40 m, 40 m × 40 m, and 50 m × 50 m nested plots (Figure 3.6), which
were used to determine species-area relationships (Kent and Coker 1992). Plot areas
were corrected when these were on slopes steeper than 10 %. All stems with a diameter
at breast height (DBH) > 5 cm and all diameter classes of the target species (i.e.,
Juniperus procera, Olea europaea subsp. cuspidata, and Afrocarpus falcatus) were
measured in all nested plots, while stems with DBH < 5 cm were measured in 20 m × 20
m nested plots. In all cases, data on the seedling were collected using 10 m × 10 m
nested plots. A total of 286 plots (106 from Agoro; 115 from Esot, and 65 from
Hugumburda) were studied.
Figure 3.6 Layout of a nested plot used in vegetation data collection.
Study sites and general methods
27
3.2.3 Vegetation data
Abundance, frequency, stand density, and basal area per hectare were determined for all
trees with a height > 1.5 m and diameter > 2 cm at breast height (DBH), while those
smaller than these minimum values were counted and included in the abundance and
frequency data. Species were identified in the field and at the National Herbarium,
Addis Ababa University; nomenclature follows the Flora of Ethiopia and Eritrea
(Hedberg and Edwards 1989; Edwards et al. 1995; Hedberg and Edwards 1995;
Edwards et al. 1997; Edwards et al. 2000; Hedberg et al. 2003).
3.2.4 Environmental data
The environmental variables used in this study were elevation (taken from a topographic
map), slope (measured with clinometer), aspect (measured using compass), soil depth
(measured using pits), distance to the nearest stream, and extent of disturbance
(subjectively rated as 0 = no disturbance, 1 = slightly disturbed, 2 = moderately
disturbed, and 3 = highly disturbed) based on grazing intensity, cut stems, and human
trails). Distance to the nearest stream was measured by overlaying the plots on the
drainage map in ILWIS 3.3 GIS software.
Plant species diversity and natural regeneration in an isolated Afromontane forest, northern Ethiopia
28
4 PLANT SPECIES DIVERSITY AND NATURAL REGENERATION IN
AN ISOLATED AFROMONTANE FOREST, NORTHERN ETHIOPIA
4.1 Introduction
Understanding species distribution patterns along environmental variables is a central
component of plant ecology (Rosenzweig 1995). Topographical, climatic, and edaphic
factors are widely considered as determinants of species distribution and community
structure (Whittaker et al. 2003; Currie et al. 2004). The effect of environmental
variables on species diversity depends on the spatial scale (Whittaker et al. 2003;
Laurance 2004; Nogues-Bravo et al. 2008). Habitat disturbance, for instance, affects
species diversity at the local scale (species diversity within a plant community), while
soil, topography, elevation, and drainage are considered as landscape-level determinants
of species diversity (Whittaker et al. 2003). Forest disturbance also influences species
diversity through alteration and fragmentation of forests, which is a serious concern in
the management of tropical forests (Laurance and Bierregaard 1997). Fragmentation
affects species diversity by reducing areas, which leads to a small number of individuals
and species (Rosenzweig 1995; Whittaker et al. 2003).
The Ethiopian highlands constitute large parts of the Afromontane regions of
Africa, which stretch from Cameroon to eastern Africa (White 1983), where
biodiversity hotspots exist (Conservation International 2007). However, as in many
tropical forests, forest disturbance (natural and anthropogenic) has changed the structure
and floristic composition of forests in northern Ethiopia for centuries (Darbyshire et al.
2003). Currently, only a few natural forest remnants are left as islands in the landscapes
dominated by agriculture (Aerts et al. 2006c).
Hugumburda forest is unique in the sense that it is (1) the only well-protected
large Afromontane forest remnant in northern Ethiopia, and (2) an isolated forest not
only because the surrounding area has been cleared, but mainly because it is located in a
secluded valley next to the parallel rift of Lake Hashenge. Thus, it is an isolated island
of forest in a landscape dominated by crop and grazing land. In such isolated areas,
limited cross-pollination, inbreeding, and genetic drift (Ellstrand and Elam 1993) are
likely to negatively impact plant populations (Reed and Frankham 2003; Hirayama et al.
2007). This can to be observed in the population structure of the trees, i.e., a low
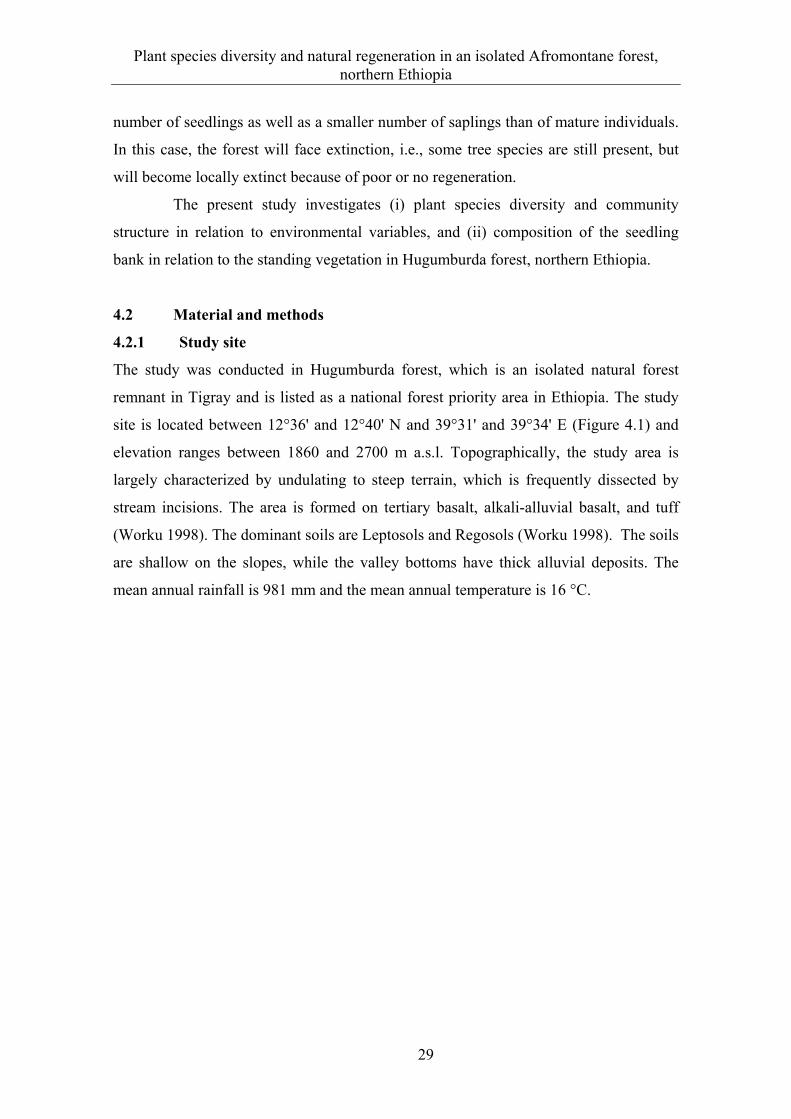
Plant species diversity and natural regeneration in an isolated Afromontane forest, northern Ethiopia
29
number of seedlings as well as a smaller number of saplings than of mature individuals.
In this case, the forest will face extinction, i.e., some tree species are still present, but
will become locally extinct because of poor or no regeneration.
The present study investigates (i) plant species diversity and community
structure in relation to environmental variables, and (ii) composition of the seedling
bank in relation to the standing vegetation in Hugumburda forest, northern Ethiopia.
4.2 Material and methods
4.2.1 Study site
The study was conducted in Hugumburda forest, which is an isolated natural forest
remnant in Tigray and is listed as a national forest priority area in Ethiopia. The study
site is located between 12°36' and 12°40' N and 39°31' and 39°34' E (Figure 4.1) and
elevation ranges between 1860 and 2700 m a.s.l. Topographically, the study area is
largely characterized by undulating to steep terrain, which is frequently dissected by
stream incisions. The area is formed on tertiary basalt, alkali-alluvial basalt, and tuff
(Worku 1998). The dominant soils are Leptosols and Regosols (Worku 1998). The soils
are shallow on the slopes, while the valley bottoms have thick alluvial deposits. The
mean annual rainfall is 981 mm and the mean annual temperature is 16 °C.
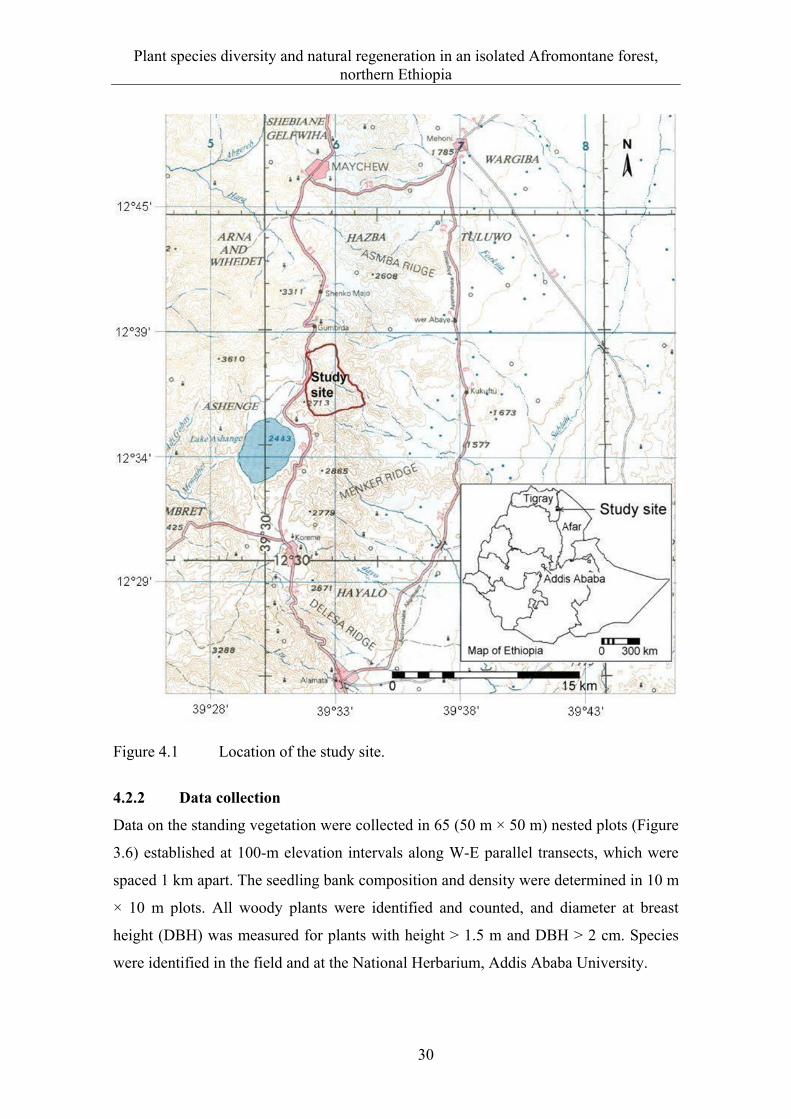
Plant species diversity and natural regeneration in an isolated Afromontane forest, northern Ethiopia
30
Figure 4.1 Location of the study site.
4.2.2 Data collection
Data on the standing vegetation were collected in 65 (50 m × 50 m) nested plots (Figure
3.6) established at 100-m elevation intervals along W-E parallel transects, which were
spaced 1 km apart. The seedling bank composition and density were determined in 10 m
× 10 m plots. All woody plants were identified and counted, and diameter at breast
height (DBH) was measured for plants with height > 1.5 m and DBH > 2 cm. Species
were identified in the field and at the National Herbarium, Addis Ababa University.
Plant species diversity and natural regeneration in an isolated Afromontane forest, northern Ethiopia
31
The environmental variables used in this study are elevation (taken from a topographic
map), slope (measured with a clinometer), soil depth (measured in pits), distance to the
nearest stream (measured by overlaying the plots on the drainage map in a GIS), and
extent of disturbance was subjectively ranked based on grazing intensity, cut stems, and
human trails (0 = no disturbance, 1 = slightly disturbed, 2 = moderately disturbed, and 3
= highly disturbed).
4.2.3 Data analysis
Forest structure and diversity
The importance of a species is determined by calculating the importance value index
(IVI), which is obtained by summing up relative density, relative dominance and
relative frequency of a species (Mueller-Dombois and Ellenberg 1974). Density of a
species is the number of individuals per hectare, frequency is the percentage of plots in
which a species occurs, and dominance of a species is the sum of the basal area of
individual stems.
Hill’s (1973) diversity numbers were derived from the Shannon diversity and
Simpson’s index of diversity indices which are unaffected by species richness and tend
to be independent of sample size. N0 (= γ) to determine species richness in plant
communities, N1 (=exp (H')), and N2 (=D-1) are used to calculate species richness and
diversity, and E1 (=N1/N0) to calculate species evenness for every plot: γ is total species
richness; H' is Shannon diversity index; D is Simpson’s index of diversity. Similarity
between seedling and standing vegetation species composition was determined using
the Sørensen coefficient of similarity (Krebs 1989).
Topographic information was derived from a digital elevation model, which
was generated from a topographic map. Topographic wetness index (TWI) (Eq. 4.1),
which indicates the spatial distribution of soil moisture and ground water flow, is
generated from the digital elevation model of the study area by computing the upslope
contributing area of a grid in relation to the slope gradient (Beven and Kirkby 1979) in a
GIS environment. The digital elevation model is developed using the topographic map
(1:50,000 scale).
Plant species diversity and natural regeneration in an isolated Afromontane forest, northern Ethiopia
32
TWI =
(4.1)
where TWI is topographc wetness index, a is upslope contributing area of a grid (flow
accumulation), and β is slope gradient.
The species-area curve was determined using the number of species recorded
in the nested plots. The vegetation of moist and dry forests was delineated by overlaying
the plots that belong to either of the plant communities on the map of the study area in
GIS. The location map, distance to the nearest stream, topographical wetness index, and
a map showing the plant communities were developed using ILWIS 3.3 GIS software
(ITC 2001).
Cluster analysis
A multivariate hierarchical clustering using the Euclidean distance and Ward’s group
linkage method, and indicator species analysis were performed to identify plant
communities (McCune and Grace 2002). The dendrogram was scaled using Wishart’s
objective function that measures the percent information remaining at each level of
clustering and pruned at the minimum average P-value of the indicator species (McCune
and Grace 2002). The indicator value of a species was calculated using Dufrene and
Legendre’s (1997) method, which considers the abundance of a species in a group and
its distribution among plots within a group. The statistical significance of the indicator
values of a species was tested with the Monte Carlo permutation test. The difference in
the floristic compositions among the plant communities was tested with the
nonparametric Multi-Response Permutation Procedure (MRPP; Biondini et al. 1985).
The P-value in MRPP, which is associated with the test statistics (T), evaluates if the
observed differences among groups are due to chance and the chance-corrected within-
group agreement (A) measures within group homogeneity. When all items within
groups are identical, A = 1. when A = 0, the heterogeneity within groups equals the
expectation by chance, while A < 0 when there is less agreement within groups than
expected by chance (McCune and Grace 2002).
Plant species diversity and natural regeneration in an isolated Afromontane forest, northern Ethiopia
33
Ordination
Nonmetric multidimensional scaling (NMS) ordination was used to investigate the
environmental factors that influence the structure of the plant communities. NMS is the
most effective ordination method for ecological community data (McCune and Grace
2002) and avoids the assumption of linear relationships among variables (Clarke 1993).
NMS was run using the Sørensen distance measure, 6 starting dimensions, 50 iterations
and an instability criterion of 0.00001 (McCune and Mefford 1999). Spearman rank
correlation was used to determine the bivariate relationships between explanatory
variables and ordination axes scores.
Clustering, indicator species analysis, Monte Carlo test, MRPP, and NMS
analyses were conducted in PC-ORD 5.0 software (McCune and Grace 2002).
Statistical analyses
Differences in stand structure and environmental variables among plant communities
were tested using MANOVA, and the post hoc Tukey’s test was used for pair-wise
multiple comparisons. Nonparametric Kruskal–Wallis ANOVA and pair-wise
comparison (Siegel and Castellan 1988) were used to test differences between
communities in diversity measures. All tests of statistical significance were decided at α
= 0.05 level. The statistical analyses was conducted in SPSS 13.0 for Windows (SPSS
Inc. 2004).
4.3 Results
4.3.1 Floristic composition and diversity
A total of 79 species belonging to 51 families was recorded in the 65 plots (Table 4.1).
The forest has an overall stem density of 1218 ± 74 stems ha-1 (mean ± SE), a basal area
of 9.23 ± 1.08 m2 ha-1, species richness of 22 ± 1 species per plot (0.25 ha), evenness of
0.75 ± 0.01, Shannon diversity of 2.31 ± 0.05, and Simpson index of 0.83 ± 0.01. The
three most abundant families were Fabaceae (5 species), Asteraceae (4), and
Anacardiaceae (4). Regarding plant life forms, the forest is composed of 56 % shrub,
28 % tree, 12 % herb, and 4 % liana species. Cupressus lusitanica, Eucalyptus
camaldulensis and Acacia saligna are exotic species, while the remaining species are
native. Juniperus procera, Olea europaea subsp. cuspidata and Cadia purpurea are the
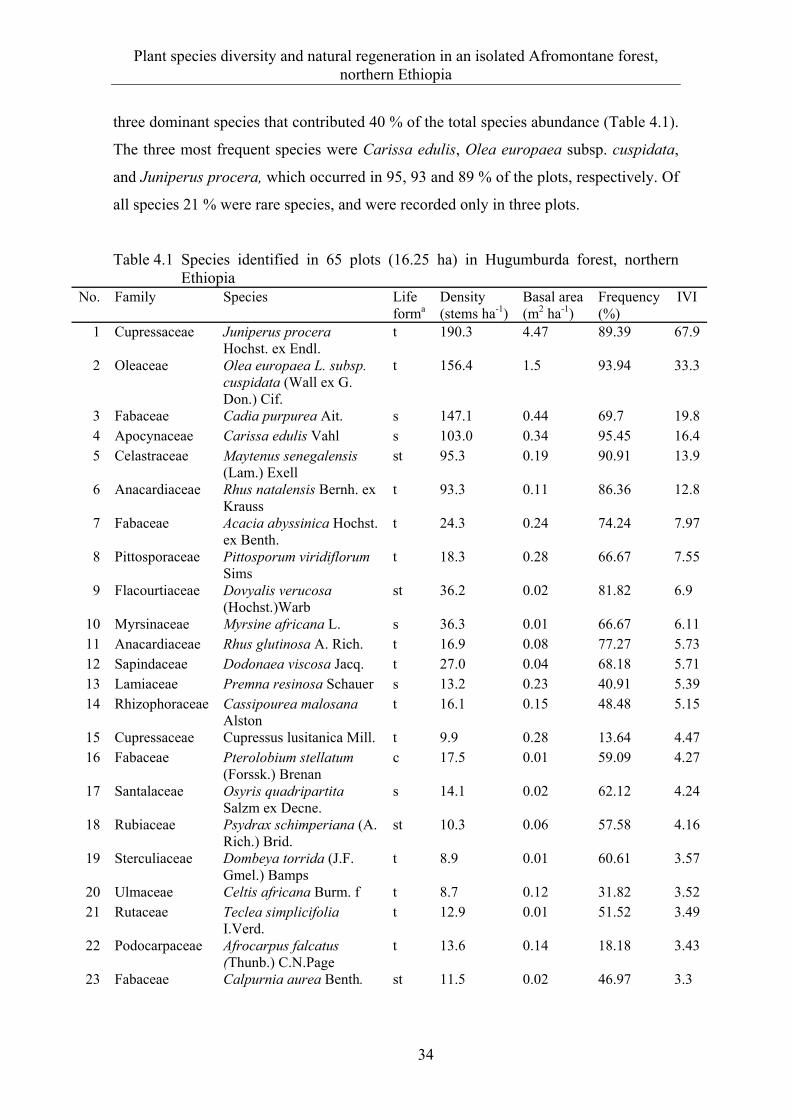
Plant species diversity and natural regeneration in an isolated Afromontane forest, northern Ethiopia
34
three dominant species that contributed 40 % of the total species abundance (Table 4.1).
The three most frequent species were Carissa edulis, Olea europaea subsp. cuspidata,
and Juniperus procera, which occurred in 95, 93 and 89 % of the plots, respectively. Of
all species 21 % were rare species, and were recorded only in three plots.
Table 4.1 Species identified in 65 plots (16.25 ha) in Hugumburda forest, northern Ethiopia
No. Family Species Life forma
Density (stems ha-1)
Basal area (m2 ha-1)
Frequency (%)
IVI
1 Cupressaceae Juniperus procera Hochst. ex Endl.
t 190.3 4.47 89.39 67.9
2 Oleaceae Olea europaea L. subsp. cuspidata (Wall ex G. Don.) Cif.
t 156.4 1.5 93.94 33.3
3 Fabaceae Cadia purpurea Ait. s 147.1 0.44 69.7 19.84 Apocynaceae Carissa edulis Vahl s 103.0 0.34 95.45 16.45 Celastraceae Maytenus senegalensis
(Lam.) Exell st 95.3 0.19 90.91 13.9
6 Anacardiaceae Rhus natalensis Bernh. ex Krauss
t 93.3 0.11 86.36 12.8
7 Fabaceae Acacia abyssinica Hochst. ex Benth.
t 24.3 0.24 74.24 7.97
8 Pittosporaceae Pittosporum viridiflorum Sims
t 18.3 0.28 66.67 7.55
9 Flacourtiaceae Dovyalis verucosa (Hochst.)Warb
st 36.2 0.02 81.82 6.9
10 Myrsinaceae Myrsine africana L. s 36.3 0.01 66.67 6.1111 Anacardiaceae Rhus glutinosa A. Rich. t 16.9 0.08 77.27 5.7312 Sapindaceae Dodonaea viscosa Jacq. t 27.0 0.04 68.18 5.7113 Lamiaceae Premna resinosa Schauer s 13.2 0.23 40.91 5.3914 Rhizophoraceae Cassipourea malosana
Alston t 16.1 0.15 48.48 5.15
15 Cupressaceae Cupressus lusitanica Mill. t 9.9 0.28 13.64 4.4716 Fabaceae Pterolobium stellatum
(Forssk.) Brenan c 17.5 0.01 59.09 4.27
17 Santalaceae Osyris quadripartita Salzm ex Decne.
s 14.1 0.02 62.12 4.24
18 Rubiaceae Psydrax schimperiana (A. Rich.) Brid.
st 10.3 0.06 57.58 4.16
19 Sterculiaceae Dombeya torrida (J.F. Gmel.) Bamps
t 8.9 0.01 60.61 3.57
20 Ulmaceae Celtis africana Burm. f t 8.7 0.12 31.82 3.5221 Rutaceae Teclea simplicifolia
I.Verd. t 12.9 0.01 51.52 3.49
22 Podocarpaceae Afrocarpus falcatus (Thunb.) C.N.Page
t 13.6 0.14 18.18 3.43
23 Fabaceae Calpurnia aurea Benth. st 11.5 0.02 46.97 3.3
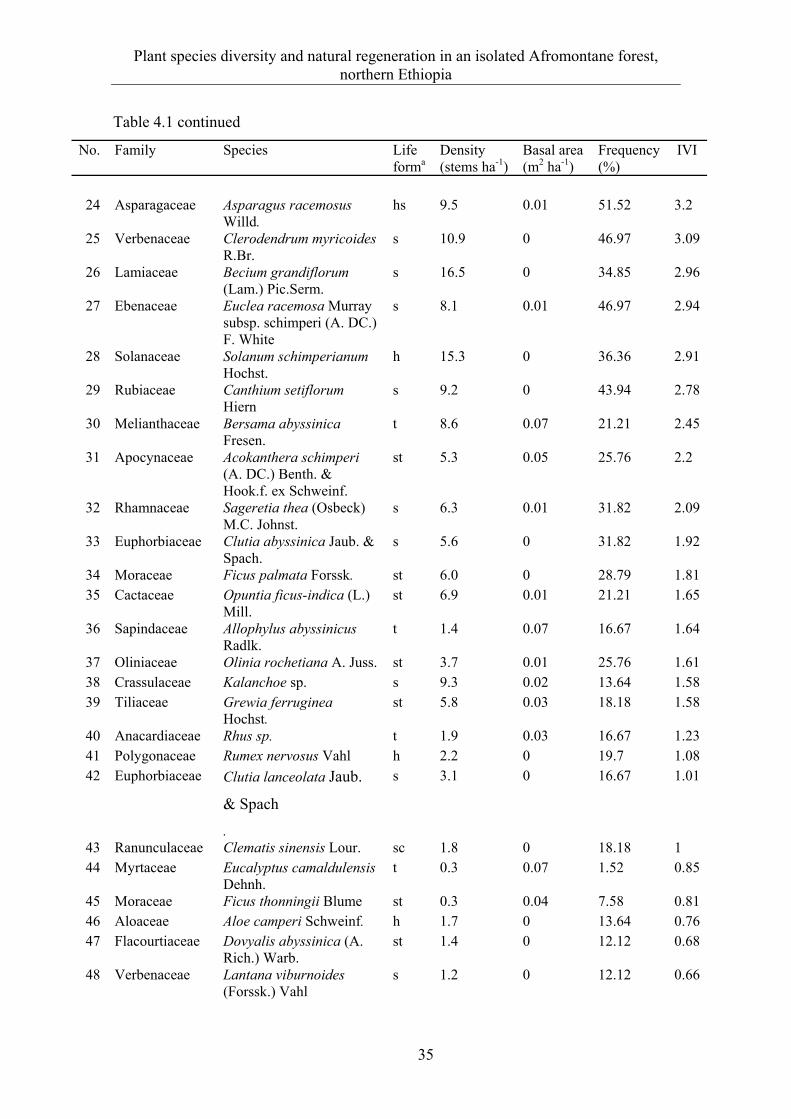
Plant species diversity and natural regeneration in an isolated Afromontane forest, northern Ethiopia
35
Table 4.1 continued
No. Family Species Life forma
Density (stems ha-1)
Basal area (m2 ha-1)
Frequency (%)
IVI
24 Asparagaceae Asparagus racemosus
Willd. hs 9.5 0.01 51.52 3.2
25 Verbenaceae Clerodendrum myricoides R.Br.
s 10.9 0 46.97 3.09
26 Lamiaceae Becium grandiflorum (Lam.) Pic.Serm.
s 16.5 0 34.85 2.96
27 Ebenaceae Euclea racemosa Murray subsp. schimperi (A. DC.) F. White
s 8.1 0.01 46.97 2.94
28 Solanaceae Solanum schimperianum Hochst.
h 15.3 0 36.36 2.91
29 Rubiaceae Canthium setiflorum Hiern
s 9.2 0 43.94 2.78
30 Melianthaceae Bersama abyssinica Fresen.
t 8.6 0.07 21.21 2.45
31 Apocynaceae Acokanthera schimperi (A. DC.) Benth. & Hook.f. ex Schweinf.
st 5.3 0.05 25.76 2.2
32 Rhamnaceae Sageretia thea (Osbeck) M.C. Johnst.
s 6.3 0.01 31.82 2.09
33 Euphorbiaceae Clutia abyssinica Jaub. & Spach.
s 5.6 0 31.82 1.92
34 Moraceae Ficus palmata Forssk. st 6.0 0 28.79 1.8135 Cactaceae Opuntia ficus-indica (L.)
Mill. st 6.9 0.01 21.21 1.65
36 Sapindaceae Allophylus abyssinicus Radlk.
t 1.4 0.07 16.67 1.64
37 Oliniaceae Olinia rochetiana A. Juss. st 3.7 0.01 25.76 1.6138 Crassulaceae Kalanchoe sp. s 9.3 0.02 13.64 1.5839 Tiliaceae Grewia ferruginea
Hochst. st 5.8 0.03 18.18 1.58
40 Anacardiaceae Rhus sp. t 1.9 0.03 16.67 1.2341 Polygonaceae Rumex nervosus Vahl h 2.2 0 19.7 1.0842 Euphorbiaceae Clutia lanceolata Jaub.
& Spach
.
s 3.1 0 16.67 1.01
43 Ranunculaceae Clematis sinensis Lour. sc 1.8 0 18.18 144 Myrtaceae Eucalyptus camaldulensis
Dehnh. t 0.3 0.07 1.52 0.85
45 Moraceae Ficus thonningii Blume st 0.3 0.04 7.58 0.8146 Aloaceae Aloe camperi Schweinf. h 1.7 0 13.64 0.7647 Flacourtiaceae Dovyalis abyssinica (A.
Rich.) Warb. st 1.4 0 12.12 0.68
48 Verbenaceae Lantana viburnoides (Forssk.) Vahl
s 1.2 0 12.12 0.66
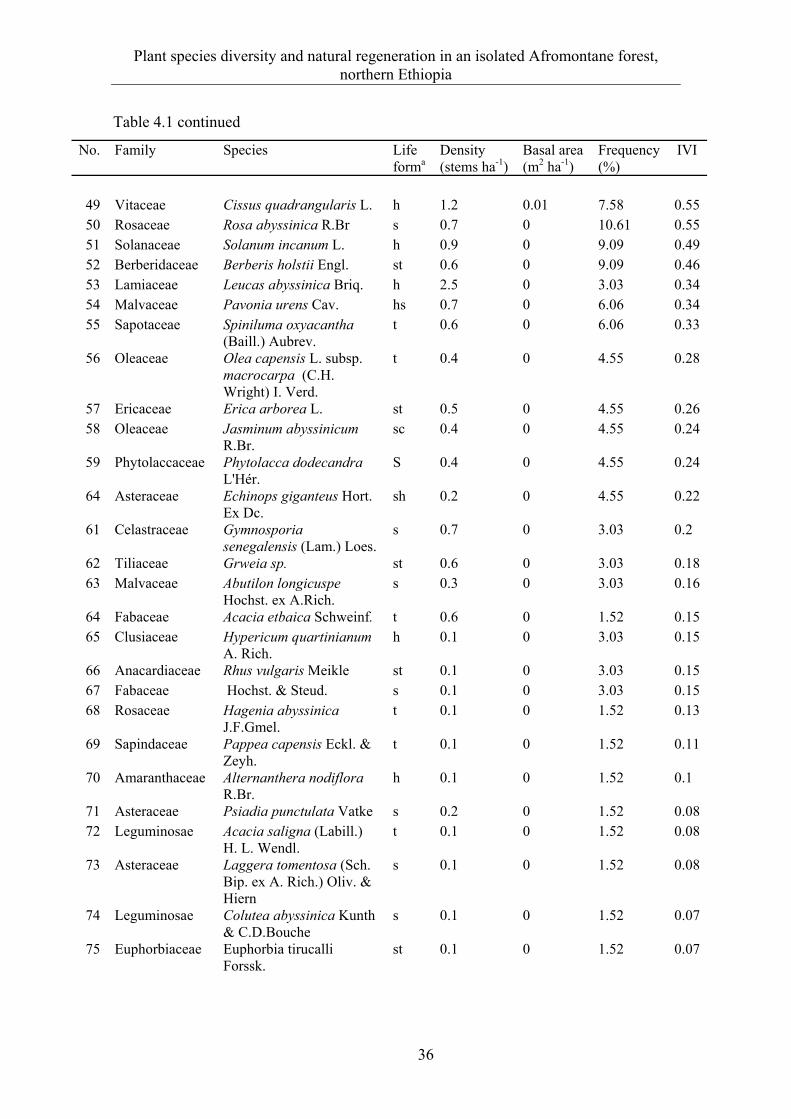
Plant species diversity and natural regeneration in an isolated Afromontane forest, northern Ethiopia
36
Table 4.1 continued
No. Family Species Life forma
Density (stems ha-1)
Basal area (m2 ha-1)
Frequency (%)
IVI
49 Vitaceae Cissus quadrangularis L. h 1.2 0.01 7.58 0.5550 Rosaceae Rosa abyssinica R.Br s 0.7 0 10.61 0.5551 Solanaceae Solanum incanum L. h 0.9 0 9.09 0.4952 Berberidaceae Berberis holstii Engl. st 0.6 0 9.09 0.4653 Lamiaceae Leucas abyssinica Briq. h 2.5 0 3.03 0.3454 Malvaceae Pavonia urens Cav. hs 0.7 0 6.06 0.3455 Sapotaceae Spiniluma oxyacantha
(Baill.) Aubrev. t 0.6 0 6.06 0.33
56 Oleaceae Olea capensis L. subsp. macrocarpa (C.H. Wright) I. Verd.
t 0.4 0 4.55 0.28
57 Ericaceae Erica arborea L. st 0.5 0 4.55 0.2658 Oleaceae Jasminum abyssinicum
R.Br. sc 0.4 0 4.55 0.24
59 Phytolaccaceae Phytolacca dodecandra L'Hér.
S 0.4 0 4.55 0.24
64 Asteraceae Echinops giganteus Hort. Ex Dc.
sh 0.2 0 4.55 0.22
61 Celastraceae Gymnosporia senegalensis (Lam.) Loes.
s 0.7 0 3.03 0.2
62 Tiliaceae Grweia sp. st 0.6 0 3.03 0.1863 Malvaceae Abutilon longicuspe
Hochst. ex A.Rich.s 0.3 0 3.03 0.16
64 Fabaceae Acacia etbaica Schweinf. t 0.6 0 1.52 0.1565 Clusiaceae Hypericum quartinianum
A. Rich. h 0.1 0 3.03 0.15
66 Anacardiaceae Rhus vulgaris Meikle st 0.1 0 3.03 0.1567 Fabaceae Hochst. & Steud. s 0.1 0 3.03 0.1568 Rosaceae Hagenia abyssinica
J.F.Gmel. t 0.1 0 1.52 0.13
69 Sapindaceae Pappea capensis Eckl. & Zeyh.
t 0.1 0 1.52 0.11
70 Amaranthaceae Alternanthera nodiflora R.Br.
h 0.1 0 1.52 0.1
71 Asteraceae Psiadia punctulata Vatke s 0.2 0 1.52 0.0872 Leguminosae Acacia saligna (Labill.)
H. L. Wendl. t 0.1 0 1.52 0.08
73 Asteraceae Laggera tomentosa (Sch. Bip. ex A. Rich.) Oliv. & Hiern
s 0.1 0 1.52 0.08
74 Leguminosae Colutea abyssinica Kunth & C.D.Bouche
s 0.1 0 1.52 0.07
75 Euphorbiaceae Euphorbia tirucalli Forssk.
st 0.1 0 1.52 0.07
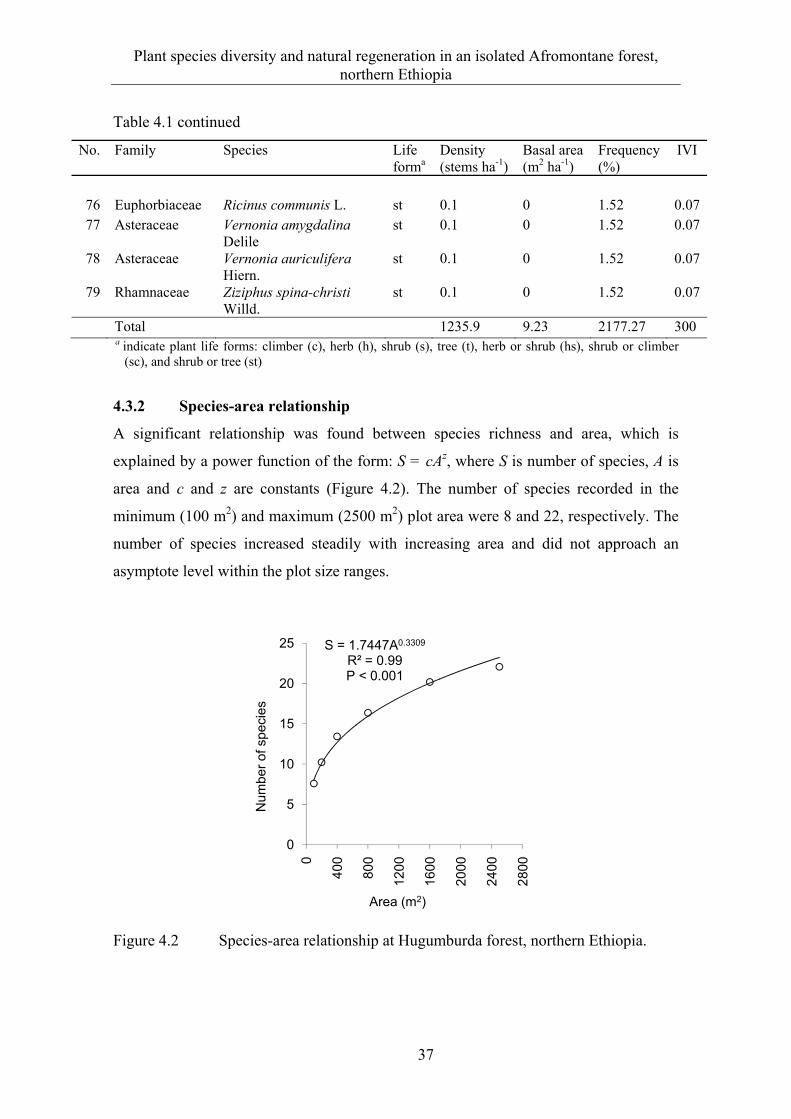
Plant species diversity and natural regeneration in an isolated Afromontane forest, northern Ethiopia
37
Table 4.1 continued
No. Family Species Life forma
Density (stems ha-1)
Basal area (m2 ha-1)
Frequency (%)
IVI
76 Euphorbiaceae Ricinus communis L. st 0.1 0 1.52 0.0777 Asteraceae Vernonia amygdalina
Delile st 0.1 0 1.52 0.07
78 Asteraceae Vernonia auriculifera Hiern.
st 0.1 0 1.52 0.07
79 Rhamnaceae Ziziphus spina-christi Willd.
st 0.1 0 1.52 0.07
Total 1235.9 9.23 2177.27 300 a indicate plant life forms: climber (c), herb (h), shrub (s), tree (t), herb or shrub (hs), shrub or climber
(sc), and shrub or tree (st)
4.3.2 Species-area relationship
A significant relationship was found between species richness and area, which is
explained by a power function of the form: S = cAz, where S is number of species, A is
area and c and z are constants (Figure 4.2). The number of species recorded in the
minimum (100 m2) and maximum (2500 m2) plot area were 8 and 22, respectively. The
number of species increased steadily with increasing area and did not approach an
asymptote level within the plot size ranges.
Figure 4.2 Species-area relationship at Hugumburda forest, northern Ethiopia.
S = 1.7447A0.3309
R² = 0.99P < 0.001
0
5
10
15
20
25
0
400
800
1200
1600
2000
2400
2800
Num
ber
of s
peci
es
Area (m2)
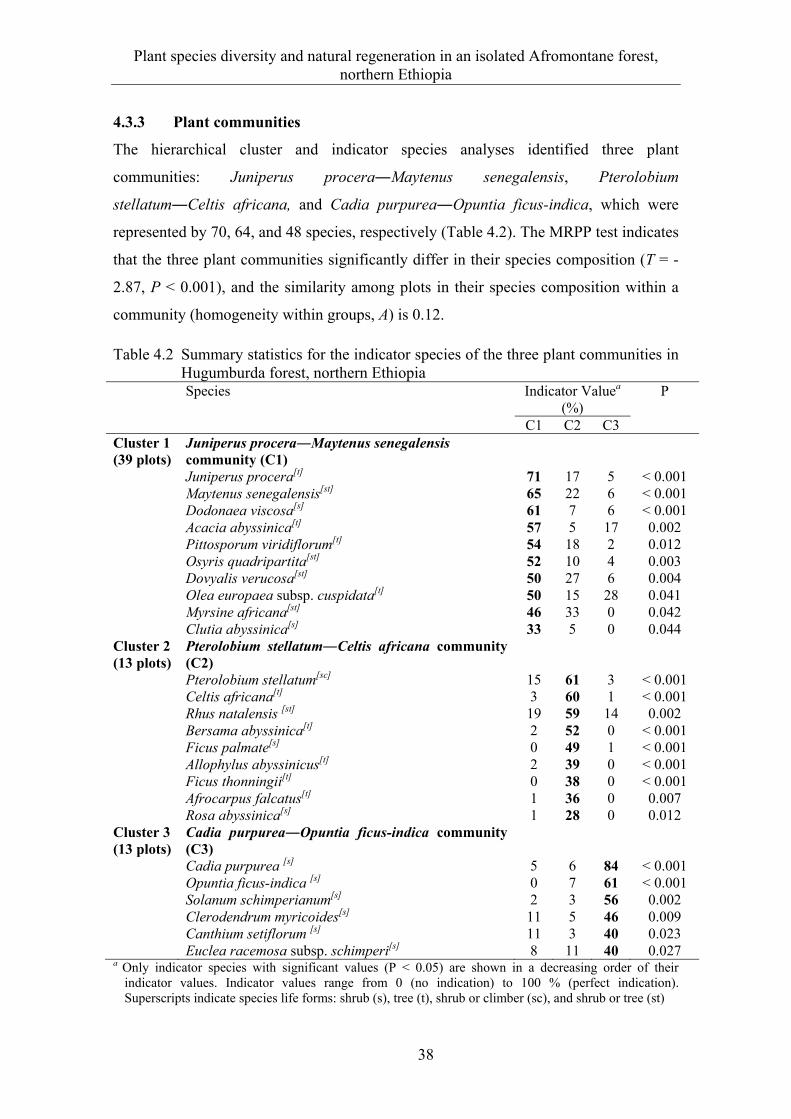
Plant species diversity and natural regeneration in an isolated Afromontane forest, northern Ethiopia
38
4.3.3 Plant communities
The hierarchical cluster and indicator species analyses identified three plant
communities: Juniperus procera―Maytenus senegalensis, Pterolobium
stellatum―Celtis africana, and Cadia purpurea―Opuntia ficus-indica, which were
represented by 70, 64, and 48 species, respectively (Table 4.2). The MRPP test indicates
that the three plant communities significantly differ in their species composition (T = -
2.87, P < 0.001), and the similarity among plots in their species composition within a
community (homogeneity within groups, A) is 0.12.
Table 4.2 Summary statistics for the indicator species of the three plant communities in Hugumburda forest, northern Ethiopia
Species Indicator Valuea (%)
P
C1 C2 C3 Cluster 1 (39 plots)
Juniperus procera―Maytenus senegalensis community (C1)
Juniperus procera[t] 71 17 5 < 0.001 Maytenus senegalensis[st] 65 22 6 < 0.001 Dodonaea viscosa[s] 61 7 6 < 0.001 Acacia abyssinica[t] 57 5 17 0.002 Pittosporum viridiflorum[t] 54 18 2 0.012 Osyris quadripartita[st] 52 10 4 0.003 Dovyalis verucosa[st] 50 27 6 0.004 Olea europaea subsp. cuspidata[t] 50 15 28 0.041 Myrsine africana[st] 46 33 0 0.042 Clutia abyssinica[s] 33 5 0 0.044 Cluster 2 (13 plots)
Pterolobium stellatum―Celtis africana community (C2)
Pterolobium stellatum[sc] 15 61 3 < 0.001 Celtis africana[t] 3 60 1 < 0.001 Rhus natalensis [st] 19 59 14 0.002 Bersama abyssinica[t] 2 52 0 < 0.001 Ficus palmate[s] 0 49 1 < 0.001 Allophylus abyssinicus[t] 2 39 0 < 0.001 Ficus thonningii[t] 0 38 0 < 0.001 Afrocarpus falcatus[t] 1 36 0 0.007 Rosa abyssinica[s] 1 28 0 0.012 Cluster 3 (13 plots)
Cadia purpurea―Opuntia ficus-indica community (C3)
Cadia purpurea [s] 5 6 84 < 0.001 Opuntia ficus-indica [s] 0 7 61 < 0.001 Solanum schimperianum[s] 2 3 56 0.002 Clerodendrum myricoides[s] 11 5 46 0.009 Canthium setiflorum [s] 11 3 40 0.023 Euclea racemosa subsp. schimperi[s] 8 11 40 0.027 a Only indicator species with significant values (P < 0.05) are shown in a decreasing order of their
indicator values. Indicator values range from 0 (no indication) to 100 % (perfect indication). Superscripts indicate species life forms: shrub (s), tree (t), shrub or climber (sc), and shrub or tree (st)
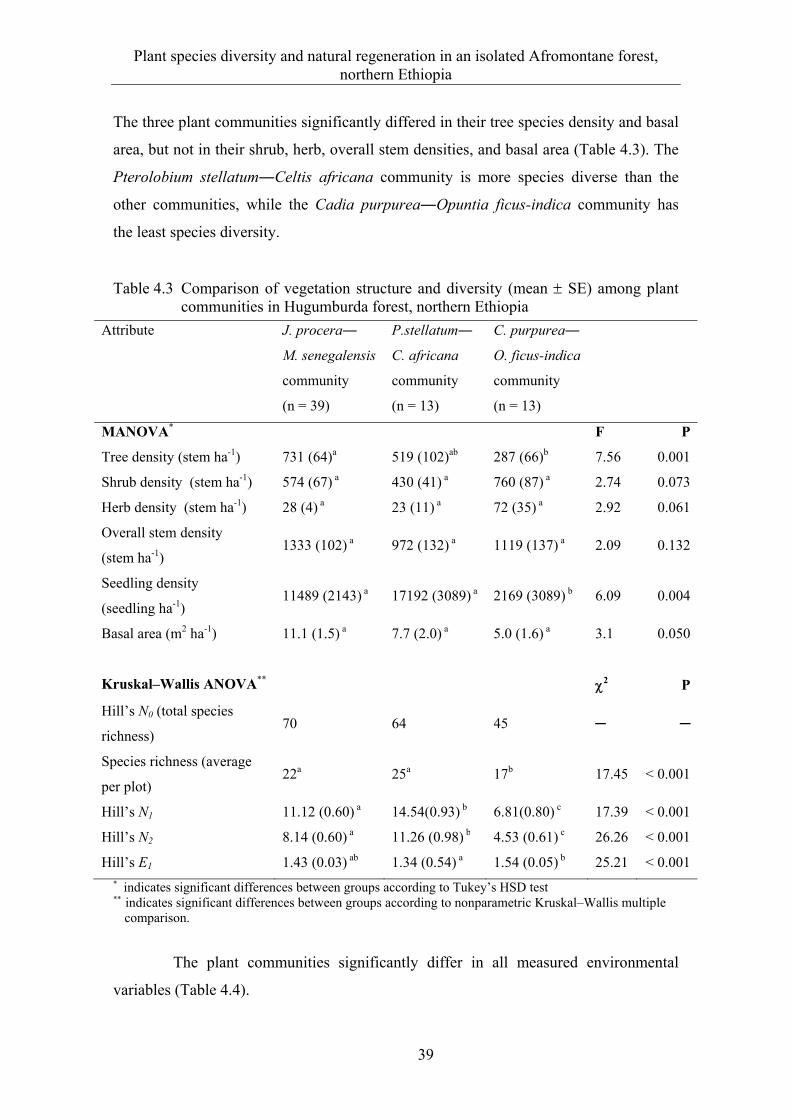
Plant species diversity and natural regeneration in an isolated Afromontane forest, northern Ethiopia
39
The three plant communities significantly differed in their tree species density and basal
area, but not in their shrub, herb, overall stem densities, and basal area (Table 4.3). The
Pterolobium stellatum―Celtis africana community is more species diverse than the
other communities, while the Cadia purpurea―Opuntia ficus-indica community has
the least species diversity.
Table 4.3 Comparison of vegetation structure and diversity (mean SE) among plant communities in Hugumburda forest, northern Ethiopia
* indicates significant differences between groups according to Tukey’s HSD test ** indicates significant differences between groups according to nonparametric Kruskal–Wallis multiple
comparison.
The plant communities significantly differ in all measured environmental
variables (Table 4.4).
Attribute J. procera―
M. senegalensis
community
(n = 39)
P.stellatum―
C. africana
community
(n = 13)
C. purpurea―
O. ficus-indica
community
(n = 13)
MANOVA* F P
Tree density (stem ha-1) 731 (64)a 519 (102)ab 287 (66)b 7.56 0.001
Shrub density (stem ha-1) 574 (67) a 430 (41) a 760 (87) a 2.74 0.073
Herb density (stem ha-1) 28 (4) a 23 (11) a 72 (35) a 2.92 0.061
Overall stem density
(stem ha-1) 1333 (102) a 972 (132) a 1119 (137) a 2.09 0.132
Seedling density
(seedling ha-1) 11489 (2143) a 17192 (3089) a 2169 (3089) b 6.09 0.004
Basal area (m2 ha-1) 11.1 (1.5) a 7.7 (2.0) a 5.0 (1.6) a 3.1 0.050
Kruskal–Wallis ANOVA** 2 P
Hill’s N0 (total species
richness) 70 64 45 ─ ─
Species richness (average
per plot) 22a 25a 17b 17.45 < 0.001
Hill’s N1 11.12 (0.60) a 14.54(0.93) b 6.81(0.80) c 17.39 < 0.001
Hill’s N2 8.14 (0.60) a 11.26 (0.98) b 4.53 (0.61) c 26.26 < 0.001
Hill’s E1 1.43 (0.03) ab 1.34 (0.54) a 1.54 (0.05) b 25.21 < 0.001
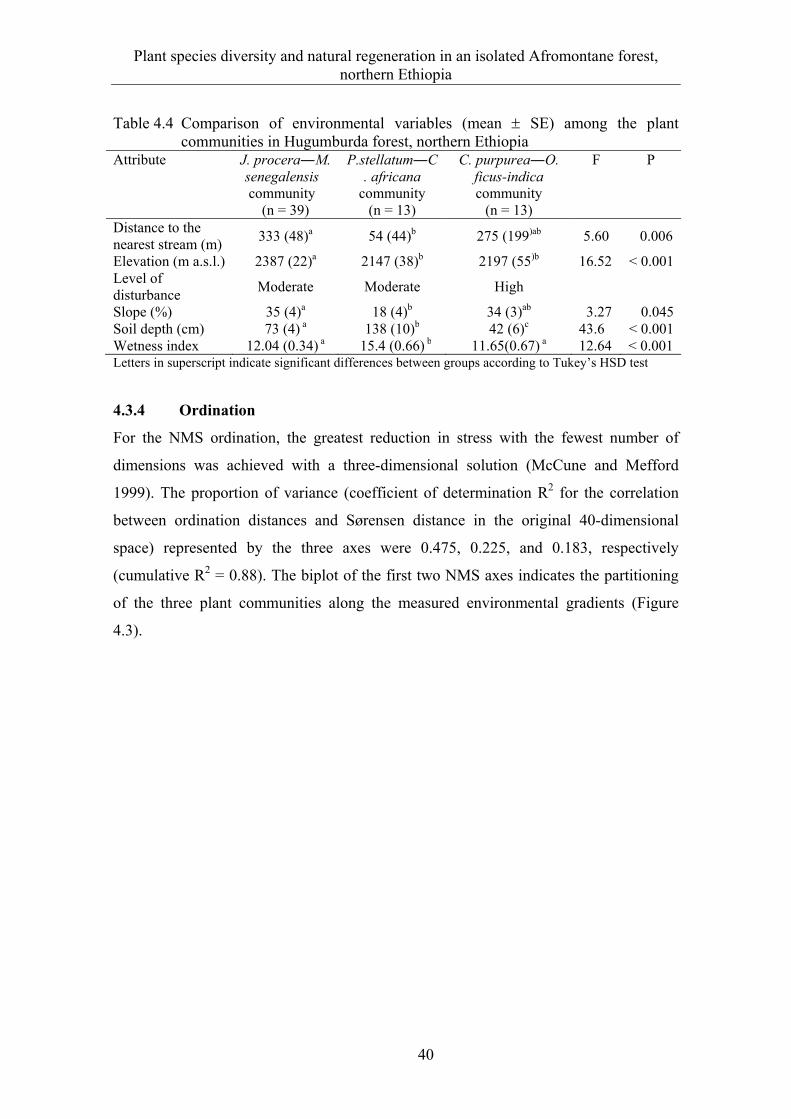
Plant species diversity and natural regeneration in an isolated Afromontane forest, northern Ethiopia
40
Table 4.4 Comparison of environmental variables (mean SE) among the plant communities in Hugumburda forest, northern Ethiopia
Attribute J. procera―M. senegalensis community
(n = 39)
P.stellatum―C. africana
community (n = 13)
C. purpurea―O. ficus-indica community
(n = 13)
F P
Distance to the nearest stream (m)
333 (48)a 54 (44)b 275 (199)ab 5.60 0.006
Elevation (m a.s.l.) 2387 (22)a 2147 (38)b 2197 (55)b 16.52 < 0.001Level of disturbance
Moderate Moderate High
Slope (%) 35 (4)a 18 (4)b 34 (3)ab 3.27 0.045Soil depth (cm) 73 (4) a 138 (10)b 42 (6)c 43.6 < 0.001Wetness index 12.04 (0.34) a 15.4 (0.66) b 11.65(0.67) a 12.64 < 0.001 Letters in superscript indicate significant differences between groups according to Tukey’s HSD test
4.3.4 Ordination
For the NMS ordination, the greatest reduction in stress with the fewest number of
dimensions was achieved with a three-dimensional solution (McCune and Mefford
1999). The proportion of variance (coefficient of determination R2 for the correlation
between ordination distances and Sørensen distance in the original 40-dimensional
space) represented by the three axes were 0.475, 0.225, and 0.183, respectively
(cumulative R2 = 0.88). The biplot of the first two NMS axes indicates the partitioning
of the three plant communities along the measured environmental gradients (Figure
4.3).
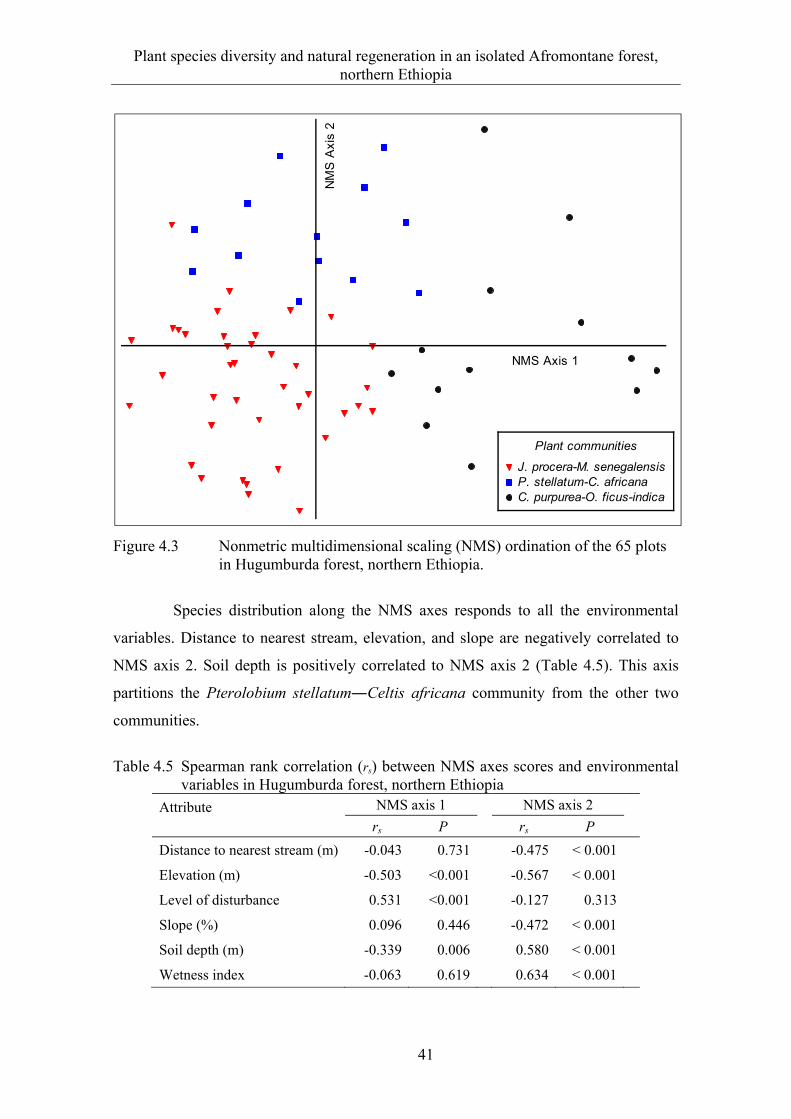
Plant species diversity and natural regeneration in an isolated Afromontane forest, northern Ethiopia
41
Figure 4.3 Nonmetric multidimensional scaling (NMS) ordination of the 65 plots in Hugumburda forest, northern Ethiopia.
Species distribution along the NMS axes responds to all the environmental
variables. Distance to nearest stream, elevation, and slope are negatively correlated to
NMS axis 2. Soil depth is positively correlated to NMS axis 2 (Table 4.5). This axis
partitions the Pterolobium stellatum―Celtis africana community from the other two
communities.
Table 4.5 Spearman rank correlation (rs) between NMS axes scores and environmental
variables in Hugumburda forest, northern Ethiopia
Attribute
NMS axis 1 NMS axis 2
rs P rs P
Distance to nearest stream (m) -0.043 0.731 -0.475 < 0.001
Elevation (m) -0.503 <0.001 -0.567 < 0.001
Level of disturbance 0.531 <0.001 -0.127 0.313
Slope (%) 0.096 0.446 -0.472 < 0.001
Soil depth (m) -0.339 0.006 0.580 < 0.001
Wetness index -0.063 0.619 0.634 < 0.001
NMS Axis 1
NM
S A
xis
2
Plant communities
J. procera-M. senegalensisP. stellatum-C. africanaC. purpurea-O. ficus-indica

Plant species diversity and natural regeneration in an isolated Afromontane forest, northern Ethiopia
42
The Pterolobium stellatum―Celtis africana community dominantly found at the lower
elevation, which is characterized by a gentle slope, deep soil, and is closer to streams
with higher soil moisture, while the other communities dominantly occur on gently to
steep slopes at middle and upper elevations with medium to shallow soil depths (Figure
4.4). The level of disturbance is significantly correlated to NMS axis 1, which partitions
the Cadia purpurea―Opuntia ficus-indica community from the other communities. The
NMS axis 3 is correlated to disturbance only.
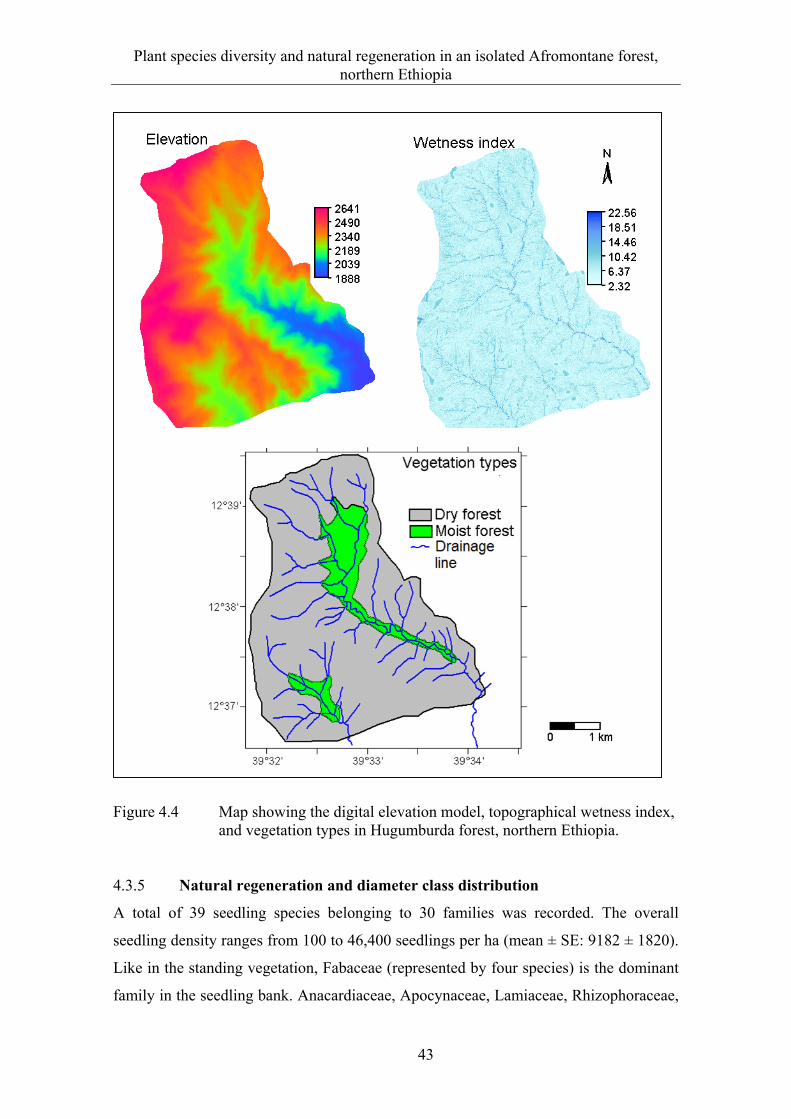
Plant species diversity and natural regeneration in an isolated Afromontane forest, northern Ethiopia
43
Figure 4.4 Map showing the digital elevation model, topographical wetness index, and vegetation types in Hugumburda forest, northern Ethiopia.
4.3.5 Natural regeneration and diameter class distribution
A total of 39 seedling species belonging to 30 families was recorded. The overall
seedling density ranges from 100 to 46,400 seedlings per ha (mean ± SE: 9182 ± 1820).
Like in the standing vegetation, Fabaceae (represented by four species) is the dominant
family in the seedling bank. Anacardiaceae, Apocynaceae, Lamiaceae, Rhizophoraceae,
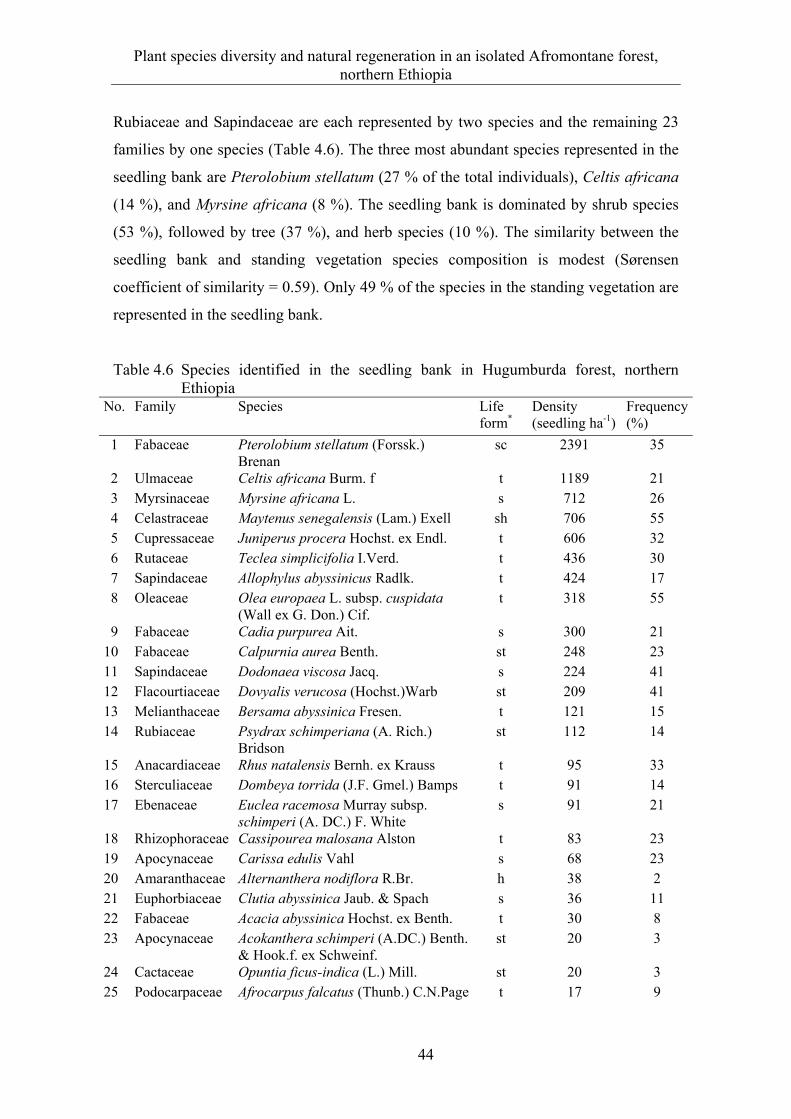
Plant species diversity and natural regeneration in an isolated Afromontane forest, northern Ethiopia
44
Rubiaceae and Sapindaceae are each represented by two species and the remaining 23
families by one species (Table 4.6). The three most abundant species represented in the
seedling bank are Pterolobium stellatum (27 % of the total individuals), Celtis africana
(14 %), and Myrsine africana (8 %). The seedling bank is dominated by shrub species
(53 %), followed by tree (37 %), and herb species (10 %). The similarity between the
seedling bank and standing vegetation species composition is modest (Sørensen
coefficient of similarity = 0.59). Only 49 % of the species in the standing vegetation are
represented in the seedling bank.
Table 4.6 Species identified in the seedling bank in Hugumburda forest, northern Ethiopia
No. Family Species Life form*
Density (seedling ha-1)
Frequency (%)
1 Fabaceae Pterolobium stellatum (Forssk.) Brenan
sc 2391 35
2 Ulmaceae Celtis africana Burm. f t 1189 21 3 Myrsinaceae Myrsine africana L. s 712 26 4 Celastraceae Maytenus senegalensis (Lam.) Exell sh 706 55 5 Cupressaceae Juniperus procera Hochst. ex Endl. t 606 32 6 Rutaceae Teclea simplicifolia I.Verd. t 436 30 7 Sapindaceae Allophylus abyssinicus Radlk. t 424 17 8 Oleaceae Olea europaea L. subsp. cuspidata
(Wall ex G. Don.) Cif. t 318 55
9 Fabaceae Cadia purpurea Ait. s 300 21 10 Fabaceae Calpurnia aurea Benth. st 248 23 11 Sapindaceae Dodonaea viscosa Jacq. s 224 41 12 Flacourtiaceae Dovyalis verucosa (Hochst.)Warb st 209 41 13 Melianthaceae Bersama abyssinica Fresen. t 121 15 14 Rubiaceae Psydrax schimperiana (A. Rich.)
Bridson st 112 14
15 Anacardiaceae Rhus natalensis Bernh. ex Krauss t 95 33 16 Sterculiaceae Dombeya torrida (J.F. Gmel.) Bamps t 91 14 17 Ebenaceae Euclea racemosa Murray subsp.
schimperi (A. DC.) F. White s 91 21
18 Rhizophoraceae Cassipourea malosana Alston t 83 23 19 Apocynaceae Carissa edulis Vahl s 68 23 20 Amaranthaceae Alternanthera nodiflora R.Br. h 38 2 21 Euphorbiaceae Clutia abyssinica Jaub. & Spach s 36 11 22 Fabaceae Acacia abyssinica Hochst. ex Benth. t 30 8 23 Apocynaceae Acokanthera schimperi (A.DC.) Benth.
& Hook.f. ex Schweinf. st 20 3
24 Cactaceae Opuntia ficus-indica (L.) Mill. st 20 3 25 Podocarpaceae Afrocarpus falcatus (Thunb.) C.N.Page t 17 9
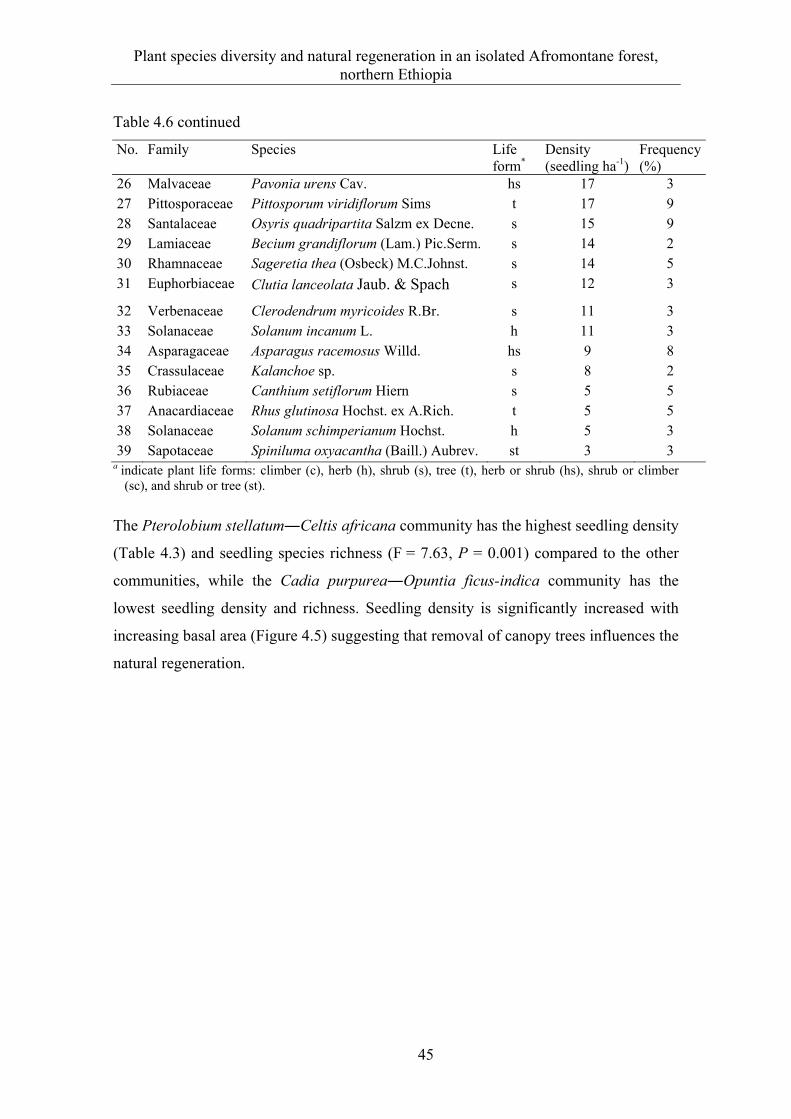
Plant species diversity and natural regeneration in an isolated Afromontane forest, northern Ethiopia
45
Table 4.6 continued
No. Family Species Life form*
Density (seedling ha-1)
Frequency (%)
26 Malvaceae Pavonia urens Cav. hs 17 3 27 Pittosporaceae Pittosporum viridiflorum Sims t 17 9 28 Santalaceae Osyris quadripartita Salzm ex Decne. s 15 9 29 Lamiaceae Becium grandiflorum (Lam.) Pic.Serm. s 14 2 30 Rhamnaceae Sageretia thea (Osbeck) M.C.Johnst. s 14 5 31 Euphorbiaceae Clutia lanceolata Jaub. & Spach s 12 3
32 Verbenaceae Clerodendrum myricoides R.Br. s 11 3 33 Solanaceae Solanum incanum L. h 11 3 34 Asparagaceae Asparagus racemosus Willd. hs 9 8 35 Crassulaceae Kalanchoe sp. s 8 2 36 Rubiaceae Canthium setiflorum Hiern s 5 5 37 Anacardiaceae Rhus glutinosa Hochst. ex A.Rich. t 5 5 38 Solanaceae Solanum schimperianum Hochst. h 5 3 39 Sapotaceae Spiniluma oxyacantha (Baill.) Aubrev. st 3 3
a indicate plant life forms: climber (c), herb (h), shrub (s), tree (t), herb or shrub (hs), shrub or climber (sc), and shrub or tree (st).
The Pterolobium stellatum―Celtis africana community has the highest seedling density
(Table 4.3) and seedling species richness (F = 7.63, P = 0.001) compared to the other
communities, while the Cadia purpurea―Opuntia ficus-indica community has the
lowest seedling density and richness. Seedling density is significantly increased with
increasing basal area (Figure 4.5) suggesting that removal of canopy trees influences the
natural regeneration.
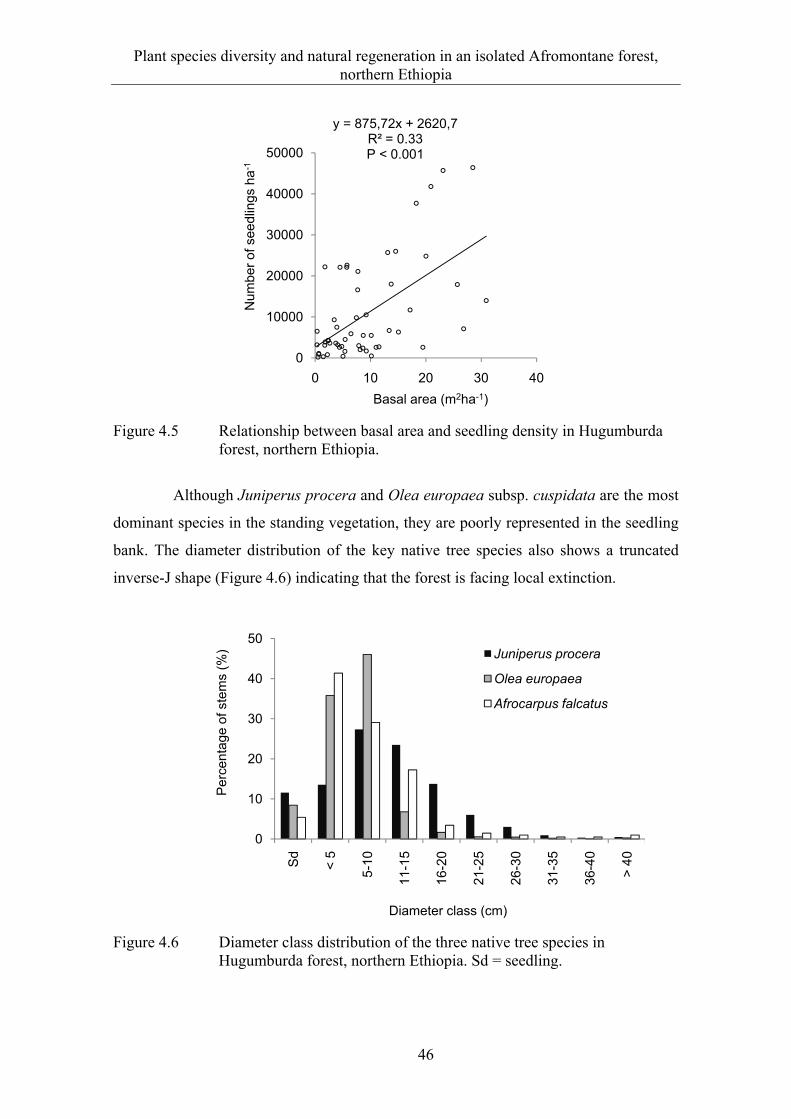
Plant species diversity and natural regeneration in an isolated Afromontane forest, northern Ethiopia
46
Figure 4.5 Relationship between basal area and seedling density in Hugumburda forest, northern Ethiopia.
Although Juniperus procera and Olea europaea subsp. cuspidata are the most
dominant species in the standing vegetation, they are poorly represented in the seedling
bank. The diameter distribution of the key native tree species also shows a truncated
inverse-J shape (Figure 4.6) indicating that the forest is facing local extinction.
Figure 4.6 Diameter class distribution of the three native tree species in Hugumburda forest, northern Ethiopia. Sd = seedling.
y = 875,72x + 2620,7R² = 0.33P < 0.001
0
10000
20000
30000
40000
50000
0 10 20 30 40
Num
ber
of s
eedl
ings
ha
-1
Basal area (m2ha-1)
0
10
20
30
40
50
Sd
< 5
5-10
11-1
5
16-2
0
21-2
5
26-3
0
31-3
5
36-4
0
> 4
0
Per
cent
age
of s
tem
s (%
)
Diameter class (cm)
Juniperus procera
Olea europaea
Afrocarpus falcatus
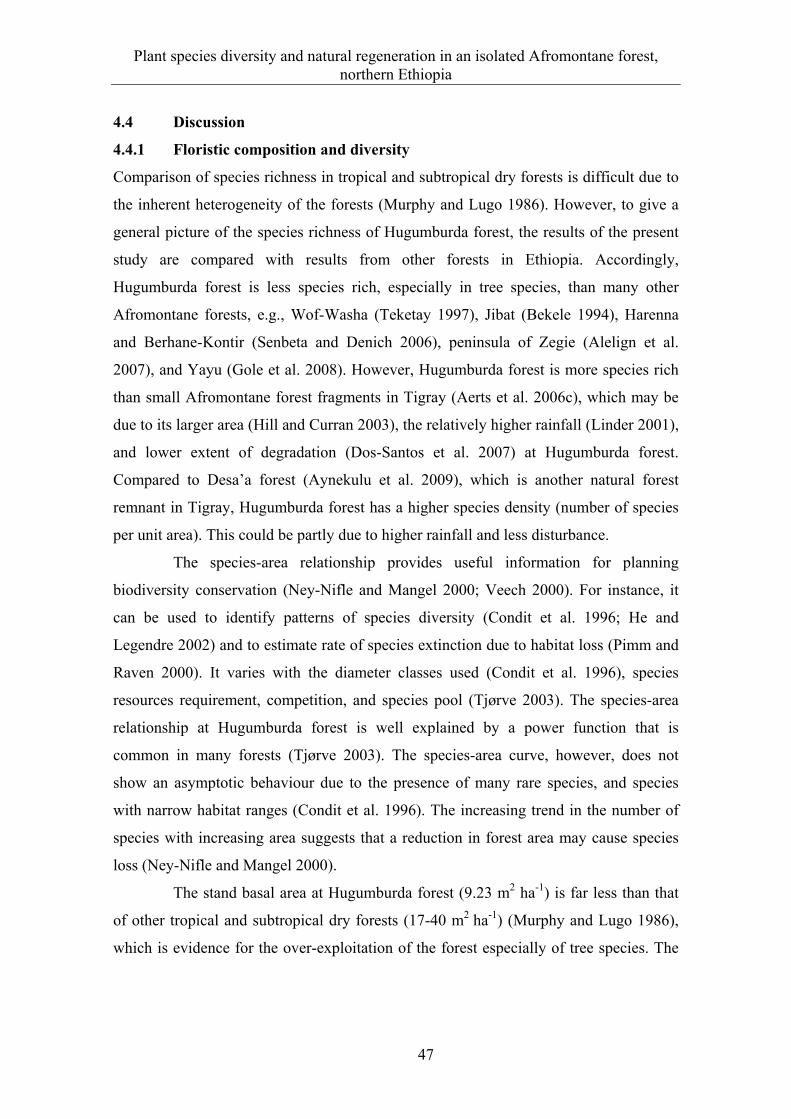
Plant species diversity and natural regeneration in an isolated Afromontane forest, northern Ethiopia
47
4.4 Discussion
4.4.1 Floristic composition and diversity
Comparison of species richness in tropical and subtropical dry forests is difficult due to
the inherent heterogeneity of the forests (Murphy and Lugo 1986). However, to give a
general picture of the species richness of Hugumburda forest, the results of the present
study are compared with results from other forests in Ethiopia. Accordingly,
Hugumburda forest is less species rich, especially in tree species, than many other
Afromontane forests, e.g., Wof-Washa (Teketay 1997), Jibat (Bekele 1994), Harenna
and Berhane-Kontir (Senbeta and Denich 2006), peninsula of Zegie (Alelign et al.
2007), and Yayu (Gole et al. 2008). However, Hugumburda forest is more species rich
than small Afromontane forest fragments in Tigray (Aerts et al. 2006c), which may be
due to its larger area (Hill and Curran 2003), the relatively higher rainfall (Linder 2001),
and lower extent of degradation (Dos-Santos et al. 2007) at Hugumburda forest.
Compared to Desa’a forest (Aynekulu et al. 2009), which is another natural forest
remnant in Tigray, Hugumburda forest has a higher species density (number of species
per unit area). This could be partly due to higher rainfall and less disturbance.
The species-area relationship provides useful information for planning
biodiversity conservation (Ney-Nifle and Mangel 2000; Veech 2000). For instance, it
can be used to identify patterns of species diversity (Condit et al. 1996; He and
Legendre 2002) and to estimate rate of species extinction due to habitat loss (Pimm and
Raven 2000). It varies with the diameter classes used (Condit et al. 1996), species
resources requirement, competition, and species pool (Tjørve 2003). The species-area
relationship at Hugumburda forest is well explained by a power function that is
common in many forests (Tjørve 2003). The species-area curve, however, does not
show an asymptotic behaviour due to the presence of many rare species, and species
with narrow habitat ranges (Condit et al. 1996). The increasing trend in the number of
species with increasing area suggests that a reduction in forest area may cause species
loss (Ney-Nifle and Mangel 2000).
The stand basal area at Hugumburda forest (9.23 m2 ha-1) is far less than that
of other tropical and subtropical dry forests (17-40 m2 ha-1) (Murphy and Lugo 1986),
which is evidence for the over-exploitation of the forest especially of tree species. The
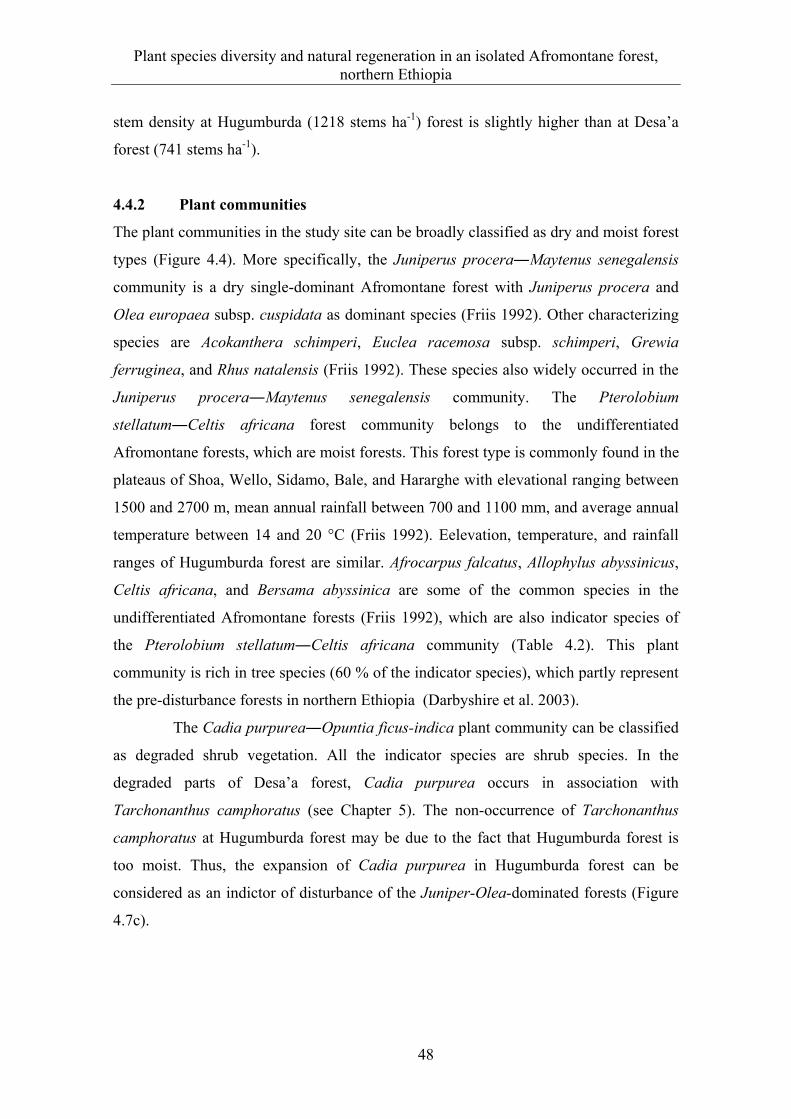
Plant species diversity and natural regeneration in an isolated Afromontane forest, northern Ethiopia
48
stem density at Hugumburda (1218 stems ha-1) forest is slightly higher than at Desa’a
forest (741 stems ha-1).
4.4.2 Plant communities
The plant communities in the study site can be broadly classified as dry and moist forest
types (Figure 4.4). More specifically, the Juniperus procera―Maytenus senegalensis
community is a dry single-dominant Afromontane forest with Juniperus procera and
Olea europaea subsp. cuspidata as dominant species (Friis 1992). Other characterizing
species are Acokanthera schimperi, Euclea racemosa subsp. schimperi, Grewia
ferruginea, and Rhus natalensis (Friis 1992). These species also widely occurred in the
Juniperus procera―Maytenus senegalensis community. The Pterolobium
stellatum―Celtis africana forest community belongs to the undifferentiated
Afromontane forests, which are moist forests. This forest type is commonly found in the
plateaus of Shoa, Wello, Sidamo, Bale, and Hararghe with elevational ranging between
1500 and 2700 m, mean annual rainfall between 700 and 1100 mm, and average annual
temperature between 14 and 20 °C (Friis 1992). Eelevation, temperature, and rainfall
ranges of Hugumburda forest are similar. Afrocarpus falcatus, Allophylus abyssinicus,
Celtis africana, and Bersama abyssinica are some of the common species in the
undifferentiated Afromontane forests (Friis 1992), which are also indicator species of
the Pterolobium stellatum―Celtis africana community (Table 4.2). This plant
community is rich in tree species (60 % of the indicator species), which partly represent
the pre-disturbance forests in northern Ethiopia (Darbyshire et al. 2003).
The Cadia purpurea―Opuntia ficus-indica plant community can be classified
as degraded shrub vegetation. All the indicator species are shrub species. In the
degraded parts of Desa’a forest, Cadia purpurea occurs in association with
Tarchonanthus camphoratus (see Chapter 5). The non-occurrence of Tarchonanthus
camphoratus at Hugumburda forest may be due to the fact that Hugumburda forest is
too moist. Thus, the expansion of Cadia purpurea in Hugumburda forest can be
considered as an indictor of disturbance of the Juniper-Olea-dominated forests (Figure
4.7c).
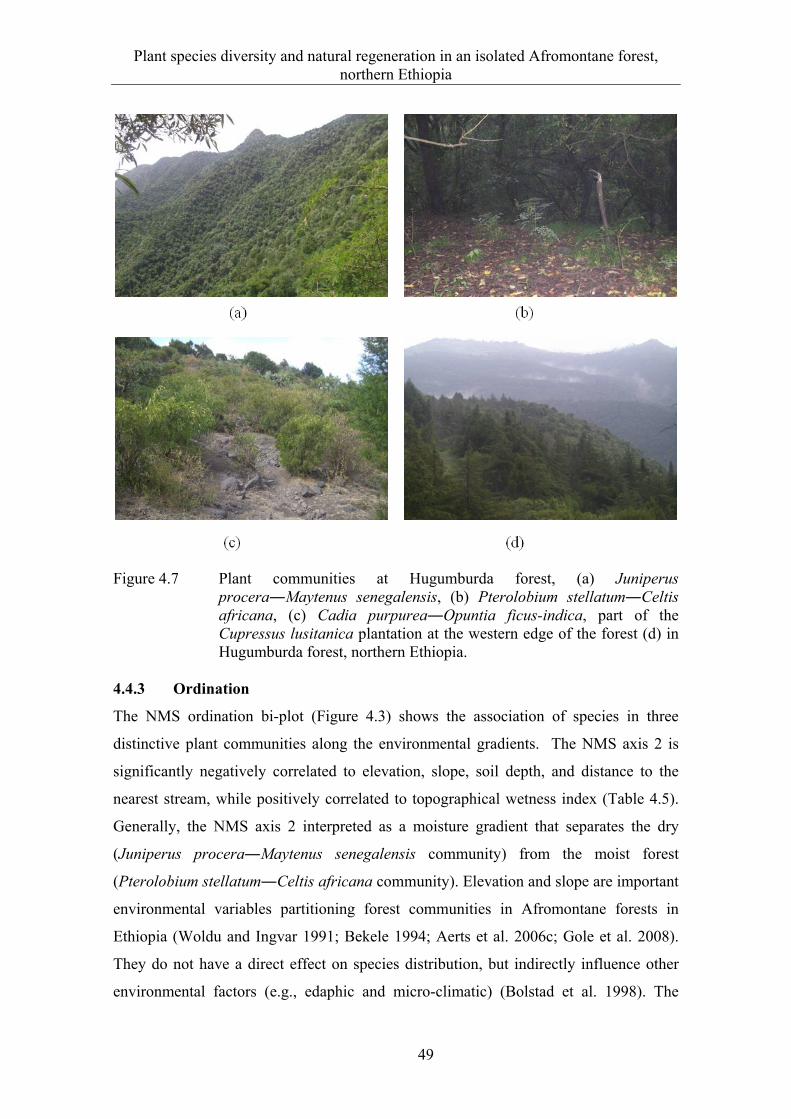
Plant species diversity and natural regeneration in an isolated Afromontane forest, northern Ethiopia
49
Figure 4.7 Plant communities at Hugumburda forest, (a) Juniperus procera―Maytenus senegalensis, (b) Pterolobium stellatum―Celtis africana, (c) Cadia purpurea―Opuntia ficus-indica, part of the Cupressus lusitanica plantation at the western edge of the forest (d) in Hugumburda forest, northern Ethiopia.
4.4.3 Ordination
The NMS ordination bi-plot (Figure 4.3) shows the association of species in three
distinctive plant communities along the environmental gradients. The NMS axis 2 is
significantly negatively correlated to elevation, slope, soil depth, and distance to the
nearest stream, while positively correlated to topographical wetness index (Table 4.5).
Generally, the NMS axis 2 interpreted as a moisture gradient that separates the dry
(Juniperus procera―Maytenus senegalensis community) from the moist forest
(Pterolobium stellatum―Celtis africana community). Elevation and slope are important
environmental variables partitioning forest communities in Afromontane forests in
Ethiopia (Woldu and Ingvar 1991; Bekele 1994; Aerts et al. 2006c; Gole et al. 2008).
They do not have a direct effect on species distribution, but indirectly influence other
environmental factors (e.g., edaphic and micro-climatic) (Bolstad et al. 1998). The
Plant species diversity and natural regeneration in an isolated Afromontane forest, northern Ethiopia
50
gentle slope at the lower elevation contributes to the formation of deep soils with a
better moisture holding capacity (Hodgson 1978), and here the Pterolobium
stellatum―Celtis africana community occurs (Table 4.4). The positive correlation
between wetness index and NMS axis 2 indicates the occurrence of the Pterolobium
stellatum―Celtis africana community in moister parts of the forest. Aerts et al.
(2006c) also found a moist vegetation type along drainage lines in Tigray, which makes
the riverine habitats important islands of moist forests in the dry-forest dominated
landscapes of northern Ethiopia.
The steep slopes surrounding the stream lines may also create a humid micro-
climate by protecting the area from the dry warm air coming from the lowlands and the
cold western highlands. Thus, the higher plant diversity in the Pterolobium
stellatum―Celtis africana community may be due to higher site productivity created by
such mild climate and deep and moist soils (Flombaum and Sala 2008) compared to the
surrounding slopes where the other communities occur. Thus, the higher level of energy
is one explanation for the higher species-richness in this community. A higher energy
level stimulates greater biomass that enables more individuals and species to coexist
(Gaston 2000).
Juniperus procera―Maytenus senegalensis and Cadia purpurea―Opuntia
ficus-indica communities are largely found on the steep slopes, but significantly vary in
their species composition. The two communities are clearly separated along the NMS
axis 1, which is associated with disturbance. This suggests that the Cadia
purpurea―Opuntia ficus-indica communities may not be an old vegetation type, but a
recent succession that gradually replaced the Juniper-Olea-dominated forest following
forest disturbance. The negative significant correlation between NMS axis 1 and basal
area also suggests the influence of disturbance on community composition.
The low level of diversity in the Juniperus procera―Maytenus senegalensis
and Cadia purpurea―Opuntia ficus-indica communities (Table 4.3) are due to the
abundance and dominance of J. procera and C. purpurea in the two plant communities,
respectively. The Cadia purpurea―Opuntia ficus-indica community has a lower
species richness and diversity than the Juniperus procera―Maytenus senegalensis
community, which could be due to the higher disturbance in the Cadia
purpurea―Opuntia ficus-indica community. Disturbance affects species composition
Plant species diversity and natural regeneration in an isolated Afromontane forest, northern Ethiopia
51
and diversity by affecting certain species and size classes, and by changing the light
environment of the understory (Slik 2004; Engelbrecht et al. 2007). The higher species
diversity at the Pterolobium stellatum―Celtis africana community also correlates with
the topographic wetness index. The higher species richness in the wetter site can be due
to the increase in pH with increasing moisture that stimulates plant diversity (Zinko et
al. 2006). The riverine systems are regulated by water and nutrient inputs from the
upper slopes, which make them important areas of high species diversity, especially in
dry environments.
4.4.4 Natural regeneration
A seedling bank is crucial for old forests because it provides individuals that will
eventually influence the composition of future plant communities (Swine 1996).
However, most of the seedlings of the native trees species like Juniperus procera, Olea
europaea subsp. cuspidata, Rhus natalensis, Allophylus abyssinicus, Bersama
abyssinica, Afrocarpus falcatus, and Teclea simplicifolia are poorly represented in the
seedling bank, while some other native species, namely Erica arborea and Hagenia
abyssinica do not occur at all. Similar studies in other dry forest remnants of northern
Ethiopia also report poor regeneration of native tree species (Aerts et al. 2006c;
Aynekulu et al. 2009), suggesting that some species are experiencing local extinction.
Seedling density is highest in the Pterolobium stellatum―Celtis africana
community (Table 4.2). This may be due to moister soils (Benítez-malvido and
Martínez-ramos 2003) and less disturbance (Farwig et al. 2008). Pterolobium stellatum
has the highest seedling abundance, which might be due to the canopy gaps created in
the forest that encourage the spread of the species (Schnitzer et al. 2000). Although such
climber species are important in the overall species diversity, they suppress the
recruitment of other species (Schnitzer et al. 2000).
In dry tropical forests, tree canopies are favorable for germination and early
establishment of seedling (Teketay 1997; Vieira and Scariot 2006; Wassie et al. 2009b).
Basal area can be used as a surrogate for canopy cover. The positive correlation
between seedling density and basal area (Figure 4.5) thus suggests that a reduction in
canopy cover in dry environments may lead to soil desiccation, which hampers
regeneration and seedling establishment of native tree species. Hence, a further increase
Plant species diversity and natural regeneration in an isolated Afromontane forest, northern Ethiopia
52
in canopy gaps in Hugumburda forest may favor the spread of pioneer shrub and herb
species like Cadia purpurea, which may gradually replace the tree-dominated landscape
with encroaching shrubs and herbs.
4.5 Implications for conservation
Three plant communities belonging to dry and moist forests were identified in
Hugumburda forest. This indicates that topographical position (e.g., elevation, distance
to the drainage line) and disturbance are important determinants of species distribution
and community structure. These factors are important and need to be considered in the
design of biodiversity conservation programs. The Pterolobium stellatum―Celtis
africana community is more diverse and contains species (e.g., Afrocarpus falcatus,
Allophylus abyssinicus, Bersama abyssinica, and Celtis africana) that are locally
threatened in northern Ethiopia. Furthermore, this community is found in a narrower
habitat range (e.g., elevation, slope, soil depth) than the other communities, which
makes the rare tree species vulnerable to location extinction. In northern Ethiopia, such
a relatively large habitat, rich in diversity and at the same time with rare species is very
uncommon. Hugumburda forest at a landscape scale and the Pterolobium
stellatum―Celtis africana community at a local scale are thus important species-rich
areas for biodiversity conservation that need conservation priority.
Soil moisture is a major limiting factor for the regeneration of dry forest
species. Thus, maintaining a high canopy cover may create a better soil moisture
environment for a successful regeneration and seedling establishment. The removal of
the canopy species also affects the regeneration of native species while favoring the
spread of colonizing shrub and herb species. Poor representation of most of the native
tree species in the seedling and sapling stages also suggests that the forest is
experiencing extinction. Thus, to conserve such rare and isolated forests, it is important
to (1) conserve the standing canopy species, and (2) complement the natural
regeneration with enrichment planting.
Plant species diversity pattern along an elevational gradient on the western escarpment of the Great Rift Valley, northern Ethiopia
53
5 PLANT SPECIES DIVERSITY PATTERN ALONG AN
ELEVATIONAL GRADIENT ON THE WESTERN ESCARPMENT OF
THE GREAT RIFT VALLEY, NORTHERN ETHIOPIA
5.1 Introduction
Understanding plant species distribution pattern along environmental gradients is
crucial for the understanding of ecological processes and managing ecosystems (Naveh
and Whittaker 1979; Woldu et al. 1989; Noss 1999; Lovett et al. 2000). The concept of
identifying biodiversity-rich areas along environmental gradients has been used, for
instance, as a criterion for biodiversity conservation priority setting (Myers 1988;
Mittermeier et al. 1998; Breshears et al. 2005). Elevation is a complex environmental
factor influencing the distribution patterns of plant species (Perrott and Hamilton 1981;
Hegazy et al. 1998; Lovett et al. 2000; Sánchez-González and López-Mata 2005; Zhao
and Fang 2006). Accordingly, elevation plays a major role in plant species diversity and
floristic formations in Ethiopia (Woldu et al. 1989). Friis (1992) uses elevation as one
major criterion for mapping the forests and forest trees of north-eastern tropical Africa.
The elevational pattern of species diversity is a function of ecological and
evolutionary processes (Lomolino 2001). Elevation determines species distribution in
montane systems by influencing area, climate, geographical isolation of montane
communities, and feedback among zonal communities (Lomolino 2001). Larger ranges
contribute to diversity by supporting large populations, which enhances speciation while
reducing accidental extinction (Rosenzweig 1995). Climate is related to productivity in
which diversity commonly peaks at the intermediate level of productivity (Kassen et al.
2000; Lomolino 2001). Elevation has been widely used as a predictor of regional
species richness and diversity (Kreft and Jetz 2007) due to its influence on moisture and
temperature (Gutierrez et al. 1998; Lovett et al. 2000; Eilu et al. 2004; Sánchez-
González and López-Mata 2005). High-elevation habitats are more isolated from other
similar habitats, which increases the rate of extinction. Species diversity peaks at the
transition zone between two habitats and the respective plant communities (Lomolino
2001).
Studies have shown that response of plant species distribution to elevation
varies among ecosystems (Hegazy et al. 1998; Kessler 2000; Lovett et al. 2000;
Sánchez-González and López-Mata 2005; Grytnes and Beaman 2006). Furthermore,
Plant species diversity pattern along an elevational gradient on the western escarpment of the Great Rift Valley, northern Ethiopia
54
different life forms may respond similarly (e.g., Sánchez-González and López-Mata
2005) or differently (e.g., Ren et al. 2006) to elevation. The response of species richness
to elevation is also affected by the scale of the study, a hump-shaped pattern is
commonly found when data is taken from an entire elevation range (Nogues-Bravo et al.
2008). With decreasing scale, a monotonic pattern is common. Generally, the hump-
shaped species distribution pattern is more common than the monotonic decline with
increasing elevation (Rahbek 1995). Besides the environmental factors, anthropogenic
disturbance affect species diversity. According to the intermediate disturbance
hypothesis (Connell 1978), intermediate disturbance promotes species diversity by
facilitating regeneration of many species (Denslow 1980; Bongers et al. 2009).
However, it is often difficult to determine the influence of the existing environmental
factors and forest history on species assemblage (Mutke and Barthlott 2005).
The study site covers large parts of Desa’a forest. Desa’a forest is an important
habitat for Dracaena ombet, which is listed on the IUCN endangered plant species list
(World Conservation Monitoring Centre 1998), and locally rare tree species like Erica
arborea. Desa’a forest is also an important bird habitat. It is the only habitat in Ethiopia
for Emberiza cineracea (Bird Life International 2008), which is a migratory bird listed
on the IUCN Red List as a Near Threatened species (IUCN 2009). According to
Conservation International’s (2007) lists of global biodiversity hotspots, the study site is
located in the Eastern Afromontane hotspot (Tigray highlands) and the arid Horn of
Africa hotspot (Afar lowlands).
Despite the high conservation value, the natural forest remnants in northern
Ethiopia are poorly studied (Friis 1992; Aerts et al. 2006c), and information necessary
for effective biodiversity conservation is meager (Aerts et al. 2006c). Therefore, the
present study examines patterns of alpha and beta diversity, and community
composition along an elevational gradient.
5.2 Material and methods
5.2.1 Study site
The study was conducted in the western escarpment of the Great Rift Valley that
stretches from the highlands of Tigray to the lowlands of the Afar region in northern
Ethiopia (Figure 5.1). Two transects were taken along the mesic Tigraean plateau to the
Plant species diversity pattern along an elevational gradient on the western escarpment of the Great Rift Valley, northern Ethiopia
55
xeric Afar lowlands. The first transect stretches from Agoro village (Tigray highland,
2400 m a.s.l.; 13°40' N, 39°46') to Shaigubi village (Afar low land, 1000 m a.s.l.; 13°40'
N, 39°52' E), and the second trensect from Esot village on the Tigrean plateau (2760 m
a.s.l., 13°56' N, 39°48' E) to Koneba town of the Afar region at its lower end (1400 m
a.s.l.; 13°56' N, 39°51' E). Both transects cross Desa’a forest, which is one of the 58
national forest priority areas in Ethiopia. Unlike mountainous landscapes, the upper
limit of the study area is a plateau, where land area per bioclimatic belt has no impact
on vegetation distribution (Körner 2007).
Based on the classification of the forests and forest trees of northeast tropical
Africa (Friis 1992), Desa’a forest is categorized as a dry single-dominant Afromontane
forest, which is characterized by a dry climate (annual precipitation less than 1000 mm)
with Juniperus procera and Olea europaea subsp. cuspidata as dominant species. A
large part of the study area is formed on shale, limestone, and sandstone of the Tertiary
and Mesozoic era (TFAP 1996). The diverse geological formations have led to soil
variability, and the dominating soil types in the study region are Leptosols, Cambisols,
Vertisols, Regosols and Arenosols (TFAP 1996). The study area receives a mean annual
rainfall of 532 mm (Abegaz 2005). The climate of the study area is influenced by
elevation in which the decline in rainfall and the increase in temperature from the
upland plateau to the eastern slopes are sharp (Degefu 1987).
.
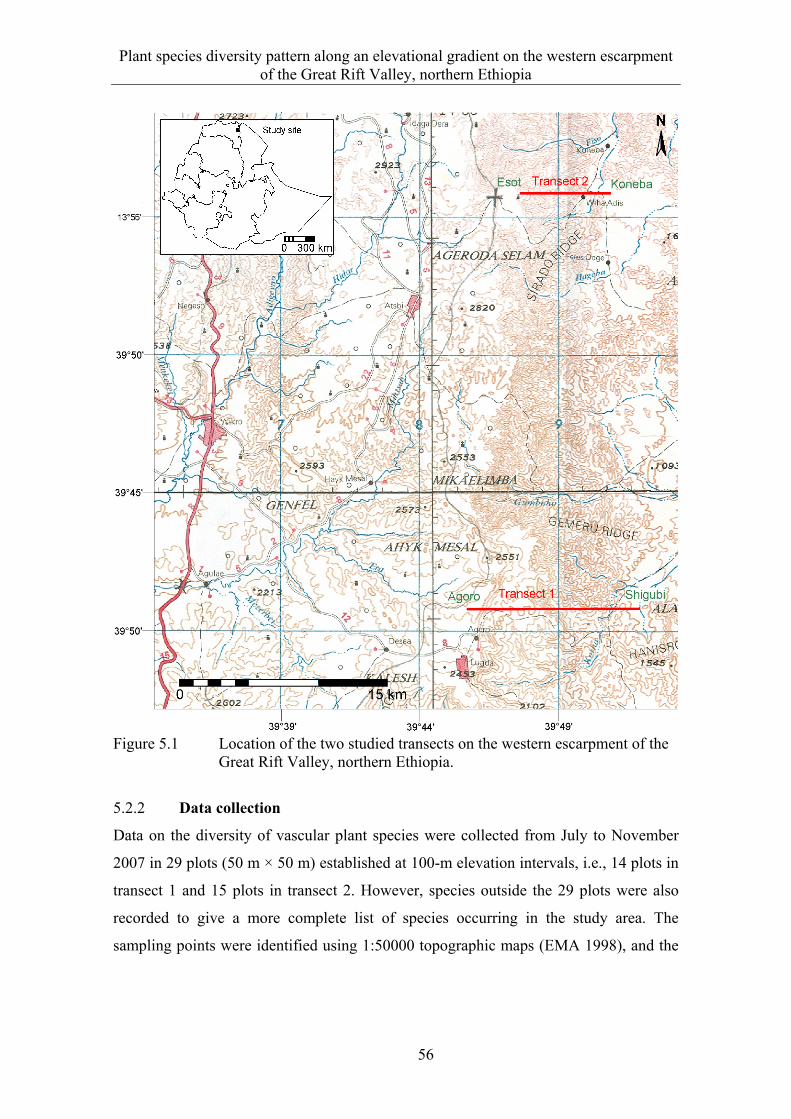
Plant species diversity pattern along an elevational gradient on the western escarpment of the Great Rift Valley, northern Ethiopia
56
Figure 5.1 Location of the two studied transects on the western escarpment of the
Great Rift Valley, northern Ethiopia.
5.2.2 Data collection
Data on the diversity of vascular plant species were collected from July to November
2007 in 29 plots (50 m × 50 m) established at 100-m elevation intervals, i.e., 14 plots in
transect 1 and 15 plots in transect 2. However, species outside the 29 plots were also
recorded to give a more complete list of species occurring in the study area. The
sampling points were identified using 1:50000 topographic maps (EMA 1998), and the
Plant species diversity pattern along an elevational gradient on the western escarpment of the Great Rift Valley, northern Ethiopia
57
transect layout and coordinates of the plots were identified using ILWIS GIS software
(ITC 2001). Plots were identified in the field using a GPS device.
All individual plants were enumerated, and stand density and basal area per
hectare for all trees with a height > 1.5 m and diameter > 2 cm at breast height (DBH)
were calculated for each sampling plot. Species were identified in the field and at the
National Herbarium, Addis Ababa University.
5.2.3 Data analyses
Species diversity
Species diversity (-diversity) is determined using the Shannon diversity index. In this
study, Whittaker’s (1972) -diversity (βw) is used as a general indicator of species
turnover (Eq. 5.1) and pair-wise comparisons of species turnover among plant
elevational gradients and communities were determined using the Wilson and Shmida’s
(1984) -diversity (Eq. 5.2).
1w
Scβ
s (5.1)
where βw isWhittaker’s -diversity, Sc is the total number of species in the composite sample (i.e. gamma diversity), and s is the average number of species found in the plots.
βT = 2
b c
a b c
(5.2)
where βT is Wilson and Shmida’s beta diversity, a is total number of species that occur in both communities, b is the total number of species in the second community but not in the focal one, and c is the number of species in the focal community but not in the second one.
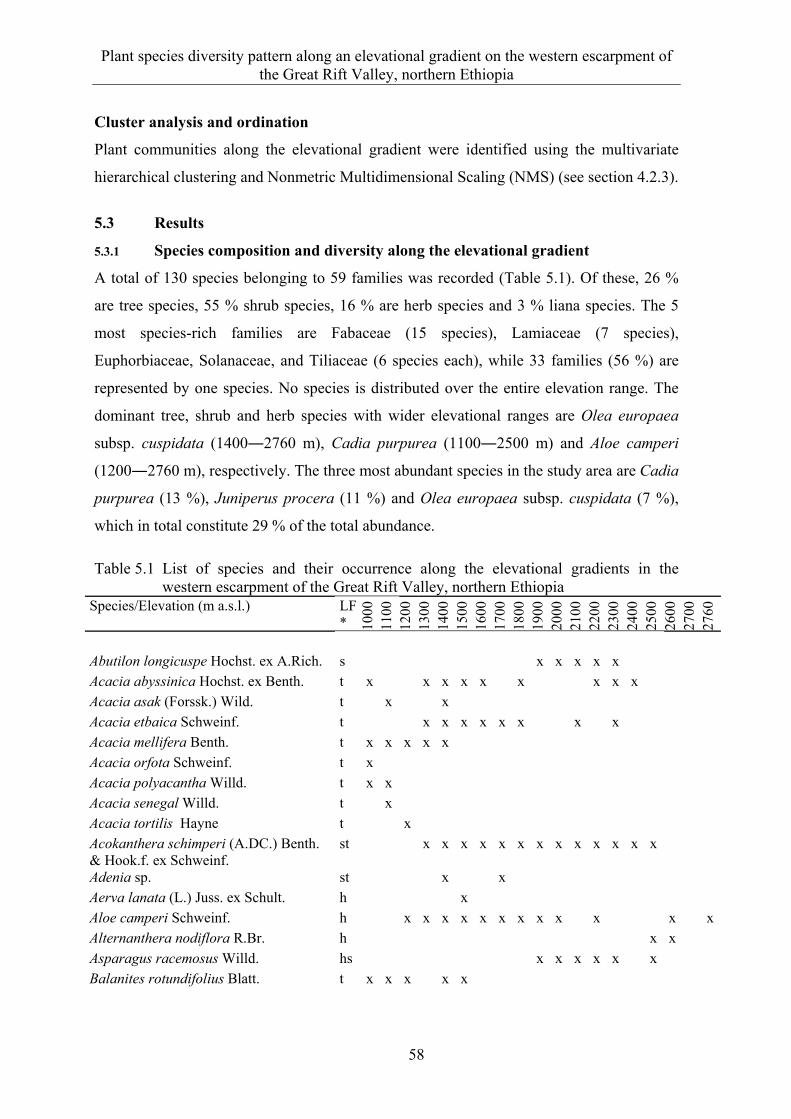
Plant species diversity pattern along an elevational gradient on the western escarpment of the Great Rift Valley, northern Ethiopia
58
Cluster analysis and ordination
Plant communities along the elevational gradient were identified using the multivariate
hierarchical clustering and Nonmetric Multidimensional Scaling (NMS) (see section 4.2.3).
5.3 Results
5.3.1 Species composition and diversity along the elevational gradient
A total of 130 species belonging to 59 families was recorded (Table 5.1). Of these, 26 %
are tree species, 55 % shrub species, 16 % are herb species and 3 % liana species. The 5
most species-rich families are Fabaceae (15 species), Lamiaceae (7 species),
Euphorbiaceae, Solanaceae, and Tiliaceae (6 species each), while 33 families (56 %) are
represented by one species. No species is distributed over the entire elevation range. The
dominant tree, shrub and herb species with wider elevational ranges are Olea europaea
subsp. cuspidata (1400―2760 m), Cadia purpurea (1100―2500 m) and Aloe camperi
(1200―2760 m), respectively. The three most abundant species in the study area are Cadia
purpurea (13 %), Juniperus procera (11 %) and Olea europaea subsp. cuspidata (7 %),
which in total constitute 29 % of the total abundance.
Table 5.1 List of species and their occurrence along the elevational gradients in the
western escarpment of the Great Rift Valley, northern Ethiopia Species/Elevation (m a.s.l.) LF
* 1000
11
00
1200
13
00
1400
15
00
1600
17
00
1800
19
00
2000
21
00
2200
23
00
2400
25
00
2600
27
00
2760
Abutilon longicuspe Hochst. ex A.Rich. s x x x x x Acacia abyssinica Hochst. ex Benth. t x x x x x x x x x Acacia asak (Forssk.) Wild. t x x Acacia etbaica Schweinf. t x x x x x x x x Acacia mellifera Benth. t x x x x x Acacia orfota Schweinf. t x Acacia polyacantha Willd. t x x Acacia senegal Willd. t x Acacia tortilis Hayne t x Acokanthera schimperi (A.DC.) Benth. & Hook.f. ex Schweinf.
st x x x x x x x x x x x x x
Adenia sp. st x x Aerva lanata (L.) Juss. ex Schult. h x Aloe camperi Schweinf. h x x x x x x x x x x x x
Alternanthera nodiflora R.Br. h x x Asparagus racemosus Willd. hs x x x x x x Balanites rotundifolius Blatt. t x x x x x
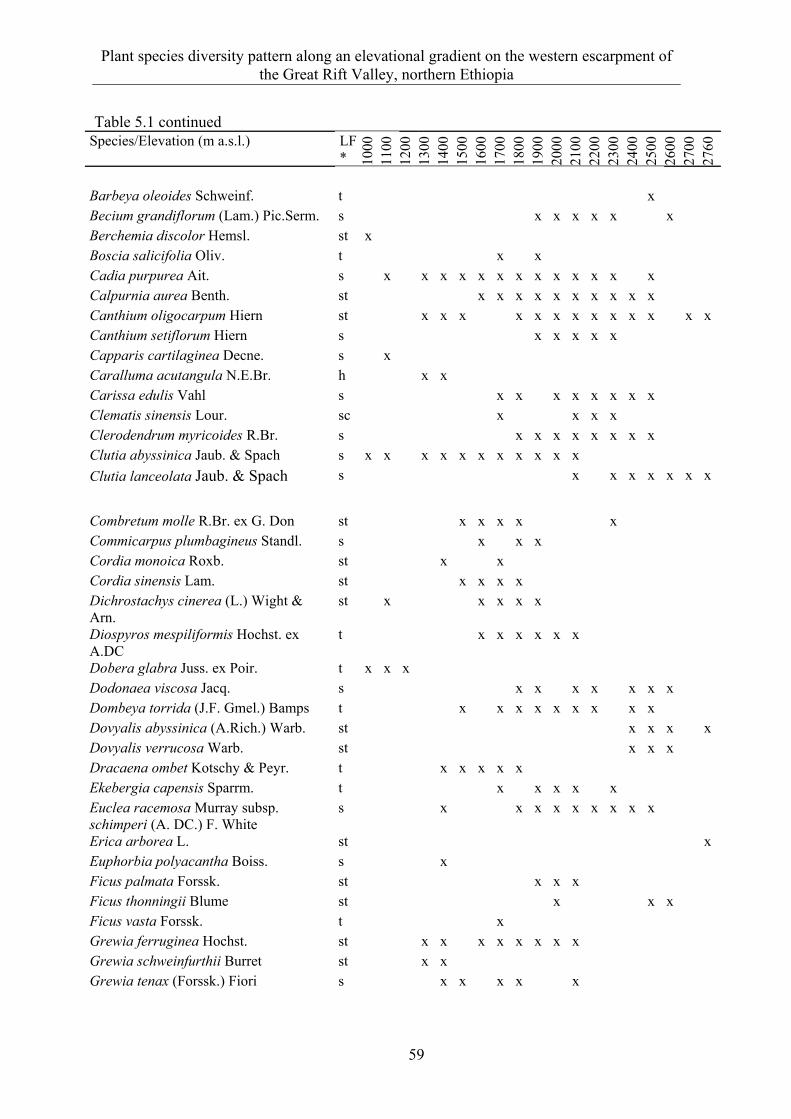
Plant species diversity pattern along an elevational gradient on the western escarpment of the Great Rift Valley, northern Ethiopia
59
Table 5.1 continued Species/Elevation (m a.s.l.) LF
* 1000
11
00
1200
13
00
1400
15
00
1600
17
00
1800
19
00
2000
21
00
2200
23
00
2400
25
00
2600
27
00
2760
Barbeya oleoides Schweinf. t x Becium grandiflorum (Lam.) Pic.Serm. s x x x x x x Berchemia discolor Hemsl. st x Boscia salicifolia Oliv. t x x Cadia purpurea Ait. s x x x x x x x x x x x x x Calpurnia aurea Benth. st x x x x x x x x x x Canthium oligocarpum Hiern st x x x x x x x x x x x x xCanthium setiflorum Hiern s x x x x x Capparis cartilaginea Decne. s x Caralluma acutangula N.E.Br. h x x Carissa edulis Vahl s x x x x x x x x Clematis sinensis Lour. sc x x x x Clerodendrum myricoides R.Br. s x x x x x x x x Clutia abyssinica Jaub. & Spach s x x x x x x x x x x x Clutia lanceolata Jaub. & Spach
s x x x x x x x
Combretum molle R.Br. ex G. Don st x x x x x Commicarpus plumbagineus Standl. s x x x Cordia monoica Roxb. st x x Cordia sinensis Lam. st x x x x Dichrostachys cinerea (L.) Wight & Arn.
st x x x x x
Diospyros mespiliformis Hochst. ex A.DC
t x x x x x x
Dobera glabra Juss. ex Poir. t x x x Dodonaea viscosa Jacq. s x x x x x x x Dombeya torrida (J.F. Gmel.) Bamps t x x x x x x x x x Dovyalis abyssinica (A.Rich.) Warb. st x x x xDovyalis verrucosa Warb. st x x x Dracaena ombet Kotschy & Peyr. t x x x x x Ekebergia capensis Sparrm. t x x x x x Euclea racemosa Murray subsp. schimperi (A. DC.) F. White
s x x x x x x x x x
Erica arborea L. st xEuphorbia polyacantha Boiss. s x Ficus palmata Forssk. st x x x Ficus thonningii Blume st x x x Ficus vasta Forssk. t x Grewia ferruginea Hochst. st x x x x x x x x Grewia schweinfurthii Burret st x x Grewia tenax (Forssk.) Fiori s x x x x x
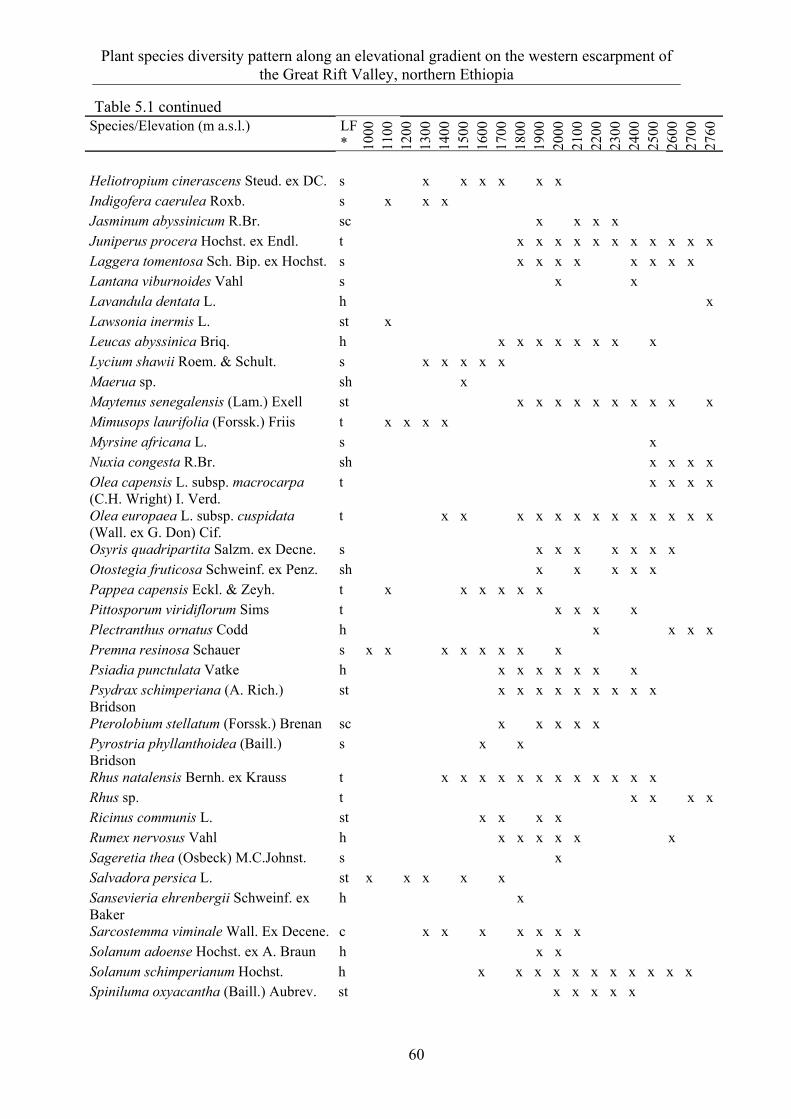
Plant species diversity pattern along an elevational gradient on the western escarpment of the Great Rift Valley, northern Ethiopia
60
Table 5.1 continued Species/Elevation (m a.s.l.) LF
* 1000
11
00
1200
13
00
1400
15
00
1600
17
00
1800
19
00
2000
21
00
2200
23
00
2400
25
00
2600
27
00
2760
Heliotropium cinerascens Steud. ex DC. s x x x x x x Indigofera caerulea Roxb. s x x x Jasminum abyssinicum R.Br. sc x x x x Juniperus procera Hochst. ex Endl. t x x x x x x x x x x xLaggera tomentosa Sch. Bip. ex Hochst. s x x x x x x x x Lantana viburnoides Vahl s x x Lavandula dentata L. h xLawsonia inermis L. st x Leucas abyssinica Briq. h x x x x x x x x Lycium shawii Roem. & Schult. s x x x x x Maerua sp. sh x Maytenus senegalensis (Lam.) Exell st x x x x x x x x x xMimusops laurifolia (Forssk.) Friis t x x x x Myrsine africana L. s x Nuxia congesta R.Br. sh x x x xOlea capensis L. subsp. macrocarpa (C.H. Wright) I. Verd.
t x x x x
Olea europaea L. subsp. cuspidata (Wall. ex G. Don) Cif.
t x x x x x x x x x x x x x
Osyris quadripartita Salzm. ex Decne. s x x x x x x x Otostegia fruticosa Schweinf. ex Penz. sh x x x x x Pappea capensis Eckl. & Zeyh. t x x x x x x Pittosporum viridiflorum Sims t x x x x Plectranthus ornatus Codd h x x x xPremna resinosa Schauer s x x x x x x x x Psiadia punctulata Vatke h x x x x x x x Psydrax schimperiana (A. Rich.) Bridson
st x x x x x x x x x
Pterolobium stellatum (Forssk.) Brenan sc x x x x x Pyrostria phyllanthoidea (Baill.) Bridson
s x x
Rhus natalensis Bernh. ex Krauss t x x x x x x x x x x x x Rhus sp. t x x x xRicinus communis L. st x x x x Rumex nervosus Vahl h x x x x x x Sageretia thea (Osbeck) M.C.Johnst. s x Salvadora persica L. st x x x x x Sansevieria ehrenbergii Schweinf. ex Baker
h x
Sarcostemma viminale Wall. Ex Decene. c x x x x x x x Solanum adoense Hochst. ex A. Braun h x x Solanum schimperianum Hochst. h x x x x x x x x x x x Spiniluma oxyacantha (Baill.) Aubrev. st x x x x x
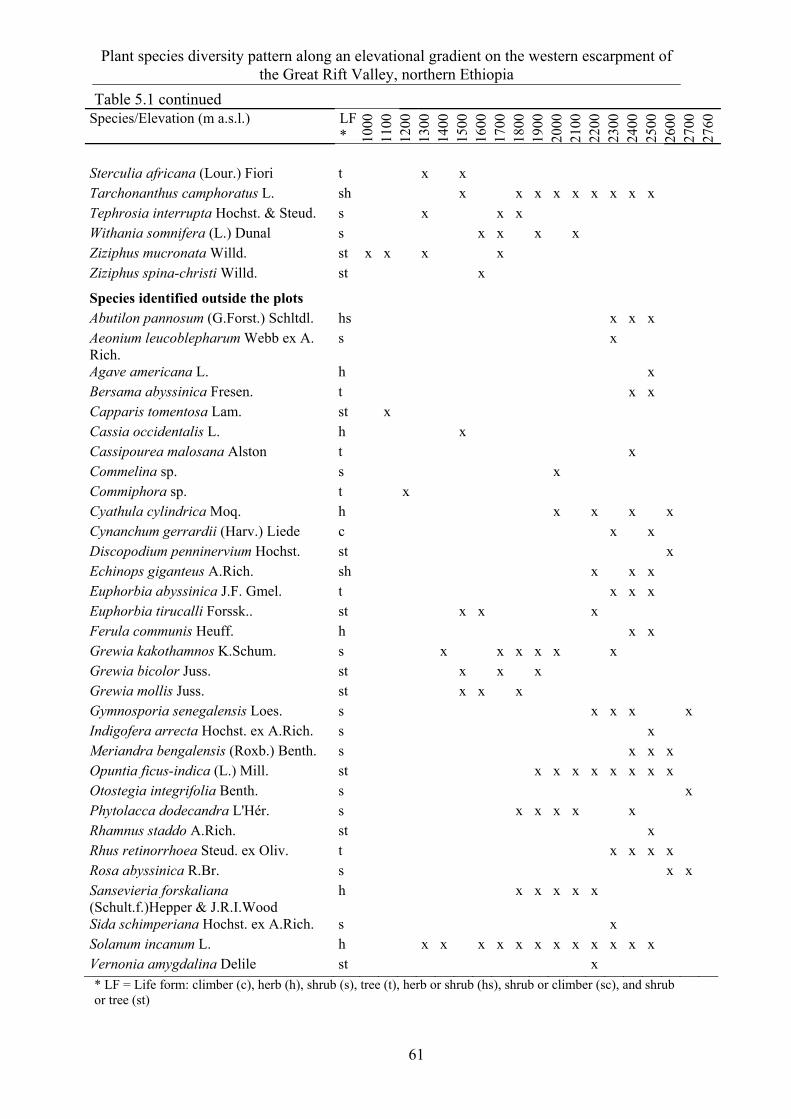
Plant species diversity pattern along an elevational gradient on the western escarpment of the Great Rift Valley, northern Ethiopia
61
Table 5.1 continued Species/Elevation (m a.s.l.) LF
* 1000
11
00
1200
13
00
1400
15
00
1600
17
00
1800
19
00
2000
21
00
2200
23
00
2400
25
00
2600
27
00
2760
Sterculia africana (Lour.) Fiori t x x Tarchonanthus camphoratus L. sh x x x x x x x x x Tephrosia interrupta Hochst. & Steud. s x x x Withania somnifera (L.) Dunal s x x x x Ziziphus mucronata Willd. st x x x x Ziziphus spina-christi Willd. st x
Species identified outside the plots Abutilon pannosum (G.Forst.) Schltdl. hs x x x Aeonium leucoblepharum Webb ex A. Rich.
s x
Agave americana L. h x Bersama abyssinica Fresen. t x x Capparis tomentosa Lam. st x Cassia occidentalis L. h x Cassipourea malosana Alston t x Commelina sp. s x Commiphora sp. t x Cyathula cylindrica Moq. h x x x x Cynanchum gerrardii (Harv.) Liede c x x Discopodium penninervium Hochst. st x Echinops giganteus A.Rich. sh x x x Euphorbia abyssinica J.F. Gmel. t x x x Euphorbia tirucalli Forssk.. st x x x Ferula communis Heuff. h x x Grewia kakothamnos K.Schum. s x x x x x x Grewia bicolor Juss. st x x x Grewia mollis Juss. st x x x Gymnosporia senegalensis Loes. s x x x x Indigofera arrecta Hochst. ex A.Rich. s x Meriandra bengalensis (Roxb.) Benth. s x x x Opuntia ficus-indica (L.) Mill. st x x x x x x x x Otostegia integrifolia Benth. s x Phytolacca dodecandra L'Hér. s x x x x x Rhamnus staddo A.Rich. st x Rhus retinorrhoea Steud. ex Oliv. t x x x x Rosa abyssinica R.Br. s x x Sansevieria forskaliana (Schult.f.)Hepper & J.R.I.Wood
h x x x x x
Sida schimperiana Hochst. ex A.Rich. s x Solanum incanum L. h x x x x x x x x x x x x Vernonia amygdalina Delile st x
* LF = Life form: climber (c), herb (h), shrub (s), tree (t), herb or shrub (hs), shrub or climber (sc), and shrub or tree (st)
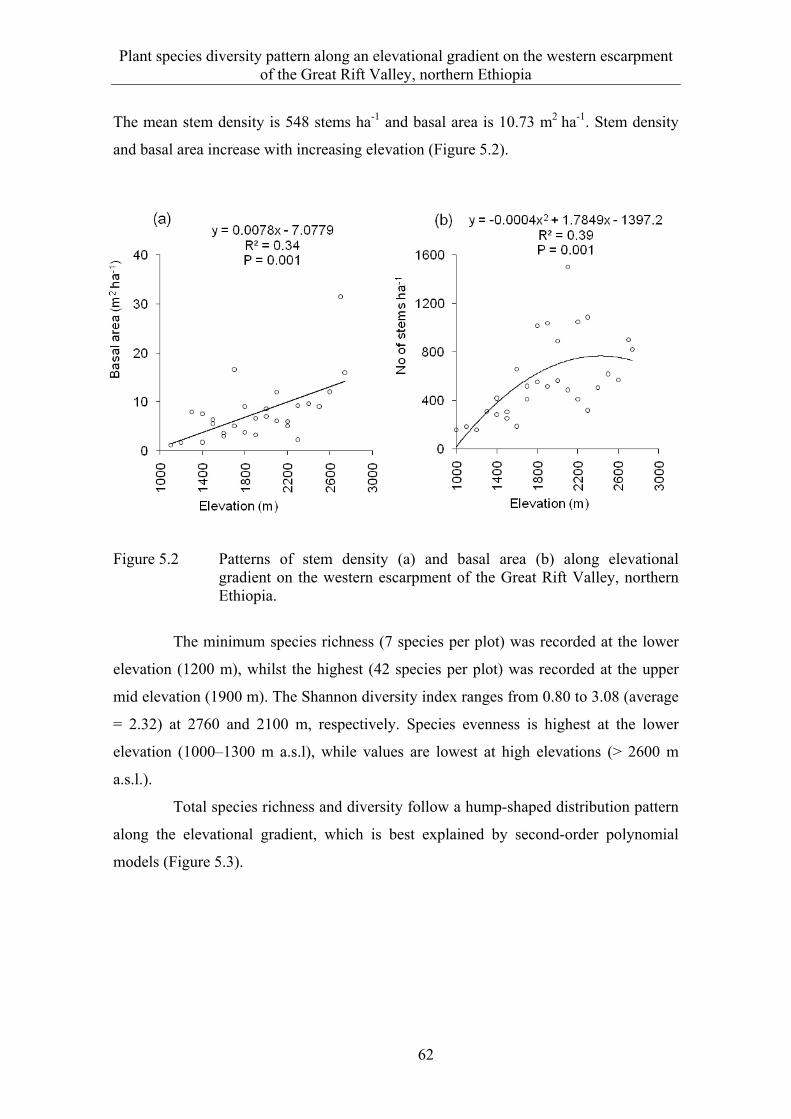
Plant species diversity pattern along an elevational gradient on the western escarpment of the Great Rift Valley, northern Ethiopia
62
The mean stem density is 548 stems ha-1 and basal area is 10.73 m2 ha-1. Stem density
and basal area increase with increasing elevation (Figure 5.2).
Figure 5.2 Patterns of stem density (a) and basal area (b) along elevational
gradient on the western escarpment of the Great Rift Valley, northern Ethiopia.
The minimum species richness (7 species per plot) was recorded at the lower
elevation (1200 m), whilst the highest (42 species per plot) was recorded at the upper
mid elevation (1900 m). The Shannon diversity index ranges from 0.80 to 3.08 (average
= 2.32) at 2760 and 2100 m, respectively. Species evenness is highest at the lower
elevation (1000–1300 m a.s.l), while values are lowest at high elevations (> 2600 m
a.s.l.).
Total species richness and diversity follow a hump-shaped distribution pattern
along the elevational gradient, which is best explained by second-order polynomial
models (Figure 5.3).
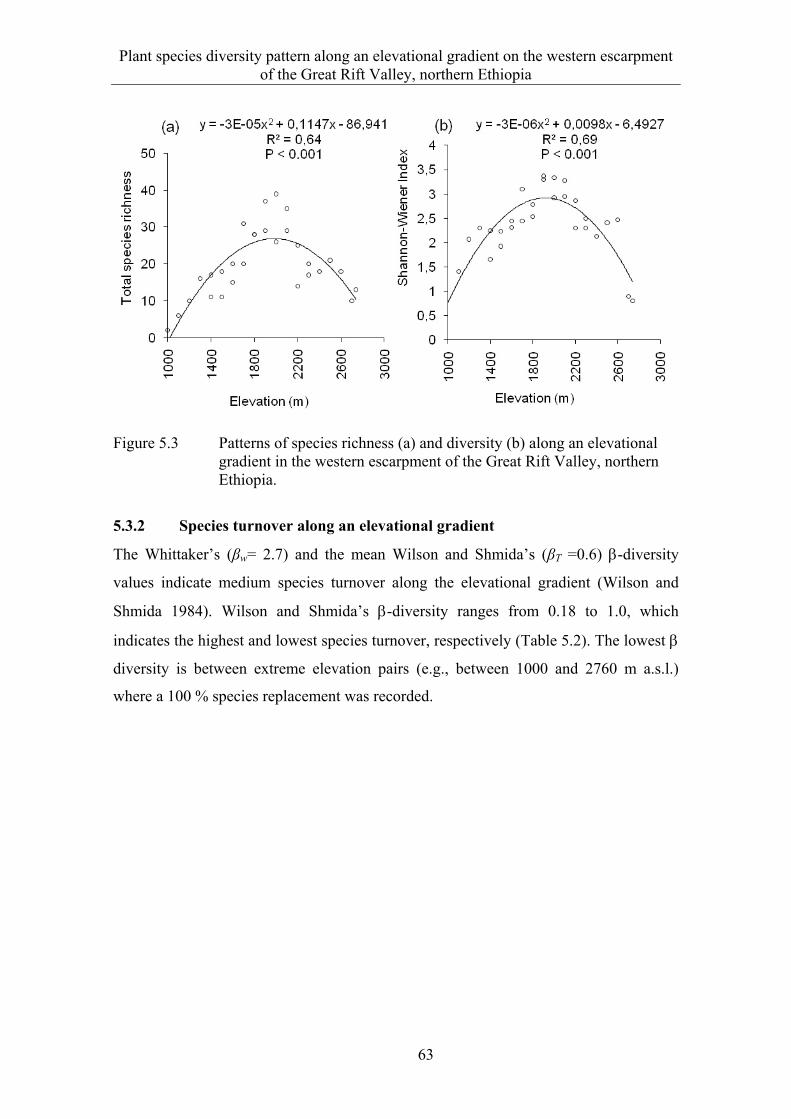
Plant species diversity pattern along an elevational gradient on the western escarpment of the Great Rift Valley, northern Ethiopia
63
Figure 5.3 Patterns of species richness (a) and diversity (b) along an elevational
gradient in the western escarpment of the Great Rift Valley, northern Ethiopia.
5.3.2 Species turnover along an elevational gradient
The Whittaker’s (βw= 2.7) and the mean Wilson and Shmida’s (βT =0.6) -diversity
values indicate medium species turnover along the elevational gradient (Wilson and
Shmida 1984). Wilson and Shmida’s -diversity ranges from 0.18 to 1.0, which
indicates the highest and lowest species turnover, respectively (Table 5.2). The lowest
diversity is between extreme elevation pairs (e.g., between 1000 and 2760 m a.s.l.)
where a 100 % species replacement was recorded.
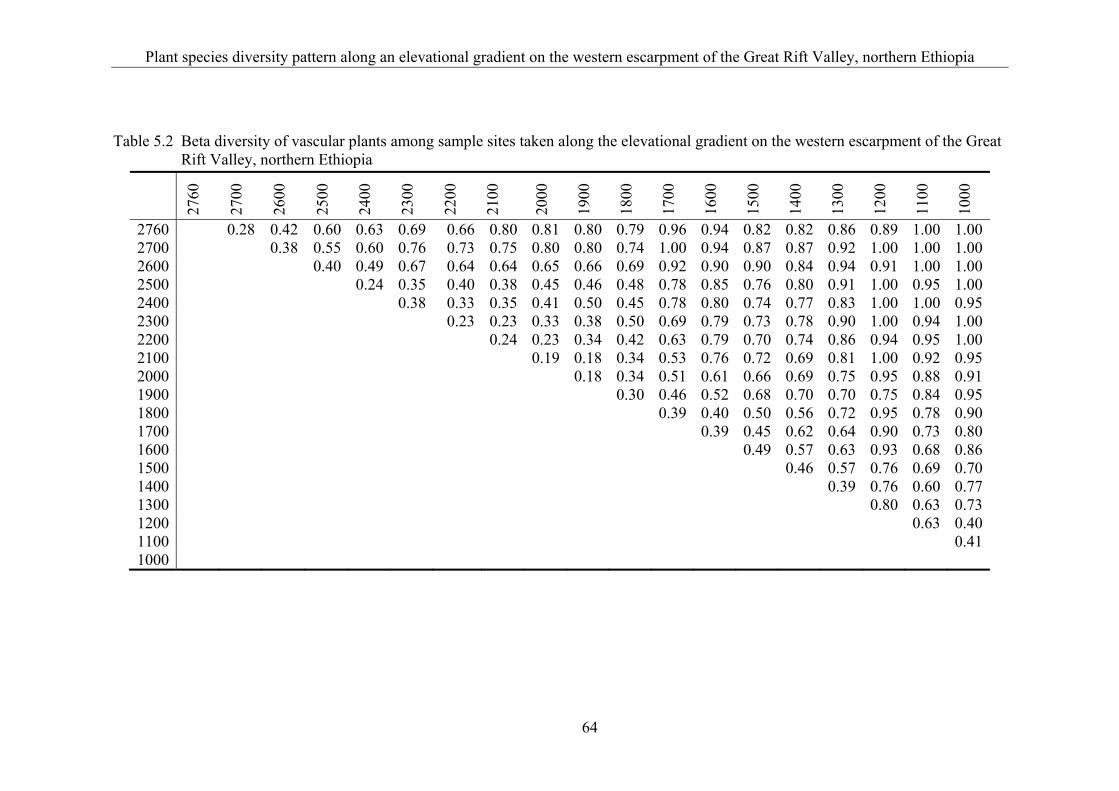
Plant species diversity pattern along an elevational gradient on the western escarpment of the Great Rift Valley, northern Ethiopia
64
Table 5.2 Beta diversity of vascular plants among sample sites taken along the elevational gradient on the western escarpment of the Great
Rift Valley, northern Ethiopia
2
760
270
0
260
0
250
0
240
0
230
0
220
0
210
0
200
0
190
0
180
0
170
0
160
0
150
0
140
0
130
0
120
0
110
0
100
0
2760 0.28 0.42 0.60 0.63 0.69 0.66 0.80 0.81 0.80 0.79 0.96 0.94 0.82 0.82 0.86 0.89 1.00 1.00 2700 0.38 0.55 0.60 0.76 0.73 0.75 0.80 0.80 0.74 1.00 0.94 0.87 0.87 0.92 1.00 1.00 1.00 2600 0.40 0.49 0.67 0.64 0.64 0.65 0.66 0.69 0.92 0.90 0.90 0.84 0.94 0.91 1.00 1.00 2500 0.24 0.35 0.40 0.38 0.45 0.46 0.48 0.78 0.85 0.76 0.80 0.91 1.00 0.95 1.00 2400 0.38 0.33 0.35 0.41 0.50 0.45 0.78 0.80 0.74 0.77 0.83 1.00 1.00 0.95 2300 0.23 0.23 0.33 0.38 0.50 0.69 0.79 0.73 0.78 0.90 1.00 0.94 1.00 2200 0.24 0.23 0.34 0.42 0.63 0.79 0.70 0.74 0.86 0.94 0.95 1.00 2100 0.19 0.18 0.34 0.53 0.76 0.72 0.69 0.81 1.00 0.92 0.95 2000 0.18 0.34 0.51 0.61 0.66 0.69 0.75 0.95 0.88 0.91 1900 0.30 0.46 0.52 0.68 0.70 0.70 0.75 0.84 0.95 1800 0.39 0.40 0.50 0.56 0.72 0.95 0.78 0.90 1700 0.39 0.45 0.62 0.64 0.90 0.73 0.80 1600 0.49 0.57 0.63 0.93 0.68 0.86 1500 0.46 0.57 0.76 0.69 0.70 1400 0.39 0.76 0.60 0.77 1300 0.80 0.63 0.73 1200 0.63 0.40 1100 0.41 1000
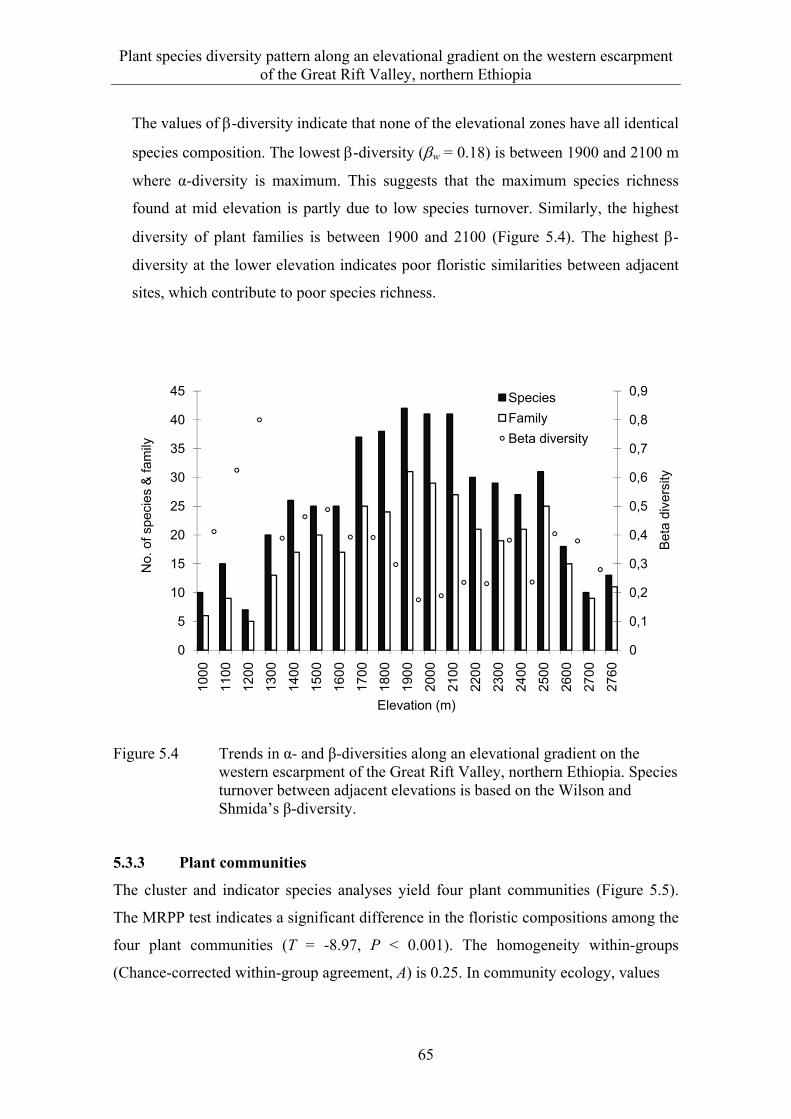
Plant species diversity pattern along an elevational gradient on the western escarpment of the Great Rift Valley, northern Ethiopia
65
The values of -diversity indicate that none of the elevational zones have all identical
species composition. The lowest -diversity (w = 0.18) is between 1900 and 2100 m
where α-diversity is maximum. This suggests that the maximum species richness
found at mid elevation is partly due to low species turnover. Similarly, the highest
diversity of plant families is between 1900 and 2100 (Figure 5.4). The highest -
diversity at the lower elevation indicates poor floristic similarities between adjacent
sites, which contribute to poor species richness.
Figure 5.4 Trends in α- and β-diversities along an elevational gradient on the western escarpment of the Great Rift Valley, northern Ethiopia. Species turnover between adjacent elevations is based on the Wilson and Shmida’s β-diversity.
5.3.3 Plant communities
The cluster and indicator species analyses yield four plant communities (Figure 5.5).
The MRPP test indicates a significant difference in the floristic compositions among the
four plant communities (T = -8.97, P < 0.001). The homogeneity within-groups
(Chance-corrected within-group agreement, A) is 0.25. In community ecology, values
0
0,1
0,2
0,3
0,4
0,5
0,6
0,7
0,8
0,9
0
5
10
15
20
25
30
35
40
45
1000
1100
1200
1300
1400
1500
1600
1700
1800
1900
2000
2100
2200
2300
2400
2500
2600
2700
2760
Bet
a di
vers
ity
No.
of s
peci
es &
fam
ily
Elevation (m)
Species
Family
Beta diversity
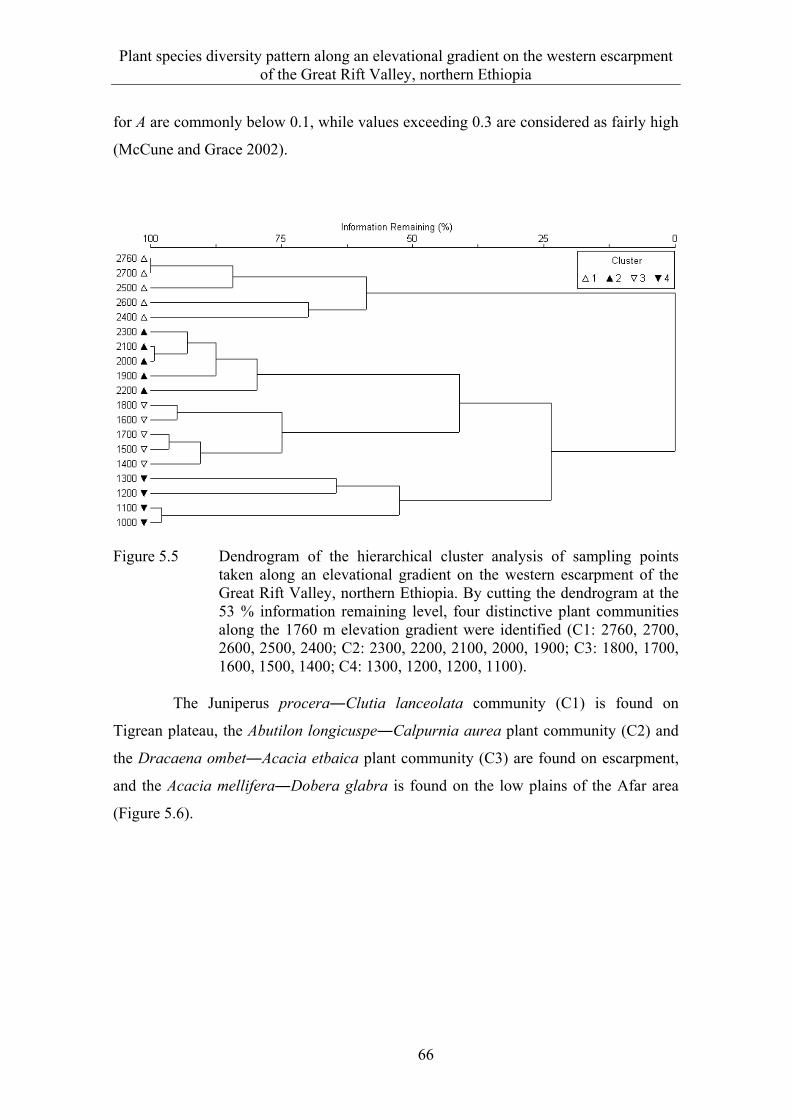
Plant species diversity pattern along an elevational gradient on the western escarpment of the Great Rift Valley, northern Ethiopia
66
for A are commonly below 0.1, while values exceeding 0.3 are considered as fairly high
(McCune and Grace 2002).
Figure 5.5 Dendrogram of the hierarchical cluster analysis of sampling points
taken along an elevational gradient on the western escarpment of the Great Rift Valley, northern Ethiopia. By cutting the dendrogram at the 53 % information remaining level, four distinctive plant communities along the 1760 m elevation gradient were identified (C1: 2760, 2700, 2600, 2500, 2400; C2: 2300, 2200, 2100, 2000, 1900; C3: 1800, 1700, 1600, 1500, 1400; C4: 1300, 1200, 1200, 1100).
The Juniperus procera―Clutia lanceolata community (C1) is found on
Tigrean plateau, the Abutilon longicuspe―Calpurnia aurea plant community (C2) and
the Dracaena ombet―Acacia etbaica plant community (C3) are found on escarpment,
and the Acacia mellifera―Dobera glabra is found on the low plains of the Afar area
(Figure 5.6).
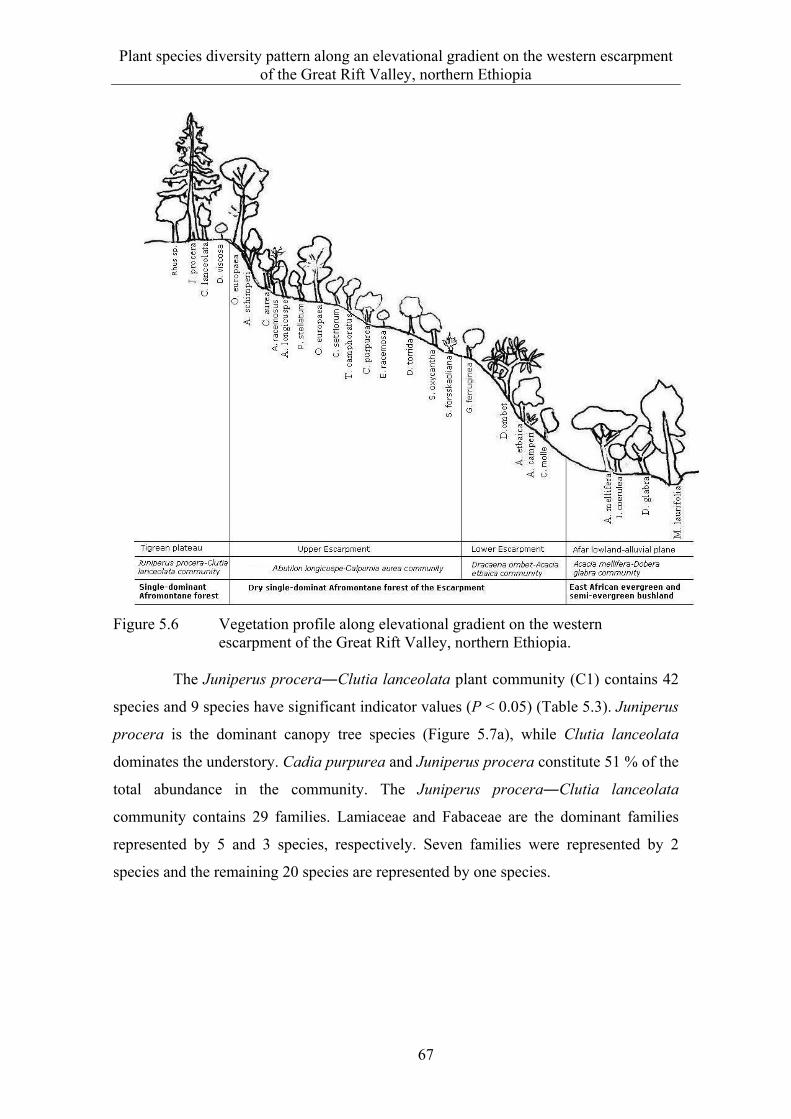
Plant species diversity pattern along an elevational gradient on the western escarpment of the Great Rift Valley, northern Ethiopia
67
Figure 5.6 Vegetation profile along elevational gradient on the western escarpment of the Great Rift Valley, northern Ethiopia.
The Juniperus procera―Clutia lanceolata plant community (C1) contains 42
species and 9 species have significant indicator values (P < 0.05) (Table 5.3). Juniperus
procera is the dominant canopy tree species (Figure 5.7a), while Clutia lanceolata
dominates the understory. Cadia purpurea and Juniperus procera constitute 51 % of the
total abundance in the community. The Juniperus procera―Clutia lanceolata
community contains 29 families. Lamiaceae and Fabaceae are the dominant families
represented by 5 and 3 species, respectively. Seven families were represented by 2
species and the remaining 20 species are represented by one species.
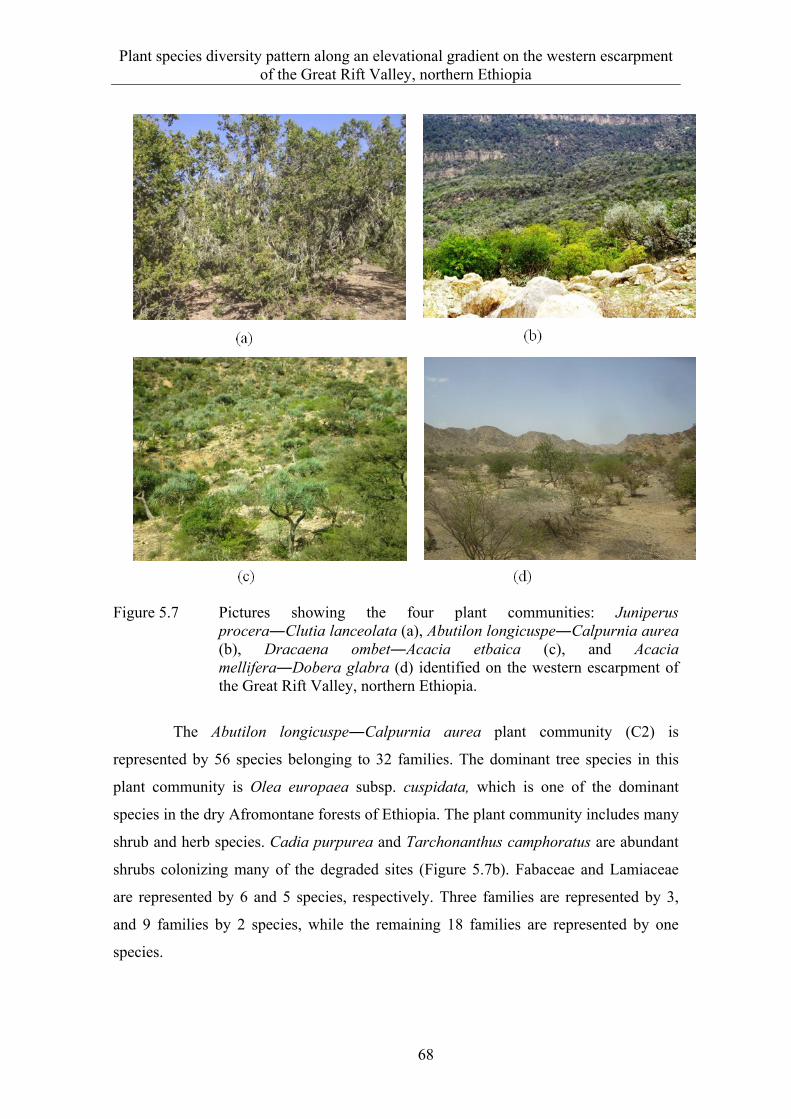
Plant species diversity pattern along an elevational gradient on the western escarpment of the Great Rift Valley, northern Ethiopia
68
Figure 5.7 Pictures showing the four plant communities: Juniperus procera―Clutia lanceolata (a), Abutilon longicuspe―Calpurnia aurea (b), Dracaena ombet―Acacia etbaica (c), and Acacia mellifera―Dobera glabra (d) identified on the western escarpment of the Great Rift Valley, northern Ethiopia.
The Abutilon longicuspe―Calpurnia aurea plant community (C2) is
represented by 56 species belonging to 32 families. The dominant tree species in this
plant community is Olea europaea subsp. cuspidata, which is one of the dominant
species in the dry Afromontane forests of Ethiopia. The plant community includes many
shrub and herb species. Cadia purpurea and Tarchonanthus camphoratus are abundant
shrubs colonizing many of the degraded sites (Figure 5.7b). Fabaceae and Lamiaceae
are represented by 6 and 5 species, respectively. Three families are represented by 3,
and 9 families by 2 species, while the remaining 18 families are represented by one
species.
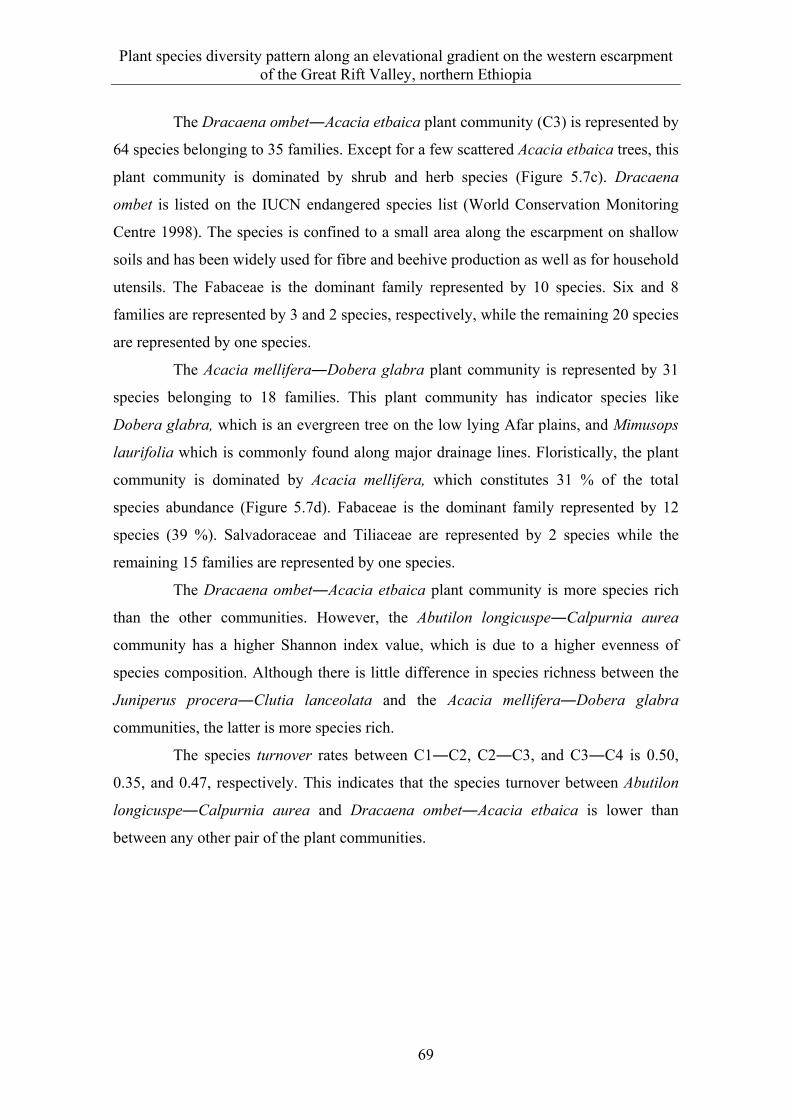
Plant species diversity pattern along an elevational gradient on the western escarpment of the Great Rift Valley, northern Ethiopia
69
The Dracaena ombet―Acacia etbaica plant community (C3) is represented by
64 species belonging to 35 families. Except for a few scattered Acacia etbaica trees, this
plant community is dominated by shrub and herb species (Figure 5.7c). Dracaena
ombet is listed on the IUCN endangered species list (World Conservation Monitoring
Centre 1998). The species is confined to a small area along the escarpment on shallow
soils and has been widely used for fibre and beehive production as well as for household
utensils. The Fabaceae is the dominant family represented by 10 species. Six and 8
families are represented by 3 and 2 species, respectively, while the remaining 20 species
are represented by one species.
The Acacia mellifera―Dobera glabra plant community is represented by 31
species belonging to 18 families. This plant community has indicator species like
Dobera glabra, which is an evergreen tree on the low lying Afar plains, and Mimusops
laurifolia which is commonly found along major drainage lines. Floristically, the plant
community is dominated by Acacia mellifera, which constitutes 31 % of the total
species abundance (Figure 5.7d). Fabaceae is the dominant family represented by 12
species (39 %). Salvadoraceae and Tiliaceae are represented by 2 species while the
remaining 15 families are represented by one species.
The Dracaena ombet―Acacia etbaica plant community is more species rich
than the other communities. However, the Abutilon longicuspe―Calpurnia aurea
community has a higher Shannon index value, which is due to a higher evenness of
species composition. Although there is little difference in species richness between the
Juniperus procera―Clutia lanceolata and the Acacia mellifera―Dobera glabra
communities, the latter is more species rich.
The species turnover rates between C1―C2, C2―C3, and C3―C4 is 0.50,
0.35, and 0.47, respectively. This indicates that the species turnover between Abutilon
longicuspe―Calpurnia aurea and Dracaena ombet―Acacia etbaica is lower than
between any other pair of the plant communities.
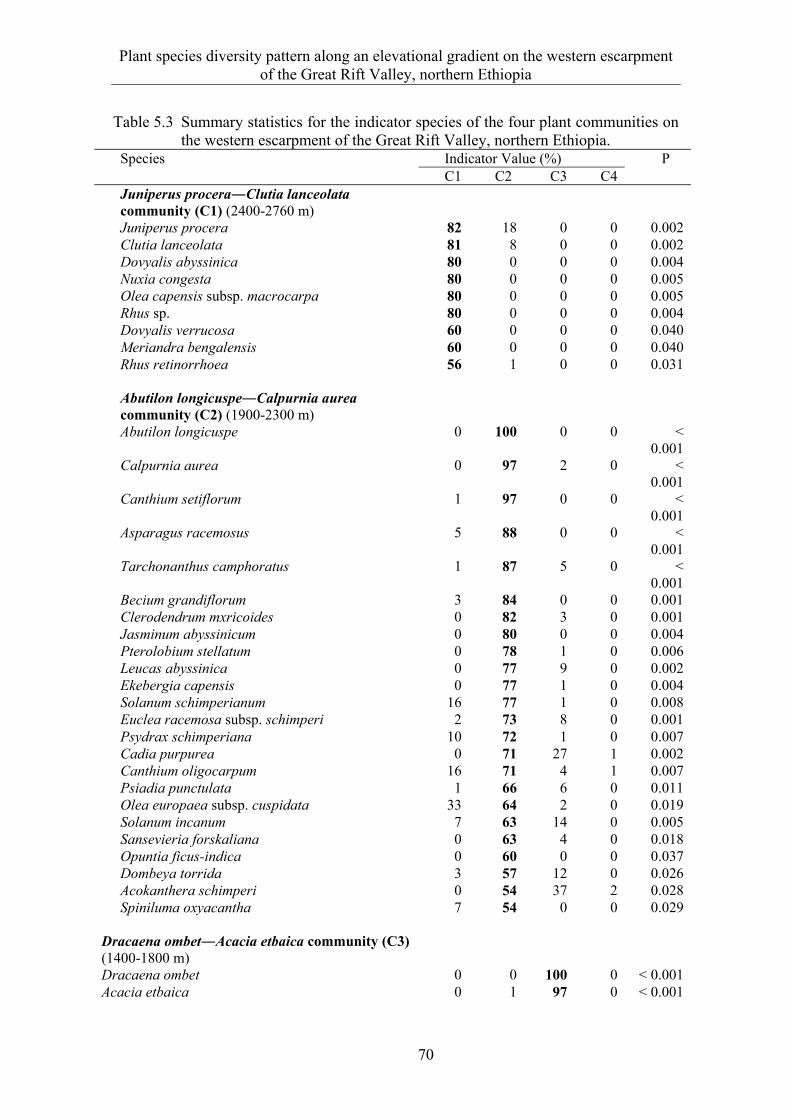
Plant species diversity pattern along an elevational gradient on the western escarpment of the Great Rift Valley, northern Ethiopia
70
Table 5.3 Summary statistics for the indicator species of the four plant communities on the western escarpment of the Great Rift Valley, northern Ethiopia.
Species Indicator Value (%) P C1 C2 C3 C4 Juniperus procera―Clutia lanceolata community (C1) (2400-2760 m)
Juniperus procera 82 18 0 0 0.002Clutia lanceolata 81 8 0 0 0.002Dovyalis abyssinica 80 0 0 0 0.004Nuxia congesta 80 0 0 0 0.005Olea capensis subsp. macrocarpa 80 0 0 0 0.005Rhus sp. 80 0 0 0 0.004Dovyalis verrucosa 60 0 0 0 0.040Meriandra bengalensis 60 0 0 0 0.040Rhus retinorrhoea 56 1 0 0 0.031
Abutilon longicuspe―Calpurnia aurea community (C2) (1900-2300 m)
Abutilon longicuspe 0 100 0 0 < 0.001
Calpurnia aurea 0 97 2 0 < 0.001
Canthium setiflorum 1 97 0 0 < 0.001
Asparagus racemosus 5 88 0 0 < 0.001
Tarchonanthus camphoratus 1 87 5 0 < 0.001
Becium grandiflorum 3 84 0 0 0.001Clerodendrum mxricoides 0 82 3 0 0.001Jasminum abyssinicum 0 80 0 0 0.004Pterolobium stellatum 0 78 1 0 0.006Leucas abyssinica 0 77 9 0 0.002Ekebergia capensis 0 77 1 0 0.004Solanum schimperianum 16 77 1 0 0.008Euclea racemosa subsp. schimperi 2 73 8 0 0.001Psydrax schimperiana 10 72 1 0 0.007Cadia purpurea 0 71 27 1 0.002Canthium oligocarpum 16 71 4 1 0.007Psiadia punctulata 1 66 6 0 0.011Olea europaea subsp. cuspidata 33 64 2 0 0.019Solanum incanum 7 63 14 0 0.005Sansevieria forskaliana 0 63 4 0 0.018Opuntia ficus-indica 0 60 0 0 0.037Dombeya torrida 3 57 12 0 0.026Acokanthera schimperi 0 54 37 2 0.028Spiniluma oxyacantha 7 54 0 0 0.029
Dracaena ombet―Acacia etbaica community (C3) (1400-1800 m)
Dracaena ombet 0 0 100 0 < 0.001Acacia etbaica 0 1 97 0 < 0.001
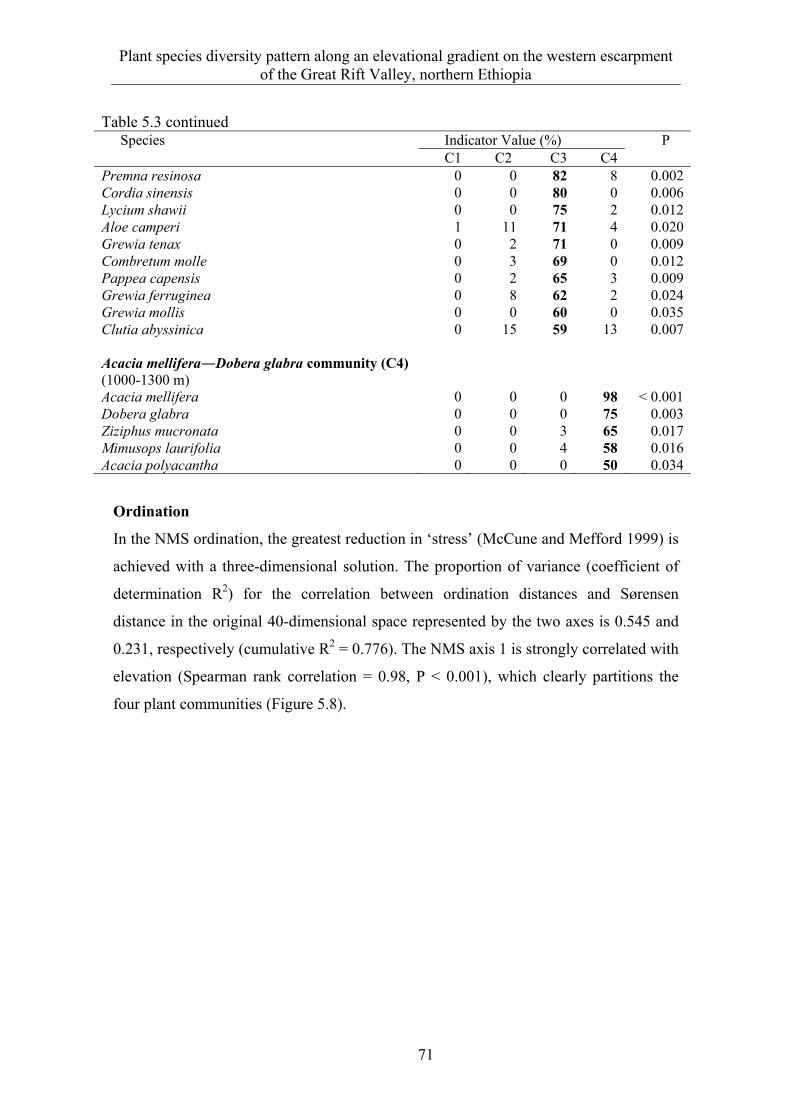
Plant species diversity pattern along an elevational gradient on the western escarpment of the Great Rift Valley, northern Ethiopia
71
Table 5.3 continued Species Indicator Value (%) P C1 C2 C3 C4
Premna resinosa 0 0 82 8 0.002Cordia sinensis 0 0 80 0 0.006Lycium shawii 0 0 75 2 0.012Aloe camperi 1 11 71 4 0.020Grewia tenax 0 2 71 0 0.009Combretum molle 0 3 69 0 0.012Pappea capensis 0 2 65 3 0.009Grewia ferruginea 0 8 62 2 0.024Grewia mollis 0 0 60 0 0.035Clutia abyssinica 0 15 59 13 0.007
Acacia mellifera―Dobera glabra community (C4) (1000-1300 m)
Acacia mellifera 0 0 0 98 < 0.001Dobera glabra 0 0 0 75 0.003Ziziphus mucronata 0 0 3 65 0.017Mimusops laurifolia 0 0 4 58 0.016Acacia polyacantha 0 0 0 50 0.034
Ordination
In the NMS ordination, the greatest reduction in ‘stress’ (McCune and Mefford 1999) is
achieved with a three-dimensional solution. The proportion of variance (coefficient of
determination R2) for the correlation between ordination distances and Sørensen
distance in the original 40-dimensional space represented by the two axes is 0.545 and
0.231, respectively (cumulative R2 = 0.776). The NMS axis 1 is strongly correlated with
elevation (Spearman rank correlation = 0.98, P < 0.001), which clearly partitions the
four plant communities (Figure 5.8).
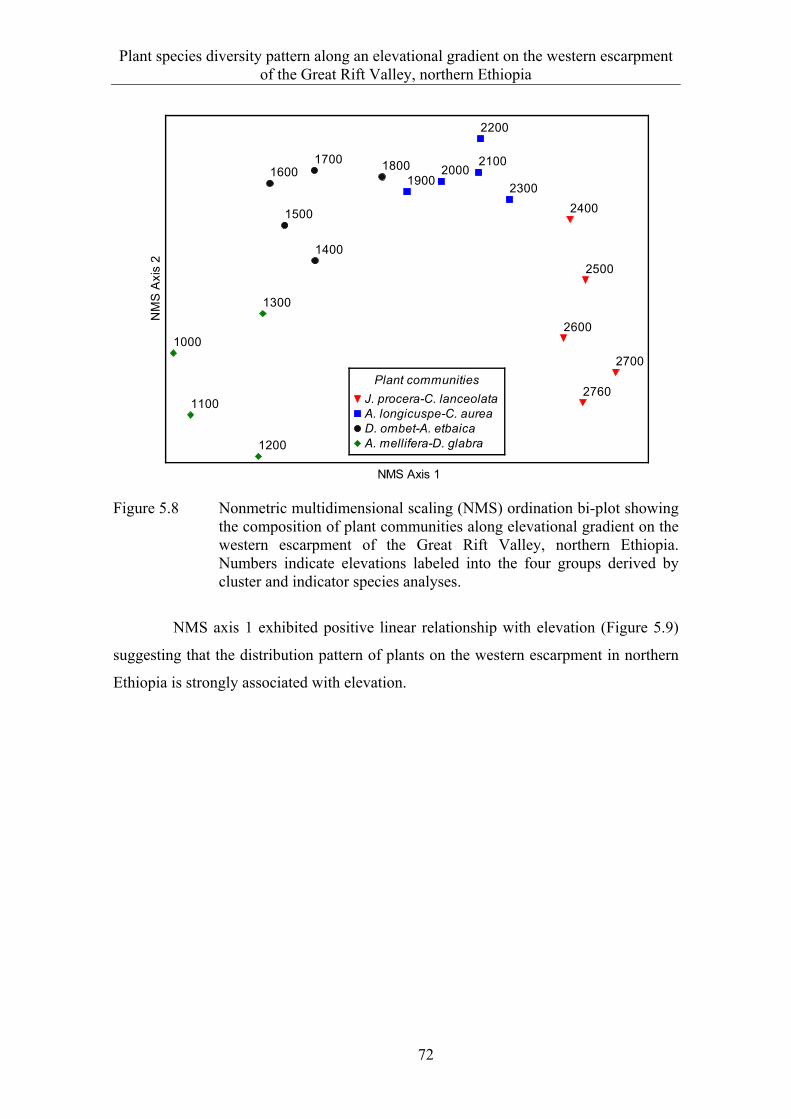
Plant species diversity pattern along an elevational gradient on the western escarpment of the Great Rift Valley, northern Ethiopia
72
Figure 5.8 Nonmetric multidimensional scaling (NMS) ordination bi-plot showing the composition of plant communities along elevational gradient on the western escarpment of the Great Rift Valley, northern Ethiopia. Numbers indicate elevations labeled into the four groups derived by cluster and indicator species analyses.
NMS axis 1 exhibited positive linear relationship with elevation (Figure 5.9)
suggesting that the distribution pattern of plants on the western escarpment in northern
Ethiopia is strongly associated with elevation.
2760
2700
2600
2500
2400
2300
2200
21002000
190018001700
1600
1500
1400
1300
1200
1100
1000
NMS Axis 1
NM
S A
xis
2
Plant communities
J. procera-C. lanceolata A. longicuspe-C. aurea D. ombet-A. etbaica A. mellifera-D. glabra
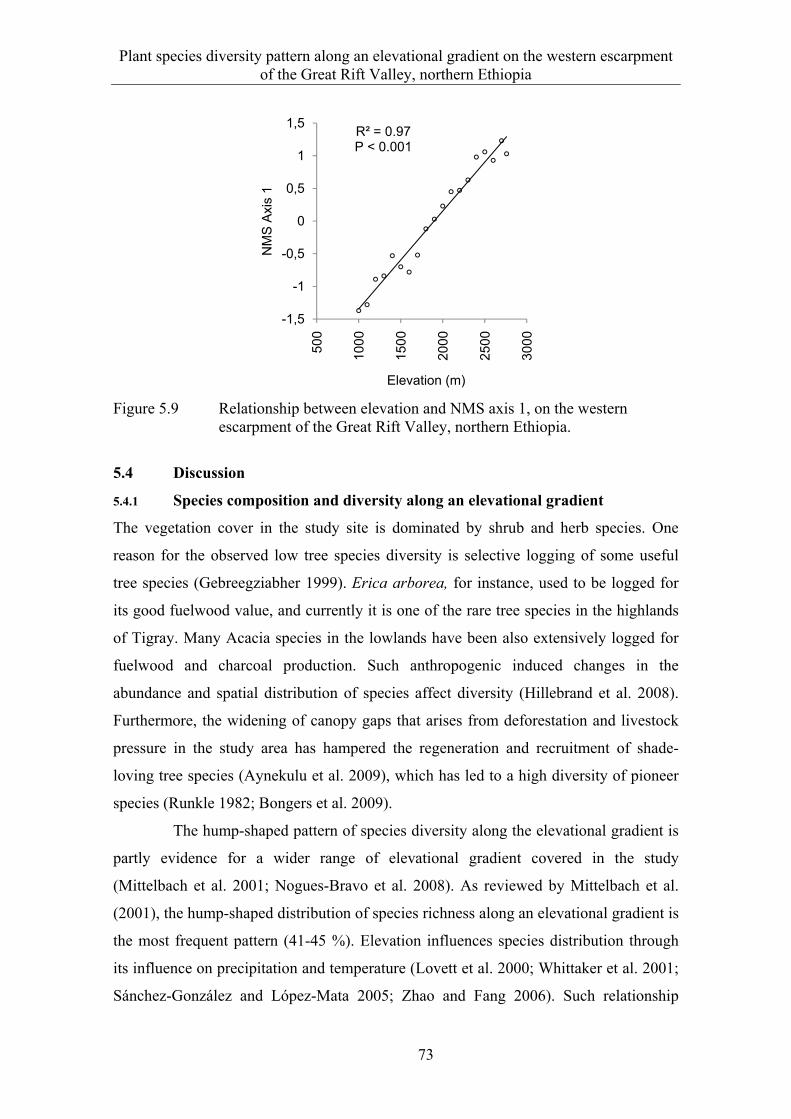
Plant species diversity pattern along an elevational gradient on the western escarpment of the Great Rift Valley, northern Ethiopia
73
Figure 5.9 Relationship between elevation and NMS axis 1, on the western escarpment of the Great Rift Valley, northern Ethiopia.
5.4 Discussion
5.4.1 Species composition and diversity along an elevational gradient
The vegetation cover in the study site is dominated by shrub and herb species. One
reason for the observed low tree species diversity is selective logging of some useful
tree species (Gebreegziabher 1999). Erica arborea, for instance, used to be logged for
its good fuelwood value, and currently it is one of the rare tree species in the highlands
of Tigray. Many Acacia species in the lowlands have been also extensively logged for
fuelwood and charcoal production. Such anthropogenic induced changes in the
abundance and spatial distribution of species affect diversity (Hillebrand et al. 2008).
Furthermore, the widening of canopy gaps that arises from deforestation and livestock
pressure in the study area has hampered the regeneration and recruitment of shade-
loving tree species (Aynekulu et al. 2009), which has led to a high diversity of pioneer
species (Runkle 1982; Bongers et al. 2009).
The hump-shaped pattern of species diversity along the elevational gradient is
partly evidence for a wider range of elevational gradient covered in the study
(Mittelbach et al. 2001; Nogues-Bravo et al. 2008). As reviewed by Mittelbach et al.
(2001), the hump-shaped distribution of species richness along an elevational gradient is
the most frequent pattern (41-45 %). Elevation influences species distribution through
its influence on precipitation and temperature (Lovett et al. 2000; Whittaker et al. 2001;
Sánchez-González and López-Mata 2005; Zhao and Fang 2006). Such relationship
R² = 0.97P < 0.001
-1,5
-1
-0,5
0
0,5
1
1,5
500
1000
1500
2000
2500
3000
NM
S A
xis
1
Elevation (m)
Plant species diversity pattern along an elevational gradient on the western escarpment of the Great Rift Valley, northern Ethiopia
74
between diversity and climate is often associated with productivity (Whittaker et al.
2003). The decrease in species richness at higher elevations may be due to the decrease
in temperature, which may reduce productivity (Rahbek 1995). Soil moisture is also
another limiting factor in species richness and diversity in dry forests (Engelbrecht et al.
2007). Hence, the higher diversity of plants recorded at the mid elevation is likely due
to the optimum climatic conditions that allow many species to coexist (Oommen and
Shanker 2005; Hemp 2006). Besides environmental variables, the distribution of a
species across different habitats also depends on species requirements, tolerances, and
their efficiency in utilizing environmental resources (Dansereau 1951). The lower
Shannon index at higher elevation was due to the higher abundance of Juniperus
procera, which reduces the evenness of species distribution.
Due to the variation in the environmental conditions and forest disturbance
history, it is difficult to compare species response to elevation among sites (Nogues-
Bravo et al. 2008). The heterogeneity in sampling techniques used in such ecological
studies also makes it difficult to compare studies (Rahbek 1995). The species richness
along an elevational gradient in the study area is in agreement with that of the forest and
forest trees of northeast tropical Africa, where Friis (1992) observed the highest
diversity of species and families between 1523 and 2135 m a.s.l. The species richness
and diversity along an elevational gradient in the study area also shows a similar pattern
to those studies in Lokapel Turkana, Kenya (Mwaura and Kaburu 2009), Shennongjia
Mountain, China (Zhao and Fang 2006), Guandi Mountain, China (Jun-feng and Yun-
xiang 2006), and western Himalaya (Oommen and Shanker 2005).
5.4.2 Species turnover along an elevational gradient
The values of diversity indicate that none of the elevational zones are identical in their
species composition. The highest species turnover was recorded between the extreme
elevational zones. This is logical that the elevation below 1300 m and above 2000 m are
found in a different ecological zones that leads to maximum (w=1) variation in their
species compositions. The lower diversity (w = 0.18) was recorded between 1900
and 2100m where α diversity is maximum. This suggests, the maximum species
richness found between 1900-2100, is partly due to high species turnover between these
adjacent elevations. Similarly, the highest diversity of plant families was recorded
Plant species diversity pattern along an elevational gradient on the western escarpment of the Great Rift Valley, northern Ethiopia
75
between 1900―2100 (Table 1). The highest diversity at the lower elevation indicates
poor floristic similarities between adjacent sites which contribute for poor species
richness. Contrarily, the diversity at the higher elevations is high, but the dominance
of few species is a reason for the low species richness.
5.4.3 Plant communities
Based on the hierarchical clustering, we found four distinctive plant communities along
the elevational gradient. The indicator species that characterize the plant communities
are in agreement with the species used in the classification of the forests of northeast
tropical Africa (Friis 1992). Accordingly, the plant communities identified in this study
belong to the dry single-dominant Afromontane forest, which is a transition between the
dry single-dominant Afromontane forest and East African evergreen and semi-
evergreen bushland. The Juniperus procera―Clutia lanceolata community is found on
Tigrean plateau (Figure 5.6). The indicator species of this plant community belong to
the dry single-dominant Afromontane forests, which are commonly found in the
northwest and southeast Ethiopian Highlands (Friis 1992).
The Abutilon longicuspe―Calpurnia aurea and Dracaena ombet―Acacia
etbaica communities are categorized under the dry single-dominant Afromontane forest
of the escarpments, and transition area between the dry single-dominant Afromontane
forest of the Tigrean plateau and the East African evergreen and semi-evergreen
bushland and thicket of the Afar lowlands (Friis 1992). The lower species turnover in
the two communities (Figure 5.4) contributes to the higher floristic similarities. The two
plant communities are mainly found on sloping terrain characterized by shallow soils
and frequent rock outcrops. This forest type includes a range of physiognomic types,
from typical forest to evergreen scrub with dispersed trees. Many of the plant species
recorded in the two plant communities are also recorded on steep terrains of Eritrea,
Djibouti and Somalia (Friis 1992). Besides anthropogenic reasons, the vegetation on the
escapement is affected by mass tree dieback (see Chapter 6). Such disturbance might
create a favorable environment for the regeneration of many species that increase the
species richness in this part of the landscape (Denslow 1980; Bongers et al. 2009). The
dominance of Cadia purpurea and Tarchonanthus camphoratus in the Abutilon
Plant species diversity pattern along an elevational gradient on the western escarpment of the Great Rift Valley, northern Ethiopia
76
longicuspe―Calpurnia aurea plant community is evidence of the severe forest
degradation in the escarpment.
The Acacia mellifera―Dobera glabra community is dominated by the
Fabaceae family and is located at the foot slope of the lower dry Afar lowlands, where
the alluvial deposits have led to a thicker soil layer and thus higher soil moisture than on
the upper slopes where Abutilon longicuspe―Calpurnia aurea and Dracaena
ombet―Acacia etbaica communities are located. Based on Friis (1992), the Acacia
mellifera―Dobera glabra community belongs to the East African evergreen and semi-
evergreen bushland and thicket.
5.5 Implications for conservation
In developing regions like northern Ethiopia, the conflict between agriculture and
forestry makes conserving large forests for their biodiversity values difficult (Margules
et al. 2007). Therefore, it is important to prioritize biodiversity conservation sites. Thus,
information on diversity of species along environmental gradients plays a key role in
conservation planning (Naveh and Whittaker 1979). A large part of the forest remnants
are found on the escarpment of the Great Rift Valley, which is less suitable for
agricultural activities. This may be an opportunity to obtain more land for biodiversity
conservation. Since the concept of biodiversity conservation prioritization is based on
species richness, endemism and threat of extinction, further investigations on the degree
of overlap among these criteria are recommended (Reid 1998). Conserving a large
number of species may provide the opportunity to conserve species that are rare and
whose ecosystem regulatory role may not be yet known (Huston and Gilbert 1996).
Thus, besides the species-rich zones, conservation programs should also consider plant
communities that may not be species rich, but may include endemic and threatened
species. This is typically for northern Ethiopia, where church forests and other small
forest fragments play a meaningful role in conserving plant diversity. To conserve a
large number of species and plant communities, it is worth establishing a biodiversity
conservation corridor along elevational gradient that includes the four plant
communities. Such conservation approach may provide the opportunity to conserve
species like Dracaena ombet, which is listed on the Red List of the IUCN as an
Plant species diversity pattern along an elevational gradient on the western escarpment of the Great Rift Valley, northern Ethiopia
77
endangered species and is found in the Dracaena ombet―Acacia etbaica community
that needs conservation priority.
In this study, we covered the spatial diversity of plant species and
communities. Since the vegetation in the study area has been continuously changing
(Darbyshire et al. 2003), it is important to study the species composition and
distribution patterns over time (Magurran 2007). Recently, the over-exploitation of
canopy tree species like J. procera and O. europaea subsp. cuspidata has led to the
gradual replacing of the tree dominated landscapes with pioneer shrub species (e.g.,
Cadia purpurea, Tarconanthus camphoratus). Such a loss of or change in habitat may
also affect the diversity of fauna, epiphytes, and other associated species, which have
rarely been studied. Similar to the dry Afromontane forest at Mafai, Tanzania, mosses
are commonly found hanging on big trees. these are important for keeping the
microclimate cooler during the dry seasons by trapping and maintaining moisture from
the atmosphere (Lyaruu et al. 2000). A further deterioration of the remaining forests
will seriously affect the socio-economic and environmental conditions of the region.
Thus, it is important to define conservation priorities and take urgent action to protect
these habitats. Recently, conservation of biodiversity in the dryland ecosystems has
received more attention (CBD 1992), and conserving these last natural forest remnants
will address local, national, and international conservation goals.
Effects of mass tree dieback on stand structure and diversity in a dry Afromontane forest, northern Ethiopia
78
6 EFFECTS OF MASS TREE DIEBACK ON STAND STRUCTURE AND
DIVERSITY IN A DRY AFROMONTANE FOREST, NORTHERN
ETHIOPIA
6.1 Introduction
Dead standing trees (hereafter snags) of the two keystone species Juniperus procera
(Cuperessaceae) and Olea europaea subsp. cuspidata (Oleaceae) were frequently
observed in a dry Afromontane forest remnant in northern Ethiopia (Desa’a forest). The
local people noticed that mass tree dieback occurred in the study area in the late 1980s.
Changes in forest composition and structure may result from periodic, abrupt, and
catastrophic environmental impacts (e.g., White 1979) depending on local situation of
the forest, including environmental heterogeneity, regeneration success, and
competition (e.g., Chen et al. 2004). Forest dynamics range from those that are the
result of individual tree senescence and fall, and those that are the result of large
disturbances such as windstorms (White 1979). Human disturbance (e.g., Feoli et al.
2002; Darbyshire et al. 2003) and climate change (e.g., Dale et al. 2000; Hansen and
Dale 2001; Lingua et al. 2008) are the major driving forces that shape forest
ecosystems. Studies in other areas indicate that mass tree dieback affects species
composition and diversity by affecting certain species and size classes, and by changing
the light environment of the understory (Slik 2004; Engelbrecht et al. 2007).
The occurrence of large number of snags in the dry Afromontane forest is a
notable sign of natural forest degradation. However, snags are important ecological
components of forest ecosystems (Franklin et al. 1987). Snags also an important source
of nutrients (Kueppers et al. 2004), serve as habitats for a wide range of plant and
animal species (Ohmann et al. 1994; Harmon et al. 2000) and as carbon storages
(Kueppers et al. 2004). In steep terrains like in the study area, snags play important
roles in soil and water conservation (Russell et al. 2006). On the other hand, increased
snag density makes the forest more vulnerable to fire hazards and forest managers need
to pay more attention to sites with high snag densities (Agee and Skinner 2005; Holden
et al. 2006). Snags also contribute to the structural diversity of stands (Hennon and
McClellan 2003). However, snags have been removed from the studied forest for
fuelwood, which is partly due to lack of knowledge on the roles of snags in ecological
processes. It is therefore important to provide information to forest managers on the
Effects of mass tree dieback on stand structure and diversity in a dry Afromontane forest, northern Ethiopia
79
roles of snags in the ecological process so that they define a standard number of snags
to be retained in the forest (Ganey 1999; Marage and Lemperiere 2005).
Understanding the extent of tree dieback and spatial patterns of snags is
therefore useful in managing forests (Craig and Friedland 1991; Gitlin et al. 2006). In
particular, understanding the spatial distribution of snags in forests provides useful
information to plan assisted regeneration and to investigate the role of snags in
maintaining habitats for wildlife, soil protection, and other ecosystem services.
However, the status of snags in the tropics has been less studied (Grove 2001).
Although a few studies exist on the ecology of dry Afromontane forest remnants in
northern Ethiopia (e.g., Aerts et al. 2006c; Aynekulu et al. 2009), they are largely
focused on anthropogenic-related disturbance and did not take tree dieback into
consideration.
With a rapid development of remote sensing, it is possible to address a number
of ecological questions using remotely sensed data. Vegetation indices, for instance,
have been widely used to examine the biological and abiotic components of forest
ecosystems at different scales (Huete et al. 2002). ASTER imagery has a 16-days revisit
time with 15-m spatial resolution in the visible and near infrared bands and has been
used in many ecological studies (Clark et al. 2004; Muukkonen and Heiskanen 2005;
Buhe et al. 2007; Rivero et al. 2007; García et al. 2008; Yüksel et al. 2008). It is
therefore hypothesized that the normalized difference vegetation index (NDVI) from
ASTER imagery can estimate the extent of mass tree dieback of J. procera and O.
europaea subsp. cuspidata.
Thus, the objectives of this study are to investigate (i) the extent and spatial
patterns of mass tree dieback of J. procera and O. europaea subsp. cuspidata, (ii) the
applicability of NDVI of ASTER imagery in quantifying the extent of mass tree
dieback, and (iii) the influence of mass tree dieback of the two species on the overall
stand structure and species diversity in a dry Afromontane forest in northern Ethiopia.
6.2 Material and methods
6.2.1 Study site
The study was conducted in the Desa’a Forest (13o53' - 13o56' N and 39o48' - 39o51' E),
which is located on the western escarpment of the Great Rift Valley in northern Ethiopia
Effects of mass tree dieback on stand structure and diversity in a dry Afromontane forest, northern Ethiopia
80
(Figure 6.1). The study area lies between the Tigrean plateau (2720 m a.s.l.) and the
Afar lowlands (1400 m a.s.l.). Based on the forest classification of northeast tropical
Africa (Friis 1992), Desa’a forest is classified as dry single-dominant Afromontane
forest with J. procera in the canopy and O. europaea subsp. cuspidata in the understory
as dominant species. These are drought-tolerant species (Cuneo and Leishman 2006;
Breshears et al. 2009) widely grown from Arabia to the southern Africa. Desa’a forest is
a national forest priority area, but illegal logging and free grazing are commonly
practiced.
The plateau section of the study site receives a mean annual rainfall of 532
mm (Abegaz 2005). The climate of the study area is influenced by its elevation in which
the decline in rainfall and increase in temperature from the upland plateau to the eastern
slopes are sharp (Degefu 1987). The geology is characterized by Enticho sandstone and
crystalline basement (Asrat 2002). A large part of the study site is characterized by
shallow soils and frequent rock outcrops.
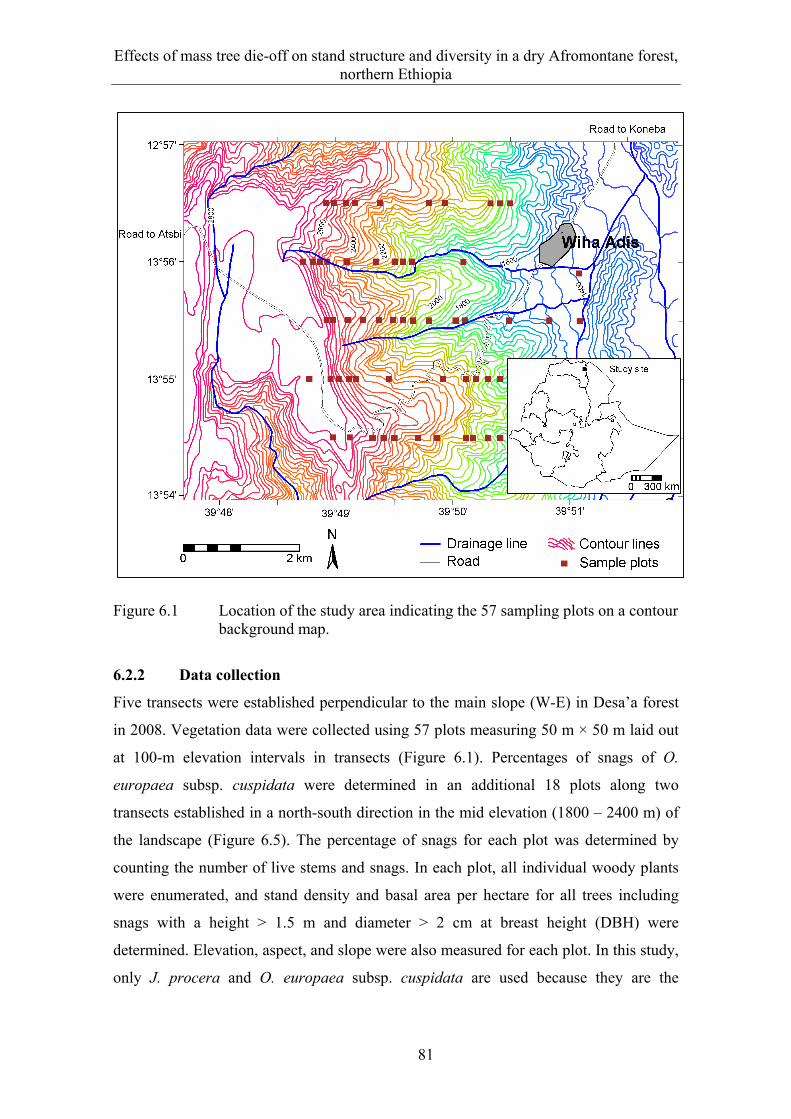
Effects of mass tree die-off on stand structure and diversity in a dry Afromontane forest, northern Ethiopia
81
Figure 6.1 Location of the study area indicating the 57 sampling plots on a contour background map.
6.2.2 Data collection
Five transects were established perpendicular to the main slope (W-E) in Desa’a forest
in 2008. Vegetation data were collected using 57 plots measuring 50 m × 50 m laid out
at 100-m elevation intervals in transects (Figure 6.1). Percentages of snags of O.
europaea subsp. cuspidata were determined in an additional 18 plots along two
transects established in a north-south direction in the mid elevation (1800 – 2400 m) of
the landscape (Figure 6.5). The percentage of snags for each plot was determined by
counting the number of live stems and snags. In each plot, all individual woody plants
were enumerated, and stand density and basal area per hectare for all trees including
snags with a height > 1.5 m and diameter > 2 cm at breast height (DBH) were
determined. Elevation, aspect, and slope were also measured for each plot. In this study,
only J. procera and O. europaea subsp. cuspidata are used because they are the
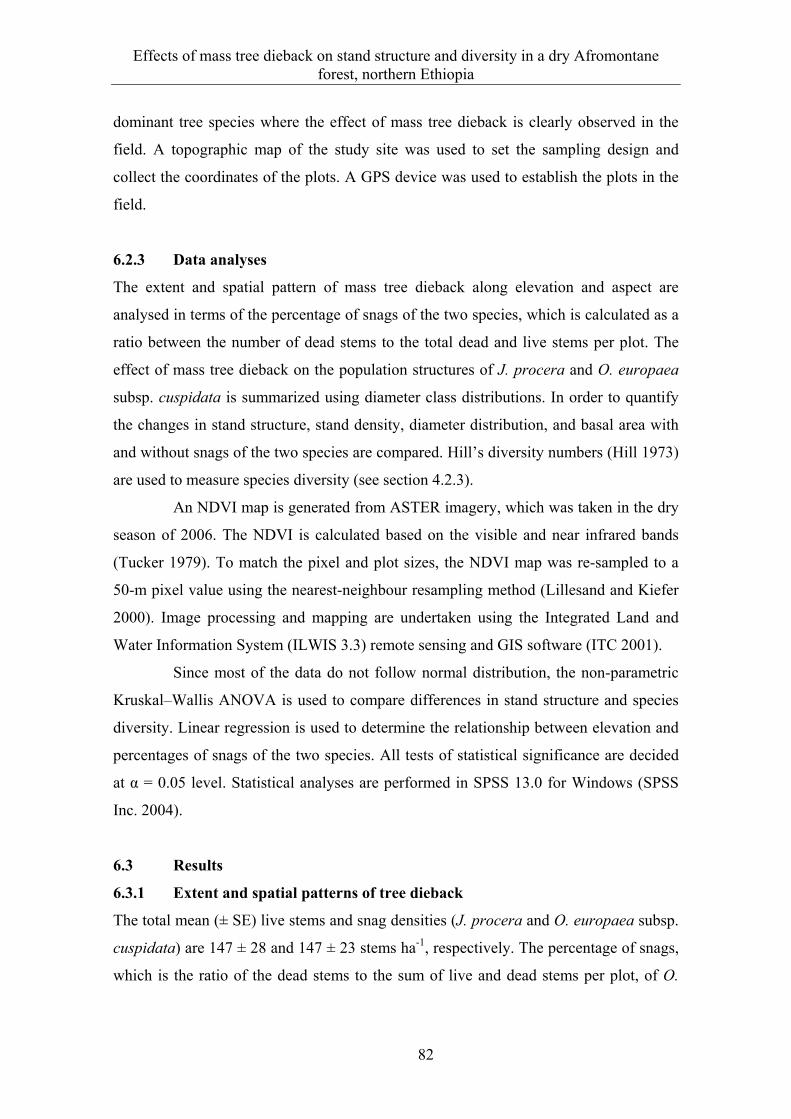
Effects of mass tree dieback on stand structure and diversity in a dry Afromontane forest, northern Ethiopia
82
dominant tree species where the effect of mass tree dieback is clearly observed in the
field. A topographic map of the study site was used to set the sampling design and
collect the coordinates of the plots. A GPS device was used to establish the plots in the
field.
6.2.3 Data analyses
The extent and spatial pattern of mass tree dieback along elevation and aspect are
analysed in terms of the percentage of snags of the two species, which is calculated as a
ratio between the number of dead stems to the total dead and live stems per plot. The
effect of mass tree dieback on the population structures of J. procera and O. europaea
subsp. cuspidata is summarized using diameter class distributions. In order to quantify
the changes in stand structure, stand density, diameter distribution, and basal area with
and without snags of the two species are compared. Hill’s diversity numbers (Hill 1973)
are used to measure species diversity (see section 4.2.3).
An NDVI map is generated from ASTER imagery, which was taken in the dry
season of 2006. The NDVI is calculated based on the visible and near infrared bands
(Tucker 1979). To match the pixel and plot sizes, the NDVI map was re-sampled to a
50-m pixel value using the nearest-neighbour resampling method (Lillesand and Kiefer
2000). Image processing and mapping are undertaken using the Integrated Land and
Water Information System (ILWIS 3.3) remote sensing and GIS software (ITC 2001).
Since most of the data do not follow normal distribution, the non-parametric
Kruskal–Wallis ANOVA is used to compare differences in stand structure and species
diversity. Linear regression is used to determine the relationship between elevation and
percentages of snags of the two species. All tests of statistical significance are decided
at α = 0.05 level. Statistical analyses are performed in SPSS 13.0 for Windows (SPSS
Inc. 2004).
6.3 Results
6.3.1 Extent and spatial patterns of tree dieback
The total mean (± SE) live stems and snag densities (J. procera and O. europaea subsp.
cuspidata) are 147 ± 28 and 147 ± 23 stems ha-1, respectively. The percentage of snags,
which is the ratio of the dead stems to the sum of live and dead stems per plot, of O.
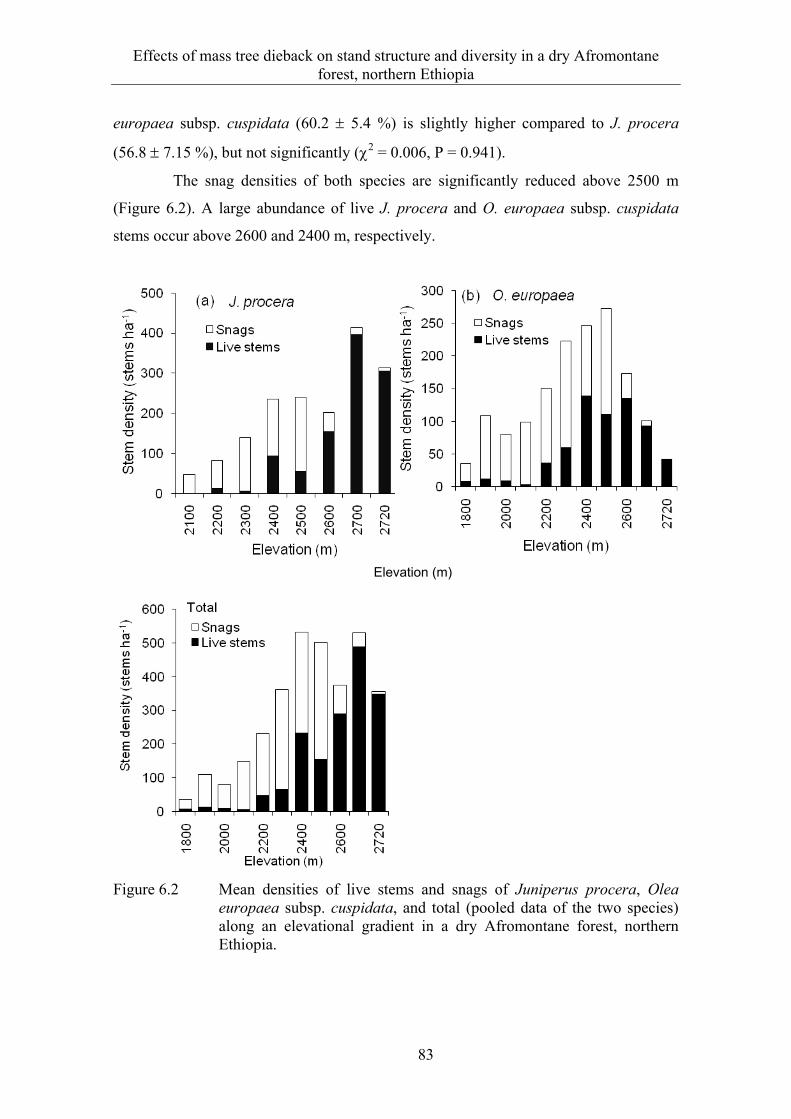
Effects of mass tree dieback on stand structure and diversity in a dry Afromontane forest, northern Ethiopia
83
europaea subsp. cuspidata (60.2 5.4 %) is slightly higher compared to J. procera
(56.8 7.15 %), but not significantly (2 = 0.006, P = 0.941).
The snag densities of both species are significantly reduced above 2500 m
(Figure 6.2). A large abundance of live J. procera and O. europaea subsp. cuspidata
stems occur above 2600 and 2400 m, respectively.
Figure 6.2 Mean densities of live stems and snags of Juniperus procera, Olea europaea subsp. cuspidata, and total (pooled data of the two species) along an elevational gradient in a dry Afromontane forest, northern Ethiopia.
Elevation (m)
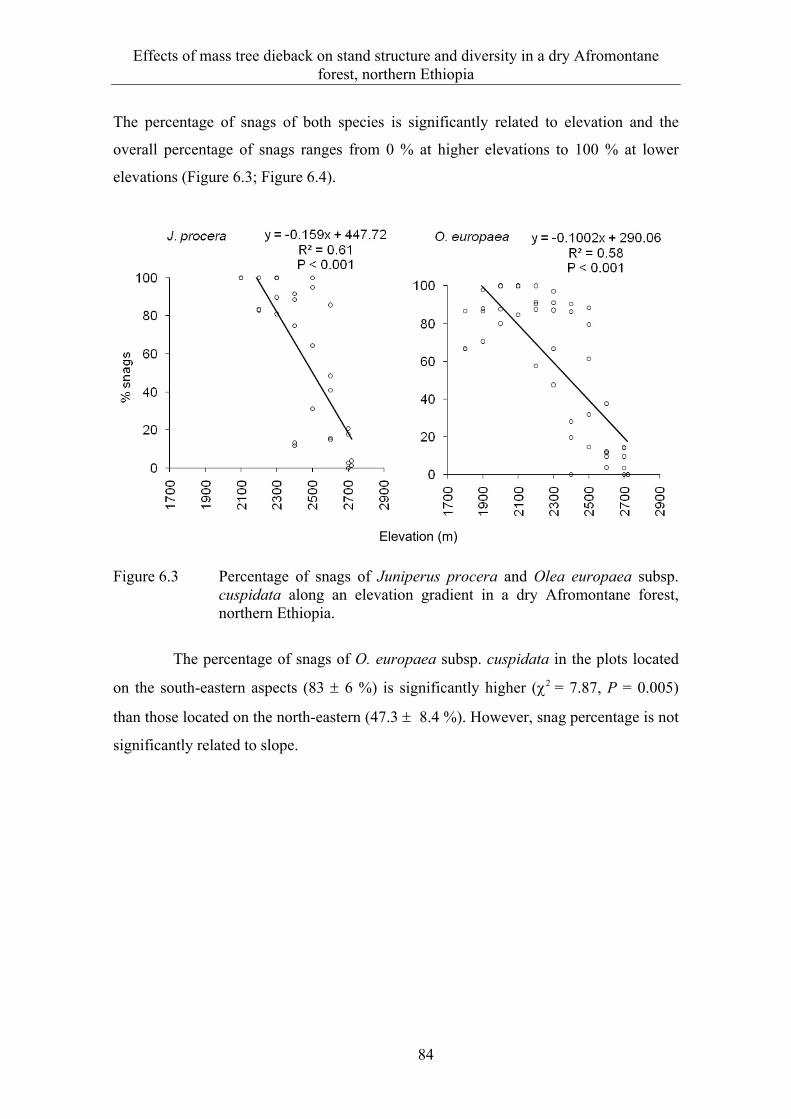
Effects of mass tree dieback on stand structure and diversity in a dry Afromontane forest, northern Ethiopia
84
The percentage of snags of both species is significantly related to elevation and the
overall percentage of snags ranges from 0 % at higher elevations to 100 % at lower
elevations (Figure 6.3; Figure 6.4).
Figure 6.3 Percentage of snags of Juniperus procera and Olea europaea subsp. cuspidata along an elevation gradient in a dry Afromontane forest, northern Ethiopia.
The percentage of snags of O. europaea subsp. cuspidata in the plots located
on the south-eastern aspects (83 6 %) is significantly higher (2 = 7.87, P = 0.005)
than those located on the north-eastern (47.3 8.4 %). However, snag percentage is not
significantly related to slope.
Elevation (m)
Effects of mass tree die-off on stand structure and diversity in a dry Afromontane forest, northern Ethiopia
85
Figure 6.4 Dry Afromontane forest with a) high density of snags at lower elevations, b) no tree die-off at higher elevations (> 2500 m) in a dry Afromontane forest, northern Ethiopia.
6.3.2 Estimation of mass tree die-off using NDVI
The False Colour Composite and the NDVI maps give a visual impression of the
alternating pattern of high and low extent of tree die-off across the landscape (Figure
6.5). The percentage of snags per plot ranges from 16 to 100 % and the NDVI values
range from -0.08 to 0.18.
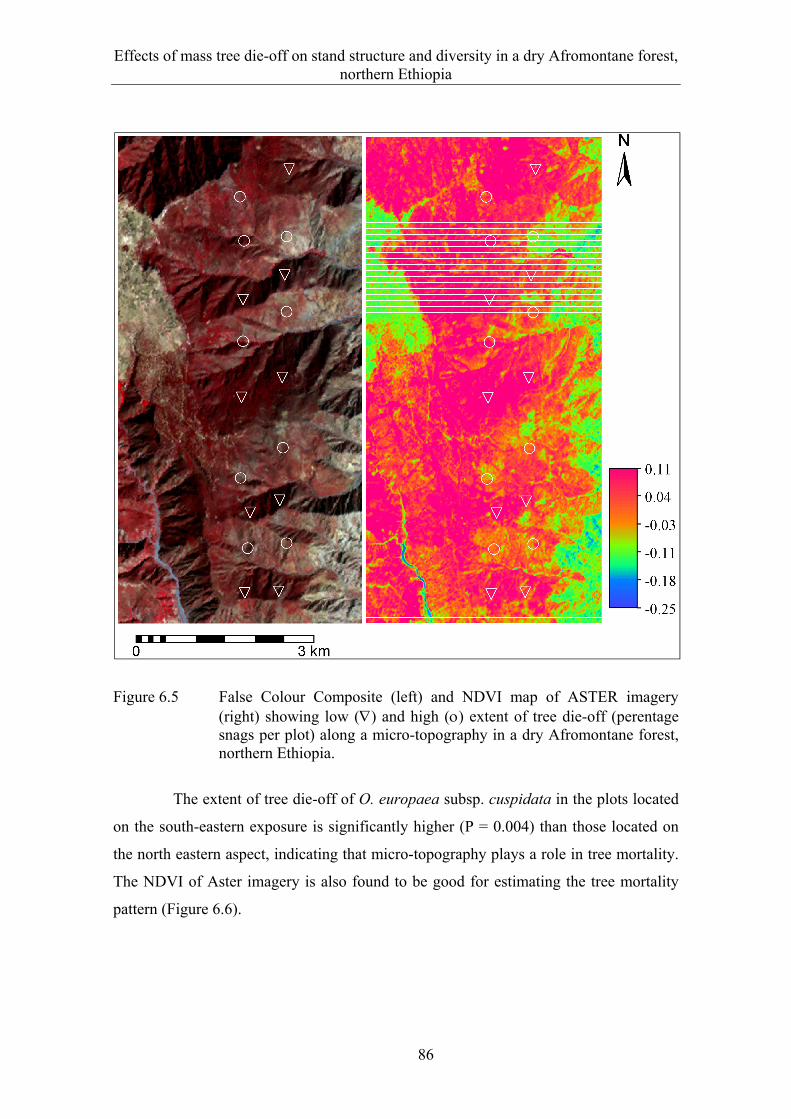
Effects of mass tree die-off on stand structure and diversity in a dry Afromontane forest, northern Ethiopia
86
Figure 6.5 False Colour Composite (left) and NDVI map of ASTER imagery (right) showing low () and high () extent of tree die-off (perentage snags per plot) along a micro-topography in a dry Afromontane forest, northern Ethiopia.
The extent of tree die-off of O. europaea subsp. cuspidata in the plots located
on the south-eastern exposure is significantly higher (P = 0.004) than those located on
the north eastern aspect, indicating that micro-topography plays a role in tree mortality.
The NDVI of Aster imagery is also found to be good for estimating the tree mortality
pattern (Figure 6.6).
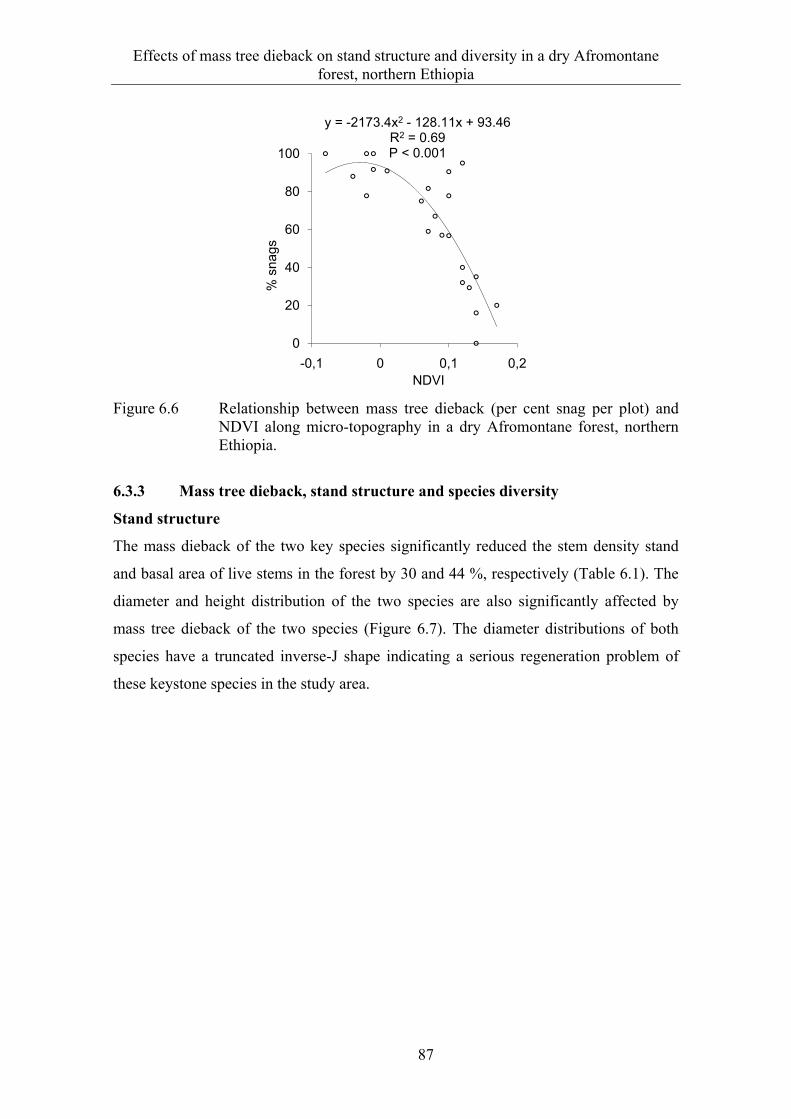
Effects of mass tree dieback on stand structure and diversity in a dry Afromontane forest, northern Ethiopia
87
Figure 6.6 Relationship between mass tree dieback (per cent snag per plot) and NDVI along micro-topography in a dry Afromontane forest, northern Ethiopia.
6.3.3 Mass tree dieback, stand structure and species diversity
Stand structure
The mass dieback of the two key species significantly reduced the stem density stand
and basal area of live stems in the forest by 30 and 44 %, respectively (Table 6.1). The
diameter and height distribution of the two species are also significantly affected by
mass tree dieback of the two species (Figure 6.7). The diameter distributions of both
species have a truncated inverse-J shape indicating a serious regeneration problem of
these keystone species in the study area.
y = -2173.4x2 - 128.11x + 93.46R2 = 0.69P < 0.001
0
20
40
60
80
100
-0,1 0 0,1 0,2
% s
nags
NDVI
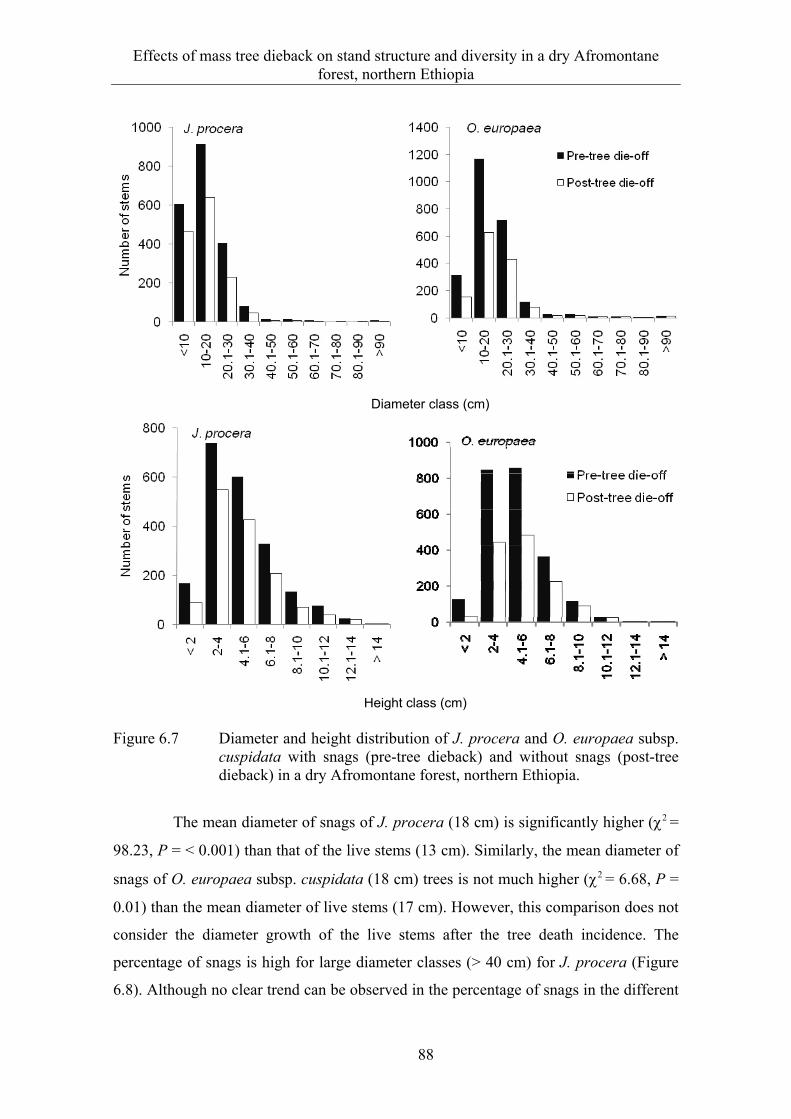
Effects of mass tree dieback on stand structure and diversity in a dry Afromontane forest, northern Ethiopia
88
Figure 6.7 Diameter and height distribution of J. procera and O. europaea subsp. cuspidata with snags (pre-tree dieback) and without snags (post-tree dieback) in a dry Afromontane forest, northern Ethiopia.
The mean diameter of snags of J. procera (18 cm) is significantly higher (2 =
98.23, P = < 0.001) than that of the live stems (13 cm). Similarly, the mean diameter of
snags of O. europaea subsp. cuspidata (18 cm) trees is not much higher (2 = 6.68, P =
0.01) than the mean diameter of live stems (17 cm). However, this comparison does not
consider the diameter growth of the live stems after the tree death incidence. The
percentage of snags is high for large diameter classes (> 40 cm) for J. procera (Figure
6.8). Although no clear trend can be observed in the percentage of snags in the different
Diameter class (cm)
Height class (cm)
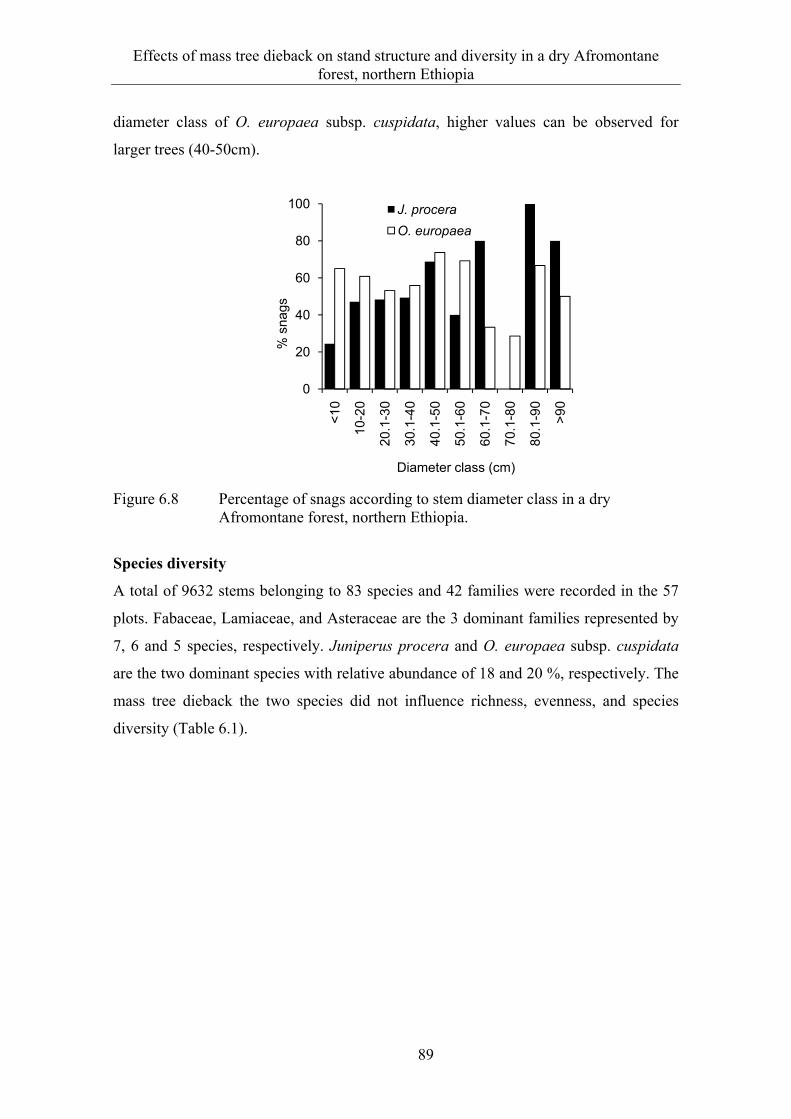
Effects of mass tree dieback on stand structure and diversity in a dry Afromontane forest, northern Ethiopia
89
diameter class of O. europaea subsp. cuspidata, higher values can be observed for
larger trees (40-50cm).
Figure 6.8 Percentage of snags according to stem diameter class in a dry Afromontane forest, northern Ethiopia.
Species diversity
A total of 9632 stems belonging to 83 species and 42 families were recorded in the 57
plots. Fabaceae, Lamiaceae, and Asteraceae are the 3 dominant families represented by
7, 6 and 5 species, respectively. Juniperus procera and O. europaea subsp. cuspidata
are the two dominant species with relative abundance of 18 and 20 %, respectively. The
mass tree dieback the two species did not influence richness, evenness, and species
diversity (Table 6.1).
0
20
40
60
80
100
<10
10-2
0
20.1
-30
30.1
-40
40.1
-50
50.1
-60
60.1
-70
70.1
-80
80.1
-90
>90
% s
nags
Diameter class (cm)
J. procera
O. europaea
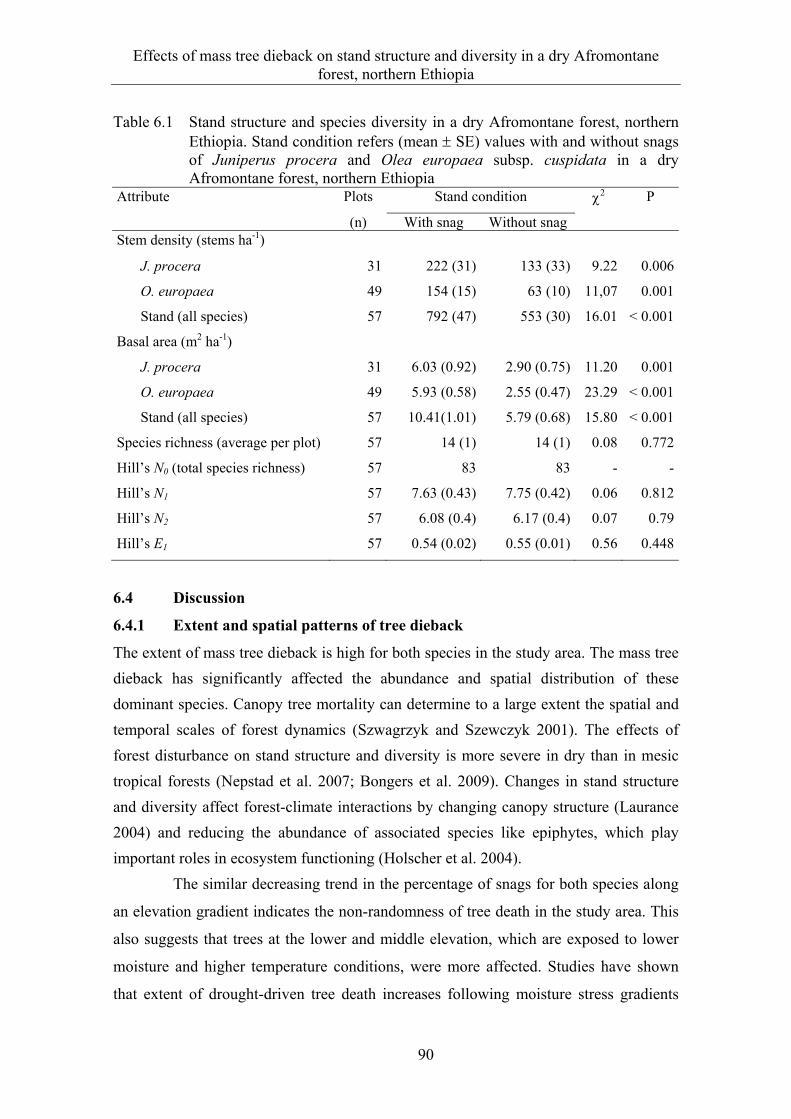
Effects of mass tree dieback on stand structure and diversity in a dry Afromontane forest, northern Ethiopia
90
Table 6.1 Stand structure and species diversity in a dry Afromontane forest, northern Ethiopia. Stand condition refers (mean SE) values with and without snags of Juniperus procera and Olea europaea subsp. cuspidata in a dry Afromontane forest, northern Ethiopia
Attribute Plots Stand condition 2 P
(n) With snag Without snag Stem density (stems ha-1)
J. procera 31 222 (31) 133 (33) 9.22 0.006
O. europaea 49 154 (15) 63 (10) 11,07 0.001
Stand (all species) 57 792 (47) 553 (30) 16.01 < 0.001
Basal area (m2 ha-1)
J. procera 31 6.03 (0.92) 2.90 (0.75) 11.20 0.001
O. europaea 49 5.93 (0.58) 2.55 (0.47) 23.29 < 0.001
Stand (all species) 57 10.41(1.01) 5.79 (0.68) 15.80 < 0.001
Species richness (average per plot) 57 14 (1) 14 (1) 0.08 0.772
Hill’s N0 (total species richness) 57 83 83 - -
Hill’s N1 57 7.63 (0.43) 7.75 (0.42) 0.06 0.812
Hill’s N2 57 6.08 (0.4) 6.17 (0.4) 0.07 0.79
Hill’s E1 57 0.54 (0.02) 0.55 (0.01) 0.56 0.448
6.4 Discussion
6.4.1 Extent and spatial patterns of tree dieback
The extent of mass tree dieback is high for both species in the study area. The mass tree
dieback has significantly affected the abundance and spatial distribution of these
dominant species. Canopy tree mortality can determine to a large extent the spatial and
temporal scales of forest dynamics (Szwagrzyk and Szewczyk 2001). The effects of
forest disturbance on stand structure and diversity is more severe in dry than in mesic
tropical forests (Nepstad et al. 2007; Bongers et al. 2009). Changes in stand structure
and diversity affect forest-climate interactions by changing canopy structure (Laurance
2004) and reducing the abundance of associated species like epiphytes, which play
important roles in ecosystem functioning (Holscher et al. 2004).
The similar decreasing trend in the percentage of snags for both species along
an elevation gradient indicates the non-randomness of tree death in the study area. This
also suggests that trees at the lower and middle elevation, which are exposed to lower
moisture and higher temperature conditions, were more affected. Studies have shown
that extent of drought-driven tree death increases following moisture stress gradients
Effects of mass tree dieback on stand structure and diversity in a dry Afromontane forest, northern Ethiopia
91
(Hanson and Weltzin 2000; Suarez et al. 2004). Lower elevations have warm
temperatures where a slight increase in temperatures or a short drought can cause mass
death of trees (Adams et al. 2009). A study on the density of snags in a tropical dry
forest in western Mexico also shows a high percentage of snags at the driest site (Segura
et al. 2003). A study in northern Arizona reports a decline in tree mortality with
increasing elevation (Gitlin et al. 2006). Thus, lower abundance of live trees at lower
elevations (Figure 6.3) implies that the distribution of the two species may be shifted
500 m to higher elevation from the lower extremes in the study area.
The percentage of snags of O. europaea subsp. cuspidata is slightly higher
than that of J. procera. This is partly because O. europaea subsp. cuspidata is largely
found at lower elevations compared to J. procera (Figure 6.3). Tree dieback is more
pronounced in large trees, particularly in the case of J. procera (Figure 6.8). Similar
findings were reported for the Amazon forest (Nepstad et al. 2007), northern Arizona
(Mueller et al. 2005), and Indonesia (Slik 2004), where large trees were more affected
by drought-triggered mortality. Since large trees use more water per unit time than
smaller trees (Meizner 2003), the higher death rate of larger trees following elevated
temperatures is probably due to the higher vulnerability of larger trees to xylem
cavitations especially during extreme drought conditions (Brodribb and Cochard 2009).
Although there is a clear trend in the percentage of snags along an elevation
gradient, some variations along the aspects were observed. Accordingly, percentages of
snags are higher in the plots found in the south-eastern aspects. Similarly, mortality of
pine and juniper trees is higher on the southern than on the northern aspect in mid-
elevation woodlands in Arizona (Gitlin et al. 2006). This can be due to the exposition of
south-eastern plots to thermal wind, while plots in north-eastern aspects are protected by
micro-topography. Slopes with a south-eastern aspect also receive a higher heat load
during the day than slopes oriented to the north-east (McCune and Keon 2002).
The high mortality of larger trees, particularly in the middle and lower
elevations of O. europaea subsp. cuspidata, leads to a high variation in the level of
greenness, which makes NDVI very suitable for estimating tree mortality patterns. The
same applies to ASTER imagery with its relatively high spatial resolution (15 m). Other
studies have also documented the applicability of such remotely sensed data in similar
ecological studies. Levin et al. (2007) find NDVI of ASTER imagery useful for
Effects of mass tree dieback on stand structure and diversity in a dry Afromontane forest, northern Ethiopia
92
predicting plant cover and species richness in dry environments in Israel. The Moderate
Resolution Imaging Spectroradiometer (MODIS) satellite imagery for estimating insect-
triggered tree mortality in a pine plantation in Australia based on NDVI (Verbesselt et
al. 2009).
6.4.2 Mass tree dieback, stand structure and species diversity
Stand density, basal area and diameter distribution are significantly affected by the mass
tree dieback of J. procera and O. europaea subsp. cuspidata, which indicates the
dominance of the two species in the stand. The wider gap created in the diameter
distribution (Figure 6.7) due to tree dieback suggests that the stand structure did not
recover after the incidence. The return to the pre-disturbance status is less likely due to
the slow growth and poor regeneration of the species (Aynekulu et al. 2009; Wassie et
al. 2009a). The increase in canopy gaps caused by mass tree dieback might have
increased the soil temperature and reduces soil moisture availability, which are major
limiting factors for the regeneration of many dry Afromontane tree species (Teketay
1997). Moreover, mass tree dieback may also reduce the availability of nursing trees for
a successful establishment of seedlings (Mueller et al. 2005; Aerts et al. 2007). Mass
tree dieback (74 % snags) strongly affects the reproductive range (10 - 40 cm) of
Juniperus procera (Couralet et al. 2005), which may influence the maintenance of a
viable plant population.
The openness of the canopies due to tree dieback also changes the understory
light conditions and encourages the establishment of pioneer species (Slik 2004).
Accordingly, dry Afromontane forests in northern Ethiopia, which were dominated by
J. procera and O. europaea subsp. cuspidata prior to disturbance, have been gradually
replaced by encroaching light-demanding shrubs and herbs such as Cadia purpurea and
Tarchonanthus camphoratus (Gebreegziabher 1999; Feoli et al. 2002). Thus, mass tree
dieback in the dry Afromontane forests in the study area may further lead to a gradual
replacement of the high canopy trees by pioneer shrub and herb species.
Despite the massive decline in the abundance of the two dominant species,
overall species evenness and diversity are not affected. This is because of the
dominance of J. procera and O. europaea subsp. cuspidata in the community even after
the tree dieback. A review of studies from 1985 to 1996 concludes that disturbance and
Effects of mass tree dieback on stand structure and diversity in a dry Afromontane forest, northern Ethiopia
93
diversity have no strong relationship (Mackey and Currie 2001). Unlike in moist
tropical forests, disturbance in dry forests does not create diverse habitats that
encourage tree species diversity (Denslow 1980; Engelbrecht et al. 2007). Spatial and
temporal variations in gap disturbance regimes may not explain variations in species
richness (Engelbrecht et al. 2007). Since data on species richness before the mass tree
dieback incidence are not available, there is no evidence on whether some species have
disappeared from the community or whether others are new. This implies that species
richness may not be a good indicator of community disturbance due to mass tree
dieback in this study.
Even if no significant difference in species diversity can be observed, a
reduction in the abundance of the two dominant tree species might reduce the net
primary productivity of the forests that affects the energy flow and nutrient recycling.
Wittebolle et al. (2009) also indicate that the original species evenness plays a key role
in stabilizing ecosystem productivity. Moreover, the poor evenness of species
distribution in the study site due to the dominance of J. procera and O. europaea subsp.
cuspidata also makes the study area poor in species diversity, which may make it less
resistant to environmental stress (Wittebolle et al. 2009).
6.5 Conclusions and management implications
The results indicate that mass tree dieback was not a random process, but significantly
related to elevation and aspect. The lower elevation and south-eastern aspects are more
affected by mass tree dieback. This implies that the distribution of the two species may
shift to a higher elevation from the lower extremes. The tree dieback of the two
dominant tree species has significantly reduced the stand density and basal area, but has
had no effect on species diversity. The population structure of the two species is
affected by the mass tree dieback, and both species have smaller seedling and sapling
populations than mature individuals. Besides mass tree dieback, continued pressure on
the J. procera and O. europaea subsp. cuspidata trees for their economic value is a
major concern in the tree-scarce landscapes in northern Ethiopia. Thus, it is important to
reduce further anthropogenic pressure on the forest to restore the population of the two
species. It is also important to increase their seedling population through assisted

Effects of mass tree dieback on stand structure and diversity in a dry Afromontane forest, northern Ethiopia
94
restoration measures. Sites with high snag density should also be carefully managed to
reduce potential fire incidents.
Climate-driven mortality is difficult to predict, and the frequency of extreme
climatic conditions that greatly affect semi-arid habitats is expected to increase (IPCC
2007), and may cause a further decreases in the habitat range of canopy species. Thus,
further degradation of the few natural forest remnants in northern Ethiopia might lead to
a change in plant community composition in the long run. Forest managers therefore
need to plan for potential climate change.
Regeneration response of native tree species to exclosure in a dry Afromontane forest, northern Ethiopia
95
7 REGENERATION RESPONSE OF NATIVE TREE SPECIES TO
EXCLOSURE IN A DRY AFROMONTANE FOREST, NORTHERN
ETHIOPIA
7.1 Introduction
In many tropical forests, excessive deforestation has hampered natural regeneration and
seedling establishment and affected the diversity and structure of plant communities
(Denslow 1980; Runkle 1982; Denslow 1987; Bussmann 2001). Similarly, forests in
Ethiopia have been affected by climatic and anthropogenic factors for centuries (Friis
1992; Machado et al. 1998; Tekle and Hedlund 2000; Zeleke and Hurni 2001; Dessie
and Kleman 2007). Historically, soil erosion as a result of vegetation clearing in the
highlands of Tigray, for instance, took place in the Middle Holocene (Bard et al. 2000;
Darbyshire et al. 2003).
The vascular plants of the Afromontane forests of Ethiopia maintain their
population through natural regeneration (Teketay 1997; Mamo et al. 2006). However,
large-scale degradation of natural forest in Ethiopia has created a major challenge with
respect to the regeneration of key native tree species (Wassie et al. 2009a), while
favoring shrub and herb species. For instance, Desa’a Afromontane forest, which was
dominated by Juniperus procera and Olea europaea prior to disturbance, has been
gradually replaced by encroaching light-demanding shrubs such as Cadia purpurea and
Tarchonanthus camphoratus.
Natural regeneration is a site-specific ecological process, and it is usually
difficult to characterize the factors that control regeneration processes (Schupp 1988;
Khurana and Singh 2001). Protecting areas from livestock intervention i.e., a practice
termed exclosure, is an assisted natural regeneration strategy to restore degraded forests
(Parrotta et al. 1997; Shono et al. 2007). Many degraded sites have been managed as
exclosures in northern Ethiopia, and attempts have been made to document the
regeneration and ecology of the plants in these exclosures. Studies have indicated that
vegetation recovery is quick in the younger stages (Mengistu et al. 2005; Abebe et al.
2006). However, exclosures that are older than 8 years do not show significant increases
in species diversity and biomass production (Asefa et al. 2003; Yayneshet et al. 2009).
Regeneration response of native tree species to exclosure in a dry Afromontane forest, northern Ethiopia
96
Some studies on vegetation restoration in Ethiopia have suggested that the presence of
matured trees as seed sources (Tekle and Hedlund 2000), plantation forests (Senbeta
and Teketay 2001; Yirdaw 2001; Lemenih et al. 2004), and minimization of livestock
pressure (Aerts et al. 2007) create favorable conditions for the regeneration of native
species. Although some studies exist on the regeneration and ecology of J. procera and
O. europaea in the northern Ethiopian highlands (Aerts et al. 2006c; Wassie et al.
2009a) little is known about regeneration in the relatively larger dry Afromontane forest
remnants in northern Ethiopia. Thus, the aim of this study is to investigate the response
of natural regeneration of J. procera and O. europaea to a 3-year exclosure in
comparison to an open forest management system in a dry Afromontane forest in
northern Ethiopia.
7.2 Material and methods
7.2.1 Study site
The study was conducted in Desa’a forest, which is one of the dry Afromontane forest
remnants in northern Ethiopia (Friis 1992). The site is located at 13°56' N, 39°49' E at
an elevation of 2700 m above sea level (Figure 7.1). The study is located on the Tigrean
Plateau, which lies immediately above the escarpment of north western Great Rift
Valley. A large part of the site is located on shale, limestone, and sandstone of the
Tertiary and Mesozoic era (TFAP 1996). Based on the diverse geological formations,
the soils are variable; the dominating soil types in the study region are Leptosols,
Cambisols, Vertisols, Regosols, and Arenosols (TFAP 1996).
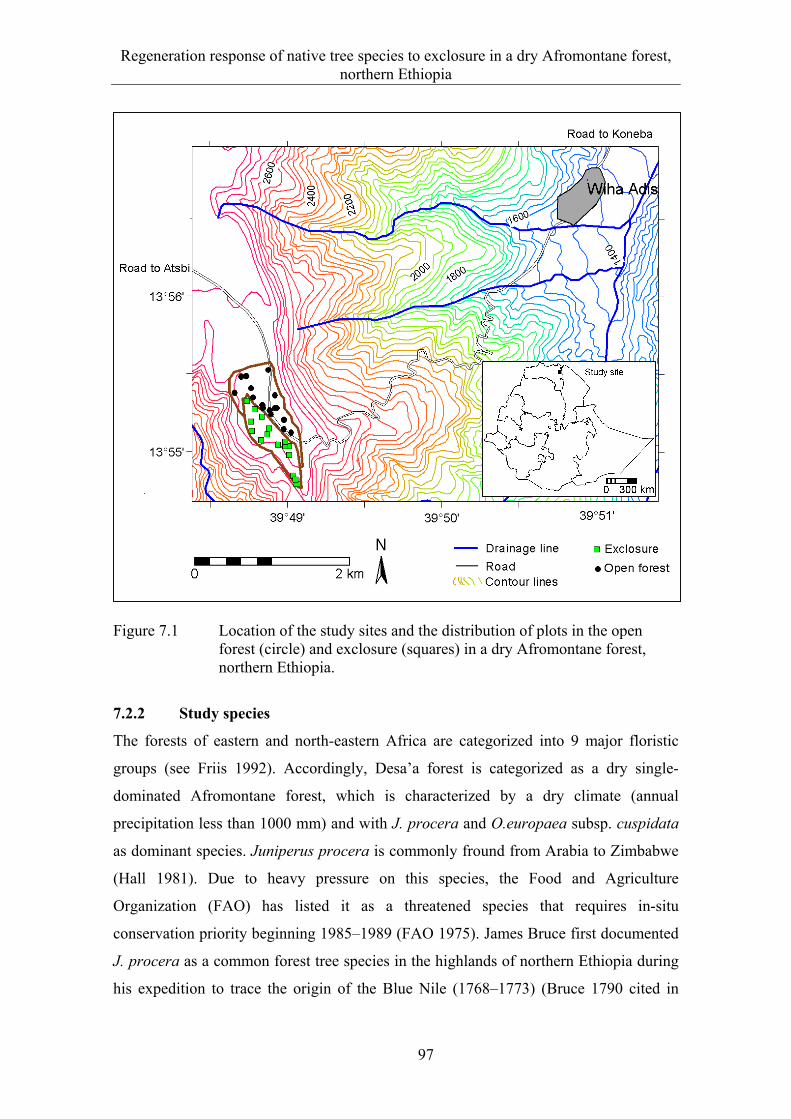
Regeneration response of native tree species to exclosure in a dry Afromontane forest, northern Ethiopia
97
Figure 7.1 Location of the study sites and the distribution of plots in the open
forest (circle) and exclosure (squares) in a dry Afromontane forest, northern Ethiopia.
7.2.2 Study species
The forests of eastern and north-eastern Africa are categorized into 9 major floristic
groups (see Friis 1992). Accordingly, Desa’a forest is categorized as a dry single-
dominated Afromontane forest, which is characterized by a dry climate (annual
precipitation less than 1000 mm) and with J. procera and O.europaea subsp. cuspidata
as dominant species. Juniperus procera is commonly fround from Arabia to Zimbabwe
(Hall 1981). Due to heavy pressure on this species, the Food and Agriculture
Organization (FAO) has listed it as a threatened species that requires in-situ
conservation priority beginning 1985–1989 (FAO 1975). James Bruce first documented
J. procera as a common forest tree species in the highlands of northern Ethiopia during
his expedition to trace the origin of the Blue Nile (1768–1773) (Bruce 1790 cited in
Regeneration response of native tree species to exclosure in a dry Afromontane forest, northern Ethiopia
98
Friis 1992). Juniperus procera has a slow germination rate (Yirdaw and Leinonen 2002)
and low germination capacity, which are mainly attributed to seed dormancy (Tigabu et
al. 2007).
The genus Olea has 33 species, and Olea europaea subsp. cuspidata is one of
the subspecies that was previously named Olea africana. The species is commonly
called the African olive and is widely distributed from Arabia to southern Africa.
Although it is a useful tree species in its natural habitat, it is categorized as an invasive
plant in countries like Australia (Cuneo and Leishman 2006) and Hawaii (Santos et al.
1992). Olea europaea subsp. cuspidata is a common species in the highlands of
Ethiopia.
7.2.3 Sampling design
The exclosure and an adjacent open forest, which is not protected from livestock, were
mapped using a global positioning system (GPS) device. Later, the GPS data were
transferred to a geographic information system (GIS) environment for further mapping.
The exclosure and open forest areas cover 33 and 43 ha, respectively. Data on the
floristic and structural compositions of the standing vegetation were collected in 32
randomly selected plots (20 m × 20 m), and nested plots (10 m × 10 m) were used to
investigate the seedling bank in the exclosure and the adjacent open forest. Emphasis
was placed on the two target species, i.e., J. procera and O. europaea subsp. cuspidata.
7.2.4 Data analysis
The importance of a species is determined using the importance value index (IVI) (see
section 4.2.3). Species diversity is determined using the Shannon diversity index and
Simpson’s Index of diversity given by (Magurran 2004). The generalized linear model
(GLM) with quasi-Poisson distribution (with log link) is used to determine the effect of
management on seedling abundance of J. procera and O. europaea subsp. cuspidata in
R software version 2.7.0 (R Development Core Team 2008). The family quasi-Poisson
distribution is used because there were over-dispersions when Poisson distribution was
run (Crawley 2007). For a better visualization and consideration of spatial correlations
(Webster and Oliver 2001), the spatial distribution of seedling density (number of
Regeneration response of native tree species to exclosure in a dry Afromontane forest, northern Ethiopia
99
seedlings per plot) is mapped using the ordinary kriging interpolation method with the
Integrated Land and Water Information System (ILWIS 3.3) GIS software (ITC 2001).
7.3 Results
7.3.1 Floristic composition
In total, 17 vascular plant species (with measured DBH) belonging to 12 families were
recorded in the exclosure and the open forest; J. procera is the dominant species with
the highest relative importance value (Table 7.1). Juniperus procea, Olea europaea
subsp. cuspidata, Solanum schimperianum, and Maytenus senegalensis are the most
common species found in more than 75 % of the plots, while Erica arborea is among
the rare species, recorded only in one plot.
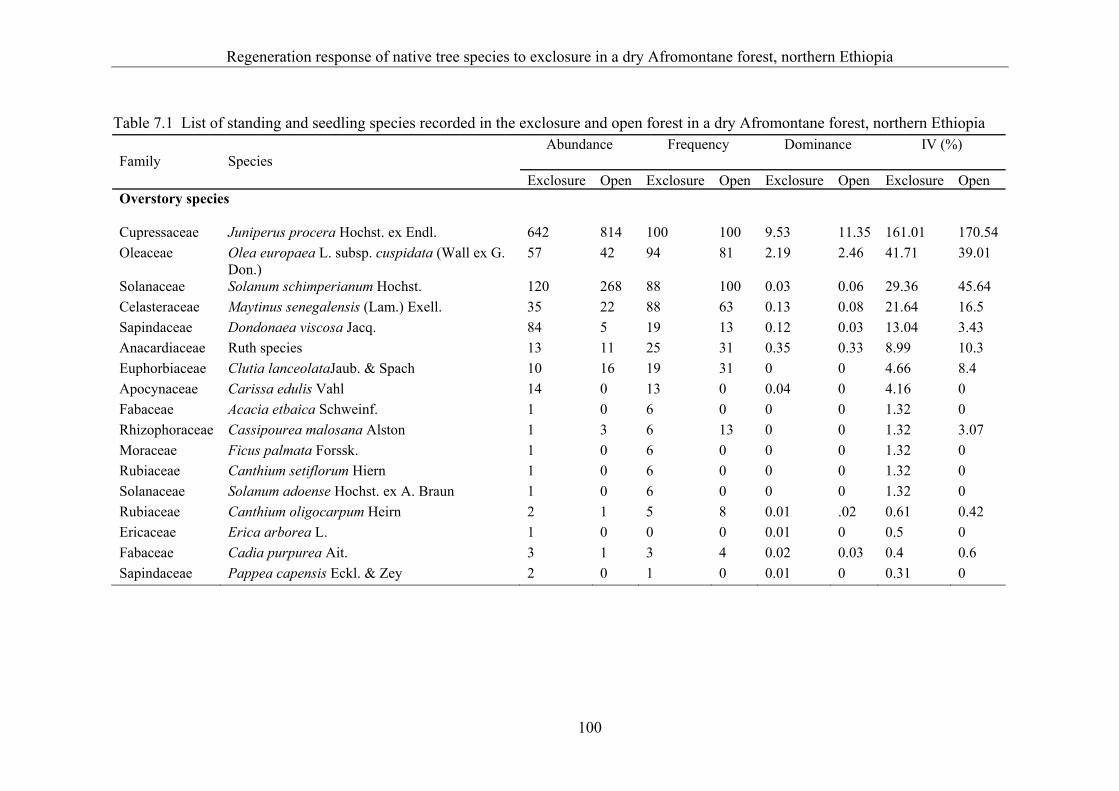
Regeneration response of native tree species to exclosure in a dry Afromontane forest, northern Ethiopia
100
Table 7.1 List of standing and seedling species recorded in the exclosure and open forest in a dry Afromontane forest, northern Ethiopia
Family Species Abundance
Frequency
Dominance
IV (%)
Exclosure Open Exclosure Open Exclosure Open Exclosure Open Overstory species Cupressaceae Juniperus procera Hochst. ex Endl. 642 814 100 100 9.53 11.35 161.01 170.54
Oleaceae Olea europaea L. subsp. cuspidata (Wall ex G. Don.)
57 42 94 81 2.19 2.46 41.71 39.01
Solanaceae Solanum schimperianum Hochst. 120 268 88 100 0.03 0.06 29.36 45.64
Celasteraceae Maytinus senegalensis (Lam.) Exell. 35 22 88 63 0.13 0.08 21.64 16.5
Sapindaceae Dondonaea viscosa Jacq. 84 5 19 13 0.12 0.03 13.04 3.43
Anacardiaceae Ruth species 13 11 25 31 0.35 0.33 8.99 10.3
Euphorbiaceae Clutia lanceolataJaub. & Spach 10 16 19 31 0 0 4.66 8.4
Apocynaceae Carissa edulis Vahl 14 0 13 0 0.04 0 4.16 0
Fabaceae Acacia etbaica Schweinf. 1 0 6 0 0 0 1.32 0
Rhizophoraceae Cassipourea malosana Alston 1 3 6 13 0 0 1.32 3.07
Moraceae Ficus palmata Forssk. 1 0 6 0 0 0 1.32 0
Rubiaceae Canthium setiflorum Hiern 1 0 6 0 0 0 1.32 0
Solanaceae Solanum adoense Hochst. ex A. Braun 1 0 6 0 0 0 1.32 0
Rubiaceae Canthium oligocarpum Heirn 2 1 5 8 0.01 .02 0.61 0.42
Ericaceae Erica arborea L. 1 0 0 0 0.01 0 0.5 0
Fabaceae Cadia purpurea Ait. 3 1 3 4 0.02 0.03 0.4 0.6
Sapindaceae Pappea capensis Eckl. & Zey 2 0 1 0 0.01 0 0.31 0
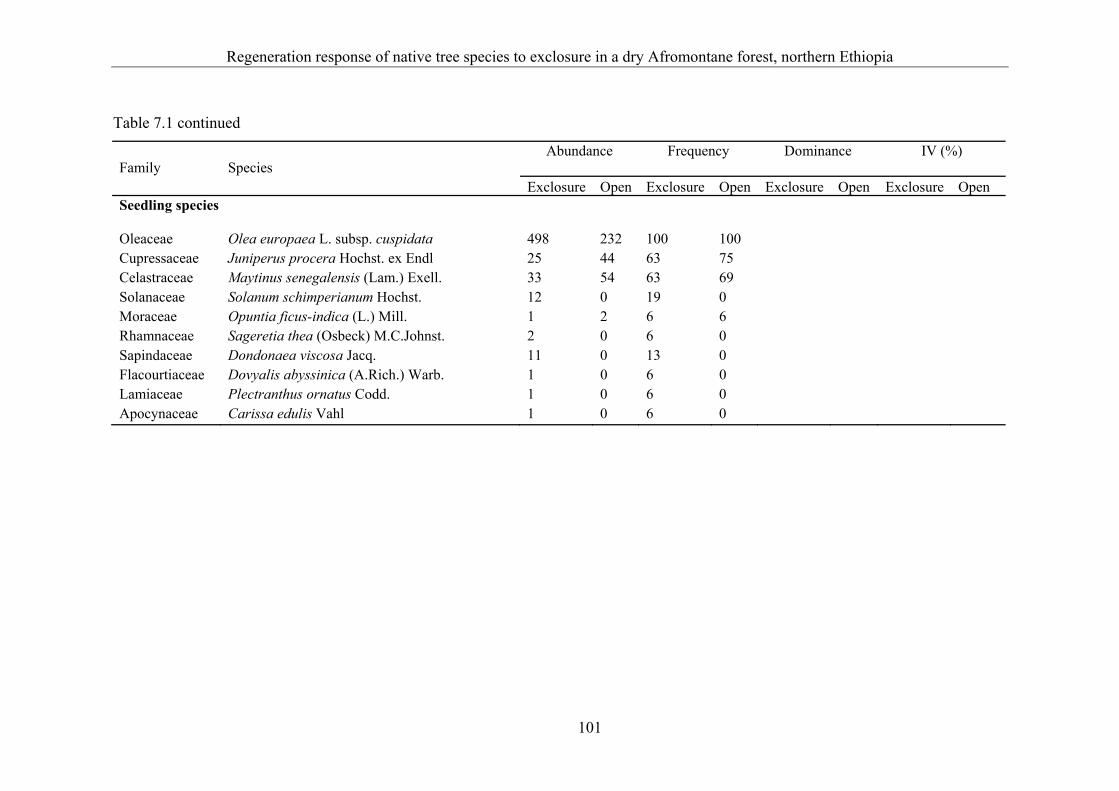
Regeneration response of native tree species to exclosure in a dry Afromontane forest, northern Ethiopia
101
Table 7.1 continued
Family Species Abundance
Frequency
Dominance
IV (%)
Exclosure Open Exclosure Open Exclosure Open Exclosure Open Seedling species Oleaceae Olea europaea L. subsp. cuspidata 498 232 100 100 Cupressaceae Juniperus procera Hochst. ex Endl 25 44 63 75 Celastraceae Maytinus senegalensis (Lam.) Exell. 33 54 63 69 Solanaceae Solanum schimperianum Hochst. 12 0 19 0 Moraceae Opuntia ficus-indica (L.) Mill. 1 2 6 6 Rhamnaceae Sageretia thea (Osbeck) M.C.Johnst. 2 0 6 0 Sapindaceae Dondonaea viscosa Jacq. 11 0 13 0 Flacourtiaceae Dovyalis abyssinica (A.Rich.) Warb. 1 0 6 0 Lamiaceae Plectranthus ornatus Codd. 1 0 6 0 Apocynaceae Carissa edulis Vahl 1 0 6 0
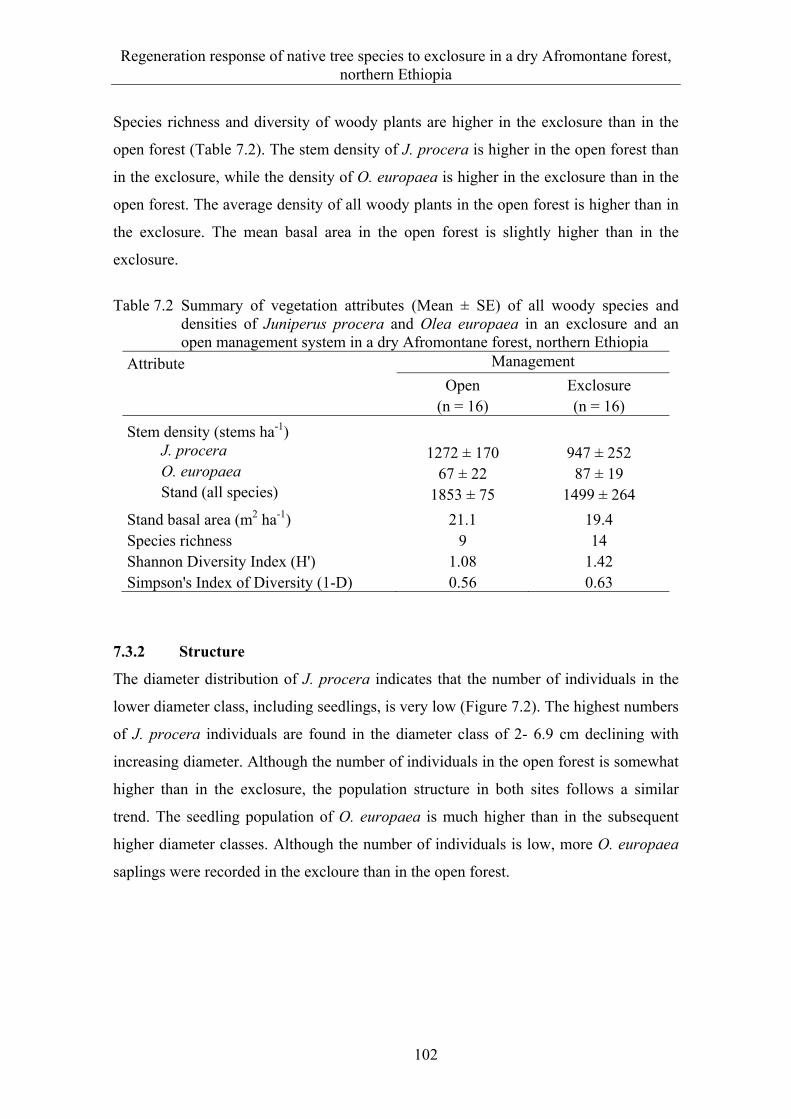
Regeneration response of native tree species to exclosure in a dry Afromontane forest, northern Ethiopia
102
Species richness and diversity of woody plants are higher in the exclosure than in the
open forest (Table 7.2). The stem density of J. procera is higher in the open forest than
in the exclosure, while the density of O. europaea is higher in the exclosure than in the
open forest. The average density of all woody plants in the open forest is higher than in
the exclosure. The mean basal area in the open forest is slightly higher than in the
exclosure.
Table 7.2 Summary of vegetation attributes (Mean ± SE) of all woody species and
densities of Juniperus procera and Olea europaea in an exclosure and an open management system in a dry Afromontane forest, northern Ethiopia
Attribute Management
Open Exclosure (n = 16) (n = 16)
Stem density (stems ha-1) J. procera 1272 ± 170 947 ± 252 O. europaea 67 ± 22 87 ± 19 Stand (all species) 1853 ± 75 1499 ± 264
Stand basal area (m2 ha-1) 21.1 19.4 Species richness 9 14 Shannon Diversity Index (H') 1.08 1.42 Simpson's Index of Diversity (1-D) 0.56 0.63
7.3.2 Structure
The diameter distribution of J. procera indicates that the number of individuals in the
lower diameter class, including seedlings, is very low (Figure 7.2). The highest numbers
of J. procera individuals are found in the diameter class of 2- 6.9 cm declining with
increasing diameter. Although the number of individuals in the open forest is somewhat
higher than in the exclosure, the population structure in both sites follows a similar
trend. The seedling population of O. europaea is much higher than in the subsequent
higher diameter classes. Although the number of individuals is low, more O. europaea
saplings were recorded in the excloure than in the open forest.
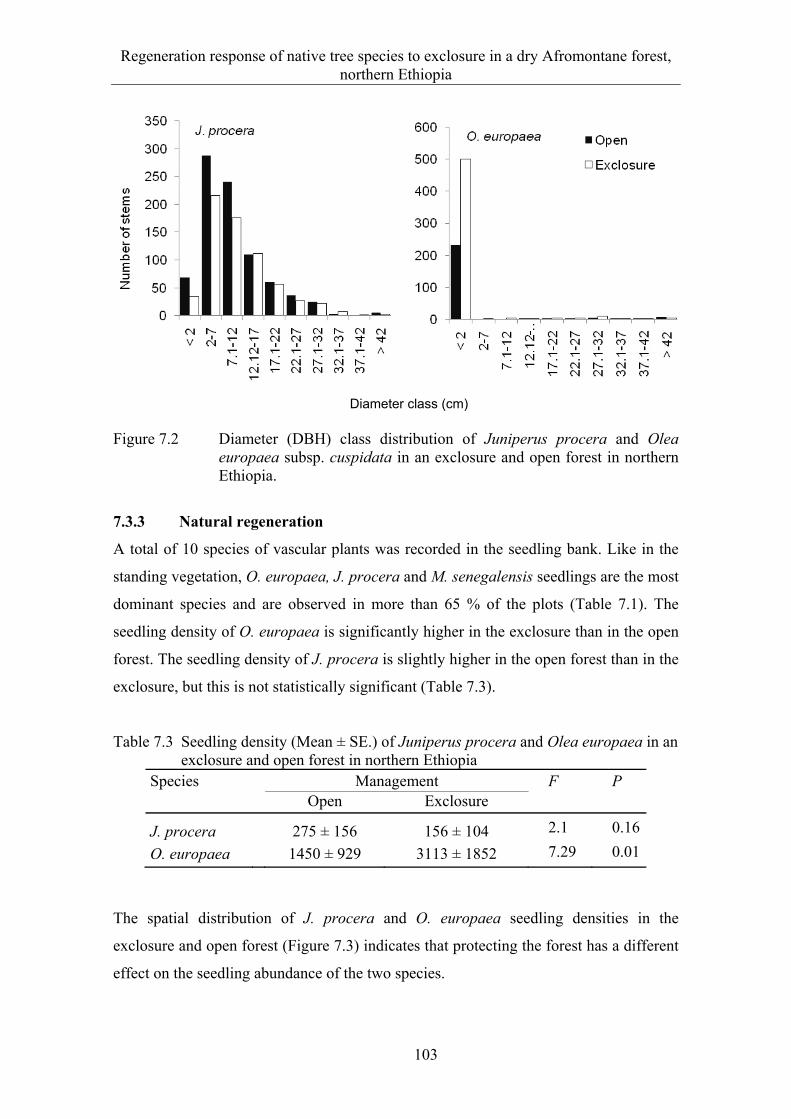
Regeneration response of native tree species to exclosure in a dry Afromontane forest, northern Ethiopia
103
Figure 7.2 Diameter (DBH) class distribution of Juniperus procera and Olea
europaea subsp. cuspidata in an exclosure and open forest in northern Ethiopia.
7.3.3 Natural regeneration
A total of 10 species of vascular plants was recorded in the seedling bank. Like in the
standing vegetation, O. europaea, J. procera and M. senegalensis seedlings are the most
dominant species and are observed in more than 65 % of the plots (Table 7.1). The
seedling density of O. europaea is significantly higher in the exclosure than in the open
forest. The seedling density of J. procera is slightly higher in the open forest than in the
exclosure, but this is not statistically significant (Table 7.3).
Table 7.3 Seedling density (Mean ± SE.) of Juniperus procera and Olea europaea in an exclosure and open forest in northern Ethiopia
Species Management F P Open Exclosure
J. procera 275 ± 156 156 ± 104 2.1 0.16
O. europaea 1450 ± 929 3113 ± 1852 7.29 0.01
The spatial distribution of J. procera and O. europaea seedling densities in the
exclosure and open forest (Figure 7.3) indicates that protecting the forest has a different
effect on the seedling abundance of the two species.
Diameter class (cm)
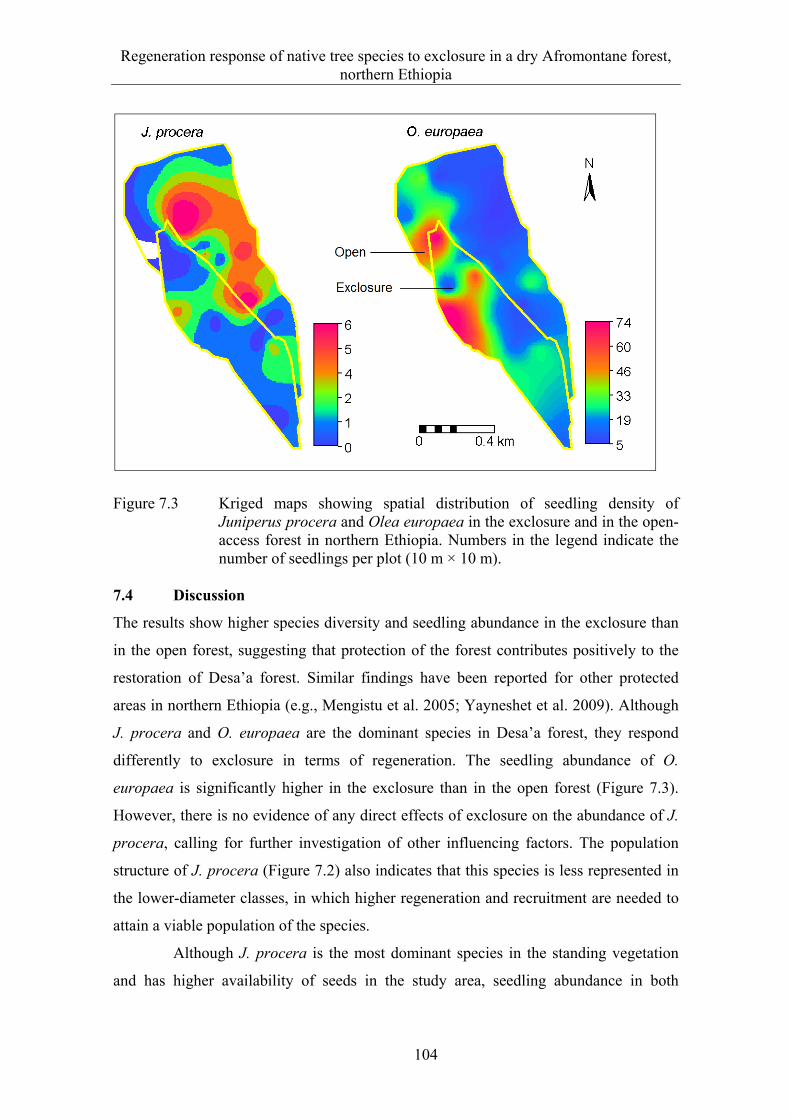
Regeneration response of native tree species to exclosure in a dry Afromontane forest, northern Ethiopia
104
Figure 7.3 Kriged maps showing spatial distribution of seedling density of Juniperus procera and Olea europaea in the exclosure and in the open-access forest in northern Ethiopia. Numbers in the legend indicate the number of seedlings per plot (10 m × 10 m).
7.4 Discussion
The results show higher species diversity and seedling abundance in the exclosure than
in the open forest, suggesting that protection of the forest contributes positively to the
restoration of Desa’a forest. Similar findings have been reported for other protected
areas in northern Ethiopia (e.g., Mengistu et al. 2005; Yayneshet et al. 2009). Although
J. procera and O. europaea are the dominant species in Desa’a forest, they respond
differently to exclosure in terms of regeneration. The seedling abundance of O.
europaea is significantly higher in the exclosure than in the open forest (Figure 7.3).
However, there is no evidence of any direct effects of exclosure on the abundance of J.
procera, calling for further investigation of other influencing factors. The population
structure of J. procera (Figure 7.2) also indicates that this species is less represented in
the lower-diameter classes, in which higher regeneration and recruitment are needed to
attain a viable population of the species.
Although J. procera is the most dominant species in the standing vegetation
and has higher availability of seeds in the study area, seedling abundance in both
Regeneration response of native tree species to exclosure in a dry Afromontane forest, northern Ethiopia
105
exclosure and open forest is very low. This is also in agreement with the findings of
Wassie et al. (2009a) who found lower regeneration of J. procera in church forests in
northern Ethiopia. Although not statistically significant, regeneration of J. procera is
higher at the open forest than at the exclosure (Table 7.3). This is in agreement with the
findings of Mamo et al. (2006), who found poor regeneration of J. procera under field
conditions, suggesting a need for additional manipulation. Although some studies have
indicated that light may not be a major limiting factor for the germination of J. procera
(Sharew et al. 1997; Wassie et al. 2009a), the dense grass and herb cover in the
exclosure might prevent optimum radiation reaching the forest floor (Yirdaw and
Leinonen 2002; Teketay 2005) and thus influence germination (Cabin et al. 2002).
Seed dormancy, which varies depending on the provenance of J. procera in
Ethiopia (Tigabu et al. 2007), might also influence germination. The thick, less
decomposable litter of J. procera (Prescott et al. 2000) in the exclosure also prevents
seeds from contacting the soil. This might slow down the breaking of seed dormancy,
which would ultimately hamper germination (Rotundo and Aguiar 2005; Cierjacks et al.
2008). The thick litter in the exclosure might also have influenced emergence of newly
germinated seedlings (Yirdaw and Leinonen 2002; Teketay 2005). Sharew et al. (1997)
found that land preparation by raking and burning increased the germination capacity of
this species. Hence, the relatively higher abundance of J. procera seedlings in the open
forest than in the exclosure suggests that other factors such as absence of excessive
shade, less litter, low livestock preference, and the breaking of seed dormancy through
livestock trampling (Cierjacks et al. 2008) may determine regeneration.
The seedling abundance of O. europaea is higher in the exclosure than in the
open forest (Table 7.3), indicating that this species is negatively influenced by livestock
browsing and other microsite characteristics such as shade. Studies indicate that the
establishment and recruitment of O. europaea are better under shaded and protected
conditions (Fetene and Feleke 2001; Bekele 2005; Aerts et al. 2006c; Aerts et al. 2008).
In contrast, Tesfaye et al. (2002) found that O. europaea is a light-demanding species in
the Harena forest in the south-eastern highlands of Ethiopia, which is wetter than the
study site. This indicates that the establishment of O. europaea requires shade in drier
environments that reduces moisture loss during the dry season (Holmgren et al. 1997).
Regeneration response of native tree species to exclosure in a dry Afromontane forest, northern Ethiopia
106
In line with this, Aerts et al. (2006b) also found successful regeneration of O. europaea
under Euclea shrubs, which create a better moisture regime through thick humus and
organic matter accumulation (Descheemaeker et al. 2006) in protected sites in northern
Ethiopia. Rey et al. (2000) also found that regeneration of O. europaea is much
influenced by the availability of moisture. Although mature individuals trees of this
species are tolerant to browsing (Dansereau 1951; Dale et al. 2000; Tesfaye et al. 2002;
Darbyshire et al. 2003; DeLong et al. 2008), seedlings are sensitive to herbivory
(Tesfaye et al. 2002). Thus, protection of O. europaea seedlings from herbivory in the
exclosure contributed to a higher abundance of seedlings than in the open forest. Like
the findings of Aerts et al. (2008), coppicing shoots of O. europaea subsp. cuspidata are
commonly observed in the exclosures and can be used to restore Desa’a forest.
Similar to findings elsewhere (Richter et al. 2001; Cabin et al. 2002), the
exclosure in Desa’a forest favors grass and herbaceous species (Figure 7.4), which may
lead to a gradual shift of the forestland to wooded grassland. Hence, it is important to
reduce the grass cover to enhance the regeneration of tree species (Cabin et al. 2002). It
is well documented that livestock is an important agent of regeneration (e.g., Cierjacks
et al. 2008). However, in degraded environments where there is overgrazing, the impact
of livestock with respect to enhancing regeneration is limited. Instead, livestock
contribute negatively to the establishment of seedlings through intensive browsing
(Wassie et al. 2009b). In such degraded environments, species such as O. europaea are
frequently browsed in the absence of other feed sources, particularly during the long dry
season, which does not allow the species to develop a viable population (Gunderson
2000).
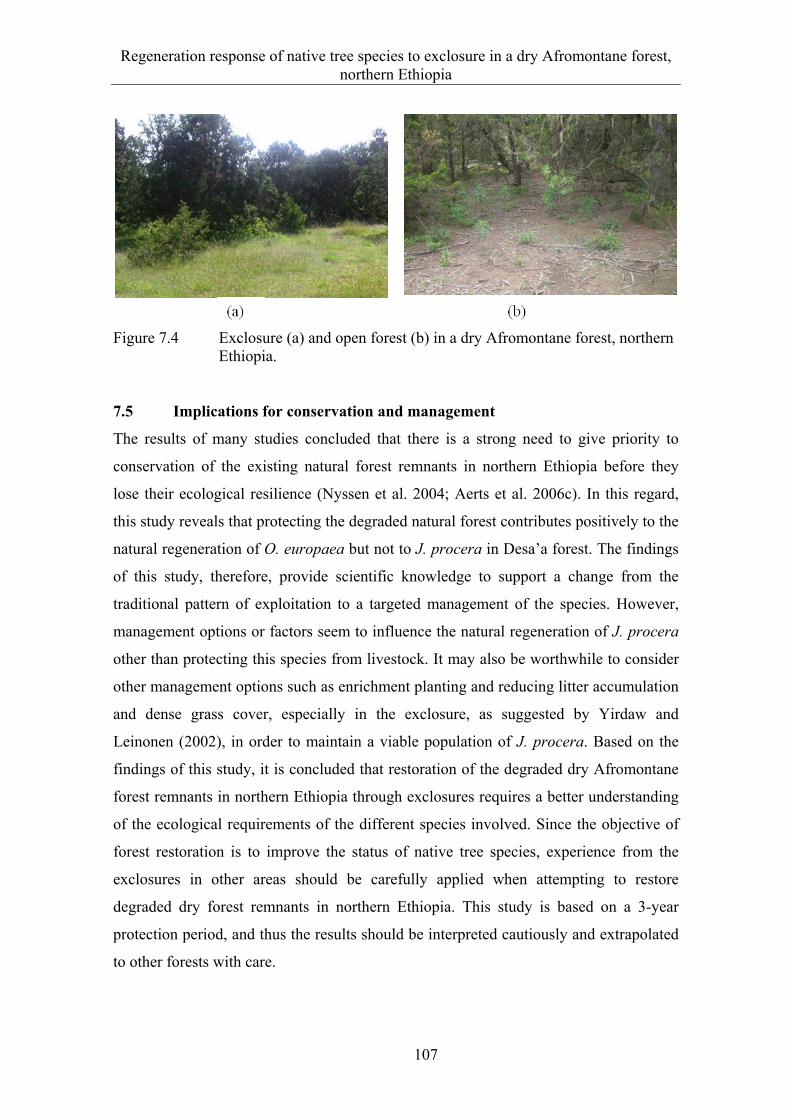
Regeneration response of native tree species to exclosure in a dry Afromontane forest, northern Ethiopia
107
Figure 7.4 Exclosure (a) and open forest (b) in a dry Afromontane forest, northern
Ethiopia. 7.5 Implications for conservation and management
The results of many studies concluded that there is a strong need to give priority to
conservation of the existing natural forest remnants in northern Ethiopia before they
lose their ecological resilience (Nyssen et al. 2004; Aerts et al. 2006c). In this regard,
this study reveals that protecting the degraded natural forest contributes positively to the
natural regeneration of O. europaea but not to J. procera in Desa’a forest. The findings
of this study, therefore, provide scientific knowledge to support a change from the
traditional pattern of exploitation to a targeted management of the species. However,
management options or factors seem to influence the natural regeneration of J. procera
other than protecting this species from livestock. It may also be worthwhile to consider
other management options such as enrichment planting and reducing litter accumulation
and dense grass cover, especially in the exclosure, as suggested by Yirdaw and
Leinonen (2002), in order to maintain a viable population of J. procera. Based on the
findings of this study, it is concluded that restoration of the degraded dry Afromontane
forest remnants in northern Ethiopia through exclosures requires a better understanding
of the ecological requirements of the different species involved. Since the objective of
forest restoration is to improve the status of native tree species, experience from the
exclosures in other areas should be carefully applied when attempting to restore
degraded dry forest remnants in northern Ethiopia. This study is based on a 3-year
protection period, and thus the results should be interpreted cautiously and extrapolated
to other forests with care.
Forest diversity in fragmented landscapes in northern Ethiopia: synthesis, implications for conservation, and further studies
108
8 FOREST DIVERSITY IN FRAGMENTED LANDSCAPES IN
NORTHERN ETHIOPIA: SYNTHESIS, IMPLICATIONS FOR
CONSERVATION, AND FURTHER STUDIES
Deforestation and forest degradation in northern Ethiopia has a long history. Following
the early settlements in northern Ethiopia, the extent of deforestation and forest
degradation in northern Ethiopia is more severe than in other parts of the country. The
forests have suffered from anthropogenic and natural disturbance. The forest remnants
in northern Ethiopia are part of the eastern Afromontane and Horn of Africa
biodiversity hotspots that need conservation priorities. Recently, conservation of
biodiversity in the dryland ecosystems has received greater attention. One of the
national biodiversity strategies of Ethiopia is conserving forest ecosystems (IBC 2005).
This study gives detailed analyses of species diversity, composition of plant
communities, natural regeneration, and forest structure in relation to selected
environmental factors in Desa’a and Hugumburda forests, which are large natural forest
remnants in northern Ethiopia. The findings can provide decision support in the design
of such a conservation strategy.
Species diversity and assemblage
Species diversity in the study forests is lower than in many of the natural forests in
southern Ethiopia. Floristically, the studied forests are largely (ca. 70 %) composed of
shrub and herb species. This indicates that the forest remnants in northern Ethiopia,
particularly Desa’a forest, are experiencing a retrogressive succession in which tree
species are gradually replaced by shrub and herb species.
Topographic position, which is associated to moisture availability, and forest
disturbance explain the species distribution patterns and partitioned plant communities
(Chapter 4, 5). The Pterolobium stellatum―Celtis africana plant community, which is
found in Hugumburda forest (Chapter 4) is categorized under a moist forest type while
all other plant communities belong to dry Afromontane forests with J. procera and O.
europaea subsp. cuspidata as dominant species. This indicates that the riverine plant
communalities are islands of moist forest in the dry lands of northern Ethiopia that need
conservation priority.
Forest diversity in fragmented landscapes in northern Ethiopia: synthesis, implications for conservation, and further studies
109
Natural regeneration
The results indicate that the standing vegetation is only partly represented in the
seedling bank, and many of the rare tree species show poor or no regeneration (Chapter
4, 6). A smaller number of saplings than mature species suggests that locally some tree
species are experiencing extinction.
The natural regeneration at the exclosure in Desa’a forest did not significantly
contribute to the natural regeneration of native tree species. This implies that closing of
the degraded forests to livestock intervention may not guarantee a successful
regeneration of tree species in the degraded dry forests especially for J. procera. Thus,
it is important to complement protected forests with enrichment planting and other
assisted regeneration measures like reducing litter accumulation and dense-grass cover
while managing exclosures. Since moisture is a limiting factor for regeneration in dry
forests (Chapter 4), it is also important to reduce soil desiccation by maintaining
adequate canopy cover.
Effects of mass tree dieback on forest structure
The results indicate that mass tree dieback of J. procera and O. europaea subsp.
cuspidata has significantly reduced the living stand density and basal area of Desa’a
forest (Chapter 6). Mass tree dieback is significantly reduced with increasing elevation,
which reduces the elevational range of the key tree species (J. procera and O. europaea)
by nearly 500 m to the higher elevations. This may also cause a shift in the forest-shrub
land ecotone to higher elevation. Besides continued pressure on the J. procera and O.
europaea trees for their economic value, mass tree dieback of these species is thus a
major concern in the tree-scarce landscapes in northern Ethiopia. Forest disturbance has
favored the expansion of herbs and pioneer shrub species e.g., Cadia purpurea and
Tarchonanthus camphoratus (Chapter 4 & 5), which may change the once forest-
dominated landscape of the escarpment of the western Rift Valley into a shrub-herb
dominated degraded vegetation landscape. Therefore, it is important to reduce further
anthropogenic pressure on the remnant forests to restore the population of the tree
species.
Forest diversity in fragmented landscapes in northern Ethiopia: synthesis, implications for conservation, and further studies
110
The ecological importance of snags is less understood and has been overlooked.
However, studies show that snags are part of the ecological process in the forest
ecosystem that should not be over exploited. To prevent loss of nutrients, soils and
water, habitats for birds, etc., in the forest ecosystems it is important to leave the snags
in the forest. But, places with high snag density should be also carefully managed to
reduce potential fire incidents. Climate-driven mortality is difficult to predict, and the
frequency of extreme climatic conditions that greatly affect semi-arid habitats is
expected to increase (IPCC 2007). Thus, forest managers need to plan for potential tree
dieback.
Conservation strategy
It is important to follow the ecosystem strategy of biodiversity conservation that
integrates land, water and living resources. The ecosystem approach of biodiversity
conservation provides an opportunity to conserve large numbers of species that are rare
and whose ecosystem regulating role might not be yet known. Thus, besides the species-
rich zones, conservation programs should also consider plant communities that are not
species rich but contain endemic and threatened species. In the study area, to conserve a
large number of species and plant communities, it is worth establishing a biodiversity
conservation corridor along the Tigrean-Afar ecological zones.
However, with the current socio-economic context in northern Ethiopia, it may
be difficult to implement some of the recommendations stated above. The expansion of
agricultural lands in Tigray has reached its limits, and there is a serious shortage of
grazing land, which increases the pressure on the forests and thus makes conservation of
forests for their biodiversity values difficult. Thus, it is important to prioritize
conservation sites. The Pterolobium stellatum―Celtis africana community identified at
Hugumburda forest, for instance, contains many rare species experiencing extinction
and needs conservation priority. Dracaena ombet, which is found in the Dracaena
ombet―Acacia etbaica community in Desa’a forest, is listed under the Red List of the
IUCN as an endangered species that needs conservation priority. However, a sustainable
forest development in the region can be realised when the pressure on the forests from
further expansion of agriculture and high demand for biomass energy is reduced.
Therefore, it is indispensible to have a strategy for a sustainable rural development that
increases the productivity of the agriculture sector. Shortage of wood has also been a
Forest diversity in fragmented landscapes in northern Ethiopia: synthesis, implications for conservation, and further studies
111
serious problem in the rural and urban areas, and broader rural-urban solutions like
establishing fuelwood plantations to reduce the pressure on the remnant forests are
necessary.
Income from forest-related economic activities accounts for the second largest
share in the average total household income in Tigray. Thus, it is important to develop
the forestry sector to improve the rural livelihoods in northern Ethiopia. It is also
important to strengthen the forest institutions from national to local levels, so that
appropriate policies can be designed and their implementation monitored. There are
many successful community-based soil and water conservation and vegetation
restoration programs in Tigray. It is important to also implement community-based
forest development programs to develop the existing forest remnants.
In conclusion, the results of the present study clearly show that forest
disturbance due to human and natural causes has significantly affected the dry
Afromontane forests in northern Ethiopia, which need urgent conservation attention.
Thus, the findings can provide important information for researchers, conservationists,
policy makers, and other stakeholders for conservation of the remnant forests. The study
also addresses the lack of information on the vegetation ecology of the two large forest
remnants in northern Ethiopia, which is one of the major limitations for students and
researchers.
Further research
The present study is based on few selected environmental factors that determine
species distribution patterns in which further investigations on the influence of soil
physical and chemical properties on species distribution is needed.
No empirical evidence on the time and cause for the mass tree dieback exists,
which needs further investigations.
Natural regeneration of tree species in the fragmented forests, even in protected
forests from livestock is poor. Thus, further research on the regeneration ecology of
key native tree species is recommended. One major limiting factor for poor sapling
population that affects the population structure of many native tree species is lack
of recruitment of both natural regenerated and planted seedlings that needs further
investigations.
References
112
9 REFERENCES
Abebe MH, Oba G, Angassa A et al (2006) The role of area enclosures and fallow age in the restoration of plant diversity in northern Ethiopia. African Journal of Ecology 44(4):507-514
Abegaz A (2005) Farm management in mixed crop-livestock systems in the northern Highlands of Ethiopia. Dissertation, Wageningen University and Research Center, Wageningen
Adams HD, Guardiola-Claramonte M, Barron-Gafford GA et al (2009) Temperature sensitivity of drought-induced tree mortality portends increased regional dieback under global-change-type drought. Proceedings of the National Academy of Sciences 106(17):7063-7066
Aerts R, Maes W, November E et al (2006a) Restoring dry Afromontane forest using bird and nurse plant effects: Direct sowing of Olea europaea ssp. cuspidata seeds. Forest Ecology and Management 230:23-31
Aerts R, November E, Van der Borght I et al (2006b) Effects of pioneer shrubs on the recruitment of the fleshy-fruited tree Olea europaea ssp. cuspidata in Afromontane savanna. Applied Vegetation Science 9:117-126
Aerts R, Van-Overtveld K, Deckers J et al (2006c) Species composition and diversity of small Afromontane forest fragments in northern Ethiopia. Plant Ecology 187:127-142
Aerts R, Negussie A, Maes W et al (2007) Restoration of dry Afromontane forest using pioneer shrubs as nurse-plants for Olea europaea ssp. cuspidata. Restoration Ecology 15:129-138
Aerts R, November E, Maes W et al (2008) In situ persistence of African wild olive and forest restoration in degraded semiarid savanna. Journal of Arid Environments 76(6):1131-1136
Agee JK, Skinner CN (2005) Basic principles of forest fuel reduction treatments. Forest Ecology and Management 211:83-96
Alelign A, Teketay D, Yemshaw Y et al (2007) Diversity and status of regeneration of woody plants on the peninsula of Zegie, northwester Ethiopia. Tropical Ecology 48:37-49
Asefa DT, Oba G, Weladji RB et al (2003) An Assessment of restoration of Biodiversity in degraded high mountain grazing lands in northern Ethiopia. Land Degradation & Development 14:25-38
Asrat A (2002) The Rock-Hewn churches of Tigrai, northern Ethiopia: A geological perspective. Geoarchaeology 17:649-663
Aynekulu E, Denich M, Tsegaye D (2009) Regeneration response of Juniperus procera and Olea europaea subsp. cuspidata to exclosure in a dry Afromontane forest in northern Ethiopia. Mountain Research and Development 29(2):143-152
Ayyad MA (2003) Case studies in the conservation of biodiversity: degradation and threats. Journal of Arid Environments 54:165-182
Babulo B, Muys B, Nega F et al (2009) The economic contribution of forest resource use to rural livelihoods in Tigray, Northern Ethiopia. Forest Policy and Economics 11(2):109-117
Badege B (2001) Deforestation and land degradation in the Ethiopian highlands: a strategy for physical recovery. Northeast African Studies 8(1):7-26
References
113
Bard KA, Coltorti M, Di-Blasi MC et al (2000) The environmental history of Tigray (northern Ethiopia) in the middle and late Holocene: A preliminary outline. African Archaeological Review 17(2):65-86
Bekele M (2003) Forest property rights, the role of the State and institutional exigency: The Ethiopian experience. Currents 31/32:14-17
Bekele T (1994) Phytosociology and ecology of a humid Afromontane forest on the Central Plateau of Ethiopia. Journal of Vegetation Science 5:87-98
Bekele T (2005) Recruitment, survival and growth of Olea europaea subsp. cuspidata seedlings and juveniles in dry Afromontane forests of northern Ethiopia. Tropical Ecology 46:113-126
Benítez-malvido J, Martínez-ramos M (2003) Impact of forest fragmentation on understory plant species richness in Amazonia. Conservation Biology 37:389-400
Beven K, Kirkby MJ (1979) A physically based, variable contributing area model of basin hydrology. Hydrological processes 24(1):43-69
Biondini ME, Bonham CE, Redente EF (1985) Secondary successional patterns in a sagebrush (Artemisia tridentata) community as they relate to soil disturbance and soil biological activity. Vegetatio 60:25-36
Bird Life International (2008) BirdLife's online World Bird Database: the site for bird conservation. Version 2.1. http://www.birdlife.org. Cited 5 May 2009
BoANR, IDC (1997) Dessa State Forest Management Plan, National Regional State of Tigray, Mekelle, Ethiopia
Bobe R (2006) The evolution of arid ecosystems in eastern Africa. Journal of Arid Environments 66:564–584
Bolstad PV, Swank W, Vose J (1998) Predicting southern Appalachaian overstory vegetation with digital terrain data. Landscape Ecology 13:271-283
Bongers F, Poorter L, Hawthorne WD et al (2009) The intermediate disturbance hypothesis applies to tropical forests, but disturbance contributes little to tree diversity. Ecology Letters 12(8):798-805
Breitenbach F-V (1963) The Indigenous trees of Ethiopia. 2nd revised and enlarged edition, Ethiopian Forestry Association, Addis Ababa
Breshears DD, Myers OB, Meyer CW et al (2009) Tree dieback in response to global change-type drought: mortality insights from decade of plant water potential measurements. Frontiers in Ecology and the Environment 7(4):185-189
Breshears DD, Cobb NS, Rich PM et al (2005) Regional vegetation dieback in response to global-change-type drought. PNAS 102:15144-15148
Brodribb TJ, Cochard H (2009) Hydraulic failure defines the recovery and point of death in water-stressed conifers. Plant Physiology 149:575-584
Brooks TM, Mittermeier RA, Mittermeier CG et al (2002) Habitat Loss and Extinction in the Hotspots of Biodiversity. Conservation Biology 16(4):909-923
Bruce J (1790) Select specimens of natural history, collected in travels to discover the source of the Nile, in Egypt, Arabia, Abyssinia and Nubia, Vol. 3, Edinburgh
Buhe A, Tsuchiya K, Maneko M et al (2007) Land cover of oases and forest in XinJiang, China retrieved from ASTER data. Advances in Space Research. 39:39-45
Bussmann RW (2001) Succession and regeneration patterns of East African mountain forests. Systematic and Geography of Plants 71:957-974
References
114
Cabin RJ, Weller SG, Lorence DH et al (2002) Effects of light, alien grass, and native species addition on Hawaiian dry forest restoration. Ecological Applications 12(6):1595-1610
Callaway RM (1997) Positive interactions in plant communities and the individualistic-continuum concept. Oecologia 112:143-149
Campbell J (1991) Land or Peasants? The dilemma confronting Ethiopian resource conservation. African Affairs 90:5-21
Cardinale BJ, Srivastava DS, Duffy JE et al (2006) Effects of biodiversity on the functioning of trophic groups and ecosystems. Nature 443:989-992
CBD (1992) Convention on Biological Diversity. In: http://www.cbd.int/doc/legal/cbd-en.pdf. Cited 27/10/2009 2009
Chaerle P, Viane R (2007) A new species of Asplenium (Aspleniaceae, Pteridophyta) from Ethiopia. NOVON 17:148-153
Chen J, Song B, Rudnicki M et al (2004) Spatial relationship of biomass and species distribution in an old-growth Pseudotsuga - Tsuga forest. Forest Science 50:364-375
Cierjacks A, Rühr NK, Wesche K et al (2008) Effects of altitude and livestock on the regeneration of two tree line forming Polylepis species in Ecuador. Plant Ecology 194(2):207-221
Cincotta RP, Wisnewski J, Engelman R (2000) Human population in the biodiversity hotspots. Nature 404:990-992
Clark DB, Castro CS, Alvarado LDA et al (2004) Quantifying mortality of tropical rain forest trees using high-spatial-resolution satellite data. Ecology Letters 7:52-59
Clarke KR (1993) Non-parametric multivariate analyses of changes in community structure. Australian Journal of Ecology 18:117-143
Clements FE (1916) Plant succession: An analysis of the development of vegetation Publication No. 242, Carnegie Inst., Washington, DC
Condit R, Hubbell SP, Lafrankie JV et al (1996) Species-area and species-individual relationships for tropical trees: a comparison of three 50-ha plots. Journal of Ecology 84:549-562
Connell JH (1978) Diversity in tropical rain forests and coral reefs. Science 199:1302-1310
Conservation International (2007) Biodiversity hotspots. http://www.biodiversityhotspots.org/xp/hotspots/caucasus/Pages/default.aspx. Cited 4 Oct 2009
Couralet C, Sass-Klaassen U, Sterck F et al (2005) Combining dendrochronology and matrix modelling in demographic studies: An evaluation for Juniperus procera in Ethiopia. Forest Ecology and Management 216:317-330
Craig BW, Friedland AJ (1991) Spatial patterns in forest composition and standing dead red spruce in montane forests of the Adirondacks and northern Appalachians. Environmental Monitoring and Assessment 18(2):129-143
Crawley MJ (2007) The R Book. John Wiley & Sons Ltd., Chichester, England Cuneo P, Leishman MR (2006) African Olive (Olea europaea subsp. cuspidata) as an
environmental weed in eastern Australia: a review. Cunninghamia 9(4):545-577
Currie DJ, Mittelbach GG, Cornell HV et al (2004) Predictions and tests of climate-based hypotheses of broad-scale variation in taxonomic richness. Ecology Letters 7:1121-1134
References
115
Dale VH, Joyce LA, McNulty S et al (2000) The interplay between climate change, forests, and disturbances. The Science of the Total Environment 262:211-204
Dansereau P (1951) Description and recording of vegetation upon a structural basis. Ecology 3(2):172-229
Darbyshire I, Lamb H, Umer M (2003) Forest clearance and regrowth in northern Ethiopia during the last 3000 years. The Holocene 13:537-546
Degefu W (1987) Some aspects of meteorological drought in Ethiopia. In M. H. Glantz (ed) Drought and hunger in Africa. Cambridge University Press, Cambridge, pp23-36
DeLong SC, Sutherland GD, Daniels LO et al (2008) Temporal dynamics of snags and development of snag habitats in wet spruce–fir stands in east-central British Columbia. Forest Ecology and Management 255:3613-3620
Demissew S, Wondafrash M, Dellellegn Y (1996) Forest resources of Ethiopia. In S. Tilahun et al (eds) Important Bird Areas of Ethiopia. Ethiopian Wildlife and Natural History Society, Addis Ababa, pp10-25
Denslow JS (1980) Patterns of plant species diversity during succession under different disturbance regimes. Oecologia 46:18-21
Denslow JS (1987) Tropical Rainforest gaps and tree species diversity. Ann. Rev.Ecol.Syst. 18:431-451
Descheemaeker K, Muys B, Nyssen J et al (2006) Litter production and organic matter accumulation in exclosures of the Tigray highlands, Ethiopia. Forest Ecology and Management 233:21-35
Dessie G, Kleman J (2007) Pattern and magnitude of deforestation in the south central Rift Valley region of Ethiopia. Mountain Research and Development 27(2):162-168
Dos-Santos K, Kinoshita LS, Dos-Santos FAM (2007) Tree species composition and similarity in semideciduous forest fragments of southeastern Brazil. Biological Conservation 135:268-277
Dufrene M, Legendre P (1997) Species assemblages and indicator species: the need for a flexible asymmetrical approach. Ecological Monographs 67:345-366
Dugdale JS (1964) Vegetation climates and vegetation: The state of our present knowldege. Journal of Semitic Studies 9:250-256
Edwards S, Tadesse M, Hedberg I (eds) (1995) Flora of Ethiopia and Eritrea. Canellaceae to Euphorbiaceae Vol. 2, Part 2, pp. 1-456 The National Herbarium, Addis Ababa University and Uppsala University, Uppsala
Edwards S, Demissew S, Hedberg I (eds) (1997) Flora of Ethiopia. Hydrocharitaceae to Arecaceae, Vol. 6, pp. 1-586 The National Herbarium, Addis Ababa and Uppsala University, Uppsala
Edwards S, Tadesse M, Demissew S et al (eds) (2000) Flora of Ethiopia and Eritrea. Magnoliaceae to Flacourtiaceae, Vol. 2, Part 1, pp. 1-532 The National Herbarium, Addis Ababa University and University, Uppsala
EEA (2004) Report on the Ethiopian Economy. Ethiopian Economic Association, Addis Ababa, Ethiopia
EFAP (1994) Ethiopian Forest Action Program. Ministry of Natural Resources, Development and Environmental Protection, Addis Ababa
Eilu G, Hafashimana DLN, Kasenene JM (2004) Density and species diversity of trees in four tropical forests of the Albertine rift, western Uganda. Diverstiy and Distributions 10:303-312
References
116
Ellstrand NC, Elam DR (1993) Population genetic consequences of small population size: implications for plant conservation. Annual Review of Ecology and Systematics 24:217-242
EMA. 1998. Map, series ETH. 4, sheet 1339 B2, 1st ed, Addis Ababa Engelbrecht BMJ, Comita LS, Condit R et al (2007) Drought sensitivity shapes species
distribution patterns in tropical forests. Nature 447(3):80-83 Erik L (1994) Some comments on the classification of African vegetation. Journal of
Vegetation Science 5:441-444 FAO (1975) Forest Genetic Resources Information. No. 4. Forest Occasional Paper
(1975/1), Food and Agricultural Organization, Rome FAO (2001) Global Forest Resources Assessment 2000: Main report FAO Forestry
Paper 140. FAO, Rome FAO (2005) Global Forest Resources Assessment 2005: Progress towards sustainable
forest management FAO Forest Paper 147. FAO, Rome FAO (2007) State of the world's forests 2007, Rome Farhrig L (2003) Effects of habitat fragmentation on biodiversity. Ann. Rev.Ecol.Syst.
34:487-515 Farwig N, Sajita N, Schaab G et al (2008) Human impact diminishes seedling species
richness in Kakamega Forest, Kenya. Basic and Applied Ecology 9:383-391 Federal Democratic Republic of Ethiopia Population Census Commission (2008)
Summary and statistical report of the 2007 population and housing census: population site by age and sex. Federal Democratic Republic of Ethiopia Population Census Commission, Addis Ababa
Feoli E, Vuerich LG, Zerihun W (2002) Evaluation of environmental degradation in northern Ethiopia using GIS to integrate vegetation, geomorphological, erosion and socio-economic factors. Agriculture, Ecosystems and Environment 91:313-325
Ferrier S, Faith DP, Arponen A et al (2009) Community-level approaches to spatial conservation prioritization. In Moilanen A et al (eds) Spatial conservation prioritization. Oxford University Press, New York, PP. 95-109
Fetene M, Feleke Y (2001) Growth and photosynthesis of seedlings of four tree species from a dry tropical afromontane forest. Journal of Tropical Ecology 17(17):269-283
Flombaum P, Sala OE (2008) Higher effect of plant species diversity on productivity in natural than artificial ecosystems. PNAS 105:6089-6090
Franklin JF, Shugart HH, Harmon ME (1987) Tree death as an ecological process. BioScience 37:550-556
Friis I (1992) Forests and forest trees of northeast tropical Africa: Their natural habitats and distribution patterns in Ethiopia, Djibouti and Somalia. Her Majesty’s Stationery Office, London
Friis I, Demissew S (2001) Vegetation maps of Ethiopia and Eritrea. A review of existing maps and the need for a new map for the flora of Ethiopia and Eritrea. Biol. Skr. 54:399-439
Friis I, Edwards S, Kelbessa E et al (2001) Diversity and endemism in the flora of Ethiopia and Eritrea - what do the published Flora volumes tell us? Biol. Skr. 54:173-193
Ganey JL (1999) Snag density and composition of snag populations on two National Forest in northern Arizona. Forest Ecology and Management 117:169-178
References
117
García M, Oyonarte C, Villagarcía L et al (2008) Monitoring land degradation risk using ASTER data: The non-evaporative fraction as an indicator of ecosystem function. Remote Sensing of Environment 112:3720-3736
Gaston KJ (2000) Global patterns in biodiversity. Nature 405:220-227 Gebre Egziabher TB (1988) Vegetation and environment of the mountains of Ethiopia:
Implications for utilization and conservation. Mountain Research and Development 8:211-216
Gebre Egziabher TB (1991) Plant genetic resources of Ethiopia. In Engels JMM et al (eds) Diversity of the Ethiopian flora. Cambridge University Press, New York, pp75-81
Gebreegziabher Z (1999) Dessa'a protected area: An assessment of human impact, evolutionary pattern and options for sustainable management. http://www.unesco.org/mab/doc/mys/97/Zenebe/report.pdf. Cited 27 Sep 2009
Gebreegziabher Z (2007) Household fuel consumption and resource use in rural-urban Ethiopia. PhD Thesis, Wageningen University
Gitlin AR, Sthultz CM, Bowker MA et al (2006) Mortality gradients within and among dominant plant populations as barometers of ecosystem change during extreme drought. Conservation Biology 20(5):1477-1486
Gleason HA (1926) The individualistic concept of the plant association. Bull Torrey Bot Club 53:7-26
Gole TW, Borsch T, Denich M et al (2008) Floristic composition and environmental factors characterizing coffee forests in southwest Ethiopia. Forest Ecology and Management 255:2138–2150
Grove SJ (2001) Extent and composition of dead wood in Australian lowland tropical rainforest with different management history. Forest Ecology and Management 154:35-53
Grytnes JA, Beaman JH (2006) Elevational species richness patterns for vascular plants on Mount Kinabalu, Borneo. Journal of Biogeography 33:1838-1849
Gunderson LH (2000) Ecological resilience-in theory and application. Annual Review of Ecological Systems 31:425-439
Gutierrez JR, Lopez-Cortes F, Marquet PA (1998) Vegetation in an altitudinal gradient along the R´ıo Loa in the Atacama Desert of northern Chile. Journal of Arid Environments 40:383-399
Hadera G (2000) A study on the ecology and management of Dess’a forest in the northeastern escarpment of Ethiopia. MSc. thesis, Addis Ababa
Hagos F, Pender L, Gebreselassie N (1999) Land degradation in the highlands of Tigray and strategies for sustainable land management. ILRI (International Livestock Research Institute), Addis Ababa
Hall JB (1981) Data sheets on species undergoing genetic impoverishment Juniperus procera Hochst. ex Endl. Forest Genetic Resources Bulletin 010, Rome
Hansen A, Dale V (2001) Biodiversity in US forests under global climate change. Ecosystems 4:161-163
Hanson PJ, Weltzin JF (2000) Drought disturbance from climate change: response of United States forests. The Science of the Total Environment 262:205-220
Harmon ME, Krankina ON, Sexton J (2000) Decomposition vectors: a new approach to estimating woody detritus decomposition dynamics. Canadian Journal of Forest Research 30:76-84
References
118
He F, Legendre P (2002) Species diversity patterns derived from species-area models. Ecology 83(5):1185-1198
Hedberg I, Edwards s (eds) (1989) Flora of Ethiopia. Pittosporaceae to Araliaceae, Vol. 3, pp. 1-659. The National Herbarium, Addis Ababa and Uppsala University, Uppsala
Hedberg I, Edwards S (eds) (1995) Flora of Ethiopia and Eritrea. Poaceae (Graminae), Vol. 7. The National Herbarium, Addis Ababa University and Uppsala University, Uppsala
Hedberg I, Edwards S, Nemomissa S (eds) (2003) Flora of Ethiopia and Eritrea. Apiaceae to Dipsaceae, pp. 1-352 The National Herbarium, Addis Ababa University and Uppsala University, Uppsala
Hegazy AK, El-Demerdas MA, Hosni HA (1998) Vegetation, species diversity and floristic relations along an altitudinal gradient in south-west Saudi Arabia. Journal of Arid Environments 38:3-13
Hemp A (2006) Continuum or zonation? Altitudinal gradients in the forest vegetation of Mt. Kilimanjaro. Plant Ecology 184:27-42
Hennon PE, McClellan MH (2003) Tree mortality and forest structure in the temperate rain forests of southeast Alaska. Canadian Journal of Forest Research 33:1621-1634
Hill JL, Curran PJ (2003) Area, shape and isolation of tropical forest fragments: effects on tree species diversity and implications for conservation. Journal of Biogeography 30:1391-1403
Hill MO (1973) Diversity and evenness: a unifying notation and its consequences. Ecology 54(2):427-432
Hillebrand H, Bennett DM, Cadotte MW (2008) Consequences of dominance: a review of evenness effects on local and regional ecosystem processes. Ecology 89(6):1510-1520
Hirayama K, Ishida K, Setsuko S et al (2007) Reduced seed production, inbreeding, and pollen shortage in a small population of a threatened tree, Magnolia stellata. Biological Conservation 136:315-323
Hodgson JM (1978) Soil sampling and soil description. Oxford University Press, New York
Holden ZA, Morgan P, Rollins MG et al (2006) Ponderosa pine snag densities following multiple fires in the Gila Wilderness, New Mexico. Forest Ecology and Management 221:140-146
Holmgren M, Scheffer M, Huston MA (1997) The interplay of facilitation and competition in plant communities. Ecology 78(7):1966-1975
Holscher D, Köhler L, van Dijk AIJM et al (2004) The importance of epiphytes to total rainfall interception by a tropical montane rain forest in Costa Rica. Journal of Hydrology 292:308-322
Huete A, Didan K, Miura T et al (2002) Overview of the radiometric and biophysical performance of the MODIS vegetation indices. Remote Sensing of Environment 83:195-213
Hurlbert SH (1971) The Nonconcept of Species Diversity: A Critique and Alternative Parameters. Ecology 52:557-586
Hurni H (1988) Degradation and conservation of the resources in the Ethiopian highlands. Mountain Research and Development 8(2/3):123-130
References
119
Huston M, Gilbert L (1996) Consumer diversity and secondary production. In G. H. Orians et al (eds) Biodiversity and Ecosystem processes in Tropical Forests, vol. 122. Springer, Verlag, pp33-47
IBC (2005) National biodiversity strategy and action plan. Institute of Biodiversity Conservation, Addis Ababa
IPCC (2007) Climate change 2007. Synthesis report. Contribution of working group I, II and III to the fourth assessment report of the Intergovernmental Panel on Climate Change (core writing team). IPCC, Geneva
ITC (2001) ILWIS 3.0 Academic User’s Guide. Enschede, The Netherlands IUCN (2009) IUCN Red List of Threatened Species. Version 2009.1.
www.iucnredlist.org. Cited 5 May 2009 Jagger P, Pender J (2003) The role of trees for sustainable management of less-favored
lands: the case of eucalyptus in Ethiopia. Forest Policy and Economics 5:83-95 Janssen E (2009) Diversity, biomass and natural regeneration as a function of crown
coverage in a degraded Afromontane forest. MSc thesis, Katholieke Hogeschool Kfmpfn, Geel
Jeffries MJ (ed) (2005) Biodiversity and conservation, pp. 1-236. Routledge, New York Jun-feng G, Yun-xiang Z (2006) Distributional patterns of species diversity of main
plant communities along altitudinal gradient in secondary forest region, Guandi Mountain, China. Journal of Forest Research 17(2):111-115
Kassen R, Buckling A, Bell G et al (2000) Diversity peaks at intermediate productivity in a laboratory microcosm. Nature 406:507-512
Kent M, Coker P (1992) Vegetation Description and Analysis: A Practical Approach. Belhaven Press, London
Kessler M (2000) Elevational gradients in species richness and endemism of selected plant groups in the central Bolivian Andes. Plant Ecology 149:181-193
Khurana E, Singh JS (2001) Ecology of seed and seedling growth for conservation and restoration of tropical dry forest: a review. Environmental Conservation 28:39-52
Kier G, Mutke J, Dinerstein E et al (2005) Global patterns of plant diversity and floristic knowledge. Journal of Biogeography 32:1107-1116
Körner C (2007) The use of 'altitude' in ecological research. Trends in Ecology and Evolution 22(11):569-574
Krebs CJ (1989) Ecological Methodology. Harper & Row, New York Kreft H, Jetz W (2007) Global patterns and determinants of vascular plant diversity.
PNAS 104(14):5925-5930 Kueppers KJ, Southon J, Baer P et al (2004) Dead wood biomass and turnover time,
measured by radiocarbon, along a subalpine elevation gradient. Oecologia 141:641-651
Lamb H, Darbyshire I, Verschuren D (2003) Vegetation response to rainfall variation and human impact in central Kenya during the past 1100 years. The Holocene 13(2):285-292
Laurance WF (2004) Forest–climate interactions in fragmented tropical landscapes. Phil. Trans. R. Soc. Lond. B 359:345-352
Laurance WF, Bierregaard RO (1997) Tropical forest remnants: ecology, management, and conservation of fragmented communities. University of Chicago Press
References
120
Lemenih M, Gideyelew T, Teketay D (2004) Effects of canopy cover and understory environment of tree plantations on richness, density and size of colonizing wood species in southern Ethiopia. Forest Ecology and Management 194(3):1-10
Levin N, Shmida A, Levanoni O et al (2007) Predicting mountain plant richness and rarity from space using satellite-derived vegetation indices. Diversity and Distributions 13:692-703
Lillesand MT, Kiefer WR (2000) Remote Sensing and Image Interpretation. 4th ed. John Wiley & Sons, Inc.
Linder HP (2001) Plant diversity and endemism in sub-Saharan tropical Africa. Journal of Biogeography 28:169-182
Lingua E, Cherubini P, Motta R et al (2008) Spatial structure along an altitudinal gradient in the Italian central Alps suggests competition and facilitation among coniferous species. Journal of Vegetation Science 13:425-436
Lomolino MV (2001) Elevation gradients of species-density: historical and prospective views. Global Ecology & Biogeography 10:3-13
Loreau M, Naeem S, Inchausti P et al (2001) Biodiversity and ecosystem functioning: current knowledge and future challenges. Science 294:804-808
Lovett JC, Rudd S, Taplin J et al (2000) Patterns of plant diversity in Africa south of the Sahara and their implications for conservation management. Biodiversity and Conservation 9:37-46
Lyaruu HV, Eliapenda S, Backeus I (2000) Floristic, structural and seed bank diversity of a dry Afromontane forest at Mafai, central Tanzania. Biodiversity and Conservation 9:241-263
MA (2005) Ecosystems and human well-being. World Resource Institute, Washington, DC.
MacArthur RH (1972) Geographical Ecology: Patterns in the distribution of species. Harper & Row, New York
MacArthur RH, Wilson EO (1967) The theory of Island Biogeography. Princeton University Press, Princeton, New Jersy
Machado MJ, Perez-Gonzalez A, Benito G (1998) Paleoenvironmental changes during the last 4000 yr in the Tigray, northern Ethiopia. Quaternary Research 49(3):312-321
Mackey RL, Currie DJ (2001) The diversity-disturbance relationship: Is it generally strong and peaked? Ecology 82(12):3479-3492
Magurran AE (2004) Measuring Ecological Diversity. Blackwell Science Ltd., Malden Magurran AE (2007) Species abundance distributions over time. Ecology letters
10:347-354 Mamo N, Mihretu M, M. F et al (2006) Variation in seed and germination
characteristics among Juniperus procera populations in Ethiopia. Forest Ecology and Management 225:320-327
Marage D, Lemperiere G (2005) The management of snags: A comparison in managed and unmanaged ancient forests of the southern French Alps. Annals of Forest Science 62:135-142
Margules CR, Pressey RL, Williams PH (2007) Representing biodiversity: Data and procedures for identifying priority areas for conservation. J. Biosci. 27(Suppl. 2):309-326
References
121
Mark V (2001) Do commonly used indices β-diversity measure species turnover? Journal of Vegetation Science 12:545-552
McCune B, Mefford MJ (1999) PC-ORD Multivariate analysis of Ecological data. Version 5.0. MjM software, Gleneden Beach,Oregon
McCune B, Grace JB (2002) Analysis of Ecological Communities. MjM Software Design, USA
McCune B, Keon D (2002) Equations for potential annual direct incident radiation and heat load. Journal of Vegetation Science 13:603-606
McKee JK, Sciulli PW, Fooce CD et al (2004) Forecasting global biodiversity threats associated with human population growth. Biological Conservation 15:161-164
Meizner FC (2003) Functional convergence of plant responses to the environment. Oecologia 134:1-11
Mekuria W, Veldkamp E, Haile M et al (2007) Effectiveness of exclosures to restore degraded soils as a result of overgrazing in Tigray, Ethiopia. Journal of Arid Environments 269:270-284
Mengistu T, Teketay D, Hulten H et al (2005) The role of enclosures in the recovery of woody vegetation in degraded dryland hillsides of central and northern Ethiopia. Journal of Arid Environments 60:259-281
Ministry of Agriculture (2003) A strategic plan for the sustainable development, conservation and management of the woody biomass resources (Final Draft). Woody Biomass Inventory and Strategy Planning Project Office, Addis Ababa
Mittelbach GG, Steiner CF, Scheiner SM et al (2001) What is the observed relationship between species richness and productivity. Ecology 82:2381-2396
Mittermeier RA, Myers N, Thomsen JB (1998) Biodiversity hotspots and major tropical wilderness areas: Approaches to setting conservation priorities. Conservation Biology 12(3):516-520
Mogaka H, Simons G, Turpie J et al (2001) Economic aspects of community involvement in sustainable forest management in Eastern and Southern Africa. No. 8. IUCN Eastern Africa Programme
Mueller-Dombois D, Ellenberg H (1974) Aims and Methods of Vegetation Ecology. John Wiley & Sons, Ltd., New York
Mueller RC, Scudder CM, Porter ME et al (2005) Differential tree mortality in response to severe drought: evidence for long-term vegetation shifts. Journal of Ecology 93:1085-1093
Murphy PG, Lugo AE (1986) Ecology of tropical dry forest. Annu. Rev. Ecol. Syst. 17:67-88
Mutke J, Barthlott W (2005) Patterns of vascular plant diversity at continental to global scales. Biol. Skr. 55:521-531
Muukkonen P, Heiskanen J (2005) Estimating biomass for boreal forests using ASTER satellite data combined with stand wise forest inventory data. Remote Sensing of Environment 99:434-447
Mwaura F, Kaburu HM (2009) Spatial variability in woody species richness along altitudinal gradient in a lowland-dryland site, Lokapel Turkana, Kenya. Biodiversity and Conservation 18:19-32
Myers N (1988) Threatened Biotas: "Hot Spots" in Tropical Forests. The Environmentalist 8(3):187-208
References
122
Myers N, Mittermeier RA, Mittermeier CG et al (2000) Biodiversity hotspots for conservation priorities. Nature 403:853-858
Naeem S, Thompson LJ, Lawler SP et al (1974) Declining biodiversity can alter the performance of ecosystems. Nature 368:734-737
Naveh Z, Whittaker RH (1979) Structural and floristic diversity of shrublands and woodlands in northern Israel and other Mediterranean areas. Vegetatio 41(3):171-190
NBE (2007) National Bank of Ethiopia Annual Report 2006/07 Nepstad DC, Tohver IM, Ray D et al (2007) Mortality of large trees and lianas
following experimental drought in an Amazon rain forest. Ecology 88(9):2259-2269
Ney-Nifle M, Mangel M (2000) Habitat loss and changes in species-area relationship. Conservation Biology 14:893-898
Nogues-Bravo D, Araújo MB, Romdal T et al (2008) Scale effects and human impact on the elevational species richness gradients. Nature 453:216-220
Noss RF (1999) Assessing and monitoring forest biodiversity: A suggested framework and indicators. Forest Ecology and Management 115:135-146
Nyssen J, Poesen J, Moeyersons J et al (2004) Human impact on the environment in the Ethiopian and Eritrean highlands—a state of the art. Earth-Science Reviews 64:273-320
Nyssen J, Vandenreyken H, Poesen J et al (2005) Rainfall erosivity and variability in the northern Ethiopian Highlands. Journal of Hydrology 311:172-187
Nyssen J, Haile M, Naudts J et al (2009) Desertification? Northern Ethiopia re-photographed after 140 years. Science of the Total Environment 407:2749-2755
O'Brien EM (1993) Climatic gradients in woody plant species richness: towards an explanation based on an analysis of southern Africa's woody flora. Journal of Biogeography 20:181-198
Ohmann JL, McComb WC, Zumrawi AZ (1994) Snag abundance for primary cavity-nesting birds on nonfederal forest lands in Oregon and Washington Wildlife Society Bulletin 22:607-620
Oommen MA, Shanker K (2005) Elevational species richness patterns emerge from multiple local mechanisms in Himalayan woody plants. Ecology 86(11):3039-3047
Orme CDL, Davies RG, Burgess M et al (2005) Global hotspots of species richness are not congruent with endemism or threat. Nature 436:1010-1019
Parrotta JA, Turnbull JW, Jones N (1997) Catalyzing native forest regeneration on degraded tropical lands. Forest Ecology and Management 99(1-2):1-7
Pausas JG, Carreras J, Ferreira A et al (2003) Coarse-scale plant species richness in relation to environmental heterogeneity. Journal of Vegetation Science 14:661-668
Peet RK (1974) The measurement of species diversity. Ann. Rev.Ecol.Syst. 5:285-307 Perrott RA, Hamilton AC (1981) A study of altitudinal zonation in the montane forest
belt of Mt. Elgon, Kenya/Uganda. Vegetatio 45:107-125 Pianka ER (1966) Latitudinal gradients in species diversity: a review of concepts. The
American Naturalist 100(910):33-46 Pichi-Sermolli REG (1957) Una carta geobotanica dell'Africa Orientale (Eritrea,
Etiopia. Somalia). Webbia 13:15-132 & 1 map
References
123
Pimm SL, Raven P (2000) Extinction by numbers. Nature 403:843-845 Prescott CE, Zabek LK, Staley CL et al (2000) Decomposition of broadleaf and needle
litter in forests of British Columbia: influences of litter type, forest type, and litter mixtures. Can. J. For. Res. 30:1742-1750
R Development Core Team (2008) R: A Language and Environment for Statistical Computing. R Foundation for Statistical Computing, Vienna
Rahbek C (1995) The elevational gradient of species richness: a uniform pattern? Ecography 18(2):200-205
Reed DH, Frankham R (2003) Correlation between fitness and genetic diversity. Conservation Biology 17:230-237
Reid WV (1998) Biodiversity hotspots. Tree 13:275-280 Ren H-B, Niu S-K, Zhang L-Y et al (2006) Distribution of vascular plant species
richness along an elevational gradient in the Dongling mountains, Beijing, China. Journal of Integrative Plant Biology 48(2):153−160
Rey PJ, Julio M, Alcantara M (2000) Recruitment dynamics of a fleshy-fruited plant (Olea europaea): Connecting patterns of seed dispersal to seedling establishment. Journal of Ecology 88(4):622-633.
Richter CGF, Snyman HA, Smit GN (2001) The influence of tree density on the grass layer of three semi-arid savanna types of southern Africa. African Journal of Range and Forage Science 18(2-3):103-109
Rivero RG, Grunwald S, Bruland GL (2007) Incorporation of spectral data into multivariate geostatistical models to map soil phosphorus variability in a Florida wetland. Geoderma 140:428-443
Rosenzweig ML (1995) Species diversity in space and time. Cambridge University Press, Cambridge
Rotundo JL, Aguiar MR (2005) Litter effects on plant regeneration in arid lands: a complex balance between seed retention, seed longevity and soil–seed contact. Journal of Ecology 93:829-838
Rudel T, Roper J (1997) Forest Fragmentation in the Humid Tropics: A Cross–National Analysis. Singapore Journal of Tropical Geography 18(1):99-109
Runkle JR (1982) Patterns of disturbance in some old-growth mesic forests of Eastern North America. Ecology 63:1533-1546
Russell RE, Saab VA, Dudley JD et al (2006) Snag longevity in relation to wildfire and postfire salvage logging. Forest Ecology and Management 232:179-187
Sánchez-González A, López-Mata L (2005) Plant species richness and diversity along an altitudinal gradient in the Sierra Nevada, Mexico. Diversity and Distributions 11:567–575
Sanderson SE, Redford K, H, (1997) Biodiversity politics and the contest for ownership of the world's biota. In R. Kramer et al (eds) Protected areas and the defense of tropical biodiversity. Oxford University Press, New York, pp115-132
Sanjit L, Bhatt D (2005) How relevant are the concepts of species diversity and species richness? . Journal of Biosciences 30(5):557-560
Santos GL, Kageler D, Gardner DE et al (1992) Herbicidal Control of Selected Alien Plant Species in Hawaii Volcanoes National Park. In C. P. Stone et al (eds) Alien Plant Invasions in Native Ecosystems of Hawaii: Management and Research. University of Hawaii Press, Honolulu, pp341-342
References
124
Schefus E, Schouten S, Jansen JHF et al (2003) African vegetation controlled by tropical sea surface temperatures in the mid-Pleistocene period. Nature 422:418–421
Schnitzer SA, Dalling JW, Carson WC (2000) The impact of lianas on tree regeneration in tropical forest canopy gaps: evidence for an alternative pathway of gap-phase regeneration. Journal of Ecology 88:655-666
Schupp EW (1988) Factors affecting post-dispersal seed survival in a tropical forest. Oecologia 76:525-530
Segura G, Balvanera P, Durán E et al (2003) Tree community structure and stem mortality along a water availability gradient in a Mexican tropical dry forest. Plant Ecology 169:259-271
Senbeta F, Teketay D (2001) Regeneration of indigenous woody species under the canopies of tree plantations in Central Ethiopia. Tropical Ecology 42:175-185
Senbeta F, Denich M (2006) Effects of wild coffee management on species diversity in the Afromontane rainforests of Ethiopia. Forest Ecology and Management 232:68-74
Sharew H, Legg JC, Grace J (1997) Effects of ground preparation and microenvironment on germination and natural regeneration of Juniperus procera and Afrocarpus gracilior in Ethiopia. Forest Ecology and Management 93:215-225
Shono K, Cadawent EA, Durst PB (2007) Applications of assisted natural regeneration to restore degraded tropical forestland. Restoration Ecology 15(4):620-626
Siegel S, Castellan NJ (1988) Nonparametric statistics for the behavioral sciences. McGraw-Hill, New York
Simpson EH (1949) Measurement of diversity. Nature 163:688:688 Slik JW (2004) El Nino droughts and their effects on tree species composition and
diversity in tropical rain forests. Oecologia 141:114-120 Southwood TRE, Handerson PA (2000) Ecological Methods Blackwell Science Ltd,
Oxford SPSS Inc. (2004) SPSS 13.0 for Windows., Chicago, IL, USA Stohlgren TJ, Coughenour MB, Chong GW et al (1997) Landscape analysis of plant
diversity. Landscape Ecology 1:155-170 Suarez ML, Ghermandi L, Kitzberger T (2004) Factors predisposing episodic drought-
induced tree mortality in Northofagus-site, climatic sensitivity and growth trends. Journal of Ecology 92:954-966
Szwagrzyk J, Szewczyk J (2001) Tree mortality and effects of release from competition in an old-growth Fagus-Abies-Picea stand. Journal of Vegetation Science 12:621-626
Taddese G (2001) Land degradation: A challenge to Ethiopia. Environmental Management 27(6):815-824
Tamene D, Vlek PLG (2007) Soil erosion studies in northern Ethiopia. In A. K. Krainmoh , P. L. G. Vlek (eds) Land use and soil resources pp73-100
Teketay D (1997) Seedling populations and regeneration of woody species in dry Afromontane forests of Ethiopia. Forest Ecology and Management 98:149-165
Teketay D (2001) Deforestation, wood famine, and environmental degradation in Ethiopia's highland Ecosystems: urgent need for action. Northeast African Studies 8(1):53-76
References
125
Teketay D (2004) Forestry research in Ethiopia: Past, present and future. In G. Balcha et al (eds) Forest resources of Ethiopia: status, challenges and opportunities, Addis Ababa, Ethiopia. vol Institute of Biodiversity Conservation (IBC) and German Development Cooperation (GTZ), pp 272
Teketay D (2005) Seed and regeneration ecology in dry Afromontane forests of Ethiopia: II. Forest disturbances and succession. Tropical Ecology 46(1):45-64
Tekle K, Hedlund L (2000) Land cover changes between 1958 and 1986 in Kalu district, Southern Wello, Ethiopia. Mountain Research and Development 20(1):42-51
ter Steege H, Zagt R (2002) Density and diversity. Nature 417(12):698-699 Terborgh J, van Schaik CP (1997) Minimizing species loss: The imperative of
protection. In R. Kramer et al (eds) Protected areas and the defense of tropical biodiversity. Oxford University Press, New York, pp15-35
Tesfaye G, Teketay D, Fetene M (2002) Regeneration of fourteen tree species in Harena forest, southeastern Ethiopia. Flora 197:461-474
TFAP (1996) Tigray Forest Action program main report. Ethiopia. Tigray Bureau of Agriculture and Natural Resources, Mekelle
Thulin M (2007) Acacia fumosa sp. nov. (Fabaceae) from eastern Ethiopia. Nordic Journal of Botany 25:272-274
Tigabu M, Fjellstro J, Ode´n PC et al (2007) Germination of Juniperus procera seeds in response to stratification and smoke treatments, and detection of insect-damaged seeds with VIS + NIR spectroscopy. New Forests 33:155-169
Tjørve E (2003) Shapes and functions of species-area curves: a review of possible models. Journal of Biogeography 30:827-835
Tokeshi M (1999) Species coexistence: Ecological and evolutionary peerespectives. Blackwell Science Ltd, Malden
Tucker CJ (1979) Red and photographic infrared linear combinations for monitoring of vegetation. Remote Sensing of Environment 8:127-150
UNEP/CBD (2006) Report of the eighth meeting of the Parties to the Convention on Biological Diversity UNEP/CBD/COP/8/31, Curitiba
Veech JA (2000) Choice of species-area function affects identification of Hotspots. Conservation Biology 14:140-147
Verbesselt J, Robinson A, Stone C et al (2009) Forecasting tree mortality using change metrics derived from MODIS satellite data. Forest Ecology and Management 258(7):1166-1173
Vieira DLM, Scariot A (2006) Principles of natural regeneration of tropical dry forests for restoration. Restoration Ecology 14(1):11-20
Wassie A, Sterck FJ, Teketay D et al (2009a) Tree regeneration in Church Forest of Ethiopia: Effects of microsites and management. Biotropica 41(1):110-119
Wassie A, Sterck FJ, Teketay D et al (2009b) Effect of livestock exclusion on tree regeneration in church forests of Ethiopia. Forest Ecology and Management 257(3):765-772
Webb P, von Braun J, Yohannes Y (1992) Famine in Ethiopia: Policy implications of coping failure at national and household levels. Research Report 92. International Food Policy Research Institute, Washington, D.C.
Webster R, Oliver M (2001) Geostatistics for Environmental Scientists. John Wiley & Sons, Ltd., Chichester
References
126
White F (1983) Vegetation of Africa - a descriptive memoir to accompany the unesco/AETFAT/ UNSO vegetation map of Africa Natural Resources Research Report XX. U.N. Educational, Scientific and Cultural Organization, Paris
White PS (1979) Pattern, process, and natural disturbance in vegetation. Botanical Review 45:229-299
Whitemore TC (1997) Tropical forest disturbance, disappearance, and species loss. In Laurance WF, Bierregaard RO (eds.) Tropical forest remnants: Ecology, management, and conservation of fragmented communities. The University of Chicago Press, Chicago pp 616
Whittaker RH (1972) Evolution and measurement of species diversity. Taxon 21:213-251
Whittaker RJ, Willis KJ, Field R (2001) Scale and species richness: towards a general hierarchical theory of species diversity. Journal of Biogeography 28:453-470
Whittaker RJ, Willis KJ, Field R (2003) Climatic–energetic explanations of diversity: a macroscopic perspective. Macroecology: concepts and consequences. In T. M. Blackburn , K. J. Gaston (eds). Cambridge University Press, Cambridge, pp107-129
Wilson MV, Shmida A (1984) Measuring beta diversity with presence-absence data. Journal of Ecology 12:1055-1064
Wittebolle L, Marzorati M, Clement L et al (2009) Initial community evenness favours functionality under selective stress. Nature 458:623-626
Woldu Z, Ingvar Bf (1991) The shrubland vegetation in western Shewa, Ethiopia and its possible recovery. Journal of Vegetation Science 2:173-180
Woldu Z, Feoli E, Nigatu L (1989) Partitioning an elevation gradient of vegetation from southeastern Ethiopia by probabilistic methods. Vegetatio 81:189-198
Wood A, Stedman-Edwards P, Mang J (eds) (2000) The root causes of biodiversity loss. Earthscan Publishings Ltd, London
Woodwell GM (1994) Ecology. The restoration. Restoration Ecology 2(1):1-3 Worku A (1998) Hugumburda-Grathahassu forest management plan. National Regional
State of Tigray, Bureau of Agriculture and Natural Resources Development, Mekelle
World Conservation Monitoring Centre (1998) Dracaena ombet. 2008 IUCN Red List of threatened species. www.iucnredlist.org. Cited 5 Jun 2009
Yayneshet T, Eik LO, Moe SR (2009) The effects of exclosures in restoring degraded semi-arid vegetation in communal grazing lands in northern Ethiopia. Journal of Arid Environments 73(4-5):542-549
Yirdaw E (2001) Diversity of naturally-regenerated native woody species in forest plantations in the Ethiopian highlands. New Forests 22(3):159-177
Yirdaw E, Leinonen k (2002) Seed germination responses of four Afromontane tree species to red/far-red ratio and temperature. Forest Ecology and Management 168:53-61
Yüksel A, Akay AE, Recep G (2008) Using ASTER Imagery in Land Use/cover Classification of Eastern Mediterranean Landscapes According to CORINE Land Cover Project. Sensors 8:1237-1251
Zeleke G, Hurni H (2001) Implications of land use and land cover dynamics for mountain resource degradation in the northwestern Ethiopian highlands. Mountain Research and Development 21(2):184-191
References
127
Zhao S, Fang J (2006) Patterns of species richness for vascular plants in China's nature reserves. Diversity and Distributions 12:364-372
Zinko U, Dynesius M, Nilsson C et al (2006) The role of pH in linking groundwater flow and plant species density in boreal forest landscapes. Ecography 29:515-524
Appendix
128
10 APPENDIX
Appendix 10.1 List of species recorded at Desa’a and Hugumburda forests in northern Ethiopia. Abbrevations in the parantheses indicate speices life form, where [C] is climber, [H] is Herb, [S] is shrub, and [T] is tree. Number indicates the site where the spcies is recorded, where 1 is Desa’a and 2 is Hugumburda forest
Agavaceae
Agave americana L., [H]1
Aloaceae
Aloe camperi Schweinf., [H] 1,2
Amaranthaceae
Aerva lanata (L.) Juss. ex Schult., [H] 1
Alternanthera nodiflora R.Br., [H] 1,2
Cyathula cylindrica Moq., [H] 1
Anacardiaceae
Rhus glutinosa Hochst. ex A.Rich., [T] 2
Rhus natalensis Bernh. ex Krauss, [T] 2
Rhus retinorrhoea Steud. ex Oliv., [T] 1
Rhus sp., [ST] 1,2
Rhus vulgaris Meikle, [ST] 2
Apiaceae
Ferula communis Heuff., [H] 1
Apocynaceae
Acokanthera schimperi (A.DC.) Benth.
& Hook.f. ex Schweinf., [ST] 1,2
Carissa edulis Vahl, [S] 1,2
Asciepiadaceae
Caralluma acutangula N. E. Br., [H] 1
Cynanchum gerrardii (Harv.) Liede,
[C]1
Sarcostemma viminale Wall. Ex
Decene., [C] 1
Asparagaceae
Asparagus racemosus Willd., [HS] 1,2
Asteraceae
Echinops giganteus A.Rich., [H] 1,2
Laggera tomentosa Sch. Bip. ex Hochst.
[S] 1,2
Psiadia punctulata Vatke, [S] 1,2
Vernonia amygdalina Delile, [ST] 1,2
Vernonia auriculifera Hiern, [ST] 1,2
Tarchonanthus camphoratus L., [HS] 1
Balanitaceae
Balanites rotundifolius Blatt. [H] 1
Barbeyaceae
Barbeya oleoides Schweinf., [T] 1
Berberidaceae
Berberis holstii Engl., [ST] 2
Boraginaceae
Cordia monoica Roxb., [ST] 1
Appendix
129
Cordia sinensis Lam., [ST] 1
Heliotropium cinerascens Steud. ex
DC., [S] 1
Cactaceae
Opuntia ficus-indica (L.) Mill., [ST] 1,2
Caesalpiniaceae
Cassia occidentalis L., [H] 1
Capparaceae
Boscia salicifolia Oliv., [S] 1
Capparis tomentosa Lam., [ST] 1
Capparidaceae
Capparis cartilaginea Decne., [S] 1
Maerua sp., [HS] 2
Celasteraceae
Maytenus senegalensis (Lam.) Exell.,
[ST] 1,2
Clusiaceae
Gymnosporia senegalensis Loes., [S] 1,2
Hypericum quartinianum A. Rich., [H] 2
Combretaceae
Combretum molle G.Don, [ST] 1
Commelinaceae
Commelina sp., [S] 1
Crassulaceae
Aeonium leucoblepharum Webb ex A.
Rich. [S] 1
Kalanchoe sp., [S]2
Cupressaceae
Cupressus lusitanica Mill., [T] 2
Juniperus procera Hochst. ex Endl., [T] 1,2
Dracaenacease
Dracaena ombet Kotschy & Peyr., [T] 1
Sansevieria ehrenbergii Schweinf. ex
Baker, [H] 1
Sansevieria forskaliana (Schult.f.)
Hepper & J.R.I.Wood, [H] 1
Ebenaceae
Diospyros mespiliformis Hochst. ex
A.DC ., [T] 1
Euclea racemosa Murray subsp.
schimperi (A. DC.) F. White, [S] 1,2
Ericaceae
Erica arborea L.; [ST] 1,2
Euphorbiaceae
Clutia abyssinica Jaub. & Spach, [S] 1,2
Clutia lanceolata Jaub. & Spach., [S] 1
Euphorbia abyssinica J.F. Gmel., [T] 1
Euphorbia polyacantha Boiss., [S] 1
Euphorbia tirucalli Forssk.., [ST] 1,2
Appendix
130
Ricinus communis L., [ST] 1
Fabaceae
Acacia abyssinica Hochst. ex Benth.,
[T] 1,2
Acacia asak (Forssk.) Wild., [T] 1
Acacia etbaica Schweinf., [T] 1,2
Acacia mellifera Benth. [T] 1
Acacia orfota Schweinf., [T] 1
Acacia polyacantha Willd., [T] 1
Acacia saligna (Labill.) H. L. Wendl.;
[T] 2
Acacia senegal Willd., [T] 1
Acacia tortilis Hayne, [T] 1
Cadia purpurea Ait. [S] 1,2
Calpurnia aurea Benth., [ST] 1,2
Colutea abyssinica Kunth &
C.D.Bouche, [S] 2
Dichrostachys cinerea (L.) Wight &
Arn., [TS] 1
Indigofera caerulea Roxb., [S] 1
Indigofera arrecta Hochst. Ex A. Rich.,
[S] 1
Nuxia congesta R.Br., [HS] 2
Pterolobium stellatum (Forssk.) Brenan,
[CS] 1,2
Tephrosia interrupta Hochst. & Steud..,
[S] 1,2
Flacourtiaceae
Dovyalis abyssinica (A.Rich.) Warb.,
[ST] 1,2
Dovyalis verrucosa Warb., [ST] 1,2
Lamiaceae
Becium grandiflorum (Lam.) Pic.Serm.,
[S] 1,2
Clerodendrum myricoides R.Br. [S] 1,2
Lavandula dentata L., [H] 1
Leucas abyssinica Briq., [H] 1,2
Meriandra bengalensis (Roxb.) Benth.,
[S] 1
Otostegia fruticosa Schweinf. ex Penz.,
[HS] 1
Otostegia integrifolia Benth., [H] 1
Plectranthus ornatus Codd., [H] 1
Premna resinosa Schauer, [S] 1,2
Lythraceae
Lawsonia inermis L., [ST] 1
Malvaceae
Abutilon longicuspe Hochst. ex A.Rich.,
[S] 1,2
Abutilon pannosum (G.Forst.) Schltdl.,
[HS] 1
Pavonia urens Cav., [HS] 2
Sida schimperiana Hochst. ex A.Rich.,
[S]
Meliaceae
Ekebergia capensis Sparrm., [T] 2
Melianthaceae
Bersama abyssinica Fresen., [T] 1,2
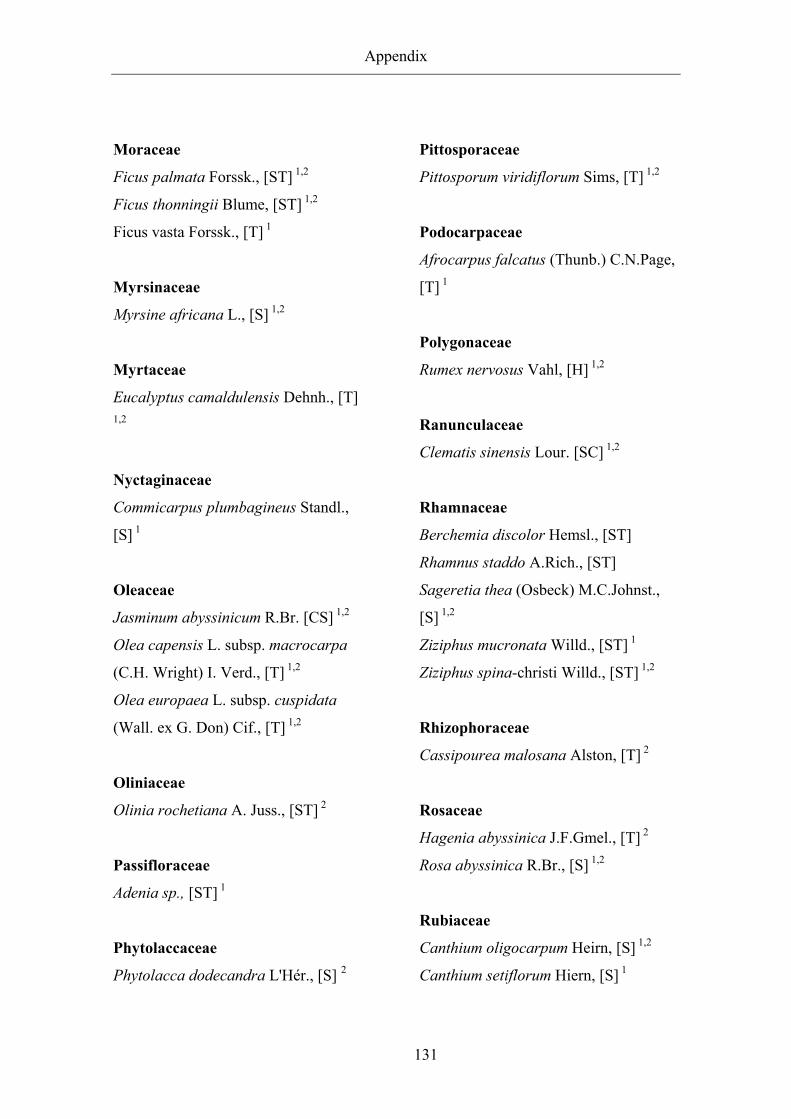
Appendix
131
Moraceae
Ficus palmata Forssk., [ST] 1,2
Ficus thonningii Blume, [ST] 1,2
Ficus vasta Forssk., [T] 1
Myrsinaceae
Myrsine africana L., [S] 1,2
Myrtaceae
Eucalyptus camaldulensis Dehnh., [T]
1,2
Nyctaginaceae
Commicarpus plumbagineus Standl.,
[S] 1
Oleaceae
Jasminum abyssinicum R.Br. [CS] 1,2
Olea capensis L. subsp. macrocarpa
(C.H. Wright) I. Verd., [T] 1,2
Olea europaea L. subsp. cuspidata
(Wall. ex G. Don) Cif., [T] 1,2
Oliniaceae
Olinia rochetiana A. Juss., [ST] 2
Passifloraceae
Adenia sp., [ST] 1
Phytolaccaceae
Phytolacca dodecandra L'Hér., [S] 2
Pittosporaceae
Pittosporum viridiflorum Sims, [T] 1,2
Podocarpaceae
Afrocarpus falcatus (Thunb.) C.N.Page,
[T] 1
Polygonaceae
Rumex nervosus Vahl, [H] 1,2
Ranunculaceae
Clematis sinensis Lour. [SC] 1,2
Rhamnaceae
Berchemia discolor Hemsl., [ST]
Rhamnus staddo A.Rich., [ST]
Sageretia thea (Osbeck) M.C.Johnst.,
[S] 1,2
Ziziphus mucronata Willd., [ST] 1
Ziziphus spina-christi Willd., [ST] 1,2
Rhizophoraceae
Cassipourea malosana Alston, [T] 2
Rosaceae
Hagenia abyssinica J.F.Gmel., [T] 2
Rosa abyssinica R.Br., [S] 1,2
Rubiaceae
Canthium oligocarpum Heirn, [S] 1,2
Canthium setiflorum Hiern, [S] 1
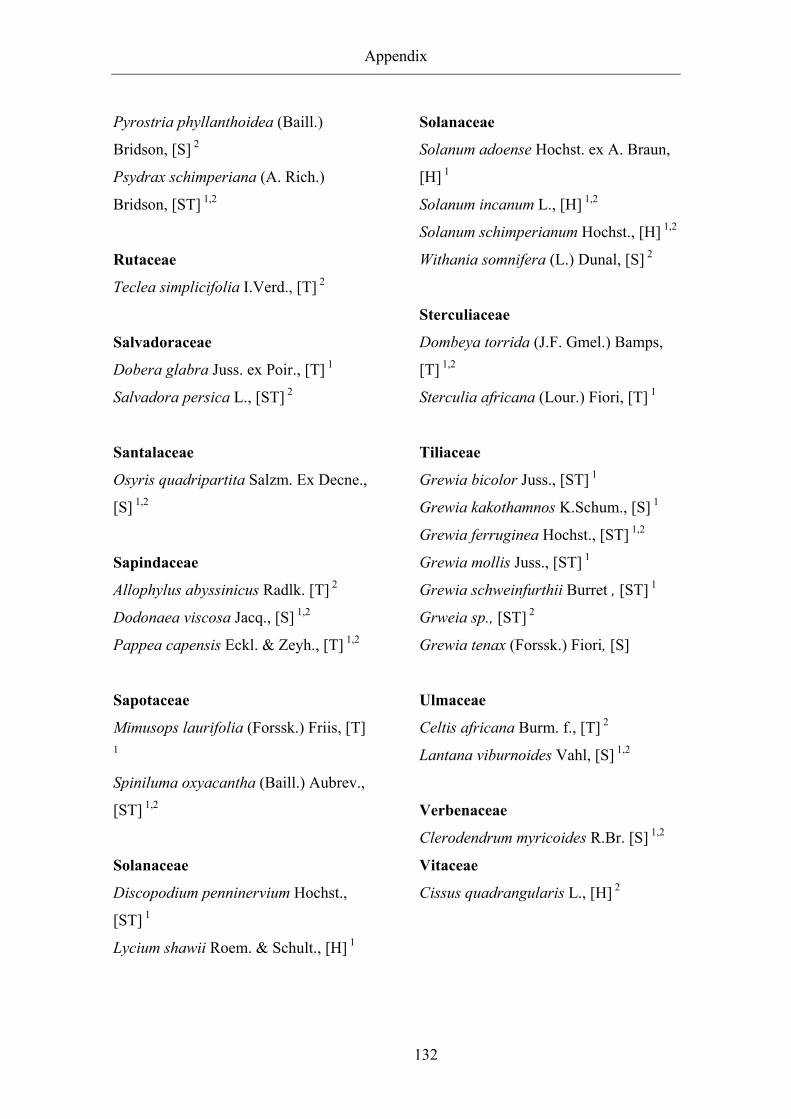
Appendix
132
Pyrostria phyllanthoidea (Baill.)
Bridson, [S] 2
Psydrax schimperiana (A. Rich.)
Bridson, [ST] 1,2
Rutaceae
Teclea simplicifolia I.Verd., [T] 2
Salvadoraceae
Dobera glabra Juss. ex Poir., [T] 1
Salvadora persica L., [ST] 2
Santalaceae
Osyris quadripartita Salzm. Ex Decne.,
[S] 1,2
Sapindaceae
Allophylus abyssinicus Radlk. [T] 2
Dodonaea viscosa Jacq., [S] 1,2
Pappea capensis Eckl. & Zeyh., [T] 1,2
Sapotaceae
Mimusops laurifolia (Forssk.) Friis, [T]
1
Spiniluma oxyacantha (Baill.) Aubrev.,
[ST] 1,2
Solanaceae
Discopodium penninervium Hochst.,
[ST] 1
Lycium shawii Roem. & Schult., [H] 1
Solanaceae
Solanum adoense Hochst. ex A. Braun,
[H] 1
Solanum incanum L., [H] 1,2
Solanum schimperianum Hochst., [H] 1,2
Withania somnifera (L.) Dunal, [S] 2
Sterculiaceae
Dombeya torrida (J.F. Gmel.) Bamps,
[T] 1,2
Sterculia africana (Lour.) Fiori, [T] 1
Tiliaceae
Grewia bicolor Juss., [ST] 1
Grewia kakothamnos K.Schum., [S] 1
Grewia ferruginea Hochst., [ST] 1,2
Grewia mollis Juss., [ST] 1
Grewia schweinfurthii Burret , [ST] 1
Grweia sp., [ST] 2
Grewia tenax (Forssk.) Fiori, [S]
Ulmaceae
Celtis africana Burm. f., [T] 2
Lantana viburnoides Vahl, [S] 1,2
Verbenaceae
Clerodendrum myricoides R.Br. [S] 1,2
Vitaceae
Cissus quadrangularis L., [H] 2
ACKNOWLEDGEMENT
During my PhD study I have received support from a number of people and organizations. I am grateful to the German Academic Exchange Service (DAAD) for granting me the scholarship to join University of Bonn. I am also grateful to Mekelle University for the logistical support during my field data collection in Ethiopia. I thank the National Meteorological Services Agency of Ethiopia for providing climate data free of charge. I would also like to thank Geoeye for providing me with five IKONOS images free of charge.
I would like to thank my first supervisor PD. Dr. Hans Juergen Boehmer for the technical support and for encouraging me to do more research in forest ecology.I would sincerely like to thank my second supervisor Prof. Dr. Paul L.G. Vlek for accepting me as his student, and I benefited greatly from his research team at all stages of my study. I would also like to extend my profound thanks and appreciation to Dr. Manfred Denich for his encouragement, guidance, and technical support throughout the study period. I also appreciate his valuable comments, which significantly improves the quality of the dissertation.
I would like to thank Dr. Lulseged Tamene and Dr. Wuang Bao Le for sharing their knowledge and experiences in spatial data analyses. I am grateful to Dr. Raf Aerts (Khatolic University of Leuven) for sharing his knowledge and experience in the ecology of dry forests in northern Ethiopia and for providing valuable comments. I would like to thank Dr. Burkhard Neuwirth (Institute of Geography, University of Bonn) and Dr. Zewdu Eshetu (Ethiopian Forest Research Center) for introducing me to the dendrochronology methods.
My special thanks to Mr. Diress Tsegay, who is a friend and colleague, for the scientific discussions we had throughout my PhD study. I am also grateful to Dr. Kindeya Gebrehiwot, Mr. Emiru Birhane, Mr. Aklilu Nigussie, Mr. Haile Bezabih, Mr. Mulugeta Sebhatleab, Mr. Zelalem Hadush, Mr. Abadi Tesfay, Mr. Abebe Damitew, Mr. Agazi Hailay, Mr. Tekalign Simeneh, who are staff members of Mekelle University, for their technical support during the field work. I also would like to thank my field research assistants, Asefa, Teumay, Hayelom, and Tsegay for their excellent job under challenging field conditions. I would like to acknowledge the work of the local people, particularly the forest guards, at Desa’a and Hugumburda forests for facilitating the field work and providing useful information on the history of the forests and identifying the local names of plants. I also wish to thank Mr. Eyob Tenkir and Kidist Admass for their support in organizing field data and their encouragement. I thank Mr. Melaku Wondafrash (The National Herbarium, Ethiopia) for his assistance in plant identification.
I would like to thank Dr. Gunther Manske for administrative support and for facilitating my participation in three scientific conferences. My special thanks to Ms Rosmarie Zable for her support in a number of administrative issues related to scholarship and visa extension, and accommodation that made my stay in Bonn more comfortable. I also would like to thank a number of staff members of ZEF, especially, Mr. Volker Merx and Mr. Ludger Hammer for their assistance. I thank Ms. Sabine Aengenendt-Baer for her assistance in arranging the office facilities. My special thanks to Dr. Seid Nuru and his family, who made my stay in Bonn enjoyable. I would like to

thank my officemates Mr. Tyler Frazier at ZEF and Mr. Johannes Schultz at the Geography Department for the nice time we had together.
My special thanks to my mother Asegedech Asfaw, my brothers Mebea, Amha, and Natnael and my sisters Alamz and Betelihem for their love and encouragement.
Above all, I thank the Lord Almighty for "His unspeakable gift".


![ISO-Zylinder ISO-Standard (15552) · 2018. 5. 22. · AUS 12272 2454 3682 4909 6136 7363 8590 9817 1104512272 EIN 11468 2294 3440 4587 5734 6881 8027 9174 1032111468 Kolben-Ø [mm]](https://img.pdfslide.org/doc/110x75/608a01384d23a84274694f14/iso-zylinder-iso-standard-15552-2018-5-22-aus-12272-2454-3682-4909-6136-7363.jpg)