Embed Size (px)
Citation preview
This work has been digitalized and published in 2013 by Verlag Zeitschrift für Naturforschung in cooperation with the Max Planck Society for the Advancement of Science under a Creative Commons Attribution4.0 International License.
Dieses Werk wurde im Jahr 2013 vom Verlag Zeitschrift für Naturforschungin Zusammenarbeit mit der Max-Planck-Gesellschaft zur Förderung derWissenschaften e.V. digitalisiert und unter folgender Lizenz veröffentlicht:Creative Commons Namensnennung 4.0 Lizenz.
Generation of a Steady-State Overdense Plasma by Microwaves near the Dipole Resonance of a Coaxial Discharge Device B. Kampmann Institut für Experimentalphysik II, Ruhr-Universität Bochum, D-4630 Bochum 1
Z. Naturforsch. 34a, 423-429 (1979) ; received Marth 1, 1979
At electron densities above the dipole resonance of a coaxial plasma-waveguide-system a steady-state discharge has been generated. The measured complex wave vector is compared to the calcu-lated electromagnetic dispersion relation and allows conclusions concerning electron densities as well as relative electron density profiles. Attention is paid to the occurrence of parametric decay.
1. Introduction
In the preceeding article [1] temporal develop-ment and properties of high density plasmas generat-ed by microwaves in a coaxial discharge device have been reported.
Here a steady-state discharge at medium micro-wave power level (/ = 4.8GHz; Pmw ^ 1300 W) is discussed. At this power level the electron density of the discharge is near the dipole resonance of the plasma-waveguide-system.
In this region of density real part and imaginary part of the complex wave vector k show strong variation as function of electron density and relative electron density profile, corresponding to analytical calculations [2], So the experimental results can be used to obtain information about relative electron density profiles. Attention is paid to the appearance of parametric decay.
2. Experimental Apparatus
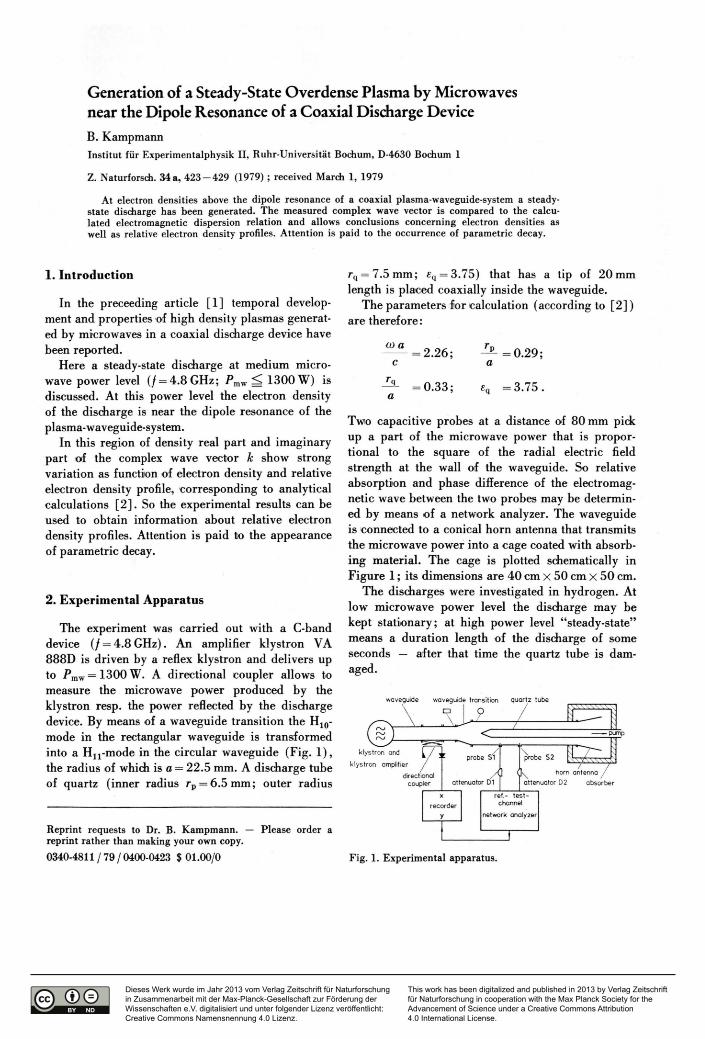
The experiment was carried out with a C-band device (/ = 4.8 GHz). An amplifier klystron VA 888D is driven by a reflex klystron and delivers up to jPm w=1300W. A directional coupler allows to measure the microwave power produced by the klystron resp. the power reflected by the discharge device. By means of a waveguide transition the H10-mode in the rectangular waveguide is transformed into a H11-mode in the circular waveguide (Fig. 1), the radius of which is a = 22.5 mm. A discharge tube of quartz (inner radius rp = 6.5mm; outer radius
Reprint requests to Dr. B. Kampmann. — Please order a reprint rather than making your own copy. 0340-4811 / 79 / 0400-0423 $ 01.00/0
rq = 7.5mm; £q = 3.75) that has a tip of 20 mm length is placed coaxially inside the waveguide.
The parameters for calculation (according to [2 ] ) are therefore:
co a = 2.26;
= 0.33;
= 0.29;
en = 3 . 7 5 .
Two capacitive probes at a distance of 80 mm pick up a part of the microwave power that is propor-tional to the square of the radial electric field strength at the wall of the waveguide. So relative absorption and phase difference of the electromag-netic wave between the two probes may be determin-ed by means of a network analyzer. The waveguide is connected to a conical horn antenna that transmits the microwave power into a cage coated with absorb-ing material. The cage is plotted schematically in Figure 1; its dimensions are 40 cm x 50 cm x 50 cm.
The discharges were investigated in hydrogen. At low microwave power level the discharge may be kept stationary; at high power level "steady-state" means a duration length of the discharge of some seconds — after that time the quartz tube is dam-aged.
waveguide waveguide transition
° ! ? quartz tube
klystron and klystron amplifier /
directional coupler
probe s i ' probe S2
born antenna attenuator D2
X
recorder y
ret.- test-channel
network analyzer
ret.- test-channel
network analyzer
Fig. 1. Experimental apparatus.
424 B. Kampmann • Generation of a Steady-State Overdense Plasma by Microwaves
3. Experimental Results
3.1. Reflected Power
The plasma-waveguide-system shows a reflection coefficient that depends on the properties of the generated plasma and, of course, on the transition from the waveguide to the discharge section; i. e. on the special outline of the front end of the discharge tube. The quotient of reflected and incident power reduces with increasing power level from 25% about 15%.
The reflected power might be reduced e. g. by means of movable inserts in the waveguide that just compensate the reflected wave (e.g. Harvey [3 ] ) . In case of a microwave discharge Musil et al. [4] have used an arrangement of dielectric layers work-ing in a similar way.
3.2. Spectroscopic Measurement of Electron Density and Neutral Gas Temperature
An estimate of electron density by means of 8-mm microwave interferometry across the waveguide is very difficult because of multiple reflections of the 8-mm microwaves at the walls of the waveguide. — Probe measurements are problematic since the probes are easily damaged at the high neutral gas temper-ature.
So hydrogen line profiles of H^ and H3 were recorded spectroscopically by means of a 1-m Czerny-Turner spectrograph. Electron density was estimated from the half width of H^ and H^ (of. [1, 5] ) according to the unified theory by Yidal et al. [6].
Depending on microwave power level, electron densities between n = 1012 cm - 3 and n = 3 • 1012 c m - 3
were found; i. e. values near the lower limit where Stark broadening affects the line profiles. So the neutral gas temperature was calculated from the half width of H^ which was assumed to be purely Dopp-ler broadened.
The results were:
and T = 1970 K at a filling pressure p = 0.52 Torr
T = 1710 K at p = 2.0 Torr.
These temperatures changed as function of the micro-wave power level by less than 10% so that the values given above may be used to estimate the neutral particle density. As the mean free path is small compared to the diameter of the quartz tube no
Knudsen-diffusion (e.g. Cap [7]) has to be taken into account. The volume of the apparatus is large compared to the volume of the discharge tube; so it may be assumed that the pressure in the apparatus remains approximately constant when a discharge is generated. Therefore the particle density in the dis-charge tube changes:
300 K nj = n0- ———
where n0 is the particle density at room temperature (300 K). Thus an effective collision frequency v is obtained according to Cottingham and Buchsbaum [8]:
300 K T '
v = 4.8-109 P o Torr
The measured values of neutral gas temperature now yield relative collision frequencies v/w (for / = 4.8 GHz):
p = 0.52 Torr: v/w = 0.013; p = 2.0 Torr: v/<o = 0.056,
which will be used in the following when the ex-perimental results are compared to analytical calcu-lations.
3.3. Measurement of Relative Absorption in the Plasma- W aveguide-System
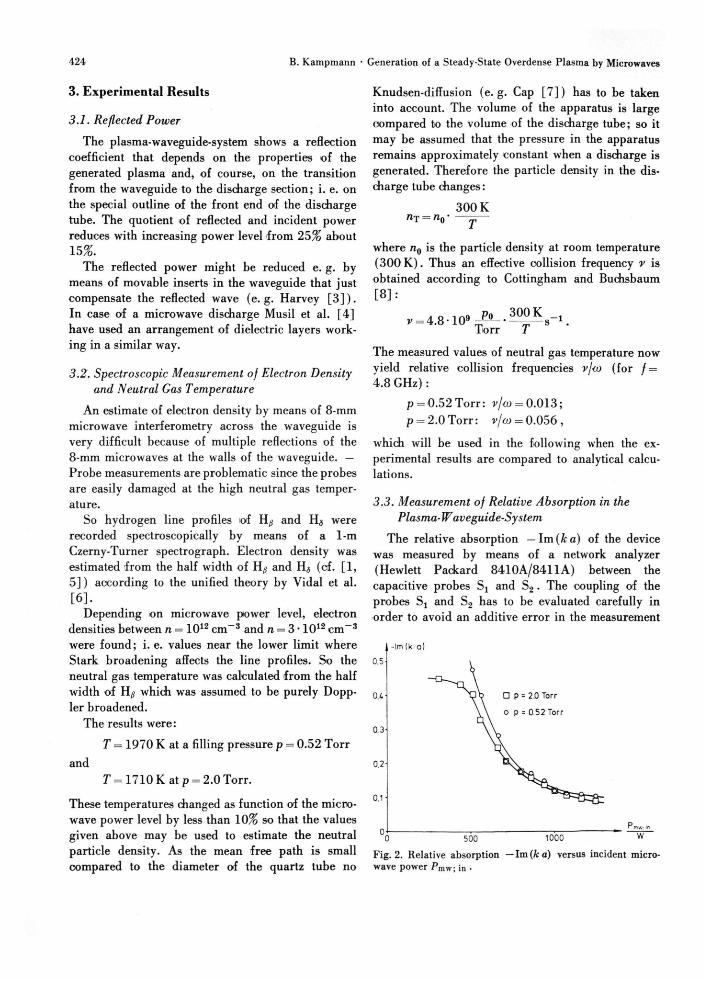
The relative absorption —Im(A:a) of the device was measured by means of a network analyzer (Hewlett Packard 8410A/8411A) between the capacitive probes Si and S2 . The coupling of the probes Sj and S2 has to be evaluated carefully in order to avoid an additive error in the measurement
0.5
0.4
0.3
0.2
0.1
-Im (k a)
• p = 2.0 Torr o p - 0.52 Torr
500 1000
Fig. 2. Relative absorption — Im (A: a) versus incident micro-wave power PJIW; in •

425 B. Kampmann • Generation of a Steady-State Overdense Plasma by Microwaves
0.5
(K
0.3
0.2
0.1
-lm(k-a)
• p = 2.0 Torr o p = 0.52 Torr
200 iOO 600
Fig. 3. — Im (k a) as a function of the microwave power that is present in the waveguide Pmw •
of relative absorption. The measurement of relative absorption is significant only when the plasma col-umn is extending further then probe S 2 . The results are shown in Figure 2: the relative absorption — Im (A: a) is decreasing monotonously with in-creasing power of the incident microwave. Surpris-ingly — Im {k a) only differs slightly for both values of neutral gas pressure.
In order to take into account the power reflected by the discharge and the power absorbed in front of probe Si , —Im (k a) should be given as function of the microwave power that is present in the wave-guide. The microwave power ooupled by Si was compared to the power coupled by the directional coupler using the network analyzer in order to determine the microwave power level at the position of S j . As the coupling coefficient of S t has been measured before, the microwave power at the posi-tion of S t can now be calculated. Taking the mean value of relative absorption (Fig. 2) between Sj
2.8
2.6-
7.U-
2.2
2.0
Re Ik- a
0 500 1000 W
Fig. 4. Re (A; a) versus incident microwave power Pmw; in
5-
2 -
1.0-
0.5-
0 . 2 -
0.1-
k-o
Re (k a)
—i 1 1 i—i—i—n—i— 20 50 100
a)
5-
2 -
1.0-
0.5-
0 .2 -
0.1-
k a
a = 0.33
eq = 3.75
•£ = 0.056
60 layers
-n .^^ .J^ß .Jo^ .Jo \2.Jo \jo • -^uS \ \ \ \ \ \ 32-Jo\ \ \ v
\ \ \ x v \ \ \ \ \ \
\ \
10 20 50 100
b) Fig. 5. Dispersion relation of the plasma-waveguide-system for several relative density profiles. (Q denotes a homo-geneous plasma column; J0 denotes a radial Bessel profile of electron density; m * /„ denotes a relative density profile y = m * J0(2A r/rp), that is cut at y = 1. a) v/(o=0.013, b) vjco - 0.056.

426 B. Kampmann • Generation of a Steady-State Overdense Plasma by Microwaves
and S 2 , the power in the center between Sx and S2
has been computed: Fig. 3 shows the relative absorp-tion as a function of the microwave power Pmw that is present in the waveguide. The relative absorption in case of both neutral gas pressures differs only for small values of microwave power.
3.4. Measurement of Wavelength
The phase difference between probe Sx and S2 can also be measured by means of the network analyzer. Different phase shifts in test and reference cables can be eliminated by making two measurements with test and reference cables exchanged: the difference of both results gives twice the phase shift beetwen SA
and S2 . The result of the measurement is given in Figure 4: for both values of neutral gas pressure Re (k a) shows a maximum with increasing micro-wave power level; thereafter it decreases monoton-ously, as one would have expected from analytical dispersion relations for increasing electron density (e. g. Figure 5).
3.5. Parametric Decay
For high electric field strength the incident micro-wave exhibits parametric decay in case of similar microwave discharges (e.g. Beerwald et al. [ 9 ] ) . This type of instability can be detected easily by means of a spectrum analyzer as the waves resulting from the decay have a frequency different from the incident microwave frequency.
The klystron that was used generates a nearly monochromatic microwave so that the measurement is not disturbed by noise of the klystron. Therefore the signal coupled by probe Sj was examined with a spectrum analyzer: at low microwave power level { P i n w ; in ~ 200 W) — when the plasma column ex-tended not yet up to probe Sx — an asymmetric sideband was generated about 1 MHz below the incident frequency; it was most distinct at low neutral gas pressure (p <0 .2 Torr). When the micro-wave power level was increased the relative sideband amplitude decreased and at a microwave power level at which the interpretation of data starts in Fig. 2, no sideband could be detected. This property of the discharge will be discussed in Section 4.
4. Interpretation of Experimental Results
Near the dipole resonance the dispersion relation is influenced strongly by the relative electron density
profile; so one may draw conclusions from the specific slope of Re [k a) and —Im (k a) on the relative density profile. A comparison of analytical and experimental results gives no consistency with spectrosoopically determined electron densities in case of either a homogeneous plasma column or a Bessel profile / 0 of electron density. So a set of relative density profiles with gradients of electron density increased by a factor m is chosen [2 ] ; the electron density in the inner part of the plasma col-umn is assumed not to increase strongly and there-fore is approximated by constant electron density. Figure 5 shows the analytical dispersion relation for different relative density profiles.
Figure 6 gives the same dispersion diagram with Re(ka) plotted versus —Im (k a) where the density is now varying along the thin lines. The experimental
Fig. 6. Dispersion diagrams plotted for the determination of the relative electron density profiles, a) p = 0.52 Torr, b) p = 2.0 Torr.

427 B. Kampmann • Generation of a Steady-State Overdense Plasma by Microwaves
results from Fig. 2 and Fig. 4 are also plotted within Fig. 6 in order to to determine the relative density profile of the plasma column; the parameter varying along the bold line is the incident microwave power.
In order to prove the results of Fig. 6, the micro-wave power absorbed in the plasma per cm length of the discharge is given in Figure 7. Although the relative absorption decreases with increasing micro-wave power level (Fig. 3), the absorbed power in-creases monotonously (as in [1 ] ) . In case of p = 2.0 Torr the relative density profile steepens strong-ly; in accordance Fig. 7 b shows a strong increase of absorbed microwave power at low values of
6 0 -
50
40-
30-
2 0 -
1 0 -
P-bsfcm W/cm
p = 0.52 Torr
100 200 300 400 500 600 700 a)
60
50-
40
3 0 -
20
10
P s/cm W/cm
p= 2.0 Torr
0 100 200 300 400 500 600 700 w
b)
Fig. 7. Absorbed power per cm length of the discharge versus microwave power Pmw . a) p = 0.52 Torr, b) p = 2.0 Torr.
1 0 -
5-
p = 0.52 Torr
0 100 200 300 400 500 600 7oÖ~
A /
A / .
V
/ /
/ /
/ /
/ /
V /a
p = 0.52 Torr
10 20 30 40 50 60 W/cm
b)
Fig. 8. Relative electron density n/nc as a function of a) microwave power; b) absorbed microwave power per cm length of the discharge.
microwave power: steeper density gradients cause enhanced electron losses by diffusion that must be compensated. The increase of absorbed power diminishes when the final relative density profile has established.
When the relative profile of electron density is known, the electron density in the center of the plasma column can be given by using Figure 5. In case of p = 0.52 Torr filling pressure the relative electron density profile does not change very much. As Fig. 8 a shows, the electron density increases only slightly with microwave power. The power has to be raised from Pmw = 100 W to about Pmw = 700 W to get twice the electron density. This is caused by the strong decrease of relative absorption with increasing electron density near the dipole

428 B. Kampmann • Generation of a Steady-State Overdense Plasma by Microwaves
resonance (Figure 5 a). When the electron density is plotted versus absorbed microwave power in Fig. 8 b, one gets a linear dependence. For / = 4.8 GHz the cut-off density is nc = 2.9• 1011 c m - 3 ; so the electron density increases from n = 1.6* 1012 c m - 3 to n = 2.9 • 1012 cm - 3 . This is in good agreement with the spectroscopical results (cf. Sec-tion 3.2).
The electron losses of the plasma due to dif-fusion increase proportional to the gradient of elec-tron density at the edge of the plasma n . In our case n is approximately proportional to the maximum elec-tron density inside the plasma, since the relative den-sity profile does not change considerably; thus the linear dependence of electron density from absorbed microwave power as well as the absolute values of electron density proove the consistency of experi-mental data and the model outlined above.
The absorption characteristic of the plasma-wave-guide-system can be explained as follows: in the plasmaguide-mode (of. [2] ) the relative absorption of the plasma diminishes with increasing electron density and ( [ 2 ] ; Fig.13) with increasing density gradient at the edge of the plasma. In this part of the dispersion diagram a steady-state discharge may be established: for a given level of microwave power a decrease of electron density below equilibrium leads to enhanced absorption of the microwave, whereas the diffusion losses decrease; so electron density will rise until production and losses of elec-trons are balanced. Vice versa an increase of elec-tron density above equilibrium causes a decrease of absorbed microwave power and higher electron los-ses, so that electron density will fall again. In case of a steady-state discharge such an equilibrium has established everywhere along the plasma column. This explains the experimental observation that the absorbed power increases with increasing electron density whereas the relative absorption —Im(A;a) decreases.
The considerations concerning a stable equilibrium of the plasma apply to the electron density as well as to the gradient of electron density at the edge of the plasma; this means that the plasma may respond to an increase of microwave power either by in-creasing the electron density or by steepening the relative density profile. At low microwave power level it is difficult for the discharge to compensate the diffusion losses; therefore a relative density
profile with low steepness appears that causes strong absorption and low diffusion losses.
The calculation shows that the relative absorption for both collision frequencies should not differ con-siderably in the region of electron density consider-ed : in case of a relative density profile 8 * / 0 the relative absorption differs — according to Fig. 5 — only by about 30% in the region of electron density given by Fig. 8 a; this is possible around a reso-nance, as the absorption is larger near the resonance in case of a low collision frequency, whereas in some distance from the resonance the absorption is larger in case of a high collision frequency. The influence of a density gradien on the absorption for parame-ters near a resonance cannot be given schematically, but is included in the analytic calculations. The results are in accordance with the experimental results of Fig. 3 that show only slight difference of relative absorption for both collision frequencies.
The observations in Sect. 3.5 concerning parame-tric decay are explained qualitatively as follows: In case of high frequency (v w) the power absorbed in a homogeneous plasma is described by (e. g. [ 1 0 ] ) :
This means that the absorbed power increases linearly with electron density if electric field strength and collision frequency remain constant. In Fig. 8 b the absorbed power also increases linearly with electron density; so the electric field strength should remain constant in good approximation. (The calculation for a homogeneous plasma shows that the electric field at the edge of the plasma only increases by 30% if a plasma with n/nc = 50 ab-sorbes ten times the power that is absorbed by a plasma with n/nc = 5.0. The slight increase is mainly due to the decreasing skin depth which causes a modified field distribution in case of a denser plasma.)
Perkins and Flick [11] have shown that in case of an inhomogeneous plasma the threshold field of the parametric decay increases linearly with the gradient of electron density. In our case the electric field remains approximately constant; so the electric field falls below the increasing threshold value when the density gradient increases more and more. This explains the feature described in Section 3.5 that parametric decay is not observed at medium and high microwave power level.

429 B. Kampmann • Generation of a Steady-State Overdense Plasma by Microwaves
5. Summary
The plasmaguide-mode of a coaxial plasma-wave-guide-system shows strong absorption near the dipole resonance of the plasma column also for low colli-sion frequencies V/<JO in the order of some percent. This high absorption has been used to generate overdense plasmas; the characteristic of the disper-sion relation allows to generate a stationary dis-charge. The slope of real part and imaginary part of the wave vector has been measured and gives in-formation about electron density and relative elec-tron density profiles; the results are in accordance with spectroscopic measurements of electron density. The plasma is overdense: for Pmw = 1.3 kW densities of n/nc = 10 resp. n = 3 • 1012 c m - 3 have been achiev-ed in the discharge device described here. Parametric
[1] B. Kampmann, Z. Naturforsch. 34 a, 414 (1979). [2] B. Kampmann, Z. Naturforsch. 32 a, 935 (1977). [3] A. F. Harvey, Microwave Engineering, Academic Press,
London and N. Y. «1963, p. 122. [4] J. Musil, F. Zacek, and V. N. Budnikov, Czech. J.
Phys. B 23, 736 (1973). [5] B. Kampmann, Verhandl. DPG (VI) 10, 285 (1975). [6] C. R. Vidal, J. Cooper, and E. W. Smith, Astrophys.
J. Suppl. Series 25, 37 (1973). [7] F. Cap, Einführung in die Plasmaphysik I, Vieweg &
Sohn, Berlin 1970, p. 121.
decay of the microwave has been found only for low microwave power level as the threshold for parame-tric decay is strongly increased by the electron density gradients that are present at high microwave power.
Acknowledgements
These investigations have been supported by the Sonderforschungsbereich 162 "Plasmaphysik Bo-chum/Jülich" and partially by the DFG Schwerpunkt-programm "Fusionsorientierte Plasmaphysik". The author wishes to thank Prof. Dr. H. Schlüter and Dr. H. Beerwald for the support of the work and Mr. K. Brinkhoff for his technical assistance during the experiments and for plotting the diagrams.
[8] W. B. Cottingham and S. J. Buchsbaum, Phys. Rev. 130,1002 (1963).
[9] H. Beerwald, G. Böhm, B. Kampmann, and B. Schweer, Proc. Xllth Conf. Phen. Ion. Gases; Eindhoven 1975, p. 296.
[10] S. C. Brown, Introduction to Electrical Discharges in Gases, J. Wiley & Sons, New York 1966, p. 166.
[11] F. W. Perkins and J. Flick, Phys. Fluids 14, 2012 (1971).

![Zeitschrift für Naturforschung / C / 35 (1980)zfn.mpdl.mpg.de/data/Reihe_C/35/ZNC-1980-35c-0423.pdf-$7 Z? 8[Q E - 7! ' E E - & E & ' -$7 & H ' & ) Z>[ & E !;]!E E -$7 Q & D ' ` -$7a](https://img.pdfslide.org/doc/110x75/5ad72d0a7f8b9a865b8bc96d/zeitschrift-fr-naturforschung-c-35-1980zfnmpdlmpgdedatareihec35znc-1980-35c-0423pdf-7.jpg)


![Journal für Reproduktionsmedizin und EndokrinologieThe prevalence of infertility among couples of reproduc-tive age is estimated at 15 % [1]. In approximately 25 %, various causes](https://img.pdfslide.org/doc/110x75/600f3716e12e95082562ba4d/journal-fr-reproduktionsmedizin-und-endokrinologie-the-prevalence-of-infertility.jpg)