Embed Size (px)
Citation preview
Atmos. Chem. Phys., 13, 11675–11693, 2013www.atmos-chem-phys.net/13/11675/2013/doi:10.5194/acp-13-11675-2013© Author(s) 2013. CC Attribution 3.0 License.
Atmospheric Chemistry
and PhysicsO
pen Access
Impact of emission changes on secondary inorganic aerosol episodesacross Germany
S. Banzhaf1, M. Schaap2, R. J. Wichink Kruit 2, H. A. C. Denier van der Gon2, R. Stern1, and P. J. H. Builtjes1,2
1Institut für Meteorologie, Freie Universität Berlin, Carl-Heinrich-Becker Weg 6–10, 12165 Berlin, Germany2TNO, Department Climate, Air Quality and sustainability, Princetonlaan 6, 3508 TA Utrecht, the Netherlands
Correspondence to:S. Banzhaf ([email protected])
Received: 29 April 2013 – Published in Atmos. Chem. Phys. Discuss.: 14 June 2013Revised: 16 October 2013 – Accepted: 28 October 2013 – Published: 3 December 2013
Abstract. In this study, the response of secondary inorganicaerosol (SIA) concentrations to changes in precursor emis-sions during high PM10 episodes over central Europe inspring 2009 was investigated with the Eulerian ChemistryTransport Model (CTM) REM-Calgrid (RCG). The modelperformed well in capturing the temporal variation of PM10and SIA concentrations and was used to analyse the differ-ent origin, development and characteristics of the selectedhigh PM10 episodes. SIA concentrations, which contributeto about 50 % of the PM10 concentration in northwesternEurope, have been studied by means of several model runsfor different emission scenarios. SO2, NOx and NH3 emis-sions have been varied within a domain covering Germanyand within a domain covering Europe. It was confirmed thatthe response of sulfate, nitrate and ammonium concentrationsand deposition fluxes of S and N to SO2, NOx and NH3 emis-sion changes is non-linear. The deviation from linearity wasfound to be lower for total deposition fluxes of S and N thanfor SIA concentrations. Furthermore, the study has shownthat incorporating explicit cloud chemistry in the model addsnon-linear responses to the system. It significantly modifiesthe response of modelled SIA concentrations and S and N de-position fluxes to changes in precursor emissions. The anal-ysis of emission reduction scenario runs demonstrates thatnext to European-wide emission reductions additional na-tional NH3 measures in Germany are more effective in reduc-ing SIA concentrations and deposition fluxes than additionalnational measures on SO2 and NOx.
1 Introduction
Particulate matter has adverse impact on public health (Popeet al., 2007, 2008). The European Commission establisheddirectives regarding PM10 concentration level to avoid, pre-vent or reduce harmful effects on human health (EuropeanCommission, 2008). The analysis of observations revealsthat the current EU limit values for PM10 are still exceededover large parts of Europe (EEA, 2012) indicating a contin-ued need for further implementation of abatement strategies.Secondary inorganic aerosol (= SIA: SO2−
4 , NO−
3 and NH+
4 )originating from gaseous precursors such as SO2, NOx andNH3 (Fountoukis and Nenes, 2007) comprises an importantfraction of PM10. Experimental studies have shown that inthe rural background the average PM10 is dominated by SIAcontribution (Van Dingenen et al., 2004; Putaud et al., 2004).Moreover, during PM episodes the fraction of SIA is higherthan on average (Weijers et al., 2011). After removal of SIAand its precursors from the atmosphere they contribute to eu-trophication and acidification of soils and water bodies withharmful effects to vulnerable ecosystems (Bobbink et al.,1998).
SIA is dominated by ammonium-sulfate and ammonium-nitrate salts (Putaud et al., 2010). The precursor gases NOxand SO2 are oxidised to form HNO3 and H2SO4, respec-tively. Ammonium-sulfate and ammonium-nitrate are thenformed when nitric acid and sulfuric acid are neutralised byNH3. In contrast to ammonium-sulfate, ammonium-nitrate isa semi-volatile component (Nenes et al., 1999). NH3 pref-erentially neutralizes sulfuric acid due to its low saturationvapour pressure. If abundant NH3 is available, ammonium-nitrate may form. The thermodynamic equilibrium between
Published by Copernicus Publications on behalf of the European Geosciences Union.
11676 S. Banzhaf et al.: Impact of emission changes on SIA episodes across Germany
gas and aqueous aerosol phase is determined by temperature,relative humidity and the ambient concentrations of sulfate,total nitrate and total ammonia (West et al., 1999). In addi-tion, NH3 constrains cloud droplet pH, which regulates theoxidation pathway of SO2 and therewith the formation effi-ciency of sulfate (Fowler et al., 2007). Furthermore, the drydeposition velocities of NH3 and SO2 are connected (Fowleret al., 2001). Hence, emission reductions of gaseous SIA pre-cursors lead to shifts in the equilibrium and affect the for-mation, residence time and removal of sulfur and nitrogencompounds and result in a non-linear response of the SIAconcentrations (Fagerli and Aas, 2008). The impact of thecomplex interactions varies seasonally and regionally overEurope with changing emission regime.
Among emission changes of SO2, NOx and NH3, re-sponses to NH3 emission changes show the largest non-linearbehaviour (Tarrasón et al., 2003). Former studies over Europeregarding responses of ambient PM levels to emission reduc-tions indicate that a decrease of NH3 emissions may entail ahigh reduction potential for SIA (and therewith PM) concen-trations and deposition fluxes of S and N (e.g. Erisman andSchaap, 2004; Derwent et al., 2009; Redington et al., 2009;Matejko et al., 2009). Pinder et al. (2007) found that reducingNH3 emissions may offer significant cost savings comparedto further controls on SO2 and NOx (in the US). In contrast,other studies indicated that for regions, in which SIA forma-tion is SO2- and HNO3-limited due to high NH3 concentra-tions, a decrease in SO2 and NOx emissions may result in alarge reduction of SIA concentrations (Pay et al., 2012; deMeij et al., 2009). Further research is needed to consider andinclude the impact of the non-linear system described abovein current PM10 mitigation strategies.
So far, investigations on the impact of emission reductionsof precursors SO2, NOx and NH3 on SIA or PM concentra-tions focussed on long-term trends (Fagerli and Aas, 2008;Fowler et al., 2005; Lövblad et al., 2004; Erisman et al.,2003), on the analysis of one specific year (Tarrasón et al.,2003; Derwent et al., 2009) or on separate months (Erismanand Schaap, 2003; Renner and Wolke, 2010; de Meij et al.,2009), but not on specific periods with elevated PM10 levels.During the last decade, springtime high PM10 episodes wererepeatedly reported in large areas over Europe with PM10concentrations above 100 µg m−3 (e.g. 2006, 2007, 2009 and2011). Springtime is marked by periods of fair weather withmedium temperatures combined with high NH3 emission dueto incipient agricultural activity. The latter leads to high NH3availability, which enhances SIA formation.
In this study, the development and characteristics of twohigh PM10 episodes over central Europe in spring 2009 arestudied. Furthermore, the response of modelled SIA concen-trations to changes in the precursor emission is investigatedfor this time period. With respect to the latter, the sensitivityof modelled SIA concentrations to changes in NH3 emissionsis investigated. Furthermore, SIA concentrations are calcu-lated for different scenario runs with simultaneously varying
SO2, NOx and NH3 emissions. A critical question for na-tional policy makers is how much reduction in population ex-posure can be achieved by national measures versus genericEuropean measures. We define measures in the German na-tional domain and compare the impact with European-widemeasures. Therefore, for each scenario run, two cases weresimulated: in the first case the emission scenario runs wereonly applied to the model domain covering Germany, and inthe second case, the emission scenario runs were also appliedto the European model domain, which provides the boundaryconditions for the national domain. Besides SIA concentra-tions, deposition fluxes of S and N are also included in theanalysis. Deposition fluxes are important sinks for SIA andthe air concentrations of its precursor gases.
In the following section, the model and observations aredescribed. A detailed overview of the model set up and theperformed emission scenario runs is given. In Sect. 3, theinvestigation period is described. In the subsequent section(Sect. 4) the characteristics of the PM episodes in spring2009 and results of the model evaluation and the emissionscenario runs are presented. The results are discussed andconclusions are drawn in Sect. 5.
2 Methods and data
2.1 Model description and set-up
The Eulerian grid model REM-Calgrid (RCG) simulatesair pollution concentrations solving the advection-diffusionequation on a regular latitude-longitude-grid with variableresolution over Europe (Beekmann et al., 2007; Stern, 2006).RCG is offline-coupled to the German Weather Service op-erational NWP model COSMO-EU (Schättler et al., 2008).The vertical transport and diffusion scheme accounts foratmospheric density variations in space and time and forall vertical flux components. For the horizontal advec-tion of pollutants the advection scheme developed by Wal-cek (2000) is used. Gas-phase chemistry is simulated usingan updated version of the photochemical reaction schemeCBM-IV (Gery et al., 1989), including Carter’s 1-productisoprene scheme (Carter, 1996), as described in Gipsonand Young (1999). Furthermore, RCG features thermody-namic equilibrium modules for secondary inorganic aerosols(ISORROPIA: Nenes et al., 1999) and organic aerosols(SORGAM: Schell et al., 2001). RCG includes modules totreat the emissions of sea salt aerosols (Gong et al., 1997)and wind-blown dust particles (Claiborn et al., 1998; Loose-more und Hunt, 2000). Dry deposition fluxes are calculatedfollowing a resistance approach as proposed by Erisman etal. (1994).
RCG is used within Germany to evaluate emission reduc-tion strategies for the German government (PAREST; Built-jes et al., 2010). Moreover, RCG is one of the models thatare used to benchmark the EMEP model against within the
Atmos. Chem. Phys., 13, 11675–11693, 2013 www.atmos-chem-phys.net/13/11675/2013/
S. Banzhaf et al.: Impact of emission changes on SIA episodes across Germany 11677
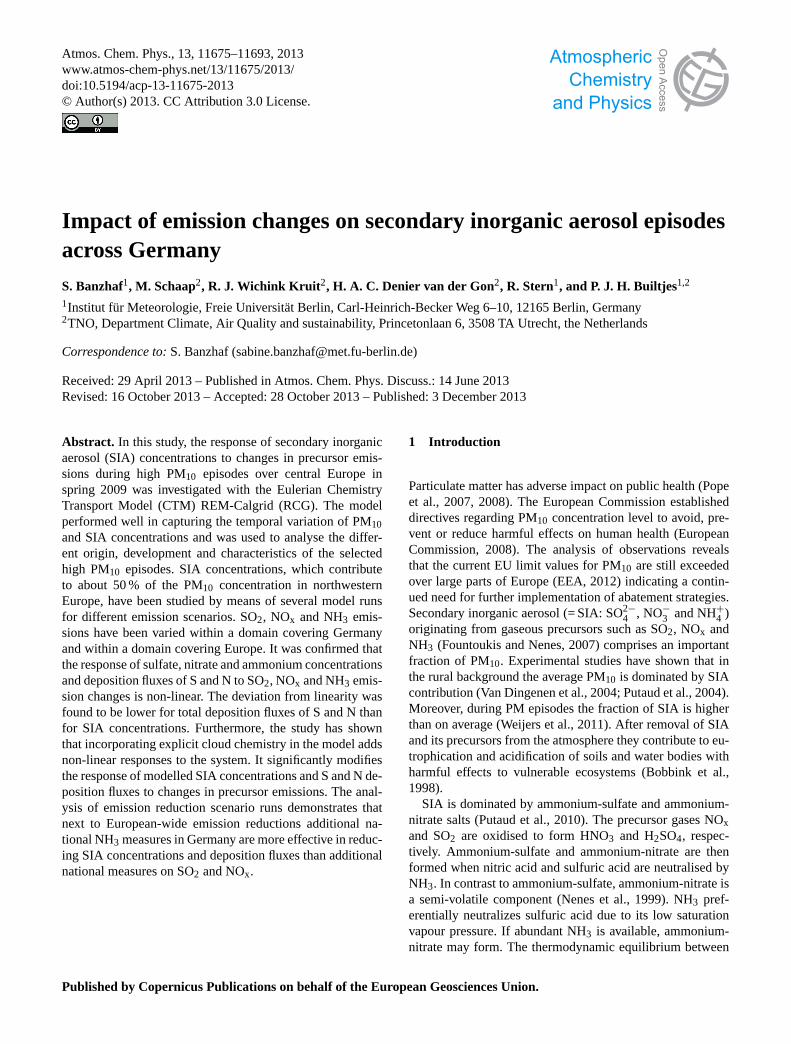
Fig. 1.Spatial distribution of the total annual(a) SOx, (b) NOx and(c) NH3 emissions in t a−1 cell−1.
Table 1.Overview of performed emission reduction scenario runs and their set-up.
Scenario runs pH pH German Europeanmodelled constant domain (GD) domain (ED)
base run x – x x−40 %NH3 x – x x−20 % NOx −50 %SO2 x – x x−40 %NH3 −20 % NOx −50 %SO2 x – x x
Task Force on Measurements and Modelling (TFMM) EU-RODELTA (Vautard et al., 2009) studies.
For this study, a research version of RCG was used as de-scribed in Banzhaf et al. (2012). It includes enhanced phys-ical and chemical descriptions of scavenging processes andsulfate production as a function of cloud liquid water con-tent and cloud/rain droplet pH. Cloud droplet pH is estimatedusing the concentrations of the (strong) acids and bases, in-cluding the buffering by bi-carbonate (through CO2). For theformation of sulfate in cloud water the oxidation of dissolvedSO2 by hydrogen peroxide and ozone are simulated. Sulfateformation and wet scavenging can either be calculated usingmodelled droplet pH or using a constant droplet pH. Banzhafet al. (2012) showed that a modelled droplet pH gives a bettermodel performance and better model consistency concerningair concentrations and wet deposition fluxes than a constantpH. The RCG wet deposition scheme distinguishes betweenin-cloud and below-cloud scavenging of gases and particles.
The applied scheme integrates wet deposition throughout thecolumn.
The model runs for spring 2009 were performed on a do-main covering Germany (47.2◦ N–55.1◦ N; 5.4◦ E–15.7◦ E),in the following referred to as the German domain (GD), witha horizontal resolution of approximately 7× 7 km2 and 20vertical layers up to 5000 m. An RCG run covering Europe(35.1◦ N–66.3◦ N; 10.2◦ W–30.8◦ E), in the following re-ferred to as the European domain (ED), provided the bound-ary conditions. Emissions for Germany were taken from anational inventory for the year 2005 (Appelhans et al., 2012,Builtjes et al., 2010) and combined with the European TNO-MACC (Monitoring Atmospheric Composition and Climate)data set for the same year (Denier van der Gon et al., 2010;Kuenen et al., 2011). The spatial distributions of the total an-nual NH3, SOx and NOx emissions of the German domainare presented in Fig. 1. The distributions illustrate that emis-sion regimes vary significantly. Agricultural ammonia-rich
www.atmos-chem-phys.net/13/11675/2013/ Atmos. Chem. Phys., 13, 11675–11693, 2013
11678 S. Banzhaf et al.: Impact of emission changes on SIA episodes across Germany
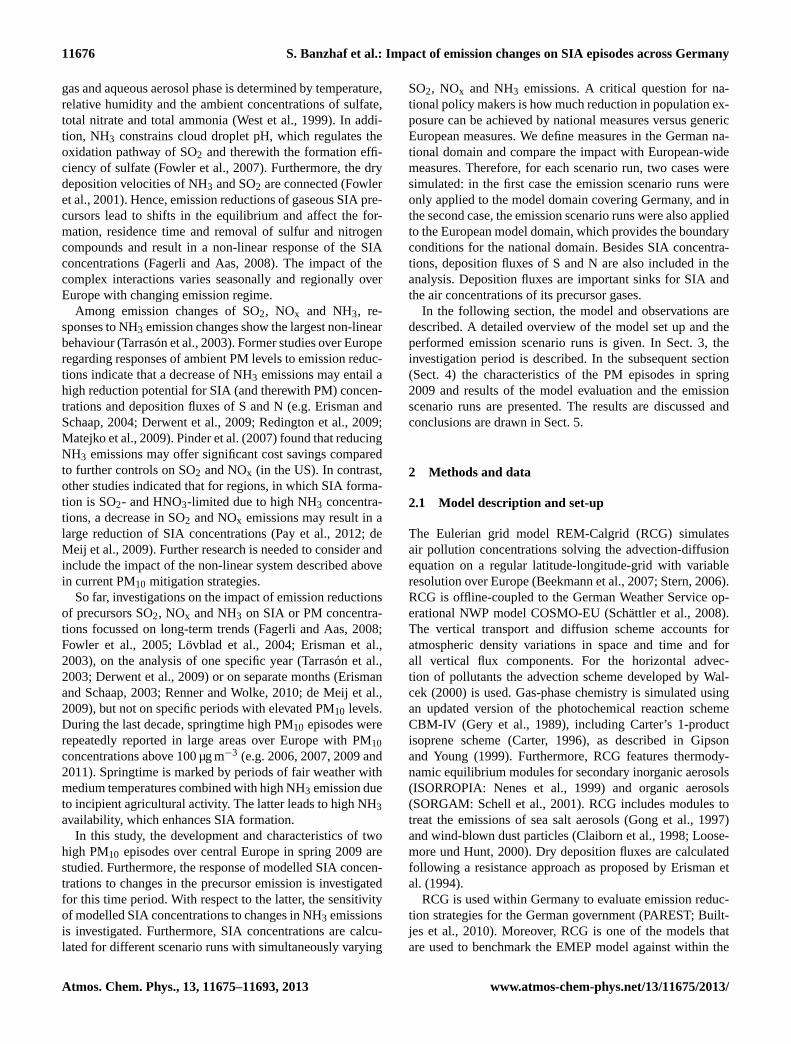
Fig. 2. Profiles of(a) monthly and(b) hourly ammonia emissionfactors applied in RCG.
areas are situated in the northwest and southeast of the do-main. The SOx emissions are located in the industrial areaswhereas NOx emissions are highest in urbanised regions andtransport corridors. The temporal variation of the emissionsis represented by monthly, day-of-the-week and hourly timefactors for each source category. These factors were takenfrom the EURODELTA database (Thunis et al., 2008). Theapplied monthly and hourly time factors for ammonia areshown in Fig. 2. The seasonal variation in ammonia emis-sions is uncertain and may differ regionally as a functionof farming procedures and climatic conditions (Geels et al.,2012). The seasonal variation for Germany shows a distinctmaximum in March/April due to the application of manure.The diurnal cycle in the emission follows the empiricallyderived distribution by Asman (2001) with half the averagevalue at midnight and twice the average at noon.
2.2 Model runs
To investigate the mitigation potential of emission reductionsof the precursor gases SO2, NOx and NH3 on SIA concentra-tions and S and N deposition fluxes, a base case simulationand model runs for three reduction scenarios have been per-formed:
1. reducing NH3 emissions only,
2. reducing SO2 and NOx emissions simultaneously, and
3. reducing SO2, NOx and NH3 simultaneously.
The emission reduction scenario runs are listed and labelledin Table 1. All model runs have been performed using mod-elled droplet pH. To study the impact of national measurescompared to European-wide mitigation efforts, all reductionscenario runs have been performed twice:
Table 2. Total annual German and German domain SOx, NOx andNH3 emissions and the ratio of German emissions to German do-main emissions.
Emissions SOx NOx NH3(t a−1) (t a−1) (t a−1)
German domain emissions 979 800 2 402 052 876 200German emissions 561 580 1 543 970 606 880German emissions/ 0.57 0.64 0.69German domain emissions
Table 3.Overview of performed ammonia emission sensitivity sce-nario runs and their set-up.
Scenario runs pH pH German Europeanmodelled constant domain (GD) domain (ED)
−60 % NH3 x x x –−40 % NH3 x x x x−20 % NH3 x x x –base run x x x –+20 % NH3 x x x –+40% NH3 x x x –
1. emissions have been reduced within the German do-main only (scenario runs denoted by GD) and
2. emissions have been reduced within the German do-main and within the European domain lowering theboundary conditions (scenario runs denoted by ED).
For simplicity, the emission reductions to assess national orregional measures were applied to the whole German zoomdomain. Inevitably, this domain comprises parts of neigh-bouring countries and seas. As for the land area, around twothirds of the emissions in the GD domain are from Germanyitself (see Table 2).
To study the model sensitivity to ammonia emissionchanges in more detail, additional model runs have been per-formed in which ammonia emissions have been varied on theGerman domain 20 %-stepwise from−60 % to+40 %. Theemission scenario runs are listed and labelled in Table 3. Tostudy the sensitivity of the model results to the variable pHin cloud water, which has often been neglected in previousstudies, the sensitivity runs have been performed twice:
1. applying modelled droplet pH and
2. applying a constant pH of 5.5.
Finally, to study the impact of long-range transport, the−40 % NH3 emission scenario run has been performed onthe German domain (scenario runs denoted by GD) and onthe European domain implying emission reduction within theGerman and the boundary conditions (scenario runs denotedby ED).
Atmos. Chem. Phys., 13, 11675–11693, 2013 www.atmos-chem-phys.net/13/11675/2013/
S. Banzhaf et al.: Impact of emission changes on SIA episodes across Germany 11679
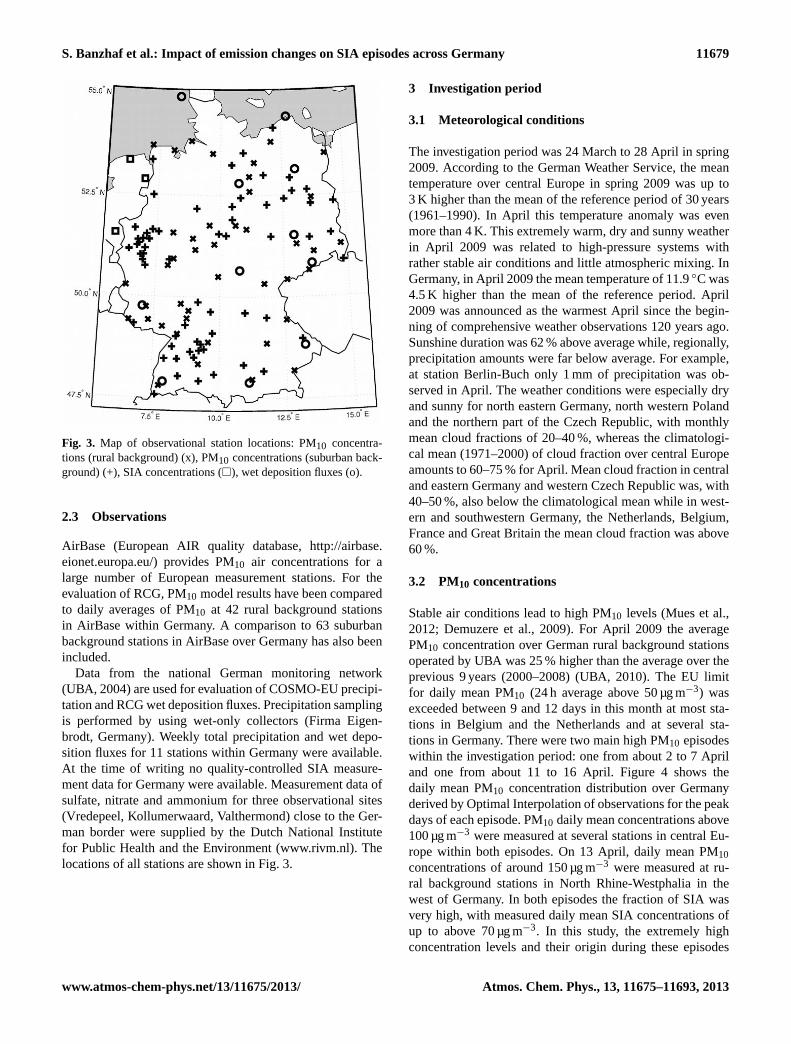
Fig. 3. Map of observational station locations: PM10 concentra-tions (rural background) (x), PM10 concentrations (suburban back-ground) (+), SIA concentrations (�), wet deposition fluxes (o).
2.3 Observations
AirBase (European AIR quality database,http://airbase.eionet.europa.eu/) provides PM10 air concentrations for alarge number of European measurement stations. For theevaluation of RCG, PM10 model results have been comparedto daily averages of PM10 at 42 rural background stationsin AirBase within Germany. A comparison to 63 suburbanbackground stations in AirBase over Germany has also beenincluded.
Data from the national German monitoring network(UBA, 2004) are used for evaluation of COSMO-EU precipi-tation and RCG wet deposition fluxes. Precipitation samplingis performed by using wet-only collectors (Firma Eigen-brodt, Germany). Weekly total precipitation and wet depo-sition fluxes for 11 stations within Germany were available.At the time of writing no quality-controlled SIA measure-ment data for Germany were available. Measurement data ofsulfate, nitrate and ammonium for three observational sites(Vredepeel, Kollumerwaard, Valthermond) close to the Ger-man border were supplied by the Dutch National Institutefor Public Health and the Environment (www.rivm.nl). Thelocations of all stations are shown in Fig. 3.
3 Investigation period
3.1 Meteorological conditions
The investigation period was 24 March to 28 April in spring2009. According to the German Weather Service, the meantemperature over central Europe in spring 2009 was up to3 K higher than the mean of the reference period of 30 years(1961–1990). In April this temperature anomaly was evenmore than 4 K. This extremely warm, dry and sunny weatherin April 2009 was related to high-pressure systems withrather stable air conditions and little atmospheric mixing. InGermany, in April 2009 the mean temperature of 11.9◦C was4.5 K higher than the mean of the reference period. April2009 was announced as the warmest April since the begin-ning of comprehensive weather observations 120 years ago.Sunshine duration was 62 % above average while, regionally,precipitation amounts were far below average. For example,at station Berlin-Buch only 1 mm of precipitation was ob-served in April. The weather conditions were especially dryand sunny for north eastern Germany, north western Polandand the northern part of the Czech Republic, with monthlymean cloud fractions of 20–40 %, whereas the climatologi-cal mean (1971–2000) of cloud fraction over central Europeamounts to 60–75 % for April. Mean cloud fraction in centraland eastern Germany and western Czech Republic was, with40–50 %, also below the climatological mean while in west-ern and southwestern Germany, the Netherlands, Belgium,France and Great Britain the mean cloud fraction was above60 %.
3.2 PM10 concentrations
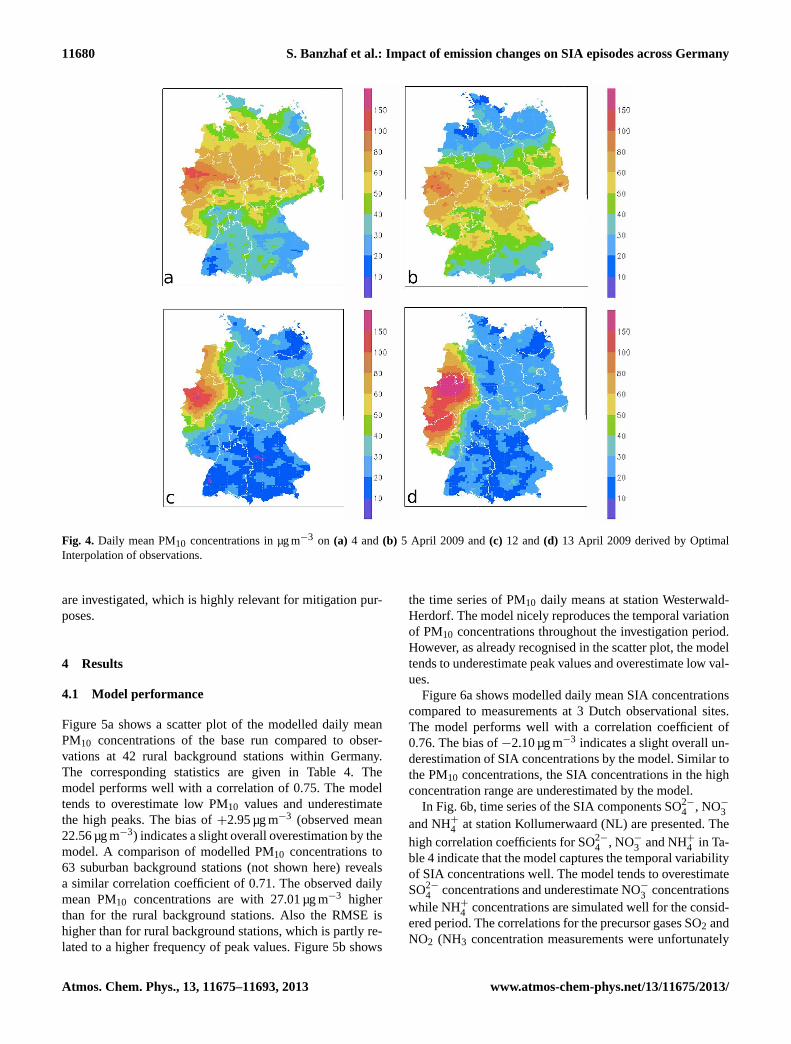
Stable air conditions lead to high PM10 levels (Mues et al.,2012; Demuzere et al., 2009). For April 2009 the averagePM10 concentration over German rural background stationsoperated by UBA was 25 % higher than the average over theprevious 9 years (2000–2008) (UBA, 2010). The EU limitfor daily mean PM10 (24 h average above 50 µg m−3) wasexceeded between 9 and 12 days in this month at most sta-tions in Belgium and the Netherlands and at several sta-tions in Germany. There were two main high PM10 episodeswithin the investigation period: one from about 2 to 7 Apriland one from about 11 to 16 April. Figure 4 shows thedaily mean PM10 concentration distribution over Germanyderived by Optimal Interpolation of observations for the peakdays of each episode. PM10 daily mean concentrations above100 µg m−3 were measured at several stations in central Eu-rope within both episodes. On 13 April, daily mean PM10concentrations of around 150 µg m−3 were measured at ru-ral background stations in North Rhine-Westphalia in thewest of Germany. In both episodes the fraction of SIA wasvery high, with measured daily mean SIA concentrations ofup to above 70 µg m−3. In this study, the extremely highconcentration levels and their origin during these episodes
www.atmos-chem-phys.net/13/11675/2013/ Atmos. Chem. Phys., 13, 11675–11693, 2013
11680 S. Banzhaf et al.: Impact of emission changes on SIA episodes across Germany
Fig. 4. Daily mean PM10 concentrations in µg m−3 on (a) 4 and(b) 5 April 2009 and(c) 12 and(d) 13 April 2009 derived by OptimalInterpolation of observations.
are investigated, which is highly relevant for mitigation pur-poses.
4 Results
4.1 Model performance
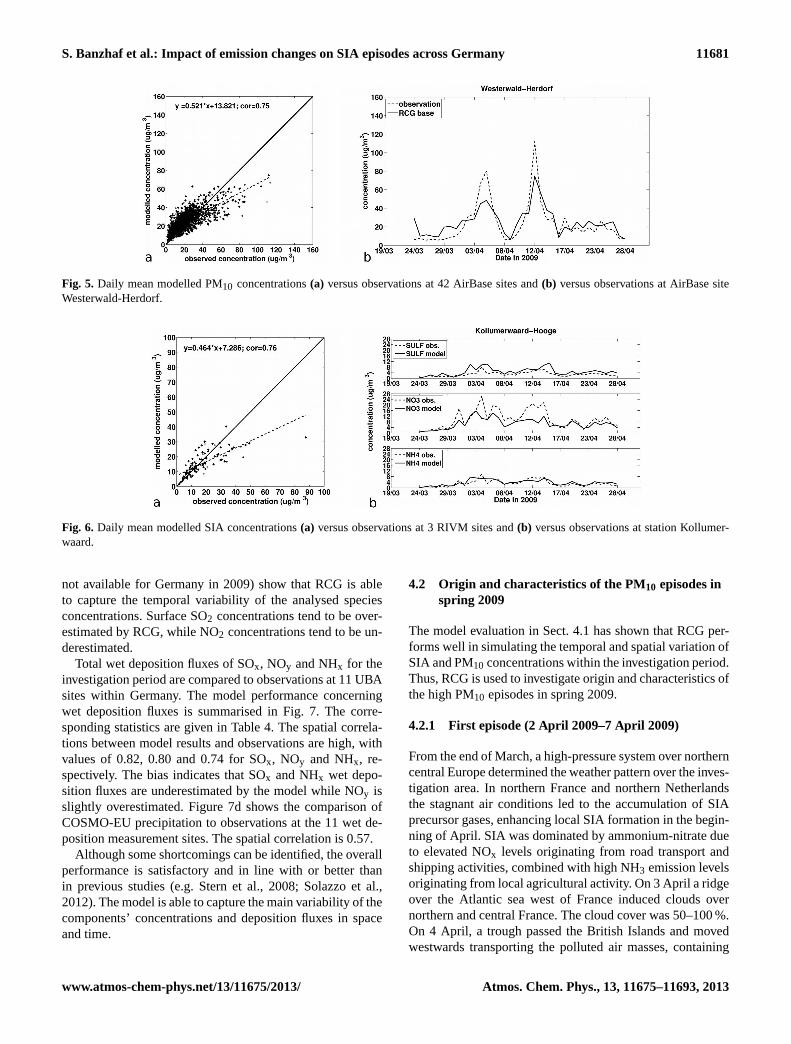
Figure 5a shows a scatter plot of the modelled daily meanPM10 concentrations of the base run compared to obser-vations at 42 rural background stations within Germany.The corresponding statistics are given in Table 4. Themodel performs well with a correlation of 0.75. The modeltends to overestimate low PM10 values and underestimatethe high peaks. The bias of+2.95 µg m−3 (observed mean22.56 µg m−3) indicates a slight overall overestimation by themodel. A comparison of modelled PM10 concentrations to63 suburban background stations (not shown here) revealsa similar correlation coefficient of 0.71. The observed dailymean PM10 concentrations are with 27.01 µg m−3 higherthan for the rural background stations. Also the RMSE ishigher than for rural background stations, which is partly re-lated to a higher frequency of peak values. Figure 5b shows
the time series of PM10 daily means at station Westerwald-Herdorf. The model nicely reproduces the temporal variationof PM10 concentrations throughout the investigation period.However, as already recognised in the scatter plot, the modeltends to underestimate peak values and overestimate low val-ues.
Figure 6a shows modelled daily mean SIA concentrationscompared to measurements at 3 Dutch observational sites.The model performs well with a correlation coefficient of0.76. The bias of−2.10 µg m−3 indicates a slight overall un-derestimation of SIA concentrations by the model. Similar tothe PM10 concentrations, the SIA concentrations in the highconcentration range are underestimated by the model.
In Fig. 6b, time series of the SIA components SO2−
4 , NO−
3and NH+
4 at station Kollumerwaard (NL) are presented. Thehigh correlation coefficients for SO2−
4 , NO−
3 and NH+
4 in Ta-ble 4 indicate that the model captures the temporal variabilityof SIA concentrations well. The model tends to overestimateSO2−
4 concentrations and underestimate NO−
3 concentrationswhile NH+
4 concentrations are simulated well for the consid-ered period. The correlations for the precursor gases SO2 andNO2 (NH3 concentration measurements were unfortunately
Atmos. Chem. Phys., 13, 11675–11693, 2013 www.atmos-chem-phys.net/13/11675/2013/
S. Banzhaf et al.: Impact of emission changes on SIA episodes across Germany 11681
Fig. 5. Daily mean modelled PM10 concentrations(a) versus observations at 42 AirBase sites and(b) versus observations at AirBase siteWesterwald-Herdorf.
Fig. 6. Daily mean modelled SIA concentrations(a) versus observations at 3 RIVM sites and(b) versus observations at station Kollumer-waard.
not available for Germany in 2009) show that RCG is ableto capture the temporal variability of the analysed speciesconcentrations. Surface SO2 concentrations tend to be over-estimated by RCG, while NO2 concentrations tend to be un-derestimated.
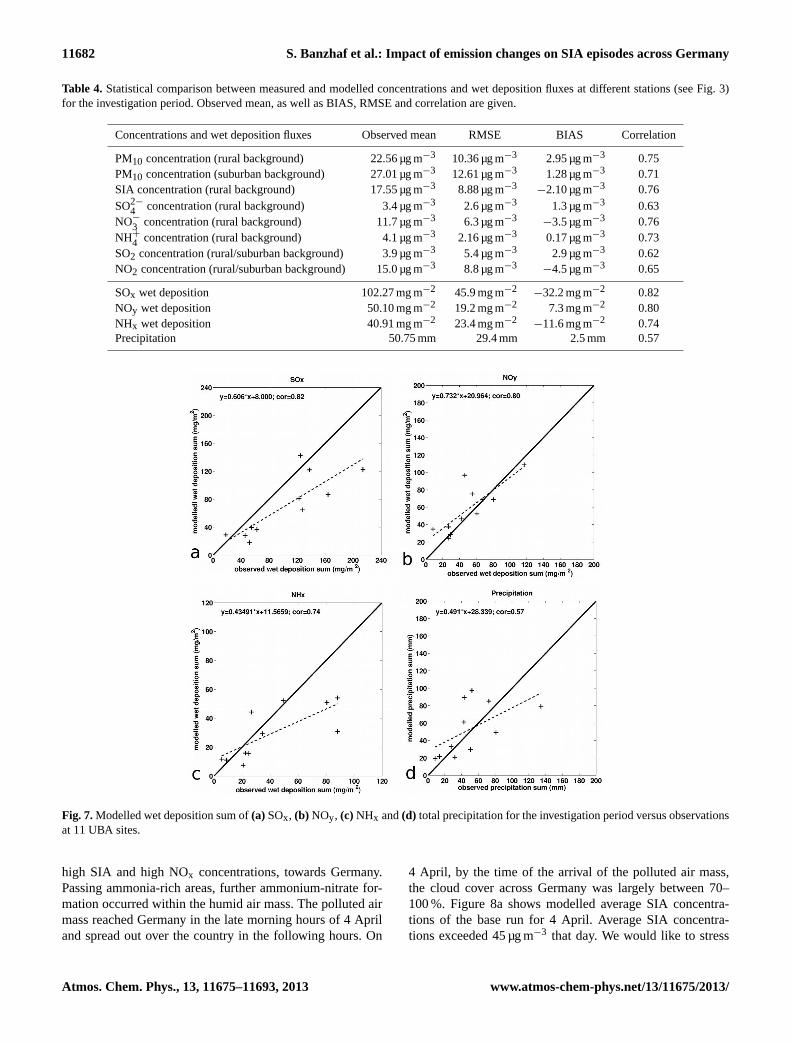
Total wet deposition fluxes of SOx, NOy and NHx for theinvestigation period are compared to observations at 11 UBAsites within Germany. The model performance concerningwet deposition fluxes is summarised in Fig. 7. The corre-sponding statistics are given in Table 4. The spatial correla-tions between model results and observations are high, withvalues of 0.82, 0.80 and 0.74 for SOx, NOy and NHx, re-spectively. The bias indicates that SOx and NHx wet depo-sition fluxes are underestimated by the model while NOy isslightly overestimated. Figure 7d shows the comparison ofCOSMO-EU precipitation to observations at the 11 wet de-position measurement sites. The spatial correlation is 0.57.
Although some shortcomings can be identified, the overallperformance is satisfactory and in line with or better thanin previous studies (e.g. Stern et al., 2008; Solazzo et al.,2012). The model is able to capture the main variability of thecomponents’ concentrations and deposition fluxes in spaceand time.
4.2 Origin and characteristics of the PM10 episodes inspring 2009
The model evaluation in Sect. 4.1 has shown that RCG per-forms well in simulating the temporal and spatial variation ofSIA and PM10 concentrations within the investigation period.Thus, RCG is used to investigate origin and characteristics ofthe high PM10 episodes in spring 2009.
4.2.1 First episode (2 April 2009–7 April 2009)
From the end of March, a high-pressure system over northerncentral Europe determined the weather pattern over the inves-tigation area. In northern France and northern Netherlandsthe stagnant air conditions led to the accumulation of SIAprecursor gases, enhancing local SIA formation in the begin-ning of April. SIA was dominated by ammonium-nitrate dueto elevated NOx levels originating from road transport andshipping activities, combined with high NH3 emission levelsoriginating from local agricultural activity. On 3 April a ridgeover the Atlantic sea west of France induced clouds overnorthern and central France. The cloud cover was 50–100 %.On 4 April, a trough passed the British Islands and movedwestwards transporting the polluted air masses, containing
www.atmos-chem-phys.net/13/11675/2013/ Atmos. Chem. Phys., 13, 11675–11693, 2013
11682 S. Banzhaf et al.: Impact of emission changes on SIA episodes across Germany
Table 4. Statistical comparison between measured and modelled concentrations and wet deposition fluxes at different stations (see Fig. 3)for the investigation period. Observed mean, as well as BIAS, RMSE and correlation are given.
Concentrations and wet deposition fluxes Observed mean RMSE BIAS Correlation
PM10 concentration (rural background) 22.56 µg m−3 10.36 µg m−3 2.95 µg m−3 0.75PM10 concentration (suburban background) 27.01 µg m−3 12.61 µg m−3 1.28 µg m−3 0.71SIA concentration (rural background) 17.55 µg m−3 8.88 µg m−3
−2.10 µg m−3 0.76SO2−
4 concentration (rural background) 3.4 µg m−3 2.6 µg m−3 1.3 µg m−3 0.63NO−
3 concentration (rural background) 11.7 µg m−3 6.3 µg m−3−3.5 µg m−3 0.76
NH+
4 concentration (rural background) 4.1 µg m−3 2.16 µg m−3 0.17 µg m−3 0.73SO2 concentration (rural/suburban background) 3.9 µg m−3 5.4 µg m−3 2.9 µg m−3 0.62NO2 concentration (rural/suburban background) 15.0 µg m−3 8.8 µg m−3
−4.5 µg m−3 0.65
SOx wet deposition 102.27 mg m−2 45.9 mg m−2−32.2 mg m−2 0.82
NOy wet deposition 50.10 mg m−2 19.2 mg m−2 7.3 mg m−2 0.80NHx wet deposition 40.91 mg m−2 23.4 mg m−2
−11.6 mg m−2 0.74Precipitation 50.75 mm 29.4 mm 2.5 mm 0.57
Fig. 7.Modelled wet deposition sum of(a) SOx, (b) NOy, (c) NHx and(d) total precipitation for the investigation period versus observationsat 11 UBA sites.
high SIA and high NOx concentrations, towards Germany.Passing ammonia-rich areas, further ammonium-nitrate for-mation occurred within the humid air mass. The polluted airmass reached Germany in the late morning hours of 4 Apriland spread out over the country in the following hours. On
4 April, by the time of the arrival of the polluted air mass,the cloud cover across Germany was largely between 70–100 %. Figure 8a shows modelled average SIA concentra-tions of the base run for 4 April. Average SIA concentra-tions exceeded 45 µg m−3 that day. We would like to stress
Atmos. Chem. Phys., 13, 11675–11693, 2013 www.atmos-chem-phys.net/13/11675/2013/
S. Banzhaf et al.: Impact of emission changes on SIA episodes across Germany 11683
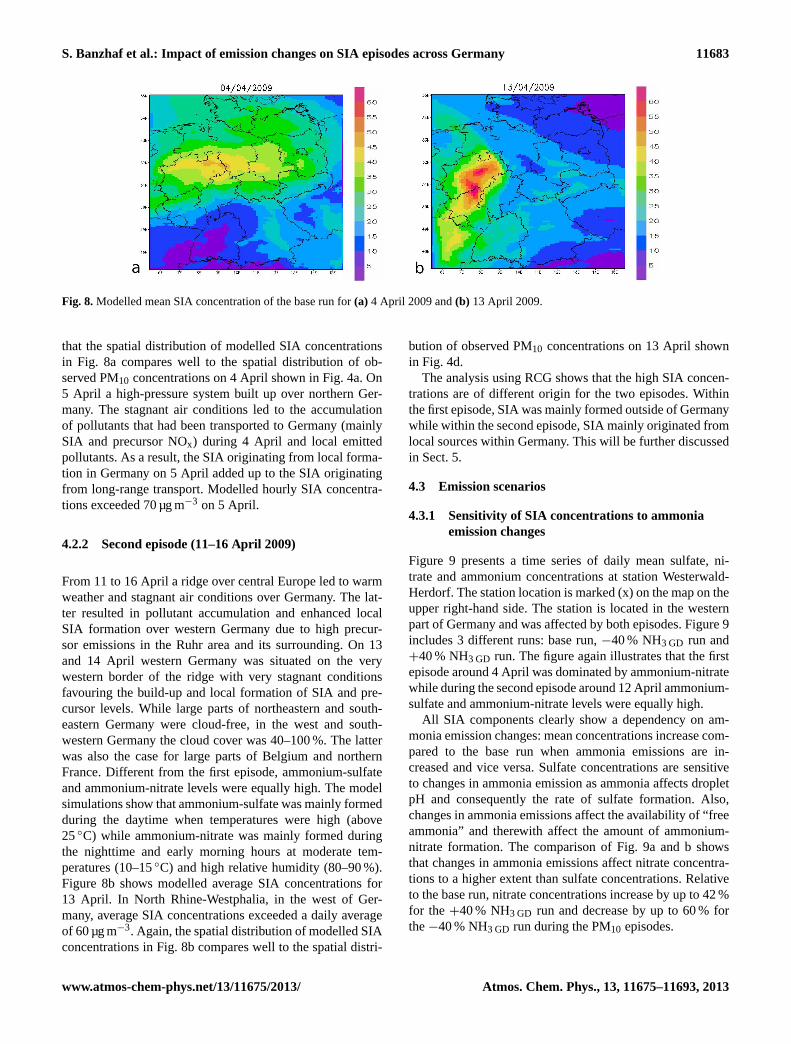
Fig. 8.Modelled mean SIA concentration of the base run for(a) 4 April 2009 and(b) 13 April 2009.
that the spatial distribution of modelled SIA concentrationsin Fig. 8a compares well to the spatial distribution of ob-served PM10 concentrations on 4 April shown in Fig. 4a. On5 April a high-pressure system built up over northern Ger-many. The stagnant air conditions led to the accumulationof pollutants that had been transported to Germany (mainlySIA and precursor NOx) during 4 April and local emittedpollutants. As a result, the SIA originating from local forma-tion in Germany on 5 April added up to the SIA originatingfrom long-range transport. Modelled hourly SIA concentra-tions exceeded 70 µg m−3 on 5 April.
4.2.2 Second episode (11–16 April 2009)
From 11 to 16 April a ridge over central Europe led to warmweather and stagnant air conditions over Germany. The lat-ter resulted in pollutant accumulation and enhanced localSIA formation over western Germany due to high precur-sor emissions in the Ruhr area and its surrounding. On 13and 14 April western Germany was situated on the verywestern border of the ridge with very stagnant conditionsfavouring the build-up and local formation of SIA and pre-cursor levels. While large parts of northeastern and south-eastern Germany were cloud-free, in the west and south-western Germany the cloud cover was 40–100 %. The latterwas also the case for large parts of Belgium and northernFrance. Different from the first episode, ammonium-sulfateand ammonium-nitrate levels were equally high. The modelsimulations show that ammonium-sulfate was mainly formedduring the daytime when temperatures were high (above25◦C) while ammonium-nitrate was mainly formed duringthe nighttime and early morning hours at moderate tem-peratures (10–15◦C) and high relative humidity (80–90 %).Figure 8b shows modelled average SIA concentrations for13 April. In North Rhine-Westphalia, in the west of Ger-many, average SIA concentrations exceeded a daily averageof 60 µg m−3. Again, the spatial distribution of modelled SIAconcentrations in Fig. 8b compares well to the spatial distri-
bution of observed PM10 concentrations on 13 April shownin Fig. 4d.
The analysis using RCG shows that the high SIA concen-trations are of different origin for the two episodes. Withinthe first episode, SIA was mainly formed outside of Germanywhile within the second episode, SIA mainly originated fromlocal sources within Germany. This will be further discussedin Sect. 5.
4.3 Emission scenarios
4.3.1 Sensitivity of SIA concentrations to ammoniaemission changes
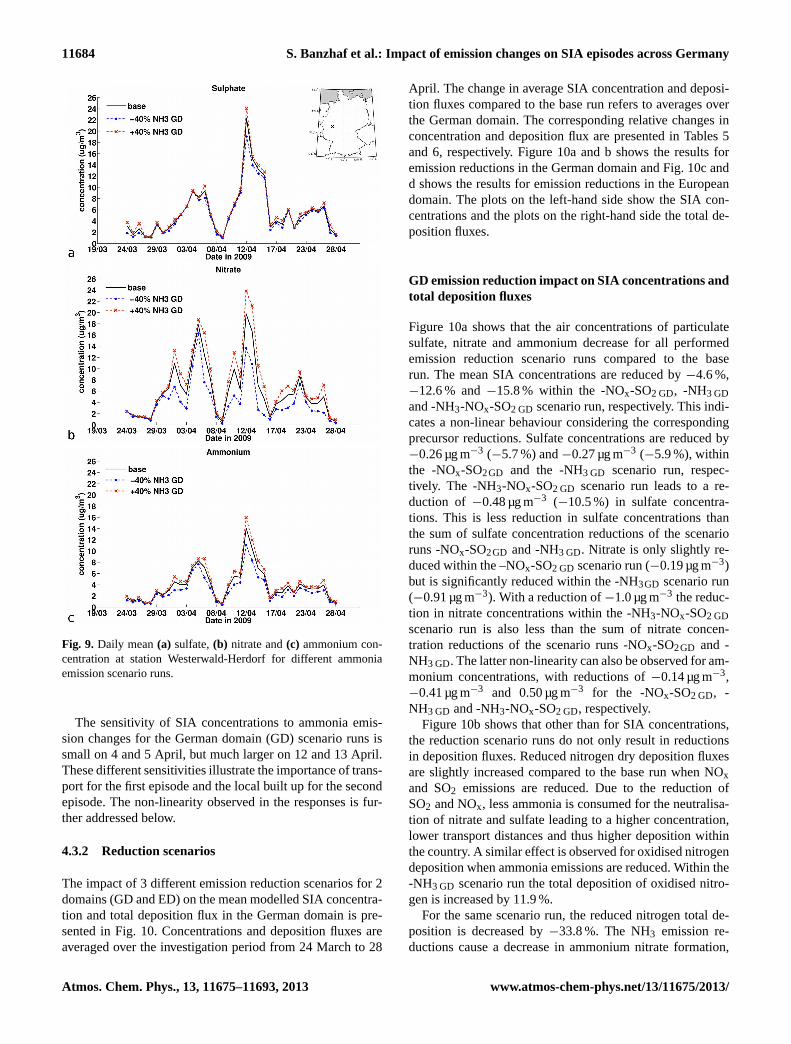
Figure 9 presents a time series of daily mean sulfate, ni-trate and ammonium concentrations at station Westerwald-Herdorf. The station location is marked (x) on the map on theupper right-hand side. The station is located in the westernpart of Germany and was affected by both episodes. Figure 9includes 3 different runs: base run,−40 % NH3 GD run and+40 % NH3 GD run. The figure again illustrates that the firstepisode around 4 April was dominated by ammonium-nitratewhile during the second episode around 12 April ammonium-sulfate and ammonium-nitrate levels were equally high.
All SIA components clearly show a dependency on am-monia emission changes: mean concentrations increase com-pared to the base run when ammonia emissions are in-creased and vice versa. Sulfate concentrations are sensitiveto changes in ammonia emission as ammonia affects dropletpH and consequently the rate of sulfate formation. Also,changes in ammonia emissions affect the availability of “freeammonia” and therewith affect the amount of ammonium-nitrate formation. The comparison of Fig. 9a and b showsthat changes in ammonia emissions affect nitrate concentra-tions to a higher extent than sulfate concentrations. Relativeto the base run, nitrate concentrations increase by up to 42 %for the +40 % NH3 GD run and decrease by up to 60 % forthe−40 % NH3 GD run during the PM10 episodes.
www.atmos-chem-phys.net/13/11675/2013/ Atmos. Chem. Phys., 13, 11675–11693, 2013
11684 S. Banzhaf et al.: Impact of emission changes on SIA episodes across Germany
Fig. 9. Daily mean(a) sulfate,(b) nitrate and(c) ammonium con-centration at station Westerwald-Herdorf for different ammoniaemission scenario runs.
The sensitivity of SIA concentrations to ammonia emis-sion changes for the German domain (GD) scenario runs issmall on 4 and 5 April, but much larger on 12 and 13 April.These different sensitivities illustrate the importance of trans-port for the first episode and the local built up for the secondepisode. The non-linearity observed in the responses is fur-ther addressed below.
4.3.2 Reduction scenarios
The impact of 3 different emission reduction scenarios for 2domains (GD and ED) on the mean modelled SIA concentra-tion and total deposition flux in the German domain is pre-sented in Fig. 10. Concentrations and deposition fluxes areaveraged over the investigation period from 24 March to 28
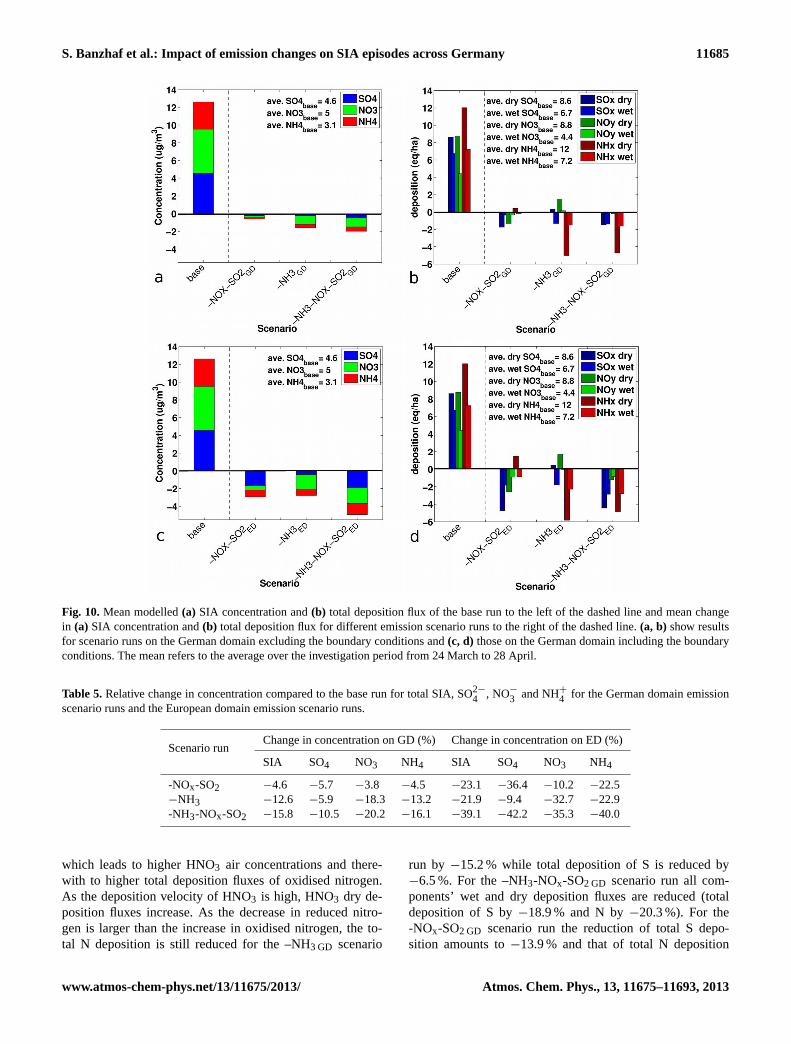
April. The change in average SIA concentration and deposi-tion fluxes compared to the base run refers to averages overthe German domain. The corresponding relative changes inconcentration and deposition flux are presented in Tables 5and 6, respectively. Figure 10a and b shows the results foremission reductions in the German domain and Fig. 10c andd shows the results for emission reductions in the Europeandomain. The plots on the left-hand side show the SIA con-centrations and the plots on the right-hand side the total de-position fluxes.
GD emission reduction impact on SIA concentrations andtotal deposition fluxes
Figure 10a shows that the air concentrations of particulatesulfate, nitrate and ammonium decrease for all performedemission reduction scenario runs compared to the baserun. The mean SIA concentrations are reduced by−4.6 %,−12.6 % and−15.8 % within the -NOx-SO2 GD, -NH3 GDand -NH3-NOx-SO2 GD scenario run, respectively. This indi-cates a non-linear behaviour considering the correspondingprecursor reductions. Sulfate concentrations are reduced by−0.26 µg m−3 (−5.7 %) and−0.27 µg m−3 (−5.9 %), withinthe -NOx-SO2GD and the -NH3 GD scenario run, respec-tively. The -NH3-NOx-SO2 GD scenario run leads to a re-duction of −0.48 µg m−3 (−10.5 %) in sulfate concentra-tions. This is less reduction in sulfate concentrations thanthe sum of sulfate concentration reductions of the scenarioruns -NOx-SO2GD and -NH3 GD. Nitrate is only slightly re-duced within the –NOx-SO2 GD scenario run (−0.19 µg m−3)but is significantly reduced within the -NH3GD scenario run(−0.91 µg m−3). With a reduction of−1.0 µg m−3 the reduc-tion in nitrate concentrations within the -NH3-NOx-SO2 GDscenario run is also less than the sum of nitrate concen-tration reductions of the scenario runs -NOx-SO2GD and -NH3 GD. The latter non-linearity can also be observed for am-monium concentrations, with reductions of−0.14 µg m−3,−0.41 µg m−3 and 0.50 µg m−3 for the -NOx-SO2 GD, -NH3 GD and -NH3-NOx-SO2 GD, respectively.
Figure 10b shows that other than for SIA concentrations,the reduction scenario runs do not only result in reductionsin deposition fluxes. Reduced nitrogen dry deposition fluxesare slightly increased compared to the base run when NOxand SO2 emissions are reduced. Due to the reduction ofSO2 and NOx, less ammonia is consumed for the neutralisa-tion of nitrate and sulfate leading to a higher concentration,lower transport distances and thus higher deposition withinthe country. A similar effect is observed for oxidised nitrogendeposition when ammonia emissions are reduced. Within the-NH3 GD scenario run the total deposition of oxidised nitro-gen is increased by 11.9 %.
For the same scenario run, the reduced nitrogen total de-position is decreased by−33.8 %. The NH3 emission re-ductions cause a decrease in ammonium nitrate formation,
Atmos. Chem. Phys., 13, 11675–11693, 2013 www.atmos-chem-phys.net/13/11675/2013/
S. Banzhaf et al.: Impact of emission changes on SIA episodes across Germany 11685
Fig. 10.Mean modelled(a) SIA concentration and(b) total deposition flux of the base run to the left of the dashed line and mean changein (a) SIA concentration and(b) total deposition flux for different emission scenario runs to the right of the dashed line.(a, b) show resultsfor scenario runs on the German domain excluding the boundary conditions and(c, d) those on the German domain including the boundaryconditions. The mean refers to the average over the investigation period from 24 March to 28 April.
Table 5.Relative change in concentration compared to the base run for total SIA, SO2−
4 , NO−
3 and NH+
4 for the German domain emissionscenario runs and the European domain emission scenario runs.
Scenario runChange in concentration on GD (%) Change in concentration on ED (%)
SIA SO4 NO3 NH4 SIA SO4 NO3 NH4
-NOx-SO2 −4.6 −5.7 −3.8 −4.5 −23.1 −36.4 −10.2 −22.5−NH3 −12.6 −5.9 −18.3 −13.2 −21.9 −9.4 −32.7 −22.9-NH3-NOx-SO2 −15.8 −10.5 −20.2 −16.1 −39.1 −42.2 −35.3 −40.0
which leads to higher HNO3 air concentrations and there-with to higher total deposition fluxes of oxidised nitrogen.As the deposition velocity of HNO3 is high, HNO3 dry de-position fluxes increase. As the decrease in reduced nitro-gen is larger than the increase in oxidised nitrogen, the to-tal N deposition is still reduced for the –NH3 GD scenario
run by −15.2 % while total deposition of S is reduced by−6.5 %. For the –NH3-NOx-SO2 GD scenario run all com-ponents’ wet and dry deposition fluxes are reduced (totaldeposition of S by−18.9 % and N by−20.3 %). For the-NOx-SO2 GD scenario run the reduction of total S depo-sition amounts to−13.9 % and that of total N deposition
www.atmos-chem-phys.net/13/11675/2013/ Atmos. Chem. Phys., 13, 11675–11693, 2013
11686 S. Banzhaf et al.: Impact of emission changes on SIA episodes across Germany
Table 6.Relative change in deposition of S and N compared to the base run for the German domain scenario runs and the European domainscenario runs.
Scenario runChange in deposition on GD (%) Change in deposition on ED (%)
S N S N
-NOx-SO2 −13.9 −4.4 −42.6 −8.8-NH3 −6.5 −15.2 −8.7 −19.8-NH3-NOx-SO2 −18.9 −20.3 −47.5 −29.9
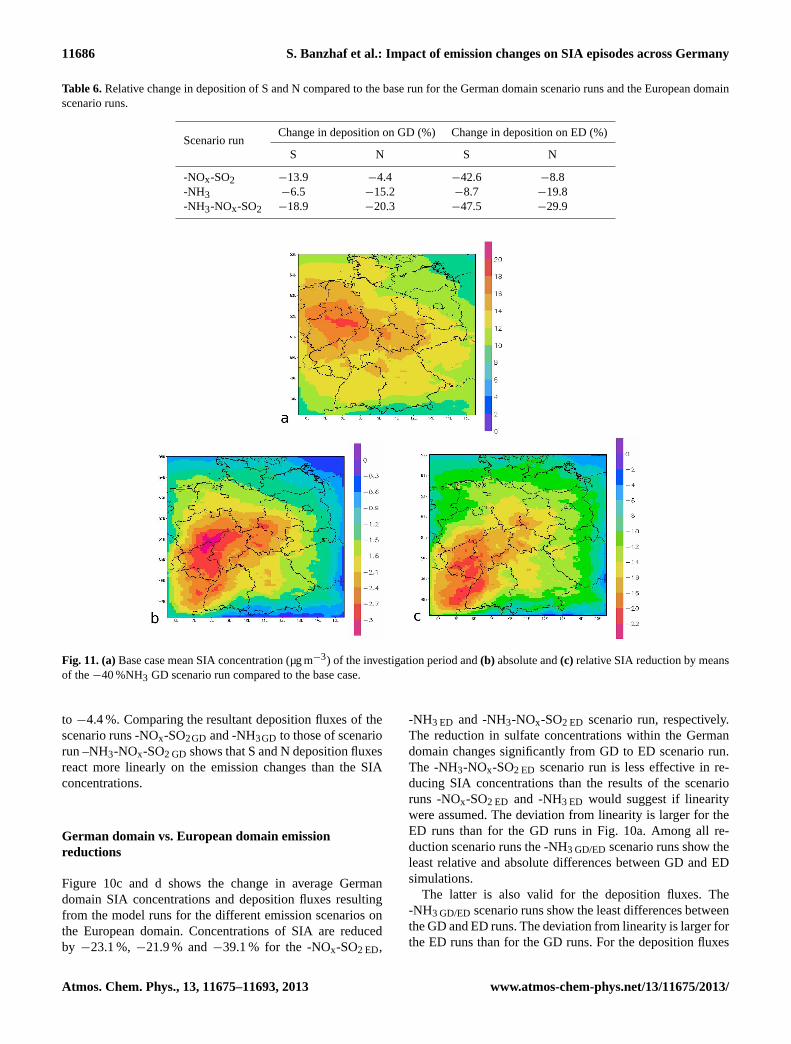
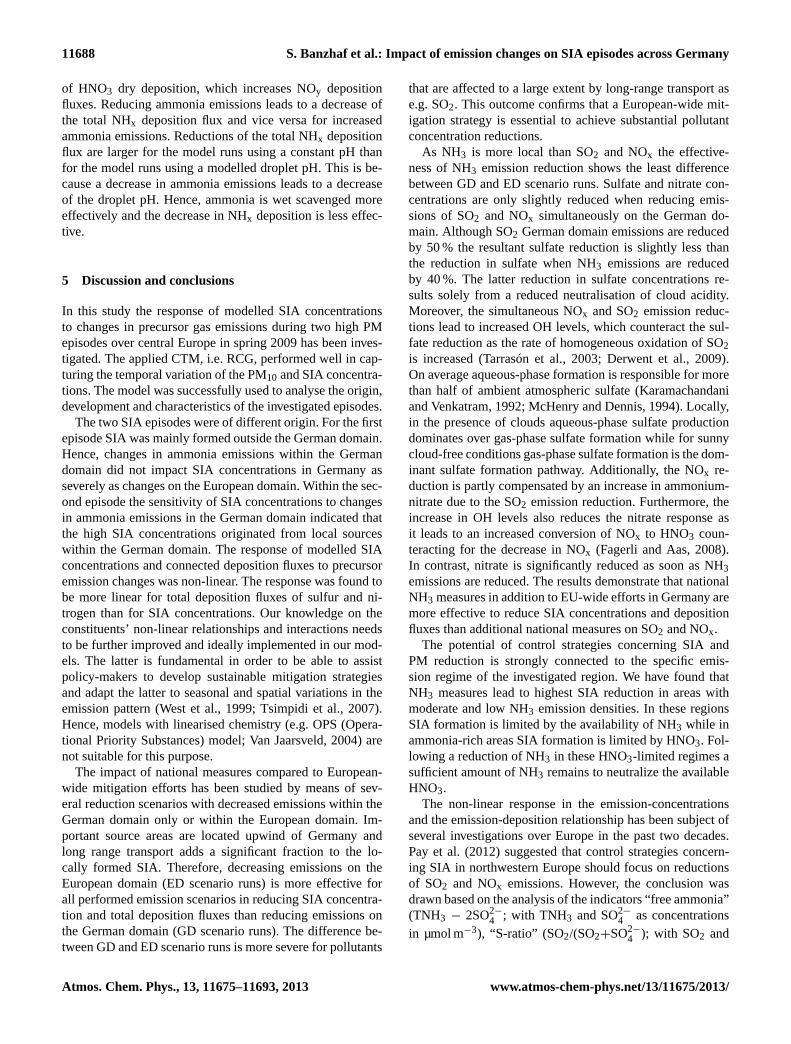
Fig. 11. (a)Base case mean SIA concentration (µg m−3) of the investigation period and(b) absolute and(c) relative SIA reduction by meansof the−40 %NH3 GD scenario run compared to the base case.
to −4.4 %. Comparing the resultant deposition fluxes of thescenario runs -NOx-SO2GD and -NH3GD to those of scenariorun –NH3-NOx-SO2 GD shows that S and N deposition fluxesreact more linearly on the emission changes than the SIAconcentrations.
German domain vs. European domain emissionreductions
Figure 10c and d shows the change in average Germandomain SIA concentrations and deposition fluxes resultingfrom the model runs for the different emission scenarios onthe European domain. Concentrations of SIA are reducedby −23.1 %,−21.9 % and−39.1 % for the -NOx-SO2 ED,
-NH3 ED and -NH3-NOx-SO2 ED scenario run, respectively.The reduction in sulfate concentrations within the Germandomain changes significantly from GD to ED scenario run.The -NH3-NOx-SO2 ED scenario run is less effective in re-ducing SIA concentrations than the results of the scenarioruns -NOx-SO2 ED and -NH3 ED would suggest if linearitywere assumed. The deviation from linearity is larger for theED runs than for the GD runs in Fig. 10a. Among all re-duction scenario runs the -NH3 GD/ED scenario runs show theleast relative and absolute differences between GD and EDsimulations.
The latter is also valid for the deposition fluxes. The-NH3 GD/ED scenario runs show the least differences betweenthe GD and ED runs. The deviation from linearity is larger forthe ED runs than for the GD runs. For the deposition fluxes
Atmos. Chem. Phys., 13, 11675–11693, 2013 www.atmos-chem-phys.net/13/11675/2013/
S. Banzhaf et al.: Impact of emission changes on SIA episodes across Germany 11687
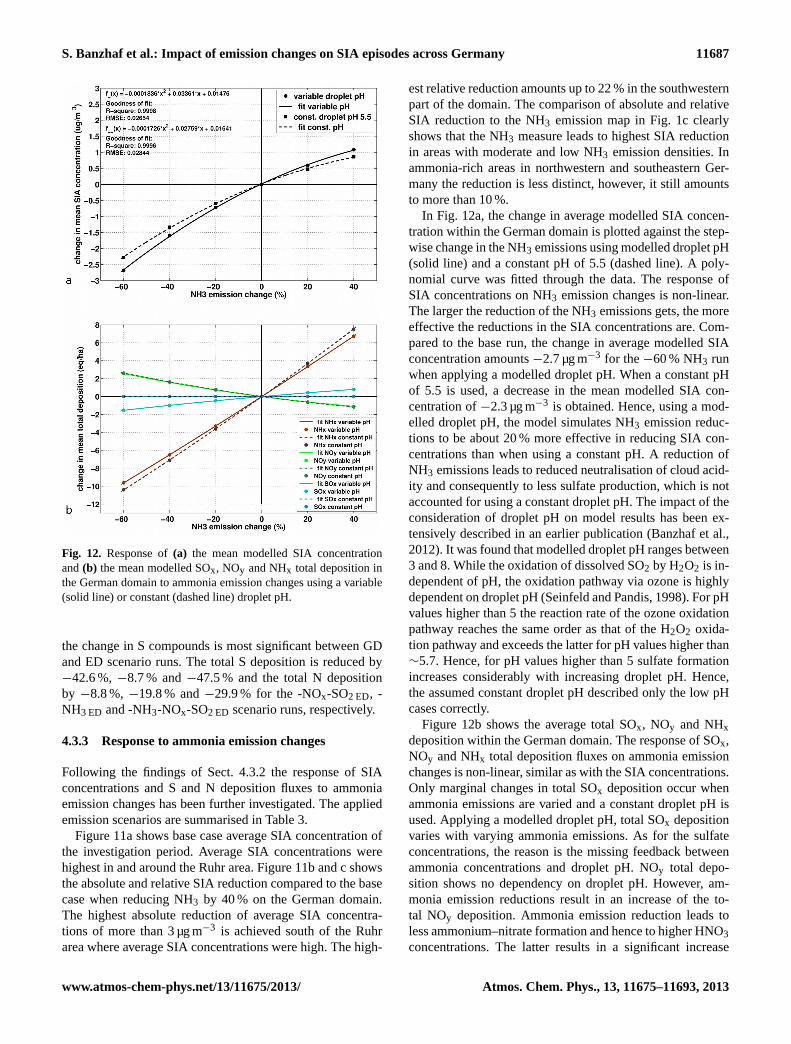
Fig. 12. Response of(a) the mean modelled SIA concentrationand(b) the mean modelled SOx, NOy and NHx total deposition inthe German domain to ammonia emission changes using a variable(solid line) or constant (dashed line) droplet pH.
the change in S compounds is most significant between GDand ED scenario runs. The total S deposition is reduced by−42.6 %,−8.7 % and−47.5 % and the total N depositionby −8.8 %,−19.8 % and−29.9 % for the -NOx-SO2 ED, -NH3 ED and -NH3-NOx-SO2 ED scenario runs, respectively.
4.3.3 Response to ammonia emission changes
Following the findings of Sect. 4.3.2 the response of SIAconcentrations and S and N deposition fluxes to ammoniaemission changes has been further investigated. The appliedemission scenarios are summarised in Table 3.
Figure 11a shows base case average SIA concentration ofthe investigation period. Average SIA concentrations werehighest in and around the Ruhr area. Figure 11b and c showsthe absolute and relative SIA reduction compared to the basecase when reducing NH3 by 40 % on the German domain.The highest absolute reduction of average SIA concentra-tions of more than 3 µg m−3 is achieved south of the Ruhrarea where average SIA concentrations were high. The high-
est relative reduction amounts up to 22 % in the southwesternpart of the domain. The comparison of absolute and relativeSIA reduction to the NH3 emission map in Fig. 1c clearlyshows that the NH3 measure leads to highest SIA reductionin areas with moderate and low NH3 emission densities. Inammonia-rich areas in northwestern and southeastern Ger-many the reduction is less distinct, however, it still amountsto more than 10 %.
In Fig. 12a, the change in average modelled SIA concen-tration within the German domain is plotted against the step-wise change in the NH3 emissions using modelled droplet pH(solid line) and a constant pH of 5.5 (dashed line). A poly-nomial curve was fitted through the data. The response ofSIA concentrations on NH3 emission changes is non-linear.The larger the reduction of the NH3 emissions gets, the moreeffective the reductions in the SIA concentrations are. Com-pared to the base run, the change in average modelled SIAconcentration amounts−2.7 µg m−3 for the−60 % NH3 runwhen applying a modelled droplet pH. When a constant pHof 5.5 is used, a decrease in the mean modelled SIA con-centration of−2.3 µg m−3 is obtained. Hence, using a mod-elled droplet pH, the model simulates NH3 emission reduc-tions to be about 20 % more effective in reducing SIA con-centrations than when using a constant pH. A reduction ofNH3 emissions leads to reduced neutralisation of cloud acid-ity and consequently to less sulfate production, which is notaccounted for using a constant droplet pH. The impact of theconsideration of droplet pH on model results has been ex-tensively described in an earlier publication (Banzhaf et al.,2012). It was found that modelled droplet pH ranges between3 and 8. While the oxidation of dissolved SO2 by H2O2 is in-dependent of pH, the oxidation pathway via ozone is highlydependent on droplet pH (Seinfeld and Pandis, 1998). For pHvalues higher than 5 the reaction rate of the ozone oxidationpathway reaches the same order as that of the H2O2 oxida-tion pathway and exceeds the latter for pH values higher than∼5.7. Hence, for pH values higher than 5 sulfate formationincreases considerably with increasing droplet pH. Hence,the assumed constant droplet pH described only the low pHcases correctly.
Figure 12b shows the average total SOx, NOy and NHxdeposition within the German domain. The response of SOx,NOy and NHx total deposition fluxes on ammonia emissionchanges is non-linear, similar as with the SIA concentrations.Only marginal changes in total SOx deposition occur whenammonia emissions are varied and a constant droplet pH isused. Applying a modelled droplet pH, total SOx depositionvaries with varying ammonia emissions. As for the sulfateconcentrations, the reason is the missing feedback betweenammonia concentrations and droplet pH. NOy total depo-sition shows no dependency on droplet pH. However, am-monia emission reductions result in an increase of the to-tal NOy deposition. Ammonia emission reduction leads toless ammonium–nitrate formation and hence to higher HNO3concentrations. The latter results in a significant increase
www.atmos-chem-phys.net/13/11675/2013/ Atmos. Chem. Phys., 13, 11675–11693, 2013
11688 S. Banzhaf et al.: Impact of emission changes on SIA episodes across Germany
of HNO3 dry deposition, which increases NOy depositionfluxes. Reducing ammonia emissions leads to a decrease ofthe total NHx deposition flux and vice versa for increasedammonia emissions. Reductions of the total NHx depositionflux are larger for the model runs using a constant pH thanfor the model runs using a modelled droplet pH. This is be-cause a decrease in ammonia emissions leads to a decreaseof the droplet pH. Hence, ammonia is wet scavenged moreeffectively and the decrease in NHx deposition is less effec-tive.
5 Discussion and conclusions
In this study the response of modelled SIA concentrationsto changes in precursor gas emissions during two high PMepisodes over central Europe in spring 2009 has been inves-tigated. The applied CTM, i.e. RCG, performed well in cap-turing the temporal variation of the PM10 and SIA concentra-tions. The model was successfully used to analyse the origin,development and characteristics of the investigated episodes.
The two SIA episodes were of different origin. For the firstepisode SIA was mainly formed outside the German domain.Hence, changes in ammonia emissions within the Germandomain did not impact SIA concentrations in Germany asseverely as changes on the European domain. Within the sec-ond episode the sensitivity of SIA concentrations to changesin ammonia emissions in the German domain indicated thatthe high SIA concentrations originated from local sourceswithin the German domain. The response of modelled SIAconcentrations and connected deposition fluxes to precursoremission changes was non-linear. The response was found tobe more linear for total deposition fluxes of sulfur and ni-trogen than for SIA concentrations. Our knowledge on theconstituents’ non-linear relationships and interactions needsto be further improved and ideally implemented in our mod-els. The latter is fundamental in order to be able to assistpolicy-makers to develop sustainable mitigation strategiesand adapt the latter to seasonal and spatial variations in theemission pattern (West et al., 1999; Tsimpidi et al., 2007).Hence, models with linearised chemistry (e.g. OPS (Opera-tional Priority Substances) model; Van Jaarsveld, 2004) arenot suitable for this purpose.
The impact of national measures compared to European-wide mitigation efforts has been studied by means of sev-eral reduction scenarios with decreased emissions within theGerman domain only or within the European domain. Im-portant source areas are located upwind of Germany andlong range transport adds a significant fraction to the lo-cally formed SIA. Therefore, decreasing emissions on theEuropean domain (ED scenario runs) is more effective forall performed emission scenarios in reducing SIA concentra-tion and total deposition fluxes than reducing emissions onthe German domain (GD scenario runs). The difference be-tween GD and ED scenario runs is more severe for pollutants
that are affected to a large extent by long-range transport ase.g. SO2. This outcome confirms that a European-wide mit-igation strategy is essential to achieve substantial pollutantconcentration reductions.
As NH3 is more local than SO2 and NOx the effective-ness of NH3 emission reduction shows the least differencebetween GD and ED scenario runs. Sulfate and nitrate con-centrations are only slightly reduced when reducing emis-sions of SO2 and NOx simultaneously on the German do-main. Although SO2 German domain emissions are reducedby 50 % the resultant sulfate reduction is slightly less thanthe reduction in sulfate when NH3 emissions are reducedby 40 %. The latter reduction in sulfate concentrations re-sults solely from a reduced neutralisation of cloud acidity.Moreover, the simultaneous NOx and SO2 emission reduc-tions lead to increased OH levels, which counteract the sul-fate reduction as the rate of homogeneous oxidation of SO2is increased (Tarrasón et al., 2003; Derwent et al., 2009).On average aqueous-phase formation is responsible for morethan half of ambient atmospheric sulfate (Karamachandaniand Venkatram, 1992; McHenry and Dennis, 1994). Locally,in the presence of clouds aqueous-phase sulfate productiondominates over gas-phase sulfate formation while for sunnycloud-free conditions gas-phase sulfate formation is the dom-inant sulfate formation pathway. Additionally, the NOx re-duction is partly compensated by an increase in ammonium-nitrate due to the SO2 emission reduction. Furthermore, theincrease in OH levels also reduces the nitrate response asit leads to an increased conversion of NOx to HNO3 coun-teracting for the decrease in NOx (Fagerli and Aas, 2008).In contrast, nitrate is significantly reduced as soon as NH3emissions are reduced. The results demonstrate that nationalNH3 measures in addition to EU-wide efforts in Germany aremore effective to reduce SIA concentrations and depositionfluxes than additional national measures on SO2 and NOx.
The potential of control strategies concerning SIA andPM reduction is strongly connected to the specific emis-sion regime of the investigated region. We have found thatNH3 measures lead to highest SIA reduction in areas withmoderate and low NH3 emission densities. In these regionsSIA formation is limited by the availability of NH3 while inammonia-rich areas SIA formation is limited by HNO3. Fol-lowing a reduction of NH3 in these HNO3-limited regimes asufficient amount of NH3 remains to neutralize the availableHNO3.
The non-linear response in the emission-concentrationsand the emission-deposition relationship has been subject ofseveral investigations over Europe in the past two decades.Pay et al. (2012) suggested that control strategies concern-ing SIA in northwestern Europe should focus on reductionsof SO2 and NOx emissions. However, the conclusion wasdrawn based on the analysis of the indicators “free ammonia”(TNH3 − 2SO2−
4 ; with TNH3 and SO2−
4 as concentrationsin µmol m−3), “S-ratio” (SO2/(SO2+SO2−
4 ); with SO2 and
Atmos. Chem. Phys., 13, 11675–11693, 2013 www.atmos-chem-phys.net/13/11675/2013/
S. Banzhaf et al.: Impact of emission changes on SIA episodes across Germany 11689
SO2−
4 as concentrations in µg m−3) (Hass et al., 2003) and“G-ratio” ((TNH3 − 2 SO2−
4 )/TNO3; with TNH3, SO2−
4 andTNO3 as concentrations in µmol m−3) (Ansari and Pandis,1998). These indicators do not include all sensitivities, e.g.OH interactions, which contribute to non-linearities in thesulfur and oxidised nitrogen budget (Tarrasón et al., 2003;Derwent et al., 2009). However, our findings are in line withearlier studies for different European regions (e.g. Tarrasón etal., 2003; Derwent et al., 2009; Erisman and Schaap, 2004;Builtjes et al., 2010) showing that NH3 emission reductionmeasures maintain a high reduction potential for SIA andtherewith PM10 concentrations. The response of SIA concen-trations on NH3 emission changes was found to be non-linearwith an increasing SIA reduction effectiveness with increas-ing reduction of NH3 emissions. The latter was also foundin the German PAREST project in which model runs for dif-ferent scenarios were performed on an annual basis for theyear 2005 (Builtjes et al., 2010). Tarrason et al. (2003) per-formed model runs for emission scenarios reducing Germanemissions of NOx (−25 %) and NH3 (−25 %) separately forthe year 2000 using the EMEP model. The maximum reduc-tion in annual mean SIA concentration following the−25 %NH3 emission reduction was about 1 µg m−3. Consideringthat SIA concentrations peak in springtime, this is in goodagreement with the maximum reduction in mean SIA con-centrations (not shown here) of 1.3 µg m−3 for the −20 %NH3 emission scenario run in the investigation presentedhere. In addition to the SIA reduction stated by former stud-ies, this study accounted for an additional sulfate reduction.When NH3 emissions are decreased, sulfate is reduced dueto a reduced neutralisation of cloud acidity through the vari-able droplet pH approach (Banzhaf et al., 2012) as suggestedby Redington et al. (2009). The incorporation of the explicitcloud chemistry adds more non-linearity to the system. AllSIA components are sensitive to ammonia emission changeswhen using a modelled droplet pH, while the change in SIAconcentrations results solely from changes in nitrate and am-monium concentrations when assuming a constant dropletpH.
Although RCG simulates the temporal development of thePM episodes well, some shortcomings of the model havebeen identified. The model was not able to capture the PM10peaks, which is partly due to missing components in themodelled PM budget. In contrast, low PM10 levels are sim-ulated too high. As the latter is not the case for the over-all SIA concentrations, the reason for overestimation likelyoriginates from the primary fraction. It was found that thisoverestimation is connected to high levels of wind blowndust for high wind speed conditions. As high PM levelsduring the investigation period occur at low wind speeds,high concentrations of wind blown dust do not occur dur-ing these episodes. The slight overestimation of sulfate con-centrations can be partly attributed to an overestimation ofmodelled droplet pH leading to a too high rate of sulfate
formation. Next to the buffering by carbon dioxide the ef-fects of other buffering systems such as sea salt, mineral dustand organic components (Deguillaume et al., 2009) are notaccounted for when modelling droplet pH (Banzhaf et al.,2012). In contrast to the sulfate concentrations, the nitrateconcentrations are underestimated by RCG. This is partlyconnected to the overestimation of sulfate, which leads toa lower rate of ammonium-nitrate formation. Furthermore,evaluations of the applied equilibrium module ISORROPIA(Nenes et al., 1999) have indicated diverse shortcomingswithin the approach concerning the equilibrium between ni-tric acid and particulate ammonium nitrate (e.g. Schaap etal., 2011; Morino et al., 2006; Fisseha et al., 2006). The un-certainty in ammonia emission inventories in space and time(Geels et al., 2012) leads to an additional uncertainty in themodelled nitric acid-ammonium nitrate-equilibrium and theoverall modelled SIA formation. Next to the uncertainty inspace and time according to EMEP (2009) the uncertaintyin magnitude of absolute annual ammonia emission valuesamounts about± 30 % in Europe. As non-linearities are to alarge extent controlled by ammonia, the uncertainty in am-monia emissions severely impacts the modelled SIA budget.Also the correlations for the precursor gases SO2 and NO2 inair are encouraging as they show the ability of the model tocapture the temporal variability of the analysed species con-centrations. However, RCG tends to overestimate SO2 con-centrations, while NO2 concentrations tend to be underesti-mated. As former studies have shown primary pollutants –like SO2 and NO2 (which can be considered as almost pri-mary pollutant as it is formed rapidly from emitted NO) –are more difficult to model (Vautard et al., 2009). The evalu-ation of modelled SOx, NOy and NHx wet deposition fluxesindicated a good model performance with correlation coeffi-cients between 0.74 and 0.82. The improvement of the spatialrepresentation of precipitation of the meteorological drivermay lead to a better representation of modelled wet deposi-tion fluxes.
To further improve the performance of RCG, several op-tions are identified: (1) inclusion of coarse nitrate from thereaction of HNO3 with soil and sea-salt particles (Pakkanen,1996), (2) accounting for the co-deposition of SO2 and NH3(Flechard et al., 1999) within the deposition routine, and (3)incorporation of the compensation point in the RCG dry de-position scheme (Wichink Kruit et al., 2010). The implemen-tation of these processes may add further interdependenciesand non-linear responses. The resultant variations in the re-sponse to emission changes need to be identified and under-stood. Therefore, a future study should expand the investi-gation period to several years/springs to better differentiatebetween episodes and non-episodes. In addition, a dynamicevaluation should be performed to investigate the ability ofthe model to correctly respond to emission changes. We arecurrently investigating the model performance for the 20 yearperiod from 1990 to 2009 for this purpose.
www.atmos-chem-phys.net/13/11675/2013/ Atmos. Chem. Phys., 13, 11675–11693, 2013
11690 S. Banzhaf et al.: Impact of emission changes on SIA episodes across Germany
This study confirmed the important role of NH3 whenconsidering reductions of SIA concentrations and depositionfluxes of sulfur and nitrogen compounds. The NEC Directiveand the Gothenburg protocol provide national emission ceil-ings for SO2, NOx, NH3 and VOC. Following the latest cur-rent legislation baseline, according to Amann et al. (2012),SO2 and NOx emissions will decrease significantly from2010–2030 in the EU-27 (SO2: ∼ −70 %; NOx: ∼ −65 %)and Germany (SO2: ∼ −45 %; NOx: ∼ −65 %) comparedto 2005 emissions. NH3 emissions are expected to increasefor the EU-27 (∼ +2 %) and for Germany (∼ +11 %). How-ever, results of a “maximum technically feasible reduction”(MTFR) scenario show that available measures could re-duce NH3 emissions significantly for the EU-27 (∼ −30 %)and Germany (∼ −35 %) compared to the current legislationbaseline. The latter reveals that the NH3 reduction potential isnot fully utilised yet. EU ammonia emission targets for 2010and 2020 given by the NEC Directive and the Gothenburgprotocol are not stringent enough and do not force the Eu-ropean member states policy to act on ammonia emission re-duction. Next to the reduction potential the cost-effectivenessof measures needs to be considered. In Europe, costs for airpollution control including the costs for the current legisla-tion baseline are significantly lower in the agricultural sec-tor (which includes∼95 % of the total NH3 emissions) thanin other sectors, where stringent emission control is alreadyin force (Amann et al., 2011, 2012; Appelhans et al., 2012;Builtjes et al., 2010). Future negotiations for further emissionreductions over Europe should focus on further implementa-tion of sustainable and cost-effective NH3 measures.
Acknowledgements.This work was funded by TNO within theframework of the R&D Project 3710 63 246 –“PINETI” (PollutantInput and Ecosystem Impact) – funded by the Federal EnvironmentAgency (Umweltbundesamt, Germany). We thank the FederalEnvironment Agency (Germany), the RIVM (The Netherlands) andthe EEA for providing the comprehensive measurement data andthe German Weather Service (DWD) for providing COSMO-EUdata. Further support was provided by Freie Universität Berlin.
Edited by: B. Ervens
References
Amann, M., Bertok, I., Borken-Kleefeld, J., Cofala, J., Heyes, C.,Höglund-Isaksson, L., Klimont, Z., Rafaj, P., Schöpp, W., andWagner, F.: Cost-effective Emission Reductions to Improve AirQuality in Europe in 2020. Analysis of Policy Options for theEU for the Revision of the Gothenburg Protocol. NEC ScenarioAnalysis Report #8. International Institute for Applied SystemsAnalysis (IIASA), Laxenburg, Austria, 2011.
Amann, M., Borken-Kleefeld, J., Cofala, J., Heyes, C., Klimont,Z., Rafaj, P., Purohit, P., Schöpp, W., and Winiwarter, W.: Fu-ture Emissions of Air Pollutants in Europe – Current LegislationBaseline and the Scope for Further Reductions. TSAP Report No
1. International Institute for Applied Systems Analysis (IIASA),Laxenburg, Austria, 2012.
Ansari, A. S. and Pandis, S. N.: Responce of inorganic PM to pre-cursor concentrations, Environ. Sci. Technol., 32, 2706–2714,1998.
Appelhans, J., Builtjes, P., Jörß, W., Stern, R., and Theloke, J.:Exploring strategies to reduce particle concentrations- Resultsof the research project PAREST, Immissionsschutz 1–12, ErichSchmitt-Verlag Berlin, ISSN1430-9262, 2012.
Asman, W. A. H.: Modelling the atmospheric transport and deposi-tion of ammonia and ammonium: an overview with special ref-erence to Denmark, Atmos. Environ., 35, 1969-1983, 2001.
Banzhaf, S., Schaap, M., Kerschbaumer, A., Reimer, E., Stern, R.,van der Swaluw, E., and Builtjes, P.: Implementation and eval-uation of pH-dependent cloud chemistry and wet deposition inthe chemical transport model REM-Calgrid, Atmos. Environ.,49, 378–390, 2012.
Beekmann, M., Kerschbaumer, A., Reimer, E., Stern, R., andMöller, D.: PM measurement campaign HOVERT in the GreaterBerlin area: model evaluation with chemically specified partic-ulate matter observations for a one year period, Atmos. Chem.Phys., 7, 55–68, doi:10.5194/acp-7-55-2007, 2007.
Bobbink, R., Hornung, M., and Roelofs, J. M.: The effects of air-borne pollutants on species diversity in natural and semi-naturalEuropean vegetation, J. Ecol., 86, 717–738, doi:10.1046/j.1365-2745.1998.8650717.x, 1998.
Builtjes, P., Jörß, W., Stern, R., and Theloke, J.: Strategien zur Ver-minderung der Feinstaubbelastung. PAREST-Summary report,FKZ 206 43 200/01. UBA-Texte Nr. 09/2012. 2012 Umweltbun-desamt,www.umweltbundesamt.de(last access: May 2013),2010.
Carter, W. P. L.: Condensed atmospheric photooxidation mecha-nisms for isoprene. Atmos. Environ., 24, 4275–4290, 1996.
Claiborn, C., Lamb, B., Miller, A., Beseda, J., Clode, B., Vaughan,J., Kang, L., amd Newvine, C.: Regional measurements andmodeling of windblown agricultural dust: The Columbia PlateauPM10 Program, J. Geophys. Res., 103, 19753–19767, 1998.
Deguillaume, L., Tilgner, A., Schrödner, R., Wolke, R., Chaumer-liac, N., and Herrmann, H.: Towards an operational aqueousphase chemistry mechanism for regional chemistry-transportmodels: CAPRAM-RED and its application to the COSMO-MUSCAT model. J. Atmos. Chem., 64, 1–35, 2009.
de Meij, A., Thunis, P., Bessagnet, B., and Cuvelier, C.: The sensi-tivity of the CHIMERE model to emissions reduction scenarioson air quality in Northern Italy, Atmos. Environ., 43, 1897–1907,2009.
Demuzere, M., Trigo, R. M., Vila-Guerau de Arellano, J., and vanLipzig, N. P. M.: The impact of weather and atmospheric cir-culation on O3 and PM10 levels at a rural mid-latitude site, At-mos. Chem. Phys., 9, 2695–2714, doi:10.5194/acp-9-2695-2009,2009.
Denier van der Gon, H. A. C., Visschedijk, A., van den Brugh,H., and Dröge, R.: F&E Vorhaben: Strategien zur Verminderungder Feinstaubbelastung – PAREST: A high resolution Europeanemission data base for the year 2005, TNO-Report, TNO-034-UT-2010-01895_RPT-ML, Utrecht, 2010.
Derwent, R. G., Witham, C. J., Redington, A. L., Jenkin, M., Sted-man, J, Yardley, R., and Hayman, G.: Particulate matter at a rural
Atmos. Chem. Phys., 13, 11675–11693, 2013 www.atmos-chem-phys.net/13/11675/2013/
S. Banzhaf et al.: Impact of emission changes on SIA episodes across Germany 11691
location in southern England during 2006: model sensitivities toprecursor emissions. Atmos. Environ., 43, 689–696, 2009.
EEA: Air quality in Europe – 2012 report. EEA ReportNo 4/2012. ISBN:978-92-9213-328-3. European EnvironmentAgency (EEA), Copenhagen, Denmark, 2012.
EMEP: Transboundary, acidification, eutrophication and groundlevel ozone in Europe in 2007 EMEP August 2009, ISSN 1504-6192, 2009.
Erisman, J. W. and Schaap, M.: The need for ammonia abatementwith respect to secondary PM reductions in Europe. Environ.Pollut., 129, 159–163, 2004.
Erisman, J. W., van Pul, A., and Wyers, P.: Parametrization ofsurface-resistance for the quantification of atmospheric deposi-tion of acidifying pollutants and ozone. Atmos. Environ., 28,2595–2607, 1994.
Erisman, J. W., Grennfelt, P., and Sutton, M.: The European per-spective on nitrogen emission and deposition. Environ. Int., 29,311–325, 2003.
European Commission: European Commission. Directive2008/50/EC of the European Parliament and of the Coun-cil of 21 May 2008 on ambient air quality and cleaner airfor Europe. Technical Report 2008/50/EC, L152, Off. J. Eur.Commun, 2008.
Fagerli, H. and Aas, W.: Trends of nitrogen in air and precipitation:Model results and observations at EMEP sites in Europe, 1980–2003, Environ. Pollut., 154, 448–461, 2008.
Fisseha, R., Dommen, J., Gutzwiller, L., Weingartner, E., Gysel, M.,Emmenegger, C., Kalberer, M., and Baltensperger, U.: Seasonaland diurnal characteristics of water soluble inorganic compoundsin the gas and aerosol phase in the Zurich area, Atmos. Chem.Phys., 6, 1895–1904, doi:10.5194/acp-6-1895-2006, 2006.
Flechard, C. R., Fowler, D., Sutton, M. A., and Cape, J. N.: A dy-namic chemical model of bi-directional ammonia exchange be-tween semi-natural vegetation and the atmosphere, Q. J. Roy.Meteor. Soc., 125, 2611–2641, 1999.
Fountoukis, C. and Nenes, A.: ISORROPIA II: a computa-tionally efficient thermodynamic equilibrium model forK+,Ca2+,Mg2+,NH+
4 ,Na+,SO2−
4 ,NO−
3 ,Cl−, H2O aerosols,Atmos. Chem. Phys., 7, 4639–4659, doi:10.5194/acp-7-4639-2007, 2007.
Fowler, D., Sutton, M., Flechard, C., Cape, J. N., Storeton-West, R.L., Coyle, M., and Smith, R. I.: The Control of SO2 Dry Depo-sition on to Natural Surfaces by NH3 and its Effects on RegionalDeposition, Water Air Soil Poll., Focus, 1, 39–48, 2001.
Fowler, D., Müller, J., Smith, R. I., Cape, J. N., and Erisman, J.W.: Nonlinearities in source-receptor relationships for sulfur andnitrogen compounds, Ambio., 34, 41–46, 2005.
Fowler, D., Smith, R., Müller, J., Cape, J. N., Sutton, M., Erisman,J. W., and Fagerli, H.: Long-term trends in sulphur and nitrogendeposition in Europe and the cause of nonlinearities, Water AirSoil Poll., 7, 41–47, 2007.
Geels, C., Andersen, H. V., Ambelas Skjøth, C., Christensen, J.H., Ellermann, T., Løfstrøm, P., Gyldenkærne, S., Brandt, J.,Hansen, K. M., Frohn, L. M., and Hertel, O.: Improved mod-elling of atmospheric ammonia over Denmark using the cou-pled modelling system DAMOS, Biogeosciences, 9, 2625–2647,doi:10.5194/bg-9-2625-2012, 2012.
Gery, M. W., Whitten, G. Z., Killus, J. P., and Dodge, M. C.: Aphotochemical kinetics mechanism for urban and regional scalecomputer modeling, J. Geophys. Res., 94, 12925–12956, 1989.
Gipson, G. and Young, J.: Gas phase chemistry, Chapter 8 in: Sci-ence algorithms of the EPA models-3 community multiscale airquality (CMAQ) modeling system, Edited by: Byun, D. W. andChing, J. K. S., Atmospheric Modeling Division National Expo-sure Research Laboratory US Environmental Protection AgencyResearch Triangle Park, NC 27711, EPA/600/R-99/030, 1999.
Gong, S. L., Barrie, L. A., and Blanchet, J.-P.: Modelling sea-saltaerosols in the atmosphere. 1. Model development. J. Geophys.Res., 102, 3805–3818, 1997.
Hass, H., van Loon, M., Kessler, C., Stern, R., Matthijsen, J.,Sauter, F., Zlatev, Z., Langner, J., Foltescu, V., and Schaap, M.:Aerosol Modelling: Results and Intercomparison from 15 Euro-pean Regional-scale Modelling Systems, EUROTRAC-2 Specialreport, Eurotrac-ISS, Garmisch Partenkirchen, Germany, 2003.
Karamachandani, P., and Venkatram, A.: The role of non-precipitating clouds in producing ambient sulfate during sum-mer: results from simulations with the Acid Deposition and Ox-idant Model (ADOM), Atmos. Environ. 26A, 1041–1052, 1992.
Kuenen, J., Denier van der Gon, H., Visschedijk, A., van der Brugh,H., and van Gijlswijk, R.: MACC European emission inven-tory for the years 2003–2007. TNO report, TNO-060-UT-2011-00588, Utrecht, 2011.
Lövblad, G., Tarrasón, L., Tørseth, K., and Dutchak, S.: EMEP As-sessment Part I: European Perspective. Norwegian Meteorologi-cal Institute, P.O. Box 43, N-313 Oslo, Norway, 2004.
Loosmore, G. A. and Hunt, J. R.: Dust resuspension with-out saltation. J. Geophys. Res., 105, 20663–20671,doi:10.1029/2000JD900271, 2000.
Matejko, M., Dore, A. J. Hall, J., Dore, C. J., Blas, M., Kryza, M.,Smith, R., and Fowler, D.: The influence of long term trends inpollutant emissions on deposition of sulphur and nitrogen andexceedance of critical loads in the United Kingdom, Environ. Sci.Policy, 12, 882–896, 2009.
McHenry, J. N. and Dennis, R. L.: The relative importance of oxida-tion pathways and clouds to atmospheric ambient sulfate produc-tion as predicted by Regional Acid Deposition Model, J. Appl.Meteorol., 33, 890–905, 1994.
Morino, Y., Kondo, Y., Takegawa, N., Miyazaki, Y., Kita, K., Ko-mazaki, Y., Fukuda, M., Miyakawa, T., Moteki, N., and Worsnop,D. R.: Partitioning of HNO3 and particulate nitrate over Tokyo:Effect of vertical mixing, J. Geophys. Res.-Atmos., 111, D15215,doi:10.1029/2005JD006887, 2006.
Mues, A., Manders, A., Schaap, M., Kerschbaumer, A., Stern, R.,and Builtjes, P.: Impact of the extreme meteorological conditionsduring the summer 2003 in Europe on particle matter concen-trations – an observation and model study, Atmos. Environ., 55,377–391, 2012.
Nenes, A., Pilinis, C., and Pandis, S.: Continued development andtesting of a new thermodynamic aerosol module for urban andregional air quality models, Atmos. Environ., 33, 1553–1560,1999.
Pakkanen, T. A.: Study of formation of coarse particle nitrateaerosol, Atmos. Environ., 30, 2475–2482, 1996.
Pay, M. T., Jiménez, P., and Baldasano, J.: Assessing sensitivityregimes of secondary inorganic aerosol formation in Europe with
www.atmos-chem-phys.net/13/11675/2013/ Atmos. Chem. Phys., 13, 11675–11693, 2013
11692 S. Banzhaf et al.: Impact of emission changes on SIA episodes across Germany
the CALIOPE-EU modeling system, Atmos. Environ., 51, 146–164, 2012.
Pinder, R. W., Adams, P. J., and Pandis, S. N.: Ammonia emissioncontrols as a costeffective strategy for reducing atmospheric par-ticulate matter in the eastern United States, Environ. Sci. Tech-nol., 41, 380–386, 2007.
Pope, C. A.: Mortality effects of longer term exposures to fine par-ticulate air pollution: review of recent epidemiological evidence,Inhal. Toxicol., 19 (Suppl. 1), 33–38, 2007.
Pope, C. A., Renlund, D. G., Kfoury, A. G., May, H. T., and Horne,B. D.: Relation of heart failure hospitalization to exposure to fineparticulate air pollution, Am. J. Cardiol. 102, 1230–1234, 2008.
Putaud, J.-P., Raesa, F., Van Dingenen, R., Bruggemann, E., Fac-chini, M., Decesari, S., Fuzzi, S., Gehrig, R., Hueglin, C., Laj,P., Lorbeer, G., Maenhaut, W., Mihalopoulos, N., Mueller, K.,Querol, X., Rodriguez, S., Schneider, J., Spindler, G., ten Brink,H., Torseth, K., and Wiedensohler, A.: A European aerosolphenomenology—2:chemical characteristics of particulate mat-ter at kerbside, urban, rural and background sites in Europe, At-mos. Environ., 38, 2579–2595, 2004.
Putaud, J.-P., Van Dingenen, R., Alastuey, A., Bauer, H., Birmili,W., Cyrys, J., Flentje, H., Fuzzi, S., Gehrig, R., Hansson, H.C., Harrison, R. M., Herrmann, H., Hitzenberger, R., Huglin, C.,Jones, A. M., Kasper-Giebl, A., Kiss, G., Kousa, A., Kuhlbusch,T. A. J., Löschau, G., Maenhaut, W., Molnar, A., Moreno, T.,Pekkanen, J., Perrino, C., Pitz, M., Puxbaum, H., Querol, X.,Rodriguez, S., Salma, I., Schwarz, J., Smolik, J., Schneider, J.,Spindler, G., ten Brink, H., Tursic, J., Viana, M., Wiedensohler,A., and Raes, F.: A European aerosol phenomenology e 3: Phys-ical and chemical characteristics of particulate matter from 60rural, urban, and kerbside sites across Europe, Atmos. Environ.,44, 1308–1320, 2010.
Redington, A. L., Derwent, R. G., Witham, C. S., and Manning, A.J.: Sensitivity of modelled sulphate and nitrate aerosol to cloud,pH and ammonia emissions, Atmos. Environ., 43, 20, 3227–3234, 2009.
Renner, E. and Wolke, R.: Modelling the formation and atmospherictransport of secondary inorganic aerosols with special attentionto regions with high ammonia emissions. Atmos. Environ., 44,1904-1912, 2010.
Schaap, M., Otjes, R. P., and Weijers, E. P.: Illustrating the benefitof using hourly monitoring data on secondary inorganic aerosoland its precursors for model evaluation, Atmos. Chem. Phys., 11,11041–11053, doi:10.5194/acp-11-11041-2011, 2011.
Schättler, U., Doms, G., and Schraff, C.: A description of thenonhydrostatic regional COSMO-model. Part VII: User’s guide,Deutscher Wetterdienst, Offenbach, 135 pp., 2008.
Schell, B., Ackermann, I., Hass, H., Binkowski, F., and Ebel, A.:Modelling the formation of secondary organic aerosol within acomprehensive air quality model system, J. Geophys. Res., 106,28275–28293, 2001.
Seinfeld, J. H. and Pandis, N.: Atmospheric Chemistry and Physics:From Air Pollution to Climate Change. From Air Pollution toClimate Change, John Wiley and Sons, Inc., New York, 1326pp., 1998.
Solazzo, E., Biancini, R., Pirovano, G., Matthias, V., Vautard, R.,Moran, M. D., Appel, K. W., Bessagnet, B., Brandt, J., Chris-tensen, J. H., Chemel, C., Coll, I., Ferreira, J., Forkel, R., Fran-cis, X. V., Grell, G., Grossi, P., Hansen, A. B., Miranda, A. I.,
Nopmongcol, U., Prank, M., Sartelet, K. N., Schaap, M., Silver,J. D., Sokhil, R. S., Vira, J., Werhahn, J., Wolke, R., Yarwood,G., Zhang, J., Rao, S. T., and Galmarini, S.: Operational modelevaluation for particulate matter in Europe and North America inthe context of AQMEII, Atmos. Environ., 53, 75–92, 2012.
Stern, R., Yamartino, R., and Graff, A.: Analyzing the response ofa chemical transport model to emissions reductions utilizing var-ious grid resolutions. In: Twenty-eighth ITM on Air PollutionModelling and its Application, Leipzig, Germany, 15–19 May2006, 2006.
Stern R., Builtjes, P., Schaap, M., Timmermans, R., Vautard, R.,Hodzic, A., Memmesheimer, M., Feldmann, H., Renner, E.,Wolke, R., and Kerschbaumer, A.: A model inter-comparisonstudy focussing on episodes with elevated PM10 concentrations,Atmos. Environ., 42, 4567–4588, 2008.
Tarrasón, L., Johnson, J.E., Fagerli, H., Benedictow, A., Wind, P.,Simpson, D., Klein, H.: EMEP Status Report 1/2003 – Part III:Source-Receptor Relationships, Transboundary acidification, eu-trophication and ground level ozone in Europe, Norwegian Me-teorological Institute, Oslo, 2003.
Thunis, P., Cuvelier, C., Roberts, P., White, L., Post, L., Tarrason,L., Tsyro, S., Stern, R., Kerschbaumer, A., Rouil, L., Bessag-net, B., Builtjes, P., Schaap, M., Boersen, G., and Bergstroem,R.: Evaluation of a Sectoral Approach to Integrated AssessmentModelling including the Mediterranean Sea, Eurodelta II report,Joint Research Center, Ispra, Italy, 2008.
Tsimpidi, A. P., Karydis, V. A., and Pandis, S. N.: Response of in-organic fine particulate matters to emission changes of SO2 andNH3: the Eastern United States as a case study, J. Air Waste Man-age., 57, 1489–1498, 2007.
UBA: Manual for Quality Assurance (in German), Texte 28/04,ISSN 0722-186X, Umweltbundesamt – Berlin, Fachgebiet II 5.6,536 pp., 2004.
UBA: Auswertung der Luftbelastungssituation 2009. FachgebietII 4.2 Beurteilung der Luftqualität, Umweltbundesamt, Dessau-Roßlau, Germany, 2010.
van Dingenen, R., Raes, F., Putaud, J. P., Baltensperger, U., Brügge-mann, E., Charron, A., Facchini, M. C., Decesari, S., Fuzzi,S., Gehrig, R., Hansson, H. C., Harrison, R. M., Hüglin, Ch.,Jones, A. M., Laj, P., Lorbeer, G., Maenhaut,W., Palmgren, F.,Querol, X., Rodríguez, S., Schneider, J., ten Brink, H., Tunved,P., Tørseth, K., Wehner, B., Weingartner, E., Wiedensohler, A.,and Wåhlin, P. A.: European Aerosol Phenomenology I: Physicalcharacteristics of particulate matter at kerbside, urban, rural andbackground sites in Europe. Atmos. Environ., 38, 2561–2577,2004.
Van Jaarsveld, J. A.: The Operational Priority Substances model,description and validation of OPS-Pro 4.1, RIVM report500045001/2004, Bilthoven, The Netherlands, 2004.
Vautard, R., Schaap, M., and Bergström, R.: Skill and uncertaintyof a regional air quality model ensemble, Atmos. Environ., 43,4822–4832, 2009.
Walcek, C. J.: Minor flux adjustment near mixing ratio extremesfor simplified yet highly accurate monotonic calculation of traceradvection, J. Geophys. Res., 105, 9335–9348, 2000.
Weijers, E. P., Schaap, M., Nguyen, L., Matthijsen, J., Deniervan der Gon, H. A. C., ten Brink, H. M., and Hoogerbrugge,R.: Anthropogenic and natural constituents in particulate mat-
Atmos. Chem. Phys., 13, 11675–11693, 2013 www.atmos-chem-phys.net/13/11675/2013/
S. Banzhaf et al.: Impact of emission changes on SIA episodes across Germany 11693
ter in the Netherlands, Atmos. Chem. Phys., 11, 2281–2294,doi:10.5194/acp-11-2281-2011, 2011.
West, J. J., Ansari, A. S., and Pandis, S. N.: Marginal PM2.5: Non-linear Aerosol Mass Response to Sulphate Reductions in theEastern United States, J. Air Waste Manage., 49, 1415–1424,1999.
Wichink Kruit, R. J., Van Pul, W. A. J., Sauter, F. J., Van den Broek,M., Nemitz, E., Sutton, M. A., Krol, M., and Holtslag, A. A. M.:Modeling the surface-atmosphere exchange of ammonia, Atmos.Environ., 44, 945–957, 2010.
www.atmos-chem-phys.net/13/11675/2013/ Atmos. Chem. Phys., 13, 11675–11693, 2013


![Das Berufsbildungssystem Neuseelands seit 1989 - BQ-Portal · 11. Klasse Sekundarschule [Year 11 secondary school] - 1 Jahr Sekundarschule (9. Klasse -10.Klasse) [Secondary school](https://img.pdfslide.org/doc/110x75/5dd0ebeed6be591ccb63597b/das-berufsbildungssystem-neuseelands-seit-1989-bq-portal-11-klasse-sekundarschule.jpg)