Embed Size (px)
Citation preview
econstor www.econstor.eu
Der Open-Access-Publikationsserver der ZBW – Leibniz-Informationszentrum WirtschaftThe Open Access Publication Server of the ZBW – Leibniz Information Centre for Economics
Standard-Nutzungsbedingungen:
Die Dokumente auf EconStor dürfen zu eigenen wissenschaftlichenZwecken und zum Privatgebrauch gespeichert und kopiert werden.
Sie dürfen die Dokumente nicht für öffentliche oder kommerzielleZwecke vervielfältigen, öffentlich ausstellen, öffentlich zugänglichmachen, vertreiben oder anderweitig nutzen.
Sofern die Verfasser die Dokumente unter Open-Content-Lizenzen(insbesondere CC-Lizenzen) zur Verfügung gestellt haben sollten,gelten abweichend von diesen Nutzungsbedingungen die in der dortgenannten Lizenz gewährten Nutzungsrechte.
Terms of use:
Documents in EconStor may be saved and copied for yourpersonal and scholarly purposes.
You are not to copy documents for public or commercialpurposes, to exhibit the documents publicly, to make thempublicly available on the internet, or to distribute or otherwiseuse the documents in public.
If the documents have been made available under an OpenContent Licence (especially Creative Commons Licences), youmay exercise further usage rights as specified in the indicatedlicence.
zbw Leibniz-Informationszentrum WirtschaftLeibniz Information Centre for Economics
Tonin, Mirco; Vlassopoulos, Michael
Working Paper
Sharing One's Fortune? An Experimental Study onEarned Income and Giving
CESifo Working Paper, No. 4475
Provided in Cooperation with:Ifo Institute – Leibniz Institute for Economic Research at the University ofMunich
Suggested Citation: Tonin, Mirco; Vlassopoulos, Michael (2013) : Sharing One's Fortune? AnExperimental Study on Earned Income and Giving, CESifo Working Paper, No. 4475
This Version is available at:http://hdl.handle.net/10419/89667
Sharing One’s Fortune? An Experimental Study on Earned Income and Giving
Mirco Tonin Michael Vlassopoulos
CESIFO WORKING PAPER NO. 4475 CATEGORY 12: EMPIRICAL AND THEORETICAL METHODS
NOVEMBER 2013
An electronic version of the paper may be downloaded • from the SSRN website: www.SSRN.com • from the RePEc website: www.RePEc.org
• from the CESifo website: Twww.CESifo-group.org/wp T
CESifo Working Paper No. 4475
Sharing One’s Fortune? An Experimental Study on Earned Income and Giving
Abstract In this paper we investigate the relationship between earnings and charitable giving. We set up a real effort experiment, in which subjects enter data in four one-hour occasions and are paid a piece rate. From the second occasion onwards, we randomly assign half of the subjects to a treatment with higher piece rates. At the end we ask subjects whether they want to donate a share of their earnings to a charity of their choice. We find that, despite large differences in earnings due to the different piece rates, subjects receiving the higher piece rate are actually less likely to give, and that givers in the two groups give the same share of their total earnings. Charities receive the same average donation from members of the two groups indicating that subjects in this experiment do not treat charitable giving as a normal good.
JEL-Code: D640, J390.
Keywords: charity, earnings, buck, effort, windfall.
Mirco Tonin Economics Division
School of Social Sciences University of Southampton
United Kingdom – Southampton SO17 1BJ [email protected]
Michael Vlassopoulos Economics Division
School of Social Sciences University of Southampton
United Kingdom – Southampton SO17 1BJ [email protected]
May 2013 This work was supported by the Economic and Social Research Council [grant number RES-061-25-0461].
1 Introduction
The relationship between an individual’s income and charitable giving is a topic of great concern
for policy makers and charities alike. For policy makers it is interesting because it informs the
design of tax policy vis-a-vis charitable contributions. For charities it is relevant because it informs
them on how to best focus their fundraising efforts. Both intuition and economic theories of giving
predicated, for instance, on the notion that people derive some joy from the act of giving (Andreoni
1989, 1990), suggest that we should expect people with higher income to give more, in absolute
terms, provided giving is a normal good. In fact, the evidence from the US is suggestive of a U-
shaped relationship between household income and the percentage given to charity (e.g. Andreoni
2006), and of a positive income elasticity of charitable giving (e.g. Auten et al., 2002), while the
evidence from experimental studies is mixed (Andreoni and Vesterlund, 2001; Buckley and Croson,
2006; Eckel et al., 2007; Erkal et al., 2011). There has also been a recognition that the donor’s
source of income may play an important role in the decision to give. In particular, people may feel
more inclined to share with others if income is due to good luck rather than effort.1 There is indeed
a robust finding in the experimental literature showing that in dictator games people are less likely
to share earned income compared to windfall income (Hoffman et al., 1994; Ruffle, 1998; Cherry
et al., 2002; Cherry and Shogren, 2008; Oxoby and Spraggon, 2008; Carlsson et al., 2012).2 A
few recent experimental studies (Erkal et al., 2011; Rey-Biel et al., 2011), to be discussed in detail
further on, go one step further by examining giving when income is determined partly by effort and
partly by a random element. However, one aspect that has been largely neglected in this literature
is that, in reality, while income is determined by different factors, including skills, effort, and luck,
it is often not straightforward to disentangle the independent contribution of these different factors,
in particular, because in most instances good luck needs to be combined with some effort to bear
fruits. For example, whether I get a big performance-related bonus at the end of the year depends
probably on a combination of my effort and some exogenous factors (e.g. market performance,
1References to luck figure prominently in the pledges by American billionaires to give most of their wealth tophilanthropy that can be found in givingpledge.org. For example, Bill and Melinda Gates state “[w]e have beenblessed with good fortune beyond our wildest expectations, and we are profoundly grateful.” Warren Buffett writes“My wealth has come from a combination of living in America, some lucky genes, and compound interest. Both mychildren and I won what I call the ovarian lottery.” and goes on talking about “luck”, “fate’s distribution of longstraws”, “good fortune”. Others write “While I worked hard, I must say I had more than my share of good luck” or“I recognized early on, that my good fortune was not due to superior personal character or initiative so much as itwas to dumb luck.” It has also been found that people are more likely to share when recipients have or are believedto have low income due to bad luck rather than because of lack of effort, and that this may explain the differences inredistributive policies between the US and Europe (Alesina and Angeletos, 2005; Benabou and Tirole, 2006; Fong,2007).
2A possible explanation for this is that an individual’s sense of entitlement over income is related to his contributionin generating it. This perspective is consistent with the accountability principle, a rule of justice according to whicha person’s perception of a fair allocation is sensitive only to factors that he can influence (Konow, 2000; Cappelenet al., 2007). Gill and Stone (2010) apply a similar principle by assuming that an agent’s perceived entitlement in atournament competition is sensitive to how hard she has worked relative to her rival.
2
idiosyncratic shocks),3 but even in a booming economy I need to put some effort to be successful.
In this paper we explore whether people who earn a higher income are more likely to give, in
an environment in which earnings depend on luck but not in a manner that makes its contribution
obvious, nor are they independent of effort, as good luck must be complemented with effort to
generate income. To do this we design a real effort experiment, in which participants perform a
data entry task on four hour-long occasions that take place within the course of a week and their
pay depends on performance. In particular, in the first occasion all subjects receive the same piece
rate, while in the second occasion we randomly split participants into two groups. In the remaining
three occasions, participants in the first group keep working under the same piece rate, whereas
participants in the second group work under different piece rates in each of the three occasions,
which are always higher compared to that of participants in the first group (and to what they
received in the first occasion). In this setting, therefore, it is as if a lottery determines whether
a participant will receive a high or low compensation for a given amount of effort, but, much like
in real life, the participant does not witness the actual random draw; moreover, conditional upon
winning the lottery, some effort has to be exerted in order for luck to translate into higher earnings.
At the end of the experiment, we ask participants whether they want to donate a percentage of
their earnings to a charity of their choice.4 We then investigate whether the propensity to give to
a charity out of earned experimental income depends on the treatment, that is, on the fact that
compensation was generous, controlling for how hard the participant has worked on the data entry
task.
We find that, despite large differences in earnings due, almost entirely, to different piece rates –
subjects in the high piece rate group earn on average three times more variable pay than those in
the low piece rate group – the propensity to give is actually lower for those with higher earnings,
albeit this difference is statistically only marginally significant. Moreover, conditionally on giving,
the average proportion of earnings donated across the two groups is the same. As a result, charities
receive the same average donation from members of the two groups indicating that charitable
giving is not viewed as a normal good. Why is it the case then in our experiment that earning more
because of luck – receiving a generous piece rate – does not translate into more generous charitable
donations? After all, this is what one might have expected in light of previous experimental evidence
suggesting that individuals give more when their endowment is windfall rather than earned. This
outcome may be imputed to the notion of self-serving attribution bias, the human tendency to
attribute good outcomes to own actions, rather than to external factors such as luck, that has been
3Bertrand and Mullainathan (2001) provide empirical evidence that for CEOs pay is as responsive to luck as it isto performance.
4The closest real-world parallel to our setting is the so-called “payroll giving”, a scheme whereby em-ployees sign up to donate a part of their salary to charity each month. For instance, in the UK735,000 employees donated almost £118 million through payroll giving during the 2011/12 fiscal year(http://www.payrollgivingcentre.com/facts20figures.htm).
3
well-documented by psychologists (Miller and Ross, 1975), and has been invoked in economics to
explain behavior in a variety of settings (Babcock and Loewenstein, 1997).5 In our experiment,
a process of self-serving attribution – facilitated by the fact that in our design the role of luck
in assigning subjects to groups is not explicit – may lead subjects in the high piece rate group to
attribute the higher earnings to their own effort, even if in reality the difference in earnings between
the two groups is mostly due to exogenous factors. In turn, this distorted feeling of entitlement
may furnish subjects in the high piece rate group the moral ground not to act more generously.
This reasoning is related to the notion that people take advantage of “moral wiggle room” to act
self-interestedly as shown in Dana et al. (2007). They found that, when there is uncertainty about
the relationship between a dictator’s actions and outcomes, subjects choose more frequently the
selfish action. In our setting, the “moral wiggle room” is provided by the lack of transparency over
the roles of effort and luck in determining the donor’s earnings.
Our study is related to Erkal et al. (2011). They find that subjects who rank first in a real
effort tournament (and thus receive higher earnings) are less likely to give to their group members
than those ranked second. The explanation they provide for this is that there is selection on
other-regarding preferences, namely, selfish subjects tend to exert more effort and thus have higher
earnings than other-regarding subjects. They also find, similarly to us, that in a treatment where
both effort and luck determine outcomes people with good luck are not more likely to give, and in
a treatment where luck only determines ranking, people ranking first are as likely to give as people
ranking second, despite earning a third more. The authors call for future work to consider whether
their results hold when subjects give to an actual charity instead of each other and when earnings
are determined using a piece rate scheme, two features that our experimental design exhibits.
Another related study is Rey-Biel et al. (2011); in the first stage of their experiment subjects earn
their income (partially due to effort and partially due to luck), and then play a two-person dictator
game. In one treatment dictators know the determinants of the recipients’ income, while in the
other treatment they only know the total amount. They run their experiment in Spain and in
the US and find that Spanish subjects give more when they get luckier, while Americans do not
condition their giving on their own luck and transfer a flat amount.
It is worth highlighting two features of the above two studies that differentiate them from our
setting: first, the role of luck versus that of effort in determining own income is very transparent
there, whereas in our design, as we highlighted above, the two cannot be readily separated. Second,
giving is directed toward other experimental participants who also earn income in the experiment.
This brings to the front distributional considerations, that are more subdued in our setting in which
5Konow (2000) finds evidence of self-serving distortion of beliefs of what constitutes a fair allocation in the contextof a dictator experiment. Evidence for a similar type of self-serving distortion of beliefs is provided by Di Tella etal. (2007) who find that squatters that were randomly assigned land titles in Argentina hold significantly morematerialistic and individualistic beliefs compared to similar squatters without land titles.
4
giving is “impersonal”, taking place by donating to charities, whose worthiness is determined outside
the experiment.
The structure of the rest of the paper is as follows: the next section describes the procedures and
experimental design, while section 3 presents the results. The last section offers some concluding
remarks.
2 The Experiment
Our experiment involves two stages: in the first stage subjects performed a computerized real effort
task and earned performance-related compensation. In the second stage, subjects were asked what
proportion of their earnings, if any, they wanted to donate to a charity of their choice. The real effort
task, entering bibliographic records of published academic articles in an online repository platform,
was designed to be effort-intensive and not cognitively challenging, so that it could be performed
remotely online on the subjects’ own computer and required little training. In the Appendix we
provide a screenshot of the task page, illustrating the various fields in which subjects would enter the
details of the articles that were uploaded on the bottom of the page. Subjects received instructions
when they first logged in and a video describing the task at hand. The experiment was arranged
in four one-hour work periods, which participants had to complete within a week at a time of their
choosing. The only restrictions we imposed were that participants could perform only one session
per day, and that they could log in between 8am and 10pm. Participants were recruited from the
University of Southampton student body through email announcements.
Subjects received £20 for completing the experiment (equivalent to a £5 flat fee per hourly
session), and a piece rate compensation for each correctly entered record. They were informed that
the piece rate may vary from session to session but that neither the piece rate nor any other aspect
of a given session depended on performance in previous sessions. They were also informed that
payment would be contingent on completing all stages of the experiment. Subjects found out the
applicable piece rate at the beginning of each session. In particular, in the first session, the piece
rate was set at 2.5p for everyone. From session 2 onwards, we randomly assigned subjects into 2
groups: subjects in Group 1 received the baseline piece rate of 2.5p for the remaining three sessions;
subjects in Group 2 faced three piece rates in sessions 2-4: either 5p, 7.5p or 10p in random order.6
6In addition, the experimental design involved two more groups who on top of receiving the baseline piece rate,received compensation in the form of a donation made to a charity of the subject’s choice, flat or related to perfor-mance. These variations in compensation were designed to address the question of how private incentives compareto social incentives in terms of raising productivity, and are the subject of Tonin and Vlassopoulos (2012). Group1 was used to determine the trend in productivity. Group 2 was used to determine the elasticity of productivitywith respect to private incentives, hence the variation in the piece rate in each session. For details, see Tonin andVlassopoulos (2012).
5
Thus, to summarize, subjects in Group 1 faced the same piece rate throughout, whereas subjects
in Group 2 experienced 4 different piece rates: the same as Group 1 in the first session, and higher
ones from sessions 2 onwards. At the end of the fourth session, we informed subjects of their total
earnings from participating in the experiment, and asked them whether they wanted to donate a
percentage of their total earnings to a charity of their choice from a list of 9 with various missions
(see Appendix for the list of charities).7 It should be noted that to avoid selection effects of the
type found in Erkal et al. (2011) subjects were not aware of this possibility of donation at the
work stage of the experiment. In this paper we focus on whether the decision to donate at the end
is affected by earnings, and in particular on whether receiving higher earnings by virtue of having
been assigned into the group with higher piece rates induces higher donations.
3 Results
Our analysis is based on a sample of 104 subjects - 52 subjects in each condition.8 To address
the recent literature that identifies gender differences in social preferences (Croson and Gneezy,
2009), we invited an equal number of males and females, and indeed the gender composition is
quite balanced, with 46% being women in Group 1 and 52% being women in Group 2.
We begin by presenting in Table 1 summary statistics of subjects’ productivity on the real effort
task in each session and for each group separately. We use two measures of productivity, correct and
completed number of records entered.9 Accuracy, defined as correct entries divided by completed
entries, is on average 0.93 (s.d. 0.08) for both groups (Mann-Whitney - henceforth MW - two-
tailed test, p-value=0.67; Kolmogorov-Smirnov - henceforth KS - two-tailed test, p-value=0.97).
The first point to note is that we cannot reject the hypothesis of equal distribution of productivity
in session 1 across the two groups (KS two-tailed test, p-value=0.91 for correct and p-value=0.29
for completed entries), indicating that to start with there are no significant differences in the two
groups’ ability and desire to perform the task. When we consider total productivity, by adding up
7Reported earnings were calculated on the basis of the total number of records entered. However, we informedparticipants that the amount of actual earnings they would receive would be based on the number of correct recordsthey had entered, which we would verify later. This means that when subjects made the decision to donate they wereaware of their reported earnings and not of their actual earnings, as payments were arranged by bank transfers afterthe experiment had ended. Our results are robust to using reported or actual earnings.
8A total of 8 subjects did not complete the whole set of sessions after being assigned to treatments. In particular,5 subjects, 2 from Group 1 and 3 from Group 2, stopped after the second session, while 3 subjects, all from Group2, stopped after the third session. Using probit, logit or linear regressions we do not find any significant correlationbetween treatment group and the probability of dropping out after being assigned to treatment instead of completingthe whole sequence. Therefore, we consider attrition bias not to be a threat to the validity of our results.
9Throughout the experiment subjects could see on their screen the amount of entered records within the session,while they did not receive any feedback regarding the number of correct records. This allows us, in Tonin andVlassopoulos (2012), to assess whether incentives have a differential impact on quantity and quality. We find noevidence for that.
6
the number of entries in all 4 sessions, we could expect a difference between the two groups given
that subjects in Group 2 face higher piece rates in sessions 2-4. In fact, subjects in Group 2 enter
on average 11% more correct records (12% completed records) but this difference is not statistically
significant (KS two-tailed test, p-value=0.43 for correct and p-value=0.29 for completed entries).10
In terms of earnings derived from working on the task (over and above the £20 flat fee), subjects
in Group 2 earn substantially more than those in Group 1, £23.6 versus £8.3. This difference is
statistically significant (MW two-tailed test, p-value=0.000) and is almost entirely due to the fact
that subjects in Group 2 are paid higher piece rates in sessions 2-4. To see why this is the case,
note that if we keep the piece rate constant across the two groups at the baseline level of 2.5p, then
average earnings in Group 2 would have been £9.2. Thus, only 6% of the observed difference of
£15.3 in earnings across the two groups can be attributed to differences in effort, while the bulk of
it is in fact due to differences in how effort is compensated for exogenous reasons.
We next turn our attention to giving behavior. Figure 1 illustrates the histograms of amount
donated as percentage of total experimental earnings by group.11 Table 2 presents descriptive
statistics on the number of subjects who made a donation and on the average proportion of earnings
given, both for the whole sample and among those who gave a positive amount. Table 3 presents
descriptive statistics on the average amount of giving across the two groups, based on both reported
and actual earnings.
The first thing to notice from Table 2 is that the share of subjects giving zero is higher than
what is usually found in dictator experiments, including studies in which endowments are earned
(e.g. Hoffman et al., 1994; Cherry et al., 2002; Cherry and Shogren, 2008; Oxoby and Spraggon,
2008; Carlsson et al., 2012).12 The difference vis-a-vis experiments where the endowment is a
windfall is not surprising. Compared to studies in which the endowment is earned, two distinctive
features of our design are that the earnings-generating activity is more lengthy (four hours instead
of less than an hour in previous studies) and that earnings are not fixed but vary continuously
with performance (while in previous studies subjects perform a task to earn some predetermined
amount). Both of these elements are likely to increase the sense of entitlement of earnings in our
experiment, and thus explain the lower likelihood to give we find. Interestingly, at an average of
2.5% of earnings for the whole sample, giving behavior in our experiment is actually very similar to
the average percentage of income donated by Americans (Andreoni, 2006), and close to the average
10In Tonin and Vlassopoulos (2012) we find that subjects who in the first session had a productivity above themedian do not respond to higher piece rates and keep their productivity level at a similar (high) level throughout theexperiment, while the productivity of subjects below the median displays a downward trend and responds positivelyto higher piece rates. See that paper for more details on productivity patterns.
11The most popular charity was Cancer Research UK, followed by the British Red Cross and Doctors withoutBorders.
12We have no reason to believe that this difference is due to a peculiarity of our sample per se. In fact, subjectsrecruited from the same subject pool to participate in dictator experiments have shown levels of giving that aresimilar to what is reported in the literature (Tonin and Vlassopoulos, 2013).
7
level of donations as share of household expenditures in the UK (Cowley et al., 2011).
What is also evident in Table 2 is that there are more givers in Group 1 than in Group 2 (36.5%
vs 21.2%) with the difference being marginally significant (χ2 two-tailed test, p = 0.08). Moreover,
the average proportion of earnings given, among those who give, 8.7%, is not different across the
two groups. As a result, the average proportion of earnings given for the whole group is lower for
Group 2 (1.8%) than for Group 1 (3.2%), even if the difference is not statistically significant. In
terms of amounts given, Table 3 indicates that on average charities receive the same amount from
members of the two groups, with (the fewer) givers in Group 2 giving a significantly higher amount
(£4) than givers in Group 1 (£2.3). This is true regardless of whether we focus on giving out of
actual (columns 1, 2) or reported earnings (columns 3, 4).
We next turn to regression analysis that allows us to control for other possible determinants
of giving, such as, total effort exerted on the task and gender. Columns 1 to 4 of Table 4 display
regressions where the dependent variable is an indicator for whether a subject has donated, whereas
in columns 5 to 8 the dependent variable is percentage given. It should be noted that from a
theoretical standpoint, it is not clear whether we should expect someone who has earned a higher
income because she worked harder - and not for exogenous reasons - to be more likely to give.
This is because it may well be that the reason she worked hard was exactly to enjoy higher private
consumption. What we see in Table 4 (columns 2 and 6) is that the total number of correct entries
(measured in hundreds) is not an important determinant of the decision to give, and that the
difference in proportions of givers across the two groups remains after controlling for productivity.
Also, there is absolutely no indication that the decision on the percentage given is influenced by how
hard the subject worked on the task. Finally, we see no evidence of differences in the percentage
given across the two groups even after controlling for productivity. Results are almost identical
when we use total number of completed entries as a measure of productivity. We also find no
evidence of any gender effects (columns 3 and 7), as males and females in our sample do not behave
differently.
One may be worried that the giving patterns of subjects in Group 2 may be driven by the
sequence of piece rates experienced during the four sessions. In particular, subjects experiencing
a drop in the piece rate in the last session may feel underpaid (or unfairly treated) and may be
less likely to give than subjects who experience a rise. The change in the piece rate from session
3 to 4 may be particularly relevant as the giving decision takes place at the end of session 4. To
check whether this is the case, we include in the regressions (columns 4 and 8) a dummy indicating
whether subjects experienced a hike in the piece rate when going from session 3 to session 4. This
happens in 3 out of the 6 possible sequences and splits group 2 in two equally sized subgroups.
We find no evidence that there is a significant difference between these two subgroups. We also
8
investigated whether the piece rate experienced in the last session matters. Dummies for the piece
rate experienced in the last session or a variable controlling for its value are all insignificant.
All these results are robust to a logit or probit specification for the probability of donating
or to a tobit specification for the percentage given. Also estimating a hurdle model in which the
decision to give and the amount given are determined by two separate stochastic processes leaves
the picture unchanged. Therefore, the regression analysis confirms the patterns emerging from the
nonparametric tests reported above.
4 Conclusion
We conduct an experiment in which subjects first earn money working on a real effort task and are
then offered the opportunity to make a donation to a charity of their choice. We find that varying
exogenously the compensation received for exerting effort on the task does not induce high earners
to be more generous towards the charities, even though it leads to large differences in earnings that
are not related to effort. Thus, in our setting charitable giving does not appear to be a normal
good.
One could interpret the higher piece rates for Group 2 as a windfall that does not take the
form of a lump sum payment but of an overly generous compensation package. However, we
do not find that this windfall generates more giving, as it is instead the case in the previously
mentioned literature that examines the effects of windfall and earned endowment on giving. One
possible explanation for this is that subjects in our experiment exploit the uncertainty surrounding
the relative contribution of effort and luck in the determination of their earnings to distort the
attribution in the direction of effort mattering more. In this way they construe as earned income
what is in effect a windfall increase in their earnings. This distorted sense of entitlement then may
allow subjects who earn more to act less generously, compared to what would be expected from
subjects who earn more out of sheer luck, without damaging their self-perception. Pushing this
logic further by applying it to real life, where there is indeed ambiguity over whether effort or luck
is responsible for someone’s success, may at least partially account for the finding of a relatively
flat relationship between share of income donated to charity and income (e.g. Andreoni 2006).13
Finally, our results have implications for the design of effective fundraising by charities. As the
average donation collected from the two groups in our experiment is identical, it would seem that
there is no sense for charities to target their fundraising efforts and resources toward high earners
13In a similar vein, Mayo and Tinsley (2009) argue that a donor’s inability - which is a function of his income - todisentangle the role of luck and effort in determining the recipient’s income is also important in explaining patternsof charitable giving in the US.
9
and disregard low earners. Of course, in reality, differences in earnings are due to a vast array of
factors that are left out of our experiment, so this implication should be treated as only a step
toward a better understanding of whether an individual’s salary is a good indication of whether he
will be an attractive candidate for providing support to a charitable organization.
References
[1] Alesina, A., and Angeletos, G.M. (2005). Fairness and Redistribution: US vs. Europe, Amer-
ican Economic Review, 95(4), 913-35.
[2] Andreoni, J. (1989). Giving with Impure Altruism: Applications to Charity and Ricardian
Equivalence, Journal of Political Economy, 97(6), 1447-58.
[3] Andreoni, J. (1990). Impure Altruism and Donations to Public Goods: A Theory of Warm-
Glow Giving, Economic Journal, 100(401), 464-477.
[4] Andreoni, J. (2006). “Philanthropy,” in S-C. Kolm and J. Mercier Ythier, eds., Handbook of
Giving, Reciprocity and Altruism, Amsterdam: North Holland.
[5] Andreoni, J., and Vesterlund, L. (2001). Which Is the Fair Sex? Gender Differences in Altru-
ism, Quarterly Journal of Economics, 116(1), 293-312.
[6] Auten, G.E., H. Sieg, and Clotfelter, C.T. (2002). Charitable Giving, Income, and Taxes: An
Analysis of Panel Data, American Economic Review, 92(1), 371-382.
[7] Babcock, L., and Loewenstein, G. (1997). Explaining Bargaining Impasse: The Role of Self-
Serving Biases, Journal of Economic Perspectives, 11(1), 109-126.
[8] Benabou, R., and Tirole, J. (2006). Belief in Just World and Redistributive Politics. Quarterly
Journal of Economics, 121(2), 699-746.
[9] Bertrand, M. and Mullainathan, S. (2001). Are CEOs rewarded for luck? The ones without
principals are, Quarterly Journal of Economics, 116(3), 901-932.
[10] Buckley, E., and Croson, R. (2006). Income and Wealth Heterogeneity in the Voluntary Pro-
vision of Linear Public Goods, Journal of Public Economics, 90(4-5), 935-55.
[11] Cappelen, A.W., A.D. Hole, E. Sorensen, and Tungodden, B. (2007). The Pluralism of Fairness
Ideals: An Experimental Approach, American Economic Review, 97(3), 818-827.
[12] Carlsson, F., H. He, and Martinsson, P. (2012). Easy come, easy go. The role of windfall money
in lab and field experiments, Experimental Economics, forthcoming.
10
[13] Cherry, T., P. Frykblom, and Shogren, J. (2002). Hardnose the Dictator, American Economic
Review, 92(4), 1218-1221.
[14] Cherry, T., and Shogren, J. (2008). Self-Interest, sympathy and the origin of the endowment,
Economics Letters, 101(1), 69-72.
[15] Cowley, E., T. McKenzie, C. Pharaoh, and Smith, S. (2011). The new state of donation:
Three decades of household giving to charity 1978-2008, Centre for Charitable Giving and
Philanthropy.
[16] Croson, R., and Gneezy, U. (2009): Gender Differences in Preferences, Journal of Economic
Literature, 47(2), 1-27.
[17] Dana, J., R. A. Weber, and Kuang, J. X. (2007). Exploiting moral wiggle room: experiments
demonstrating an illusory preference for fairness, Economic Theory, 33(1), 67-80.
[18] Di Tella, R., S. Galiant, and Schargrodsky, E. (2007). The formation of beliefs: evidence from
the allocation of land titles to squatters, Quarterly Journal of Economics, 122(1), 209-241.
[19] Eckel, C, P. J. Grossman, and Milano, A. (2007). Is More Information Always Better? An
Experimental Study of Charitable Giving and Hurricane Katrina, Southern Economic Journal,
72(2), 388-411.
[20] Erkal, N., L. Gangadharan, and Nikiforakis, N. (2011). Relative Earnings and Giving in a
Real-Effort Experiment, American Economic Review, 101(7), 3330-48.
[21] Fong, C. (2007). Evidence from an Experiment on Charity to Welfare Recipients: Reciprocity,
Altruism and the Empathic Responsiveness Hypothesis, Economic Journal, 117(522), 1008-
1024.
[22] Gill, D., and Stone, R. (2010). Fairness and desert in tournaments, Games and Economic
Behavior, 69(2), 346-364
[23] Hoffman, E., K. McCabe, K. Shachat, and Smith, V. (1994). Preference, Property Rights and
Anonymity in Bargaining Games, Games and Economic Behavior, 7(3), 346-380.
[24] Konow, J., (2000). Fair shares: Accountability and cognitive dissonance in allocation decisions,
American Economic Review, 90(4), 1072-1091.
[25] Mayo, J., and Tinsley, C. (2009). Warm glow and charitable giving: Why the wealthy do not
give more to charity? Journal of Economic Psychology, 30(3), 490-499.
[26] Miller, D. T., and Ross, M. (1975). Self-serving bases in the attribution of causality: Fact or
fiction? Psychological Bulletin, 82, 213-225.
11
[27] Oxoby, R. J., and Spraggon, J. (2008). Mine and yours: Property rights in dictator games,
Journal of Economic Behavior and Organization, 65(3-4), 703-713.
[28] Rey-Biel, P., R. Sheremeta, and Uler, N. (2011). (Bad) Luck or (Lack of) Effort?: Sharing
Norms in the US and Europe, mimeo.
[29] Ruffle, B. (1998). More Is Better, but Fair Is Fair: Tipping in Dictator and Ultimatum Games,
Games and Economic Behavior, 23(2), 247-65.
[30] Tonin, M., and Vlassopoulos, M. (2012). Social Incentives Matter: Evidence from an Online
Real Effort Experiment, IZA Discussion Paper No. 6716.
[31] Tonin, M., and Vlassopoulos, M. (2013). An Experimental Investigation of Intrinsic Motiva-
tions for Giving, Theory and Decision, forthcoming.
12
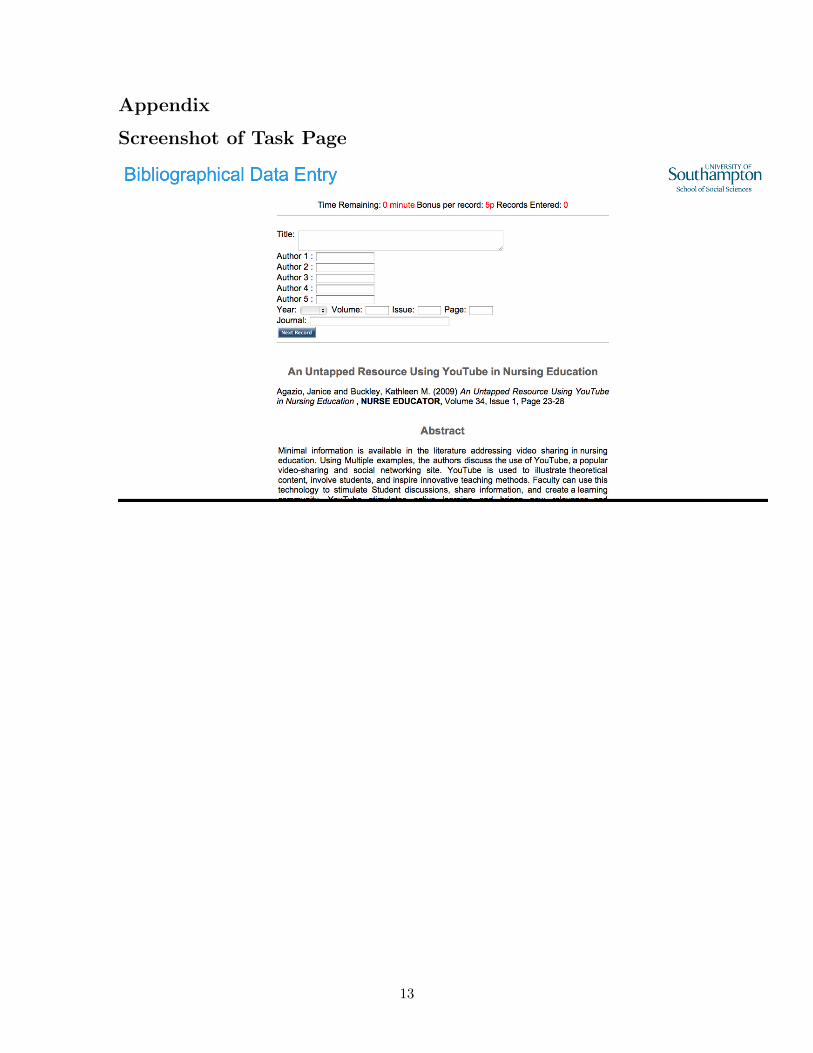
Appendix
Screenshot of Task Page
13
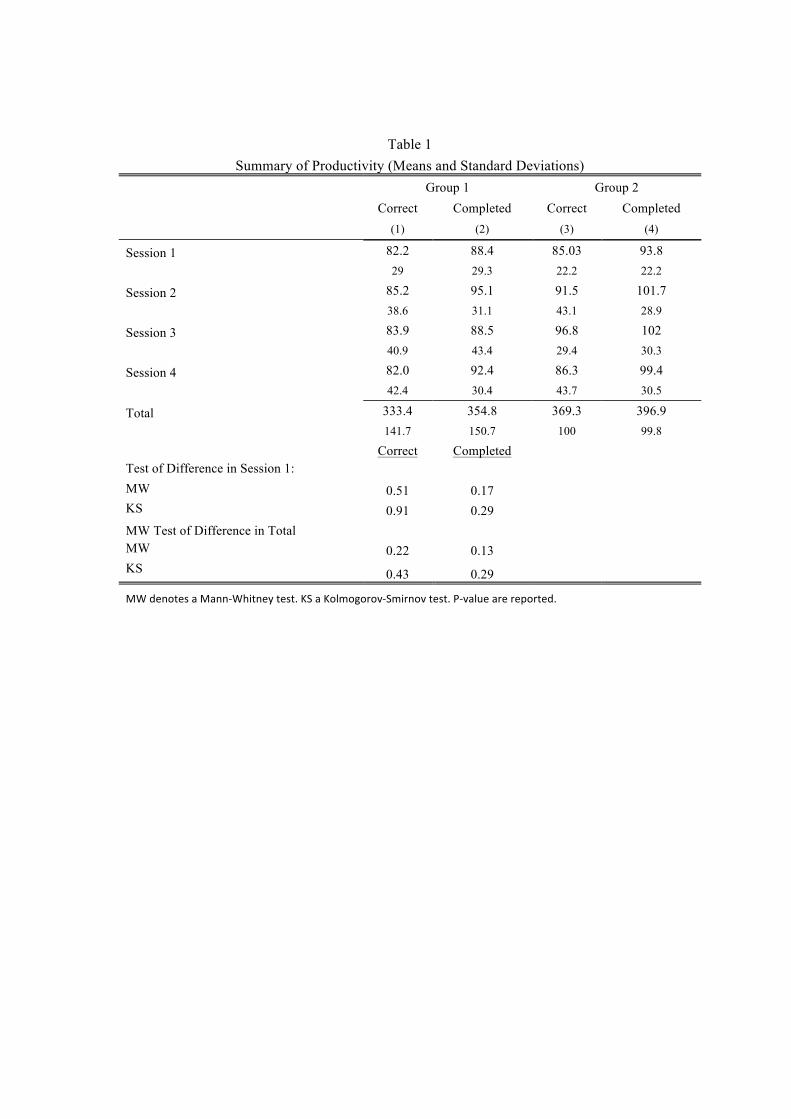
Table 1 Summary of Productivity (Means and Standard Deviations)
Group 1 Group 2
Correct Completed Correct Completed
(1) (2) (3) (4)
Session 1 82.2 88.4 85.03 93.8
29 29.3 22.2 22.2
Session 2 85.2 95.1 91.5 101.7
38.6 31.1 43.1 28.9
Session 3 83.9 88.5 96.8 102
40.9 43.4 29.4 30.3
Session 4 82.0 92.4 86.3 99.4
42.4 30.4 43.7 30.5
Total 333.4 354.8 369.3 396.9
141.7 150.7 100 99.8
Correct Completed
Test of Difference in Session 1:
MW 0.51 0.17 KS 0.91 0.29 MW Test of Difference in Total
MW 0.22 0.13 KS 0.43 0.29
MW denotes a Mann-‐Whitney test. KS a Kolmogorov-‐Smirnov test. P-‐value are reported.
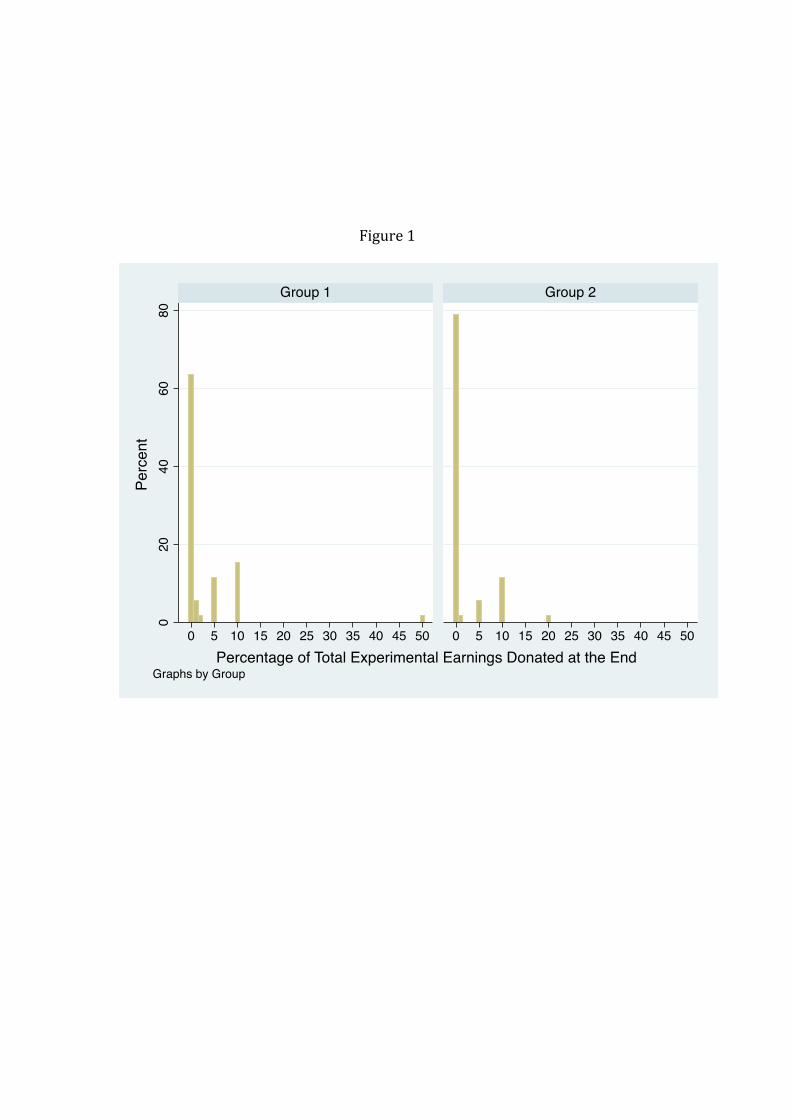
Figure 1
020
4060
80
0 5 10 15 20 25 30 35 40 45 50 0 5 10 15 20 25 30 35 40 45 50
Group 1 Group 2
Perc
ent
Percentage of Total Experimental Earnings Donated at the EndGraphs by Group
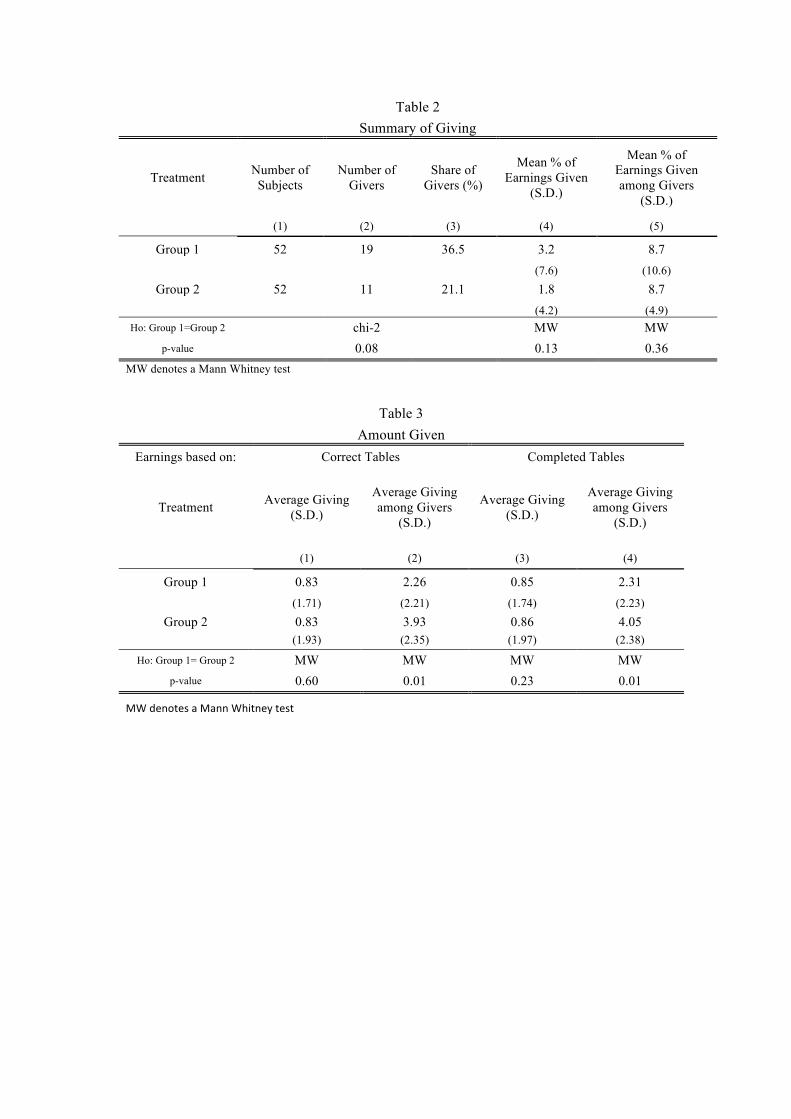
Table 2 Summary of Giving
Treatment Number of Subjects
Number of Givers
Share of Givers (%)
Mean % of Earnings Given
(S.D.)
Mean % of Earnings Given among Givers
(S.D.)
(1) (2) (3) (4) (5)
Group 1 52 19 36.5 3.2 8.7
(7.6) (10.6)
Group 2 52 11 21.1 1.8 8.7
(4.2) (4.9)
Ho: Group 1=Group 2 chi-2 MW MW p-value 0.08 0.13 0.36
MW denotes a Mann Whitney test
Table 3
Amount Given Earnings based on: Correct Tables Completed Tables
Treatment Average Giving (S.D.)
Average Giving among Givers
(S.D.)
Average Giving (S.D.)
Average Giving among Givers
(S.D.)
(1) (2) (3) (4)
Group 1 0.83 2.26 0.85 2.31
(1.71) (2.21) (1.74) (2.23)
Group 2 0.83 3.93 0.86 4.05 (1.93) (2.35) (1.97) (2.38)
Ho: Group 1= Group 2 MW MW MW MW p-value 0.60 0.01 0.23 0.01
MW denotes a Mann Whitney test
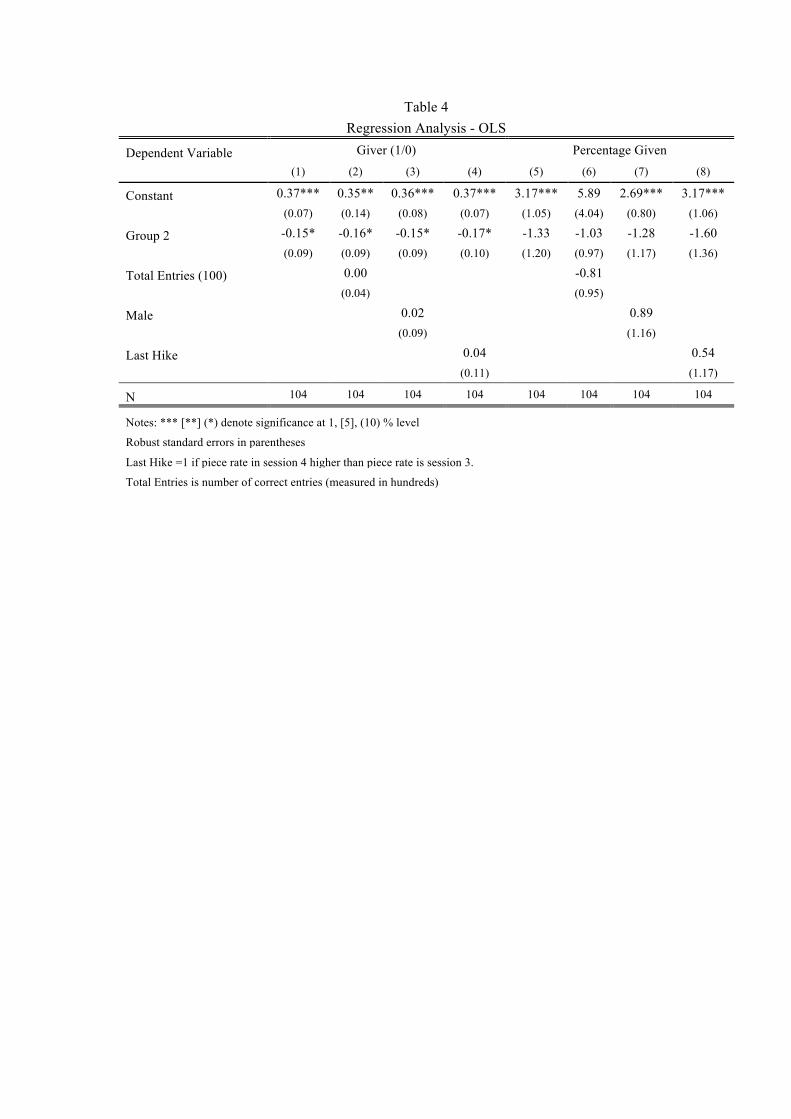
Table 4 Regression Analysis - OLS
Dependent Variable Giver (1/0) Percentage Given
(1) (2) (3) (4) (5) (6) (7) (8)
Constant 0.37*** 0.35** 0.36*** 0.37*** 3.17*** 5.89 2.69*** 3.17***
(0.07) (0.14) (0.08) (0.07) (1.05) (4.04) (0.80) (1.06)
Group 2 -0.15* -0.16* -0.15* -0.17* -1.33 -1.03 -1.28 -1.60
(0.09) (0.09) (0.09) (0.10) (1.20) (0.97) (1.17) (1.36)
Total Entries (100) 0.00 -0.81
(0.04) (0.95)
Male 0.02 0.89
(0.09)
(1.16)
Last Hike
0.04
0.54
(0.11)
(1.17)
N 104 104 104 104 104 104 104 104
Notes: *** [**] (*) denote significance at 1, [5], (10) % level
Robust standard errors in parentheses
Last Hike =1 if piece rate in session 4 higher than piece rate is session 3.
Total Entries is number of correct entries (measured in hundreds)