Embed Size (px)
Citation preview

This work has been digitalized and published in 2013 by Verlag Zeitschrift für Naturforschung in cooperation with the Max Planck Society for the Advancement of Science under a Creative Commons Attribution4.0 International License.
Dieses Werk wurde im Jahr 2013 vom Verlag Zeitschrift für Naturforschungin Zusammenarbeit mit der Max-Planck-Gesellschaft zur Förderung derWissenschaften e.V. digitalisiert und unter folgender Lizenz veröffentlicht:Creative Commons Namensnennung 4.0 Lizenz.
Infrared Absorption of Concentrated Aqueous NaCl04 Solutions to High Pressures and Temperatures V. M. Valyashko N . S . K u r n a k o v Ins t i tu te of General and Inorganic Chemistry of the U S S R Academy of Sciences, Moscow, U S S R
M. Buback and E. U. Franck I ns t i tu t für Physikalische Chemie und Elektrochemie, Universi tät Karlsruhe
Z . Naturforsch. 3 6 a , 1 1 6 9 - 1 1 7 6 (1981); received June 3, 1981)
The infrared absorption of the O - D stretching fundamental of H D O in concentrated aqueous ( H D 0 / H 2 0 ) N a C 1 0 4 solutions up to 20 m o l e % salt has been measured. T h e data for the wave-number of m a x i m u m absorption, v (max) , and for the integrated molar absorpt iv i ty B up to pressures and temperatures of 2800 bar and 250 °C, respectively, demonstrate the importance of non-hydrogen-bonded interactions in aqueous Perchlorate solutions. A non-continuous dis-t r ibut ion of the states of water molecules is clearly evident f rom the experimental spectra. A band separation using three Gaussian components proves the close similari ty between the high-pressure high-temperature vibrat ional O - D infrared spectra of aqueous Perchlorate solutions and the O - D R a m a n spectra of water and aqueous solutions.
Results of the band separation together w i t h l i terature R a m a n data provide some evidence t h a t a transit ion f rom "water - l ike" to "mel t - l ike" behaviour occurs in a fa ir ly narrow concentra-t ion region between 10 and 15 m o l e % salt.
Introduction
Studies of concentrated aqueous electrolyte solu-tions are interesting for several reasons: There is an obvious need for a general description of ionic fluids. Numerous experimental investigations and theoretical treatments of the limiting situations, fused salts [1] and dilute aqueous salt solutions [2], are available. Quantitative experimental and theo-retical work on concentrated aqueous solutions, however, is scarce [3]. Much more data are needed, and measurements at elevated temperatures and pressures are particularly desirable. An improved understanding of high-pressure high-temperature solutions is also important in geochemistry and for certain parts of power plant operation.
Electrolytic conductance data on concentrated aqueous solutions up to about 600 °C and to high pressures have been published by several groups (e.g. [4, 5]). A useful source of information about the structure in aqueous solutions is, among others, the infrared absorption and Raman scattering of the hydrogen-oxygen stretching modes of the water molecules [6—9]. It has become the established practice to use HDO in H 2 0 (or in D20) as the
Repr in t requests to Prof. D r . M . Buback, Ins t i tu t für Physikalische Chemie und Elektrochemie der Universi tät Karlsruhe, Kaiserstraße 12, D - 7 5 0 0 Karlsruhe.
solvent rather than pure H 2 0 or D20, which largely facilitates the interpretation of the spectra. In the dilute gas, the wavenumber of the O-D vibration is 2720 cm -1 . In liquid water at room temperature, the absorption band maximum is positioned at about 2500 cm -1 . The strong wavenumber shift is attributed to hydrogen bonding in liquid water at ambient temperature. The large increase in molar integrated absorptivity by about an order of mag-nitude between gaseous and liquid-like states pro-vides another measure for the strong intermolecular interactions in liquid water.
In the previous paper on the infrared absorption of concentrated aqueous LiCl-solutions, O-D spectra have been measured to 2800 bar and 350 °C and up to a maximum of 40 mole percent salt [10]. The analysis of the wavenumber data clearly indicates different kinds of intermolecular interactions at low and at high salt concentrations. The transition from "water-like" to "melt-like" behaviour occurs with-in a fairly narrow region between about 12 to 15 mole percent LiCl.
The purpose of the present paper is to investigate quantitatively the infrared absorption of the O-D stretching mode in NaC104-solutions to 20 mole percent salt and to pressures and temperatures of 2800 bar and 250 °C, respectively. In aqueous solu-tions containing Perchlorate ions some peculiar
0340-4811 / 81 / 0900-0967 $ 01.00/0. — Please order a reprint rather than making your own copy.

1170 V. M. Valyashko et al. • Infrared Absorption of Concentrated Aqueous NaC104 Solutions
effects in the field of nuclear magnetic resonance [11] and of infrared and Raman spectroscopy [12 — 15] have been observed: 1. The water proton relaxation rates strongly increase with Perchlorate concentration. 2. In the fundamental and overtone vibrational spectra, the O-D bands are clearly split into two components, whereas the absorption con-tour in aqueous alkali halide solutions, as in pure HDO/H2O, is only slightly asymmetric and has a rather simple shape with one maximum.
Experimental
The infrared spectra were measured with a high-pressure high-temperature cell described elsewhere [16]. The cell has only one window made from colourless synthetic sapphire. Details about the equipment and the experimental procedure are given in [10].
The spectra were recorded on a Perkin-Elmer 521 grating spectrometer which plots transmittance T versus wavenumber v. The molar absorptivity e(v) is calculated from the relation:
e(v) = A(v)ICHJiO-l.
C H D O is the concentration of HDO in moles per cubic meter, I is the optical path length in meters and A(v) = \og(TO(v)IT(V)) is the absorbance. The transmittances, TQ(V) and T(V), are measured in independent runs: TO(V) is obtained with aqueous NaC104-solutions at the experimental temperature and pressure without HDO, and T(v) is measured at the same conditions on solutions containing HDO.
The HDO-concentrations in the aqueous (6.4 mole% HDO in H2O) salt solutions, presented in Table 1, are derived from PVT data of the cor-responding NaC104-solutions in pure H2O. These solution densities are obtained by interpolation from the experimental high-temperature high-pres-sure PVT data for water [17] including some data for solid NaC104 and some results for H20-NaC104 solutions at ambient temperature and pressure.
The calculations of e (v) have been performed on the BESM-4 at the Computer Center of the In-stitute of General and Inorganic Chemistry of the USSR Academy of Sciences. A band analysis using Gaussian components has been performed using a program developed by Gorbatyi's group [18]. The accuracy of the molar integrated absorptivity B = f e(v)dv depends on the precise knowledge of
Table 1. Wavenumber p (max) of the absorption m a x i m u m and molar integrated absorptivi ty B (O -D) of the O - D band i n aqueous NaC104-solutions. T, P, and Q are the experi-mental temperature, pressure, and density.
T/°C P / b a r e/g cm" 3 v (max) / c m - 1
B(0-V)/ k m m o l e - 1
0 m o l e % NaC10 4
25 10 1.000 2505 110.5 1000 1.038 2502 111 2800 1.096 2497 111
200 500 0.897 2572 61 1000 0.924 2569 63 2000 0.967 2568 67 2800 0.995 2567 66.5
250 500 0.843 2589 50.5 1000 0.877 2587 54 2000 0.928 2583 54 2800 0.959 2579 59
5 m o l e % NaC10 4
25 25 1.19 2507 96.7 200 500 1.075 2589 64
1000 1.104 2577 63.4 2000 1.148 2577 65.1 2800 1.176 2567 66.9
250 500 1.015 2607 54.4 1000 1.050 2607 55.7
10 m o l e % NaC10 4
25 25 1.348 2530 89.1 2000 1.421 2522 91.4
200 500 1.228 2624 47.6 1000 1.258 2632 49.8 2000 1.302 2632 50.1 2800 1.330 2627 53.9
250 500 1.164 2632 41.7 1000 1.202 2632 44.9 2000 1.255 2624 48.3 2800 1.287 2622 47.8
15 m o l e % NaC10 4
25 25 1.486 2627 79.6 2000 1.557 2627 83.7
200 500 1.364 2637 49.7 1000 1.393 2632 50.4 2000 1.435 2637 50.4 2800 1.462 2637 53.4
250 500 1.297 2639 44.6 1000 1.333 2637 45.6 2000 1.385 2637 46.8 2800 1.418 2637 49.9
20 m o l e % NaC10 4
25 25 1.608 2629 76 2000 1.674 2629 80.7
200 500 1.484 2637 54.3 1000 1.511 2639 49.7 2000 1.550 2637 54.9 2800 1.577 2637 54.3
250 500 1.414 2637 49.6 2000 1.502 2637 53.9 2800 1.531 2639 55.2
1171 V. M. Valyashko et al. • Infrared Absorption of Concentrated Aqueous NaC104 Solutions
the HDO concentration, the BVT-data of the aqueous solutions, the measured transmittances, and the optical path length which was below 30 ^m in most experiments. The accuracy of U(O-D), the molar integrated intensity of the O-D mode in HDO, is assumed to be better than ± 1 2 % . The maxima of the O-D absorption bands are broad. This poses problems for a precise determination of v(max), the wavenumber in the band maximum. i»(max) is assumed to be accurate within ± 4 cm - 1 .
Results
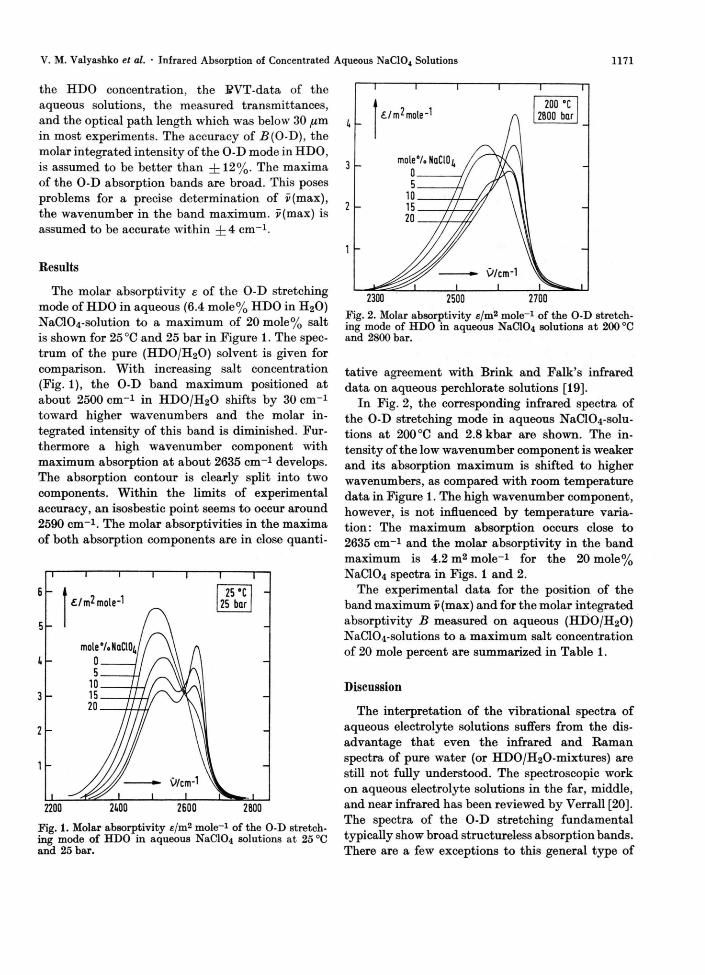
The molar absorptivity e of the O-D stretching mode of HDO in aqueous (6.4 mole% HDO in H20) NaC104-solution to a maximum of 20 mole% salt is shown for 25 °C and 25 bar in Figure 1. The spec-trum of the pure (HD0/H20) solvent is given for comparison. With increasing salt concentration (Fig. 1), the O-D band maximum positioned at about 2500 cm"1 in HD0/H 2 0 shifts by 30 cm"1
toward higher wavenumbers and the molar in-tegrated intensity of this band is diminished. Fur-thermore a high wavenumber component with maximum absorption at about 2635 cm - 1 develops. The absorption contour is clearly split into two components. Within the limits of experimental accuracy, an isosbestic point seems to occur around 2590 cm - 1 . The molar absorptivities in the maxima of both absorption components are in close quanti-
2200 22.00 2600 2800
2500 2700
Fig. 1. Molar absorptivity e/m2 m o l e - 1 of the O - D stretch-ing mode of H D O in aqueous NaC104 solutions at 25 °C and 25 bar.
Fig. 2. Molar absorptivity e/m2 m o l e - 1 of the O - D stretch-ing mode of H D O in aqueous NaC104 solutions a t 200 °C and 2800 bar.
tative agreement with Brink and Falk's infrared data on aqueous Perchlorate solutions [19].
In Fig. 2, the corresponding infrared spectra of the O-D stretching mode in aqueous NaC104-solu-tions at 200 °C and 2.8 kbar are shown. The in-tensity of the low wavenumber component is weaker and its absorption maximum is shifted to higher wavenumbers, as compared with room temperature data in Figure 1. The high wavenumber component, however, is not influenced by temperature varia-tion: The maximum absorption occurs close to 2635 cm - 1 and the molar absorptivity in the band maximum is 4.2 m2 mole -1 for the 20 mole% NaC104 spectra in Figs. 1 and 2.
The experimental data for the position of the band maximum v (max) and for the molar integrated absorptivity B measured on aqueous (HD0/H20) NaC104-solutions to a maximum salt concentration of 20 mole percent are summarized in Table 1.
Discussion
The interpretation of the vibrational spectra of aqueous electrolyte solutions suffers from the dis-advantage that even the infrared and Raman spectra of pure water (or HD0/H20-mixtures) are still not fully understood. The spectroscopic work on aqueous electrolyte solutions in the far, middle, and near infrared has been reviewed by Verrall [20]. The spectra of the O-D stretching fundamental typically show broad structureless absorption bands. There are a few exceptions to this general type of

1172 V. M. Valyashko et al. • Infrared Absorption of Concentrated Aqueous NaC10 4 Solutions
behaviour: aqueous solutions with polyatomic an-ions of low proton affinity, such as CIO4-, BF 4
- , PFe - , and SbF6~ show an additional high wave-number component. The position of this rather narrow component is almost independent of the anion concentration. The variation of the spectra with Perchlorate concentration, as in Fig. 1, demon-strates that the high wavenumber component is essentially due to the absorption of water molecules influenced by Perchlorate ions whereas the low wavenumber component represents the absorption of the remaining bulk water.
In Fig. 3, the molar integrated absorptivity 2? (O-D) of the O-D stretching mode in aqueous Per-chlorate solutions which corresponds to the area below the e(v)-spectra as in Figs. 1 and 2 is plotted versus the NaC104-concentration for three temper-atures (25 °C, 200 °C, and 250 °C) at 0.5 kbar and 2 kbar. The addition of Perchlorate to pure water lowers B(O-D). The effect is less pronounced at higher temperature. At 200 °C and 250 °C, within the limits of experimental accuracy, . B ( O - D ) seems to be independent of concentration above 10 mole% NaC104. A mean value of B(O-D), calculated from the high-temperature data (200 °C and 250 °C) at 10 and 15 mole% NaC104, is 47.3 km mole"1. A val-ue of this size is found for pure high density water
0.5 kbar 2kbar 25*C m a 200 *C A A 250 *C a> 0
C/mole 7. NaClOf, t I
Fig. 3. Concentration dependence of the molar integrated absorptivity B(0-D)/km mole - 1 of the O - D stretching mode of H D O in aqueous (HD0/H20)NaClC>4 solutions at temperatures of 25 °C, 200 °C, and 250 °C and pressures of 0.5 kbar and 2 kbar.
( H D O / H 2 O ) at higher temperatures close to the critical temperature (374 °C) [8], where hydrogen bonds have been shown to be of minor importance [21]. A comparison via the experimental . B ( O - D ) -
values thus suggests that water molecules in con-centrated Perchlorate solution are, if at all, only weakly (hydrogen) bonded at 200 °C.
The molar integrated absorptivities B (O-D) in sodium perchlorate solution differ from the cor-responding data for LiCl-solutions where J 5 ( 0 - D )
has been observed to increase with salt concentra-tion [10]. Experimental intensity data for both systems at 200 °C are plotted versus the HDO-density, £hdo> in Figure 4. A few data points for pure water ( H D O / H 2 O ) are included in Figure 4 .
With increasing LiCl-concentration, the molar in-tegrated absorptivity J B ( O - D ) is clearly enhanced. At 25 mole % LiCl, B (O-D) approaches the values observed in pure water at ambient temperature where water molecules are strongly interacting via hydrogen bonds. Increasing perchlorate concentra-tion decreases B(O-D) to about 50 km mole -1 . These values are in close agreement with (hypothet-ical) pure water data as extrapolated along the dashed line in Figure 4. Since hydrogen bonded interactions are not important in pure water at elevated temperature and at moderate densities in the order of 0.6 g cm - 3 , this agreement provides another indication of non-hydrogen-bonded inter-actions in concentrated perchlorate solutions at and above 200 °C.
Further support for the breakdown of hydrogen bonded interactions in aqueous perchlorate solu-
120 -
100 -
80 -
B (0-0) km mole
to - W9cm~3
06 0.7 08 0.9 1.0
Fig. 4. Molar integrated absorptivity l ? ( 0 - D ) / k m m o l e - 1
of the O - D stretching mode of H D O in aqueous ( H D O / H 2 O ) NaClÜ4 and LiCl solutions a t 200 °C plotted versus the H D O density £>HDO-

1173 V. M. Valyashko et al. • Infrared Absorption of Concentrated Aqueous NaC104 Solutions
2500 -
Fig. 5. Wavenumber j> (max) /cm - 1 in the absorption band m a x i m u m of the O - D stretching mode of H D O in aqueous ( H D 0 / H 2 0 ) NaC10 4 and L i C l solutions a t 200 °C plotted versus the H D O density £HDO-
tions results from the high value of v(max), the position of the absorption band maximum of the O-D stretching mode in HDO. Data for 200 °C are presented in Figure 5. In pure water and in 5 mole% NaC104-solution, the O-D absorption band maxi-mum is determined by the bulk water species where-as, toward higher Perchlorate concentrations, the high wavenumber component around 2635 c m - 1
constitutes the band maximum. With increasing LiCl-concentration, v(max) shifts to lower values and approaches the corresponding room tempera-ture data of v(max) for LiCl- and NaC104-solutions at about 2530 cm - 1 . The experimental observations for LiCl-solutions, an increase of 5 (O-D) (Fig. 4) and a decrease of v(max), demonstrate the strong water-ion interactions in these solutions. The oppo-site type of behaviour, as measured on aqueous NaC104-solutions, proves the weak interactions be-tween water molecules and surrounding perchlorate ions. The large differences in the vibrational band characteristics of concentrated aqueous NaC104-and Lid-solutions are remarkable: The molar in-tegrated absorptivities differ by a factor of two and the maximum wavenumbers differ by about 100 cm - 1 . The quantitative theory of integrated intensities and wavenumber shifts in dense polar materials is still in an unsatisfactory stage. Thus the experimental observations can not be ade-quately discussed at present time.
The conclusions about the weak bonding in per-chlorate solution are in complete agreement with previous results by Kecki [14] and by Walrafen [13] about the extensive breakdown of hydrogen-bonded
water structure due to perchlorate ions. Further-more Chizhik [22] derived from NMR relaxation data that C104~-ions form extremely weak bonds with water molecules and thus carry no surround-ing hydration sphere. These bonds may be identi-fied as weak hydrogen bonds [23] or as non-hydro-gen-bonded interactions. A clear distinction can not be made.
By computer analysis the experimental spectra have been resolved into three Gaussian compo-nents. The results for the molar integrated ab-sorptivity B of the high wavenumber component with maximum absorption around 2635 c m - 1 are given in Table 2 for 20 mole% NaC104. Within the limits of experimental accuracy, the component intensity B turns out to be independent of tempera-ture and pressure (or density). The scattering of the data is probably due to the band separation pro-cedure. The constancy of this component molar absorptivity is in satisfactory agreement with the observation that also the maximum wavenumber of this band is insensitive toward temperature and pressure variation (Figure 5). Both results establish tha t weakly bonded water molecules give rise to this band [21]. The high wavenumber component occurs also at lower temperatures and at smaller perchlorate concentrations as can be visualized by the computer band resolution. I t is interesting to note that v(max) of this band almost coincides with v(max) of the high wavenumber component in the Raman spectrum of pure water (HDO/H2O) mea-sured to high pressures and temperatures [24]. Computer analysis of these scattering data revealed that , a t high densities, r(max) of the (Gaussian) high wavenumber component occurs close to 2635 c m - 1 and is independent of temperature in an extended region from 25 °C to 400 °C. A high wave-number component around 2630 c m - 1 was also ob-served in the Raman spectra of aqueous K I solu-
T/° C P/b&T B\km m o l e - 1
25 25 15.5 2000 18.3
200 500 15.3 1000 15.4 2000 15.9 2800 15.6
250 500 16.2 2000 18.4 2800 15.8
Table 2. Molar integrat-ed absorptivi ty B o f the high wavenumber com-ponent I of the O - D stretching mode in aque-ous 20 m o l e % sodium perchlorate solution. (The data are derived f rom a computer band analysis.)

1174 V. M. Valyashko et al. • Infrared Absorption of Concentrated Aqueous NaC104 Solutions
tions measured to high temperatures and pressures [24]. This coincidence in the infrared and Raman spectra of high-pressure high-temperature aqueous systems is important as interpretational uncer-tainties exist in literature which are due to the rather different appearance of Raman and infrared spectra measured on the same sample. The dis-crepancies are resolved if it is taken into account that the molar absorptivities for water molecules in different states are clearly different; hydrogen bonded species absorb about ten times as strongly as non-hydrogen-bonded water molecules. Thus if both kinds of water species are present, the hydro-gen-bonded molecules dominate the absorption spectrum and give rise to a fairly symmetric band contour [8].
This argument has originally been made by Luck and Ditter [9] who measured the overtone absorp-tion spectra and discussed the different appearance of fundamental and overtone HDO-spectra. The molar absorptivity of overtone and combination modes and the molar Raman scattering intensities seem to be rather similar for different kinds of water species. Thus speciation in the sample is directly reproduced by the vibrational overtone absorption and Raman scattering spectra.
The aqueous perchlorate solutions constitute an important spectroscopic system in that a non-continuous distribution of states is evident also from the O-D infrared spectrum. The C104--ion decreases the strength and thus the number of strong water-water interactions. The high molar absorptivity of these bonded HDO species is re-duced simultaneously. As the HDO species influ-enced by perchlorate ions absorb at considerably higher wavenumbers, a band contour with clear indication of individual components results.
In the band analysis of the infrared and Raman spectra of the O-D stretching fundamental in pure water and aqueous solutions mostly three Gaussian components are used: a high wavenumber compo-nent I, a second component (II) which determines the O-D infrared absorption in water-rich systems, and a third component (III), mostly toward lower wavenumbers, which may be produced by devia-tions of the component bands from a true Gaussian shape. A band separation using three components has also been applied in the study of the correspond-ing overtone data [9]. The main features of the ex-perimental spectra are described by means of the
first two of these components. The results of a computer band separation for the O-D vibrational band in aqueous 20 mole% NaC104-solution at 250 °C and 2800 bar are illustrated in Figure 6. Com-ponent I occurs at 2642 cm -1 , component I I at 2602 cm - 1 , and component I I I at 2517 cm-1. The assignment of component I I I is uncertain. The position of component I I is remarkably close to the value of 2603 cm - 1 which is extrapolated from Franck and Roth's data for pure water (HDO/H2O) at 250 °C and 0.59 g cm-» density [8, 25]. This hypo-thetical state is equivalent to the conditions as in Fig. 6, if the presence of NaC104 is neglected. All infrared perchlorate spectra as well as the pure water and solution Raman spectra [24] are reason-ably well described by these three components where the main contributions are due to compo-nents I and II. They reflect the occurrence of loosely bound water species and bonded water species, re-spectively. An interpretation of the spectra in terms of a mixture of two discrete species, however, does not seem to be justified. The spectral characteristics, especially of component II, are drastically changed with temperature and pressure. Thus, at ambient temperature, component II refers to hydrogen-bonded species with maximum absorption at about 2500 cm - 1 and high values of i?(0-D) whereas, at
Fig. 6. Computer analysis of the infrared O - D stretching band of H D O in aqueous ( H D O / H a O ) 20 m o l e % NaC10 4
solution a t 250 °C and 2800 bar using three Gaussian com-ponents.

1175 V. M. Valyashko et al. • Infrared Absorption of Concentrated Aqueous NaC104 Solutions
300 °C, component I I refers to water molecules which are only weakly bound to one another. Their absorption has a maximum value close to 2600 cm - 1 . The molar absorptivity is clearly reduced with respect to the room temperature data for the same component. These considerations demonstrate tha t a wide variety of states is contributing to the ab-sorption of component II . The distribution of states giving rise to absorption component I seems to be rather narrow, as v (max) and the integrated molar absorptivity turn out to be insensitive to tempera-ture and pressure variation. Even this component, however, does not refer to one well defined species of HDO-molecules as v(max) clearly depends on the specific solution under investigation. The in-frared O-D vibrational spectra measured on the system water (HD0/H20)-carbon dioxide at high pressures and temperatures also show this high wavenumber component with maximum absorp-tion, however, at about 2700 c m - 1 [26]. From these observations it is concluded that each of the ab-sorption components I and I I refers to a distribu-tion of states which seems to be especially broad for component II . The whole set of HDO infrared and Raman spectra measured on aqueous solutions or on pure water can probably be subdivided into components I and II (and perhaps a few more components). The occurrence of different kinds of water molecules which perform vibrational motions in at least two fairly limited frequency regions seems to be a general effect which has been ob-scured by the large molar absorptivity of compo-nent II.
The infrared spectra are not sufficient to charac-terize the states of water molecules which contrib-ute to the individual absorption components. I t has been assumed that water molecules located on a line between anion and cation give rise to the
[1] J . Braunstein, G. Mamantov , and G. P . Smi th (eds.), Advances in Molten Salt Chemistry, Vol . 1 — 3, P lenum Press, N e w Y o r k 1971 — 1975.
[2] F . Franks (ed.), W a t e r - A Comprehensive Treatise, V o l . 3 : Aqueous Solutions of Simple Electrolytes, Plenum Press, New Y o r k 1973.
[3] K . S. Pi tzer , Acc. Chem. Res. 10, 371 (1977); K . S. Pitzer, R . N . Roy , and L . F . Silvester, J . Amer . Chem. Soc. 99 , 4930 (1977).
[4] J . U . H w a n g , H . D . Lüdemarm, and D . H a r t m a n n , H igh Temperatures — H i g h Pressures 2, 651 (1970).
[5] W . Klostermeier, Die elektrische Leit fähigkeit kon-zentrierter Alkalichloridlösungen bei hohen Drücken und Temperaturen, Diplomthesis, Karlsruhe 1973.
component I absorption [14]. The interpretation of recent NMR experiments by means of electro-static relaxation theory yields a liquid structure with various kinds of water molecules vibrating at higher wavenumber. The qualitative explanation uses the concept of a "dielectric hole" [11].
In aqueous LiCl solutions between 12 and 15 mole% salt a transition from "water-like" to "melt-like" states appears to be indicated by the infrared absorption of the OD-stretching funda-mental. A transition of this kind is not so evident from the NaClO4-solution spectra. Apparently, temperature and concentration ranges are too limited. The concentration dependence, however, of the position of component I I does, perhaps, pro-vide a first indication that a transition of this kind does occur between 10 and 15 mole% NaC104 be-cause, at 200 °C, its maximum shifts from 2570 c m - 1
to 2600 c m - 1 with increasing concentration. More convincing evidence may be derived from the Raman scattering of the Cl-0 stretching mode of C104~-ions in aqueous perchlorate solutions [27]. Changes are found only to 11 mole%. At higher concentrations, the water-ion interaction seems to remain unchanged. This observation is thus con-sistent with previous results [28] indicating tha t in aqueous solutions composed of monovalent ions a transition from "water-like" to "melt-like" states occurs between 10 and 15 mole% salt.
Acknowledgements
The authors wish to thank Dr. Y. E. Gorbatyi and Dr. G. V. Novikov for their support in the computer calculations.
The fellowships (to V.M.V. and M.B.) by the "Deutsche Forschungsgemeinschaft" are gratefully acknowledged.
[6] G. E . Walra fen, in: W a t e r - A Comprehensive Treatise, Vol . 1, F . Franks (ed.), P lenum Press, N e w Y o r k 1972.
[7] P. Schuster, G. Zundel, and C. Sandorfy (eds.), The Hydrogen Bond, Vol . 1—3, Nor th -Ho l land Publish-ing Company, Amsterdam 1976.
[8] E . U . Franck and K . Roth , Discuss. Faraday Soc. 43, 108, (1967).
[9] W . A . P. Luck and W . D i t te r , Z . Naturforsch. 24 b, 482 (1969).
[10] V . M . Valyashko, M . Buback, and E . U . Franck, Z . Naturforsch. 35 a , 549 (1980).
[11] M . Contreras and H . G. Her tz , J . Sol. Chem. 7, 99 (1978).
[12] K . A. H a r t m a n , J . Phys. Chem. 70, 270 (1966).

1176 V. M. Valyashko et al. • Infrared Absorption of Concentrated Aqueous NaC104 Solutions
[13] G . E . Wal ra fen , J . Chem. Phys. 55, 768 (1971). [14] P . D r y j a n s k i and Z . Keck i , J . Mol . Struct. 12, 219
(1972). [15] K . Buijs and G. R . Choppin, J . Chem. Phys. 39, 2035
(1963). [16] St . von Tapavicza, M . Buback, and E . U . Franck,
H i g h Temperatures — H i g h Pressures 7, 535 (1975). [17] R . H i lber t , K . Tödheide, and E . U . Franck, Ber. Bun-
senges. Phys. Chem. 85, 636 (1981). [18] G . V . Bondarenko and Y . E . Gorbatyi , Zh . S t rukt .
K h i m . 17, 1036 (1976). [19] G . Br ink and M . Fa lk , Canad. J . Chem. 48, 2096
(1970). [20] R . E . Ver ra l l , in : W a t e r - A Comprehensive Treatise,
Vol . 3, F . Franks (ed.), P lenum Press, New Y o r k 1973. [21] M . Buback and E . U . Franck, Ber. Bunsenges. Phys.
Chem. 75, 33 (1971). [22] V . I . Chizhik, Zh . Strukt . K h i m . 8, 350 (1967), (Engl ,
transl . : J . Struct . Chem. 8, 303 (1967)).
[23] D . Schiöberg, Ber. Bunsenges. Phys. Chem. 85, 513 (1981).
[24] H . A . L indner , Ramanspektroskopische Untersuchun-gen a n H D O , gelöst in H 2 O , a n H D O in wäßrigen Kaliumiodidlösungen und a n reinem H2O bis 400 °C u n d 5000 bar, Thesis, Kar lsruhe 1970.
[25] K . H . R o t h , D ie Infrarotabsorpt ion von H D O in H 2 0 u n d der Zustand des Wassers bis 500 °C und 4000 bar, Thesis, Kar lsruhe 1969.
[26] W . U . v . Osten, D ie Infrarotabsorption von H D O in H 2 O in homogenen Mischungen m i t CO2 und X e bei hohen Drucken und Temperaturen, Thesis, Karlsruhe 1971.
[27] D . N . Glebovskaya, V . A . Latysheva, L . A . M u n d , and B . P . Tarasov, in: Molecular physics and biophysics of water system, Vol . 1, M . F . Vuks and A . J . Sido-rova (eds.), Leningrad State University, Leningrad 1973.
[28] V . M . Valyashko, Ber. Bunsenges. Phys. Chem. 81, 388 (1977).