Embed Size (px)
Citation preview
Investigation of Variability of Primary Materials on the Intrinsic Dissolution Behavior of Carbamazepine
Inauguraldissertation
zur Erlangung der Würde eines Doktors der Philosophie
vorgelegt der Philosophisch-Naturwissenschaftlichen Fakultät
der Universität Basel
von
Selma Šehić (aus Bosnien Herzegowina)
Basel, 2008
Genehmigt von der Philosophisch-Naturwissenschaftlichen Fakultät auf Antrag von Prof. Dr. H. Leuenberger, Dr. G. Betz Und PD Dr. P. van Hoogevest Basel, den 24. Marz 2008 Professor Dr. H-P Hauri Dekan

Acknowledgements I wish to express my deepest gratitude to my supervisor Professor Dr. H. Leuenberger for giving me the opportunity to perform this thesis and for his guidance and great support during the work. I am particularly grateful to Dr. G. Betz for supervising my work, for her help, support and encouragement during this study, for the great atmosphere and team that she created in the Industrial Pharmacy Lab. Sincere thanks go to PD Dr. P. van Hoogevest who accepted assuming the co-reference of this work. I deeply thank Bosnalijek dd, for financing my studies and most of all to MSc Š.Hadžidedić, head of Development Department, for giving me this great opportunity to perform PhD study, for her support, understanding and help. I thank professor Dr. S. Kocova El-Arini for co-supervising the research work and for her suggestions and recommendations on the outline of the Ph.D. program. I am sincerely grateful to my dear colleagues and friends at the Institute of Pharmaceutical Technology (IPT) and Industrial Pharmacy Lab (IPL), especially grateful to Mrs. E. Hadžović, Mrs. M. Pašić, Dr. K. Chansanroj, Mr. M. Rumman, Dr. E. Krausbauer, Dr. V. Balzano, Mr. M. Saeed, Dr. M. Puchkov, Mr. H. Yamaguchi, Mr. H. Myojyo, Mr. G. Kimura, MSc. S. Abdel-Hamid, Dr I. Jeon, Mrs. I. Vejnović and Mrs. E. Darronqui for creating pleasant and inspiring working atmosphere for their help, suggestions and companionship. It was a real pleasure to work in IPL with such a warm and friendly atmosphere. A special thanks to Mr. S. Winzap for his great availability and helpful presence. I would like to thank also to Dr. M. Lanz, Dr. V. Balzano, Mr. T. Meyer, and Mrs. F. Müller for nice and interesting collaboration in solid dosage forms practical course Many tanks go to my colleagues from Bosnalijek's Development Department for their support and precious help. My warmest thanks go to my family and friends: to my dear husband Vedran Jazić, for his love and patience during these 3 years, to my parents Jasminka and Reuf Šehić, my sister Sanela Pašić and her family for their endless love and support.
Table of contents
1. SUMMARY .....................................................................................................................................1
2. INTRODUCTION ............................................................................................................................3
2.1. PAT.......................................................................................................................................................... 3 2.2. Preformulation ....................................................................................................................................... 4
3. THEORETICAL SECTION .............................................................................................................7
3.1. Crystal Structure.................................................................................................................................... 7 3.2. Polymorphism........................................................................................................................................ 9
3.2.1. Thermodynamics of polymorphs .................................................................................................... 13 3.2.2. Phase mechanism and transformation........................................................................................... 18
3.3. Characterization of Polymorphs ........................................................................................................ 21 3.3.1. X – ray diffraction ........................................................................................................................... 21 3.3.2. Microscopy (Light Microscopy and Scanning Electron Microscopy) .............................................. 22 3.3.3. Thermal Analyses........................................................................................................................... 23 3.3.4. Solubility ......................................................................................................................................... 25 3.3.5. Spectroscopic methods .................................................................................................................. 29
3.4. Carbamazepine .................................................................................................................................... 30 3.5. Dissolution ........................................................................................................................................... 38
3.5.1. Dissolution process ........................................................................................................................ 38 3.5.2. Dissolution methodology ................................................................................................................ 41
3.5.2.1. Rotating basket method .......................................................................................................... 41 3.5.2.2. Paddle method........................................................................................................................ 41
3.5.3. Intrinsic dissolution ......................................................................................................................... 43 3.6. Preparation of tablets.......................................................................................................................... 44
3.6.1. Compaction simulator..................................................................................................................... 48
4. AIMS OF THE STUDY..................................................................................................................49
5. MATERIALS AND METHODS .....................................................................................................50
5.1. Materials ............................................................................................................................................... 50 5.2. Methods ................................................................................................................................................ 51
5.2.1. Characterization of CBZ anhydrous ............................................................................................... 51 5.2.1.1. High performance liquid chromatography (HPLC).................................................................. 51 5.2.1.2. Fourier transform infrared spectroscopy (FTIR) ..................................................................... 52 5.2.1.3. Determination of residual moisture content ............................................................................ 52 5.2.1.4. Scanning electron microscopy (SEM)..................................................................................... 52 5.2.1.5. Particle size analysis (PSA) .................................................................................................... 53 5.2.1.6. True density ............................................................................................................................ 53
Table of contents
5.2.1.7. Bulk and tap density................................................................................................................ 53 5.2.1.8. X-ray powder diffraction .......................................................................................................... 54 5.2.1.9. Thermal analysis..................................................................................................................... 55
5.2.1.9.1. Differential scanning calorimetry (DSC) .......................................................................... 55 5.2.1.9.2. Thermogravimetric analysis (TGA).................................................................................. 55 5.2.1.9.3. Hot stage microscopy (HSM)........................................................................................... 55
5.2.1.10. Solubility................................................................................................................................ 55 5.2.1.11. Porosity ................................................................................................................................. 56 5.2.1.12. Intrinsic dissolution rate ........................................................................................................ 56
5.2.2. CBZ dihydrate ................................................................................................................................ 58 5.2.2.1. Preparation of dihydrate.......................................................................................................... 58 5.2.2.2. Characterization of CBZ dihydrate.......................................................................................... 58
5.2.3. Carbamazepine binary mixtures..................................................................................................... 58 5.2.3.1. Preparation of binary mixtures ................................................................................................ 58 5.2.3.2. Tabbletting of binary mixtures................................................................................................. 59 5.2.3.3. Disintegration of binary mixtures............................................................................................. 59 5.2.3.4. Intrinsic dissolution of binary mixtures .................................................................................... 59
5.2.4. Carbamazepine formulations ......................................................................................................... 60 5.2.4.1. Preparation of CBZ formulations............................................................................................. 60 5.2.4.2. Tabletting of CBZ formulations ............................................................................................... 60 5.2.4.3. Tablet strength ........................................................................................................................ 60 5.2.4.4. Disintegration of CBZ formulations ......................................................................................... 60 5.2.4.5. Dissolution............................................................................................................................... 60
6. RESULTS AND DISCUSSION .....................................................................................................61
6.1. Carbamazepine anhydrous................................................................................................................. 61 6.1.1. Identification of carbamazepine raw material................................................................................. 61 6.1.2. FTIR................................................................................................................................................ 62 6.1.3. Synthetic pathways ........................................................................................................................ 64 6.1.4. Morphology..................................................................................................................................... 67 6.1.5. Particle size and particle size distribution ...................................................................................... 70 6.1.6. True density, Bulk and Tapped densities ....................................................................................... 74 6.1.7. X-ray powder diffraction (XRPD).................................................................................................... 75 6.1.8. Thermal analysis ............................................................................................................................ 77
6.1.8.1. Differential scanning calorimetry (DSC).................................................................................. 77 6.1.8.2. Hot stage microscopy (HSM) .................................................................................................. 84 6.1.8.3. Thermogravimetric analysis (TGA) ......................................................................................... 87
6.1.9. Solubility ......................................................................................................................................... 88 6.1.10. Disc intrinsic dissolution ............................................................................................................... 91
Table of contents
6.2. Carbamazepine dihydrate characterization .................................................................................... 106 6.2.1. X-ray powder diffraction of dihydrates.......................................................................................... 107 6.2.2. Loss on drying .............................................................................................................................. 107 6.2.3. Differential scanning calorimetry (DSC) of dihydrates ................................................................. 109 6.2.4. Solubility of dihydrates ................................................................................................................. 112 6.2.5. Disc intrinsic dissolution of dihydrates ......................................................................................... 113
6.3. The influence of particle size on IDR behavior............................................................................... 121 6.4. Binary mixtures.................................................................................................................................. 126
6.4.1. Disintegration of binary mixtures.................................................................................................. 127 6.4.2. Intrinsic dissolution rate of binary mixtures .................................................................................. 129
6.5. Carbamazepine formulations ........................................................................................................... 134
7. CONCLUSIONS .........................................................................................................................141
7.1. How to avoid problems with CBZ? .................................................................................................. 142 7.2. Suggestions for a robust CBZ formulation ...................................................................................... 143
8. REFERENCES ...........................................................................................................................144
9. APPENDIX..................................................................................................................................151
CURRICULUM VITAE ....................................................................................................................156
Summary
1
1. Summary
Carbamazepine (CBZ) is a poorly water soluble drug, classified as class II according to
the Biopharmaceutics Classification System and exhibits at least four polymorphic forms
and a dihydrate. CBZ polymorphs have different crystal structures and exhibit different
melting points, chemical reactivity, solubility and compactibility, all of which can
contribute to the differences in their bioavailability. In aqueous solution, CBZ anhydrous
has ability to convert to dihydrate form, and the kinetic of that conversion is important for
the dissolution of the drug. Commercially available raw material can contain a mixture of
CBZ polymorphs as well as amorphous parts.
The aim of the present study was to investigate the effect of the variability of different
commercially available CBZ samples on the intrinsic dissolution behavior in order to
recommend a strategy to maintain product quality by monitoring the variability of critical
parameters of the bulk drug.
Therefore, extensive physical characterization of nine anhydrous CBZ samples from
three different sources was carried out. Polymorphism (by X-ray powder diffraction -
XRPD and Fourier transformation infrared - FTIR microspectroscopy), thermal behavior
(by differential scanning calorimetry - DSC, hot stage microscopy - HSM), particle
size/particle size distribution, morphology, and solubility were investigated.
The results showed that the commercial anhydrous CBZ samples exhibited the same
polymorphic form, but different morphology, particle size and size distribution, which led
to a variation in the kinetics of conversion from anhydrous to the dihydrate form of CBZ
and therefore to variation in the kinetics of solubility. The detected variability was
suggested to be attributed to variations in the manufacturing processes, such as the use
of different solvents in the crystallization stage and/or grinding of the crystals in the final
stage of the manufacture of CBZ.
Furthermore, disc intrinsic dissolution rate (DIDR) tests of the CBZ samples were
conducted in the order to investigate if the DIDR test can provide information about the
kinetics of conversion of anhydrous CBZ to its dihydrate form. For that purpose,
compacts of pure raw material were prepared using Zwick material tester. The
compacts were imbedded in paraffin leaving only one side free to be exposed to the
dissolution media.
Summary
2
CBZ anhydrous samples showed different intrinsic dissolution behavior. Moreover
examined compacts within one sample have shown high standard deviation. Intrinsic
dissolution parameters were determined with scope to calculate the transition point of
anhydrous to dihydrate conversion for each sample, which was found to vary among the
CBZs obtained from different sources between 15 and 25 minutes.
Carbamazepine dihydrate samples were crystallized from anhydrous samples in order
to be tested on intrinsic dissolution behavior and were characterized by XRPD and DSC
to confirm complete dihydrate formation. It was found that all previously detected
variations between the different samples were significantly reduced, and all nine
samples had constant characteristics. When dihydrate samples were investigated on
intrinsic dissolution behavior, the results showed that deviation within one group of
samples were reduced and the variations between dihydrates prepared from anhydrous
CBZ from different sources did not exist anymore.
Considering that excipients can influence phase transformation of CBZ anhydrous to its
dihydrate form, binary mixtures of CBZ (from different sources) and Fast Flo® lactose
were investigated in this study. Mixtures with different ratios of drug and excipient were
compacted to the same porosity, and disintegration time and intrinsic dissolution
behavior of the produced compacts were studied. The results showed that the selected
excipient had no influence on the anhydrate dihydrate conversion.
As a final step in this study, it was proposed to examine if the results obtained for the
transition point of anhydrous form to dihydrate can be used to predict the dissolution
behavior of CBZ in model formulation. For this purpose, formulations of CBZ were
prepared by direct compaction process using different CBZs and Ludipress®, which
were subsequently analyzed for disintegration time and dissolution. It turned out that the
amount of CBZ dissolved after 15 minutes showed the same order (CBZ B > CBZ A >
CBZ P) being identical to the time event of the transition point determined by intrinsic
dissolution test, meaning CBZ B had the earliest and CBZ P the latest transition point.
Therefore, the intrinsic dissolution test turned out to be a valuable and simple
monitoring tool for characterization of CBZ raw materials, to detect the variability of
primary material, to be employed for the determination of the transition point and to be
used for estimation of CBZ dissolution behavior.
Theoretical section
3
2. Introduction
2.1. PAT
The aim of process analytical technology (PAT) is to understand and control the
manufacturing process which is consistent with the following quality system: quality
should not be tested into products; it should be built-in or should be by design. PAT is a
new concept for designing, analyzing and controlling manufacturing through timely
measurements (i.e. during processing) of critical quality and performance attributes of
raw and in-process materials and also of processes with the goal of ensuring final
product quality (FDA, 2004).
There are many current and new process analytical tools available that enable scientific
and risk-managed pharmaceutical development, manufacture, and quality assurance.
These tools, when used within a system can provide effective and efficient means for
acquiring information to facilitate process understanding, develop risk-mitigation
strategies, achieve continuous improvement, and share information and knowledge. In
the PAT framework, these tools can be categorized as:
- multivariate data acquisition and analysis tools
- modern process analyzers or process analytical chemistry tools
- process and endpoint monitoring and control tools
- continuous improvement and knowledge management tools
A desired goal of the PAT framework is to design and develop processes that can
consistently ensure a predefined quality at the end of the manufacturing process. Such
procedures would be consistent with the basic tenet of quality by design and could
reduce risks to quality and regulatory concerns while improving efficiency. Gains in
quality, safety and/or efficiency will vary depending on the product and are likely to
come from:
- reducing production cycle times by using on-, in-, and/or at-line measurements and
controls
- preventing rejects, scrap, and re-processing
- considering the possibility of real time release
- increasing automation to improve operator safety and reduce human error
Theoretical section
4
- facilitating continuous processing to improve efficiency and manage variability by using
small-scale equipment (to eliminate certain scale-up issues) and dedicated
manufacturing facilities or by improving energy and material use and increasing
capacity (FDA, 2004).
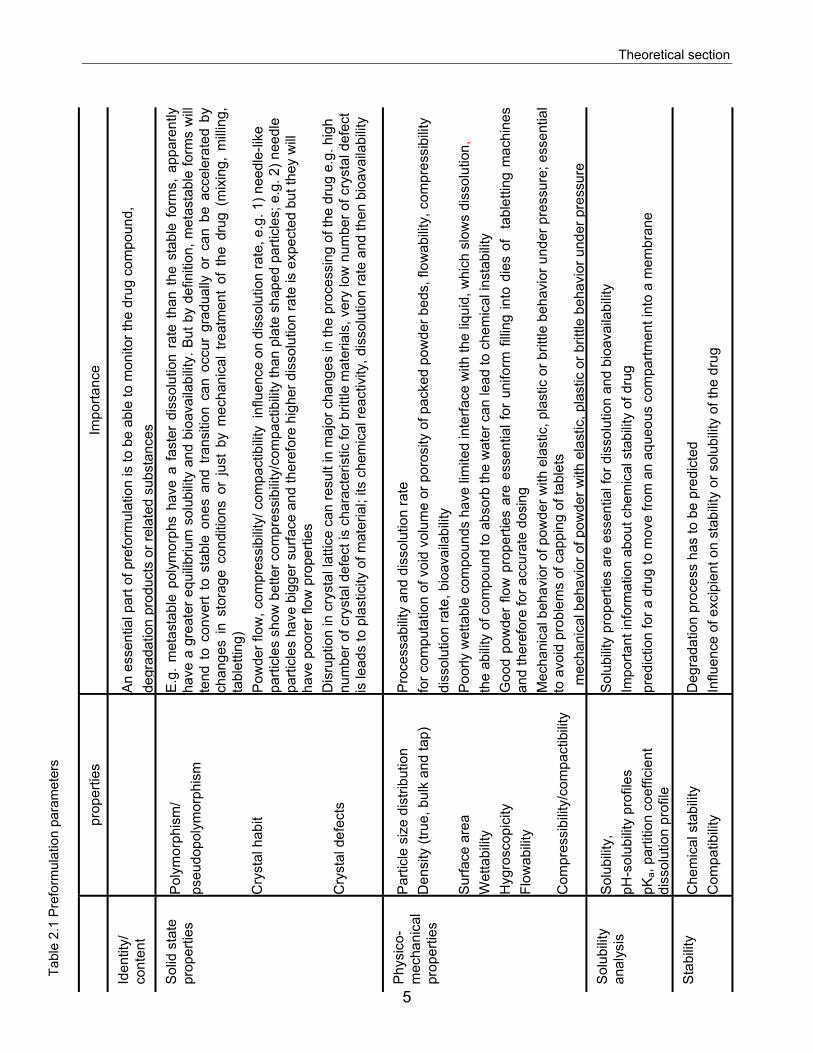
2.2. Preformulation
Preformulation is a stage of drug development during which physicochemical and
mechanical properties of a compound are investigated, understood and effectively
utilized. In other words, the objective of preformulation studies is to develop a portfolio
of information about the drug substance to serve as a set of parameters against which
detailed formulation design can be carried out (Augsburger et al., 2002). Preformulation
investigations are designed to identify those physicochemical properties of drug
substances and excipients that may influence the formulation design, method of
manufacture, and pharmacokinetic-biopharmaceutical properties of the resulting
product. Preformulation studies include the evaluation of different parameters which are
summarized in table 2.1.
Identifying the key issues (critical parameters) prior to development will ultimately
expedite product development minimizing risk-associated mistakes. Preformulation
testing provides the necessary physicochemical and physicomechanical properties of
drug and excipient at the early stage of development to allow a logical, scientific
approach to formulation optimization. The best products can be regarded as being
those that are simple, elegant and robust. There is a greater chance of achieving such a
product if the correct foundations are laid and an understanding of the potential
problems has been obtained by rigorous preformulation testing (Augsburger et al.,
2002).
The term “preformulation studies” is often used for a development of newly synthesized
drug compounds, but it is also an extremely important stage during the development of
generic drugs. For a generic drug to be approved by the authorities it must be shown to
be pharmaceutically equivalent and bioequivalent to the reference drug product.
Pharmaceutically equivalent means the identical amounts of the same active ingredient
in the same dosage form and for the same route of administration.
Theoretical section
5
Impo
rtanc
e
An
esse
ntia
l par
t of p
refo
rmul
atio
n is
to b
e ab
le to
mon
itor t
he d
rug
com
poun
d,
degr
adat
ion
prod
ucts
or r
elat
ed s
ubst
ance
s
E.g
. m
etas
tabl
e po
lym
orph
s ha
ve a
fas
ter
diss
olut
ion
rate
tha
n th
e st
able
for
ms,
app
aren
tlyha
ve a
gre
ater
equ
ilibriu
m s
olub
ility
and
bioa
vaila
bilit
y. B
ut b
y de
finiti
on, m
etas
tabl
e fo
rms
will
tend
to
conv
ert
to s
tabl
e on
es a
nd t
rans
ition
can
occ
ur g
radu
ally
or
can
be a
ccel
erat
ed b
ych
ange
s in
sto
rage
con
ditio
ns o
r ju
st b
y m
echa
nica
l tre
atm
ent
of t
he d
rug
(mix
ing,
milli
ng,
tabl
ettin
g)
Pow
der f
low
, com
pres
sibi
lity/
com
pact
ibili
ty i
nflu
ence
on
diss
olut
ion
rate
, e.g
. 1) n
eedl
e-lik
e pa
rticl
es s
how
bet
ter c
ompr
essi
bilit
y/co
mpa
ctib
ility
than
pla
te s
hape
d pa
rticl
es; e
.g. 2
) nee
dle
parti
cles
hav
e bi
gger
sur
face
and
ther
efor
e hi
gher
dis
solu
tion
rate
is e
xpec
ted
but t
hey
will
ha
ve p
oore
r flo
w p
rope
rties
D
isru
ptio
n in
cry
stal
latti
ce c
an re
sult
in m
ajor
cha
nges
in th
e pr
oces
sing
of t
he d
rug
e.g.
hig
h nu
mbe
r of c
ryst
al d
efec
t is
char
acte
ristic
for b
rittle
mat
eria
ls, v
ery
low
num
ber o
f cry
stal
def
ect
is le
ads
to p
last
icity
of m
ater
ial;
its c
hem
ical
reac
tivity
, dis
solu
tion
rate
and
then
bio
avai
labi
lity
Pro
cess
abili
ty a
nd d
isso
lutio
n ra
te
for c
ompu
tatio
n of
voi
d vo
lum
e or
por
osity
of p
acke
d po
wde
r bed
s, fl
owab
ility
, com
pres
sibi
lity
diss
olut
ion
rate
, bio
avai
labi
lity
Poo
rly w
etta
ble
com
poun
ds h
ave
limite
d in
terfa
ce w
ith th
e liq
uid,
whi
ch s
low
s di
ssol
utio
n,
the
abilit
y of
com
poun
d to
abs
orb
the
wat
er c
an le
ad to
che
mic
al in
stab
ility
G
ood
pow
der
flow
pro
perti
es a
re e
ssen
tial f
or u
nifo
rm fi
lling
into
die
s of
ta
blet
ting
mac
hine
san
d th
eref
ore
for a
ccur
ate
dosi
ng
Mec
hani
cal b
ehav
ior o
f pow
der w
ith e
last
ic, p
last
ic o
r brit
tle b
ehav
ior u
nder
pre
ssur
e; e
ssen
tial
to a
void
pro
blem
s of
cap
ping
of t
able
ts
mec
hani
cal b
ehav
ior o
f pow
der w
ith e
last
ic, p
last
ic o
r brit
tle b
ehav
ior u
nder
pre
ssur
e
Sol
ubili
ty p
rope
rties
are
ess
entia
l for
dis
solu
tion
and
bioa
vaila
bilit
y Im
porta
nt in
form
atio
n ab
out c
hem
ical
sta
bilit
y of
dru
g pr
edic
tion
for a
dru
g to
mov
e fro
m a
n aq
ueou
s co
mpa
rtmen
t int
o a
mem
bran
e
Deg
rada
tion
proc
ess
has
to b
e pr
edic
ted
Influ
ence
of e
xcip
ient
on
stab
ility
or s
olub
ility
of th
e dr
ug
prop
ertie
s
Pol
ymor
phis
m/
pseu
dopo
lym
orph
ism
C
ryst
al h
abit
C
ryst
al d
efec
ts
Par
ticle
siz
e di
strib
utio
n D
ensi
ty (t
rue,
bul
k an
d ta
p)
Sur
face
are
a W
etta
bilit
y
Hyg
rosc
opic
ity
Flow
abili
ty
Com
pres
sibi
lity/
com
pact
ibili
ty
Sol
ubili
ty,
pH-s
olub
ility
pro
files
pK
a, pa
rtitio
n co
effic
ient
di
ssol
utio
n pr
ofile
Che
mic
al s
tabi
lity
Com
patib
ility
Iden
tity/
co
nten
t
Sol
id s
tate
pr
oper
ties
Phy
sico
-m
echa
nica
l pr
oper
ties
Sol
ubili
ty
anal
ysis
Sta
bilit
y
Tabl
e 2.
1 P
refo
rmul
atio
n pa
ram
eter
s
Introduction
6
Bioequivalence is defined as the absence of a significant difference in the bioavailability
of the drug when administered at the same molar dose under similar conditions.
The development of a drug formulation for the commercial market requires a
tremendous effort in order to assure constant quality of the product, i.e. its ability to
deliver the therapeutic effect for which it was intended.
The generic industry relies in major part on the publicly available information and
through literature research it tries to minimize unnecessary experimentation.
Unfortunately sometimes only small amount of data is available and if the
preformulation studies are not conducted formulators must rely on their experience to
predictions based on the reactivity of the functional groups present in the active
pharmaceutical ingredient (API) and thus they design a product using excipient that will
minimize the anticipated degradation.
Variability in the properties of the primary materials, both active and excipients can
“spoil” the enormous effort spent on the development if the effects of such variability are
not well understood.
Since many of generic companies are not synthesizing active ingredients for their
formulation, they are directly dependent on drug producers. As the formulator cannot
rely only on the specification provided by the supplier of bulk drug, preformulation
studies in that case are extremely important during selection of the best raw material for
the formulation of the dosage form and the most reliable manufacturer which will
provide the active materials of consistently high quality and without batch to batch
variation. Moreover, the generic product manufacturer must sometimes change the
source of bulk drug due to market fluctuation. Hence, it is necessary to specify the
critical parameters for each drug which will be monitored in order to control variability
during the selection of new raw materials if there is a need for it.
Theoretical section
7
3. Theoretical section
3.1. Crystal Structure
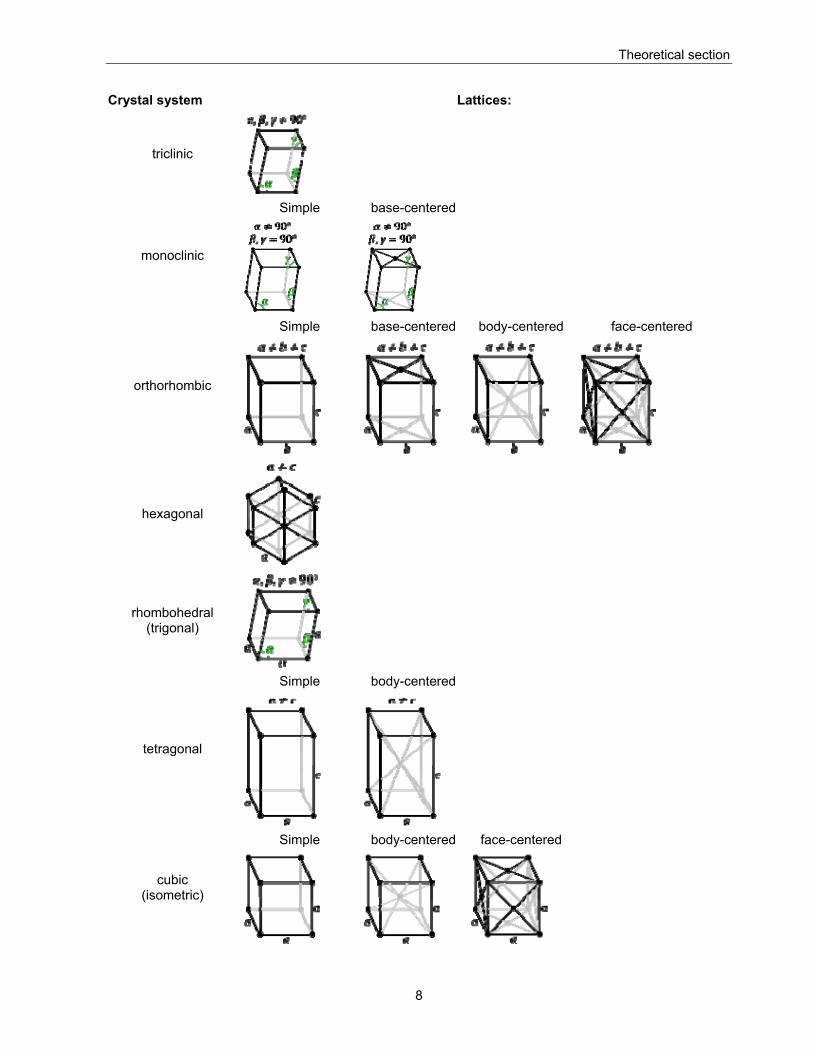
Crystal is a solid in which the constituent atoms, molecules or ions are packed in
regularly ordered, repeating pattern extending in all dimensions. The three-dimensional
geometric arrangement of atoms, molecules or ions (unit cells) composing a crystal is
called crystal lattice. In the solid state, the atoms of a molecule may be arranged in one
of seven fundamental unit cells: triclinic, monoclinic, orthorhombic, tetragonal, trigonal,
hexagonal or cubic (Brittain, 1999, Florence et al., 1998). These seven types of unit
cells may have atoms or molecules not only at each corner of the unit cell but certain of
them may also have unit cell with atoms or molecules at the center of the top and
bottom faces, end-centered (monoclinic and orthorhombic), at the center of every face,
face-centered (cubic and orthorhombic) or with a single atom in the center of the crystal
body-centered (cubic, tetragonal or orthorhombic). All together there are 14 possible
types of unit cell - Bravais lattices. All the crystalline forms which are known in organic
or inorganic chemistry may be encountered (figure 3.2) (Brittain,1999).
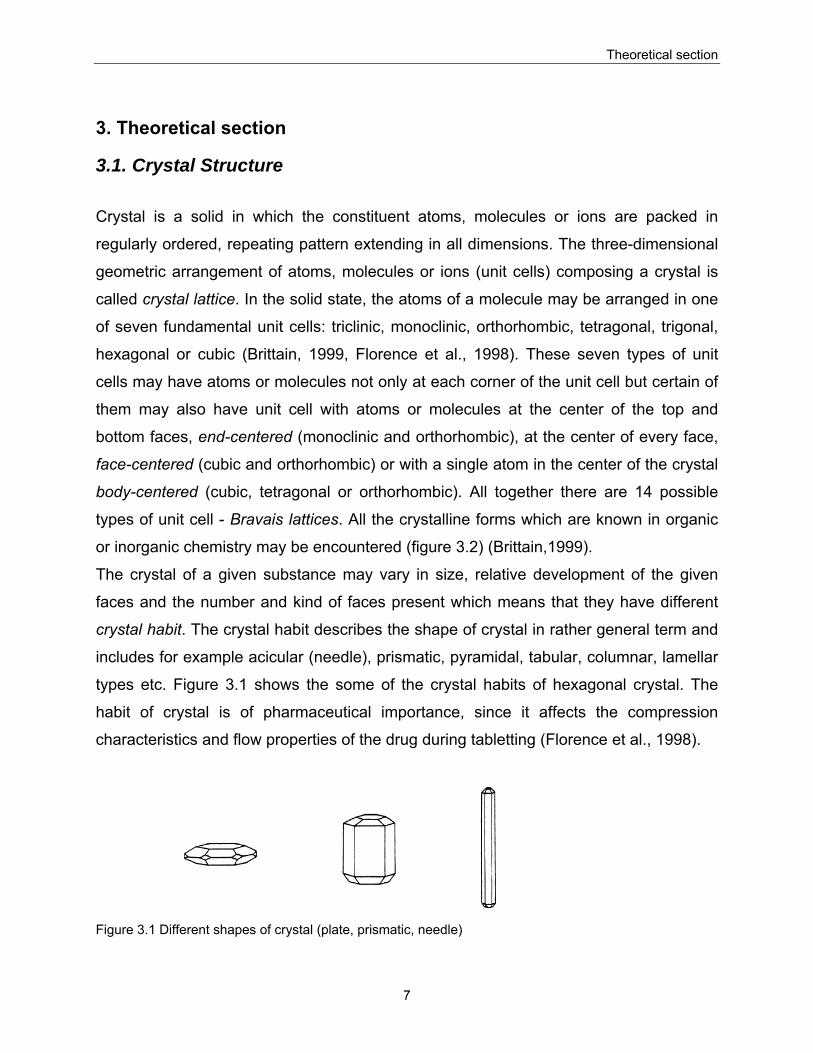
The crystal of a given substance may vary in size, relative development of the given
faces and the number and kind of faces present which means that they have different
crystal habit. The crystal habit describes the shape of crystal in rather general term and
includes for example acicular (needle), prismatic, pyramidal, tabular, columnar, lamellar
types etc. Figure 3.1 shows the some of the crystal habits of hexagonal crystal. The
habit of crystal is of pharmaceutical importance, since it affects the compression
characteristics and flow properties of the drug during tabletting (Florence et al., 1998).
Figure 3.1 Different shapes of crystal (plate, prismatic, needle)
Theoretical section
8
Crystal system Lattices:
triclinic
Simple base-centered
monoclinic
Simple base-centered body-centered face-centered
orthorhombic
hexagonal
rhombohedral (trigonal)
Simple body-centered
tetragonal
Simple body-centered face-centered
cubic (isometric)
Theoretical section
9
3.2. Polymorphism
Many pharmaceutical solids can exist in different physical forms. Polymorphism may be
defined as the ability of a compound to crystallize in two or more crystalline phases with
different arrangements and/or conformations of the molecule in the crystal lattice.
Therefore, polymorphs are different crystalline forms of the same pure chemical
compound. The phenomenon of polymorphism in molecular crystals is analogous to
allotropism among elements (Grant, 1989).
Solvates (pseudo-polymorphs) are crystalline solid adducts containing either
stoichiometric or nonstoichiometric amounts of a solvent incorporated within the crystal
structure. If the incorporated solvent is water, the solvates are also commonly known as
hydrates (Grant, 1989).
Hydrates are the most important subclass of solvates. They can be classified into three
categories (Vippaguanta et al., 2001):
- isolated site hydrates, where the water molecules are isolated from direct contact
with other water molecules by drug molecules,
- channel hydrates, where the water molecules are located next to each other
along one direction in the lattice, forming “channels” trough the crystal,
- ion associated hydrates, which contain metal ion coordinated water.
In hydrates, water occupies definite position in the crystal lattice, usually by forming
hydrogen bonds with the anhydrate molecules. The stability of hydrates, beside by
pressure and temperature, is governed by the water activity of the environment and the
intermolecular bonding and arrangement of molecules in the lattice. The critical water
activity determines whether the stable form is the anhydrate or the hydrate one.
Grant and Higuchi have established the following relationship to describe the
equilibrium between a hydrate and anhydrate (Grant et al., 1990):
)()( 22 solidOmHAOmHsolidA ⋅↔+ Equation 3.1
Theoretical section
10
[ ][ ] [ ]mh OHasolidAa
solidOmHAaK2
2
)()(⋅
= Equation 3.2
where:
Kh is the equilibrium constant for the process,
[ ])(2 solidOmHAa ⋅ , [ ])(solidAa ⋅ and [ ]OHa 2 are thermodynamic activities of the hydrate,
the anhydrate and water,
m is the number of water moles taken up by one mole of the anhydrate.
When [ ] [ ][ ][ ] mhKsolidAasolidOmHAaOHa /1
22 )(/)(⋅> , the more stable form is hydrate
(Grant et al., 1990).
In other words, hydrates are more stable than their anhydrate counterparts at conditions
below dehydration temperature and above critical water activity, such as high humidity
or saturated solution. Isolated hydrates usually dehydrate at relatively high temperature.
The dehydration process of such hydrates is destructive for the crystal since it requires
rearrangement of the molecules in the unit cell in order to allow water molecules to
escape the lattice.
Channel hydrates usually dehydrate at lower temperatures than isolated site hydrates.
In ion associated hydrates the bonding between the metal ion and water molecule can
be strong, which results in very high dehydration temperature (Aaltonen, 2007).
Many pharmaceutical solids can exist in a not crystalline form - amorphous form.
Amorphous solids consist of disordered arrangements of molecules and do not possess
a distinguishable crystal lattice nor unit cell and consequently have zero crystallinity. In
amorphous forms, the molecules display no long-range order, although the short-range
intermolecular forces give rise to the short-range order typical of that between nearest
neighbors. Thermodynamically, the absence of stabilizing lattice energy causes the
molar internal energy or molar enthalpy of the amorphous form to exceed that of the
crystalline state (Grant, 1989). The name “glassy state” is given to amorphous products
which liquefy by undergoing a glass transition.
Theoretical section
11
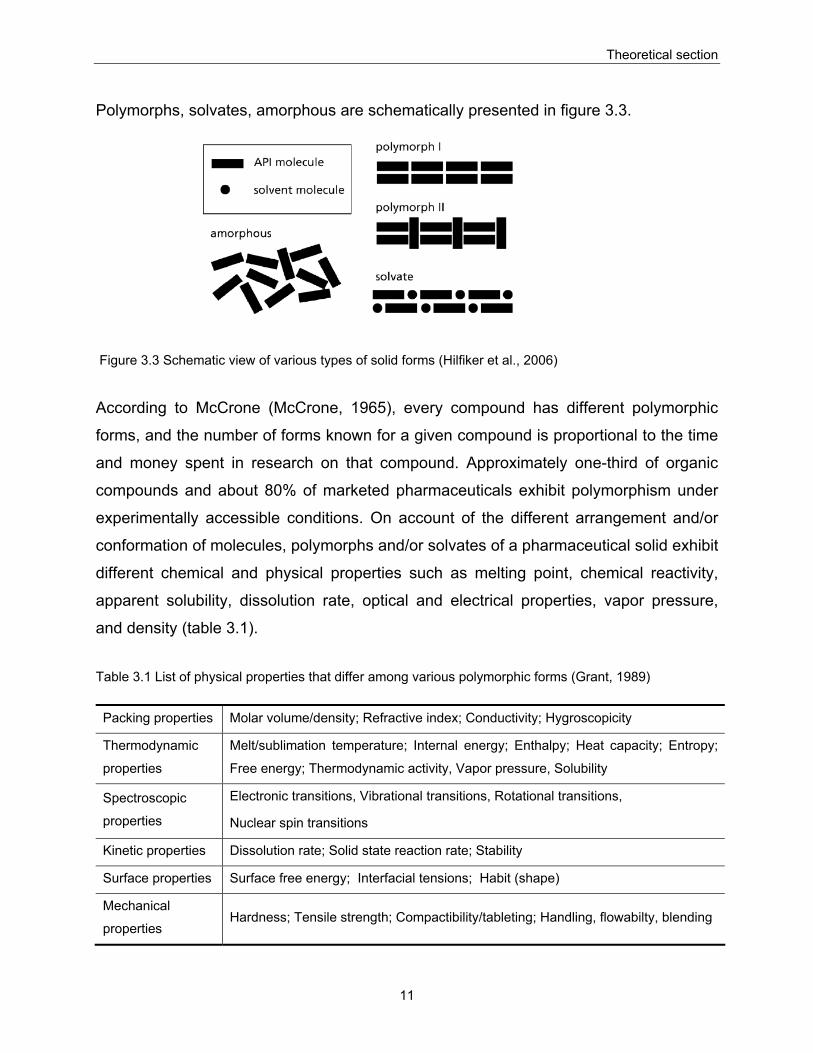
Polymorphs, solvates, amorphous are schematically presented in figure 3.3.
Figure 3.3 Schematic view of various types of solid forms (Hilfiker et al., 2006)
According to McCrone (McCrone, 1965), every compound has different polymorphic
forms, and the number of forms known for a given compound is proportional to the time
and money spent in research on that compound. Approximately one-third of organic
compounds and about 80% of marketed pharmaceuticals exhibit polymorphism under
experimentally accessible conditions. On account of the different arrangement and/or
conformation of molecules, polymorphs and/or solvates of a pharmaceutical solid exhibit
different chemical and physical properties such as melting point, chemical reactivity,
apparent solubility, dissolution rate, optical and electrical properties, vapor pressure,
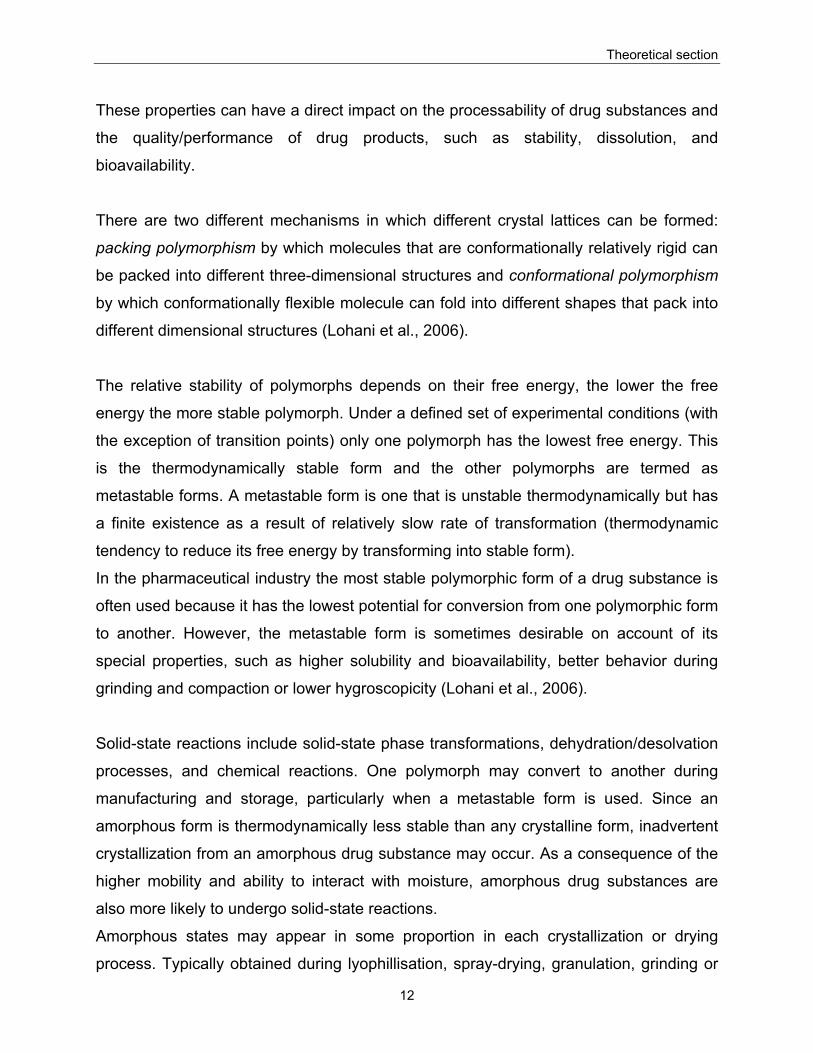
and density (table 3.1).
Table 3.1 List of physical properties that differ among various polymorphic forms (Grant, 1989)
Packing properties Molar volume/density; Refractive index; Conductivity; Hygroscopicity
Thermodynamic
properties
Melt/sublimation temperature; Internal energy; Enthalpy; Heat capacity; Entropy;
Free energy; Thermodynamic activity, Vapor pressure, Solubility
Spectroscopic
properties
Electronic transitions, Vibrational transitions, Rotational transitions,
Nuclear spin transitions
Kinetic properties Dissolution rate; Solid state reaction rate; Stability
Surface properties Surface free energy; Interfacial tensions; Habit (shape)
Mechanical
properties Hardness; Tensile strength; Compactibility/tableting; Handling, flowabilty, blending
Theoretical section
12
These properties can have a direct impact on the processability of drug substances and
the quality/performance of drug products, such as stability, dissolution, and
bioavailability.
There are two different mechanisms in which different crystal lattices can be formed:
packing polymorphism by which molecules that are conformationally relatively rigid can
be packed into different three-dimensional structures and conformational polymorphism
by which conformationally flexible molecule can fold into different shapes that pack into
different dimensional structures (Lohani et al., 2006).
The relative stability of polymorphs depends on their free energy, the lower the free
energy the more stable polymorph. Under a defined set of experimental conditions (with
the exception of transition points) only one polymorph has the lowest free energy. This
is the thermodynamically stable form and the other polymorphs are termed as
metastable forms. A metastable form is one that is unstable thermodynamically but has
a finite existence as a result of relatively slow rate of transformation (thermodynamic
tendency to reduce its free energy by transforming into stable form).
In the pharmaceutical industry the most stable polymorphic form of a drug substance is
often used because it has the lowest potential for conversion from one polymorphic form
to another. However, the metastable form is sometimes desirable on account of its
special properties, such as higher solubility and bioavailability, better behavior during
grinding and compaction or lower hygroscopicity (Lohani et al., 2006).
Solid-state reactions include solid-state phase transformations, dehydration/desolvation
processes, and chemical reactions. One polymorph may convert to another during
manufacturing and storage, particularly when a metastable form is used. Since an
amorphous form is thermodynamically less stable than any crystalline form, inadvertent
crystallization from an amorphous drug substance may occur. As a consequence of the
higher mobility and ability to interact with moisture, amorphous drug substances are
also more likely to undergo solid-state reactions.
Amorphous states may appear in some proportion in each crystallization or drying
process. Typically obtained during lyophillisation, spray-drying, granulation, grinding or
Theoretical section
13
milling, the amorphous form is responsible for the higher reactivity of some batches
(Giron, 1995).
Phase conversions of one polymorphic form to another one are possible when exposed
to a range of manufacturing processes. Milling/micronization operations may result in
polymorphic form conversion of a drug substance. In the case of wet granulation
processes, where the usual solvents are aqueous, one may encounter a variety of
interconversions between anhydrates and hydrates, or between different hydrates.
Spray-drying processes have been shown to produce amorphous drug substances
(Hilfiker et al., 2006).
3.2.1. Thermodynamics of polymorphs The relationship between different phases of a substance is governed by Gibbs’s phase
rule (Britain, 1999, Giron, 1995):
2+=+ CFP Equation 3.3
where:
C is the number of components,
P is the number of phases that exist in equilibrium,
F is the number of degrees of freedom.
In the case of single substances exhibiting polymorphism, C equals unity. If one phase
(polymorph) is present, P = 1, F = 2. If F = 2 means that both temperature and pressure
may be varied without changing number of phases. If two phases (polymorphs) are in
equilibrium (P=2), the variance F=1, means that at chosen pressure, the temperature of
the system is fixed at the transition temperature (Tt). The conclusion of Gibb's phase
rule is that only one phase (polymorph) can exist at a any given temperature and
pressure, except the transition temperature, in which case at defined pressure, usually
atmospheric one, two phases (polymorphs) exist in equilibrium.
Theoretical section
14
The process of transformation of one polymorph into another is phase transition and
according to the phase rule may occur at given pressure by changing the temperature.
If the phase transition is reversible, two polymorphs are enantiotropes and energy
transition on heating is endothermic. If the phase transition is not reversible, the
polymorphs are monotropes, in which case only one form is stable whatever the
temperature and the transformation of unstable form to the stable one is exothermic.
For kinetic reason, an unstable form may exist for time outside the region assigned by
the phase diagram and the phase rule, and it is termed as metastable form (Britain,
1999, Giron, 2001, Giron, 1995).
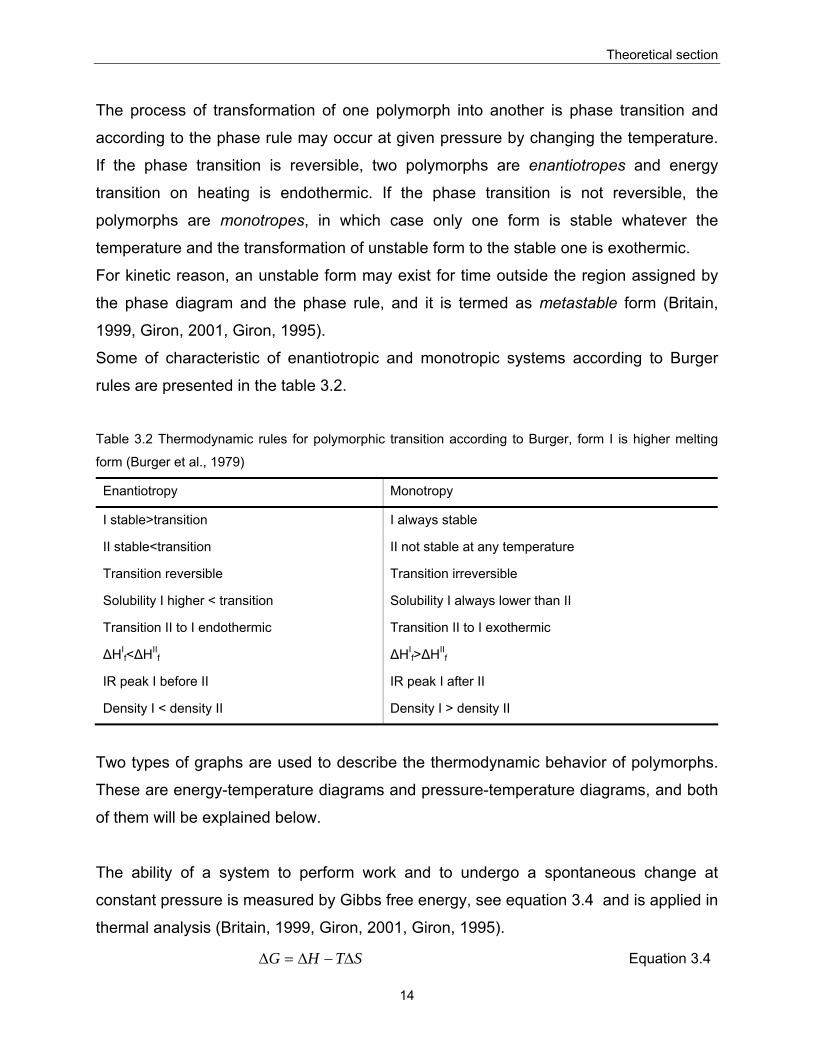
Some of characteristic of enantiotropic and monotropic systems according to Burger
rules are presented in the table 3.2.
Table 3.2 Thermodynamic rules for polymorphic transition according to Burger, form I is higher melting
form (Burger et al., 1979)
Enantiotropy Monotropy
I stable>transition I always stable
II stable<transition II not stable at any temperature
Transition reversible Transition irreversible
Solubility I higher < transition Solubility I always lower than II
Transition II to I endothermic Transition II to I exothermic
ΔHIf<ΔHII
f ΔHIf>ΔHII
f
IR peak I before II IR peak I after II
Density I < density II Density I > density II
Two types of graphs are used to describe the thermodynamic behavior of polymorphs.
These are energy-temperature diagrams and pressure-temperature diagrams, and both
of them will be explained below.
The ability of a system to perform work and to undergo a spontaneous change at
constant pressure is measured by Gibbs free energy, see equation 3.4 and is applied in
thermal analysis (Britain, 1999, Giron, 2001, Giron, 1995).
STHG Δ−Δ=Δ Equation 3.4
Theoretical section
15
where:
G is Gibbs free energy (J)
H is enthalpy (J),
T is temperature (K) and
S is entropy of system (JK-1).
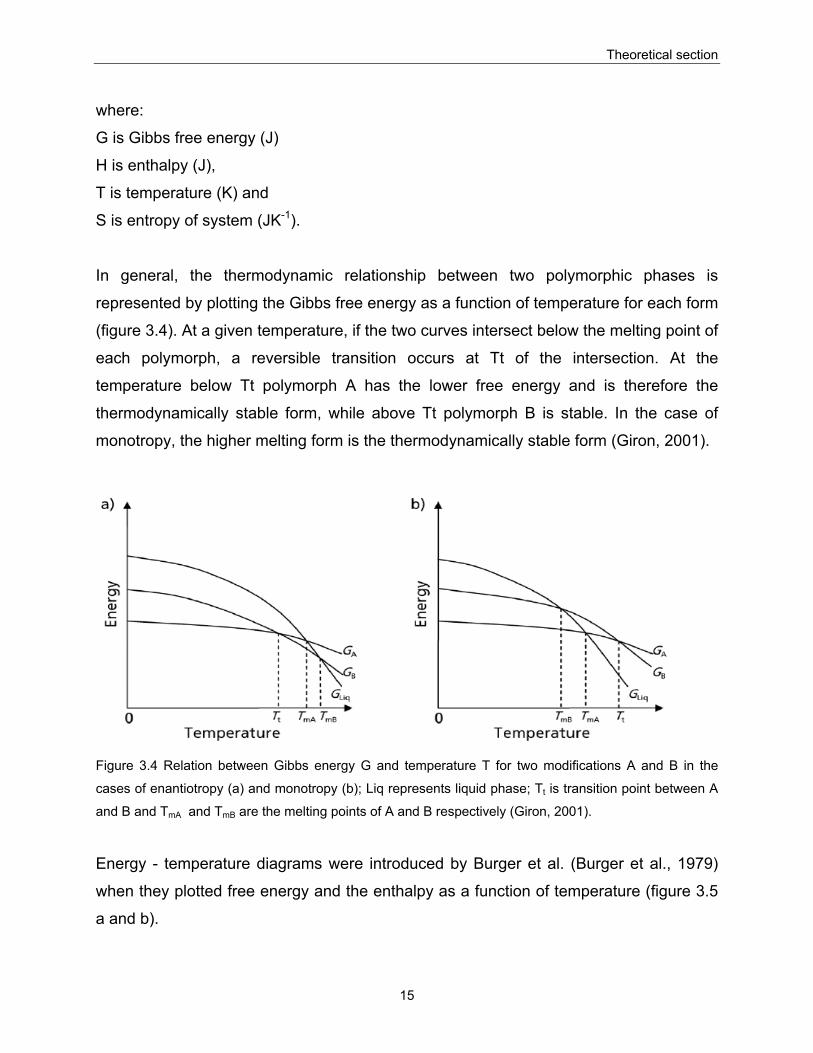
In general, the thermodynamic relationship between two polymorphic phases is
represented by plotting the Gibbs free energy as a function of temperature for each form
(figure 3.4). At a given temperature, if the two curves intersect below the melting point of
each polymorph, a reversible transition occurs at Tt of the intersection. At the
temperature below Tt polymorph A has the lower free energy and is therefore the
thermodynamically stable form, while above Tt polymorph B is stable. In the case of
monotropy, the higher melting form is the thermodynamically stable form (Giron, 2001).
Figure 3.4 Relation between Gibbs energy G and temperature T for two modifications A and B in the
cases of enantiotropy (a) and monotropy (b); Liq represents liquid phase; Tt is transition point between A
and B and TmA and TmB are the melting points of A and B respectively (Giron, 2001).
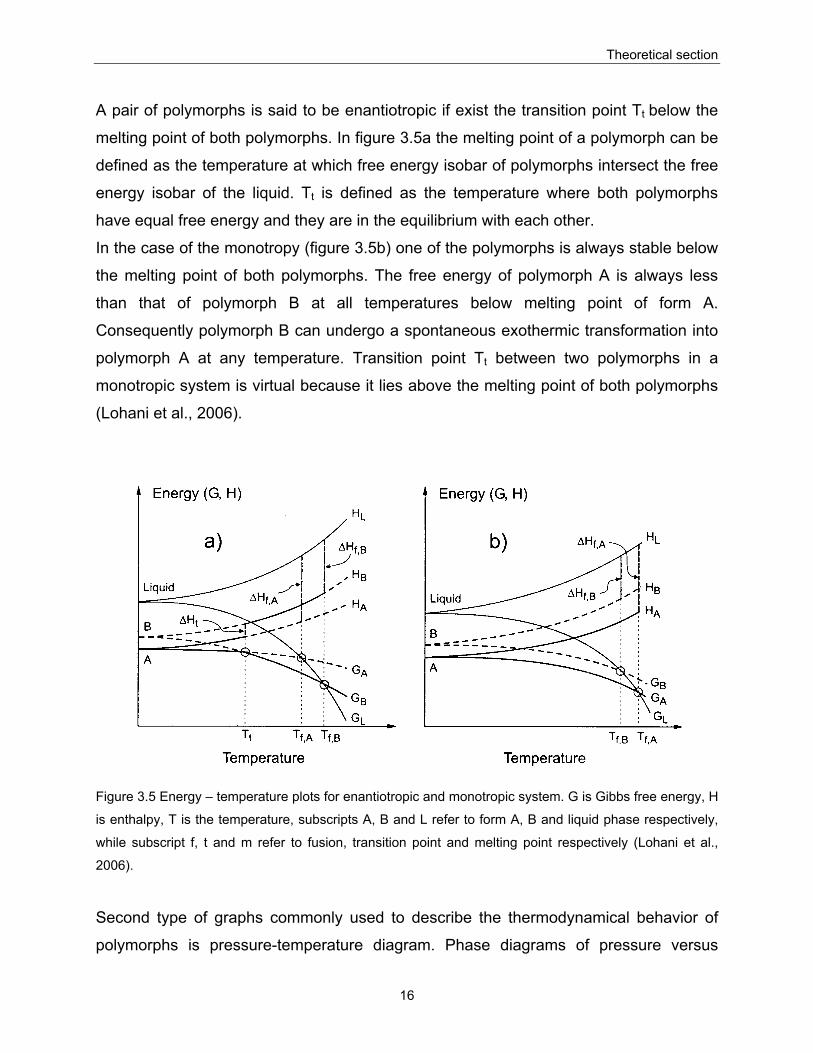
Energy - temperature diagrams were introduced by Burger et al. (Burger et al., 1979)
when they plotted free energy and the enthalpy as a function of temperature (figure 3.5
a and b).
Theoretical section
16
A pair of polymorphs is said to be enantiotropic if exist the transition point Tt below the
melting point of both polymorphs. In figure 3.5a the melting point of a polymorph can be
defined as the temperature at which free energy isobar of polymorphs intersect the free
energy isobar of the liquid. Tt is defined as the temperature where both polymorphs
have equal free energy and they are in the equilibrium with each other.
In the case of the monotropy (figure 3.5b) one of the polymorphs is always stable below
the melting point of both polymorphs. The free energy of polymorph A is always less
than that of polymorph B at all temperatures below melting point of form A.
Consequently polymorph B can undergo a spontaneous exothermic transformation into
polymorph A at any temperature. Transition point Tt between two polymorphs in a
monotropic system is virtual because it lies above the melting point of both polymorphs
(Lohani et al., 2006).
Figure 3.5 Energy – temperature plots for enantiotropic and monotropic system. G is Gibbs free energy, H
is enthalpy, T is the temperature, subscripts A, B and L refer to form A, B and liquid phase respectively,
while subscript f, t and m refer to fusion, transition point and melting point respectively (Lohani et al.,
2006).
Second type of graphs commonly used to describe the thermodynamical behavior of
polymorphs is pressure-temperature diagram. Phase diagrams of pressure versus
Theoretical section
17
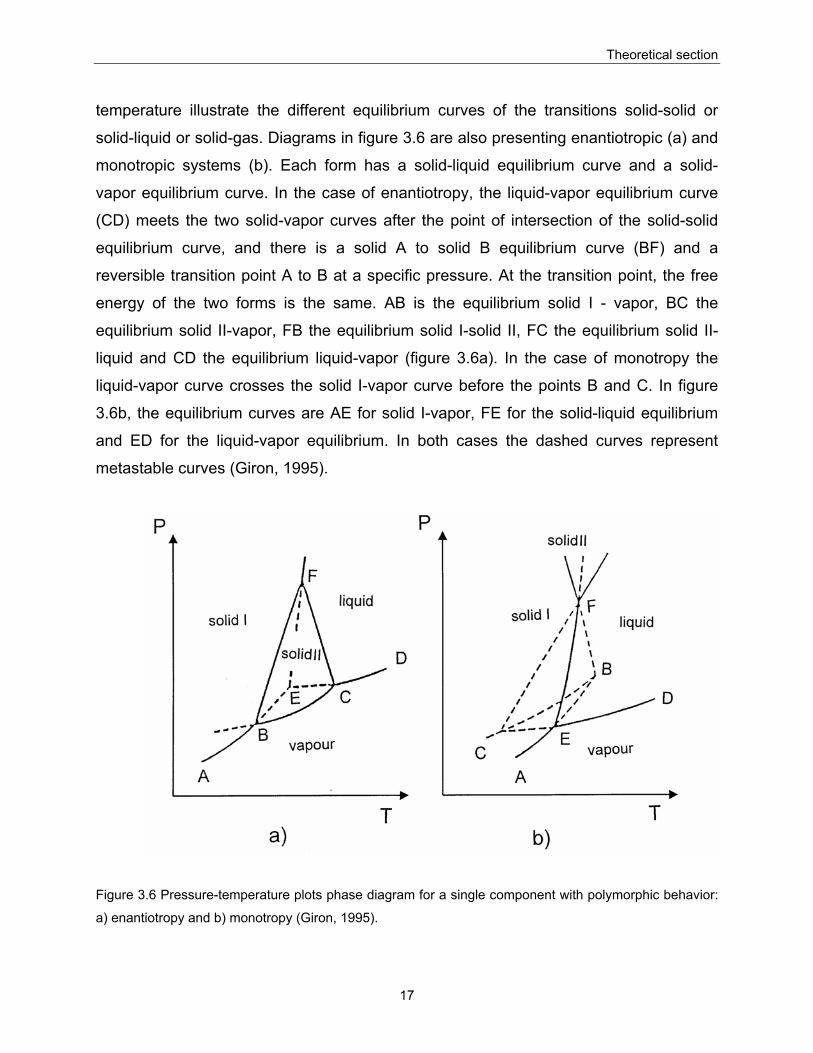
temperature illustrate the different equilibrium curves of the transitions solid-solid or
solid-liquid or solid-gas. Diagrams in figure 3.6 are also presenting enantiotropic (a) and
monotropic systems (b). Each form has a solid-liquid equilibrium curve and a solid-
vapor equilibrium curve. In the case of enantiotropy, the liquid-vapor equilibrium curve
(CD) meets the two solid-vapor curves after the point of intersection of the solid-solid
equilibrium curve, and there is a solid A to solid B equilibrium curve (BF) and a
reversible transition point A to B at a specific pressure. At the transition point, the free
energy of the two forms is the same. AB is the equilibrium solid I - vapor, BC the
equilibrium solid II-vapor, FB the equilibrium solid I-solid II, FC the equilibrium solid II-
liquid and CD the equilibrium liquid-vapor (figure 3.6a). In the case of monotropy the
liquid-vapor curve crosses the solid I-vapor curve before the points B and C. In figure
3.6b, the equilibrium curves are AE for solid I-vapor, FE for the solid-liquid equilibrium
and ED for the liquid-vapor equilibrium. In both cases the dashed curves represent
metastable curves (Giron, 1995).
Figure 3.6 Pressure-temperature plots phase diagram for a single component with polymorphic behavior:
a) enantiotropy and b) monotropy (Giron, 1995).
Theoretical section
18
3.2.2. Phase mechanism and transformation The solid-state properties of the API and the excipients must be understood in order to
ensure consistent product performance. During product development it is necessary to
identify the solid phases and recognize the transitions among them under relevant
conditions. Knowledge of the mechanism of phase transitions becomes helpful in
identifying the potential for such transitions and the factors affecting their kinetics which
allows then rational formulation design and the selection of robust processes to ensure
consistent product manufacturing and performance (Zhang et al., 2004).
There are four different underlying mechanisms for phase transformation:
- solid – state
- melt
- solution
- solution – mediated
Phase transitions which occur in the solid-state without passing through intervening
transient liquid or vapor phases are defined to have solid state mechanism. In general,
the kinetics of phase transition via a solid-state mechanism is influenced by the
environment (T, P, RH, etc.), the presence of crystalline defects, particle size and
distribution, and impurities (Van Campen et al., 1984).
By melting mechanism it is considered when a compound is heated above its melting
point, and then subsequently cooled back to the ambient temperatures and the original
solid phase may not be regenerated. In this case the phase transition may occur
through heating/cooling cycle. Among the factors determining the final solid phase are
the relative rates of nucleation, crystal growth, and cooling. Impurities or excipients are
also likely to affect the course of crystallization (Zhang et al., 2004).
If the drug is dissolved or partially dissolved in a solvent during processing and if
subsequent solvent removal induces a transformation, this transformation mechanism is
considered as solution mechanism. The final solid may be a single phase or a mixture
of amorphous and crystal forms depending on the rate of solvent removal, the ease of
nucleation and crystal growth of the possible crystal forms under the processing
conditions. It is important to note that the transition can be from a metastable phase to
the stable phase or from the stable phase to one or more metastable phases (Zhang et
al., 2004).
Theoretical section
19
As opposed to the solution mechanism, the solution-mediated mechanism only allows
the transition from a metastable phase to the stable phase. This type of transformation
is driven by the difference in solubility between the two phases. In contrast to the
solution mechanism where transformation occurs during drying, the solution-mediated
mechanism operates when the metastable phase is in contact with the saturated
solution. Three steps are involved in a solution-mediated transformation (Rodríguez-
Hornedo et al., 1992): 1) initial dissolution of the metastable phase into the solution to
reach and exceed the solubility of the stable phase; 2) nucleation of the stable phase; 3)
crystal growth of the stable phase coupled with the continuous dissolution of the
metastable phase.
If step 2 is rate-determining any factor that affects nucleation (solubility, solubility
difference between the phases, temperature, contact surfaces, agitation, and soluble
excipients/impurities) will influence the overall transformation. When step 3 is the rate-
controlling step, the kinetics of the conversion is determined by solubility difference,
solid/solvent ratio, agitation, process temperature, particle size of the original phase,
and soluble excipients/impurities.
These four general phase mechanisms can lead to three classes of phase transitions:
polymorphic, hydration/dehydration, and vitrification/amorphous crystallization (Zhang et
al., 2004).
The term polymorphic transition refers to the interconversion among polymorphic forms.
As it was already discussed above, the stability relationship between a pair of
polymorphs can be categorized as monotropic or enantiotropic. Only one polymorph is
stable throughout the temperature range for a monotropic system.
In the case of a monotropic system, a metastable polymorph can undergo a
polymorphic transition to the stable polymorph during processing via all four
mechanisms. In the solid-state these transitions are kinetically prevented due to
molecular mobility. Stressing such systems either with heat or mechanical forces
(drying, milling, or compaction) accelerates the transition to the stable polymorph. When
the drug loading is low and the solubility in the processing solvent is high,
transformation to a different solid phase via the solution mechanism is likely. On the
other hand, the solution-mediated mechanism is more likely to occur if a high drug load
Theoretical section
20
formulation is wet granulated and the solubility of the drug in the processing solvent is
low. Polymorphic transitions from the stable to the metastable polymorph can only
proceed via the melt or solution mechanisms (Zhang et al., 2004).
In the case of an enantiotropic system, if the temperature is raised above the transition
temperature Tt, polymorphic transitions between the two phases can proceed via any of
the four mechanisms. It has to be notes that for transitions that proceed via the solid-
state mechanism, super-heating is much less likely than super-cooling near the Tt,
because of the large temperature dependence of molecular mobility. Therefore,
conversion to the low-temperature metastable form and thus the high-temperature
stable form at temperatures above the Tt upon heating may not be reversed during
cooling.
For both monotropic and enantiotropic systems, a sequence of phase transitions is
often responsible for an overall polymorphic transition. For instance, a process may
begin with hydration and then proceed through dehydration, or begin with vitrification
and then proceed through crystallization (Zhang et al., 2004).
Hydration/dehydration is the type of transition which can be described as the conversion
between crystalline anhydrates and hydrates, and between lower hydrates and higher
hydrates. At constant temperature, one crystal form is stable over a range of water
activities (or relative humidities, RH). At the critical water activities, the
anhydrate/hydrate or lower hydrate/higher hydrate pairs can coexist. With increasing
temperature, the critical water activity usually shifts to a lower value because of the
endothermic nature of dehydration.
Hydration typically proceeds via solution or solution-mediated mechanisms. Sometimes
for channel-type hydrates hydration may proceed via the solid-state mechanism.
Dehydration can proceed via solid-state, solution, and occasionally via the melt
mechanism. In the case when a nonaqueous solvent is used this process may occur by
the solution-mediated mechanism. Mechanical treatments, such as milling, tend to
accelerate the kinetics of dehydration by generating surface/defects and by local
heating.
Vitrification and amorphous crystallization correspond to the interconversion between
the amorphous phase and crystalline polymorphs or hydrates. The amorphous phase,
Theoretical section
21
as being non stable one, is always disposed to crystallization at all temperatures, via
solid-state, solution, or solution-mediated mechanisms.
Vitrification, which is a transition from a crystalline to an amorphous phase often
proceeds via melt and solution mechanisms. In both mechanisms, the crystal nucleation
or growth rates are slow compared with the rate of cooling or solvent evaporation.
Vitrification may also proceed via the solid-state mechanism under mechanical stresses
and upon dehydration (Zhang et al., 2004).
3.3. Characterization of Polymorphs
A number of methods have been employed for characterizing polymorphs in
pharmaceutical solids. Of all methods available for the physical characterization of solid
materials, it is generally agreed that crystallography, microscopy, thermal analysis,
solubility studies, vibrational spectroscopy and nuclear magnetic resonance are the
most useful.
3.3.1. X – ray diffraction The x-ray crystallography technique whether performed using single crystals or
powdered solids is concerned mainly with structural analysis and is therefore eminently
suited for the characterization of polymorphs and solvates.
Diffraction is a scattering phenomenon. When x-rays are incident on the crystalline
solids, they are scattered in all direction. In some of these directions, the scattered
beams are completely in phase and reinforce one another to form the diffracted beams
(Brittain, 1999). The Bragg law describes the conditions under which this occurs. It is
assumed that perfectly parallel and monochromatic x-ray beam, of wavelength λ, is
incident on a crystalline sample at an angle θ (°). Diffraction will occur if:
θλ ⋅⋅⋅= ⋅ sin2 dn Equation 3.5
Theoretical section
22
where:
d is distance between successive molecular planes in the crystal and
n is order of the diffraction pattern.
Most of drug substances are obtained as microcrystalline powders, from which is
difficult to obtain crystals adequate for crystallography because the different crystal
faces are oriented randomly in all possible direction of the powder. Furthermore it is
usually sufficient to establish only the polymorphic identity of solid and verify that certain
compound has desirable structure. For these reasons and for the simplicity of
performance, powder x-ray diffraction is a predominant tool in the characterization of the
polymorphs and solvates and it can also be used to quantify the amorphous content.
3.3.2. Microscopy (Light Microscopy and Scanning Electron Microscopy) An extremely important tool for the characterization is that of microscopy, since
observable habits of differing crystal structures must necessarily be different and
therefore useful for characterization of such systems. Both, optical and electron
microscopy may be used. Polarization microscopy is based on the way that examined
crystal affects polarized light that is transmitted trough the crystal in different angles.
The method can be also used to differ between amorphous and crystalline material
(Brittain, 1999). Optical microscopy is more limited in the range of magnification suitable
for routine work because beyond 600X is difficult for observation of microcrystalline
materials. On the other hand, electron microscopy can use high magnifications, up to
90000X and the images can contain a considerable degree of three-dimensional
information. These two microscopic methods are complementary in that each one can
provide the information which the other can not. Scanning electron microscopy uses
electrons rather than light to form an image.
This technique is a powerful tool for characterization of pharmaceutical solids, but
because it is descriptive and not quantitative it is often used in combination with other
techniques. A conventional SEM can be thought of as an inverted light microscope,
consisting of an electron gun for electron beam generation (illumination), a column with
lenses form beam focusing, a sample chamber and a detector. The conventional type
Theoretical section
23
exhibits a resolution of approximately 100Å and its large depth of field yields three-
dimensional images. High vacuum is required for the electron source and sample
chamber (Brittain, 1999).
Hot-stage microscopy (thermal microscopy or fusion microscopy) is extremely valuable
tool for characterization of polymorphs and solvates because allows observation of the
substance during the heating and cooling of just few milligrams of substance on a
microscope slide. It is possible to conduct rapid analysis using small quantities of
material and the entire phase diagram of drug material can be deduced upon the
conduct of suitably designed experiments (Brittain, 1999, McCauley et al., 1995).
3.3.3. Thermal Analyses Thermal analysis methods are differential scanning calorimetry (DSC) and
thermogravimetric analysis (TGA), differential thermal analysis etc. These are
techniques in which property of the examined material is determined as a function of an
externally applied temperature. By using of a thermal analysis it is possible to evaluate
physical and chemical changes that may take place in a heated sample. The nature of
thermal reactions can be:
- endothermic (melting, boiling, sublimation, vaporization, desolvation, solid-solid
phase transitions, chemical degradation etc) or
- exothermic (crystallization, oxidative decomposition etc).
Thermal analyses are widely used in pharmaceutical industry for the characterization of
compound purity, salvation, degradation, and excipient compatibility. They also are
employed to distinguish between enantiotropic and monotropic systems. For an
enantiotropic system, the relative stability of a pair of solid forms inverts at some
transition temperature beneath the melting point while a single form is always more
stable beneath the melting point in a monotropic system (Brittain, 1999).
DSC measures the temperature and the flow associated with the transition in materials
as a function of time and temperature. The sample and the reference materials are
maintained at the same temperature and what is measured is the heat flow required to
keep the equality in temperature. DSC plots are obtained as the differential rate of
heating (in units of W/s, cal/s or J/s) against temperature. The area under the DSC peak
Theoretical section
24
is directly proportional to the heat absorbed or evolved by the specific thermal event.
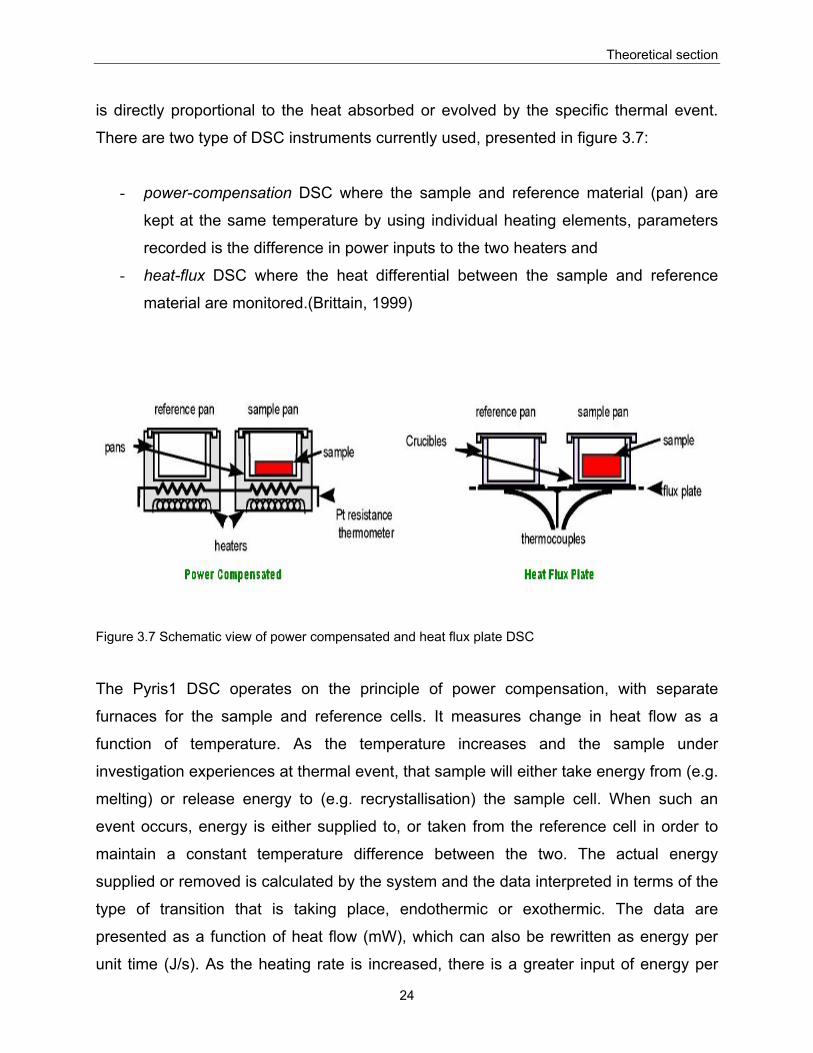
There are two type of DSC instruments currently used, presented in figure 3.7:
- power-compensation DSC where the sample and reference material (pan) are
kept at the same temperature by using individual heating elements, parameters
recorded is the difference in power inputs to the two heaters and
- heat-flux DSC where the heat differential between the sample and reference
material are monitored.(Brittain, 1999)
Figure 3.7 Schematic view of power compensated and heat flux plate DSC
The Pyris1 DSC operates on the principle of power compensation, with separate
furnaces for the sample and reference cells. It measures change in heat flow as a
function of temperature. As the temperature increases and the sample under
investigation experiences at thermal event, that sample will either take energy from (e.g.
melting) or release energy to (e.g. recrystallisation) the sample cell. When such an
event occurs, energy is either supplied to, or taken from the reference cell in order to
maintain a constant temperature difference between the two. The actual energy
supplied or removed is calculated by the system and the data interpreted in terms of the
type of transition that is taking place, endothermic or exothermic. The data are
presented as a function of heat flow (mW), which can also be rewritten as energy per
unit time (J/s). As the heating rate is increased, there is a greater input of energy per
Theoretical section
25
unit time applied across the sample and reference cells, resulting in an increase in the
overall sensitivity of the DSC instrumentation.
Thermogravimetry is a measure of the thermally induced weight loss of a material as a
function of the applied temperature. It can be a useful method for quantitative
determination of the total volatile content of solid thus it can be used as addition to e.g.
Karl Fischer titrations for the determination of moisture. It also represents a powerful
adjunct to DSC analysis because combination of these two methods is very useful in the
assignment of thermal events. As such it permits the distinction between solvates and
the anhydrous form of a given compound. Thermogravimetric analysis is most
commonly used to study desolvation processes and compound decomposition because
they are accompanied by weight changes. On the other hand, solid-liquid or solid-solid
phase transformations are not accompanied by any weight loss of sample mass and
would not be registered in TG thermogram (Brittain, 1999).
Thermogravimetry consists of the continual recording of the mass of the sample as it is
heated in a furnace. The weighing device used is a microbalance, which permits
accurate determination of milligram changes in the sample mass (McCauley et al.,
1995).
3.3.4. Solubility Solubility is defined as the equilibrium concentration of dissolved solid in the solvent
medium and is ordinarily a function of temperature and pressure (Brittain, 1999). The
solubility depends on the physical form of the solid, the nature of composition of the
solvent medium, the temperature and the pressure (Grant et al., 1995). Therefore, e.g.
temperature must be recorded for each solubility measurement in addition to the precise
nature of the solvent and solid state at equilibrium. Solubility may be expressed in any
appropriate units of concentration, such as quantity of solute dissolved divided by
quantity of the solvent i.e. g/l mol/l etc.
Theoretical section
26
The solubility of a solid in a liquid cannot be predicted in a wholly satisfactory manner as
yet, except possibly for ideal solution, because of the complicating factor which must be
taken in account (Martin, 1993).
The solubility of a solid in an ideal solution depends on temperature, melting point of the
solid, and molar heat of fusion ΔHf (heat absorbed when the solid melts). In an ideal
solution, the heat of solution is equal to the heat of fusion, which is assumed to be a
constant independent of the temperature. Ideal solubility is not affected by the nature of
the solvent. The equation 3.6 derived from thermodynamics considerations for an ideal
solution of solid in a liquid is:
⎟⎟⎠
⎞⎜⎜⎝
⎛ −Δ=−
0
0
303.2log
2 TTTT
RH
X fi Equation 3.6
where:
X2i is the ideal solubility of the solute expressed in mole fraction (the superscript i is
refers to an ideal solution, and subscript 2 designates the mole fraction as that of solute)
T0 is the melting point of the solid in absolute degrees, and
T is the absolute temperature of solution (Martin, 1993).
At the temperature above the melting point, the solute is in liquid state and in an ideal
solution is miscible in all proportions with the solvent. Therefore, when T > T0 the
equation 3.6 is not applicable. The equation is also inadequate at temperatures below
the melting point where ΔHf can no longer be used (Martin, 1993).
Equation 3.6 can also be written as follows:
tconsTR
HX fi tan1
303.2log
2+
Δ−= Equation 3.7
Therefore a plot of the logarithm of the solubility expressed in mole fraction, against the
reciprocal of the absolute temperature results in a straight line with a slope of
ΔHf/2.3030R. By this means, the molar heat of fusion of various drugs may be obtained
from their solubility in ideal solution (Martin, 1993).
Theoretical section
27
The aqueous solubility of a drug is an important factor affecting its bioavailability. Solid
drugs administered orally for systemic activity must dissolve in the gastro-intestinal
fluids prior to their absorption. Thus, the rate of dissolution of drugs in gastrointestinal
fluids could influence the rate and extent of their absorption.
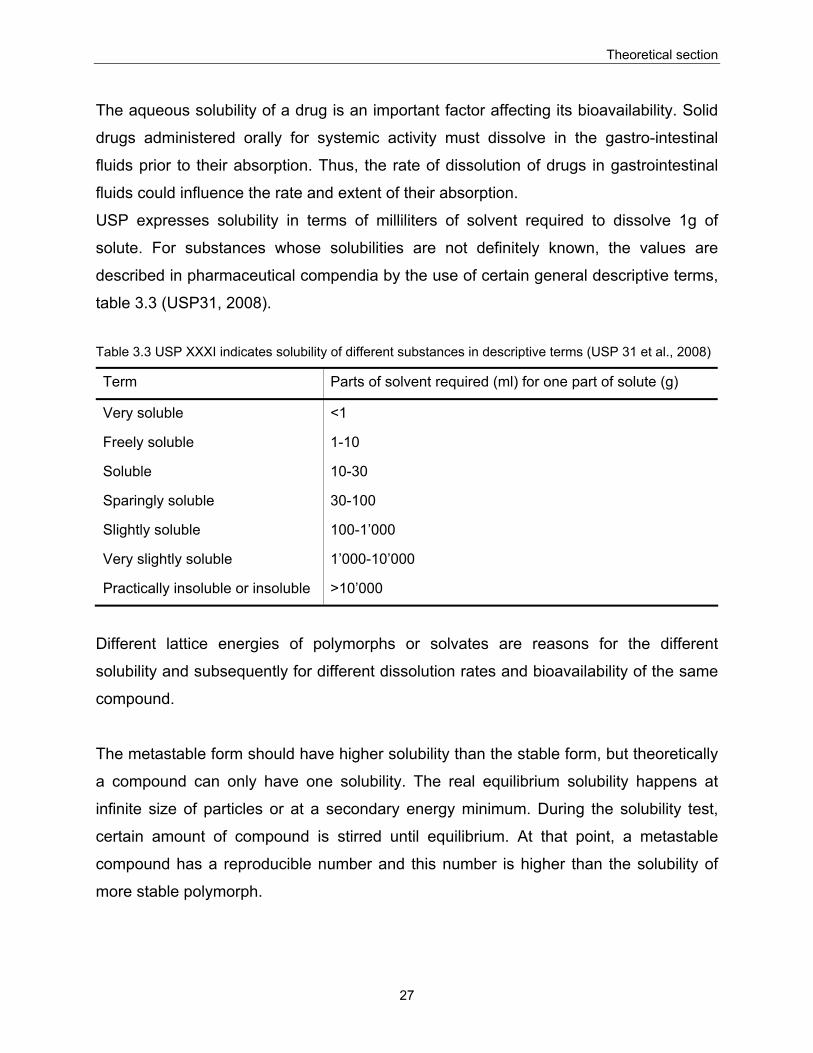
USP expresses solubility in terms of milliliters of solvent required to dissolve 1g of
solute. For substances whose solubilities are not definitely known, the values are
described in pharmaceutical compendia by the use of certain general descriptive terms,
table 3.3 (USP31, 2008).
Table 3.3 USP XXXI indicates solubility of different substances in descriptive terms (USP 31 et al., 2008)
Term Parts of solvent required (ml) for one part of solute (g)
Very soluble <1
Freely soluble 1-10
Soluble 10-30
Sparingly soluble 30-100
Slightly soluble 100-1’000
Very slightly soluble 1’000-10’000
Practically insoluble or insoluble >10’000
Different lattice energies of polymorphs or solvates are reasons for the different
solubility and subsequently for different dissolution rates and bioavailability of the same
compound.
The metastable form should have higher solubility than the stable form, but theoretically
a compound can only have one solubility. The real equilibrium solubility happens at
infinite size of particles or at a secondary energy minimum. During the solubility test,
certain amount of compound is stirred until equilibrium. At that point, a metastable
compound has a reproducible number and this number is higher than the solubility of
more stable polymorph.
Theoretical section
28
But the molecules in solution are the same and saturated solution of metastable form is
just a supersaturated solution of the compound itself. Waiting for a sufficient long time
will result in precipitation of the more stable polymorph. Important thing is that solution
made from different polymorphs contains the same compound (Carstensen, 2001).
The influence of crystal structure on the solubility of a solid can be explained using a
model. For a solid to dissolve, the disruptive force of solvent molecules must overcome
the attractive force holding the solid intact, which means that the salvation free energy
released upon dissolution must exceed the lattice free energy of the solid for the
process to proceed spontaneously. The equilibrium solubility of the solid will be
determined by the relative balancing of the attractive and disruptive forces. The balance
of these forces is determined by the enthalpy change and the increase in disorder of the
system (entropy). Since different crystal structures are characterized by different lattice
energies and enthalpies, solubility of different crystal polymorphs must differ as well. It
should be emphasized that the solubility differences between polymorphs will be
maintained only when a less stable form cannot convert to the most stable form. When
such conversion takes place, the equilibrium solubility of all forms will approach a
common value, namely that of the most stable form at room temperature (Grant et al.,
1995).
The effect of polymorphism becomes critical on solubility since the rate of compound
dissolution must be also dictated by the balance of the attractive forces exiting at the
crystal-solvent interface. A less stable polymorph having a higher lattice free energy will
tend to dissolve faster, it will release higher amount of free energy which will increase
the solubility and hence the driving force for dissolution. At the same time, each species
would liberate the same amount of solvation energy because all dissolved species must
be thermodynamically equivalent. The variation of dissolution rate due to different
structures of the same drug can lead to the variation of bioavailability for different
polymorphs or solvates (Brittain et al., 1999).
Determination of the solubility of solid materials can be obtained using equilibrium
method where an excess amount of the compound is suspended in the chosen solvent.
Theoretical section
29
During the test, temperature is fixed, samples has to be shaken (agitated), while the
concentration of the solute in a saturated solution is determined at equilibrium by
suitable analytical procedure. The application of equilibrium method to a metastable
phase will result in determination of the solubility of the stable phase.
3.3.5. Spectroscopic methods The utility of solid-state spectroscopy for characterization of polymorphic systems is
becoming exceedingly important. Nuclear magnetic resonance (NMR), infrared
absorption, and Raman spectroscopy are used to study crystal structures. These
methods require that either the nuclei of the pair of substances being examined exist in
magnetically inequivalent environments or the vibrational modes are sufficiently different
between the structural forms to permit differentiation (Brittain, 1999).
Infrared absorption spectroscopy is type of vibrational spectroscopy where it is possible
to observe the absorbance of compound in infrared region of the spectrum (400-
4000cm-1). The characterization of polymorphs is done by using Fourier transformation
technology (FTIR method) because it minimizes transmission and beams attenuation
problems. Essentially all FTIR spectrometers use a Michelson interferometer. Radiation
entering the interferometer is split into two beams by means of a beam splitter. One
beam follows a path of fixed distance before being reflected back into the beam splitter,
while the second beam travels a variable distance before being recombined with the
first beam. The recombination of these two beams yields an interference pattern, and
the time dependent constructive and destructive interferences have the effect of forming
a cosine signal.
However, sometimes the solid state FTIR spectra of polymorphic systems are found to
be only slightly different indicating that the pattern of molecular vibration is not so much
affected by differences in crystal structure (Brittain, 1999).
It should be emphasized that the definitive criterion for the existence of polymorphism is
via demonstration of a nonequivalent crystal structure, usually by comparison of the x-
ray diffraction patterns. Microscopy, thermal analysis methodology, and solid state NMR
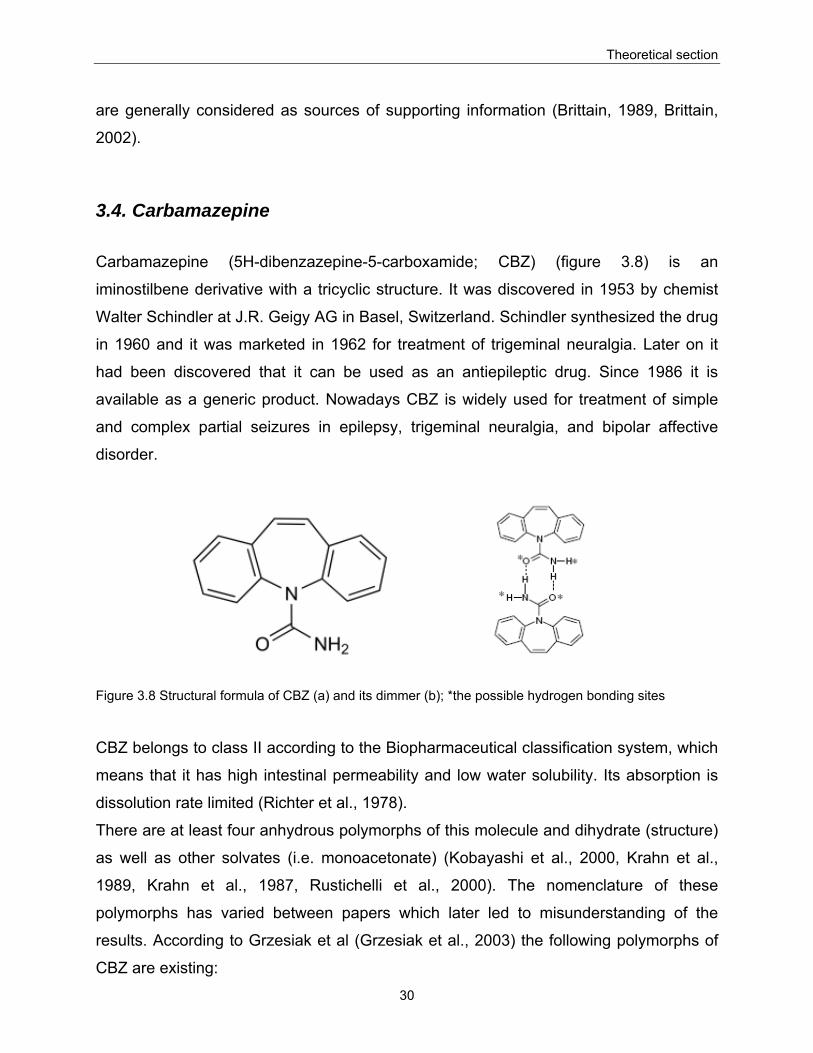
Theoretical section
30
are generally considered as sources of supporting information (Brittain, 1989, Brittain,
2002).
3.4. Carbamazepine
Carbamazepine (5H-dibenzazepine-5-carboxamide; CBZ) (figure 3.8) is an
iminostilbene derivative with a tricyclic structure. It was discovered in 1953 by chemist
Walter Schindler at J.R. Geigy AG in Basel, Switzerland. Schindler synthesized the drug
in 1960 and it was marketed in 1962 for treatment of trigeminal neuralgia. Later on it
had been discovered that it can be used as an antiepileptic drug. Since 1986 it is
available as a generic product. Nowadays CBZ is widely used for treatment of simple
and complex partial seizures in epilepsy, trigeminal neuralgia, and bipolar affective
disorder.
Figure 3.8 Structural formula of CBZ (a) and its dimmer (b); *the possible hydrogen bonding sites
CBZ belongs to class II according to the Biopharmaceutical classification system, which
means that it has high intestinal permeability and low water solubility. Its absorption is
dissolution rate limited (Richter et al., 1978).
There are at least four anhydrous polymorphs of this molecule and dihydrate (structure)
as well as other solvates (i.e. monoacetonate) (Kobayashi et al., 2000, Krahn et al.,
1989, Krahn et al., 1987, Rustichelli et al., 2000). The nomenclature of these
polymorphs has varied between papers which later led to misunderstanding of the
results. According to Grzesiak et al (Grzesiak et al., 2003) the following polymorphs of
CBZ are existing:
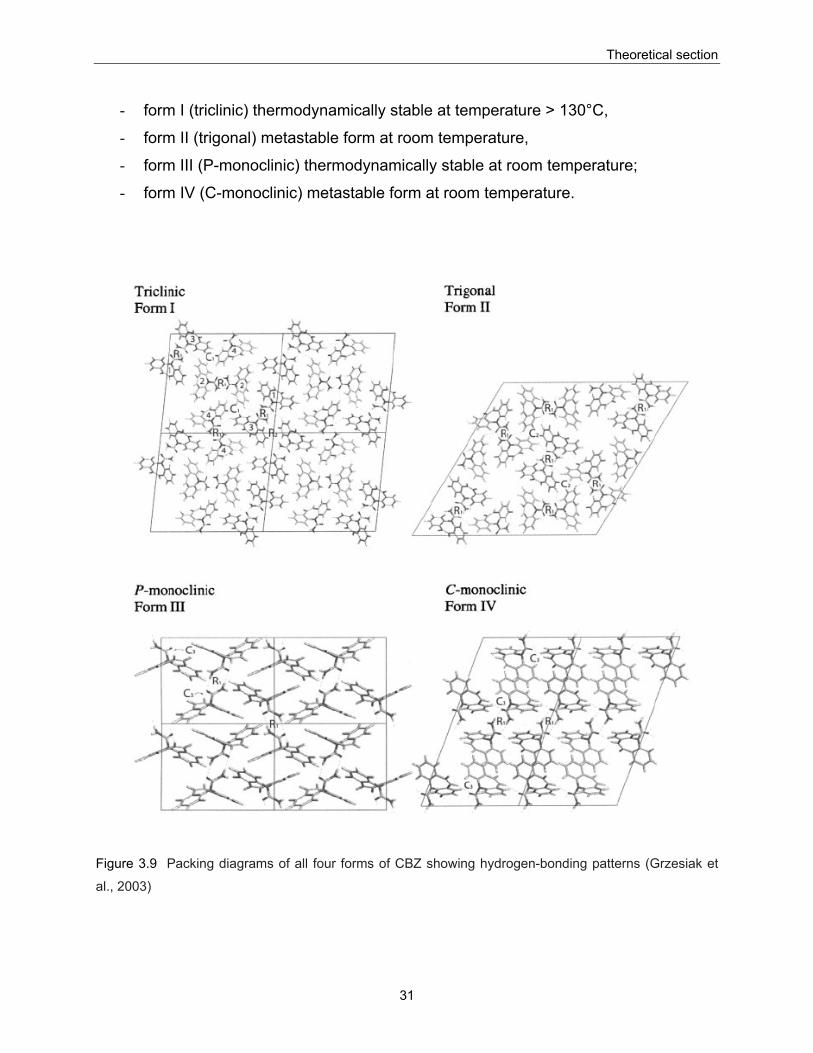
Theoretical section
31
- form I (triclinic) thermodynamically stable at temperature > 130°C,
- form II (trigonal) metastable form at room temperature,
- form III (P-monoclinic) thermodynamically stable at room temperature;
- form IV (C-monoclinic) metastable form at room temperature.
Figure 3.9 Packing diagrams of all four forms of CBZ showing hydrogen-bonding patterns (Grzesiak et
al., 2003)
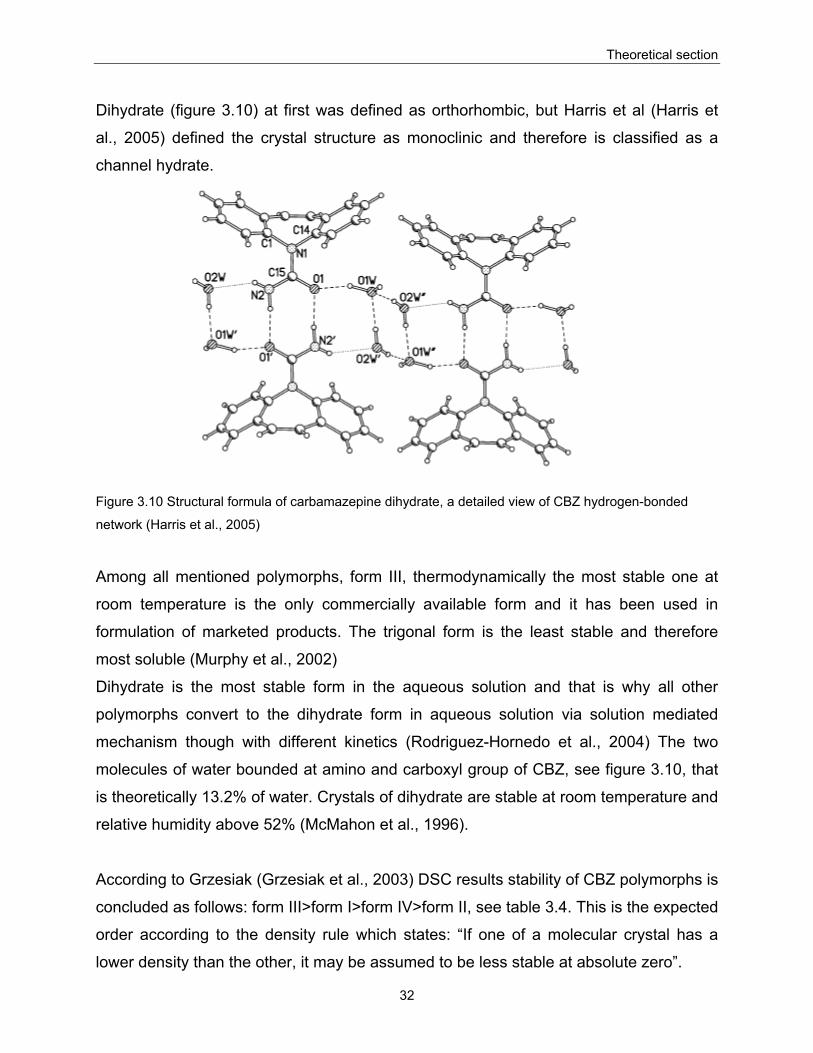
Theoretical section
32
Dihydrate (figure 3.10) at first was defined as orthorhombic, but Harris et al (Harris et
al., 2005) defined the crystal structure as monoclinic and therefore is classified as a
channel hydrate.
Figure 3.10 Structural formula of carbamazepine dihydrate, a detailed view of CBZ hydrogen-bonded
network (Harris et al., 2005)
Among all mentioned polymorphs, form III, thermodynamically the most stable one at
room temperature is the only commercially available form and it has been used in
formulation of marketed products. The trigonal form is the least stable and therefore
most soluble (Murphy et al., 2002)
Dihydrate is the most stable form in the aqueous solution and that is why all other
polymorphs convert to the dihydrate form in aqueous solution via solution mediated
mechanism though with different kinetics (Rodriguez-Hornedo et al., 2004) The two
molecules of water bounded at amino and carboxyl group of CBZ, see figure 3.10, that
is theoretically 13.2% of water. Crystals of dihydrate are stable at room temperature and
relative humidity above 52% (McMahon et al., 1996).
According to Grzesiak (Grzesiak et al., 2003) DSC results stability of CBZ polymorphs is
concluded as follows: form III>form I>form IV>form II, see table 3.4. This is the expected
order according to the density rule which states: “If one of a molecular crystal has a
lower density than the other, it may be assumed to be less stable at absolute zero”.
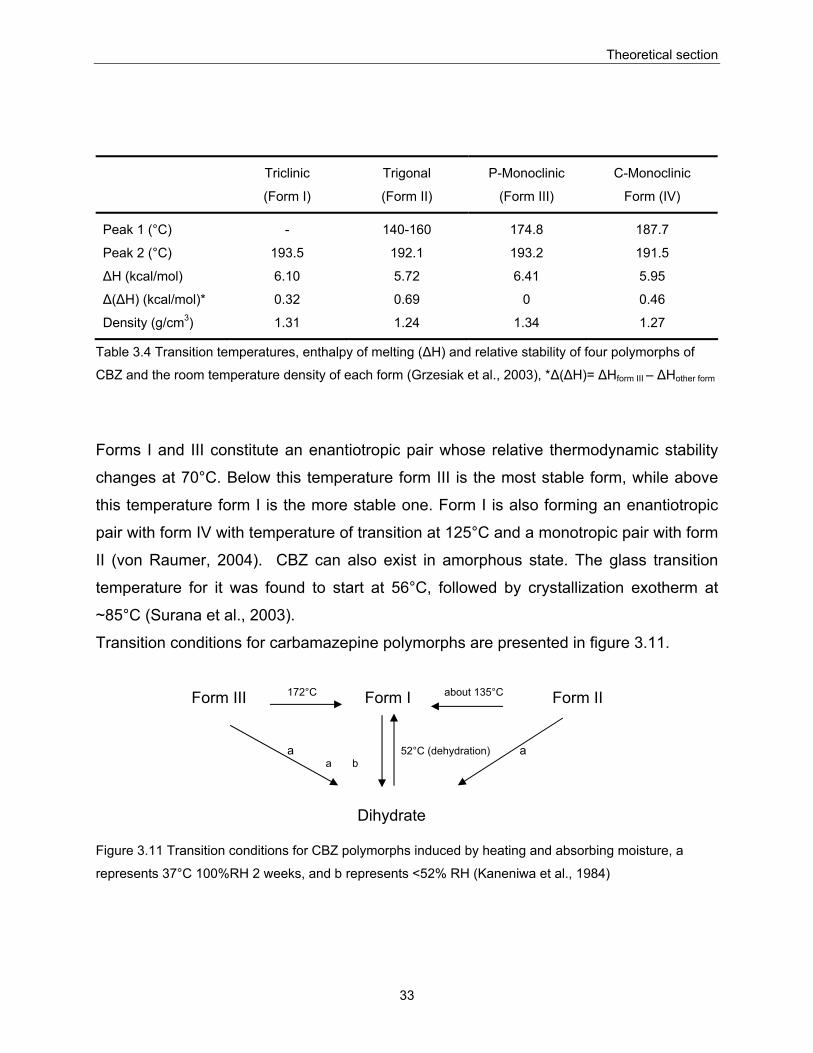
Theoretical section
33
Table 3.4 Transition temperatures, enthalpy of melting (ΔH) and relative stability of four polymorphs of
CBZ and the room temperature density of each form (Grzesiak et al., 2003), *Δ(ΔH)= ΔHform III – ΔHother form
Forms I and III constitute an enantiotropic pair whose relative thermodynamic stability
changes at 70°C. Below this temperature form III is the most stable form, while above
this temperature form I is the more stable one. Form I is also forming an enantiotropic
pair with form IV with temperature of transition at 125°C and a monotropic pair with form
II (von Raumer, 2004). CBZ can also exist in amorphous state. The glass transition
temperature for it was found to start at 56°C, followed by crystallization exotherm at
~85°C (Surana et al., 2003).
Transition conditions for carbamazepine polymorphs are presented in figure 3.11.
Form III 172°C Form I about 135°C Form II
a 52°C (dehydration) a a b
Dihydrate
Figure 3.11 Transition conditions for CBZ polymorphs induced by heating and absorbing moisture, a
represents 37°C 100%RH 2 weeks, and b represents <52% RH (Kaneniwa et al., 1984)
Triclinic
(Form I)
Trigonal
(Form II)
P-Monoclinic
(Form III)
C-Monoclinic
Form (IV)
Peak 1 (°C)
Peak 2 (°C)
ΔH (kcal/mol)
Δ(ΔH) (kcal/mol)*
Density (g/cm3)
-
193.5
6.10
0.32
1.31
140-160
192.1
5.72
0.69
1.24
174.8
193.2
6.41
0
1.34
187.7
191.5
5.95
0.46
1.27
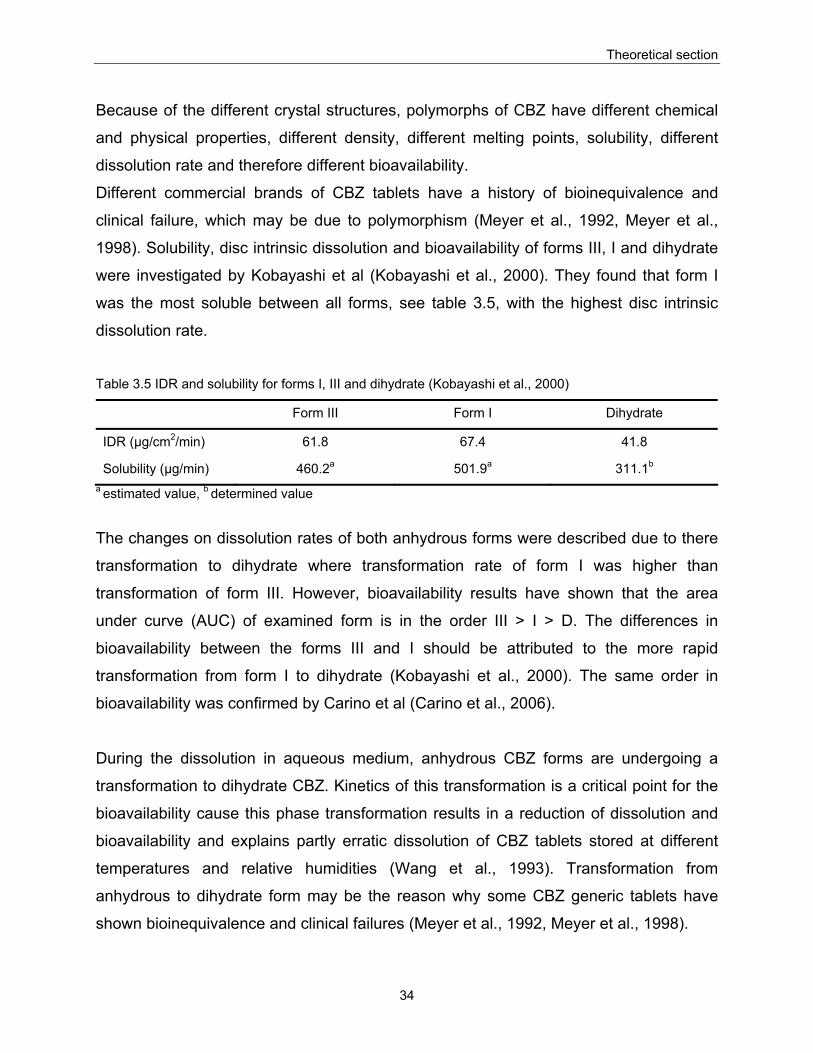
Theoretical section
34
Because of the different crystal structures, polymorphs of CBZ have different chemical
and physical properties, different density, different melting points, solubility, different
dissolution rate and therefore different bioavailability.
Different commercial brands of CBZ tablets have a history of bioinequivalence and
clinical failure, which may be due to polymorphism (Meyer et al., 1992, Meyer et al.,
1998). Solubility, disc intrinsic dissolution and bioavailability of forms III, I and dihydrate
were investigated by Kobayashi et al (Kobayashi et al., 2000). They found that form I
was the most soluble between all forms, see table 3.5, with the highest disc intrinsic
dissolution rate.
Table 3.5 IDR and solubility for forms I, III and dihydrate (Kobayashi et al., 2000)
Form III Form I Dihydrate
IDR (μg/cm2/min) 61.8 67.4 41.8
Solubility (μg/min) 460.2a 501.9a 311.1b a estimated value, b determined value
The changes on dissolution rates of both anhydrous forms were described due to there
transformation to dihydrate where transformation rate of form I was higher than
transformation of form III. However, bioavailability results have shown that the area
under curve (AUC) of examined form is in the order III > I > D. The differences in
bioavailability between the forms III and I should be attributed to the more rapid
transformation from form I to dihydrate (Kobayashi et al., 2000). The same order in
bioavailability was confirmed by Carino et al (Carino et al., 2006).
During the dissolution in aqueous medium, anhydrous CBZ forms are undergoing a
transformation to dihydrate CBZ. Kinetics of this transformation is a critical point for the
bioavailability cause this phase transformation results in a reduction of dissolution and
bioavailability and explains partly erratic dissolution of CBZ tablets stored at different
temperatures and relative humidities (Wang et al., 1993). Transformation from
anhydrous to dihydrate form may be the reason why some CBZ generic tablets have
shown bioinequivalence and clinical failures (Meyer et al., 1992, Meyer et al., 1998).
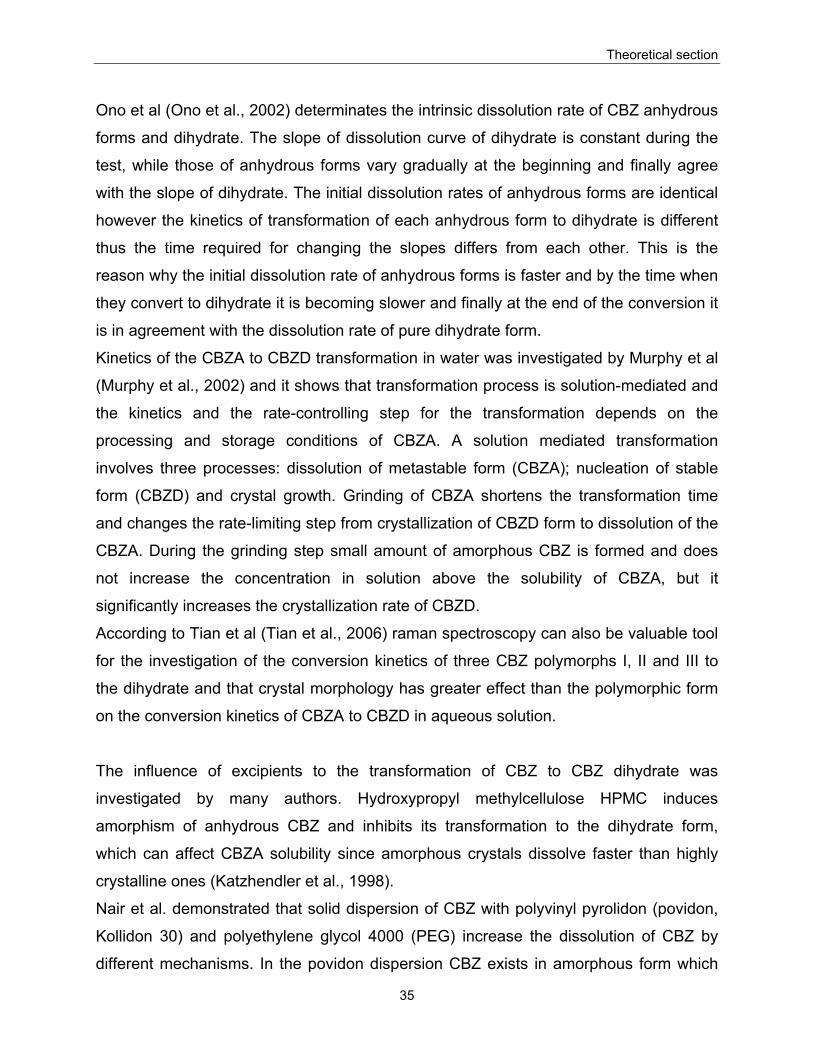
Theoretical section
35
Ono et al (Ono et al., 2002) determinates the intrinsic dissolution rate of CBZ anhydrous
forms and dihydrate. The slope of dissolution curve of dihydrate is constant during the
test, while those of anhydrous forms vary gradually at the beginning and finally agree
with the slope of dihydrate. The initial dissolution rates of anhydrous forms are identical
however the kinetics of transformation of each anhydrous form to dihydrate is different
thus the time required for changing the slopes differs from each other. This is the
reason why the initial dissolution rate of anhydrous forms is faster and by the time when
they convert to dihydrate it is becoming slower and finally at the end of the conversion it
is in agreement with the dissolution rate of pure dihydrate form.
Kinetics of the CBZA to CBZD transformation in water was investigated by Murphy et al
(Murphy et al., 2002) and it shows that transformation process is solution-mediated and
the kinetics and the rate-controlling step for the transformation depends on the
processing and storage conditions of CBZA. A solution mediated transformation
involves three processes: dissolution of metastable form (CBZA); nucleation of stable
form (CBZD) and crystal growth. Grinding of CBZA shortens the transformation time
and changes the rate-limiting step from crystallization of CBZD form to dissolution of the
CBZA. During the grinding step small amount of amorphous CBZ is formed and does
not increase the concentration in solution above the solubility of CBZA, but it
significantly increases the crystallization rate of CBZD.
According to Tian et al (Tian et al., 2006) raman spectroscopy can also be valuable tool
for the investigation of the conversion kinetics of three CBZ polymorphs I, II and III to
the dihydrate and that crystal morphology has greater effect than the polymorphic form
on the conversion kinetics of CBZA to CBZD in aqueous solution.
The influence of excipients to the transformation of CBZ to CBZ dihydrate was
investigated by many authors. Hydroxypropyl methylcellulose HPMC induces
amorphism of anhydrous CBZ and inhibits its transformation to the dihydrate form,
which can affect CBZA solubility since amorphous crystals dissolve faster than highly
crystalline ones (Katzhendler et al., 1998).
Nair et al. demonstrated that solid dispersion of CBZ with polyvinyl pyrolidon (povidon,
Kollidon 30) and polyethylene glycol 4000 (PEG) increase the dissolution of CBZ by
different mechanisms. In the povidon dispersion CBZ exists in amorphous form which
Theoretical section
36
allows the higher release of CBZ from the dispersion and in the second case this effect
is achieved due to the presence of CBZ as very small crystallites dispersed within the
matrix of PEG (Nair et al., 2002).
Influence of the surfactant on CBZ conversion is interesting from the dissolution aspect
because sodium lauryl sulfate is used in the USP dissolution medium for the CBZ
tablets.
The surfactants, sodium lauryl sulfate (SLS) and sodium taurocholate (STC) can
increase the solution-mediated transformation of CBZ. Their effect depends on the type
and concentration of surfactants. SLS promotes the surface – mediated nucleation of
CBZD on CBZA crystals at the concentration below critical micellar concentration
(CMC) and has a little effect on CBZ morphology. Above the CMC, both surfactants
SLS and STC promote the transformation by increasing the bulk nucleation of CBZD.
STC depending on concentration changes the crystal morphology of CBZD from
acicular to prismatic (Rodriguez-Hornedo et al., 2004)
Tian et al (Tian et al., 2006) found that all of the following excipients, hydroxypropyl
cellulose (HPC), polyvinyl pyrolidon (PVP) and carboxymethyl cellulose may retard the
conversion of CBZA to CBZD to a certain extent. HPC and PVP show the highest
inhibitory effect by the complete inhibition of conversion for 18 hours. In that case
crystals of CBZA are dissolving without formation of CBZD nuclei. Carboxymethyl
cellulose increases the crystal roughness implying the CBZ dissolution in carboxymethyl
cellulose solution without conversion to dihydrate.
Influence of one excipient on the phase transformations of a substance is not always
the same and it may depend on the substance itself. Physical stability of hydrates and
anhydrates of theophylline and carbamazepine in presence of excipients is investigated
by Salameh et al (Salameh et al., 2006). They found out that in general examined
excipients (PVP, microcrystalline cellulose and mannitol) can promote dehydration
process. For the hydration process (conversion from anhydrous to dihydrate phase)
excipient can enhance, retard or have little effect on hydration kinetics and different
effect was observed between theophylline and carbamazepine.
Recently Tian et al. (Tian et al., 2007) studied the dissolution of CBZA and CBZD in
water and 0,1% w/v solutions of polyethilenglycol (PEG) and HPMC. Anhydrate shows
the highest dissolution rate when water is used as dissolution medium. In this case the
Theoretical section
37
increased surface area which is formed by crystallization of CBZD needle-like crystals
improves the dissolution rate. As some of the excipients, especially HPMC, can
completely stop the transformation to CBZD, the dissolution rate in that case is not
enhanced. The enhancement of dissolution is not observed in the dissolution of CBZD
compacts and the initial dissolution rate is much lower than for CBZA. For the
dissolution of CBZD in excipient solutions, HPMC and PEG increase the wettability of
CBZD and improve the dissolution of compound.
Since carbamazepine is prone to phase transformation from one form to another and
because the transformation may occur during the preparation of raw material and solid
dosage forms it is important to take care of all possible condition which can induce
them.
For technological purposes it is important to know that during aqueous granulation of
form III partial formation of the dihydrate will occur. As the following process is the
drying process, the formed dihydrate may be dehydrated again, but leading to formation
of form I. Granules may result with a core of form III and a surface covered by form I,
where this part slowly will convert back to form III (Krahn et al., 1989).
Dehydration of CBZ dihydrate results in formation of different forms. The anhydrous
form obtained by heating dihydrate was form I. If the dehydration under reduced
pressure was used the form was obtained III, while dehydration under nitrogen flow or
under low water vapor pressure results in amorphous anhydrate (McMahon et al.,
1996). According to Suryanarayanan (Han et al., 1998) dehydration under low water
vapor pressure results in an amorphous anhydrate whereas high vapor pressure results
in crystalline form I.
CBZ is considered as a drug with a narrow therapeutic index. The therapeutic index or
ratio according to definition is ratio between the median lethal dose (LD50) and median
effective dose (ED50). According to FDA pharmacologic agents with a therapeutic index
< 2 are considered to exhibit a narrow difference between therapeutic and toxic plasma
concentrations and therefore are classified as narrow therapeutic index drugs.
Theoretical section
38
3.5. Dissolution
3.5.1. Dissolution process Dissolution is widely used in vitro test for determination of release rate of drug from a
dosage form. It is used for characterization of drugs, quality control of dosage form, to
guide development of new formulations and to correlate results with in vivo activity.
Dissolution tests are used to confirm compliance with compendial specifications (Ford et
al., 2002). Dissolution rate may be defined as the amount of active ingredient in a
dosage form dissolved in unit time under standardized conditions of liquid-solid
interface, temperature and media composition.
The mathematical expression for this definition is according to Noyes-Whitney (Noyes et
al., 1897) given in equation 3.8:
( )solsat CCkSdtdW −⋅=/ Equation 3.8
where:
dW / dt is the dissolution rate (mgml-1min-1)
k is a dissolution constant
S is the surface area of the solid (cm2)
Csat is the concentration of a saturated solution (mg/ml)
Csol is the concentration at any given time (mg/ml)
The basic step in drug dissolution is the reaction of the solid with dissolution medium.
The dissolution media will pass the solid with a certain velocity. In the diffusion layer
concept or film theory it is assumed that the solid is surrounded by a stagnant liquid
layer with a certain thickness h. At the surface of solid (x=0), the concentration of
dissolved solid is equal to its saturation concentration, Cs. Beyond the static diffusion
layers, at x grater than h, mixing occurs in the dissolution media so the drug is found to
be in a uniform concentration C, figure 3.12. The thickness h of unstable stagnant layer
can be influenced by the stirring rate in the dissolution apparatus and it is also
influenced in the case of the intrinsic dissolution test.
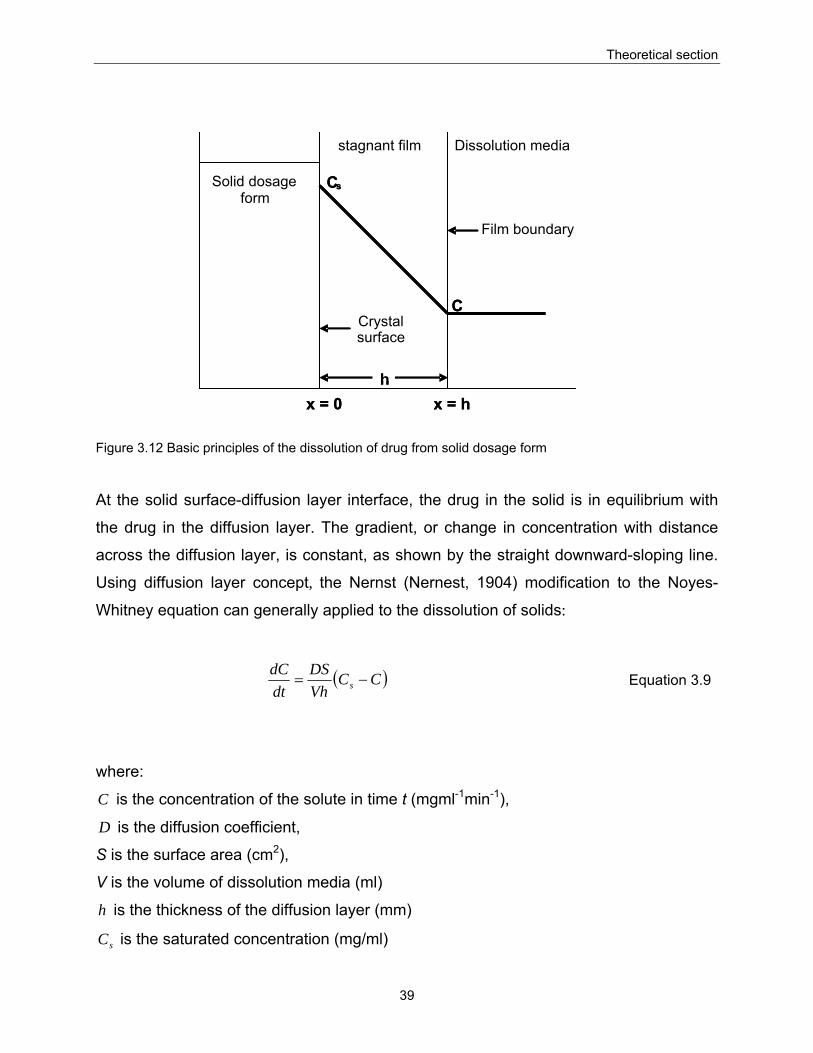
Theoretical section
39
Figure 3.12 Basic principles of the dissolution of drug from solid dosage form
At the solid surface-diffusion layer interface, the drug in the solid is in equilibrium with
the drug in the diffusion layer. The gradient, or change in concentration with distance
across the diffusion layer, is constant, as shown by the straight downward-sloping line.
Using diffusion layer concept, the Nernst (Nernest, 1904) modification to the Noyes-
Whitney equation can generally applied to the dissolution of solids:
( )CCVhDS
dtdC
s −= Equation 3.9
where:
C is the concentration of the solute in time t (mgml-1min-1),
D is the diffusion coefficient,
S is the surface area (cm2),
V is the volume of dissolution media (ml)
h is the thickness of the diffusion layer (mm)
sC is the saturated concentration (mg/ml)
form
stagnant film Dissolution media
x = 0 x = h
Cs
C
h
Crystal surface
Solid dosage form
x = 0 x = h
Cs
C
h
Film boundary
Theoretical section
40
There are a number of experimental factors which can have a direct impact on the
dissolution process. The optimum dissolution testing conditions differ with each drug
formulation. Different agitation rates, different medium (including different pH), and
different dissolution apparatus should be tried to distinguish which dissolution method is
optimum for the drug product and discriminating for drug formulation changes. The
appropriate dissolution test condition for the drug product is then used to determine
acceptable dissolution specifications.
The size and shape of the dissolution vessel may affect the rate and extent of
dissolution. For example, the vessel may range in size from several milliliters to several
liters. The amount of agitation and the nature of the stirrer affect the dissolution rate.
Stirring rates must be controlled, and specifications differ between drug products.
The temperature of the dissolution medium must be controlled and variations in
temperature must be avoided. Most dissolution tests are performed at 37±1°C.
The nature of the dissolution medium, the solubility of the drug and the amount of drug
in the dosage form will affect the dissolution test. The dissolution medium should not be
saturated by the drug. Usually, a volume of medium larger than the amount of solvent
needed to completely dissolve the drug is used in such tests. The usual volume of the
medium is 500–1000 ml. Drugs that are not very water soluble may require use of a
very large capacity vessel (up to 2000 ml) to observe significant dissolution (Ford et al.,
2002).
Sink conditions is a term referring to an excess volume of medium that allows the solid
drug to continuously dissolve. If the drug solution becomes saturated, no further net
drug dissolution will take place. Therefore, sink conditions are one of the main
parameters which have to be controlled during the dissolution test, especially for low
water soluble drugs. By keeping the volume of solvent large with the respect to
saturation point (at least three to ten times larger), sink condition are granted (Csat
>>Csol) (Hanson et al., 2004).
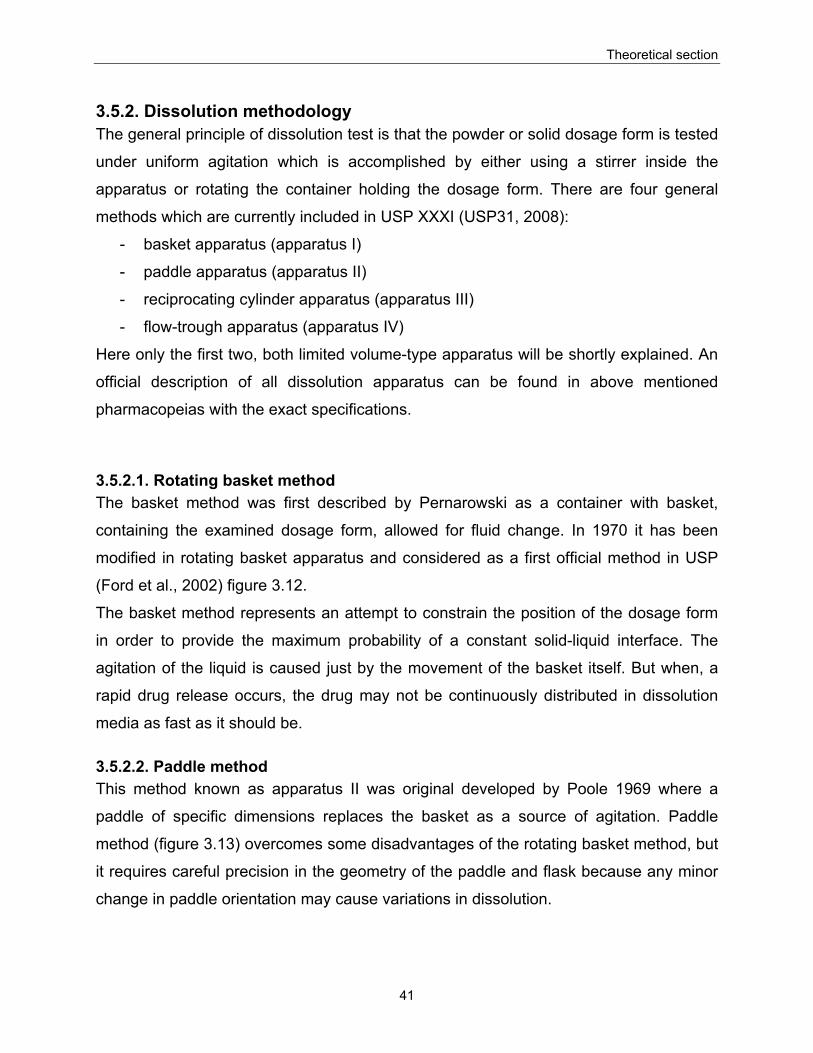
Theoretical section
41
3.5.2. Dissolution methodology The general principle of dissolution test is that the powder or solid dosage form is tested
under uniform agitation which is accomplished by either using a stirrer inside the
apparatus or rotating the container holding the dosage form. There are four general
methods which are currently included in USP XXXI (USP31, 2008):
- basket apparatus (apparatus I)
- paddle apparatus (apparatus II)
- reciprocating cylinder apparatus (apparatus III)
- flow-trough apparatus (apparatus IV)
Here only the first two, both limited volume-type apparatus will be shortly explained. An
official description of all dissolution apparatus can be found in above mentioned
pharmacopeias with the exact specifications.
3.5.2.1. Rotating basket method The basket method was first described by Pernarowski as a container with basket,
containing the examined dosage form, allowed for fluid change. In 1970 it has been
modified in rotating basket apparatus and considered as a first official method in USP
(Ford et al., 2002) figure 3.12.
The basket method represents an attempt to constrain the position of the dosage form
in order to provide the maximum probability of a constant solid-liquid interface. The
agitation of the liquid is caused just by the movement of the basket itself. But when, a
rapid drug release occurs, the drug may not be continuously distributed in dissolution
media as fast as it should be.
3.5.2.2. Paddle method This method known as apparatus II was original developed by Poole 1969 where a
paddle of specific dimensions replaces the basket as a source of agitation. Paddle
method (figure 3.13) overcomes some disadvantages of the rotating basket method, but
it requires careful precision in the geometry of the paddle and flask because any minor
change in paddle orientation may cause variations in dissolution.
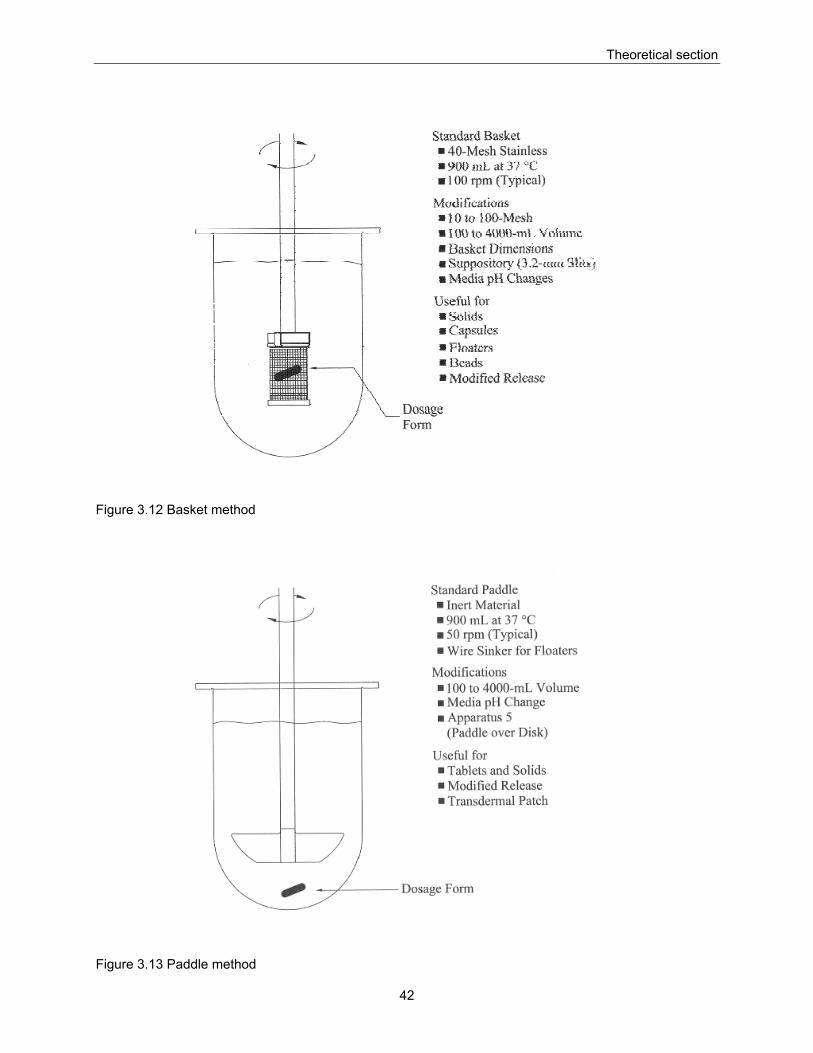
Theoretical section
42
Figure 3.12 Basket method
Figure 3.13 Paddle method
Theoretical section
43
During the dissolution tests solution-mediated transformation are important because the
rate of transformation determines the concentration of drug in solution, with faster
conversion rates leading to lower levels of drug dissolved.
Solution mediated transformation involves three main steps: dissolution of metastable
solid phase, nucleation and growth of stable solid phase (Ford et al., 2002)
It is known that anhydrous CBZ converts to dihydrate in aqueous solution mediated
mechanism. The reason for a solution-mediated transformation to the dihydrate crystal
form is that solubility in water of anhydrous CBZ form is at leas three times higher at the
room temperature than of CBZ D (Murphy et al., 2002)
Because of CBZ poor solubility, USP dissolution method for CBZ tablets requires use of
surfactant, 1% sodium lauryl sulfate (Rodriguez-Hornedo et al., 2004).
3.5.3. Intrinsic dissolution Intrinsic dissolution, or measurement of the rates of solution, is a very powerful method
for the evaluation of solubility differences between polymorphs or solvates. It is a
method which gives valuable information about physicochemical behavior of a pure
drug substance in dissolution medium by removing many of the variables you would find
in normal dissolution (effect of change of surface area, effect of excipients, etc).
There are two types of intrinsic dissolution methods. One is to simply pour powder into
the dissolution medium and to monitor the concentration of dissolved solute as a
function of the time. Data obtained by this method should be corrected by the factors
relating to surface area or particle size distribution. In the second approach, the powder
is compacted in a tabletting die. Only one face of the disc is exposed to the dissolution
medium and rotated at the constant speed e.g. of 100rpm (Yu et al., 2004).
The advantage of the constant surface area method is that its dissolution profiles are
linear with time and more easily comparable. Additional information about relative
surface areas or particle size distributions of two materials is not required, since these
differences were eliminated when the analyzed disc was prepared (Grant et al., 1995).
Under constant hydrodynamic conditions, the intrinsic dissolution rate is usually
proportional to the solubility of the dissolving solid. Consequently, in a polymorphic
system, the most stable form will ordinarily exhibit the slowest dissolution rate.
Theoretical section
44
Intrinsic dissolution rate investigation becomes more complicated when one or more of
the studied polymorphs interconvert to another during the measurement (Brittain et al.,
1999).
If sink conditions are given, the concentration of the drug C (mg/ml) at the time t (min)
can be expressed by equation 3.10 (Nogami et al., 1966):
tkCVSC s= Equation 3.10
where:
S is the surface area of the tablet (cm2),
V is volume of test solution (ml),
k is intrinsic dissolution rate constant
Cs represents solubility (mg/ml).
Subsequently the intrinsic dissolution rate (IDR) or dissolution rate from unit surface
area than can be calculated by the following equation 3.11 (Kobayashi et al., 2000,
Sethia et al., 2004):
CskSV
tCIDR ⋅=⋅= Equation 3.11
Intrinsic dissolution rate is expressed in terms of mg/cm2/min. IDR above
1.0mg/cm2/min suggest negligible problems with dissolution rate limiting absorbtion, but
rates below 0.1mg/cm2/min indicate likelihood with dissolution rate limited absorption
(Hanson et al., 2004).
3.6. Preparation of tablets
A powder can physically be described as a special type of disperse system consisting of
discrete, solid particles which are surrounded by or dispersed in air. However, the
particles are normally in contact with each other. The interparticulate attractions at the
Theoretical section
45
point of contact are relatively weak and the powder is thus characterized by exhibiting a
low mechanical strength. The transformation of powder into a compact is the result of a
reduction in the porosity of the powder system, and thus particle surface will be brought
into close proximity to each other. As a consequence, the number and strength of
interparticulate attractions will increase with a subsequent increased coherency of the
powder system. The result of the compaction procedure is a solid specimen of a certain
porosity, normally in the range of 5 to 35% for pharmaceutical compact (Alderborn,
1996).
Compressibility may be defined as the ability of the material to undergo a reduction in
volume as a result of applied pressure. Compressibility indicates the case with which
powder bed undergoes volume reduction under pressure and is represented by a plot
showing the reduction of tablet porosity with increasing of pressure. The lower the
porosity at a given compaction pressure, the better the compressibility and the greater
the interparticulate bonding.
Compactibility is the ability of a material to produce tablets with sufficient strength under
the effect of densification. The tensile strength of a tablet decrease exponentially with
increasing porosity. Compactibility shows the tensile strength of tablets normalized by
tablet porosity (Leuenberger, 1982).
Tablets are the most commonly used dosage form for pharmaceutical preparations.
They are prepared by applying a pressure to a powder bed, which compacts the powder
into a coherent compact (powder compaction), the tablet. When external mechanical
forces are applied to a powder mass several following processes may occur:
- particle rearrangement
- elastic deformation of particles
- plastic deformation of particles
- fragmentation of particles
- formation of interparticulate bonds
During the compression process particles are initially rearranged and they are forming
closer packing structure. As the load increases, rearrangement becomes more difficult
and packing characteristics of the particles or a high interparticulate friction between
Theoretical section
46
particles will prevent any further interparticulate movement. The further compaction
involves some types of particle deformations. If on removal of the applied load,
deformation is spontaneously reversible than this type of deformation is elastic. This is
true for any material. On the other hand, plastic or brittle fracture deformation is
irreversible and in that case an elastic limit (yield point) is reached and loads above it
result in not reversible deformation on removal of applied force.
Plastic deformation mechanism dominates in materials in which shear strength is less
than the tensile or breaking strength. When the shear strength is greater, particles may
be fractured (fragmentation) into smaller fragments, which will decrease the compact
volume by rearrangement. If the applied pressure is increased the smaller particles can
again be deformed. A single particle may pass through some of these processes
several times during the compaction cycle. This is brittle fracture and most likely occurs
with hard, brittle particles.
When the particle surface area brought together into close vicinity they may form
interparticulate attraction or bonds. Some deformation processes like plastic
deformation are time dependent and occur at various rates during the compaction
sequence. This means that if a plastically deforming solid is loaded too rapidly for this
process to take place, the solid may exhibit brittle fracture. Contrary, if the dwell time
under the compressive load is prolonged, than plastic deformation may continue leading
to more consolidation (Marshall, 1986).
Information on the compression and compaction properties of the pure drug is
extremely useful. The tabletted material should be plastic and capable of permanent
deformation, but it should also exhibit a degree of brittleness (fragmentation).
Pharmaceutical materials normally consolidate by more than one of these mechanisms,
depending on the applied pressure range and therefore it is a need to have adequate
characterization techniques.
The factors accounting for the strength of the tablets can be classified as primary and
secondary. The primary factors are bonding mechanism and the surface area over
which they act. Secondary factors include particle shape, surface texture and particle
size distribution.
Theoretical section
47
The general bonding mechanisms responsible for compaction are classified according
to Rumpf (Rumpf, 1958) in five types:
- bonding due to movable liquids (surface tension and capillary pressure)
- non-freely-movable binder bridges (adhesion and cohesion forces)
- solid bridges
- attractions between solid particles (intermolecular forces)
- shape-related bonding (mechanical interlocking)
The dominating bond types adhering particles together in compaction of dry powder can
be limited to three types: intermolecular bonding, mechanical interlocking and solid
bridges.
Intermolecular forces are all the forces that act between surfaces separated by some
distance (Van der Waals forces, electrostatic forces and hydrogen bonding) (Nystrom et
al., 1995) and they are considered to be the most important for the mechanical strength
in the tablet. Mechanical interlocking is dependent on the shape and the surface of the
particles and their deformation during the compaction process. The material/solid bridge
appears just in special cases like partial melting or dissolution in adsorbed water.
Particles dimensions and their shape before compaction are other very important
factors for the tablet strength. It is generally assumed that a change in particle size not
only affects the external surface area of particles but also their. Furthermore, it is
suggested that reducing of original particle size will increase the compact strength.
However, deviations from this pattern are commonly reported for the highly fragmenting
materials, in which case the tablet strength is independent of particle size.
The shape of crystals is a complex characteristic but that it is difficult to assess its
importance in relationship to powder properties. Concerning the influence of the shape
of the particles before compaction on the compact strength, it seems that only in case
when material fragments to a limited degree during the compaction phase a change
toward more irregular particles increases the compact strength (Alderborn, 1996)
Theoretical section
48
3.6.1. Compaction simulator Compaction simulators are sophisticated tools that enable the reproduction of different
compaction parameters of any industrial machine (as compaction speed, compaction
force, etc.). Published works encourage to use compaction simulators as research tools
for robust formulations (Marshall, 1986, Muller et al., 1994)
The PressterTM is a single station, linear compaction simulator, which can simulate any
rotary tablet press by mimicking the mechanics of these machines (Picker, 2003). Built
around a linear carriage that moves a set of punches and a die between two
compression rolls, it can mimic press geometry by matching the compression wheels. It
can also match press speed using a variable speed motor drive; match tablet weight
and thickness by adjusting depth of fill and the distance between the rolls; and match
tooling by installing standard or any special tooling (Levin, 2002).
PressterTM is instrumented with:
- Linear Variable Differential Transformers (LVDT) for upper and lower punch
displacement measurement.
- Strain gauges for force measurement during compaction and precompression.
- Strain gauges for die wall expansion measurement with instrumented die.
- Strain gauges for ejection force.
- Strain gauges for tablet take-off force.
The following set up can be installed before compaction:
- Selection of an industrial machine model in a list
- Filling position of the lower punch before compression
- Minimal gap between the punches during precompression and compaction by
variation of the rolls positions
- compaction speed
- Ejection angle
Aims of the studies
49
4. Aims of the study
The polymorphs and hydrate of carbamazepine have been shown to exhibit different
dissolution rates, bioavailability and different commercial brands of carbamazepine
tablets have a history of bioinequivalence and clinical failure, which may be assigned
polymorphism.
It is well known that raw materials obtained from different producers, although
containing, as declared, the same polymorphic form, can show different properties
during the dissolution caused by possible variation in the synthesis or influenced by
presence of impurities or mixture of polymorphic forms.
Carbamazepine - the selected model drug which has a problem with the uniformity of
dissolution of final product is one example that illustrates the necessity to identify and
characterize polymorphic modifications as precise as possible.
We hypothesize that the variation in dissolution may be avoided by establishing an
adequate strategy to maintain product quality by defining and monitoring the variability
of critical parameters of the bulk drug and by using specific excipients in the formulation
which will control the CBZ anhydrate to dihydrate conversion and thereby stabilize the
variation in dissolution behavior of the final CBZ product.
Thus, the aims of the study include the following issues:
• Investigation of the variability of commercially available CBZ on the intrinsic
dissolution behavior in order to recommend a strategy to maintain product quality
by monitoring the variability of critical parameters of the bulk drug
• To suggest a method to delete the prehistory of the active material
• Investigation of the influence of selected excipients on the IDR of CBZ
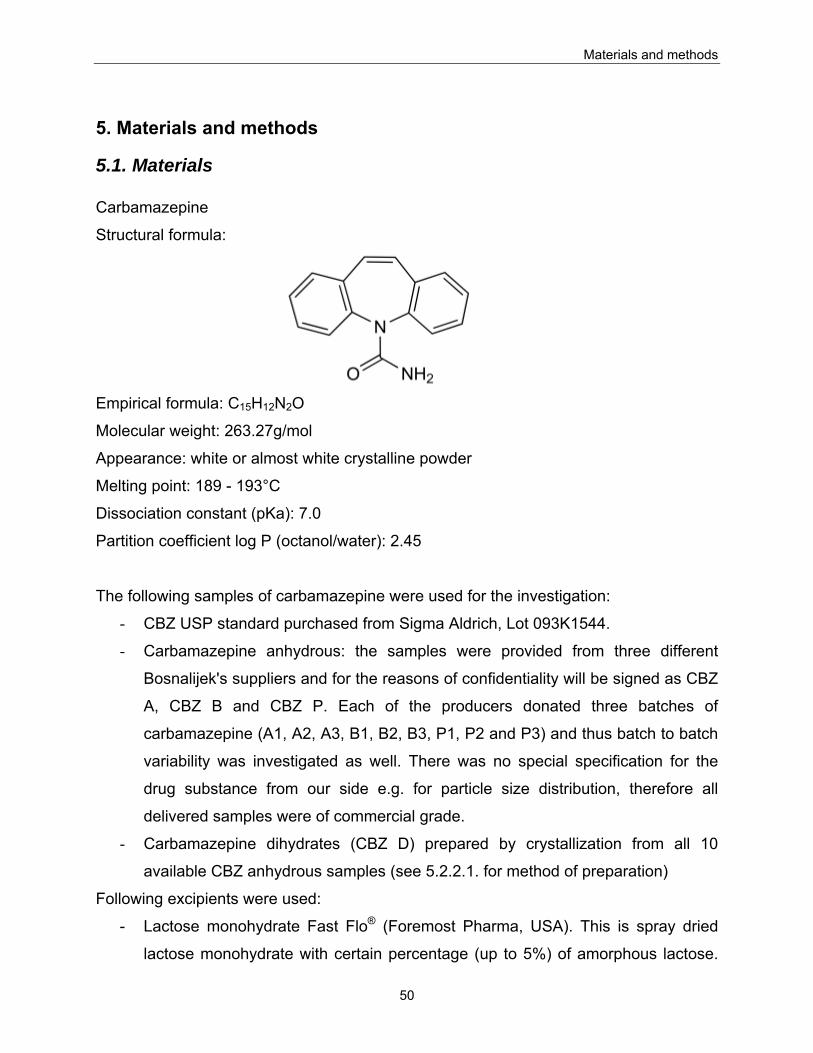
Materials and methods
50
5. Materials and methods
5.1. Materials Carbamazepine
Structural formula:
Empirical formula: C15H12N2O
Molecular weight: 263.27g/mol
Appearance: white or almost white crystalline powder
Melting point: 189 - 193°C
Dissociation constant (pKa): 7.0
Partition coefficient log P (octanol/water): 2.45
The following samples of carbamazepine were used for the investigation:
- CBZ USP standard purchased from Sigma Aldrich, Lot 093K1544.
- Carbamazepine anhydrous: the samples were provided from three different
Bosnalijek's suppliers and for the reasons of confidentiality will be signed as CBZ
A, CBZ B and CBZ P. Each of the producers donated three batches of
carbamazepine (A1, A2, A3, B1, B2, B3, P1, P2 and P3) and thus batch to batch
variability was investigated as well. There was no special specification for the
drug substance from our side e.g. for particle size distribution, therefore all
delivered samples were of commercial grade.
- Carbamazepine dihydrates (CBZ D) prepared by crystallization from all 10
available CBZ anhydrous samples (see 5.2.2.1. for method of preparation)
Following excipients were used:
- Lactose monohydrate Fast Flo® (Foremost Pharma, USA). This is spray dried
lactose monohydrate with certain percentage (up to 5%) of amorphous lactose.
Materials and methods
51
Fast Flo® lactose has improved flow and compression properties in comparison
with lactose α-monohydrate and it is manly used in direct compression.
- Ludipress®, purchased from BASF, Germany. Ludipress® contains 93±2% of
spray dried lactose α-monohydrate, 3.5±0.5% of Kollidon®30 (polyvinyl
pyrolidone) as a binder with superior binding powers and 3.5±0.5% of a
Kollidon®CL (crosspovidone) as a disintegrant which ensure that the tablet
disintegrates and releases active ingredients rapidly in contact with water. Its
main characteristics are controlled particle size, high bulk density, low degree of
hygroscopicity, good flowability, and the possibility of producing tablets with good
hardness and low friability independent of machine speed.
For tablet preparation for intrinsic dissolution the following wax was used:
- Paraffin wax, white pellets, solidification point 50-52°C, Fluka, Chemie AG,
Switzerland.
All other chemicals and reagents purchased from commercial sources were of analytical
grade.
5.2. Methods
5.2.1. Characterization of CBZ anhydrous
5.2.1.1. High performance liquid chromatography (HPLC) HPLC was used for identification (assay) of carbamazepine and impurity test.
Carbamazepines A, B, P were assayed by using HPLC System (Shimadzu, Japan),
equipped with a photon diode area detector. A reversed-phase column Luna 100a CN
250mm x 4.0mm, 10μm was used. A mobile phase consisting of water, methanol and
tetrahydrofurantoin (850:120:30) with the addition of formic acid and triethylamin was
prepared. UV-detection at 230nm was made. Flow rate was 2ml/min and injection
volume 20μl. Sample solutions were prepared by dissolving a certain amount of
carbamazepine in methanol. Each measurement was repeated two times.
Assay was calculated according to the following formula:
Materials and methods
52
100% ⋅⋅⋅⋅
= fmPmP
pst
stp Equation 5.1
where:
Pp and Pst – area under peak of sample and standard respectively
mp and mst – weight of sample and standard (mg)
f – factor to eliminate the humidity in standard (f = 100/ (100-loss on drying))
5.2.1.2. Fourier transform infrared spectroscopy (FTIR) FTIR spectroscopy was accomplished with a microscope Olympus BX/51-52 (Olympus,
Japan) modified with an infrared microspectrometer IlluminatIR® (Smith Detection,
USA), and equipped with an ATR objective (attenuated total reflectance objective). Only
small amount of crystals was placed onto the microscopical slide and analyzed at room
temperature. Setting parameters were: resolution 4cm-1, data region 4000 – 700 cm-1,
aperture 100μm, energy 27000, detector type MCT (mercury-cadmium-telluride) and
numbers of runs per spectrum 32.
5.2.1.3. Determination of residual moisture content Loss on drying measurements were carried out according to European Pharmacopoeia
Ph.Eur.5., using an infrared balance Type LP 16M (Mettler Toledo, Switzerland).
Samples of approximately 1g were heated up for 2 hours at temperature of 105°C.
5.2.1.4. Scanning electron microscopy (SEM) The morphology of the bulk materials and the lower surface of CBZ compacts before
and after intrinsic dissolution were determined by scanning electron microscopy. SEM
images were taken using an ESEM XL 30 FEG (Philips, The Netherland). The samples
were mounted with carbon adhesive on aluminum holder, sputtered with gold and
photographed at a voltage of 10kV. In the case of compacts, Ag was used as additional
conductor.
Materials and methods
53
5.2.1.5. Particle size analysis (PSA) The average particle size and particle size distribution were determined by laser
diffraction technique with a Malvern Mastersizer 2000 (Malvern Instruments, United
Kingdom) using dry unit Scirocco 2000 (Malvern Instruments, United Kingdom). The
following instrument settings have been done: measurement time 10s, measurement
snaps 10000, vibration feeding rate 45%, and dispersive air pressure 0,1bar. In order to
have a representative sampling and good reproducibility of results, before applying
powders in measurement unit, sample was shaken for 10 seconds. The measurement
was carried out six times and five consecutive values with the smallest variation were
taken in account. An obscuration value between 1 and 10% was achieved in all
measurements. Particle size and particle size distribution were calculated on Malvern
software.
5.2.1.6. True density The true density was measured with a helium pycnometer AccuPyc 1330 (Micrometrics,
USA) with nominal cell volume of 10ml. As the true density is expressed as a quotient
of mass and volume, the samples were weighted on balance AX204 (Mettler Toledo,
Switzerland) and placed in the cell. The volume was determined by purging each
sample 10 times with helium. The first five runs were considered as an equilibrating
procedure and the average of the last five measurements was taken as the value for
true density.
5.2.1.7. Bulk and tap density The bulk and tap density were determined using an appropriate apparatus Type STAV
2003 (Engelsmann AG, Germany). 100g sample was placed into a graduated cylinder.
The volumes at the beginning (bulk volume V0) and after tapping 1250 times (tap
volume V1250) were noted. The bulk density (ρb) was calculated as a ratio of mass and
initial volume V0, while the tapped density (ρt) was calculated as a ratio of mass and
tapped volume V1250. The Hausner ratio (HF) and the Carr’s index CI were determined
according to following equations:
Materials and methods
54
b
tHFρρ
= Equation 5.2
( )
100⋅−
=t
btCIρ
ρρ Equation 5.3
where:
HF - Hausner ratio ρb – bulk density (g/cm3)
CI - Carr’s index (%) ρt – tapped density (g/cm3)
Hausner ratio values less than 1.25 indicate good flow, whereas values greater than
1.25 indicate poor flow. For values between 1.25 and 1.5, added glidant normally would
improve flowability.
Carr's index can be interpreted as in table 5.1:
Table 5.1 Interpretation of Carr’s index
Carr’s index (%) Type of flow
5-15 Excellent
12-16 Good
18-21 Fair to passable
23-35 Poor
33-38 Very poor
>40 Extremely poor
5.2.1.8. X-ray powder diffraction X-ray powder diffraction profiles of powders were taken at room temperature with a
Diffractometer D5000 (Siemens, Germany). Powder samples were placed in special
sample holders, and the surface was excess off powder was removed to be totally flat.
The operating conditions were as following: Ni filtered Cu-Kα radiation (λ=1.5406Å),
voltage 40kV, current 30mA; step 0.02° step time 1.2s, angular scanning speed 1°
2θ/min and angular range between 2° and 40° 2θ scale.
Materials and methods
55
5.2.1.9. Thermal analysis
5.2.1.9.1. Differential scanning calorimetry (DSC) DSC measurements were performed using a Differential Scanning Calorimeter, Pyris 1,
(Perkin Elmer, USA). CBZ samples of 4-6mg were weighed into 30μl perforated
aluminum pans and scanned from 40 to 220°C at the heating rate of 10 and 40°C/min
and at the flow rate of nitrogen gas of 20ml/min. The Pyris 1 instrument was calibrated
with indium and zinc prior to analysis. Baseline runs were performed by scanning empty
perforated Al pans in the temperature range between 40 and 250˚C in order to test the
thermal behavior of the measuring system itself and the degree and influence of
unavoidable asymmetries. DSC measurements were performed in triplicate.
5.2.1.9.2. Thermogravimetric analysis (TGA) Thermogravimetric analyses were conducted on the Pyris TGA 6 (Perkin Elmer, USA).
Samples of 8-10mg were weighed into sample pan and scanned from 40 to 220°C at
the heating rate 10°C/min with nitrogen gas flow rate 100ml/min. Loss of mass was
registered on instruments microbalance. TGA measurements were conducted in
triplicate.
5.2.1.9.3. Hot stage microscopy (HSM) Physical changes in the samples during heating were monitored by hot stage
microscopy. Lynkam THMS 600 (Lynkam, United Kingdom) was used as a hostage unit.
A small amount of each sample was placed on a glass slide and scanned at the same
heating rate and the same temperature range as for DSC measurements, (see
5.2.1.9.1). The changes in the samples were observed via an optical microscope
Olympus BX51 (Olympus, Japan) with 10x magnification.
5.2.1.10. Solubility Equilibrium solubility was determined by adding an excess amount of sample into 100ml
of distilled water. The samples were placed in a shaker, set at 100rpm, and tempered
by water bath (Heto, Denmark) at 37±1°C for 72hours (Murphy et al., 2002). Samples of
Materials and methods
56
2ml milliliter were withdrawn at the following time intervals: 5, 10, 15, 20, 25, 30, 45, 60,
90min, 2, 4, 8, 12, 24, 36, 48 and 72h. Then, they were filtered and analyzed by UV/VIS
spectrophotometer (Beckman, USA) at λ=285nm. Solubility measurements were
performed in triplicate.
5.2.1.11. Porosity The porosity of CBZ compacts was measured using a mercury porosimeter PoreSizer
9320 (Micrometrics, USA). Three tablets were used for each analysis. The sample cell
was filled with mercury in an evacuated state. The low pressure run was performed
manually in the pressure range from 5 – 20psia (i.e. 35-150kPa) and the high pressure
run was automatically done in the pressure range from 20psia – 30kpsia (i.e. 150-
207MPa) with an equilibrium time of 10s after each pressure.
The porosity of compacts was also calculated using the following equation:
1001 ⋅⎟⎟⎠
⎞⎜⎜⎝
⎛⋅
−=ttV
mρ
ε Equation 5.4
where:
ε – porosity of tablet (%)
m – weight of tablet (g)
Vt – volume of the tablet (cm3)
ρ – true density of powder (g/cm3)
The thickness of the tablet for calculation was measured with a thickness gauge 532 G
(Compac, Switzerland). The tablet volume was calculated geometrically from the
diameter and thickness.
5.2.1.12. Intrinsic dissolution rate The intrinsic dissolution rate was measured by the rotating disk method. A compact of
11mm diameter was prepared by compacting 400mg of sample using Zwick 1478
material tester (Zwick, Germany) with flat faced round punches. CBZ samples were
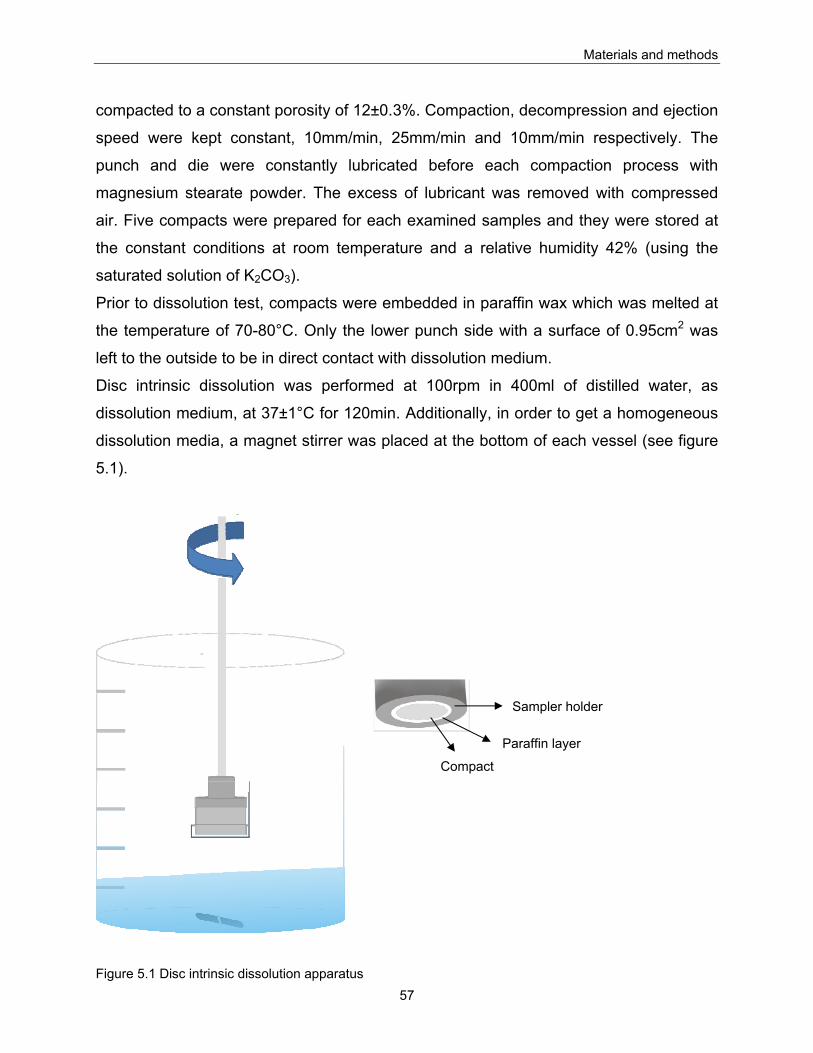
Materials and methods
57
compacted to a constant porosity of 12±0.3%. Compaction, decompression and ejection
speed were kept constant, 10mm/min, 25mm/min and 10mm/min respectively. The
punch and die were constantly lubricated before each compaction process with
magnesium stearate powder. The excess of lubricant was removed with compressed
air. Five compacts were prepared for each examined samples and they were stored at
the constant conditions at room temperature and a relative humidity 42% (using the
saturated solution of K2CO3).
Prior to dissolution test, compacts were embedded in paraffin wax which was melted at
the temperature of 70-80°C. Only the lower punch side with a surface of 0.95cm2 was
left to the outside to be in direct contact with dissolution medium.
Disc intrinsic dissolution was performed at 100rpm in 400ml of distilled water, as
dissolution medium, at 37±1°C for 120min. Additionally, in order to get a homogeneous
dissolution media, a magnet stirrer was placed at the bottom of each vessel (see figure
5.1).
Figure 5.1 Disc intrinsic dissolution apparatus
Paraffin layer
Sampler holder
Compact
Materials and methods
58
Aliquots of 5ml were withdrawn every minute during the first 20min, then every 5min
during the first hour, and afterward every 10min during the second hour. Dissolution
media was replaced after every sampling. Concentration of CBZ in solution was
measured by UV spectrophotometer DU 530 (Beckman, USA) at wavelength of 285nm.
The sink conditions were maintained during the whole dissolution experiment, which
means that the total concentration of investigated drug dissolved in dissolution medium
was not higher than 10% of its saturated concentration.
5.2.2. CBZ dihydrate
5.2.2.1. Preparation of dihydrate CBZ dihydrates (CBZ D) were prepared by crystallization of all 10 available CBZ
anhydrous forms by suspending samples in distilled water and stirring with a magnetic
stirrer for 24h at room temperature. The precipitated crystals were filtrated on filter and
dried at room temperature. Dihydrates were stored at room temperature and a relative
humidity of 55-60% to maintain hydrate conditions (McMahon et al., 1996).
5.2.2.2. Characterization of CBZ dihydrate Carbamazepine dihydrates were characterized using the same methods as for CBZ
anhydrous: x-ray diffraction (see 5.2.1.8.), thermal behavior by DSC (see 5.2.1.9.1.),
morphology (see 5.2.1.4), loss on drying (see 5.2.1.3.), solubility (see 5.2.1.10.) and
disc intrinsic dissolution (see 5.2.1.11.).
5.2.3. Carbamazepine binary mixtures
5.2.3.1. Preparation of binary mixtures Carbamazepine CBZ A3, CBZ B3, CBZ P3 and CBZ D were selected to be investigated
in binary mixtures with Fast Flo® lactose as an excipient. Mixtures were prepared in
ratios presented in table 5.2. Mixtures were mixed in a blender Turbula T2C (W.
Bachofen, Switzerland) for 10 minutes prior to compaction.
Materials and methods
59
Table 5.2 Binary mixtures of CBZ A, B, P and D and Fast Flo® lactose
Mixture Carbamazepine (%) Fast Flo lactose (%)
Mixture 1 90 10
Mixture 2 80 20
Mixture 3 70 30
Mixture 4 60 40
Mixture 5 50 50
Mixture 6 40 60
Mixture 7 30 70
Mixture 8 20 80
Mixture 9 10 90
5.2.3.2. Tabbletting of binary mixtures Tablets with constant porosity were prepared by using Zwick material tester (for
compaction parameters see 4.2.1.12.). The porosity of 12±0.5% was kept constant in
order to compare the obtained data with data of pure CBZ compacts.
Prepared compacts were stored for two weeks at room temperature at two different
storage conditions in desiccators under saturated salts solutions (at 55-60%RH using
sodium bromide and at 85-90%RH using potassium chloride).
5.2.3.3. Disintegration of binary mixtures The disintegration time of binary mixtures was measured with disintegration apparatus
Sotax DT3, (Sotax AG, Switzerland). The disintegration medium used was distilled
water, at the temperature of 37±1°C. The tablets were considered disintegrated when
no residue of the units remained in the basket. For each binary mixture and formulation,
six tablets were tested and the time taken to complete the disintegration was recorded.
5.2.3.4. Intrinsic dissolution of binary mixtures Intrinsic dissolution test was performed as fom CBZ pure compacts (see 5.2.1.11.).
Materials and methods
60
5.2.4. Carbamazepine formulations
5.2.4.1. Preparation of CBZ formulations Five different formulations have been prepared consisting of CBZ (USP standard, CBZ
A3, CBZ B3, CBZ P3 and CBZ D), Ludipress® and magnesium stearate. Formulations
were mixed in blender Turbula T2C (W. Bachofen, Switzerland) for 5min.
5.2.4.2. Tabletting of CBZ formulations Tablets of 350mg for each formulation were produced using PressterTM compaction
simulator (MCC, USA) with flat faced round punches of 10mm diameter. The tablet
press simulated was Korsch PH336, with desired press speed of 10800 TPH (tablet per
hour) and resulting dwell time of 32.0±1.9ms. The porosity of the tablet was kept
constant (12.7±0.2%), simulating the porosity of marketed CBZ tablets, and in respect
to that the gap value was adapted in the range from 2.75 to 2.90mm.
5.2.4.3. Tablet strength The tablet strength was measured using the tablet tester Dr.Schleuniger (Pharmatron,
Switzerland). Six tablets were used for each measurement and average value was
calculated.
5.2.4.4. Disintegration of CBZ formulations Disintegration test was performed as for binary mixture tablets (see 5.2.3.3.)
5.2.4.5. Dissolution The dissolution test for the five CBZ formulations (CBZ, Ludipress® and magnesium
stearate) was performed according to USP XXXI for dissolution of Carbamazepine
immediate release tablets, dissolution apparatus II (USP31, 2008). The dissolution
apparatus used was VK7025 (Varian, USA). Dissolution media was 900ml of distilled
water containing 1% of sodium lauryl sulfate at 37±1°C, with a rotation speed of 75rpm
during 60min. Samples of 5ml were withdrawn every five minutes during the dissolution,
and replaced by the same amount of dissolution media. Concentration of CBZ in
solution was measured by UV spectrophotometer (Perkin Elmer, USA) at wavelength of
288nm. The weight of each tablet was used in the calculation of dissolved percentage of
the drug.
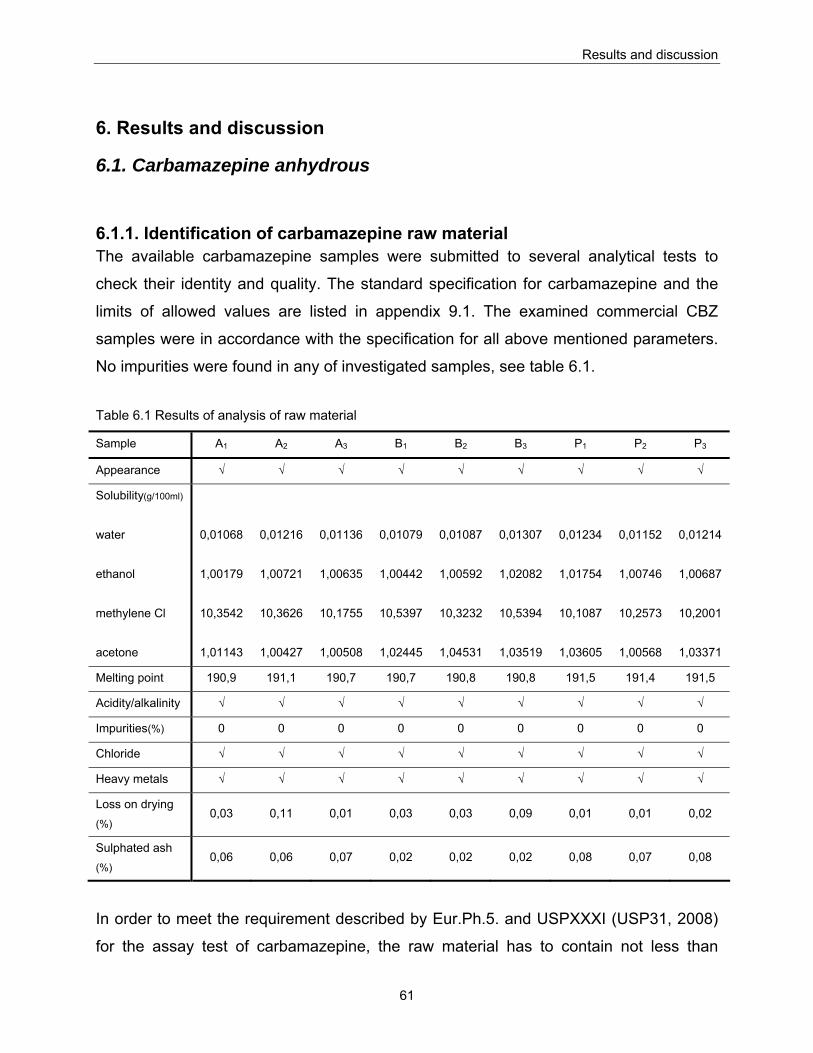
Results and discussion
61
6. Results and discussion
6.1. Carbamazepine anhydrous
6.1.1. Identification of carbamazepine raw material The available carbamazepine samples were submitted to several analytical tests to
check their identity and quality. The standard specification for carbamazepine and the
limits of allowed values are listed in appendix 9.1. The examined commercial CBZ
samples were in accordance with the specification for all above mentioned parameters.
No impurities were found in any of investigated samples, see table 6.1.
Table 6.1 Results of analysis of raw material
Sample A1 A2 A3 B1 B2 B3 P1 P2 P3
Appearance √ √ √ √ √ √ √ √ √
Solubility(g/100ml)
water
ethanol
methylene Cl
acetone
0,01068
1,00179
10,3542
1,01143
0,01216
1,00721
10,3626
1,00427
0,01136
1,00635
10,1755
1,00508
0,01079
1,00442
10,5397
1,02445
0,01087
1,00592
10,3232
1,04531
0,01307
1,02082
10,5394
1,03519
0,01234
1,01754
10,1087
1,03605
0,01152
1,00746
10,2573
1,00568
0,01214
1,00687
10,2001
1,03371
Melting point 190,9 191,1 190,7 190,7 190,8 190,8 191,5 191,4 191,5
Acidity/alkalinity √ √ √ √ √ √ √ √ √
Impurities(%) 0 0 0 0 0 0 0 0 0
Chloride √ √ √ √ √ √ √ √ √
Heavy metals √ √ √ √ √ √ √ √ √
Loss on drying (%)
0,03 0,11 0,01 0,03 0,03 0,09 0,01 0,01 0,02
Sulphated ash (%)
0,06 0,06 0,07 0,02 0,02 0,02 0,08 0,07 0,08
In order to meet the requirement described by Eur.Ph.5. and USPXXXI (USP31, 2008)
for the assay test of carbamazepine, the raw material has to contain not less than
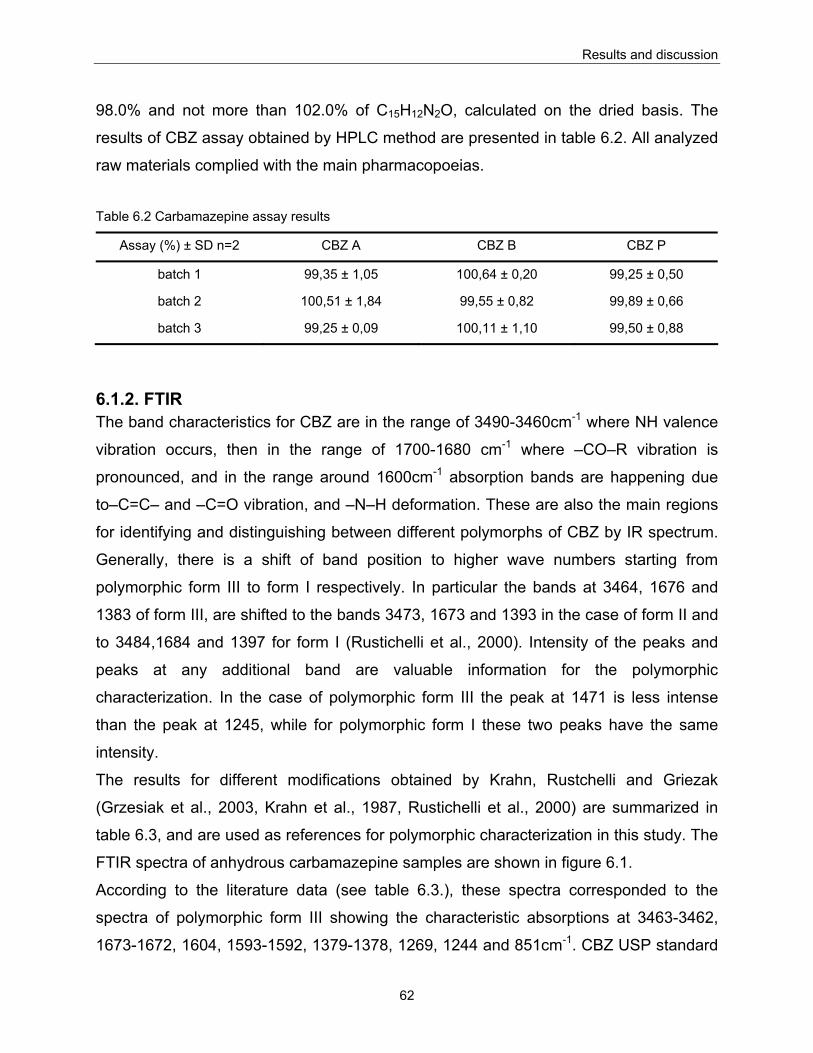
Results and discussion
62
98.0% and not more than 102.0% of C15H12N2O, calculated on the dried basis. The
results of CBZ assay obtained by HPLC method are presented in table 6.2. All analyzed
raw materials complied with the main pharmacopoeias. Table 6.2 Carbamazepine assay results
Assay (%) ± SD n=2 CBZ A CBZ B CBZ P
batch 1 99,35 ± 1,05 100,64 ± 0,20 99,25 ± 0,50
batch 2 100,51 ± 1,84 99,55 ± 0,82 99,89 ± 0,66
batch 3 99,25 ± 0,09 100,11 ± 1,10 99,50 ± 0,88
6.1.2. FTIR The band characteristics for CBZ are in the range of 3490-3460cm-1 where NH valence
vibration occurs, then in the range of 1700-1680 cm-1 where –CO–R vibration is
pronounced, and in the range around 1600cm-1 absorption bands are happening due
to–C=C– and –C=O vibration, and –N–H deformation. These are also the main regions
for identifying and distinguishing between different polymorphs of CBZ by IR spectrum.
Generally, there is a shift of band position to higher wave numbers starting from
polymorphic form III to form I respectively. In particular the bands at 3464, 1676 and
1383 of form III, are shifted to the bands 3473, 1673 and 1393 in the case of form II and
to 3484,1684 and 1397 for form I (Rustichelli et al., 2000). Intensity of the peaks and
peaks at any additional band are valuable information for the polymorphic
characterization. In the case of polymorphic form III the peak at 1471 is less intense
than the peak at 1245, while for polymorphic form I these two peaks have the same
intensity.
The results for different modifications obtained by Krahn, Rustchelli and Griezak
(Grzesiak et al., 2003, Krahn et al., 1987, Rustichelli et al., 2000) are summarized in
table 6.3, and are used as references for polymorphic characterization in this study. The
FTIR spectra of anhydrous carbamazepine samples are shown in figure 6.1.
According to the literature data (see table 6.3.), these spectra corresponded to the
spectra of polymorphic form III showing the characteristic absorptions at 3463-3462,
1673-1672, 1604, 1593-1592, 1379-1378, 1269, 1244 and 851cm-1. CBZ USP standard
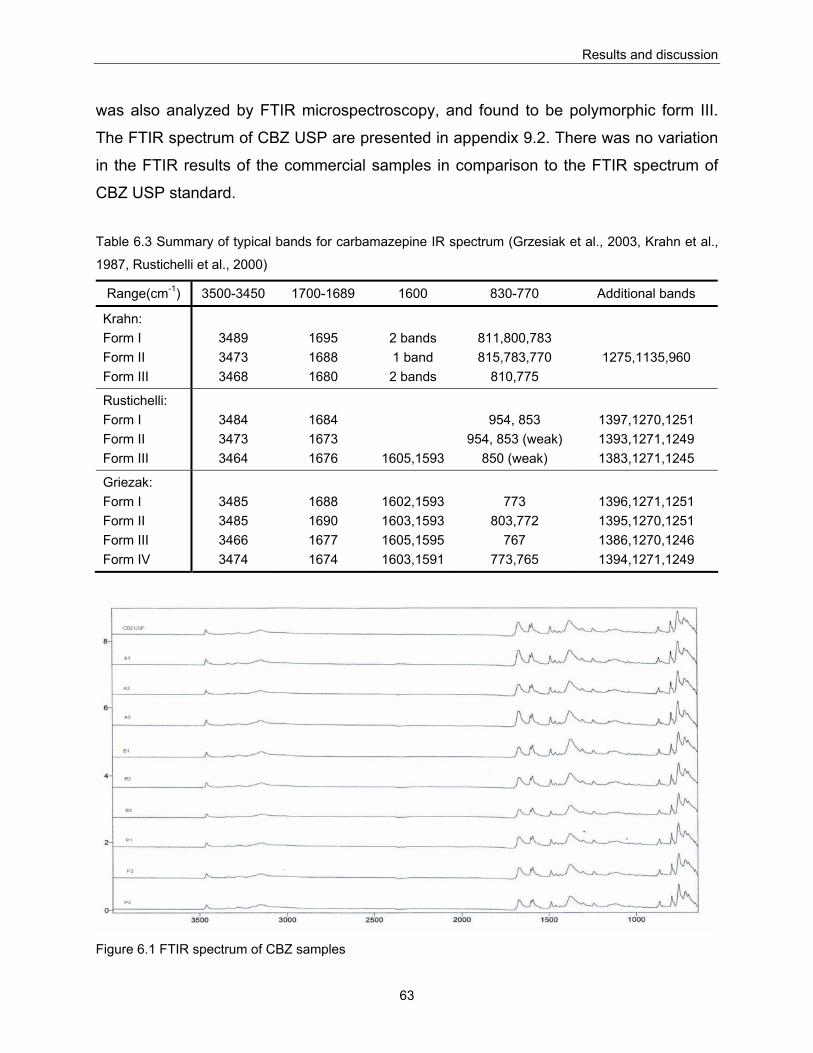
Results and discussion
63
was also analyzed by FTIR microspectroscopy, and found to be polymorphic form III.
The FTIR spectrum of CBZ USP are presented in appendix 9.2. There was no variation
in the FTIR results of the commercial samples in comparison to the FTIR spectrum of
CBZ USP standard.
Table 6.3 Summary of typical bands for carbamazepine IR spectrum (Grzesiak et al., 2003, Krahn et al.,
1987, Rustichelli et al., 2000)
Range(cm-1) 3500-3450 1700-1689 1600 830-770 Additional bands
Krahn: Form I Form II Form III
3489 3473 3468
1695 1688 1680
2 bands 1 band 2 bands
811,800,783 815,783,770
810,775
1275,1135,960
Rustichelli: Form I Form II Form III
3484 3473 3464
1684 1673 1676
1605,1593
954, 853
954, 853 (weak) 850 (weak)
1397,1270,1251 1393,1271,1249 1383,1271,1245
Griezak: Form I Form II Form III Form IV
3485 3485 3466 3474
1688 1690 1677 1674
1602,1593 1603,1593 1605,1595 1603,1591
773
803,772 767
773,765
1396,1271,1251 1395,1270,1251 1386,1270,1246 1394,1271,1249
Figure 6.1 FTIR spectrum of CBZ samples
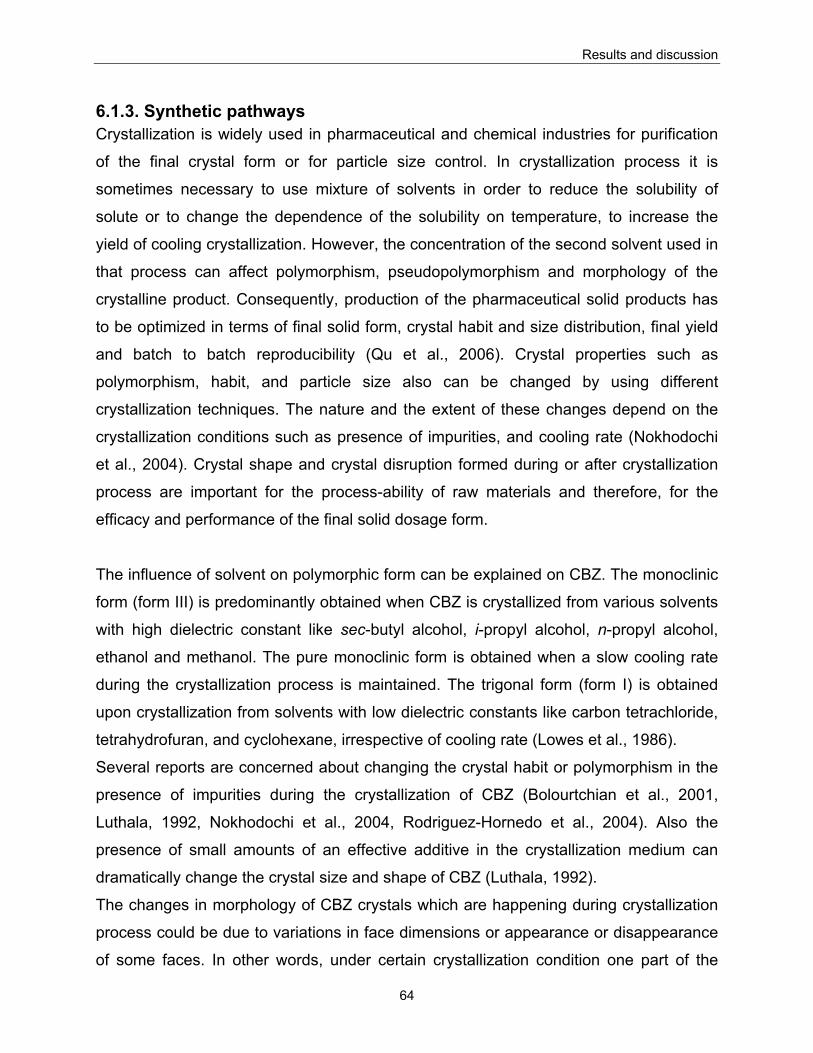
Results and discussion
64
6.1.3. Synthetic pathways Crystallization is widely used in pharmaceutical and chemical industries for purification
of the final crystal form or for particle size control. In crystallization process it is
sometimes necessary to use mixture of solvents in order to reduce the solubility of
solute or to change the dependence of the solubility on temperature, to increase the
yield of cooling crystallization. However, the concentration of the second solvent used in
that process can affect polymorphism, pseudopolymorphism and morphology of the
crystalline product. Consequently, production of the pharmaceutical solid products has
to be optimized in terms of final solid form, crystal habit and size distribution, final yield
and batch to batch reproducibility (Qu et al., 2006). Crystal properties such as
polymorphism, habit, and particle size also can be changed by using different
crystallization techniques. The nature and the extent of these changes depend on the
crystallization conditions such as presence of impurities, and cooling rate (Nokhodochi
et al., 2004). Crystal shape and crystal disruption formed during or after crystallization
process are important for the process-ability of raw materials and therefore, for the
efficacy and performance of the final solid dosage form.
The influence of solvent on polymorphic form can be explained on CBZ. The monoclinic
form (form III) is predominantly obtained when CBZ is crystallized from various solvents
with high dielectric constant like sec-butyl alcohol, i-propyl alcohol, n-propyl alcohol,
ethanol and methanol. The pure monoclinic form is obtained when a slow cooling rate
during the crystallization process is maintained. The trigonal form (form I) is obtained
upon crystallization from solvents with low dielectric constants like carbon tetrachloride,
tetrahydrofuran, and cyclohexane, irrespective of cooling rate (Lowes et al., 1986).
Several reports are concerned about changing the crystal habit or polymorphism in the
presence of impurities during the crystallization of CBZ (Bolourtchian et al., 2001,
Luthala, 1992, Nokhodochi et al., 2004, Rodriguez-Hornedo et al., 2004). Also the
presence of small amounts of an effective additive in the crystallization medium can
dramatically change the crystal size and shape of CBZ (Luthala, 1992).
The changes in morphology of CBZ crystals which are happening during crystallization
process could be due to variations in face dimensions or appearance or disappearance
of some faces. In other words, under certain crystallization condition one part of the
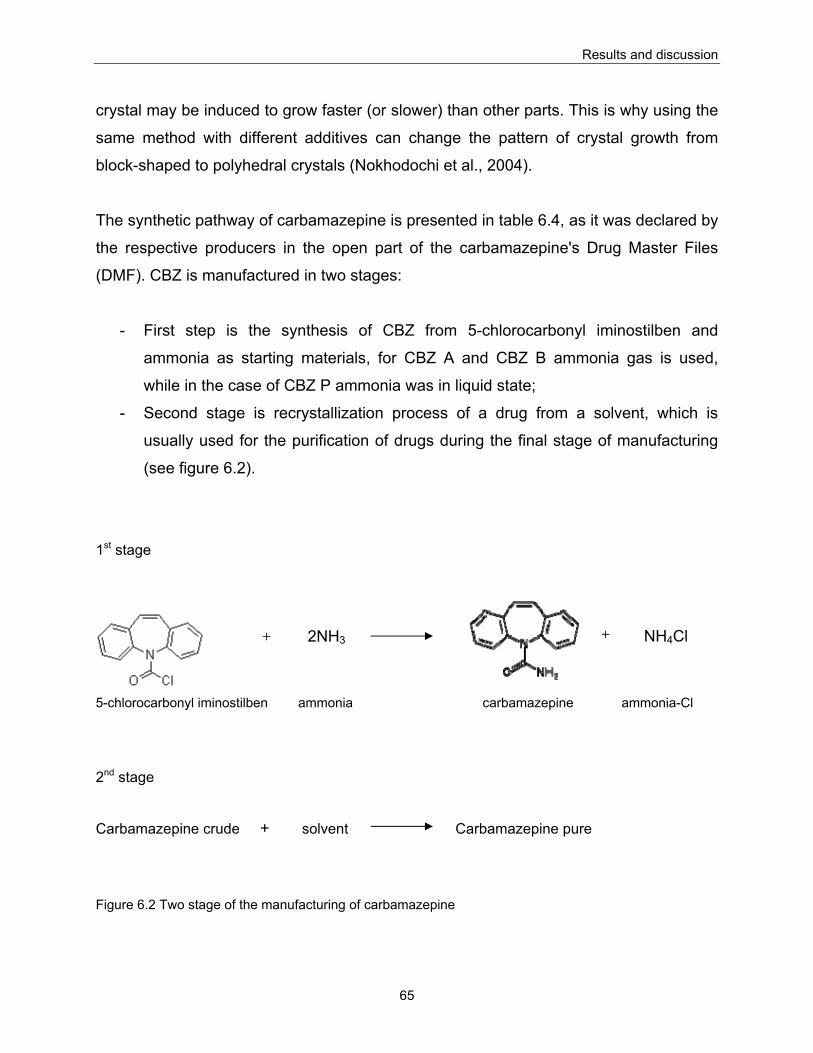
Results and discussion
65
crystal may be induced to grow faster (or slower) than other parts. This is why using the
same method with different additives can change the pattern of crystal growth from
block-shaped to polyhedral crystals (Nokhodochi et al., 2004).
The synthetic pathway of carbamazepine is presented in table 6.4, as it was declared by
the respective producers in the open part of the carbamazepine's Drug Master Files
(DMF). CBZ is manufactured in two stages:
- First step is the synthesis of CBZ from 5-chlorocarbonyl iminostilben and
ammonia as starting materials, for CBZ A and CBZ B ammonia gas is used,
while in the case of CBZ P ammonia was in liquid state;
- Second stage is recrystallization process of a drug from a solvent, which is
usually used for the purification of drugs during the final stage of manufacturing
(see figure 6.2).
1st stage
5-chlorocarbonyl iminostilben ammonia carbamazepine ammonia-Cl
2nd stage
Carbamazepine crude + solvent Carbamazepine pure
Figure 6.2 Two stage of the manufacturing of carbamazepine
+ 2NH3 NH4Cl +
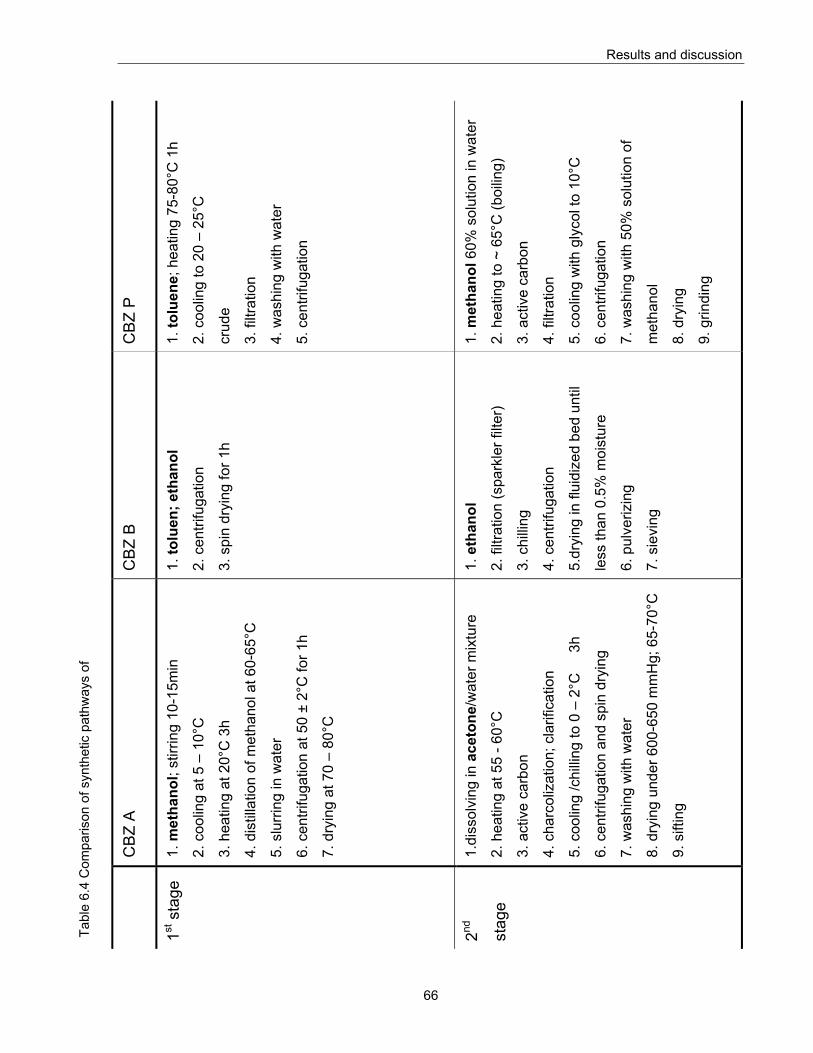
Results and discussion
66
CBZ
P
1. to
luen
e; h
eatin
g 75
-80°
C 1
h
2. c
oolin
g to
20
– 25
°C
crud
e
3. fi
ltrat
ion
4. w
ashi
ng w
ith w
ater
5. c
entri
fuga
tion
1. m
etha
nol 6
0% s
olut
ion
in w
ater
2. h
eatin
g to
~ 6
5°C
(boi
ling)
3. a
ctiv
e ca
rbon
4. fi
ltrat
ion
5. c
oolin
g w
ith g
lyco
l to
10°C
6. c
entri
fuga
tion
7. w
ashi
ng w
ith 5
0% s
olut
ion
of
met
hano
l
8. d
ryin
g
9. g
rindi
ng
CBZ
B
1. to
luen
; eth
anol
2. c
entri
fuga
tion
3. s
pin
dryi
ng fo
r 1h
1. e
than
ol
2. fi
ltrat
ion
(spa
rkle
r filt
er)
3. c
hilli
ng
4. c
entri
fuga
tion
5.dr
ying
in fl
uidi
zed
bed
until
less
than
0.5
% m
oist
ure
6. p
ulve
rizin
g
7. s
ievi
ng
CBZ
A
1. m
etha
nol;
stirr
ing
10-1
5min
2. c
oolin
g at
5 –
10°
C
3. h
eatin
g at
20°
C 3
h
4. d
istil
latio
n of
met
hano
l at 6
0-65
°C
5. s
lurr
ing
in w
ater
6. c
entri
fuga
tion
at 5
0 ±
2°C
for 1
h
7. d
ryin
g at
70
– 80
°C
1.di
ssol
ving
in a
ceto
ne/w
ater
mix
ture
2. h
eatin
g at
55
- 60°
C
3. a
ctiv
e ca
rbon
4. c
harc
oliz
atio
n; c
larif
icat
ion
5. c
oolin
g /c
hilli
ng to
0 –
2°C
3
h
6. c
entri
fuga
tion
and
spin
dry
ing
7. w
ashi
ng w
ith w
ater
8. d
ryin
g un
der 6
00-6
50 m
mH
g; 6
5-70
°C
9. s
iftin
g
1st s
tage
2nd
stag
e
Tabl
e 6.
4 C
ompa
rison
of s
ynth
etic
pat
hway
s of
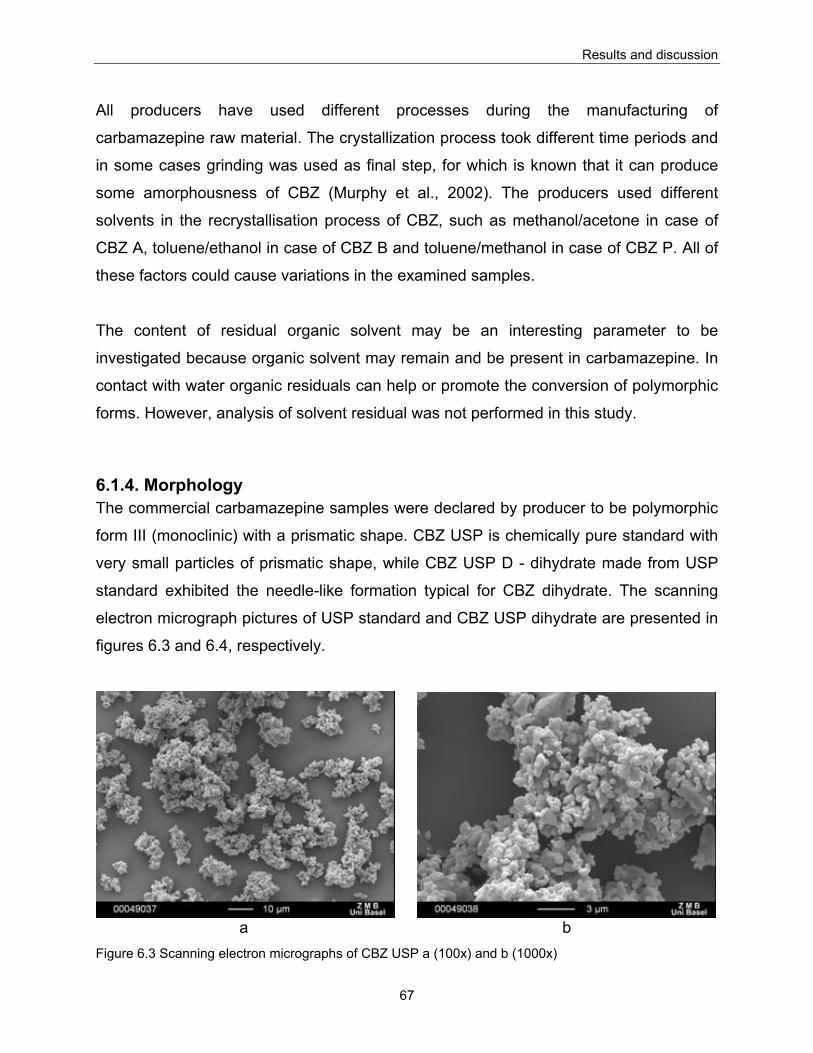
Results and discussion
67
All producers have used different processes during the manufacturing of
carbamazepine raw material. The crystallization process took different time periods and
in some cases grinding was used as final step, for which is known that it can produce
some amorphousness of CBZ (Murphy et al., 2002). The producers used different
solvents in the recrystallisation process of CBZ, such as methanol/acetone in case of
CBZ A, toluene/ethanol in case of CBZ B and toluene/methanol in case of CBZ P. All of
these factors could cause variations in the examined samples.
The content of residual organic solvent may be an interesting parameter to be
investigated because organic solvent may remain and be present in carbamazepine. In
contact with water organic residuals can help or promote the conversion of polymorphic
forms. However, analysis of solvent residual was not performed in this study.
6.1.4. Morphology The commercial carbamazepine samples were declared by producer to be polymorphic
form III (monoclinic) with a prismatic shape. CBZ USP is chemically pure standard with
very small particles of prismatic shape, while CBZ USP D - dihydrate made from USP
standard exhibited the needle-like formation typical for CBZ dihydrate. The scanning
electron micrograph pictures of USP standard and CBZ USP dihydrate are presented in
figures 6.3 and 6.4, respectively.
a b
Figure 6.3 Scanning electron micrographs of CBZ USP a (100x) and b (1000x)
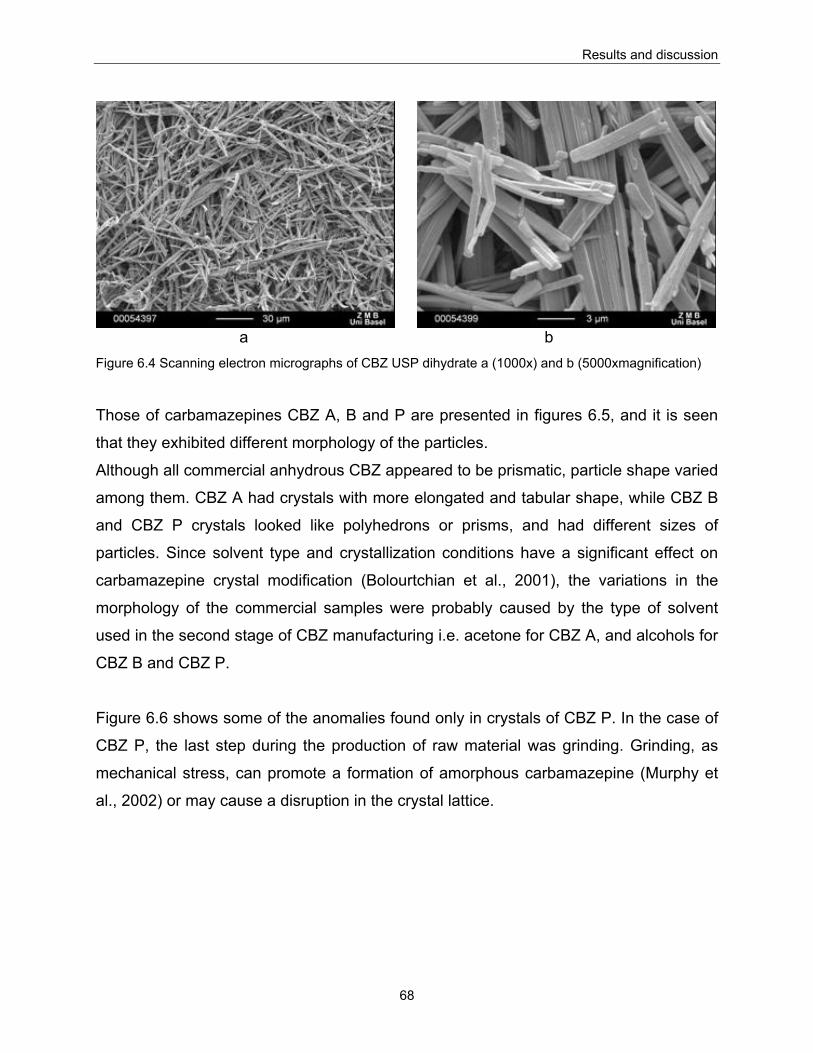
Results and discussion
68
a b Figure 6.4 Scanning electron micrographs of CBZ USP dihydrate a (1000x) and b (5000xmagnification)
Those of carbamazepines CBZ A, B and P are presented in figures 6.5, and it is seen
that they exhibited different morphology of the particles.
Although all commercial anhydrous CBZ appeared to be prismatic, particle shape varied
among them. CBZ A had crystals with more elongated and tabular shape, while CBZ B
and CBZ P crystals looked like polyhedrons or prisms, and had different sizes of
particles. Since solvent type and crystallization conditions have a significant effect on
carbamazepine crystal modification (Bolourtchian et al., 2001), the variations in the
morphology of the commercial samples were probably caused by the type of solvent
used in the second stage of CBZ manufacturing i.e. acetone for CBZ A, and alcohols for
CBZ B and CBZ P.
Figure 6.6 shows some of the anomalies found only in crystals of CBZ P. In the case of
CBZ P, the last step during the production of raw material was grinding. Grinding, as
mechanical stress, can promote a formation of amorphous carbamazepine (Murphy et
al., 2002) or may cause a disruption in the crystal lattice.
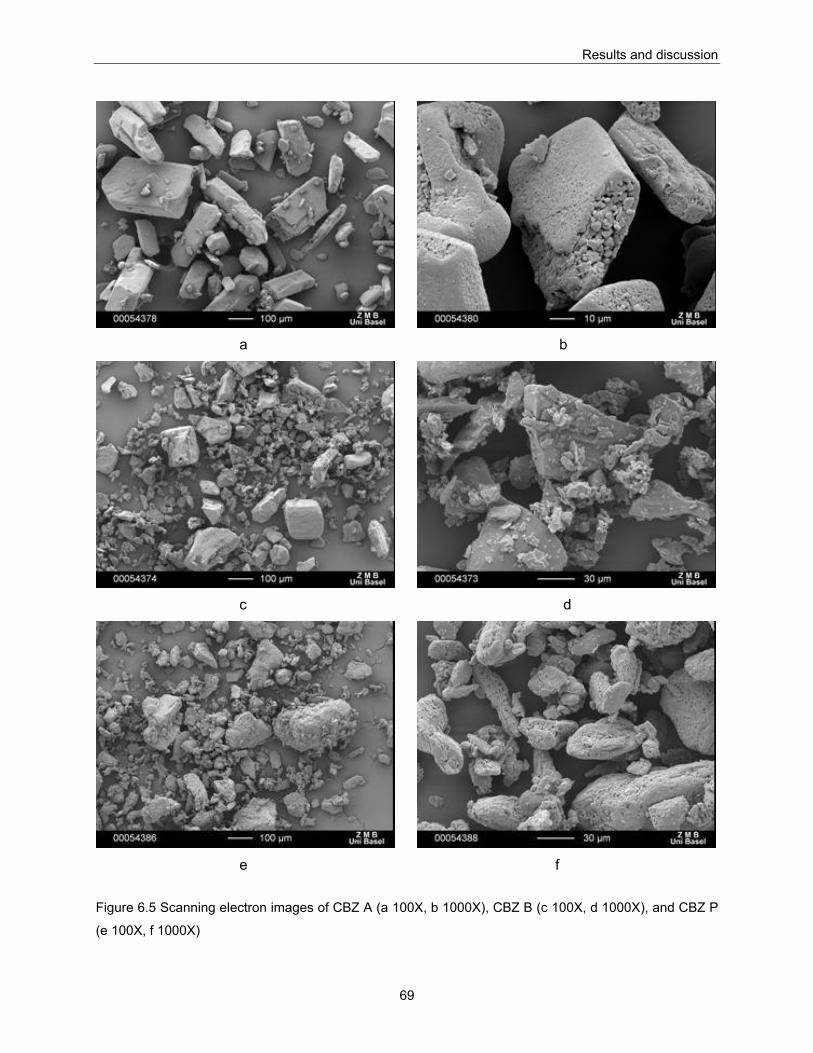
Results and discussion
69
a b
c d
e f
Figure 6.5 Scanning electron images of CBZ A (a 100X, b 1000X), CBZ B (c 100X, d 1000X), and CBZ P
(e 100X, f 1000X)
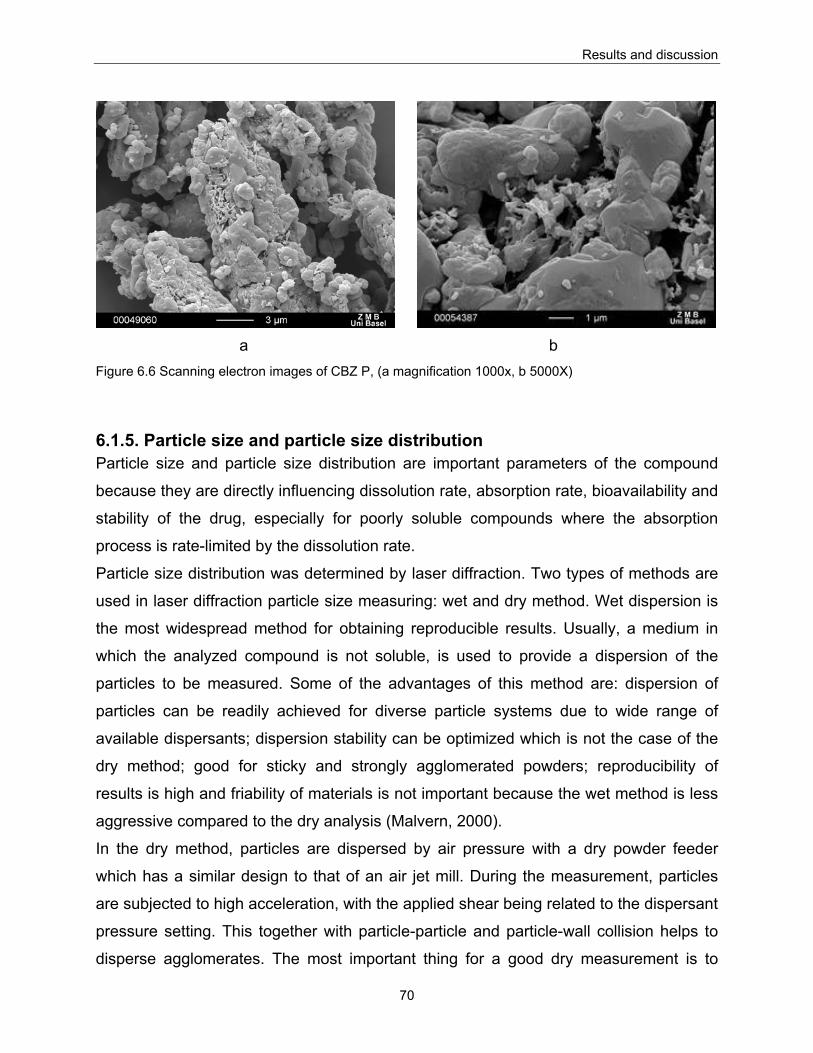
Results and discussion
70
a b Figure 6.6 Scanning electron images of CBZ P, (a magnification 1000x, b 5000X)
6.1.5. Particle size and particle size distribution Particle size and particle size distribution are important parameters of the compound
because they are directly influencing dissolution rate, absorption rate, bioavailability and
stability of the drug, especially for poorly soluble compounds where the absorption
process is rate-limited by the dissolution rate.
Particle size distribution was determined by laser diffraction. Two types of methods are
used in laser diffraction particle size measuring: wet and dry method. Wet dispersion is
the most widespread method for obtaining reproducible results. Usually, a medium in
which the analyzed compound is not soluble, is used to provide a dispersion of the
particles to be measured. Some of the advantages of this method are: dispersion of
particles can be readily achieved for diverse particle systems due to wide range of
available dispersants; dispersion stability can be optimized which is not the case of the
dry method; good for sticky and strongly agglomerated powders; reproducibility of
results is high and friability of materials is not important because the wet method is less
aggressive compared to the dry analysis (Malvern, 2000).
In the dry method, particles are dispersed by air pressure with a dry powder feeder
which has a similar design to that of an air jet mill. During the measurement, particles
are subjected to high acceleration, with the applied shear being related to the dispersant
pressure setting. This together with particle-particle and particle-wall collision helps to
disperse agglomerates. The most important thing for a good dry measurement is to
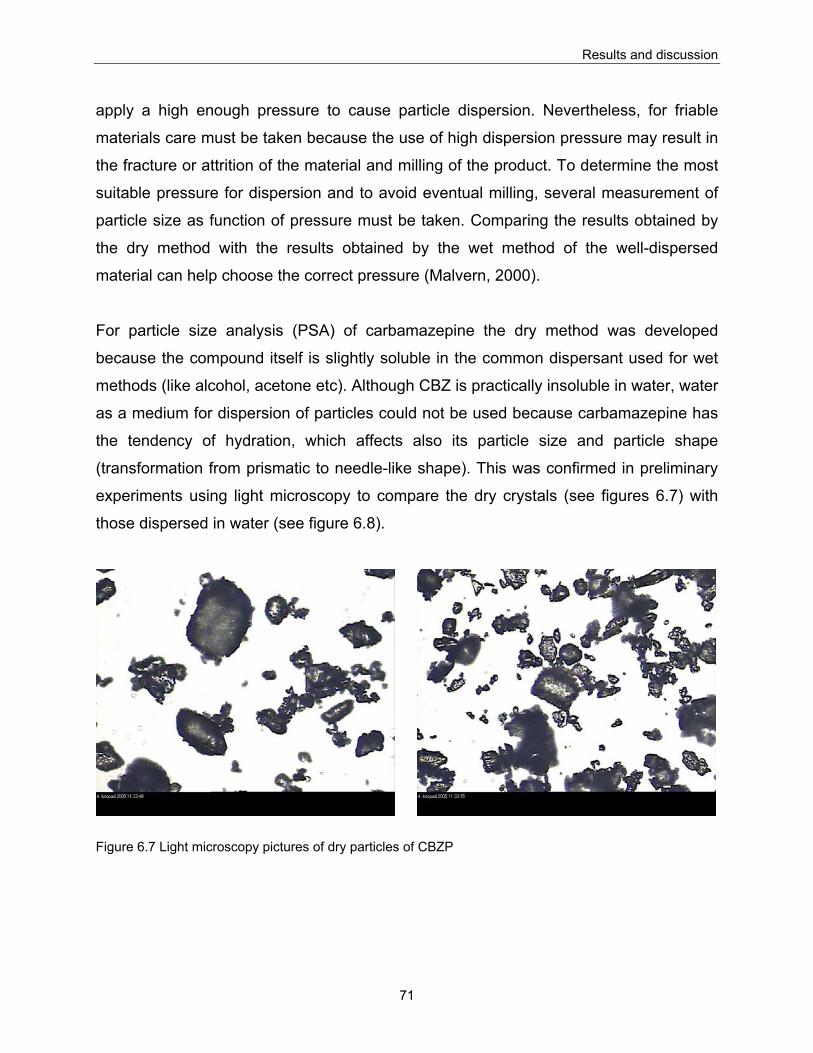
Results and discussion
71
apply a high enough pressure to cause particle dispersion. Nevertheless, for friable
materials care must be taken because the use of high dispersion pressure may result in
the fracture or attrition of the material and milling of the product. To determine the most
suitable pressure for dispersion and to avoid eventual milling, several measurement of
particle size as function of pressure must be taken. Comparing the results obtained by
the dry method with the results obtained by the wet method of the well-dispersed
material can help choose the correct pressure (Malvern, 2000).
For particle size analysis (PSA) of carbamazepine the dry method was developed
because the compound itself is slightly soluble in the common dispersant used for wet
methods (like alcohol, acetone etc). Although CBZ is practically insoluble in water, water
as a medium for dispersion of particles could not be used because carbamazepine has
the tendency of hydration, which affects also its particle size and particle shape
(transformation from prismatic to needle-like shape). This was confirmed in preliminary
experiments using light microscopy to compare the dry crystals (see figures 6.7) with
those dispersed in water (see figure 6.8).
Figure 6.7 Light microscopy pictures of dry particles of CBZP
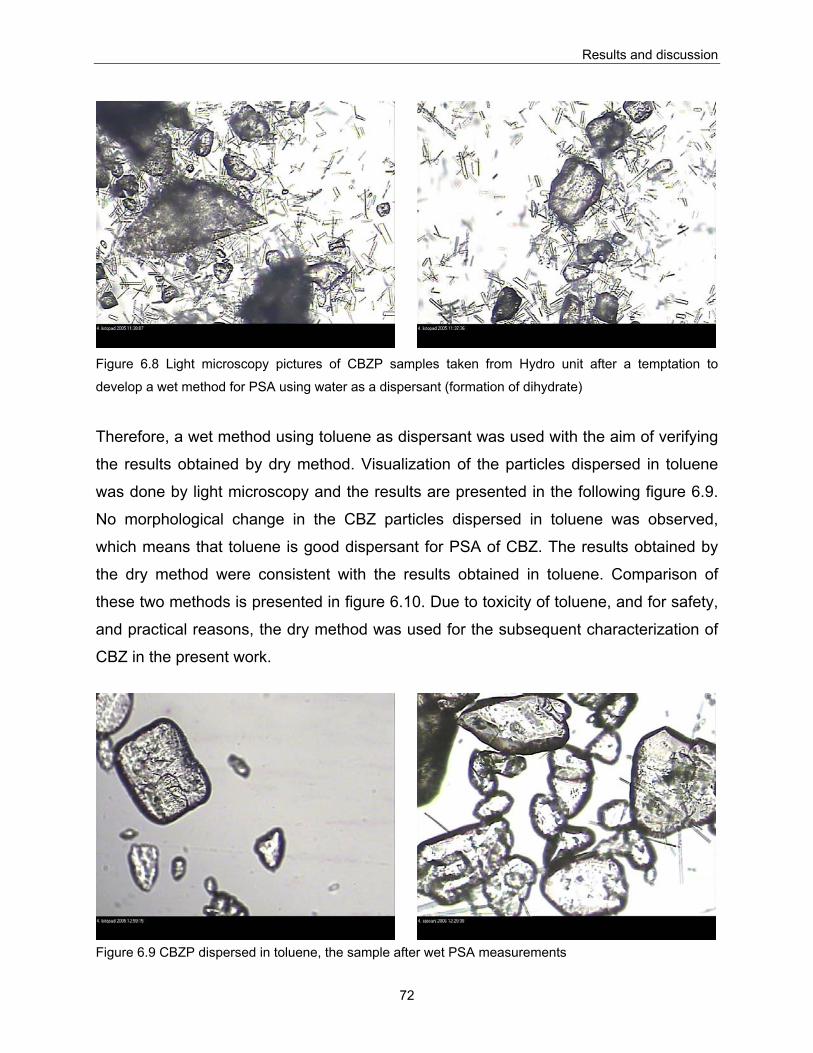
Results and discussion
72
Figure 6.8 Light microscopy pictures of CBZP samples taken from Hydro unit after a temptation to
develop a wet method for PSA using water as a dispersant (formation of dihydrate)
Therefore, a wet method using toluene as dispersant was used with the aim of verifying
the results obtained by dry method. Visualization of the particles dispersed in toluene
was done by light microscopy and the results are presented in the following figure 6.9.
No morphological change in the CBZ particles dispersed in toluene was observed,
which means that toluene is good dispersant for PSA of CBZ. The results obtained by
the dry method were consistent with the results obtained in toluene. Comparison of
these two methods is presented in figure 6.10. Due to toxicity of toluene, and for safety,
and practical reasons, the dry method was used for the subsequent characterization of
CBZ in the present work.
Figure 6.9 CBZP dispersed in toluene, the sample after wet PSA measurements
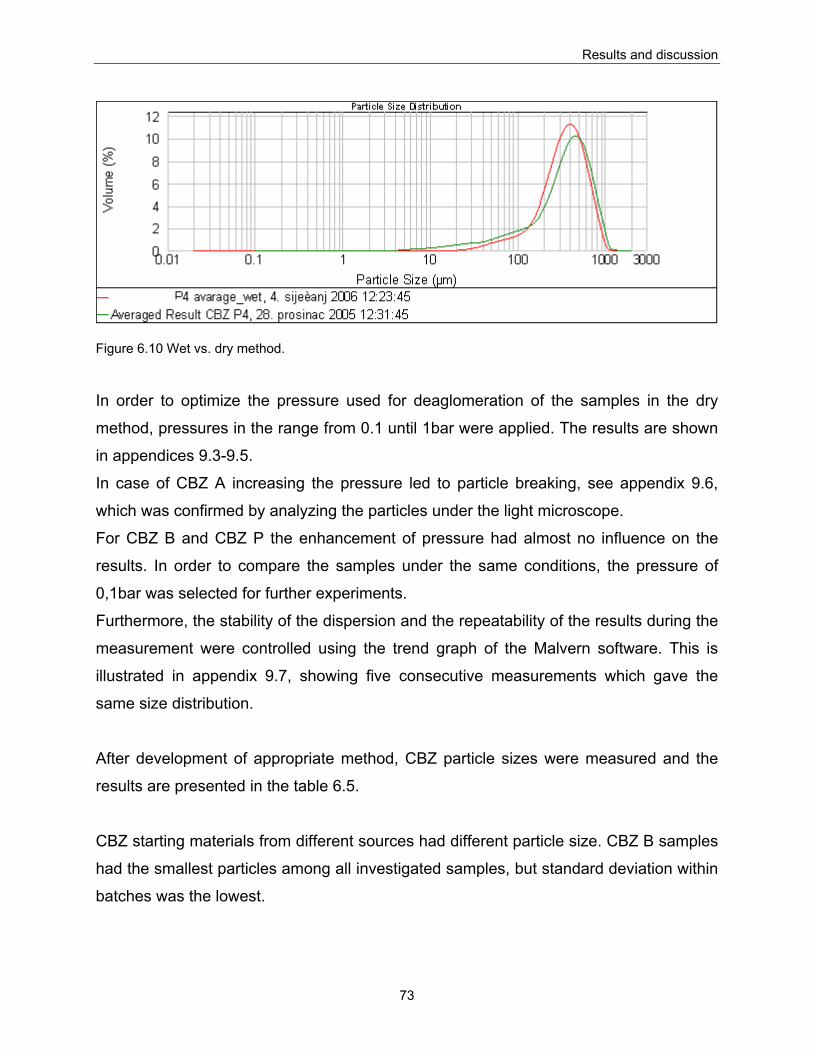
Results and discussion
73
Figure 6.10 Wet vs. dry method.
In order to optimize the pressure used for deaglomeration of the samples in the dry
method, pressures in the range from 0.1 until 1bar were applied. The results are shown
in appendices 9.3-9.5.
In case of CBZ A increasing the pressure led to particle breaking, see appendix 9.6,
which was confirmed by analyzing the particles under the light microscope.
For CBZ B and CBZ P the enhancement of pressure had almost no influence on the
results. In order to compare the samples under the same conditions, the pressure of
0,1bar was selected for further experiments.
Furthermore, the stability of the dispersion and the repeatability of the results during the
measurement were controlled using the trend graph of the Malvern software. This is
illustrated in appendix 9.7, showing five consecutive measurements which gave the
same size distribution.
After development of appropriate method, CBZ particle sizes were measured and the
results are presented in the table 6.5.
CBZ starting materials from different sources had different particle size. CBZ B samples
had the smallest particles among all investigated samples, but standard deviation within
batches was the lowest.
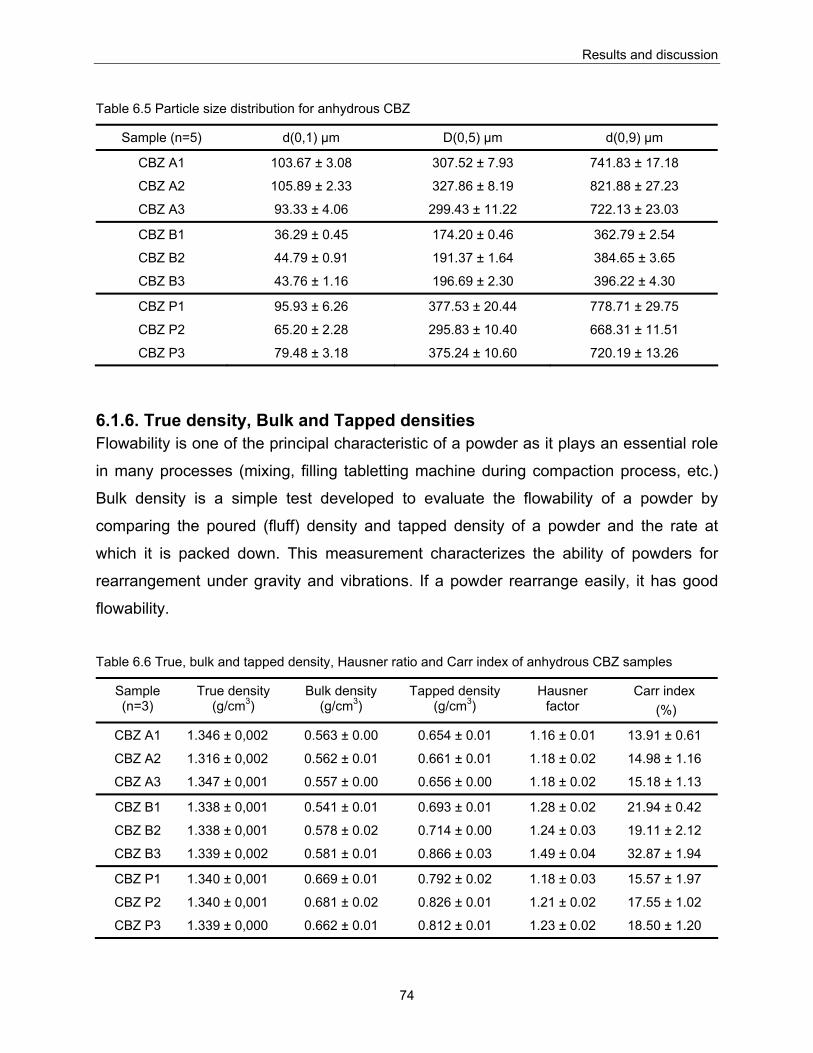
Results and discussion
74
Table 6.5 Particle size distribution for anhydrous CBZ
Sample (n=5) d(0,1) μm D(0,5) μm d(0,9) μm
CBZ A1 103.67 ± 3.08 307.52 ± 7.93 741.83 ± 17.18
CBZ A2 105.89 ± 2.33 327.86 ± 8.19 821.88 ± 27.23
CBZ A3 93.33 ± 4.06 299.43 ± 11.22 722.13 ± 23.03
CBZ B1 36.29 ± 0.45 174.20 ± 0.46 362.79 ± 2.54
CBZ B2 44.79 ± 0.91 191.37 ± 1.64 384.65 ± 3.65
CBZ B3 43.76 ± 1.16 196.69 ± 2.30 396.22 ± 4.30
CBZ P1 95.93 ± 6.26 377.53 ± 20.44 778.71 ± 29.75
CBZ P2 65.20 ± 2.28 295.83 ± 10.40 668.31 ± 11.51
CBZ P3 79.48 ± 3.18 375.24 ± 10.60 720.19 ± 13.26
6.1.6. True density, Bulk and Tapped densities Flowability is one of the principal characteristic of a powder as it plays an essential role
in many processes (mixing, filling tabletting machine during compaction process, etc.)
Bulk density is a simple test developed to evaluate the flowability of a powder by
comparing the poured (fluff) density and tapped density of a powder and the rate at
which it is packed down. This measurement characterizes the ability of powders for
rearrangement under gravity and vibrations. If a powder rearrange easily, it has good
flowability.
Table 6.6 True, bulk and tapped density, Hausner ratio and Carr index of anhydrous CBZ samples
Sample (n=3)
True density (g/cm3)
Bulk density (g/cm3)
Tapped density (g/cm3)
Hausner factor
Carr index (%)
CBZ A1 1.346 ± 0,002 0.563 ± 0.00 0.654 ± 0.01 1.16 ± 0.01 13.91 ± 0.61
CBZ A2 1.316 ± 0,002 0.562 ± 0.01 0.661 ± 0.01 1.18 ± 0.02 14.98 ± 1.16
CBZ A3 1.347 ± 0,001 0.557 ± 0.00 0.656 ± 0.00 1.18 ± 0.02 15.18 ± 1.13
CBZ B1 1.338 ± 0,001 0.541 ± 0.01 0.693 ± 0.01 1.28 ± 0.02 21.94 ± 0.42
CBZ B2 1.338 ± 0,001 0.578 ± 0.02 0.714 ± 0.00 1.24 ± 0.03 19.11 ± 2.12
CBZ B3 1.339 ± 0,002 0.581 ± 0.01 0.866 ± 0.03 1.49 ± 0.04 32.87 ± 1.94
CBZ P1 1.340 ± 0,001 0.669 ± 0.01 0.792 ± 0.02 1.18 ± 0.03 15.57 ± 1.97
CBZ P2 1.340 ± 0,001 0.681 ± 0.02 0.826 ± 0.01 1.21 ± 0.02 17.55 ± 1.02
CBZ P3 1.339 ± 0,000 0.662 ± 0.01 0.812 ± 0.01 1.23 ± 0.02 18.50 ± 1.20
Results and discussion
75
Data for true density, bulk and tapped density, Hausner ratio and Carr index
respectively are shown in table 6.6. True densities for all CBZ are corresponding to
literature data (form III) (Grzesiak et al., 2003). Differences in bulk and tapped density
may be noted among CBZ from different producers. Flowability expressed in terms of
Hausener ratio for CBZA was good, while CBZB and CBZP have shown higher values
and therefore poorer flow properties. According to Carr's index, CBZA had good flow
properties, CBZP good to fair, while CBZB exhibit poor flow properties.
6.1.7. X-ray powder diffraction (XRPD) As every crystalline solid phase has a unique XRPD pattern, this technique is very
powerful for identification of crystalline solid states. It is the most reliable method to
distinguish the four polymorphic forms of CBZ and its dihydrate. Characteristic peaks for
different forms are presented in the table 6.7 (Grzesiak et al., 2003, Krahn et al., 1987,
Rustichelli et al., 2000).
Table 6.7 Literature data of XRPD characteristic peaks for CBZ polymorphs (Grzesiak et al., 2003, Krahn
et al., 1987, Rustichelli et al., 2000)
2θ Form I Form II Form III Form IV
Rustichelli:
(*II=IV)
6.1, 9.4, 12.25, 19.8,
19.9, 22.8 17.8, 21.2, 33.0*
14.9, 15.2, 15.8,
27.2, 27.5, 32.0
Griezak:
7.92, 9.37, 12.28,
19.94
8.68, 13.26,
18.56, 24.54
15.36, 19.56, 25.00,
27.47
14.11, 17.89,
21.79, 33.11
Krahn 14.9, 15.2, 15.8,
27.2, 27.5, 32.0 16.5, 18 15, 16, 25
The anhydrous CBZ samples showed patterns corresponding to polymorphic form III
reported in the literature (Grzesiak et al., 2003, Krahn et al., 1987), see figure 6.11.
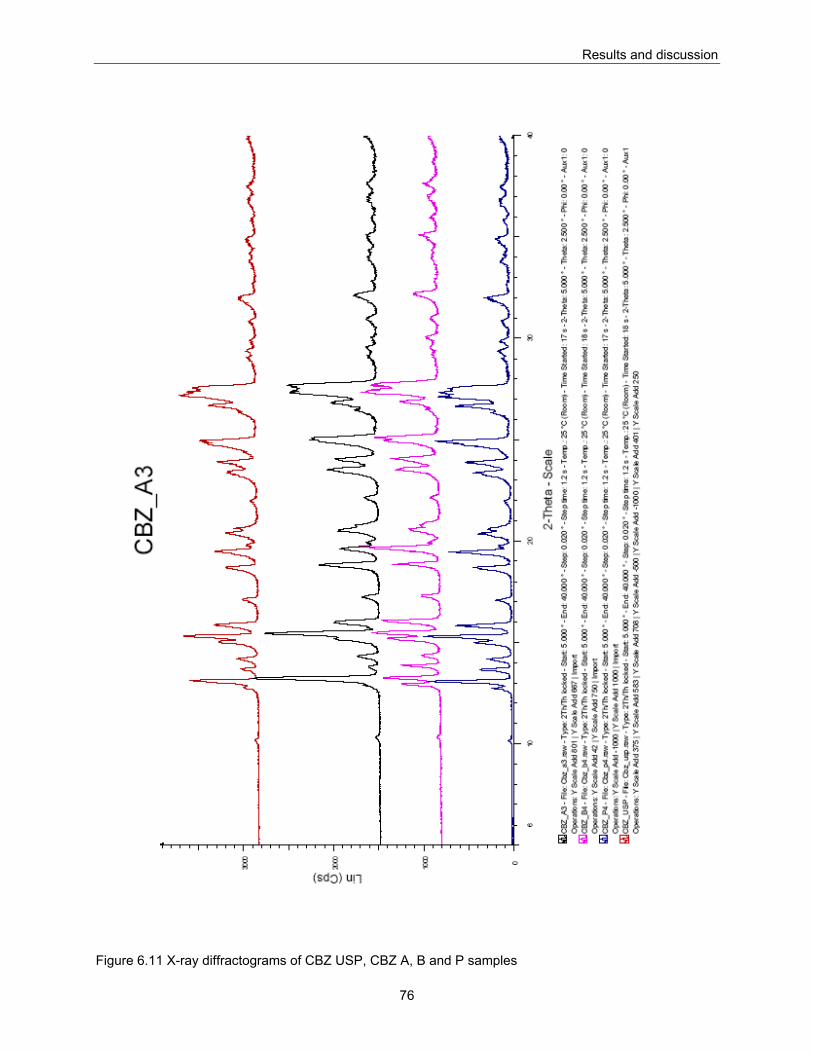
Results and discussion
76
Figure 6.11 X-ray diffractograms of CBZ USP, CBZ A, B and P samples
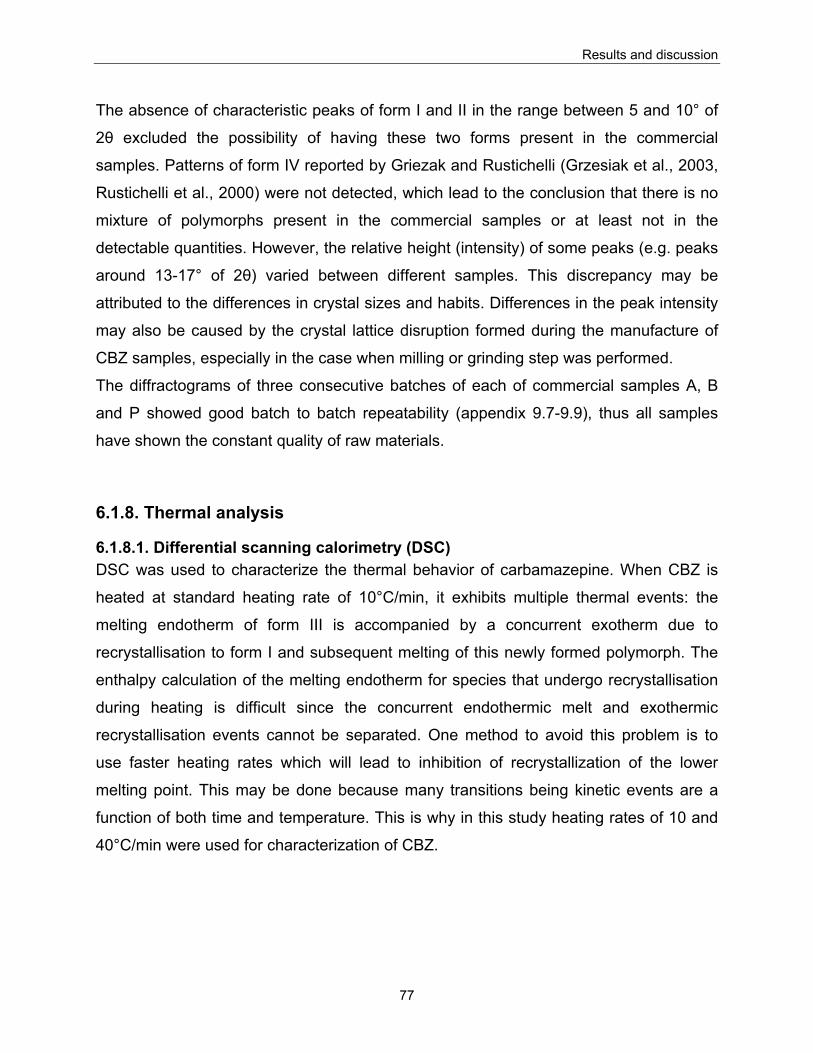
Results and discussion
77
The absence of characteristic peaks of form I and II in the range between 5 and 10° of
2θ excluded the possibility of having these two forms present in the commercial
samples. Patterns of form IV reported by Griezak and Rustichelli (Grzesiak et al., 2003,
Rustichelli et al., 2000) were not detected, which lead to the conclusion that there is no
mixture of polymorphs present in the commercial samples or at least not in the
detectable quantities. However, the relative height (intensity) of some peaks (e.g. peaks
around 13-17° of 2θ) varied between different samples. This discrepancy may be
attributed to the differences in crystal sizes and habits. Differences in the peak intensity
may also be caused by the crystal lattice disruption formed during the manufacture of
CBZ samples, especially in the case when milling or grinding step was performed.
The diffractograms of three consecutive batches of each of commercial samples A, B
and P showed good batch to batch repeatability (appendix 9.7-9.9), thus all samples
have shown the constant quality of raw materials.
6.1.8. Thermal analysis
6.1.8.1. Differential scanning calorimetry (DSC) DSC was used to characterize the thermal behavior of carbamazepine. When CBZ is
heated at standard heating rate of 10°C/min, it exhibits multiple thermal events: the
melting endotherm of form III is accompanied by a concurrent exotherm due to
recrystallisation to form I and subsequent melting of this newly formed polymorph. The
enthalpy calculation of the melting endotherm for species that undergo recrystallisation
during heating is difficult since the concurrent endothermic melt and exothermic
recrystallisation events cannot be separated. One method to avoid this problem is to
use faster heating rates which will lead to inhibition of recrystallization of the lower
melting point. This may be done because many transitions being kinetic events are a
function of both time and temperature. This is why in this study heating rates of 10 and
40°C/min were used for characterization of CBZ.
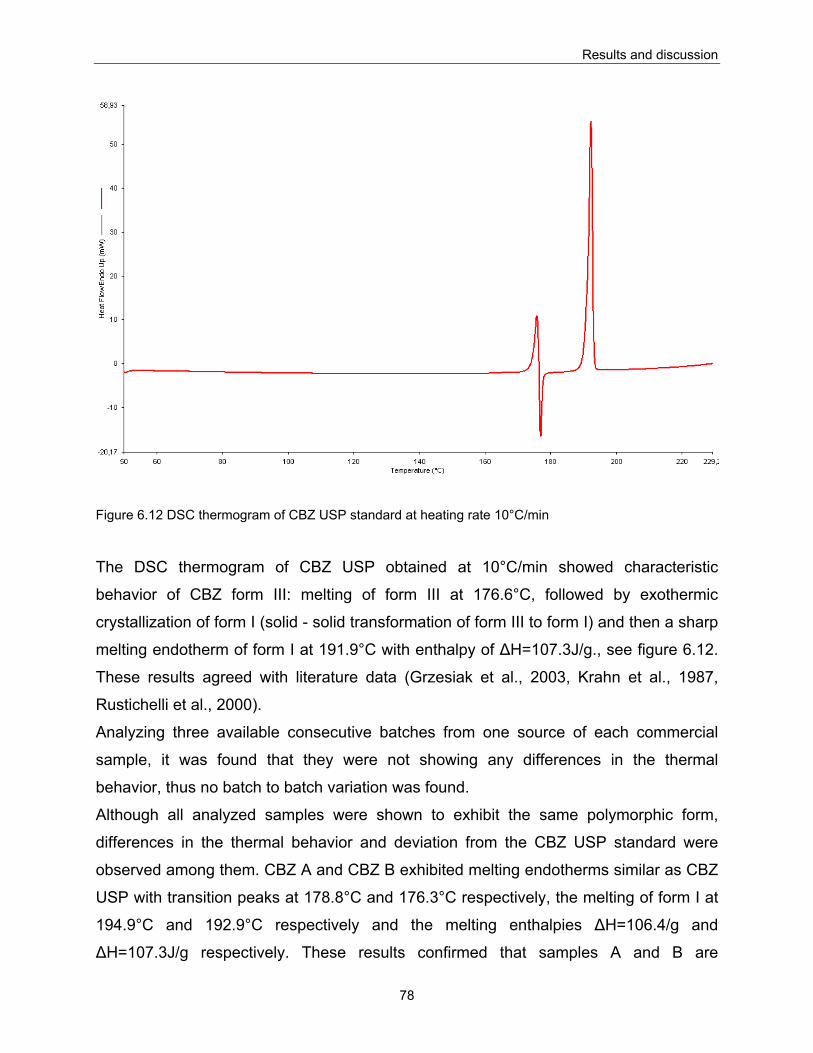
Results and discussion
78
Figure 6.12 DSC thermogram of CBZ USP standard at heating rate 10°C/min
The DSC thermogram of CBZ USP obtained at 10°C/min showed characteristic
behavior of CBZ form III: melting of form III at 176.6°C, followed by exothermic
crystallization of form I (solid - solid transformation of form III to form I) and then a sharp
melting endotherm of form I at 191.9°C with enthalpy of ΔH=107.3J/g., see figure 6.12.
These results agreed with literature data (Grzesiak et al., 2003, Krahn et al., 1987,
Rustichelli et al., 2000).
Analyzing three available consecutive batches from one source of each commercial
sample, it was found that they were not showing any differences in the thermal
behavior, thus no batch to batch variation was found.
Although all analyzed samples were shown to exhibit the same polymorphic form,
differences in the thermal behavior and deviation from the CBZ USP standard were
observed among them. CBZ A and CBZ B exhibited melting endotherms similar as CBZ
USP with transition peaks at 178.8°C and 176.3°C respectively, the melting of form I at
194.9°C and 192.9°C respectively and the melting enthalpies ΔH=106.4/g and
ΔH=107.3J/g respectively. These results confirmed that samples A and B are
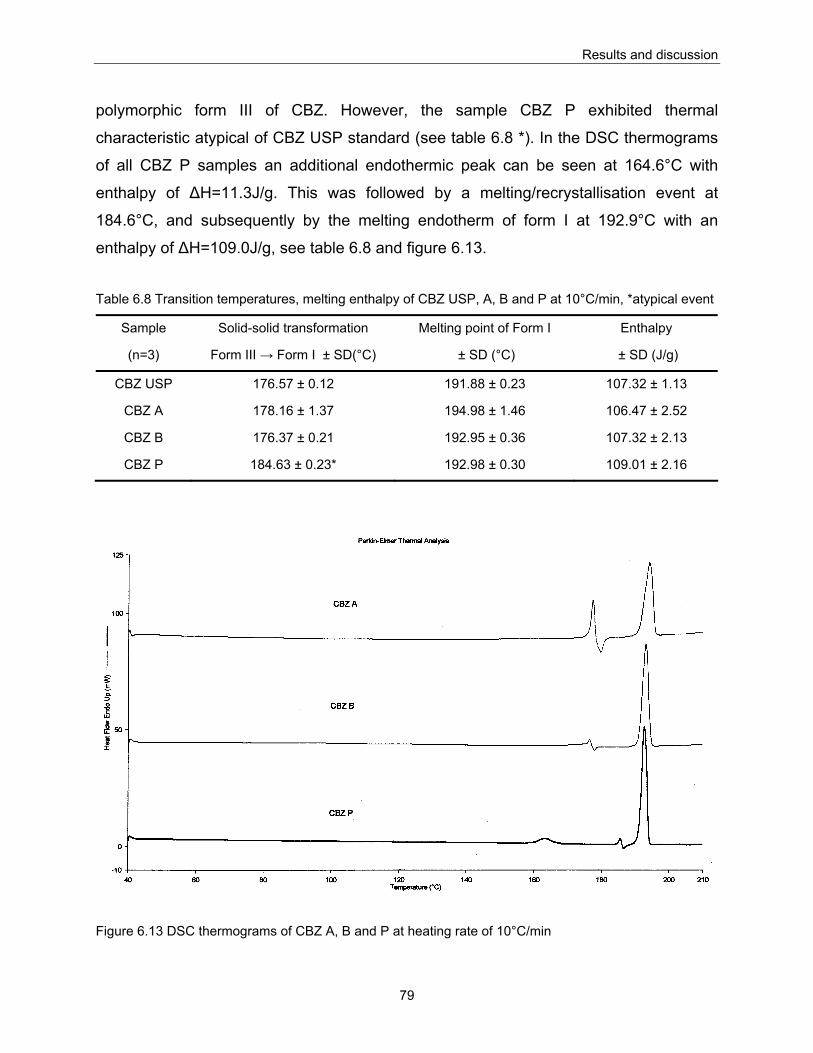
Results and discussion
79
polymorphic form III of CBZ. However, the sample CBZ P exhibited thermal
characteristic atypical of CBZ USP standard (see table 6.8 *). In the DSC thermograms
of all CBZ P samples an additional endothermic peak can be seen at 164.6°C with
enthalpy of ΔH=11.3J/g. This was followed by a melting/recrystallisation event at
184.6°C, and subsequently by the melting endotherm of form I at 192.9°C with an
enthalpy of ΔH=109.0J/g, see table 6.8 and figure 6.13. Table 6.8 Transition temperatures, melting enthalpy of CBZ USP, A, B and P at 10°C/min, *atypical event
Sample
(n=3)
Solid-solid transformation
Form III → Form I ± SD(°C)
Melting point of Form I
± SD (°C)
Enthalpy
± SD (J/g)
CBZ USP 176.57 ± 0.12 191.88 ± 0.23 107.32 ± 1.13
CBZ A 178.16 ± 1.37 194.98 ± 1.46 106.47 ± 2.52
CBZ B 176.37 ± 0.21 192.95 ± 0.36 107.32 ± 2.13
CBZ P 184.63 ± 0.23* 192.98 ± 0.30 109.01 ± 2.16
Figure 6.13 DSC thermograms of CBZ A, B and P at heating rate of 10°C/min
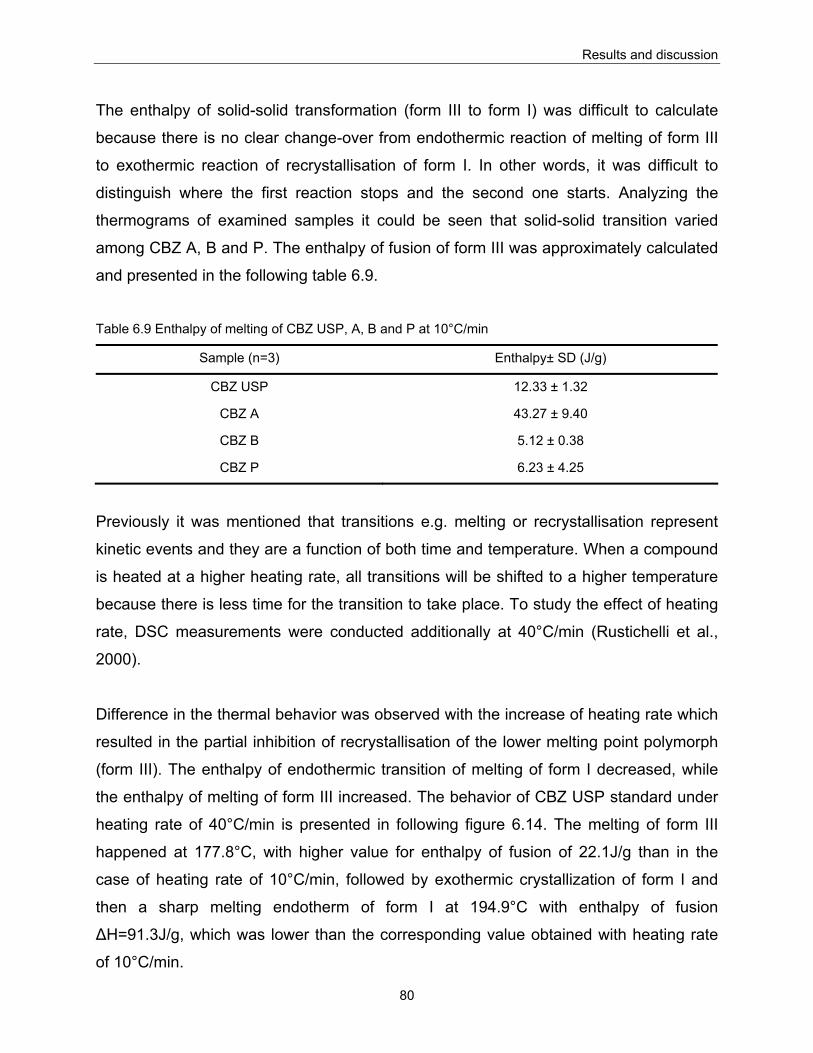
Results and discussion
80
The enthalpy of solid-solid transformation (form III to form I) was difficult to calculate
because there is no clear change-over from endothermic reaction of melting of form III
to exothermic reaction of recrystallisation of form I. In other words, it was difficult to
distinguish where the first reaction stops and the second one starts. Analyzing the
thermograms of examined samples it could be seen that solid-solid transition varied
among CBZ A, B and P. The enthalpy of fusion of form III was approximately calculated
and presented in the following table 6.9.
Table 6.9 Enthalpy of melting of CBZ USP, A, B and P at 10°C/min
Sample (n=3) Enthalpy± SD (J/g)
CBZ USP 12.33 ± 1.32
CBZ A 43.27 ± 9.40
CBZ B 5.12 ± 0.38
CBZ P 6.23 ± 4.25
Previously it was mentioned that transitions e.g. melting or recrystallisation represent
kinetic events and they are a function of both time and temperature. When a compound
is heated at a higher heating rate, all transitions will be shifted to a higher temperature
because there is less time for the transition to take place. To study the effect of heating
rate, DSC measurements were conducted additionally at 40°C/min (Rustichelli et al.,
2000).
Difference in the thermal behavior was observed with the increase of heating rate which
resulted in the partial inhibition of recrystallisation of the lower melting point polymorph
(form III). The enthalpy of endothermic transition of melting of form I decreased, while
the enthalpy of melting of form III increased. The behavior of CBZ USP standard under
heating rate of 40°C/min is presented in following figure 6.14. The melting of form III
happened at 177.8°C, with higher value for enthalpy of fusion of 22.1J/g than in the
case of heating rate of 10°C/min, followed by exothermic crystallization of form I and
then a sharp melting endotherm of form I at 194.9°C with enthalpy of fusion
ΔH=91.3J/g, which was lower than the corresponding value obtained with heating rate
of 10°C/min.
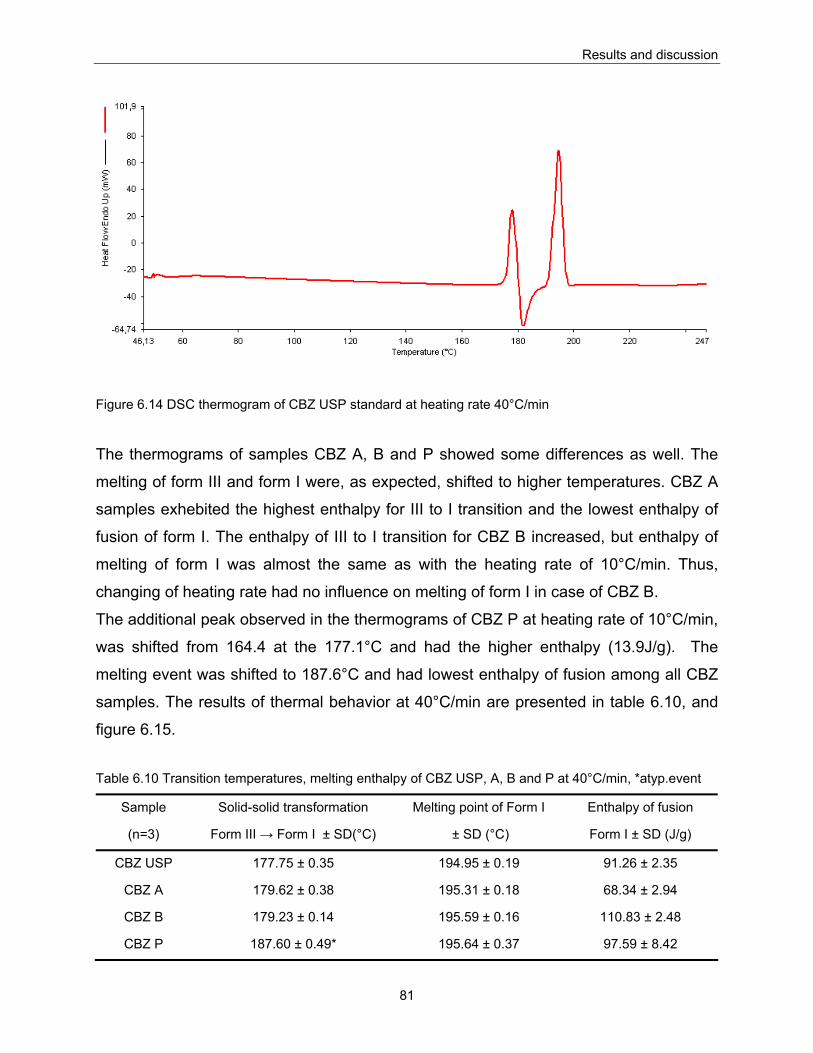
Results and discussion
81
Figure 6.14 DSC thermogram of CBZ USP standard at heating rate 40°C/min
The thermograms of samples CBZ A, B and P showed some differences as well. The
melting of form III and form I were, as expected, shifted to higher temperatures. CBZ A
samples exhebited the highest enthalpy for III to I transition and the lowest enthalpy of
fusion of form I. The enthalpy of III to I transition for CBZ B increased, but enthalpy of
melting of form I was almost the same as with the heating rate of 10°C/min. Thus,
changing of heating rate had no influence on melting of form I in case of CBZ B.
The additional peak observed in the thermograms of CBZ P at heating rate of 10°C/min,
was shifted from 164.4 at the 177.1°C and had the higher enthalpy (13.9J/g). The
melting event was shifted to 187.6°C and had lowest enthalpy of fusion among all CBZ
samples. The results of thermal behavior at 40°C/min are presented in table 6.10, and
figure 6.15.
Table 6.10 Transition temperatures, melting enthalpy of CBZ USP, A, B and P at 40°C/min, *atyp.event
Sample
(n=3)
Solid-solid transformation
Form III → Form I ± SD(°C)
Melting point of Form I
± SD (°C)
Enthalpy of fusion
Form I ± SD (J/g)
CBZ USP 177.75 ± 0.35 194.95 ± 0.19 91.26 ± 2.35
CBZ A 179.62 ± 0.38 195.31 ± 0.18 68.34 ± 2.94
CBZ B 179.23 ± 0.14 195.59 ± 0.16 110.83 ± 2.48
CBZ P 187.60 ± 0.49* 195.64 ± 0.37 97.59 ± 8.42
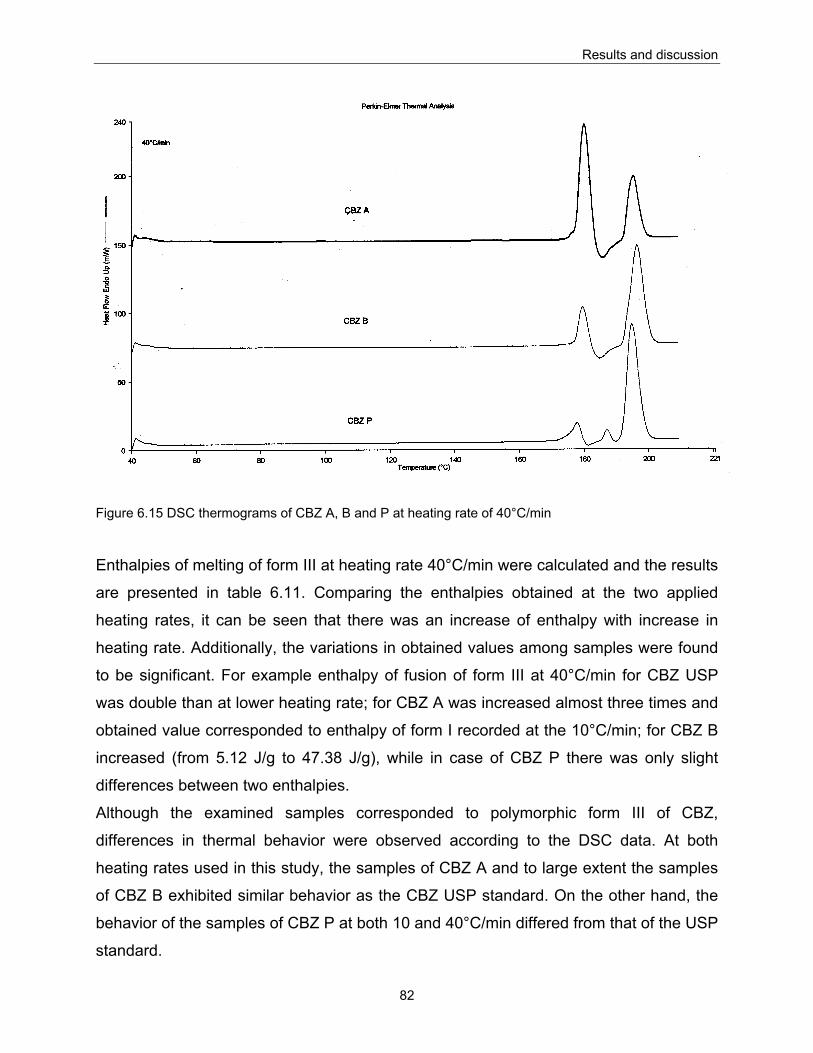
Results and discussion
82
Figure 6.15 DSC thermograms of CBZ A, B and P at heating rate of 40°C/min
Enthalpies of melting of form III at heating rate 40°C/min were calculated and the results
are presented in table 6.11. Comparing the enthalpies obtained at the two applied
heating rates, it can be seen that there was an increase of enthalpy with increase in
heating rate. Additionally, the variations in obtained values among samples were found
to be significant. For example enthalpy of fusion of form III at 40°C/min for CBZ USP
was double than at lower heating rate; for CBZ A was increased almost three times and
obtained value corresponded to enthalpy of form I recorded at the 10°C/min; for CBZ B
increased (from 5.12 J/g to 47.38 J/g), while in case of CBZ P there was only slight
differences between two enthalpies.
Although the examined samples corresponded to polymorphic form III of CBZ,
differences in thermal behavior were observed according to the DSC data. At both
heating rates used in this study, the samples of CBZ A and to large extent the samples
of CBZ B exhibited similar behavior as the CBZ USP standard. On the other hand, the
behavior of the samples of CBZ P at both 10 and 40°C/min differed from that of the USP
standard.
Results and discussion
83
Table 6.11 Comparison of enthalpies of melting of form III obtained by different heating rates for CBZ
USP, A, B and P at 10 and 40°C/min
Sample (n=3) Enthalpy± SD (J/g) at 10°C/min Enthalpy± SD (J/g) at 40°C/min
CBZ USP 12.33 ± 1.32 22.14 ± 2.72
CBZ A 43.27 ± 9.40 109.38 ± 3.30
CBZ B 5.12 ± 0.38 47.38 ± 2.41
CBZ P 6.23 ± 4.25 7.27 ± 2.49
To explain the atypical thermal events seen on the DSC thermograms of CBZ P the
following mechanisms are considered.
One explanation for the additional endothermal peak in the case of all CBZ P samples is
sublimation of CBZ which is an endothermic reaction that occurs around 150°C. But
since all measurements where done with the same type of pan (open pan), it is not clear
why it was not registered with the other samples. On the other hand, sublimation (which
can be observed with the hot stage microscope) results in a loss of compound and it
would be possible to record it by TGA (HSM and TGA studies were therefore conducted
and results are discussed in sections 6.1.8.2 and 6.1.8.3 respectively).
The possibility of presence of small amount of form II can be considered as well
because the form II exhibits the thermal reaction between 140 and 160°C as reported
by Khran (Krahn et al., 1987). However, according to Griezak, Umeda and Kaneniwa
(Grzesiak et al., 2003, Kaneniwa et al., 1984, Umeda et al., 1984) solid-solid transition
in the case of monotropic pair of polymorphs is exothermal.
Other possibilities are to have a small solvent inclusion (entrapped solvent) in the
crystal pores, which may play a role in the crystal stability or to have presence of
amorphous material, created by grinding during the manufacture of the raw material.
Amorphous CBZ would exhibit crystallization around 80°C (glass transition and than
crystallization), and this could be detected by TGA (TGA tests were therefore conducted
and the results are discussed in section 6.1.8.2).
Results and discussion
84
6.1.8.2. Hot stage microscopy (HSM)
The DSC results of anhydrous forms were confirmed by the visual images obtained with
HSM operated at the same heating rate as the one used for DSC. The examination by
optical microscope revealed, in agreement with previous results from XRPD and PSA
tests, the presence of prismatic particles of CBZ in all analyzed samples and the
difference in particle size. The prisms appeared brightly colored under polarized light.
During the heating of CBZ USP at 10°C/min heating rate, the melting of the form III
could be observed around 176°C followed by formation of the needle-like particles of
form I which then melted around 192°C. Obtained data were in agreement with literature
data (Rustichelli et al., 2000).
The anhydrous samples CBZ A exhibited analog behavior as CZB USP standard. With
increase in the temperature, at 176-178°C melting of form III particles began, and
around 179°C some needles started to spread out from the edges of the prisms. The
transformation into needles was completed at 182°C. Subsequently, these crystals
melted in the 189–192°C range, according to the endothermal event previously
registered by DSC. A very similar situation was observed analyzing the sample CBZ B.
During heating, the smallest particles disappeared, turning into needles at temperatures
higher than 175°C. Finally, the fusion of the crystals occurred at 193–195°C. CBZ P
samples on the other hand showed discrepancies from all the other samples. At
temperature of 149°C there were slight changes in the intensity of the color of the
samples. Starting from 160°C, the formation of needle-shaped crystals could be
observed, followed by intense needle formation at 184-188°C and their melting between
192 and 194°C (see figures 6.16 and 6.17).
CBZ is known to undergo sublimation in the temperature range of 145-155°C which was
noticed in all samples as formation of small crystals at the upper lid of THSM unit.
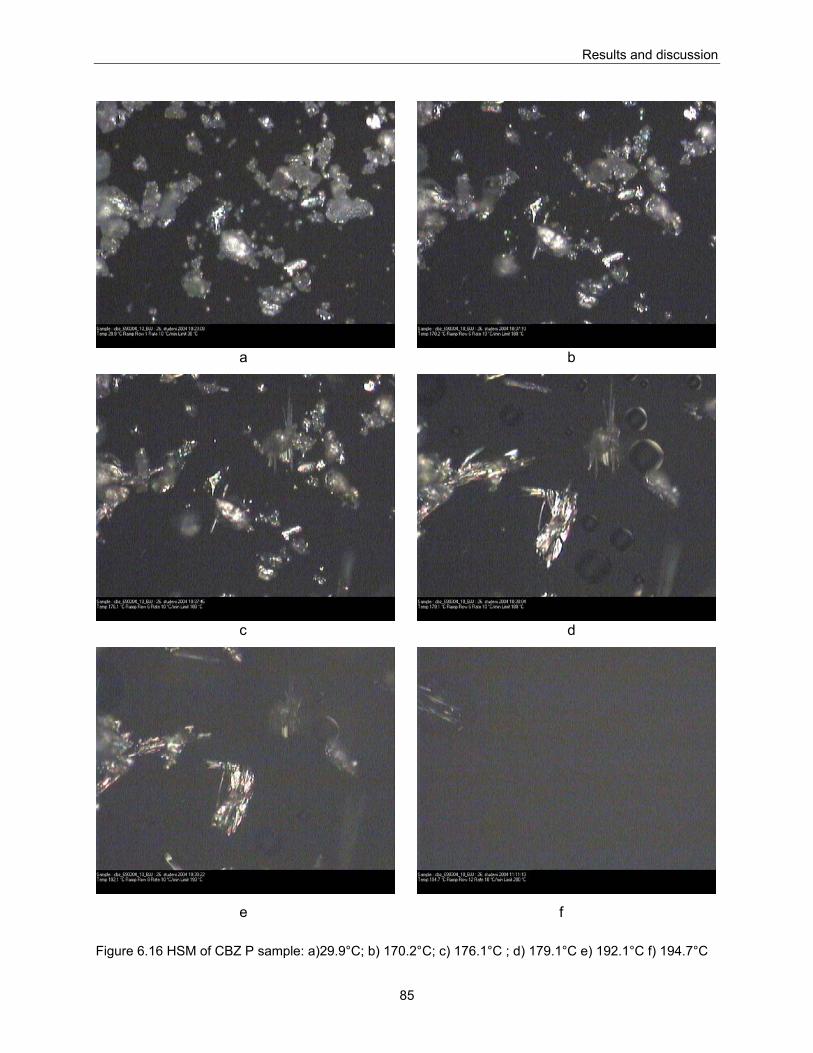
Results and discussion
85
a b
c d
e f
Figure 6.16 HSM of CBZ P sample: a)29.9°C; b) 170.2°C; c) 176.1°C ; d) 179.1°C e) 192.1°C f) 194.7°C
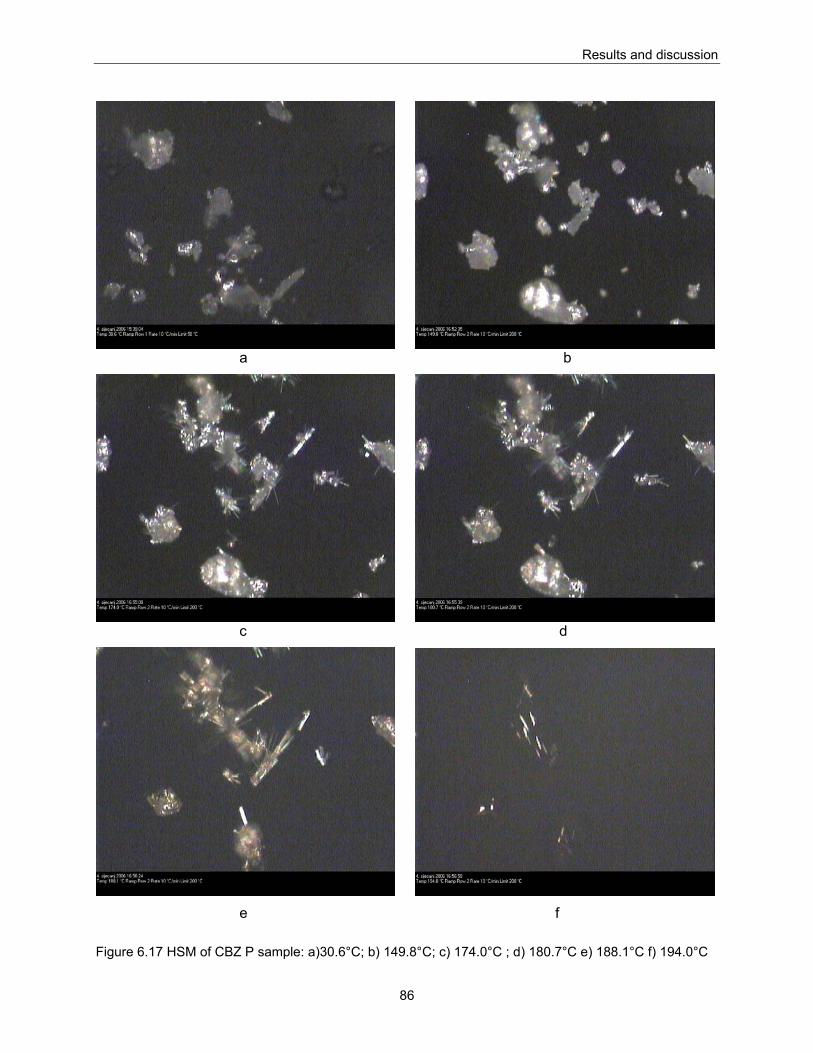
Results and discussion
86
a b
c d
e f
Figure 6.17 HSM of CBZ P sample: a)30.6°C; b) 149.8°C; c) 174.0°C ; d) 180.7°C e) 188.1°C f) 194.0°C
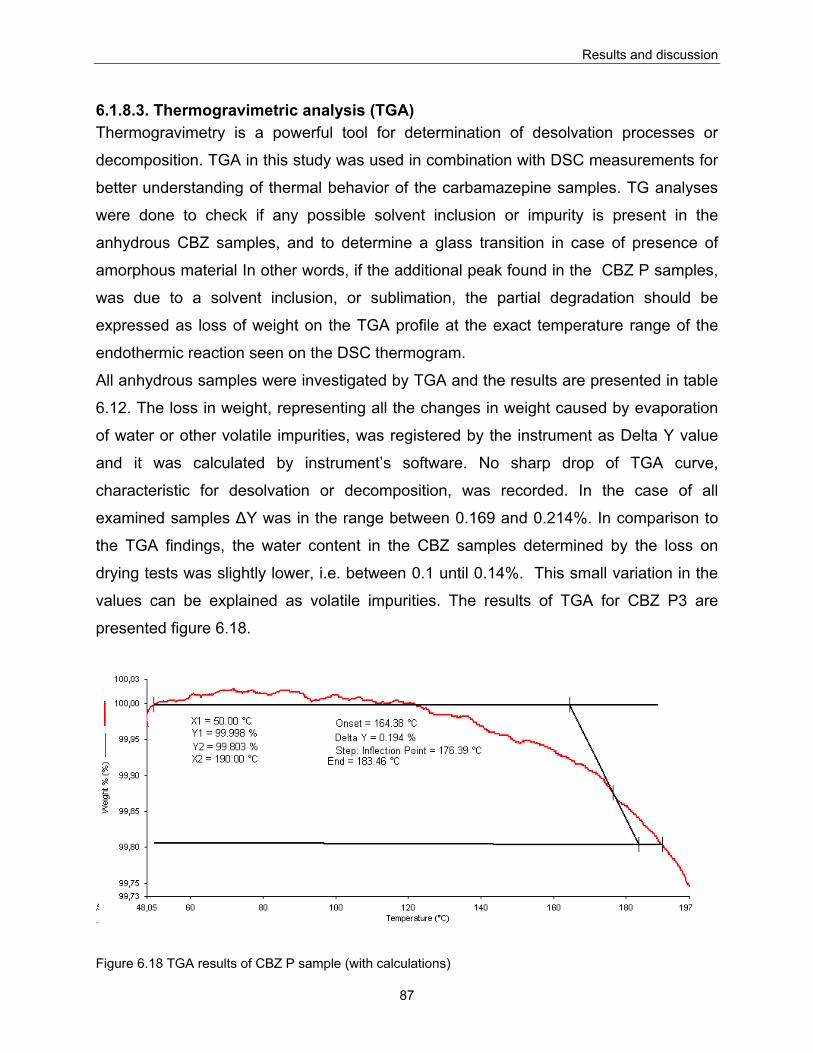
Results and discussion
87
6.1.8.3. Thermogravimetric analysis (TGA) Thermogravimetry is a powerful tool for determination of desolvation processes or
decomposition. TGA in this study was used in combination with DSC measurements for
better understanding of thermal behavior of the carbamazepine samples. TG analyses
were done to check if any possible solvent inclusion or impurity is present in the
anhydrous CBZ samples, and to determine a glass transition in case of presence of
amorphous material In other words, if the additional peak found in the CBZ P samples,
was due to a solvent inclusion, or sublimation, the partial degradation should be
expressed as loss of weight on the TGA profile at the exact temperature range of the
endothermic reaction seen on the DSC thermogram.
All anhydrous samples were investigated by TGA and the results are presented in table
6.12. The loss in weight, representing all the changes in weight caused by evaporation
of water or other volatile impurities, was registered by the instrument as Delta Y value
and it was calculated by instrument’s software. No sharp drop of TGA curve,
characteristic for desolvation or decomposition, was recorded. In the case of all
examined samples ΔY was in the range between 0.169 and 0.214%. In comparison to
the TGA findings, the water content in the CBZ samples determined by the loss on
drying tests was slightly lower, i.e. between 0.1 until 0.14%. This small variation in the
values can be explained as volatile impurities. The results of TGA for CBZ P3 are
presented figure 6.18.
Figure 6.18 TGA results of CBZ P sample (with calculations)
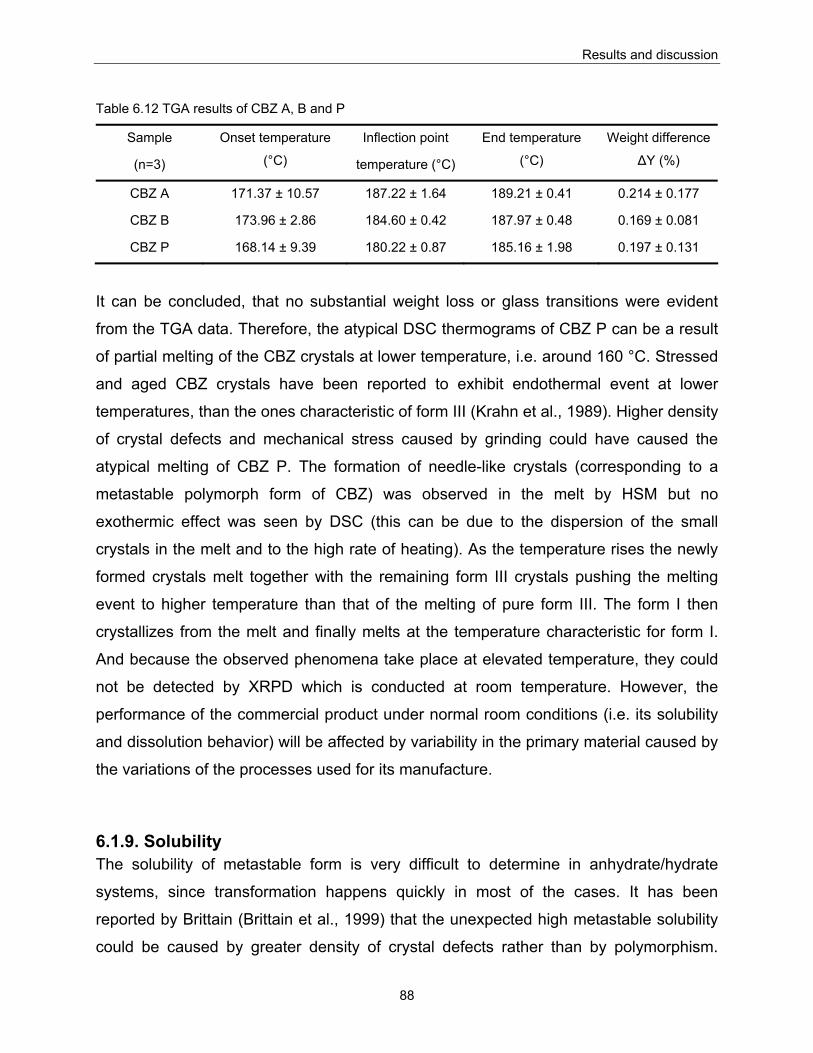
Results and discussion
88
Table 6.12 TGA results of CBZ A, B and P
Sample
(n=3)
Onset temperature
(°C)
Inflection point
temperature (°C)
End temperature
(°C)
Weight difference
ΔY (%)
CBZ A 171.37 ± 10.57 187.22 ± 1.64 189.21 ± 0.41 0.214 ± 0.177
CBZ B 173.96 ± 2.86 184.60 ± 0.42 187.97 ± 0.48 0.169 ± 0.081
CBZ P 168.14 ± 9.39 180.22 ± 0.87 185.16 ± 1.98 0.197 ± 0.131
It can be concluded, that no substantial weight loss or glass transitions were evident
from the TGA data. Therefore, the atypical DSC thermograms of CBZ P can be a result
of partial melting of the CBZ crystals at lower temperature, i.e. around 160 °C. Stressed
and aged CBZ crystals have been reported to exhibit endothermal event at lower
temperatures, than the ones characteristic of form III (Krahn et al., 1989). Higher density
of crystal defects and mechanical stress caused by grinding could have caused the
atypical melting of CBZ P. The formation of needle-like crystals (corresponding to a
metastable polymorph form of CBZ) was observed in the melt by HSM but no
exothermic effect was seen by DSC (this can be due to the dispersion of the small
crystals in the melt and to the high rate of heating). As the temperature rises the newly
formed crystals melt together with the remaining form III crystals pushing the melting
event to higher temperature than that of the melting of pure form III. The form I then
crystallizes from the melt and finally melts at the temperature characteristic for form I.
And because the observed phenomena take place at elevated temperature, they could
not be detected by XRPD which is conducted at room temperature. However, the
performance of the commercial product under normal room conditions (i.e. its solubility
and dissolution behavior) will be affected by variability in the primary material caused by
the variations of the processes used for its manufacture.
6.1.9. Solubility The solubility of metastable form is very difficult to determine in anhydrate/hydrate
systems, since transformation happens quickly in most of the cases. It has been
reported by Brittain (Brittain et al., 1999) that the unexpected high metastable solubility
could be caused by greater density of crystal defects rather than by polymorphism.
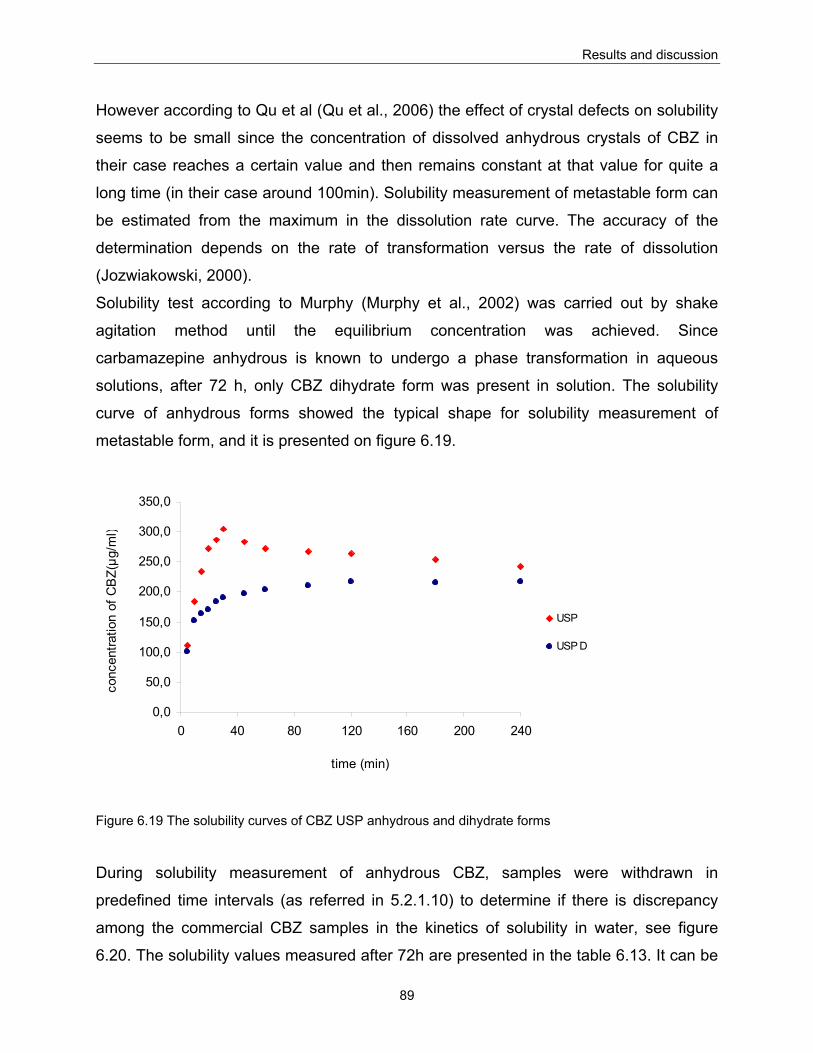
Results and discussion
89
However according to Qu et al (Qu et al., 2006) the effect of crystal defects on solubility
seems to be small since the concentration of dissolved anhydrous crystals of CBZ in
their case reaches a certain value and then remains constant at that value for quite a
long time (in their case around 100min). Solubility measurement of metastable form can
be estimated from the maximum in the dissolution rate curve. The accuracy of the
determination depends on the rate of transformation versus the rate of dissolution
(Jozwiakowski, 2000).
Solubility test according to Murphy (Murphy et al., 2002) was carried out by shake
agitation method until the equilibrium concentration was achieved. Since
carbamazepine anhydrous is known to undergo a phase transformation in aqueous
solutions, after 72 h, only CBZ dihydrate form was present in solution. The solubility
curve of anhydrous forms showed the typical shape for solubility measurement of
metastable form, and it is presented on figure 6.19.
0,0
50,0
100,0
150,0
200,0
250,0
300,0
350,0
0 40 80 120 160 200 240
time (min)
conc
entra
tion
of C
BZ(μg
/ml)
USP
USP D
Figure 6.19 The solubility curves of CBZ USP anhydrous and dihydrate forms
During solubility measurement of anhydrous CBZ, samples were withdrawn in
predefined time intervals (as referred in 5.2.1.10) to determine if there is discrepancy
among the commercial CBZ samples in the kinetics of solubility in water, see figure
6.20. The solubility values measured after 72h are presented in the table 6.13. It can be
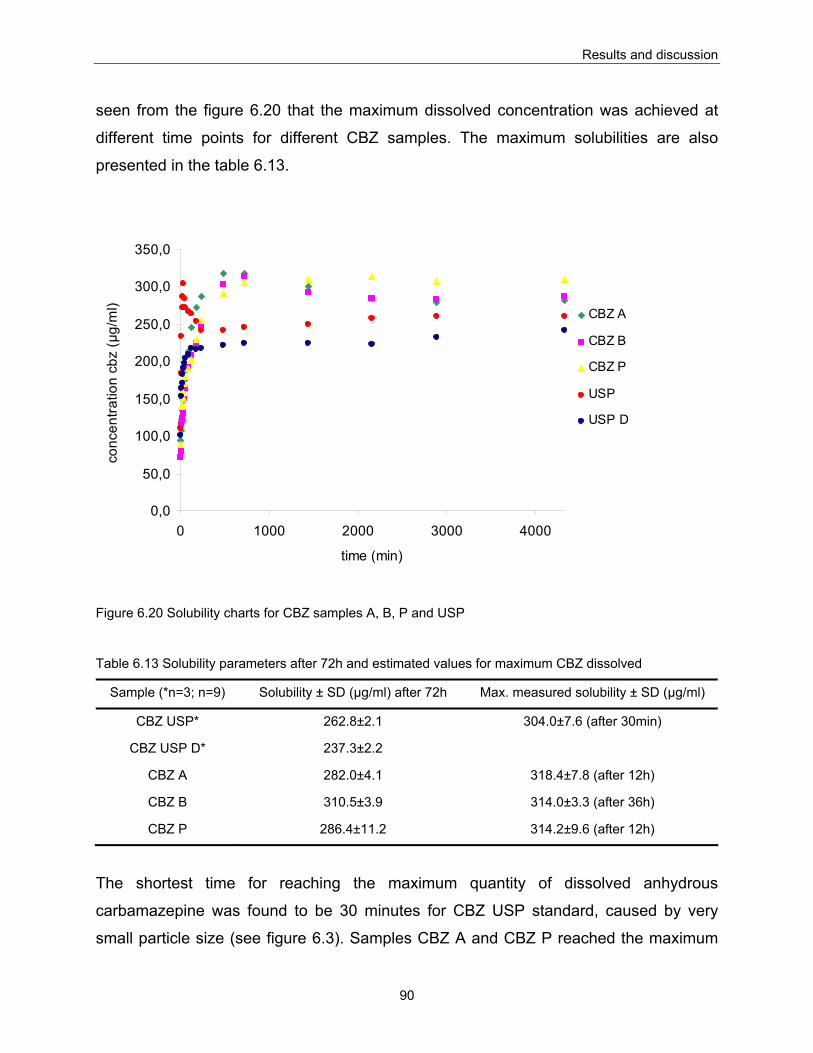
Results and discussion
90
seen from the figure 6.20 that the maximum dissolved concentration was achieved at
different time points for different CBZ samples. The maximum solubilities are also
presented in the table 6.13.
0,0
50,0
100,0
150,0
200,0
250,0
300,0
350,0
0 1000 2000 3000 4000
time (min)
conc
entra
tion
cbz
(μg/
ml) CBZ A
CBZ B
CBZ P
USP
USP D
Figure 6.20 Solubility charts for CBZ samples A, B, P and USP
Table 6.13 Solubility parameters after 72h and estimated values for maximum CBZ dissolved
Sample (*n=3; n=9) Solubility ± SD (μg/ml) after 72h Max. measured solubility ± SD (μg/ml)
CBZ USP* 262.8±2.1 304.0±7.6 (after 30min)
CBZ USP D* 237.3±2.2
CBZ A 282.0±4.1 318.4±7.8 (after 12h)
CBZ B 310.5±3.9 314.0±3.3 (after 36h)
CBZ P 286.4±11.2 314.2±9.6 (after 12h)
The shortest time for reaching the maximum quantity of dissolved anhydrous
carbamazepine was found to be 30 minutes for CBZ USP standard, caused by very
small particle size (see figure 6.3). Samples CBZ A and CBZ P reached the maximum
Results and discussion
91
quantity dissolved after 12h, while in the CBZ B samples which showed the highest
amount of dissolved material, the maximum dissolved was reached only after 36h.
Calculations of solubility of anhydrous CBZ were made as well using the results
obtained by DIDR tests, whereby only the initial part of the curve was used for the
calculations. The estimated solubilities had higher values than the measured ones,
because during the equilibrium method after 72 hours CBZ was almost completely
converted to dihydrate form which has lower solubility (see 6.1.10).
ANOVA tests were performed to evaluate batch to batch variation (variation within the
same sources of CBZ) and variation between the different samples. Results within one
group of samples did not show significant batch to batch variation. However, comparing
the solubility results between CBZ A, B, P and USP, differences were found. CBZ P
samples exhibited the highest variation from CBZ USP, but that discrepancy was
statistically significant (confidence interval α=0.05, p<0.1).
6.1.10. Disc intrinsic dissolution Because of the poor compactibility of anhydrous CBZ (Villafuerte-Robles, 1982),
preliminary tests were conducted to determine the compression force needed for the
preparation of reproducible compacts for the intrinsic dissolution measurements. For
this purpose, compacts were prepared at different pressure levels from 4kN to 20kN.
With force in the range from 4 to 6kN and from 18 to 20kN, the obtained compacts were
too weak, with low crushing strength (less than 10N). Using compaction force in the
range from 14 to 20kN resulted in compact lamination of the compact. Only compaction
force in the range from 8 to 12kN was acceptable for producing compacts which despite
of low hardness of 34 - 40N, were robust enough to be submitted to intrinsic dissolution
test. After selection of the compaction pressure range, the porosity of obtained compact
was measured by mercury porosimeter and then calculated as well (as referred in
method 5.2.1.11.).
The ideal case for investigating intrinsic dissolution of some material is to start with 0%
porosity compact (which is practically not achievable) and perfectly flat surface. In such
Results and discussion
92
cases the influence of particle size and surface area on the intrinsic dissolution will be
minimized.
The CBZ samples used in this study varied in their particle size, particle shape and bulk
density. As it was impossible to obtain compacts with less than 12% porosity, the further
investigations were carried out with constant porosity compacts (12±0.3%) by varying
only the compaction force in the range between 8 and 12kN (for CBZ A samples the
compaction force was 10kN, and for CBZ B and CBZ P samples the compaction force
was 8kN).
The aim was also to compare commercial samples with the chemically pure standard of
carbamazepine sample, CBZ USP however all efforts to compact CBZ USP were
unsuccessful, because lamination occurred with all compaction forces in the range of 4
to 16kN. With lower force (< 4kN), the compacts were not robust enough to handle for
the subsequent preparation for intrinsic dissolution. The effort to recompress the
laminated compact (simulation of dry granulation or slugging method) also failed. This
poor tablettability is due to very small particles size of the USP CBZ sample.
In the USP XXXI monograph for Carbamazepine 200mg immediate release tablet the
recommended dissolution medium is 1% solution of sodium lauryl sulphate (SLS)
(USP31, 2008). Rodriguez-Hornedo reported that surfactants (especially SLS) affect the
solution mediated transformation of CBZ by increasing the anhydrous to dihydrate
conversion (Rodriguez-Hornedo et al., 2004). The aim of this study was to investigate
the intrinsic dissolution behavior of commercially available carbamazepine samples
without influencing the anhydrous to dihydrate conversion. Therefore distilled water was
chosen as the dissolution medium.
And because the intrinsic dissolution rate of carbamazepine is independent of pH of the
medium as reported by Yu (Yu et al., 2004), water alone is the most appropriate
medium for the IDR tests.
The slope of the intrinsic dissolution curve is usually linear, but that it is not the case of
carbamazepine because anhydrous CBZ was shown to undergo a phase transition into
the dihydrate form during the test (Kobayashi et al., 2000, Murphy et al., 2002, Ono et
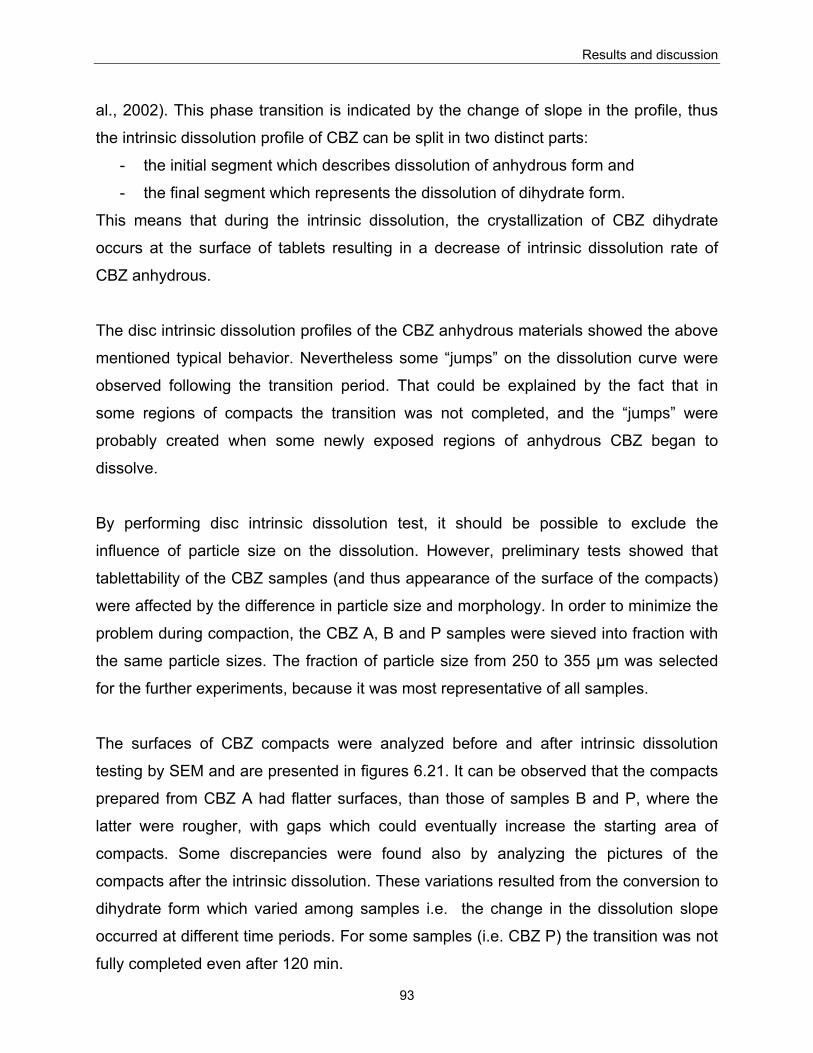
Results and discussion
93
al., 2002). This phase transition is indicated by the change of slope in the profile, thus
the intrinsic dissolution profile of CBZ can be split in two distinct parts:
- the initial segment which describes dissolution of anhydrous form and
- the final segment which represents the dissolution of dihydrate form.
This means that during the intrinsic dissolution, the crystallization of CBZ dihydrate
occurs at the surface of tablets resulting in a decrease of intrinsic dissolution rate of
CBZ anhydrous.
The disc intrinsic dissolution profiles of the CBZ anhydrous materials showed the above
mentioned typical behavior. Nevertheless some “jumps” on the dissolution curve were
observed following the transition period. That could be explained by the fact that in
some regions of compacts the transition was not completed, and the “jumps” were
probably created when some newly exposed regions of anhydrous CBZ began to
dissolve.
By performing disc intrinsic dissolution test, it should be possible to exclude the
influence of particle size on the dissolution. However, preliminary tests showed that
tablettability of the CBZ samples (and thus appearance of the surface of the compacts)
were affected by the difference in particle size and morphology. In order to minimize the
problem during compaction, the CBZ A, B and P samples were sieved into fraction with
the same particle sizes. The fraction of particle size from 250 to 355 μm was selected
for the further experiments, because it was most representative of all samples.
The surfaces of CBZ compacts were analyzed before and after intrinsic dissolution
testing by SEM and are presented in figures 6.21. It can be observed that the compacts
prepared from CBZ A had flatter surfaces, than those of samples B and P, where the
latter were rougher, with gaps which could eventually increase the starting area of
compacts. Some discrepancies were found also by analyzing the pictures of the
compacts after the intrinsic dissolution. These variations resulted from the conversion to
dihydrate form which varied among samples i.e. the change in the dissolution slope
occurred at different time periods. For some samples (i.e. CBZ P) the transition was not
fully completed even after 120 min.
94
CBZ A before (magnification 100) CBZ A after (magnification 100) CBZ A after (magnification 1000)
CBZ B before (magnification 100) CBZ B after (magnification 100) CBZ B after (magnification 1000)
CBZ P before (magnification 100) CBZ P after (magnification 100) CBZ P after (magnification 1000)
Figure 6.21 Surface of compacts before and after disc intrinsic dissolution
Results and discussion
95
Therefore, based on the observation of the SEM pictures, the conversion of anhydrous
to dihydrate form of CBZ A was completed after 120 minutes of dissolution (as
confirmed by needle-like formations which were covering the surface of the compacts).
In the case of CBZ P, after 120 minutes of dissolution, besides the needle-like
formations, some prismatic particles were present as well.
The dissolution profiles of each group of CBZ anhydrous samples during the initial 20
minutes and during 120 minutes are shown in the figures 6.22 and 6.23 respectively.
The time interval of 20 minutes was selected because the transition from anhydrous to
dihydrate CBZ normally would take place within the first 20 minutes of intrinsic
dissolution. Therefore, it is important to determine the variations in the intrinsic
dissolution behavior of the commercial CBZ samples during that particular time interval.
One of the major difficulties in formulating CBZ immediate release tablets was that the
formulations did not meet the narrow requirements for CBZ recommended by USP,
where the amount of carbamazepine dissolved from the dosage unit must conform with
the Acceptance Table 2 (see section 6.5) (USP31, 2008). Moreover, the amount of
dissolved CBZ was often outside the levels L1 and L2 given in the Acceptance Table 2,
and this was accompanied by high variation between six analyzed tablets.
The intrinsic dissolution results of anhydrous CBZ B and P samples showed higher
variations within the tablets of one sample than those of CBZ A (compare the error bars
in the figures 6.22.-24). In other words the erratic dissolution found in the CBZ pure
compacts confirmed that the variations in dissolution results of formulated CBZ tablets
are most likely caused by the properties of CBZ raw material itself.
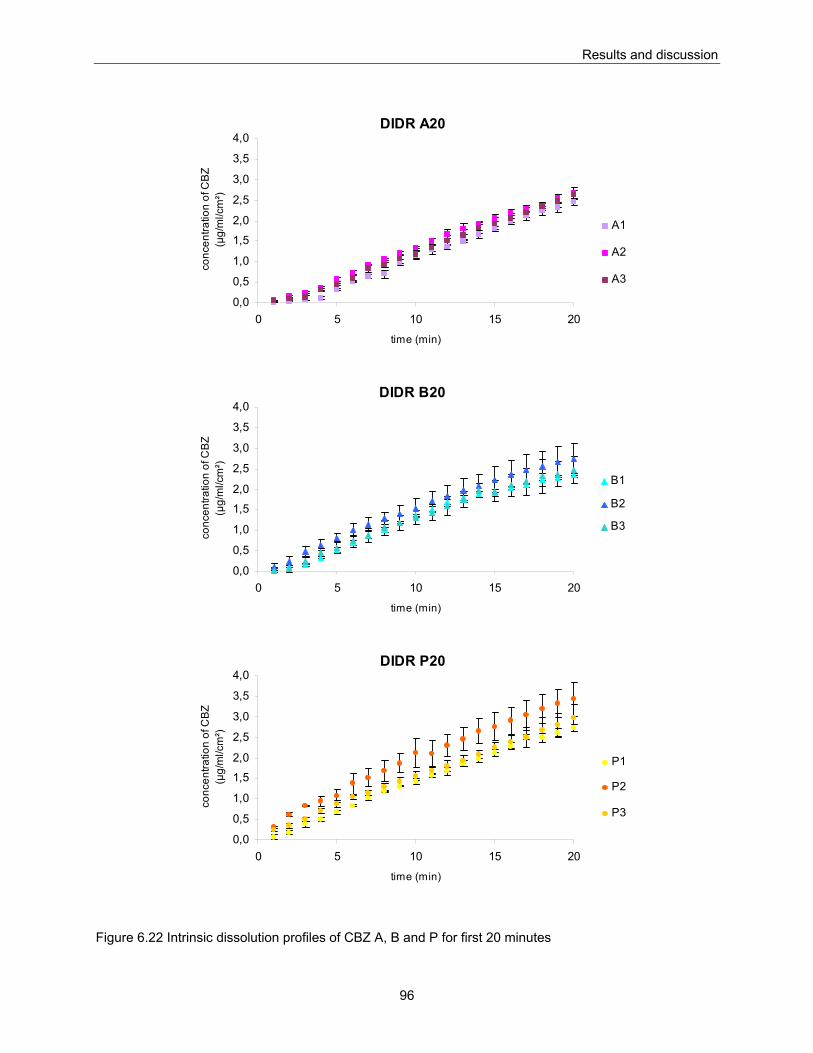
Results and discussion
96
DIDR A20
0,0
0,5
1,0
1,5
2,0
2,5
3,0
3,5
4,0
0 5 10 15 20
time (min)
conc
entra
tion
of C
BZ
(μg/
ml/c
m²)
A1
A2
A3
DIDR B20
0,0
0,5
1,0
1,5
2,0
2,5
3,0
3,5
4,0
0 5 10 15 20
time (min)
conc
entra
tion
of C
BZ
(μg/
ml/c
m²)
B1
B2
B3
DIDR P20
0,0
0,5
1,0
1,5
2,0
2,5
3,0
3,5
4,0
0 5 10 15 20
time (min)
conc
entra
tion
of C
BZ
(μg/
ml/c
m²)
P1
P2
P3
Figure 6.22 Intrinsic dissolution profiles of CBZ A, B and P for first 20 minutes
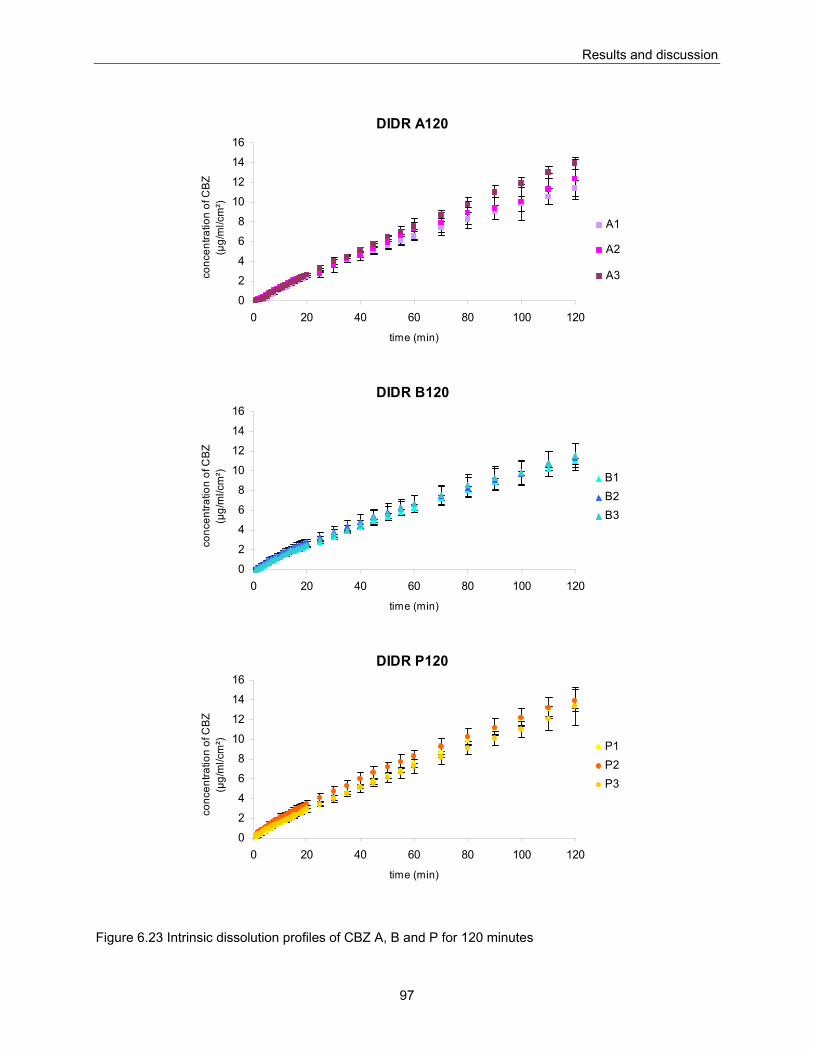
Results and discussion
97
DIDR A120
0
2
4
6
8
10
12
14
16
0 20 40 60 80 100 120
time (min)
conc
entra
tion
of C
BZ
(μg/
ml/c
m²)
A1
A2
A3
DIDR B120
0
2
4
6
8
10
12
14
16
0 20 40 60 80 100 120
time (min)
conc
entra
tion
of C
BZ
(μg/
ml/c
m²) B1
B2B3
DIDR P120
0
2
4
6
8
10
12
14
16
0 20 40 60 80 100 120
time (min)
conc
entra
tion
of C
BZ
(μg/
ml/c
m²) P1
P2P3
Figure 6.23 Intrinsic dissolution profiles of CBZ A, B and P for 120 minutes
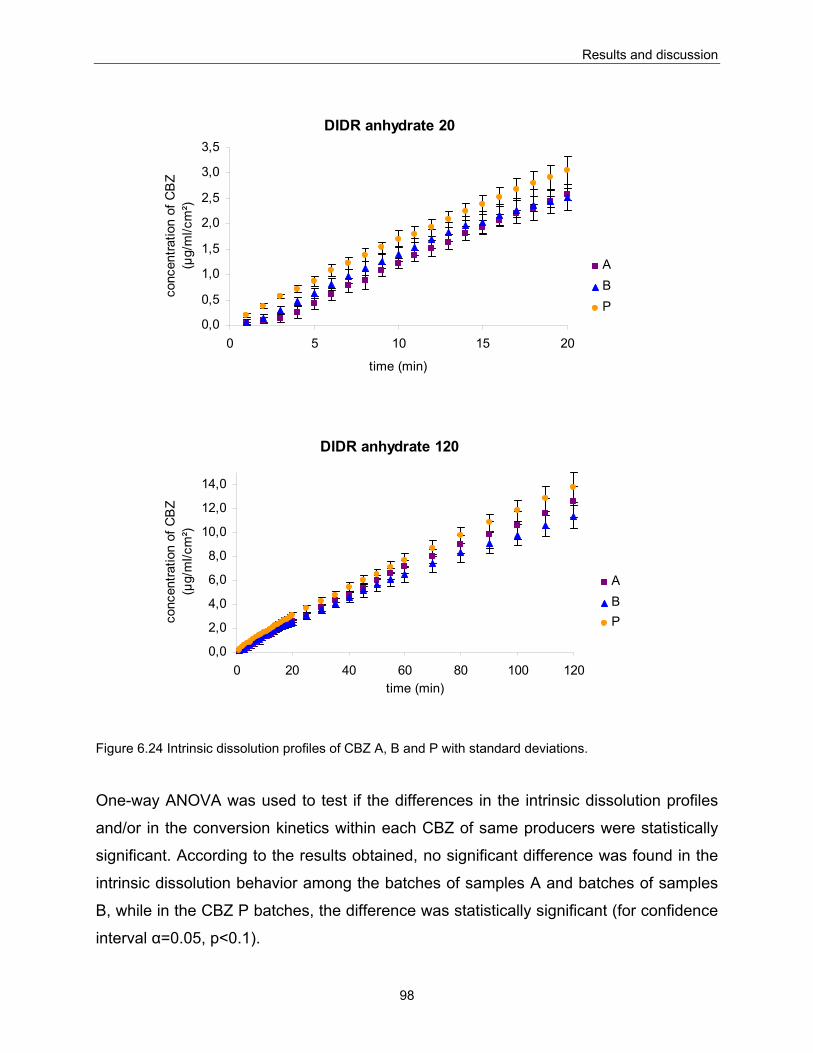
Results and discussion
98
DIDR anhydrate 20
0,0
0,5
1,0
1,5
2,0
2,5
3,0
3,5
0 5 10 15 20
time (min)
conc
entra
tion
of C
BZ
(μg/
ml/c
m²)
ABP
DIDR anhydrate 120
0,0
2,0
4,0
6,0
8,0
10,0
12,0
14,0
0 20 40 60 80 100 120time (min)
conc
entra
tion
of C
BZ
(μg/
ml/c
m²)
ABP
Figure 6.24 Intrinsic dissolution profiles of CBZ A, B and P with standard deviations.
One-way ANOVA was used to test if the differences in the intrinsic dissolution profiles
and/or in the conversion kinetics within each CBZ of same producers were statistically
significant. According to the results obtained, no significant difference was found in the
intrinsic dissolution behavior among the batches of samples A and batches of samples
B, while in the CBZ P batches, the difference was statistically significant (for confidence
interval α=0.05, p<0.1).
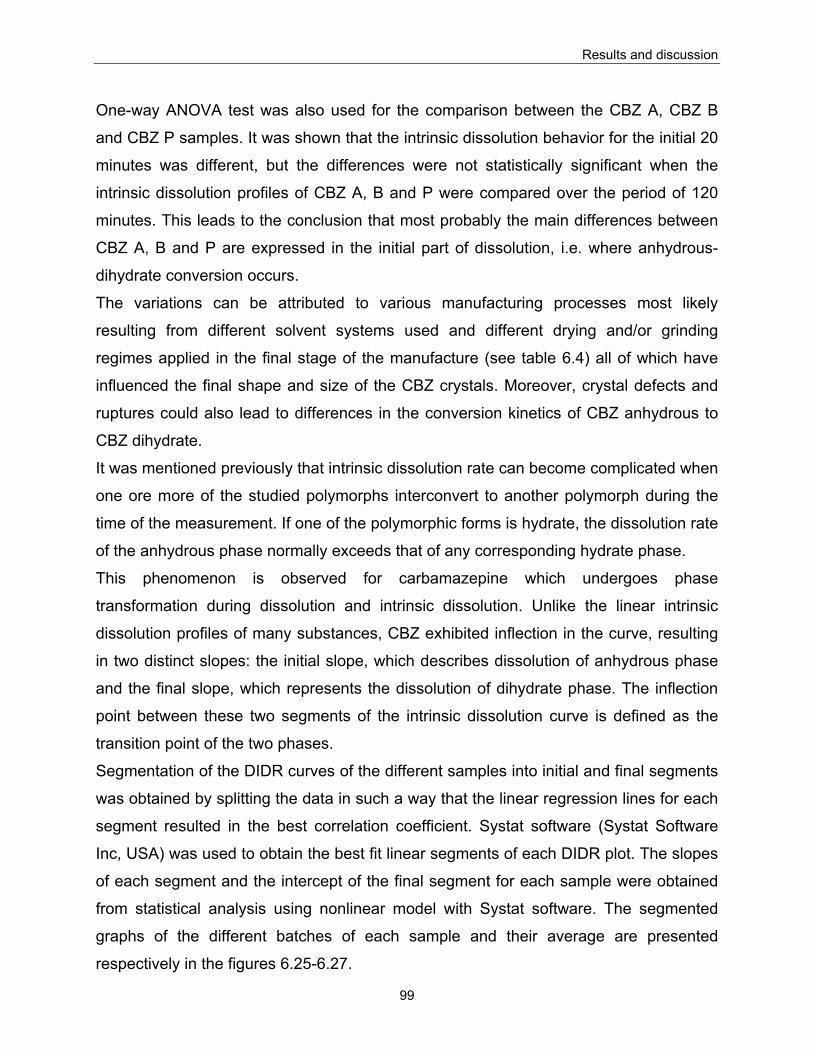
Results and discussion
99
One-way ANOVA test was also used for the comparison between the CBZ A, CBZ B
and CBZ P samples. It was shown that the intrinsic dissolution behavior for the initial 20
minutes was different, but the differences were not statistically significant when the
intrinsic dissolution profiles of CBZ A, B and P were compared over the period of 120
minutes. This leads to the conclusion that most probably the main differences between
CBZ A, B and P are expressed in the initial part of dissolution, i.e. where anhydrous-
dihydrate conversion occurs.
The variations can be attributed to various manufacturing processes most likely
resulting from different solvent systems used and different drying and/or grinding
regimes applied in the final stage of the manufacture (see table 6.4) all of which have
influenced the final shape and size of the CBZ crystals. Moreover, crystal defects and
ruptures could also lead to differences in the conversion kinetics of CBZ anhydrous to
CBZ dihydrate.
It was mentioned previously that intrinsic dissolution rate can become complicated when
one ore more of the studied polymorphs interconvert to another polymorph during the
time of the measurement. If one of the polymorphic forms is hydrate, the dissolution rate
of the anhydrous phase normally exceeds that of any corresponding hydrate phase.
This phenomenon is observed for carbamazepine which undergoes phase
transformation during dissolution and intrinsic dissolution. Unlike the linear intrinsic
dissolution profiles of many substances, CBZ exhibited inflection in the curve, resulting
in two distinct slopes: the initial slope, which describes dissolution of anhydrous phase
and the final slope, which represents the dissolution of dihydrate phase. The inflection
point between these two segments of the intrinsic dissolution curve is defined as the
transition point of the two phases.
Segmentation of the DIDR curves of the different samples into initial and final segments
was obtained by splitting the data in such a way that the linear regression lines for each
segment resulted in the best correlation coefficient. Systat software (Systat Software
Inc, USA) was used to obtain the best fit linear segments of each DIDR plot. The slopes
of each segment and the intercept of the final segment for each sample were obtained
from statistical analysis using nonlinear model with Systat software. The segmented
graphs of the different batches of each sample and their average are presented
respectively in the figures 6.25-6.27.
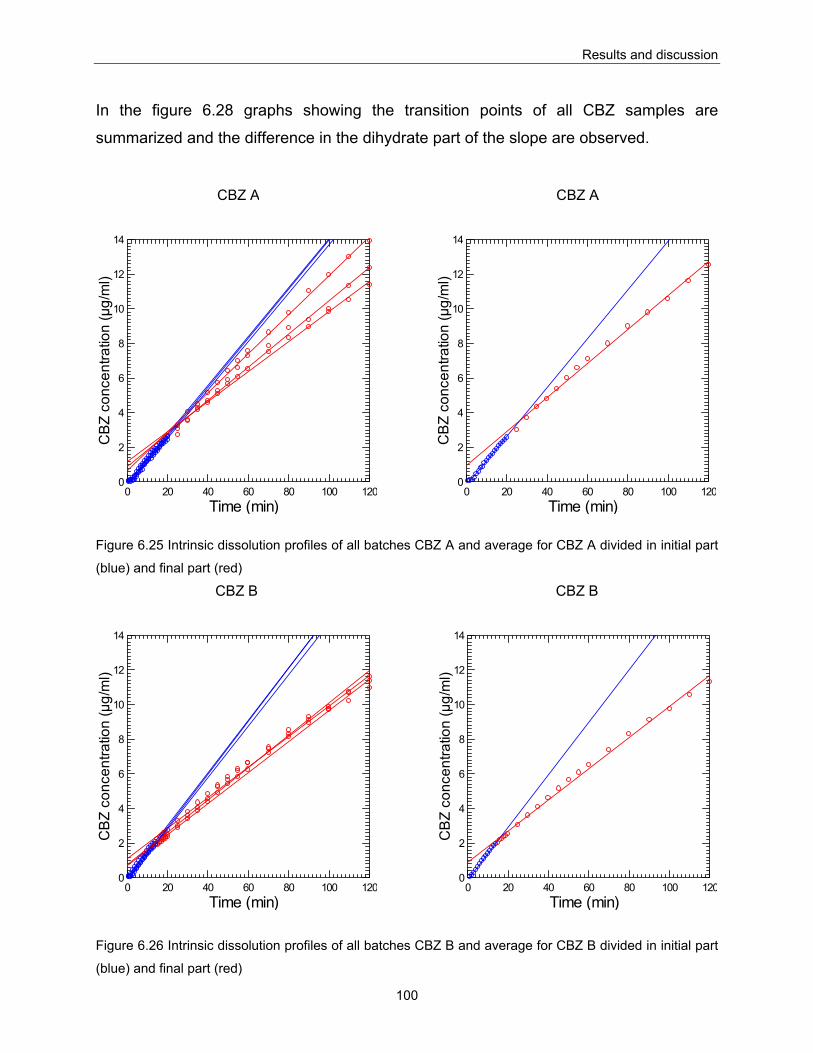
Results and discussion
100
In the figure 6.28 graphs showing the transition points of all CBZ samples are
summarized and the difference in the dihydrate part of the slope are observed.
CBZ A
0 20 40 60 80 100 120Time (min)
0
2
4
6
8
10
12
14
CB
Z co
ncen
tratio
n (µ
g/m
l)
CBZ A
0 20 40 60 80 100 120Time (min)
0
2
4
6
8
10
12
14
CB
Z co
ncen
tratio
n (µ
g/m
l)
Figure 6.25 Intrinsic dissolution profiles of all batches CBZ A and average for CBZ A divided in initial part
(blue) and final part (red)
CBZ B
0 20 40 60 80 100 120Time (min)
0
2
4
6
8
10
12
14
CB
Z co
ncen
tratio
n (µ
g/m
l)
CBZ B
0 20 40 60 80 100 120Time (min)
0
2
4
6
8
10
12
14
CB
Z co
ncen
tratio
n (µ
g/m
l)
Figure 6.26 Intrinsic dissolution profiles of all batches CBZ B and average for CBZ B divided in initial part
(blue) and final part (red)
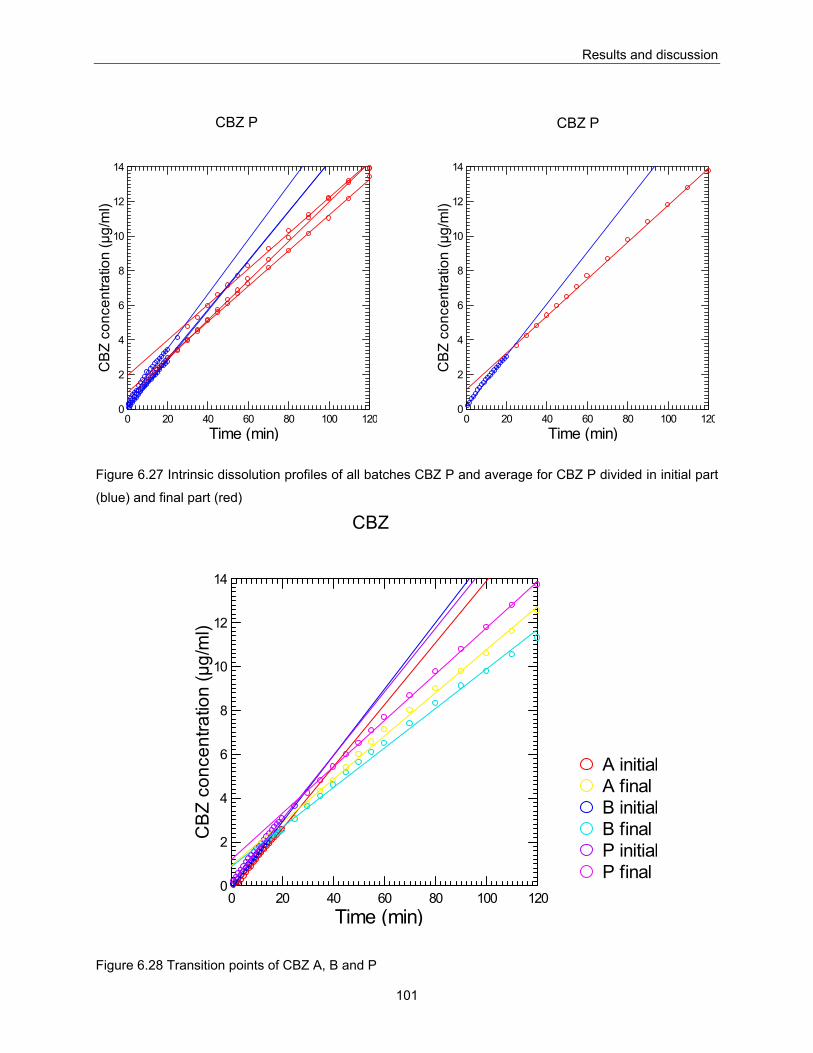
Results and discussion
101
CBZ P
0 20 40 60 80 100 120Time (min)
0
2
4
6
8
10
12
14
CB
Z co
ncen
tratio
n (µ
g/m
l)
CBZ P
0 20 40 60 80 100 120Time (min)
0
2
4
6
8
10
12
14
CB
Z co
ncen
tratio
n (µ
g/m
l)
Figure 6.27 Intrinsic dissolution profiles of all batches CBZ P and average for CBZ P divided in initial part
(blue) and final part (red)
CBZ
P finalP initialB finalB initialA finalA initial
0 20 40 60 80 100 120Time (min)
0
2
4
6
8
10
12
14
CB
Z co
ncen
tratio
n (µ
g/m
l)
Figure 6.28 Transition points of CBZ A, B and P
Results and discussion
102
It can be seen that the times required for conversion of anhydrous CBZ to dihydrate
differed in each group of carbamazepines. They were around 20min, around 15min and
between 20 and 25 min for CBZ A, CBZ B and CBZ P respectively. According to
literature data, the transformation occurs after 5 to 10 min of intrinsic dissolution test
(Kobayashi et al., 2000, Ono et al., 2002). The discrepancies found in the present work
can be explained by the different raw material used.
In can be seen in figures 6.25, 6.26 and 6.27, that the initial part of the dissolution curve
did not show batch to batch variation for CBZ A and B, while for CBZ P (figure 6.27)
deviation was observed.
One-way ANOVA confirmed that the batch to batch variations in CBZ P samples were
not statistically significant. The differences seen in the slope of the final segment of the
intrinsic dissolution curves, i.e. the slope after the detected transition point can be
explained by the differences in the crystallization process of CBZ dihydrates. During the
intrinsic dissolution test nucleuses of dihydrate are formed on the surface of the
compact which act as initiators for the dihydrate crystallization process. The kinetics of
the crystallization process depends on the size of the nucleuses and this can have
direct influence on the final slope of DIDR profile.
The segmented plots were analyzed employing the method of Nogami et al (Nogami et
al., 1969) and Ono et al (Ono et al., 2002) to calculate the dissolution parameters using
the following equations:
SHtCkdtdC
= Equation 6.1
SAtt
CkdtdC
=⎟⎠⎞
⎜⎝⎛
=0
Equation 6.2
( )
r
SHSAt
kCCk
b−
= Equation 6.3
Results and discussion
103
where:
C represents the concentration of carbamazepine in bulk solution (μg/ml)
t is the time (min)
kt and is the rate constant of the transport process (min)
kr is the rate constant of the phase transformation process (min)
CSH is the saturated concentration of dihydrate (μg/ml)
CSA is the saturated concentration of anhydrous form (μg/ml)
b represents the intercept obtained by the extrapolation of the linear portion of the
dissolution curve of the anhydrous form.
The parameters kt, kr and CSA were calculated from the above equations. kt or the rate
constant of the transport process was calculated from the slope of the dihydrate curve
(equation 6.2) using the solubility value for the respective dihydrate CSH obtained from
equilibrium solubility testing (see later 6.2.4 and 6.2.5). CSA was calculated from
equation 6.1 using the estimate of the slope of the initial segment and the kt value
calculated from equation 6.2. The intercept of the final segment was calculated using
the equation 6.3. The results are presented in table 6.14. Table 6.15 shows the average
values obtained of all tested CBZ samples. Values for the final slope in anhydrous part
were lower than the initial slope (because of phase transformation). However, these
values are markedly higher than those of pure dihydrates. The reason may be that even
after 2 hours of disc intrinsic dissolution test, there were some parts of compact
remaining in anhydrous form which increased the intrinsic dissolution rates. It is
interesting to note that CBZ B, which gave the highest amount of drug released in 20
minutes, had a final slope relatively close to the slope of dihydrate, suggesting the most
complete transformation from anhydrous to dihydrate.
The turning point on the DIDR curves (transition point), where the slope changes from
dissolution of anhydrous CBZ to dissolution of dihydrate, varied from sample to sample:
CBZ A ~20 min; CBZ B ~15 min; CBZ P 20~25 min. In addition to that, variations were
found in the value for the constant of phase transformation process (kr) were found (see
table 6.14).
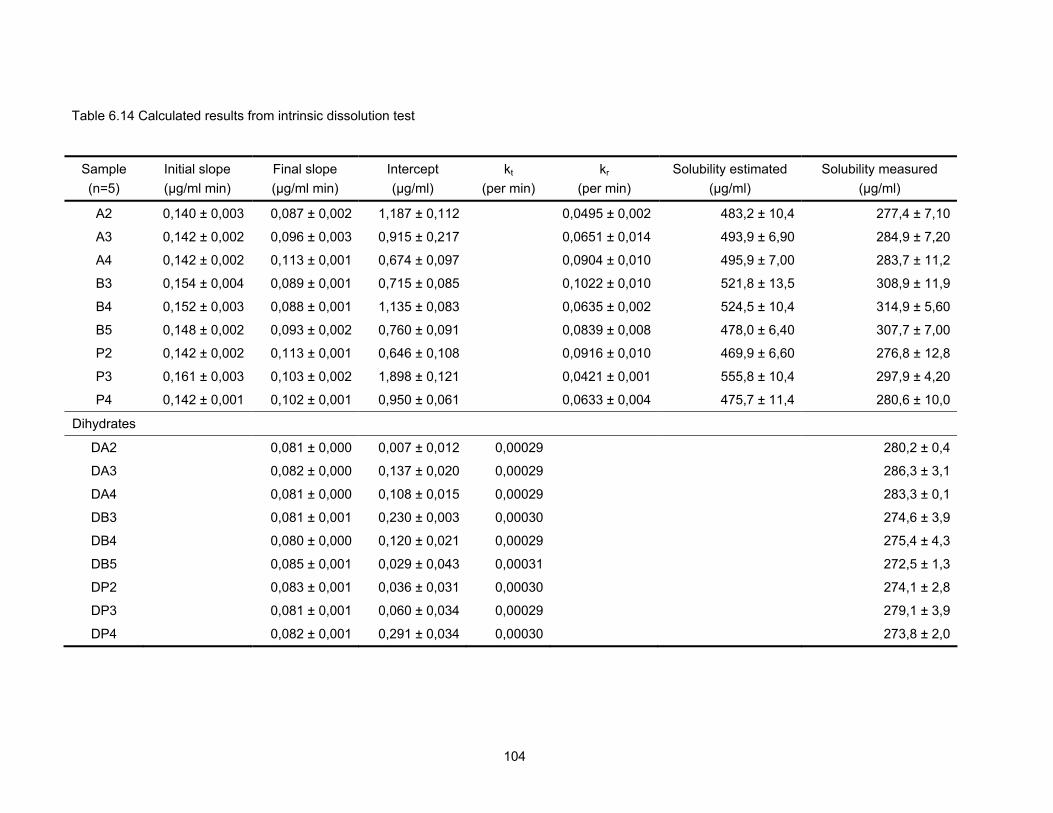
104
Table 6.14 Calculated results from intrinsic dissolution test
Sample (n=5)
Initial slope (μg/ml min)
Final slope (μg/ml min)
Intercept (μg/ml)
kt (per min)
kr (per min)
Solubility estimated (μg/ml)
Solubility measured (μg/ml)
A2 0,140 ± 0,003 0,087 ± 0,002 1,187 ± 0,112 0,0495 ± 0,002 483,2 ± 10,4 277,4 ± 7,10
A3 0,142 ± 0,002 0,096 ± 0,003 0,915 ± 0,217 0,0651 ± 0,014 493,9 ± 6,90 284,9 ± 7,20
A4 0,142 ± 0,002 0,113 ± 0,001 0,674 ± 0,097 0,0904 ± 0,010 495,9 ± 7,00 283,7 ± 11,2
B3 0,154 ± 0,004 0,089 ± 0,001 0,715 ± 0,085 0,1022 ± 0,010 521,8 ± 13,5 308,9 ± 11,9
B4 0,152 ± 0,003 0,088 ± 0,001 1,135 ± 0,083 0,0635 ± 0,002 524,5 ± 10,4 314,9 ± 5,60
B5 0,148 ± 0,002 0,093 ± 0,002 0,760 ± 0,091 0,0839 ± 0,008 478,0 ± 6,40 307,7 ± 7,00
P2 0,142 ± 0,002 0,113 ± 0,001 0,646 ± 0,108 0,0916 ± 0,010 469,9 ± 6,60 276,8 ± 12,8
P3 0,161 ± 0,003 0,103 ± 0,002 1,898 ± 0,121 0,0421 ± 0,001 555,8 ± 10,4 297,9 ± 4,20
P4 0,142 ± 0,001 0,102 ± 0,001 0,950 ± 0,061 0,0633 ± 0,004 475,7 ± 11,4 280,6 ± 10,0
Dihydrates
DA2 0,081 ± 0,000 0,007 ± 0,012 0,00029 280,2 ± 0,4
DA3 0,082 ± 0,000 0,137 ± 0,020 0,00029 286,3 ± 3,1
DA4 0,081 ± 0,000 0,108 ± 0,015 0,00029 283,3 ± 0,1
DB3 0,081 ± 0,001 0,230 ± 0,003 0,00030 274,6 ± 3,9
DB4 0,080 ± 0,000 0,120 ± 0,021 0,00029 275,4 ± 4,3
DB5 0,085 ± 0,001 0,029 ± 0,043 0,00031 272,5 ± 1,3
DP2 0,083 ± 0,001 0,036 ± 0,031 0,00030 274,1 ± 2,8
DP3 0,081 ± 0,001 0,060 ± 0,034 0,00029 279,1 ± 3,9
DP4 0,082 ± 0,001 0,291 ± 0,034 0,00030 273,8 ± 2,0
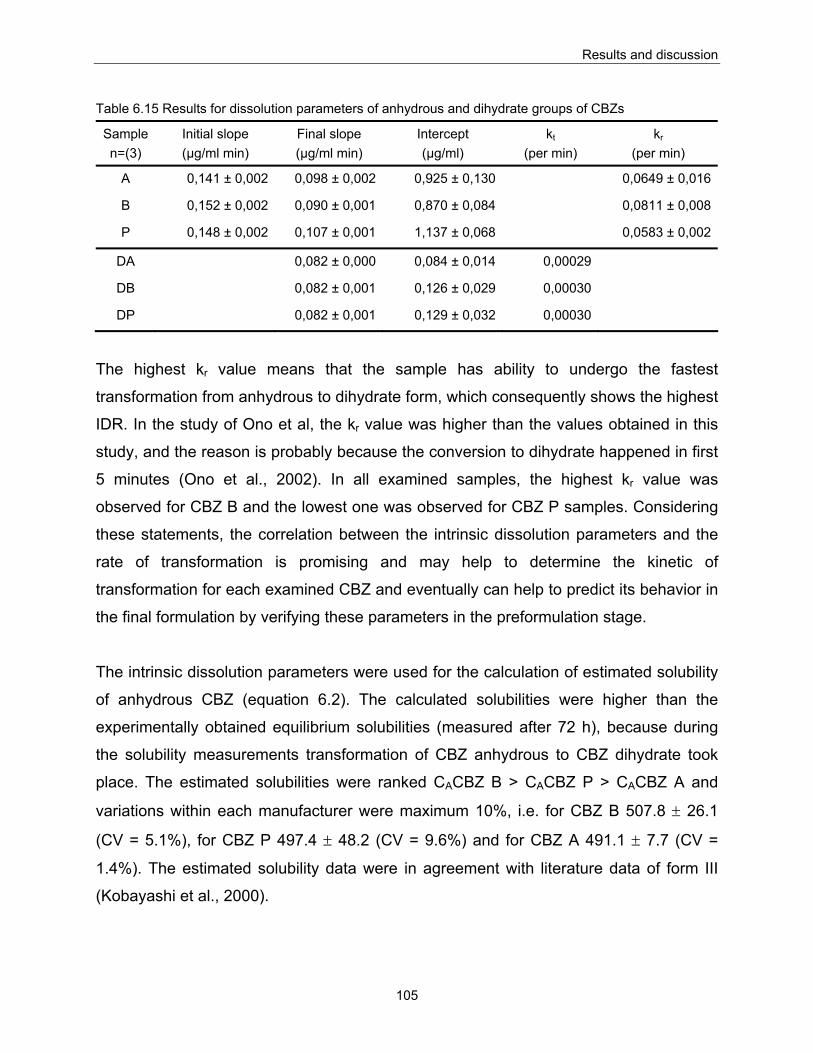
Results and discussion
105
Table 6.15 Results for dissolution parameters of anhydrous and dihydrate groups of CBZs
Sample n=(3)
Initial slope (μg/ml min)
Final slope (μg/ml min)
Intercept (μg/ml)
kt (per min)
kr (per min)
A 0,141 ± 0,002 0,098 ± 0,002 0,925 ± 0,130 0,0649 ± 0,016
B 0,152 ± 0,002 0,090 ± 0,001 0,870 ± 0,084 0,0811 ± 0,008
P 0,148 ± 0,002 0,107 ± 0,001 1,137 ± 0,068 0,0583 ± 0,002
DA 0,082 ± 0,000 0,084 ± 0,014 0,00029
DB 0,082 ± 0,001 0,126 ± 0,029 0,00030
DP 0,082 ± 0,001 0,129 ± 0,032 0,00030
The highest kr value means that the sample has ability to undergo the fastest
transformation from anhydrous to dihydrate form, which consequently shows the highest
IDR. In the study of Ono et al, the kr value was higher than the values obtained in this
study, and the reason is probably because the conversion to dihydrate happened in first
5 minutes (Ono et al., 2002). In all examined samples, the highest kr value was
observed for CBZ B and the lowest one was observed for CBZ P samples. Considering
these statements, the correlation between the intrinsic dissolution parameters and the
rate of transformation is promising and may help to determine the kinetic of
transformation for each examined CBZ and eventually can help to predict its behavior in
the final formulation by verifying these parameters in the preformulation stage.
The intrinsic dissolution parameters were used for the calculation of estimated solubility
of anhydrous CBZ (equation 6.2). The calculated solubilities were higher than the
experimentally obtained equilibrium solubilities (measured after 72 h), because during
the solubility measurements transformation of CBZ anhydrous to CBZ dihydrate took
place. The estimated solubilities were ranked CACBZ B > CACBZ P > CACBZ A and
variations within each manufacturer were maximum 10%, i.e. for CBZ B 507.8 ± 26.1
(CV = 5.1%), for CBZ P 497.4 ± 48.2 (CV = 9.6%) and for CBZ A 491.1 ± 7.7 (CV =
1.4%). The estimated solubility data were in agreement with literature data of form III
(Kobayashi et al., 2000).
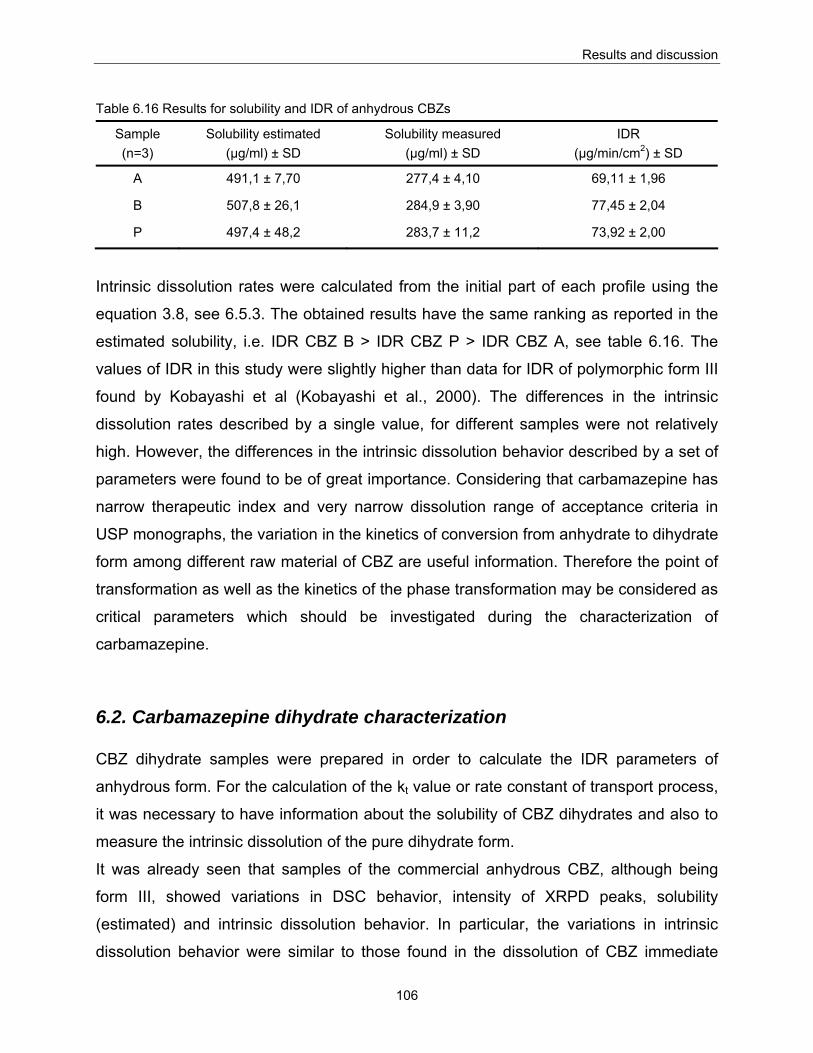
Results and discussion
106
Table 6.16 Results for solubility and IDR of anhydrous CBZs
Sample (n=3)
Solubility estimated (μg/ml) ± SD
Solubility measured (μg/ml) ± SD
IDR (μg/min/cm2) ± SD
A 491,1 ± 7,70 277,4 ± 4,10 69,11 ± 1,96
B 507,8 ± 26,1 284,9 ± 3,90 77,45 ± 2,04
P 497,4 ± 48,2 283,7 ± 11,2 73,92 ± 2,00
Intrinsic dissolution rates were calculated from the initial part of each profile using the
equation 3.8, see 6.5.3. The obtained results have the same ranking as reported in the
estimated solubility, i.e. IDR CBZ B > IDR CBZ P > IDR CBZ A, see table 6.16. The
values of IDR in this study were slightly higher than data for IDR of polymorphic form III
found by Kobayashi et al (Kobayashi et al., 2000). The differences in the intrinsic
dissolution rates described by a single value, for different samples were not relatively
high. However, the differences in the intrinsic dissolution behavior described by a set of
parameters were found to be of great importance. Considering that carbamazepine has
narrow therapeutic index and very narrow dissolution range of acceptance criteria in
USP monographs, the variation in the kinetics of conversion from anhydrate to dihydrate
form among different raw material of CBZ are useful information. Therefore the point of
transformation as well as the kinetics of the phase transformation may be considered as
critical parameters which should be investigated during the characterization of
carbamazepine.
6.2. Carbamazepine dihydrate characterization CBZ dihydrate samples were prepared in order to calculate the IDR parameters of
anhydrous form. For the calculation of the kt value or rate constant of transport process,
it was necessary to have information about the solubility of CBZ dihydrates and also to
measure the intrinsic dissolution of the pure dihydrate form.
It was already seen that samples of the commercial anhydrous CBZ, although being
form III, showed variations in DSC behavior, intensity of XRPD peaks, solubility
(estimated) and intrinsic dissolution behavior. In particular, the variations in intrinsic
dissolution behavior were similar to those found in the dissolution of CBZ immediate
Results and discussion
107
tablet formulations in Bosnalijek's R&D. Therefore it was proposed to convert the
anhydrous CBZ into their respective dihydrates and to evaluate the impact of this
strategy on the variability seen in commercial CBZ products. Namely, it was already
shown in the previous discussion, that variability due to previous history of the samples
(e.g. manufacturing process, grinding etc) influenced their intrinsic dissolution behavior.
Thus the question: Can the observed variability be eliminated or indeed “erased” from
the previous history of anhydrous commercial products by converting them their
dihydrate form? For this purpose, dihydrates of all commercial anhydrous samples were
prepared and were fully characterized prior to subjecting them to intrinsic dissolution
testing
6.2.1. X-ray powder diffraction of dihydrates CBZ dihydrate has its own unique XRPD pattern. CBZ dihydrates prepared from the
nine available samples (CBZ DA, DB, DP) had characteristic reflections at 2θ = 8,9;
18,9 and 19,4 which correspond to literature data for CBZ D (Carino et al., 2006,
Kobayashi et al., 2000). It was therefore confirmed that CBZ dihydrate was properly
formed. In addition it was also observed that the differences in the intensity of the peaks
found on the X-ray diffractograms of CBZ A, B, and P disappeared after their conversion
to dihydrate, see figure 6.29.
6.2.2. Loss on drying Complete hydration of the anhydrous samples was confirmed by the loss on drying
method. The water content of the anhydrous CBZ was 0.1±0.05% of whereas the,
dihydrate samples had a loss on drying of 13,2% for CBZ DA, 13,3% for CBZ DB and
13,1% for CBZ DP. These values are nearly equal to the stoichiometric value calculated
for the water content of CBZ dihydrate (13,2% wt/wt) reported in literature (McMahon et
al., 1996). The weight loss is attributed to the dehydration of CBZ D, i.e. removal of
lattice water (Surana et al., 2003).
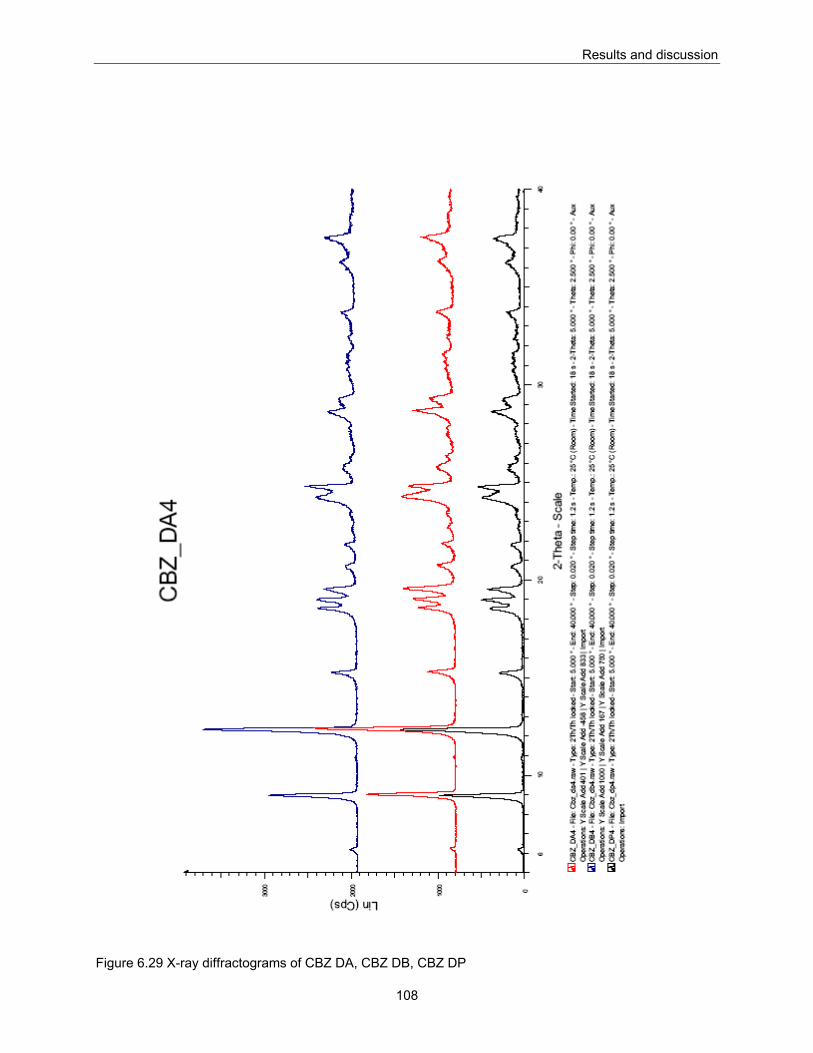
Results and discussion
108
Figure 6.29 X-ray diffractograms of CBZ DA, CBZ DB, CBZ DP
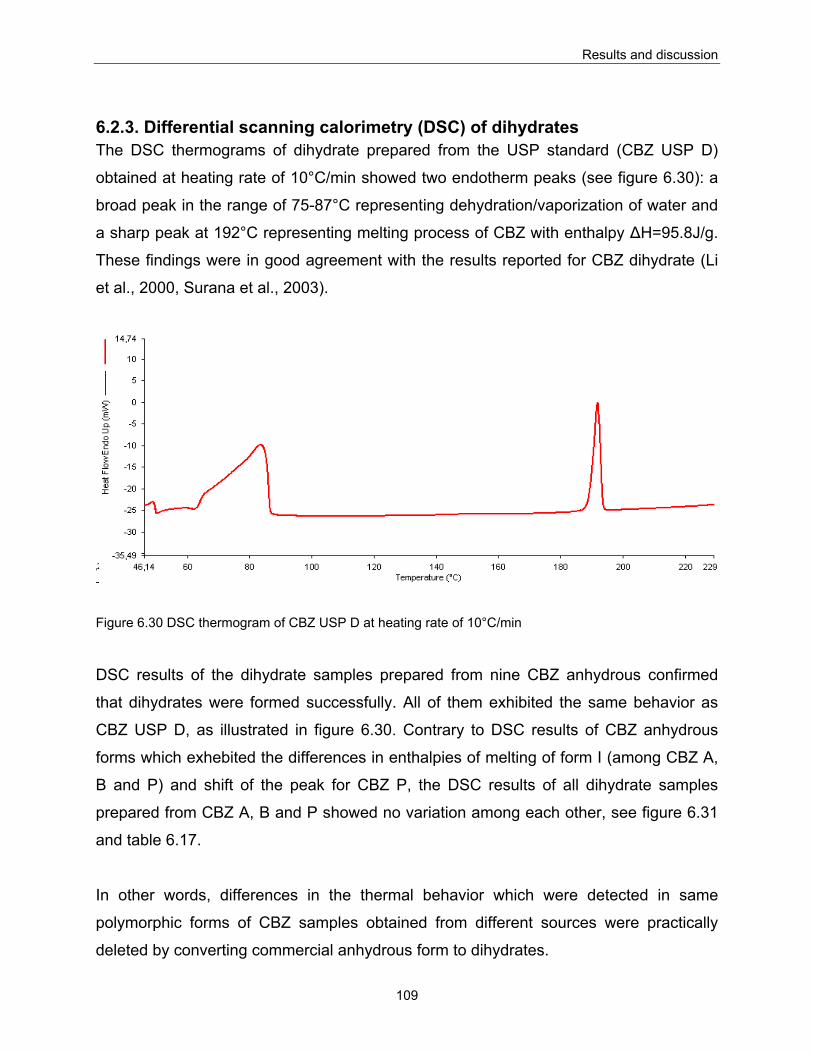
Results and discussion
109
6.2.3. Differential scanning calorimetry (DSC) of dihydrates The DSC thermograms of dihydrate prepared from the USP standard (CBZ USP D)
obtained at heating rate of 10°C/min showed two endotherm peaks (see figure 6.30): a
broad peak in the range of 75-87°C representing dehydration/vaporization of water and
a sharp peak at 192°C representing melting process of CBZ with enthalpy ΔH=95.8J/g.
These findings were in good agreement with the results reported for CBZ dihydrate (Li
et al., 2000, Surana et al., 2003).
Figure 6.30 DSC thermogram of CBZ USP D at heating rate of 10°C/min
DSC results of the dihydrate samples prepared from nine CBZ anhydrous confirmed
that dihydrates were formed successfully. All of them exhibited the same behavior as
CBZ USP D, as illustrated in figure 6.30. Contrary to DSC results of CBZ anhydrous
forms which exhebited the differences in enthalpies of melting of form I (among CBZ A,
B and P) and shift of the peak for CBZ P, the DSC results of all dihydrate samples
prepared from CBZ A, B and P showed no variation among each other, see figure 6.31
and table 6.17.
In other words, differences in the thermal behavior which were detected in same
polymorphic forms of CBZ samples obtained from different sources were practically
deleted by converting commercial anhydrous form to dihydrates.
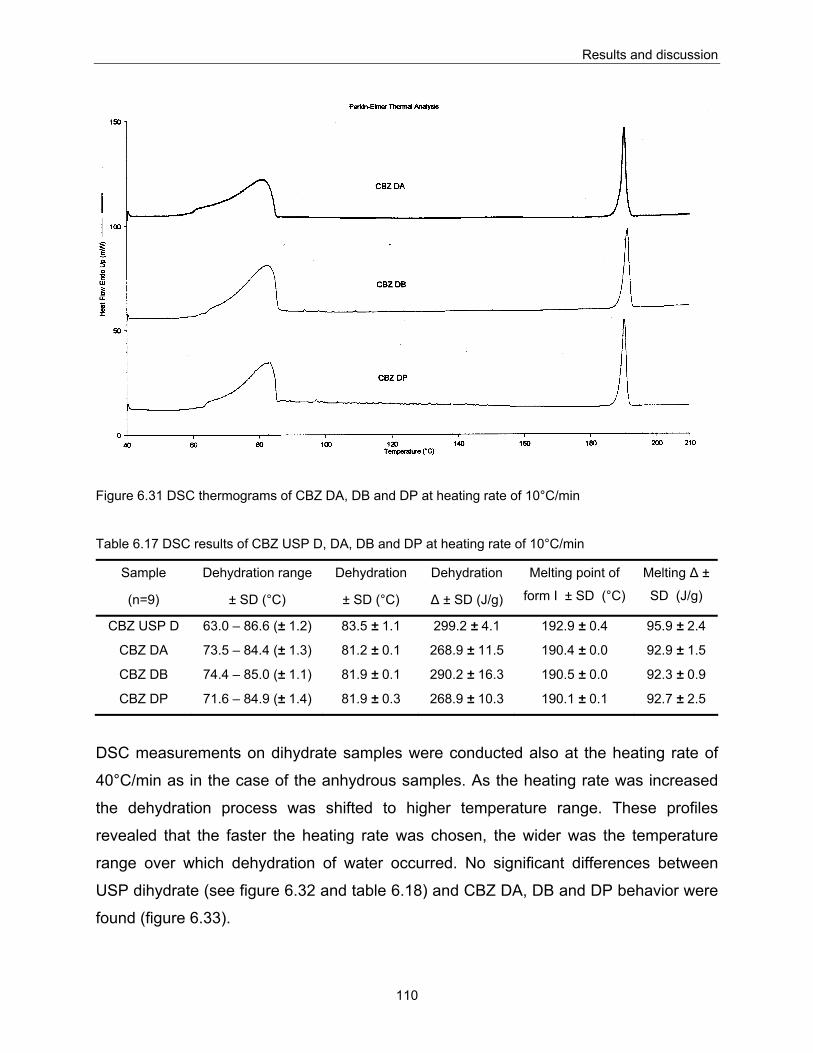
Results and discussion
110
Figure 6.31 DSC thermograms of CBZ DA, DB and DP at heating rate of 10°C/min
Table 6.17 DSC results of CBZ USP D, DA, DB and DP at heating rate of 10°C/min
Sample
(n=9)
Dehydration range
± SD (°C)
Dehydration
± SD (°C)
Dehydration
Δ ± SD (J/g)
Melting point of
form I ± SD (°C)
Melting Δ ±
SD (J/g)
CBZ USP D 63.0 – 86.6 (± 1.2) 83.5 ± 1.1 299.2 ± 4.1 192.9 ± 0.4 95.9 ± 2.4
CBZ DA 73.5 – 84.4 (± 1.3) 81.2 ± 0.1 268.9 ± 11.5 190.4 ± 0.0 92.9 ± 1.5
CBZ DB 74.4 – 85.0 (± 1.1) 81.9 ± 0.1 290.2 ± 16.3 190.5 ± 0.0 92.3 ± 0.9
CBZ DP 71.6 – 84.9 (± 1.4) 81.9 ± 0.3 268.9 ± 10.3 190.1 ± 0.1 92.7 ± 2.5
DSC measurements on dihydrate samples were conducted also at the heating rate of
40°C/min as in the case of the anhydrous samples. As the heating rate was increased
the dehydration process was shifted to higher temperature range. These profiles
revealed that the faster the heating rate was chosen, the wider was the temperature
range over which dehydration of water occurred. No significant differences between
USP dihydrate (see figure 6.32 and table 6.18) and CBZ DA, DB and DP behavior were
found (figure 6.33).
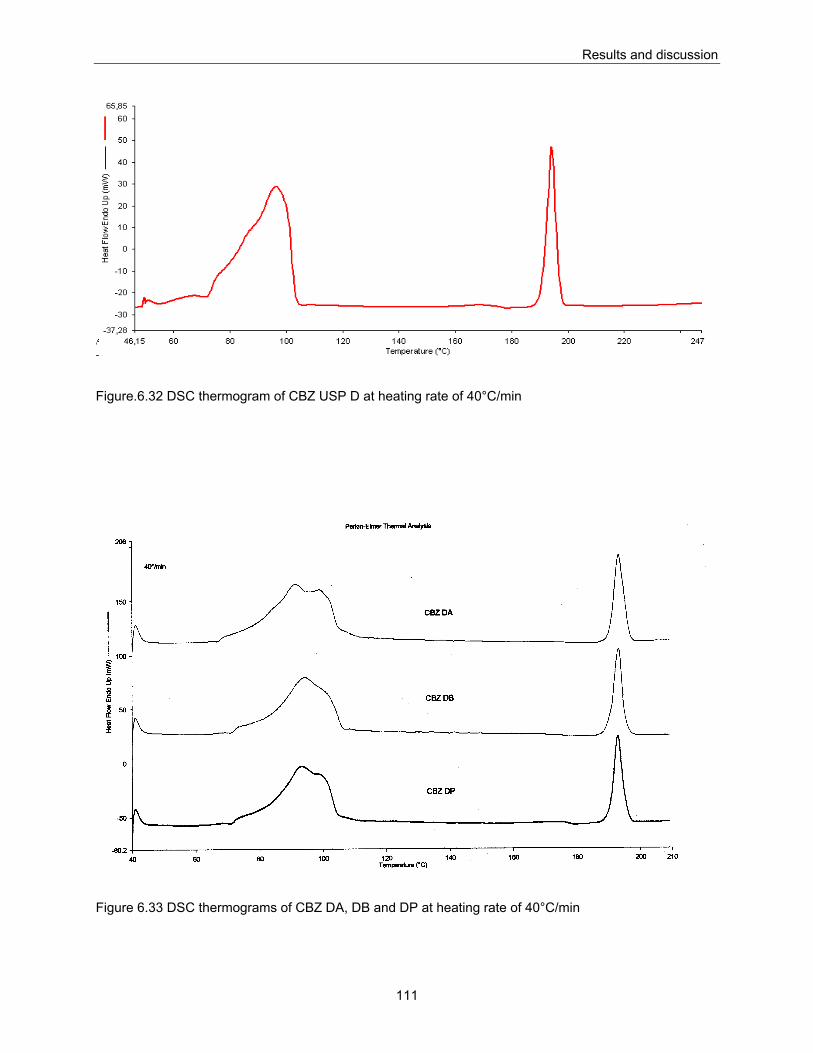
Results and discussion
111
Figure.6.32 DSC thermogram of CBZ USP D at heating rate of 40°C/min
Figure 6.33 DSC thermograms of CBZ DA, DB and DP at heating rate of 40°C/min
Results and discussion
112
Table 6.18 DSC results of CBZ USP D, DA, DB and DP at heating rate of 40°C/min
Sample
(n=9)
Dehydration range
± SD (°C)
Dehydration
± SD (°C)
Dehydration
Δ ± SD (J/g)
Melting point of
form I ± SD (°C)
Melting Δ ±
SD (J/g)
CBZ USP D 80.1 –103.2 (± 0.3) 96.3 ± 1.1 307.5 ± 7.1 194.1 ± 0.2 95.5 ± 1.5
CBZ DA 80.0 –116.1 (± 0.1) 92.1 ± 0.4 329.4 ± 8.5 193.2 ± 0.4 95.0 ± 3.7
CBZ DB 82.0 –107.0 (± 0.3) 93.4 ± 2.0 310.3 ± 17.4 193.3 ± 0.1 94.6 ± 0.4
CBZ DP 81.9 –104.7 (± 0.4) 92.7 ± 0.9 284.5 ± 3.5 192.9 ± 0.1 87.3 ± 1.9
6.2.4. Solubility of dihydrates Dihydrate of CBZ is the stable form in aqueous conditions, therefore no phase
transformation during this test was expected. The solubility of dihydrates was
determined by supersaturation, where an excess amount of CBZ dihydrate solid phase
was added to distilled water at 37±1°C and was shaken for 72h to equilibrium.
The obtained results are presented in following table 6.19, and are compared with the
solubility data of “anhydrous” CBZ obtained previously with the same method.
Table 6.19 Solubility parameters after 72h
Sample
(n=9)
Solubility ± SD (μg/ml) after 72h
DIHYDRATE
Solubility ± SD (μg/ml) after 72h
“ANHYDROUS”
CBZ A 283.3 ± 3.0 282.0 ± 4.1
CBZ B 274.2 ± 1.5 310.5 ± 3.9
CBZ P 275.7 ± 2.9 286.4 ± 11.2
One way ANOVA analysis showed that there were no significant differences in solubility
between dihydrates prepared from CBZ A, CBZ B and CBZ P. Furthermore, no
differences were found within dihydrates prepared from different batches of the same
producers.
It can be noted that the solubility values of dihydrates measured after 72 hours were
approximately equal to the values of anhydrous CBZ measured in the same time
interval, except for CBZ B. The reason for this is that during the measurement time, the
anhydrous CBZ was converted completely or almost completely to dihydrate. In the
case of CBZ B, the measured solubility of the anhydrate was slightly higher than in the
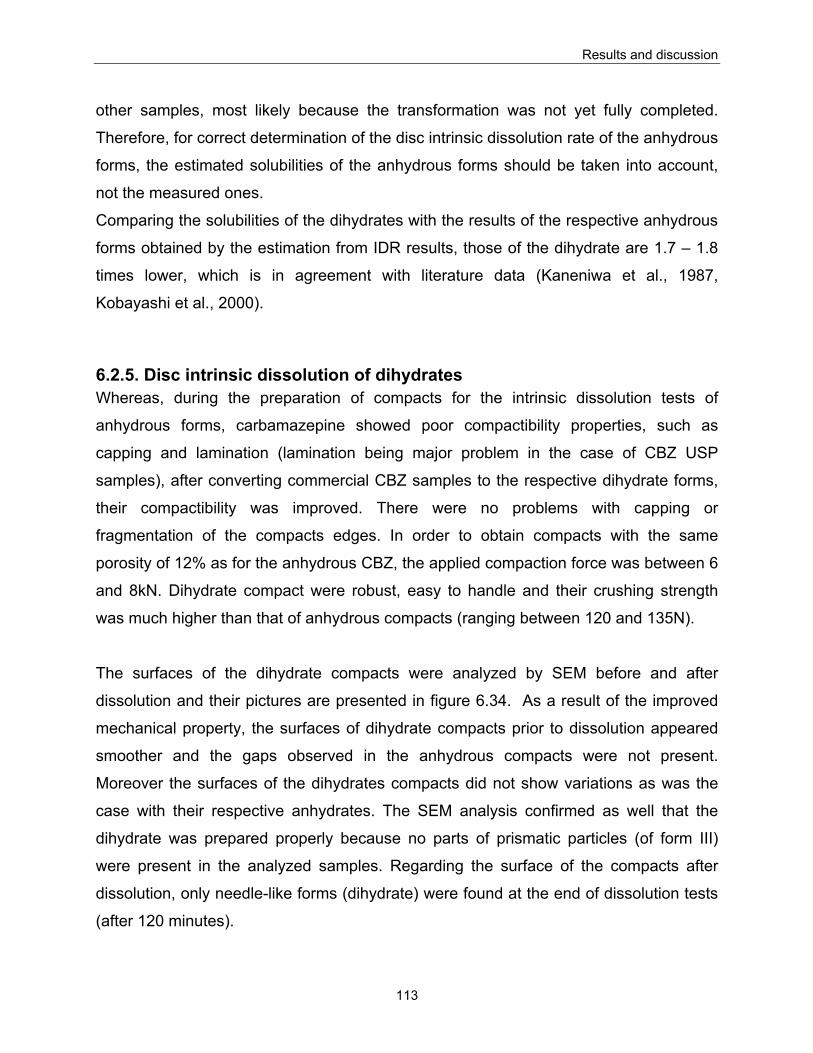
Results and discussion
113
other samples, most likely because the transformation was not yet fully completed.
Therefore, for correct determination of the disc intrinsic dissolution rate of the anhydrous
forms, the estimated solubilities of the anhydrous forms should be taken into account,
not the measured ones.
Comparing the solubilities of the dihydrates with the results of the respective anhydrous
forms obtained by the estimation from IDR results, those of the dihydrate are 1.7 – 1.8
times lower, which is in agreement with literature data (Kaneniwa et al., 1987,
Kobayashi et al., 2000).
6.2.5. Disc intrinsic dissolution of dihydrates Whereas, during the preparation of compacts for the intrinsic dissolution tests of
anhydrous forms, carbamazepine showed poor compactibility properties, such as
capping and lamination (lamination being major problem in the case of CBZ USP
samples), after converting commercial CBZ samples to the respective dihydrate forms,
their compactibility was improved. There were no problems with capping or
fragmentation of the compacts edges. In order to obtain compacts with the same
porosity of 12% as for the anhydrous CBZ, the applied compaction force was between 6
and 8kN. Dihydrate compact were robust, easy to handle and their crushing strength
was much higher than that of anhydrous compacts (ranging between 120 and 135N).
The surfaces of the dihydrate compacts were analyzed by SEM before and after
dissolution and their pictures are presented in figure 6.34. As a result of the improved
mechanical property, the surfaces of dihydrate compacts prior to dissolution appeared
smoother and the gaps observed in the anhydrous compacts were not present.
Moreover the surfaces of the dihydrates compacts did not show variations as was the
case with their respective anhydrates. The SEM analysis confirmed as well that the
dihydrate was prepared properly because no parts of prismatic particles (of form III)
were present in the analyzed samples. Regarding the surface of the compacts after
dissolution, only needle-like forms (dihydrate) were found at the end of dissolution tests
(after 120 minutes).
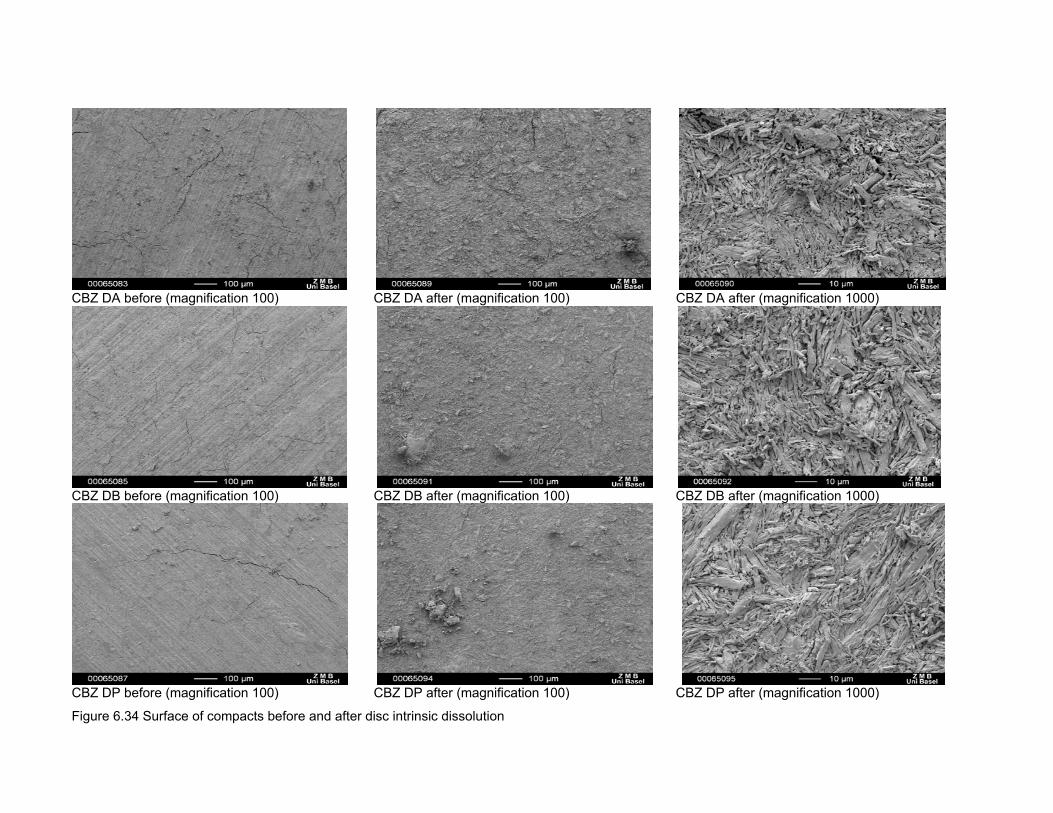
114
CBZ DA before (magnification 100) CBZ DA after (magnification 100) CBZ DA after (magnification 1000)
CBZ DB before (magnification 100) CBZ DB after (magnification 100) CBZ DB after (magnification 1000)
CBZ DP before (magnification 100) CBZ DP after (magnification 100) CBZ DP after (magnification 1000)
Figure 6.34 Surface of compacts before and after disc intrinsic dissolution
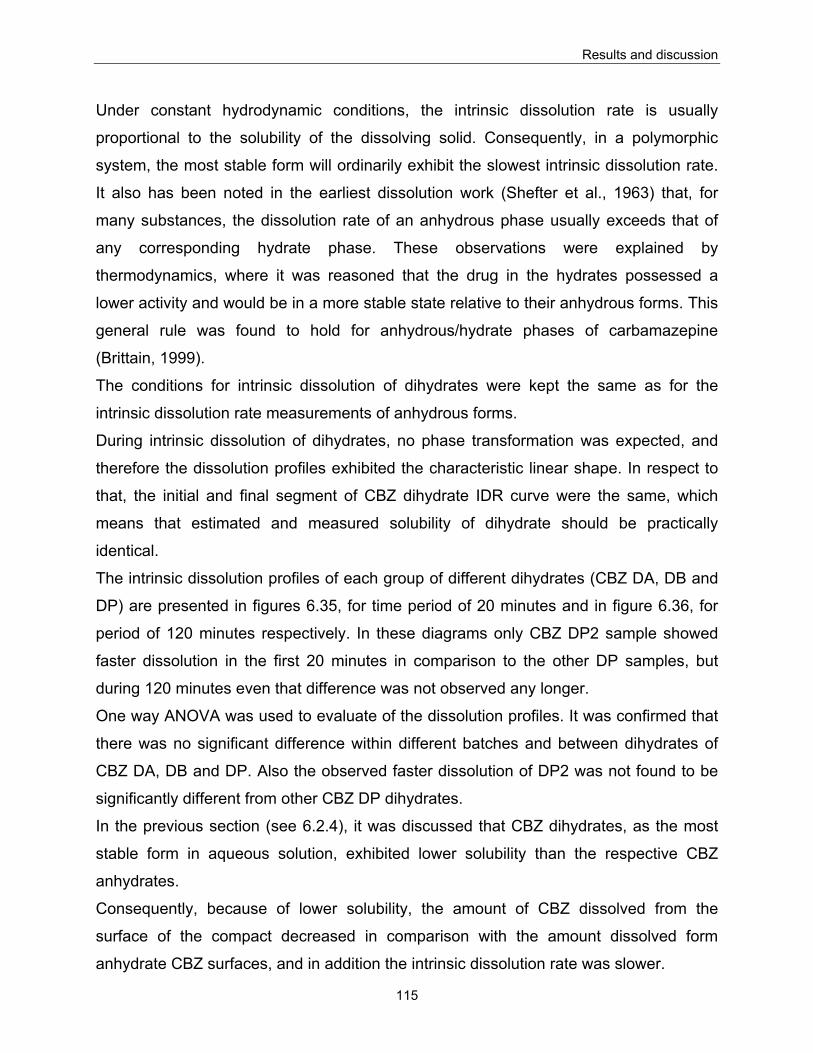
Results and discussion
115
Under constant hydrodynamic conditions, the intrinsic dissolution rate is usually
proportional to the solubility of the dissolving solid. Consequently, in a polymorphic
system, the most stable form will ordinarily exhibit the slowest intrinsic dissolution rate.
It also has been noted in the earliest dissolution work (Shefter et al., 1963) that, for
many substances, the dissolution rate of an anhydrous phase usually exceeds that of
any corresponding hydrate phase. These observations were explained by
thermodynamics, where it was reasoned that the drug in the hydrates possessed a
lower activity and would be in a more stable state relative to their anhydrous forms. This
general rule was found to hold for anhydrous/hydrate phases of carbamazepine
(Brittain, 1999).
The conditions for intrinsic dissolution of dihydrates were kept the same as for the
intrinsic dissolution rate measurements of anhydrous forms.
During intrinsic dissolution of dihydrates, no phase transformation was expected, and
therefore the dissolution profiles exhibited the characteristic linear shape. In respect to
that, the initial and final segment of CBZ dihydrate IDR curve were the same, which
means that estimated and measured solubility of dihydrate should be practically
identical.
The intrinsic dissolution profiles of each group of different dihydrates (CBZ DA, DB and
DP) are presented in figures 6.35, for time period of 20 minutes and in figure 6.36, for
period of 120 minutes respectively. In these diagrams only CBZ DP2 sample showed
faster dissolution in the first 20 minutes in comparison to the other DP samples, but
during 120 minutes even that difference was not observed any longer.
One way ANOVA was used to evaluate of the dissolution profiles. It was confirmed that
there was no significant difference within different batches and between dihydrates of
CBZ DA, DB and DP. Also the observed faster dissolution of DP2 was not found to be
significantly different from other CBZ DP dihydrates.
In the previous section (see 6.2.4), it was discussed that CBZ dihydrates, as the most
stable form in aqueous solution, exhibited lower solubility than the respective CBZ
anhydrates.
Consequently, because of lower solubility, the amount of CBZ dissolved from the
surface of the compact decreased in comparison with the amount dissolved form
anhydrate CBZ surfaces, and in addition the intrinsic dissolution rate was slower.
Results and discussion
116
DIDR DA 20
0,0
0,5
1,0
1,5
2,0
2,5
0 5 10 15 20
time (min)
conc
entra
tion
of C
BZ
(μg/
ml/c
m²)
DA1
DA2
DA3
DIDR DB 20
0,0
0,5
1,0
1,5
2,0
2,5
0 5 10 15 20
time (min)
conc
entra
tion
of C
BZ
(μg/
ml/c
m²)
DB1
DB2
DB3
DIDR DP 20
0,0
0,5
1,0
1,5
2,0
2,5
0 5 10 15 20
time (min)
conc
entra
tion
of C
BZ
(μg/
ml/c
m²)
DP1
DP2
DP3
Figure 6.35 Intrinsic dissolution profiles of CBZ DA, DB and DP for first 20 minutes
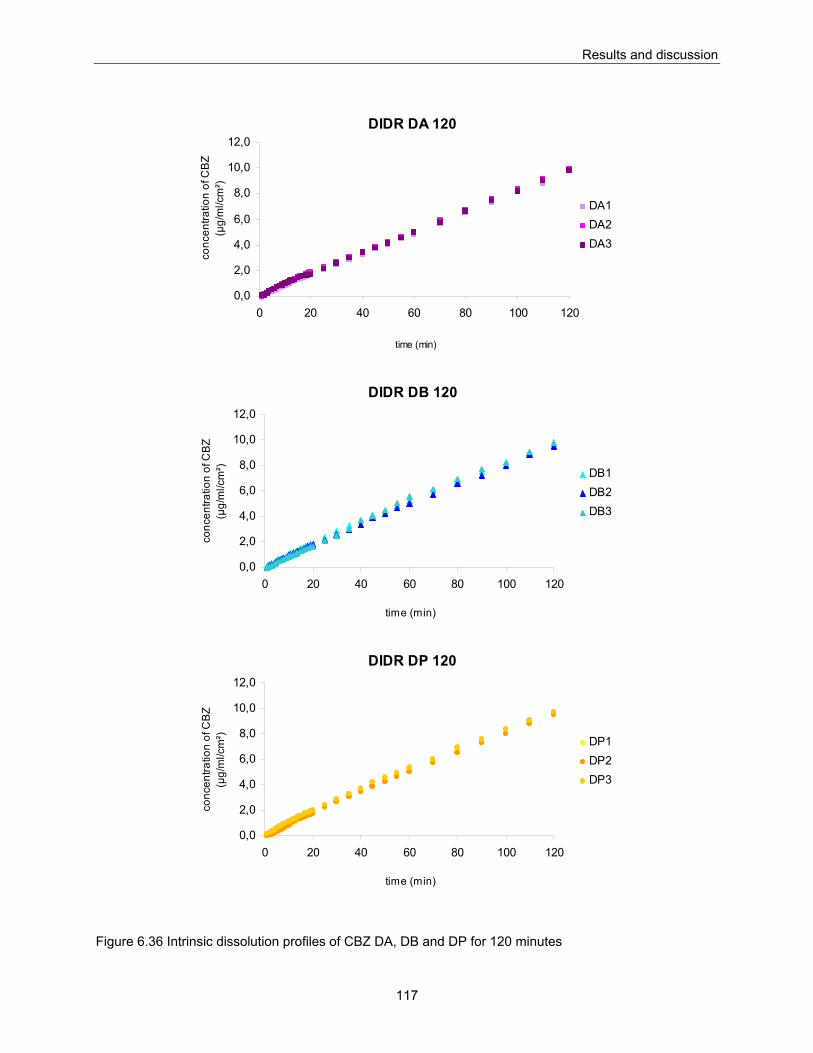
Results and discussion
117
DIDR DA 120
0,0
2,0
4,0
6,0
8,0
10,0
12,0
0 20 40 60 80 100 120
time (min)
conc
entra
tion
of C
BZ
(μg/
ml/c
m²)
DA1DA2DA3
DIDR DB 120
0,0
2,0
4,0
6,0
8,0
10,0
12,0
0 20 40 60 80 100 120
time (min)
conc
entra
tion
of C
BZ
(μg/
ml/c
m²) DB1
DB2DB3
DIDR DP 120
0,0
2,0
4,0
6,0
8,0
10,0
12,0
0 20 40 60 80 100 120
time (min)
conc
entra
tion
of C
BZ
(μg/
ml/c
m²) DP1
DP2DP3
Figure 6.36 Intrinsic dissolution profiles of CBZ DA, DB and DP for 120 minutes
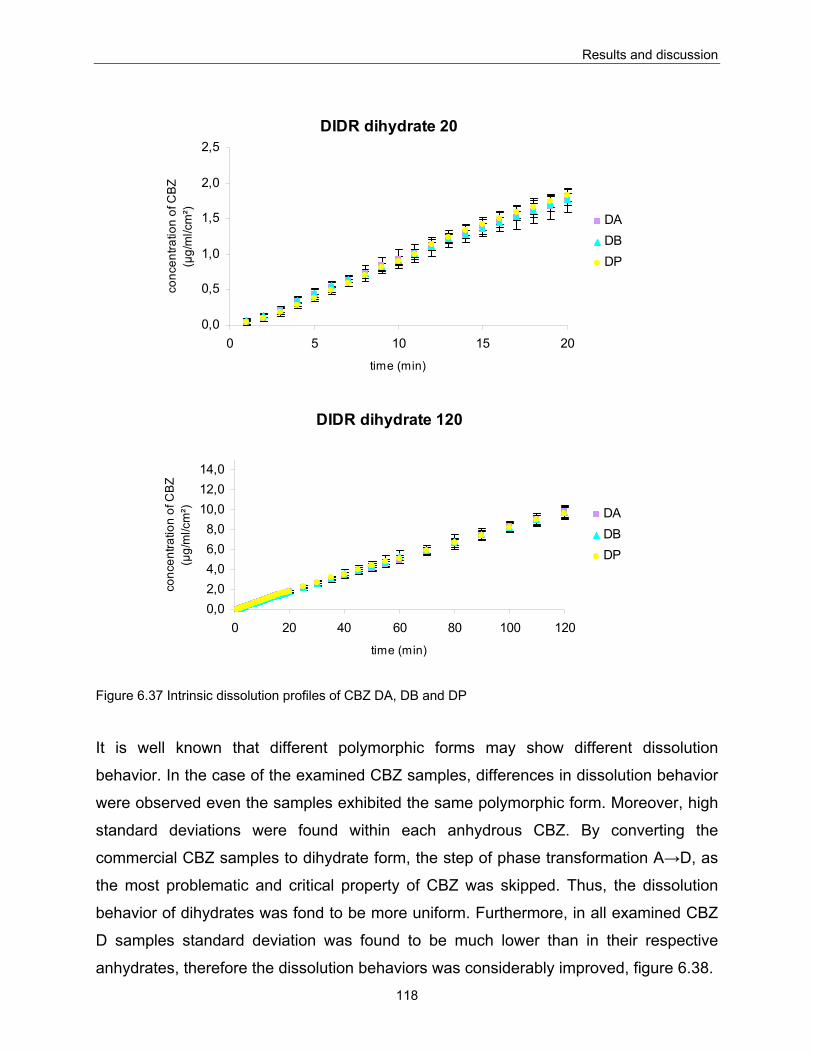
Results and discussion
118
DIDR dihydrate 20
0,0
0,5
1,0
1,5
2,0
2,5
0 5 10 15 20
time (min)
conc
entra
tion
of C
BZ
(μg/
ml/c
m²)
DADBDP
DIDR dihydrate 120
0,02,04,06,08,0
10,012,014,0
0 20 40 60 80 100 120
time (min)
conc
entra
tion
of C
BZ
(μg/
ml/c
m²) DA
DBDP
Figure 6.37 Intrinsic dissolution profiles of CBZ DA, DB and DP
It is well known that different polymorphic forms may show different dissolution
behavior. In the case of the examined CBZ samples, differences in dissolution behavior
were observed even the samples exhibited the same polymorphic form. Moreover, high
standard deviations were found within each anhydrous CBZ. By converting the
commercial CBZ samples to dihydrate form, the step of phase transformation A→D, as
the most problematic and critical property of CBZ was skipped. Thus, the dissolution
behavior of dihydrates was fond to be more uniform. Furthermore, in all examined CBZ
D samples standard deviation was found to be much lower than in their respective
anhydrates, therefore the dissolution behaviors was considerably improved, figure 6.38.
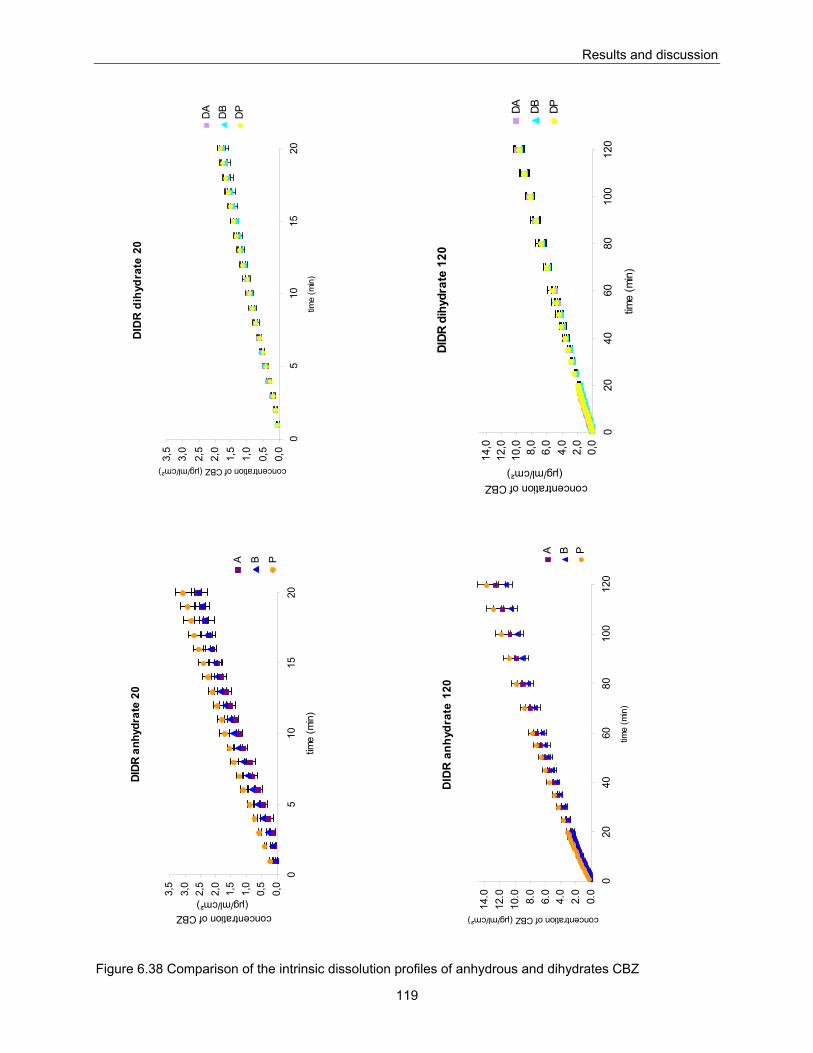
Results and discussion
119
Figure 6.38 Comparison of the intrinsic dissolution profiles of anhydrous and dihydrates CBZ
DI
DR a
nhyd
rate
20
0,0
0,5
1,0
1,5
2,0
2,5
3,0
3,5
05
1015
20
time
(min
)
concentration of CBZ (μg/ml/cm²)
A B P
D
IDR
dih
ydra
te 2
0
0,0
0,5
1,0
1,5
2,0
2,5
3,0
3,5
05
1015
20tim
e (m
in)
concentration of CBZ (μg/ml/cm²)
DA
DB
DP
D
IDR
anh
ydra
te 1
20
0.0
2.0
4.0
6.0
8.0
10.0
12.0
14.0
020
4060
8010
012
0tim
e (m
in)
concentration of CBZ (μg/ml/cm²)
A B P
DI
DR d
ihyd
rate
120
0,0
2,0
4,0
6,0
8,0
10,0
12,0
14,0
020
4060
8010
012
0
time
(min
)
concentration of CBZ (μg/ml/cm²)
DA DB DP
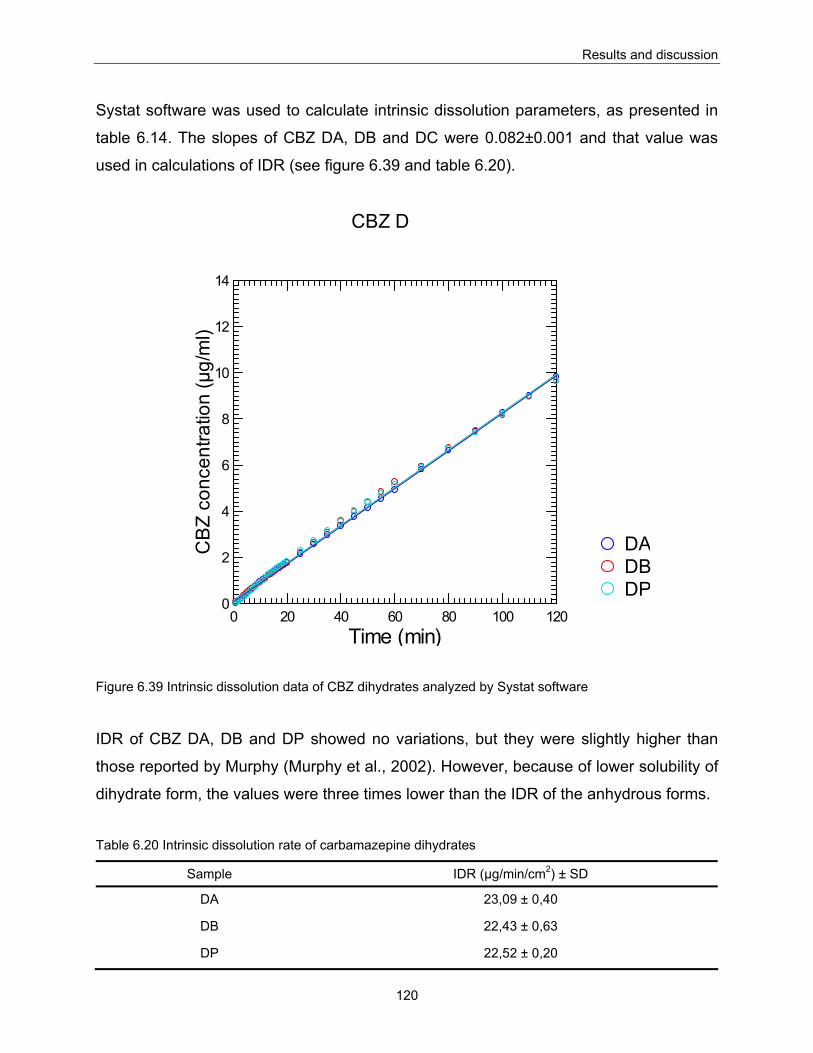
Results and discussion
120
Systat software was used to calculate intrinsic dissolution parameters, as presented in
table 6.14. The slopes of CBZ DA, DB and DC were 0.082±0.001 and that value was
used in calculations of IDR (see figure 6.39 and table 6.20).
CBZ D
DPDBDA
0 20 40 60 80 100 120Time (min)
0
2
4
6
8
10
12
14
CB
Z co
ncen
tratio
n (µ
g/m
l)
Figure 6.39 Intrinsic dissolution data of CBZ dihydrates analyzed by Systat software
IDR of CBZ DA, DB and DP showed no variations, but they were slightly higher than
those reported by Murphy (Murphy et al., 2002). However, because of lower solubility of
dihydrate form, the values were three times lower than the IDR of the anhydrous forms.
Table 6.20 Intrinsic dissolution rate of carbamazepine dihydrates
Sample IDR (μg/min/cm2) ± SD
DA 23,09 ± 0,40
DB 22,43 ± 0,63
DP 22,52 ± 0,20
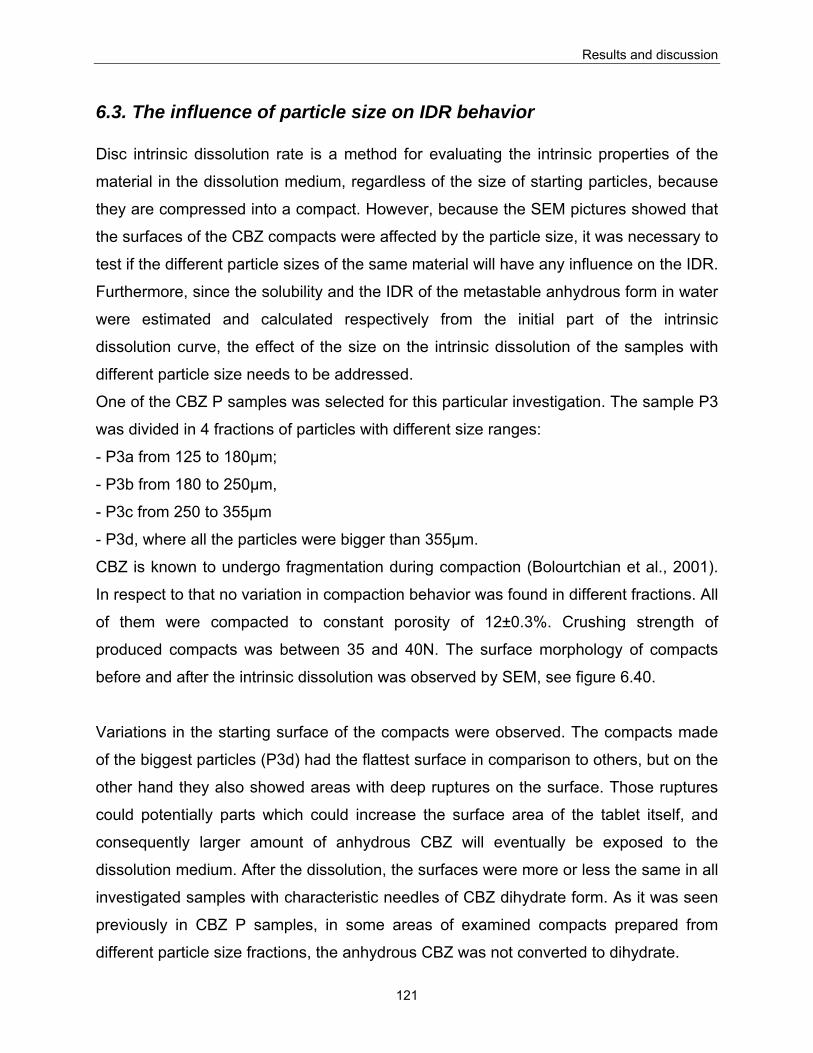
Results and discussion
121
6.3. The influence of particle size on IDR behavior Disc intrinsic dissolution rate is a method for evaluating the intrinsic properties of the
material in the dissolution medium, regardless of the size of starting particles, because
they are compressed into a compact. However, because the SEM pictures showed that
the surfaces of the CBZ compacts were affected by the particle size, it was necessary to
test if the different particle sizes of the same material will have any influence on the IDR.
Furthermore, since the solubility and the IDR of the metastable anhydrous form in water
were estimated and calculated respectively from the initial part of the intrinsic
dissolution curve, the effect of the size on the intrinsic dissolution of the samples with
different particle size needs to be addressed.
One of the CBZ P samples was selected for this particular investigation. The sample P3
was divided in 4 fractions of particles with different size ranges:
- P3a from 125 to 180μm;
- P3b from 180 to 250μm,
- P3c from 250 to 355μm
- P3d, where all the particles were bigger than 355μm.
CBZ is known to undergo fragmentation during compaction (Bolourtchian et al., 2001).
In respect to that no variation in compaction behavior was found in different fractions. All
of them were compacted to constant porosity of 12±0.3%. Crushing strength of
produced compacts was between 35 and 40N. The surface morphology of compacts
before and after the intrinsic dissolution was observed by SEM, see figure 6.40.
Variations in the starting surface of the compacts were observed. The compacts made
of the biggest particles (P3d) had the flattest surface in comparison to others, but on the
other hand they also showed areas with deep ruptures on the surface. Those ruptures
could potentially parts which could increase the surface area of the tablet itself, and
consequently larger amount of anhydrous CBZ will eventually be exposed to the
dissolution medium. After the dissolution, the surfaces were more or less the same in all
investigated samples with characteristic needles of CBZ dihydrate form. As it was seen
previously in CBZ P samples, in some areas of examined compacts prepared from
different particle size fractions, the anhydrous CBZ was not converted to dihydrate.
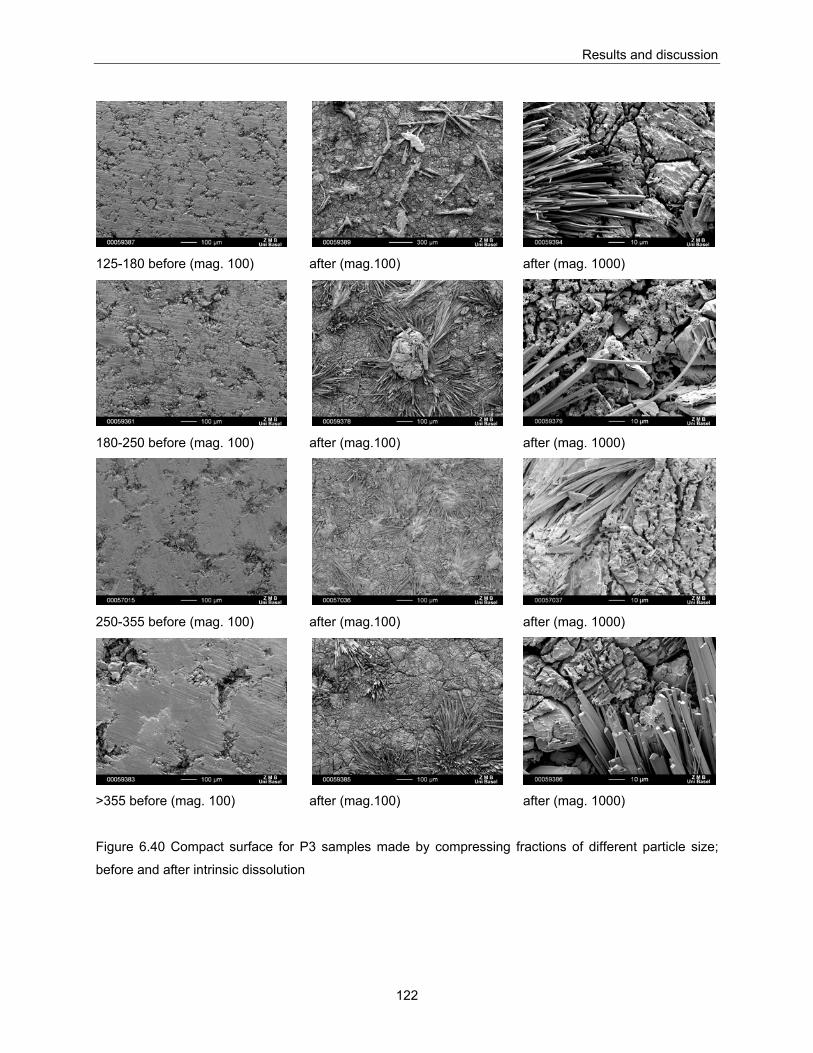
Results and discussion
122
125-180 before (mag. 100) after (mag.100) after (mag. 1000)
180-250 before (mag. 100) after (mag.100) after (mag. 1000)
250-355 before (mag. 100) after (mag.100) after (mag. 1000)
>355 before (mag. 100) after (mag.100) after (mag. 1000)
Figure 6.40 Compact surface for P3 samples made by compressing fractions of different particle size;
before and after intrinsic dissolution
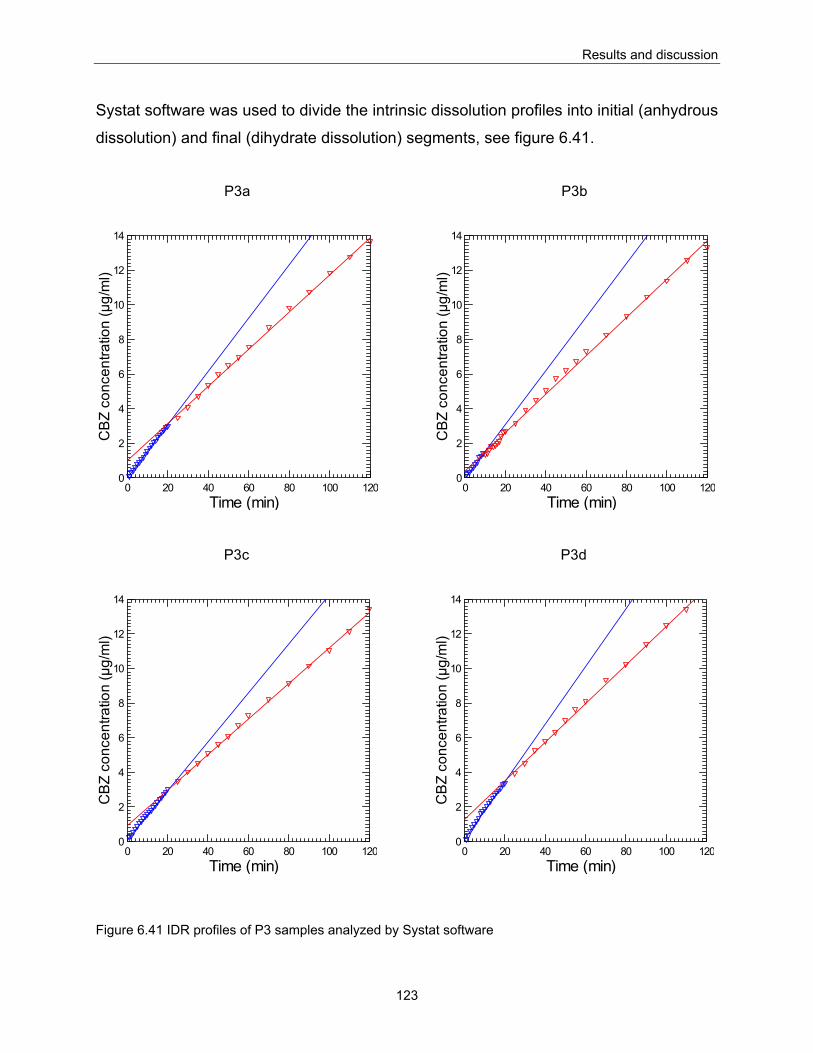
Results and discussion
123
Systat software was used to divide the intrinsic dissolution profiles into initial (anhydrous
dissolution) and final (dihydrate dissolution) segments, see figure 6.41.
P3a
0 20 40 60 80 100 120Time (min)
0
2
4
6
8
10
12
14
CB
Z co
ncen
tratio
n (µ
g/m
l)
P3b
0 20 40 60 80 100 120Time (min)
0
2
4
6
8
10
12
14
CB
Z co
ncen
tratio
n (µ
g/m
l)
P3c
0 20 40 60 80 100 120Time (min)
0
2
4
6
8
10
12
14
CB
Z co
ncen
tratio
n (µ
g/m
l)
P3d
0 20 40 60 80 100 120Time (min)
0
2
4
6
8
10
12
14
CB
Z co
ncen
tratio
n (µ
g/m
l)
Figure 6.41 IDR profiles of P3 samples analyzed by Systat software
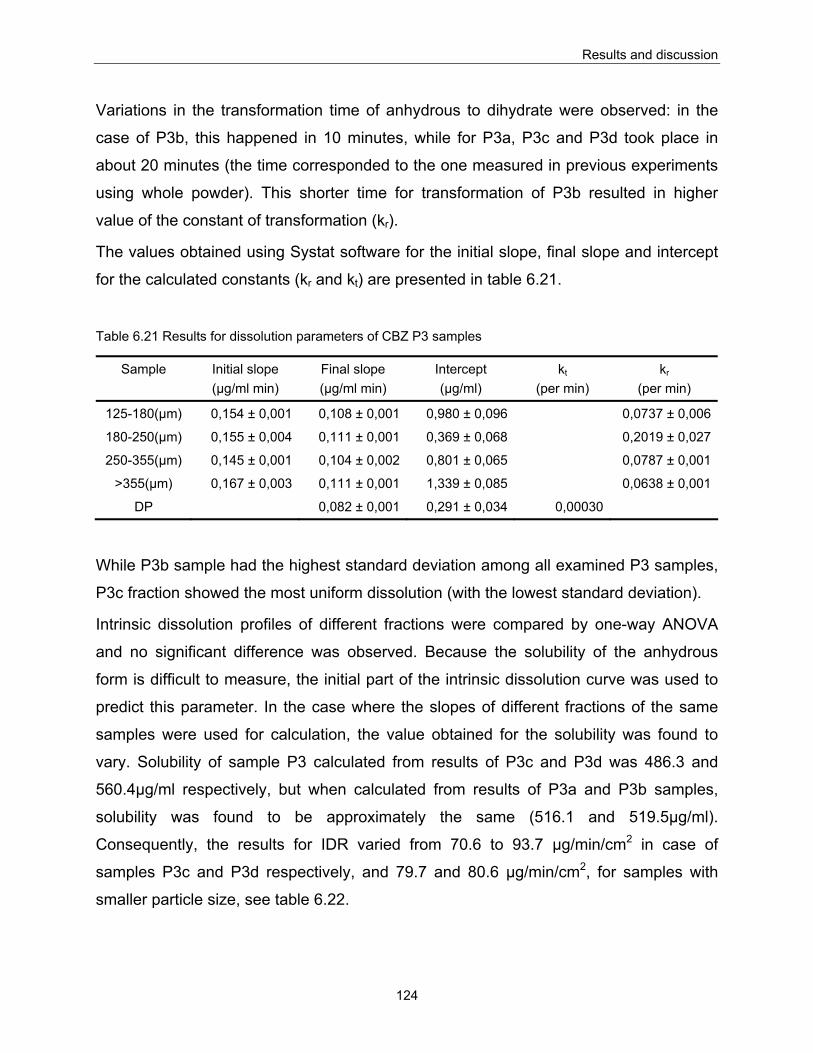
Results and discussion
124
Variations in the transformation time of anhydrous to dihydrate were observed: in the
case of P3b, this happened in 10 minutes, while for P3a, P3c and P3d took place in
about 20 minutes (the time corresponded to the one measured in previous experiments
using whole powder). This shorter time for transformation of P3b resulted in higher
value of the constant of transformation (kr).
The values obtained using Systat software for the initial slope, final slope and intercept
for the calculated constants (kr and kt) are presented in table 6.21.
Table 6.21 Results for dissolution parameters of CBZ P3 samples
Sample
Initial slope (μg/ml min)
Final slope (μg/ml min)
Intercept (μg/ml)
kt (per min)
kr (per min)
125-180(μm) 0,154 ± 0,001 0,108 ± 0,001 0,980 ± 0,096 0,0737 ± 0,006
180-250(μm) 0,155 ± 0,004 0,111 ± 0,001 0,369 ± 0,068 0,2019 ± 0,027
250-355(μm) 0,145 ± 0,001 0,104 ± 0,002 0,801 ± 0,065 0,0787 ± 0,001
>355(μm) 0,167 ± 0,003 0,111 ± 0,001 1,339 ± 0,085 0,0638 ± 0,001
DP 0,082 ± 0,001 0,291 ± 0,034 0,00030
While P3b sample had the highest standard deviation among all examined P3 samples,
P3c fraction showed the most uniform dissolution (with the lowest standard deviation).
Intrinsic dissolution profiles of different fractions were compared by one-way ANOVA
and no significant difference was observed. Because the solubility of the anhydrous
form is difficult to measure, the initial part of the intrinsic dissolution curve was used to
predict this parameter. In the case where the slopes of different fractions of the same
samples were used for calculation, the value obtained for the solubility was found to
vary. Solubility of sample P3 calculated from results of P3c and P3d was 486.3 and
560.4μg/ml respectively, but when calculated from results of P3a and P3b samples,
solubility was found to be approximately the same (516.1 and 519.5μg/ml).
Consequently, the results for IDR varied from 70.6 to 93.7 μg/min/cm2 in case of
samples P3c and P3d respectively, and 79.7 and 80.6 μg/min/cm2, for samples with
smaller particle size, see table 6.22.
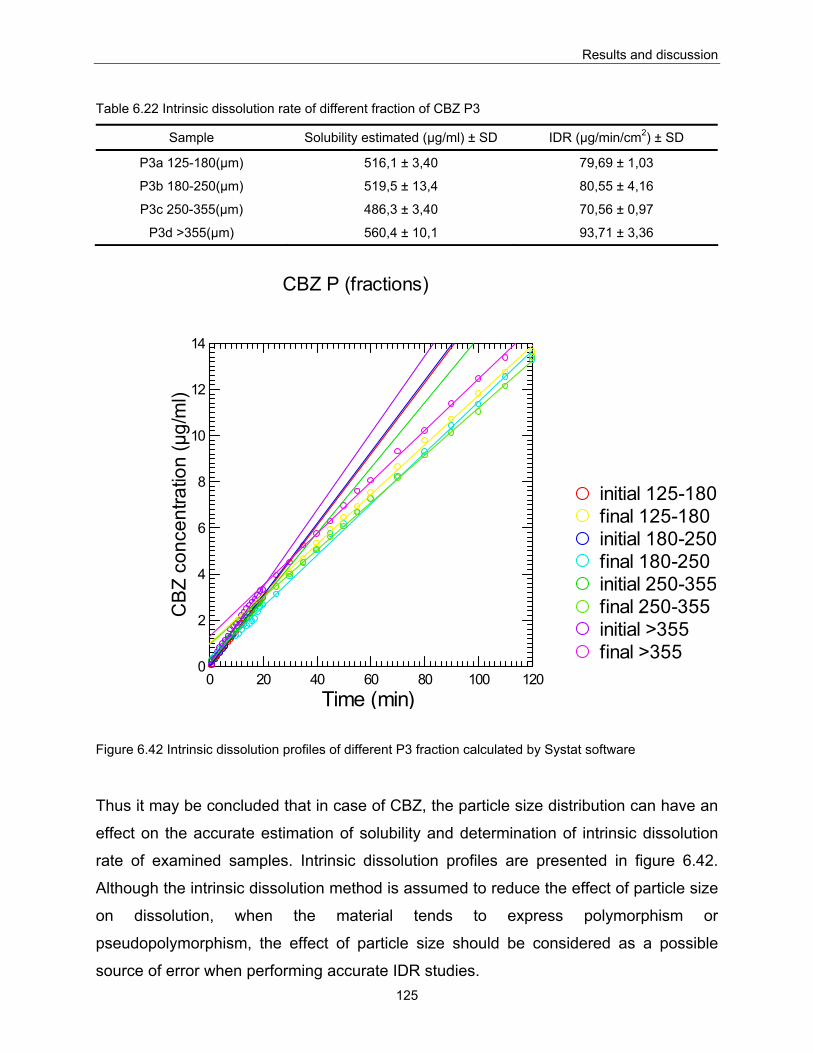
Results and discussion
125
Table 6.22 Intrinsic dissolution rate of different fraction of CBZ P3
Sample Solubility estimated (μg/ml) ± SD IDR (μg/min/cm2) ± SD
P3a 125-180(μm) 516,1 ± 3,40 79,69 ± 1,03
P3b 180-250(μm) 519,5 ± 13,4 80,55 ± 4,16
P3c 250-355(μm) 486,3 ± 3,40 70,56 ± 0,97
P3d >355(μm) 560,4 ± 10,1 93,71 ± 3,36
CBZ P (fractions)
final >355initial >355final 250-355initial 250-355final 180-250initial 180-250final 125-180initial 125-180
0 20 40 60 80 100 120Time (min)
0
2
4
6
8
10
12
14
CB
Z co
ncen
tratio
n (µ
g/m
l)
Figure 6.42 Intrinsic dissolution profiles of different P3 fraction calculated by Systat software
Thus it may be concluded that in case of CBZ, the particle size distribution can have an
effect on the accurate estimation of solubility and determination of intrinsic dissolution
rate of examined samples. Intrinsic dissolution profiles are presented in figure 6.42.
Although the intrinsic dissolution method is assumed to reduce the effect of particle size
on dissolution, when the material tends to express polymorphism or
pseudopolymorphism, the effect of particle size should be considered as a possible
source of error when performing accurate IDR studies.
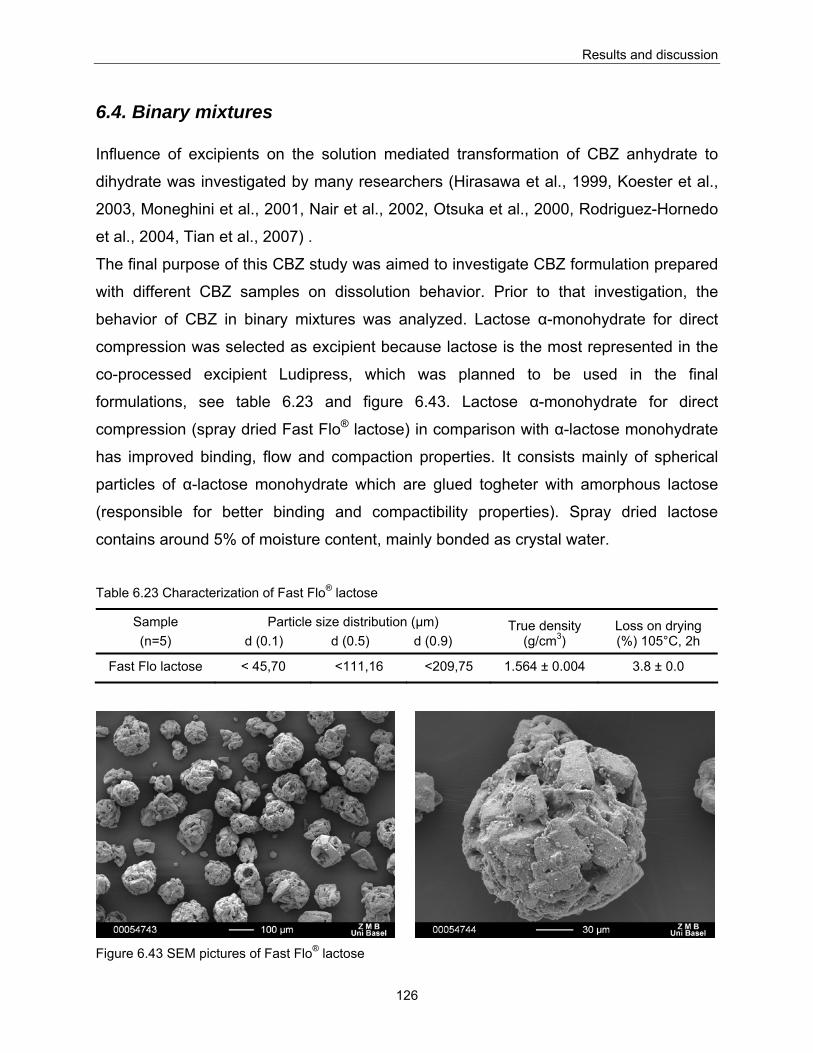
Results and discussion
126
6.4. Binary mixtures Influence of excipients on the solution mediated transformation of CBZ anhydrate to
dihydrate was investigated by many researchers (Hirasawa et al., 1999, Koester et al.,
2003, Moneghini et al., 2001, Nair et al., 2002, Otsuka et al., 2000, Rodriguez-Hornedo
et al., 2004, Tian et al., 2007) .
The final purpose of this CBZ study was aimed to investigate CBZ formulation prepared
with different CBZ samples on dissolution behavior. Prior to that investigation, the
behavior of CBZ in binary mixtures was analyzed. Lactose α-monohydrate for direct
compression was selected as excipient because lactose is the most represented in the
co-processed excipient Ludipress, which was planned to be used in the final
formulations, see table 6.23 and figure 6.43. Lactose α-monohydrate for direct
compression (spray dried Fast Flo® lactose) in comparison with α-lactose monohydrate
has improved binding, flow and compaction properties. It consists mainly of spherical
particles of α-lactose monohydrate which are glued togheter with amorphous lactose
(responsible for better binding and compactibility properties). Spray dried lactose
contains around 5% of moisture content, mainly bonded as crystal water.
Table 6.23 Characterization of Fast Flo® lactose
Sample (n=5)
Particle size distribution (μm) d (0.1) d (0.5) d (0.9)
True density (g/cm3)
Loss on drying (%) 105°C, 2h
Fast Flo lactose < 45,70 <111,16 <209,75 1.564 ± 0.004 3.8 ± 0.0
Figure 6.43 SEM pictures of Fast Flo® lactose
Results and discussion
127
Preparation of tablets of binary mixtures with constant porosity for different mixture
compositions (form mixture compositions see 5.2.3.1.) required changing the range of
applied compaction force form 8 to 14kN in the case of CBZ B and P and from 10-16kN
for binary mixtures with CBZ A and D. This increment of applied compaction force
depended on the quantity of lactose in the mixture – for compacts containing higher
amount of lactose, higher compaction force was required in order to have compacts with
approximately the same porosity.
6.4.1. Disintegration of binary mixtures Disintegration test was carried out on the mixtures 6, 7, 8 and 9 (the amount of CBZ
was 40%, 30%, 20% and 10% respectively). Considering that lactose α-monohydrate
has no disintegrating properties, it was impossible to measure disintegration time on the
mixtures containing higher concentration of CBZ where no disintegration occurred.
Mixture 6 from all CBZs disintegrated in more than 4 hours, and was excluded from the
results presented in table 6.24. Logical tendency of having faster disintegration time by
increasing the amount of excipient from mixture 7 to mixture 9 was present in all
analyzed samples. However some discrepancies among binary mixture prepared from
different CBZ were found. While in the case of mixtures 9 and 8 of CBZ A and CBZ B,
compact disintegrated in 1 – 3 minutes, in the case of CBZ P for the same mixtures they
disintegrated only after 9 to 10 minutes. In the case of CBZ P mixtures, although
decreasing trend of disintegration time was found as in the others, variations in
disintegration time between mixture 7, 8 and 9 were very small, see table 6.24 and
figure 6.44.
Table 6.24 Disintegration time of compacts stored at 55% of relative humidity
Samples (n=6) (RH 55%)
Disintegration time (s) Mix 7 Mix 8 Mix 9
CBZ A 4143 ± 322 168 ± 19 65 ± 3
CBZ B 8282 ± 194 126 ± 37 47 ± 6
CBZ P 754 ± 120 575 ± 75 534 ± 48
CBZ D 4312 ± 100 1358 ± 77 181 ± 24

Results and discussion
128
0
20
40
60
80
100
120
140
160
60 70 80 90 100
excipient (%)
time
(min
) ABPD
Figure 6.44 Disintegration time of compacts stored at 55% of relative humidity
Differences in disintegration time of examined mixtures are probably results of different
morphology and particle size distribution between CBZ A, B and P. These results
confirmed clearly the importance of raw material selection.
The effect of storage condition on disintegration time of tablets was studied at two
different conditions of relative humidity. Generally it was noticed that upon storing the
compacts of binary mixtures under higher humidity, the disintegration time increased, in
other words longer time was required for the compacts to disintegrated. Mixtures of Fast
Flo® lactose and CBZ dihydrate showed the longest disintegration time, which may lead
to the conclusion that prolonged disintegration in samples stored at 85%RH was caused
probably because during storage some anhydrous carbamazepine converted to CBZ
dihydrate. The results are presented in table 6.25 and figure 6.45.
Table 6.24 Disintegration time of compacts stored at 55% of relative humidity
Samples (n=6) (RH 85%)
Disintegration time (s) Mix 7 Mix 8 Mix 9
CBZ A 5636 ± 289 2541 ± 127 769 ± 72
CBZ B 7731 ± 114 3045 ± 52 1233 ± 234
CBZ P 4121 ± 172 1756 ± 39 412 ± 19
CBZ D 8195 ± 266 3145 ± 48 770 ± 103
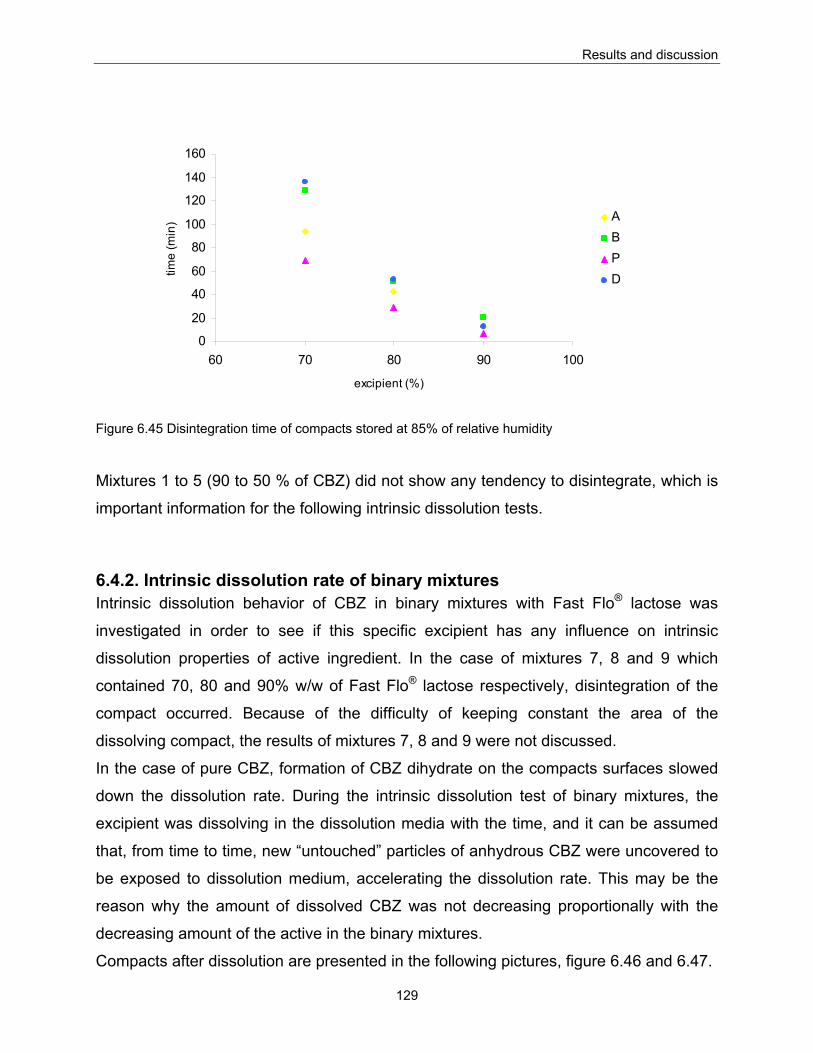
Results and discussion
129
0
20
40
60
80
100
120
140
160
60 70 80 90 100
excipient (%)
time
(min
) ABPD
Figure 6.45 Disintegration time of compacts stored at 85% of relative humidity
Mixtures 1 to 5 (90 to 50 % of CBZ) did not show any tendency to disintegrate, which is
important information for the following intrinsic dissolution tests.
6.4.2. Intrinsic dissolution rate of binary mixtures Intrinsic dissolution behavior of CBZ in binary mixtures with Fast Flo® lactose was
investigated in order to see if this specific excipient has any influence on intrinsic
dissolution properties of active ingredient. In the case of mixtures 7, 8 and 9 which
contained 70, 80 and 90% w/w of Fast Flo® lactose respectively, disintegration of the
compact occurred. Because of the difficulty of keeping constant the area of the
dissolving compact, the results of mixtures 7, 8 and 9 were not discussed.
In the case of pure CBZ, formation of CBZ dihydrate on the compacts surfaces slowed
down the dissolution rate. During the intrinsic dissolution test of binary mixtures, the
excipient was dissolving in the dissolution media with the time, and it can be assumed
that, from time to time, new “untouched” particles of anhydrous CBZ were uncovered to
be exposed to dissolution medium, accelerating the dissolution rate. This may be the
reason why the amount of dissolved CBZ was not decreasing proportionally with the
decreasing amount of the active in the binary mixtures.
Compacts after dissolution are presented in the following pictures, figure 6.46 and 6.47.
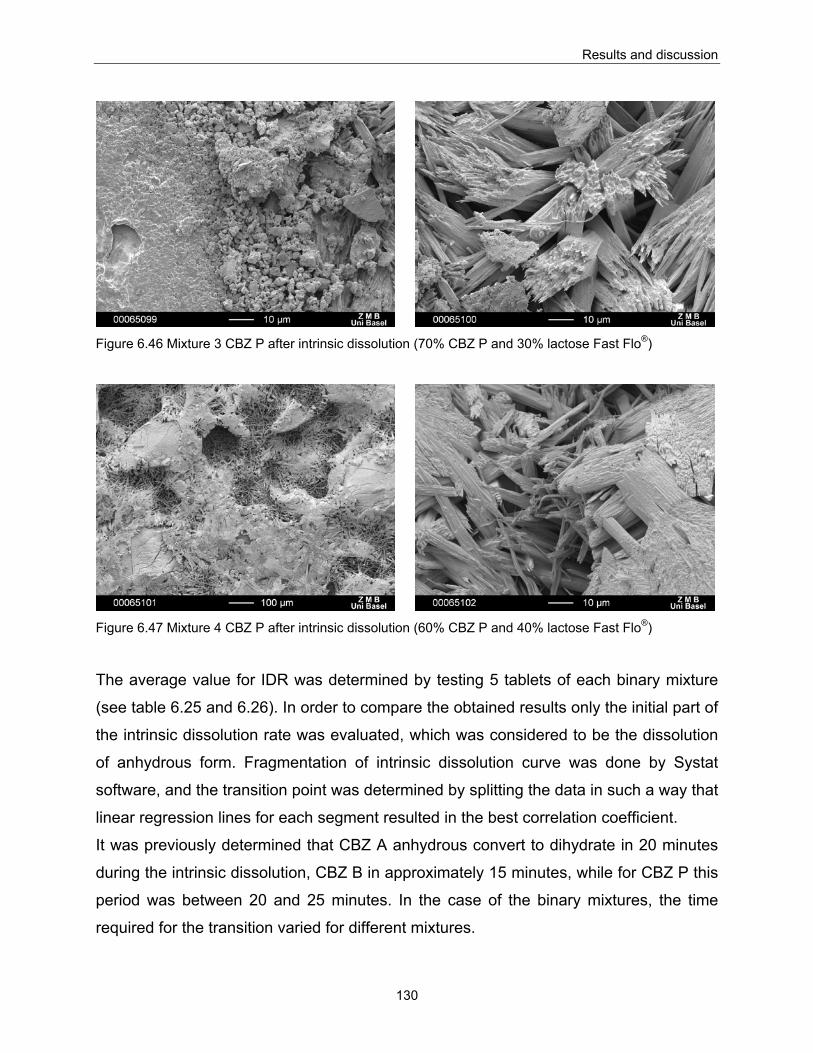
Results and discussion
130
Figure 6.46 Mixture 3 CBZ P after intrinsic dissolution (70% CBZ P and 30% lactose Fast Flo®)
Figure 6.47 Mixture 4 CBZ P after intrinsic dissolution (60% CBZ P and 40% lactose Fast Flo®)
The average value for IDR was determined by testing 5 tablets of each binary mixture
(see table 6.25 and 6.26). In order to compare the obtained results only the initial part of
the intrinsic dissolution rate was evaluated, which was considered to be the dissolution
of anhydrous form. Fragmentation of intrinsic dissolution curve was done by Systat
software, and the transition point was determined by splitting the data in such a way that
linear regression lines for each segment resulted in the best correlation coefficient.
It was previously determined that CBZ A anhydrous convert to dihydrate in 20 minutes
during the intrinsic dissolution, CBZ B in approximately 15 minutes, while for CBZ P this
period was between 20 and 25 minutes. In the case of the binary mixtures, the time
required for the transition varied for different mixtures.
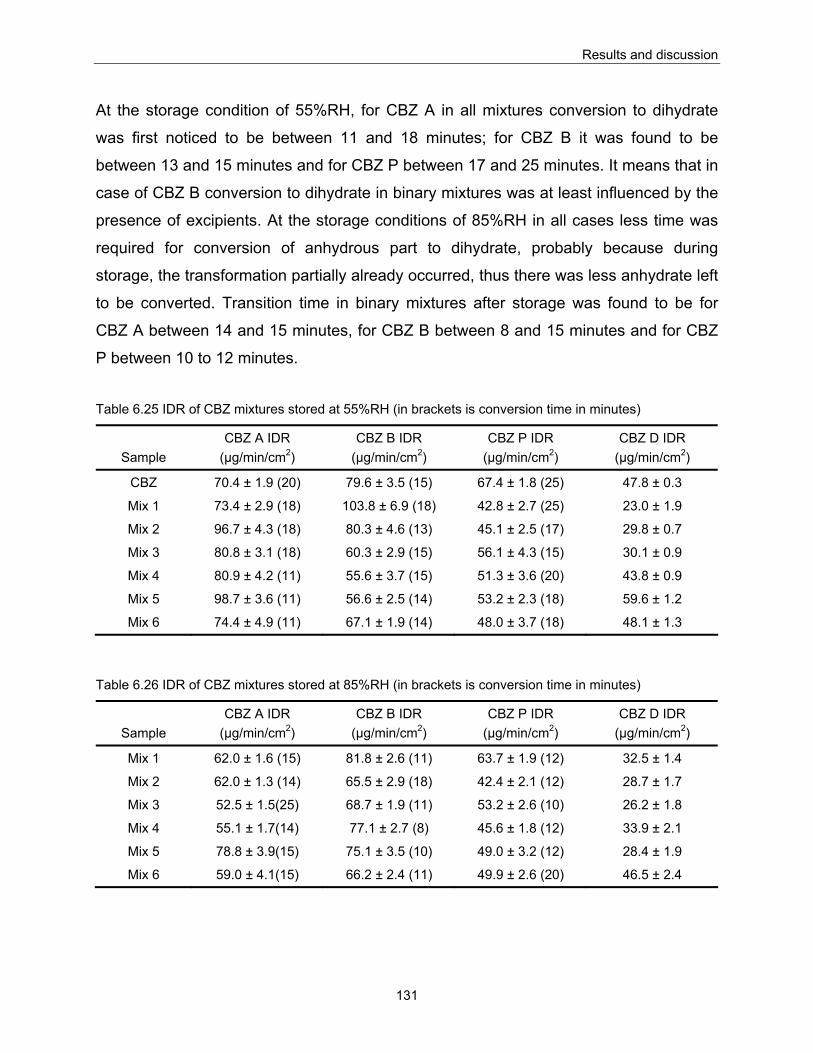
Results and discussion
131
At the storage condition of 55%RH, for CBZ A in all mixtures conversion to dihydrate
was first noticed to be between 11 and 18 minutes; for CBZ B it was found to be
between 13 and 15 minutes and for CBZ P between 17 and 25 minutes. It means that in
case of CBZ B conversion to dihydrate in binary mixtures was at least influenced by the
presence of excipients. At the storage conditions of 85%RH in all cases less time was
required for conversion of anhydrous part to dihydrate, probably because during
storage, the transformation partially already occurred, thus there was less anhydrate left
to be converted. Transition time in binary mixtures after storage was found to be for
CBZ A between 14 and 15 minutes, for CBZ B between 8 and 15 minutes and for CBZ
P between 10 to 12 minutes. Table 6.25 IDR of CBZ mixtures stored at 55%RH (in brackets is conversion time in minutes)
Sample CBZ A IDR
(μg/min/cm2) CBZ B IDR
(μg/min/cm2) CBZ P IDR
(μg/min/cm2) CBZ D IDR
(μg/min/cm2)
CBZ 70.4 ± 1.9 (20) 79.6 ± 3.5 (15) 67.4 ± 1.8 (25) 47.8 ± 0.3
Mix 1 73.4 ± 2.9 (18) 103.8 ± 6.9 (18) 42.8 ± 2.7 (25) 23.0 ± 1.9
Mix 2 96.7 ± 4.3 (18) 80.3 ± 4.6 (13) 45.1 ± 2.5 (17) 29.8 ± 0.7
Mix 3 80.8 ± 3.1 (18) 60.3 ± 2.9 (15) 56.1 ± 4.3 (15) 30.1 ± 0.9
Mix 4 80.9 ± 4.2 (11) 55.6 ± 3.7 (15) 51.3 ± 3.6 (20) 43.8 ± 0.9
Mix 5 98.7 ± 3.6 (11) 56.6 ± 2.5 (14) 53.2 ± 2.3 (18) 59.6 ± 1.2
Mix 6 74.4 ± 4.9 (11) 67.1 ± 1.9 (14) 48.0 ± 3.7 (18) 48.1 ± 1.3
Table 6.26 IDR of CBZ mixtures stored at 85%RH (in brackets is conversion time in minutes)
Sample CBZ A IDR
(μg/min/cm2) CBZ B IDR
(μg/min/cm2) CBZ P IDR
(μg/min/cm2) CBZ D IDR
(μg/min/cm2)
Mix 1 62.0 ± 1.6 (15) 81.8 ± 2.6 (11) 63.7 ± 1.9 (12) 32.5 ± 1.4
Mix 2 62.0 ± 1.3 (14) 65.5 ± 2.9 (18) 42.4 ± 2.1 (12) 28.7 ± 1.7
Mix 3 52.5 ± 1.5(25) 68.7 ± 1.9 (11) 53.2 ± 2.6 (10) 26.2 ± 1.8
Mix 4 55.1 ± 1.7(14) 77.1 ± 2.7 (8) 45.6 ± 1.8 (12) 33.9 ± 2.1
Mix 5 78.8 ± 3.9(15) 75.1 ± 3.5 (10) 49.0 ± 3.2 (12) 28.4 ± 1.9
Mix 6 59.0 ± 4.1(15) 66.2 ± 2.4 (11) 49.9 ± 2.6 (20) 46.5 ± 2.4
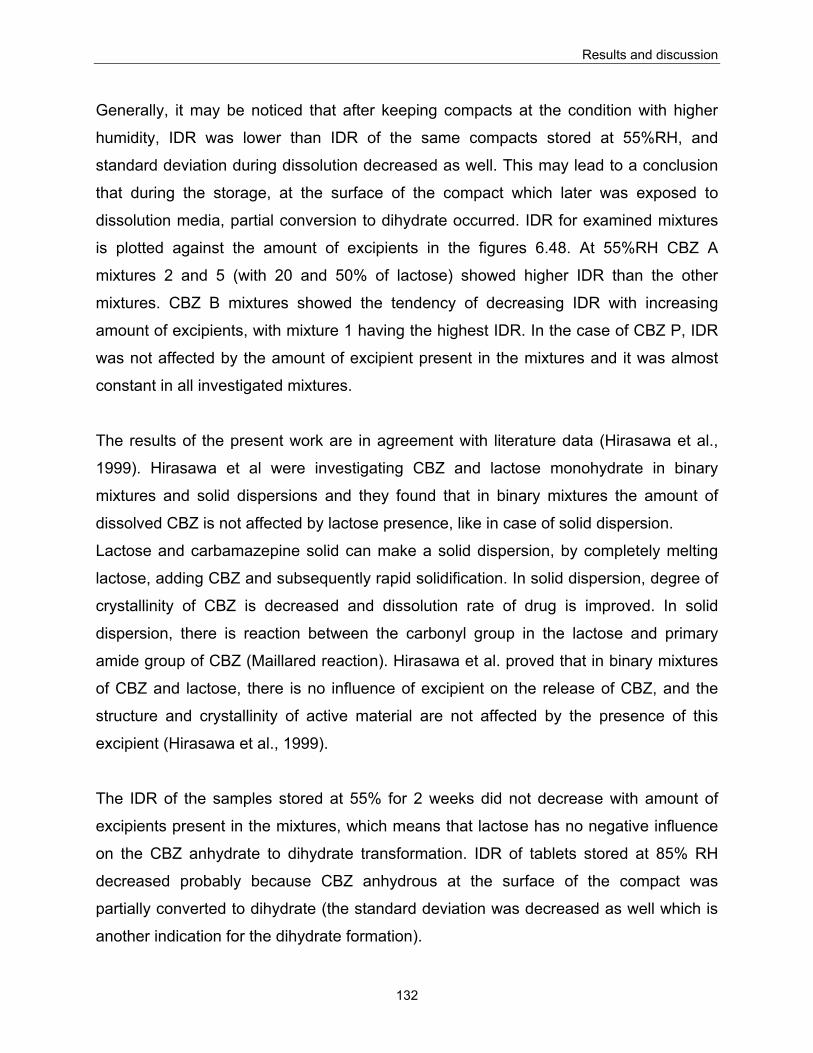
Results and discussion
132
Generally, it may be noticed that after keeping compacts at the condition with higher
humidity, IDR was lower than IDR of the same compacts stored at 55%RH, and
standard deviation during dissolution decreased as well. This may lead to a conclusion
that during the storage, at the surface of the compact which later was exposed to
dissolution media, partial conversion to dihydrate occurred. IDR for examined mixtures
is plotted against the amount of excipients in the figures 6.48. At 55%RH CBZ A
mixtures 2 and 5 (with 20 and 50% of lactose) showed higher IDR than the other
mixtures. CBZ B mixtures showed the tendency of decreasing IDR with increasing
amount of excipients, with mixture 1 having the highest IDR. In the case of CBZ P, IDR
was not affected by the amount of excipient present in the mixtures and it was almost
constant in all investigated mixtures.
The results of the present work are in agreement with literature data (Hirasawa et al.,
1999). Hirasawa et al were investigating CBZ and lactose monohydrate in binary
mixtures and solid dispersions and they found that in binary mixtures the amount of
dissolved CBZ is not affected by lactose presence, like in case of solid dispersion.
Lactose and carbamazepine solid can make a solid dispersion, by completely melting
lactose, adding CBZ and subsequently rapid solidification. In solid dispersion, degree of
crystallinity of CBZ is decreased and dissolution rate of drug is improved. In solid
dispersion, there is reaction between the carbonyl group in the lactose and primary
amide group of CBZ (Maillared reaction). Hirasawa et al. proved that in binary mixtures
of CBZ and lactose, there is no influence of excipient on the release of CBZ, and the
structure and crystallinity of active material are not affected by the presence of this
excipient (Hirasawa et al., 1999).
The IDR of the samples stored at 55% for 2 weeks did not decrease with amount of
excipients present in the mixtures, which means that lactose has no negative influence
on the CBZ anhydrate to dihydrate transformation. IDR of tablets stored at 85% RH
decreased probably because CBZ anhydrous at the surface of the compact was
partially converted to dihydrate (the standard deviation was decreased as well which is
another indication for the dihydrate formation).
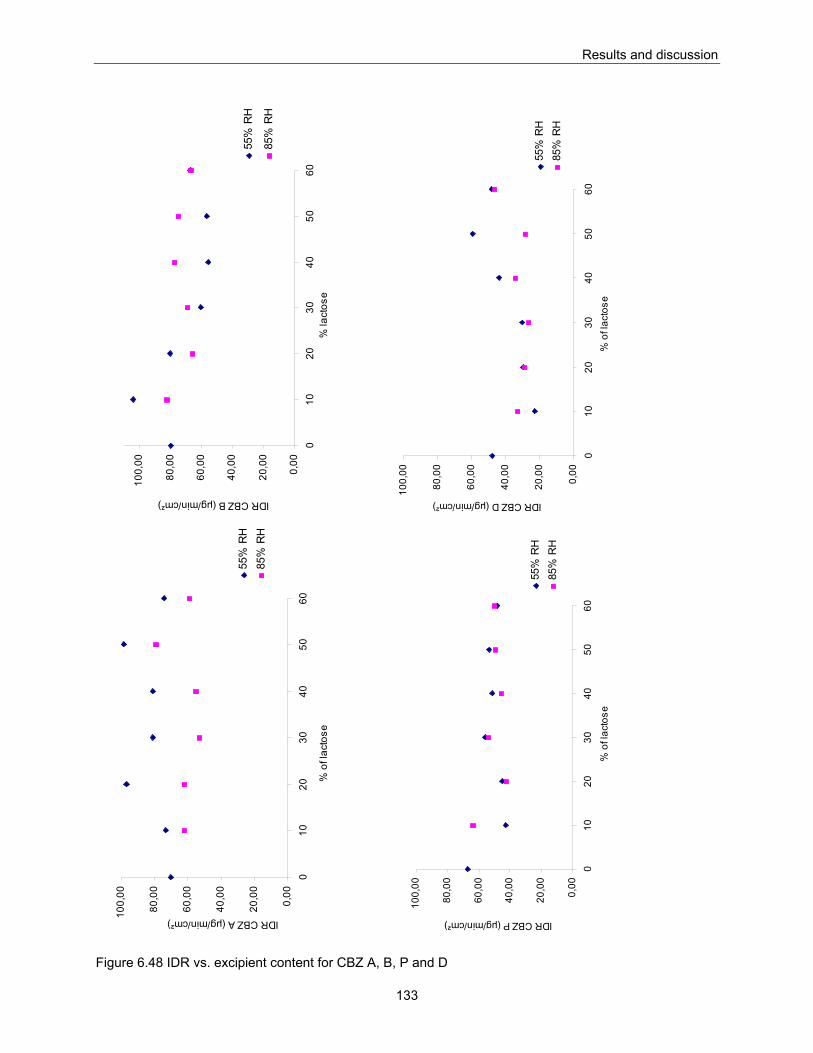
Results and discussion
133
Figure 6.48 IDR vs. excipient content for CBZ A, B, P and D
0,00
20,0
0
40,0
0
60,0
0
80,0
0
100,
00
010
2030
4050
60%
of l
acto
se
IDR CBZ D (μg/min/cm²)55
% R
H85
% R
H0,
00
20,0
0
40,0
0
60,0
0
80,0
0
100,
00
010
2030
4050
60
% o
f lac
tose
IDR CBZ P (μg/min/cm²)
55%
RH
85%
RH
0,00
20,0
0
40,0
0
60,0
0
80,0
0
100,
00
010
2030
4050
60
% o
f lac
tose
IDR CBZ A (μg/min/cm²)
55%
RH
85%
RH
0,00
20,0
0
40,0
0
60,0
0
80,0
0
100,
00
010
2030
4050
60%
lact
ose
IDR CBZ B (μg/min/cm²)
55%
RH
85%
RH
Results and discussion
134
However, lactose as excipients has no influence on the anhydrate dihydrate conversion.
The amount of drug dissolved during the intrinsic dissolution test was increasing with
the increased amount of lactose in the mixtures, simply because during the dissolution
lactose was dissolving and new parts of anhydrous CBZ were exposed to dissolution
media.
It is relevant to notice that tablets which coincidently remained more than 4 weeks at
conditions of 85% of RH (mixtures contained 60% of lactose and more) showed
discoloration on their surfaces i.e. browning, which is probably caused by reaction of
lactose and the amide group of CBZ.
6.5. Carbamazepine formulations Carbamazepine presents formulation challenges due to its inherent poor compressibility
and compactibility, high dose and low water solubility. The wet granulation process may
be utilized to improve the flow and compression/compaction properties of the
formulation. However, during wet granulation, if combination of ethanol and water was
used, the solution–mediated transformation of CBZ occurs (Otsuka et al., 1999, Otsuka
et al., 1997) and the amount of dihydrate formed during this process may be
appreciable. In that case, during the drying process, dihydrate may convert back to
initial form III, or eventually may convert in form I, thus a mixture of form I and III is
created and that will influence on the dissolution process of the final product. If only
aqueous solution is used, whole process has to be carefully controlled to insure that
phase transformation does not occur. Therefore CBZ is a good example to illustrate
how a wrong choice of the manufacturing process, may lead to an increased phase
transformation, processing difficulties and problems with dissolution.
In order to avoid the possible phase transformation of CBZ, for this study direct
compaction was chosen as process for producing CBZ tablets for this study, and
therefore a co-processed excipient for direct compaction Ludipress® was selected.
Co-processed excipients are prepared by incorporating one excipient into the particle
structure of another excipient by appropriate processes such as co-drying. Thus, they
are simple physical mixtures of two or more existing excipients mixed at the particle
level. Co-processing of excipients leads to the formation of excipient granulates with
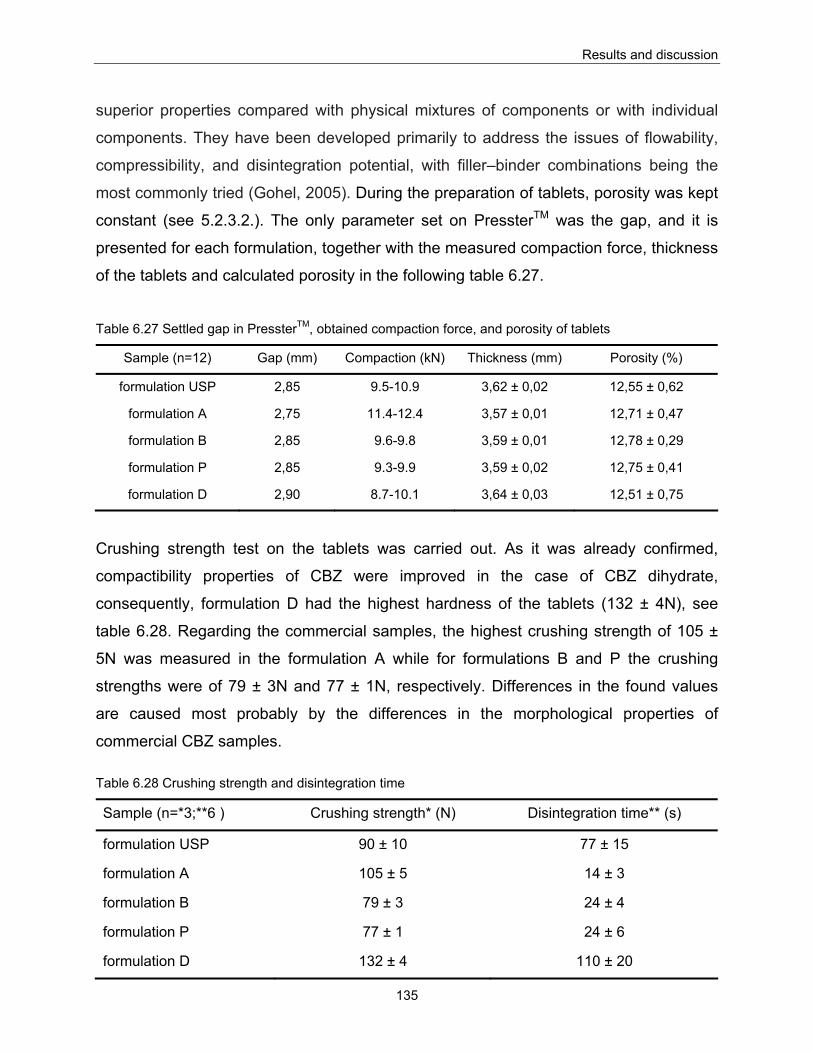
Results and discussion
135
superior properties compared with physical mixtures of components or with individual
components. They have been developed primarily to address the issues of flowability,
compressibility, and disintegration potential, with filler–binder combinations being the
most commonly tried (Gohel, 2005). During the preparation of tablets, porosity was kept
constant (see 5.2.3.2.). The only parameter set on PressterTM was the gap, and it is
presented for each formulation, together with the measured compaction force, thickness
of the tablets and calculated porosity in the following table 6.27. Table 6.27 Settled gap in PressterTM, obtained compaction force, and porosity of tablets
Sample (n=12) Gap (mm) Compaction (kN) Thickness (mm) Porosity (%)
formulation USP 2,85 9.5-10.9 3,62 ± 0,02 12,55 ± 0,62
formulation A 2,75 11.4-12.4 3,57 ± 0,01 12,71 ± 0,47
formulation B 2,85 9.6-9.8 3,59 ± 0,01 12,78 ± 0,29
formulation P 2,85 9.3-9.9 3,59 ± 0,02 12,75 ± 0,41
formulation D 2,90 8.7-10.1 3,64 ± 0,03 12,51 ± 0,75
Crushing strength test on the tablets was carried out. As it was already confirmed,
compactibility properties of CBZ were improved in the case of CBZ dihydrate,
consequently, formulation D had the highest hardness of the tablets (132 ± 4N), see
table 6.28. Regarding the commercial samples, the highest crushing strength of 105 ±
5N was measured in the formulation A while for formulations B and P the crushing
strengths were of 79 ± 3N and 77 ± 1N, respectively. Differences in the found values
are caused most probably by the differences in the morphological properties of
commercial CBZ samples.
Table 6.28 Crushing strength and disintegration time
Sample (n=*3;**6 ) Crushing strength* (N) Disintegration time** (s)
formulation USP 90 ± 10 77 ± 15
formulation A 105 ± 5 14 ± 3
formulation B 79 ± 3 24 ± 4
formulation P 77 ± 1 24 ± 6
formulation D 132 ± 4 110 ± 20
Results and discussion
136
On the other hand, disintegration time weres longer for formulation B and P (24 ± 4s
and 24 ± 6s respectively) than for formulation A (14 ± 3s). It was expected that the
harder tablet will need more time to disintegrate, but it was not the case for anhydrous
samples. Formulation D had the longest disintegration time, due to the highest hardness
of these tablets.
Dissolution of CBZ formulations was conducted according to USP monograph for the
CBZ immediate release tablets (USP31, 2008). Six tablets were examined per all
formulations. The apparatus and the method used were described previously (see
5.2.3.5.). The requirements for the time and tolerance for CBZ drug release in USP
pharmacopoeia are the following:
- 45 – 75% of drug has to be dissolved in the first 15min
- >75% of drug has to be dissolved in 60min.
The first range is the critical one and a lot of previously investigated CBZ formulations
failed to meet that requirement during the dissolution test.
According to USP monograph for CBZ, immediate release tablets will meet
requirements if the dissolved amount of drug agrees with the interpretations specified in
the Acceptance table 2 in USP pharmacopoeia (table 6.29).
For CBZ immediate release tablets the following exceptions are allowed:
- At 15 minutes: at L2, no unit is more than 5% outside the stated range; at L3, no
unit is more than 10% outside the stated range; and not more than 2 of the 24
units are more than 5% outside the stated range;
- At 60 minutes at L2, no unit is less than Q 5%; at L3, no unit is less than Q
10%; and not more than 2 of the 24 units are less than Q 5%.
L1 or L2 are limits of the amounts of active ingredients dissolved and are expressed in
terms of the percentage of labeled content of the dosage unit, and Q value is the
amount dissolved at each specified fractional dosing interval specified in individual
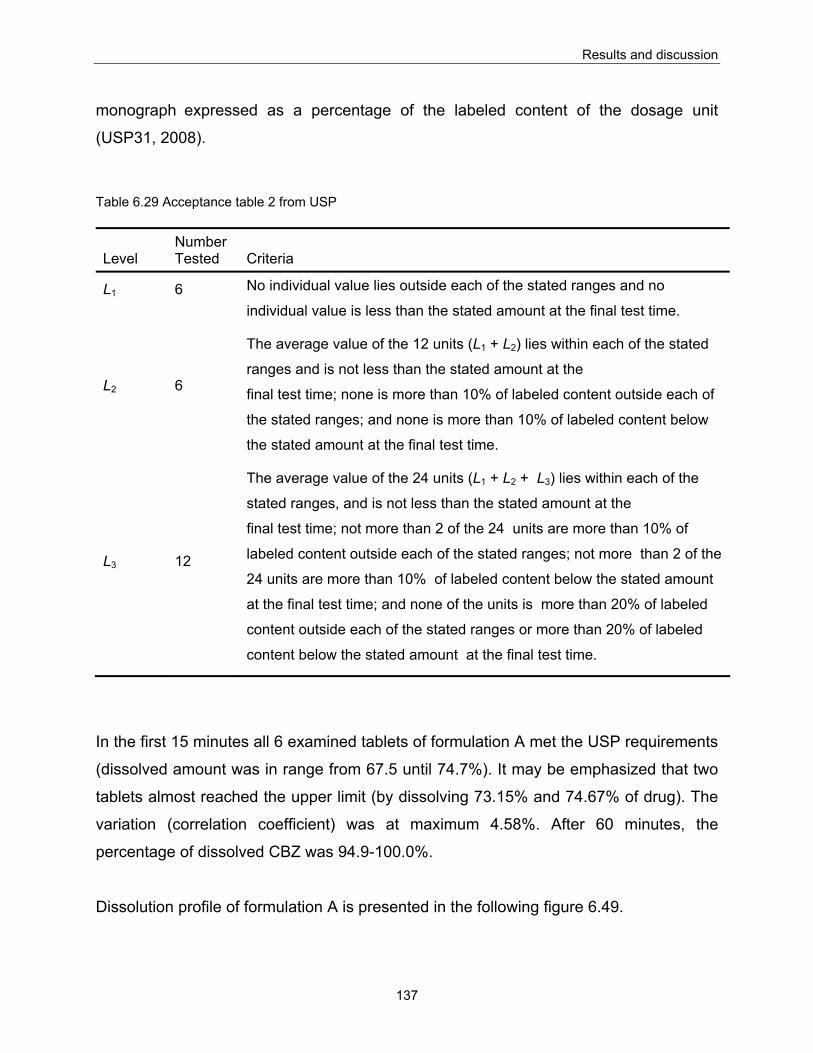
Results and discussion
137
monograph expressed as a percentage of the labeled content of the dosage unit
(USP31, 2008).
Table 6.29 Acceptance table 2 from USP
Level Number Tested Criteria
L1 6 No individual value lies outside each of the stated ranges and no
individual value is less than the stated amount at the final test time.
L2
6
The average value of the 12 units (L1 + L2) lies within each of the stated
ranges and is not less than the stated amount at the
final test time; none is more than 10% of labeled content outside each of
the stated ranges; and none is more than 10% of labeled content below
the stated amount at the final test time.
L3
12
The average value of the 24 units (L1 + L2 + L3) lies within each of the
stated ranges, and is not less than the stated amount at the
final test time; not more than 2 of the 24 units are more than 10% of
labeled content outside each of the stated ranges; not more than 2 of the
24 units are more than 10% of labeled content below the stated amount
at the final test time; and none of the units is more than 20% of labeled
content outside each of the stated ranges or more than 20% of labeled
content below the stated amount at the final test time.
In the first 15 minutes all 6 examined tablets of formulation A met the USP requirements
(dissolved amount was in range from 67.5 until 74.7%). It may be emphasized that two
tablets almost reached the upper limit (by dissolving 73.15% and 74.67% of drug). The
variation (correlation coefficient) was at maximum 4.58%. After 60 minutes, the
percentage of dissolved CBZ was 94.9-100.0%.
Dissolution profile of formulation A is presented in the following figure 6.49.
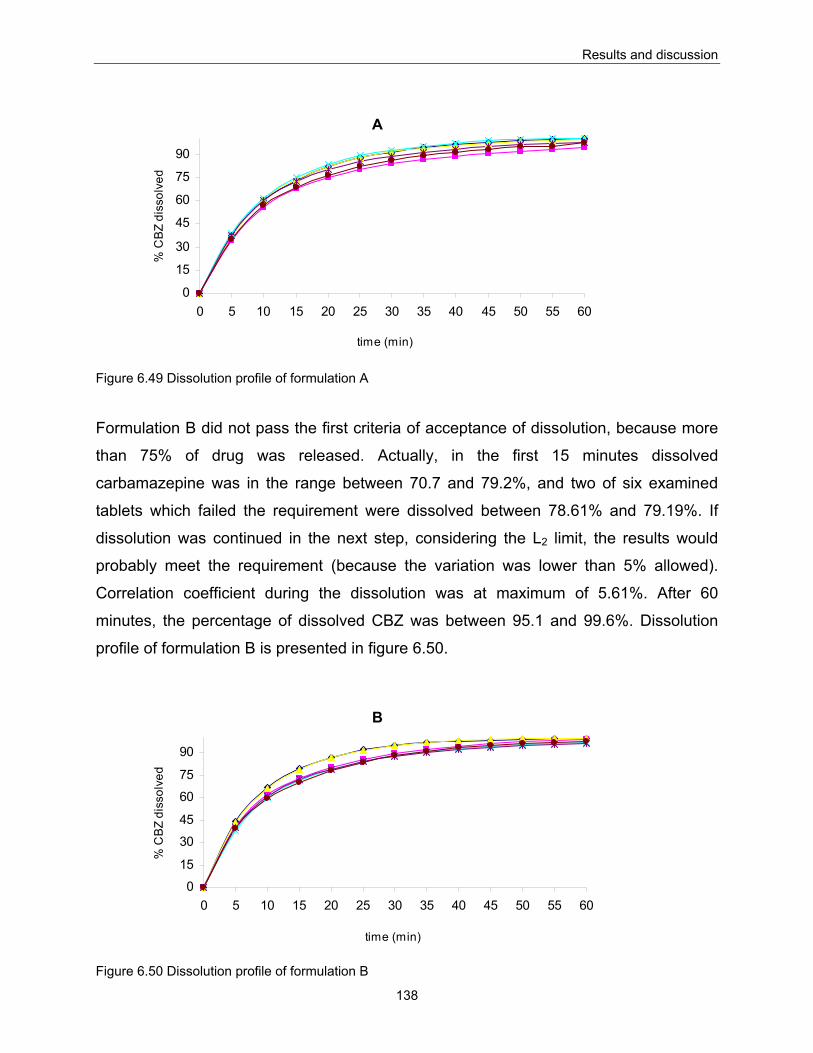
Results and discussion
138
A
0
15
30
45
60
75
90
0 5 10 15 20 25 30 35 40 45 50 55 60
time (min)
% C
BZ
diss
olve
d
Figure 6.49 Dissolution profile of formulation A
Formulation B did not pass the first criteria of acceptance of dissolution, because more
than 75% of drug was released. Actually, in the first 15 minutes dissolved
carbamazepine was in the range between 70.7 and 79.2%, and two of six examined
tablets which failed the requirement were dissolved between 78.61% and 79.19%. If
dissolution was continued in the next step, considering the L2 limit, the results would
probably meet the requirement (because the variation was lower than 5% allowed).
Correlation coefficient during the dissolution was at maximum of 5.61%. After 60
minutes, the percentage of dissolved CBZ was between 95.1 and 99.6%. Dissolution
profile of formulation B is presented in figure 6.50.
B
0
15
30
45
60
75
90
0 5 10 15 20 25 30 35 40 45 50 55 60
time (min)
% C
BZ
diss
olve
d
Figure 6.50 Dissolution profile of formulation B
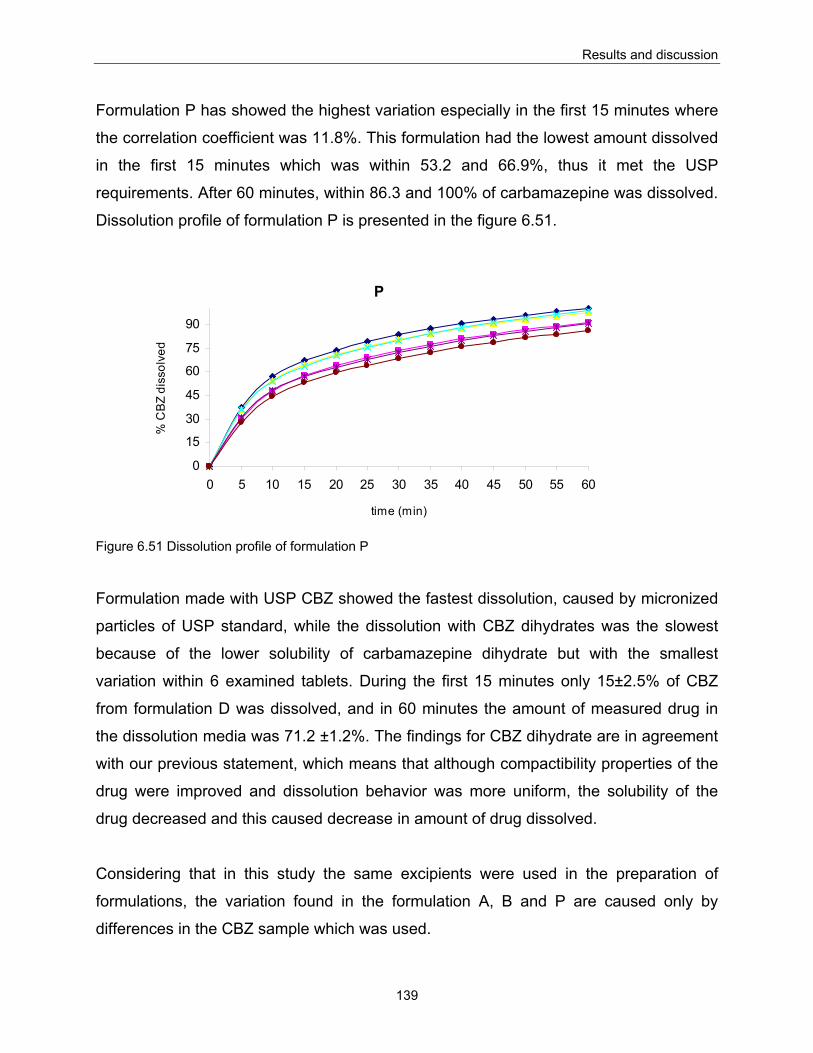
Results and discussion
139
Formulation P has showed the highest variation especially in the first 15 minutes where
the correlation coefficient was 11.8%. This formulation had the lowest amount dissolved
in the first 15 minutes which was within 53.2 and 66.9%, thus it met the USP
requirements. After 60 minutes, within 86.3 and 100% of carbamazepine was dissolved.
Dissolution profile of formulation P is presented in the figure 6.51.
P
0
15
30
45
60
75
90
0 5 10 15 20 25 30 35 40 45 50 55 60
time (min)
% C
BZ d
isso
lved
Figure 6.51 Dissolution profile of formulation P
Formulation made with USP CBZ showed the fastest dissolution, caused by micronized
particles of USP standard, while the dissolution with CBZ dihydrates was the slowest
because of the lower solubility of carbamazepine dihydrate but with the smallest
variation within 6 examined tablets. During the first 15 minutes only 15±2.5% of CBZ
from formulation D was dissolved, and in 60 minutes the amount of measured drug in
the dissolution media was 71.2 ±1.2%. The findings for CBZ dihydrate are in agreement
with our previous statement, which means that although compactibility properties of the
drug were improved and dissolution behavior was more uniform, the solubility of the
drug decreased and this caused decrease in amount of drug dissolved.
Considering that in this study the same excipients were used in the preparation of
formulations, the variation found in the formulation A, B and P are caused only by
differences in the CBZ sample which was used.
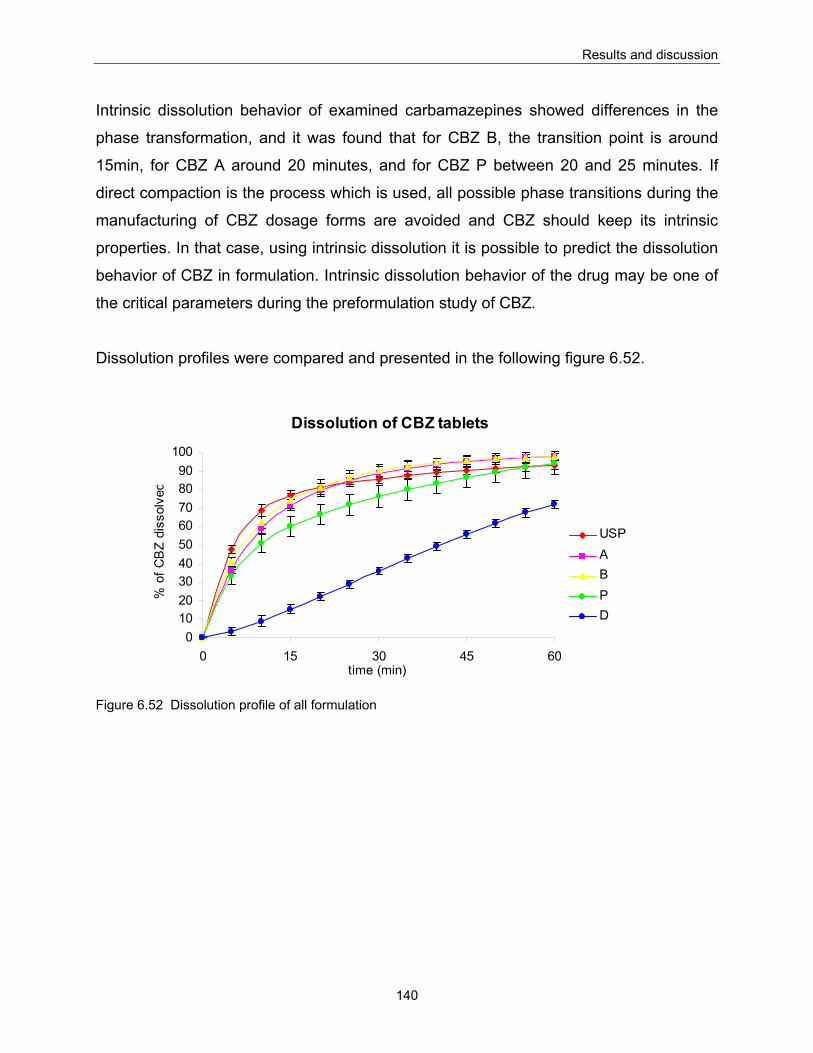
Results and discussion
140
Intrinsic dissolution behavior of examined carbamazepines showed differences in the
phase transformation, and it was found that for CBZ B, the transition point is around
15min, for CBZ A around 20 minutes, and for CBZ P between 20 and 25 minutes. If
direct compaction is the process which is used, all possible phase transitions during the
manufacturing of CBZ dosage forms are avoided and CBZ should keep its intrinsic
properties. In that case, using intrinsic dissolution it is possible to predict the dissolution
behavior of CBZ in formulation. Intrinsic dissolution behavior of the drug may be one of
the critical parameters during the preformulation study of CBZ.
Dissolution profiles were compared and presented in the following figure 6.52.
Dissolution of CBZ tablets
0102030405060708090
100
0 15 30 45 60time (min)
% o
f CB
Z di
ssol
ved
USPABPD
Figure 6.52 Dissolution profile of all formulation
Conclusions
141
7. Conclusions Understanding variations in the characteristics of raw material during preformulation
stage is necessary in order to ensure reproducibility of results, and correctly predict the
cause of eventual instability or poor performance of a dosage form. One of the tasks of
preformulation studies is defining the critical parameters which influence the product
quality and furthermore to suggest a method to monitor it during development of a
product.
The aim of this work was to suggest a robust formulation for CBZ immediate release
tablets under the frame of PAT initiative, by building the quality into the product. For that
purpose, carbamazepine raw material provided from three different sources, was fully
investigated.
The first step in this study was to identify the polymorphic form of the available samples
in order to approve or exclude the possibility of having pure starting material.
After characterization by thermal analysis, X-ray, and FTIR, nine analyzed samples of
anhydrous CBZ obtained from different sources, were shown to exhibit the same
polymorphic form (form III). Nevertheless, in the further investigation was found that
CBZ anhydrous samples exhibited different morphology, had different particle size and
size distribution all of which led to a variation in solubility and in the intrinsic dissolution
behavior. The found variations were suggested to be attributed to various manufacturing
processes most likely resulting from different solvents used in the crystallization process
and drying and/or grinding regimes in the final stage of the manufacture of CBZ.
Investigated samples varied as well in particle size distribution. In order to compare their
properties, intrinsic dissolution tests were conducted with samples containing the same
particle size fraction. CBZ A, B and P showed different intrinsic dissolution behavior,
and moreover for each sample exhibited different transition point for the transformation
of anhydrous to dihydrate form.
This lead to the conclusion that selecting just a stable and pure polymorphic starting
material is not alone the solution to assure the constant quality of a product, because
Conclusions
142
polymorphs can exist in different habits which can influence dissolution or stability of the
final dosage form. Therefore, critical parameters for CBZ formulation which may assure
the desired quality of the product beside the polymorphic form are particle size, size
distribution and morphology.
All of these critical characteristics had an effect on the intrinsic dissolution behavior of
CBZ and thus the intrinsic dissolution test is suggested as a valuable and simple
monitoring tool. It also can be used for determination of anhydrous to dihydrate
transition point for CBZ and therefore for prediction of CBZ behavior in the final dosage
form.
During this study, properties of CBZ dihydrate were examined. As commercial samples
were converted to CBZ dihydrate form, variations in solubility, thermal and intrinsic
dissolution behavior were significantly reduced from batch to batch and within one
sample. Due to the lower solubility of dihydrate, dissolution rate was decreased in
comparison with dissolution of anhydrous form and this factor must be considered for
the bioavailability of CBZ.
7.1. How to avoid problems with CBZ?
By determining the transition point of phase transformation of anhydrous to dihydrate
CBZ, it became possible to predict the dissolution behavior. There are two possible
strategies suggested at the raw material level in order to decrease the variability and
improve constant dissolution of CBZ formulation:
- To control synthetic pathway of raw material and to keep it constant with no
variation in order to produce the specific particle size (narrow distribution) and desired
morphology of crystal which can help to control the dissolution (CBZ A to CBZ D
transformation steps)
- To delete the prehistory of the active material by converting it to dihydrate form
prior to formulation, in order to have a constant dissolution rate with less variation (this
step then requires the improvement of solubility of dihydrate itself by co-crystallization or
other methods).
Conclusions
143
7.2. Suggestions for a robust CBZ formulation
Information about the transition point of CBZ anhydrous to dihydrate form is important
for selection of excipients and process which will be used for the CBZ final dosage form.
This is especially important because the USP requires a dissolution of 45-75% after 15
min and >75% after 60 min. As the excipients play a key role in CBZ phase
transformation from anhydrous to dihydrate form, they should be selected carefully on
the base of all available information. In this respect, if CBZ raw material exhibit fast
anhydrous to dihydrate transition point, then excipients which are capable of increasing
the phase transition point of CBZ should be selected in order to meet the USP
requirements.
Decisions regarding the process to be used for the preparation of CBZ immediate
release tablets are also directly dependent on the properties of CBZ raw material.
Wet granulation can be a good solution for CBZ which has fast anhydrous to dihydrate
transformation, because using that process the kinetic of transition can be decreased
and thus the transition point is increasing. But it has to be taken into account that in
every step of wet granulation process, polymorphic changes which are likely to occur,
have to be controlled and monitored to assure that final product will have constant
release of drug.
On the other hand, to avoid any polymorphic modification, then direct compaction
should be the process of choice. In order to keep the dissolution rate constant, it is
recommended to use starting material with narrow particle size distribution and
furthermore with constant morphology.
Any exchange of CBZ raw material will most probably require development of a new
formulation.
References
144
8. References Aaltonen J.: From Polymorph Screening to Dissolution Testing University of Helsinki, Finland, 2007. Alderborn G.: Particle dimensions, in G. Alderborn CN (ed): Pharmaceutical Powder Compaction Technology. New York, Basel, Marcel Dekker, 1996, vol 71, pp 245-282. Augsburger L. L., Zellhofer M. J.: Tablet formulation, in J. Swarbrick JCB (ed): Encyclopedia of Pharmaceutical Technology. New York, Basel, Marcel Dekker, Inc, 2002, vol 3, pp 2701-2711. Bolourtchian N., Nokhodochi A., Dinarvand R.: The effect of solvent and crystallization conditions on habit modification of carbamazepine. Daru 2001;9(1&2):12-22. Britain H. G.: The Phase Rules in Polymorphic Systems, in Britain HG (ed): Polymorphism in Pharmaceutical Solids. New York, Basel, Marcel Dekker, Inc., 1999, vol 95, pp 35-72. Brittain H. G.: Methods for Characterization of Polymorphs and Solvates, in Britan HG (ed): Polymorphism in Pharmaceutical Solids. New York - Basel, Marcel Dekker, Inc, 1989, vol 95, pp 227-278. Brittain H. G.: Methods for Characterization of Polymorphs and Solvates, in Brittain HG (ed): Polymorphism in Pharmaceutical Solids. New York - Basel, Marcel Dekker, Inc, 1999, vol 95, pp 228-280. Brittain H. G.: The Phase Rules in Polymorphic Systems, in Britain HG (ed): Polymorphism in Pharmaceutical Solids. New York, Basel, Marcel Dekker, Inc., 1999, vol 95, pp 35-72. Brittain H. G.: Polymorphism: Pharmaceutical Aspects: Encyclopedia of Pharmaceutical Technology. New York, Marcel Dekker, Inc, 2002, pp 2239-2249. Brittain H. G., Grant D. J. W.: Effects of polymorphism and Solid-State Solvation on Solubility and Dissolution Rate, in Brittain HG (ed): Polymorphism in Pharmaceutical Solids. New York - Basel, Marcel Dekker, Inc, 1999, vol 95, pp 280-330. Burger A., Ramberger R.: On the polymorphism of pharmaceuticals and other organic molecular crystals. I: Theory of thermodynamic rules. Mikrochim. Acta 1979;II:259-271. Carino S. R., Sperry D. C., Hawley M.: Relative Bioavailability Estimation of Carbamazepine Crystal Forms using an Artificial Stomach-Duodenum Model. Journal of Pharmaceutical Science 2006;95(1):116-125. Carstensen J. T.: Polymorphism, in Carstensen JT (ed): Advanced Pharmaceutical Solids. New York- Basel, Marcel Dekker, Inc., 2001, vol 110, pp 118-130. FDA: Guidance for Industry, PAT — A Framework for Innovative Pharmaceutical Development, Manufacturing, and Quality Assurance: http://www.fda.gov/cvm/guidance/published.html, 2004.
References
145
Florence A. T., Attwood D.: Properties of the Solid State, in A.T. Florence DA (ed): Physicochemical Principles of Pharmacy, Palgrave, 1998, pp 5-33. Ford J. L., Rajabi-Siahboomi A. R.: Dissolution and dissolution testing, in J. Swarbrick JCB (ed): Encyclopedia of Pharmaceutical Technology. New York, Basel, Marcel Dekker, 2002. Giron D.: Investigations of Polymorphism and Pseudo-polymorphism in Pharmaceuticals by Combined Thermoanalytical Techniques. Journal of Thermal Analysis and Calorimetry 2001;64(1):37-60. Giron D.: Thermal analysis and calorimetric methods in the characterization of polymorphs and solvates. Thermochimica Acta 1995;248:1-59. Gohel M. C.: A review of co-processed directly compressible excipients. Journal of Pharmaceutical Sciences 2005;8(1):76-93. Grant D. J. W.: Theory and Origin of Polymorphism, in Brittain HG (ed): Polymorphism in Pharmaceutical Solids. New York - Basel, Marcel Dekker, Inc., 1989, vol 95, pp 1-31. Grant D. J. W., Brittain H. G.: Solubility of Pharmaceutical Solids, in Brittain HG (ed): Physical Characterization of Pharmaceutical Solids. New York - Basel - Hong Kong, Marcel Dekker, Inc., 1995, vol 70, pp 322-386. Grant D. J. W., Higuchi T.: Solubility Behavior of Organic Compounds. New York, John Wiley, 1990. Grzesiak A. L., Lang M., Kim K., Matzger A. J.: Comparison of the Four Anhydrous Polymorphs of Carbamazepine and the Crystal Structure of Form I. Journal of Pharmaceutical Science 2003;92(11):2260-2271. Han J., Suryanarayanan R.: Influence of environmental conditions on the kinetics and mechanism of dehydration of carbamazepine dihydrate. Pharmaceutical Development and Technology 1998;3(4):587-596. Hanson R., Gray V.: Handbook of Dissolution Testing. Hockessin, Delaware, Dissolution Technlogies, Inc, 2004. Harris R. K., Ghi P. Y., Puschmann H., Apperley D. C., Griesser U. J., Hammond R. B., Ma C., Roberts K. J., Pearce G. J., Yates J. R., Pickard C. J.: Structural Studies of the Polymorphs of Carbamazepine, Its Dihydrate, and Two Solvates. Organic Process Research & Development 2005;9:902-910. Hilfiker R., Blatter F., von Raumer M.: Relevance of Solid-state Properties for Pharmaceutical Products, in Hilfiker R (ed): Polymorphism, Wiley-VCH Verlag GmbH&Co. KGaA, 2006, pp 1-19. Hirasawa N., Okamoto H., Danjo K.: Lactose as a Low Molecular Weight Carrier of Solid Dispersions for Carbamazepine and Ethenzamide. Chem. Pharm. Bull. 1999;47(3):417-420.
References
146
Jozwiakowski M. J.: Alteration of the Solid State of the Drug Substance: Polymorphs, Solvates and Amorphous Forms, in Liu R (ed): Water-Insoluble Drug Formulation. Denver, Interpharm Press, 2000, pp 525-568. Kaneniwa K., Yamagouchi T., Watari N., Otsuka M.: Higroscopicity of carbamazepine crystalline powder. Yakugaku Zasshi 1984;104:184-190. Kaneniwa N., Ichikawa J., Yamaguchi T., Hayashi K., Watari N., Sumi M.: Dissolution behavior of carbamazepine polymorphs. Yakugaku Zasshi 1987;107:808-813. Katzhendler I., Azoury R., Friedman M.: Crystalline properties of carbamazepine in sustained release hydrophilic matrix tablets based on hydroxypropyl methylcellulose. Journal of Controlled Release 1998;54(1):69-85. Kobayashi Y., Ito S., Itai S., Yamamoto K.: Physicochemical properties and bioavailability of carbamazepine polymorphs and dihydrate. International Journal of Pharmaceutics 2000;193(2):137-146. Koester L. S., Mayorga P., Bassani V. L.: Carbamazepine/βCD/HPMC Solid Dispersions. I. Influence of the Spray-Draying Process and βCD/HPMC on the Drug Dissolution Profile. Drug Development and Industrial Pharmacy 2003;29(2):139-144. Krahn F. U., Mielck J. B.: Effect of type and extent of crystalline order on chemical and physical stability of carbamazepine. International Journal of Pharmaceutics 1989;53(1):25-34. Krahn F. U., Mielck J. B.: Relation between several polymorphic forms and the dihydrate of carbamazepine. Pharmaceutica Acta Helvetiae 1987;62:247-254. Leuenberger H.: The compressibility and compactibility of powders systems. International Journal of Pharmaceutics 1982;12:41-55. Levin M.: Tablet Press Instrumentation: Encyclopedia of Pharmaceutical Technology. New York, Marcel Dekker, Inc., 2002, vol 3. Li Y., Han J., Zhang G. G. Z., Grant D. J. W., Suryanarayanan R.: In Situ Dehydration of Carbamazepine Dihydrate: A Novel Technique to Prepare Amorphous Anhydrous Carbamazepine. Pharmaceutical Development and Technology 2000;5(2):257-266. Lohani S., Grant D. J. W.: Thermodynamics of Polymorphs, in Hilfiker R (ed): Polymorphism in the Pharmaceutical Industry. Basel, WILEY-VCH Verlag GmbH&Co., 2006, pp 21-42. Lowes M. M. J., Caira M. R., Lotter A. P., Van der Watt J. G.: Physicochemical Properties and X-ray Structural Studies of the Trigonal Polymorph of Carbamazepine. Journal of Pharmaceutical Sciences 1986;76(9):744-752. Luthala S.: Effect of sodium lauryl sulphate and polysorbate 80 on crystal growth and aqueous solubility of carbamazepine. Acta Pharmaceutica Nordica 1992;4(2):85-90. Malvern: Developing a method for dry powder analysis, Malvern Instruments, 2000.
References
147
Marshall K.: Compression and Consolidation of Powder Solids, in L. Lachman HAL, J. L. Kanig (ed): The Theory and Practice of Industrial Pharmacy. Philadelphia, Lea & Febiger, 1986, pp 66-100. Martin A.: Physical Pharmacy: physical chemical principles in the pharmaceutical sciences. Philadelphia, London, Lea&Febiger, 1993. McCauley J. A., Brittain H. G.: Thermal Methods of Analysis, in Swarbrick J (ed): Physical Characterization of Pharmaceutical Solids. New York, Basel, Hong Kong, Marcel Dekker, 1995, vol 70, pp 223-251. McCrone W. C.: Polymorphism: Physics and Chemistry of the organic Solid State, 1965, vol 2, pp 725-767. McMahon L. E., Timmins P., Williams A. C., York P.: Characterization of Dihydrates Prepared from Carbamazepine Polymorphs. Journal of Pharmaceutical Sciences 1996;85(10):1064-1069. Meyer M. C., Straughn A. B., Jarvi E. J., Wood G. C., Pelsor F. R., Shah V. P.: The Bioinequivalence of Carbamazepine Tablets with a History of Clinical Failures. Pharmaceutical Research 1992;9(12):1612-1616. Meyer M. C., Straughn A. B., Mhatre R. M., Shah V. P., Williams R. L., Lesko L. J.: The Relative Bioavailability and In Vivo-In Vitro Correlations for Four Marketed Carbamazepine Tablets. Pharmaceutical Research 1998;15(11):1787-1791. Moneghini M., Kikic I., Voinovich D., Perissutti B., Flipovic-Grgic J.: Processing of carbamazepine-PEG 4000 solid dispersions with supercritical carbon dioxide: preparation, characterization and in-vitro dissolution. International Journal of Pharmaceutics 2001;222(1):129-138. Muller F. X., Augsburger L. L.: The role of the displacement-time waveform in the determination of Heckel behavior under dynamic conditions in a compaction simulator and a fully-instrumented rotary tablet machine. J. Pharm. Pharmacol. 1994;46(6):468-475. Murphy D., Rodriguez-Cintron F., Langevin B., Kelly R. C., Rodrriguez-Hornedo N.: Solution-mediated phase transformation of anhydrous to dihydrate carbamazepine and the effect of lattice disorder. International Journal of Pharmaceutics 2002;246(1-2):121-134. Nair R., Gonen S., Hoag S. W.: Influence of polyethylene glycol and povidone on the polymorphic transformation and solubility of carbamazepine. International Journal of Pharmaceutics 2002;240(1):11-12. Nernest W.: Theory of reaction velocity in heterogeneous systems. Zeitschrift für Physikalische Chemie, Stoechiometrie und Verwandtschaftslehre 1904;47:52-55. Nogami H., Nagai T., Suzuki A.: Studies on powdered preparations XVII. Dissolution rate of sulfonamides by rotating disk method. Chem. Pharm. Bull. 1966(14):329-338. Nogami H., Nagai T., Yotsuyamnagi T.: Dissolution phenomena of organic medicinals involving simultaneous phase changes. Chem. Pharm. Bull. 1969;17:499-509.
References
148
Nokhodochi A., Bolourtchian N., Dinarvand R.: Dissolution and mechanical behaviors of recrystallized carbamazepine from alcohol solution in the presence of additives. Journal of Crystal Growth 2004;274:573-584. Noyes A. A., Whitney W. R.: The rate of solution of solid substances in their own solutions. J. Am. Chem. Soc. 1897;19(930-934). Nystrom C., Karehill P. G.: The Importance of Intermolecular Bonding Forces and the Concept of Bonding Surface Area, in G. Alderborn CN (ed): Pharmaceutical Powder Compaction Technology. New York - Basel, Marcel Dekker, Inc, 1995, vol 71, pp 17-53. Ono M., Tozuka Y., Oguchi T., Yamamura S., Yamamoto K.: Effects of dehydration temperature on water vapor adsorption and dissolution behavior of carbamazepine. International Journal of Pharmaceutics 2002;239(1-2):1-12. Otsuka M., Hasegawa H., Matsuda Y.: Effect of polymorphic forms of bulk powders on pharmaceutical properties of carbamazepine granules. Chem. Pharm. Bull. 1999;47:852-856. Otsuka M., Hasegawa H., Matsuda Y.: Effect of polymorphic transformation during the extrusion-granulation process on the pharmaceutical properties of carbamazepine granules. Chem. Pharm. Bull. 1997;45:894-898. Otsuka M., Ohfusa T., Matsuda Y.: Effect of binders on polymorphic transformation kinetics of carbamazepine in aqueous solution. Colloids and Surfaces B: Biointerfaces 2000;17(3):145-152. Picker K. M.: The 3-D model: comparison of parameters obtained from and by simulating different tableting machines. AAPS PharmSciTech 2003;4(3):35. Qu H., Louhi-Kultanen M., Kallas J.: Solubility and stability of anhydrate/hydrate in solvent mixtures. International Journal of Pharmaceutics 2006;321(1-2):101-107. Richter K., Terhaag B.: The relative bioavailability and pharmacokinetics of carbamazepine. Int J Clin Pharmacol Biopharm 1978;16:377-379. Rodríguez-Hornedo N., D. L.-B., Wu H. J.: Phase transition and heterogeneous/epitaxial nucleation of hydrated and anhydrous theophylline crystals. International Journal of Pharmaceutics 1992(85):149-162. Rodriguez-Hornedo N., Murphy D.: Surfactant-Facilitated Crystallization of Dihydrate Carbamazepine during Dissolution of Anhydrous Polymorph. Journal of Pharmaceutical Science 2004;93(2):449-460. Rumpf H.: Grundlagen und Methoden der Granulierens. Chemie Ingenieur Technik 1958;30(3):144-158. Rustichelli C., Gamberini G., Ferioli V., Gamberini M. C., Ficarra R., Tommasini S.: Solid-state study of polymorphic drugs: carbamazepine. Journal of Pharmaceutical and Biomedical Analysis 2000;23(1):41-54.
References
149
Salameh A. K., Taylor L. S.: Physical Stability of Crystal Hydrates and their Anhydrates in the Presence of Excipients. Journal of Pharmaceutical Science 2006;95(2):446-461. Sethia S., Squillante E.: Solid dispersion of carbamazepine in PVP K30 by conventional solvent evaporation and supercritical methods. International Journal of Pharmaceutics 2004;272(1):1-10. Shefter E., Higuchi T.: Dissolution behavior of crystalline solvated and nonsolvated forms of some pharmaceuticals. Journal of Pharmaceutical Sciences 1963;52:781-791. Surana R., Pyne A., Suryanarayanan R.: Solid-Vapor Interactions: Influence of Environmental Conditions on the Dehydration of Carbamazepine Dihydrate. AAPS PharmSciTech 2003;4(4):1-10. Tian F., Sandler N., Aaltonen J., Lang C., Saville D. J., Gordon K. C., Strachan C. J., Rantanen J., Rades T.: Influence of Polymorphic Form, Morphology, and Excipient Interactions on the Dissolution of Carbamazepine Compacts. International Journal of Pharmaceutics 2007;96(3):584-594. Tian F., Sandler N., Gordon K. C., McGoverin C. M., Reay A., Strachan C. J., Saville D. J., Rades T.: Visualizing the conversion of carbamazepine in aqueous suspension with and without the presence of excipients: A single crystal study using SEM and Raman microscopy. European Journal of Pharmaceutics and Biopharmaceutics 2006;64(3):326-335. Tian F., Zeitler J. A., Strachan C. J., Saville D. J., Gordon K. C., Rades T.: Characterizing the conversion kinetics of carbamazepine polymorphs to the dihydrate in aqueous suspension using Raman spectroscopy. Journal of Pharmaceutical and Biomedical Analysis 2006;40:271-280. Umeda T., Ohnishi N., Yokoyama T., Kuroda K., Kuroda T., Matsuda Y.: Kinetics of the thermal transition of carbamazepine polymorphic forms in the solid state. Yakugaku Zasshi 1984;104:786-792. USP31: Carbamazepine immediate release tablets, The United States Pharmacopoeial Convention, 2008, pp 1631-1632. USP31: Description and Solubility, The United States Pharmacopoeial Convention, 2008, pp 840. USP31: Dissolution (711), The United States Pharmacopoeial Convention, 2008, pp 267-272. USP 31, Pharmacopeia T. U. S.: Description and Solubility, The United States Pharmacopeial Convention, 2008, pp 840. Van Campen L., Monkhouse D. C.: Solid-state reactions-theoretical and experimental aspects. Drug Dev. Ind. Pharm. 1984;10:1175-1276. Villafuerte-Robles L.: Zur polymorphic and mechanischen Erbeitung des carbamazepine University Hamburg, 1982.
References
150
Vippaguanta S. R., Britain H. G., Grant D. J. W.: Crystalline solids. Advanced Drug Delivery Reviews 2001;48(1):3-26. von Raumer M.: Polymorphism and Salts: An Integrated Approach from High Throughput Screening to Crystallization Optimization: Polymorphism and crystallization. Frankfurt, Germany, 2004. Wang J. T., Shiu G. K., Ong-Chen T., Vitswanathan C. T., Skelly J. P.: Effects of Humidity and Temperature on In Vitro Dissolution of Carbamazepine Tablets. Journal of Pharmaceutical Sciences 1993;83(10):1002-1005. Yu L. X., Carlin A. S., Amidon G. L., Hussain A. S.: Feasibility studies of utilizing disk intrinsic dissolution rate to classify drugs. International Journal of Pharmaceutics 2004;270(1-2):221-227. Zhang G. G. Z., Clawa D., Schmitt E. A., Qiu Y.: Phase transformation considerations during process development and manufacture of solid oral dosage forms. Advanced Drug Delivery Reviews 2004;56:371-390.
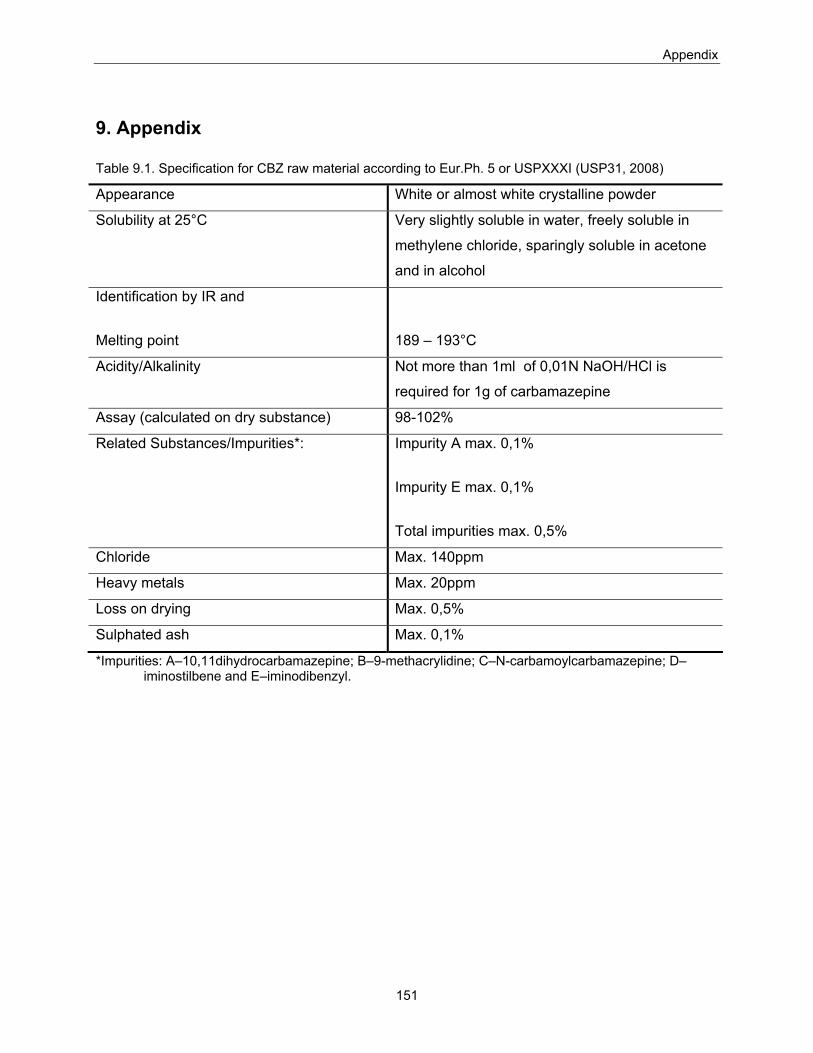
Appendix
151
9. Appendix Table 9.1. Specification for CBZ raw material according to Eur.Ph. 5 or USPXXXI (USP31, 2008)
Appearance White or almost white crystalline powder
Solubility at 25°C Very slightly soluble in water, freely soluble in
methylene chloride, sparingly soluble in acetone
and in alcohol
Identification by IR and
Melting point
189 – 193°C
Acidity/Alkalinity Not more than 1ml of 0,01N NaOH/HCl is
required for 1g of carbamazepine
Assay (calculated on dry substance) 98-102%
Related Substances/Impurities*:
Impurity A max. 0,1%
Impurity E max. 0,1%
Total impurities max. 0,5%
Chloride Max. 140ppm
Heavy metals Max. 20ppm
Loss on drying Max. 0,5%
Sulphated ash Max. 0,1%
*Impurities: A–10,11dihydrocarbamazepine; B–9-methacrylidine; C–N-carbamoylcarbamazepine; D–iminostilbene and E–iminodibenzyl.
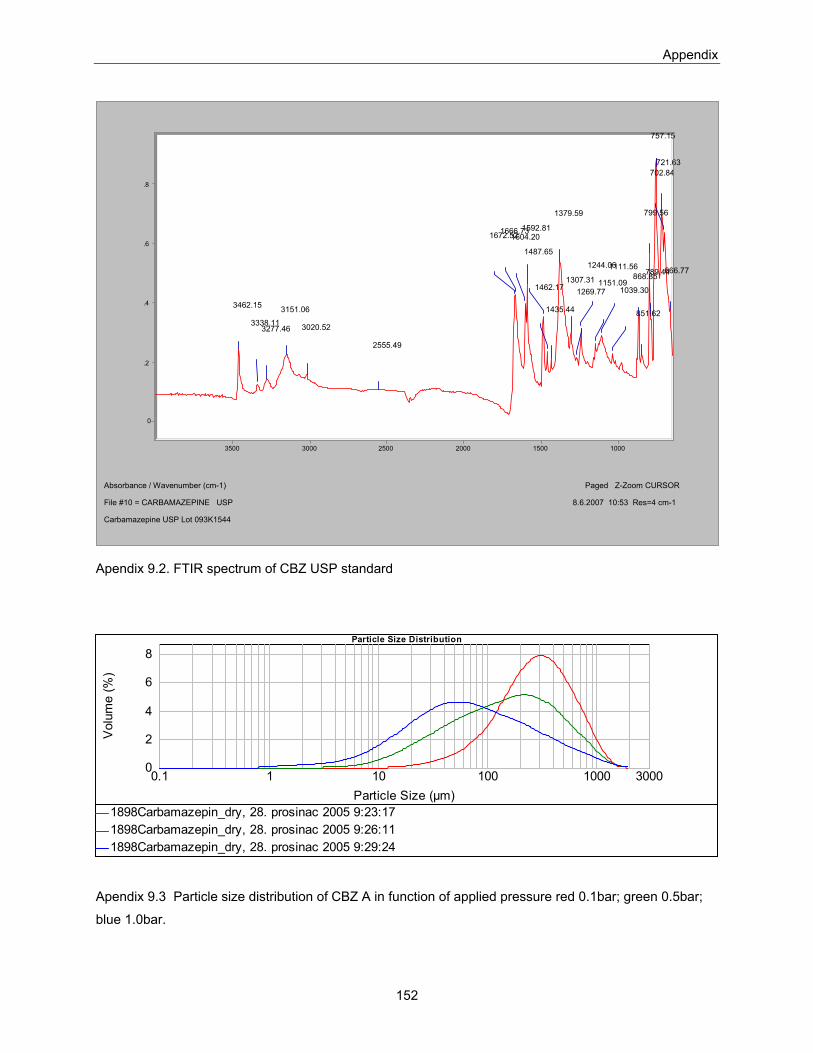
Appendix
152
Apendix 9.2. FTIR spectrum of CBZ USP standard
Particle Size Distribution
0.1 1 10 100 1000 3000 Particle Size (µm)
0
2
4
6
8
Vol
ume
(%)
1898Carbamazepin_dry, 28. prosinac 2005 9:23:171898Carbamazepin_dry, 28. prosinac 2005 9:26:111898Carbamazepin_dry, 28. prosinac 2005 9:29:24
Apendix 9.3 Particle size distribution of CBZ A in function of applied pressure red 0.1bar; green 0.5bar;
blue 1.0bar.
3462.15
3338.113277.46
3151.06
3020.52
2555.49
1672.521666.731604.20
1592.81
1487.65
1462.17
1435.44
1379.59
1307.311269.77
1244.06
1151.09
1111.56
1039.30
868.85
851.62
799.56
789.44
757.15
721.63702.84
666.77
0
.2
.4
.6
.8
3500 3000 2500 2000 1500 1000
Absorbance / Wavenumber (cm-1) Paged Z-Zoom CURSOR
File #10 = CARBAMAZEPINE USP 8.6.2007 10:53 Res=4 cm-1
Carbamazepine USP Lot 093K1544
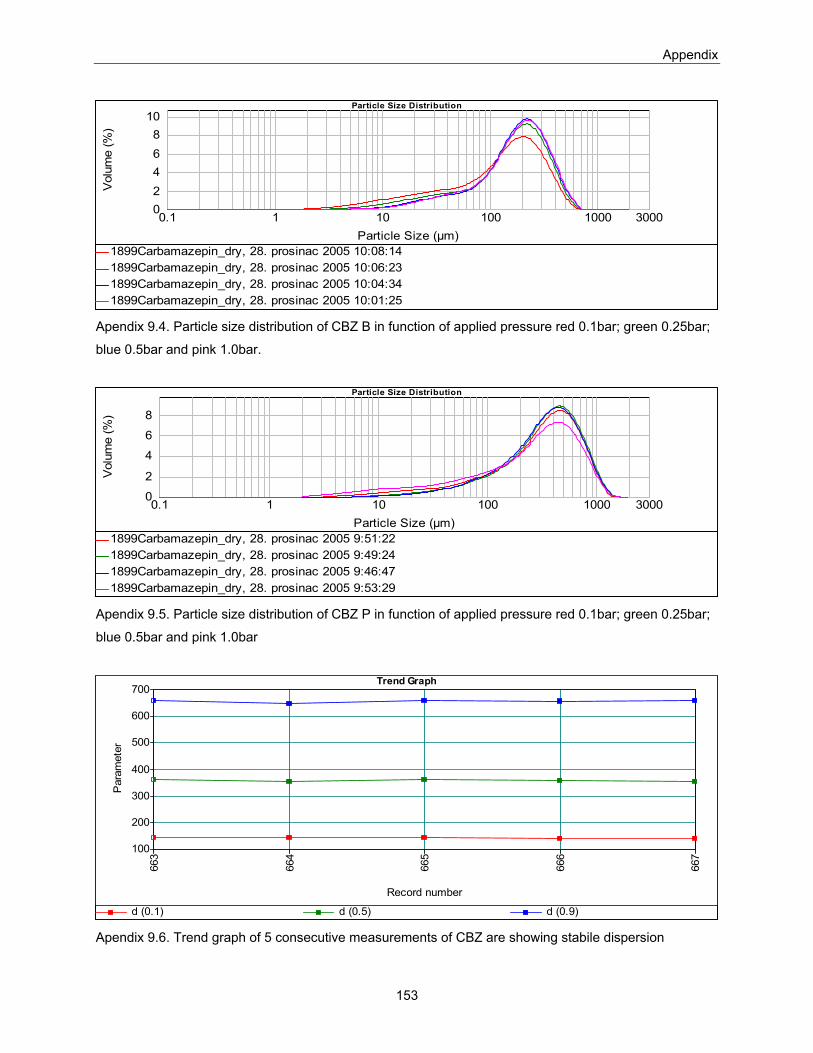
Appendix
153
Particle Size Distribution
0.1 1 10 100 1000 3000 Particle Size (µm)
0 2 4 6 8
10 V
olum
e (%
)
1899Carbamazepin_dry, 28. prosinac 2005 10:08:141899Carbamazepin_dry, 28. prosinac 2005 10:06:231899Carbamazepin_dry, 28. prosinac 2005 10:04:341899Carbamazepin_dry, 28. prosinac 2005 10:01:25
Apendix 9.4. Particle size distribution of CBZ B in function of applied pressure red 0.1bar; green 0.25bar;
blue 0.5bar and pink 1.0bar.
Particle Size Distribution
0.1 1 10 100 1000 3000 Particle Size (µm)
0
2
4
6
8
Vol
ume
(%)
1899Carbamazepin_dry, 28. prosinac 2005 9:51:221899Carbamazepin_dry, 28. prosinac 2005 9:49:241899Carbamazepin_dry, 28. prosinac 2005 9:46:471899Carbamazepin_dry, 28. prosinac 2005 9:53:29
Apendix 9.5. Particle size distribution of CBZ P in function of applied pressure red 0.1bar; green 0.25bar;
blue 0.5bar and pink 1.0bar
Trend Graph
663
664
665
666
667
Record number
100
200
300
400
500
600
700
Par
amet
er
d (0.1) d (0.5) d (0.9) Apendix 9.6. Trend graph of 5 consecutive measurements of CBZ are showing stabile dispersion
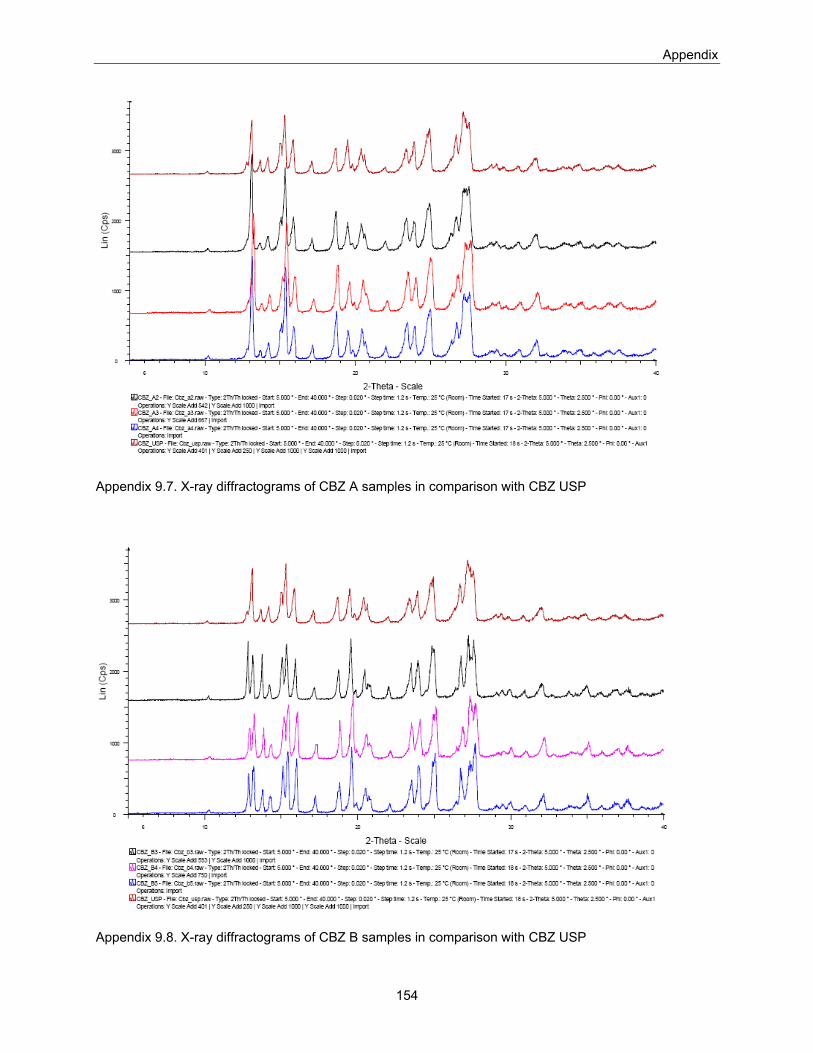
Appendix
154
Appendix 9.7. X-ray diffractograms of CBZ A samples in comparison with CBZ USP
Appendix 9.8. X-ray diffractograms of CBZ B samples in comparison with CBZ USP
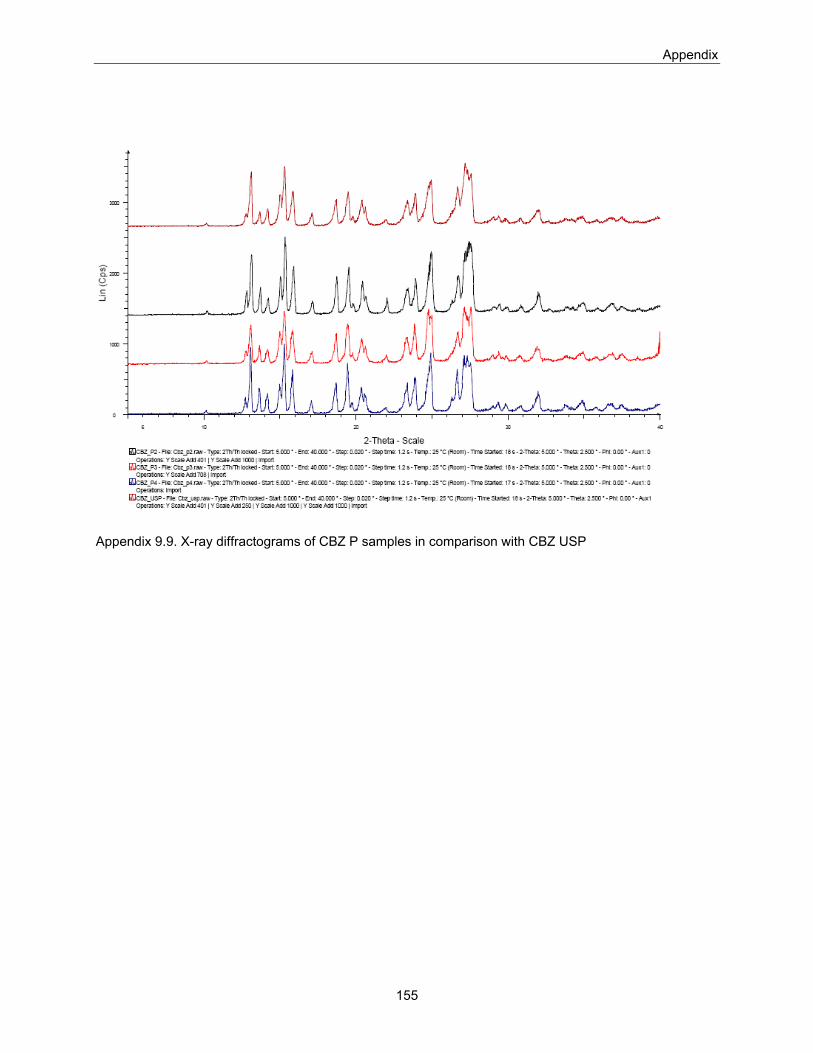
Appendix
155
Appendix 9.9. X-ray diffractograms of CBZ P samples in comparison with CBZ USP
Curriculum Vitae
156
Curriculum Vitae
Personal data:
Name Selma Šehić
Date of birth 17th of July 1977
Nationality Bosnian
Education:
1992 – 1996 High school at Gymnasium, Visoko, Bosnia and Herzegovina
1996 – 2003 Study in Pharmacy at the University of Pharmacy in Sarajevo,
Bosnia and Herzegovina
2004 State Exam in Pharmacy, Sarajevo, Bosnia and Herzegovina
2004 – 2008 PhD study at the University of Basel, Institute of Pharmaceutical
Technology
Professional experience:
2003 Six month of practical work in the pharmacy “Apoteke Sarajevo”,
Bosnia and Herzegovina
Since March 2003 In the pharmaceutical company “Bosnalijek dd”, Sarajevo, Bosnia
and Herzegovina; (Development Department, Preformulation)
2003 1 year of the practical trainee in pharmaceutical technology in the
Production Departement, in “Bosnalijek dd”, Bosnia and
Herzegovina
2005 - 2007 Assistant in practical courses of solid dosage formulations at the
Institute of Pharmaceutical Technology, University of Basel