Embed Size (px)
Citation preview
RED CELLS, IRON, AND ERYTHROPOIESIS
e-Blood
Iron regulatory protein-1 and -2: transcriptome-wide definition of bindingmRNAs and shaping of the cellular proteome by iron regulatory proteinsMayka Sanchez,1-3 Bruno Galy,1 Bjoern Schwanhaeusser,4 Jonathon Blake,1 Tomi Bahr-Ivacevic,1 Vladimir Benes,1
Matthias Selbach,4 *Martina U. Muckenthaler,2,5 and *Matthias W. Hentze1,2
1European Molecular Biology Laboratory (EMBL), Heidelberg, Germany; 2Molecular Medicine Partnership Unit (MMPU), EMBL, University of Heidelberg,Heidelberg, Germany; 3Institute of Predictive and Personalized Medicine of Cancer (IMPPC), Barcelona, Spain; 4Max Delbruck Center for Molecular Medicine,Berlin, Germany; and 5Department of Pediatric Oncology, Haematology, and Immunology, University Hospital of Heidelberg, Heidelberg, Germany
Iron regulatory proteins (IRPs) 1 and 2 areRNA-binding proteins that control cellulariron metabolism by binding to conservedRNA motifs called iron-responsive ele-ments (IREs). The currently known IRP-binding mRNAs encode proteins involvedin iron uptake, storage, and release aswell as heme synthesis. To systematicallydefine the IRE/IRP regulatory network ona transcriptome-wide scale, IRP1/IRE andIRP2/IRE messenger ribonucleoprotein
complexes were immunoselected, and themRNA composition was determined us-ing microarrays. We identify 35 novelmRNAs that bind both IRP1 and IRP2, andwe also report for the first time cellularmRNAs with exclusive specificity for IRP1or IRP2. To further explore cellular ironmetabolism at a system-wide level, weundertook proteomic analysis by pulsedstable isotope labeling by amino acids incell culture in an iron-modulated mouse
hepatic cell line and in bone marrow-derived macrophages from IRP1- andIRP2-deficient mice. This work investi-gates cellular iron metabolism in unprec-edented depth and defines a wide net-work of mRNAs and proteins with iron-dependent regulation, IRP-dependentregulation, or both. (Blood. 2011;118(22):e168-e179)
Introduction
Iron homeostasis in mammalian cells is maintained throughposttranscriptional regulation by the IRP/IRE regulatory system.1,2
In iron-deficient cells, active iron regulatory protein (IRP) 1 andIRP2 recognize iron-responsive elements (IREs), conserved RNAstructures located in the untranslated regions (UTRs) of mRNAsthat encode proteins involved in iron metabolism.3 IRP/IRE-regulated mRNAs include those encoding proteins for iron acquisi-tion (transferrin receptor 1 [Tfrc], divalent metal transporter1 [Slc11a2]), storage (ferritin H [Fth1] and ferritin L [Ftl]), use(erythroid 5-aminolevulinic acid synthase [ALAS2], mitochondrialaconitase [Aco2], Drosophila succinate dehydrogenase [Sdh]), andexport (ferroportin [Slc40a1]). A typical IRE is composed of a6-nucleotide apical loop (5�-CAGWGH-3�, where W stands for Aor U and H for A, C, or U) on a stem of 5 paired nucleotides, anunpaired asymmetrical cytosine bulge on the 5�strand of the stem,and an additional lower stem of variable length (depicted inFigure 3A); the nucleotide composition forming the 2 stemsegments may vary considerably.4,5 The mRNAs of Fth1, Ftl,Alas2, Aco2, dSdh, and Slc40a1 contain one single IRE in their5�UTRs, whereas the Slc11a2 mRNA harbors a single IRE in its3�UTR; Tfrc mRNA is the only currently known mRNA withmultiple (5) IREs, and all of them are located in its 3�UTR.Depending on the location of the IRE, IRP binding regulates geneexpression by different mechanisms. Both IRPs inhibit translationinitiation when bound to 5�UTR IREs (eg, Fth1 and Ftl mRNAs),whereas their association with the 3�UTR IREs of the Tfrc mRNA
mediates mRNA stabilization by preventing endonucleolyticcleavage.6-8
IRP binding activity to IREs is differentially regulated byintracellular iron levels and other stimuli, including nitric oxide,oxidative stress, and hypoxia. IRP1 and IRP2 share 60% to 70%overall amino acid identity, depending on the studied species.Notably, not all amino acids of IRP1 that directly contact the IRE inthe IRP1/H-ferritin IRE crystal structure9 are conserved in IRP2,which may be relevant in the context of IRP-specific mRNAs. Inresponse to the cellular labile iron pool, distinct mechanismscontrol the activities of IRP1 and IRP2, which is high in iron-deficient cells and low in iron-replete cells. Under iron-repleteconditions, an iron-sulfur cluster (4Fe-4S) assembles in IRP1,preventing IRE binding and converting it into the cytosolicaconitase. In iron deficiency, IRP1 undergoes conformationalchanges that allow it to bind to IREs as an apoprotein.9-11 Incontrast, IRP2 does not contain an Fe-S cluster and is regulated byubiquitination and degradation mediated by the iron-regulatedubiquitin ligase FBXL5.12,13 The IRP/IRE regulatory system isessential, as demonstrated by the embryonic lethality of micelacking both IRPs.14,15 From a cell biology perspective, the IRPsare critical for securing sufficient iron supplies to mitochondria.16
Overall, the regulation of the IRE-binding activities of IRP1 andIRP2 ensures the appropriate expression of IRP target genes andcellular iron balance.
Over the past 25 years, IREs have been identified successivelyin less than a dozen mRNAs by coincidence or after diverse
SubmittedApril 1, 2011; accepted September 1, 2011. Prepublished online as BloodFirst Edition paper, September 22, 2011; DOI 10.1182/blood-2011-04-343541.
*M.U.M. and M.W.H. contributed equally to this study.
This article contains a data supplement.
The publication costs of this article were defrayed in part by page chargepayment. Therefore, and solely to indicate this fact, this article is herebymarked ‘‘advertisement’’ in accordance with 18 USC section 1734.
© 2011 by The American Society of Hematology
e168 BLOOD, 24 NOVEMBER 2011 � VOLUME 118, NUMBER 22
For personal use only.on April 9, 2019. by guest www.bloodjournal.orgFrom
directed approaches (eg, study of iron-regulated genes, specificbioinformatics searches). To systematically define the IRP/IREregulatory network on a genome-wide and proteomic scale, wefollowed 2 approaches. First, we isolated complexes formedbetween IRP1 or IRP2 and mRNAs isolated from 5 differentmurine tissues, and then we identified their mRNA constituentsusing genome-wide microarrays. As a proof of concept for thismethod, we recently identified 2 novel IRE-containing mRNAs inthe oxygen-sensing transcription factor Epas1 (Hif2�) and in thehuman cell cycle phosphatase Cdc14A using a small, custom-madecDNA microarray, the IronChip.17,18 Second, we used bone marrow-derived macrophages from control mice or animals lacking bothmacrophage IRPs as well as an iron-perturbed hepatocytic cell line,and then we analyzed the impact of IRP expression, activity, andiron-induced changes on cellular protein synthesis by pulsed stableisotope labeling by amino acids in cell culture (pSILAC).19
Methods
Mice and RNA extraction
Brain and bone marrow (BM) samples were obtained from 8- to 10-week-oldC57BL6 mice fed with a standard chow. BM cells were flushed out from thefemur with ice-cold Hanks balanced salt solution (HBSS) and pelleted at300g for 10 minutes at 4°C for RNA extraction. Duodenum, liver, andspleen tissues were obtained from C57BL6 mice fed with a low iron(� 10-mg/kg) diet (C1000; Altromin) for 3 weeks, starting at weaning age;iron deficiency was functionally validated by decreased hematocrit andhemoglobin values compared with animals that received a control diet.
Mice with selective ablation of both IRP1 and IRP2 in macrophageswere generated using Cre/Lox technology. Mice homozygous for floxedAco1 (Irp1) and Ireb2 (Irp2) alleles (Aco1flox/flox, Ireb2flox/flox)15 were bred toa knockin strain (LysM�/Cre) with an insertion of the Cre recombinasecDNA into the LysozymeM locus.20 Aco1flox/flox, Ireb2flox/flox, LysM�/Cre
animals [designated IrpLysM::Cre(�)] were born at mendelian ratios and werephysically indistinguishable from Aco1flox/flox, Ireb2flox/flox, LysM�/� controllittermates [IrpLysM::Cre(�); Ferring-Appel et al, manuscript in preparation].Animals were housed under a constant light/dark cycle in the EuropeanMolecular Biology Laboratory specific-pathogen-free mouse barrier unitand had access to food and water ad libitum. They were killed by CO2
inhalation. Animal handling was in accordance with institutional guidelines.Total RNA used for immunoprecipitations (IPs) was extracted from
mouse tissues using TRIzol reagent (Invitrogen) following the manufactur-er’s protocol.
Immunoprecipitations
The IP experiments were performed as described previously.18 In brief,50 �g of total RNA was combined with purified, His6-tagged recombinantIRP1 or His-tagged IRP2 produced in Escherichia coli and a rabbitpolyclonal anti-IRP1 antibody (for IRP1 IPs) or a mouse monoclonalanti-His tag antibody (for IRP2 IPs). A control reaction in which therecombinant IRP was omitted was performed in parallel (mock IP). The IPswere done in duplicate using 2 independent pools of total RNA, each onecomposed of a pool of total RNA extracted from 4 to 6 mice. Coimmunopre-cipitated RNAs from the messenger ribonucleoproteins (mRNPs) wereisolated by proteinase K digestion and ethanol precipitation.
Quantitative real-time PCR
Quantitative (q)PCR was performed in an ABI PRISM 7500 Real TimePCR system (Applied Biosystems) with SYBR Green and ROX as a passivereference dye. Seventy nanograms of RNA recovered from the immunopre-cipitation reactions was used for qPCR analysis. Genes analyzed were asfollows: Fth1, Tfrc, Slc11a2-IRE, Slc11a2-nonIRE, Slc40a1, Epas1, Gapdh,and ACtb. Levels of Actb, Gapdh, and Slc11a2-nonIRE were used as
negative controls, for normalization, or both. PCR product quality wasmonitored by post-PCR melt curve analysis. Fold enrichments werecalculated using the relative expression software tool.21 Primer sequencesare available on request.
Microarray experiments
In total, 40 Affymetrix GeneChip Mouse Genome 430 2.0 arrays were usedto determine the mRNA composition of mRNPs obtained by immunoprecipi-tation with the recombinant IRPs. Immunopreciptated RNA (120 ng) wasused as input for a 2-step amplification procedure to generate biotin-labeledRNA fragments for hybridization to the Affymetrix microarray according tothe Standard Affymetrix 2 Cycle protocol (Eukaryotic Sample and ArrayProcessing manual 701024 Rev.3). The amplified material was verified forspecificity by qPCR before labeling and hybridization (data not shown).Intensity values for the hybridizations were obtained either using robustmultichip average (RMA), with calculations done in bioconductor (www.bioconductor.org) or Affymetrix Microarray Suite 5 (MAS5), with calcula-tions done using the Affymetrix GCOS package. MAS5-calculated intensi-ties were further quantile normalized using bioconductor. Both methods arecomplementary and commonly used normalization procedures in thecontext of established algorithms for microarray evaluation. Ratios betweenthe intensities from immunoprecipitate and mock reactions were calculatedto obtain the fold enrichment level for each probe. Genes were considered“positive” if both independent biologic replicas yielded significant enrich-ment values above the cut-off threshold, based in the lowest log2 ratioobtained from probes of known IRE-containing mRNAs or a 0.6 log2 ratiovalue as threshold (1.5-fold enrichment). Microarray data reported herehave been deposited within Gene Expression Omnibus (National Center forBiotechnology Information; GSE17096, GSE17097).
Plasmids
Mouse full-length cDNA clones for Fth1, Slc40a1, Ppp1r1b, Gyg, Gstm6,Cxcl16, Pfn2, and Pdcl3 were obtained from Origene Technologies orRiken FATOM 3 clone collections. Clones containing the H-ferritinwild-type and mutant IRE followed by the chloramphenicol-acetyltransferase(CAT) mRNA (wt and mut in this paper, originally pI-12.CAT andpI-19.CAT clones)10 and the Renilla luciferase control plasmid weredescribed previously.22 All plasmids were verified by DNA sequencing.
Competitive EMSAs
Competitive EMSAs were done using from 15 000 to 30 000 cpm of32P-radiolabeled H-ferritin IRE probe mixed with appropriate molar excessof trace-labeled competitor (1�, 2�, 5�, 10�, and 40� fold molar excess)and 10 to 60 ng of recombinant IRP1 in cell lysis buffer as describedpreviously.17 The H-ferritin mutant with a deletion (�-C, N14) in the IREloop was used as a negative control. An extensive description of competi-tive EMSAs with H-ferritin IRE mutants and with full-length transcripts isprovided in supplemental Methods (available on the Blood Web site; see theSupplemental Materials link at the top of the online article).
Tissue culture, pSILAC, and protein detection
Cells were grown at 37°C in a 5% CO2 atmosphere.The murine hepatocellular carcinoma cell line Hepa 1-6 was purchased
from DSMZ and grown in Dulbecco modified Eagle medium with 4.5 g/Lglucose supplemented with 10% of heat-inactivated FCS (HyClone Labora-tories), and 1% penicillin � streptomycin (Invitrogen). Hepa 1-6 cells wereadapted to SILAC light medium that contains dialyzed FCS for 1 week. Onthe day of the experiment, cells were incubated with 100�M hemin (LeirasOy) or 200�M desferrioxamine (DFO; Sigma-Aldrich) or left untreated for2 hours, followed by 1 hour of amino acid starvation to enhance theincorporation of isotopes, and 6 hours of labeling with M SILAC mediumfor control cells and H SILAC medium for hemin- or DFO-treated cells;total treatment time was therefore 9 hours. Cells were washed twice,harvested on ice with cold PBS, and then centrifuged; the pellets werefrozen in liquid nitrogen.
SYSTEMS ANALYSIS OF THE MURINE IRE/IRP NETWORK e169BLOOD, 24 NOVEMBER 2011 � VOLUME 118, NUMBER 22
For personal use only.on April 9, 2019. by guest www.bloodjournal.orgFrom
Time and concentration of the hemin or DFO treatments for pSILACexperiments were optimized in [35S]methionine/cysteine metabolic labelingstudies monitoring ferritin L and H protein levels and transferrin receptor1 mRNA levels (data not shown). Cell toxicity of the treatments wasassessed by the colorimetric MTT assay, and no adverse effects wereobserved under the chosen conditions (data not shown).
Bone marrow–derived macrophages (BMDMs) were recovered fromthe femur of IrpLysM::Cre(�) and IrpLysM::Cre(�) animals using ice-cold HBSS.The cell suspension was filtered through an 80-�m cell strainer (Falcon, BDBiosciences Discovery Labware), and cells were seeded at a density of 5 � 104 cells/cm2 in RPMI 1640 � GlutaMAX (Invitrogen) supple-mented with 20% of heat-inactivated FCS (HyClone Laboratories),1% penicillin � streptomycin (Invitrogen), and 100 ng/mL of macrophagecolony-stimulating factor (M-CSF; Sigma-Aldrich). After 4 days, nonadher-ent cells were removed by washing with HBSS, and the medium wassubsequently replaced daily with light SILAC medium containing M-CSFfor 2 days. Cells were further incubated in the presence of medium (controlBMDM) versus heavy (IRP-deficient cells) SILAC medium containingM-CSF for 24 hours. After 3 washes with ice-cold HBSS, cells wereharvested using a rubber policeman and pelleted by centrifugation at 300gfor 10 minutes at 4°C, and pellets were frozen in liquid nitrogen. Theproportion of macrophages typically exceeds 90% as assessed bylabeling with an Alexa Fluor 488–coupled rat monoclonal antibodyagainst the F4/80 macrophage-specific marker (Serotec); consistent withits reported efficiency,20 the LysM�/Cre deletor strain yields 70% to 80%recombination of the floxed Aco1 and Ireb2 alleles as assessed by Southernblotting (data not shown).
Cell pellets were lysed in SDS-sample buffer, and then appropriatesamples were combined, separated by SDS-PAGE, processed, andanalyzed by liquid chromatography-tandem mass spectrometry.19 Adetailed description is fully provided in supplemental Methods. Dataanalysis for mass spectrometry was performed as described previously19; acut-off for protein regulation of 1.4-fold was chosen based on results withthe control protein Tfrc.
Bioinformatic analysis
The searching for iron-responsive elements (SIREs) web-server tool forprediction of iron-responsive elements has been described previously.23
Statistics
The data are reported as mean SEM. All statistical analyses wereperformed using Prism version 5.0 (GraphPad Software). Student t testswere used to compare results between groups of 2. A value of P � .05 isconsidered statistically significant.
Results
Isolation and identification of mRNAs associated with IRP1 andIRP2
To systematically elucidate the IRP regulatory network, we devel-oped a strategy to specifically immunoprecipitate IRP-containingmRNP particles and to identify the copurified mRNAs by microar-ray analysis. Total RNA from 5 different mouse tissues (duodenum,liver, brain, spleen, and bone marrow) was incubated with recombi-nant IRP1 or IRP2 and suitable antibodies (see “Methods”). Inparallel, a reaction omitting the recombinant protein was analyzed(mock IP) to assess the background level of the system.
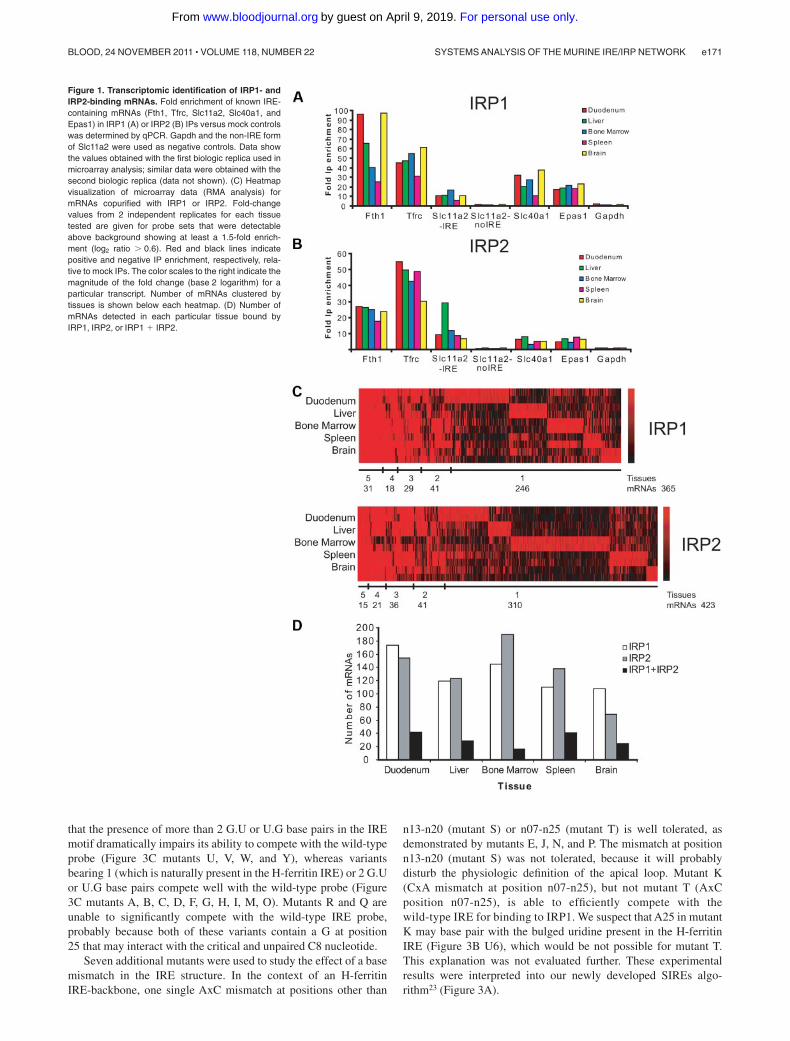
The IPs were tested for specificity by analyzing the enrichmentof known IRE-containing mRNAs in the IP versus the mock IPreactions by qPCR. The mRNAs of Fth1, Tfrc, Slc11a2, Slc40a1,and Epas1 are all strongly enriched (from 3- to 97-fold) in the IPfractions with recombinant IRP1 or IRP2 from RNA samples of all5 analyzed tissues (Figure 1A-B). No enrichment over the back-
ground was detected for Gapdh mRNA and for the non-IRE form ofSlc11a2 mRNA (Figure 1A-B). Thus, IRP1- and IRP2-bindingmRNAs are consistently and specifically detected by this procedure.
Genome-wide identification of the immunoprecipitated mRNAswithin the IRP mRNP complexes was achieved using Affymetrixmicroarrays (GeneChip Mouse Genome 430 2.0) that cover�39 000 mRNAs and RNA variants. Affymetrix array data werenormalized and analyzed using 2 independent and commonlyused statistical algorithms, MAS5 and RMA, to perform strin-gent data analysis. The total number of IRP1- or IRP2-bindingmRNAs clustered by tissues is shown below the heatmap inFigure 1C (RMA analysis), and the total number of mRNAsdetected in each particular tissue is shown in Figure 1D (RMAanalysis). A similar analysis was done with the MAS5 data(supplemental Figure 1A-B). The majority of IRP-associatedmRNAs is detected in a tissue-specific way (for IRP1, 67.4% or70.3% and for IRP2, 73.3% or 80.3%, respectively, depending onthe microarray algorithm used).
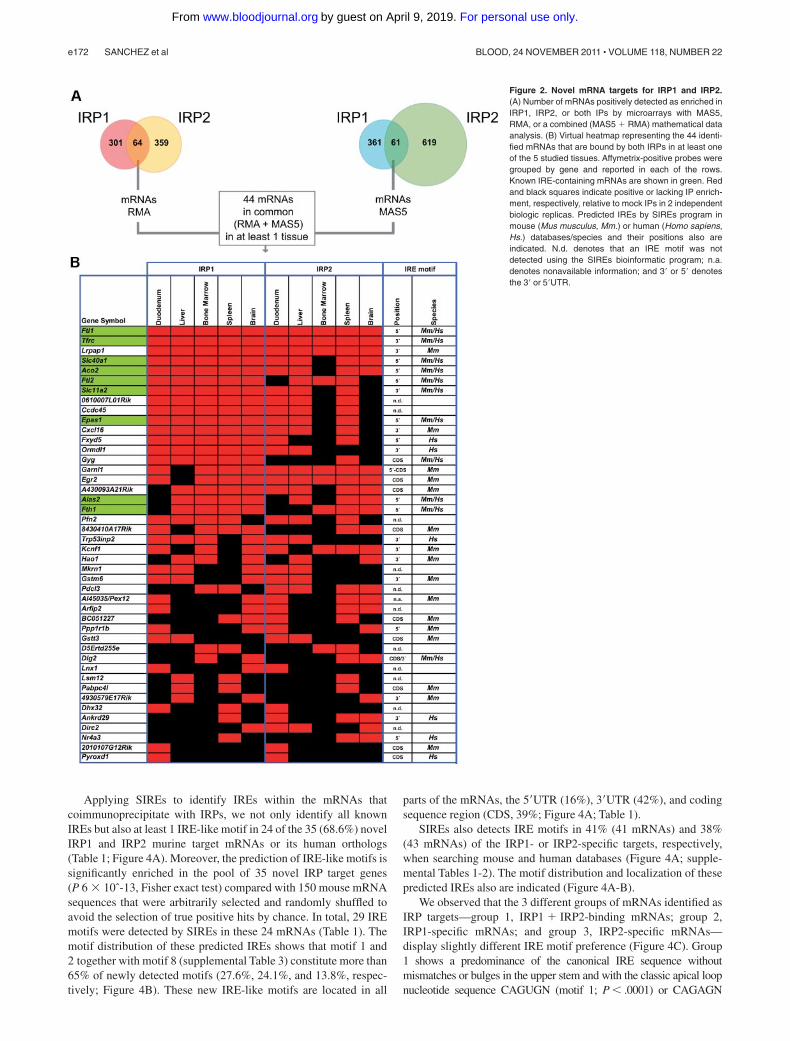
The RMA microarray data analysis revealed that 64 mRNAsbind to both IRPs in at least one tissue; 61 mRNAs were detectedusing the MAS5 analysis method (Figure 2A). Combining bothanalyses, we identified 44 mRNAs that are significantly enriched inboth IRP1 and IRP2 mRNPs (Figure 2A-B). Importantly, all9 previously known murine IRE-containing mRNAs (Ftl1, Ftl2,Fth1, Tfrc, Slc40a1, Slc11a2, Alas2, Aco2, and Epas1; marked ingreen in Figure 2B) were reidentified by our experiments. There-fore, the genome-wide search for IRP-associated mRNAs reveals35 novel mRNAs able to bind both IRP1 and IRP2 in at least 1 ofthe 5 tested tissues (Figure 2B).
In addition to these mRNAs that are bound by both IRPs, themicroarray data (combining MAS5 and RMA analysis methods)detect 101 mRNAs as exclusive interactors of IRP1 and 113 IRP2-binding mRNAs in at least one tissue (supplemental Tables 1-2). Tothe best of our knowledge, this is the first time that exclusive IRP1-or IRP2-interacting cellular mRNAs are identified.
Experimental refinement of and bioinformatic analysis for IREmotifs in novel IRP target mRNAs
Earlier bioinformatic searches of mammalian transcriptomes forIRE motifs24,25 had not identified any of the novel mRNAs that wefound to bind IRP1 and IRP2 in the experiments described so far. Inpart, such failure probably results from limitations of the definitionof an “IRE motif” that was used for these searches. To addresssome of these limitations experimentally, we first consideredprevious systematic evolution of ligands by exponential enrich-ment experiments that reported that the 6-nucleotide apical loop ofan IRE can differ from the canonical CAG(U/A)GN sequence26-28
or that the C-bulge can be replaced by a G-bulge28,29 (supplementalTable 3). In addition, we also accommodated atypical IRE struc-tures that are present in the validated Slc11a2, Epas1, and Hao1mRNAs.30-32
On the basis of these published data, we designed a series ofadditional experiments to further define IRP1-binding RNA motifsby competitive EMSA (Figure 3A; supplemental Table 3). Specifi-cally, we subjected the upper stem and the position below thebulged cytosine (C8) of the H-ferritin IRE to further analysis,testing 24 new variants (Figure 3C) together with the H-ferritinIRE controls (Figure 3B) in competitive EMSAs with recombi-nant IRP1.
Fifteen of the 24 H-ferritin IRE mutants were used to testwhether the number and position of G.U or U.G wobble base pairsin the upper stem are relevant for IRP binding. The results show
e170 SANCHEZ et al BLOOD, 24 NOVEMBER 2011 � VOLUME 118, NUMBER 22
For personal use only.on April 9, 2019. by guest www.bloodjournal.orgFrom
that the presence of more than 2 G.U or U.G base pairs in the IREmotif dramatically impairs its ability to compete with the wild-typeprobe (Figure 3C mutants U, V, W, and Y), whereas variantsbearing 1 (which is naturally present in the H-ferritin IRE) or 2 G.Uor U.G base pairs compete well with the wild-type probe (Figure3C mutants A, B, C, D, F, G, H, I, M, O). Mutants R and Q areunable to significantly compete with the wild-type IRE probe,probably because both of these variants contain a G at position25 that may interact with the critical and unpaired C8 nucleotide.
Seven additional mutants were used to study the effect of a basemismatch in the IRE structure. In the context of an H-ferritinIRE-backbone, one single AxC mismatch at positions other than
n13-n20 (mutant S) or n07-n25 (mutant T) is well tolerated, asdemonstrated by mutants E, J, N, and P. The mismatch at positionn13-n20 (mutant S) was not tolerated, because it will probablydisturb the physiologic definition of the apical loop. Mutant K(CxA mismatch at position n07-n25), but not mutant T (AxCposition n07-n25), is able to efficiently compete with thewild-type IRE for binding to IRP1. We suspect that A25 in mutantK may base pair with the bulged uridine present in the H-ferritinIRE (Figure 3B U6), which would be not possible for mutant T.This explanation was not evaluated further. These experimentalresults were interpreted into our newly developed SIREs algo-rithm23 (Figure 3A).
Figure 1. Transcriptomic identification of IRP1- andIRP2-binding mRNAs. Fold enrichment of known IRE-containing mRNAs (Fth1, Tfrc, Slc11a2, Slc40a1, andEpas1) in IRP1 (A) or IRP2 (B) IPs versus mock controlswas determined by qPCR. Gapdh and the non-IRE formof Slc11a2 were used as negative controls. Data showthe values obtained with the first biologic replica used inmicroarray analysis; similar data were obtained with thesecond biologic replica (data not shown). (C) Heatmapvisualization of microarray data (RMA analysis) formRNAs copurified with IRP1 or IRP2. Fold-changevalues from 2 independent replicates for each tissuetested are given for probe sets that were detectableabove background showing at least a 1.5-fold enrich-ment (log2 ratio � 0.6). Red and black lines indicatepositive and negative IP enrichment, respectively, rela-tive to mock IPs. The color scales to the right indicate themagnitude of the fold change (base 2 logarithm) for aparticular transcript. Number of mRNAs clustered bytissues is shown below each heatmap. (D) Number ofmRNAs detected in each particular tissue bound byIRP1, IRP2, or IRP1 � IRP2.
SYSTEMS ANALYSIS OF THE MURINE IRE/IRP NETWORK e171BLOOD, 24 NOVEMBER 2011 � VOLUME 118, NUMBER 22
For personal use only.on April 9, 2019. by guest www.bloodjournal.orgFrom
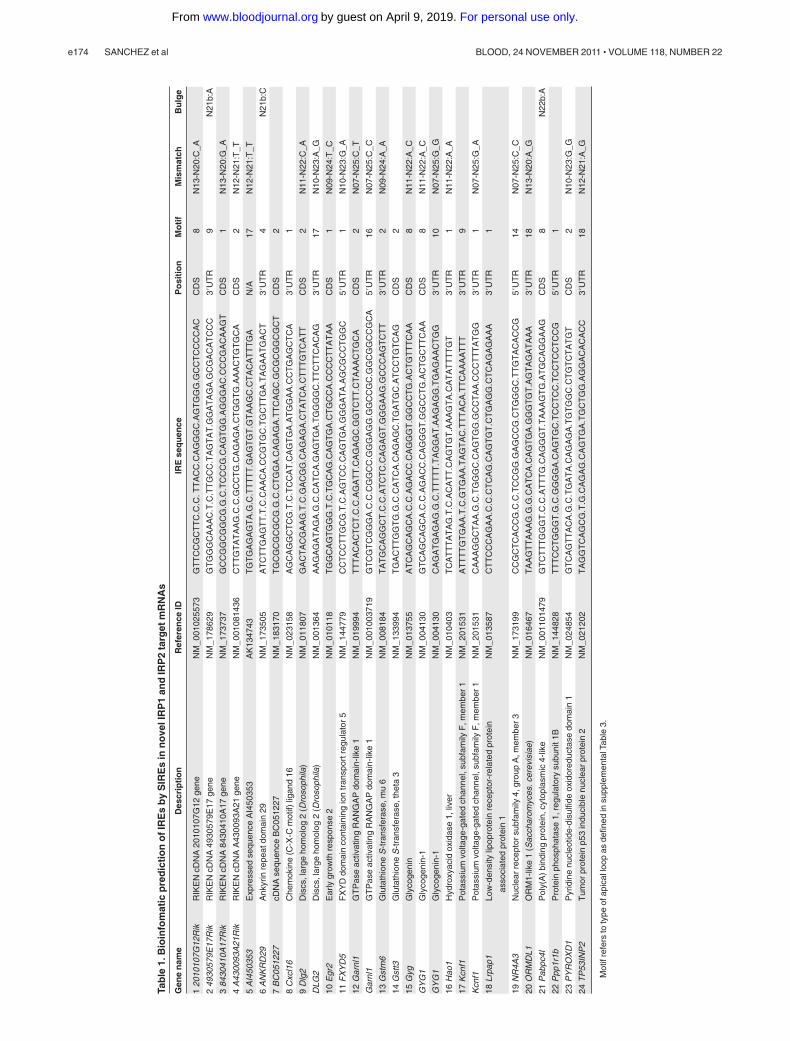
Applying SIREs to identify IREs within the mRNAs thatcoimmunoprecipitate with IRPs, we not only identify all knownIREs but also at least 1 IRE-like motif in 24 of the 35 (68.6%) novelIRP1 and IRP2 murine target mRNAs or its human orthologs(Table 1; Figure 4A). Moreover, the prediction of IRE-like motifs issignificantly enriched in the pool of 35 novel IRP target genes(P 6 � 10ˆ-13, Fisher exact test) compared with 150 mouse mRNAsequences that were arbitrarily selected and randomly shuffled toavoid the selection of true positive hits by chance. In total, 29 IREmotifs were detected by SIREs in these 24 mRNAs (Table 1). Themotif distribution of these predicted IREs shows that motif 1 and2 together with motif 8 (supplemental Table 3) constitute more than65% of newly detected motifs (27.6%, 24.1%, and 13.8%, respec-tively; Figure 4B). These new IRE-like motifs are located in all
parts of the mRNAs, the 5�UTR (16%), 3�UTR (42%), and codingsequence region (CDS, 39%; Figure 4A; Table 1).
SIREs also detects IRE motifs in 41% (41 mRNAs) and 38%(43 mRNAs) of the IRP1- or IRP2-specific targets, respectively,when searching mouse and human databases (Figure 4A; supple-mental Tables 1-2). The motif distribution and localization of thesepredicted IREs also are indicated (Figure 4A-B).
We observed that the 3 different groups of mRNAs identified asIRP targets—group 1, IRP1 � IRP2-binding mRNAs; group 2,IRP1-specific mRNAs; and group 3, IRP2-specific mRNAs—display slightly different IRE motif preference (Figure 4C). Group1 shows a predominance of the canonical IRE sequence withoutmismatches or bulges in the upper stem and with the classic apical loopnucleotide sequence CAGUGN (motif 1; P � .0001) or CAGAGN
Figure 2. Novel mRNA targets for IRP1 and IRP2.(A) Number of mRNAs positively detected as enriched inIRP1, IRP2, or both IPs by microarrays with MAS5,RMA, or a combined (MAS5 � RMA) mathematical dataanalysis. (B) Virtual heatmap representing the 44 identi-fied mRNAs that are bound by both IRPs in at least oneof the 5 studied tissues. Affymetrix-positive probes weregrouped by gene and reported in each of the rows.Known IRE-containing mRNAs are shown in green. Redand black squares indicate positive or lacking IP enrich-ment, respectively, relative to mock IPs in 2 independentbiologic replicas. Predicted IREs by SIREs program inmouse (Mus musculus, Mm.) or human (Homo sapiens,Hs.) databases/species and their positions also areindicated. N.d. denotes that an IRE motif was notdetected using the SIREs bioinformatic program; n.a.denotes nonavailable information; and 3� or 5� denotesthe 3� or 5�UTR.
e172 SANCHEZ et al BLOOD, 24 NOVEMBER 2011 � VOLUME 118, NUMBER 22
For personal use only.on April 9, 2019. by guest www.bloodjournal.orgFrom
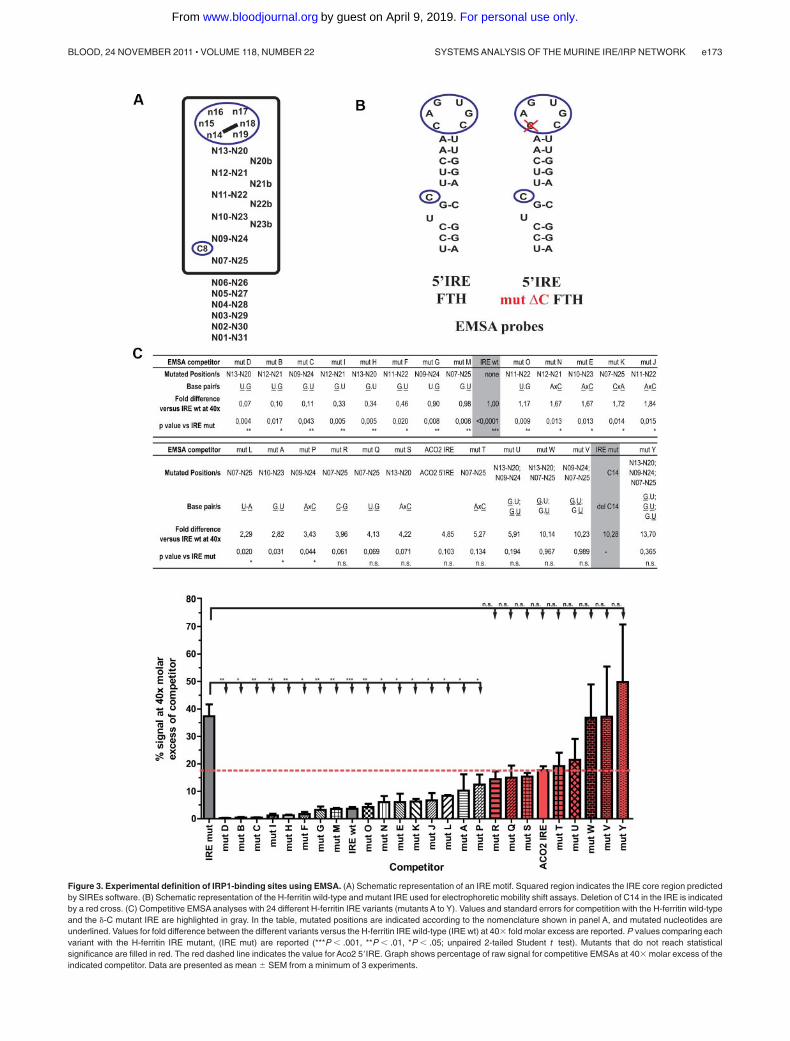
Figure 3. Experimental definition of IRP1-binding sites using EMSA. (A) Schematic representation of an IRE motif. Squared region indicates the IRE core region predictedby SIREs software. (B) Schematic representation of the H-ferritin wild-type and mutant IRE used for electrophoretic mobility shift assays. Deletion of C14 in the IRE is indicatedby a red cross. (C) Competitive EMSA analyses with 24 different H-ferritin IRE variants (mutants A to Y). Values and standard errors for competition with the H-ferritin wild-typeand the �-C mutant IRE are highlighted in gray. In the table, mutated positions are indicated according to the nomenclature shown in panel A, and mutated nucleotides areunderlined. Values for fold difference between the different variants versus the H-ferritin IRE wild-type (IRE wt) at 40� fold molar excess are reported. P values comparing eachvariant with the H-ferritin IRE mutant, (IRE mut) are reported (***P � .001, **P � .01, *P � .05; unpaired 2-tailed Student t test). Mutants that do not reach statisticalsignificance are filled in red. The red dashed line indicates the value for Aco2 5�IRE. Graph shows percentage of raw signal for competitive EMSAs at 40� molar excess of theindicated competitor. Data are presented as mean SEM from a minimum of 3 experiments.
SYSTEMS ANALYSIS OF THE MURINE IRE/IRP NETWORK e173BLOOD, 24 NOVEMBER 2011 � VOLUME 118, NUMBER 22
For personal use only.on April 9, 2019. by guest www.bloodjournal.orgFrom
Tab
le1.
Bio
info
mat
icp
red
icti
on
ofI
RE
sb
yS
IRE
sin
no
velI
RP
1an
dIR
P2
targ
etm
RN
As
Gen
en
ame
Des
crip
tio
nR
efer
ence
IDIR
Ese
qu
ence
Po
siti
on
Mo
tif
Mis
mat
chB
ulg
e
120
1010
7G12
Rik
RIK
EN
cDN
A20
1010
7G12
gene
NM
_001
0255
73G
TT
CC
GC
TT
C.C
.C.T
TA
CC
.CA
GG
GC
.AG
TG
GG
.GC
CT
CC
CC
AC
CD
S8
N13
-N20
:C_A
249
3057
9E17
Rik
RIK
EN
cDN
A49
3057
9E17
gene
NM
_178
629
GT
GG
GC
AA
AC
.T.C
.TT
GC
C.T
AG
TA
T.G
GA
TA
GA
.GC
GA
CA
TC
CC
3�U
TR
9N
21b:
A
384
3041
0A17
Rik
RIK
EN
cDN
A84
3041
0A17
gene
NM
_173
737
GC
CG
GC
GG
CG
.G.C
.TC
CC
G.C
AG
TG
G.A
GG
GA
C.C
CC
GA
CA
AG
TC
DS
1N
13-N
20:G
_A
4A
4300
93A
21R
ikR
IKE
NcD
NA
A43
0093
A21
gene
NM
_001
0814
36C
TT
GT
AT
AA
G.C
.C.G
CC
TG
.CA
GA
GA
.CT
GG
TG
.AA
AC
TG
TG
CA
CD
S2
N12
-N21
:T_T
5A
I450
353
Exp
ress
edse
quen
ceA
I450
353
AK
1347
43T
GT
GA
GA
GT
A.G
.C.T
TT
TT
.GA
GT
GT
.GT
AA
GC
.CT
AC
AT
TT
GA
N/A
17N
12-N
21:T
_T
6A
NK
RD
29A
nkyr
inre
peat
dom
ain
29N
M_1
7350
5A
TC
TT
GA
GT
T.T
.C.C
AA
CA
.CC
GT
GC
.TG
CT
TG
A.T
AG
AA
TG
AC
T3�
UT
R4
N21
b:C
7B
C05
1227
cDN
Ase
quen
ceB
C05
1227
NM
_183
170
TG
CG
CG
CG
CG
.G.C
.CT
GG
A.C
AG
AG
A.T
TC
AG
C.G
CG
CG
GC
GC
TC
DS
2
8C
xcl1
6C
hem
okin
e(C
-X-C
mot
if)lig
and
16N
M_0
2315
8A
GC
AG
GC
TC
G.T
.C.T
CC
AT
.CA
GT
GA
.AT
GG
AA
.CC
TG
AG
CT
CA
3�U
TR
1
9D
lg2
Dis
cs,l
arge
hom
olog
2(D
roso
phila
)N
M_0
1180
7G
AC
TA
CG
AA
G.T
.C.G
AC
GG
.CA
GA
GA
.CT
AT
CA
.CT
TT
GT
CA
TT
CD
S2
N11
-N22
:C_A
DLG
2D
iscs
,lar
geho
mol
og2
(Dro
soph
ila)
NM
_001
364
AA
GA
GA
TA
GA
.G.C
.CA
TC
A.G
AG
TG
A.T
GG
GG
C.T
TC
TT
CA
CA
G3�
UT
R17
N10
-N23
:A_G
10E
gr2
Ear
lygr
owth
resp
onse
2N
M_0
1011
8T
GG
CA
GT
GG
G.T
.C.T
GC
AG
.CA
GT
GA
.CT
GC
CA
.CC
CC
TT
AT
AA
CD
S1
N09
-N24
:T_C
11F
XY
D5
FX
YD
dom
ain
cont
aini
ngio
ntr
ansp
ortr
egul
ator
5N
M_1
4477
9C
CT
CC
TT
GC
G.T
.C.A
GT
CC
.CA
GT
GA
.GG
GA
TA
.AG
CG
CC
TG
GC
5�U
TR
1N
10-N
23:G
_A
12G
arnl
1G
TP
ase
activ
atin
gR
AN
GA
Pdo
mai
n-lik
e1
NM
_019
994
TT
TA
CA
CT
CT
.C.C
.AG
AT
T.C
AG
AG
C.G
GT
CT
T.C
TA
AA
CT
GC
AC
DS
2N
07-N
25:C
_T
Gar
nl1
GT
Pas
eac
tivat
ing
RA
NG
AP
dom
ain-
like
1N
M_0
0100
3719
GT
CG
TC
GG
GA
.C.C
.CG
GC
C.G
GG
AG
G.G
GC
CG
C.G
GC
GG
CC
GC
A5�
UT
R16
N07
-N25
:C_C
13G
stm
6G
luta
thio
neS
-tra
nsfe
rase
,mu
6N
M_0
0818
4T
AT
GC
AG
GC
T.C
.C.A
TC
TC
.CA
GA
GT
.GG
GA
AG
.GC
CC
AG
TC
TT
3�U
TR
2N
09-N
24:A
_A
14G
stt3
Glu
tath
ione
S-t
rans
fera
se,t
heta
3N
M_1
3399
4T
GA
CT
TG
GT
G.G
.C.C
AT
CA
.CA
GA
GC
.TG
AT
GC
.AT
CC
TG
TC
AG
CD
S2
15G
ygG
lyco
geni
nN
M_0
1375
5A
TC
AG
CA
GC
A.C
.C.A
GA
CC
.CA
GG
GT
.GG
CC
TG
.AC
TG
TT
TC
AA
CD
S8
N11
-N22
:A_C
GY
G1
Gly
coge
nin-
1N
M_0
0413
0G
TC
AG
CA
GC
A.C
.C.A
GA
CC
.CA
GG
GT
.GG
CC
TG
.AC
TG
CT
TC
AA
CD
S8
N11
-N22
:A_C
GY
G1
Gly
coge
nin-
1N
M_0
0413
0C
AG
AT
GA
GA
G.G
.C.T
TT
TT
.TA
GG
AT
.AA
GA
GG
.TG
AG
AA
CT
GG
3�U
TR
10N
07-N
25:G
_G
16H
ao1
Hyd
roxy
acid
oxid
ase
1,liv
erN
M_0
1040
3T
CA
TT
TA
TA
G.T
.C.A
CA
TT
.CA
GT
GT
.AA
AG
TA
.CA
TA
TT
TT
GT
3�U
TR
1N
11-N
22:A
_A
17K
cnf1
Pot
assi
umvo
ltage
-gat
edch
anne
l,su
bfam
ilyF
,mem
ber
1N
M_2
0153
1A
TT
TT
GT
GA
A.T
.C.G
TG
AA
.TA
GT
AC
.TT
TA
CA
.TT
CA
AA
AT
TT
3�U
TR
9
Kcn
f1P
otas
sium
volta
ge-g
ated
chan
nel,
subf
amily
F,m
embe
r1
NM
_201
531
CA
AA
GG
CT
AA
.G.C
.TG
GG
C.C
AG
TG
G.G
CC
TA
A.C
CC
TT
TA
TG
G3�
UT
R1
N07
-N25
:G_A
18Lr
pap1
Low
-den
sity
lipop
rote
inre
cept
or-r
elat
edpr
otei
n
asso
ciat
edpr
otei
n1
NM
_013
587
CT
TC
CC
AG
AA
.C.C
.CT
CA
G.C
AG
TG
T.C
TG
AG
G.C
TC
AG
AG
AA
A3�
UT
R1
19N
R4A
3N
ucle
arre
cept
orsu
bfam
ily4,
grou
pA
,mem
ber
3N
M_1
7319
9C
CG
CT
CA
CC
G.C
.C.T
CC
GG
.GA
GC
CG
.CT
GG
GC
.TT
GT
AC
AC
CG
5�U
TR
14N
07-N
25:C
_C
20O
RM
DL1
OR
M1-
like
1(S
acch
arom
yces
.cer
evis
iae)
NM
_016
467
TA
AG
TT
AA
AG
.G.G
.CA
TC
A.C
AG
TG
A.G
GG
TG
T.A
GT
AG
AT
AA
A3�
UT
R18
N13
-N20
:A_G
21P
abpc
4lP
oly(
A)
bind
ing
prot
ein,
cyto
plas
mic
4-lik
eN
M_0
0110
1479
GT
CT
TT
GG
GT
.C.C
.AT
TT
G.C
AG
GG
T.T
AA
AG
TG
.AT
GC
AG
GA
AG
CD
S8
N22
b:A
22P
pp1r
1bP
rote
inph
osph
atas
e1,
regu
lato
rysu
buni
t1B
NM
_144
828
TT
TC
CT
GG
GT
.G.C
.GG
GG
A.C
AG
TG
C.T
CC
TC
C.T
CC
TC
CT
CC
G5�
UT
R1
23P
YR
OX
D1
Pyr
idin
enu
cleo
tide-
disu
lfide
oxid
ored
ucta
sedo
mai
n1
NM
_024
854
GT
CA
GT
TA
CA
.G.C
.TG
AT
A.C
AG
AG
A.T
GT
GG
C.C
TG
TC
TA
TG
TC
DS
2N
10-N
23:G
_G
24T
P53
INP
2T
umor
prot
ein
p53
indu
cibl
enu
clea
rpr
otei
n2
NM
_021
202
TA
GG
TC
AG
CG
.T.G
.CA
GA
G.C
AG
TG
A.T
GC
TG
G.A
GG
AC
AC
AC
C3�
UT
R18
N12
-N21
:A_G
Mot
ifre
fers
toty
peof
apic
allo
opas
defin
edin
supp
lem
enta
lTab
le3.
e174 SANCHEZ et al BLOOD, 24 NOVEMBER 2011 � VOLUME 118, NUMBER 22
For personal use only.on April 9, 2019. by guest www.bloodjournal.orgFrom
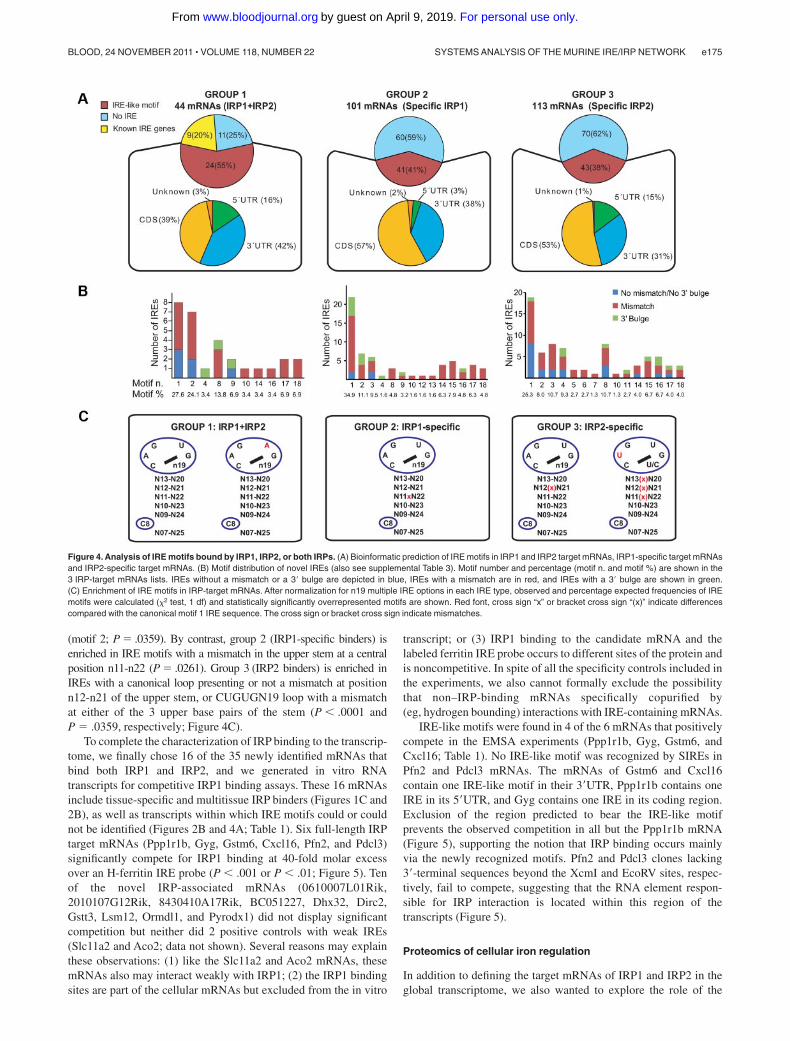
(motif 2; P � .0359). By contrast, group 2 (IRP1-specific binders) isenriched in IRE motifs with a mismatch in the upper stem at a centralposition n11-n22 (P � .0261). Group 3 (IRP2 binders) is enriched inIREs with a canonical loop presenting or not a mismatch at positionn12-n21 of the upper stem, or CUGUGN19 loop with a mismatchat either of the 3 upper base pairs of the stem (P � .0001 andP � .0359, respectively; Figure 4C).
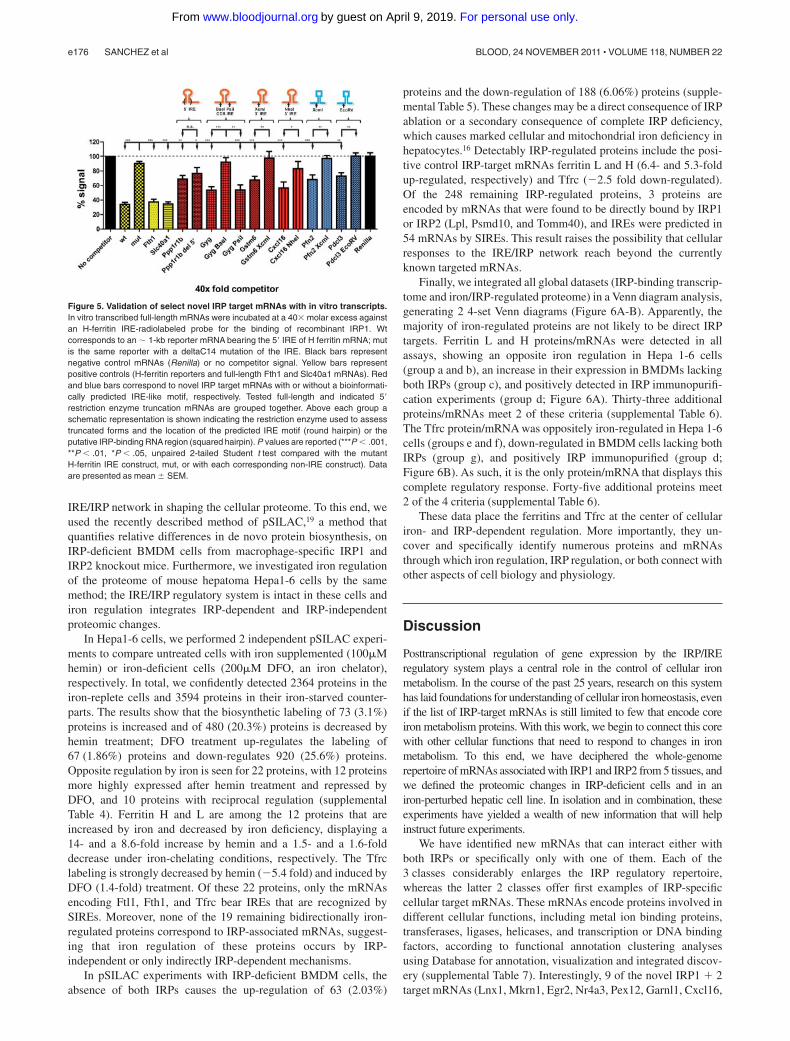
To complete the characterization of IRP binding to the transcrip-tome, we finally chose 16 of the 35 newly identified mRNAs thatbind both IRP1 and IRP2, and we generated in vitro RNAtranscripts for competitive IRP1 binding assays. These 16 mRNAsinclude tissue-specific and multitissue IRP binders (Figures 1C and2B), as well as transcripts within which IRE motifs could or couldnot be identified (Figures 2B and 4A; Table 1). Six full-length IRPtarget mRNAs (Ppp1r1b, Gyg, Gstm6, Cxcl16, Pfn2, and Pdcl3)significantly compete for IRP1 binding at 40-fold molar excessover an H-ferritin IRE probe (P � .001 or P � .01; Figure 5). Tenof the novel IRP-associated mRNAs (0610007L01Rik,2010107G12Rik, 8430410A17Rik, BC051227, Dhx32, Dirc2,Gstt3, Lsm12, Ormdl1, and Pyrodx1) did not display significantcompetition but neither did 2 positive controls with weak IREs(Slc11a2 and Aco2; data not shown). Several reasons may explainthese observations: (1) like the Slc11a2 and Aco2 mRNAs, thesemRNAs also may interact weakly with IRP1; (2) the IRP1 bindingsites are part of the cellular mRNAs but excluded from the in vitro
transcript; or (3) IRP1 binding to the candidate mRNA and thelabeled ferritin IRE probe occurs to different sites of the protein andis noncompetitive. In spite of all the specificity controls included inthe experiments, we also cannot formally exclude the possibilitythat non–IRP-binding mRNAs specifically copurified by(eg, hydrogen bounding) interactions with IRE-containing mRNAs.
IRE-like motifs were found in 4 of the 6 mRNAs that positivelycompete in the EMSA experiments (Ppp1r1b, Gyg, Gstm6, andCxcl16; Table 1). No IRE-like motif was recognized by SIREs inPfn2 and Pdcl3 mRNAs. The mRNAs of Gstm6 and Cxcl16contain one IRE-like motif in their 3�UTR, Ppp1r1b contains oneIRE in its 5�UTR, and Gyg contains one IRE in its coding region.Exclusion of the region predicted to bear the IRE-like motifprevents the observed competition in all but the Ppp1r1b mRNA(Figure 5), supporting the notion that IRP binding occurs mainlyvia the newly recognized motifs. Pfn2 and Pdcl3 clones lacking3�-terminal sequences beyond the XcmI and EcoRV sites, respec-tively, fail to compete, suggesting that the RNA element respon-sible for IRP interaction is located within this region of thetranscripts (Figure 5).
Proteomics of cellular iron regulation
In addition to defining the target mRNAs of IRP1 and IRP2 in theglobal transcriptome, we also wanted to explore the role of the
Figure 4. Analysis of IRE motifs bound by IRP1, IRP2, or both IRPs. (A) Bioinformatic prediction of IRE motifs in IRP1 and IRP2 target mRNAs, IRP1-specific target mRNAsand IRP2-specific target mRNAs. (B) Motif distribution of novel IREs (also see supplemental Table 3). Motif number and percentage (motif n. and motif %) are shown in the3 IRP-target mRNAs lists. IREs without a mismatch or a 3� bulge are depicted in blue, IREs with a mismatch are in red, and IREs with a 3� bulge are shown in green.(C) Enrichment of IRE motifs in IRP-target mRNAs. After normalization for n19 multiple IRE options in each IRE type, observed and percentage expected frequencies of IREmotifs were calculated ( 2 test, 1 df) and statistically significantly overrepresented motifs are shown. Red font, cross sign “x” or bracket cross sign “(x)” indicate differencescompared with the canonical motif 1 IRE sequence. The cross sign or bracket cross sign indicate mismatches.
SYSTEMS ANALYSIS OF THE MURINE IRE/IRP NETWORK e175BLOOD, 24 NOVEMBER 2011 � VOLUME 118, NUMBER 22
For personal use only.on April 9, 2019. by guest www.bloodjournal.orgFrom
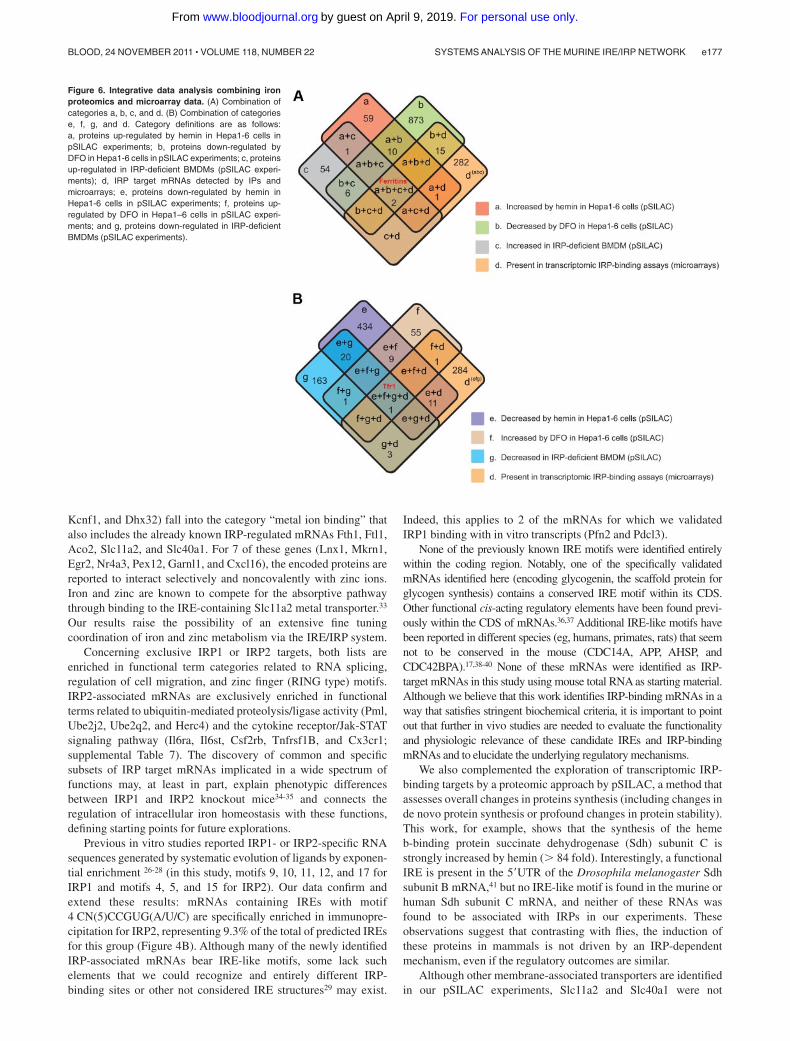
IRE/IRP network in shaping the cellular proteome. To this end, weused the recently described method of pSILAC,19 a method thatquantifies relative differences in de novo protein biosynthesis, onIRP-deficient BMDM cells from macrophage-specific IRP1 andIRP2 knockout mice. Furthermore, we investigated iron regulationof the proteome of mouse hepatoma Hepa1-6 cells by the samemethod; the IRE/IRP regulatory system is intact in these cells andiron regulation integrates IRP-dependent and IRP-independentproteomic changes.
In Hepa1-6 cells, we performed 2 independent pSILAC experi-ments to compare untreated cells with iron supplemented (100�Mhemin) or iron-deficient cells (200�M DFO, an iron chelator),respectively. In total, we confidently detected 2364 proteins in theiron-replete cells and 3594 proteins in their iron-starved counter-parts. The results show that the biosynthetic labeling of 73 (3.1%)proteins is increased and of 480 (20.3%) proteins is decreased byhemin treatment; DFO treatment up-regulates the labeling of67 (1.86%) proteins and down-regulates 920 (25.6%) proteins.Opposite regulation by iron is seen for 22 proteins, with 12 proteinsmore highly expressed after hemin treatment and repressed byDFO, and 10 proteins with reciprocal regulation (supplementalTable 4). Ferritin H and L are among the 12 proteins that areincreased by iron and decreased by iron deficiency, displaying a14- and a 8.6-fold increase by hemin and a 1.5- and a 1.6-folddecrease under iron-chelating conditions, respectively. The Tfrclabeling is strongly decreased by hemin (�5.4 fold) and induced byDFO (1.4-fold) treatment. Of these 22 proteins, only the mRNAsencoding Ftl1, Fth1, and Tfrc bear IREs that are recognized bySIREs. Moreover, none of the 19 remaining bidirectionally iron-regulated proteins correspond to IRP-associated mRNAs, suggest-ing that iron regulation of these proteins occurs by IRP-independent or only indirectly IRP-dependent mechanisms.
In pSILAC experiments with IRP-deficient BMDM cells, theabsence of both IRPs causes the up-regulation of 63 (2.03%)
proteins and the down-regulation of 188 (6.06%) proteins (supple-mental Table 5). These changes may be a direct consequence of IRPablation or a secondary consequence of complete IRP deficiency,which causes marked cellular and mitochondrial iron deficiency inhepatocytes.16 Detectably IRP-regulated proteins include the posi-tive control IRP-target mRNAs ferritin L and H (6.4- and 5.3-foldup-regulated, respectively) and Tfrc (�2.5 fold down-regulated).Of the 248 remaining IRP-regulated proteins, 3 proteins areencoded by mRNAs that were found to be directly bound by IRP1or IRP2 (Lpl, Psmd10, and Tomm40), and IREs were predicted in54 mRNAs by SIREs. This result raises the possibility that cellularresponses to the IRE/IRP network reach beyond the currentlyknown targeted mRNAs.
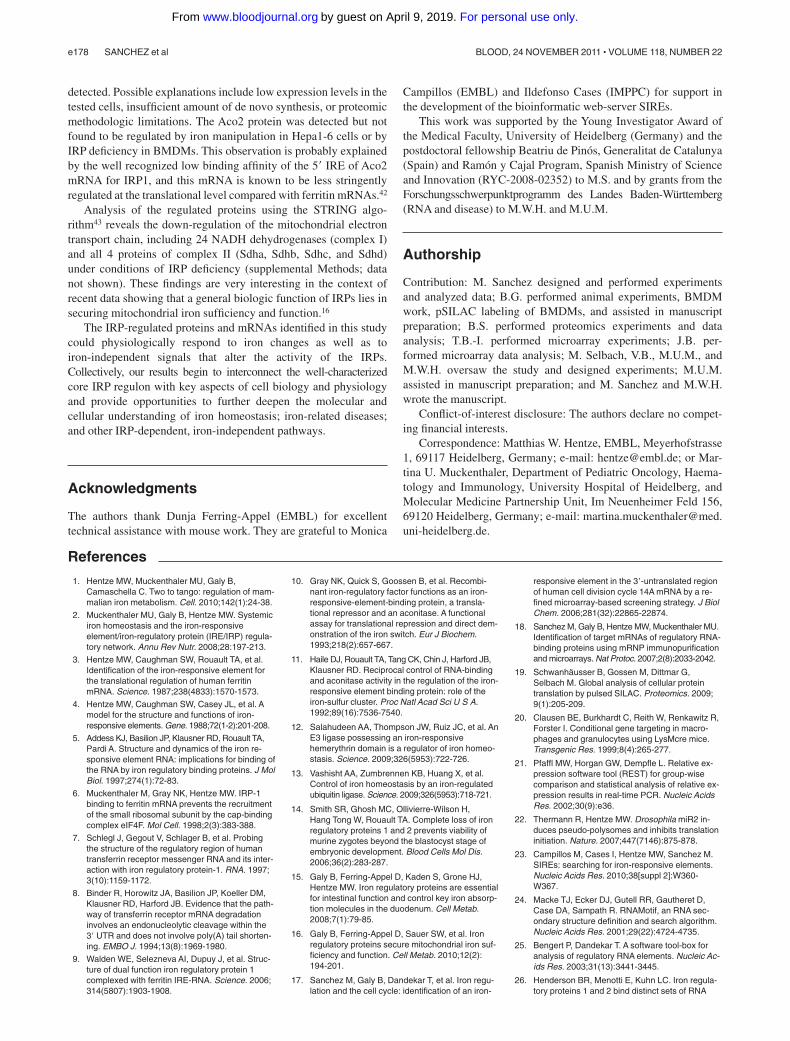
Finally, we integrated all global datasets (IRP-binding transcrip-tome and iron/IRP-regulated proteome) in a Venn diagram analysis,generating 2 4-set Venn diagrams (Figure 6A-B). Apparently, themajority of iron-regulated proteins are not likely to be direct IRPtargets. Ferritin L and H proteins/mRNAs were detected in allassays, showing an opposite iron regulation in Hepa 1-6 cells(group a and b), an increase in their expression in BMDMs lackingboth IRPs (group c), and positively detected in IRP immunopurifi-cation experiments (group d; Figure 6A). Thirty-three additionalproteins/mRNAs meet 2 of these criteria (supplemental Table 6).The Tfrc protein/mRNA was oppositely iron-regulated in Hepa 1-6cells (groups e and f), down-regulated in BMDM cells lacking bothIRPs (group g), and positively IRP immunopurified (group d;Figure 6B). As such, it is the only protein/mRNA that displays thiscomplete regulatory response. Forty-five additional proteins meet2 of the 4 criteria (supplemental Table 6).
These data place the ferritins and Tfrc at the center of cellulariron- and IRP-dependent regulation. More importantly, they un-cover and specifically identify numerous proteins and mRNAsthrough which iron regulation, IRP regulation, or both connect withother aspects of cell biology and physiology.
Discussion
Posttranscriptional regulation of gene expression by the IRP/IREregulatory system plays a central role in the control of cellular ironmetabolism. In the course of the past 25 years, research on this systemhas laid foundations for understanding of cellular iron homeostasis, evenif the list of IRP-target mRNAs is still limited to few that encode coreiron metabolism proteins. With this work, we begin to connect this corewith other cellular functions that need to respond to changes in ironmetabolism. To this end, we have deciphered the whole-genomerepertoire of mRNAs associated with IRP1 and IRP2 from 5 tissues, andwe defined the proteomic changes in IRP-deficient cells and in aniron-perturbed hepatic cell line. In isolation and in combination, theseexperiments have yielded a wealth of new information that will helpinstruct future experiments.
We have identified new mRNAs that can interact either withboth IRPs or specifically only with one of them. Each of the3 classes considerably enlarges the IRP regulatory repertoire,whereas the latter 2 classes offer first examples of IRP-specificcellular target mRNAs. These mRNAs encode proteins involved indifferent cellular functions, including metal ion binding proteins,transferases, ligases, helicases, and transcription or DNA bindingfactors, according to functional annotation clustering analysesusing Database for annotation, visualization and integrated discov-ery (supplemental Table 7). Interestingly, 9 of the novel IRP1 � 2target mRNAs (Lnx1, Mkrn1, Egr2, Nr4a3, Pex12, Garnl1, Cxcl16,
Figure 5. Validation of select novel IRP target mRNAs with in vitro transcripts.In vitro transcribed full-length mRNAs were incubated at a 40� molar excess againstan H-ferritin IRE-radiolabeled probe for the binding of recombinant IRP1. Wtcorresponds to an 1-kb reporter mRNA bearing the 5� IRE of H ferritin mRNA; mutis the same reporter with a deltaC14 mutation of the IRE. Black bars representnegative control mRNAs (Renilla) or no competitor signal. Yellow bars representpositive controls (H-ferritin reporters and full-length Fth1 and Slc40a1 mRNAs). Redand blue bars correspond to novel IRP target mRNAs with or without a bioinformati-cally predicted IRE-like motif, respectively. Tested full-length and indicated 5�restriction enzyme truncation mRNAs are grouped together. Above each group aschematic representation is shown indicating the restriction enzyme used to assesstruncated forms and the location of the predicted IRE motif (round hairpin) or theputative IRP-binding RNAregion (squared hairpin). P values are reported (***P � .001,**P � .01, *P � .05, unpaired 2-tailed Student t test compared with the mutantH-ferritin IRE construct, mut, or with each corresponding non-IRE construct). Dataare presented as mean SEM.
e176 SANCHEZ et al BLOOD, 24 NOVEMBER 2011 � VOLUME 118, NUMBER 22
For personal use only.on April 9, 2019. by guest www.bloodjournal.orgFrom
Kcnf1, and Dhx32) fall into the category “metal ion binding” thatalso includes the already known IRP-regulated mRNAs Fth1, Ftl1,Aco2, Slc11a2, and Slc40a1. For 7 of these genes (Lnx1, Mkrn1,Egr2, Nr4a3, Pex12, Garnl1, and Cxcl16), the encoded proteins arereported to interact selectively and noncovalently with zinc ions.Iron and zinc are known to compete for the absorptive pathwaythrough binding to the IRE-containing Slc11a2 metal transporter.33
Our results raise the possibility of an extensive fine tuningcoordination of iron and zinc metabolism via the IRE/IRP system.
Concerning exclusive IRP1 or IRP2 targets, both lists areenriched in functional term categories related to RNA splicing,regulation of cell migration, and zinc finger (RING type) motifs.IRP2-associated mRNAs are exclusively enriched in functionalterms related to ubiquitin-mediated proteolysis/ligase activity (Pml,Ube2j2, Ube2q2, and Herc4) and the cytokine receptor/Jak-STATsignaling pathway (Il6ra, Il6st, Csf2rb, Tnfrsf1B, and Cx3cr1;supplemental Table 7). The discovery of common and specificsubsets of IRP target mRNAs implicated in a wide spectrum offunctions may, at least in part, explain phenotypic differencesbetween IRP1 and IRP2 knockout mice34-35 and connects theregulation of intracellular iron homeostasis with these functions,defining starting points for future explorations.
Previous in vitro studies reported IRP1- or IRP2-specific RNAsequences generated by systematic evolution of ligands by exponen-tial enrichment 26-28 (in this study, motifs 9, 10, 11, 12, and 17 forIRP1 and motifs 4, 5, and 15 for IRP2). Our data confirm andextend these results: mRNAs containing IREs with motif4 CN(5)CCGUG(A/U/C) are specifically enriched in immunopre-cipitation for IRP2, representing 9.3% of the total of predicted IREsfor this group (Figure 4B). Although many of the newly identifiedIRP-associated mRNAs bear IRE-like motifs, some lack suchelements that we could recognize and entirely different IRP-binding sites or other not considered IRE structures29 may exist.
Indeed, this applies to 2 of the mRNAs for which we validatedIRP1 binding with in vitro transcripts (Pfn2 and Pdcl3).
None of the previously known IRE motifs were identified entirelywithin the coding region. Notably, one of the specifically validatedmRNAs identified here (encoding glycogenin, the scaffold protein forglycogen synthesis) contains a conserved IRE motif within its CDS.Other functional cis-acting regulatory elements have been found previ-ously within the CDS of mRNAs.36,37 Additional IRE-like motifs havebeen reported in different species (eg, humans, primates, rats) that seemnot to be conserved in the mouse (CDC14A, APP, AHSP, andCDC42BPA).17,38-40 None of these mRNAs were identified as IRP-target mRNAs in this study using mouse total RNA as starting material.Although we believe that this work identifies IRP-binding mRNAs in away that satisfies stringent biochemical criteria, it is important to pointout that further in vivo studies are needed to evaluate the functionalityand physiologic relevance of these candidate IREs and IRP-bindingmRNAs and to elucidate the underlying regulatory mechanisms.
We also complemented the exploration of transcriptomic IRP-binding targets by a proteomic approach by pSILAC, a method thatassesses overall changes in proteins synthesis (including changes inde novo protein synthesis or profound changes in protein stability).This work, for example, shows that the synthesis of the hemeb-binding protein succinate dehydrogenase (Sdh) subunit C isstrongly increased by hemin (� 84 fold). Interestingly, a functionalIRE is present in the 5�UTR of the Drosophila melanogaster Sdhsubunit B mRNA,41 but no IRE-like motif is found in the murine orhuman Sdh subunit C mRNA, and neither of these RNAs wasfound to be associated with IRPs in our experiments. Theseobservations suggest that contrasting with flies, the induction ofthese proteins in mammals is not driven by an IRP-dependentmechanism, even if the regulatory outcomes are similar.
Although other membrane-associated transporters are identifiedin our pSILAC experiments, Slc11a2 and Slc40a1 were not
Figure 6. Integrative data analysis combining ironproteomics and microarray data. (A) Combination ofcategories a, b, c, and d. (B) Combination of categoriese, f, g, and d. Category definitions are as follows:a, proteins up-regulated by hemin in Hepa1-6 cells inpSILAC experiments; b, proteins down-regulated byDFO in Hepa1-6 cells in pSILAC experiments; c, proteinsup-regulated in IRP-deficient BMDMs (pSILAC experi-ments); d, IRP target mRNAs detected by IPs andmicroarrays; e, proteins down-regulated by hemin inHepa1-6 cells in pSILAC experiments; f, proteins up-regulated by DFO in Hepa1–6 cells in pSILAC experi-ments; and g, proteins down-regulated in IRP-deficientBMDMs (pSILAC experiments).
SYSTEMS ANALYSIS OF THE MURINE IRE/IRP NETWORK e177BLOOD, 24 NOVEMBER 2011 � VOLUME 118, NUMBER 22
For personal use only.on April 9, 2019. by guest www.bloodjournal.orgFrom
detected. Possible explanations include low expression levels in thetested cells, insufficient amount of de novo synthesis, or proteomicmethodologic limitations. The Aco2 protein was detected but notfound to be regulated by iron manipulation in Hepa1-6 cells or byIRP deficiency in BMDMs. This observation is probably explainedby the well recognized low binding affinity of the 5� IRE of Aco2mRNA for IRP1, and this mRNA is known to be less stringentlyregulated at the translational level compared with ferritin mRNAs.42
Analysis of the regulated proteins using the STRING algo-rithm43 reveals the down-regulation of the mitochondrial electrontransport chain, including 24 NADH dehydrogenases (complex I)and all 4 proteins of complex II (Sdha, Sdhb, Sdhc, and Sdhd)under conditions of IRP deficiency (supplemental Methods; datanot shown). These findings are very interesting in the context ofrecent data showing that a general biologic function of IRPs lies insecuring mitochondrial iron sufficiency and function.16
The IRP-regulated proteins and mRNAs identified in this studycould physiologically respond to iron changes as well as toiron-independent signals that alter the activity of the IRPs.Collectively, our results begin to interconnect the well-characterizedcore IRP regulon with key aspects of cell biology and physiologyand provide opportunities to further deepen the molecular andcellular understanding of iron homeostasis; iron-related diseases;and other IRP-dependent, iron-independent pathways.
Acknowledgments
The authors thank Dunja Ferring-Appel (EMBL) for excellenttechnical assistance with mouse work. They are grateful to Monica
Campillos (EMBL) and Ildefonso Cases (IMPPC) for support inthe development of the bioinformatic web-server SIREs.
This work was supported by the Young Investigator Award ofthe Medical Faculty, University of Heidelberg (Germany) and thepostdoctoral fellowship Beatriu de Pinos, Generalitat de Catalunya(Spain) and Ramon y Cajal Program, Spanish Ministry of Scienceand Innovation (RYC-2008-02352) to M.S. and by grants from theForschungsschwerpunktprogramm des Landes Baden-Wurttemberg(RNA and disease) to M.W.H. and M.U.M.
Authorship
Contribution: M. Sanchez designed and performed experimentsand analyzed data; B.G. performed animal experiments, BMDMwork, pSILAC labeling of BMDMs, and assisted in manuscriptpreparation; B.S. performed proteomics experiments and dataanalysis; T.B.-I. performed microarray experiments; J.B. per-formed microarray data analysis; M. Selbach, V.B., M.U.M., andM.W.H. oversaw the study and designed experiments; M.U.M.assisted in manuscript preparation; and M. Sanchez and M.W.H.wrote the manuscript.
Conflict-of-interest disclosure: The authors declare no compet-ing financial interests.
Correspondence: Matthias W. Hentze, EMBL, Meyerhofstrasse1, 69117 Heidelberg, Germany; e-mail: [email protected]; or Mar-tina U. Muckenthaler, Department of Pediatric Oncology, Haema-tology and Immunology, University Hospital of Heidelberg, andMolecular Medicine Partnership Unit, Im Neuenheimer Feld 156,69120 Heidelberg, Germany; e-mail: [email protected].
References
1. Hentze MW, Muckenthaler MU, Galy B,Camaschella C. Two to tango: regulation of mam-malian iron metabolism. Cell. 2010;142(1):24-38.
2. Muckenthaler MU, Galy B, Hentze MW. Systemiciron homeostasis and the iron-responsiveelement/iron-regulatory protein (IRE/IRP) regula-tory network. Annu Rev Nutr. 2008;28:197-213.
3. Hentze MW, Caughman SW, Rouault TA, et al.Identification of the iron-responsive element forthe translational regulation of human ferritinmRNA. Science. 1987;238(4833):1570-1573.
4. Hentze MW, Caughman SW, Casey JL, et al. Amodel for the structure and functions of iron-responsive elements. Gene. 1988;72(1-2):201-208.
5. Addess KJ, Basilion JP, Klausner RD, Rouault TA,Pardi A. Structure and dynamics of the iron re-sponsive element RNA: implications for binding ofthe RNA by iron regulatory binding proteins. J MolBiol. 1997;274(1):72-83.
6. Muckenthaler M, Gray NK, Hentze MW. IRP-1binding to ferritin mRNA prevents the recruitmentof the small ribosomal subunit by the cap-bindingcomplex eIF4F. Mol Cell. 1998;2(3):383-388.
7. Schlegl J, Gegout V, Schlager B, et al. Probingthe structure of the regulatory region of humantransferrin receptor messenger RNA and its inter-action with iron regulatory protein-1. RNA. 1997;3(10):1159-1172.
8. Binder R, Horowitz JA, Basilion JP, Koeller DM,Klausner RD, Harford JB. Evidence that the path-way of transferrin receptor mRNA degradationinvolves an endonucleolytic cleavage within the3� UTR and does not involve poly(A) tail shorten-ing. EMBO J. 1994;13(8):1969-1980.
9. Walden WE, Selezneva AI, Dupuy J, et al. Struc-ture of dual function iron regulatory protein 1complexed with ferritin IRE-RNA. Science. 2006;314(5807):1903-1908.
10. Gray NK, Quick S, Goossen B, et al. Recombi-nant iron-regulatory factor functions as an iron-responsive-element-binding protein, a transla-tional repressor and an aconitase. A functionalassay for translational repression and direct dem-onstration of the iron switch. Eur J Biochem.1993;218(2):657-667.
11. Haile DJ, Rouault TA, Tang CK, Chin J, Harford JB,Klausner RD. Reciprocal control of RNA-bindingand aconitase activity in the regulation of the iron-responsive element binding protein: role of theiron-sulfur cluster. Proc Natl Acad Sci U S A.1992;89(16):7536-7540.
12. Salahudeen AA, Thompson JW, Ruiz JC, et al. AnE3 ligase possessing an iron-responsivehemerythrin domain is a regulator of iron homeo-stasis. Science. 2009;326(5953):722-726.
13. Vashisht AA, Zumbrennen KB, Huang X, et al.Control of iron homeostasis by an iron-regulatedubiquitin ligase. Science. 2009;326(5953):718-721.
14. Smith SR, Ghosh MC, Ollivierre-Wilson H,Hang Tong W, Rouault TA. Complete loss of ironregulatory proteins 1 and 2 prevents viability ofmurine zygotes beyond the blastocyst stage ofembryonic development. Blood Cells Mol Dis.2006;36(2):283-287.
15. Galy B, Ferring-Appel D, Kaden S, Grone HJ,Hentze MW. Iron regulatory proteins are essentialfor intestinal function and control key iron absorp-tion molecules in the duodenum. Cell Metab.2008;7(1):79-85.
16. Galy B, Ferring-Appel D, Sauer SW, et al. Ironregulatory proteins secure mitochondrial iron suf-ficiency and function. Cell Metab. 2010;12(2):194-201.
17. Sanchez M, Galy B, Dandekar T, et al. Iron regu-lation and the cell cycle: identification of an iron-
responsive element in the 3�-untranslated regionof human cell division cycle 14A mRNA by a re-fined microarray-based screening strategy. J BiolChem. 2006;281(32):22865-22874.
18. Sanchez M, Galy B, Hentze MW, Muckenthaler MU.Identification of target mRNAs of regulatory RNA-binding proteins using mRNP immunopurificationand microarrays. Nat Protoc. 2007;2(8):2033-2042.
19. Schwanhausser B, Gossen M, Dittmar G,Selbach M. Global analysis of cellular proteintranslation by pulsed SILAC. Proteomics. 2009;9(1):205-209.
20. Clausen BE, Burkhardt C, Reith W, Renkawitz R,Forster I. Conditional gene targeting in macro-phages and granulocytes using LysMcre mice.Transgenic Res. 1999;8(4):265-277.
21. Pfaffl MW, Horgan GW, Dempfle L. Relative ex-pression software tool (REST) for group-wisecomparison and statistical analysis of relative ex-pression results in real-time PCR. Nucleic AcidsRes. 2002;30(9):e36.
22. Thermann R, Hentze MW. Drosophila miR2 in-duces pseudo-polysomes and inhibits translationinitiation. Nature. 2007;447(7146):875-878.
23. Campillos M, Cases I, Hentze MW, Sanchez M.SIREs: searching for iron-responsive elements.Nucleic Acids Res. 2010;38[suppl 2]:W360-W367.
24. Macke TJ, Ecker DJ, Gutell RR, Gautheret D,Case DA, Sampath R. RNAMotif, an RNA sec-ondary structure definition and search algorithm.Nucleic Acids Res. 2001;29(22):4724-4735.
25. Bengert P, Dandekar T. A software tool-box foranalysis of regulatory RNA elements. Nucleic Ac-ids Res. 2003;31(13):3441-3445.
26. Henderson BR, Menotti E, Kuhn LC. Iron regula-tory proteins 1 and 2 bind distinct sets of RNA
e178 SANCHEZ et al BLOOD, 24 NOVEMBER 2011 � VOLUME 118, NUMBER 22
For personal use only.on April 9, 2019. by guest www.bloodjournal.orgFrom
target sequences. J Biol Chem. 1996;271(9):4900-4908.
27. Butt J, Kim HY, Basilion JP, et al. Differences inthe RNA binding sites of iron regulatory proteinsand potential target diversity. Proc Natl Acad SciU S A. 1996;93(9):4345-4349.
28. Henderson BR, Menotti E, Bonnard C, Kuhn LC.Optimal sequence and structure of iron-responsiveelements. Selection of RNA stem-loops with highaffinity for iron regulatory factor. J Biol Chem.1994;269(26):17481-17489.
29. Meehan HA, Connell GJ. The hairpin loop but notthe bulged C of the iron responsive element isessential for high affinity binding to iron regulatoryprotein-1. J Biol Chem. 2001;276(18):14791-14796.
30. Gunshin H, Mackenzie B, Berger UV, et al. Clon-ing and characterization of a mammalian proton-coupled metal-ion transporter. Nature. 1997;388(6641):482-488.
31. Kohler SA, Menotti E, Kuhn LC. Molecular clon-ing of mouse glycolate oxidase. High evolutionaryconservation and presence of an iron-responsiveelement-like sequence in the mRNA. J BiolChem. 1999;274(4):2401-2407.
32. Sanchez M, Galy B, Muckenthaler MU, Hentze MW.
Iron-regulatory proteins limit hypoxia-induciblefactor-2alpha expression in iron deficiency. NatStruct Mol Biol. 2007;14(5):420-426.
33. Troost FJ, Brummer RJ, Dainty JR, Hoogewerff JA,Bull VJ, Saris WH. Iron supplements inhibit zincbut not copper absorption in vivo in ileostomysubjects. Am J Clin Nutr. 2003;78(5):1018-1023.
34. Galy B, Ferring D, Minana B, et al. Altered bodyiron distribution and microcytosis in mice deficientin iron regulatory protein 2 (IRP2). Blood. 2005;106(7):2580-2589.
35. Cooperman SS, Meyron-Holtz EG, Olivierre-Wilson H, Ghosh MC, McConnell JP, Rouault TA.Microcytic anemia, erythropoietic protoporphyria,and neurodegeneration in mice with targeted de-letion of iron-regulatory protein 2. Blood. 2005;106(3):1084-1091.
36. Lin X, Parsels LA, Voeller DM, et al. Character-ization of a cis-acting regulatory element in theprotein coding region of thymidylate synthasemRNA. Nucleic Acids Res. 2000;28(6):1381-1389.
37. Tai N, Schmitz JC, Chen TM, Chu E. Character-ization of a cis-acting regulatory element in theprotein-coding region of human dihydrofolate re-ductase mRNA. Biochem J. 2004;378(Pt 3):999-1006.
38. Rogers JT, Randall JD, Cahill CM, et al. An iron-responsive element type II in the 5�-untranslatedregion of the Alzheimer’s amyloid precursor pro-tein transcript. J Biol Chem. 2002;277(47):45518-45528.
39. dos Santos CO, Dore LC, Valentine E, et al. Aniron responsive element-like stem-loop regulatesalpha-hemoglobin-stabilizing protein mRNA.J Biol Chem. 2008;283(40):26956-26964.
40. Cmejla R, Petrak J, Cmejlova J. A novel iron re-sponsive element in the 3�UTR of human MRCK-alpha. Biochem Biophys Res Commun. 2006;341(1):158-166.
41. Gray NK, Pantopoulos K, Dandekar T, Ackrell BA,Hentze MW. Translational regulation of mamma-lian and Drosophila citric acid cycle enzymes viairon-responsive elements. Proc Natl Acad SciU S A. 1996;93(10):4925-4930.
42. Goforth JB, Anderson SA, Nizzi CP, Eisenstein RS.Multiple determinants within iron-responsive ele-ments dictate iron regulatory protein binding andregulatory hierarchy. RNA. 2010;16(1):154-169.
43. Jensen LJ, Kuhn M, Stark M, et al. STRING 8–aglobal view on proteins and their functional inter-actions in 630 organisms. Nucleic Acids Res.2009;37:D412-416.
SYSTEMS ANALYSIS OF THE MURINE IRE/IRP NETWORK e179BLOOD, 24 NOVEMBER 2011 � VOLUME 118, NUMBER 22
For personal use only.on April 9, 2019. by guest www.bloodjournal.orgFrom

online September 22, 2011 originally publisheddoi:10.1182/blood-2011-04-343541
2011 118: e168-e179
Benes, Matthias Selbach, Martina U. Muckenthaler and Matthias W. HentzeMayka Sanchez, Bruno Galy, Bjoern Schwanhaeusser, Jonathon Blake, Tomi Bähr-Ivacevic, Vladimir
proteinsmRNAs and shaping of the cellular proteome by iron regulatory Iron regulatory protein-1 and -2: transcriptome-wide definition of binding
http://www.bloodjournal.org/content/118/22/e168.full.htmlUpdated information and services can be found at:
(940 articles)Red Cells, Iron, and Erythropoiesis (161 articles)e-Blood
Articles on similar topics can be found in the following Blood collections
http://www.bloodjournal.org/site/misc/rights.xhtml#repub_requestsInformation about reproducing this article in parts or in its entirety may be found online at:
http://www.bloodjournal.org/site/misc/rights.xhtml#reprintsInformation about ordering reprints may be found online at:
http://www.bloodjournal.org/site/subscriptions/index.xhtmlInformation about subscriptions and ASH membership may be found online at:
Copyright 2011 by The American Society of Hematology; all rights reserved.of Hematology, 2021 L St, NW, Suite 900, Washington DC 20036.Blood (print ISSN 0006-4971, online ISSN 1528-0020), is published weekly by the American Society
For personal use only.on April 9, 2019. by guest www.bloodjournal.orgFrom