Embed Size (px)
Citation preview
Anchorages and Laps in Reinforced Concrete Members under Monotonic Loading
Von der Fakultät für Bauingenieurwesen
der Rheinisch-Westfälischen Technischen Hochschule Aachen
zur Erlangung des akademischen Grades einer Doktorin der Ingenieurwissenschaften
genehmigte Dissertation
vorgelegt von
Janna Caroline Schoening
Berichter: Univ.-Prof. Dr.-Ing. Josef Hegger
Prof. Dr.-Ing. Rolf Eligehausen Prof. Dr. John Cairns Tag der mündlichen Prüfung: 21.06.2018
Diese Dissertation ist auf den Internetseiten der Hochschulbibliothek online verfügbar.


Kurzfassung
Der Verbund zwischen Stahlbetonbewehrung und umgebendem Beton wird durchhohe einzuleitende Zug- oder Druckkräfte stark beansprucht. Bewehrungsstäbe mitgroßen Stabdurchmessern, die hohe Längskräfte aufnehmen können, aber auch engangeordnete Bewehrung mit geringer Betondeckung führen zu einer hohenAusnutzung von Verbundbereichen in Stahlbetonbauteilen. Die Tragfähigkeit derVerbundbereiche wird dabei durch werkstofftechnische, größtenteils abergeometrische Parameter beeinflusst.
Für die zweite Generation des Eurocode 2 wurde eine neue Bemessungsgleichung fürdie Berechnung erforderlicher Verankerungs- und Übergreifungslängenvorgeschlagen. Dieser Ansatz basiert auf einer Bemessungsgleichung aufMittelwertniveau, die bei der Erstellung des Model Codes 2010 aus einerumfangreichen Datenbank abgleitet wurde. Eine Überführung des vorgeschlagenenBemessungsansatzes vom gegebenen Mittelwertniveau auf das Bemessungsniveau, dasdem Sicherheitskonzept des Eurocode 0 entspricht, steht bisher noch aus.
Während der aktuelle Eurocode 2 und insbesondere der Nationale Anhang fürDeutschland zahlreiche Zusatzregeln zum Einsatz großer Stabdurchmesser > Ø 32 mmenthalten, enthält der Neuvorschlag keine dieser Regeln mehr. Dies wurde zum Anlassgenommen, die Notwendigkeit der Zusatzregeln grundlegend zu untersuchen.
Zur Bestimmung des Verbundtragverhaltens von Stahlbetonbauteilen mit großenStabdurchmessern wurden Beam-End Versuche, Vierpunkt-Biegeversuche mitÜbergreifungsstößen und Verankerungsversuche an direkten Auflagern durchgeführt.Dabei stand neben der Untersuchung der Verbundtragfähigkeit insbesondere auch dieRissentwicklung im Fokus. Während Eurocode 2 verschiedene Möglichkeiten zurRissbreitenreduktion von Querrissen in kontinuierlich bewehrten Stahlbetonbauteilendefiniert, sind bisher für Querrissbreiten an Stoßenden und für Längsrisse inVerbundbereichen keine konkreten Angaben enthalten.
Außerdem werden die Parametereinflüsse anhand einer umfassenden Datenbank mitVerankerungs- und Stoßversuchen bestimmt. Diese dient ebenfalls zur Ableitung vonKalibrierwerten für die Bemessungsgleichungen der mittleren Bewehrungsspannungin Verbundbereichen. Bemessungswerte der erforderlichen Verbundlänge werden aufGrundlage einer statistischen Auswertung der Verbunddatenbank und eineranschließenden Anwendung des Verfahrens in Eurocode 0 ermittelt. Nebenerforderlichen Kalibrierwerten werden Bewehrungsregeln für hoch ausgenutzteVerankerungen und Übergreifungen vorgeschlagen. Für die Empfehlungpraxisgerechter Konstruktionsregeln werden sowohl die Ergebnisse derTragfähigkeitsuntersuchung als auch der Rissbreitenauswertung herangezogen.
Abstract
In structural concrete members with reinforcing bars subjected to high longitudinal
forces, bond zones are highly utilised. The bond strength between reinforcement and
surrounding concrete depends on material and geometric parameters. Reinforcement
with large-diameter bars bearing high longitudinal forces as well as dense
reinforcement positioning further increase the utilisation of bond zones.
For the second generation of Eurocode 2, a new design equation for the calculation of
necessary anchorage and lap lengths was proposed. This equation is based on a model
for the calculation of mean strength that was derived for Model Code 2010 on the
basis of a comprehensive bond database. A transfer of the given design model from
mean to design level corresponding with the safety concept of Eurocode 0 is not
conducted, yet. While Eurocode 2 and the German National Annex comprise
numerous additional rules for the application of large diameter bars Ø > 32 mm, the
proposal for the next generation of Eurocode 2 does not include any rules for large
diameter bars. For this reason, the necessity of additional rules for large diameter bars
is closely investigated in this thesis.
For the determination of the bond behaviour of structural elements with large diameter
bars, beam-end tests, four-point bending tests with laps as well as anchorage tests at
direct supports were conducted. The fundamental bond behaviour of large-diameter
bars was investigated in beam-end tests. Since the additional rules for large-diameter
bars are most restrictive for laps, the necessity of these rules were analysed on the
basis of four-point bending tests with laps. The actual structural behaviour of end
anchorages was tested in anchorages in simply supported beams to account for
transverse pressure and densely positioned bars.
While Eurocode 2 defines several possibilities for transverse crack width reduction in
continuously reinforced structural elements, specifications for transverse cracks at lap
ends and longitudinal cracks are not given. Hence, the key objectives of this thesis are
the investigation of developable bar stress in bond zones and the crack development.
Calibration factors for the transfer of mean values to design values are derived from
the bond database. Initially, characteristic values of bar stress in bond zones and
corresponding model uncertainties are obtained by a statistical evaluation of the test
results given in the database. Subsequently, the design value for anchorage and lap
lengths is obtained by applying the method according to Eurocode 0. The resulting
calibration factor is verified by a level II reliability analysis. Besides the necessary
calibration factor, detailing rules for highly utilised anchorages and laps are proposed.
The detailing recommendations for practical application are based on the results of
experimental load and crack width investigations.

Preface and Acknowledgements
This dissertation was created during my time as research associate at the Institute ofStructural Concrete at RWTH Aachen University. It is based on four extensiveresearch projects on bond between reinforcing bars and surrounding concrete. Withinthese projects, connections of prefabricated members in UHPC (DFG), structuralelements with high-strength reinforcement (BBSR) and particularly reinforcementwith large diameter bars (AiF) were investigated.
I would like to thank Univ.-Prof. Dr.-Ing. Hegger for the opportunity to work on theseprojects and for the supervision of this thesis. Despite his many commitments,Professor Hegger has often taken a good deal of time to discuss technical issuestogether. His advice and his focused way of processing projects has definitelyprovided support for this work. Prof. Dr. Cairns and Prof. Dr.-Ing. Eligehausen havenot only reviewed this thesis, but also conduced toward its success by discussionswithin the fib task group 2.5 on bond.
During my long time at the institute, I collaborated with many colleagues, whom Iwould like to thank for the great cooperation. I am very happy that this has resulted inmany friendships. My thorough student assistants have contributed to the realisation ofthe numerous tests. Especially those who have measured and evaluated cracks forhours. For the careful review of this text I would like to thank my colleague Alexanderand my brother Timm.
Many thanks are due to my parents, who always stand by my side. The processing ofseveral research projects, the publications, the travels and the finalisation of thisdissertation besides the parenting of our children were only possible with the activesupport of all grandparents, for which I would like to thank them very much.
Most of all, I would like to thank Rahul, who has never questioned the demandingcombination of raising children and scientific work, and who is my steady support inall respects.
Aachen, March 2018 Janna Schoening

I
1 Introduction .............................................................................................. 11.1 Background and Motivation ................................................................. 11.2 Aim and Applied Methodology ............................................................ 2
2 State of the Art on Bond in Concrete ....................................................... 52.1 Bond in Concrete ................................................................................. 52.2 Slip and Crack Development ................................................................ 62.3 Differential Equation for Bond ............................................................. 72.4 Influencing Parameters on Bond .......................................................... 82.4.1 Bond Length ........................................................................................ 82.4.2 Concrete Strength................................................................................. 92.4.3 Bar Diameter ........................................................................................ 92.4.4 Confinement by Concrete Cover .......................................................... 102.4.5 Confinement by Transverse Reinforcement .......................................... 112.4.6 Confinement by Transverse Pressure.................................................... 122.4.7 Further Influencing Parameters ............................................................ 122.5 Differences between Anchorages and Laps .......................................... 132.6 Test Setups for Bond Investigation ....................................................... 152.7 Large Diameter Bars ............................................................................ 202.7.1 Definition of Large Diameter Bars ....................................................... 202.7.2 Origin of Additional Rules for Large Diameter Bars ............................ 202.7.3 Additional Rules for Large Diameter Bars ........................................... 212.8 State of Standardisation of Bond Zones ................................................ 252.9 Design Models for Anchorages and Laps ............................................. 252.9.1 General ................................................................................................ 252.9.2 EUROCODE 2 ........................................................................................ 272.9.3 GERMAN NATIONAL ANNEX ................................................................. 292.9.4 ACI CODE ............................................................................................ 302.9.5 FIB BULLETIN 72 .................................................................................. 312.9.6 MODEL CODE 2010............................................................................... 332.9.7 PT1 WORKING DRAFT .......................................................................... 372.9.8 ELIGEHAUSEN ...................................................................................... 372.9.9 BURKHARDT ......................................................................................... 392.9.10 LETTOW ............................................................................................... 402.9.11 ZUO AND DARWIN ................................................................................ 412.9.12 CANBAY AND FROSCH .......................................................................... 412.9.13 Summary.............................................................................................. 432.10 Limit State of Cracking ........................................................................ 442.10.1 Definition of Crack Width .................................................................... 442.10.2 Crack Phases in Structural Concrete ..................................................... 462.10.3 Models for the Calculation of Characteristic Crack Spacing ................. 472.10.4 Characteristic Values of Crack Spacing and Crack Width .................... 482.10.5 Statistical Distribution of Crack Widths ............................................... 502.10.6 Evaluation of Crack Width Measurements in Literature ....................... 50
II
2.10.7 Acceptance Criteria for Measured Crack Widths .................................. 512.10.8 Crack width for Different Bar Diameters.............................................. 522.10.9 Crack Width in Reinforcement Laps .................................................... 52
3 Bond tests .................................................................................................. 553.1 General ................................................................................................ 553.2 Materials .............................................................................................. 553.3 Beam-End Tests ................................................................................... 563.3.1 Test-Specimen Dimensioning and Test-Setup ...................................... 563.3.2 Test Parameter ..................................................................................... 573.3.3 Measurements and Test Procedure ....................................................... 593.3.4 Test Results .......................................................................................... 593.4 Lap Tests ............................................................................................. 693.4.1 Test Setup and Dimensioning ............................................................... 693.4.2 Test Parameter for the Lap Tests .......................................................... 703.4.3 Measurements and Test Procedure ....................................................... 713.4.4 General Test Results ............................................................................ 743.4.5 Maximum Bar Strength in Lap ............................................................. 763.4.6 Crack Formation in Four-Point Bending Tests ..................................... 853.4.7 Conclusion on Crack Width in Laps ..................................................... 963.5 Anchorage Tests................................................................................... 1003.5.1 Test-Specimen Dimensioning and Test-Setup ...................................... 1003.5.2 Test Parameter ..................................................................................... 1023.5.3 Measurements and Test Procedure ....................................................... 1033.5.4 Test Results .......................................................................................... 1043.6 Necessity of Additional Rules for Large Diameter Bars ....................... 112
4 Bond Strengths Obtained in Different Test Specimens........................... 1134.1 General ................................................................................................ 1134.2 Effect of Bond Length .......................................................................... 1134.3 Effect of Bar Diameter ......................................................................... 1144.4 Effect of Concrete Strength .................................................................. 1154.5 Effect of Transverse Pressure ............................................................... 1154.6 Effect of Concrete Cover ...................................................................... 1174.7 Effect of Transverse Reinforcement ..................................................... 1194.8 Predictability of Bond Behaviour by Beam-End Tests .......................... 121
5 Database for the Ultimate Limit State ..................................................... 1235.1 Database Filter ..................................................................................... 1235.2 Statistical Database Evaluation for Different Design Models ............... 1265.3 Database Evaluation of Parameter Effects in Lap Tests ........................ 1305.3.1 Lap Length ........................................................................................... 1315.3.2 Concrete Strength................................................................................. 1335.3.3 Bar Diameter ........................................................................................ 135
III
5.3.4 Concrete Cover .................................................................................... 1375.3.5 Transverse Reinforcement .................................................................... 1405.3.6 Yield Strength ...................................................................................... 1485.3.7 Summary of Parameter Effects ............................................................. 1495.4 Database Evaluation of Parameter Effects in Anchorages .................... 1505.4.1 Reinforcing Bar Stress Calculation....................................................... 1505.4.2 Transverse Pressure.............................................................................. 1515.4.3 Parameter Effects for Anchorages ........................................................ 1565.4.4 Statistical Evaluation of Design Models for Anchorages ...................... 1595.5 Comparison of own Tests with Database .............................................. 1615.6 Own Design Model for Anchorages and Laps ...................................... 1625.6.1 Consideration of Transverse Reinforcement ......................................... 1635.6.2 Consideration of Transverse Pressure ................................................... 1665.6.3 Own Model for Mean Bar Stress in Anchorages and Laps.................... 1675.6.4 Design Model According to [PT18] with own Calibration Factors ....... 1685.6.5 Statistical Evaluation of Models for Mean Bar Stress in Bond Zones ... 169
6 Lap Database for the Limit State of Cracking ........................................ 1726.1 General ................................................................................................ 1726.2 Parameter Effects ................................................................................. 1726.2.1 Lap Length ........................................................................................... 1726.2.2 Concrete Cover .................................................................................... 1736.2.3 Reinforcement Ratio ............................................................................ 1736.2.4 Bar Diameter ........................................................................................ 1746.2.5 Transverse Reinforcement .................................................................... 1756.2.6 Concrete Strength................................................................................. 1756.3 Summary.............................................................................................. 175
7 Design Values for Anchorage and Lap Lengths ...................................... 1767.1 Eurocode Reliability Management ....................................................... 1767.2 General Derivation of Design Values ................................................... 1797.2.1 Characteristic Values ........................................................................... 1797.2.2 Partial Safety Factors in Codes ............................................................. 1807.2.3 Consideration of Model Uncertainties .................................................. 1817.2.4 Consideration of Material Uncertainties ............................................... 1827.2.5 Design Values According to Eurocode 0 .............................................. 1837.3 Derivation of Design Values for Anchorages and Laps in Literature .... 1857.3.1 ELIGEHAUSEN ...................................................................................... 1867.3.2 FIB TASK GROUP BOND ........................................................................ 1867.3.3 MANCINI ET AL. .................................................................................... 1887.3.4 DARWIN ET AL. ..................................................................................... 1907.3.5 Summary of Parameters Taken into Account........................................ 1927.4 Own Derivation of Design Values for Anchorage and Lap Length ....... 193
IV
7.4.1 Method for the derivation of design values for anchorage and laplength ................................................................................................... 193
7.4.2 Mean Values for Anchorage and Lap Length ....................................... 1937.4.3 Statistical Data for Derivation of Design Values .................................. 1977.4.4 Consideration of Concrete Strength ...................................................... 1987.4.5 Design Values for Anchorage and Lap Length according to [EC0] ...... 1997.4.6 Comparison of Design Values with Acceptance Criteria ...................... 2037.4.7 Reliability of Design Lengths for Anchorages and Laps ....................... 2037.5 Possible Reduction of Design Anchorage and Lap Length ................... 2097.5.1 Reduction of Bond Length for Minimum Transverse Reinforcement ... 2097.5.2 Reduction of Bond Length for Small Utilization of Bars ...................... 2097.5.3 Reduction of Bond Length for Staggering ............................................ 2107.5.4 Classification of Bar Stress in Database ............................................... 2117.6 Difference Between Anchorages and Laps ........................................... 213
8 Anchorage and Lap Detailing .................................................................. 2148.1 General ................................................................................................ 2148.2 Percentage of Bars Anchored or Lapped at a Section ........................... 2148.3 Minimum Anchorage and Lap Length .................................................. 2158.4 Laps of Bars with Different Bar Diameters .......................................... 2168.5 Anchorages and Laps in Several Layers ............................................... 2178.6 Casting Position ................................................................................... 2178.7 Transverse Reinforcement .................................................................... 2188.8 Surface Reinforcement ......................................................................... 2188.9 Robustness of Anchorages and Laps .................................................... 219
9 Summary and Conclusions ....................................................................... 2219.1 Summary.............................................................................................. 2219.2 Design Anchorage and Lap Length ...................................................... 2249.3 Necessity of Additional Rules for Large Diameter Bars ....................... 2259.4 Proposal for Future Research ............................................................... 226
10 Additional publications in database ......................................................... 228
11 Literature .................................................................................................. 229
V
Notation
Units
Strain: ‰Force: kN, MNStress: MPaDistance: mm, cm, m
Capital Latin LettersAs cross-sectional area of one bar of the longitudinal reinforcementAs,calc calculated cross-sectional area of longitudinal reinforcementAs,prov cross-sectional area of longitudinal reinforcement providedAst cross-sectional area of one leg of transverse reinforcementCOV coefficient of variationEc Young’s Modulus of concreteEd design value of action effectsEk characteristic value of action effectsEs Young’s Modulus of reinforcing barF forceFs reinforcing bar forceFsplitting splitting resistance by concrete cover along the lap lengthFstirrup splitting resistance by transverse reinforcementK coefficient for efficiency of transverse reinforcement defined in EUROCODE 2Ktr transverse reinforcement index defined in ACIM momentPf failure probability for a certain time periodPs reliability of a structureQ standard deviation defined in EUROCODE 0Rd design value of structural resistanceRk characteristic value of structural resistanceRp p-quantile of structural resistanceV shear forceVd coefficient of variation of the errors di defined in EUROCODE 0Vfc coefficient of variation of concrete strengthVi coefficient of variationVq coefficient of variation of model uncertaintyVfc coefficient of variation of concrete strengthVm coefficient of variation of the design model
VI
VT/P coefficient of variation of the test to prediction ratioVts coefficient of variation of uncertainties in the measured loads and differences in the actual material and geometric propertiesVR coefficient of variation for unknown relative rib areas defined by DARWIN
VR coefficient of variation of resistanceVx coefficient of variation of a model defined in EUROCODE 0Vxi coefficient of variation of stochastically independent random variablesXdi material properties (stochastically independent random variables)
Lowercase Latin Lettersadi design value of a geometrical propertyaeff shear spanb widthb slope of the least-squares best fit linecb minimum concrete cover as defined in ACIcd smallest value of cs/2, cx and cy
cmin minimum concrete covercmax maximum concrete covercx side concrete covercy bottom concrete covercs anchored or lapped bar spacingd effective depthfbm mean bond strengthfc concrete compressive strengthfc’ concrete compressive strength as defined in ACIfc,cube concrete cube strength (200 mm cubes)fck characteristic concrete compressive strengthfcm mean concrete compressive strengthfct tensile strength of concretefctd design tensile strength of concretefctk;0.05 characteristic tensile strength of concrete defined as 5%-quantile valuefctm mean tensile strength of concretefR relative rib areafstd design longitudinal bar stress in bond zonesfstm mean longitudinal bar stress in bond zonesfy yield strength of reinforcing barsfyk characteristic yield strength of reinforcing barsfyd design yield strength of reinforcing bars
VII
g limit state functiongrt limit state functionh heightkconf effectiveness factor for confinementkd coefficient for efficiency of transverse reinforcementkd coefficient for the effect of bar diameterkd,n factor for quantile values taking the index of reliability into accountkm coefficient for efficiency of transverse reinforcementkp coefficient for reinforcing bar surfacekq coefficient for the effect of different steel stress at the lap endskR coefficient for statistical distribution of resistancekv coefficient for bond conditionsl0 lap lengthlb bond or anchorage lengthlt development lengthlx distance from centre of supportnb number of anchored bars or pairs of lapped barsnl number of legs of confining reinforcement defined in FIB BULLETIN 72nst number of items of confining reinforcement within bond lengthnt number of legs of confining reinforcementptr compression stress perpendicular to the potential splitting planerei experimental value of a resistancerk characteristic value of resistance defined in EUROCODE 0rt theoretical resistance defined in EUROCODE 0rti theoretical value of a resistancesD standard deviation of logarithm of error terms di
sst longitudinal spacing of confining reinforcementsr,max maximum possible crack spacingtd coefficient for the effect of bar diametertr coefficient for the effect of rib geometrywk crack widthwE crack width at lap endswlim crack width limitx Position in the lap commencing from the lap endxlt Position between the cracks commencing from the crackz lever arm of internal forces
Greek Letters and SymbolsØ bar diameterØeq equivalent bar diameter
VIII
a6 lap factor defined in EUROCODE 2ac confinement contribution provided by concrete coveraE weighting factor for action effects Eai,EC reduction factors defined in EUROCODE 2aQ coefficient for calibrationaR weighting factor for resistance Rat coefficient for the bar diameteratp confinement contribution provided by transverse pressureatr confinement contribution provided by transverse reinforcementb index of reliabilitybt coefficient for strain functiondi error term which defines the model uncertainty defined in EUROCODE 0Di logarithm of error terms di
ecm mean concrete strain along crack spacingesm mean steel strain along crack spacingesr1 steel strain between the cracks at crack formationesr2 steel strain in the crack at crack formationes2,end reinforcement strain at the lap endfACI strength reduction factor defined in ACI CODE 318fb reduction factor for bondF cumulative distribution function of the standardised normal distributiongc partial safety factor for concretegF safety factor for action effectsggl global safety factorgm partial safety factor for uncertainties in material propertiesgM partial safety factor for uncertainties in material properties and model uncertaintiesgR partial safety factor for structural resistancegRd partial safety factor for model uncertainties in structural resistanceh conversion factor defined in EUROCODE 0 h1 coefficient for reinforcement surfaceh2 coefficient for bond conditionsh3 coefficient for the effect of bar diameterh4 coefficient for the characteristic strength of steel reinforcementhd design value of a conversion factor for volume and scale effectsl coefficient for light-weight concrete (1.0 for normal concrete)l coefficient for contribution of transverse reinforcement defined in
IX
EUROCODE 2mE mean value of action effectsmg mean valuemq mean value of model uncertaintymR mean value of resistancemx mean value of a model defined in EUROCODE 0q inclination of strutsq model uncertaintyqdi model uncertainties within a model with several stochastically independent random variablesyt coefficient for bond (1.0 for good bond conditions)ye coefficient for coated reinforcementys coefficient for bar diameterrconf ratio of the reinforcement providing confinementsctd design value of the mean compression stress perpendicular to the potential splitting planesE standard deviation of action effectssfc standard deviation of concrete strengthsg standard deviationsR standard deviation of resistancess reinforcing bar stressss,max calculated or observed maximum reinforcing bar stressss,test reinforcing bar stress obtained in testsss,calc reinforcing bar stress calculated according to design modelsssc concrete contributionssst transverse reinforcement contribution

1
1 Introduction
1.1 Background and MotivationThere is international consensus on many design models for structural concreteelements. However, the harmonisation of code provisions reveals that the structuralanalysis of some details was conducted very differently in single national codes in thepast. The omnipresent anchorage of reinforcing bars is one of the issues still unsolved.At supports of beams and slabs, at curtailed reinforcement and in laps, the questionarises, what development length safely anchors the reinforcing bar in the surroundingconcrete.
The equations for lap and anchorage length in MODEL CODE 2010 [MC2010] differsfrom EUROCODE 2 [EC2]. While the equation according to [EC2] is based on MODELCODE 1990 [MC90], the equation in [MC2010] was derived by a regression analysisdescribed in the Model Code background document on bond [FIB14]. The recentlydiscussed proposal for the next generation of EUROCODE 2 [PT18] contains anequation also based on [FIB14] with a coefficient still under discussion. The resultinglap and anchorage lengths calculated with the equations given in [EC2] and the newproposal [PT18] differ depending on the coefficient used. The design equation for themean stress in anchorages or laps given in [FIB14] was calibrated with a lap databasecompiled by the American Concrete Institute and the Institute of ConstructionMaterials at the University of Stuttgart and verified by anchorage tests conducted byAMIN [AMI09]. The influencing parameters for laps and anchorages have beeninvestigated comprehensively in the past, but the design model for lap and anchoragelengths in [MC2010] and the PT1 WORKING DRAFT for the next generation ofEUROCODE 2 [PT18] lacks a well-founded derivation of design values. The questionarises which coefficient needs to be applied in the equation according to FIB BULLETIN72 [FIB14] elaborated by fib task group 2.5 for anchorages and laps to safelydetermine the necessary bond length.
The design model for laps according to the German code for structural concretepublished in 1988, DIN 1045 [DEU88] was based on investigations at the TechnicalUniversity of Munich and at the University of Stuttgart in the 1970s and 1980s. Thefindings from these investigations were taken into account in the following Germancodes [DEU08] and [EC2/NA]. The resulting lap lengths were rather long compared toother European codes. The necessity of such lengths was justified by increasing crackwidths at lap ends for cyclic loading depending on the lap length. Currentinvestigations by CAIRNS AND ELIGEHAUSEN [CAI14b] showed that the lap designaccording to EUROCODE 2 [EC2] is partly unsafe. Despite many previous nationalcodes providing shorter lap and anchorage lengths, no major lap or anchorage failure isknown.
Bond zones with anchorages and laps are highly utilised, where reinforcing bars aredensely positioned and where large diameter bars are used. The necessary bar number
2
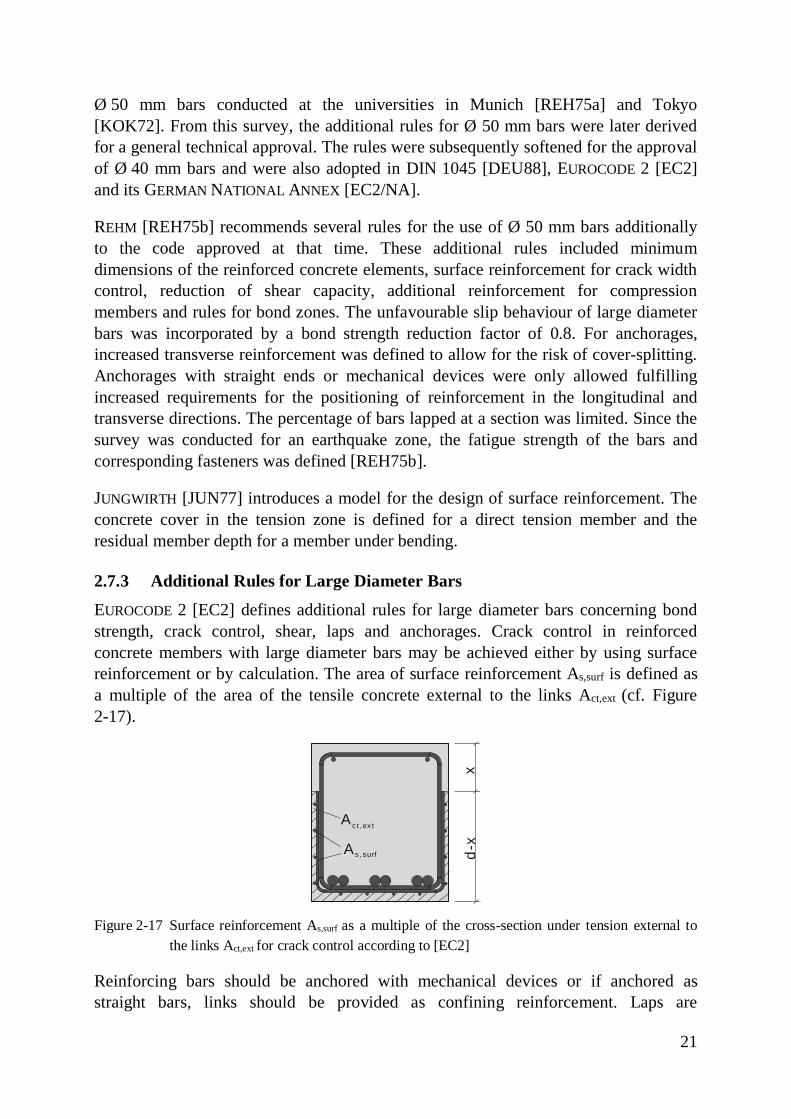
in structural members can be reduced by using large diameter bars. The smaller bar orlayer number simplifies the placing and compaction of concrete and concurrentlyenhances the bond quality and durability. During a research project on theinvestigation of reinforced concrete members with large diameter bars, several issueson laps and anchorages in general arose [HEG15], [HEG18]. The original aim of theconducted research project was the investigation of the numerous additional rules forlarge diameter bars in EUROCODE 2 [EC2] and its GERMAN NATIONAL ANNEX[EC2/NA]. [EC2] allows for the use of bar diameters up to Ø 40 mm in structuralelements without further approval. Depending on the concerned National Annex, bardiameters above a certain limit – the recommended value is Ø 32 mm – underlieadditional detailing rules.
Within the research project, the bond behaviour of large diameter bars wasinvestigated by beam-end tests, four-point bending tests with laps and anchorages atdirect supports. The replacement of the common pull-out tests by beam-end tests forreinforcement approvals is currently under discussion. Recent investigation showedless scatter in beam-end tests than in pull-out tests [WIL13], but the effort andexpenses for beam-end test are higher compared to pull-out test. While the pull-out testis well-suited for the comparison of the bond behaviour of different reinforcementtypes, it does not reflect real bond zones in structural elements. The question is,whether the beam-end test that rather represents a direct support of a beam, reflects theeffects of bond length and confinement in anchorages applied in practice better.
It is known from many lap tests in reinforced concrete members that cracks forming atthe lap ends are much wider than cracks in the undisturbed element. [EC2] comprisescrack width control for undisturbed structural concrete elements but does not definehow to address large crack widths at lap ends. For the bond stress, additionallongitudinal cracks can occur in laps and anchorages at high loads and littleconfinement. [EC2] only states that reinforcing bars shall be anchored so that the bondforces are safely transmitted to the concrete avoiding longitudinal cracking or spallingand that transverse reinforcement shall be provided if necessary. The crack formationboth in the transverse and the longitudinal directions does not play a major role forlaps with small bar diameters, but for highly utilised cross-sections and large diameterbars, the crack formation becomes increasingly important.
1.2 Aim and Applied MethodologyThe aim of this thesis is to investigate the necessity of additional rules for largediameter bars. Furthermore, the thesis aims at the validation of the design model forthe bar stress in anchorages and laps according to [FIB14] and the derivation of designvalues for anchorage and lap lengths.
Chapter 2 presents the basic principles of bond between concrete and ribbedreinforcing bars, as well as the principles of anchorages and lapped splices inreinforced concrete elements. The essential parameters influencing the bond behaviour
3
are described to provide a background for the conducted experimental programme.Since various test specimens for the investigation of bond between concrete andreinforcing bars exist, chapter 2 includes a brief comparison of bond testing methods.Design equations and rules for anchorages and laps including the ultimate andserviceability limit states are given. The current European design code for reinforcedconcrete structures includes additional rules for large diameter bars described in thischapter. Furthermore, the explanation of the statistical model for the derivation ofmean and characteristic crack widths from test specimens is given.
In chapter 3, the beam-end tests, lap and anchorage tests conducted at RWTH AachenUniversity are documented. The test-specimen design and experimental setup as wellas the investigated parameters are described. This chapter presents the appliedmaterials, manufacturing, instrumentation and loading rate of the test specimens. Thetest results for varying concrete strength, bar diameter, bond length and confinementare given. The test results are compared to the calculated strength and crack widthsaccording to the design models given in Chapter 2. An assessment whether thecharacteristic crack widths defined in [EC2] covers the large crack widths at the lapends is given.
Chapter 4 gives a comparison between beam-end tests and beam tests with anchoragesand laps. The chapter describes the influences by various parameters observed in thedifferent bond tests. For this purpose, bond strengths obtained in beam-end tests arecompared to maximum local bond strengths and bond strengths averaged over thebond length in anchorage and lap tests. The juxtaposition shall clarify whether beam-end tests are suitable for the prediction of bond behaviour in actual structural elementssuch as in beams with anchorages and laps.
In Chapter 5, a description and analysis of the bond database is shown that providesthe basis of the MODEL CODE 2010 [MC2010] formulation for the required anchoragelength as described in the fib background document [FIB14]. An adoption of thisanchorage design formulation is currently planned for the new EUROCODE 2 generation[PT18]. The database was extended by anchorage tests mostly compiled by AMIN[AMI09] and the own tests described in chapter 3. Since the database evaluationparticularly depends on the test results considered, the applied filters and the statisticalmodels are defined. By means of the database, the parameter effects on lap andanchorage strength are analysed. Chapter 5 presents the statistical distribution of theratio of the test results to the calculated bar stresses according to the design models foranchorages and laps described in chapter 2. Furthermore, a modified design model formean anchorage and lap strengths is derived.
The database did not include any information on crack width along lapped splices inreinforced concrete elements. Therefore, chapter 6 presents the database extension byinformation on crack width. The crack width database shows the effects of bondlength, bar diameter, reinforcement ratio, confinement and continuous bars on thecrack widths at lap ends.
4
In Chapter 7, the consistent design equation for the mean strength of anchorages andlaps for all bar diameters is transferred to design values for anchorage and lap lengths.Previous evaluations of reliability and design values for bond and bar stress inanchorages are presented. Design values for the own model and the model accordingto [PT18] with own calibration factors derived in chapter 5 are obtained by applicationof the procedure given in annex D in [EC0]. A level II reliability analysis withCOMREL verifies the achievement of the desired index of reliability with the proposedcalibration factor.
Chapter 8 illustrates the relation between the design equation and detailing rules foranchorages and laps of straight bars under tension. The detailing includes thepercentage of bars anchored or lapped at a section, minimum anchorage lengths, lapsof bars with different bar diameters, transverse reinforcement and robustness.
Chapter 9 provides a summary and conclusion of the conducted research on anchorageand lap lengths, a summary on the necessity of additional rules for large diameter barsas well as suggestions for further research.
5
2 State of the Art on Bond in Concrete
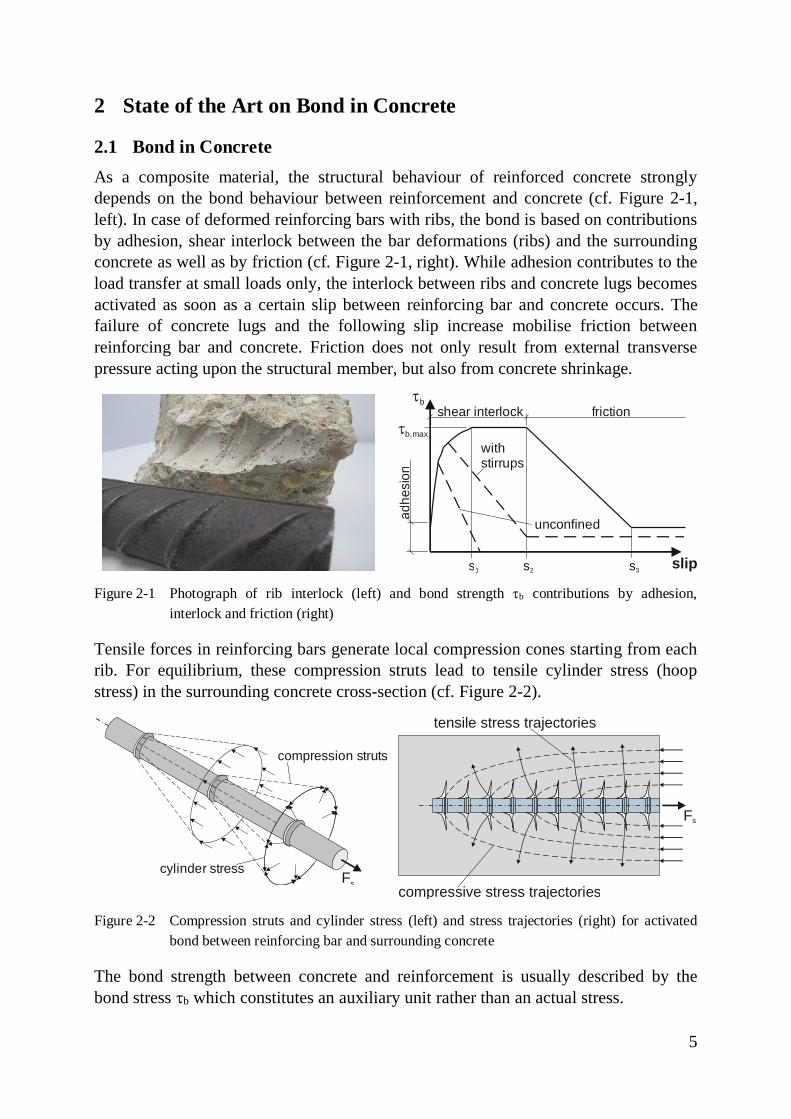
2.1 Bond in ConcreteAs a composite material, the structural behaviour of reinforced concrete stronglydepends on the bond behaviour between reinforcement and concrete (cf. Figure 2-1,left). In case of deformed reinforcing bars with ribs, the bond is based on contributionsby adhesion, shear interlock between the bar deformations (ribs) and the surroundingconcrete as well as by friction (cf. Figure 2-1, right). While adhesion contributes to theload transfer at small loads only, the interlock between ribs and concrete lugs becomesactivated as soon as a certain slip between reinforcing bar and concrete occurs. Thefailure of concrete lugs and the following slip increase mobilise friction betweenreinforcing bar and concrete. Friction does not only result from external transversepressure acting upon the structural member, but also from concrete shrinkage.
Figure 2-1 Photograph of rib interlock (left) and bond strength tb contributions by adhesion,interlock and friction (right)
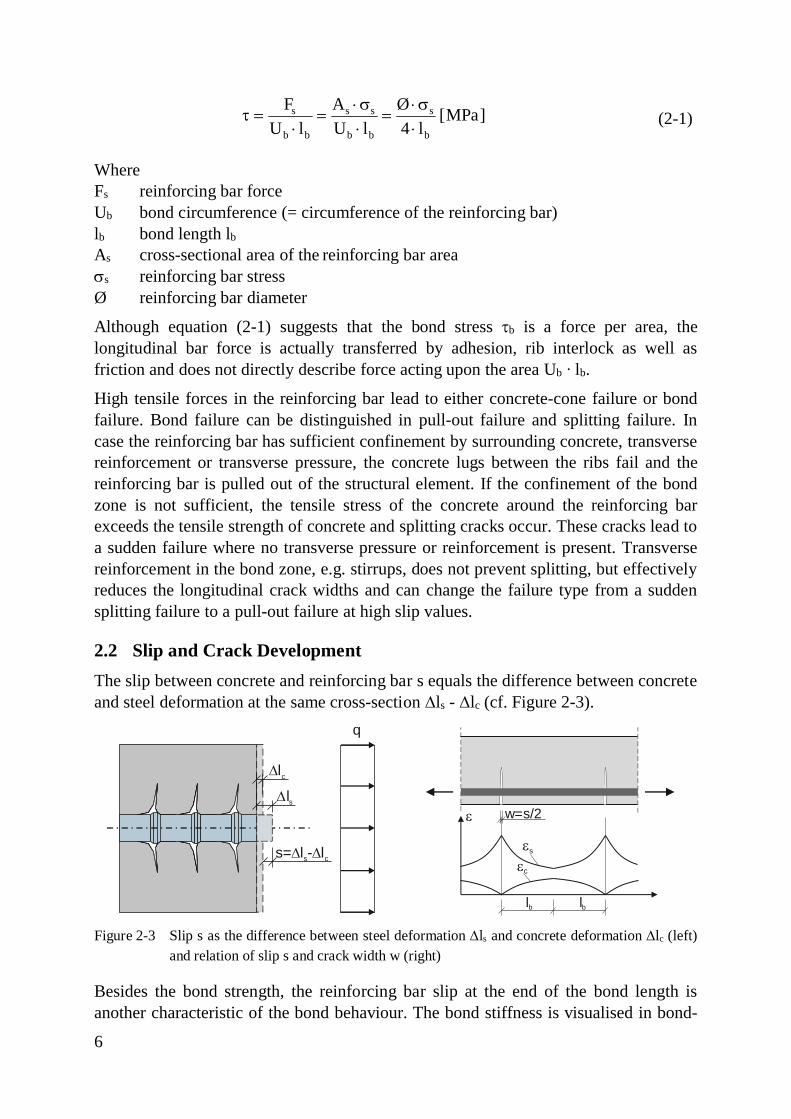
Tensile forces in reinforcing bars generate local compression cones starting from eachrib. For equilibrium, these compression struts lead to tensile cylinder stress (hoopstress) in the surrounding concrete cross-section (cf. Figure 2-2).
Figure 2-2 Compression struts and cylinder stress (left) and stress trajectories (right) for activatedbond between reinforcing bar and surrounding concrete
The bond strength between concrete and reinforcement is usually described by thebond stress tb which constitutes an auxiliary unit rather than an actual stress.
slip
withstirrups
unconfined
s1 s2 s3
tb
tb,max
adhe
sion
shear interlock friction
compression struts
cylinder stress Fscompressive stress trajectories
tensile stress trajectories
Fs
6
]MPa[l4
ØlU
AlU
Fb
s
bb
ss
bb
s
×s×
=×s×
=×
=t (2-1)
WhereFs reinforcing bar forceUb bond circumference (= circumference of the reinforcing bar)lb bond length lb
As cross-sectional area of the reinforcing bar areass reinforcing bar stressØ reinforcing bar diameter
Although equation (2-1) suggests that the bond stress tb is a force per area, thelongitudinal bar force is actually transferred by adhesion, rib interlock as well asfriction and does not directly describe force acting upon the area Ub ∙ lb.
High tensile forces in the reinforcing bar lead to either concrete-cone failure or bondfailure. Bond failure can be distinguished in pull-out failure and splitting failure. Incase the reinforcing bar has sufficient confinement by surrounding concrete, transversereinforcement or transverse pressure, the concrete lugs between the ribs fail and thereinforcing bar is pulled out of the structural element. If the confinement of the bondzone is not sufficient, the tensile stress of the concrete around the reinforcing barexceeds the tensile strength of concrete and splitting cracks occur. These cracks lead toa sudden failure where no transverse pressure or reinforcement is present. Transversereinforcement in the bond zone, e.g. stirrups, does not prevent splitting, but effectivelyreduces the longitudinal crack widths and can change the failure type from a suddensplitting failure to a pull-out failure at high slip values.
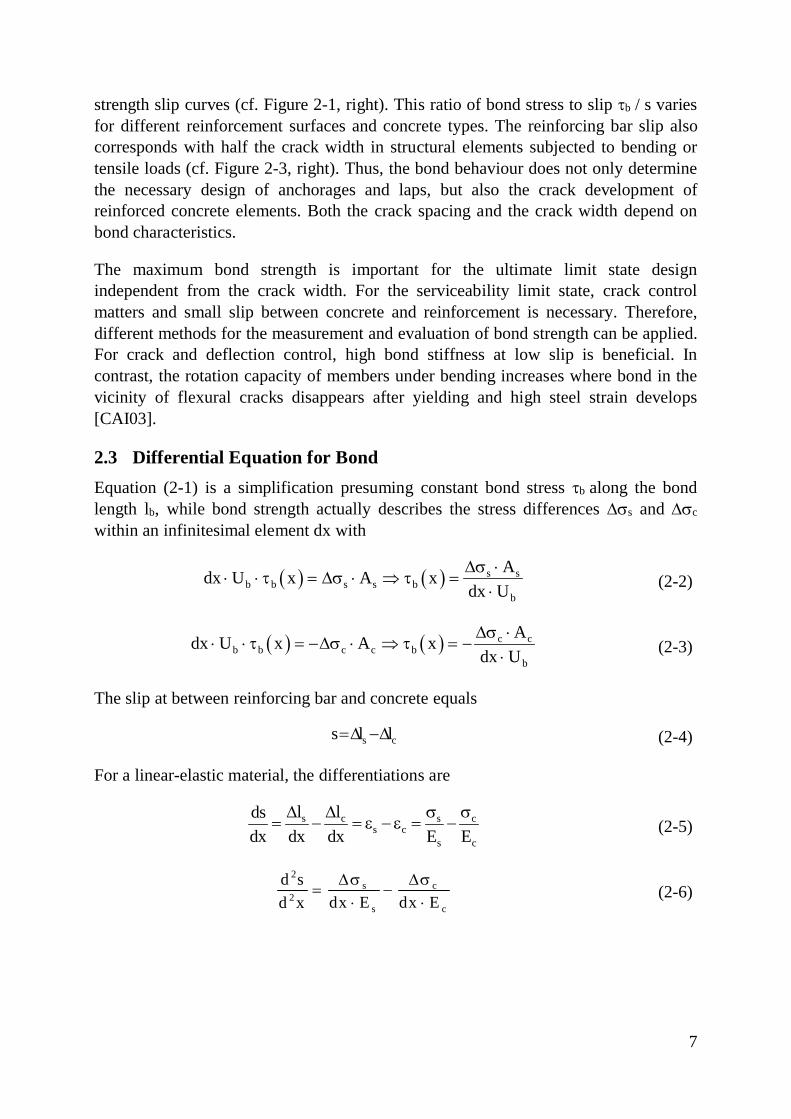
2.2 Slip and Crack DevelopmentThe slip between concrete and reinforcing bar s equals the difference between concreteand steel deformation at the same cross-section Dls - Dlc (cf. Figure 2-3).
Figure 2-3 Slip s as the difference between steel deformation Dls and concrete deformation Dlc (left)and relation of slip s and crack width w (right)
Besides the bond strength, the reinforcing bar slip at the end of the bond length isanother characteristic of the bond behaviour. The bond stiffness is visualised in bond-
Dlc
Dls
s= l - lD Ds c
q
lb
e
lb
ec
es
w=s/2
7
strength slip curves (cf. Figure 2-1, right). This ratio of bond stress to slip tb / s variesfor different reinforcement surfaces and concrete types. The reinforcing bar slip alsocorresponds with half the crack width in structural elements subjected to bending ortensile loads (cf. Figure 2-3, right). Thus, the bond behaviour does not only determinethe necessary design of anchorages and laps, but also the crack development ofreinforced concrete elements. Both the crack spacing and the crack width depend onbond characteristics.
The maximum bond strength is important for the ultimate limit state designindependent from the crack width. For the serviceability limit state, crack controlmatters and small slip between concrete and reinforcement is necessary. Therefore,different methods for the measurement and evaluation of bond strength can be applied.For crack and deflection control, high bond stiffness at low slip is beneficial. Incontrast, the rotation capacity of members under bending increases where bond in thevicinity of flexural cracks disappears after yielding and high steel strain develops[CAI03].
2.3 Differential Equation for BondEquation (2-1) is a simplification presuming constant bond stress tb along the bondlength lb, while bond strength actually describes the stress differences Dss and Dsc
within an infinitesimal element dx with
( ) ( ) s sb b s s b
b
Adx U x A xdx UDs ×
× × t = Ds × Þ t =× (2-2)
( ) ( ) c cb b c c b
b
Adx U x A xdx UDs ×
× × t = -Ds × Þ t = -× (2-3)
The slip at between reinforcing bar and concrete equals
s cs l l=D -D (2-4)
For a linear-elastic material, the differentiations are
s c s cs c
s c
l ldsdx dx dx E E
D D s s= - = e - e = - (2-5)
2s c
2s c
d sdx E dx Ed xDs Ds
= -× ×
(2-6)
8
Introducing equations (2-2) and (2-3) gives
( ) ( ) ( )2
bb bb e2
s s c c s
4 xU Ud s x 1A E A E Ø Ed x
× tæ ö= - × t = × + a ×rç ÷× × ×è ø
(2-7)
Withae = Es / Ec
r = As / Ac
The second order differential equation (2-7) can be solved by applying the boundaryconditions for reinforcing anchorages or laps. For this purpose, bond strength-sliprelations tb(s) must be introduced. Such relations were given in several publicationssuch as [MC2010], [MAR73], [KOE96], [SCH14].
2.4 Influencing Parameters on Bond
2.4.1 Bond Length
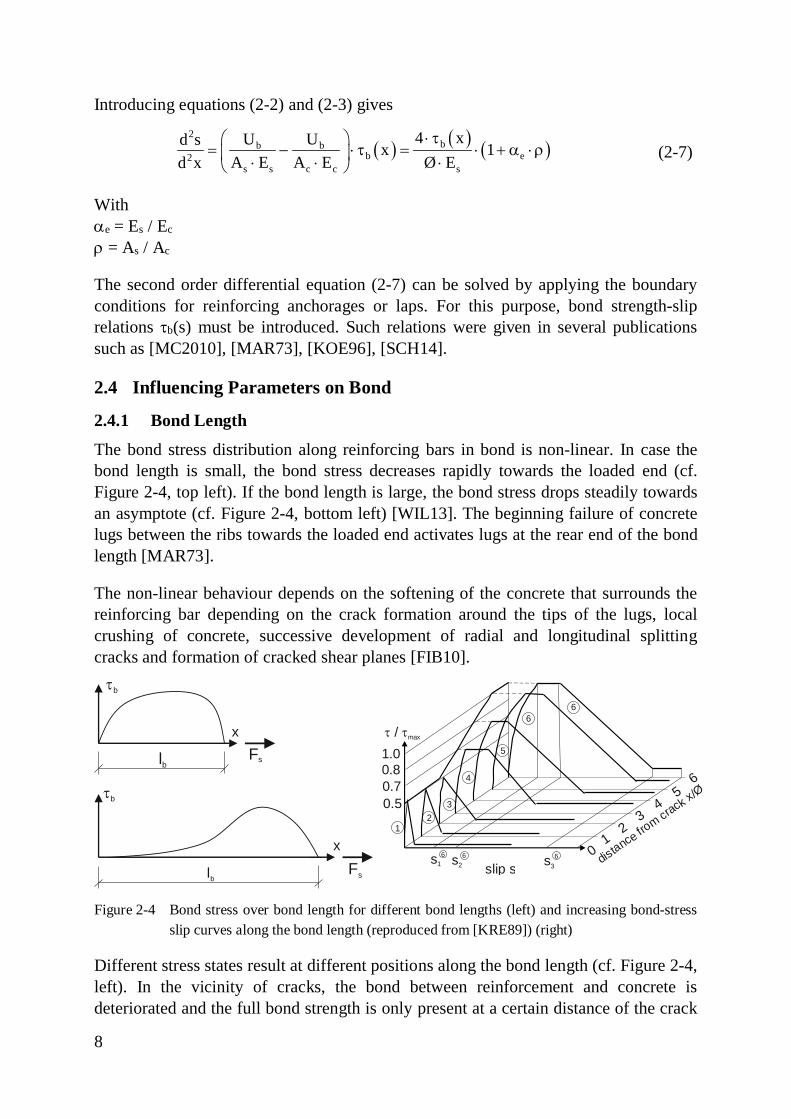
The bond stress distribution along reinforcing bars in bond is non-linear. In case thebond length is small, the bond stress decreases rapidly towards the loaded end (cf.Figure 2-4, top left). If the bond length is large, the bond stress drops steadily towardsan asymptote (cf. Figure 2-4, bottom left) [WIL13]. The beginning failure of concretelugs between the ribs towards the loaded end activates lugs at the rear end of the bondlength [MAR73].
The non-linear behaviour depends on the softening of the concrete that surrounds thereinforcing bar depending on the crack formation around the tips of the lugs, localcrushing of concrete, successive development of radial and longitudinal splittingcracks and formation of cracked shear planes [FIB10].
Figure 2-4 Bond stress over bond length for different bond lengths (left) and increasing bond-stressslip curves along the bond length (reproduced from [KRE89]) (right)
Different stress states result at different positions along the bond length (cf. Figure 2-4,left). In the vicinity of cracks, the bond between reinforcement and concrete isdeteriorated and the full bond strength is only present at a certain distance of the crack
tb
x
x
lb
Fslb
tb
Fs
12
s36s2
6s16
12
3
4
5
6
34
56
6
0 distance from crack x/Ø
slip s
t t / max
1.0
0.5
0.80.7
9
(cf. Figure 2-4, right) [KRE89]. Rear locations along the bond length do not developthe full bond strength where loads are low. As soon as the maximum bond strength isexceeded at the loaded end, the bond between reinforcement and concrete at rearpositions of the bond length is activated.
2.4.2 Concrete Strength
Since bond action results from the localised pressure underneath the ribs, it is directlyrelated to the shear component of the interface forces. Additionally, the disseminatingcompressive struts result in tensile cylinder stress. Bond performance thus depends onboth the concrete multi-axial behaviour in compression and on the tensile strength ofconcrete [FIB10].
For the concrete covers used in practice, bond zones usually fail by splitting and– if confined with transverse reinforcement – by a secondary bar pull-out. Therefore,splitting forces are usually decisive and bond strength is described by the tensilestrength of concrete [FIB14].
Both, the bond stiffness Dt / Ds (cf. Figure 2-1, right) and the bond strength increaseby concrete strength are non-linear. Codes usually define bond strength for small slipvalues to prevent the development of large crack widths. Hence, the bond strengthgiven as the relation of tb ~ fcx is usually defined for the initial stiffness with anexponent x between 1/4 and 2/3.
The bond strength of short bond lengths increases with fc2/3, while the increase in bondstrength is much smaller for larger bond lengths, since the distribution of the bondstrength varies along the bond length. For short bond length and low concrete strength,the bond strength is approximately constant. For high concrete strength and large bondlengths, the bond stress distribution is increasingly non-linear [ELI79].
2.4.3 Bar Diameter
The maximum bar force Fs depends on the cross-sectional area of a reinforcing bar As,while the bond strength tb is related to the reinforcing-bar circumference Ub. Since theratio of circumference per cross-sectional area Ub / As decreases with increasing bardiameter, large diameter bars presumably offer less bond strength [MAR73]. For a safetransfer of bar force, large diameter bars have higher relative rib areas fR [DEU09].
For the evaluation of the bar diameter effect, the bond length, the concrete cover andthe relative rib area have to be taken into account. The findings in literature on theeffect of bar diameter are contradictory. While some authors did not find any effect(e.g. [REH68], [STE07]), others found a slight impairment in bond strength withincreasing bar diameter (e.g. [VIW79], [ELI79], [ELI83], [REY82]). Where the cross-sectional dimensions and the bond length are multiples of the bar diameter, the effectof bar diameter is small [ELI83].
10
TEPFERS [TEP73] conducted a comprehensive test programme on laps and found adecrease in developable bar stress for increasing bar diameters at constant bond length.Considering the ratio of bond length to bar diameter l0 / Ø in the test results conductedby [TEP73], an effect of bar diameter is not visible.
For increasing bar diameter, the bond stiffness decreases, leading to a softer bondbehaviour [VIW79], [UED86], [SCH98b]. This effect results from a smaller availablearea of concrete lugs for large bar diameters [SCH98b].
2.4.4 Confinement by Concrete Cover
Reinforcing bars with large bar diameters transfer higher loads and lead to increasingtensile stress around the bars. Hence, the concrete cover should increase withincreasing bar diameter. The cylinder stress decreases with increasing concrete cover[MAR73]. From a certain multiple of the cover to bar-diameter ratio c / Ø, a concretecover failure is not decisive, but pull-out failure occurs [MAR73]. The theoreticalboundary is the concrete cover that can resist the splitting forces [MAR73]. Thetransition between splitting and pull-out failure was often found to occur at a concretecover of 3 ∙ Ø to 5 ∙ Ø [FIB14].
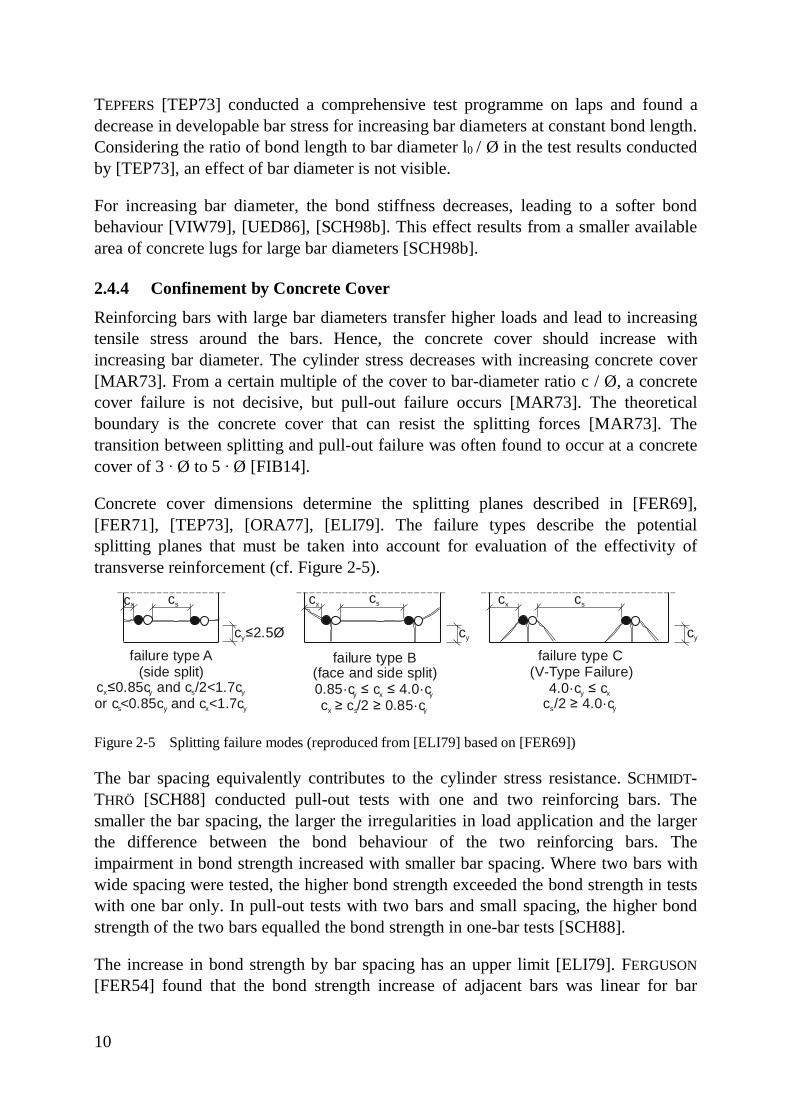
Concrete cover dimensions determine the splitting planes described in [FER69],[FER71], [TEP73], [ORA77], [ELI79]. The failure types describe the potentialsplitting planes that must be taken into account for evaluation of the effectivity oftransverse reinforcement (cf. Figure 2-5).
Figure 2-5 Splitting failure modes (reproduced from [ELI79] based on [FER69])
The bar spacing equivalently contributes to the cylinder stress resistance. SCHMIDT-THRÖ [SCH88] conducted pull-out tests with one and two reinforcing bars. Thesmaller the bar spacing, the larger the irregularities in load application and the largerthe difference between the bond behaviour of the two reinforcing bars. Theimpairment in bond strength increased with smaller bar spacing. Where two bars withwide spacing were tested, the higher bond strength exceeded the bond strength in testswith one bar only. In pull-out tests with two bars and small spacing, the higher bondstrength of the two bars equalled the bond strength in one-bar tests [SCH88].
The increase in bond strength by bar spacing has an upper limit [ELI79]. FERGUSON[FER54] found that the bond strength increase of adjacent bars was linear for bar
failure type A(side split)
c ≤0.85c and c /2<1.7cx y s y
s y x yor c<0.85c and c <1.7c
cscx
c ≤2.5Øy
failure type B(face and side split)0.85·c ≤ c ≤ 4.0·cy x y
x s yc ≥ c /2 ≥ 0.85·c
failure type C(V-Type Failure)
4.0·c ≤ cy x
s yc /2 ≥ 4.0·c
cy
cscx
cy
cscx
11
spacing between 1·Ø to 4·Ø. For larger bar spacing, the bond strength increase wasless than proportional.
2.4.5 Confinement by Transverse Reinforcement
Transverse reinforcement prevents sudden splitting failure and reduces the splittingcrack width considerably. To adequately reduce longitudinal crack widths, transversebars must have a reasonable spacing. All reinforcing bars only reduce crack widthseffectively within their vicinity. Therefore, the transverse bar spacing must not be toowide. On the other hand, the spacing must be wide enough to allow for a goodcompaction of concrete between the transverse bars. Since the bond stress distributionis non-linear along the bond length, transverse reinforcement is most effective in thehighly utilised section of the bond length.
Although transverse reinforcing bars are capable of a longitudinal crack widthreduction, they do not yield (e.g. [BUR00], [HEG15]; [ELI79]). Still, some authorsfound an effect of transverse bar diameter on the obtainable bond strength. Inanchorage tests with long bond lengths, the longitudinal crack widths decreased withincreasing transverse bar diameter. A linear correlation between transverse bardiameter and bond strength was found [PLI98].
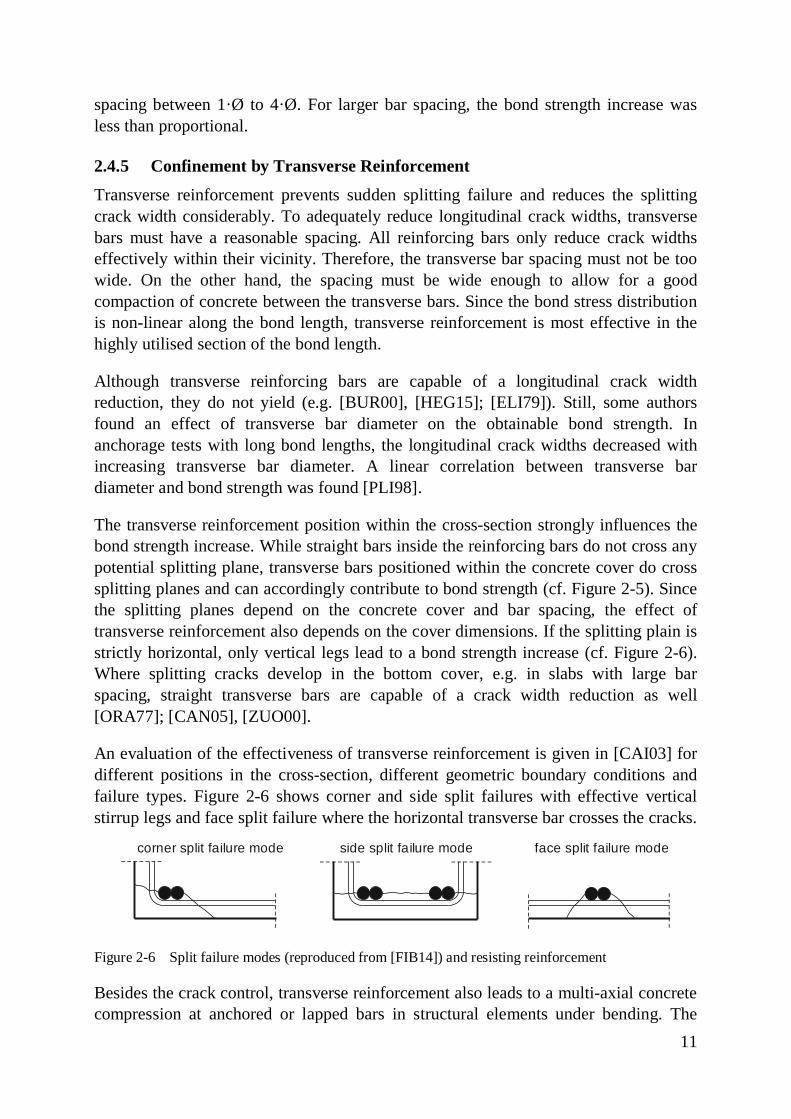
The transverse reinforcement position within the cross-section strongly influences thebond strength increase. While straight bars inside the reinforcing bars do not cross anypotential splitting plane, transverse bars positioned within the concrete cover do crosssplitting planes and can accordingly contribute to bond strength (cf. Figure 2-5). Sincethe splitting planes depend on the concrete cover and bar spacing, the effect oftransverse reinforcement also depends on the cover dimensions. If the splitting plain isstrictly horizontal, only vertical legs lead to a bond strength increase (cf. Figure 2-6).Where splitting cracks develop in the bottom cover, e.g. in slabs with large barspacing, straight transverse bars are capable of a crack width reduction as well[ORA77]; [CAN05], [ZUO00].
An evaluation of the effectiveness of transverse reinforcement is given in [CAI03] fordifferent positions in the cross-section, different geometric boundary conditions andfailure types. Figure 2-6 shows corner and side split failures with effective verticalstirrup legs and face split failure where the horizontal transverse bar crosses the cracks.
Figure 2-6 Split failure modes (reproduced from [FIB14]) and resisting reinforcement
Besides the crack control, transverse reinforcement also leads to a multi-axial concretecompression at anchored or lapped bars in structural elements under bending. The
face split failure modecorner split failure mode side split failure mode
12
concrete cover in such elements is subject to additional tensile stress by bursting forcesof the longitudinal bars at the lap ends. In this case, transverse reinforcement confinesthe lap ends and leads to an increase in stress developed by bond. The positive effectof transverse reinforcement equally applies to direct tension members and beams[BUR00].
2.4.6 Confinement by Transverse Pressure
The maximum bond strength is increased by transverse pressure if present. For smoothbars, the bond strength increases linearly with increasing transverse pressure [SCH88],whereas the bond strength increase for deformed bars is non-linear [ROB82],[SCH88], [FIB14]. The effect of transverse pressure increases with increasing slip fordeformed bars [UNT65], [SCH88].
SCHMIDT-THRÖ [SCH88] conducted anchorage tests with transverse pressure pvarying from p = 0 to p = 20 N/mm². The transverse pressure increased with increasingbar force and was therefore comparable to beam supports. The bond strength increaseby transverse pressure was more than 100 % for some test configurations. At hightransverse pressure, the longitudinal splitting cracks were controlled by transversepressure and concrete pry-out was observed. In tests without or small transversepressure, longitudinal cracks developed above the anchored bars. The transversepressure perpendicular to the splitting plane reduced the mutual influence of adjacentbars [SCH88].
2.4.7 Further Influencing Parameters
Besides the described bond parameters, several additional parameters influence thebond behaviour. These parameters will be described briefly, but will not be evaluatedin detail in this thesis.
For the effect of reinforcing bar position during casting, different bond zones aredistinguished [EC2]. The best bond conditions for horizontal bars are close to thebottom of the formwork and for vertical bars when loaded against the castingdirection. In both cases the ribs induce compression struts against a less porous mortar[FIB10]. Most codes include a factor for good and poor bond conditions (e.g. [EC2],[MC2010], [ACI14]). If the bond strength is impaired by consolidation of the fluidconcrete under the bar, poor bond conditions are presumed [REH61], [MC2010].
In addition to the concrete strength, the aggregate distribution [MAR81], the strengthof the aggregate [ZUO00] and the concrete consistency [MAR73] influence themaximum bond strength.
The bond-strength slip relationship is strongly affected by rib geometry thatdetermines the bond stiffness and the splitting tendency. Reinforcing bar ribs aredescribed by the relative rib area fR. This value is only one reference for the quality ofreinforcing bar surfaces, since bond behaviour also depends on the rib angle and the
13
rib filleting. The differences between North American and European rib patterns arenot visible in statistical evaluation of bond strength [FIB14].
Reinforced concrete is also influenced by corrosion of the composite materials. Both adeterioration of concrete cover and corrosion of the steel surface influence the bondstrength. Corrosion increases the bar diameter and friction, but also leads to thedevelopment of longitudinal cracks [FIB10]. A firmly adherent layer of rust beforecasting is insignificant [MAS90], [FIB10] or even enhances the bond strength at earlystages of corrosion [AL-90]. Only at more advanced stages of corrosion, weak materialbetween bar and concrete will reduce the bond strength [CAB94]. Small ordelaminated covers increase the tensile cylinder stress and impair the bond strength[COR12], [FIB10].
Furthermore, bond characteristics depend on the loading type. The bearing of the endsof compression bars provides an additional contribution to load transfer [FIB14].Secondly, the bond stresses in the vicinity of transverse cracks do not occur incompression zones as transverse cracks do not develop. In tension laps, each lappedbar carries half the force of a single bar outside the lap. This is not the case in laps incompression where concrete contributes to the load transfer [FIB14].
Cyclic loads usually do not reduce the developable stress in laps, but increase the slipat the lap ends [REH77]. The slip is significantly influenced by the load history[FIB10]. The deterioration of bond under repeated loading primarily depends on thepeak slip [ELI83]. The bond deterioration is not only due to the repeated loading, butalso to long term effects [FIB10]. Bond zones under long-term loads corresponding tothe serviceability load have the same bond strength as bond zones under a constantload increase until failure [REH77].
2.5 Differences between Anchorages and LapsWhether design models for necessary bond lengths are equally applicable to bothlapped joints and anchorages is an issue that has not been resolved despite many yearsof effort [FIB14], [REY82]. Compression struts mutually stabilise in the direction ofthe second bar. Three theories on the inequality of lapped joints and anchorages aredistinguished:
· Hydraulic pressure theory by [FER65a] and [TEP73]· Rib interference by adjacent bars (shielded ribs between the bars)· Strut-and-tie model with considerable transverse strain at lap ends [BUR00]
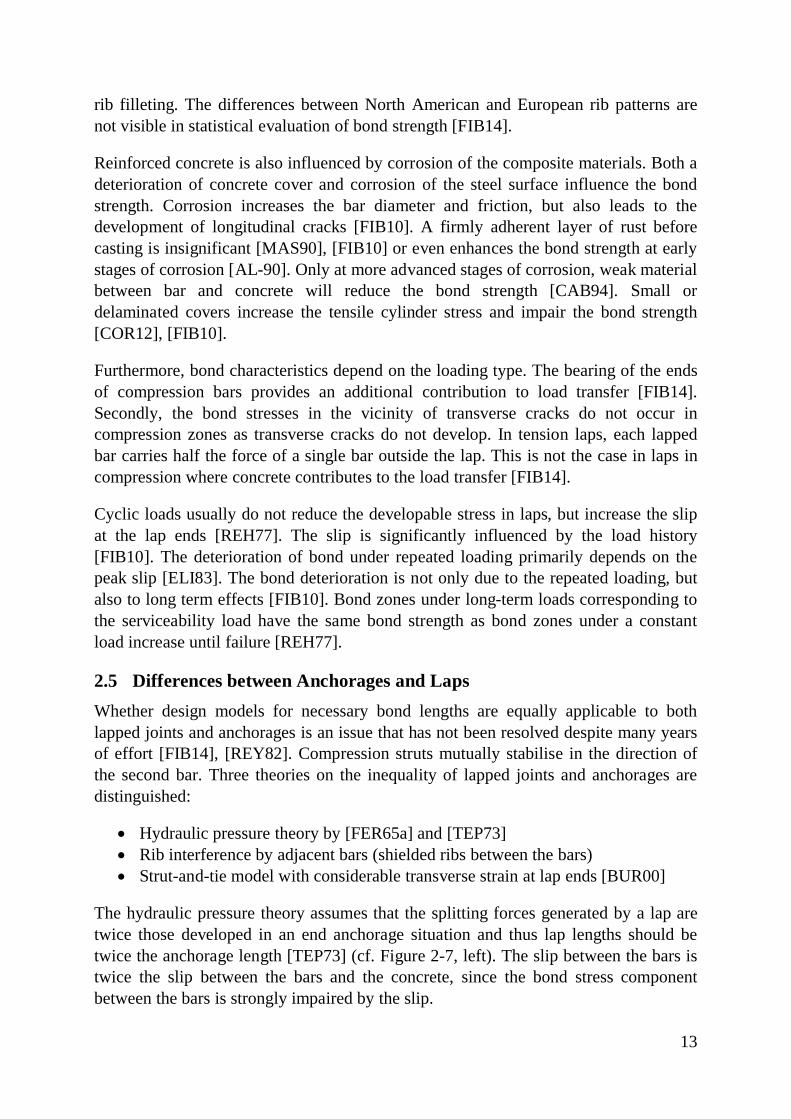
The hydraulic pressure theory assumes that the splitting forces generated by a lap aretwice those developed in an end anchorage situation and thus lap lengths should betwice the anchorage length [TEP73] (cf. Figure 2-7, left). The slip between the bars istwice the slip between the bars and the concrete, since the bond stress componentbetween the bars is strongly impaired by the slip.
14
While anchored bars are entirely surrounded by concrete, ribs of lapped bars areimpaired, where bars are positioned directly side-by-side. If the ribs towards thesecond lapped bar do not participate in the load transfer, not the entire circumferencecontributes to resistance (cf. Figure 2-7, right). In contrast, CAIRNS [CAI96] describesthat the distance between lapped bars does not influence the lap strength until the barstrength decreases for spacings between lapped bars of more than 4 ∙ Ø.
Figure 2-7 Hydraulic pressure theory by [FER65a] and [TEP73] (left) and shielded ribs minimisingthe bond circumference Ub (right)
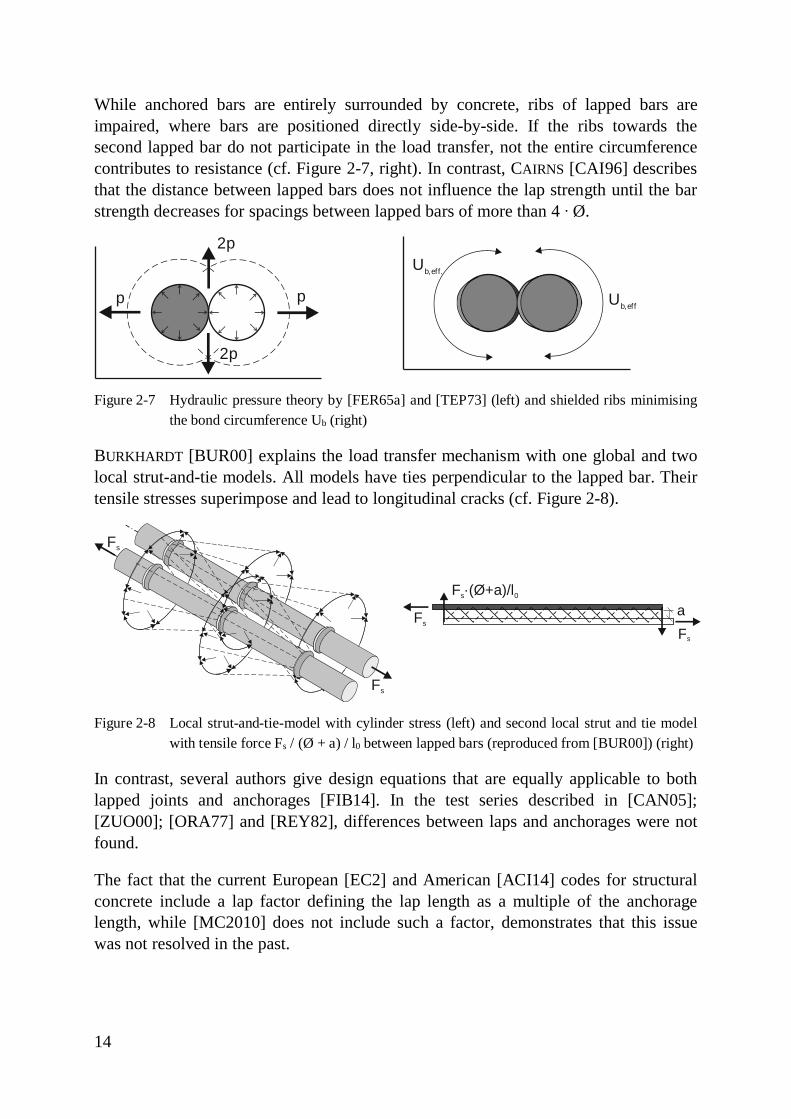
BURKHARDT [BUR00] explains the load transfer mechanism with one global and twolocal strut-and-tie models. All models have ties perpendicular to the lapped bar. Theirtensile stresses superimpose and lead to longitudinal cracks (cf. Figure 2-8).
Figure 2-8 Local strut-and-tie-model with cylinder stress (left) and second local strut and tie modelwith tensile force Fs / (Ø + a) / l0 between lapped bars (reproduced from [BUR00]) (right)
In contrast, several authors give design equations that are equally applicable to bothlapped joints and anchorages [FIB14]. In the test series described in [CAN05];[ZUO00]; [ORA77] and [REY82], differences between laps and anchorages were notfound.
The fact that the current European [EC2] and American [ACI14] codes for structuralconcrete include a lap factor defining the lap length as a multiple of the anchoragelength, while [MC2010] does not include such a factor, demonstrates that this issuewas not resolved in the past.
pp
2p
2p
Ub,eff.
Ub,eff.
Fs
Fs
Fs
Fs
F ·(Ø+a)/ls 0
a
15
2.6 Test Setups for Bond InvestigationFor the investigation of bond in concrete, various test specimens and test-setups exist.RILEM RECOMMENDATION RC5 [RIL82], [RIL83], [AST15] provide standard tests forbond of reinforcing bars in concrete. CAIRNS [CAI02] distinguishes transfer type bondtests and anchorage- or development-type bond tests. The RILEM Pull-Out [RIL83],the RILEM Beam Test [RIL82] and the ASTM Beam-End Test [AST15] areanchorage types (cf. Figure 2-9). Transfer tests with reinforcement stressed in tensionat both ends of the bar are used for crack observation mainly [CAI02]. The bond zonesin the various test specimens differ by development length and confinement. For theevaluation of bond test results, the afore mentioned influencing parameters must betaken into account.
Most pull-out test specimens have much shorter bond lengths than the requiredanchorage length for the development of yield strength. Thus, there is usuallymeasurable slip at the unloaded end of the bar and the bond stress is very high.
Besides scientific investigation on bond behaviour, many bond tests are conducted inreinforcing steel industry for technical approvals and regular quality control. For thesecases, simple test specimens with little manufacturing complexity and effort aredesired.
Pull-Out Test
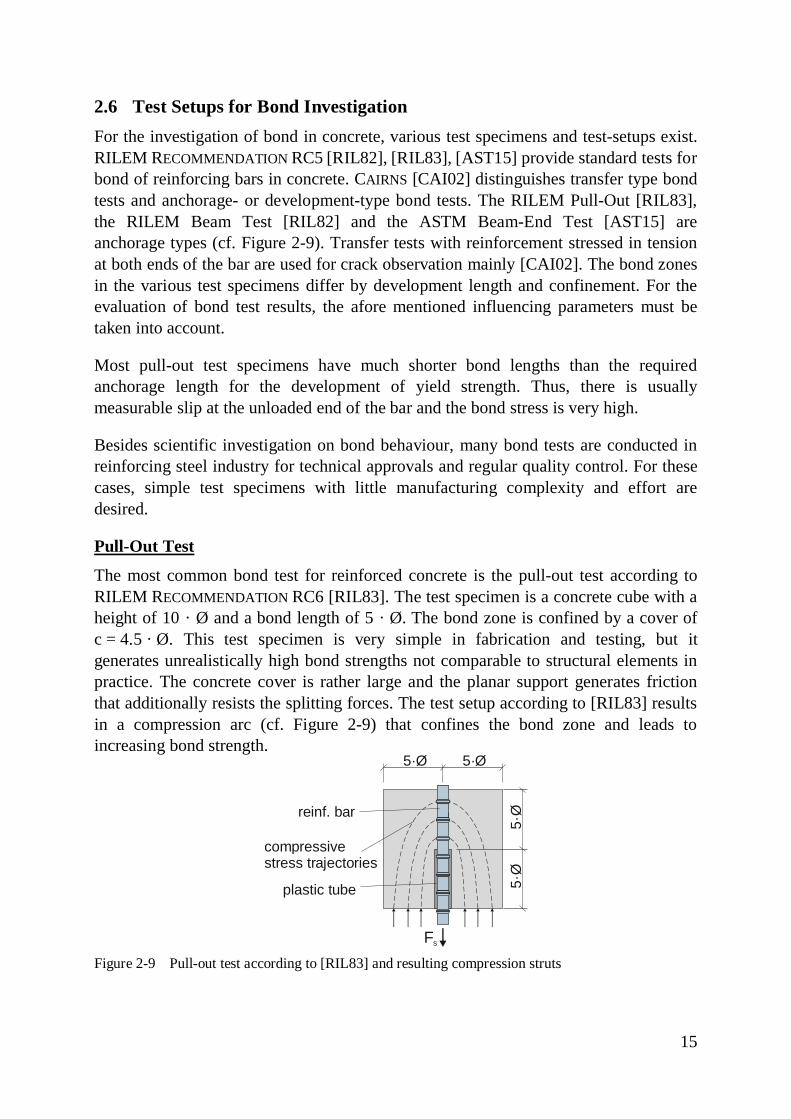
The most common bond test for reinforced concrete is the pull-out test according toRILEM RECOMMENDATION RC6 [RIL83]. The test specimen is a concrete cube with aheight of 10 · Ø and a bond length of 5 · Ø. The bond zone is confined by a cover ofc = 4.5 · Ø. This test specimen is very simple in fabrication and testing, but itgenerates unrealistically high bond strengths not comparable to structural elements inpractice. The concrete cover is rather large and the planar support generates frictionthat additionally resists the splitting forces. The test setup according to [RIL83] resultsin a compression arc (cf. Figure 2-9) that confines the bond zone and leads toincreasing bond strength.
Figure 2-9 Pull-out test according to [RIL83] and resulting compression struts
compressivestress trajectories
Fs
5·Ø
5·Ø
5·Ø 5·Ø
reinf. bar
plastic tube
16
Beam-End Test
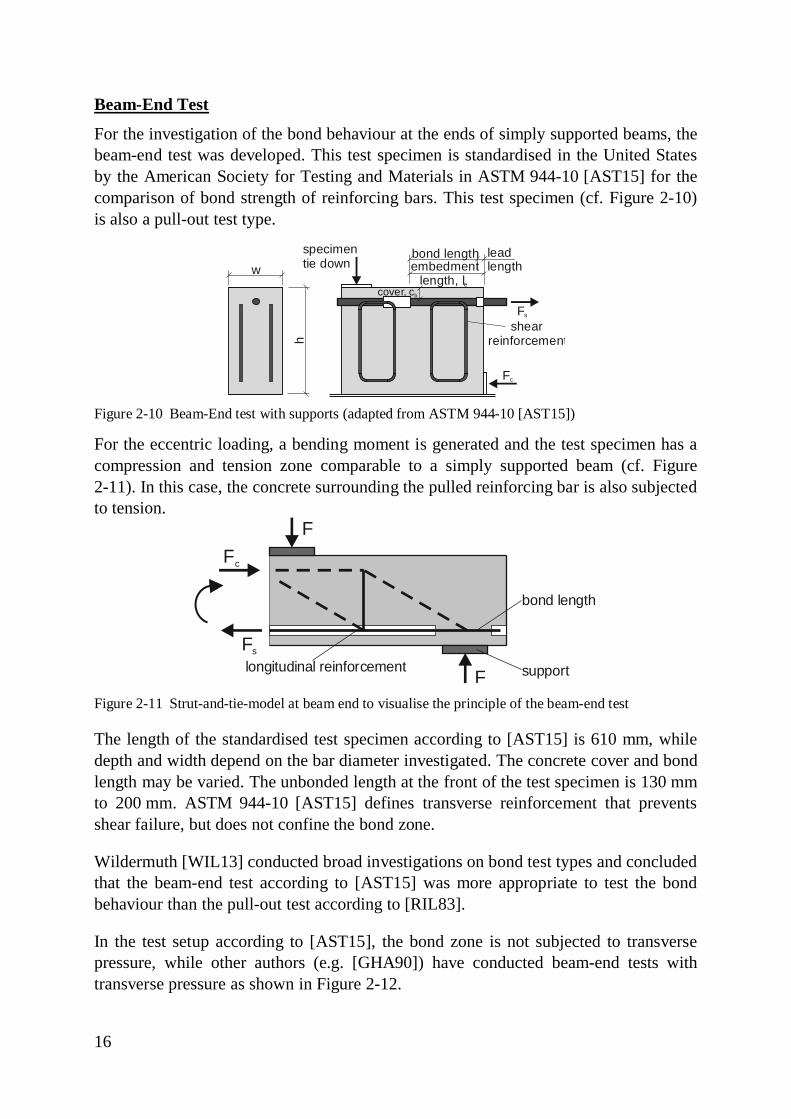
For the investigation of the bond behaviour at the ends of simply supported beams, thebeam-end test was developed. This test specimen is standardised in the United Statesby the American Society for Testing and Materials in ASTM 944-10 [AST15] for thecomparison of bond strength of reinforcing bars. This test specimen (cf. Figure 2-10)is also a pull-out test type.
Figure 2-10 Beam-End test with supports (adapted from ASTM 944-10 [AST15])
For the eccentric loading, a bending moment is generated and the test specimen has acompression and tension zone comparable to a simply supported beam (cf. Figure2-11). In this case, the concrete surrounding the pulled reinforcing bar is also subjectedto tension.
Figure 2-11 Strut-and-tie-model at beam end to visualise the principle of the beam-end test
The length of the standardised test specimen according to [AST15] is 610 mm, whiledepth and width depend on the bar diameter investigated. The concrete cover and bondlength may be varied. The unbonded length at the front of the test specimen is 130 mmto 200 mm. ASTM 944-10 [AST15] defines transverse reinforcement that preventsshear failure, but does not confine the bond zone.
Wildermuth [WIL13] conducted broad investigations on bond test types and concludedthat the beam-end test according to [AST15] was more appropriate to test the bondbehaviour than the pull-out test according to [RIL83].
In the test setup according to [AST15], the bond zone is not subjected to transversepressure, while other authors (e.g. [GHA90]) have conducted beam-end tests withtransverse pressure as shown in Figure 2-12.
w
h
bond lengthembedment
length, le
leadlength
cover, cb
Fs
Fc
specimentie down
shearreinforcement
Fs
Fc
longitudinal reinforcement support
bond length
F
F
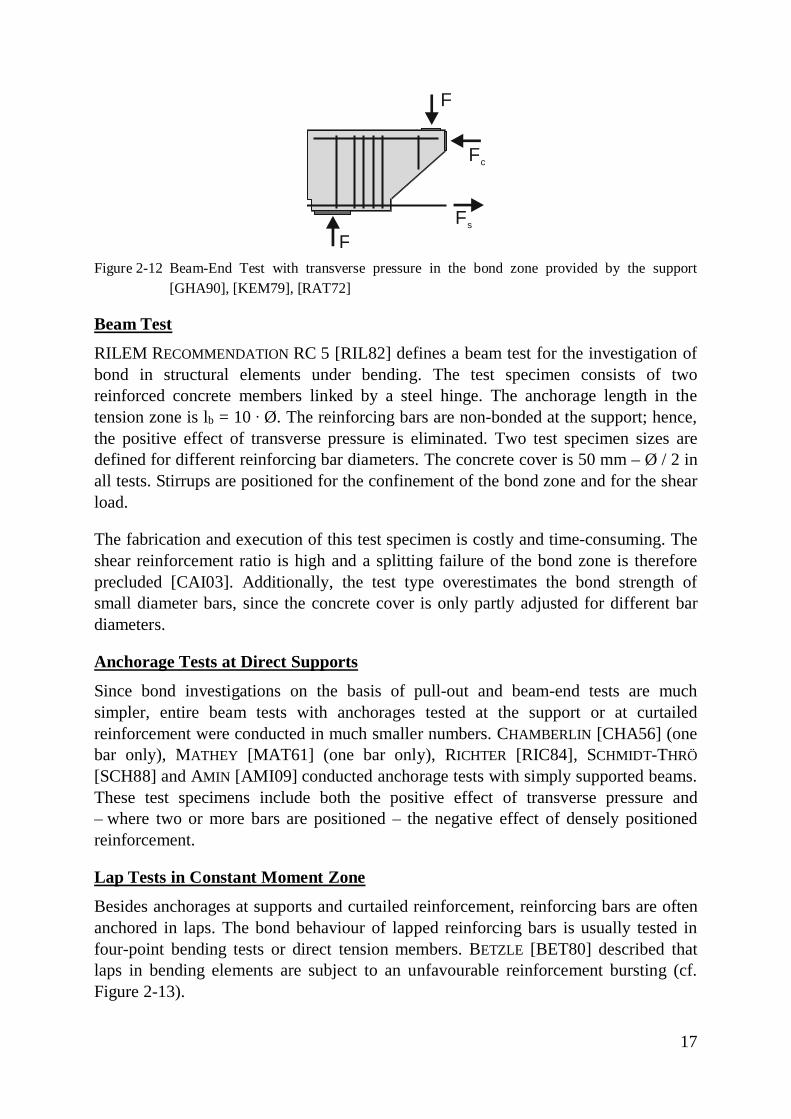
17
Figure 2-12 Beam-End Test with transverse pressure in the bond zone provided by the support[GHA90], [KEM79], [RAT72]
Beam Test
RILEM RECOMMENDATION RC 5 [RIL82] defines a beam test for the investigation ofbond in structural elements under bending. The test specimen consists of tworeinforced concrete members linked by a steel hinge. The anchorage length in thetension zone is lb = 10 ∙ Ø. The reinforcing bars are non-bonded at the support; hence,the positive effect of transverse pressure is eliminated. Two test specimen sizes aredefined for different reinforcing bar diameters. The concrete cover is 50 mm – Ø / 2 inall tests. Stirrups are positioned for the confinement of the bond zone and for the shearload.
The fabrication and execution of this test specimen is costly and time-consuming. Theshear reinforcement ratio is high and a splitting failure of the bond zone is thereforeprecluded [CAI03]. Additionally, the test type overestimates the bond strength ofsmall diameter bars, since the concrete cover is only partly adjusted for different bardiameters.
Anchorage Tests at Direct Supports
Since bond investigations on the basis of pull-out and beam-end tests are muchsimpler, entire beam tests with anchorages tested at the support or at curtailedreinforcement were conducted in much smaller numbers. CHAMBERLIN [CHA56] (onebar only), MATHEY [MAT61] (one bar only), RICHTER [RIC84], SCHMIDT-THRÖ[SCH88] and AMIN [AMI09] conducted anchorage tests with simply supported beams.These test specimens include both the positive effect of transverse pressure and– where two or more bars are positioned – the negative effect of densely positionedreinforcement.
Lap Tests in Constant Moment Zone
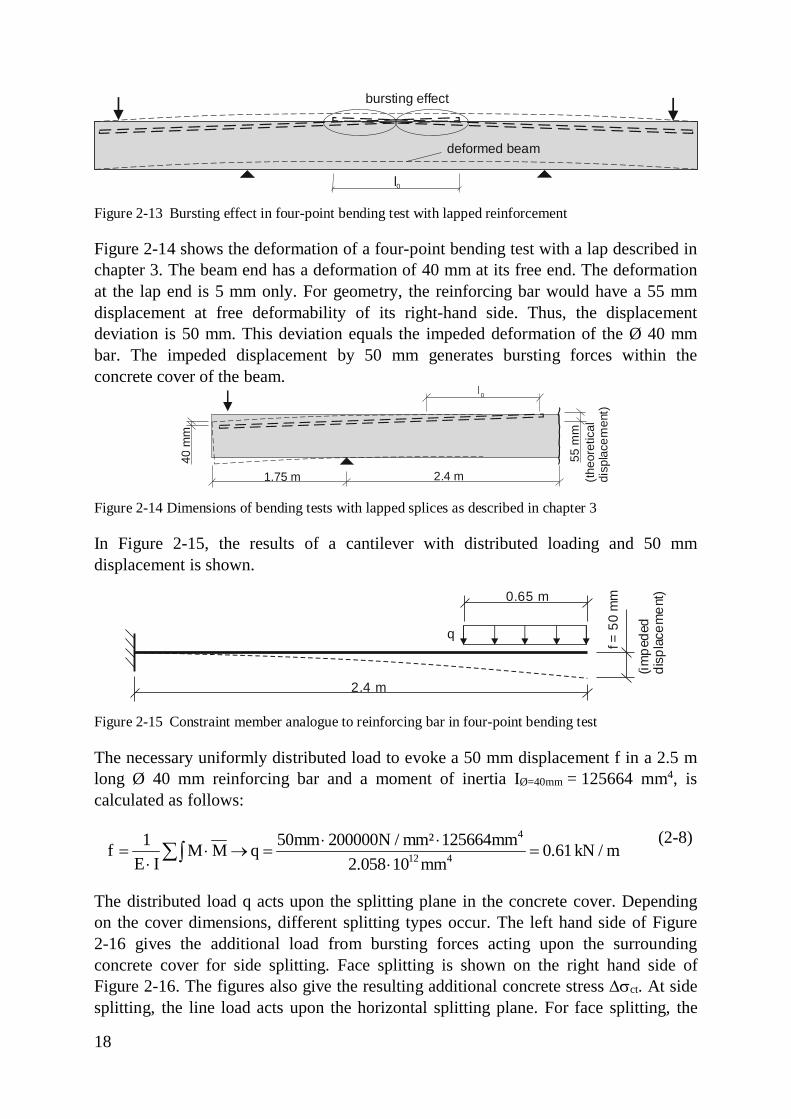
Besides anchorages at supports and curtailed reinforcement, reinforcing bars are oftenanchored in laps. The bond behaviour of lapped reinforcing bars is usually tested infour-point bending tests or direct tension members. BETZLE [BET80] described thatlaps in bending elements are subject to an unfavourable reinforcement bursting (cf.Figure 2-13).
Fs
F
F
Fc
18
Figure 2-13 Bursting effect in four-point bending test with lapped reinforcement
Figure 2-14 shows the deformation of a four-point bending test with a lap described inchapter 3. The beam end has a deformation of 40 mm at its free end. The deformationat the lap end is 5 mm only. For geometry, the reinforcing bar would have a 55 mmdisplacement at free deformability of its right-hand side. Thus, the displacementdeviation is 50 mm. This deviation equals the impeded deformation of the Ø 40 mmbar. The impeded displacement by 50 mm generates bursting forces within theconcrete cover of the beam.
Figure 2-14 Dimensions of bending tests with lapped splices as described in chapter 3
In Figure 2-15, the results of a cantilever with distributed loading and 50 mmdisplacement is shown.
Figure 2-15 Constraint member analogue to reinforcing bar in four-point bending test
The necessary uniformly distributed load to evoke a 50 mm displacement f in a 2.5 mlong Ø 40 mm reinforcing bar and a moment of inertia IØ=40mm = 125664 mm4, iscalculated as follows:
4
12 41 50mm 200000N / mm² 125664mmf M M q 0.61 kN / m
E I 2.058 10 mm× ×
= × ® = =× ×åò
(2-8)
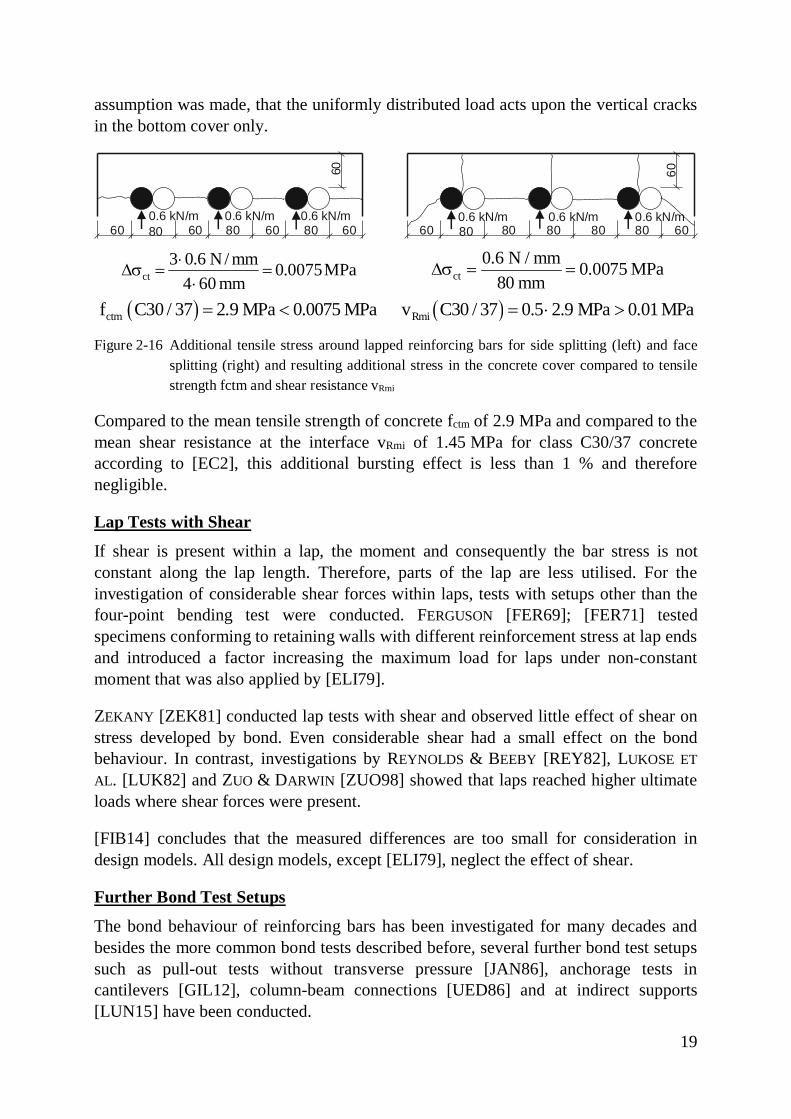
The distributed load q acts upon the splitting plane in the concrete cover. Dependingon the cover dimensions, different splitting types occur. The left hand side of Figure2-16 gives the additional load from bursting forces acting upon the surroundingconcrete cover for side splitting. Face splitting is shown on the right hand side ofFigure 2-16. The figures also give the resulting additional concrete stress Dsct. At sidesplitting, the line load acts upon the horizontal splitting plane. For face splitting, the
l0
bursting effect
deformed beam
1.75 m 2.4 m
55 m
m
40m
m
l0
(theo
retic
aldi
spla
cem
ent)
2.4 m
f = 5
0 m
mq
0.65 m
(impe
ded
disp
lace
men
t)
19
assumption was made, that the uniformly distributed load acts upon the vertical cracksin the bottom cover only.
MPa0075.0mm604
mm/N6.03ct =
××
=sD
( )ctmf C30 / 37 2.9 MPa 0.0075 MPa= <
ct0.6 N / mm 0.0075 MPa
80 mmDs = =
( )Rmiv C30 / 37 0.5 2.9 MPa 0.01 MPa= × >
Figure 2-16 Additional tensile stress around lapped reinforcing bars for side splitting (left) and facesplitting (right) and resulting additional stress in the concrete cover compared to tensilestrength fctm and shear resistance vRmi
Compared to the mean tensile strength of concrete fctm of 2.9 MPa and compared to themean shear resistance at the interface vRmi of 1.45 MPa for class C30/37 concreteaccording to [EC2], this additional bursting effect is less than 1 % and thereforenegligible.
Lap Tests with Shear
If shear is present within a lap, the moment and consequently the bar stress is notconstant along the lap length. Therefore, parts of the lap are less utilised. For theinvestigation of considerable shear forces within laps, tests with setups other than thefour-point bending test were conducted. FERGUSON [FER69]; [FER71] testedspecimens conforming to retaining walls with different reinforcement stress at lap endsand introduced a factor increasing the maximum load for laps under non-constantmoment that was also applied by [ELI79].
ZEKANY [ZEK81] conducted lap tests with shear and observed little effect of shear onstress developed by bond. Even considerable shear had a small effect on the bondbehaviour. In contrast, investigations by REYNOLDS & BEEBY [REY82], LUKOSE ETAL. [LUK82] and ZUO & DARWIN [ZUO98] showed that laps reached higher ultimateloads where shear forces were present.
[FIB14] concludes that the measured differences are too small for consideration indesign models. All design models, except [ELI79], neglect the effect of shear.
Further Bond Test Setups
The bond behaviour of reinforcing bars has been investigated for many decades andbesides the more common bond tests described before, several further bond test setupssuch as pull-out tests without transverse pressure [JAN86], anchorage tests incantilevers [GIL12], column-beam connections [UED86] and at indirect supports[LUN15] have been conducted.
60 6080 60 80 80 60
60
0.6 kN/m 0.6 kN/m 0.6 kN/m60 8080 80 80 80 60
60
0.6 kN/m 0.6 kN/m 0.6 kN/m
20
2.7 Large Diameter Bars
2.7.1 Definition of Large Diameter Bars
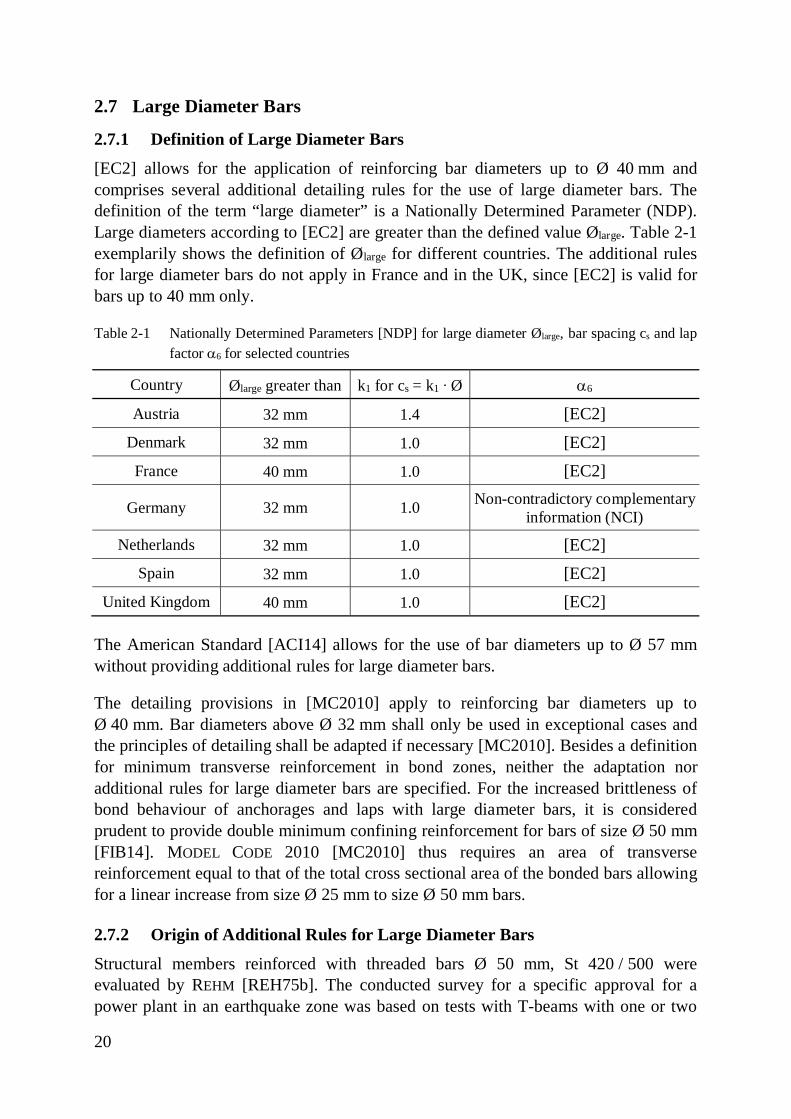
[EC2] allows for the application of reinforcing bar diameters up to Ø 40 mm andcomprises several additional detailing rules for the use of large diameter bars. Thedefinition of the term “large diameter” is a Nationally Determined Parameter (NDP).Large diameters according to [EC2] are greater than the defined value Ølarge. Table 2-1exemplarily shows the definition of Ølarge for different countries. The additional rulesfor large diameter bars do not apply in France and in the UK, since [EC2] is valid forbars up to 40 mm only.
Table 2-1 Nationally Determined Parameters [NDP] for large diameter Ølarge, bar spacing cs and lapfactor a6 for selected countries
Country Ølarge greater than k1 for cs = k1 ∙ Ø a6
Austria 32 mm 1.4 [EC2]Denmark 32 mm 1.0 [EC2]
France 40 mm 1.0 [EC2]
Germany 32 mm 1.0 Non-contradictory complementaryinformation (NCI)
Netherlands 32 mm 1.0 [EC2]Spain 32 mm 1.0 [EC2]
United Kingdom 40 mm 1.0 [EC2]
The American Standard [ACI14] allows for the use of bar diameters up to Ø 57 mmwithout providing additional rules for large diameter bars.
The detailing provisions in [MC2010] apply to reinforcing bar diameters up toØ 40 mm. Bar diameters above Ø 32 mm shall only be used in exceptional cases andthe principles of detailing shall be adapted if necessary [MC2010]. Besides a definitionfor minimum transverse reinforcement in bond zones, neither the adaptation noradditional rules for large diameter bars are specified. For the increased brittleness ofbond behaviour of anchorages and laps with large diameter bars, it is consideredprudent to provide double minimum confining reinforcement for bars of size Ø 50 mm[FIB14]. MODEL CODE 2010 [MC2010] thus requires an area of transversereinforcement equal to that of the total cross sectional area of the bonded bars allowingfor a linear increase from size Ø 25 mm to size Ø 50 mm bars.
2.7.2 Origin of Additional Rules for Large Diameter Bars
Structural members reinforced with threaded bars Ø 50 mm, St 420 / 500 wereevaluated by REHM [REH75b]. The conducted survey for a specific approval for apower plant in an earthquake zone was based on tests with T-beams with one or two
21
Ø 50 mm bars conducted at the universities in Munich [REH75a] and Tokyo[KOK72]. From this survey, the additional rules for Ø 50 mm bars were later derivedfor a general technical approval. The rules were subsequently softened for the approvalof Ø 40 mm bars and were also adopted in DIN 1045 [DEU88], EUROCODE 2 [EC2]and its GERMAN NATIONAL ANNEX [EC2/NA].
REHM [REH75b] recommends several rules for the use of Ø 50 mm bars additionallyto the code approved at that time. These additional rules included minimumdimensions of the reinforced concrete elements, surface reinforcement for crack widthcontrol, reduction of shear capacity, additional reinforcement for compressionmembers and rules for bond zones. The unfavourable slip behaviour of large diameterbars was incorporated by a bond strength reduction factor of 0.8. For anchorages,increased transverse reinforcement was defined to allow for the risk of cover-splitting.Anchorages with straight ends or mechanical devices were only allowed fulfillingincreased requirements for the positioning of reinforcement in the longitudinal andtransverse directions. The percentage of bars lapped at a section was limited. Since thesurvey was conducted for an earthquake zone, the fatigue strength of the bars andcorresponding fasteners was defined [REH75b].
JUNGWIRTH [JUN77] introduces a model for the design of surface reinforcement. Theconcrete cover in the tension zone is defined for a direct tension member and theresidual member depth for a member under bending.
2.7.3 Additional Rules for Large Diameter Bars
EUROCODE 2 [EC2] defines additional rules for large diameter bars concerning bondstrength, crack control, shear, laps and anchorages. Crack control in reinforcedconcrete members with large diameter bars may be achieved either by using surfacereinforcement or by calculation. The area of surface reinforcement As,surf is defined asa multiple of the area of the tensile concrete external to the links Act,ext (cf. Figure2-17).
Figure 2-17 Surface reinforcement As,surf as a multiple of the cross-section under tension external tothe links Act,ext for crack control according to [EC2]
Reinforcing bars should be anchored with mechanical devices or if anchored asstraight bars, links should be provided as confining reinforcement. Laps are
As,surf
xd-
x
Ac t ,ex t
22
permissible for limited bar stress and minimum dimensions of the structural elementonly. Transverse reinforcement additional to that for shear should be provided in theanchorage zones where transverse compression is not present [EC2].
The GERMAN NATIONAL ANNEX [EC2/NA] appends further additional rules for largediameter bars incorporating the findings from the described survey [REH75b].Minimum dimensions, concrete strength limits, a shear capacity reduction, highervalues for the cross-sectional area of surface reinforcement and minimum mandreldiameters. Additionally, further rules for bond zones were defined. Bars may belapped in members subjected to bending only and the permissible percentage of lappedbars is limited. All members must have direct supports and the longitudinalreinforcement for beams at intermediate supports must be anchored in compressionzones. Curtailed bars must exceed the zero-crossing of the envelope of the actingtensile force by the effective depth. Curtailed bars are allowed for members withh ≥ 800 mm, only [EC2/NA].
Table 2-2 shows an overview of the additional rules defined in [REH75b], [EC2/NA]and [EC2]. The rules given in the column for [EC2] are also valid for the applicationof [EC2/NA].
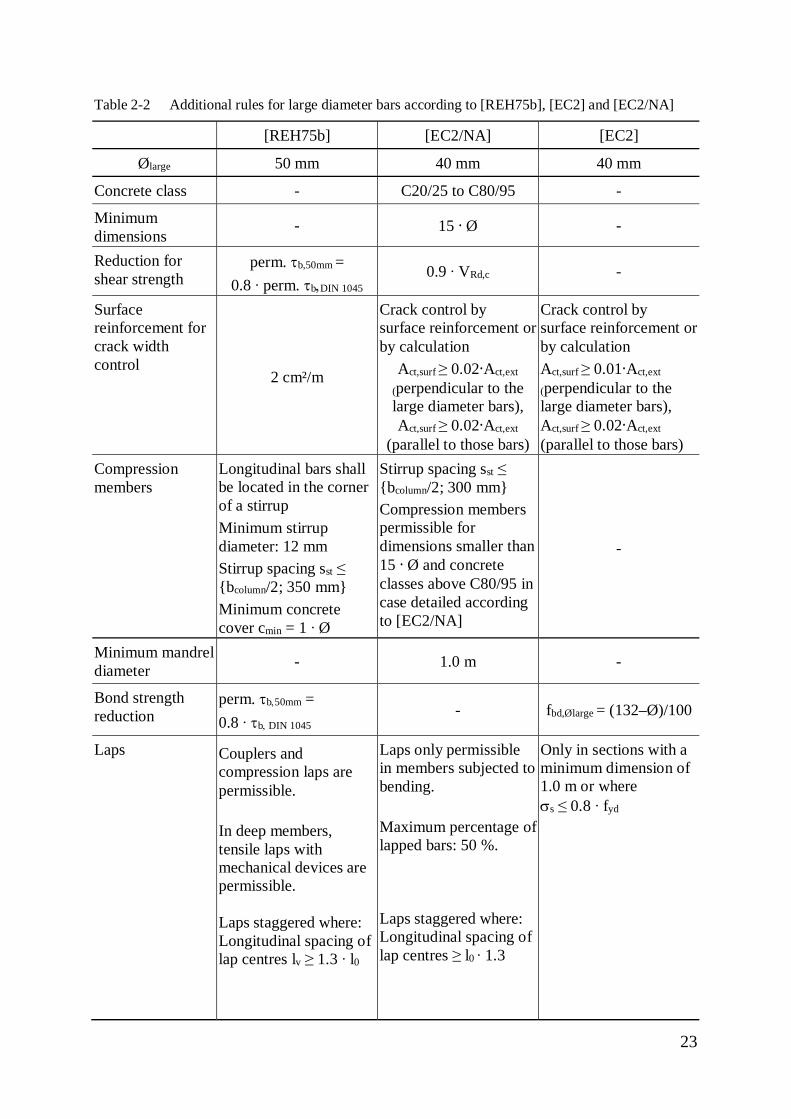
23
Table 2-2 Additional rules for large diameter bars according to [REH75b], [EC2] and [EC2/NA]
[REH75b] [EC2/NA] [EC2]
Ølarge 50 mm 40 mm 40 mm
Concrete class - C20/25 to C80/95 -
Minimumdimensions
- 15 · Ø -
Reduction forshear strength
perm. tb,50mm =0.8 ∙ perm. tb,DIN 1045
0.9 ∙ VRd,c -
Surfacereinforcement forcrack widthcontrol
2 cm²/m
Crack control bysurface reinforcement orby calculation
Act,surf≥ 0.02·Act,ext
(perpendicular to thelarge diameter bars),Act,surf≥ 0.02·Act,ext
(parallel to those bars)
Crack control bysurface reinforcement orby calculationAct,surf≥ 0.01·Act,ext
(perpendicular to thelarge diameter bars),Act,surf≥ 0.02·Act,ext
(parallel to those bars)Compressionmembers
Longitudinal bars shallbe located in the cornerof a stirrupMinimum stirrupdiameter: 12 mmStirrup spacing sst ≤{bcolumn/2; 350 mm}Minimum concretecover cmin = 1 ∙ Ø
Stirrup spacing sst ≤{bcolumn/2; 300 mm}Compression memberspermissible fordimensions smaller than15 · Ø and concreteclasses above C80/95 incase detailed accordingto [EC2/NA]
-
Minimum mandreldiameter - 1.0 m -
Bond strengthreduction
perm. tb,50mm =0.8 ∙ tb, DIN 1045
- fbd,Ølarge = (132–Ø)/100
Laps Couplers andcompression laps arepermissible.
In deep members,tensile laps withmechanical devices arepermissible.
Laps staggered where:Longitudinal spacing oflap centres lv ≥ 1.3 ∙ l0
Laps only permissiblein members subjected tobending.
Maximum percentage oflapped bars: 50 %.
Laps staggered where:Longitudinal spacing oflap centres ≥ l0 ∙ 1.3
Only in sections with aminimum dimension of1.0 m or wheress ≤ 0.8 ∙ fyd
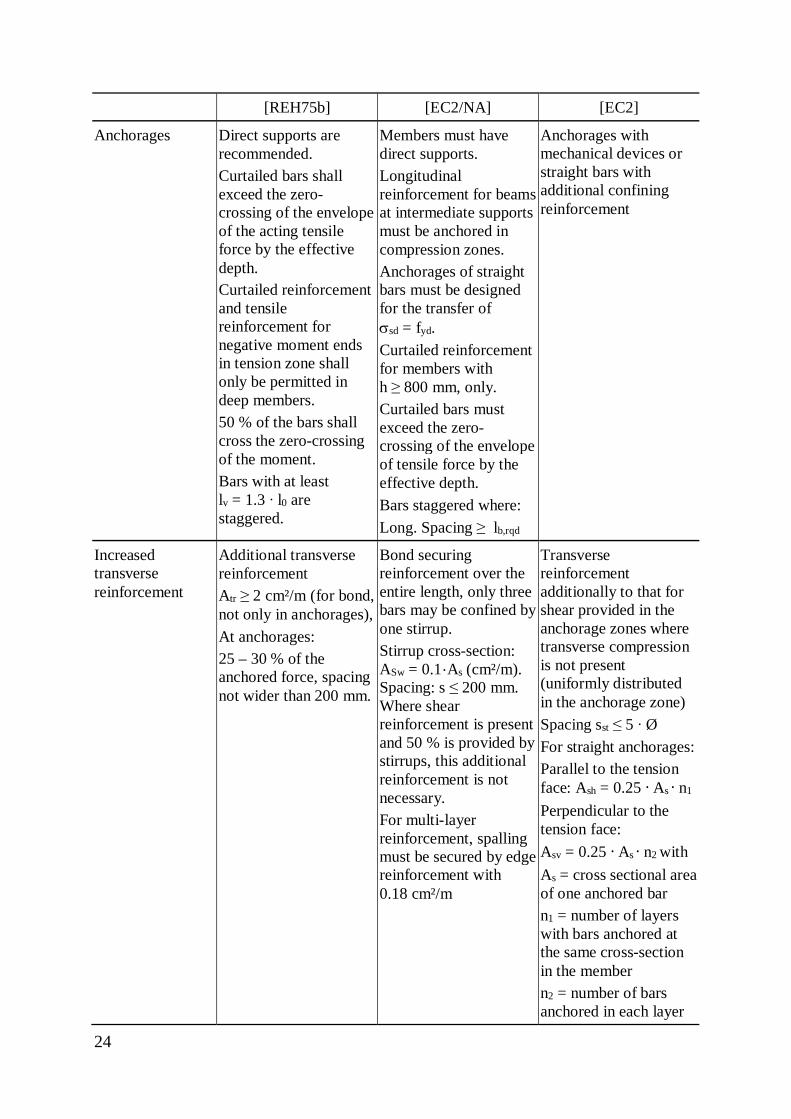
24
[REH75b] [EC2/NA] [EC2]
Anchorages Direct supports arerecommended.Curtailed bars shallexceed the zero-crossing of the envelopeof the acting tensileforce by the effectivedepth.Curtailed reinforcementand tensilereinforcement fornegative moment endsin tension zone shallonly be permitted indeep members.50 % of the bars shallcross the zero-crossingof the moment.Bars with at leastlv = 1.3 ∙ l0 arestaggered.
Members must havedirect supports.Longitudinalreinforcement for beamsat intermediate supportsmust be anchored incompression zones.Anchorages of straightbars must be designedfor the transfer ofssd = fyd.Curtailed reinforcementfor members withh ≥ 800 mm, only.Curtailed bars mustexceed the zero-crossing of the envelopeof tensile force by theeffective depth.Bars staggered where:Long. Spacing ≥ lb,rqd
Anchorages withmechanical devices orstraight bars withadditional confiningreinforcement
Increasedtransversereinforcement
Additional transversereinforcementAtr ≥ 2 cm²/m (for bond,not only in anchorages),At anchorages:25 – 30 % of theanchored force, spacingnot wider than 200 mm.
Bond securingreinforcement over theentire length, only threebars may be confined byone stirrup.Stirrup cross-section:ASw = 0.1·As (cm²/m).Spacing: s ≤ 200 mm.Where shearreinforcement is presentand 50 % is provided bystirrups, this additionalreinforcement is notnecessary.For multi-layerreinforcement, spallingmust be secured by edgereinforcement with0.18 cm²/m
Transversereinforcementadditionally to that forshear provided in theanchorage zones wheretransverse compressionis not present(uniformly distributedin the anchorage zone)Spacing sst ≤ 5 ∙ ØFor straight anchorages:Parallel to the tensionface: Ash = 0.25 · As · n1
Perpendicular to thetension face:Asv = 0.25 · As · n2 withAs = cross sectional areaof one anchored barn1 = number of layerswith bars anchored atthe same cross-sectionin the membern2 = number of barsanchored in each layer
25
2.8 State of Standardisation of Bond ZonesCodes for the design of structural members account for the stress developed in bondzones by design models for required anchorage and lap length. The design modelshave been continuously revised with each new code reissue. [EC2], which is validsince 2004 comprises an anchorage design model previously given in [MC90]. TheEC2 Project Team elaborated a new proposal [PT18] for the next generation of [EC2].Its design model for anchorages and laps was taken from [FIB14], which is thebackground document on bond for [MC2010]. The Project Team removed theadditional provisions regarding large diameter bars according to [EC2] on the basisthat size effect is accounted for systematically [PT18]. For laps, [PT18] recommendsadditional verification of cracking at serviceability limit states in the lap region,particularly for large diameter bars. According to the [PT18] working draft comment,the avoidance of spalling for large diameter bars is a very specific case for structuresnormally designed according to specific recommendations. For the design model foranchorages and laps, the EC2 Project Team gives provisional calibration factors forthe conversion from mean values given in [FIB14] to design values that are still to bevalidated [PT18].
Code provisions for anchorages and laps can be distinguished between models withbond strength definition and without bond strength. Previous codes gave anchorageand lap lengths depending on a certain bond strength for different concrete classes (cf.[DEU88], [MC90], [EC2]). In contrast, the models according to [ACI14] and [FIB14]were derived from statistical evaluations of test results accounting for the maximumbar strength in anchorages and laps without defining bond strength. For [MC2010], thebond strength was derived from the [FIB14] design model. Bond strength is anauxiliary value that simplifies the design or the comprehension of the design, while itis ultimately not necessary for anchorage and lap design.
As described above, the maximum transferrable bar stress in anchorages and lapsdepends on many influencing parameters. A preferably simple equation is still desiredfor structural design. Therefore, the most important influencing parameters must beidentified and calibration factors have to be found, which are in agreement with thedefined level of safety according to [EC0].
2.9 Design Models for Anchorages and Laps
2.9.1 General
In this section, the design equations for anchorages and laps according to [EC2],[EC2/NA] and [ACI14] are presented. The derivation of the design equations inMODEL CODE 2010 [MC2010] and in the proposal for the next generation ofEUROCODE 2 [PT18] from [FIB14] is explained and the design models elaborated byELIGEHAUSEN [ELI79], BURKHARDT [BUR00], LETTOW [LET06a], ZUO / DARWIN[ZUO00] and CANBAY / FROSCH [CAN06] are shown. For comparability and
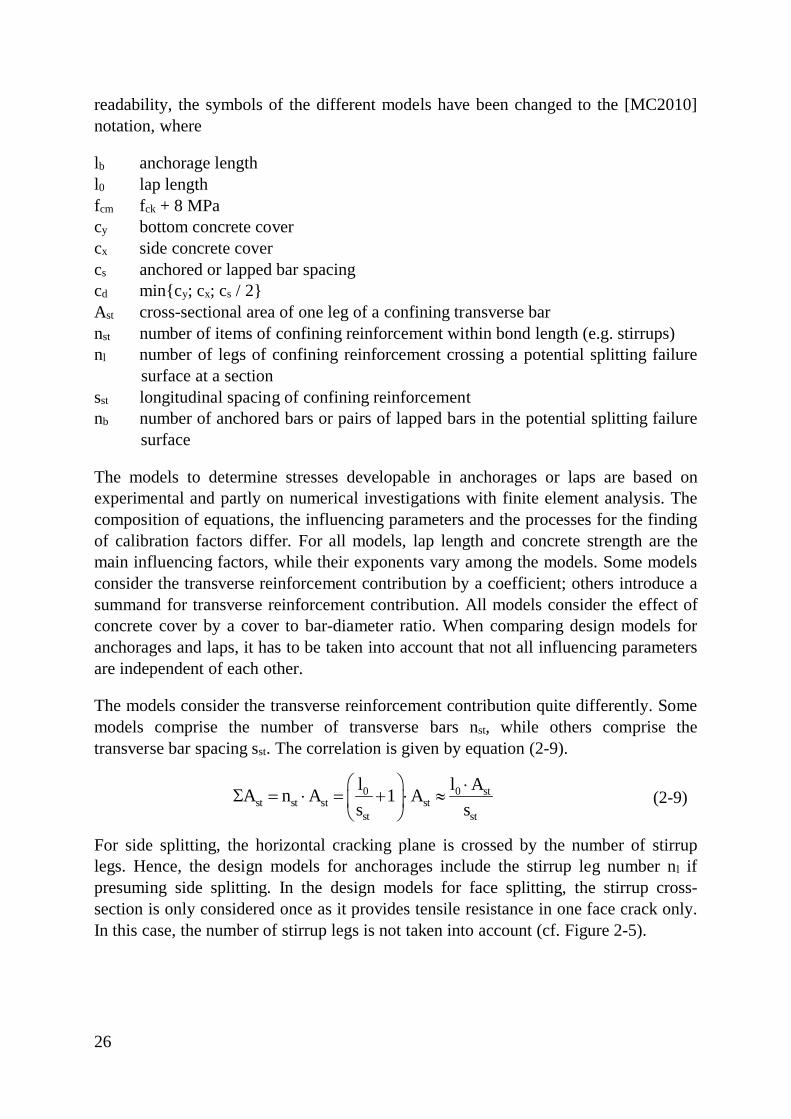
26
readability, the symbols of the different models have been changed to the [MC2010]notation, where
lb anchorage lengthl0 lap lengthfcm fck + 8 MPacy bottom concrete covercx side concrete covercs anchored or lapped bar spacingcd min{cy; cx; cs / 2}Ast cross-sectional area of one leg of a confining transverse barnst number of items of confining reinforcement within bond length (e.g. stirrups)nl number of legs of confining reinforcement crossing a potential splitting failure
surface at a sectionsst longitudinal spacing of confining reinforcementnb number of anchored bars or pairs of lapped bars in the potential splitting failure
surface
The models to determine stresses developable in anchorages or laps are based onexperimental and partly on numerical investigations with finite element analysis. Thecomposition of equations, the influencing parameters and the processes for the findingof calibration factors differ. For all models, lap length and concrete strength are themain influencing factors, while their exponents vary among the models. Some modelsconsider the transverse reinforcement contribution by a coefficient; others introduce asummand for transverse reinforcement contribution. All models consider the effect ofconcrete cover by a cover to bar-diameter ratio. When comparing design models foranchorages and laps, it has to be taken into account that not all influencing parametersare independent of each other.
The models consider the transverse reinforcement contribution quite differently. Somemodels comprise the number of transverse bars nst, while others comprise thetransverse bar spacing sst. The correlation is given by equation (2-9).
0 0 stst st st st
st st
l l AA n A 1 As sæ ö ×
S = × = + × »ç ÷è ø
(2-9)
For side splitting, the horizontal cracking plane is crossed by the number of stirruplegs. Hence, the design models for anchorages include the stirrup leg number nl ifpresuming side splitting. In the design models for face splitting, the stirrup cross-section is only considered once as it provides tensile resistance in one face crack only.In this case, the number of stirrup legs is not taken into account (cf. Figure 2-5).
27
2.9.2 EUROCODE 2
Bond Strength
The design model according to EUROCODE 2 [EC2] for anchorages and laps is basedon MODEL CODE 1990 [MC90]. The anchorage length shall be calculated from thebond strength fbd following from
fbd = 2.25 · h1 · h2 · fctd (2-10)
The coefficient 2.25 describes the relation of bond strength to the tensile concretestrength. The coefficients h1 and h2 take the bond conditions (h1 = 1.0 for good bondconditions) and the bar diameter into account with
h2 = (132 - Ø) / 100 (2-11)
The design concrete strength fctd is calculated from fctk;0.05 / gc, where fctk;0,05 is limitedto the value for C60/75. The design tensile strength of concrete fctd shall be calculatedfrom the 5%-fractile of the tensile strength of concrete with
fctd = fctk;0,05 / gc = act · 0.7 · 0.3 · fck2/3 / gc (2-12)
The coefficient act taking long term and loading effects on the tensile strength intoaccount is a nationally determined parameter (NDP), the recommended value is 1.0.The safety considered in the [EC2] anchorage design model is given in equation (2-12)calculating the bond strength with a 5%-fractile of the tensile strength of concretedivided by the partial safety factor for concrete gc being 1.5. The mean bond strengthfbm necessary for a comparison of test results is therefore
fbm = 2.25 · h1 · h2 · 0.3 · fck2/3 (2-13)
Anchorage Length
The value of the basic required anchorage length lb,rqd is
lb,rqd = (Ø / 4) · (ssd / fbd) (2-14)
The design stress of the bar ssd is the stress at the cross-section where the anchoragelength commences. The design anchorage length lbd is
lbd = a1,EC · a2,EC · a3,EC · a4,EC · a5,EC · lb,rqd ≥ lb,min (2-15)
Witha1, EC coefficient for bar shape (a1,EC = 1.0 for straight bars)a2, EC coefficient for concrete cover with 0.7 ≤ a2,EC = 1 – 0.15 · (cmin - Ø) / Ø ≤ 1.0
for straight bars with cmin = {cs / 2; cy; cx} the minimum bar spacing cs is a NDP that equals cs = 1.0 · Ø in most European
countries, an overview is given in Table 2-1a3, EC coefficient for transverse reinforcement if present, with
28
0.7 ≤ a3,EC = 1 - K · l = 1 – K · (SAst – SAst,min ) / As ≤ 1.0 (2-16)
K takes the efficiency of the transverse reinforcement depending on its locationin the section into account (cf. Figure 2-6 and Figure 2-18).
The coefficient l describes the difference between the cross-sectional area ofthe transverse reinforcement provided along the anchorage length and the cross-sectional area of the minimum transverse reinforcement SAst,min with
SAst,min = 0.25 · As (anchorages)SAst,min = 1.0 · As · (ssd / fyd) ≥ 1.0 · As (laps)
Figure 2-18 Efficiency factor K depending on the positioning of transverse reinforcement (adaptedfrom [EC2])
a4, EC coefficient for welded transverse bars along the anchorage length where present(otherwise a4,EC = 1.0)
a5, EC coefficient for transverse pressure p in the plane of splitting. Where present, theanchorage length may be reduced by 0.7 ≤ a5,EC = 1 – 0.04 · p ≤ 1.0.
Lap Length
Laps should be staggered and not located in areas of high moments. The clear spacingbetween lapped bars should not be greater than 4 · Ø or 50 mm. The permissiblepercentage of lapped bars in tension may be 100 % if all bars are in one layer. Forlapped bars in several layers, the percentage should not exceed 50 % [EC2].
The design lap length lb,rqd comprises the basic required anchorage length andcoefficients taking the main influencing parameters into account.
l0 = a1,EC · a2,EC · a3,EC · a5,EC · a6,EC · lb,rqd ≥ l0,min (2-17)
The coefficients a1,EC to a5,EC are given above. The coefficient a6,EC for the percentageof bars lapped at a section is determined as follows:
1.0 ≥ a6,EC = (rl / 25)0.5 ≤ 1.5 (2-18)
Withrl percentage of bars lapped at a section
For the concentration of splitting forces at lap ends, [EC2] requires the positioning oftransverse reinforcement at the outer sections of the lap length. If the bar diameter ofthe lapped bars is less than Ø 20 mm or the percentage of lapped bars amounts to lessthan 25 %, the transverse reinforcement necessary for other reasons may be assumed
K=0.1
As Ast
K=0.05
As Ast
K=0
As
Ast
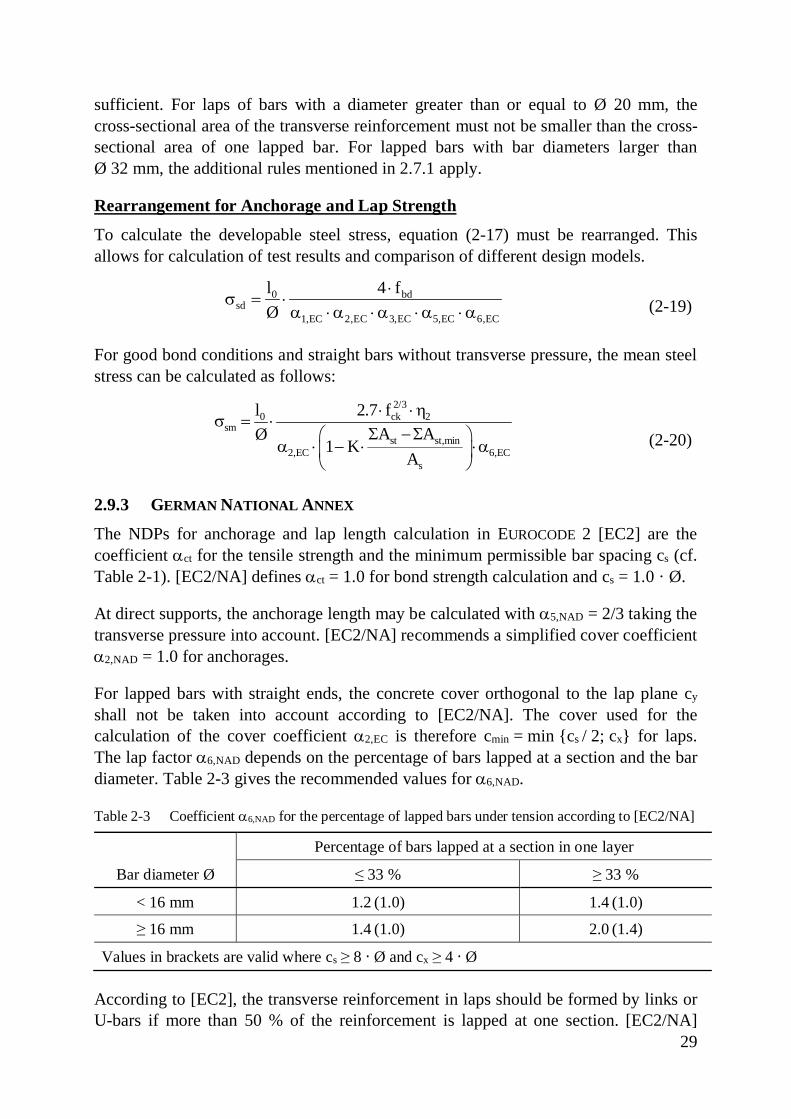
29
sufficient. For laps of bars with a diameter greater than or equal to Ø 20 mm, thecross-sectional area of the transverse reinforcement must not be smaller than the cross-sectional area of one lapped bar. For lapped bars with bar diameters larger thanØ 32 mm, the additional rules mentioned in 2.7.1 apply.
Rearrangement for Anchorage and Lap Strength
To calculate the developable steel stress, equation (2-17) must be rearranged. Thisallows for calculation of test results and comparison of different design models.
0 bdsd
1,EC 2,EC 3,EC 5,EC 6,EC
l 4 fØ
×s = ×
a × a × a × a × a (2-19)
For good bond conditions and straight bars without transverse pressure, the mean steelstress can be calculated as follows:
2/30 ck 2
smst st,min
2,EC 6,ECs
l 2.7 fA AØ
1 KA
× ×hs = ×
S - Sæ öa × - × ×aç ÷
è ø(2-20)
2.9.3 GERMAN NATIONAL ANNEX
The NDPs for anchorage and lap length calculation in EUROCODE 2 [EC2] are thecoefficient act for the tensile strength and the minimum permissible bar spacing cs (cf.Table 2-1). [EC2/NA] defines act = 1.0 for bond strength calculation and cs = 1.0 · Ø.
At direct supports, the anchorage length may be calculated with a5,NAD = 2/3 taking thetransverse pressure into account. [EC2/NA] recommends a simplified cover coefficienta2,NAD = 1.0 for anchorages.
For lapped bars with straight ends, the concrete cover orthogonal to the lap plane cy
shall not be taken into account according to [EC2/NA]. The cover used for thecalculation of the cover coefficient a2,EC is therefore cmin = min {cs / 2; cx} for laps.The lap factor a6,NAD depends on the percentage of bars lapped at a section and the bardiameter. Table 2-3 gives the recommended values for a6,NAD.
Table 2-3 Coefficient a6,NAD for the percentage of lapped bars under tension according to [EC2/NA]
Bar diameter Ø
Percentage of bars lapped at a section in one layer
≤ 33 % ≥ 33 %
< 16 mm 1.2 (1.0) 1.4 (1.0)
≥ 16 mm 1.4 (1.0) 2.0 (1.4)
Values in brackets are valid where cs ≥ 8 · Ø and cx ≥ 4 · Ø
According to [EC2], the transverse reinforcement in laps should be formed by links orU-bars if more than 50 % of the reinforcement is lapped at one section. [EC2/NA]
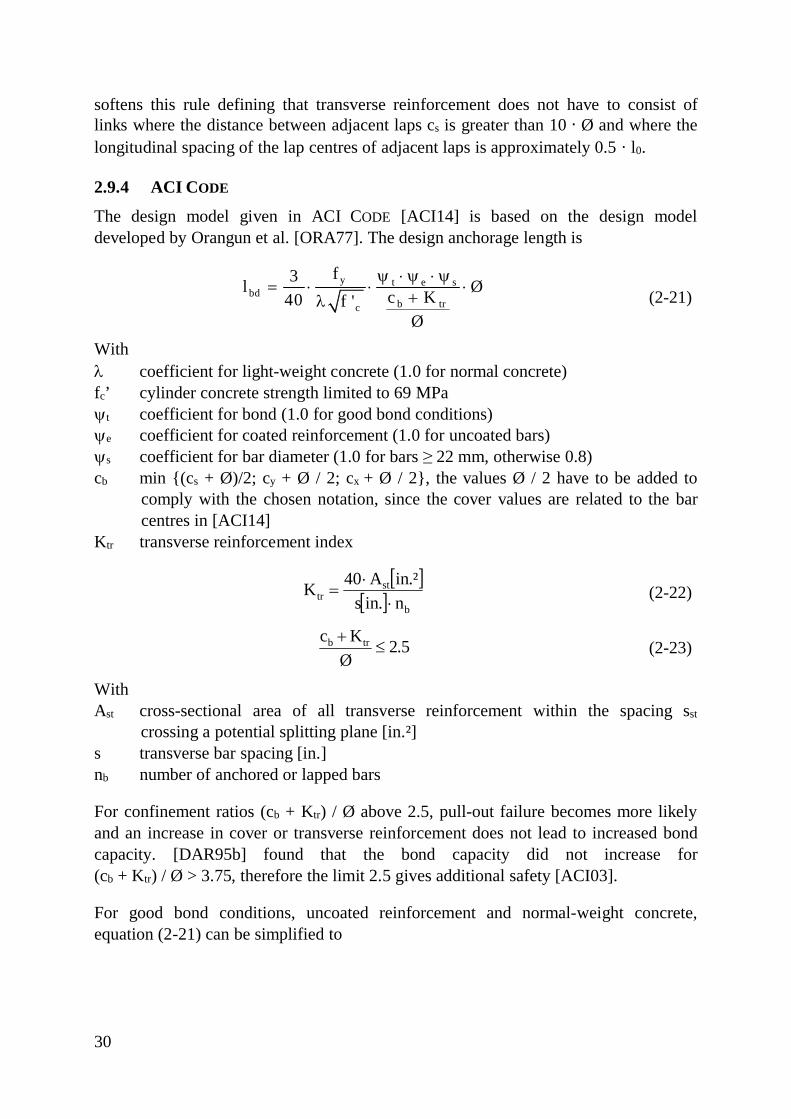
30
softens this rule defining that transverse reinforcement does not have to consist oflinks where the distance between adjacent laps cs is greater than 10 · Ø and where thelongitudinal spacing of the lap centres of adjacent laps is approximately 0.5 · l0.
2.9.4 ACI CODE
The design model given in ACI CODE [ACI14] is based on the design modeldeveloped by Orangun et al. [ORA77]. The design anchorage length is
y t e sbd
b trc
f3l Øc K40 f 'Ø
y × y × y= × × ×
+l (2-21)
Withl coefficient for light-weight concrete (1.0 for normal concrete)fc’ cylinder concrete strength limited to 69 MPayt coefficient for bond (1.0 for good bond conditions)ye coefficient for coated reinforcement (1.0 for uncoated bars)ys coefficient for bar diameter (1.0 for bars ≥ 22 mm, otherwise 0.8)cb min {(cs + Ø)/2; cy + Ø / 2; cx + Ø / 2}, the values Ø / 2 have to be added to
comply with the chosen notation, since the cover values are related to the barcentres in [ACI14]
Ktr transverse reinforcement index
[ ][ ] b
sttr n.ins
.²inA40K×
×= (2-22)
5.2Ø
Kc trb £+
(2-23)
WithAst cross-sectional area of all transverse reinforcement within the spacing sst
crossing a potential splitting plane [in.²]s transverse bar spacing [in.]nb number of anchored or lapped bars
For confinement ratios (cb + Ktr) / Ø above 2.5, pull-out failure becomes more likelyand an increase in cover or transverse reinforcement does not lead to increased bondcapacity. [DAR95b] found that the bond capacity did not increase for(cb + Ktr) / Ø > 3.75, therefore the limit 2.5 gives additional safety [ACI03].
For good bond conditions, uncoated reinforcement and normal-weight concrete,equation (2-21) can be simplified to
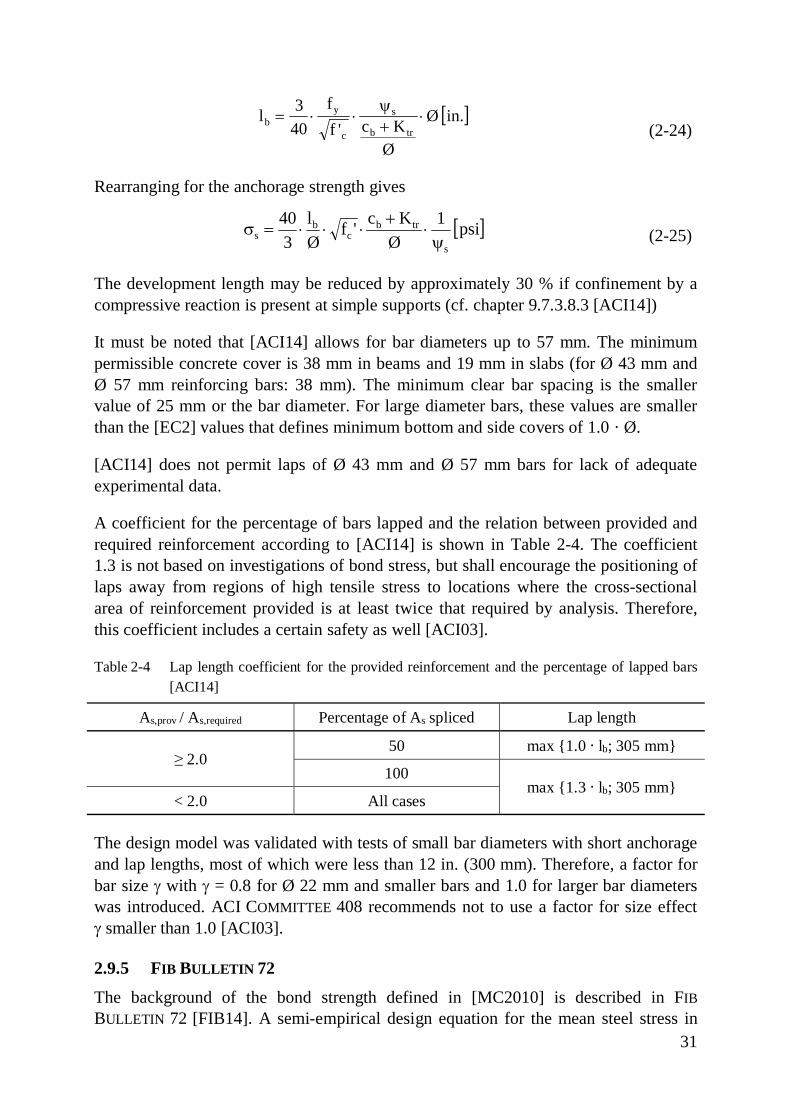
31
[ ].inØ
ØKc'f
f403l
trb
s
c
yb ×
+y
××=(2-24)
Rearranging for the anchorage strength gives
[ ]psi1Ø
Kc'fØl
340
s
trbc
bs y
×+
×××=s (2-25)
The development length may be reduced by approximately 30 % if confinement by acompressive reaction is present at simple supports (cf. chapter 9.7.3.8.3 [ACI14])
It must be noted that [ACI14] allows for bar diameters up to 57 mm. The minimumpermissible concrete cover is 38 mm in beams and 19 mm in slabs (for Ø 43 mm andØ 57 mm reinforcing bars: 38 mm). The minimum clear bar spacing is the smallervalue of 25 mm or the bar diameter. For large diameter bars, these values are smallerthan the [EC2] values that defines minimum bottom and side covers of 1.0 · Ø.
[ACI14] does not permit laps of Ø 43 mm and Ø 57 mm bars for lack of adequateexperimental data.
A coefficient for the percentage of bars lapped and the relation between provided andrequired reinforcement according to [ACI14] is shown in Table 2-4. The coefficient1.3 is not based on investigations of bond stress, but shall encourage the positioning oflaps away from regions of high tensile stress to locations where the cross-sectionalarea of reinforcement provided is at least twice that required by analysis. Therefore,this coefficient includes a certain safety as well [ACI03].
Table 2-4 Lap length coefficient for the provided reinforcement and the percentage of lapped bars[ACI14]
As,prov / As,required Percentage of As spliced Lap length
≥ 2.050 max {1.0 · lb; 305 mm}
100max {1.3 · lb; 305 mm}
< 2.0 All cases
The design model was validated with tests of small bar diameters with short anchorageand lap lengths, most of which were less than 12 in. (300 mm). Therefore, a factor forbar size g with g = 0.8 for Ø 22 mm and smaller bars and 1.0 for larger bar diameterswas introduced. ACI COMMITTEE 408 recommends not to use a factor for size effectg smaller than 1.0 [ACI03].
2.9.5 FIB BULLETIN 72
The background of the bond strength defined in [MC2010] is described in FIBBULLETIN 72 [FIB14]. A semi-empirical design equation for the mean steel stress in
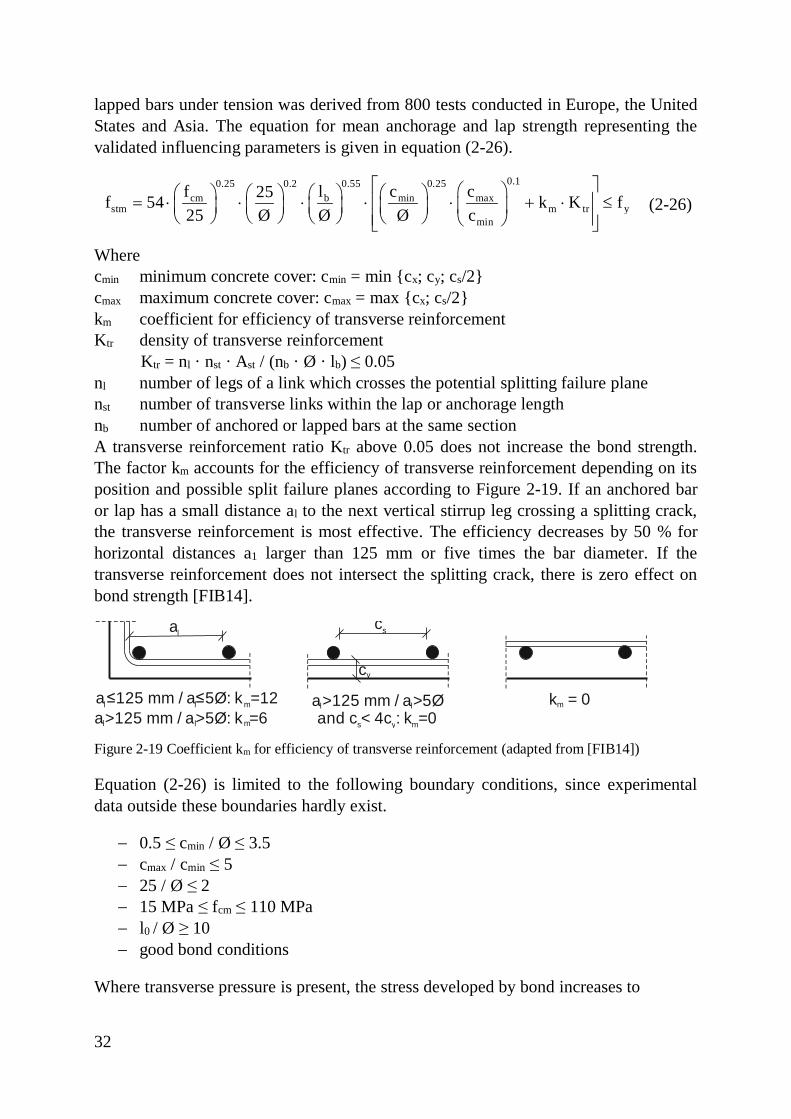
32
lapped bars under tension was derived from 800 tests conducted in Europe, the UnitedStates and Asia. The equation for mean anchorage and lap strength representing thevalidated influencing parameters is given in equation (2-26).
0.10.25 0.55 0.250.2cm b maxmin
stm m tr ymin
f l cc25f 54 k K f25 Ø Ø Ø c
é ùæ öæ ö æ ö æ öæ ö= × × × × × + × £ê úç ÷ ç ÷ç ÷ç ÷ ç ÷è ø è øè ø è ø ê úè øë û
(2-26)
Wherecmin minimum concrete cover: cmin = min {cx; cy; cs/2}cmax maximum concrete cover: cmax = max {cx; cs/2}km coefficient for efficiency of transverse reinforcementKtr density of transverse reinforcement
Ktr = nl · nst · Ast / (nb · Ø · lb) ≤ 0.05nl number of legs of a link which crosses the potential splitting failure planenst number of transverse links within the lap or anchorage lengthnb number of anchored or lapped bars at the same sectionA transverse reinforcement ratio Ktr above 0.05 does not increase the bond strength.The factor km accounts for the efficiency of transverse reinforcement depending on itsposition and possible split failure planes according to Figure 2-19. If an anchored baror lap has a small distance al to the next vertical stirrup leg crossing a splitting crack,the transverse reinforcement is most effective. The efficiency decreases by 50 % forhorizontal distances a1 larger than 125 mm or five times the bar diameter. If thetransverse reinforcement does not intersect the splitting crack, there is zero effect onbond strength [FIB14].
Figure 2-19 Coefficient km for efficiency of transverse reinforcement (adapted from [FIB14])
Equation (2-26) is limited to the following boundary conditions, since experimentaldata outside these boundaries hardly exist.
- 0.5 ≤ cmin / Ø ≤ 3.5- cmax / cmin ≤ 5- 25 / Ø ≤ 2- 15 MPa ≤ fcm ≤ 110 MPa- l0 / Ø ≥ 10- good bond conditions
Where transverse pressure is present, the stress developed by bond increases to
a≤125 mm / a≤5Ø: k =12l l m
al
a>125 mm / a>5Ø: k =6l l m
cs
a>125 mm / a>5Øl l
and c < 4c : k =0s y m
k = 0m
cy
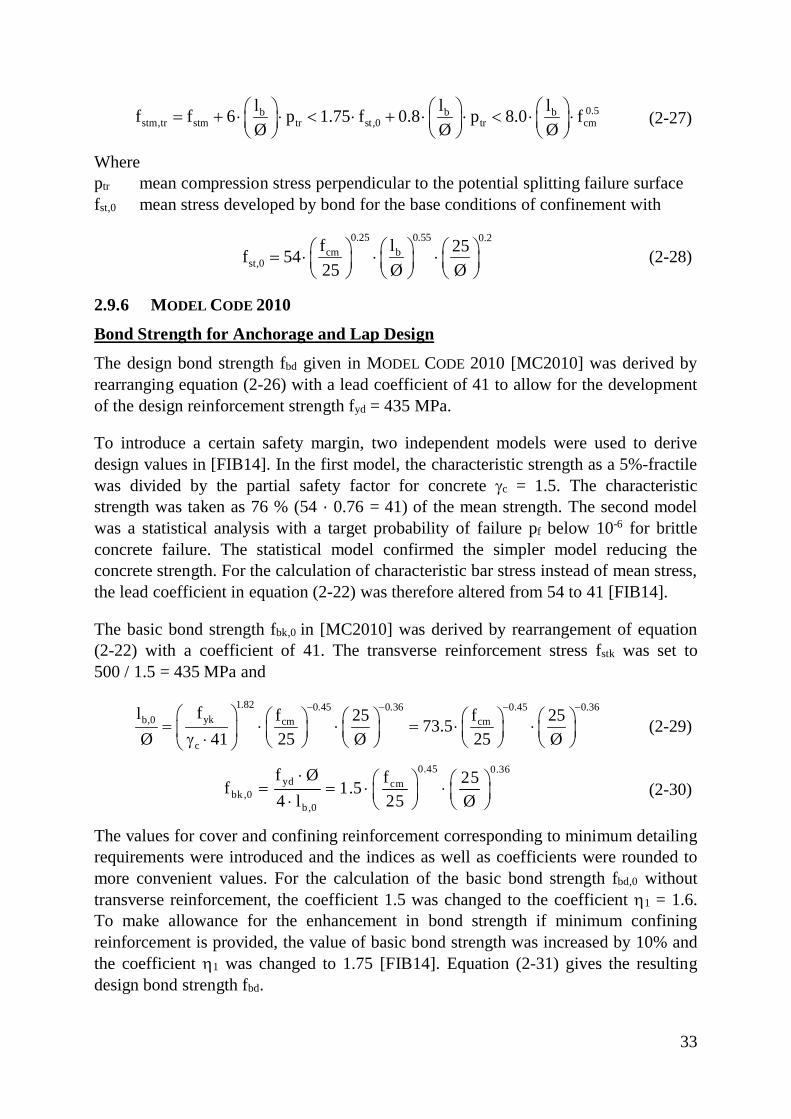
33
0.5b b bstm,tr stm tr st,0 tr cm
l l lf f 6 p 1.75 f 0.8 p 8.0 fØ Ø Ø
æ ö æ ö æ ö= + × × < × + × × < × ×ç ÷ ç ÷ ç ÷è ø è ø è ø
(2-27)
Whereptr mean compression stress perpendicular to the potential splitting failure surfacefst,0 mean stress developed by bond for the base conditions of confinement with
0.25 0.55 0.2cm b
st,0f l 25f 5425 Ø Ø
æ ö æ ö æ ö= × × × ç ÷ç ÷ ç ÷è øè ø è ø
(2-28)
2.9.6 MODEL CODE 2010
Bond Strength for Anchorage and Lap Design
The design bond strength fbd given in MODEL CODE 2010 [MC2010] was derived byrearranging equation (2-26) with a lead coefficient of 41 to allow for the developmentof the design reinforcement strength fyd = 435 MPa.
To introduce a certain safety margin, two independent models were used to derivedesign values in [FIB14]. In the first model, the characteristic strength as a 5%-fractilewas divided by the partial safety factor for concrete gc = 1.5. The characteristicstrength was taken as 76 % (54 · 0.76 = 41) of the mean strength. The second modelwas a statistical analysis with a target probability of failure pf below 10-6 for brittleconcrete failure. The statistical model confirmed the simpler model reducing theconcrete strength. For the calculation of characteristic bar stress instead of mean stress,the lead coefficient in equation (2-22) was therefore altered from 54 to 41 [FIB14].
The basic bond strength fbk,0 in [MC2010] was derived by rearrangement of equation(2-22) with a coefficient of 41. The transverse reinforcement stress fstk was set to500 / 1.5 = 435 MPa and
1.82 0.45 0.450.36 0.36ykb,0 cm cm
c
fl f f25 2573.5Ø 41 25 Ø 25 Ø
- -- -æ ö æ ö æ öæ ö æ ö= × × = × ×ç ÷ ç ÷ ç ÷ç ÷ ç ÷g × è ø è øè ø è øè ø(2-29)
0.45 0.36yd cm
bk ,0b ,0
f Ø f 25f 1.54 l 25 Ø
× æ ö æ ö= = × × ç ÷ç ÷× è øè ø(2-30)
The values for cover and confining reinforcement corresponding to minimum detailingrequirements were introduced and the indices as well as coefficients were rounded tomore convenient values. For the calculation of the basic bond strength fbd,0 withouttransverse reinforcement, the coefficient 1.5 was changed to the coefficient h1 = 1.6.To make allowance for the enhancement in bond strength if minimum confiningreinforcement is provided, the value of basic bond strength was increased by 10% andthe coefficient h1 was changed to 1.75 [FIB14]. Equation (2-31) gives the resultingdesign bond strength fbd.
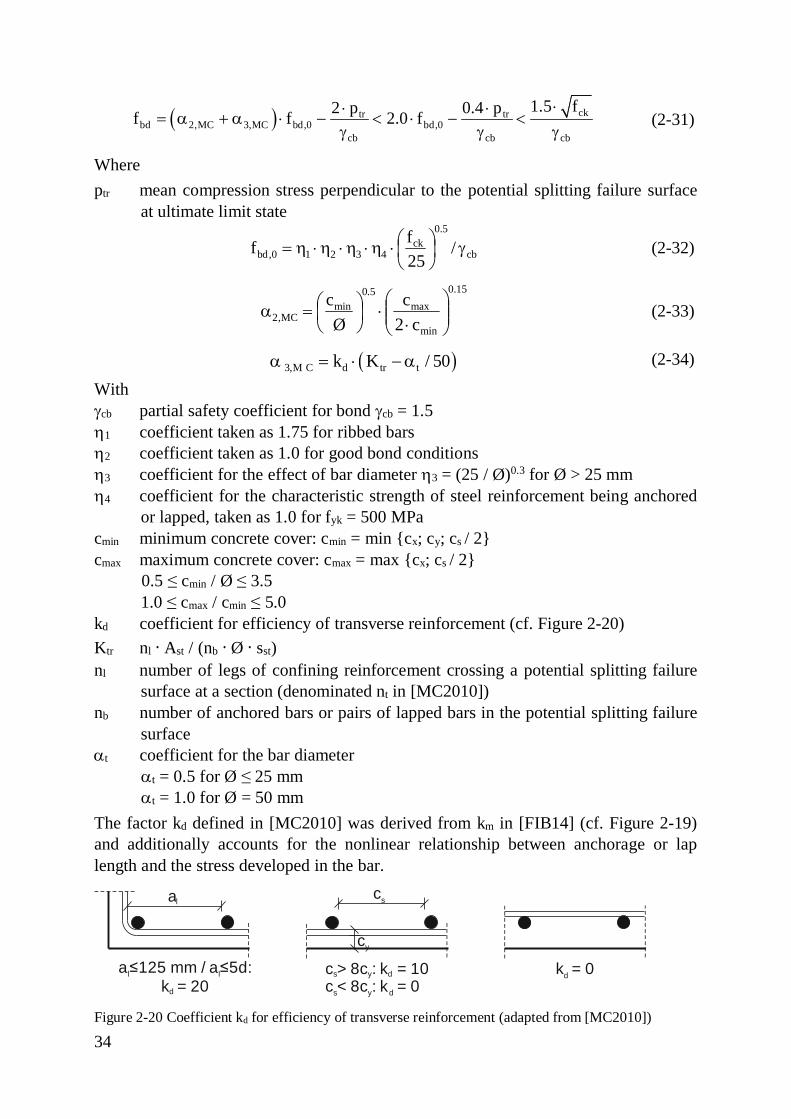
34
( ) cktr trbd 2,MC 3,MC bd,0 bd,0
cb cb cb
1.5 f2 p 0.4 pf f 2.0 f×× ×
= a + a × - < × - <g g g
(2-31)
Whereptr mean compression stress perpendicular to the potential splitting failure surface
at ultimate limit state
cb
5.0ck
43210,bd /25ff g÷
øö
çèæ×h×h×h×h= (2-32)
15.0
min
max5.0
minMC,2 c2
cØ
c÷÷ø
öççè
æ×
×÷øö
çèæ=a (2-33)
( )3,M C d tr tk K / 50a = × - a (2-34)
Withgcb partial safety coefficient for bond gcb = 1.5h1 coefficient taken as 1.75 for ribbed barsh2 coefficient taken as 1.0 for good bond conditionsh3 coefficient for the effect of bar diameter h3 = (25 / Ø)0.3 for Ø > 25 mmh4 coefficient for the characteristic strength of steel reinforcement being anchored
or lapped, taken as 1.0 for fyk = 500 MPacmin minimum concrete cover: cmin = min {cx; cy; cs / 2}cmax maximum concrete cover: cmax = max {cx; cs / 2}
0.5 ≤ cmin / Ø ≤ 3.51.0 ≤ cmax / cmin ≤ 5.0
kd coefficient for efficiency of transverse reinforcement (cf. Figure 2-20)Ktr nl · Ast / (nb · Ø · sst)nl number of legs of confining reinforcement crossing a potential splitting failure
surface at a section (denominated nt in [MC2010])nb number of anchored bars or pairs of lapped bars in the potential splitting failure
surfaceat coefficient for the bar diameter
at = 0.5 for Ø ≤ 25 mmat = 1.0 for Ø = 50 mm
The factor kd defined in [MC2010] was derived from km in [FIB14] (cf. Figure 2-19)and additionally accounts for the nonlinear relationship between anchorage or laplength and the stress developed in the bar.
Figure 2-20 Coefficient kd for efficiency of transverse reinforcement (adapted from [MC2010])
a≤125 mm / a≤5d:l l
k = 20d
al cs
c > 8c : k = 10s y d k = 0d
cy
c < 8c : k = 0s y d
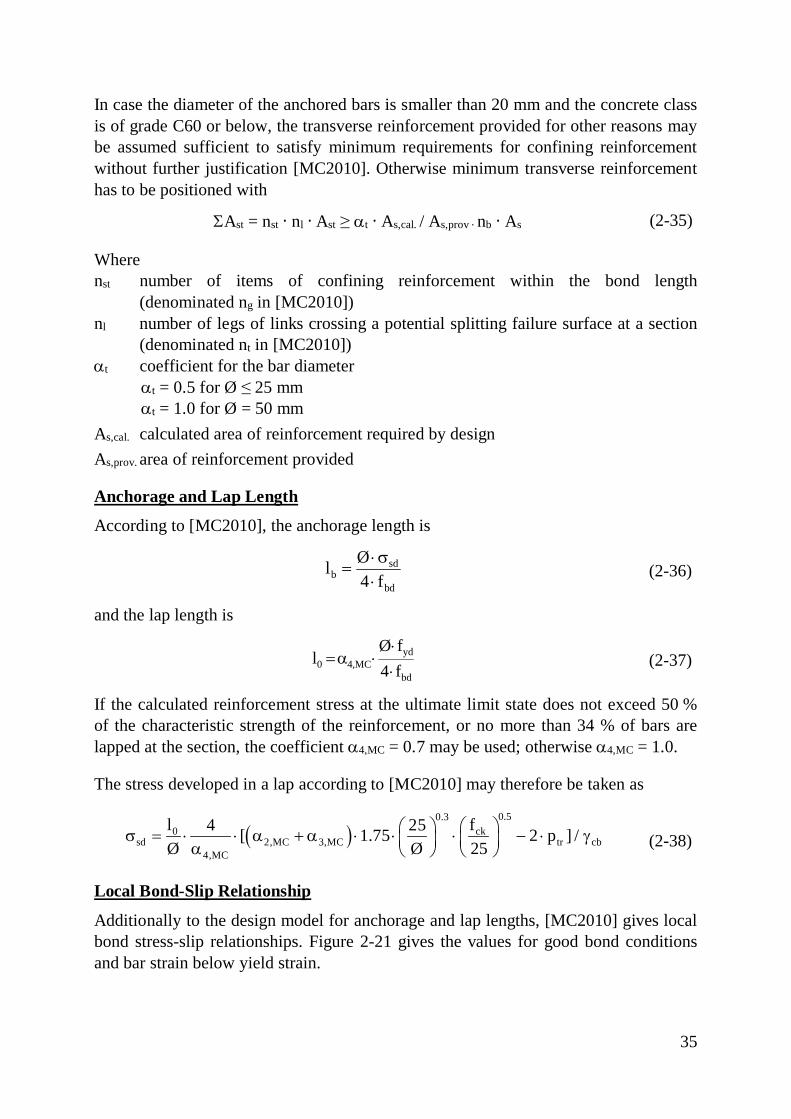
35
In case the diameter of the anchored bars is smaller than 20 mm and the concrete classis of grade C60 or below, the transverse reinforcement provided for other reasons maybe assumed sufficient to satisfy minimum requirements for confining reinforcementwithout further justification [MC2010]. Otherwise minimum transverse reinforcementhas to be positioned with
SAst = nst · nl · Ast ≥ at · As,cal. / As,prov · nb · As (2-35)
Wherenst number of items of confining reinforcement within the bond length
(denominated ng in [MC2010])nl number of legs of links crossing a potential splitting failure surface at a section
(denominated nt in [MC2010])at coefficient for the bar diameter
at = 0.5 for Ø ≤ 25 mmat = 1.0 for Ø = 50 mm
As,cal. calculated area of reinforcement required by designAs,prov. area of reinforcement provided
Anchorage and Lap Length
According to [MC2010], the anchorage length is
bd
sdb f4
Øl×s×
= (2-36)
and the lap length is
bd
ydMC,40 f4
fØl
××
×a= (2-37)
If the calculated reinforcement stress at the ultimate limit state does not exceed 50 %of the characteristic strength of the reinforcement, or no more than 34 % of bars arelapped at the section, the coefficient a4,MC = 0.7 may be used; otherwise a4,MC = 1.0.
The stress developed in a lap according to [MC2010] may therefore be taken as
( )0.50.3
0 cksd 2,MC 3,MC tr cb
4,MC
l f4 25[ 1.75 2 p ] /Ø Ø 25
æ öæ ös = × × a + a × × × - × gç ÷ ç ÷a è ø è ø (2-38)
Local Bond-Slip Relationship
Additionally to the design model for anchorage and lap lengths, [MC2010] gives localbond stress-slip relationships. Figure 2-21 gives the values for good bond conditionsand bar strain below yield strain.
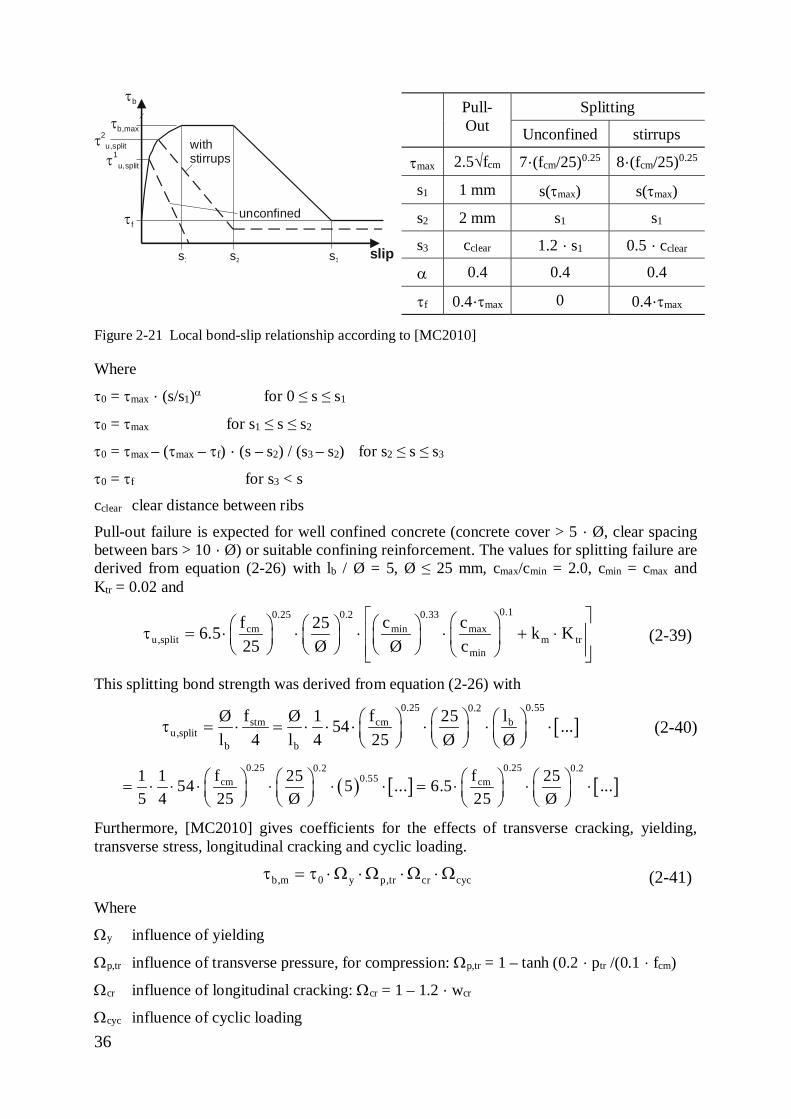
36
Pull-Out
Splitting
Unconfined stirrups
tmax 2.5√fcm 7·(fcm/25)0.25 8·(fcm/25)0.25
s1 1 mm s(tmax) s(tmax)
s2 2 mm s1 s1
s3 cclear 1.2 · s1 0.5 · cclear
a 0.4 0.4 0.4
tf 0.4·tmax 0 0.4·tmax
Figure 2-21 Local bond-slip relationship according to [MC2010]
Where
t0 = tmax · (s/s1)a for 0 ≤ s ≤ s1
t0 = tmax for s1 ≤ s ≤ s2
t0 = tmax – (tmax – tf) · (s – s2) / (s3 – s2) for s2 ≤ s ≤ s3
t0 = tf for s3 < s
cclear clear distance between ribs
Pull-out failure is expected for well confined concrete (concrete cover > 5 · Ø, clear spacingbetween bars > 10 · Ø) or suitable confining reinforcement. The values for splitting failure arederived from equation (2-26) with lb / Ø = 5, Ø ≤ 25 mm, cmax/cmin = 2.0, cmin = cmax andKtr = 0.02 and
0.10.25 0.330.2cm maxmin
u,split m trmin
f cc256.5 k K25 Ø Ø c
é ùæ öæ ö æ öæ öt = × × × × + ×ê úç ÷ ç ÷ç ÷ç ÷è ø è øè ø ê úè øë û
(2-39)
This splitting bond strength was derived from equation (2-26) with
[ ]0.25 0.550.2
stm cm bu,split
b b
f f lØ Ø 1 2554 ...l 4 l 4 25 Ø Ø
æ ö æ öæ öt = × = × × × × × ×ç ÷ç ÷ ç ÷è øè ø è ø
(2-40)
( ) [ ] [ ]0.25 0.250.2 0.2
0.55cm cmf f1 1 25 2554 5 ... 6.5 ...5 4 25 Ø 25 Ø
æ ö æ öæ ö æ ö= × × × × × × = × × ×ç ÷ ç ÷ç ÷ ç ÷è ø è øè ø è ø
Furthermore, [MC2010] gives coefficients for the effects of transverse cracking, yielding,transverse stress, longitudinal cracking and cyclic loading.
b,m 0 y p,tr cr cyct = t × W × W × W × W (2-41)
Where
Wy influence of yielding
Wp,tr influence of transverse pressure, for compression: Wp,tr = 1 – tanh (0.2 · ptr /(0.1 · fcm)
Wcr influence of longitudinal cracking: Wcr = 1 – 1.2 · wcr
Wcyc influence of cyclic loading
slip
withstirrups
unconfined
s1 s2 s3
tb
tb,max
tf
t2u,split
t1u,split
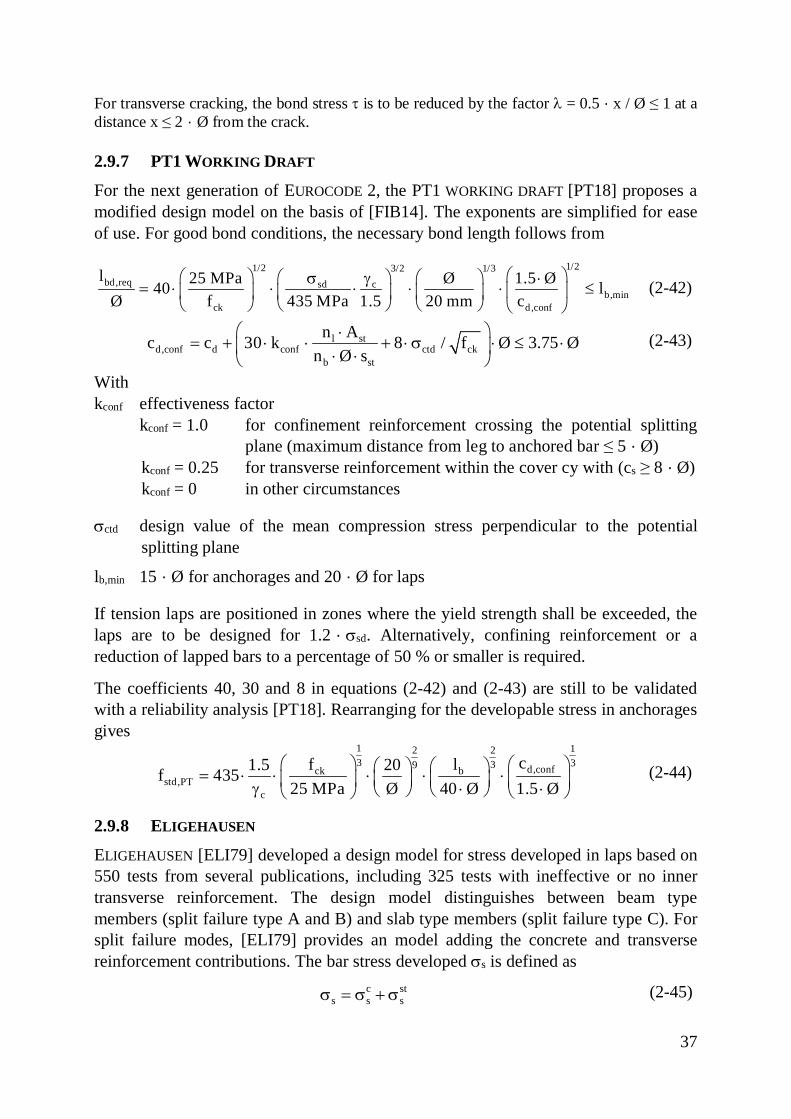
37
For transverse cracking, the bond stress t is to be reduced by the factor l = 0.5 · x / Ø ≤ 1 at adistance x ≤ 2 · Ø from the crack.
2.9.7 PT1 WORKING DRAFT
For the next generation of EUROCODE 2, the PT1 WORKING DRAFT [PT18] proposes amodified design model on the basis of [FIB14]. The exponents are simplified for easeof use. For good bond conditions, the necessary bond length follows from
1/21/2 3/2 1/3bd,req sd c
b,minck d,conf
l 25 MPa Ø 1.5 Ø40 lØ f 435 MPa 1.5 20 mm c
æ öæ ö æ ö æ ös g ×= × × × × × £ç ÷ç ÷ ç ÷ ç ÷
è ø è øè ø è ø(2-42)
l std,conf d conf ctd ck
b st
n Ac c 30 k 8 / f Ø 3.75 Øn Ø s
æ ö×= + × × + × s × £ ×ç ÷× ×è ø
(2-43)
Withkconf effectiveness factor
kconf = 1.0 for confinement reinforcement crossing the potential splittingplane (maximum distance from leg to anchored bar ≤ 5 · Ø)
kconf = 0.25 for transverse reinforcement within the cover cy with (cs ≥ 8 · Ø)kconf = 0 in other circumstances
sctd design value of the mean compression stress perpendicular to the potentialsplitting plane
lb,min 15 · Ø for anchorages and 20 · Ø for laps
If tension laps are positioned in zones where the yield strength shall be exceeded, thelaps are to be designed for 1.2 · ssd. Alternatively, confining reinforcement or areduction of lapped bars to a percentage of 50 % or smaller is required.
The coefficients 40, 30 and 8 in equations (2-42) and (2-43) are still to be validatedwith a reliability analysis [PT18]. Rearranging for the developable stress in anchoragesgives
1 1223 339 d,confck b
std,PTc
cf l1.5 20f 43525 MPa Ø 40 Ø 1.5 Ø
æ ö æ öæ öæ ö= × × × × ×ç ÷ ç ÷ç ÷ ç ÷g × ×è ø è ø è øè ø(2-44)
2.9.8 ELIGEHAUSEN
ELIGEHAUSEN [ELI79] developed a design model for stress developed in laps based on550 tests from several publications, including 325 tests with ineffective or no innertransverse reinforcement. The design model distinguishes between beam typemembers (split failure type A and B) and slab type members (split failure type C). Forsplit failure modes, [ELI79] provides an model adding the concrete and transversereinforcement contributions. The bar stress developed ss is defined as
sts
css s+s=s (2-45)
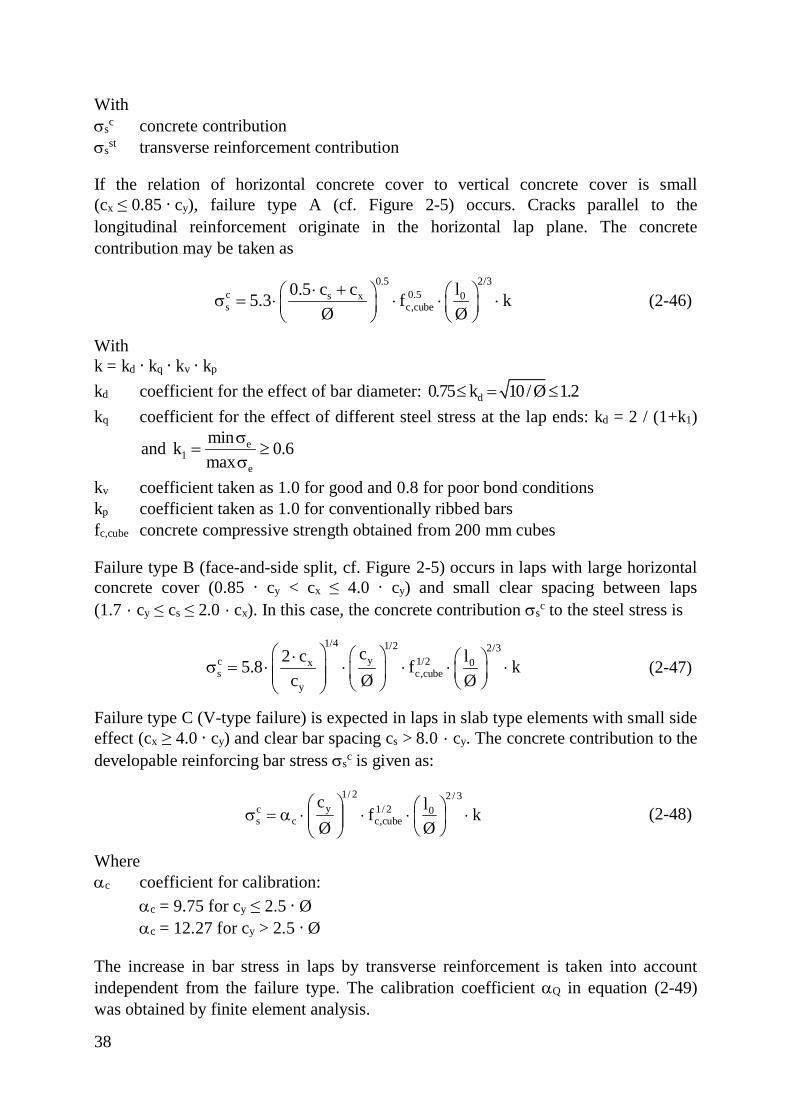
38
Withssc concrete contributionssst transverse reinforcement contribution
If the relation of horizontal concrete cover to vertical concrete cover is small(cx ≤ 0.85 · cy), failure type A (cf. Figure 2-5) occurs. Cracks parallel to thelongitudinal reinforcement originate in the horizontal lap plane. The concretecontribution may be taken as
0.5 2/3c 0.5s x 0s c,cube
0.5 c c l5.3 f kØ Ø× +æ ö æ ös = × × × ×ç ÷ ç ÷
è ø è ø (2-46)
Withk = kd · kq · kv · kp
kd coefficient for the effect of bar diameter: d0.75 k 10/Ø 1.2£ = £kq coefficient for the effect of different steel stress at the lap ends: kd = 2 / (1+k1)
and e1
e
mink 0.6max
s= ³
skv coefficient taken as 1.0 for good and 0.8 for poor bond conditionskp coefficient taken as 1.0 for conventionally ribbed barsfc,cube concrete compressive strength obtained from 200 mm cubes
Failure type B (face-and-side split, cf. Figure 2-5) occurs in laps with large horizontalconcrete cover (0.85 · cy < cx ≤ 4.0 · cy) and small clear spacing between laps(1.7 · cy ≤ cs ≤ 2.0 · cx). In this case, the concrete contribution ssc to the steel stress is
1/4 1/2 2/3yc 1/2 0x
s c,cubey
c l2 c5.8 f kc Ø Ø
æ ö æ ö× æ ös = × × × × ×ç ÷ ç ÷ç ÷ç ÷ è øè øè ø (2-47)
Failure type C (V-type failure) is expected in laps in slab type elements with small sideeffect (cx ≥ 4.0 · cy) and clear bar spacing cs > 8.0 · cy. The concrete contribution to thedevelopable reinforcing bar stress ssc is given as:
kØlf
Øc 3/2
02/1cube,c
2/1y
ccs ×÷
øö
çèæ××÷÷
ø
öççè
æ×a=s (2-48)
Whereac coefficient for calibration:
ac = 9.75 for cy ≤ 2.5 · Øac = 12.27 for cy > 2.5 · Ø
The increase in bar stress in laps by transverse reinforcement is taken into accountindependent from the failure type. The calibration coefficient aQ in equation (2-49)was obtained by finite element analysis.
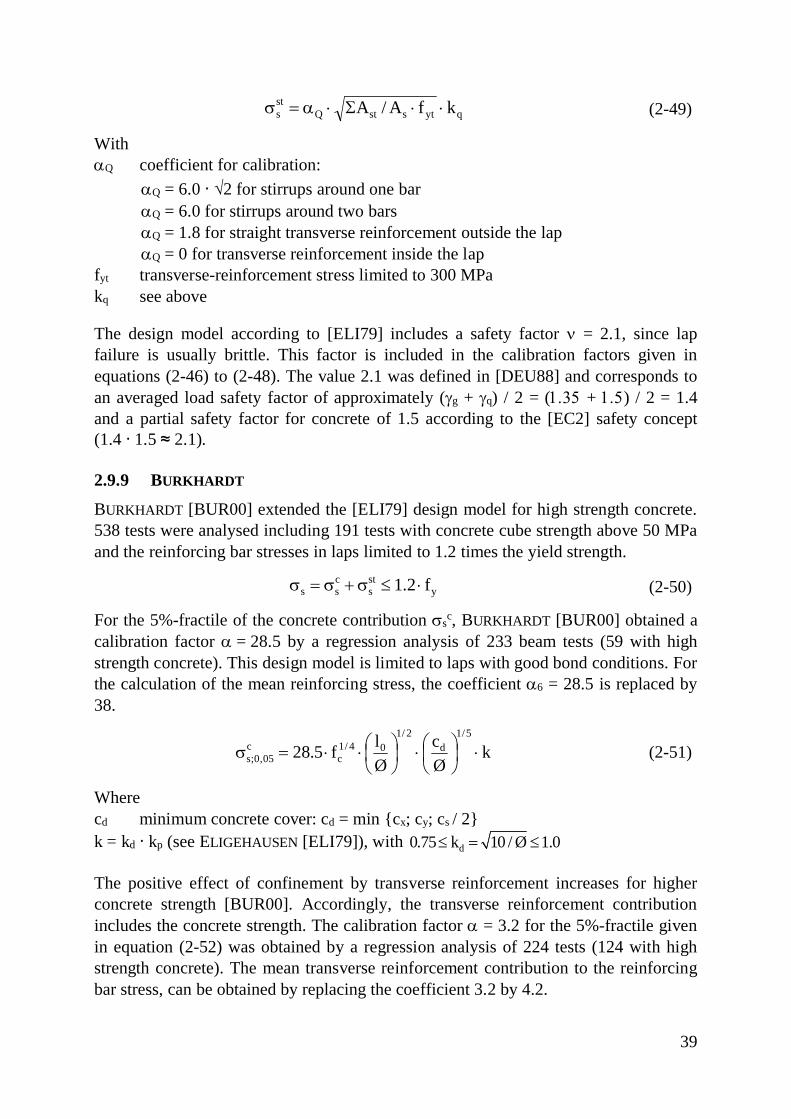
39
qytsstQsts kfA/A ××S×a=s (2-49)
WithaQ coefficient for calibration:
aQ = 6.0 · √2 for stirrups around one baraQ = 6.0 for stirrups around two barsaQ = 1.8 for straight transverse reinforcement outside the lapaQ = 0 for transverse reinforcement inside the lap
fyt transverse-reinforcement stress limited to 300 MPakq see above
The design model according to [ELI79] includes a safety factor n = 2.1, since lapfailure is usually brittle. This factor is included in the calibration factors given inequations (2-46) to (2-48). The value 2.1 was defined in [DEU88] and corresponds toan averaged load safety factor of approximately (gg + gq) / 2 = (1.35 + 1.5) / 2 = 1.4and a partial safety factor for concrete of 1.5 according to the [EC2] safety concept(1.4 · 1.5 ≈ 2.1).
2.9.9 BURKHARDT
BURKHARDT [BUR00] extended the [ELI79] design model for high strength concrete.538 tests were analysed including 191 tests with concrete cube strength above 50 MPaand the reinforcing bar stresses in laps limited to 1.2 times the yield strength.
ysts
css f2.1 ×£s+s=s (2-50)
For the 5%-fractile of the concrete contribution ssc, BURKHARDT [BUR00] obtained acalibration factor a = 28.5 by a regression analysis of 233 beam tests (59 with highstrength concrete). This design model is limited to laps with good bond conditions. Forthe calculation of the mean reinforcing stress, the coefficient a6 = 28.5 is replaced by38.
kØc
Ølf5.28
5/1d
2/104/1
cc
05,0;s ×÷øö
çèæ×÷
øö
çèæ××=s (2-51)
Wherecd minimum concrete cover: cd = min {cx; cy; cs / 2}k = kd · kp (see ELIGEHAUSEN [ELI79]), with d0.75 k 10 / Ø 1.0£ = £
The positive effect of confinement by transverse reinforcement increases for higherconcrete strength [BUR00]. Accordingly, the transverse reinforcement contributionincludes the concrete strength. The calibration factor a = 3.2 for the 5%-fractile givenin equation (2-52) was obtained by a regression analysis of 224 tests (124 with highstrength concrete). The mean transverse reinforcement contribution to the reinforcingbar stress, can be obtained by replacing the coefficient 3.2 by 4.2.
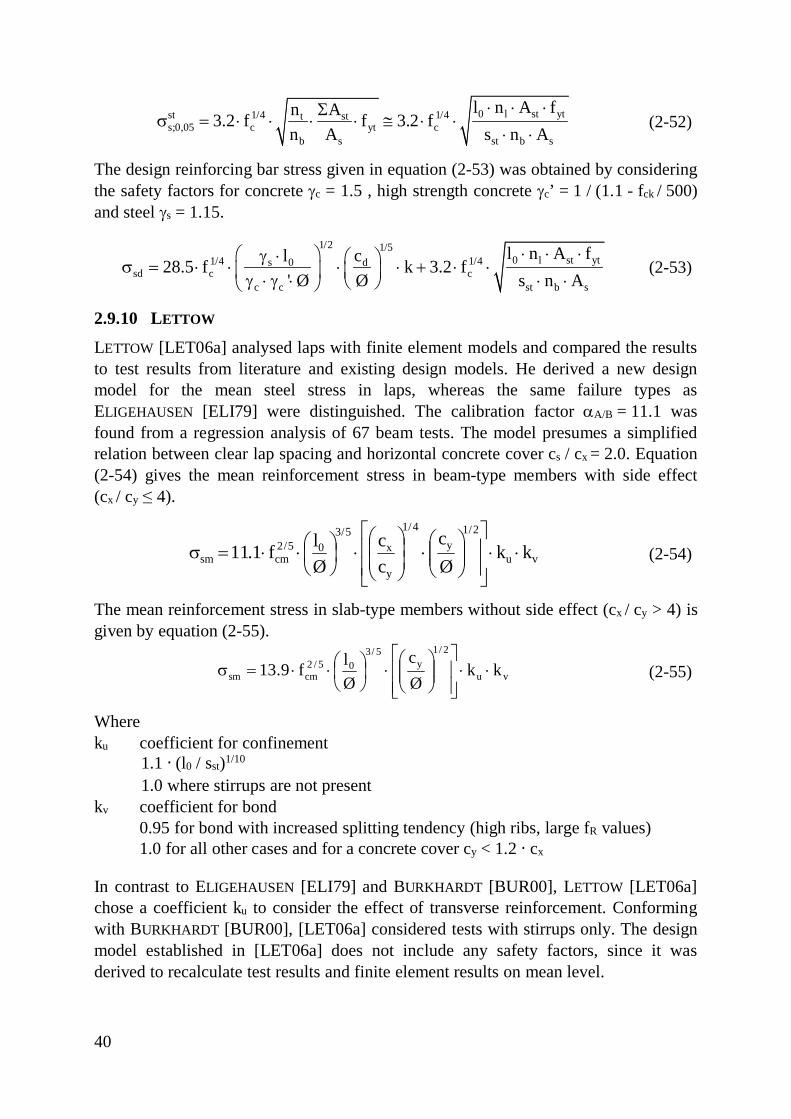
40
0 l st ytst 1/4 1/4t sts;0,05 c yt c
b s st b s
l n A fn A3.2 f f 3.2 fn A s n A
× × ×Ss = × × × × @ × ×
× ×(2-52)
The design reinforcing bar stress given in equation (2-53) was obtained by consideringthe safety factors for concrete gc = 1.5 , high strength concrete gc’ = 1 / (1.1 - fck / 500)and steel gs = 1.15.
1/2 1/50 l st yt1/4 1/4s 0 d
sd c cc c st b s
l n A fl c28.5 f k 3.2 f' Ø Ø s n A
× × ×æ ög × æ ös = × × × × + × ×ç ÷ ç ÷g × g × × ×è øè ø (2-53)
2.9.10 LETTOW
LETTOW [LET06a] analysed laps with finite element models and compared the resultsto test results from literature and existing design models. He derived a new designmodel for the mean steel stress in laps, whereas the same failure types asELIGEHAUSEN [ELI79] were distinguished. The calibration factor aA/B = 11.1 wasfound from a regression analysis of 67 beam tests. The model presumes a simplifiedrelation between clear lap spacing and horizontal concrete cover cs / cx = 2.0. Equation(2-54) gives the mean reinforcement stress in beam-type members with side effect(cx / cy ≤ 4).
vu
2/1y
4/1
y
x5/3
05/2cmsm kk
Øc
cc
Ølf1.11 ××
úú
û
ù
êê
ë
é÷÷ø
öççè
æ×÷
÷ø
öççè
æ×÷
øö
çèæ××=s (2-54)
The mean reinforcement stress in slab-type members without side effect (cx / cy > 4) isgiven by equation (2-55).
vu
2/1y
5/305/2
cmsm kkØc
Ølf9.13 ××
úúû
ù
êêë
é÷÷ø
öççè
æ×÷
øö
çèæ××=s (2-55)
Whereku coefficient for confinement
1.1 · (l0 / sst)1/10
1.0 where stirrups are not presentkv coefficient for bond 0.95 for bond with increased splitting tendency (high ribs, large fR values) 1.0 for all other cases and for a concrete cover cy < 1.2 · cx
In contrast to ELIGEHAUSEN [ELI79] and BURKHARDT [BUR00], LETTOW [LET06a]chose a coefficient ku to consider the effect of transverse reinforcement. Conformingwith BURKHARDT [BUR00], [LET06a] considered tests with stirrups only. The designmodel established in [LET06a] does not include any safety factors, since it wasderived to recalculate test results and finite element results on mean level.
41
2.9.11 ZUO AND DARWIN
The design model by ZUO AND DARWIN [ZUO00] is based on experimentalinvestigations including 64 lap tests with different concrete strengths and relative ribareas. In addition to the experiments, a regression analysis was conducted for 367 testswith and without transverse reinforcement. Conforming with [ELI79], the lap strengthconsists of a concrete and a transverse reinforcement contribution with
sts
css s+s=s (2-56)
The concrete contribution ssc is given by
( ) [ ]minc 1/4maxsm 0 c
s min
c 0.5 Ø c59.8 l 2350 0.1 0.9 f psiA c+ ×é ù æ ö
s = × × + × × + ×ç ÷ê úè øë û
(2-57)
Withcmax = max {cmin,ZD; cy}cmin = min {cz/D; cy}cmin,ZD = min {cs/2; 6.4 mm; cx}cmax / cmin ≤ 3.5
Zuo and Darwin [ZUO00] found that the concrete strength has a different effect on thetransverse reinforcement contribution than on the concrete contribution. The transversereinforcement contribution ssst may be calculated as follows
[ ]psifA99.3
AnAnt14.31 4/3
cssb
stststsm ×÷÷
ø
öççè
æ+
××
××=s (2-58)
Wheret = td · trtd coefficient for the effect of bar diameter: td = 0.78 · Ø + 0.22 [in.]tr coefficient for the effect of rib geometry: tr = 9.6 · fR + 0.28
The relative rib area fR ranges from 0.056 to 0.086, leading to values for tr between0.82 to 1.11 with an average value of 0.98 [DAR95b]. For simplicity, the coefficient tr
is taken as 1.0 in the comparison of design models in chapter 5.
Equations (2-57) and (2-58) were derived from test results and thus give mean values.The equations for design values given in [ZUO00] include calibration factors with astrength reduction factor fZ/D of 0.9.
2.9.12 CANBAY AND FROSCH
CANBAY AND FROSCH [CAN05] verified their model for the ultimate lap load by 480lap tests with and without transverse reinforcement. The maximum lap strength atsplitting failure including the contribution by transverse reinforcement is defined as
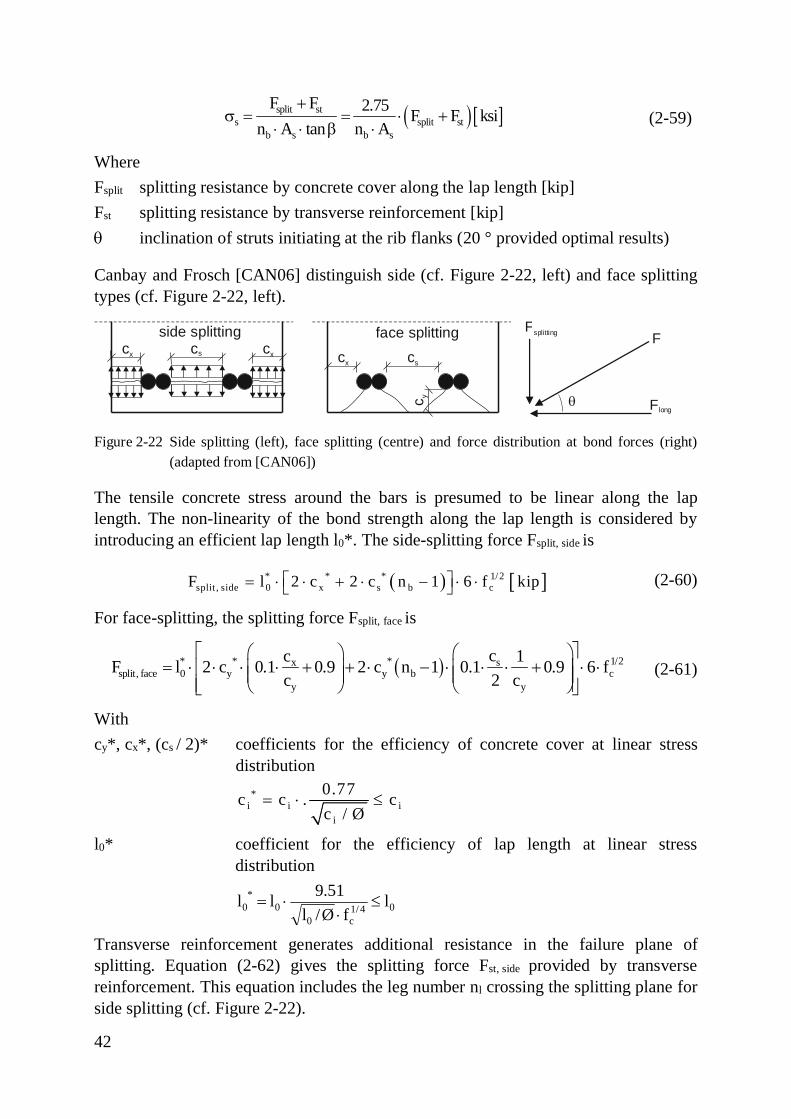
42
( ) [ ]split sts split st
b s b s
F F 2.75 F F ksin A tan n A
+s = = × +
× × b ×(2-59)
WhereFsplit splitting resistance by concrete cover along the lap length [kip]Fst splitting resistance by transverse reinforcement [kip]q inclination of struts initiating at the rib flanks (20 ° provided optimal results)
Canbay and Frosch [CAN06] distinguish side (cf. Figure 2-22, left) and face splittingtypes (cf. Figure 2-22, left).
Figure 2-22 Side splitting (left), face splitting (centre) and force distribution at bond forces (right)(adapted from [CAN06])
The tensile concrete stress around the bars is presumed to be linear along the laplength. The non-linearity of the bond strength along the lap length is considered byintroducing an efficient lap length l0*. The side-splitting force Fsplit, side is
( ) [ ]* * * 1/2split , side 0 x s b cF l 2 c 2 c n 1 6 f kipé ù= × × + × - × ×ë û (2-60)
For face-splitting, the splitting force Fsplit, face is
( )* * * 1/2sxsplit, face 0 y y b c
y y
cc 1F l 2 c 0.1 0.9 2 c n 1 0.1 0.9 6 fc 2 c
é ùæ ö æ ö= × × × × + + × - × × × + × ×ê úç ÷ ç ÷ç ÷ ç ÷ê úè ø è øë û
(2-61)
Withcy*, cx*, (cs / 2)* coefficients for the efficiency of concrete cover at linear stress
distribution*
i i ii
0.77c c . cc / Ø
= × £
l0* coefficient for the efficiency of lap length at linear stressdistribution
04/1c0
0*
0 lfØ/l
51.9ll £×
×=
Transverse reinforcement generates additional resistance in the failure plane ofsplitting. Equation (2-62) gives the splitting force Fst, side provided by transversereinforcement. This equation includes the leg number nl crossing the splitting plane forside splitting (cf. Figure 2-22).
side splittingcscx cx cscx
c y
face splitting Fsplitting F
Flongq
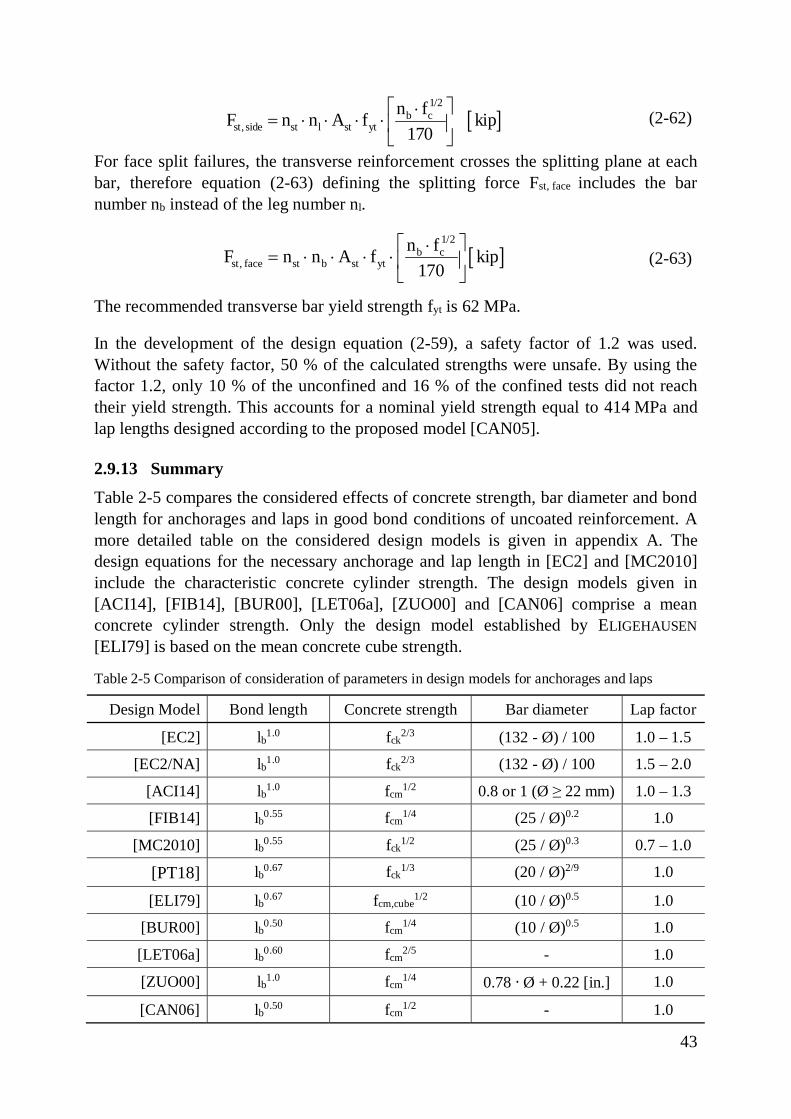
43
[ ]1/2
b cst, side st l st yt
n fF n n A f kip170
é ù×= × × × × ê ú
ë û(2-62)
For face split failures, the transverse reinforcement crosses the splitting plane at eachbar, therefore equation (2-63) defining the splitting force Fst, face includes the barnumber nb instead of the leg number nl.
[ ]1/2
b cst, face st b st yt
n fF n n A f kip170
é ù×= × × × × ê ú
ë û(2-63)
The recommended transverse bar yield strength fyt is 62 MPa.
In the development of the design equation (2-59), a safety factor of 1.2 was used.Without the safety factor, 50 % of the calculated strengths were unsafe. By using thefactor 1.2, only 10 % of the unconfined and 16 % of the confined tests did not reachtheir yield strength. This accounts for a nominal yield strength equal to 414 MPa andlap lengths designed according to the proposed model [CAN05].
2.9.13 Summary
Table 2-5 compares the considered effects of concrete strength, bar diameter and bondlength for anchorages and laps in good bond conditions of uncoated reinforcement. Amore detailed table on the considered design models is given in appendix A. Thedesign equations for the necessary anchorage and lap length in [EC2] and [MC2010]include the characteristic concrete cylinder strength. The design models given in[ACI14], [FIB14], [BUR00], [LET06a], [ZUO00] and [CAN06] comprise a meanconcrete cylinder strength. Only the design model established by ELIGEHAUSEN[ELI79] is based on the mean concrete cube strength.
Table 2-5 Comparison of consideration of parameters in design models for anchorages and laps
Design Model Bond length Concrete strength Bar diameter Lap factor
[EC2] lb1.0 fck2/3 (132 - Ø) / 100 1.0 – 1.5
[EC2/NA] lb1.0 fck2/3 (132 - Ø) / 100 1.5 – 2.0
[ACI14] lb1.0 fcm1/2 0.8 or 1 (Ø ≥ 22 mm) 1.0 – 1.3
[FIB14] lb0.55 fcm1/4 (25 / Ø)0.2 1.0
[MC2010] lb0.55 fck1/2 (25 / Ø)0.3 0.7 – 1.0
[PT18] lb0.67 fck1/3 (20 / Ø)2/9 1.0
[ELI79] lb0.67 fcm,cube1/2 (10 / Ø)0.5 1.0
[BUR00] lb0.50 fcm1/4 (10 / Ø)0.5 1.0
[LET06a] lb0.60 fcm2/5 - 1.0
[ZUO00] lb1.0 fcm1/4 0.78 · Ø + 0.22 [in.] 1.0
[CAN06] lb0.50 fcm1/2 - 1.0
44
2.10 Limit State of Cracking
2.10.1 Definition of Crack Width
The bearing behaviour of structural concrete elements under bending and tension ischaracterised by the development of cracks. Cracks impair the structural elements’aesthetics, but contribute to the utilisation of the material properties of concrete andreinforcing steel. Only in case the crack widths exceed certain limiting values, thecracks impair the durability and bond strength of structural concrete elements. [EC2]provides values for the calculated crack widths wk that depend on exposure classes.The limiting value should be established accounting for the proposed application andtype of the structure as well as for the costs of crack limitation [EC2].
Even satisfying the detailing rules according to [EC2] cannot prevent single cracks thatexceed the calculated crack width. The rules for crack control shall not guarantee theexplicit compliance of a defined crack width, but avoid the occurrence of single largecracks [EC2]. The exact crack width can hardly be calculated, since the existing crackmodels include simplifications, loads as well as materials are not perfectly distributedand the execution quality is not constant [DEU12].
For the evaluation of crack widths, the distribution of crack widths along the cracklength as well as along the structural element length has to be considered. While thereinforcement reduces the crack width in its vicinity, the crack width increases atincreasing distance from the reinforcement. According to the GUIDE TO GOODPRACTICE FOR CRACK MEASUREMENTS published by the German Society for Concreteand Construction Technology [DEU06], the value wk calculated according to [EC2]equations does not correspond to the crack width at the concrete surface, but conformswith a mean crack width over the effective depth of the reinforcement. Therefore, thecrack control procedure can only control the crack width in the vicinity of thereinforcement in bond [EC2] (cf. Figure 2-23, left).
Figure 2-23 Calculated crack width wk (left) and crack measurement parallel to reinforcement versusorthogonal to crack course (right)
The GUIDE TO GOOD PRACTICE [DEU06] defines the crack width wtest as the distancebetween the two edges of the crack measured orthogonally to the course of the crack atthe concrete surface. It is not clear whether the local or the global course of the crackis meant (cf. Figure 2-23, right). The direction of the measurement however influences
wk
> 5(
c+Ø
/2)
>wkFF
h c,e
ffh c
,eff
parallel toreinforcement
orthogonal tolocal courseof the crackglobal course: 90°
to reinforcement
local course: 60°to reinforcement
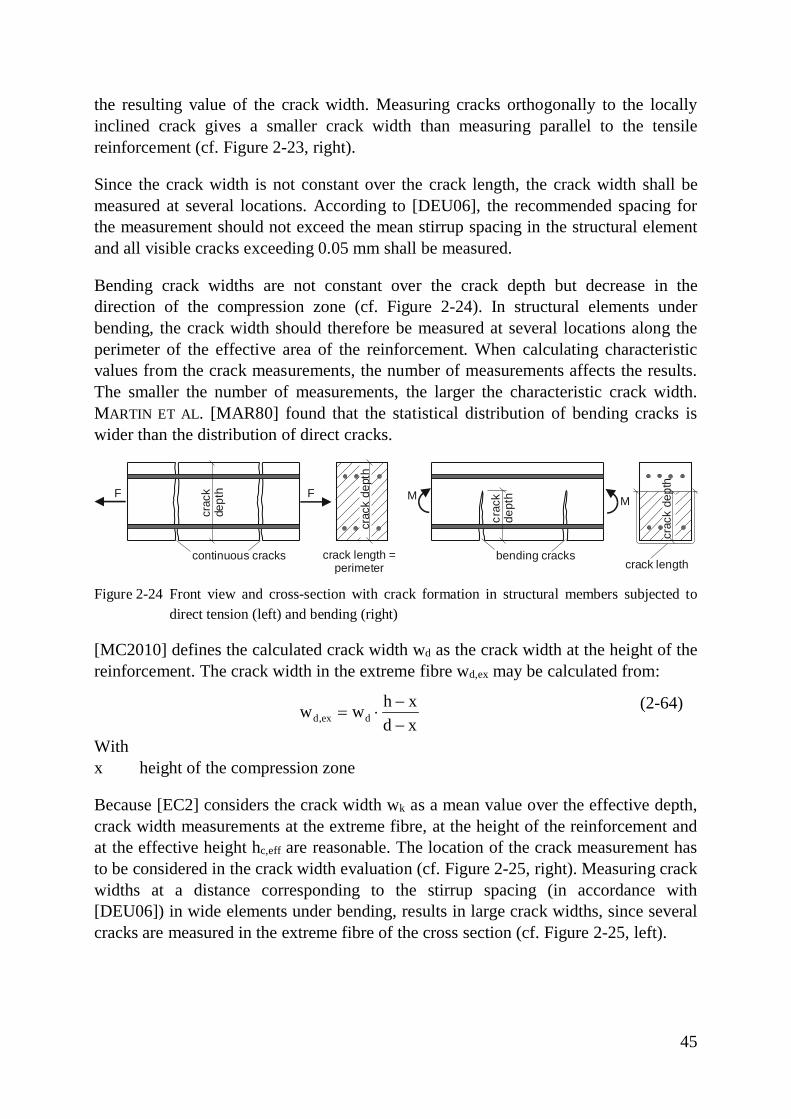
45
the resulting value of the crack width. Measuring cracks orthogonally to the locallyinclined crack gives a smaller crack width than measuring parallel to the tensilereinforcement (cf. Figure 2-23, right).
Since the crack width is not constant over the crack length, the crack width shall bemeasured at several locations. According to [DEU06], the recommended spacing forthe measurement should not exceed the mean stirrup spacing in the structural elementand all visible cracks exceeding 0.05 mm shall be measured.
Bending crack widths are not constant over the crack depth but decrease in thedirection of the compression zone (cf. Figure 2-24). In structural elements underbending, the crack width should therefore be measured at several locations along theperimeter of the effective area of the reinforcement. When calculating characteristicvalues from the crack measurements, the number of measurements affects the results.The smaller the number of measurements, the larger the characteristic crack width.MARTIN ET AL. [MAR80] found that the statistical distribution of bending cracks iswider than the distribution of direct cracks.
Figure 2-24 Front view and cross-section with crack formation in structural members subjected todirect tension (left) and bending (right)
[MC2010] defines the calculated crack width wd as the crack width at the height of thereinforcement. The crack width in the extreme fibre wd,ex may be calculated from:
d,ex dh xw wd x-
= ×-
(2-64)
Withx height of the compression zone
Because [EC2] considers the crack width wk as a mean value over the effective depth,crack width measurements at the extreme fibre, at the height of the reinforcement andat the effective height hc,eff are reasonable. The location of the crack measurement hasto be considered in the crack width evaluation (cf. Figure 2-25, right). Measuring crackwidths at a distance corresponding to the stirrup spacing (in accordance with[DEU06]) in wide elements under bending, results in large crack widths, since severalcracks are measured in the extreme fibre of the cross section (cf. Figure 2-25, left).
continuous cracks bending cracks
F F M M
crac
kde
pth
crac
k de
pth
crack length =perimeter
crac
kde
pth
crac
k de
pth
crack length
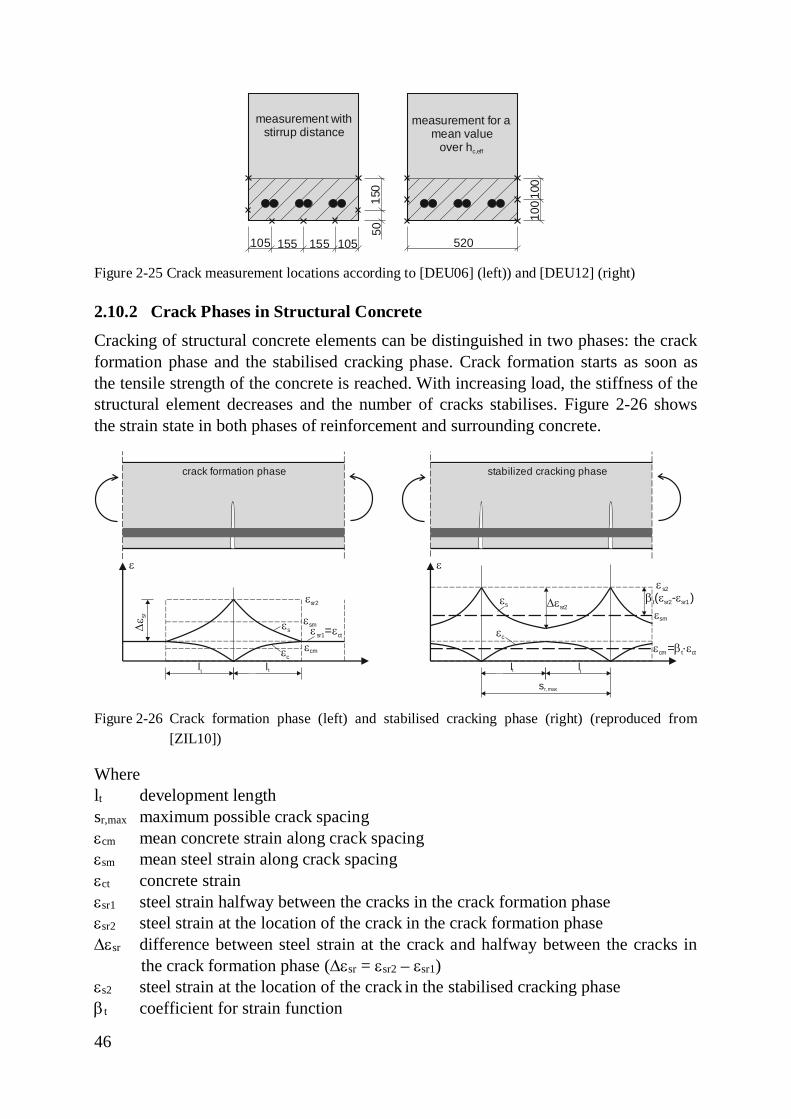
46
Figure 2-25 Crack measurement locations according to [DEU06] (left)) and [DEU12] (right)
2.10.2 Crack Phases in Structural Concrete
Cracking of structural concrete elements can be distinguished in two phases: the crackformation phase and the stabilised cracking phase. Crack formation starts as soon asthe tensile strength of the concrete is reached. With increasing load, the stiffness of thestructural element decreases and the number of cracks stabilises. Figure 2-26 showsthe strain state in both phases of reinforcement and surrounding concrete.
Figure 2-26 Crack formation phase (left) and stabilised cracking phase (right) (reproduced from[ZIL10])
Wherelt development lengthsr,max maximum possible crack spacingecm mean concrete strain along crack spacingesm mean steel strain along crack spacingect concrete strainesr1 steel strain halfway between the cracks in the crack formation phaseesr2 steel strain at the location of the crack in the crack formation phaseDesr difference between steel strain at the crack and halfway between the cracks in
the crack formation phase (Desr = esr2 – esr1)es2 steel strain at the location of the crack in the stabilised cracking phasebt coefficient for strain function
10015
050
155155 105105
measurement withstirrup distance
measurement for amean value
over hc,eff
100
520
lt lt
ecm
esr2
esmes
ec
e esr1 ct=De s
r
e
lt
e
lt
e b ecm t ct= ·
Desr2esm
es
ec
sr,max
b e et sr2 sr1( - )es2
crack formation phase stabilized cracking phase
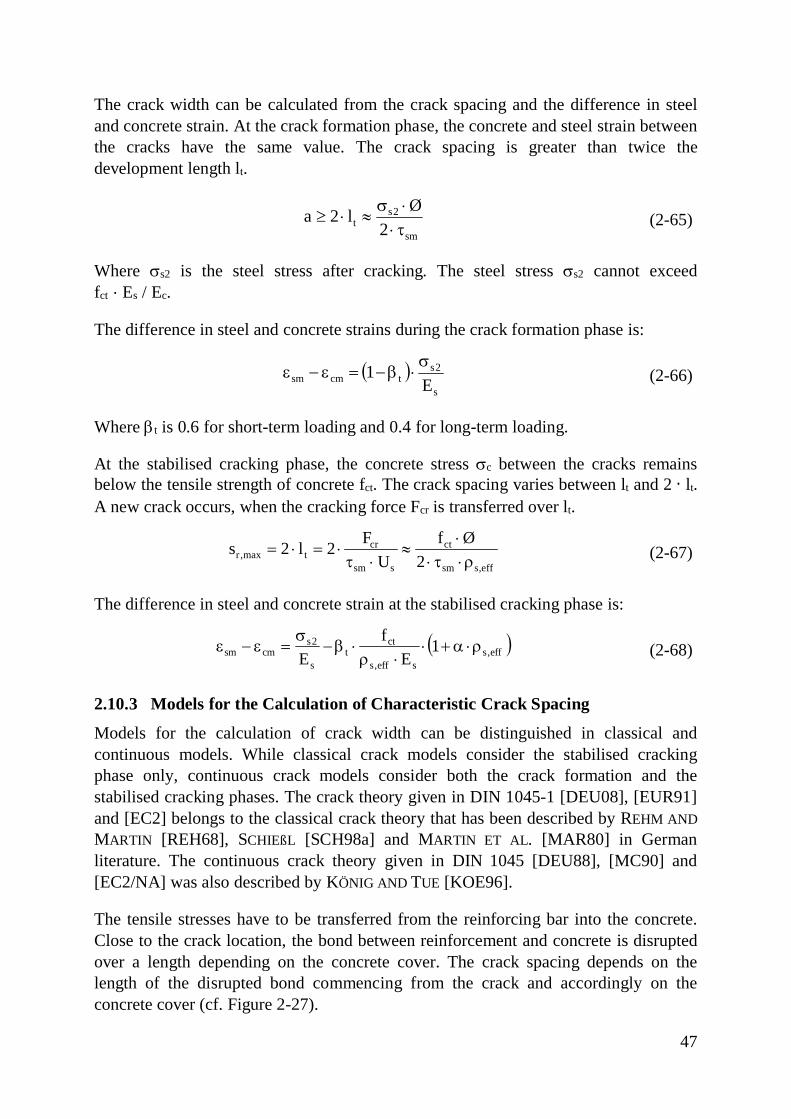
47
The crack width can be calculated from the crack spacing and the difference in steeland concrete strain. At the crack formation phase, the concrete and steel strain betweenthe cracks have the same value. The crack spacing is greater than twice thedevelopment length lt.
sm
2st 2
Øl2at××s
»×³ (2-65)
Where ss2 is the steel stress after cracking. The steel stress ss2 cannot exceedfct · Es / Ec.
The difference in steel and concrete strains during the crack formation phase is:
( )s
2stcmsm E
1 s×b-=e-e (2-66)
Where bt is 0.6 for short-term loading and 0.4 for long-term loading.
At the stabilised cracking phase, the concrete stress sc between the cracks remainsbelow the tensile strength of concrete fct. The crack spacing varies between lt and 2 · lt.A new crack occurs, when the cracking force Fcr is transferred over lt.
cr ctr ,max t
sm s sm s,eff
F f Øs 2 l 2U 2
×= × = × »
t × × t ×r (2-67)
The difference in steel and concrete strain at the stabilised cracking phase is:
( )eff,sseff,s
ctt
s
2scmsm 1
Ef
Er×a+×
×r×b-
s=e-e (2-68)
2.10.3 Models for the Calculation of Characteristic Crack Spacing
Models for the calculation of crack width can be distinguished in classical andcontinuous models. While classical crack models consider the stabilised crackingphase only, continuous crack models consider both the crack formation and thestabilised cracking phases. The crack theory given in DIN 1045-1 [DEU08], [EUR91]and [EC2] belongs to the classical crack theory that has been described by REHM ANDMARTIN [REH68], SCHIEßL [SCH98a] and MARTIN ET AL. [MAR80] in Germanliterature. The continuous crack theory given in DIN 1045 [DEU88], [MC90] and[EC2/NA] was also described by KÖNIG AND TUE [KOE96].
The tensile stresses have to be transferred from the reinforcing bar into the concrete.Close to the crack location, the bond between reinforcement and concrete is disruptedover a length depending on the concrete cover. The crack spacing depends on thelength of the disrupted bond commencing from the crack and accordingly on theconcrete cover (cf. Figure 2-27).
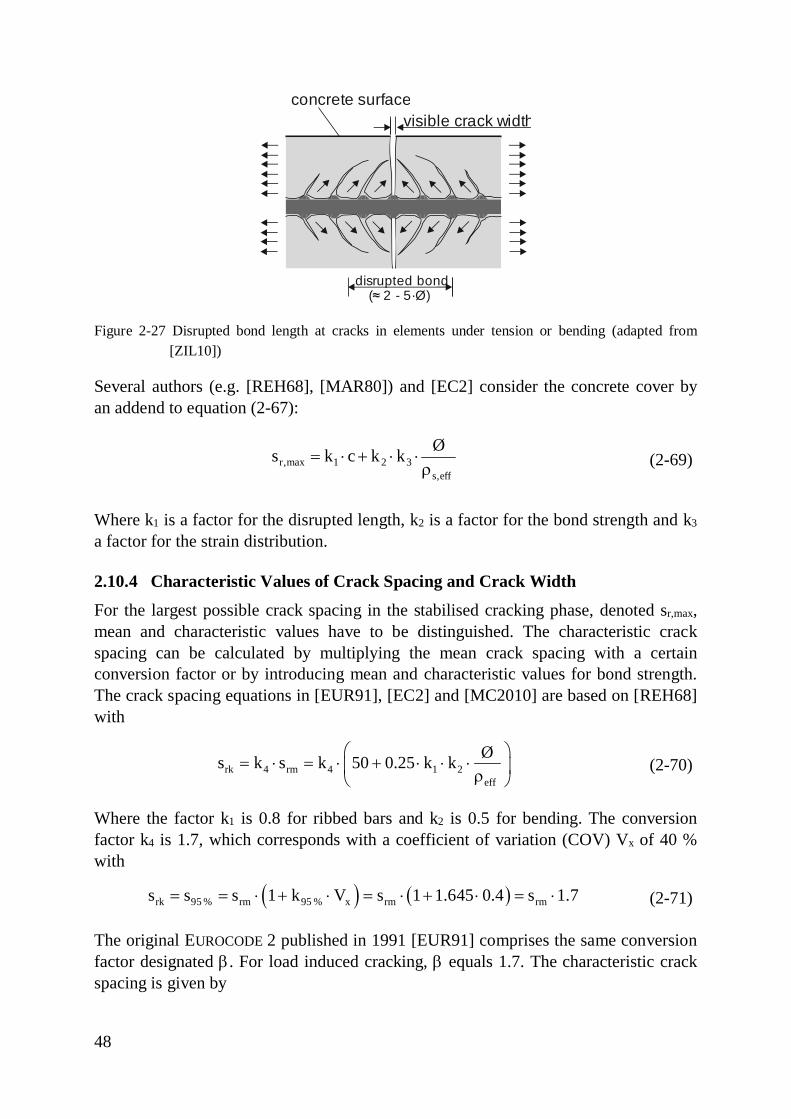
48
Figure 2-27 Disrupted bond length at cracks in elements under tension or bending (adapted from[ZIL10])
Several authors (e.g. [REH68], [MAR80]) and [EC2] consider the concrete cover byan addend to equation (2-67):
eff,s321max,r
Økkcksr××+×= (2-69)
Where k1 is a factor for the disrupted length, k2 is a factor for the bond strength and k3
a factor for the strain distribution.
2.10.4 Characteristic Values of Crack Spacing and Crack Width
For the largest possible crack spacing in the stabilised cracking phase, denoted sr,max,mean and characteristic values have to be distinguished. The characteristic crackspacing can be calculated by multiplying the mean crack spacing with a certainconversion factor or by introducing mean and characteristic values for bond strength.The crack spacing equations in [EUR91], [EC2] and [MC2010] are based on [REH68]with
rk 4 rm 4 1 2eff
Øs k s k 50 0.25 k kæ ö
= × = × + × × ×ç ÷rè ø(2-70)
Where the factor k1 is 0.8 for ribbed bars and k2 is 0.5 for bending. The conversionfactor k4 is 1.7, which corresponds with a coefficient of variation (COV) Vx of 40 %with
( ) ( )rk 95 % rm 95 % x rm rms s s 1 k V s 1 1.645 0.4 s 1.7= = × + × = × + × = × (2-71)
The original EUROCODE 2 published in 1991 [EUR91] comprises the same conversionfactor designated b. For load induced cracking, b equals 1.7. The characteristic crackspacing is given by
concrete surfacevisible crack width
disrupted bond(≈ 2 - 5·Ø)
49
÷÷ø
öççè
ær×××+×b=×b=
eff21rmENV,rk
Økk25.050ss (2-72)
The crack spacing according to [EC2] follows from
eff212EC,rk
Ø425.0kkc4.3sr×××+×= (2-73)
This equation also corresponds with the formulation according to [REH68] with aconversion factor of 1.7 for the transformation from mean to characteristic crackspacing when a concrete cover c = 25 mm is assumed (3.4 · c = 85 mm = 1.7 · 50):
÷÷ø
öççè
ær×××+×=
eff212EC,rk
Økk25.0507.1s (2-74)
The [EC2] crack spacing is thus a characteristic crack spacing derived from the meancrack spacing and the conversion factor 1.7. According to equation (2-71), this factorcorresponds with a 95% quantile and a COV of 40%.
A conversion factor for the calculation of characteristic values can also be found in[MC90] and [EC2/NA]. The following crack spacing equation for stabilised crackingis given in [MC90] and [EC2/NA].
ctrk,MC90 rk,NAD t
sm s,eff
f Øs s 2 l2
×= = × =
× t ×r(2-75)
Applying the bond strength tsm = 2.25 · fct results in the mean crack width, while abond strength tsm = 1.8 · fct represents the characteristic value of the crack width as75% quantile [MC90]. Thus, the relation between mean and characteristic value is2.25 / 1.8 = 1.25. Accordingly, the crack spacing defined in [EC2/NA] and [MC90] isa characteristic value calculated from the mean value multiplied with a conversionfactor of 1.25 instead of 1.7. The factor 1.25 approximately corresponds with a COVVx of 40 % with
( ) ( )rk 75 % rm 75 % x rm rms s s 1 k V s 1 0.675 0.4 s 1.27= = × + × = × + × = × (2-76)
The procedure for statistical analysis of crack width measurements is not clearlydefined in codes or guidelines. From the literature review, the following coherencewas identified:
- The crack spacing srk according to [EC2] is a characteristic crack spacing equalto 1.7 · srm. The factor 1.7 corresponds with a 95%-fractile value and a COV of40%.
- The crack spacing srk according to [EC2/NA] and [MC90] is a characteristiccrack spacing derived from 1.25 · srm. The value 1.25 corresponds with a75%-fractile value and a COV of 40 %.
50
2.10.5 Statistical Distribution of Crack Widths
For a statistic evaluation, the probability distribution of the sample and the desiredconfidence level have to be defined. The quantiles can be obtained with equation(2-77) for a normal distribution or with equation (2-78) for a log-normal distribution.
Xk = mx · (1 + kn · Vx) (2-77)
Xk = mx · exp (m + kn · s) (2-78)
The symbols are given below. The kn-factors depend on the required quantile, thenumber of measurements, the probability distribution of the population and the desiredconfidence level.
Quantile values of crack measurements can be calculated from those tabulatedkn-factors given in DIN ISO 16269 [DEU14]. These tables are valid for the normal andlog-normal distributions. BERGMEISTER [BER99] found in a c²-test that the crackspacing has a log-normal distribution, while the crack width has a gamma distribution.The tables given in [EC0] for the calculation of characteristic values were derivedfrom Bayesian procedures with vague prior distributions [EC0] and can therefore notbe compared exactly to the classic statistical analysis. For simplification, theevaluation of crack measurements in chapter 3 was accomplished with log-normaldistributions for crack spacing and crack width. When presuming a log-normaldistribution, the logarithmised crack widths have a normal distribution. The meanvalue mx, the standard deviation sx, the COV Vx and the quantile values Xk of thecrack width can be calculated with equations (2-78) to (2-81).
2
xm exp2
æ ös= m +ç ÷
è ø(2-79)
( )2
2xs exp exp 1
2æ ös
= m + × s -ç ÷è ø
(2-80)
( )2xx
x
mV (x) exp 1s
= = s - (2-81)
Where m and s are the mean value and the standard deviation of the logarithmisedmeasured crack widths ln(wtest).
2.10.6 Evaluation of Crack Width Measurements in Literature
In the numerous published crack investigations, the crack width has certainly beenmeasured in different locations (extreme fibre or at the height of the reinforcement)and in different directions (orthogonally to the local course of the crack or parallel tothe reinforcement under tension). Besides different methods for practical crackmeasurements, two different definitions of 95% quantile values have been found inliterature.
51
Some authors define the 95%-quantile of a measurement as the crack width that only5% of the measurements exceed [DEU06], [EMP16]. This definition disrespects thenumber of measurements, the statistical distribution of the sample and the COV. Otherauthors use a statistical analysis as described above to calculate the 95%-quantile fromthe crack width sample. [MAR80], [REH68], [EC2], [MC2010] and their precedingdocuments are based on such statistical analyses. The two definitions of quantilevalues may lead to the same results depending on the number of measurements, thestatistical distribution and the COV Vx.
KÖNIG AND TUE [KOE96] directly compare mean crack widths instead of 95%-quantiles. Since many test reports give mean values only, they determine the meancalculated crack width of their crack model from the maximum crack width. Theconversion is done based on the mechanical crack model rather than on a statisticalanalysis.
Since the crack width wk according to [EC2] is calculated from a 95% quantile forcrack spacing, the crack width is larger than the crack width wk according to[EC2/NA], which is calculated from a 75% quantile for the maximum crack spacing.
2.10.7 Acceptance Criteria for Measured Crack Widths
For the evaluation of mean and quantile values from crack width samples, acceptancecriteria have to be applied. The GUIDE TO GOOD PRACTICE [DEU06] definespermissible percentages of exceedance of the allowable crack width. The evaluation ofmaximum exceedances of single measurements should be done with engineeringexpertise. For the durability of the structure, single crack widths shall not exceed0.4 mm to 0.5 mm [DEU12]. Based on the capability of the crack width equation[DEU06] gives the following permissible percentages of exceedance:
· wk = 0.4 mm (maximum 5 % exceedance)· wk = 0.3 mm (maximum 10 % exceedance)· wk = 0.2 mm (maximum 20 % exceedance)
In this case, the 95%-quantile of the crack width sample is defined as the crack widththat only 5% of the measurements exceed disrespecting the number of measurements,the statistical distribution and the COV.
SCHIEßL [SCH98a] recommends that mean values of the data set of crackmeasurements must fall below the defined limiting value wmax and that the largestcrack width, defined as the 95%-quantile of the sample may not exceed the limitingvalue by more than 30 % (wtest,95%≤ 1.3· wmax). The 95% quantiles are determined by aclassic statistical analysis.
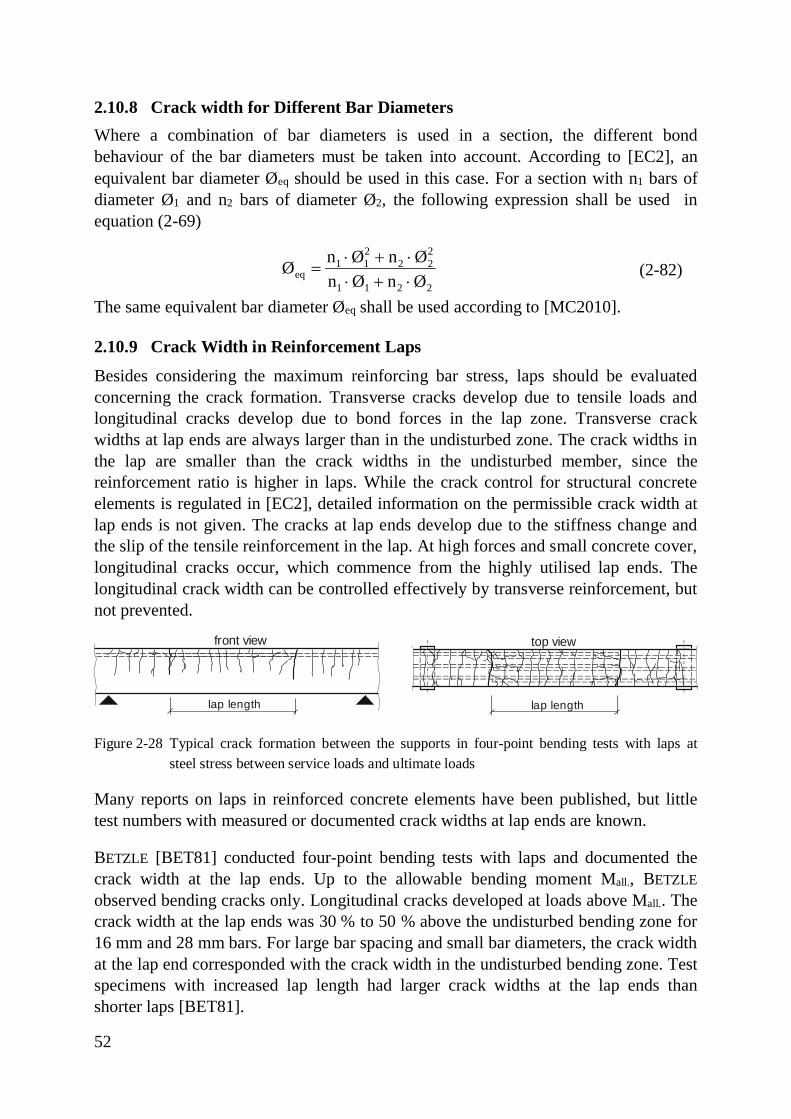
52
2.10.8 Crack width for Different Bar DiametersWhere a combination of bar diameters is used in a section, the different bondbehaviour of the bar diameters must be taken into account. According to [EC2], anequivalent bar diameter Øeq should be used in this case. For a section with n1 bars ofdiameter Ø1 and n2 bars of diameter Ø2, the following expression shall be used inequation (2-69)
2 21 1 2 2
eq1 1 2 2
n Ø n ØØn Ø n Ø× + ×
=× + ×
(2-82)
The same equivalent bar diameter Øeq shall be used according to [MC2010].
2.10.9 Crack Width in Reinforcement Laps
Besides considering the maximum reinforcing bar stress, laps should be evaluatedconcerning the crack formation. Transverse cracks develop due to tensile loads andlongitudinal cracks develop due to bond forces in the lap zone. Transverse crackwidths at lap ends are always larger than in the undisturbed zone. The crack widths inthe lap are smaller than the crack widths in the undisturbed member, since thereinforcement ratio is higher in laps. While the crack control for structural concreteelements is regulated in [EC2], detailed information on the permissible crack width atlap ends is not given. The cracks at lap ends develop due to the stiffness change andthe slip of the tensile reinforcement in the lap. At high forces and small concrete cover,longitudinal cracks occur, which commence from the highly utilised lap ends. Thelongitudinal crack width can be controlled effectively by transverse reinforcement, butnot prevented.
Figure 2-28 Typical crack formation between the supports in four-point bending tests with laps atsteel stress between service loads and ultimate loads
Many reports on laps in reinforced concrete elements have been published, but littletest numbers with measured or documented crack widths at lap ends are known.
BETZLE [BET81] conducted four-point bending tests with laps and documented thecrack width at the lap ends. Up to the allowable bending moment Mall., BETZLEobserved bending cracks only. Longitudinal cracks developed at loads above Mall.. Thecrack width at the lap ends was 30 % to 50 % above the undisturbed bending zone for16 mm and 28 mm bars. For large bar spacing and small bar diameters, the crack widthat the lap end corresponded with the crack width in the undisturbed bending zone. Testspecimens with increased lap length had larger crack widths at the lap ends thanshorter laps [BET81].
front view top view
lap length lap length
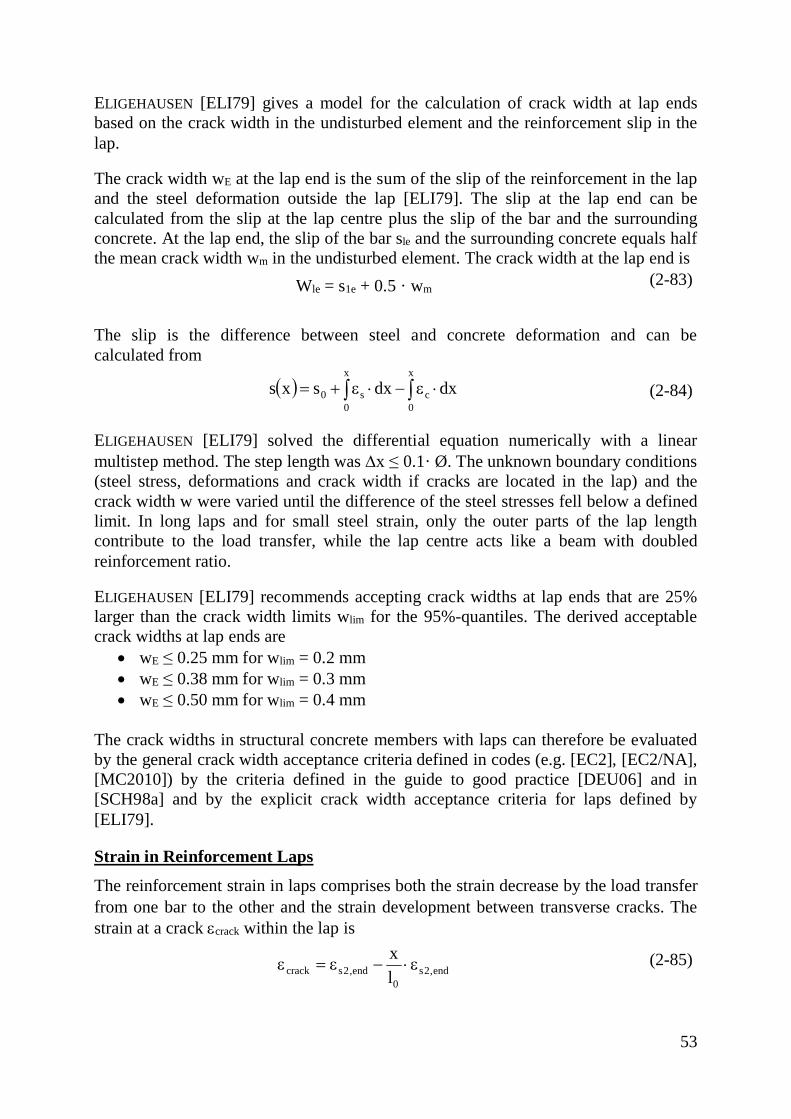
53
ELIGEHAUSEN [ELI79] gives a model for the calculation of crack width at lap endsbased on the crack width in the undisturbed element and the reinforcement slip in thelap.
The crack width wE at the lap end is the sum of the slip of the reinforcement in the lapand the steel deformation outside the lap [ELI79]. The slip at the lap end can becalculated from the slip at the lap centre plus the slip of the bar and the surroundingconcrete. At the lap end, the slip of the bar sle and the surrounding concrete equals halfthe mean crack width wm in the undisturbed element. The crack width at the lap end is
Wle = s1e + 0.5 · wm(2-83)
The slip is the difference between steel and concrete deformation and can becalculated from
( ) ò ò ×e-×e+=x
0
x
0cs0 dxdxsxs (2-84)
ELIGEHAUSEN [ELI79] solved the differential equation numerically with a linearmultistep method. The step length was Dx ≤ 0.1· Ø. The unknown boundary conditions(steel stress, deformations and crack width if cracks are located in the lap) and thecrack width w were varied until the difference of the steel stresses fell below a definedlimit. In long laps and for small steel strain, only the outer parts of the lap lengthcontribute to the load transfer, while the lap centre acts like a beam with doubledreinforcement ratio.
ELIGEHAUSEN [ELI79] recommends accepting crack widths at lap ends that are 25%larger than the crack width limits wlim for the 95%-quantiles. The derived acceptablecrack widths at lap ends are
· wE ≤ 0.25 mm for wlim = 0.2 mm· wE ≤ 0.38 mm for wlim = 0.3 mm· wE ≤ 0.50 mm for wlim = 0.4 mm
The crack widths in structural concrete members with laps can therefore be evaluatedby the general crack width acceptance criteria defined in codes (e.g. [EC2], [EC2/NA],[MC2010]) by the criteria defined in the guide to good practice [DEU06] and in[SCH98a] and by the explicit crack width acceptance criteria for laps defined by[ELI79].
Strain in Reinforcement Laps
The reinforcement strain in laps comprises both the strain decrease by the load transferfrom one bar to the other and the strain development between transverse cracks. Thestrain at a crack ecrack within the lap is
end,2s0
end,2scrack lx
e×-e=e (2-85)
54
Withes2,end Reinforcement strain at the lap endx Position in the lap starting from the lap end
Test results have shown that the reinforcement strain is rather constant in the innerthird of the lap length. The load transfer takes place at the lap ends while the innerlength does not contribute to the load transfer. This changes as soon as the lap length isvery short or in case the bond has been deteriorated at the lap length and the inner partof the lap is activated. While the real strain distribution in the lap is non-linear[BUR00], the function can be approximated with a linear decrease having a plateau atthe lap centre, with tri-linear or non-linear functions.
Figure 2-29 Tri-linear strain function in a lap considering cracks
In the stabilised crack phase, the structural concrete member remains uncrackedbetween the cracks. The strain between the cracks reaches the values of the crackedstate in the cracks only (cf. Figure 2-29, right). The strain in the lap between the crackscan be calculated with equation (2-86).
( ) ltsi s2,end s2,end sr2 sr1
0 t
xx 0.6l l
e = e - × e - × e - e × (2-86)
Withesr1 steel strain between the cracks at crack formation
ct1sr e=e (2-87)esr2 steel strain in the crack at crack formation
ss
cteff,c2sr EA
fA××
=e (2-88)
xlt position between the cracks commencing from the cracklt transfer length or half the crack spacing
The bond strength in the lap can be derived from the strain difference as follows
( )i
1i,si,ssi l4
EØ×
e-e××=t - (2-89)
es
es,end
2l /30
0.6·es,end
0.4·es,end
l /30
x
(e esr2 sr1- )
xlt
lt lt
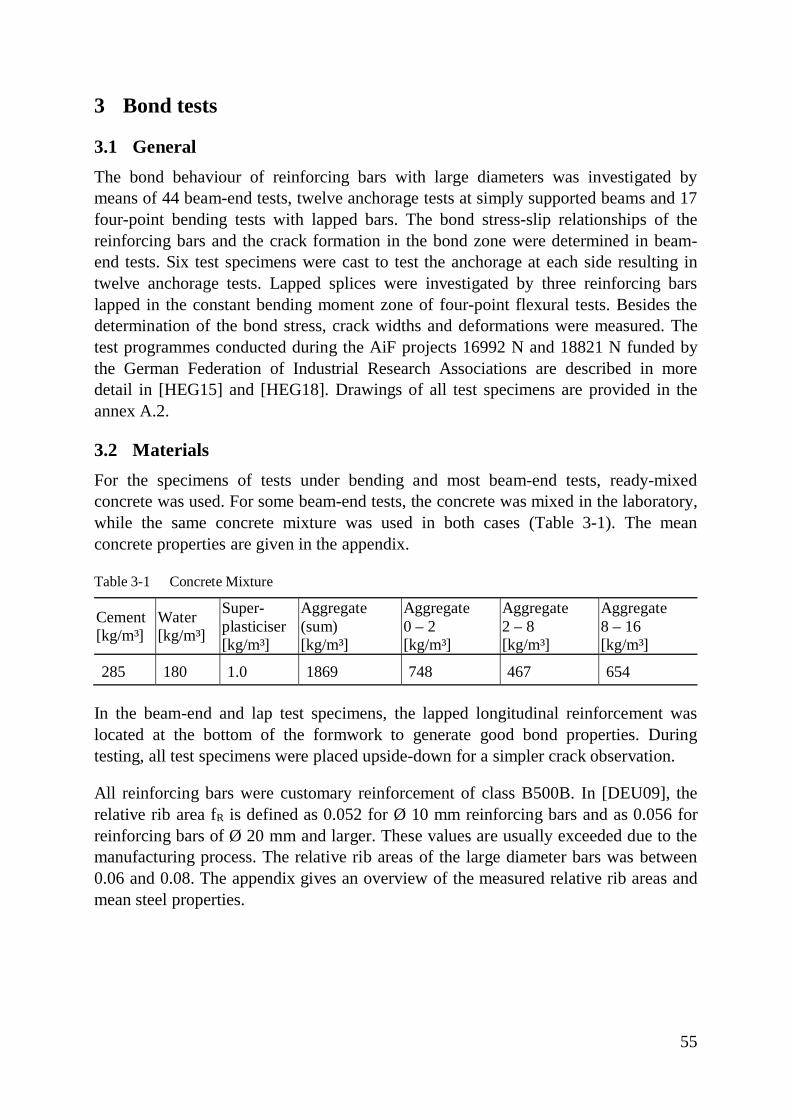
55
3 Bond tests
3.1 GeneralThe bond behaviour of reinforcing bars with large diameters was investigated bymeans of 44 beam-end tests, twelve anchorage tests at simply supported beams and 17four-point bending tests with lapped bars. The bond stress-slip relationships of thereinforcing bars and the crack formation in the bond zone were determined in beam-end tests. Six test specimens were cast to test the anchorage at each side resulting intwelve anchorage tests. Lapped splices were investigated by three reinforcing barslapped in the constant bending moment zone of four-point flexural tests. Besides thedetermination of the bond stress, crack widths and deformations were measured. Thetest programmes conducted during the AiF projects 16992 N and 18821 N funded bythe German Federation of Industrial Research Associations are described in moredetail in [HEG15] and [HEG18]. Drawings of all test specimens are provided in theannex A.2.
3.2 MaterialsFor the specimens of tests under bending and most beam-end tests, ready-mixedconcrete was used. For some beam-end tests, the concrete was mixed in the laboratory,while the same concrete mixture was used in both cases (Table 3-1). The meanconcrete properties are given in the appendix.
Table 3-1 Concrete Mixture
Cement[kg/m³]
Water[kg/m³]
Super-plasticiser[kg/m³]
Aggregate(sum)[kg/m³]
Aggregate0 – 2[kg/m³]
Aggregate2 – 8[kg/m³]
Aggregate8 – 16[kg/m³]
285 180 1.0 1869 748 467 654
In the beam-end and lap test specimens, the lapped longitudinal reinforcement waslocated at the bottom of the formwork to generate good bond properties. Duringtesting, all test specimens were placed upside-down for a simpler crack observation.
All reinforcing bars were customary reinforcement of class B500B. In [DEU09], therelative rib area fR is defined as 0.052 for Ø 10 mm reinforcing bars and as 0.056 forreinforcing bars of Ø 20 mm and larger. These values are usually exceeded due to themanufacturing process. The relative rib areas of the large diameter bars was between0.06 and 0.08. The appendix gives an overview of the measured relative rib areas andmean steel properties.
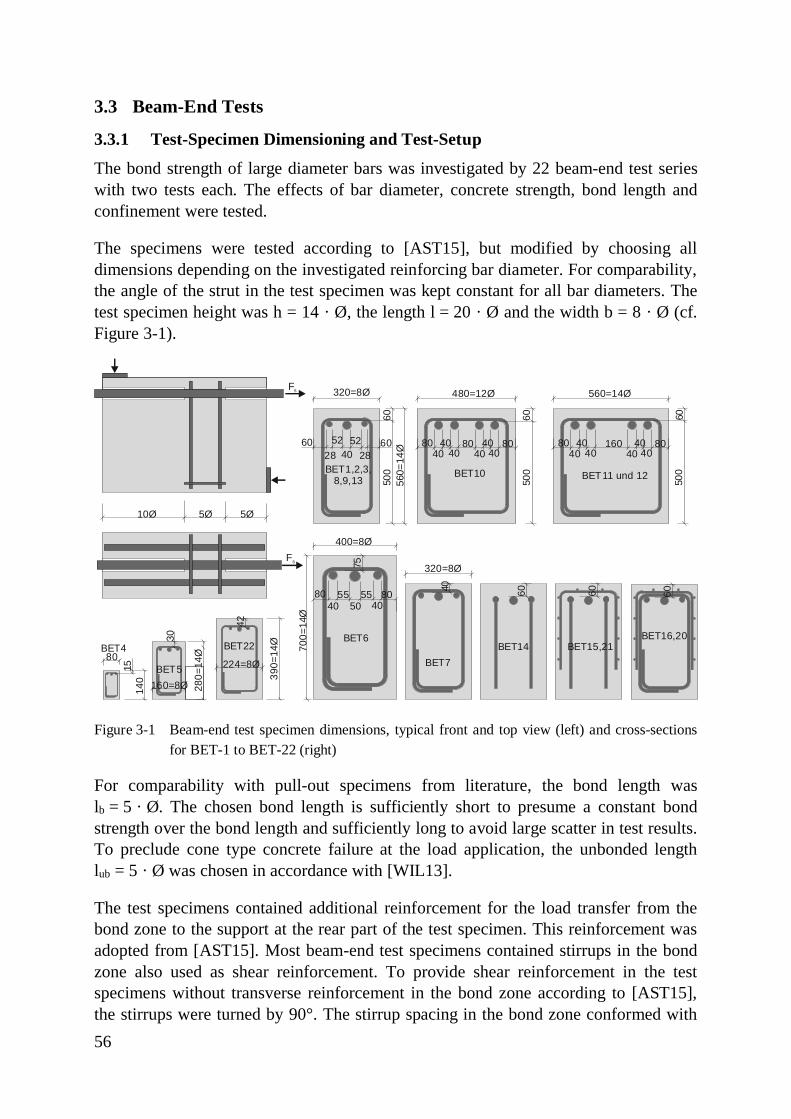
56
3.3 Beam-End Tests
3.3.1 Test-Specimen Dimensioning and Test-Setup
The bond strength of large diameter bars was investigated by 22 beam-end test serieswith two tests each. The effects of bar diameter, concrete strength, bond length andconfinement were tested.
The specimens were tested according to [AST15], but modified by choosing alldimensions depending on the investigated reinforcing bar diameter. For comparability,the angle of the strut in the test specimen was kept constant for all bar diameters. Thetest specimen height was h = 14 · Ø, the length l = 20 · Ø and the width b = 8 · Ø (cf.Figure 3-1).
Figure 3-1 Beam-end test specimen dimensions, typical front and top view (left) and cross-sectionsfor BET-1 to BET-22 (right)
For comparability with pull-out specimens from literature, the bond length waslb = 5 · Ø. The chosen bond length is sufficiently short to presume a constant bondstrength over the bond length and sufficiently long to avoid large scatter in test results.To preclude cone type concrete failure at the load application, the unbonded lengthlub = 5 · Ø was chosen in accordance with [WIL13].
The test specimens contained additional reinforcement for the load transfer from thebond zone to the support at the rear part of the test specimen. This reinforcement wasadopted from [AST15]. Most beam-end test specimens contained stirrups in the bondzone also used as shear reinforcement. To provide shear reinforcement in the testspecimens without transverse reinforcement in the bond zone according to [AST15],the stirrups were turned by 90°. The stirrup spacing in the bond zone conformed with
320=8Ø
5Ø
560=
14Ø
500
60Fs
Fs
560=14Ø
500
60
804040 40
401604040
80
BET11 und 12
604028 28
5252 60
BET1,2,3,8,9,13
80
140
15
BET4
280=
14Ø
BET5
400=8Ø
700=
14Ø
BET6
320=8Ø
BET7
480=12Ø
500
60
804040 40
40804040
80
BET10
5040 40555580 80
224=8Ø
390=
14ØBET22
160=8Ø
BET16,20BET15,21
60
BET14
60 6040
30
42
75
5Ø10Ø
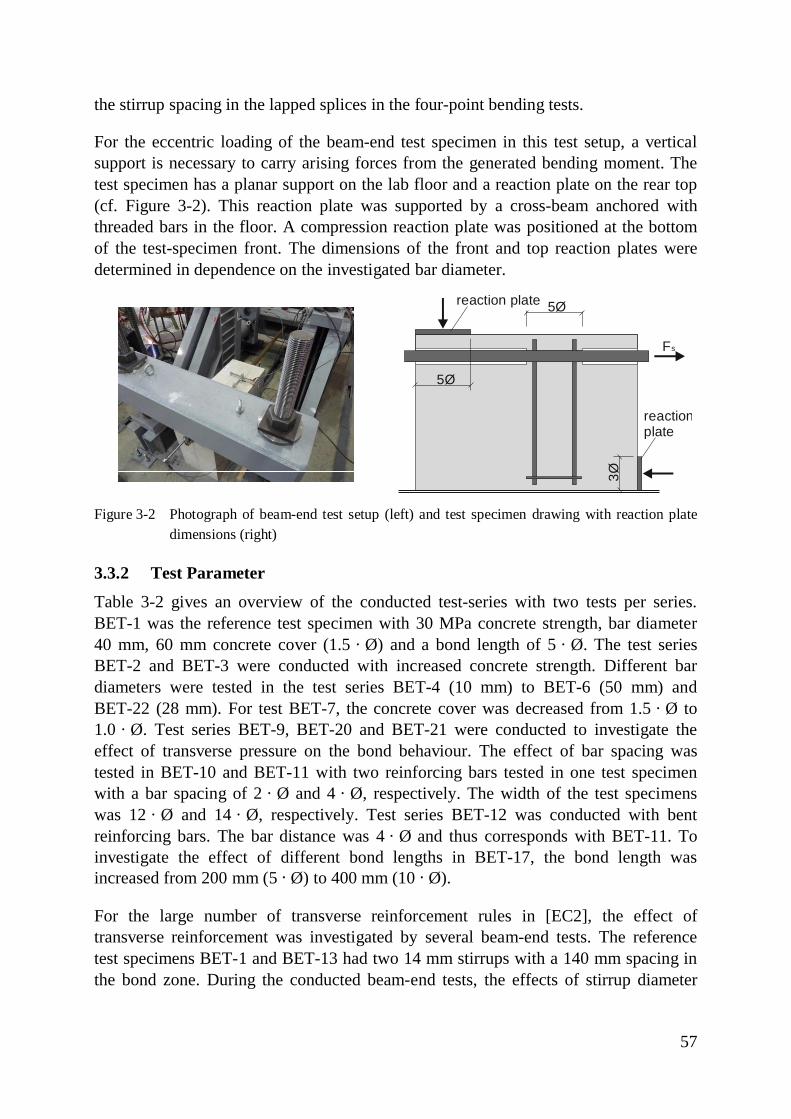
57
the stirrup spacing in the lapped splices in the four-point bending tests.
For the eccentric loading of the beam-end test specimen in this test setup, a verticalsupport is necessary to carry arising forces from the generated bending moment. Thetest specimen has a planar support on the lab floor and a reaction plate on the rear top(cf. Figure 3-2). This reaction plate was supported by a cross-beam anchored withthreaded bars in the floor. A compression reaction plate was positioned at the bottomof the test-specimen front. The dimensions of the front and top reaction plates weredetermined in dependence on the investigated bar diameter.
Figure 3-2 Photograph of beam-end test setup (left) and test specimen drawing with reaction platedimensions (right)
3.3.2 Test Parameter
Table 3-2 gives an overview of the conducted test-series with two tests per series.BET-1 was the reference test specimen with 30 MPa concrete strength, bar diameter40 mm, 60 mm concrete cover (1.5 · Ø) and a bond length of 5 · Ø. The test seriesBET-2 and BET-3 were conducted with increased concrete strength. Different bardiameters were tested in the test series BET-4 (10 mm) to BET-6 (50 mm) andBET-22 (28 mm). For test BET-7, the concrete cover was decreased from 1.5 · Ø to1.0 · Ø. Test series BET-9, BET-20 and BET-21 were conducted to investigate theeffect of transverse pressure on the bond behaviour. The effect of bar spacing wastested in BET-10 and BET-11 with two reinforcing bars tested in one test specimenwith a bar spacing of 2 · Ø and 4 · Ø, respectively. The width of the test specimenswas 12 · Ø and 14 · Ø, respectively. Test series BET-12 was conducted with bentreinforcing bars. The bar distance was 4 · Ø and thus corresponds with BET-11. Toinvestigate the effect of different bond lengths in BET-17, the bond length wasincreased from 200 mm (5 · Ø) to 400 mm (10 · Ø).
For the large number of transverse reinforcement rules in [EC2], the effect oftransverse reinforcement was investigated by several beam-end tests. The referencetest specimens BET-1 and BET-13 had two 14 mm stirrups with a 140 mm spacing inthe bond zone. During the conducted beam-end tests, the effects of stirrup diameter
Fs
3Ø
5Ø
5Øreaction plate
reactionplate
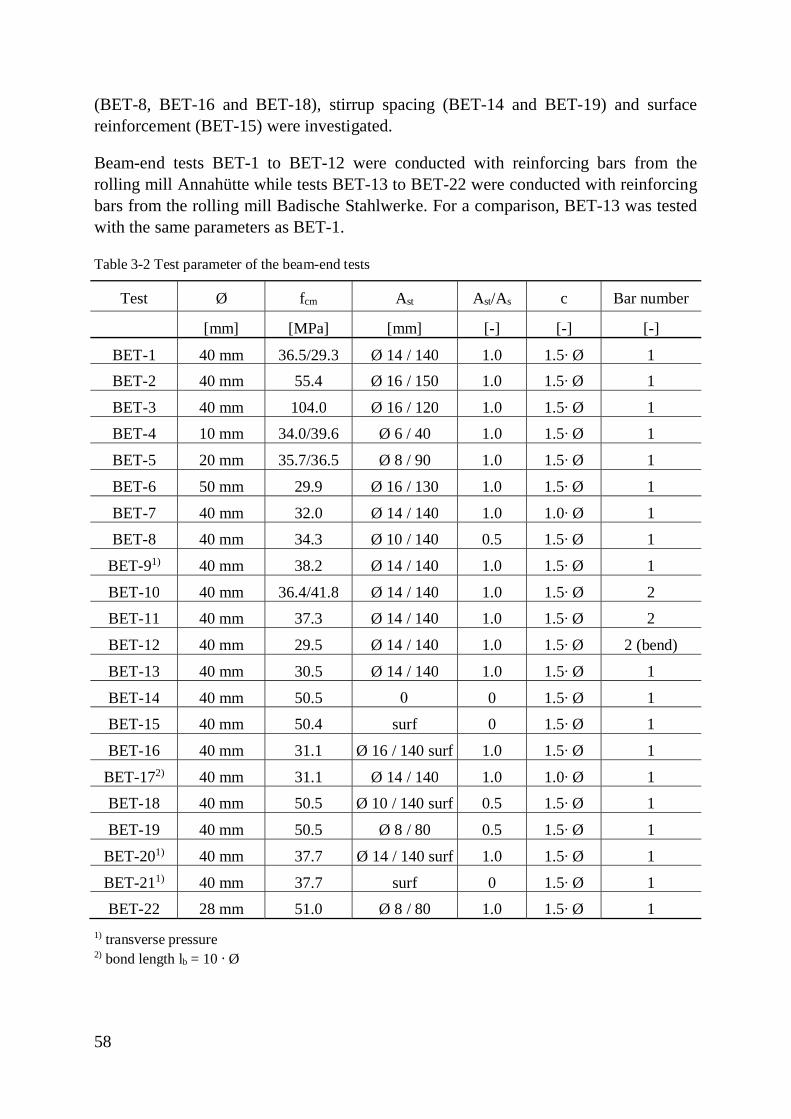
58
(BET-8, BET-16 and BET-18), stirrup spacing (BET-14 and BET-19) and surfacereinforcement (BET-15) were investigated.
Beam-end tests BET-1 to BET-12 were conducted with reinforcing bars from therolling mill Annahütte while tests BET-13 to BET-22 were conducted with reinforcingbars from the rolling mill Badische Stahlwerke. For a comparison, BET-13 was testedwith the same parameters as BET-1.
Table 3-2 Test parameter of the beam-end tests
Test Ø fcm Ast Ast/As c Bar number
[mm] [MPa] [mm] [-] [-] [-]
BET-1 40 mm 36.5/29.3 Ø 14 / 140 1.0 1.5∙ Ø 1BET-2 40 mm 55.4 Ø 16 / 150 1.0 1.5∙ Ø 1
BET-3 40 mm 104.0 Ø 16 / 120 1.0 1.5∙ Ø 1BET-4 10 mm 34.0/39.6 Ø 6 / 40 1.0 1.5∙ Ø 1
BET-5 20 mm 35.7/36.5 Ø 8 / 90 1.0 1.5∙ Ø 1
BET-6 50 mm 29.9 Ø 16 / 130 1.0 1.5∙ Ø 1
BET-7 40 mm 32.0 Ø 14 / 140 1.0 1.0∙ Ø 1BET-8 40 mm 34.3 Ø 10 / 140 0.5 1.5∙ Ø 1
BET-91) 40 mm 38.2 Ø 14 / 140 1.0 1.5∙ Ø 1
BET-10 40 mm 36.4/41.8 Ø 14 / 140 1.0 1.5∙ Ø 2BET-11 40 mm 37.3 Ø 14 / 140 1.0 1.5∙ Ø 2
BET-12 40 mm 29.5 Ø 14 / 140 1.0 1.5∙ Ø 2 (bend)
BET-13 40 mm 30.5 Ø 14 / 140 1.0 1.5∙ Ø 1
BET-14 40 mm 50.5 0 0 1.5∙ Ø 1BET-15 40 mm 50.4 surf 0 1.5∙ Ø 1
BET-16 40 mm 31.1 Ø 16 / 140 surf 1.0 1.5∙ Ø 1
BET-172) 40 mm 31.1 Ø 14 / 140 1.0 1.0∙ Ø 1BET-18 40 mm 50.5 Ø 10 / 140 surf 0.5 1.5∙ Ø 1
BET-19 40 mm 50.5 Ø 8 / 80 0.5 1.5∙ Ø 1
BET-201) 40 mm 37.7 Ø 14 / 140 surf 1.0 1.5∙ Ø 1
BET-211) 40 mm 37.7 surf 0 1.5∙ Ø 1BET-22 28 mm 51.0 Ø 8 / 80 1.0 1.5∙ Ø 1
1) transverse pressure2) bond length lb = 10 · Ø
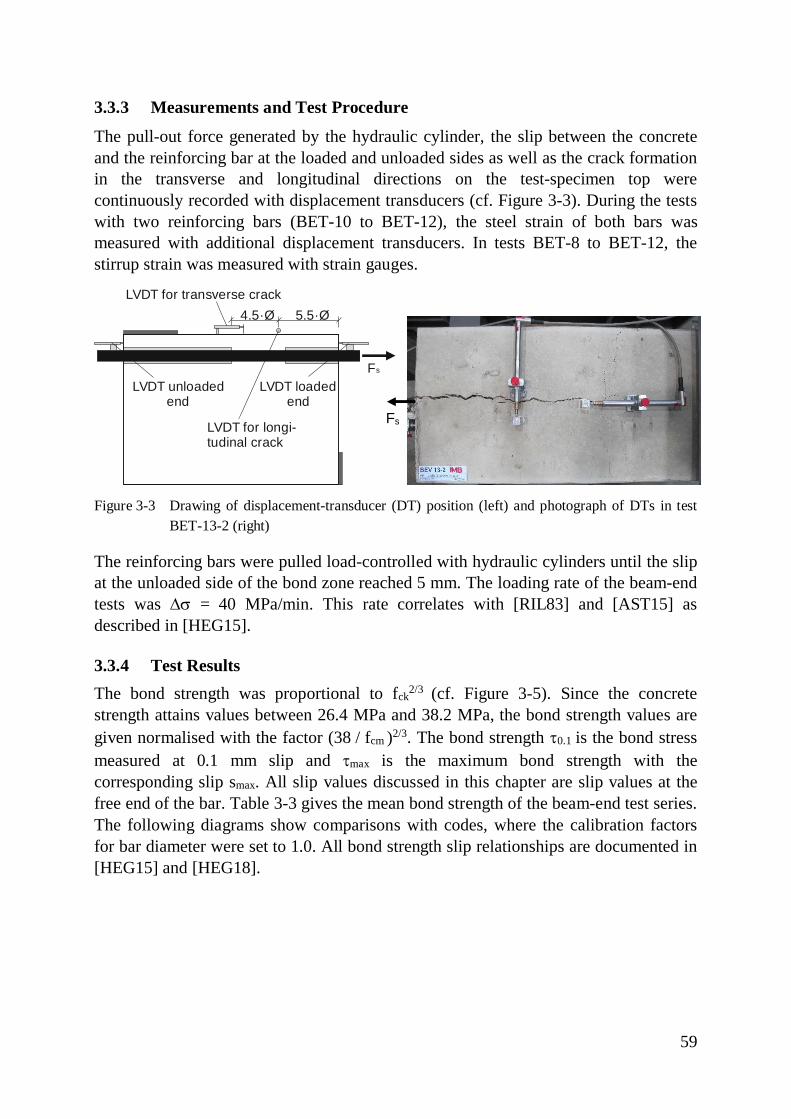
59
3.3.3 Measurements and Test Procedure
The pull-out force generated by the hydraulic cylinder, the slip between the concreteand the reinforcing bar at the loaded and unloaded sides as well as the crack formationin the transverse and longitudinal directions on the test-specimen top werecontinuously recorded with displacement transducers (cf. Figure 3-3). During the testswith two reinforcing bars (BET-10 to BET-12), the steel strain of both bars wasmeasured with additional displacement transducers. In tests BET-8 to BET-12, thestirrup strain was measured with strain gauges.
Figure 3-3 Drawing of displacement-transducer (DT) position (left) and photograph of DTs in testBET-13-2 (right)
The reinforcing bars were pulled load-controlled with hydraulic cylinders until the slipat the unloaded side of the bond zone reached 5 mm. The loading rate of the beam-endtests was Ds = 40 MPa/min. This rate correlates with [RIL83] and [AST15] asdescribed in [HEG15].
3.3.4 Test ResultsThe bond strength was proportional to fck2/3 (cf. Figure 3-5). Since the concretestrength attains values between 26.4 MPa and 38.2 MPa, the bond strength values aregiven normalised with the factor (38 / fcm )2/3. The bond strength t0.1 is the bond stressmeasured at 0.1 mm slip and tmax is the maximum bond strength with thecorresponding slip smax. All slip values discussed in this chapter are slip values at thefree end of the bar. Table 3-3 gives the mean bond strength of the beam-end test series.The following diagrams show comparisons with codes, where the calibration factorsfor bar diameter were set to 1.0. All bond strength slip relationships are documented in[HEG15] and [HEG18].
Fs
5.5·Ø4.5·Ø
LVDT loadedend
LVDT unloadedend
LVDT for longi-tudinal crack
LVDT for transverse crack
Fs
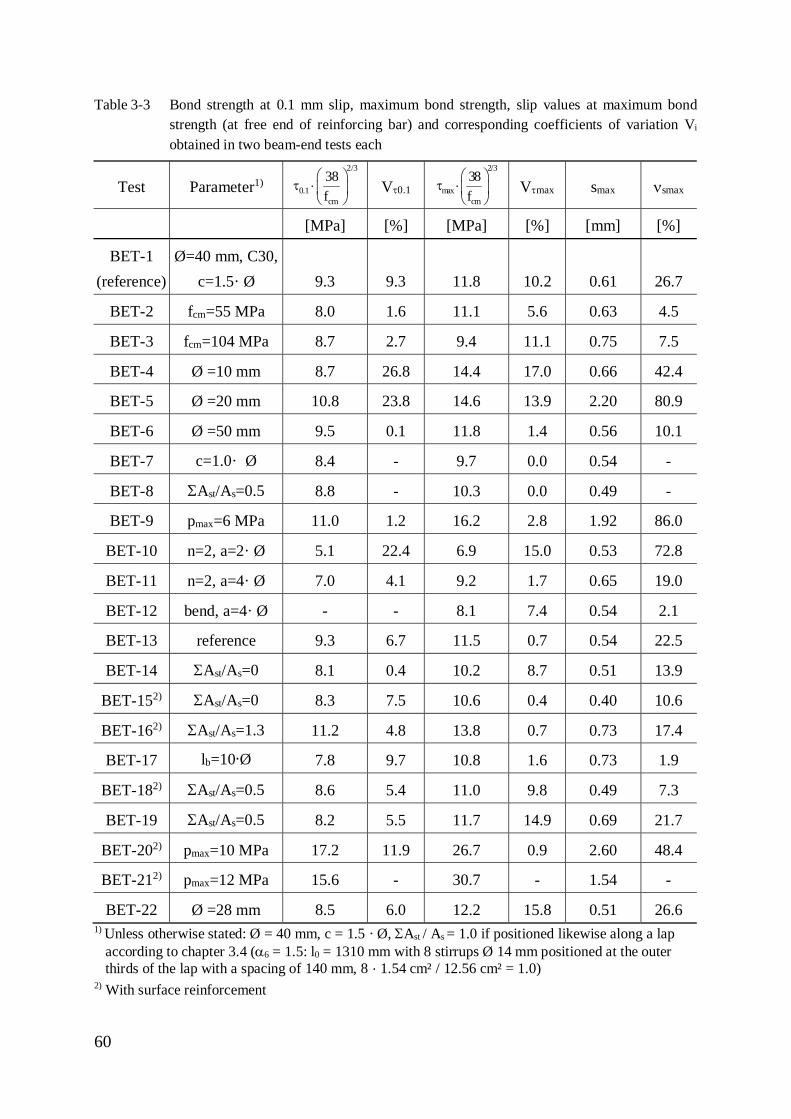
60
Table 3-3 Bond strength at 0.1 mm slip, maximum bond strength, slip values at maximum bondstrength (at free end of reinforcing bar) and corresponding coefficients of variation Vi
obtained in two beam-end tests each
Test Parameter1)2/3
0.1cm
38f
æ öt ×ç ÷
è øVt0.1
2/3
maxcm
38f
æ öt ×ç ÷
è øVtmax smax nsmax
[MPa] [%] [MPa] [%] [mm] [%]
BET-1(reference)
Ø=40 mm, C30,c=1.5· Ø 9.3 9.3 11.8 10.2 0.61 26.7
BET-2 fcm=55 MPa 8.0 1.6 11.1 5.6 0.63 4.5
BET-3 fcm=104 MPa 8.7 2.7 9.4 11.1 0.75 7.5
BET-4 Ø =10 mm 8.7 26.8 14.4 17.0 0.66 42.4
BET-5 Ø =20 mm 10.8 23.8 14.6 13.9 2.20 80.9
BET-6 Ø =50 mm 9.5 0.1 11.8 1.4 0.56 10.1
BET-7 c=1.0· Ø 8.4 - 9.7 0.0 0.54 -
BET-8 SAst/As=0.5 8.8 - 10.3 0.0 0.49 -
BET-9 pmax=6 MPa 11.0 1.2 16.2 2.8 1.92 86.0
BET-10 n=2, a=2· Ø 5.1 22.4 6.9 15.0 0.53 72.8
BET-11 n=2, a=4· Ø 7.0 4.1 9.2 1.7 0.65 19.0
BET-12 bend, a=4· Ø - - 8.1 7.4 0.54 2.1
BET-13 reference 9.3 6.7 11.5 0.7 0.54 22.5
BET-14 SAst/As=0 8.1 0.4 10.2 8.7 0.51 13.9
BET-152) SAst/As=0 8.3 7.5 10.6 0.4 0.40 10.6
BET-162) SAst/As=1.3 11.2 4.8 13.8 0.7 0.73 17.4
BET-17 lb=10·Ø 7.8 9.7 10.8 1.6 0.73 1.9
BET-182) SAst/As=0.5 8.6 5.4 11.0 9.8 0.49 7.3
BET-19 SAst/As=0.5 8.2 5.5 11.7 14.9 0.69 21.7
BET-202) pmax=10 MPa 17.2 11.9 26.7 0.9 2.60 48.4
BET-212) pmax=12 MPa 15.6 - 30.7 - 1.54 -
BET-22 Ø =28 mm 8.5 6.0 12.2 15.8 0.51 26.61) Unless otherwise stated: Ø = 40 mm, c = 1.5 · Ø, SAst / As = 1.0 if positioned likewise along a lap
according to chapter 3.4 (a6 = 1.5: l0 = 1310 mm with 8 stirrups Ø 14 mm positioned at the outerthirds of the lap with a spacing of 140 mm, 8 · 1.54 cm² / 12.56 cm² = 1.0)
2) With surface reinforcement
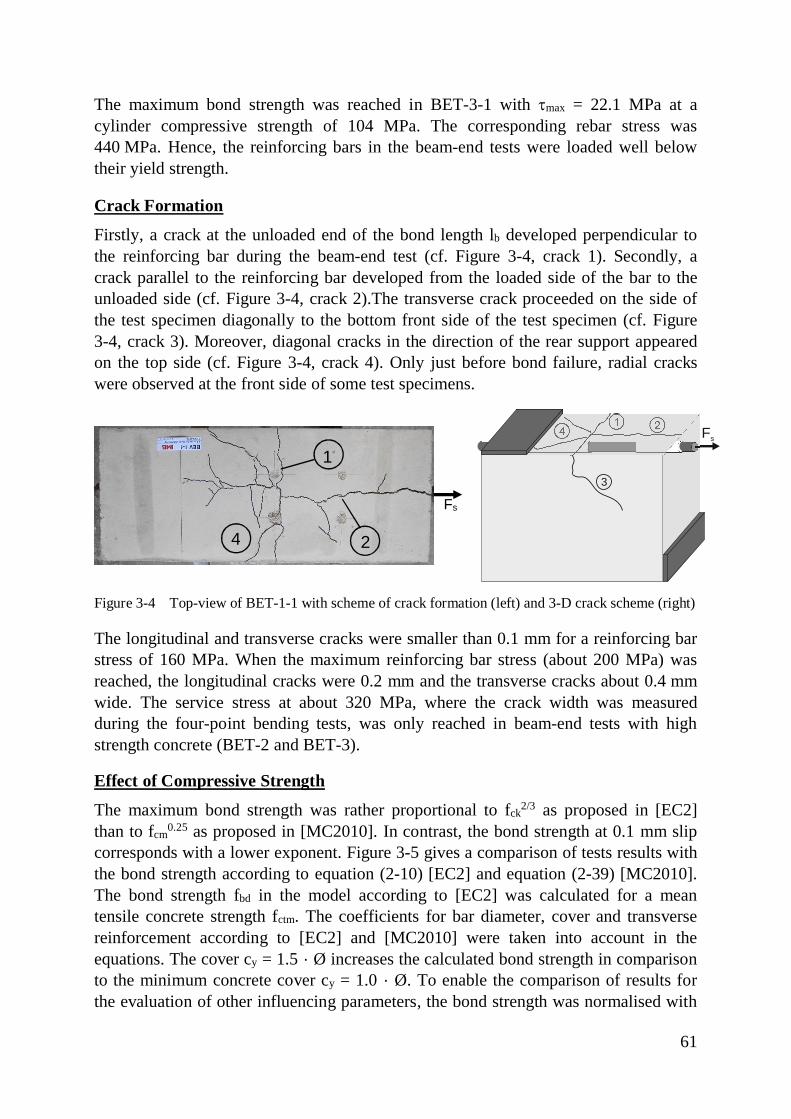
61
The maximum bond strength was reached in BET-3-1 with tmax = 22.1 MPa at acylinder compressive strength of 104 MPa. The corresponding rebar stress was440 MPa. Hence, the reinforcing bars in the beam-end tests were loaded well belowtheir yield strength.
Crack Formation
Firstly, a crack at the unloaded end of the bond length lb developed perpendicular tothe reinforcing bar during the beam-end test (cf. Figure 3-4, crack 1). Secondly, acrack parallel to the reinforcing bar developed from the loaded side of the bar to theunloaded side (cf. Figure 3-4, crack 2).The transverse crack proceeded on the side ofthe test specimen diagonally to the bottom front side of the test specimen (cf. Figure3-4, crack 3). Moreover, diagonal cracks in the direction of the rear support appearedon the top side (cf. Figure 3-4, crack 4). Only just before bond failure, radial crackswere observed at the front side of some test specimens.
Figure 3-4 Top-view of BET-1-1 with scheme of crack formation (left) and 3-D crack scheme (right)
The longitudinal and transverse cracks were smaller than 0.1 mm for a reinforcing barstress of 160 MPa. When the maximum reinforcing bar stress (about 200 MPa) wasreached, the longitudinal cracks were 0.2 mm and the transverse cracks about 0.4 mmwide. The service stress at about 320 MPa, where the crack width was measuredduring the four-point bending tests, was only reached in beam-end tests with highstrength concrete (BET-2 and BET-3).
Effect of Compressive Strength
The maximum bond strength was rather proportional to fck2/3 as proposed in [EC2]than to fcm0.25 as proposed in [MC2010]. In contrast, the bond strength at 0.1 mm slipcorresponds with a lower exponent. Figure 3-5 gives a comparison of tests results withthe bond strength according to equation (2-10) [EC2] and equation (2-39) [MC2010].The bond strength fbd in the model according to [EC2] was calculated for a meantensile concrete strength fctm. The coefficients for bar diameter, cover and transversereinforcement according to [EC2] and [MC2010] were taken into account in theequations. The cover cy = 1.5 · Ø increases the calculated bond strength in comparisonto the minimum concrete cover cy = 1.0 · Ø. To enable the comparison of results forthe evaluation of other influencing parameters, the bond strength was normalised with
Fs
3
214
1
4 2
Fs
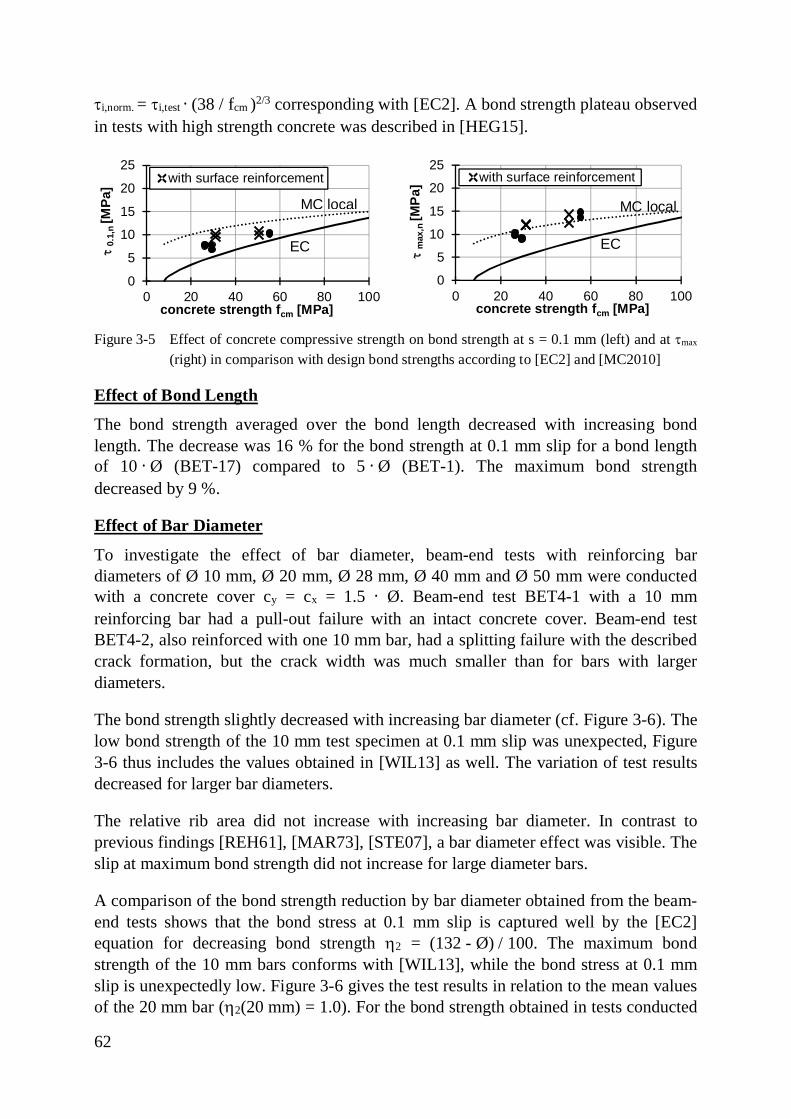
62
ti,norm. = ti,test · (38 / fcm )2/3 corresponding with [EC2]. A bond strength plateau observedin tests with high strength concrete was described in [HEG15].
Figure 3-5 Effect of concrete compressive strength on bond strength at s = 0.1 mm (left) and at tmax
(right) in comparison with design bond strengths according to [EC2] and [MC2010]
Effect of Bond Length
The bond strength averaged over the bond length decreased with increasing bondlength. The decrease was 16 % for the bond strength at 0.1 mm slip for a bond lengthof 10 · Ø (BET-17) compared to 5 · Ø (BET-1). The maximum bond strengthdecreased by 9 %.
Effect of Bar Diameter
To investigate the effect of bar diameter, beam-end tests with reinforcing bardiameters of Ø 10 mm, Ø 20 mm, Ø 28 mm, Ø 40 mm and Ø 50 mm were conductedwith a concrete cover cy = cx = 1.5 · Ø. Beam-end test BET4-1 with a 10 mmreinforcing bar had a pull-out failure with an intact concrete cover. Beam-end testBET4-2, also reinforced with one 10 mm bar, had a splitting failure with the describedcrack formation, but the crack width was much smaller than for bars with largerdiameters.
The bond strength slightly decreased with increasing bar diameter (cf. Figure 3-6). Thelow bond strength of the 10 mm test specimen at 0.1 mm slip was unexpected, Figure3-6 thus includes the values obtained in [WIL13] as well. The variation of test resultsdecreased for larger bar diameters.
The relative rib area did not increase with increasing bar diameter. In contrast toprevious findings [REH61], [MAR73], [STE07], a bar diameter effect was visible. Theslip at maximum bond strength did not increase for large diameter bars.
A comparison of the bond strength reduction by bar diameter obtained from the beam-end tests shows that the bond stress at 0.1 mm slip is captured well by the [EC2]equation for decreasing bond strength h2 = (132 - Ø) / 100. The maximum bondstrength of the 10 mm bars conforms with [WIL13], while the bond stress at 0.1 mmslip is unexpectedly low. Figure 3-6 gives the test results in relation to the mean valuesof the 20 mm bar (h2(20 mm) = 1.0). For the bond strength obtained in tests conducted
0
5
10
15
20
25
0 20 40 60 80 100
t0.
1,n
[MPa
]
concrete strength fcm [MPa]
with surface reinforcement
EC
MC local
0
5
10
15
20
25
0 20 40 60 80 100
tm
ax,n
[MPa
]
concrete strength fcm [MPa]
with surface reinforcement
EC
MC local
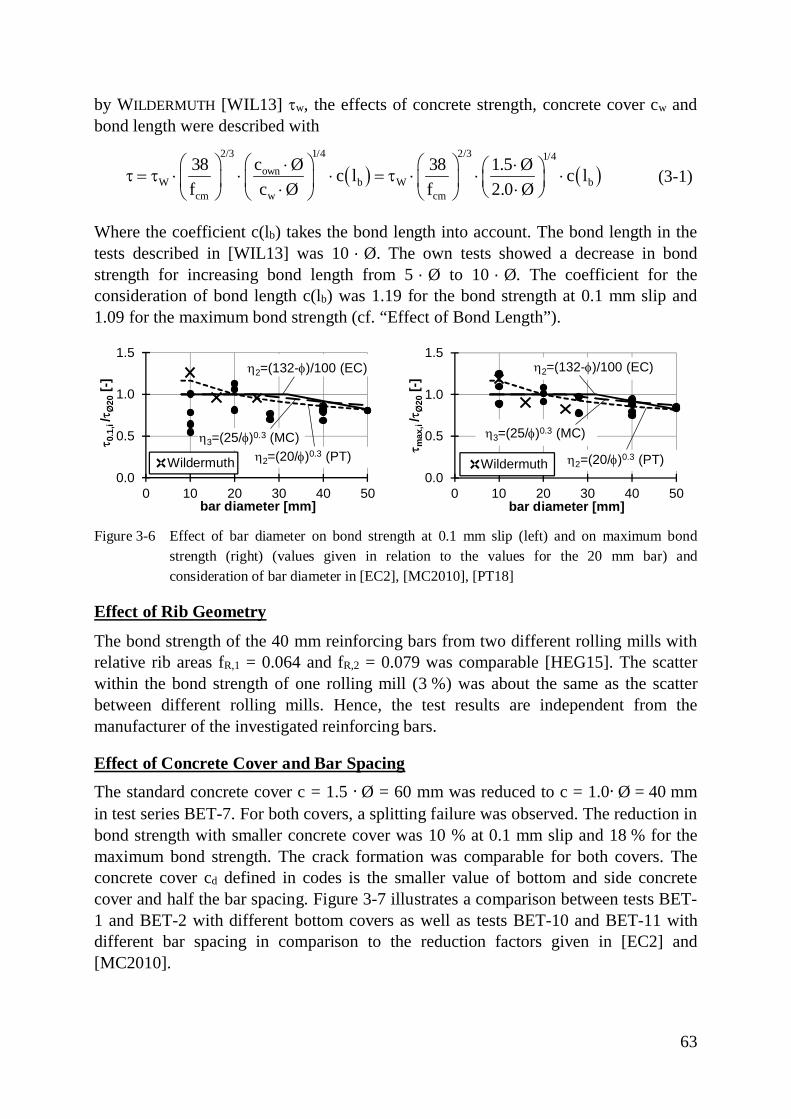
63
by WILDERMUTH [WIL13] tw, the effects of concrete strength, concrete cover cw andbond length were described with
( ) ( )2/3 1/4 2/3 1/4
ownW b W b
cm w cm
c Ø38 38 1.5 Øc l c lf c Ø f 2.0 Ø
æ ö æ ö æ ö× ×æ öt = t × × × = t × × ×ç ÷ ç ÷ ç ÷ ç ÷× ×è øè ø è ø è ø(3-1)
Where the coefficient c(lb) takes the bond length into account. The bond length in thetests described in [WIL13] was 10 · Ø. The own tests showed a decrease in bondstrength for increasing bond length from 5 · Ø to 10 · Ø. The coefficient for theconsideration of bond length c(lb) was 1.19 for the bond strength at 0.1 mm slip and1.09 for the maximum bond strength (cf. “Effect of Bond Length”).
Figure 3-6 Effect of bar diameter on bond strength at 0.1 mm slip (left) and on maximum bondstrength (right) (values given in relation to the values for the 20 mm bar) andconsideration of bar diameter in [EC2], [MC2010], [PT18]
Effect of Rib Geometry
The bond strength of the 40 mm reinforcing bars from two different rolling mills withrelative rib areas fR,1 = 0.064 and fR,2 = 0.079 was comparable [HEG15]. The scatterwithin the bond strength of one rolling mill (3 %) was about the same as the scatterbetween different rolling mills. Hence, the test results are independent from themanufacturer of the investigated reinforcing bars.
Effect of Concrete Cover and Bar SpacingThe standard concrete cover c = 1.5 · Ø = 60 mm was reduced to c = 1.0· Ø = 40 mmin test series BET-7. For both covers, a splitting failure was observed. The reduction inbond strength with smaller concrete cover was 10 % at 0.1 mm slip and 18 % for themaximum bond strength. The crack formation was comparable for both covers. Theconcrete cover cd defined in codes is the smaller value of bottom and side concretecover and half the bar spacing. Figure 3-7 illustrates a comparison between tests BET-1 and BET-2 with different bottom covers as well as tests BET-10 and BET-11 withdifferent bar spacing in comparison to the reduction factors given in [EC2] and[MC2010].
0.0
0.5
1.0
1.5
0 10 20 30 40 50
t 0.1
,i/t
Ø20
[-]
bar diameter [mm]
Wildermuth
h2=(132-f)/100 (EC)
h3=(25/f)0.3 (MC)h2=(20/f)0.3 (PT)
0.0
0.5
1.0
1.5
0 10 20 30 40 50
t max
,i/t
Ø20
[-]
bar diameter [mm]
Wildermuth
h2=(132-f)/100 (EC)
h3=(25/f)0.3 (MC)
h2=(20/f)0.3 (PT)
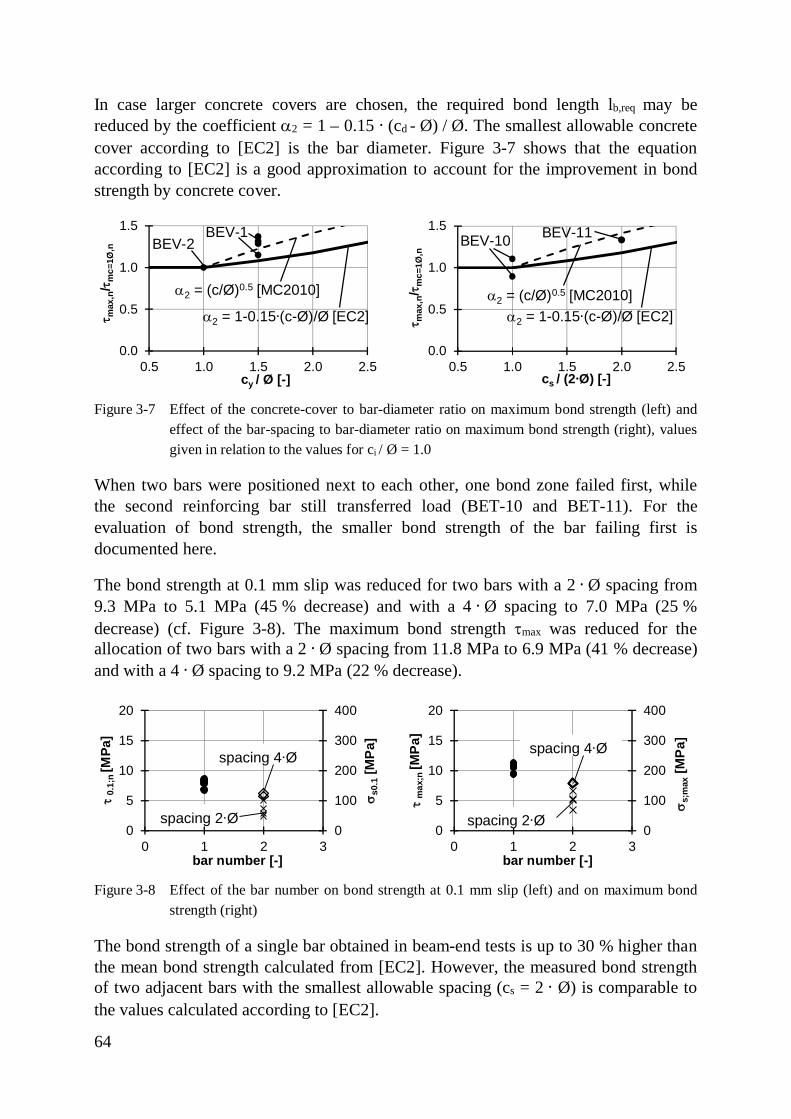
64
In case larger concrete covers are chosen, the required bond length lb,req may bereduced by the coefficient a2 = 1 – 0.15 · (cd - Ø) / Ø. The smallest allowable concretecover according to [EC2] is the bar diameter. Figure 3-7 shows that the equationaccording to [EC2] is a good approximation to account for the improvement in bondstrength by concrete cover.
Figure 3-7 Effect of the concrete-cover to bar-diameter ratio on maximum bond strength (left) andeffect of the bar-spacing to bar-diameter ratio on maximum bond strength (right), valuesgiven in relation to the values for ci / Ø = 1.0
When two bars were positioned next to each other, one bond zone failed first, whilethe second reinforcing bar still transferred load (BET-10 and BET-11). For theevaluation of bond strength, the smaller bond strength of the bar failing first isdocumented here.
The bond strength at 0.1 mm slip was reduced for two bars with a 2 · Ø spacing from9.3 MPa to 5.1 MPa (45 % decrease) and with a 4 · Ø spacing to 7.0 MPa (25 %decrease) (cf. Figure 3-8). The maximum bond strength tmax was reduced for theallocation of two bars with a 2 · Ø spacing from 11.8 MPa to 6.9 MPa (41 % decrease)and with a 4 · Ø spacing to 9.2 MPa (22 % decrease).
Figure 3-8 Effect of the bar number on bond strength at 0.1 mm slip (left) and on maximum bondstrength (right)
The bond strength of a single bar obtained in beam-end tests is up to 30 % higher thanthe mean bond strength calculated from [EC2]. However, the measured bond strengthof two adjacent bars with the smallest allowable spacing (cs = 2 · Ø) is comparable tothe values calculated according to [EC2].
0.0
0.5
1.0
1.5
0.5 1.0 1.5 2.0 2.5
t max
,n/t m
c=1Ø
,n
cy / Ø [-]
a2 = (c/Ø)0.5 [MC2010]
a2 = 1-0.15·(c-Ø)/Ø [EC2]
BEV-2BEV-1
0.0
0.5
1.0
1.5
0.5 1.0 1.5 2.0 2.5
t max
,n/t m
c=1Ø
,n
cs / (2·Ø) [-]
a2 = (c/Ø)0.5 [MC2010]a2 = 1-0.15·(c-Ø)/Ø [EC2]
BEV-10 BEV-11
0
100
200
300
400
0
5
10
15
20
0 1 2 3
s s0.
1[M
Pa]
t0.
1;n
[MPa
]
bar number [-]
spacing 2∙Ø
spacing 4∙Ø
0
100
200
300
400
0
5
10
15
20
0 1 2 3
ss;
max
[MPa
]
tm
ax;n
[MPa
]
bar number [-]
spacing 2∙Ø
spacing 4∙Ø
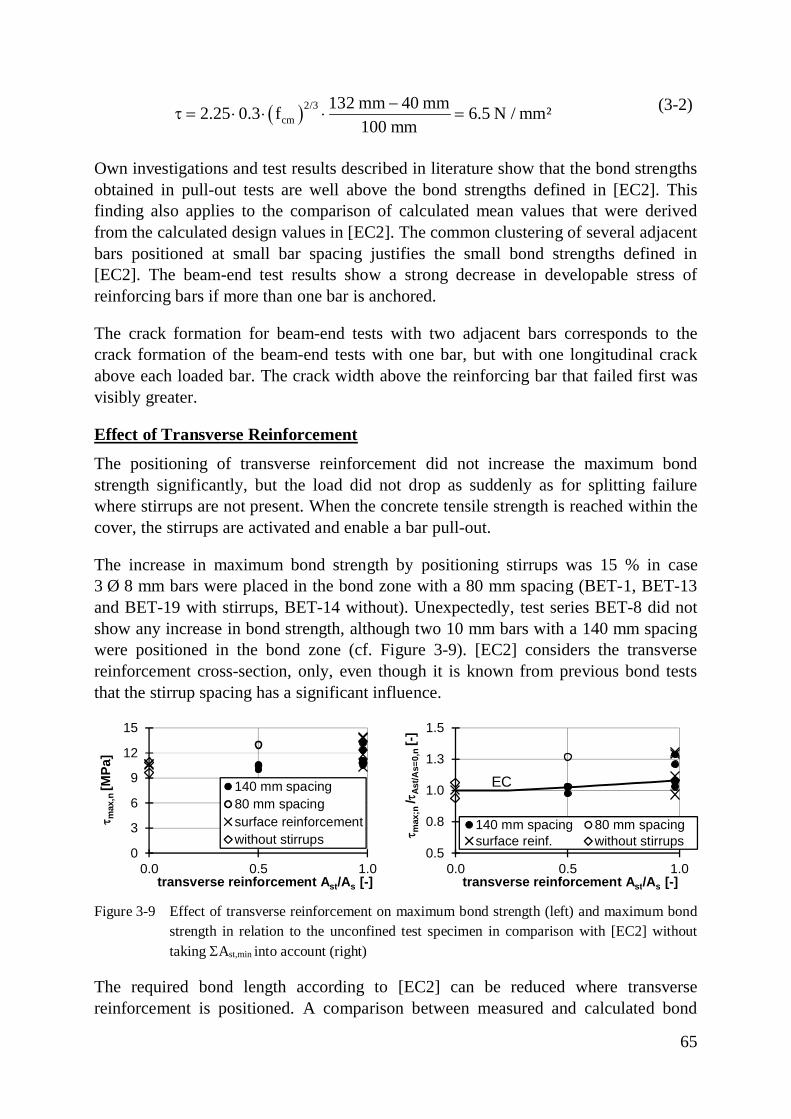
65
( )2/3cm
132 mm 40 mm2.25 0.3 f 6.5 N / mm²100 mm
-t = × × × = (3-2)
Own investigations and test results described in literature show that the bond strengthsobtained in pull-out tests are well above the bond strengths defined in [EC2]. Thisfinding also applies to the comparison of calculated mean values that were derivedfrom the calculated design values in [EC2]. The common clustering of several adjacentbars positioned at small bar spacing justifies the small bond strengths defined in[EC2]. The beam-end test results show a strong decrease in developable stress ofreinforcing bars if more than one bar is anchored.
The crack formation for beam-end tests with two adjacent bars corresponds to thecrack formation of the beam-end tests with one bar, but with one longitudinal crackabove each loaded bar. The crack width above the reinforcing bar that failed first wasvisibly greater.
Effect of Transverse Reinforcement
The positioning of transverse reinforcement did not increase the maximum bondstrength significantly, but the load did not drop as suddenly as for splitting failurewhere stirrups are not present. When the concrete tensile strength is reached within thecover, the stirrups are activated and enable a bar pull-out.
The increase in maximum bond strength by positioning stirrups was 15 % in case3 Ø 8 mm bars were placed in the bond zone with a 80 mm spacing (BET-1, BET-13and BET-19 with stirrups, BET-14 without). Unexpectedly, test series BET-8 did notshow any increase in bond strength, although two 10 mm bars with a 140 mm spacingwere positioned in the bond zone (cf. Figure 3-9). [EC2] considers the transversereinforcement cross-section, only, even though it is known from previous bond teststhat the stirrup spacing has a significant influence.
Figure 3-9 Effect of transverse reinforcement on maximum bond strength (left) and maximum bondstrength in relation to the unconfined test specimen in comparison with [EC2] withouttaking SAst,min into account (right)
The required bond length according to [EC2] can be reduced where transversereinforcement is positioned. A comparison between measured and calculated bond
0
3
6
9
12
15
0.0 0.5 1.0
t max
,n[M
Pa]
transverse reinforcement Ast/As [-]
140 mm spacing80 mm spacingsurface reinforcementwithout stirrups
0.5
0.8
1.0
1.3
1.5
0.0 0.5 1.0
t max
;n/t A
st/A
s=0,
n[-]
transverse reinforcement Ast/As [-]
140 mm spacing 80 mm spacingsurface reinf. without stirrups
EC
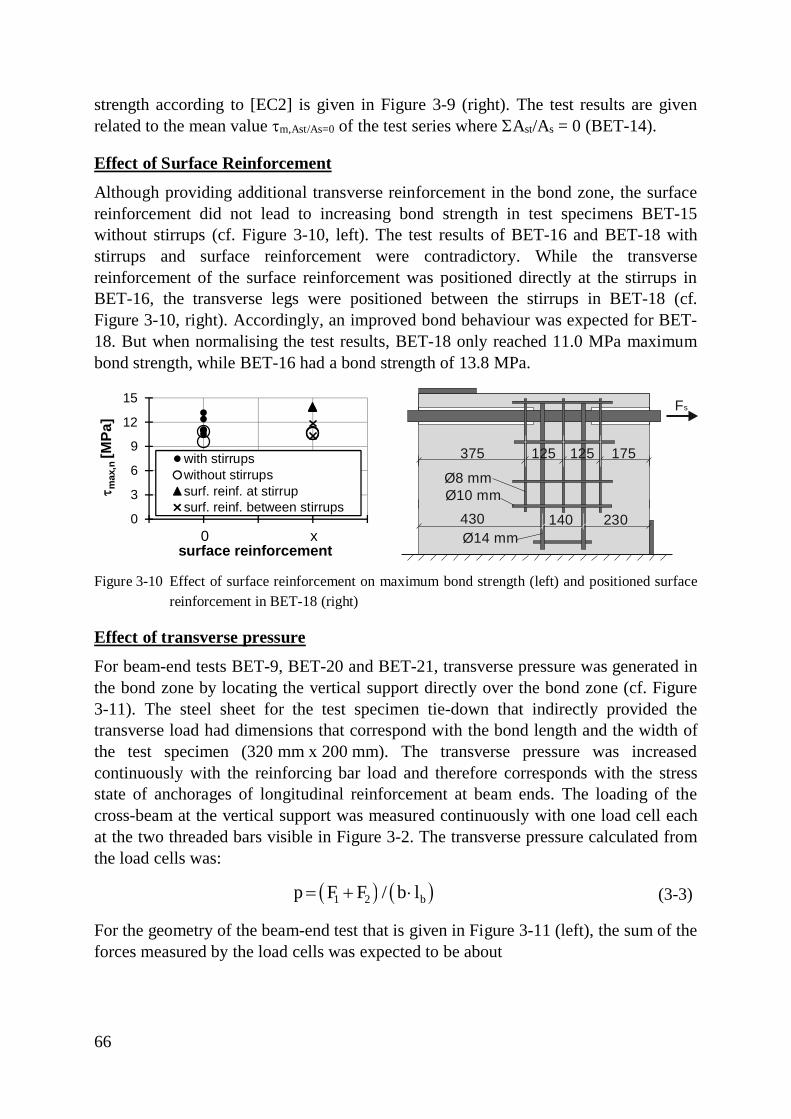
66
strength according to [EC2] is given in Figure 3-9 (right). The test results are givenrelated to the mean value tm,Ast/As=0 of the test series where SAst/As = 0 (BET-14).
Effect of Surface Reinforcement
Although providing additional transverse reinforcement in the bond zone, the surfacereinforcement did not lead to increasing bond strength in test specimens BET-15without stirrups (cf. Figure 3-10, left). The test results of BET-16 and BET-18 withstirrups and surface reinforcement were contradictory. While the transversereinforcement of the surface reinforcement was positioned directly at the stirrups inBET-16, the transverse legs were positioned between the stirrups in BET-18 (cf.Figure 3-10, right). Accordingly, an improved bond behaviour was expected for BET-18. But when normalising the test results, BET-18 only reached 11.0 MPa maximumbond strength, while BET-16 had a bond strength of 13.8 MPa.
Figure 3-10 Effect of surface reinforcement on maximum bond strength (left) and positioned surfacereinforcement in BET-18 (right)
Effect of transverse pressure
For beam-end tests BET-9, BET-20 and BET-21, transverse pressure was generated inthe bond zone by locating the vertical support directly over the bond zone (cf. Figure3-11). The steel sheet for the test specimen tie-down that indirectly provided thetransverse load had dimensions that correspond with the bond length and the width ofthe test specimen (320 mm x 200 mm). The transverse pressure was increasedcontinuously with the reinforcing bar load and therefore corresponds with the stressstate of anchorages of longitudinal reinforcement at beam ends. The loading of thecross-beam at the vertical support was measured continuously with one load cell eachat the two threaded bars visible in Figure 3-2. The transverse pressure calculated fromthe load cells was:
( ) ( )1 2 bp F F / b l= + × (3-3)
For the geometry of the beam-end test that is given in Figure 3-11 (left), the sum of theforces measured by the load cells was expected to be about
0
3
6
9
12
15
0 1 1 2 2
t max
,n[M
Pa]
surface reinforcement
with stirrupswithout stirrupssurf. reinf. at stirrupsurf. reinf. between stirrups
0 x
Fs
140 230430
125375 125 175
Ø14 mm
Ø10 mmØ8 mm
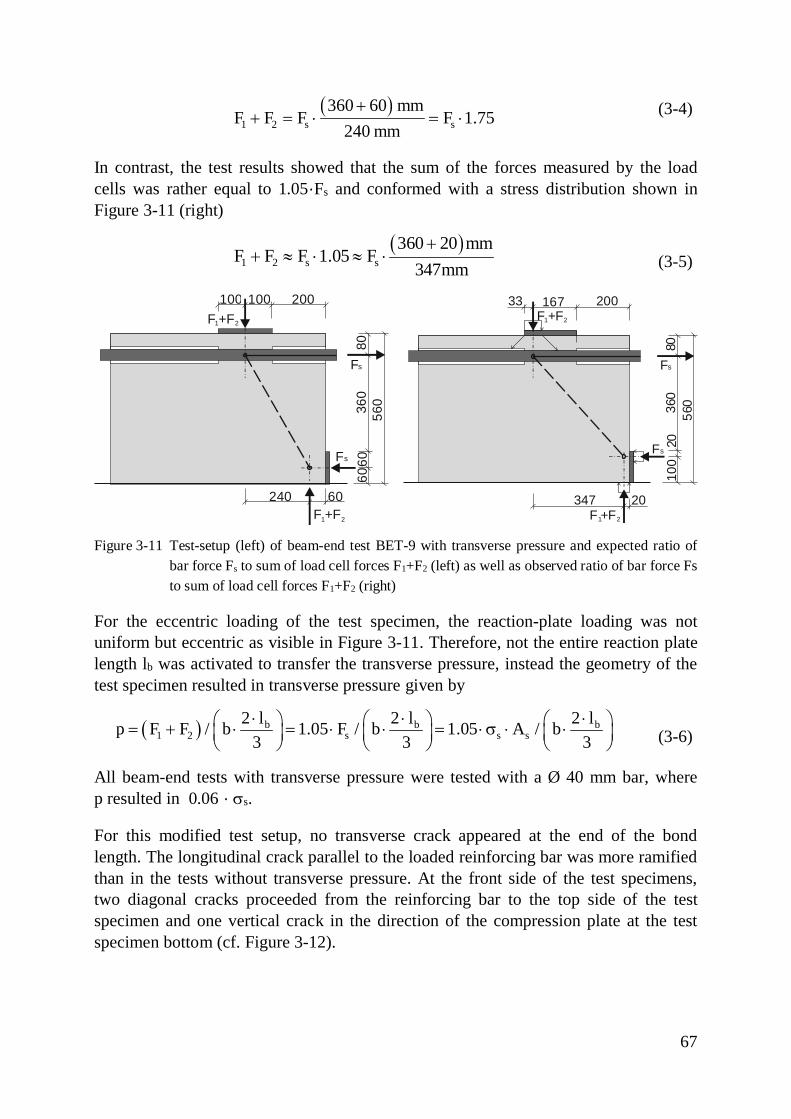
67
( )1 2 s s
360 60 mmF F F F 1.75
240 mm+
+ = × = × (3-4)
In contrast, the test results showed that the sum of the forces measured by the loadcells was rather equal to 1.05·Fs and conformed with a stress distribution shown inFigure 3-11 (right)
( )1 2 s s
360 20 mmF F F 1.05 F
347mm+
+ » × » × (3-5)
Figure 3-11 Test-setup (left) of beam-end test BET-9 with transverse pressure and expected ratio ofbar force Fs to sum of load cell forces F1+F2 (left) as well as observed ratio of bar force Fsto sum of load cell forces F1+F2 (right)
For the eccentric loading of the test specimen, the reaction-plate loading was notuniform but eccentric as visible in Figure 3-11. Therefore, not the entire reaction platelength lb was activated to transfer the transverse pressure, instead the geometry of thetest specimen resulted in transverse pressure given by
( ) b b b1 2 s s s
2 l 2 l 2 lp F F / b 1.05 F / b 1.05 A / b3 3 3× × ×æ ö æ ö æ ö= + × = × × = × s × ×ç ÷ ç ÷ ç ÷
è ø è ø è ø (3-6)
All beam-end tests with transverse pressure were tested with a Ø 40 mm bar, wherep resulted in 0.06 · ss.
For this modified test setup, no transverse crack appeared at the end of the bondlength. The longitudinal crack parallel to the loaded reinforcing bar was more ramifiedthan in the tests without transverse pressure. At the front side of the test specimens,two diagonal cracks proceeded from the reinforcing bar to the top side of the testspecimen and one vertical crack in the direction of the compression plate at the testspecimen bottom (cf. Figure 3-12).
Fs56
0360
8060
60
60
200100100
240
Fs
F +F1 2
F +F1 2
Fs
56036
080
100
20
20
20016733
347
Fs
F +F1 2
F +F1 2
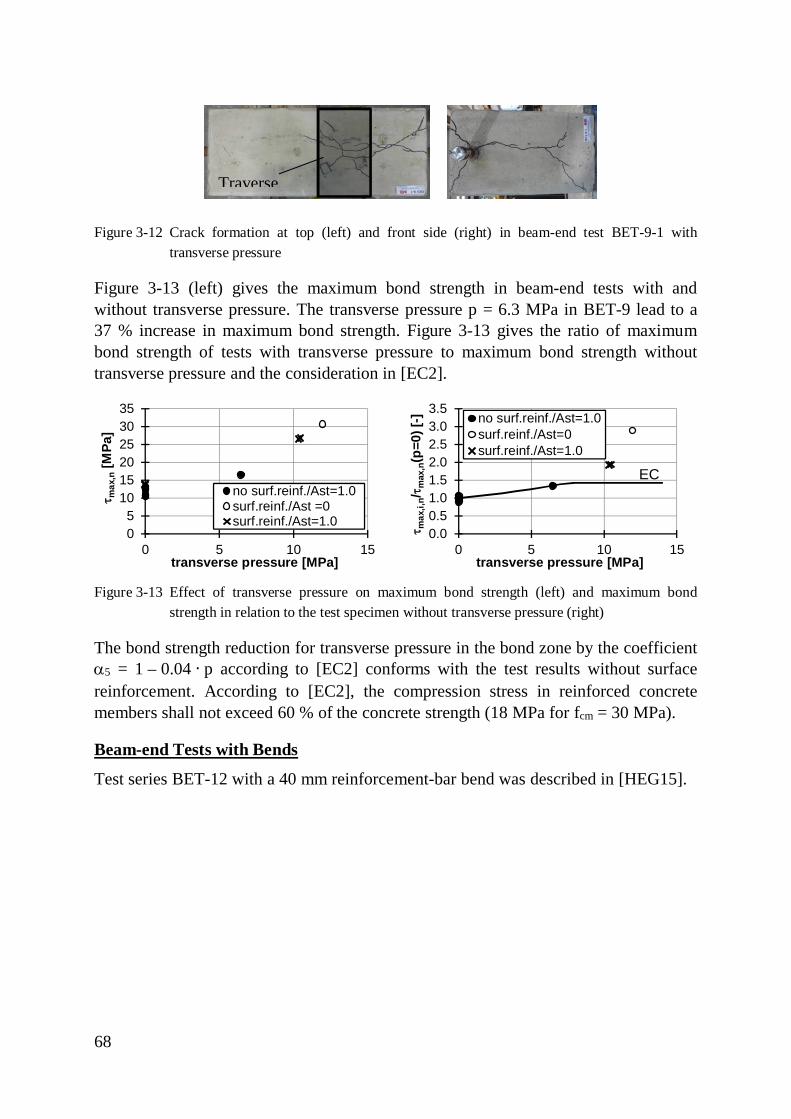
68
Figure 3-12 Crack formation at top (left) and front side (right) in beam-end test BET-9-1 withtransverse pressure
Figure 3-13 (left) gives the maximum bond strength in beam-end tests with andwithout transverse pressure. The transverse pressure p = 6.3 MPa in BET-9 lead to a37 % increase in maximum bond strength. Figure 3-13 gives the ratio of maximumbond strength of tests with transverse pressure to maximum bond strength withouttransverse pressure and the consideration in [EC2].
Figure 3-13 Effect of transverse pressure on maximum bond strength (left) and maximum bondstrength in relation to the test specimen without transverse pressure (right)
The bond strength reduction for transverse pressure in the bond zone by the coefficienta5 = 1 – 0.04 · p according to [EC2] conforms with the test results without surfacereinforcement. According to [EC2], the compression stress in reinforced concretemembers shall not exceed 60 % of the concrete strength (18 MPa for fcm = 30 MPa).
Beam-end Tests with Bends
Test series BET-12 with a 40 mm reinforcement-bar bend was described in [HEG15].
05
101520253035
0 5 10 15
t max
,n[M
Pa]
transverse pressure [MPa]
no surf.reinf./Ast=1.0surf.reinf./Ast =0surf.reinf./Ast=1.0
0.00.51.01.52.02.53.03.5
0 5 10 15
t max
,i,n/t
max
,n(p
=0)[
-]
transverse pressure [MPa]
no surf.reinf./Ast=1.0surf.reinf./Ast=0surf.reinf./Ast=1.0
EC
Traverse
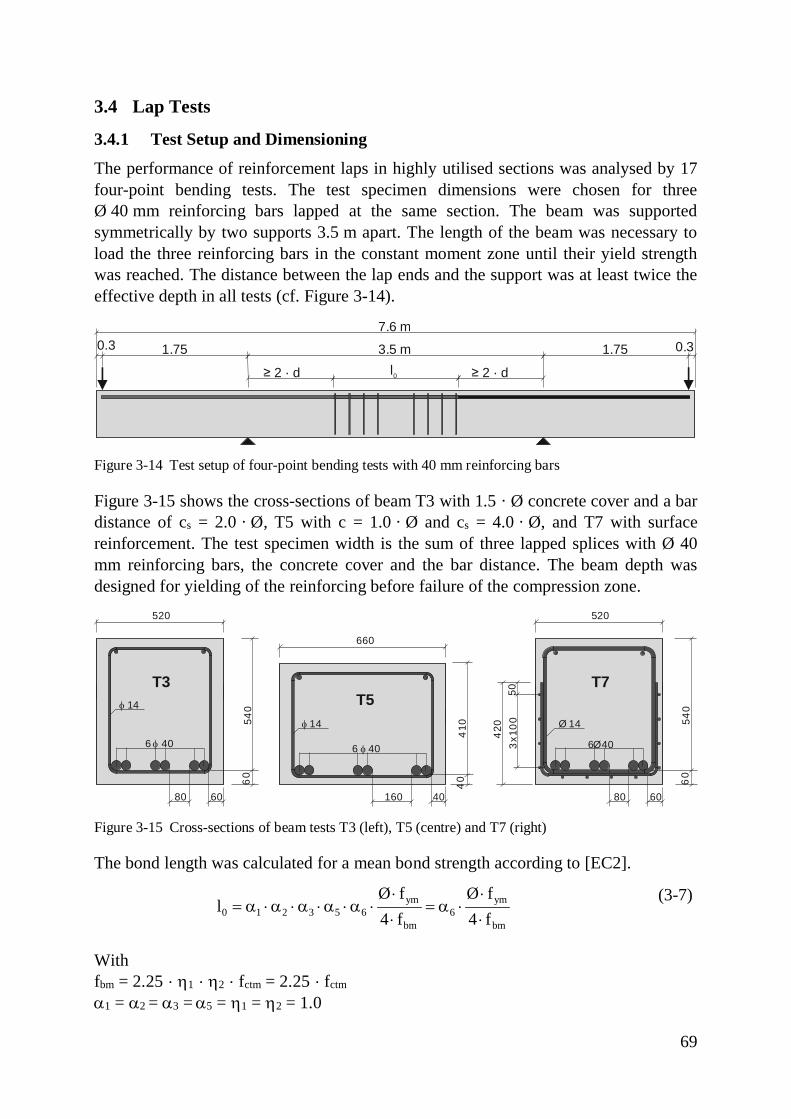
69
3.4 Lap Tests
3.4.1 Test Setup and Dimensioning
The performance of reinforcement laps in highly utilised sections was analysed by 17four-point bending tests. The test specimen dimensions were chosen for threeØ 40 mm reinforcing bars lapped at the same section. The beam was supportedsymmetrically by two supports 3.5 m apart. The length of the beam was necessary toload the three reinforcing bars in the constant moment zone until their yield strengthwas reached. The distance between the lap ends and the support was at least twice theeffective depth in all tests (cf. Figure 3-14).
Figure 3-14 Test setup of four-point bending tests with 40 mm reinforcing bars
Figure 3-15 shows the cross-sections of beam T3 with 1.5 · Ø concrete cover and a bardistance of cs = 2.0 · Ø, T5 with c = 1.0 · Ø and cs = 4.0 · Ø, and T7 with surfacereinforcement. The test specimen width is the sum of three lapped splices with Ø 40mm reinforcing bars, the concrete cover and the bar distance. The beam depth wasdesigned for yielding of the reinforcing before failure of the compression zone.
Figure 3-15 Cross-sections of beam tests T3 (left), T5 (centre) and T7 (right)
The bond length was calculated for a mean bond strength according to [EC2].
ym ym0 1 2 3 5 6 6
bm bm
Ø f Ø fl
4 f 4 f× ×
= a × a × a × a × a × = a ×× ×
(3-7)
Withfbm = 2.25 · h1 · h2 · fctm = 2.25 · fctm
a1 = a2 = a3 = a5 = h1 = h2 = 1.0
7.6 m3.5 m0.3 0.31.75 1.75
l0 ≥ 2 · d≥ 2 · d
60
540
60
80
6 40 f
f 14
660
40
410
40
160
6 40 f
f 14
60
540
60
80
6 40Ø
Ø 14
420
503x
100
520 520
T3T5
T7
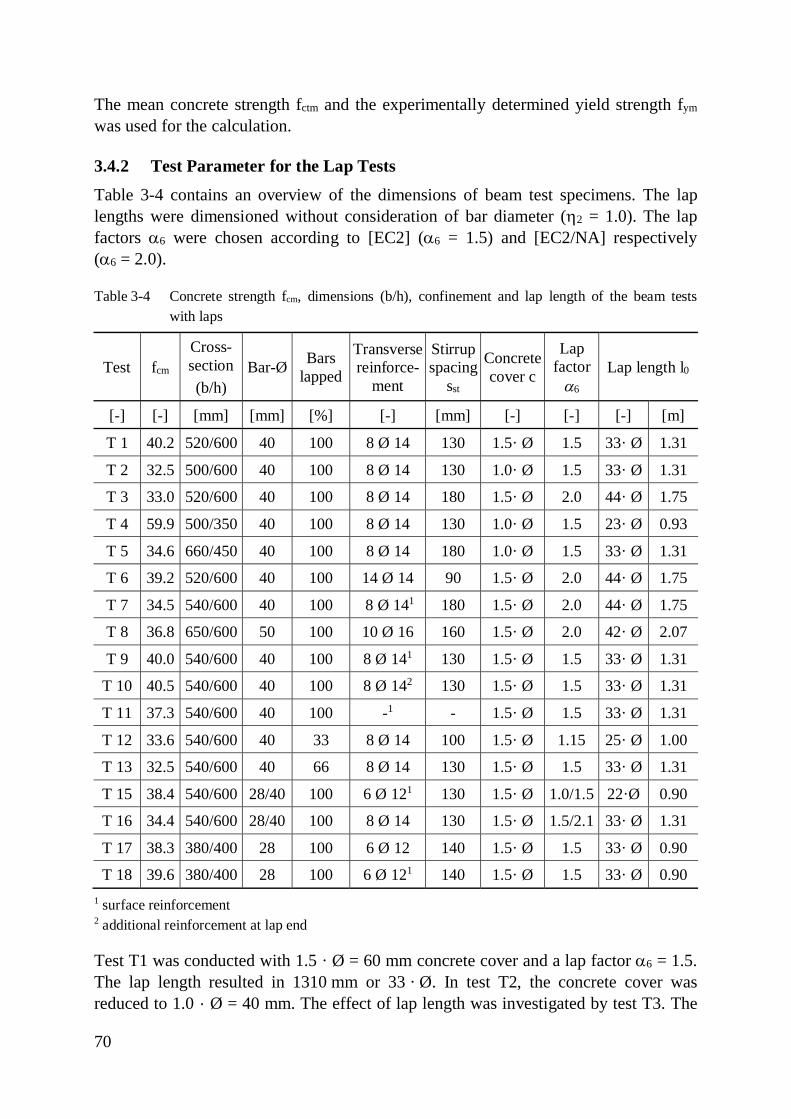
70
The mean concrete strength fctm and the experimentally determined yield strength fym
was used for the calculation.
3.4.2 Test Parameter for the Lap Tests
Table 3-4 contains an overview of the dimensions of beam test specimens. The laplengths were dimensioned without consideration of bar diameter (h2 = 1.0). The lapfactors a6 were chosen according to [EC2] (a6 = 1.5) and [EC2/NA] respectively(a6 = 2.0).
Table 3-4 Concrete strength fcm, dimensions (b/h), confinement and lap length of the beam testswith laps
Test fcm
Cross-section(b/h)
Bar-Ø Barslapped
Transversereinforce-
ment
Stirrupspacing
sst
Concretecover c
Lapfactor
a6
Lap length l0
[-] [-] [mm] [mm] [%] [-] [mm] [-] [-] [-] [m]
T 1 40.2 520/600 40 100 8 Ø 14 130 1.5· Ø 1.5 33· Ø 1.31
T 2 32.5 500/600 40 100 8 Ø 14 130 1.0· Ø 1.5 33· Ø 1.31
T 3 33.0 520/600 40 100 8 Ø 14 180 1.5· Ø 2.0 44· Ø 1.75
T 4 59.9 500/350 40 100 8 Ø 14 130 1.0· Ø 1.5 23· Ø 0.93
T 5 34.6 660/450 40 100 8 Ø 14 180 1.0· Ø 1.5 33· Ø 1.31
T 6 39.2 520/600 40 100 14 Ø 14 90 1.5· Ø 2.0 44· Ø 1.75
T 7 34.5 540/600 40 100 8 Ø 141 180 1.5· Ø 2.0 44· Ø 1.75
T 8 36.8 650/600 50 100 10 Ø 16 160 1.5· Ø 2.0 42· Ø 2.07
T 9 40.0 540/600 40 100 8 Ø 141 130 1.5· Ø 1.5 33· Ø 1.31
T 10 40.5 540/600 40 100 8 Ø 142 130 1.5· Ø 1.5 33· Ø 1.31
T 11 37.3 540/600 40 100 -1 - 1.5· Ø 1.5 33· Ø 1.31
T 12 33.6 540/600 40 33 8 Ø 14 100 1.5· Ø 1.15 25· Ø 1.00
T 13 32.5 540/600 40 66 8 Ø 14 130 1.5· Ø 1.5 33· Ø 1.31
T 15 38.4 540/600 28/40 100 6 Ø 121 130 1.5· Ø 1.0/1.5 22·Ø 0.90
T 16 34.4 540/600 28/40 100 8 Ø 14 130 1.5· Ø 1.5/2.1 33· Ø 1.31
T 17 38.3 380/400 28 100 6 Ø 12 140 1.5· Ø 1.5 33· Ø 0.90
T 18 39.6 380/400 28 100 6 Ø 121 140 1.5· Ø 1.5 33· Ø 0.901 surface reinforcement2 additional reinforcement at lap end
Test T1 was conducted with 1.5 · Ø = 60 mm concrete cover and a lap factor a6 = 1.5.The lap length resulted in 1310 mm or 33 · Ø. In test T2, the concrete cover wasreduced to 1.0 · Ø = 40 mm. The effect of lap length was investigated by test T3. The
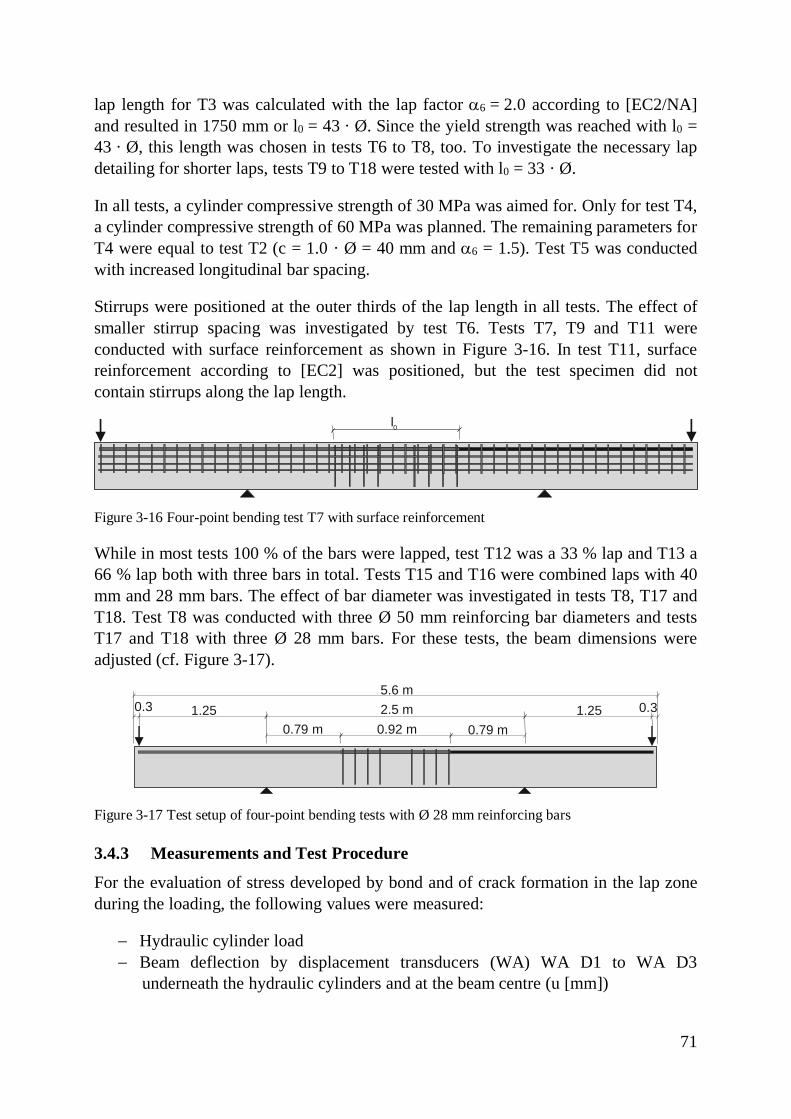
71
lap length for T3 was calculated with the lap factor a6 = 2.0 according to [EC2/NA]and resulted in 1750 mm or l0 = 43 · Ø. Since the yield strength was reached with l0 =43 · Ø, this length was chosen in tests T6 to T8, too. To investigate the necessary lapdetailing for shorter laps, tests T9 to T18 were tested with l0 = 33 · Ø.
In all tests, a cylinder compressive strength of 30 MPa was aimed for. Only for test T4,a cylinder compressive strength of 60 MPa was planned. The remaining parameters forT4 were equal to test T2 (c = 1.0 · Ø = 40 mm and a6 = 1.5). Test T5 was conductedwith increased longitudinal bar spacing.
Stirrups were positioned at the outer thirds of the lap length in all tests. The effect ofsmaller stirrup spacing was investigated by test T6. Tests T7, T9 and T11 wereconducted with surface reinforcement as shown in Figure 3-16. In test T11, surfacereinforcement according to [EC2] was positioned, but the test specimen did notcontain stirrups along the lap length.
Figure 3-16 Four-point bending test T7 with surface reinforcement
While in most tests 100 % of the bars were lapped, test T12 was a 33 % lap and T13 a66 % lap both with three bars in total. Tests T15 and T16 were combined laps with 40mm and 28 mm bars. The effect of bar diameter was investigated in tests T8, T17 andT18. Test T8 was conducted with three Ø 50 mm reinforcing bar diameters and testsT17 and T18 with three Ø 28 mm bars. For these tests, the beam dimensions wereadjusted (cf. Figure 3-17).
Figure 3-17 Test setup of four-point bending tests with Ø 28 mm reinforcing bars
3.4.3 Measurements and Test Procedure
For the evaluation of stress developed by bond and of crack formation in the lap zoneduring the loading, the following values were measured:
- Hydraulic cylinder load- Beam deflection by displacement transducers (WA) WA D1 to WA D3
underneath the hydraulic cylinders and at the beam centre (u [mm])
l0
5.6 m2.5 m0.3 0.31.25 1.250.92 m 0.79 m0.79 m
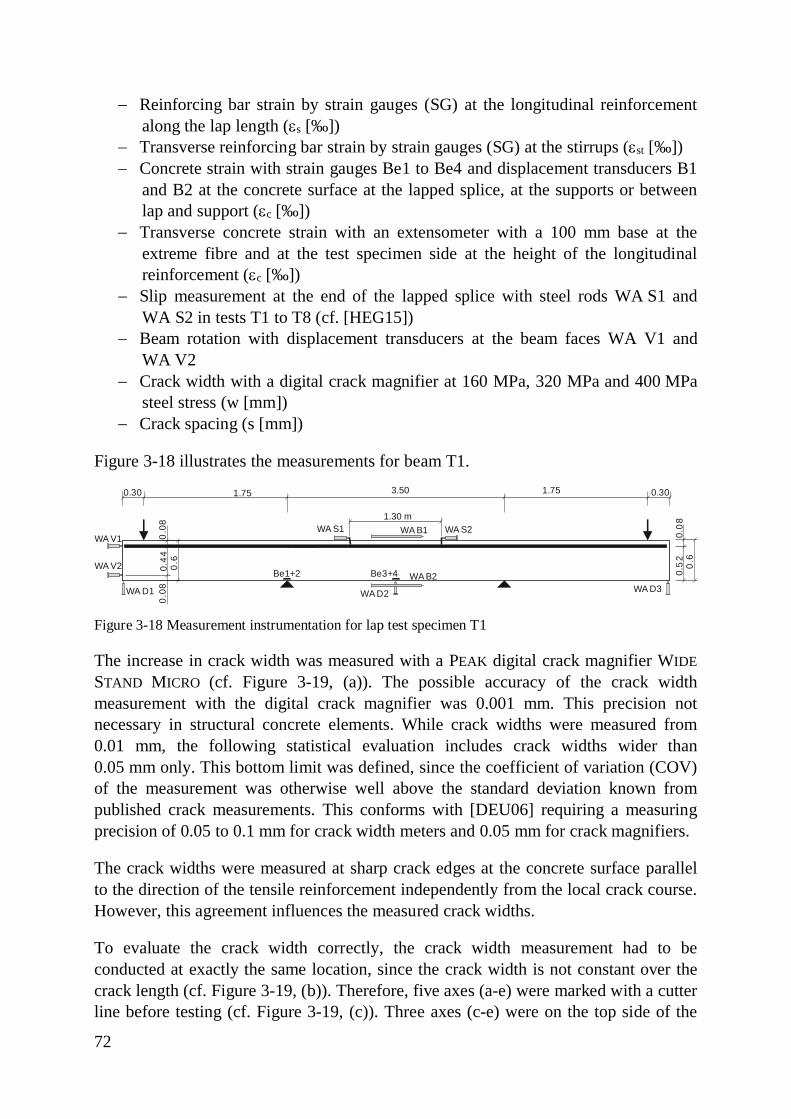
72
- Reinforcing bar strain by strain gauges (SG) at the longitudinal reinforcementalong the lap length (es [‰])
- Transverse reinforcing bar strain by strain gauges (SG) at the stirrups (est [‰])- Concrete strain with strain gauges Be1 to Be4 and displacement transducers B1
and B2 at the concrete surface at the lapped splice, at the supports or betweenlap and support (ec [‰])
- Transverse concrete strain with an extensometer with a 100 mm base at theextreme fibre and at the test specimen side at the height of the longitudinalreinforcement (ec [‰])
- Slip measurement at the end of the lapped splice with steel rods WA S1 andWA S2 in tests T1 to T8 (cf. [HEG15])
- Beam rotation with displacement transducers at the beam faces WA V1 andWA V2
- Crack width with a digital crack magnifier at 160 MPa, 320 MPa and 400 MPasteel stress (w [mm])
- Crack spacing (s [mm])
Figure 3-18 illustrates the measurements for beam T1.
Figure 3-18 Measurement instrumentation for lap test specimen T1
The increase in crack width was measured with a PEAK digital crack magnifier WIDESTAND MICRO (cf. Figure 3-19, (a)). The possible accuracy of the crack widthmeasurement with the digital crack magnifier was 0.001 mm. This precision notnecessary in structural concrete elements. While crack widths were measured from0.01 mm, the following statistical evaluation includes crack widths wider than0.05 mm only. This bottom limit was defined, since the coefficient of variation (COV)of the measurement was otherwise well above the standard deviation known frompublished crack measurements. This conforms with [DEU06] requiring a measuringprecision of 0.05 to 0.1 mm for crack width meters and 0.05 mm for crack magnifiers.
The crack widths were measured at sharp crack edges at the concrete surface parallelto the direction of the tensile reinforcement independently from the local crack course.However, this agreement influences the measured crack widths.
To evaluate the crack width correctly, the crack width measurement had to beconducted at exactly the same location, since the crack width is not constant over thecrack length (cf. Figure 3-19, (b)). Therefore, five axes (a-e) were marked with a cutterline before testing (cf. Figure 3-19, (c)). Three axes (c-e) were on the top side of the
1.751.75 3.50
0.5
20
.60.
08
WA V1
WA D1WA B2
WA D3
1.30 m
0.300.30
WA V2
WA S1 WA S2
WA D2
WA B1
Be3+4Be1+20.44
0.6
0.0
80.
08
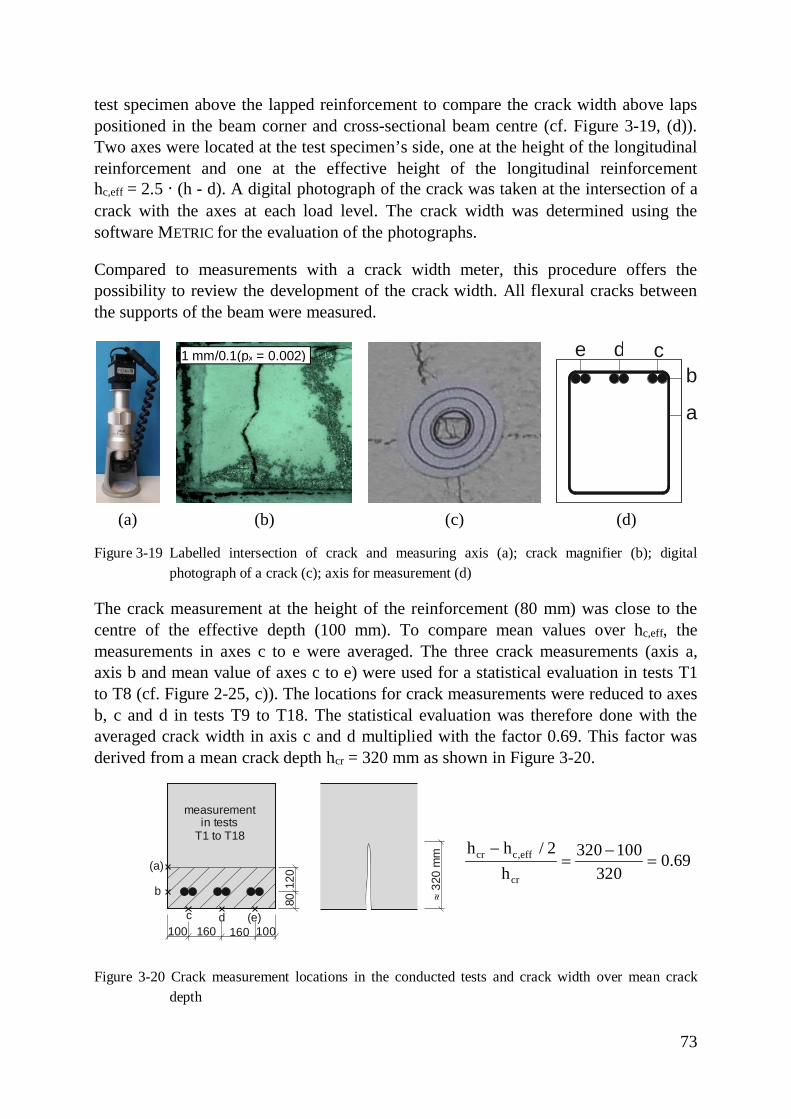
73
test specimen above the lapped reinforcement to compare the crack width above lapspositioned in the beam corner and cross-sectional beam centre (cf. Figure 3-19, (d)).Two axes were located at the test specimen’s side, one at the height of the longitudinalreinforcement and one at the effective height of the longitudinal reinforcementhc,eff = 2.5 · (h - d). A digital photograph of the crack was taken at the intersection of acrack with the axes at each load level. The crack width was determined using thesoftware METRIC for the evaluation of the photographs.
Compared to measurements with a crack width meter, this procedure offers thepossibility to review the development of the crack width. All flexural cracks betweenthe supports of the beam were measured.
(a) (b) (c) (d)
Figure 3-19 Labelled intersection of crack and measuring axis (a); crack magnifier (b); digitalphotograph of a crack (c); axis for measurement (d)
The crack measurement at the height of the reinforcement (80 mm) was close to thecentre of the effective depth (100 mm). To compare mean values over hc,eff, themeasurements in axes c to e were averaged. The three crack measurements (axis a,axis b and mean value of axes c to e) were used for a statistical evaluation in tests T1to T8 (cf. Figure 2-25, c)). The locations for crack measurements were reduced to axesb, c and d in tests T9 to T18. The statistical evaluation was therefore done with theaveraged crack width in axis c and d multiplied with the factor 0.69. This factor wasderived from a mean crack depth hcr = 320 mm as shown in Figure 3-20.
cr c,eff
cr
h h / 2 320 100 0.69h 320
- -= =
Figure 3-20 Crack measurement locations in the conducted tests and crack width over mean crackdepth
e d cb
a»
320
mm
measurementin tests
T1 to T18
(a)
b
c d (e)
120
80
160160 100100
1 mm/0.1(px = 0.002)
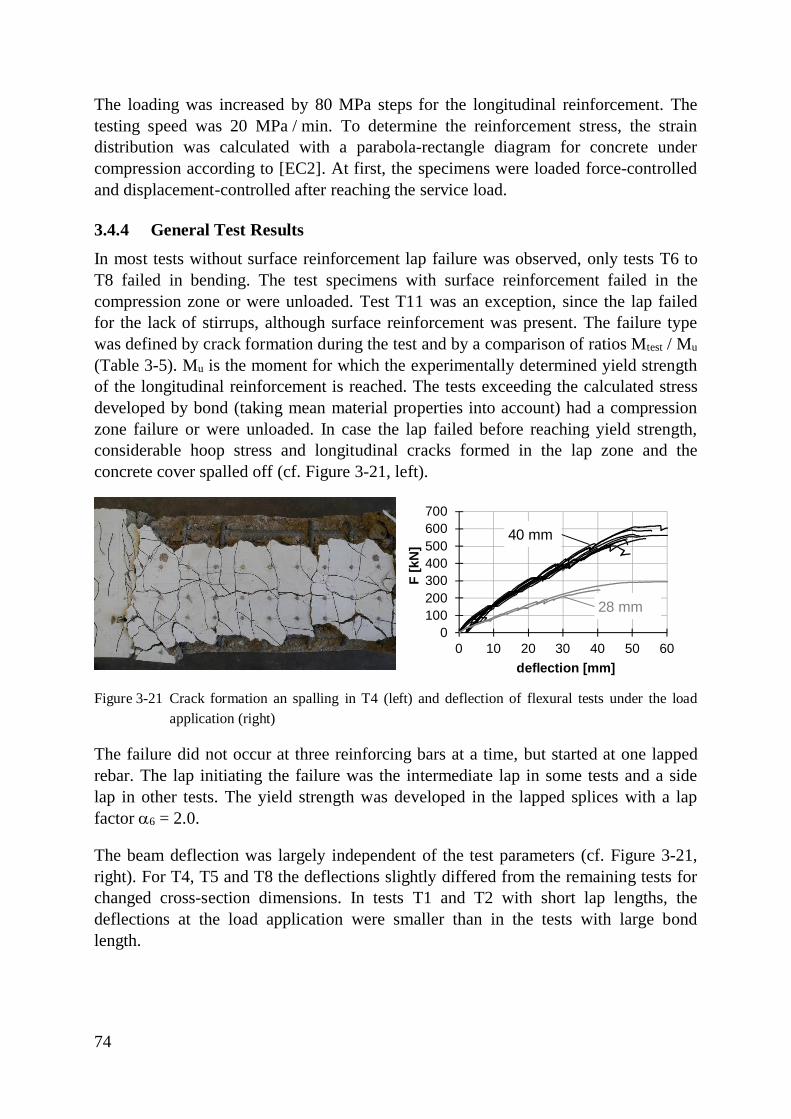
74
The loading was increased by 80 MPa steps for the longitudinal reinforcement. Thetesting speed was 20 MPa / min. To determine the reinforcement stress, the straindistribution was calculated with a parabola-rectangle diagram for concrete undercompression according to [EC2]. At first, the specimens were loaded force-controlledand displacement-controlled after reaching the service load.
3.4.4 General Test Results
In most tests without surface reinforcement lap failure was observed, only tests T6 toT8 failed in bending. The test specimens with surface reinforcement failed in thecompression zone or were unloaded. Test T11 was an exception, since the lap failedfor the lack of stirrups, although surface reinforcement was present. The failure typewas defined by crack formation during the test and by a comparison of ratios Mtest / Mu
(Table 3-5). Mu is the moment for which the experimentally determined yield strengthof the longitudinal reinforcement is reached. The tests exceeding the calculated stressdeveloped by bond (taking mean material properties into account) had a compressionzone failure or were unloaded. In case the lap failed before reaching yield strength,considerable hoop stress and longitudinal cracks formed in the lap zone and theconcrete cover spalled off (cf. Figure 3-21, left).
Figure 3-21 Crack formation an spalling in T4 (left) and deflection of flexural tests under the loadapplication (right)
The failure did not occur at three reinforcing bars at a time, but started at one lappedrebar. The lap initiating the failure was the intermediate lap in some tests and a sidelap in other tests. The yield strength was developed in the lapped splices with a lapfactor a6 = 2.0.
The beam deflection was largely independent of the test parameters (cf. Figure 3-21,right). For T4, T5 and T8 the deflections slightly differed from the remaining tests forchanged cross-section dimensions. In tests T1 and T2 with short lap lengths, thedeflections at the load application were smaller than in the tests with large bondlength.
0100200300400500600700
0 10 20 30 40 50 60
F [k
N]
deflection [mm]
28 mm
40 mm
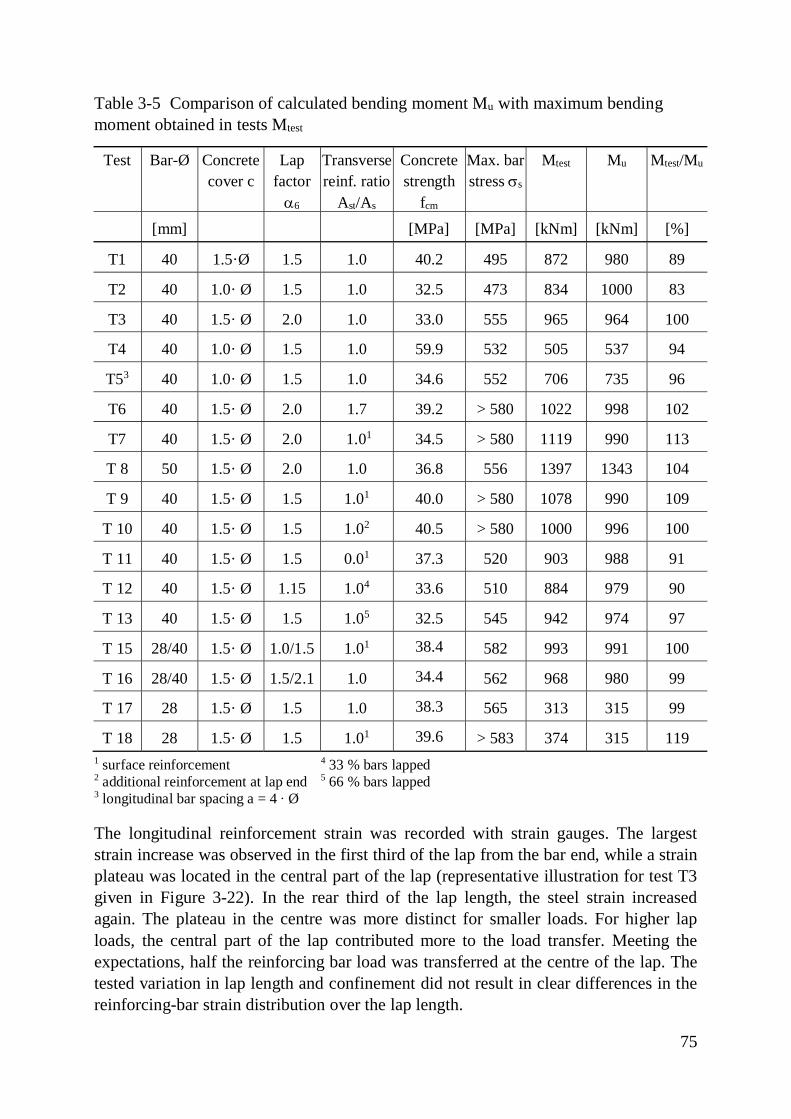
75
Table 3-5 Comparison of calculated bending moment Mu with maximum bendingmoment obtained in tests Mtest
Test Bar-Ø Concretecover c
Lapfactor
a6
Transversereinf. ratio
Ast/As
Concretestrength
fcm
Max. barstress ss
Mtest Mu Mtest/Mu
[mm] [MPa] [MPa] [kNm] [kNm] [%]
T1 40 1.5·Ø 1.5 1.0 40.2 495 872 980 89
T2 40 1.0· Ø 1.5 1.0 32.5 473 834 1000 83
T3 40 1.5· Ø 2.0 1.0 33.0 555 965 964 100
T4 40 1.0· Ø 1.5 1.0 59.9 532 505 537 94
T53 40 1.0· Ø 1.5 1.0 34.6 552 706 735 96
T6 40 1.5· Ø 2.0 1.7 39.2 > 580 1022 998 102
T7 40 1.5· Ø 2.0 1.01 34.5 > 580 1119 990 113
T 8 50 1.5· Ø 2.0 1.0 36.8 556 1397 1343 104
T 9 40 1.5· Ø 1.5 1.01 40.0 > 580 1078 990 109
T 10 40 1.5· Ø 1.5 1.02 40.5 > 580 1000 996 100
T 11 40 1.5· Ø 1.5 0.01 37.3 520 903 988 91
T 12 40 1.5· Ø 1.15 1.04 33.6 510 884 979 90
T 13 40 1.5· Ø 1.5 1.05 32.5 545 942 974 97
T 15 28/40 1.5· Ø 1.0/1.5 1.01 38.4 582 993 991 100
T 16 28/40 1.5· Ø 1.5/2.1 1.0 34.4 562 968 980 99
T 17 28 1.5· Ø 1.5 1.0 38.3 565 313 315 99
T 18 28 1.5· Ø 1.5 1.01 39.6 > 583 374 315 1191 surface reinforcement 4 33 % bars lapped2 additional reinforcement at lap end 5 66 % bars lapped3 longitudinal bar spacing a = 4 ∙ Ø
The longitudinal reinforcement strain was recorded with strain gauges. The largeststrain increase was observed in the first third of the lap from the bar end, while a strainplateau was located in the central part of the lap (representative illustration for test T3given in Figure 3-22). In the rear third of the lap length, the steel strain increasedagain. The plateau in the centre was more distinct for smaller loads. For higher laploads, the central part of the lap contributed more to the load transfer. Meeting theexpectations, half the reinforcing bar load was transferred at the centre of the lap. Thetested variation in lap length and confinement did not result in clear differences in thereinforcing-bar strain distribution over the lap length.
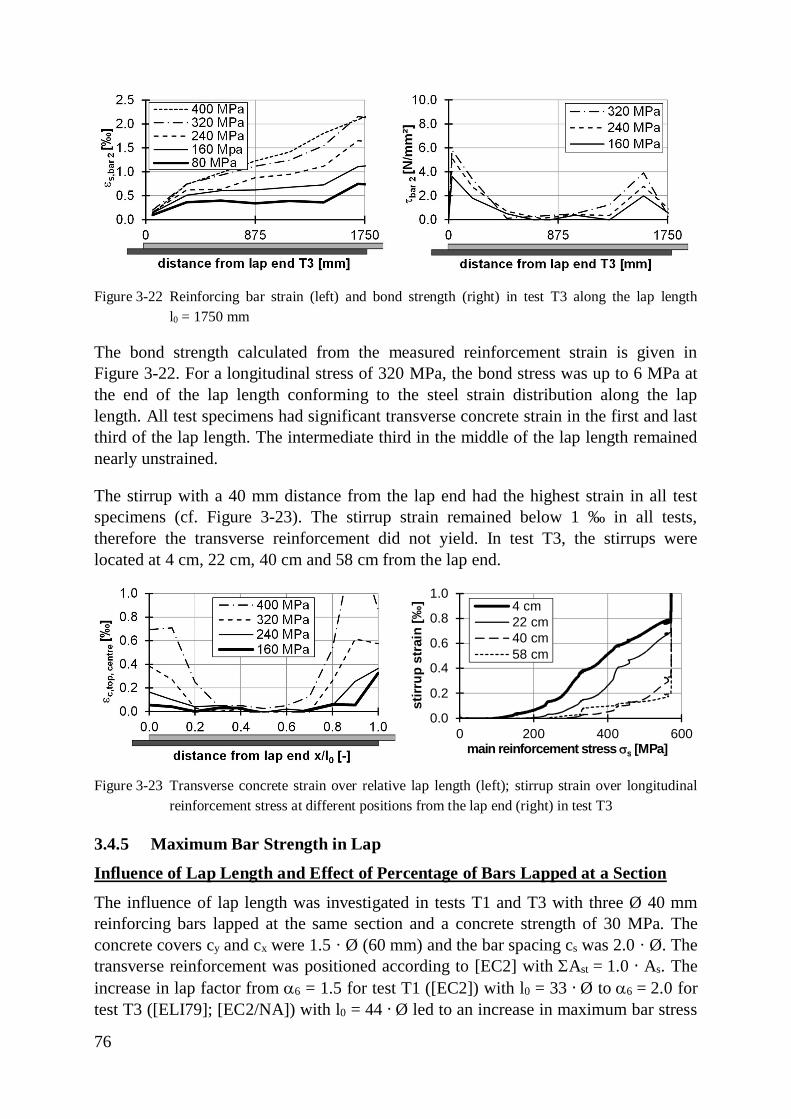
76
Figure 3-22 Reinforcing bar strain (left) and bond strength (right) in test T3 along the lap lengthl0 = 1750 mm
The bond strength calculated from the measured reinforcement strain is given inFigure 3-22. For a longitudinal stress of 320 MPa, the bond stress was up to 6 MPa atthe end of the lap length conforming to the steel strain distribution along the laplength. All test specimens had significant transverse concrete strain in the first and lastthird of the lap length. The intermediate third in the middle of the lap length remainednearly unstrained.
The stirrup with a 40 mm distance from the lap end had the highest strain in all testspecimens (cf. Figure 3-23). The stirrup strain remained below 1 ‰ in all tests,therefore the transverse reinforcement did not yield. In test T3, the stirrups werelocated at 4 cm, 22 cm, 40 cm and 58 cm from the lap end.
Figure 3-23 Transverse concrete strain over relative lap length (left); stirrup strain over longitudinalreinforcement stress at different positions from the lap end (right) in test T3
3.4.5 Maximum Bar Strength in Lap
Influence of Lap Length and Effect of Percentage of Bars Lapped at a Section
The influence of lap length was investigated in tests T1 and T3 with three Ø 40 mmreinforcing bars lapped at the same section and a concrete strength of 30 MPa. Theconcrete covers cy and cx were 1.5 · Ø (60 mm) and the bar spacing cs was 2.0 · Ø. Thetransverse reinforcement was positioned according to [EC2] with SAst = 1.0 · As. Theincrease in lap factor from a6 = 1.5 for test T1 ([EC2]) with l0 = 33 · Ø to a6 = 2.0 fortest T3 ([ELI79]; [EC2/NA]) with l0 = 44 · Ø led to an increase in maximum bar stress
0.0
0.2
0.4
0.6
0.8
1.0
0 200 400 600
stirr
up s
trai
n [‰
]
main reinforcement stress ss [MPa]
4 cm22 cm40 cm58 cm
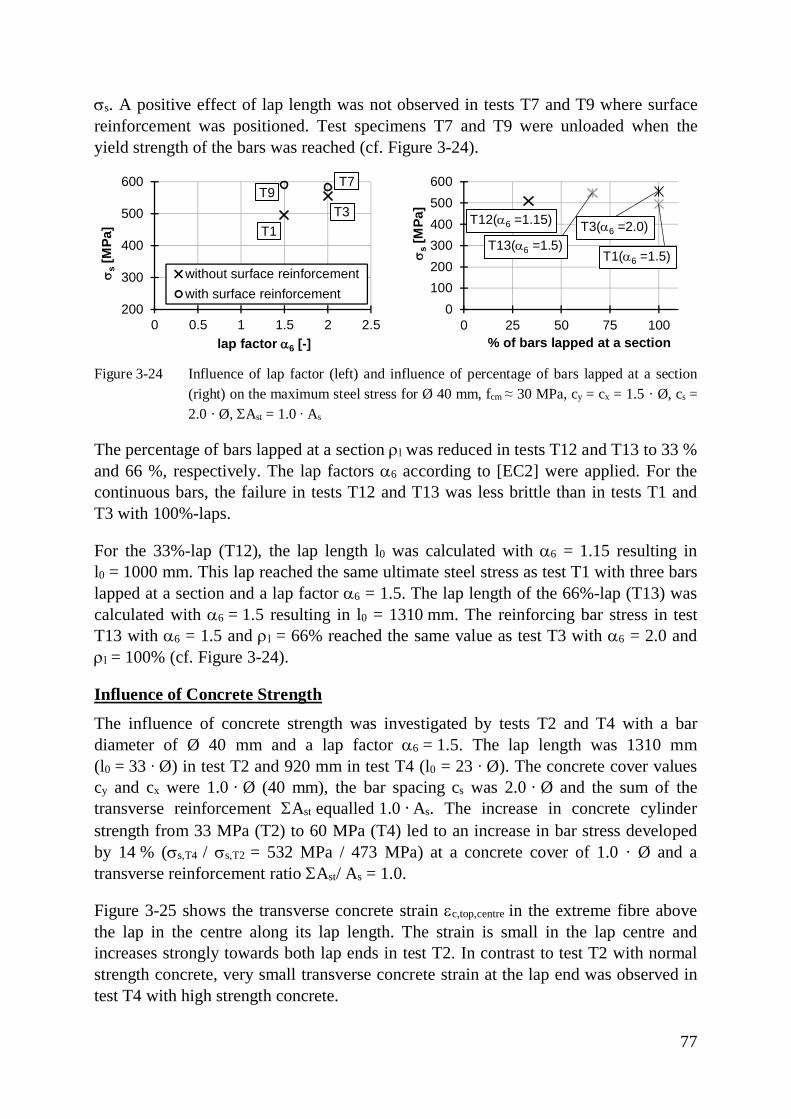
77
ss. A positive effect of lap length was not observed in tests T7 and T9 where surfacereinforcement was positioned. Test specimens T7 and T9 were unloaded when theyield strength of the bars was reached (cf. Figure 3-24).
Figure 3-24 Influence of lap factor (left) and influence of percentage of bars lapped at a section(right) on the maximum steel stress for Ø 40 mm, fcm ≈ 30 MPa, cy = cx = 1.5 · Ø, cs =2.0 · Ø, SAst = 1.0 ∙ As
The percentage of bars lapped at a section rl was reduced in tests T12 and T13 to 33 %and 66 %, respectively. The lap factors a6 according to [EC2] were applied. For thecontinuous bars, the failure in tests T12 and T13 was less brittle than in tests T1 andT3 with 100%-laps.
For the 33%-lap (T12), the lap length l0 was calculated with a6 = 1.15 resulting inl0 = 1000 mm. This lap reached the same ultimate steel stress as test T1 with three barslapped at a section and a lap factor a6 = 1.5. The lap length of the 66%-lap (T13) wascalculated with a6 = 1.5 resulting in l0 = 1310 mm. The reinforcing bar stress in testT13 with a6 = 1.5 and rl = 66% reached the same value as test T3 with a6 = 2.0 andrl = 100% (cf. Figure 3-24).
Influence of Concrete Strength
The influence of concrete strength was investigated by tests T2 and T4 with a bardiameter of Ø 40 mm and a lap factor a6 = 1.5. The lap length was 1310 mm(l0 = 33 ∙ Ø) in test T2 and 920 mm in test T4 (l0 = 23 ∙ Ø). The concrete cover valuescy and cx were 1.0 · Ø (40 mm), the bar spacing cs was 2.0 · Ø and the sum of thetransverse reinforcement SAst equalled 1.0 · As. The increase in concrete cylinderstrength from 33 MPa (T2) to 60 MPa (T4) led to an increase in bar stress developedby 14 % (ss,T4 / ss,T2 = 532 MPa / 473 MPa) at a concrete cover of 1.0 · Ø and atransverse reinforcement ratio SAst/ As = 1.0.
Figure 3-25 shows the transverse concrete strain ec,top,centre in the extreme fibre abovethe lap in the centre along its lap length. The strain is small in the lap centre andincreases strongly towards both lap ends in test T2. In contrast to test T2 with normalstrength concrete, very small transverse concrete strain at the lap end was observed intest T4 with high strength concrete.
200
300
400
500
600
0 0.5 1 1.5 2 2.5
ss
[MPa
]
lap factor a6 [-]
without surface reinforcementwith surface reinforcement
T1T3
T9T7
0100200300400500600
0 25 50 75 100
ss
[MPa
]
% of bars lapped at a section
T3(a6 =2.0)
T1(a6 =1.5)T13(a6 =1.5)
T12(a6 =1.15)
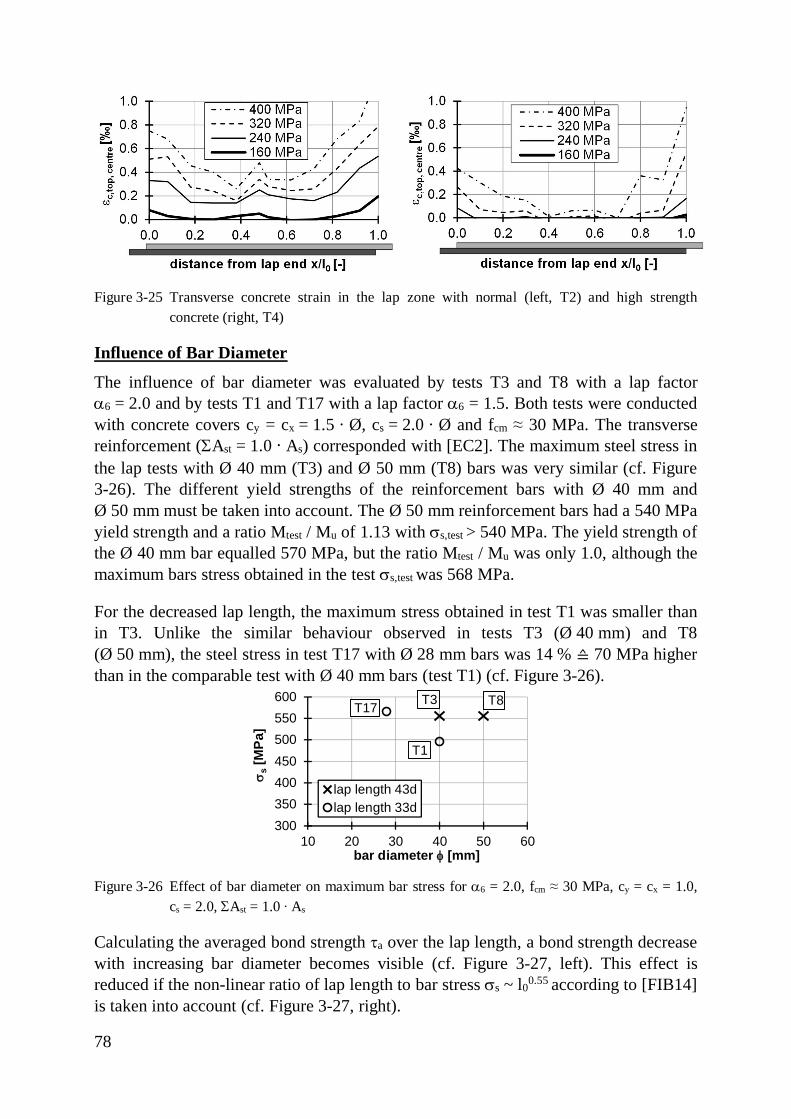
78
Figure 3-25 Transverse concrete strain in the lap zone with normal (left, T2) and high strengthconcrete (right, T4)
Influence of Bar Diameter
The influence of bar diameter was evaluated by tests T3 and T8 with a lap factora6 = 2.0 and by tests T1 and T17 with a lap factor a6 = 1.5. Both tests were conductedwith concrete covers cy = cx = 1.5 · Ø, cs = 2.0 · Ø and fcm ≈ 30 MPa. The transversereinforcement (SAst = 1.0 · As) corresponded with [EC2]. The maximum steel stress inthe lap tests with Ø 40 mm (T3) and Ø 50 mm (T8) bars was very similar (cf. Figure3-26). The different yield strengths of the reinforcement bars with Ø 40 mm andØ 50 mm must be taken into account. The Ø 50 mm reinforcement bars had a 540 MPayield strength and a ratio Mtest / Mu of 1.13 with ss,test > 540 MPa. The yield strength ofthe Ø 40 mm bar equalled 570 MPa, but the ratio Mtest / Mu was only 1.0, although themaximum bars stress obtained in the test ss,test was 568 MPa.
For the decreased lap length, the maximum stress obtained in test T1 was smaller thanin T3. Unlike the similar behaviour observed in tests T3 (Ø 40 mm) and T8(Ø 50 mm), the steel stress in test T17 with Ø 28 mm bars was 14 % ≙ 70 MPa higherthan in the comparable test with Ø 40 mm bars (test T1) (cf. Figure 3-26).
Figure 3-26 Effect of bar diameter on maximum bar stress for a6 = 2.0, fcm ≈ 30 MPa, cy = cx = 1.0,cs = 2.0, SAst = 1.0 ∙ As
Calculating the averaged bond strength ta over the lap length, a bond strength decreasewith increasing bar diameter becomes visible (cf. Figure 3-27, left). This effect isreduced if the non-linear ratio of lap length to bar stress ss ~ l00.55 according to [FIB14]is taken into account (cf. Figure 3-27, right).
300350400450500550600
10 20 30 40 50 60
ss
[MPa
]
bar diameter f [mm]
lap length 43dlap length 33d
T3 T8T17
T1
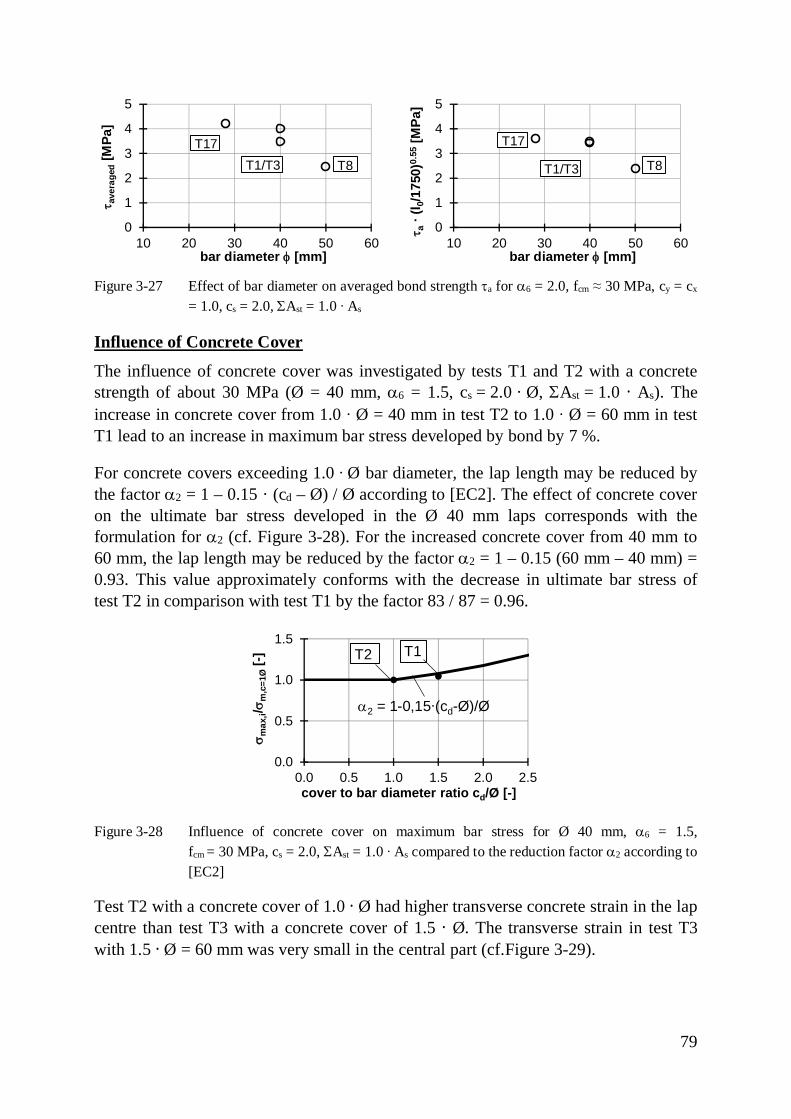
79
Figure 3-27 Effect of bar diameter on averaged bond strength ta for a6 = 2.0, fcm ≈ 30 MPa, cy = cx
= 1.0, cs = 2.0, SAst = 1.0 ∙ As
Influence of Concrete Cover
The influence of concrete cover was investigated by tests T1 and T2 with a concretestrength of about 30 MPa (Ø = 40 mm, a6 = 1.5, cs = 2.0 · Ø, SAst = 1.0 · As). Theincrease in concrete cover from 1.0 ∙ Ø = 40 mm in test T2 to 1.0 ∙ Ø = 60 mm in testT1 lead to an increase in maximum bar stress developed by bond by 7 %.
For concrete covers exceeding 1.0 ∙ Ø bar diameter, the lap length may be reduced bythe factor a2 = 1 – 0.15 · (cd – Ø) / Ø according to [EC2]. The effect of concrete coveron the ultimate bar stress developed in the Ø 40 mm laps corresponds with theformulation for a2 (cf. Figure 3-28). For the increased concrete cover from 40 mm to60 mm, the lap length may be reduced by the factor a2 = 1 – 0.15 (60 mm – 40 mm) =0.93. This value approximately conforms with the decrease in ultimate bar stress oftest T2 in comparison with test T1 by the factor 83 / 87 = 0.96.
Figure 3-28 Influence of concrete cover on maximum bar stress for Ø 40 mm, a6 = 1.5,fcm = 30 MPa, cs = 2.0, SAst = 1.0 ∙ As compared to the reduction factor a2 according to[EC2]
Test T2 with a concrete cover of 1.0 · Ø had higher transverse concrete strain in the lapcentre than test T3 with a concrete cover of 1.5 · Ø. The transverse strain in test T3with 1.5 · Ø = 60 mm was very small in the central part (cf.Figure 3-29).
0
1
2
3
4
5
10 20 30 40 50 60
t ave
rage
d[M
Pa]
bar diameter f [mm]
T8T17
T1/T3
0
1
2
3
4
5
10 20 30 40 50 60
t a∙ (
l 0/17
50)0
.55
[MPa
]
bar diameter f [mm]
T8
T17
T1/T3
0.0
0.5
1.0
1.5
0.0 0.5 1.0 1.5 2.0 2.5
s max
,i/sm
,c=1
Ø[-]
cover to bar diameter ratio cd/Ø [-]
a2 = 1-0,15∙(cd-Ø)/Ø
T2 T1
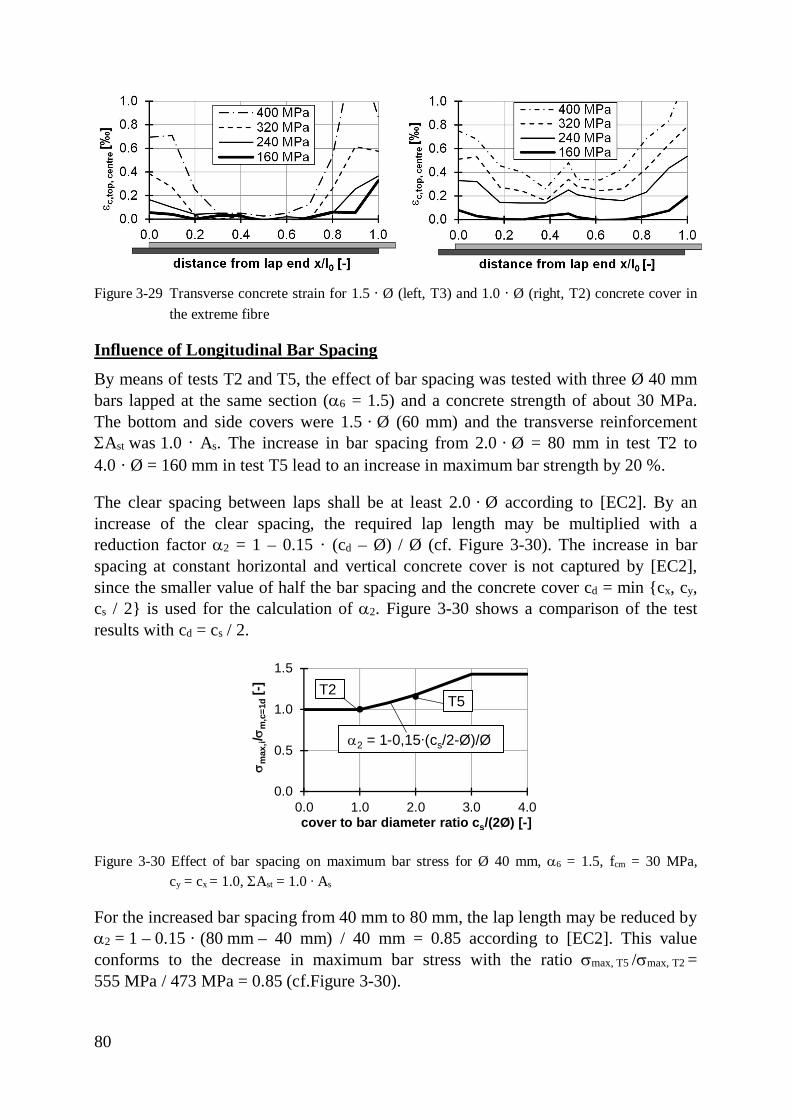
80
Figure 3-29 Transverse concrete strain for 1.5 · Ø (left, T3) and 1.0 · Ø (right, T2) concrete cover inthe extreme fibre
Influence of Longitudinal Bar Spacing
By means of tests T2 and T5, the effect of bar spacing was tested with three Ø 40 mmbars lapped at the same section (a6 = 1.5) and a concrete strength of about 30 MPa.The bottom and side covers were 1.5 · Ø (60 mm) and the transverse reinforcementSAst was 1.0 · As. The increase in bar spacing from 2.0 · Ø = 80 mm in test T2 to4.0 · Ø = 160 mm in test T5 lead to an increase in maximum bar strength by 20 %.
The clear spacing between laps shall be at least 2.0 · Ø according to [EC2]. By anincrease of the clear spacing, the required lap length may be multiplied with areduction factor a2 = 1 – 0.15 · (cd – Ø) / Ø (cf. Figure 3-30). The increase in barspacing at constant horizontal and vertical concrete cover is not captured by [EC2],since the smaller value of half the bar spacing and the concrete cover cd = min {cx, cy,cs / 2} is used for the calculation of a2. Figure 3-30 shows a comparison of the testresults with cd = cs / 2.
Figure 3-30 Effect of bar spacing on maximum bar stress for Ø 40 mm, a6 = 1.5, fcm = 30 MPa,cy = cx = 1.0, SAst = 1.0 ∙ As
For the increased bar spacing from 40 mm to 80 mm, the lap length may be reduced bya2 = 1 – 0.15 · (80 mm – 40 mm) / 40 mm = 0.85 according to [EC2]. This valueconforms to the decrease in maximum bar stress with the ratio smax, T5 /smax, T2 =555 MPa / 473 MPa = 0.85 (cf.Figure 3-30).
0.0
0.5
1.0
1.5
0.0 1.0 2.0 3.0 4.0
sm
ax,i/s
m,c
=1d
[-]
cover to bar diameter ratio cs/(2Ø) [-]
a2 = 1-0,15∙(cs/2-Ø)/Ø
T2T5
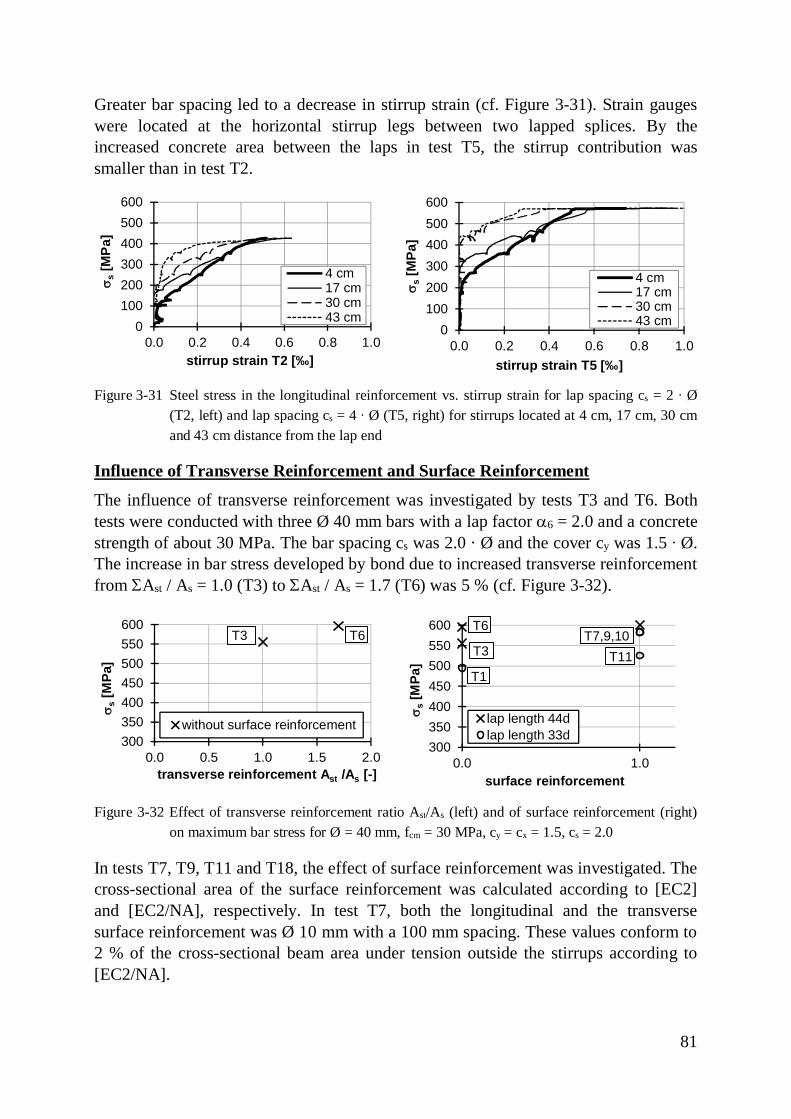
81
Greater bar spacing led to a decrease in stirrup strain (cf. Figure 3-31). Strain gaugeswere located at the horizontal stirrup legs between two lapped splices. By theincreased concrete area between the laps in test T5, the stirrup contribution wassmaller than in test T2.
Figure 3-31 Steel stress in the longitudinal reinforcement vs. stirrup strain for lap spacing cs = 2 ∙ Ø(T2, left) and lap spacing cs = 4 ∙ Ø (T5, right) for stirrups located at 4 cm, 17 cm, 30 cmand 43 cm distance from the lap end
Influence of Transverse Reinforcement and Surface Reinforcement
The influence of transverse reinforcement was investigated by tests T3 and T6. Bothtests were conducted with three Ø 40 mm bars with a lap factor a6 = 2.0 and a concretestrength of about 30 MPa. The bar spacing cs was 2.0 · Ø and the cover cy was 1.5 ∙ Ø.The increase in bar stress developed by bond due to increased transverse reinforcementfrom SAst / As = 1.0 (T3) to SAst / As = 1.7 (T6) was 5 % (cf. Figure 3-32).
Figure 3-32 Effect of transverse reinforcement ratio Ast/As (left) and of surface reinforcement (right)on maximum bar stress for Ø = 40 mm, fcm = 30 MPa, cy = cx = 1.5, cs = 2.0
In tests T7, T9, T11 and T18, the effect of surface reinforcement was investigated. Thecross-sectional area of the surface reinforcement was calculated according to [EC2]and [EC2/NA], respectively. In test T7, both the longitudinal and the transversesurface reinforcement was Ø 10 mm with a 100 mm spacing. These values conform to2 % of the cross-sectional beam area under tension outside the stirrups according to[EC2/NA].
0100200300400500600
0.0 0.2 0.4 0.6 0.8 1.0
s s[M
Pa]
stirrup strain T2 [‰]
4 cm17 cm30 cm43 cm
0100200300400500600
0.0 0.2 0.4 0.6 0.8 1.0
s s[M
Pa]
stirrup strain T5 [‰]
4 cm17 cm30 cm43 cm
300350400450500550600
0.0 0.5 1.0 1.5 2.0
s s[M
Pa]
transverse reinforcement Ast /As [-]
without surface reinforcement
T3 T6
300350400450500550600
0.0 1.0
s s[M
Pa]
surface reinforcement
lap length 44dlap length 33d
T3T7,9,10
T1
T6
T11
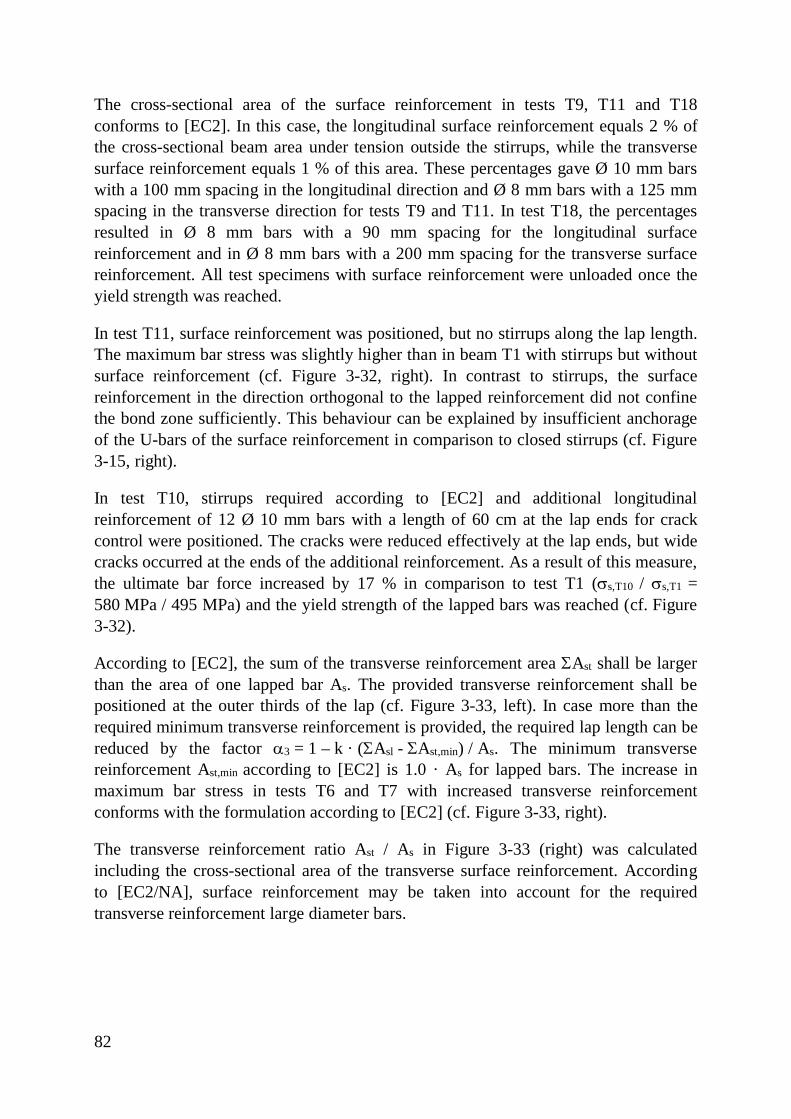
82
The cross-sectional area of the surface reinforcement in tests T9, T11 and T18conforms to [EC2]. In this case, the longitudinal surface reinforcement equals 2 % ofthe cross-sectional beam area under tension outside the stirrups, while the transversesurface reinforcement equals 1 % of this area. These percentages gave Ø 10 mm barswith a 100 mm spacing in the longitudinal direction and Ø 8 mm bars with a 125 mmspacing in the transverse direction for tests T9 and T11. In test T18, the percentagesresulted in Ø 8 mm bars with a 90 mm spacing for the longitudinal surfacereinforcement and in Ø 8 mm bars with a 200 mm spacing for the transverse surfacereinforcement. All test specimens with surface reinforcement were unloaded once theyield strength was reached.
In test T11, surface reinforcement was positioned, but no stirrups along the lap length.The maximum bar stress was slightly higher than in beam T1 with stirrups but withoutsurface reinforcement (cf. Figure 3-32, right). In contrast to stirrups, the surfacereinforcement in the direction orthogonal to the lapped reinforcement did not confinethe bond zone sufficiently. This behaviour can be explained by insufficient anchorageof the U-bars of the surface reinforcement in comparison to closed stirrups (cf. Figure3-15, right).
In test T10, stirrups required according to [EC2] and additional longitudinalreinforcement of 12 Ø 10 mm bars with a length of 60 cm at the lap ends for crackcontrol were positioned. The cracks were reduced effectively at the lap ends, but widecracks occurred at the ends of the additional reinforcement. As a result of this measure,the ultimate bar force increased by 17 % in comparison to test T1 (ss,T10 / ss,T1 =580 MPa / 495 MPa) and the yield strength of the lapped bars was reached (cf. Figure3-32).
According to [EC2], the sum of the transverse reinforcement area SAst shall be largerthan the area of one lapped bar As. The provided transverse reinforcement shall bepositioned at the outer thirds of the lap (cf. Figure 3-33, left). In case more than therequired minimum transverse reinforcement is provided, the required lap length can bereduced by the factor a3 = 1 – k · (SAsl - SAst,min) / As. The minimum transversereinforcement Ast,min according to [EC2] is 1.0 · As for lapped bars. The increase inmaximum bar stress in tests T6 and T7 with increased transverse reinforcementconforms with the formulation according to [EC2] (cf. Figure 3-33, right).
The transverse reinforcement ratio Ast / As in Figure 3-33 (right) was calculatedincluding the cross-sectional area of the transverse surface reinforcement. Accordingto [EC2/NA], surface reinforcement may be taken into account for the requiredtransverse reinforcement large diameter bars.
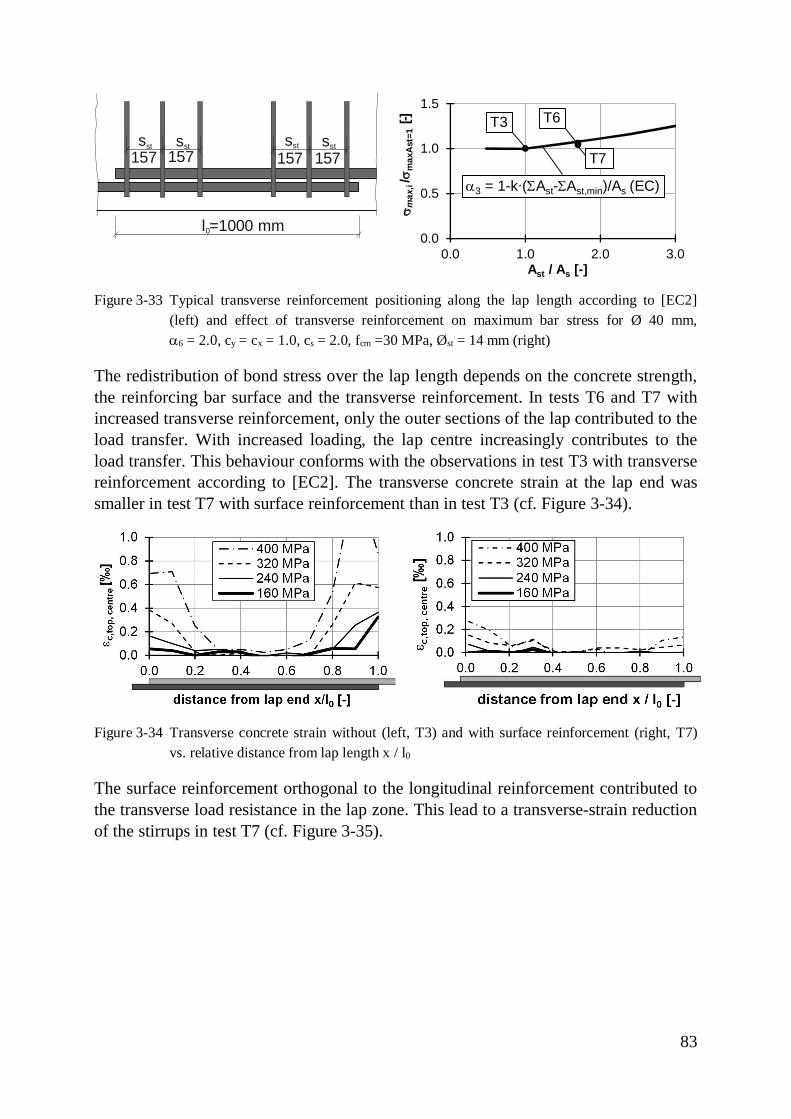
83
Figure 3-33 Typical transverse reinforcement positioning along the lap length according to [EC2](left) and effect of transverse reinforcement on maximum bar stress for Ø 40 mm,a6 = 2.0, cy = cx = 1.0, cs = 2.0, fcm =30 MPa, Øst = 14 mm (right)
The redistribution of bond stress over the lap length depends on the concrete strength,the reinforcing bar surface and the transverse reinforcement. In tests T6 and T7 withincreased transverse reinforcement, only the outer sections of the lap contributed to theload transfer. With increased loading, the lap centre increasingly contributes to theload transfer. This behaviour conforms with the observations in test T3 with transversereinforcement according to [EC2]. The transverse concrete strain at the lap end wassmaller in test T7 with surface reinforcement than in test T3 (cf. Figure 3-34).
Figure 3-34 Transverse concrete strain without (left, T3) and with surface reinforcement (right, T7)vs. relative distance from lap length x / l0
The surface reinforcement orthogonal to the longitudinal reinforcement contributed tothe transverse load resistance in the lap zone. This lead to a transverse-strain reductionof the stirrups in test T7 (cf. Figure 3-35).
l =1000 mm0
sst sst sst sst
157 157 157 157
0.0
0.5
1.0
1.5
0.0 1.0 2.0 3.0
s max
,i/s
max
Ast
=1[-]
Ast / As [-]
T7
T3 T6
a3 = 1-k∙(SAst-SAst,min)/As (EC)
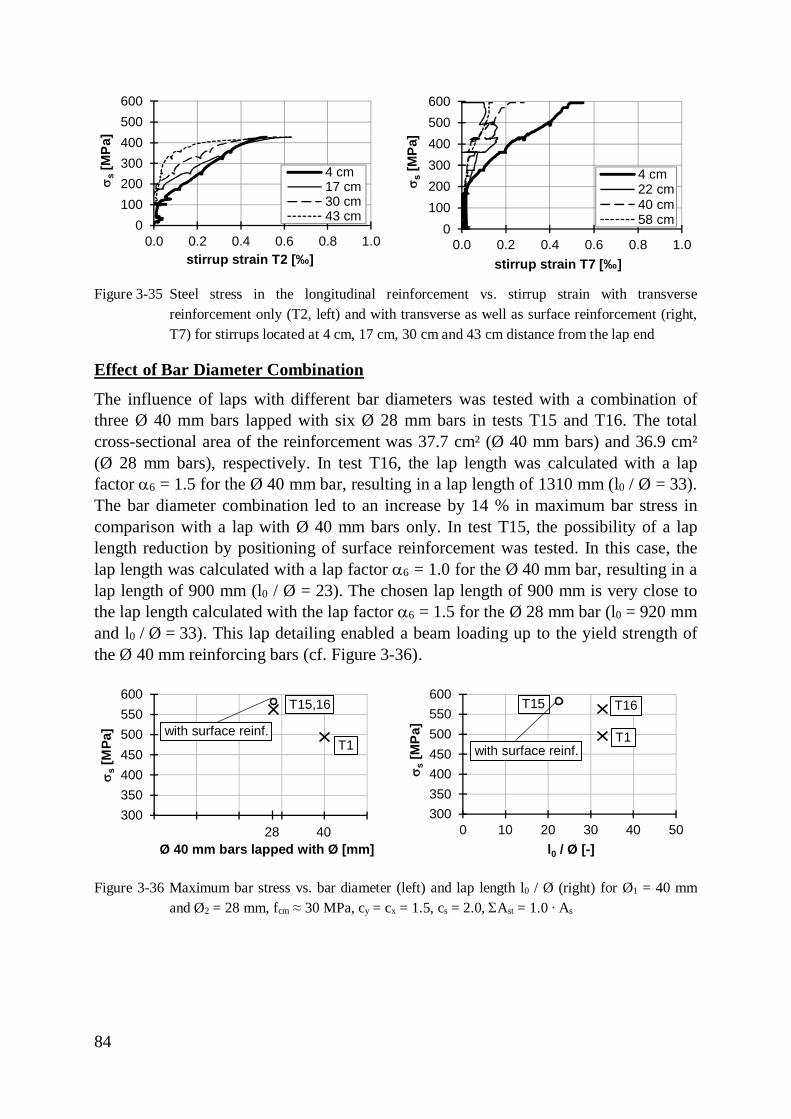
84
Figure 3-35 Steel stress in the longitudinal reinforcement vs. stirrup strain with transversereinforcement only (T2, left) and with transverse as well as surface reinforcement (right,T7) for stirrups located at 4 cm, 17 cm, 30 cm and 43 cm distance from the lap end
Effect of Bar Diameter Combination
The influence of laps with different bar diameters was tested with a combination ofthree Ø 40 mm bars lapped with six Ø 28 mm bars in tests T15 and T16. The totalcross-sectional area of the reinforcement was 37.7 cm² (Ø 40 mm bars) and 36.9 cm²(Ø 28 mm bars), respectively. In test T16, the lap length was calculated with a lapfactor a6 = 1.5 for the Ø 40 mm bar, resulting in a lap length of 1310 mm (l0 / Ø = 33).The bar diameter combination led to an increase by 14 % in maximum bar stress incomparison with a lap with Ø 40 mm bars only. In test T15, the possibility of a laplength reduction by positioning of surface reinforcement was tested. In this case, thelap length was calculated with a lap factor a6 = 1.0 for the Ø 40 mm bar, resulting in alap length of 900 mm (l0 / Ø = 23). The chosen lap length of 900 mm is very close tothe lap length calculated with the lap factor a6 = 1.5 for the Ø 28 mm bar (l0 = 920 mmand l0 / Ø = 33). This lap detailing enabled a beam loading up to the yield strength ofthe Ø 40 mm reinforcing bars (cf. Figure 3-36).
Figure 3-36 Maximum bar stress vs. bar diameter (left) and lap length l0 / Ø (right) for Ø1 = 40 mmand Ø2 = 28 mm, fcm ≈ 30 MPa, cy = cx = 1.5, cs = 2.0, SAst = 1.0 ∙ As
0100200300400500600
0.0 0.2 0.4 0.6 0.8 1.0
ss
[MPa
]
stirrup strain T2 [‰]
4 cm17 cm30 cm43 cm
0100200300400500600
0.0 0.2 0.4 0.6 0.8 1.0
s s[M
Pa]
stirrup strain T7 [‰]
4 cm22 cm40 cm58 cm
300350400450500550600
0 10 20 30 40 50
ss
[MPa
]
Ø 40 mm bars lapped with Ø [mm]
with surface reinf.
28 40
T1
T15,16
300350400450500550600
0 10 20 30 40 50
s s[M
Pa]
l0 / Ø [-]
with surface reinf.T1
T16T15
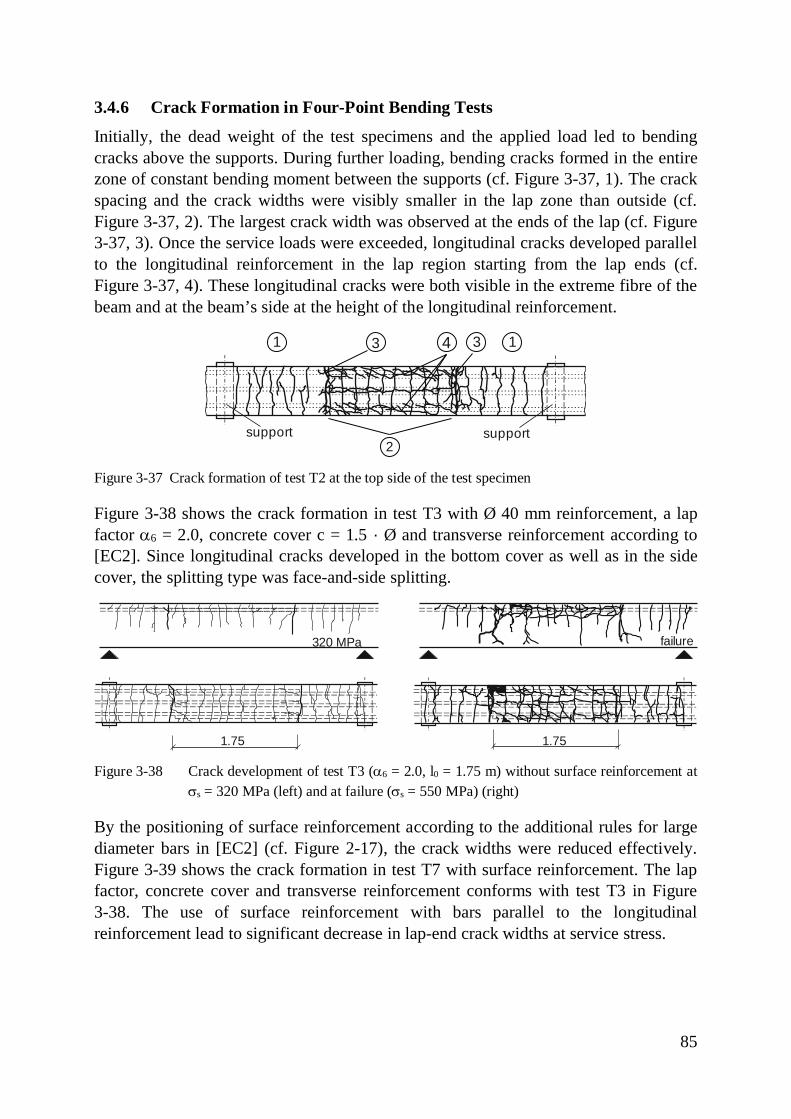
85
3.4.6 Crack Formation in Four-Point Bending Tests
Initially, the dead weight of the test specimens and the applied load led to bendingcracks above the supports. During further loading, bending cracks formed in the entirezone of constant bending moment between the supports (cf. Figure 3-37, 1). The crackspacing and the crack widths were visibly smaller in the lap zone than outside (cf.Figure 3-37, 2). The largest crack width was observed at the ends of the lap (cf. Figure3-37, 3). Once the service loads were exceeded, longitudinal cracks developed parallelto the longitudinal reinforcement in the lap region starting from the lap ends (cf.Figure 3-37, 4). These longitudinal cracks were both visible in the extreme fibre of thebeam and at the beam’s side at the height of the longitudinal reinforcement.
Figure 3-37 Crack formation of test T2 at the top side of the test specimen
Figure 3-38 shows the crack formation in test T3 with Ø 40 mm reinforcement, a lapfactor a6 = 2.0, concrete cover c = 1.5 · Ø and transverse reinforcement according to[EC2]. Since longitudinal cracks developed in the bottom cover as well as in the sidecover, the splitting type was face-and-side splitting.
Figure 3-38 Crack development of test T3 (a6 = 2.0, l0 = 1.75 m) without surface reinforcement atss = 320 MPa (left) and at failure (ss = 550 MPa) (right)
By the positioning of surface reinforcement according to the additional rules for largediameter bars in [EC2] (cf. Figure 2-17), the crack widths were reduced effectively.Figure 3-39 shows the crack formation in test T7 with surface reinforcement. The lapfactor, concrete cover and transverse reinforcement conforms with test T3 in Figure3-38. The use of surface reinforcement with bars parallel to the longitudinalreinforcement lead to significant decrease in lap-end crack widths at service stress.
2
1 3 14
supportsupport
3
1.75
320 MPa
1.75
failure
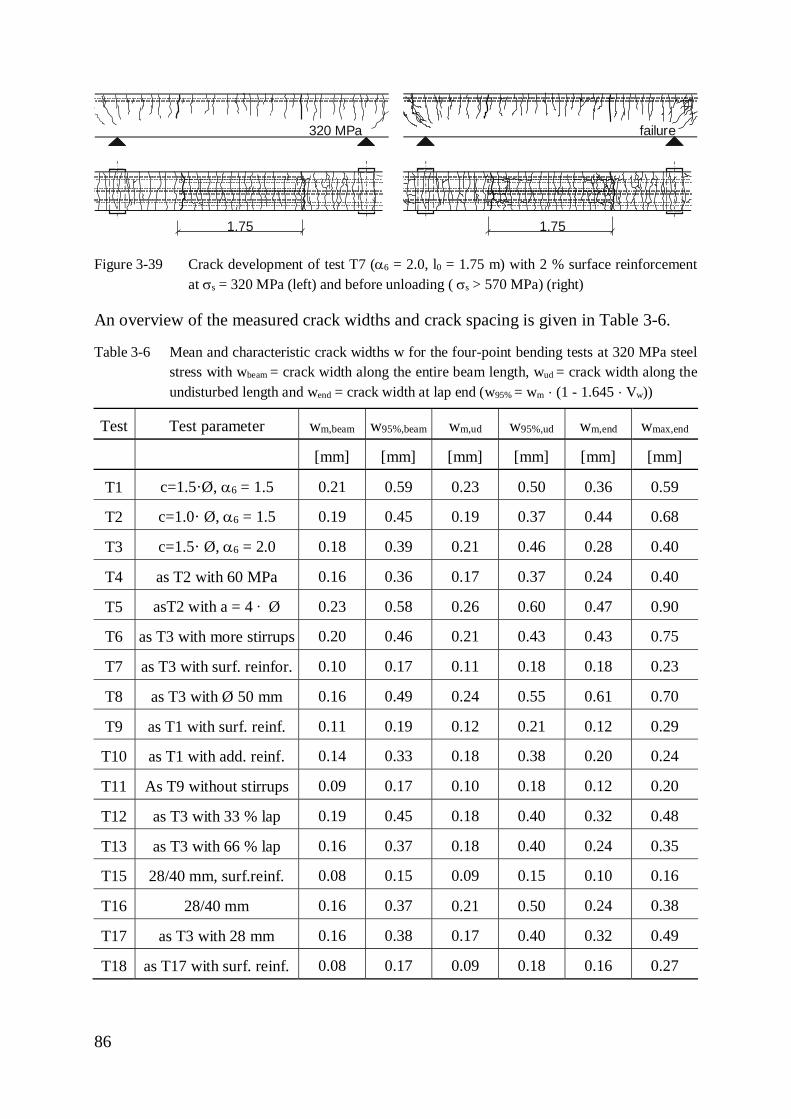
86
Figure 3-39 Crack development of test T7 (a6 = 2.0, l0 = 1.75 m) with 2 % surface reinforcementat ss = 320 MPa (left) and before unloading ( ss > 570 MPa) (right)
An overview of the measured crack widths and crack spacing is given in Table 3-6.
Table 3-6 Mean and characteristic crack widths w for the four-point bending tests at 320 MPa steelstress with wbeam = crack width along the entire beam length, wud = crack width along theundisturbed length and wend = crack width at lap end (w95% = wm · (1 - 1.645 · Vw))
Test Test parameter wm,beam w95%,beam wm,ud w95%,ud wm,end wmax,end
[mm] [mm] [mm] [mm] [mm] [mm]
T1 c=1.5·Ø, a6 = 1.5 0.21 0.59 0.23 0.50 0.36 0.59
T2 c=1.0· Ø, a6 = 1.5 0.19 0.45 0.19 0.37 0.44 0.68
T3 c=1.5· Ø, a6 = 2.0 0.18 0.39 0.21 0.46 0.28 0.40
T4 as T2 with 60 MPa 0.16 0.36 0.17 0.37 0.24 0.40
T5 asT2 with a = 4 ∙ Ø 0.23 0.58 0.26 0.60 0.47 0.90
T6 as T3 with more stirrups 0.20 0.46 0.21 0.43 0.43 0.75
T7 as T3 with surf. reinfor. 0.10 0.17 0.11 0.18 0.18 0.23
T8 as T3 with Ø 50 mm 0.16 0.49 0.24 0.55 0.61 0.70
T9 as T1 with surf. reinf. 0.11 0.19 0.12 0.21 0.12 0.29
T10 as T1 with add. reinf. 0.14 0.33 0.18 0.38 0.20 0.24
T11 As T9 without stirrups 0.09 0.17 0.10 0.18 0.12 0.20
T12 as T3 with 33 % lap 0.19 0.45 0.18 0.40 0.32 0.48
T13 as T3 with 66 % lap 0.16 0.37 0.18 0.40 0.24 0.35
T15 28/40 mm, surf.reinf. 0.08 0.15 0.09 0.15 0.10 0.16
T16 28/40 mm 0.16 0.37 0.21 0.50 0.24 0.38
T17 as T3 with 28 mm 0.16 0.38 0.17 0.40 0.32 0.49
T18 as T17 with surf. reinf. 0.08 0.17 0.09 0.18 0.16 0.27
1.75
320 MPa failure
1.75
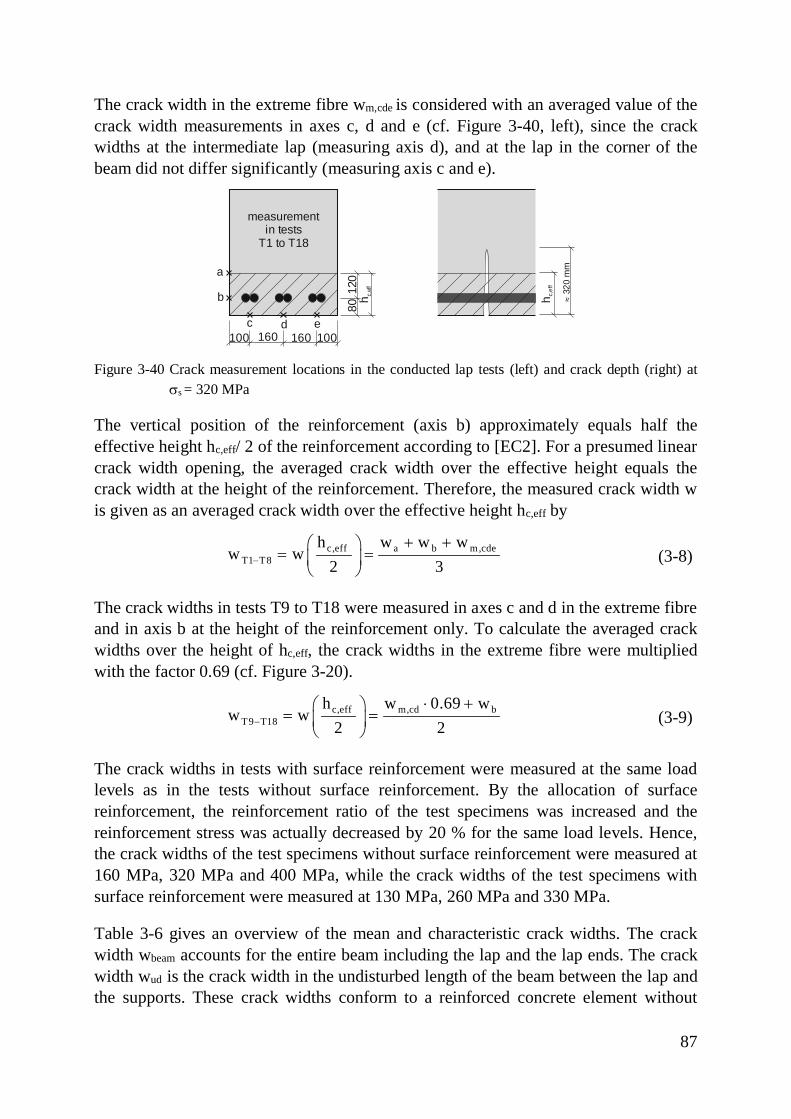
87
The crack width in the extreme fibre wm,cde is considered with an averaged value of thecrack width measurements in axes c, d and e (cf. Figure 3-40, left), since the crackwidths at the intermediate lap (measuring axis d), and at the lap in the corner of thebeam did not differ significantly (measuring axis c and e).
Figure 3-40 Crack measurement locations in the conducted lap tests (left) and crack depth (right) atss = 320 MPa
The vertical position of the reinforcement (axis b) approximately equals half theeffective height hc,eff/ 2 of the reinforcement according to [EC2]. For a presumed linearcrack width opening, the averaged crack width over the effective height equals thecrack width at the height of the reinforcement. Therefore, the measured crack width wis given as an averaged crack width over the effective height hc,eff by
c,eff a b m,cdeT1 T8
h w w ww w
2 3-
+ +æ ö= =ç ÷
è ø(3-8)
The crack widths in tests T9 to T18 were measured in axes c and d in the extreme fibreand in axis b at the height of the reinforcement only. To calculate the averaged crackwidths over the height of hc,eff, the crack widths in the extreme fibre were multipliedwith the factor 0.69 (cf. Figure 3-20).
c,eff m,cd bT9 T18
h w 0.69 ww w
2 2-
× +æ ö= =ç ÷
è ø(3-9)
The crack widths in tests with surface reinforcement were measured at the same loadlevels as in the tests without surface reinforcement. By the allocation of surfacereinforcement, the reinforcement ratio of the test specimens was increased and thereinforcement stress was actually decreased by 20 % for the same load levels. Hence,the crack widths of the test specimens without surface reinforcement were measured at160 MPa, 320 MPa and 400 MPa, while the crack widths of the test specimens withsurface reinforcement were measured at 130 MPa, 260 MPa and 330 MPa.
Table 3-6 gives an overview of the mean and characteristic crack widths. The crackwidth wbeam accounts for the entire beam including the lap and the lap ends. The crackwidth wud is the crack width in the undisturbed length of the beam between the lap andthe supports. These crack widths conform to a reinforced concrete element without
measurementin tests
T1 to T18
a
b
c d e
120
80160160 100100
h c,ef
f
» 32
0 m
m
h c,e
ff
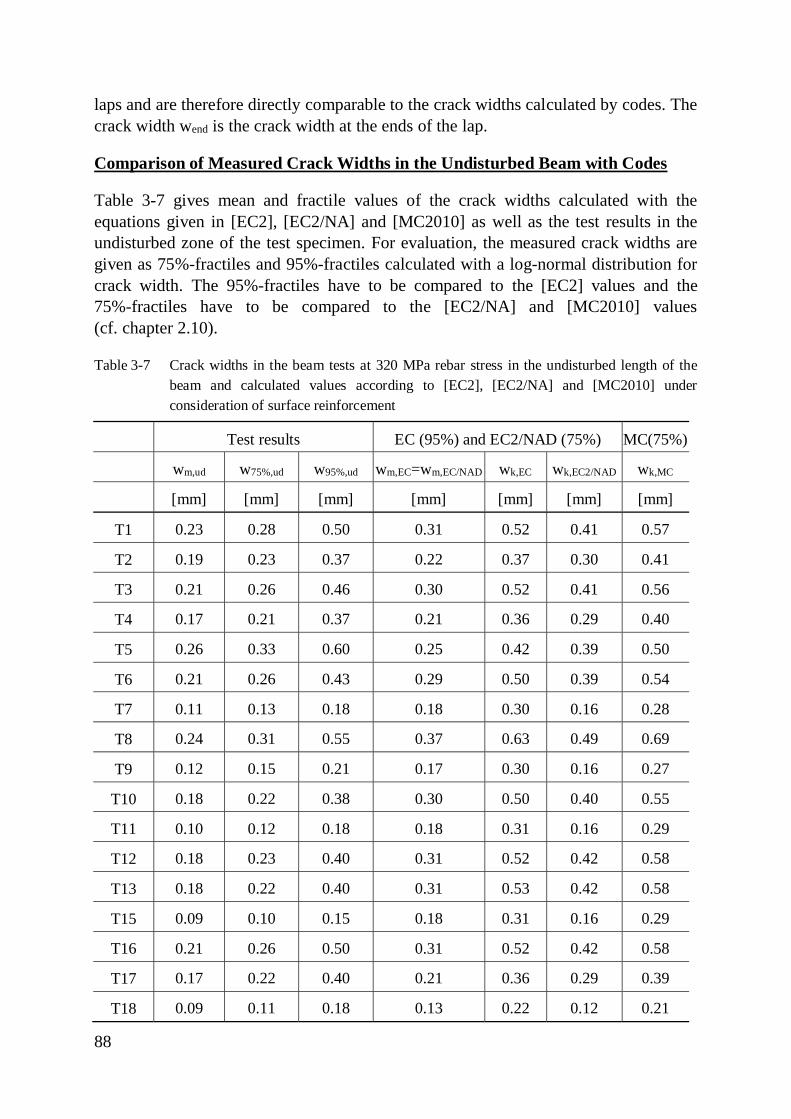
88
laps and are therefore directly comparable to the crack widths calculated by codes. Thecrack width wend is the crack width at the ends of the lap.
Comparison of Measured Crack Widths in the Undisturbed Beam with Codes
Table 3-7 gives mean and fractile values of the crack widths calculated with theequations given in [EC2], [EC2/NA] and [MC2010] as well as the test results in theundisturbed zone of the test specimen. For evaluation, the measured crack widths aregiven as 75%-fractiles and 95%-fractiles calculated with a log-normal distribution forcrack width. The 95%-fractiles have to be compared to the [EC2] values and the75%-fractiles have to be compared to the [EC2/NA] and [MC2010] values(cf. chapter 2.10).
Table 3-7 Crack widths in the beam tests at 320 MPa rebar stress in the undisturbed length of thebeam and calculated values according to [EC2], [EC2/NA] and [MC2010] underconsideration of surface reinforcement
Test results EC (95%) and EC2/NAD (75%) MC(75%)
wm,ud w75%,ud w95%,ud wm,EC=wm,EC/NAD wk,EC wk,EC2/NAD wk,MC
[mm] [mm] [mm] [mm] [mm] [mm] [mm]
T1 0.23 0.28 0.50 0.31 0.52 0.41 0.57
T2 0.19 0.23 0.37 0.22 0.37 0.30 0.41
T3 0.21 0.26 0.46 0.30 0.52 0.41 0.56
T4 0.17 0.21 0.37 0.21 0.36 0.29 0.40
T5 0.26 0.33 0.60 0.25 0.42 0.39 0.50
T6 0.21 0.26 0.43 0.29 0.50 0.39 0.54
T7 0.11 0.13 0.18 0.18 0.30 0.16 0.28
T8 0.24 0.31 0.55 0.37 0.63 0.49 0.69
T9 0.12 0.15 0.21 0.17 0.30 0.16 0.27
T10 0.18 0.22 0.38 0.30 0.50 0.40 0.55
T11 0.10 0.12 0.18 0.18 0.31 0.16 0.29
T12 0.18 0.23 0.40 0.31 0.52 0.42 0.58
T13 0.18 0.22 0.40 0.31 0.53 0.42 0.58
T15 0.09 0.10 0.15 0.18 0.31 0.16 0.29
T16 0.21 0.26 0.50 0.31 0.52 0.42 0.58
T17 0.17 0.22 0.40 0.21 0.36 0.29 0.39
T18 0.09 0.11 0.18 0.13 0.22 0.12 0.21
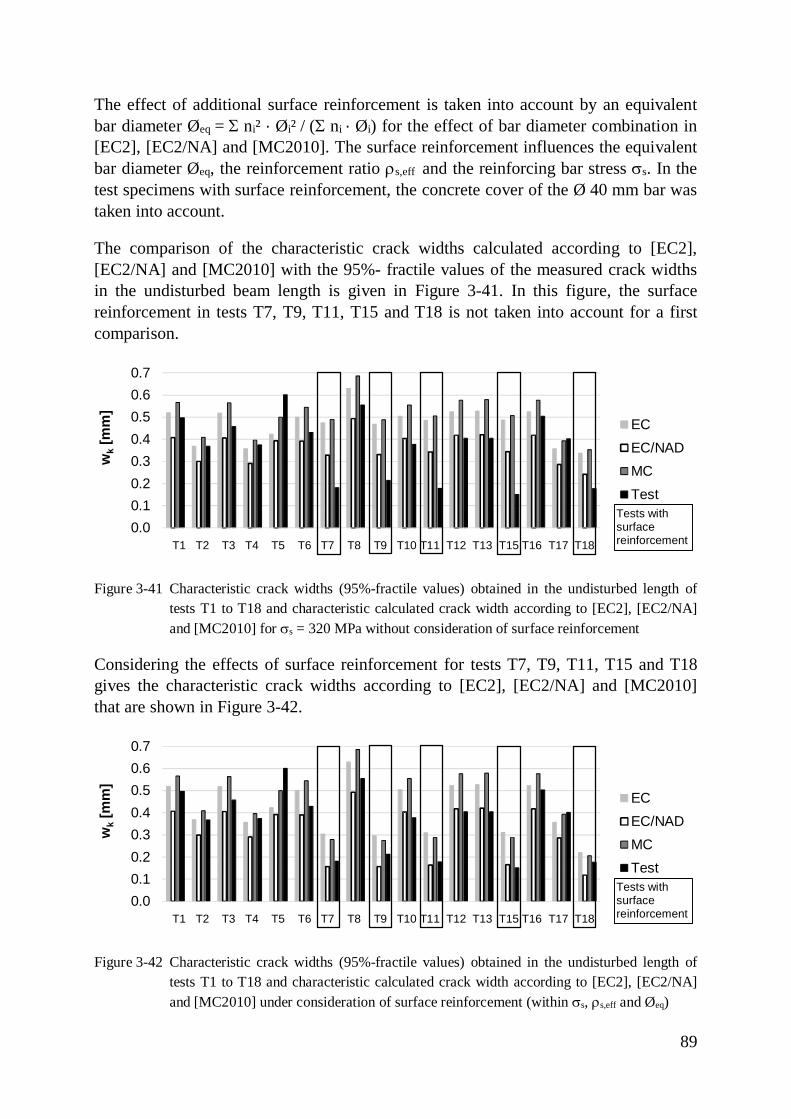
89
The effect of additional surface reinforcement is taken into account by an equivalentbar diameter Øeq = S ni² · Øi² / (S ni · Øi) for the effect of bar diameter combination in[EC2], [EC2/NA] and [MC2010]. The surface reinforcement influences the equivalentbar diameter Øeq, the reinforcement ratio rs,eff and the reinforcing bar stress ss. In thetest specimens with surface reinforcement, the concrete cover of the Ø 40 mm bar wastaken into account.
The comparison of the characteristic crack widths calculated according to [EC2],[EC2/NA] and [MC2010] with the 95%- fractile values of the measured crack widthsin the undisturbed beam length is given in Figure 3-41. In this figure, the surfacereinforcement in tests T7, T9, T11, T15 and T18 is not taken into account for a firstcomparison.
Figure 3-41 Characteristic crack widths (95%-fractile values) obtained in the undisturbed length oftests T1 to T18 and characteristic calculated crack width according to [EC2], [EC2/NA]and [MC2010] for ss = 320 MPa without consideration of surface reinforcement
Considering the effects of surface reinforcement for tests T7, T9, T11, T15 and T18gives the characteristic crack widths according to [EC2], [EC2/NA] and [MC2010]that are shown in Figure 3-42.
Figure 3-42 Characteristic crack widths (95%-fractile values) obtained in the undisturbed length oftests T1 to T18 and characteristic calculated crack width according to [EC2], [EC2/NA]and [MC2010] under consideration of surface reinforcement (within ss, rs,eff and Øeq)
0.00.10.20.30.40.50.60.7
1 2 3 4 5 6 7 8 9 10 11 12 13 14 15 16 17
wk
[mm
]
ECEC/NADMCTest
T1 T2 T3 T4 T5 T6 T7 T8 T9 T10 T11 T12 T13 T15 T16 T17 T18
Tests withsurfacereinforcement
0.00.10.20.30.40.50.60.7
1 2 3 4 5 6 7 8 9 10 11 12 13 14 15 16 17
wk
[mm
]
ECEC/NADMCTest
T1 T2 T3 T4 T5 T6 T7 T8 T9 T10 T11 T12 T13 T15 T16 T17 T18
Tests withsurfacereinforcement
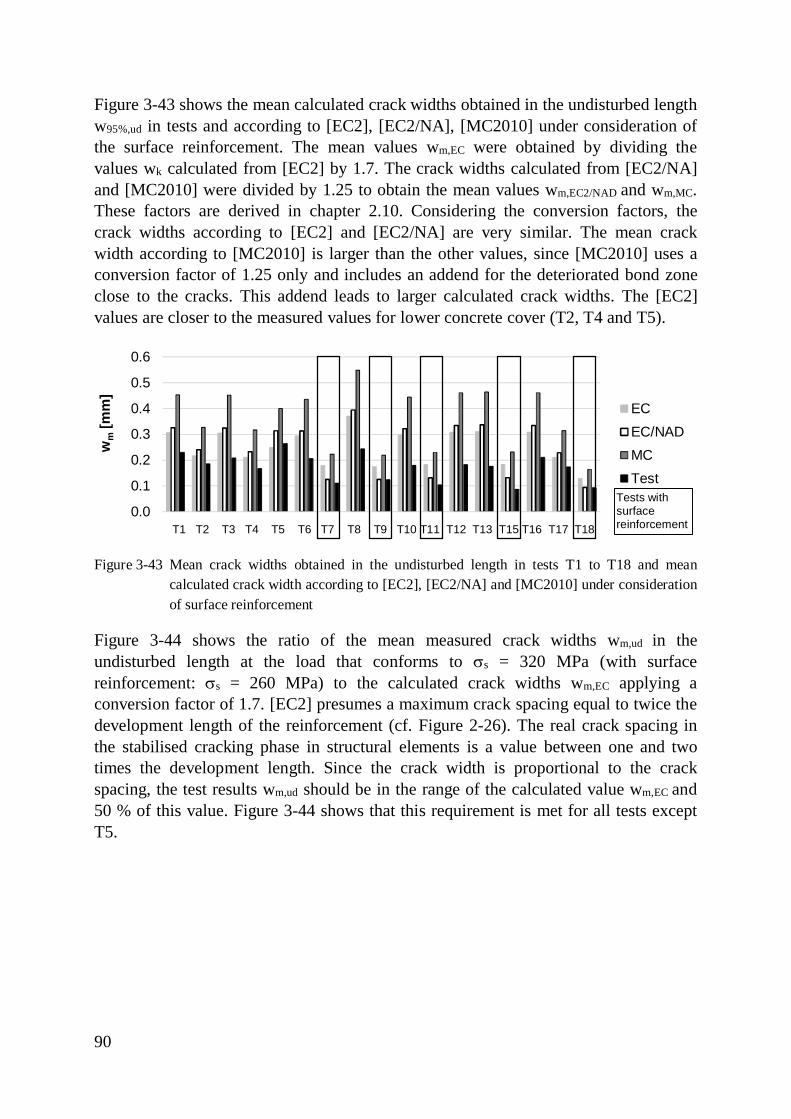
90
Figure 3-43 shows the mean calculated crack widths obtained in the undisturbed lengthw95%,ud in tests and according to [EC2], [EC2/NA], [MC2010] under consideration ofthe surface reinforcement. The mean values wm,EC were obtained by dividing thevalues wk calculated from [EC2] by 1.7. The crack widths calculated from [EC2/NA]and [MC2010] were divided by 1.25 to obtain the mean values wm,EC2/NAD and wm,MC.These factors are derived in chapter 2.10. Considering the conversion factors, thecrack widths according to [EC2] and [EC2/NA] are very similar. The mean crackwidth according to [MC2010] is larger than the other values, since [MC2010] uses aconversion factor of 1.25 only and includes an addend for the deteriorated bond zoneclose to the cracks. This addend leads to larger calculated crack widths. The [EC2]values are closer to the measured values for lower concrete cover (T2, T4 and T5).
Figure 3-43 Mean crack widths obtained in the undisturbed length in tests T1 to T18 and meancalculated crack width according to [EC2], [EC2/NA] and [MC2010] under considerationof surface reinforcement
Figure 3-44 shows the ratio of the mean measured crack widths wm,ud in theundisturbed length at the load that conforms to ss = 320 MPa (with surfacereinforcement: ss = 260 MPa) to the calculated crack widths wm,EC applying aconversion factor of 1.7. [EC2] presumes a maximum crack spacing equal to twice thedevelopment length of the reinforcement (cf. Figure 2-26). The real crack spacing inthe stabilised cracking phase in structural elements is a value between one and twotimes the development length. Since the crack width is proportional to the crackspacing, the test results wm,ud should be in the range of the calculated value wm,EC and50 % of this value. Figure 3-44 shows that this requirement is met for all tests exceptT5.
0.0
0.1
0.2
0.3
0.4
0.5
0.6
1 2 3 4 5 6 7 8 9 10 11 12 13 14 15 16 17
wm
[mm
]
ECEC/NADMCTest
T1 T2 T3 T4 T5 T6 T7 T8 T9 T10 T11 T12 T13 T15 T16 T17 T18
Tests withsurfacereinforcement
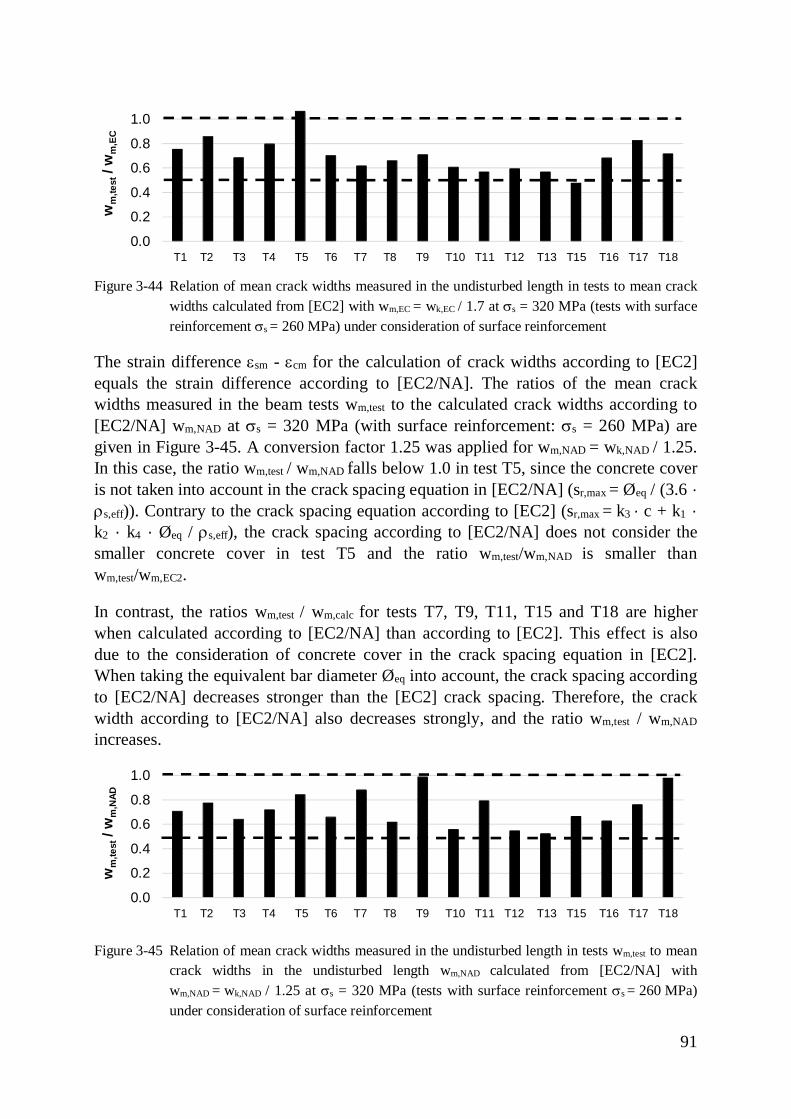
91
Figure 3-44 Relation of mean crack widths measured in the undisturbed length in tests to mean crackwidths calculated from [EC2] with wm,EC = wk,EC / 1.7 at ss = 320 MPa (tests with surfacereinforcement ss = 260 MPa) under consideration of surface reinforcement
The strain difference esm - ecm for the calculation of crack widths according to [EC2]equals the strain difference according to [EC2/NA]. The ratios of the mean crackwidths measured in the beam tests wm,test to the calculated crack widths according to[EC2/NA] wm,NAD at ss = 320 MPa (with surface reinforcement: ss = 260 MPa) aregiven in Figure 3-45. A conversion factor 1.25 was applied for wm,NAD = wk,NAD / 1.25.In this case, the ratio wm,test / wm,NAD falls below 1.0 in test T5, since the concrete coveris not taken into account in the crack spacing equation in [EC2/NA] (sr,max = Øeq / (3.6 ·rs,eff)). Contrary to the crack spacing equation according to [EC2] (sr,max = k3 · c + k1 ·k2 · k4 · Øeq / rs,eff), the crack spacing according to [EC2/NA] does not consider thesmaller concrete cover in test T5 and the ratio wm,test/wm,NAD is smaller thanwm,test/wm,EC2.
In contrast, the ratios wm,test / wm,calc for tests T7, T9, T11, T15 and T18 are higherwhen calculated according to [EC2/NA] than according to [EC2]. This effect is alsodue to the consideration of concrete cover in the crack spacing equation in [EC2].When taking the equivalent bar diameter Øeq into account, the crack spacing accordingto [EC2/NA] decreases stronger than the [EC2] crack spacing. Therefore, the crackwidth according to [EC2/NA] also decreases strongly, and the ratio wm,test / wm,NAD
increases.
Figure 3-45 Relation of mean crack widths measured in the undisturbed length in tests wm,test to meancrack widths in the undisturbed length wm,NAD calculated from [EC2/NA] withwm,NAD = wk,NAD / 1.25 at ss = 320 MPa (tests with surface reinforcement ss = 260 MPa)under consideration of surface reinforcement
0.0
0.2
0.4
0.6
0.8
1.0
1 2 3 4 5 6 7 8 9 10 11 12 13 14 15 16 17
wm
,test
/ wm
,EC
T1 T2 T3 T4 T5 T6 T7 T8 T9 T10 T11 T12 T13 T15 T16 T17 T18
0.0
0.2
0.4
0.6
0.8
1.0
1 2 3 4 5 6 7 8 9 10 11 12 13 14 15 16 17
wm
,test
/ wm
,NAD
T1 T2 T3 T4 T5 T6 T7 T8 T9 T10 T11 T12 T13 T15 T16 T17 T18
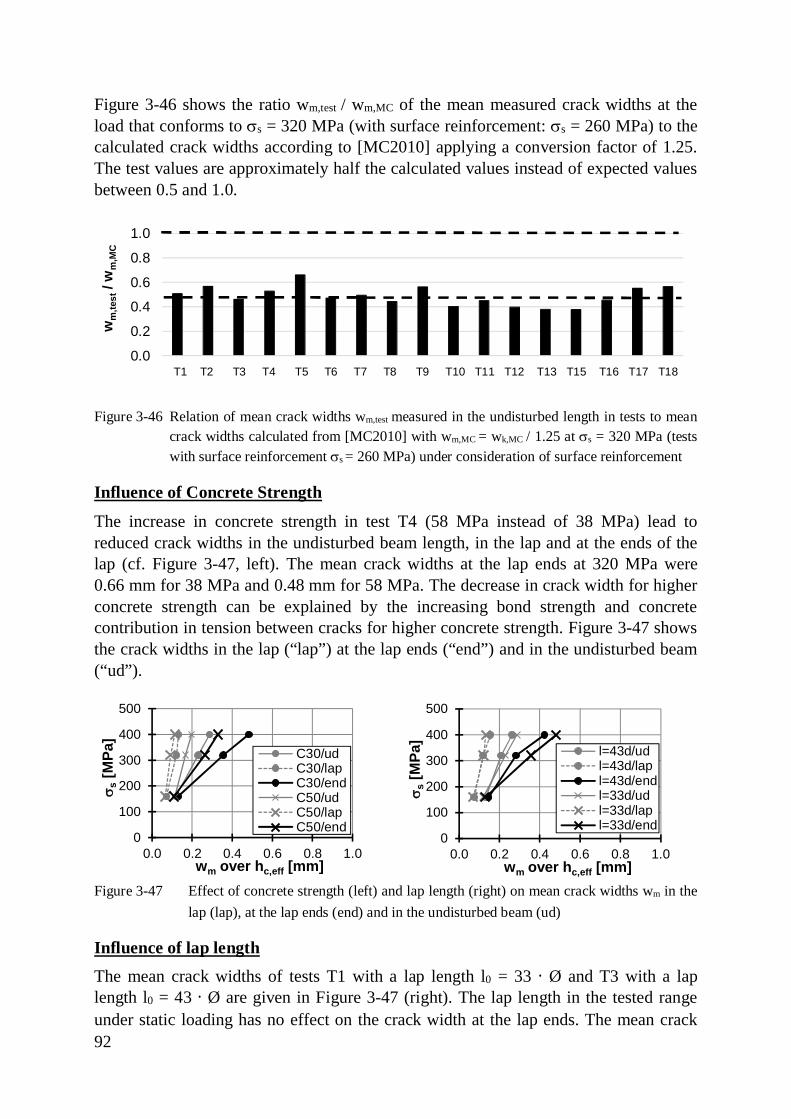
92
Figure 3-46 shows the ratio wm,test / wm,MC of the mean measured crack widths at theload that conforms to ss = 320 MPa (with surface reinforcement: ss = 260 MPa) to thecalculated crack widths according to [MC2010] applying a conversion factor of 1.25.The test values are approximately half the calculated values instead of expected valuesbetween 0.5 and 1.0.
Figure 3-46 Relation of mean crack widths wm,test measured in the undisturbed length in tests to meancrack widths calculated from [MC2010] with wm,MC = wk,MC / 1.25 at ss = 320 MPa (testswith surface reinforcement ss = 260 MPa) under consideration of surface reinforcement
Influence of Concrete Strength
The increase in concrete strength in test T4 (58 MPa instead of 38 MPa) lead toreduced crack widths in the undisturbed beam length, in the lap and at the ends of thelap (cf. Figure 3-47, left). The mean crack widths at the lap ends at 320 MPa were0.66 mm for 38 MPa and 0.48 mm for 58 MPa. The decrease in crack width for higherconcrete strength can be explained by the increasing bond strength and concretecontribution in tension between cracks for higher concrete strength. Figure 3-47 showsthe crack widths in the lap (“lap”) at the lap ends (“end”) and in the undisturbed beam(“ud”).
Figure 3-47 Effect of concrete strength (left) and lap length (right) on mean crack widths wm in thelap (lap), at the lap ends (end) and in the undisturbed beam (ud)
Influence of lap lengthThe mean crack widths of tests T1 with a lap length l0 = 33 · Ø and T3 with a laplength l0 = 43 · Ø are given in Figure 3-47 (right). The lap length in the tested rangeunder static loading has no effect on the crack width at the lap ends. The mean crack
0.0
0.2
0.4
0.6
0.8
1.0
1 2 3 4 5 6 7 8 9 10 11 12 13 14 15 16 17
wm
,test
/ wm
,MC
T1 T2 T3 T4 T5 T6 T7 T8 T9 T10 T11 T12 T13 T15 T16 T17 T18
0
100
200
300
400
500
0.0 0.2 0.4 0.6 0.8 1.0
s s[M
Pa]
wm over hc,eff [mm]
C30/udC30/lapC30/endC50/udC50/lapC50/end
0
100
200
300
400
500
0.0 0.2 0.4 0.6 0.8 1.0
s s[M
Pa]
wm over hc,eff [mm]
l=43d/udl=43d/lapl=43d/endl=33d/udl=33d/lapl=33d/end
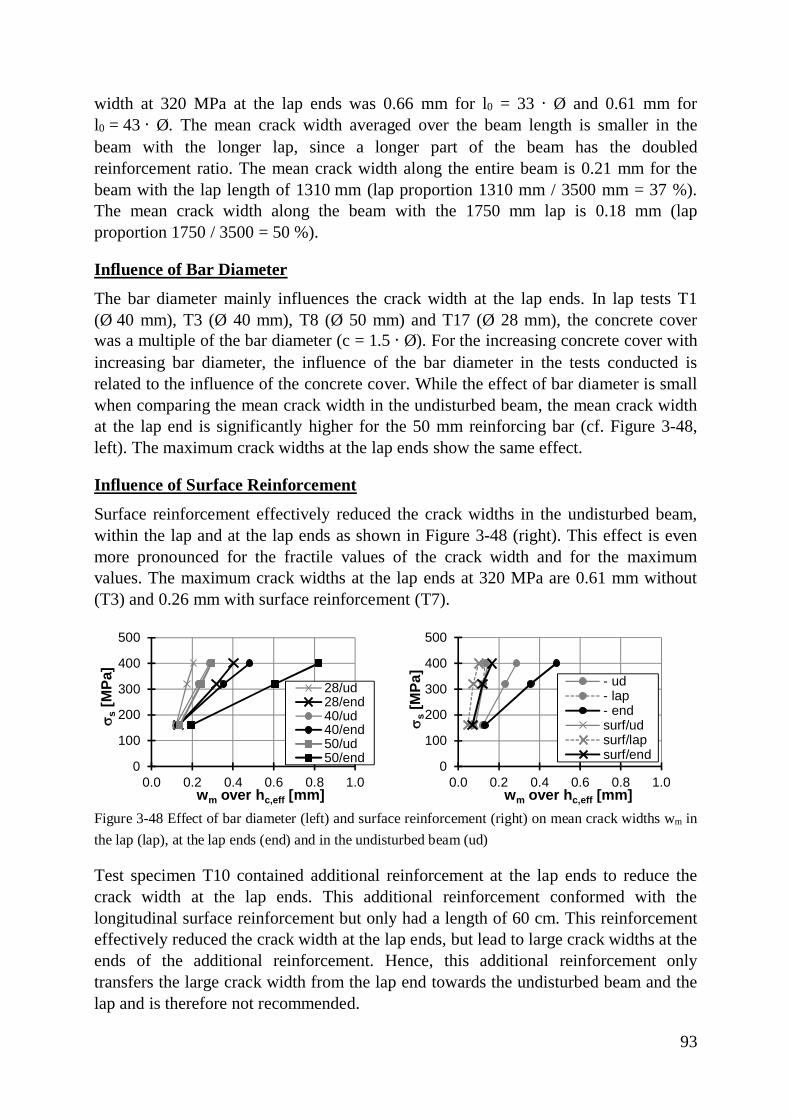
93
width at 320 MPa at the lap ends was 0.66 mm for l0 = 33 · Ø and 0.61 mm forl0 = 43 · Ø. The mean crack width averaged over the beam length is smaller in thebeam with the longer lap, since a longer part of the beam has the doubledreinforcement ratio. The mean crack width along the entire beam is 0.21 mm for thebeam with the lap length of 1310 mm (lap proportion 1310 mm / 3500 mm = 37 %).The mean crack width along the beam with the 1750 mm lap is 0.18 mm (lapproportion 1750 / 3500 = 50 %).
Influence of Bar Diameter
The bar diameter mainly influences the crack width at the lap ends. In lap tests T1(Ø 40 mm), T3 (Ø 40 mm), T8 (Ø 50 mm) and T17 (Ø 28 mm), the concrete coverwas a multiple of the bar diameter (c = 1.5 · Ø). For the increasing concrete cover withincreasing bar diameter, the influence of the bar diameter in the tests conducted isrelated to the influence of the concrete cover. While the effect of bar diameter is smallwhen comparing the mean crack width in the undisturbed beam, the mean crack widthat the lap end is significantly higher for the 50 mm reinforcing bar (cf. Figure 3-48,left). The maximum crack widths at the lap ends show the same effect.
Influence of Surface Reinforcement
Surface reinforcement effectively reduced the crack widths in the undisturbed beam,within the lap and at the lap ends as shown in Figure 3-48 (right). This effect is evenmore pronounced for the fractile values of the crack width and for the maximumvalues. The maximum crack widths at the lap ends at 320 MPa are 0.61 mm without(T3) and 0.26 mm with surface reinforcement (T7).
Figure 3-48 Effect of bar diameter (left) and surface reinforcement (right) on mean crack widths wm inthe lap (lap), at the lap ends (end) and in the undisturbed beam (ud)
Test specimen T10 contained additional reinforcement at the lap ends to reduce thecrack width at the lap ends. This additional reinforcement conformed with thelongitudinal surface reinforcement but only had a length of 60 cm. This reinforcementeffectively reduced the crack width at the lap ends, but lead to large crack widths at theends of the additional reinforcement. Hence, this additional reinforcement onlytransfers the large crack width from the lap end towards the undisturbed beam and thelap and is therefore not recommended.
0
100
200
300
400
500
0.0 0.2 0.4 0.6 0.8 1.0
s s[M
Pa]
wm over hc,eff [mm]
28/ud28/end40/ud40/end50/ud50/end 0
100
200
300
400
500
0.0 0.2 0.4 0.6 0.8 1.0
s s[M
Pa]
wm over hc,eff [mm]
- ud- lap- endsurf/udsurf/lapsurf/end
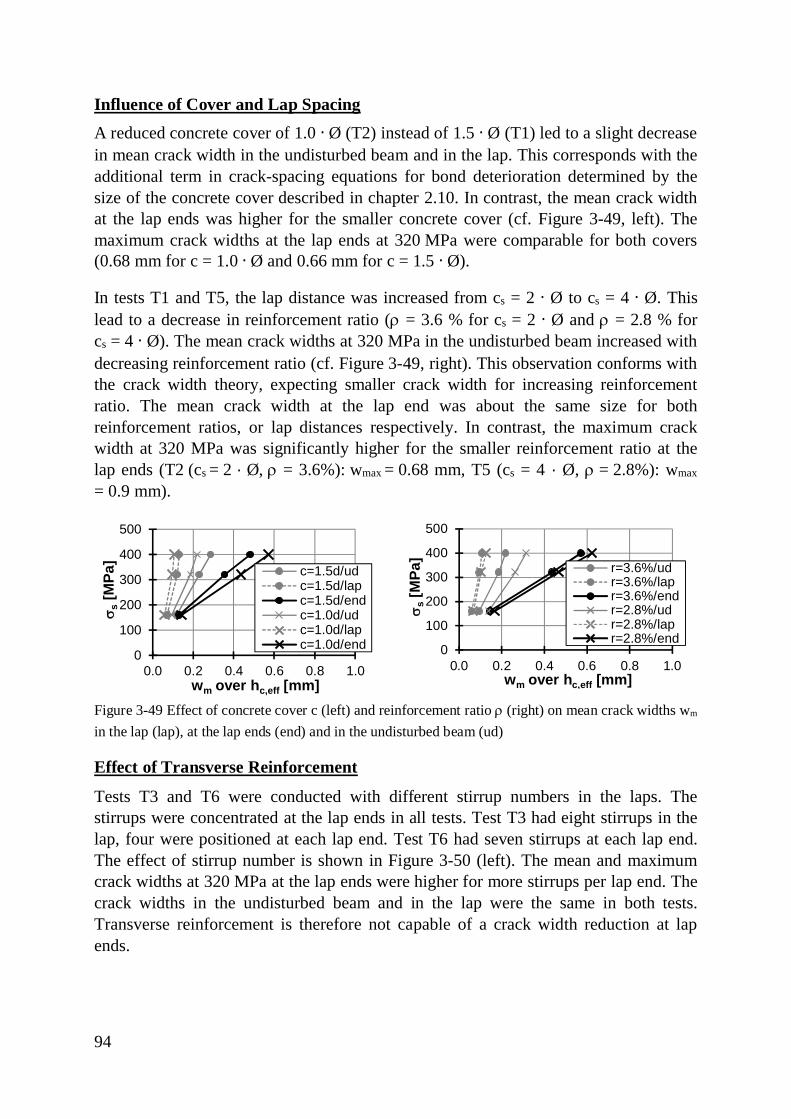
94
Influence of Cover and Lap SpacingA reduced concrete cover of 1.0 · Ø (T2) instead of 1.5 · Ø (T1) led to a slight decreasein mean crack width in the undisturbed beam and in the lap. This corresponds with theadditional term in crack-spacing equations for bond deterioration determined by thesize of the concrete cover described in chapter 2.10. In contrast, the mean crack widthat the lap ends was higher for the smaller concrete cover (cf. Figure 3-49, left). Themaximum crack widths at the lap ends at 320 MPa were comparable for both covers(0.68 mm for c = 1.0 · Ø and 0.66 mm for c = 1.5 · Ø).
In tests T1 and T5, the lap distance was increased from cs = 2 · Ø to cs = 4 · Ø. Thislead to a decrease in reinforcement ratio (r = 3.6 % for cs = 2 · Ø and r = 2.8 % forcs = 4 · Ø). The mean crack widths at 320 MPa in the undisturbed beam increased withdecreasing reinforcement ratio (cf. Figure 3-49, right). This observation conforms withthe crack width theory, expecting smaller crack width for increasing reinforcementratio. The mean crack width at the lap end was about the same size for bothreinforcement ratios, or lap distances respectively. In contrast, the maximum crackwidth at 320 MPa was significantly higher for the smaller reinforcement ratio at thelap ends (T2 (cs = 2 · Ø, r = 3.6%): wmax = 0.68 mm, T5 (cs = 4 · Ø, r = 2.8%): wmax
= 0.9 mm).
Figure 3-49 Effect of concrete cover c (left) and reinforcement ratio r (right) on mean crack widths wm
in the lap (lap), at the lap ends (end) and in the undisturbed beam (ud)
Effect of Transverse Reinforcement
Tests T3 and T6 were conducted with different stirrup numbers in the laps. Thestirrups were concentrated at the lap ends in all tests. Test T3 had eight stirrups in thelap, four were positioned at each lap end. Test T6 had seven stirrups at each lap end.The effect of stirrup number is shown in Figure 3-50 (left). The mean and maximumcrack widths at 320 MPa at the lap ends were higher for more stirrups per lap end. Thecrack widths in the undisturbed beam and in the lap were the same in both tests.Transverse reinforcement is therefore not capable of a crack width reduction at lapends.
0
100
200
300
400
500
0.0 0.2 0.4 0.6 0.8 1.0
s s[M
Pa]
wm over hc,eff [mm]
c=1.5d/udc=1.5d/lapc=1.5d/endc=1.0d/udc=1.0d/lapc=1.0d/end 0
100
200
300
400
500
0.0 0.2 0.4 0.6 0.8 1.0
s s[M
Pa]
wm over hc,eff [mm]
r=3.6%/udr=3.6%/lapr=3.6%/endr=2.8%/udr=2.8%/lapr=2.8%/end
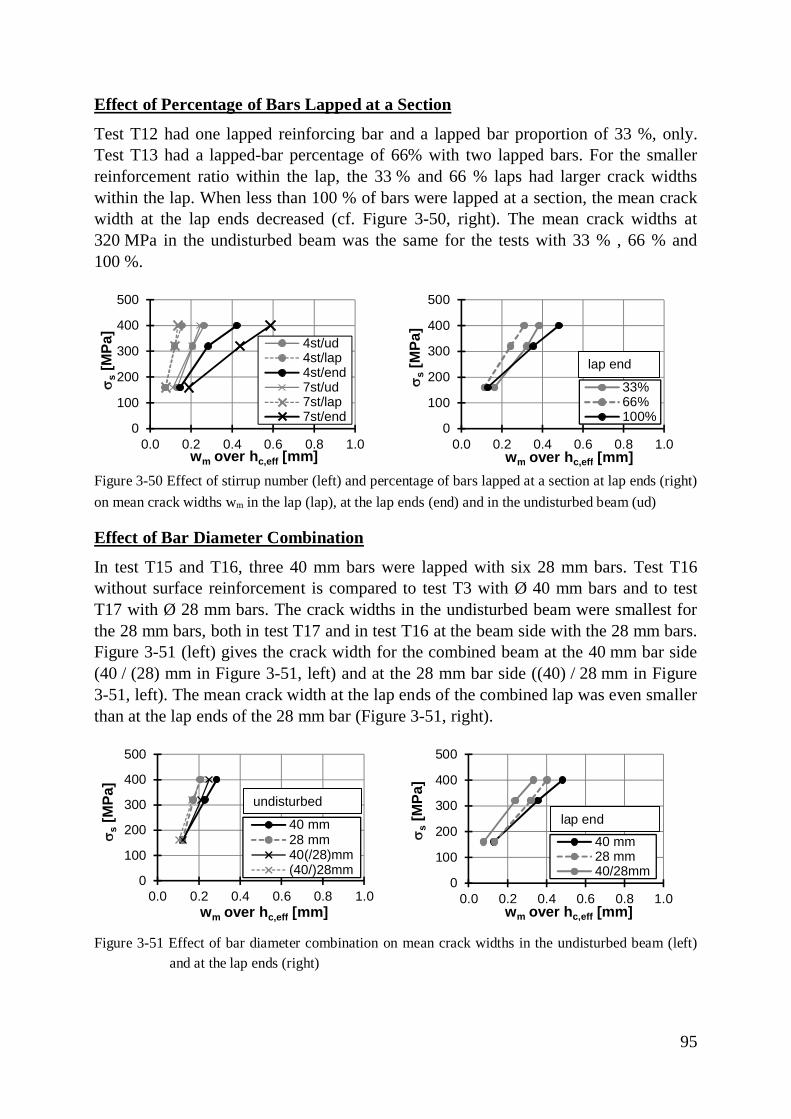
95
Effect of Percentage of Bars Lapped at a Section
Test T12 had one lapped reinforcing bar and a lapped bar proportion of 33 %, only.Test T13 had a lapped-bar percentage of 66% with two lapped bars. For the smallerreinforcement ratio within the lap, the 33 % and 66 % laps had larger crack widthswithin the lap. When less than 100 % of bars were lapped at a section, the mean crackwidth at the lap ends decreased (cf. Figure 3-50, right). The mean crack widths at320 MPa in the undisturbed beam was the same for the tests with 33 % , 66 % and100 %.
Figure 3-50 Effect of stirrup number (left) and percentage of bars lapped at a section at lap ends (right)on mean crack widths wm in the lap (lap), at the lap ends (end) and in the undisturbed beam (ud)
Effect of Bar Diameter Combination
In test T15 and T16, three 40 mm bars were lapped with six 28 mm bars. Test T16without surface reinforcement is compared to test T3 with Ø 40 mm bars and to testT17 with Ø 28 mm bars. The crack widths in the undisturbed beam were smallest forthe 28 mm bars, both in test T17 and in test T16 at the beam side with the 28 mm bars.Figure 3-51 (left) gives the crack width for the combined beam at the 40 mm bar side(40 / (28) mm in Figure 3-51, left) and at the 28 mm bar side ((40) / 28 mm in Figure3-51, left). The mean crack width at the lap ends of the combined lap was even smallerthan at the lap ends of the 28 mm bar (Figure 3-51, right).
Figure 3-51 Effect of bar diameter combination on mean crack widths in the undisturbed beam (left)and at the lap ends (right)
0
100
200
300
400
500
0.0 0.2 0.4 0.6 0.8 1.0
s s[M
Pa]
wm over hc,eff [mm]
4st/ud4st/lap4st/end7st/ud7st/lap7st/end
0
100
200
300
400
500
0.0 0.2 0.4 0.6 0.8 1.0
s s[M
Pa]
wm over hc,eff [mm]
33%66%100%
lap end
0
100
200
300
400
500
0.0 0.2 0.4 0.6 0.8 1.0
s s[M
Pa]
wm over hc,eff [mm]
40 mm28 mm40(/28)mm(40/)28mm
undisturbed
0
100
200
300
400
500
0.0 0.2 0.4 0.6 0.8 1.0
s s[M
Pa]
wm over hc,eff [mm]
40 mm28 mm40/28mm
lap end
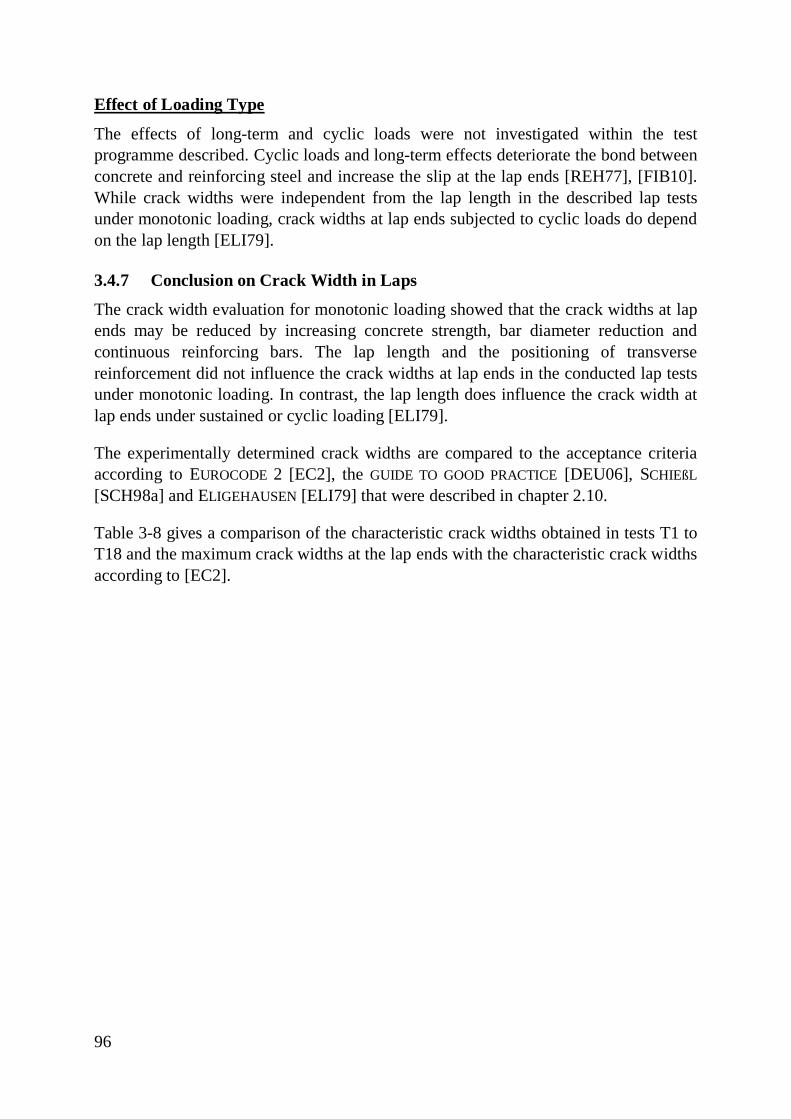
96
Effect of Loading Type
The effects of long-term and cyclic loads were not investigated within the testprogramme described. Cyclic loads and long-term effects deteriorate the bond betweenconcrete and reinforcing steel and increase the slip at the lap ends [REH77], [FIB10].While crack widths were independent from the lap length in the described lap testsunder monotonic loading, crack widths at lap ends subjected to cyclic loads do dependon the lap length [ELI79].
3.4.7 Conclusion on Crack Width in Laps
The crack width evaluation for monotonic loading showed that the crack widths at lapends may be reduced by increasing concrete strength, bar diameter reduction andcontinuous reinforcing bars. The lap length and the positioning of transversereinforcement did not influence the crack widths at lap ends in the conducted lap testsunder monotonic loading. In contrast, the lap length does influence the crack width atlap ends under sustained or cyclic loading [ELI79].
The experimentally determined crack widths are compared to the acceptance criteriaaccording to EUROCODE 2 [EC2], the GUIDE TO GOOD PRACTICE [DEU06], SCHIEßL[SCH98a] and ELIGEHAUSEN [ELI79] that were described in chapter 2.10.
Table 3-8 gives a comparison of the characteristic crack widths obtained in tests T1 toT18 and the maximum crack widths at the lap ends with the characteristic crack widthsaccording to [EC2].
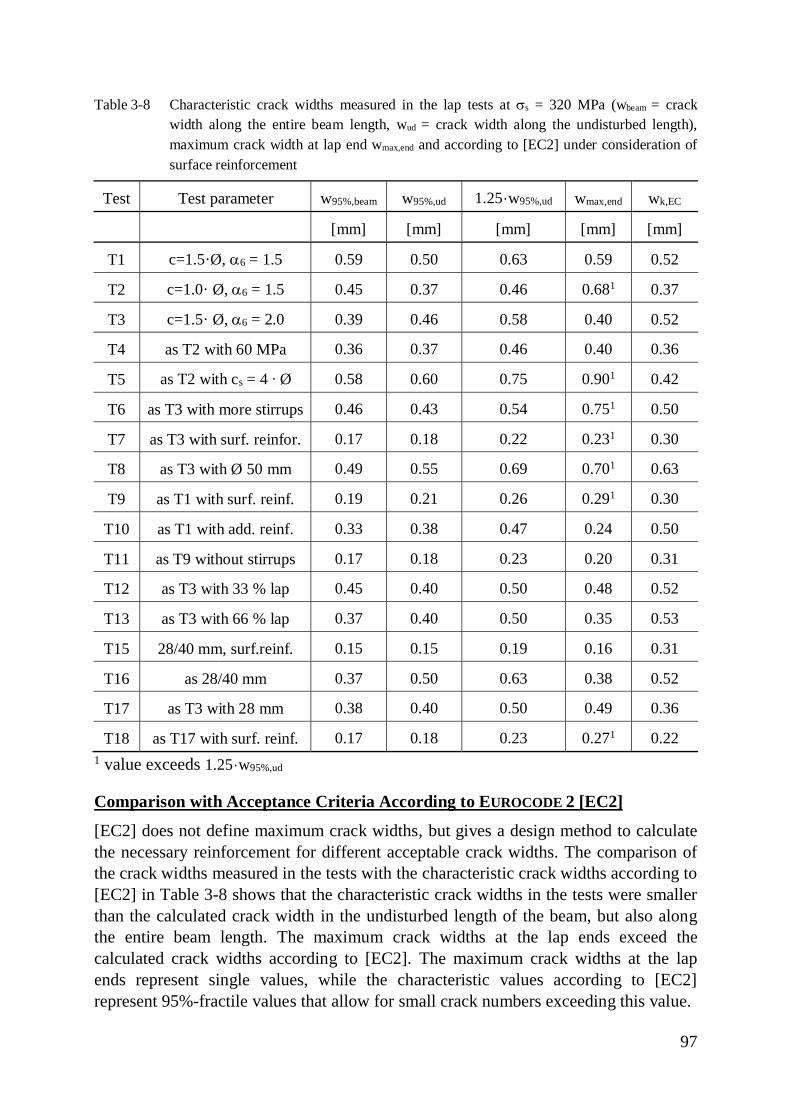
97
Table 3-8 Characteristic crack widths measured in the lap tests at ss = 320 MPa (wbeam = crackwidth along the entire beam length, wud = crack width along the undisturbed length),maximum crack width at lap end wmax,end and according to [EC2] under consideration ofsurface reinforcement
Test Test parameter w95%,beam w95%,ud 1.25·w95%,ud wmax,end wk,EC
[mm] [mm] [mm] [mm] [mm]
T1 c=1.5·Ø, a6 = 1.5 0.59 0.50 0.63 0.59 0.52
T2 c=1.0· Ø, a6 = 1.5 0.45 0.37 0.46 0.681 0.37
T3 c=1.5· Ø, a6 = 2.0 0.39 0.46 0.58 0.40 0.52
T4 as T2 with 60 MPa 0.36 0.37 0.46 0.40 0.36
T5 as T2 with cs = 4 ∙ Ø 0.58 0.60 0.75 0.901 0.42
T6 as T3 with more stirrups 0.46 0.43 0.54 0.751 0.50
T7 as T3 with surf. reinfor. 0.17 0.18 0.22 0.231 0.30
T8 as T3 with Ø 50 mm 0.49 0.55 0.69 0.701 0.63
T9 as T1 with surf. reinf. 0.19 0.21 0.26 0.291 0.30
T10 as T1 with add. reinf. 0.33 0.38 0.47 0.24 0.50
T11 as T9 without stirrups 0.17 0.18 0.23 0.20 0.31
T12 as T3 with 33 % lap 0.45 0.40 0.50 0.48 0.52
T13 as T3 with 66 % lap 0.37 0.40 0.50 0.35 0.53
T15 28/40 mm, surf.reinf. 0.15 0.15 0.19 0.16 0.31
T16 as 28/40 mm 0.37 0.50 0.63 0.38 0.52
T17 as T3 with 28 mm 0.38 0.40 0.50 0.49 0.36
T18 as T17 with surf. reinf. 0.17 0.18 0.23 0.271 0.221 value exceeds 1.25·w95%,ud
Comparison with Acceptance Criteria According to EUROCODE 2 [EC2]
[EC2] does not define maximum crack widths, but gives a design method to calculatethe necessary reinforcement for different acceptable crack widths. The comparison ofthe crack widths measured in the tests with the characteristic crack widths according to[EC2] in Table 3-8 shows that the characteristic crack widths in the tests were smallerthan the calculated crack width in the undisturbed length of the beam, but also alongthe entire beam length. The maximum crack widths at the lap ends exceed thecalculated crack widths according to [EC2]. The maximum crack widths at the lapends represent single values, while the characteristic values according to [EC2]represent 95%-fractile values that allow for small crack numbers exceeding this value.
98
The crack widths in tests T2 and T5 with a concrete cover of 40 mm (1 · Ø) exceededthe characteristic values according to [EC2] when considering the entire beam length.In both tests, the 95% quantiles wk95%,test were above the calculated crack widths wk,EC
in all parts of the beam.
In the tests with surface reinforcement (T7, T9, T11, T15, T18), the characteristiccrack widths were smaller than 0.2 mm when considering the entire beam length(Table 3-6). The measured crack widths were also smaller than the characteristicvalues according to [EC2] taking the equivalent bar diameter, the smaller bar stressand the increased reinforcement ratio into account.
Comparison with Acceptance Criteria According to SCHIEßL [SCH98a]
SCHIEßL [SCH98a] recommends that the mean value of the data set of crackmeasurements shall be smaller than the defined limiting value wlim and that the largestcrack width ˗ defined as the 95%-fractile of the sample ˗ may not exceed the limitingvalue by more than 30 % (wtest,95%≤ 1.3· wlim). In contrast, the 95%-fractiles aredetermined by a classical statistical analysis with wk,95% = wm · (1+1.645 ·Vx).
In the tests without surface reinforcement, the largest 95%-fractile value of the crackwidth including the lap end was 0.59 mm in test T1 (cf. Table 3-8). The requirementwtest,95% ≤ 1.3· wlim according to SCHIEßL [SCH98a] would therefore be met whendefining wlim = 0.45 mm. In the tests with surface reinforcement, the requirement thatthe largest crack width falls below 1.3-times the limiting value would be met forwlim = 0.15 mm.
Comparison with Acceptance Criteria According to ELIGEHAUSEN [ELI79]ELIGEHAUSEN [ELI79] recommends accepting crack widths at lap ends that are 25%larger than the crack width limits wlim for the 95%-quantiles. The maximum crackwidths at the lap ends exceeding 25 % of the 95%-fractile values along the entire beamlength are indicated in Table 3-8. The maximum crack width at the lap ends in the testspecimens with surface reinforcement T7, T9 and T18 exceed 1.25-times the 95%-fractile values, but the absolute values are small. For the test specimens withoutsurface reinforcement, the acceptance criteria is not met in tests with small concretecover T2 and T5, but neither in test T6 with increased transverse reinforcement.
Comparison with Acceptance Criteria According to GUIDE TO GOOD PRACTICE[DEU06]
Single crack widths shall not exceed 0.4 mm to 0.5 mm [DEU12] and the percentagesof exceedance shall not be larger than the following values [DEU08], [DEU06]:
· wk,lim. = 0.4 mm (maximum 5 % exceedance)· wk,lim. = 0.3 mm (maximum 10 % exceedance)· wk,lim. = 0.2 mm (maximum 20 % exceedance)
In this case, the number of crack widths above the given limits is counted
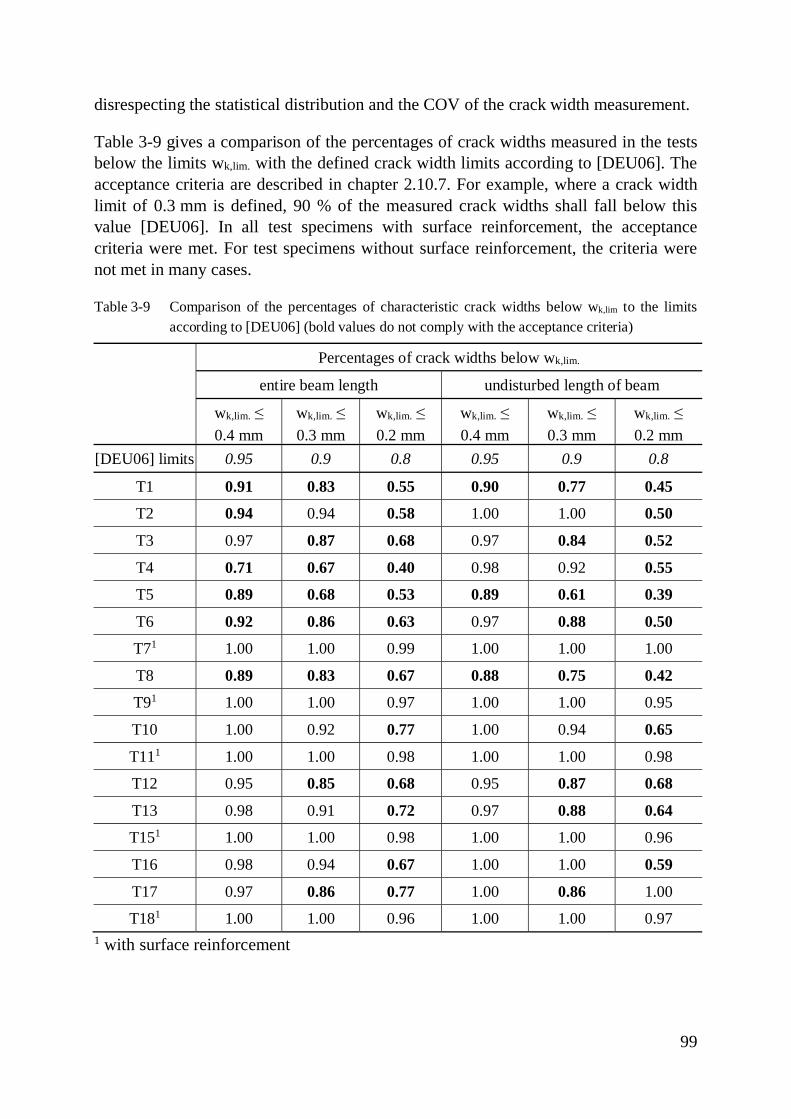
99
disrespecting the statistical distribution and the COV of the crack width measurement.
Table 3-9 gives a comparison of the percentages of crack widths measured in the testsbelow the limits wk,lim. with the defined crack width limits according to [DEU06]. Theacceptance criteria are described in chapter 2.10.7. For example, where a crack widthlimit of 0.3 mm is defined, 90 % of the measured crack widths shall fall below thisvalue [DEU06]. In all test specimens with surface reinforcement, the acceptancecriteria were met. For test specimens without surface reinforcement, the criteria werenot met in many cases.
Table 3-9 Comparison of the percentages of characteristic crack widths below wk,lim to the limitsaccording to [DEU06] (bold values do not comply with the acceptance criteria)
Percentages of crack widths below wk,lim.
entire beam length undisturbed length of beam
wk,lim. ≤0.4 mm
wk,lim. ≤0.3 mm
wk,lim. ≤0.2 mm
wk,lim. ≤0.4 mm
wk,lim. ≤0.3 mm
wk,lim. ≤0.2 mm
[DEU06] limits 0.95 0.9 0.8 0.95 0.9 0.8
T1 0.91 0.83 0.55 0.90 0.77 0.45
T2 0.94 0.94 0.58 1.00 1.00 0.50
T3 0.97 0.87 0.68 0.97 0.84 0.52
T4 0.71 0.67 0.40 0.98 0.92 0.55
T5 0.89 0.68 0.53 0.89 0.61 0.39
T6 0.92 0.86 0.63 0.97 0.88 0.50
T71 1.00 1.00 0.99 1.00 1.00 1.00
T8 0.89 0.83 0.67 0.88 0.75 0.42
T91 1.00 1.00 0.97 1.00 1.00 0.95
T10 1.00 0.92 0.77 1.00 0.94 0.65
T111 1.00 1.00 0.98 1.00 1.00 0.98
T12 0.95 0.85 0.68 0.95 0.87 0.68
T13 0.98 0.91 0.72 0.97 0.88 0.64
T151 1.00 1.00 0.98 1.00 1.00 0.96
T16 0.98 0.94 0.67 1.00 1.00 0.59
T17 0.97 0.86 0.77 1.00 0.86 1.00
T181 1.00 1.00 0.96 1.00 1.00 0.971 with surface reinforcement
100
Conclusion on Crack Widths in Lap Tests with Ø 40 mm Bars
- The mean measured crack widths are smaller than the mean calculated valuesaccording to [EC2], [EC2/NA] and [MC2010].
- The characteristic measured crack widths are not always smaller than thecharacteristic values calculated according to [EC2], [EC2/NA] and [MC2010],since the COV of the crack measurement along the entire beam including thelap was higher than 0.4.
- The calculated crack widths according to [EC2] and [EC2/NA] meet the testresults better than [MC2010] that gives values well above the measured crackwidths.
- The crack widths for a concrete cover 1.5 · Ø = 60 mm obtained in tests weresimilar to the calculated values, while the crack widths for a concrete cover1.0 · Ø = 40 mm were larger than the calculated values. The effect of coverseems therefore overestimated in [EC2].
- For tests with surface reinforcement, the crack widths can be obtained from thedesign equations in [EC2] and [EC2/NA] with the equivalent bar diameter Øeq,the increased reinforcement ratio and the decreased bar stress.
- Surface reinforcement reduces the characteristic crack width (95%-fractilevalues) along the beam length to values below 0.2 mm.
- The maximum crack widths at lap ends exceed 1.25-times the 95%-fractilevalues of the crack widths along the entire beam length in some tests with andwithout surface reinforcement.
- The defined maximum percentages of crack widths exceeding the limitsaccording to [DEU06] are met in the tests with surface reinforcement, but not inthe test specimens without surface reinforcement.
- The maximum crack widths at the lap ends exceed the calculated valuesaccording to [EC2] and [EC2/NA], but are still acceptable, since the calculatedvalues represent 95%-fractile values instead of maximum permissible values.
3.5 Anchorage Tests
3.5.1 Test-Specimen Dimensioning and Test-Setup
In [EC2], different required bond lengths and detailing rules are applied foranchorages and laps. The additional rules for large diameter bars in [EC2] are morerestrictive for laps, but some additional rules apply to anchorages as well. Toinvestigate the necessity of these rules and to clarify the differences betweenanchorages and laps, twelve anchorage tests were conducted. In structural elements,reinforcing bars are anchored at curtailed reinforcement and at the ends of beams andslabs. While anchorages at beam or slab supports benefit from transverse pressure,curtailed reinforcement lacks additional confinement by transverse pressure. Theconducted beam-end tests also correspond to simply supported beam ends. To accountfor their frequent occurrence and for a direct comparison with the beam-end testresults, anchorages were tested under transverse pressure in simply supported beams.
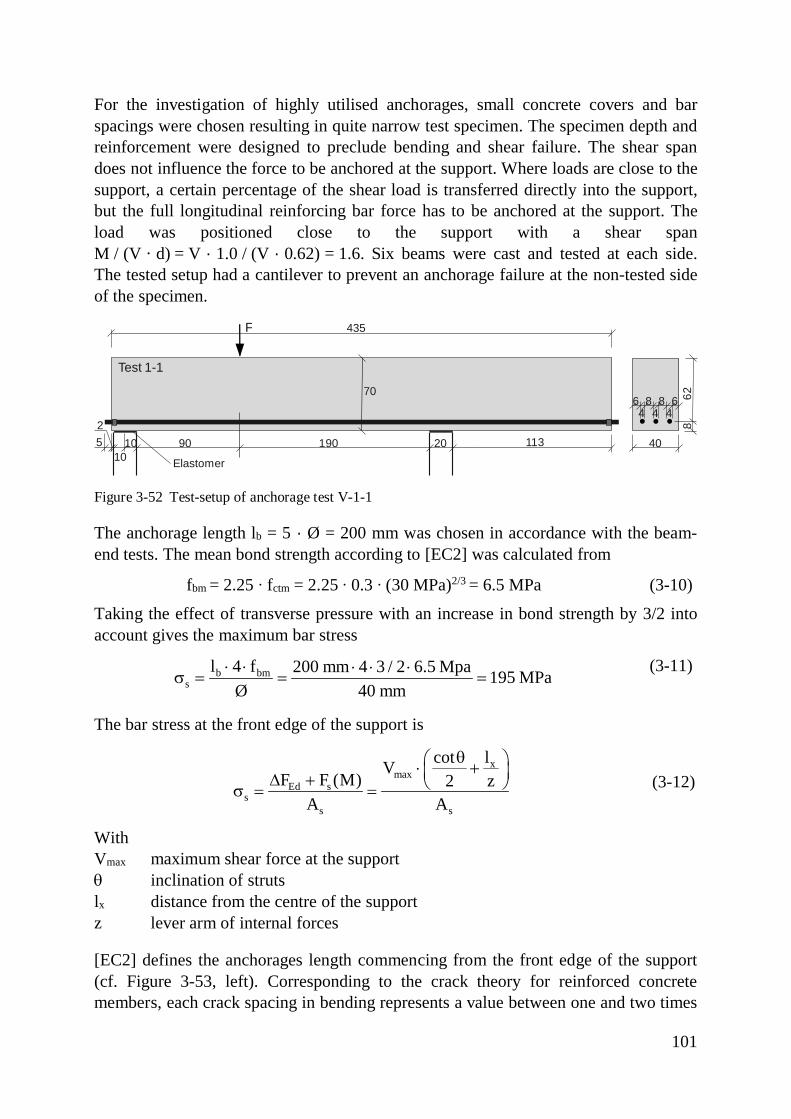
101
For the investigation of highly utilised anchorages, small concrete covers and barspacings were chosen resulting in quite narrow test specimen. The specimen depth andreinforcement were designed to preclude bending and shear failure. The shear spandoes not influence the force to be anchored at the support. Where loads are close to thesupport, a certain percentage of the shear load is transferred directly into the support,but the full longitudinal reinforcing bar force has to be anchored at the support. Theload was positioned close to the support with a shear spanM / (V · d) = V · 1.0 / (V · 0.62) = 1.6. Six beams were cast and tested at each side.The tested setup had a cantilever to prevent an anchorage failure at the non-tested sideof the specimen.
Figure 3-52 Test-setup of anchorage test V-1-1
The anchorage length lb = 5 · Ø = 200 mm was chosen in accordance with the beam-end tests. The mean bond strength according to [EC2] was calculated from
fbm = 2.25 ∙ fctm = 2.25 ∙ 0.3 ∙ (30 MPa)2/3 = 6.5 MPa (3-10)
Taking the effect of transverse pressure with an increase in bond strength by 3/2 intoaccount gives the maximum bar stress
b bms
l 4 f 200 mm 4 3 / 2 6.5 Mpa 195 MPaØ 40 mm
× × × × ×s = = =
(3-11)
The bar stress at the front edge of the support is
xmax
Ed ss
s s
lcotVF F (M) 2 z
A A
qæ ö× +ç ÷D + è øs = = (3-12)
WithVmax maximum shear force at the supportq inclination of strutslx distance from the centre of the supportz lever arm of internal forces
[EC2] defines the anchorages length commencing from the front edge of the support(cf. Figure 3-53, left). Corresponding to the crack theory for reinforced concretemembers, each crack spacing in bending represents a value between one and two times
435
190
70
102
2090 113
Test 1-1
Elastomer
5
62
40
88 664 4 4
F
10
8
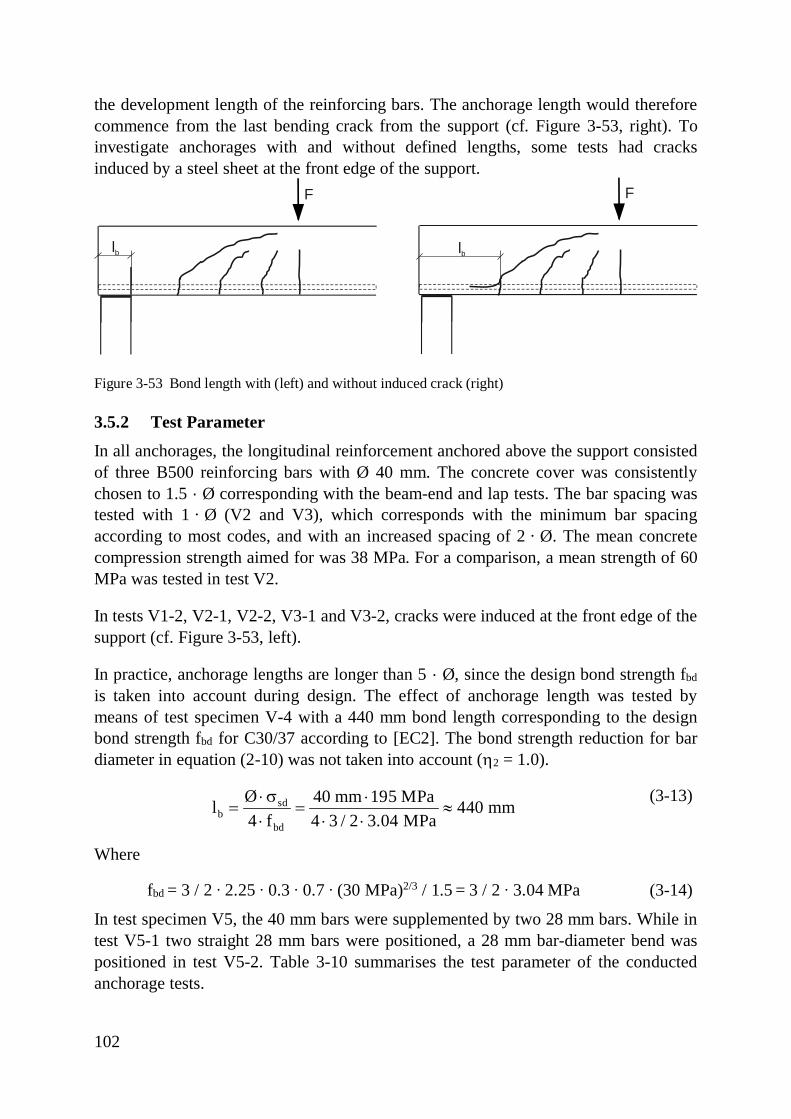
102
the development length of the reinforcing bars. The anchorage length would thereforecommence from the last bending crack from the support (cf. Figure 3-53, right). Toinvestigate anchorages with and without defined lengths, some tests had cracksinduced by a steel sheet at the front edge of the support.
Figure 3-53 Bond length with (left) and without induced crack (right)
3.5.2 Test Parameter
In all anchorages, the longitudinal reinforcement anchored above the support consistedof three B500 reinforcing bars with Ø 40 mm. The concrete cover was consistentlychosen to 1.5 · Ø corresponding with the beam-end and lap tests. The bar spacing wastested with 1 · Ø (V2 and V3), which corresponds with the minimum bar spacingaccording to most codes, and with an increased spacing of 2 · Ø. The mean concretecompression strength aimed for was 38 MPa. For a comparison, a mean strength of 60MPa was tested in test V2.
In tests V1-2, V2-1, V2-2, V3-1 and V3-2, cracks were induced at the front edge of thesupport (cf. Figure 3-53, left).
In practice, anchorage lengths are longer than 5 · Ø, since the design bond strength fbd
is taken into account during design. The effect of anchorage length was tested bymeans of test specimen V-4 with a 440 mm bond length corresponding to the designbond strength fbd for C30/37 according to [EC2]. The bond strength reduction for bardiameter in equation (2-10) was not taken into account (h2 = 1.0).
sdb
bd
Ø 40 mm 195 MPal 440 mm4 f 4 3 / 2 3.04 MPa
× s ×= = »
× × ×(3-13)
Where
fbd = 3 / 2 ∙ 2.25 ∙ 0.3 ∙ 0.7 ∙ (30 MPa)2/3 / 1.5 = 3 / 2 ∙ 3.04 MPa (3-14)
In test specimen V5, the 40 mm bars were supplemented by two 28 mm bars. While intest V5-1 two straight 28 mm bars were positioned, a 28 mm bar-diameter bend waspositioned in test V5-2. Table 3-10 summarises the test parameter of the conductedanchorage tests.
F
lb
F
lb
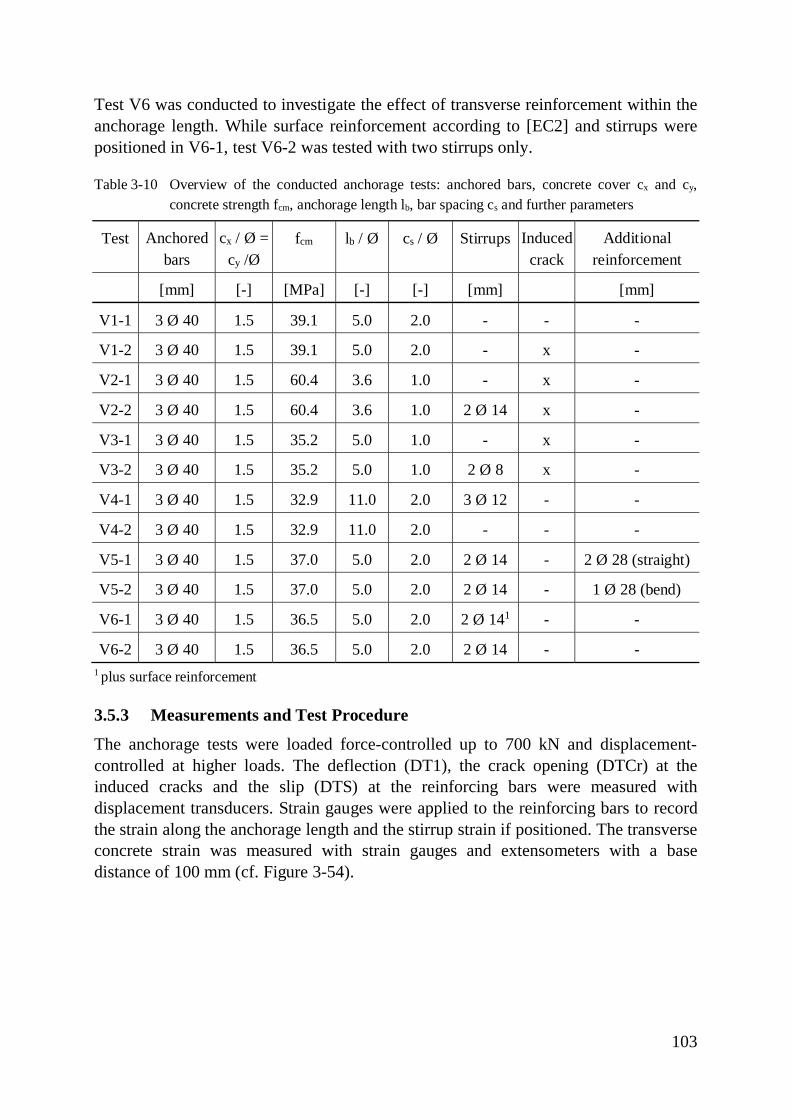
103
Test V6 was conducted to investigate the effect of transverse reinforcement within theanchorage length. While surface reinforcement according to [EC2] and stirrups werepositioned in V6-1, test V6-2 was tested with two stirrups only.
Table 3-10 Overview of the conducted anchorage tests: anchored bars, concrete cover cx and cy,concrete strength fcm, anchorage length lb, bar spacing cs and further parameters
Test Anchoredbars
cx / Ø =cy /Ø
fcm lb / Ø cs / Ø Stirrups Inducedcrack
Additionalreinforcement
[mm] [-] [MPa] [-] [-] [mm] [mm]
V1-1 3 Ø 40 1.5 39.1 5.0 2.0 - - -
V1-2 3 Ø 40 1.5 39.1 5.0 2.0 - x -
V2-1 3 Ø 40 1.5 60.4 3.6 1.0 - x -
V2-2 3 Ø 40 1.5 60.4 3.6 1.0 2 Ø 14 x -
V3-1 3 Ø 40 1.5 35.2 5.0 1.0 - x -
V3-2 3 Ø 40 1.5 35.2 5.0 1.0 2 Ø 8 x -
V4-1 3 Ø 40 1.5 32.9 11.0 2.0 3 Ø 12 - -
V4-2 3 Ø 40 1.5 32.9 11.0 2.0 - - -
V5-1 3 Ø 40 1.5 37.0 5.0 2.0 2 Ø 14 - 2 Ø 28 (straight)
V5-2 3 Ø 40 1.5 37.0 5.0 2.0 2 Ø 14 - 1 Ø 28 (bend)
V6-1 3 Ø 40 1.5 36.5 5.0 2.0 2 Ø 141 - -
V6-2 3 Ø 40 1.5 36.5 5.0 2.0 2 Ø 14 - -1 plus surface reinforcement
3.5.3 Measurements and Test Procedure
The anchorage tests were loaded force-controlled up to 700 kN and displacement-controlled at higher loads. The deflection (DT1), the crack opening (DTCr) at theinduced cracks and the slip (DTS) at the reinforcing bars were measured withdisplacement transducers. Strain gauges were applied to the reinforcing bars to recordthe strain along the anchorage length and the stirrup strain if positioned. The transverseconcrete strain was measured with strain gauges and extensometers with a basedistance of 100 mm (cf. Figure 3-54).
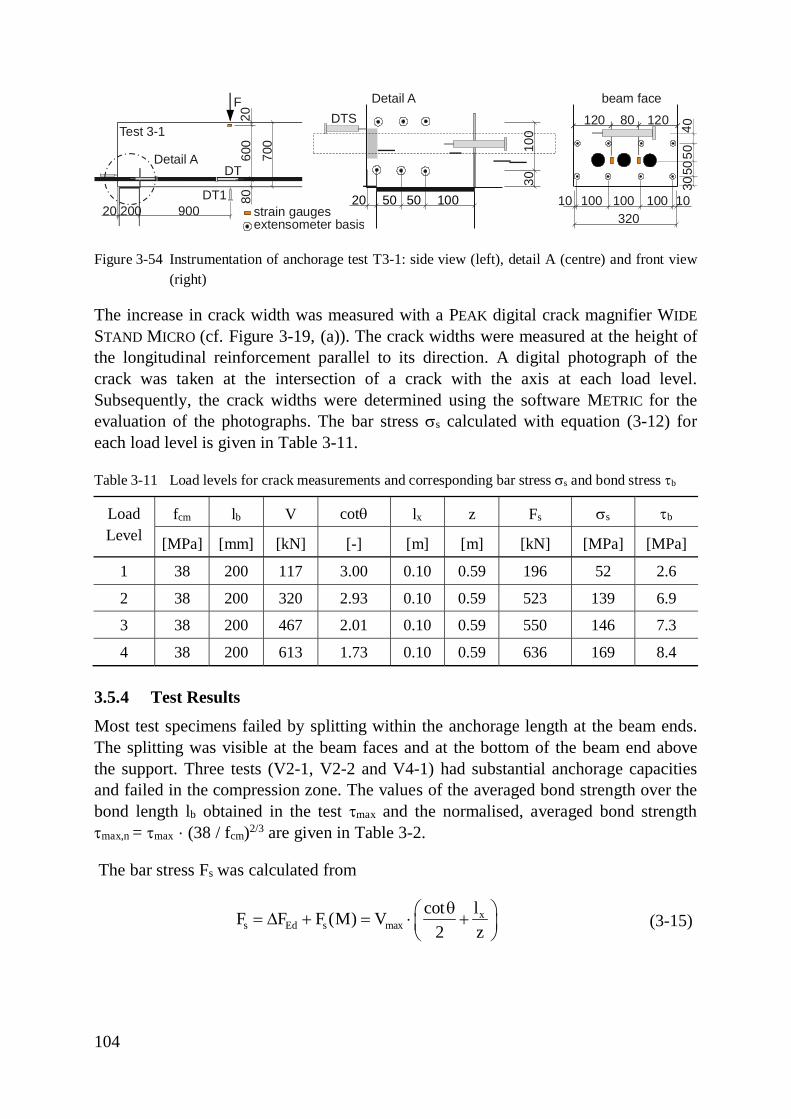
104
Figure 3-54 Instrumentation of anchorage test T3-1: side view (left), detail A (centre) and front view(right)
The increase in crack width was measured with a PEAK digital crack magnifier WIDESTAND MICRO (cf. Figure 3-19, (a)). The crack widths were measured at the height ofthe longitudinal reinforcement parallel to its direction. A digital photograph of thecrack was taken at the intersection of a crack with the axis at each load level.Subsequently, the crack widths were determined using the software METRIC for theevaluation of the photographs. The bar stress ss calculated with equation (3-12) foreach load level is given in Table 3-11.
Table 3-11 Load levels for crack measurements and corresponding bar stress ss and bond stress tb
LoadLevel
fcm lb V cotq lx z Fs ss tb
[MPa] [mm] [kN] [-] [m] [m] [kN] [MPa] [MPa]
1 38 200 117 3.00 0.10 0.59 196 52 2.6
2 38 200 320 2.93 0.10 0.59 523 139 6.9
3 38 200 467 2.01 0.10 0.59 550 146 7.3
4 38 200 613 1.73 0.10 0.59 636 169 8.4
3.5.4 Test Results
Most test specimens failed by splitting within the anchorage length at the beam ends.The splitting was visible at the beam faces and at the bottom of the beam end abovethe support. Three tests (V2-1, V2-2 and V4-1) had substantial anchorage capacitiesand failed in the compression zone. The values of the averaged bond strength over thebond length lb obtained in the test tmax and the normalised, averaged bond strengthtmax,n = tmax · (38 / fcm)2/3 are given in Table 3-2.
The bar stress Fs was calculated from
xs Ed s max
lcotF F F (M) V2 z
qæ ö= D + = × +ç ÷è ø
(3-15)
50
10 100320
10100 100
3050
20 50
100
30
80120 120
700
200 900
Test 3-1
FDTS
DT1
DT
600
8020
4 0
50 100
Detail A
Detail A beam face
20 strain gaugesextensometer basis
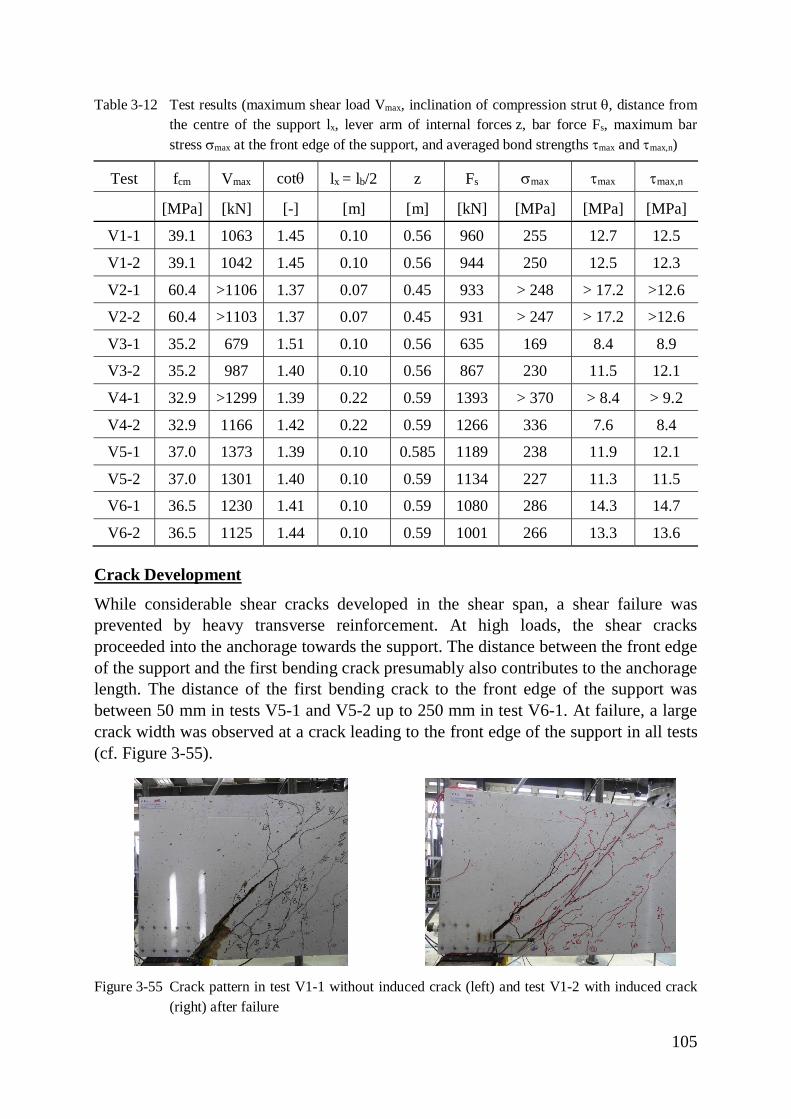
105
Table 3-12 Test results (maximum shear load Vmax, inclination of compression strut q, distance fromthe centre of the support lx, lever arm of internal forces z, bar force Fs, maximum barstress smax at the front edge of the support, and averaged bond strengths tmax and tmax,n)
Test fcm Vmax cotq lx = lb/2 z Fs smax tmax tmax,n
[MPa] [kN] [-] [m] [m] [kN] [MPa] [MPa] [MPa]
V1-1 39.1 1063 1.45 0.10 0.56 960 255 12.7 12.5
V1-2 39.1 1042 1.45 0.10 0.56 944 250 12.5 12.3
V2-1 60.4 >1106 1.37 0.07 0.45 933 > 248 > 17.2 >12.6
V2-2 60.4 >1103 1.37 0.07 0.45 931 > 247 > 17.2 >12.6
V3-1 35.2 679 1.51 0.10 0.56 635 169 8.4 8.9
V3-2 35.2 987 1.40 0.10 0.56 867 230 11.5 12.1
V4-1 32.9 >1299 1.39 0.22 0.59 1393 > 370 > 8.4 > 9.2
V4-2 32.9 1166 1.42 0.22 0.59 1266 336 7.6 8.4
V5-1 37.0 1373 1.39 0.10 0.585 1189 238 11.9 12.1
V5-2 37.0 1301 1.40 0.10 0.59 1134 227 11.3 11.5
V6-1 36.5 1230 1.41 0.10 0.59 1080 286 14.3 14.7
V6-2 36.5 1125 1.44 0.10 0.59 1001 266 13.3 13.6
Crack Development
While considerable shear cracks developed in the shear span, a shear failure wasprevented by heavy transverse reinforcement. At high loads, the shear cracksproceeded into the anchorage towards the support. The distance between the front edgeof the support and the first bending crack presumably also contributes to the anchoragelength. The distance of the first bending crack to the front edge of the support wasbetween 50 mm in tests V5-1 and V5-2 up to 250 mm in test V6-1. At failure, a largecrack width was observed at a crack leading to the front edge of the support in all tests(cf. Figure 3-55).
Figure 3-55 Crack pattern in test V1-1 without induced crack (left) and test V1-2 with induced crack(right) after failure
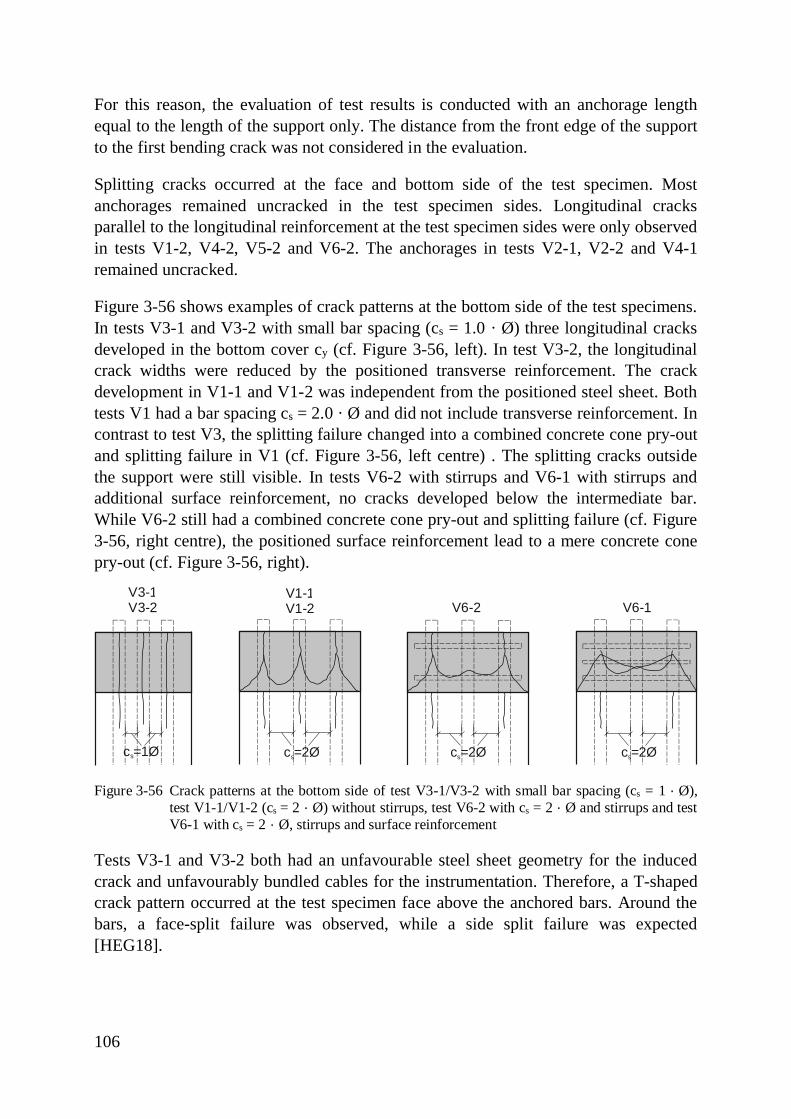
106
For this reason, the evaluation of test results is conducted with an anchorage lengthequal to the length of the support only. The distance from the front edge of the supportto the first bending crack was not considered in the evaluation.
Splitting cracks occurred at the face and bottom side of the test specimen. Mostanchorages remained uncracked in the test specimen sides. Longitudinal cracksparallel to the longitudinal reinforcement at the test specimen sides were only observedin tests V1-2, V4-2, V5-2 and V6-2. The anchorages in tests V2-1, V2-2 and V4-1remained uncracked.
Figure 3-56 shows examples of crack patterns at the bottom side of the test specimens.In tests V3-1 and V3-2 with small bar spacing (cs = 1.0 · Ø) three longitudinal cracksdeveloped in the bottom cover cy (cf. Figure 3-56, left). In test V3-2, the longitudinalcrack widths were reduced by the positioned transverse reinforcement. The crackdevelopment in V1-1 and V1-2 was independent from the positioned steel sheet. Bothtests V1 had a bar spacing cs = 2.0 · Ø and did not include transverse reinforcement. Incontrast to test V3, the splitting failure changed into a combined concrete cone pry-outand splitting failure in V1 (cf. Figure 3-56, left centre) . The splitting cracks outsidethe support were still visible. In tests V6-2 with stirrups and V6-1 with stirrups andadditional surface reinforcement, no cracks developed below the intermediate bar.While V6-2 still had a combined concrete cone pry-out and splitting failure (cf. Figure3-56, right centre), the positioned surface reinforcement lead to a mere concrete conepry-out (cf. Figure 3-56, right).
Figure 3-56 Crack patterns at the bottom side of test V3-1/V3-2 with small bar spacing (cs = 1 · Ø),test V1-1/V1-2 (cs = 2 · Ø) without stirrups, test V6-2 with cs = 2 · Ø and stirrups and testV6-1 with cs = 2 · Ø, stirrups and surface reinforcement
Tests V3-1 and V3-2 both had an unfavourable steel sheet geometry for the inducedcrack and unfavourably bundled cables for the instrumentation. Therefore, a T-shapedcrack pattern occurred at the test specimen face above the anchored bars. Around thebars, a face-split failure was observed, while a side split failure was expected[HEG18].
V3-1V3-2
V1-1V1-2 V6-1V6-2
c =1Øs c =2Øs c =2Øs c =2Øs
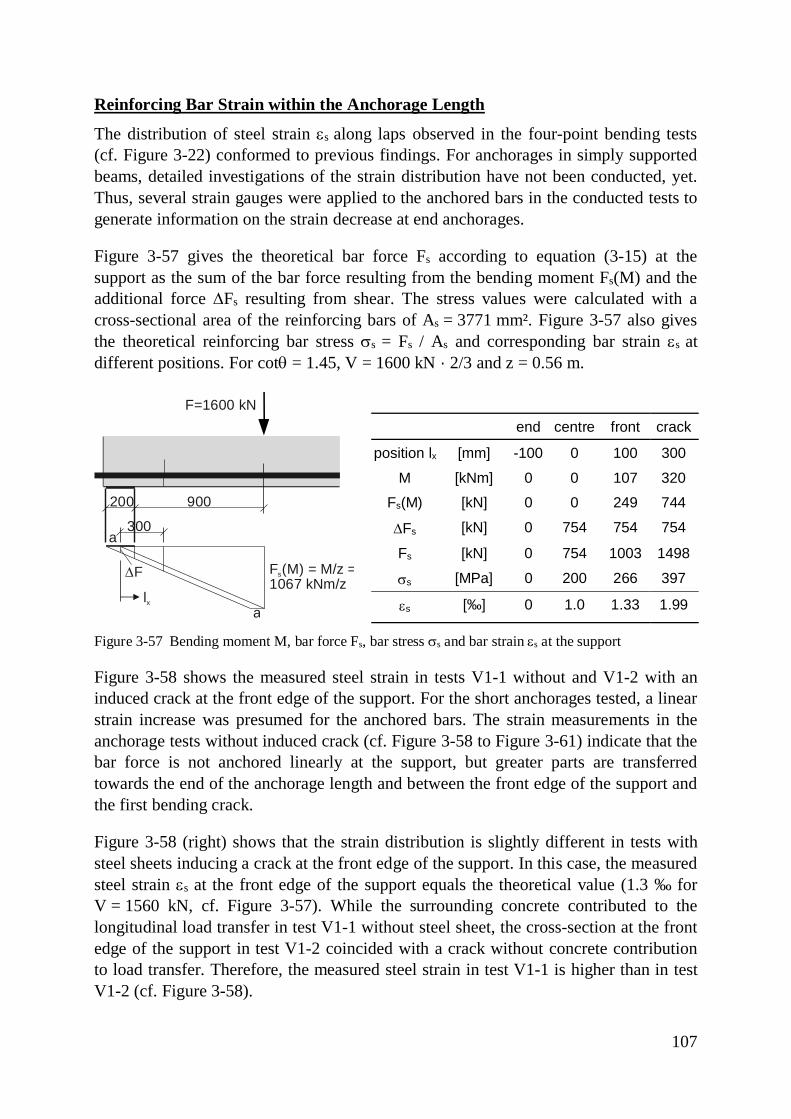
107
Reinforcing Bar Strain within the Anchorage Length
The distribution of steel strain es along laps observed in the four-point bending tests(cf. Figure 3-22) conformed to previous findings. For anchorages in simply supportedbeams, detailed investigations of the strain distribution have not been conducted, yet.Thus, several strain gauges were applied to the anchored bars in the conducted tests togenerate information on the strain decrease at end anchorages.
Figure 3-57 gives the theoretical bar force Fs according to equation (3-15) at thesupport as the sum of the bar force resulting from the bending moment Fs(M) and theadditional force DFs resulting from shear. The stress values were calculated with across-sectional area of the reinforcing bars of As = 3771 mm². Figure 3-57 also givesthe theoretical reinforcing bar stress ss = Fs / As and corresponding bar strain es atdifferent positions. For cotq = 1.45, V = 1600 kN · 2/3 and z = 0.56 m.
end centre front crack
position lx [mm] -100 0 100 300M [kNm] 0 0 107 320
Fs(M) [kN] 0 0 249 744
DFs [kN] 0 754 754 754
Fs [kN] 0 754 1003 1498
ss [MPa] 0 200 266 397
es [‰] 0 1.0 1.33 1.99
Figure 3-57 Bending moment M, bar force Fs, bar stress ss and bar strain es at the support
Figure 3-58 shows the measured steel strain in tests V1-1 without and V1-2 with aninduced crack at the front edge of the support. For the short anchorages tested, a linearstrain increase was presumed for the anchored bars. The strain measurements in theanchorage tests without induced crack (cf. Figure 3-58 to Figure 3-61) indicate that thebar force is not anchored linearly at the support, but greater parts are transferredtowards the end of the anchorage length and between the front edge of the support andthe first bending crack.
Figure 3-58 (right) shows that the strain distribution is slightly different in tests withsteel sheets inducing a crack at the front edge of the support. In this case, the measuredsteel strain es at the front edge of the support equals the theoretical value (1.3 ‰ forV = 1560 kN, cf. Figure 3-57). While the surrounding concrete contributed to thelongitudinal load transfer in test V1-1 without steel sheet, the cross-section at the frontedge of the support in test V1-2 coincided with a crack without concrete contributionto load transfer. Therefore, the measured steel strain in test V1-1 is higher than in testV1-2 (cf. Figure 3-58).
200 900
F (M) = M/z =s1067 kNm/z
a
a
DF
300
F=1600 kN
lx
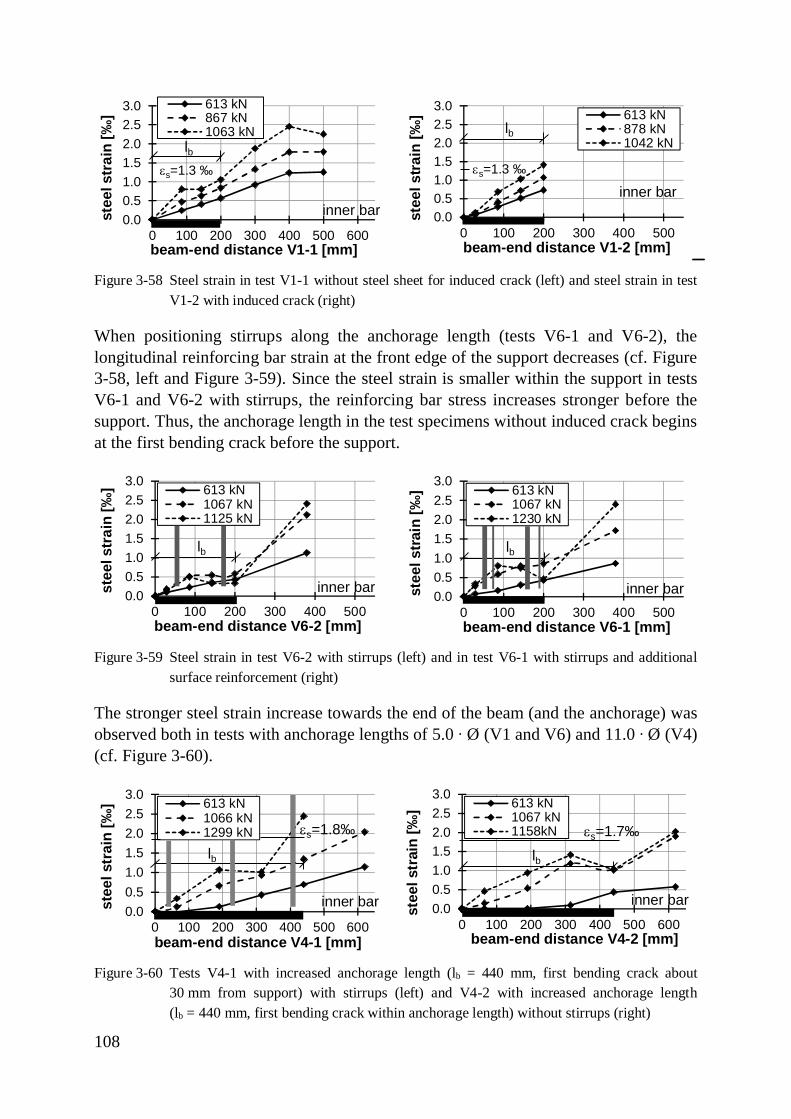
108
Figure 3-58 Steel strain in test V1-1 without steel sheet for induced crack (left) and steel strain in testV1-2 with induced crack (right)
When positioning stirrups along the anchorage length (tests V6-1 and V6-2), thelongitudinal reinforcing bar strain at the front edge of the support decreases (cf. Figure3-58, left and Figure 3-59). Since the steel strain is smaller within the support in testsV6-1 and V6-2 with stirrups, the reinforcing bar stress increases stronger before thesupport. Thus, the anchorage length in the test specimens without induced crack beginsat the first bending crack before the support.
Figure 3-59 Steel strain in test V6-2 with stirrups (left) and in test V6-1 with stirrups and additionalsurface reinforcement (right)
The stronger steel strain increase towards the end of the beam (and the anchorage) wasobserved both in tests with anchorage lengths of 5.0 ∙ Ø (V1 and V6) and 11.0 ∙ Ø (V4)(cf. Figure 3-60).
Figure 3-60 Tests V4-1 with increased anchorage length (lb = 440 mm, first bending crack about30 mm from support) with stirrups (left) and V4-2 with increased anchorage length(lb = 440 mm, first bending crack within anchorage length) without stirrups (right)
0.00.51.01.52.02.53.0
0 100 200 300 400 500 600
stee
l str
ain
[‰]
beam-end distance V1-1 [mm]
613 kN867 kN1063 kN
lb
inner bar
es=1.3 ‰
0.00.51.01.52.02.53.0
0 100 200 300 400 500
stee
l stra
in [‰
]
beam-end distance V1-2 [mm]
613 kN878 kN1042 kN
lb
inner bares=1.3 ‰
0.00.51.01.52.02.53.0
0 100 200 300 400 500
stee
l str
ain
[‰]
beam-end distance V6-2 [mm]
613 kN1067 kN1125 kN
inner bar
lb
0.00.51.01.52.02.53.0
0 100 200 300 400 500
stee
l stra
in [‰
]
beam-end distance V6-1 [mm]
613 kN1067 kN1230 kN
lb
inner bar
0.00.51.01.52.02.53.0
0 100 200 300 400 500 600
stee
l str
ain
[‰]
beam-end distance V4-1 [mm]
613 kN1066 kN1299 kN
inner bar
lb
es=1.8‰
0.00.51.01.52.02.53.0
0 100 200 300 400 500 600
stee
l str
ain
[‰]
beam-end distance V4-2 [mm]
613 kN1067 kN1158kN
inner bar
lb
es=1.7‰
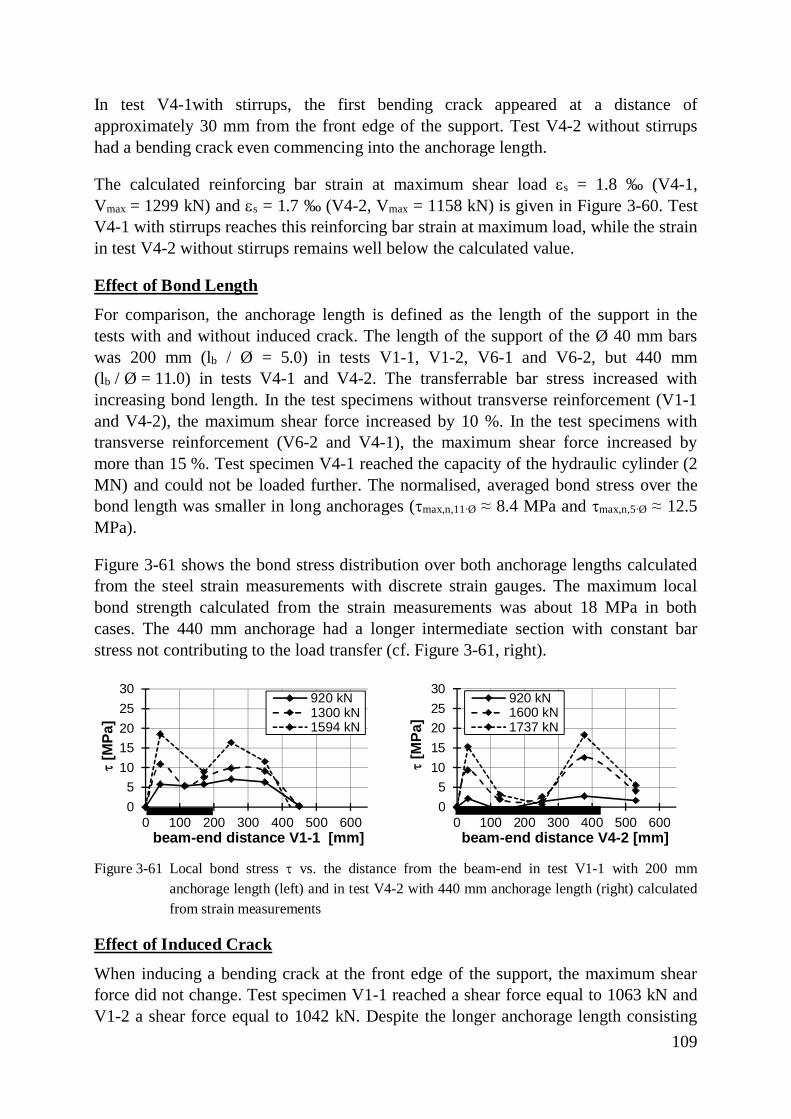
109
In test V4-1with stirrups, the first bending crack appeared at a distance ofapproximately 30 mm from the front edge of the support. Test V4-2 without stirrupshad a bending crack even commencing into the anchorage length.
The calculated reinforcing bar strain at maximum shear load es = 1.8 ‰ (V4-1,Vmax = 1299 kN) and es = 1.7 ‰ (V4-2, Vmax = 1158 kN) is given in Figure 3-60. TestV4-1 with stirrups reaches this reinforcing bar strain at maximum load, while the strainin test V4-2 without stirrups remains well below the calculated value.
Effect of Bond Length
For comparison, the anchorage length is defined as the length of the support in thetests with and without induced crack. The length of the support of the Ø 40 mm barswas 200 mm (lb / Ø = 5.0) in tests V1-1, V1-2, V6-1 and V6-2, but 440 mm(lb / Ø = 11.0) in tests V4-1 and V4-2. The transferrable bar stress increased withincreasing bond length. In the test specimens without transverse reinforcement (V1-1and V4-2), the maximum shear force increased by 10 %. In the test specimens withtransverse reinforcement (V6-2 and V4-1), the maximum shear force increased bymore than 15 %. Test specimen V4-1 reached the capacity of the hydraulic cylinder (2MN) and could not be loaded further. The normalised, averaged bond stress over thebond length was smaller in long anchorages (tmax,n,11∙Ø ≈ 8.4 MPa and tmax,n,5∙Ø ≈ 12.5MPa).
Figure 3-61 shows the bond stress distribution over both anchorage lengths calculatedfrom the steel strain measurements with discrete strain gauges. The maximum localbond strength calculated from the strain measurements was about 18 MPa in bothcases. The 440 mm anchorage had a longer intermediate section with constant barstress not contributing to the load transfer (cf. Figure 3-61, right).
Figure 3-61 Local bond stress t vs. the distance from the beam-end in test V1-1 with 200 mmanchorage length (left) and in test V4-2 with 440 mm anchorage length (right) calculatedfrom strain measurements
Effect of Induced Crack
When inducing a bending crack at the front edge of the support, the maximum shearforce did not change. Test specimen V1-1 reached a shear force equal to 1063 kN andV1-2 a shear force equal to 1042 kN. Despite the longer anchorage length consisting
05
1015202530
0 100 200 300 400 500 600
t[M
Pa]
beam-end distance V1-1 [mm]
920 kN1300 kN1594 kN
05
1015202530
0 100 200 300 400 500 600
t[M
Pa]
beam-end distance V4-2 [mm]
920 kN1600 kN1737 kN
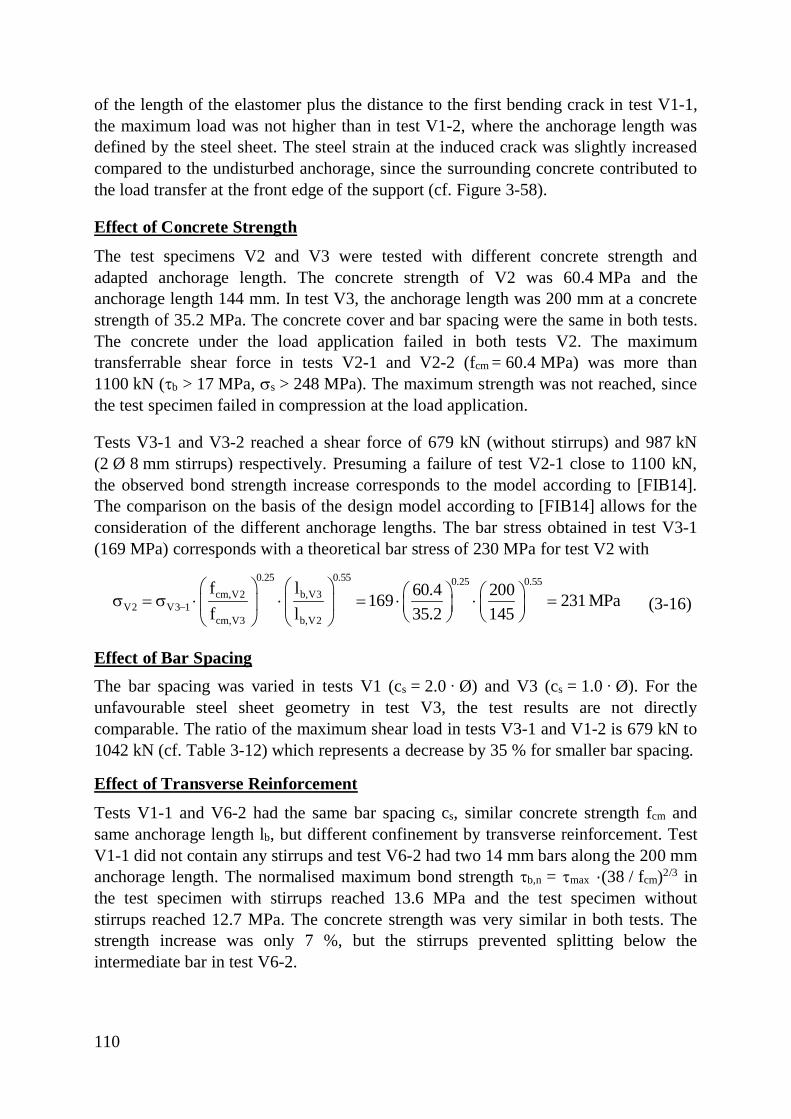
110
of the length of the elastomer plus the distance to the first bending crack in test V1-1,the maximum load was not higher than in test V1-2, where the anchorage length wasdefined by the steel sheet. The steel strain at the induced crack was slightly increasedcompared to the undisturbed anchorage, since the surrounding concrete contributed tothe load transfer at the front edge of the support (cf. Figure 3-58).
Effect of Concrete Strength
The test specimens V2 and V3 were tested with different concrete strength andadapted anchorage length. The concrete strength of V2 was 60.4 MPa and theanchorage length 144 mm. In test V3, the anchorage length was 200 mm at a concretestrength of 35.2 MPa. The concrete cover and bar spacing were the same in both tests.The concrete under the load application failed in both tests V2. The maximumtransferrable shear force in tests V2-1 and V2-2 (fcm = 60.4 MPa) was more than1100 kN (tb > 17 MPa, ss > 248 MPa). The maximum strength was not reached, sincethe test specimen failed in compression at the load application.
Tests V3-1 and V3-2 reached a shear force of 679 kN (without stirrups) and 987 kN(2 Ø 8 mm stirrups) respectively. Presuming a failure of test V2-1 close to 1100 kN,the observed bond strength increase corresponds to the model according to [FIB14].The comparison on the basis of the design model according to [FIB14] allows for theconsideration of the different anchorage lengths. The bar stress obtained in test V3-1(169 MPa) corresponds with a theoretical bar stress of 230 MPa for test V2 with
0.25 0.55 0.25 0.55cm,V2 b,V3
V2 V3 1cm,V3 b,V2
f l 60.4 200169 231 MPaf l 35.2 145-
æ ö æ ö æ ö æ ös = s × × = × × =ç ÷ ç ÷ ç ÷ ç ÷è ø è øè ø è ø
(3-16)
Effect of Bar SpacingThe bar spacing was varied in tests V1 (cs = 2.0 ∙ Ø) and V3 (cs = 1.0 ∙ Ø). For theunfavourable steel sheet geometry in test V3, the test results are not directlycomparable. The ratio of the maximum shear load in tests V3-1 and V1-2 is 679 kN to1042 kN (cf. Table 3-12) which represents a decrease by 35 % for smaller bar spacing.
Effect of Transverse Reinforcement
Tests V1-1 and V6-2 had the same bar spacing cs, similar concrete strength fcm andsame anchorage length lb, but different confinement by transverse reinforcement. TestV1-1 did not contain any stirrups and test V6-2 had two 14 mm bars along the 200 mmanchorage length. The normalised maximum bond strength tb,n = tmax ·(38 / fcm)2/3 inthe test specimen with stirrups reached 13.6 MPa and the test specimen withoutstirrups reached 12.7 MPa. The concrete strength was very similar in both tests. Thestrength increase was only 7 %, but the stirrups prevented splitting below theintermediate bar in test V6-2.
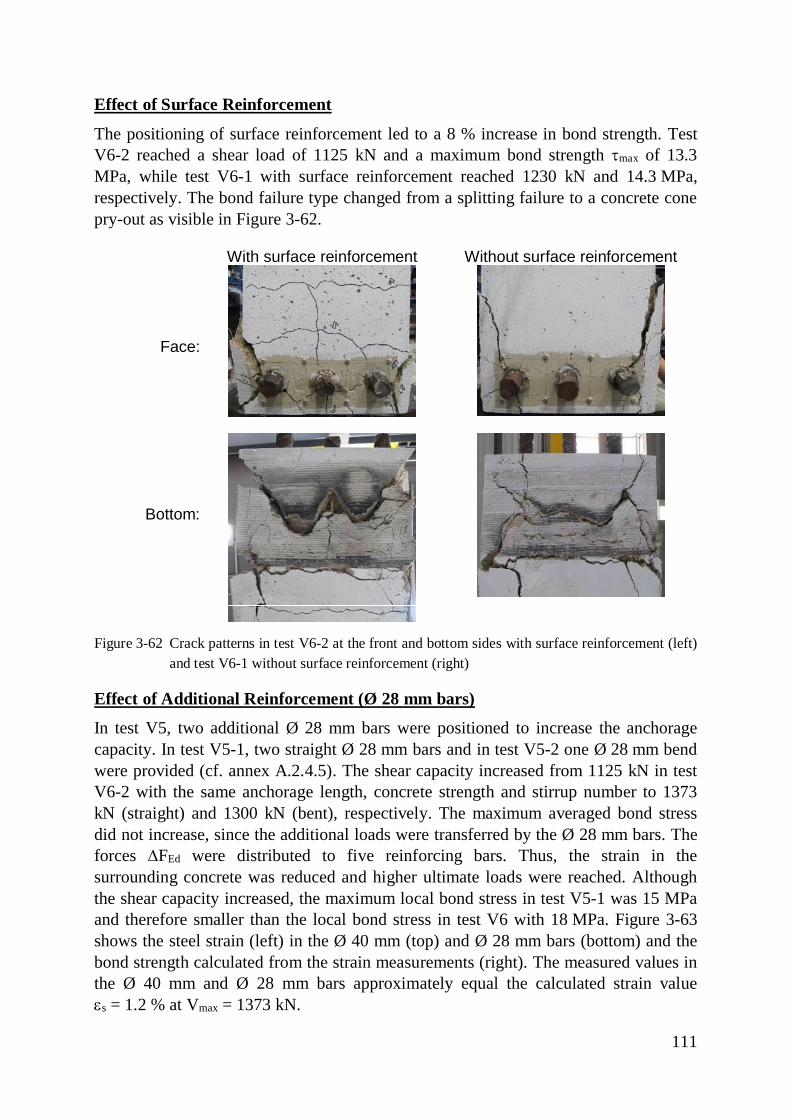
111
Effect of Surface Reinforcement
The positioning of surface reinforcement led to a 8 % increase in bond strength. TestV6-2 reached a shear load of 1125 kN and a maximum bond strength tmax of 13.3MPa, while test V6-1 with surface reinforcement reached 1230 kN and 14.3 MPa,respectively. The bond failure type changed from a splitting failure to a concrete conepry-out as visible in Figure 3-62.
With surface reinforcement Without surface reinforcement
Face:
Bottom:
Figure 3-62 Crack patterns in test V6-2 at the front and bottom sides with surface reinforcement (left)and test V6-1 without surface reinforcement (right)
Effect of Additional Reinforcement (Ø 28 mm bars)
In test V5, two additional Ø 28 mm bars were positioned to increase the anchoragecapacity. In test V5-1, two straight Ø 28 mm bars and in test V5-2 one Ø 28 mm bendwere provided (cf. annex A.2.4.5). The shear capacity increased from 1125 kN in testV6-2 with the same anchorage length, concrete strength and stirrup number to 1373kN (straight) and 1300 kN (bent), respectively. The maximum averaged bond stressdid not increase, since the additional loads were transferred by the Ø 28 mm bars. Theforces DFEd were distributed to five reinforcing bars. Thus, the strain in thesurrounding concrete was reduced and higher ultimate loads were reached. Althoughthe shear capacity increased, the maximum local bond stress in test V5-1 was 15 MPaand therefore smaller than the local bond stress in test V6 with 18 MPa. Figure 3-63shows the steel strain (left) in the Ø 40 mm (top) and Ø 28 mm bars (bottom) and thebond strength calculated from the strain measurements (right). The measured values inthe Ø 40 mm and Ø 28 mm bars approximately equal the calculated strain valuees = 1.2 % at Vmax = 1373 kN.
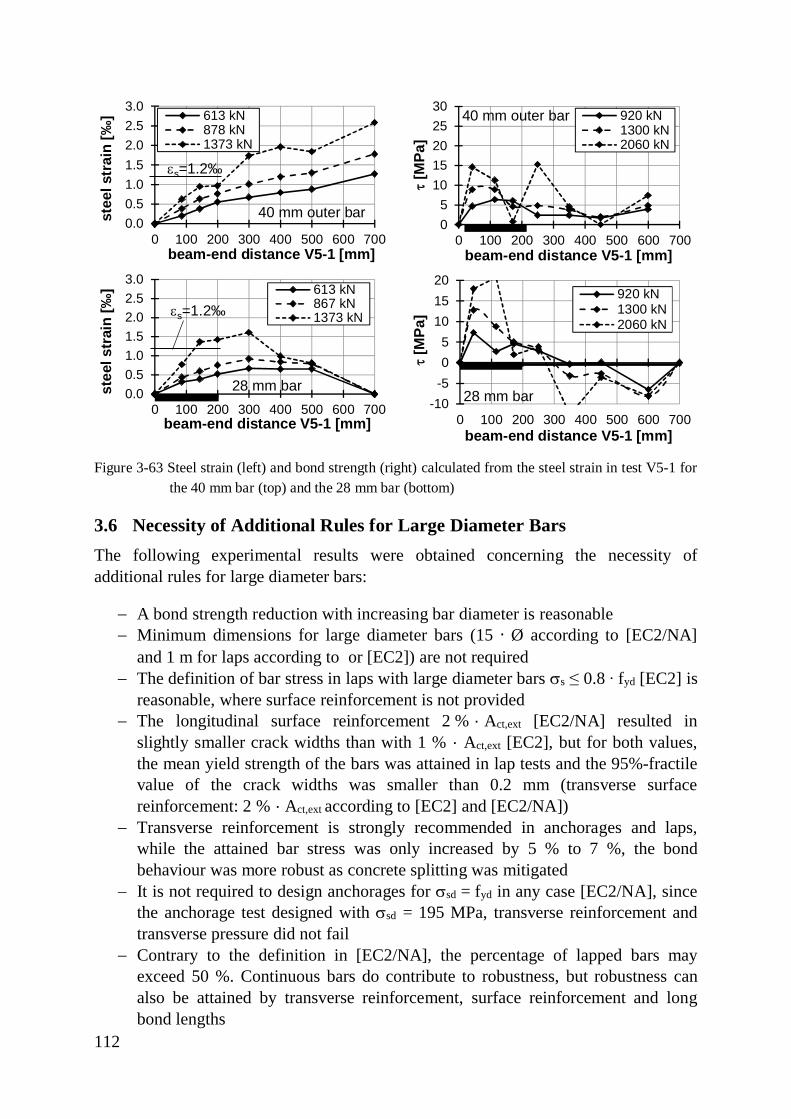
112
Figure 3-63 Steel strain (left) and bond strength (right) calculated from the steel strain in test V5-1 forthe 40 mm bar (top) and the 28 mm bar (bottom)
3.6 Necessity of Additional Rules for Large Diameter BarsThe following experimental results were obtained concerning the necessity ofadditional rules for large diameter bars:
- A bond strength reduction with increasing bar diameter is reasonable- Minimum dimensions for large diameter bars (15 · Ø according to [EC2/NA]
and 1 m for laps according to or [EC2]) are not required- The definition of bar stress in laps with large diameter bars ss ≤ 0.8 ∙ fyd [EC2] is
reasonable, where surface reinforcement is not provided- The longitudinal surface reinforcement 2 % · Act,ext [EC2/NA] resulted in
slightly smaller crack widths than with 1 % · Act,ext [EC2], but for both values,the mean yield strength of the bars was attained in lap tests and the 95%-fractilevalue of the crack widths was smaller than 0.2 mm (transverse surfacereinforcement: 2 % · Act,ext according to [EC2] and [EC2/NA])
- Transverse reinforcement is strongly recommended in anchorages and laps,while the attained bar stress was only increased by 5 % to 7 %, the bondbehaviour was more robust as concrete splitting was mitigated
- It is not required to design anchorages for ssd = fyd in any case [EC2/NA], sincethe anchorage test designed with ssd = 195 MPa, transverse reinforcement andtransverse pressure did not fail
- Contrary to the definition in [EC2/NA], the percentage of lapped bars mayexceed 50 %. Continuous bars do contribute to robustness, but robustness canalso be attained by transverse reinforcement, surface reinforcement and longbond lengths
0.00.51.01.52.02.53.0
0 100 200 300 400 500 600 700
stee
l str
ain
[‰]
beam-end distance V5-1 [mm]
613 kN878 kN1373 kN
40 mm outer bar
es=1.2‰
05
1015202530
0 100 200 300 400 500 600 700
t[M
Pa]
beam-end distance V5-1 [mm]
920 kN1300 kN2060 kN
40 mm outer bar
0.00.51.01.52.02.53.0
0 100 200 300 400 500 600 700
stee
l str
ain
[‰]
beam-end distance V5-1 [mm]
613 kN867 kN1373 kN
28 mm bar
es=1.2‰
-10-505
101520
0 100 200 300 400 500 600 700t
[MPa
]beam-end distance V5-1 [mm]
920 kN1300 kN2060 kN
28 mm bar
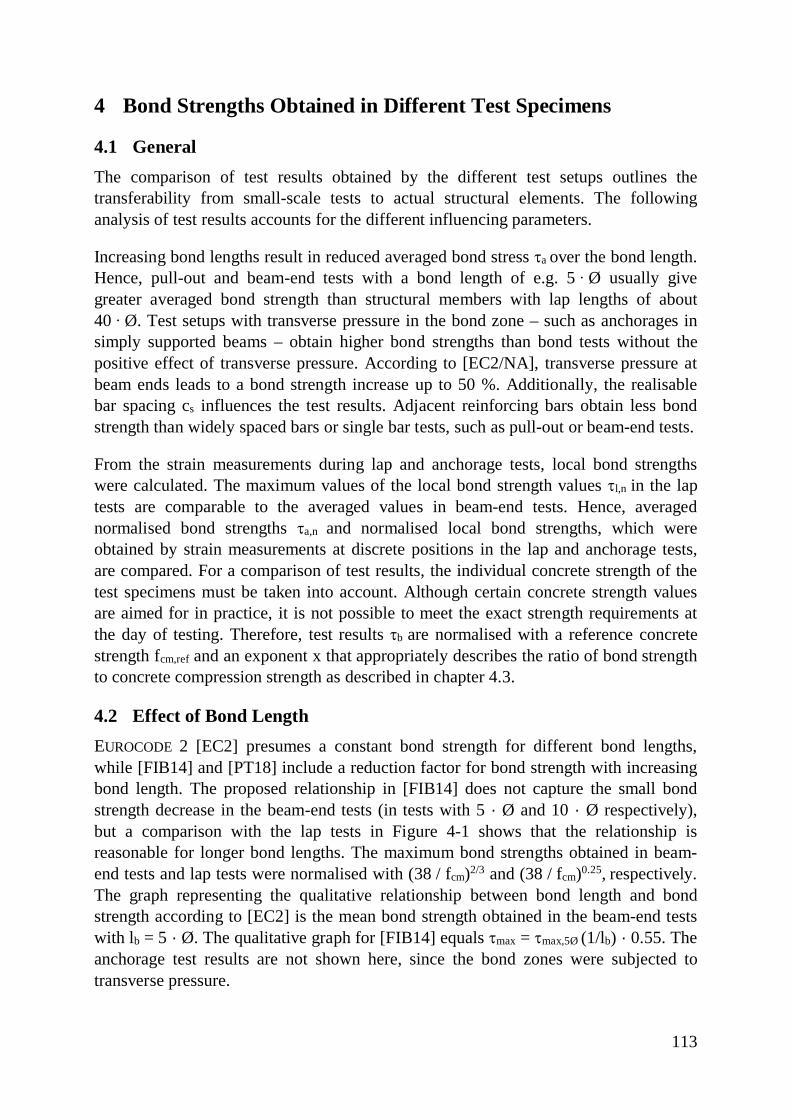
113
4 Bond Strengths Obtained in Different Test Specimens
4.1 GeneralThe comparison of test results obtained by the different test setups outlines thetransferability from small-scale tests to actual structural elements. The followinganalysis of test results accounts for the different influencing parameters.
Increasing bond lengths result in reduced averaged bond stress ta over the bond length.Hence, pull-out and beam-end tests with a bond length of e.g. 5 ∙ Ø usually givegreater averaged bond strength than structural members with lap lengths of about40 ∙ Ø. Test setups with transverse pressure in the bond zone – such as anchorages insimply supported beams – obtain higher bond strengths than bond tests without thepositive effect of transverse pressure. According to [EC2/NA], transverse pressure atbeam ends leads to a bond strength increase up to 50 %. Additionally, the realisablebar spacing cs influences the test results. Adjacent reinforcing bars obtain less bondstrength than widely spaced bars or single bar tests, such as pull-out or beam-end tests.
From the strain measurements during lap and anchorage tests, local bond strengthswere calculated. The maximum values of the local bond strength values tl,n in the laptests are comparable to the averaged values in beam-end tests. Hence, averagednormalised bond strengths ta,n and normalised local bond strengths, which wereobtained by strain measurements at discrete positions in the lap and anchorage tests,are compared. For a comparison of test results, the individual concrete strength of thetest specimens must be taken into account. Although certain concrete strength valuesare aimed for in practice, it is not possible to meet the exact strength requirements atthe day of testing. Therefore, test results tb are normalised with a reference concretestrength fcm,ref and an exponent x that appropriately describes the ratio of bond strengthto concrete compression strength as described in chapter 4.3.
4.2 Effect of Bond LengthEUROCODE 2 [EC2] presumes a constant bond strength for different bond lengths,while [FIB14] and [PT18] include a reduction factor for bond strength with increasingbond length. The proposed relationship in [FIB14] does not capture the small bondstrength decrease in the beam-end tests (in tests with 5 · Ø and 10 · Ø respectively),but a comparison with the lap tests in Figure 4-1 shows that the relationship isreasonable for longer bond lengths. The maximum bond strengths obtained in beam-end tests and lap tests were normalised with (38 / fcm)2/3 and (38 / fcm)0.25, respectively.The graph representing the qualitative relationship between bond length and bondstrength according to [EC2] is the mean bond strength obtained in the beam-end testswith lb = 5 · Ø. The qualitative graph for [FIB14] equals tmax = tmax,5Ø (1/lb) · 0.55. Theanchorage test results are not shown here, since the bond zones were subjected totransverse pressure.
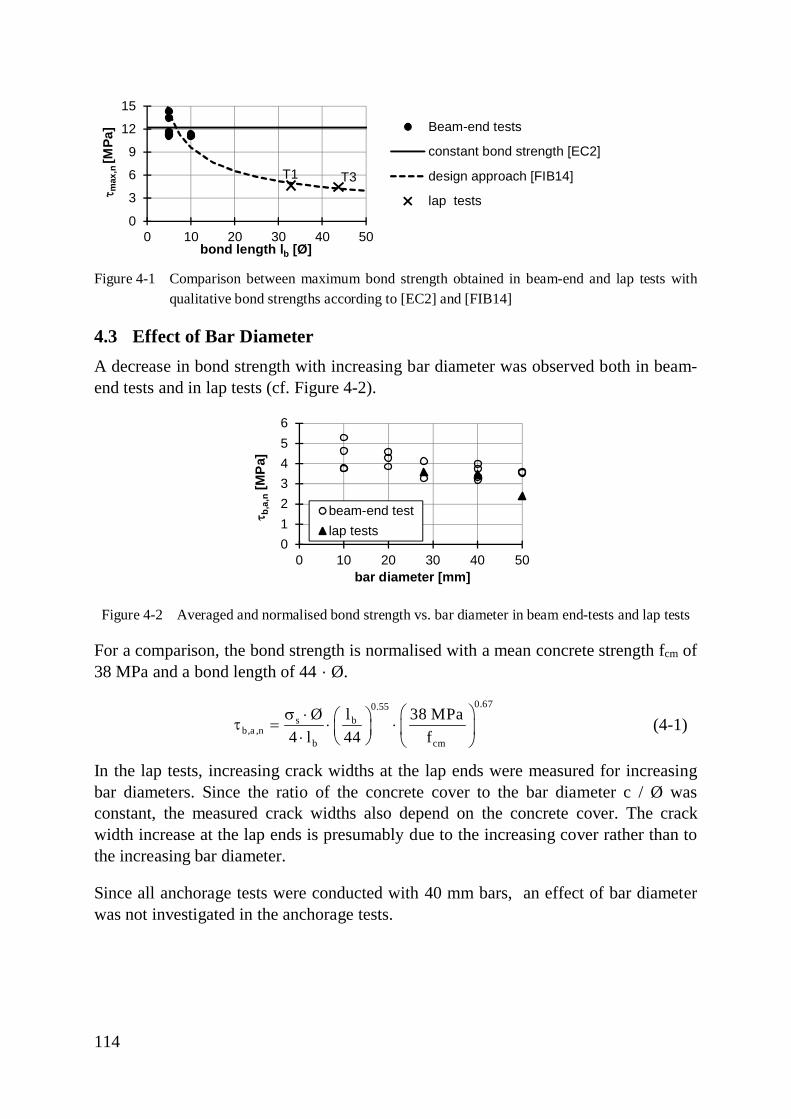
114
Figure 4-1 Comparison between maximum bond strength obtained in beam-end and lap tests withqualitative bond strengths according to [EC2] and [FIB14]
4.3 Effect of Bar DiameterA decrease in bond strength with increasing bar diameter was observed both in beam-end tests and in lap tests (cf. Figure 4-2).
Figure 4-2 Averaged and normalised bond strength vs. bar diameter in beam end-tests and lap tests
For a comparison, the bond strength is normalised with a mean concrete strength fcm of38 MPa and a bond length of 44 · Ø.
0.670.55s b
b,a ,nb cm
Ø l 38 MPa4 l 44 f
æ ös × æ öt = × × ç ÷ç ÷× è ø è ø(4-1)
In the lap tests, increasing crack widths at the lap ends were measured for increasingbar diameters. Since the ratio of the concrete cover to the bar diameter c / Ø wasconstant, the measured crack widths also depend on the concrete cover. The crackwidth increase at the lap ends is presumably due to the increasing cover rather than tothe increasing bar diameter.
Since all anchorage tests were conducted with 40 mm bars, an effect of bar diameterwas not investigated in the anchorage tests.
0
3
6
9
12
15
0 10 20 30 40 50
t max
,n[M
Pa]
bond length lb [Ø]
Beam-end tests
constant bond strength [EC2]
design approach [FIB14]
lap tests
T1 T3
0123456
0 10 20 30 40 50
t b,a
,n[M
Pa]
bar diameter [mm]
beam-end testlap tests
115
4.4 Effect of Concrete StrengthThe test results tb,t are normalised with a reference concrete strength fcm,ref and anexponent x that appropriately describes the ratio of bond strength to concretecompression strength.
xcm,ref
b,n b,tcm,t
ff
æ öt = t × ç ÷
è ø(4-2)
The beam-end tests conducted showed a good correlation between concrete strengthand bond strength for an exponent x = 2/3, conforming with [EC2]. Thus, for thefollowing comparison of test results, the results from beam-end tests (BET) tb,n,BET andanchorage tests tb,n,ancho are normalised with equation (4-3). The reference concretestrength fcm,ref was set to 38 MPa representing the concrete class aimed for (C30/37).
0.67
b,n,BET b,n,ancho b,tcm,t
38 MPaf
æ öt = t = t × ç ÷
è ø(4-3)
In contrast, the model for the calculation of lap strength proposed in [FIB14], gives anexponent of x = 0.25 for the effect of concrete strength. This relation was also found inlap tests described in chapter 3.4. The difference can be explained by the varying bondlengths. While most beam-end and anchorage tests had bond lengths of 5 · Ø, the lapswere tested with 33 · Ø to 43 · Ø.
This observation conforms with the findings by ELIGEHAUSEN in [ELI79]. The bondstrength of short bond lengths increases with fc2/3, while the increase in bond strengthis much smaller for larger bond lengths, since the distribution of bond stress isincreasingly non-linear with increasing bond lengths.
In the following comparison, the bond strengths obtained in lap tests tb,lap arenormalised with equation (4-4).
0.25
b,n,lap b,lapcm,t
38 MPaf
æ öt = t × ç ÷
è ø(4-4)
4.5 Effect of Transverse Pressure
The anchorages tested in simply supported beams were always subjected to transversepressure, while the lap tests were not subjected to transverse pressure. Therefore, theeffect of transverse pressure was investigated in the beam-end tests by a modificationof test setup (cf. chapter 3.3.1).
Table 4-1 gives the averaged normalised bond strength tb,a,n taking the concretestrength according to equations (4-3) and (4-4) into account. Additionally, thenormalised local bond stress is given that was obtained by strain measurements atdiscrete positions in the lap and anchorage tests. Since crack widths correspond to
116
twice the slip of reinforcing bars at the crack location, the slip at the maximum loads(tmax) measured in beam-end tests is compared to the crack width in the lap andanchorage tests in Table 4-1.
Table 4-1 Normalised and averaged bond strength tb,a,n, normalised local bond stress tb,l,n andcorresponding slip s or crack width w for beam-end tests and lap tests (width oftransverse crack at the end of the bond length) with varying transverse pressure p
Transversepressure p fcm tb,a,n tb,l,n s(tmax) w(tmax)
[MPa] [MPa] [MPa] [MPa] [mm] [mm]
Beam-endtests
BET-1 0 38.2 11.8 - 0.68 0.38
BET-9 6.0 MPa 27.9 16.2 - - -
Lap testsT1 0 40.2 3.7 10.9 - 0.76
T3 0 33.0 3.3 13.3 - 0.66
Anchoragetests
V3-1 15.4 MPa 35.2 12.1 27.1 - 0.22
V6-2 14.1 MPa 36.5 13.7 24.3 - -
The observed bond strength increase for transverse pressure was 40 % in the beam-endtests. Beam-end tests without transverse pressure and laps can be used for acomparison of small-scale and real-scale test setups without transverse pressure. Forthe non-linear effect of bond length, the direct comparison of averaged bond strengthsalong the bond length is not recommended. Instead, the averaged bond strength tb,a,n inbeam-end test BET-1 (11.8 MPa) without transverse pressure is compared to themaximum local bond stress tb,l,n. These values are in the same range as the maximumlocal bond strength tb,l,n measured in the lap tests without transverse pressure(10.9 MPa and 13.3 MPa respectively). In both test setups, the vertical concrete coverwas 1.5 · Ø and Ø 14 mm stirrups were positioned with a 130 mm spacing.
The averaged bond strength tb,a,nwas not higher in the anchorage tests, althoughsubstantial transverse pressure was present. This effect is partly based on the straindistribution within the anchorage of the simply supported beam (cf. chapter 3.5.4). Themaximum local bond strength measured in the anchorage tests was 50 % higher thanthe average bond strength tb,a,n measured in beam-end test BET-9 with transversepressure (cf. Table 4-1). Another reason for the non-conformity of averaged values ta,n
of anchorages and beam-ends with transverse pressure is the fact that three denselyspaced adjacent bars were tested at the anchorage. Figure 4-3 shows the ratio of bondstrengths in tests without transverse pressure to tests with transverse pressure and theconsideration of its effect according to [EC2] and [EC2/NA]. The beam-end andanchorage test results in Figure 4-3 are normalised with (fcm / 38)2/3. The increase inbond strength for transverse pressure according to [EC2/NA] is 1.5-times the bondstrength without transverse pressure and the increase according to [EC2] is the smallervalue of 1 / 0.7 and 1 / (1 - 0.04 · p).
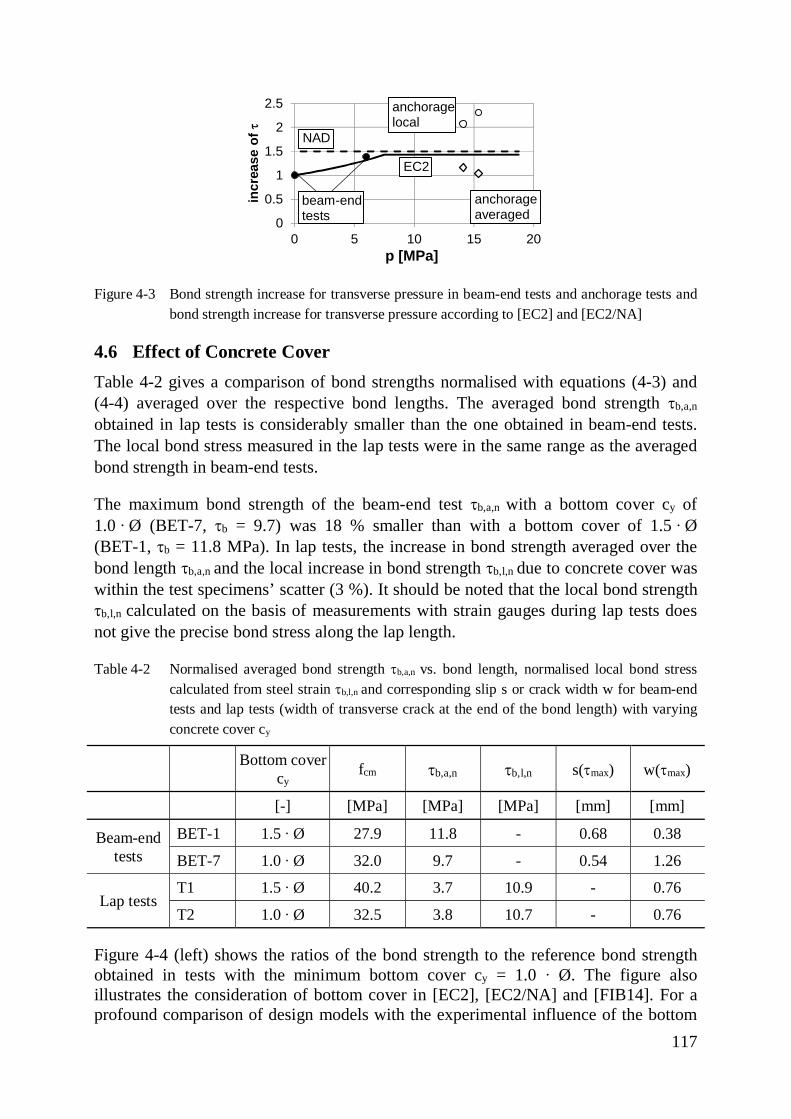
117
Figure 4-3 Bond strength increase for transverse pressure in beam-end tests and anchorage tests andbond strength increase for transverse pressure according to [EC2] and [EC2/NA]
4.6 Effect of Concrete CoverTable 4-2 gives a comparison of bond strengths normalised with equations (4-3) and(4-4) averaged over the respective bond lengths. The averaged bond strength tb,a,n
obtained in lap tests is considerably smaller than the one obtained in beam-end tests.The local bond stress measured in the lap tests were in the same range as the averagedbond strength in beam-end tests.
The maximum bond strength of the beam-end test tb,a,n with a bottom cover cy of1.0 ∙ Ø (BET-7, tb = 9.7) was 18 % smaller than with a bottom cover of 1.5 ∙ Ø(BET-1, tb = 11.8 MPa). In lap tests, the increase in bond strength averaged over thebond length tb,a,n and the local increase in bond strength tb,l,n due to concrete cover waswithin the test specimens’ scatter (3 %). It should be noted that the local bond strengthtb,l,n calculated on the basis of measurements with strain gauges during lap tests doesnot give the precise bond stress along the lap length.
Table 4-2 Normalised averaged bond strength tb,a,n vs. bond length, normalised local bond stresscalculated from steel strain tb,l,n and corresponding slip s or crack width w for beam-endtests and lap tests (width of transverse crack at the end of the bond length) with varyingconcrete cover cy
Bottom covercy
fcm tb,a,n tb,l,n s(tmax) w(tmax)
[-] [MPa] [MPa] [MPa] [mm] [mm]
Beam-endtests
BET-1 1.5 ∙ Ø 27.9 11.8 - 0.68 0.38
BET-7 1.0 ∙ Ø 32.0 9.7 - 0.54 1.26
Lap testsT1 1.5 ∙ Ø 40.2 3.7 10.9 - 0.76
T2 1.0 ∙ Ø 32.5 3.8 10.7 - 0.76
Figure 4-4 (left) shows the ratios of the bond strength to the reference bond strengthobtained in tests with the minimum bottom cover cy = 1.0 ∙ Ø. The figure alsoillustrates the consideration of bottom cover in [EC2], [EC2/NA] and [FIB14]. For aprofound comparison of design models with the experimental influence of the bottom
0
0.5
1
1.5
2
2.5
0 5 10 15 20in
crea
se o
ftp [MPa]
EC2
anchoragelocal
anchorageaveraged
NAD
beam-endtests
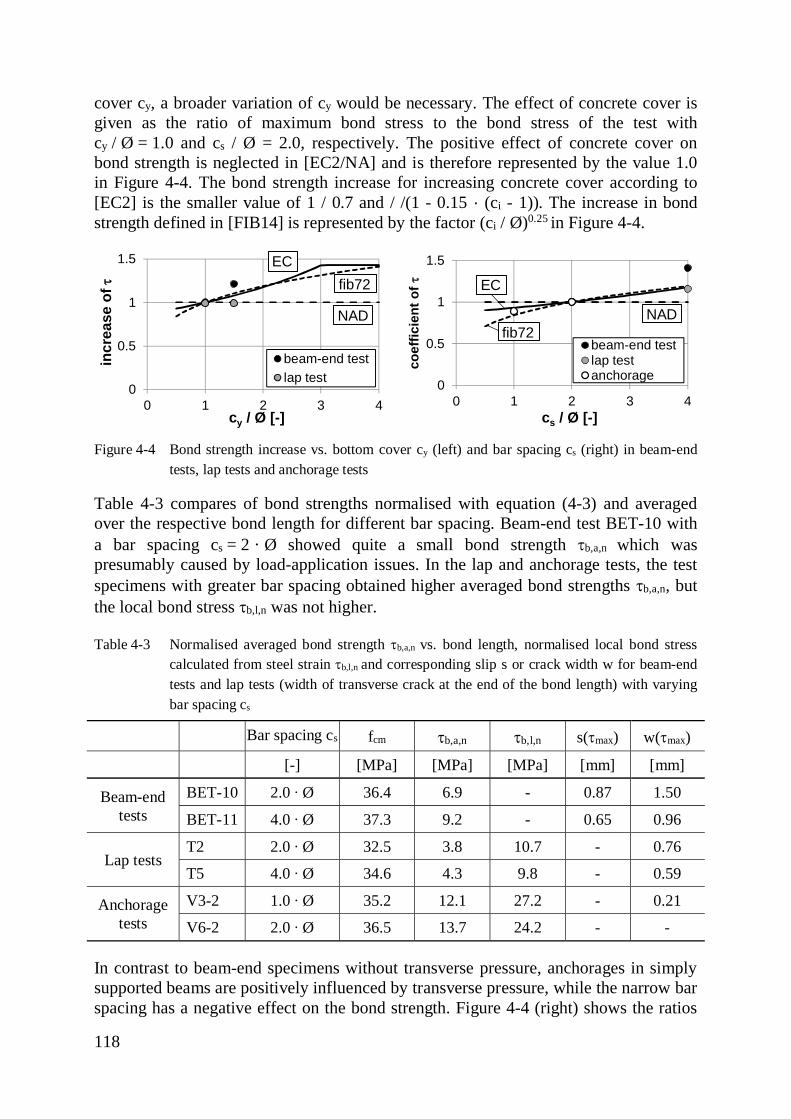
118
cover cy, a broader variation of cy would be necessary. The effect of concrete cover isgiven as the ratio of maximum bond stress to the bond stress of the test withcy / Ø = 1.0 and cs / Ø = 2.0, respectively. The positive effect of concrete cover onbond strength is neglected in [EC2/NA] and is therefore represented by the value 1.0in Figure 4-4. The bond strength increase for increasing concrete cover according to[EC2] is the smaller value of 1 / 0.7 and / /(1 - 0.15 · (ci - 1)). The increase in bondstrength defined in [FIB14] is represented by the factor (ci / Ø)0.25 in Figure 4-4.
Figure 4-4 Bond strength increase vs. bottom cover cy (left) and bar spacing cs (right) in beam-endtests, lap tests and anchorage tests
Table 4-3 compares of bond strengths normalised with equation (4-3) and averagedover the respective bond length for different bar spacing. Beam-end test BET-10 witha bar spacing cs = 2 · Ø showed quite a small bond strength tb,a,n which waspresumably caused by load-application issues. In the lap and anchorage tests, the testspecimens with greater bar spacing obtained higher averaged bond strengths tb,a,n, butthe local bond stress tb,l,n was not higher.
Table 4-3 Normalised averaged bond strength tb,a,n vs. bond length, normalised local bond stresscalculated from steel strain tb,l,n and corresponding slip s or crack width w for beam-endtests and lap tests (width of transverse crack at the end of the bond length) with varyingbar spacing cs
Bar spacing cs fcm tb,a,n tb,l,n s(tmax) w(tmax)
[-] [MPa] [MPa] [MPa] [mm] [mm]
Beam-endtests
BET-10 2.0 ∙ Ø 36.4 6.9 - 0.87 1.50
BET-11 4.0 ∙ Ø 37.3 9.2 - 0.65 0.96
Lap testsT2 2.0 ∙ Ø 32.5 3.8 10.7 - 0.76
T5 4.0 ∙ Ø 34.6 4.3 9.8 - 0.59
Anchoragetests
V3-2 1.0 ∙ Ø 35.2 12.1 27.2 - 0.21
V6-2 2.0 ∙ Ø 36.5 13.7 24.2 - -
In contrast to beam-end specimens without transverse pressure, anchorages in simplysupported beams are positively influenced by transverse pressure, while the narrow barspacing has a negative effect on the bond strength. Figure 4-4 (right) shows the ratios
0
0.5
1
1.5
0 1 2 3 4
incr
ease
oft
cy / Ø [-]
beam-end testlap test
EC
NAD
fib72
0
0.5
1
1.5
0 1 2 3 4co
effic
ient
oft
cs / Ø [-]
beam-end testlap testanchorage
EC
NADfib72
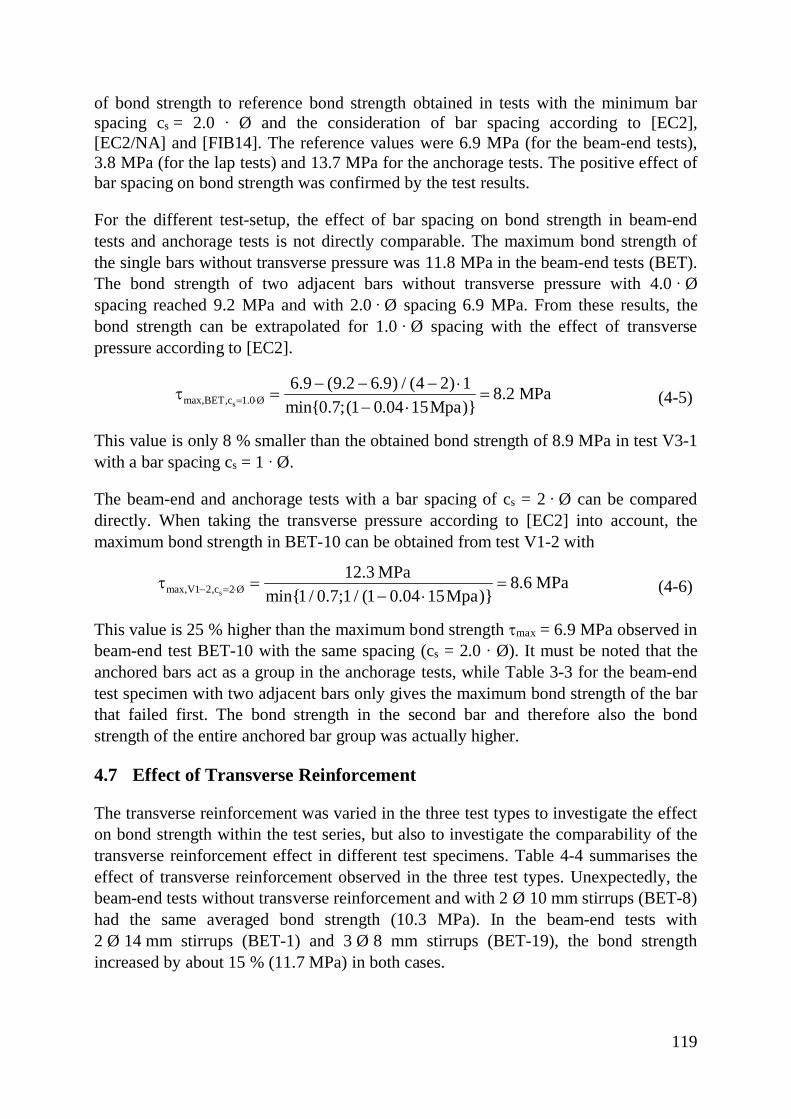
119
of bond strength to reference bond strength obtained in tests with the minimum barspacing cs = 2.0 ∙ Ø and the consideration of bar spacing according to [EC2],[EC2/NA] and [FIB14]. The reference values were 6.9 MPa (for the beam-end tests),3.8 MPa (for the lap tests) and 13.7 MPa for the anchorage tests. The positive effect ofbar spacing on bond strength was confirmed by the test results.
For the different test-setup, the effect of bar spacing on bond strength in beam-endtests and anchorage tests is not directly comparable. The maximum bond strength ofthe single bars without transverse pressure was 11.8 MPa in the beam-end tests (BET).The bond strength of two adjacent bars without transverse pressure with 4.0 ∙ Øspacing reached 9.2 MPa and with 2.0 ∙ Ø spacing 6.9 MPa. From these results, thebond strength can be extrapolated for 1.0 ∙ Ø spacing with the effect of transversepressure according to [EC2].
smax,BET,c 1.0 Ø6.9 (9.2 6.9) / (4 2) 1 8.2 MPa
min{0.7;(1 0.04 15Mpa)}= ×- - - ×t = =
- × (4-5)
This value is only 8 % smaller than the obtained bond strength of 8.9 MPa in test V3-1with a bar spacing cs = 1 ∙ Ø.
The beam-end and anchorage tests with a bar spacing of cs = 2 ∙ Ø can be compareddirectly. When taking the transverse pressure according to [EC2] into account, themaximum bond strength in BET-10 can be obtained from test V1-2 with
smax,V1 2,c 2 Ø12.3 MPa 8.6 MPa
min{1 / 0.7;1 / (1 0.04 15Mpa)}- = ×t = =- × (4-6)
This value is 25 % higher than the maximum bond strength tmax = 6.9 MPa observed inbeam-end test BET-10 with the same spacing (cs = 2.0 ∙ Ø). It must be noted that theanchored bars act as a group in the anchorage tests, while Table 3-3 for the beam-endtest specimen with two adjacent bars only gives the maximum bond strength of the barthat failed first. The bond strength in the second bar and therefore also the bondstrength of the entire anchored bar group was actually higher.
4.7 Effect of Transverse Reinforcement
The transverse reinforcement was varied in the three test types to investigate the effecton bond strength within the test series, but also to investigate the comparability of thetransverse reinforcement effect in different test specimens. Table 4-4 summarises theeffect of transverse reinforcement observed in the three test types. Unexpectedly, thebeam-end tests without transverse reinforcement and with 2 Ø 10 mm stirrups (BET-8)had the same averaged bond strength (10.3 MPa). In the beam-end tests with2 Ø 14 mm stirrups (BET-1) and 3 Ø 8 mm stirrups (BET-19), the bond strengthincreased by about 15 % (11.7 MPa) in both cases.
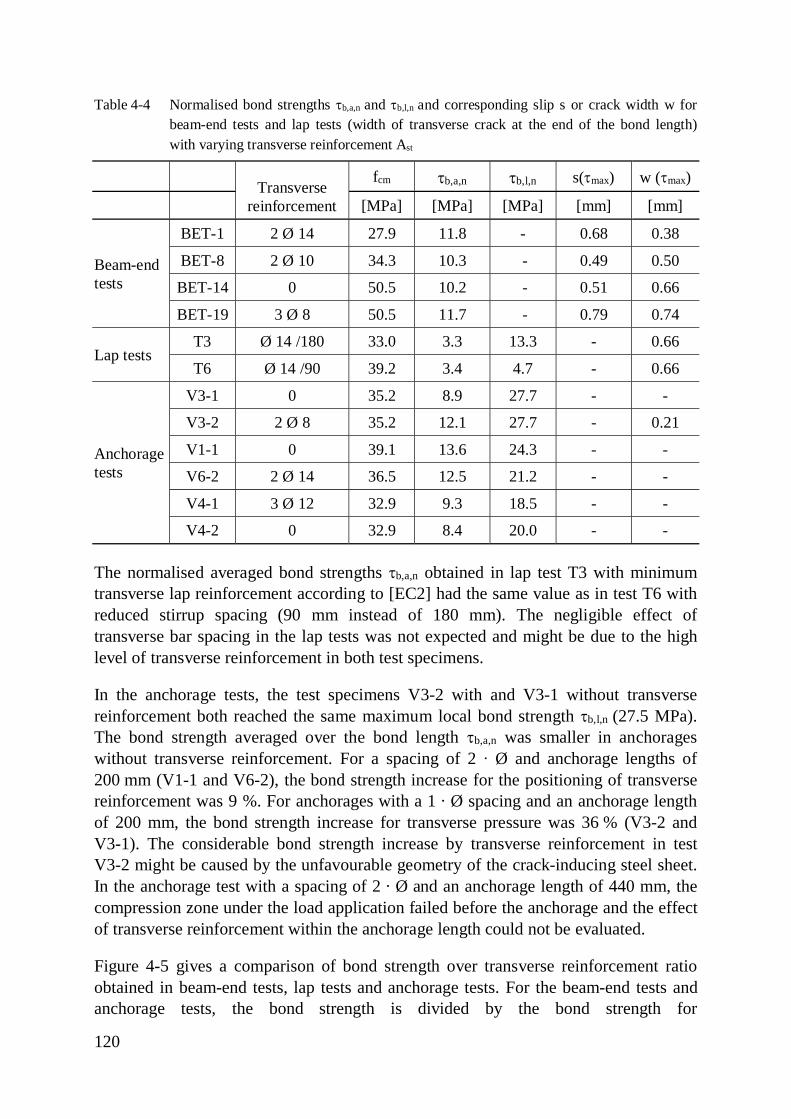
120
Table 4-4 Normalised bond strengths tb,a,n and tb,l,n and corresponding slip s or crack width w forbeam-end tests and lap tests (width of transverse crack at the end of the bond length)with varying transverse reinforcement Ast
Transversereinforcement
fcm tb,a,n tb,l,n s(tmax) w (tmax)
[MPa] [MPa] [MPa] [mm] [mm]
Beam-endtests
BET-1 2 Ø 14 27.9 11.8 - 0.68 0.38
BET-8 2 Ø 10 34.3 10.3 - 0.49 0.50
BET-14 0 50.5 10.2 - 0.51 0.66
BET-19 3 Ø 8 50.5 11.7 - 0.79 0.74
Lap testsT3 Ø 14 /180 33.0 3.3 13.3 - 0.66
T6 Ø 14 /90 39.2 3.4 4.7 - 0.66
Anchoragetests
V3-1 0 35.2 8.9 27.7 - -
V3-2 2 Ø 8 35.2 12.1 27.7 - 0.21
V1-1 0 39.1 13.6 24.3 - -
V6-2 2 Ø 14 36.5 12.5 21.2 - -
V4-1 3 Ø 12 32.9 9.3 18.5 - -
V4-2 0 32.9 8.4 20.0 - -
The normalised averaged bond strengths tb,a,n obtained in lap test T3 with minimumtransverse lap reinforcement according to [EC2] had the same value as in test T6 withreduced stirrup spacing (90 mm instead of 180 mm). The negligible effect oftransverse bar spacing in the lap tests was not expected and might be due to the highlevel of transverse reinforcement in both test specimens.
In the anchorage tests, the test specimens V3-2 with and V3-1 without transversereinforcement both reached the same maximum local bond strength tb,l,n (27.5 MPa).The bond strength averaged over the bond length tb,a,n was smaller in anchorageswithout transverse reinforcement. For a spacing of 2 ∙ Ø and anchorage lengths of200 mm (V1-1 and V6-2), the bond strength increase for the positioning of transversereinforcement was 9 %. For anchorages with a 1 · Ø spacing and an anchorage lengthof 200 mm, the bond strength increase for transverse pressure was 36 % (V3-2 andV3-1). The considerable bond strength increase by transverse reinforcement in testV3-2 might be caused by the unfavourable geometry of the crack-inducing steel sheet.In the anchorage test with a spacing of 2 · Ø and an anchorage length of 440 mm, thecompression zone under the load application failed before the anchorage and the effectof transverse reinforcement within the anchorage length could not be evaluated.
Figure 4-5 gives a comparison of bond strength over transverse reinforcement ratioobtained in beam-end tests, lap tests and anchorage tests. For the beam-end tests andanchorage tests, the bond strength is divided by the bond strength for
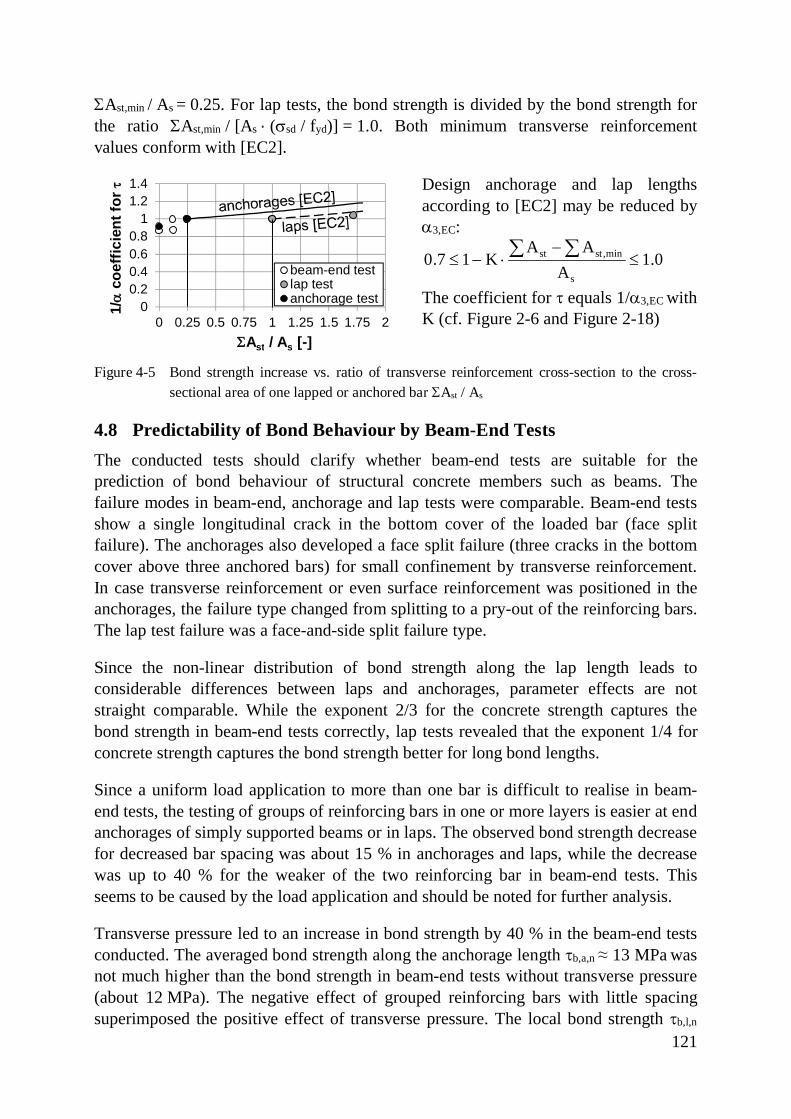
121
SAst,min / As = 0.25. For lap tests, the bond strength is divided by the bond strength forthe ratio SAst,min / [As · (ssd / fyd)] = 1.0. Both minimum transverse reinforcementvalues conform with [EC2].
Design anchorage and lap lengthsaccording to [EC2] may be reduced bya3,EC:
st st ,min
s
A A0.7 1 K 1.0
A-
£ - × £å å
The coefficient for t equals 1/a3,EC withK (cf. Figure 2-6 and Figure 2-18)
Figure 4-5 Bond strength increase vs. ratio of transverse reinforcement cross-section to the cross-sectional area of one lapped or anchored bar SAst / As
4.8 Predictability of Bond Behaviour by Beam-End TestsThe conducted tests should clarify whether beam-end tests are suitable for theprediction of bond behaviour of structural concrete members such as beams. Thefailure modes in beam-end, anchorage and lap tests were comparable. Beam-end testsshow a single longitudinal crack in the bottom cover of the loaded bar (face splitfailure). The anchorages also developed a face split failure (three cracks in the bottomcover above three anchored bars) for small confinement by transverse reinforcement.In case transverse reinforcement or even surface reinforcement was positioned in theanchorages, the failure type changed from splitting to a pry-out of the reinforcing bars.The lap test failure was a face-and-side split failure type.
Since the non-linear distribution of bond strength along the lap length leads toconsiderable differences between laps and anchorages, parameter effects are notstraight comparable. While the exponent 2/3 for the concrete strength captures thebond strength in beam-end tests correctly, lap tests revealed that the exponent 1/4 forconcrete strength captures the bond strength better for long bond lengths.
Since a uniform load application to more than one bar is difficult to realise in beam-end tests, the testing of groups of reinforcing bars in one or more layers is easier at endanchorages of simply supported beams or in laps. The observed bond strength decreasefor decreased bar spacing was about 15 % in anchorages and laps, while the decreasewas up to 40 % for the weaker of the two reinforcing bar in beam-end tests. Thisseems to be caused by the load application and should be noted for further analysis.
Transverse pressure led to an increase in bond strength by 40 % in the beam-end testsconducted. The averaged bond strength along the anchorage length tb,a,n ≈ 13 MPa wasnot much higher than the bond strength in beam-end tests without transverse pressure(about 12 MPa). The negative effect of grouped reinforcing bars with little spacingsuperimposed the positive effect of transverse pressure. The local bond strength tb,l,n
00.20.40.60.8
11.21.4
0 0.25 0.5 0.75 1 1.25 1.5 1.75 2
1/a
coef
ficie
nt fo
rt
SAst / As [-]
beam-end testlap testanchorage test
122
calculated from strain measurements in anchorage tests was more than twice as muchas the bond strength without transverse pressure. Such high values were only observedlocally and cannot be reached along the entire anchorage length.
The slight increase in averaged bond strength tb,a,n observed in beam-end tests for thepositioned transverse reinforcement conforms with the increase investigated inanchorages, while it seems to be more beneficial in laps without transverse pressure.
The beam end-test is therefore capable to predict different parameter effects on bondcapacity in bond zones. For a correct capture of the effect of adjacent bars with smallspacing, a uniform load application must be planned thoroughly.
In beam-end tests, the transverse crack at the end of the bond length is reduced by thecontinuous reinforcement shown in Figure 3-1. Still, the widths of the transverse crackat the end of the bond length (denominated crack 1 in Figure 3-4) measured in beam-end tests resemble the crack width dimensions obtained at lap ends. Since a wide rangeof transverse crack widths was observed at the end of the bond length in beam-endtests for equal parameters, parameter effects are not clearly visible. In contrast,parameter effects on crack width are clearly visible within the lap length and in theundisturbed length of lap tests. While the concrete strength, the presence of continuousbars and the bar diameter influence the crack widths at the lap ends, the change instiffness prevails.
123
5 Database for the Ultimate Limit State
5.1 Database FilterIn this chapter, a comparison of the described test results and design models with a lapand anchorage database is presented. The database was originally compiled by ACICOMMITTEE 408 [ACI01] and FIB TASK GROUP 2.5 [FIB05] and comprises more than800 tests with anchorages and laps. Annex A.3 provides drawings and tables of theanchorage and lap tests included in the database.
The database comprises several lap investigations. The first major lap investigationswere conducted by FERGUSON ET AL. in the 1950s and 1960s at the University ofTexas at Austin [FER65a], [FER65c], [FER69]; [FER62]; [FER65b]. The Europeaninvestigations were performed in the 1970s by TEPFERS [TEP73] as well as REHM ANDELIGEHAUSEN [REH77] in Gothenburg and Stuttgart, respectively. For new materialssuch as high-strength reinforcement, high-strength concrete and epoxy-coatedreinforcing bars, new test programmes were conducted during the 1990s (e.g.[DAR95a], [ZUO00], [DAR95b], [AZI99], [AZI93], [DEV91], [CHO91], [KAD94],[BUR00]). All of these investigations comprise more than 20 lap tests each, but thetest programme described in [TEP73] was the largest investigation performedincluding 173 tests.
The tests in the original database include different concrete strength, bar diameter,yield strength, rib area, lap length and confinement as well as bottom, top and sidebars. Most tests are four-point bending tests with laps in the constant moment zone,but different test-setups are covered as well. The database does not comprise testswith:
- Anchorages with bends and hooks- Coated bars- Lapped bars with different bar diameters- Pull-out tests- Anchorages under compression
The original database comprises anchorages and laps in poor bond conditions and lapswhere less than 100 % of the bars are lapped. In the course of this evaluation, thesecases were excluded from the database and described briefly in chapter 8.1.
[FIB14] defines a database filter, which was mostly applied for the followingevaluation as well. The own filtered database comprises only test specimen where:
- 20 MPa < fcm < 110 MPa (the lower limit is representative of practice and theupper limit represents a limit of experimental data)
- l0 / Ø ≥ 15 for laps (representative of practice)- 0.95 ≤ cmin / Ø < 3.5 (the lower limit is representative of practice and the upper
limit represents a limit of experimental data)
124
- cmax / cmin ≤ 5 (limit of experimental data)- Ktr ≤ 0.05 (little increase in bond strength above this value)- ss,test / fym > 1.2 (otherwise failure probably not attributable to bond)- nb >1 (otherwise no mutual influence of adjacent bars)
The database was extended by the anchorage test data compiled by AMIN [AMI09].Since the stress to be developed in anchorages is usually much lower than the yieldstrength, shorter anchorages were allowed in the own database.
The cover values correspond with the minimum cover and bar spacing cmin accordingto [EC2] and [MC2010] (1.0 ∙ Ø). Without consideration of durability requirements,the minimum cover defined in [ACI14] is 38 mm for Ø 43 mm (0.88 ∙ Ø) bars. Inslabs, the minimum cover is 19 mm for bar diameters up to Ø 36 mm (0.53 ∙ Ø)according to [ACI14]. Cover dimensions in existing structures often do not fulfilcurrent cover requirements. The performance of anchorages and laps with smallercovers was described by SCHENKEL [SCH98b] (with cover ratios cy / Ø from 0 to 1.9).
The maximum bar stress ss,test was extracted from the individual publications byFib task group 2.5. The reinforcing bar stresses of the tests conducted at IMB werecalculated with a parabola-rectangle diagram for concrete stress. The aim of lap tests isusually to reach the mean yield strength fym without prior failure and certain ability forload increase above the yield strength to obtain ductile behaviour. Test specimensincluded in the database with lapped-bar stress well above the yield strength probablyfailed in shear or bending rather than in bond. Therefore, test results with bar stressesabove 1.2 ∙ fym were excluded from the database.
The database also comprised anchorage and lap tests with one bar only. The bondstrength of single bars is higher than for several lapped or anchored bars, since coverand bar spacing influence the bond strength (cf. chapters 3.3.4, 3.4.4, 3.5.4 and 5.3.4).Therefore, tests with one bar only were excluded in the following evaluation.Additionally, structural elements with one bar only do not represent structuralelements in practice. The database was described and evaluated in several publications[BUR00], [ACI01]; [ACI03], [LET06b],[BUR00]; [CAI14b]; [FIB14]; [LET06a];[LET06b]. Table 5-1 gives an overview of the database test numbers used for thesepublications. The publications including statistical analyses of the database were usedto check the results of the database evaluation in this thesis. The appendix of this thesiscontains tables and drawings of the single test programmes included in the database.
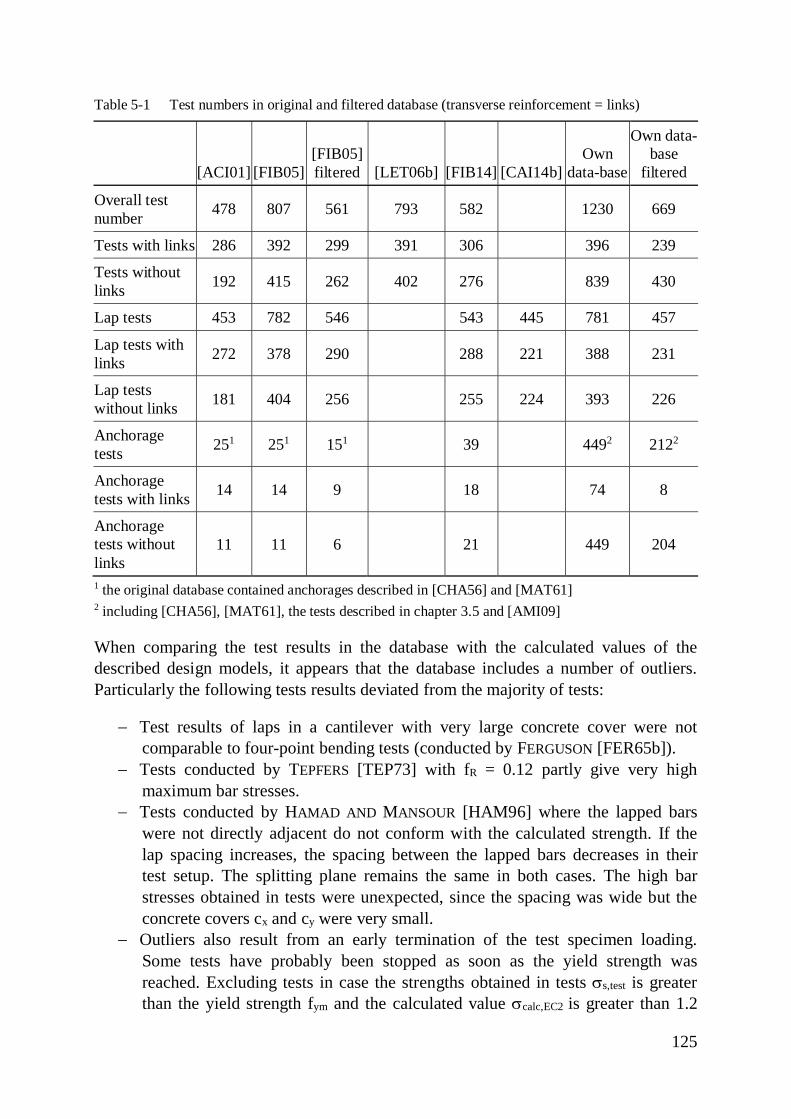
125
Table 5-1 Test numbers in original and filtered database (transverse reinforcement = links)
[ACI01] [FIB05][FIB05]filtered [LET06b] [FIB14] [CAI14b]
Owndata-base
Own data-base
filtered
Overall testnumber 478 807 561 793 582 1230 669
Tests with links 286 392 299 391 306 396 239
Tests withoutlinks 192 415 262 402 276 839 430
Lap tests 453 782 546 543 445 781 457
Lap tests withlinks 272 378 290 288 221 388 231
Lap testswithout links 181 404 256 255 224 393 226
Anchoragetests 251 251 151 39 4492 2122
Anchoragetests with links 14 14 9 18 74 8
Anchoragetests withoutlinks
11 11 6 21 449 204
1 the original database contained anchorages described in [CHA56] and [MAT61]2 including [CHA56], [MAT61], the tests described in chapter 3.5 and [AMI09]
When comparing the test results in the database with the calculated values of thedescribed design models, it appears that the database includes a number of outliers.Particularly the following tests results deviated from the majority of tests:
- Test results of laps in a cantilever with very large concrete cover were notcomparable to four-point bending tests (conducted by FERGUSON [FER65b]).
- Tests conducted by TEPFERS [TEP73] with fR = 0.12 partly give very highmaximum bar stresses.
- Tests conducted by HAMAD AND MANSOUR [HAM96] where the lapped barswere not directly adjacent do not conform with the calculated strength. If thelap spacing increases, the spacing between the lapped bars decreases in theirtest setup. The splitting plane remains the same in both cases. The high barstresses obtained in tests were unexpected, since the spacing was wide but theconcrete covers cx and cy were very small.
- Outliers also result from an early termination of the test specimen loading.Some tests have probably been stopped as soon as the yield strength wasreached. Excluding tests in case the strengths obtained in tests ss,test is greaterthan the yield strength fym and the calculated value scalc,EC2 is greater than 1.2
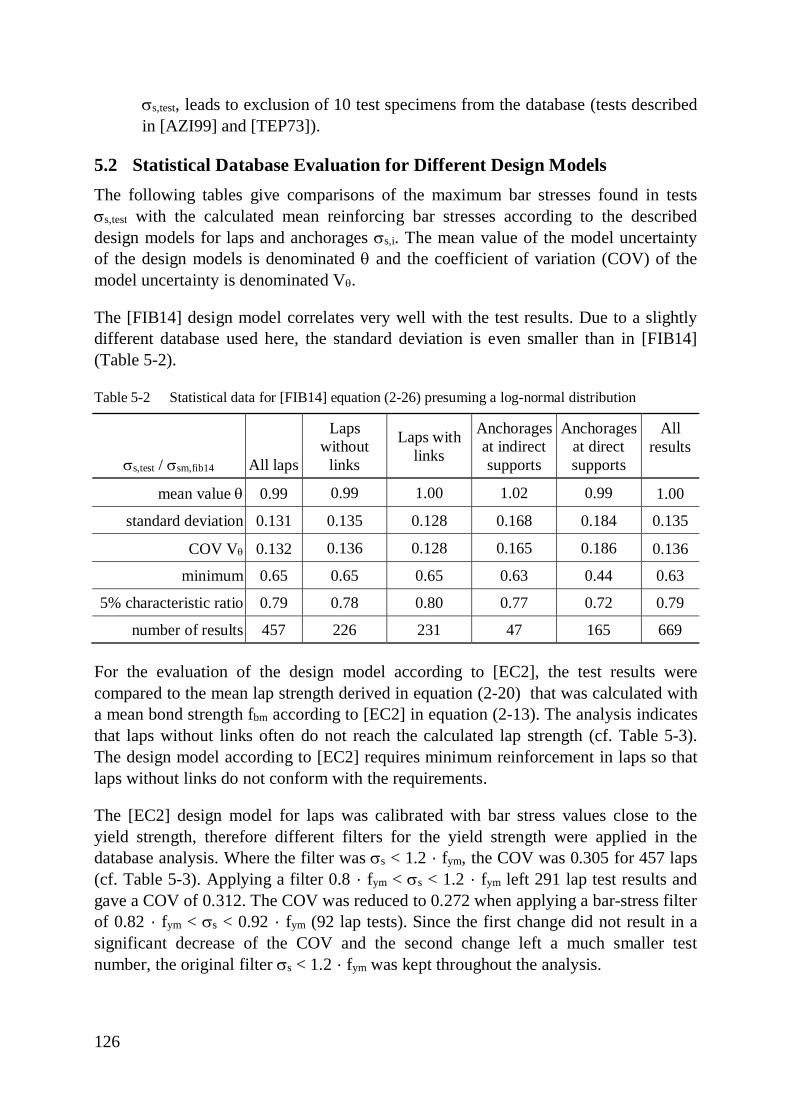
126
ss,test, leads to exclusion of 10 test specimens from the database (tests describedin [AZI99] and [TEP73]).
5.2 Statistical Database Evaluation for Different Design ModelsThe following tables give comparisons of the maximum bar stresses found in testsss,test with the calculated mean reinforcing bar stresses according to the describeddesign models for laps and anchorages ss,i. The mean value of the model uncertaintyof the design models is denominated q and the coefficient of variation (COV) of themodel uncertainty is denominated Vq.
The [FIB14] design model correlates very well with the test results. Due to a slightlydifferent database used here, the standard deviation is even smaller than in [FIB14](Table 5-2).
Table 5-2 Statistical data for [FIB14] equation (2-26) presuming a log-normal distribution
ss,test / ssm,fib14 All laps
Lapswithout
links
Laps withlinks
Anchoragesat indirectsupports
Anchoragesat directsupports
Allresults
mean value q 0.99 0.99 1.00 1.02 0.99 1.00
standard deviation 0.131 0.135 0.128 0.168 0.184 0.135
COV Vq 0.132 0.136 0.128 0.165 0.186 0.136
minimum 0.65 0.65 0.65 0.63 0.44 0.63
5% characteristic ratio 0.79 0.78 0.80 0.77 0.72 0.79
number of results 457 226 231 47 165 669
For the evaluation of the design model according to [EC2], the test results werecompared to the mean lap strength derived in equation (2-20) that was calculated witha mean bond strength fbm according to [EC2] in equation (2-13). The analysis indicatesthat laps without links often do not reach the calculated lap strength (cf. Table 5-3).The design model according to [EC2] requires minimum reinforcement in laps so thatlaps without links do not conform with the requirements.
The [EC2] design model for laps was calibrated with bar stress values close to theyield strength, therefore different filters for the yield strength were applied in thedatabase analysis. Where the filter was ss < 1.2 · fym, the COV was 0.305 for 457 laps(cf. Table 5-3). Applying a filter 0.8 · fym < ss < 1.2 · fym left 291 lap test results andgave a COV of 0.312. The COV was reduced to 0.272 when applying a bar-stress filterof 0.82 · fym < ss < 0.92 · fym (92 lap tests). Since the first change did not result in asignificant decrease of the COV and the second change left a much smaller testnumber, the original filter ss < 1.2 · fym was kept throughout the analysis.
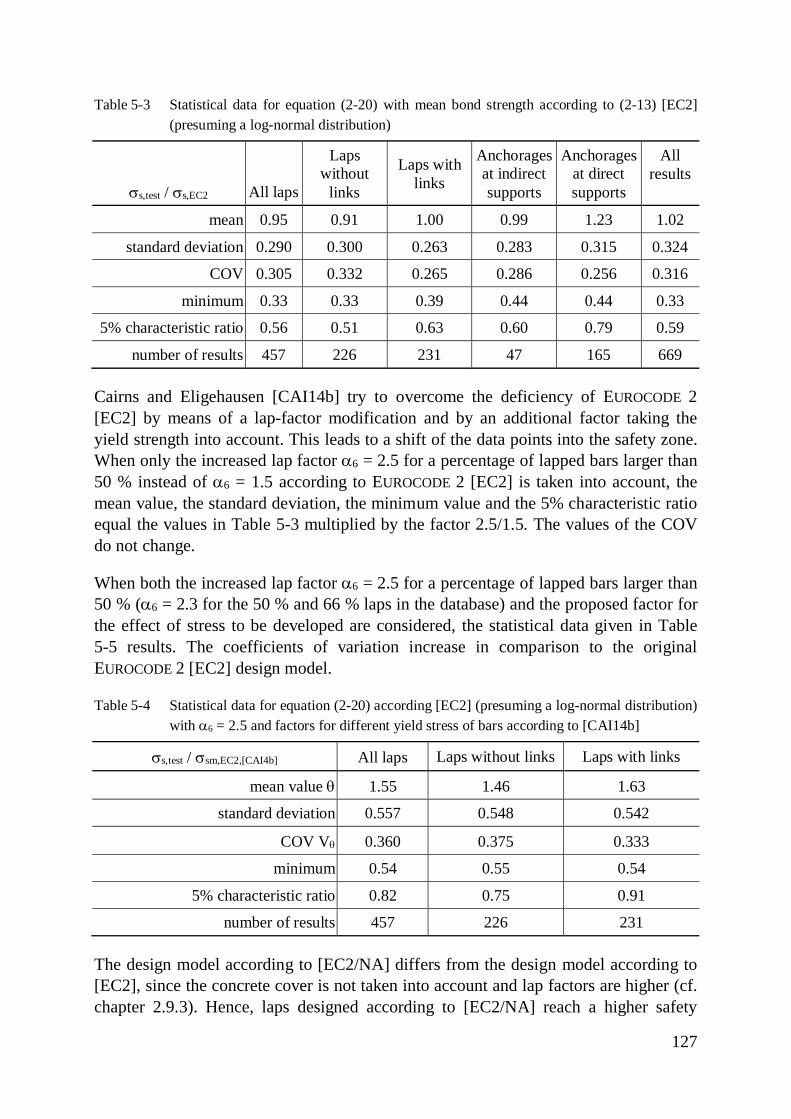
127
Table 5-3 Statistical data for equation (2-20) with mean bond strength according to (2-13) [EC2](presuming a log-normal distribution)
ss,test / ss,EC2 All laps
Lapswithout
links
Laps withlinks
Anchoragesat indirectsupports
Anchoragesat directsupports
Allresults
mean 0.95 0.91 1.00 0.99 1.23 1.02
standard deviation 0.290 0.300 0.263 0.283 0.315 0.324
COV 0.305 0.332 0.265 0.286 0.256 0.316
minimum 0.33 0.33 0.39 0.44 0.44 0.33
5% characteristic ratio 0.56 0.51 0.63 0.60 0.79 0.59
number of results 457 226 231 47 165 669
Cairns and Eligehausen [CAI14b] try to overcome the deficiency of EUROCODE 2[EC2] by means of a lap-factor modification and by an additional factor taking theyield strength into account. This leads to a shift of the data points into the safety zone.When only the increased lap factor a6 = 2.5 for a percentage of lapped bars larger than50 % instead of a6 = 1.5 according to EUROCODE 2 [EC2] is taken into account, themean value, the standard deviation, the minimum value and the 5% characteristic ratioequal the values in Table 5-3 multiplied by the factor 2.5/1.5. The values of the COVdo not change.
When both the increased lap factor a6 = 2.5 for a percentage of lapped bars larger than50 % (a6 = 2.3 for the 50 % and 66 % laps in the database) and the proposed factor forthe effect of stress to be developed are considered, the statistical data given in Table5-5 results. The coefficients of variation increase in comparison to the originalEUROCODE 2 [EC2] design model.
Table 5-4 Statistical data for equation (2-20) according [EC2] (presuming a log-normal distribution)with a6 = 2.5 and factors for different yield stress of bars according to [CAI14b]
ss,test / ssm,EC2,[CAI4b] All laps Laps without links Laps with links
mean value q 1.55 1.46 1.63
standard deviation 0.557 0.548 0.542
COV Vq 0.360 0.375 0.333
minimum 0.54 0.55 0.54
5% characteristic ratio 0.82 0.75 0.91
number of results 457 226 231
The design model according to [EC2/NA] differs from the design model according to[EC2], since the concrete cover is not taken into account and lap factors are higher (cf.chapter 2.9.3). Hence, laps designed according to [EC2/NA] reach a higher safety
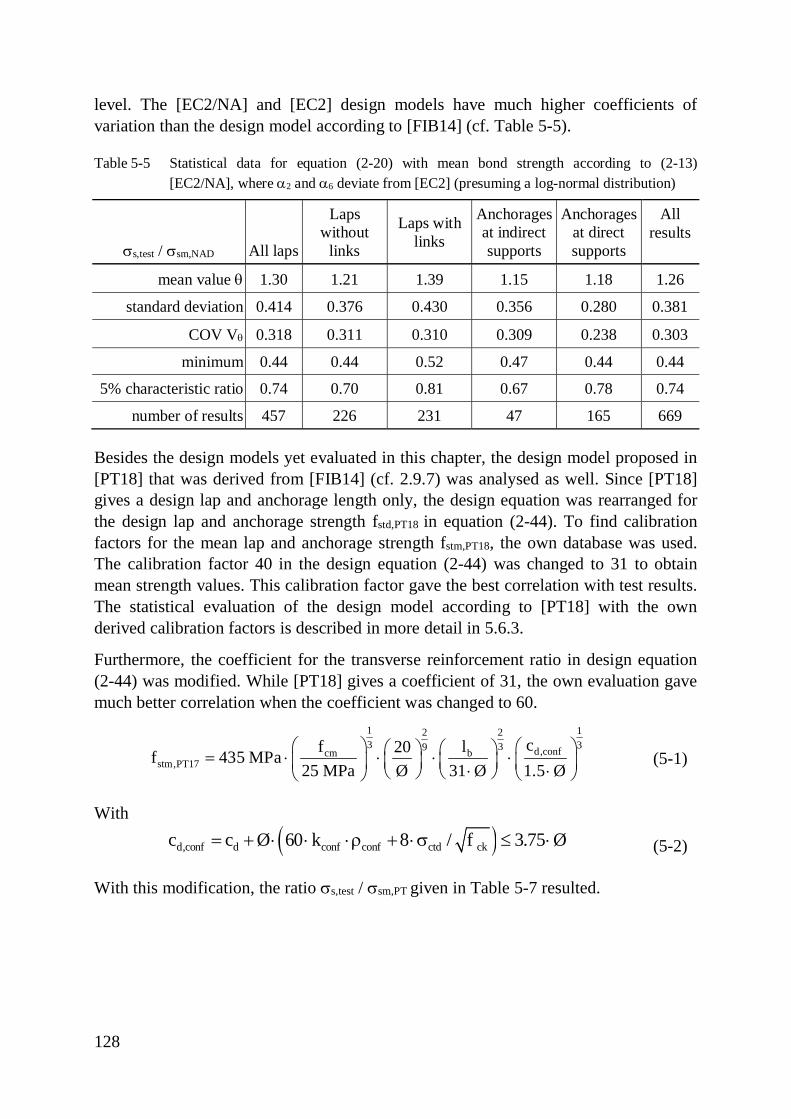
128
level. The [EC2/NA] and [EC2] design models have much higher coefficients ofvariation than the design model according to [FIB14] (cf. Table 5-5).
Table 5-5 Statistical data for equation (2-20) with mean bond strength according to (2-13)[EC2/NA], where a2 and a6 deviate from [EC2] (presuming a log-normal distribution)
ss,test / ssm,NAD All laps
Lapswithout
links
Laps withlinks
Anchoragesat indirectsupports
Anchoragesat directsupports
Allresults
mean value q 1.30 1.21 1.39 1.15 1.18 1.26
standard deviation 0.414 0.376 0.430 0.356 0.280 0.381
COV Vq 0.318 0.311 0.310 0.309 0.238 0.303
minimum 0.44 0.44 0.52 0.47 0.44 0.44
5% characteristic ratio 0.74 0.70 0.81 0.67 0.78 0.74
number of results 457 226 231 47 165 669
Besides the design models yet evaluated in this chapter, the design model proposed in[PT18] that was derived from [FIB14] (cf. 2.9.7) was analysed as well. Since [PT18]gives a design lap and anchorage length only, the design equation was rearranged forthe design lap and anchorage strength fstd,PT18 in equation (2-44). To find calibrationfactors for the mean lap and anchorage strength fstm,PT18, the own database was used.The calibration factor 40 in the design equation (2-44) was changed to 31 to obtainmean strength values. This calibration factor gave the best correlation with test results.The statistical evaluation of the design model according to [PT18] with the ownderived calibration factors is described in more detail in 5.6.3.
Furthermore, the coefficient for the transverse reinforcement ratio in design equation(2-44) was modified. While [PT18] gives a coefficient of 31, the own evaluation gavemuch better correlation when the coefficient was changed to 60.
1 1223 339 d,confcm b
stm,PT17cf l20f 435 MPa
25 MPa Ø 31 Ø 1.5 Øæ ö æ öæ öæ ö= × × × ×ç ÷ ç ÷ç ÷ ç ÷× ×è ø è ø è øè ø
(5-1)
With
( )d,conf d conf conf ctd ckc c Ø 60 k 8 / f 3.75 Ø= + × × ×r + ×s £ × (5-2)
With this modification, the ratio ss,test / ssm,PT given in Table 5-7 resulted.
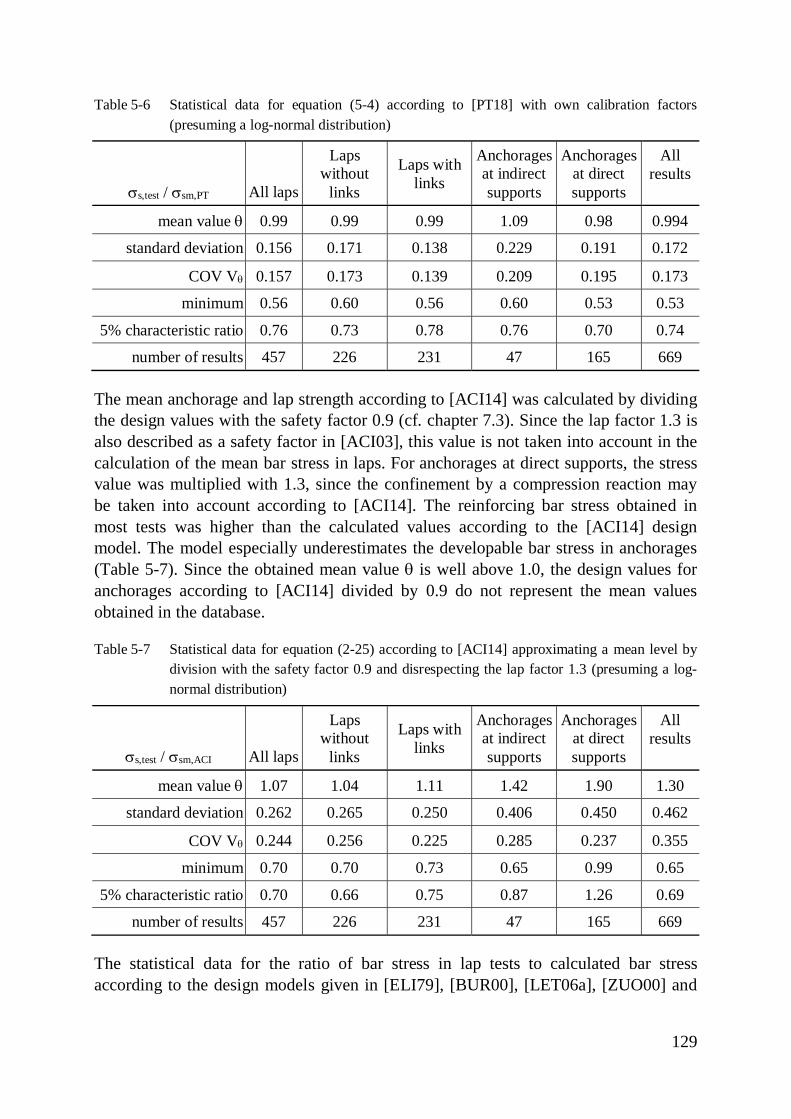
129
Table 5-6 Statistical data for equation (5-4) according to [PT18] with own calibration factors(presuming a log-normal distribution)
ss,test / ssm,PT All laps
Lapswithout
links
Laps withlinks
Anchoragesat indirectsupports
Anchoragesat directsupports
Allresults
mean value q 0.99 0.99 0.99 1.09 0.98 0.994
standard deviation 0.156 0.171 0.138 0.229 0.191 0.172
COV Vq 0.157 0.173 0.139 0.209 0.195 0.173
minimum 0.56 0.60 0.56 0.60 0.53 0.53
5% characteristic ratio 0.76 0.73 0.78 0.76 0.70 0.74
number of results 457 226 231 47 165 669
The mean anchorage and lap strength according to [ACI14] was calculated by dividingthe design values with the safety factor 0.9 (cf. chapter 7.3). Since the lap factor 1.3 isalso described as a safety factor in [ACI03], this value is not taken into account in thecalculation of the mean bar stress in laps. For anchorages at direct supports, the stressvalue was multiplied with 1.3, since the confinement by a compression reaction maybe taken into account according to [ACI14]. The reinforcing bar stress obtained inmost tests was higher than the calculated values according to the [ACI14] designmodel. The model especially underestimates the developable bar stress in anchorages(Table 5-7). Since the obtained mean value q is well above 1.0, the design values foranchorages according to [ACI14] divided by 0.9 do not represent the mean valuesobtained in the database.
Table 5-7 Statistical data for equation (2-25) according to [ACI14] approximating a mean level bydivision with the safety factor 0.9 and disrespecting the lap factor 1.3 (presuming a log-normal distribution)
ss,test / ssm,ACI All laps
Lapswithout
links
Laps withlinks
Anchoragesat indirectsupports
Anchoragesat directsupports
Allresults
mean value q 1.07 1.04 1.11 1.42 1.90 1.30
standard deviation 0.262 0.265 0.250 0.406 0.450 0.462
COV Vq 0.244 0.256 0.225 0.285 0.237 0.355
minimum 0.70 0.70 0.73 0.65 0.99 0.65
5% characteristic ratio 0.70 0.66 0.75 0.87 1.26 0.69
number of results 457 226 231 47 165 669
The statistical data for the ratio of bar stress in lap tests to calculated bar stressaccording to the design models given in [ELI79], [BUR00], [LET06a], [ZUO00] and
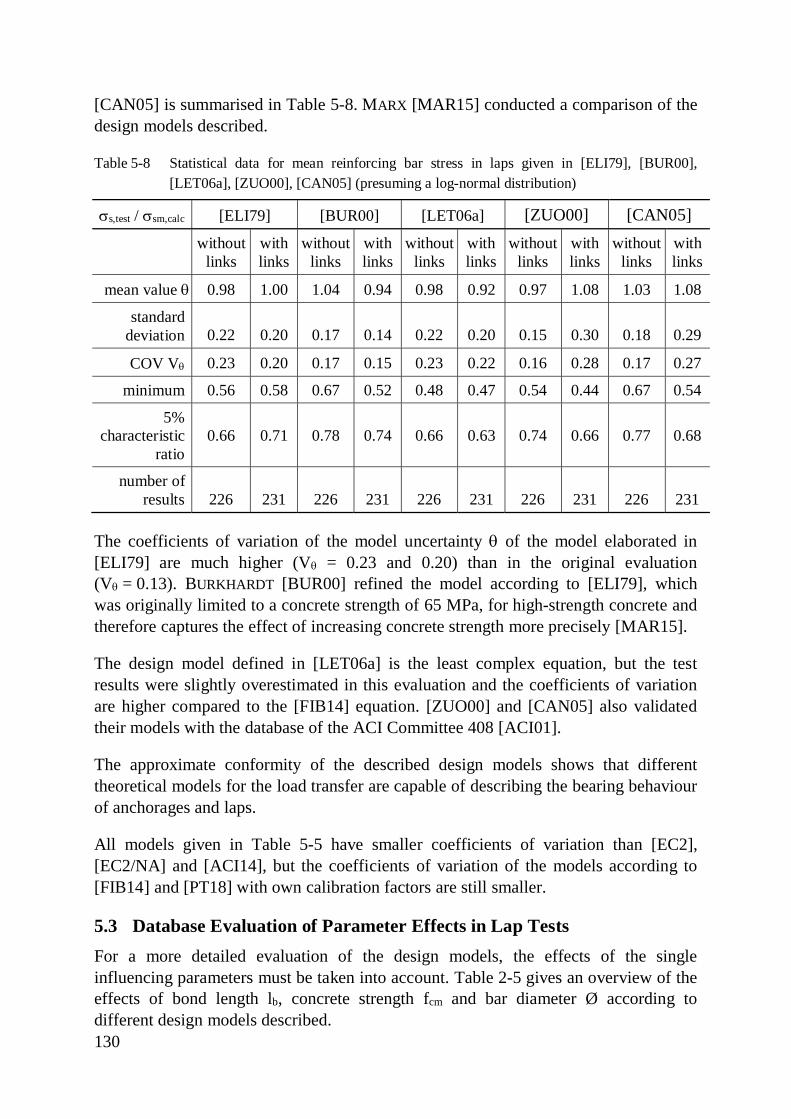
130
[CAN05] is summarised in Table 5-8. MARX [MAR15] conducted a comparison of thedesign models described.
Table 5-8 Statistical data for mean reinforcing bar stress in laps given in [ELI79], [BUR00],[LET06a], [ZUO00], [CAN05] (presuming a log-normal distribution)
ss,test / ssm,calc [ELI79] [BUR00] [LET06a] [ZUO00] [CAN05]without
linkswithlinks
withoutlinks
withlinks
withoutlinks
withlinks
withoutlinks
withlinks
withoutlinks
withlinks
mean value q 0.98 1.00 1.04 0.94 0.98 0.92 0.97 1.08 1.03 1.08
standarddeviation 0.22 0.20 0.17 0.14 0.22 0.20 0.15 0.30 0.18 0.29
COV Vq 0.23 0.20 0.17 0.15 0.23 0.22 0.16 0.28 0.17 0.27
minimum 0.56 0.58 0.67 0.52 0.48 0.47 0.54 0.44 0.67 0.54
5%characteristic
ratio0.66 0.71 0.78 0.74 0.66 0.63 0.74 0.66 0.77 0.68
number ofresults 226 231 226 231 226 231 226 231 226 231
The coefficients of variation of the model uncertainty q of the model elaborated in[ELI79] are much higher (Vq = 0.23 and 0.20) than in the original evaluation(Vq = 0.13). BURKHARDT [BUR00] refined the model according to [ELI79], whichwas originally limited to a concrete strength of 65 MPa, for high-strength concrete andtherefore captures the effect of increasing concrete strength more precisely [MAR15].
The design model defined in [LET06a] is the least complex equation, but the testresults were slightly overestimated in this evaluation and the coefficients of variationare higher compared to the [FIB14] equation. [ZUO00] and [CAN05] also validatedtheir models with the database of the ACI Committee 408 [ACI01].
The approximate conformity of the described design models shows that differenttheoretical models for the load transfer are capable of describing the bearing behaviourof anchorages and laps.
All models given in Table 5-5 have smaller coefficients of variation than [EC2],[EC2/NA] and [ACI14], but the coefficients of variation of the models according to[FIB14] and [PT18] with own calibration factors are still smaller.
5.3 Database Evaluation of Parameter Effects in Lap TestsFor a more detailed evaluation of the design models, the effects of the singleinfluencing parameters must be taken into account. Table 2-5 gives an overview of theeffects of bond length lb, concrete strength fcm and bar diameter Ø according todifferent design models described.
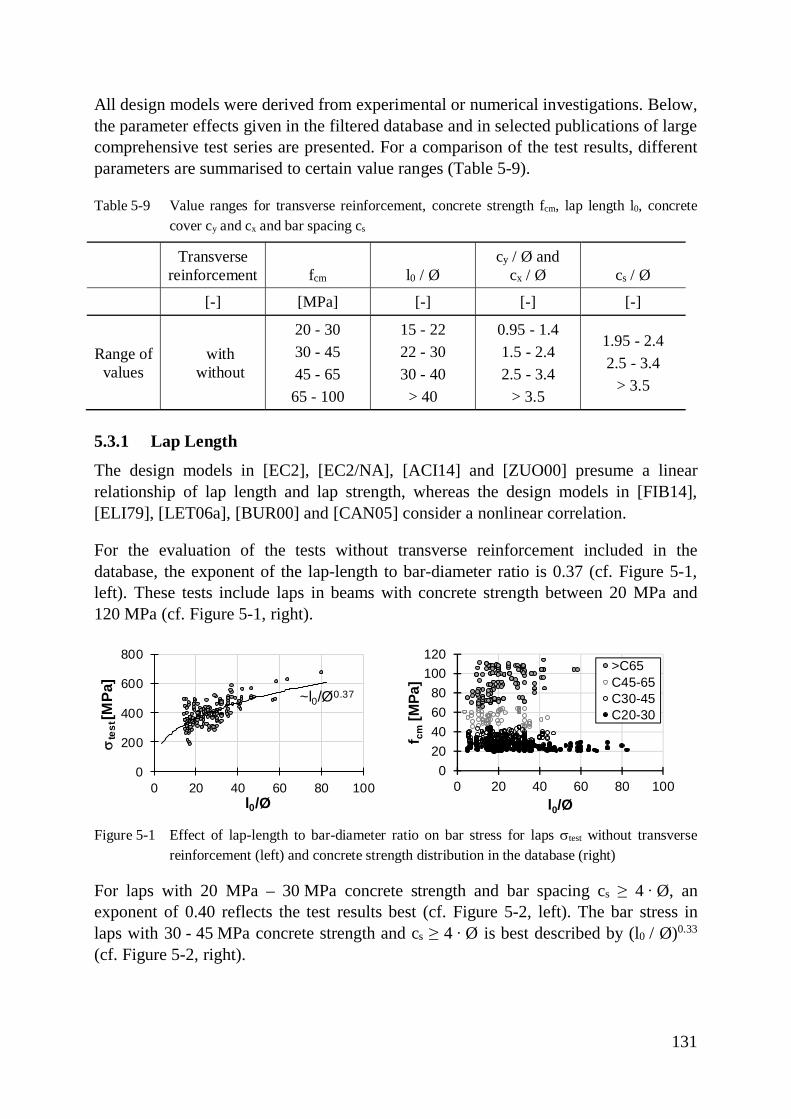
131
All design models were derived from experimental or numerical investigations. Below,the parameter effects given in the filtered database and in selected publications of largecomprehensive test series are presented. For a comparison of the test results, differentparameters are summarised to certain value ranges (Table 5-9).
Table 5-9 Value ranges for transverse reinforcement, concrete strength fcm, lap length l0, concretecover cy and cx and bar spacing cs
Transversereinforcement fcm l0 / Ø
cy / Ø andcx / Ø cs / Ø
[-] [MPa] [-] [-] [-]
Range ofvalues
withwithout
20 - 3030 - 4545 - 6565 - 100
15 - 2222 - 3030 - 40
> 40
0.95 - 1.41.5 - 2.42.5 - 3.4
> 3.5
1.95 - 2.42.5 - 3.4
> 3.5
5.3.1 Lap Length
The design models in [EC2], [EC2/NA], [ACI14] and [ZUO00] presume a linearrelationship of lap length and lap strength, whereas the design models in [FIB14],[ELI79], [LET06a], [BUR00] and [CAN05] consider a nonlinear correlation.
For the evaluation of the tests without transverse reinforcement included in thedatabase, the exponent of the lap-length to bar-diameter ratio is 0.37 (cf. Figure 5-1,left). These tests include laps in beams with concrete strength between 20 MPa and120 MPa (cf. Figure 5-1, right).
Figure 5-1 Effect of lap-length to bar-diameter ratio on bar stress for laps stest without transversereinforcement (left) and concrete strength distribution in the database (right)
For laps with 20 MPa – 30 MPa concrete strength and bar spacing cs ≥ 4 ∙ Ø, anexponent of 0.40 reflects the test results best (cf. Figure 5-2, left). The bar stress inlaps with 30 - 45 MPa concrete strength and cs ≥ 4 ∙ Ø is best described by (l0 / Ø)0.33
(cf. Figure 5-2, right).
0
200
400
600
800
0 20 40 60 80 100
ste
st[M
Pa]
l0/Ø
~l0/Ø0.37
020406080
100120
0 20 40 60 80 100
f cm
[MPa
]
l0/Ø
>C65C45-65C30-45C20-30
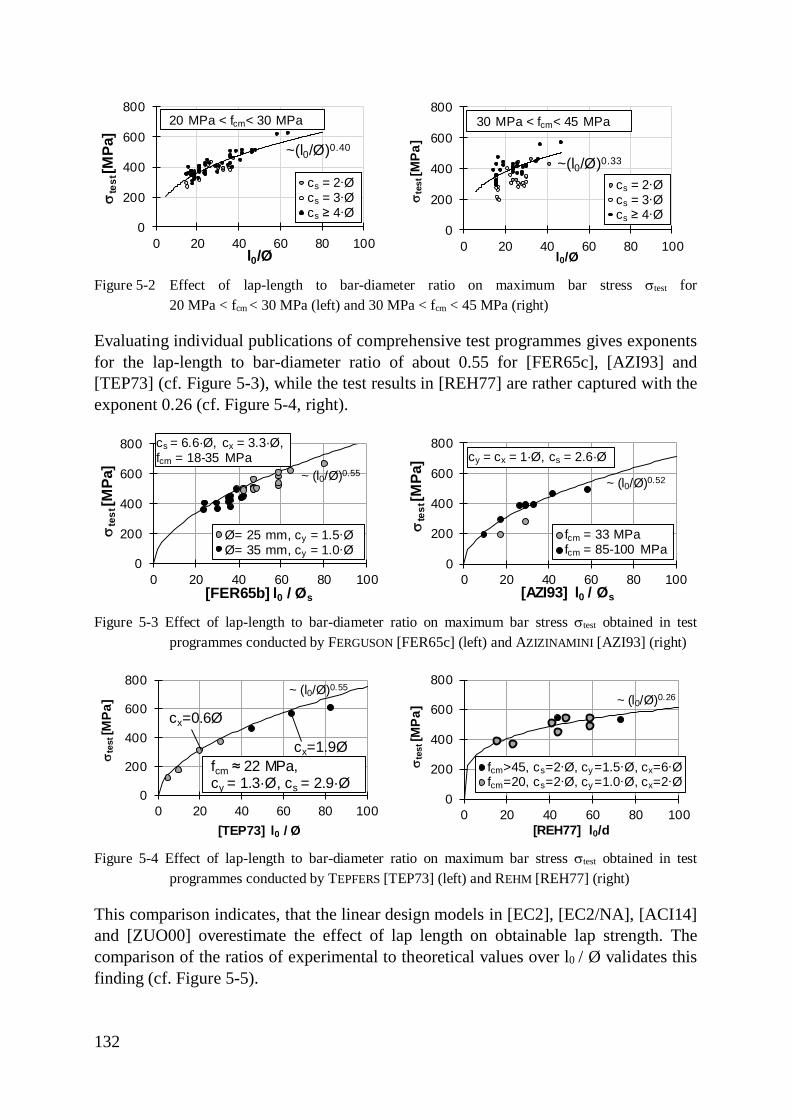
132
Figure 5-2 Effect of lap-length to bar-diameter ratio on maximum bar stress stest for20 MPa < fcm < 30 MPa (left) and 30 MPa < fcm < 45 MPa (right)
Evaluating individual publications of comprehensive test programmes gives exponentsfor the lap-length to bar-diameter ratio of about 0.55 for [FER65c], [AZI93] and[TEP73] (cf. Figure 5-3), while the test results in [REH77] are rather captured with theexponent 0.26 (cf. Figure 5-4, right).
Figure 5-3 Effect of lap-length to bar-diameter ratio on maximum bar stress stest obtained in testprogrammes conducted by FERGUSON [FER65c] (left) and AZIZINAMINI [AZI93] (right)
Figure 5-4 Effect of lap-length to bar-diameter ratio on maximum bar stress stest obtained in testprogrammes conducted by TEPFERS [TEP73] (left) and REHM [REH77] (right)
This comparison indicates, that the linear design models in [EC2], [EC2/NA], [ACI14]and [ZUO00] overestimate the effect of lap length on obtainable lap strength. Thecomparison of the ratios of experimental to theoretical values over l0 / Ø validates thisfinding (cf. Figure 5-5).
0
200
400
600
800
0 20 40 60 80 100
ste
st[M
Pa]
l0/Ø
20 MPa < fcm< 30 MPa
~(l0/Ø)0.40
cs = 2∙Øcs = 3∙Øcs ≥ 4∙Ø
0
200
400
600
800
0 20 40 60 80 100
ste
st[M
Pa]
l0/Ø
30 MPa < fcm< 45 MPa
~(l0/Ø)0.33
cs = 2∙Øcs = 3∙Øcs ≥ 4∙Ø
0
200
400
600
800
0 20 40 60 80 100
ste
st[M
Pa]
[FER65b] l0 / Øs
cs = 6.6·Ø, cx = 3.3·Ø,fcm = 18-35 MPa
~ (l0/Ø)0.55
Ø= 25 mm, cy = 1.5∙ØØ= 35 mm, cy = 1.0∙Ø
0
200
400
600
800
0 20 40 60 80 100
ste
st[M
Pa]
[AZI93] l0 / Øs
cy = cx = 1·Ø, cs = 2.6·Ø
~ (l0/Ø)0.52
fcm = 33 MPafcm = 85-100 MPa
0
200
400
600
800
0 20 40 60 80 100
ste
st[M
Pa]
[TEP73] l0 / Ø
fcm ≈ 22 MPa,cy = 1.3·Ø, cs = 2.9·Ø
cx=0.6Ø
cx=1.9Ø
~ (l0/Ø)0.55
0
200
400
600
800
0 20 40 60 80 100
ste
st[M
Pa]
[REH77] l0/d
~ (l0/Ø)0.26
fcm>45, cs=2∙Ø, cy =1.5∙Ø, cx=6∙Øfcm=20, cs=2∙Ø, cy =1.0∙Ø, cx=2∙Ø
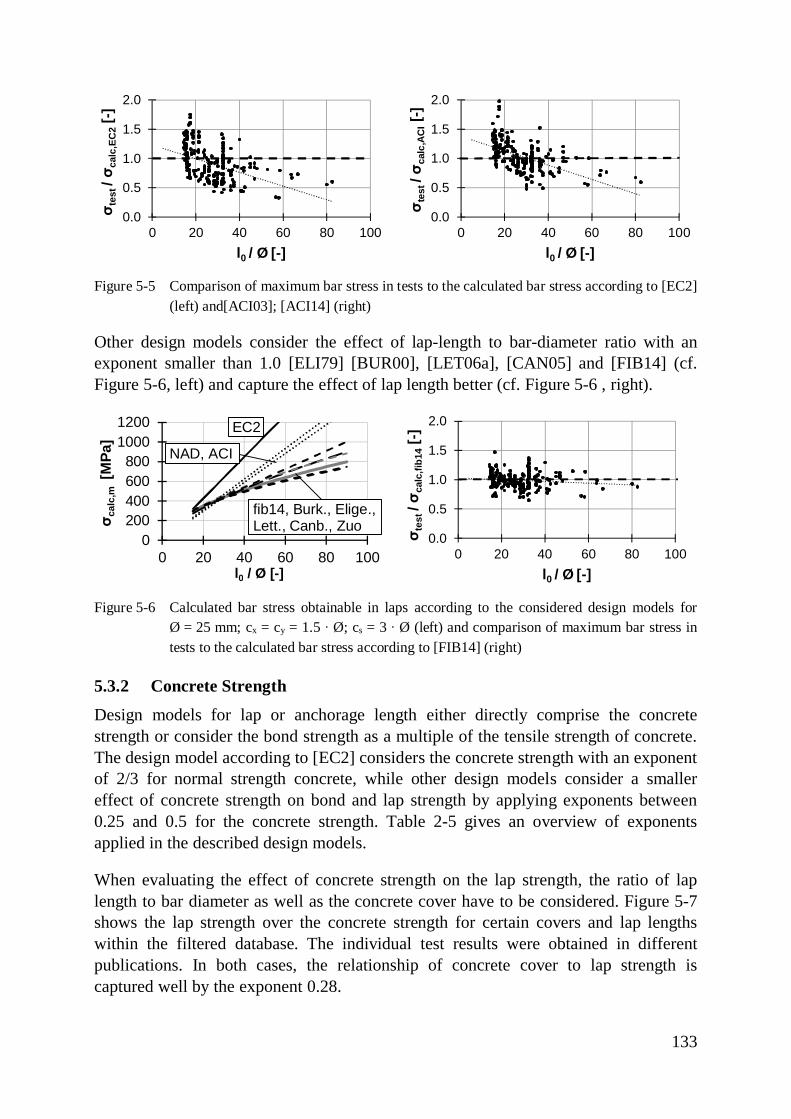
133
Figure 5-5 Comparison of maximum bar stress in tests to the calculated bar stress according to [EC2](left) and[ACI03]; [ACI14] (right)
Other design models consider the effect of lap-length to bar-diameter ratio with anexponent smaller than 1.0 [ELI79] [BUR00], [LET06a], [CAN05] and [FIB14] (cf.Figure 5-6, left) and capture the effect of lap length better (cf. Figure 5-6 , right).
Figure 5-6 Calculated bar stress obtainable in laps according to the considered design models forØ = 25 mm; cx = cy = 1.5 ∙ Ø; cs = 3 ∙ Ø (left) and comparison of maximum bar stress intests to the calculated bar stress according to [FIB14] (right)
5.3.2 Concrete Strength
Design models for lap or anchorage length either directly comprise the concretestrength or consider the bond strength as a multiple of the tensile strength of concrete.The design model according to [EC2] considers the concrete strength with an exponentof 2/3 for normal strength concrete, while other design models consider a smallereffect of concrete strength on bond and lap strength by applying exponents between0.25 and 0.5 for the concrete strength. Table 2-5 gives an overview of exponentsapplied in the described design models.
When evaluating the effect of concrete strength on the lap strength, the ratio of laplength to bar diameter as well as the concrete cover have to be considered. Figure 5-7shows the lap strength over the concrete strength for certain covers and lap lengthswithin the filtered database. The individual test results were obtained in differentpublications. In both cases, the relationship of concrete cover to lap strength iscaptured well by the exponent 0.28.
0.0
0.5
1.0
1.5
2.0
0 20 40 60 80 100
σ tes
t/ σ c
alc,
EC2
[-]
l0 / Ø [-]
0.0
0.5
1.0
1.5
2.0
0 20 40 60 80 100
σ tes
t/ σ c
alc,
ACI[-]
l0 / Ø [-]
0200400600800
10001200
0 20 40 60 80 100
σ cal
c,m
[MPa
]
l0 / Ø [-]
EC2
fib14, Burk., Elige.,Lett., Canb., Zuo
NAD, ACI
0.0
0.5
1.0
1.5
2.0
0 20 40 60 80 100
σ tes
t/ σ c
alc,
fib14
[-]
l0 / Ø [-]
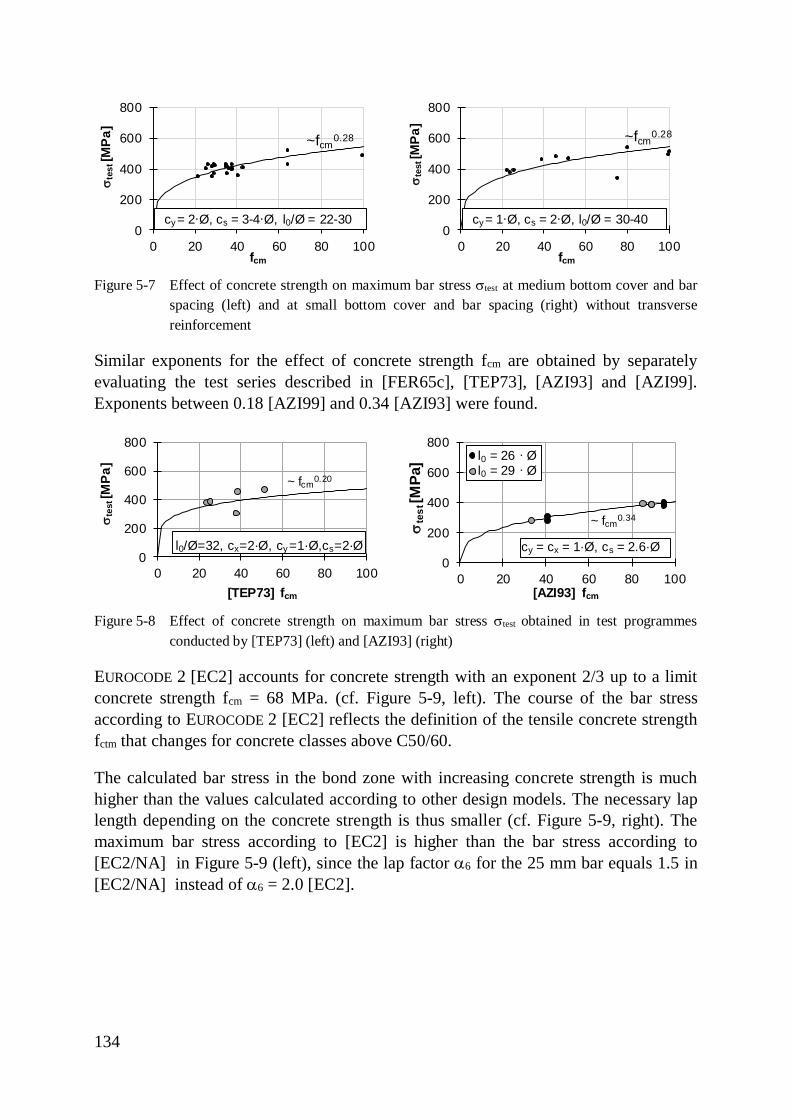
134
Figure 5-7 Effect of concrete strength on maximum bar stress stest at medium bottom cover and barspacing (left) and at small bottom cover and bar spacing (right) without transversereinforcement
Similar exponents for the effect of concrete strength fcm are obtained by separatelyevaluating the test series described in [FER65c], [TEP73], [AZI93] and [AZI99].Exponents between 0.18 [AZI99] and 0.34 [AZI93] were found.
Figure 5-8 Effect of concrete strength on maximum bar stress stest obtained in test programmesconducted by [TEP73] (left) and [AZI93] (right)
EUROCODE 2 [EC2] accounts for concrete strength with an exponent 2/3 up to a limitconcrete strength fcm = 68 MPa. (cf. Figure 5-9, left). The course of the bar stressaccording to EUROCODE 2 [EC2] reflects the definition of the tensile concrete strengthfctm that changes for concrete classes above C50/60.
The calculated bar stress in the bond zone with increasing concrete strength is muchhigher than the values calculated according to other design models. The necessary laplength depending on the concrete strength is thus smaller (cf. Figure 5-9, right). Themaximum bar stress according to [EC2] is higher than the bar stress according to[EC2/NA] in Figure 5-9 (left), since the lap factor a6 for the 25 mm bar equals 1.5 in[EC2/NA] instead of a6 = 2.0 [EC2].
0
200
400
600
800
0 20 40 60 80 100
s tes
t[MPa
]
fcm
cy = 2∙Ø, cs = 3-4∙Ø, l0/Ø = 22-30
~fcm0.28
0
200
400
600
800
0 20 40 60 80 100
ste
st[M
Pa]
fcm
cy = 1∙Ø, cs = 2∙Ø, l0/Ø = 30-40
~fcm0.28
0
200
400
600
800
0 20 40 60 80 100
ste
st[M
Pa]
[TEP73] fcm
l0/Ø=32, cx=2·Ø, cy =1·Ø,cs=2·Ø
~ fcm0.20
0
200
400
600
800
0 20 40 60 80 100
ste
st[M
Pa]
[AZI93] fcm
cy = cx = 1·Ø, cs = 2.6·Ø
~ fcm0.34
l0 = 26 ∙ Øl0 = 29 ∙ Ø
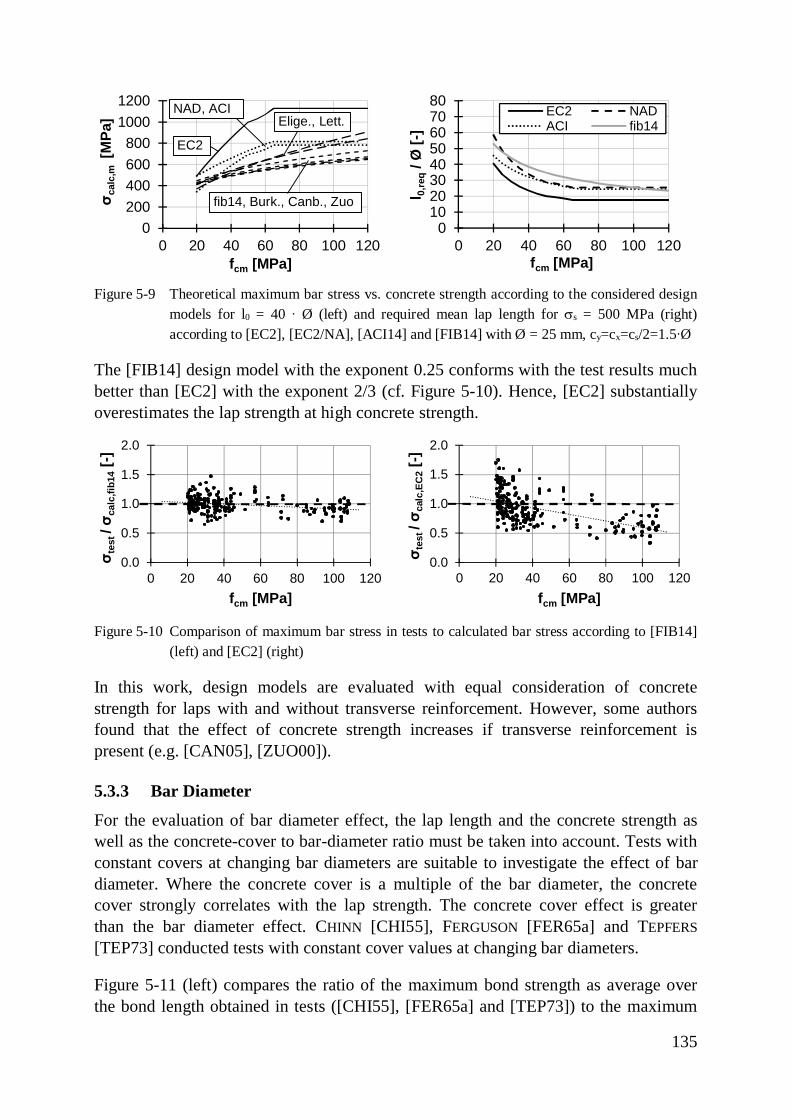
135
Figure 5-9 Theoretical maximum bar stress vs. concrete strength according to the considered designmodels for l0 = 40 ∙ Ø (left) and required mean lap length for ss = 500 MPa (right)according to [EC2], [EC2/NA], [ACI14] and [FIB14] with Ø = 25 mm, cy=cx=cs/2=1.5∙Ø
The [FIB14] design model with the exponent 0.25 conforms with the test results muchbetter than [EC2] with the exponent 2/3 (cf. Figure 5-10). Hence, [EC2] substantiallyoverestimates the lap strength at high concrete strength.
Figure 5-10 Comparison of maximum bar stress in tests to calculated bar stress according to [FIB14](left) and [EC2] (right)
In this work, design models are evaluated with equal consideration of concretestrength for laps with and without transverse reinforcement. However, some authorsfound that the effect of concrete strength increases if transverse reinforcement ispresent (e.g. [CAN05], [ZUO00]).
5.3.3 Bar Diameter
For the evaluation of bar diameter effect, the lap length and the concrete strength aswell as the concrete-cover to bar-diameter ratio must be taken into account. Tests withconstant covers at changing bar diameters are suitable to investigate the effect of bardiameter. Where the concrete cover is a multiple of the bar diameter, the concretecover strongly correlates with the lap strength. The concrete cover effect is greaterthan the bar diameter effect. CHINN [CHI55], FERGUSON [FER65a] and TEPFERS[TEP73] conducted tests with constant cover values at changing bar diameters.
Figure 5-11 (left) compares the ratio of the maximum bond strength as average overthe bond length obtained in tests ([CHI55], [FER65a] and [TEP73]) to the maximum
0200400600800
10001200
0 20 40 60 80 100 120
σ cal
c,m
[MPa
]
fcm [MPa]
EC2
NAD, ACI
fib14, Burk., Canb., Zuo
Elige., Lett.
01020304050607080
0 20 40 60 80 100 120
l 0,re
q/ Ø
[-]
fcm [MPa]
EC2 NADACI fib14
0.0
0.5
1.0
1.5
2.0
0 20 40 60 80 100 120
σ tes
t/ σ c
alc,
fib14
[-]
fcm [MPa]
0.0
0.5
1.0
1.5
2.0
0 20 40 60 80 100 120
σ tes
t/ σ c
alc,
EC2
[-]
fcm [MPa]
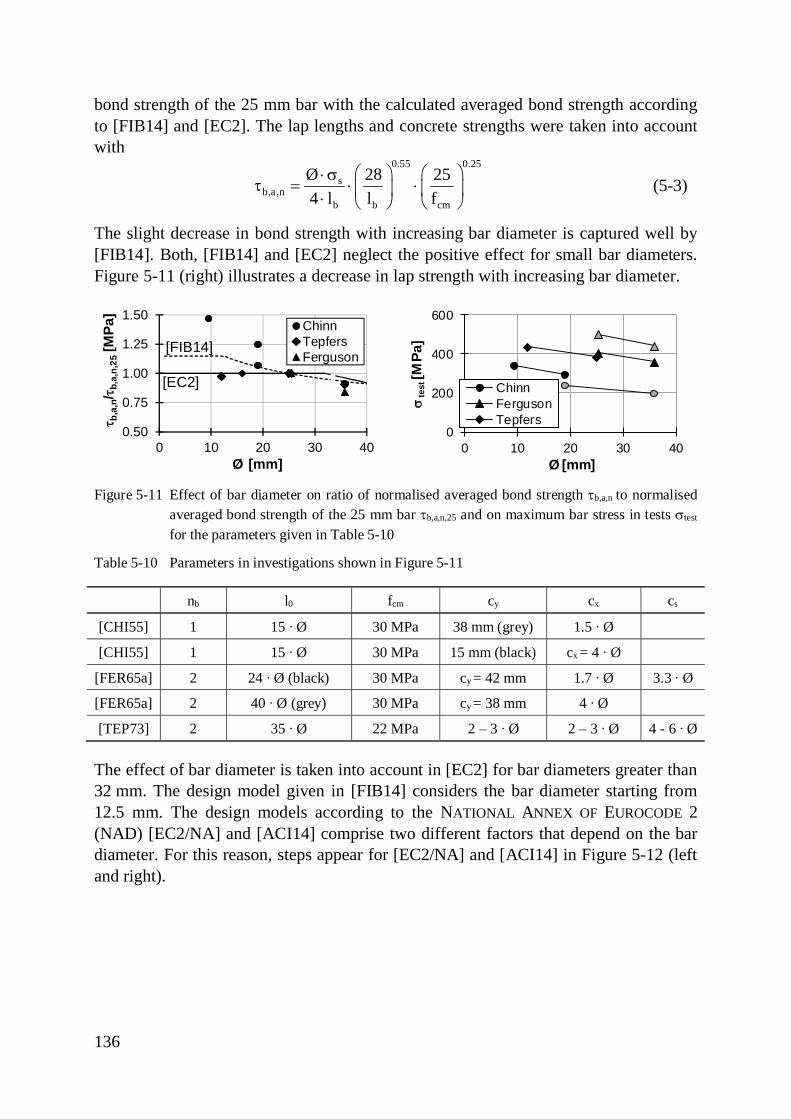
136
bond strength of the 25 mm bar with the calculated averaged bond strength accordingto [FIB14] and [EC2]. The lap lengths and concrete strengths were taken into accountwith
0.55 0.25s
b,a,nb b cm
Ø 28 254 l l f
æ ö æ ö× st = × ×ç ÷ ç ÷× è ø è ø
(5-3)
The slight decrease in bond strength with increasing bar diameter is captured well by[FIB14]. Both, [FIB14] and [EC2] neglect the positive effect for small bar diameters.Figure 5-11 (right) illustrates a decrease in lap strength with increasing bar diameter.
Figure 5-11 Effect of bar diameter on ratio of normalised averaged bond strength tb,a,n to normalisedaveraged bond strength of the 25 mm bar tb,a,n,25 and on maximum bar stress in tests stest
for the parameters given in Table 5-10
Table 5-10 Parameters in investigations shown in Figure 5-11
nb l0 fcm cy cx cs
[CHI55] 1 15 ∙ Ø 30 MPa 38 mm (grey) 1.5 ∙ Ø
[CHI55] 1 15 ∙ Ø 30 MPa 15 mm (black) cx = 4 ∙ Ø
[FER65a] 2 24 ∙ Ø (black) 30 MPa cy = 42 mm 1.7 ∙ Ø 3.3 ∙ Ø
[FER65a] 2 40 ∙ Ø (grey) 30 MPa cy = 38 mm 4 ∙ Ø
[TEP73] 2 35 ∙ Ø 22 MPa 2 – 3 ∙ Ø 2 – 3 ∙ Ø 4 - 6 ∙ Ø
The effect of bar diameter is taken into account in [EC2] for bar diameters greater than32 mm. The design model given in [FIB14] considers the bar diameter starting from12.5 mm. The design models according to the NATIONAL ANNEX OF EUROCODE 2(NAD) [EC2/NA] and [ACI14] comprise two different factors that depend on the bardiameter. For this reason, steps appear for [EC2/NA] and [ACI14] in Figure 5-12 (leftand right).
0.50
0.75
1.00
1.25
1.50
0 10 20 30 40
t b,a
,n/t b
,a,n
,25
[MPa
]
Ø [mm]
ChinnTepfersFerguson
[FIB14]
[EC2]
0
200
400
600
0 10 20 30 40
ste
st[M
Pa]
Ø [mm]
ChinnFergusonTepfers
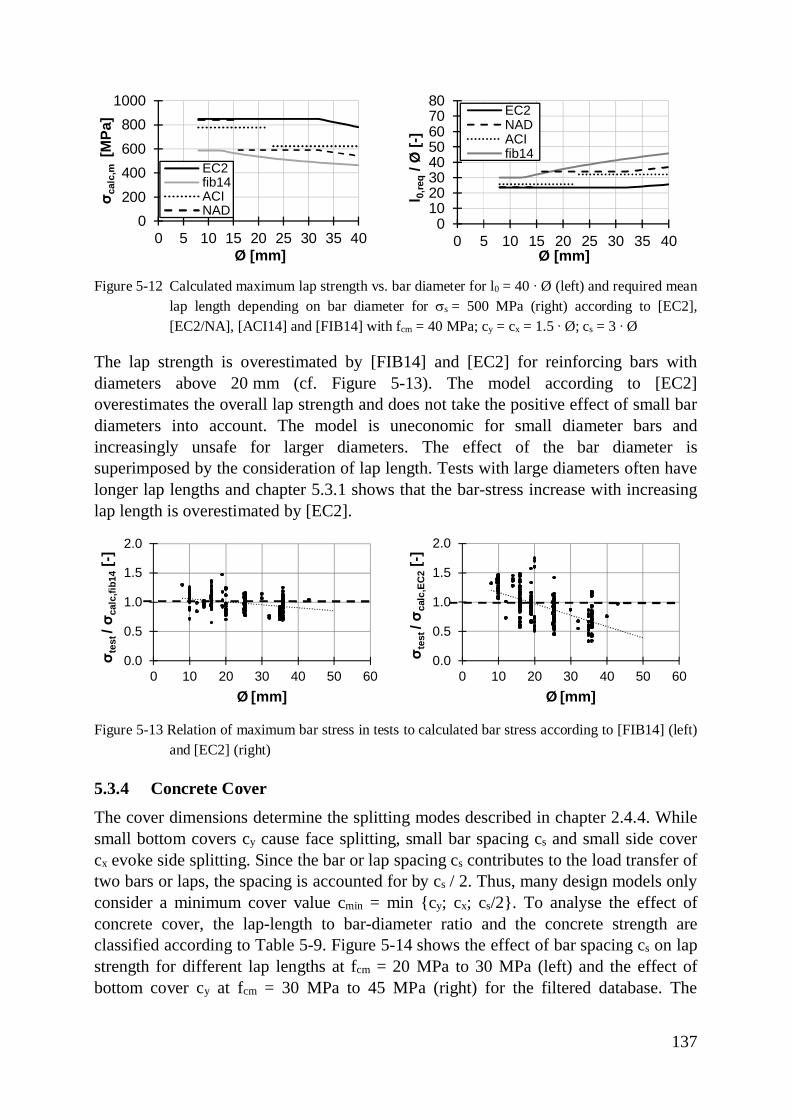
137
Figure 5-12 Calculated maximum lap strength vs. bar diameter for l0 = 40 ∙ Ø (left) and required meanlap length depending on bar diameter for ss = 500 MPa (right) according to [EC2],[EC2/NA], [ACI14] and [FIB14] with fcm = 40 MPa; cy = cx = 1.5 ∙ Ø; cs = 3 ∙ Ø
The lap strength is overestimated by [FIB14] and [EC2] for reinforcing bars withdiameters above 20 mm (cf. Figure 5-13). The model according to [EC2]overestimates the overall lap strength and does not take the positive effect of small bardiameters into account. The model is uneconomic for small diameter bars andincreasingly unsafe for larger diameters. The effect of the bar diameter issuperimposed by the consideration of lap length. Tests with large diameters often havelonger lap lengths and chapter 5.3.1 shows that the bar-stress increase with increasinglap length is overestimated by [EC2].
Figure 5-13 Relation of maximum bar stress in tests to calculated bar stress according to [FIB14] (left)and [EC2] (right)
5.3.4 Concrete Cover
The cover dimensions determine the splitting modes described in chapter 2.4.4. Whilesmall bottom covers cy cause face splitting, small bar spacing cs and small side covercx evoke side splitting. Since the bar or lap spacing cs contributes to the load transfer oftwo bars or laps, the spacing is accounted for by cs / 2. Thus, many design models onlyconsider a minimum cover value cmin = min {cy; cx; cs/2}. To analyse the effect ofconcrete cover, the lap-length to bar-diameter ratio and the concrete strength areclassified according to Table 5-9. Figure 5-14 shows the effect of bar spacing cs on lapstrength for different lap lengths at fcm = 20 MPa to 30 MPa (left) and the effect ofbottom cover cy at fcm = 30 MPa to 45 MPa (right) for the filtered database. The
0200400600800
1000
0 5 10 15 20 25 30 35 40
σ cal
c,m
[MPa
]
Ø [mm]
EC2fib14ACINAD
01020304050607080
0 5 10 15 20 25 30 35 40
l 0,re
q/ Ø
[-]
Ø [mm]
EC2NADACIfib14
0.0
0.5
1.0
1.5
2.0
0 10 20 30 40 50 60
σ tes
t/ σ c
alc,
fib14
[-]
Ø [mm]
0.0
0.5
1.0
1.5
2.0
0 10 20 30 40 50 60
σ tes
t/ σ c
alc,
EC2
[-]
Ø [mm]
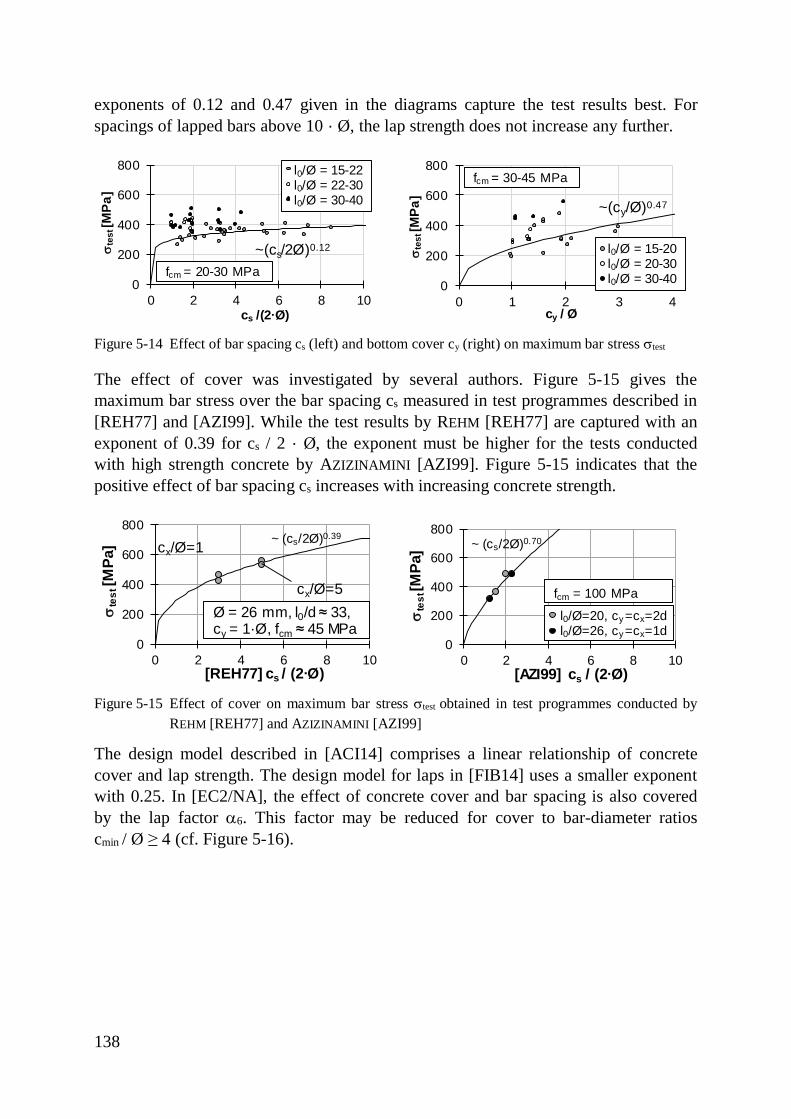
138
exponents of 0.12 and 0.47 given in the diagrams capture the test results best. Forspacings of lapped bars above 10 · Ø, the lap strength does not increase any further.
Figure 5-14 Effect of bar spacing cs (left) and bottom cover cy (right) on maximum bar stress stest
The effect of cover was investigated by several authors. Figure 5-15 gives themaximum bar stress over the bar spacing cs measured in test programmes described in[REH77] and [AZI99]. While the test results by REHM [REH77] are captured with anexponent of 0.39 for cs / 2 · Ø, the exponent must be higher for the tests conductedwith high strength concrete by AZIZINAMINI [AZI99]. Figure 5-15 indicates that thepositive effect of bar spacing cs increases with increasing concrete strength.
Figure 5-15 Effect of cover on maximum bar stress stest obtained in test programmes conducted byREHM [REH77] and AZIZINAMINI [AZI99]
The design model described in [ACI14] comprises a linear relationship of concretecover and lap strength. The design model for laps in [FIB14] uses a smaller exponentwith 0.25. In [EC2/NA], the effect of concrete cover and bar spacing is also coveredby the lap factor a6. This factor may be reduced for cover to bar-diameter ratioscmin / Ø ≥ 4 (cf. Figure 5-16).
0
200
400
600
800
0 2 4 6 8 10
ste
st[M
Pa]
cs /(2∙Ø)
fcm = 20-30 MPa~(cs/2Ø)0.12
l0/Ø = 15-22l0/Ø = 22-30l0/Ø = 30-40
0
200
400
600
800
0 1 2 3 4
ste
st[M
Pa]
cy / Ø
fcm = 30-45 MPa
~(cy/Ø)0.47
l0/Ø = 15-20l0/Ø = 20-30l0/Ø = 30-40
0
200
400
600
800
0 2 4 6 8 10
ste
st[M
Pa]
[REH77] cs / (2∙Ø)
Ø = 26 mm, l0/d ≈ 33,cy = 1·Ø, fcm ≈ 45 MPa
cx/Ø=1
cx/Ø=5
~ (cs/2Ø)0.39
0
200
400
600
800
0 2 4 6 8 10
ste
st[M
Pa]
[AZI99] cs / (2∙Ø)
fcm = 100 MPa
~ (cs/2Ø)0.70
l0/Ø=20, cy =cx=2dl0/Ø=26, cy =cx=1d
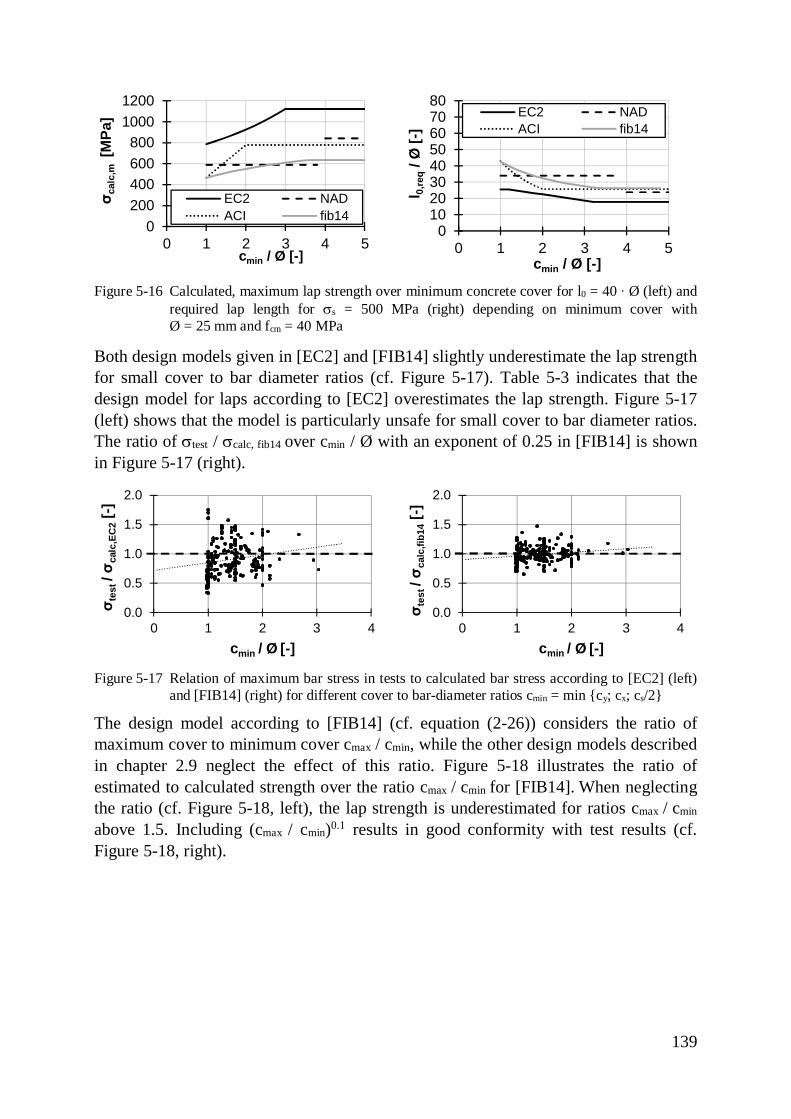
139
Figure 5-16 Calculated, maximum lap strength over minimum concrete cover for l0 = 40 ∙ Ø (left) andrequired lap length for ss = 500 MPa (right) depending on minimum cover withØ = 25 mm and fcm = 40 MPa
Both design models given in [EC2] and [FIB14] slightly underestimate the lap strengthfor small cover to bar diameter ratios (cf. Figure 5-17). Table 5-3 indicates that thedesign model for laps according to [EC2] overestimates the lap strength. Figure 5-17(left) shows that the model is particularly unsafe for small cover to bar diameter ratios.The ratio of stest / scalc, fib14 over cmin / Ø with an exponent of 0.25 in [FIB14] is shownin Figure 5-17 (right).
Figure 5-17 Relation of maximum bar stress in tests to calculated bar stress according to [EC2] (left)and [FIB14] (right) for different cover to bar-diameter ratios cmin = min {cy; cx; cs/2}
The design model according to [FIB14] (cf. equation (2-26)) considers the ratio ofmaximum cover to minimum cover cmax / cmin, while the other design models describedin chapter 2.9 neglect the effect of this ratio. Figure 5-18 illustrates the ratio ofestimated to calculated strength over the ratio cmax / cmin for [FIB14]. When neglectingthe ratio (cf. Figure 5-18, left), the lap strength is underestimated for ratios cmax / cmin
above 1.5. Including (cmax / cmin)0.1 results in good conformity with test results (cf.Figure 5-18, right).
0200400600800
10001200
0 1 2 3 4 5
σ cal
c,m
[MPa
]
cmin / Ø [-]
EC2 NADACI fib14
01020304050607080
0 1 2 3 4 5
l 0,re
q/ Ø
[-]
cmin / Ø [-]
EC2 NADACI fib14
0.0
0.5
1.0
1.5
2.0
0 1 2 3 4
σ tes
t/ σ c
alc,
EC2
[-]
cmin / Ø [-]
0.0
0.5
1.0
1.5
2.0
0 1 2 3 4
σ tes
t/ σ c
alc,
fib14
[-]
cmin / Ø [-]
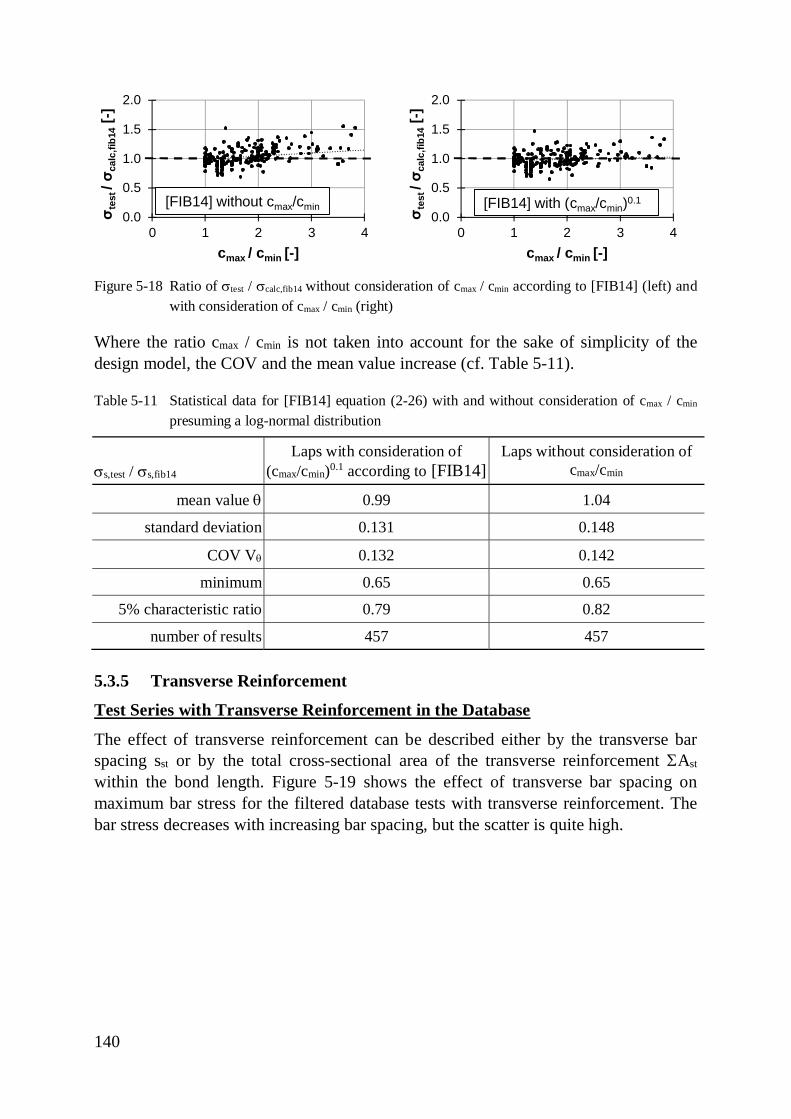
140
Figure 5-18 Ratio of stest / scalc,fib14 without consideration of cmax / cmin according to [FIB14] (left) andwith consideration of cmax / cmin (right)
Where the ratio cmax / cmin is not taken into account for the sake of simplicity of thedesign model, the COV and the mean value increase (cf. Table 5-11).
Table 5-11 Statistical data for [FIB14] equation (2-26) with and without consideration of cmax / cmin
presuming a log-normal distribution
ss,test / ss,fib14
Laps with consideration of(cmax/cmin)0.1 according to [FIB14]
Laps without consideration ofcmax/cmin
mean value q 0.99 1.04
standard deviation 0.131 0.148
COV Vq 0.132 0.142
minimum 0.65 0.65
5% characteristic ratio 0.79 0.82
number of results 457 457
5.3.5 Transverse Reinforcement
Test Series with Transverse Reinforcement in the Database
The effect of transverse reinforcement can be described either by the transverse barspacing sst or by the total cross-sectional area of the transverse reinforcement SAst
within the bond length. Figure 5-19 shows the effect of transverse bar spacing onmaximum bar stress for the filtered database tests with transverse reinforcement. Thebar stress decreases with increasing bar spacing, but the scatter is quite high.
0.0
0.5
1.0
1.5
2.0
0 1 2 3 4
σ tes
t/ σ c
alc,
fib14
[-]
cmax / cmin [-]
[FIB14] without cmax/cmin0.0
0.5
1.0
1.5
2.0
0 1 2 3 4
σ tes
t/ σ c
alc,
fib14
[-]
cmax / cmin [-]
[FIB14] with (cmax/cmin)0.1
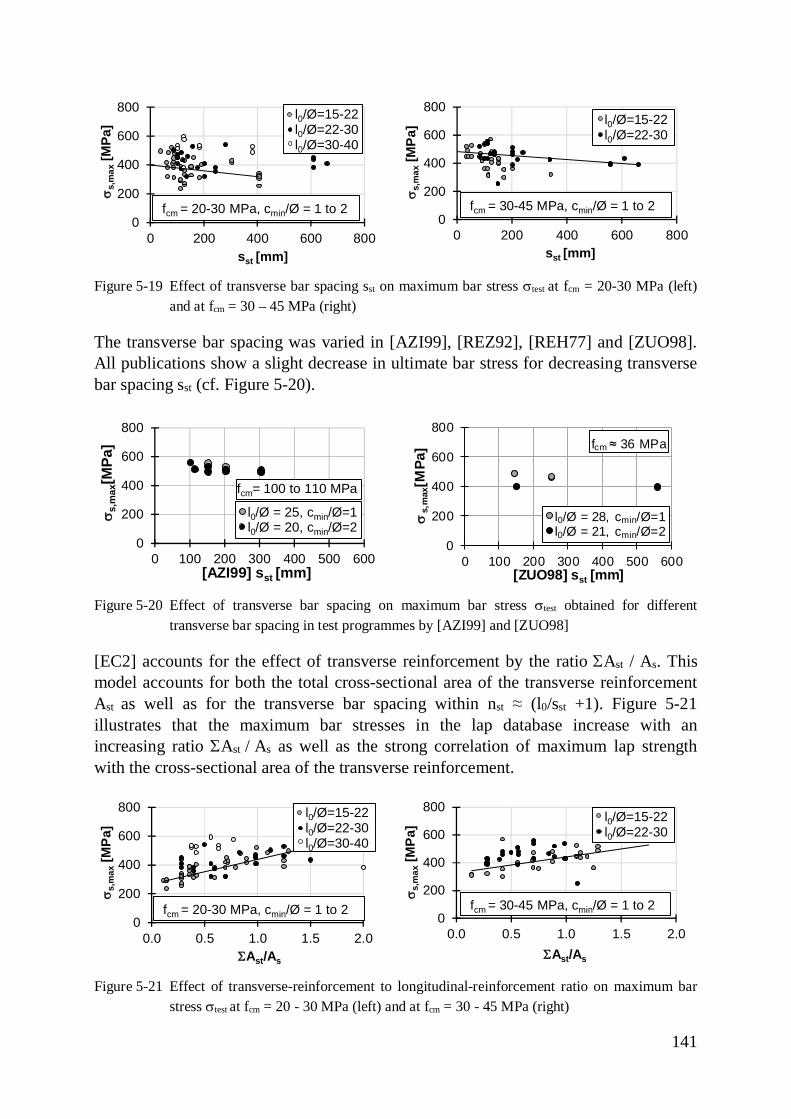
141
Figure 5-19 Effect of transverse bar spacing sst on maximum bar stress stest at fcm = 20-30 MPa (left)and at fcm = 30 – 45 MPa (right)
The transverse bar spacing was varied in [AZI99], [REZ92], [REH77] and [ZUO98].All publications show a slight decrease in ultimate bar stress for decreasing transversebar spacing sst (cf. Figure 5-20).
Figure 5-20 Effect of transverse bar spacing on maximum bar stress stest obtained for differenttransverse bar spacing in test programmes by [AZI99] and [ZUO98]
[EC2] accounts for the effect of transverse reinforcement by the ratio SAst / As. Thismodel accounts for both the total cross-sectional area of the transverse reinforcementAst as well as for the transverse bar spacing within nst ≈ (l0/sst +1). Figure 5-21illustrates that the maximum bar stresses in the lap database increase with anincreasing ratio SAst / As as well as the strong correlation of maximum lap strengthwith the cross-sectional area of the transverse reinforcement.
Figure 5-21 Effect of transverse-reinforcement to longitudinal-reinforcement ratio on maximum barstress stest at fcm = 20 - 30 MPa (left) and at fcm = 30 - 45 MPa (right)
0
200
400
600
800
0 200 400 600 800
ss,
max
[MPa
]
sst [mm]
fcm = 20-30 MPa, cmin/Ø = 1 to 2
l0/Ø=15-22l0/Ø=22-30l0/Ø=30-40
0
200
400
600
800
0 200 400 600 800
s s,m
ax[M
Pa]
sst [mm]
fcm = 30-45 MPa, cmin/Ø = 1 to 2
l0/Ø=15-22l0/Ø=22-30
0
200
400
600
800
0 100 200 300 400 500 600
s s,m
ax[M
Pa]
[AZI99] sst [mm]
fcm= 100 to 110 MPa
l0/Ø = 25, cmin/Ø=1l0/Ø = 20, cmin/Ø=2
0
200
400
600
800
0 100 200 300 400 500 600
ss,
max
[MPa
]
[ZUO98] sst [mm]
fcm ≈ 36 MPa
l0/Ø = 28, cmin/Ø=1l0/Ø = 21, cmin/Ø=2
0
200
400
600
800
0.0 0.5 1.0 1.5 2.0
s s,m
ax[M
Pa]
SAst/As
fcm = 20-30 MPa, cmin/Ø = 1 to 2
l0/Ø=15-22l0/Ø=22-30l0/Ø=30-40
0
200
400
600
800
0.0 0.5 1.0 1.5 2.0
s s,m
ax[M
Pa]
SAst/As
fcm = 30-45 MPa, cmin/Ø = 1 to 2
l0/Ø=15-22l0/Ø=22-30
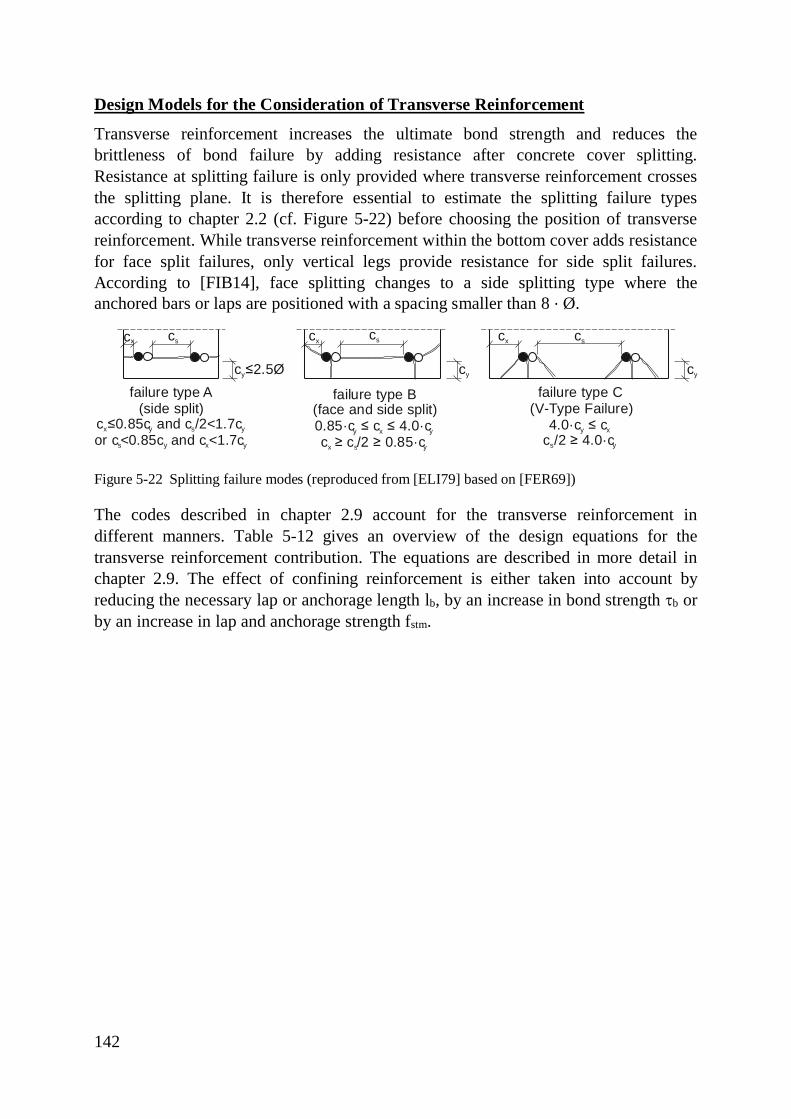
142
Design Models for the Consideration of Transverse Reinforcement
Transverse reinforcement increases the ultimate bond strength and reduces thebrittleness of bond failure by adding resistance after concrete cover splitting.Resistance at splitting failure is only provided where transverse reinforcement crossesthe splitting plane. It is therefore essential to estimate the splitting failure typesaccording to chapter 2.2 (cf. Figure 5-22) before choosing the position of transversereinforcement. While transverse reinforcement within the bottom cover adds resistancefor face split failures, only vertical legs provide resistance for side split failures.According to [FIB14], face splitting changes to a side splitting type where theanchored bars or laps are positioned with a spacing smaller than 8 · Ø.
Figure 5-22 Splitting failure modes (reproduced from [ELI79] based on [FER69])
The codes described in chapter 2.9 account for the transverse reinforcement indifferent manners. Table 5-12 gives an overview of the design equations for thetransverse reinforcement contribution. The equations are described in more detail inchapter 2.9. The effect of confining reinforcement is either taken into account byreducing the necessary lap or anchorage length lb, by an increase in bond strength tb orby an increase in lap and anchorage strength fstm.
failure type A(side split)
c ≤0.85c and c /2<1.7cx y s y
s y x yor c<0.85c and c <1.7c
cscx
c ≤2.5Øy
failure type B(face and side split)0.85·c ≤ c ≤ 4.0·cy x y
x s yc ≥ c /2 ≥ 0.85·c
failure type C(V-Type Failure)
4.0·c ≤ cy x
s yc /2 ≥ 4.0·c
cy
cscx
cy
cscx
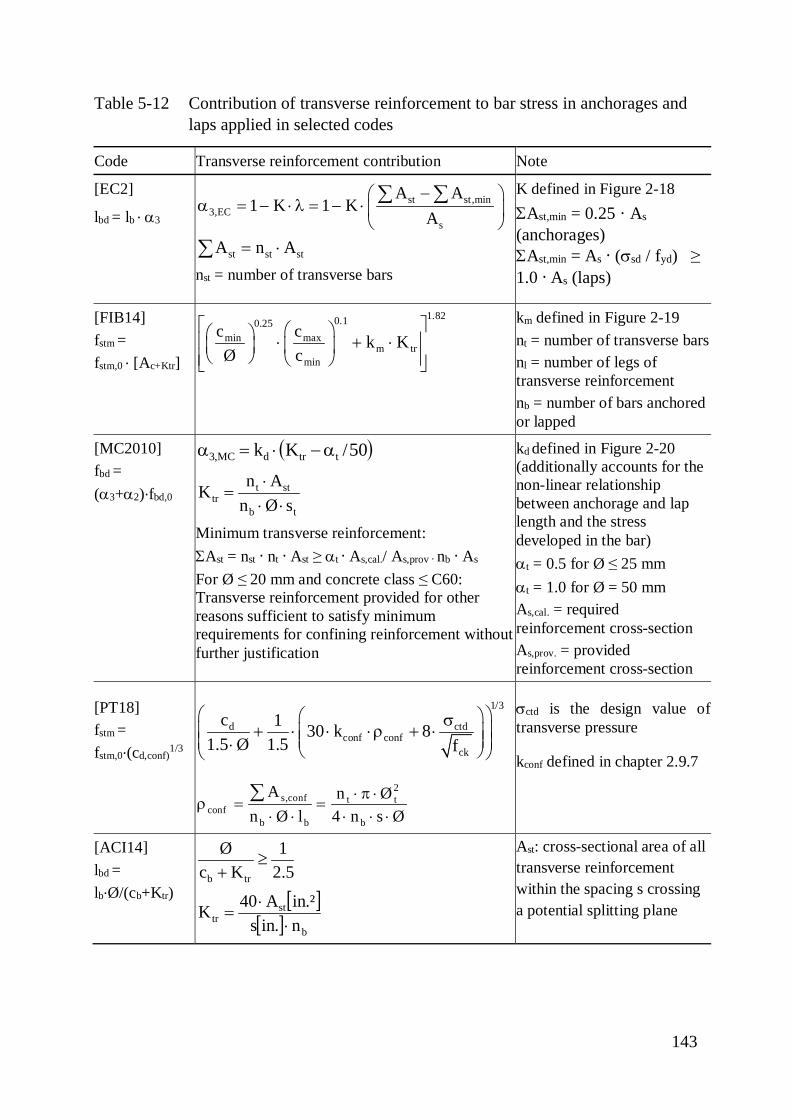
143
Table 5-12 Contribution of transverse reinforcement to bar stress in anchorages andlaps applied in selected codes
Code Transverse reinforcement contribution Note
[EC2]st st ,min
3,ECs
A A1 K 1 K
A-æ ö
a = - × l = - × ç ÷è ø
å å
st st stA n A= ×ånst = number of transverse bars
K defined in Figure 2-18SAst,min = 0.25 · As
(anchorages)SAst,min = As · (ssd / fyd) ≥1.0 · As (laps)
lbd = lb · a3
[FIB14]fstm =fstm,0 · [Ac+Ktr]
1.820.10.25maxmin
m trmin
cc k KØ c
é ùæ öæ ö × + ×ê úç ÷ç ÷è øê úè øë û
km defined in Figure 2-19nt = number of transverse barsnl = number of legs oftransverse reinforcementnb = number of bars anchoredor lapped
[MC2010]fbd =(a3+a2)·fbd,0
( )50/Kk ttrdMC,3 a-×=a
t sttr
b t
n AKn Ø s
×=
× ×
Minimum transverse reinforcement:SAst = nst · nt · Ast ≥ at · As,cal./ As,prov · nb · As
For Ø ≤ 20 mm and concrete class ≤ C60:Transverse reinforcement provided for otherreasons sufficient to satisfy minimumrequirements for confining reinforcement withoutfurther justification
kd defined in Figure 2-20(additionally accounts for thenon-linear relationshipbetween anchorage and laplength and the stressdeveloped in the bar)at = 0.5 for Ø ≤ 25 mmat = 1.0 for Ø = 50 mmAs,cal. = requiredreinforcement cross-sectionAs,prov. = providedreinforcement cross-section
[PT18]fstm =fstm,0·(cd,conf)
1/3
1/3
d ctdconf conf
ck
c 1 30 k 81.5 Ø 1.5 f
æ öæ ös+ × × ×r + ×ç ÷ç ÷ç ÷ç ÷× è øè ø
2s,conf t t
confb b b
A n Øn Ø l 4 n s Ø
× p ×r = =
× × × × ×å
sctd is the design value oftransverse pressure
kconf defined in chapter 2.9.7
[ACI14]lbd =lb·Ø/(cb+Ktr)
b tr
Ø 1c K 2.5
³+
[ ][ ] b
sttr n.ins
.²inA40K×
×=
Ast: cross-sectional area of alltransverse reinforcementwithin the spacing s crossinga potential splitting plane
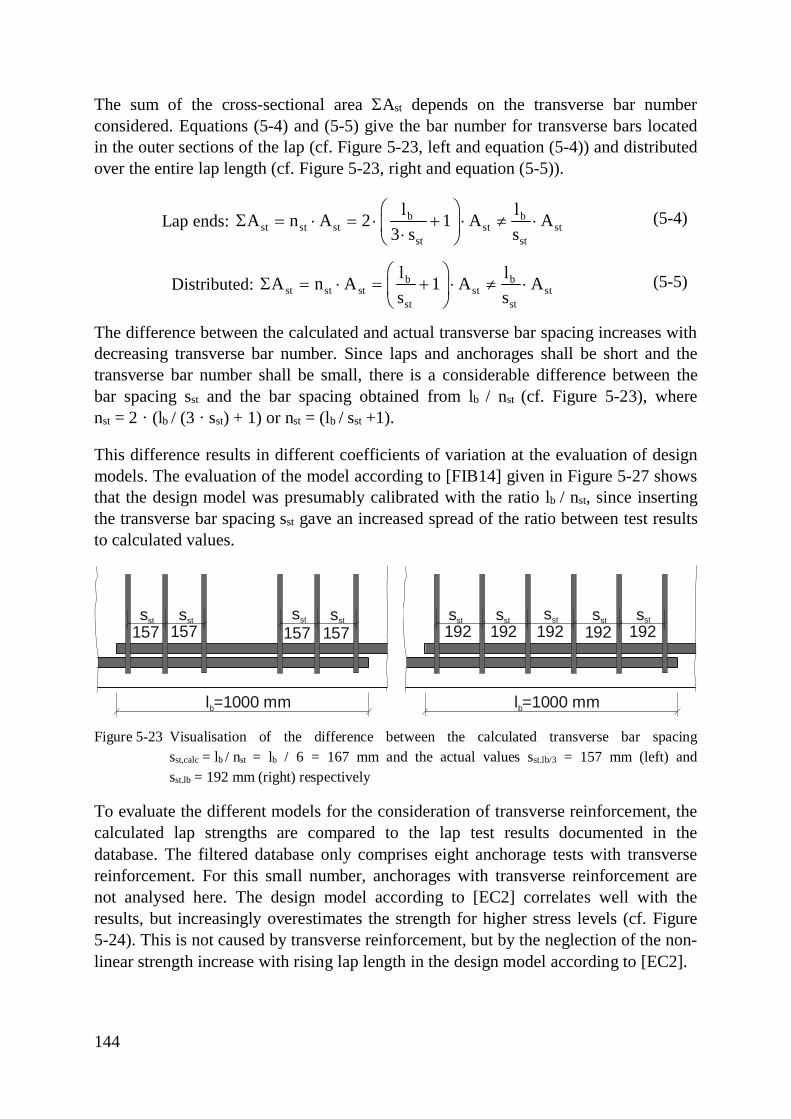
144
The sum of the cross-sectional area SAst depends on the transverse bar numberconsidered. Equations (5-4) and (5-5) give the bar number for transverse bars locatedin the outer sections of the lap (cf. Figure 5-23, left and equation (5-4)) and distributedover the entire lap length (cf. Figure 5-23, right and equation (5-5)).
Lap ends: b bst st st st st
st st
l lA n A 2 1 A A3 s s
æ öS = × = × + × ¹ ×ç ÷×è ø
(5-4)
Distributed: b bst st st st st
st st
l lA n A 1 A As s
æ öS = × = + × ¹ ×ç ÷
è ø(5-5)
The difference between the calculated and actual transverse bar spacing increases withdecreasing transverse bar number. Since laps and anchorages shall be short and thetransverse bar number shall be small, there is a considerable difference between thebar spacing sst and the bar spacing obtained from lb / nst (cf. Figure 5-23), wherenst = 2 · (lb / (3 · sst) + 1) or nst = (lb / sst +1).
This difference results in different coefficients of variation at the evaluation of designmodels. The evaluation of the model according to [FIB14] given in Figure 5-27 showsthat the design model was presumably calibrated with the ratio lb / nst, since insertingthe transverse bar spacing sst gave an increased spread of the ratio between test resultsto calculated values.
Figure 5-23 Visualisation of the difference between the calculated transverse bar spacingsst,calc = lb / nst = lb / 6 = 167 mm and the actual values sst.lb/3 = 157 mm (left) andsst.lb = 192 mm (right) respectively
To evaluate the different models for the consideration of transverse reinforcement, thecalculated lap strengths are compared to the lap test results documented in thedatabase. The filtered database only comprises eight anchorage tests with transversereinforcement. For this small number, anchorages with transverse reinforcement arenot analysed here. The design model according to [EC2] correlates well with theresults, but increasingly overestimates the strength for higher stress levels (cf. Figure5-24). This is not caused by transverse reinforcement, but by the neglection of the non-linear strength increase with rising lap length in the design model according to [EC2].
l =1000 mmb
sst sst sst sst
157 157 157 157
l =1000 mmb
sst sst sst sst
192 192 192 192sst
192
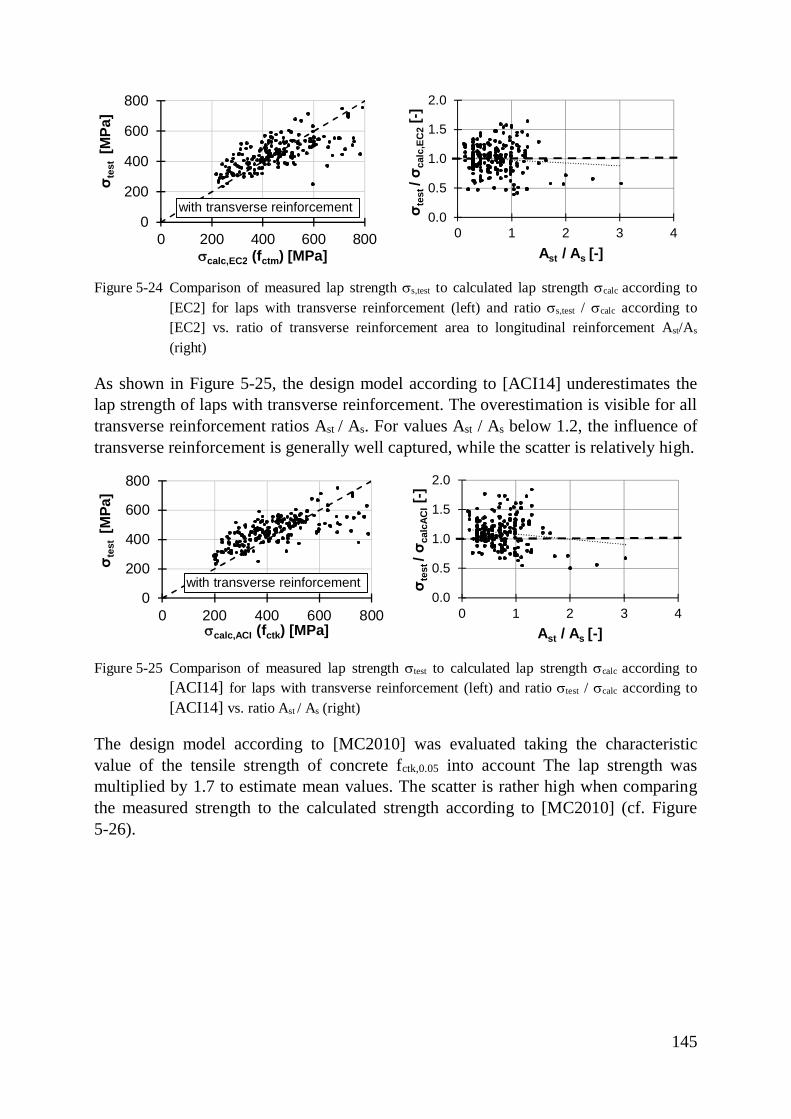
145
Figure 5-24 Comparison of measured lap strength ss,test to calculated lap strength scalc according to[EC2] for laps with transverse reinforcement (left) and ratio ss,test / scalc according to[EC2] vs. ratio of transverse reinforcement area to longitudinal reinforcement Ast/As
(right)
As shown in Figure 5-25, the design model according to [ACI14] underestimates thelap strength of laps with transverse reinforcement. The overestimation is visible for alltransverse reinforcement ratios Ast / As. For values Ast / As below 1.2, the influence oftransverse reinforcement is generally well captured, while the scatter is relatively high.
Figure 5-25 Comparison of measured lap strength stest to calculated lap strength scalc according to[ACI14] for laps with transverse reinforcement (left) and ratio stest / scalc according to[ACI14] vs. ratio Ast / As (right)
The design model according to [MC2010] was evaluated taking the characteristicvalue of the tensile strength of concrete fctk,0.05 into account The lap strength wasmultiplied by 1.7 to estimate mean values. The scatter is rather high when comparingthe measured strength to the calculated strength according to [MC2010] (cf. Figure5-26).
0
200
400
600
800
0 200 400 600 800
σ tes
t[M
Pa]
scalc,EC2 (fctm) [MPa]
with transverse reinforcement0.0
0.5
1.0
1.5
2.0
0 1 2 3 4
σ tes
t/ σ c
alc,
EC2
[-]
Ast / As [-]
0
200
400
600
800
0 200 400 600 800
σ tes
t[M
Pa]
scalc,ACI (fctk) [MPa]
with transverse reinforcement0.0
0.5
1.0
1.5
2.0
0 1 2 3 4
σ tes
t/ σ c
alcA
CI[-]
Ast / As [-]
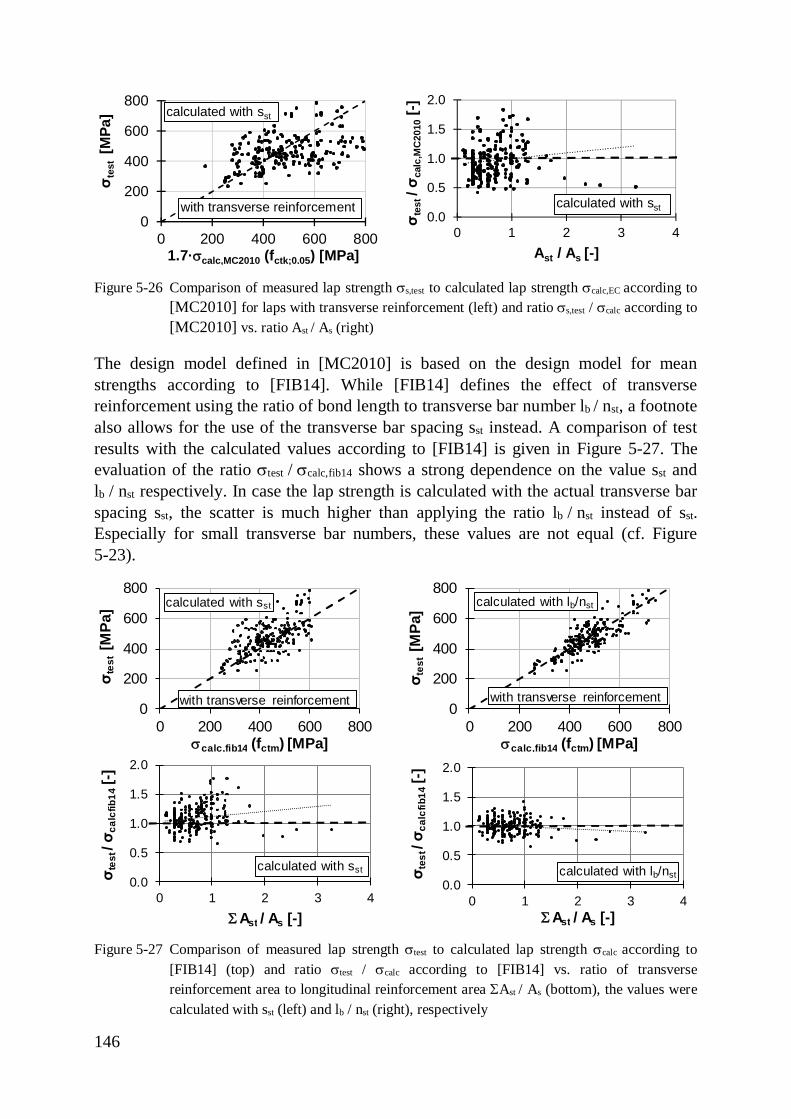
146
Figure 5-26 Comparison of measured lap strength ss,test to calculated lap strength scalc,EC according to[MC2010] for laps with transverse reinforcement (left) and ratio ss,test / scalc according to[MC2010] vs. ratio Ast / As (right)
The design model defined in [MC2010] is based on the design model for meanstrengths according to [FIB14]. While [FIB14] defines the effect of transversereinforcement using the ratio of bond length to transverse bar number lb / nst, a footnotealso allows for the use of the transverse bar spacing sst instead. A comparison of testresults with the calculated values according to [FIB14] is given in Figure 5-27. Theevaluation of the ratio stest / scalc,fib14 shows a strong dependence on the value sst andlb / nst respectively. In case the lap strength is calculated with the actual transverse barspacing sst, the scatter is much higher than applying the ratio lb / nst instead of sst.Especially for small transverse bar numbers, these values are not equal (cf. Figure5-23).
Figure 5-27 Comparison of measured lap strength stest to calculated lap strength scalc according to[FIB14] (top) and ratio stest / scalc according to [FIB14] vs. ratio of transversereinforcement area to longitudinal reinforcement area SAst / As (bottom), the values werecalculated with sst (left) and lb / nst (right), respectively
0
200
400
600
800
0 200 400 600 800
σ tes
t[M
Pa]
1.7·scalc,MC2010 (fctk;0.05) [MPa]
calculated with sst
with transverse reinforcement0.0
0.5
1.0
1.5
2.0
0 1 2 3 4
σ tes
t/ σ c
alc,
MC
2010
[-]
Ast / As [-]
calculated with sst
0
200
400
600
800
0 200 400 600 800
σ tes
t[M
Pa]
scalc,fib14 (fctm) [MPa]
with transverse reinforcement
calculated with sst
0
200
400
600
800
0 200 400 600 800
σ tes
t[M
Pa]
scalc,fib14 (fctm) [MPa]
with transverse reinforcement
calculated with lb/nst
0.0
0.5
1.0
1.5
2.0
0 1 2 3 4
σ tes
t/ σ c
alcf
ib14
[-]
S Ast / As [-]
calculated with sst
0.0
0.5
1.0
1.5
2.0
0 1 2 3 4
σ tes
t/ σ c
alcf
ib14
[-]
S Ast / As [-]
calculated with lb/nst
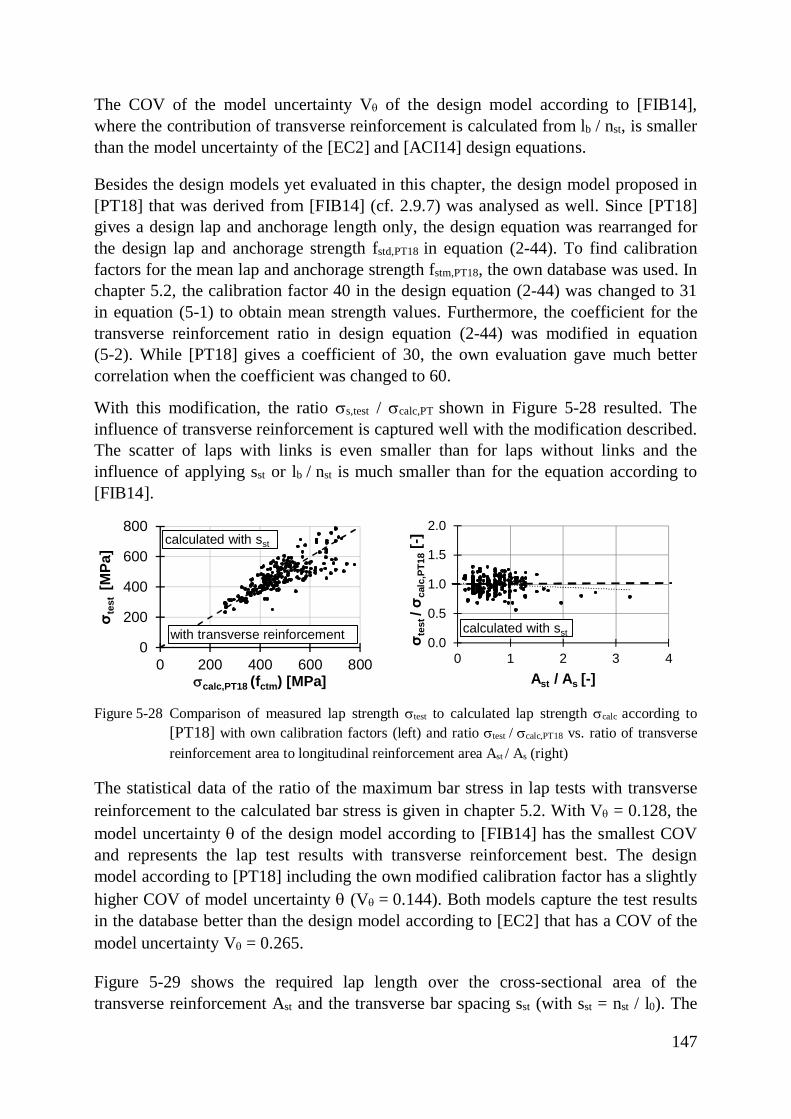
147
The COV of the model uncertainty Vq of the design model according to [FIB14],where the contribution of transverse reinforcement is calculated from lb / nst, is smallerthan the model uncertainty of the [EC2] and [ACI14] design equations.
Besides the design models yet evaluated in this chapter, the design model proposed in[PT18] that was derived from [FIB14] (cf. 2.9.7) was analysed as well. Since [PT18]gives a design lap and anchorage length only, the design equation was rearranged forthe design lap and anchorage strength fstd,PT18 in equation (2-44). To find calibrationfactors for the mean lap and anchorage strength fstm,PT18, the own database was used. Inchapter 5.2, the calibration factor 40 in the design equation (2-44) was changed to 31in equation (5-1) to obtain mean strength values. Furthermore, the coefficient for thetransverse reinforcement ratio in design equation (2-44) was modified in equation(5-2). While [PT18] gives a coefficient of 30, the own evaluation gave much bettercorrelation when the coefficient was changed to 60.
With this modification, the ratio ss,test / scalc,PT shown in Figure 5-28 resulted. Theinfluence of transverse reinforcement is captured well with the modification described.The scatter of laps with links is even smaller than for laps without links and theinfluence of applying sst or lb / nst is much smaller than for the equation according to[FIB14].
Figure 5-28 Comparison of measured lap strength stest to calculated lap strength scalc according to[PT18] with own calibration factors (left) and ratio stest / scalc,PT18 vs. ratio of transversereinforcement area to longitudinal reinforcement area Ast / As (right)
The statistical data of the ratio of the maximum bar stress in lap tests with transversereinforcement to the calculated bar stress is given in chapter 5.2. With Vq = 0.128, themodel uncertainty q of the design model according to [FIB14] has the smallest COVand represents the lap test results with transverse reinforcement best. The designmodel according to [PT18] including the own modified calibration factor has a slightlyhigher COV of model uncertainty q (Vq = 0.144). Both models capture the test resultsin the database better than the design model according to [EC2] that has a COV of themodel uncertainty Vq = 0.265.
Figure 5-29 shows the required lap length over the cross-sectional area of thetransverse reinforcement Ast and the transverse bar spacing sst (with sst = nst / l0). The
0
200
400
600
800
0 200 400 600 800
σ tes
t[M
Pa]
scalc,PT18 (fctm) [MPa]
calculated with sst
with transverse reinforcement 0.0
0.5
1.0
1.5
2.0
0 1 2 3 4
σ tes
t/ σ c
alc,
PT18
[-]
Ast / As [-]
calculated with sst
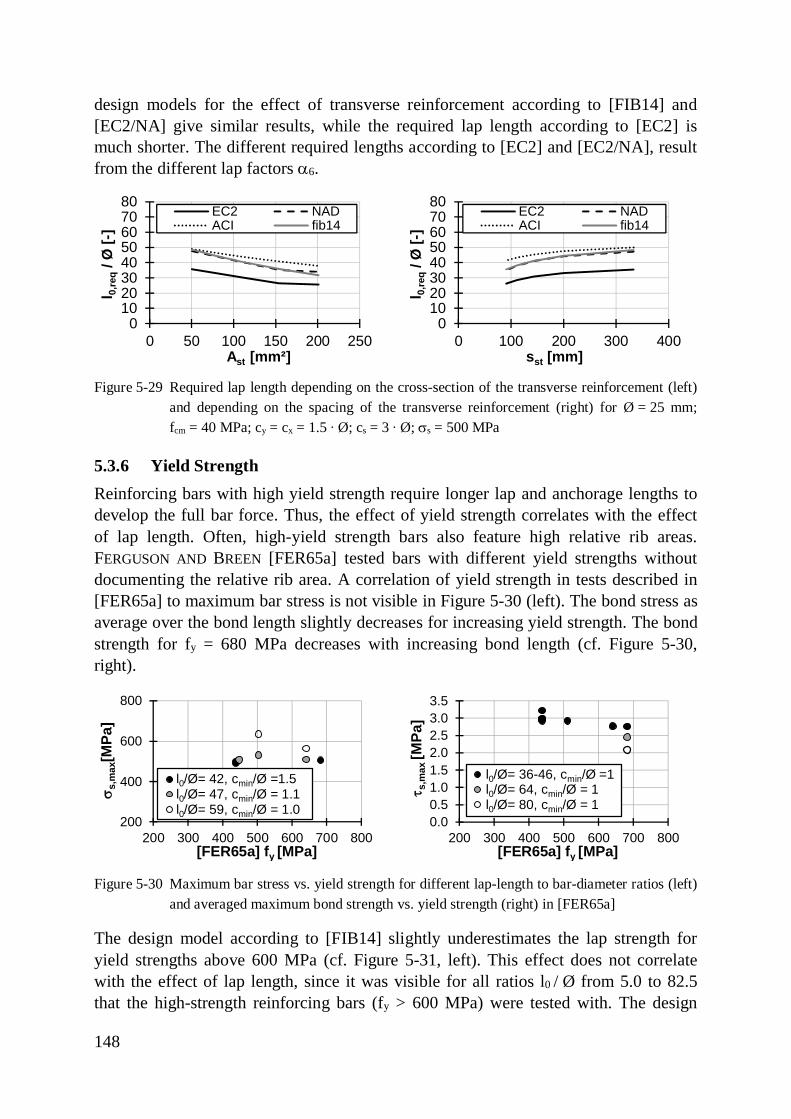
148
design models for the effect of transverse reinforcement according to [FIB14] and[EC2/NA] give similar results, while the required lap length according to [EC2] ismuch shorter. The different required lengths according to [EC2] and [EC2/NA], resultfrom the different lap factors a6.
Figure 5-29 Required lap length depending on the cross-section of the transverse reinforcement (left)and depending on the spacing of the transverse reinforcement (right) for Ø = 25 mm;fcm = 40 MPa; cy = cx = 1.5 ∙ Ø; cs = 3 ∙ Ø; ss = 500 MPa
5.3.6 Yield StrengthReinforcing bars with high yield strength require longer lap and anchorage lengths todevelop the full bar force. Thus, the effect of yield strength correlates with the effectof lap length. Often, high-yield strength bars also feature high relative rib areas.FERGUSON AND BREEN [FER65a] tested bars with different yield strengths withoutdocumenting the relative rib area. A correlation of yield strength in tests described in[FER65a] to maximum bar stress is not visible in Figure 5-30 (left). The bond stress asaverage over the bond length slightly decreases for increasing yield strength. The bondstrength for fy = 680 MPa decreases with increasing bond length (cf. Figure 5-30,right).
Figure 5-30 Maximum bar stress vs. yield strength for different lap-length to bar-diameter ratios (left)and averaged maximum bond strength vs. yield strength (right) in [FER65a]
The design model according to [FIB14] slightly underestimates the lap strength foryield strengths above 600 MPa (cf. Figure 5-31, left). This effect does not correlatewith the effect of lap length, since it was visible for all ratios l0 / Ø from 5.0 to 82.5that the high-strength reinforcing bars (fy > 600 MPa) were tested with. The design
01020304050607080
0 50 100 150 200 250
l 0,re
q/ Ø
[-]
Ast [mm²]
EC2 NADACI fib14
01020304050607080
0 100 200 300 400
l 0,re
q/ Ø
[-]
sst [mm]
EC2 NADACI fib14
200
400
600
800
200 300 400 500 600 700 800
s s,m
ax[M
Pa]
[FER65a] fy [MPa]
l0/Ø= 42, cmin/Ø =1.5l0/Ø= 47, cmin/Ø = 1.1l0/Ø= 59, cmin/Ø = 1.0
0.00.51.01.52.02.53.03.5
200 300 400 500 600 700 800
t s,m
ax[M
Pa]
[FER65a] fy [MPa]
l0/Ø= 36-46, cmin/Ø =1l0/Ø= 64, cmin/Ø = 1l0/Ø= 80, cmin/Ø = 1
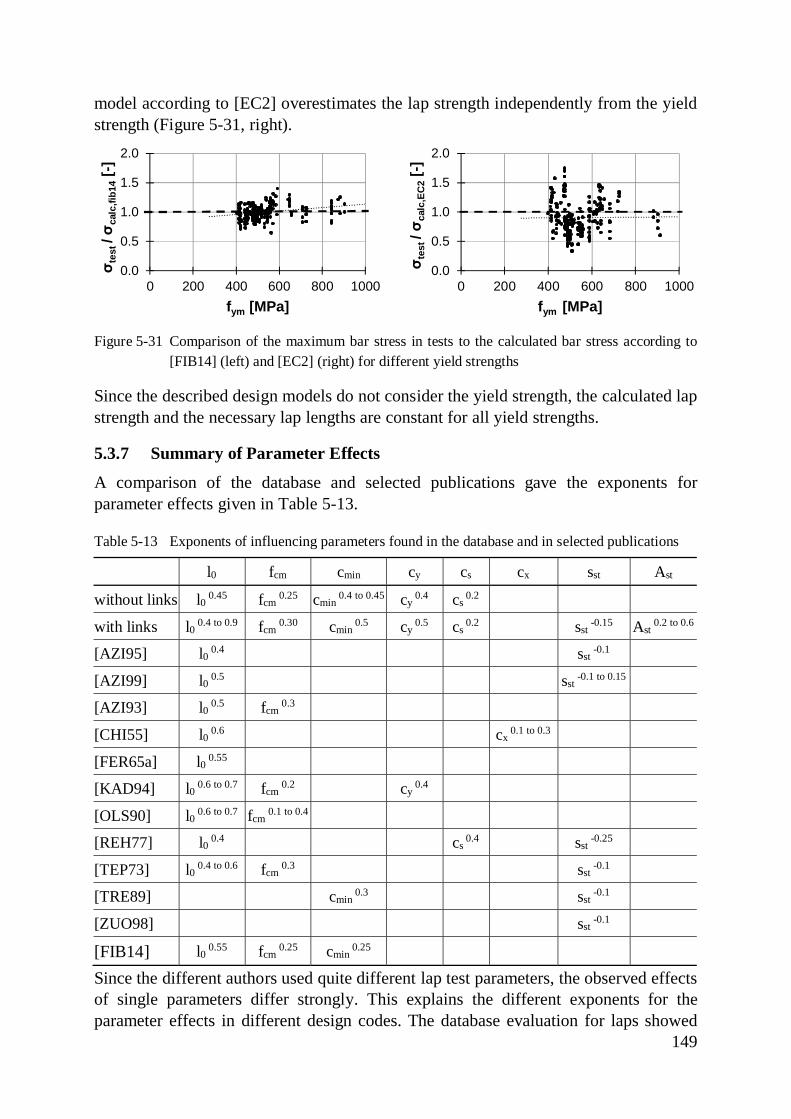
149
model according to [EC2] overestimates the lap strength independently from the yieldstrength (Figure 5-31, right).
Figure 5-31 Comparison of the maximum bar stress in tests to the calculated bar stress according to[FIB14] (left) and [EC2] (right) for different yield strengths
Since the described design models do not consider the yield strength, the calculated lapstrength and the necessary lap lengths are constant for all yield strengths.
5.3.7 Summary of Parameter Effects
A comparison of the database and selected publications gave the exponents forparameter effects given in Table 5-13.
Table 5-13 Exponents of influencing parameters found in the database and in selected publications
l0 fcm cmin cy cs cx sst Ast
without links l0 0.45 fcm 0.25 cmin
0.4 to 0.45 cy 0.4 cs
0.2
with links l0 0.4 to 0.9 fcm 0.30 cmin
0.5 cy 0.5 cs
0.2 sst -0.15 Ast
0.2 to 0.6
[AZI95] l0 0.4 sst -0.1
[AZI99] l0 0.5 sst -0.1 to 0.15
[AZI93] l0 0.5 fcm0.3
[CHI55] l0 0.6 cx 0.1 to 0.3
[FER65a] l0 0.55
[KAD94] l0 0.6 to 0.7 fcm 0.2 cy
0.4
[OLS90] l0 0.6 to 0.7 fcm 0.1 to 0.4
[REH77] l0 0.4 cs 0.4 sst
-0.25
[TEP73] l0 0.4 to 0.6 fcm 0.3 sst
-0.1
[TRE89] cmin 0.3 sst
-0.1
[ZUO98] sst -0.1
[FIB14] l0 0.55 fcm 0.25 cmin
0.25
Since the different authors used quite different lap test parameters, the observed effectsof single parameters differ strongly. This explains the different exponents for theparameter effects in different design codes. The database evaluation for laps showed
0.0
0.5
1.0
1.5
2.0
0 200 400 600 800 1000
σ tes
t/ σ c
alc,
fib14
[-]
fym [MPa]
0.0
0.5
1.0
1.5
2.0
0 200 400 600 800 1000
σ tes
t/ σ c
alc,
EC2
[-]
fym [MPa]
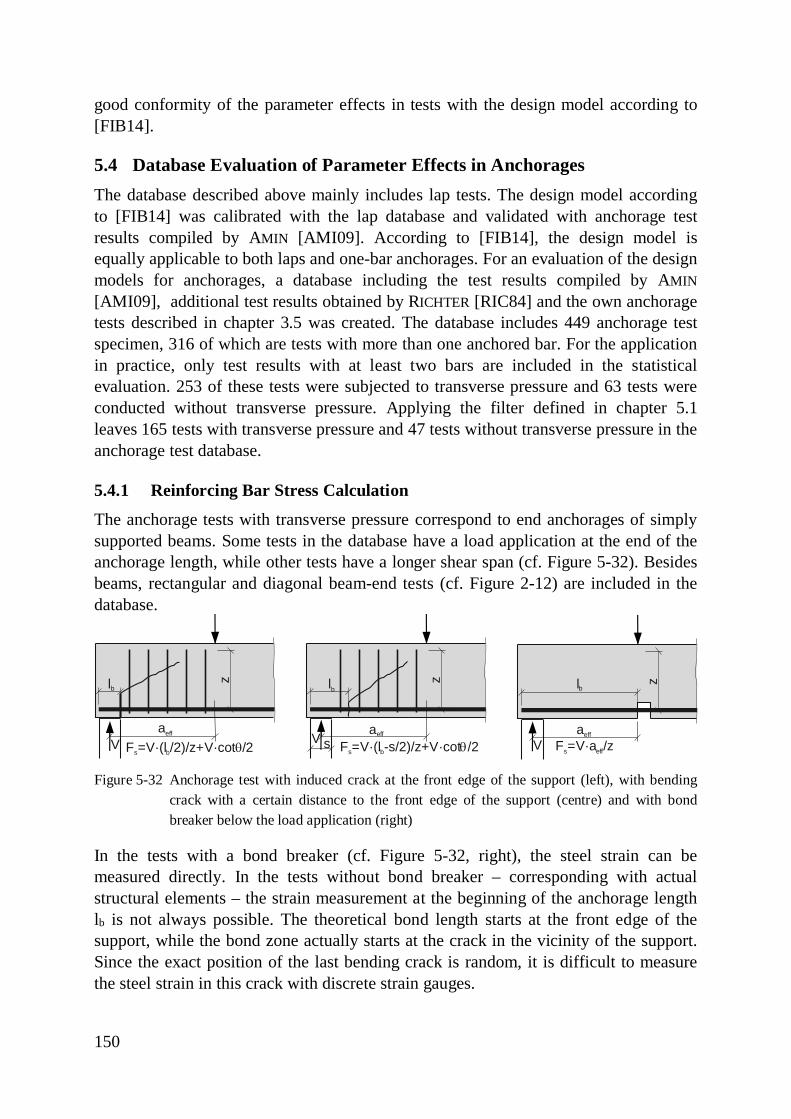
150
good conformity of the parameter effects in tests with the design model according to[FIB14].
5.4 Database Evaluation of Parameter Effects in AnchoragesThe database described above mainly includes lap tests. The design model accordingto [FIB14] was calibrated with the lap database and validated with anchorage testresults compiled by AMIN [AMI09]. According to [FIB14], the design model isequally applicable to both laps and one-bar anchorages. For an evaluation of the designmodels for anchorages, a database including the test results compiled by AMIN[AMI09], additional test results obtained by RICHTER [RIC84] and the own anchoragetests described in chapter 3.5 was created. The database includes 449 anchorage testspecimen, 316 of which are tests with more than one anchored bar. For the applicationin practice, only test results with at least two bars are included in the statisticalevaluation. 253 of these tests were subjected to transverse pressure and 63 tests wereconducted without transverse pressure. Applying the filter defined in chapter 5.1leaves 165 tests with transverse pressure and 47 tests without transverse pressure in theanchorage test database.
5.4.1 Reinforcing Bar Stress Calculation
The anchorage tests with transverse pressure correspond to end anchorages of simplysupported beams. Some tests in the database have a load application at the end of theanchorage length, while other tests have a longer shear span (cf. Figure 5-32). Besidesbeams, rectangular and diagonal beam-end tests (cf. Figure 2-12) are included in thedatabase.
Figure 5-32 Anchorage test with induced crack at the front edge of the support (left), with bendingcrack with a certain distance to the front edge of the support (centre) and with bondbreaker below the load application (right)
In the tests with a bond breaker (cf. Figure 5-32, right), the steel strain can bemeasured directly. In the tests without bond breaker – corresponding with actualstructural elements – the strain measurement at the beginning of the anchorage lengthlb is not always possible. The theoretical bond length starts at the front edge of thesupport, while the bond zone actually starts at the crack in the vicinity of the support.Since the exact position of the last bending crack is random, it is difficult to measurethe steel strain in this crack with discrete strain gauges.
aeff
zlb lb lb
V F =V·a /zs effF =V·(l -s/2)/z+V·cot /2s b qsF =V·(l /2)/z+V·cot /2s b qV V
z z
aeff aeff
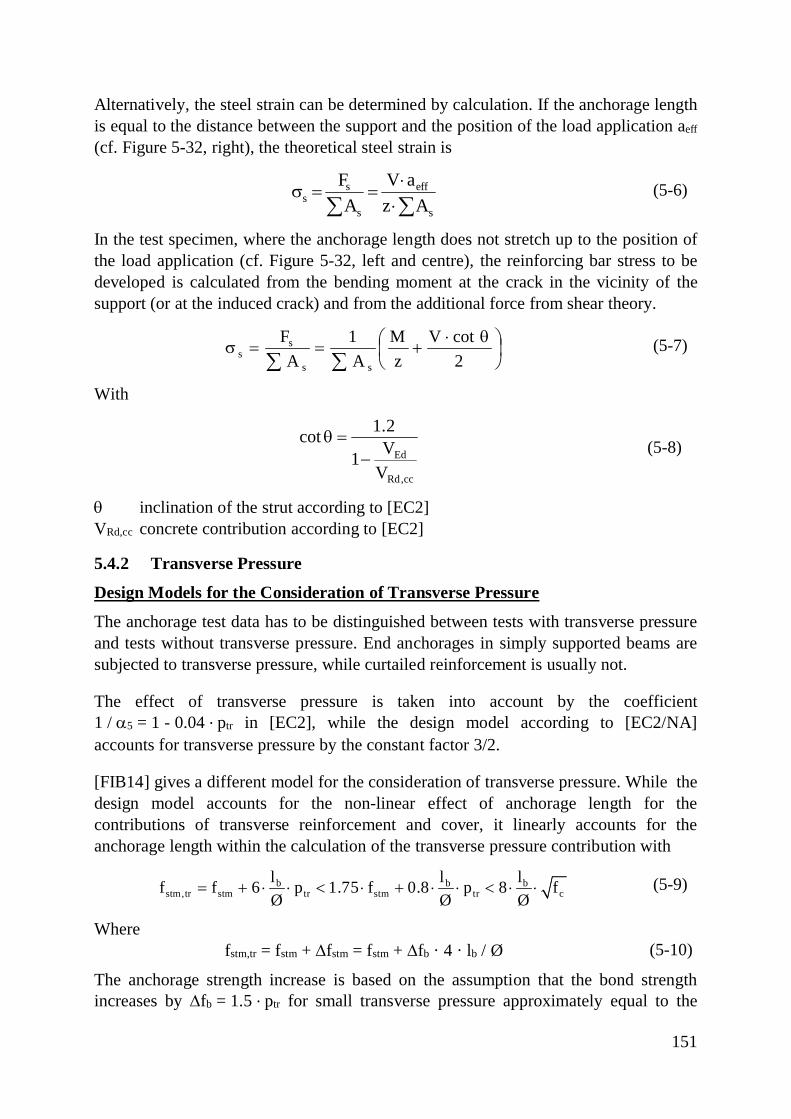
151
Alternatively, the steel strain can be determined by calculation. If the anchorage lengthis equal to the distance between the support and the position of the load application aeff
(cf. Figure 5-32, right), the theoretical steel strain is
åå ××
==ss
eff
s
ss Az
aVA
F (5-6)
In the test specimen, where the anchorage length does not stretch up to the position ofthe load application (cf. Figure 5-32, left and centre), the reinforcing bar stress to bedeveloped is calculated from the bending moment at the crack in the vicinity of thesupport (or at the induced crack) and from the additional force from shear theory.
÷øö
çèæ q×
+==såå 2
cotVz
MA1
AF
ss
ss (5-7)
With
cc,Rd
Ed
VV1
2.1cot-
=q (5-8)
q inclination of the strut according to [EC2]VRd,cc concrete contribution according to [EC2]
5.4.2 Transverse Pressure
Design Models for the Consideration of Transverse Pressure
The anchorage test data has to be distinguished between tests with transverse pressureand tests without transverse pressure. End anchorages in simply supported beams aresubjected to transverse pressure, while curtailed reinforcement is usually not.
The effect of transverse pressure is taken into account by the coefficient1 / a5 = 1 - 0.04 · ptr in [EC2], while the design model according to [EC2/NA]accounts for transverse pressure by the constant factor 3/2.
[FIB14] gives a different model for the consideration of transverse pressure. While thedesign model accounts for the non-linear effect of anchorage length for thecontributions of transverse reinforcement and cover, it linearly accounts for theanchorage length within the calculation of the transverse pressure contribution with
b b bstm,tr stm tr stm tr c
l l lf f 6 p 1.75 f 0.8 p 8 fØ Ø Ø
= + × × < × + × × < × × (5-9)
Wherefstm,tr = fstm + Dfstm = fstm + Dfb · 4 · lb / Ø (5-10)
The anchorage strength increase is based on the assumption that the bond strengthincreases by Dfb = 1.5 · ptr for small transverse pressure approximately equal to the
152
tensile strength of the concrete applied. The increase reduces to Dfb = 0.2 · p for highertransverse pressure. Figure 5-33 shows the increase in anchorage strength bytransverse pressure defined in [FIB14].
Figure 5-33 Increase of mean bond strength by transverse pressure ptr according to [FIB14]
The design model for the consideration of transverse pressure in [FIB14] is applied ina slightly modified manner in [MC2010] (cf. equation (2-31)).
The Project Team [PT18] defined a design model accounting for transverse pressure inthe proposal for the next generation of EUROCODE 2 based on [FIB14] that is given inequations (2-42) to (2-44) .
While [PT18] considers the non-linearity of bond-strength along the lap length,[FIB14] and [MC2010] – although based on the non-linear model – define the barstress by the linear equation fst = 4 · fbd · lb / Ø. This model requires a constantinfluence of transverse pressure along the anchorage length lb.
Tests Series with Transverse Pressure in the Database
The anchorage tests with transverse pressure in the database comprise the datacompiled by [AMI09] and were complemented by the tests conducted by RICHTER[RIC84] as well as with the tests in chapter 3.5. For the different test setup, the testresults obtained in [CAI96] are not included in the database (cf. Figure 5-39). Figure5-34 shows a comparison of anchorage test results with transverse pressure incomparison to the design model according to [FIB14].
ptr
fbm,0
≈ fctm
Df =1.5·pb tr
Df =0.2·pb tr
fb
1.75·fbm,0
[FIB14]
1.50·fbm,0
[EC2/NAD]
2.0·√fc
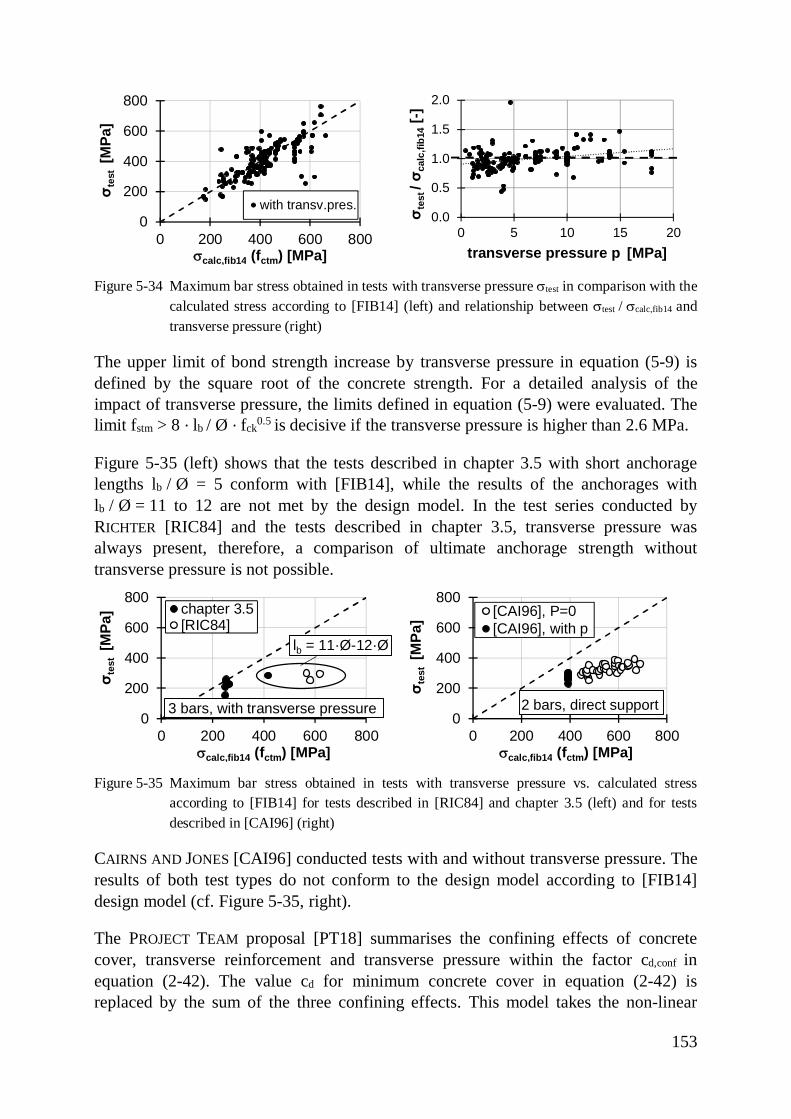
153
Figure 5-34 Maximum bar stress obtained in tests with transverse pressure stest in comparison with thecalculated stress according to [FIB14] (left) and relationship between stest / scalc,fib14 andtransverse pressure (right)
The upper limit of bond strength increase by transverse pressure in equation (5-9) isdefined by the square root of the concrete strength. For a detailed analysis of theimpact of transverse pressure, the limits defined in equation (5-9) were evaluated. Thelimit fstm > 8 · lb / Ø · fck0.5 is decisive if the transverse pressure is higher than 2.6 MPa.
Figure 5-35 (left) shows that the tests described in chapter 3.5 with short anchoragelengths lb / Ø = 5 conform with [FIB14], while the results of the anchorages withlb / Ø = 11 to 12 are not met by the design model. In the test series conducted byRICHTER [RIC84] and the tests described in chapter 3.5, transverse pressure wasalways present, therefore, a comparison of ultimate anchorage strength withouttransverse pressure is not possible.
Figure 5-35 Maximum bar stress obtained in tests with transverse pressure vs. calculated stressaccording to [FIB14] for tests described in [RIC84] and chapter 3.5 (left) and for testsdescribed in [CAI96] (right)
CAIRNS AND JONES [CAI96] conducted tests with and without transverse pressure. Theresults of both test types do not conform to the design model according to [FIB14]design model (cf. Figure 5-35, right).
The PROJECT TEAM proposal [PT18] summarises the confining effects of concretecover, transverse reinforcement and transverse pressure within the factor cd,conf inequation (2-42). The value cd for minimum concrete cover in equation (2-42) isreplaced by the sum of the three confining effects. This model takes the non-linear
0
200
400
600
800
0 200 400 600 800
σ tes
t[M
Pa]
scalc,fib14 (fctm) [MPa]
with transv.pres.0.0
0.5
1.0
1.5
2.0
0 5 10 15 20
σ tes
t/ σ c
alc,
fib14
[-]
transverse pressure p [MPa]
0
200
400
600
800
0 200 400 600 800
σ tes
t[M
Pa]
scalc,fib14 (fctm) [MPa]
chapter 3.5[RIC84]
3 bars, with transverse pressure
lb = 11·Ø-12·Ø
0
200
400
600
800
0 200 400 600 800
σ tes
t[M
Pa]
scalc,fib14 (fctm) [MPa]
[CAI96], P=0[CAI96], with p
2 bars, direct support
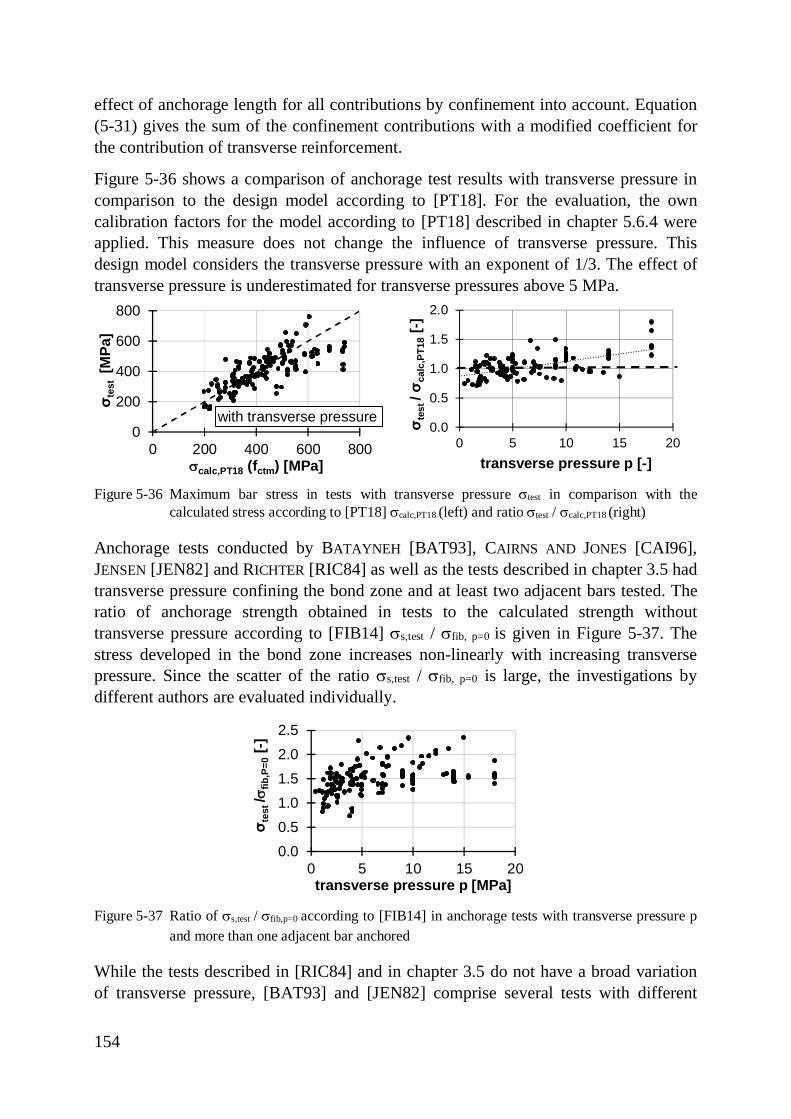
154
effect of anchorage length for all contributions by confinement into account. Equation(5-31) gives the sum of the confinement contributions with a modified coefficient forthe contribution of transverse reinforcement.
Figure 5-36 shows a comparison of anchorage test results with transverse pressure incomparison to the design model according to [PT18]. For the evaluation, the owncalibration factors for the model according to [PT18] described in chapter 5.6.4 wereapplied. This measure does not change the influence of transverse pressure. Thisdesign model considers the transverse pressure with an exponent of 1/3. The effect oftransverse pressure is underestimated for transverse pressures above 5 MPa.
Figure 5-36 Maximum bar stress in tests with transverse pressure stest in comparison with thecalculated stress according to [PT18] scalc,PT18 (left) and ratio stest / scalc,PT18 (right)
Anchorage tests conducted by BATAYNEH [BAT93], CAIRNS AND JONES [CAI96],JENSEN [JEN82] and RICHTER [RIC84] as well as the tests described in chapter 3.5 hadtransverse pressure confining the bond zone and at least two adjacent bars tested. Theratio of anchorage strength obtained in tests to the calculated strength withouttransverse pressure according to [FIB14] ss,test / sfib, p=0 is given in Figure 5-37. Thestress developed in the bond zone increases non-linearly with increasing transversepressure. Since the scatter of the ratio ss,test / sfib, p=0 is large, the investigations bydifferent authors are evaluated individually.
Figure 5-37 Ratio of ss,test / sfib,p=0 according to [FIB14] in anchorage tests with transverse pressure pand more than one adjacent bar anchored
While the tests described in [RIC84] and in chapter 3.5 do not have a broad variationof transverse pressure, [BAT93] and [JEN82] comprise several tests with different
0
200
400
600
800
0 200 400 600 800
σ tes
t[M
Pa]
scalc,PT18 (fctm) [MPa]
with transverse pressure0.0
0.5
1.0
1.5
2.0
0 5 10 15 20
σ tes
t/ σ c
alc,
PT18
[-]
transverse pressure p [-]
0.00.51.01.52.02.5
0 5 10 15 20
σ tes
t/sfib
,P=0
[-]
transverse pressure p [MPa]
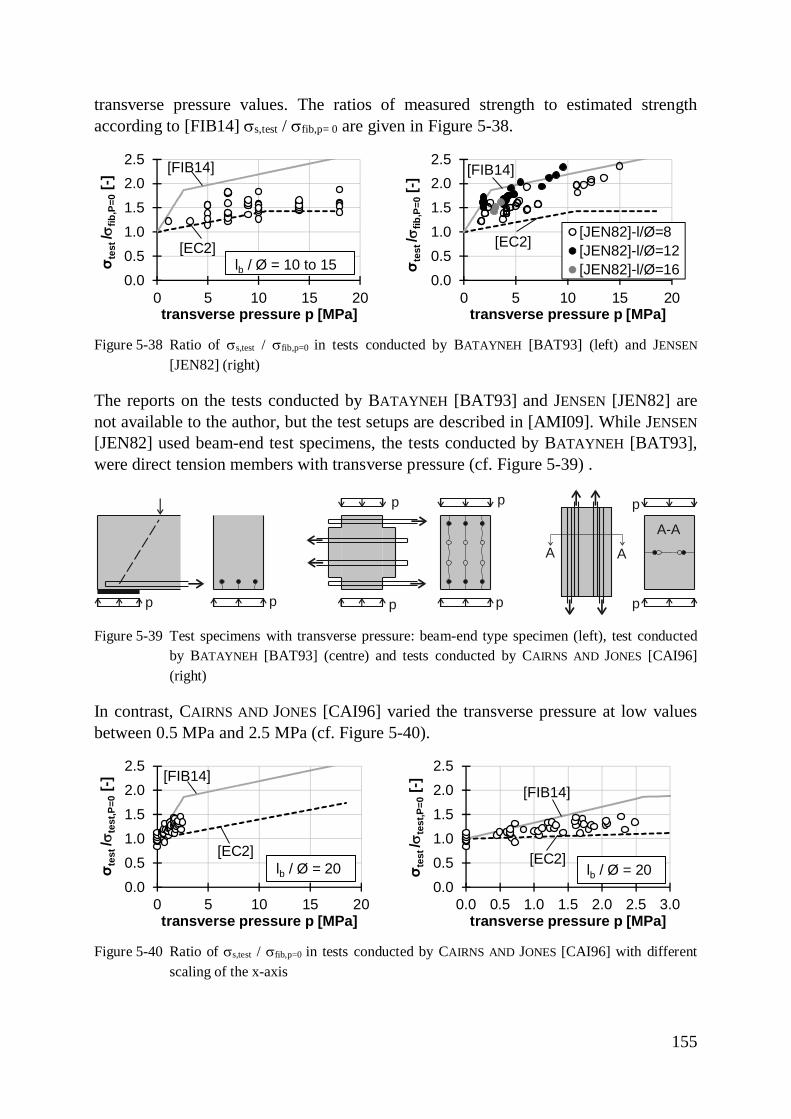
155
transverse pressure values. The ratios of measured strength to estimated strengthaccording to [FIB14] ss,test / sfib,p= 0 are given in Figure 5-38.
Figure 5-38 Ratio of ss,test / sfib,p=0 in tests conducted by BATAYNEH [BAT93] (left) and JENSEN
[JEN82] (right)
The reports on the tests conducted by BATAYNEH [BAT93] and JENSEN [JEN82] arenot available to the author, but the test setups are described in [AMI09]. While JENSEN[JEN82] used beam-end test specimens, the tests conducted by BATAYNEH [BAT93],were direct tension members with transverse pressure (cf. Figure 5-39) .
Figure 5-39 Test specimens with transverse pressure: beam-end type specimen (left), test conductedby BATAYNEH [BAT93] (centre) and tests conducted by CAIRNS AND JONES [CAI96](right)
In contrast, CAIRNS AND JONES [CAI96] varied the transverse pressure at low valuesbetween 0.5 MPa and 2.5 MPa (cf. Figure 5-40).
Figure 5-40 Ratio of ss,test / sfib,p=0 in tests conducted by CAIRNS AND JONES [CAI96] with differentscaling of the x-axis
0.00.51.01.52.02.5
0 5 10 15 20
σ tes
t/sfib
,P=0
[-]
transverse pressure p [MPa]
lb / Ø = 10 to 15[EC2]
[FIB14]
0.00.51.01.52.02.5
0 5 10 15 20
σ tes
t/sfib
,P=0
[-]
transverse pressure p [MPa]
[JEN82]-l/Ø=8[JEN82]-l/Ø=12[JEN82]-l/Ø=16
[FIB14]
[EC2]
A A
A-A
p
p
p
p
p
pp p
0.00.51.01.52.02.5
0 5 10 15 20
σ tes
t/ste
st,P
=0[-]
transverse pressure p [MPa]
lb / Ø = 20[EC2]
[FIB14]
0.00.51.01.52.02.5
0.0 0.5 1.0 1.5 2.0 2.5 3.0
σ tes
t/ste
st,P
=0[-]
transverse pressure p [MPa]
lb / Ø = 20[EC2]
[FIB14]
156
CAIRNS AND JONES [CAI96] tested laps in direct tension members with very largebottom cover. The concrete strength only varied slightly in the test programmes. Thelap length was 10 · Ø to 15 · Ø in [BAT93], 8 · Ø to 16 · Ø in [JEN82] and 20 · Ø in[CAI96]. The cover values were different, but these basic parameters (cx, cy, cs, lb, fcm)are considered within the calculated values sfib,p=0 according to [FIB14].
For both the beam-end tests and the direct tension members, the results of longanchorages are only captured well with a non-linear model for lap length. In some testsetups, the transverse pressure acts in the direction of the splitting cracks, while it actsorthogonally to the direction of the splitting cracks in other test setups (cf. Figure5-39). The own anchorage tests developed vertical cracks in the bottom cover (cf.Figure 3-56, and Figure 5-39, left). This crack formation is even facilitated by theacting transverse pressure. Likewise, the face splitting cracks in the test specimensconducted by BATAYNEH [BAT93] are facilitated by the acting transverse pressure (cf.Figure 5-39, centre). In contrast, the transverse pressure acts orthogonal to the sidesplitting cracks that develop in the test specimens used by CAIRNS AND JONES[CAI96]. For the large bottom cover, face splits in the same direction as the transversepressure are unlikely (cf. Figure 5-39, right). This fact might explain the higherincrease in ultimate strength by transverse pressure observed in [CAI96] than for othertest specimens. The specimens tested by [CAI96] without transverse pressure reachedmuch lower stresses than calculated by [FIB14].5.4.3 Parameter Effects for Anchorages
Most authors varied the transverse pressure and the concrete cover values in anchoragetests, while the concrete strength and the anchorage length were kept constant. Hence,only little data is available for an evaluation of the influence of anchorage length ondevelopable bond stress.
Anchorage Length
Figure 5-41 (left) shows the effect of anchorage length on maximum bar stress in testsconducted by AMIN [AMI09] and in the tests described in chapter 3.5. The anchoragelength effect can be described with the exponents 0.20 and 0.30, respectively.
Bar Diameter
BATAYNEH [BAT93] investigated the effect of bar diameter on the maximum barstress. Figure 5-41 (right) compares the ratio of the maximum bond strength as averageover the bond length obtained in tests [BAT93] tb,a,n to the maximum bond strength of25 mm bars tb,a,n,25 with the calculated averaged bond strength according to [FIB14]and [EC2]. The lap lengths and concrete strengths were taken into account with
0.55 0.25s
b,a,nb b cm
Ø 10 314 l l f
æ ö æ ö× st = × ×ç ÷ ç ÷× è ø è ø
(5-11)
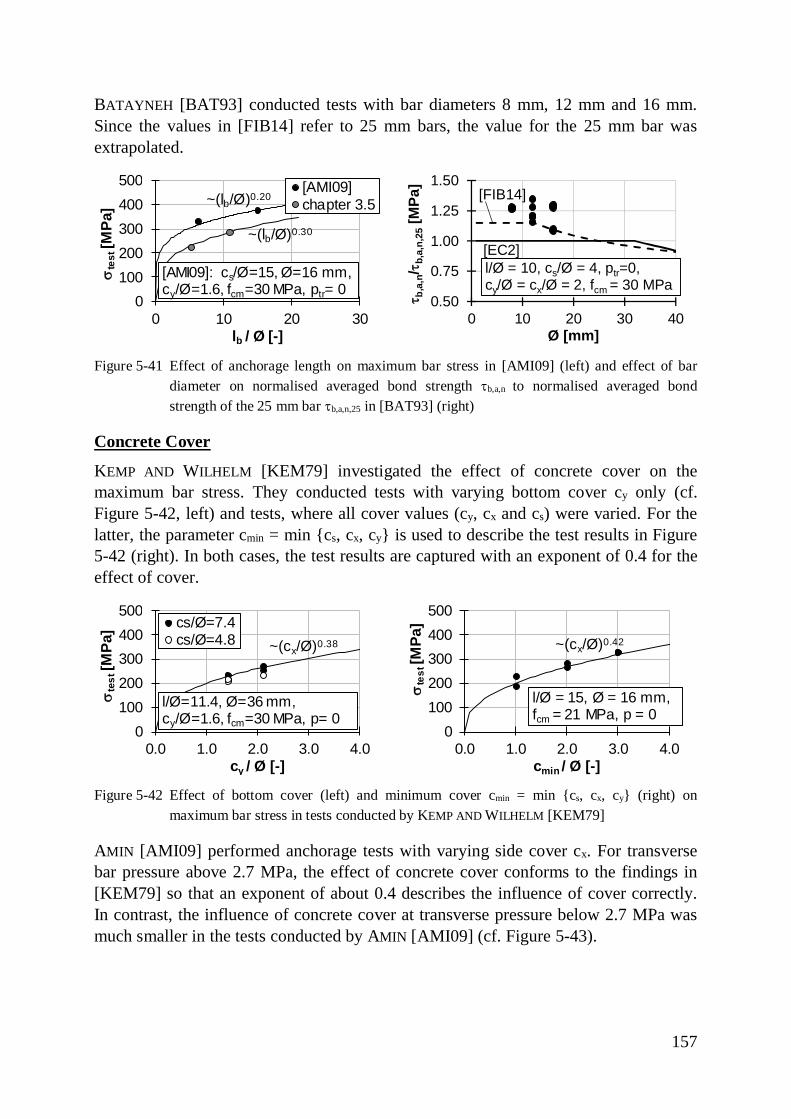
157
BATAYNEH [BAT93] conducted tests with bar diameters 8 mm, 12 mm and 16 mm.Since the values in [FIB14] refer to 25 mm bars, the value for the 25 mm bar wasextrapolated.
Figure 5-41 Effect of anchorage length on maximum bar stress in [AMI09] (left) and effect of bardiameter on normalised averaged bond strength tb,a,n to normalised averaged bondstrength of the 25 mm bar tb,a,n,25 in [BAT93] (right)
Concrete Cover
KEMP AND WILHELM [KEM79] investigated the effect of concrete cover on themaximum bar stress. They conducted tests with varying bottom cover cy only (cf.Figure 5-42, left) and tests, where all cover values (cy, cx and cs) were varied. For thelatter, the parameter cmin = min {cs, cx, cy} is used to describe the test results in Figure5-42 (right). In both cases, the test results are captured with an exponent of 0.4 for theeffect of cover.
Figure 5-42 Effect of bottom cover (left) and minimum cover cmin = min {cs, cx, cy} (right) onmaximum bar stress in tests conducted by KEMP AND WILHELM [KEM79]
AMIN [AMI09] performed anchorage tests with varying side cover cx. For transversebar pressure above 2.7 MPa, the effect of concrete cover conforms to the findings in[KEM79] so that an exponent of about 0.4 describes the influence of cover correctly.In contrast, the influence of concrete cover at transverse pressure below 2.7 MPa wasmuch smaller in the tests conducted by AMIN [AMI09] (cf. Figure 5-43).
0100200300400500
0 10 20 30
ste
st[M
Pa]
lb / Ø [-]
[AMI09]chapter 3.5
[AMI09]: cs/Ø=15, Ø=16 mm,cy/Ø=1.6, fcm=30 MPa, ptr= 0
~(lb/Ø)0.20
~(lb/Ø)0.30
0.50
0.75
1.00
1.25
1.50
0 10 20 30 40
t b,a
,n/t
b,a,
n,25
[MPa
]
Ø [mm]
l/Ø = 10, cs/Ø = 4, ptr=0,cy/Ø = cx/Ø = 2, fcm = 30 MPa
[FIB14]
[EC2]
0100200300400500
0.0 1.0 2.0 3.0 4.0
ste
st[M
Pa]
cy / Ø [-]
cs/Ø=7.4cs/Ø=4.8
l/Ø=11.4, Ø=36 mm,cy/Ø=1.6, fcm=30 MPa, p= 0
~(cx/Ø)0.38
0100200300400500
0.0 1.0 2.0 3.0 4.0
ste
st[M
Pa]
cmin / Ø [-]
l/Ø = 15, Ø = 16 mm,fcm = 21 MPa, p = 0
~(cx/Ø)0.42
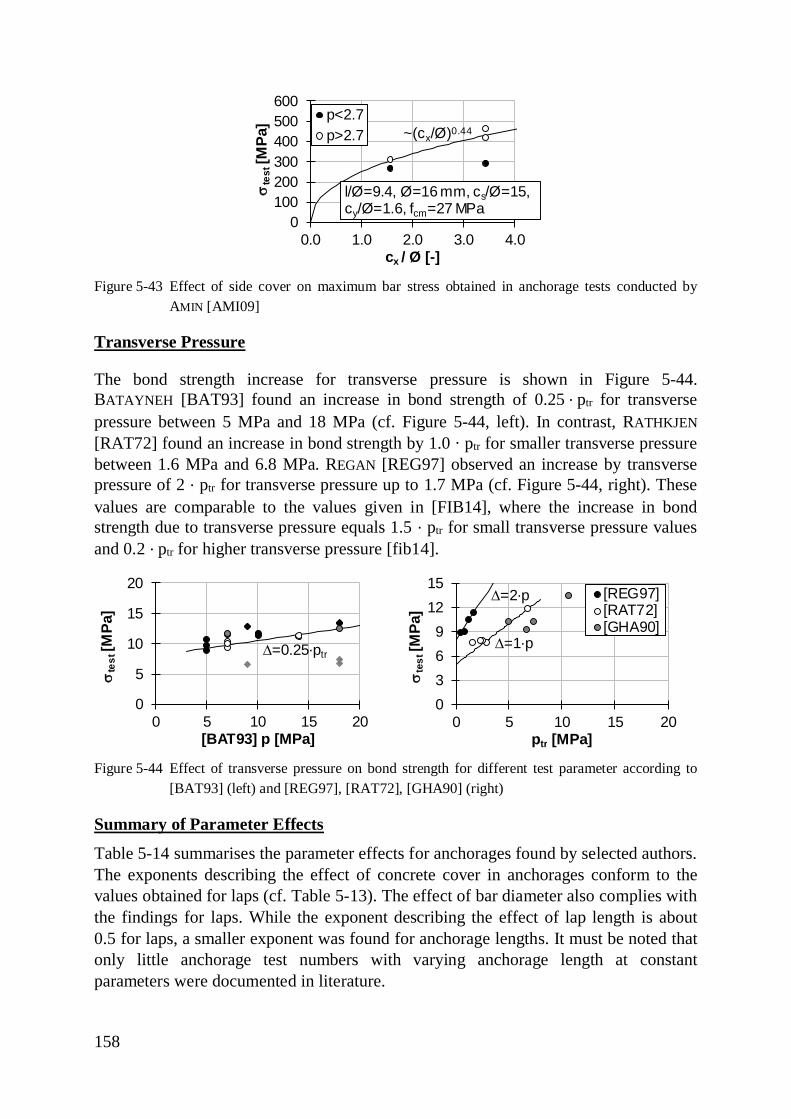
158
Figure 5-43 Effect of side cover on maximum bar stress obtained in anchorage tests conducted byAMIN [AMI09]
Transverse Pressure
The bond strength increase for transverse pressure is shown in Figure 5-44.BATAYNEH [BAT93] found an increase in bond strength of 0.25 · ptr for transversepressure between 5 MPa and 18 MPa (cf. Figure 5-44, left). In contrast, RATHKJEN[RAT72] found an increase in bond strength by 1.0 · ptr for smaller transverse pressurebetween 1.6 MPa and 6.8 MPa. REGAN [REG97] observed an increase by transversepressure of 2 · ptr for transverse pressure up to 1.7 MPa (cf. Figure 5-44, right). Thesevalues are comparable to the values given in [FIB14], where the increase in bondstrength due to transverse pressure equals 1.5 · ptr for small transverse pressure valuesand 0.2 · ptr for higher transverse pressure [fib14].
Figure 5-44 Effect of transverse pressure on bond strength for different test parameter according to[BAT93] (left) and [REG97], [RAT72], [GHA90] (right)
Summary of Parameter Effects
Table 5-14 summarises the parameter effects for anchorages found by selected authors.The exponents describing the effect of concrete cover in anchorages conform to thevalues obtained for laps (cf. Table 5-13). The effect of bar diameter also complies withthe findings for laps. While the exponent describing the effect of lap length is about0.5 for laps, a smaller exponent was found for anchorage lengths. It must be noted thatonly little anchorage test numbers with varying anchorage length at constantparameters were documented in literature.
0100200300400500600
0.0 1.0 2.0 3.0 4.0s
test
[MPa
]cx / Ø [-]
p<2.7p>2.7
l/Ø=9.4, Ø=16 mm, cs/Ø=15,cy/Ø=1.6, fcm=27 MPa
~(cx/Ø)0.44
0
5
10
15
20
0 5 10 15 20
ste
st[M
Pa]
[BAT93] p [MPa]
D=0.25·ptr
0369
1215
0 5 10 15 20
ste
st[M
Pa]
ptr [MPa]
[REG97][RAT72][GHA90]
D=1·p
D=2·p
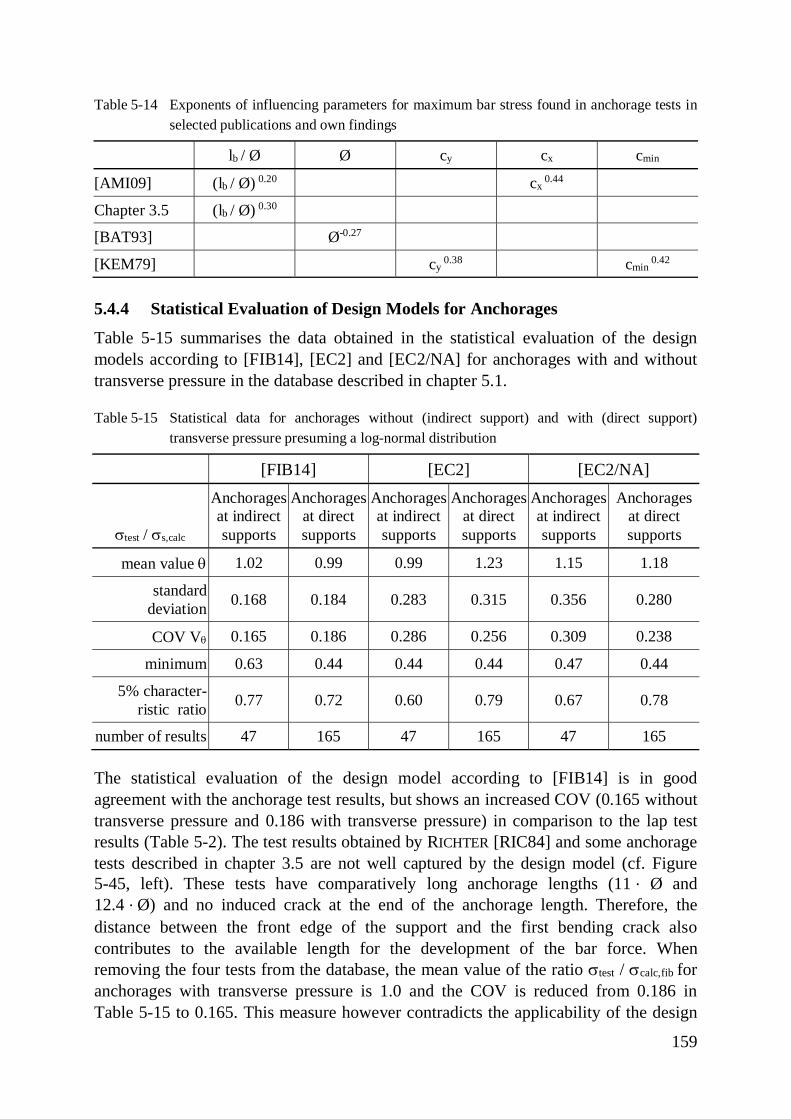
159
Table 5-14 Exponents of influencing parameters for maximum bar stress found in anchorage tests inselected publications and own findings
lb / Ø Ø cy cx cmin
[AMI09] (lb / Ø) 0.20 cx 0.44
Chapter 3.5 (lb / Ø) 0.30
[BAT93] Ø-0.27
[KEM79] cy 0.38 cmin
0.42
5.4.4 Statistical Evaluation of Design Models for Anchorages
Table 5-15 summarises the data obtained in the statistical evaluation of the designmodels according to [FIB14], [EC2] and [EC2/NA] for anchorages with and withouttransverse pressure in the database described in chapter 5.1.
Table 5-15 Statistical data for anchorages without (indirect support) and with (direct support)transverse pressure presuming a log-normal distribution
[FIB14] [EC2] [EC2/NA]
stest / ss,calc
Anchoragesat indirectsupports
Anchoragesat directsupports
Anchoragesat indirectsupports
Anchoragesat directsupports
Anchoragesat indirectsupports
Anchoragesat directsupports
mean value q 1.02 0.99 0.99 1.23 1.15 1.18
standarddeviation 0.168 0.184 0.283 0.315 0.356 0.280
COV Vq 0.165 0.186 0.286 0.256 0.309 0.238
minimum 0.63 0.44 0.44 0.44 0.47 0.44
5% character-ristic ratio 0.77 0.72 0.60 0.79 0.67 0.78
number of results 47 165 47 165 47 165
The statistical evaluation of the design model according to [FIB14] is in goodagreement with the anchorage test results, but shows an increased COV (0.165 withouttransverse pressure and 0.186 with transverse pressure) in comparison to the lap testresults (Table 5-2). The test results obtained by RICHTER [RIC84] and some anchoragetests described in chapter 3.5 are not well captured by the design model (cf. Figure5-45, left). These tests have comparatively long anchorage lengths (11 · Ø and12.4 · Ø) and no induced crack at the end of the anchorage length. Therefore, thedistance between the front edge of the support and the first bending crack alsocontributes to the available length for the development of the bar force. Whenremoving the four tests from the database, the mean value of the ratio stest / scalc,fib foranchorages with transverse pressure is 1.0 and the COV is reduced from 0.186 inTable 5-15 to 0.165. This measure however contradicts the applicability of the design
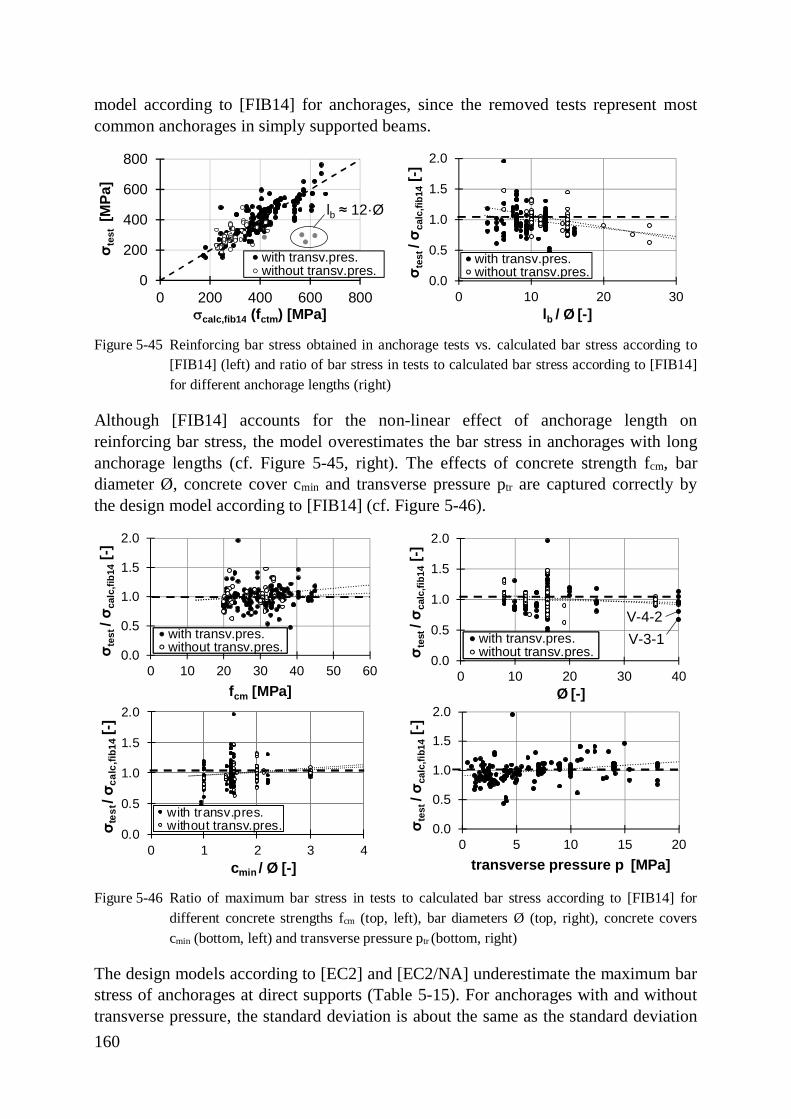
160
model according to [FIB14] for anchorages, since the removed tests represent mostcommon anchorages in simply supported beams.
Figure 5-45 Reinforcing bar stress obtained in anchorage tests vs. calculated bar stress according to[FIB14] (left) and ratio of bar stress in tests to calculated bar stress according to [FIB14]for different anchorage lengths (right)
Although [FIB14] accounts for the non-linear effect of anchorage length onreinforcing bar stress, the model overestimates the bar stress in anchorages with longanchorage lengths (cf. Figure 5-45, right). The effects of concrete strength fcm, bardiameter Ø, concrete cover cmin and transverse pressure ptr are captured correctly bythe design model according to [FIB14] (cf. Figure 5-46).
Figure 5-46 Ratio of maximum bar stress in tests to calculated bar stress according to [FIB14] fordifferent concrete strengths fcm (top, left), bar diameters Ø (top, right), concrete coverscmin (bottom, left) and transverse pressure ptr (bottom, right)
The design models according to [EC2] and [EC2/NA] underestimate the maximum barstress of anchorages at direct supports (Table 5-15). For anchorages with and withouttransverse pressure, the standard deviation is about the same as the standard deviation
0
200
400
600
800
0 200 400 600 800
σ tes
t[M
Pa]
scalc,fib14 (fctm) [MPa]
with transv.pres.without transv.pres.
lb ≈ 12·Ø
0.0
0.5
1.0
1.5
2.0
0 10 20 30
σ tes
t/ σ c
alc,
fib14
[-]
lb / Ø [-]
with transv.pres.without transv.pres.
0.0
0.5
1.0
1.5
2.0
0 10 20 30 40 50 60
σ tes
t/ σ c
alc,
fib14
[-]
fcm [MPa]
with transv.pres.without transv.pres.
0.0
0.5
1.0
1.5
2.0
0 10 20 30 40
σ tes
t/ σ c
alc,
fib14
[-]
Ø [-]
with transv.pres.without transv.pres.
V-4-2V-3-1
0.0
0.5
1.0
1.5
2.0
0 1 2 3 4
σ tes
t/ σ c
alc,
fib14
[-]
cmin / Ø [-]
with transv.pres.without transv.pres. 0.0
0.5
1.0
1.5
2.0
0 5 10 15 20
σ tes
t/ σ c
alc,
fib14
[-]
transverse pressure p [MPa]
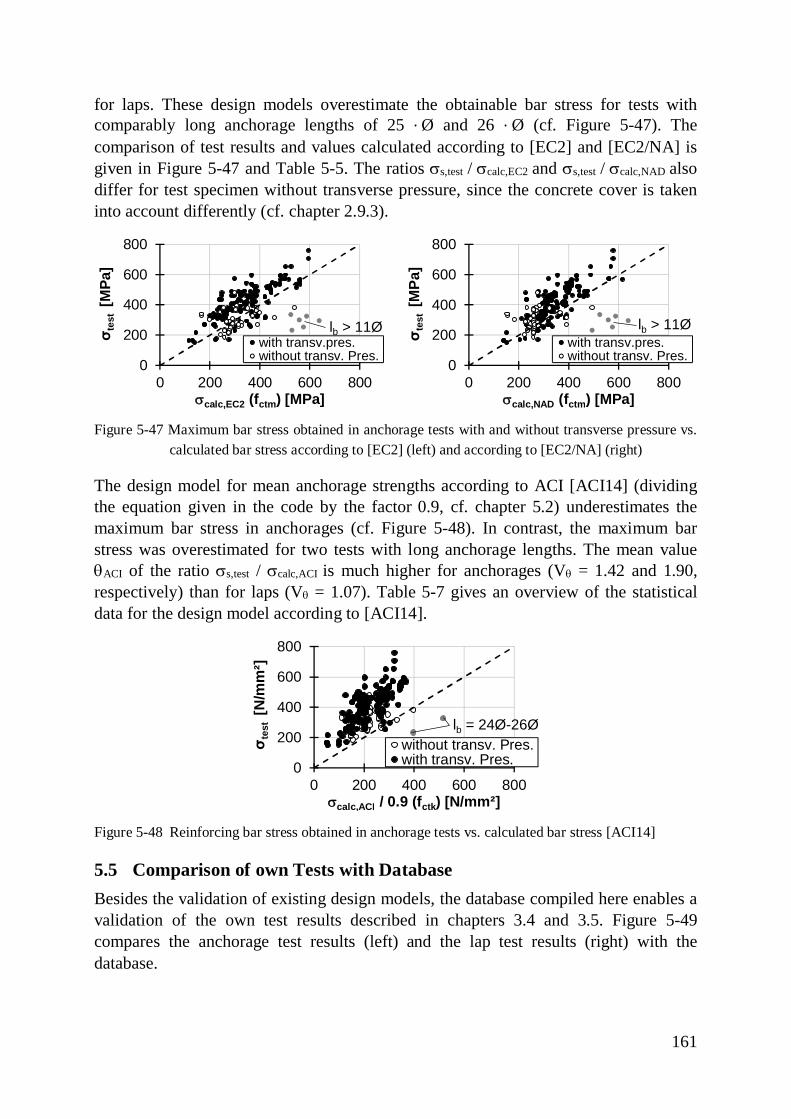
161
for laps. These design models overestimate the obtainable bar stress for tests withcomparably long anchorage lengths of 25 · Ø and 26 · Ø (cf. Figure 5-47). Thecomparison of test results and values calculated according to [EC2] and [EC2/NA] isgiven in Figure 5-47 and Table 5-5. The ratios ss,test / scalc,EC2 and ss,test / scalc,NAD alsodiffer for test specimen without transverse pressure, since the concrete cover is takeninto account differently (cf. chapter 2.9.3).
Figure 5-47 Maximum bar stress obtained in anchorage tests with and without transverse pressure vs.calculated bar stress according to [EC2] (left) and according to [EC2/NA] (right)
The design model for mean anchorage strengths according to ACI [ACI14] (dividingthe equation given in the code by the factor 0.9, cf. chapter 5.2) underestimates themaximum bar stress in anchorages (cf. Figure 5-48). In contrast, the maximum barstress was overestimated for two tests with long anchorage lengths. The mean valueqACI of the ratio ss,test / scalc,ACI is much higher for anchorages (Vq = 1.42 and 1.90,respectively) than for laps (Vq = 1.07). Table 5-7 gives an overview of the statisticaldata for the design model according to [ACI14].
Figure 5-48 Reinforcing bar stress obtained in anchorage tests vs. calculated bar stress [ACI14]
5.5 Comparison of own Tests with DatabaseBesides the validation of existing design models, the database compiled here enables avalidation of the own test results described in chapters 3.4 and 3.5. Figure 5-49compares the anchorage test results (left) and the lap test results (right) with thedatabase.
0
200
400
600
800
0 200 400 600 800
σ tes
t[M
Pa]
scalc,EC2 (fctm) [MPa]
with transv.pres.without transv. Pres.
lb > 11Ø
0
200
400
600
800
0 200 400 600 800
σ tes
t[M
Pa]
scalc,NAD (fctm) [MPa]
with transv.pres.without transv. Pres.
lb > 11Ø
0
200
400
600
800
0 200 400 600 800
σ tes
t[N
/mm
²]
scalc,ACI / 0.9 (fctk) [N/mm²]
without transv. Pres.with transv. Pres.
lb = 24Ø-26Ø
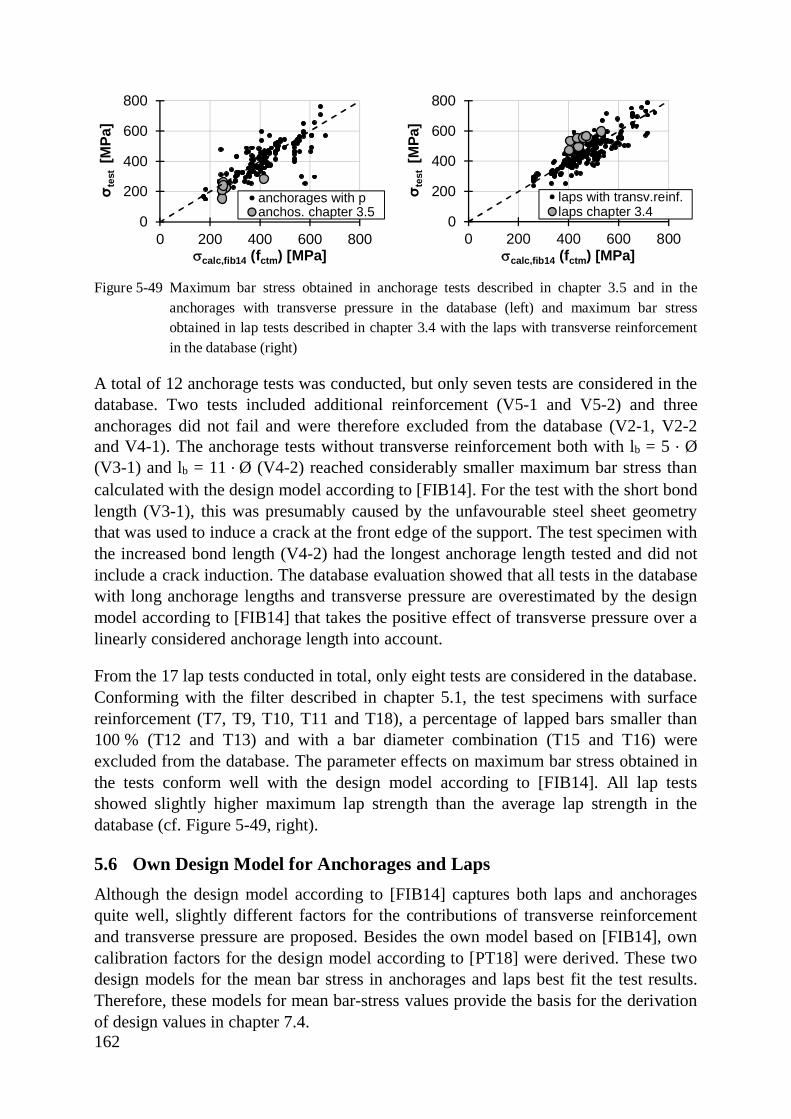
162
Figure 5-49 Maximum bar stress obtained in anchorage tests described in chapter 3.5 and in theanchorages with transverse pressure in the database (left) and maximum bar stressobtained in lap tests described in chapter 3.4 with the laps with transverse reinforcementin the database (right)
A total of 12 anchorage tests was conducted, but only seven tests are considered in thedatabase. Two tests included additional reinforcement (V5-1 and V5-2) and threeanchorages did not fail and were therefore excluded from the database (V2-1, V2-2and V4-1). The anchorage tests without transverse reinforcement both with lb = 5 · Ø(V3-1) and lb = 11 · Ø (V4-2) reached considerably smaller maximum bar stress thancalculated with the design model according to [FIB14]. For the test with the short bondlength (V3-1), this was presumably caused by the unfavourable steel sheet geometrythat was used to induce a crack at the front edge of the support. The test specimen withthe increased bond length (V4-2) had the longest anchorage length tested and did notinclude a crack induction. The database evaluation showed that all tests in the databasewith long anchorage lengths and transverse pressure are overestimated by the designmodel according to [FIB14] that takes the positive effect of transverse pressure over alinearly considered anchorage length into account.
From the 17 lap tests conducted in total, only eight tests are considered in the database.Conforming with the filter described in chapter 5.1, the test specimens with surfacereinforcement (T7, T9, T10, T11 and T18), a percentage of lapped bars smaller than100 % (T12 and T13) and with a bar diameter combination (T15 and T16) wereexcluded from the database. The parameter effects on maximum bar stress obtained inthe tests conform well with the design model according to [FIB14]. All lap testsshowed slightly higher maximum lap strength than the average lap strength in thedatabase (cf. Figure 5-49, right).
5.6 Own Design Model for Anchorages and LapsAlthough the design model according to [FIB14] captures both laps and anchoragesquite well, slightly different factors for the contributions of transverse reinforcementand transverse pressure are proposed. Besides the own model based on [FIB14], owncalibration factors for the design model according to [PT18] were derived. These twodesign models for the mean bar stress in anchorages and laps best fit the test results.Therefore, these models for mean bar-stress values provide the basis for the derivationof design values in chapter 7.4.
0
200
400
600
800
0 200 400 600 800
σ tes
t[M
Pa]
scalc,fib14 (fctm) [MPa]
anchorages with panchos. chapter 3.5
0
200
400
600
800
0 200 400 600 800
σ tes
t[M
Pa]
scalc,fib14 (fctm) [MPa]
laps with transv.reinf.laps chapter 3.4
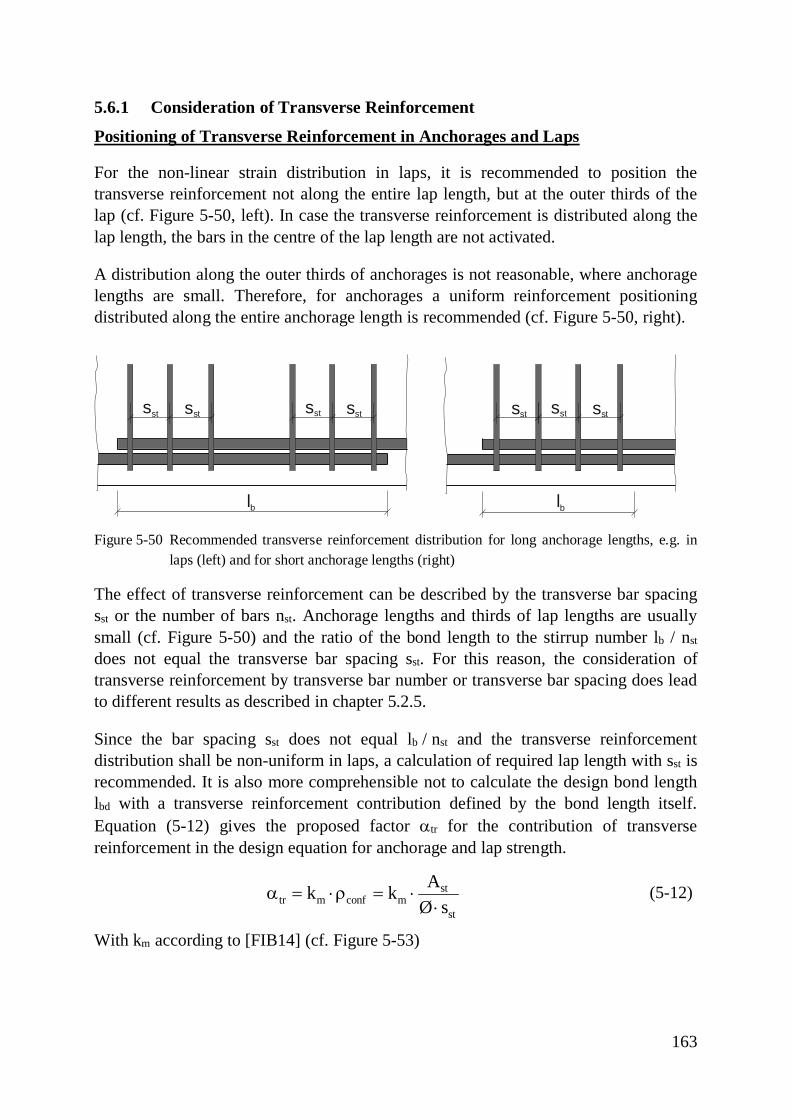
163
5.6.1 Consideration of Transverse Reinforcement
Positioning of Transverse Reinforcement in Anchorages and Laps
For the non-linear strain distribution in laps, it is recommended to position thetransverse reinforcement not along the entire lap length, but at the outer thirds of thelap (cf. Figure 5-50, left). In case the transverse reinforcement is distributed along thelap length, the bars in the centre of the lap length are not activated.
A distribution along the outer thirds of anchorages is not reasonable, where anchoragelengths are small. Therefore, for anchorages a uniform reinforcement positioningdistributed along the entire anchorage length is recommended (cf. Figure 5-50, right).
Figure 5-50 Recommended transverse reinforcement distribution for long anchorage lengths, e.g. inlaps (left) and for short anchorage lengths (right)
The effect of transverse reinforcement can be described by the transverse bar spacingsst or the number of bars nst. Anchorage lengths and thirds of lap lengths are usuallysmall (cf. Figure 5-50) and the ratio of the bond length to the stirrup number lb / nst
does not equal the transverse bar spacing sst. For this reason, the consideration oftransverse reinforcement by transverse bar number or transverse bar spacing does leadto different results as described in chapter 5.2.5.
Since the bar spacing sst does not equal lb / nst and the transverse reinforcementdistribution shall be non-uniform in laps, a calculation of required lap length with sst isrecommended. It is also more comprehensible not to calculate the design bond lengthlbd with a transverse reinforcement contribution defined by the bond length itself.Equation (5-12) gives the proposed factor atr for the contribution of transversereinforcement in the design equation for anchorage and lap strength.
sttr m conf m
st
Ak kØ s
a = ×r = ××
(5-12)
With km according to [FIB14] (cf. Figure 5-53)
lb
sst sst sst sst
lb
sst sstsst
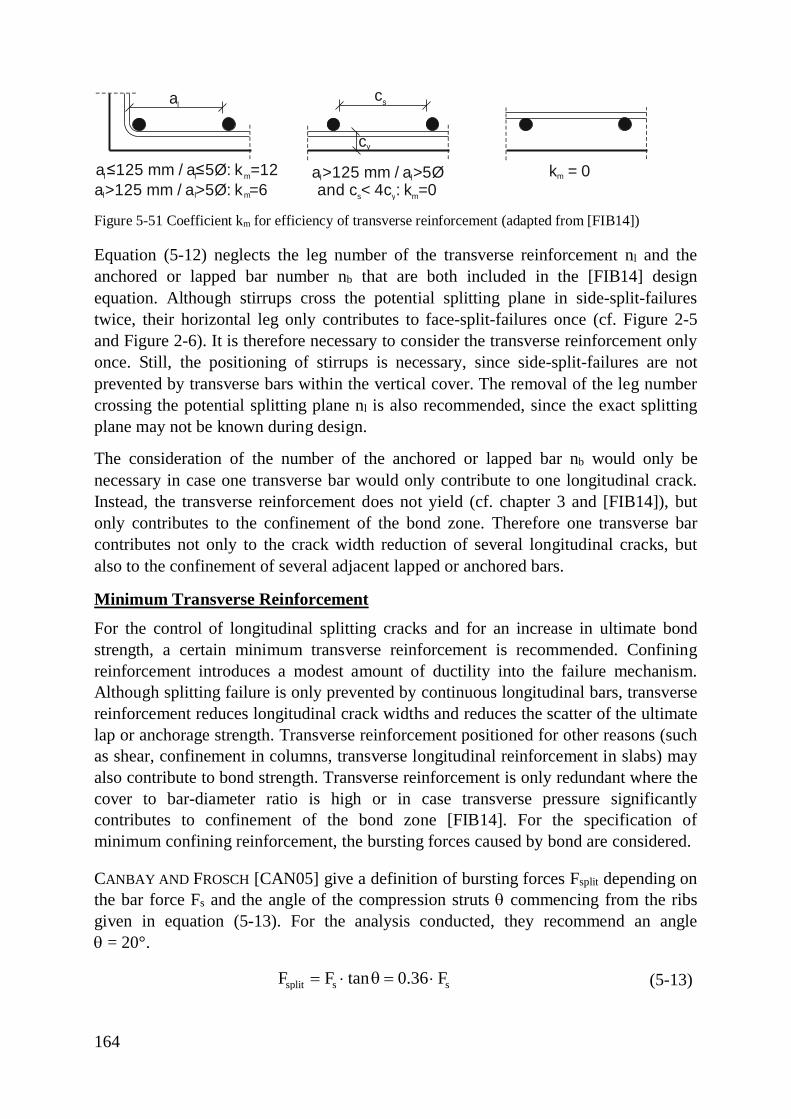
164
Figure 5-51 Coefficient km for efficiency of transverse reinforcement (adapted from [FIB14])
Equation (5-12) neglects the leg number of the transverse reinforcement nl and theanchored or lapped bar number nb that are both included in the [FIB14] designequation. Although stirrups cross the potential splitting plane in side-split-failurestwice, their horizontal leg only contributes to face-split-failures once (cf. Figure 2-5and Figure 2-6). It is therefore necessary to consider the transverse reinforcement onlyonce. Still, the positioning of stirrups is necessary, since side-split-failures are notprevented by transverse bars within the vertical cover. The removal of the leg numbercrossing the potential splitting plane nl is also recommended, since the exact splittingplane may not be known during design.
The consideration of the number of the anchored or lapped bar nb would only benecessary in case one transverse bar would only contribute to one longitudinal crack.Instead, the transverse reinforcement does not yield (cf. chapter 3 and [FIB14]), butonly contributes to the confinement of the bond zone. Therefore one transverse barcontributes not only to the crack width reduction of several longitudinal cracks, butalso to the confinement of several adjacent lapped or anchored bars.
Minimum Transverse Reinforcement
For the control of longitudinal splitting cracks and for an increase in ultimate bondstrength, a certain minimum transverse reinforcement is recommended. Confiningreinforcement introduces a modest amount of ductility into the failure mechanism.Although splitting failure is only prevented by continuous longitudinal bars, transversereinforcement reduces longitudinal crack widths and reduces the scatter of the ultimatelap or anchorage strength. Transverse reinforcement positioned for other reasons (suchas shear, confinement in columns, transverse longitudinal reinforcement in slabs) mayalso contribute to bond strength. Transverse reinforcement is only redundant where thecover to bar-diameter ratio is high or in case transverse pressure significantlycontributes to confinement of the bond zone [FIB14]. For the specification ofminimum confining reinforcement, the bursting forces caused by bond are considered.
CANBAY AND FROSCH [CAN05] give a definition of bursting forces Fsplit depending onthe bar force Fs and the angle of the compression struts q commencing from the ribsgiven in equation (5-13). For the analysis conducted, they recommend an angleq = 20°.
split s sF F tan 0.36 F= × q = × (5-13)
a≤125 mm / a≤5Ø: k =12l l m
al
a>125 mm / a>5Ø: k =6l l m
cs
a>125 mm / a>5Øl l
and c < 4c : k =0s y m
k = 0m
cy
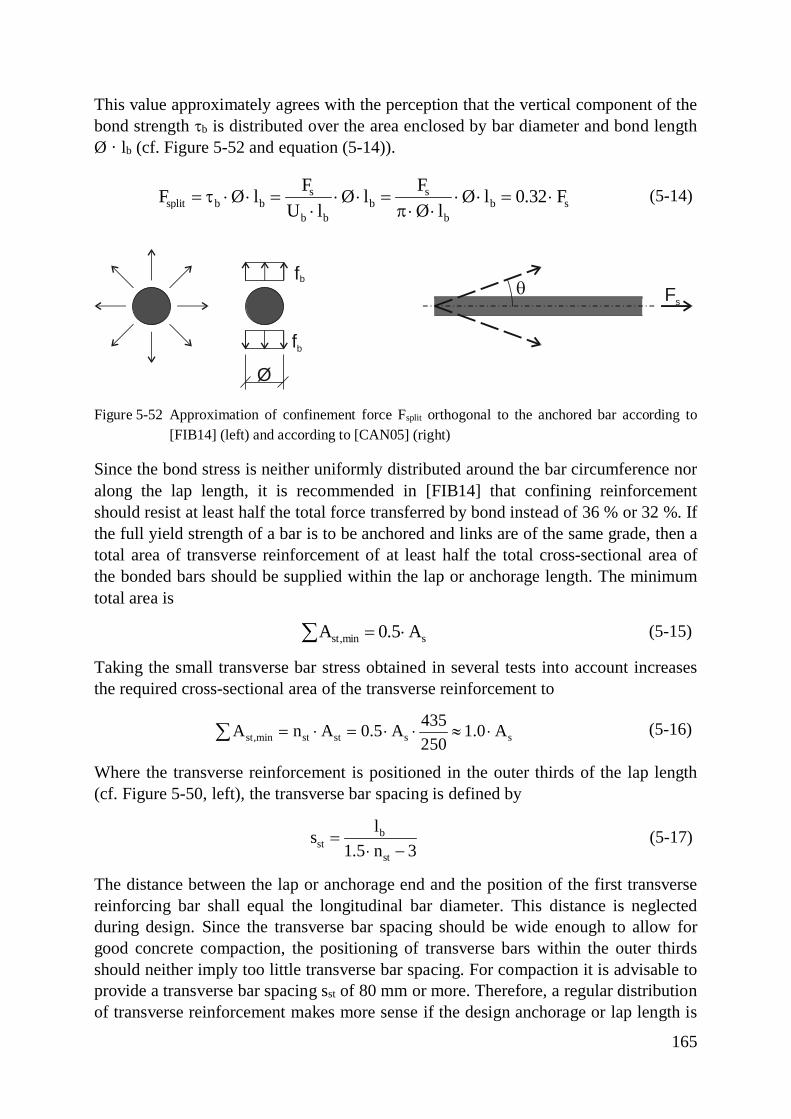
165
This value approximately agrees with the perception that the vertical component of thebond strength tb is distributed over the area enclosed by bar diameter and bond lengthØ · lb (cf. Figure 5-52 and equation (5-14)).
s ssplit b b b b s
b b b
F FF Ø l Ø l Ø l 0.32 FU l Ø l
= t × × = × × = × × = ×× p × ×
(5-14)
Figure 5-52 Approximation of confinement force Fsplit orthogonal to the anchored bar according to[FIB14] (left) and according to [CAN05] (right)
Since the bond stress is neither uniformly distributed around the bar circumference noralong the lap length, it is recommended in [FIB14] that confining reinforcementshould resist at least half the total force transferred by bond instead of 36 % or 32 %. Ifthe full yield strength of a bar is to be anchored and links are of the same grade, then atotal area of transverse reinforcement of at least half the total cross-sectional area ofthe bonded bars should be supplied within the lap or anchorage length. The minimumtotal area is
st,min sA 0.5 A= ×å (5-15)
Taking the small transverse bar stress obtained in several tests into account increasesthe required cross-sectional area of the transverse reinforcement to
st,min st st s s435A n A 0.5 A 1.0 A250
= × = × × » ×å (5-16)
Where the transverse reinforcement is positioned in the outer thirds of the lap length(cf. Figure 5-50, left), the transverse bar spacing is defined by
bst
st
ls1.5 n 3
=× -
(5-17)
The distance between the lap or anchorage end and the position of the first transversereinforcing bar shall equal the longitudinal bar diameter. This distance is neglectedduring design. Since the transverse bar spacing should be wide enough to allow forgood concrete compaction, the positioning of transverse bars within the outer thirdsshould neither imply too little transverse bar spacing. For compaction it is advisable toprovide a transverse bar spacing sst of 80 mm or more. Therefore, a regular distributionof transverse reinforcement makes more sense if the design anchorage or lap length is
fb
fb
Fsq
Ø
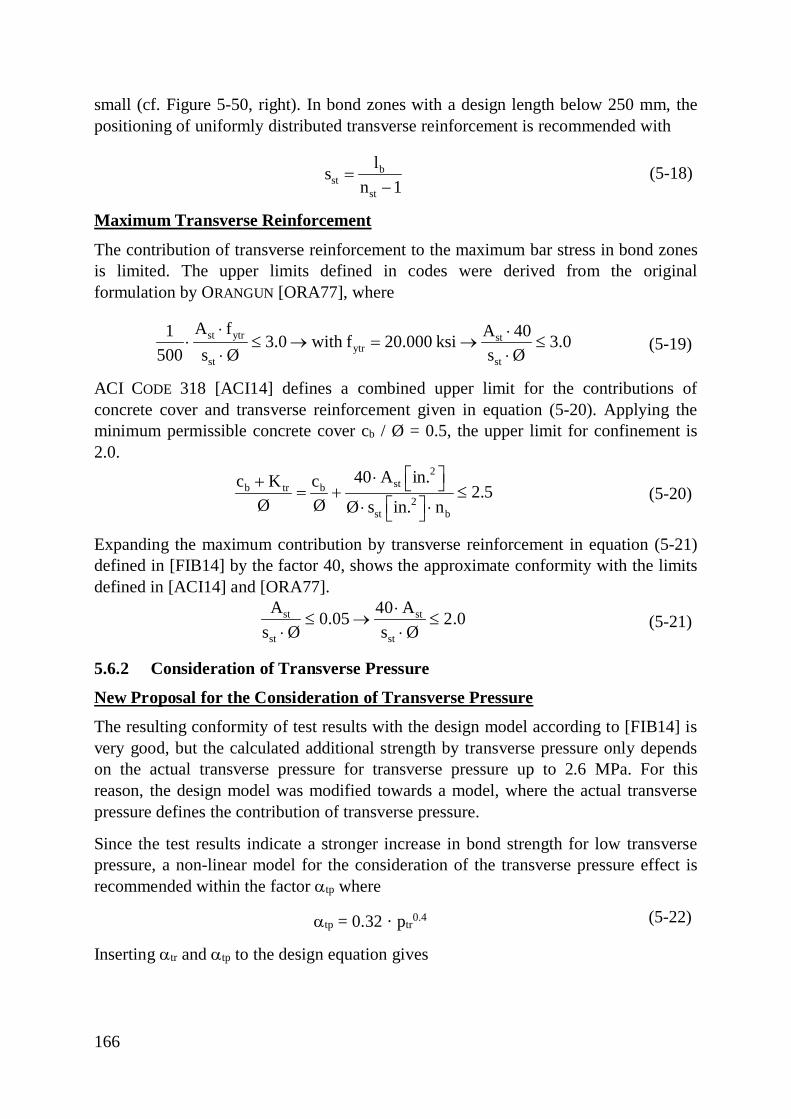
166
small (cf. Figure 5-50, right). In bond zones with a design length below 250 mm, thepositioning of uniformly distributed transverse reinforcement is recommended with
bst
st
lsn 1
=-
(5-18)
Maximum Transverse Reinforcement
The contribution of transverse reinforcement to the maximum bar stress in bond zonesis limited. The upper limits defined in codes were derived from the originalformulation by ORANGUN [ORA77], where
st ytr stytr
st st
A f A 401 3.0 with f 20.000 ksi 3.0500 s Ø s Ø
× ×× £ ® = ® £
× ×(5-19)
ACI CODE 318 [ACI14] defines a combined upper limit for the contributions ofconcrete cover and transverse reinforcement given in equation (5-20). Applying theminimum permissible concrete cover cb / Ø = 0.5, the upper limit for confinement is2.0.
2stb tr b
2st b
40 A in.c K c 2.5Ø Ø Ø s in. n
é ù×+ ë û= + £é ù× ×ë û
(5-20)
Expanding the maximum contribution by transverse reinforcement in equation (5-21)defined in [FIB14] by the factor 40, shows the approximate conformity with the limitsdefined in [ACI14] and [ORA77].
st st
st st
A 40 A0.05 2.0s Ø s Ø
×£ ® £
× × (5-21)
5.6.2 Consideration of Transverse Pressure
New Proposal for the Consideration of Transverse Pressure
The resulting conformity of test results with the design model according to [FIB14] isvery good, but the calculated additional strength by transverse pressure only dependson the actual transverse pressure for transverse pressure up to 2.6 MPa. For thisreason, the design model was modified towards a model, where the actual transversepressure defines the contribution of transverse pressure.
Since the test results indicate a stronger increase in bond strength for low transversepressure, a non-linear model for the consideration of the transverse pressure effect isrecommended within the factor atp where
atp = 0.32 · ptr0.4 (5-22)
Inserting atr and atp to the design equation gives
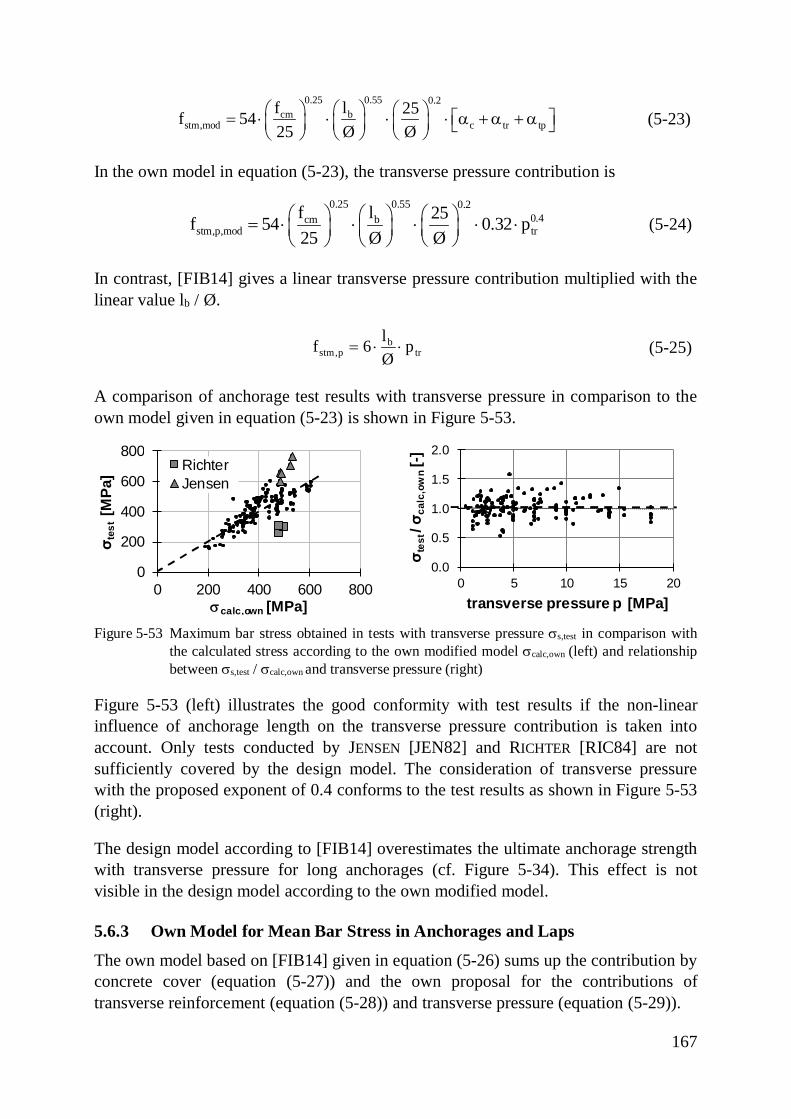
167
0.25 0.55 0.2cm b
stm,mod c tr tpf l 25f 5425 Ø Ø
æ ö æ ö æ ö é ù= × × × × a + a + aç ÷ç ÷ ç ÷ ë ûè øè ø è ø(5-23)
In the own model in equation (5-23), the transverse pressure contribution is
0.25 0.55 0.20.4cm b
stm,p,mod trf l 25f 54 0.32 p25 Ø Ø
æ ö æ ö æ ö= × × × × ×ç ÷ç ÷ ç ÷è øè ø è ø
(5-24)
In contrast, [FIB14] gives a linear transverse pressure contribution multiplied with thelinear value lb / Ø.
bstm,p tr
lf 6 pØ
= × × (5-25)
A comparison of anchorage test results with transverse pressure in comparison to theown model given in equation (5-23) is shown in Figure 5-53.
Figure 5-53 Maximum bar stress obtained in tests with transverse pressure ss,test in comparison withthe calculated stress according to the own modified model scalc,own (left) and relationshipbetween ss,test / scalc,own and transverse pressure (right)
Figure 5-53 (left) illustrates the good conformity with test results if the non-linearinfluence of anchorage length on the transverse pressure contribution is taken intoaccount. Only tests conducted by JENSEN [JEN82] and RICHTER [RIC84] are notsufficiently covered by the design model. The consideration of transverse pressurewith the proposed exponent of 0.4 conforms to the test results as shown in Figure 5-53(right).
The design model according to [FIB14] overestimates the ultimate anchorage strengthwith transverse pressure for long anchorages (cf. Figure 5-34). This effect is notvisible in the design model according to the own modified model.
5.6.3 Own Model for Mean Bar Stress in Anchorages and Laps
The own model based on [FIB14] given in equation (5-26) sums up the contribution byconcrete cover (equation (5-27)) and the own proposal for the contributions oftransverse reinforcement (equation (5-28)) and transverse pressure (equation (5-29)).
0
200
400
600
800
0 200 400 600 800
σ tes
t[M
Pa]
scalc,own [MPa]
RichterJensen
0.0
0.5
1.0
1.5
2.0
0 5 10 15 20
σ tes
t/ σ c
alc,
own
[-]
transverse pressure p [MPa]
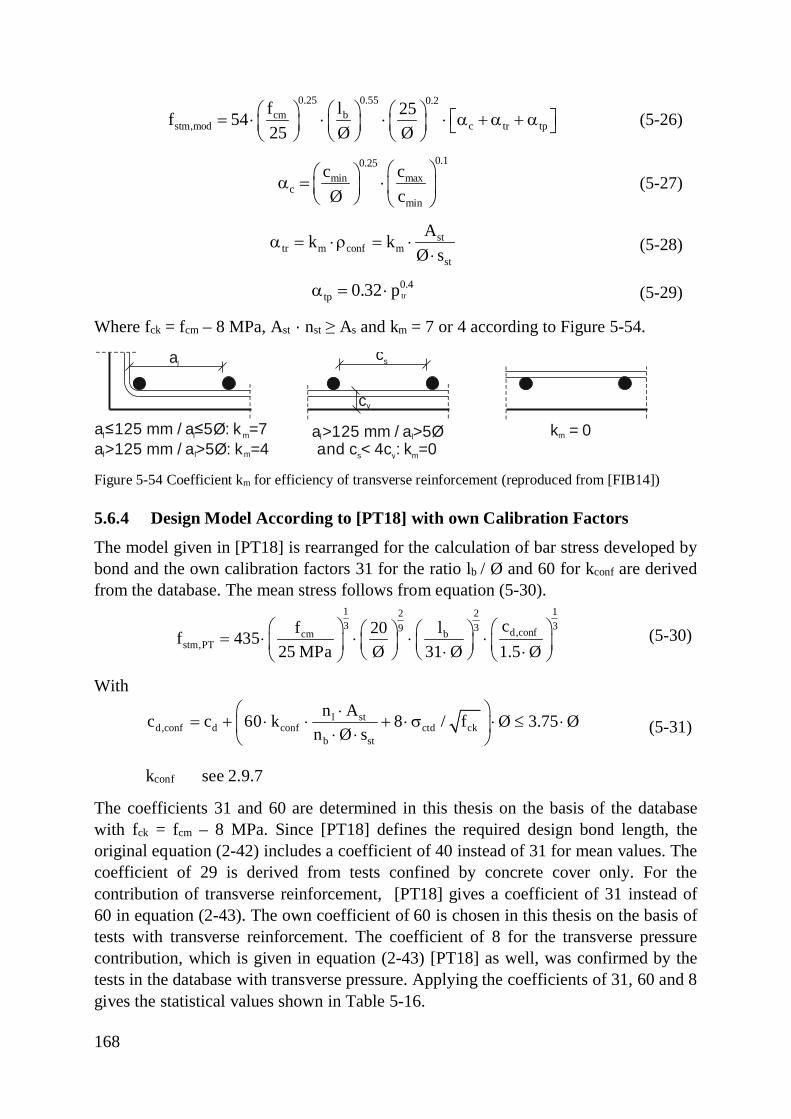
168
0.25 0.55 0.2cm b
stm,mod c tr tpf l 25f 5425 Ø Ø
æ ö æ ö æ ö é ù= × × × × a + a + aç ÷ç ÷ ç ÷ ë ûè øè ø è ø (5-26)
0.10.25maxmin
cmin
ccØ c
æ öæ öa = ×ç ÷ç ÷è ø è ø
(5-27)
sttr m conf m
st
Ak kØ s
a = ×r = ×× (5-28)
tr0.4
tp 0.32 pa = × (5-29)
Where fck = fcm – 8 MPa, Ast · nst ≥ As and km = 7 or 4 according to Figure 5-54.
Figure 5-54 Coefficient km for efficiency of transverse reinforcement (reproduced from [FIB14])
5.6.4 Design Model According to [PT18] with own Calibration Factors
The model given in [PT18] is rearranged for the calculation of bar stress developed bybond and the own calibration factors 31 for the ratio lb / Ø and 60 for kconf are derivedfrom the database. The mean stress follows from equation (5-30).
1 1223 339 d,confcm b
stm,PTcf l20f 435
25 MPa Ø 31 Ø 1.5 Øæ ö æ öæ öæ ö= × × × ×ç ÷ ç ÷ç ÷ ç ÷× ×è ø è ø è øè ø
(5-30)
With
l std,conf d conf ctd ck
b st
n Ac c 60 k 8 / f Ø 3.75 Øn Ø s
æ ö×= + × × + × s × £ ×ç ÷× ×è ø
(5-31)
kconf see 2.9.7
The coefficients 31 and 60 are determined in this thesis on the basis of the databasewith fck = fcm – 8 MPa. Since [PT18] defines the required design bond length, theoriginal equation (2-42) includes a coefficient of 40 instead of 31 for mean values. Thecoefficient of 29 is derived from tests confined by concrete cover only. For thecontribution of transverse reinforcement, [PT18] gives a coefficient of 31 instead of60 in equation (2-43). The own coefficient of 60 is chosen in this thesis on the basis oftests with transverse reinforcement. The coefficient of 8 for the transverse pressurecontribution, which is given in equation (2-43) [PT18] as well, was confirmed by thetests in the database with transverse pressure. Applying the coefficients of 31, 60 and 8gives the statistical values shown in Table 5-16.
a≤125 mm / a≤5Ø: k =7l l m
al
a>125 mm / a>5Ø: k =4l l m
cs
a>125 mm / a>5Øl l
and c < 4c : k =0s y m
k = 0m
cy
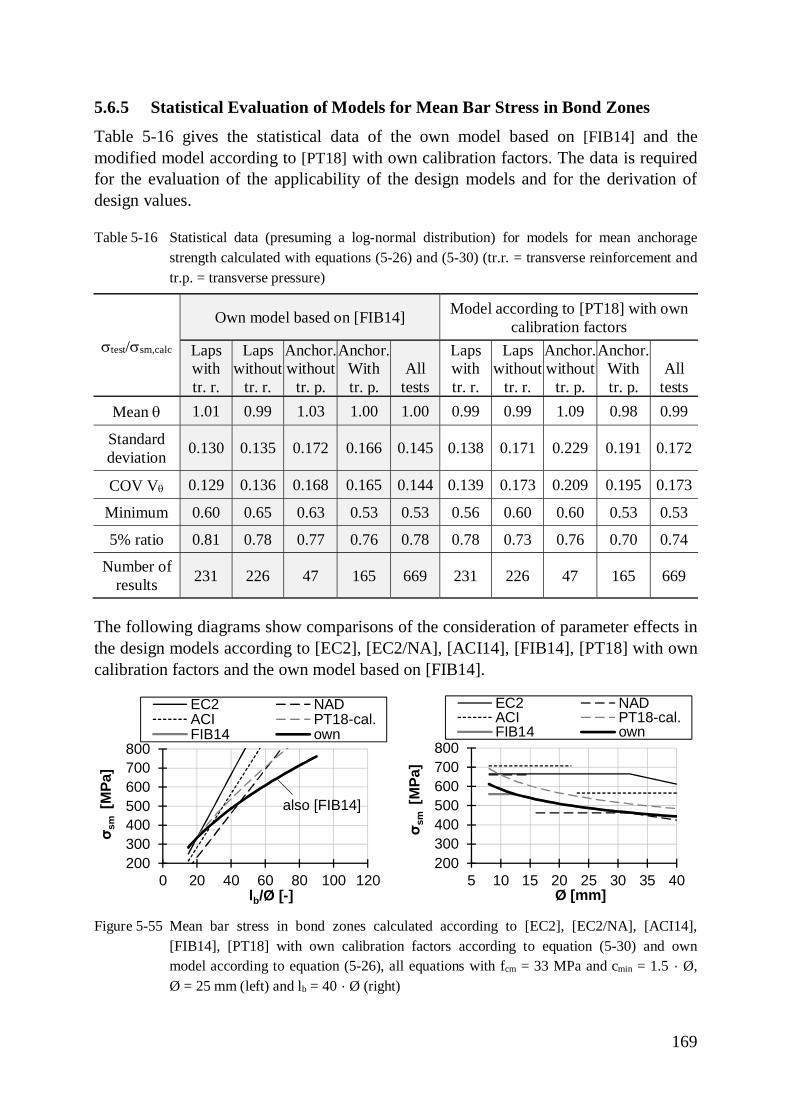
169
5.6.5 Statistical Evaluation of Models for Mean Bar Stress in Bond Zones
Table 5-16 gives the statistical data of the own model based on [FIB14] and themodified model according to [PT18] with own calibration factors. The data is requiredfor the evaluation of the applicability of the design models and for the derivation ofdesign values.
Table 5-16 Statistical data (presuming a log-normal distribution) for models for mean anchoragestrength calculated with equations (5-26) and (5-30) (tr.r. = transverse reinforcement andtr.p. = transverse pressure)
stest/ssm,calc
Own model based on [FIB14] Model according to [PT18] with owncalibration factors
Lapswithtr. r.
Lapswithout
tr. r.
Anchor.without
tr. p.
Anchor.Withtr. p.
Alltests
Lapswithtr. r.
Lapswithout
tr. r.
Anchor.without
tr. p.
Anchor.Withtr. p.
Alltests
Mean q 1.01 0.99 1.03 1.00 1.00 0.99 0.99 1.09 0.98 0.99
Standarddeviation 0.130 0.135 0.172 0.166 0.145 0.138 0.171 0.229 0.191 0.172
COV Vq 0.129 0.136 0.168 0.165 0.144 0.139 0.173 0.209 0.195 0.173
Minimum 0.60 0.65 0.63 0.53 0.53 0.56 0.60 0.60 0.53 0.53
5% ratio 0.81 0.78 0.77 0.76 0.78 0.78 0.73 0.76 0.70 0.74
Number ofresults 231 226 47 165 669 231 226 47 165 669
The following diagrams show comparisons of the consideration of parameter effects inthe design models according to [EC2], [EC2/NA], [ACI14], [FIB14], [PT18] with owncalibration factors and the own model based on [FIB14].
Figure 5-55 Mean bar stress in bond zones calculated according to [EC2], [EC2/NA], [ACI14],[FIB14], [PT18] with own calibration factors according to equation (5-30) and ownmodel according to equation (5-26), all equations with fcm = 33 MPa and cmin = 1.5 · Ø,Ø = 25 mm (left) and lb = 40 · Ø (right)
200300400500600700800
0 20 40 60 80 100 120
σ sm
[MPa
]
lb/Ø [-]
EC2 NADACI PT18-cal.FIB14 own
also [FIB14]
200300400500600700800
5 10 15 20 25 30 35 40
σ sm
[MPa
]
Ø [mm]
EC2 NADACI PT18-cal.FIB14 own
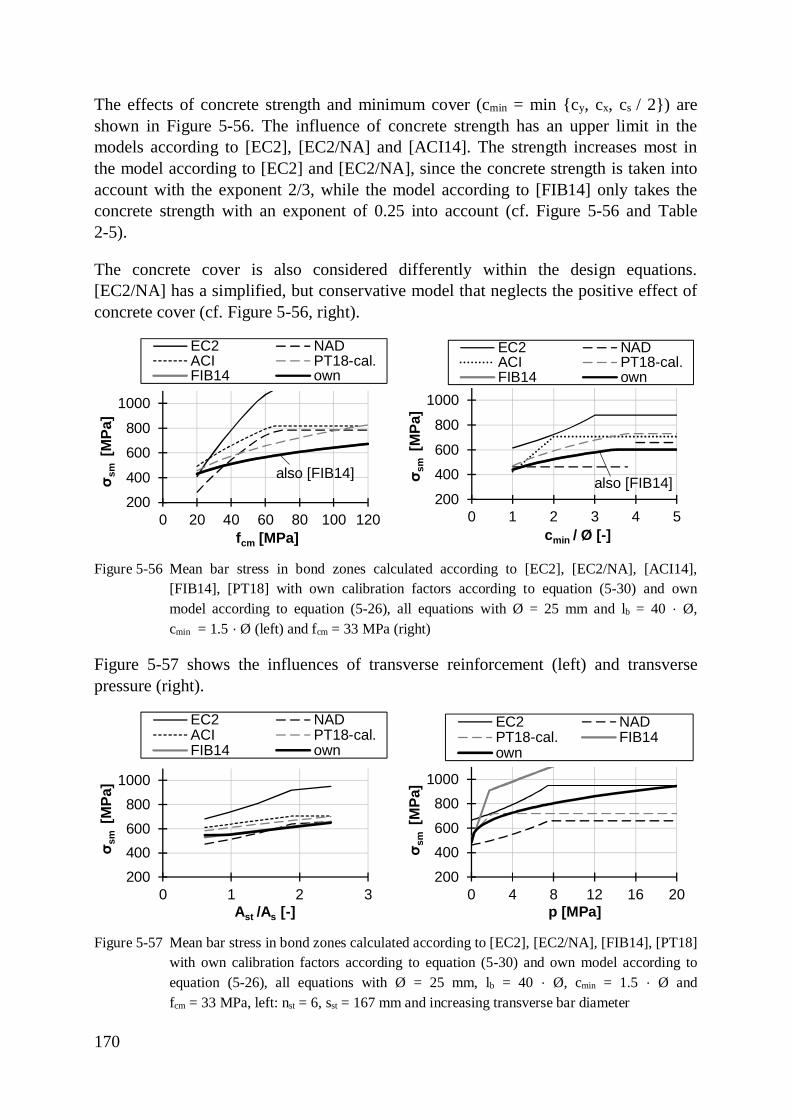
170
The effects of concrete strength and minimum cover (cmin = min {cy, cx, cs / 2}) areshown in Figure 5-56. The influence of concrete strength has an upper limit in themodels according to [EC2], [EC2/NA] and [ACI14]. The strength increases most inthe model according to [EC2] and [EC2/NA], since the concrete strength is taken intoaccount with the exponent 2/3, while the model according to [FIB14] only takes theconcrete strength with an exponent of 0.25 into account (cf. Figure 5-56 and Table2-5).
The concrete cover is also considered differently within the design equations.[EC2/NA] has a simplified, but conservative model that neglects the positive effect ofconcrete cover (cf. Figure 5-56, right).
Figure 5-56 Mean bar stress in bond zones calculated according to [EC2], [EC2/NA], [ACI14],[FIB14], [PT18] with own calibration factors according to equation (5-30) and ownmodel according to equation (5-26), all equations with Ø = 25 mm and lb = 40 · Ø,cmin = 1.5 · Ø (left) and fcm = 33 MPa (right)
Figure 5-57 shows the influences of transverse reinforcement (left) and transversepressure (right).
Figure 5-57 Mean bar stress in bond zones calculated according to [EC2], [EC2/NA], [FIB14], [PT18]with own calibration factors according to equation (5-30) and own model according toequation (5-26), all equations with Ø = 25 mm, lb = 40 · Ø, cmin = 1.5 · Ø andfcm = 33 MPa, left: nst = 6, sst = 167 mm and increasing transverse bar diameter
200400600800
1000
0 20 40 60 80 100 120
σ sm
[MPa
]
fcm [MPa]
EC2 NADACI PT18-cal.FIB14 own
also [FIB14]
200400600800
1000
0 1 2 3 4 5
σ sm
[MPa
]
cmin / Ø [-]
EC2 NADACI PT18-cal.FIB14 own
also [FIB14]
200400600800
1000
0 1 2 3
σ sm
[MPa
]
Ast /As [-]
EC2 NADACI PT18-cal.FIB14 own
200400600800
1000
0 4 8 12 16 20
σ sm
[MPa
]
p [MPa]
EC2 NADPT18-cal. FIB14own
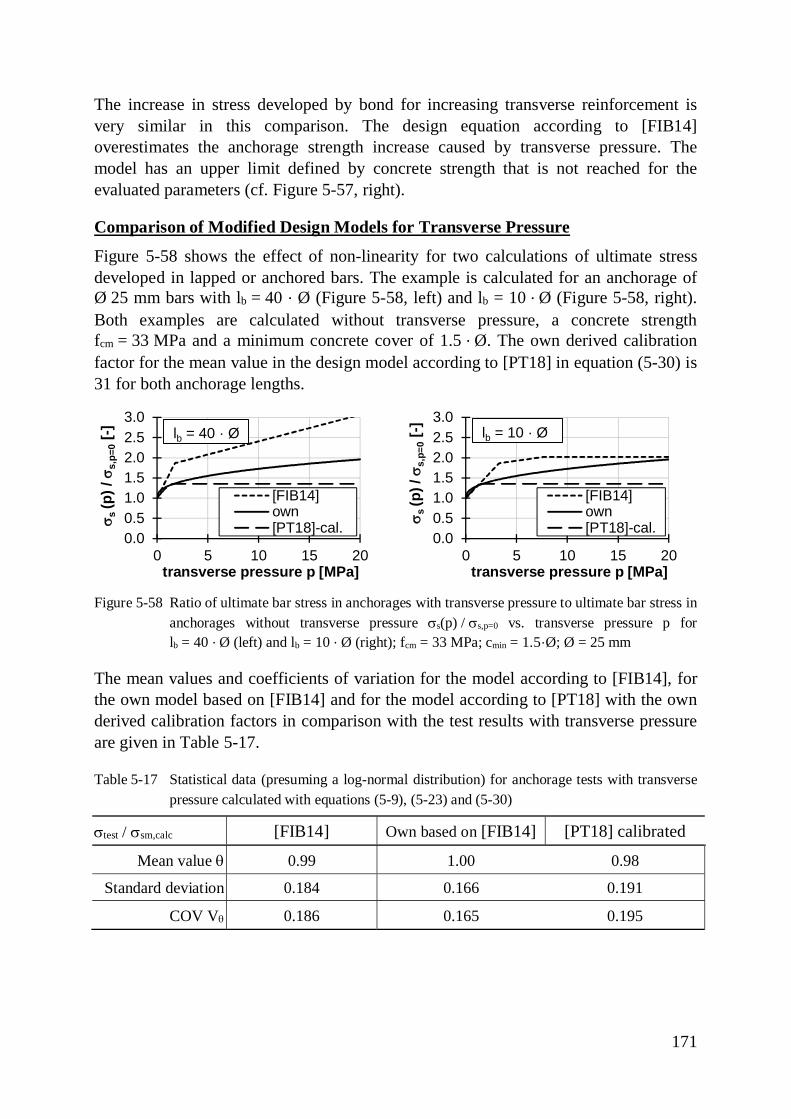
171
The increase in stress developed by bond for increasing transverse reinforcement isvery similar in this comparison. The design equation according to [FIB14]overestimates the anchorage strength increase caused by transverse pressure. Themodel has an upper limit defined by concrete strength that is not reached for theevaluated parameters (cf. Figure 5-57, right).
Comparison of Modified Design Models for Transverse Pressure
Figure 5-58 shows the effect of non-linearity for two calculations of ultimate stressdeveloped in lapped or anchored bars. The example is calculated for an anchorage ofØ 25 mm bars with lb = 40 · Ø (Figure 5-58, left) and lb = 10 · Ø (Figure 5-58, right).Both examples are calculated without transverse pressure, a concrete strengthfcm = 33 MPa and a minimum concrete cover of 1.5 · Ø. The own derived calibrationfactor for the mean value in the design model according to [PT18] in equation (5-30) is31 for both anchorage lengths.
Figure 5-58 Ratio of ultimate bar stress in anchorages with transverse pressure to ultimate bar stress inanchorages without transverse pressure ss(p) / ss,p=0 vs. transverse pressure p forlb = 40 · Ø (left) and lb = 10 · Ø (right); fcm = 33 MPa; cmin = 1.5·Ø; Ø = 25 mm
The mean values and coefficients of variation for the model according to [FIB14], forthe own model based on [FIB14] and for the model according to [PT18] with the ownderived calibration factors in comparison with the test results with transverse pressureare given in Table 5-17.
Table 5-17 Statistical data (presuming a log-normal distribution) for anchorage tests with transversepressure calculated with equations (5-9), (5-23) and (5-30)
stest / ssm,calc [FIB14] Own based on [FIB14] [PT18] calibrated
Mean value q 0.99 1.00 0.98
Standard deviation 0.184 0.166 0.191
COV Vq 0.186 0.165 0.195
0.00.51.01.52.02.53.0
0 5 10 15 20
s s(p
) /s s
,p=0
[-]
transverse pressure p [MPa]
[FIB14]own[PT18]-cal.
lb = 40 · Ø
0.00.51.01.52.02.53.0
0 5 10 15 20
s s(p
) /s s
,p=0
[-]
transverse pressure p [MPa]
[FIB14]own[PT18]-cal.
lb = 10 · Ø
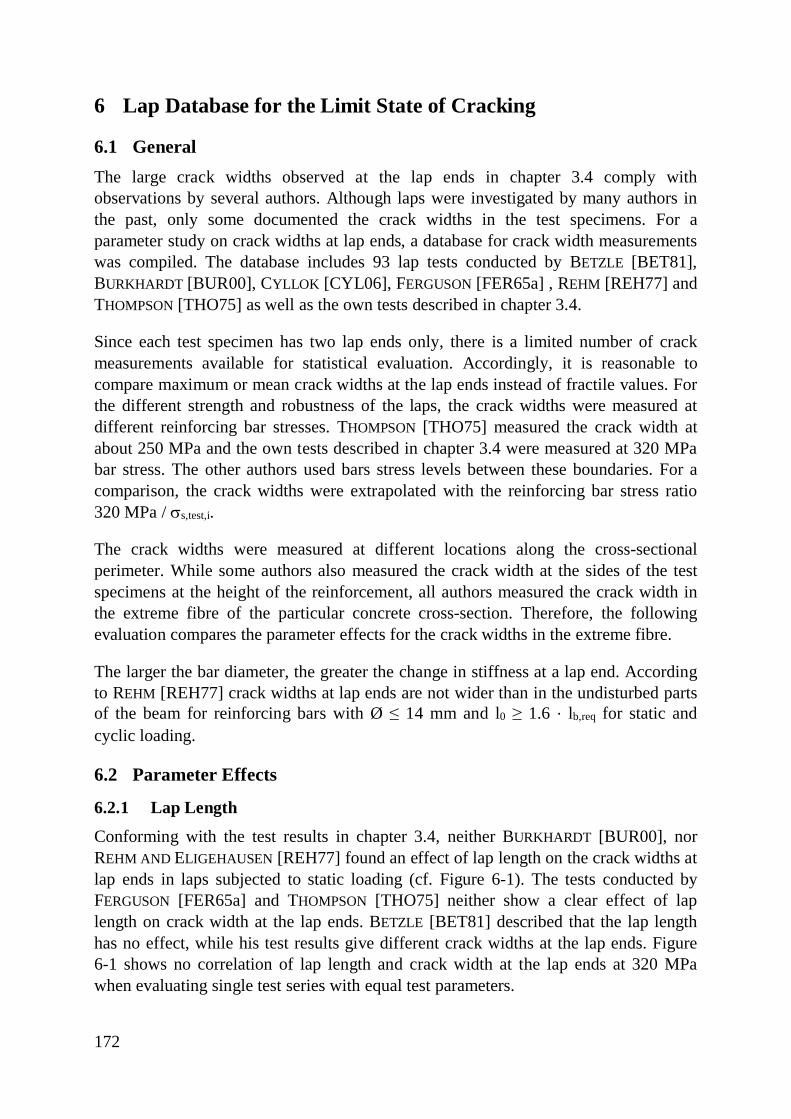
172
6 Lap Database for the Limit State of Cracking
6.1 GeneralThe large crack widths observed at the lap ends in chapter 3.4 comply withobservations by several authors. Although laps were investigated by many authors inthe past, only some documented the crack widths in the test specimens. For aparameter study on crack widths at lap ends, a database for crack width measurementswas compiled. The database includes 93 lap tests conducted by BETZLE [BET81],BURKHARDT [BUR00], CYLLOK [CYL06], FERGUSON [FER65a] , REHM [REH77] andTHOMPSON [THO75] as well as the own tests described in chapter 3.4.
Since each test specimen has two lap ends only, there is a limited number of crackmeasurements available for statistical evaluation. Accordingly, it is reasonable tocompare maximum or mean crack widths at the lap ends instead of fractile values. Forthe different strength and robustness of the laps, the crack widths were measured atdifferent reinforcing bar stresses. THOMPSON [THO75] measured the crack width atabout 250 MPa and the own tests described in chapter 3.4 were measured at 320 MPabar stress. The other authors used bars stress levels between these boundaries. For acomparison, the crack widths were extrapolated with the reinforcing bar stress ratio320 MPa / ss,test,i.
The crack widths were measured at different locations along the cross-sectionalperimeter. While some authors also measured the crack width at the sides of the testspecimens at the height of the reinforcement, all authors measured the crack width inthe extreme fibre of the particular concrete cross-section. Therefore, the followingevaluation compares the parameter effects for the crack widths in the extreme fibre.
The larger the bar diameter, the greater the change in stiffness at a lap end. Accordingto REHM [REH77] crack widths at lap ends are not wider than in the undisturbed partsof the beam for reinforcing bars with Ø ≤ 14 mm and l0 ≥ 1.6 · lb,req for static andcyclic loading.
6.2 Parameter Effects
6.2.1 Lap Length
Conforming with the test results in chapter 3.4, neither BURKHARDT [BUR00], norREHM AND ELIGEHAUSEN [REH77] found an effect of lap length on the crack widths atlap ends in laps subjected to static loading (cf. Figure 6-1). The tests conducted byFERGUSON [FER65a] and THOMPSON [THO75] neither show a clear effect of laplength on crack width at the lap ends. BETZLE [BET81] described that the lap lengthhas no effect, while his test results give different crack widths at the lap ends. Figure6-1 shows no correlation of lap length and crack width at the lap ends at 320 MPawhen evaluating single test series with equal test parameters.
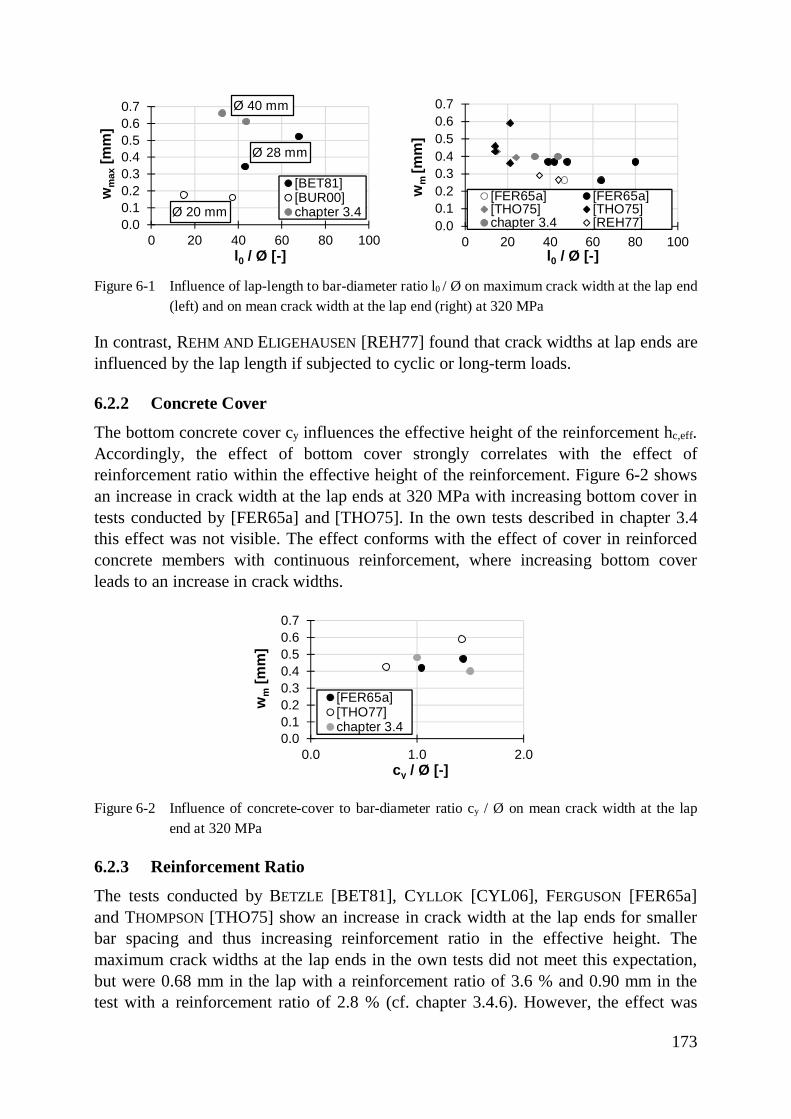
173
Figure 6-1 Influence of lap-length to bar-diameter ratio l0 / Ø on maximum crack width at the lap end(left) and on mean crack width at the lap end (right) at 320 MPa
In contrast, REHM AND ELIGEHAUSEN [REH77] found that crack widths at lap ends areinfluenced by the lap length if subjected to cyclic or long-term loads.
6.2.2 Concrete Cover
The bottom concrete cover cy influences the effective height of the reinforcement hc,eff.Accordingly, the effect of bottom cover strongly correlates with the effect ofreinforcement ratio within the effective height of the reinforcement. Figure 6-2 showsan increase in crack width at the lap ends at 320 MPa with increasing bottom cover intests conducted by [FER65a] and [THO75]. In the own tests described in chapter 3.4this effect was not visible. The effect conforms with the effect of cover in reinforcedconcrete members with continuous reinforcement, where increasing bottom coverleads to an increase in crack widths.
Figure 6-2 Influence of concrete-cover to bar-diameter ratio cy / Ø on mean crack width at the lapend at 320 MPa
6.2.3 Reinforcement Ratio
The tests conducted by BETZLE [BET81], CYLLOK [CYL06], FERGUSON [FER65a]and THOMPSON [THO75] show an increase in crack width at the lap ends for smallerbar spacing and thus increasing reinforcement ratio in the effective height. Themaximum crack widths at the lap ends in the own tests did not meet this expectation,but were 0.68 mm in the lap with a reinforcement ratio of 3.6 % and 0.90 mm in thetest with a reinforcement ratio of 2.8 % (cf. chapter 3.4.6). However, the effect was
0.00.10.20.30.40.50.60.7
0 20 40 60 80 100
wm
ax[m
m]
l0 / Ø [-]
[BET81][BUR00]chapter 3.4Ø 20 mm
Ø 28 mm
Ø 40 mm
0.00.10.20.30.40.50.60.7
0 20 40 60 80 100
wm
[mm
]
l0 / Ø [-]
[FER65a] [FER65a][THO75] [THO75]chapter 3.4 [REH77]
0.00.10.20.30.40.50.60.7
0.0 1.0 2.0
wm
[mm
]
cy / Ø [-]
[FER65a][THO77]chapter 3.4
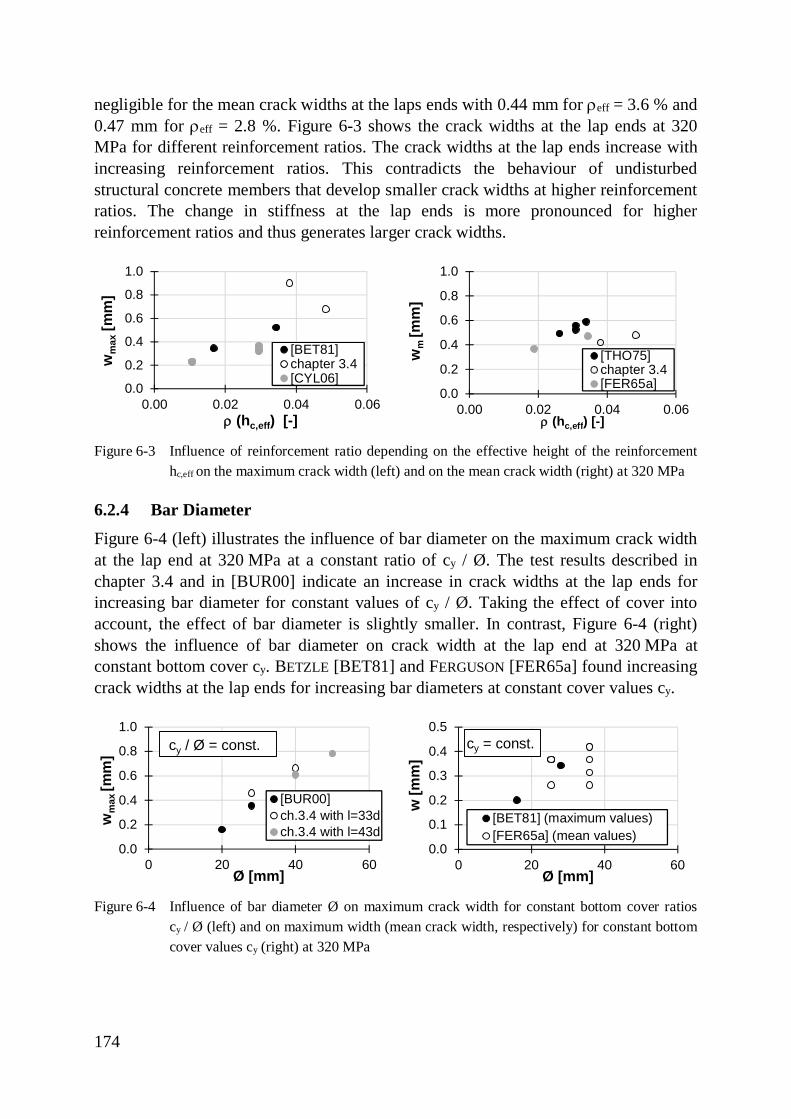
174
negligible for the mean crack widths at the laps ends with 0.44 mm for reff = 3.6 % and0.47 mm for reff = 2.8 %. Figure 6-3 shows the crack widths at the lap ends at 320MPa for different reinforcement ratios. The crack widths at the lap ends increase withincreasing reinforcement ratios. This contradicts the behaviour of undisturbedstructural concrete members that develop smaller crack widths at higher reinforcementratios. The change in stiffness at the lap ends is more pronounced for higherreinforcement ratios and thus generates larger crack widths.
Figure 6-3 Influence of reinforcement ratio depending on the effective height of the reinforcementhc,eff on the maximum crack width (left) and on the mean crack width (right) at 320 MPa
6.2.4 Bar Diameter
Figure 6-4 (left) illustrates the influence of bar diameter on the maximum crack widthat the lap end at 320 MPa at a constant ratio of cy / Ø. The test results described inchapter 3.4 and in [BUR00] indicate an increase in crack widths at the lap ends forincreasing bar diameter for constant values of cy / Ø. Taking the effect of cover intoaccount, the effect of bar diameter is slightly smaller. In contrast, Figure 6-4 (right)shows the influence of bar diameter on crack width at the lap end at 320 MPa atconstant bottom cover cy. BETZLE [BET81] and FERGUSON [FER65a] found increasingcrack widths at the lap ends for increasing bar diameters at constant cover values cy.
Figure 6-4 Influence of bar diameter Ø on maximum crack width for constant bottom cover ratioscy / Ø (left) and on maximum width (mean crack width, respectively) for constant bottomcover values cy (right) at 320 MPa
0.0
0.2
0.4
0.6
0.8
1.0
0.00 0.02 0.04 0.06
wm
ax[m
m]
r (hc,eff) [-]
[BET81]chapter 3.4[CYL06]
0.0
0.2
0.4
0.6
0.8
1.0
0.00 0.02 0.04 0.06w
m[m
m]
r (hc,eff) [-]
[THO75]chapter 3.4[FER65a]
0.0
0.2
0.4
0.6
0.8
1.0
0 20 40 60
wm
ax[m
m]
Ø [mm]
[BUR00]ch.3.4 with l=33dch.3.4 with l=43d
cy / Ø = const.
0.0
0.1
0.2
0.3
0.4
0.5
0 20 40 60
w [m
m]
Ø [mm]
[BET81] (maximum values)[FER65a] (mean values)
cy = const.
175
6.2.5 Transverse Reinforcement
FERGUSON [FER65a] and BURKHARDT [BUR00] did not observe an effect oftransverse reinforcement on the crack width at lap ends. This finding conforms to theown test results described in chapter 3.4.
6.2.6 Concrete Strength
The tests in REHM AND ELIGEHAUSEN [REH77] indicate an increase in crack width forsmaller concrete strength at constant lap length to bar diameter ratios l0 / Ø.
6.3 SummaryThe crack widths in structural members with continuous reinforcement are influencedby the reinforcement ratio in the effective height, the concrete cover, the bar diameterand the concrete strength. In undisturbed members with continuous reinforcement aswell as at lap ends, larger bottom concrete cover, larger bar diameters and smallerconcrete strength lead to increased crack widths. While increasing reinforcement ratioswithin the effective height reduce the crack width in undisturbed members, it increasesthe crack width at lap ends. Transverse reinforcement neither reduces the transversecrack width in continuously reinforced members nor at lap ends.
176
7 Design Values for Anchorage and Lap Lengths
7.1 Eurocode Reliability ManagementThe Eurocodes on structural design are based on a semi-probabilistic safety conceptdefined in EUROCODE 0 [EC0]. For higher consequence of failure, the probability offailure depending on action effects Ed and resistance Rd of a structure shall decrease.The probability of failure of a structure or member corresponds with the reliabilityindex b by
Pf = F(-b) (7-1)WithPf failure probability for a certain time periodF cumulative distribution function of the standardised normal distribution.
The relationship between failure probability Pf and reliability index b is given in Table7-1. The probability of failure implies that in one in 10i instances failure occurs.
Table 7-1 Relation between Pf and b
Pf 10-1 10-2 10-3 10-4 10-5 10-6 10-7
b 1.28 2.32 3.09 3.72 4.27 4.75 5.20
A certain reliability of structures can be achieved by preventative measures, design,quality management, efficient execution and inspection. [EC0] defines three levels ofreliability that apply to the structure as a whole or to its components. The complexityof design increases with the level applied. The classes are based on the assumedconsequences of failure and the exposure of the construction works to hazard. [EC0]differentiates between high, medium and low consequence regarding loss of humanlife as well as economic, social or environmental impact. The reliability classes areassociated with three consequence classes as shown in Table 7-2.
Table 7-2 Reliability classes according to [EC0] associated with consequence classes andrecommended minimum values for reliability index b
Reliability ClassDescription ofconsequence
Minimum values for reliability index b
1 year referenceperiod
50 years referenceperiod
RC3 High consequence 5.2 4.3
RC2 Medium consequence 4.7 3.8
RC1 Low consequence 4.2 3.3
The reliability index b included in the partial safety factors is distinguished for thelimit states, the reference period, the consequences of failure and the cost of safetymeasures. Table 7-3 gives the target reliability index b at different design situationsand reference periods for medium consequences of failure at reliability class RC2.
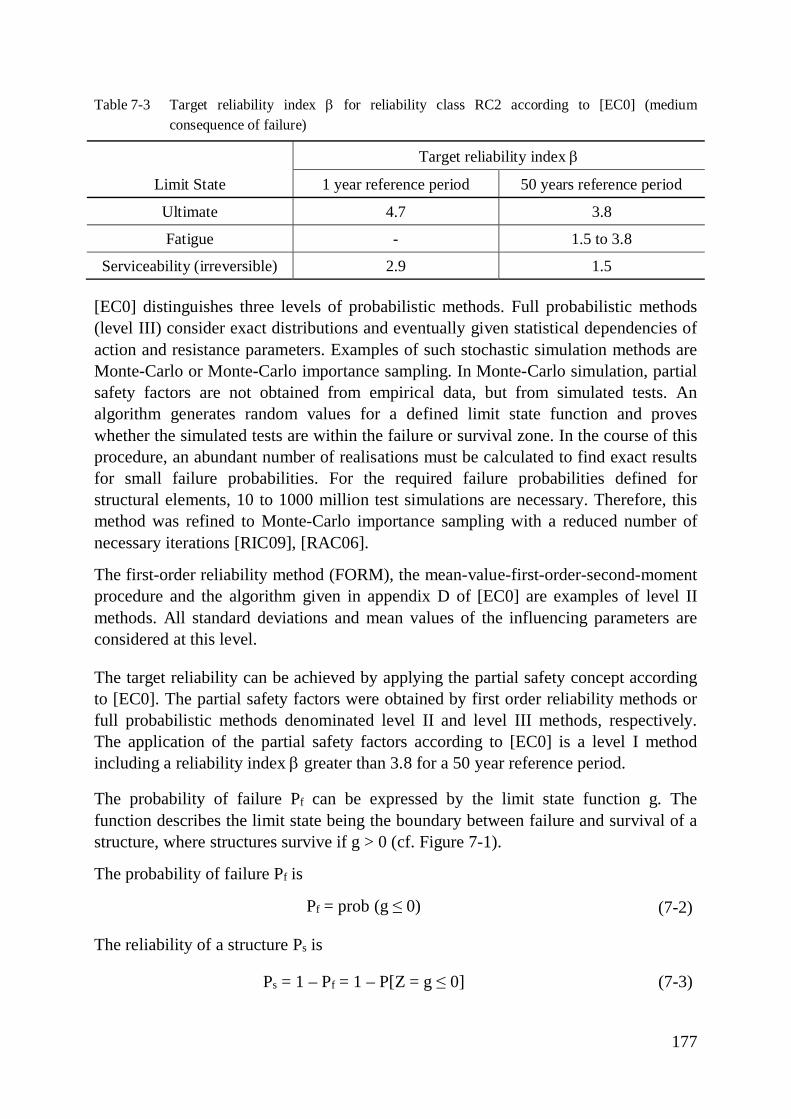
177
Table 7-3 Target reliability index b for reliability class RC2 according to [EC0] (mediumconsequence of failure)
Limit State
Target reliability index b
1 year reference period 50 years reference period
Ultimate 4.7 3.8
Fatigue - 1.5 to 3.8
Serviceability (irreversible) 2.9 1.5
[EC0] distinguishes three levels of probabilistic methods. Full probabilistic methods(level III) consider exact distributions and eventually given statistical dependencies ofaction and resistance parameters. Examples of such stochastic simulation methods areMonte-Carlo or Monte-Carlo importance sampling. In Monte-Carlo simulation, partialsafety factors are not obtained from empirical data, but from simulated tests. Analgorithm generates random values for a defined limit state function and proveswhether the simulated tests are within the failure or survival zone. In the course of thisprocedure, an abundant number of realisations must be calculated to find exact resultsfor small failure probabilities. For the required failure probabilities defined forstructural elements, 10 to 1000 million test simulations are necessary. Therefore, thismethod was refined to Monte-Carlo importance sampling with a reduced number ofnecessary iterations [RIC09], [RAC06].
The first-order reliability method (FORM), the mean-value-first-order-second-momentprocedure and the algorithm given in appendix D of [EC0] are examples of level IImethods. All standard deviations and mean values of the influencing parameters areconsidered at this level.
The target reliability can be achieved by applying the partial safety concept accordingto [EC0]. The partial safety factors were obtained by first order reliability methods orfull probabilistic methods denominated level II and level III methods, respectively.The application of the partial safety factors according to [EC0] is a level I methodincluding a reliability index b greater than 3.8 for a 50 year reference period.
The probability of failure Pf can be expressed by the limit state function g. Thefunction describes the limit state being the boundary between failure and survival of astructure, where structures survive if g > 0 (cf. Figure 7-1).
The probability of failure Pf is
Pf = prob (g ≤ 0) (7-2)
The reliability of a structure Ps is
Ps = 1 – Pf = 1 – P[Z = g ≤ 0] (7-3)
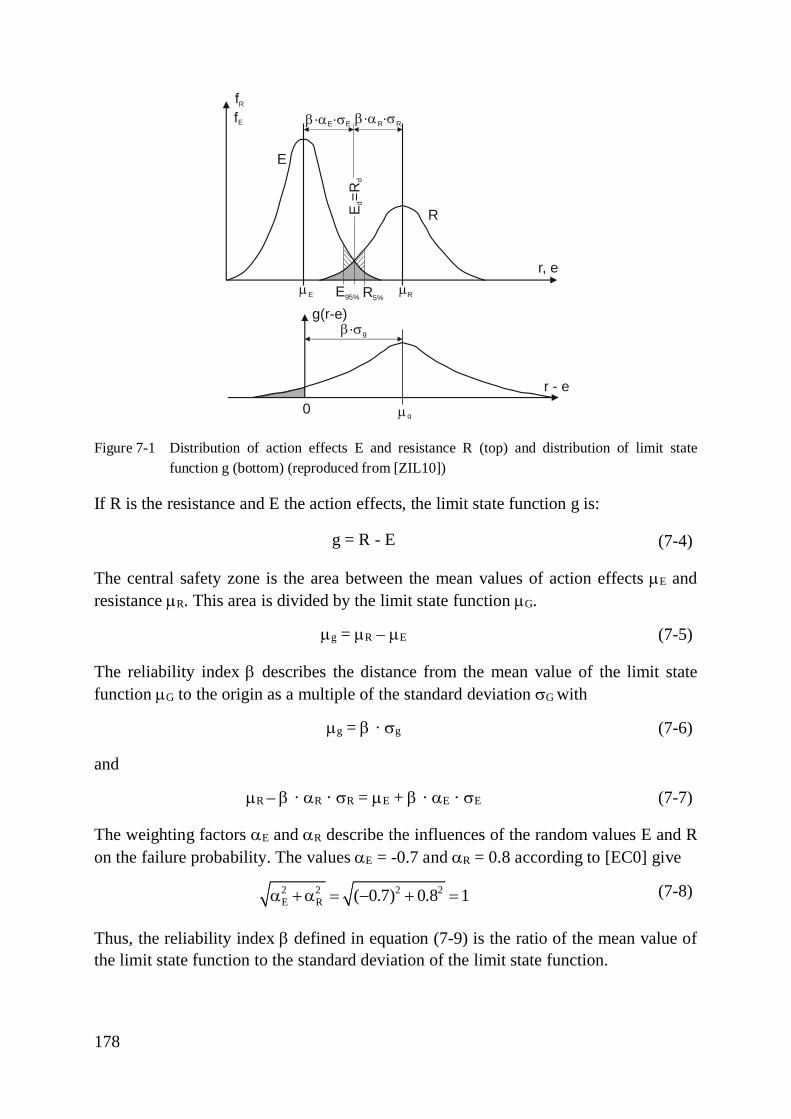
178
Figure 7-1 Distribution of action effects E and resistance R (top) and distribution of limit statefunction g (bottom) (reproduced from [ZIL10])
If R is the resistance and E the action effects, the limit state function g is:
g = R - E (7-4)
The central safety zone is the area between the mean values of action effects mE andresistance mR. This area is divided by the limit state function mG.
mg = mR – mE (7-5)
The reliability index b describes the distance from the mean value of the limit statefunction mG to the origin as a multiple of the standard deviation sG with
mg = b · sg (7-6)
and
mR – b · aR · sR = mE + b · aE · sE (7-7)
The weighting factors aE and aR describe the influences of the random values E and Ron the failure probability. The values aE = -0.7 and aR = 0.8 according to [EC0] give
2 2 2 2E R ( 0.7) 0.8 1a + a = - + = (7-8)
Thus, the reliability index b defined in equation (7-9) is the ratio of the mean value ofthe limit state function to the standard deviation of the limit state function.
b a s· ·E E b a s· ·R R
fR
fE
E
RE=R d
d
mE mR
r, e
b s· g
r - e
g(r-e)
mg0
E95% R5%
179
g R E R E2 2
g E E R RR E
m m - m m - mb = = =
s a × s + a × ss + s(7-9)
withsg2 = sR2 + sE2 (7-10)
Structures and structural elements conform to the [EC0] safety concept, where
Ed < Rd = R {Xd1, Xd2, …, ad1, ad2, …, qd1, qd2, …} (7-11)
withR resistance of the structureXdi material properties (stochastically independent random variables)adi geometrical propertiesqdi model uncertaintiesThe probability of finding a resistance R smaller than the design resistance Rd shall be:
P(R ≤ Rd) = F (- aR · b) = F (- 0.8 · b) (7-12)
7.2 General Derivation of Design Values
7.2.1 Characteristic ValuesDesign values can be obtained by deterministic methods based on empirical data or byprobabilistic methods. The following methods may be used to calculate designresistances from mean test results according to [EC0]. At an interim stage,characteristic values defined as 5% fractiles of empirical data must be calculated.
The p-quantile RP of a resistance R is
RP = mR – kR · sR = mR · (1 - kR · sR / mR) (7-13)
For a log-normal distribution, RP is
RP = exp (mR · (1 - kR · sR / mR)) (7-14)
The coefficient kR describes the statistical distribution, the level of confidence and thefractile value. Equation (7-15) gives 5%-fractiles for test numbers above 100.
R5% = mR – 1.645 · sR = mR · (1 – 1.645 · sR / mR) (7-15)
For the log-normal distribution, the 5%-fractile can be obtained from equation (7-16).
R5% = exp (mR · (1 – 1.645 · sR / mR)) (7-16)
180
7.2.2 Partial Safety Factors in Codes
Partial safety factors for structural resistance describe the ratio of characteristicresistance values to the design point of the limit state function g in Figure 7-1.Presuming a normal distribution, the partial safety factor for the resistance of concretein [EC2] is
( )( )
( )( )
R n R5%kR
d d R R R
1 k V 1 1.645 0.172RR 1.5R R 1 V 1 0.8 3.8 0.172
m × - × - ×g = = = = =
m × - a ×b × - × × (7-17)
with
VR coefficient of variation of resistance VR = sR / mR
The partial safety factor for resistance gR shall include the material uncertainties,geometric uncertainties and model uncertainties. According to [EC0], the factor gR
˗ denominated gM ˗ includes a safety factor gm for the uncertainty in material propertiesand a factor gRd for the model uncertainty in structural resistance. The factor gM isdefined as:
gM = gm ∙ gRd (7-18)
The resulting partial safety factor depends on the coefficient of variation (COV) of theresistance VR as shown in equation (7-17). Since most design models comprise severalinfluencing parameters with different statistical distributions, the coefficients ofvariation have to be summarised for the derivation of design values. [EC0] gives twopossibilities for the addition of coefficients of variation for product functions of theform
R = {X1 · X2 · …· Xi} ·q (7-19)
withXi basic variablesq model uncertainty
The general model for the consideration of multiple coefficients of variation is
( ) ( )2 2 2r XiV V 1 V 1 1q
é ù= + × P + -ë û (7-20)
For small values of Vq² and V xi ², Vr² may be simplified to
2 2 2r XiV V Vq= +å (7-21)
If the resistance function grt is a more complex function, the COV may be obtainedfrom
( ) å=
÷÷ø
öççè
æs×=
j
1i
2
ii
rt
m2rt
2rt dX
dgXg1V (7-22)
181
Most design models for structural concrete members comprise the concrete strengthfck. Hence, at least the coefficients of variation of the model uncertainty and of theconcrete strength must be combined.
The previous German code for structural concrete DIN 1045 [DEU88] applied globalsafety factors ggl for ductile and robust failure. For brittle failure, the safety factor forresistance was
50.14.11.2
F
glR ==
g
g=g (7-23)
withggl global safety factorgF safety factor for action effects
ACI 318 [ACI14] provides the necessary level of safety by coefficients applied to theloads and by strength reduction factors fACI applied to the nominal strength. Thecoefficients fACI account for the probability of understrength due to variations of in-place material strengths and dimensions, the effect of simplifying assumptions in thedesign equations, the degree of ductility, the potential failure mode of the member, therequired reliability, the significance of failure and the existence of alternative loadpaths for the member in the structure [ACI03], [DAR98].
7.2.3 Consideration of Model Uncertainties
During structural design, assumptions must be made on the structural systems, cross-sections, materials, joints, foundations and many more [SPA92]. The modeluncertainty describes the difference between design model and actual structuralresistance. This uncertainty results from stochastic effects not sufficiently captured bythe design model. It comprises the model uncertainty itself and uncertainties of the test(instrumentation, test-setup and undocumented tolerances of geometric values).
The model uncertainty is taken into account by introducing its COV for thedetermination of design values. The statistic values of the model uncertainty for theresistance model may be derived from a comparison of theoretical resistance toexperimental resistance obtained in tests as representative as possible. The mostaccurate consideration of model uncertainties is the introduction of one modeluncertainty per base variable, but often a global design-model uncertainty is added ormultiplied [SPA92].
Therefore, the design strength of structural elements accounts for the deviation ofmaterial strength and dimensions as well as for the model uncertainty. The modeluncertainty is either accounted for within the design model by a value q inequation (7-24) or by a partial safety factor gRd in equation (7-25). The partial safetyconcept according to [EC0] applies equation (7-25) without actually defining themodel uncertainty gRd. Only the product gM = gm · gRd is defined in [EC2].
182
Rd = R {h· Xk / gm; ad…,q} (7-24)
Rd = R {h· Xk / gm; ad…} / gRd (7-25)
withRd design strengthh conversion factorgm partial safety factor for uncertainty in material propertiesgRd partial safety factor for model uncertainty in structural resistancead design values of geometrical data
Appendix D of [EC0] provides a procedure to calculate the model uncertainties dusing the correction factor b described in chapter 7.2.5 (cf. Table 7-5). After a meanvalue correction of the limit state function, the standard deviation and coefficient ofcorrelation of the model uncertainty can be obtained. For the uncertainties of testing,[EC0] defines a COV of about 5%.
The PROBABILISTIC MODEL CODE [JOI00] recommends the assumption of log-normaldistributed model uncertainties for design equations. The mean value of the modeluncertainty is 1.0, while the COV shall be calculated or defined. [JOI00] gives partialsafety factors including model and material uncertainties for the design models forshear and bending, but not for bond strength.
7.2.4 Consideration of Material Uncertainties
The partial safety factor for material uncertainties gm comprises the uncertainty in theratio between the material in structures and the concrete samples tested. Sometimes, aspecific model uncertainty is not covered by a partial safety factor gRd, but is includedin the partial safety factor for material uncertainties. Additionally, the effect ofdeviations in cross-sectional dimensions is often covered by the material factor[SPA92].
The difference between characteristic concrete strength and mean concrete strength isconstantly 8 MPa according to [EC2]. This is equivalent to
ck cm cm fc fcf f 8 MPa f 1.645 8 MPa /1.645 4.86 MPa= - = - × s ® s = = (7-26)
The COV is therefore not constant, but decreases with increasing concrete class. Table7-4 shows examples of coefficients of variation Vfc for different concrete classes.
The COV of 0.172 that is given in equation (7-17) and corresponds to gR = 1.5approximately equals the COV for class C20/25 concrete VC20/25 = 0.174. Calculatingthe partial safety factor for C20/25 with Vfc = 0.174 gives a material uncertaintygm = 1.5 and a partial safety factor for model uncertainty gRd = 1.0. Thus, for C20/25,the entire COV is “consumed” by the concrete strength. In case higher concretestrength is applied, the coefficients of variation of the material decrease and the partial
183
safety factor gRd is greater than 1.0. For C30/37, a COV of Vfc = 0.128 gives a partialsafety factor for material uncertainty of gm = 1.30 and a partial safety factor for themodel uncertainty of gRd = 1.15. This means that a constant partial safety factor ofgM = 1.5 includes an increasing model uncertainty for increasing concrete strength,since the material uncertainty decreases.
Table 7-4 Mean values fcm, standard deviation sfc and coefficients of variation for concrete strength
fck fcm sfc Vfc
[MPa] [MPa] [MPa] [-]
C20/25 20 28 4.86 0.174
C25/30 25 33 4.86 0.147
C30/37 30 38 4.86 0.128
C40/50 40 48 4.86 0.101
7.2.5 Design Values According to Eurocode 0
Application of Partial Safety Factors
EUROCODE 0 [EC0] gives two models for the calculation of design values. The firstmodel (method A) requires a characteristic value divided by the partial safety factorfor material gm. In this case, the model uncertainty is incorporated by the COV of themodel Vx.
( ) ( )xxm
dxnx
m
d)n(k
m
dd V645.11Vk1XX ×-×m×
gh
=×-×m×gh
=gh
= (7-27)
Where hd is the design value of a conversion factor for volume and scale effects,effects of moisture and temperature and any other relevant parameter [EC0].
Alternatively, design values may be obtained directly by accounting for the reliabilityrequired with kd,n-factors (method B). The kd,n-factors given in [EC0] are based on theassumption that the design value corresponds to an index of reliability b = 3.8 withkd,n = aR · b = 0.8 · 3.8 = 3.04.
( ) ( )xxdxn,dxdoddd V8.38.01Vk1XX ××-×m×h=×-×m×h=×h= (7-28)
The equations for design values according to [EC0] use BAYESIAN procedures withvague prior distributions and lead to almost the same results as classical statistics withconfidence levels equal to 0.75.
[EC0] also gives a procedure for the calibration of resistance models and for thederivation of design values from tests (cf. Table 7-5). A resistance function rt
(statistical formulation) must be established for the design model grt (X). Theresistance function rt is a function of a number of independent variables Xi. All
184
relevant geometrical and material properties shall be measured. There must not be anycorrelation between the variables in the resistance function.
Table 7-5 Calculation of design values according to [EC0] and [LEO05]
1 Development of a design model for the theoretical resistance rt = grt (Xi)
2 Calculation of theoretical values rti for the design model
3 Estimation of the mean value correction factor b, which is the slope of the least-
squares best fit line ei ti2ti
r rbr
S ×=
S
Where rei are the experimental results
4 Statistical Evaluation of the error terms di that represent the model uncertainty
eii
ti
rb r
d =×
For the error terms a log-normal distribution is presumed. This means that thelogarithmised error terms Di = ln(di) are distributed normally with a mean value
å D=D=
n
1iin
1 and a variance ( )å D-D-
==
D
n
1i
2i
2
1n1s
The coefficient of variation of the error terms di follows from 1)sexp(V 2 -= Dd
(The statistical evaluation for the log-normal distribution is also described in chapter2.10 for the statistical evaluation of crack widths measurements in equations (2-79) to(2-81) with different notations. For the crack width measurements the slope of theleast-squares best fit line b was not taken into account)
5 Determination of the coefficients of variation Vxi of the basic variables, e.g. concretestrength, usually on the basis of prior knowledge
6 Coefficient of variation and standard deviation of the resistance functionWhere the values of Vd² and Vxi² are small:Vr² = Vd
2 + Vrt² = Vd² + SVxi²2rQ ln(V 1)= + (standard deviation)
7 Determination of the characteristic value rk of the resistance: If a large number of testsis available, the characteristic resistance rk may be obtained fromrk = b · grt(Xm) · exp (– kn · Q – 0.5 · Q²)For test numbers n > 100, kn = 1.645For the determination of the design value rd of the resistance, the fractile factor kn isreplaced by the design fractile factor kd,n
rd = b · grt(Xm) · exp (– kd,n · Q – 0.5 · Q²)For test numbers n > 100, kd,n = 3.04
The expressions for rk and rd are derived from the log-normally distributed resistancefunction rt where m and s are the mean value and the standard deviation of thelogarithmised values of rt [LEO05] with
185
ln rk = m – kn · s (7-29)
rk = exp (m – kn · s) = exp (m) / exp (kn · s) (7-30)
rm = exp (m + s²/2) = exp (m) · exp (s²/2) (7-31)
rk = rm / [exp (kn · s) · exp (s2/2)] = rm · exp (– kn · s – s²/2) (7-32)
Probabilistic Methods
Alternatively, level II or level III methods can be applied for the derivation of designvalues. Therefore, standard deviations and mean values of all influencing parametersmust be defined. The mean value and the standard deviation of the model uncertaintyare obtained by a comparison of the investigated design model with a test database.The statistical characteristics of material parameters shall correspond to acceptabletolerances defined in codes. Geometric parameters are either covered by the modeluncertainty or can be incorporated by tolerances [EC0].
7.3 Derivation of Design Values for Anchorages and Laps in LiteratureDesign values of bar stress in anchorages and laps as well as required anchorage andlap lengths were derived in [ELI79], [FIB14], [MAN17] and [DAR98]. Design valuesof structural resistance were obtained by division with partial safety factors in [ELI79],[FIB14]. In [MAN17] and [DAR98], the necessary coefficients for design equationswere obtained by comparing the required level of reliability with probabilisticmethods. The methods applied in [MAN17] give reliability indices b above 3.8 tofulfil the requirements of [EC0]. In contrast, DARWIN ET AL. [DAR98] calculate thedesign values for anchorages and laps according to [ACI14] with b = 3.5. Figure 7-2shows an overview of the applied methods for the derivation of design bar stress inanchorages and laps.
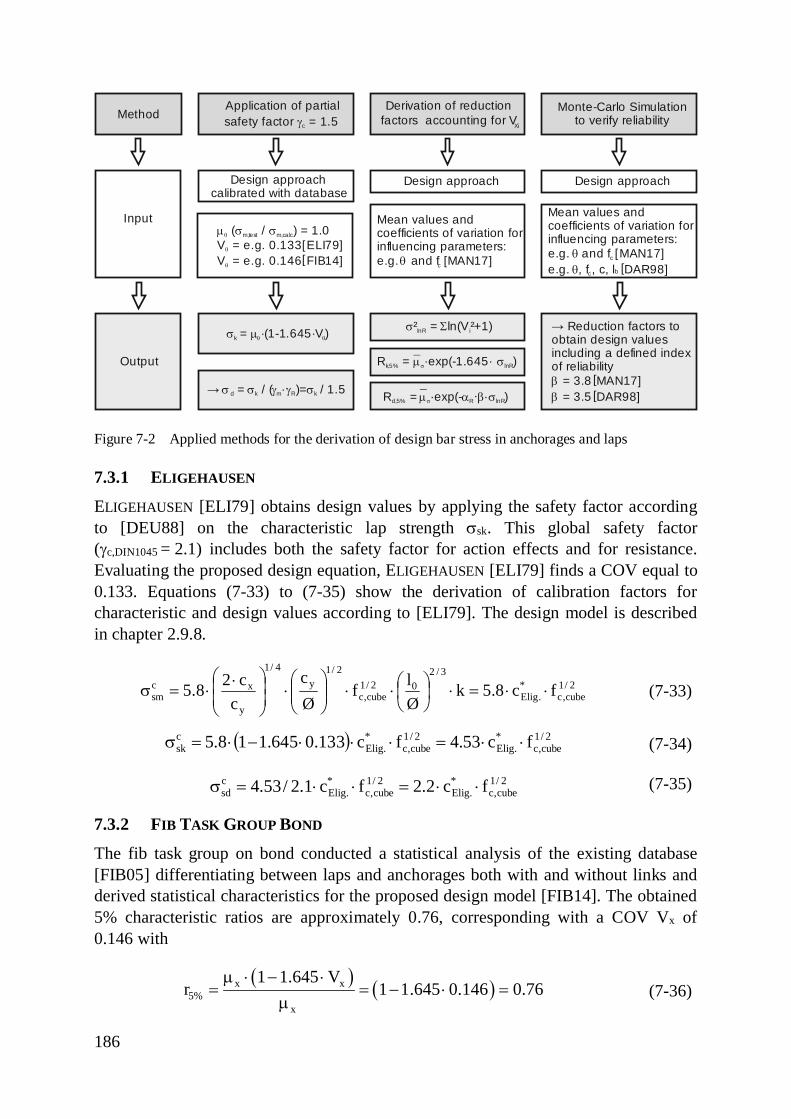
186
Figure 7-2 Applied methods for the derivation of design bar stress in anchorages and laps
7.3.1 ELIGEHAUSEN
ELIGEHAUSEN [ELI79] obtains design values by applying the safety factor accordingto [DEU88] on the characteristic lap strength ssk. This global safety factor(gc,DIN1045 = 2.1) includes both the safety factor for action effects and for resistance.Evaluating the proposed design equation, ELIGEHAUSEN [ELI79] finds a COV equal to0.133. Equations (7-33) to (7-35) show the derivation of calibration factors forcharacteristic and design values according to [ELI79]. The design model is describedin chapter 2.9.8.
2/1cube,c
*.Elig
3/202/1
cube,c
2/1y
4/1
y
xcsm fc8.5k
Ølf
Øc
cc28.5 ××=×÷
øö
çèæ××÷÷
ø
öççè
æ×÷
÷ø
öççè
æ ××=s (7-33)
( ) 2/1cube,c
*.Elig
2/1cube,c
*.Elig
csk fc53.4fc133.0645.118.5 ××=×××-×=s (7-34)
2/1cube,c
*.Elig
2/1cube,c
*.Elig
csd fc2.2fc1.2/53.4 ××=××=s (7-35)
7.3.2 FIB TASK GROUP BOND
The fib task group on bond conducted a statistical analysis of the existing database[FIB05] differentiating between laps and anchorages both with and without links andderived statistical characteristics for the proposed design model [FIB14]. The obtained5% characteristic ratios are approximately 0.76, corresponding with a COV Vx of0.146 with
( ) ( )x x5%
x
1 1.645 Vr 1 1.645 0.146 0.76
m × - ×= = - × =
m(7-36)
Application of partialsafety factor = 1.5gc
Design approachcalibrated with database
Derivation of reductionfactors accounting for V
Monte-Carlo Simulationto verify reliability
= ·(1-1.645·V )sk mq q
= / ( · )=→ / 1.5 s d k m R ks g g s
Mean values andcoefficients of variation forinfluencing parameters:e.g. and f 17]q MANe.g. , f , c, l 98]q c DAR
→ Reduction factors toobtain design valuesincluding a defined indexof reliability
= 3.8 17]b MAN = 3.5 98]b DAR
Method
Input
Output
( / ) = 1.0m s sq m,test m,calc
V = e.g. 0.133 79]q ELIV = e.g. 0.146 14]q FIB
Design approach
Mean values andcoefficients of variation forinfluencing parameters:e.g. and f 17]q MAN
Design approach
² = ln(V ²+1)s lnR iS
= ·exp(-1.645· )Rk,5% lnRms s
= ·exp(- ∙ · )Rd,5% R lnRms a b s
Xi
c
bc
[[ [ [
[
[[
187
The coefficient used in equation (2-26) for the mean anchored and lapped bar stress isconsequently changed from 54 to 54 · 0.76 = 41.
0.10.25 0.55 0.250.2cm 0 maxmin
stm m tr ymmin
f l cc25f 54 k K f25 Ø Ø Ø c
é ùæ öæ ö æ ö æ öæ ö= × × × × × + × £ê úç ÷ ç ÷ç ÷ç ÷ ç ÷è ø è øè ø è ø ê úè øë û
(2-26)
0.10.25 0.55 0.250.2cm 0 maxmin
stk m tr ykmin
f l cc25f 41 k K f25 Ø Ø Ø c
é ùæ öæ ö æ ö æ öæ ö= × × × × × + × £ê úç ÷ ç ÷ç ÷ç ÷ ç ÷è ø è øè ø è ø ê úè øë û
(7-37)
The task group verifies the derived coefficient by a detailed statistical analysis, wherea target probability of failure pf not exceeding 10-6 is chosen for a brittle concretesplitting mode. This probability of failure implies that in all but one in 106 instances,the reinforcement would reach yield before a bond failure occurs. The statisticalanalysis accounts for the independent statistical distribution of the parameters withinthe expression and of the yield strength of the reinforcement. The coefficient obtainedby the simpler model is confirmed by the detailed statistical analysis [FIB14].
The task group derives the bond strength for MODEL CODE 2010 [MC2010] fromrearranging equation (7-37) for fst = 500 MPa / 1.15 with
0.451.82 0.36b,k cl f500 / 1.15 25Ø 41 25 Ø
- -æ öæ ö æ ö= × ×ç ÷ ç ÷ç ÷
è ø è øè ø (7-38)
The corresponding characteristic bond strength is
0.45 0.36yd c
bk,0b,k
f Ø f 25f 1.54 l 25 Ø
× æ ö æ ö= = × × ç ÷ç ÷× è øè ø(7-39)
For the definition of minimum confining reinforcement and rounded exponents, thecoeffiecient of the characteristic bond strength is increased from 1.5 to 1.75 inequation (7-40).
( )32
3.05.0c
bk Ø25
25f75.1f a+a×÷
øö
çèæ×÷
øö
çèæ×= (7-40)
The design bond strength is derived by division with the partial safety factor forconcrete resistance gc = 1.5.
( ) 5.1/Ø25
25f75.1f 32
3.05.0c
bd a+a×÷øö
çèæ×÷
øö
çèæ×= (7-41)
The method applied in equations (7-38) to (7-41) for the derivation of design valuesfor [MC2010] implies that the partial safety factor g = 1.5 is applied to the bond lengthand not to the bar stress. Concurrently, the design model in [MC2010] becomes
188
conservative by introducing the bond strength neglecting the exponential decrease inrequired lap length with decreasing bar stress.
According to [MC2010], the partial safety factor gM = gm · gRd is a partial safety factorfor material properties also accounting for the model uncertainties and dimensionalvariations. For concrete, the partial safety factor gM (also denominated gC) covers thedeviations of structural dimensions not considered as basic variables and includes aconversion factor for the ratio of the strength obtained in test specimens to the strengthin the actual structure. The value of gC should be increased if the geometricaltolerances defined in [MC2010] are not fulfilled.
Furthermore, in [FIB14] the following acceptance criteria for the suitability ofequation (2-26) are defined:
- The 5% characteristic value should not lie below 1.0- The number of results with a ratio of measured to estimated strength below 1.0
should not exceed 5%- No individual ratio of measured to estimated strength should fall below 2/3, as
lower values are not covered by the safety factor of 1.5
7.3.3 MANCINI ET AL.
MANCINI ET AL. [MAN17] evaluate the original fib database [FIB05] and derivecharacteristic and design values for the design model according to [FIB14]. Forconcrete strength and model uncertainty, log-normal distributions are verified[MAN17]. A COV of 0.15 for concrete strength and a mean concrete strength fcm areapplied. The evaluation distinguishes between new and existing structures. Thevariation in concrete strength and concrete cover is broader for existing structures,therefore, the coefficients of variation are slightly higher. For the model uncertainty ofnew structures, a COV Vq = 0.126 and a mean value q = 0.98 are used. The lap andanchorage resistance according to [FIB14] given in equation (2-26) is summarised to
R(q, f) = q · fcm0.25 · A (7-42)
Where
q model uncertainty with st,test
stm,calc
ff
q =
A coefficient including all influencing parameters except the concrete strength fcm
MANCINI ET AL. [MAN17] choose a constant value of 0.15 for the COV of concretestrength independent from the concrete class. This assumption is contrary to [EC2],which defines a constant standard deviation of 4.86 MPa and a COV depending on theconcrete strength Vfc = 4.86 MPa / fcm. The statistical characteristics defined in[MAN17] are summarised in Table 7-6.
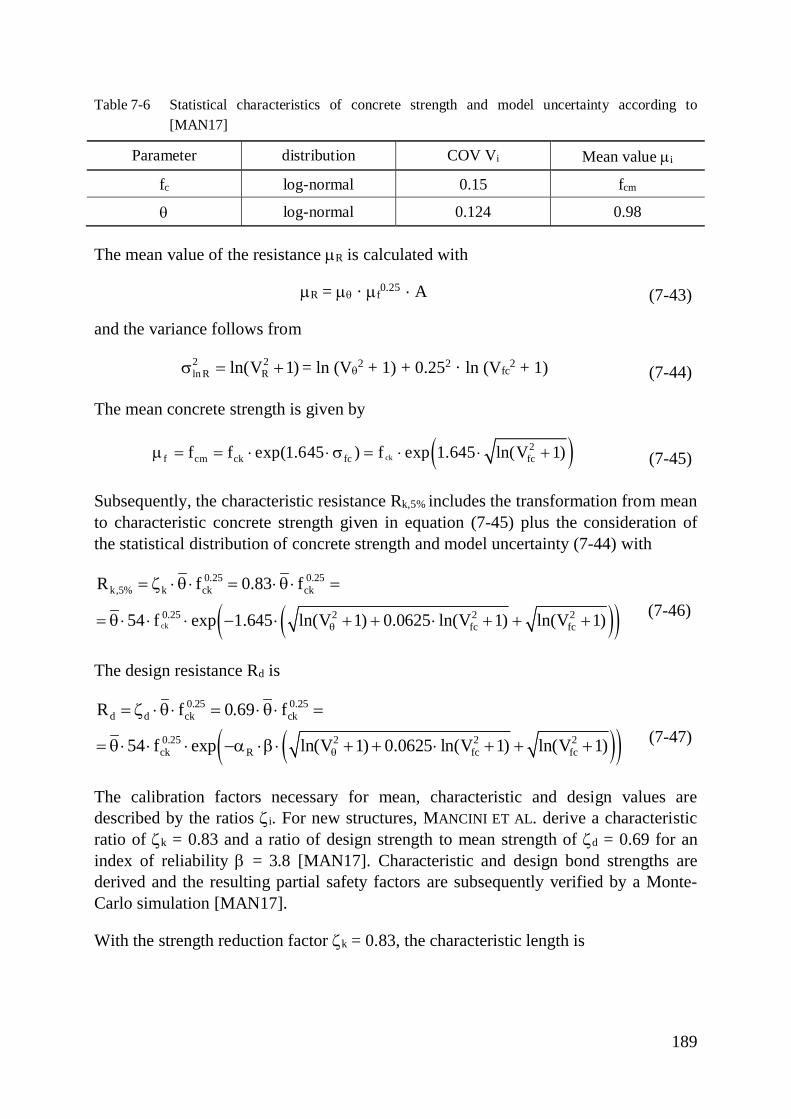
189
Table 7-6 Statistical characteristics of concrete strength and model uncertainty according to[MAN17]
Parameter distribution COV Vi Mean value mi
fc log-normal 0.15 fcm
q log-normal 0.124 0.98
The mean value of the resistance mR is calculated with
mR = mq · mf0.25 · A (7-43)
and the variance follows from
)1Vln( 2R
2Rln +=s = ln (Vq
2 + 1) + 0.252 · ln (Vfc2 + 1) (7-44)
The mean concrete strength is given by
( )ck2
f cm ck fc fcf f exp(1.645 ) f exp 1.645 ln(V 1)m = = × × s = × × + (7-45)
Subsequently, the characteristic resistance Rk,5% includes the transformation from meanto characteristic concrete strength given in equation (7-45) plus the consideration ofthe statistical distribution of concrete strength and model uncertainty (7-44) with
( )( )ck
0.25 0.25k,5% k ck ck
0.25 2 2 2fc fc
R f 0.83 f
54 f exp 1.645 ln(V 1) 0.0625 ln(V 1) ln(V 1)q
= z × q × = × q × =
= q × × × - × + + × + + + (7-46)
The design resistance Rd is
( )( )0.25 0.25
d d ck ck
0.25 2 2 2ck R fc fc
R f 0.69 f
54 f exp ln(V 1) 0.0625 ln(V 1) ln(V 1)q
= z × q × = × q× =
= q× × × -a ×b × + + × + + + (7-47)
The calibration factors necessary for mean, characteristic and design values aredescribed by the ratios zi. For new structures, MANCINI ET AL. derive a characteristicratio of zk = 0.83 and a ratio of design strength to mean strength of zd = 0.69 for anindex of reliability b = 3.8 [MAN17]. Characteristic and design bond strengths arederived and the resulting partial safety factors are subsequently verified by a Monte-Carlo simulation [MAN17].
With the strength reduction factor zk = 0.83, the characteristic length is
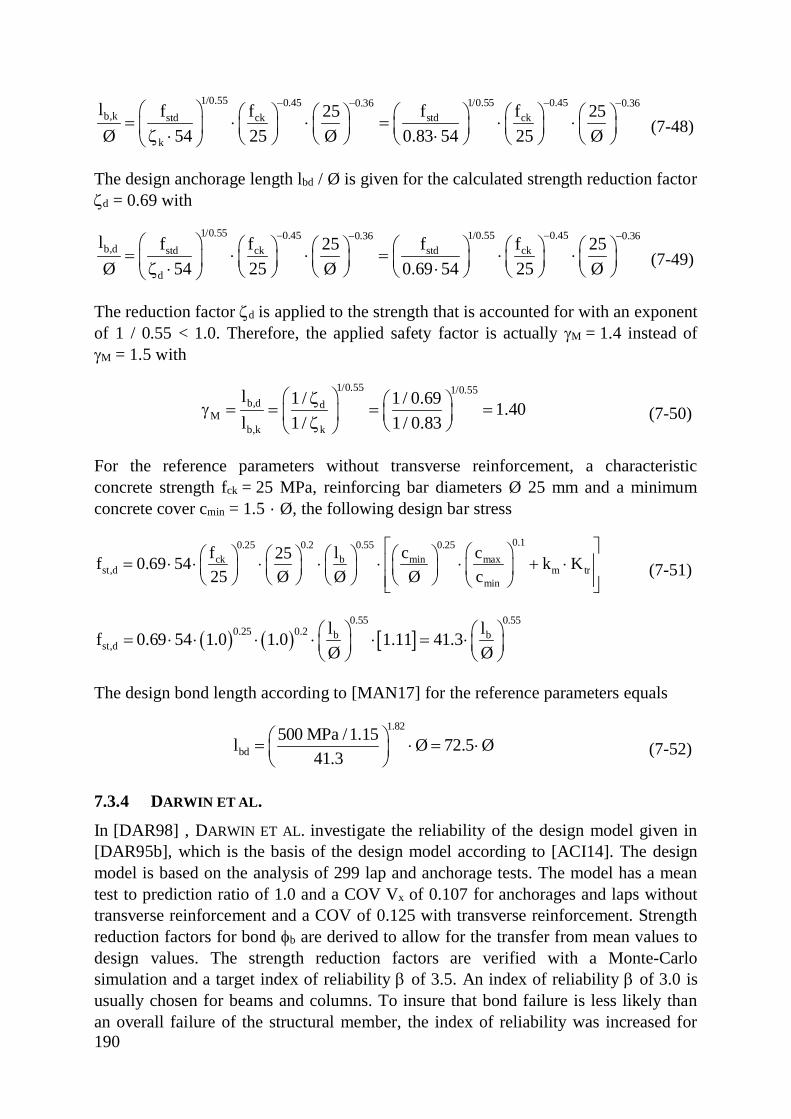
190
1/0.55 0.45 1/0.55 0.450.36 0.36b,k std ck std ck
k
l f f f f25 25Ø 54 25 Ø 0.83 54 25 Ø
- -- -æ ö æ ö æ ö æ öæ ö æ ö= × × = × ×ç ÷ ç ÷ç ÷ ç ÷ ç ÷ ç ÷z × ×è ø è øè ø è ø è øè ø(7-48)
The design anchorage length lbd / Ø is given for the calculated strength reduction factorzd = 0.69 with
1/0.55 0.45 1/0.55 0.450.36 0.36b,d std ck std ck
d
l f f f f25 25Ø 54 25 Ø 0.69 54 25 Ø
- -- -æ ö æ ö æ ö æ öæ ö æ ö= × × = × ×ç ÷ ç ÷ ç ÷ç ÷ ç ÷ ç ÷z × ×è ø è øè ø è ø è øè ø(7-49)
The reduction factor zd is applied to the strength that is accounted for with an exponentof 1 / 0.55 < 1.0. Therefore, the applied safety factor is actually gM = 1.4 instead ofgM = 1.5 with
1/0.55 1/0.55b,d d
Mb,k k
l 1 / 1 / 0.69 1.40l 1 / 1 / 0.83
æ öz æ ög = = = =ç ÷ç ÷z è øè ø(7-50)
For the reference parameters without transverse reinforcement, a characteristicconcrete strength fck = 25 MPa, reinforcing bar diameters Ø 25 mm and a minimumconcrete cover cmin = 1.5 · Ø, the following design bar stress
0.10.25 0.55 0.250.2ck b maxmin
st,d m trmin
f l cc25f 0.69 54 k K25 Ø Ø Ø c
é ùæ öæ ö æ ö æ öæ ö= × × × × × × + ×ê úç ÷ ç ÷ç ÷ç ÷ ç ÷è ø è øè ø è ø ê úè øë û
(7-51)
( ) ( ) [ ]0.55 0.55
0.25 0.2 b bst,d
l lf 0.69 54 1.0 1.0 1.11 41.3Ø Ø
æ ö æ ö= × × × × × = ×ç ÷ ç ÷è ø è ø
The design bond length according to [MAN17] for the reference parameters equals
1.82
bd500 MPa /1.15l Ø 72.5 Ø
41.3æ ö= × = ×ç ÷è ø
(7-52)
7.3.4 DARWIN ET AL.
In [DAR98] , DARWIN ET AL. investigate the reliability of the design model given in[DAR95b], which is the basis of the design model according to [ACI14]. The designmodel is based on the analysis of 299 lap and anchorage tests. The model has a meantest to prediction ratio of 1.0 and a COV Vx of 0.107 for anchorages and laps withouttransverse reinforcement and a COV of 0.125 with transverse reinforcement. Strengthreduction factors for bond fb are derived to allow for the transfer from mean values todesign values. The strength reduction factors are verified with a Monte-Carlosimulation and a target index of reliability b of 3.5. An index of reliability b of 3.0 isusually chosen for beams and columns. To insure that bond failure is less likely thanan overall failure of the structural member, the index of reliability was increased for
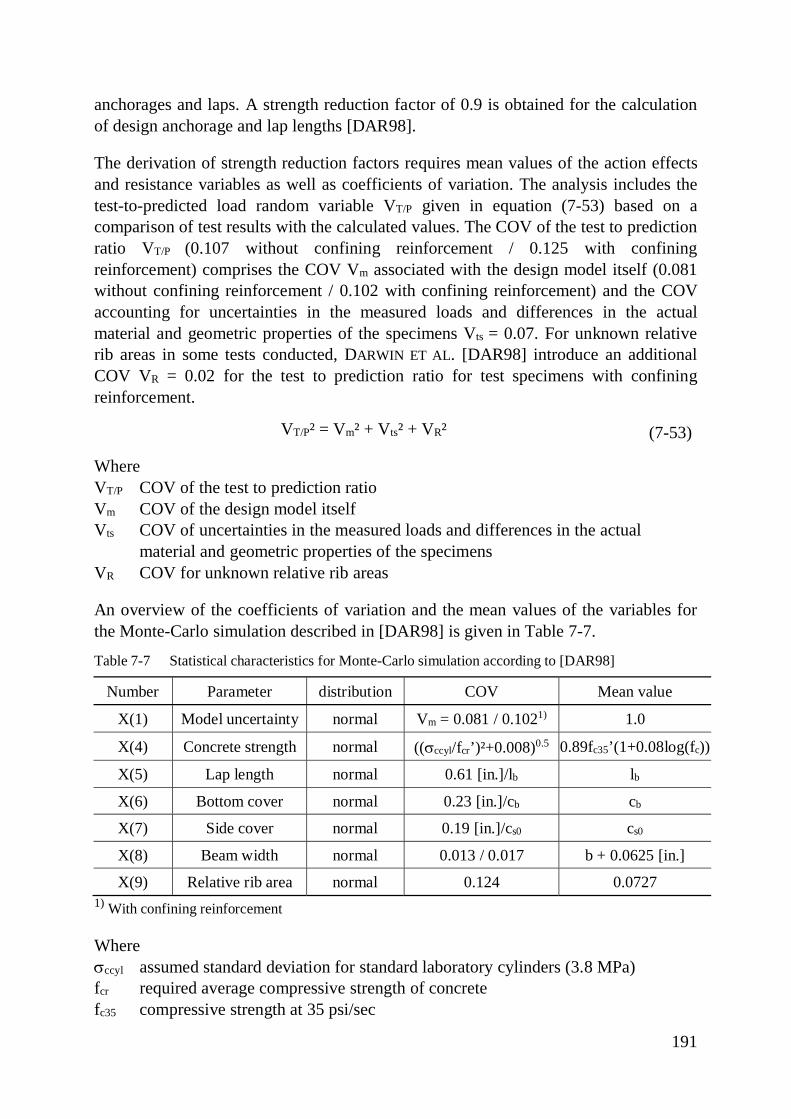
191
anchorages and laps. A strength reduction factor of 0.9 is obtained for the calculationof design anchorage and lap lengths [DAR98].
The derivation of strength reduction factors requires mean values of the action effectsand resistance variables as well as coefficients of variation. The analysis includes thetest-to-predicted load random variable VT/P given in equation (7-53) based on acomparison of test results with the calculated values. The COV of the test to predictionratio VT/P (0.107 without confining reinforcement / 0.125 with confiningreinforcement) comprises the COV Vm associated with the design model itself (0.081without confining reinforcement / 0.102 with confining reinforcement) and the COVaccounting for uncertainties in the measured loads and differences in the actualmaterial and geometric properties of the specimens Vts = 0.07. For unknown relativerib areas in some tests conducted, DARWIN ET AL. [DAR98] introduce an additionalCOV VR = 0.02 for the test to prediction ratio for test specimens with confiningreinforcement.
VT/P² = Vm² + Vts² + VR² (7-53)
WhereVT/P COV of the test to prediction ratioVm COV of the design model itselfVts COV of uncertainties in the measured loads and differences in the actual material and geometric properties of the specimensVR COV for unknown relative rib areas
An overview of the coefficients of variation and the mean values of the variables forthe Monte-Carlo simulation described in [DAR98] is given in Table 7-7.
Table 7-7 Statistical characteristics for Monte-Carlo simulation according to [DAR98]
Number Parameter distribution COV Mean value
X(1) Model uncertainty normal Vm = 0.081 / 0.1021) 1.0
X(4) Concrete strength normal ((sccyl/fcr’)²+0.008)0.5 0.89fc35’(1+0.08log(fc))
X(5) Lap length normal 0.61 [in.]/lb lbX(6) Bottom cover normal 0.23 [in.]/cb cb
X(7) Side cover normal 0.19 [in.]/cs0 cs0
X(8) Beam width normal 0.013 / 0.017 b + 0.0625 [in.]
X(9) Relative rib area normal 0.124 0.07271) With confining reinforcement
Wheresccyl assumed standard deviation for standard laboratory cylinders (3.8 MPa)fcr required average compressive strength of concretefc35 compressive strength at 35 psi/sec
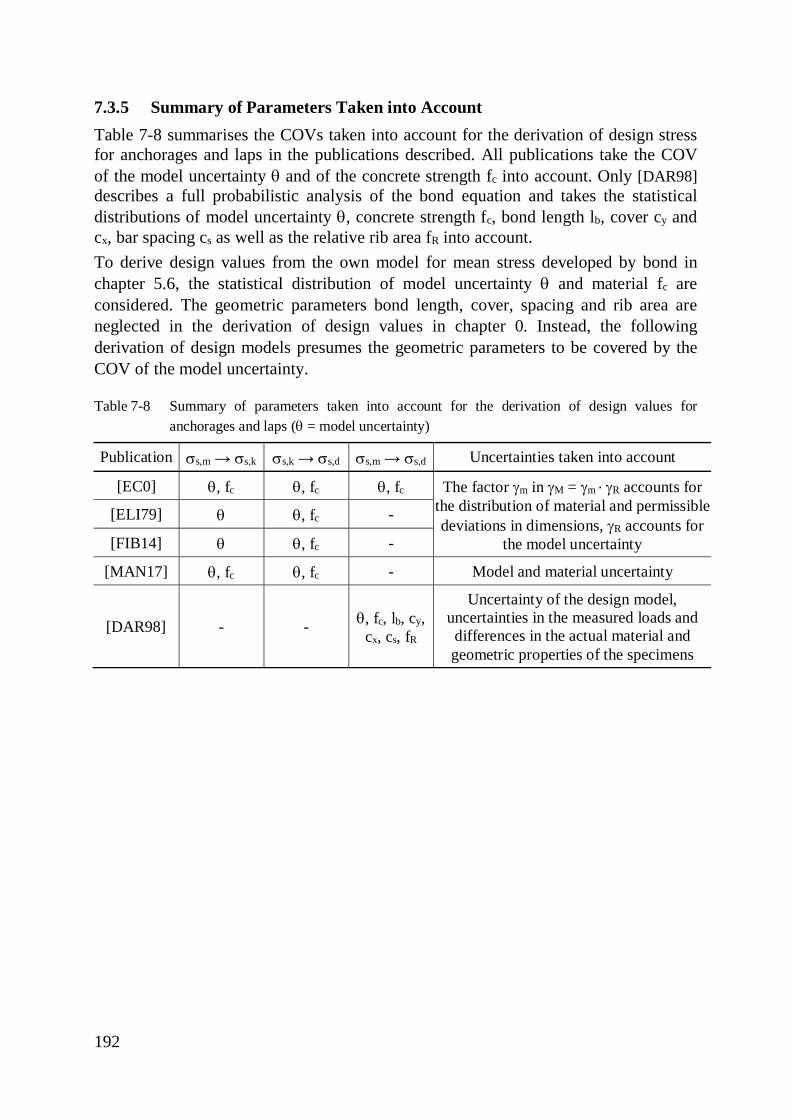
192
7.3.5 Summary of Parameters Taken into AccountTable 7-8 summarises the COVs taken into account for the derivation of design stressfor anchorages and laps in the publications described. All publications take the COVof the model uncertainty q and of the concrete strength fc into account. Only [DAR98]describes a full probabilistic analysis of the bond equation and takes the statisticaldistributions of model uncertainty q, concrete strength fc, bond length lb, cover cy andcx, bar spacing cs as well as the relative rib area fR into account.To derive design values from the own model for mean stress developed by bond inchapter 5.6, the statistical distribution of model uncertainty q and material fc areconsidered. The geometric parameters bond length, cover, spacing and rib area areneglected in the derivation of design values in chapter 0. Instead, the followingderivation of design models presumes the geometric parameters to be covered by theCOV of the model uncertainty.
Table 7-8 Summary of parameters taken into account for the derivation of design values foranchorages and laps (q = model uncertainty)
Publication ss,m → ss,k ss,k → ss,d ss,m → ss,d Uncertainties taken into account
[EC0] q, fc q, fc q, fc The factor gm in gM = gm · gR accounts forthe distribution of material and permissibledeviations in dimensions, gR accounts for
the model uncertainty
[ELI79] q q, fc -
[FIB14] q q, fc -
[MAN17] q, fc q, fc - Model and material uncertainty
[DAR98] - - q, fc, lb, cy,cx, cs, fR
Uncertainty of the design model,uncertainties in the measured loads anddifferences in the actual material andgeometric properties of the specimens
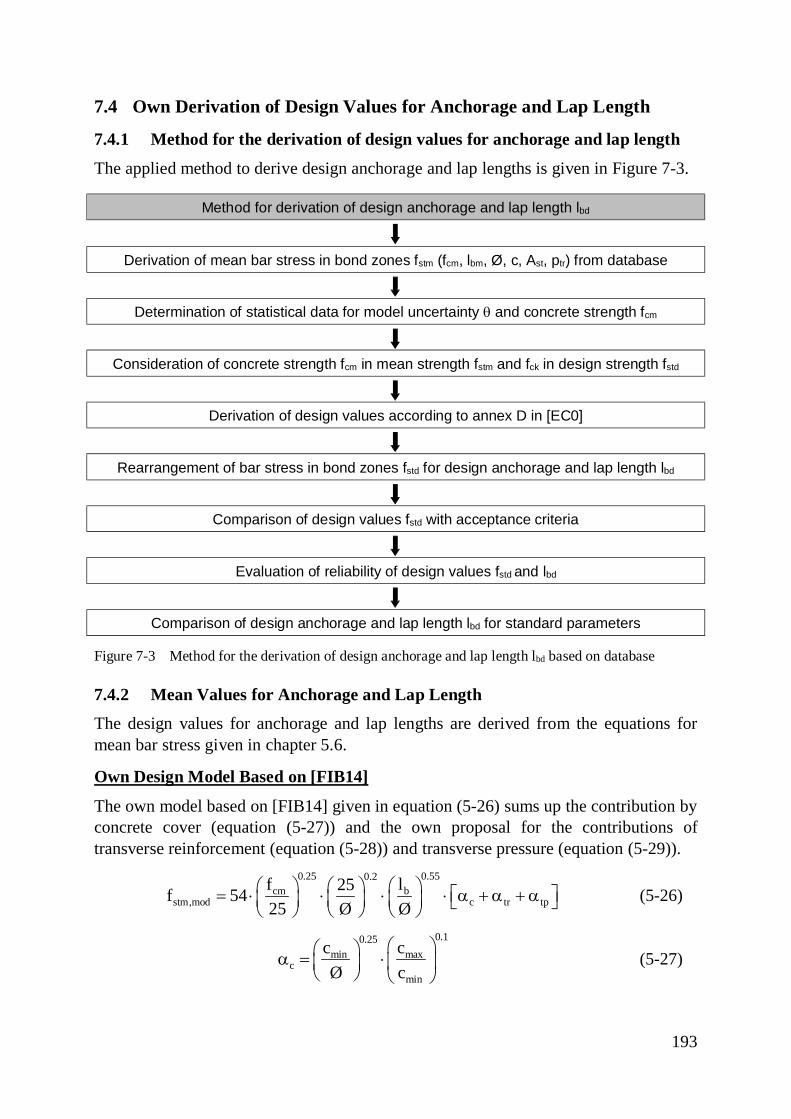
193
7.4 Own Derivation of Design Values for Anchorage and Lap Length
7.4.1 Method for the derivation of design values for anchorage and lap length
The applied method to derive design anchorage and lap lengths is given in Figure 7-3.
Method for derivation of design anchorage and lap length lbd
Derivation of mean bar stress in bond zones fstm (fcm, lbm, Ø, c, Ast, ptr) from database
Determination of statistical data for model uncertainty q and concrete strength fcm
Consideration of concrete strength fcm in mean strength fstm and fck in design strength fstd
Derivation of design values according to annex D in [EC0]
Rearrangement of bar stress in bond zones fstd for design anchorage and lap length lbd
Comparison of design values fstd with acceptance criteria
Evaluation of reliability of design values fstd and lbd
Comparison of design anchorage and lap length lbd for standard parameters
Figure 7-3 Method for the derivation of design anchorage and lap length lbd based on database
7.4.2 Mean Values for Anchorage and Lap Length
The design values for anchorage and lap lengths are derived from the equations formean bar stress given in chapter 5.6.
Own Design Model Based on [FIB14]
The own model based on [FIB14] given in equation (5-26) sums up the contribution byconcrete cover (equation (5-27)) and the own proposal for the contributions oftransverse reinforcement (equation (5-28)) and transverse pressure (equation (5-29)).
0.25 0.550.2cm b
stm,mod c tr tpf l25f 5425 Ø Ø
æ ö æ öæ ö é ù= × × × × a + a + aç ÷ç ÷ ç ÷ ë ûè øè ø è ø (5-26)
0.10.25maxmin
cmin
ccØ c
æ öæ öa = ×ç ÷ç ÷è ø è ø
(5-27)
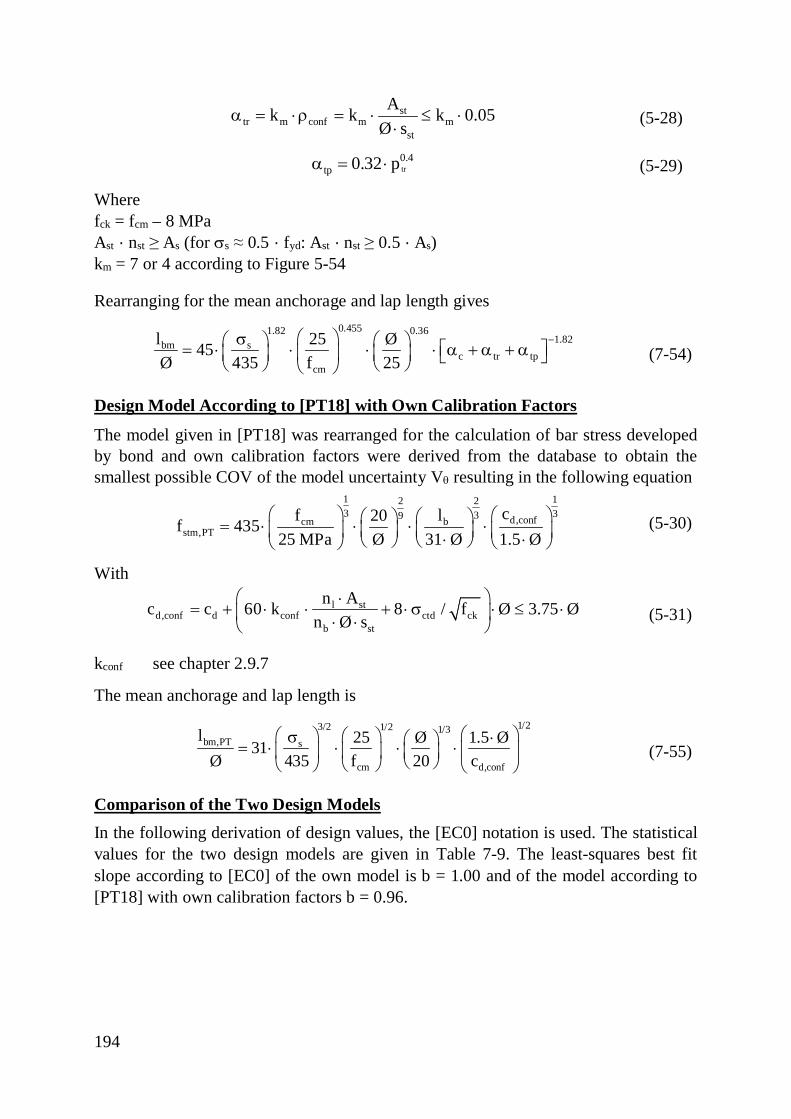
194
sttr m conf m m
st
Ak k k 0.05Ø s
a = ×r = × £ ×× (5-28)
tr0.4
tp 0.32 pa = × (5-29)
Wherefck = fcm – 8 MPaAst · nst ≥ As (for ss ≈ 0.5 · fyd: Ast · nst ≥ 0.5 · As)km = 7 or 4 according to Figure 5-54
Rearranging for the mean anchorage and lap length gives0.4551.82 0.36
1.82bm sc tr tp
cm
l 25 Ø45Ø 435 f 25
-æ ösæ ö æ ö é ù= × × × × a + a + aç ÷ ç ÷ç ÷ ë ûè øè ø è ø(7-54)
Design Model According to [PT18] with Own Calibration Factors
The model given in [PT18] was rearranged for the calculation of bar stress developedby bond and own calibration factors were derived from the database to obtain thesmallest possible COV of the model uncertainty Vq resulting in the following equation
1 1223 339 d,confcm b
stm,PTcf l20f 435
25 MPa Ø 31 Ø 1.5 Øæ ö æ öæ öæ ö= × × × ×ç ÷ ç ÷ç ÷ ç ÷× ×è ø è ø è øè ø
(5-30)
With
l std,conf d conf ctd ck
b st
n Ac c 60 k 8 / f Ø 3.75 Øn Ø s
æ ö×= + × × + × s × £ ×ç ÷× ×è ø
(5-31)
kconf see chapter 2.9.7
The mean anchorage and lap length is1/23/2 1/2 1/3
bm,PT s
cm d,conf
l 25 Ø 1.5 Ø31Ø 435 f 20 c
æ öæ ö æ ös ×æ ö= × × × × ç ÷ç ÷ ç ÷ ç ÷è øè øè ø è ø
(7-55)
Comparison of the Two Design ModelsIn the following derivation of design values, the [EC0] notation is used. The statisticalvalues for the two design models are given in Table 7-9. The least-squares best fitslope according to [EC0] of the own model is b = 1.00 and of the model according to[PT18] with own calibration factors b = 0.96.
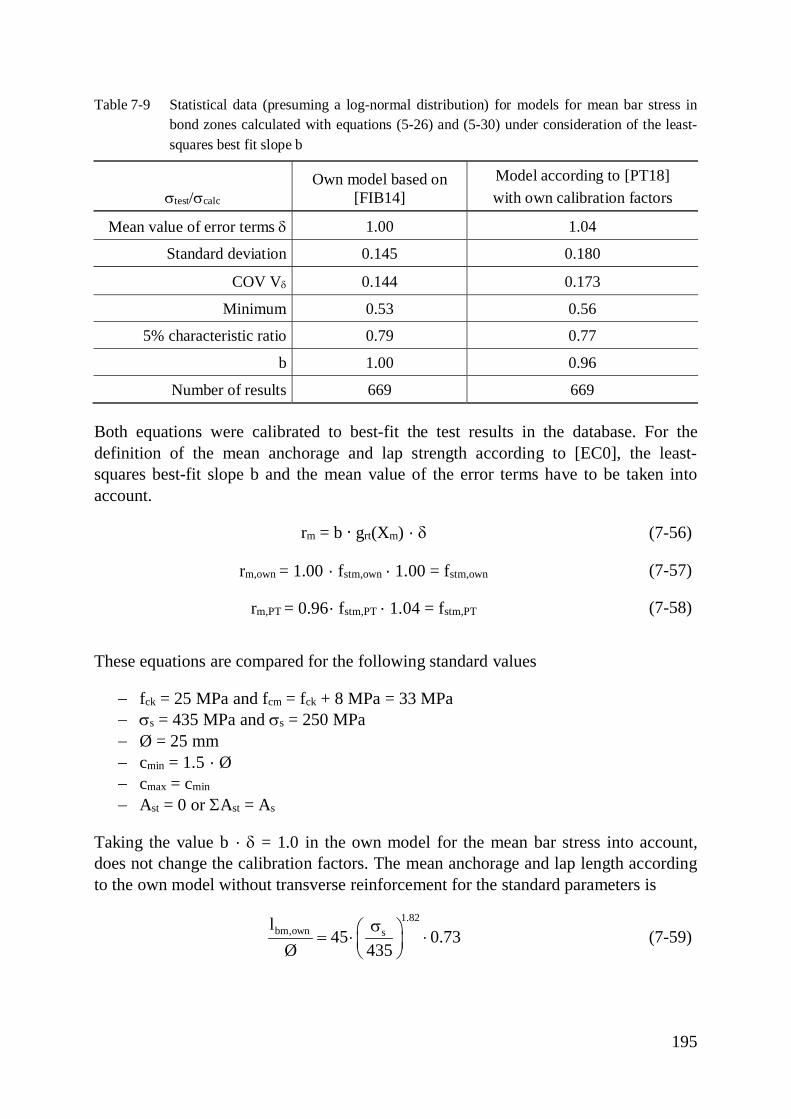
195
Table 7-9 Statistical data (presuming a log-normal distribution) for models for mean bar stress inbond zones calculated with equations (5-26) and (5-30) under consideration of the least-squares best fit slope b
stest/scalc
Own model based on[FIB14]
Model according to [PT18]with own calibration factors
Mean value of error terms d 1.00 1.04
Standard deviation 0.145 0.180
COV Vd 0.144 0.173
Minimum 0.53 0.56
5% characteristic ratio 0.79 0.77
b 1.00 0.96
Number of results 669 669
Both equations were calibrated to best-fit the test results in the database. For thedefinition of the mean anchorage and lap strength according to [EC0], the least-squares best-fit slope b and the mean value of the error terms have to be taken intoaccount.
rm = b · grt(Xm) · d (7-56)
rm,own = 1.00 · fstm,own · 1.00 = fstm,own (7-57)
rm,PT = 0.96· fstm,PT · 1.04 = fstm,PT (7-58)
These equations are compared for the following standard values
- fck = 25 MPa and fcm = fck + 8 MPa = 33 MPa- ss = 435 MPa and ss = 250 MPa- Ø = 25 mm- cmin = 1.5 · Ø- cmax = cmin
- Ast = 0 or SAst = As
Taking the value b · d = 1.0 in the own model for the mean bar stress into account,does not change the calibration factors. The mean anchorage and lap length accordingto the own model without transverse reinforcement for the standard parameters is
1.82bm,own sl
45 0.73Ø 435
sæ ö= × ×ç ÷è ø
(7-59)
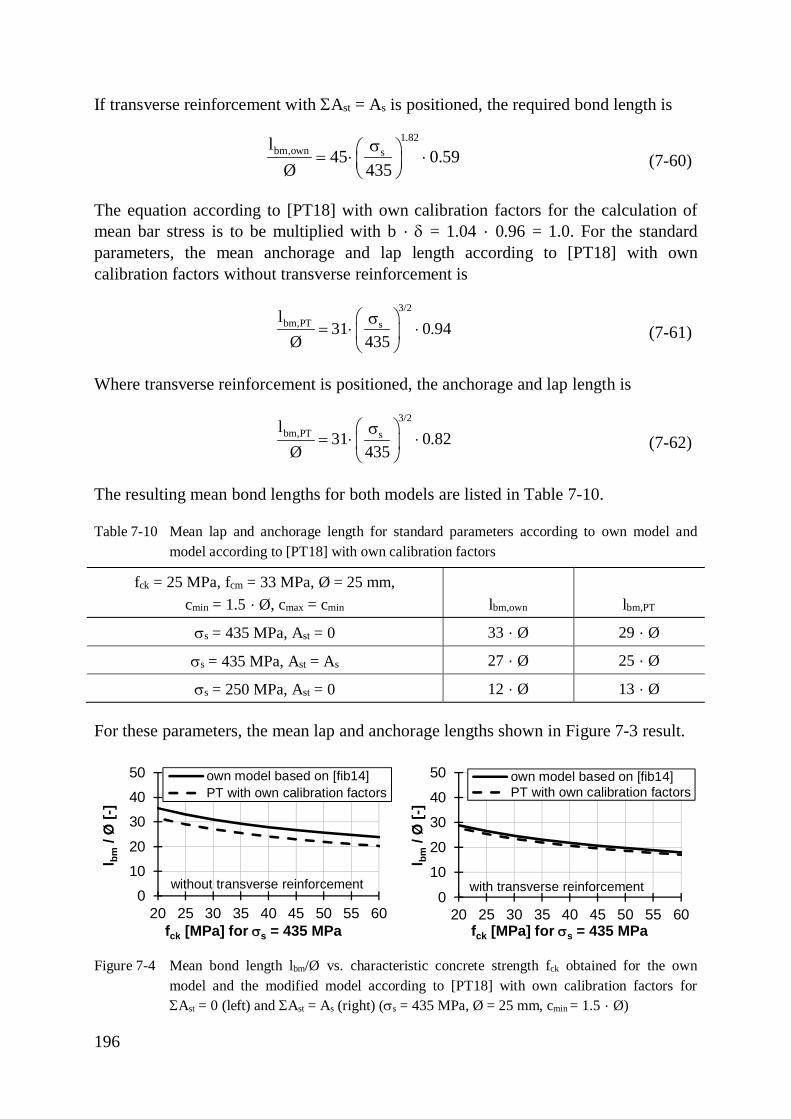
196
If transverse reinforcement with SAst = As is positioned, the required bond length is
1.82bm,own sl
45 0.59Ø 435
sæ ö= × ×ç ÷è ø
(7-60)
The equation according to [PT18] with own calibration factors for the calculation ofmean bar stress is to be multiplied with b · d = 1.04 · 0.96 = 1.0. For the standardparameters, the mean anchorage and lap length according to [PT18] with owncalibration factors without transverse reinforcement is
3/2bm,PT sl
31 0.94Ø 435
æ ös= × ×ç ÷
è ø(7-61)
Where transverse reinforcement is positioned, the anchorage and lap length is
3/2bm,PT sl
31 0.82Ø 435
æ ös= × ×ç ÷
è ø(7-62)
The resulting mean bond lengths for both models are listed in Table 7-10.
Table 7-10 Mean lap and anchorage length for standard parameters according to own model andmodel according to [PT18] with own calibration factors
fck = 25 MPa, fcm = 33 MPa, Ø = 25 mm,cmin = 1.5 · Ø, cmax = cmin lbm,own lbm,PT
ss = 435 MPa, Ast = 0 33 · Ø 29 · Ø
ss = 435 MPa, Ast = As 27 · Ø 25 · Ø
ss = 250 MPa, Ast = 0 12 · Ø 13 · Ø
For these parameters, the mean lap and anchorage lengths shown in Figure 7-3 result.
Figure 7-4 Mean bond length lbm/Ø vs. characteristic concrete strength fck obtained for the ownmodel and the modified model according to [PT18] with own calibration factors forSAst = 0 (left) and SAst = As (right) (ss = 435 MPa, Ø = 25 mm, cmin = 1.5 · Ø)
01020304050
20 25 30 35 40 45 50 55 60
l bm/ Ø
[-]
fck [MPa] for ss = 435 MPa
own model based on [fib14]PT with own calibration factors
without transverse reinforcement0
1020304050
20 25 30 35 40 45 50 55 60
l bm/ Ø
[-]
fck [MPa] for ss = 435 MPa
own model based on [fib14]PT with own calibration factors
with transverse reinforcement
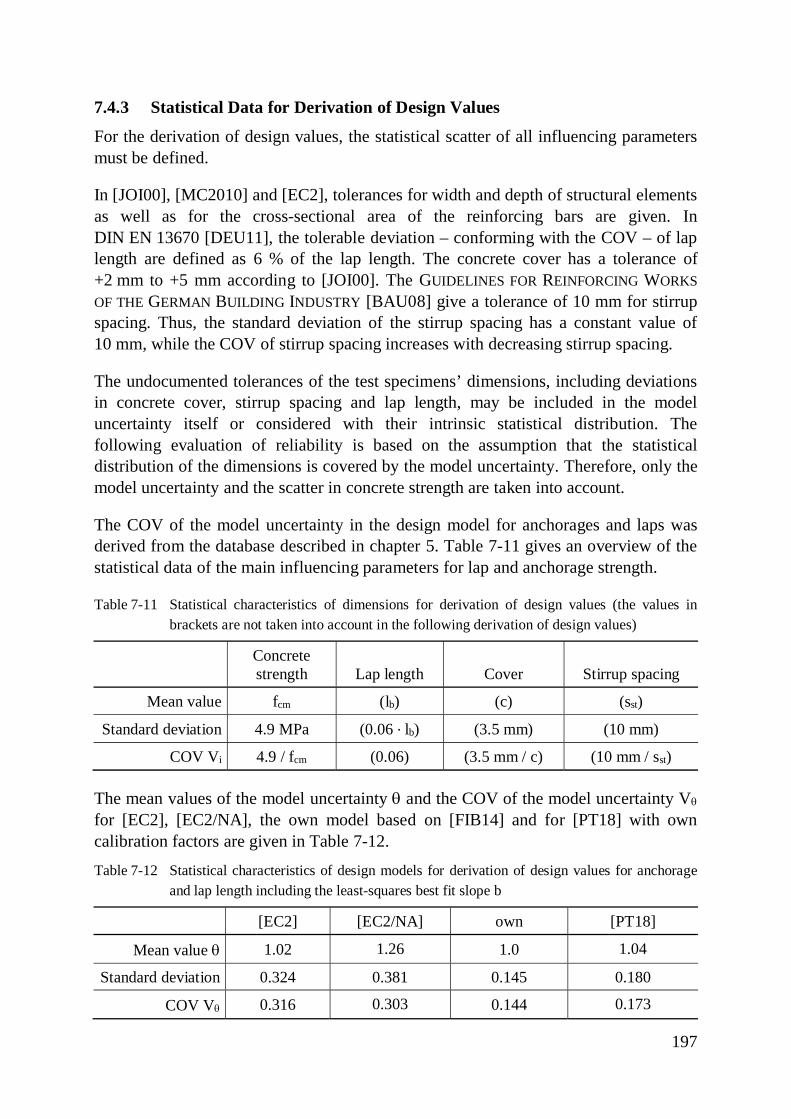
197
7.4.3 Statistical Data for Derivation of Design Values
For the derivation of design values, the statistical scatter of all influencing parametersmust be defined.
In [JOI00], [MC2010] and [EC2], tolerances for width and depth of structural elementsas well as for the cross-sectional area of the reinforcing bars are given. InDIN EN 13670 [DEU11], the tolerable deviation – conforming with the COV – of laplength are defined as 6 % of the lap length. The concrete cover has a tolerance of+2 mm to +5 mm according to [JOI00]. The GUIDELINES FOR REINFORCING WORKSOF THE GERMAN BUILDING INDUSTRY [BAU08] give a tolerance of 10 mm for stirrupspacing. Thus, the standard deviation of the stirrup spacing has a constant value of10 mm, while the COV of stirrup spacing increases with decreasing stirrup spacing.
The undocumented tolerances of the test specimens’ dimensions, including deviationsin concrete cover, stirrup spacing and lap length, may be included in the modeluncertainty itself or considered with their intrinsic statistical distribution. Thefollowing evaluation of reliability is based on the assumption that the statisticaldistribution of the dimensions is covered by the model uncertainty. Therefore, only themodel uncertainty and the scatter in concrete strength are taken into account.
The COV of the model uncertainty in the design model for anchorages and laps wasderived from the database described in chapter 5. Table 7-11 gives an overview of thestatistical data of the main influencing parameters for lap and anchorage strength.
Table 7-11 Statistical characteristics of dimensions for derivation of design values (the values inbrackets are not taken into account in the following derivation of design values)
Concretestrength Lap length Cover Stirrup spacing
Mean value fcm (lb) (c) (sst)
Standard deviation 4.9 MPa (0.06 · lb) (3.5 mm) (10 mm)
COV Vi 4.9 / fcm (0.06) (3.5 mm / c) (10 mm / sst)
The mean values of the model uncertainty q and the COV of the model uncertainty Vq
for [EC2], [EC2/NA], the own model based on [FIB14] and for [PT18] with owncalibration factors are given in Table 7-12.Table 7-12 Statistical characteristics of design models for derivation of design values for anchorage
and lap length including the least-squares best fit slope b
[EC2] [EC2/NA] own [PT18]
Mean value q 1.02 1.26 1.0 1.04
Standard deviation 0.324 0.381 0.145 0.180
COV Vq 0.316 0.303 0.144 0.173
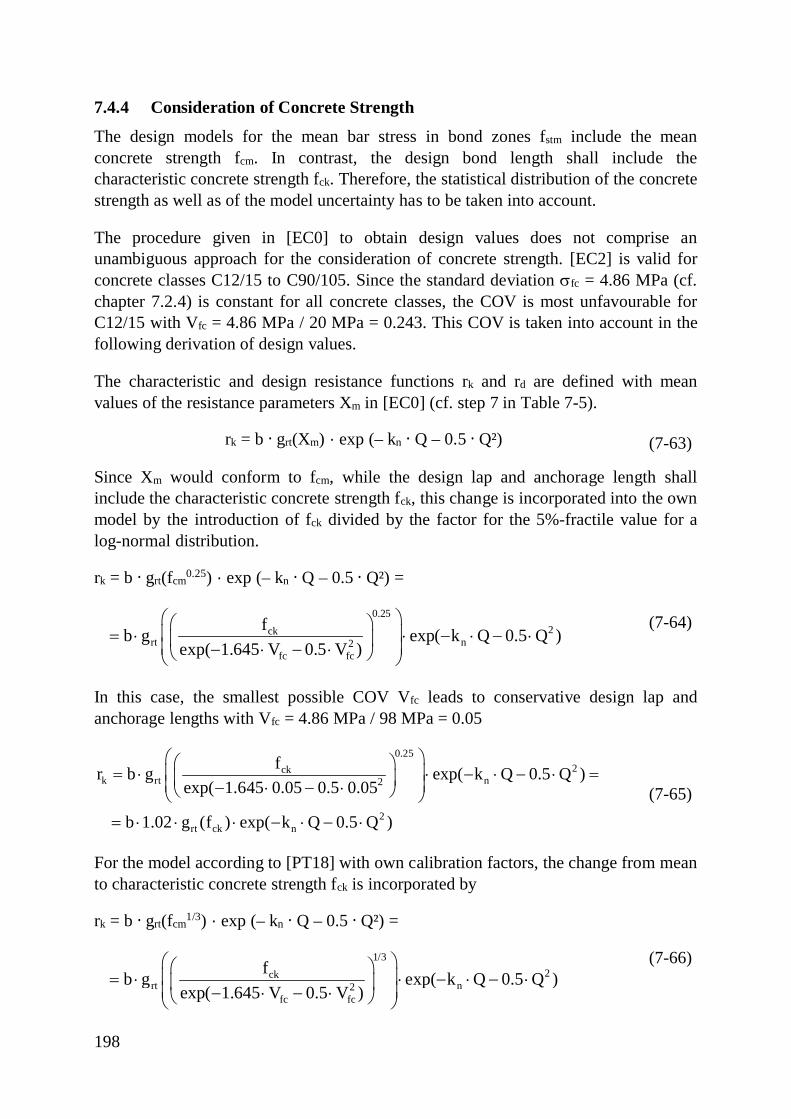
198
7.4.4 Consideration of Concrete Strength
The design models for the mean bar stress in bond zones fstm include the meanconcrete strength fcm. In contrast, the design bond length shall include thecharacteristic concrete strength fck. Therefore, the statistical distribution of the concretestrength as well as of the model uncertainty has to be taken into account.
The procedure given in [EC0] to obtain design values does not comprise anunambiguous approach for the consideration of concrete strength. [EC2] is valid forconcrete classes C12/15 to C90/105. Since the standard deviation sfc = 4.86 MPa (cf.chapter 7.2.4) is constant for all concrete classes, the COV is most unfavourable forC12/15 with Vfc = 4.86 MPa / 20 MPa = 0.243. This COV is taken into account in thefollowing derivation of design values.
The characteristic and design resistance functions rk and rd are defined with meanvalues of the resistance parameters Xm in [EC0] (cf. step 7 in Table 7-5).
rk = b · grt(Xm) · exp (– kn · Q – 0.5 · Q²) (7-63)
Since Xm would conform to fcm, while the design lap and anchorage length shallinclude the characteristic concrete strength fck, this change is incorporated into the ownmodel by the introduction of fck divided by the factor for the 5%-fractile value for alog-normal distribution.
rk = b · grt(fcm0.25) · exp (– kn · Q – 0.5 · Q²) =
0.252ck
rt n2fc fc
fb g exp( k Q 0.5 Q )exp( 1.645 V 0.5 V )
æ öæ öç ÷= × × - × - ×ç ÷ç ÷- × - ×è øè ø
(7-64)
In this case, the smallest possible COV Vfc leads to conservative design lap andanchorage lengths with Vfc = 4.86 MPa / 98 MPa = 0.05
0.252ck
k rt n2
2rt ck n
fr b g exp( k Q 0.5 Q )exp( 1.645 0.05 0.5 0.05
b 1.02 g (f ) exp( k Q 0.5 Q )
æ öæ öç ÷= × × - × - × =ç ÷ç ÷- × - ×è øè ø
= × × × - × - ×
(7-65)
For the model according to [PT18] with own calibration factors, the change from meanto characteristic concrete strength fck is incorporated by
rk = b · grt(fcm1/3) · exp (– kn · Q – 0.5 · Q²) =
1/32ck
rt n2fc fc
fb g exp( k Q 0.5 Q )exp( 1.645 V 0.5 V )
æ öæ öç ÷= × × - × - ×ç ÷ç ÷- × - ×è øè ø
(7-66)
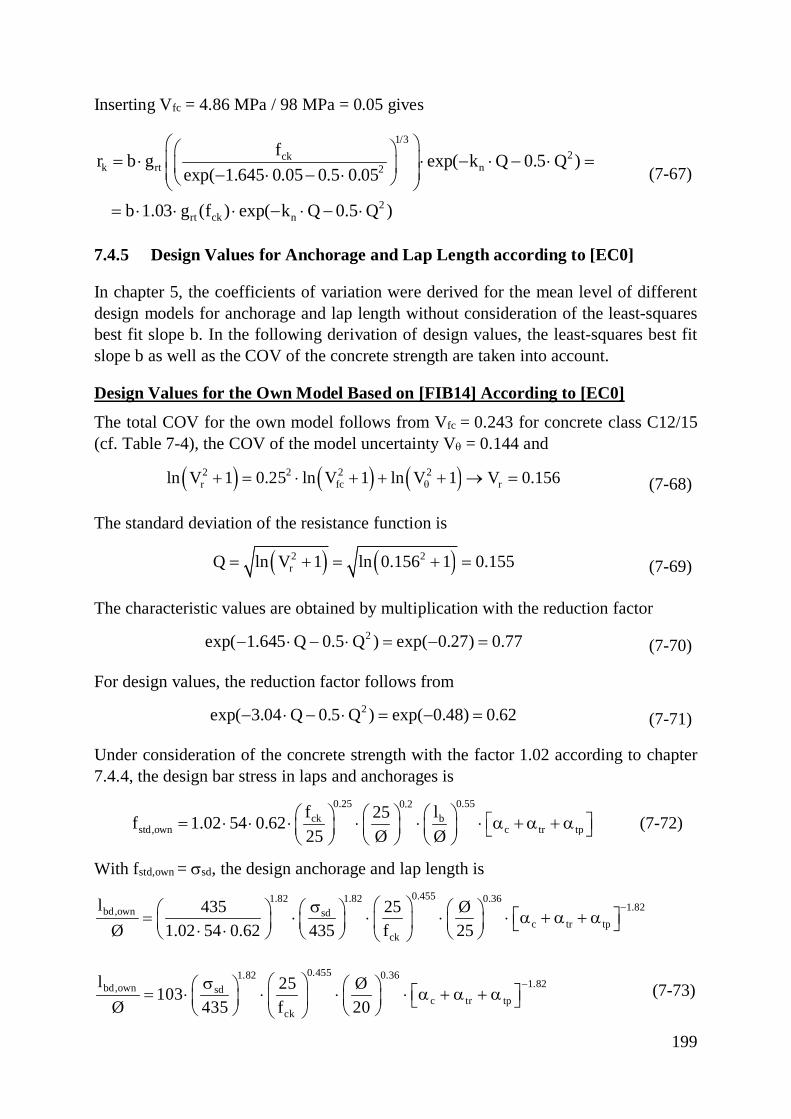
199
Inserting Vfc = 4.86 MPa / 98 MPa = 0.05 gives
1/32ck
k rt n2
2rt ck n
fr b g exp( k Q 0.5 Q )exp( 1.645 0.05 0.5 0.05
b 1.03 g (f ) exp( k Q 0.5 Q )
æ öæ öç ÷= × × - × - × =ç ÷ç ÷- × - ×è øè ø
= × × × - × - ×
(7-67)
7.4.5 Design Values for Anchorage and Lap Length according to [EC0]
In chapter 5, the coefficients of variation were derived for the mean level of differentdesign models for anchorage and lap length without consideration of the least-squaresbest fit slope b. In the following derivation of design values, the least-squares best fitslope b as well as the COV of the concrete strength are taken into account.
Design Values for the Own Model Based on [FIB14] According to [EC0]
The total COV for the own model follows from Vfc = 0.243 for concrete class C12/15(cf. Table 7-4), the COV of the model uncertainty Vq = 0.144 and
( ) ( ) ( )2 2 2 2r fc rln V 1 0.25 ln V 1 ln V 1 V 0.156q+ = × + + + ® = (7-68)
The standard deviation of the resistance function is
( ) ( )2 2rQ ln V 1 ln 0.156 1 0.155= + = + = (7-69)
The characteristic values are obtained by multiplication with the reduction factor2exp( 1.645 Q 0.5 Q ) exp( 0.27) 0.77- × - × = - = (7-70)
For design values, the reduction factor follows from2exp( 3.04 Q 0.5 Q ) exp( 0.48) 0.62- × - × = - = (7-71)
Under consideration of the concrete strength with the factor 1.02 according to chapter7.4.4, the design bar stress in laps and anchorages is
0.25 0.550.2ck b
std,own c tr tpf l25f 1.02 54 0.6225 Ø Ø
æ ö æ öæ ö é ù= × × × × × × a + a + aç ÷ç ÷ ç ÷ ë ûè øè ø è ø (7-72)
With fstd,own = ssd, the design anchorage and lap length is0.4551.821.82 0.36
1.82bd,own sdc tr tp
ck
l 435 25 ØØ 1.02 54 0.62 435 f 25
-æ ösæ öæ ö æ ö é ù= × × × × a + a + aç ÷ç ÷ ç ÷ç ÷ ë û× ×è ø è øè ø è ø
0.4551.82 0.361.82bd,own sd
c tr tpck
l 25 Ø103Ø 435 f 20
-æ ösæ ö æ ö é ù= × × × × a + a + aç ÷ ç ÷ç ÷ ë ûè øè ø è ø(7-73)
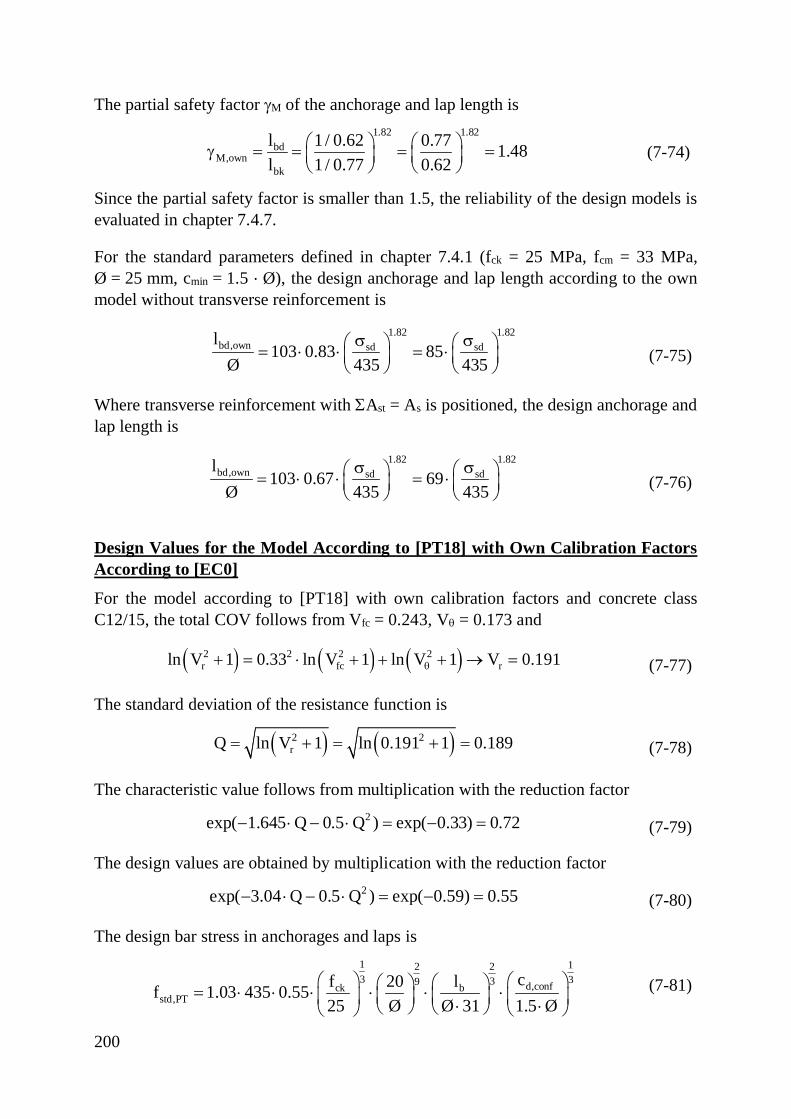
200
The partial safety factor gM of the anchorage and lap length is1.82 1.82
bdM,own
bk
l 1 / 0.62 0.77 1.48l 1 / 0.77 0.62
æ ö æ ög = = = =ç ÷ ç ÷è ø è ø
(7-74)
Since the partial safety factor is smaller than 1.5, the reliability of the design models isevaluated in chapter 7.4.7.
For the standard parameters defined in chapter 7.4.1 (fck = 25 MPa, fcm = 33 MPa,Ø = 25 mm, cmin = 1.5 · Ø), the design anchorage and lap length according to the ownmodel without transverse reinforcement is
1.82 1.82bd,own sd sdl
103 0.83 85Ø 435 435
s sæ ö æ ö= × × = ×ç ÷ ç ÷è ø è ø
(7-75)
Where transverse reinforcement with SAst = As is positioned, the design anchorage andlap length is
1.82 1.82bd,own sd sdl
103 0.67 69Ø 435 435
s sæ ö æ ö= × × = ×ç ÷ ç ÷è ø è ø
(7-76)
Design Values for the Model According to [PT18] with Own Calibration FactorsAccording to [EC0]
For the model according to [PT18] with own calibration factors and concrete classC12/15, the total COV follows from Vfc = 0.243, Vq = 0.173 and
( ) ( ) ( )2 2 2 2r fc rln V 1 0.33 ln V 1 ln V 1 V 0.191q+ = × + + + ® = (7-77)
The standard deviation of the resistance function is
( ) ( )2 2rQ ln V 1 ln 0.191 1 0.189= + = + = (7-78)
The characteristic value follows from multiplication with the reduction factor2exp( 1.645 Q 0.5 Q ) exp( 0.33) 0.72- × - × = - = (7-79)
The design values are obtained by multiplication with the reduction factor2exp( 3.04 Q 0.5 Q ) exp( 0.59) 0.55- × - × = - = (7-80)
The design bar stress in anchorages and laps is1 1223 339 d,confck b
std,PTcf l20f 1.03 435 0.55
25 Ø Ø 31 1.5 Øæ ö æ öæ öæ ö= × × × × × ×ç ÷ ç ÷ç ÷ ç ÷× ×è ø è ø è øè ø
(7-81)
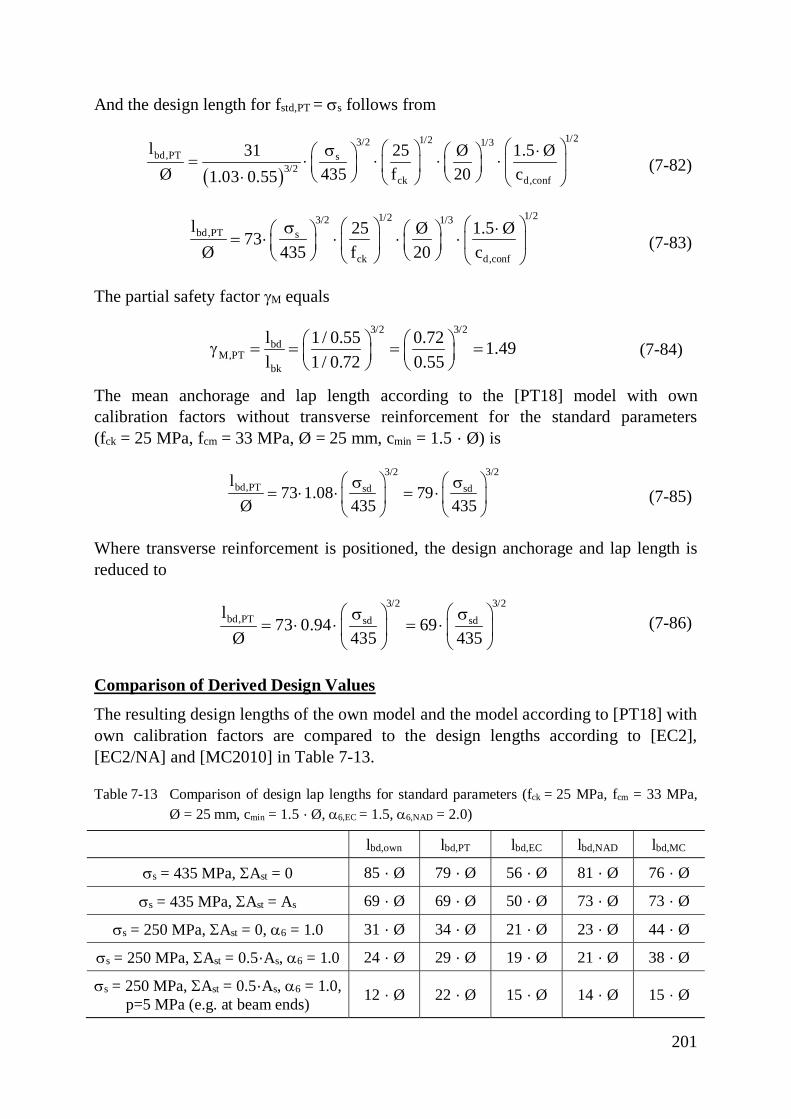
201
And the design length for fstd,PT = ss follows from
( )
1/21/23/2 1/3bd,PT s
3/2ck d,conf
l 31 25 Ø 1.5 ØØ 435 f 20 c1.03 0.55
æ öæ ös ×æ ö æ ö= × × × × ç ÷ç ÷ ç ÷ç ÷è øè ø× è ø è ø
(7-82)
1/21/23/2 1/3bd,PT s
ck d,conf
l 25 Ø 1.5 Ø73Ø 435 f 20 c
æ öæ ös ×æ ö æ ö= × × × × ç ÷ç ÷ ç ÷ç ÷ è øè ø è ø è ø(7-83)
The partial safety factor gM equals
3/2 3/2bd
M,PTbk
l 1 / 0.55 0.72 1.49l 1 / 0.72 0.55
æ ö æ ög = = = =ç ÷ ç ÷è ø è ø
(7-84)
The mean anchorage and lap length according to the [PT18] model with owncalibration factors without transverse reinforcement for the standard parameters(fck = 25 MPa, fcm = 33 MPa, Ø = 25 mm, cmin = 1.5 · Ø) is
3/2 3/2bd,PT sd sdl
73 1.08 79Ø 435 435
æ ö æ ös s= × × = ×ç ÷ ç ÷
è ø è ø(7-85)
Where transverse reinforcement is positioned, the design anchorage and lap length isreduced to
3/2 3/2bd,PT sd sdl
73 0.94 69Ø 435 435
æ ö æ ös s= × × = ×ç ÷ ç ÷
è ø è ø(7-86)
Comparison of Derived Design Values
The resulting design lengths of the own model and the model according to [PT18] withown calibration factors are compared to the design lengths according to [EC2],[EC2/NA] and [MC2010] in Table 7-13.
Table 7-13 Comparison of design lap lengths for standard parameters (fck = 25 MPa, fcm = 33 MPa,Ø = 25 mm, cmin = 1.5 · Ø, a6,EC = 1.5, a6,NAD = 2.0)
lbd,own lbd,PT lbd,EC lbd,NAD lbd,MC
ss = 435 MPa, SAst = 0 85 · Ø 79 · Ø 56 · Ø 81 · Ø 76 · Ø
ss = 435 MPa, SAst = As 69 · Ø 69 · Ø 50 · Ø 73 · Ø 73 · Ø
ss = 250 MPa, SAst = 0, a6 = 1.0 31 · Ø 34 · Ø 21 · Ø 23 · Ø 44 · Ø
ss = 250 MPa, SAst = 0.5·As, a6 = 1.0 24 · Ø 29 · Ø 19 · Ø 21 · Ø 38 · Ø
ss = 250 MPa, SAst = 0.5·As, a6 = 1.0,p=5 MPa (e.g. at beam ends) 12 · Ø 22 · Ø 15 · Ø 14 · Ø 15 · Ø
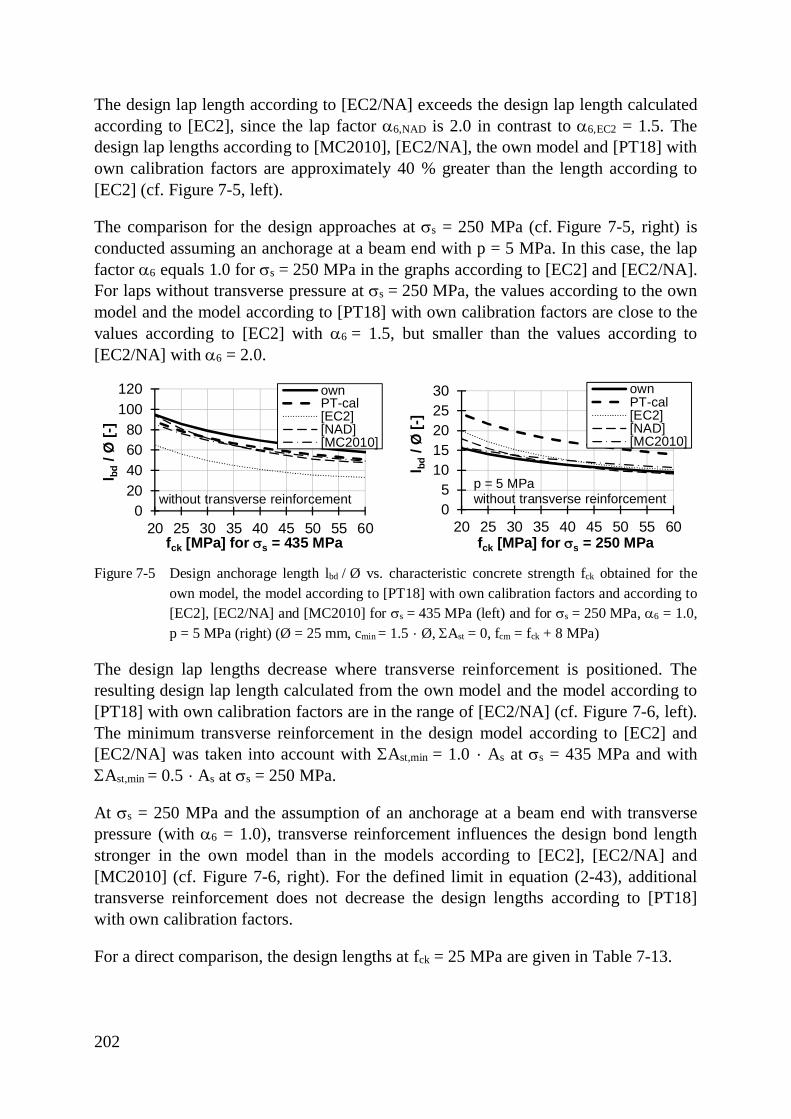
202
The design lap length according to [EC2/NA] exceeds the design lap length calculatedaccording to [EC2], since the lap factor a6,NAD is 2.0 in contrast to a6,EC2 = 1.5. Thedesign lap lengths according to [MC2010], [EC2/NA], the own model and [PT18] withown calibration factors are approximately 40 % greater than the length according to[EC2] (cf. Figure 7-5, left).
The comparison for the design approaches at ss = 250 MPa (cf. Figure 7-5, right) isconducted assuming an anchorage at a beam end with p = 5 MPa. In this case, the lapfactor a6 equals 1.0 for ss = 250 MPa in the graphs according to [EC2] and [EC2/NA].For laps without transverse pressure at ss = 250 MPa, the values according to the ownmodel and the model according to [PT18] with own calibration factors are close to thevalues according to [EC2] with a6 = 1.5, but smaller than the values according to[EC2/NA] with a6 = 2.0.
Figure 7-5 Design anchorage length lbd / Ø vs. characteristic concrete strength fck obtained for theown model, the model according to [PT18] with own calibration factors and according to[EC2], [EC2/NA] and [MC2010] for ss = 435 MPa (left) and for ss = 250 MPa, a6 = 1.0,p = 5 MPa (right) (Ø = 25 mm, cmin = 1.5 · Ø, SAst = 0, fcm = fck + 8 MPa)
The design lap lengths decrease where transverse reinforcement is positioned. Theresulting design lap length calculated from the own model and the model according to[PT18] with own calibration factors are in the range of [EC2/NA] (cf. Figure 7-6, left).The minimum transverse reinforcement in the design model according to [EC2] and[EC2/NA] was taken into account with SAst,min = 1.0 · As at ss = 435 MPa and withSAst,min = 0.5 · As at ss = 250 MPa.
At ss = 250 MPa and the assumption of an anchorage at a beam end with transversepressure (with a6 = 1.0), transverse reinforcement influences the design bond lengthstronger in the own model than in the models according to [EC2], [EC2/NA] and[MC2010] (cf. Figure 7-6, right). For the defined limit in equation (2-43), additionaltransverse reinforcement does not decrease the design lengths according to [PT18]with own calibration factors.
For a direct comparison, the design lengths at fck = 25 MPa are given in Table 7-13.
020406080
100120
20 25 30 35 40 45 50 55 60
l bd/ Ø
[-]
fck [MPa] for ss = 435 MPa
ownPT-cal[EC2][NAD][MC2010]
without transverse reinforcement05
1015202530
20 25 30 35 40 45 50 55 60
l bd/ Ø
[-]
fck [MPa] for ss = 250 MPa
ownPT-cal[EC2][NAD][MC2010]
p = 5 MPawithout transverse reinforcement
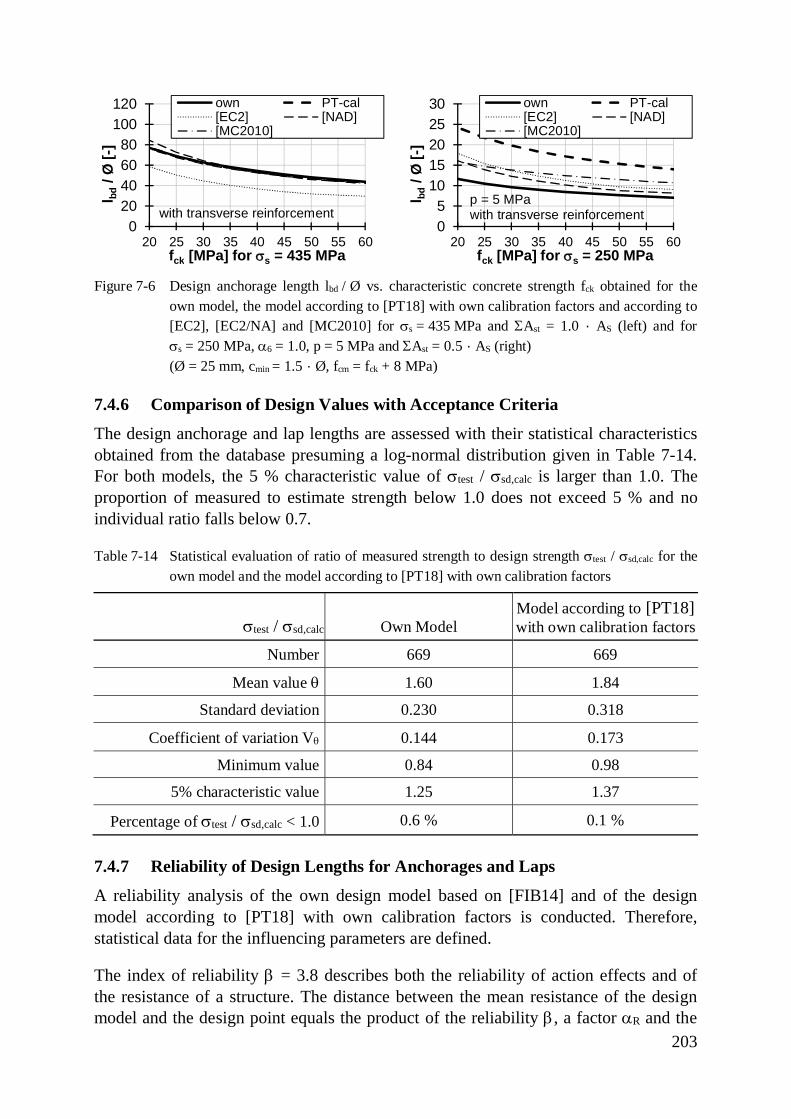
203
Figure 7-6 Design anchorage length lbd / Ø vs. characteristic concrete strength fck obtained for theown model, the model according to [PT18] with own calibration factors and according to[EC2], [EC2/NA] and [MC2010] for ss = 435 MPa and SAst = 1.0 · AS (left) and forss = 250 MPa, a6 = 1.0, p = 5 MPa and SAst = 0.5 · AS (right)
(Ø = 25 mm, cmin = 1.5 · Ø, fcm = fck + 8 MPa)
7.4.6 Comparison of Design Values with Acceptance Criteria
The design anchorage and lap lengths are assessed with their statistical characteristicsobtained from the database presuming a log-normal distribution given in Table 7-14.For both models, the 5 % characteristic value of stest / ssd,calc is larger than 1.0. Theproportion of measured to estimate strength below 1.0 does not exceed 5 % and noindividual ratio falls below 0.7.
Table 7-14 Statistical evaluation of ratio of measured strength to design strength stest / ssd,calc for theown model and the model according to [PT18] with own calibration factors
stest / ssd,calc Own ModelModel according to [PT18]with own calibration factors
Number 669 669
Mean value q 1.60 1.84
Standard deviation 0.230 0.318
Coefficient of variation Vq 0.144 0.173
Minimum value 0.84 0.98
5% characteristic value 1.25 1.37
Percentage of stest / ssd,calc < 1.0 0.6 % 0.1 %
7.4.7 Reliability of Design Lengths for Anchorages and Laps
A reliability analysis of the own design model based on [FIB14] and of the designmodel according to [PT18] with own calibration factors is conducted. Therefore,statistical data for the influencing parameters are defined.
The index of reliability b = 3.8 describes both the reliability of action effects and ofthe resistance of a structure. The distance between the mean resistance of the designmodel and the design point equals the product of the reliability b, a factor aR and the
020406080
100120
20 25 30 35 40 45 50 55 60
l bd/ Ø
[-]
fck [MPa] for ss = 435 MPa
own PT-cal[EC2] [NAD][MC2010]
with transverse reinforcement05
1015202530
20 25 30 35 40 45 50 55 60
l bd/ Ø
[-]
fck [MPa] for ss = 250 MPa
own PT-cal[EC2] [NAD][MC2010]
p = 5 MPawith transverse reinforcement
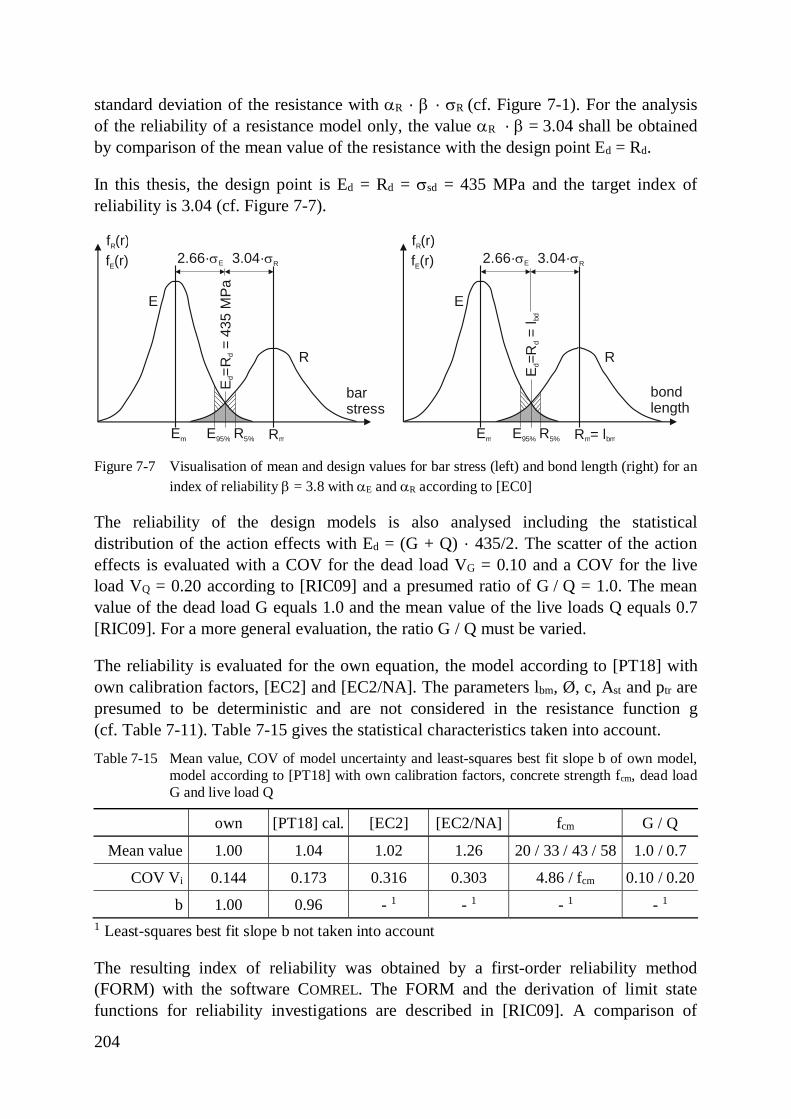
204
standard deviation of the resistance with aR · b · sR (cf. Figure 7-1). For the analysisof the reliability of a resistance model only, the value aR · b = 3.04 shall be obtainedby comparison of the mean value of the resistance with the design point Ed = Rd.
In this thesis, the design point is Ed = Rd = ssd = 435 MPa and the target index ofreliability is 3.04 (cf. Figure 7-7).
Figure 7-7 Visualisation of mean and design values for bar stress (left) and bond length (right) for anindex of reliability b = 3.8 with aE and aR according to [EC0]
The reliability of the design models is also analysed including the statisticaldistribution of the action effects with Ed = (G + Q) · 435/2. The scatter of the actioneffects is evaluated with a COV for the dead load VG = 0.10 and a COV for the liveload VQ = 0.20 according to [RIC09] and a presumed ratio of G / Q = 1.0. The meanvalue of the dead load G equals 1.0 and the mean value of the live loads Q equals 0.7[RIC09]. For a more general evaluation, the ratio G / Q must be varied.
The reliability is evaluated for the own equation, the model according to [PT18] withown calibration factors, [EC2] and [EC2/NA]. The parameters lbm, Ø, c, Ast and ptr arepresumed to be deterministic and are not considered in the resistance function g(cf. Table 7-11). Table 7-15 gives the statistical characteristics taken into account.Table 7-15 Mean value, COV of model uncertainty and least-squares best fit slope b of own model,
model according to [PT18] with own calibration factors, concrete strength fcm, dead loadG and live load Q
own [PT18] cal. [EC2] [EC2/NA] fcm G / Q
Mean value 1.00 1.04 1.02 1.26 20 / 33 / 43 / 58 1.0 / 0.7
COV Vi 0.144 0.173 0.316 0.303 4.86 / fcm 0.10 / 0.20
b 1.00 0.96 - 1 - 1 - 1 - 1
1 Least-squares best fit slope b not taken into account
The resulting index of reliability was obtained by a first-order reliability method(FORM) with the software COMREL. The FORM and the derivation of limit statefunctions for reliability investigations are described in [RIC09]. A comparison of
2.66·sE 3.04·sR
f (r)R
f (r)E
E
R
E=R
= 4
35 M
Pad
d
Em Rm
barstress
E95% R5%
2.66·sE 3.04·sR
f (r)R
f (r)E
E
R
E=R
= l
dd
bd
Em Rm bm= l
bondlength
E95% R5%
205
results of the FORM and a Monte-Carlo simulation with 1,000,000 samples give rathersimilar values for b (cf. Table 7-16).
Table 7-16 Values for b for the design model according to [EC2] calculated with FORM and Monte-Carlo simulation
FORM Monte-Carlo simulation
[EC2] (fck = 12 MPa) 1.628 1.575
[EC2] (fck = 50 MPa) 2.367 2.367
Limit State Function for the own Design Model for Anchorage and Lap Length
For the limit state functions, the statistical distribution of the model uncertainty and theconcrete strength are taken into account. The parameters are defined as Ø = 25 mmand [ac + atr + atp] = 1. Since the statistical distribution of these parameters is nottaken into account, their values do not influence the resulting reliability. Forfcm = 20 MPa and ssd = 435 MPa = Ed = Rd, the design model for mean bar stress canbe simplified to
0.25cm
stm,own own ownff 460 435 MPa25
æ ö= q × × = q ×ç ÷è ø
(7-87)
For the mean concrete strength values 33 MPa, 43 MPa and 58 MPa, the calibrationfactor 460 is modified. The design value is obtained by multiplication with the factor0.62 (cf. equation (7-71)). For the resistance only, the limit state function for fcm =20 MPa is
0.25cm
E R, ,own m d ownfg R R 460 / 0.62 43525+ s
æ ö= - = q × × -ç ÷è ø
(7-88)
Taking the statistical distribution of the action effects into account, the limit statefunction is given by
0.25cm
E R, ,own m d ownf 435g R R 460 / 0.62 (G Q)25 2+ s
æ ö= - = q × × - + ×ç ÷è ø
(7-89)
The reliability of the design models for bond lengths is also evaluated. For the designanchorage and lap lengths according to equation (7-73), the following limit statefunction is defined
0.4551.82 1.82 0.455own
R,lb,owncm
435 25 435 25g54 0.62 f 54 20
æ ö× qæ ö æ ö æ ö= × - ×ç ÷ ç ÷ ç ÷ç ÷× è ø è øè ø è ø(7-90)
Taking the action effects into account leads to the limit state function for anchorageand lap lengths
206
( ) 1.820.4551.82 0.455own
R E,lb,owncm
G Q 435435 25 25g54 0.62 f 2 54 20+
+ ×æ öæ ö× qæ ö æ ö= × - ×ç ÷ç ÷ ç ÷ç ÷× × è øè ø è ø è ø(7-91)
For all limit state functions, the target value is 0.8 · 3.8 = 3.04. The mean values andCOVs of the parameters considered are given in Table 7-15.
Limit State Function for the Design Model for Anchorage and Lap LengthAccording to [PT18] with Own Calibration Factors
Accordingly, the reliability was evaluated for the design model according to [PT18]with own calibration factors including the least-squares best fit slope b = 0.96 with
1/3cm
stm,PT PT PTff 0.96 468.5 0.96 43525
æ ö= × q × × = × q ×ç ÷è ø
(7-92)
1/3cm
R, ,PT m d PTfg R R 0.96 468.5 / 0.55 43525s
æ ö= - = × q × × -ç ÷è ø
(7-93)
Taking the statistical distribution of the action effects into account, the limit statefunction for fcm = 20 MPa and Ed = Rd = ssd = 435 MPa is
( )1/3
cmR E, ,PT m d PT
f 435g R R 0.96 468.5 / 0.55 G Q25 2+ s
æ ö= - = × q × × - + ×ç ÷è ø
(7-94)
The limit state functions for the design anchorage and lap lengths according to thismodel (cf. equation (7-82)) follow from
0.51.5 1.5 0.5PT
R,lb,PTcm
0.96 25 435 25g 31 310.55 f 435 20
æ ö× qæ ö æ ö æ ö= × × - × ×ç ÷ ç ÷ ç ÷ç ÷è ø è øè ø è ø
(7-95)
( ) 1.50.51.5 0.5PT
R E,lb,PTcm
G Q0.96 25 25g 31 310.55 f 2 20+
+æ öæ ö× qæ ö æ ö= × × - × ×ç ÷ç ÷ ç ÷ç ÷è øè ø è ø è ø
(7-96)
Limit State Function for Design Model According to [EC2] and [EC2/NA]
For [EC2], the evaluation is conducted with the following limit state functions and thestatistical data given in Table 7-15. The design tensile concrete strength according to[EC2] is fctd = 0.7 · fctm / 1.5 = 0.7 · 0.3 · fck2/3 / 1.5. For a mean concrete strengthfcm = 20 MPa:
( )2/3std,EC2 EC2 cmf 83 f 8 435 MPa= q × × - = (7-97)
( )2/3R, ,EC2 m d EC2 cmg R R 83 1.5 / 0.7 f 8 435s = - = q × × × - - (7-98)
Where the action effects are taken into account, the limit state function for [EC2] isdefined as follows
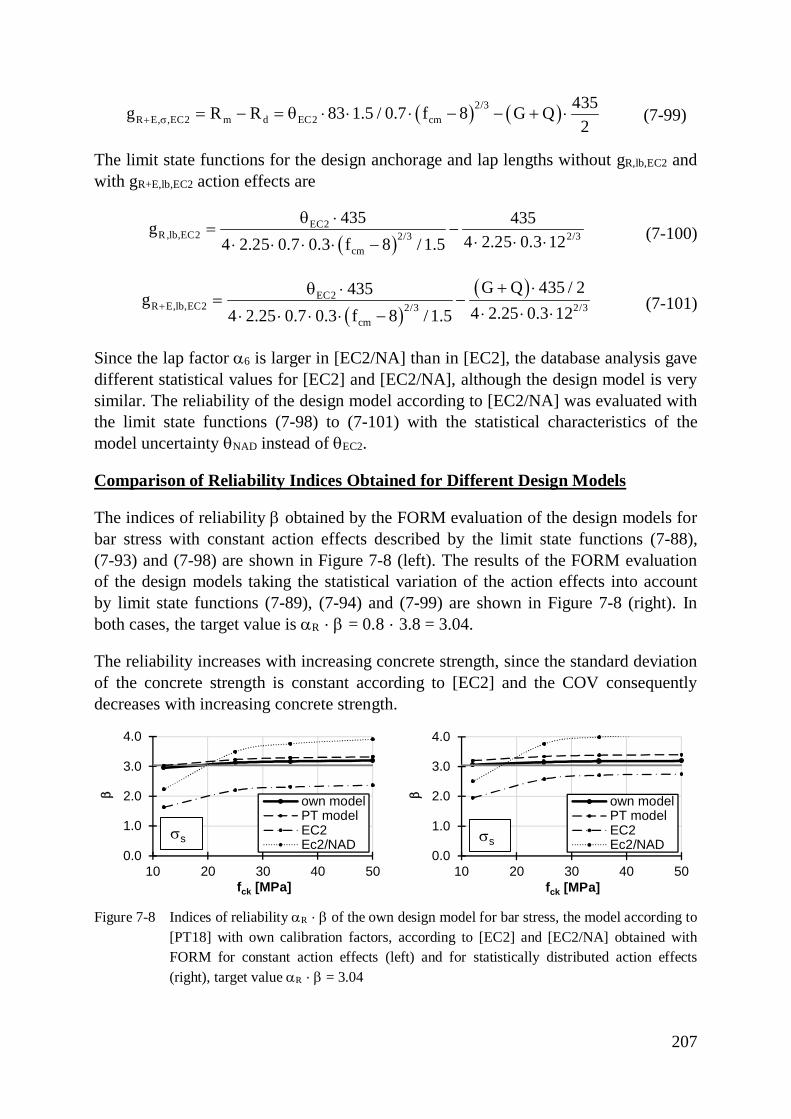
207
( ) ( )2/3R E, ,EC2 m d EC2 cm
435g R R 83 1.5 / 0.7 f 8 G Q2+ s = - = q × × × - - + × (7-99)
The limit state functions for the design anchorage and lap lengths without gR,lb,EC2 andwith gR+E,lb,EC2 action effects are
( )EC2
R,lb,EC2 2/3 2/3cm
435 435g4 2.25 0.3 124 2.25 0.7 0.3 f 8 / 1.5
q ×= -
× × ×× × × × -(7-100)
( )( )EC2
R E,lb,EC2 2/3 2/3cm
G Q 435 / 2435g4 2.25 0.3 124 2.25 0.7 0.3 f 8 / 1.5
+
+ ×q ×= -
× × ×× × × × -(7-101)
Since the lap factor a6 is larger in [EC2/NA] than in [EC2], the database analysis gavedifferent statistical values for [EC2] and [EC2/NA], although the design model is verysimilar. The reliability of the design model according to [EC2/NA] was evaluated withthe limit state functions (7-98) to (7-101) with the statistical characteristics of themodel uncertainty qNAD instead of qEC2.
Comparison of Reliability Indices Obtained for Different Design Models
The indices of reliability b obtained by the FORM evaluation of the design models forbar stress with constant action effects described by the limit state functions (7-88),(7-93) and (7-98) are shown in Figure 7-8 (left). The results of the FORM evaluationof the design models taking the statistical variation of the action effects into accountby limit state functions (7-89), (7-94) and (7-99) are shown in Figure 7-8 (right). Inboth cases, the target value is aR · b = 0.8 · 3.8 = 3.04.
The reliability increases with increasing concrete strength, since the standard deviationof the concrete strength is constant according to [EC2] and the COV consequentlydecreases with increasing concrete strength.
Figure 7-8 Indices of reliability aR · b of the own design model for bar stress, the model according to[PT18] with own calibration factors, according to [EC2] and [EC2/NA] obtained withFORM for constant action effects (left) and for statistically distributed action effects(right), target value aR · b = 3.04
0.0
1.0
2.0
3.0
4.0
10 20 30 40 50
b
fck [MPa]
own modelPT modelEC2Ec2/NAD
ss0.0
1.0
2.0
3.0
4.0
10 20 30 40 50
b
fck [MPa]
own modelPT modelEC2Ec2/NADss
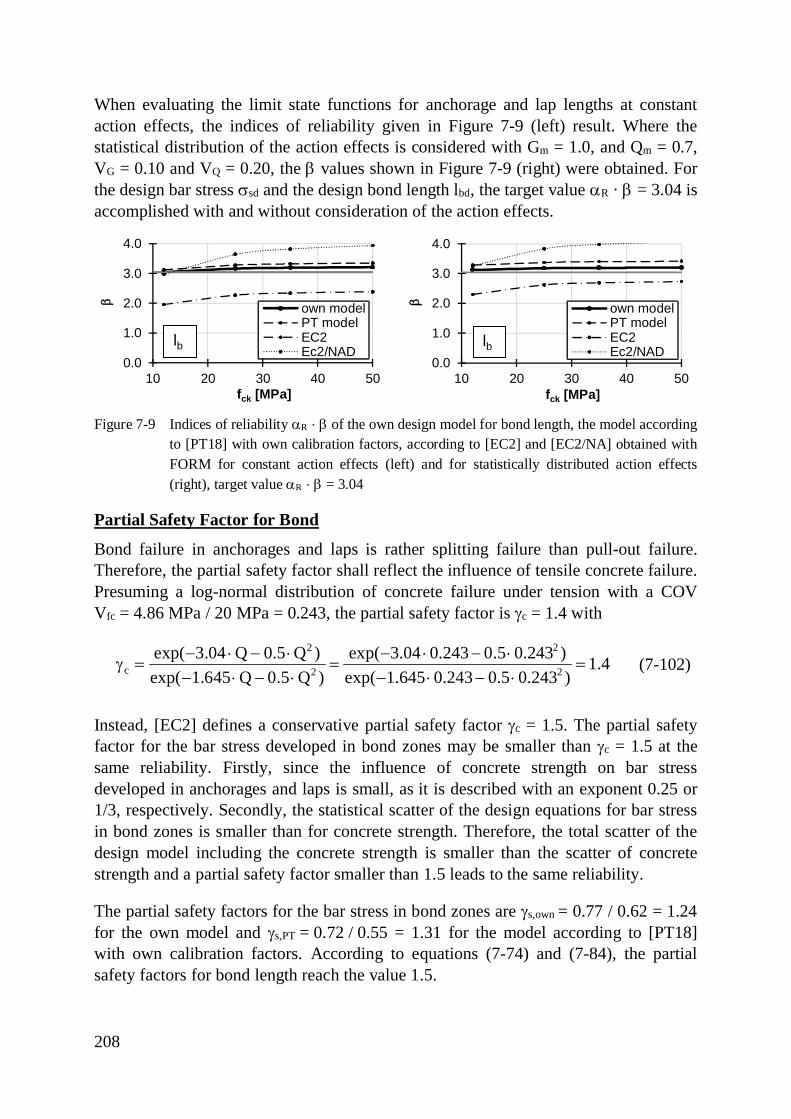
208
When evaluating the limit state functions for anchorage and lap lengths at constantaction effects, the indices of reliability given in Figure 7-9 (left) result. Where thestatistical distribution of the action effects is considered with Gm = 1.0, and Qm = 0.7,VG = 0.10 and VQ = 0.20, the b values shown in Figure 7-9 (right) were obtained. Forthe design bar stress ssd and the design bond length lbd, the target value aR · b = 3.04 isaccomplished with and without consideration of the action effects.
Figure 7-9 Indices of reliability aR · b of the own design model for bond length, the model accordingto [PT18] with own calibration factors, according to [EC2] and [EC2/NA] obtained withFORM for constant action effects (left) and for statistically distributed action effects(right), target value aR · b = 3.04
Partial Safety Factor for Bond
Bond failure in anchorages and laps is rather splitting failure than pull-out failure.Therefore, the partial safety factor shall reflect the influence of tensile concrete failure.Presuming a log-normal distribution of concrete failure under tension with a COVVfc = 4.86 MPa / 20 MPa = 0.243, the partial safety factor is gc = 1.4 with
2 2
c 2 2exp( 3.04 Q 0.5 Q ) exp( 3.04 0.243 0.5 0.243 ) 1.4exp( 1.645 Q 0.5 Q ) exp( 1.645 0.243 0.5 0.243 )
- × - × - × - ×g = = =
- × - × - × - ×(7-102)
Instead, [EC2] defines a conservative partial safety factor gc = 1.5. The partial safetyfactor for the bar stress developed in bond zones may be smaller than gc = 1.5 at thesame reliability. Firstly, since the influence of concrete strength on bar stressdeveloped in anchorages and laps is small, as it is described with an exponent 0.25 or1/3, respectively. Secondly, the statistical scatter of the design equations for bar stressin bond zones is smaller than for concrete strength. Therefore, the total scatter of thedesign model including the concrete strength is smaller than the scatter of concretestrength and a partial safety factor smaller than 1.5 leads to the same reliability.
The partial safety factors for the bar stress in bond zones are gs,own = 0.77 / 0.62 = 1.24for the own model and gs,PT = 0.72 / 0.55 = 1.31 for the model according to [PT18]with own calibration factors. According to equations (7-74) and (7-84), the partialsafety factors for bond length reach the value 1.5.
0.0
1.0
2.0
3.0
4.0
10 20 30 40 50
b
fck [MPa]
own modelPT modelEC2Ec2/NAD
lb0.0
1.0
2.0
3.0
4.0
10 20 30 40 50
bfck [MPa]
own modelPT modelEC2Ec2/NAD
lb
209
7.5 Possible Reduction of Design Anchorage and Lap LengthThe design lengths derived in chapter 7.4.5 without transverse pressure are longer thanthe design lengths according to [EC2]. To allow for a definition of shorter designlengths in future codes, different measures are considered.
The maximum bar stress in bond zones increases where transverse reinforcement ispositioned. Therefore, the values for necessary design lengths can be reduced by thedefinition of minimum transverse reinforcement. Secondly, laps could only bepermitted in zones with bar stresses well below the yield stress. In this case, thenecessary bond lengths decrease significantly. Furthermore, staggered anchorages orlaps slightly increase the bearing capacity of bond zones for increasing concrete cover.Design values can also be reduced by a reduction of database scatter, since smallercoefficients of variation are taken into account.
To reduce the required anchorage and lap length, it is eventually most effective to takethe bar stress into account during design and to position transverse reinforcement thatalso provides robustness.
7.5.1 Reduction of Bond Length for Minimum Transverse Reinforcement
The database includes anchorages and laps with an without transverse reinforcement.Not all tests with transverse reinforcement fulfil the minimum reinforcementrequirement with SAst,min = 1.0 · As, but have transverse reinforcement ratios SAst / As
between 0.2 and 3.3. Taking only laps with minimum transverse reinforcementSAst,min = 1.0 · As into account, leaves only 35 of 231 lap tests with transversereinforcement in the dataset. Just three anchorage tests in the database fulfil therequirement SAst,min = 0.5 · As.
The exclusion of tests with transverse reinforcement smaller than the minimumtransverse reinforcement gives a mean value of the model uncertainty q = 1.03 and aCOV of 0.175 for the remaining 35 tests if evaluated with the own design model. Thetotal COV of the model uncertainty for the own model is Vq = 0.153 for 473 testsinstead of Vq = 0.144 for 669 tests. Since this COV exceeds the value (Vq = 0.144)considered in the derivation of design values in chapter 7.4.5, this method would evenincrease the design anchorage and lap length.
A reduction of the calibration factors on the basis of smaller coefficients of variationfor minimum transverse reinforcement is therefore not possible. Still, the resulting lapand anchorage lengths according to the proposed design equations are smaller iftransverse reinforcement is positioned (cf. Figure 7-6).
7.5.2 Reduction of Bond Length for Small Utilization of Bars
EUROCODE 2 [EC2] recommends not to locate laps in areas of high moments and barforces. Where reinforcing bars are only utilized up to about 60 %(250 MPa / 435 MPa), the anchorage and lap lengths given in Table 7-13 for
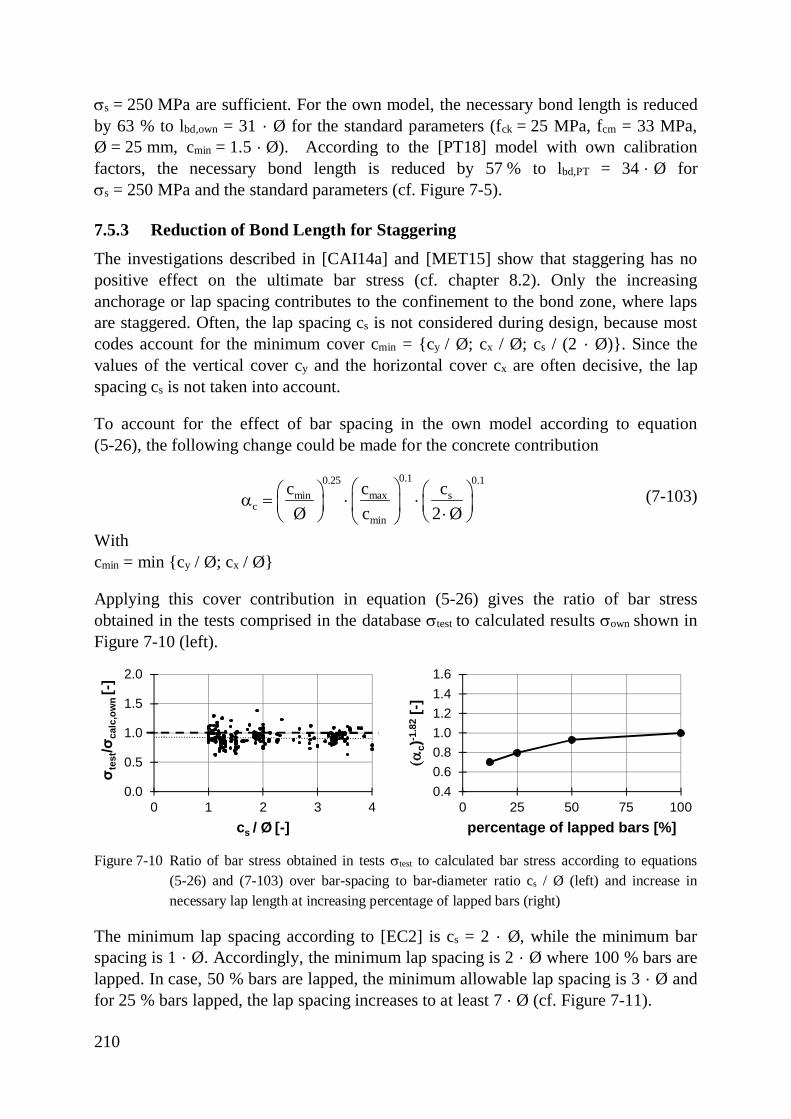
210
ss = 250 MPa are sufficient. For the own model, the necessary bond length is reducedby 63 % to lbd,own = 31 · Ø for the standard parameters (fck = 25 MPa, fcm = 33 MPa,Ø = 25 mm, cmin = 1.5 · Ø). According to the [PT18] model with own calibrationfactors, the necessary bond length is reduced by 57 % to lbd,PT = 34 · Ø forss = 250 MPa and the standard parameters (cf. Figure 7-5).
7.5.3 Reduction of Bond Length for Staggering
The investigations described in [CAI14a] and [MET15] show that staggering has nopositive effect on the ultimate bar stress (cf. chapter 8.2). Only the increasinganchorage or lap spacing contributes to the confinement to the bond zone, where lapsare staggered. Often, the lap spacing cs is not considered during design, because mostcodes account for the minimum cover cmin = {cy / Ø; cx / Ø; cs / (2 · Ø)}. Since thevalues of the vertical cover cy and the horizontal cover cx are often decisive, the lapspacing cs is not taken into account.
To account for the effect of bar spacing in the own model according to equation(5-26), the following change could be made for the concrete contribution
0.1 0.10.25max smin
cmin
c ccØ c 2 Ø
æ ö æ öæ öa = × ×ç ÷ç ÷ ç ÷×è ø è øè ø(7-103)
Withcmin = min {cy / Ø; cx / Ø}
Applying this cover contribution in equation (5-26) gives the ratio of bar stressobtained in the tests comprised in the database stest to calculated results sown shown inFigure 7-10 (left).
Figure 7-10 Ratio of bar stress obtained in tests stest to calculated bar stress according to equations(5-26) and (7-103) over bar-spacing to bar-diameter ratio cs / Ø (left) and increase innecessary lap length at increasing percentage of lapped bars (right)
The minimum lap spacing according to [EC2] is cs = 2 · Ø, while the minimum barspacing is 1 · Ø. Accordingly, the minimum lap spacing is 2 · Ø where 100 % bars arelapped. In case, 50 % bars are lapped, the minimum allowable lap spacing is 3 · Ø andfor 25 % bars lapped, the lap spacing increases to at least 7 · Ø (cf. Figure 7-11).
0.0
0.5
1.0
1.5
2.0
0 1 2 3 4
σ tes
t/σca
lc,o
wn
[-]
cs / Ø [-]
0.40.60.81.01.21.41.6
0 25 50 75 100
(ac)-1
.82
[-]
percentage of lapped bars [%]
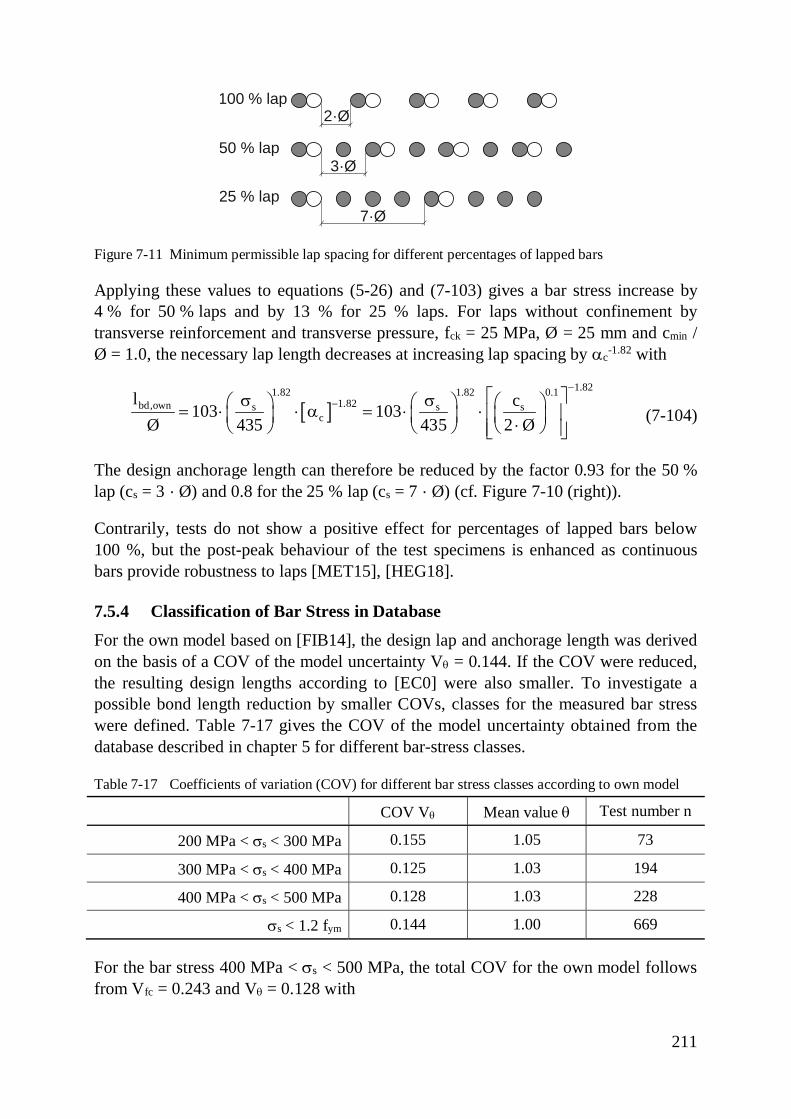
211
Figure 7-11 Minimum permissible lap spacing for different percentages of lapped bars
Applying these values to equations (5-26) and (7-103) gives a bar stress increase by4 % for 50 % laps and by 13 % for 25 % laps. For laps without confinement bytransverse reinforcement and transverse pressure, fck = 25 MPa, Ø = 25 mm and cmin /Ø = 1.0, the necessary lap length decreases at increasing lap spacing by ac-1.82 with
[ ]1.821.82 1.82 0.1
1.82bd,own s s sc
l c103 103Ø 435 435 2 Ø
-- é ùs sæ ö æ ö æ ö= × × a = × × ê úç ÷ ç ÷ ç ÷×è ø è ø è øê úë û
(7-104)
The design anchorage length can therefore be reduced by the factor 0.93 for the 50 %lap (cs = 3 · Ø) and 0.8 for the 25 % lap (cs = 7 · Ø) (cf. Figure 7-10 (right)).
Contrarily, tests do not show a positive effect for percentages of lapped bars below100 %, but the post-peak behaviour of the test specimens is enhanced as continuousbars provide robustness to laps [MET15], [HEG18].
7.5.4 Classification of Bar Stress in Database
For the own model based on [FIB14], the design lap and anchorage length was derivedon the basis of a COV of the model uncertainty Vq = 0.144. If the COV were reduced,the resulting design lengths according to [EC0] were also smaller. To investigate apossible bond length reduction by smaller COVs, classes for the measured bar stresswere defined. Table 7-17 gives the COV of the model uncertainty obtained from thedatabase described in chapter 5 for different bar-stress classes.
Table 7-17 Coefficients of variation (COV) for different bar stress classes according to own model
COV Vq Mean value q Test number n
200 MPa < ss < 300 MPa 0.155 1.05 73
300 MPa < ss < 400 MPa 0.125 1.03 194
400 MPa < ss < 500 MPa 0.128 1.03 228
ss < 1.2 fym 0.144 1.00 669
For the bar stress 400 MPa < ss < 500 MPa, the total COV for the own model followsfrom Vfc = 0.243 and Vq = 0.128 with
7·Ø
3·Ø
2·Ø100 % lap
50 % lap
25 % lap
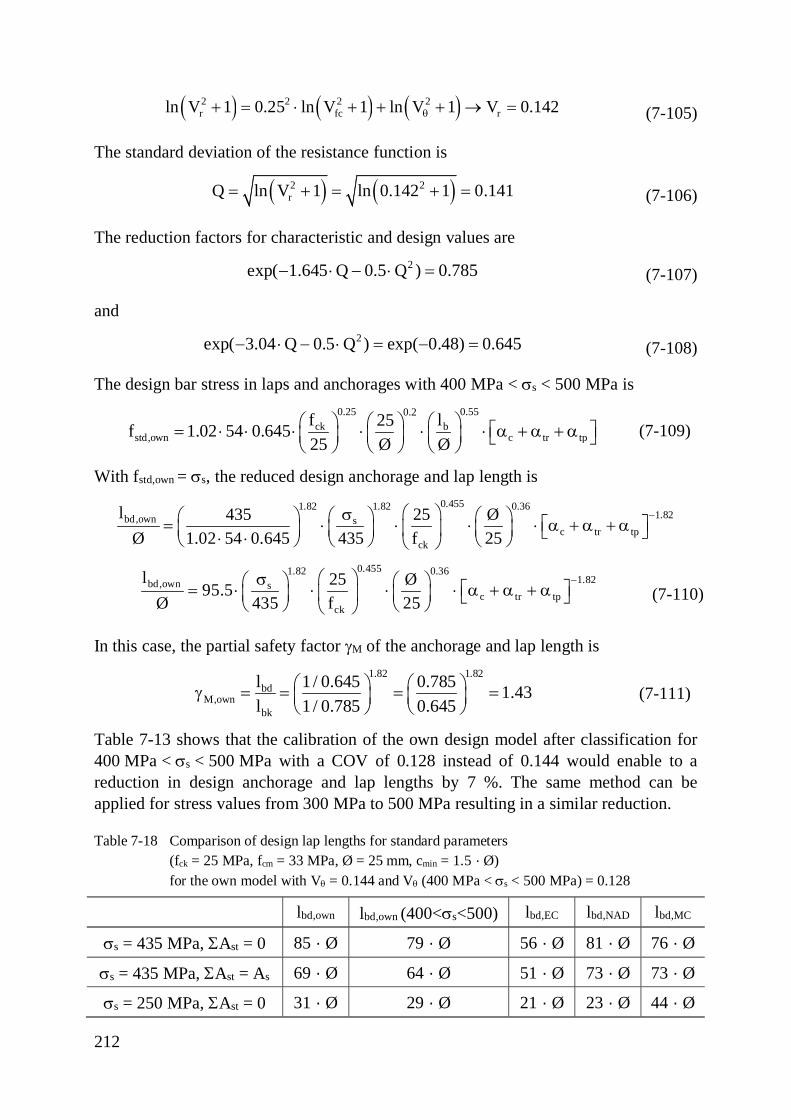
212
( ) ( ) ( )2 2 2 2r fc rln V 1 0.25 ln V 1 ln V 1 V 0.142q+ = × + + + ® = (7-105)
The standard deviation of the resistance function is
( ) ( )2 2rQ ln V 1 ln 0.142 1 0.141= + = + = (7-106)
The reduction factors for characteristic and design values are2exp( 1.645 Q 0.5 Q ) 0.785- × - × = (7-107)
and2exp( 3.04 Q 0.5 Q ) exp( 0.48) 0.645- × - × = - = (7-108)
The design bar stress in laps and anchorages with 400 MPa < ss < 500 MPa is0.25 0.550.2
ck bstd,own c tr tp
f l25f 1.02 54 0.64525 Ø Ø
æ ö æ öæ ö é ù= × × × × × × a + a + aç ÷ç ÷ ç ÷ ë ûè øè ø è ø(7-109)
With fstd,own = ss, the reduced design anchorage and lap length is0.4551.821.82 0.36
1.82bd,own sc tr tp
ck
l 435 25 ØØ 1.02 54 0.645 435 f 25
-æ ösæ öæ ö æ ö é ù= × × × × a + a + aç ÷ç ÷ ç ÷ç ÷ ë û× ×è ø è øè ø è ø0.4551.82 0.36
1.82bd,own sc tr tp
ck
l 25 Ø95.5Ø 435 f 25
-æ ösæ ö æ ö é ù= × × × × a + a + aç ÷ ç ÷ç ÷ ë ûè øè ø è ø(7-110)
In this case, the partial safety factor gM of the anchorage and lap length is1.82 1.82
bdM,own
bk
l 1 / 0.645 0.785 1.43l 1 / 0.785 0.645
æ ö æ ög = = = =ç ÷ ç ÷è ø è ø
(7-111)
Table 7-13 shows that the calibration of the own design model after classification for400 MPa < ss < 500 MPa with a COV of 0.128 instead of 0.144 would enable to areduction in design anchorage and lap lengths by 7 %. The same method can beapplied for stress values from 300 MPa to 500 MPa resulting in a similar reduction.
Table 7-18 Comparison of design lap lengths for standard parameters (fck = 25 MPa, fcm = 33 MPa, Ø = 25 mm, cmin = 1.5 · Ø) for the own model with Vq = 0.144 and Vq (400 MPa < ss < 500 MPa) = 0.128
lbd,own lbd,own (400<ss<500) lbd,EC lbd,NAD lbd,MC
ss = 435 MPa, SAst = 0 85 · Ø 79 · Ø 56 · Ø 81 · Ø 76 · Ø
ss = 435 MPa, SAst = As 69 · Ø 64 · Ø 51 · Ø 73 · Ø 73 · Ø
ss = 250 MPa, SAst = 0 31 · Ø 29 · Ø 21 · Ø 23 · Ø 44 · Ø

213
7.6 Difference Between Anchorages and LapsThe governing difference between anchorages and laps lies in the stress state of thebars. While the maximum bar stress at beam ends of simply supported beams isusually much smaller than the yield strength, laps must transfer bar forces up to theyield strength. Accordingly, the necessary lap lengths must be longer than anchorages.The increase in lap or anchorage strength and developable bar force respectively doesnot increase linearly with the bond length. Therefore, the lap length must be increasedby a certain factor in case the bond strength is presumed constant over bond length.This is done in [EC2] by the lap factor a6. When the non-linear effect of bond length istaken into account within the design equation as in [FIB14], [MC2010], [ELI79],[BUR00], [LET06a] and [CAN05]) a lap factor for the increase in anchorage length isnot necessary. In contrast, a factor is necessary in [EC2], [EC2/NA] and [ACI14].
Where a linear relationship is presumed, the ratio of the required bond length lb,lin at500 MPa to the reqired bond length lb,lin at 250 MPa is
( ) ( )b,lin b,linØ 500 Ø 250l 500 / l 250 / 2.0
4 4× ×
= =× t × t (7-112)
Where the non-linearity of the bond length effect is accounted for, e.g. with theexponent 0.5, the ratio of the required bond length lb,non-lin at 500 MPa to the reqiredbond length lb,non-lin at 250 MPa is
( ) ( )( ) ( )
2 2
b,non lin b,non lin 2 2Ø 500 Ø 250l 500 / l 250 / 4.0
4 4- -
× ×= =
× t × t(7-113)
Where design models neglect the non-linear relationship, a lap factor 4.0 / 2.0 = 2.0 isrequired. [EC2] gives lap factors a6 up to 1.5 and [EC2/NA] up to 2.0. The necessarylap factor – that is only needed in design models if the bar stress is considered linearly– actually depends on the bar stresses. Subsequently, anchorages that transfer the samereinforcing bar stress as laps require the same length as laps.
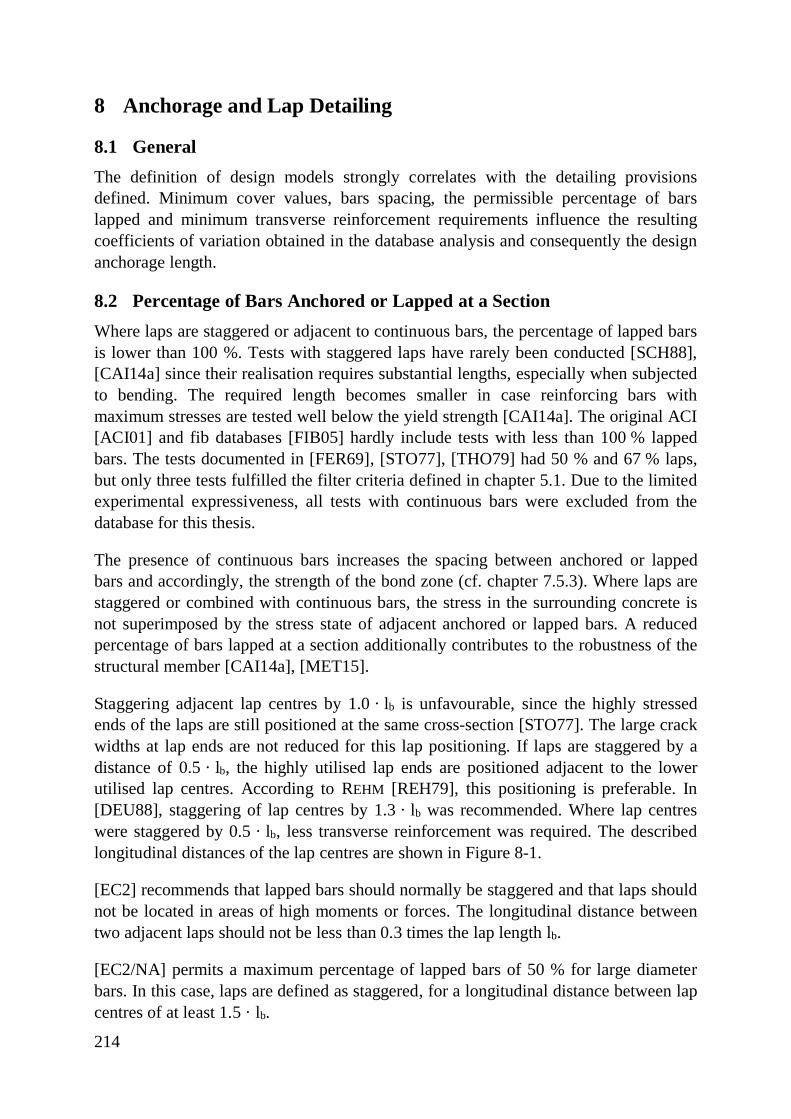
214
8 Anchorage and Lap Detailing
8.1 GeneralThe definition of design models strongly correlates with the detailing provisionsdefined. Minimum cover values, bars spacing, the permissible percentage of barslapped and minimum transverse reinforcement requirements influence the resultingcoefficients of variation obtained in the database analysis and consequently the designanchorage length.
8.2 Percentage of Bars Anchored or Lapped at a SectionWhere laps are staggered or adjacent to continuous bars, the percentage of lapped barsis lower than 100 %. Tests with staggered laps have rarely been conducted [SCH88],[CAI14a] since their realisation requires substantial lengths, especially when subjectedto bending. The required length becomes smaller in case reinforcing bars withmaximum stresses are tested well below the yield strength [CAI14a]. The original ACI[ACI01] and fib databases [FIB05] hardly include tests with less than 100 % lappedbars. The tests documented in [FER69], [STO77], [THO79] had 50 % and 67 % laps,but only three tests fulfilled the filter criteria defined in chapter 5.1. Due to the limitedexperimental expressiveness, all tests with continuous bars were excluded from thedatabase for this thesis.
The presence of continuous bars increases the spacing between anchored or lappedbars and accordingly, the strength of the bond zone (cf. chapter 7.5.3). Where laps arestaggered or combined with continuous bars, the stress in the surrounding concrete isnot superimposed by the stress state of adjacent anchored or lapped bars. A reducedpercentage of bars lapped at a section additionally contributes to the robustness of thestructural member [CAI14a], [MET15].
Staggering adjacent lap centres by 1.0 · lb is unfavourable, since the highly stressedends of the laps are still positioned at the same cross-section [STO77]. The large crackwidths at lap ends are not reduced for this lap positioning. If laps are staggered by adistance of 0.5 · lb, the highly utilised lap ends are positioned adjacent to the lowerutilised lap centres. According to REHM [REH79], this positioning is preferable. In[DEU88], staggering of lap centres by 1.3 · lb was recommended. Where lap centreswere staggered by 0.5 · lb, less transverse reinforcement was required. The describedlongitudinal distances of the lap centres are shown in Figure 8-1.
[EC2] recommends that lapped bars should normally be staggered and that laps shouldnot be located in areas of high moments or forces. The longitudinal distance betweentwo adjacent laps should not be less than 0.3 times the lap length lb.
[EC2/NA] permits a maximum percentage of lapped bars of 50 % for large diameterbars. In this case, laps are defined as staggered, for a longitudinal distance between lapcentres of at least 1.5 · lb.
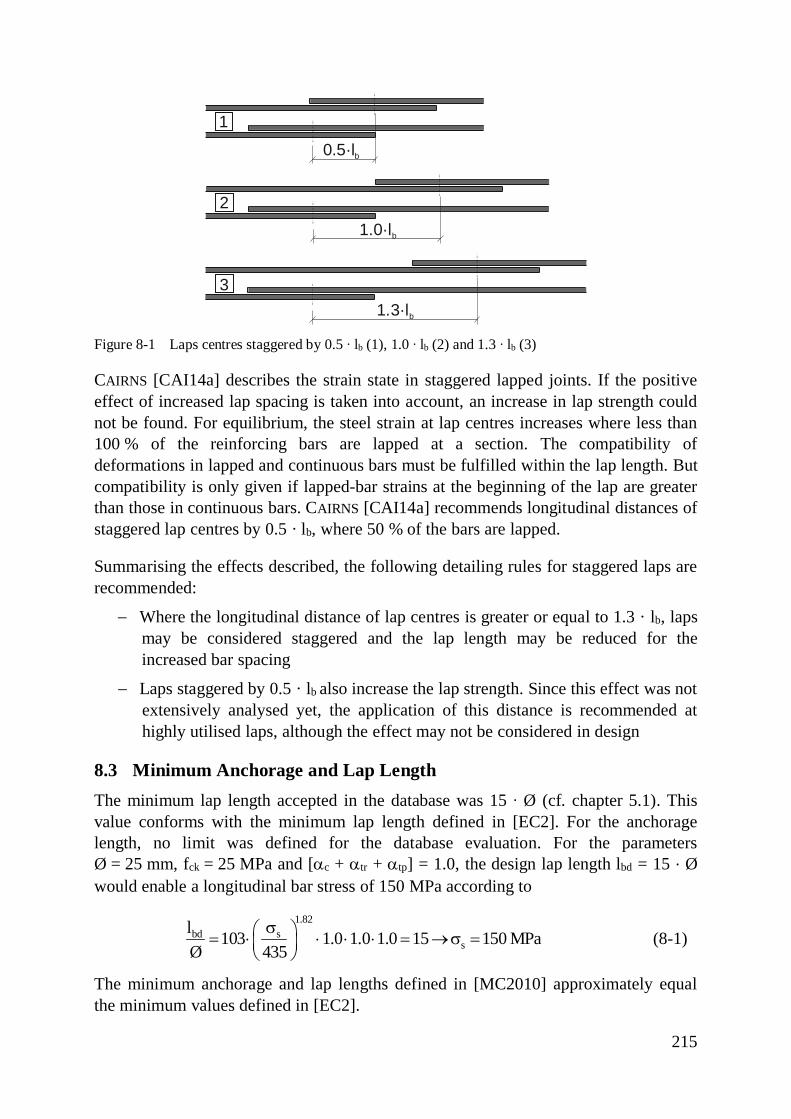
215
Figure 8-1 Laps centres staggered by 0.5 ∙ lb (1), 1.0 ∙ lb (2) and 1.3 ∙ lb (3)
CAIRNS [CAI14a] describes the strain state in staggered lapped joints. If the positiveeffect of increased lap spacing is taken into account, an increase in lap strength couldnot be found. For equilibrium, the steel strain at lap centres increases where less than100 % of the reinforcing bars are lapped at a section. The compatibility ofdeformations in lapped and continuous bars must be fulfilled within the lap length. Butcompatibility is only given if lapped-bar strains at the beginning of the lap are greaterthan those in continuous bars. CAIRNS [CAI14a] recommends longitudinal distances ofstaggered lap centres by 0.5 · lb, where 50 % of the bars are lapped.
Summarising the effects described, the following detailing rules for staggered laps arerecommended:
- Where the longitudinal distance of lap centres is greater or equal to 1.3 · lb, lapsmay be considered staggered and the lap length may be reduced for theincreased bar spacing
- Laps staggered by 0.5 · lb also increase the lap strength. Since this effect was notextensively analysed yet, the application of this distance is recommended athighly utilised laps, although the effect may not be considered in design
8.3 Minimum Anchorage and Lap LengthThe minimum lap length accepted in the database was 15 ∙ Ø (cf. chapter 5.1). Thisvalue conforms with the minimum lap length defined in [EC2]. For the anchoragelength, no limit was defined for the database evaluation. For the parametersØ = 25 mm, fck = 25 MPa and [ac + atr + atp] = 1.0, the design lap length lbd = 15 · Øwould enable a longitudinal bar stress of 150 MPa according to
1.82bd s
sl 103 1.0 1.0 1.0 15 150 MPaØ 435
sæ ö= × × × × = ®s =ç ÷è ø
(8-1)
The minimum anchorage and lap lengths defined in [MC2010] approximately equalthe minimum values defined in [EC2].
0.5·lb
1.0·lb
1.3·lb
1
2
3
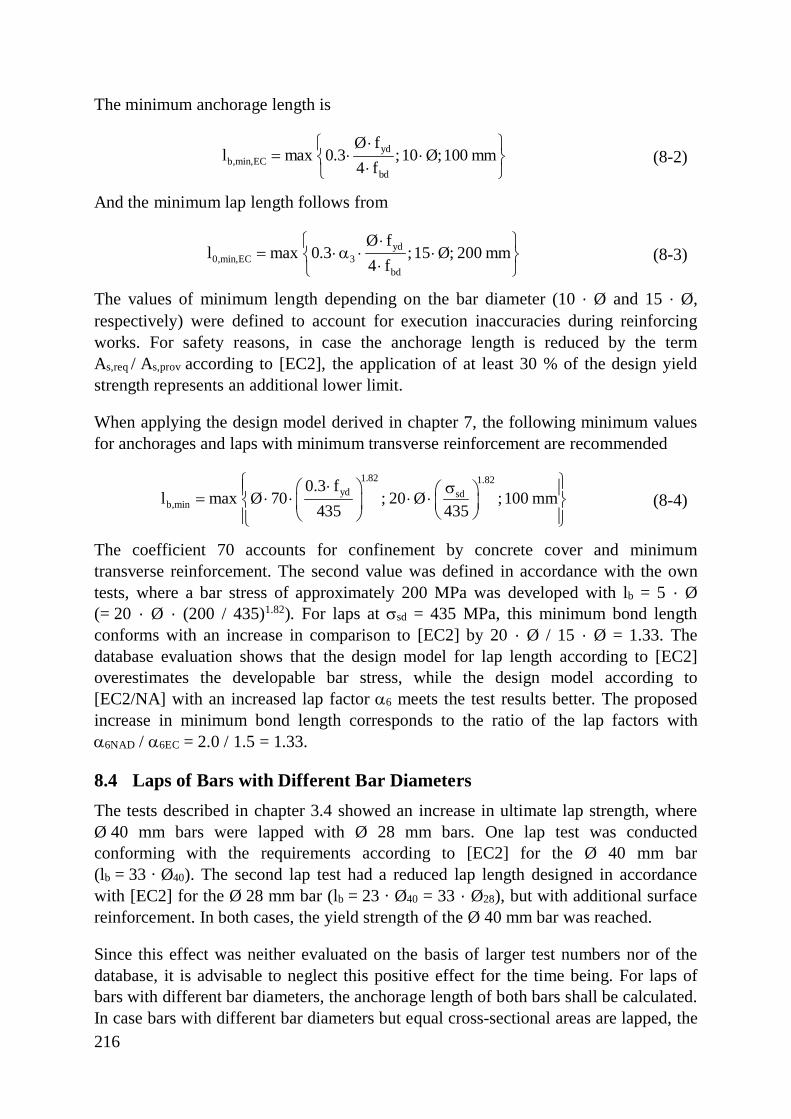
216
The minimum anchorage length is
ydb,min,EC
bd
Ø fl max 0.3 ;10 Ø;100 mm
4 f×ì ü
= × ×í ý×î þ(8-2)
And the minimum lap length follows from
yd0,min,EC 3
bd
Ø fl max 0.3 ;15 Ø; 200 mm
4 f×ì ü
= ×a × ×í ý×î þ(8-3)
The values of minimum length depending on the bar diameter (10 · Ø and 15 · Ø,respectively) were defined to account for execution inaccuracies during reinforcingworks. For safety reasons, in case the anchorage length is reduced by the termAs,req / As,prov according to [EC2], the application of at least 30 % of the design yieldstrength represents an additional lower limit.
When applying the design model derived in chapter 7, the following minimum valuesfor anchorages and laps with minimum transverse reinforcement are recommended
1.82 1.82yd sd
b,min0.3 f
l max Ø 70 ; 20 Ø ;100 mm435 435
ì ü×æ ö sï ïæ ö= × × × ×í ýç ÷ç ÷è øè øï ïî þ
(8-4)
The coefficient 70 accounts for confinement by concrete cover and minimumtransverse reinforcement. The second value was defined in accordance with the owntests, where a bar stress of approximately 200 MPa was developed with lb = 5 · Ø(= 20 · Ø · (200 / 435)1.82). For laps at ssd = 435 MPa, this minimum bond lengthconforms with an increase in comparison to [EC2] by 20 · Ø / 15 · Ø = 1.33. Thedatabase evaluation shows that the design model for lap length according to [EC2]overestimates the developable bar stress, while the design model according to[EC2/NA] with an increased lap factor a6 meets the test results better. The proposedincrease in minimum bond length corresponds to the ratio of the lap factors witha6NAD / a6EC = 2.0 / 1.5 = 1.33.
8.4 Laps of Bars with Different Bar DiametersThe tests described in chapter 3.4 showed an increase in ultimate lap strength, whereØ 40 mm bars were lapped with Ø 28 mm bars. One lap test was conductedconforming with the requirements according to [EC2] for the Ø 40 mm bar(lb = 33 · Ø40). The second lap test had a reduced lap length designed in accordancewith [EC2] for the Ø 28 mm bar (lb = 23 · Ø40 = 33 · Ø28), but with additional surfacereinforcement. In both cases, the yield strength of the Ø 40 mm bar was reached.
Since this effect was neither evaluated on the basis of larger test numbers nor of thedatabase, it is advisable to neglect this positive effect for the time being. For laps ofbars with different bar diameters, the anchorage length of both bars shall be calculated.In case bars with different bar diameters but equal cross-sectional areas are lapped, the
217
bar with the larger bar diameter is decisive. If the bar number is equal, the smaller barhas a smaller cross-sectional area, develops higher bar stress than the bar with thelarger diameter and is thus governing.
8.5 Anchorages and Laps in Several Layers[EC2] allows for laps with up to 100 % lapped bars in a single layer, but only up to50 % in case several layers are positioned. This requirement was justified by increasedloads and the lack of experimental data [REH79]. [FIB14] finds no argument in favourof modifying bond length where there is more than a single layer of reinforcement.
In anchorage tests with a double layer of bonded bars, JIRSA ET AL. [JIR95] observedthat the bond resistance of the well confined inner layer increased after failure, whilethe resistance of the outer layer dropped sharply.
For the confinement of anchorages and laps in several layers, additional transversereinforcement is required. [EC2] defines increasing transverse reinforcement parallelto the tension face for anchorages of large diameter bars in several layers.Additionally, [EC2/NA] requires additional edge reinforcement of at least 0.18 · Asl
[cm²/m], where Asl is the cross-sectional area of the lapped reinforcement. This valueoriginates from the requirements for Ø 50 mm bars that were defined in [JUN77].
The own lap tests showed that the confinement by transverse surface reinforcementwith U-shaped bars, which were not adequately anchored in the compression zone, didnot confine the bond zone sufficiently. It is therefore recommended to mind properanchorage of transverse reinforcement for the upper layers as well. U-shapedhorizontal edge reinforcement is recommended that encloses the longitudinal bars inthe upper layers. This reinforcement crosses the potential splitting plane for side andface splitting of the bars in the upper layer.
8.6 Casting PositionThe position of reinforcement during casting influences the quality of bond betweenreinforcing bars and concrete. In case bars are positioned at the top of the cross-sectional height, their bond strength is often smaller than for bottom cast bars.Furthermore, the bond conditions of bars positioned horizontally during casting differfrom bars positioned vertically during casting. MARTIN AND NOAKOWSKI [MAR81]found that the bond strength of vertical bars was up to twice as high as the bondstrength of horizontal bars. This bond strength reduction is due to slump and poreformation below reinforcing bars. The loss in circumference contributing to bondcaused by poor bond conditions is limited to 50 % [REH61]. While pores can formbelow all horizontal reinforcing bars, bars at the top of a member’s height are mostlikely to suffer from concrete slump. Therefore, bars at top of the cross-sectionalheight develop significantly smaller bond strength than bars positioned at the bottomof the structural member during casting. Top cast laps at low slump showed a bond
218
strength reduction by 20 % in tests, while top cast laps at high concrete slump showeda bond strength reduction by 60 % [HAM98].
DIN 1045 [DEU88] defined a bond strength reduction by 50% for anchorages and by30% for laps. Since splitting failures are usually decisive in both cases, the reductionwas harmonised in the following codes. While [EC2], [MC90] and [MC2010] define abond strength reduction by 30 % for poor bond conditions, the proposal for the nextgeneration of EUROCODE 2 [PT18] gives a smaller strength decrease for anchoragesand laps by 20 %.
The range of reduction factors for poor bond conditions given in literature varieswidely, since the effect strongly depends on the concrete characteristics. While thereduction is up to 50 % in pull-out failures, the reduction is only 30 % for splittingfailures that rather depend on the tensile strength of the surrounding concrete [ELI79].ACI COMMITTEE 408 [ACI03] gives a comprehensive overview of publications onbond strength reduction caused by unfavourable casting positions.
The original fib lap database [FIB05] comprises several lap tests in the top castposition (e.g. [AZI93], [FER69], [FER62], [FER71], [HAM98], [HES93], [STO77],[TRE89], [ZEK81]). However, the single investigations often focused on otherinfluencing parameters or showed contradictory results for the effect of castingposition.
8.7 Transverse ReinforcementThe positioning of minimum transverse reinforcement in laps and anchorages isstrongly recommended. Transverse reinforcement effectively controls the longitudinalcrack width if the tensile strength of the confining concrete cover is exceeded in bondzones. This effect implies that transverse reinforcement is not necessary where smallbars with large concrete cover are anchored. The recommended minimumreinforcement is SAst = 1.0 · As. If the longitudinal bar stress is well below the yieldstress, the minimum reinforcement may be reduced to SAst = 0.5 · As. Lowerlongitudinal bar stresses are reached e.g. at supports of simply supported beams. Theadditional transverse reinforcement for anchorages of large diameter bars defined in[EC2] is covered by the afore mentioned values. The bond securing transversereinforcement required along the entire beam length for bars with large diametersdefined in [EC2/NA] is only covered in anchorages and laps. Anyhow, tests conductedwith Ø 40 mm bars proved that longitudinal cracks only occurred in bond zones.
8.8 Surface ReinforcementAccording to [EC2], the crack control of reinforced concrete members with largediameter bars can be accomplished either by direct calculation of crack width or bypositioning of surface reinforcement. Tests conducted with direct tension membersreinforced with Ø 40 mm bars ([HEG15], [HEG18]) showed that crack calculationcan be omitted where surface reinforcement is positioned, which is equal to 2 % of the
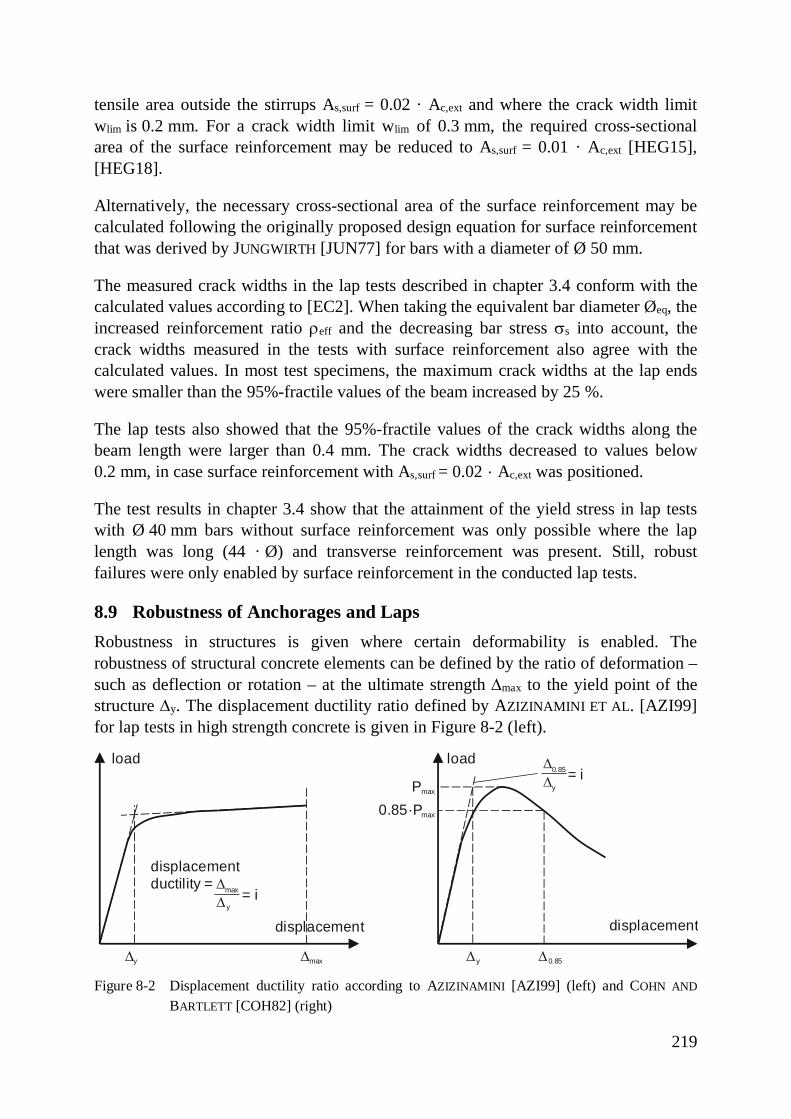
219
tensile area outside the stirrups As,surf = 0.02 · Ac,ext and where the crack width limitwlim is 0.2 mm. For a crack width limit wlim of 0.3 mm, the required cross-sectionalarea of the surface reinforcement may be reduced to As,surf = 0.01 · Ac,ext [HEG15],[HEG18].
Alternatively, the necessary cross-sectional area of the surface reinforcement may becalculated following the originally proposed design equation for surface reinforcementthat was derived by JUNGWIRTH [JUN77] for bars with a diameter of Ø 50 mm.
The measured crack widths in the lap tests described in chapter 3.4 conform with thecalculated values according to [EC2]. When taking the equivalent bar diameter Øeq, theincreased reinforcement ratio reff and the decreasing bar stress ss into account, thecrack widths measured in the tests with surface reinforcement also agree with thecalculated values. In most test specimens, the maximum crack widths at the lap endswere smaller than the 95%-fractile values of the beam increased by 25 %.
The lap tests also showed that the 95%-fractile values of the crack widths along thebeam length were larger than 0.4 mm. The crack widths decreased to values below0.2 mm, in case surface reinforcement with As,surf = 0.02 · Ac,ext was positioned.
The test results in chapter 3.4 show that the attainment of the yield stress in lap testswith Ø 40 mm bars without surface reinforcement was only possible where the laplength was long (44 · Ø) and transverse reinforcement was present. Still, robustfailures were only enabled by surface reinforcement in the conducted lap tests.
8.9 Robustness of Anchorages and LapsRobustness in structures is given where certain deformability is enabled. Therobustness of structural concrete elements can be defined by the ratio of deformation –such as deflection or rotation – at the ultimate strength Dmax to the yield point of thestructure Dy. The displacement ductility ratio defined by AZIZINAMINI ET AL. [AZI99]for lap tests in high strength concrete is given in Figure 8-2 (left).
Figure 8-2 Displacement ductility ratio according to AZIZINAMINI [AZI99] (left) and COHN AND
BARTLETT [COH82] (right)
load
displacement
displacementductility = Dmax
Dy
Dy Dmax
= i
load
displacement
D0.85
Dy
Dy D0.85
= iPmax
0.85·Pmax
220
Alternatively, robustness can be described by the ratio of displacement correspondingto a percentage (e.g. 85 %) of the maximum load to the displacement at theintersection of maximum load and tangent of the initial load-displacement curvecorresponding to the first yield displacement of a structure [COH82] (cf. Figure 8-2,right).
If possible, anchorages and laps should not be placed in cross-sectional areas withmaximum reinforcing bar stress. Robustness is given where continuous reinforcingbars in zones with high utilisation yield before anchorages and laps outside these zonesfail. Transverse reinforcement, continuous longitudinal bars and long bond lengthscontribute to the robustness of anchorages and laps.
In [FIB14], minimum amounts of confining reinforcement are recommended to reducethe brittleness of splitting failure. Smaller stirrup sizes and spacing result in increasedrobustness [RAK14]. However, even if transverse reinforcement is provided andsplitting cracks are crossed by links, experimental evidence shows that links will notbe capable to provide a fully ductile failure [FIB14].
In case of staggered laps, the ductility index increases for greater stagger-distance tolap-length ratios (cf. Figure 8-1). CAIRNS [CAI14a] finds that brittleness is reduced iflaps are staggered, while the additional positive effect of positioned transversereinforcement was not clearly distinguishable. The own tests also showed thatpercentages of lapped bars below 100 % increased the robustness of the test specimensat failure.
Surface reinforcement in the directions parallel and orthogonal to the longitudinalreinforcement effectively contributes to the robustness of laps and anchorages. Thepositioning of surface reinforcement is advisable for large diameter bars if all bars areto be lapped at one section, the concrete cover and bar spacing are small, thereinforcement shall reach its yield strength and substantial ductility is required.
Another possibility for providing robustness to anchorages and laps are long bondlengths to reach the yield strength of the reinforcing bars. Therefore, the PT1 WORKINGDRAFT [PT18] recommends the design of tension laps for 1.2 · ssd at plastic hinges andin sections where maximum effcts are expected.
221
9 Summary and Conclusions
9.1 SummaryAnchorages and laps of reinforcing bars are required in most structural concretemembers. The characteristics of bond between concrete and reinforcement alsodetermine the crack formation in structural concrete members. The bond betweenreinforcement and surrounding concrete has therefore been subject to research over thelast decades. Numerous investigations on the bond behaviour between different kindsof reinforcement, concrete characteristics and anchorage types have been published.Still, bond mechanisms in reinforced concrete are not fully understood and differentmodels for the structural design of bond zones exist. For large diameter reinforcingbars above Ø 32 mm, additional detailing rules – mostly regarding the bond behaviour– are defined in [EC2]. Large diameter bars are especially suitable for heavilyreinforced concrete members with high reinforcement ratios. In this case usually onlylittle cover and bar spacing contribute to the confinement of the bond zone.
European [EC2] and American [ACI14] codes as well as MODEL CODE 2010[MC2010] comprise different design models for bond zones. The design model foranchorages and laps in the proposal for the next generation of EUROCODE 2 [PT18]differs from the model currently applied in [EC2]. For this new model, suitablecalibration factors for the contributions of concrete cover, transverse reinforcementand transverse pressure had not been validated.
To investigate the bond behaviour of large diameter bars in structural elements,beam-end tests and simply supported beams were tested. Beam-end tests wereconducted to obtain bond strength slip relationships for the investigated Ø 40 mm bars.The significance of the rather simple beam-end test specimens was analysed byvariation of several test parameters. Subsequently, their influence was compared to theeffects observed in the simply supported beams. The applicability of this test specimenfor the investigation of the effects of confinement by concrete cover, transversereinforcement and transverse pressure was confirmed.
The question whether design rules are equally applicable to anchorages and laps hadnot been resolved, yet. Hence, 17 four-point bending tests with laps in the constantmoment zone were conducted to investigate the ultimate strength and crackdevelopment in laps with large diameter bars. While the focus of the researchprogramme was set on Ø 40 mm bars, two lap tests with Ø 28 mm bars were executedto compare the bond behaviour of bars below and above the defined value of largediameter bars according to [EC2] (> Ø 32 mm).
To investigate the bond behaviour of anchorages with Ø 40 mm bars, six simplysupported beams were tested at each side. The anchorage lengths (5 · Ø to 11 · Ø)were much shorter than the lap lengths applied in the four-point bending tests (33 · Øto 44 · Ø). Another major difference to the lap tests was the presence of transverse
222
pressure provided by the support. In contrast to the beam-end test specimens, whichhad been developed for the testing of single reinforcing bars, anchorage tests in simplysupported beams allow for the positioning of adjacent longitudinal reinforcing barswith very small bar spacing.
The ultimate stress in the lapped reinforcing bars reached the design yield strength(435 MPa), where the laps were designed according to [EC2]. In case the lap lengthwas increased by 30 %, the stress obtained was above the actual yield strength (about570 MPa). Surface reinforcement positioned in the lap tests effectively reducedlongitudinal and transverse cracks and increased the ultimate strength.
Since the stress to be developed in anchorages was much lower than in laps, the testedanchorage lengths were much smaller. The conducted anchorage tests revealed that theanchorage length at the ends of simply supported beams actually extends over thelength of the support plus the distance to the bending crack next to the support. Thisdistance adds a certain safety to anchorages at beam ends. But beam-end tests aregenerally suitable to characterise the bond behaviour of single bars. In case two ormore bars are anchored, the load application has some issues. Thus, actual anchoragetests are favourable for the investigation of groups of anchored bars at beam ends.
Since the known mechanisms of bond behaviour are equally applicable to largediameter bars, additional rules for these bars are not necessary where a thorough crackcontrol is provided. In case the crack width cannot be verified by direct calculation,surface reinforcement is recommended.
A bond test database with more than 1200 lap and anchorage tests was compiled toanalyse the influence of single parameters and the applicability of design models givenin literature. Originally, partly coinciding databases were compiled byACI COMMITTEE 308 [ACI01], FIB TASK GROUP 2.5 [FIB05] and AMIN [AMI09].Many tests were excluded from the combined database in this thesis, since the testparameters were not state of the art, poor bond conditions were tested or only singlebars were anchored or lapped. After filtering, the database comprised 669 anchorageand lap tests including 123 tests with bar diameters above Ø 32 mm.
In this thesis, single parameter influences were analysed for the entire database and –since comparability is only given where the remaining parameters are equal – forselected test series. The analysis revealed very good conformity for the effects ofconcrete strength, anchorage length, bar diameter and concrete cover with the designmodel proposed in [FIB14]. However, this design model was modified for thecontributions by transverse reinforcement and transverse pressure. The proposed owndesign model on the basis of [FIB14] is the sum of the three contributions by concretecover, transverse reinforcement and transverse pressure.
In the PT1 WORKING DRAFT for the next generation of EUROCODE 2 [PT18] a designmodel for anchorage and lap length based on the design model according to [FIB14]
223
was proposed. In this thesis, calibration factors for the proposal were derived on thebasis of the database.
Since the design model according to [FIB14] shall be adopted in the next generation ofEUROCODE 2, design values were derived for the own modified model and for themodel defined in [PT18] with own calibration factors. The design values were derivedaccording to annex D in [EC0]. To verify the desired index of reliability b = 3.8, areliability analysis applying the first-order reliability method was conducted.
If minimum transverse reinforcement is positioned, the resulting lap lengths are similarto the lap lengths according to [EC2/NA] at ss = 435 MPa. The design bond lengths atss = 250 MPa exceed the values according to [EC2] and [EC2/NA] if calculated witha6 = 1.0. The design lengths according to the own model and the [PT18] model withown calibration factors are smaller when the values according to [EC2] and [EC2/NA]are calculated with a6 = 1.5 and a6 = 2.0, respectively.
The key findings of this investigation are:
- Beam-end tests are suitable to characterise the parameter effects in lap andanchorage tests
- The effect of bar diameter on crack width strongly depends on the increasingconcrete cover with increasing bar diameter
- Surface reinforcement effectively reduces the crack width in members withlarge diameter bars and provides robustness
- The design model according to [FIB14] captures the parameter effects verywell, only for transverse reinforcement and pressure, modifications areproposed
- The contribution of transverse pressure was defined considering the non-lineareffects of transverse pressure and bond length
- The contribution of transverse reinforcement was modified to a factor thatneither includes the leg number of the transverse reinforcement nor the numberof lapped or anchored bars
- Calibration factors were derived for the design model proposed in [PT18]model, the calibration factor for design bond length shall be 73 instead of 40
- The design models are equally applicable to large diameter bars- Design values for anchorages and laps were derived applying the method in
[EC0]. The partial safety factors for bar stress developed in bond zones aresmaller than 1.5, while the desired reliability b = 3.8 is accomplished
- Design anchorage and lap lengths can be calculated with the own design modelbased on [FIB14] or – with simplified exponents – with the design modelaccording to [PT18] with own calibration factors
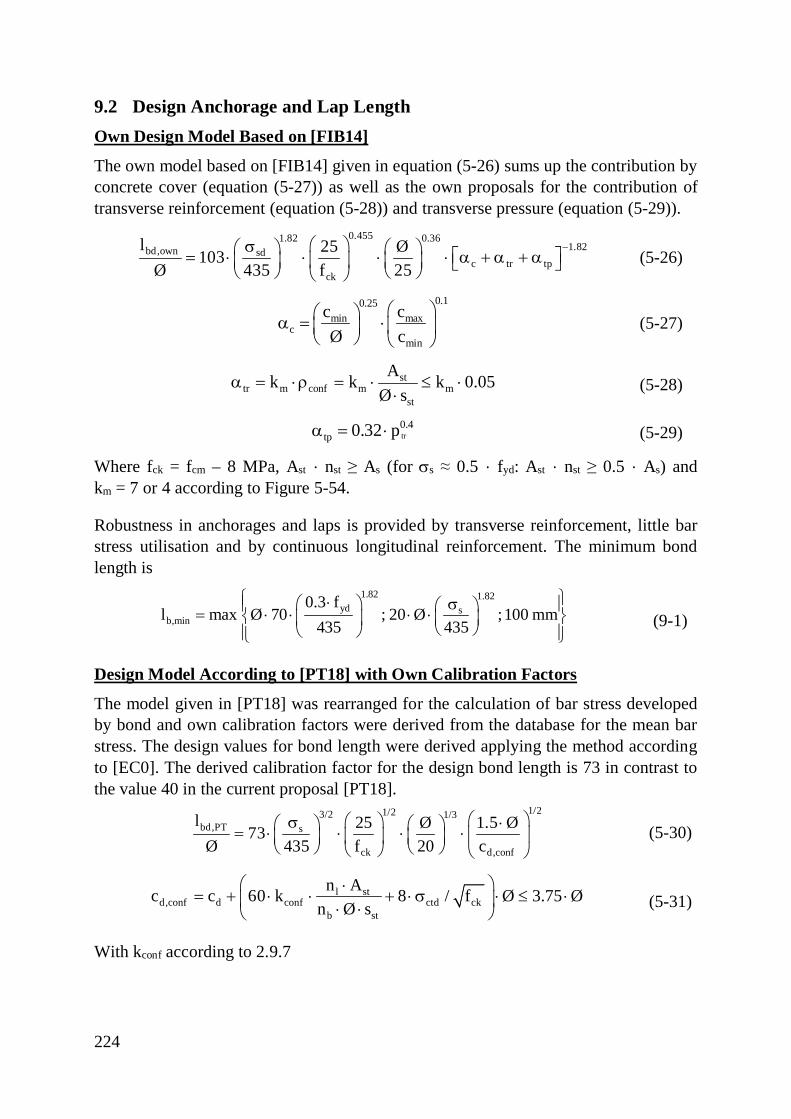
224
9.2 Design Anchorage and Lap LengthOwn Design Model Based on [FIB14]
The own model based on [FIB14] given in equation (5-26) sums up the contribution byconcrete cover (equation (5-27)) as well as the own proposals for the contribution oftransverse reinforcement (equation (5-28)) and transverse pressure (equation (5-29)).
0.4551.82 0.361.82bd,own sd
c tr tpck
l 25 Ø103Ø 435 f 25
-æ ösæ ö æ ö é ù= × × × × a + a + aç ÷ ç ÷ç ÷ ë ûè øè ø è ø(5-26)
0.10.25maxmin
cmin
ccØ c
æ öæ öa = ×ç ÷ç ÷è ø è ø
(5-27)
sttr m conf m m
st
Ak k k 0.05Ø s
a = ×r = × £ ×× (5-28)
tr0.4
tp 0.32 pa = × (5-29)
Where fck = fcm – 8 MPa, Ast · nst ≥ As (for ss ≈ 0.5 · fyd: Ast · nst ≥ 0.5 · As) andkm = 7 or 4 according to Figure 5-54.
Robustness in anchorages and laps is provided by transverse reinforcement, little barstress utilisation and by continuous longitudinal reinforcement. The minimum bondlength is
1.82 1.82yd s
b,min0.3 f
l max Ø 70 ; 20 Ø ;100 mm435 435
ì ü×æ ö sï ïæ ö= × × × ×í ýç ÷ç ÷è øè øï ïî þ
(9-1)
Design Model According to [PT18] with Own Calibration Factors
The model given in [PT18] was rearranged for the calculation of bar stress developedby bond and own calibration factors were derived from the database for the mean barstress. The design values for bond length were derived applying the method accordingto [EC0]. The derived calibration factor for the design bond length is 73 in contrast tothe value 40 in the current proposal [PT18].
1/21/23/2 1/3bd,PT s
ck d,conf
l 25 Ø 1.5 Ø73Ø 435 f 20 c
æ öæ ös ×æ ö æ ö= × × × × ç ÷ç ÷ ç ÷ç ÷è øè ø è ø è ø
(5-30)
l std,conf d conf ctd ck
b st
n Ac c 60 k 8 / f Ø 3.75 Øn Ø s
æ ö×= + × × + × s × £ ×ç ÷× ×è ø
(5-31)
With kconf according to 2.9.7
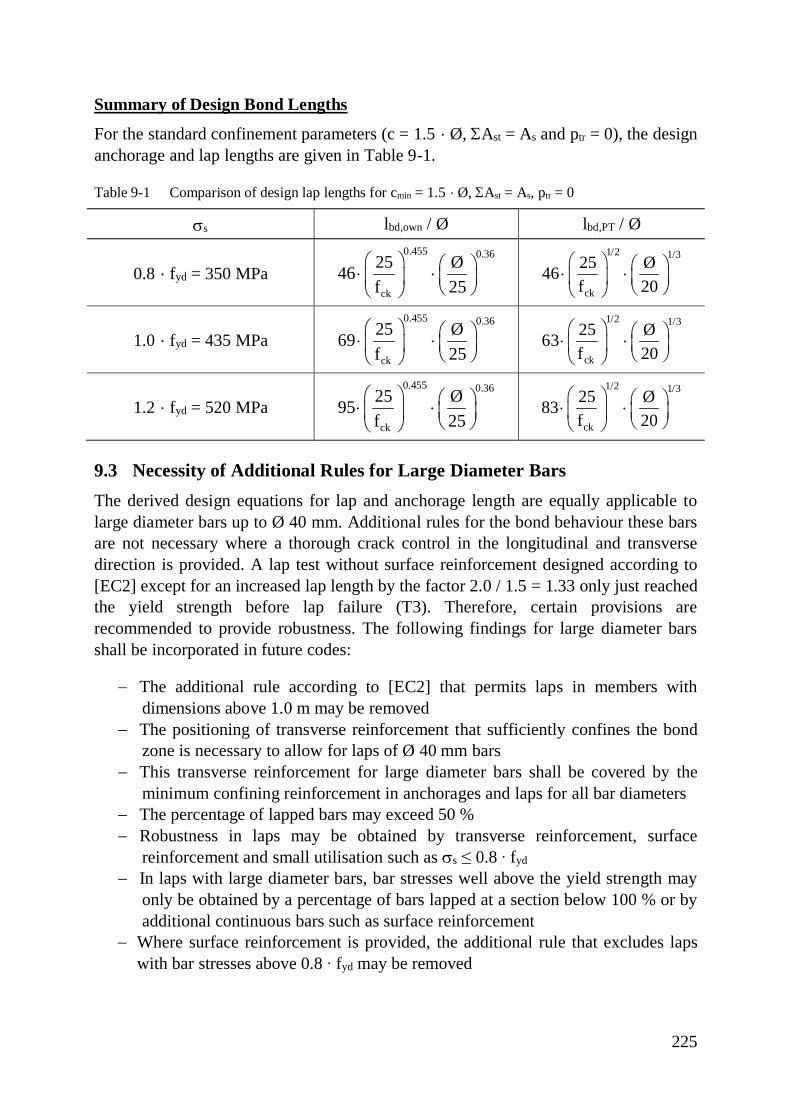
225
Summary of Design Bond Lengths
For the standard confinement parameters (c = 1.5 · Ø, SAst = As and ptr = 0), the designanchorage and lap lengths are given in Table 9-1.
Table 9-1 Comparison of design lap lengths for cmin = 1.5 · Ø, SAst = As, ptr = 0
ss lbd,own / Ø lbd,PT / Ø
0.8 · fyd = 350 MPa0.455 0.36
ck
25 Ø46f 25
æ ö æ ö× ×ç ÷ ç ÷è øè ø
1/2 1/3
ck
25 Ø46f 20
æ ö æ ö× ×ç ÷ ç ÷è øè ø
1.0 · fyd = 435 MPa0.455 0.36
ck
25 Ø69f 25
æ ö æ ö× ×ç ÷ ç ÷è øè ø
1/2 1/3
ck
25 Ø63f 20
æ ö æ ö× ×ç ÷ ç ÷è øè ø
1.2 · fyd = 520 MPa0.455 0.36
ck
25 Ø95f 25
æ ö æ ö× ×ç ÷ ç ÷è øè ø
1/2 1/3
ck
25 Ø83f 20
æ ö æ ö× ×ç ÷ ç ÷è øè ø
9.3 Necessity of Additional Rules for Large Diameter BarsThe derived design equations for lap and anchorage length are equally applicable tolarge diameter bars up to Ø 40 mm. Additional rules for the bond behaviour these barsare not necessary where a thorough crack control in the longitudinal and transversedirection is provided. A lap test without surface reinforcement designed according to[EC2] except for an increased lap length by the factor 2.0 / 1.5 = 1.33 only just reachedthe yield strength before lap failure (T3). Therefore, certain provisions arerecommended to provide robustness. The following findings for large diameter barsshall be incorporated in future codes:
- The additional rule according to [EC2] that permits laps in members withdimensions above 1.0 m may be removed
- The positioning of transverse reinforcement that sufficiently confines the bondzone is necessary to allow for laps of Ø 40 mm bars
- This transverse reinforcement for large diameter bars shall be covered by theminimum confining reinforcement in anchorages and laps for all bar diameters
- The percentage of lapped bars may exceed 50 %- Robustness in laps may be obtained by transverse reinforcement, surface
reinforcement and small utilisation such as ss ≤ 0.8 ∙ fyd
- In laps with large diameter bars, bar stresses well above the yield strength mayonly be obtained by a percentage of bars lapped at a section below 100 % or byadditional continuous bars such as surface reinforcement
- Where surface reinforcement is provided, the additional rule that excludes lapswith bar stresses above 0.8 ∙ fyd may be removed
226
The crack widths in beams with large diameter bars with and without surfacereinforcement can be calculated with the [EC2] equations for crack widths. However,the measured and calculated 95%-fractile values were larger than 0.4 mm. Whereadditional reinforcement with smaller bar diameters for crack control such as surfacereinforcement is positioned, this value may be reduced. Surface reinforcement with across sectional area equal to 2% of the cross-sectional concrete area under tensionoutside the stirrups according to [EC2] leads to a crack width reduction of the95%-fractile values below 0.2 mm.
The cracks at lap ends have the largest crack widths along structural concrete membersindependent from the bar diameter. In contrast, crack widths within laps are smallerthan outside laps, since the reinforcement ratio is increased along the lap length. Sincecrack width limits are not maximum values, but 95%-fractile values along the entirestructural member, large crack widths at lap ends are acceptable and do not requireadditional rules.
Not all additional rules for large diameter bars defined in [EC2/NA] were investigated,such as rules concerning curtailed reinforcement or shear. But under consideration ofthe detailing recommendations defined for all bar diameters in [EC2], the additionalrules for large diameter bars in [EC2/NA] do not seem necessary.
9.4 Proposal for Future ResearchDuring the analysis of the database, the small number of anchorage tests in structuralelements subjected to bending, such as anchorages at beam-ends with transversepressure as well as curtailed reinforcement was apparent. This fact is probably due tothe lower costs of simplified tests. To investigate reinforcing bar stresses up to theyield strength, other test setups have to be used. Still, to derive design models andrecommendations for detailing for anchorages, such structural member tests areadvisable. Anchorage tests with transverse pressure and Ø 40 mm bars were testedwithin the test programme described in this thesis, but tests with conventional bardiameters have hardly been tested. Although the design model according to [FIB14]was calibrated with a large number of lap tests and validated with anchorage tests, thevalidity of these simplified, mainly one-bar anchorage tests should be reviewed on thebasis of anchorages in actual beams. Especially anchorages with low transversepressure up to the tensile strength of concrete should be validated.
The number of available tests with reinforcement lapped at the same position issufficient for the statistical analysis of design models and for the derivation ofnecessary detailing rules. But certain special anchorage and lap parameters only existin small numbers and were excluded from the database. Laps with staggeredreinforcing bars are one example of deviating test setups. If the lap end of one lap endsright at the beginning of the following lap, the crack width presumably equals thecrack width at 100 % laps. For detailing rules in codes, such crack analysis ofstaggered laps is recommended.
227
The tests performed by the author and the tests included in the database wereperformed under short term monotonic loading. Investigations have shown that thecrack widths at lap ends subjected to sustained and cyclic loads depend on the laplength, since the bond strength decreases under such loads. Therefore, the influence ofsustained or fatigue load on the required bond length should be analysed. Aninvestigation would clarify whether an increased lap length or additional reinforcementsuch as surface reinforcement contributes to crack control under sustained or cyclicloads more effectively.
The effect of poor bond conditions was only briefly discussed in this thesis. Thecompilation of a database including the effects of slump and porosity below horizontalreinforcing bars is recommended. To define reduction factors for lap and anchoragestrength for the next generation of EUROCODE 2 and MODEL CODE, a more profoundreview of this effect is advisable.
The non-linear strain development in laps was derived from discrete strainmeasurements in several lap investigations in the past. For anchorages, thismeasurement becomes increasingly difficult to accomplish, since anchorage lengthsare usually small and strain gauges shall not impair the entire bond zone. Therefore,continuous measurements of the strain development in anchorages and laps – such asdistributed fibre-optic strain measurements – would contribute to the understanding ofbond behaviour to a great extent.

228
10 Additional publications in database
The described database includes further publications not cited within the thesis butwithin annex A.3:
AHLBORG [AHL02], ATKINS [ATK97], BEEBY, BRUFFEL AND GOUGH [BEE73],CHAMBERLIN [CHA56], [CHA58], [CHA87], HAMAD [HAM90], [HAM95],[HAM96], HASAN AND CLEARY [HAS96] , HWANG [HWA94], [HWA96] , MORITAAND FUJI [MOR82], PERRY AND JUNDI [PER69], REZANSOFF, AKANNI AND SPARLING[REZ93]
229
11 Literature
[ACI01] ACI 408: ACI 408 bond database,www.concrete.org/Store/ProductDetail.aspx?ItemID=408DB, 2001.
[ACI03] ACI COMMITTEE 408: Bond and development of straight reinforcing bars intension. American Concrete Institute, Farmington Hills, MI, 2003.
[ACI14] 318-14: Building Code Requirements for Structural Concrete. AmericanConcrete Institute, Farmington Hills, MI,
[AHL02] AHLBORG, T.; DEN HARTIGH, T.: A comparative bond study of MMFXreinforcing steel in concrete. Final Report, Michigan TechnologicalUniversity, 2002.
[AL-90] AL-SULAIMANI, G. J.; KALEEMULLAH, M.; BASUNBUL, I. A.;Rasheeduzzafar: Influence of Corrosion and Cracking on Bond Behaviorand Strength of Reinforced Concrete. ACI Structural Journal. Vol. 87, Issue2, pp. 220–231, 1990.
[AMI09] AMIN, R. S.: End Anchorage at simple supports in reinforced concrete.Dissertation, South Bank University London, 2009.
[AST15] ASTM A 944-10(2015): Test Method for Comparing Bond Strength of SteelReinforcing Bars to Concrete Using Beam-End Specimens. ASTMInternational, Subcommittee A01.05, West Conshohocken, PA, 2015.
[ATK97] ATKINS, W. S.: Deteriorated Structures. Phase 2 A Report to the HighwaysAgency, 1997.
[AZI93] AZIZINAMINI, A.; STARK, M.; ROLLER, J. J.; GHOSH, S. K.: BondPerformance of Reinforcing Bars Embedded in High-Strength Concrete.ACI Structural Journal. Vol. 90, Issue 5, pp. 554–561, 1993.
[AZI95] AZIZINAMINI, A.; CHISALA, M.; GHOSH, S. K.: Tension development lengthof reinforcing bars embedded in high-strength concrete. EngineeringStructures. Vol. 17, Issue 7, pp. 476–540, 1995.
[AZI99] AZIZINAMINI, A.; PAVEL, R.; HATFIELD, E.; GHOSH, S. K.: Behavior of lap-spliced reinforcing bars embedded in high-strength concrete. ACIStructural Journal. Vol. 96, Issue 5, pp. 826–835, 1999.
[BAT93] BATAYNEH, M. K.: The effects of lateral compression on bond betweendeformed reinforcing bars and concrete. Dissertation, Oxford BrookesUniversity, 1993.
[BAU08] Die Deutsche Bauindustrie: Richtlinienentwurf: Qualität derBewehrungsarbeiten,https://www.bauindustrie.de/media/documents/Bewehrungsarbeiten-RichtlinienentwurfQualitaetderBewehrung.pdf, 2008.
[BEE73] BEEBY, A. W.; BRUFFELL, S.; GOUGH, D.: Bond - Project Report No. 4.Research Seminar, Cement and Concrete Association. Vol. 1, Issue 1, pp.15–20, 1973.
[BER99] BERGMEISTER, K.: Risse im Konstruktionsbeton. Beton- und Stahlbetonbau.Vol. 94, Issue 6, pp. 245–253, 1999.
230
[BET80] BETZLE, M.: Experimentelle und theoretische Untersuchungen zumTragverhalten von Vollstößen bei Überreifung von zugbeanspruchtenRippenstählen. Dissertation, Technical University of Munich, 1980.
[BET81] BETZLE, M.: Vollstöße durch Übergreifung von zugbeanspruchtenRippenstählen in Normalbeton. DAfStb publication series, issue 319,Wilhelm Ernst & Sohn, Berlin, 1981.
[BUR00] BURKHARDT, C. J.: Zum Tragverhalten von Übergreifungsstößen inhochfestem Beton. Dissertation, Institute for Structural Concrete, RWTHAachen University, 2000.
[CAB94] CABRERA, J. G.; GHODDOUSSI, P.: Influence of Fly Ash on the Resistivityand Rate of Corrosion of Reinforced Concrete. ACI Special Publication.Vol. 145, Issue 1, pp. 229–244, 1994.
[CAI02] CAIRNS, J.; PLIZZARI, G. A.: Do we need a standard test for bond?International Conference on Bond in Concrete - from research to standards,Budapest, 2002.
[CAI03] CAIRNS, J.; PLIZZARI, G. A.: Towards a harmonised European bond test.Materials and Structures. Vol. 36, Issue 8, pp. 498–506, 2003.
[CAI14a] CAIRNS, J.: Staggered lap joints for tension reinforcement. StructuralConcrete. Vol. 15, Issue , pp. 45–54, 2014.
[CAI14b] CAIRNS, J.; ELIGEHAUSEN, R.: Evaluation of EC 2 rules for design oftension lap joints. The Structural Engineer. Vol. 92, Issue 9, pp. 44–52,2014.
[CAI96] CAIRNS, J.; JONES, K.: An Evaluation of the Bond-Splitting Action of RibbedBars. ACI Materials Journal. Vol. 93, Issue 1, pp. 10–19, 1996.
[CAN05] CANBAY, E.; FROSCH, R. J.: Bond Strength of Lap-Spliced Bars. ACIStructural Journal. Vol. 102, Issue 4, pp. 605–614, 2005.
[CAN06] CANBAY, E.; FROSCH, R. J.: Design of Lap-Spliced Bars. ACI StructuralJournal. Vol. 103, Issue 3, pp. 444–451, 2006.
[CHA56] CHAMBERLIN, S. J.: Spacing of Reinforcement in Beams. ACI Journal. Vol.53, Issue 7, pp. 113–134, 1956.
[CHA58] CHAMBERLIN, S. J.: Spacing of Spliced Bars in Beams. ACI JournalProceedings. Vol. 54, Issue 8, pp. 689–698, 1958.
[CHA87] Chapman, Ralph, A.; Shah, Surendra, P.: Early-age bond strength inreinforced concrete. ACI Materials Journal. Vol. 84, Issue 6, pp. 501–510,1987.
[CHI55] CHINN, J.; FERGUSON, P. M.; THOMPSON, J. N.: Lapped Splices inReinforced Concrete Beams. ACI Journal Proceedings. Vol. 52, Issue 2, pp.201–214, 1955.
[CHO91] CHOI, O. C.; HADJE-GHAFFARI, H.; DARWIN, D.; MCCABE, S. L.: Bond ofEpox-Coated Reinforcement: Bar Parameters. ACI Materials Journal. Vol.88, Issue 2, pp. 207–217, 1991.
[COH82] COHN, M. Z.; BARTLETT, M.: Computer-Simulated Flexural Tests ofPartially Prestressed Concrete Sections. ASCE Journal of StructuralDivision. Vol. 108, Issue 1, pp. 2747–2765, 1982.
231
[COR12] CORONELLI, D.; HANJARI, K. Z.; LUNDGREN, K.: Bond Strength of HighlyCorroded Reinforcement and Cover Delamination. InternationalConference on Bond in Concrete 2012 - General Aspects of Bond, Brescia,2012.
[CYL06] CYLLOK, M. K.: Zugbeanspruchte Übergreifungsstöße in Beton mitrezyklierter Gesteinskörnung: Rissbildung, Tragfähigkeit undumweltökonomischer Nutzen. Dissertation, Institute for Structural Concrete,Technical University of Munich, 2006.
[DAR95a] DARWIN, D.; THOLEN, M. L.; IDUN, E. K.; ZUO, J.: Splice Strength of HighRelative Rib Area Reinforcing Bars. Report, University of Kansas Centerfor Research, 1995.
[DAR95b] DARWIN, D.; ZUO, J.; THOLEN, M.; IDUN, E.: Development Length Criteriafor Conventional and High Relative Rib Area Reinforcing Bars. Report,University of Kansas Center for Research, 1995.
[DAR98] DARWIN, D.; IDUN, E. K.; ZUO, J.; THOLEN, M. L.: Reliability-BasedStrength Reduction Factor for Bond. ACI Structural Journal. Vol. 95, Issue4, pp. 434–443, 1998.
[DEU06] DEUTSCHER BETON- UND BAUTECHNIKVEREIN E.V.: Begrenzung derRissbildung im Stahlbeton- und Spannbetonbau. Merkblatt, Berlin, 2006.
[DEU08] DIN 1045-1: Tragwerke aus Beton, Stahlbeton und Spannbeton - Teil 1:Bemessung und Konstruktion. Deutsches Institut für Normung e.V., BeuthVerlag, Berlin, 2008-08.
[DEU09] DIN 488-1: Betonstahl - Teil 1: Stahlsorten, Eigenschaften, Kennzeichnung.Deutsches Institut für Normung e.V., Beuth Verlag, Berlin, 2009-08.
[DEU11] DIN EN 13670: Ausführung von Tragwerken aus Beton. Deutsches Institutfür Normung e.V., 2011-03.
[DEU12] DEUTSCHER AUSSCHUSS FÜR STAHLBETON: Erläuterungen zu DIN EN1992-1-1 und DIN EN 1992-1-1/NA (Eurocode 2). DAfStb publicationseries, issue 600, Beuth Verlag, Berlin, 2012.
[DEU14] ISO 16269-6: Statistische Auswertung von Daten - Teil6: Ermittlung vonstatistischen Anteilsbereichen. Deutsches Institut für Normung e.V., BeuthVerlag, Berlin, 2014-01.
[DEU88] DIN 1045: Beton und Stahlbeton - Bemessung und Ausführung. DeutschesInstitut für Normung e.V., Beuth Verlag, Berlin, 1988-07.
[DEV91] DeVries, Moehle, Hester: Lap Splice Strength of Plain and Epoxy-coatedReinforcements. Report, Structural Engineering Mechanics and Materials,University of California, 1991.
[EC0] DIN EN 1990: Eurocode: Grundlagen der Tragwerksplanung; DeutscheFassung EN 1990: 2002-A1:2055-A1:2005/AC:2010. Deutsches Institut fürNormung e.V., Beuth Verlag, Berlin, 2012-12.
[EC2/NA] DIN EN 1992-1-1/NA: Nationaler Anhang Eurocode 2: Bemessung undKonstruktion von Stahlbeton- und Spannbetontragwerken - Teil 1-1:Allgemeine Bemessungsregeln und Regeln für den Hochbau. DeutschesInstitut für Normung e.V., Beuth Verlag, Berlin, 2011-01.
232
[EC2] DIN EN 1992-1-1:2011-01: Eurocode 2: Bemessung und Konstruktion vonStahlbeton- und Spannbetontragwerken - Teil 1-1: AllgemeineBemessungsregeln und Regeln für den Hochbau; Fassung EN 1992-1-1:2004 + AC:2010. Deutsches Institut für Normung e.V., Beuth Verlag,Berlin, 2011-01.
[ELI79] ELIGEHAUSEN, R.: Übergreifungsstöße zugbeanspruchter Rippenstäbe mitgeraden Stabenden. DAfStb publication series, issue 301, Wilhelm Ernst &Sohn, Berlin, 1979.
[ELI83] ELIGEHAUSEN, R.; POPOV, E. P.; BERTERO, V. V.: Local Bond Stress-SlipRelationships of Deformed Bars under Generalized Excitations. Report,UCB/EERC-83/23, Earthquake Engineering Research Center, College ofEngineering, University of California, 1983.
[EMP16] EMPELMANN, M.; BUSSE, D.: Vergleich der Nachweiskonzepte zurRissbreitenbegrenzung nach EN 1992-1-1, DIN EN 1992-1-1/NA sowieModel Code 2010. Report, Nr. P02-19-1A (AG: Initiative PraxisgerechteRegelwerke im Bauwesen e.V.), iBMB Fachgebiet Massivbau, TechnicalUniversity Braunschweig, 2016.
[EUR91] ENV 1992-1-1: Eurocode 2. European Committee for Standardization,1991.
[FER54] FERGUSON, P. M.; TURPIN, R. D.; THOMPSON, J. N.: Minimun Bar Spacingas a Function of Bond and Shear Strength. ACI Journal Proceedings. Vol.50, Issue 6, pp. 869–887, 1954.
[FER62] FERGUSON, P. M.; THOMPSON, J. N.: Development Length of High StrengthReinforcing Bars in Bond. ACI Journal Proceedings. Vol. 59, Issue 7, pp.887–922, 1962.
[FER65a] FERGUSON, P. M.; BREEN, J. E.: Lapped Splices For High StrengthReinforcing Bars. ACI Journal Proceedings. Vol. 62, Issue 9, pp. 1063–1078, 1965.
[FER65b] FERGUSON, P. M.; THOMPSON, J. N.: Development Length for Large HighStrength Reinforcing Bars. ACI Journal Proceedings. Vol. 62, Issue 1, pp.71–94, 1965.
[FER65c] FERGUSON, P. M.; BREEN, J. E.; THOMPSON, J. N.: Pullout Tests on HighStrength Reinforcing Bars. ACI Journal Proceedings. Vol. 62, Issue 8, pp.933–950, 1965.
[FER69] FERGUSON, P. M.; BRICENO, E. A.: Tensile Lap Splices - Part 1: RetainingWall Type, Varying Moment Zone. Report, Center for Highway Research,University of Texas, 1969.
[FER71] FERGUSON, P. M.; KRISHNASWAMY, C. N.: Tensile Lap Splices - Part 2:Design Recommendation for Retaining Wall Splices and Large Bar Splices.Research Report No. 113-2, Center for Highway Research, The Universityof Texas at Austin, 1971.
[FIB05] fib TG 4.5: Bond test database,fibtg45.dii.unile.it/files%20scaricabili/Database_splicetest%20Stuttgart%20sept%202005.xls, 2005.
233
[FIB10] INTERNATIONAL FEDERATION FOR STRUCTURAL CONCRETE: Bond ofreinforcement in concrete: State-of-art report. fib Bulletin 10, Lausanne,2000.
[FIB14] INTERNATIONAL FEDERATION FOR STRUCTURAL CONCRETE: Bond andanchorage of embedded reinforcement: Background to the fib Model Codefor Concrete Structures 2010. fib Bulletin 72, Lausanne, Switzerland, 2014.
[GHA90] GHAGHEI, P.: Influence of transverse pressure on bond strength inreinforced concrete. Dissertation, Polytechnic of Central London, 1990.
[GIL12] GILBERT, R. I.; MAZUMDER, M.; CHANG, Z.-T.: Bond, slip and crackingwithin the anchorage length of deformed reinforcing bars in tension.International Conference on Bond in Concrete 2012 - General Aspects ofBond, Brescia, 2012.
[HAM90] HAMAD, B. S.; JIRSA, J. O.: Influence of Epoxy Coating on Stress Transferfrom Steel to Concrete. First Materials Engineering Congress, New York,1990.
[HAM95] HAMAD, B. S.: Bond strength improvement of reinforcing bars withspecially designed rib geometries. ACI Structural Journal. Vol. 92, Issue 1,pp. 3–13, 1995.
[HAM96] HAMAD, B. S.; MANSOUR, M.: Bond Strength of Noncontact Tension LapSplices. ACI Structural Journal. Vol. 93, Issue 3, pp. 1–11, 1996.
[HAM98] HAMAD, B. S.; ITANI, M. S.: Bond STrength of REinforcement in High-Performance Concrete: The Role of Silica Fume, Casting Position andSuperplasticizer Dosage. ACI Materials Journal. Vol. 95, Issue 5, pp. 499–511, 1998.
[HAS96] HASAN, H. O.; CLEARY, D. E. A.B.: Performance of Concrete Bridge Decksand Slabs reinforced with Epoxy-Coated Steel under Repeated Loading.ACI Structural Journal. Vol. 93, Issue , pp. 397–403, 1996.
[HEG15] HEGGER, J.; EMPELMANN, M.; SCHNELL, J.: Weiterentwicklung vonBemessungs- und Konstruktionsregeln bei großen Stabdurchmessern (> 32mm, B500). Report, https://www.isb-ev.de/wp-content/uploads/2014/05/AiF-16992-Schlussbericht.pdf, Institute ofStructural Concrete, RWTH Aachen University, 2015.
[HEG18] HEGGER, J.; EMPELMANN, M.; SCHNELL, J.: Bemessungs- undKonstruktionsregeln bei großen Stabdurchmessern und hohenBewehrungsgraden. Report, Institute of Structural Concrete, RWTHAachen University, 2018.
[HES93] HESTER, C. J.; SALAMIZAVAREGH, S. E. A.: Bond of Epoxy-CoatedReinforcement: Splices. ACI Structural Journal. Vol. 90, Issue , pp. 89–102,1993.
[HWA94] HWANG, L.: Effect of Silica Fume on the Splice Strength of Deformed Barsof High-Performance Concrete. ACI Structural Journal. Vol. , Issue , 1994.
[HWA96] HWANG, L.: Tensile Bond Strengths of Deformed Bars of High-StrengthConcrete. ACI Structural Journal. Vol. , Issue , 1996.
234
[JAN86] JANOVIC, K.: Verbundverhalten von Bewehrungsstählen unterDauerbelastung in Normal- und Leichtbeton. DAfStb publication series,issue 367, Ernst und Sohn, Berlin, 1986.
[JEN82] JENSEN, J. H.: Forkammede armeringsstængers forankring, specielt vedvederlag. Report, Department of Structural Engineering, TechnicalUniversity of Denmark, 1982.
[JIR95] JIRSA, J. O.; CHEN, W. E. A.: Development of Bundled Reinforcing Steel,Research Report No. 1363. Report, Center for Transportation Research,University of Texas, 1995.
[JOI00] JOINT COMMITTEE ON STRUCTURAL SAFETY: Probabilistic Model Code.Technical University of Denmark, Lyngby, 2000.
[JUN77] JUNGWIRTH, D.; KERN, G.: Verwendung von Bewehrungsstäben mit großenDurchmessern bzw. hohen Festigkeiten am Beispiel des Dywidag-Gewindestabs. Beton- und Stahlbetonbau. Vol. 72, Issue 10, pp. 237–243,1977.
[KAD94] Kadoriku: Study on Behaviour of lap splices in Hogh-Strength ReinforcedConcrete Members. Dissertation, Kobe University, 1994.
[KEM79] KEMP, E. L.; WILHELM, W. J.: Investigation of the parameters influencingbond cracking. ACI Journal. Vol. 76, Issue 1, pp. 47–71, 1979.
[KOE96] KÖNIG, G.; TUE, N. V.: Grundlagen und Bemessungshilfen für dieRissbreitenbeschränkung im Stahlbeton und Spannbeton - sowieKommentare, Hintergrundinformationen und Anwendungsbeispiele zu denRegelungen nach DIN 1045, EC2 und Model Code 90. DAfStb publicationseries, issue 466, Beuth Verlag, Berlin, 1996.
[KOK72] KOKUBU, M.; OKAMURA, H.: Use of Large-Sized Deformed Bars inReinforced Concrete. Faculty of Engineering, University of Tokyo, Tokyo,1972.
[KRE89] KRELLER, H.: Zum nichtlinearen Trag- und Verformungsverhalten vonStahlbetonstabtragwerken unter Last- und Zwangeinwirkung. Dissertation,University of Stuttgart, 1989.
[LEO05] Leonardo da Vinci Pilot Project CZ/02/B/F/PP-134007: Development ofSkills Facilitating Implementation of Eurocodes, Reliability Backgrounds -Handbook 2, http://eurocodes.jrc.ec.europa.eu/showpublication.php?id=63,2005.
[LET06a] LETTOW, S.: Ein Verbundelement für nichtlineare Finite-Elemente-Analysen - Anwendung auf Übergreifungsstöße. Dissertation, University ofStuttgart, 2006.
[LET06b] LETTOW, S.; ELIGEHAUSEN, R.: Formulation of application rules for lapsplices. Meeting of TG 4.5 - bond models, fédération internationale dubeton (fib), 2006.
[LUK82] LUKOSE, K.; GERGELY, P. E. A.: Behavior of Reinforced Concrete LappedSplices for Inelastic Cyclic Loading. ACI Journal Proceedings. Vol. 79,Issue 5, pp. 355–365, 1982.
235
[LUN15] LUNDGREN, K.; TAHERSHAMI, M.; ZANDI, K.; PLOS, M.: Tests onanchorage of naturally corroded reinforcement in concrete. Materials andStructures. Vol. 48, Issue 7, pp. 2009–2022, 2015.
[MAN17] MANCINI, G.; CARBONE, V. I.; BERTAGNOLI, G.; GINO, D.: Reliability-based evaluation of bond strength for tensed lapped joints and anchoragesin new and existing reinforced concrete structures. Structural Concrete.Vol. online, Issue 1-14, 2017.
[MAR15] MARX, C.: Erstellung und Auswertung einer Datenbank zum Tragverhaltenvon Übergreifungsstößen in Stahlbetonbauteilen. Master Thesis, Institutefor Structural Concrete, RWTH Aachen University, 2015.
[MAR73] MARTIN, H.: Zusammenhang zwischen Oberflächenbeschaffenheit, Verbundund Sprengwirkung. DAfStb publication series, issue 228, Verlag Ernst &Sohn, Berlin, 1973.
[MAR80] MARTIN, H.; SCHIEßL, P.; SCHWARZKOPF, M.: Berechnungsverfahren fürRissbreiten aus Lastbeanspruchung. Forschung Straßenbau undStraßenverkehrstechnik. Vol. 309, Issue 1, pp. 34–65, 1980.
[MAR81] MARTIN, H.; NOAKOWSKI, P.: Verbundverhalten von Betonstählen -Untersuchungen auf der Grundlage von Ausziehversuchen. DAfStbpublication series, issue 319, 1981.
[MAS90] MASLEHUDDIN, M.; ALLAM, I. A.; Al-Sulaimani, Ghazi, J.; AL-MANA, A.;ABDULJAUWAD, S. N.: Effect of Rusting of Reinforcing Steel on itsMechanical Properties and Bond with Concrete. ACI Materials Journal.Vol. 87, Issue 5, pp. 496–502, 1990.
[MAT61] MATHEY, R.; WATSTEIN, D.: Investigation of Bond in Beam and Pull-OutSpecimens with High-Yield-Strength Deformed Bars. ACI JournalProceedings. Vol. 32, Issue 9, pp. 1071–1090, 1961.
[MC2010] INTERNATIONAL FEDERATION FOR STRUCTURAL CONCRETE: fib ModelCode for Concrete Structures 2010. Ernst & Sohn (Wiley), Lausanne,Switzerland, 2013.
[MC90] EURO-INTERNATIONAL COMMITTEE FOR CONCRETE: CEB-FIP Model Code1990. Design code, Telford, London, 1993.
[MET15] METELLI, G.; CAIRNS, J.; PLIZZARI, G. A.: The influence of percentage ofbars lapped on performance of splices. Materials and Structures. Vol. ,Issue 48, pp. 2983–2996, 2015.
[MOR82] MORITA, S.; FUJI, S.: Bond capacity of deformed bars due to splitting ofsurrounding concrete. International Conference on Bond in Concrete,Paisley, Scotland, 1982.
[OLS90] OLSEN, N. H.: The strength of overlapped deformed tensile reinforcementsplices in high-strength concrete. Report, Technical University of Denmark,Lyngby, 1990.
[ORA77] ORANGUN, C. O.; JIRSA, J. O.; BREEN, J. E.: A Reevaulation of Test Data onDevelopment Length and Splices. ACI Journal Proceedings. Vol. 74, Issue3, pp. 114–122, 1977.
236
[PER69] PERRY, E. S.; JUNDI, N.: Pullout bond stress distribution under static anddynamic repeated loadings. ACI Journal. Vol. 66, Issue 5, pp. 377–380,1969.
[PLI98] PLIZZARI, G. A.; DELDOSSI, M. A.; MASSIMO, S.: Transverse ReinforcementEffects in Anchored Deformed Bars. Magazine of Concrete Research. Vol.50, Issue 2, pp. 161–177, 1998.
[PT18] PT.SC2.T1: PT1 working draft prEN 1992-1-1:2018. European Committeefor Standardization; CEN, European Committee for Standardization, 2018.
[RAC06] RACKWITZ, R.: Zuverlässigkeit und Lasten im konstruktiven Ingenieurbau.Lecture Notes, Technical University of Munich, 2006.
[RAK14] RAKHSHANIMEHR, M.; ESFAHANI, M. R.; KIANOUSH, M. R.;MOHAMMADZADEH, B. A.; MOUSAVI, S. R.: Flexural ductility of reinforcedconcrete beams with lap-spliced bars. Canadian Journal of CivilEngineering. Vol. 41, Issue 7, pp. 594–604, 2014.
[RAT72] RATHKJEN, A.: Forankringsstyrker af armeringsjern vedbjælkeunderstotninger. Report 7203, Renog Anvendt Mekanik, CivilEngineering Academy of Denmark, 1972.
[REG97] REGAN, P. E.: Tests of slabs with fully or partly exposed mainreinforcement. Report to W.S. Atkins / The Highways Agency, School ofArchitecture and Engineering, University of Westminster, 1997.
[REH61] REHM, G.: Über die Grundlagen des Verbundes zwischen Stahl und Beton.DAfStb publication series, issue 138, Verlag Ernst & Sohn, Berlin, 1961.
[REH68] REHM, G.; MARTIN, H.: Zur Frage der Rissbegrenzung im Stahlbetonbau.Beton- und Stahlbetonbau. Vol. 63, Issue 8, pp. 175–182, 1968.
[REH75a] REHM, G.: Vorbericht über Versuche mit GEWI-Stahl BSt 42/50, d = 50 mmund entsprechenden Muffenverbindungen. Report 1415, Institute ofStructural Concrete, Technical University of Munich, 1975.
[REH75b] REHM, G.: Rippenstäbe mit d = 50 mm als Bewehrung inStahlbetonbauteilen. Report, University of Stuttgart, 1975.
[REH77] REHM, G.; ELIGEHAUSEN, R.: Übergreifungsstöße von Rippenstäben unterschwellender Belastung. DAfStb publication series, issue 291, WilhelmErnst & Sohn, Berlin, 1977.
[REH79] REHM, G.; ELIGEHAUSEN, R.; NEUBERT, B.: Erläuterung derBewehrungsrichtlinien DIN 1045, Abschnitt 18, Ausgabe 12/78. DAfStbpublication series, issue 300, Beuth, Berlin, 1979.
[REY82] REYNOLDS, G.; BEEBY, A. W.: Bond Strength of deformed Bars.International Conference on Bond in Concrete, Paisley, 1982.
[REZ92] REZANSOFF, T.; KONKANKAR, U. S.; FU, Y. C.: Confinement Limits forTension Lap Splices under Static Loading. Canadian Journal of CivilEngineering. Vol. 19, Issue 3, pp. 447–453, 1992.
[REZ93] REZANSOFF, T.; AKANNI, A.; SPARLING, B.: Tensile Lap Splices underStatic Loading: A Review of the proposed ACI 318 Code Provisions. ACIStructural Journal. Vol. 90, Issue 4, pp. 374–384, 1993.
237
[RIC09] RICKER, M.: Zur Zuverlässigkeit der Bemessung gegen Durchstanzen beiEinzelfundamenten. Dissertation, Institute for Structural Concrete, RWTHAachen University, 2009.
[RIC84] RICHTER, T.: Untersuchungen zur Verankerung von Betonrippenstahl.Dissertation, Fakultät für Bau-, Wasser- und Forstwesen, TU Dresden,1984.
[RIL82] RILEM: RILEM Recommendations RC5 : bond test for reinforcement steel.1. Beam test. TC9-RC. RILEM, Paris, 1982.
[RIL83] RILEM: RILEM Recommendations RC6: bond test for reinforcement steel.2. Pull-out test. TC9-RC. RILEM, Paris, 1983.
[ROB82] ROBINS, P. J.; STANDISH, I. G.: Effect of Lateral Pressure on bond ofReinforcing Bars in Concrete. International Conference on Bond inConcrete, Paisley, 1982.
[SCH14] SCHEIBE, M.; HUDE, F.; HEGGER, J.; SCHOENING, J.: High-strengthreinforcement in reinforced concrete construction - Identification ofpotential fields of application, development of design principles anddetermination of potential economic savings. Fraunhofer IRB Verlag, 2014.
[SCH88] SCHMIDT-THRÖ; G.; STÖCKL, S.; KUPFER, H.: Verankerugn der Bewehrungam Endauflager bei einachsiger Querpressung und Einfluss einereinachsigen Querpressung und der Verankerungslänge auf dasVerbundverhalten von Rippenstählen im Beton. DAfStb publication series,issue 389, Verlag Ernst & Sohn, Berlin, 1988.
[SCH98a] SCHIEßL, P.: Grundlagen der Neuregelung zur Beschränkung derRissbreite. DAfStb publication series, issue 400, Beuth Verlag, Berlin,1998.
[SCH98b] SCHENKEL, M.: Zum Verbundverhalten von Bewehrung bei kleinerBetondeckung. Dissertation, ETH Zurich, 1998.
[SPA92] SPAETHE, G.: Die Sicherheit tragender Baukonstruktionen. Springer, WienNew York, 1992.
[STE07] STEUCK, K. P.; PANG, J. B. K.; EBERHARD, M. O.; STANTON, J. F.:Anchorage of large-diameter reinforcing bars grouted into ducts - DraftResearch Report. Washington State Transportation Center (TRAC), 2007.
[STO77] STÖCKL, S.; MENNE, B.; KUPFER, H.: Versuche an zugbeanspruchtenÜbergreifungsstöen von Rippenstählen. DAfStb publication series, issue276, Wilhelm Ernst & Sohn, Berlin, 1977.
[TEP73] TEPFERS, R.: A theory of bond applied to overlapped tensile reinforcementsplices for deformed bars. Dissertation, Division of Concrete Structures,Chalmers University of Technology, 1973.
[THO75] THOMPSON, M. A.; JIRSA, J. O.; et al.: The Behaviour of Multiple LapSplices in Wide Sections. Report No. 154-1; Project 3-5-72-154, Universityof Texas, 1975.
[THO79] THOMPSON, M. A.; Jirsa, J. O. et al.: Behavior of Multiple Lap Splices inWide Sections. ACI Journal Proceedings. Vol. 76, Issue 2, pp. 227–248,1979.
238
[TRE89] TREECE, R. A.; JIRSA, J. O.: Bond Strength of Epoxy-Coated ReinforcingBars. ACI Materials Journal. Vol. 86, Issue 167-174, 1989.
[UED86] UEDA, T.; LIN, I.; HAWKINS, N. M.: Beam Bar Anchorage in ExteriorColumn-Beam Connections. ACI Journal. Vol. 83, Issue 3, pp. 412–422,1986.
[UNT65] UNTRAUER, R. E.; HENRY, R. L.: Influence of Normal Pressure on BondStrength. ACI Journal Proceedings. Vol. 62, Issue 5, pp. 577–586, 1965.
[VIW79] VIWATHANATEPA, S.; POPOV, E. P.; BERTERO, V. V.: Effects of generalizedloadings on bond of reinforcing bars embedded in confined concrete blocks.Report to National Science Foundation, Earthquake Engineering ResearchCenter, College of Engineering, University of California, 1979.
[WIL13] WILDERMUTH, A.: Untersuchungen zum Verbundverhalten vonBewehrungsstäben mittels vereinfachter Versuchskörper. DAfStbpublication series, issue 609, Beuth Verlag, Berlin, 2013.
[ZEK81] ZEKANY, A. J.: The Influence of Shear on Lapped Splices in ReinforcedConcrete. Report, Center for Highway Research, University of Texas, 1981.
[ZIL10] ZILCH, K.; ZEHETMAIER, G.: Bemessung im konstruktiven Ingenieurbau.Springer, Berlin Heidelberg, 2010.
[ZUO00] ZUO, J.; DARWIN, D.: Splice Strength of Conventional and High RelativeRib Area Bars in Normal and High-Strength Concrete. ACI StructuralJournal. Vol. 97, Issue 4, pp. 630–641, 2000.
[ZUO98] ZUO, J.; DARWIN, D.: Bond Strength of High Relative Rib Area ReinforcingBars. Report, University of Kansas, 1998.

Annex

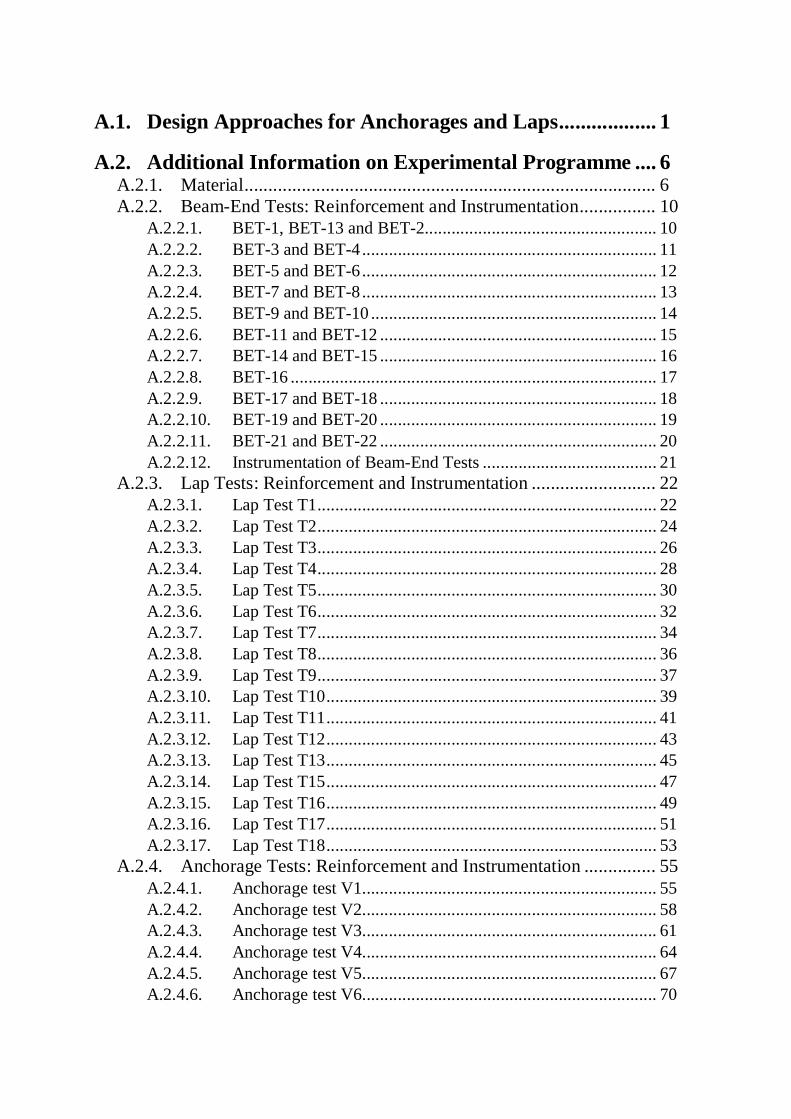
A.1. Design Approaches for Anchorages and Laps .................. 1
A.2. Additional Information on Experimental Programme .... 6A.2.1. Material ...................................................................................... 6A.2.2. Beam-End Tests: Reinforcement and Instrumentation ................ 10
A.2.2.1. BET-1, BET-13 and BET-2.................................................... 10A.2.2.2. BET-3 and BET-4 .................................................................. 11A.2.2.3. BET-5 and BET-6 .................................................................. 12A.2.2.4. BET-7 and BET-8 .................................................................. 13A.2.2.5. BET-9 and BET-10 ................................................................ 14A.2.2.6. BET-11 and BET-12 .............................................................. 15A.2.2.7. BET-14 and BET-15 .............................................................. 16A.2.2.8. BET-16 .................................................................................. 17A.2.2.9. BET-17 and BET-18 .............................................................. 18A.2.2.10. BET-19 and BET-20 .............................................................. 19A.2.2.11. BET-21 and BET-22 .............................................................. 20A.2.2.12. Instrumentation of Beam-End Tests ....................................... 21
A.2.3. Lap Tests: Reinforcement and Instrumentation .......................... 22A.2.3.1. Lap Test T1 ............................................................................ 22A.2.3.2. Lap Test T2 ............................................................................ 24A.2.3.3. Lap Test T3 ............................................................................ 26A.2.3.4. Lap Test T4 ............................................................................ 28A.2.3.5. Lap Test T5 ............................................................................ 30A.2.3.6. Lap Test T6 ............................................................................ 32A.2.3.7. Lap Test T7 ............................................................................ 34A.2.3.8. Lap Test T8 ............................................................................ 36A.2.3.9. Lap Test T9 ............................................................................ 37A.2.3.10. Lap Test T10 .......................................................................... 39A.2.3.11. Lap Test T11 .......................................................................... 41A.2.3.12. Lap Test T12 .......................................................................... 43A.2.3.13. Lap Test T13 .......................................................................... 45A.2.3.14. Lap Test T15 .......................................................................... 47A.2.3.15. Lap Test T16 .......................................................................... 49A.2.3.16. Lap Test T17 .......................................................................... 51A.2.3.17. Lap Test T18 .......................................................................... 53
A.2.4. Anchorage Tests: Reinforcement and Instrumentation ............... 55A.2.4.1. Anchorage test V1.................................................................. 55A.2.4.2. Anchorage test V2.................................................................. 58A.2.4.3. Anchorage test V3.................................................................. 61A.2.4.4. Anchorage test V4.................................................................. 64A.2.4.5. Anchorage test V5.................................................................. 67A.2.4.6. Anchorage test V6.................................................................. 70
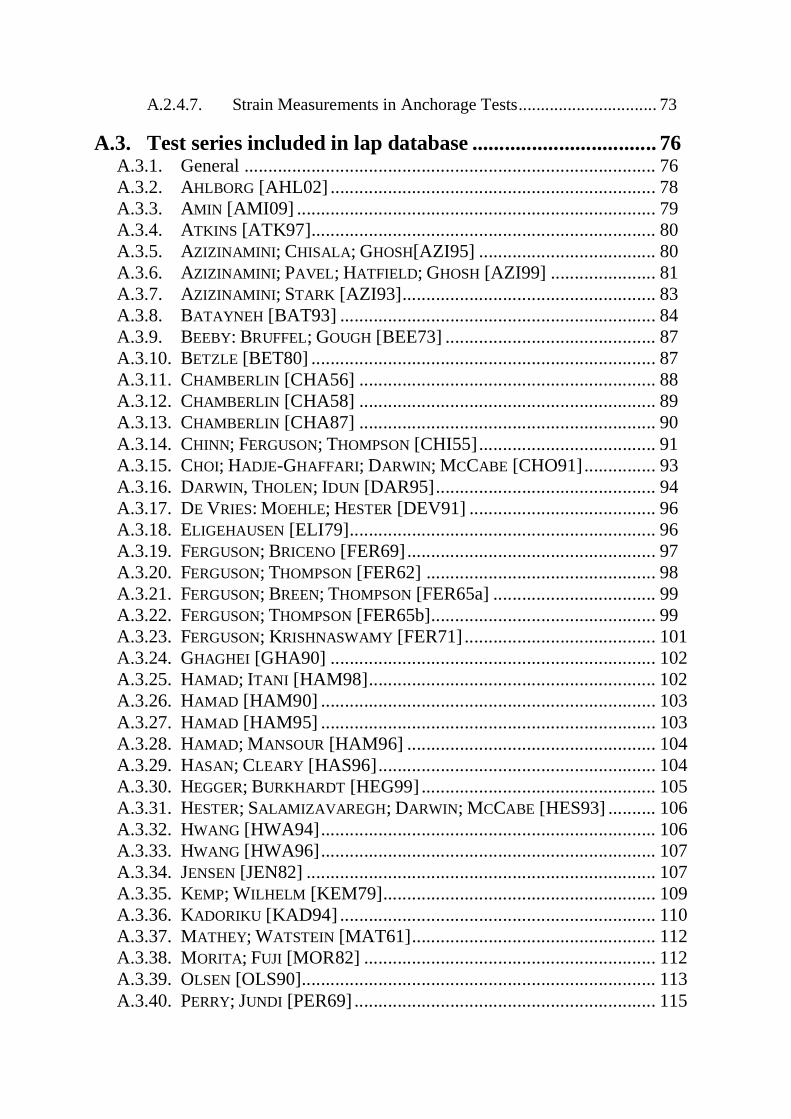
A.2.4.7. Strain Measurements in Anchorage Tests ............................... 73
A.3. Test series included in lap database .................................. 76A.3.1. General ...................................................................................... 76A.3.2. AHLBORG [AHL02] .................................................................... 78A.3.3. AMIN [AMI09] ........................................................................... 79A.3.4. ATKINS [ATK97]........................................................................ 80A.3.5. AZIZINAMINI; CHISALA; GHOSH[AZI95] ..................................... 80A.3.6. AZIZINAMINI; PAVEL; HATFIELD; GHOSH [AZI99] ...................... 81A.3.7. AZIZINAMINI; STARK [AZI93] ..................................................... 83A.3.8. BATAYNEH [BAT93] .................................................................. 84A.3.9. BEEBY: BRUFFEL; GOUGH [BEE73] ............................................ 87A.3.10. BETZLE [BET80] ........................................................................ 87A.3.11. CHAMBERLIN [CHA56] .............................................................. 88A.3.12. CHAMBERLIN [CHA58] .............................................................. 89A.3.13. CHAMBERLIN [CHA87] .............................................................. 90A.3.14. CHINN; FERGUSON; THOMPSON [CHI55] ..................................... 91A.3.15. CHOI; HADJE-GHAFFARI; DARWIN; MCCABE [CHO91] ............... 93A.3.16. DARWIN, THOLEN; IDUN [DAR95] .............................................. 94A.3.17. DE VRIES: MOEHLE; HESTER [DEV91] ....................................... 96A.3.18. ELIGEHAUSEN [ELI79] ................................................................ 96A.3.19. FERGUSON; BRICENO [FER69] .................................................... 97A.3.20. FERGUSON; THOMPSON [FER62] ................................................ 98A.3.21. FERGUSON; BREEN; THOMPSON [FER65a] .................................. 99A.3.22. FERGUSON; THOMPSON [FER65b]............................................... 99A.3.23. FERGUSON; KRISHNASWAMY [FER71] ........................................ 101A.3.24. GHAGHEI [GHA90] .................................................................... 102A.3.25. HAMAD; ITANI [HAM98] ............................................................ 102A.3.26. HAMAD [HAM90] ...................................................................... 103A.3.27. HAMAD [HAM95] ...................................................................... 103A.3.28. HAMAD; MANSOUR [HAM96] .................................................... 104A.3.29. HASAN; CLEARY [HAS96] .......................................................... 104A.3.30. HEGGER; BURKHARDT [HEG99] ................................................. 105A.3.31. HESTER; SALAMIZAVAREGH; DARWIN; MCCABE [HES93] .......... 106A.3.32. HWANG [HWA94] ...................................................................... 106A.3.33. HWANG [HWA96] ...................................................................... 107A.3.34. JENSEN [JEN82] ......................................................................... 107A.3.35. KEMP; WILHELM [KEM79] ......................................................... 109A.3.36. KADORIKU [KAD94] .................................................................. 110A.3.37. MATHEY; WATSTEIN [MAT61] ................................................... 112A.3.38. MORITA; FUJI [MOR82] ............................................................. 112A.3.39. OLSEN [OLS90].......................................................................... 113A.3.40. PERRY; JUNDI [PER69] ............................................................... 115
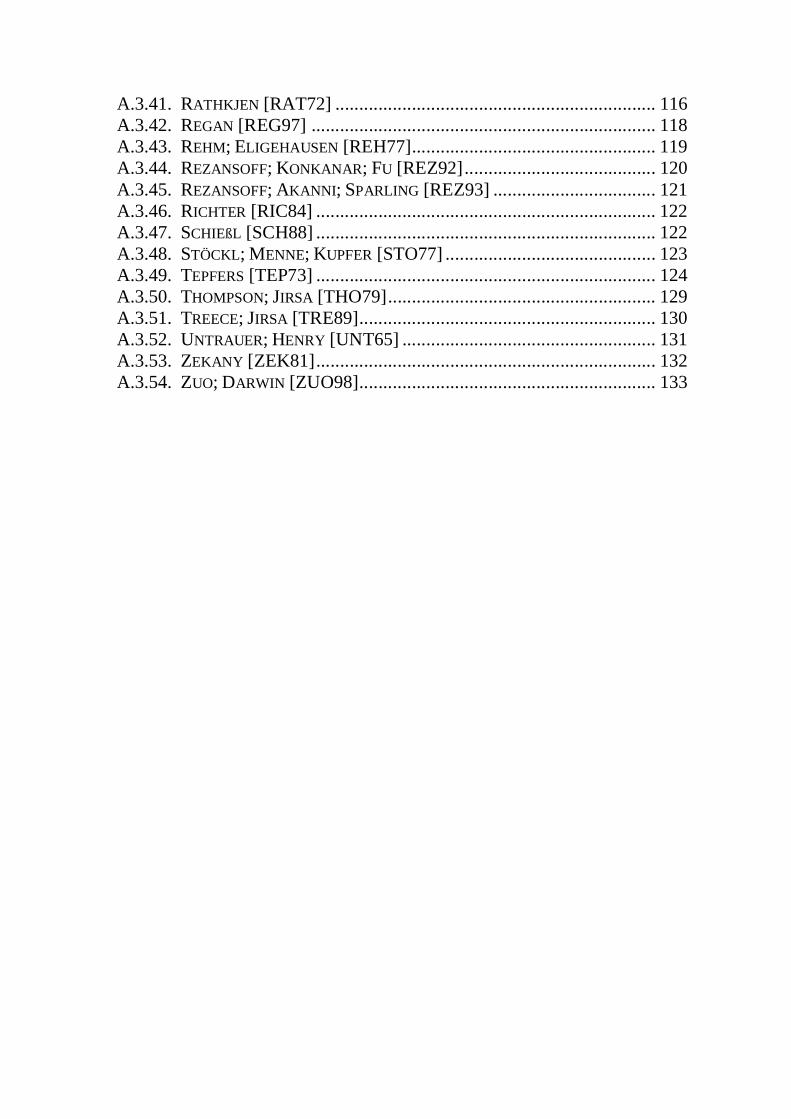
A.3.41. RATHKJEN [RAT72] ................................................................... 116A.3.42. REGAN [REG97] ........................................................................ 118A.3.43. REHM; ELIGEHAUSEN [REH77] ................................................... 119A.3.44. REZANSOFF; KONKANAR; FU [REZ92] ........................................ 120A.3.45. REZANSOFF; AKANNI; SPARLING [REZ93] .................................. 121A.3.46. RICHTER [RIC84] ....................................................................... 122A.3.47. SCHIEßL [SCH88] ....................................................................... 122A.3.48. STÖCKL; MENNE; KUPFER [STO77] ............................................ 123A.3.49. TEPFERS [TEP73] ....................................................................... 124A.3.50. THOMPSON; JIRSA [THO79] ........................................................ 129A.3.51. TREECE; JIRSA [TRE89] .............................................................. 130A.3.52. UNTRAUER; HENRY [UNT65] ..................................................... 131A.3.53. ZEKANY [ZEK81] ....................................................................... 132A.3.54. ZUO; DARWIN [ZUO98] .............................................................. 133

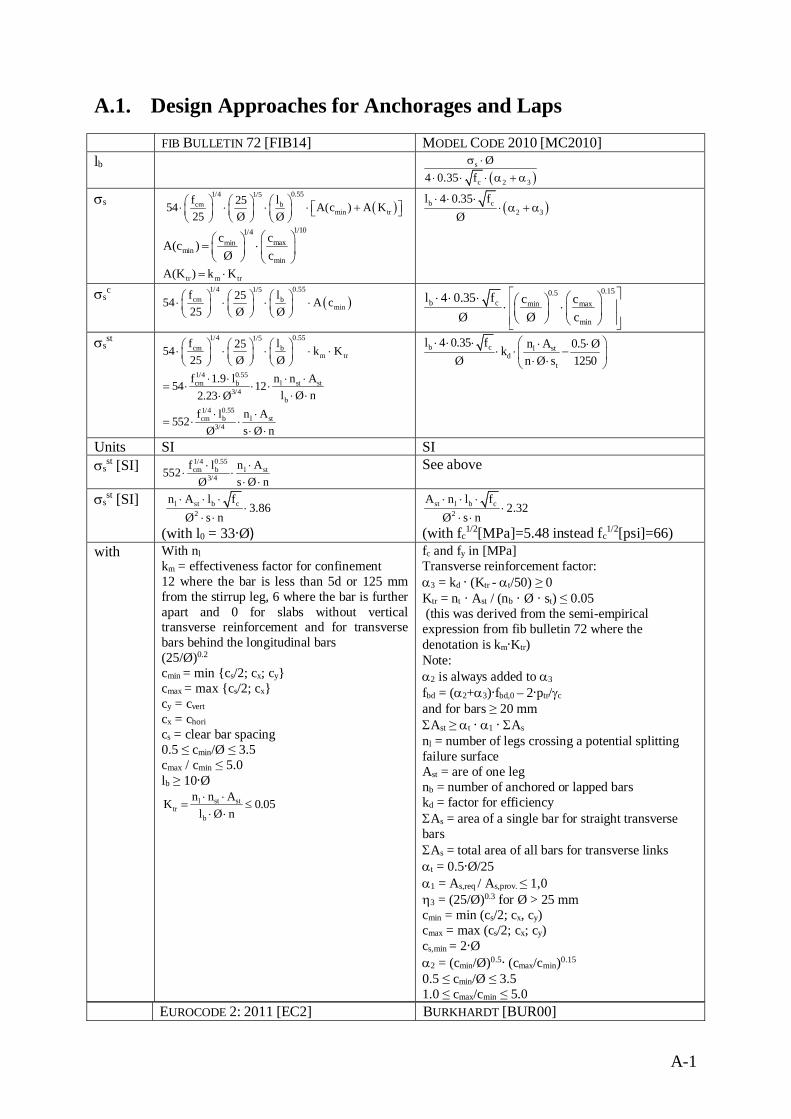
A-1
A.1. Design Approaches for Anchorages and LapsFIB BULLETIN 72 [FIB14] MODEL CODE 2010 [MC2010]
lb( )
s
c 2 3
Ø4 0.35 f
s ×× × × a + a
ss ( )1/4 0.551/5
cm bmin tr
f l2554 A(c ) A K25 Ø Ø
æ ö æ öæ ö× × × × +é ùç ÷ç ÷ ç ÷ ë ûè øè ø è ø1/101/4
maxminmin
min
ccA(c )Ø c
æ öæ ö= ×ç ÷ç ÷è ø è ø
trmtr Kk)K(A ×=
( )b c2 3
l 4 0.35 fØ
× × ×× a + a
ssc ( )
1/4 0.551/5cm b
minf l2554 A c25 Ø Ø
æ ö æ öæ ö× × × ×ç ÷ç ÷ ç ÷è øè ø è ø
0.150.5b c maxmin
min
l 4 0.35 f ccØ Ø c
é ù× × × æ öæ ö× ×ê úç ÷ç ÷è øê úè øë û
ssst 1/4 0.551/5
cm bm tr
f l2554 k K25 Ø Ø
æ ö æ öæ ö× × × × ×ç ÷ç ÷ ç ÷è øè ø è ø
1/4 0.55cm b l st st
3/4b
f 1.9 l n n A54 12l Ø n2.23 Ø
× × × ×= × × ×
× ××1/4 0.55cm b l st
3/4f l n A552
s Ø nØ× ×
= × ×× ×
b c l std
t
l 4 0.35 f n A 0.5 ØkØ n Ø s 1250
× × × æ ö× ×× × -ç ÷× ×è ø
Units SI SIss
st [SI] 1/4 0.55cm b l st
3/4f l n A552
s Ø nØ× ×
× ×× ×
See above
ssst [SI] l st b c
2
n A l f3.86
Ø s n× × ×
×× ×
(with l0 = 33·Ø)
st l b c2
A n l f2.32
Ø s n× × ×
×× ×
(with fc1/2[MPa]=5.48 instead fc
1/2[psi]=66)with With nl
km = effectiveness factor for confinement12 where the bar is less than 5d or 125 mmfrom the stirrup leg, 6 where the bar is furtherapart and 0 for slabs without verticaltransverse reinforcement and for transversebars behind the longitudinal bars(25/Ø)0.2
cmin = min {cs/2; cx; cy}cmax = max {cs/2; cx}cy = cvertcx = chorics = clear bar spacing0.5 ≤ cmin/Ø ≤ 3.5cmax / cmin ≤ 5.0lb ≥ 10·Ø
l st sttr
b
n n AK 0.05l Ø n× ×
= £× ×
fc and fy in [MPa]Transverse reinforcement factor:a3 = kd · (Ktr - at/50) ≥ 0Ktr = nt · Ast / (nb · Ø · st) ≤ 0.05 (this was derived from the semi-empiricalexpression from fib bulletin 72 where thedenotation is km·Ktr)Note:a2 is always added to a3
fbd = (a2+a3)·fbd,0 – 2·ptr/gc
and for bars ≥ 20 mmSAst ≥ at · a1 · SAs
nl = number of legs crossing a potential splittingfailure surfaceAst = are of one legnb = number of anchored or lapped barskd = factor for efficiencySAs = area of a single bar for straight transversebarsSAs = total area of all bars for transverse linksat = 0.5·Ø/25a1 = As,req / As,prov. ≤ 1,0h3 = (25/Ø)0.3 for Ø > 25 mmcmin = min (cs/2; cx, cy)cmax = max (cs/2; cx; cy)cs,min = 2·Øa2 = (cmin/Ø)0.5· (cmax/cmin)0.15
0.5 ≤ cmin/Ø ≤ 3.51.0 ≤ cmax/cmin ≤ 5.0
EUROCODE 2: 2011 [EC2] BURKHARDT [BUR00]
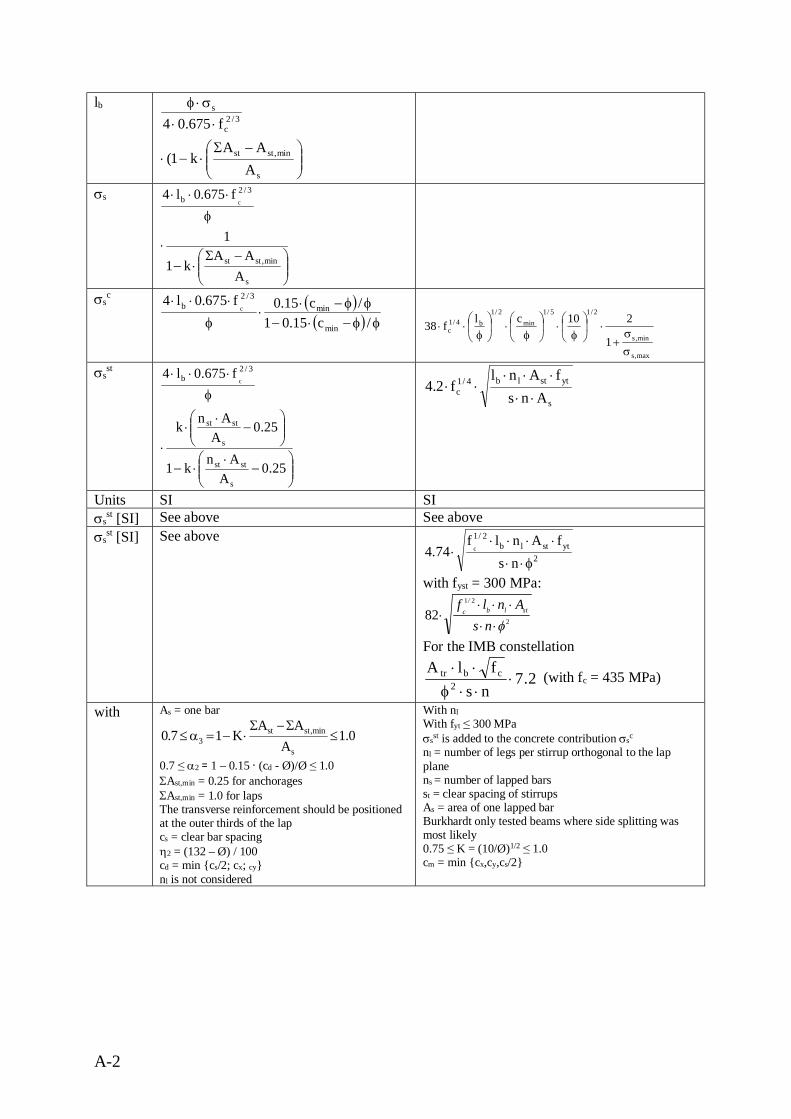
A-2
lb
÷÷ø
öççè
æ -S×-×
××s×f
s
min,stst
3/2c
s
AAA
k1(
f675.04
ss
÷÷ø
öççè
æ -S×-
×
f
×××
s
min,stst
3/2b
AAA
k1
1
f675.0l4c
ssc ( )
( ) ff-×-ff-×
×f
×××
/c15.01/c15.0f675.0l4
min
min3/2
b c
max,s
min,s
2/15/1min
2/1b4/1
c
1
210clf38
ss
+×÷
ø
öçè
æf
×÷ø
öçè
æf
×÷ø
öçè
æf
××
ssst
÷÷ø
öççè
æ-
××-
÷÷ø
öççè
æ-
××
×
f
×××
25.0A
Ank1
25.0A
Ank
f675.0l4
s
stst
s
stst
3/2b c
s
ytstlb4/1c Ans
fAnlf2.4
××
×××××
Units SI SIss
st [SI] See above See abovess
st [SI] See above2
ytstlb2/1
nsfAnlf
74.4 c
f××
×××××
with fyst = 300 MPa:
2
21
82f××
××××
nsAnlf stlb
/c
For the IMB constellation
2.7ns
flA2
cbtr ×××f×× (with fc = 435 MPa)
with As = one bar
0.1A
AAK17.0
s
min,stst3 £
S-S×-=a£
0.7 ≤ a2 = 1 – 0.15 · (cd - Ø)/Ø ≤ 1.0SAst,min = 0.25 for anchoragesSAst,min = 1.0 for lapsThe transverse reinforcement should be positionedat the outer thirds of the lapcs = clear bar spacingh2 = (132 – Ø) / 100cd = min {cs/2; cx; cy}nl is not considered
With nlWith fyt ≤ 300 MPassst is added to the concrete contribution ssc
nl = number of legs per stirrup orthogonal to the lapplanens = number of lapped barsst = clear spacing of stirrupsAs = area of one lapped barBurkhardt only tested beams where side splitting wasmost likely0.75 ≤ K = (10/Ø)1/2 ≤ 1.0cm = min {cx,cy,cs/2}
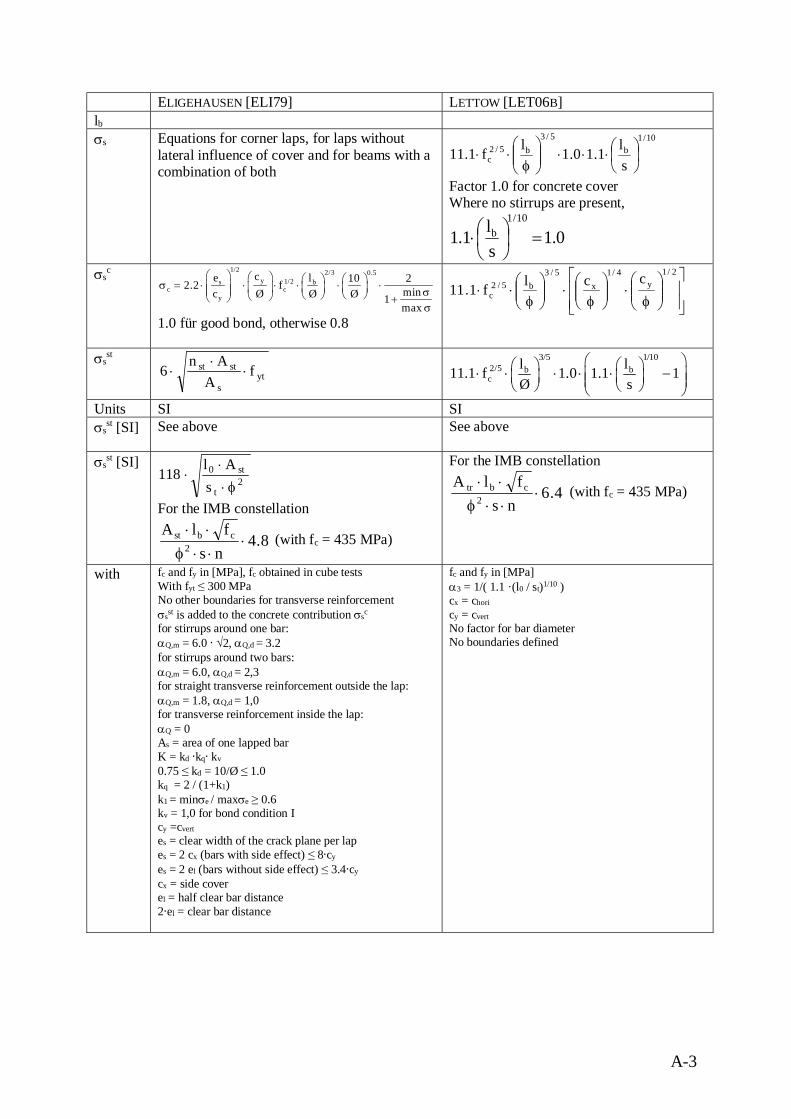
A-3
ELIGEHAUSEN [ELI79] LETTOW [LET06B]lb
ss Equations for corner laps, for laps withoutlateral influence of cover and for beams with acombination of both
10/1b
5/3b5/2
c sl1.10.1lf1.11 ÷
øö
çèæ×××÷÷
ø
öççè
æf
××
Factor 1.0 for concrete coverWhere no stirrups are present,
0.1sl1.1
10/1b =÷
øö
çèæ×
ssc 1/2 2/3 0.5
y 1/2s bc c
y
ce l 10 22.2 f minc Ø Ø Ø 1max
æ ö æ ö æ ö æ ös = × × × × × ×ç ÷ ç ÷ç ÷ç ÷ç ÷ sè øè øè øè ø +s
1.0 für good bond, otherwise 0.8úúû
ù
êêë
é÷÷ø
öççè
æf
×÷÷ø
öççè
æf
×÷÷ø
öççè
æf
××2/1
y4/1
x5/3
b5/2c
cclf1.11
ssst
yts
stst fA
An6 ×
××
3/5 1/102/5 b bc
l l11.1 f 1.0 1.1 1Ø s
æ öæ ö æ ö× × × × × -ç ÷ç ÷ ç ÷ç ÷è ø è øè øUnits SI SIss
st [SI] See above See above
ssst [SI]
2t
st0
sAl
118f×
××
For the IMB constellation
8.4ns
flA2
cbst ×××f×× (with fc = 435 MPa)
For the IMB constellation
4.6ns
flA2
cbtr ×××f×× (with fc = 435 MPa)
with fc and fy in [MPa], fc obtained in cube testsWith fyt ≤ 300 MPaNo other boundaries for transverse reinforcementssst is added to the concrete contribution ssc
for stirrups around one bar:aQ,m = 6.0 · √2, aQ,d = 3.2for stirrups around two bars:aQ,m = 6.0, aQ,d = 2,3for straight transverse reinforcement outside the lap:aQ,m = 1.8, aQ,d = 1,0for transverse reinforcement inside the lap:aQ = 0As = area of one lapped barK = kd ·kq· kv
0.75 ≤ kd = 10/Ø ≤ 1.0kq = 2 / (1+k1)k1 = minse / maxse ≥ 0.6kv = 1,0 for bond condition Icy =cvertes = clear width of the crack plane per lapes = 2 cx (bars with side effect) ≤ 8·cy
es = 2 el (bars without side effect) ≤ 3.4·cy
cx = side coverel = half clear bar distance2·el = clear bar distance
fc and fy in [MPa]a3 = 1/( 1.1 ·(l0 / st)1/10 )cx = chori
cy = cvertNo factor for bar diameterNo boundaries defined
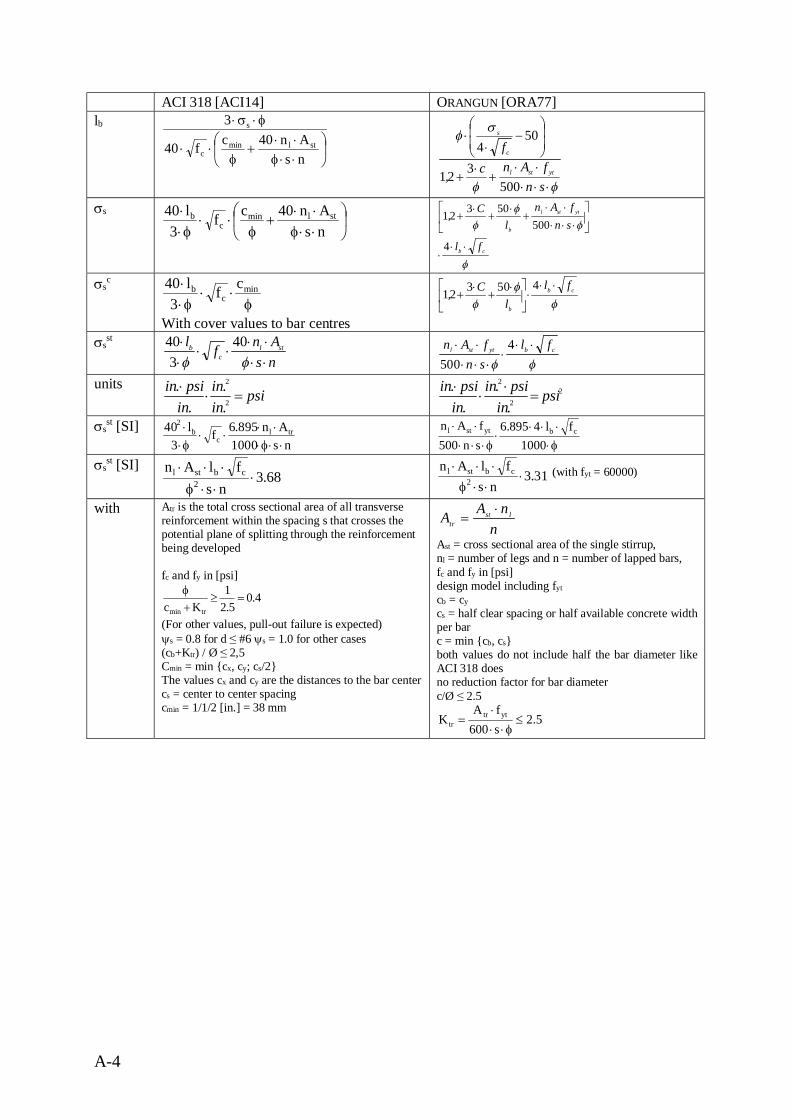
A-4
ACI 318 [ACI14] ORANGUN [ORA77]lb
÷ø
öçè
æ××f××
+f
××
f×s×
nsAn40cf40
3
stlminc
s
ff
sf
×××××
+×
+
÷÷ø
öççè
æ-
××
snfAnc,
f
ytstl
c
s
500321
504
ss÷ø
öçè
æ××f××
+f
××f××
nsAn40cf
3l40 stlmin
cb
f
ff
f
cb
ytstl
b
fl
snfAn
lC,
×××
úû
ùêë
é×××
××+
×+
×+
4
50050321
ssc
f××
f×× min
cb cf
3l40
With cover values to bar centresf
ff
cb
b
fll
C,××
×úû
ùêë
é ×+
×+
450321
ssst
nsAnfl stl
cb
××××
××××
ff40
340
ffcbytstl fl
snfAn ××
××××
×× 4500
unitspsi
.in
.in.inpsi.in
=××
2
22
2
2
psi.inpsi.in
.inpsi.in
=×
××
ssst [SI]
ns1000An895.6f
3l40 trl
cb
2
××f×××
××f××
f××××
×f×××
××
1000fl4895.6
sn500fAn cbytstl
ssst [SI]
68.3ns
flAn2
cbstl ×××f
××× 31.3ns
flAn2
cbstl ×××f
××× (with fyt = 60000)
with Atr is the total cross sectional area of all transversereinforcement within the spacing s that crosses thepotential plane of splitting through the reinforcementbeing developed
fc and fy in [psi]
4.05.2
1Kc trmin
=³+f
(For other values, pull-out failure is expected)ys = 0.8 for d ≤ #6 ys = 1.0 for other cases(cb+Ktr) / Ø ≤ 2,5Cmin = min {cx, cy; cs/2}The values cx and cy are the distances to the bar centercs = center to center spacingcmin = 1/1/2 [in.] = 38 mm
nnAA lst
tr
×=
Ast = cross sectional area of the single stirrup,nl = number of legs and n = number of lapped bars,fc and fy in [psi]design model including fytcb = cycs = half clear spacing or half available concrete widthper barc = min {cb, cs}both values do not include half the bar diameter likeACI 318 doesno reduction factor for bar diameterc/Ø ≤ 2.5
5.2s600fA
K yttrtr £
f××
×=
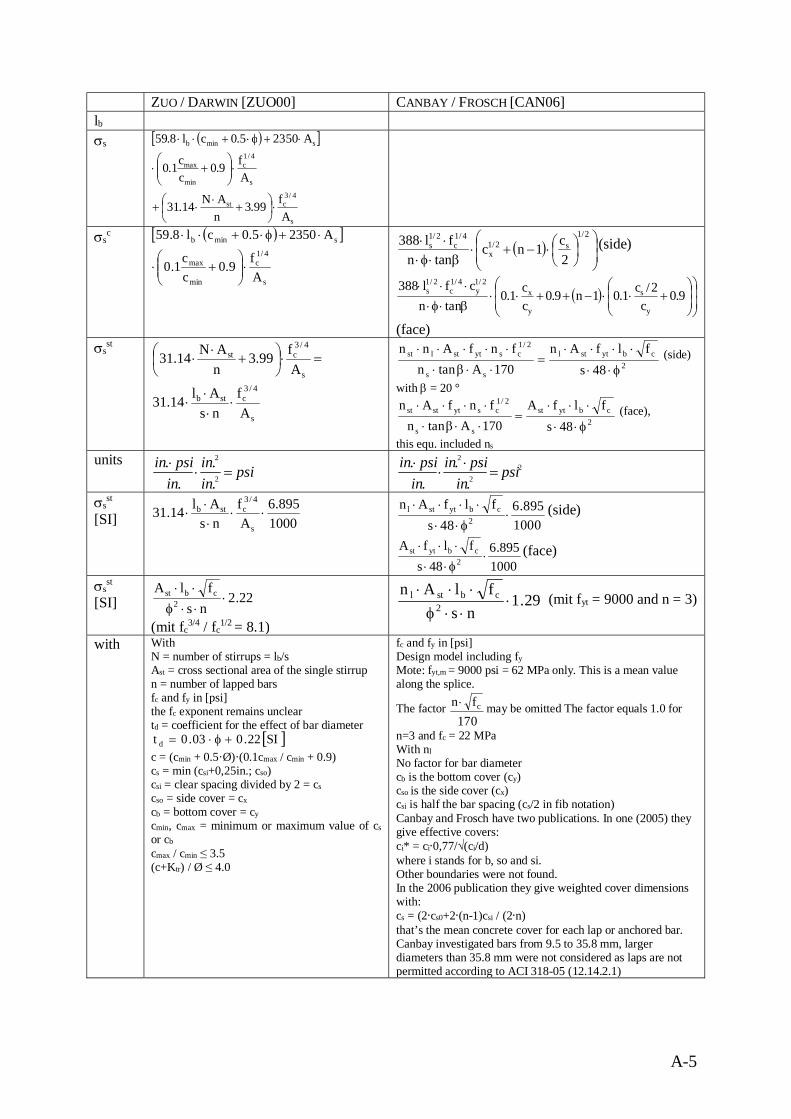
A-5
ZUO / DARWIN [ZUO00] CANBAY / FROSCH [CAN06]lb
ss ( )[ ]
s
4/3cst
s
4/1c
min
max
sminb
Af99.3
nAN14.31
Af9.0
cc1.0
A23505.0cl8.59
×÷øö
çèæ +
××+
×÷÷ø
öççè
æ+×
×+f×+××
ssc ( )[ ]
s
4/1c
min
max
sminb
Af9.0
cc1.0
A23505.0cl8.59
×÷÷ø
öççè
æ+×
×+f×+××( ) ÷
÷ø
öççè
æ÷øö
çèæ×-+×
b×f××× 2/1
s2/1x
4/1c
2/1s
2c1nc
tannfl388 (side)
( ) ÷÷ø
öççè
æ÷÷ø
öççè
æ+××-++××
b×f××××
9.0c
2/c1.01n9.0cc1.0
tanncfl388
y
s
y
x2/1
y4/1
c2/1
s
(face)ss
st
s
4/3cstb
s
4/3cst
Af
nsAl14.31
Af99.3
nAN14.31
×××
×
=×÷øö
çèæ +
××
2cbytstl
ss
2/1csytstlst
48sflfAn
170AtannfnfAnn
f××
××××=
××b×
××××× (side)
with b = 20 °
2cbytst
ss
2/1csytstst
48sflfA
170AtannfnfAn
f××
×××=
××b×
×××× (face),
this equ. included ns
unitspsi
.in
.in.inpsi.in
=××
2
22
2
2
psi.inpsi.in
.inpsi.in
=×
××
ssst
[SI] 1000895.6
Af
nsAl14.31
s
4/3cstb ××
××
×1000
895.648s
flfAn2
cbytstl ×f××
×××× (side)
1000895.6
48sflfA
2cbytst ×
f××
××× (face)
ssst
[SI] 22.2ns
flA2
cbst ×××f××
(mit fc3/4 / fc
1/2 = 8.1)
29.1ns
flAn2
cbstl ×××f
××× (mit fyt = 9000 and n = 3)
with WithN = number of stirrups = lb/sAst = cross sectional area of the single stirrupn = number of lapped barsfc and fy in [psi]the fc exponent remains uncleartd = coefficient for the effect of bar diameter
[ ]SI22.003.0t d +f×=c = (cmin + 0.5·Ø)·(0.1cmax / cmin + 0.9)cs = min (csi+0,25in.; cso)csi = clear spacing divided by 2 = cscso = side cover = cxcb = bottom cover = cycmin, cmax = minimum or maximum value of csor cb
cmax / cmin ≤ 3.5(c+Ktr) / Ø ≤ 4.0
fc and fy in [psi]Design model including fyMote: fyt,m = 9000 psi = 62 MPa only. This is a mean valuealong the splice.
The factor170
fn c× may be omitted The factor equals 1.0 for
n=3 and fc = 22 MPaWith nlNo factor for bar diametercb is the bottom cover (cy)cso is the side cover (cx)csi is half the bar spacing (cs/2 in fib notation)Canbay and Frosch have two publications. In one (2005) theygive effective covers:ci* = ci·0,77/√(ci/d)where i stands for b, so and si.Other boundaries were not found.In the 2006 publication they give weighted cover dimensionswith:cs = (2·cs0+2·(n-1)csi / (2·n)that’s the mean concrete cover for each lap or anchored bar.Canbay investigated bars from 9.5 to 35.8 mm, largerdiameters than 35.8 mm were not considered as laps are notpermitted according to ACI 318-05 (12.14.2.1)
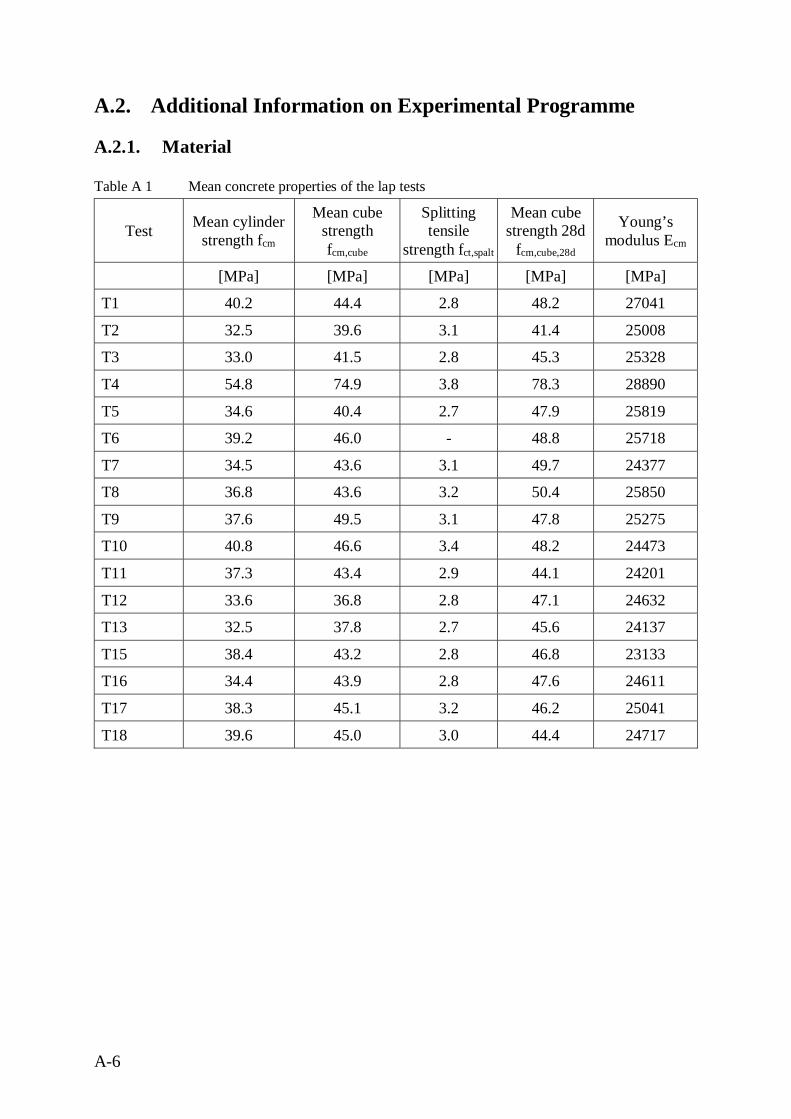
A-6
A.2. Additional Information on Experimental Programme
A.2.1. Material
Table A 1 Mean concrete properties of the lap tests
Test Mean cylinderstrength fcm
Mean cubestrengthfcm,cube
Splittingtensile
strength fct,spalt
Mean cubestrength 28d
fcm,cube,28d
Young’smodulus Ecm
[MPa] [MPa] [MPa] [MPa] [MPa]
T1 40.2 44.4 2.8 48.2 27041
T2 32.5 39.6 3.1 41.4 25008
T3 33.0 41.5 2.8 45.3 25328
T4 54.8 74.9 3.8 78.3 28890
T5 34.6 40.4 2.7 47.9 25819
T6 39.2 46.0 - 48.8 25718
T7 34.5 43.6 3.1 49.7 24377
T8 36.8 43.6 3.2 50.4 25850
T9 37.6 49.5 3.1 47.8 25275
T10 40.8 46.6 3.4 48.2 24473
T11 37.3 43.4 2.9 44.1 24201
T12 33.6 36.8 2.8 47.1 24632
T13 32.5 37.8 2.7 45.6 24137
T15 38.4 43.2 2.8 46.8 23133
T16 34.4 43.9 2.8 47.6 24611
T17 38.3 45.1 3.2 46.2 25041
T18 39.6 45.0 3.0 44.4 24717
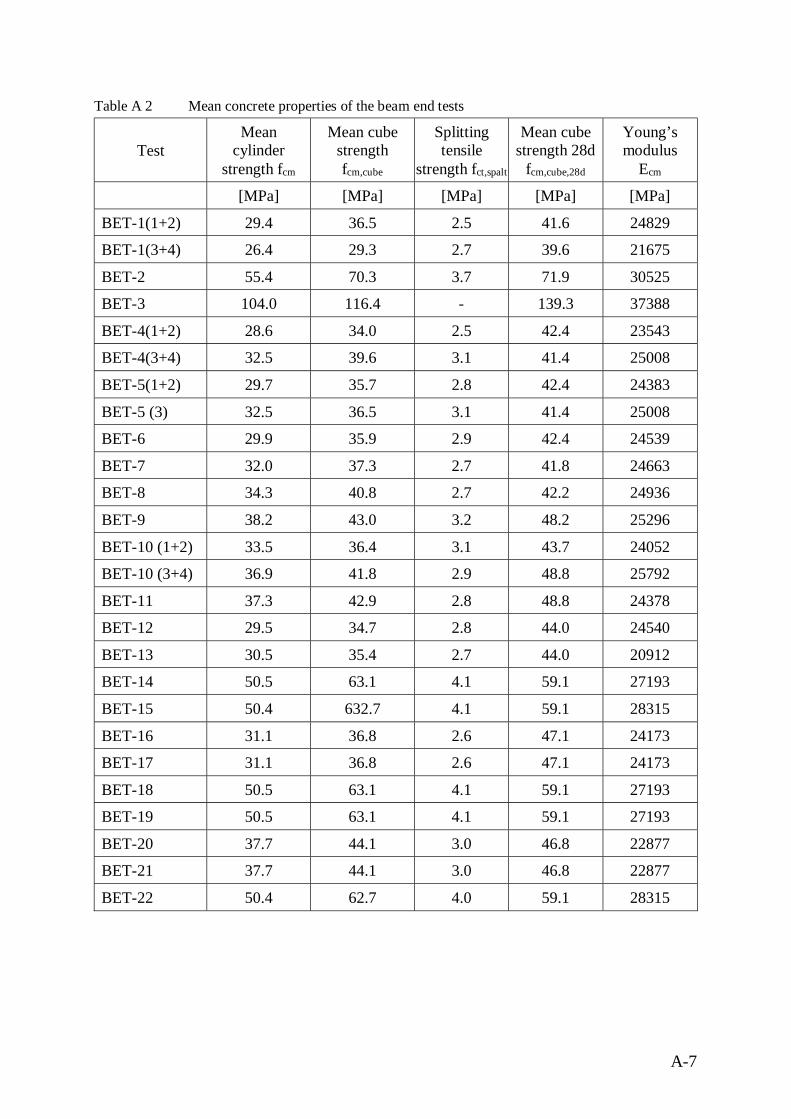
A-7
Table A 2 Mean concrete properties of the beam end tests
TestMean
cylinderstrength fcm
Mean cubestrengthfcm,cube
Splittingtensile
strength fct,spalt
Mean cubestrength 28d
fcm,cube,28d
Young’smodulus
Ecm
[MPa] [MPa] [MPa] [MPa] [MPa]
BET-1(1+2) 29.4 36.5 2.5 41.6 24829
BET-1(3+4) 26.4 29.3 2.7 39.6 21675
BET-2 55.4 70.3 3.7 71.9 30525
BET-3 104.0 116.4 - 139.3 37388
BET-4(1+2) 28.6 34.0 2.5 42.4 23543
BET-4(3+4) 32.5 39.6 3.1 41.4 25008
BET-5(1+2) 29.7 35.7 2.8 42.4 24383
BET-5 (3) 32.5 36.5 3.1 41.4 25008
BET-6 29.9 35.9 2.9 42.4 24539
BET-7 32.0 37.3 2.7 41.8 24663
BET-8 34.3 40.8 2.7 42.2 24936
BET-9 38.2 43.0 3.2 48.2 25296
BET-10 (1+2) 33.5 36.4 3.1 43.7 24052
BET-10 (3+4) 36.9 41.8 2.9 48.8 25792
BET-11 37.3 42.9 2.8 48.8 24378
BET-12 29.5 34.7 2.8 44.0 24540
BET-13 30.5 35.4 2.7 44.0 20912
BET-14 50.5 63.1 4.1 59.1 27193
BET-15 50.4 632.7 4.1 59.1 28315
BET-16 31.1 36.8 2.6 47.1 24173
BET-17 31.1 36.8 2.6 47.1 24173
BET-18 50.5 63.1 4.1 59.1 27193
BET-19 50.5 63.1 4.1 59.1 27193
BET-20 37.7 44.1 3.0 46.8 22877
BET-21 37.7 44.1 3.0 46.8 22877
BET-22 50.4 62.7 4.0 59.1 28315
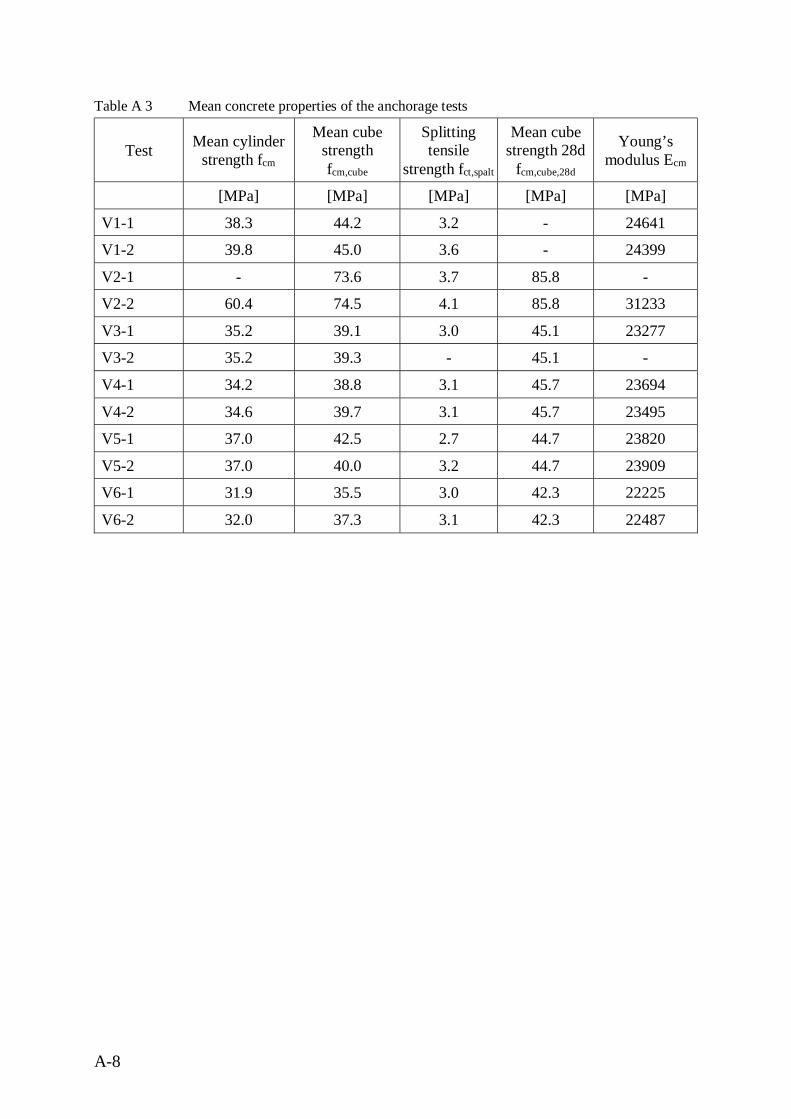
A-8
Table A 3 Mean concrete properties of the anchorage tests
Test Mean cylinderstrength fcm
Mean cubestrengthfcm,cube
Splittingtensile
strength fct,spalt
Mean cubestrength 28d
fcm,cube,28d
Young’smodulus Ecm
[MPa] [MPa] [MPa] [MPa] [MPa]
V1-1 38.3 44.2 3.2 - 24641
V1-2 39.8 45.0 3.6 - 24399
V2-1 - 73.6 3.7 85.8 -
V2-2 60.4 74.5 4.1 85.8 31233
V3-1 35.2 39.1 3.0 45.1 23277
V3-2 35.2 39.3 - 45.1 -
V4-1 34.2 38.8 3.1 45.7 23694
V4-2 34.6 39.7 3.1 45.7 23495
V5-1 37.0 42.5 2.7 44.7 23820
V5-2 37.0 40.0 3.2 44.7 23909
V6-1 31.9 35.5 3.0 42.3 22225
V6-2 32.0 37.3 3.1 42.3 22487
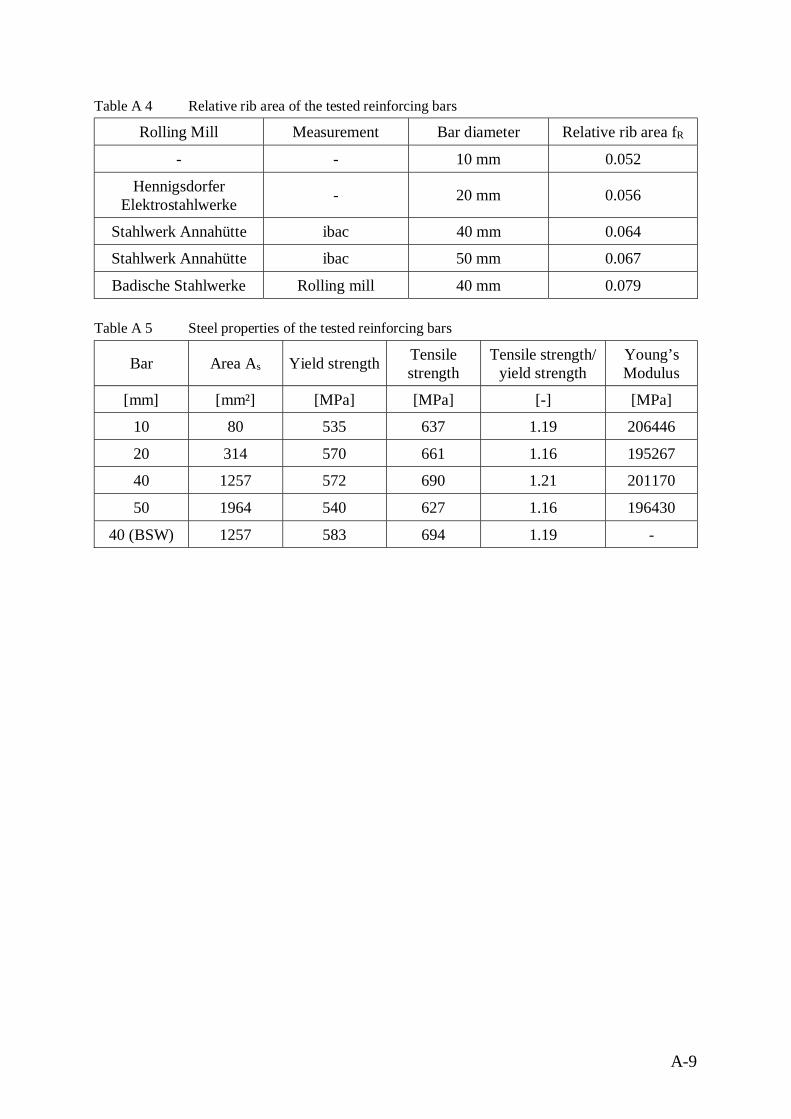
A-9
Table A 4 Relative rib area of the tested reinforcing bars
Rolling Mill Measurement Bar diameter Relative rib area fR
- - 10 mm 0.052
HennigsdorferElektrostahlwerke - 20 mm 0.056
Stahlwerk Annahütte ibac 40 mm 0.064
Stahlwerk Annahütte ibac 50 mm 0.067
Badische Stahlwerke Rolling mill 40 mm 0.079
Table A 5 Steel properties of the tested reinforcing bars
Bar Area As Yield strength Tensilestrength
Tensile strength/yield strength
Young’sModulus
[mm] [mm²] [MPa] [MPa] [-] [MPa]
10 80 535 637 1.19 206446
20 314 570 661 1.16 195267
40 1257 572 690 1.21 201170
50 1964 540 627 1.16 196430
40 (BSW) 1257 583 694 1.19 -
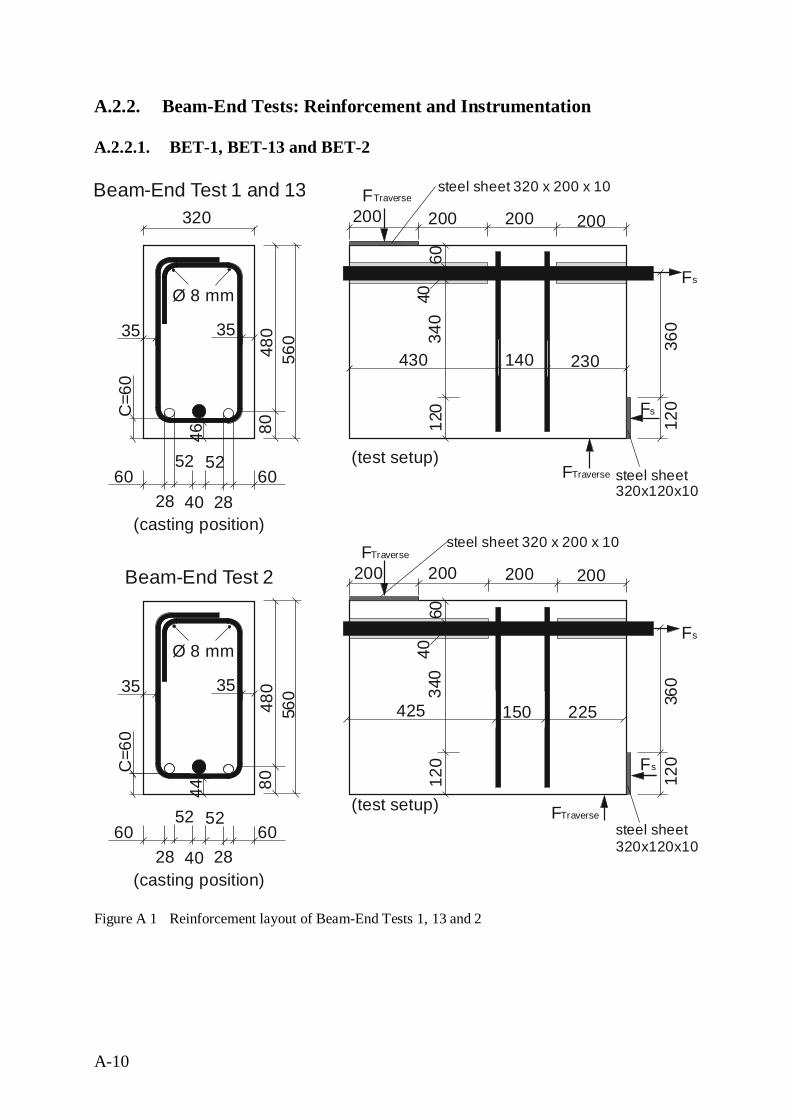
A-10
A.2.2. Beam-End Tests: Reinforcement and Instrumentation
A.2.2.1. BET-1, BET-13 and BET-2
Figure A 1 Reinforcement layout of Beam-End Tests 1, 13 and 2
320
604028 28
525260
560
Beam-End Test 1 and 13
C=6
0
480
80
steel sheet 320 x 200 x 10FTraverse
FTraverse
Fs
Fs
360
200200 200200
6012
034
0
steel sheet320x120x10
120
3535
46
40Ø 8 mm
140 230430
(casting position)
(test setup)
604028 28
525260
560
Beam-End Test 2
C=6
0
480
80
steel sheet 320 x 200 x 10FTraverse
FTraverse
Fs
360
200200 200200
6012
034
0
steel sheet320x120x10
Fs
120
3535
44
40Ø 8 mm
150 225425
(casting position)
(test setup)
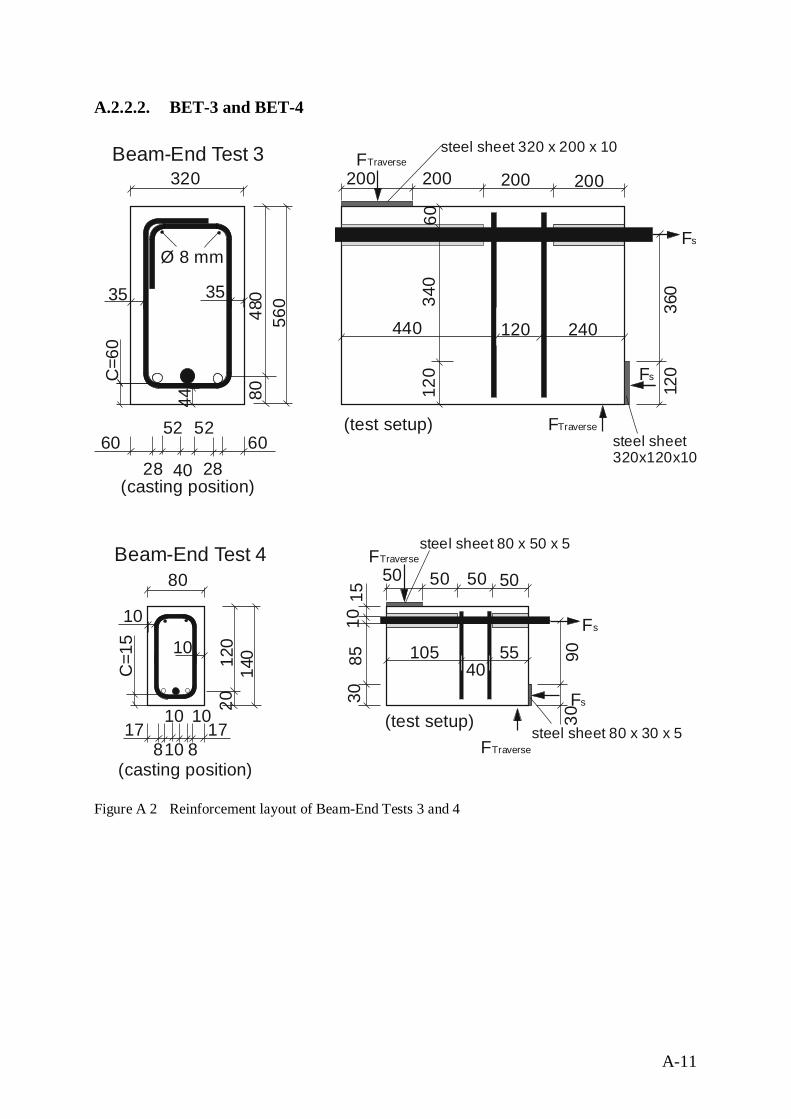
A-11
A.2.2.2. BET-3 and BET-4
Figure A 2 Reinforcement layout of Beam-End Tests 3 and 4
320
604028 28
525260
560
Beam-End Test 3
C=6
0
480
80
steel sheet 320 x 200 x 10FTraverse
FTraverse
Fs
360
200200 200200
6012
034
0steel sheet320x120x10
Fs
120
3535
44
Ø 8 mm
120 240440
(casting position)
(test setup)
80
17108 8
101017
140
Fs
Beam-End Test 4 FTraverse
C=1
5
120
Fs
steel sheet 80 x 30 x 5
50
FTraverse
1510
3085
50 505090
steel sheet 80 x 50 x 5
30
10
10 5540
105
20
(casting position)
(test setup)
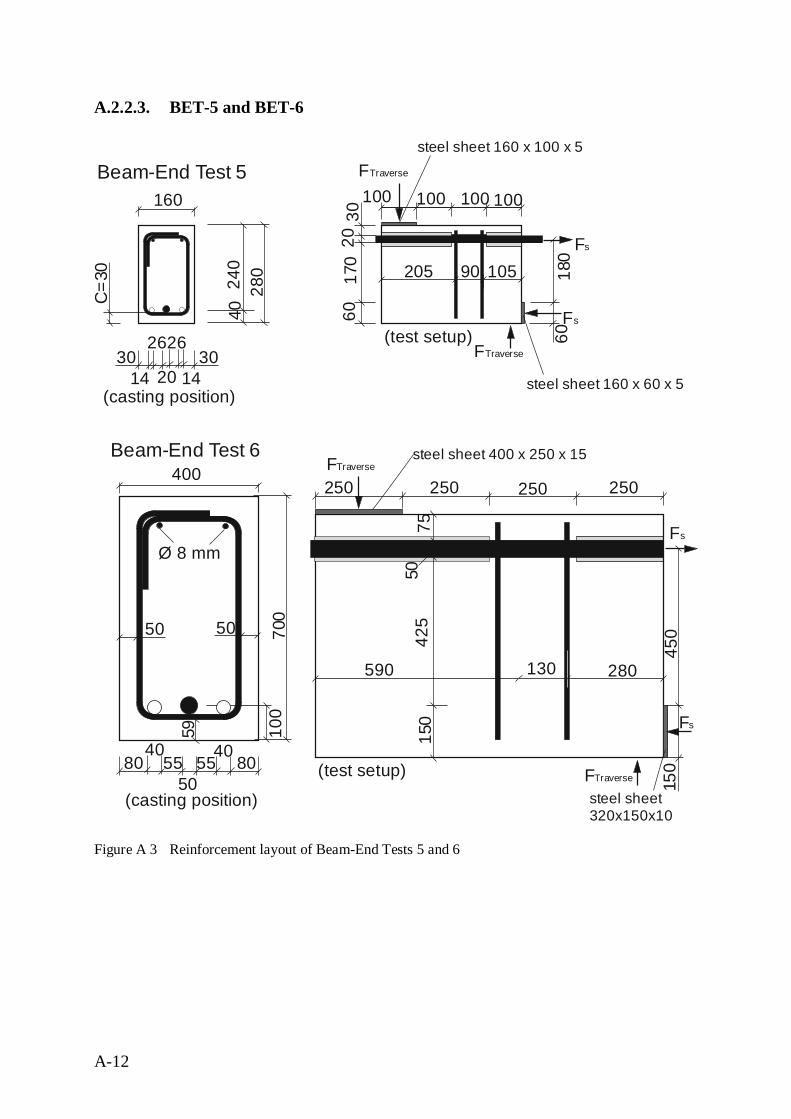
A-12
A.2.2.3. BET-5 and BET-6
Figure A 3 Reinforcement layout of Beam-End Tests 5 and 6
160
302014 14
262630
280
Beam-End Test 5
C=3
0
240
40Fs
FTraverse
Fs
steel sheet 160 x 60 x 5
100
FTraverse30
2060
170
100 100100
180
steel sheet 160 x 100 x 5
60
10590205
(casting position)
(test setup)
400
8050
40 405555 80
700
Beam-End Test 6
100
Fs
steel sheet320x150x10
FTraverse
Fs
7515
042
5
steel sheet 400 x 250 x 15FTraverse
250250 250250
450
150
50
5050
59
Ø 8 mm
130 280590
(casting position)
(test setup)
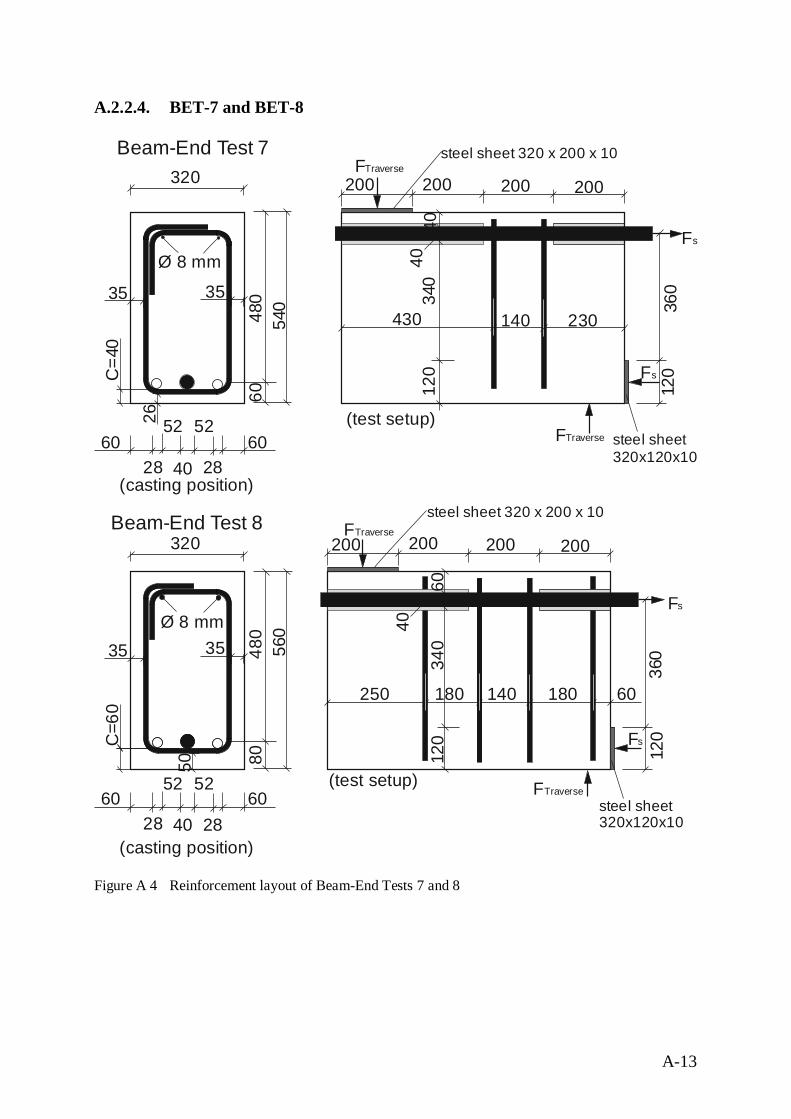
A-13
A.2.2.4. BET-7 and BET-8
Figure A 4 Reinforcement layout of Beam-End Tests 7 and 8
320
604028 28
525260
540
Beam-End Test 7
C=4
0
480
60
steel sheet 320 x 200 x 10FTraverse
FTraverse
Fs
360
200200 200200
4012
034
0steel sheet320x120x10
Fs
120
3535
26
40Ø 8 mm
140 230430
(casting position)
(test setup)
320
604028 28
525260
560
Beam-End Test 8
C=6
0
480
80
steel sheet 320 x 200 x 10FTraverse
FTraverse
Fs
360
200200 200200
6012
034
0
steel sheet320x120x10
Fs
120
3535
50
40Ø 8 mm
140 180250 180 60
(casting position)
(test setup)
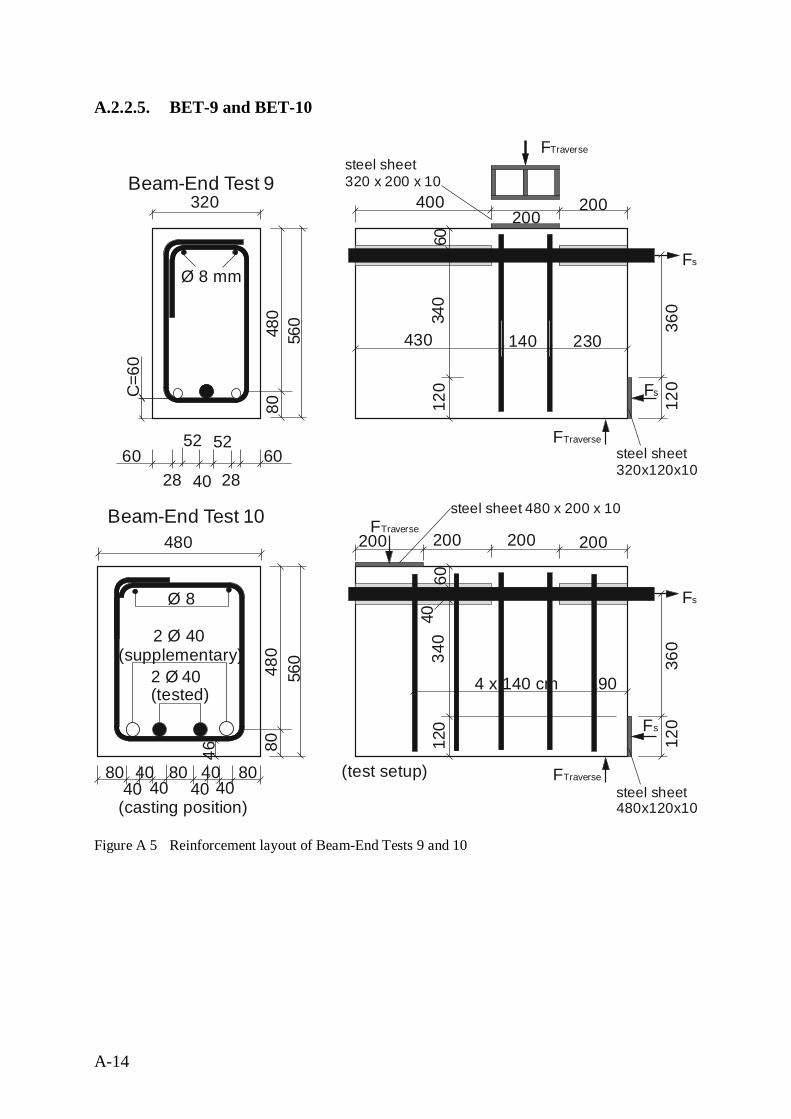
A-14
A.2.2.5. BET-9 and BET-10
Figure A 5 Reinforcement layout of Beam-End Tests 9 and 10
320
604028 28
525260
560
Beam-End Test 9
C=6
0
480
80
steel sheet320 x 200 x 10
FTraverse
Fs
360
200200
400
6012
034
0steel sheet320x120x10
Fs
120
FTraverse
140 230430
Ø 8 mm
480
804040 40
4080
560
Beam-End Test 10
480
80
4040
80
46
Ø 8
2 40Ø(tested)
2 40Ø(supplementary)
steel sheet 480 x 200 x 10FTraverse
FTraverse
Fs
360
200200 200200
6012
034
0
steel sheet480x120x10
Fs
120
40
4 x 140 cm 90
(casting position)
(test setup)
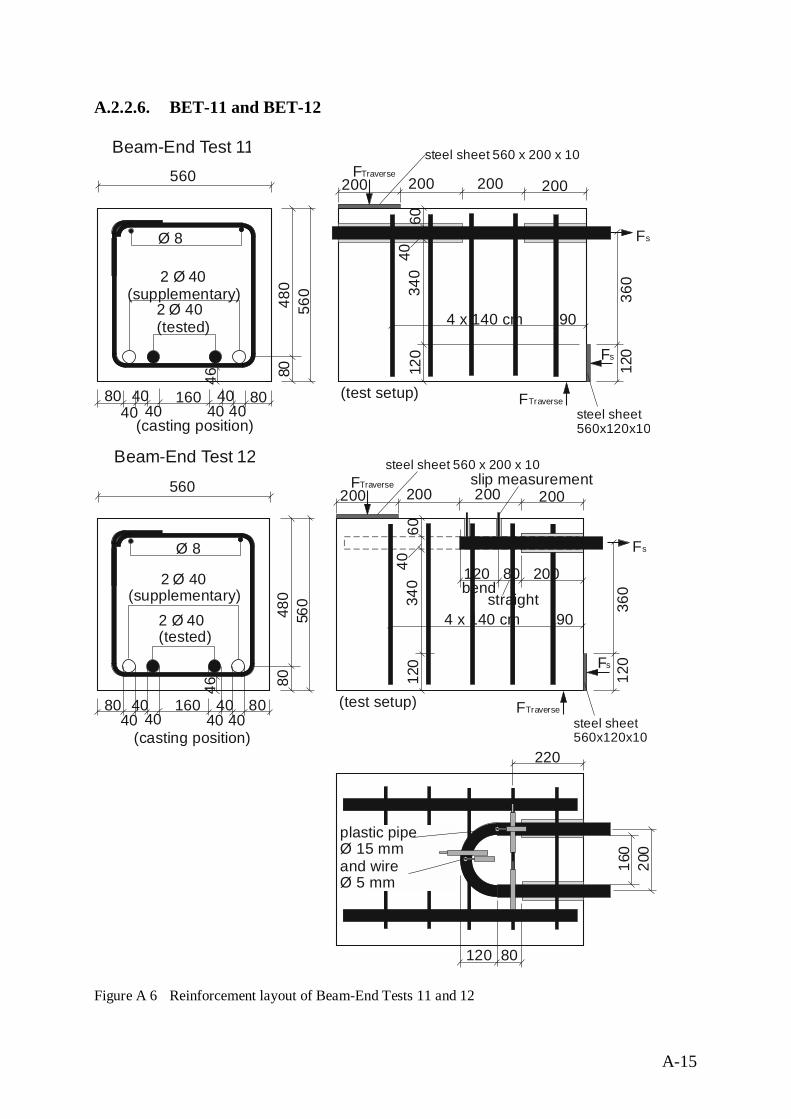
A-15
A.2.2.6. BET-11 and BET-12
Figure A 6 Reinforcement layout of Beam-End Tests 11 and 12
560
804040 40
40160
560
480
80
4040
80
46
Ø 8
2 40Ø(tested)
2 40Ø(supplementary)
Beam-End Test 11 steel sheet 560 x 200 x 10FTraverse
FTraverse
Fs
360
200200 200200
6012
034
0steel sheet560x120x10
Fs
120
40
4 x 140 cm 90
(casting position)
(test setup)
560
804040 40
40160
120 200
560
480
80
4040
80
46
Ø 8
160
200
120 80
80bend
straight
plastic pipeØ 15 mmand wireØ 5 mm
slip measurement
220
Beam-End Test 12
2 40Ø(tested)
2 40Ø(supplementary)
steel sheet 560 x 200 x 10FTraverse
FTraverse
Fs
360
200200 200200
6012
034
0
steel sheet560x120x10
Fs
120
40
4 x 140 cm 90
(casting position)
(test setup)
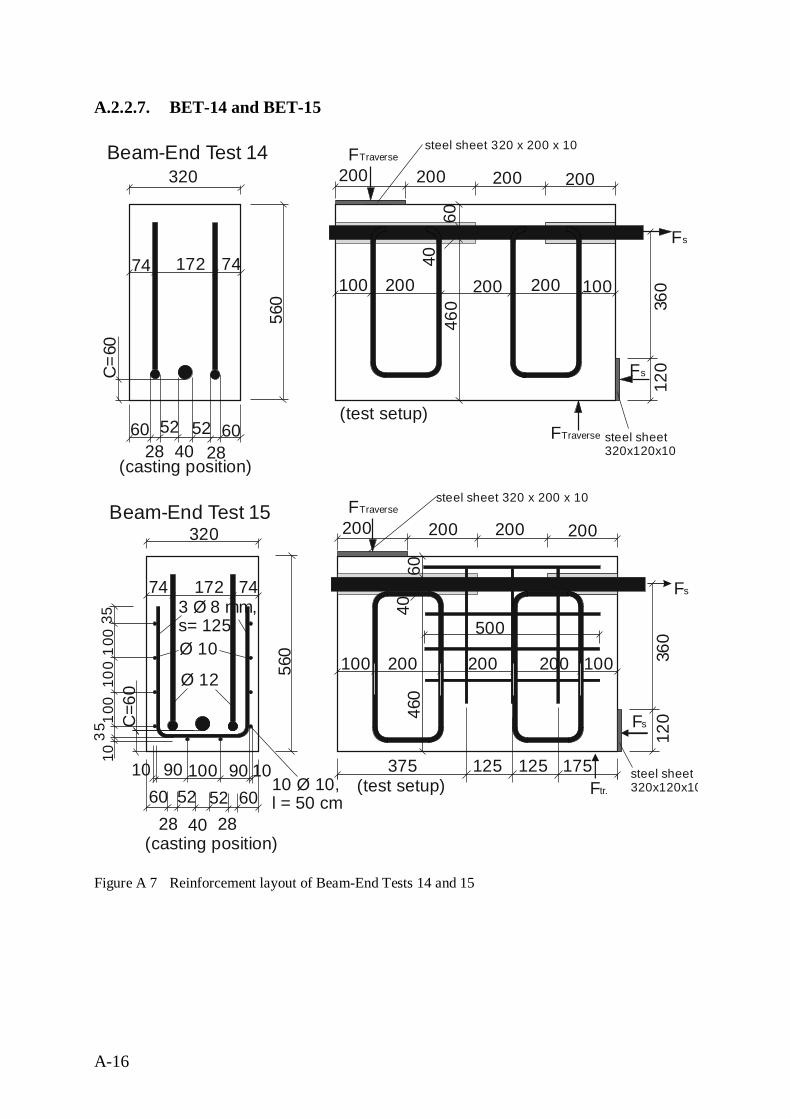
A-16
A.2.2.7. BET-14 and BET-15
Figure A 7 Reinforcement layout of Beam-End Tests 14 and 15
320
604028 28
5252 60
560
Beam-End Test 14
C=6
0
steel sheet 320 x 200 x 10FTraverse
FTraverse
Fs
Fs
360
200200 200200
6046
0steel sheet320x120x10
120
74 40172 74
Beam-End Test 15320
604028 28
5252 60
560
C=6
0
steel sheet 320 x 200 x 10FTraverse
Ftr.
Fs
360
200200 200200
6046
0
steel sheet320x120x10
Fs
120
40
375 125
Ø 12
125
74 172 74
175
3 8 ,Ø mms= 125
10 Ø 10,l = 50 cm
100
10
9010 90 10100
100
100
3535
200 100200 200100
Ø 10200 100200 200100
500
(casting position)
(test setup)
(test setup)
(casting position)
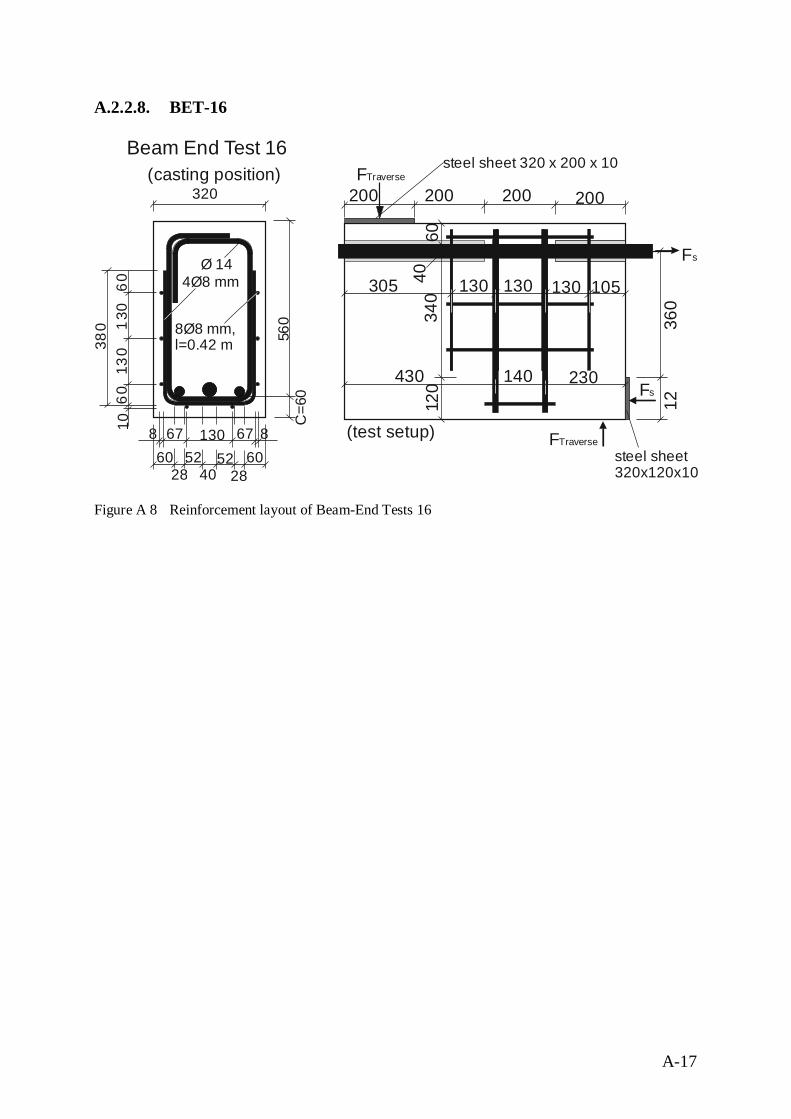
A-17
A.2.2.8. BET-16
Figure A 8 Reinforcement layout of Beam-End Tests 16
Beam End Test 16
320
604028 28
5252 60
560
C=6
0
steel sheet 320 x 200 x 10FTraverse
FTraverse
Fs
360
200200 200200
6012
034
0steel sheet320x120x10
Fs
12
140 230430
40
Ø 14
130
380
10 678 67 8130
130
60
4 8Ø mm60
8Ø8 mm,l=0.42 m
130305 130130 105
(casting position)
(test setup)
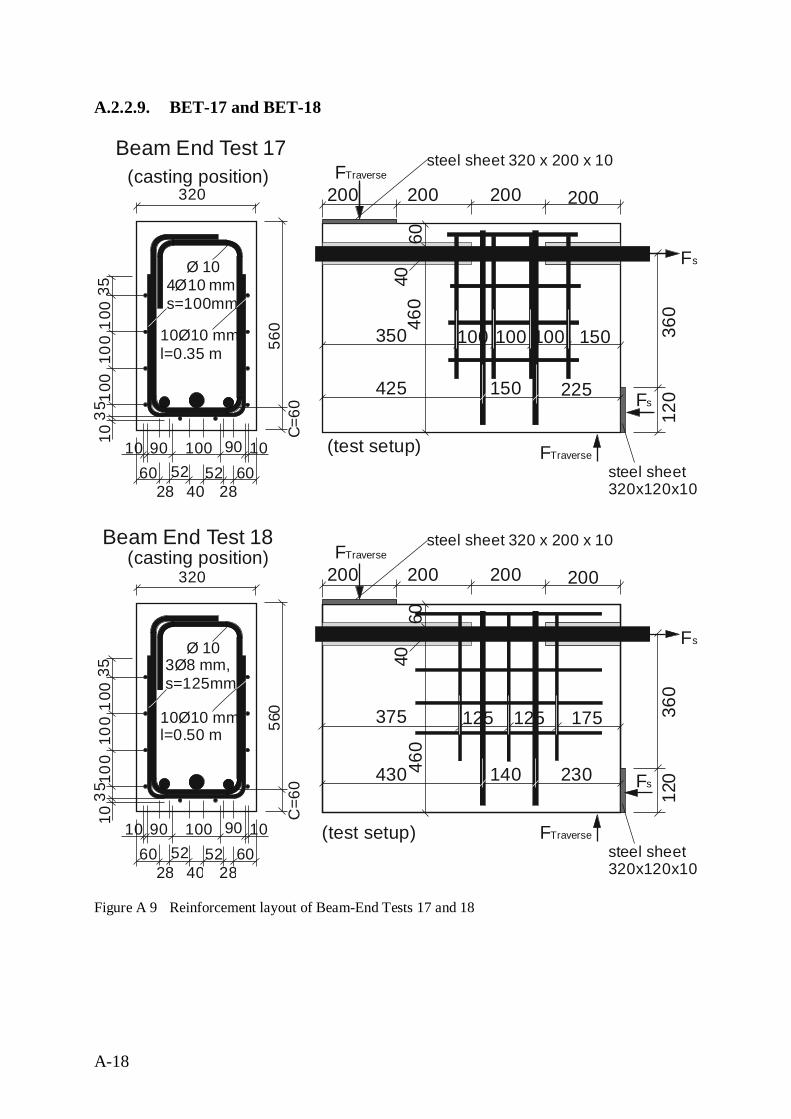
A-18
A.2.2.9. BET-17 and BET-18
Figure A 9 Reinforcement layout of Beam-End Tests 17 and 18
Beam End Test 18 steel sheet 320 x 200 x 10FTraverse
FTraverse
Fs
360
200200 200200
6046
0
steel sheet320x120x10
Fs
120140 230430
40
125375 125 175
Beam End Test 17 steel sheet 320 x 200 x 10FTraverse
FTraverse
Fs
360
200200 200200
6046
0
steel sheet320x120x10
Fs
120150 225425
40
100 150350 100 100
100
1010
010
035
3510
010
100
100
3535
320
604028 28
5252 60
560
C=60
Ø 10
9010 90 10100
4 10Ø mms=100mm
10Ø10 mm,l=0.35 m
(casting position)
320
604028 28
5252 60
560
C=6
0
Ø 10
9010 90 10100
3 8 ,Ø mms=125mm
10Ø10 mm,l=0.50 m
(casting position)
(test setup)
(test setup)
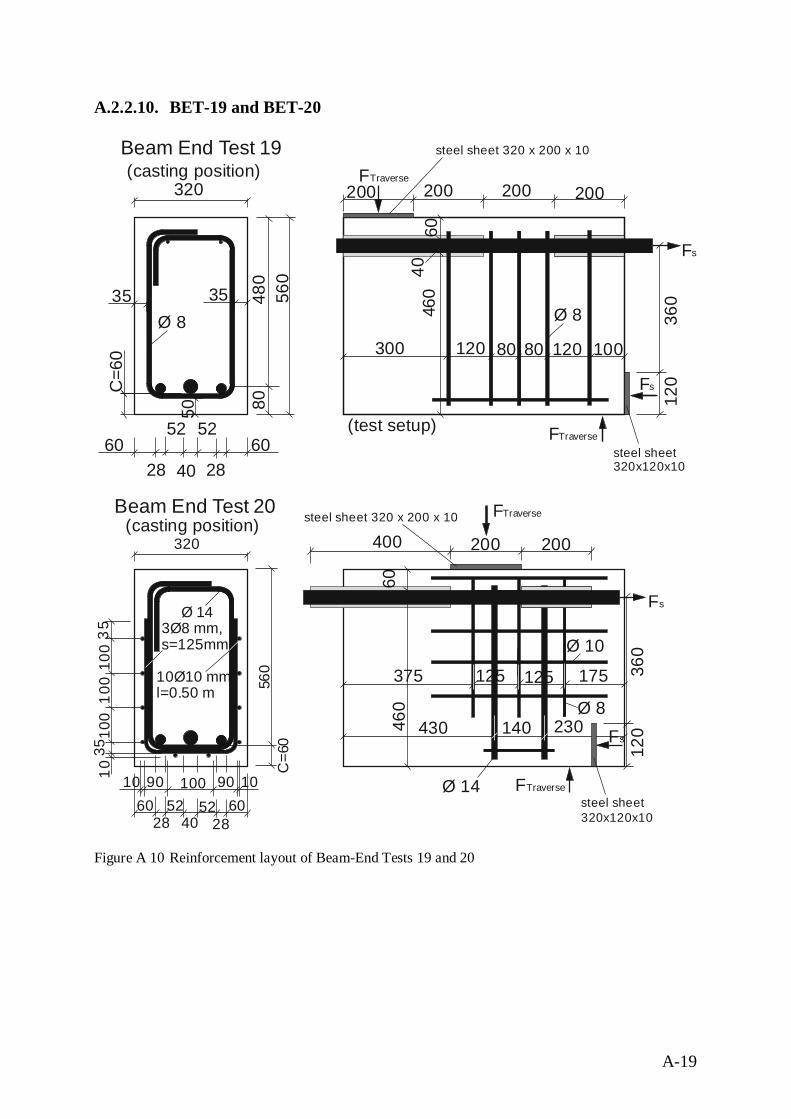
A-19
A.2.2.10. BET-19 and BET-20
Figure A 10 Reinforcement layout of Beam-End Tests 19 and 20
320
604028 28
525260
560
Beam End Test 19
C=6
0
480
80
steel sheet 320 x 200 x 10
FTraverse
FTraverse
Fs
360
200200 200200
6046
0steel sheet320x120x10
Fs
120
80 120300
3535
50
40
120 10080
Ø 8Ø 8
(casting position)
(test setup)
Beam End Test 20
140 230430
125375 125
Ø 14
Ø 10
Ø 8
175
steel sheet 320 x 200 x 10
FTraverse
Fs
360
200200400
6046
0
steel sheet320x120x10
Fs
120
FTraverse
100
1010
010
035
35
320
604028 28
5252 60
560
C=6
0
Ø 14
9010 90 10100
3 8 ,Ø mms=125mm
10Ø10 mm,l=0.50 m
(casting position)
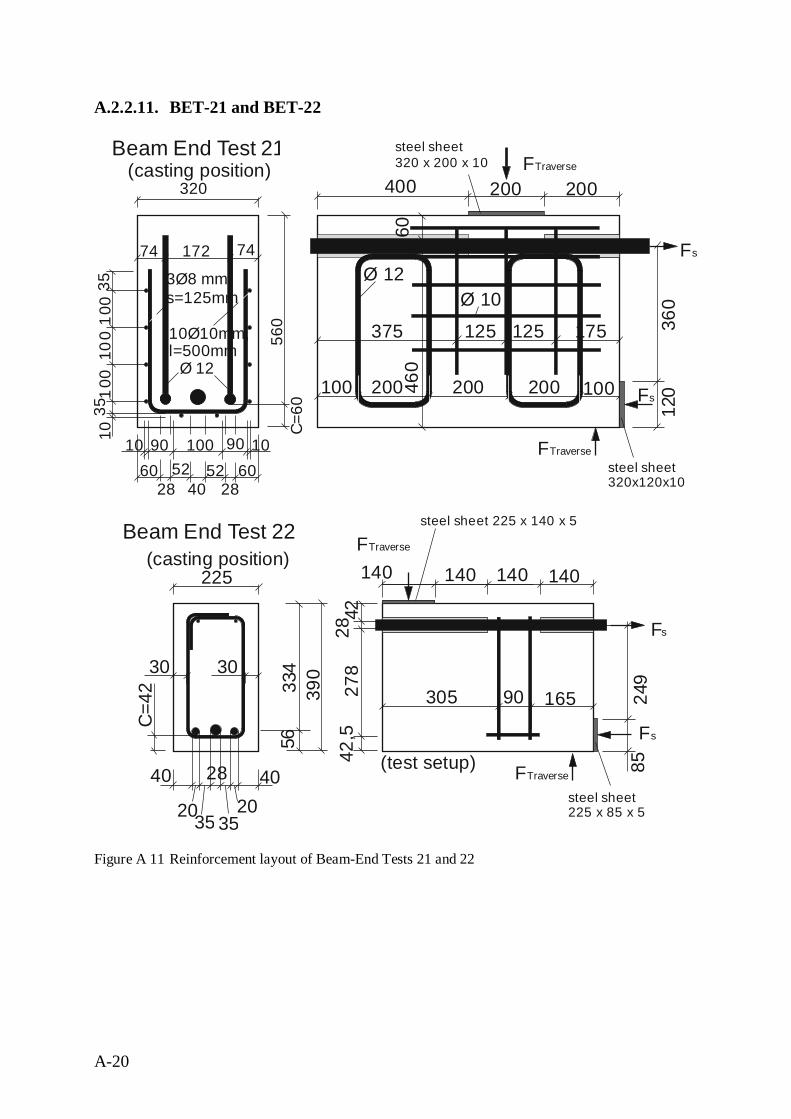
A-20
A.2.2.11. BET-21 and BET-22
Figure A 11 Reinforcement layout of Beam-End Tests 21 and 22
225
40 28
20 2035 35
40
390
Beam End Test 22
C=4
2 334
56
Fs
FTraverse
Fs
steel sheet225 x 85 x 5
140
FTraverse
4228
42,5
278
140 140140
249
steel sheet 225 x 140 x 5
85
165903053030
(casting position)
(test setup)
Beam End Test 21
375 125
Ø 10
125
200 100200 200100
74 172 74Ø 12
175
steel sheet320 x 200 x 10
FTraverse
Fs
360
200200400
6046
0
steel sheet320x120x10
Fs
120
FTraverse
100
1010
010
035
35
320
604028 28
5252 60
560
C=60
9010 90 10100
3 8 ,Ø mms=125mm
10Ø10mm,l=500mm
(casting position)
Ø 12
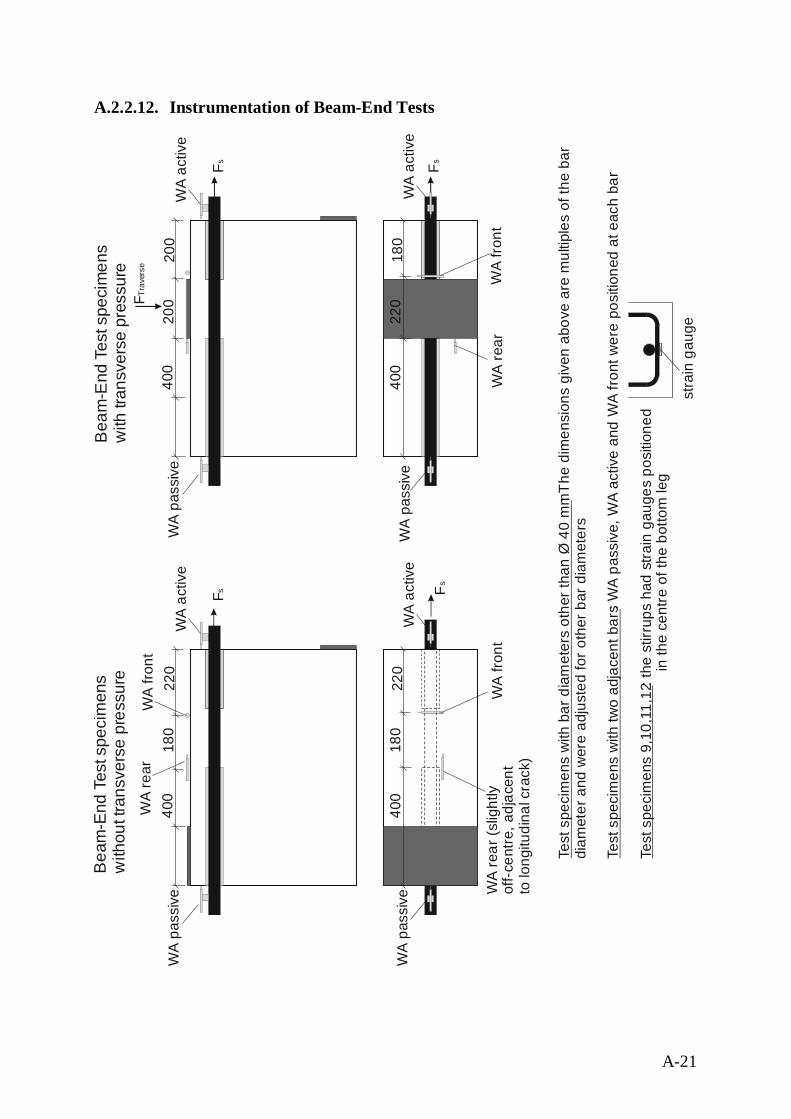
A-21
A.2.2.12. Instrumentation of Beam-End Tests
F s
220
180
400
WA
activ
eW
A pa
ssiv
e
WA
front
WA
rear
F s
WA
activ
eW
A pa
ssiv
e22
018
040
0
WA
front
WA
rear
(slig
htly
off-c
entre
, adj
acen
tto
long
itudi
nal c
rack
)
F Tra
vers
e
F s
200
200
400
Fs
WA
activ
eW
A pa
ssiv
e
WA
activ
eW
A pa
ssiv
e18
022
040
0
WA
front
WA
rear
Bea
m-E
nd T
est s
peci
men
sw
ithou
t tra
nsve
rse
pres
sure
Bea
m-E
nd T
est s
peci
men
sw
ith tr
ansv
erse
pre
ssur
e
Test
spe
cim
ens
with
bar
dia
met
ers
othe
r tha
n Ø
40
mm:
The
dim
ensi
ons
give
n ab
ove
are
mul
tiple
s of
the
bar
diam
eter
and
wer
e ad
just
ed fo
r oth
er b
ar d
iam
eter
s
: WA
pass
ive,
WA
activ
e an
d W
A fro
nt w
ere
posi
tione
d at
eac
h ba
rTe
st s
peci
men
s w
ith tw
o ad
jace
nt b
ars
: the
stir
rups
had
stra
in g
auge
s po
sitio
ned
Test
spe
cim
ens
9,10
,11,
12
in th
e ce
ntre
of t
he b
otto
m le
g
stra
in g
auge
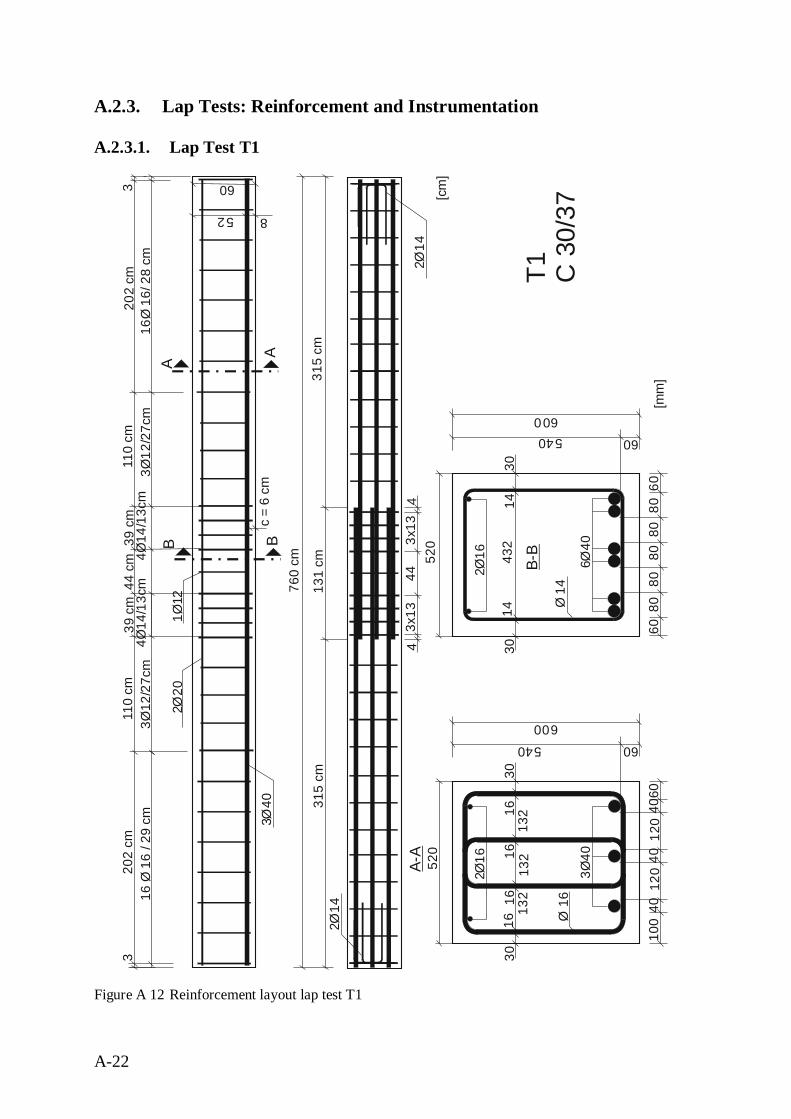
A-22
A.2.3. Lap Tests: Reinforcement and Instrumentation
A.2.3.1. Lap Test T1
Figure A 12 Reinforcement layout lap test T1
520
T1 C 3
0/37
760
cm
131
cm
202
cm20
2 cm
44 c
m 8060
c =
6 cm
540 60600
52
60
8
8080
80
340
Ø
16 Ø
16
/ 29
cm3
16Ø
16/
28
cm3
220
Ø
[cm
]
26
Ø1 6
40ØB-B
A
A
6080
432
1414
3030
315
cm31
5 cm
443x
133x
1352
0 4060
540 60600
120
4012
026
Ø1
3Ø40
A-A
100
40
1616
3030
4Ø14
/13c
m
B B
Ø 1
6Ø
14
44
1616
132
132
132
3Ø12
/27c
m3Ø
12/2
7cm
39 c
m39
cm
110
cm11
0 cm
214
Ø
214
Ø
1Ø12
[mm
]
4Ø14
/13c
m
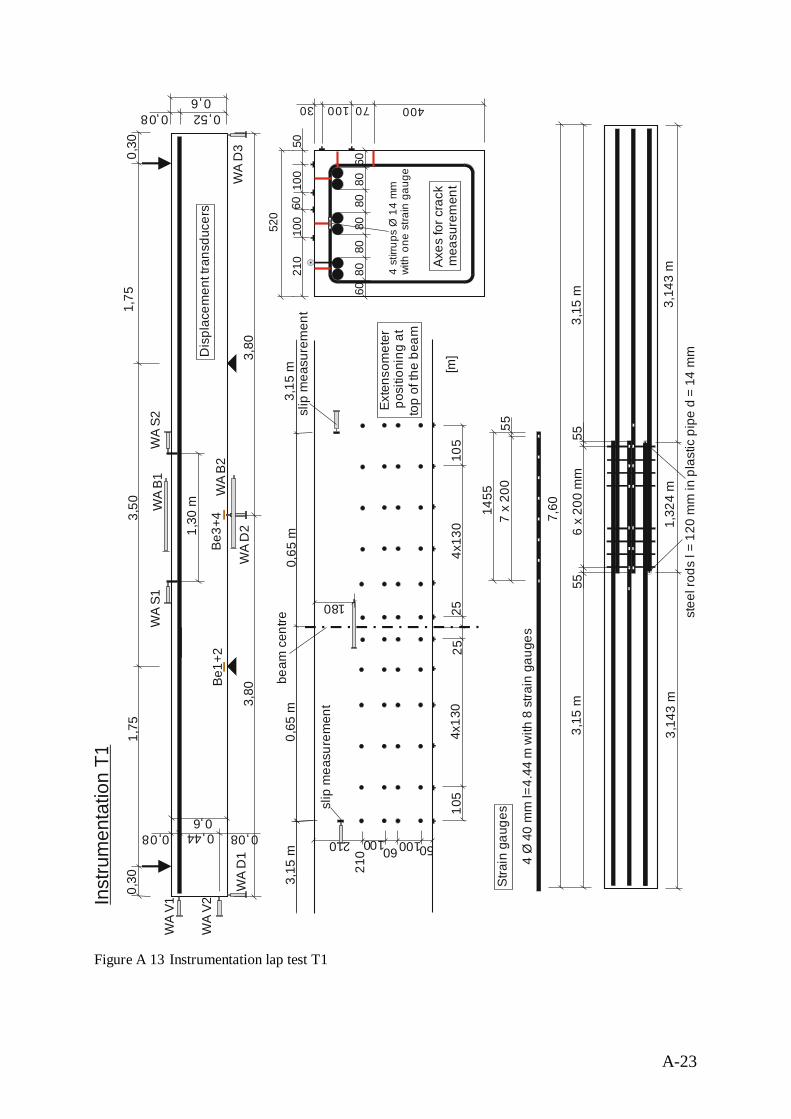
A-23
Figure A 13 Instrumentation lap test T1
1,75
1,75
3,50
0,520,6
0,08
WA
V1
WA
D1
WA
D30,30
0,30
WA
V2Be
1+2
0,440,6
0,08 0,08
Inst
rum
enta
tion
T1
0,65
m
[m]
100100 50210 60
0,65
m
180
beam
cen
tre52
0
100
50
400
6021
010
0
10030
8060
8080
8060
80
4 4.
44 w
ith 8
stra
in g
auge
sØ
40
mm
l= m
7,60
6 x
200
mm
3,15
m3,
15 m
5555
4 st
irrup
s Ø
14
mm
with
one
stra
in g
auge
Stra
in g
auge
s
Exte
nsom
eter
posi
tioni
ng a
tto
p of
the
beam
Axes
for c
rack
mea
sure
men
t
Dis
plac
emen
t tra
nsdu
cers
3,80
WA
B2
WA
D2
Be3+
4
3,80
3,15
m3,
15 m
210
slip
mea
sure
men
t
slip
mea
sure
men
t
stee
l rod
s l =
120
mm
in p
last
ic p
ipe
d =
14 m
m1,
324
m3,
143
m3,
143
m
1,30
m
WA
S1W
A S2
WA
B1
105
4x13
010
54x
130
2525
7 x
200
5514
55
70
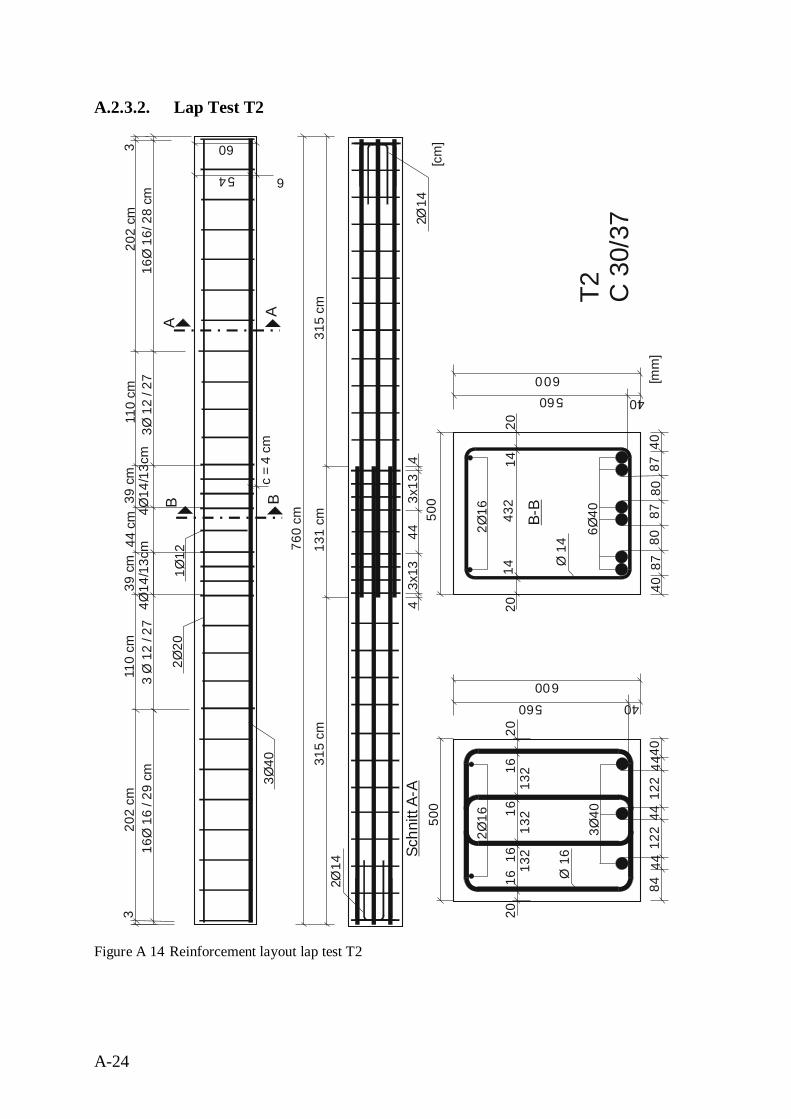
A-24
A.2.3.2. Lap Test T2
Figure A 14 Reinforcement layout lap test T2
500
T2 C 3
0/37
8740
560 40
600
8087
80
26
Ø1
640
ØB-B
4087
432
1414
2020
500
4440
560 40600
122
4412
226
Ø1
3Ø40
8444
1616
2020
Ø 1
6Ø
14
1616
132
132
132
[mm
]
760
cm
131
cm
202
cm20
2 cm
44 c
m
c =
4 cm
54
60
6
340
Ø
16Ø
16
/ 29
cm3
16Ø
16/
28
cm3
220
Ø
[cm
]
A
A
315
cm31
5 cm
443x
133x
13Sc
hnitt
A-A
4Ø14
/13c
m
B B
44
3 Ø
12
/ 27
3Ø 1
2 / 2
739
cm
39 c
m11
0 cm
110
cm
214
Ø
214
Ø
1Ø12
4Ø14
/13c
m
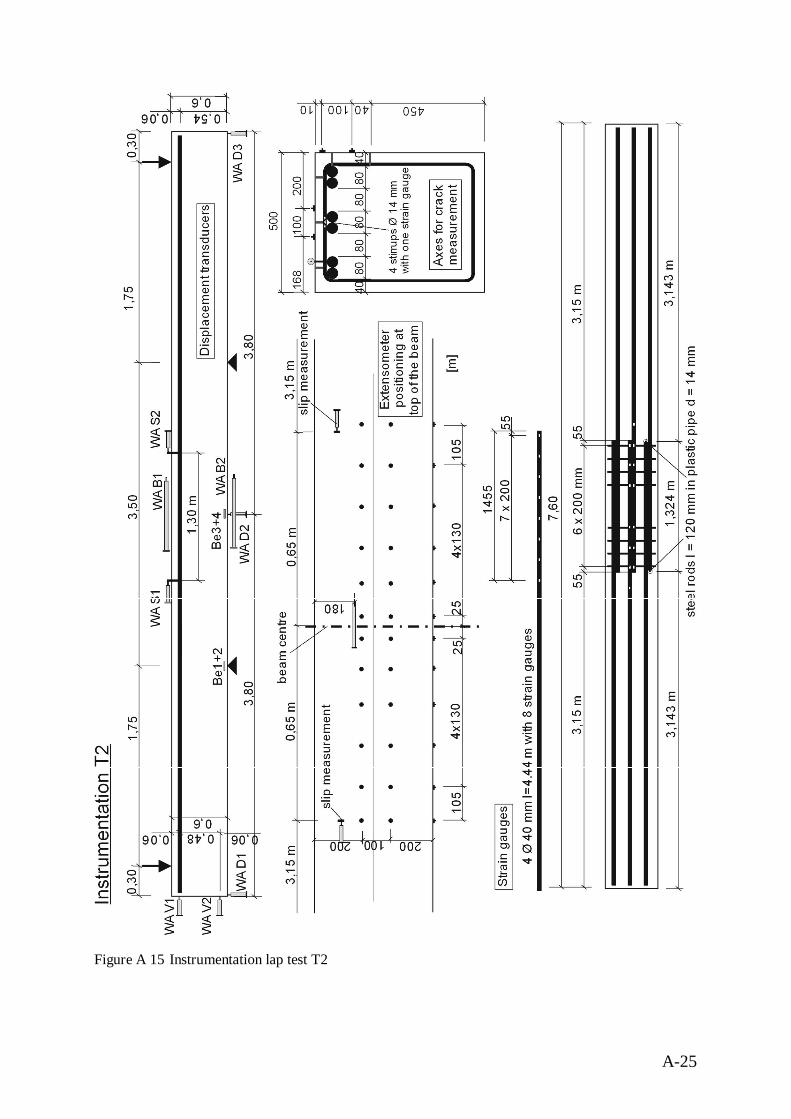
A-25
Figure A 15 Instrumentation lap test T2
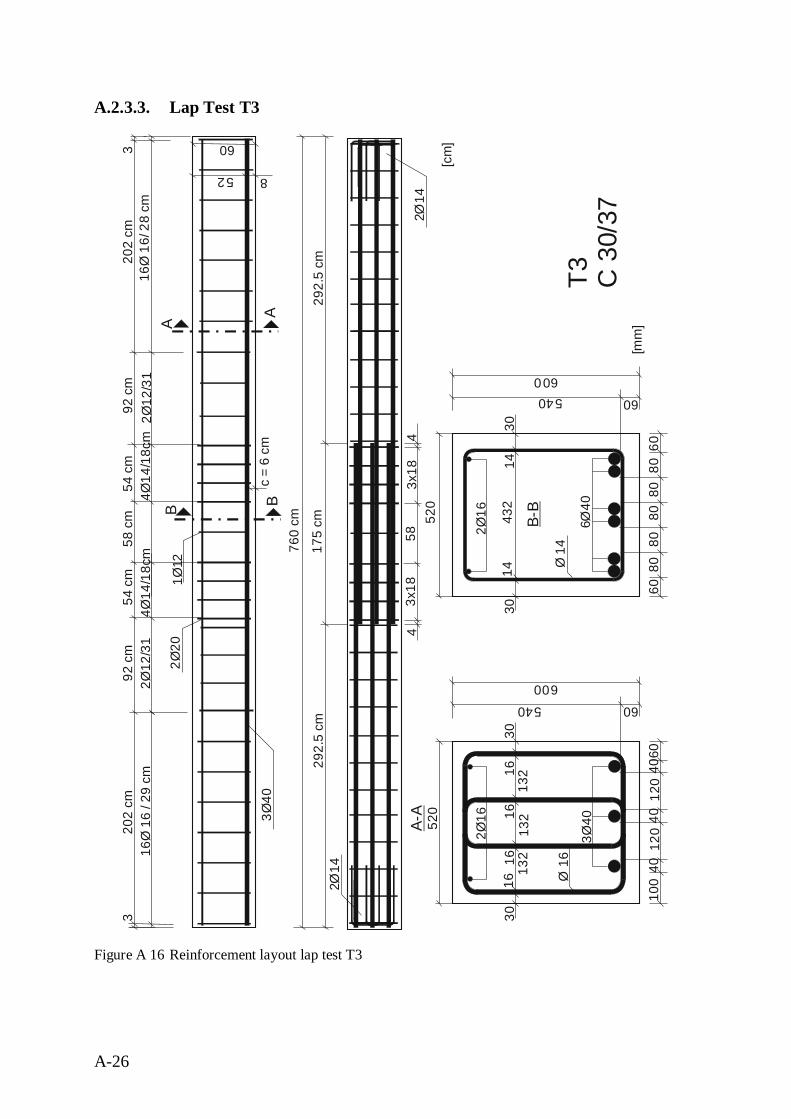
A-26
A.2.3.3. Lap Test T3
Figure A 16 Reinforcement layout lap test T3
520
T3 C 3
0/37
760
cm
175
cm
202
cm20
2 cm
58 c
m 8060
c =
6 cm
540 60600
52
60
8
8080
80
340
Ø
16Ø
16
/ 29
cm3
16Ø
16/
28
cm3
220
Ø
[cm
]
26
Ø1
640
ØB-B
A
A
6080
432
1414
3030
292.
5 cm
583x
183x
1852
0 4060
540 60600
120
4012
026
Ø1
3Ø40A-
A
100
40
1616
3030
4Ø14
/18c
m
B B
Ø 1
6Ø
14
44
1616
132
132
132
2Ø12
/31
2Ø12
/31
54 c
m54
cm
92 c
m92
cm
214
Ø
214
Ø
1Ø12
292.
5 cm
4Ø14
/18c
m
[mm
]

A-27
Figure A 17 Instrumentation lap test T3
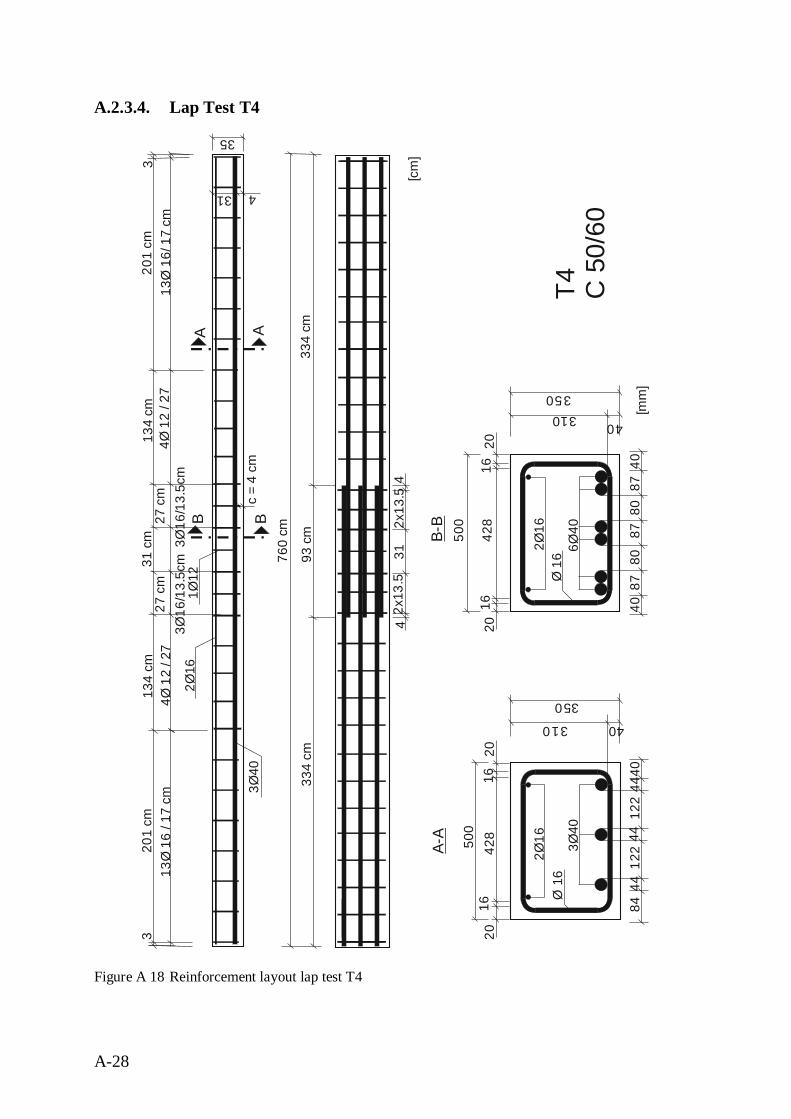
A-28
A.2.3.4. Lap Test T4
Figure A 18 Reinforcement layout lap test T4
500
T4 C 5
0/60
760
cm
93 c
m
201
cm20
1 cm
31 c
m 8740
c =
4 cm
310 40
350
31
35
4
8087
80
340
Ø
13Ø
16
/ 17
cm3
13Ø
16/
17
cm3
216
Ø
[cm
]
26
Ø1
640
ØB-B
A A
4087
428
1616
2020
334
cm33
4 cm
312x
13.5
2x13
.5
500 44
40
310 40
350
122
4412
226
Ø1 3Ø
40
A-A
8444
1616
2020
3Ø16
/13.
5cm
B B
Ø 1
6Ø
16
44
428
4Ø 1
2 / 2
74Ø
12
/ 27
27 c
m27
cm
134
cm13
4 cm
1Ø12
[mm
]
3Ø16
/13.
5cm
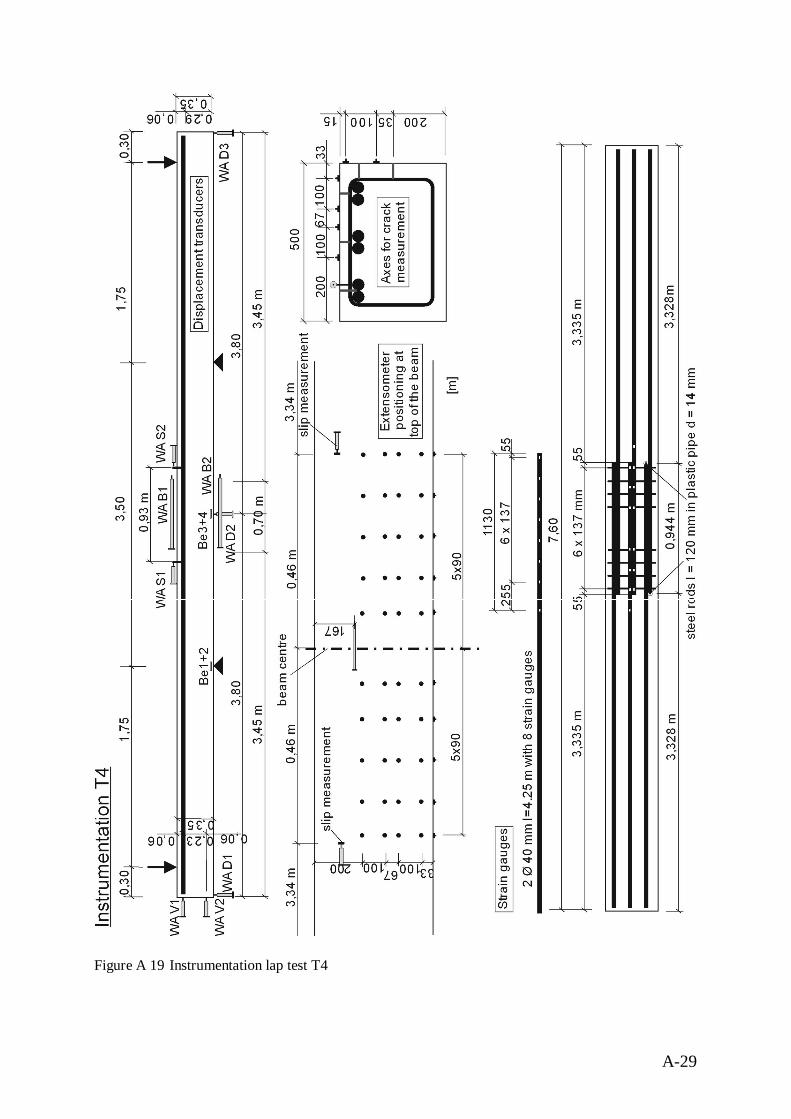
A-29
Figure A 19 Instrumentation lap test T4
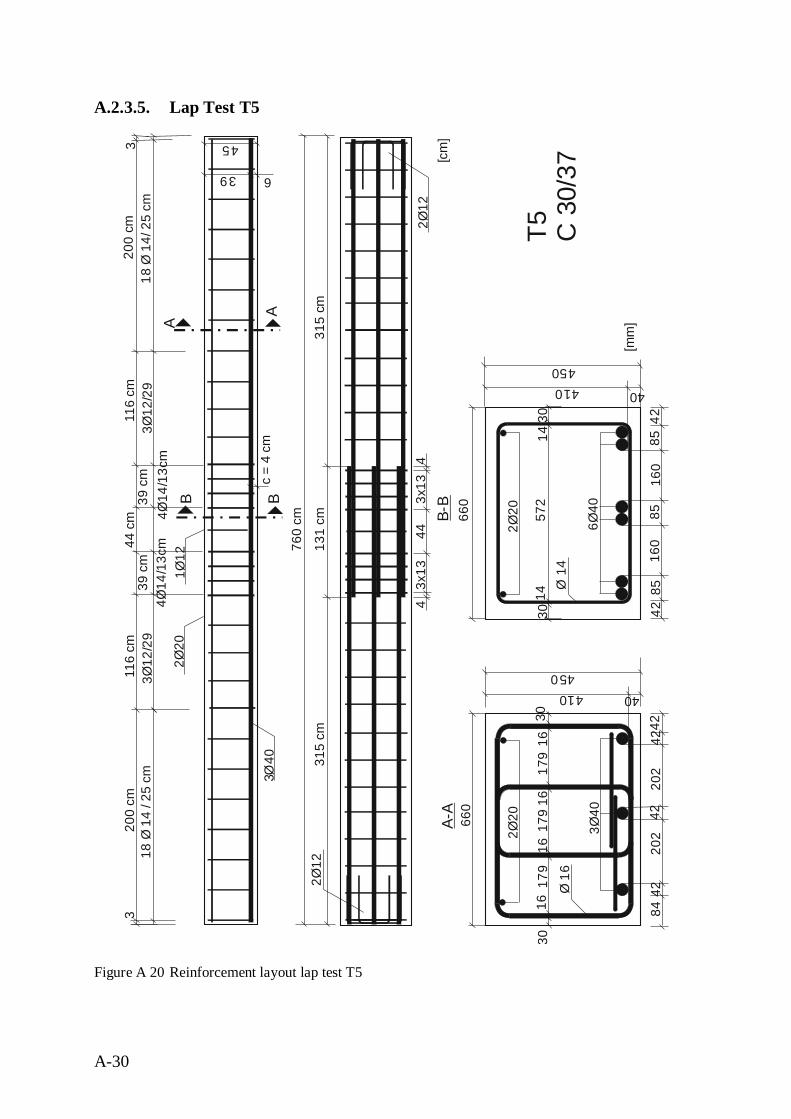
A-30
A.2.3.5. Lap Test T5
Figure A 20 Reinforcement layout lap test T5
660
T5 C 3
0/37
8542
410 40
450
160
8516
0
220
Ø 640
ØB-B
4285
572
1414
3030
660 42
42
410 40450
202
4220
2220
Ø 3Ø40
8442
1616
3030
Ø 1
6Ø
14
1616
179
179
179
[mm
]
760
cm
131
cm
200
cm20
0 cm
44 c
m
c =
4 cm
39
45
6
340
Ø
18 Ø
14
/ 25
cm3
18 Ø
14/
25
cm3
220
Ø
[cm
]
A
A
315
cm31
5 cm
443x
133x
13
A-A
4Ø14
/13c
m
B B
44
3Ø12
/29
3Ø12
/29
39 c
m39
cm
116
cm11
6 cm
212
Ø
212
Ø
1Ø12
4Ø14
/13c
m
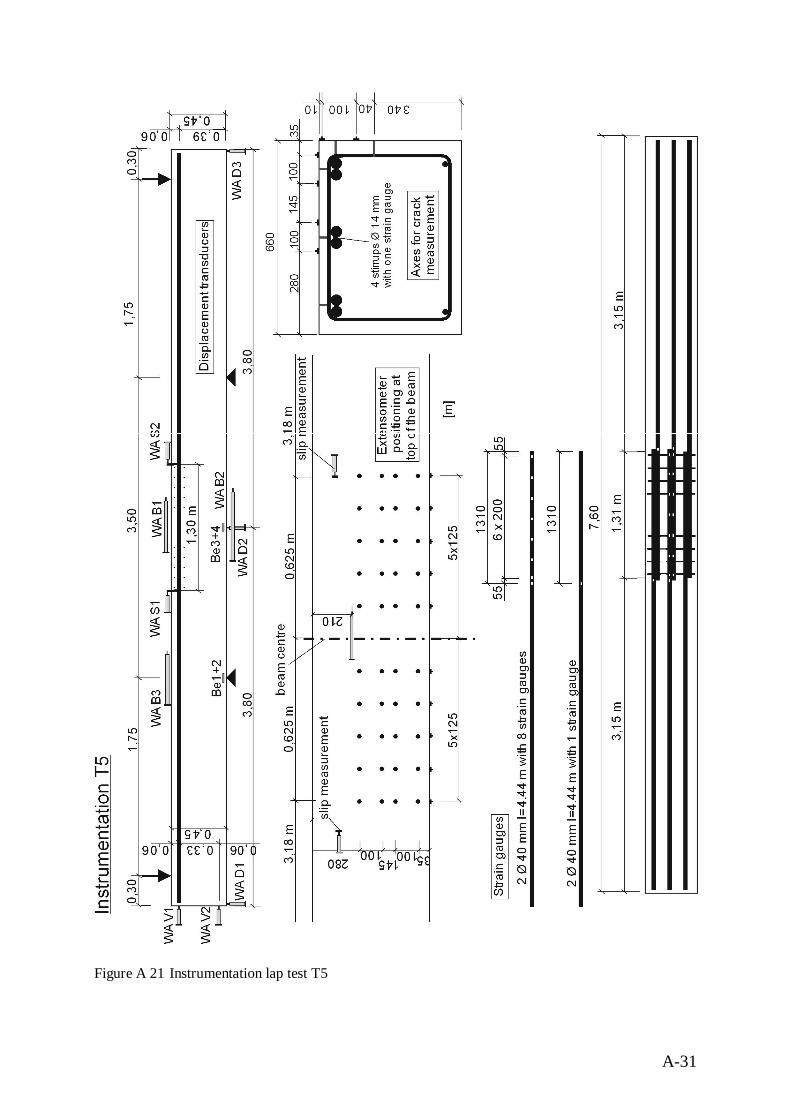
A-31
Figure A 21 Instrumentation lap test T5
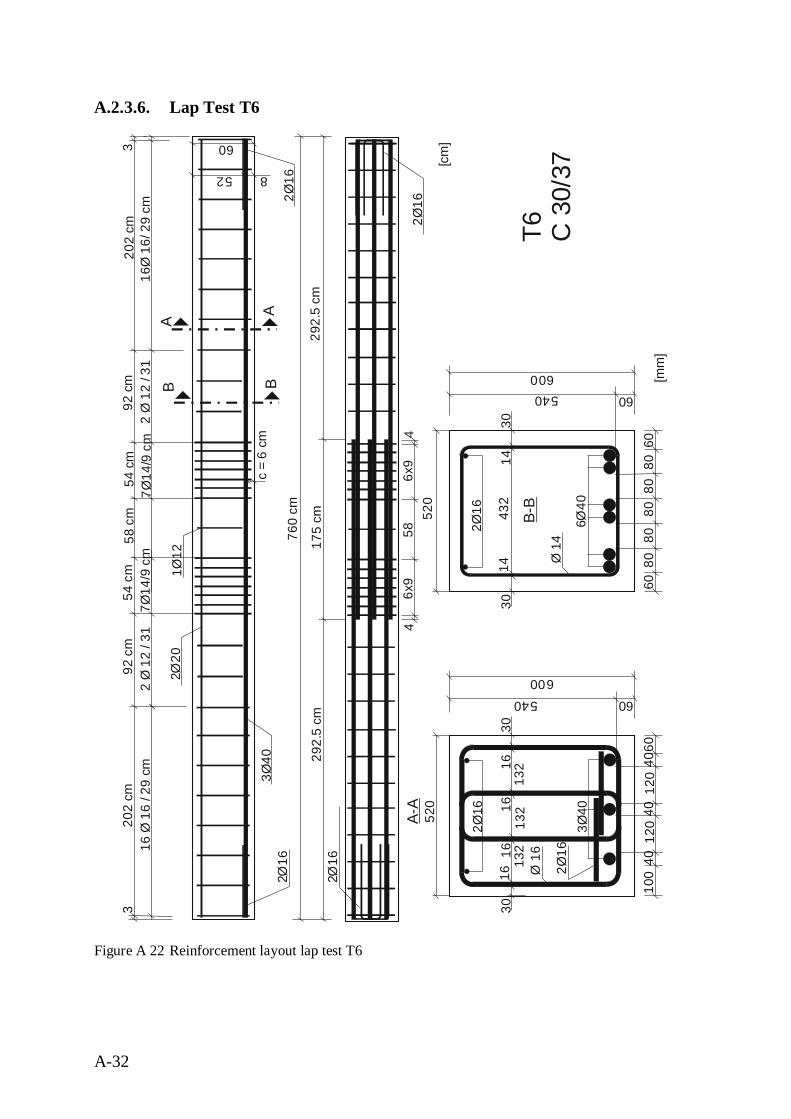
A-32
A.2.3.6. Lap Test T6
Figure A 22 Reinforcement layout lap test T6
520
T6 C 3
0/37
760
cm
175
cm
202
cm20
2 cm
58 c
m 8060
c =
6 cm
540 60600
52
60
8
8080
80
340
Ø
16 Ø
16
/ 29
cm3
16Ø
16/
29
cm3
220
Ø
[cm
]
26
Ø1
640
ØB-B
A
A
6080
432
1414
3030
292.
5 cm
292.
5 cm
586x
96x
952
0 4060
540 60600
120
4012
026
Ø1
3Ø40A-A
100
40
1616
3030
7Ø14
/9 c
m
B B
Ø 1
6Ø
14
44
1616
132
132
132
2 Ø
12
/ 31
2 Ø
12
/ 31
54 c
m54
cm
92 c
m92
cm
216
Ø
216
Ø
1Ø12
[mm
]
216
Ø2
16Ø
216
Ø
7Ø14
/9 c
m
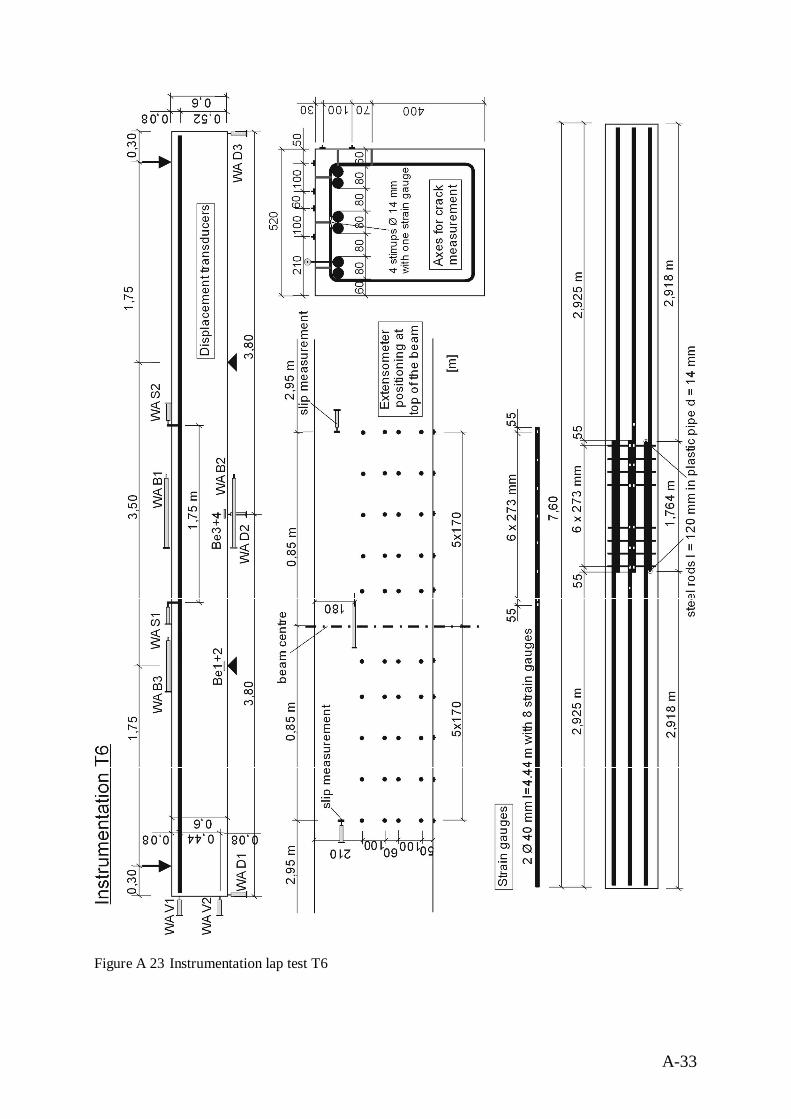
A-33
Figure A 23 Instrumentation lap test T6
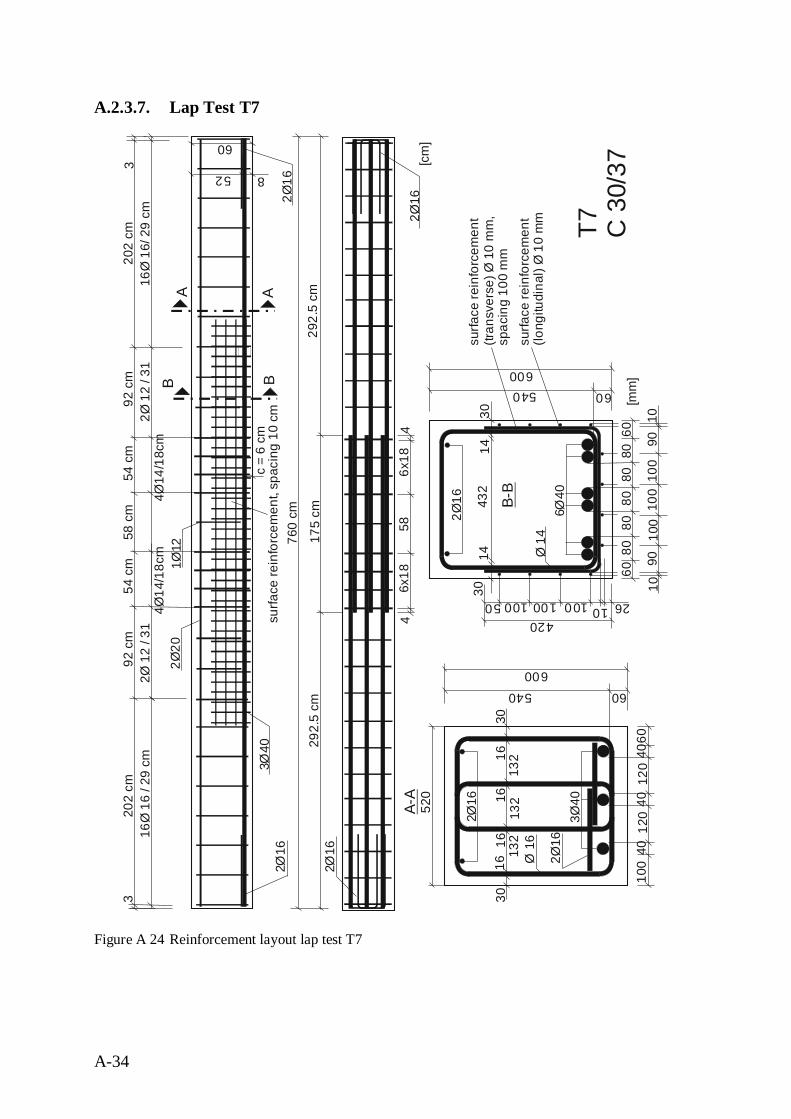
A-34
A.2.3.7. Lap Test T7
Figure A 24 Reinforcement layout lap test T7
T7 C 3
0/37
760
cm
175
cm
202
cm20
2 cm
58 c
m
8060
c =
6 cm
540 60600
52
60
8
8080
80
340
Ø
16Ø
16
/ 29
cm3
16Ø
16/
29
cm3
220
Ø
[cm
]
26
Ø1
640
ØB-B
A A
6080
432
1414
3030
292.
5 cm
292.
5 cm
586x
186x
1852
0 4060
540 60600
120
4012
026
Ø1
3Ø40A-A
100
40
1616
3030
4Ø14
/18c
mB B
Ø 1
6Ø
14
44
1616
132
132
132
2Ø 1
2 / 3
12Ø
12
/ 31
54 c
m54
cm
92 c
m92
cm
216
Ø
216
Ø
1Ø12
216
Ø2
16Ø
216
Ø
4Ø14
/18c
m
100420
261050 100 100
surfa
ce re
info
rcem
ent,
spac
ing
10 c
m
surfa
ce re
info
rcem
ent
(tran
sver
se) Ø
10
mm
,sp
acin
g 10
0 m
msu
rface
rein
forc
emen
t(lo
ngitu
dina
l) Ø
10
mm
[mm
]10
010
090
1090
1010
0
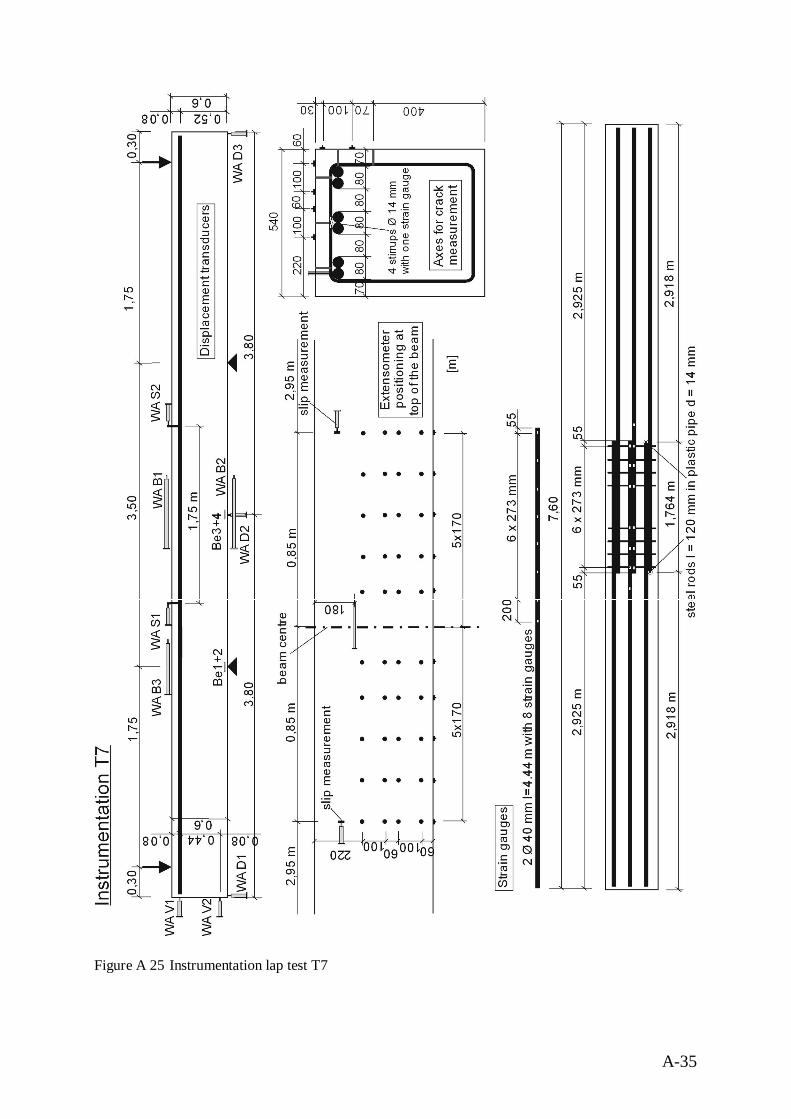
A-35
Figure A 25 Instrumentation lap test T7
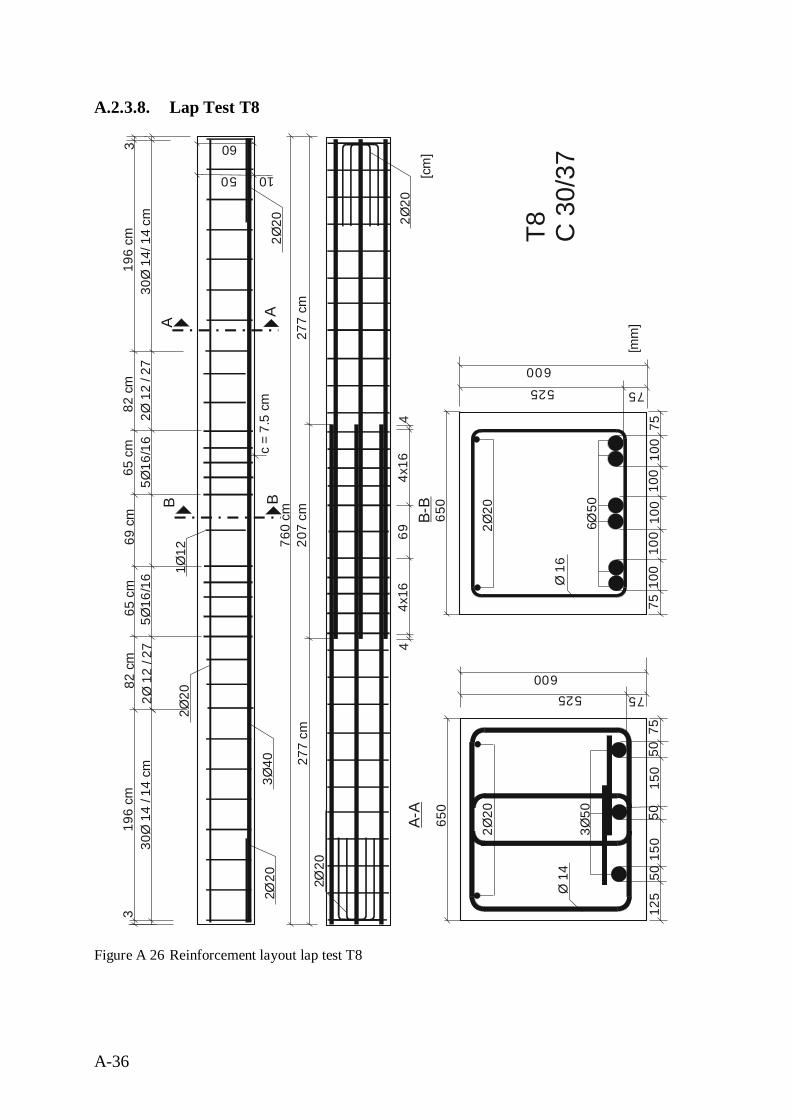
A-36
A.2.3.8. Lap Test T8
Figure A 26 Reinforcement layout lap test T8
650
T8 C 3
0/37
100
75
525 75
600
100
100
1002
20Ø 6
50ØB-
B
7510
0
650 50
75
525 75600
150
5015
0
220
Ø 3Ø50
125
50
Ø 1
4Ø
16
[mm
]
760
cm20
7 cm
196
cm19
6 cm
69 c
m
c =
7.5
cm
50
60
10
340
Ø
30Ø
14
/ 14
cm3
30Ø
14/
14
cm3
220
Ø
[cm
]
A
A
277
cm27
7 cm
694x
164x
16A-
A
5Ø16
/16
B B
44
2Ø 1
2 / 2
72Ø
12
/ 27
65 c
m65
cm
82 c
m82
cm
220
Ø
220
Ø
1Ø12
220
Ø2
20Ø
5Ø16
/16
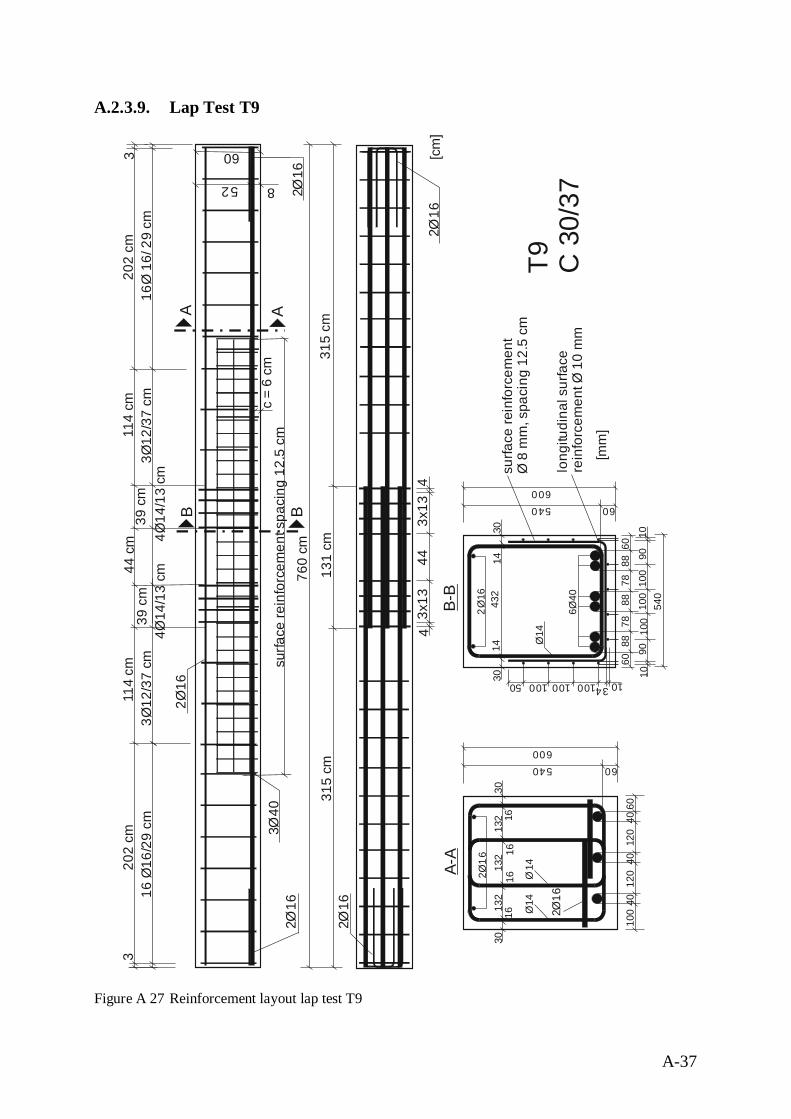
A-37
A.2.3.9. Lap Test T9
Figure A 27 Reinforcement layout lap test T9
T9 C 3
0/37
760
cm
131
cm
202
cm20
2 cm
44 c
m
c =
6 cm
52
60
8
340
Ø
16 Ø
16/2
9 cm
316
Ø 1
6/ 2
9 cm
3
216
Ø
[cm
]
A A
315
cm31
5 cm
443x
133x
13
A-A
4Ø14
/13
cm
B B
44
3Ø12
/37
cm3Ø
12/3
7 cm
39 c
m39
cm
114
cm11
4 cm
216
Ø
216
Ø216
Ø2
16Ø
4Ø14
/13
cm
surfa
ce re
info
rcem
ent s
paci
ng 1
2.5
cm
60
600
1202
6Ø
1
100
120
540 60
4040
40
B-B
8860
60078
8878
26
Ø1
640
Ø
6088
432
1414
3030
Ø14
540 60
132
1616
3030
1616
132
132
Ø14
216
Ø
surfa
ce re
info
rcem
ent
Ø 8
mm
, spa
cing
12.
5 cm
540
[mm
]
Ø14
100 10
100
100
9010
9010
100
100 100 3450
long
itudi
nal s
urfa
cere
info
rcem
ent Ø
10
mm
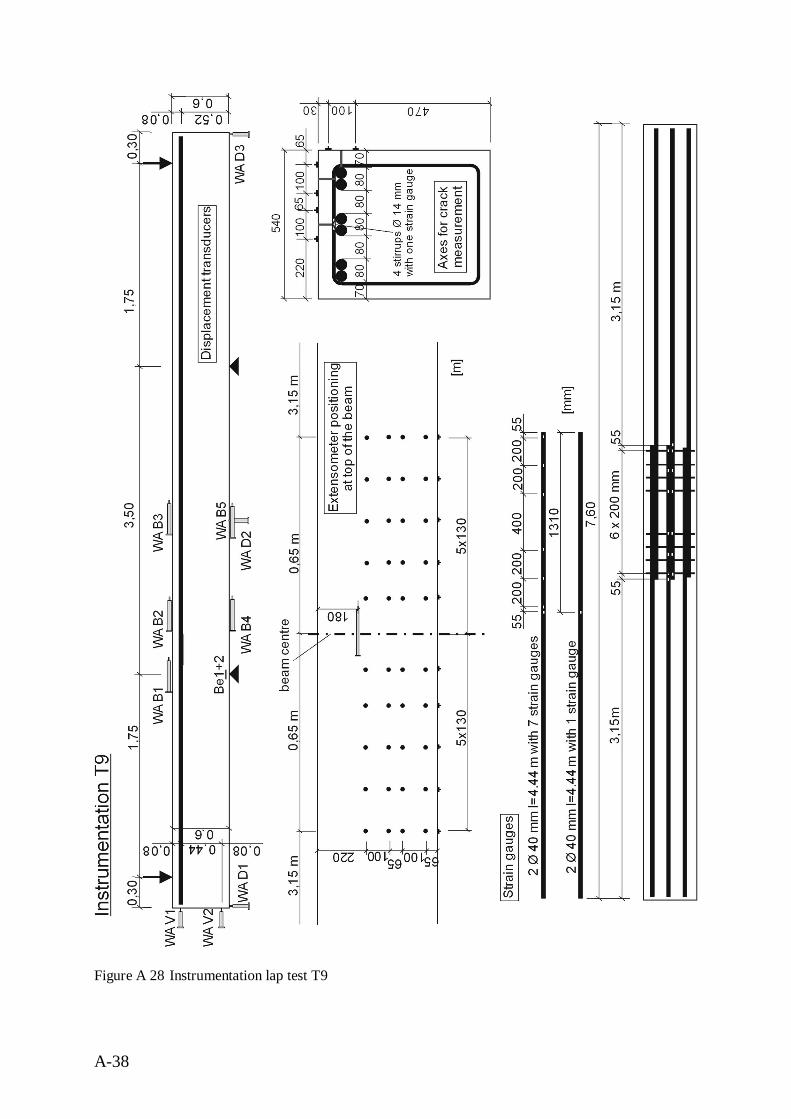
A-38
Figure A 28 Instrumentation lap test T9
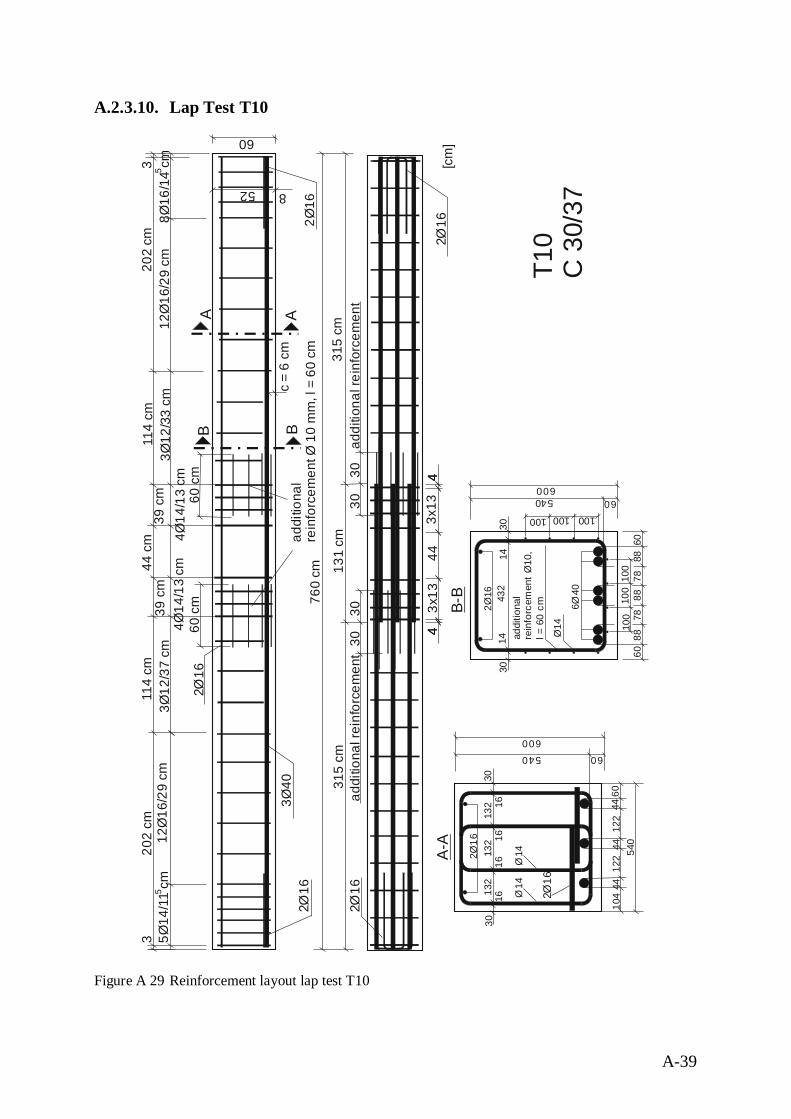
A-39
A.2.3.10. Lap Test T10
Figure A 29 Reinforcement layout lap test T10
760
cm 131
cm
202
cm20
2 cm
44 c
m
c =
6 cm
52
60
8
340
Ø
12Ø
16/2
9 cm
312
Ø16
/29
cm3
216
Ø
[cm
]
A A
315
cm31
5 cm
443x
133x
13
4Ø14
/13
cm
B B
44
3Ø12
/37
cm3Ø
12/3
3 cm
39 c
m39
cm
114
cm11
4 cm
216
Ø
216
Ø216
Ø2
16Ø
4Ø14
/13
cm
addi
tiona
lre
info
rcem
ent Ø
10
mm
, l =
60
cm
3030
3030
addi
tiona
l rei
nfor
cem
ent
addi
tiona
l rei
nfor
cem
ent
8Ø16
/14
cm5Ø
14/1
1 cm5
5
44
A-A
60
600
1222
6Ø
1
104
122
540 60
4444
44
B-B 88
60600
7888
78
26
Ø1
640
Ø
6088
432
1414
3030
Ø14
540 60
132
1616
3030
1616
132
132
Ø14
216
Ø
addi
tiona
lre
info
rcem
ent
10,
Øl =
60
cm 100
100
100
100100 100
540
Ø14
T10
C 3
0/37
60 c
m60
cm
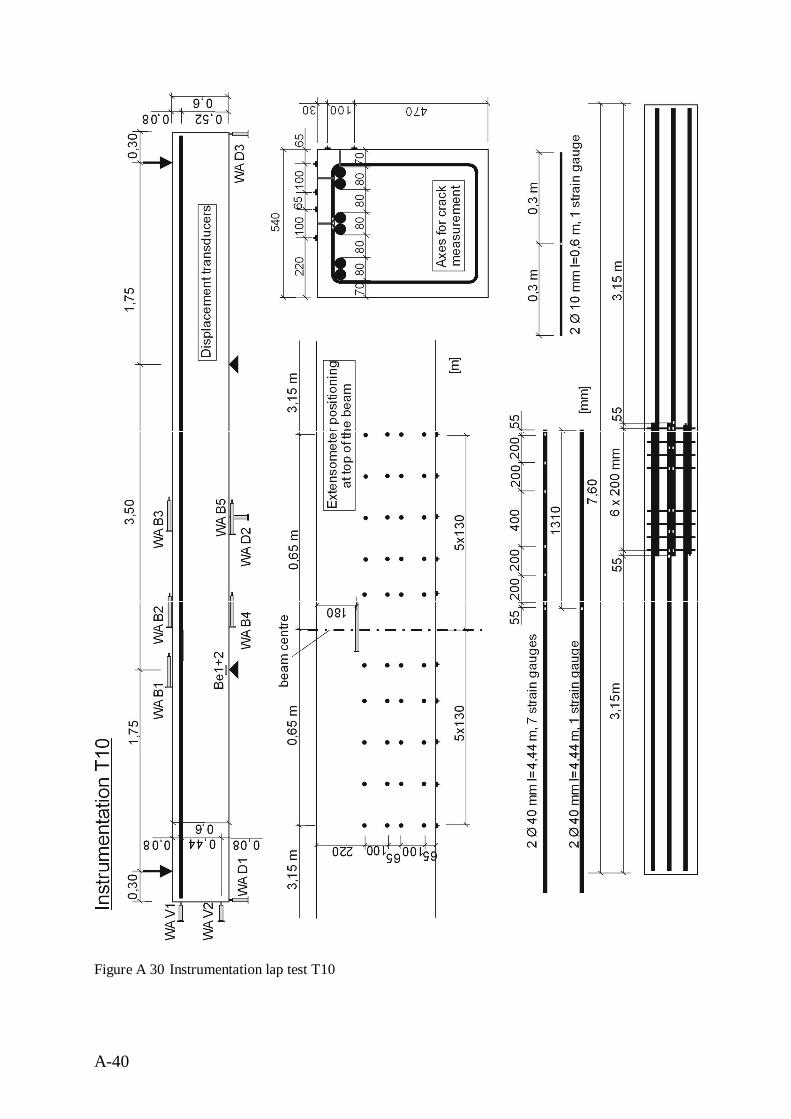
A-40
Figure A 30 Instrumentation lap test T10
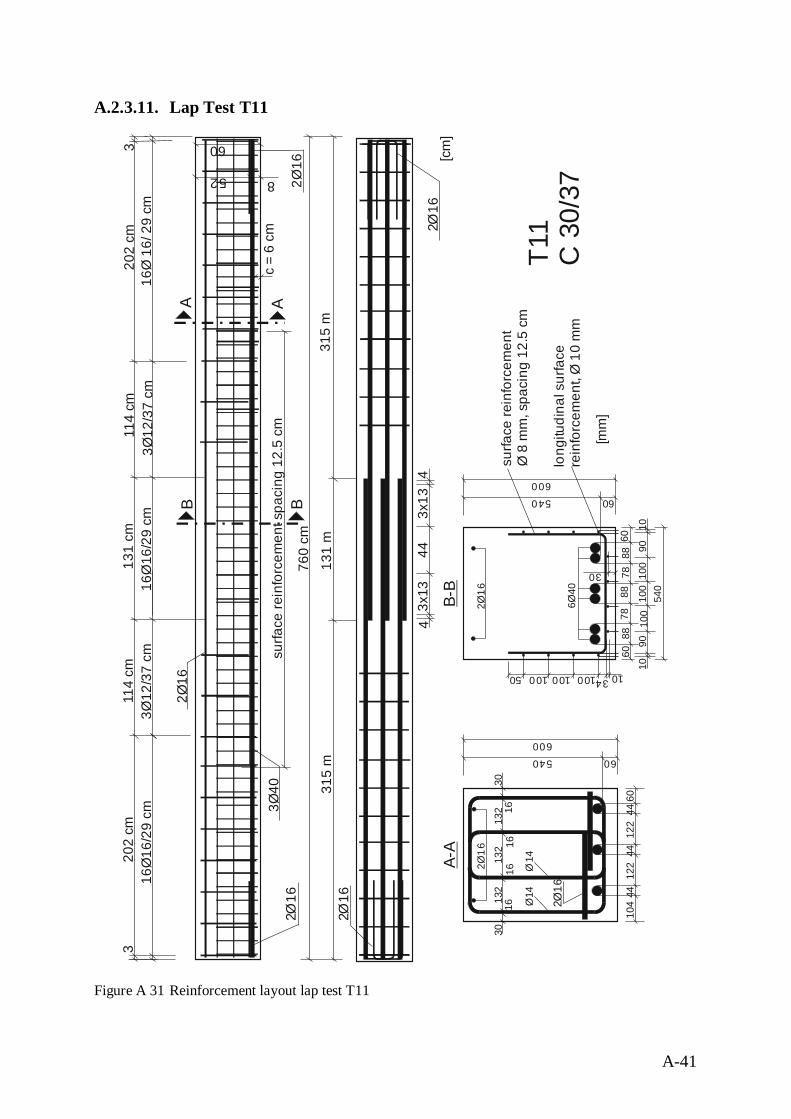
A-41
A.2.3.11. Lap Test T11
Figure A 31 Reinforcement layout lap test T11
A-A
60
600
1222
6Ø
1
104
122
540 60
4444
44
B-B
600
26
Ø1
640
Ø
540 60
132
1616
3030
1616
132
132
Ø14
216
Ø30
surfa
ce re
info
rcem
ent
Ø 8
mm
, spa
cing
12.
5 cm
760
cm13
1 m
202
cm20
2 cm
131
cm
c =
6 cm
52
60
8
340
Ø
16Ø
16/2
9 cm
316
Ø 1
6/ 2
9 cm
3
216
Ø
[cm
]
A A
315
m31
5 m
443x
133x
13B B
44
3Ø12
/37
cm3Ø
12/3
7 cm
114
cm11
4 cm
216
Ø
216
Ø216
Ø2
16Ø
surfa
ce re
info
rcem
ent s
paci
ng 1
2.5
cm
Ø14
16Ø
16/2
9 cm
T11
C 3
0/37
[mm
]88
6078
8878
6088
540
100 10
100
100
9010
9010
100
100 100 3450
long
itudi
nal s
urfa
cere
info
rcem
ent,
Ø 1
0 m
m
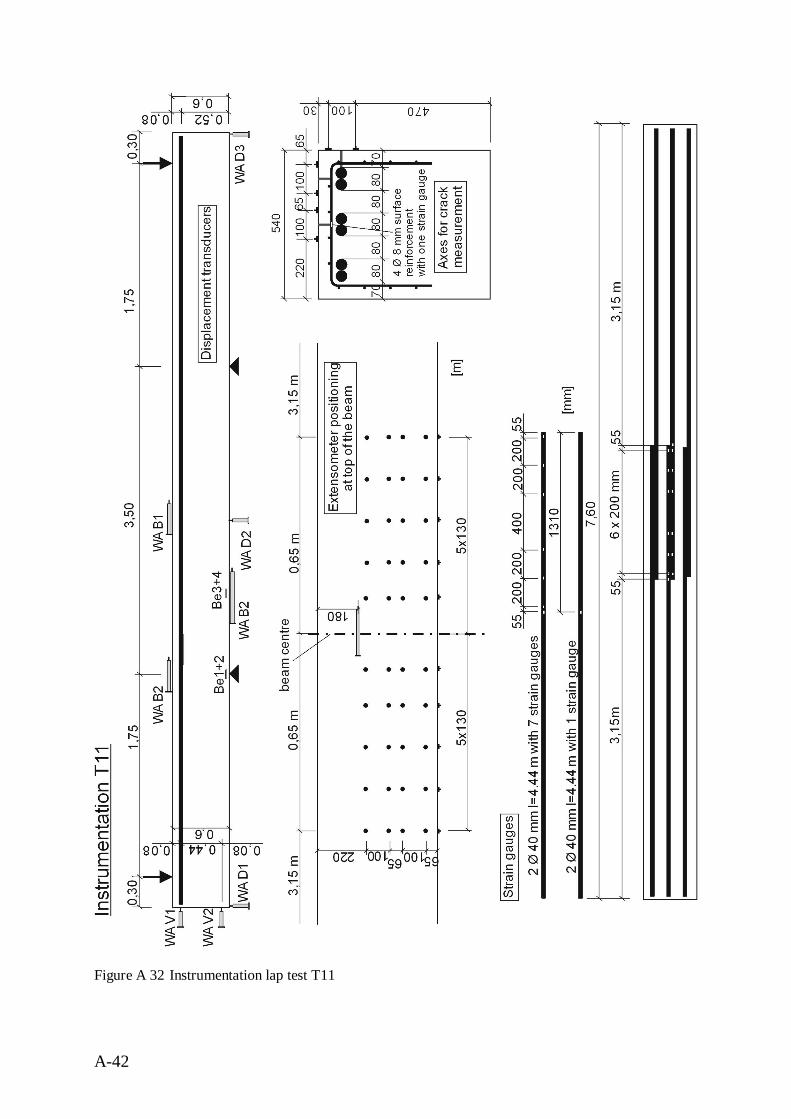
A-42
Figure A 32 Instrumentation lap test T11
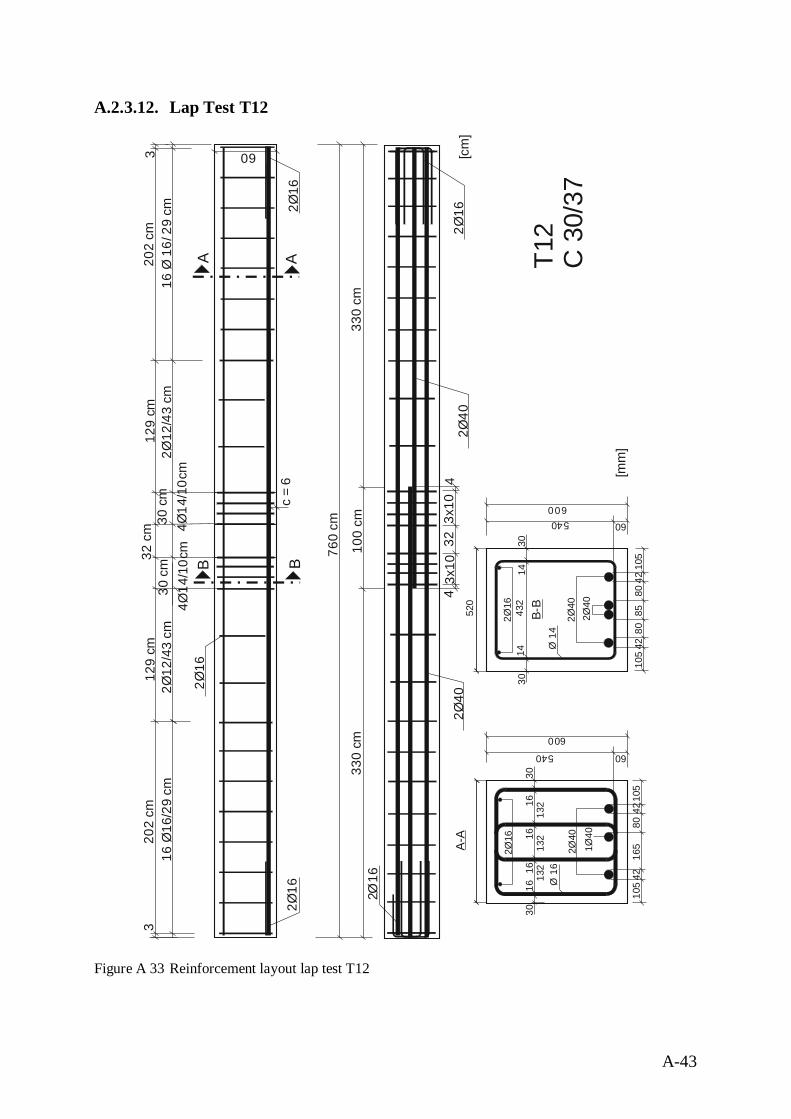
A-43
A.2.3.12. Lap Test T12
Figure A 33 Reinforcement layout lap test T12
80
540 60600
8010
5
26
Ø1
240
ØB-B
105
432
1414
3030
540 60
600
26
Ø1
240
Ø
1616
3030
Ø 1
6Ø
14
1616
132
132
132
[mm
]
240
Ø 8542
4216
580
105
105
4242
140
Ø
760
cm
100
cm
202
cm20
2 cm
32 c
m
c =
6
60
16 Ø
16/2
9 cm
316
Ø 1
6/ 2
9 cm
3
216
Ø
[cm
]
A A
323x
103x
10
4Ø14
/10c
mB B
44
2Ø12
/43
cm2Ø
12/4
3 cm
30 c
m30
cm
129
cm12
9 cm
216
Ø
216
Ø
216
Ø2
16Ø
4Ø14
/10c
m
330
cm33
0 cm
240
Ø52
0A-
A2
40Ø
T12
C 3
0/37
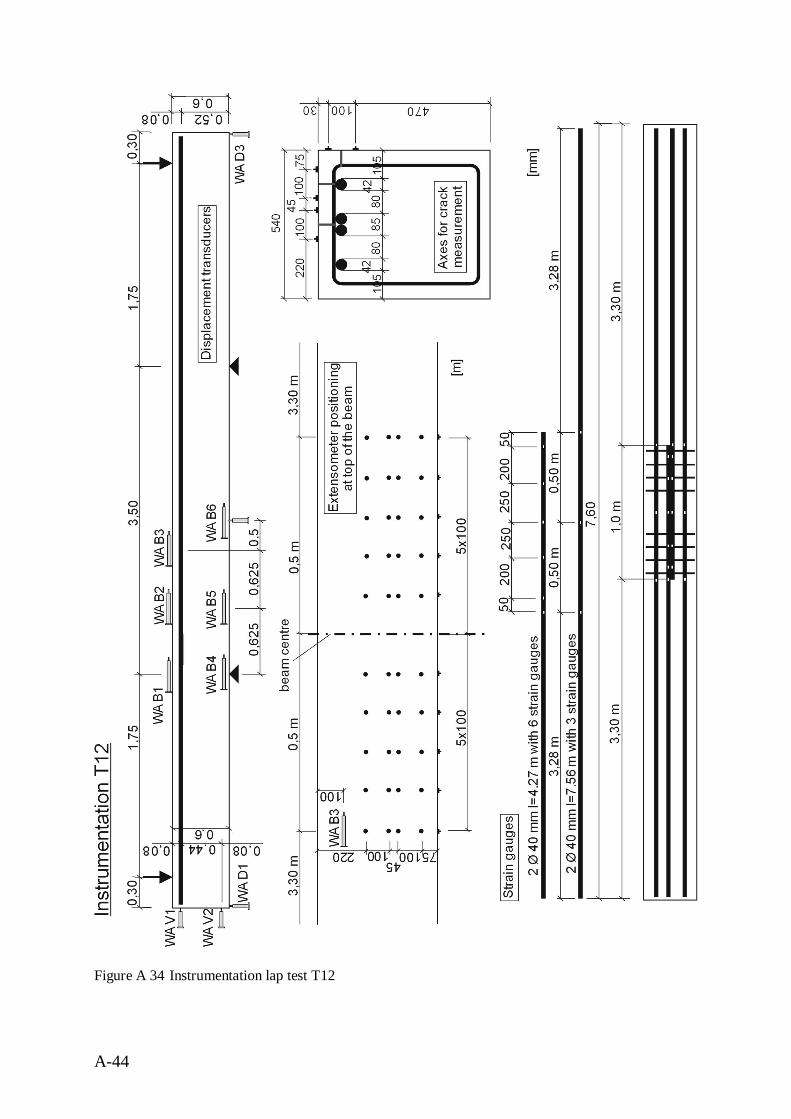
A-44
Figure A 34 Instrumentation lap test T12
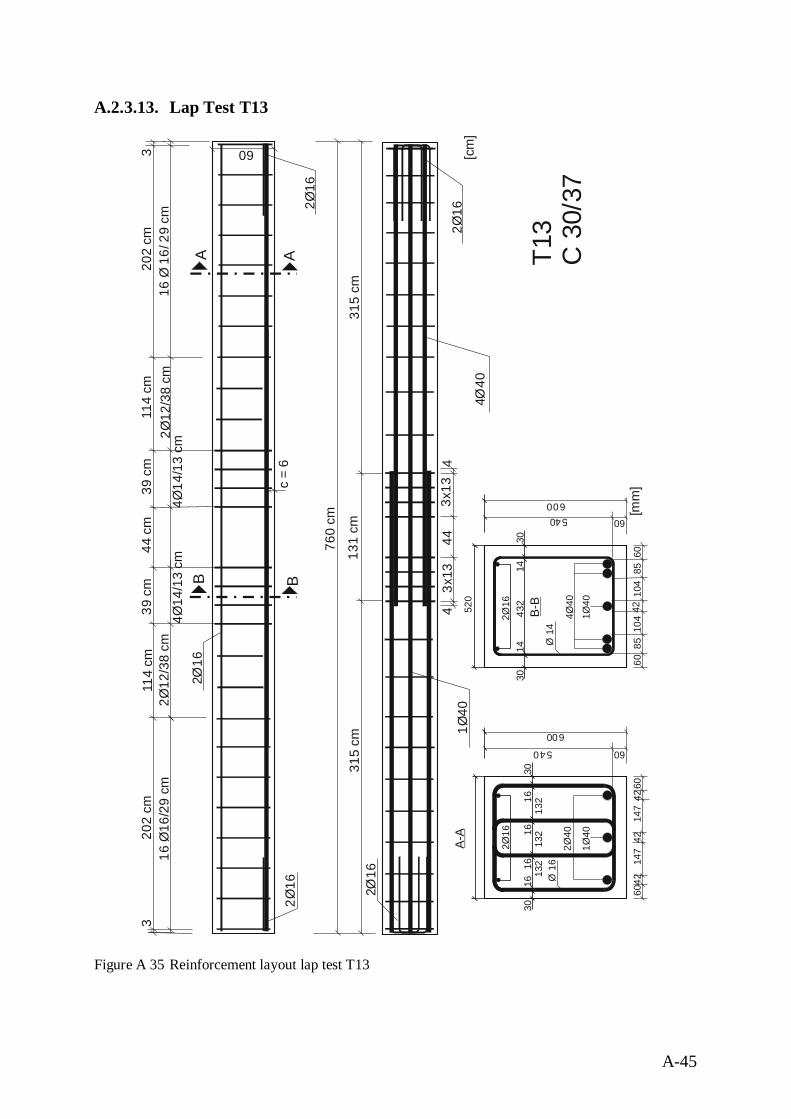
A-45
A.2.3.13. Lap Test T13
Figure A 35 Reinforcement layout lap test T13
104
60
540 60600
104
85
26
Ø1
440
Ø
6085
432
1414
3030
540 60
600
26
Ø1
140
Ø
1616
3030
Ø 1
6Ø
14
1616
132
132
132
[mm
]42
6014
742
147
6042
140
Ø 42
240
Ø
760
cm
131
cm
202
cm20
2 cm
44 c
m
c =
6
60
140
Ø
16 Ø
16/2
9 cm
316
Ø 1
6/ 2
9 cm
3
216
Ø
[cm
]
A A
443x
133x
13
4Ø14
/13
cmB B
44
2Ø12
/38
cm2Ø
12/3
8 cm
39 c
m39
cm
114
cm11
4 cm
216
Ø
216
Ø
216
Ø2
16Ø
4Ø14
/13
cm
315
cm31
5 cm
440
Ø52
0
B-B
A-A
T13
C 3
0/37
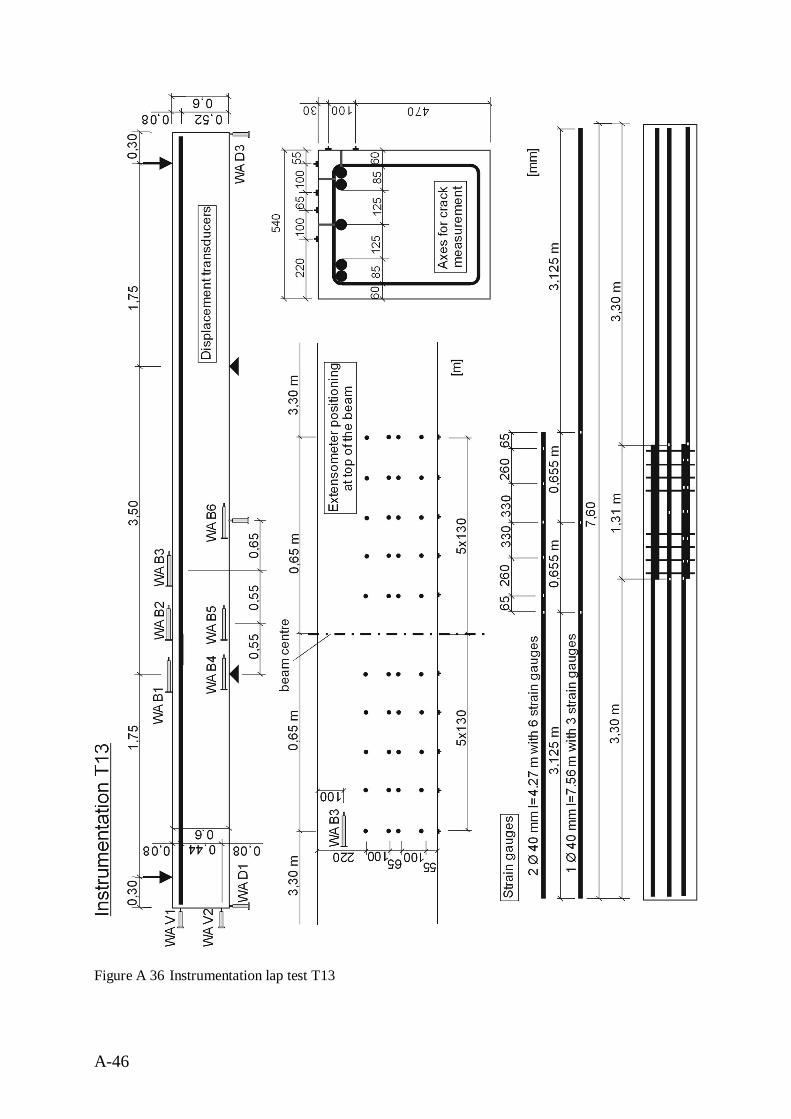
A-46
Figure A 36 Instrumentation lap test T13
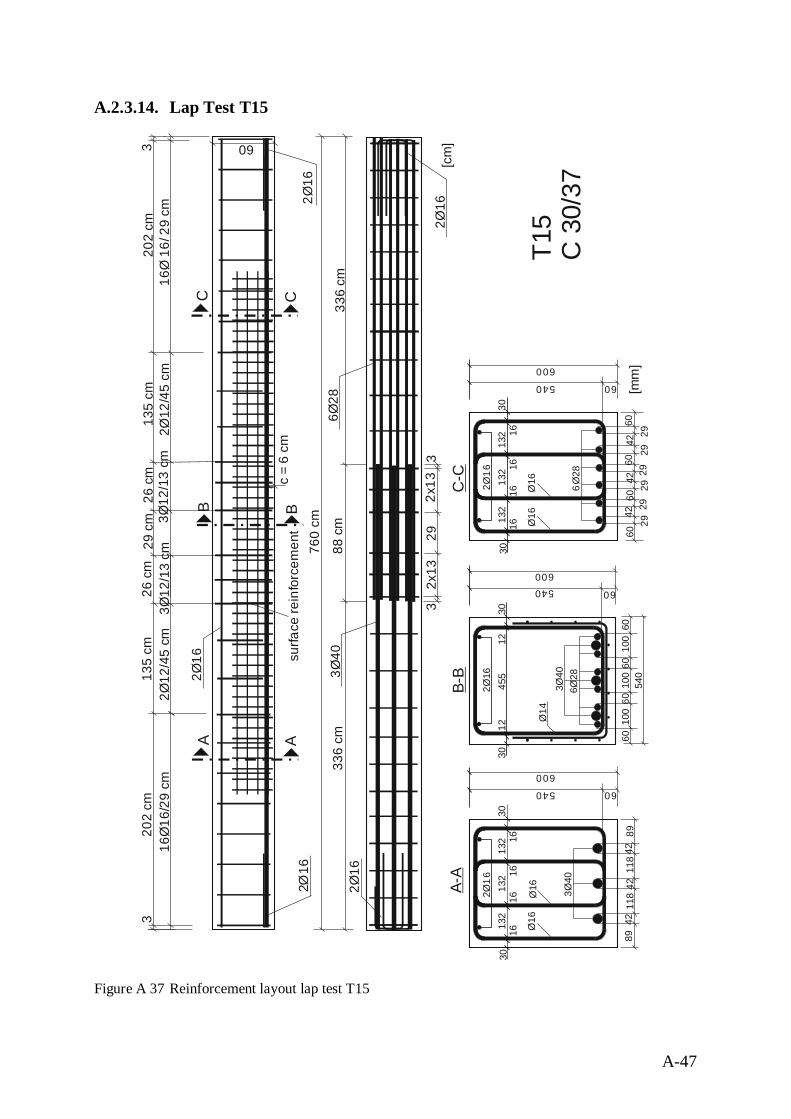
A-47
A.2.3.14. Lap Test T15
Figure A 37 Reinforcement layout lap test T15
B-B
100
60
600
6010
060
26
Ø1
340
Ø
6010
0
455
1212
3030
Ø14
540 60
540
A-A
89
600
1182
6Ø
1
8911
8
540 60
4242
42
132
1616
3030
1616
132
132
628
Ø
C-C
60
600
6060
42
540 60
2929
29
132
1616
3030
1616
132
132 42
2929
2942
60
340
Ø6
28Ø
760
cm
88 c
m
202
cm20
2 cm
29 c
m
c =
6 cm
60
340
Ø
16Ø
16/2
9 cm
316
Ø 1
6/ 2
9 cm
3
216
Ø
[cm
]
C C
336
cm33
6 cm
292x
132x
13
3Ø12
/13
cm
B B
33
2Ø12
/45
cm2Ø
12/4
5 cm
26 c
m13
5 cm
135
cm26
cm
216
Ø
216
Ø216
Ø2
16Ø
3Ø12
/13
cm
surfa
ce re
info
rcem
ent
Ø16
26
Ø1
Ø16
A A
628
Ø
Ø16
Ø16
[mm
]
T15
C 3
0/37
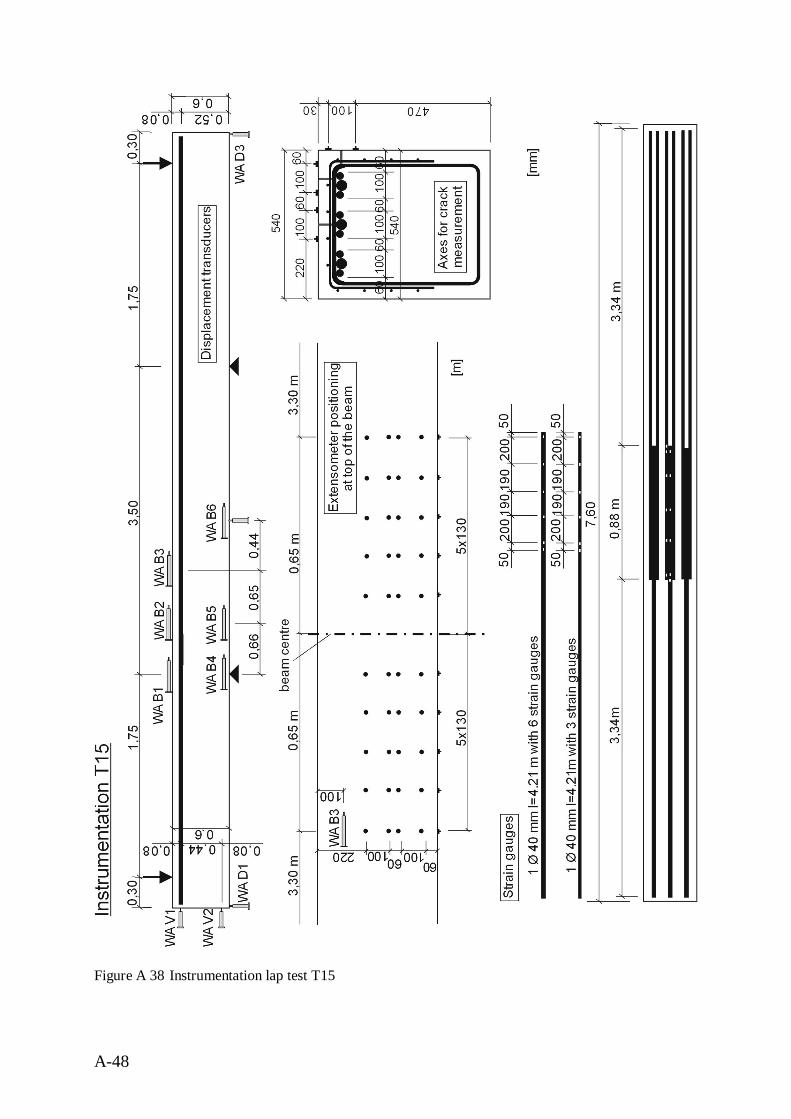
A-48
Figure A 38 Instrumentation lap test T15
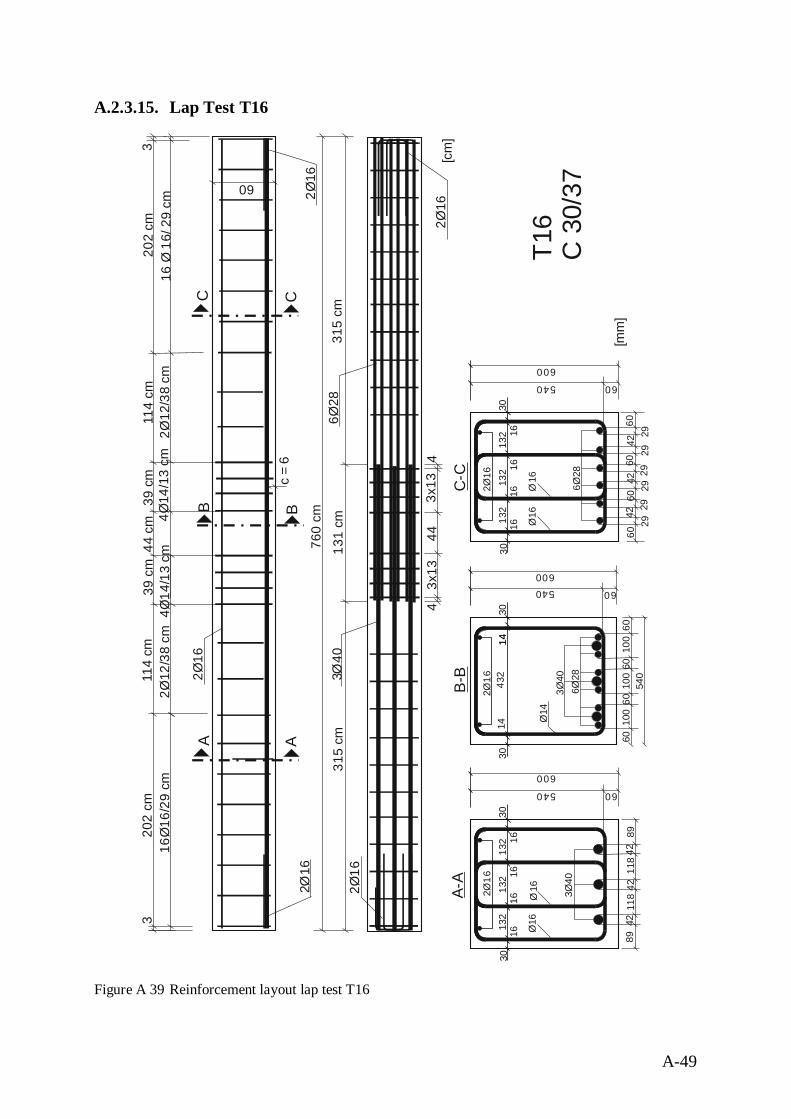
A-49
A.2.3.15. Lap Test T16
Figure A 39 Reinforcement layout lap test T16
B-B
100
60
600
6010
060
340
Ø
6010
0
432
1414
3030
Ø14
540 60
540
A-A
89
600
1182
6Ø
1
8911
8
540 60
4242
42
132
1616
3030
1616
132
132
628
Ø
C-C
60
600
6060
42
540 60
2929
29
132
1616
3030
1616
132
132
Ø16 42
2929
2942
60
340
Ø6
28Ø
760
cm13
1 cm
202
cm20
2 cm
44 c
m
c =
6
60
340
Ø
16Ø
16/2
9 cm
316
Ø 1
6/ 2
9 cm
3
216
Ø
[mm
]
C C
315
cm31
5 cm
443x
133x
13
4Ø14
/13
cm
B B
44
2Ø12
/38
cm2Ø
12/3
8 cm
39 c
m11
4 cm
114
cm39
cm
216
Ø
216
Ø216
Ø2
16Ø
4Ø14
/13
cm
26
Ø1
14
16Ø
26
Ø1
A A
628
Ø
Ø16
16Ø
T16
C 3
0/37
[cm
]
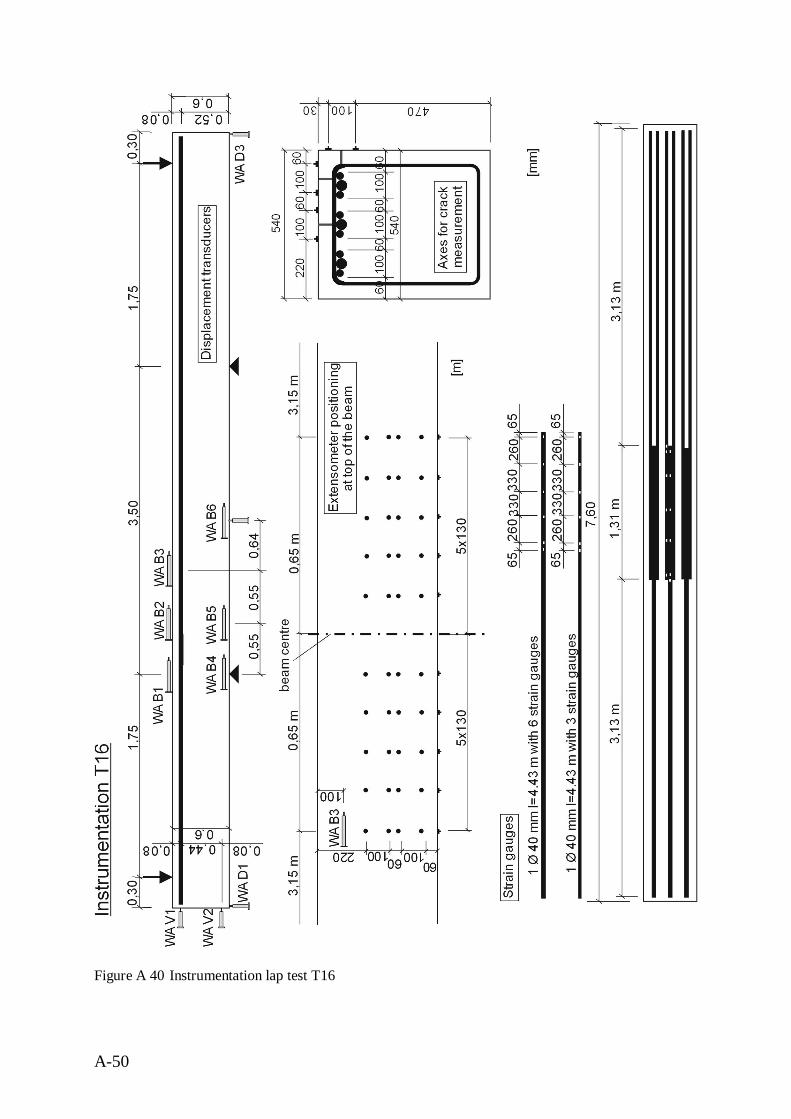
A-50
Figure A 40 Instrumentation lap test T16
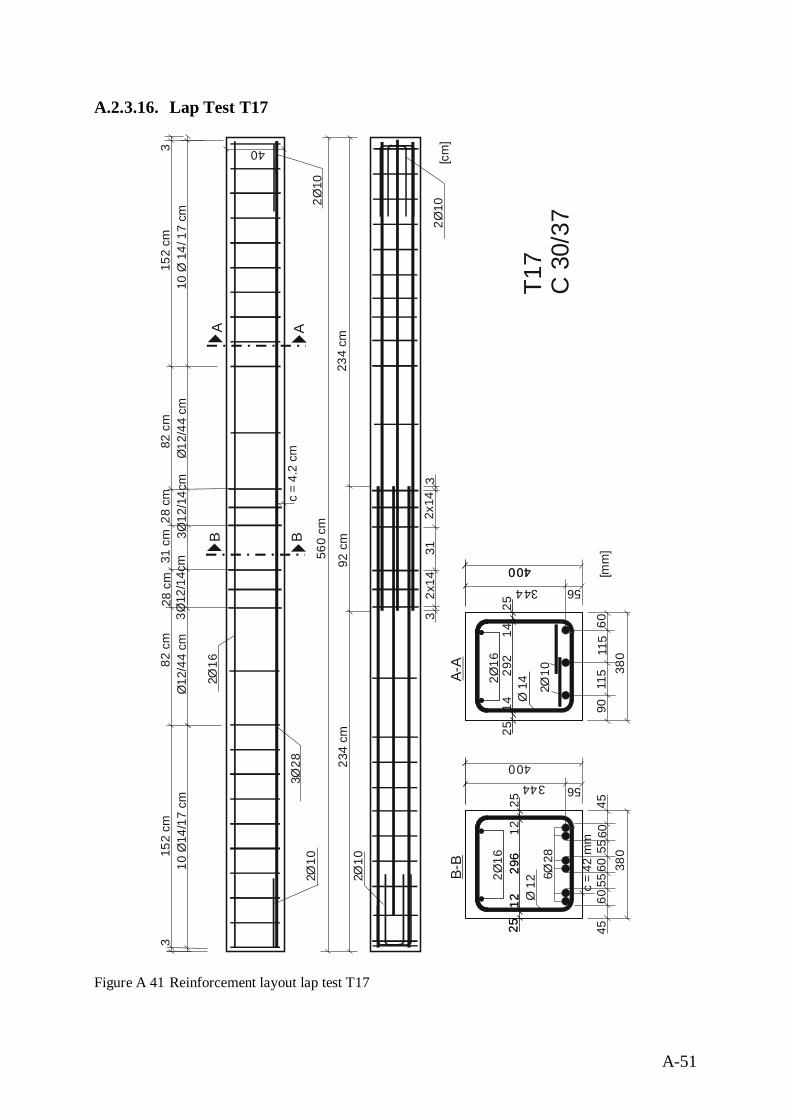
A-51
A.2.3.16. Lap Test T17
Figure A 41 Reinforcement layout lap test T17
115
60
344 56
400
9011
5 380
296
1212
2525
5545
344 56
400
6055
4560
60 380
c =
42 m
m
628
Ø2
10Ø2
6Ø
129
214
1425
25
560
cm
92 c
m
152
cm15
2 cm
31 c
m
c =
4.2
cm
40
328
Ø
10 Ø
14/1
7 cm
310
Ø 1
4/ 1
7 cm
3
216
Ø
[cm
]
A A
234
cm23
4 cm
312x
142x
14
A-A
3Ø12
/14c
m
33
Ø12
/44
cmØ
12/4
4 cm
28 c
m28
cm
82 c
m82
cm
210
Ø
210
Ø210
Ø2
10Ø
3Ø12
/14c
m
400
296
1225
B-B
26
Ø1
Ø 1
4
B B
[mm
]
T17
C 3
0/37
Ø 1
2
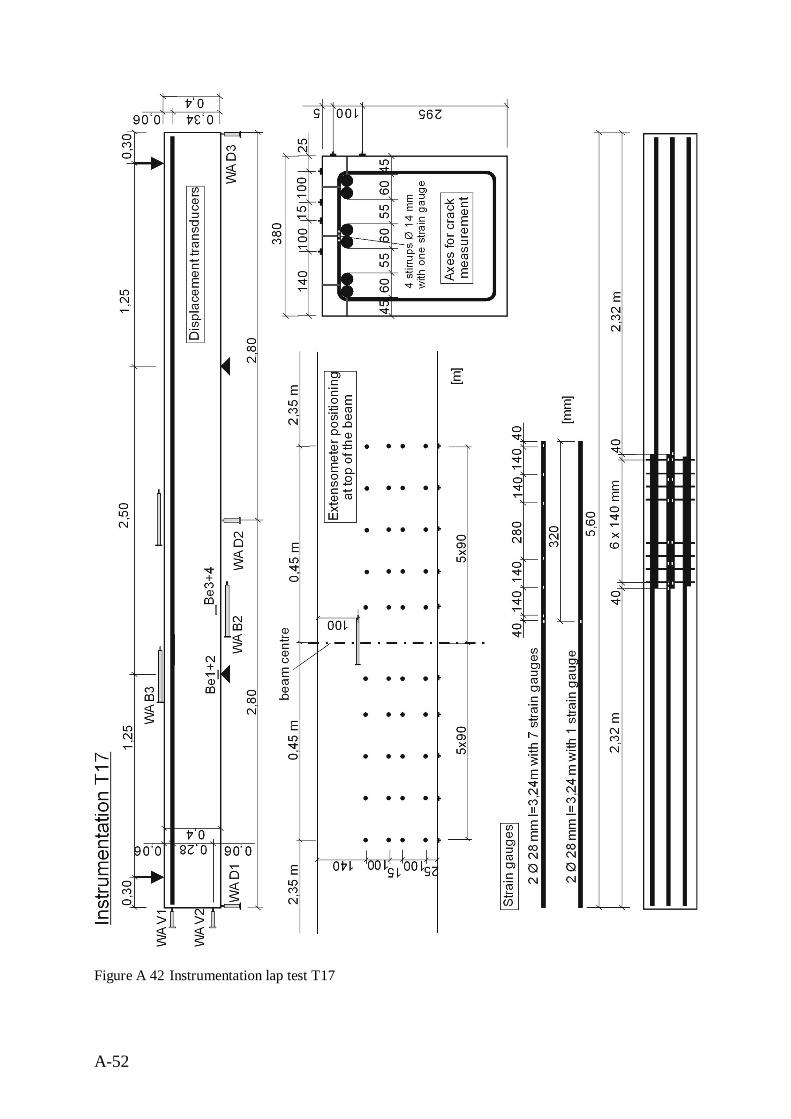
A-52
Figure A 42 Instrumentation lap test T17
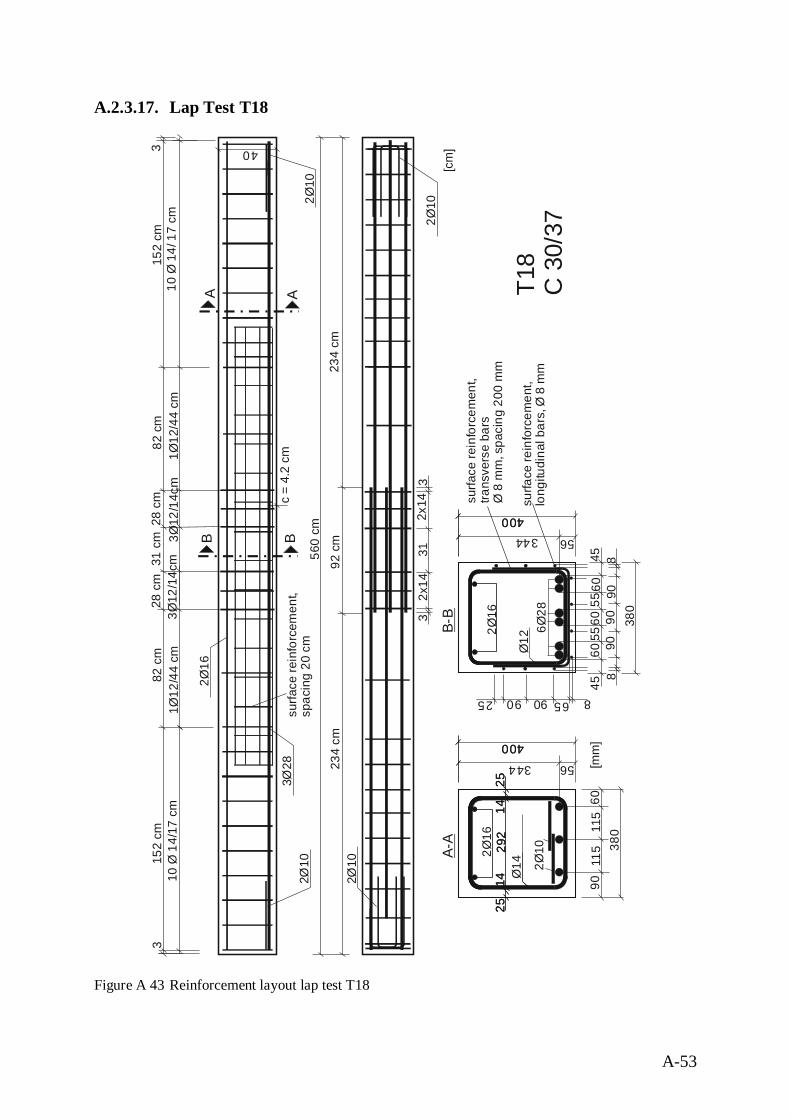
A-53
A.2.3.17. Lap Test T18
Figure A 43 Reinforcement layout lap test T18
115
60
344 56
400
9011
5 380
5545
344 56
40060
5545
6060 38
0
628
Ø2
10Ø
292
1414
2525
560
cm92
cm
152
cm15
2 cm
31 c
m
c =
4.2
cm
40
328
Ø
10 Ø
14/
17 c
m3
10 Ø
14/
17
cm3
216
Ø
[cm
]
A A
234
cm23
4 cm
312x
142x
14
A-A
3Ø12
/14c
m
33
1Ø12
/44
cm1Ø
12/4
4 cm
28 c
m28
cm
82 c
m82
cm
210
Ø
210
Ø210
Ø2
10Ø
3Ø12
/14c
m
400
B-B
400
26
Ø1
26
Ø1
292
1414
2525
Ø14
B Bsu
rface
rein
forc
emen
t,sp
acin
g 20
cm Ø12
[mm
]
T18
C 3
0/37
8
9090
88
90
90 90 6525
surfa
ce re
info
rcem
ent,
long
itudi
nal b
ars,
Ø 8
mm
surfa
ce re
info
rcem
ent,
trans
vers
e ba
rsØ
8 m
m, s
paci
ng 2
00 m
m
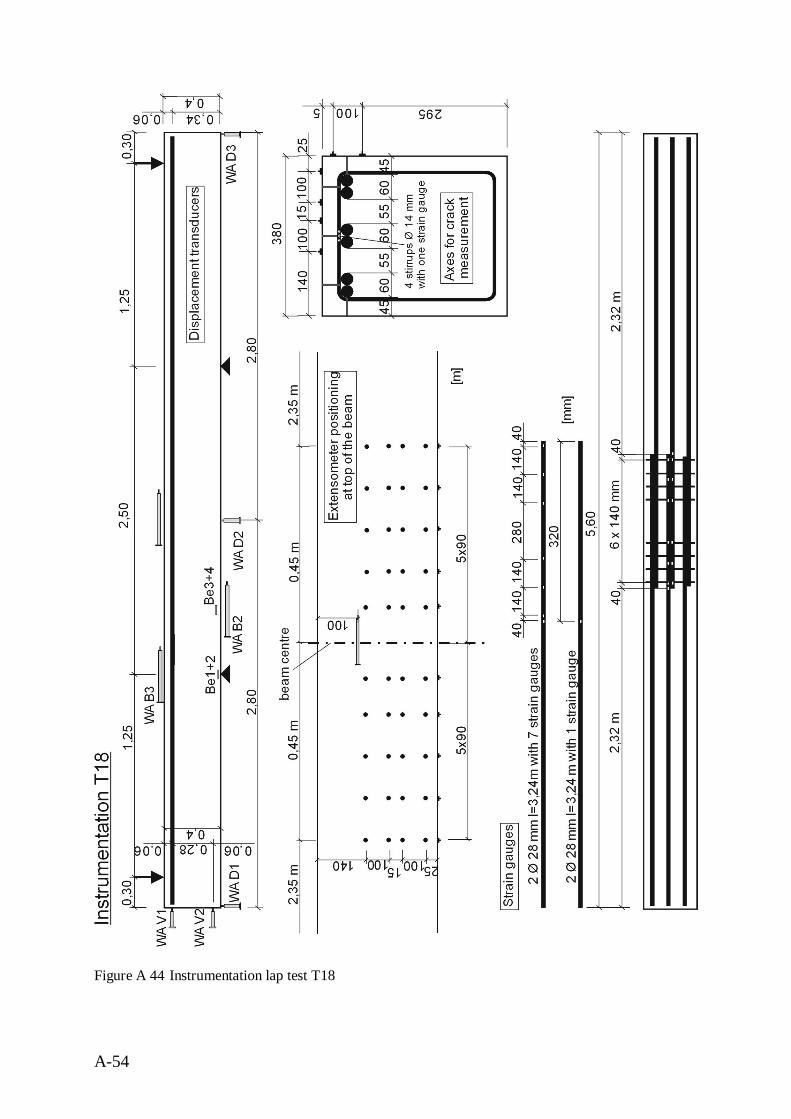
A-54
Figure A 44 Instrumentation lap test T18
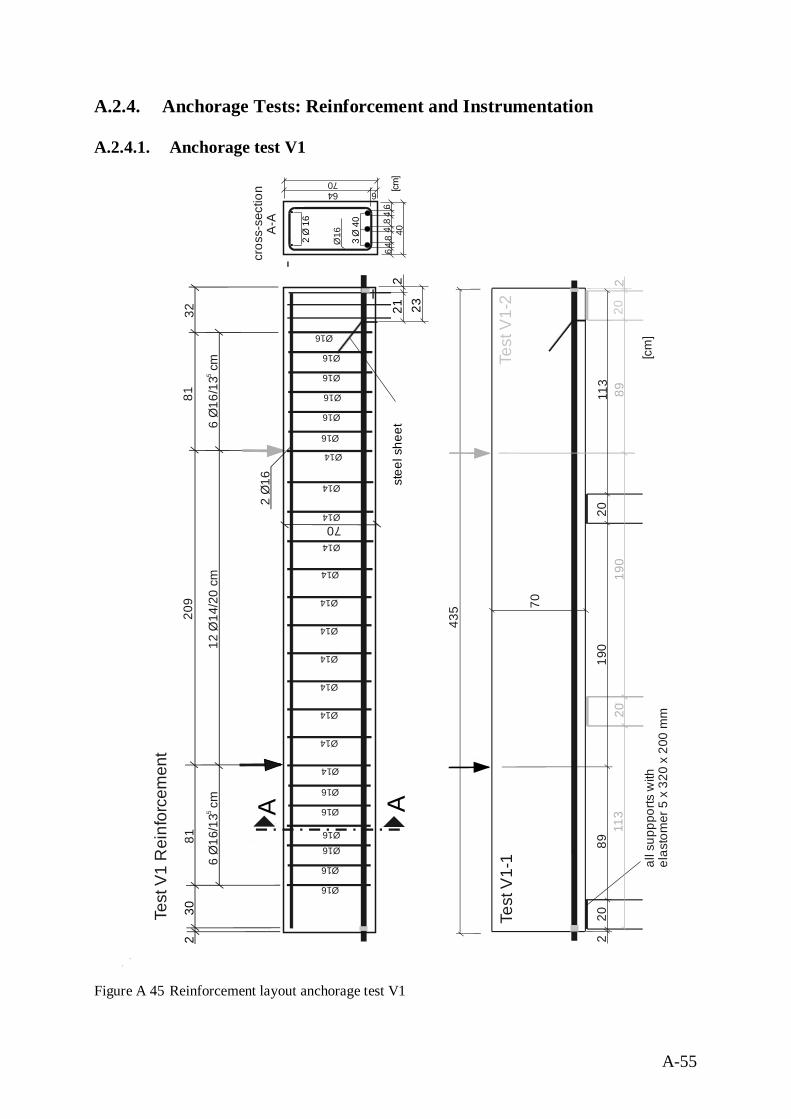
A-55
A.2.4. Anchorage Tests: Reinforcement and Instrumentation
A.2.4.1. Anchorage test V1
Figure A 45 Reinforcement layout anchorage test V1
Test
V1
Rei
nfor
cem
ent
A A
3281
302
8120
9
12 Ø
14/2
0 cm
6 Ø
16/1
3 c
m5
6 Ø
16/1
3 c
m5
2 Ø
16
Ø16
Ø16
Ø16
Ø14
Ø14
Ø14
70
Ø16
Ø16
Ø16
Ø16
Ø16
Ø16
Ø14
Ø14
Ø14
Ø14
Ø14
Ø14
232
Ø16
Ø16
Ø16
stee
l she
et21
Ø14
Ø14
Ø14
cros
s-se
ctio
nA-
A
86
44
86
3 Ø
40
4
2 Ø
16
Ø16 40
435
190
70
202
2089
113
Test
V1-
1
190
202
2089
113
Test
V1-
2
all s
uppp
orts
with
elas
tom
er 5
x 3
20 x
200
mm
[cm]
66470
[cm
]
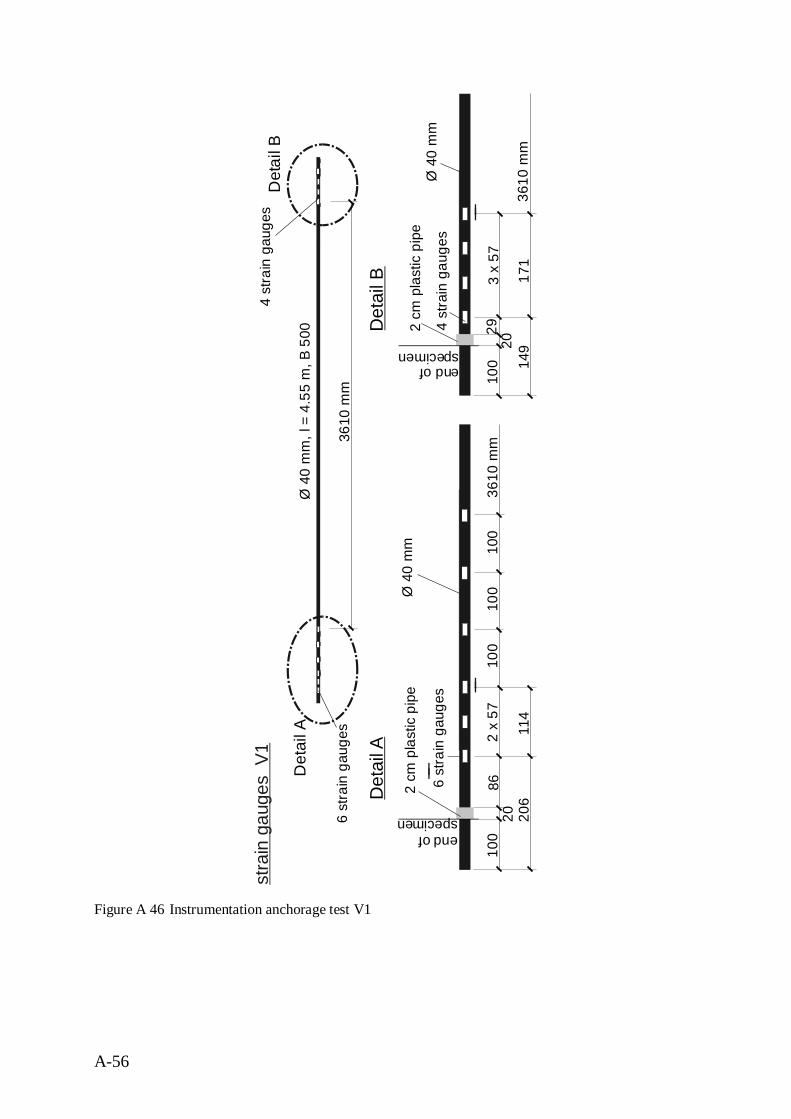
A-56
Figure A 46 Instrumentation anchorage test V1
stra
in g
auge
s V
1
Ø 4
0 m
m, l
= 4
.55
m, B
500
6 st
rain
gau
ges
Det
ail A
3 x
5710
0
4 st
rain
gau
ges
Det
ail B
2029
149
171
3610
mm
3610
mm
Det
ail A
6 st
rain
gau
ges
2 x
5710
020
86
206
end ofspecimen
2 cm
pla
stic
pip
e
114
3610
mm
100
100
Ø 4
0 m
m
100
Det
ail B
4 st
rain
gau
ges
Ø 4
0 m
m
end ofspecimen
2 cm
pla
stic
pip
e
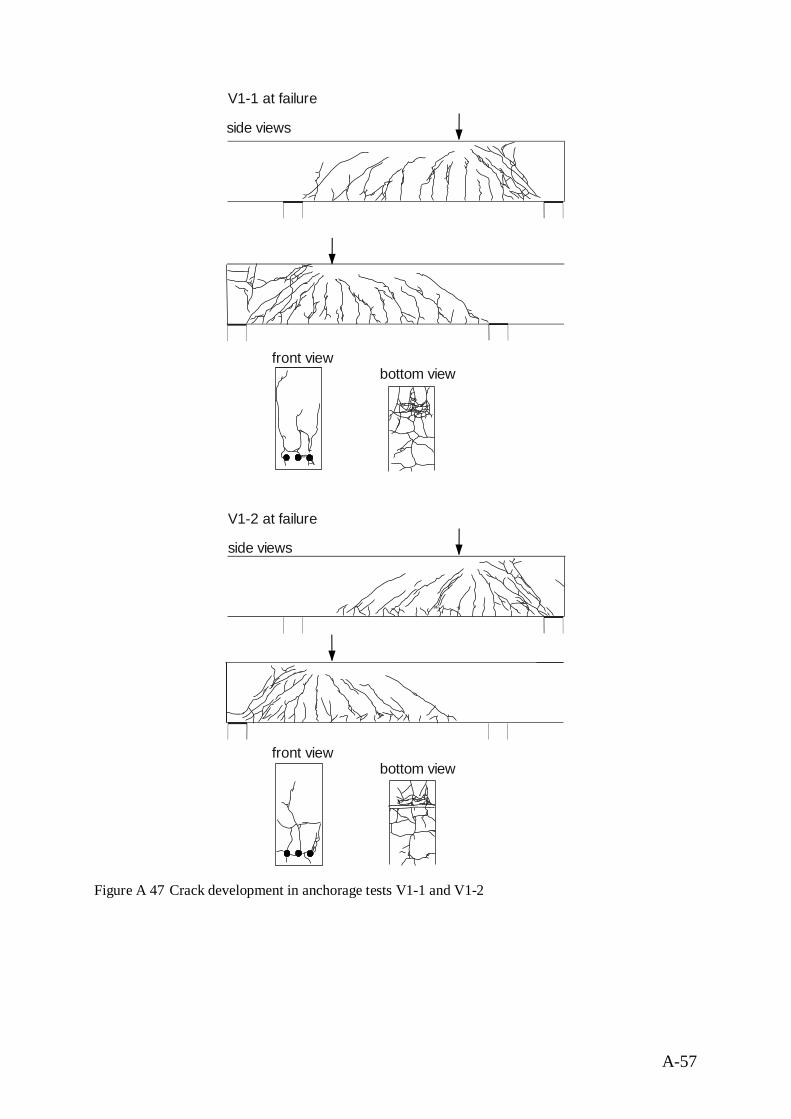
A-57
Figure A 47 Crack development in anchorage tests V1-1 and V1-2
bottom view
V1-1 at failure
front view
side views
14N
V1-2 at failure
side views
bottom viewfront view
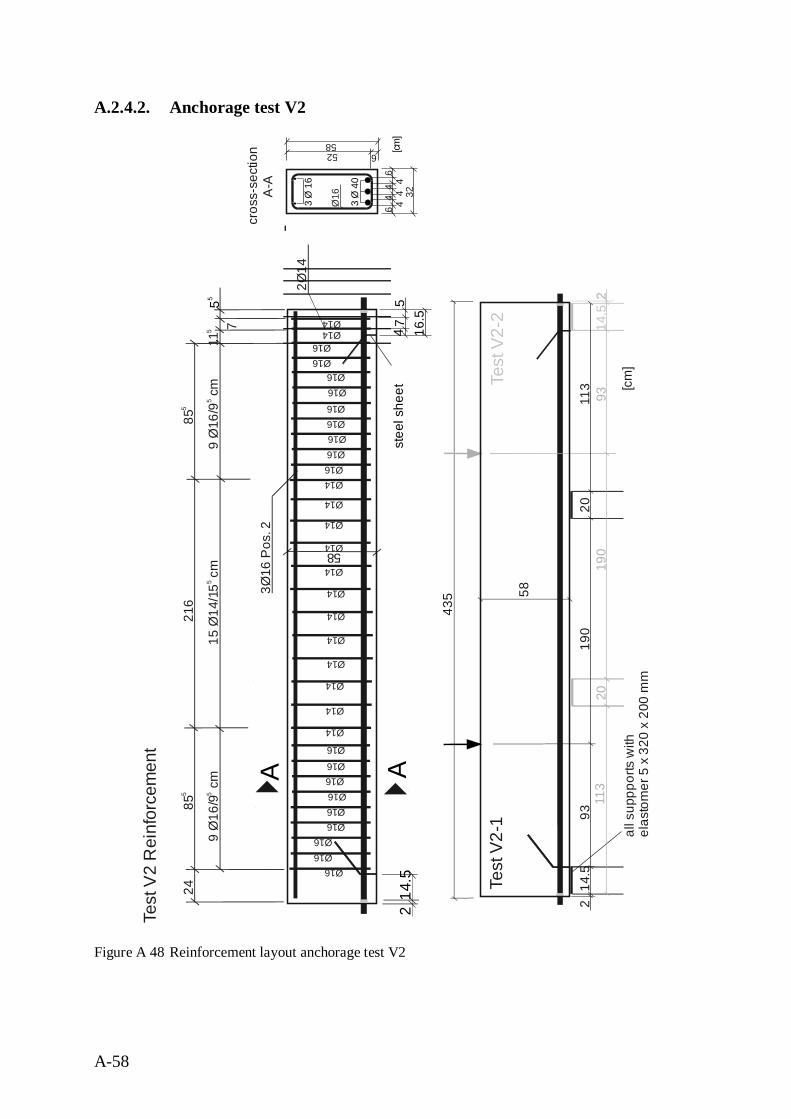
A-58
A.2.4.2. Anchorage test V2
Figure A 48 Reinforcement layout anchorage test V2
Test
V2
Rei
nfor
cem
ent
16.5
5st
eel s
heet
7
435
190
58
14.5
220
9311
3
Test
V2-
1
190
14.5
220
9311
3
Test
V2-
2
all s
uppp
orts
with
elas
tom
er 5
x 3
20 x
200
mm
cros
s-se
ctio
nA
-A
46
44
46
3 Ø
40
4
3 Ø
16
Ø16 32
[cm]
65258
A14
.52
A
855
2485
521
6
15 Ø
14/1
cm
559
Ø16
/9 c
m5
9 Ø
16/9
cm
5
3Ø16
Pos
. 2
2Ø14
Ø14
Ø16Ø14Ø14
Ø14
755
58
Ø16
Ø16Ø16
Ø16
Ø16
Ø16Ø16
Ø16
Ø16
Ø14
Ø16
Ø16Ø16
Ø16
Ø16
Ø16Ø16Ø16
Ø14
Ø14
Ø14
Ø14
Ø14
Ø14
Ø14
Ø14
Ø14
115 4
[cm
]
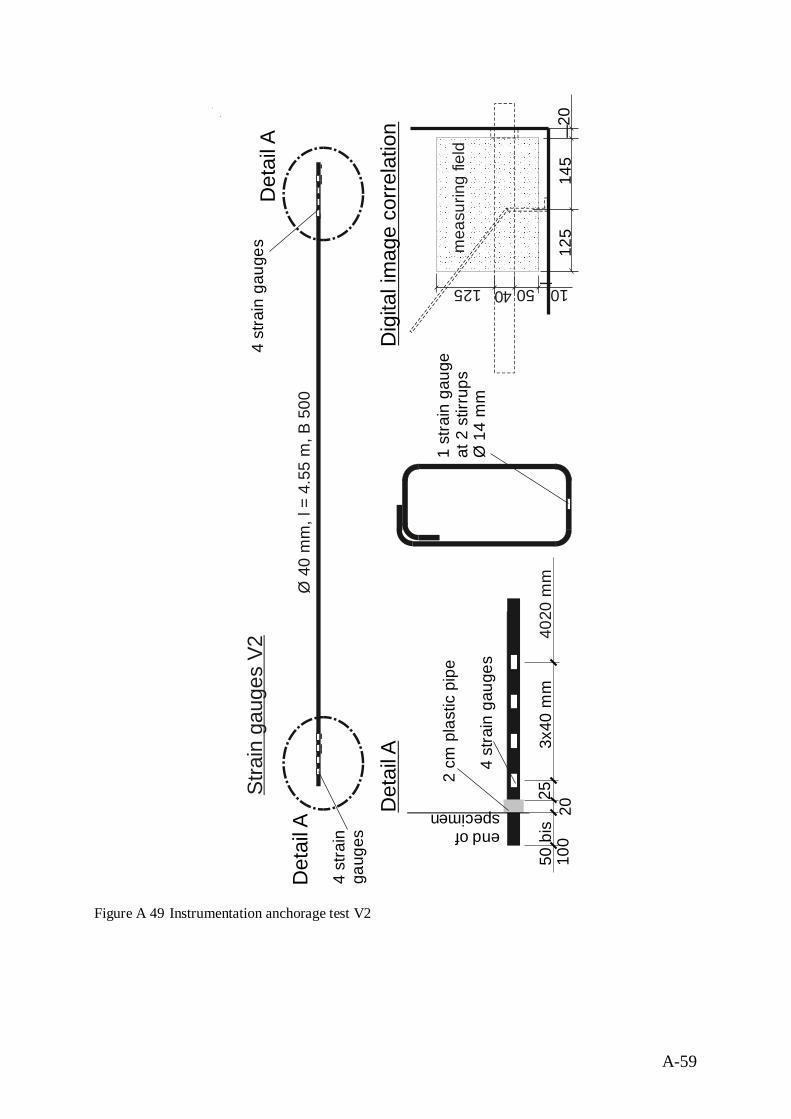
A-59
Figure A 49 Instrumentation anchorage test V2
Stra
in g
auge
s V2
Ø 4
0 m
m, l
= 4
.55
m, B
500
1 st
rain
gau
geat
2 s
tirru
psØ
14
mm
4 st
rain
gaug
es
Det
ail A
Det
ail A 4 st
rain
gau
ges
3x40
mm
50 b
is10
0
4 st
rain
gau
ges
Det
ail A
2025
end ofspecimen
2 cm
pla
stic
pip
e
4020
mm
2014
512
5
40 50125 10
mea
surin
g fie
ld
Dig
ital i
mag
e co
rrela
tion
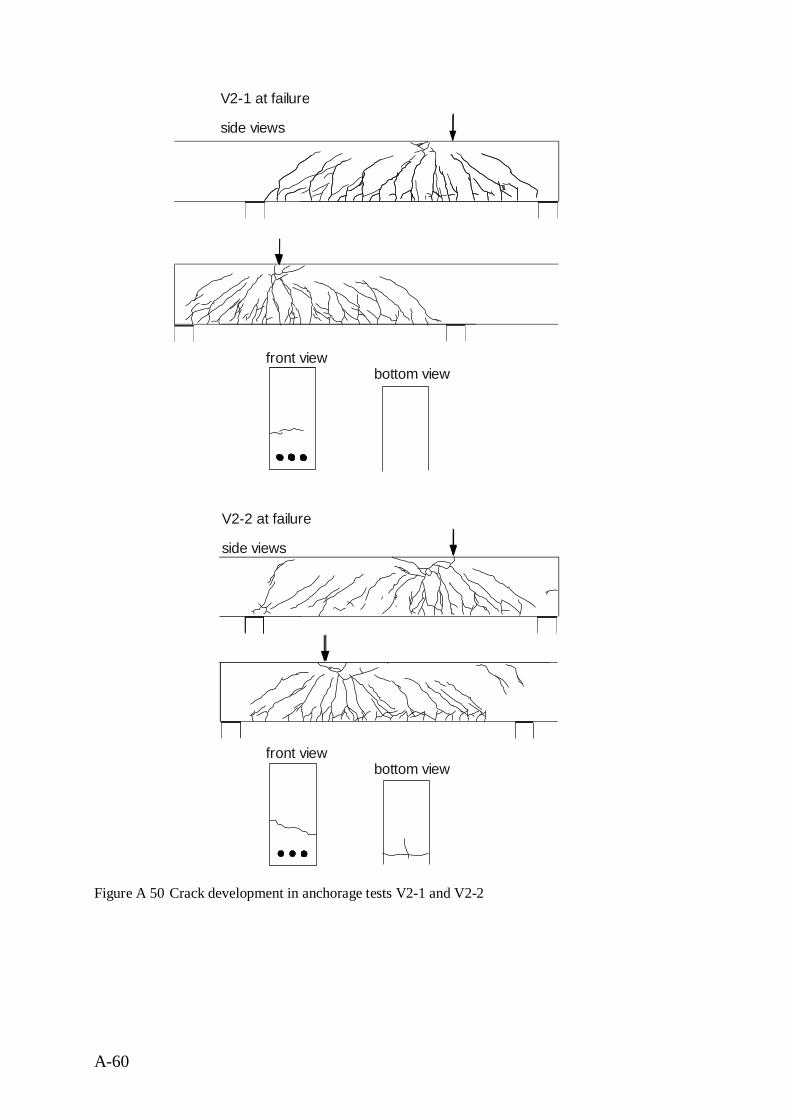
A-60
Figure A 50 Crack development in anchorage tests V2-1 and V2-2
bottom view
V2-1 at failure
front view
side views
V2-2 at failure
side views
bottom viewfront view
11
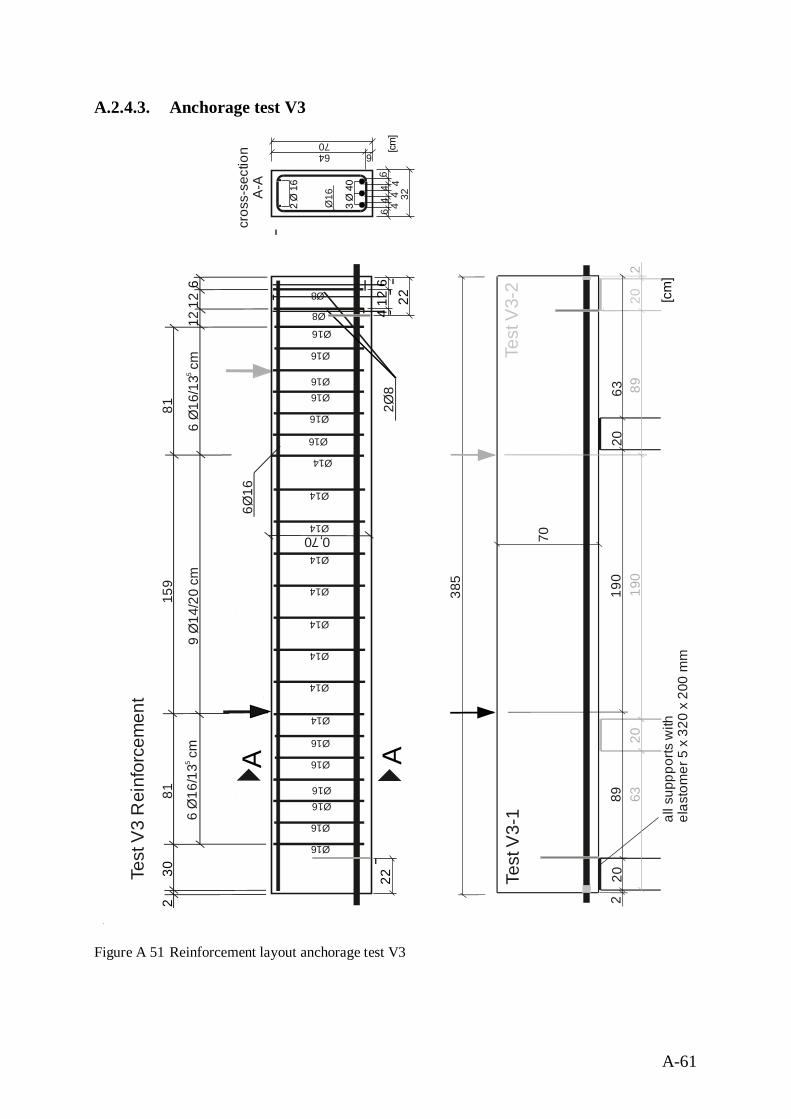
A-61
A.2.4.3. Anchorage test V3
Figure A 51 Reinforcement layout anchorage test V3
Test
V3
Rei
nfor
cem
ent
cros
s-se
ctio
nA-
A
46
44
46
3 Ø
40
4
2 Ø
16
Ø16 32
385
190
70
202
2089
63
Test
V3-
1
190
202
2089
63
Test
V3-
2
all s
uppp
orts
with
elas
tom
er 5
x 3
20 x
200
mm
[cm]
66470
A A
12
8130
281
159
9 Ø
14/2
0 cm
6 Ø
16/1
3 c
m5
6 Ø
16/1
3 c
m5
6Ø16
2Ø8
124
Ø16
Ø16
Ø16
Ø14
Ø14
Ø16
Ø8
Ø8
Ø14
126
0,70
Ø16
Ø16
Ø16
Ø16
Ø16
Ø16
Ø16
Ø14
Ø14
Ø14
Ø14
Ø14
Ø14
22
Ø16
226
[cm
]
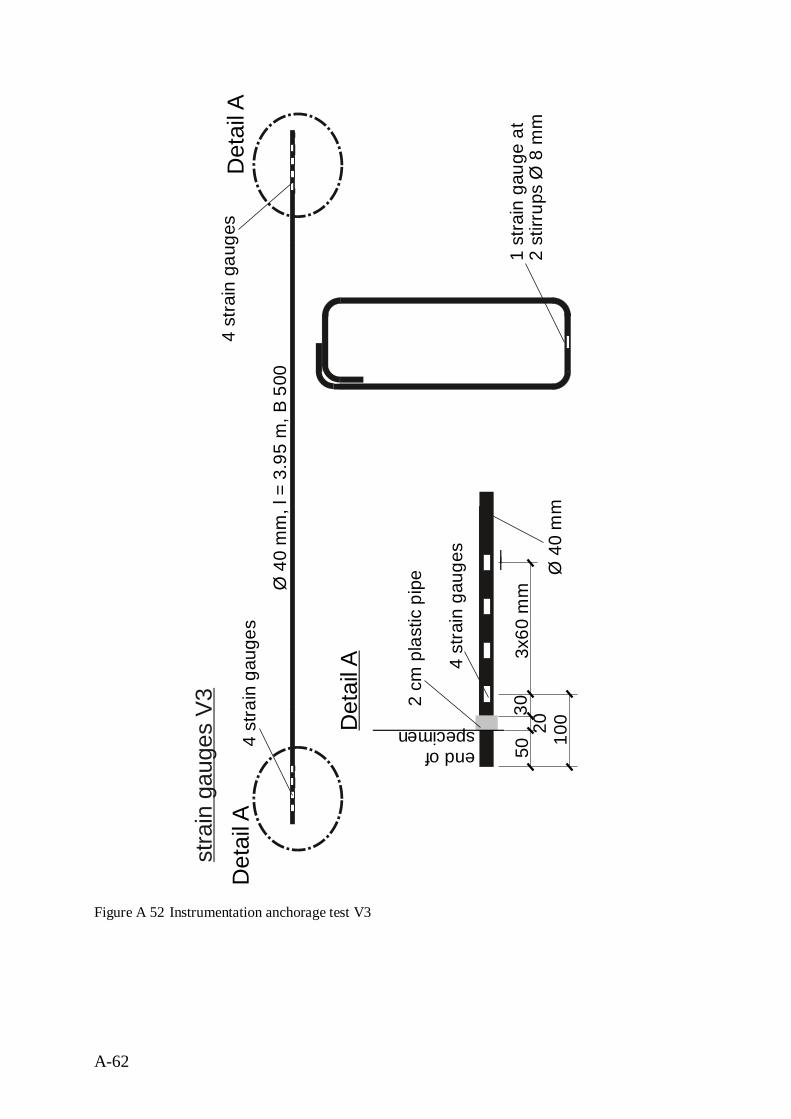
A-62
Figure A 52 Instrumentation anchorage test V3
stra
in g
auge
s V3
Ø 4
0 m
m, l
= 3
.95
m, B
500
1 st
rain
gau
ge a
t2
stirr
ups
Ø 8
mm
4 st
rain
gau
ges
Det
ail A
Det
ail A 4
stra
in g
auge
s
3x60
mm
50
4 st
rain
gau
ges
Det
ail A
2030
100
end ofspecimen
Ø 4
0 m
m
2 cm
pla
stic
pip
e
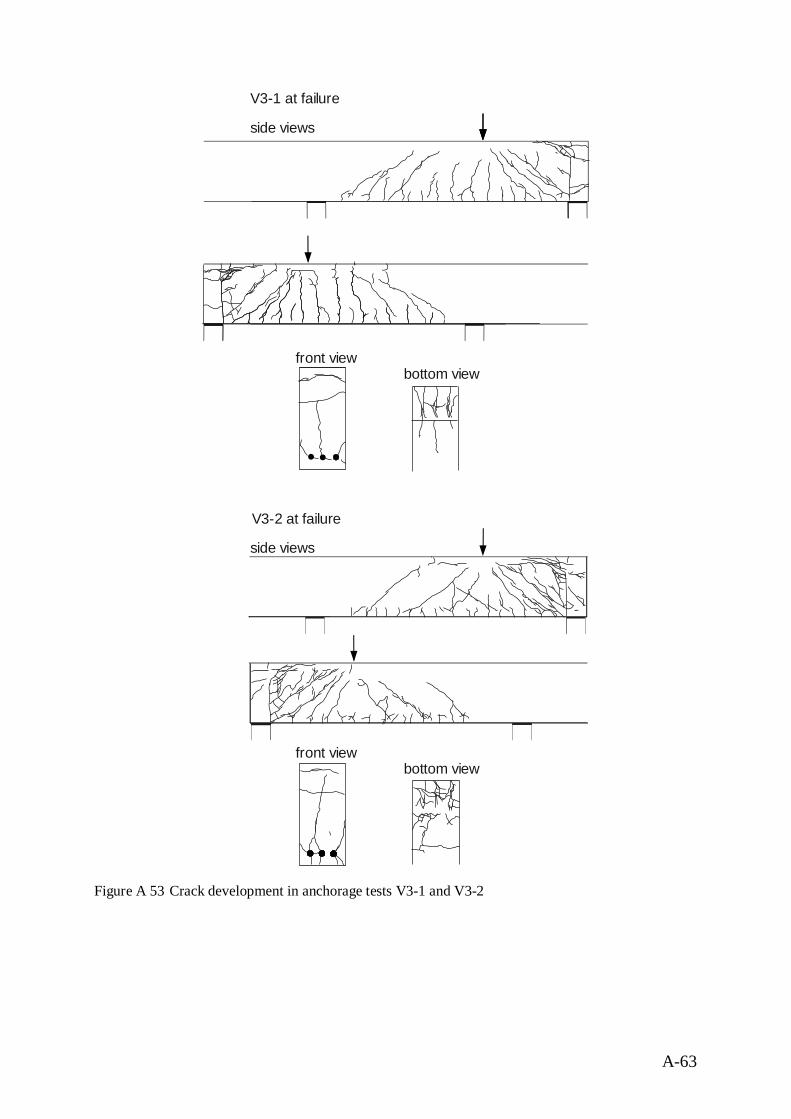
A-63
Figure A 53 Crack development in anchorage tests V3-1 and V3-2
bottom view
V3-1 at failure
front view
side views
V3-2 at failure
side views
bottom viewfront view
7
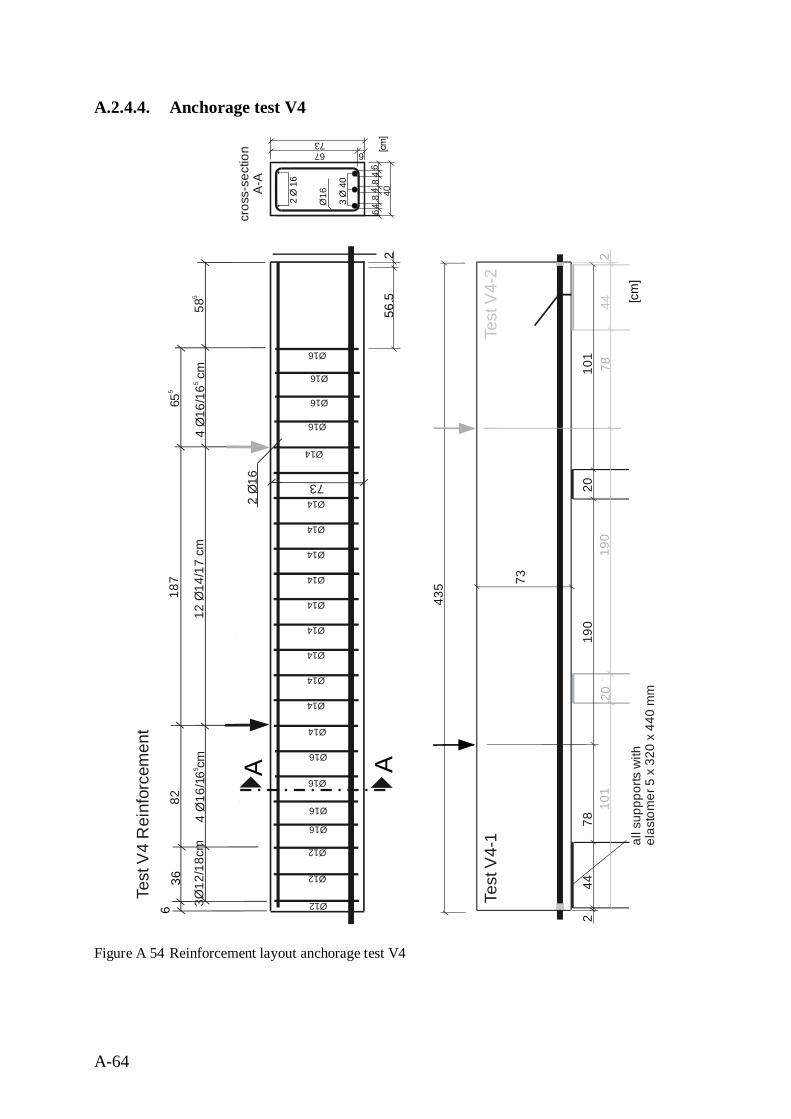
A-64
A.2.4.4. Anchorage test V4
Figure A 54 Reinforcement layout anchorage test V4
Test
V4
Rei
nfor
cem
ent
256
.5
cros
s-se
ctio
nA-
A
86
44
86
3 Ø
40
4
2 Ø
16
Ø16 40
435
190
73
442
2078
101
Test
V4-
1
190
442
2078
101
Test
V4-
2
all s
uppp
orts
with
elas
tom
er 5
x 3
20 x
440
mm
[cm]
66773
A A
585
8236
665
518
7
12 Ø
14/1
7 cm
4 Ø
16/1
cm
654
Ø16
/1cm
65
2 Ø
16
Ø16
Ø14
Ø14
Ø14
73
Ø16
Ø16
Ø16
Ø16
Ø16
Ø16
Ø14
Ø14
Ø14
Ø16
Ø14
Ø14
Ø14
Ø14
Ø14
Ø12
Ø12
Ø123Ø12
/18c
m
[cm
]
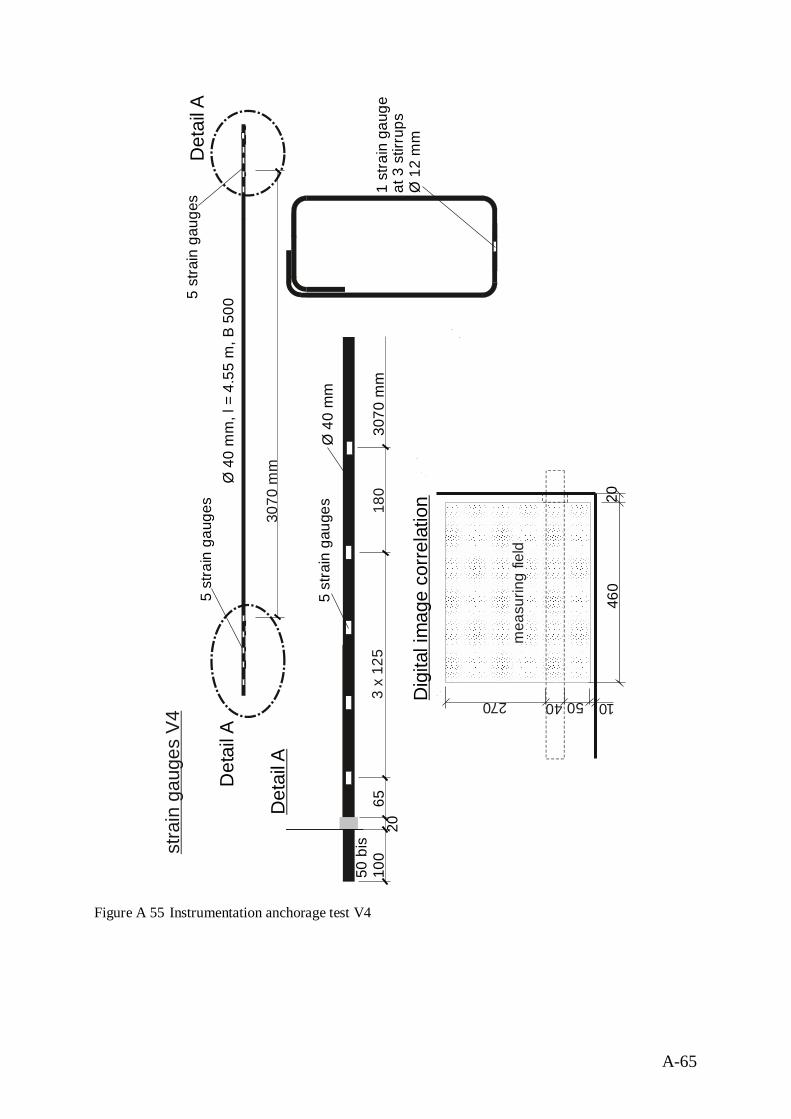
A-65
Figure A 55 Instrumentation anchorage test V4
stra
in g
auge
s V4
Ø 4
0 m
m, l
= 4
.55
m, B
500
5 st
rain
gau
ges
Det
ail A
3 x
125
50 b
is10
0
5 st
rain
gau
ges
Det
ail A
2065
3070
mm
3070
mm
Ø 4
0 m
m
Det
ail A
5 st
rain
gau
ges 18
01
stra
in g
auge
at 3
stir
rups
Ø 1
2 m
m
2046
0
40 50270 10Dig
ital i
mag
e co
rrela
tion
mea
surin
g fie
ld
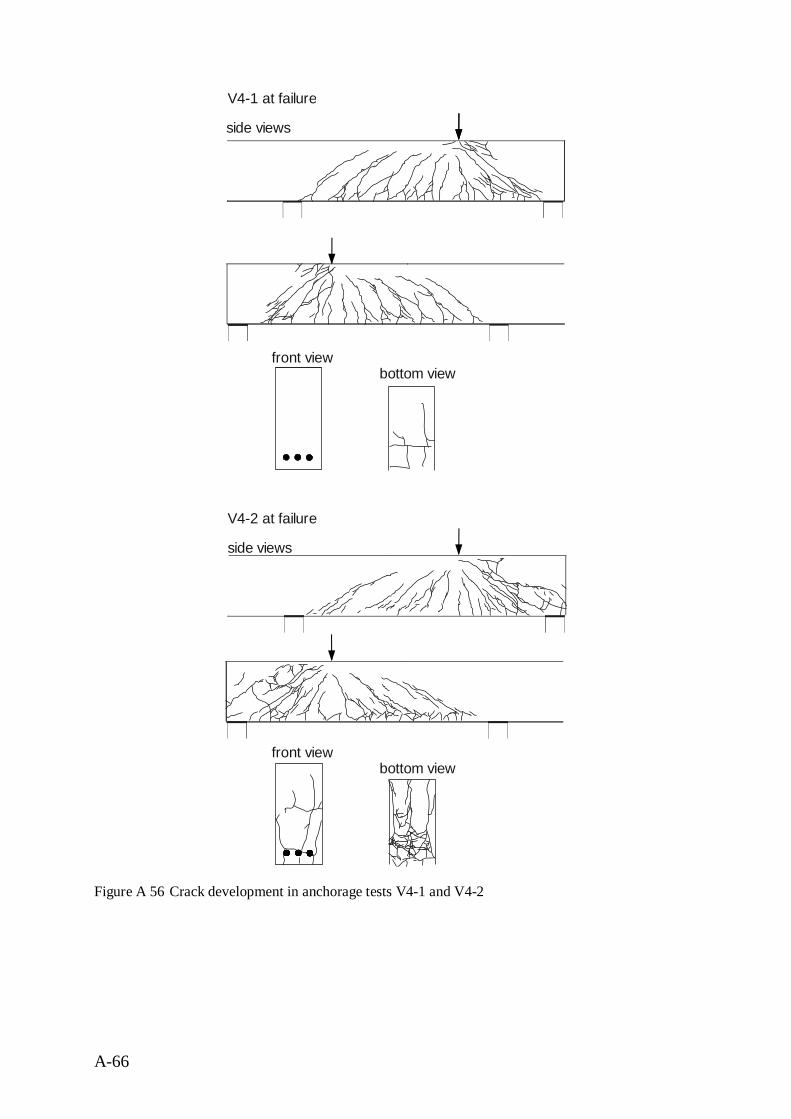
A-66
Figure A 56 Crack development in anchorage tests V4-1 and V4-2
bottom view
V4-1 at failure
front view
side views
V4-2 at failure
side views
bottom viewfront view
1
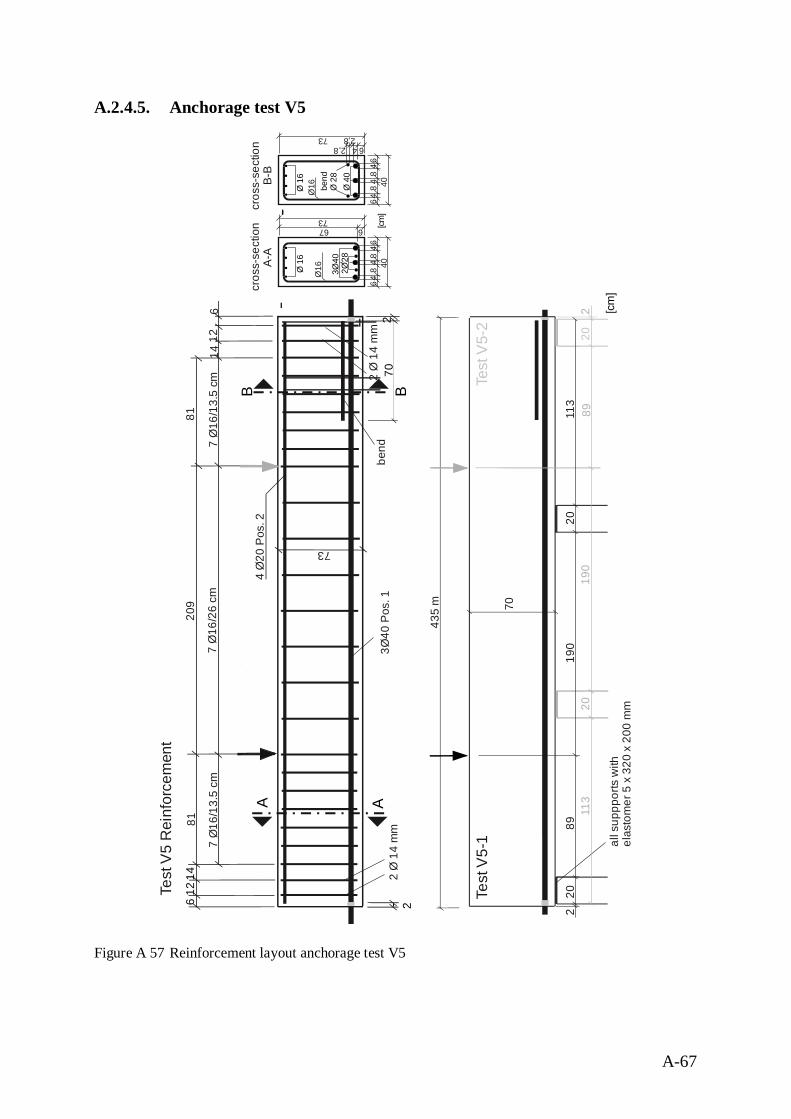
A-67
A.2.4.5. Anchorage test V5
Figure A 57 Reinforcement layout anchorage test V5
Test
V5
Rei
nfor
cem
ent
cros
s-se
ctio
nA-
A
86
44
86
2Ø28 4
Ø16 40
435
m
190
70
202
2089
113
Test
V5-
1
190
202
2089
113
Test
V5-
2
all s
uppp
orts
with
elas
tom
er 5
x 3
20 x
200
mm
[cm]
66773
3Ø40
cros
s-se
ctio
nB-
B
86
44
86
Ø 4
0
4
Ø 1
6Ø
16 40
673
bend
Ø 2
8
42,8
2,8
Ø 1
6
A A
6
8181
209
7 Ø
16/2
6 cm
7 Ø
16/1
3.5
cm7
Ø16
/13.
5 cm
4 Ø
20 P
os. 2
73
270
B B
2 Ø
14
mm
bend
3Ø40
Pos
. 1
1214
2 Ø
14
mm
1214
26
[cm
]
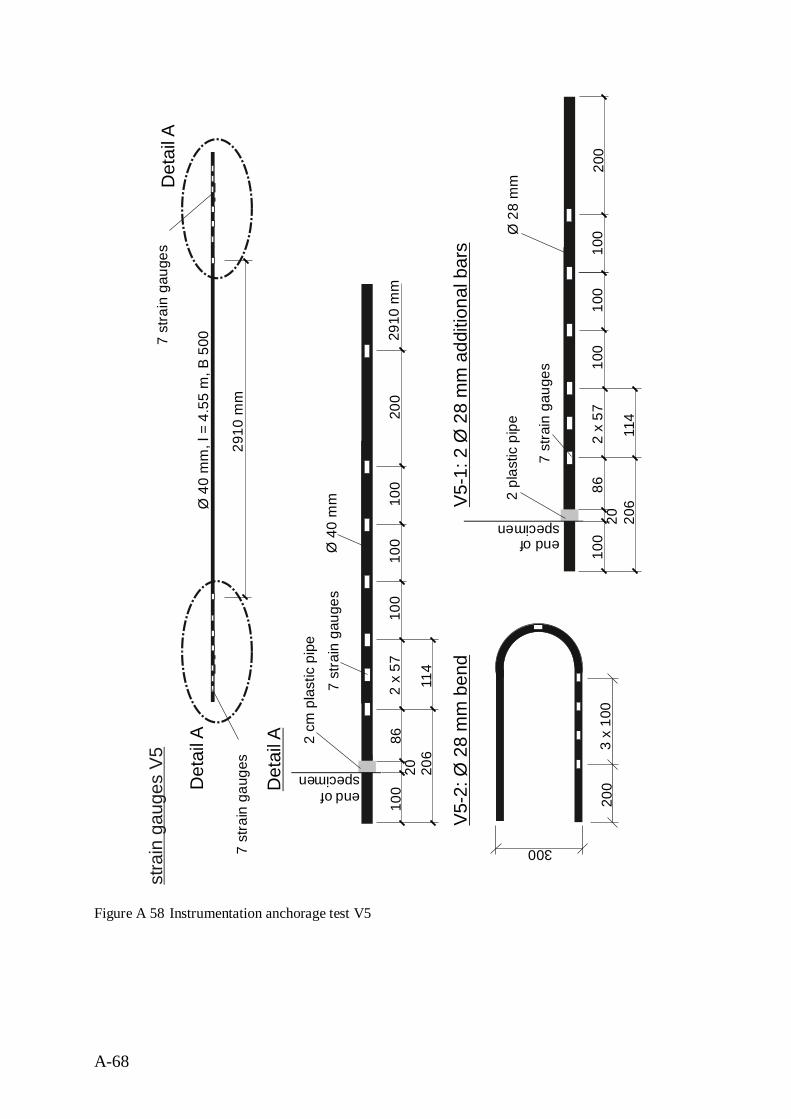
A-68
Figure A 58 Instrumentation anchorage test V5
stra
in g
auge
s V5
Ø 4
0 m
m, l
= 4
.55
m, B
500
7 st
rain
gau
ges
Det
ail A
Det
ail A
7 st
rain
gau
ges
2 x
5710
0
7 st
rain
gau
ges
Det
ail A
2086
206
end ofspecimen
2 cm
pla
stic
pip
e
114
2910
mm
2910
mm
100
100Ø 4
0 m
m
2 x
5710
020
86
206
end ofspecimen
2 pl
astic
pip
e
114
200
100
100
Ø 2
8 m
m
100
100
200
300
3 x
100
200
7 st
rain
gau
ges
V5-1
: 2 Ø
28
mm
add
ition
al b
ars
V5-2
: Ø 2
8 m
m b
end
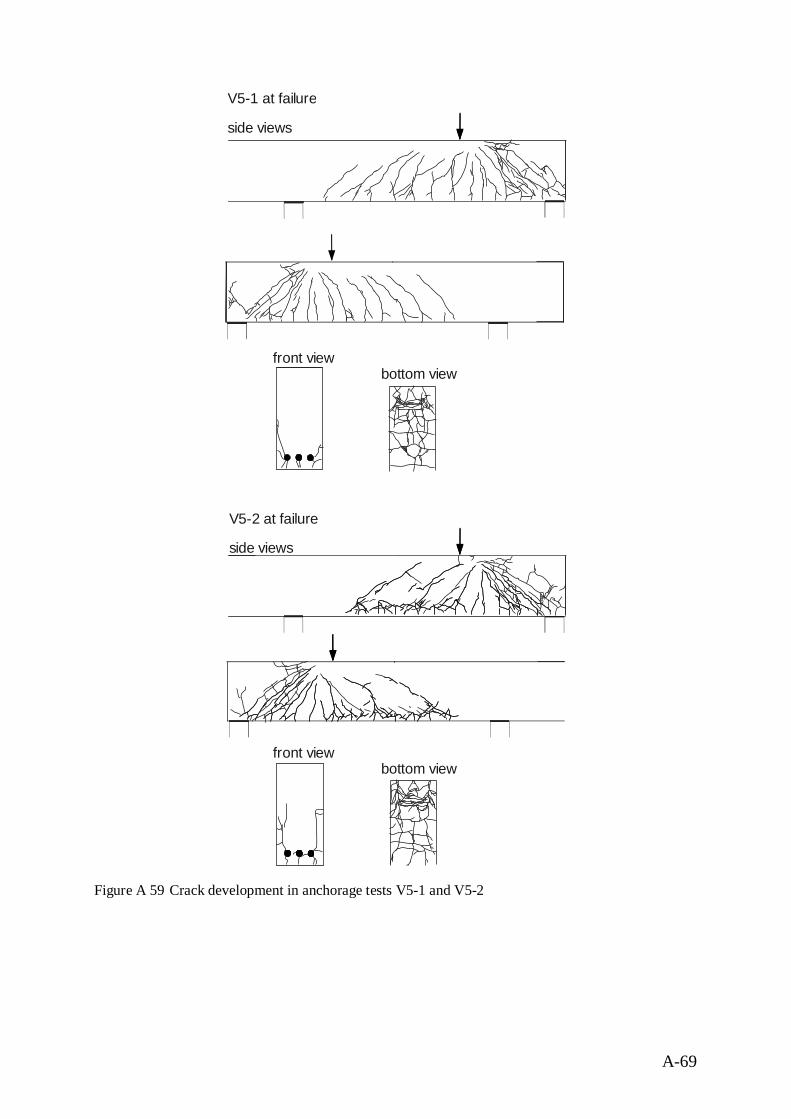
A-69
Figure A 59 Crack development in anchorage tests V5-1 and V5-2
bottom view
V5-1 at failure
front view
side views
V5-2 at failure
side views
bottom viewfront view
77
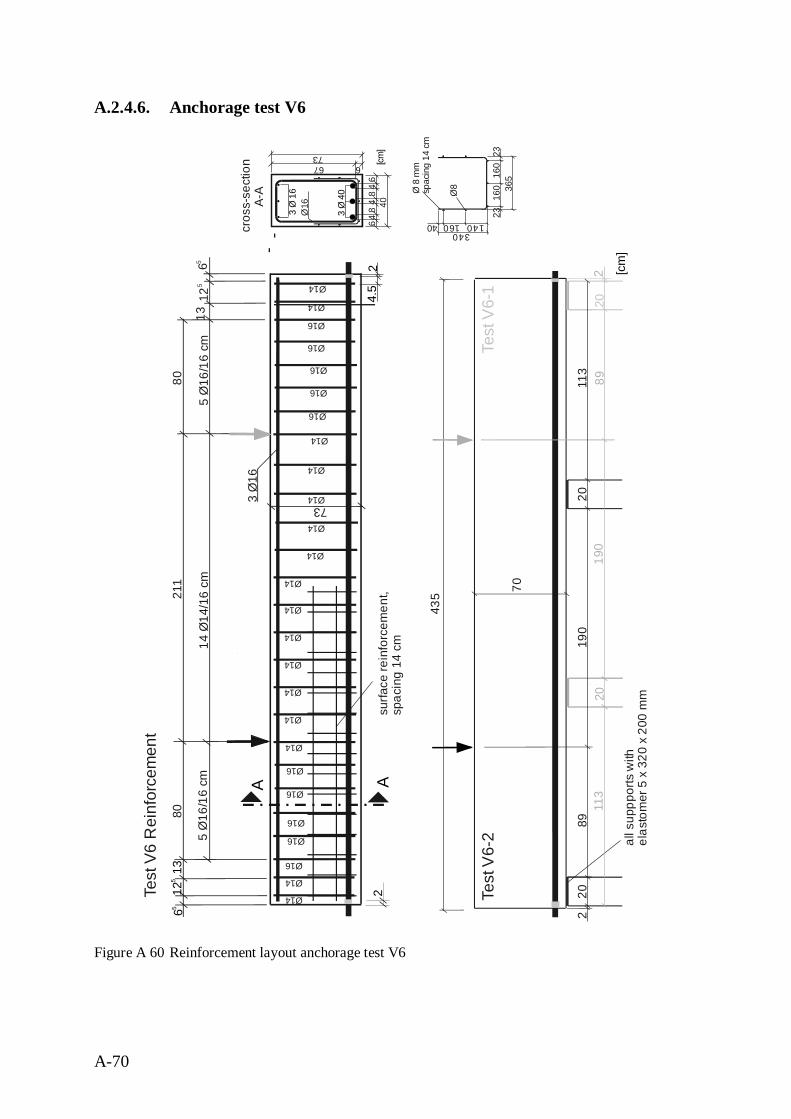
A-70
A.2.4.6. Anchorage test V6
Figure A 60 Reinforcement layout anchorage test V6
Test
V6
Rei
nfor
cem
ent
24.
5
cros
s-se
ctio
nA-
A
86
44
86
3 Ø
40
4
3 Ø
16
Ø16 40
435
190
70
202
2089
113
Test
V6-
2
190
202
2089
113
Test
V6-
1
all s
uppp
orts
with
elas
tom
er 5
x 3
20 x
200
mm
[cm]
66773
Ø8
A A
8012
565
8021
1
14 Ø
14/1
6 cm
5 Ø
16/1
6 cm
5 Ø
16/1
6 cm
3 Ø
16
Ø14
Ø14
Ø14
73
Ø16
Ø16
Ø16
Ø14
Ø14
Ø14
Ø14
Ø14
Ø14
2
Ø16
Ø16
Ø14
Ø14
Ø14
6513
125
13
surfa
ce re
info
rcem
ent,
spac
ing
14 c
m
Ø16
Ø16
Ø16
Ø16
Ø16
Ø14
Ø14
Ø14
Ø14
[cm
]
Ø 8
mm
spac
ing
14 c
m
340
160
160
160 140
365
2323
40
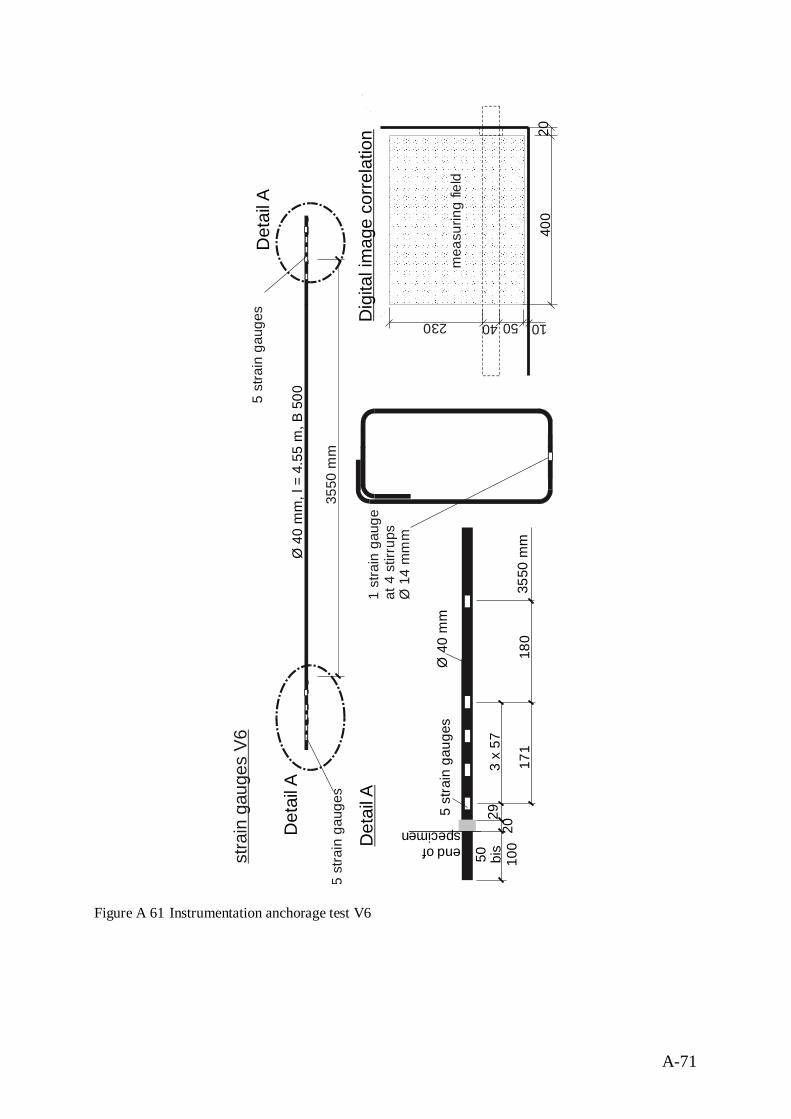
A-71
Figure A 61 Instrumentation anchorage test V6
stra
in g
auge
s V6
Ø 4
0 m
m, l
= 4
.55
m, B
500
5 st
rain
gau
ges
Det
ail A
3 x
5750 bi
s10
0
5 st
rain
gau
ges
Det
ail A
2029
171
3550
mm
3550
mm
Ø 4
0 m
m
Det
ail A
5 st
rain
gau
ges
1 st
rain
gau
geat
4 s
tirru
psØ
14
mm
m
180
end ofspecimen
2040
0
40 50230 10Dig
ital i
mag
e co
rrela
tion
mea
surin
g fie
ld
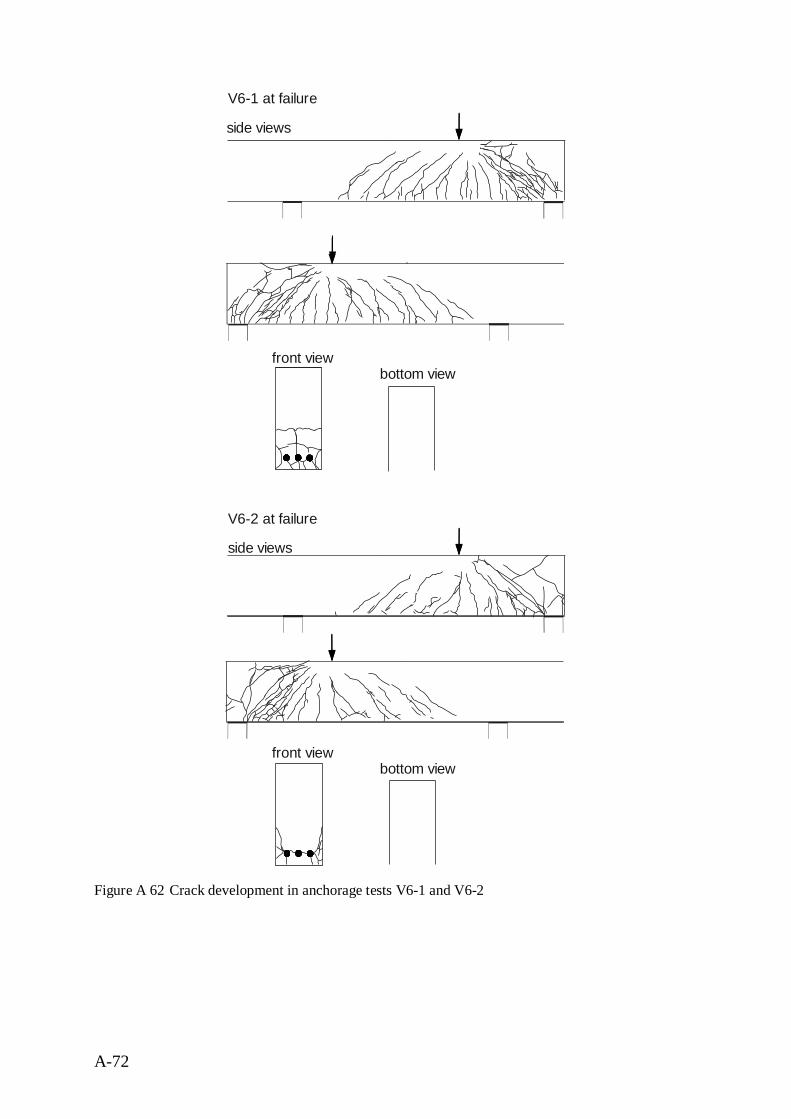
A-72
Figure A 62 Crack development in anchorage tests V6-1 and V6-2
bottom view
V6-1 at failure
front view
side views
V6-2 at failure
side views
bottom viewfront view
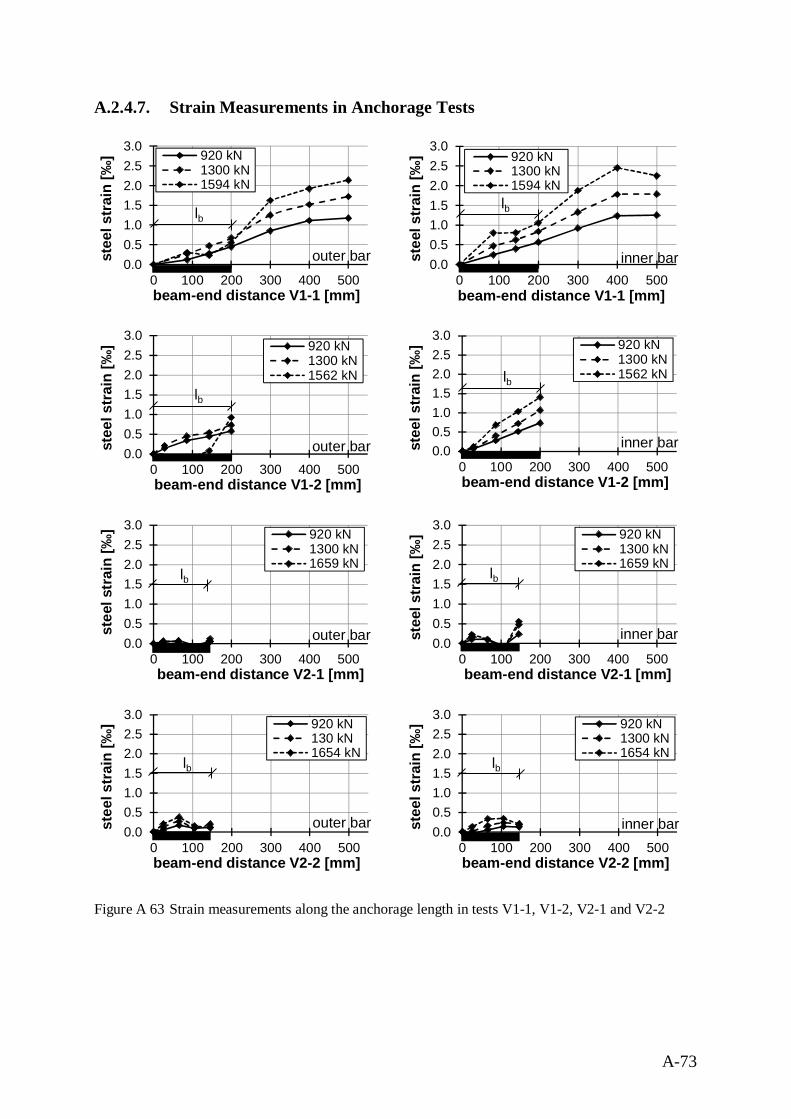
A-73
A.2.4.7. Strain Measurements in Anchorage Tests
Figure A 63 Strain measurements along the anchorage length in tests V1-1, V1-2, V2-1 and V2-2
0.00.51.01.52.02.53.0
0 100 200 300 400 500
stee
l str
ain
[‰]
beam-end distance V1-1 [mm]
920 kN1300 kN1594 kN
outer bar
lb
0.00.51.01.52.02.53.0
0 100 200 300 400 500
stee
l str
ain
[‰]
beam-end distance V1-1 [mm]
920 kN1300 kN1594 kN
lb
inner bar
0.00.51.01.52.02.53.0
0 100 200 300 400 500
stee
l str
ain
[‰]
beam-end distance V1-2 [mm]
920 kN1300 kN1562 kN
lb
outer bar 0.00.51.01.52.02.53.0
0 100 200 300 400 500
stee
l str
ain
[‰]
beam-end distance V1-2 [mm]
920 kN1300 kN1562 kNlb
inner bar
0.00.51.01.52.02.53.0
0 100 200 300 400 500
stee
l str
ain
[‰]
beam-end distance V2-1 [mm]
920 kN1300 kN1659 kN
lb
outer bar 0.00.51.01.52.02.53.0
0 100 200 300 400 500
stee
l str
ain
[‰]
beam-end distance V2-1 [mm]
920 kN1300 kN1659 kN
lb
inner bar
0.00.51.01.52.02.53.0
0 100 200 300 400 500
stee
l str
ain
[‰]
beam-end distance V2-2 [mm]
920 kN130 kN1654 kN
lb
outer bar 0.00.51.01.52.02.53.0
0 100 200 300 400 500
stee
l str
ain
[‰]
beam-end distance V2-2 [mm]
920 kN1300 kN1654 kN
lb
inner bar
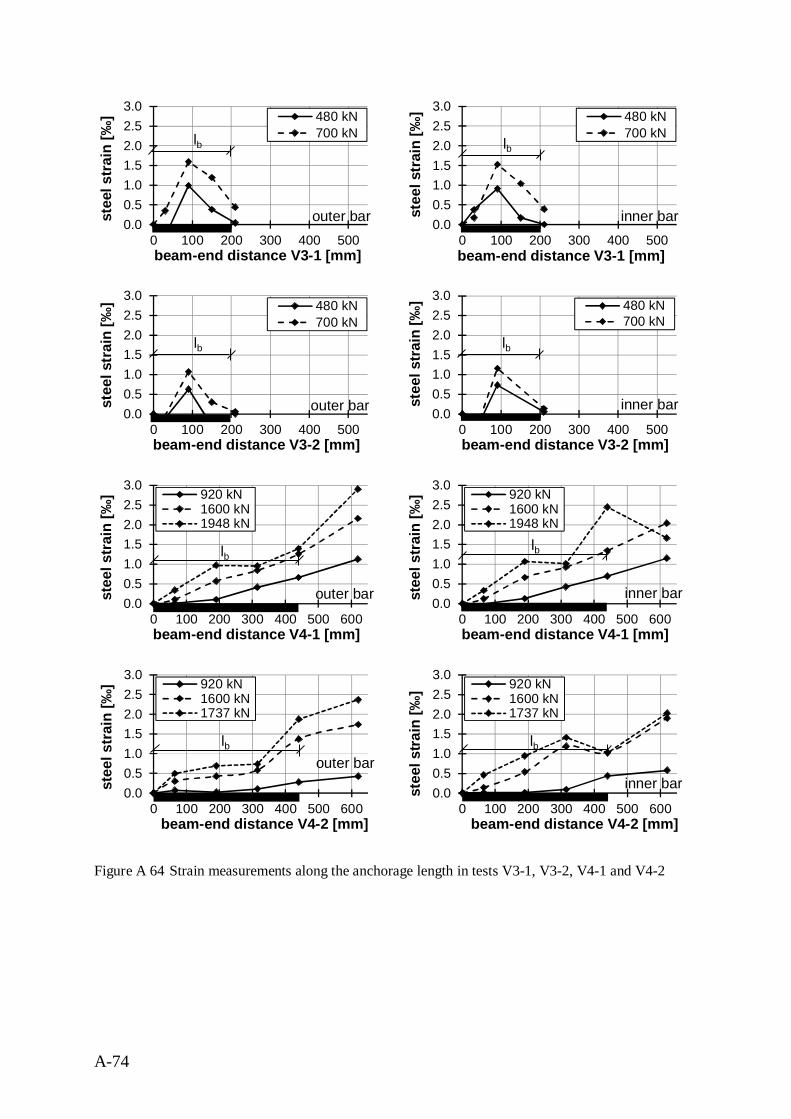
A-74
Figure A 64 Strain measurements along the anchorage length in tests V3-1, V3-2, V4-1 and V4-2
0.00.51.01.52.02.53.0
0 100 200 300 400 500
stee
l str
ain
[‰]
beam-end distance V3-1 [mm]
480 kN700 kNlb
outer bar 0.00.51.01.52.02.53.0
0 100 200 300 400 500
stee
l str
ain
[‰]
beam-end distance V3-1 [mm]
480 kN700 kN
lb
inner bar
0.00.51.01.52.02.53.0
0 100 200 300 400 500
stee
l str
ain
[‰]
beam-end distance V3-2 [mm]
480 kN700 kN
lb
outer bar 0.00.51.01.52.02.53.0
0 100 200 300 400 500st
eel s
trai
n [‰
]
beam-end distance V3-2 [mm]
480 kN700 kN
lb
inner bar
0.00.51.01.52.02.53.0
0 100 200 300 400 500 600
stee
l str
ain
[‰]
beam-end distance V4-1 [mm]
920 kN1600 kN1948 kN
outer bar
lb
0.00.51.01.52.02.53.0
0 100 200 300 400 500 600
stee
l str
ain
[‰]
beam-end distance V4-1 [mm]
920 kN1600 kN1948 kN
inner bar
lb
0.00.51.01.52.02.53.0
0 100 200 300 400 500 600
stee
l str
ain
[‰]
beam-end distance V4-2 [mm]
920 kN1600 kN1737 kN
outer barlb
0.00.51.01.52.02.53.0
0 100 200 300 400 500 600
stee
l stra
in [‰
]
beam-end distance V4-2 [mm]
920 kN1600 kN1737 kN
inner bar
lb
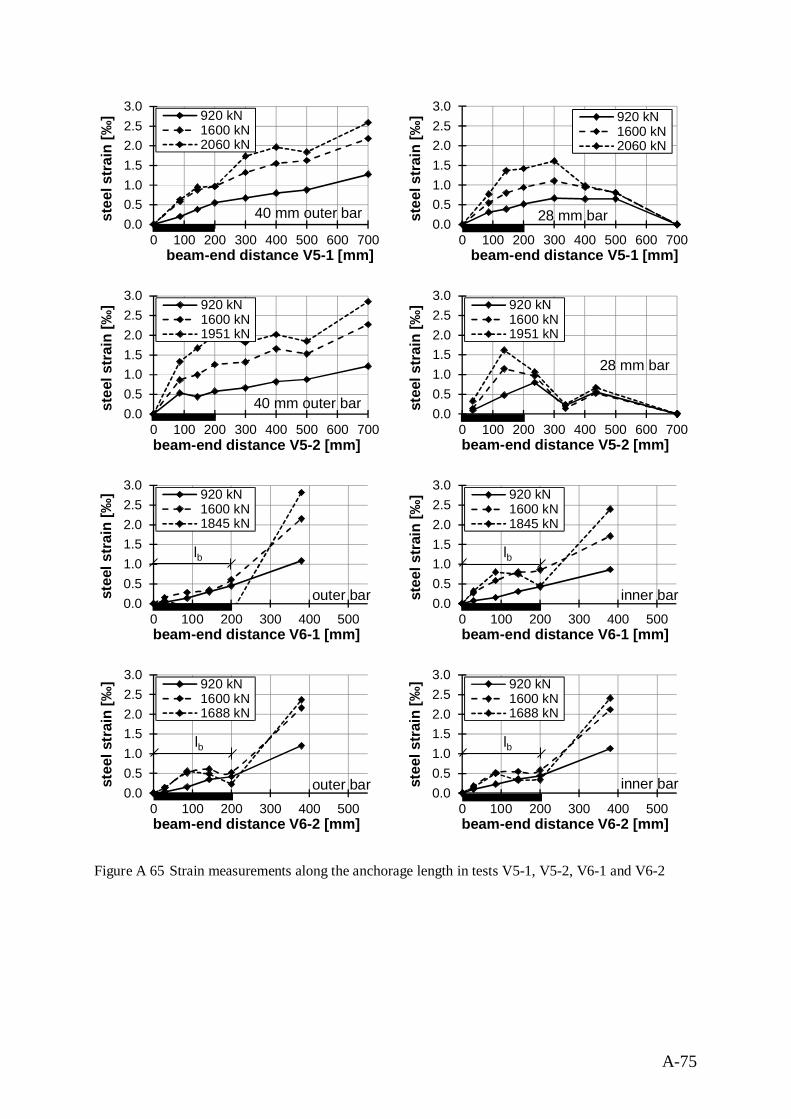
A-75
Figure A 65 Strain measurements along the anchorage length in tests V5-1, V5-2, V6-1 and V6-2
0.00.51.01.52.02.53.0
0 100 200 300 400 500 600 700
stee
l str
ain
[‰]
beam-end distance V5-1 [mm]
920 kN1600 kN2060 kN
40 mm outer bar0.00.51.01.52.02.53.0
0 100 200 300 400 500 600 700
stee
l str
ain
[‰]
beam-end distance V5-1 [mm]
920 kN1600 kN2060 kN
28 mm bar
0.00.51.01.52.02.53.0
0 100 200 300 400 500 600 700
stee
l str
ain
[‰]
beam-end distance V5-2 [mm]
920 kN1600 kN1951 kN
40 mm outer bar0.00.51.01.52.02.53.0
0 100 200 300 400 500 600 700st
eel s
trai
n [‰
]
beam-end distance V5-2 [mm]
920 kN1600 kN1951 kN
28 mm bar
0.00.51.01.52.02.53.0
0 100 200 300 400 500
stee
l str
ain
[‰]
beam-end distance V6-1 [mm]
920 kN1600 kN1845 kN
lb
outer bar 0.00.51.01.52.02.53.0
0 100 200 300 400 500
stee
l str
ain
[‰]
beam-end distance V6-1 [mm]
920 kN1600 kN1845 kN
lb
inner bar
0.00.51.01.52.02.53.0
0 100 200 300 400 500
stee
l str
ain
[‰]
beam-end distance V6-2 [mm]
920 kN1600 kN1688 kN
lb
outer bar 0.00.51.01.52.02.53.0
0 100 200 300 400 500
stee
l str
ain
[‰]
beam-end distance V6-2 [mm]
920 kN1600 kN1688 kN
inner bar
lb
A-76
A.3. Test series included in lap database
A.3.1. General
Numbers given in Table 2-1:
1 Tests with transverse reinforcement
2 Tests without transverse reinforcement
3 fib database 2005 [FIB05]
4 fib database 2006 with filter
5 ACI database 2001 [ACI01] (bottom bars only)
6 LETTOW database 2006 [LET06a]
7 own database 2018
8 own database 2018, filtered:
laps only, l0 / Ø > 14.5, fcm > 20 MPa, cmin > 0.95, ss < 1.2 ∙ fy
9 fib bulletin 72, filtered:
l0 / Ø >15, fcm > 20 MPa, cmin > 0.95, ss < 1.2∙fy
10 CAIRNS AND ELIGEHAUSEN [CAI14], filtered:
fc > C20/25, cmin > Ø, ss < 1.2 ∙ fy
1 cantilever2 tension member
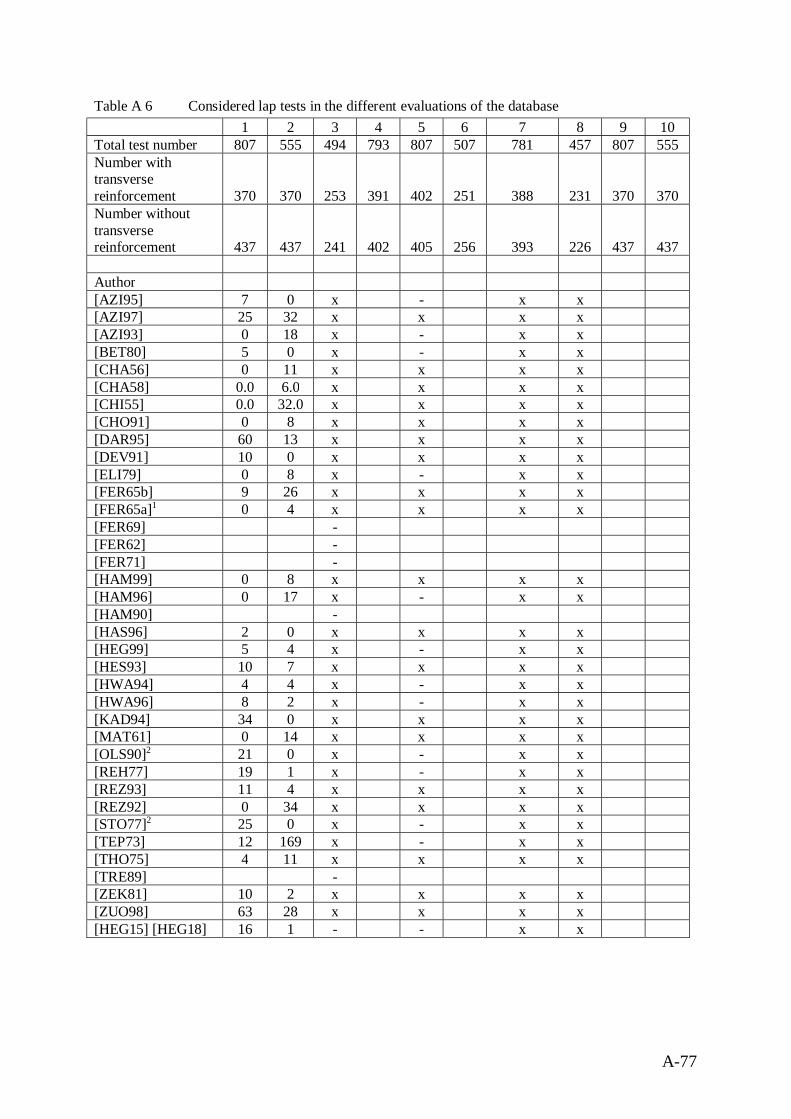
A-77
Table A 6 Considered lap tests in the different evaluations of the database1 2 3 4 5 6 7 8 9 10
Total test number 807 555 494 793 807 507 781 457 807 555Number withtransversereinforcement 370 370 253 391 402 251 388 231 370 370Number withouttransversereinforcement 437 437 241 402 405 256 393 226 437 437
Author[AZI95] 7 0 x - x x[AZI97] 25 32 x x x x[AZI93] 0 18 x - x x[BET80] 5 0 x - x x[CHA56] 0 11 x x x x[CHA58] 0.0 6.0 x x x x[CHI55] 0.0 32.0 x x x x[CHO91] 0 8 x x x x[DAR95] 60 13 x x x x[DEV91] 10 0 x x x x[ELI79] 0 8 x - x x[FER65b] 9 26 x x x x[FER65a]1 0 4 x x x x[FER69] -[FER62] -[FER71] -[HAM99] 0 8 x x x x[HAM96] 0 17 x - x x[HAM90] -[HAS96] 2 0 x x x x[HEG99] 5 4 x - x x[HES93] 10 7 x x x x[HWA94] 4 4 x - x x[HWA96] 8 2 x - x x[KAD94] 34 0 x x x x[MAT61] 0 14 x x x x[OLS90]2 21 0 x - x x[REH77] 19 1 x - x x[REZ93] 11 4 x x x x[REZ92] 0 34 x x x x[STO77]2 25 0 x - x x[TEP73] 12 169 x - x x[THO75] 4 11 x x x x[TRE89] -[ZEK81] 10 2 x x x x[ZUO98] 63 28 x x x x[HEG15] [HEG18] 16 1 - - x x
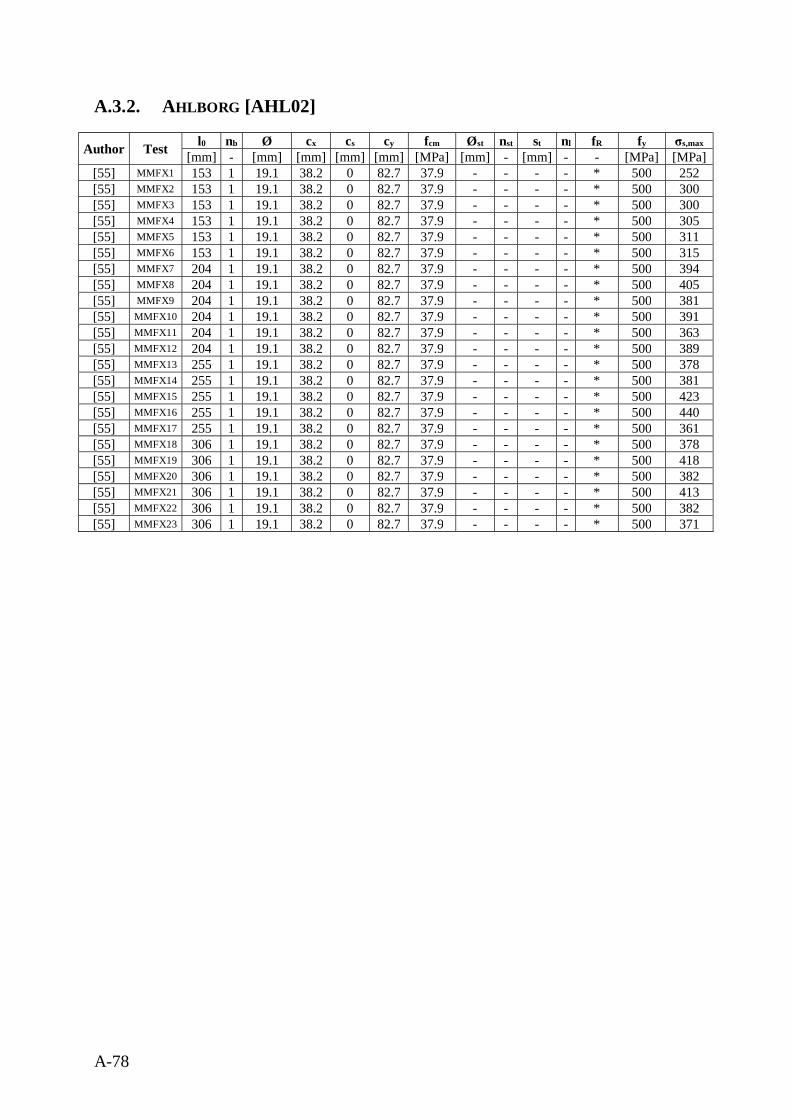
A-78
A.3.2. AHLBORG [AHL02]
Author Test l0 nb Ø cx cs cy fcm Øst nst st nl fR fy σs,max
[mm] - [mm] [mm] [mm] [mm] [MPa] [mm] - [mm] - - [MPa] [MPa][55] MMFX1 153 1 19.1 38.2 0 82.7 37.9 - - - - * 500 252[55] MMFX2 153 1 19.1 38.2 0 82.7 37.9 - - - - * 500 300[55] MMFX3 153 1 19.1 38.2 0 82.7 37.9 - - - - * 500 300[55] MMFX4 153 1 19.1 38.2 0 82.7 37.9 - - - - * 500 305[55] MMFX5 153 1 19.1 38.2 0 82.7 37.9 - - - - * 500 311[55] MMFX6 153 1 19.1 38.2 0 82.7 37.9 - - - - * 500 315[55] MMFX7 204 1 19.1 38.2 0 82.7 37.9 - - - - * 500 394[55] MMFX8 204 1 19.1 38.2 0 82.7 37.9 - - - - * 500 405[55] MMFX9 204 1 19.1 38.2 0 82.7 37.9 - - - - * 500 381[55] MMFX10 204 1 19.1 38.2 0 82.7 37.9 - - - - * 500 391[55] MMFX11 204 1 19.1 38.2 0 82.7 37.9 - - - - * 500 363[55] MMFX12 204 1 19.1 38.2 0 82.7 37.9 - - - - * 500 389[55] MMFX13 255 1 19.1 38.2 0 82.7 37.9 - - - - * 500 378[55] MMFX14 255 1 19.1 38.2 0 82.7 37.9 - - - - * 500 381[55] MMFX15 255 1 19.1 38.2 0 82.7 37.9 - - - - * 500 423[55] MMFX16 255 1 19.1 38.2 0 82.7 37.9 - - - - * 500 440[55] MMFX17 255 1 19.1 38.2 0 82.7 37.9 - - - - * 500 361[55] MMFX18 306 1 19.1 38.2 0 82.7 37.9 - - - - * 500 378[55] MMFX19 306 1 19.1 38.2 0 82.7 37.9 - - - - * 500 418[55] MMFX20 306 1 19.1 38.2 0 82.7 37.9 - - - - * 500 382[55] MMFX21 306 1 19.1 38.2 0 82.7 37.9 - - - - * 500 413[55] MMFX22 306 1 19.1 38.2 0 82.7 37.9 - - - - * 500 382[55] MMFX23 306 1 19.1 38.2 0 82.7 37.9 - - - - * 500 371
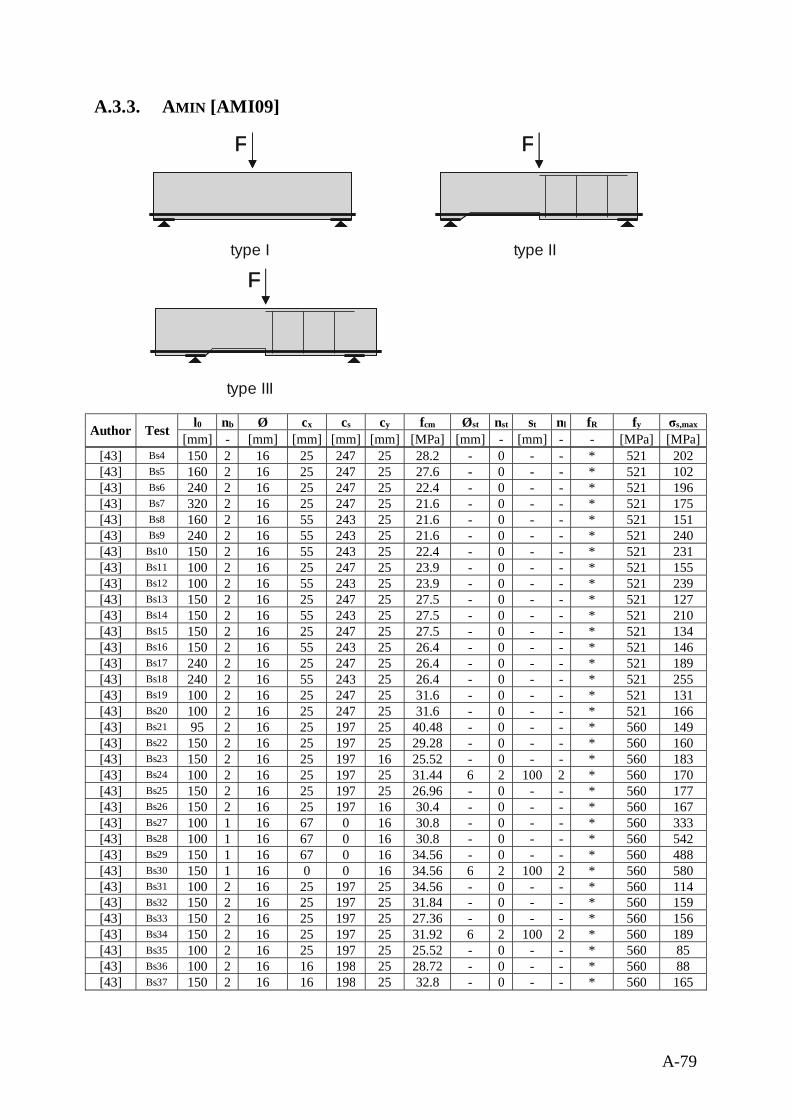
A-79
A.3.3. AMIN [AMI09]
Author Test l0 nb Ø cx cs cy fcm Øst nst st nl fR fy σs,max
[mm] - [mm] [mm] [mm] [mm] [MPa] [mm] - [mm] - - [MPa] [MPa][43] Bs4 150 2 16 25 247 25 28.2 - 0 - - * 521 202[43] Bs5 160 2 16 25 247 25 27.6 - 0 - - * 521 102[43] Bs6 240 2 16 25 247 25 22.4 - 0 - - * 521 196[43] Bs7 320 2 16 25 247 25 21.6 - 0 - - * 521 175[43] Bs8 160 2 16 55 243 25 21.6 - 0 - - * 521 151[43] Bs9 240 2 16 55 243 25 21.6 - 0 - - * 521 240[43] Bs10 150 2 16 55 243 25 22.4 - 0 - - * 521 231[43] Bs11 100 2 16 25 247 25 23.9 - 0 - - * 521 155[43] Bs12 100 2 16 55 243 25 23.9 - 0 - - * 521 239[43] Bs13 150 2 16 25 247 25 27.5 - 0 - - * 521 127[43] Bs14 150 2 16 55 243 25 27.5 - 0 - - * 521 210[43] Bs15 150 2 16 25 247 25 27.5 - 0 - - * 521 134[43] Bs16 150 2 16 55 243 25 26.4 - 0 - - * 521 146[43] Bs17 240 2 16 25 247 25 26.4 - 0 - - * 521 189[43] Bs18 240 2 16 55 243 25 26.4 - 0 - - * 521 255[43] Bs19 100 2 16 25 247 25 31.6 - 0 - - * 521 131[43] Bs20 100 2 16 25 247 25 31.6 - 0 - - * 521 166[43] Bs21 95 2 16 25 197 25 40.48 - 0 - - * 560 149[43] Bs22 150 2 16 25 197 25 29.28 - 0 - - * 560 160[43] Bs23 150 2 16 25 197 16 25.52 - 0 - - * 560 183[43] Bs24 100 2 16 25 197 25 31.44 6 2 100 2 * 560 170[43] Bs25 150 2 16 25 197 25 26.96 - 0 - - * 560 177[43] Bs26 150 2 16 25 197 16 30.4 - 0 - - * 560 167[43] Bs27 100 1 16 67 0 16 30.8 - 0 - - * 560 333[43] Bs28 100 1 16 67 0 16 30.8 - 0 - - * 560 542[43] Bs29 150 1 16 67 0 16 34.56 - 0 - - * 560 488[43] Bs30 150 1 16 0 0 16 34.56 6 2 100 2 * 560 580[43] Bs31 100 2 16 25 197 25 34.56 - 0 - - * 560 114[43] Bs32 150 2 16 25 197 25 31.84 - 0 - - * 560 159[43] Bs33 150 2 16 25 197 25 27.36 - 0 - - * 560 156[43] Bs34 150 2 16 25 197 25 31.92 6 2 100 2 * 560 189[43] Bs35 100 2 16 25 197 25 25.52 - 0 - - * 560 85[43] Bs36 100 2 16 16 198 25 28.72 - 0 - - * 560 88[43] Bs37 150 2 16 16 198 25 32.8 - 0 - - * 560 165
F F
type I type II
F
type III
F F
F
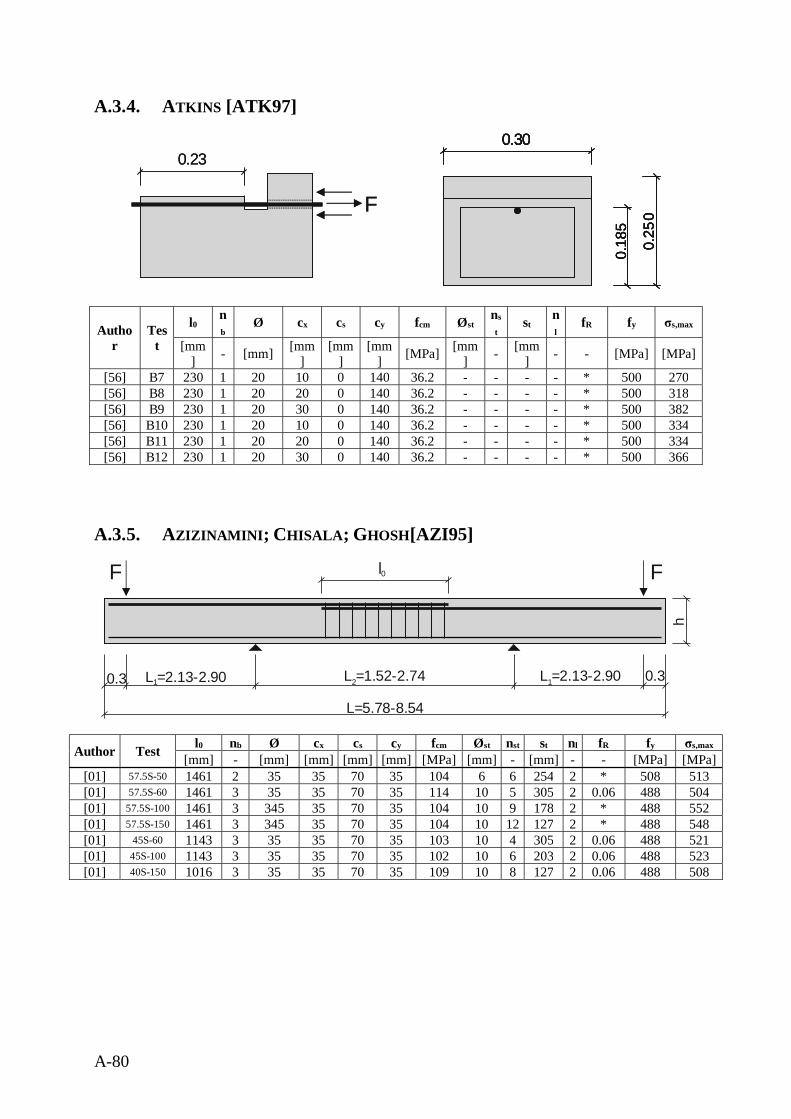
A-80
A.3.4. ATKINS [ATK97]
Author
Test
l0nb
Ø cx cs cy fcm Østns
tst
nl
fR fy σs,max
[mm] - [mm] [mm
][mm
][mm
] [MPa] [mm] - [mm
] - - [MPa] [MPa]
[56] B7 230 1 20 10 0 140 36.2 - - - - * 500 270[56] B8 230 1 20 20 0 140 36.2 - - - - * 500 318[56] B9 230 1 20 30 0 140 36.2 - - - - * 500 382[56] B10 230 1 20 10 0 140 36.2 - - - - * 500 334[56] B11 230 1 20 20 0 140 36.2 - - - - * 500 334[56] B12 230 1 20 30 0 140 36.2 - - - - * 500 366
A.3.5. AZIZINAMINI; CHISALA; GHOSH[AZI95]
Author Test l0 nb Ø cx cs cy fcm Øst nst st nl fR fy σs,max
[mm] - [mm] [mm] [mm] [mm] [MPa] [mm] - [mm] - - [MPa] [MPa][01] 57.5S-50 1461 2 35 35 70 35 104 6 6 254 2 * 508 513[01] 57.5S-60 1461 3 35 35 70 35 114 10 5 305 2 0.06 488 504[01] 57.5S-100 1461 3 345 35 70 35 104 10 9 178 2 * 488 552[01] 57.5S-150 1461 3 345 35 70 35 104 10 12 127 2 * 488 548[01] 45S-60 1143 3 35 35 70 35 103 10 4 305 2 0.06 488 521[01] 45S-100 1143 3 35 35 70 35 102 10 6 203 2 0.06 488 523[01] 40S-150 1016 3 35 35 70 35 109 10 8 127 2 0.06 488 508
F
0.18
5
0.300.23
0.25
0
0.18
5
0.30
0.25
0
0.18
5
0.30
0.25
0
0.18
5
0.30
0.25
0F
0.23
F F
h0.3 L =2.13-2.901 L =1.52-2.742 L =2.13-2.901 0.3
L=5.78-8.54
l0
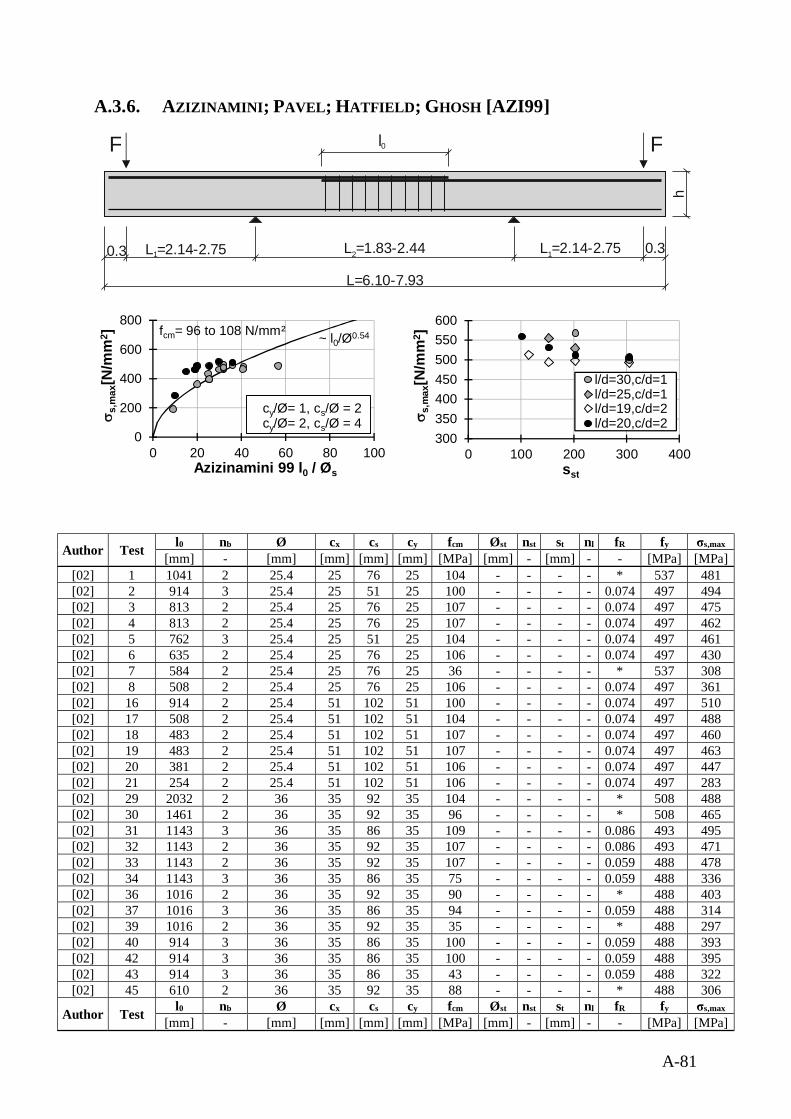
A-81
A.3.6. AZIZINAMINI; PAVEL; HATFIELD; GHOSH [AZI99]
Author Test l0 nb Ø cx cs cy fcm Øst nst st nl fR fy σs,max
[mm] - [mm] [mm] [mm] [mm] [MPa] [mm] - [mm] - - [MPa] [MPa][02] 1 1041 2 25.4 25 76 25 104 - - - - * 537 481[02] 2 914 3 25.4 25 51 25 100 - - - - 0.074 497 494[02] 3 813 2 25.4 25 76 25 107 - - - - 0.074 497 475[02] 4 813 2 25.4 25 76 25 107 - - - - 0.074 497 462[02] 5 762 3 25.4 25 51 25 104 - - - - 0.074 497 461[02] 6 635 2 25.4 25 76 25 106 - - - - 0.074 497 430[02] 7 584 2 25.4 25 76 25 36 - - - - * 537 308[02] 8 508 2 25.4 25 76 25 106 - - - - 0.074 497 361[02] 16 914 2 25.4 51 102 51 100 - - - - 0.074 497 510[02] 17 508 2 25.4 51 102 51 104 - - - - 0.074 497 488[02] 18 483 2 25.4 51 102 51 107 - - - - 0.074 497 460[02] 19 483 2 25.4 51 102 51 107 - - - - 0.074 497 463[02] 20 381 2 25.4 51 102 51 106 - - - - 0.074 497 447[02] 21 254 2 25.4 51 102 51 106 - - - - 0.074 497 283[02] 29 2032 2 36 35 92 35 104 - - - - * 508 488[02] 30 1461 2 36 35 92 35 96 - - - - * 508 465[02] 31 1143 3 36 35 86 35 109 - - - - 0.086 493 495[02] 32 1143 2 36 35 92 35 107 - - - - 0.086 493 471[02] 33 1143 2 36 35 92 35 107 - - - - 0.059 488 478[02] 34 1143 3 36 35 86 35 75 - - - - 0.059 488 336[02] 36 1016 2 36 35 92 35 90 - - - - * 488 403[02] 37 1016 3 36 35 86 35 94 - - - - 0.059 488 314[02] 39 1016 2 36 35 92 35 35 - - - - * 488 297[02] 40 914 3 36 35 86 35 100 - - - - 0.059 488 393[02] 42 914 3 36 35 86 35 100 - - - - 0.059 488 395[02] 43 914 3 36 35 86 35 43 - - - - 0.059 488 322[02] 45 610 2 36 35 92 35 88 - - - - * 488 306
Author Test l0 nb Ø cx cs cy fcm Øst nst st nl fR fy σs,max
[mm] - [mm] [mm] [mm] [mm] [MPa] [mm] - [mm] - - [MPa] [MPa]
F F
h
0.3 L =2.14-2.751 L =1.83-2.442 L =2.14-2.751 0.3
L=6.10-7.93
l0
0
200
400
600
800
0 20 40 60 80 100
s s,m
ax[N
/mm
2 ]
Azizinamini 99 l0 / Øs
cy/Ø= 1, cs/Ø = 2cy/Ø= 2, cs/Ø = 4
fcm= 96 to 108 N/mm² ~ l0/Ø0.54
300350400450500550600
0 100 200 300 400
s s,m
ax[N
/mm
2 ]
sst
l/d=30,c/d=1l/d=25,c/d=1l/d=19,c/d=2l/d=20,c/d=2
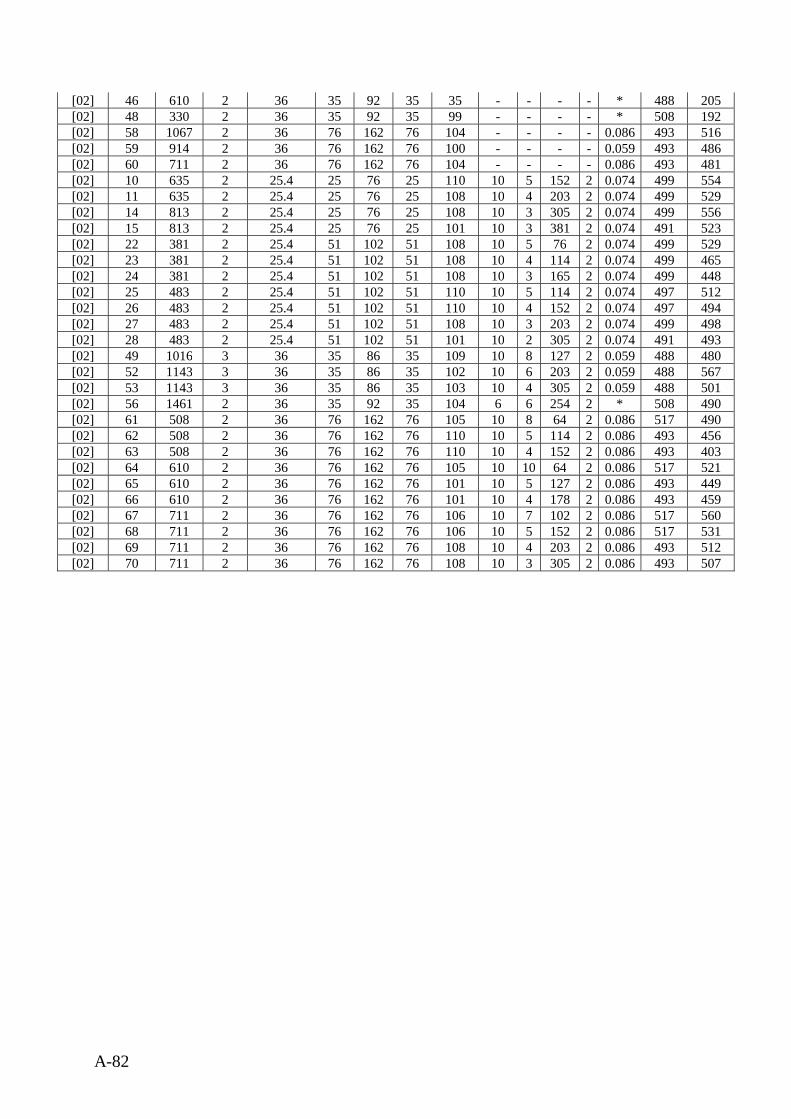
A-82
[02] 46 610 2 36 35 92 35 35 - - - - * 488 205[02] 48 330 2 36 35 92 35 99 - - - - * 508 192[02] 58 1067 2 36 76 162 76 104 - - - - 0.086 493 516[02] 59 914 2 36 76 162 76 100 - - - - 0.059 493 486[02] 60 711 2 36 76 162 76 104 - - - - 0.086 493 481[02] 10 635 2 25.4 25 76 25 110 10 5 152 2 0.074 499 554[02] 11 635 2 25.4 25 76 25 108 10 4 203 2 0.074 499 529[02] 14 813 2 25.4 25 76 25 108 10 3 305 2 0.074 499 556[02] 15 813 2 25.4 25 76 25 101 10 3 381 2 0.074 491 523[02] 22 381 2 25.4 51 102 51 108 10 5 76 2 0.074 499 529[02] 23 381 2 25.4 51 102 51 108 10 4 114 2 0.074 499 465[02] 24 381 2 25.4 51 102 51 108 10 3 165 2 0.074 499 448[02] 25 483 2 25.4 51 102 51 110 10 5 114 2 0.074 497 512[02] 26 483 2 25.4 51 102 51 110 10 4 152 2 0.074 497 494[02] 27 483 2 25.4 51 102 51 108 10 3 203 2 0.074 499 498[02] 28 483 2 25.4 51 102 51 101 10 2 305 2 0.074 491 493[02] 49 1016 3 36 35 86 35 109 10 8 127 2 0.059 488 480[02] 52 1143 3 36 35 86 35 102 10 6 203 2 0.059 488 567[02] 53 1143 3 36 35 86 35 103 10 4 305 2 0.059 488 501[02] 56 1461 2 36 35 92 35 104 6 6 254 2 * 508 490[02] 61 508 2 36 76 162 76 105 10 8 64 2 0.086 517 490[02] 62 508 2 36 76 162 76 110 10 5 114 2 0.086 493 456[02] 63 508 2 36 76 162 76 110 10 4 152 2 0.086 493 403[02] 64 610 2 36 76 162 76 105 10 10 64 2 0.086 517 521[02] 65 610 2 36 76 162 76 101 10 5 127 2 0.086 493 449[02] 66 610 2 36 76 162 76 101 10 4 178 2 0.086 493 459[02] 67 711 2 36 76 162 76 106 10 7 102 2 0.086 517 560[02] 68 711 2 36 76 162 76 106 10 5 152 2 0.086 517 531[02] 69 711 2 36 76 162 76 108 10 4 203 2 0.086 493 512[02] 70 711 2 36 76 162 76 108 10 3 305 2 0.086 493 507
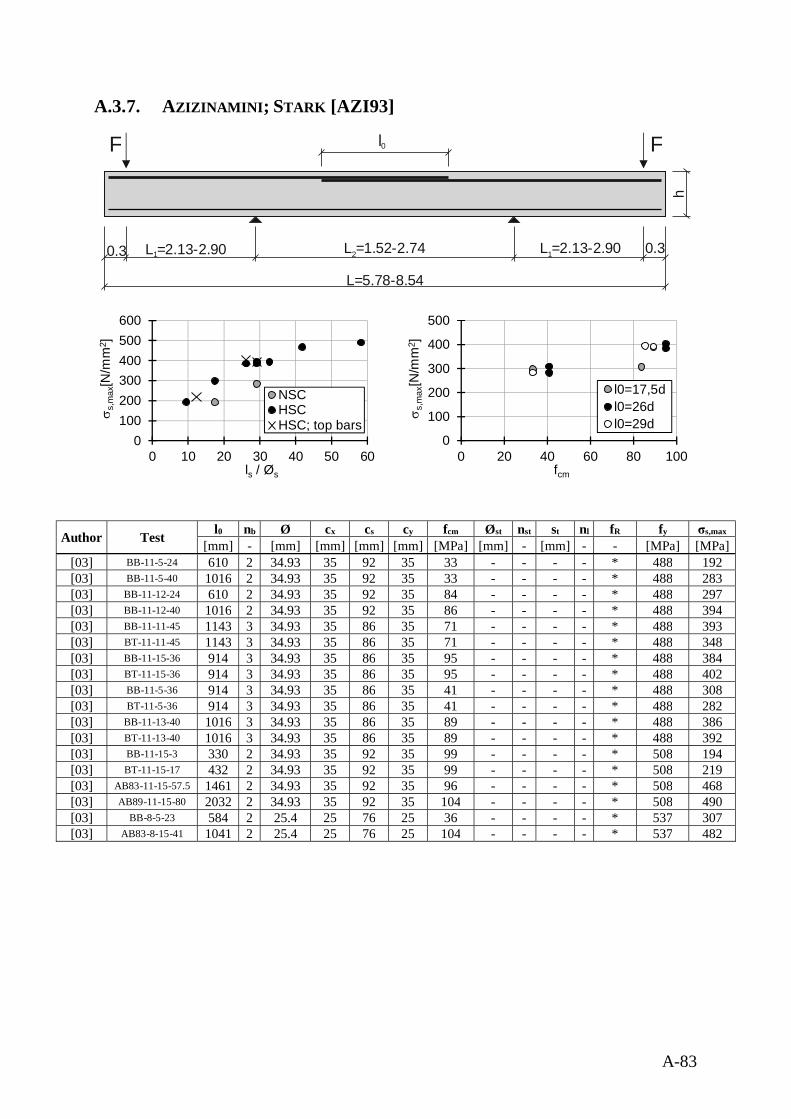
A-83
A.3.7. AZIZINAMINI; STARK [AZI93]
Author Test l0 nb Ø cx cs cy fcm Øst nst st nl fR fy σs,max
[mm] - [mm] [mm] [mm] [mm] [MPa] [mm] - [mm] - - [MPa] [MPa][03] BB-11-5-24 610 2 34.93 35 92 35 33 - - - - * 488 192[03] BB-11-5-40 1016 2 34.93 35 92 35 33 - - - - * 488 283[03] BB-11-12-24 610 2 34.93 35 92 35 84 - - - - * 488 297[03] BB-11-12-40 1016 2 34.93 35 92 35 86 - - - - * 488 394[03] BB-11-11-45 1143 3 34.93 35 86 35 71 - - - - * 488 393[03] BT-11-11-45 1143 3 34.93 35 86 35 71 - - - - * 488 348[03] BB-11-15-36 914 3 34.93 35 86 35 95 - - - - * 488 384[03] BT-11-15-36 914 3 34.93 35 86 35 95 - - - - * 488 402[03] BB-11-5-36 914 3 34.93 35 86 35 41 - - - - * 488 308[03] BT-11-5-36 914 3 34.93 35 86 35 41 - - - - * 488 282[03] BB-11-13-40 1016 3 34.93 35 86 35 89 - - - - * 488 386[03] BT-11-13-40 1016 3 34.93 35 86 35 89 - - - - * 488 392[03] BB-11-15-3 330 2 34.93 35 92 35 99 - - - - * 508 194[03] BT-11-15-17 432 2 34.93 35 92 35 99 - - - - * 508 219[03] AB83-11-15-57.5 1461 2 34.93 35 92 35 96 - - - - * 508 468[03] AB89-11-15-80 2032 2 34.93 35 92 35 104 - - - - * 508 490[03] BB-8-5-23 584 2 25.4 25 76 25 36 - - - - * 537 307[03] AB83-8-15-41 1041 2 25.4 25 76 25 104 - - - - * 537 482
F F
h
0.3 L =2.13-2.901 L =1.52-2.742 L =2.13-2.901 0.3
L=5.78-8.54
l0
0100200300400500600
0 10 20 30 40 50 60
s s,m
ax[N
/mm
2 ]
ls / Øs
NSCHSCHSC; top bars
0
100
200
300
400
500
0 20 40 60 80 100
s s,m
ax[N
/mm
2 ]
fcm
l0=17,5dl0=26dl0=29d
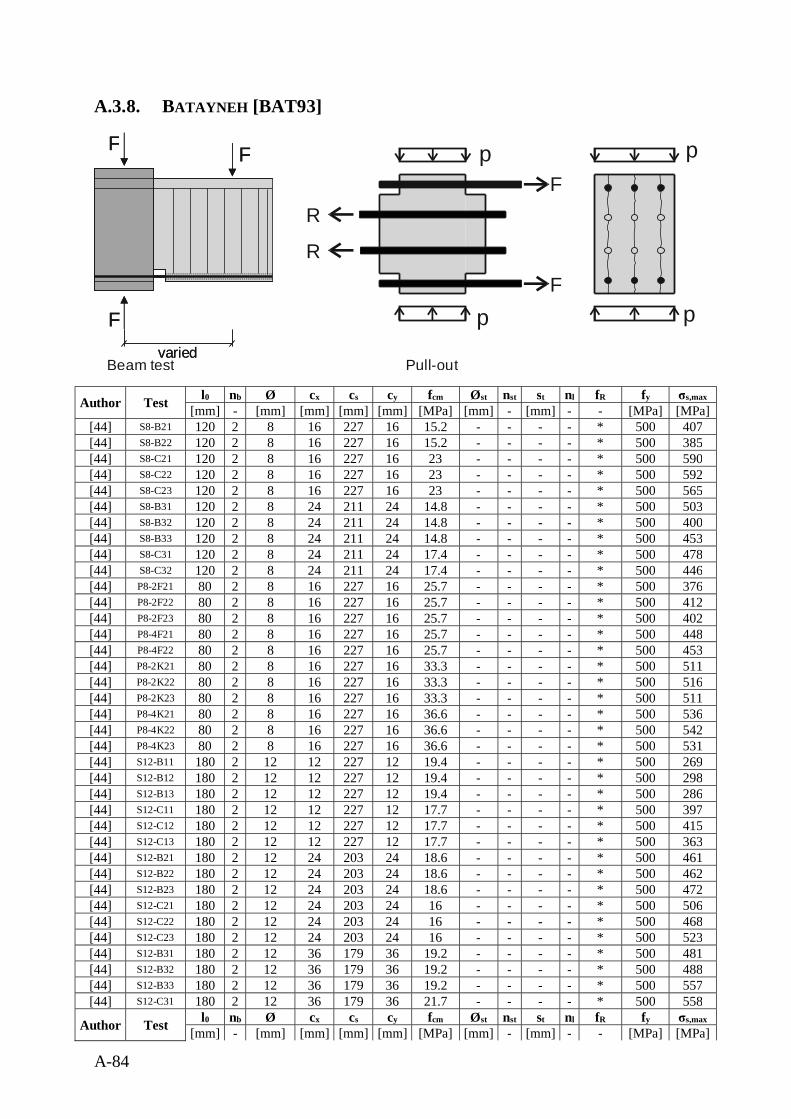
A-84
A.3.8. BATAYNEH [BAT93]
Author Test l0 nb Ø cx cs cy fcm Øst nst st nl fR fy σs,max
[mm] - [mm] [mm] [mm] [mm] [MPa] [mm] - [mm] - - [MPa] [MPa][44] S8-B21 120 2 8 16 227 16 15.2 - - - - * 500 407[44] S8-B22 120 2 8 16 227 16 15.2 - - - - * 500 385[44] S8-C21 120 2 8 16 227 16 23 - - - - * 500 590[44] S8-C22 120 2 8 16 227 16 23 - - - - * 500 592[44] S8-C23 120 2 8 16 227 16 23 - - - - * 500 565[44] S8-B31 120 2 8 24 211 24 14.8 - - - - * 500 503[44] S8-B32 120 2 8 24 211 24 14.8 - - - - * 500 400[44] S8-B33 120 2 8 24 211 24 14.8 - - - - * 500 453[44] S8-C31 120 2 8 24 211 24 17.4 - - - - * 500 478[44] S8-C32 120 2 8 24 211 24 17.4 - - - - * 500 446[44] P8-2F21 80 2 8 16 227 16 25.7 - - - - * 500 376[44] P8-2F22 80 2 8 16 227 16 25.7 - - - - * 500 412[44] P8-2F23 80 2 8 16 227 16 25.7 - - - - * 500 402[44] P8-4F21 80 2 8 16 227 16 25.7 - - - - * 500 448[44] P8-4F22 80 2 8 16 227 16 25.7 - - - - * 500 453[44] P8-2K21 80 2 8 16 227 16 33.3 - - - - * 500 511[44] P8-2K22 80 2 8 16 227 16 33.3 - - - - * 500 516[44] P8-2K23 80 2 8 16 227 16 33.3 - - - - * 500 511[44] P8-4K21 80 2 8 16 227 16 36.6 - - - - * 500 536[44] P8-4K22 80 2 8 16 227 16 36.6 - - - - * 500 542[44] P8-4K23 80 2 8 16 227 16 36.6 - - - - * 500 531[44] S12-B11 180 2 12 12 227 12 19.4 - - - - * 500 269[44] S12-B12 180 2 12 12 227 12 19.4 - - - - * 500 298[44] S12-B13 180 2 12 12 227 12 19.4 - - - - * 500 286[44] S12-C11 180 2 12 12 227 12 17.7 - - - - * 500 397[44] S12-C12 180 2 12 12 227 12 17.7 - - - - * 500 415[44] S12-C13 180 2 12 12 227 12 17.7 - - - - * 500 363[44] S12-B21 180 2 12 24 203 24 18.6 - - - - * 500 461[44] S12-B22 180 2 12 24 203 24 18.6 - - - - * 500 462[44] S12-B23 180 2 12 24 203 24 18.6 - - - - * 500 472[44] S12-C21 180 2 12 24 203 24 16 - - - - * 500 506[44] S12-C22 180 2 12 24 203 24 16 - - - - * 500 468[44] S12-C23 180 2 12 24 203 24 16 - - - - * 500 523[44] S12-B31 180 2 12 36 179 36 19.2 - - - - * 500 481[44] S12-B32 180 2 12 36 179 36 19.2 - - - - * 500 488[44] S12-B33 180 2 12 36 179 36 19.2 - - - - * 500 557[44] S12-C31 180 2 12 36 179 36 21.7 - - - - * 500 558
Author Test l0 nb Ø cx cs cy fcm Øst nst st nl fR fy σs,max
[mm] - [mm] [mm] [mm] [mm] [MPa] [mm] - [mm] - - [MPa] [MPa]
F
R
varied
F F
F
Fvaried
F F
Beam test
RF
Pull-out
p
p
p
p
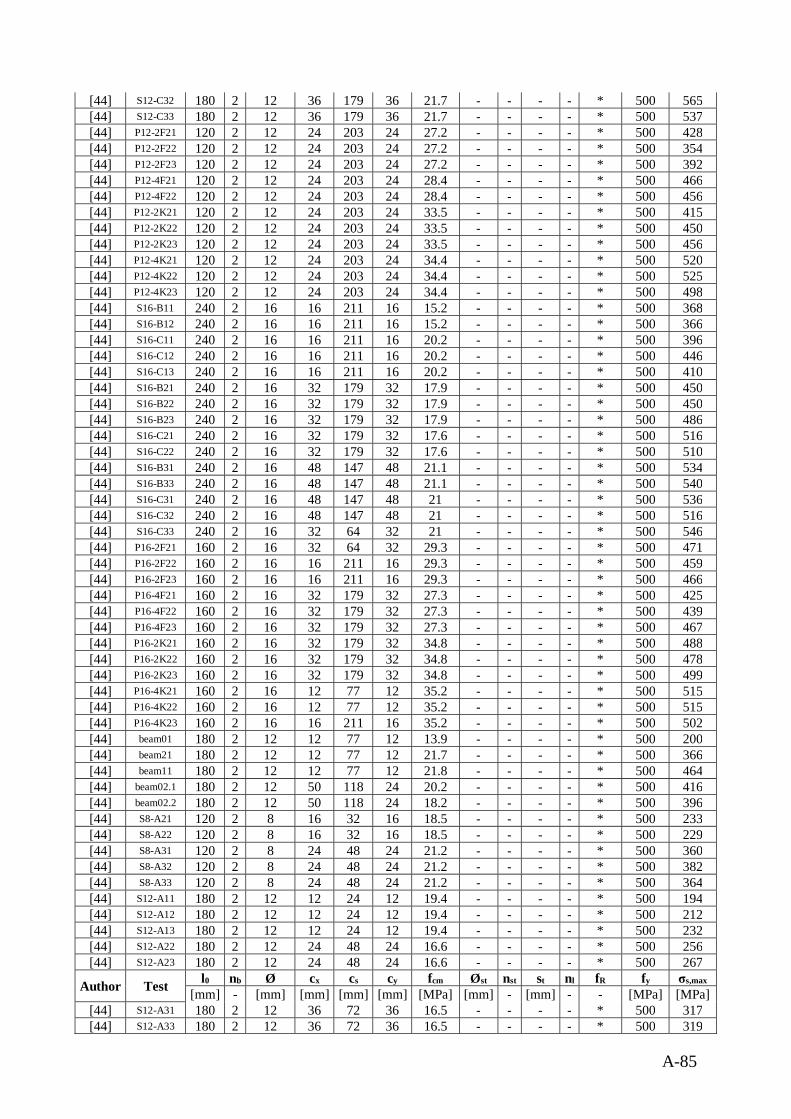
A-85
[44] S12-C32 180 2 12 36 179 36 21.7 - - - - * 500 565[44] S12-C33 180 2 12 36 179 36 21.7 - - - - * 500 537[44] P12-2F21 120 2 12 24 203 24 27.2 - - - - * 500 428[44] P12-2F22 120 2 12 24 203 24 27.2 - - - - * 500 354[44] P12-2F23 120 2 12 24 203 24 27.2 - - - - * 500 392[44] P12-4F21 120 2 12 24 203 24 28.4 - - - - * 500 466[44] P12-4F22 120 2 12 24 203 24 28.4 - - - - * 500 456[44] P12-2K21 120 2 12 24 203 24 33.5 - - - - * 500 415[44] P12-2K22 120 2 12 24 203 24 33.5 - - - - * 500 450[44] P12-2K23 120 2 12 24 203 24 33.5 - - - - * 500 456[44] P12-4K21 120 2 12 24 203 24 34.4 - - - - * 500 520[44] P12-4K22 120 2 12 24 203 24 34.4 - - - - * 500 525[44] P12-4K23 120 2 12 24 203 24 34.4 - - - - * 500 498[44] S16-B11 240 2 16 16 211 16 15.2 - - - - * 500 368[44] S16-B12 240 2 16 16 211 16 15.2 - - - - * 500 366[44] S16-C11 240 2 16 16 211 16 20.2 - - - - * 500 396[44] S16-C12 240 2 16 16 211 16 20.2 - - - - * 500 446[44] S16-C13 240 2 16 16 211 16 20.2 - - - - * 500 410[44] S16-B21 240 2 16 32 179 32 17.9 - - - - * 500 450[44] S16-B22 240 2 16 32 179 32 17.9 - - - - * 500 450[44] S16-B23 240 2 16 32 179 32 17.9 - - - - * 500 486[44] S16-C21 240 2 16 32 179 32 17.6 - - - - * 500 516[44] S16-C22 240 2 16 32 179 32 17.6 - - - - * 500 510[44] S16-B31 240 2 16 48 147 48 21.1 - - - - * 500 534[44] S16-B33 240 2 16 48 147 48 21.1 - - - - * 500 540[44] S16-C31 240 2 16 48 147 48 21 - - - - * 500 536[44] S16-C32 240 2 16 48 147 48 21 - - - - * 500 516[44] S16-C33 240 2 16 32 64 32 21 - - - - * 500 546[44] P16-2F21 160 2 16 32 64 32 29.3 - - - - * 500 471[44] P16-2F22 160 2 16 16 211 16 29.3 - - - - * 500 459[44] P16-2F23 160 2 16 16 211 16 29.3 - - - - * 500 466[44] P16-4F21 160 2 16 32 179 32 27.3 - - - - * 500 425[44] P16-4F22 160 2 16 32 179 32 27.3 - - - - * 500 439[44] P16-4F23 160 2 16 32 179 32 27.3 - - - - * 500 467[44] P16-2K21 160 2 16 32 179 32 34.8 - - - - * 500 488[44] P16-2K22 160 2 16 32 179 32 34.8 - - - - * 500 478[44] P16-2K23 160 2 16 32 179 32 34.8 - - - - * 500 499[44] P16-4K21 160 2 16 12 77 12 35.2 - - - - * 500 515[44] P16-4K22 160 2 16 12 77 12 35.2 - - - - * 500 515[44] P16-4K23 160 2 16 16 211 16 35.2 - - - - * 500 502[44] beam01 180 2 12 12 77 12 13.9 - - - - * 500 200[44] beam21 180 2 12 12 77 12 21.7 - - - - * 500 366[44] beam11 180 2 12 12 77 12 21.8 - - - - * 500 464[44] beam02.1 180 2 12 50 118 24 20.2 - - - - * 500 416[44] beam02.2 180 2 12 50 118 24 18.2 - - - - * 500 396[44] S8-A21 120 2 8 16 32 16 18.5 - - - - * 500 233[44] S8-A22 120 2 8 16 32 16 18.5 - - - - * 500 229[44] S8-A31 120 2 8 24 48 24 21.2 - - - - * 500 360[44] S8-A32 120 2 8 24 48 24 21.2 - - - - * 500 382[44] S8-A33 120 2 8 24 48 24 21.2 - - - - * 500 364[44] S12-A11 180 2 12 12 24 12 19.4 - - - - * 500 194[44] S12-A12 180 2 12 12 24 12 19.4 - - - - * 500 212[44] S12-A13 180 2 12 12 24 12 19.4 - - - - * 500 232[44] S12-A22 180 2 12 24 48 24 16.6 - - - - * 500 256[44] S12-A23 180 2 12 24 48 24 16.6 - - - - * 500 267
Author Test l0 nb Ø cx cs cy fcm Øst nst st nl fR fy σs,max
[mm] - [mm] [mm] [mm] [mm] [MPa] [mm] - [mm] - - [MPa] [MPa][44] S12-A31 180 2 12 36 72 36 16.5 - - - - * 500 317[44] S12-A33 180 2 12 36 72 36 16.5 - - - - * 500 319
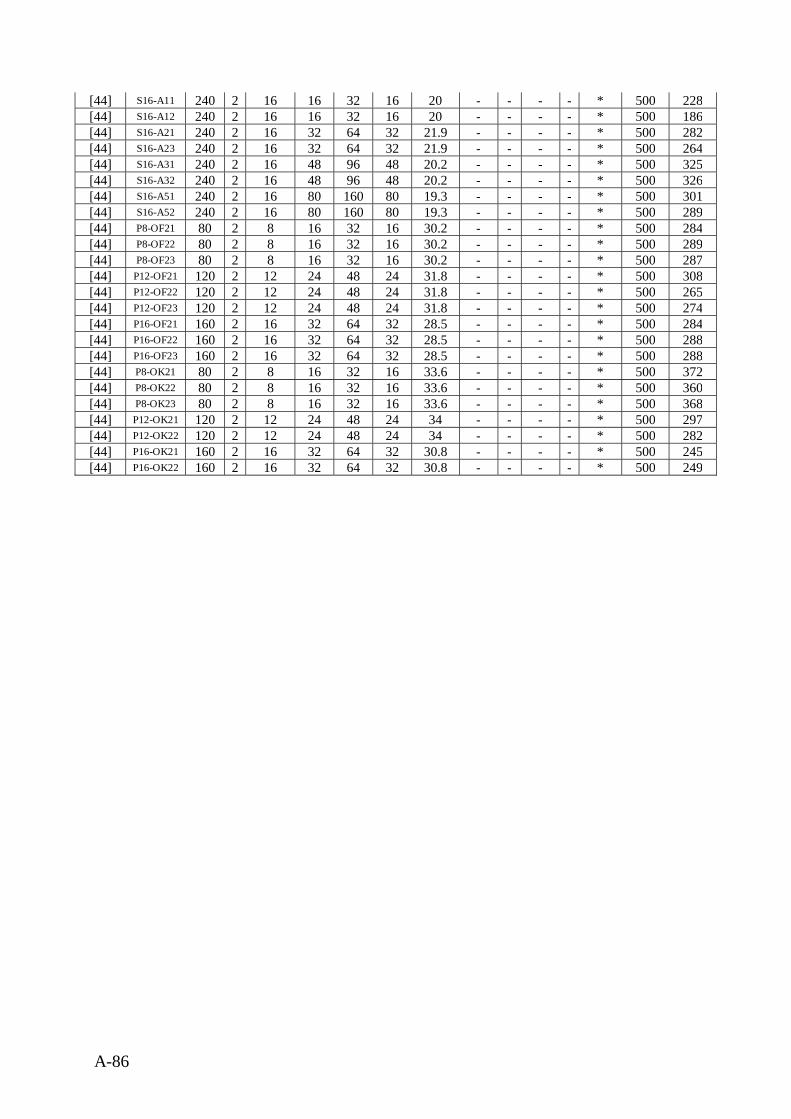
A-86
[44] S16-A11 240 2 16 16 32 16 20 - - - - * 500 228[44] S16-A12 240 2 16 16 32 16 20 - - - - * 500 186[44] S16-A21 240 2 16 32 64 32 21.9 - - - - * 500 282[44] S16-A23 240 2 16 32 64 32 21.9 - - - - * 500 264[44] S16-A31 240 2 16 48 96 48 20.2 - - - - * 500 325[44] S16-A32 240 2 16 48 96 48 20.2 - - - - * 500 326[44] S16-A51 240 2 16 80 160 80 19.3 - - - - * 500 301[44] S16-A52 240 2 16 80 160 80 19.3 - - - - * 500 289[44] P8-OF21 80 2 8 16 32 16 30.2 - - - - * 500 284[44] P8-OF22 80 2 8 16 32 16 30.2 - - - - * 500 289[44] P8-OF23 80 2 8 16 32 16 30.2 - - - - * 500 287[44] P12-OF21 120 2 12 24 48 24 31.8 - - - - * 500 308[44] P12-OF22 120 2 12 24 48 24 31.8 - - - - * 500 265[44] P12-OF23 120 2 12 24 48 24 31.8 - - - - * 500 274[44] P16-OF21 160 2 16 32 64 32 28.5 - - - - * 500 284[44] P16-OF22 160 2 16 32 64 32 28.5 - - - - * 500 288[44] P16-OF23 160 2 16 32 64 32 28.5 - - - - * 500 288[44] P8-OK21 80 2 8 16 32 16 33.6 - - - - * 500 372[44] P8-OK22 80 2 8 16 32 16 33.6 - - - - * 500 360[44] P8-OK23 80 2 8 16 32 16 33.6 - - - - * 500 368[44] P12-OK21 120 2 12 24 48 24 34 - - - - * 500 297[44] P12-OK22 120 2 12 24 48 24 34 - - - - * 500 282[44] P16-OK21 160 2 16 32 64 32 30.8 - - - - * 500 245[44] P16-OK22 160 2 16 32 64 32 30.8 - - - - * 500 249
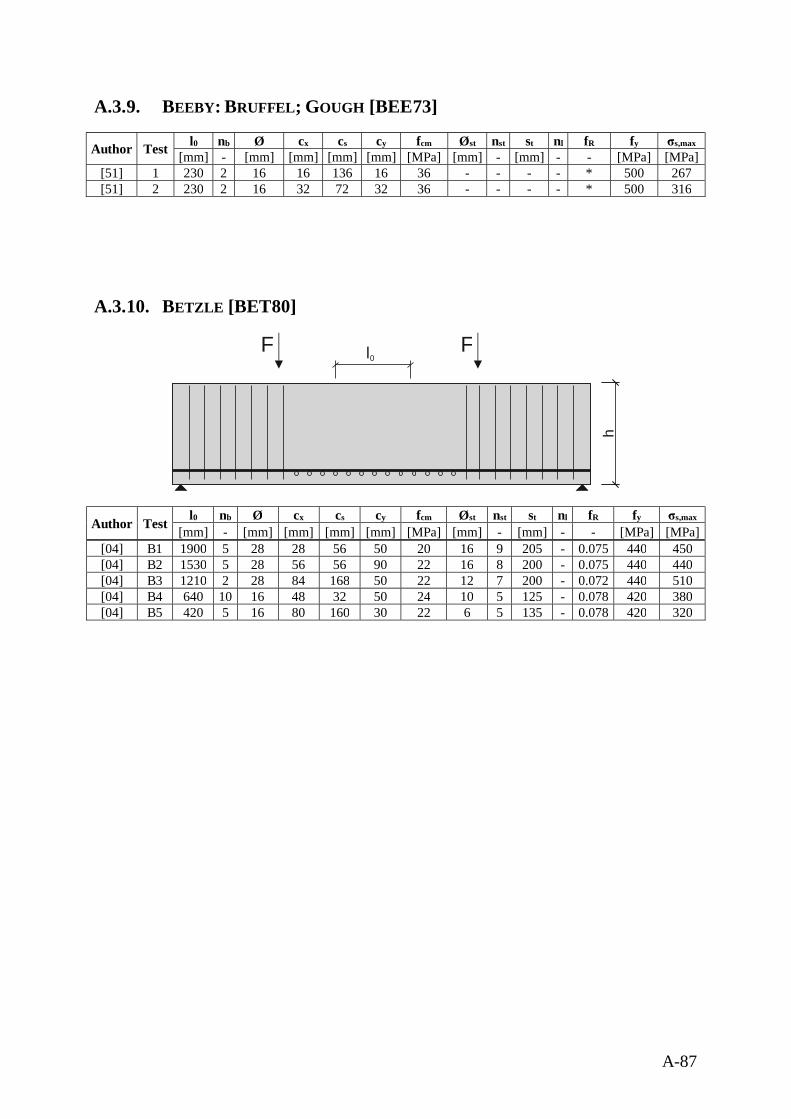
A-87
A.3.9. BEEBY: BRUFFEL; GOUGH [BEE73]
Author Test l0 nb Ø cx cs cy fcm Øst nst st nl fR fy σs,max
[mm] - [mm] [mm] [mm] [mm] [MPa] [mm] - [mm] - - [MPa] [MPa][51] 1 230 2 16 16 136 16 36 - - - - * 500 267[51] 2 230 2 16 32 72 32 36 - - - - * 500 316
A.3.10. BETZLE [BET80]
Author Test l0 nb Ø cx cs cy fcm Øst nst st nl fR fy σs,max
[mm] - [mm] [mm] [mm] [mm] [MPa] [mm] - [mm] - - [MPa] [MPa][04] B1 1900 5 28 28 56 50 20 16 9 205 - 0.075 440 450[04] B2 1530 5 28 56 56 90 22 16 8 200 - 0.075 440 440[04] B3 1210 2 28 84 168 50 22 12 7 200 - 0.072 440 510[04] B4 640 10 16 48 32 50 24 10 5 125 - 0.078 420 380[04] B5 420 5 16 80 160 30 22 6 5 135 - 0.078 420 320
l0
h
F F
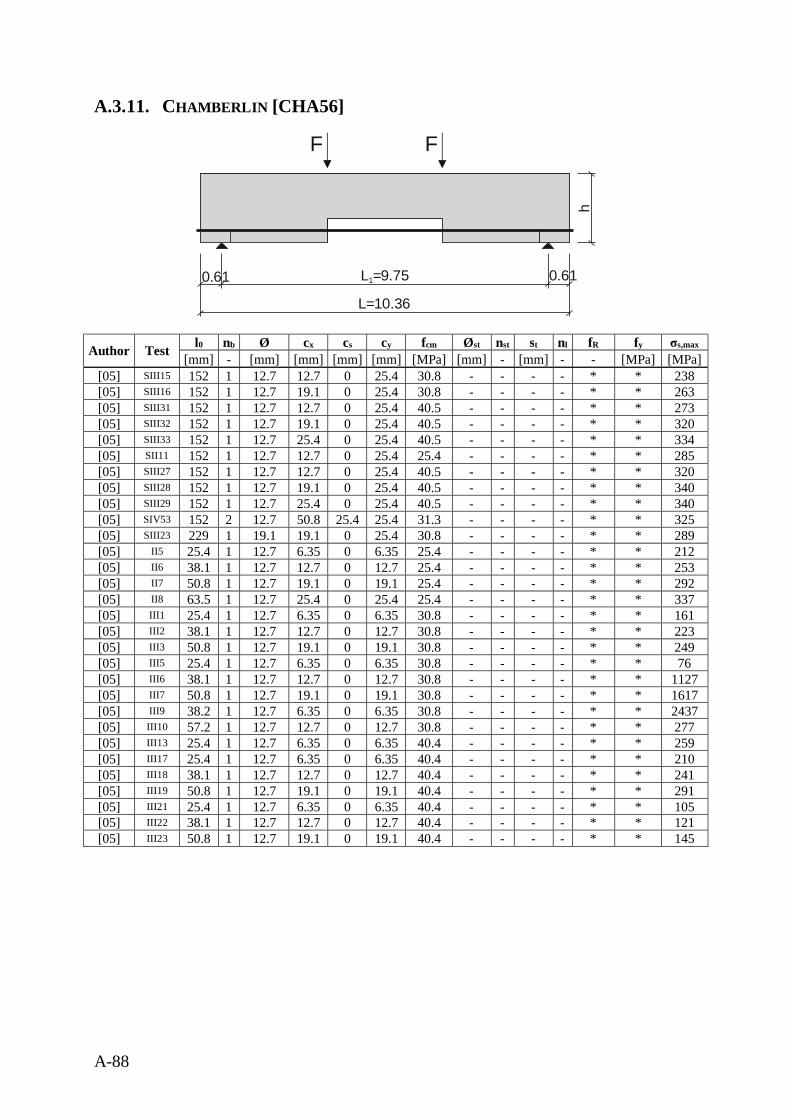
A-88
A.3.11. CHAMBERLIN [CHA56]
Author Test l0 nb Ø cx cs cy fcm Øst nst st nl fR fy σs,max
[mm] - [mm] [mm] [mm] [mm] [MPa] [mm] - [mm] - - [MPa] [MPa][05] SIII15 152 1 12.7 12.7 0 25.4 30.8 - - - - * * 238[05] SIII16 152 1 12.7 19.1 0 25.4 30.8 - - - - * * 263[05] SIII31 152 1 12.7 12.7 0 25.4 40.5 - - - - * * 273[05] SIII32 152 1 12.7 19.1 0 25.4 40.5 - - - - * * 320[05] SIII33 152 1 12.7 25.4 0 25.4 40.5 - - - - * * 334[05] SII11 152 1 12.7 12.7 0 25.4 25.4 - - - - * * 285[05] SIII27 152 1 12.7 12.7 0 25.4 40.5 - - - - * * 320[05] SIII28 152 1 12.7 19.1 0 25.4 40.5 - - - - * * 340[05] SIII29 152 1 12.7 25.4 0 25.4 40.5 - - - - * * 340[05] SIV53 152 2 12.7 50.8 25.4 25.4 31.3 - - - - * * 325[05] SIII23 229 1 19.1 19.1 0 25.4 30.8 - - - - * * 289[05] II5 25.4 1 12.7 6.35 0 6.35 25.4 - - - - * * 212[05] II6 38.1 1 12.7 12.7 0 12.7 25.4 - - - - * * 253[05] II7 50.8 1 12.7 19.1 0 19.1 25.4 - - - - * * 292[05] II8 63.5 1 12.7 25.4 0 25.4 25.4 - - - - * * 337[05] III1 25.4 1 12.7 6.35 0 6.35 30.8 - - - - * * 161[05] III2 38.1 1 12.7 12.7 0 12.7 30.8 - - - - * * 223[05] III3 50.8 1 12.7 19.1 0 19.1 30.8 - - - - * * 249[05] III5 25.4 1 12.7 6.35 0 6.35 30.8 - - - - * * 76[05] III6 38.1 1 12.7 12.7 0 12.7 30.8 - - - - * * 1127[05] III7 50.8 1 12.7 19.1 0 19.1 30.8 - - - - * * 1617[05] III9 38.2 1 12.7 6.35 0 6.35 30.8 - - - - * * 2437[05] III10 57.2 1 12.7 12.7 0 12.7 30.8 - - - - * * 277[05] III13 25.4 1 12.7 6.35 0 6.35 40.4 - - - - * * 259[05] III17 25.4 1 12.7 6.35 0 6.35 40.4 - - - - * * 210[05] III18 38.1 1 12.7 12.7 0 12.7 40.4 - - - - * * 241[05] III19 50.8 1 12.7 19.1 0 19.1 40.4 - - - - * * 291[05] III21 25.4 1 12.7 6.35 0 6.35 40.4 - - - - * * 105[05] III22 38.1 1 12.7 12.7 0 12.7 40.4 - - - - * * 121[05] III23 50.8 1 12.7 19.1 0 19.1 40.4 - - - - * * 145
F
0.61 L =9.751 0.61
L=10.36
F
h
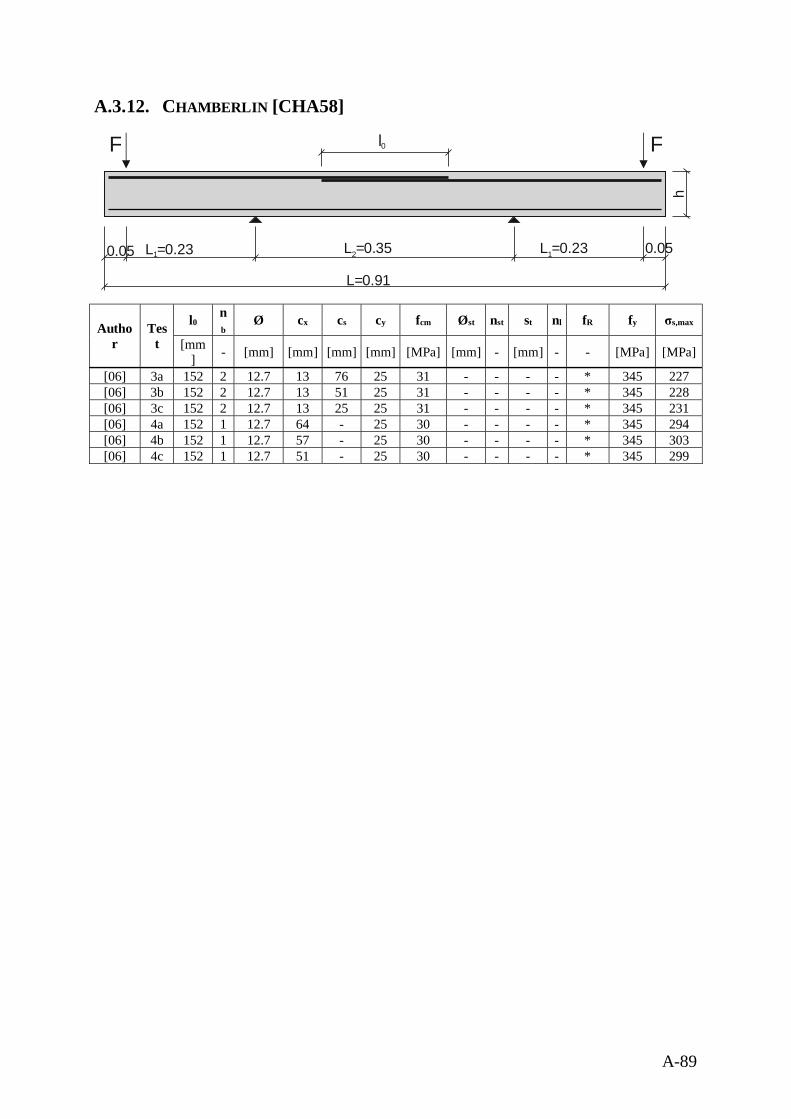
A-89
A.3.12. CHAMBERLIN [CHA58]
Author
Test
l0nb
Ø cx cs cy fcm Øst nst st nl fR fy σs,max
[mm] - [mm] [mm] [mm] [mm] [MPa] [mm] - [mm] - - [MPa] [MPa]
[06] 3a 152 2 12.7 13 76 25 31 - - - - * 345 227[06] 3b 152 2 12.7 13 51 25 31 - - - - * 345 228[06] 3c 152 2 12.7 13 25 25 31 - - - - * 345 231[06] 4a 152 1 12.7 64 - 25 30 - - - - * 345 294[06] 4b 152 1 12.7 57 - 25 30 - - - - * 345 303[06] 4c 152 1 12.7 51 - 25 30 - - - - * 345 299
F F
h
0.05 L =0.231 L =0.352 L =0.231 0.05
L=0.91
l0
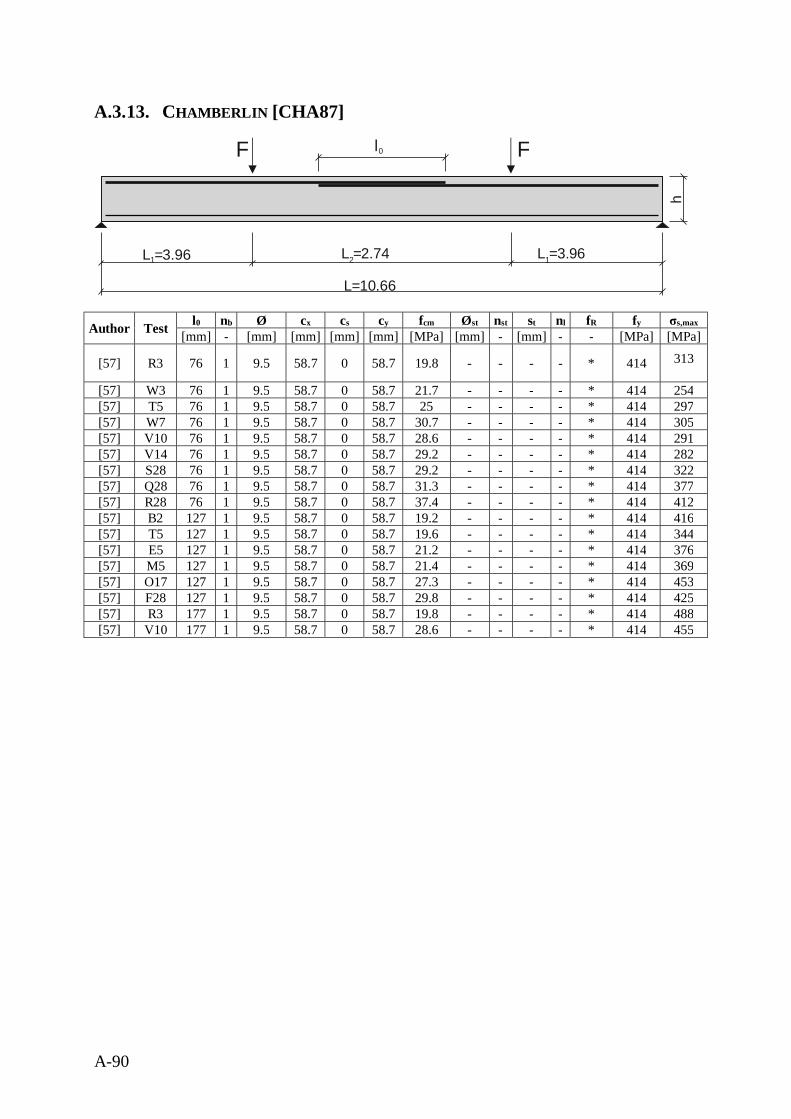
A-90
A.3.13. CHAMBERLIN [CHA87]
Author Test l0 nb Ø cx cs cy fcm Øst nst st nl fR fy σs,max
[mm] - [mm] [mm] [mm] [mm] [MPa] [mm] - [mm] - - [MPa] [MPa]
[57] R3 76 1 9.5 58.7 0 58.7 19.8 - - - - * 414 313
[57] W3 76 1 9.5 58.7 0 58.7 21.7 - - - - * 414 254[57] T5 76 1 9.5 58.7 0 58.7 25 - - - - * 414 297[57] W7 76 1 9.5 58.7 0 58.7 30.7 - - - - * 414 305[57] V10 76 1 9.5 58.7 0 58.7 28.6 - - - - * 414 291[57] V14 76 1 9.5 58.7 0 58.7 29.2 - - - - * 414 282[57] S28 76 1 9.5 58.7 0 58.7 29.2 - - - - * 414 322[57] Q28 76 1 9.5 58.7 0 58.7 31.3 - - - - * 414 377[57] R28 76 1 9.5 58.7 0 58.7 37.4 - - - - * 414 412[57] B2 127 1 9.5 58.7 0 58.7 19.2 - - - - * 414 416[57] T5 127 1 9.5 58.7 0 58.7 19.6 - - - - * 414 344[57] E5 127 1 9.5 58.7 0 58.7 21.2 - - - - * 414 376[57] M5 127 1 9.5 58.7 0 58.7 21.4 - - - - * 414 369[57] O17 127 1 9.5 58.7 0 58.7 27.3 - - - - * 414 453[57] F28 127 1 9.5 58.7 0 58.7 29.8 - - - - * 414 425[57] R3 177 1 9.5 58.7 0 58.7 19.8 - - - - * 414 488[57] V10 177 1 9.5 58.7 0 58.7 28.6 - - - - * 414 455
F F
h
L =3.961 L =2.742 L =3.961
L=10.66
l0
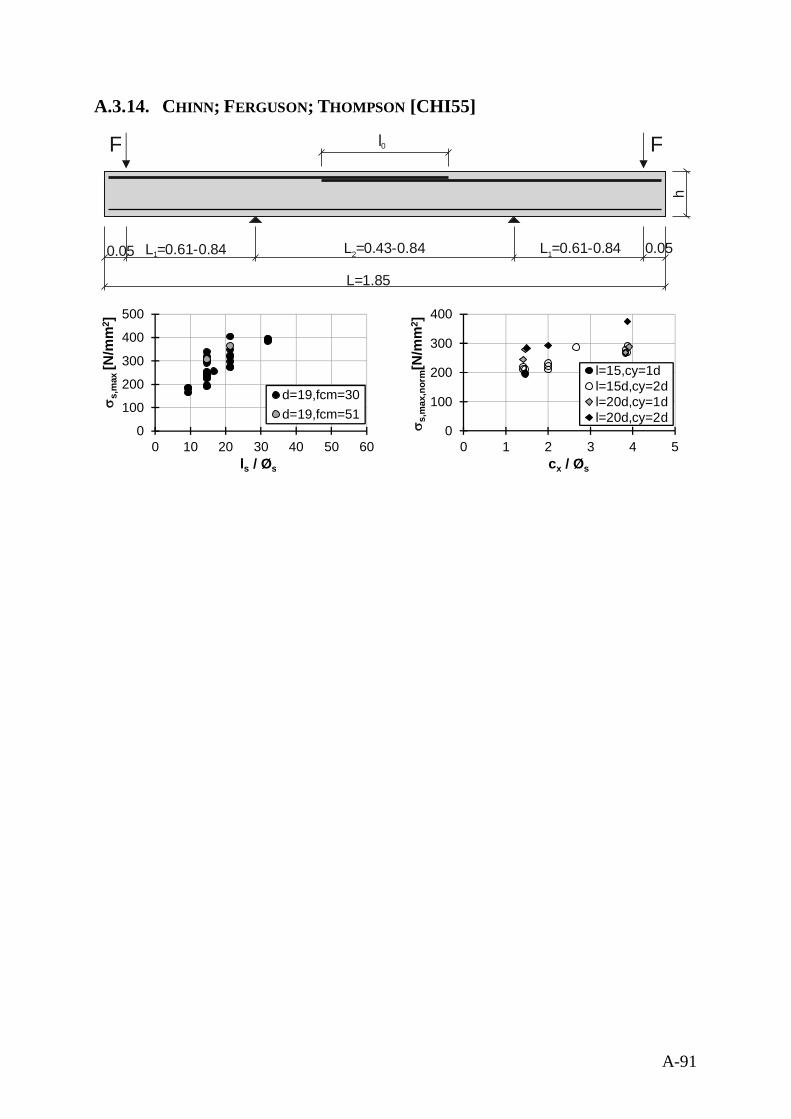
A-91
A.3.14. CHINN; FERGUSON; THOMPSON [CHI55]
F F
h
0.05 L =0.61-0.841 L =0.43-0.842 L =0.61-0.841 0.05
L=1.85
l0
0
100
200
300
400
500
0 10 20 30 40 50 60
ss,
max
[N/m
m2 ]
ls / Øs
d=19,fcm=30d=19,fcm=51
0
100
200
300
400
0 1 2 3 4 5
s s,m
ax,n
orm
[N/m
m2 ]
cx / Øs
l=15,cy=1dl=15d,cy=2dl=20d,cy=1dl=20d,cy=2d
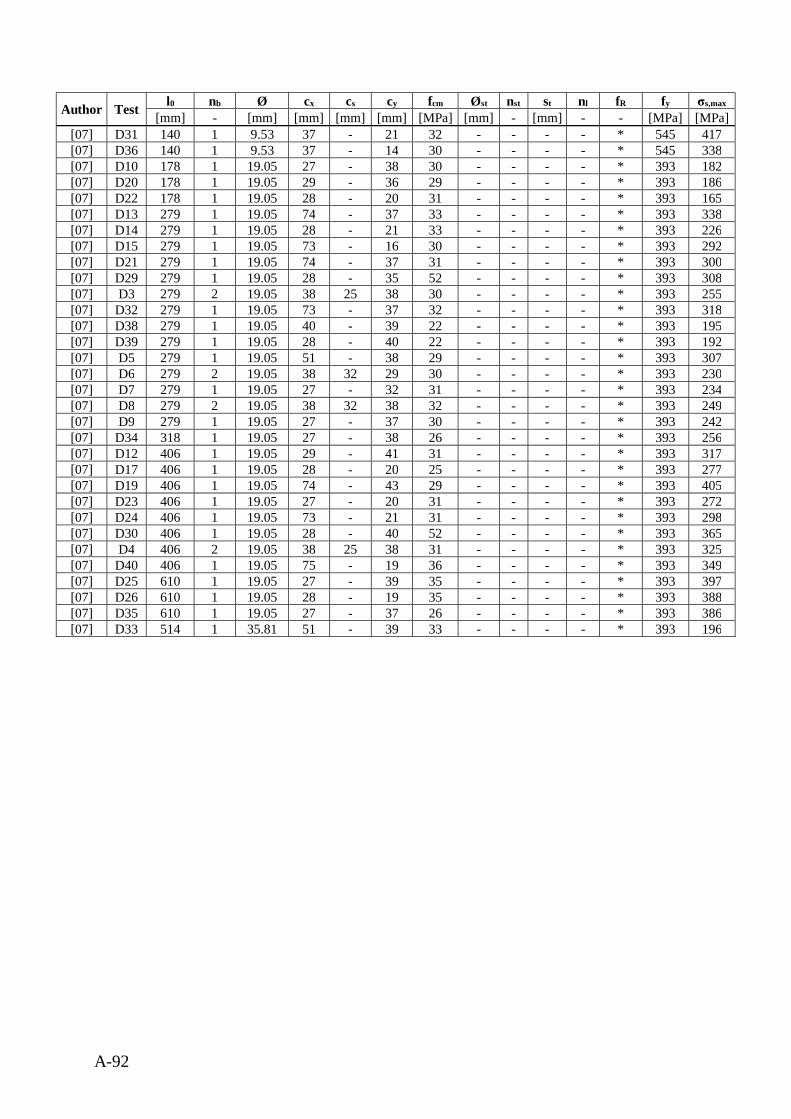
A-92
Author Test l0 nb Ø cx cs cy fcm Øst nst st nl fR fy σs,max
[mm] - [mm] [mm] [mm] [mm] [MPa] [mm] - [mm] - - [MPa] [MPa][07] D31 140 1 9.53 37 - 21 32 - - - - * 545 417[07] D36 140 1 9.53 37 - 14 30 - - - - * 545 338[07] D10 178 1 19.05 27 - 38 30 - - - - * 393 182[07] D20 178 1 19.05 29 - 36 29 - - - - * 393 186[07] D22 178 1 19.05 28 - 20 31 - - - - * 393 165[07] D13 279 1 19.05 74 - 37 33 - - - - * 393 338[07] D14 279 1 19.05 28 - 21 33 - - - - * 393 226[07] D15 279 1 19.05 73 - 16 30 - - - - * 393 292[07] D21 279 1 19.05 74 - 37 31 - - - - * 393 300[07] D29 279 1 19.05 28 - 35 52 - - - - * 393 308[07] D3 279 2 19.05 38 25 38 30 - - - - * 393 255[07] D32 279 1 19.05 73 - 37 32 - - - - * 393 318[07] D38 279 1 19.05 40 - 39 22 - - - - * 393 195[07] D39 279 1 19.05 28 - 40 22 - - - - * 393 192[07] D5 279 1 19.05 51 - 38 29 - - - - * 393 307[07] D6 279 2 19.05 38 32 29 30 - - - - * 393 230[07] D7 279 1 19.05 27 - 32 31 - - - - * 393 234[07] D8 279 2 19.05 38 32 38 32 - - - - * 393 249[07] D9 279 1 19.05 27 - 37 30 - - - - * 393 242[07] D34 318 1 19.05 27 - 38 26 - - - - * 393 256[07] D12 406 1 19.05 29 - 41 31 - - - - * 393 317[07] D17 406 1 19.05 28 - 20 25 - - - - * 393 277[07] D19 406 1 19.05 74 - 43 29 - - - - * 393 405[07] D23 406 1 19.05 27 - 20 31 - - - - * 393 272[07] D24 406 1 19.05 73 - 21 31 - - - - * 393 298[07] D30 406 1 19.05 28 - 40 52 - - - - * 393 365[07] D4 406 2 19.05 38 25 38 31 - - - - * 393 325[07] D40 406 1 19.05 75 - 19 36 - - - - * 393 349[07] D25 610 1 19.05 27 - 39 35 - - - - * 393 397[07] D26 610 1 19.05 28 - 19 35 - - - - * 393 388[07] D35 610 1 19.05 27 - 37 26 - - - - * 393 386[07] D33 514 1 35.81 51 - 39 33 - - - - * 393 196
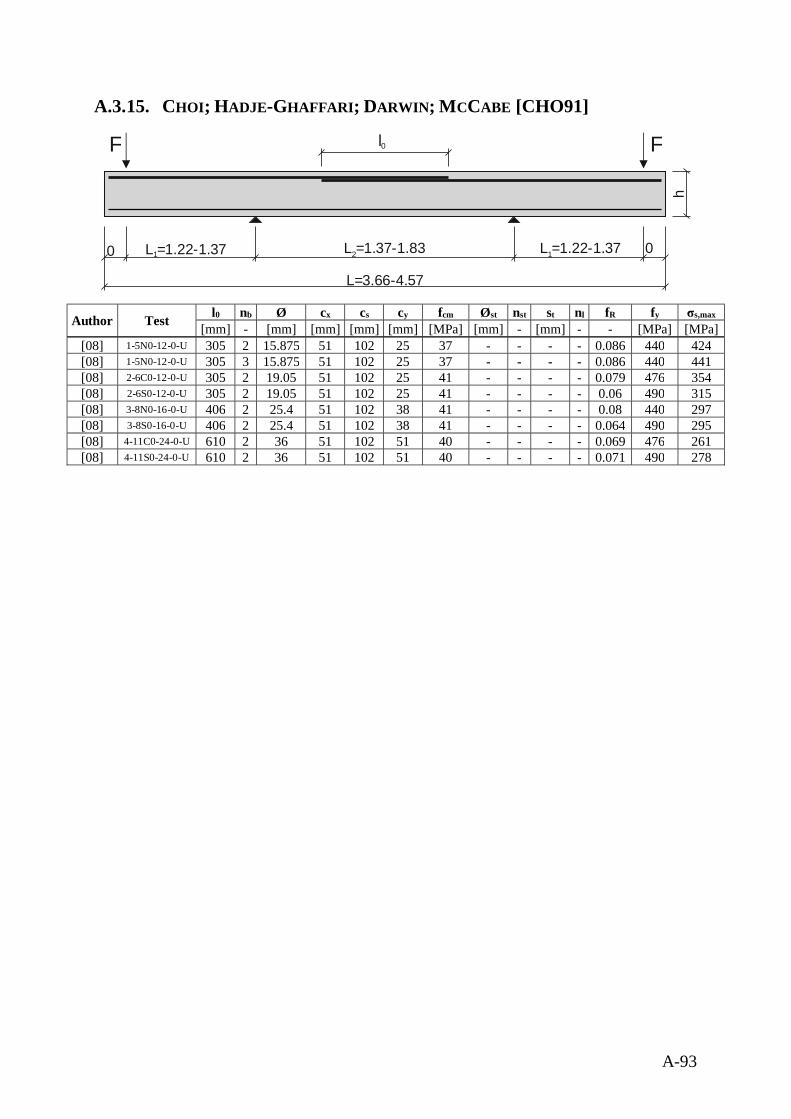
A-93
A.3.15. CHOI; HADJE-GHAFFARI; DARWIN; MCCABE [CHO91]
Author Test l0 nb Ø cx cs cy fcm Øst nst st nl fR fy σs,max
[mm] - [mm] [mm] [mm] [mm] [MPa] [mm] - [mm] - - [MPa] [MPa][08] 1-5N0-12-0-U 305 2 15.875 51 102 25 37 - - - - 0.086 440 424[08] 1-5N0-12-0-U 305 3 15.875 51 102 25 37 - - - - 0.086 440 441[08] 2-6C0-12-0-U 305 2 19.05 51 102 25 41 - - - - 0.079 476 354[08] 2-6S0-12-0-U 305 2 19.05 51 102 25 41 - - - - 0.06 490 315[08] 3-8N0-16-0-U 406 2 25.4 51 102 38 41 - - - - 0.08 440 297[08] 3-8S0-16-0-U 406 2 25.4 51 102 38 41 - - - - 0.064 490 295[08] 4-11C0-24-0-U 610 2 36 51 102 51 40 - - - - 0.069 476 261[08] 4-11S0-24-0-U 610 2 36 51 102 51 40 - - - - 0.071 490 278
F F
h
0 L =1.22-1.371 L =1.37-1.832 L =1.22-1.371 0
L=3.66-4.57
l0
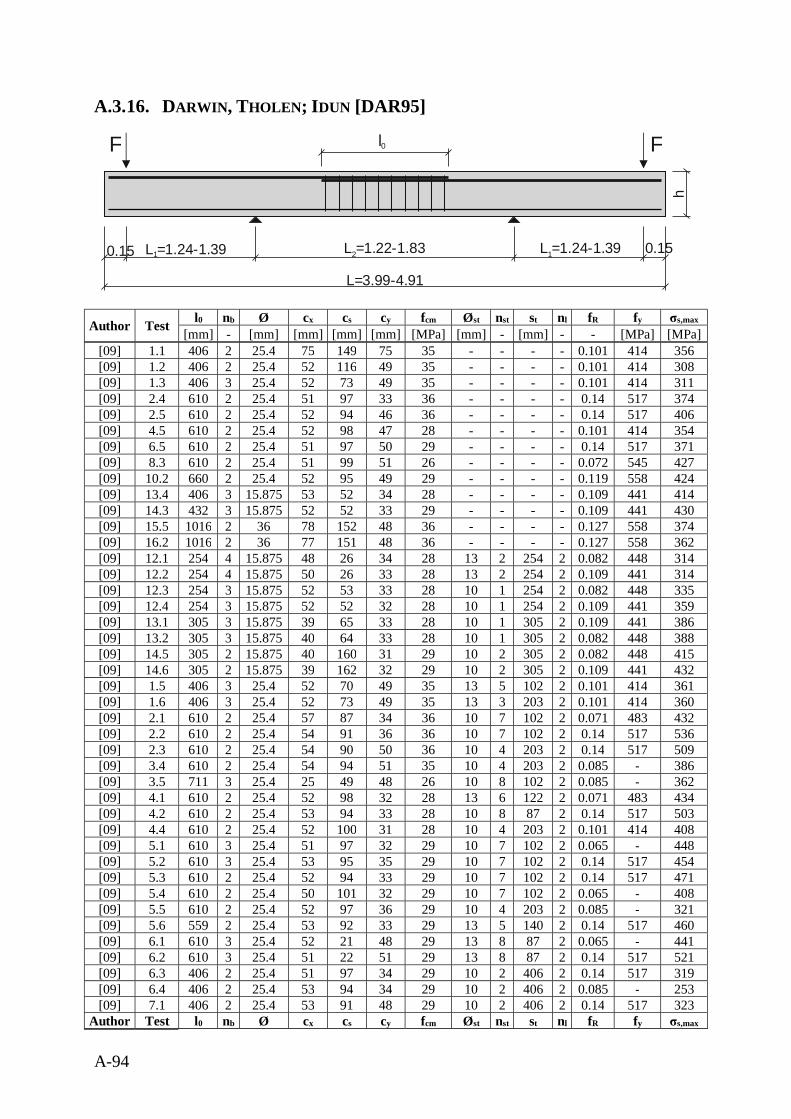
A-94
A.3.16. DARWIN, THOLEN; IDUN [DAR95]
Author Test l0 nb Ø cx cs cy fcm Øst nst st nl fR fy σs,max
[mm] - [mm] [mm] [mm] [mm] [MPa] [mm] - [mm] - - [MPa] [MPa][09] 1.1 406 2 25.4 75 149 75 35 - - - - 0.101 414 356[09] 1.2 406 2 25.4 52 116 49 35 - - - - 0.101 414 308[09] 1.3 406 3 25.4 52 73 49 35 - - - - 0.101 414 311[09] 2.4 610 2 25.4 51 97 33 36 - - - - 0.14 517 374[09] 2.5 610 2 25.4 52 94 46 36 - - - - 0.14 517 406[09] 4.5 610 2 25.4 52 98 47 28 - - - - 0.101 414 354[09] 6.5 610 2 25.4 51 97 50 29 - - - - 0.14 517 371[09] 8.3 610 2 25.4 51 99 51 26 - - - - 0.072 545 427[09] 10.2 660 2 25.4 52 95 49 29 - - - - 0.119 558 424[09] 13.4 406 3 15.875 53 52 34 28 - - - - 0.109 441 414[09] 14.3 432 3 15.875 52 52 33 29 - - - - 0.109 441 430[09] 15.5 1016 2 36 78 152 48 36 - - - - 0.127 558 374[09] 16.2 1016 2 36 77 151 48 36 - - - - 0.127 558 362[09] 12.1 254 4 15.875 48 26 34 28 13 2 254 2 0.082 448 314[09] 12.2 254 4 15.875 50 26 33 28 13 2 254 2 0.109 441 314[09] 12.3 254 3 15.875 52 53 33 28 10 1 254 2 0.082 448 335[09] 12.4 254 3 15.875 52 52 32 28 10 1 254 2 0.109 441 359[09] 13.1 305 3 15.875 39 65 33 28 10 1 305 2 0.109 441 386[09] 13.2 305 3 15.875 40 64 33 28 10 1 305 2 0.082 448 388[09] 14.5 305 2 15.875 40 160 31 29 10 2 305 2 0.082 448 415[09] 14.6 305 2 15.875 39 162 32 29 10 2 305 2 0.109 441 432[09] 1.5 406 3 25.4 52 70 49 35 13 5 102 2 0.101 414 361[09] 1.6 406 3 25.4 52 73 49 35 13 3 203 2 0.101 414 360[09] 2.1 610 2 25.4 57 87 34 36 10 7 102 2 0.071 483 432[09] 2.2 610 2 25.4 54 91 36 36 10 7 102 2 0.14 517 536[09] 2.3 610 2 25.4 54 90 50 36 10 4 203 2 0.14 517 509[09] 3.4 610 2 25.4 54 94 51 35 10 4 203 2 0.085 - 386[09] 3.5 711 3 25.4 25 49 48 26 10 8 102 2 0.085 - 362[09] 4.1 610 2 25.4 52 98 32 28 13 6 122 2 0.071 483 434[09] 4.2 610 2 25.4 53 94 33 28 10 8 87 2 0.14 517 503[09] 4.4 610 2 25.4 52 100 31 28 10 4 203 2 0.101 414 408[09] 5.1 610 3 25.4 51 97 32 29 10 7 102 2 0.065 - 448[09] 5.2 610 3 25.4 53 95 35 29 10 7 102 2 0.14 517 454[09] 5.3 610 2 25.4 52 94 33 29 10 7 102 2 0.14 517 471[09] 5.4 610 2 25.4 50 101 32 29 10 7 102 2 0.065 - 408[09] 5.5 610 2 25.4 52 97 36 29 10 4 203 2 0.085 - 321[09] 5.6 559 2 25.4 53 92 33 29 13 5 140 2 0.14 517 460[09] 6.1 610 3 25.4 52 21 48 29 13 8 87 2 0.065 - 441[09] 6.2 610 3 25.4 51 22 51 29 13 8 87 2 0.14 517 521[09] 6.3 406 2 25.4 51 97 34 29 10 2 406 2 0.14 517 319[09] 6.4 406 2 25.4 53 94 34 29 10 2 406 2 0.085 - 253[09] 7.1 406 2 25.4 53 91 48 29 10 2 406 2 0.14 517 323
Author Test l0 nb Ø cx cs cy fcm Øst nst st nl fR fy σs,max
F F
h
0.15 L =1.24-1.391 L =1.22-1.832 L =1.24-1.391 0.15
L=3.99-4.91
l0
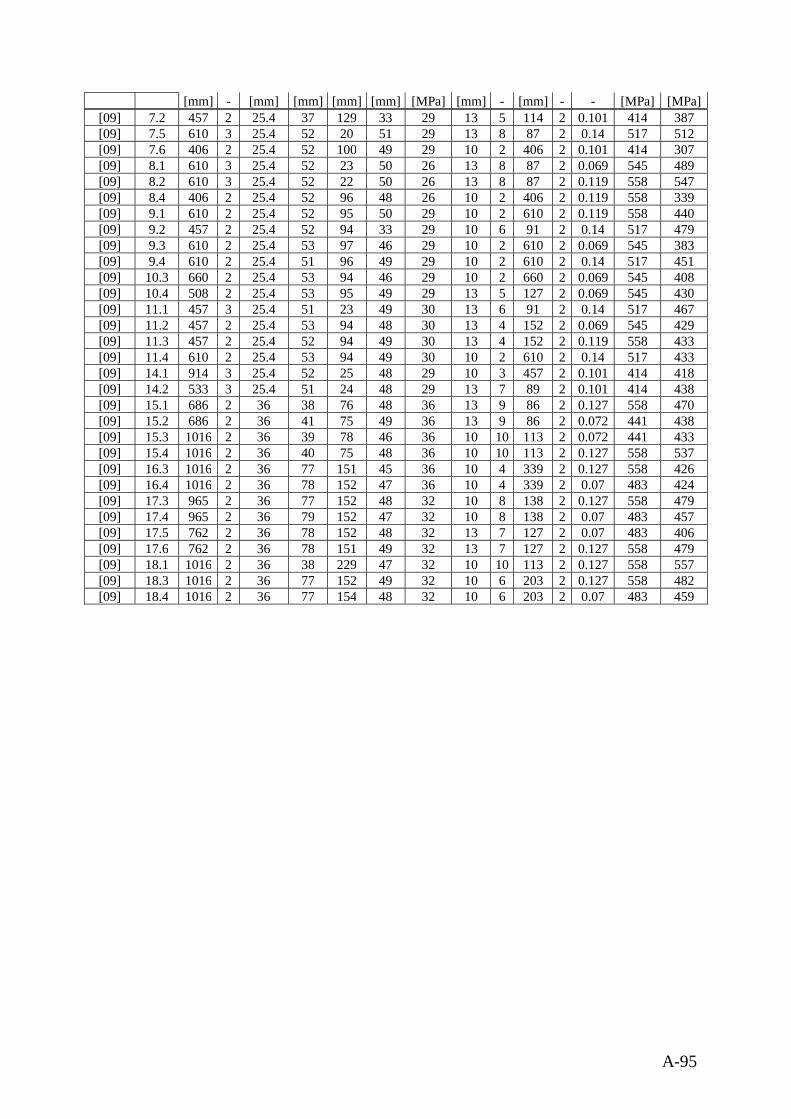
A-95
[mm] - [mm] [mm] [mm] [mm] [MPa] [mm] - [mm] - - [MPa] [MPa][09] 7.2 457 2 25.4 37 129 33 29 13 5 114 2 0.101 414 387[09] 7.5 610 3 25.4 52 20 51 29 13 8 87 2 0.14 517 512[09] 7.6 406 2 25.4 52 100 49 29 10 2 406 2 0.101 414 307[09] 8.1 610 3 25.4 52 23 50 26 13 8 87 2 0.069 545 489[09] 8.2 610 3 25.4 52 22 50 26 13 8 87 2 0.119 558 547[09] 8.4 406 2 25.4 52 96 48 26 10 2 406 2 0.119 558 339[09] 9.1 610 2 25.4 52 95 50 29 10 2 610 2 0.119 558 440[09] 9.2 457 2 25.4 52 94 33 29 10 6 91 2 0.14 517 479[09] 9.3 610 2 25.4 53 97 46 29 10 2 610 2 0.069 545 383[09] 9.4 610 2 25.4 51 96 49 29 10 2 610 2 0.14 517 451[09] 10.3 660 2 25.4 53 94 46 29 10 2 660 2 0.069 545 408[09] 10.4 508 2 25.4 53 95 49 29 13 5 127 2 0.069 545 430[09] 11.1 457 3 25.4 51 23 49 30 13 6 91 2 0.14 517 467[09] 11.2 457 2 25.4 53 94 48 30 13 4 152 2 0.069 545 429[09] 11.3 457 2 25.4 52 94 49 30 13 4 152 2 0.119 558 433[09] 11.4 610 2 25.4 53 94 49 30 10 2 610 2 0.14 517 433[09] 14.1 914 3 25.4 52 25 48 29 10 3 457 2 0.101 414 418[09] 14.2 533 3 25.4 51 24 48 29 13 7 89 2 0.101 414 438[09] 15.1 686 2 36 38 76 48 36 13 9 86 2 0.127 558 470[09] 15.2 686 2 36 41 75 49 36 13 9 86 2 0.072 441 438[09] 15.3 1016 2 36 39 78 46 36 10 10 113 2 0.072 441 433[09] 15.4 1016 2 36 40 75 48 36 10 10 113 2 0.127 558 537[09] 16.3 1016 2 36 77 151 45 36 10 4 339 2 0.127 558 426[09] 16.4 1016 2 36 78 152 47 36 10 4 339 2 0.07 483 424[09] 17.3 965 2 36 77 152 48 32 10 8 138 2 0.127 558 479[09] 17.4 965 2 36 79 152 47 32 10 8 138 2 0.07 483 457[09] 17.5 762 2 36 78 152 48 32 13 7 127 2 0.07 483 406[09] 17.6 762 2 36 78 151 49 32 13 7 127 2 0.127 558 479[09] 18.1 1016 2 36 38 229 47 32 10 10 113 2 0.127 558 557[09] 18.3 1016 2 36 77 152 49 32 10 6 203 2 0.127 558 482[09] 18.4 1016 2 36 77 154 48 32 10 6 203 2 0.07 483 459
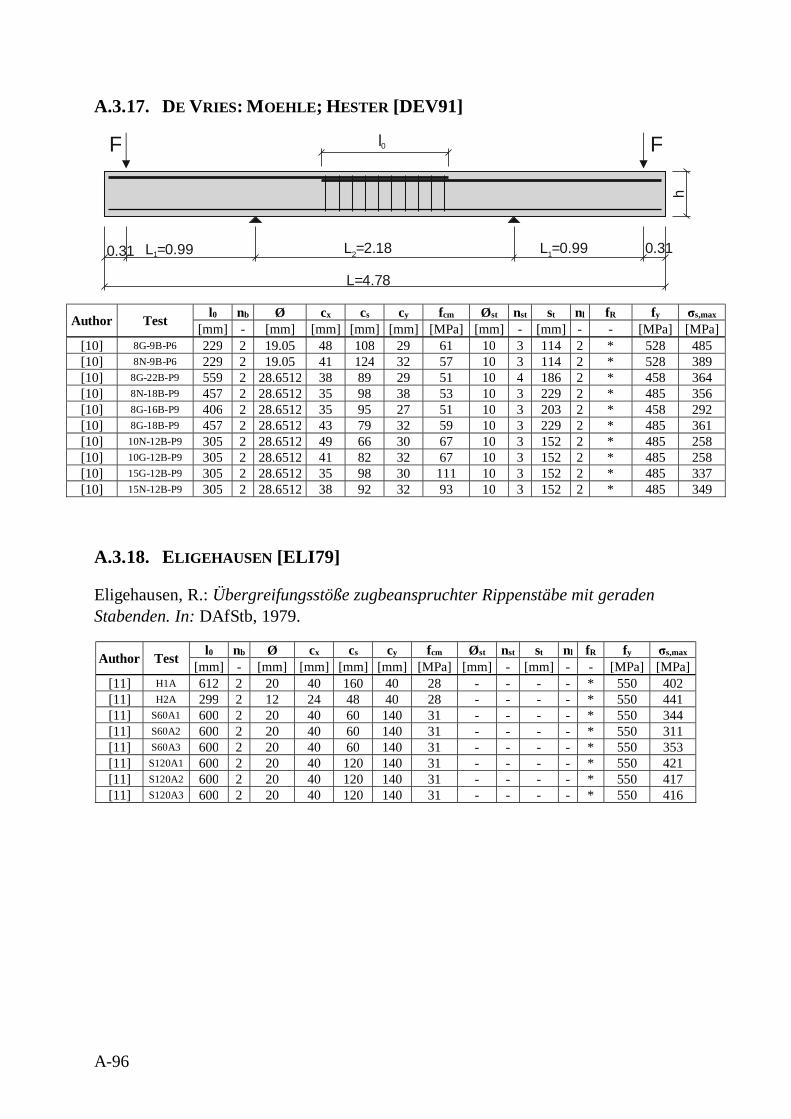
A-96
A.3.17. DE VRIES: MOEHLE; HESTER [DEV91]
Author Test l0 nb Ø cx cs cy fcm Øst nst st nl fR fy σs,max
[mm] - [mm] [mm] [mm] [mm] [MPa] [mm] - [mm] - - [MPa] [MPa][10] 8G-9B-P6 229 2 19.05 48 108 29 61 10 3 114 2 * 528 485[10] 8N-9B-P6 229 2 19.05 41 124 32 57 10 3 114 2 * 528 389[10] 8G-22B-P9 559 2 28.6512 38 89 29 51 10 4 186 2 * 458 364[10] 8N-18B-P9 457 2 28.6512 35 98 38 53 10 3 229 2 * 485 356[10] 8G-16B-P9 406 2 28.6512 35 95 27 51 10 3 203 2 * 458 292[10] 8G-18B-P9 457 2 28.6512 43 79 32 59 10 3 229 2 * 485 361[10] 10N-12B-P9 305 2 28.6512 49 66 30 67 10 3 152 2 * 485 258[10] 10G-12B-P9 305 2 28.6512 41 82 32 67 10 3 152 2 * 485 258[10] 15G-12B-P9 305 2 28.6512 35 98 30 111 10 3 152 2 * 485 337[10] 15N-12B-P9 305 2 28.6512 38 92 32 93 10 3 152 2 * 485 349
A.3.18. ELIGEHAUSEN [ELI79]
Eligehausen, R.: Übergreifungsstöße zugbeanspruchter Rippenstäbe mit geradenStabenden. In: DAfStb, 1979.
Author Test l0 nb Ø cx cs cy fcm Øst nst st nl fR fy σs,max
[mm] - [mm] [mm] [mm] [mm] [MPa] [mm] - [mm] - - [MPa] [MPa][11] H1A 612 2 20 40 160 40 28 - - - - * 550 402[11] H2A 299 2 12 24 48 40 28 - - - - * 550 441[11] S60A1 600 2 20 40 60 140 31 - - - - * 550 344[11] S60A2 600 2 20 40 60 140 31 - - - - * 550 311[11] S60A3 600 2 20 40 60 140 31 - - - - * 550 353[11] S120A1 600 2 20 40 120 140 31 - - - - * 550 421[11] S120A2 600 2 20 40 120 140 31 - - - - * 550 417[11] S120A3 600 2 20 40 120 140 31 - - - - * 550 416
F F
h
0.31 L =0.991 L =2.182 L =0.991 0.31
L=4.78
l0
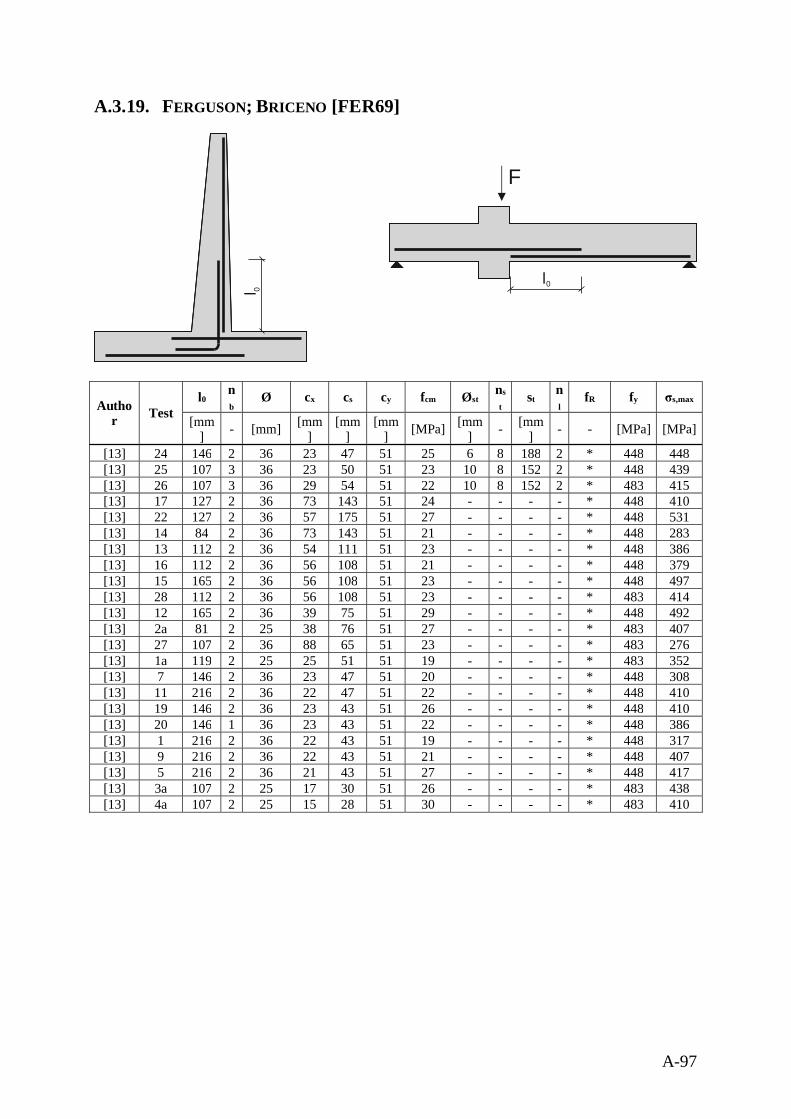
A-97
A.3.19. FERGUSON; BRICENO [FER69]
Author Test
l0nb
Ø cx cs cy fcm Østns
tst
nl
fR fy σs,max
[mm] - [mm] [mm
][mm
][mm
] [MPa] [mm] - [mm
] - - [MPa] [MPa]
[13] 24 146 2 36 23 47 51 25 6 8 188 2 * 448 448[13] 25 107 3 36 23 50 51 23 10 8 152 2 * 448 439[13] 26 107 3 36 29 54 51 22 10 8 152 2 * 483 415[13] 17 127 2 36 73 143 51 24 - - - - * 448 410[13] 22 127 2 36 57 175 51 27 - - - - * 448 531[13] 14 84 2 36 73 143 51 21 - - - - * 448 283[13] 13 112 2 36 54 111 51 23 - - - - * 448 386[13] 16 112 2 36 56 108 51 21 - - - - * 448 379[13] 15 165 2 36 56 108 51 23 - - - - * 448 497[13] 28 112 2 36 56 108 51 23 - - - - * 483 414[13] 12 165 2 36 39 75 51 29 - - - - * 448 492[13] 2a 81 2 25 38 76 51 27 - - - - * 483 407[13] 27 107 2 36 88 65 51 23 - - - - * 483 276[13] 1a 119 2 25 25 51 51 19 - - - - * 483 352[13] 7 146 2 36 23 47 51 20 - - - - * 448 308[13] 11 216 2 36 22 47 51 22 - - - - * 448 410[13] 19 146 2 36 23 43 51 26 - - - - * 448 410[13] 20 146 1 36 23 43 51 22 - - - - * 448 386[13] 1 216 2 36 22 43 51 19 - - - - * 448 317[13] 9 216 2 36 22 43 51 21 - - - - * 448 407[13] 5 216 2 36 21 43 51 27 - - - - * 448 417[13] 3a 107 2 25 17 30 51 26 - - - - * 483 438[13] 4a 107 2 25 15 28 51 30 - - - - * 483 410
F
l0l 0
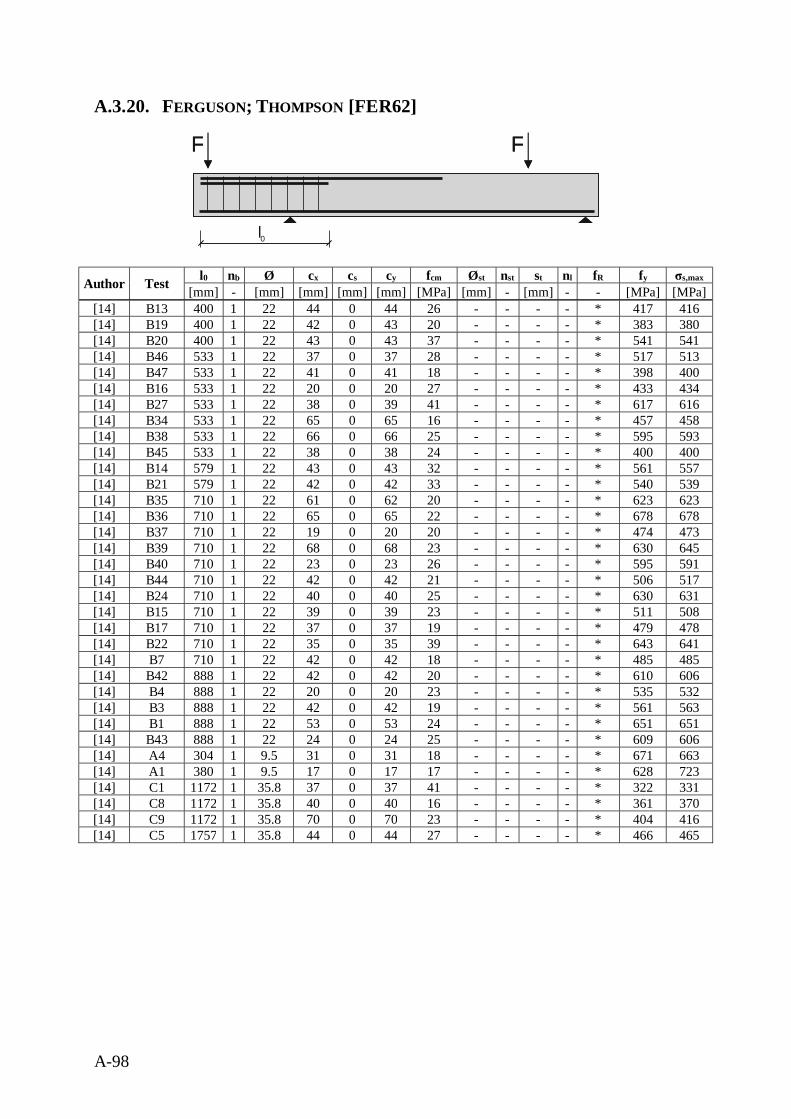
A-98
A.3.20. FERGUSON; THOMPSON [FER62]
Author Test l0 nb Ø cx cs cy fcm Øst nst st nl fR fy σs,max
[mm] - [mm] [mm] [mm] [mm] [MPa] [mm] - [mm] - - [MPa] [MPa][14] B13 400 1 22 44 0 44 26 - - - - * 417 416[14] B19 400 1 22 42 0 43 20 - - - - * 383 380[14] B20 400 1 22 43 0 43 37 - - - - * 541 541[14] B46 533 1 22 37 0 37 28 - - - - * 517 513[14] B47 533 1 22 41 0 41 18 - - - - * 398 400[14] B16 533 1 22 20 0 20 27 - - - - * 433 434[14] B27 533 1 22 38 0 39 41 - - - - * 617 616[14] B34 533 1 22 65 0 65 16 - - - - * 457 458[14] B38 533 1 22 66 0 66 25 - - - - * 595 593[14] B45 533 1 22 38 0 38 24 - - - - * 400 400[14] B14 579 1 22 43 0 43 32 - - - - * 561 557[14] B21 579 1 22 42 0 42 33 - - - - * 540 539[14] B35 710 1 22 61 0 62 20 - - - - * 623 623[14] B36 710 1 22 65 0 65 22 - - - - * 678 678[14] B37 710 1 22 19 0 20 20 - - - - * 474 473[14] B39 710 1 22 68 0 68 23 - - - - * 630 645[14] B40 710 1 22 23 0 23 26 - - - - * 595 591[14] B44 710 1 22 42 0 42 21 - - - - * 506 517[14] B24 710 1 22 40 0 40 25 - - - - * 630 631[14] B15 710 1 22 39 0 39 23 - - - - * 511 508[14] B17 710 1 22 37 0 37 19 - - - - * 479 478[14] B22 710 1 22 35 0 35 39 - - - - * 643 641[14] B7 710 1 22 42 0 42 18 - - - - * 485 485[14] B42 888 1 22 42 0 42 20 - - - - * 610 606[14] B4 888 1 22 20 0 20 23 - - - - * 535 532[14] B3 888 1 22 42 0 42 19 - - - - * 561 563[14] B1 888 1 22 53 0 53 24 - - - - * 651 651[14] B43 888 1 22 24 0 24 25 - - - - * 609 606[14] A4 304 1 9.5 31 0 31 18 - - - - * 671 663[14] A1 380 1 9.5 17 0 17 17 - - - - * 628 723[14] C1 1172 1 35.8 37 0 37 41 - - - - * 322 331[14] C8 1172 1 35.8 40 0 40 16 - - - - * 361 370[14] C9 1172 1 35.8 70 0 70 23 - - - - * 404 416[14] C5 1757 1 35.8 44 0 44 27 - - - - * 466 465
F FF F
l0
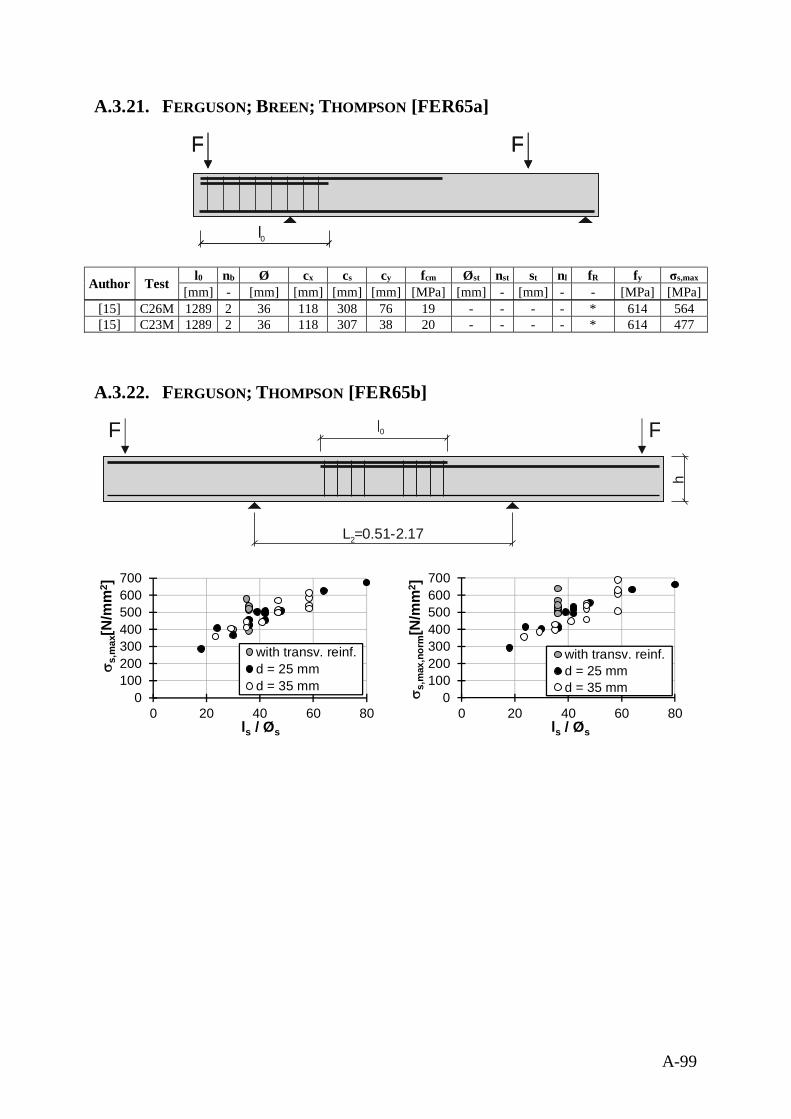
A-99
A.3.21. FERGUSON; BREEN; THOMPSON [FER65a]
Author Test l0 nb Ø cx cs cy fcm Øst nst st nl fR fy σs,max
[mm] - [mm] [mm] [mm] [mm] [MPa] [mm] - [mm] - - [MPa] [MPa][15] C26M 1289 2 36 118 308 76 19 - - - - * 614 564[15] C23M 1289 2 36 118 307 38 20 - - - - * 614 477
A.3.22. FERGUSON; THOMPSON [FER65b]
F FF F
l0
F F
h
L =0.51-2.172
l0
0100200300400500600700
0 20 40 60 80
s s,m
ax[N
/mm
2 ]
ls / Øs
with transv. reinf.d = 25 mmd = 35 mm
0100200300400500600700
0 20 40 60 80
s s,m
ax,n
orm
[N/m
m2 ]
ls / Øs
with transv. reinf.d = 25 mmd = 35 mm
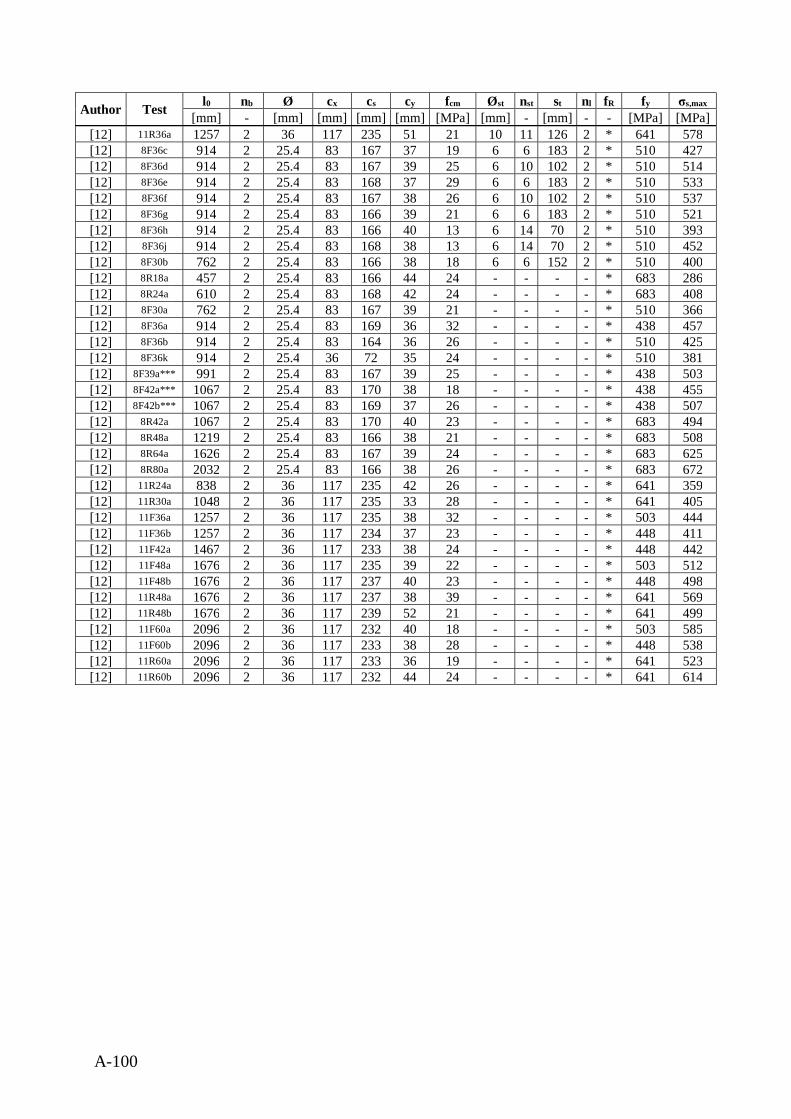
A-100
Author Test l0 nb Ø cx cs cy fcm Øst nst st nl fR fy σs,max
[mm] - [mm] [mm] [mm] [mm] [MPa] [mm] - [mm] - - [MPa] [MPa][12] 11R36a 1257 2 36 117 235 51 21 10 11 126 2 * 641 578[12] 8F36c 914 2 25.4 83 167 37 19 6 6 183 2 * 510 427[12] 8F36d 914 2 25.4 83 167 39 25 6 10 102 2 * 510 514[12] 8F36e 914 2 25.4 83 168 37 29 6 6 183 2 * 510 533[12] 8F36f 914 2 25.4 83 167 38 26 6 10 102 2 * 510 537[12] 8F36g 914 2 25.4 83 166 39 21 6 6 183 2 * 510 521[12] 8F36h 914 2 25.4 83 166 40 13 6 14 70 2 * 510 393[12] 8F36j 914 2 25.4 83 168 38 13 6 14 70 2 * 510 452[12] 8F30b 762 2 25.4 83 166 38 18 6 6 152 2 * 510 400[12] 8R18a 457 2 25.4 83 166 44 24 - - - - * 683 286[12] 8R24a 610 2 25.4 83 168 42 24 - - - - * 683 408[12] 8F30a 762 2 25.4 83 167 39 21 - - - - * 510 366[12] 8F36a 914 2 25.4 83 169 36 32 - - - - * 438 457[12] 8F36b 914 2 25.4 83 164 36 26 - - - - * 510 425[12] 8F36k 914 2 25.4 36 72 35 24 - - - - * 510 381[12] 8F39a*** 991 2 25.4 83 167 39 25 - - - - * 438 503[12] 8F42a*** 1067 2 25.4 83 170 38 18 - - - - * 438 455[12] 8F42b*** 1067 2 25.4 83 169 37 26 - - - - * 438 507[12] 8R42a 1067 2 25.4 83 170 40 23 - - - - * 683 494[12] 8R48a 1219 2 25.4 83 166 38 21 - - - - * 683 508[12] 8R64a 1626 2 25.4 83 167 39 24 - - - - * 683 625[12] 8R80a 2032 2 25.4 83 166 38 26 - - - - * 683 672[12] 11R24a 838 2 36 117 235 42 26 - - - - * 641 359[12] 11R30a 1048 2 36 117 235 33 28 - - - - * 641 405[12] 11F36a 1257 2 36 117 235 38 32 - - - - * 503 444[12] 11F36b 1257 2 36 117 234 37 23 - - - - * 448 411[12] 11F42a 1467 2 36 117 233 38 24 - - - - * 448 442[12] 11F48a 1676 2 36 117 235 39 22 - - - - * 503 512[12] 11F48b 1676 2 36 117 237 40 23 - - - - * 448 498[12] 11R48a 1676 2 36 117 237 38 39 - - - - * 641 569[12] 11R48b 1676 2 36 117 239 52 21 - - - - * 641 499[12] 11F60a 2096 2 36 117 232 40 18 - - - - * 503 585[12] 11F60b 2096 2 36 117 233 38 28 - - - - * 448 538[12] 11R60a 2096 2 36 117 233 36 19 - - - - * 641 523[12] 11R60b 2096 2 36 117 232 44 24 - - - - * 641 614
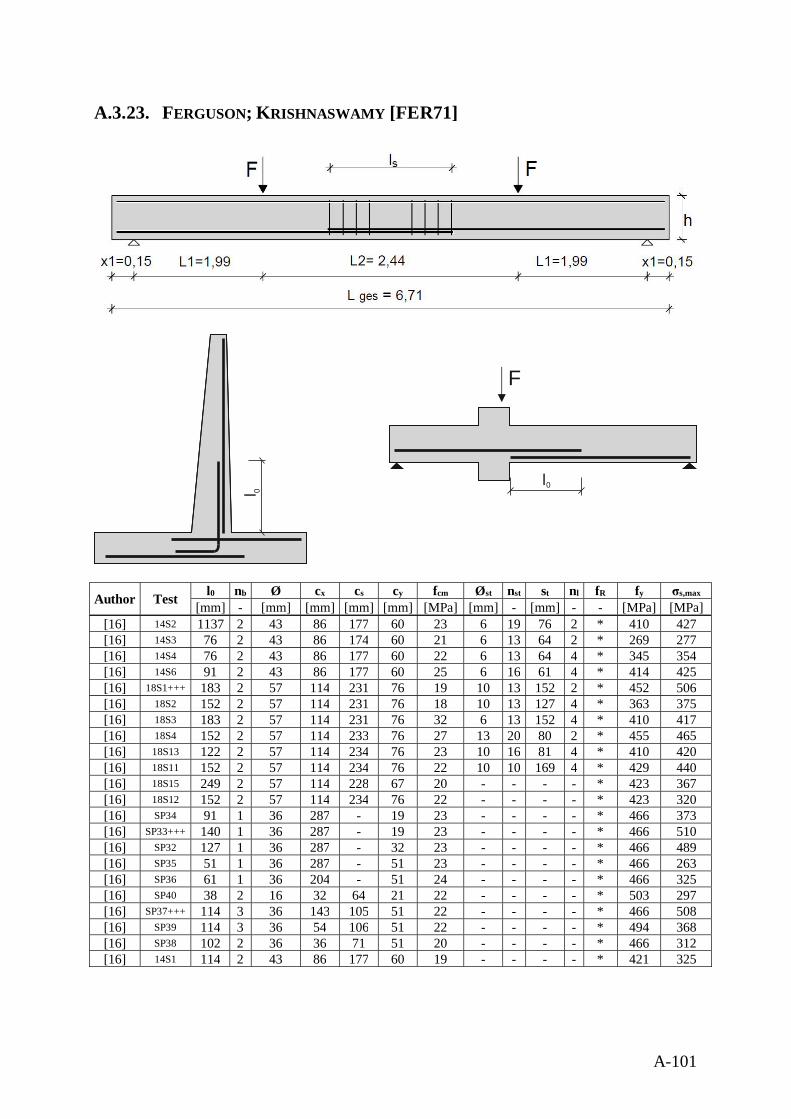
A-101
A.3.23. FERGUSON; KRISHNASWAMY [FER71]
Author Test l0 nb Ø cx cs cy fcm Øst nst st nl fR fy σs,max
[mm] - [mm] [mm] [mm] [mm] [MPa] [mm] - [mm] - - [MPa] [MPa][16] 14S2 1137 2 43 86 177 60 23 6 19 76 2 * 410 427[16] 14S3 76 2 43 86 174 60 21 6 13 64 2 * 269 277[16] 14S4 76 2 43 86 177 60 22 6 13 64 4 * 345 354[16] 14S6 91 2 43 86 177 60 25 6 16 61 4 * 414 425[16] 18S1+++ 183 2 57 114 231 76 19 10 13 152 2 * 452 506[16] 18S2 152 2 57 114 231 76 18 10 13 127 4 * 363 375[16] 18S3 183 2 57 114 231 76 32 6 13 152 4 * 410 417[16] 18S4 152 2 57 114 233 76 27 13 20 80 2 * 455 465[16] 18S13 122 2 57 114 234 76 23 10 16 81 4 * 410 420[16] 18S11 152 2 57 114 234 76 22 10 10 169 4 * 429 440[16] 18S15 249 2 57 114 228 67 20 - - - - * 423 367[16] 18S12 152 2 57 114 234 76 22 - - - - * 423 320[16] SP34 91 1 36 287 - 19 23 - - - - * 466 373[16] SP33+++ 140 1 36 287 - 19 23 - - - - * 466 510[16] SP32 127 1 36 287 - 32 23 - - - - * 466 489[16] SP35 51 1 36 287 - 51 23 - - - - * 466 263[16] SP36 61 1 36 204 - 51 24 - - - - * 466 325[16] SP40 38 2 16 32 64 21 22 - - - - * 503 297[16] SP37+++ 114 3 36 143 105 51 22 - - - - * 466 508[16] SP39 114 3 36 54 106 51 22 - - - - * 494 368[16] SP38 102 2 36 36 71 51 20 - - - - * 466 312[16] 14S1 114 2 43 86 177 60 19 - - - - * 421 325
F
l0l 0
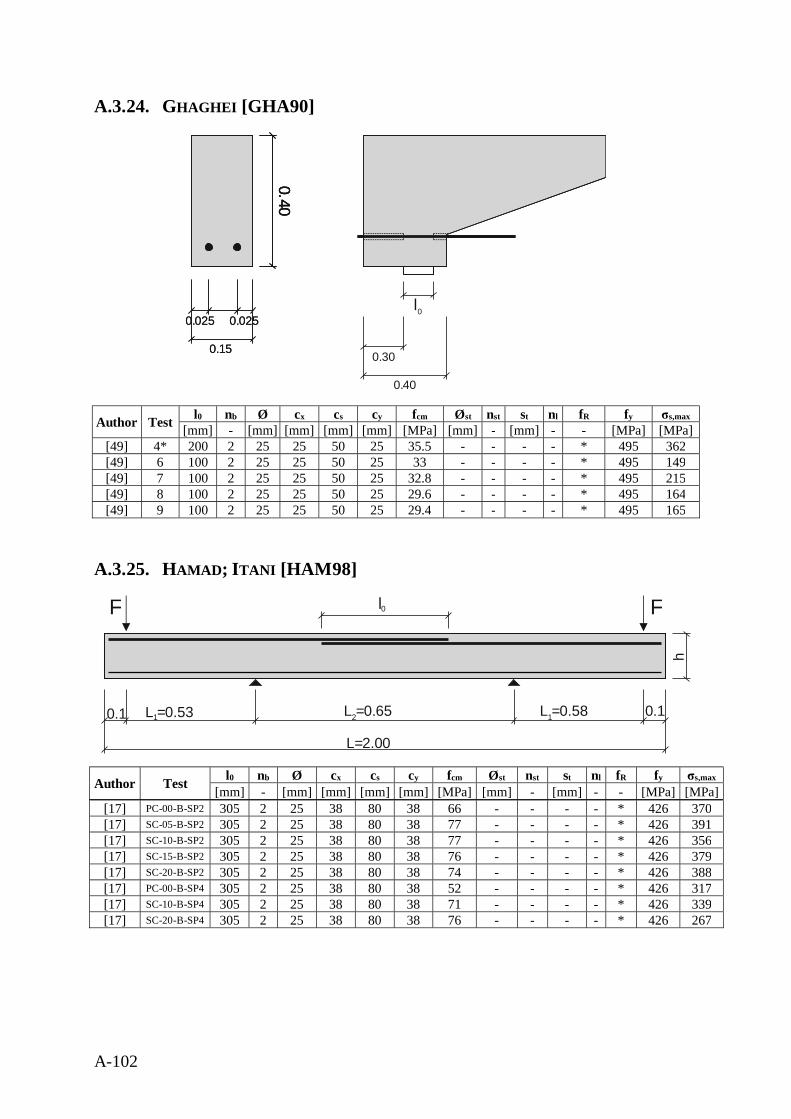
A-102
A.3.24. GHAGHEI [GHA90]
Author Test l0 nb Ø cx cs cy fcm Øst nst st nl fR fy σs,max
[mm] - [mm] [mm] [mm] [mm] [MPa] [mm] - [mm] - - [MPa] [MPa][49] 4* 200 2 25 25 50 25 35.5 - - - - * 495 362[49] 6 100 2 25 25 50 25 33 - - - - * 495 149[49] 7 100 2 25 25 50 25 32.8 - - - - * 495 215[49] 8 100 2 25 25 50 25 29.6 - - - - * 495 164[49] 9 100 2 25 25 50 25 29.4 - - - - * 495 165
A.3.25. HAMAD; ITANI [HAM98]
Author Test l0 nb Ø cx cs cy fcm Øst nst st nl fR fy σs,max
[mm] - [mm] [mm] [mm] [mm] [MPa] [mm] - [mm] - - [MPa] [MPa][17] PC-00-B-SP2 305 2 25 38 80 38 66 - - - - * 426 370[17] SC-05-B-SP2 305 2 25 38 80 38 77 - - - - * 426 391[17] SC-10-B-SP2 305 2 25 38 80 38 77 - - - - * 426 356[17] SC-15-B-SP2 305 2 25 38 80 38 76 - - - - * 426 379[17] SC-20-B-SP2 305 2 25 38 80 38 74 - - - - * 426 388[17] PC-00-B-SP4 305 2 25 38 80 38 52 - - - - * 426 317[17] SC-10-B-SP4 305 2 25 38 80 38 71 - - - - * 426 339[17] SC-20-B-SP4 305 2 25 38 80 38 76 - - - - * 426 267
0.025 0.025
0.40
0.15
l0
0.30
0.40
0.40
0.025 0.025
0.40
0.15
F F
h
0.1 L =0.531 L =0.652 L =0.581 0.1
L=2.00
l0
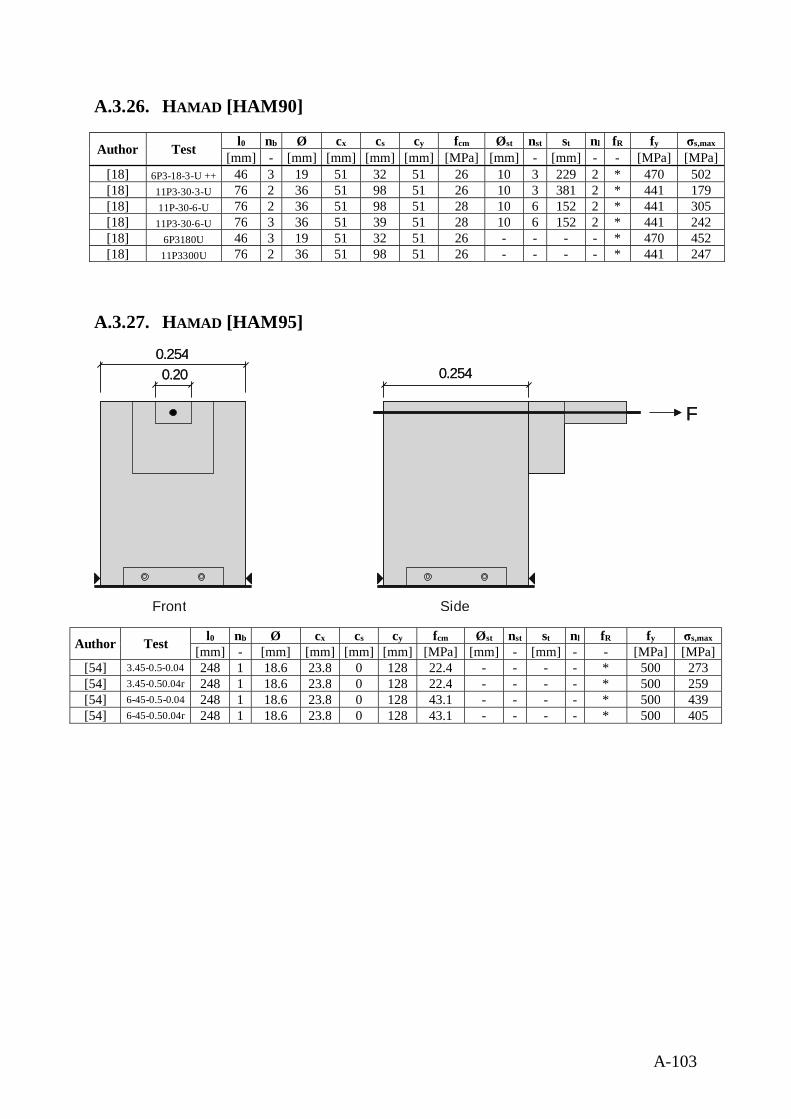
A-103
A.3.26. HAMAD [HAM90]
Author Test l0 nb Ø cx cs cy fcm Øst nst st nl fR fy σs,max
[mm] - [mm] [mm] [mm] [mm] [MPa] [mm] - [mm] - - [MPa] [MPa][18] 6P3-18-3-U ++ 46 3 19 51 32 51 26 10 3 229 2 * 470 502[18] 11P3-30-3-U 76 2 36 51 98 51 26 10 3 381 2 * 441 179[18] 11P-30-6-U 76 2 36 51 98 51 28 10 6 152 2 * 441 305[18] 11P3-30-6-U 76 3 36 51 39 51 28 10 6 152 2 * 441 242[18] 6P3180U 46 3 19 51 32 51 26 - - - - * 470 452[18] 11P3300U 76 2 36 51 98 51 26 - - - - * 441 247
A.3.27. HAMAD [HAM95]
Author Test l0 nb Ø cx cs cy fcm Øst nst st nl fR fy σs,max
[mm] - [mm] [mm] [mm] [mm] [MPa] [mm] - [mm] - - [MPa] [MPa][54] 3.45-0.5-0.04 248 1 18.6 23.8 0 128 22.4 - - - - * 500 273[54] 3.45-0.50.04r 248 1 18.6 23.8 0 128 22.4 - - - - * 500 259[54] 6-45-0.5-0.04 248 1 18.6 23.8 0 128 43.1 - - - - * 500 439[54] 6-45-0.50.04r 248 1 18.6 23.8 0 128 43.1 - - - - * 500 405
F
0.2540.200.254
Front Side
F
0.2540.200.254
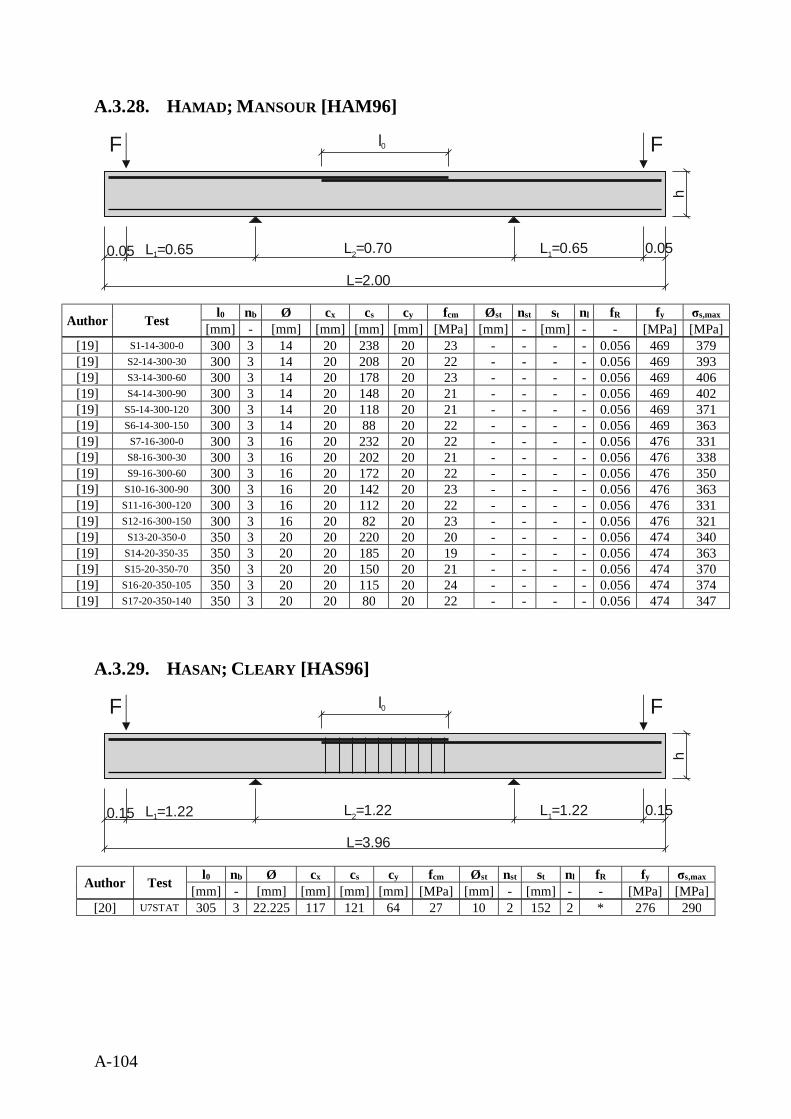
A-104
A.3.28. HAMAD; MANSOUR [HAM96]
Author Test l0 nb Ø cx cs cy fcm Øst nst st nl fR fy σs,max
[mm] - [mm] [mm] [mm] [mm] [MPa] [mm] - [mm] - - [MPa] [MPa][19] S1-14-300-0 300 3 14 20 238 20 23 - - - - 0.056 469 379[19] S2-14-300-30 300 3 14 20 208 20 22 - - - - 0.056 469 393[19] S3-14-300-60 300 3 14 20 178 20 23 - - - - 0.056 469 406[19] S4-14-300-90 300 3 14 20 148 20 21 - - - - 0.056 469 402[19] S5-14-300-120 300 3 14 20 118 20 21 - - - - 0.056 469 371[19] S6-14-300-150 300 3 14 20 88 20 22 - - - - 0.056 469 363[19] S7-16-300-0 300 3 16 20 232 20 22 - - - - 0.056 476 331[19] S8-16-300-30 300 3 16 20 202 20 21 - - - - 0.056 476 338[19] S9-16-300-60 300 3 16 20 172 20 22 - - - - 0.056 476 350[19] S10-16-300-90 300 3 16 20 142 20 23 - - - - 0.056 476 363[19] S11-16-300-120 300 3 16 20 112 20 22 - - - - 0.056 476 331[19] S12-16-300-150 300 3 16 20 82 20 23 - - - - 0.056 476 321[19] S13-20-350-0 350 3 20 20 220 20 20 - - - - 0.056 474 340[19] S14-20-350-35 350 3 20 20 185 20 19 - - - - 0.056 474 363[19] S15-20-350-70 350 3 20 20 150 20 21 - - - - 0.056 474 370[19] S16-20-350-105 350 3 20 20 115 20 24 - - - - 0.056 474 374[19] S17-20-350-140 350 3 20 20 80 20 22 - - - - 0.056 474 347
A.3.29. HASAN; CLEARY [HAS96]
Author Test l0 nb Ø cx cs cy fcm Øst nst st nl fR fy σs,max
[mm] - [mm] [mm] [mm] [mm] [MPa] [mm] - [mm] - - [MPa] [MPa][20] U7STAT 305 3 22.225 117 121 64 27 10 2 152 2 * 276 290
F F
h
0.05 L =0.651 L =0.702 L =0.651 0.05
L=2.00
l0
F Fh
0.15 L =1.221 L =1.222 L =1.221 0.15
L=3.96
l0
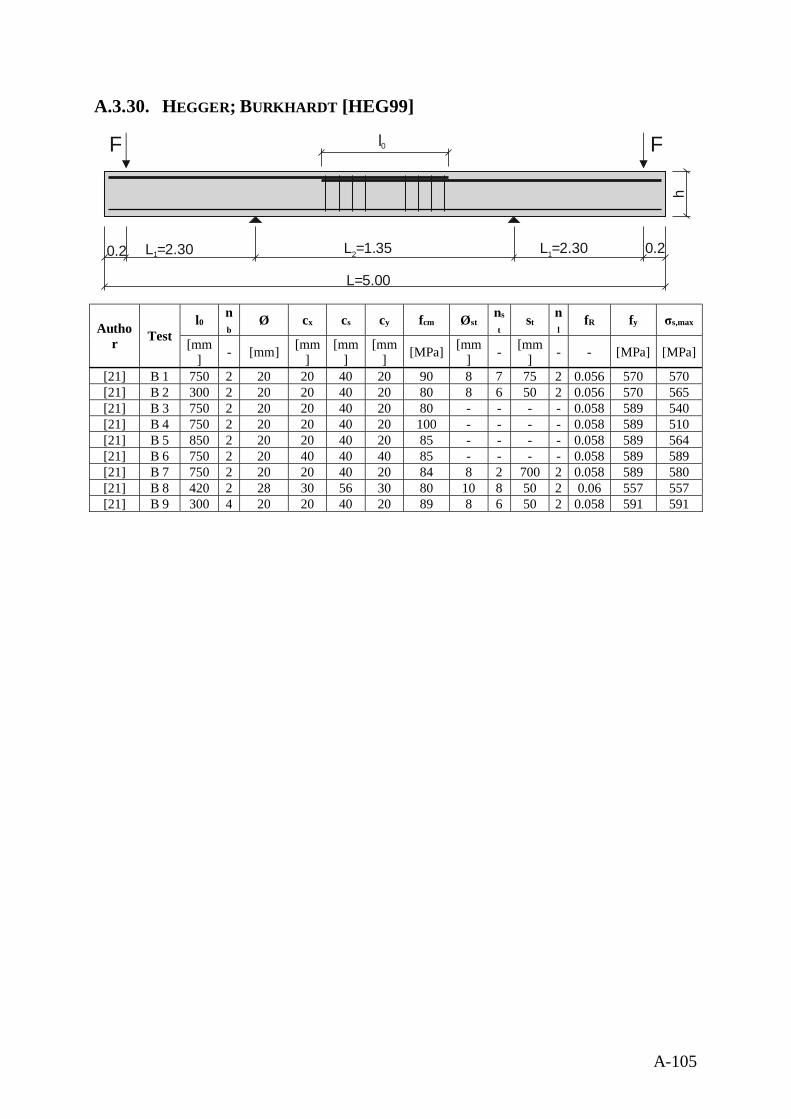
A-105
A.3.30. HEGGER; BURKHARDT [HEG99]
Author Test
l0nb
Ø cx cs cy fcm Østns
tst
nl
fR fy σs,max
[mm] - [mm] [mm
][mm
][mm
] [MPa] [mm] - [mm
] - - [MPa] [MPa]
[21] B 1 750 2 20 20 40 20 90 8 7 75 2 0.056 570 570[21] B 2 300 2 20 20 40 20 80 8 6 50 2 0.056 570 565[21] B 3 750 2 20 20 40 20 80 - - - - 0.058 589 540[21] B 4 750 2 20 20 40 20 100 - - - - 0.058 589 510[21] B 5 850 2 20 20 40 20 85 - - - - 0.058 589 564[21] B 6 750 2 20 40 40 40 85 - - - - 0.058 589 589[21] B 7 750 2 20 20 40 20 84 8 2 700 2 0.058 589 580[21] B 8 420 2 28 30 56 30 80 10 8 50 2 0.06 557 557[21] B 9 300 4 20 20 40 20 89 8 6 50 2 0.058 591 591
F F
h
0.2 L =2.301 L =1.352 L =2.301 0.2
L=5.00
l0
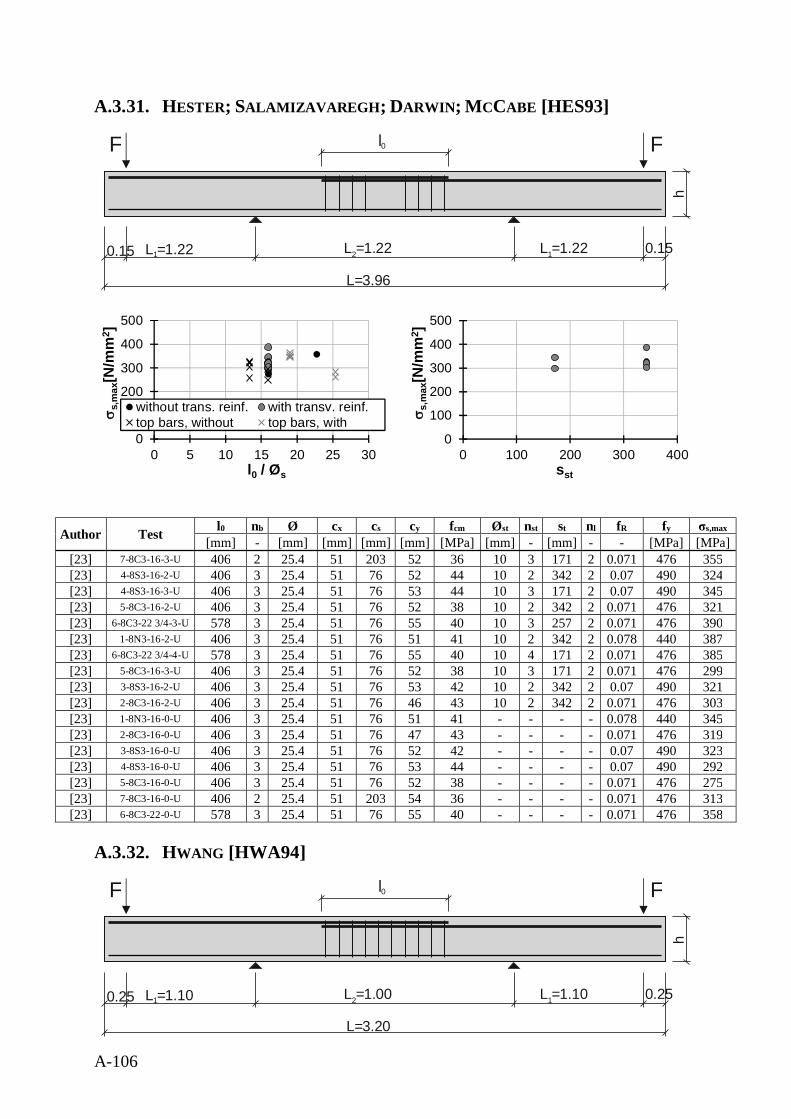
A-106
A.3.31. HESTER; SALAMIZAVAREGH; DARWIN; MCCABE [HES93]
Author Test l0 nb Ø cx cs cy fcm Øst nst st nl fR fy σs,max
[mm] - [mm] [mm] [mm] [mm] [MPa] [mm] - [mm] - - [MPa] [MPa][23] 7-8C3-16-3-U 406 2 25.4 51 203 52 36 10 3 171 2 0.071 476 355[23] 4-8S3-16-2-U 406 3 25.4 51 76 52 44 10 2 342 2 0.07 490 324[23] 4-8S3-16-3-U 406 3 25.4 51 76 53 44 10 3 171 2 0.07 490 345[23] 5-8C3-16-2-U 406 3 25.4 51 76 52 38 10 2 342 2 0.071 476 321[23] 6-8C3-22 3/4-3-U 578 3 25.4 51 76 55 40 10 3 257 2 0.071 476 390[23] 1-8N3-16-2-U 406 3 25.4 51 76 51 41 10 2 342 2 0.078 440 387[23] 6-8C3-22 3/4-4-U 578 3 25.4 51 76 55 40 10 4 171 2 0.071 476 385[23] 5-8C3-16-3-U 406 3 25.4 51 76 52 38 10 3 171 2 0.071 476 299[23] 3-8S3-16-2-U 406 3 25.4 51 76 53 42 10 2 342 2 0.07 490 321[23] 2-8C3-16-2-U 406 3 25.4 51 76 46 43 10 2 342 2 0.071 476 303[23] 1-8N3-16-0-U 406 3 25.4 51 76 51 41 - - - - 0.078 440 345[23] 2-8C3-16-0-U 406 3 25.4 51 76 47 43 - - - - 0.071 476 319[23] 3-8S3-16-0-U 406 3 25.4 51 76 52 42 - - - - 0.07 490 323[23] 4-8S3-16-0-U 406 3 25.4 51 76 53 44 - - - - 0.07 490 292[23] 5-8C3-16-0-U 406 3 25.4 51 76 52 38 - - - - 0.071 476 275[23] 7-8C3-16-0-U 406 2 25.4 51 203 54 36 - - - - 0.071 476 313[23] 6-8C3-22-0-U 578 3 25.4 51 76 55 40 - - - - 0.071 476 358
A.3.32. HWANG [HWA94]
F F
h
0.15 L =1.221 L =1.222 L =1.221 0.15
L=3.96
l0
0
100
200
300
400
500
0 5 10 15 20 25 30
s s,m
ax[N
/mm
2 ]
l0 / Øs
without trans. reinf. with transv. reinf.top bars, without top bars, with
0
100
200
300
400
500
0 100 200 300 400
s s,m
ax[N
/mm
2 ]
sst
F F
h
0.25 L =1.101 L =1.002 L =1.101 0.25
L=3.20
l0
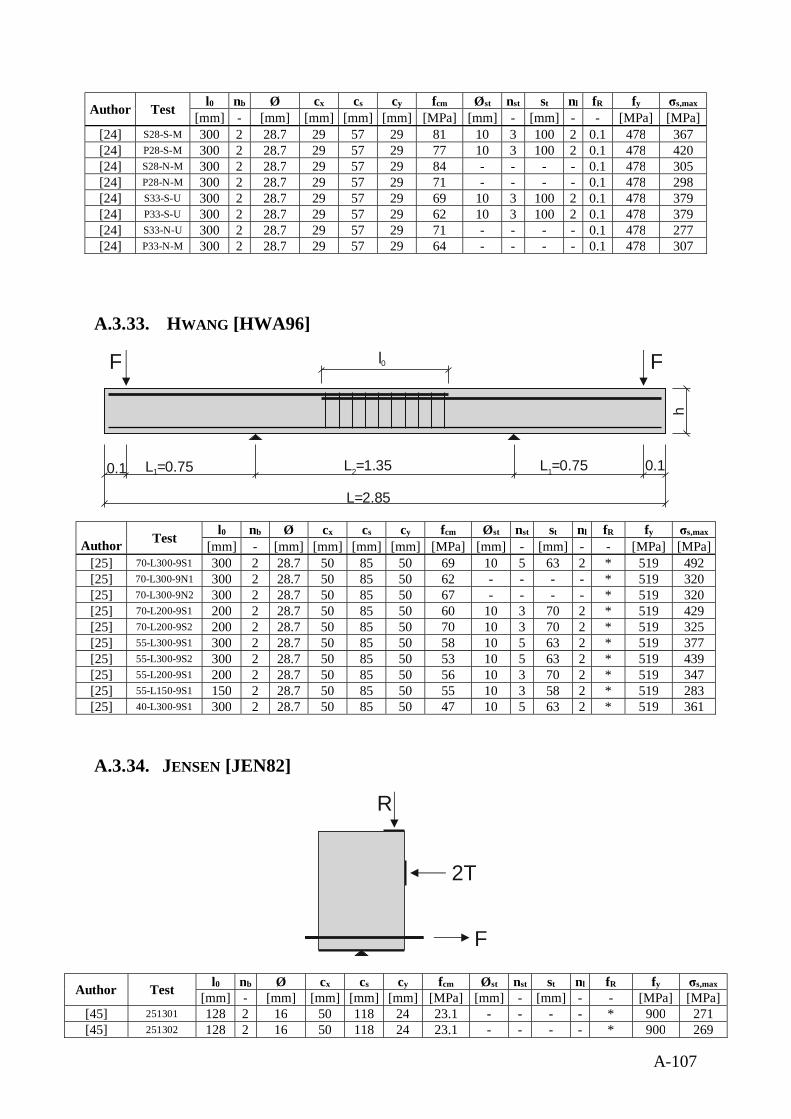
A-107
Author Test l0 nb Ø cx cs cy fcm Øst nst st nl fR fy σs,max
[mm] - [mm] [mm] [mm] [mm] [MPa] [mm] - [mm] - - [MPa] [MPa][24] S28-S-M 300 2 28.7 29 57 29 81 10 3 100 2 0.1 478 367[24] P28-S-M 300 2 28.7 29 57 29 77 10 3 100 2 0.1 478 420[24] S28-N-M 300 2 28.7 29 57 29 84 - - - - 0.1 478 305[24] P28-N-M 300 2 28.7 29 57 29 71 - - - - 0.1 478 298[24] S33-S-U 300 2 28.7 29 57 29 69 10 3 100 2 0.1 478 379[24] P33-S-U 300 2 28.7 29 57 29 62 10 3 100 2 0.1 478 379[24] S33-N-U 300 2 28.7 29 57 29 71 - - - - 0.1 478 277[24] P33-N-M 300 2 28.7 29 57 29 64 - - - - 0.1 478 307
A.3.33. HWANG [HWA96]
Author Test l0 nb Ø cx cs cy fcm Øst nst st nl fR fy σs,max
[mm] - [mm] [mm] [mm] [mm] [MPa] [mm] - [mm] - - [MPa] [MPa][25] 70-L300-9S1 300 2 28.7 50 85 50 69 10 5 63 2 * 519 492[25] 70-L300-9N1 300 2 28.7 50 85 50 62 - - - - * 519 320[25] 70-L300-9N2 300 2 28.7 50 85 50 67 - - - - * 519 320[25] 70-L200-9S1 200 2 28.7 50 85 50 60 10 3 70 2 * 519 429[25] 70-L200-9S2 200 2 28.7 50 85 50 70 10 3 70 2 * 519 325[25] 55-L300-9S1 300 2 28.7 50 85 50 58 10 5 63 2 * 519 377[25] 55-L300-9S2 300 2 28.7 50 85 50 53 10 5 63 2 * 519 439[25] 55-L200-9S1 200 2 28.7 50 85 50 56 10 3 70 2 * 519 347[25] 55-L150-9S1 150 2 28.7 50 85 50 55 10 3 58 2 * 519 283[25] 40-L300-9S1 300 2 28.7 50 85 50 47 10 5 63 2 * 519 361
A.3.34. JENSEN [JEN82]
Author Test l0 nb Ø cx cs cy fcm Øst nst st nl fR fy σs,max
[mm] - [mm] [mm] [mm] [mm] [MPa] [mm] - [mm] - - [MPa] [MPa][45] 251301 128 2 16 50 118 24 23.1 - - - - * 900 271[45] 251302 128 2 16 50 118 24 23.1 - - - - * 900 269
F F
h
0.1 L =0.751 L =1.352 L =0.751 0.1
L=2.85
l0
R
2T
F
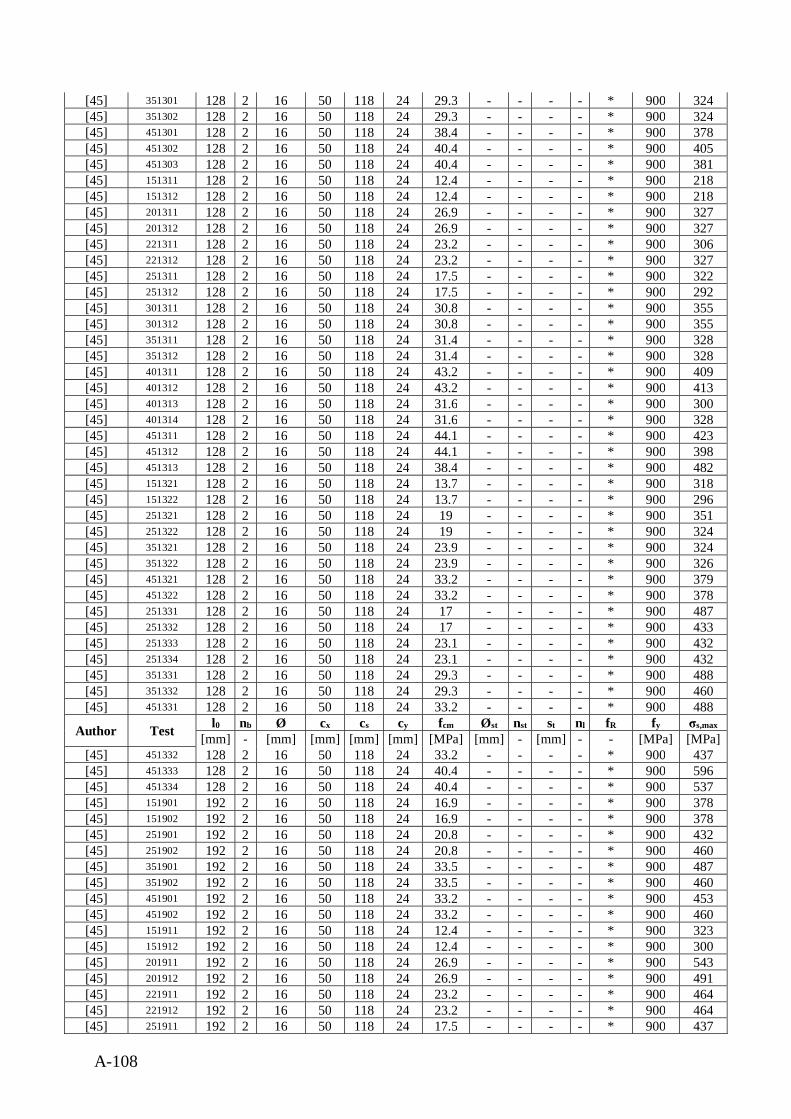
A-108
[45] 351301 128 2 16 50 118 24 29.3 - - - - * 900 324[45] 351302 128 2 16 50 118 24 29.3 - - - - * 900 324[45] 451301 128 2 16 50 118 24 38.4 - - - - * 900 378[45] 451302 128 2 16 50 118 24 40.4 - - - - * 900 405[45] 451303 128 2 16 50 118 24 40.4 - - - - * 900 381[45] 151311 128 2 16 50 118 24 12.4 - - - - * 900 218[45] 151312 128 2 16 50 118 24 12.4 - - - - * 900 218[45] 201311 128 2 16 50 118 24 26.9 - - - - * 900 327[45] 201312 128 2 16 50 118 24 26.9 - - - - * 900 327[45] 221311 128 2 16 50 118 24 23.2 - - - - * 900 306[45] 221312 128 2 16 50 118 24 23.2 - - - - * 900 327[45] 251311 128 2 16 50 118 24 17.5 - - - - * 900 322[45] 251312 128 2 16 50 118 24 17.5 - - - - * 900 292[45] 301311 128 2 16 50 118 24 30.8 - - - - * 900 355[45] 301312 128 2 16 50 118 24 30.8 - - - - * 900 355[45] 351311 128 2 16 50 118 24 31.4 - - - - * 900 328[45] 351312 128 2 16 50 118 24 31.4 - - - - * 900 328[45] 401311 128 2 16 50 118 24 43.2 - - - - * 900 409[45] 401312 128 2 16 50 118 24 43.2 - - - - * 900 413[45] 401313 128 2 16 50 118 24 31.6 - - - - * 900 300[45] 401314 128 2 16 50 118 24 31.6 - - - - * 900 328[45] 451311 128 2 16 50 118 24 44.1 - - - - * 900 423[45] 451312 128 2 16 50 118 24 44.1 - - - - * 900 398[45] 451313 128 2 16 50 118 24 38.4 - - - - * 900 482[45] 151321 128 2 16 50 118 24 13.7 - - - - * 900 318[45] 151322 128 2 16 50 118 24 13.7 - - - - * 900 296[45] 251321 128 2 16 50 118 24 19 - - - - * 900 351[45] 251322 128 2 16 50 118 24 19 - - - - * 900 324[45] 351321 128 2 16 50 118 24 23.9 - - - - * 900 324[45] 351322 128 2 16 50 118 24 23.9 - - - - * 900 326[45] 451321 128 2 16 50 118 24 33.2 - - - - * 900 379[45] 451322 128 2 16 50 118 24 33.2 - - - - * 900 378[45] 251331 128 2 16 50 118 24 17 - - - - * 900 487[45] 251332 128 2 16 50 118 24 17 - - - - * 900 433[45] 251333 128 2 16 50 118 24 23.1 - - - - * 900 432[45] 251334 128 2 16 50 118 24 23.1 - - - - * 900 432[45] 351331 128 2 16 50 118 24 29.3 - - - - * 900 488[45] 351332 128 2 16 50 118 24 29.3 - - - - * 900 460[45] 451331 128 2 16 50 118 24 33.2 - - - - * 900 488
Author Test l0 nb Ø cx cs cy fcm Øst nst st nl fR fy σs,max
[mm] - [mm] [mm] [mm] [mm] [MPa] [mm] - [mm] - - [MPa] [MPa][45] 451332 128 2 16 50 118 24 33.2 - - - - * 900 437[45] 451333 128 2 16 50 118 24 40.4 - - - - * 900 596[45] 451334 128 2 16 50 118 24 40.4 - - - - * 900 537[45] 151901 192 2 16 50 118 24 16.9 - - - - * 900 378[45] 151902 192 2 16 50 118 24 16.9 - - - - * 900 378[45] 251901 192 2 16 50 118 24 20.8 - - - - * 900 432[45] 251902 192 2 16 50 118 24 20.8 - - - - * 900 460[45] 351901 192 2 16 50 118 24 33.5 - - - - * 900 487[45] 351902 192 2 16 50 118 24 33.5 - - - - * 900 460[45] 451901 192 2 16 50 118 24 33.2 - - - - * 900 453[45] 451902 192 2 16 50 118 24 33.2 - - - - * 900 460[45] 151911 192 2 16 50 118 24 12.4 - - - - * 900 323[45] 151912 192 2 16 50 118 24 12.4 - - - - * 900 300[45] 201911 192 2 16 50 118 24 26.9 - - - - * 900 543[45] 201912 192 2 16 50 118 24 26.9 - - - - * 900 491[45] 221911 192 2 16 50 118 24 23.2 - - - - * 900 464[45] 221912 192 2 16 50 118 24 23.2 - - - - * 900 464[45] 251911 192 2 16 50 118 24 17.5 - - - - * 900 437
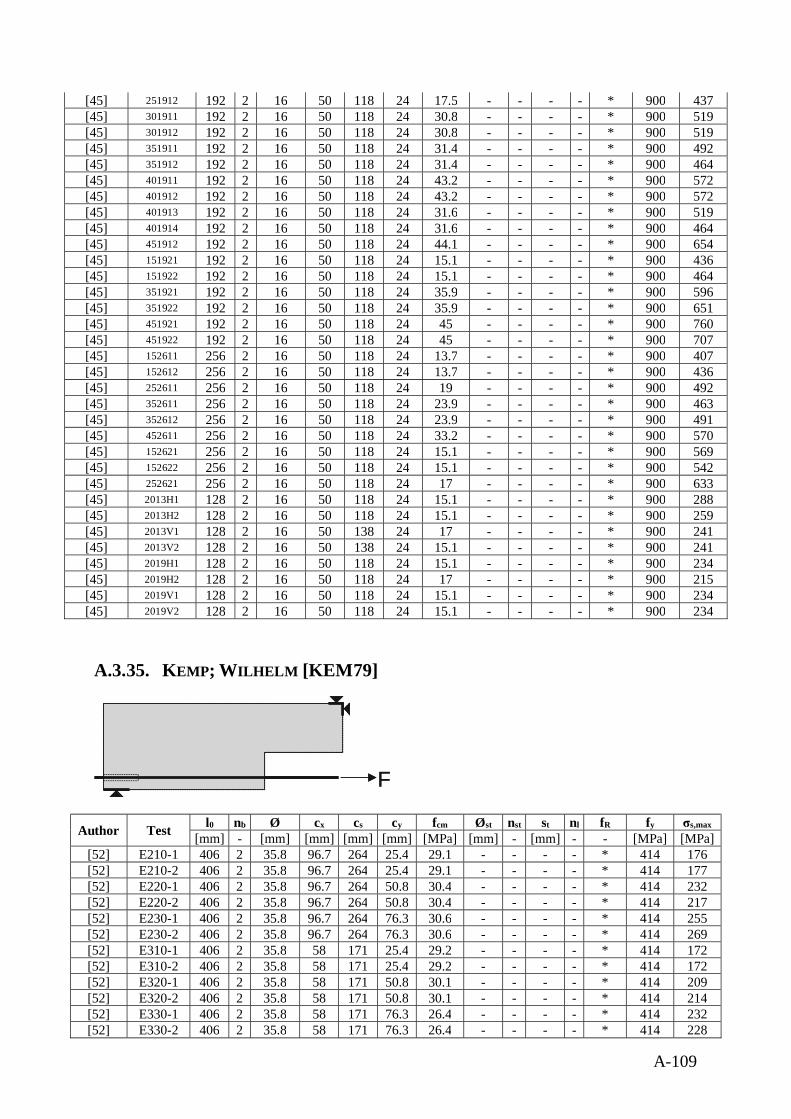
A-109
[45] 251912 192 2 16 50 118 24 17.5 - - - - * 900 437[45] 301911 192 2 16 50 118 24 30.8 - - - - * 900 519[45] 301912 192 2 16 50 118 24 30.8 - - - - * 900 519[45] 351911 192 2 16 50 118 24 31.4 - - - - * 900 492[45] 351912 192 2 16 50 118 24 31.4 - - - - * 900 464[45] 401911 192 2 16 50 118 24 43.2 - - - - * 900 572[45] 401912 192 2 16 50 118 24 43.2 - - - - * 900 572[45] 401913 192 2 16 50 118 24 31.6 - - - - * 900 519[45] 401914 192 2 16 50 118 24 31.6 - - - - * 900 464[45] 451912 192 2 16 50 118 24 44.1 - - - - * 900 654[45] 151921 192 2 16 50 118 24 15.1 - - - - * 900 436[45] 151922 192 2 16 50 118 24 15.1 - - - - * 900 464[45] 351921 192 2 16 50 118 24 35.9 - - - - * 900 596[45] 351922 192 2 16 50 118 24 35.9 - - - - * 900 651[45] 451921 192 2 16 50 118 24 45 - - - - * 900 760[45] 451922 192 2 16 50 118 24 45 - - - - * 900 707[45] 152611 256 2 16 50 118 24 13.7 - - - - * 900 407[45] 152612 256 2 16 50 118 24 13.7 - - - - * 900 436[45] 252611 256 2 16 50 118 24 19 - - - - * 900 492[45] 352611 256 2 16 50 118 24 23.9 - - - - * 900 463[45] 352612 256 2 16 50 118 24 23.9 - - - - * 900 491[45] 452611 256 2 16 50 118 24 33.2 - - - - * 900 570[45] 152621 256 2 16 50 118 24 15.1 - - - - * 900 569[45] 152622 256 2 16 50 118 24 15.1 - - - - * 900 542[45] 252621 256 2 16 50 118 24 17 - - - - * 900 633[45] 2013H1 128 2 16 50 118 24 15.1 - - - - * 900 288[45] 2013H2 128 2 16 50 118 24 15.1 - - - - * 900 259[45] 2013V1 128 2 16 50 138 24 17 - - - - * 900 241[45] 2013V2 128 2 16 50 138 24 15.1 - - - - * 900 241[45] 2019H1 128 2 16 50 118 24 15.1 - - - - * 900 234[45] 2019H2 128 2 16 50 118 24 17 - - - - * 900 215[45] 2019V1 128 2 16 50 118 24 15.1 - - - - * 900 234[45] 2019V2 128 2 16 50 118 24 15.1 - - - - * 900 234
A.3.35. KEMP; WILHELM [KEM79]
Author Test l0 nb Ø cx cs cy fcm Øst nst st nl fR fy σs,max
[mm] - [mm] [mm] [mm] [mm] [MPa] [mm] - [mm] - - [MPa] [MPa][52] E210-1 406 2 35.8 96.7 264 25.4 29.1 - - - - * 414 176[52] E210-2 406 2 35.8 96.7 264 25.4 29.1 - - - - * 414 177[52] E220-1 406 2 35.8 96.7 264 50.8 30.4 - - - - * 414 232[52] E220-2 406 2 35.8 96.7 264 50.8 30.4 - - - - * 414 217[52] E230-1 406 2 35.8 96.7 264 76.3 30.6 - - - - * 414 255[52] E230-2 406 2 35.8 96.7 264 76.3 30.6 - - - - * 414 269[52] E310-1 406 2 35.8 58 171 25.4 29.2 - - - - * 414 172[52] E310-2 406 2 35.8 58 171 25.4 29.2 - - - - * 414 172[52] E320-1 406 2 35.8 58 171 50.8 30.1 - - - - * 414 209[52] E320-2 406 2 35.8 58 171 50.8 30.1 - - - - * 414 214[52] E330-1 406 2 35.8 58 171 76.3 26.4 - - - - * 414 232[52] E330-2 406 2 35.8 58 171 76.3 26.4 - - - - * 414 228
FF
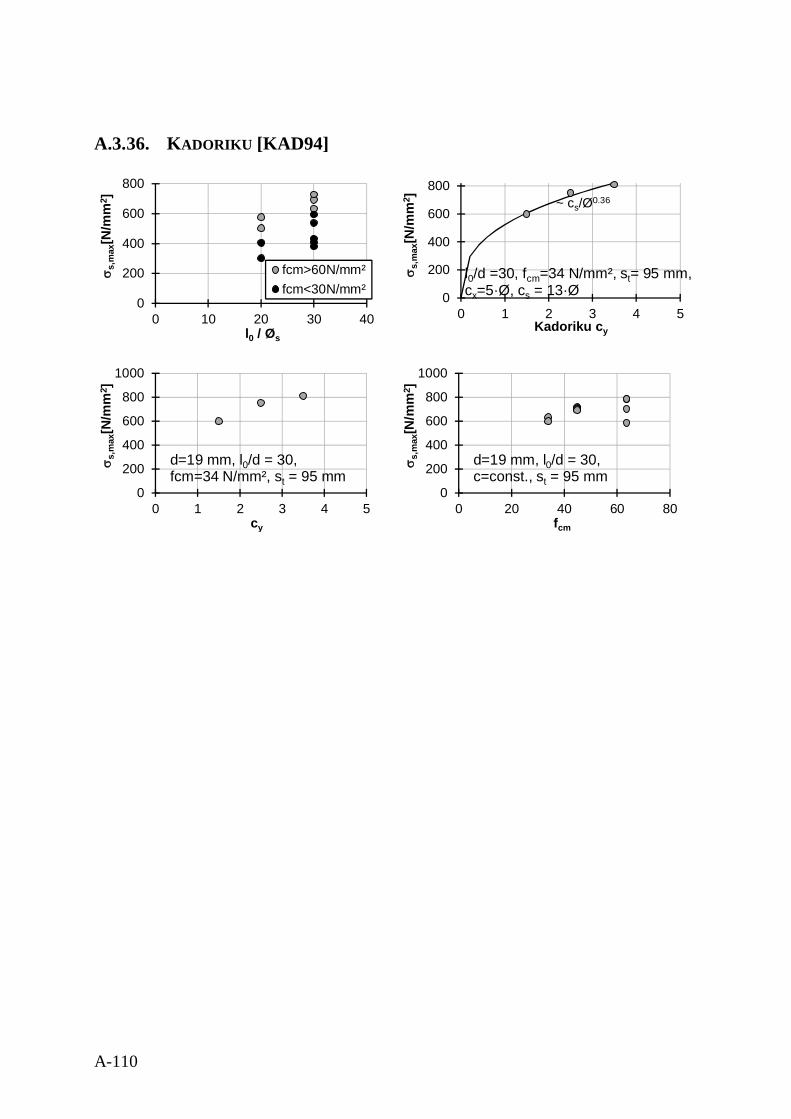
A-110
A.3.36. KADORIKU [KAD94]
0
200
400
600
800
0 10 20 30 40
s s,m
ax[N
/mm
2 ]
l0 / Øs
fcm>60N/mm²fcm<30N/mm² 0
200
400
600
800
0 1 2 3 4 5
s s,m
ax[N
/mm
2 ]
Kadoriku cy
l0/d =30, fcm=34 N/mm², st= 95 mm,cx=5·Ø, cs = 13·Ø
~ cs/Ø0.36
0
200
400
600
800
1000
0 1 2 3 4 5
s s,m
ax[N
/mm
2 ]
cy
d=19 mm, l0/d = 30,fcm=34 N/mm², st = 95 mm
0
200
400
600
800
1000
0 20 40 60 80
s s,m
ax[N
/mm
2 ]
fcm
d=19 mm, l0/d = 30,c=const., st = 95 mm
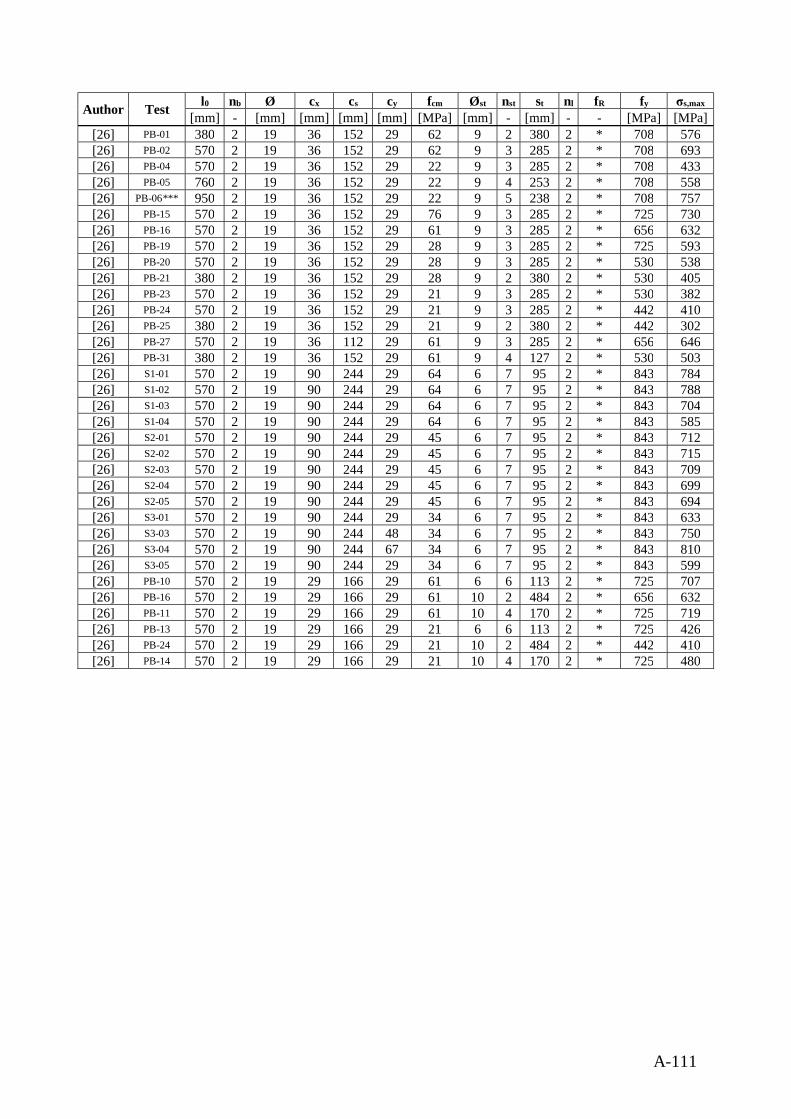
A-111
Author Test l0 nb Ø cx cs cy fcm Øst nst st nl fR fy σs,max
[mm] - [mm] [mm] [mm] [mm] [MPa] [mm] - [mm] - - [MPa] [MPa][26] PB-01 380 2 19 36 152 29 62 9 2 380 2 * 708 576[26] PB-02 570 2 19 36 152 29 62 9 3 285 2 * 708 693[26] PB-04 570 2 19 36 152 29 22 9 3 285 2 * 708 433[26] PB-05 760 2 19 36 152 29 22 9 4 253 2 * 708 558[26] PB-06*** 950 2 19 36 152 29 22 9 5 238 2 * 708 757[26] PB-15 570 2 19 36 152 29 76 9 3 285 2 * 725 730[26] PB-16 570 2 19 36 152 29 61 9 3 285 2 * 656 632[26] PB-19 570 2 19 36 152 29 28 9 3 285 2 * 725 593[26] PB-20 570 2 19 36 152 29 28 9 3 285 2 * 530 538[26] PB-21 380 2 19 36 152 29 28 9 2 380 2 * 530 405[26] PB-23 570 2 19 36 152 29 21 9 3 285 2 * 530 382[26] PB-24 570 2 19 36 152 29 21 9 3 285 2 * 442 410[26] PB-25 380 2 19 36 152 29 21 9 2 380 2 * 442 302[26] PB-27 570 2 19 36 112 29 61 9 3 285 2 * 656 646[26] PB-31 380 2 19 36 152 29 61 9 4 127 2 * 530 503[26] S1-01 570 2 19 90 244 29 64 6 7 95 2 * 843 784[26] S1-02 570 2 19 90 244 29 64 6 7 95 2 * 843 788[26] S1-03 570 2 19 90 244 29 64 6 7 95 2 * 843 704[26] S1-04 570 2 19 90 244 29 64 6 7 95 2 * 843 585[26] S2-01 570 2 19 90 244 29 45 6 7 95 2 * 843 712[26] S2-02 570 2 19 90 244 29 45 6 7 95 2 * 843 715[26] S2-03 570 2 19 90 244 29 45 6 7 95 2 * 843 709[26] S2-04 570 2 19 90 244 29 45 6 7 95 2 * 843 699[26] S2-05 570 2 19 90 244 29 45 6 7 95 2 * 843 694[26] S3-01 570 2 19 90 244 29 34 6 7 95 2 * 843 633[26] S3-03 570 2 19 90 244 48 34 6 7 95 2 * 843 750[26] S3-04 570 2 19 90 244 67 34 6 7 95 2 * 843 810[26] S3-05 570 2 19 90 244 29 34 6 7 95 2 * 843 599[26] PB-10 570 2 19 29 166 29 61 6 6 113 2 * 725 707[26] PB-16 570 2 19 29 166 29 61 10 2 484 2 * 656 632[26] PB-11 570 2 19 29 166 29 61 10 4 170 2 * 725 719[26] PB-13 570 2 19 29 166 29 21 6 6 113 2 * 725 426[26] PB-24 570 2 19 29 166 29 21 10 2 484 2 * 442 410[26] PB-14 570 2 19 29 166 29 21 10 4 170 2 * 725 480
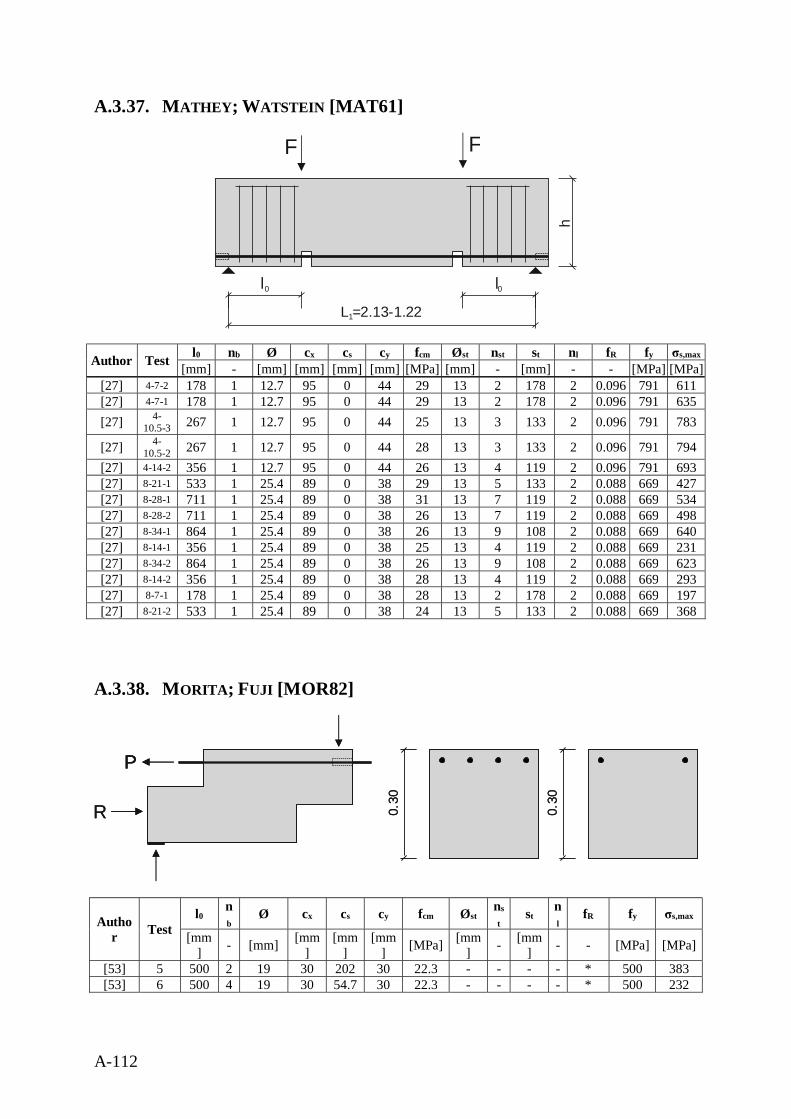
A-112
A.3.37. MATHEY; WATSTEIN [MAT61]
Author Test l0 nb Ø cx cs cy fcm Øst nst st nl fR fy σs,max
[mm] - [mm] [mm] [mm] [mm] [MPa] [mm] - [mm] - - [MPa] [MPa][27] 4-7-2 178 1 12.7 95 0 44 29 13 2 178 2 0.096 791 611[27] 4-7-1 178 1 12.7 95 0 44 29 13 2 178 2 0.096 791 635[27] 4-
10.5-3 267 1 12.7 95 0 44 25 13 3 133 2 0.096 791 783
[27] 4-10.5-2 267 1 12.7 95 0 44 28 13 3 133 2 0.096 791 794
[27] 4-14-2 356 1 12.7 95 0 44 26 13 4 119 2 0.096 791 693[27] 8-21-1 533 1 25.4 89 0 38 29 13 5 133 2 0.088 669 427[27] 8-28-1 711 1 25.4 89 0 38 31 13 7 119 2 0.088 669 534[27] 8-28-2 711 1 25.4 89 0 38 26 13 7 119 2 0.088 669 498[27] 8-34-1 864 1 25.4 89 0 38 26 13 9 108 2 0.088 669 640[27] 8-14-1 356 1 25.4 89 0 38 25 13 4 119 2 0.088 669 231[27] 8-34-2 864 1 25.4 89 0 38 26 13 9 108 2 0.088 669 623[27] 8-14-2 356 1 25.4 89 0 38 28 13 4 119 2 0.088 669 293[27] 8-7-1 178 1 25.4 89 0 38 28 13 2 178 2 0.088 669 197[27] 8-21-2 533 1 25.4 89 0 38 24 13 5 133 2 0.088 669 368
A.3.38. MORITA; FUJI [MOR82]
Author Test
l0nb
Ø cx cs cy fcm Østns
tst
nl
fR fy σs,max
[mm] - [mm] [mm
][mm
][mm
] [MPa] [mm] - [mm
] - - [MPa] [MPa]
[53] 5 500 2 19 30 202 30 22.3 - - - - * 500 383[53] 6 500 4 19 30 54.7 30 22.3 - - - - * 500 232
h
l0 l0L =2.13-1.221
F F
0.30
P
R 0.30
P
0.30
P
R 0.30
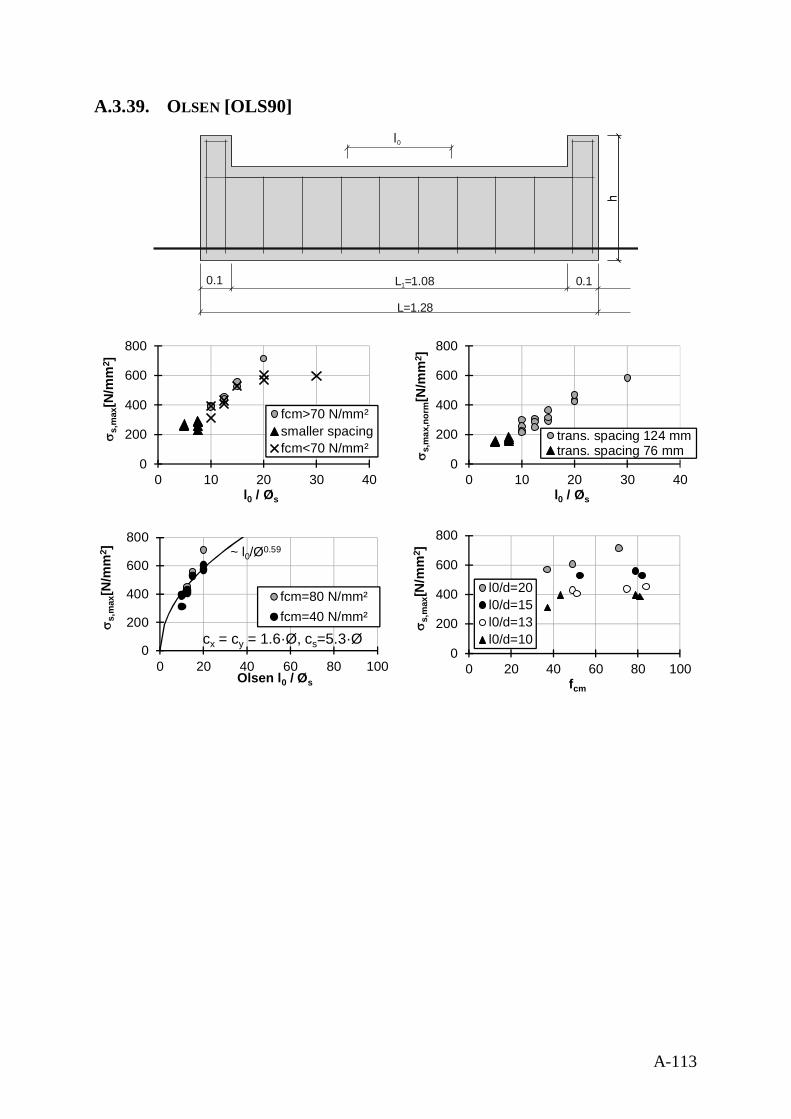
A-113
A.3.39. OLSEN [OLS90]
h
L =1.081 0.1
L=1.28
l0
h
0.1
0
200
400
600
800
0 10 20 30 40
s s,m
ax[N
/mm
2 ]
l0 / Øs
fcm>70 N/mm²smaller spacingfcm<70 N/mm²
0
200
400
600
800
0 10 20 30 40
s s,m
ax,n
orm
[N/m
m2 ]
l0 / Øs
trans. spacing 124 mmtrans. spacing 76 mm
0
200
400
600
800
0 20 40 60 80 100
s s,m
ax[N
/mm
2 ]
Olsen l0 / Øs
fcm=80 N/mm²fcm=40 N/mm²
cx = cy = 1.6·Ø, cs=5.3·Ø
~ l0/Ø0.59
0
200
400
600
800
0 20 40 60 80 100
s s,m
ax[N
/mm
2 ]
fcm
l0/d=20l0/d=15l0/d=13l0/d=10
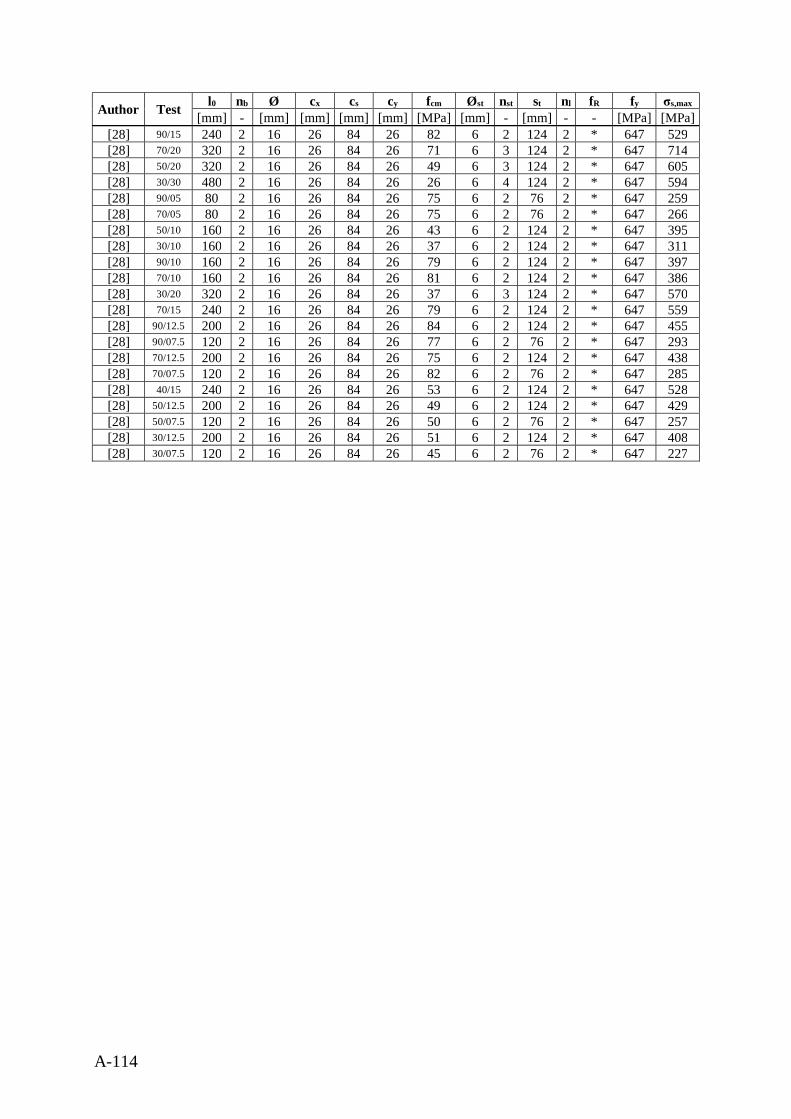
A-114
Author Test l0 nb Ø cx cs cy fcm Øst nst st nl fR fy σs,max
[mm] - [mm] [mm] [mm] [mm] [MPa] [mm] - [mm] - - [MPa] [MPa][28] 90/15 240 2 16 26 84 26 82 6 2 124 2 * 647 529[28] 70/20 320 2 16 26 84 26 71 6 3 124 2 * 647 714[28] 50/20 320 2 16 26 84 26 49 6 3 124 2 * 647 605[28] 30/30 480 2 16 26 84 26 26 6 4 124 2 * 647 594[28] 90/05 80 2 16 26 84 26 75 6 2 76 2 * 647 259[28] 70/05 80 2 16 26 84 26 75 6 2 76 2 * 647 266[28] 50/10 160 2 16 26 84 26 43 6 2 124 2 * 647 395[28] 30/10 160 2 16 26 84 26 37 6 2 124 2 * 647 311[28] 90/10 160 2 16 26 84 26 79 6 2 124 2 * 647 397[28] 70/10 160 2 16 26 84 26 81 6 2 124 2 * 647 386[28] 30/20 320 2 16 26 84 26 37 6 3 124 2 * 647 570[28] 70/15 240 2 16 26 84 26 79 6 2 124 2 * 647 559[28] 90/12.5 200 2 16 26 84 26 84 6 2 124 2 * 647 455[28] 90/07.5 120 2 16 26 84 26 77 6 2 76 2 * 647 293[28] 70/12.5 200 2 16 26 84 26 75 6 2 124 2 * 647 438[28] 70/07.5 120 2 16 26 84 26 82 6 2 76 2 * 647 285[28] 40/15 240 2 16 26 84 26 53 6 2 124 2 * 647 528[28] 50/12.5 200 2 16 26 84 26 49 6 2 124 2 * 647 429[28] 50/07.5 120 2 16 26 84 26 50 6 2 76 2 * 647 257[28] 30/12.5 200 2 16 26 84 26 51 6 2 124 2 * 647 408[28] 30/07.5 120 2 16 26 84 26 45 6 2 76 2 * 647 227
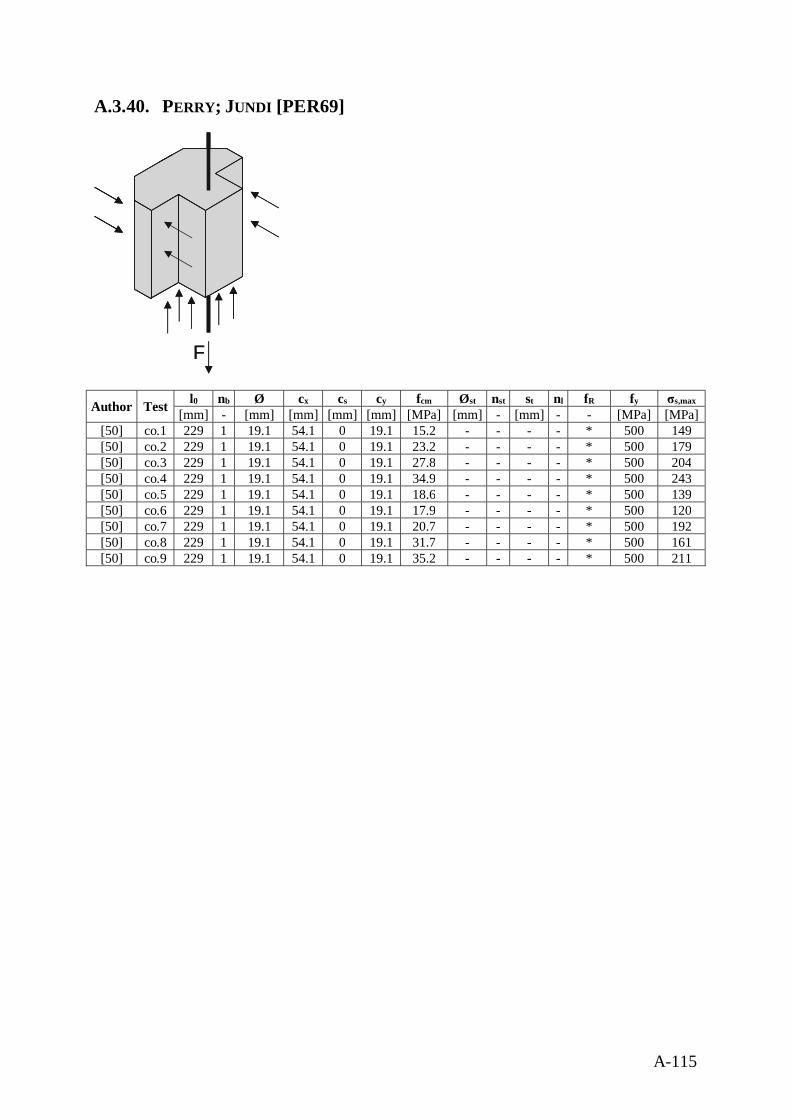
A-115
A.3.40. PERRY; JUNDI [PER69]
Author Test l0 nb Ø cx cs cy fcm Øst nst st nl fR fy σs,max
[mm] - [mm] [mm] [mm] [mm] [MPa] [mm] - [mm] - - [MPa] [MPa][50] co.1 229 1 19.1 54.1 0 19.1 15.2 - - - - * 500 149[50] co.2 229 1 19.1 54.1 0 19.1 23.2 - - - - * 500 179[50] co.3 229 1 19.1 54.1 0 19.1 27.8 - - - - * 500 204[50] co.4 229 1 19.1 54.1 0 19.1 34.9 - - - - * 500 243[50] co.5 229 1 19.1 54.1 0 19.1 18.6 - - - - * 500 139[50] co.6 229 1 19.1 54.1 0 19.1 17.9 - - - - * 500 120[50] co.7 229 1 19.1 54.1 0 19.1 20.7 - - - - * 500 192[50] co.8 229 1 19.1 54.1 0 19.1 31.7 - - - - * 500 161[50] co.9 229 1 19.1 54.1 0 19.1 35.2 - - - - * 500 211
FF
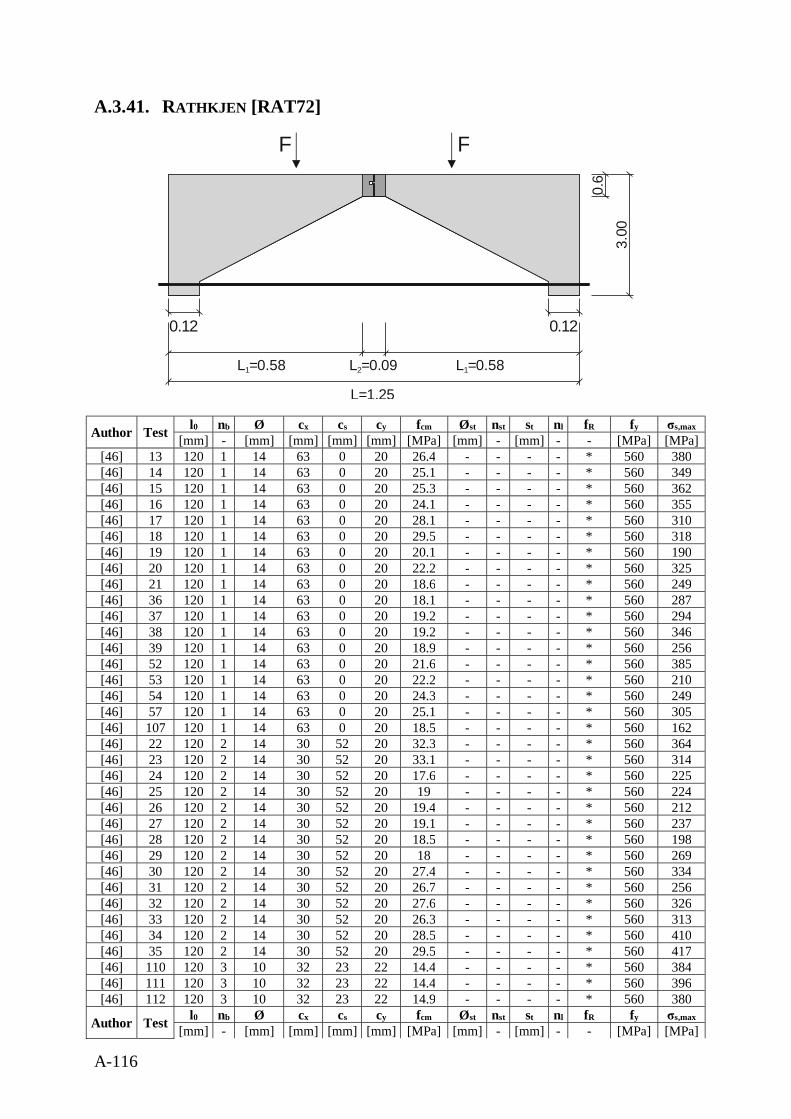
A-116
A.3.41. RATHKJEN [RAT72]
Author Test l0 nb Ø cx cs cy fcm Øst nst st nl fR fy σs,max
[mm] - [mm] [mm] [mm] [mm] [MPa] [mm] - [mm] - - [MPa] [MPa][46] 13 120 1 14 63 0 20 26.4 - - - - * 560 380[46] 14 120 1 14 63 0 20 25.1 - - - - * 560 349[46] 15 120 1 14 63 0 20 25.3 - - - - * 560 362[46] 16 120 1 14 63 0 20 24.1 - - - - * 560 355[46] 17 120 1 14 63 0 20 28.1 - - - - * 560 310[46] 18 120 1 14 63 0 20 29.5 - - - - * 560 318[46] 19 120 1 14 63 0 20 20.1 - - - - * 560 190[46] 20 120 1 14 63 0 20 22.2 - - - - * 560 325[46] 21 120 1 14 63 0 20 18.6 - - - - * 560 249[46] 36 120 1 14 63 0 20 18.1 - - - - * 560 287[46] 37 120 1 14 63 0 20 19.2 - - - - * 560 294[46] 38 120 1 14 63 0 20 19.2 - - - - * 560 346[46] 39 120 1 14 63 0 20 18.9 - - - - * 560 256[46] 52 120 1 14 63 0 20 21.6 - - - - * 560 385[46] 53 120 1 14 63 0 20 22.2 - - - - * 560 210[46] 54 120 1 14 63 0 20 24.3 - - - - * 560 249[46] 57 120 1 14 63 0 20 25.1 - - - - * 560 305[46] 107 120 1 14 63 0 20 18.5 - - - - * 560 162[46] 22 120 2 14 30 52 20 32.3 - - - - * 560 364[46] 23 120 2 14 30 52 20 33.1 - - - - * 560 314[46] 24 120 2 14 30 52 20 17.6 - - - - * 560 225[46] 25 120 2 14 30 52 20 19 - - - - * 560 224[46] 26 120 2 14 30 52 20 19.4 - - - - * 560 212[46] 27 120 2 14 30 52 20 19.1 - - - - * 560 237[46] 28 120 2 14 30 52 20 18.5 - - - - * 560 198[46] 29 120 2 14 30 52 20 18 - - - - * 560 269[46] 30 120 2 14 30 52 20 27.4 - - - - * 560 334[46] 31 120 2 14 30 52 20 26.7 - - - - * 560 256[46] 32 120 2 14 30 52 20 27.6 - - - - * 560 326[46] 33 120 2 14 30 52 20 26.3 - - - - * 560 313[46] 34 120 2 14 30 52 20 28.5 - - - - * 560 410[46] 35 120 2 14 30 52 20 29.5 - - - - * 560 417[46] 110 120 3 10 32 23 22 14.4 - - - - * 560 384[46] 111 120 3 10 32 23 22 14.4 - - - - * 560 396[46] 112 120 3 10 32 23 22 14.9 - - - - * 560 380
Author Test l0 nb Ø cx cs cy fcm Øst nst st nl fR fy σs,max
[mm] - [mm] [mm] [mm] [mm] [MPa] [mm] - [mm] - - [MPa] [MPa]
F
3.00
L =0.581 L =0.092 L =0.581
L=1.25
0.12 0.12
0.6
F
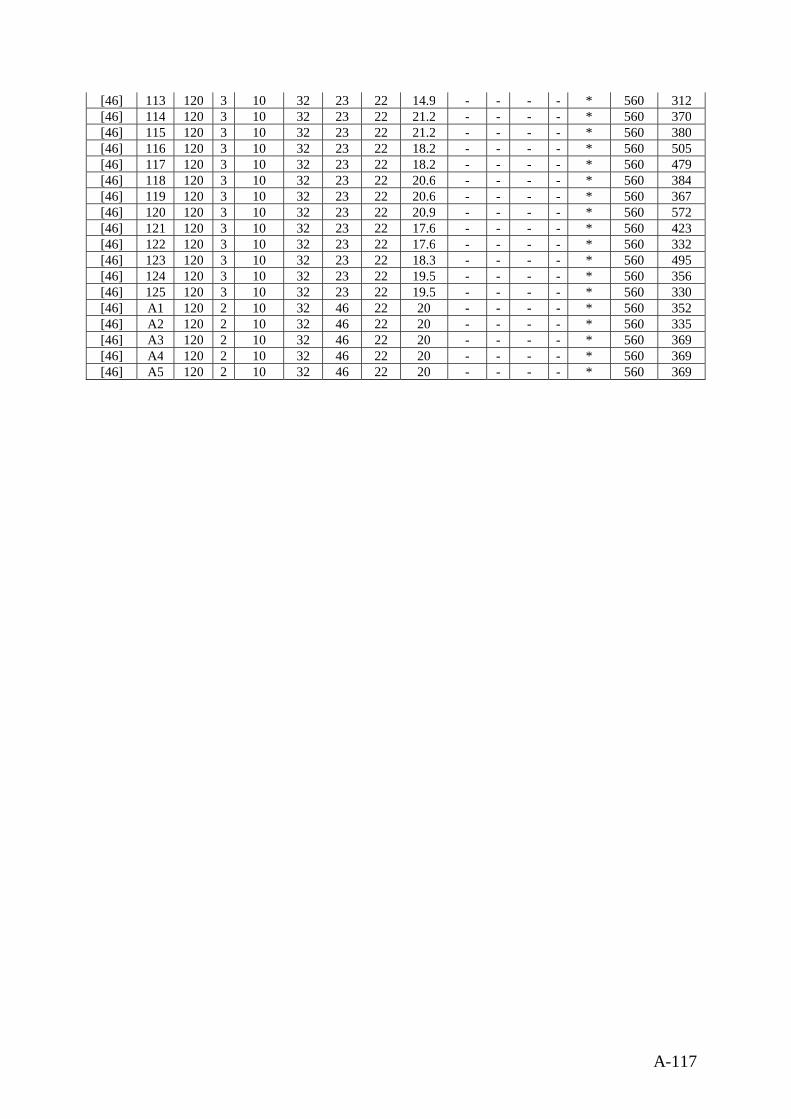
A-117
[46] 113 120 3 10 32 23 22 14.9 - - - - * 560 312[46] 114 120 3 10 32 23 22 21.2 - - - - * 560 370[46] 115 120 3 10 32 23 22 21.2 - - - - * 560 380[46] 116 120 3 10 32 23 22 18.2 - - - - * 560 505[46] 117 120 3 10 32 23 22 18.2 - - - - * 560 479[46] 118 120 3 10 32 23 22 20.6 - - - - * 560 384[46] 119 120 3 10 32 23 22 20.6 - - - - * 560 367[46] 120 120 3 10 32 23 22 20.9 - - - - * 560 572[46] 121 120 3 10 32 23 22 17.6 - - - - * 560 423[46] 122 120 3 10 32 23 22 17.6 - - - - * 560 332[46] 123 120 3 10 32 23 22 18.3 - - - - * 560 495[46] 124 120 3 10 32 23 22 19.5 - - - - * 560 356[46] 125 120 3 10 32 23 22 19.5 - - - - * 560 330[46] A1 120 2 10 32 46 22 20 - - - - * 560 352[46] A2 120 2 10 32 46 22 20 - - - - * 560 335[46] A3 120 2 10 32 46 22 20 - - - - * 560 369[46] A4 120 2 10 32 46 22 20 - - - - * 560 369[46] A5 120 2 10 32 46 22 20 - - - - * 560 369
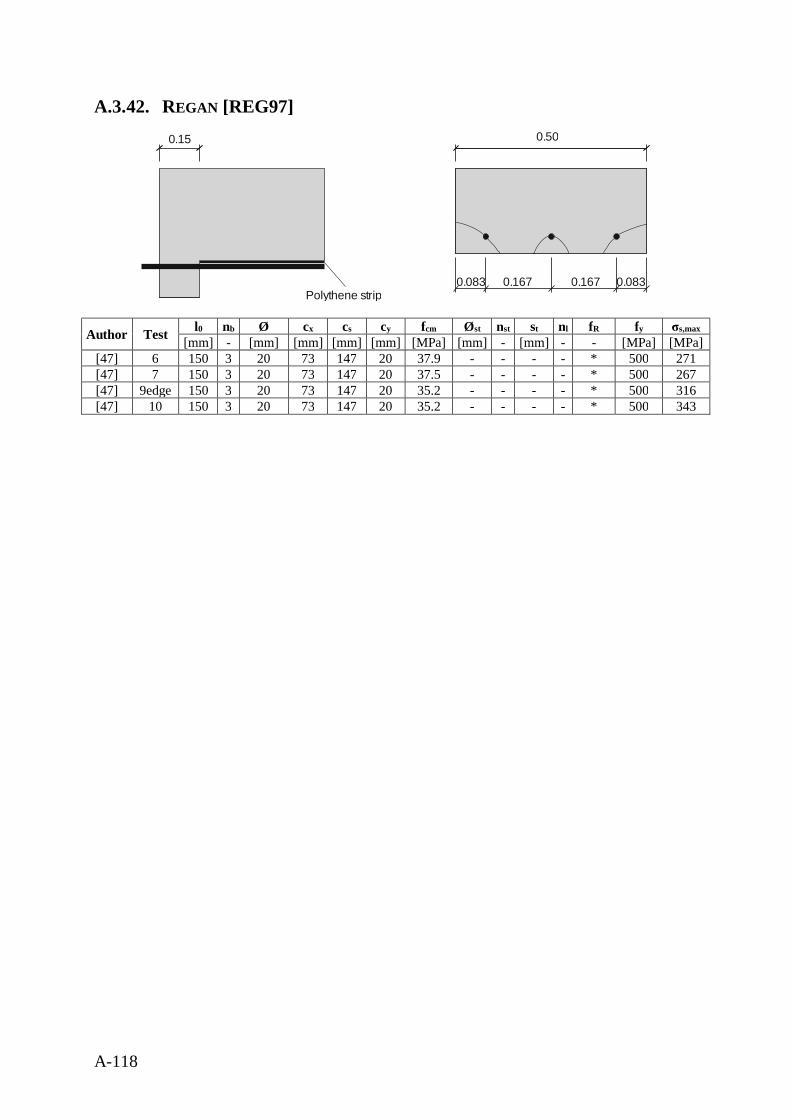
A-118
A.3.42. REGAN [REG97]
Author Test l0 nb Ø cx cs cy fcm Øst nst st nl fR fy σs,max
[mm] - [mm] [mm] [mm] [mm] [MPa] [mm] - [mm] - - [MPa] [MPa][47] 6 150 3 20 73 147 20 37.9 - - - - * 500 271[47] 7 150 3 20 73 147 20 37.5 - - - - * 500 267[47] 9edge 150 3 20 73 147 20 35.2 - - - - * 500 316[47] 10 150 3 20 73 147 20 35.2 - - - - * 500 343
0.083
0.500.15
Polythene strip0.0830.167 0.167
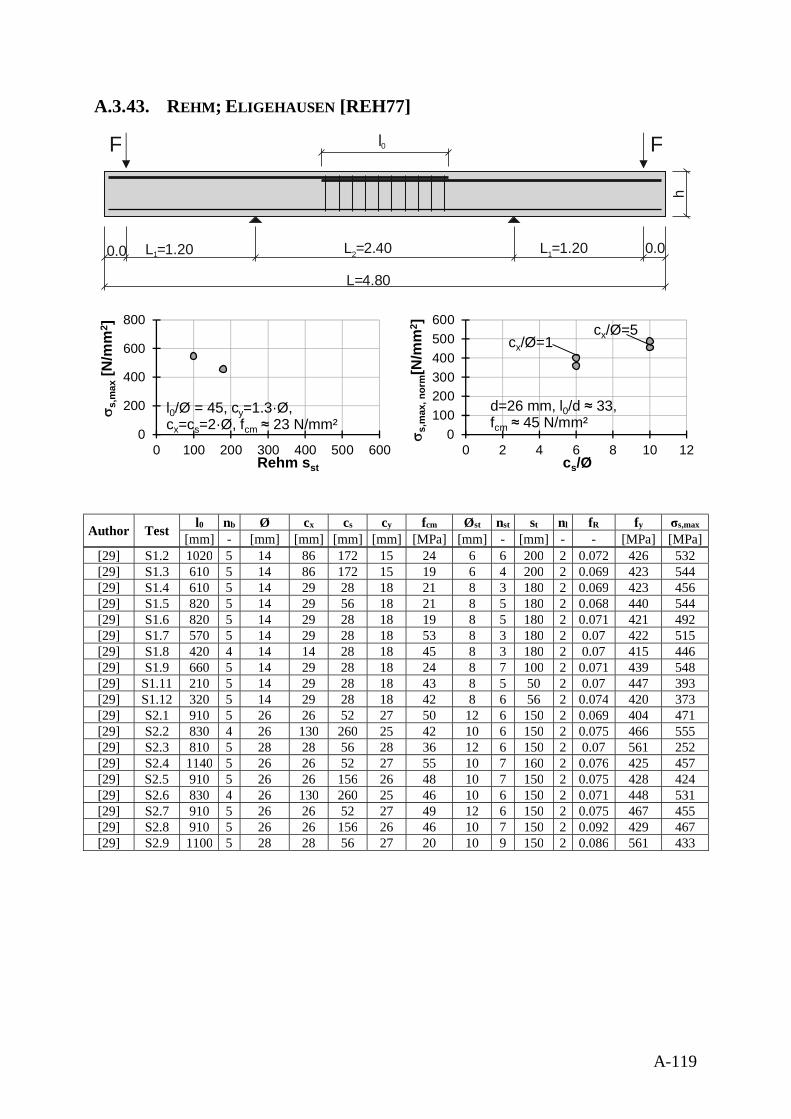
A-119
A.3.43. REHM; ELIGEHAUSEN [REH77]
Author Test l0 nb Ø cx cs cy fcm Øst nst st nl fR fy σs,max
[mm] - [mm] [mm] [mm] [mm] [MPa] [mm] - [mm] - - [MPa] [MPa][29] S1.2 1020 5 14 86 172 15 24 6 6 200 2 0.072 426 532[29] S1.3 610 5 14 86 172 15 19 6 4 200 2 0.069 423 544[29] S1.4 610 5 14 29 28 18 21 8 3 180 2 0.069 423 456[29] S1.5 820 5 14 29 56 18 21 8 5 180 2 0.068 440 544[29] S1.6 820 5 14 29 28 18 19 8 5 180 2 0.071 421 492[29] S1.7 570 5 14 29 28 18 53 8 3 180 2 0.07 422 515[29] S1.8 420 4 14 14 28 18 45 8 3 180 2 0.07 415 446[29] S1.9 660 5 14 29 28 18 24 8 7 100 2 0.071 439 548[29] S1.11 210 5 14 29 28 18 43 8 5 50 2 0.07 447 393[29] S1.12 320 5 14 29 28 18 42 8 6 56 2 0.074 420 373[29] S2.1 910 5 26 26 52 27 50 12 6 150 2 0.069 404 471[29] S2.2 830 4 26 130 260 25 42 10 6 150 2 0.075 466 555[29] S2.3 810 5 28 28 56 28 36 12 6 150 2 0.07 561 252[29] S2.4 1140 5 26 26 52 27 55 10 7 160 2 0.076 425 457[29] S2.5 910 5 26 26 156 26 48 10 7 150 2 0.075 428 424[29] S2.6 830 4 26 130 260 25 46 10 6 150 2 0.071 448 531[29] S2.7 910 5 26 26 52 27 49 12 6 150 2 0.075 467 455[29] S2.8 910 5 26 26 156 26 46 10 7 150 2 0.092 429 467[29] S2.9 1100 5 28 28 56 27 20 10 9 150 2 0.086 561 433
F F
h
0.0 L =1.201 L =2.402 L =1.201 0.0
L=4.80
l0
0
200
400
600
800
0 100 200 300 400 500 600
s s,m
ax[N
/mm
2 ]
Rehm sst
l0/Ø = 45, cy=1.3·Ø,cx=cs=2·Ø, fcm ≈ 23 N/mm²
0100200300400500600
0 2 4 6 8 10 12
s s,m
ax, n
orm
[N/m
m2 ]
cs/Ø
d=26 mm, l0/d ≈ 33,fcm ≈ 45 N/mm²
cx/Ø=1cx/Ø=5
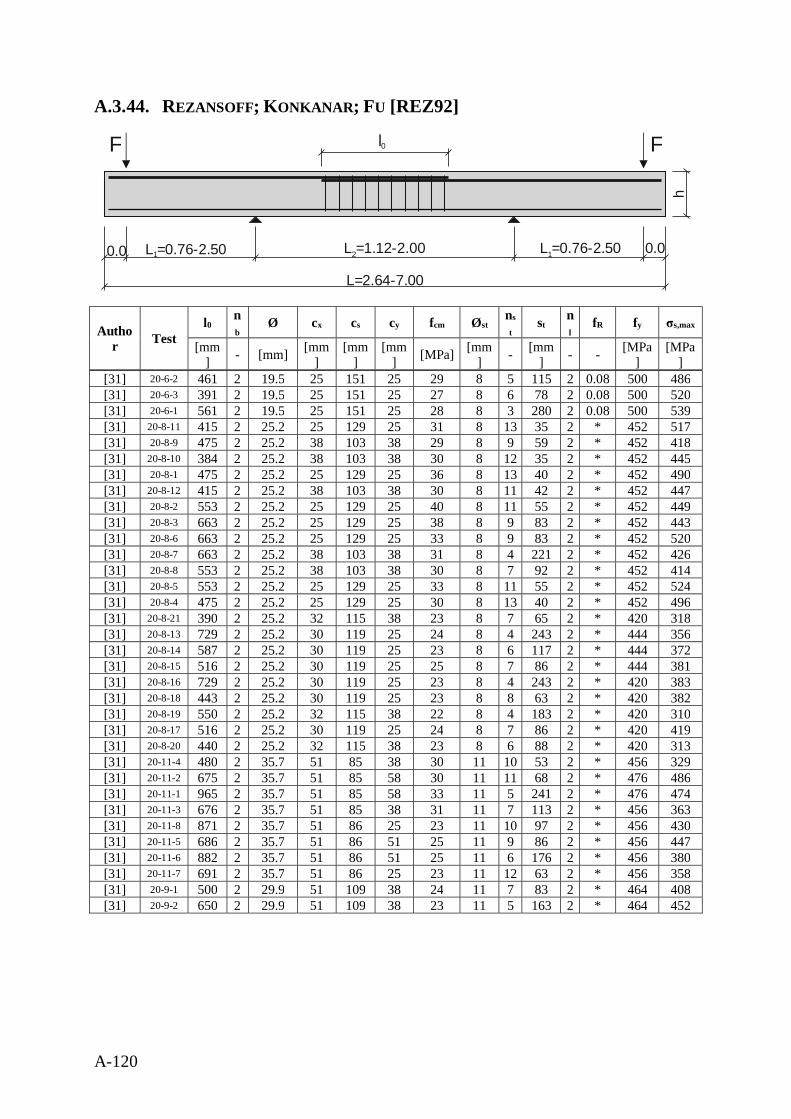
A-120
A.3.44. REZANSOFF; KONKANAR; FU [REZ92]
Author Test
l0nb
Ø cx cs cy fcm Østns
tst
nl
fR fy σs,max
[mm] - [mm] [mm
][mm
][mm
] [MPa] [mm] - [mm
] - - [MPa]
[MPa]
[31] 20-6-2 461 2 19.5 25 151 25 29 8 5 115 2 0.08 500 486[31] 20-6-3 391 2 19.5 25 151 25 27 8 6 78 2 0.08 500 520[31] 20-6-1 561 2 19.5 25 151 25 28 8 3 280 2 0.08 500 539[31] 20-8-11 415 2 25.2 25 129 25 31 8 13 35 2 * 452 517[31] 20-8-9 475 2 25.2 38 103 38 29 8 9 59 2 * 452 418[31] 20-8-10 384 2 25.2 38 103 38 30 8 12 35 2 * 452 445[31] 20-8-1 475 2 25.2 25 129 25 36 8 13 40 2 * 452 490[31] 20-8-12 415 2 25.2 38 103 38 30 8 11 42 2 * 452 447[31] 20-8-2 553 2 25.2 25 129 25 40 8 11 55 2 * 452 449[31] 20-8-3 663 2 25.2 25 129 25 38 8 9 83 2 * 452 443[31] 20-8-6 663 2 25.2 25 129 25 33 8 9 83 2 * 452 520[31] 20-8-7 663 2 25.2 38 103 38 31 8 4 221 2 * 452 426[31] 20-8-8 553 2 25.2 38 103 38 30 8 7 92 2 * 452 414[31] 20-8-5 553 2 25.2 25 129 25 33 8 11 55 2 * 452 524[31] 20-8-4 475 2 25.2 25 129 25 30 8 13 40 2 * 452 496[31] 20-8-21 390 2 25.2 32 115 38 23 8 7 65 2 * 420 318[31] 20-8-13 729 2 25.2 30 119 25 24 8 4 243 2 * 444 356[31] 20-8-14 587 2 25.2 30 119 25 23 8 6 117 2 * 444 372[31] 20-8-15 516 2 25.2 30 119 25 25 8 7 86 2 * 444 381[31] 20-8-16 729 2 25.2 30 119 25 23 8 4 243 2 * 420 383[31] 20-8-18 443 2 25.2 30 119 25 23 8 8 63 2 * 420 382[31] 20-8-19 550 2 25.2 32 115 38 22 8 4 183 2 * 420 310[31] 20-8-17 516 2 25.2 30 119 25 24 8 7 86 2 * 420 419[31] 20-8-20 440 2 25.2 32 115 38 23 8 6 88 2 * 420 313[31] 20-11-4 480 2 35.7 51 85 38 30 11 10 53 2 * 456 329[31] 20-11-2 675 2 35.7 51 85 58 30 11 11 68 2 * 476 486[31] 20-11-1 965 2 35.7 51 85 58 33 11 5 241 2 * 476 474[31] 20-11-3 676 2 35.7 51 85 38 31 11 7 113 2 * 456 363[31] 20-11-8 871 2 35.7 51 86 25 23 11 10 97 2 * 456 430[31] 20-11-5 686 2 35.7 51 86 51 25 11 9 86 2 * 456 447[31] 20-11-6 882 2 35.7 51 86 51 25 11 6 176 2 * 456 380[31] 20-11-7 691 2 35.7 51 86 25 23 11 12 63 2 * 456 358[31] 20-9-1 500 2 29.9 51 109 38 24 11 7 83 2 * 464 408[31] 20-9-2 650 2 29.9 51 109 38 23 11 5 163 2 * 464 452
F F
h
0.0 L =0.76-2.501 L =1.12-2.002 L =0.76-2.501 0.0
L=2.64-7.00
l0
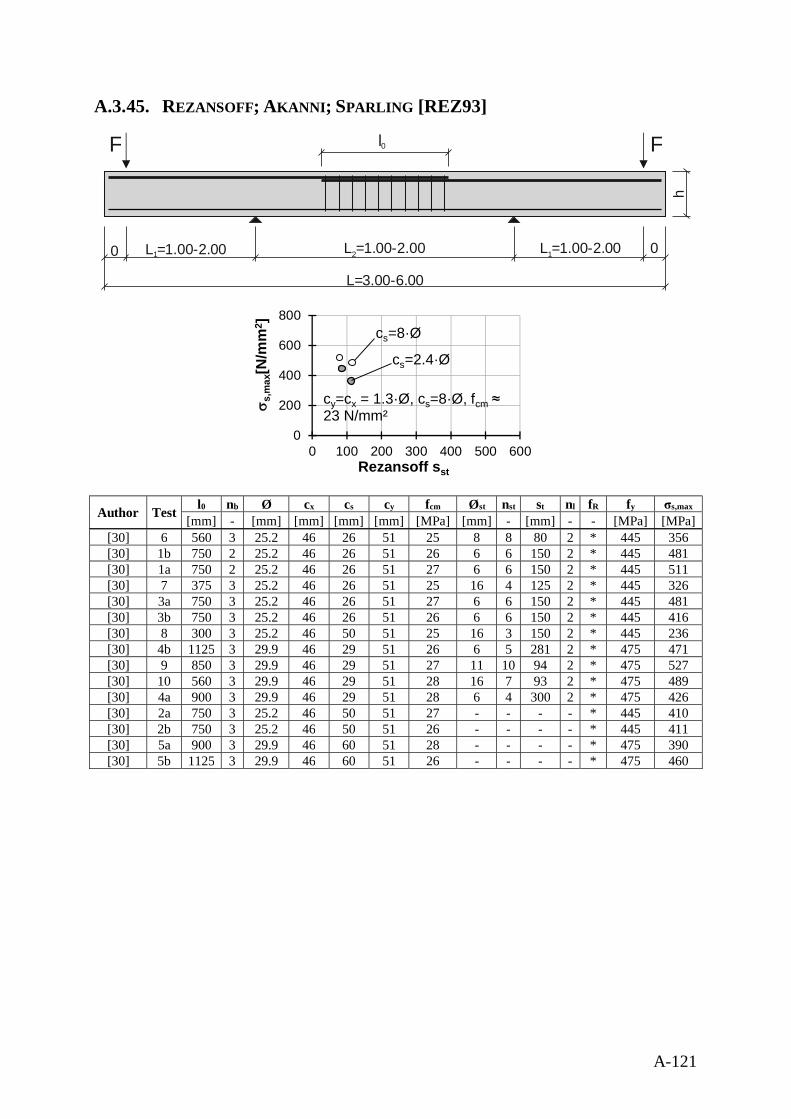
A-121
A.3.45. REZANSOFF; AKANNI; SPARLING [REZ93]
Author Test l0 nb Ø cx cs cy fcm Øst nst st nl fR fy σs,max
[mm] - [mm] [mm] [mm] [mm] [MPa] [mm] - [mm] - - [MPa] [MPa][30] 6 560 3 25.2 46 26 51 25 8 8 80 2 * 445 356[30] 1b 750 2 25.2 46 26 51 26 6 6 150 2 * 445 481[30] 1a 750 2 25.2 46 26 51 27 6 6 150 2 * 445 511[30] 7 375 3 25.2 46 26 51 25 16 4 125 2 * 445 326[30] 3a 750 3 25.2 46 26 51 27 6 6 150 2 * 445 481[30] 3b 750 3 25.2 46 26 51 26 6 6 150 2 * 445 416[30] 8 300 3 25.2 46 50 51 25 16 3 150 2 * 445 236[30] 4b 1125 3 29.9 46 29 51 26 6 5 281 2 * 475 471[30] 9 850 3 29.9 46 29 51 27 11 10 94 2 * 475 527[30] 10 560 3 29.9 46 29 51 28 16 7 93 2 * 475 489[30] 4a 900 3 29.9 46 29 51 28 6 4 300 2 * 475 426[30] 2a 750 3 25.2 46 50 51 27 - - - - * 445 410[30] 2b 750 3 25.2 46 50 51 26 - - - - * 445 411[30] 5a 900 3 29.9 46 60 51 28 - - - - * 475 390[30] 5b 1125 3 29.9 46 60 51 26 - - - - * 475 460
F F
h
0 L =1.00-2.001 L =1.00-2.002 L =1.00-2.001 0
L=3.00-6.00
l0
0
200
400
600
800
0 100 200 300 400 500 600
s s,m
ax[N
/mm
2 ]
Rezansoff sst
cy=cx = 1.3·Ø, cs=8·Ø, fcm ≈23 N/mm²
cs=8·Ø
cs=2.4·Ø
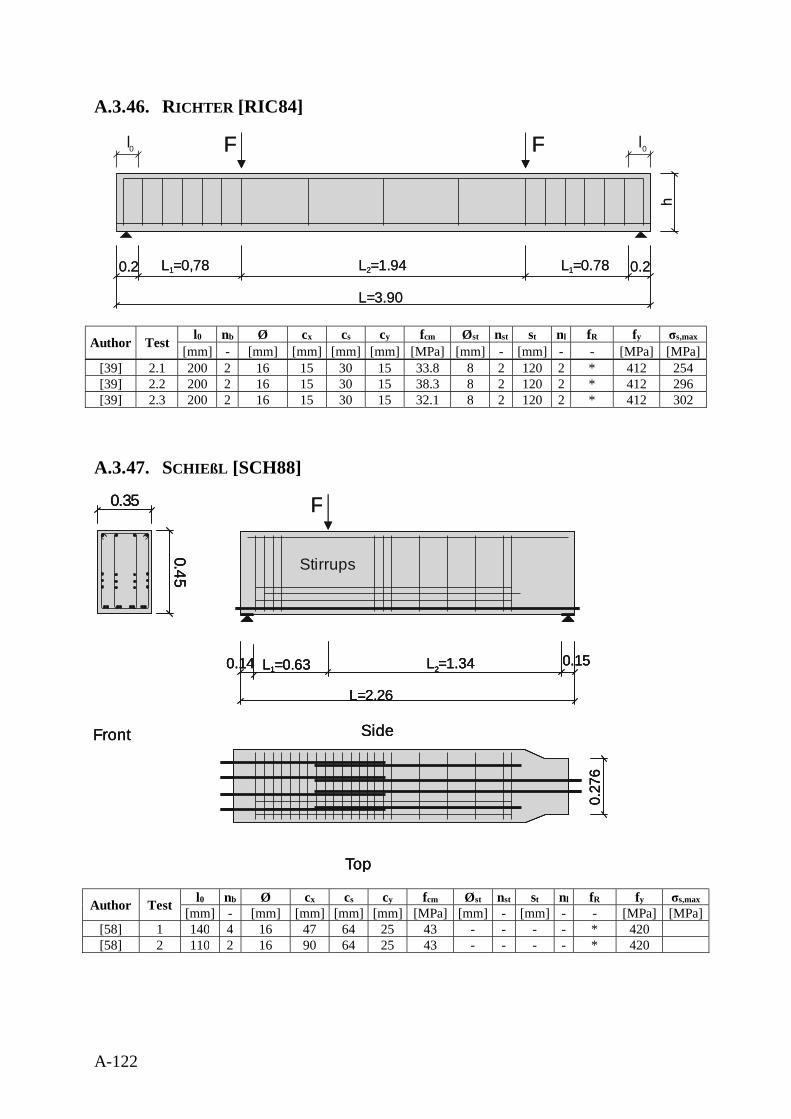
A-122
A.3.46. RICHTER [RIC84]
Author Test l0 nb Ø cx cs cy fcm Øst nst st nl fR fy σs,max
[mm] - [mm] [mm] [mm] [mm] [MPa] [mm] - [mm] - - [MPa] [MPa][39] 2.1 200 2 16 15 30 15 33.8 8 2 120 2 * 412 254[39] 2.2 200 2 16 15 30 15 38.3 8 2 120 2 * 412 296[39] 2.3 200 2 16 15 30 15 32.1 8 2 120 2 * 412 302
A.3.47. SCHIEßL [SCH88]
Author Test l0 nb Ø cx cs cy fcm Øst nst st nl fR fy σs,max
[mm] - [mm] [mm] [mm] [mm] [MPa] [mm] - [mm] - - [MPa] [MPa][58] 1 140 4 16 47 64 25 43 - - - - * 420[58] 2 110 2 16 90 64 25 43 - - - - * 420
h
0.2 L =0,781 L =1.942 L =0.781 0.2
L=3.90
F F
h
0.2 L =0,781 L =1.942 L =0.781 0.2
L=3.90
F Fl0 l0
F
0.27
6
0.14 L =0.631 L =1.3420.15
L=2.26
0.35
0.45
Front Side
Top
Stirrups
0.27
6
0.14 L =0.631 L =1.3420.15
L=2.26
0.35
0.45
Front Side
Top
F
0.27
6
0.14 L =0.631 L =1.3420.15
L=2.26
0.35
0.45
Front Side
Top
Stirrups
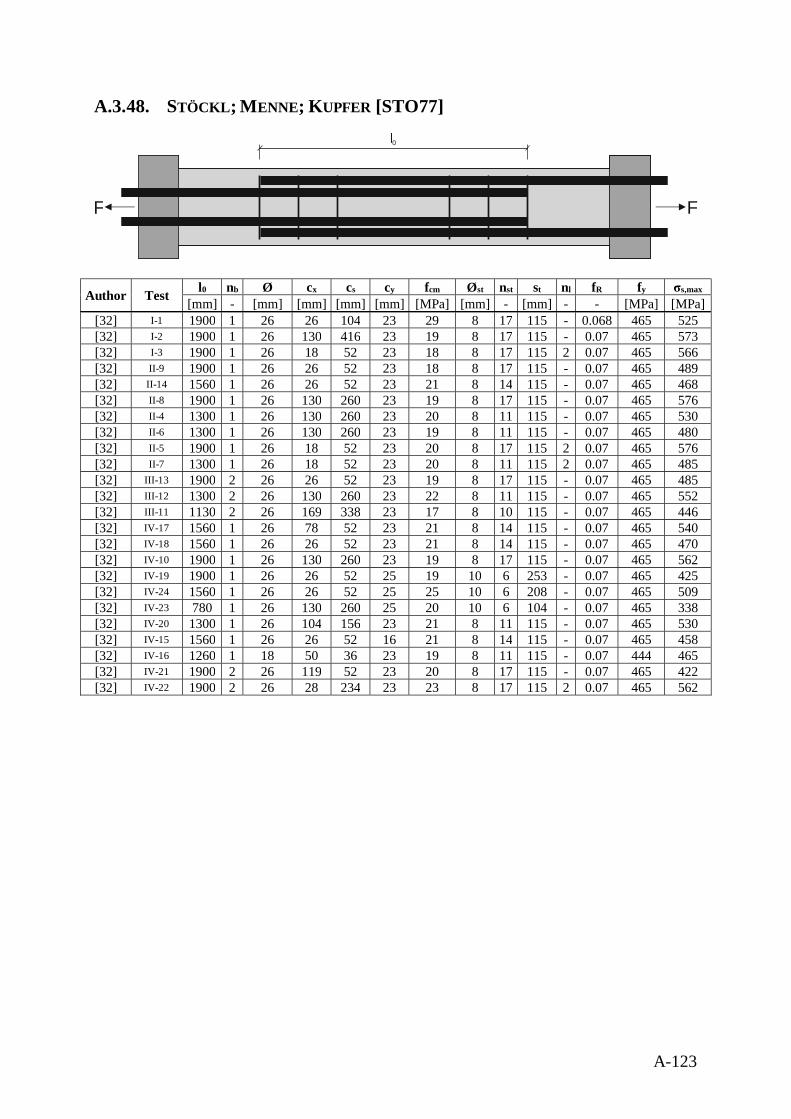
A-123
A.3.48. STÖCKL; MENNE; KUPFER [STO77]
Author Test l0 nb Ø cx cs cy fcm Øst nst st nl fR fy σs,max
[mm] - [mm] [mm] [mm] [mm] [MPa] [mm] - [mm] - - [MPa] [MPa][32] I-1 1900 1 26 26 104 23 29 8 17 115 - 0.068 465 525[32] I-2 1900 1 26 130 416 23 19 8 17 115 - 0.07 465 573[32] I-3 1900 1 26 18 52 23 18 8 17 115 2 0.07 465 566[32] II-9 1900 1 26 26 52 23 18 8 17 115 - 0.07 465 489[32] II-14 1560 1 26 26 52 23 21 8 14 115 - 0.07 465 468[32] II-8 1900 1 26 130 260 23 19 8 17 115 - 0.07 465 576[32] II-4 1300 1 26 130 260 23 20 8 11 115 - 0.07 465 530[32] II-6 1300 1 26 130 260 23 19 8 11 115 - 0.07 465 480[32] II-5 1900 1 26 18 52 23 20 8 17 115 2 0.07 465 576[32] II-7 1300 1 26 18 52 23 20 8 11 115 2 0.07 465 485[32] III-13 1900 2 26 26 52 23 19 8 17 115 - 0.07 465 485[32] III-12 1300 2 26 130 260 23 22 8 11 115 - 0.07 465 552[32] III-11 1130 2 26 169 338 23 17 8 10 115 - 0.07 465 446[32] IV-17 1560 1 26 78 52 23 21 8 14 115 - 0.07 465 540[32] IV-18 1560 1 26 26 52 23 21 8 14 115 - 0.07 465 470[32] IV-10 1900 1 26 130 260 23 19 8 17 115 - 0.07 465 562[32] IV-19 1900 1 26 26 52 25 19 10 6 253 - 0.07 465 425[32] IV-24 1560 1 26 26 52 25 25 10 6 208 - 0.07 465 509[32] IV-23 780 1 26 130 260 25 20 10 6 104 - 0.07 465 338[32] IV-20 1300 1 26 104 156 23 21 8 11 115 - 0.07 465 530[32] IV-15 1560 1 26 26 52 16 21 8 14 115 - 0.07 465 458[32] IV-16 1260 1 18 50 36 23 19 8 11 115 - 0.07 444 465[32] IV-21 1900 2 26 119 52 23 20 8 17 115 - 0.07 465 422[32] IV-22 1900 2 26 28 234 23 23 8 17 115 2 0.07 465 562
F F
l0
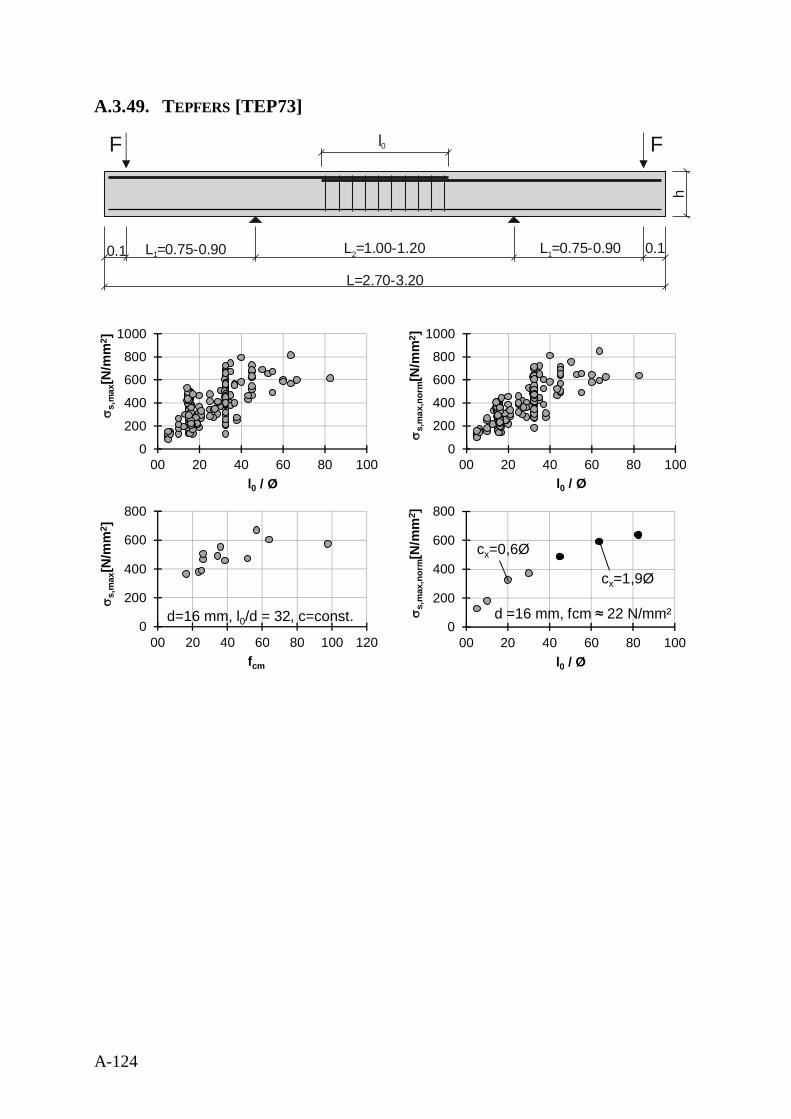
A-124
A.3.49. TEPFERS [TEP73]
F F
h
0.1 L =0.75-0.901 L =1.00-1.202 L =0.75-0.901 0.1
L=2.70-3.20
l0
0
200
400
600
800
1000
00 20 40 60 80 100
s s,m
ax[N
/mm
2 ]
l0 / Ø
0
200
400
600
800
1000
00 20 40 60 80 100
ss,
max
,nor
m[N
/mm
2 ]
l0 / Ø
0
200
400
600
800
00 20 40 60 80 100 120
s s,m
ax[N
/mm
2 ]
fcm
d=16 mm, l0/d = 32, c=const.0
200
400
600
800
00 20 40 60 80 100
s s,m
ax,n
orm
[N/m
m2 ]
l0 / Ø
d =16 mm, fcm ≈ 22 N/mm²
cx=0,6Ø
cx=1,9Ø
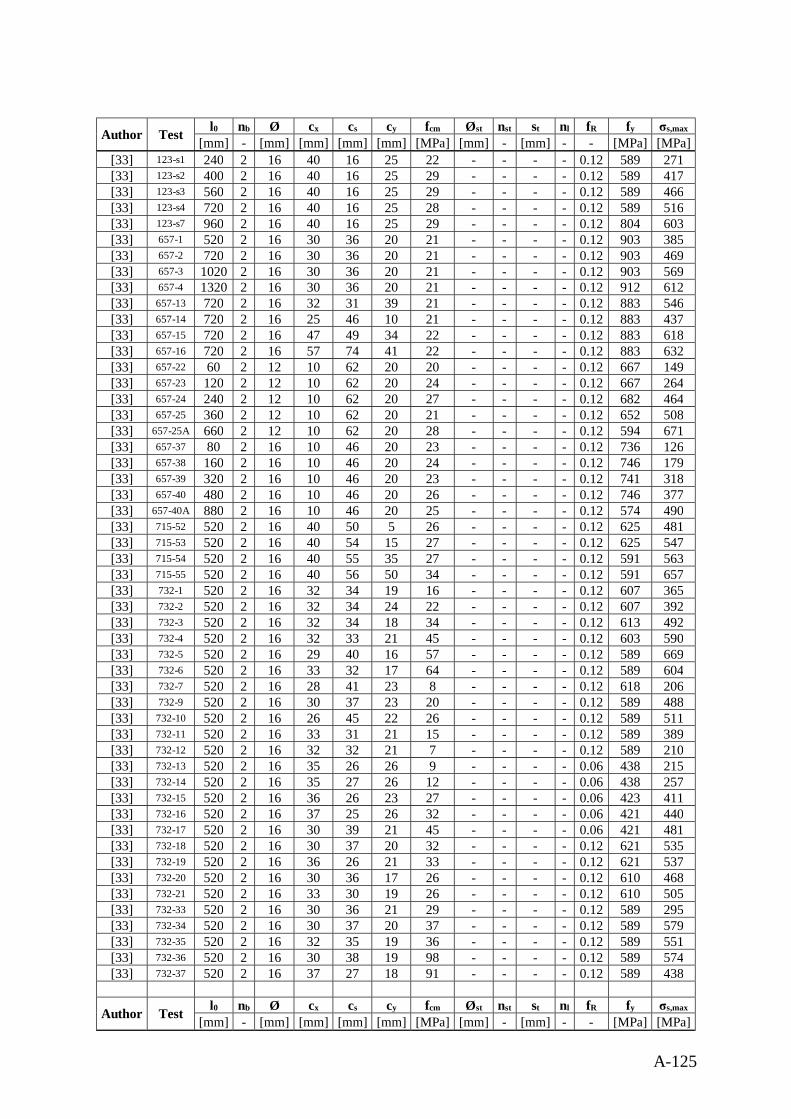
A-125
Author Test l0 nb Ø cx cs cy fcm Øst nst st nl fR fy σs,max
[mm] - [mm] [mm] [mm] [mm] [MPa] [mm] - [mm] - - [MPa] [MPa][33] 123-s1 240 2 16 40 16 25 22 - - - - 0.12 589 271[33] 123-s2 400 2 16 40 16 25 29 - - - - 0.12 589 417[33] 123-s3 560 2 16 40 16 25 29 - - - - 0.12 589 466[33] 123-s4 720 2 16 40 16 25 28 - - - - 0.12 589 516[33] 123-s7 960 2 16 40 16 25 29 - - - - 0.12 804 603[33] 657-1 520 2 16 30 36 20 21 - - - - 0.12 903 385[33] 657-2 720 2 16 30 36 20 21 - - - - 0.12 903 469[33] 657-3 1020 2 16 30 36 20 21 - - - - 0.12 903 569[33] 657-4 1320 2 16 30 36 20 21 - - - - 0.12 912 612[33] 657-13 720 2 16 32 31 39 21 - - - - 0.12 883 546[33] 657-14 720 2 16 25 46 10 21 - - - - 0.12 883 437[33] 657-15 720 2 16 47 49 34 22 - - - - 0.12 883 618[33] 657-16 720 2 16 57 74 41 22 - - - - 0.12 883 632[33] 657-22 60 2 12 10 62 20 20 - - - - 0.12 667 149[33] 657-23 120 2 12 10 62 20 24 - - - - 0.12 667 264[33] 657-24 240 2 12 10 62 20 27 - - - - 0.12 682 464[33] 657-25 360 2 12 10 62 20 21 - - - - 0.12 652 508[33] 657-25A 660 2 12 10 62 20 28 - - - - 0.12 594 671[33] 657-37 80 2 16 10 46 20 23 - - - - 0.12 736 126[33] 657-38 160 2 16 10 46 20 24 - - - - 0.12 746 179[33] 657-39 320 2 16 10 46 20 23 - - - - 0.12 741 318[33] 657-40 480 2 16 10 46 20 26 - - - - 0.12 746 377[33] 657-40A 880 2 16 10 46 20 25 - - - - 0.12 574 490[33] 715-52 520 2 16 40 50 5 26 - - - - 0.12 625 481[33] 715-53 520 2 16 40 54 15 27 - - - - 0.12 625 547[33] 715-54 520 2 16 40 55 35 27 - - - - 0.12 591 563[33] 715-55 520 2 16 40 56 50 34 - - - - 0.12 591 657[33] 732-1 520 2 16 32 34 19 16 - - - - 0.12 607 365[33] 732-2 520 2 16 32 34 24 22 - - - - 0.12 607 392[33] 732-3 520 2 16 32 34 18 34 - - - - 0.12 613 492[33] 732-4 520 2 16 32 33 21 45 - - - - 0.12 603 590[33] 732-5 520 2 16 29 40 16 57 - - - - 0.12 589 669[33] 732-6 520 2 16 33 32 17 64 - - - - 0.12 589 604[33] 732-7 520 2 16 28 41 23 8 - - - - 0.12 618 206[33] 732-9 520 2 16 30 37 23 20 - - - - 0.12 589 488[33] 732-10 520 2 16 26 45 22 26 - - - - 0.12 589 511[33] 732-11 520 2 16 33 31 21 15 - - - - 0.12 589 389[33] 732-12 520 2 16 32 32 21 7 - - - - 0.12 589 210[33] 732-13 520 2 16 35 26 26 9 - - - - 0.06 438 215[33] 732-14 520 2 16 35 27 26 12 - - - - 0.06 438 257[33] 732-15 520 2 16 36 26 23 27 - - - - 0.06 423 411[33] 732-16 520 2 16 37 25 26 32 - - - - 0.06 421 440[33] 732-17 520 2 16 30 39 21 45 - - - - 0.06 421 481[33] 732-18 520 2 16 30 37 20 32 - - - - 0.12 621 535[33] 732-19 520 2 16 36 26 21 33 - - - - 0.12 621 537[33] 732-20 520 2 16 30 36 17 26 - - - - 0.12 610 468[33] 732-21 520 2 16 33 30 19 26 - - - - 0.12 610 505[33] 732-33 520 2 16 30 36 21 29 - - - - 0.12 589 295[33] 732-34 520 2 16 30 37 20 37 - - - - 0.12 589 579[33] 732-35 520 2 16 32 35 19 36 - - - - 0.12 589 551[33] 732-36 520 2 16 30 38 19 98 - - - - 0.12 589 574[33] 732-37 520 2 16 37 27 18 91 - - - - 0.12 589 438
Author Test l0 nb Ø cx cs cy fcm Øst nst st nl fR fy σs,max
[mm] - [mm] [mm] [mm] [mm] [MPa] [mm] - [mm] - - [MPa] [MPa]
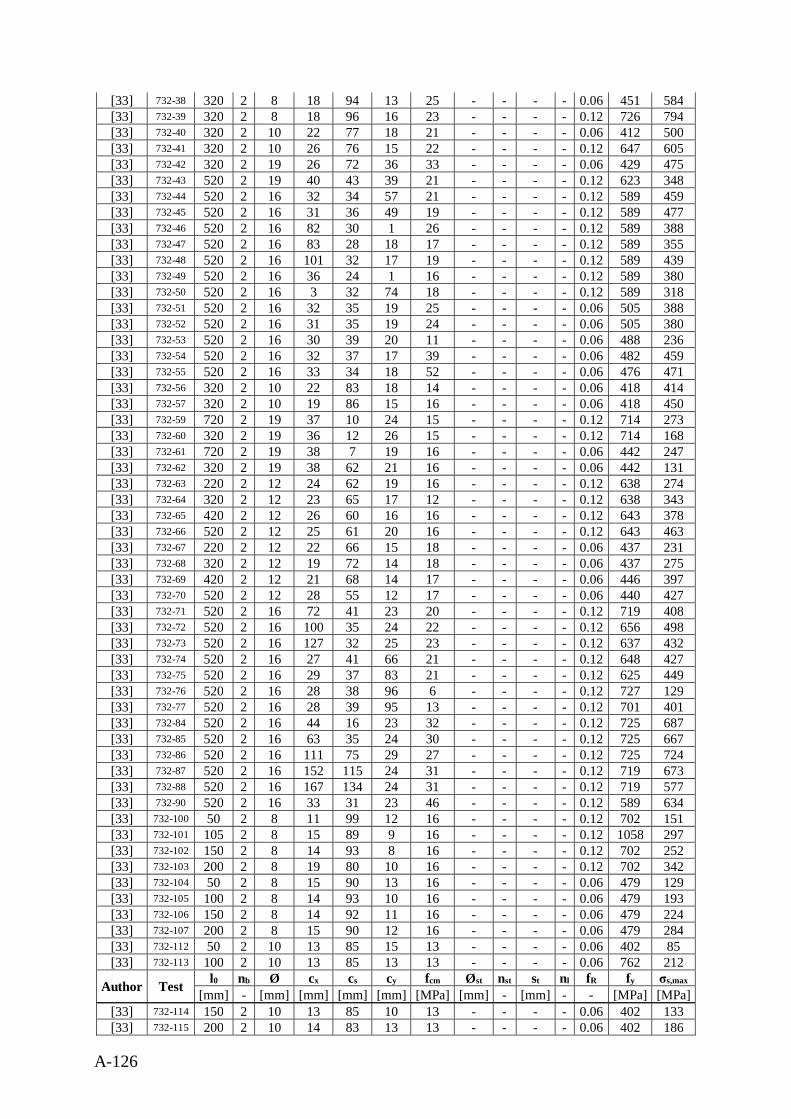
A-126
[33] 732-38 320 2 8 18 94 13 25 - - - - 0.06 451 584[33] 732-39 320 2 8 18 96 16 23 - - - - 0.12 726 794[33] 732-40 320 2 10 22 77 18 21 - - - - 0.06 412 500[33] 732-41 320 2 10 26 76 15 22 - - - - 0.12 647 605[33] 732-42 320 2 19 26 72 36 33 - - - - 0.06 429 475[33] 732-43 520 2 19 40 43 39 21 - - - - 0.12 623 348[33] 732-44 520 2 16 32 34 57 21 - - - - 0.12 589 459[33] 732-45 520 2 16 31 36 49 19 - - - - 0.12 589 477[33] 732-46 520 2 16 82 30 1 26 - - - - 0.12 589 388[33] 732-47 520 2 16 83 28 18 17 - - - - 0.12 589 355[33] 732-48 520 2 16 101 32 17 19 - - - - 0.12 589 439[33] 732-49 520 2 16 36 24 1 16 - - - - 0.12 589 380[33] 732-50 520 2 16 3 32 74 18 - - - - 0.12 589 318[33] 732-51 520 2 16 32 35 19 25 - - - - 0.06 505 388[33] 732-52 520 2 16 31 35 19 24 - - - - 0.06 505 380[33] 732-53 520 2 16 30 39 20 11 - - - - 0.06 488 236[33] 732-54 520 2 16 32 37 17 39 - - - - 0.06 482 459[33] 732-55 520 2 16 33 34 18 52 - - - - 0.06 476 471[33] 732-56 320 2 10 22 83 18 14 - - - - 0.06 418 414[33] 732-57 320 2 10 19 86 15 16 - - - - 0.06 418 450[33] 732-59 720 2 19 37 10 24 15 - - - - 0.12 714 273[33] 732-60 320 2 19 36 12 26 15 - - - - 0.12 714 168[33] 732-61 720 2 19 38 7 19 16 - - - - 0.06 442 247[33] 732-62 320 2 19 38 62 21 16 - - - - 0.06 442 131[33] 732-63 220 2 12 24 62 19 16 - - - - 0.12 638 274[33] 732-64 320 2 12 23 65 17 12 - - - - 0.12 638 343[33] 732-65 420 2 12 26 60 16 16 - - - - 0.12 643 378[33] 732-66 520 2 12 25 61 20 16 - - - - 0.12 643 463[33] 732-67 220 2 12 22 66 15 18 - - - - 0.06 437 231[33] 732-68 320 2 12 19 72 14 18 - - - - 0.06 437 275[33] 732-69 420 2 12 21 68 14 17 - - - - 0.06 446 397[33] 732-70 520 2 12 28 55 12 17 - - - - 0.06 440 427[33] 732-71 520 2 16 72 41 23 20 - - - - 0.12 719 408[33] 732-72 520 2 16 100 35 24 22 - - - - 0.12 656 498[33] 732-73 520 2 16 127 32 25 23 - - - - 0.12 637 432[33] 732-74 520 2 16 27 41 66 21 - - - - 0.12 648 427[33] 732-75 520 2 16 29 37 83 21 - - - - 0.12 625 449[33] 732-76 520 2 16 28 38 96 6 - - - - 0.12 727 129[33] 732-77 520 2 16 28 39 95 13 - - - - 0.12 701 401[33] 732-84 520 2 16 44 16 23 32 - - - - 0.12 725 687[33] 732-85 520 2 16 63 35 24 30 - - - - 0.12 725 667[33] 732-86 520 2 16 111 75 29 27 - - - - 0.12 725 724[33] 732-87 520 2 16 152 115 24 31 - - - - 0.12 719 673[33] 732-88 520 2 16 167 134 24 31 - - - - 0.12 719 577[33] 732-90 520 2 16 33 31 23 46 - - - - 0.12 589 634[33] 732-100 50 2 8 11 99 12 16 - - - - 0.12 702 151[33] 732-101 105 2 8 15 89 9 16 - - - - 0.12 1058 297[33] 732-102 150 2 8 14 93 8 16 - - - - 0.12 702 252[33] 732-103 200 2 8 19 80 10 16 - - - - 0.12 702 342[33] 732-104 50 2 8 15 90 13 16 - - - - 0.06 479 129[33] 732-105 100 2 8 14 93 10 16 - - - - 0.06 479 193[33] 732-106 150 2 8 14 92 11 16 - - - - 0.06 479 224[33] 732-107 200 2 8 15 90 12 16 - - - - 0.06 479 284[33] 732-112 50 2 10 13 85 15 13 - - - - 0.06 402 85[33] 732-113 100 2 10 13 85 13 13 - - - - 0.06 762 212
Author Test l0 nb Ø cx cs cy fcm Øst nst st nl fR fy σs,max
[mm] - [mm] [mm] [mm] [mm] [MPa] [mm] - [mm] - - [MPa] [MPa][33] 732-114 150 2 10 13 85 10 13 - - - - 0.06 402 133[33] 732-115 200 2 10 14 83 13 13 - - - - 0.06 402 186
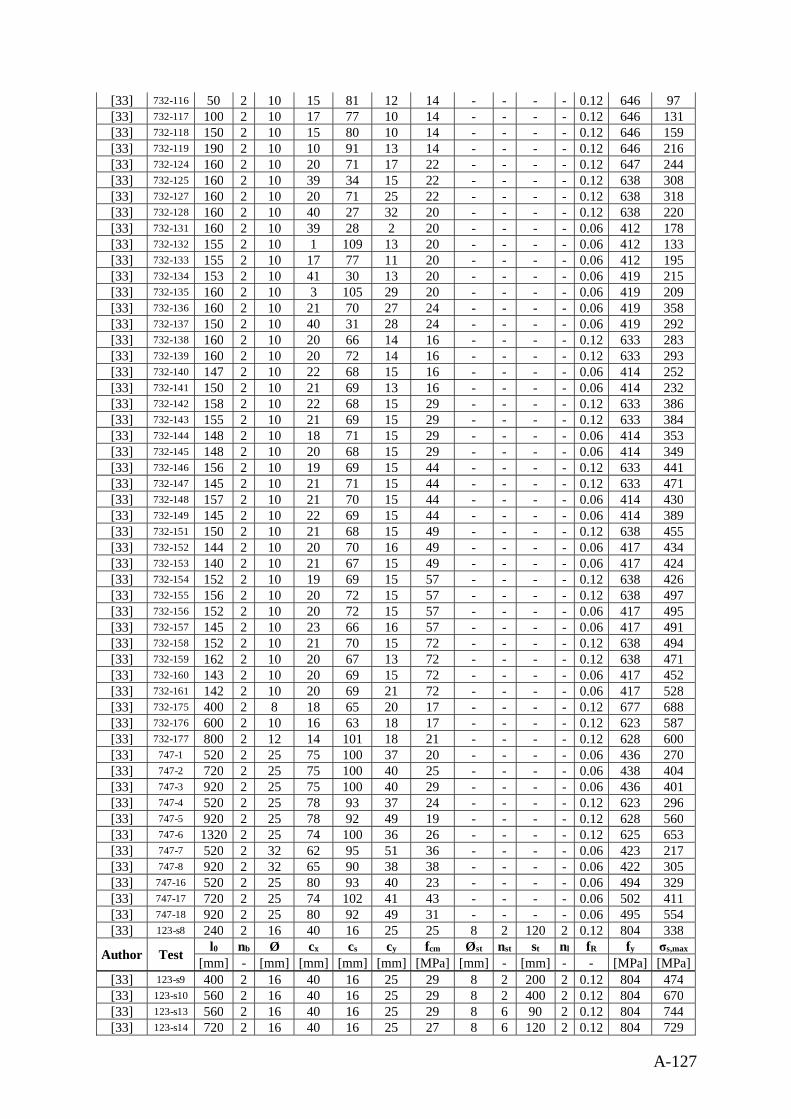
A-127
[33] 732-116 50 2 10 15 81 12 14 - - - - 0.12 646 97[33] 732-117 100 2 10 17 77 10 14 - - - - 0.12 646 131[33] 732-118 150 2 10 15 80 10 14 - - - - 0.12 646 159[33] 732-119 190 2 10 10 91 13 14 - - - - 0.12 646 216[33] 732-124 160 2 10 20 71 17 22 - - - - 0.12 647 244[33] 732-125 160 2 10 39 34 15 22 - - - - 0.12 638 308[33] 732-127 160 2 10 20 71 25 22 - - - - 0.12 638 318[33] 732-128 160 2 10 40 27 32 20 - - - - 0.12 638 220[33] 732-131 160 2 10 39 28 2 20 - - - - 0.06 412 178[33] 732-132 155 2 10 1 109 13 20 - - - - 0.06 412 133[33] 732-133 155 2 10 17 77 11 20 - - - - 0.06 412 195[33] 732-134 153 2 10 41 30 13 20 - - - - 0.06 419 215[33] 732-135 160 2 10 3 105 29 20 - - - - 0.06 419 209[33] 732-136 160 2 10 21 70 27 24 - - - - 0.06 419 358[33] 732-137 150 2 10 40 31 28 24 - - - - 0.06 419 292[33] 732-138 160 2 10 20 66 14 16 - - - - 0.12 633 283[33] 732-139 160 2 10 20 72 14 16 - - - - 0.12 633 293[33] 732-140 147 2 10 22 68 15 16 - - - - 0.06 414 252[33] 732-141 150 2 10 21 69 13 16 - - - - 0.06 414 232[33] 732-142 158 2 10 22 68 15 29 - - - - 0.12 633 386[33] 732-143 155 2 10 21 69 15 29 - - - - 0.12 633 384[33] 732-144 148 2 10 18 71 15 29 - - - - 0.06 414 353[33] 732-145 148 2 10 20 68 15 29 - - - - 0.06 414 349[33] 732-146 156 2 10 19 69 15 44 - - - - 0.12 633 441[33] 732-147 145 2 10 21 71 15 44 - - - - 0.12 633 471[33] 732-148 157 2 10 21 70 15 44 - - - - 0.06 414 430[33] 732-149 145 2 10 22 69 15 44 - - - - 0.06 414 389[33] 732-151 150 2 10 21 68 15 49 - - - - 0.12 638 455[33] 732-152 144 2 10 20 70 16 49 - - - - 0.06 417 434[33] 732-153 140 2 10 21 67 15 49 - - - - 0.06 417 424[33] 732-154 152 2 10 19 69 15 57 - - - - 0.12 638 426[33] 732-155 156 2 10 20 72 15 57 - - - - 0.12 638 497[33] 732-156 152 2 10 20 72 15 57 - - - - 0.06 417 495[33] 732-157 145 2 10 23 66 16 57 - - - - 0.06 417 491[33] 732-158 152 2 10 21 70 15 72 - - - - 0.12 638 494[33] 732-159 162 2 10 20 67 13 72 - - - - 0.12 638 471[33] 732-160 143 2 10 20 69 15 72 - - - - 0.06 417 452[33] 732-161 142 2 10 20 69 21 72 - - - - 0.06 417 528[33] 732-175 400 2 8 18 65 20 17 - - - - 0.12 677 688[33] 732-176 600 2 10 16 63 18 17 - - - - 0.12 623 587[33] 732-177 800 2 12 14 101 18 21 - - - - 0.12 628 600[33] 747-1 520 2 25 75 100 37 20 - - - - 0.06 436 270[33] 747-2 720 2 25 75 100 40 25 - - - - 0.06 438 404[33] 747-3 920 2 25 75 100 40 29 - - - - 0.06 436 401[33] 747-4 520 2 25 78 93 37 24 - - - - 0.12 623 296[33] 747-5 920 2 25 78 92 49 19 - - - - 0.12 628 560[33] 747-6 1320 2 25 74 100 36 26 - - - - 0.12 625 653[33] 747-7 520 2 32 62 95 51 36 - - - - 0.06 423 217[33] 747-8 920 2 32 65 90 38 38 - - - - 0.06 422 305[33] 747-16 520 2 25 80 93 40 23 - - - - 0.06 494 329[33] 747-17 720 2 25 74 102 41 43 - - - - 0.06 502 411[33] 747-18 920 2 25 80 92 49 31 - - - - 0.06 495 554[33] 123-s8 240 2 16 40 16 25 25 8 2 120 2 0.12 804 338
Author Test l0 nb Ø cx cs cy fcm Øst nst st nl fR fy σs,max
[mm] - [mm] [mm] [mm] [mm] [MPa] [mm] - [mm] - - [MPa] [MPa][33] 123-s9 400 2 16 40 16 25 29 8 2 200 2 0.12 804 474[33] 123-s10 560 2 16 40 16 25 29 8 2 400 2 0.12 804 670[33] 123-s13 560 2 16 40 16 25 29 8 6 90 2 0.12 804 744[33] 123-s14 720 2 16 40 16 25 27 8 6 120 2 0.12 804 729
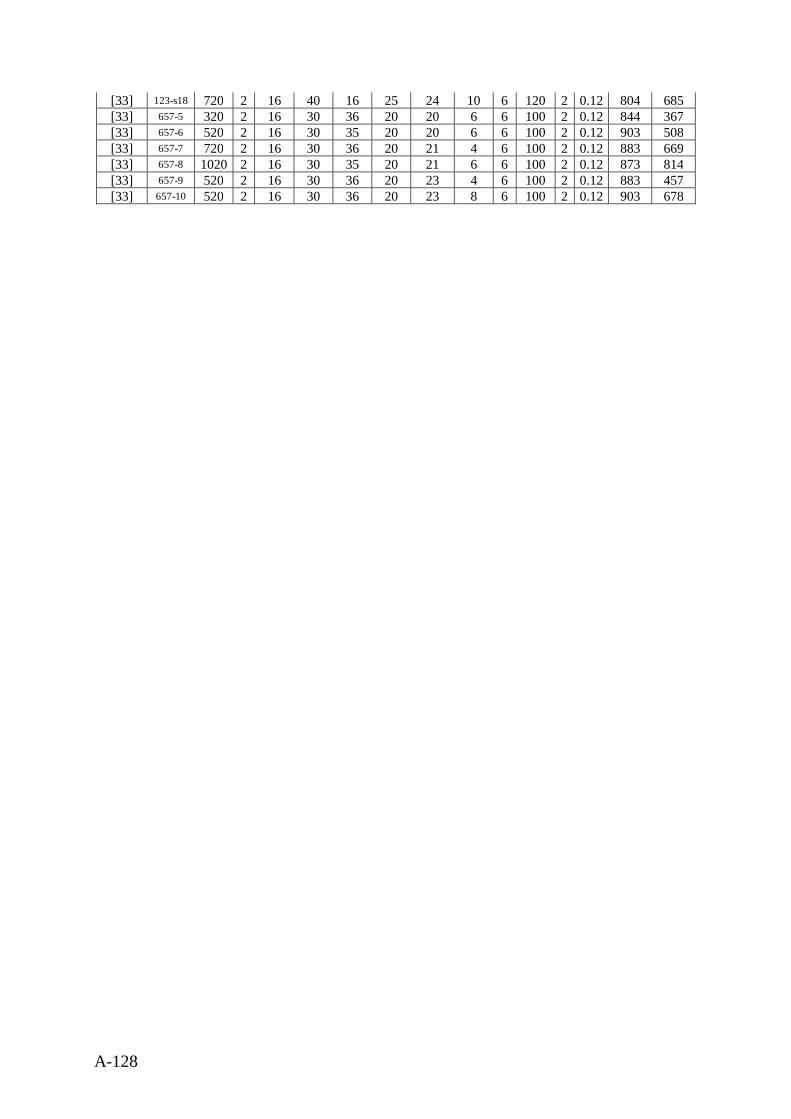
A-128
[33] 123-s18 720 2 16 40 16 25 24 10 6 120 2 0.12 804 685[33] 657-5 320 2 16 30 36 20 20 6 6 100 2 0.12 844 367[33] 657-6 520 2 16 30 35 20 20 6 6 100 2 0.12 903 508[33] 657-7 720 2 16 30 36 20 21 4 6 100 2 0.12 883 669[33] 657-8 1020 2 16 30 35 20 21 6 6 100 2 0.12 873 814[33] 657-9 520 2 16 30 36 20 23 4 6 100 2 0.12 883 457[33] 657-10 520 2 16 30 36 20 23 8 6 100 2 0.12 903 678
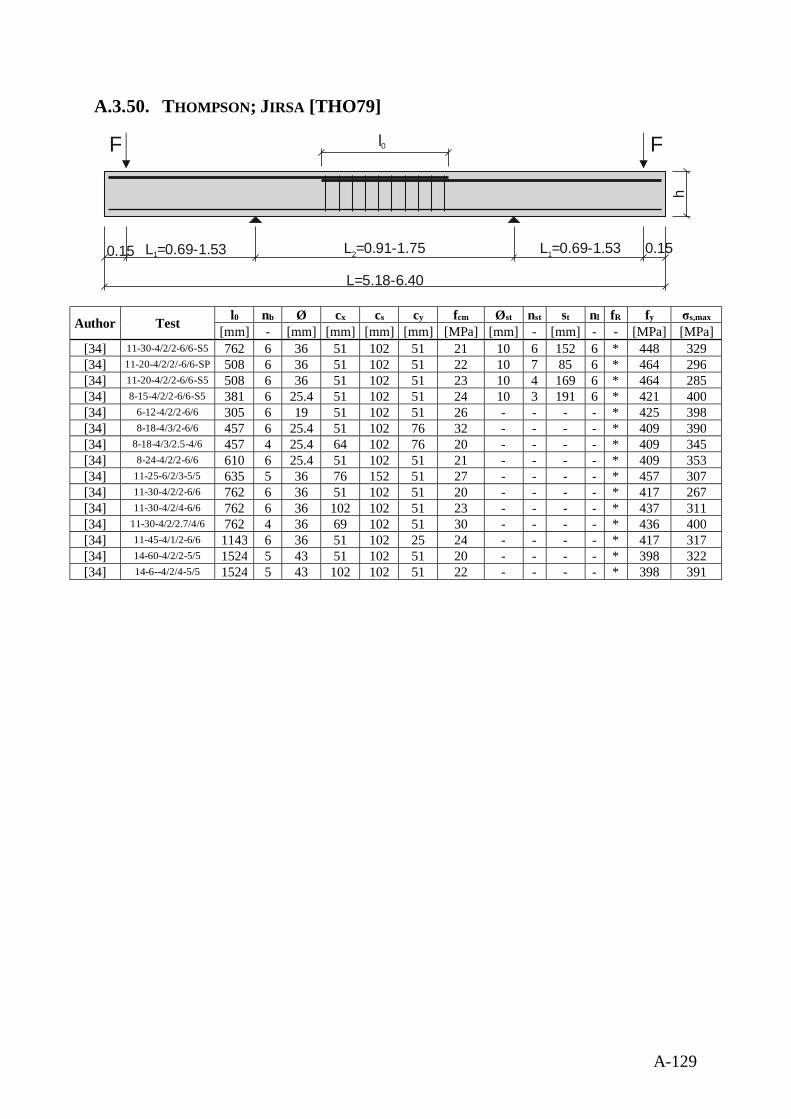
A-129
A.3.50. THOMPSON; JIRSA [THO79]
Author Test l0 nb Ø cx cs cy fcm Øst nst st nl fR fy σs,max
[mm] - [mm] [mm] [mm] [mm] [MPa] [mm] - [mm] - - [MPa] [MPa][34] 11-30-4/2/2-6/6-S5 762 6 36 51 102 51 21 10 6 152 6 * 448 329[34] 11-20-4/2/2/-6/6-SP 508 6 36 51 102 51 22 10 7 85 6 * 464 296[34] 11-20-4/2/2-6/6-S5 508 6 36 51 102 51 23 10 4 169 6 * 464 285[34] 8-15-4/2/2-6/6-S5 381 6 25.4 51 102 51 24 10 3 191 6 * 421 400[34] 6-12-4/2/2-6/6 305 6 19 51 102 51 26 - - - - * 425 398[34] 8-18-4/3/2-6/6 457 6 25.4 51 102 76 32 - - - - * 409 390[34] 8-18-4/3/2.5-4/6 457 4 25.4 64 102 76 20 - - - - * 409 345[34] 8-24-4/2/2-6/6 610 6 25.4 51 102 51 21 - - - - * 409 353[34] 11-25-6/2/3-5/5 635 5 36 76 152 51 27 - - - - * 457 307[34] 11-30-4/2/2-6/6 762 6 36 51 102 51 20 - - - - * 417 267[34] 11-30-4/2/4-6/6 762 6 36 102 102 51 23 - - - - * 437 311[34] 11-30-4/2/2.7/4/6 762 4 36 69 102 51 30 - - - - * 436 400[34] 11-45-4/1/2-6/6 1143 6 36 51 102 25 24 - - - - * 417 317[34] 14-60-4/2/2-5/5 1524 5 43 51 102 51 20 - - - - * 398 322[34] 14-6--4/2/4-5/5 1524 5 43 102 102 51 22 - - - - * 398 391
F F
h
0.15 L =0.69-1.531 L =0.91-1.752 L =0.69-1.531 0.15
L=5.18-6.40
l0
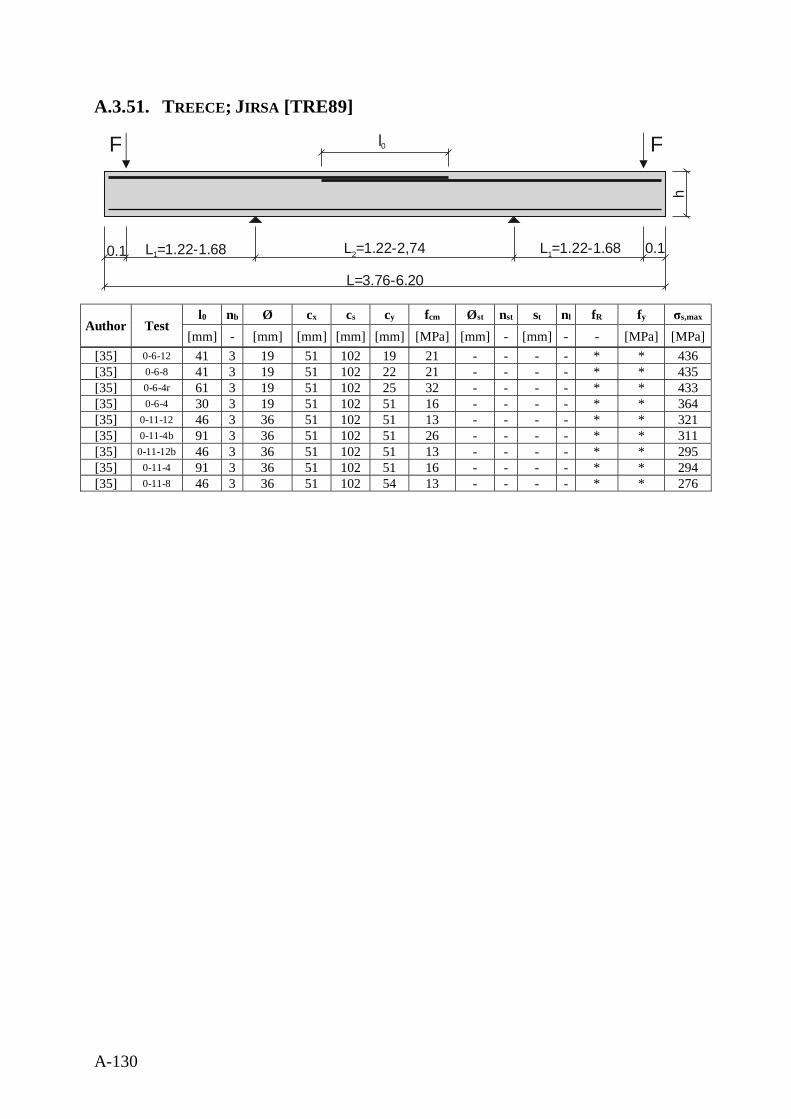
A-130
A.3.51. TREECE; JIRSA [TRE89]
Author Testl0 nb Ø cx cs cy fcm Øst nst st nl fR fy σs,max
[mm] - [mm] [mm] [mm] [mm] [MPa] [mm] - [mm] - - [MPa] [MPa][35] 0-6-12 41 3 19 51 102 19 21 - - - - * * 436[35] 0-6-8 41 3 19 51 102 22 21 - - - - * * 435[35] 0-6-4r 61 3 19 51 102 25 32 - - - - * * 433[35] 0-6-4 30 3 19 51 102 51 16 - - - - * * 364[35] 0-11-12 46 3 36 51 102 51 13 - - - - * * 321[35] 0-11-4b 91 3 36 51 102 51 26 - - - - * * 311[35] 0-11-12b 46 3 36 51 102 51 13 - - - - * * 295[35] 0-11-4 91 3 36 51 102 51 16 - - - - * * 294[35] 0-11-8 46 3 36 51 102 54 13 - - - - * * 276
F F
h
0.1 L =1.22-1.681 L =1.22-2,742 L =1.22-1.681 0.1
L=3.76-6.20
l0
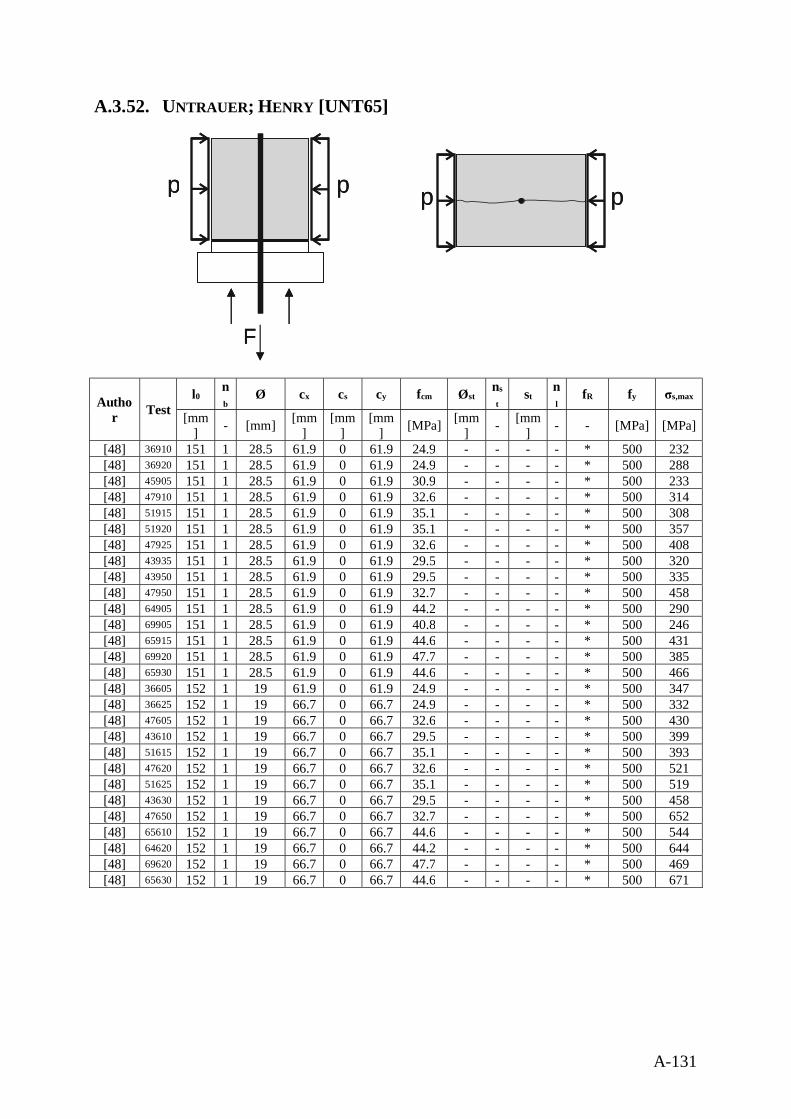
A-131
A.3.52. UNTRAUER; HENRY [UNT65]
Author Test
l0nb
Ø cx cs cy fcm Østns
tst
nl
fR fy σs,max
[mm] - [mm] [mm
][mm
][mm
] [MPa] [mm] - [mm
] - - [MPa] [MPa]
[48] 36910 151 1 28.5 61.9 0 61.9 24.9 - - - - * 500 232[48] 36920 151 1 28.5 61.9 0 61.9 24.9 - - - - * 500 288[48] 45905 151 1 28.5 61.9 0 61.9 30.9 - - - - * 500 233[48] 47910 151 1 28.5 61.9 0 61.9 32.6 - - - - * 500 314[48] 51915 151 1 28.5 61.9 0 61.9 35.1 - - - - * 500 308[48] 51920 151 1 28.5 61.9 0 61.9 35.1 - - - - * 500 357[48] 47925 151 1 28.5 61.9 0 61.9 32.6 - - - - * 500 408[48] 43935 151 1 28.5 61.9 0 61.9 29.5 - - - - * 500 320[48] 43950 151 1 28.5 61.9 0 61.9 29.5 - - - - * 500 335[48] 47950 151 1 28.5 61.9 0 61.9 32.7 - - - - * 500 458[48] 64905 151 1 28.5 61.9 0 61.9 44.2 - - - - * 500 290[48] 69905 151 1 28.5 61.9 0 61.9 40.8 - - - - * 500 246[48] 65915 151 1 28.5 61.9 0 61.9 44.6 - - - - * 500 431[48] 69920 151 1 28.5 61.9 0 61.9 47.7 - - - - * 500 385[48] 65930 151 1 28.5 61.9 0 61.9 44.6 - - - - * 500 466[48] 36605 152 1 19 61.9 0 61.9 24.9 - - - - * 500 347[48] 36625 152 1 19 66.7 0 66.7 24.9 - - - - * 500 332[48] 47605 152 1 19 66.7 0 66.7 32.6 - - - - * 500 430[48] 43610 152 1 19 66.7 0 66.7 29.5 - - - - * 500 399[48] 51615 152 1 19 66.7 0 66.7 35.1 - - - - * 500 393[48] 47620 152 1 19 66.7 0 66.7 32.6 - - - - * 500 521[48] 51625 152 1 19 66.7 0 66.7 35.1 - - - - * 500 519[48] 43630 152 1 19 66.7 0 66.7 29.5 - - - - * 500 458[48] 47650 152 1 19 66.7 0 66.7 32.7 - - - - * 500 652[48] 65610 152 1 19 66.7 0 66.7 44.6 - - - - * 500 544[48] 64620 152 1 19 66.7 0 66.7 44.2 - - - - * 500 644[48] 69620 152 1 19 66.7 0 66.7 47.7 - - - - * 500 469[48] 65630 152 1 19 66.7 0 66.7 44.6 - - - - * 500 671
F
p ppp
F
pp
F
p p
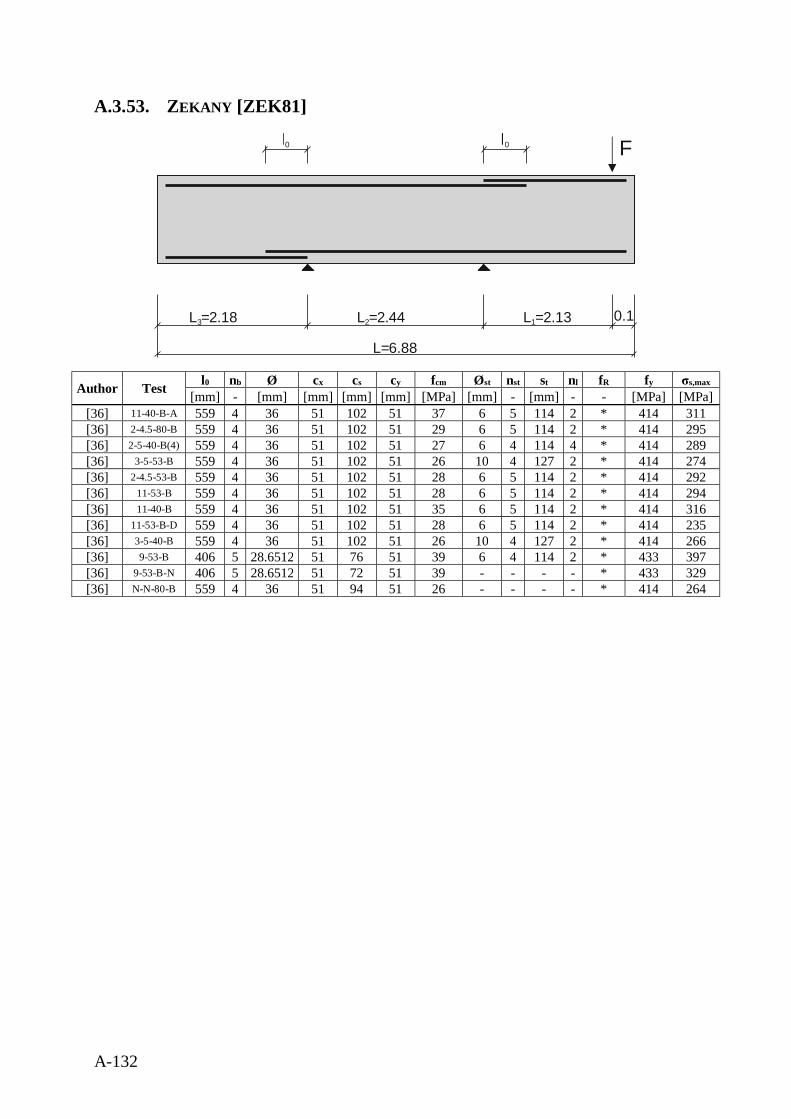
A-132
A.3.53. ZEKANY [ZEK81]
Author Test l0 nb Ø cx cs cy fcm Øst nst st nl fR fy σs,max
[mm] - [mm] [mm] [mm] [mm] [MPa] [mm] - [mm] - - [MPa] [MPa][36] 11-40-B-A 559 4 36 51 102 51 37 6 5 114 2 * 414 311[36] 2-4.5-80-B 559 4 36 51 102 51 29 6 5 114 2 * 414 295[36] 2-5-40-B(4) 559 4 36 51 102 51 27 6 4 114 4 * 414 289[36] 3-5-53-B 559 4 36 51 102 51 26 10 4 127 2 * 414 274[36] 2-4.5-53-B 559 4 36 51 102 51 28 6 5 114 2 * 414 292[36] 11-53-B 559 4 36 51 102 51 28 6 5 114 2 * 414 294[36] 11-40-B 559 4 36 51 102 51 35 6 5 114 2 * 414 316[36] 11-53-B-D 559 4 36 51 102 51 28 6 5 114 2 * 414 235[36] 3-5-40-B 559 4 36 51 102 51 26 10 4 127 2 * 414 266[36] 9-53-B 406 5 28.6512 51 76 51 39 6 4 114 2 * 433 397[36] 9-53-B-N 406 5 28.6512 51 72 51 39 - - - - * 433 329[36] N-N-80-B 559 4 36 51 94 51 26 - - - - * 414 264
F
L =2.183 L =2.442 L =2.131 0.1
L=6.88
l0l0
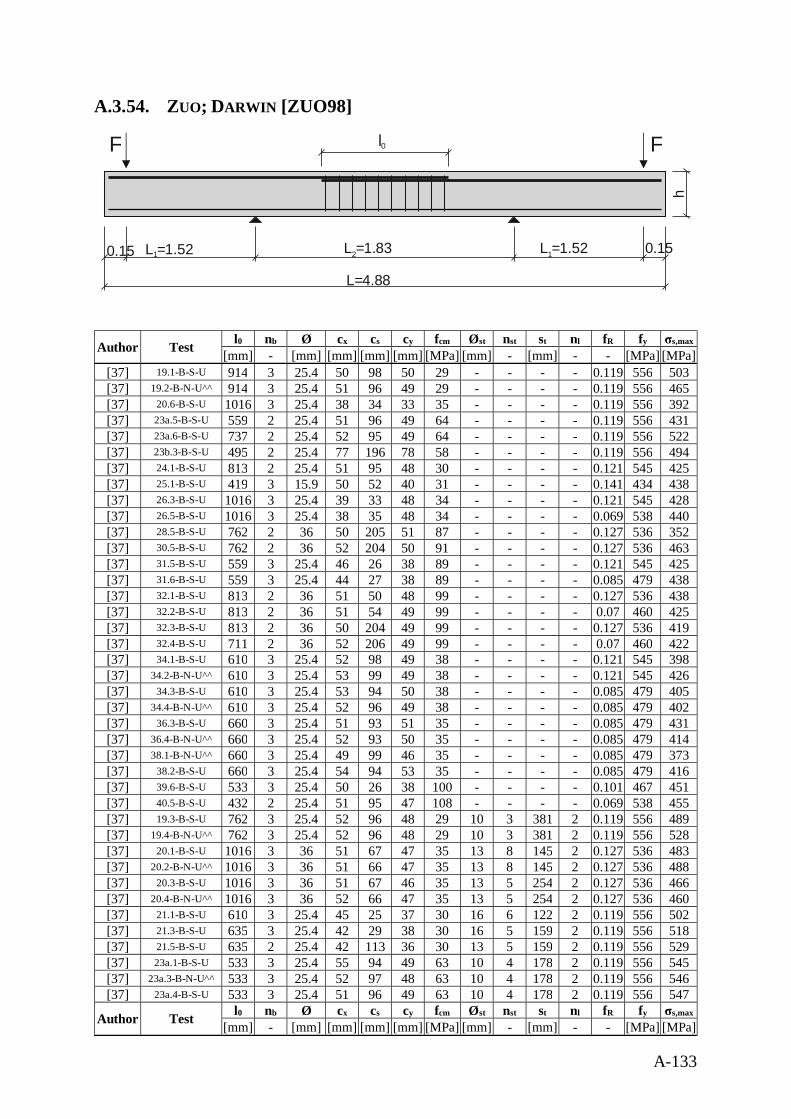
A-133
A.3.54. ZUO; DARWIN [ZUO98]
Author Test l0 nb Ø cx cs cy fcm Øst nst st nl fR fy σs,max
[mm] - [mm] [mm] [mm] [mm] [MPa] [mm] - [mm] - - [MPa] [MPa][37] 19.1-B-S-U 914 3 25.4 50 98 50 29 - - - - 0.119 556 503[37] 19.2-B-N-U^^ 914 3 25.4 51 96 49 29 - - - - 0.119 556 465[37] 20.6-B-S-U 1016 3 25.4 38 34 33 35 - - - - 0.119 556 392[37] 23a.5-B-S-U 559 2 25.4 51 96 49 64 - - - - 0.119 556 431[37] 23a.6-B-S-U 737 2 25.4 52 95 49 64 - - - - 0.119 556 522[37] 23b.3-B-S-U 495 2 25.4 77 196 78 58 - - - - 0.119 556 494[37] 24.1-B-S-U 813 2 25.4 51 95 48 30 - - - - 0.121 545 425[37] 25.1-B-S-U 419 3 15.9 50 52 40 31 - - - - 0.141 434 438[37] 26.3-B-S-U 1016 3 25.4 39 33 48 34 - - - - 0.121 545 428[37] 26.5-B-S-U 1016 3 25.4 38 35 48 34 - - - - 0.069 538 440[37] 28.5-B-S-U 762 2 36 50 205 51 87 - - - - 0.127 536 352[37] 30.5-B-S-U 762 2 36 52 204 50 91 - - - - 0.127 536 463[37] 31.5-B-S-U 559 3 25.4 46 26 38 89 - - - - 0.121 545 425[37] 31.6-B-S-U 559 3 25.4 44 27 38 89 - - - - 0.085 479 438[37] 32.1-B-S-U 813 2 36 51 50 48 99 - - - - 0.127 536 438[37] 32.2-B-S-U 813 2 36 51 54 49 99 - - - - 0.07 460 425[37] 32.3-B-S-U 813 2 36 50 204 49 99 - - - - 0.127 536 419[37] 32.4-B-S-U 711 2 36 52 206 49 99 - - - - 0.07 460 422[37] 34.1-B-S-U 610 3 25.4 52 98 49 38 - - - - 0.121 545 398[37] 34.2-B-N-U^^ 610 3 25.4 53 99 49 38 - - - - 0.121 545 426[37] 34.3-B-S-U 610 3 25.4 53 94 50 38 - - - - 0.085 479 405[37] 34.4-B-N-U^^ 610 3 25.4 52 96 49 38 - - - - 0.085 479 402[37] 36.3-B-S-U 660 3 25.4 51 93 51 35 - - - - 0.085 479 431[37] 36.4-B-N-U^^ 660 3 25.4 52 93 50 35 - - - - 0.085 479 414[37] 38.1-B-N-U^^ 660 3 25.4 49 99 46 35 - - - - 0.085 479 373[37] 38.2-B-S-U 660 3 25.4 54 94 53 35 - - - - 0.085 479 416[37] 39.6-B-S-U 533 3 25.4 50 26 38 100 - - - - 0.101 467 451[37] 40.5-B-S-U 432 2 25.4 51 95 47 108 - - - - 0.069 538 455[37] 19.3-B-S-U 762 3 25.4 52 96 48 29 10 3 381 2 0.119 556 489[37] 19.4-B-N-U^^ 762 3 25.4 52 96 48 29 10 3 381 2 0.119 556 528[37] 20.1-B-S-U 1016 3 36 51 67 47 35 13 8 145 2 0.127 536 483[37] 20.2-B-N-U^^ 1016 3 36 51 66 47 35 13 8 145 2 0.127 536 488[37] 20.3-B-S-U 1016 3 36 51 67 46 35 13 5 254 2 0.127 536 466[37] 20.4-B-N-U^^ 1016 3 36 52 66 47 35 13 5 254 2 0.127 536 460[37] 21.1-B-S-U 610 3 25.4 45 25 37 30 16 6 122 2 0.119 556 502[37] 21.3-B-S-U 635 3 25.4 42 29 38 30 16 5 159 2 0.119 556 518[37] 21.5-B-S-U 635 2 25.4 42 113 36 30 13 5 159 2 0.119 556 529[37] 23a.1-B-S-U 533 3 25.4 55 94 49 63 10 4 178 2 0.119 556 545[37] 23a.3-B-N-U^^ 533 3 25.4 52 97 48 63 10 4 178 2 0.119 556 546[37] 23a.4-B-S-U 533 3 25.4 51 96 49 63 10 4 178 2 0.119 556 547
Author Test l0 nb Ø cx cs cy fcm Øst nst st nl fR fy σs,max
[mm] - [mm] [mm] [mm] [mm] [MPa] [mm] - [mm] - - [MPa] [MPa]
F F
h
0.15 L =1.521 L =1.832 L =1.521 0.15
L=4.88
l0
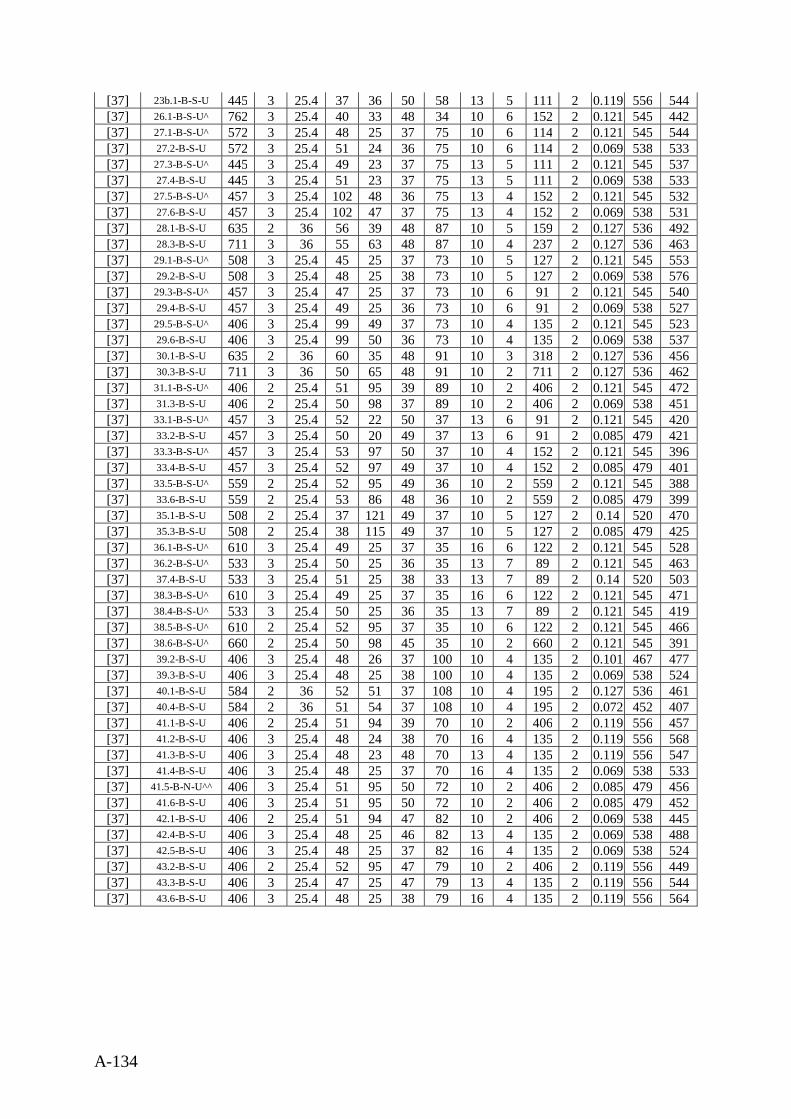
A-134
[37] 23b.1-B-S-U 445 3 25.4 37 36 50 58 13 5 111 2 0.119 556 544[37] 26.1-B-S-U^ 762 3 25.4 40 33 48 34 10 6 152 2 0.121 545 442[37] 27.1-B-S-U^ 572 3 25.4 48 25 37 75 10 6 114 2 0.121 545 544[37] 27.2-B-S-U 572 3 25.4 51 24 36 75 10 6 114 2 0.069 538 533[37] 27.3-B-S-U^ 445 3 25.4 49 23 37 75 13 5 111 2 0.121 545 537[37] 27.4-B-S-U 445 3 25.4 51 23 37 75 13 5 111 2 0.069 538 533[37] 27.5-B-S-U^ 457 3 25.4 102 48 36 75 13 4 152 2 0.121 545 532[37] 27.6-B-S-U 457 3 25.4 102 47 37 75 13 4 152 2 0.069 538 531[37] 28.1-B-S-U 635 2 36 56 39 48 87 10 5 159 2 0.127 536 492[37] 28.3-B-S-U 711 3 36 55 63 48 87 10 4 237 2 0.127 536 463[37] 29.1-B-S-U^ 508 3 25.4 45 25 37 73 10 5 127 2 0.121 545 553[37] 29.2-B-S-U 508 3 25.4 48 25 38 73 10 5 127 2 0.069 538 576[37] 29.3-B-S-U^ 457 3 25.4 47 25 37 73 10 6 91 2 0.121 545 540[37] 29.4-B-S-U 457 3 25.4 49 25 36 73 10 6 91 2 0.069 538 527[37] 29.5-B-S-U^ 406 3 25.4 99 49 37 73 10 4 135 2 0.121 545 523[37] 29.6-B-S-U 406 3 25.4 99 50 36 73 10 4 135 2 0.069 538 537[37] 30.1-B-S-U 635 2 36 60 35 48 91 10 3 318 2 0.127 536 456[37] 30.3-B-S-U 711 3 36 50 65 48 91 10 2 711 2 0.127 536 462[37] 31.1-B-S-U^ 406 2 25.4 51 95 39 89 10 2 406 2 0.121 545 472[37] 31.3-B-S-U 406 2 25.4 50 98 37 89 10 2 406 2 0.069 538 451[37] 33.1-B-S-U^ 457 3 25.4 52 22 50 37 13 6 91 2 0.121 545 420[37] 33.2-B-S-U 457 3 25.4 50 20 49 37 13 6 91 2 0.085 479 421[37] 33.3-B-S-U^ 457 3 25.4 53 97 50 37 10 4 152 2 0.121 545 396[37] 33.4-B-S-U 457 3 25.4 52 97 49 37 10 4 152 2 0.085 479 401[37] 33.5-B-S-U^ 559 2 25.4 52 95 49 36 10 2 559 2 0.121 545 388[37] 33.6-B-S-U 559 2 25.4 53 86 48 36 10 2 559 2 0.085 479 399[37] 35.1-B-S-U 508 2 25.4 37 121 49 37 10 5 127 2 0.14 520 470[37] 35.3-B-S-U 508 2 25.4 38 115 49 37 10 5 127 2 0.085 479 425[37] 36.1-B-S-U^ 610 3 25.4 49 25 37 35 16 6 122 2 0.121 545 528[37] 36.2-B-S-U^ 533 3 25.4 50 25 36 35 13 7 89 2 0.121 545 463[37] 37.4-B-S-U 533 3 25.4 51 25 38 33 13 7 89 2 0.14 520 503[37] 38.3-B-S-U^ 610 3 25.4 49 25 37 35 16 6 122 2 0.121 545 471[37] 38.4-B-S-U^ 533 3 25.4 50 25 36 35 13 7 89 2 0.121 545 419[37] 38.5-B-S-U^ 610 2 25.4 52 95 37 35 10 6 122 2 0.121 545 466[37] 38.6-B-S-U^ 660 2 25.4 50 98 45 35 10 2 660 2 0.121 545 391[37] 39.2-B-S-U 406 3 25.4 48 26 37 100 10 4 135 2 0.101 467 477[37] 39.3-B-S-U 406 3 25.4 48 25 38 100 10 4 135 2 0.069 538 524[37] 40.1-B-S-U 584 2 36 52 51 37 108 10 4 195 2 0.127 536 461[37] 40.4-B-S-U 584 2 36 51 54 37 108 10 4 195 2 0.072 452 407[37] 41.1-B-S-U 406 2 25.4 51 94 39 70 10 2 406 2 0.119 556 457[37] 41.2-B-S-U 406 3 25.4 48 24 38 70 16 4 135 2 0.119 556 568[37] 41.3-B-S-U 406 3 25.4 48 23 48 70 13 4 135 2 0.119 556 547[37] 41.4-B-S-U 406 3 25.4 48 25 37 70 16 4 135 2 0.069 538 533[37] 41.5-B-N-U^^ 406 3 25.4 51 95 50 72 10 2 406 2 0.085 479 456[37] 41.6-B-S-U 406 3 25.4 51 95 50 72 10 2 406 2 0.085 479 452[37] 42.1-B-S-U 406 2 25.4 51 94 47 82 10 2 406 2 0.069 538 445[37] 42.4-B-S-U 406 3 25.4 48 25 46 82 13 4 135 2 0.069 538 488[37] 42.5-B-S-U 406 3 25.4 48 25 37 82 16 4 135 2 0.069 538 524[37] 43.2-B-S-U 406 2 25.4 52 95 47 79 10 2 406 2 0.119 556 449[37] 43.3-B-S-U 406 3 25.4 47 25 47 79 13 4 135 2 0.119 556 544[37] 43.6-B-S-U 406 3 25.4 48 25 38 79 16 4 135 2 0.119 556 564


![arXiv:0712.4377v1 [quant-ph] 28 Dec 2007 · Vorsitzender: Prof. Dr. R. H. M¨ohring Berichter: Prof. Dr. R. Seiler Berichter: Prof. Dr. A. Knauf Zus¨atzlicher Gutachter: Prof. Dr](https://img.pdfslide.org/doc/110x75/5ecbd432c5fd074227180464/arxiv07124377v1-quant-ph-28-dec-2007-vorsitzender-prof-dr-r-h-mohring.jpg)