Embed Size (px)
Citation preview
econstor www.econstor.eu
Der Open-Access-Publikationsserver der ZBW – Leibniz-Informationszentrum WirtschaftThe Open Access Publication Server of the ZBW – Leibniz Information Centre for Economics
Standard-Nutzungsbedingungen:
Die Dokumente auf EconStor dürfen zu eigenen wissenschaftlichenZwecken und zum Privatgebrauch gespeichert und kopiert werden.
Sie dürfen die Dokumente nicht für öffentliche oder kommerzielleZwecke vervielfältigen, öffentlich ausstellen, öffentlich zugänglichmachen, vertreiben oder anderweitig nutzen.
Sofern die Verfasser die Dokumente unter Open-Content-Lizenzen(insbesondere CC-Lizenzen) zur Verfügung gestellt haben sollten,gelten abweichend von diesen Nutzungsbedingungen die in der dortgenannten Lizenz gewährten Nutzungsrechte.
Terms of use:
Documents in EconStor may be saved and copied for yourpersonal and scholarly purposes.
You are not to copy documents for public or commercialpurposes, to exhibit the documents publicly, to make thempublicly available on the internet, or to distribute or otherwiseuse the documents in public.
If the documents have been made available under an OpenContent Licence (especially Creative Commons Licences), youmay exercise further usage rights as specified in the indicatedlicence.
zbw Leibniz-Informationszentrum WirtschaftLeibniz Information Centre for Economics
Schweri, Jürg; Hartog, Joop
Working Paper
Do Wage Expectations Influence the Decision toEnroll in Nursing College?
IZA Discussion Papers, No. 9120
Provided in Cooperation with:Institute for the Study of Labor (IZA)
Suggested Citation: Schweri, Jürg; Hartog, Joop (2015) : Do Wage Expectations Influence theDecision to Enroll in Nursing College?, IZA Discussion Papers, No. 9120
This Version is available at:http://hdl.handle.net/10419/113996
DI
SC
US
SI
ON
P
AP
ER
S
ER
IE
S
Forschungsinstitut zur Zukunft der ArbeitInstitute for the Study of Labor
Do Wage Expectations Influence the Decisionto Enroll in Nursing College?
IZA DP No. 9120
June 2015
Juerg SchweriJoop Hartog
Do Wage Expectations Influence the
Decision to Enroll in Nursing College?
Juerg Schweri Swiss Federal Institute for Vocational Education and Training
Joop Hartog
University of Amsterdam, Tinbergen Institute, IZA and CESifo
Discussion Paper No. 9120 June 2015
IZA
P.O. Box 7240 53072 Bonn
Germany
Phone: +49-228-3894-0 Fax: +49-228-3894-180
E-mail: [email protected]
Any opinions expressed here are those of the author(s) and not those of IZA. Research published in this series may include views on policy, but the institute itself takes no institutional policy positions. The IZA research network is committed to the IZA Guiding Principles of Research Integrity. The Institute for the Study of Labor (IZA) in Bonn is a local and virtual international research center and a place of communication between science, politics and business. IZA is an independent nonprofit organization supported by Deutsche Post Foundation. The center is associated with the University of Bonn and offers a stimulating research environment through its international network, workshops and conferences, data service, project support, research visits and doctoral program. IZA engages in (i) original and internationally competitive research in all fields of labor economics, (ii) development of policy concepts, and (iii) dissemination of research results and concepts to the interested public. IZA Discussion Papers often represent preliminary work and are circulated to encourage discussion. Citation of such a paper should account for its provisional character. A revised version may be available directly from the author.
IZA Discussion Paper No. 9120 June 2015
ABSTRACT
Do Wage Expectations Influence the Decision to Enroll in Nursing College?*
As Switzerland experiences a severe shortage of nurses, this paper investigates the impact of students’ ex ante wage expectations on their choice to pursue a nursing college education. This analysis contributes to a small yet rapidly developing body of literature that uses subjective expectation data to predict educational choices. We surveyed a full cohort of healthcare trainees in their third year of training. The main result is that those trainees (in upper-secondary education) who expected a greater return from nursing college (tertiary education) were more likely to enroll in nursing college later on. This suggests that policies that increase returns from studying nursing can attract students to nursing. In addition, the results confirm that subjective wage expectation data are useful in modeling individual choice. JEL Classification: I11, I21, J24, J31, D84 Keywords: college choice, fractional regression, healthcare, human capital, nursing,
subjective expectations, training, wage Corresponding author: Juerg Schweri Swiss Federal Institute for Vocational Education and Training Kirchlindachstrasse 79 3052 Zollikofen/Bern Switzerland E-mail: [email protected]
* This paper has benefited greatly from work and discussions with Ines Trede. We thank Andreas Kuhn, Blaise Melly and participants at the following conferences for helpful comments: QURE (Reus, Spain), IWAEE (Catanzaro, Italy; in particular Todd Stinebrickner), “Economics of study choice” (Marbach Castle, Germany; in particular Peter Arcidiacono), Verein für Socialpolitik (Hamburg, Germany; in particular Uschi Backes-Gellner and Jens Mohrenweiser), VET Congress (Zollikofen, Switzerland). Part of the work on this paper was done while Schweri was a visiting scholar at the University of Amsterdam and at the Centre for Research in Economics of Education, University of Bern. The authors gratefully acknowledge funding for the survey by the Swiss State Secretariat for Education, Research and Innovation (SERI).
3
1. Introduction
Individuals’ decisions to enroll in nursing college are important outcomes for educational and labor market policies focused on healthcare. These policies and outcomes are particularly critical because most industrialized countries are affected by nurse shortages (Simoens et al., 2005). Therefore, many countries seek policy instruments to increase the attractiveness of the nursing profession, for example by increasing wages. In Switzerland, hospitals suffer from shortages, and the shortfall in domestic supply is partly made up by importing nurses: 21% of all nurses working in Switzerland in 2008 completed their degrees in foreign countries (Jaccard Ruedin and Widmer, 2010). National projections estimate that the demand for nurses will further increase by 13 to 25% by 2020 (OBSAN, 2009). In response, authorities have developed a national skills strategy for healthcare. This strategy focuses on a specific group of employees with upper-secondary degrees, called healthcare employees, because they constitute the main recruitment pool for new nursing students in Switzerland. Healthcare employees receive three years of nationally standardized training and provide care services in hospitals and nursing homes during the training period. They are part of a nursing team under the direction of registered nurses (RN). Therefore, the national skills strategy strives both to increase the number of training positions available for healthcare employees and to increase the number of healthcare employees that enroll in nursing colleges (DEA, 2010). As nursing colleges are not currently operating at maximum capacity, increasing the number of students means attracting additional students to nursing.
This situation provides our rationale for analyzing the effect of healthcare employees’ expected returns from nursing education, collected in a first survey, on their subsequent decision to enroll in nursing college, determined from a follow-up survey. Our analysis builds on two main strands of literature. First, a growing body of literature addresses nurses’ labor supply. Both non-pecuniary factors such as job satisfaction (Shields and Ward, 2001) and the wage elasticity of supply are analyzed. Askildsen et al. (2003) find a relatively low wage elasticity of 0.21 in their preferred estimation specification. Spetz and Given (2003) develop a forecasting model and advocate for higher wages for registered nurses to counter the nurse shortage. Hanel et al. (2014) argue that previous research may have underestimated average wage elasticities by neglecting the decision to enter or exit the profession, instead focusing on the effect of wages increasing working hours for those who already work in the profession. Several studies examine wage setting and particular mechanisms by which wages influence the supply of nurses, such as wage effects due to geographically differentiated pay (Elliot et al., 2007), monopsony (Hirsch and Schumacher, 1995; Staiger et al., 2010), or compensating differentials (Di Tommaso et al., 2009). However, while all of these aspects of wage elasticity are clearly important, the effect of wages on the training of new nurses has received little study. Shields’s (2004) overview article mentions training new nurses as a way to counter nurse shortages, but the literature he reviews barely touches on the issue of training. One exception is Spetz (2002), who finds that in the US, the choice to pursue a baccalaureate degree in
4
nursing is not associated with any financial gain compared with other tracks to becoming an RN. However, a change in the relative wage for a baccalaureate degree (BSN) versus an associate degree (AD) does have a small but significant effect on students’ choice of the type of education in nursing.1 Chiha and Link (2003) find a positive effect of RN wages on the number of people who enter first-degree nursing programs.
This work also builds upoan a second, developing strand of literature investigating the use of subjective expectations data to model educational choice. This literature is important for our research question because wage policies that increase returns to college would have to act by altering the wage expectations of these young people. Therefore, it is important to know whether students are aware of actual market wages and whether they act upon their expectations about future returns. The use of subjective data is still not standard in economics and warrants some remarks. According to the neoclassical standard model for educational choices, individuals base their decisions on a comparison of lifetime benefits to cost: the rate of return on the investment versus the cost of capital, i.e., the market rate of interest or the household discount rate, depending on whether the capital market is perfect. Upon application, this model has to face the complications of heterogeneity. Gary Becker acknowledged individual heterogeneity in his Woytinsky lecture (Becker, 1967) just after the emergence of human capital theory. Each individual has his or her own equilibrium rate of return at the intersection of the individual marginal benefit and marginal cost curves. As schooling is an investment decision, costs and, in particular, benefits lie in the future, inevitably resulting in uncertainty. No observations are readily available on these variables, and a theory of expectations is needed to understand educational choices. Can we trace the individual decision making process by asking respondents about relevant variables in a survey? For a long time, such subjective data were rejected by mainstream economists. The approved approach was to impose an econometric model of interpretation on observable market data and deduce individuals’ information sets ex hypothesi.2 As Manski (1993, 2004, 2007) notes, this approach relies on strong assumptions that are not testable with choice data (i.e., revealed preferences) alone. He advocates analyses that include subjective beliefs by eliciting individuals’ expectations and preferences. Several studies have since investigated the quality, accuracy, and distribution of expectation data. With respect to wages, many papers have shown that it is feasible to elicit wage expectations in surveys, yielding high quality, meaningful data (Dominitz and Manski, 1996; Brunello et al., 2004; Webbink and Hartog, 2004; Botelho and Costa Pinto, 2004). Some papers find that students tend to overestimate their income prospects compared to the mean of actual market wages (Betts, 2006; Jerrim, 2011), while others find that they underestimate their prospects (Nicholson, 2005; Jensen, 2010). Most studies find that wage expectations are remarkably close to actual market wages (Dominitz and Manski, 1996; Filippin and Ichino, 2005; Webbink and Hartog, 2004; for Switzerland: 1 For analyses on the rate of return to nursing, see Walton et al. (2005) and the literature cited there and in Spetz (2002). 2 Examples of this approach include Willis and Rosen (1979), Keane and Wolpin (1997), Belzil and Hansen (2002), Cunha et al. (2005), Chen (2008), and Beffy et al. (2012).
5
Wolter, 2000; Wolter and Zbinden, 2001). Overall, individuals are well-informed about their future earnings prospects, but they also report a high degree of uncertainty about their future wages (Dominitz and Manski, 1996; Schweri et al., 2011). Some studies find a contemporaneous correlation between wage expectations and study choices or intentions (Kodde, 1986; Menon, 2008; Hartog et al. 2014). Arcidiacono et al. (2014) show how students’ occupational choice probabilities reflect occupational sorting that is partly driven by their expected returns. Only a handful of recent studies use ex ante wage expectations to explain subsequent educational choices. These studies focus on the questions of physicians’ specialty choices (Nicholson and Souleles, 2001) or the college major choices (Arcidiacono et al., 2012; Stinebrickner and Stinebrickner, 2014; Zafar, 2011a) of students who have already enrolled in tertiary studies. All of these studies find that wage expectations are significant determinants of a student’s choice of college major, in addition to other factors such as beliefs about own ability.
Our study contributes to the literature on nurse supply and educational choice in three ways. First, we investigate the effects of ex ante wage expectations on the initial training of nurses. Second, rather than exploring the choice of college major, we analyze the demand for additional college education after completing upper-secondary education. College students may be a selective group of young people. Our study extends the scope of the literature on wage expectations to a group of young people in upper-secondary education and to their transition into tertiary education. Third, the homogeneity and size of our sample add to the literature, as most studies have used samples of students from single colleges with different majors. The large differences in amenities among the different jobs that are open to graduates with different majors make it difficult to control for non-pecuniary preferences in major choice, which may also lead to compensating differentials in wage expectations. In contrast, healthcare employees and registered nurses work together on the same teams in the same hospitals and nursing homes. Concerns about differences in characteristics between different career alternatives are less important in this setting because healthcare employee and nursing jobs have similar working conditions (e.g., shift work). While our results may not be generalizable outside the nursing domain, this setting enhances the internal validity of the study.
Our findings show that healthcare trainees’ wage expectations are close to actual market wages for both healthcare employees and nurses at different ages. Wage expectations are thus realistic, but the variance of expectations increases with age and level of education, indicating trainees’ increasing uncertainty about wages further in the future. Controlling for a variety of personal characteristics, we find that ex ante return expectations have a significant effect on subsequent career paths, both on actual short-term careers and on mid-term career expectations. We further show that trainees with lower time preference, higher risk aversion, and higher extrinsic motivation are more likely to enroll in nursing college.
This paper is organized as follows. Section 2 provides information on the institutional setup of Swiss healthcare education, especially on the healthcare employee occupation. Section 3 presents the multivariate fractional regression model we use to analyze graduates’ future career paths. Section 4 describes the data collected
6
from healthcare employees in two consecutive surveys. Section 5 shows how wage expectations influence the decision to enroll in nursing college, and tests whether the results are sensitive to the sample attrition in the follow-up survey. Section 6 presents conclusions and discusses the policy implications of our findings.
2. Institutional framework of Swiss healthcare education
Training for healthcare occupations is part of the vocational and professional education system in Switzerland rather than part of the general education track. These two tracks of upper-secondary education start at the end of compulsory schooling, and more than 90 percent of young people attend one of these tracks. The two predominant programs in each track are college-bound Gymnasium (chosen by approximately 20 percent of a cohort), and firm-based apprenticeship training (chosen by roughly two-thirds of a cohort) in one of approximately 260 occupations, leading to a federally recognized diploma as a skilled worker or employee (OPET, 2012). Both tracks at the upper-secondary level provide entrance to higher education, i.e., tertiary level studies.
The educational tracks for healthcare professionals in Switzerland have been completely revised since 2004 (Spitzer and Perrenoud, 2007). A new healthcare occupation was created at the upper-secondary level: healthcare employees, called “FaGe” (Fachmann/Fachfrau Gesundheit), are educated for three years. These trainees attend vocational school for 1.5 days per week and acquire occupational knowledge and skills while working 3.5 days per week in a hospital, nursing home or homecare institution. This educational track is highly popular among young women and ranks in the top three of the most frequently chosen occupations in the apprenticeship system (SERI, 2014). As part of their jobs, healthcare employees take on nursing care responsibilities under the direction of registered nurses. They also perform tasks under their own responsibility, such as administrative or domestic work (DEA, 2010).
FaGe trainees sign an apprenticeship contract, which is a combined education and work contract. The educational goals that they have to achieve during their education are set out by a national law, the “national education and training order” for this occupation. After three years of education, trainees must pass a final exam containing written, oral and practical portions, which test general as well as occupational knowledge and skills (Berufsbildungsgesetz BBG, 2002). The educational program for healthcare employees is thus highly structured and standardized compared to healthcare assistant educational tracks in other countries (Lizarondo et al., 2010).
After successful completion of their education, the training-work contract ends, and healthcare trainees3 must make career choices. The available options include (i) working in the occupation they have just learned as a healthcare employee, (ii) entering higher nursing education at a professional college or university of the applied 3 In the remainder of the paper, we will use “trainee” to denote a person who was in training to become a healthcare employee at the time of the first survey. We use “student” to denote a person who is studying nursing, despite the fact that nursing students receive a considerable amount of training in clinical practice and are de facto trainees (again).
7
sciences, or (iii) entering another profession (i.e., beginning a different educational track) or pursuing other activities such as language studies abroad. Higher education as a registered nurse (option ii) lasts for three years of full-time schooling, with integrated clinical education and a relatively low wage during this period. For successful graduates of healthcare training (i.e., holders of the national VET diploma as healthcare employees) who attained a certain GPA, some cantons reduce nursing study time by a half year or one year.
Although the main features of educations in the healthcare sector are defined at the federal level, substantial differences exist between cantons. As for cantonal education systems, some cantons offer professional colleges for nursing, while others offer nursing degrees at universities of applied sciences.4 Several large cantons offer both options, while small cantons offer neither. The cost of nursing studies also differs between cantons due to differences in tuition and grant policies. However, tuition fees only represent a small fraction of the full costs for all cantons, and grant policies are designed to cover opportunity costs rather than only covering the relatively low direct costs. As for cantonal healthcare systems, cantons have their own cantonal laws on state personnel, including nurses, and on the provision of healthcare. These different laws lead to different wage policies and also to slightly different healthcare structures (e.g., differences in the level of concentration between central and regional hospitals).
3. Estimation approach To analyze the careers chosen by healthcare employees after graduation, we ask
graduates for their realized career paths up to one year after graduation and for their mid-term expectations for their future careers. Graduates are asked to state the probabilities for every possible future career outcome (see section 4.2). As we are mainly interested in mid-term transitions into nursing, we will use these stated probabilities of career choices as the main dependent variables in the analyses. Hence, we will regress the stated choice probabilities on expected returns for nursing. This approach is similar to that of Blass et al. (2010), who use elicited choice probabilities to estimate individuals’ preferences for electricity reliability.
4 We will use nursing “college” to refer to both types of tertiary studies, professional colleges and universities of applied sciences. Both lead to a degree as a registered nurse, and more than 90 percent of nursing students in our sample attend a professional college.
8
Stated choice probabilities of the different available career alternatives take on values over the interval [0,1] for every individual. Therefore, we apply a fractional regression model that has been designed to analyze the conditional means of fractional dependent variables. Mullahy (2015) extends the model proposed by Wooldridge and Papke (1996) for a single share variable to multivariate fractions.
𝐸(𝑝𝑐|𝑋) = 𝑓(𝑋𝛽) 𝜖 (0,1), 𝑐 = 1, … ,𝐾 (1)
∑ 𝐸(𝑝𝑘|𝑋)𝐾𝑘=1 = 1 (2)
The estimation approach assumes properties (1) and (2) for the means conditional
on covariates 𝑋 of the probabilities 𝑝 to choose career alternatives 𝑐 = 1, … ,𝐾: The conditional means lie between zero and one and they sum up to unity. Mullahy (2015) assumes a multinomial logit functional form for the conditional means:
𝐸(𝑝𝑐|𝑋) = exp (𝑋𝛽𝑐)∑ exp (𝑋𝛽𝑘)𝐾𝑘=1
, 𝑐 = 1, … ,𝐾 (3)
This multivariate fractional logit model, also known as a fractional multinomial
logit model (Buis, 2012), can be estimated by maximizing a multinomial quasi-likelihood (Mullahy, 2015). The effect of covariates 𝑋 on the conditional means will be reported as average marginal effects.
4. Data and descriptive statistics
4.1 Survey design
We use data from two consecutive surveys. The first survey was administered to healthcare employees during their apprenticeship training, and the follow-up survey was administered one year after the completion of training. The first survey took place during the last year of training in all parts of Switzerland. Out of 26 Swiss cantons (i.e., states), 24 participated in the survey; the two missing cantons are small cantons that together account for only 3% of the Swiss population5. The paper-and-pencil questionnaire relied on field-tested items from the literature. Portions of the questionnaire had already been used successfully in a cross-sectional survey of healthcare trainees developed in 2009 for the canton of Bern (Trede and Schweri, 2014). We performed a pre-test of the entire questionnaire with healthcare trainee classes from five different cantons (n=70), resulting in minor adaptions.
5 Source: Census of the Federal Statistical Office (Strukturerhebung 2011). Missing cantons: Jura and Neuchâtel.
9
The first survey took place between September 2010 and January 2011.6 At this time, 2209 trainees were in their third year of training as healthcare employees in Switzerland, of whom 2089 were surveyed during class (95%). The missing 120 trainees were absent from class on the survey day due to illness or other reasons. The trainees had two 90 minute class lessons to complete the questionnaire. Teachers were introduced to the survey before it took place and were present in class, offering assistance in cases of uncertainty.
Therefore, the sample population in the first survey offers two advantages: first, because we cover almost the entire cohort, it does not suffer from selectivity due to non-randomly missing cases. Second, sampling was restricted to a well-defined and homogenous group: all trainees were in their third year of training to prepare for healthcare employment. This regularity eliminates all differences associated with differences among different educations and occupations, thus increasing the internal validity of the study.
The follow-up survey was administered one year after the trainees’ graduation, i.e., in the summer of 2012. We had collected trainees’ postal addresses, telephone numbers and email addresses in the first survey and contacted them again with a letter containing login information for the online follow-up survey. Individuals who did not complete the online survey were contacted again several times, first with letters and email, and then by telephone. Participants were also offered a short version (online or paper-and-pencil) of the follow-up survey, which included a question on their current status (working as FaGe, studying nursing, etc.). Of the 2089 trainees who participated in the first survey, 73 addresses turned out to be invalid. Of the 2016 individuals contacted, 1068 or 53% completed the follow-up survey. We eliminated three cases that had not yet finished their FaGe training. For the analysis of career choices after apprenticeship in Chapter 4, we restrict our attention to individuals who participated in the follow-up survey and who gave valid answers to the questions on career decisions (see 4.2) and wage expectations (see 4.3). This final estimation sample contains 910 observations. As attrition in the follow-up survey may bias our results, we will return to this issue when assessing the robustness of our results in section 5.3.
The longitudinal design of our study also helps to restrain possible problems due to cognitive dissonance. A reverse causality problem arises if the surveyed trainees who intended to study nursing inflated their wage expectations for nursing and decreased them for working as a healthcare employee in order to rationalize their choice. Zafar (2011b) argues that this problem would typically occur in cross-sectional settings where independent and dependent variables are measured at the same time. He tests for cognitive dissonance in a setting like ours, i.e., comparing data from a first survey with data from a later survey. He collected subjective beliefs about future career outcomes for a sample of students in their first year and again one year later. During this period, students advanced in their choice of a college major. For a variety of career expectations, Zafar (2011b) compares expectations for the chosen major with alternative choices. He does not find that expectations become more favorable for the 6 We gratefully acknowledge support in organizing and administering the survey from the cantonal professional healthcare associations. Trede and Schweri (2013) and the additional reports cited there describe the survey process in more detail.
10
chosen major and less favorable for the alternatives, even though choices have been made in the meantime. Therefore, we assume that ex-ante wage expectations in the first survey were not affected by the career choices stated in the follow-up survey.
4.2 Dependent variable: career decisions
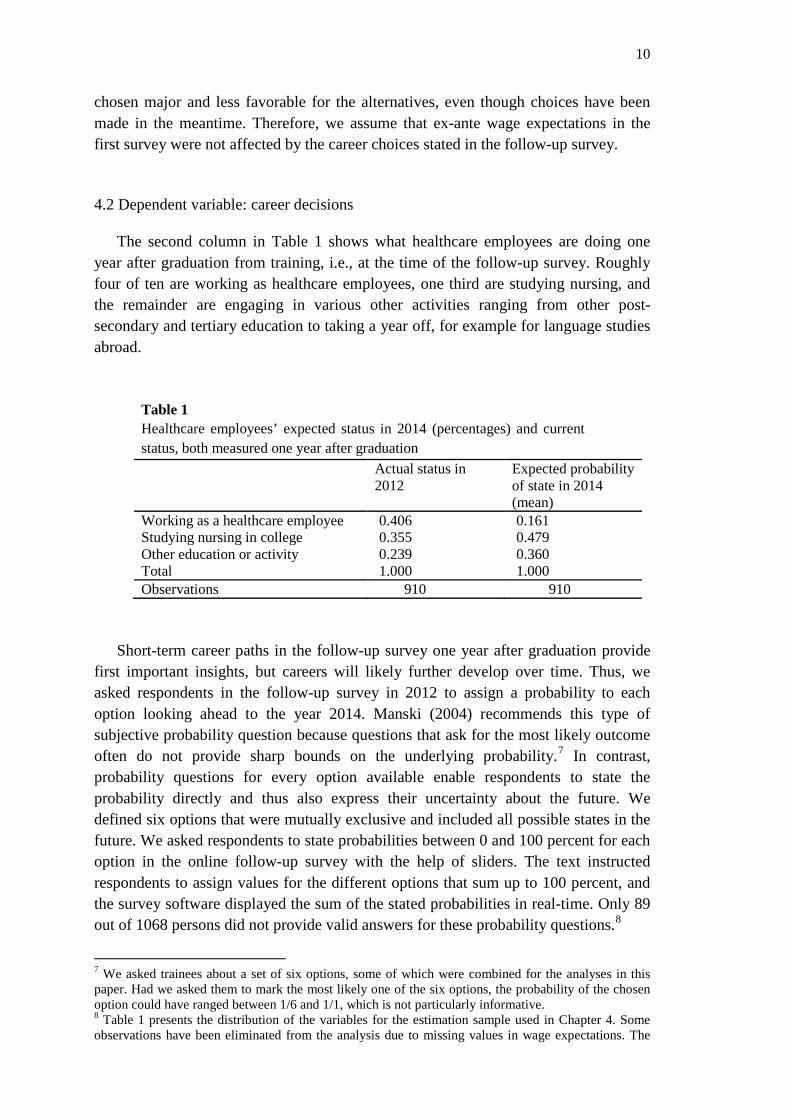
The second column in Table 1 shows what healthcare employees are doing one year after graduation from training, i.e., at the time of the follow-up survey. Roughly four of ten are working as healthcare employees, one third are studying nursing, and the remainder are engaging in various other activities ranging from other post-secondary and tertiary education to taking a year off, for example for language studies abroad.
Table 1 Healthcare employees’ expected status in 2014 (percentages) and current status, both measured one year after graduation Actual status in
2012 Expected probability of state in 2014 (mean)
Working as a healthcare employee 0.406 0.161 Studying nursing in college 0.355 0.479 Other education or activity 0.239 0.360 Total 1.000 1.000 Observations 910 910
Short-term career paths in the follow-up survey one year after graduation provide
first important insights, but careers will likely further develop over time. Thus, we asked respondents in the follow-up survey in 2012 to assign a probability to each option looking ahead to the year 2014. Manski (2004) recommends this type of subjective probability question because questions that ask for the most likely outcome often do not provide sharp bounds on the underlying probability.7 In contrast, probability questions for every option available enable respondents to state the probability directly and thus also express their uncertainty about the future. We defined six options that were mutually exclusive and included all possible states in the future. We asked respondents to state probabilities between 0 and 100 percent for each option in the online follow-up survey with the help of sliders. The text instructed respondents to assign values for the different options that sum up to 100 percent, and the survey software displayed the sum of the stated probabilities in real-time. Only 89 out of 1068 persons did not provide valid answers for these probability questions.8
7 We asked trainees about a set of six options, some of which were combined for the analyses in this paper. Had we asked them to mark the most likely one of the six options, the probability of the chosen option could have ranged between 1/6 and 1/1, which is not particularly informative. 8 Table 1 presents the distribution of the variables for the estimation sample used in Chapter 4. Some observations have been eliminated from the analysis due to missing values in wage expectations. The
11
The last column in Table 1 presents the means of the probabilities for the different options. Although the expected probabilities for 2014 depend on the career paths realized up to 2012, the proportions in Table 1 differ considerably: the respondents anticipate a shift away from working as healthcare employees to studying nursing and engaging in other activities within the two years after the follow-up survey. Although these ex ante predictions may not coincide (fully) with the respondents’ actual situations in 2014, they point to high occupational mobility in the years after graduation from healthcare training. As we are interested in the full amount of enrollment into nursing colleges in the years after graduation from healthcare employee training, we will mainly focus on the influence of wage expectations on individuals’ anticipated choices for 2014. If we focused on actual choices in 2012, we would have to assume that individuals do not consider switching status in the future (van der Klaauw, 2012), an assumption that is obviously not fulfilled according to Table 1. Therefore, we will study wage expectations’ influence on actual status in 2012 to complement the analysis of stated choice probabilities for 2014. 4.3 Main independent variable: wage expectations
In the first survey, we elicited wage expectations for the two main career options: working as a healthcare employee and working as a nurse. The career option “nursing” carries special weight because healthcare employees are the main target group for higher nursing education according to the educational and health authorities’ plans (DEA, 2010). The questionnaire asked the trainees for their expected wages in five scenarios: if they were to work as a (fully trained) healthcare employee (i) directly after training, (ii) at age 25 and (iii) at age 35. Furthermore, trainees stated their expected mean wages if they had successfully achieved a nursing degree and worked as a registered nurse (iv) at age 25 and (v) at age 35. The reason we asked for starting wages for healthcare employees but not for nurses is that age 25 is very close to the typical age when nurses begin their careers, while the majority of healthcare employee trainees finish their training around age 19. The wage expectation questions asked for gross wages per month in a full-time position, excluding allowances. Hospitals and nursing homes typically have clear rules about allowances for shifts and for changes in cost-of-living (inflation). Pretests confirmed that trainees had no problem understanding and answering these questions. The exact phrasing of the questions can be found in the Appendix.
We began to assess the quality of the responses by looking at item non-response and implausible answers. We use the full sample of the first survey for these analyses. Out of 2089 respondents, only 25 did not feel able to state an expectation for the starting wage when working as a healthcare employee. Additionally, few implausible values were observed. We have not trimmed wage expectations at this stage because we are interested in the quality of the wage expectation data and do not want to make answers look more accurate than they were. Therefore, we only discarded cases with obviously erroneous answers. For example, one respondent predicted very low wages table including all valid observations on career decisions and stated probabilities is available from the authors upon request; deviations are small.
12
for age 35 (but not for age 25) and wrote a remark on the margin of the sheet that she intended to have a family by then. As this person had not followed our instruction to state a full-time wage, her answer was removed. In a few cases, we corrected entries where the original intention was obvious. For example, one respondent gave the following answers for the healthcare employee starting wage, wage at age 25, wage at age 35, nursing wage at age 25 and age 35: {4400, 4600, 5000, 5400, 600}. In all likelihood, he meant the last figure to be 6000. We also deleted several cases where wage expectations looked plausible for healthcare employee scenarios but were implausibly low for nurse scenarios. These respondents, rather than indicating the expected wage after obtaining a nursing degree, likely provided the internship wage of approximately 1000 CHF that nursing students receive during their clinical education (as defined in the curricula). All together, we corrected 18 cases by discarding or editing as described above. Finally, we deleted several answers from respondents who were already older than specified in the scenario. Respondents who were 25 or older at the time of the survey are by definition not able to state an “expectation” for themselves about a future wage at age 25.
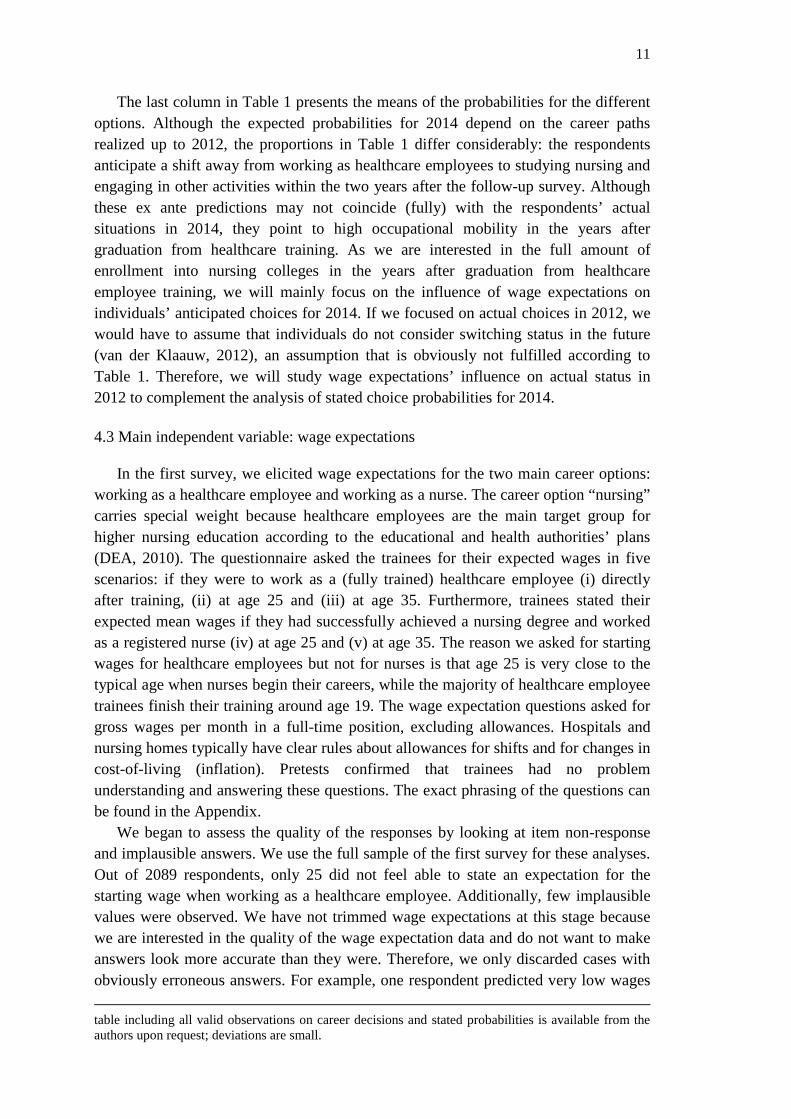
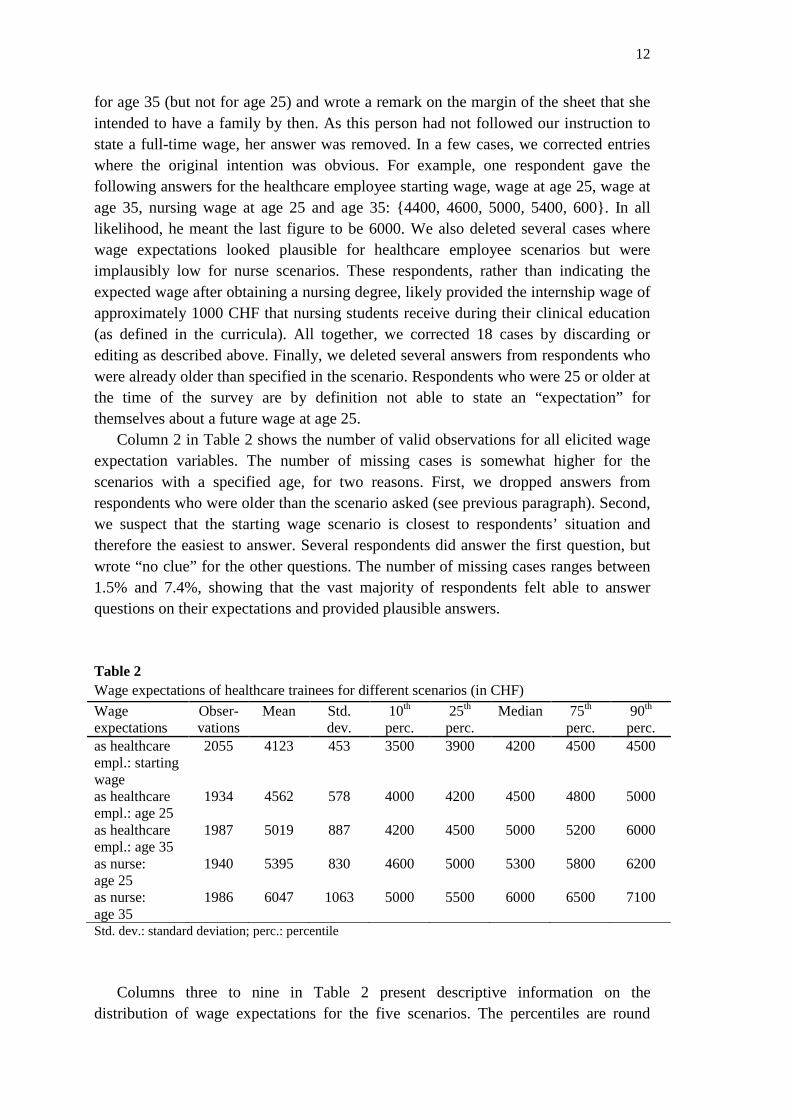
Column 2 in Table 2 shows the number of valid observations for all elicited wage expectation variables. The number of missing cases is somewhat higher for the scenarios with a specified age, for two reasons. First, we dropped answers from respondents who were older than the scenario asked (see previous paragraph). Second, we suspect that the starting wage scenario is closest to respondents’ situation and therefore the easiest to answer. Several respondents did answer the first question, but wrote “no clue” for the other questions. The number of missing cases ranges between 1.5% and 7.4%, showing that the vast majority of respondents felt able to answer questions on their expectations and provided plausible answers.
Table 2 Wage expectations of healthcare trainees for different scenarios (in CHF) Wage expectations
Obser-vations
Mean Std. dev.
10th perc.
25th perc.
Median 75th perc.
90th perc.
as healthcare empl.: starting wage
2055 4123 453 3500 3900 4200 4500 4500
as healthcare empl.: age 25
1934 4562 578 4000 4200 4500 4800 5000
as healthcare empl.: age 35
1987 5019 887 4200 4500 5000 5200 6000
as nurse: age 25
1940 5395 830 4600 5000 5300 5800 6200
as nurse: age 35
1986 6047 1063 5000 5500 6000 6500 7100
Std. dev.: standard deviation; perc.: percentile Columns three to nine in Table 2 present descriptive information on the
distribution of wage expectations for the five scenarios. The percentiles are round
13
values because respondents typically stated their expectations in steps of one hundred Swiss Francs. While responses were most often rounded to a full thousand or to five hundred, we also observed many intermediate values. The distributions are almost symmetric, with a slightly longer upper tail. Means and percentiles in the various scenarios increase with age and with level of education, a finding that mirrors stylized facts on the labor market.
Overall, the dispersion of the wage expectations appears to be limited, with the 10th and 90th percentiles within plus or minus 20 percent of the median. Variance and interquartile range increase with age and level of education. Note that the standard deviations of expected nursing wages are clearly higher than those of expected healthcare employee wages. There are two likely reasons for this. First, nurses’ careers are more heterogeneous because they can develop in different directions within nursing (e.g., critical care nurse, nursing manager, nursing teacher). This heterogeneity is associated with higher wage dispersion, especially after several years of experience, and thus higher ex ante wage uncertainty for potential future nurses. Second, healthcare employees are likely to be more uncertain about actual wages in an occupation they are not yet working in (nursing) than in the occupation they have been trained in (healthcare employee) for more than two years already.
Trainees’ wage expectations indicate their expectations for the rate of return of a nursing degree. As we observe only a few points of the expected lifetime earnings for healthcare employees and nurses, we approximate the expected lifetime rate of return as follows:
𝑅 =𝑤25𝑛 + 3 ∗ 𝑤35
𝑛
𝑤25ℎ𝑒 + 3 ∗ 𝑤35ℎ𝑒− 1
The return of graduating from nursing college is the expected lifetime income as a
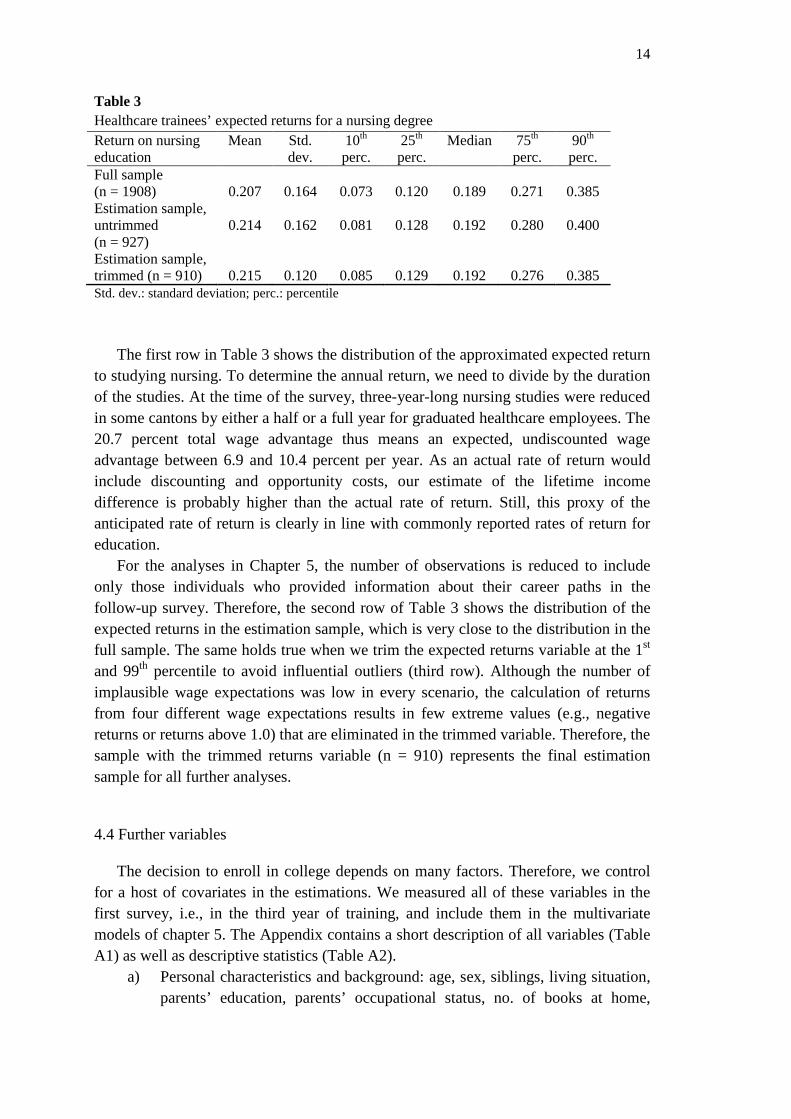
nurse (based on 𝑤𝑛 at age 25 and age 35) over the expected lifetime income as a healthcare employee (based on 𝑤ℎ𝑒 at age 25 and age 35). This calculation assumes that wage profiles are flat between age 20 and 30 (proxied by 𝑤25) and again after age 30 until age 60 (proxied by 3 ∗ 𝑤35); it does not include opportunity costs or discounting. This equation provides a simple approximation of the income difference between nurses and healthcare employees (for a similar approach, see Menon, 2008). All refinements are arbitrary as we have to rely on the available information. Of course, the different wage expectations are correlated but not collinear (see Table A3 in the Appendix). The advantage of performing this return calculation using data on expectations is that we know individuals’ evaluations of two different career options without relying on structural estimation approaches to retrieve counterfactual wages.
14
Table 3 Healthcare trainees’ expected returns for a nursing degree Return on nursing education
Mean Std. dev.
10th perc.
25th perc.
Median 75th perc.
90th perc.
Full sample (n = 1908)
0.207
0.164
0.073
0.120
0.189
0.271
0.385
Estimation sample, untrimmed (n = 927)
0.214
0.162
0.081
0.128
0.192
0.280
0.400
Estimation sample, trimmed (n = 910)
0.215
0.120
0.085
0.129
0.192
0.276
0.385
Std. dev.: standard deviation; perc.: percentile The first row in Table 3 shows the distribution of the approximated expected return
to studying nursing. To determine the annual return, we need to divide by the duration of the studies. At the time of the survey, three-year-long nursing studies were reduced in some cantons by either a half or a full year for graduated healthcare employees. The 20.7 percent total wage advantage thus means an expected, undiscounted wage advantage between 6.9 and 10.4 percent per year. As an actual rate of return would include discounting and opportunity costs, our estimate of the lifetime income difference is probably higher than the actual rate of return. Still, this proxy of the anticipated rate of return is clearly in line with commonly reported rates of return for education.
For the analyses in Chapter 5, the number of observations is reduced to include only those individuals who provided information about their career paths in the follow-up survey. Therefore, the second row of Table 3 shows the distribution of the expected returns in the estimation sample, which is very close to the distribution in the full sample. The same holds true when we trim the expected returns variable at the 1st and 99th percentile to avoid influential outliers (third row). Although the number of implausible wage expectations was low in every scenario, the calculation of returns from four different wage expectations results in few extreme values (e.g., negative returns or returns above 1.0) that are eliminated in the trimmed variable. Therefore, the sample with the trimmed returns variable (n = 910) represents the final estimation sample for all further analyses. 4.4 Further variables
The decision to enroll in college depends on many factors. Therefore, we control for a host of covariates in the estimations. We measured all of these variables in the first survey, i.e., in the third year of training, and include them in the multivariate models of chapter 5. The Appendix contains a short description of all variables (Table A1) as well as descriptive statistics (Table A2).
a) Personal characteristics and background: age, sex, siblings, living situation, parents’ education, parents’ occupational status, no. of books at home,
15
parents in healthcare, level of school track attended on the lower-secondary level
b) Preferences: time preference, risk aversion, intrinsic and extrinsic motivation, preference for patient contact, preference for work-life balance, intention to work part-time in future9
c) Information on the training as a healthcare employee: includes courses to obtain a vocational baccalaureate, includes pre-courses for the vocational baccalaureate, grade point average in vocational school, type of training firm (hospital, nursing home, home care, etc.)
d) Subjective assessment of their training as a healthcare employee and of their own performance: self-efficacy (in general education and work tasks), commitment to healthcare employee occupation, satisfaction with training, stress during training
e) Canton dummies As schooling decisions are influenced by time preference according to economic
theory, the measurement of time preference is critical. Based on Frederick et al. (2002), we decided against posing a question of the type “do you prefer 1000 CHF today or 1100 CHF in one year?” This type of question seems to be too far from the choice situation that trainees are confronted with. Therefore, we asked respondents to choose their preferred option between two lifecycle wage paths that are typical for nursing professionals with higher and lower levels of education. We derived these wage paths from cantonal wage tables and from wage information available in the Swiss Labor Force Survey for working nurses. One wage path (akin to a true wage path for healthcare employees) promises a higher wage during the next three years but less later on, compared to the other wage path. The two paths imply a discount rate of 5.3 percent, as this equalizes the present value of the two stylized, but realistic lifetime income streams for healthcare employees and nurses. This figure represents the average rate of return offered by a nursing education. Thus, the questionnaire item implicitly measures whether an individual’s discount factor is higher or lower than the rate of return of 5.3 percent.
Risk aversion is measured by a 10 point scale where individuals grade themselves on their willingness to take a business risk. Studies show that this type of survey question is correlated with outcomes from experimental lotteries and with risky behavior across a number of contexts (Ding et al., 2010; Dohmen et al., 2011).
We imputed means for the missing values in control variables (but not for the missing wage expectation figures). In the estimations, we included dummy variables indicating imputed values for every control variable. As very few variables are missing for most controls, the dummy variables were widely insignificant. In Chapter 4, we thus only include dummies for missing values if we have imputed more than 50 cases for a certain variable. This was the case for the variable of self-efficacy in general education, mother’s education and father’s education.
9 We also asked respondents to report their intention to temporarily stop working (e.g., to start a family); including this dummy variable in the models in Section 4 does not affect the results.
16
5. Findings
5.1. Are healthcare trainees’ wage expectations reasonable? Manski (2004) distinguishes among three ways to assess the accuracy of earnings
expectations: (i) comparing expectations and realizations for the same individuals, (ii) comparing mean expectations and realizations for the same populations, or (iii) comparing mean expectations with historical realizations.
Our approach falls into the third category: we compare mean expectations with current wages (which will be historical when trainees and students graduate). This is only warranted if the cohort under scrutiny will have the same distribution of realizations as shown by the wage data used for the comparison. We use two data sources for comparison. First, we use wage information from the Swiss Labor Force Survey, which provides information on the distribution of actual nursing wages. The number of observations for healthcare employees is very low because this occupation was only introduced a few years ago. Second, we use cantonal wage recommendations issued by cantonal authorities themselves or by the cantonal healthcare employers’ association. We presume that the wage expectations in our survey should be close to official wage recommendations because healthcare institutions (hospitals, nursing homes) are mostly run or financed by cantons or municipalities. Wage structures in healthcare, including starting wages and wage growth, are thus strongly influenced by the state, which leads to a reduced wage variance. This publicly available information reduces uncertainty for individuals and should help them to predict their future wages. Furthermore, trainees in our sample will graduate within a few months. Cantonal wage schemes are unlikely to change quickly and without prior public debate, which again reduces uncertainty.
Cantonal pay schemes do not lead to degenerate wage distributions within cantons for several reasons. First, private hospitals and nursing homes are not bound by pay schemes. Second, hospitals and nursing homes have some degree of autonomy and are not strictly obliged to adhere to wage recommendations. For example, salary schemes often set salary bands instead of fixing exact salaries. Third, there are different roles and positions within hospitals and nursing homes that lead to wage differences within the same institution. The heterogeneity in roles increases with age and is supposedly more pronounced for nurses than for healthcare employees.
These reasons create variance in the actual wages of healthcare employees and nurses. For a trainee with building expectations about his or her future wage, this wage variance can represent unpredictable risk or predictable heterogeneity, as far as the trainee knows his or her own ability, preferences and so forth, and uses this information to predict wage. Both risk and heterogeneity cause wage expectations to vary between individuals, even if trainees are perfectly informed about actual wages and official pay schemes. However, trainees’ information about current wages may not be perfect, which would add errors to their prediction of own future wages. Finally, the future developments in healthcare are uncertain, in particular because both the healthcare training curriculum and the nurse education curriculum were recently
17
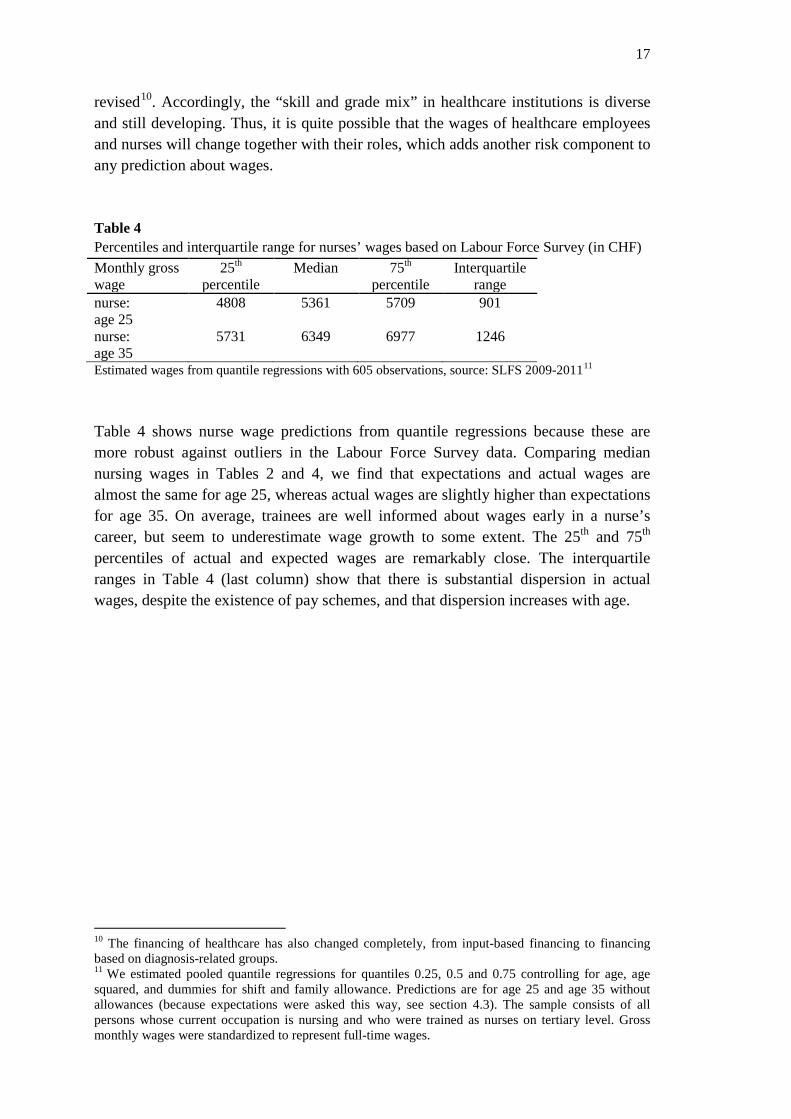
revised10. Accordingly, the “skill and grade mix” in healthcare institutions is diverse and still developing. Thus, it is quite possible that the wages of healthcare employees and nurses will change together with their roles, which adds another risk component to any prediction about wages.
Table 4 Percentiles and interquartile range for nurses’ wages based on Labour Force Survey (in CHF) Monthly gross wage
25th percentile
Median 75th percentile
Interquartile range
nurse: age 25
4808 5361 5709 901
nurse: age 35
5731 6349 6977 1246
Estimated wages from quantile regressions with 605 observations, source: SLFS 2009-201111
Table 4 shows nurse wage predictions from quantile regressions because these are more robust against outliers in the Labour Force Survey data. Comparing median nursing wages in Tables 2 and 4, we find that expectations and actual wages are almost the same for age 25, whereas actual wages are slightly higher than expectations for age 35. On average, trainees are well informed about wages early in a nurse’s career, but seem to underestimate wage growth to some extent. The 25th and 75th percentiles of actual and expected wages are remarkably close. The interquartile ranges in Table 4 (last column) show that there is substantial dispersion in actual wages, despite the existence of pay schemes, and that dispersion increases with age.
10 The financing of healthcare has also changed completely, from input-based financing to financing based on diagnosis-related groups. 11 We estimated pooled quantile regressions for quantiles 0.25, 0.5 and 0.75 controlling for age, age squared, and dummies for shift and family allowance. Predictions are for age 25 and age 35 without allowances (because expectations were asked this way, see section 4.3). The sample consists of all persons whose current occupation is nursing and who were trained as nurses on tertiary level. Gross monthly wages were standardized to represent full-time wages.
18
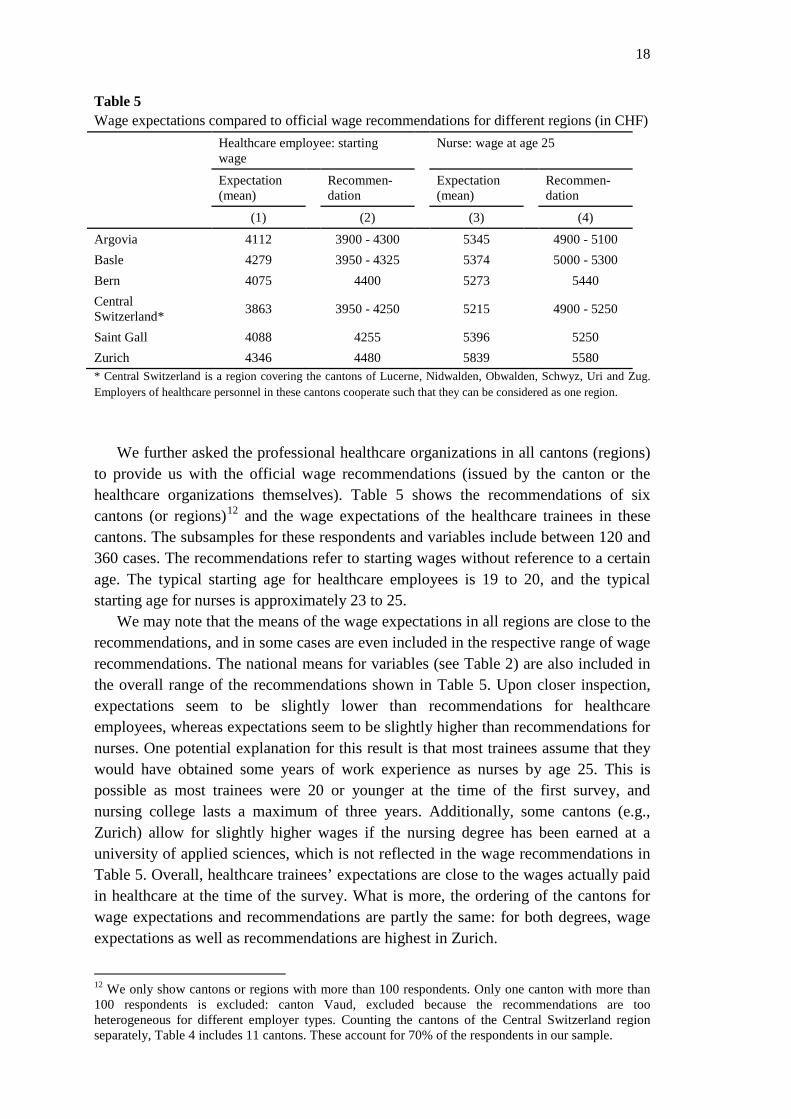
Table 5 Wage expectations compared to official wage recommendations for different regions (in CHF) Healthcare employee: starting
wage Nurse: wage at age 25
Expectation (mean)
Recommen-dation
Expectation (mean)
Recommen-dation
(1) (2) (3) (4)
Argovia 4112 3900 - 4300 5345 4900 - 5100 Basle 4279 3950 - 4325 5374 5000 - 5300 Bern 4075 4400 5273 5440 Central Switzerland* 3863 3950 - 4250 5215 4900 - 5250
Saint Gall 4088 4255 5396 5250 Zurich 4346 4480 5839 5580 * Central Switzerland is a region covering the cantons of Lucerne, Nidwalden, Obwalden, Schwyz, Uri and Zug. Employers of healthcare personnel in these cantons cooperate such that they can be considered as one region.
We further asked the professional healthcare organizations in all cantons (regions)
to provide us with the official wage recommendations (issued by the canton or the healthcare organizations themselves). Table 5 shows the recommendations of six cantons (or regions)12 and the wage expectations of the healthcare trainees in these cantons. The subsamples for these respondents and variables include between 120 and 360 cases. The recommendations refer to starting wages without reference to a certain age. The typical starting age for healthcare employees is 19 to 20, and the typical starting age for nurses is approximately 23 to 25.
We may note that the means of the wage expectations in all regions are close to the recommendations, and in some cases are even included in the respective range of wage recommendations. The national means for variables (see Table 2) are also included in the overall range of the recommendations shown in Table 5. Upon closer inspection, expectations seem to be slightly lower than recommendations for healthcare employees, whereas expectations seem to be slightly higher than recommendations for nurses. One potential explanation for this result is that most trainees assume that they would have obtained some years of work experience as nurses by age 25. This is possible as most trainees were 20 or younger at the time of the first survey, and nursing college lasts a maximum of three years. Additionally, some cantons (e.g., Zurich) allow for slightly higher wages if the nursing degree has been earned at a university of applied sciences, which is not reflected in the wage recommendations in Table 5. Overall, healthcare trainees’ expectations are close to the wages actually paid in healthcare at the time of the survey. What is more, the ordering of the cantons for wage expectations and recommendations are partly the same: for both degrees, wage expectations as well as recommendations are highest in Zurich.
12 We only show cantons or regions with more than 100 respondents. Only one canton with more than 100 respondents is excluded: canton Vaud, excluded because the recommendations are too heterogeneous for different employer types. Counting the cantons of the Central Switzerland region separately, Table 4 includes 11 cantons. These account for 70% of the respondents in our sample.
19
We conclude that the wage expectations of healthcare trainees in their final year of training are reasonable and close to observed as well as officially recommended wages. This finding is remarkable as these trainees attend an upper-secondary education program, whereas most of the literature refers to the accuracy of income expectations of college students, a positively selected group of individuals. However, this finding is not entirely surprising because healthcare trainees work on-the-job and frequently come into contact with senior team mates in hospitals and nursing homes. It is likely that they learn about salaries from their peers, senior colleagues and superiors. Our findings are in line with the hypothesis that trainees rely mainly on current wages to form wage expectations for themselves. 5.2. Wage expectations and nursing college enrollment
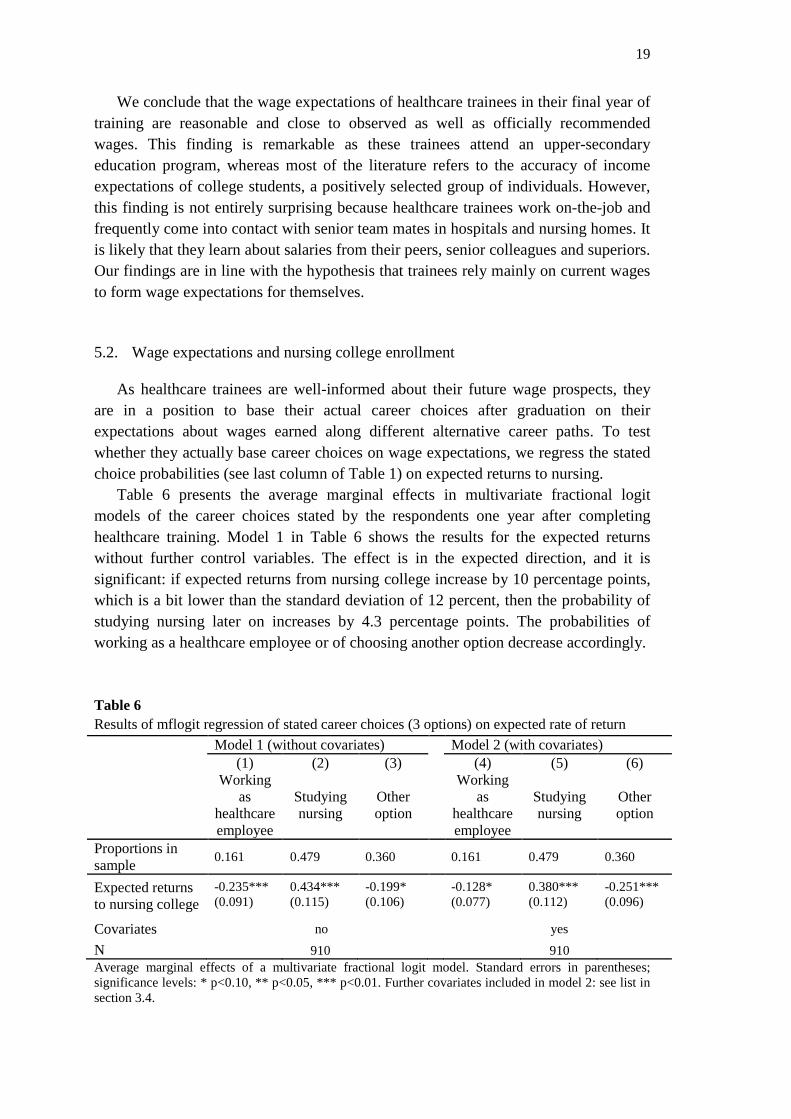
As healthcare trainees are well-informed about their future wage prospects, they are in a position to base their actual career choices after graduation on their expectations about wages earned along different alternative career paths. To test whether they actually base career choices on wage expectations, we regress the stated choice probabilities (see last column of Table 1) on expected returns to nursing.
Table 6 presents the average marginal effects in multivariate fractional logit models of the career choices stated by the respondents one year after completing healthcare training. Model 1 in Table 6 shows the results for the expected returns without further control variables. The effect is in the expected direction, and it is significant: if expected returns from nursing college increase by 10 percentage points, which is a bit lower than the standard deviation of 12 percent, then the probability of studying nursing later on increases by 4.3 percentage points. The probabilities of working as a healthcare employee or of choosing another option decrease accordingly.
Table 6 Results of mflogit regression of stated career choices (3 options) on expected rate of return Model 1 (without covariates) Model 2 (with covariates) (1)
Working as
healthcare employee
(2)
Studying nursing
(3)
Other option
(4) Working
as healthcare employee
(5)
Studying nursing
(6)
Other option
Proportions in sample 0.161 0.479 0.360 0.161 0.479 0.360
Expected returns to nursing college
-0.235*** 0.434*** -0.199* -0.128* 0.380*** -0.251*** (0.091) (0.115) (0.106) (0.077) (0.112) (0.096)
Covariates no yes
N 910 910 Average marginal effects of a multivariate fractional logit model. Standard errors in parentheses; significance levels: * p<0.10, ** p<0.05, *** p<0.01. Further covariates included in model 2: see list in section 3.4.
20
Shields (2004) points to “the lack of control for individual unobservable
heterogeneity (e.g. motivation, ability and other personality traits)” (p. F491) in most studies on nurses’ labor supply. This lack of control also makes it difficult to assess the relative importance of pecuniary and non-pecuniary factors (Antonazzo et al., 2003). In a second model, we thus include the covariates described in section 4.4 and in table A1 in the Appendix. These allow us to control for many dimensions of individual heterogeneity and to compare the effects of pecuniary and non-pecuniary factors. The last columns of Table 6 show the marginal effects of a subset of the included covariates (full results available from the authors upon request). The marginal effect of returns on the stated choice of nursing college decreases slightly from 4.3 in the model without covariates to 3.8 percentage points in the model with covariates. The diminishing effect of returns on the probability to work as a healthcare employee becomes smaller in the latter model, and the diminishing effect on the third option becomes larger. Controlling for observables does not change the result that higher anticipated returns increase enrollment in nursing college. The limited effects of the covariates on the effect of expected returns also show that returns are only weakly correlated with the covariates, as confirmed when we regress wage expectations on covariates (not shown13).
Many covariates show significant effects. Males are more likely to pursue other options (e.g., the military, other educational programs such as physiotherapist or paramedic) outside of nursing college, compared to women. Younger trainees enroll in nursing college more often, whereas older trainees are more likely to work as healthcare employees after graduation. Respondents with lower time preferences are more likely to enroll in nursing college, as predicted by the theory of schooling. Risk-loving respondents are more likely to choose other options, while risk-averse respondents prefer the direct route into nursing. One reason is that nursing is considered to be a smaller step because nursing tasks are closer to healthcare employee tasks than tasks in alternative occupations, even within health occupations.14 Good grades in vocational school strongly increase the probability of studying nursing, which can be explained by the role of grades in nursing college admissions procedures. In addition to a lower GPA, lower self-efficacy with respect to general education further increases the likelihood that trainees continue working as healthcare employees. The healthcare employees still working in their learned profession are thus a negative selection of healthcare trainees with respect to their academic skills. However, trainees with higher satisfaction with training are also more likely to stay healthcare employees, ceteris paribus.
Variables on trainees’ motivations allow us to resume a debate in the literature about nurses’ intrinsic motivation (Heyes, 2005, 2007; Taylor, 2007; Barigozzi and Turati, 2012): increasing nurses’ wages may lower average productivity if less
13 All results mentioned but not shown in the paper are available from the authors. 14 It is unlikely that the result on risk aversion is driven by unemployment risk, as unemployment is low in Switzerland for people with upper-secondary (4.1%) or tertiary degrees (3.7%). Source: Swiss Labour Force Survey, data file “je-d-03.03.02.14”. Employment prospects in healthcare are better than average due to skills shortages in the healthcare sector.
21
intrinsically motivated persons are attracted to nursing, and if these people are less productive. Indeed, we find that all else remaining equal, a higher intrinsic motivation increases the probability of choosing another option, including studies for midwifery, physiotherapy, and paramedics, and studies outside healthcare for social or teaching professions. At the same time, extrinsic motivation increases the probability that an individual will attend nursing college, even controlling for expected returns. In fact, trainees have higher intrinsic than extrinsic motivation on average15, even in the group of future nursing students (see Table A2), but selection into nursing is motivated rather extrinsically than intrinsically. One partial explanation is that healthcare trainees are already working on a nursing profession and both, healthcare employee positions as well as registered nursing positions, are already satisfying in realizing intrinsic motives, but differ in terms of satisfying external motivations. We cannot directly analyze whether the selected group of nurses with higher extrinsic motivation is less productive, as assumed by Heyes (2005). Two results caution against this interpretation in our case: First, as noted above, selection into nursing is positive in terms of ability, and extrinsic motivation and grades at vocational school are not correlated significantly in our sample. Second, those persons attaching a high importance to patient contact, which is a proxy for altruistic motivation, are more likely to choose nursing college. Thus, we find that nursing studies attract students motivated by pecuniary, extrinsic and altruistic motives, while studies in more specialized health or social professions seem to attract those students that have a strong intrinsic motivation.
Next to individual characteristics, the training firm may also play a role for future careers. Trainees who were trained in a care home are more likely to remain healthcare employees and less likely to become nurses than trainees that were trained in an acute hospital. One likely explanation is that care homes offer jobs with more responsibility to healthcare employees, as care homes typically employ only few registered nurses. This may also lead them to recruit healthcare trainees that do not intend to go on to nursing later on, but continue to work in the home as healthcare employee.
When we compare the effects of expected returns and other variables, we see that a 20 percentage point increase in expected returns has a similar effect as being of age 18 or younger, instead of age 19 to 23. A 30 percentage point increase in expected returns has a similar impact as attaching a high importance to patient contact. These comparisons show that while returns have a substantial effect on career decisions, the changes in returns that are necessary to equalize the effects of certain personal characteristics and traits are rather large.
15 Intrinsic and extrinsic motivations show a weak positive correlation in the estimation sample (r=0.22).
22
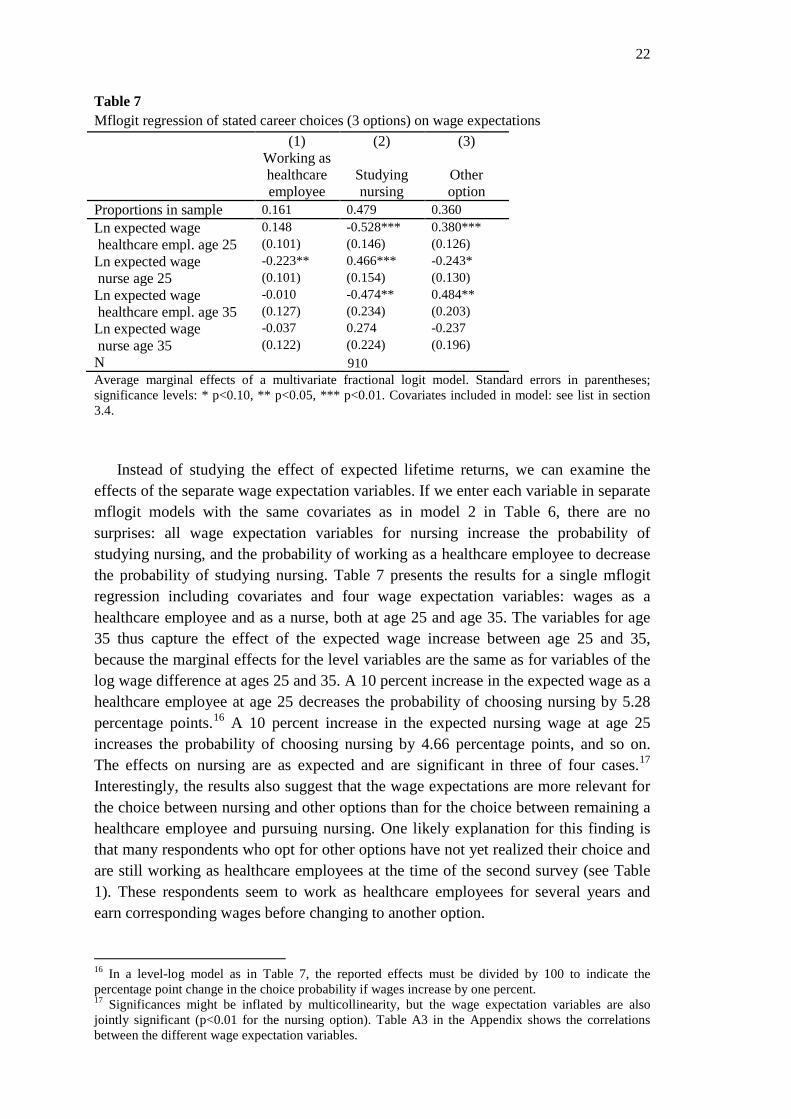
Table 7 Mflogit regression of stated career choices (3 options) on wage expectations (1)
Working as healthcare employee
(2)
Studying nursing
(3)
Other option
Proportions in sample 0.161 0.479 0.360 Ln expected wage 0.148 -0.528*** 0.380*** healthcare empl. age 25 (0.101) (0.146) (0.126) Ln expected wage -0.223** 0.466*** -0.243* nurse age 25 (0.101) (0.154) (0.130) Ln expected wage -0.010 -0.474** 0.484** healthcare empl. age 35 (0.127) (0.234) (0.203) Ln expected wage -0.037 0.274 -0.237 nurse age 35 (0.122) (0.224) (0.196) N 910 Average marginal effects of a multivariate fractional logit model. Standard errors in parentheses; significance levels: * p<0.10, ** p<0.05, *** p<0.01. Covariates included in model: see list in section 3.4.
Instead of studying the effect of expected lifetime returns, we can examine the
effects of the separate wage expectation variables. If we enter each variable in separate mflogit models with the same covariates as in model 2 in Table 6, there are no surprises: all wage expectation variables for nursing increase the probability of studying nursing, and the probability of working as a healthcare employee to decrease the probability of studying nursing. Table 7 presents the results for a single mflogit regression including covariates and four wage expectation variables: wages as a healthcare employee and as a nurse, both at age 25 and age 35. The variables for age 35 thus capture the effect of the expected wage increase between age 25 and 35, because the marginal effects for the level variables are the same as for variables of the log wage difference at ages 25 and 35. A 10 percent increase in the expected wage as a healthcare employee at age 25 decreases the probability of choosing nursing by 5.28 percentage points.16 A 10 percent increase in the expected nursing wage at age 25 increases the probability of choosing nursing by 4.66 percentage points, and so on. The effects on nursing are as expected and are significant in three of four cases.17 Interestingly, the results also suggest that the wage expectations are more relevant for the choice between nursing and other options than for the choice between remaining a healthcare employee and pursuing nursing. One likely explanation for this finding is that many respondents who opt for other options have not yet realized their choice and are still working as healthcare employees at the time of the second survey (see Table 1). These respondents seem to work as healthcare employees for several years and earn corresponding wages before changing to another option.
16 In a level-log model as in Table 7, the reported effects must be divided by 100 to indicate the percentage point change in the choice probability if wages increase by one percent. 17 Significances might be inflated by multicollinearity, but the wage expectation variables are also jointly significant (p<0.01 for the nursing option). Table A3 in the Appendix shows the correlations between the different wage expectation variables.
23
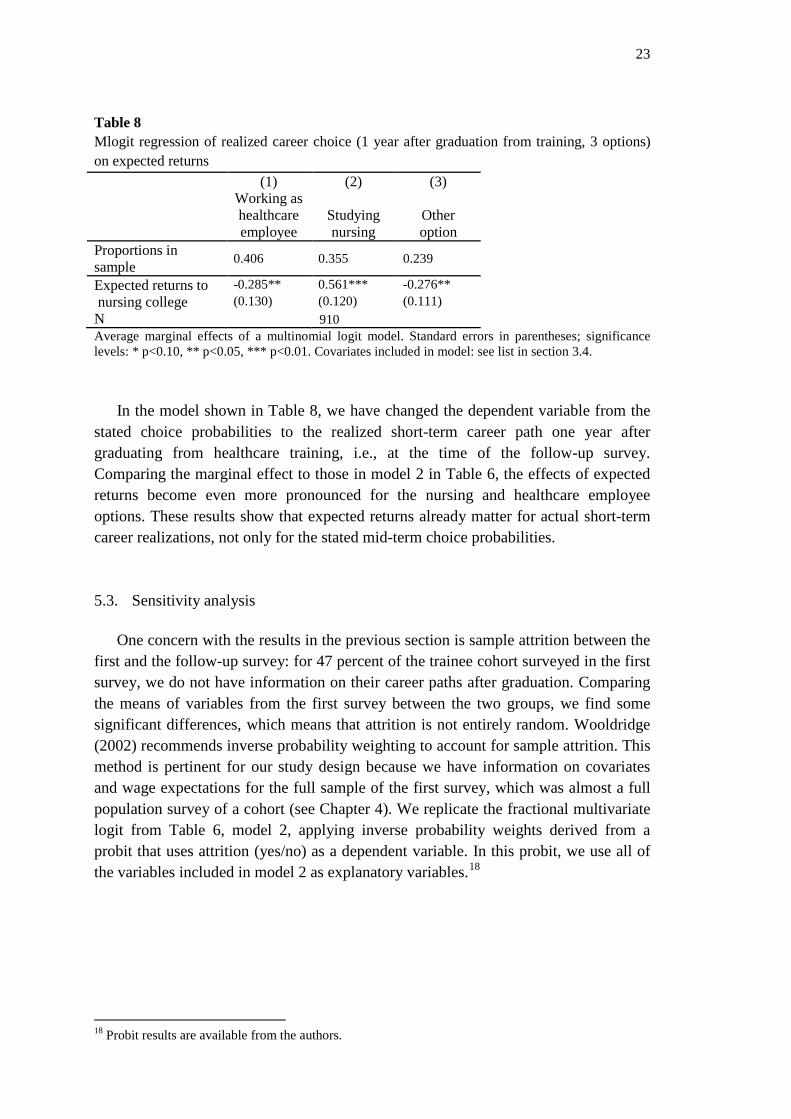
Table 8 Mlogit regression of realized career choice (1 year after graduation from training, 3 options) on expected returns (1)
Working as healthcare employee
(2)
Studying nursing
(3)
Other option
Proportions in sample 0.406 0.355 0.239
Expected returns to -0.285** 0.561*** -0.276** nursing college (0.130) (0.120) (0.111) N 910 Average marginal effects of a multinomial logit model. Standard errors in parentheses; significance levels: * p<0.10, ** p<0.05, *** p<0.01. Covariates included in model: see list in section 3.4.
In the model shown in Table 8, we have changed the dependent variable from the
stated choice probabilities to the realized short-term career path one year after graduating from healthcare training, i.e., at the time of the follow-up survey. Comparing the marginal effect to those in model 2 in Table 6, the effects of expected returns become even more pronounced for the nursing and healthcare employee options. These results show that expected returns already matter for actual short-term career realizations, not only for the stated mid-term choice probabilities.
5.3. Sensitivity analysis One concern with the results in the previous section is sample attrition between the
first and the follow-up survey: for 47 percent of the trainee cohort surveyed in the first survey, we do not have information on their career paths after graduation. Comparing the means of variables from the first survey between the two groups, we find some significant differences, which means that attrition is not entirely random. Wooldridge (2002) recommends inverse probability weighting to account for sample attrition. This method is pertinent for our study design because we have information on covariates and wage expectations for the full sample of the first survey, which was almost a full population survey of a cohort (see Chapter 4). We replicate the fractional multivariate logit from Table 6, model 2, applying inverse probability weights derived from a probit that uses attrition (yes/no) as a dependent variable. In this probit, we use all of the variables included in model 2 as explanatory variables.18
18 Probit results are available from the authors.
24
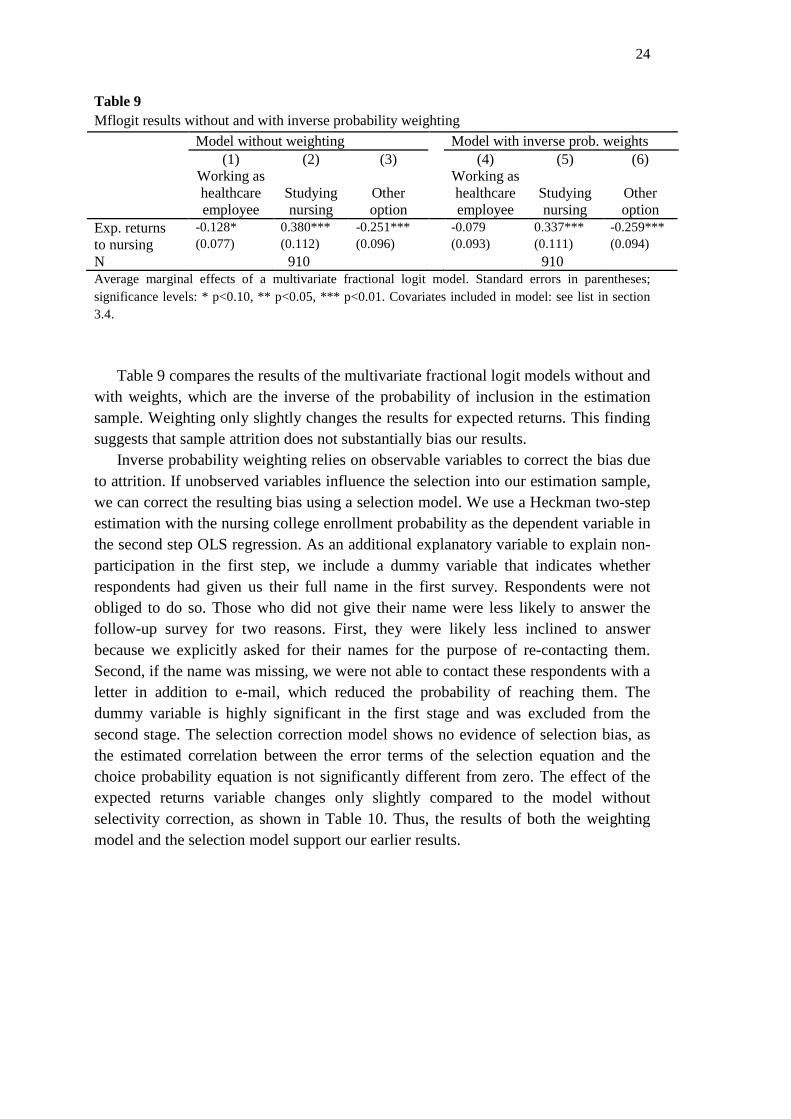
Table 9 Mflogit results without and with inverse probability weighting Model without weighting Model with inverse prob. weights (1)
Working as healthcare employee
(2)
Studying nursing
(3)
Other option
(4) Working as healthcare employee
(5)
Studying nursing
(6)
Other option
Exp. returns to nursing
-0.128* 0.380*** -0.251*** -0.079 0.337*** -0.259*** (0.077) (0.112) (0.096) (0.093) (0.111) (0.094)
N 910 910 Average marginal effects of a multivariate fractional logit model. Standard errors in parentheses; significance levels: * p<0.10, ** p<0.05, *** p<0.01. Covariates included in model: see list in section 3.4.
Table 9 compares the results of the multivariate fractional logit models without and
with weights, which are the inverse of the probability of inclusion in the estimation sample. Weighting only slightly changes the results for expected returns. This finding suggests that sample attrition does not substantially bias our results.
Inverse probability weighting relies on observable variables to correct the bias due to attrition. If unobserved variables influence the selection into our estimation sample, we can correct the resulting bias using a selection model. We use a Heckman two-step estimation with the nursing college enrollment probability as the dependent variable in the second step OLS regression. As an additional explanatory variable to explain non-participation in the first step, we include a dummy variable that indicates whether respondents had given us their full name in the first survey. Respondents were not obliged to do so. Those who did not give their name were less likely to answer the follow-up survey for two reasons. First, they were likely less inclined to answer because we explicitly asked for their names for the purpose of re-contacting them. Second, if the name was missing, we were not able to contact these respondents with a letter in addition to e-mail, which reduced the probability of reaching them. The dummy variable is highly significant in the first stage and was excluded from the second stage. The selection correction model shows no evidence of selection bias, as the estimated correlation between the error terms of the selection equation and the choice probability equation is not significantly different from zero. The effect of the expected returns variable changes only slightly compared to the model without selectivity correction, as shown in Table 10. Thus, the results of both the weighting model and the selection model support our earlier results.
25
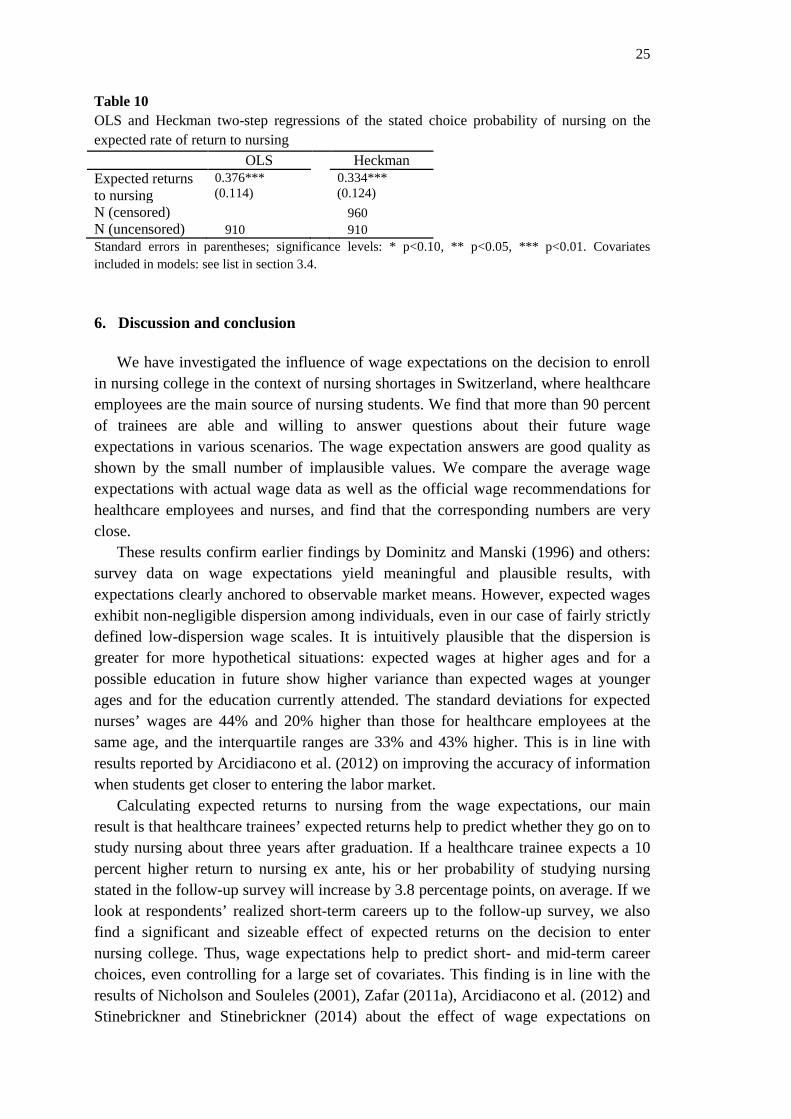
Table 10 OLS and Heckman two-step regressions of the stated choice probability of nursing on the expected rate of return to nursing OLS Heckman Expected returns to nursing
0.376*** 0.334*** (0.114) (0.124)
N (censored) 960 N (uncensored) 910 910 Standard errors in parentheses; significance levels: * p<0.10, ** p<0.05, *** p<0.01. Covariates included in models: see list in section 3.4. 6. Discussion and conclusion
We have investigated the influence of wage expectations on the decision to enroll
in nursing college in the context of nursing shortages in Switzerland, where healthcare employees are the main source of nursing students. We find that more than 90 percent of trainees are able and willing to answer questions about their future wage expectations in various scenarios. The wage expectation answers are good quality as shown by the small number of implausible values. We compare the average wage expectations with actual wage data as well as the official wage recommendations for healthcare employees and nurses, and find that the corresponding numbers are very close.
These results confirm earlier findings by Dominitz and Manski (1996) and others: survey data on wage expectations yield meaningful and plausible results, with expectations clearly anchored to observable market means. However, expected wages exhibit non-negligible dispersion among individuals, even in our case of fairly strictly defined low-dispersion wage scales. It is intuitively plausible that the dispersion is greater for more hypothetical situations: expected wages at higher ages and for a possible education in future show higher variance than expected wages at younger ages and for the education currently attended. The standard deviations for expected nurses’ wages are 44% and 20% higher than those for healthcare employees at the same age, and the interquartile ranges are 33% and 43% higher. This is in line with results reported by Arcidiacono et al. (2012) on improving the accuracy of information when students get closer to entering the labor market.
Calculating expected returns to nursing from the wage expectations, our main result is that healthcare trainees’ expected returns help to predict whether they go on to study nursing about three years after graduation. If a healthcare trainee expects a 10 percent higher return to nursing ex ante, his or her probability of studying nursing stated in the follow-up survey will increase by 3.8 percentage points, on average. If we look at respondents’ realized short-term careers up to the follow-up survey, we also find a significant and sizeable effect of expected returns on the decision to enter nursing college. Thus, wage expectations help to predict short- and mid-term career choices, even controlling for a large set of covariates. This finding is in line with the results of Nicholson and Souleles (2001), Zafar (2011a), Arcidiacono et al. (2012) and Stinebrickner and Stinebrickner (2014) about the effect of wage expectations on
26
students’ major or specialty choices. We provide evidence, for the first time, that ex ante wage expectations have a significant effect on individuals’ decisions to pursue further tertiary schooling after graduation from upper-secondary education. The significant positive effect of a low time preference lends additional support to the economic model of schooling. We further show that among other things, nursing students are younger, abler, more extrinsically and altruistically motivated, but less intrinsically motivated than trainees that do not opt for nursing.
Our findings on the relevance of wage expectations may seem particularly striking in the healthcare domain, which features a huge majority of women, because women have been shown to be less responsive to expected earnings (Freeman and Hirsch, 2008; Montmarquette et al., 2002; Zafar, 2013). Among our group of healthcare trainees, however, the decision to pursue additional education to become a registered nurse is in part determined by pecuniary factors. This is in line with Spetz’ (2002) finding that a change in the relative wage for a baccalaureate nursing degree versus an associate degree increases the probability of choosing the former degree, although Spetz found relatively small effects and the US context differs from the Swiss context. For the literature on wage elasticity of nursing labor supply, our results suggest that the education of new nurses should be accounted for as one mechanism that contributes to a positive long-term wage elasticity.
We conclude that policies affecting individual costs and benefits of nursing education could play a role in attracting more students to nursing college, in conjunction with other policies. Based on our results, we suggest that further research should be conducted on policy measures that affect individuals’ costs and benefits of pursing a nursing career, keeping in mind that we have not directly analyzed such policies. Increasing nurses’ relative wages seems to be one obvious instrument. To corroborate the effectiveness of wage policies in attracting nursing students, an ideal research design would identify a source of exogenous, substantial variation in nurses’ wages and analyze whether this variation affects potential students’ ex ante wage perceptions and finally increases enrollment for nursing studies. Apart from adjusting relative nursing wages, policies may aim to reduce the opportunity costs to increase the demand for nursing college. Nursing colleges could offer part-time studies that allow students to earn a living while studying. Finally, our finding of the greater uncertainty of expected nursing wages compared with healthcare employee wages points to another policy option: targeted information (e.g., in vocational school and/or in hospitals and nursing homes) about career opportunities for registered nurses and the benefits associated with these opportunities might help to reduce uncertainty and thus influence career choice.
27
References
Antonazzo, E., Scott, A., Skatun, D., Elliot, R., 2003. The labour market for nursing: a review of the labour supply literature. Health Economics 12(6), 465–478.
Arcidiacono, P., Hotz, J., Kang, S., 2012. Modeling College Major Choices using Elicited Measures of Expectations and Counterfactuals. Journal of Econometrics 166(1), 3-16.
Arcidiacono, P., Hotz, J., Maurel, A., Romano, T., 2014. Recovering Ex Ante Returns and Preferences for Occupations using Subjective Expectations Data. Working Paper.
Askildsen, J., Baltagi, B., Holmas, T., 2003. Wage Policy in the Health Care Sector: A Panel Data Analysis of Nurses’ Labour Supply. Health Economics 12(9), 705-719.
Barigozzi, F., Turati, G., 2012. Human health care and selection effects. Understanding labor supply in the market for nursing. Health Economics 21(4), 477-483.
Becker, G. S., 1967. Human Capital and the Personal Distribution of Income. W. S. Woytinsky Lecture No. 1. Ann Arbor: University of Michigan.
Belzil, C., Hansen, J. 2002. Unobserved Ability and the Return to Schooling. Econometrica 70(5), 2075-2091.
Beffy, M., Fougère, D., Maurel, A., 2012. Choosing the field of study in postsecondary education. Do expected earnings matter? Review of Economics and Statistics 94(1), 334-347.
Berufsbildungsgesetz, 2002. Bundesgesetz über die Berufsbildung vom 13. Dezember 2002 (BBG; SR 412.10).
Betts, J., 1996. What Do Students Know About Wages? Evidence from a Survey of Undergraduates. Journal of Human Resources 31(1), 27-56.
Botelho, A., Pinto, L., 2004. Students' expectations of the economic returns to college education: results of a controlled experiment. Economics of Education Review 23(6), 645-653.
Brunello, G., Lucifora, C., Winter-Ebmer, R., 2004. The wage expectations of European college students. Journal of Human Resources 39(4), 1116-1142.
Buis, M., 2012. MFLOGIT: Stata module fitting a multivariate fractional logit model by quasi maximum likelihood. RePEc:boc:bocode:s456976
Chen, S., 2008. Estimating the variance of wages in the presence of selection and unobserved heterogeneity. Review of Economics and Statistics 90(2), 275-289.
Chiha, Y., Link, C., 2003. The shortage of registered nurses and some new estimates of the effects of wages on registered nurses labour supply: a look at the past and a preview of the 21st century. Health Policy 64, 349–375.
Cunha, F., Heckman, J., Navarro, S., 2005. Separating uncertainty from heterogeneity in life cycle earnings. Oxford Economic Papers 57(2), 191-261.
DEA Federal Department of Economic Affairs, 2010. Education in the nursing professions. Report. Bern: Federal Department of Economic Affairs.
Di Tommaso, M.L., Strøm, S., Sæther, E.M., 2009. Nurses wanted: Is the job too harsh or is the wage too low? Journal of Health Economics 28(3), 748-757.
28
Ding, X., Hartog, J., Sun, Y., 2010. Can We Measure Individual Risk Attitudes in a Survey?, Tinbergen Institute Discussion Papers 4807.
Dohmen, T., Falk, A., Huffman, D., Sunde, U., Schupp, J., Wagner, G. , 2011. Individual Risk Attitudes: Measurement, Determinants, and Behavioral Consequences. Journal of the European Economic Association 9(3), 522–550.
Dominitz, J., Manski, C., 1996. Eliciting Student Expectations of the Return to Schooling. Journal of Human Resources 31(1), 1-26.
Elliott, R., Ma, A., Scott, A., Bell, D., Roberts, E., 2007. Geographically differentiated pay in the labour market for nurses. Journal of Health Economics 26(1), 190-212.
Filippin, A., Ichino, A., 2005. Gender wage gap in expectations and realizations. Labour Economics 12(1), 125-145.
Frederick, S., Loewenstein, G., O'Donoghue, T., 2002. Time discounting and time preference: A critical review. Journal of Economic Literature 40(2), 351-401.
Freeman, J., Hirsch, B., 2008. College majors and the knowledge content of jobs. Economics of Education Review 27(5), 517–535.
Hanel, B., Kalb, G., Scott, A., 2014. Nurses’ labour supply elasticities: The importance of accounting for extensive margins. Journal of Health Economics 33, 94-112.
Hartog, J., Ding, X., Liao, J. 2014. Is Earnings Uncertainty Relevant for Educational Choice? An Empirical Analysis for China. Education Economics 22(5), 471-483.
Heyes, A., 2005. The economics of vocation or 'why is a badly paid nurse a good nurse'? Journal of Health Economics 24(3), 561-569.
Heyes, A., 2007. "Optimal wages in the market for nurses. Journal of Health Economics 26(5), 1031-1033.
Hirsch, B., Schumacher, E., 1995. Monopsony Power and Relative Wages in the Labor Market for Nurses. Journal of Health Economics 14(4), 443-476.
Jaccard Ruedin, H., Widmer, M., 2010. Ausländisches Gesundheitspersonal in der Schweiz (Obsan Bericht 39). Neuchâtel: Schweizerisches Gesundheitsobservatorium, Bundesamt für Statistik.
Jensen, R., 2010. The (Perceived) Returns to Education and the Demand for Schooling. Quarterly Journal of Economics 125(2), 515-548.
Jerrim, J., 2011. Do UK higher education students overestimate their starting salary? Fiscal Studies 32(4), 483-509.
Keane, M., Wolpin, K., 1997. The Career Decisions of Young Men. Journal of Political Economy 105(3), 473-522.
Kodde, D., 1986. Uncertainty and the demand for education. Review of Economics and Statistics 68(3), 460-467.
Lizarondo, L., Kumar, S., Hyde, L., Skidmore, D., 2010. Allied health assistants and what they do: A systematic review of the literature. Journal of Multidisciplinary Healthcare 39(3), 143-153.
29
Manski, C., 1993. Adolescent Econometricians: How Do Youth Infer the Returns to Schooling? In: Clotfelter, C., Rothschild, M. (Eds.), Studies of Supply and Demand in Higher Education. University of Chicago Press, p. 43-60.
Manski, C., 2004. Measuring Expectations. Econometrica 72(5), 1329-1376.
Manski, C., 2007. Identification for Prediction and Decision. Cambridge (MA) and London: Harvard University Press.
Menon, M., 2008. Perceived rates of return to higher education: Further evidence from Cyprus. Economics of Education Review 27(1), 39-47.
Montmarquette, C., Cannings, K., Mahseredjian, S., 2002. How do young people choose college majors? Economics of Education Review 21(6), 543-556.
Mullahy, J., 2015. Multivariate Fractional Regression Estimation of Econometric Share Models. Journal of Econometric Methods 4(1), 71-100.
Nicholson, S., 2005. How Much Do Medical Students Know About Physician Income? Journal of Human Resources 40(1), 100-114.
Nicholson, S., Souleles, N., 2001. Physician Income Expectations and Specialty Choice. NBER working paper 8536.
OBSAN, 2009. Gesundheitspersonal in der Schweiz – Bestandesaufnahme und Perspektiven bis 2020. Neuchâtel: Swiss Health Observatory OBSAN.
Papke, L., Wooldridge, J., 1996. Econometric Methods for Fractional Response Variables with an Application to 401(k) Plan Participation Rates. Journal of Applied Econometrics 11(6), 619-632.
Schweri, J., Hartog, J., Wolter, S., 2011. Do students expect compensation for wage risk? Economics of Education Review 30(2), 215-227.
SERI, 2014. Facts and figures. Vocational and Professional Education and Training in Switzerland. Bern: State Secretariat for Education, Research and Innovation.
Shields, M.A., 2004. Adressing nurse shortages: What can policy makers learn from the econometric evidence on nurse labour supply? The Economic Journal, 114(499), F464-F498.
Shields, M.A., Ward, M., 2001. Improving nurse retention in the National Health Service in England: the impact of job satisfaction on intentions to quit. Journal of Health Economics 20(5), 677-701.
Simoens, S., Villeneuve, M., Hurst, J., 2005. Tackling Nurse Shortages in OECD Countries. OECD Health Working Papers No. 19.
Spetz, J., 2002. The value of education in a licensed profession: the choice of associate or baccalaureate degrees in nursing. Economics of Education Review 21(1), 73-85.
Spetz, J., Given, R., 2003. The Future of the Nurse Shortage: will Wage Increases Close the Gap? Health Affairs 22(6), 199-206.
Spitzer, A., Perrenoud, B., 2007. Reforming the Swiss nurse education system: a policy review. International Journal of Nursing Studies 44, 624-634.
Staiger, D., Spetz, J., Phibbs, C., 2010. Is There Monopsony in the Labor Market? Evidence from a Natural Experiment. Journal of Labor Economics 28(2), 211-236.
30
Stinebrickner, R., Stinebrickner, T.R., 2014. A Major in Science? Initial Beliefs and Final Outcomes for College Major and Dropout. Review of Economic Studies 81(1), 426-472.
Taylor, L.J., 2007. Optimal wages in the market for nurses: an analysis based on Heyes model. Journal of Health Economics 26(5), 1027–1030.
Trede, I., Schweri, J., 2013. Laufbahnentscheidungen von Fachfrauen und Fachmännern Gesundheit. Zusammenfassende Erkenntnisse und Bewertung. Zollikofen and Bern: Swiss Federal Institute for Vocational Education and Training and OdaSanté.
Trede, I., Schweri, J., 2014. Work values and intention to become a registered nurse among healthcare assistants. Nurse Education Today 34(6), 948-953.
van der Klaauw, W., 2012. On the Use of Expectations Data in Estimating Structural Dynamic Choice Models. Journal of Labor Economics 30(3), 521-554.
Walton, S.M., Graves, P.E., Sexton, R.L., 2005. New Entry and the Rate of Return to Education: The Case of Registered Nurses. Atlantic Economic Journal 33, 325-336.
Webbink, D., Hartog, J., 2004. Can students predict their starting salaries? Yes! Economics of Education Review 23(2), 103-113.
Willis, R., Rosen, S., 1979. Education and self-selection. Journal of Political Economy 87(5), S7-S36.
Wolter, S., 2000. Wage expectations: A comparison of Swiss and US Students. Kyklos 53(1), 51-69.
Wolter, S., Zbinden, A., 2001. Labour Market Expectations of Swiss University Students. International Journal of Manpower 23(5), 458-470.
Zafar, B., 2011a. How do College Students Form Expectations? Journal of Labor Economics 29(2), 301-348.
Zafar, B., 2011b. Can subjective expectations data be used in choice models? Evidence on cognitive biases. Journal of Applied Econometrics 26(3), 520-544.
Zafar, B., 2013. College Major Choice and the Gender Gap. Journal of Human Resources 48(3), 545-595.

31
Appendix Phrasing of questions about wage expectations
The following questions are about your future career. What do you think you will earn per month? Please answer these questions even if you are not entirely sure. Write down the sum that you deem likely (gross without deductions, without allowances).
1. Assume you work as a FaGe after finishing your education. How much do you estimate you would then earn per month in a full-time position?
My (gross) wage per month after training: My (gross) wage per month at age 25: My (gross) wage per month at age 35:
2. Assume that you attend and complete an education as a nurse after finishing your FaGe education. How much do you estimate you would earn as a registered nurse per month in a full-time position?
My (gross) wage per month at age 25: My (gross) wage per month at age 35:
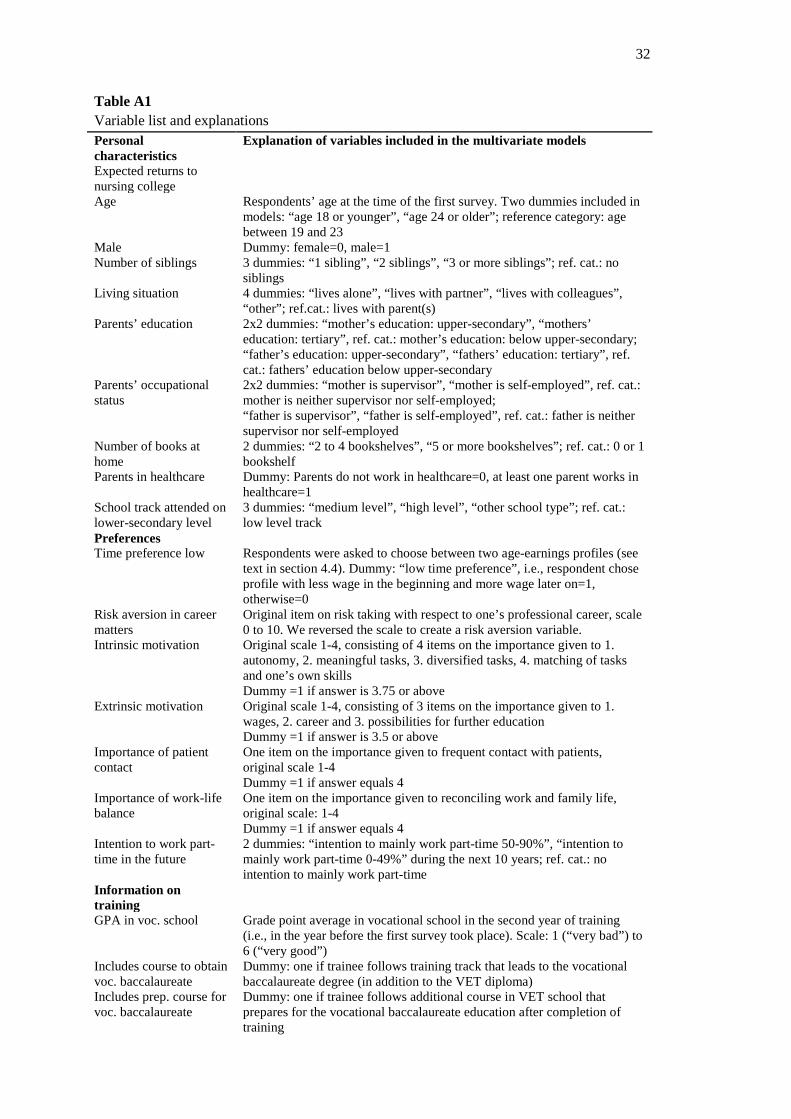
32
Table A1 Variable list and explanations Personal characteristics
Explanation of variables included in the multivariate models
Expected returns to nursing college
Age Respondents’ age at the time of the first survey. Two dummies included in models: “age 18 or younger”, “age 24 or older”; reference category: age between 19 and 23
Male Dummy: female=0, male=1 Number of siblings 3 dummies: “1 sibling”, “2 siblings”, “3 or more siblings”; ref. cat.: no
siblings Living situation 4 dummies: “lives alone”, “lives with partner”, “lives with colleagues”,
“other”; ref.cat.: lives with parent(s) Parents’ education 2x2 dummies: “mother’s education: upper-secondary”, “mothers’
education: tertiary”, ref. cat.: mother’s education: below upper-secondary; “father’s education: upper-secondary”, “fathers’ education: tertiary”, ref. cat.: fathers’ education below upper-secondary
Parents’ occupational status
2x2 dummies: “mother is supervisor”, “mother is self-employed”, ref. cat.: mother is neither supervisor nor self-employed; “father is supervisor”, “father is self-employed”, ref. cat.: father is neither supervisor nor self-employed
Number of books at home
2 dummies: “2 to 4 bookshelves”, “5 or more bookshelves”; ref. cat.: 0 or 1 bookshelf
Parents in healthcare Dummy: Parents do not work in healthcare=0, at least one parent works in healthcare=1
School track attended on lower-secondary level
3 dummies: “medium level”, “high level”, “other school type”; ref. cat.: low level track
Preferences Time preference low Respondents were asked to choose between two age-earnings profiles (see
text in section 4.4). Dummy: “low time preference”, i.e., respondent chose profile with less wage in the beginning and more wage later on=1, otherwise=0
Risk aversion in career matters
Original item on risk taking with respect to one’s professional career, scale 0 to 10. We reversed the scale to create a risk aversion variable.
Intrinsic motivation Original scale 1-4, consisting of 4 items on the importance given to 1. autonomy, 2. meaningful tasks, 3. diversified tasks, 4. matching of tasks and one’s own skills Dummy =1 if answer is 3.75 or above
Extrinsic motivation Original scale 1-4, consisting of 3 items on the importance given to 1. wages, 2. career and 3. possibilities for further education Dummy =1 if answer is 3.5 or above
Importance of patient contact
One item on the importance given to frequent contact with patients, original scale 1-4 Dummy =1 if answer equals 4
Importance of work-life balance
One item on the importance given to reconciling work and family life, original scale: 1-4 Dummy =1 if answer equals 4
Intention to work part-time in the future
2 dummies: “intention to mainly work part-time 50-90%”, “intention to mainly work part-time 0-49%” during the next 10 years; ref. cat.: no intention to mainly work part-time
Information on training
GPA in voc. school Grade point average in vocational school in the second year of training (i.e., in the year before the first survey took place). Scale: 1 (“very bad”) to 6 (“very good”)
Includes course to obtain voc. baccalaureate
Dummy: one if trainee follows training track that leads to the vocational baccalaureate degree (in addition to the VET diploma)
Includes prep. course for voc. baccalaureate
Dummy: one if trainee follows additional course in VET school that prepares for the vocational baccalaureate education after completion of training
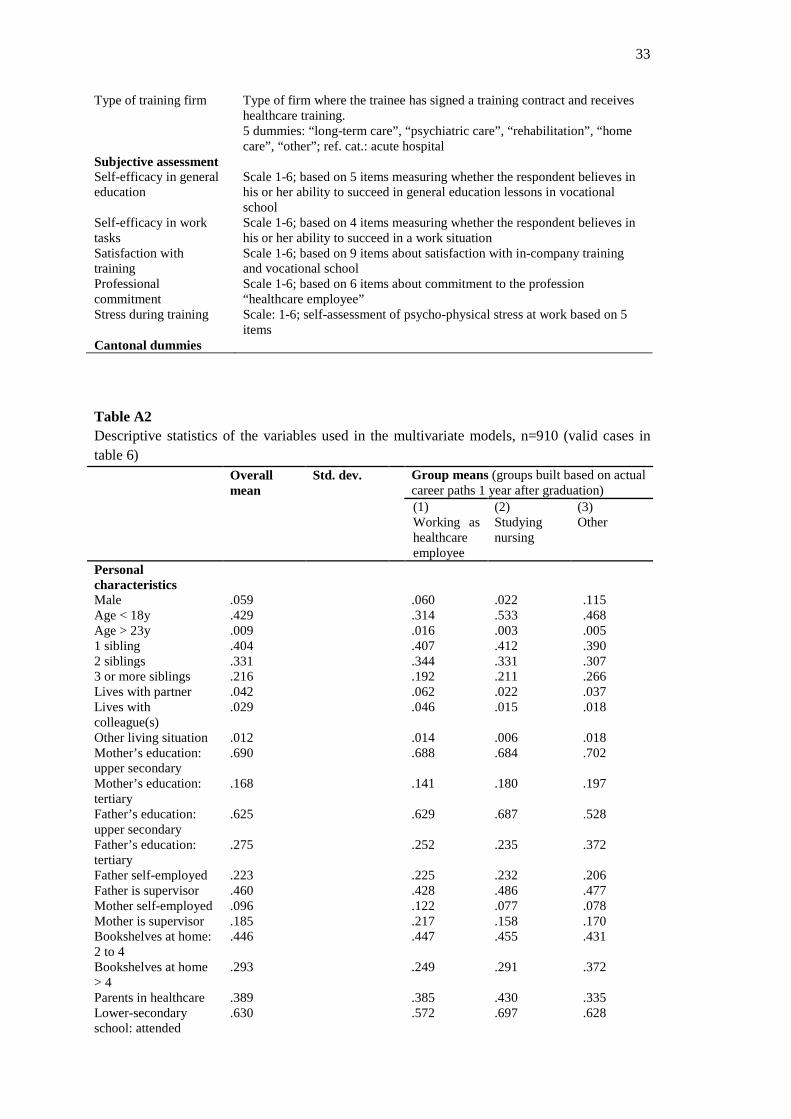
33
Type of training firm Type of firm where the trainee has signed a training contract and receives healthcare training. 5 dummies: “long-term care”, “psychiatric care”, “rehabilitation”, “home care”, “other”; ref. cat.: acute hospital
Subjective assessment Self-efficacy in general education
Scale 1-6; based on 5 items measuring whether the respondent believes in his or her ability to succeed in general education lessons in vocational school
Self-efficacy in work tasks
Scale 1-6; based on 4 items measuring whether the respondent believes in his or her ability to succeed in a work situation
Satisfaction with training
Scale 1-6; based on 9 items about satisfaction with in-company training and vocational school
Professional commitment
Scale 1-6; based on 6 items about commitment to the profession “healthcare employee”
Stress during training Scale: 1-6; self-assessment of psycho-physical stress at work based on 5 items
Cantonal dummies
Table A2 Descriptive statistics of the variables used in the multivariate models, n=910 (valid cases in table 6) Overall
mean Std. dev. Group means (groups built based on actual
career paths 1 year after graduation) (1)
Working as healthcare employee
(2) Studying nursing
(3) Other
Personal characteristics
Male .059 .060 .022 .115 Age < 18y .429 .314 .533 .468 Age > 23y .009 .016 .003 .005 1 sibling .404 .407 .412 .390 2 siblings .331 .344 .331 .307 3 or more siblings .216 .192 .211 .266 Lives with partner .042 .062 .022 .037 Lives with colleague(s)
.029 .046 .015 .018
Other living situation .012 .014 .006 .018 Mother’s education: upper secondary
.690 .688 .684 .702
Mother’s education: tertiary
.168 .141 .180 .197
Father’s education: upper secondary
.625 .629 .687 .528
Father’s education: tertiary
.275 .252 .235 .372
Father self-employed .223 .225 .232 .206 Father is supervisor .460 .428 .486 .477 Mother self-employed .096 .122 .077 .078 Mother is supervisor .185 .217 .158 .170 Bookshelves at home: 2 to 4
.446 .447 .455 .431
Bookshelves at home > 4
.293 .249 .291 .372
Parents in healthcare .389 .385 .430 .335 Lower-secondary school: attended
.630 .572 .697 .628
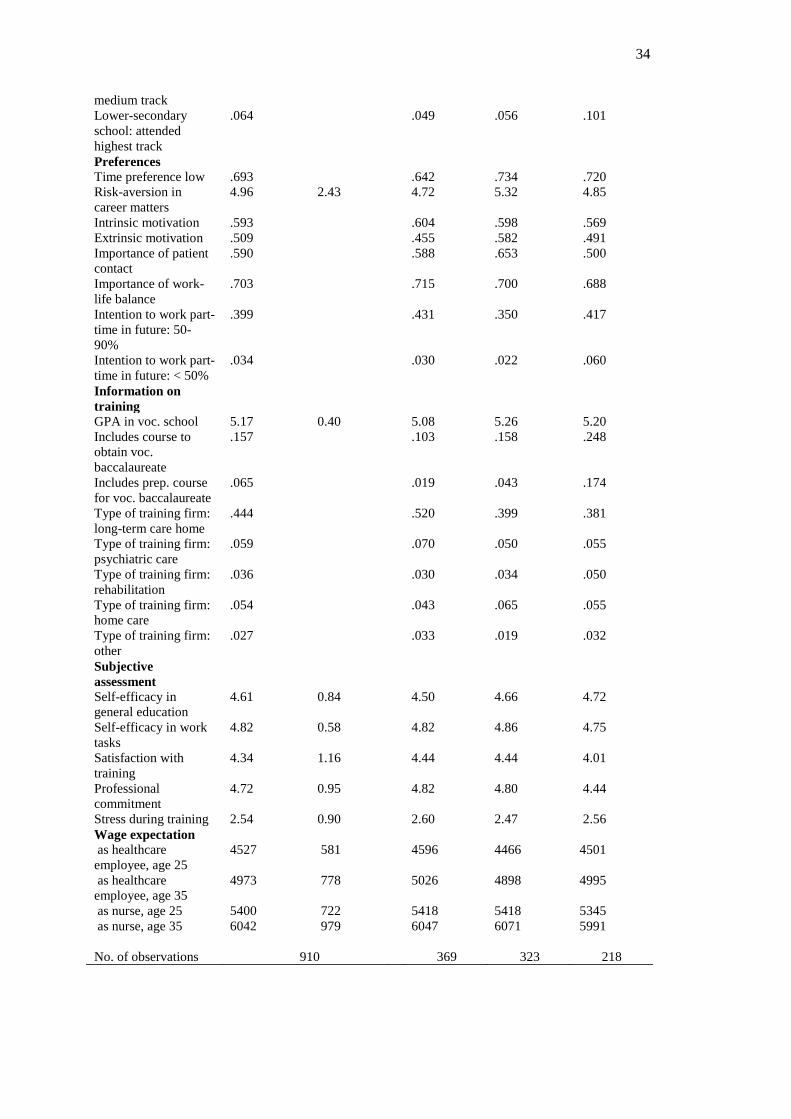
34
medium track Lower-secondary school: attended highest track
.064 .049 .056 .101
Preferences Time preference low .693 .642 .734 .720 Risk-aversion in career matters
4.96 2.43 4.72 5.32 4.85
Intrinsic motivation .593 .604 .598 .569 Extrinsic motivation .509 .455 .582 .491 Importance of patient contact
.590 .588 .653 .500
Importance of work-life balance
.703 .715 .700 .688
Intention to work part-time in future: 50-90%
.399 .431 .350 .417
Intention to work part-time in future: < 50%
.034 .030 .022 .060
Information on training
GPA in voc. school 5.17 0.40 5.08 5.26 5.20 Includes course to obtain voc. baccalaureate
.157 .103 .158 .248
Includes prep. course for voc. baccalaureate
.065 .019 .043 .174
Type of training firm: long-term care home
.444 .520 .399 .381
Type of training firm: psychiatric care
.059 .070 .050 .055
Type of training firm: rehabilitation
.036 .030 .034 .050
Type of training firm: home care
.054 .043 .065 .055
Type of training firm: other
.027 .033 .019 .032
Subjective assessment
Self-efficacy in general education
4.61 0.84 4.50 4.66 4.72
Self-efficacy in work tasks
4.82 0.58 4.82 4.86 4.75
Satisfaction with training
4.34 1.16 4.44 4.44 4.01
Professional commitment
4.72 0.95 4.82 4.80 4.44
Stress during training 2.54 0.90 2.60 2.47 2.56 Wage expectation as healthcare employee, age 25
4527 581 4596 4466 4501
as healthcare employee, age 35
4973 778 5026 4898 4995
as nurse, age 25 5400 722 5418 5418 5345 as nurse, age 35 6042 979 6047 6071 5991 No. of observations
910
369
323
218
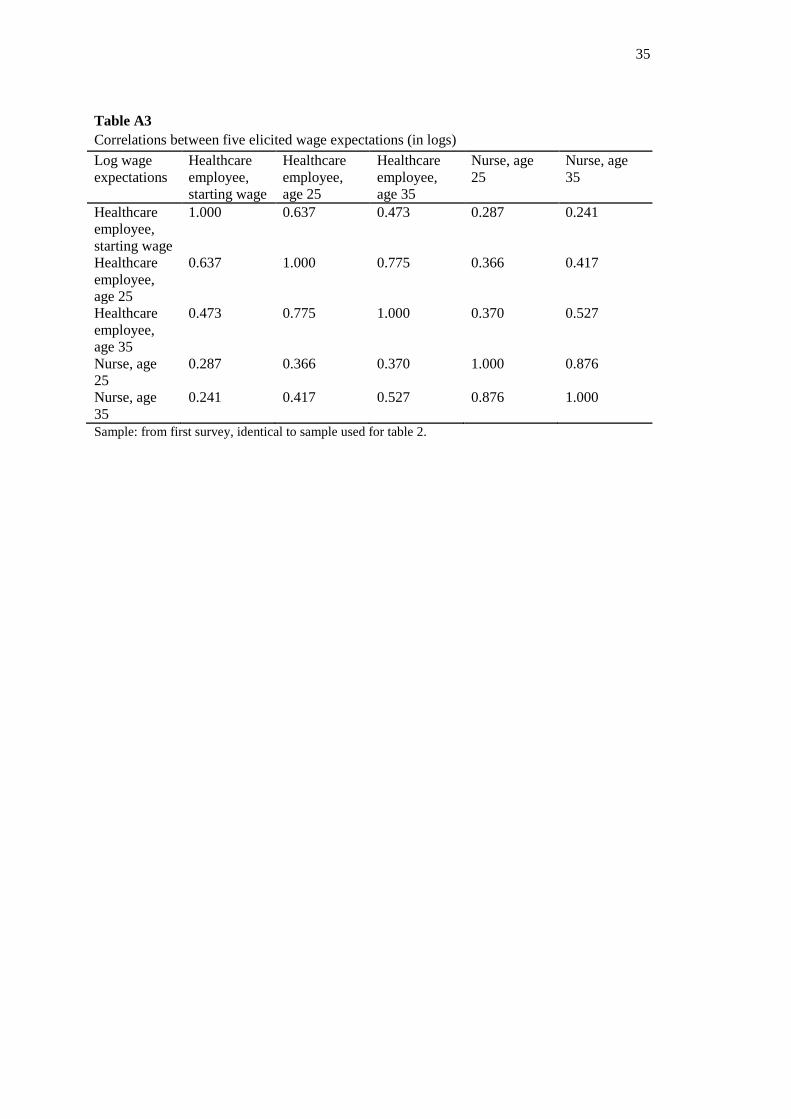
35
Table A3 Correlations between five elicited wage expectations (in logs) Log wage expectations
Healthcare employee, starting wage
Healthcare employee, age 25
Healthcare employee, age 35
Nurse, age 25
Nurse, age 35
Healthcare employee, starting wage
1.000 0.637 0.473 0.287 0.241
Healthcare employee, age 25
0.637 1.000 0.775 0.366 0.417
Healthcare employee, age 35
0.473 0.775 1.000 0.370 0.527
Nurse, age 25
0.287 0.366 0.370 1.000 0.876
Nurse, age 35
0.241 0.417 0.527 0.876 1.000
Sample: from first survey, identical to sample used for table 2.