Embed Size (px)
Citation preview
econstor www.econstor.eu
Der Open-Access-Publikationsserver der ZBW – Leibniz-Informationszentrum WirtschaftThe Open Access Publication Server of the ZBW – Leibniz Information Centre for Economics
Standard-Nutzungsbedingungen:
Die Dokumente auf EconStor dürfen zu eigenen wissenschaftlichenZwecken und zum Privatgebrauch gespeichert und kopiert werden.
Sie dürfen die Dokumente nicht für öffentliche oder kommerzielleZwecke vervielfältigen, öffentlich ausstellen, öffentlich zugänglichmachen, vertreiben oder anderweitig nutzen.
Sofern die Verfasser die Dokumente unter Open-Content-Lizenzen(insbesondere CC-Lizenzen) zur Verfügung gestellt haben sollten,gelten abweichend von diesen Nutzungsbedingungen die in der dortgenannten Lizenz gewährten Nutzungsrechte.
Terms of use:
Documents in EconStor may be saved and copied for yourpersonal and scholarly purposes.
You are not to copy documents for public or commercialpurposes, to exhibit the documents publicly, to make thempublicly available on the internet, or to distribute or otherwiseuse the documents in public.
If the documents have been made available under an OpenContent Licence (especially Creative Commons Licences), youmay exercise further usage rights as specified in the indicatedlicence.
zbw Leibniz-Informationszentrum WirtschaftLeibniz Information Centre for Economics
Gathmann, Christina; Keller, Nicolas
Working Paper
Returns to Citizenship? Evidence from Germany'sRecent Immigration Reforms
IZA Discussion Paper, No. 8064
Provided in Cooperation with:Institute for the Study of Labor (IZA)
Suggested Citation: Gathmann, Christina; Keller, Nicolas (2014) : Returns to Citizenship?Evidence from Germany's Recent Immigration Reforms, IZA Discussion Paper, No. 8064
This Version is available at:http://hdl.handle.net/10419/96691
DI
SC
US
SI
ON
P
AP
ER
S
ER
IE
S
Forschungsinstitut zur Zukunft der ArbeitInstitute for the Study of Labor
Returns to Citizenship?Evidence from Germany’s Recent Immigration Reforms
IZA DP No. 8064
March 2014
Christina GathmannNicolas Keller
Returns to Citizenship?
Evidence from Germany’s Recent Immigration Reforms
Christina Gathmann Universiy of Heidelberg,
CESifo and IZA
Nicolas Keller University of Heidelberg
Discussion Paper No. 8064 March 2014
IZA
P.O. Box 7240 53072 Bonn
Germany
Phone: +49-228-3894-0 Fax: +49-228-3894-180
E-mail: [email protected]
Any opinions expressed here are those of the author(s) and not those of IZA. Research published in this series may include views on policy, but the institute itself takes no institutional policy positions. The IZA research network is committed to the IZA Guiding Principles of Research Integrity. The Institute for the Study of Labor (IZA) in Bonn is a local and virtual international research center and a place of communication between science, politics and business. IZA is an independent nonprofit organization supported by Deutsche Post Foundation. The center is associated with the University of Bonn and offers a stimulating research environment through its international network, workshops and conferences, data service, project support, research visits and doctoral program. IZA engages in (i) original and internationally competitive research in all fields of labor economics, (ii) development of policy concepts, and (iii) dissemination of research results and concepts to the interested public. IZA Discussion Papers often represent preliminary work and are circulated to encourage discussion. Citation of such a paper should account for its provisional character. A revised version may be available directly from the author.
IZA Discussion Paper No. 8064 March 2014
ABSTRACT
Returns to Citizenship? Evidence from Germany’s Recent Immigration Reforms*
Immigrants in many countries have lower employment rates and lower earnings than natives. In this paper, we ask whether a more liberal access to citizenship can improve the economic integration of immigrants. Our analysis relies on two major immigration reforms in Germany, a country with a relatively weak record of immigrant assimilation. For identification, we exploit discontinuities in the reforms’ eligibility rules. Between 1991 and 1999, adolescents could obtain citizenship after eight years of residency in Germany, while adults faced a 15-year residency requirement. Since 2000, all immigrants face an 8-year residency requirement. OLS estimates show a positive correlation between naturalization and labor market performance. Based on the eligibility rules, we find few returns of citizenship for men, but substantial returns for women. Returns are also larger for more recent immigrants, but essentially zero for traditional guest workers. Overall, liberalization of citizenship provides some benefits in the labor market but is unlikely to result in full economic and social integration of immigrants in the host country. JEL Classification: J24, J31, J61, K37 Keywords: citizenship, assimilation, language, welfare, Germany Corresponding author: Christina Gathmann Department of Economics Alfred-Weber-Institut Bergheimer Strasse 20 69115 Heidelberg Germany E-mail: [email protected]
* We thank Christine Binzel, Zeno Enders, Ben Elsner, Giovanni Facchini, Eckhard Janeba, Astrid Kunze, Massimiliano Tani and participants at the University of Mannheim, University of Heidelberg, IZA Research Seminar, the Workshop on Experiments and Quasi-Experiments at Holzhausen, EALE and TEMPO Conferences for valuable comments. All remaining errors are our own.
1 Introduction
Over recent decades, many developed countries other than traditional immigration countries have
accumulated sizable immigrant populations. In Europe, for example, the share of foreign-born in
2005 is over 10% in France, 12% in Sweden and has reached almost 24% in Switzerland (OECD,
2006; Hanson, 2009). At the same time, immigrants often seem to perform poorly in the labor
market. They have larger unemployment rates and earn substantially less than natives (e.g. Algan
et al., 2010; OECD, 2006); and they often fall short along cultural or political integration as well
(Aleksynska and Algan, 2010).1
The lack of social and economic integration poses substantial challenges for destination countries.
A disadvantaged economic position of immigrants reduces the �scal bene�t to the destination coun-
try. The success economic integration of immigrants, their participation in the labor market and
social security contributions play an even more important role in aging societies such as Germany,
Japan or Italy. Furthermore, exclusion might threaten the social cohesion of host countries produc-
ing social unrest and hostility among the native population. As such, the current situation raises
a number of important questions how immigrants may be better integrated into host societies. In
particular, which public policies are e�ective in promoting economic integration of immigrants? Or,
does successful integration hinge on the right �selection� of immigrants instead? Answers to these
questions are crucial for the economic and social well-being of immigrants and destination countries
alike.
In this article, we ask whether a more liberal access to citizenship can improve the integration
and assimilation of immigrants. Economic theory suggests a number of reasons why citizenship could
a�ect labor market success. First, citizenship is required for a number of public sector or government
jobs. To the extent that these jobs o�er better pay or working conditions than jobs open to the
average immigrant, naturalization would improve labor market performance. A second reason is
that employers might not be willing to pay for training of immigrants who stay only for a limited
time in the host country (e.g. Lalonde and Topel, 1997). In the private sector, employers might also
be hesitant to hire a foreign citizen for jobs with extensive traveling abroad due to additional visa
1While traditional immigration countries - like Australia, Canada or the United States - have a much longer historyof immigration, the question of whether they successfully assimilate is still hotly debated as well (see e.g. Abramitzkyet al., 2012; Card, 2005; Borjas, 2013 for recent contributions about immigrant assimilation in the United States).
2
costs, for example. In theses cases, citizenship would provide a signal of long-term commitment and
reduce existing barriers to career mobility. Access to citizenship might also improve the incentives of
immigrants to invest in education and language skills in the host country. Better destination-speci�c
skills speed up assimilation as immigrants become more productive on the job or obtain access to
new job opportunities (Chiswick and Miller, 1995; Dustmann, 1994; see Dustmann and Glitz, 2011
for a comprehensive survey). Hence, arguments on both the demand and supply side of the labor
market suggest that access to citizenship could be an important policy instrument to improve the
economic integration of immigrants.
Yet, there are also reasons to believe that the bene�ts of citizenship in the labor market are over-
stated. Those applying for citizenship might well be those with the highest motivation to integrate
and the best prerequisites to perform well in the host country. Previous studies from traditional
immigration countries, such as Canada and the United States, suggest indeed that selection into
naturalizations is positive with respect to observable skills (see Yang, 1994; and De Voretz and
Pivnenko, 2006 for evidence from Canada; Chiswick and Miller, 2008; and Mazzolari, 2009 for the
United States). And yet, selection into citizenship might be di�erent in Europe, for example, because
citizens from EU member states have the same access to jobs than natives even without natural-
ization. At the same time, immigrants from EU member states are on average more skilled than
immigrants from outside the EU. Lower incentives to naturalize among EU immigrants might then
result in negative or intermediate selection into citizenship in terms of observable human capital.
Our empirical analysis is set in Germany which provides a unique opportunity to study the
potential bene�ts of citizenship. Today, almost 10 millions foreign-born live in Germany and make
up about 13% of its population. Yet, Germany is an exemplary case for the assimilation and
integration problems of immigrants with substantial lower employment and earnings even among
second-generation immigrants (e.g. Algan et al., 2010 for recent evidence). Traditionally, Germany
had a very restrictive citizenship law which was closely tied to ancestry and ethnic origin. Starting
in the early 1990s, there have been important changes in Germany's immigration policy. In 1991,
the government introduced for the �rst time explicit criteria how immigrants can obtain German
citizenship. Since 2000, immigrants can naturalize after 8 years of residency in Germany, and children
of foreign parents in Germany now obtain citizenship at birth. As such, Germany developed from
a country where citizenship was tied to ancestry alone to a country with more liberal access to
3
citizenship.
To identify the consequences of citizenship for labor market performance, we exploit two insti-
tutional peculiarities of Germany's immigration reforms. The 1991 reform de�ned age-dependent
residency requirements for naturalization. Speci�cally, adult immigrants (aged 23 and above) faced
a 15-year residency requirement before they could apply for citizenship. Adolescent immigrants (be-
tween 16 and 22) in turn could apply for German citizenship after only 8-year of residence. Hence,
immigrants under the age of 23 who arrived in Germany in 1983, for example, became eligible for
citizenship right in 1991. Immigrants aged 23 or above who came to Germany in the same year
had to wait until 1997 in order to become eligible, 7 years after the younger cohort. Since 2000, all
immigrants face a 8-year residency requirement.
We �nd that the propensity to naturalize is quite low in Germany even after liberalization. Nat-
uralizations are more common among immigrants from outside the EU member countries and among
more recent immigrants. Our results further suggest intermediate selection into citizenship for immi-
grant men and even negative selection in terms of observable skills among immigrant women. Using
the eligibility rules, we then compare labor market outcomes of immigrants who are somewhat older
or arrived in Germany somewhat earlier and, for this reason, are eligible for naturalization earlier
than other immigrants. Our main analysis therefore identi�es the returns to eligibility (intention-
to-treat) while controlling for general assimilation e�ects and labor market experience. Accounting
for selection into citizenship turns out to be important in our case. Once we adjust for selection into
naturalization, we �nd few, if any e�ects of naturalization for immigrant men. In line with negative
selection into citizenship for women, we �nd that adjusting for selection increases the wage returns
to citizenship. These wage returns for women cannot be explained by a higher propensity to work in
the public sector or white collar occupations; they are also not driven by improved language skills.
Instead, immigrant women seem to improve their labor market outcomes primarily by switching to
jobs with a permanent contract as well as moving to larger �rms or better-paying occupations within
the private sector.
This article contributes to three strands of the literature. First, we contribute to the literature
on naturalization decisions. Most evidence seems to suggest that there is positive selection into citi-
zenship (Yang, 1994 for Canada; Mazzolari, 2009 for the US, Bevelander and Veenman, 2008 for the
Netherlands; Steinhardt and Wedemeier, 2012 for Switzerland; Constant et al., 2009 for Germany).
4
We �nd mixed results for Germany. Men are intermediately selected as the medium-skilled are more
likely to naturalize than the low- and high-skilled. Women, in contrast, are negatively selected with
respect to education with high-skilled immigrants being less likely to naturalize.
Furthermore, our analysis is closely related to studies on the relationship between citizenship
and labor market outcomes in the United States or Canada (e.g. Chiswick, 1978; Bratsberg et al.,
2002; De Voretz and Pivnenko, 2006) and some European countries (see Bevelander and Veenman,
2008 for the Netherlands; Bevelander and Pendakur, 2011; and Scott, 2008 for Sweden; Fougere
and Sa�, 2009 for France; Steinhardt, 2012 for Germany). Most studies rely on cross-sectional
data comparing naturalized citizens with other immigrants. Recently, a few recent studies employ
panel data to estimate whether naturalization improves labor market performance (Bratsberg et
al., 2002; Bratsberg and Raaum, 2011; Steinhardt, 2012). We contribute to this literature in three
ways: �rst, we study the e�ect of legal access to citizenship rather than the individual decision
to naturalize. Second, we use arguably exogenous variation in eligibility rules induced by national
citizenship reforms to identify the e�ect of citizenship for labor market performance. Our study
therefore does not face the kind of selection problems of earlier, especially cross-sectional studies.
Finally, we provide evidence on the bene�ts of citizenship in a country where naturalization is
the exception rather than the norm. Returns to citizenship might di�er from those in traditional
immigration countries or countries with a long immigration history, such as the UK and France.
Taste-based discrimination, for example, might be more widespread in a country where the native
population is more homogenous and shares common values or a common religion. Citizenship might
then provide additional bene�ts to immigrants if it eliminates this discrimination on the basis of
citizenship. Bene�ts might not materialize however, if discrimination is based on foreign-sounding
names or appearance rather than citizenship status alone.2
Our study also contributes to the broader literature on immigrant assimilation. A large literature
shows substantial native-immigrant wage gaps upon arrival. With time in the home country, immi-
grants, so the argument goes, acquire language skills, better knowledge about job opportunities and
get access to social networks thus improving their position in the labor market relative to natives.
The size and speed of immigrant assimilation observed in di�erent countries is still hotly debated
2Recent �eld experiments suggest that there is some discrimination against immigrants based on foreign-soundingnames or foreign accents which might be independent of the actual citizenship (see Kaas and Manger, 2012 forGermany; or Carlsson and Rooth, 2007 for Sweden).
5
in the literature (see e.g. Abramitzky et al., 2012; Bell, 1997; Borjas, 1985, 2013; Card, 2005; Clark
and Lindley, 2009; Duleep and Dowhan, 2002; Hu, 2000; Lubotsky, 2007; see Dustmann and Glitz,
2011 for a survey)3 For Germany, most studies do not �nd much evidence for assimilation relative
to natives (Pischke, 1993; Dustmann, 1993; Licht and Steiner, 1994; Schmidt, 1997; Bauer et al.,
2005; results in Fertig and Schuster, 2007 are mixed).4 Our contribution here is twofold: �rst, we
study assimilation of subsequent immigrant cohorts from the same source country (following Lalonde
and Topel, 1997). We �nd weak support for assimilation in the German context; however, we �nd
substantial returns to German citizenship for immigrant women. As such, a more liberal access
to citizenship seems one promising instrument to improve the labor market position of immigrants
in countries with traditionally restrictive policies. Second, we shed light on the possible channels
determining assimilation in the labor market in practice: through movements up the occupational
ladder, improvements in language skills or economic self-su�ciency. Therefore, our results are highly
informative for policy-makers wishing to promote immigrant integration.
This article proceeds as follows. The next section discusses the recent immigration reforms
in Germany and outlines our empirical strategy to identify the returns to citizenship. Section 3
introduces our data. Section 4 discusses the determinants of the naturalization decision among
immigrants in Germany. Section 5 discusses our results on the returns to citizenship and explores
the heterogeneity of these returns. Section 6 presents a number of informal validity checks to test the
robustness of our results. Section 7 discusses the policy implications of our �ndings and concludes.
2 Institutional Background
2.1 A Reluctant Immigration Country
Almost 10 million foreign-born live in Germany today - or about 13% of its current population.
After World War II, most immigrants, especially from Turkey, Yugoslavia or Italy came to Ger-
many as guest workers.5 From the late 1950s until the program was abolished in 1973, the guest
3Furthermore, Borjas and Hilton (1996) show that recent immigrants in the United States are more likely toparticipate in welfare programs than earlier immigrant cohorts.
4Basilio and Bauer (2010) argue that lower returns to human capital (education and experience) accumulatedabroad can account for most of the native-immigrant wage gap in Germany.
5We abstract from war-related refugees from Eastern Europe and East Germany prior to the construction of theBerlin Wall.
6
worker program actively recruited foreign, mostly low-skilled labor, to meet the growing demand
of Germany's booming manufacturing sector. Originally, the guest worker program was intended
as a short- to medium-run measure. In practice, however, many guest workers stayed and settled
down in Germany.6 Since the late 1980s and especially after the fall of the Berlin Wall, new waves
of immigrants arrived in Germany from Eastern Europe and the former Soviet Union. In the early
1990s, around one million foreigners (about 1% of its population) arrived in Germany each year.7
These immigration rates are comparable to the ones in the United States during the period of mass
migration.
Despite substantial in�ows of foreign-born, Germany had no explicit naturalization policy at
that time. Prior to 1991, German citizenship was closely tied to ancestry (jus sanguinis) as laid
down in the law of 1913. Explicit criteria how a foreign-born immigrant without German ancestry
would qualify for naturalization did not exist. The o�cial doctrine was that foreigners were only
temporary residents in Germany - even though many foreigners had lived in the country for decades.
The Federal Naturalization Guidelines of 1977 summarize this o�cial doctrine at the time quite well:
�The Federal Republic of Germany is not a country of immigration; it does not strive to increase the
number of German citizens by way of naturalization [. . . ]. The granting of German citizenship can
only be considered if a public interest in the naturalization exists; the personal desires and economic
interests of the applicant cannot be decisive.� (Hailbronner and Renner, 1992, pp. 865-6).
2.2 A New Approach to Citizenship
The passage of the Alien Act (Ausländergesetz (AuslG)) by the federal parliament on April 26,
1990 (and the upper house on May 5, 1990) marked a turning point in Germany's approach to
immigration and citizenship. The reform which came into e�ect on January 1, 1991 de�ned, for
6Their legal status was based on a residence and work permit which became permanent after 5 years and fullyunrestricted after 8 years if a person had worked for at least 5 years in a job subject to social security contributions.Close family members could also obtain a residence permit in order to move to Germany. At the same time, theGerman government used �nancial incentives to encourage return migration, especially after the end of the guestworker program in 1973.
7Many of these were ethnic Germans (i.e. immigrants with some German ancestry), mostly from Eastern Europeand the former Soviet Union, who had access to citizenship within three years of arrival in Germany. Since 1992, thein�ow of ethnic Germans is restricted to 220,000 per year. Stricter application requirements (esp. German languagerequirements) and a reduction in �nancial assistance further reduced the number of applicants in the late 1990s.While the number of admitted ethnic Germans was 397,000 in 1990, it fell to 222,000 in 1994 and to 105,000 in 1999(Bundesministerium des Innern, 2008). Below, we drop ethnic Germans from our sample as they are not a�ected bythe immigration reforms we study.
7
the �rst time, explicit rules and criteria for naturalization.8 Most importantly for our purpose,
the new law imposed an age-dependent residency requirement. Adults (aged 23 and older) became
eligible for citizenship after 15 years of residence in Germany; adolescent immigrants (aged 16-22) in
contrast, became eligible after only 8 years.9 These residency requirements are still quite restrictive
in comparison to other countries. Immigrants in Canada, for example, may naturalize after 3 years
of permanent residence, while residency requirements in the United States and many European
countries (like the UK, or Sweden) are 5 years - still substantially shorter than the rules imposed by
the German reform.
Applicants for German citizenship had to ful�ll several other criteria: �rst, they had to renounce
their previous citizenship upon naturalization as the new law did explicitly not allow dual citizenship.
Few exemptions to this rule existed at that time. The most important exception covered citizens of
the European Union who could keep their citizenship if their country of origin allowed dual citizenship
as well.10 Second, the applicant must not be convicted of a criminal o�ense.11 Adult immigrants (23
years or older) also had to demonstrate economic self-su�ciency, i.e. they should be able to support
themselves and their dependents without welfare bene�ts or unemployment assistance. Adolescent
immigrants (aged 16-22) had to complete a minimum of six years of schooling in Germany, of which
at least four years had to be general education. Finally, an applicant needed to declare her loyalty
to the democratic principles of the German constitution. Spouses and dependent children of the
applicant could be included in the application for naturalization even if they did not ful�ll the criteria
8The reform was preceded by more than a decade of intense political discussion that oscillated between the desire torestrict immigration, to encourage return migration and the recognition for social integration of the foreign populationalready living in Germany. Several reform attempts were made during the 1980s, mostly from left-wing parties, butdefeated by the political opposition or in�uential social groups. The reform in 1991 was pushed on the political agendaby a ruling of the Federal Constitutional Court whether immigrants should be entitled to vote in local elections forforeigners in 1989. The Court ruled those local voting rights unconstitutional but advocated a liberalization ofGermany's naturalization policy (see Howard (2008) for a more detailed discussion).
9See � 85 AuslG (Alien Act) for adolescent immigrants and � 86 AuslG (Alien Act) for adult immigrants. Ifthe applicant stayed abroad for no more than 6 months, the period of absence still counted toward the residencyrequirement. Temporary stays abroad (between 6 months and 1 year) may still count for the residency requirement.For permanent stays abroad (longer than 6 months), the applicant could count up to �ve years of residency in Germanytoward the residency requirement.
10Children of bi-national marriages, for example, did not have to give up their dual citizenship until they turned18. Other exceptions were granted if the country of current citizenship did not allow the renunciation of citizenship ordelayed the renunciation for reasons outside the power of the applicant; if the applicant was an acknowledged refugeeor if the renunciation imposed special hardships on older applicants. In practice, few exceptions to the general rulewere granted in the 1990s.
11Applicants with minor convictions, such as a suspended prison sentence up to 6 months (which would be abatedat the end of the probation period), a �ne not exceeding 180 days (calculated according to the net personal incomeof the individual), or corrective methods imposed by juvenile courts, were still eligible. Convictions exceeding theselimits were considered on a case-by-case basis by the authorities.
8
individually.12
The di�erent residency requirements for adult and adolescent immigrants remained in place until
the second important reform came into e�ect on January 1, 2000. The Citizenship Act (Staatsange-
hörigkeitsgesetz (StAG)) reduced the residency requirement to 8 years irrespective of the immigrant's
age.13 The other requirements of the 1991 reform remained in place: applicants could not have a
criminal record, had to demonstrate loyalty to democratic principles and economic self-su�ciency. In
addition, the new law also required applicants to demonstrate adequate German language skills prior
to naturalization. As before, the law of 2000 did not recognize dual citizenship in general though
exemptions became more numerous in practice.14 The 2000 reform further introduced elements of
citizenship by birthplace into German law. A child born to foreign parents after January 1, 2000
was eligible for citizenship if one parent had been a legal resident in Germany for 8 years and had
a permanent residence permit for at least three years. Since our analysis focuses on �rst-generation
immigrants, our sample is not directly a�ected by the jus soli provisions of the 2000 reform.15
The liberalization of citizenship law after 1991 and again after 2000 is re�ected in the number of
naturalizations in Germany. Prior to the �rst reform, only about 34,000 persons became naturalized
on average each year (see Figure 1). After the immigration reform in 1991, naturalizations jumped
to 230,000 per year. After the second reform in 2000, the number of naturalizations was with 137,000
per year actually lower than in the 1990s though higher than in the pre-1991 period. Scaled by the
12Similar criteria are found in other countries. Overall, they seem to play a subordinate role for the naturalizationprocess. A survey of eligible immigrants by the Federal O�ce of Migration and Refugees showed that the majorityof migrants had good knowledge about the naturalization criteria. Of those, 72% reported that they ful�lled allrequirements completely while 23% reported to meet most, though not all of the criteria (BAMF, 2012). As such,rejection of applications for citizenship based on criteria other than residency requirements should not be a majorconcern. If anything, this would bias our estimates downward as we would de�ne an immigrant as eligible (based onthe residency requirement) even though she is not (based on one of the other eligibility criteria).
13The law was adopted with a large majority in the lower house on May 7, 1999 and the upper house on May 21,1999. The provisions are laid down in � 10 Abs. 1 StAG (Abs. 2 for spouses and dependent children of eligibleimmigrants), which form the basis for over 80% of all naturalizations in Germany (BAMF, 2008). Additional ways tonaturalize are laid down in � 8 (naturalizations based on a discretionary decision of the authorities because of �publicinterest�) and � 9 (naturalization for spouses of German citizens who face a reduced residency requirement of 3 years).
14In addition to citizens of the EU member states, it became easier for older applicants and refugees to keep theirprevious citizenship. Applicants could also keep their nationality if it was legally impossible to renounce it or if itimposed a special hardship like excessive costs or serious economic disadvantages (e.g. problems with inheritances orproperty in their country of origin).
15See Avitabile et al. (2013a; 2013b) for an analysis of the jus soli provisions of the 2000 reform. There might be anindirect e�ect on �rst-generation immigrants, however. Before the 2000 reform, second- or third-generation immigrantscould only become naturalized if their parents applied for citizenship. After the 2000 reform, young children had accessto German citizenship independently of their parents' decision (subject to the residency requirements outlined above).Hence, the reform of 2000 might have actually decreased the inter-generational bene�ts of citizenship for foreignparents with young children. We return to this issue below.
9
�rst-generation immigrant population, the propensity to naturalize in Germany is still low compared
to traditional immigrant countries. Among immigrants with more than 10 years of residency, about
35-40% became German citizens; for comparison, the share is about 60% in the United Kingdom
and over 80% in Canada (OECD, 2011).
2.3 Using the Eligibility Rules of the 1991 and 2000 Reforms
Can a more liberal access to citizenship promote economic integration, even in a country with little
tradition of naturalizations? To answer this question, we cannot simply compare the labor market
outcomes of naturalized immigrants with those not naturalized because the decision to naturalize is
endogenous. We now sketch how we use the discontinuities in the eligibility rules after the 1991 and
2000 reforms to identify the bene�ts of citizenship.
To illustrate the discontinuity created by the 1991 reform, consider two immigrants who arrive
in Germany in 1983. The �rst immigrant is 15 years-old (born in 1968), while the second immigrant
is 14 years old (born in 1969). When the reform comes into e�ect in 1991, both immigrants have
lived in Germany for 8 years. The younger immigrant is 22 years-old and can therefore apply for
citizenship in 1991, whereas the older immigrant is 23 years-old and can only apply for citizenship in
1998. As a result, the younger immigrant is eligible 7 years earlier than the older immigrant - though
both are of similar age and have lived in Germany for the same number of years. Figure 2 illustrates
when di�erent arrival cohorts are eligible for German citizenship following the two immigration
reforms. For immigrants arriving between 1976 and 1983, for instance, adolescents (ages 16-22) can
naturalize in 1991, adult immigrants only between 1991 and 1996, i.e. 1 to 6 years later. After
2000, all immigrants older than 16 and arriving in Germany in 1992 or later become eligible after
8 years of residency. Hence, we can exploit three types of variation in eligibility status created by
the reforms to identify the returns to citizenship: �rst, adolescent immigrants arriving in Germany
between 1976 and 1983 get eligible immediately after the �rst immigration reform in 1991. Second,
we can compare outcomes of adolescent and adult immigrants who arrive in Germany between 1976
and 1991 and get eligible in di�erent years in the 1991-1999 period. The third type of variation
arises because all adult immigrants arriving in Germany between 1985 and 1992 get eligible with
the 2000 reform.
10
3 Data Sources
3.1 Microcensus
Our main data source to study naturalization and its consequences for labor market performance is
the German Microcensus, a repeated cross-sectional survey of a 1% random sample of the German
population. It covers detailed questions about individual socio-demographic characteristics, employ-
ment, personal income and the household. The main advantages of the Microcensus are the large
samples of foreigners (about 50,000 per year) as well as detailed and precise information on years
spent in Germany and the acquisition of German citizenship.
For each foreigner we know whether he or she was born in or outside of Germany. We restrict our
sample to �rst-generation immigrants, i.e. immigrants born outside of Germany. We also need to
drop ethnic Germans who had faster access to citizenship and therefore are not a�ected by the 1991
and 2000 immigration reforms. To do so, we restrict our analysis to the 2007-2009 survey years since
the survey asks since 2007 whether an immigrant is naturalized as an ethnic German. To make our
sample even more homogeneous, we further restrict the analysis to immigrants arriving in Germany
between 1976 and 2000 who were 16-35 years-old in the post-reform period.16
The Microcensus reports the acquisition of German citizenship: whether an immigrant has ob-
tained German citizenship and the year in which naturalization took place. Based on this infor-
mation, we de�ne the number of years since an immigrant obtained German citizenship. To de�ne
eligibility for citizenship, we calculate the number of years since an immigrant is eligible using the
immigrant's year of arrival and year of birth.17 The naturalization and eligibility variables are zero
before an immigrant becomes eligible for German citizenship and equal to the number of years since
an immigrant has naturalized or become eligible thereafter.
Our main outcome variables of interest are log personal income and employment. The variable
16A potential issue of this approach is that only immigrants who survive until the survey year are in the data.However, our analysis focuses on individuals aged 16 to 35 in the 1991-2009 period. We therefore think that survivorbias is not an issue here.
17We abstract from other eligibility criteria largely because we do not have any information (e.g. about the criminalrecord) or because it is unclear how the criteria is applied (e.g. economic self-su�ciency). As a consequence, we arelikely to misclassify a few immigrants who satisfy the residency requirements but are not eligible according to someother criteria. This misclassi�cation will result in a downward bias of eligibility on naturalization propensities (assome individuals, which we classify as eligible, cannot naturalize in practice). If immigrants with a criminal recordand economic dependence have worse labor market outcomes than eligible immigrants, our estimates of the bene�tsof German citizenship are downward biased. Consequently, classi�cation errors should produce conservative estimatesin our analysis below.
11
is measured as net personal income per month and is de�ated by the national consumer price index.
Employment is an indicator equal to one if the immigrant pursues any income-generating activity
in the week before the interview and zero otherwise. We also analyze economic self-su�ciency,
i.e. whether an immigrant receives social assistance payments. The main control variables are the
number of years in Germany, age, gender and education. We distinguish between low-skilled (no
high school or vocational degree), medium-skilled (a higher school degree or a vocational degree)
and high-skilled immigrants (with a college degree).
To study heterogeneity in returns to citizenship by country of origin, we distinguish between
immigrants from the traditional EU-15 member states (e.g. Italy or Portugal), immigrants from
countries that recently joined the European Union (the so-called EU-12, e.g. Poland or the Czech
Republic), immigrants from Turkey, ex-Yugoslavia (except Slovenia) and the Former Soviet Union
(except the Baltic states). We lump together other immigrants into broad regions of origin (Asia,
Africa, the Middle East and North or South America). In addition, we analyze whether the returns
to citizenship di�er for immigrants from high- and low-income countries using data on GDP per
capita in the country of origin in 2005 from the Penn World Tables (Heston et al., 2011). Table A1
shows summary statistics of our sample of �rst-generation immigrants in the Microcensus. Further
details on the de�nition of our sample and each variable is contained in the data appendix.
3.2 German Socio-Economic Panel
To study additional outcomes and shed light on the decision to naturalize, we use the German
Socio-Economic Panel (GSOEP). The GSOEP is an annual panel interviewing more than 20,000
individuals about their labor supply, income and demographic characteristics since 1984. As in the
Microcensus, our basic sample consists of all �rst-generation immigrants who arrived in Germany
between 1976 and 2000 and are between 16-35 years-old in the post-reform period.
We de�ne naturalization based on observed changes in the citizenship recorded. The variable
is equal to zero as long as an immigrant reports a foreign nationality and one in all years when
a German citizenship is recorded. We perform several consistency checks (outlined in the data
appendix) to ensure that individuals do not change their citizenship more than once. Based on the
information about current citizenship, we de�ne the number of years since an immigrant actually
naturalized. Using the residency requirement, we de�ne an indicator for citizenship eligibility which
12
is equal to one if (1) an individual has been in Germany for at least 8 years and is between 16 and 22
years old for all years after 1990; (2) if an immigrant has been in Germany for at least 15 years and
is 23 years old or above in the 1991-1999 period; or, (3) if an immigrant has been in Germany for
at least 8 years and is 23 years old or above in 2000-2009. The indicator is zero if a �rst-generation
immigrant is not (yet) eligible for naturalization in a year. We de�ne the number of years since an
immigrant became eligible for German citizenship in a similar fashion.
Our main dependent variable is the log of monthly gross labor earnings de�ated with the national
consumer price index. Labor force participation is an indicator equal to one if an immigrant works
in any type of employment; the indicator is zero if she is unemployed or out of the labor force. We
further study self-reported language skills in writing or speaking German (recoded to range from
0= not at all to 4= very well). Our main control variables are age, years spent in Germany and
education (which are coded as in the Microcensus). Table A2 shows summary statistics for our
sample of �rst-generation immigrants in the GSOEP.
4 The Determinants of Naturalizations in Germany
4.1 Empirical Approach
We begin with an analysis of the decision to naturalize after the 1991 and 2000 reforms. To do so,
we estimate variants of the following model:
Prob(Naturalize)it = a+bEligibleit+g1Y rsinGit+g2Y rsinG2it+dXit+tt+ls+js*yeart+eit (1)
where the dependent variable is equal to one if an individual is naturalized in year t and zero
otherwise. Our main parameter of interest is b which measures how eligibility for naturalization
a�ects the decision to naturalize. Note that this e�ect is identi�ed by comparing immigrants who
just became eligible for naturalization to immigrants who are not (yet) eligible for naturalization.
Equation (1) includes a linear and squared term of years spent in Germany to capture general
assimilation among all immigrants. We also control for immigrant characteristics like age, age
squared and education. To adjust for aggregate changes and local economic conditions, we add year
and state �xed e�ects as well as state-speci�c linear trends. Finally, we include region of origin
13
�xed e�ects to capture di�erent propensities to naturalize across source countries.18 All models are
estimated separately for male and female immigrants. Note that we control in equation (1) for all
variables that also de�ne eligibility (age, years in Germany and year). A regression of the eligibility
indicator in the GSOEP on all control variables outlined above yields a R2 of 0.7 (women) and 0.72
(men). A similar regression in the Microcensus yields a R2 of 0.57 (for men and women). Hence, we
still have variation in our eligibility variables to identify the bene�ts of citizenship even controlling
for general assimilation and age e�ects. For the analysis, we cluster the standard errors at the age
x immigration year level to adjust for the level of aggregation in the eligibility variable.
4.2 The Decision to Naturalize in Germany
Table 1 shows the results of estimating equation (1) with a linear probability model using the GSOEP.
Consistent with the low naturalization numbers in the o�cial statistics, we �nd that eligibility after
the 1991 and 2000 reforms has a rather weak e�ect on the decision to naturalize. Eligibility increases
the likelihood of naturalization by 6 percentage points for men and 13 percentage points among
women. Once we control �exibly for years since immigration, the e�ect is about 4 percentage points
for men and 5 percentage points for women.19
As argued in the introduction above, the bene�ts of naturalization, and hence incentives to
naturalize, might be stronger for immigrants from outside the European Union. Therefore, we
explore next whether the propensity to naturalize di�ers by country of origin. The evidence indeed
suggests that male immigrants from the Middle East, Africa, America, Asia as well as Turkey and ex-
Yugoslavia have a much higher propensity to naturalize than immigrants from EU member countries
(EU-15 plus the new EU-12). For female immigrants, we see overall a pattern similar to that for
men. In addition, female immigrants from EU-12 and the Former Soviet Union are more likely to
18Since we are primarily interested in the e�ects of naturalization on the labor market performance of immigrants,we choose this rather reduced form approach rather than including detailed controls for the source country (as inChiswick and Miller, 2008, for example). Clearly, there might be other factors determining the decision to naturalize,for example, the presence of children or close family members in the source country who have easier access to visa orcitizenship after the naturalization of one close family member.
19One might be worried that some immigrants are more likely to exit the population because of emigration or death.Our analysis of selective dropout in Table A3 suggests that those who eventually naturalize are about 1 percentagepoint less likely to exit the population. In contrast, we �nd no correlation between naturalization or eligibility inthe current year and dropout. As a consequence, we think this issue is not a major concern. See Kroh (2011) for amore detailed discussion of attrition among panel members in the GSOEP. Constant and Massey (2002) show thatemigrants from the GSOEP have somewhat less stable employment histories but �nd no selectivity with respect toeducation or earnings.
14
obtain German citizenship than immigrants from the traditional EU-15 member states.
Table 1 also sheds some light on the selection into citizenship in Germany. In contrast to tradi-
tional immigration countries, age has no e�ect on the propensity to naturalize for male immigrants;
for women, we �nd that younger immigrants are more likely to naturalize.20 Even more interest-
ingly, we �nd no evidence for positive selection in terms of educational attainment. Medium-skilled
immigrants are about 3-4 percentage points more likely to naturalize than the low-skilled reference
group. High-skilled immigrants are, however, no more likely (male immigrants) or even 4-6 percent-
age points less likely (female immigrants) to naturalize than the low-skilled. This result is quite
surprising because studies from other countries typically �nd a positive selection into citizenship
(see Chiswick and Miller, 2008 and Yang, 1994 for the US; or Fougère and Sa�, 2008 for France).
To probe the robustness of these results, we re-estimate equation (1) using a probit model or,
alternatively, lagged (rather than current) eligibility status to allow for some delay in the process of
naturalization. Conditional on years in Germany, marginal e�ects in the probit model are similar
to those reported in Table 1. Results using lagged eligibility are statistically weaker for men and
marginally stronger for female immigrants (see Table A4).
We can also use the larger samples of the Microcensus to study naturalization decisions. To do
so, we �rst convert the Microcensus into a pseudo-panel spanning the 1985-2009 period. Speci�cally,
we create an indicator equal to one if an immigrant has naturalized in any year between 1985 and
2009 from the reported year of naturalization. We calculate age in the 1985-2000 period using
information on the year of birth; and eligibility for naturalization in any year between 1991 and
2009 from information on age and year of arrival in Germany. Finally, we assign education based
on the information recorded in 2007-2009; here, education refers to the highest educational degree
attained rather than the education level in a particular year. Results for the Microcensus pseudo-
panel in Table A5 largely con�rm the GSOEP results. Eligibility increases the decision to naturalize
by 5-6 percentage points for men and women. The e�ects decrease to 3-4 percentage points (but
remain statistically signi�cant) if we adjust for general assimilation e�ects.21 As in the GSOEP, we
�nd evidence for intermediate and negative selection into citizenship and large di�erences by source
20Our evidence is in line with Constant et al. (2009) who use the GSOEP to study naturalization decisions inGermany. Evidence from traditional immigration countries suggests instead that older immigrants are more likely tonaturalize even conditional on years since immigration (Chiswick and Miller, 2008 for the United States; De Voretzand Pivnenko, 2006 for Canada).
21We �nd similar, though slightly weaker e�ects if we include individual �xed e�ects.
15
countries. Immigrants from Africa, Asia, Middle Asia, Turkey and ex-Yugoslavia are much more
likely to naturalize than immigrants from EU member countries.
Does the propensity to naturalize also di�er between guest workers and their family members
(who came to Germany prior to the fall of the Wall) and more recent immigrants (arriving after
the fall of the Berlin Wall)? Table A6 indeed shows striking di�erences in the propensities to
naturalize between the two groups. Guest workers and their family members are much less likely to
naturalize than more recent immigrants. For both groups of immigrants, the younger are more likely
to naturalize. We again �nd intermediate selection with respect to education: the medium-skilled,
but not the high-skilled, naturalize more than the low-skilled. Finally, more recent immigrants
outside the EU are more likely to naturalize than immigrants from the European Union (both EU-
15 members and the new EU-12 states); there is much less heterogeneity across sending countries
for more traditional immigrants.
In sum, the evidence supports the idea that eligibility rules have an impact on actual naturaliza-
tion behavior. At the same time, the propensity to naturalize in Germany is quite low on average,
though higher for immigrants outside the European Union. We also show that, in sharp contrast to
traditional immigrant countries like Canada or the United States, selection into citizenship in terms
of education is intermediate for men but actually negative for women. We now turn to the question
whether access to citizenship a�ects labor market performance.
5 Citizenship and Labor Market Performance
5.1 Empirical Strategy
To identify the e�ect of obtaining German citizenship on labor market outcomes, we estimate variants
of the following model:
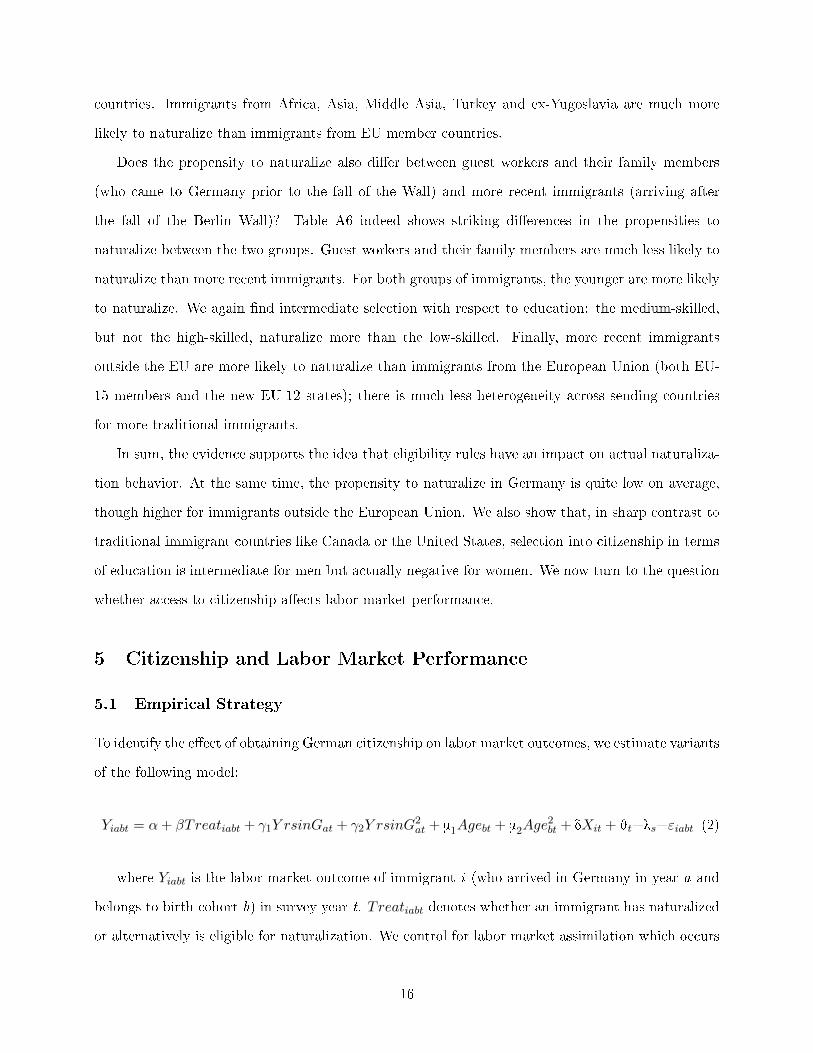
Yiabt = α+ βTreatiabt + γ1Y rsinGat + γ2Y rsinG2at + m1Agebt + m2Age
2bt + dXit + jt+ls+εiabt (2)
where Yiabt is the labor market outcome of immigrant i (who arrived in Germany in year a and
belongs to birth cohort b) in survey year t. Treatiabt denotes whether an immigrant has naturalized
or alternatively is eligible for naturalization. We control for labor market assimilation which occurs
16
independently of naturalization and general labor market experience (both linear and quadratic).
We further include the immigrant's skill, region of origin, year and state �xed e�ects as well as
state-speci�c year trends to adjust for local labor market conditions and aggregate economic shocks.
The main parameter of interest is β. In the baseline OLS speci�cation, the coe�cient measures
how actual naturalization is related to labor market performance above and beyond general labor
market assimilation and returns to human capital. Our main focus is, however, on the reduced-
form speci�cation which identi�es the intent-to-treat e�ect, i.e. whether legal access to citizenship
improves labor market outcomes among immigrants. We focus on the reduced-form speci�cation
for two reasons. First, knowing whether a more liberal access to citizenship a�ects labor market
outcomes is important in its own right. The policy e�ect is the primary parameter of interest for
policy makers who aim to improve the economic integration of immigrants in the host country.
Second, the evidence in Section 4 suggests that the immigration reforms have a rather modest e�ect
on the propensity to naturalize in Germany. Yet, the reduced-form estimator remains unbiased and
consistent even in the presence of a weak �rst stage.22
The reduced-form coe�cient is identi�ed from comparing immigrants of the same age who arrived
in slightly di�erent years (but get eligible after the immigration reforms in 1991 and 2000); or from
comparing immigrants who arrived in the same year, but at somewhat di�erent ages (and therefore
get eligible under the rule for adolescent or adult immigrants). The identifying assumption here is
that conditional on all our control variables the labor market outcomes of an immigrant who is not
yet eligible for naturalization (e.g. because she arrived in Germany somewhat later or was a bit older)
is a valid counterfactual for the labor market outcomes of an immigrant eligible for naturalization.
This identifying assumption would, for example, be violated if treatment and control groups di�er
in their pre-reform characteristics; or, if the labor market outcomes of treatment and control group
exhibit di�erential trends prior to the immigration reforms. We �nd no systematic evidence that
our identifying assumption is not valid. We report these tests of our identifying assumption and
several other validity checks after we present our main results.
For the analysis of labor market e�ects, we mostly rely on the Microcensus because it has much
22We could use the eligibility criteria to construct a supplementary instrumental variable approach. Using eligibilityas an instrument for actual naturalization, we still �nd a positive wage return for women and no return for men. The�rst stage, however, is rather weak especially for men which likely generates biased IV estimates. We therefore focusin our main analysis on the reduced-form.
17
larger samples and more accurate information on naturalization. A potential disadvantage of the
Microcensus is that we observe labor market outcomes only several years after immigrants actually
naturalize or are eligible. Estimation of equation (2) therefore identi�es persistent growth e�ects
of naturalization or eligibility. Yet, the Microcensus would not identify a level e�ect immediately
with naturalization or eligibility. The reason is that the control group of immigrants also quali�es
for citizenship during our sample period (though later than the treatment group) and would have
experienced the same upward (or downward) shift in wage levels by 2009 (see Figure A1 for an
illustration). Our robustness analysis suggests, however, that naturalization mainly works through
growth e�ects (and not level e�ects). As such, our focus on the longer-run performance of immigrants
is not a limitation of the current study. A potential advantage of focusing on long-run outcomes is
that our estimates are less likely to be a�ected by any transitory shocks around the reform years.
5.2 Naturalization, Eligibility and Labor Market Performance
Table 2 shows OLS results for employment and log monthly personal income in 2007-2009. The OLS
results suggest that an additional year as a German citizen is associated with both higher employment
rates (by about 0.3%) and higher earnings (by about 0.7%). The correlation becomes slightly weaker,
but remains robust when we control for years spent in Germany. Conditional on occupation and
sector dummies, the correlation declines by 60% and even becomes statistically insigni�cant for
female immigrants (see columns (5) and (10)). Thus, a substantial share of the correlation between
naturalization and earnings, especially for women, seems to work through occupational upgrading
and selection into higher-paying industries after getting naturalized as a German citizen. In line
with the previous literature, there is little evidence of assimilation for immigrant men in Germany.
We �nd, however, positive assimilation among immigrant women which have not been documented
before. We also �nd large age e�ects, especially for immigrant men, in part because we focus on a
young immigrant sample who are still on the steep part of their age-earnings pro�le.
If immigrants select into German citizenship based on unobservable characteristics, the correla-
tion between actual naturalization and labor market outcomes may be misleading. In most countries
with a long immigration history, naturalized immigrants seem to be positively selected in terms of
observable and possibly unobservable skills like motivation etc. In that case, we would expect that
OLS estimates overstate the true return to citizenship. In the German context, we �nd evidence for
18
intermediate selection with respect to education for male immigrants. For female immigrants, we
actually �nd support for negative selection into citizenship. Returns to citizenship would then be
larger than the OLS estimates suggest.
To identify returns to citizenship net of selection e�ects, we estimate the intent-to-treat e�ect
of citizenship on labor market performance. Table 3 shows a rather mixed picture. Generally, we
�nd no e�ect of citizenship on employment rates for both men and women. For male immigrants,
there is also no wage return to German citizenship once we control for years in Germany. Female
immigrants in contrast, have an annual wage return of 1.4%. Even accounting for occupational and
sectoral sorting, wage growth is still 1% higher after becoming eligible for citizenship. Consistent
with negative selection in terms of unobservables, we �nd that the reduced-form returns for women
are larger than the OLS estimates. These results suggest that women gain substantially from the
liberalization of citizenship laws in Germany.23
We further explore whether naturalization is related to economic self-su�ciency. We measure
self-su�ciency through an indicator equal to one if an immigrant receives unemployment bene�ts
or social assistance in the current year. Immigrants can claim both bene�ts irrespective of their
citizenship as long as they have a valid work permit. OLS estimates suggest that naturalized
immigrants are less likely to receive welfare bene�ts (see Table 4). The reduced-form estimates
tell a somewhat di�erent story: the likelihood to receive social assistance is higher among eligible
immigrants than among those not yet eligible. While the estimates are similar, they are statistically
signi�cant for men only. Table 4 further suggests that men are indeed more likely to draw welfare
bene�ts (rather than unemployment assistance). We think there are two possible interpretations
of this pattern: one based on eligibility and one based on information. Recall that one of the
criteria for naturalization is that immigrants demonstrate economic self-su�ciency. If immigrants
are well informed about these rules, they might try to avoid drawing welfare bene�ts in order not
to jeopardize their chances of naturalization. A second interpretation of the higher propensity to
draw welfare bene�ts is that immigrants are not well-informed about the welfare system in Germany.
Only when they qualify for citizenship or after naturalization do they learn about the availability
23If we translate the reduced-form e�ect into a return to actual naturalization, wages are about 14% higher comparedto non-naturalized immigrant women. The �rst-stage coe�cient of years since naturalized on years since eligible andall control variables yields an estimate of 0.1-0.15. Therefore, 0.014*1/0.1=14% (or 0.014*1/0.15 =9.3%). Thereturn would be somewhat lower if a more liberal access to citizenship also bene�ts the non-compliers because of lessdiscrimination in the labor market, for instance.
19
(or their eligibility for) welfare bene�ts and may make use of them afterward.
5.3 Type of Employment and Language Skills
What are the possible sources of the wage returns to citizenship? Naturalization might, for instance,
have an impact on the type of job or occupation immigrants work in. Theories of naturalization
suggest that citizenship provides access to certain jobs in the public sector. In addition, naturalized
immigrants might have better chances of moving up the job ladder, for example by switching from a
blue collar to a white collar job. Or, immigrants might improve their job situation by moving from a
temporary work contract to a permanent one. Table 5 explores whether citizenship a�ects the type
of job held by immigrants. The top panel shows the OLS results using actual naturalization, while
the bottom panel shows the reduced-form results based on eligibility for citizenship.
OLS estimates suggest that both male and female immigrants are more likely to work in the
public sector or in a white collar job. The reduced-form e�ects in contrast show no e�ect on working
in the public sector or in a white collar occupation once we control for general assimilation e�ects.
Hence, the fact that more naturalized immigrants work in white-collar occupations or are employed
in the public sector is driven by unobserved heterogeneity that is correlated both with the decision
to naturalize and employment in the public sector or a white-collar occupation. For example, one
could imagine that a highly risk averse immigrant, say from a politically unstable source country, has
a strong preference to naturalize and at the same time has a strong preference for the job security
o�ered in the public sector.
The results in Table 5 further show that occupational upgrading among female immigrants (see
Table 3) cannot be explained by higher rates of employment in the public sector or white collar jobs.
Instead, the wage returns seem to be largely the consequence of moving to higher-paying blue-collar
occupations within the private sector. To investigate the sources of occupational upgrading further,
Table A7 uses the GSOEP data to explore whether immigrants work in more prestigious occupations
after citizenship. The results show that occupational prestige seems to increase after eligibility for
both men and women though the e�ects are relatively modest. We also �nd that women (but not
men) work in larger �rms after eligibility. Hence, the wage return for women is in part explained by
a �rm size e�ect (as larger �rms pay higher wages). The �nal speci�cation in Table 5 shows that
both male and female immigrants are somewhat more likely to have a permanent work contract after
20
citizenship. The size of the e�ects is with about 0.5% higher wages quite small, equivalent to about
0.1 of a standard deviation for both men and women.24
Another channel how citizenship could improve labor market outcomes is through language skills.
Citizenship grants immigrants a long-time perspective in the destination country and thus increases
the return to learning the native language. Table 6 suggests positive correlations between actual
naturalization and German language ability for both male and female immigrants. Controlling for
years spent in Germany cuts the correlation in half to about 0.1 and 0.2 of a standard deviation. Once
we control for selection using eligibility rather than actual naturalization, we �nd no improvements in
language skills among male and female immigrants in Germany. If anything, there is some evidence
that the ability to speak German declines somewhat for men and women.25 Other control variables
(not shown) have the expected e�ect: more educated immigrants have better language skills as
do immigrants who have lived in Germany longer.26 We interpret these results as evidence that
language skills mostly improve with time in Germany rather than through access to citizenship per
se.
5.4 Heterogeneity of E�ects
So far we have found little evidence that German citizenship has any returns in the labor market
for men while the returns are sizable for women. This average e�ect might mask substantial het-
erogeneity in the returns across immigrant groups. Since the propensity to naturalize varies a lot
with the country of origin, we might expect that some immigrants also bene�t more from citizenship
than others in the labor market. Focusing on reduced-form estimates, Table 7a (for men) and Table
7b (for women) document substantial heterogeneity in the returns to citizenship. Male immigrants
from the Middle East, Asia and the Former Soviet Union have positive wage returns of 2-3% higher
24The mean years since eligible is 7.73 (for men) and 7.16 (for women), while the standard deviation of having apermanent work contract is 0.372 (for men) and 0.389 (for women). Hence, 0.005*7.73/0.372 =0.104 (for male immi-grants); and 0.005*7.16/0.389 = 0.092 (for women). We �nd no evidence, however, that male or female immigrantsare more (or less) likely to be self-employed upon naturalization.
25Since the language skills are self-assessed, we cannot rule out that immigrants' assessment of their own languageskills is a�ected by naturalization or eligibility for citizenship. Naturalized immigrants might see their language skillsin an over-optimistic light after obtaining citizenship; such over-optimism would bias the OLS estimates upward.Dustmann and van Soest (2001) have shown for instance, that there is substantial measurement error when individualsself assess their language skills repeatedly in a panel survey. Yet, to account for the strong positive correlation fornaturalized immigrants jointly with the negative e�ects for eligible immigrants, we would require an optimism bias inthe �rst case but an overly pessimistic view in the second case.
26In 2005, Germany introduced mandatory integration courses which also include German language instruction.Our results become actually slightly stronger if we restrict our data set to the years prior to 2005.
21
per year. All other immigrant groups, including immigrants from EU member states, have no wage
returns to citizenship. For women we �nd that immigrants from the EU-12, ex-Yugoslavia, Middle
East, Asia and the Former Soviet Union have positive wage returns ranging from 1.5-2.3% per year.
To analyze this heterogeneity more systematically, we explore whether immigrants from poorer
countries bene�t more from naturalization. We merge information on the GDP per capita in the
source country in 2005 from the Penn World Tables (Heston et al., 2011) and interact the eligibility
indicator with the GDP per capita in the immigrant's source country.27 Immigrants from richer
countries have higher wages overall. Yet, immigrants from poorer countries have higher wage growth
after citizenship than immigrants from richer source countries (see columns (3) and (4) of Table 7a
and 7b). Going from relatively rich Italy to poor Afghanistan, for instance, roughly doubles the
return to citizenship. The return of an additional year of citizenship increases wages for men from
-0.007 to +0.008; for women, the return increases from 0.011 to 0.02.28 In contrast, we do not �nd
evidence that returns to citizenship di�er across education levels.
Finally, the returns to citizenship might vary across arrival cohorts, in particular between tradi-
tional guest workers (arriving prior to 1990) and more recent immigrants (arriving after the fall of the
Berlin wall). More recent immigrants to Germany are on average younger, somewhat more skilled
and more likely to come from Eastern Europe, especially ex-Yugoslavia and the former Soviet Union,
than traditional guest workers. We �nd striking di�erences. As shown in Table 8, male immigrants
arriving in Germany before 1990 have zero returns to citizenship, while more recent immigrants have
substantial positive returns to naturalization. For women, there are positive returns to citizenship
for both guest workers and recent immigrants though the returns for more recent immigrants are
larger.
One interpretation of this heterogeneity would be that the economic and social environment
in Germany has turned in favor of immigrants. However, reduced discrimination or other more
favorable attitudes of natives toward immigrants would only explain our results if immigrants who
arrived recently in Germany bene�t from it while more traditional immigrants do not. In addition,
27The number of observations for this speci�cation is lower because we can merge GDP data only with immigrantsfor which we observe the actual country of origin (e.g. Turkey), not only the region of origin (e.g. Asia).
28In 2005, Italy's GDP per capita was 26,155 Euros, while Afghanistan had a GDP per capita of 619 Euros.Taking the main e�ect and interaction e�ect of columns (4) in Table 6a (for men) and Table 6b (for women), thereturn for an Italian men is 0.0053-0.0006*26.155=-0.0074. A male immigrant from Afghanistan in turn gets 0.0053-0.0006*0.619=0.0075. For women, the return for an Italian immigrant is calculated as: 0.0202-0.0004*26.155=0.0108;for an Afghan immigrant, the return is: 0.0202-0.0004*0.619=0.0199.
22
the more favorable treatment has to be restricted to immigrants eligible for citizenship, but cannot
bene�t immigrants who get eligible for German citizenship within a few years. We think this scenario
is unlikely. An alternative explanation would be that immigrants arriving in Germany after 1990
knew that they can obtain citizenship whereas earlier guest workers came to Germany without any
such perspective. As such, incentives to migrate and invest in destination-speci�c skills changed after
the 1991 and again after the 2000 reform. We see indeed that immigrants arriving after 1990, many
coming from Central and Eastern Europe, are on average younger and slightly more educated than
traditional guest workers in Germany. It is thus likely that their better human capital endowment
is the primary reason why recent immigrants bene�t more from citizenship. We cannot separate
however, whether the change in immigrant selection after 1991 is a consequence of the 1991 reform
or just a consequence of the new immigration opportunities after the Iron Curtain was removed.
6 Robustness Analysis
This section explores the robustness of the estimated returns to citizenship and the validity of
our identifying assumption. A �rst concern of our analysis so far is that some immigrants in our
sample might qualify for citizenship through alternative channels. The most important fast track
to citizenship is through being married to a German citizen. Foreign spouses of citizens can apply
for naturalization after 3 years of residency in Germany.29 Therefore, some of the immigrants in
our sample would be eligible for naturalization much faster than our eligibility variable indicates.
Naturalization through marriage is expected to be more important for adult immigrants aged 23 and
above. Since those immigrants are more likely to be in the control group, we possibly underestimate
the returns to German citizenship. To check whether this could explain the absence of returns for
male immigrants, we drop all immigrants who report having a German spouse in 2007-2009.30 The
results reported in Table 9 show a very similar pattern than before: no returns to citizenship for
29The immigrant has to be married for at least two years by the time he or she applies for naturalization; furthermore,the spouse has to have a German citizenship for at least 2 years. Finally, the couple has to have a permanent residencepermit.
30Note that we only observe their current spouse, not the spouse or partner an immigrant had when they �rst livedin Germany. Some immigrants we drop from the sample might have naturalized through the provisions of the 1990 or2000 reforms but married a German citizen only afterward. And some immigrants might have naturalized through aGerman spouse, but got divorced before we observe them in the 2007-2009 sample period. We think that the numberof immigrants we misclassify should be small relative to the number of immigrants who still have a German spousein the 2007-2009 period. We �nd similar results if we use the GSOEP where we have annual information on theimmigrant's partner from 1984-2009 (results are available upon request).
23
male immigrants once we control for years in Germany and positive returns for female immigrants
across all speci�cations.
A second concern is that the 2000 reform not only changed the residency requirement for adult
immigrants but also granted citizenship to children born in Germany to foreign-born parents. Immi-
grants with dependent children had therefore a higher incentive to naturalize prior to 2000 because
they could include spouses and dependent children in their application. After 2000, newborn chil-
dren obtained German citizenship independently of their parents (except for a 8 year residency
requirement for at least one parent). Hence, the bene�ts of citizenship might be smaller after 2000
for parents with very young children. Controlling for the presence of children in the household as
well as their age structure does not change our results.
Third, our sample of naturalized citizens could also be a�ected by changes in the in�ow of refugees
and asylum seekers. Prior to 1988, Germany had relatively low in�ows of asylum seekers (about
60-70,000 per year). After the opening of the Iron Curtain, large numbers of asylum seekers (more
than 200,000 per year) began to arrive in Germany. Faced with ever-increasing numbers, the federal
government restricted access to political asylum in 1993.31 Hence, the selection of refugees arriving
in Germany might have changed substantially over time, especially after 1993. Refugees who are
granted political asylum face the same naturalization criteria as all other immigrants in Germany. In
some cases, however, the residency requirement could be reduced to 6 years. As such, some refugees
might have naturalized earlier than our de�nition of eligibility indicates. Unfortunately, we do not
directly observe whether an immigrant arrives in Germany as a refugee or asylum seeker. Yet, we can
run two additional tests to check whether our results hold for the subsample of non-refugees: �rst,
we drop all immigrants from ex-Yugoslavia and the Middle East which formed the largest groups
of refugees over our sample period. Our second test restricts the sample to immigrants arriving in
Germany prior to 1988 when numbers of refugees were still small. Table 8 shows that immigrant
samples net of refugees show the same wage patterns than the main results.
Fourth, changes in the German economy more broadly might have an in�uence on the results.
Germany's labor market experienced a substantial in�ow of migrants after the fall of the Berlin Wall
and the opening of the Iron Curtain. In addition, wage inequality in Germany increased in the late
31After 1993, immigrants from source countries that are considered safe, or those arriving from safe third countries(which included all of Germany's geographic neighbors) could no longer apply for political asylum in Germany.
24
1990s and 2000s with substantial net gains for the high-skilled but net wage losses for the low-skilled.
In principle, these changes would be absorbed by year dummies or state trends if changes vary across
German states. Our reduced-form estimates would only be biased if business cycle e�ects or secular
wage changes a�ect recently eligible immigrants di�erently than not yet eligible immigrants. If
eligible immigrants perform better during a recession than non-eligible immigrants, for instance, our
results would be upward biased. Our �rst robustness test drops all East German states because
immigration �ows and labor market dynamics di�er substantially between East and West Germany.
Alternatively, we include state-level unemployment rates and GDP growth rates to our speci�cation.
In both cases, results are very similar to our main estimates.
Fifth, our results might be sensitive to functional form assumptions. Recall that the reduced-
form e�ect is identi�ed from variation in the eligibility variable net of a quadratic in age and years
in Germany. To allow for more �exible age and assimilation e�ects, we include separate indicators
for 5-year age groups; we then add separate indicators for 5-years arrival cohorts as well. The last
two speci�cations in Table 9 shows that our results are robust to these alternative de�nitions of the
main control variables: access to citizenship still carries no wage return for men and sizable wage
returns for immigrant women.32
Sixth, we probe the validity of our identifying assumption using pre-reform data from the GSOEP.
Table A8 compares the characteristics of immigrants who get eligible shortly after the 1991 reform
to those who get eligible later (in the 1996-1999 period). Each entry reports the coe�cient from a
regression on an indicator equal to one if an immigrant is eligible in 1991-1995 and zero if she gets
eligible in 1996-1999. All regressions control for age, age squared, years in Germany (a linear and
squared term), region of origin, year and state �xed e�ects as well as state-speci�c linear trends.
The results show few statistically signi�cant di�erences between immigrants in the pre-reform period
(1984-1989). The only exception for men is that immigrants who get eligible in the �rst years after
the 1991 reform are more likely to be employed in the service sector (and hence, less likely to be
32A related concern is that our immigrant sample might su�er from cohort bias where more recent arrival cohortsare of higher (or lower) quality in terms of observable characteristics than older arrival cohorts. As our estimatesrely on cross-sectional variation between di�erent immigrant cohorts (de�ned by age, arrival year and time period),cohort bias could in principle a�ect our results, though the direction of the bias is not so clear. Using Microcensusdata from 2000 to 2009, we check whether earnings of more recent arrival cohorts are below or above those of earlierarrival cohorts (holding years in Germany and age e�ects constant). We �nd little evidence for cohort bias in theGerman context (the results are available upon request) which suggests that our results are indeed driven by a moreliberal access to citizenship and not by changes in immigrant selection.
25
employed in manufacturing). Among women, immigrants eligible shortly after the reform live in
somewhat smaller households and are somewhat less likely to work full time. All di�erences are just
borderline signi�cant at the 10% level.
An alternative way to test the validity of our identifying assumption is to use placebo reforms.
To check for di�erential pre-reform trends, we use the same eligibility rules as in the actual reforms
but pretend that the reform took place 2, 3, 4, or 5 years before 1991. We restrict attention to the
�rst reform because immigrants in the pre-2000 years are a�ected by the 1991 reform. Table A9 in
the appendix shows no prior trends for male and female wages and also no prior trend for female
employment. The only exception is that labor force participation among male immigrants shows a
positive trend 5-6 years prior to the 1991 reform, but not in the period shortly before the actual
reform. Since we �nd no e�ect of the citizenship reform on employment, we think this is not a major
issue.
Finally, our main analysis only identi�es whether naturalization or eligibility for citizenship has a
persistent e�ect on the growth rate of wages. Because we only observe immigrants in the Microcensus
several years after they actually naturalize or become eligible for citizenship, we cannot identify any
level e�ect of citizenship on labor market outcomes. However, citizenship might shift employment or
wages immediately after naturalization, for example if immigrants switch careers immediately. To
test for level e�ects in employment and wages, we again use the GSOEP where we can identify both
an immediate wage e�ect of naturalization or eligibility (a level e�ect) and any persistent e�ect on
wage growth because of faster human capital accumulation (a slope e�ect). We capture the level
e�ect by a dummy variable whether an individual is naturalized or eligible in the current year. As
before, we identify the slope e�ect by including a measure of years since naturalization or eligibility
for citizenship. The results in Table A10 in the appendix show that level e�ects do not matter once
we condition on time in Germany. Overall, the results are consistent with the evidence in Table 2
and 3. There are no growth e�ects of citizenship for men but positive growth e�ects for women.33
33The main di�erence to our main results (using the Microcensus) is that for men even the OLS estimates showno correlation between naturalization and labor market outcomes. This result is most likely the consequence ofmeasurement error; in the GSOEP, we have no direct information on the year of naturalization but have to infernaturalizations from changes in citizenship status reported in each year.
26
7 Conclusion
We study the e�ects of citizenship in Germany, a country that has traditionally had little experience
with naturalizations. Over the past decades Germany has moved from a country where citizenship
was closely tied to ancestry to a more liberal understanding of citizenship and naturalization. We �nd
that the take-up of citizenship in Germany among �rst-generation immigrants is still low compared
to more traditional immigration countries, though higher among more recent immigrants. In contrast
to traditional immigrant countries, we do not �nd positive selection into German citizenship. Men
are intermediately selected in terms of observable skills, as medium-skilled immigrants are more
likely to naturalize than the low-skilled, but also more likely than high-skilled immigrants. Women,
in contrast, are even negatively selected with respect to education, with high-skilled immigrants
being less likely to naturalize than low- and medium-skilled immigrants. We also �nd that younger
immigrants are more likely to naturalize in Germany.
To identify the e�ects of citizenship acquisition in the labor market, we exploit age-dependent
residency requirements in Germany's reforms of citizenship law. Our intention-to-treat e�ect shows
few permanent bene�ts of citizenship for men, but substantial returns for immigrant women. In
contrast to previous evidence from the US, we do not �nd evidence that immigrants work more in
the public sector or in a white-collar job after citizenship. We also �nd no support that the wage
returns are driven by improvements in German language skills. Rather, a more liberal access to
citizenship allows women to move to jobs with a permanent contract, to larger �rms and to better-
paying occupations in the private sector. About 30% of the wage returns are driven by moving to
higher paying occupations and industries.
Exploring the heterogeneity of returns, we �nd that wage returns are typically larger for immi-
grants from outside the European Union and, more generally, for immigrants from poorer countries.
The picture is also more optimistic if we focus on more recent immigrant men and women which
enjoy substantial wage returns to citizenship. Overall then, naturalization appears to be one channel
to improve the economic integration of immigrants even in countries where access to citizenship has
traditionally been very restrictive. The bene�ts of a more liberal immigration policy seem to materi-
alize especially if immigrants have the human capital necessary to succeed in the host country's labor
market - a condition more recent immigrants to Germany are more likely to satisfy. As such, the
27
substantial in�ow of immigration over the past decades might provide large bene�ts for Germany.
Immigration is an important channel to counter or reduce the pressure from population aging in
Germany and other developed countries like Italy or Japan, for example. Further, economically more
successful immigrants also make higher net economic and �scal contributions to the host economy,
which in turn should promote a positive perception of immigrants in the native population. Our
results also caution us, however, that citizenship law is not a policy instrument that works for all
immigrants automatically.
References
[1] Abramitzky, R., L.P. Boustan and K. Eriksson (2012), �Europe's tired, poor, huddled masses:Self-selection and economic outcomes in the age of mass migration,� American Economic Re-
view, 102, 1832-56.
[2] Aleksynska, M. and Y. Algan (2010), �Assimilation and Integration of Immigrants in Europe,�IZA Discussion Paper No. 5185.
[3] Algan, Y., C. Dustmann, A. Glitz and A. Manning (2010), �The economic situation of �rst-and second-generation immigrants in France, Germany, and the UK,� Economic Journal, 120,F4-F30.
[4] Avitabile, C., I. Clots-Figueras and P. Masella (2013a), �The e�ect of birthright citizenship onparental integration outcomes,� Journal of Law and Economics, 56, 777-810.
[5] Avitabile, C., I. Clots-Figueras and P. Masella (2013b), �Citizenship, fertility and parentalinvestments,� American Economic Journal: Applied Economics, forthcoming.
[6] Basilio, L. and T. Bauer (2010), �Transferability of human capital and immigrant assimilation:An analysis for Germany,� IZA Discussion Paper No. 4716.
[7] Bauer, T., B. Dietz, K.F. Zimmermann and E. Zwintz (2005), �German migration: Develop-ment, assimilation, and labor market e�ects�. In: European Migration. What do we know?,
edited by K.F. Zimmermann, pp. 197-261. Oxford: Oxford University Press.
[8] Bevelander, P. and R. Pendakur (2011), �Citizenship, co-ethnic populations, and employmentprobabilities of immigrants in Sweden,� Journal of International Migration and Integration, 13,203-222.
[9] Bevelander, P. and J. Veenman (2008). �Naturalisation and socioeconomic integration: Thecase of the Netherlands.� In: The economics of citizenship, edited by P. Bevelander and D.J.DeVoretz. Malmö: Holmbergs.
[10] Birkner, E. (2007), �Aussiedler im Mikrozensus: Identi�zierungsprobleme und erste Analy-sen zur Arbeitsmarktintegration,� Presentation at the Workshop �Integrationschancen von Stä-taussiedlern,� March 29-30, Institute for Employment Research (IAB), Nuremburg.
28
[11] Borjas, G. (1985), �Assimilation, changes in cohort quality, and the earnings of immigrants,�Journal of Labor Economics, 3, 463-89.
[12] Borjas, G. (2013), �The slowdown in the economic assimilation of immigrants: Aging and cohorte�ects revisited again,� NBER working paper No. 19116.
[13] Borjas, G. and L. Hilton (1996), �Immigration and the welfare state: Immigrant participationin means- tested entitlement programs,� Quarterly Journal of Economics, 111, 575-604.
[14] Bratsberg, B., Ragan, J. F. and Z. M. Nasir (2002). �The e�ect of naturalization on wagegrowth: A panel study of young male immigrants.� Journal of Labor Economics, 20, 568�97.
[15] Bratsberg, B. and O. Raaum (2011), �The labour market outcomes of naturalised citizens inNorway,� In: Naturalisation: A passport for the better integration of immigrants?, edited by theOrganisation for Economic Cooperation and Development (OECD), Paris: OECD.
[16] Bundesministerium des Inneren (2008), Migrationsbericht des Bundesamtes für Migration und
Flüchtlinge im Namen der Bundesregierung, Berlin: Federal Ministry of the Interior.
[17] Bundesamt für Migration und Flüchtlinge (BAMF) (2008), �Die Einbürgerung von Ausländernin Deutschland�, Federal O�ce for Migration and Refugees, Working Paper No. 17.
[18] Bundesamt für Migration und Flüchtlinge (BAMF) (2012), �Einbürgerungsverhalten von Aus-länderinnen und Ausländern in Deutschland sowie Erkenntnisse zu Optionsp�ichtigen�, FederalO�ce for Migration and Refugees, Research Paper No. 15.
[19] Card, D. (2005), �Is the new immigration really so bad?� Economic Journal, 115, F300-F323.
[20] Carlsson, M. and D. Rooth (2007), �Evidence of ethnic discrimination in the Swedish labormarket using experimental data,� Labour Economics, 14, 716�729.
[21] Chiswick, B. R. (1978), �The e�ect of Americanization on the earnings of foreign-born men.�Journal of Political Economy, 86, 897�921.
[22] Chiswick, B. R. and P. W. Miller (1995), �The endogeneity between language and earnings:International analyses.� Journal of Labor Economics, 13 (2), 246-88.
[23] Chiswick, B. R. and P.W. Miller (2008), �Citizenship in the US: The roles of immigrant char-acteristics and country of origin,� Research in Labor Economics, 29, 91-130.
[24] Clark, K. and J. Lindley (2009), �Immigrant assimilation pre and post labour market entry:evidence from the UK Labour Force Survey,� Journal of Population Economics, 22, 175-198.
[25] Constant, A.F., Gataullina, L. and K. F. Zimmermann (2009). �Naturalization proclivities,ethnicity and integration,� International Journal of Manpower, 30, 70-82.
[26] Constant, A.F. and D. Massey (2002), �Self-Selection, earnings, and out-migration: A longitu-dinal study of immigrants in Germany,� IZA Discussion Paper No. 672.
[27] De Voretz, D. and S. Pivnenko (2006), �The economic causes and consequences of Canadiancitizenship,� Journal of Immigration and Integration, 6, 435-68.
[28] Duleep, H.O. and D. J. Dowhan (2002), �Insights from longitudinal data on the earnings growthof U.S. foreign-born men,� Demography, 39, 485-506.
29
[29] Dustmann, C. (1993), �Earnings Adjustment of Temporary Migrants,� Journal of Population
Economics, 6, 153-168.
[30] Dustmann, C. (1994), �Speaking �uency, writing �uency and earnings of migrants,� Journal ofPopulation Economics, 7, 133-156.
[31] Dustmann, C. and A. Glitz (2011), �Migration and Education,� Handbook of Economics of
Education, edited by E. Hanushek, North Holland: Elsevier, vol. 4, pp. 327-439.
[32] Dustmann, C. and A. Van Soest (2001), �Language �uency and earnings estimation with mis-classi�ed language indicators,� Review of Economics and Statistics, 83, 663-674.
[33] Fertig, M. and S. Schurer (2007), �Earnings assimilation of immigrants in Germany: The im-portance of heterogeneity and attrition bias,� DIW Discussion Paper No. 30.
[34] Fougère, D., Sa�, M. (2009). �The e�ects of naturalization on immigrants employment proba-bility (France, 1968-1999),� International Journal of Manpower, 30, 83-96.
[35] Hailbronner, K. and G. Renner (1992), Staatsangehörigkeitsrecht, Texte, Munich: C. H. Beck.
[36] Hanson, G.H. (2009), �The economic consequences of the international migration of labor,�Annual Review of Economics, 1, 179-207.
[37] Heston, A., R. Summers and B. Aten (2011), �Penn World Table Version 7.0,� Center forInternational Comparisons of Production, Income and Prices at the University of Pennsylvania.
[38] Howard, M. M. (2008), �The causes and consequences of Germany's new citizenship law,� Ger-man Politics, 17, 41-62.
[39] Hu, W.-Y. (2000), �Immigrant earnings assimilation: Estimates from longitudinal data,� Amer-ican Economic Review P&P, 90, 368-72.
[40] Kaas, L. and C. Manger (2012), �Ethnic discrimination in Germany's labour market: A �eldexperiment,� German Economic Review, 13, 1-20.
[41] Kroh, M. (2011), �Documentation of sample sizes and panel attrition in the German Socio-Economic Panel (1984-2010),� German Institute for Economic Research, SOEP Data Docu-mentation Paper No. 59.
[42] Lalonde, R. and R. Topel (1997), �Economic impact of international migration and the economicperformance of migrants.� In: Handbook of Population and Family Economics, vol. 1B, editedby Mark R. Rosenzweig and Oded Stark. Amsterdam: Elsevier Science.
[43] Licht, G. and V. Steiner (1994), �Assimilation, labour market experience, and earning pro�lesof temporary and permanent immigrant workers in Germany,� International Review of Applied
Economics, 8, 130-56.
[44] Lubotsky, (2007), �Chutes or ladders? A longitudinal analysis of immigrant earnings,� Journalof Political Economy, 115, 820-67.
[45] Mazzolari, F. (2009), �Determinants and e�ects of naturalization: the role of dual citizenshiplaws�, Demography, 46, 169-91.
30
[46] Organisation for Economic Cooperation and Development (2006), International Migration Out-
look : SOPEMI-2006 Edition, Paris: OECD
[47] Organisation for Economic Cooperation and Development (2011), Naturalisation: A passport
for the better integration of immigrants? Paris: OECD.
[48] Pischke, J.-S. (1993), �Assimilation and the earnings of guestworkers in Germany,� unpublishedmanuscript, MIT.
[49] Schmidt, C.M. (1997), �Immigrant performance in Germany: Labor earnings of ethnic Germanmigrants and foreign guest workers,� Quarterly Review of Economics and Finance, 37, 379-97.
[50] Scott, K. (2008), �The economics of citizenship: Is there a naturalization e�ect?� In: The
economics of citizenship, edited by P. Bevelander and D.J. DeVoretz. Malmö: Holmbergs.
[51] Steinhardt, M.F. (2012), �Does citizenship matter? The economic impact of naturalizations inGermany�, Labour Economics, 19, 813-23.
[52] Steinhardt, M. F. and J. Wedemeier (2012), �The labor market performance of naturalizedimmigrants in Switzerland - New evidence from the Swiss Labor Force Survey,� Journal of
International Migration and Integration, 13, 223-242.
[53] Yang, P.Q. (1994), �Explaining immigrant naturalization,� International Migration Review, 28,3: 449-77.
A German Microcensus (2007-2009)
Data and Sample: The Microcensus interviews about 830,000 individuals each year. Participationis required by law (though answering some questions is voluntary) as the data form the basis forthe calculation of nationally representative labor market statistics. The scienti�c use �le is a 70%subsample of the o�cial dataset. We restrict the sample to �rst-generation immigrants, i.e. foreign-born individuals who live in private households in Germany. For each person, we know the year theperson arrived in Germany and the country of origin. Individuals born abroad to German parentsare also contained in the foreign-born sample but can be identi�ed as their country of origin ismissing. We further restrict our sample to immigrants who arrived in Germany between 1976 and2000 and are between 16 and 35 years of age in the post-reform period (1991-2009).
Since 2005, the survey records whether and how an immigrant has obtained German citizenshipand the year in which naturalization took place. To de�ne our sample of interest, we �rst calculatethe number of years an immigrant has lived in Germany. Together with the age of an individual inthe post-reform period, we then de�ne the year an immigrant is �rst eligible for citizenship basedon the residency requirement. An immigrant arriving in 1976 becomes eligible for citizenship in1991 independent of her age. Adolescent immigrants (aged 16-22) arriving between 1977 and 1982become eligible in 1991 while those arriving between 1983 and 2000 become eligible after 8 years(between 1991 and 2009). Adult immigrants (aged 23 and older) arriving between 1977 and 1985become eligible after 15 years of residence (between 1991 and 2000). Adult immigrants arrivingbetween 1986 and 1991 all become eligible in 2000 when the reduced residency requirement comesinto e�ect. All adult immigrants arriving between 1992 and 2000 become eligible after 8 years ofresidency (between 2000 and 2009). In the �nal step, we then calculate the number of years animmigrant in 2007-2009 has been eligible for German citizenship.
31
We also need to distinguish regular immigrants from ethnic Germans (�Aussiedler�) who are nota�ected by the 1991 and 2000 reforms. Ethnic Germans have some German ancestry and have accessto German citizenship within three years of arrival. Aggregate statistics suggest that migration �owsof ethnic Germans started in 1985 with less than 50,000 per year, peaked between 1988 and 1991at around 300,000 per year, remained at about 200,000 per year between 1992 and 1996 and thensubsided to 100,000 and below after 1998 (Bundesministerium des Inneren, 2009). We �rst de�neethnic Germans as individuals born outside Germany with a German passport who naturalizedwithin three years of arrival in Germany (which is legally impossible for regular immigrants) andwhose previous nationality was Czech, Hungarian, Kazakh, Polish, Romanian, Russian, Slovakianor Ukrainian as ethnic Germans (see Birkner, 2007: Algan et al., 2010 follow the same approach).Based on this de�nition, we identify and exclude about 58,000 ethnic Germans in our data over theperiod from 2005 to 2009. After applying this restriction, our data still contain immigrants fromEastern Europe or the Former Soviet Union who naturalize much earlier than the required 8 or15 years. We therefore restrict our sample to the 2007-2009 survey years when we explicitly knowwhether an immigrant naturalized as an ethnic German or not.
Dependent variables: Our primary outcome variable is the log of monthly net personal income.The variable combines labor earnings, income from self-employment, rental income, public andprivate pensions as well as public transfers (like welfare or unemployment bene�ts, child bene�t orhousing subsidies) but is net of taxes and other contributions. To de�ate income to constant Euros,we use the consumer price index from the Federal Statistical O�ce (the base year is 2005). Theincome variable is recorded as a categorical variable with 24 categories. We use the midpoint of eachcategory to convert personal income into a continuous variable.
Our second outcome variable is employment. The question about employment asks whether anindividual has been working for pay or has been engaged in an income generating activity in theprevious week (�Haben Sie in der vergangenen Woche eine bezahlte bzw. eine mit einem Einkommenverbundene Tätigkeit ausgeübt? Dabei ist es egal, welchen zeitlichen Umfang diese hatte.�). Wede�ne a person as employed if she works fulltime or part-time, works for less than 400 Euros permonth, works in a family business or works in a job temporarily. A person is not employed in thecurrent year if she is either unemployed, on long-term parental leave (longer than three months) orout of the labor force. Alternatively, we de�ne individuals as employed if they are unemployed butavailable for work. We also analyze whether naturalized immigrants are more likely to work in thepublic sector or in a white-collar job. A white-collar job is de�ned as working as a clerk or o�cer,judge or civil servant. The variable is zero if someone is employed as a worker or home worker. Here,we exclude trainees (�Auszubildende�) and family workers.
Our third outcome of interest is economic self-su�ciency. The variable is coded as one if anindividual receives welfare bene�ts, either unemployment bene�ts (�Arbeitslosengeld I�) or socialassistance (�Arbeitslosengeld II�); and zero otherwise. Finally, we study whether an individualworks on a temporary or permanent contract.
Control variables: Educational attainment is de�ned as low-skilled if the individual has novocational degree and at most a lower secondary school degree. A migrant is medium-skilled if shehas a vocational degree or high school degree; and she is high-skilled if she has a college degree. Theoccupation variable distinguishes between self-employed, civil servant, employee, workers, traineesand soldiers while the sector variable distinguishes between 8 broad sectors.
To explore the heterogeneity of naturalization e�ects, we study immigrants from di�erent coun-tries of origin. In particular, we de�ne ten categories of countries of origin based on the currentcitizenship (for those who do not naturalize) or the citizenship prior to naturalization (for thosenaturalized). The �rst group (EU15: Austria, Belgium, Denmark, Finland, France, Greece, Ireland,Italy, Luxembourg, Netherlands, Portugal, Spain, Sweden and United Kingdom) includes all coun-
32
tries from the European Union before the enlargement of 2004 as well as Switzerland and Norway.This group had already free access to the German labor market in the 1990s. The second groupconsists of immigrants from Eastern European countries which joined the EU in 2004 but did nothave full access to the labor market prior to 2011 (EU12: Bulgaria, Czech Republic, Estonia, Hun-gary, Latvia, Lithuania, Poland, Romania, Slovakia, Slovenia as well as Malta and Cyprus). Theother important source countries are former Yugoslavia except Slovenia (Bosnia and Herzegovina,Croatia, Kosovo, Macedonia, Montenegro, Serbia) and Turkey. We lump together other immigrantsinto broad regions: the Middle East (for example Afghanistan, Iran and Iraq), Africa (for exampleMorocco), Asia (for example China and Vietnam), North and South America as well as Russia andother former Soviet republics which are not member of the European Union. The last categorycontains immigrants who either have no exact region of origin (�other European country� or �rest ofthe world�) or report not having any citizenship at all.
To test whether immigrants from lower-income countries bene�t more from naturalization, weuse the GDP per capita in the country of origin (divided by 1,000) in 2005 from the Penn WorldTables (Heston et al., 2011). The sample including the GDP data is smaller as we can only matchimmigrants where we know the actual country of origin and not only the broad region (such asNorth Africa). To control for state-specic labor market shocks, we use the state unemployment ratede�ned as percentage of registered unemployed people to the total number of employed persons. Tocontrol for the state's economic situation more broadly, we use the growth rate in state GDP percapita from the national accounts data.
B German Socio-Economic Panel (1984-2009)
Data and Sample: The German-Socio Economic Panel (GSOEP) is a household survey that hasbeen conducted annually since 1984 (in East Germany since 1990). The original sample oversampledmigrants from traditional sending countries (like Turkey, Yugoslavia or Italy). Several refreshmentsamples including another immigrant sample have been drawn in subsequent years to maintainthe representativeness of the GSOEP. Interviews are performed in German, the respondent's nativelanguage or a mixed mode. Our basic sample consists of all foreigners living in private households whowere born abroad and migrated to Germany between 1976 and 2000 (��rst-generation immigrants�).
The survey asks respondents whether they are German citizens; if they answer no, the respondentis asked about his or her current nationality. We can then identify naturalizations if the �rst-generation immigrant reports a German citizenship in the current year and a foreign citizenshipin previous years. Note that this de�nition only captures individuals that naturalize while in theGSOEP sample. It does not record naturalizations that occur prior to or after being a GSOEPparticipant which introduces two potential sources of bias: �rst, a sample member might drop out ofthe GSOEP and naturalize after leaving the sample. If an immigrant instead naturalizes before sheenters the panel, we only observe that a �rst-generation immigrant is naturalized but not in whichyear. In the main analysis, we restrict our sample to �rst-generation immigrants who naturalize whilebeing a sample member in the GSOEP. To the extent that this sample is representative of immigrantsmore broadly, this should not a�ect our results. Alternatively, we assign the �rst observation in thepanel as the year of naturalization; this would understate the �rst-stage e�ect of eligibility (whichis measured independently from sample membership) and would also understate the returns ofnaturalization (because naturalization is de�ned later than it actually occurred). In both cases, ourcoe�cients are conservative estimates of the true e�ect. In 2002, the survey asks all naturalizedimmigrants in which year they obtained their German citizenship. We use this information togetherwith additional consistency check to reduce measurement error in the naturalization variable. To
33
distinguish �rst-generation immigrants from ethnic Germans, we use the same procedure as in theMicrocensus (following Birkner, 2007).
We further restrict the sample to �rst-generation immigrants between age 16 and 35 in the 1991-2009 period. Based on the residency requirement, the eligibility indicator is equal to one if (1) anindividual has been in Germany for at least 8 years and is betweeen 16 and 22 years old in thepost-1990 period; (2) if an immigrant has been in Germany for at least 15 years and is 23 years oldor above during the survey years 1991-1999; and (3) if an immigrant has been in Germany for atleast 8 years and is 23 years-old or above in the survey years 2000-2009. The indicator is zero if a�rst-generation immigrant is not (yet) eligible for naturalization in the current year.
Dependent variables: The main dependent variable is self-reported language skills which areasked roughly every second year (1984-1987, 1989, 1991, 1993, 1995. 1997, 1999, 2001, 2003, 2005,2007 and 2009). We recode the language variables which are asked separately for writing andspeaking German such that the highest value (4) corresponds to very good language skills whilethe lowest value (0) implies that the immigrant has no German language skills. For robustnesschecks, we also look at earnings measured as the log of monthly gross labor earnings de�ated to2006 prices using the national consumer price index. We also de�ne an indicator for employmentwhich is equal to one if an immigrant works in any type of employment and zero if a person isunemployed or out of the labor force. Additional regressions look at �rm size and occupationalprestige after naturalization. Firm size is a categorical variable ranging from 1 (self-employed withoutemployees or working in a company with less than 5 employees) to 10 (�rm with 2000 or moreemployees). To measure occupational prestige, we use the International Socio-Economic Index ofOccupational Status (ISEI) scale (ranging from 16 for cleaning personnel to 90 for judges) or theStandard International Occupational Prestige Scale (SIOPS) (ranging from 12 for shoeshiners to 78for physicians).
Control variables: Educational attainment is de�ned as in the Microcensus: low-skilled if animmigrant has no vocational degree and at most a lower secondary school degree; medium-skilledif she has a vocational degree or high school degree (�Abitur�) and high-skilled if she has a collegedegree. We use the same classi�cation as in the Microcensus to classify source countries into 10broad groups of origin.
34
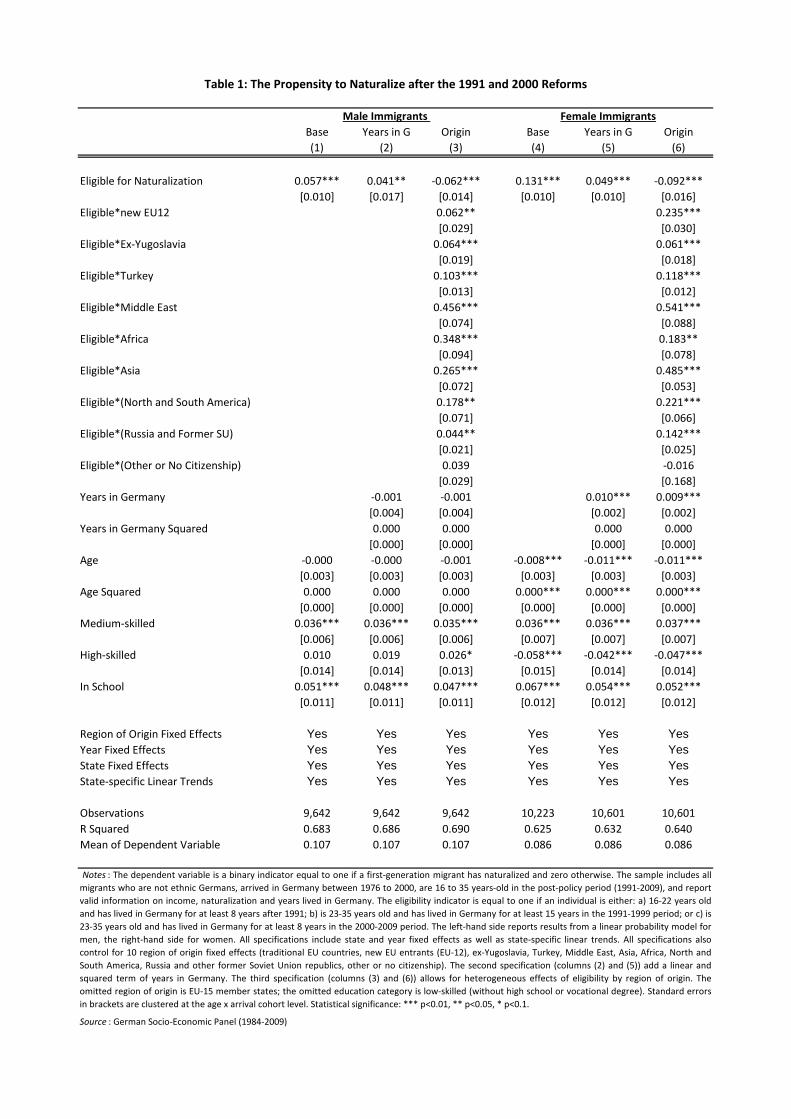
Base Years in G Origin Base Years in G Origin
(1) (2) (3) (4) (5) (6)
Eligible for Naturalization 0.057*** 0.041** -0.062*** 0.131*** 0.049*** -0.092***
[0.010] [0.017] [0.014] [0.010] [0.010] [0.016]
Eligible*new EU12 0.062** 0.235***
[0.029] [0.030]
Eligible*Ex-Yugoslavia 0.064*** 0.061***
[0.019] [0.018]
Eligible*Turkey 0.103*** 0.118***
[0.013] [0.012]
Eligible*Middle East 0.456*** 0.541***
[0.074] [0.088]
Eligible*Africa 0.348*** 0.183**
[0.094] [0.078]
Eligible*Asia 0.265*** 0.485***
[0.072] [0.053]
Eligible*(North and South America) 0.178** 0.221***
[0.071] [0.066]
Eligible*(Russia and Former SU) 0.044** 0.142***
[0.021] [0.025]
Eligible*(Other or No Citizenship) 0.039 -0.016
[0.029] [0.168]
Years in Germany -0.001 -0.001 0.010*** 0.009***
[0.004] [0.004] [0.002] [0.002]
Years in Germany Squared 0.000 0.000 0.000 0.000
[0.000] [0.000] [0.000] [0.000]
Age -0.000 -0.000 -0.001 -0.008*** -0.011*** -0.011***
[0.003] [0.003] [0.003] [0.003] [0.003] [0.003]
Age Squared 0.000 0.000 0.000 0.000*** 0.000*** 0.000***
[0.000] [0.000] [0.000] [0.000] [0.000] [0.000]
Medium-skilled 0.036*** 0.036*** 0.035*** 0.036*** 0.036*** 0.037***
[0.006] [0.006] [0.006] [0.007] [0.007] [0.007]
High-skilled 0.010 0.019 0.026* -0.058*** -0.042*** -0.047***
[0.014] [0.014] [0.013] [0.015] [0.014] [0.014]
In School 0.051*** 0.048*** 0.047*** 0.067*** 0.054*** 0.052***
[0.011] [0.011] [0.011] [0.012] [0.012] [0.012]
Region of Origin Fixed Effects Yes Yes Yes Yes Yes Yes
Year Fixed Effects Yes Yes Yes Yes Yes Yes
State Fixed Effects Yes Yes Yes Yes Yes Yes
State-specific Linear Trends Yes Yes Yes Yes Yes Yes
Observations 9,642 9,642 9,642 10,223 10,601 10,601
R Squared 0.683 0.686 0.690 0.625 0.632 0.640
Mean of Dependent Variable 0.107 0.107 0.107 0.086 0.086 0.086
Source : German Socio-Economic Panel (1984-2009)
Table 1: The Propensity to Naturalize after the 1991 and 2000 Reforms
Male Immigrants Female Immigrants
Notes : The dependent variable is a binary indicator equal to one if a first-generation migrant has naturalized and zero otherwise. The sample includes all
migrants who are not ethnic Germans, arrived in Germany between 1976 to 2000, are 16 to 35 years-old in the post-policy period (1991-2009), and report
valid information on income, naturalization and years lived in Germany. The eligibility indicator is equal to one if an individual is either: a) 16-22 years old
and has lived in Germany for at least 8 years after 1991; b) is 23-35 years old and has lived in Germany for at least 15 years in the 1991-1999 period; or c) is
23-35 years old and has lived in Germany for at least 8 years in the 2000-2009 period. The left-hand side reports results from a linear probability model for
men, the right-hand side for women. All specifications include state and year fixed effects as well as state-specific linear trends. All specifications also
control for 10 region of origin fixed effects (traditional EU countries, new EU entrants (EU-12), ex-Yugoslavia, Turkey, Middle East, Asia, Africa, North and
South America, Russia and other former Soviet Union republics, other or no citizenship). The second specification (columns (2) and (5)) add a linear and
squared term of years in Germany. The third specification (columns (3) and (6)) allows for heterogeneous effects of eligibility by region of origin. The
omitted region of origin is EU-15 member states; the omitted education category is low-skilled (without high school or vocational degree). Standard errors
in brackets are clustered at the age x arrival cohort level. Statistical significance: *** p<0.01, ** p<0.05, * p<0.1.
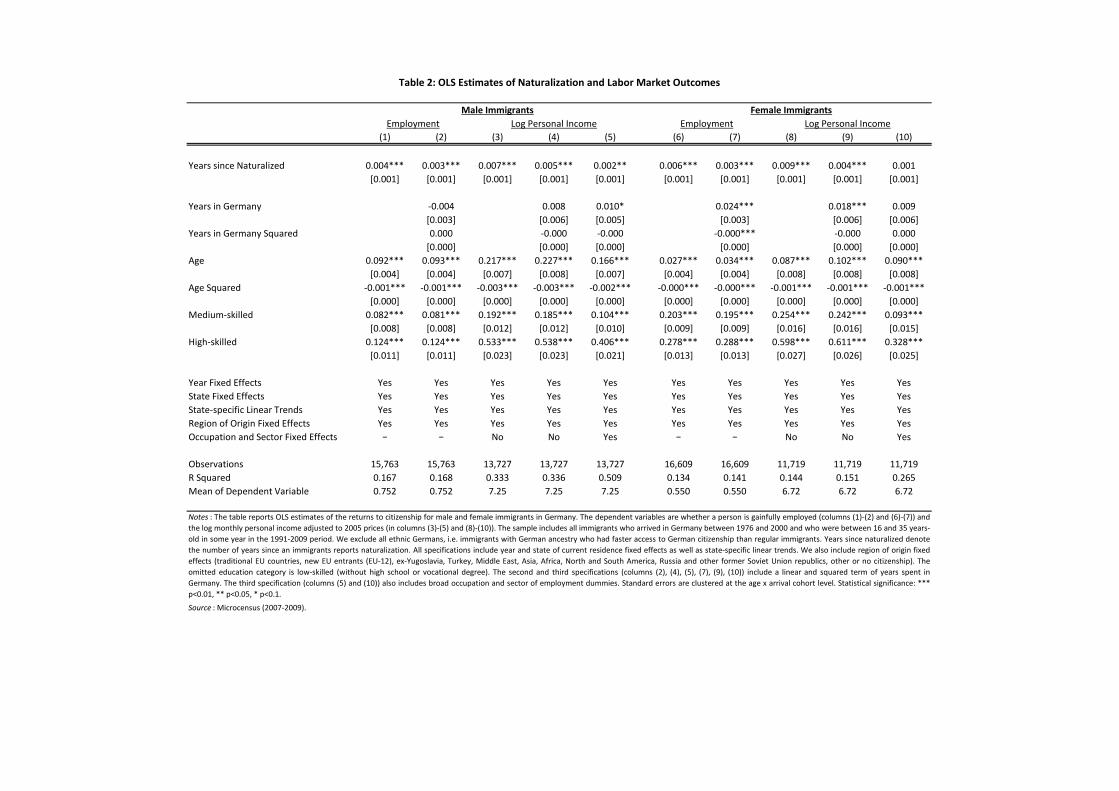
(1) (2) (3) (4) (5) (6) (7) (8) (9) (10)
Years since Naturalized 0.004*** 0.003*** 0.007*** 0.005*** 0.002** 0.006*** 0.003*** 0.009*** 0.004*** 0.001
[0.001] [0.001] [0.001] [0.001] [0.001] [0.001] [0.001] [0.001] [0.001] [0.001]
Years in Germany -0.004 0.008 0.010* 0.024*** 0.018*** 0.009
[0.003] [0.006] [0.005] [0.003] [0.006] [0.006]
Years in Germany Squared 0.000 -0.000 -0.000 -0.000*** -0.000 0.000
[0.000] [0.000] [0.000] [0.000] [0.000] [0.000]
Age 0.092*** 0.093*** 0.217*** 0.227*** 0.166*** 0.027*** 0.034*** 0.087*** 0.102*** 0.090***
[0.004] [0.004] [0.007] [0.008] [0.007] [0.004] [0.004] [0.008] [0.008] [0.008]
Age Squared -0.001*** -0.001*** -0.003*** -0.003*** -0.002*** -0.000*** -0.000*** -0.001*** -0.001*** -0.001***
[0.000] [0.000] [0.000] [0.000] [0.000] [0.000] [0.000] [0.000] [0.000] [0.000]
Medium-skilled 0.082*** 0.081*** 0.192*** 0.185*** 0.104*** 0.203*** 0.195*** 0.254*** 0.242*** 0.093***
[0.008] [0.008] [0.012] [0.012] [0.010] [0.009] [0.009] [0.016] [0.016] [0.015]
High-skilled 0.124*** 0.124*** 0.533*** 0.538*** 0.406*** 0.278*** 0.288*** 0.598*** 0.611*** 0.328***
[0.011] [0.011] [0.023] [0.023] [0.021] [0.013] [0.013] [0.027] [0.026] [0.025]
Year Fixed Effects Yes Yes Yes Yes Yes Yes Yes Yes Yes Yes
State Fixed Effects Yes Yes Yes Yes Yes Yes Yes Yes Yes Yes
State-specific Linear Trends Yes Yes Yes Yes Yes Yes Yes Yes Yes Yes
Region of Origin Fixed Effects Yes Yes Yes Yes Yes Yes Yes Yes Yes Yes
Occupation and Sector Fixed Effects − − No No Yes − − No No Yes
Observations 15,763 15,763 13,727 13,727 13,727 16,609 16,609 11,719 11,719 11,719
R Squared 0.167 0.168 0.333 0.336 0.509 0.134 0.141 0.144 0.151 0.265
Mean of Dependent Variable 0.752 0.752 7.25 7.25 7.25 0.550 0.550 6.72 6.72 6.72
Source : Microcensus (2007-2009).
Notes : The table reports OLS estimates of the returns to citizenship for male and female immigrants in Germany. The dependent variables are whether a person is gainfully employed (columns (1)-(2) and (6)-(7)) and
the log monthly personal income adjusted to 2005 prices (in columns (3)-(5) and (8)-(10)). The sample includes all immigrants who arrived in Germany between 1976 and 2000 and who were between 16 and 35 years-
old in some year in the 1991-2009 period. We exclude all ethnic Germans, i.e. immigrants with German ancestry who had faster access to German citizenship than regular immigrants. Years since naturalized denote
the number of years since an immigrants reports naturalization. All specifications include year and state of current residence fixed effects as well as state-specific linear trends. We also include region of origin fixed
effects (traditional EU countries, new EU entrants (EU-12), ex-Yugoslavia, Turkey, Middle East, Asia, Africa, North and South America, Russia and other former Soviet Union republics, other or no citizenship). The
omitted education category is low-skilled (without high school or vocational degree). The second and third specifications (columns (2), (4), (5), (7), (9), (10)) include a linear and squared term of years spent in
Germany. The third specification (columns (5) and (10)) also includes broad occupation and sector of employment dummies. Standard errors are clustered at the age x arrival cohort level. Statistical significance: ***
p<0.01, ** p<0.05, * p<0.1.
Table 2: OLS Estimates of Naturalization and Labor Market Outcomes
Employment Log Personal Income
Male Immigrants Female Immigrants
Employment Log Personal Income
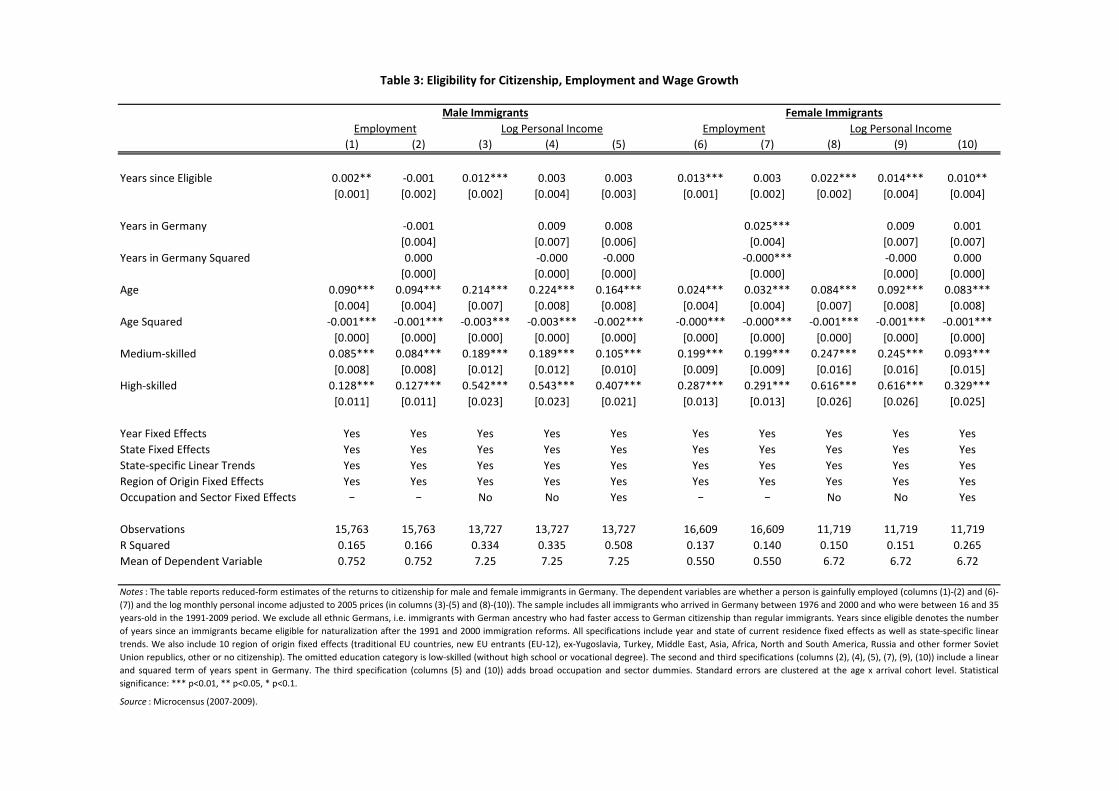
(1) (2) (3) (4) (5) (6) (7) (8) (9) (10)
Years since Eligible 0.002** -0.001 0.012*** 0.003 0.003 0.013*** 0.003 0.022*** 0.014*** 0.010**
[0.001] [0.002] [0.002] [0.004] [0.003] [0.001] [0.002] [0.002] [0.004] [0.004]
Years in Germany -0.001 0.009 0.008 0.025*** 0.009 0.001
[0.004] [0.007] [0.006] [0.004] [0.007] [0.007]
Years in Germany Squared 0.000 -0.000 -0.000 -0.000*** -0.000 0.000
[0.000] [0.000] [0.000] [0.000] [0.000] [0.000]
Age 0.090*** 0.094*** 0.214*** 0.224*** 0.164*** 0.024*** 0.032*** 0.084*** 0.092*** 0.083***
[0.004] [0.004] [0.007] [0.008] [0.008] [0.004] [0.004] [0.007] [0.008] [0.008]
Age Squared -0.001*** -0.001*** -0.003*** -0.003*** -0.002*** -0.000*** -0.000*** -0.001*** -0.001*** -0.001***
[0.000] [0.000] [0.000] [0.000] [0.000] [0.000] [0.000] [0.000] [0.000] [0.000]
Medium-skilled 0.085*** 0.084*** 0.189*** 0.189*** 0.105*** 0.199*** 0.199*** 0.247*** 0.245*** 0.093***
[0.008] [0.008] [0.012] [0.012] [0.010] [0.009] [0.009] [0.016] [0.016] [0.015]
High-skilled 0.128*** 0.127*** 0.542*** 0.543*** 0.407*** 0.287*** 0.291*** 0.616*** 0.616*** 0.329***
[0.011] [0.011] [0.023] [0.023] [0.021] [0.013] [0.013] [0.026] [0.026] [0.025]
Year Fixed Effects Yes Yes Yes Yes Yes Yes Yes Yes Yes Yes
State Fixed Effects Yes Yes Yes Yes Yes Yes Yes Yes Yes Yes
State-specific Linear Trends Yes Yes Yes Yes Yes Yes Yes Yes Yes Yes
Region of Origin Fixed Effects Yes Yes Yes Yes Yes Yes Yes Yes Yes Yes
Occupation and Sector Fixed Effects − − No No Yes − − No No Yes
Observations 15,763 15,763 13,727 13,727 13,727 16,609 16,609 11,719 11,719 11,719
R Squared 0.165 0.166 0.334 0.335 0.508 0.137 0.140 0.150 0.151 0.265
Mean of Dependent Variable 0.752 0.752 7.25 7.25 7.25 0.550 0.550 6.72 6.72 6.72
Source : Microcensus (2007-2009).
Notes : The table reports reduced-form estimates of the returns to citizenship for male and female immigrants in Germany. The dependent variables are whether a person is gainfully employed (columns (1)-(2) and (6)-
(7)) and the log monthly personal income adjusted to 2005 prices (in columns (3)-(5) and (8)-(10)). The sample includes all immigrants who arrived in Germany between 1976 and 2000 and who were between 16 and 35
years-old in the 1991-2009 period. We exclude all ethnic Germans, i.e. immigrants with German ancestry who had faster access to German citizenship than regular immigrants. Years since eligible denotes the number
of years since an immigrants became eligible for naturalization after the 1991 and 2000 immigration reforms. All specifications include year and state of current residence fixed effects as well as state-specific linear
trends. We also include 10 region of origin fixed effects (traditional EU countries, new EU entrants (EU-12), ex-Yugoslavia, Turkey, Middle East, Asia, Africa, North and South America, Russia and other former Soviet
Union republics, other or no citizenship). The omitted education category is low-skilled (without high school or vocational degree). The second and third specifications (columns (2), (4), (5), (7), (9), (10)) include a linear
and squared term of years spent in Germany. The third specification (columns (5) and (10)) adds broad occupation and sector dummies. Standard errors are clustered at the age x arrival cohort level. Statistical
significance: *** p<0.01, ** p<0.05, * p<0.1.
Table 3: Eligibility for Citizenship, Employment and Wage Growth
Male Immigrants Female Immigrants
Employment Log Personal Income Employment Log Personal Income
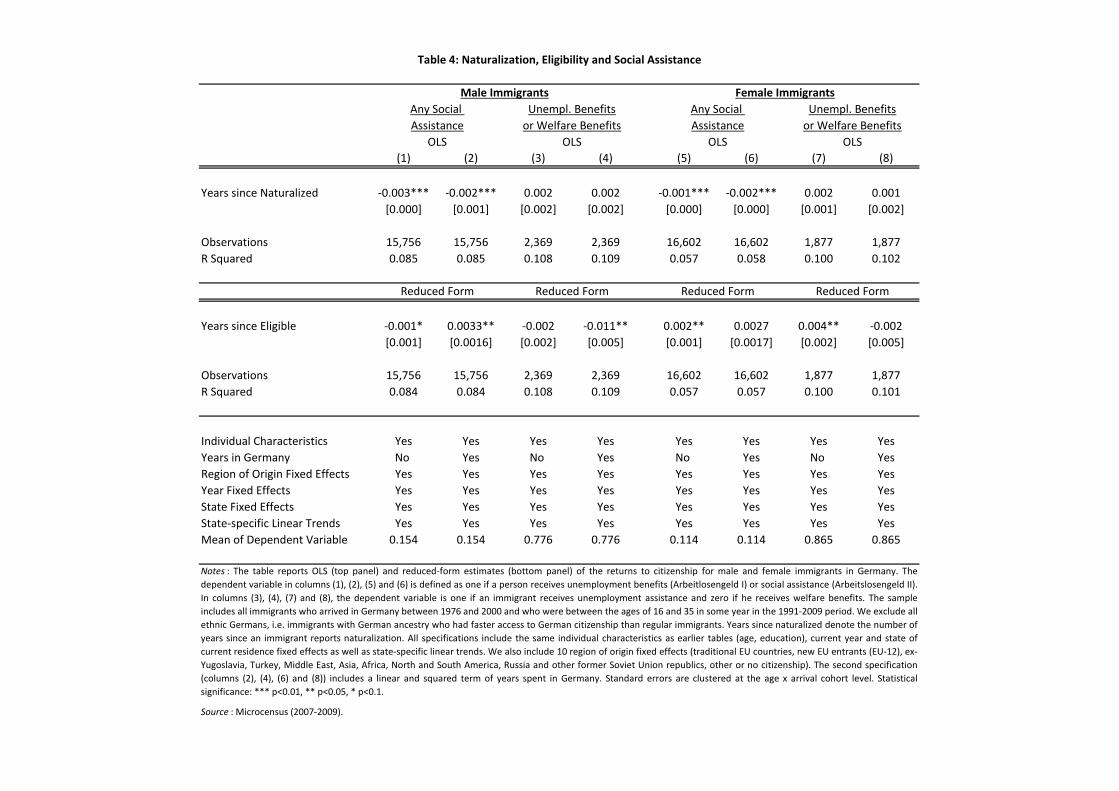
(1) (2) (3) (4) (5) (6) (7) (8)
Years since Naturalized -0.003*** -0.002*** 0.002 0.002 -0.001*** -0.002*** 0.002 0.001
[0.000] [0.001] [0.002] [0.002] [0.000] [0.000] [0.001] [0.002]
Observations 15,756 15,756 2,369 2,369 16,602 16,602 1,877 1,877
R Squared 0.085 0.085 0.108 0.109 0.057 0.058 0.100 0.102
Years since Eligible -0.001* 0.0033** -0.002 -0.011** 0.002** 0.0027 0.004** -0.002
[0.001] [0.0016] [0.002] [0.005] [0.001] [0.0017] [0.002] [0.005]
Observations 15,756 15,756 2,369 2,369 16,602 16,602 1,877 1,877
R Squared 0.084 0.084 0.108 0.109 0.057 0.057 0.100 0.101
Individual Characteristics Yes Yes Yes Yes Yes Yes Yes Yes
Years in Germany No Yes No Yes No Yes No Yes
Region of Origin Fixed Effects Yes Yes Yes Yes Yes Yes Yes Yes
Year Fixed Effects Yes Yes Yes Yes Yes Yes Yes Yes
State Fixed Effects Yes Yes Yes Yes Yes Yes Yes Yes
State-specific Linear Trends Yes Yes Yes Yes Yes Yes Yes Yes
Mean of Dependent Variable 0.154 0.154 0.776 0.776 0.114 0.114 0.865 0.865
Source : Microcensus (2007-2009).
Unempl. Benefits
Female Immigrants
Table 4: Naturalization, Eligibility and Social Assistance
Male Immigrants
Reduced Form Reduced Form
OLS OLS
Any Social Unempl. Benefits
Assistance
OLS
Notes : The table reports OLS (top panel) and reduced-form estimates (bottom panel) of the returns to citizenship for male and female immigrants in Germany. The
dependent variable in columns (1), (2), (5) and (6) is defined as one if a person receives unemployment benefits (Arbeitlosengeld I) or social assistance (Arbeitslosengeld II).
In columns (3), (4), (7) and (8), the dependent variable is one if an immigrant receives unemployment assistance and zero if he receives welfare benefits. The sample
includes all immigrants who arrived in Germany between 1976 and 2000 and who were between the ages of 16 and 35 in some year in the 1991-2009 period. We exclude all
ethnic Germans, i.e. immigrants with German ancestry who had faster access to German citizenship than regular immigrants. Years since naturalized denote the number of
years since an immigrant reports naturalization. All specifications include the same individual characteristics as earlier tables (age, education), current year and state of
current residence fixed effects as well as state-specific linear trends. We also include 10 region of origin fixed effects (traditional EU countries, new EU entrants (EU-12), ex-
Yugoslavia, Turkey, Middle East, Asia, Africa, North and South America, Russia and other former Soviet Union republics, other or no citizenship). The second specification
(columns (2), (4), (6) and (8)) includes a linear and squared term of years spent in Germany. Standard errors are clustered at the age x arrival cohort level. Statistical
significance: *** p<0.01, ** p<0.05, * p<0.1.
or Welfare Benefits
Reduced Form
or Welfare BenefitsAssistance
Reduced Form
OLS
Any Social
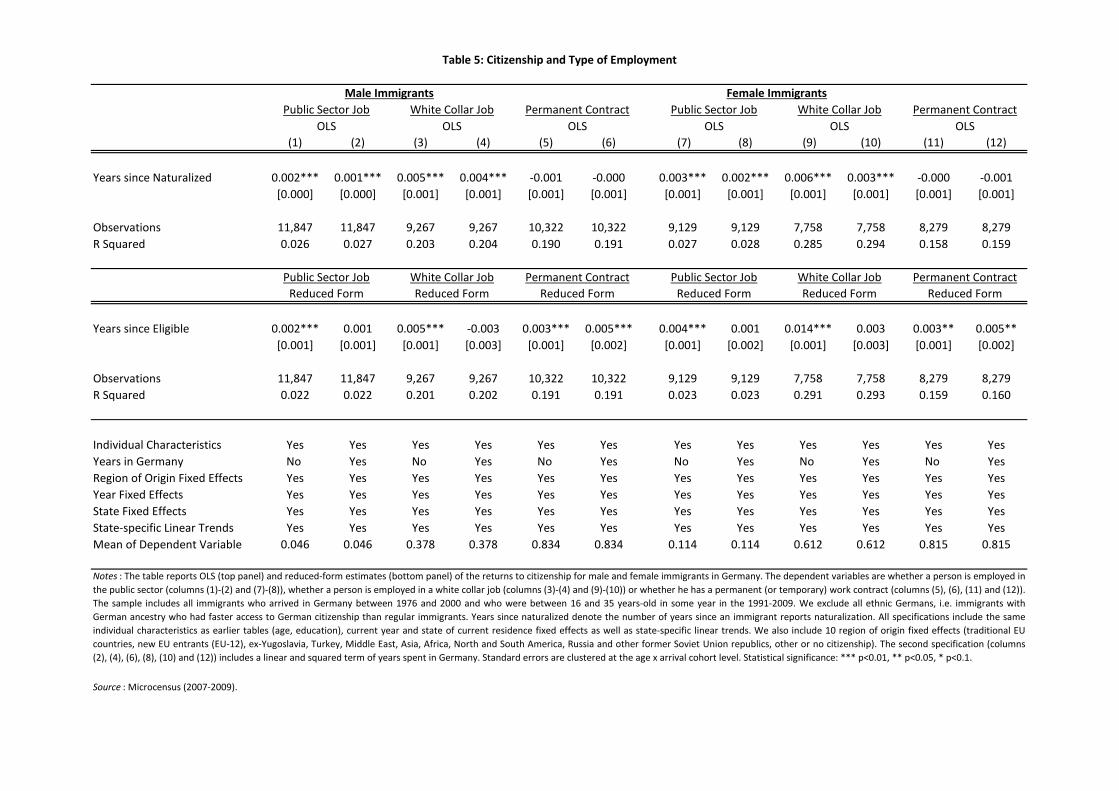
(1) (2) (3) (4) (5) (6) (7) (8) (9) (10) (11) (12)
Years since Naturalized 0.002*** 0.001*** 0.005*** 0.004*** -0.001 -0.000 0.003*** 0.002*** 0.006*** 0.003*** -0.000 -0.001
[0.000] [0.000] [0.001] [0.001] [0.001] [0.001] [0.001] [0.001] [0.001] [0.001] [0.001] [0.001]
Observations 11,847 11,847 9,267 9,267 10,322 10,322 9,129 9,129 7,758 7,758 8,279 8,279
R Squared 0.026 0.027 0.203 0.204 0.190 0.191 0.027 0.028 0.285 0.294 0.158 0.159
Years since Eligible 0.002*** 0.001 0.005*** -0.003 0.003*** 0.005*** 0.004*** 0.001 0.014*** 0.003 0.003** 0.005**
[0.001] [0.001] [0.001] [0.003] [0.001] [0.002] [0.001] [0.002] [0.001] [0.003] [0.001] [0.002]
Observations 11,847 11,847 9,267 9,267 10,322 10,322 9,129 9,129 7,758 7,758 8,279 8,279
R Squared 0.022 0.022 0.201 0.202 0.191 0.191 0.023 0.023 0.291 0.293 0.159 0.160
Individual Characteristics Yes Yes Yes Yes Yes Yes Yes Yes Yes Yes Yes Yes
Years in Germany No Yes No Yes No Yes No Yes No Yes No Yes
Region of Origin Fixed Effects Yes Yes Yes Yes Yes Yes Yes Yes Yes Yes Yes Yes
Year Fixed Effects Yes Yes Yes Yes Yes Yes Yes Yes Yes Yes Yes Yes
State Fixed Effects Yes Yes Yes Yes Yes Yes Yes Yes Yes Yes Yes Yes
State-specific Linear Trends Yes Yes Yes Yes Yes Yes Yes Yes Yes Yes Yes Yes
Mean of Dependent Variable 0.046 0.046 0.378 0.378 0.834 0.834 0.114 0.114 0.612 0.612 0.815 0.815
Source : Microcensus (2007-2009).
OLS
Reduced FormReduced Form
Permanent Contract Permanent Contract
Reduced Form Reduced Form Reduced Form Reduced Form
Notes : The table reports OLS (top panel) and reduced-form estimates (bottom panel) of the returns to citizenship for male and female immigrants in Germany. The dependent variables are whether a person is employed in
the public sector (columns (1)-(2) and (7)-(8)), whether a person is employed in a white collar job (columns (3)-(4) and (9)-(10)) or whether he has a permanent (or temporary) work contract (columns (5), (6), (11) and (12)).
The sample includes all immigrants who arrived in Germany between 1976 and 2000 and who were between 16 and 35 years-old in some year in the 1991-2009. We exclude all ethnic Germans, i.e. immigrants with
German ancestry who had faster access to German citizenship than regular immigrants. Years since naturalized denote the number of years since an immigrant reports naturalization. All specifications include the same
individual characteristics as earlier tables (age, education), current year and state of current residence fixed effects as well as state-specific linear trends. We also include 10 region of origin fixed effects (traditional EU
countries, new EU entrants (EU-12), ex-Yugoslavia, Turkey, Middle East, Asia, Africa, North and South America, Russia and other former Soviet Union republics, other or no citizenship). The second specification (columns
(2), (4), (6), (8), (10) and (12)) includes a linear and squared term of years spent in Germany. Standard errors are clustered at the age x arrival cohort level. Statistical significance: *** p<0.01, ** p<0.05, * p<0.1.
OLS OLS OLS OLS
Public Sector Job White Collar Job Public Sector Job White Collar Job
OLS
Table 5: Citizenship and Type of Employment
Male Immigrants Female Immigrants
Public Sector Job White Collar Job Public Sector Job White Collar JobPermanent Contract Permanent Contract
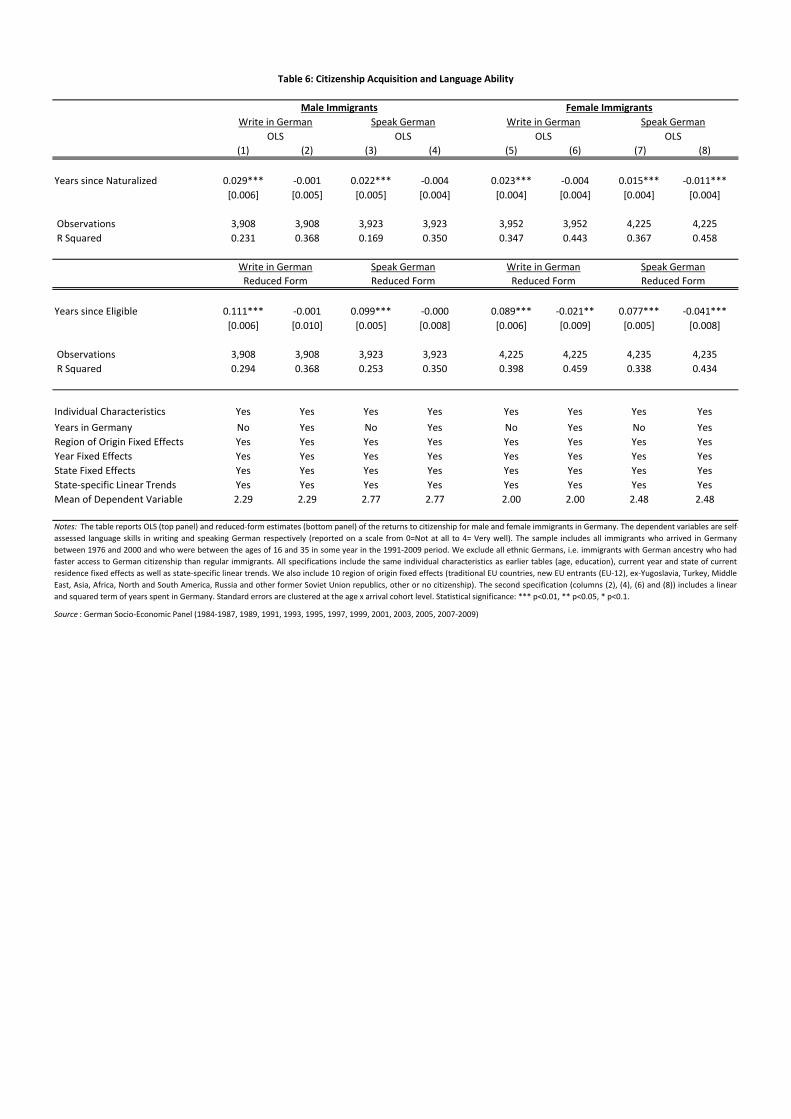
(1) (2) (3) (4) (5) (6) (7) (8)
Years since Naturalized 0.029*** -0.001 0.022*** -0.004 0.023*** -0.004 0.015*** -0.011***
[0.006] [0.005] [0.005] [0.004] [0.004] [0.004] [0.004] [0.004]
Observations 3,908 3,908 3,923 3,923 3,952 3,952 4,225 4,225
R Squared 0.231 0.368 0.169 0.350 0.347 0.443 0.367 0.458
Years since Eligible 0.111*** -0.001 0.099*** -0.000 0.089*** -0.021** 0.077*** -0.041***
[0.006] [0.010] [0.005] [0.008] [0.006] [0.009] [0.005] [0.008]
Observations 3,908 3,908 3,923 3,923 4,225 4,225 4,235 4,235
R Squared 0.294 0.368 0.253 0.350 0.398 0.459 0.338 0.434
Individual Characteristics Yes Yes Yes Yes Yes Yes Yes Yes
Years in Germany No Yes No Yes No Yes No Yes
Region of Origin Fixed Effects Yes Yes Yes Yes Yes Yes Yes Yes
Year Fixed Effects Yes Yes Yes Yes Yes Yes Yes Yes
State Fixed Effects Yes Yes Yes Yes Yes Yes Yes Yes
State-specific Linear Trends Yes Yes Yes Yes Yes Yes Yes Yes
Mean of Dependent Variable 2.29 2.29 2.77 2.77 2.00 2.00 2.48 2.48
Source : German Socio-Economic Panel (1984-1987, 1989, 1991, 1993, 1995, 1997, 1999, 2001, 2003, 2005, 2007-2009)
Write in German
OLS OLS OLS OLS
Male Immigrants Female Immigrants
Write in German Speak German Write in German Speak German
Table 6: Citizenship Acquisition and Language Ability
Speak German Write in German Speak German
Reduced Form Reduced Form Reduced Form Reduced Form
Notes: The table reports OLS (top panel) and reduced-form estimates (bottom panel) of the returns to citizenship for male and female immigrants in Germany. The dependent variables are self-
assessed language skills in writing and speaking German respectively (reported on a scale from 0=Not at all to 4= Very well). The sample includes all immigrants who arrived in Germany
between 1976 and 2000 and who were between the ages of 16 and 35 in some year in the 1991-2009 period. We exclude all ethnic Germans, i.e. immigrants with German ancestry who had
faster access to German citizenship than regular immigrants. All specifications include the same individual characteristics as earlier tables (age, education), current year and state of current
residence fixed effects as well as state-specific linear trends. We also include 10 region of origin fixed effects (traditional EU countries, new EU entrants (EU-12), ex-Yugoslavia, Turkey, Middle
East, Asia, Africa, North and South America, Russia and other former Soviet Union republics, other or no citizenship). The second specification (columns (2), (4), (6) and (8)) includes a linear
and squared term of years spent in Germany. Standard errors are clustered at the age x arrival cohort level. Statistical significance: *** p<0.01, ** p<0.05, * p<0.1.
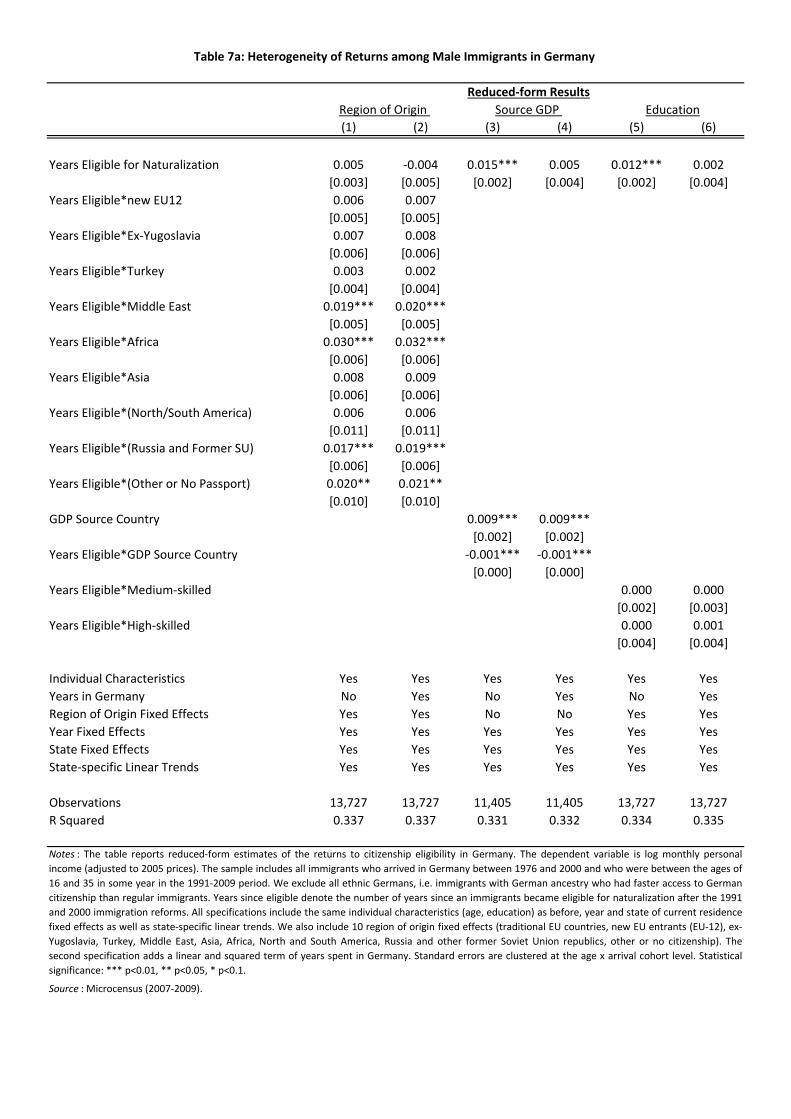
(1) (2) (3) (4) (5) (6)
Years Eligible for Naturalization 0.005 -0.004 0.015*** 0.005 0.012*** 0.002
[0.003] [0.005] [0.002] [0.004] [0.002] [0.004]
Years Eligible*new EU12 0.006 0.007
[0.005] [0.005]
Years Eligible*Ex-Yugoslavia 0.007 0.008
[0.006] [0.006]
Years Eligible*Turkey 0.003 0.002
[0.004] [0.004]
Years Eligible*Middle East 0.019*** 0.020***
[0.005] [0.005]
Years Eligible*Africa 0.030*** 0.032***
[0.006] [0.006]
Years Eligible*Asia 0.008 0.009
[0.006] [0.006]
Years Eligible*(North/South America) 0.006 0.006
[0.011] [0.011]
Years Eligible*(Russia and Former SU) 0.017*** 0.019***
[0.006] [0.006]
Years Eligible*(Other or No Passport) 0.020** 0.021**
[0.010] [0.010]
GDP Source Country 0.009*** 0.009***
[0.002] [0.002]
Years Eligible*GDP Source Country -0.001*** -0.001***
[0.000] [0.000]
Years Eligible*Medium-skilled 0.000 0.000
[0.002] [0.003]
Years Eligible*High-skilled 0.000 0.001
[0.004] [0.004]
Individual Characteristics Yes Yes Yes Yes Yes Yes
Years in Germany No Yes No Yes No Yes
Region of Origin Fixed Effects Yes Yes No No Yes Yes
Year Fixed Effects Yes Yes Yes Yes Yes Yes
State Fixed Effects Yes Yes Yes Yes Yes Yes
State-specific Linear Trends Yes Yes Yes Yes Yes Yes
Observations 13,727 13,727 11,405 11,405 13,727 13,727
R Squared 0.337 0.337 0.331 0.332 0.334 0.335
Source : Microcensus (2007-2009).
Table 7a: Heterogeneity of Returns among Male Immigrants in Germany
Notes : The table reports reduced-form estimates of the returns to citizenship eligibility in Germany. The dependent variable is log monthly personal
income (adjusted to 2005 prices). The sample includes all immigrants who arrived in Germany between 1976 and 2000 and who were between the ages of
16 and 35 in some year in the 1991-2009 period. We exclude all ethnic Germans, i.e. immigrants with German ancestry who had faster access to German
citizenship than regular immigrants. Years since eligible denote the number of years since an immigrants became eligible for naturalization after the 1991
and 2000 immigration reforms. All specifications include the same individual characteristics (age, education) as before, year and state of current residence
fixed effects as well as state-specific linear trends. We also include 10 region of origin fixed effects (traditional EU countries, new EU entrants (EU-12), ex-
Yugoslavia, Turkey, Middle East, Asia, Africa, North and South America, Russia and other former Soviet Union republics, other or no citizenship). The
second specification adds a linear and squared term of years spent in Germany. Standard errors are clustered at the age x arrival cohort level. Statistical
significance: *** p<0.01, ** p<0.05, * p<0.1.
Reduced-form Results
Region of Origin Source GDP Education
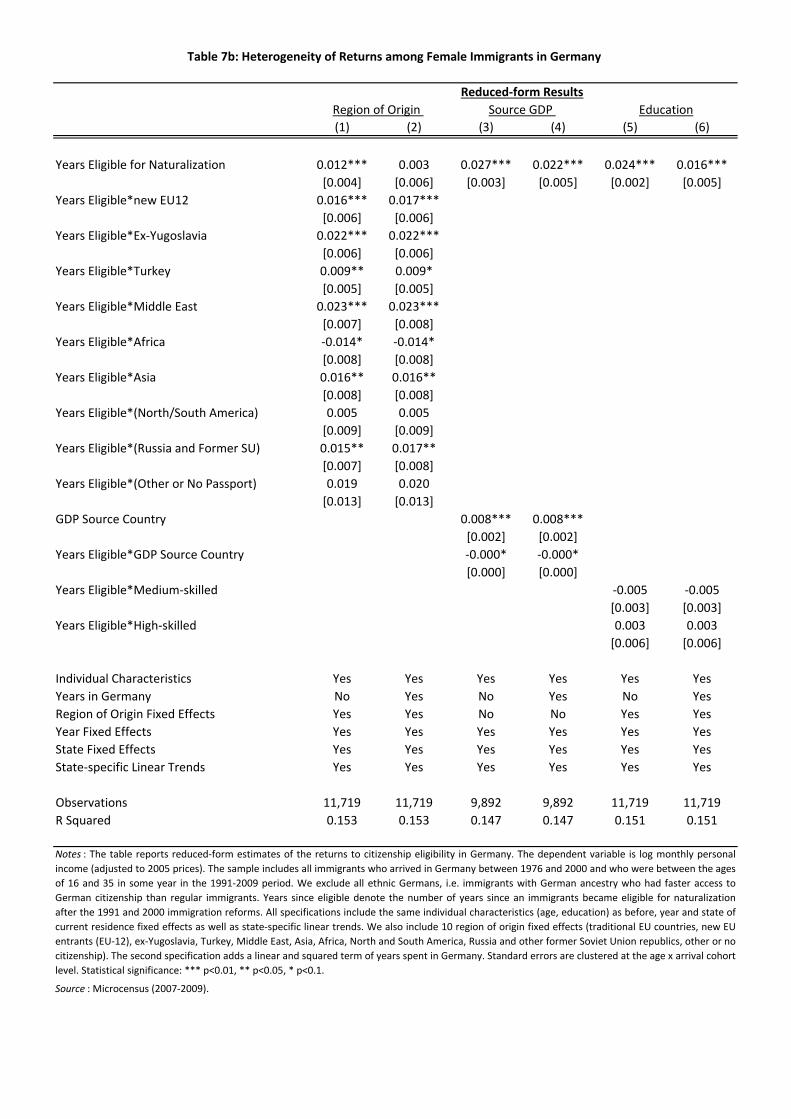
(1) (2) (3) (4) (5) (6)
Years Eligible for Naturalization 0.012*** 0.003 0.027*** 0.022*** 0.024*** 0.016***
[0.004] [0.006] [0.003] [0.005] [0.002] [0.005]
Years Eligible*new EU12 0.016*** 0.017***
[0.006] [0.006]
Years Eligible*Ex-Yugoslavia 0.022*** 0.022***
[0.006] [0.006]
Years Eligible*Turkey 0.009** 0.009*
[0.005] [0.005]
Years Eligible*Middle East 0.023*** 0.023***
[0.007] [0.008]
Years Eligible*Africa -0.014* -0.014*
[0.008] [0.008]
Years Eligible*Asia 0.016** 0.016**
[0.008] [0.008]
Years Eligible*(North/South America) 0.005 0.005
[0.009] [0.009]
Years Eligible*(Russia and Former SU) 0.015** 0.017**
[0.007] [0.008]
Years Eligible*(Other or No Passport) 0.019 0.020
[0.013] [0.013]
GDP Source Country 0.008*** 0.008***
[0.002] [0.002]
Years Eligible*GDP Source Country -0.000* -0.000*
[0.000] [0.000]
Years Eligible*Medium-skilled -0.005 -0.005
[0.003] [0.003]
Years Eligible*High-skilled 0.003 0.003
[0.006] [0.006]
Individual Characteristics Yes Yes Yes Yes Yes Yes
Years in Germany No Yes No Yes No Yes
Region of Origin Fixed Effects Yes Yes No No Yes Yes
Year Fixed Effects Yes Yes Yes Yes Yes Yes
State Fixed Effects Yes Yes Yes Yes Yes Yes
State-specific Linear Trends Yes Yes Yes Yes Yes Yes
Observations 11,719 11,719 9,892 9,892 11,719 11,719
R Squared 0.153 0.153 0.147 0.147 0.151 0.151
Source : Microcensus (2007-2009).
Table 7b: Heterogeneity of Returns among Female Immigrants in Germany
Reduced-form Results
Region of Origin Source GDP Education
Notes : The table reports reduced-form estimates of the returns to citizenship eligibility in Germany. The dependent variable is log monthly personal
income (adjusted to 2005 prices). The sample includes all immigrants who arrived in Germany between 1976 and 2000 and who were between the ages
of 16 and 35 in some year in the 1991-2009 period. We exclude all ethnic Germans, i.e. immigrants with German ancestry who had faster access to
German citizenship than regular immigrants. Years since eligible denote the number of years since an immigrants became eligible for naturalization
after the 1991 and 2000 immigration reforms. All specifications include the same individual characteristics (age, education) as before, year and state of
current residence fixed effects as well as state-specific linear trends. We also include 10 region of origin fixed effects (traditional EU countries, new EU
entrants (EU-12), ex-Yugoslavia, Turkey, Middle East, Asia, Africa, North and South America, Russia and other former Soviet Union republics, other or no
citizenship). The second specification adds a linear and squared term of years spent in Germany. Standard errors are clustered at the age x arrival cohort
level. Statistical significance: *** p<0.01, ** p<0.05, * p<0.1.
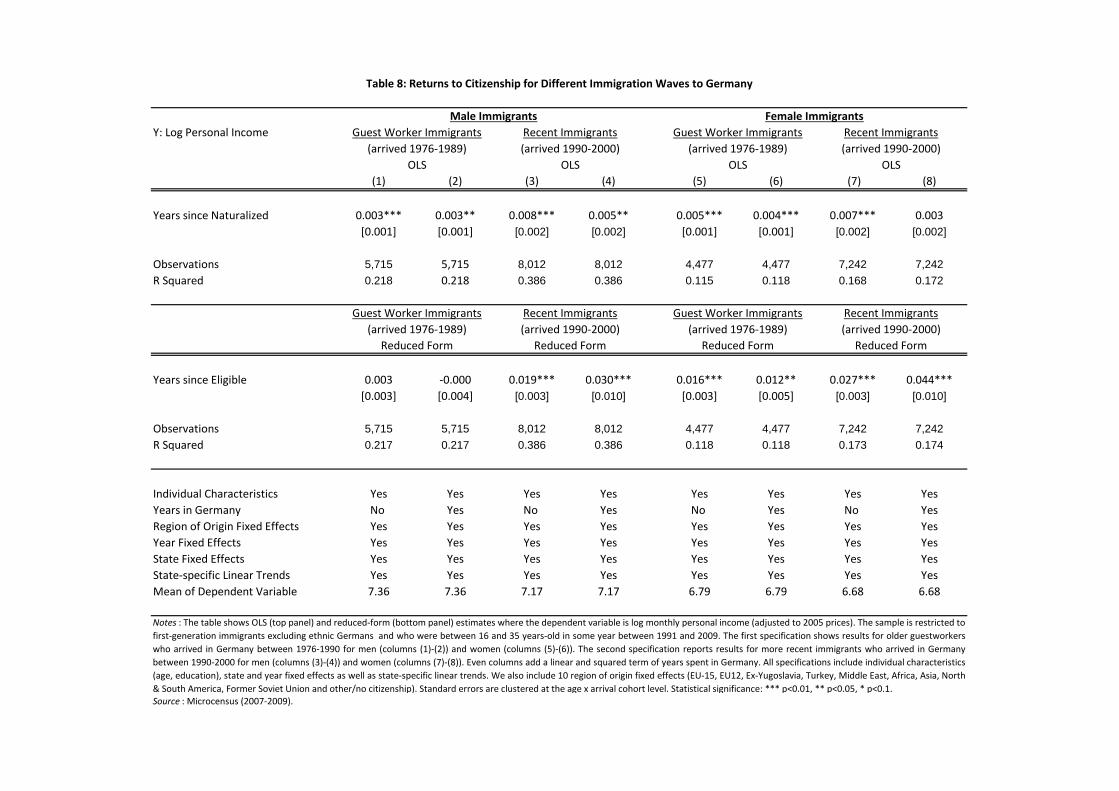
Y: Log Personal Income
(1) (2) (3) (4) (5) (6) (7) (8)
Years since Naturalized 0.003*** 0.003** 0.008*** 0.005** 0.005*** 0.004*** 0.007*** 0.003
[0.001] [0.001] [0.002] [0.002] [0.001] [0.001] [0.002] [0.002]
Observations 5,715 5,715 8,012 8,012 4,477 4,477 7,242 7,242
R Squared 0.218 0.218 0.386 0.386 0.115 0.118 0.168 0.172
Years since Eligible 0.003 -0.000 0.019*** 0.030*** 0.016*** 0.012** 0.027*** 0.044***
[0.003] [0.004] [0.003] [0.010] [0.003] [0.005] [0.003] [0.010]
Observations 5,715 5,715 8,012 8,012 4,477 4,477 7,242 7,242
R Squared 0.217 0.217 0.386 0.386 0.118 0.118 0.173 0.174
Individual Characteristics Yes Yes Yes Yes Yes Yes Yes Yes
Years in Germany No Yes No Yes No Yes No Yes
Region of Origin Fixed Effects Yes Yes Yes Yes Yes Yes Yes Yes
Year Fixed Effects Yes Yes Yes Yes Yes Yes Yes Yes
State Fixed Effects Yes Yes Yes Yes Yes Yes Yes Yes
State-specific Linear Trends Yes Yes Yes Yes Yes Yes Yes Yes
Mean of Dependent Variable 7.36 7.36 7.17 7.17 6.79 6.79 6.68 6.68
Source : Microcensus (2007-2009).
(arrived 1976-1989) (arrived 1990-2000)
Table 8: Returns to Citizenship for Different Immigration Waves to Germany
Notes : The table shows OLS (top panel) and reduced-form (bottom panel) estimates where the dependent variable is log monthly personal income (adjusted to 2005 prices). The sample is restricted to
first-generation immigrants excluding ethnic Germans and who were between 16 and 35 years-old in some year between 1991 and 2009. The first specification shows results for older guestworkers
who arrived in Germany between 1976-1990 for men (columns (1)-(2)) and women (columns (5)-(6)). The second specification reports results for more recent immigrants who arrived in Germany
between 1990-2000 for men (columns (3)-(4)) and women (columns (7)-(8)). Even columns add a linear and squared term of years spent in Germany. All specifications include individual characteristics
(age, education), state and year fixed effects as well as state-specific linear trends. We also include 10 region of origin fixed effects (EU-15, EU12, Ex-Yugoslavia, Turkey, Middle East, Africa, Asia, North
& South America, Former Soviet Union and other/no citizenship). Standard errors are clustered at the age x arrival cohort level. Statistical significance: *** p<0.01, ** p<0.05, * p<0.1.
Reduced Form Reduced Form Reduced Form Reduced Form
(arrived 1976-1989) (arrived 1990-2000) (arrived 1976-1989) (arrived 1990-2000)
(arrived 1976-1989) (arrived 1990-2000)
OLS OLS OLS OLS
Guest Worker Immigrants Recent Immigrants Guest Worker Immigrants Recent Immigrants
Male Immigrants Female Immigrants
Guest Worker Immigrants Recent Immigrants Guest Worker Immigrants Recent Immigrants
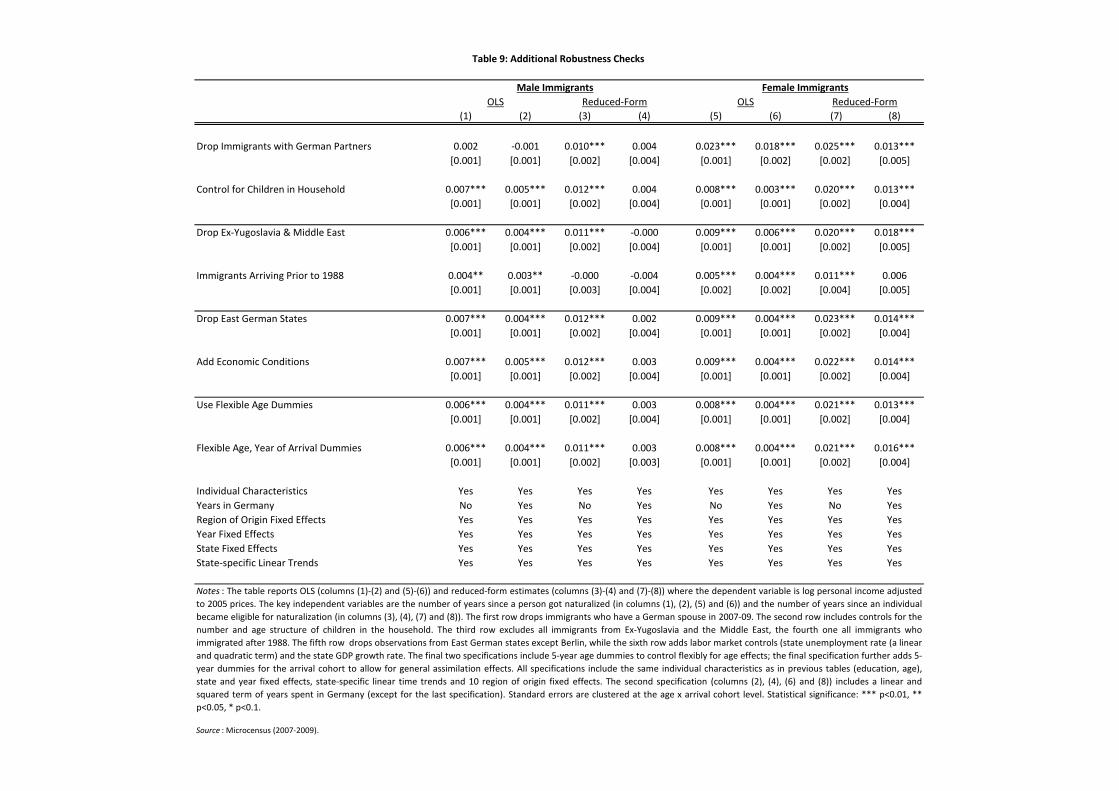
(1) (2) (3) (4) (5) (6) (7) (8)
Drop Immigrants with German Partners 0.002 -0.001 0.010*** 0.004 0.023*** 0.018*** 0.025*** 0.013***
[0.001] [0.001] [0.002] [0.004] [0.001] [0.002] [0.002] [0.005]
Control for Children in Household 0.007*** 0.005*** 0.012*** 0.004 0.008*** 0.003*** 0.020*** 0.013***
[0.001] [0.001] [0.002] [0.004] [0.001] [0.001] [0.002] [0.004]
Drop Ex-Yugoslavia & Middle East 0.006*** 0.004*** 0.011*** -0.000 0.009*** 0.006*** 0.020*** 0.018***
[0.001] [0.001] [0.002] [0.004] [0.001] [0.001] [0.002] [0.005]
Immigrants Arriving Prior to 1988 0.004** 0.003** -0.000 -0.004 0.005*** 0.004*** 0.011*** 0.006
[0.001] [0.001] [0.003] [0.004] [0.002] [0.002] [0.004] [0.005]
Drop East German States 0.007*** 0.004*** 0.012*** 0.002 0.009*** 0.004*** 0.023*** 0.014***
[0.001] [0.001] [0.002] [0.004] [0.001] [0.001] [0.002] [0.004]
Add Economic Conditions 0.007*** 0.005*** 0.012*** 0.003 0.009*** 0.004*** 0.022*** 0.014***
[0.001] [0.001] [0.002] [0.004] [0.001] [0.001] [0.002] [0.004]
Use Flexible Age Dummies 0.006*** 0.004*** 0.011*** 0.003 0.008*** 0.004*** 0.021*** 0.013***
[0.001] [0.001] [0.002] [0.004] [0.001] [0.001] [0.002] [0.004]
Flexible Age, Year of Arrival Dummies 0.006*** 0.004*** 0.011*** 0.003 0.008*** 0.004*** 0.021*** 0.016***
[0.001] [0.001] [0.002] [0.003] [0.001] [0.001] [0.002] [0.004]
Individual Characteristics Yes Yes Yes Yes Yes Yes Yes Yes
Years in Germany No Yes No Yes No Yes No Yes
Region of Origin Fixed Effects Yes Yes Yes Yes Yes Yes Yes Yes
Year Fixed Effects Yes Yes Yes Yes Yes Yes Yes Yes
State Fixed Effects Yes Yes Yes Yes Yes Yes Yes Yes
State-specific Linear Trends Yes Yes Yes Yes Yes Yes Yes Yes
Source : Microcensus (2007-2009).
Notes : The table reports OLS (columns (1)-(2) and (5)-(6)) and reduced-form estimates (columns (3)-(4) and (7)-(8)) where the dependent variable is log personal income adjusted
to 2005 prices. The key independent variables are the number of years since a person got naturalized (in columns (1), (2), (5) and (6)) and the number of years since an individual
became eligible for naturalization (in columns (3), (4), (7) and (8)). The first row drops immigrants who have a German spouse in 2007-09. The second row includes controls for the
number and age structure of children in the household. The third row excludes all immigrants from Ex-Yugoslavia and the Middle East, the fourth one all immigrants who
immigrated after 1988. The fifth row drops observations from East German states except Berlin, while the sixth row adds labor market controls (state unemployment rate (a linear
and quadratic term) and the state GDP growth rate. The final two specifications include 5-year age dummies to control flexibly for age effects; the final specification further adds 5-
year dummies for the arrival cohort to allow for general assimilation effects. All specifications include the same individual characteristics as in previous tables (education, age),
state and year fixed effects, state-specific linear time trends and 10 region of origin fixed effects. The second specification (columns (2), (4), (6) and (8)) includes a linear and
squared term of years spent in Germany (except for the last specification). Standard errors are clustered at the age x arrival cohort level. Statistical significance: *** p<0.01, **
p<0.05, * p<0.1.
Table 9: Additional Robustness Checks
Male Immigrants Female Immigrants
OLS Reduced-Form OLS Reduced-Form
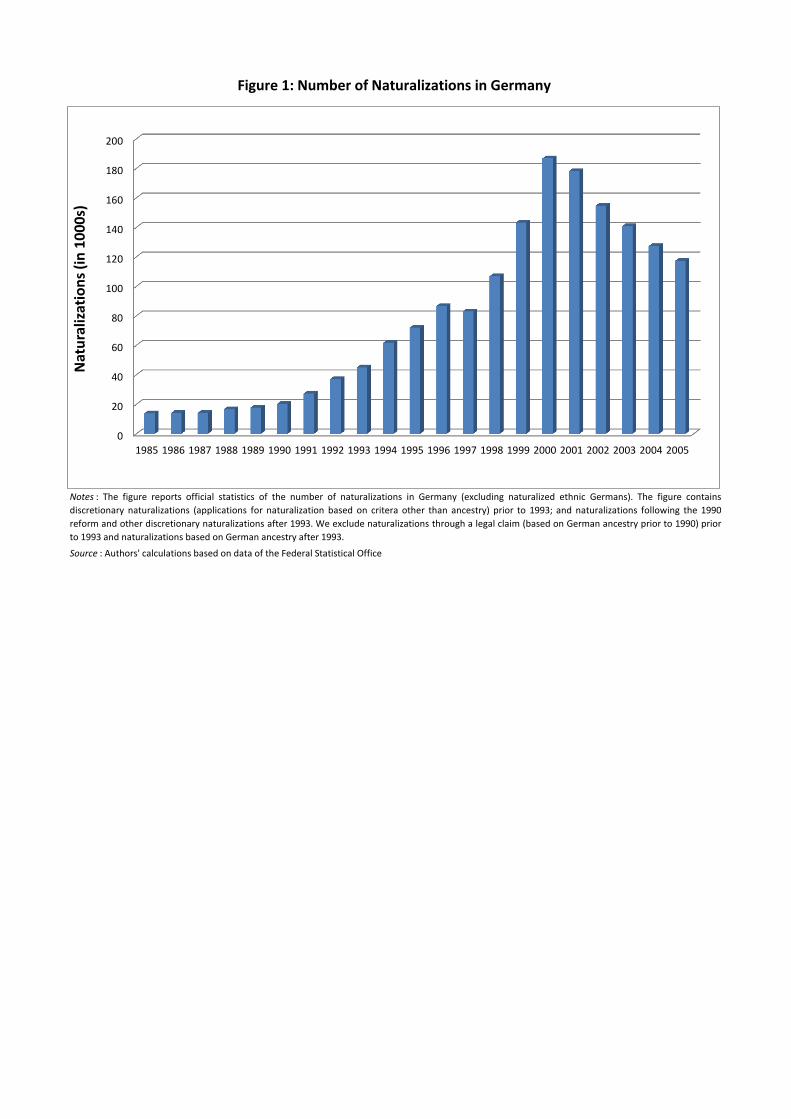
Source : Authors' calculations based on data of the Federal Statistical Office
Notes : The figure reports official statistics of the number of naturalizations in Germany (excluding naturalized ethnic Germans). The figure contains
discretionary naturalizations (applications for naturalization based on critera other than ancestry) prior to 1993; and naturalizations following the 1990
reform and other discretionary naturalizations after 1993. We exclude naturalizations through a legal claim (based on German ancestry prior to 1990) prior
to 1993 and naturalizations based on German ancestry after 1993.
Figure 1: Number of Naturalizations in Germany
0
20
40
60
80
100
120
140
160
180
200
1985 1986 1987 1988 1989 1990 1991 1992 1993 1994 1995 1996 1997 1998 1999 2000 2001 2002 2003 2004 2005
Nat
ura
lizat
ion
s (i
n 1
00
0s)
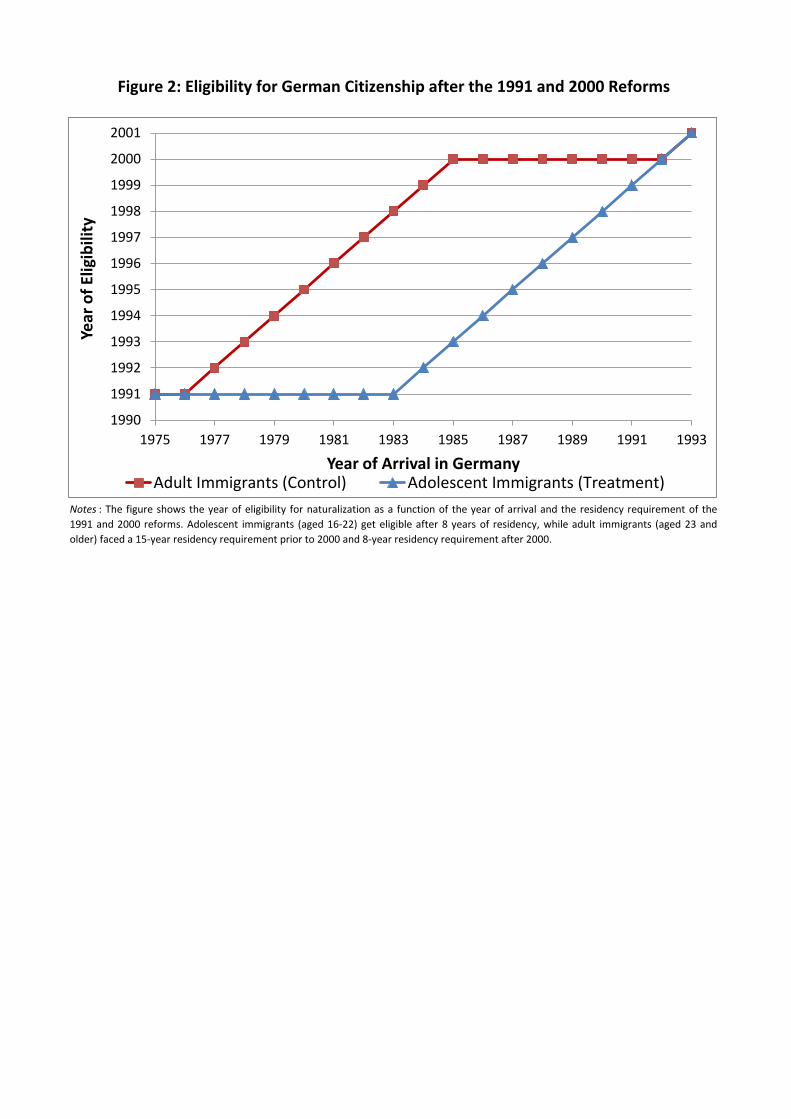
Figure 2: Eligibility for German Citizenship after the 1991 and 2000 Reforms
Notes : The figure shows the year of eligibility for naturalization as a function of the year of arrival and the residency requirement of the
1991 and 2000 reforms. Adolescent immigrants (aged 16-22) get eligible after 8 years of residency, while adult immigrants (aged 23 and
older) faced a 15-year residency requirement prior to 2000 and 8-year residency requirement after 2000.
1990
1991
1992
1993
1994
1995
1996
1997
1998
1999
2000
2001
1975 1977 1979 1981 1983 1985 1987 1989 1991 1993
Year
of
Elig
ibili
ty
Year of Arrival in Germany Adult Immigrants (Control) Adolescent Immigrants (Treatment)
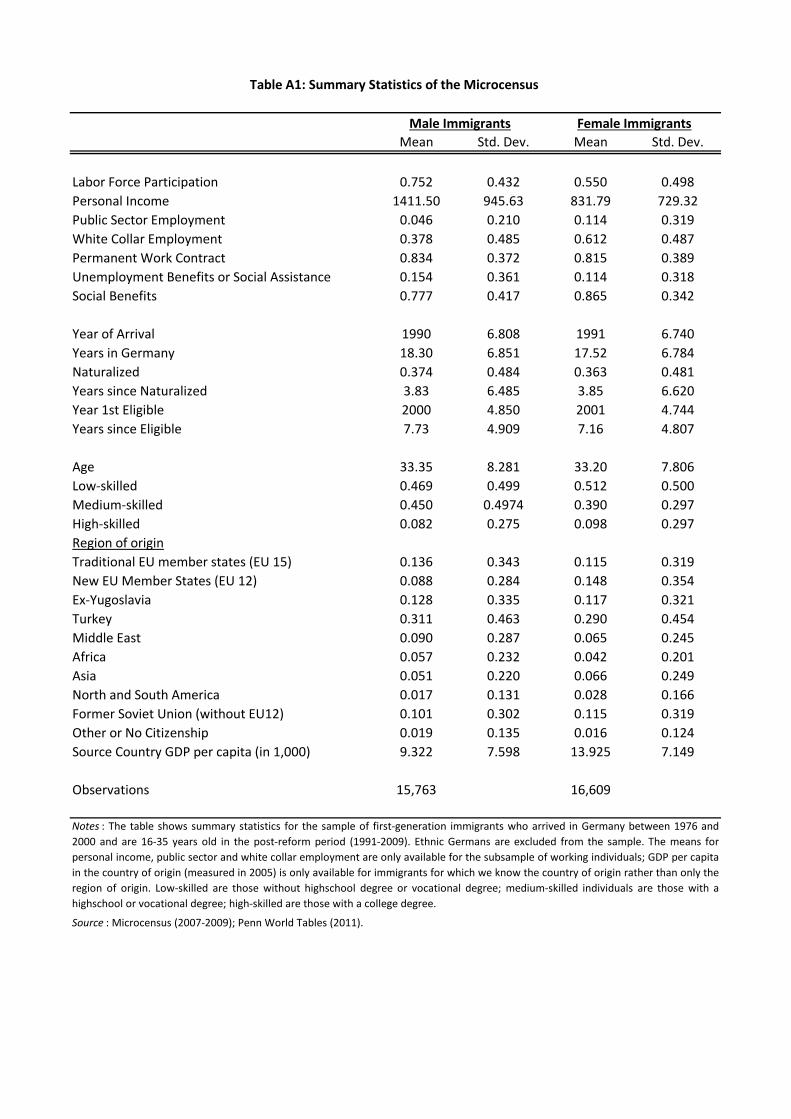
Mean Std. Dev. Mean Std. Dev.
Labor Force Participation 0.752 0.432 0.550 0.498
Personal Income 1411.50 945.63 831.79 729.32
Public Sector Employment 0.046 0.210 0.114 0.319
White Collar Employment 0.378 0.485 0.612 0.487
Permanent Work Contract 0.834 0.372 0.815 0.389
Unemployment Benefits or Social Assistance 0.154 0.361 0.114 0.318
Social Benefits 0.777 0.417 0.865 0.342
Year of Arrival 1990 6.808 1991 6.740
Years in Germany 18.30 6.851 17.52 6.784
Naturalized 0.374 0.484 0.363 0.481
Years since Naturalized 3.83 6.485 3.85 6.620
Year 1st Eligible 2000 4.850 2001 4.744
Years since Eligible 7.73 4.909 7.16 4.807
Age 33.35 8.281 33.20 7.806
Low-skilled 0.469 0.499 0.512 0.500
Medium-skilled 0.450 0.4974 0.390 0.297
High-skilled 0.082 0.275 0.098 0.297
Region of origin
Traditional EU member states (EU 15) 0.136 0.343 0.115 0.319
New EU Member States (EU 12) 0.088 0.284 0.148 0.354
Ex-Yugoslavia 0.128 0.335 0.117 0.321
Turkey 0.311 0.463 0.290 0.454
Middle East 0.090 0.287 0.065 0.245
Africa 0.057 0.232 0.042 0.201
Asia 0.051 0.220 0.066 0.249
North and South America 0.017 0.131 0.028 0.166
Former Soviet Union (without EU12) 0.101 0.302 0.115 0.319
Other or No Citizenship 0.019 0.135 0.016 0.124
Source Country GDP per capita (in 1,000) 9.322 7.598 13.925 7.149
Observations 15,763 16,609
Source : Microcensus (2007-2009); Penn World Tables (2011).
Male Immigrants Female Immigrants
Table A1: Summary Statistics of the Microcensus
Notes : The table shows summary statistics for the sample of first-generation immigrants who arrived in Germany between 1976 and
2000 and are 16-35 years old in the post-reform period (1991-2009). Ethnic Germans are excluded from the sample. The means for
personal income, public sector and white collar employment are only available for the subsample of working individuals; GDP per capita
in the country of origin (measured in 2005) is only available for immigrants for which we know the country of origin rather than only the
region of origin. Low-skilled are those without highschool degree or vocational degree; medium-skilled individuals are those with a
highschool or vocational degree; high-skilled are those with a college degree.
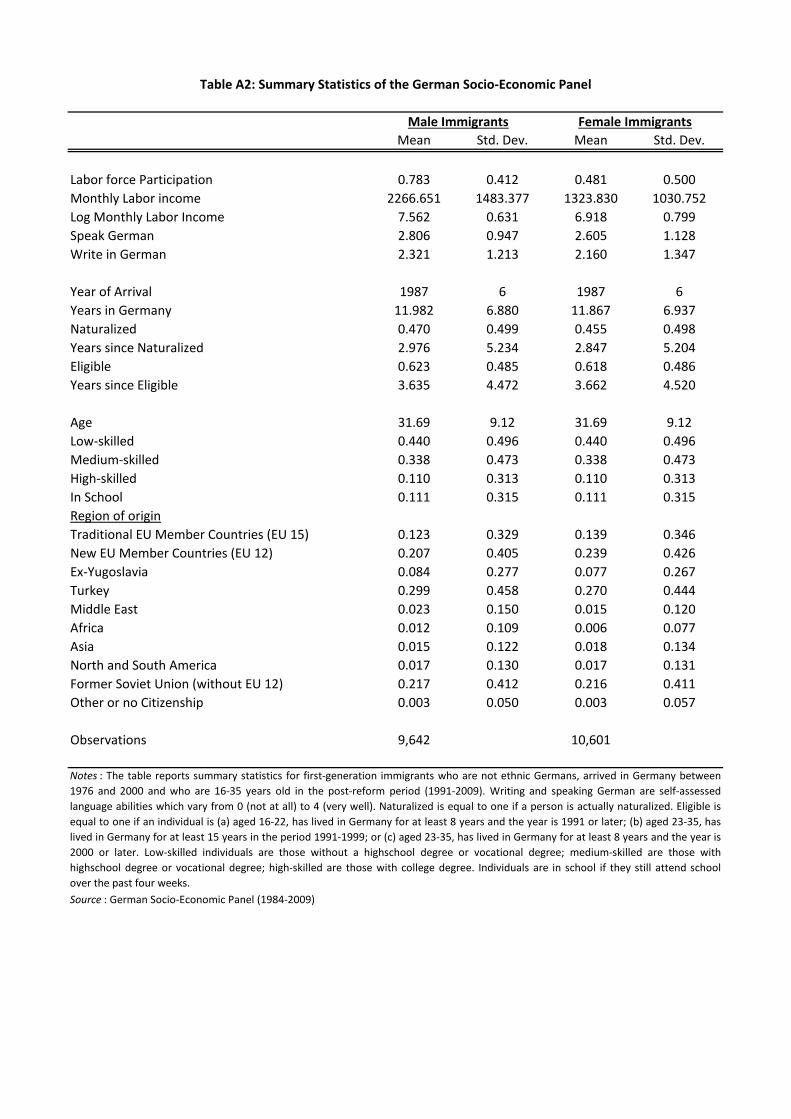
Mean Std. Dev. Mean Std. Dev.
Labor force Participation 0.783 0.412 0.481 0.500
Monthly Labor income 2266.651 1483.377 1323.830 1030.752
Log Monthly Labor Income 7.562 0.631 6.918 0.799
Speak German 2.806 0.947 2.605 1.128
Write in German 2.321 1.213 2.160 1.347
Year of Arrival 1987 6 1987 6
Years in Germany 11.982 6.880 11.867 6.937
Naturalized 0.470 0.499 0.455 0.498
Years since Naturalized 2.976 5.234 2.847 5.204
Eligible 0.623 0.485 0.618 0.486
Years since Eligible 3.635 4.472 3.662 4.520
Age 31.69 9.12 31.69 9.12
Low-skilled 0.440 0.496 0.440 0.496
Medium-skilled 0.338 0.473 0.338 0.473
High-skilled 0.110 0.313 0.110 0.313
In School 0.111 0.315 0.111 0.315
Region of origin
Traditional EU Member Countries (EU 15) 0.123 0.329 0.139 0.346
New EU Member Countries (EU 12) 0.207 0.405 0.239 0.426
Ex-Yugoslavia 0.084 0.277 0.077 0.267
Turkey 0.299 0.458 0.270 0.444
Middle East 0.023 0.150 0.015 0.120
Africa 0.012 0.109 0.006 0.077
Asia 0.015 0.122 0.018 0.134
North and South America 0.017 0.130 0.017 0.131
Former Soviet Union (without EU 12) 0.217 0.412 0.216 0.411
Other or no Citizenship 0.003 0.050 0.003 0.057
Observations 9,642 10,601
Source : German Socio-Economic Panel (1984-2009)
Table A2: Summary Statistics of the German Socio-Economic Panel
Male Immigrants Female Immigrants
Notes : The table reports summary statistics for first-generation immigrants who are not ethnic Germans, arrived in Germany between
1976 and 2000 and who are 16-35 years old in the post-reform period (1991-2009). Writing and speaking German are self-assessed
language abilities which vary from 0 (not at all) to 4 (very well). Naturalized is equal to one if a person is actually naturalized. Eligible is
equal to one if an individual is (a) aged 16-22, has lived in Germany for at least 8 years and the year is 1991 or later; (b) aged 23-35, has
lived in Germany for at least 15 years in the period 1991-1999; or (c) aged 23-35, has lived in Germany for at least 8 years and the year is
2000 or later. Low-skilled individuals are those without a highschool degree or vocational degree; medium-skilled are those with
highschool degree or vocational degree; high-skilled are those with college degree. Individuals are in school if they still attend school
over the past four weeks.
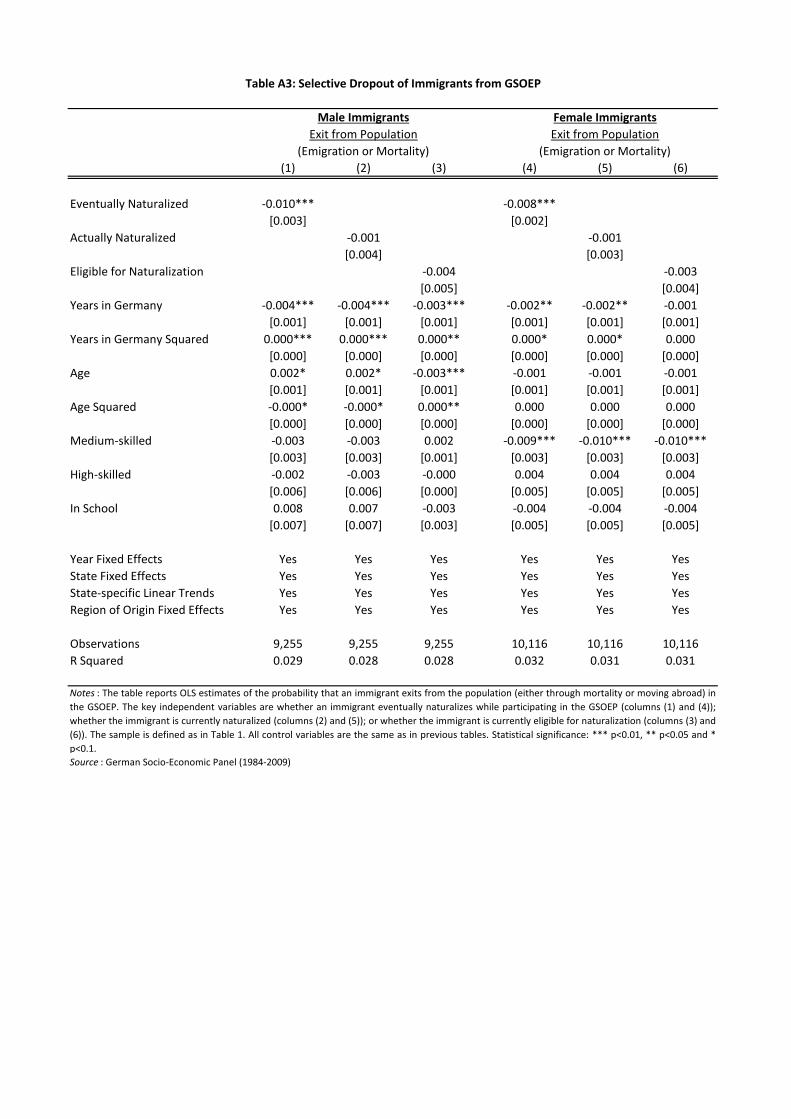
(1) (2) (3) (4) (5) (6)
Eventually Naturalized -0.010*** -0.008***
[0.003] [0.002]
Actually Naturalized -0.001 -0.001
[0.004] [0.003]
Eligible for Naturalization -0.004 -0.003
[0.005] [0.004]
Years in Germany -0.004*** -0.004*** -0.003*** -0.002** -0.002** -0.001
[0.001] [0.001] [0.001] [0.001] [0.001] [0.001]
Years in Germany Squared 0.000*** 0.000*** 0.000** 0.000* 0.000* 0.000
[0.000] [0.000] [0.000] [0.000] [0.000] [0.000]
Age 0.002* 0.002* -0.003*** -0.001 -0.001 -0.001
[0.001] [0.001] [0.001] [0.001] [0.001] [0.001]
Age Squared -0.000* -0.000* 0.000** 0.000 0.000 0.000
[0.000] [0.000] [0.000] [0.000] [0.000] [0.000]
Medium-skilled -0.003 -0.003 0.002 -0.009*** -0.010*** -0.010***
[0.003] [0.003] [0.001] [0.003] [0.003] [0.003]
High-skilled -0.002 -0.003 -0.000 0.004 0.004 0.004
[0.006] [0.006] [0.000] [0.005] [0.005] [0.005]
In School 0.008 0.007 -0.003 -0.004 -0.004 -0.004
[0.007] [0.007] [0.003] [0.005] [0.005] [0.005]
Year Fixed Effects Yes Yes Yes Yes Yes Yes
State Fixed Effects Yes Yes Yes Yes Yes Yes
State-specific Linear Trends Yes Yes Yes Yes Yes Yes
Region of Origin Fixed Effects Yes Yes Yes Yes Yes Yes
Observations 9,255 9,255 9,255 10,116 10,116 10,116
R Squared 0.029 0.028 0.028 0.032 0.031 0.031
Source : German Socio-Economic Panel (1984-2009)
Table A3: Selective Dropout of Immigrants from GSOEP
Notes : The table reports OLS estimates of the probability that an immigrant exits from the population (either through mortality or moving abroad) in
the GSOEP. The key independent variables are whether an immigrant eventually naturalizes while participating in the GSOEP (columns (1) and (4));
whether the immigrant is currently naturalized (columns (2) and (5)); or whether the immigrant is currently eligible for naturalization (columns (3) and
(6)). The sample is defined as in Table 1. All control variables are the same as in previous tables. Statistical significance: *** p<0.01, ** p<0.05 and *
p<0.1.
Exit from Population
(Emigration or Mortality)
Exit from Population
(Emigration or Mortality)
Male Immigrants Female Immigrants
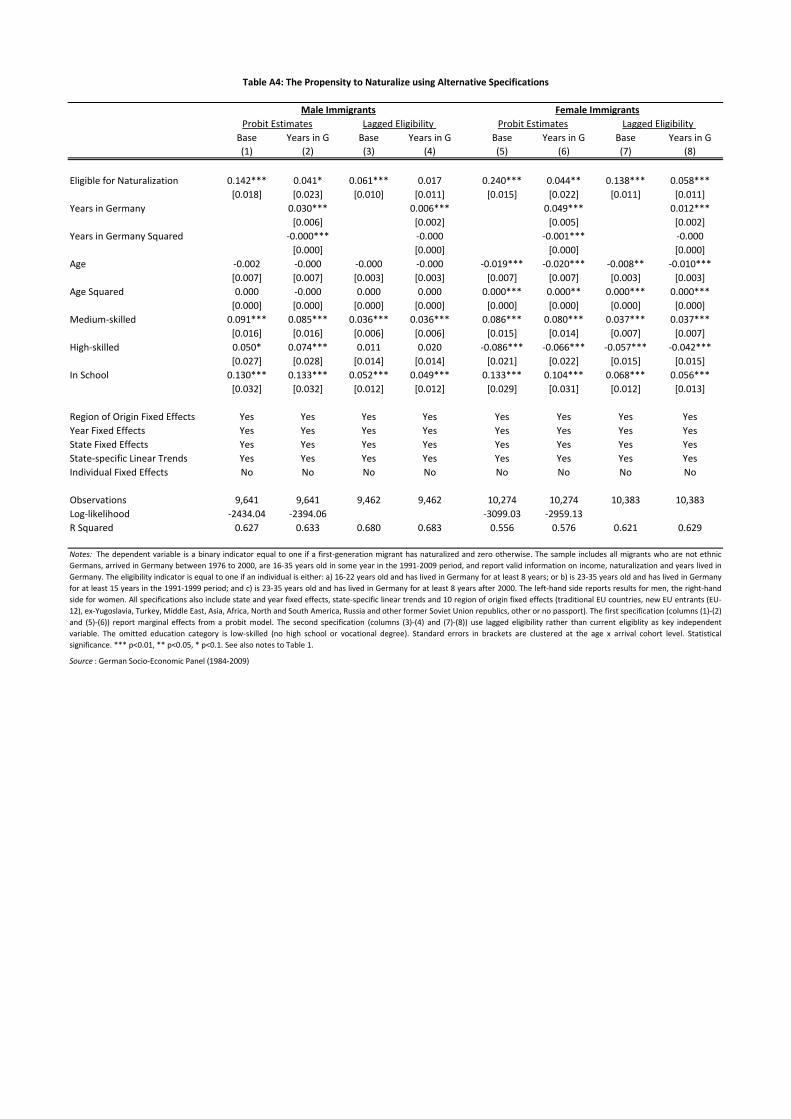
Base Years in G Base Years in G Base Years in G Base Years in G
(1) (2) (3) (4) (5) (6) (7) (8)
Eligible for Naturalization 0.142*** 0.041* 0.061*** 0.017 0.240*** 0.044** 0.138*** 0.058***
[0.018] [0.023] [0.010] [0.011] [0.015] [0.022] [0.011] [0.011]
Years in Germany 0.030*** 0.006*** 0.049*** 0.012***
[0.006] [0.002] [0.005] [0.002]
Years in Germany Squared -0.000*** -0.000 -0.001*** -0.000
[0.000] [0.000] [0.000] [0.000]
Age -0.002 -0.000 -0.000 -0.000 -0.019*** -0.020*** -0.008** -0.010***
[0.007] [0.007] [0.003] [0.003] [0.007] [0.007] [0.003] [0.003]
Age Squared 0.000 -0.000 0.000 0.000 0.000*** 0.000** 0.000*** 0.000***
[0.000] [0.000] [0.000] [0.000] [0.000] [0.000] [0.000] [0.000]
Medium-skilled 0.091*** 0.085*** 0.036*** 0.036*** 0.086*** 0.080*** 0.037*** 0.037***
[0.016] [0.016] [0.006] [0.006] [0.015] [0.014] [0.007] [0.007]
High-skilled 0.050* 0.074*** 0.011 0.020 -0.086*** -0.066*** -0.057*** -0.042***
[0.027] [0.028] [0.014] [0.014] [0.021] [0.022] [0.015] [0.015]
In School 0.130*** 0.133*** 0.052*** 0.049*** 0.133*** 0.104*** 0.068*** 0.056***
[0.032] [0.032] [0.012] [0.012] [0.029] [0.031] [0.012] [0.013]
Region of Origin Fixed Effects Yes Yes Yes Yes Yes Yes Yes Yes
Year Fixed Effects Yes Yes Yes Yes Yes Yes Yes Yes
State Fixed Effects Yes Yes Yes Yes Yes Yes Yes Yes
State-specific Linear Trends Yes Yes Yes Yes Yes Yes Yes Yes
Individual Fixed Effects No No No No No No No No
Observations 9,641 9,641 9,462 9,462 10,274 10,274 10,383 10,383
Log-likelihood -2434.04 -2394.06 -3099.03 -2959.13
R Squared 0.627 0.633 0.680 0.683 0.556 0.576 0.621 0.629
Source : German Socio-Economic Panel (1984-2009)
Notes: The dependent variable is a binary indicator equal to one if a first-generation migrant has naturalized and zero otherwise. The sample includes all migrants who are not ethnic
Germans, arrived in Germany between 1976 to 2000, are 16-35 years old in some year in the 1991-2009 period, and report valid information on income, naturalization and years lived in
Germany. The eligibility indicator is equal to one if an individual is either: a) 16-22 years old and has lived in Germany for at least 8 years; or b) is 23-35 years old and has lived in Germany
for at least 15 years in the 1991-1999 period; and c) is 23-35 years old and has lived in Germany for at least 8 years after 2000. The left-hand side reports results for men, the right-hand
side for women. All specifications also include state and year fixed effects, state-specific linear trends and 10 region of origin fixed effects (traditional EU countries, new EU entrants (EU-
12), ex-Yugoslavia, Turkey, Middle East, Asia, Africa, North and South America, Russia and other former Soviet Union republics, other or no passport). The first specification (columns (1)-(2)
and (5)-(6)) report marginal effects from a probit model. The second specification (columns (3)-(4) and (7)-(8)) use lagged eligibility rather than current eligiblity as key independent
variable. The omitted education category is low-skilled (no high school or vocational degree). Standard errors in brackets are clustered at the age x arrival cohort level. Statistical
significance. *** p<0.01, ** p<0.05, * p<0.1. See also notes to Table 1.
Table A4: The Propensity to Naturalize using Alternative Specifications
Female ImmigrantsMale Immigrants
Probit Estimates Probit EstimatesLagged Eligibility Lagged Eligibility
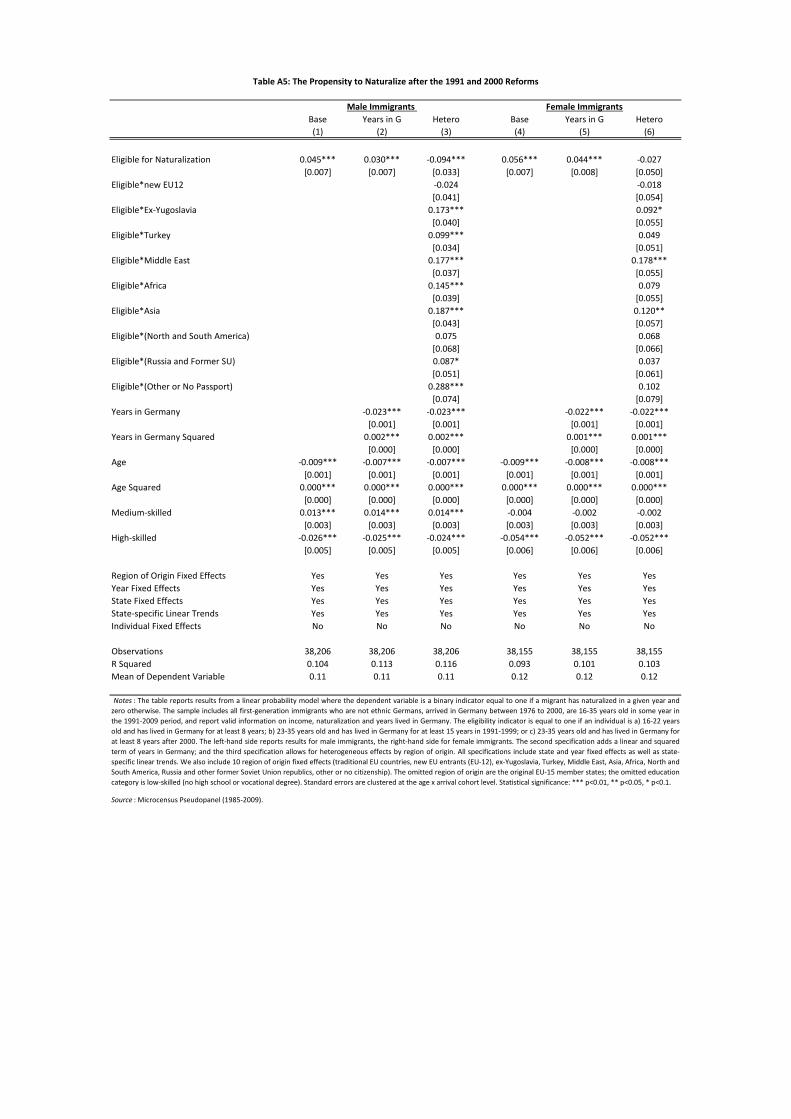
Base Years in G Hetero Base Years in G Hetero
(1) (2) (3) (4) (5) (6)
Eligible for Naturalization 0.045*** 0.030*** -0.094*** 0.056*** 0.044*** -0.027
[0.007] [0.007] [0.033] [0.007] [0.008] [0.050]
Eligible*new EU12 -0.024 -0.018
[0.041] [0.054]
Eligible*Ex-Yugoslavia 0.173*** 0.092*
[0.040] [0.055]
Eligible*Turkey 0.099*** 0.049
[0.034] [0.051]
Eligible*Middle East 0.177*** 0.178***
[0.037] [0.055]
Eligible*Africa 0.145*** 0.079
[0.039] [0.055]
Eligible*Asia 0.187*** 0.120**
[0.043] [0.057]
Eligible*(North and South America) 0.075 0.068
[0.068] [0.066]
Eligible*(Russia and Former SU) 0.087* 0.037
[0.051] [0.061]
Eligible*(Other or No Passport) 0.288*** 0.102
[0.074] [0.079]
Years in Germany -0.023*** -0.023*** -0.022*** -0.022***
[0.001] [0.001] [0.001] [0.001]
Years in Germany Squared 0.002*** 0.002*** 0.001*** 0.001***
[0.000] [0.000] [0.000] [0.000]
Age -0.009*** -0.007*** -0.007*** -0.009*** -0.008*** -0.008***
[0.001] [0.001] [0.001] [0.001] [0.001] [0.001]
Age Squared 0.000*** 0.000*** 0.000*** 0.000*** 0.000*** 0.000***
[0.000] [0.000] [0.000] [0.000] [0.000] [0.000]
Medium-skilled 0.013*** 0.014*** 0.014*** -0.004 -0.002 -0.002
[0.003] [0.003] [0.003] [0.003] [0.003] [0.003]
High-skilled -0.026*** -0.025*** -0.024*** -0.054*** -0.052*** -0.052***
[0.005] [0.005] [0.005] [0.006] [0.006] [0.006]
Region of Origin Fixed Effects Yes Yes Yes Yes Yes Yes
Year Fixed Effects Yes Yes Yes Yes Yes Yes
State Fixed Effects Yes Yes Yes Yes Yes Yes
State-specific Linear Trends Yes Yes Yes Yes Yes Yes
Individual Fixed Effects No No No No No No
Observations 38,206 38,206 38,206 38,155 38,155 38,155
R Squared 0.104 0.113 0.116 0.093 0.101 0.103
Mean of Dependent Variable 0.11 0.11 0.11 0.12 0.12 0.12
Source : Microcensus Pseudopanel (1985-2009).
Notes : The table reports results from a linear probability model where the dependent variable is a binary indicator equal to one if a migrant has naturalized in a given year and
zero otherwise. The sample includes all first-generation immigrants who are not ethnic Germans, arrived in Germany between 1976 to 2000, are 16-35 years old in some year in
the 1991-2009 period, and report valid information on income, naturalization and years lived in Germany. The eligibility indicator is equal to one if an individual is a) 16-22 years
old and has lived in Germany for at least 8 years; b) 23-35 years old and has lived in Germany for at least 15 years in 1991-1999; or c) 23-35 years old and has lived in Germany for
at least 8 years after 2000. The left-hand side reports results for male immigrants, the right-hand side for female immigrants. The second specification adds a linear and squared
term of years in Germany; and the third specification allows for heterogeneous effects by region of origin. All specifications include state and year fixed effects as well as state-
specific linear trends. We also include 10 region of origin fixed effects (traditional EU countries, new EU entrants (EU-12), ex-Yugoslavia, Turkey, Middle East, Asia, Africa, North and
South America, Russia and other former Soviet Union republics, other or no citizenship). The omitted region of origin are the original EU-15 member states; the omitted education
category is low-skilled (no high school or vocational degree). Standard errors are clustered at the age x arrival cohort level. Statistical significance: *** p<0.01, ** p<0.05, * p<0.1.
Table A5: The Propensity to Naturalize after the 1991 and 2000 Reforms
Male Immigrants Female Immigrants
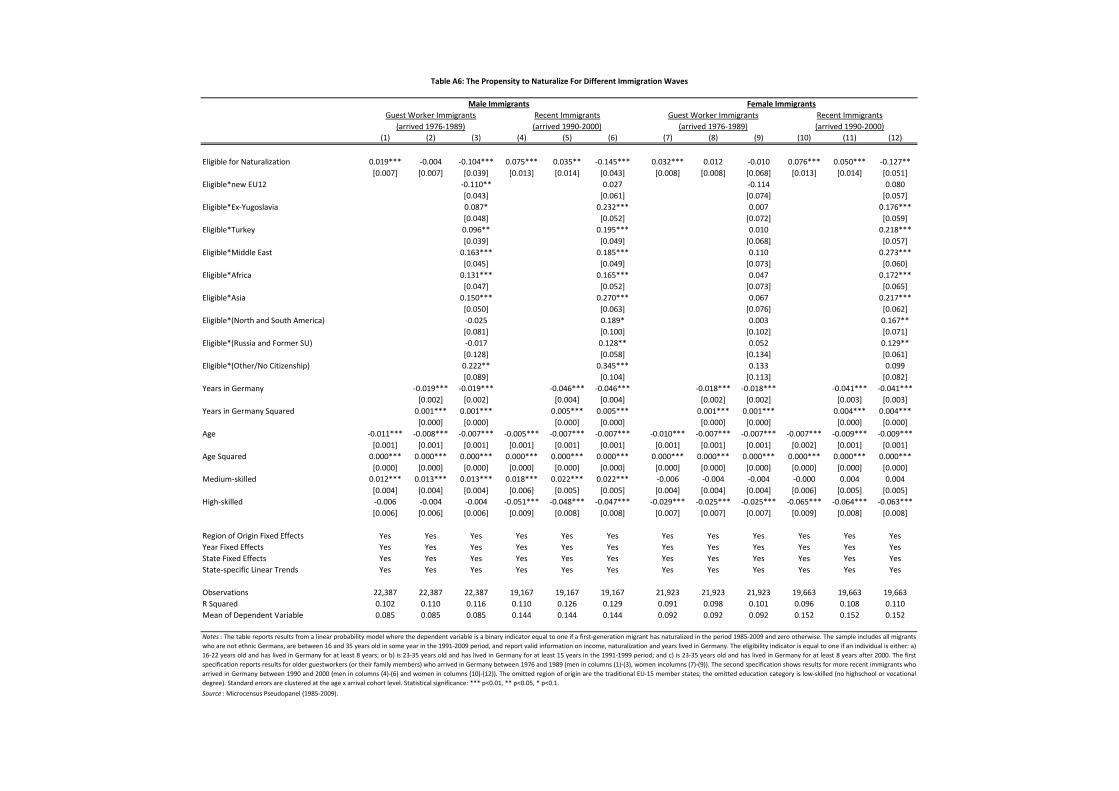
(1) (2) (3) (4) (5) (6) (7) (8) (9) (10) (11) (12)
Eligible for Naturalization 0.019*** -0.004 -0.104*** 0.075*** 0.035** -0.145*** 0.032*** 0.012 -0.010 0.076*** 0.050*** -0.127**
[0.007] [0.007] [0.039] [0.013] [0.014] [0.043] [0.008] [0.008] [0.068] [0.013] [0.014] [0.051]
Eligible*new EU12 -0.110** 0.027 -0.114 0.080
[0.043] [0.061] [0.074] [0.057]
Eligible*Ex-Yugoslavia 0.087* 0.232*** 0.007 0.176***
[0.048] [0.052] [0.072] [0.059]
Eligible*Turkey 0.096** 0.195*** 0.010 0.218***
[0.039] [0.049] [0.068] [0.057]
Eligible*Middle East 0.163*** 0.185*** 0.110 0.273***
[0.045] [0.049] [0.073] [0.060]
Eligible*Africa 0.131*** 0.165*** 0.047 0.172***
[0.047] [0.052] [0.073] [0.065]
Eligible*Asia 0.150*** 0.270*** 0.067 0.217***
[0.050] [0.063] [0.076] [0.062]
Eligible*(North and South America) -0.025 0.189* 0.003 0.167**
[0.081] [0.100] [0.102] [0.071]
Eligible*(Russia and Former SU) -0.017 0.128** 0.052 0.129**
[0.128] [0.058] [0.134] [0.061]
Eligible*(Other/No Citizenship) 0.222** 0.345*** 0.133 0.099
[0.089] [0.104] [0.113] [0.082]
Years in Germany -0.019*** -0.019*** -0.046*** -0.046*** -0.018*** -0.018*** -0.041*** -0.041***
[0.002] [0.002] [0.004] [0.004] [0.002] [0.002] [0.003] [0.003]
Years in Germany Squared 0.001*** 0.001*** 0.005*** 0.005*** 0.001*** 0.001*** 0.004*** 0.004***
[0.000] [0.000] [0.000] [0.000] [0.000] [0.000] [0.000] [0.000]
Age -0.011*** -0.008*** -0.007*** -0.005*** -0.007*** -0.007*** -0.010*** -0.007*** -0.007*** -0.007*** -0.009*** -0.009***
[0.001] [0.001] [0.001] [0.001] [0.001] [0.001] [0.001] [0.001] [0.001] [0.002] [0.001] [0.001]
Age Squared 0.000*** 0.000*** 0.000*** 0.000*** 0.000*** 0.000*** 0.000*** 0.000*** 0.000*** 0.000*** 0.000*** 0.000***
[0.000] [0.000] [0.000] [0.000] [0.000] [0.000] [0.000] [0.000] [0.000] [0.000] [0.000] [0.000]
Medium-skilled 0.012*** 0.013*** 0.013*** 0.018*** 0.022*** 0.022*** -0.006 -0.004 -0.004 -0.000 0.004 0.004
[0.004] [0.004] [0.004] [0.006] [0.005] [0.005] [0.004] [0.004] [0.004] [0.006] [0.005] [0.005]
High-skilled -0.006 -0.004 -0.004 -0.051*** -0.048*** -0.047*** -0.029*** -0.025*** -0.025*** -0.065*** -0.064*** -0.063***
[0.006] [0.006] [0.006] [0.009] [0.008] [0.008] [0.007] [0.007] [0.007] [0.009] [0.008] [0.008]
Region of Origin Fixed Effects Yes Yes Yes Yes Yes Yes Yes Yes Yes Yes Yes Yes
Year Fixed Effects Yes Yes Yes Yes Yes Yes Yes Yes Yes Yes Yes Yes
State Fixed Effects Yes Yes Yes Yes Yes Yes Yes Yes Yes Yes Yes Yes
State-specific Linear Trends Yes Yes Yes Yes Yes Yes Yes Yes Yes Yes Yes Yes
Observations 22,387 22,387 22,387 19,167 19,167 19,167 21,923 21,923 21,923 19,663 19,663 19,663
R Squared 0.102 0.110 0.116 0.110 0.126 0.129 0.091 0.098 0.101 0.096 0.108 0.110
Mean of Dependent Variable 0.085 0.085 0.085 0.144 0.144 0.144 0.092 0.092 0.092 0.152 0.152 0.152
Source : Microcensus Pseudopanel (1985-2009).
Table A6: The Propensity to Naturalize For Different Immigration Waves
Notes : The table reports results from a linear probability model where the dependent variable is a binary indicator equal to one if a first-generation migrant has naturalized in the period 1985-2009 and zero otherwise. The sample includes all migrants
who are not ethnic Germans, are between 16 and 35 years old in some year in the 1991-2009 period, and report valid information on income, naturalization and years lived in Germany. The eligibility indicator is equal to one if an individual is either: a)
16-22 years old and has lived in Germany for at least 8 years; or b) is 23-35 years old and has lived in Germany for at least 15 years in the 1991-1999 period; and c) is 23-35 years old and has lived in Germany for at least 8 years after 2000. The first
specification reports results for older guestworkers (or their family members) who arrived in Germany between 1976 and 1989 (men in columns (1)-(3), women incolumns (7)-(9)). The second specification shows results for more recent immigrants who
arrived in Germany between 1990 and 2000 (men in columns (4)-(6) and women in columns (10)-(12)). The omitted region of origin are the traditional EU-15 member states; the omitted education category is low-skilled (no highschool or vocational
degree). Standard errors are clustered at the age x arrival cohort level. Statistical significance: *** p<0.01, ** p<0.05, * p<0.1.
Guest Worker Immigrants Recent Immigrants
Male Immigrants
(arrived 1976-1989) (arrived 1990-2000) (arrived 1990-2000)(arrived 1976-1989)
Female Immigrants
Guest Worker Immigrants Recent Immigrants
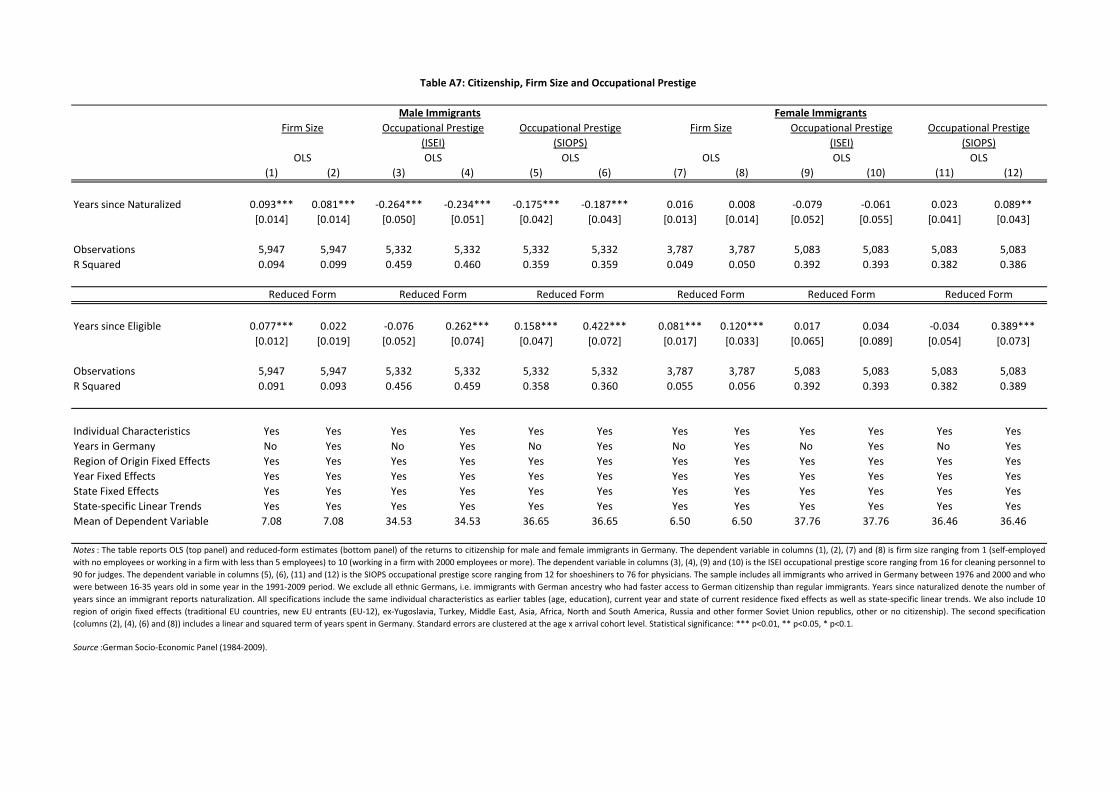
Female Immigrants
(1) (2) (3) (4) (5) (6) (7) (8) (9) (10) (11) (12)
Years since Naturalized 0.093*** 0.081*** -0.264*** -0.234*** -0.175*** -0.187*** 0.016 0.008 -0.079 -0.061 0.023 0.089**
[0.014] [0.014] [0.050] [0.051] [0.042] [0.043] [0.013] [0.014] [0.052] [0.055] [0.041] [0.043]
Observations 5,947 5,947 5,332 5,332 5,332 5,332 3,787 3,787 5,083 5,083 5,083 5,083
R Squared 0.094 0.099 0.459 0.460 0.359 0.359 0.049 0.050 0.392 0.393 0.382 0.386
Years since Eligible 0.077*** 0.022 -0.076 0.262*** 0.158*** 0.422*** 0.081*** 0.120*** 0.017 0.034 -0.034 0.389***
[0.012] [0.019] [0.052] [0.074] [0.047] [0.072] [0.017] [0.033] [0.065] [0.089] [0.054] [0.073]
Observations 5,947 5,947 5,332 5,332 5,332 5,332 3,787 3,787 5,083 5,083 5,083 5,083
R Squared 0.091 0.093 0.456 0.459 0.358 0.360 0.055 0.056 0.392 0.393 0.382 0.389
Individual Characteristics Yes Yes Yes Yes Yes Yes Yes Yes Yes Yes Yes Yes
Years in Germany No Yes No Yes No Yes No Yes No Yes No Yes
Region of Origin Fixed Effects Yes Yes Yes Yes Yes Yes Yes Yes Yes Yes Yes Yes
Year Fixed Effects Yes Yes Yes Yes Yes Yes Yes Yes Yes Yes Yes Yes
State Fixed Effects Yes Yes Yes Yes Yes Yes Yes Yes Yes Yes Yes Yes
State-specific Linear Trends Yes Yes Yes Yes Yes Yes Yes Yes Yes Yes Yes Yes
Mean of Dependent Variable 7.08 7.08 34.53 34.53 36.65 36.65 6.50 6.50 37.76 37.76 36.46 36.46
Source :German Socio-Economic Panel (1984-2009).
(SIOPS)
Table A7: Citizenship, Firm Size and Occupational Prestige
Firm Size Occupational Prestige Occupational Prestige Firm Size Occupational Prestige Occupational Prestige
(ISEI) (SIOPS) (ISEI)
Reduced Form
OLS OLS OLS OLS OLS OLS
Notes : The table reports OLS (top panel) and reduced-form estimates (bottom panel) of the returns to citizenship for male and female immigrants in Germany. The dependent variable in columns (1), (2), (7) and (8) is firm size ranging from 1 (self-employed
with no employees or working in a firm with less than 5 employees) to 10 (working in a firm with 2000 employees or more). The dependent variable in columns (3), (4), (9) and (10) is the ISEI occupational prestige score ranging from 16 for cleaning personnel to
90 for judges. The dependent variable in columns (5), (6), (11) and (12) is the SIOPS occupational prestige score ranging from 12 for shoeshiners to 76 for physicians. The sample includes all immigrants who arrived in Germany between 1976 and 2000 and who
were between 16-35 years old in some year in the 1991-2009 period. We exclude all ethnic Germans, i.e. immigrants with German ancestry who had faster access to German citizenship than regular immigrants. Years since naturalized denote the number of
years since an immigrant reports naturalization. All specifications include the same individual characteristics as earlier tables (age, education), current year and state of current residence fixed effects as well as state-specific linear trends. We also include 10
region of origin fixed effects (traditional EU countries, new EU entrants (EU-12), ex-Yugoslavia, Turkey, Middle East, Asia, Africa, North and South America, Russia and other former Soviet Union republics, other or no citizenship). The second specification
(columns (2), (4), (6) and (8)) includes a linear and squared term of years spent in Germany. Standard errors are clustered at the age x arrival cohort level. Statistical significance: *** p<0.01, ** p<0.05, * p<0.1.
Male Immigrants
Reduced Form Reduced Form Reduced Form Reduced Form Reduced Form
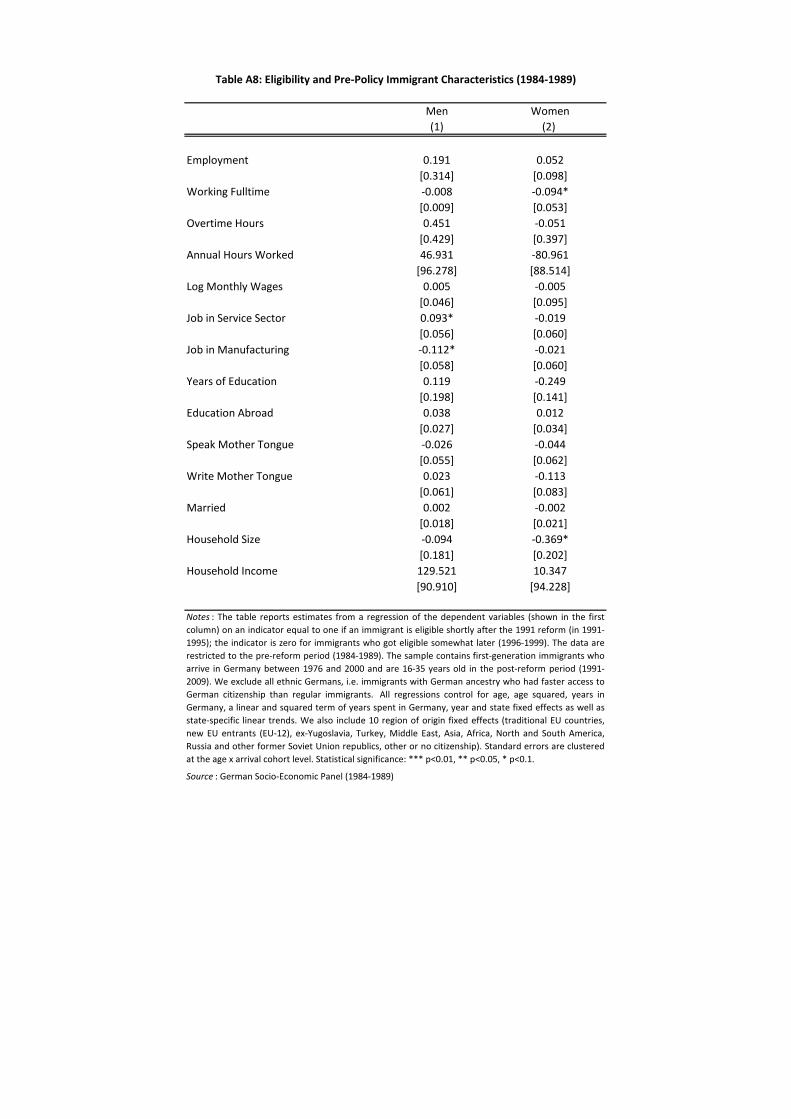
Men Women
(1) (2)
Employment 0.191 0.052
[0.314] [0.098]
Working Fulltime -0.008 -0.094*
[0.009] [0.053]
Overtime Hours 0.451 -0.051
[0.429] [0.397]
Annual Hours Worked 46.931 -80.961
[96.278] [88.514]
Log Monthly Wages 0.005 -0.005
[0.046] [0.095]
Job in Service Sector 0.093* -0.019
[0.056] [0.060]
Job in Manufacturing -0.112* -0.021
[0.058] [0.060]
Years of Education 0.119 -0.249
[0.198] [0.141]
Education Abroad 0.038 0.012
[0.027] [0.034]
Speak Mother Tongue -0.026 -0.044
[0.055] [0.062]
Write Mother Tongue 0.023 -0.113
[0.061] [0.083]
Married 0.002 -0.002
[0.018] [0.021]
Household Size -0.094 -0.369*
[0.181] [0.202]
Household Income 129.521 10.347
[90.910] [94.228]
Source : German Socio-Economic Panel (1984-1989)
Table A8: Eligibility and Pre-Policy Immigrant Characteristics (1984-1989)
Notes : The table reports estimates from a regression of the dependent variables (shown in the first
column) on an indicator equal to one if an immigrant is eligible shortly after the 1991 reform (in 1991-
1995); the indicator is zero for immigrants who got eligible somewhat later (1996-1999). The data are
restricted to the pre-reform period (1984-1989). The sample contains first-generation immigrants who
arrive in Germany between 1976 and 2000 and are 16-35 years old in the post-reform period (1991-
2009). We exclude all ethnic Germans, i.e. immigrants with German ancestry who had faster access to
German citizenship than regular immigrants. All regressions control for age, age squared, years in
Germany, a linear and squared term of years spent in Germany, year and state fixed effects as well as
state-specific linear trends. We also include 10 region of origin fixed effects (traditional EU countries,
new EU entrants (EU-12), ex-Yugoslavia, Turkey, Middle East, Asia, Africa, North and South America,
Russia and other former Soviet Union republics, other or no citizenship). Standard errors are clustered
at the age x arrival cohort level. Statistical significance: *** p<0.01, ** p<0.05, * p<0.1.
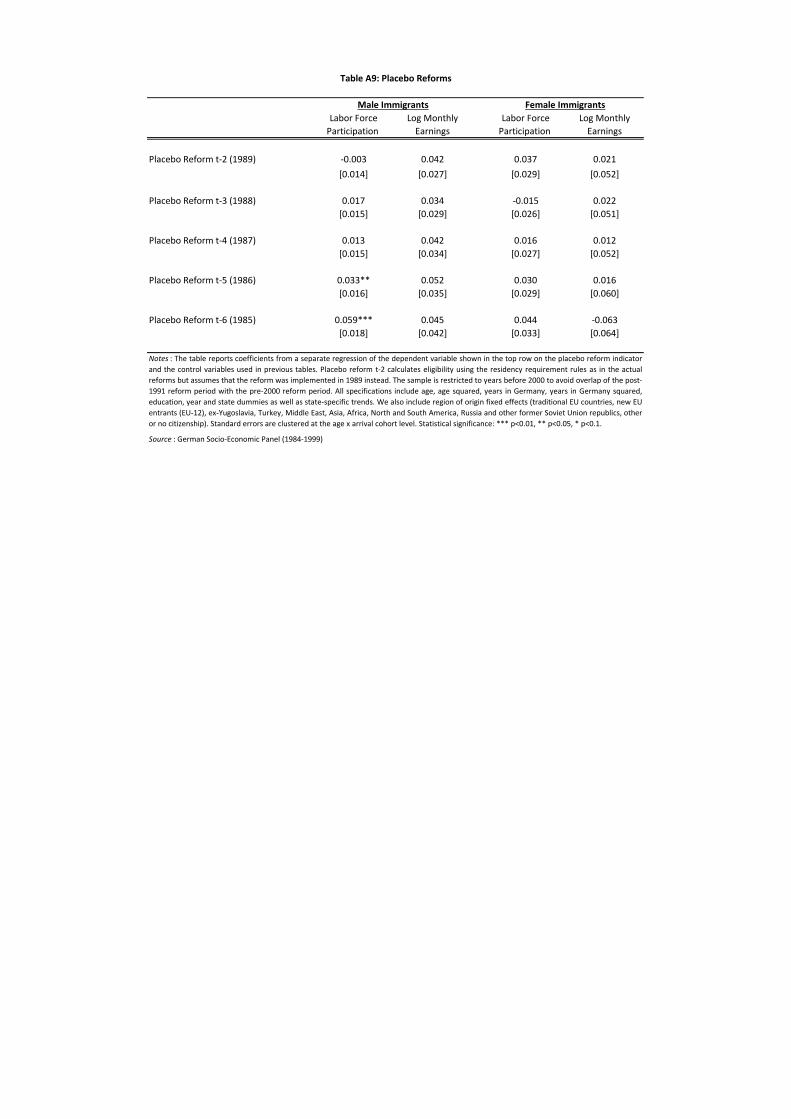
Labor Force Log Monthly Labor Force Log Monthly
Participation Earnings Participation Earnings
Placebo Reform t-2 (1989) -0.003 0.042 0.037 0.021
[0.014] [0.027] [0.029] [0.052]
Placebo Reform t-3 (1988) 0.017 0.034 -0.015 0.022
[0.015] [0.029] [0.026] [0.051]
Placebo Reform t-4 (1987) 0.013 0.042 0.016 0.012
[0.015] [0.034] [0.027] [0.052]
Placebo Reform t-5 (1986) 0.033** 0.052 0.030 0.016
[0.016] [0.035] [0.029] [0.060]
Placebo Reform t-6 (1985) 0.059*** 0.045 0.044 -0.063
[0.018] [0.042] [0.033] [0.064]
Source : German Socio-Economic Panel (1984-1999)
Table A9: Placebo Reforms
Notes : The table reports coefficients from a separate regression of the dependent variable shown in the top row on the placebo reform indicator
and the control variables used in previous tables. Placebo reform t-2 calculates eligibility using the residency requirement rules as in the actual
reforms but assumes that the reform was implemented in 1989 instead. The sample is restricted to years before 2000 to avoid overlap of the post-
1991 reform period with the pre-2000 reform period. All specifications include age, age squared, years in Germany, years in Germany squared,
education, year and state dummies as well as state-specific trends. We also include region of origin fixed effects (traditional EU countries, new EU
entrants (EU-12), ex-Yugoslavia, Turkey, Middle East, Asia, Africa, North and South America, Russia and other former Soviet Union republics, other
or no citizenship). Standard errors are clustered at the age x arrival cohort level. Statistical significance: *** p<0.01, ** p<0.05, * p<0.1.
Male Immigrants Female Immigrants
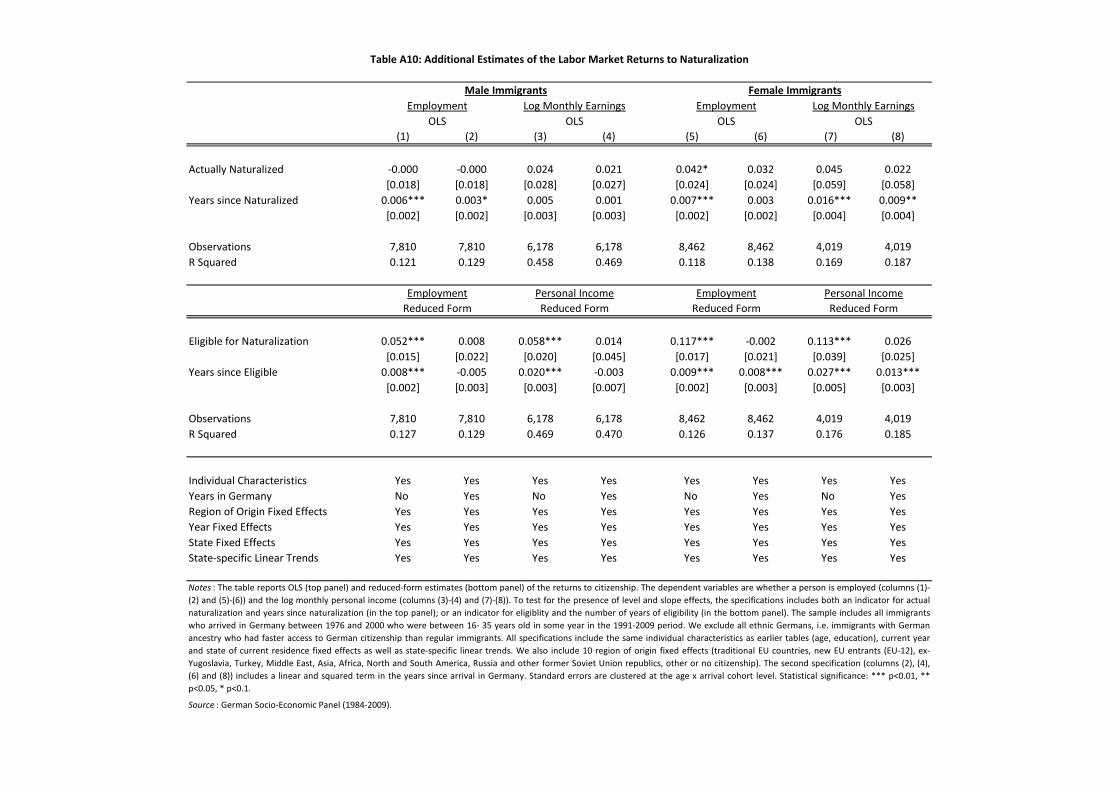
(1) (2) (3) (4) (5) (6) (7) (8)
Actually Naturalized -0.000 -0.000 0.024 0.021 0.042* 0.032 0.045 0.022
[0.018] [0.018] [0.028] [0.027] [0.024] [0.024] [0.059] [0.058]
Years since Naturalized 0.006*** 0.003* 0.005 0.001 0.007*** 0.003 0.016*** 0.009**
[0.002] [0.002] [0.003] [0.003] [0.002] [0.002] [0.004] [0.004]
Observations 7,810 7,810 6,178 6,178 8,462 8,462 4,019 4,019
R Squared 0.121 0.129 0.458 0.469 0.118 0.138 0.169 0.187
Eligible for Naturalization 0.052*** 0.008 0.058*** 0.014 0.117*** -0.002 0.113*** 0.026
[0.015] [0.022] [0.020] [0.045] [0.017] [0.021] [0.039] [0.025]
Years since Eligible 0.008*** -0.005 0.020*** -0.003 0.009*** 0.008*** 0.027*** 0.013***
[0.002] [0.003] [0.003] [0.007] [0.002] [0.003] [0.005] [0.003]
Observations 7,810 7,810 6,178 6,178 8,462 8,462 4,019 4,019
R Squared 0.127 0.129 0.469 0.470 0.126 0.137 0.176 0.185
Individual Characteristics Yes Yes Yes Yes Yes Yes Yes Yes
Years in Germany No Yes No Yes No Yes No Yes
Region of Origin Fixed Effects Yes Yes Yes Yes Yes Yes Yes Yes
Year Fixed Effects Yes Yes Yes Yes Yes Yes Yes Yes
State Fixed Effects Yes Yes Yes Yes Yes Yes Yes Yes
State-specific Linear Trends Yes Yes Yes Yes Yes Yes Yes Yes
Source : German Socio-Economic Panel (1984-2009).
Table A10: Additional Estimates of the Labor Market Returns to Naturalization
Male Immigrants Female Immigrants
Employment Log Monthly Earnings Employment Log Monthly Earnings
OLS OLS OLS OLS
Employment Personal Income Employment Personal Income
Reduced Form Reduced Form Reduced Form Reduced Form
Notes : The table reports OLS (top panel) and reduced-form estimates (bottom panel) of the returns to citizenship. The dependent variables are whether a person is employed (columns (1)-
(2) and (5)-(6)) and the log monthly personal income (columns (3)-(4) and (7)-(8)). To test for the presence of level and slope effects, the specifications includes both an indicator for actual
naturalization and years since naturalization (in the top panel); or an indicator for eligiblity and the number of years of eligibility (in the bottom panel). The sample includes all immigrants
who arrived in Germany between 1976 and 2000 who were between 16- 35 years old in some year in the 1991-2009 period. We exclude all ethnic Germans, i.e. immigrants with German
ancestry who had faster access to German citizenship than regular immigrants. All specifications include the same individual characteristics as earlier tables (age, education), current year
and state of current residence fixed effects as well as state-specific linear trends. We also include 10 region of origin fixed effects (traditional EU countries, new EU entrants (EU-12), ex-
Yugoslavia, Turkey, Middle East, Asia, Africa, North and South America, Russia and other former Soviet Union republics, other or no citizenship). The second specification (columns (2), (4),
(6) and (8)) includes a linear and squared term in the years since arrival in Germany. Standard errors are clustered at the age x arrival cohort level. Statistical significance: *** p<0.01, **
p<0.05, * p<0.1.
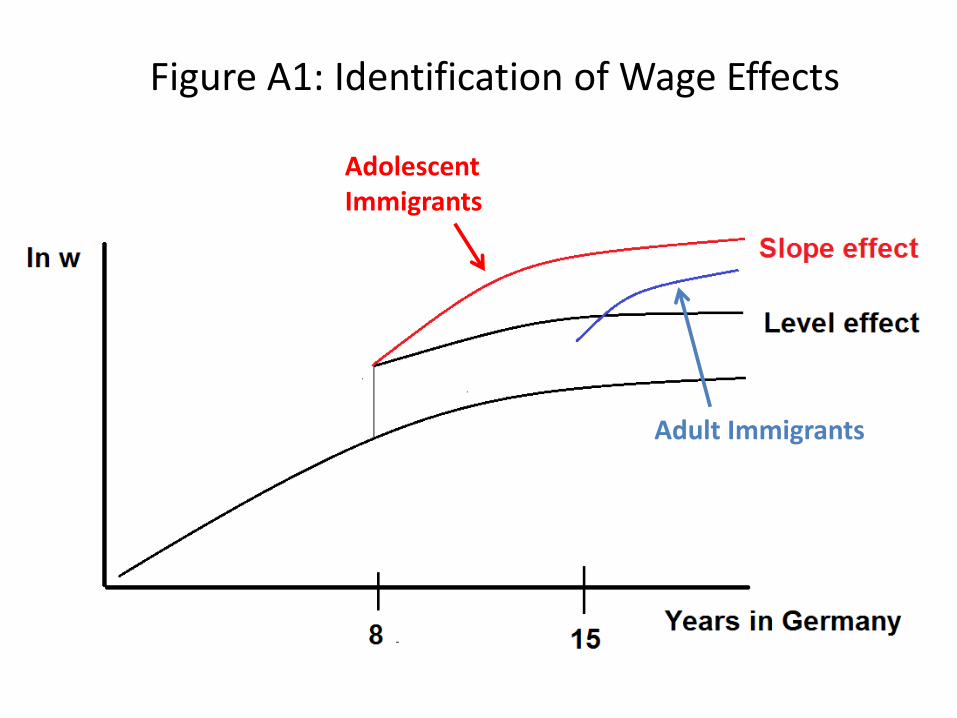
Figure A1: Identification of Wage Effects
Adolescent Immigrants
Adult Immigrants