Embed Size (px)
Citation preview

5/9/2018 Naca Panel - slidepdf.com
http://slidepdf.com/reader/full/naca-panel 1/12
Strömung um NACA-Profilemit einer Panelmethode
Fakultät Maschinenwesen Institut für Luft- und Raumfahrrtechnik
Übung Aerodynamik 2, Sommersemester 2008
Thomas Albrecht
5/9/2018 Naca Panel - slidepdf.com
http://slidepdf.com/reader/full/naca-panel 2/12
TU Dresden, 15.07.08 Strömung um NACA-Profile Folie 2 von XYZ

5/9/2018 Naca Panel - slidepdf.com
http://slidepdf.com/reader/full/naca-panel 3/12
TU Dresden, 15.07.08 Strömung um NACA-Profile Folie 3 von XYZ
NACA 0015 bei 0°Druckverteilung aus Panelmethode und experimentelle Daten

5/9/2018 Naca Panel - slidepdf.com
http://slidepdf.com/reader/full/naca-panel 4/12
TU Dresden, 15.07.08 Strömung um NACA-Profile Folie 4 von XYZ
Programm für heute (und nächste Woche)
• NACA-Profile
• Python-“Einführung“
• Gnuplot-“Einführung“• panel.py vervollständigen
• NACA 0015 und NACA 66(215)-216 berechnen und mit Experimentvergleichen

5/9/2018 Naca Panel - slidepdf.com
http://slidepdf.com/reader/full/naca-panel 5/12
TU Dresden, 15.07.08 Strömung um NACA-Profile Folie 5 von XYZ
NACA-Profile• systematische Messungen von Tragflügelprofilen ab 1930er Jahre
zB. Abbott, Doenhoff, Stivers (1945), Summary of Airfoil Data, NACA-TR 824
• 4-Digit-Series
NACA 0015 NACA 4412
• 5-Digit-Series, 6-Digit-Series, 7-Digit-Series ...
National Advisory Committee for Aeronautics
5/9/2018 Naca Panel - slidepdf.com
http://slidepdf.com/reader/full/naca-panel 6/12
TU Dresden, 15.07.08 Strömung um NACA-Profile Folie 6 von XYZ
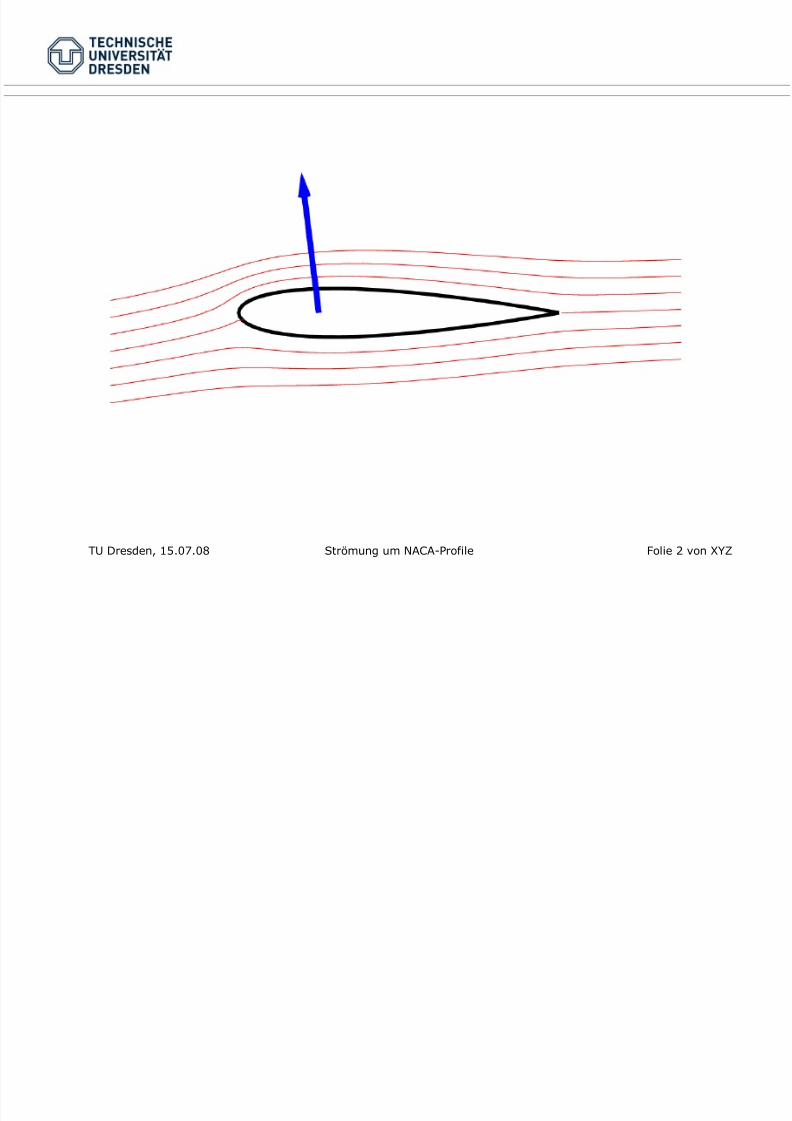
NACA 4 4 121. Stelle: max. Camber [in % c] => 0.04c
2. Stelle: Abstand von LE [in 0.1c] => 0.4c
3./4. Stelle: max. Profildicke in %c => 0.12c
4
4
12
NACA 0015: symmetrisch mit 15% max. Profildicke
5/9/2018 Naca Panel - slidepdf.com
http://slidepdf.com/reader/full/naca-panel 7/12
TU Dresden, 15.07.08 Strömung um NACA-Profile Folie 7 von XYZ
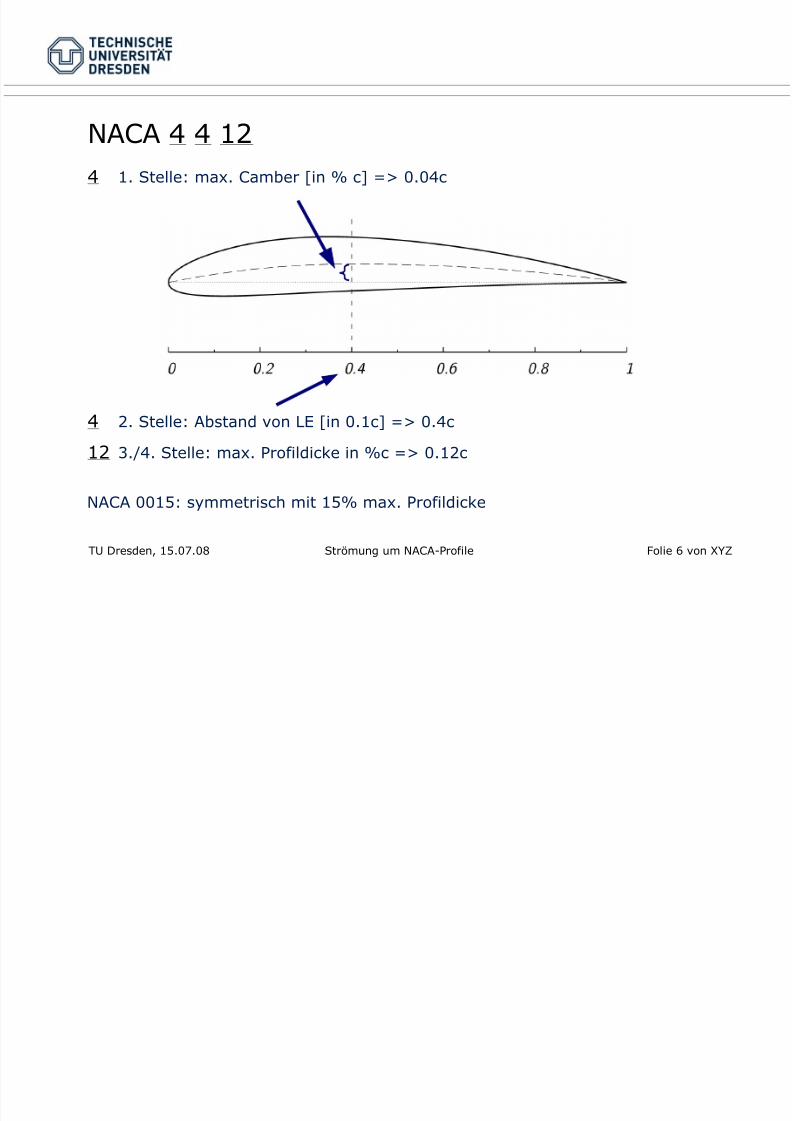
Panelmethode mit Wirbeln I
x i , y i=U ∞ y i−V ∞ x i∑ j=0
N −1
j Aij=C
Aij= 12∫S
j
ln∣r i−r s j∣ds j
• Durch Wirbelschicht auf Panel j in Kontrollpunkt i induzierte Stromfunktion:
• Stromfunktion im Kontrollpunkt i (xi, y
i):
• Konstante C und N unbekannte Wirbelstärken => N+1 Unbekannte
• N Panels und Kutta-Bedingung => N+1 lineare Gleichungen
j
Panel jKontrollpunkt i Panel jPanel jPanel j
(xi, y
i)
j
5/9/2018 Naca Panel - slidepdf.com
http://slidepdf.com/reader/full/naca-panel 8/12
TU Dresden, 15.07.08 Strömung um NACA-Profile Folie 8 von XYZ
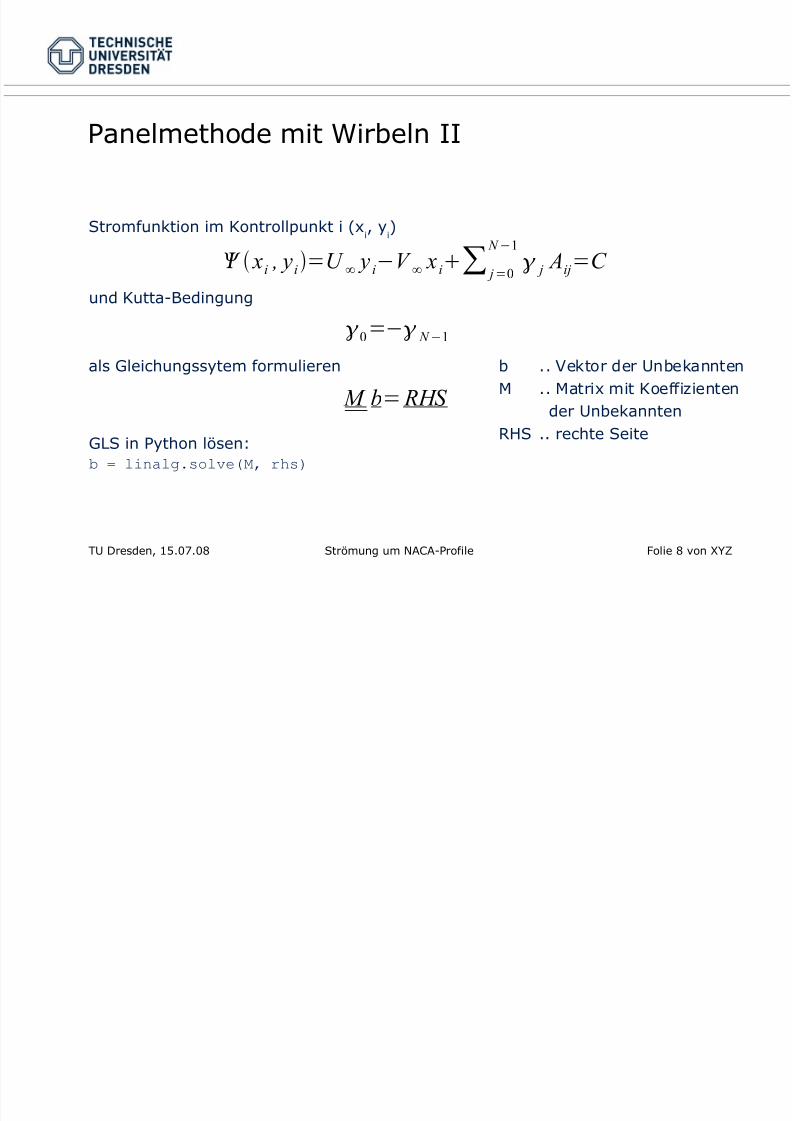
Panelmethode mit Wirbeln II
x i , y i=U ∞
y i−V ∞
x i
∑ j=0
N −1
j Aij=C
M b= RHS
und Kutta-Bedingung
Stromfunktion im Kontrollpunkt i (xi, y
i)
als Gleichungssytem formulieren
0=− N −1
GLS in Python lösen:b = linalg.solve(M, rhs)
b .. Vektor der Unbekannten
M .. Matrix mit Koeffizienten
der UnbekanntenRHS .. rechte Seite
5/9/2018 Naca Panel - slidepdf.com
http://slidepdf.com/reader/full/naca-panel 9/12
TU Dresden, 15.07.08 Strömung um NACA-Profile Folie 9 von XYZ
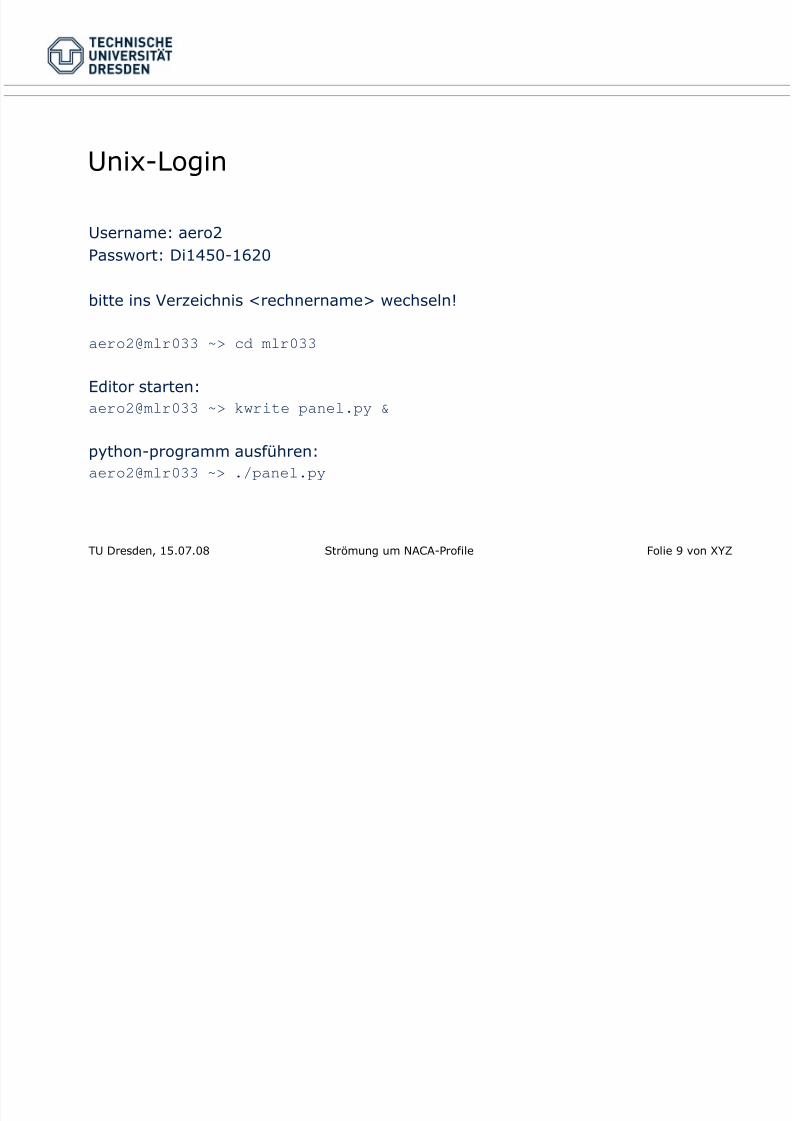
Unix-Login
Username: aero2
Passwort: Di1450-1620
bitte ins Verzeichnis <rechnername> wechseln!
aero2@mlr033 ~> cd mlr033
Editor starten:
aero2@mlr033 ~> kwrite panel.py &
python-programm ausführen:
aero2@mlr033 ~> ./panel.py
5/9/2018 Naca Panel - slidepdf.com
http://slidepdf.com/reader/full/naca-panel 10/12
TU Dresden, 15.07.08 Strömung um NACA-Profile Folie 10 von XYZ
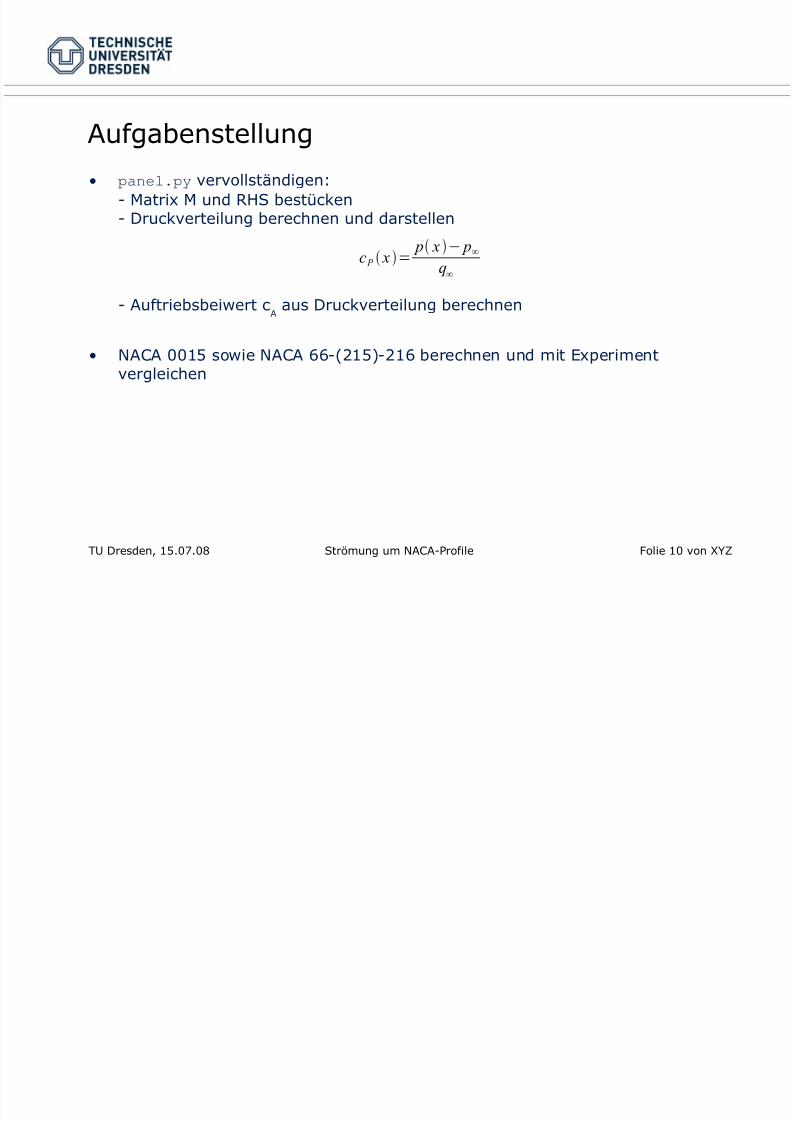
Aufgabenstellung• panel.py vervollständigen:
- Matrix M und RHS bestücken- Druckverteilung berechnen und darstellen
- Auftriebsbeiwert cA
aus Druckverteilung berechnen
• NACA 0015 sowie NACA 66-(215)-216 berechnen und mit Experimentvergleichen
c P x = p x − p∞
q∞
5/9/2018 Naca Panel - slidepdf.com
http://slidepdf.com/reader/full/naca-panel 11/12
TU Dresden, 15.07.08 Strömung um NACA-Profile Folie 11 von XYZ
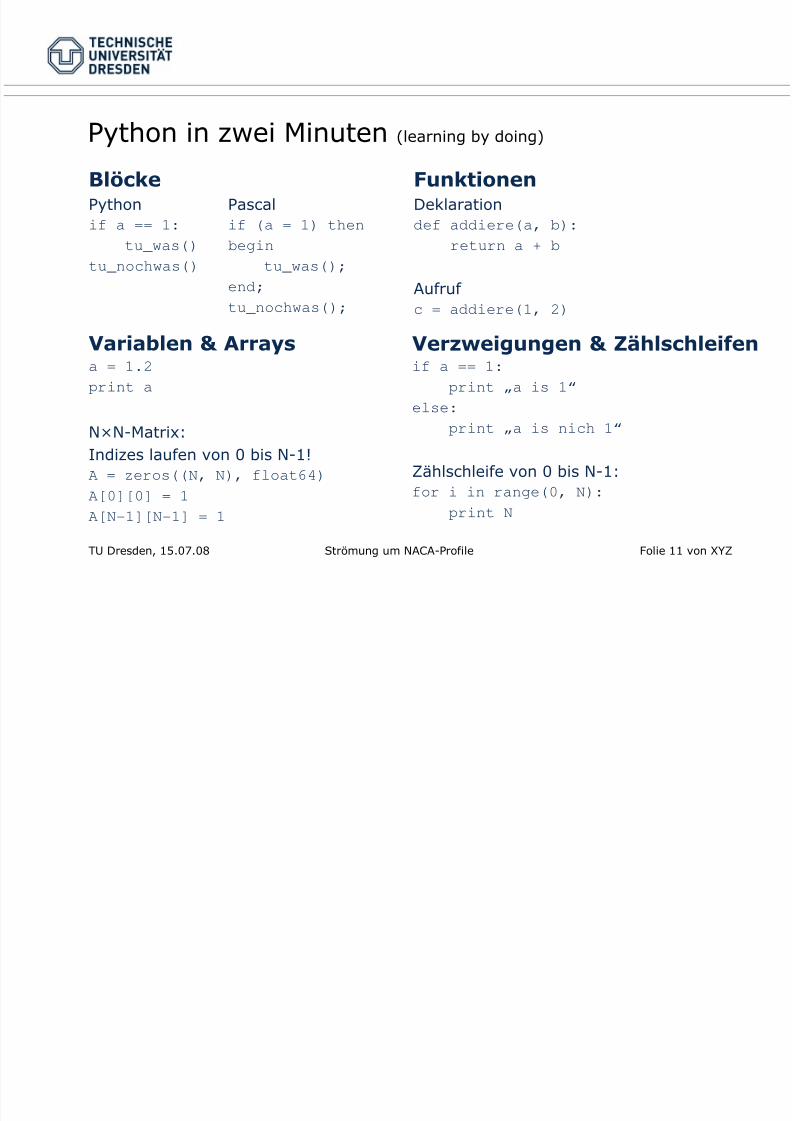
BlöckePythonif a == 1:
tu_was()
tu_nochwas()
Python in zwei Minuten (learning by doing)
Pascalif (a = 1) then
begin
tu_was();
end;
tu_nochwas();
FunktionenDeklarationdef addiere(a, b):
return a + b
Aufruf c = addiere(1, 2)
Variablen & Arraysa = 1.2
print a
N×N-Matrix:
Indizes laufen von 0 bis N-1!A = zeros((N, N), float64)
A[0][0] = 1
A[N 1][N 1] = 1
Verzweigungen & Zählschleifenif a == 1:
print „a is 1“
else:
print „a is nich 1“
Zählschleife von 0 bis N-1:for i in range(0, N):
print N
5/9/2018 Naca Panel - slidepdf.com
http://slidepdf.com/reader/full/naca-panel 12/12
TU Dresden, 15.07.08 Strömung um NACA-Profile Folie 12 von XYZ
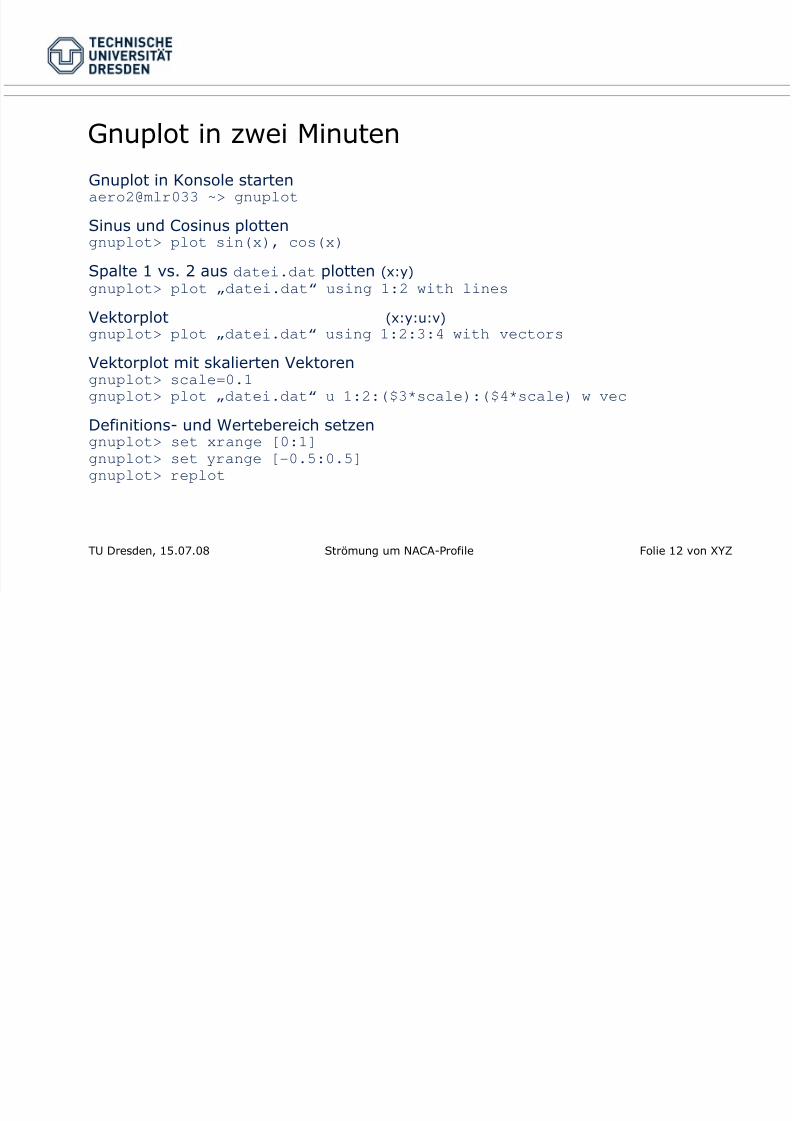
Gnuplot in zwei MinutenGnuplot in Konsole startenaero2@mlr033 ~> gnuplot
Sinus und Cosinus plottengnuplot> plot sin(x), cos(x)
Spalte 1 vs. 2 aus datei.dat plotten (x:y)gnuplot> plot „datei.dat“ using 1:2 with lines
Vektorplot (x:y:u:v)gnuplot> plot „datei.dat“ using 1:2:3:4 with vectors
Vektorplot mit skalierten Vektorengnuplot> scale=0.1
gnuplot> plot „datei.dat“ u 1:2:($3*scale):($4*scale) w vec
Definitions- und Wertebereich setzengnuplot> set xrange [0:1]
gnuplot> set yrange [ 0.5:0.5]
gnuplot> replot