Embed Size (px)
Citation preview
NOMAD spectrometer on the ExoMars trace gasorbiter mission: part 1—design, manufacturingand testing of the infrared channelsEDDY NEEFS,1,* ANN CARINE VANDAELE,1 RACHEL DRUMMOND,1 IAN R. THOMAS,1 SOPHIE BERKENBOSCH,1
ROLAND CLAIRQUIN,1 SOFIE DELANOYE,1 BOJAN RISTIC,1 JEROEN MAES,1 SABRINA BONNEWIJN,1
GERRY PIECK,1 EDDY EQUETER,1 CÉDRIC DEPIESSE,1 FRANK DAERDEN,1 EMIEL VAN RANSBEECK,2
DENNIS NEVEJANS,3 JULIO RODRIGUEZ-GÓMEZ,4 JOSÉ-JUAN LÓPEZ-MORENO,4 ROSARIO SANZ,4
RAFAEL MORALES,4 GIAN PAOLO CANDINI,4 M. CARMEN PASTOR-MORALES,4 BEATRIZ APARICIO DEL MORAL,4
JOSÉ-MARIA JERONIMO-ZAFRA,4 JUAN MANUEL GÓMEZ-LÓPEZ,4 GUSTAVO ALONSO-RODRIGO,5
ISABEL PÉREZ-GRANDE,5 JAVIER CUBAS,5 ALEJANDRO M. GOMEZ-SANJUAN,5 FERMÍN NAVARRO-MEDINA,5
TANGUY THIBERT,6 MANISH R. PATEL,7,8 GIANCARLO BELLUCCI,9 LIEVE DE VOS,10 STEFAN LESSCHAEVE,10
NICO VAN VOOREN,10 WOUTER MOELANS,10 LUDOVIC ABALLEA,10 STIJN GLORIEUX,10 ANN BAEKE,10
DAVE KENDALL,10 JURGEN DE NEEF,10 ALEXANDER SOENEN,10 PIERRE-YVES PUECH,10 JON WARD,11
JEAN-FRANÇOIS JAMOYE,12 DAVID DIEZ,13 ANA VICARIO-ARROYO,13 AND MICHEL JANKOWSKI14
1Belgian Institute for Space Aeronomy, BIRA-IASB, Ringlaan 3, 1180 Brussels, Belgium2VREC, Dries 15, 1745 Mazenzele, Belgium3(formerly) CONSERD, Krekelstraat 27, 9052 Gent, Belgium4Instituto de Astrofisica de Andalucia, IAA-CSIC, Glorieta de la Astronomia, 18008 Granada, Spain5Universidad Politéchnica de Madrid, IDR/UPM, Plaza Cardenal Cisneros 3, 28040 Madrid, Spain6Centre Spatial de Liège, CSL, Liège Science Park, Avenue du Pré-Aily, 4031 Angleur, Belgium7Department of Physical Sciences, The Open University, Milton Keynes, MK7 6AA, UK8SSTD, STFC Rutherford Appleton Laboratory, Chilton, Oxfordshire OX11 0QX, UK9Istituto di Astrofisica e Planetologia Spaziali, IAPS-INAF, Via del Fosso del Cavaliere 100, 00133 Rome, Italy10OIP, Westerring 21, 9700 Oudenaarde, Belgium11Gooch and Housego, Dowlish Ford, Ilminster, TA19 0PF, UK12AMOS, Rue des Chasseurs Ardennais 2, 4031 Angleur, Belgium13ERZIA, Castelar 3, 39004 Santander, Spain14Thales Alenia Space Belgium, Rue Chapelle Beaussart 101, 6032 Mont-sur-Marchienne, Belgium*Corresponding author: [email protected]
Received 4 June 2015; revised 12 August 2015; accepted 27 August 2015; posted 31 August 2015 (Doc. ID 242418); published 30 September 2015
NOMAD is a spectrometer suite on board ESA’s ExoMars trace gas orbiter due for launch in January 2016.NOMAD consists of two infrared channels and one ultraviolet and visible channel allowing the instrumentto perform observations quasi-constantly, by taking nadir measurements at dayside and nightside, and duringsolar occultations. In this paper, the design, manufacturing, and testing of the two infrared channels are described.We focus upon the optical working principle in these channels, where an echelle grating, used as a diffractiveelement, is combined with an acousto-optical tunable filter, used as a diffraction order sorter. © 2015 Optical
Society of America
OCIS codes: (120.6085) Space instrumentation; (120.6200) Spectrometers and spectroscopic instrumentation; (120.0280) Remote
sensing and sensors; (300.6340) Spectroscopy, infrared.
http://dx.doi.org/10.1364/AO.54.008494
1. INTRODUCTION
The Nadir and Occultation for MArs Discovery instrument(NOMAD) is a spectrometer suite led by the Belgian Institutefor Space Aeronomy (BIRA-IASB), being flown on the
ESA/Roscosmos ExoMars Trace Gas Orbiter mission.NOMAD is predominantly based upon the solar occultationsin the infrared (SOIR) channel in the spectroscopy for theinvestigation of the composition of the atmosphere of Venus
8494 Vol. 54, No. 28 / October 1 2015 / Applied Optics Research Article
1559-128X/15/288494-27$15/0$15.00 © 2015 Optical Society of America
instrument from the highly successful Venus Express mission, acompact high-resolution echelle grating spectrometer with anacousto-optical tunable filter for the infrared domain between2.3 and 4.3 μm [1–4].
NOMAD consists of three separate channels, solar occulta-tion (SO), limb nadir and occultation (LNO), and ultravioletand visible spectrometer (UVIS), all controlled via a single mainelectronics interface. SO and LNO are the infrared spectrom-eters which form the subject of this paper. UVIS is addressed inthe companion paper to this article [5].
The SO channel has exactly the same optical design as SOIR,an infrared echelle-acousto-optical tunable filter (AOTF) spec-trometer in the 2.3 to 4.3 μm range with a resolving powerat midrange of approximately λ∕Δλ � 20; 000, using uniquelythe SO observation technique. It was proven during the VenusExpress mission that, although SOIR does a great job as a SOinstrument, its signal-to-noise ratio (SNR) is too low whenobserving at the limb or nadir. The contribution of thermal back-ground in SOIR’s wavelength domain drowns the weaker signal.
The LNO channel is similar to the SO channel but it hasbeen optimized for observing weak IR light sources as encoun-tered when observing Mars in the nadir or the limb. LNO has areduced wavelength range (between 2.3 and 3.8 μm) and aresolving power at midrange of approximately λ∕Δλ � 10; 000.
The UVIS channel is an ultraviolet-visible spectrometer,capable of observations in both SO and nadir viewing geom-etries. UVIS is based upon the instrument designed and devel-oped by the Open University, UK, for the ExoMars landermission as part of the Humboldt payload [6]. UVIS operatesover a wavelength range of 200 nm in the ultraviolet up to650 nm in the visible, with a spectral resolution of approxi-mately 1.5 nm. The UVIS channel is based on a Czerny–Turner layout, a totally different spectrometer concept thanthe infrared channels. Dual front-end telescopic viewing opticspermit both viewing geometries to be achieved with a singlespectrometer.
NOMAD’s scientific goals are to look for trace gases ofpotential biological origin in the Martian atmosphere, identifypotential source regions, and provide information on the natureof the processes involved. NOMAD will study the majorclimatological cycles, such as water, ozone and carbon cycles,the components and isotopes involved, and provide insight intotheir escape from the atmosphere. NOMAD will also look fortraces of active geology and volcanism on Mars. Consequentlythe three key science objectives for NOMAD have been definedas follows.
Determine the trace gas composition of the Martian atmos-phere by detecting species such asCO2, CO,H2O,HO2,NO2,N2O, CH4, C2H2, C2H4, C2H6, H2CO, HCN, H2S,OCS, HCl (SO and LNO channels), and SO2,O3 (UVIS chan-nel), and isotopes, such as 13CO2, 17OCO, 18OCO, C18O2,13CO, C18O, HDO, 13CH4, CH3D, not only in the lowerand middle atmosphere, but also in the upper atmosphere.Contribute to the comprehension of the past and future evolu-tion of the atmosphere by studying the upper atmosphere escapeprocesses. Constrain the sources and sinks of methane, and studygases that relate to ongoing geophysical and volcanic activity.
For the above-mentioned trace gases, characterize theirspatial and temporal variations. Refine the present knowledgeof CO2-, CO-, H2O-, and O3- climatologies, and in general ofatmospheric dynamics.
For the above-mentioned trace gases, characterize theirproduction and loss mechanisms, and localize their sources.Refine the present knowledge of water, carbon, ozone and dustcycles, and their relation to surface mineralogy and polar iceformation.
The detailed science objectives of NOMAD are described ina separate paper [7].
2. DESIGN OBJECTIVES FOR SO AND LNO
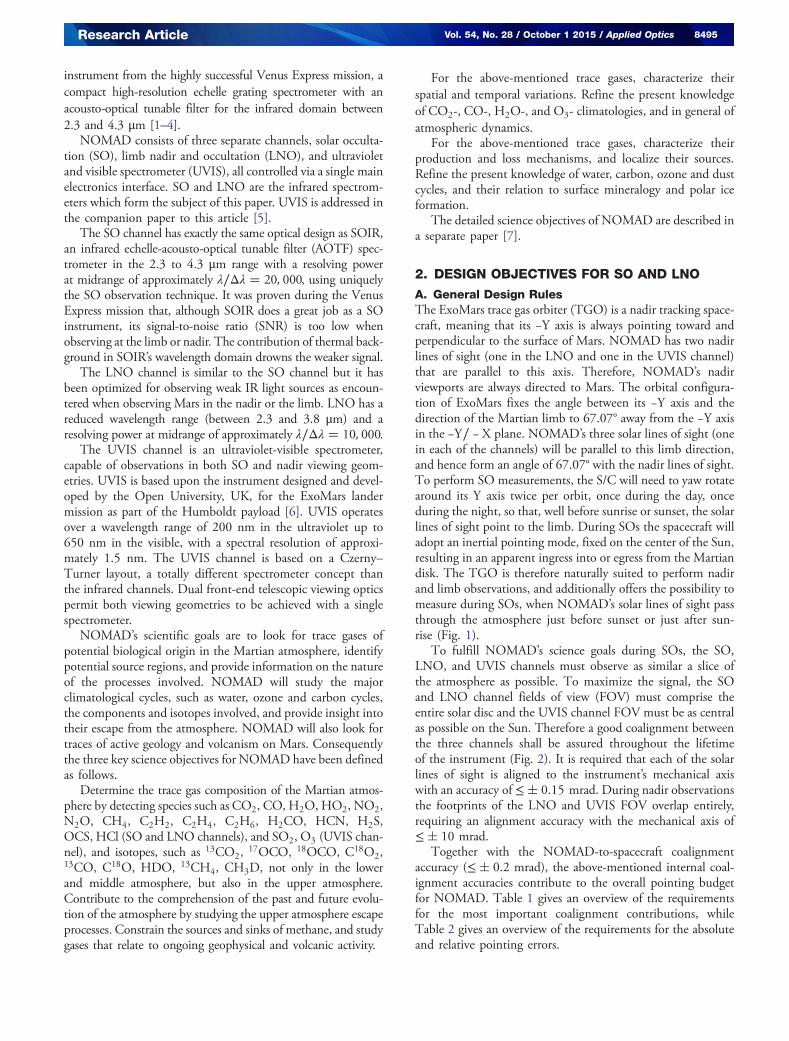
A. General Design RulesThe ExoMars trace gas orbiter (TGO) is a nadir tracking space-craft, meaning that its −Y axis is always pointing toward andperpendicular to the surface of Mars. NOMAD has two nadirlines of sight (one in the LNO and one in the UVIS channel)that are parallel to this axis. Therefore, NOMAD’s nadirviewports are always directed to Mars. The orbital configura-tion of ExoMars fixes the angle between its −Y axis and thedirection of the Martian limb to 67.07° away from the −Y axisin the −Y∕ − X plane. NOMAD’s three solar lines of sight (onein each of the channels) will be parallel to this limb direction,and hence form an angle of 67.07° with the nadir lines of sight.To perform SO measurements, the S/C will need to yaw rotatearound its Y axis twice per orbit, once during the day, onceduring the night, so that, well before sunrise or sunset, the solarlines of sight point to the limb. During SOs the spacecraft willadopt an inertial pointing mode, fixed on the center of the Sun,resulting in an apparent ingress into or egress from the Martiandisk. The TGO is therefore naturally suited to perform nadirand limb observations, and additionally offers the possibility tomeasure during SOs, when NOMAD’s solar lines of sight passthrough the atmosphere just before sunset or just after sun-rise (Fig. 1).
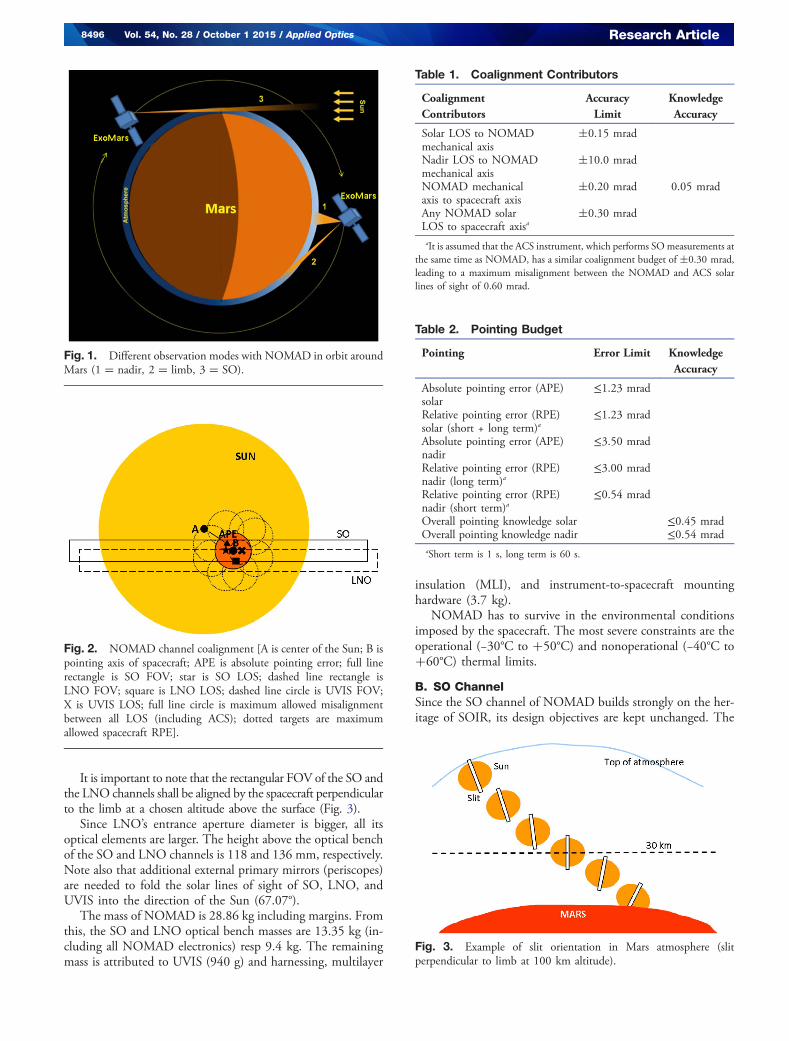
To fulfill NOMAD’s science goals during SOs, the SO,LNO, and UVIS channels must observe as similar a slice ofthe atmosphere as possible. To maximize the signal, the SOand LNO channel fields of view (FOV) must comprise theentire solar disc and the UVIS channel FOV must be as centralas possible on the Sun. Therefore a good coalignment betweenthe three channels shall be assured throughout the lifetimeof the instrument (Fig. 2). It is required that each of the solarlines of sight is aligned to the instrument’s mechanical axiswith an accuracy of ≤� 0.15 mrad. During nadir observationsthe footprints of the LNO and UVIS FOV overlap entirely,requiring an alignment accuracy with the mechanical axis of≤� 10 mrad.
Together with the NOMAD-to-spacecraft coalignmentaccuracy (≤� 0.2 mrad), the above-mentioned internal coal-ignment accuracies contribute to the overall pointing budgetfor NOMAD. Table 1 gives an overview of the requirementsfor the most important coalignment contributions, whileTable 2 gives an overview of the requirements for the absoluteand relative pointing errors.
Research Article Vol. 54, No. 28 / October 1 2015 / Applied Optics 8495
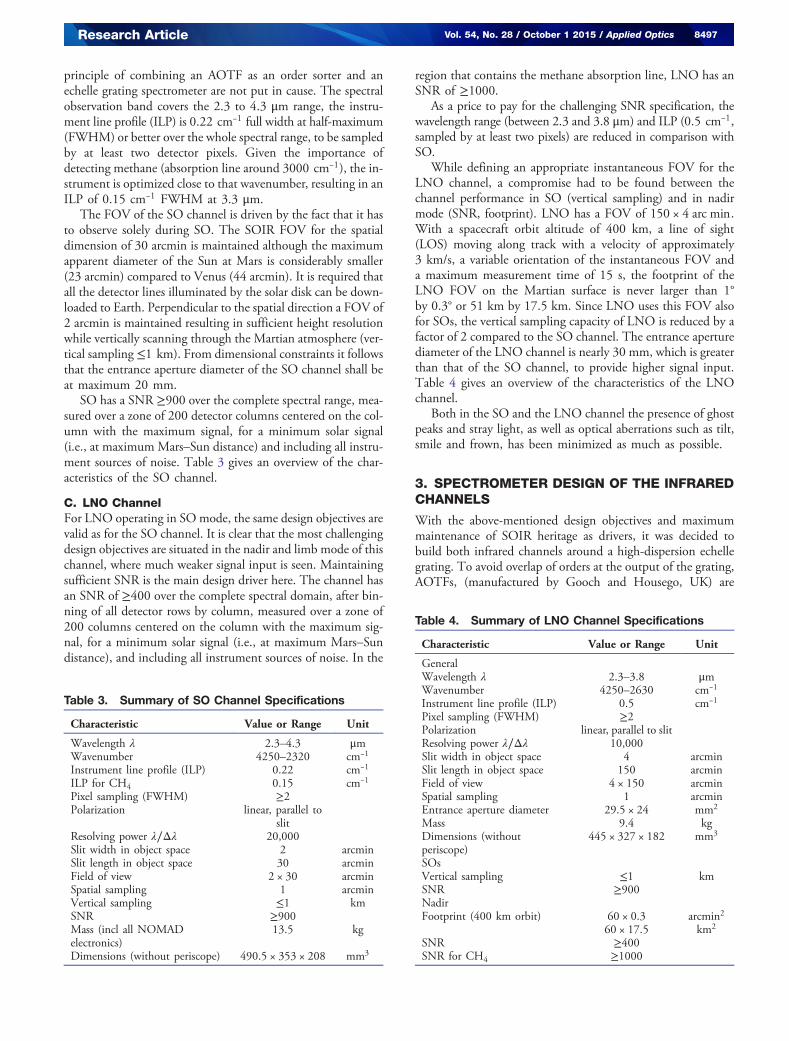
It is important to note that the rectangular FOV of the SO andthe LNO channels shall be aligned by the spacecraft perpendicularto the limb at a chosen altitude above the surface (Fig. 3).
Since LNO’s entrance aperture diameter is bigger, all itsoptical elements are larger. The height above the optical benchof the SO and LNO channels is 118 and 136 mm, respectively.Note also that additional external primary mirrors (periscopes)are needed to fold the solar lines of sight of SO, LNO, andUVIS into the direction of the Sun (67.07°).
The mass of NOMAD is 28.86 kg including margins. Fromthis, the SO and LNO optical bench masses are 13.35 kg (in-cluding all NOMAD electronics) resp 9.4 kg. The remainingmass is attributed to UVIS (940 g) and harnessing, multilayer
insulation (MLI), and instrument-to-spacecraft mountinghardware (3.7 kg).
NOMAD has to survive in the environmental conditionsimposed by the spacecraft. The most severe constraints are theoperational (−30°C to �50°C) and nonoperational (−40°C to�60°C) thermal limits.
B. SO ChannelSince the SO channel of NOMAD builds strongly on the her-itage of SOIR, its design objectives are kept unchanged. The
Fig. 1. Different observation modes with NOMAD in orbit aroundMars (1 � nadir, 2 � limb, 3 � SO).
Fig. 2. NOMAD channel coalignment [A is center of the Sun; B ispointing axis of spacecraft; APE is absolute pointing error; full linerectangle is SO FOV; star is SO LOS; dashed line rectangle isLNO FOV; square is LNO LOS; dashed line circle is UVIS FOV;X is UVIS LOS; full line circle is maximum allowed misalignmentbetween all LOS (including ACS); dotted targets are maximumallowed spacecraft RPE].
Table 1. Coalignment Contributors
CoalignmentContributors
AccuracyLimit
KnowledgeAccuracy
Solar LOS to NOMADmechanical axis
�0.15 mrad
Nadir LOS to NOMADmechanical axis
�10.0 mrad
NOMAD mechanicalaxis to spacecraft axis
�0.20 mrad 0.05 mrad
Any NOMAD solarLOS to spacecraft axisa
�0.30 mrad
aIt is assumed that the ACS instrument, which performs SOmeasurements atthe same time as NOMAD, has a similar coalignment budget of �0.30 mrad,leading to a maximum misalignment between the NOMAD and ACS solarlines of sight of 0.60 mrad.
Fig. 3. Example of slit orientation in Mars atmosphere (slitperpendicular to limb at 100 km altitude).
Table 2. Pointing Budget
Pointing Error Limit KnowledgeAccuracy
Absolute pointing error (APE)solar
≤1.23 mrad
Relative pointing error (RPE)solar (short + long term)a
≤1.23 mrad
Absolute pointing error (APE)nadir
≤3.50 mrad
Relative pointing error (RPE)nadir (long term)a
≤3.00 mrad
Relative pointing error (RPE)nadir (short term)a
≤0.54 mrad
Overall pointing knowledge solar ≤0.45 mradOverall pointing knowledge nadir ≤0.54 mrad
aShort term is 1 s, long term is 60 s.
8496 Vol. 54, No. 28 / October 1 2015 / Applied Optics Research Article
principle of combining an AOTF as an order sorter and anechelle grating spectrometer are not put in cause. The spectralobservation band covers the 2.3 to 4.3 μm range, the instru-ment line profile (ILP) is 0.22 cm−1 full width at half-maximum(FWHM) or better over the whole spectral range, to be sampledby at least two detector pixels. Given the importance ofdetecting methane (absorption line around 3000 cm−1), the in-strument is optimized close to that wavenumber, resulting in anILP of 0.15 cm−1 FWHM at 3.3 μm.
The FOV of the SO channel is driven by the fact that it hasto observe solely during SO. The SOIR FOV for the spatialdimension of 30 arcmin is maintained although the maximumapparent diameter of the Sun at Mars is considerably smaller(23 arcmin) compared to Venus (44 arcmin). It is required thatall the detector lines illuminated by the solar disk can be down-loaded to Earth. Perpendicular to the spatial direction a FOV of2 arcmin is maintained resulting in sufficient height resolutionwhile vertically scanning through the Martian atmosphere (ver-tical sampling ≤1 km). From dimensional constraints it followsthat the entrance aperture diameter of the SO channel shall beat maximum 20 mm.
SO has a SNR ≥900 over the complete spectral range, mea-sured over a zone of 200 detector columns centered on the col-umn with the maximum signal, for a minimum solar signal(i.e., at maximum Mars–Sun distance) and including all instru-ment sources of noise. Table 3 gives an overview of the char-acteristics of the SO channel.
C. LNO ChannelFor LNO operating in SOmode, the same design objectives arevalid as for the SO channel. It is clear that the most challengingdesign objectives are situated in the nadir and limb mode of thischannel, where much weaker signal input is seen. Maintainingsufficient SNR is the main design driver here. The channel hasan SNR of ≥400 over the complete spectral domain, after bin-ning of all detector rows by column, measured over a zone of200 columns centered on the column with the maximum sig-nal, for a minimum solar signal (i.e., at maximum Mars–Sundistance), and including all instrument sources of noise. In the
region that contains the methane absorption line, LNO has anSNR of ≥1000.
As a price to pay for the challenging SNR specification, thewavelength range (between 2.3 and 3.8 μm) and ILP (0.5 cm−1,sampled by at least two pixels) are reduced in comparison withSO.
While defining an appropriate instantaneous FOV for theLNO channel, a compromise had to be found between thechannel performance in SO (vertical sampling) and in nadirmode (SNR, footprint). LNO has a FOV of 150 × 4 arc min.With a spacecraft orbit altitude of 400 km, a line of sight(LOS) moving along track with a velocity of approximately3 km/s, a variable orientation of the instantaneous FOV anda maximum measurement time of 15 s, the footprint of theLNO FOV on the Martian surface is never larger than 1°by 0.3° or 51 km by 17.5 km. Since LNO uses this FOV alsofor SOs, the vertical sampling capacity of LNO is reduced by afactor of 2 compared to the SO channel. The entrance aperturediameter of the LNO channel is nearly 30 mm, which is greaterthan that of the SO channel, to provide higher signal input.Table 4 gives an overview of the characteristics of the LNOchannel.
Both in the SO and the LNO channel the presence of ghostpeaks and stray light, as well as optical aberrations such as tilt,smile and frown, has been minimized as much as possible.
3. SPECTROMETER DESIGN OF THE INFRAREDCHANNELS
With the above-mentioned design objectives and maximummaintenance of SOIR heritage as drivers, it was decided tobuild both infrared channels around a high-dispersion echellegrating. To avoid overlap of orders at the output of the grating,AOTFs, (manufactured by Gooch and Housego, UK) are
Table 3. Summary of SO Channel Specifications
Characteristic Value or Range Unit
Wavelength λ 2.3–4.3 μmWavenumber 4250–2320 cm−1
Instrument line profile (ILP) 0.22 cm−1
ILP for CH4 0.15 cm−1
Pixel sampling (FWHM) ≥2Polarization linear, parallel to
slitResolving power λ∕Δλ 20,000Slit width in object space 2 arcminSlit length in object space 30 arcminField of view 2 × 30 arcminSpatial sampling 1 arcminVertical sampling ≤1 kmSNR ≥900Mass (incl all NOMADelectronics)
13.5 kg
Dimensions (without periscope) 490.5 × 353 × 208 mm3
Table 4. Summary of LNO Channel Specifications
Characteristic Value or Range Unit
GeneralWavelength λ 2.3–3.8 μmWavenumber 4250–2630 cm−1
Instrument line profile (ILP) 0.5 cm−1
Pixel sampling (FWHM) ≥2Polarization linear, parallel to slitResolving power λ∕Δλ 10,000Slit width in object space 4 arcminSlit length in object space 150 arcminField of view 4 × 150 arcminSpatial sampling 1 arcminEntrance aperture diameter 29.5 × 24 mm2
Mass 9.4 kgDimensions (withoutperiscope)
445 × 327 × 182 mm3
SOsVertical sampling ≤1 kmSNR ≥900NadirFootprint (400 km orbit) 60 × 0.3 arcmin2
60 × 17.5 km2
SNR ≥400SNR for CH4 ≥1000
Research Article Vol. 54, No. 28 / October 1 2015 / Applied Optics 8497
placed as order sorting devices in front of the spectrometer sec-tions. We remind that the use of echelle gratings has the dis-tinct advantage over other types of spectrometers (based, e.g.,on cross-orthogonal dispersion) that the full height of the de-tector can be used to register spectral lines, allowing to improvethe SNR by column binning. AOTFs, on the other hand, offera quick electronic driven random access to the spectral orders,with no need for moving mechanical parts, and with the pos-sibility to use them as an optical shutter, blocking incident lightso that background measurements can be performed.
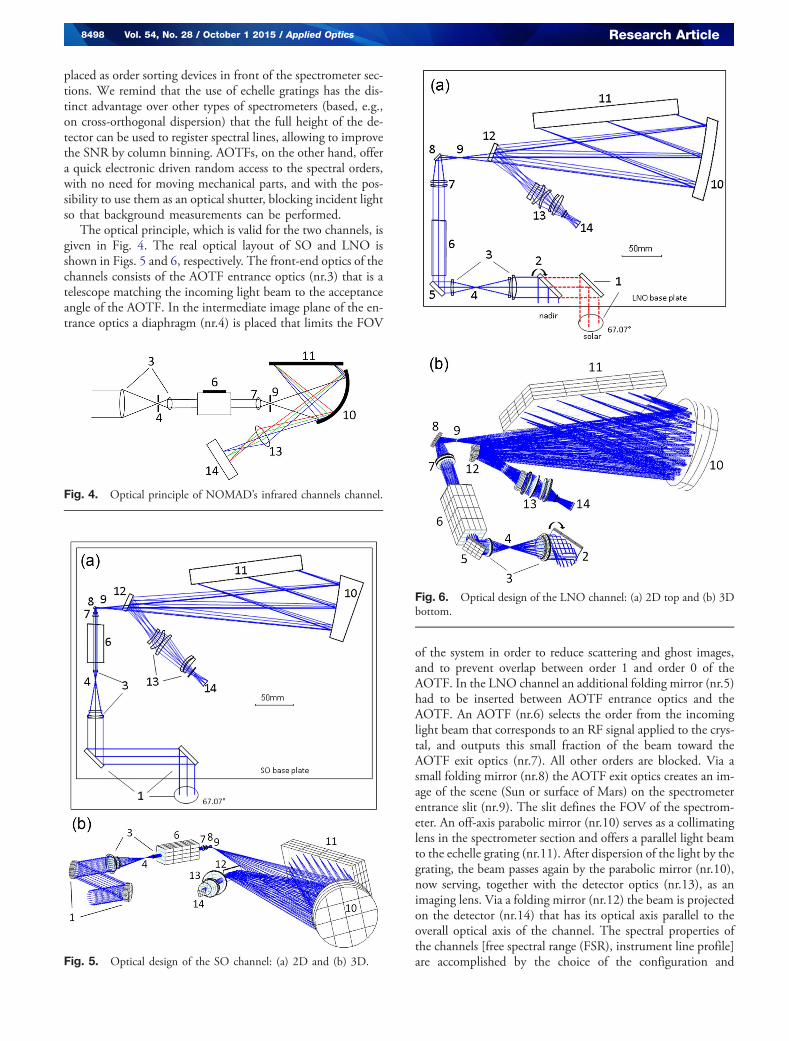
The optical principle, which is valid for the two channels, isgiven in Fig. 4. The real optical layout of SO and LNO isshown in Figs. 5 and 6, respectively. The front-end optics of thechannels consists of the AOTF entrance optics (nr.3) that is atelescope matching the incoming light beam to the acceptanceangle of the AOTF. In the intermediate image plane of the en-trance optics a diaphragm (nr.4) is placed that limits the FOV
of the system in order to reduce scattering and ghost images,and to prevent overlap between order 1 and order 0 of theAOTF. In the LNO channel an additional folding mirror (nr.5)had to be inserted between AOTF entrance optics and theAOTF. An AOTF (nr.6) selects the order from the incominglight beam that corresponds to an RF signal applied to the crys-tal, and outputs this small fraction of the beam toward theAOTF exit optics (nr.7). All other orders are blocked. Via asmall folding mirror (nr.8) the AOTF exit optics creates an im-age of the scene (Sun or surface of Mars) on the spectrometerentrance slit (nr.9). The slit defines the FOV of the spectrom-eter. An off-axis parabolic mirror (nr.10) serves as a collimatinglens in the spectrometer section and offers a parallel light beamto the echelle grating (nr.11). After dispersion of the light by thegrating, the beam passes again by the parabolic mirror (nr.10),now serving, together with the detector optics (nr.13), as animaging lens. Via a folding mirror (nr.12) the beam is projectedon the detector (nr.14) that has its optical axis parallel to theoverall optical axis of the channel. The spectral properties ofthe channels [free spectral range (FSR), instrument line profile]are accomplished by the choice of the configuration and
Fig. 4. Optical principle of NOMAD’s infrared channels channel.
Fig. 5. Optical design of the SO channel: (a) 2D and (b) 3D.
Fig. 6. Optical design of the LNO channel: (a) 2D top and (b) 3Dbottom.
8498 Vol. 54, No. 28 / October 1 2015 / Applied Optics Research Article
characteristics of echelle grating, parabolic mirror, and detectoroptics. To obtain the required spectral sampling interval of thesystem, also the pixel size of the detector is of importance.
The entrance of the SO channel is a periscope consisting ofthree flat mirrors (nr.1 in Fig. 5). The two mirrors inside theSO base plate are needed to shift the channel’s aperture to alocation where the incoming beam is not obstructed by otherspacecraft elements. The third mirror is protruding outside thebase plate and tilts the optical axis by 67.07° in the direction ofthe Martian limb.
The LNO channel has two entrance apertures. The solarentrance is a periscope with two flat mirrors (nr.1 in Fig. 6),one inside the base plate, one protruding and tilting the beamby 67.07°. The nadir entrance consists of one single flat flipmirror (nr.2). This mirror is driven by a motor and can beplaced either inside the beam (nominal position, the LNOchannel looks at the nadir) or outside the beam (the LNOchannel looks at the Sun).
Although the conceptual design of the SO and LNO chan-nels is similar, some differences can be noticed. In the SO chan-nel, from heritage, the F -numbers of the optics (f ∕5.16) andthe detector (f ∕3.936) are not matched; in LNO they aref ∕3.936 everywhere. While the focal length (103 mm) re-mains the same in the two channels, this means that the opticalelements in LNO scale up in size by approximately 30%, and ahigher spectrometer slit can be used, contributing positively tothe SNR (see below).
In the SO channel the limiting aperture of the system is thediaphragm in the AOTF entrance optics (f ∕# � f ∕5.16),while in the LNO channel it is the cold shield of the detector(f ∕# � f ∕3.936). This means that in SO it is the entrancepupil (coincident with the first lens of the instrument) thatis imaged along the optical path, and in LNO it is the exit pupil(coincident with the cold shield). Images of the respectivepupils are formed at the first lens and the cold shield, but alsoat two other positions in the instrument: (1) in the middle ofthe AOTF to avoid vignetting of the spatial FOV at the en-trance and exit of the crystal; and (2) on the grating, to keepits dimensions as small as possible. Table 5 gives an overview ofthe first-order optical properties for the two channels.
4. GRATING AND IMAGER OPTICALPROPERTIES
A. Free Spectral RangeFor an echelle grating that is used in the Littrow configuration(incidence angle α and diffraction angle β are the same andequal to the blaze angle ΘB) the grating equation is [8,9]
m · λc �sin α� sin β
g� 2 · sin θB
g; (1)
where g is the groove density (in lines/mm) of the grating, mthe diffraction order, and λc the central wavelength of order m.
The echelle gratings in the infrared channels of NOMADare used in a “near” Littrow configuration. To separate the in-cident and diffracted beam, the gratings are slightly tilted suchthat both beams make a small angle γ with the plane that isperpendicular to the grating surface and the grooves. Besidesthat there is also a small deviation i of the angle of incidence
from the blaze angle in the plane normal to grooves and surface.In these conditions the simplified grating Eq. (1) has to be re-written as
m · λc �2 · sin θB · cos i · cos γ
g: (2)
The spectrometer design and alignment of the NOMADchannels is such that the central wavelength λc of each orderfalls in the center of the detector.
The FSR, the wavelength range in which there is no overlapby adjacent orders, is a constant for echelle gratings:
FSR � 1
λc · m� g
2 · sin θB · cos i · cos γ� Cte: (3)
The wavelengths at the edges of the FSR can be derivedfrom Eqs. (2) and (3) as follows:
λ0 � λc �FSR
2� 2 · sin θB · cos i · cos γ
g · �m� 1∕2� : (4)
Table 6 gives an overview of the grating characteristics.Tables 7 and 8 give for each channel the theoretical valuesof λc , λ
�0 , and λ−0 for some orders.
Writing again the grating Eq. (2) for the near-Littrow case ofNOMAD, now for a diffracted beam at wavelength λ, makingan angle ϕ with the diffracted ray at wavelength λc , the ray thatdefines the optical axis of the imager, we have
m · λ � �sin�θB � i� � sin �θB − i − φ�� · cos γg
: (5)
A special case of Eq. (5) can be written for the rays at wave-lengths λ�e and λ−e that fall on the edges of the detector’s sensi-tive area:
m · λ�e � �sin�θB � i� � sin�θB − i � Δφ�� · cos γg
(6)
Table 5. First-Order Optical Properties
Parameter SO LNO Unit
Entrance aperture 20 × 20(circular)
29.5 × 24(elliptical)
mm2
Overall focal length 103 mmFocal length optics infront of slit
103 mm
Magnification AOTFentrance optics
5× 1.85×
Focal length AOTFentrance “objective”
58.4 57.0 mm
Focal length AOTFentrance “collimator”
11.6 30.7 mm
Focal length AOTF exitoptics
20 55.8 mm
Magnification opticsbehind slit
1×
Focal length collimatinglens
300 mm
Focal length imaging lens 300 mmFocal length parabolicmirror
300 mm
Magnification detectoroptics
1×
Limiting F -number f ∕5.12 f ∕3.936
Research Article Vol. 54, No. 28 / October 1 2015 / Applied Optics 8499
and
m · λ−e ��sin�θB � i� � sin�θB − i − Δφ�� · cos γ
g: (7)
Tables 7 and 8 give for each channel the values of λ�e and λ−efor some orders. The product of the order and the wavelengthat a given pixel, e.g., the central pixel or the two edge pixels,in the “near”-Littrow condition, remains “nearly” constantthroughout the complete spectral domain.
It has to be noted that the free spectral range of theNOMAD channels (FSR � 22.56 cm−1) is slightly larger thanthe spectral span of the detector’s sensitive area for lower orders.
There the edges of the free spectral range that fall off the de-tector. For orders m � 130 and higher, the free spectral rangefalls entirely on the detector.
B. Dispersion and Spectral Sampling IntervalAlso the spectral sampling interval on the detector is defined bythe grating characteristics.
By differentiating Eq. (5) we obtaing · mcos γ
· ∂λ � cos�θB − i − φ� · ∂φ: (8)
While wavelength λc is forced to fall in the center of thedetector, wavelength λ falls a distance D away from the centerof the detector,
Table 6. Grating Characteristics
Parameter SO LNO Accuracy Unit
Wavelength range 2.3–4.3 2.3–3.9 μmBlaze angle ΘB 63.43 �0.1 °Groove density g (at 24.5°C)a 4.031283 lines/mmGroove density g (at 0°C)b 4.033512 lines/mmTotal number of grooves on grating N ≥593 ≥765Groove spacing(at 24.5°C)a 248.06 �0.001 μmLength of grooved area N × 248.06 �0.1 μmOff Littrow angle γ 2.6 2.75 �0.025 °Off blaze angle i −0.02 0 �0.016 °Useful area ≥147.1 × 74.5 ≥ 190 × �97.50–91.85�c mm2
Size (L ×W × T ) 148.1 × 96.84 × 25 191 × 123.5 × 40 �0.1 mm3
Free spectral range FSR 22.56 cm−1
Efficiency at near-Littrow conditiond 85 85 2 %aManufacturing temperature.bGoal operating temperature.cUseful area is not fully rectangular.dDrops to approximately half the value at grating edges.
Table 7. Theoretical Values for λc, λ�0 , λ
−0, λ
�e , λ−e , and the Dispersion on the Detector at λc for SO
Order λc [μm] λ�0 [μm] λ−0 [μm] λ−e [μm] λ�e [μm] ∂λ∕∂D [cm−1∕mm]
100 4.4302 4.4082 4.4524 4.4123 4.4477 1.88110 4.0275 4.0093 4.0459 4.0112 4.0434 2.07120 3.6919 3.6765 3.7073 3.6770 3.7064 2.25130 3.4079 3.3948 3.4210 3.3941 3.4213 2.44140 3.1661 3.1532 3.1758 3.1517 3.1769 2.63150 2.9535 2.9437 2.9637 2.9416 2.9651 2.82160 2.7689 2.7603 2.7776 2.7577 2.7798 3.01170 2.6060 2.5984 2.6137 2.5955 2.6163 3.19180 2.4612 2.4544 2.4681 2.4513 2.4709 3.38190 2.3317 2.3256 2.3379 2.3223 2.3409 3.57200 2.2151 2.2096 2.2207 2.2062 2.2239 3.76
Table 8. Theoretical Values for λc, λ�0 , λ
−0, λ
�e , λ−e , and the Dispersion on the Detector at λc for LNO
Order λc [μm] λ�0 [μm] λ−0 [μm] λ−e [μm] λ�e [μm] ∂λ∕∂D [cm−1∕mm]
120 3.6914 3.6761 3.7069 3.6765 3.7059 2.26130 3.4076 3.3944 3.4206 3.3937 3.4208 2.44140 3.1641 3.1528 3.1754 3.1513 3.1765 2.63150 2.9531 2.9433 2.9630 2.9412 2.9647 2.82160 2.7686 2.7599 2.7772 2.7574 2.7794 3.01170 2.6057 2.5980 2.6134 2.5952 2.6159 3.20180 2.4609 2.4541 2.4678 2.4510 2.4706 3.39190 2.3314 2.3253 2.3376 2.3220 2.3406 3.57200 2.2148 2.2093 2.2204 2.2059 2.2235 3.76
8500 Vol. 54, No. 28 / October 1 2015 / Applied Optics Research Article
D � f imager · tgφ; (9)
where f imager is the focal length of the imaging system. Afterdifferentiation of this equation we have
∂D �f imager
cos2 φ· ∂φ: (10)
Combining Eqs. (8) and (10) the dispersion ∂λ∕∂D, whichindicates how the light is spectrally spread over the detector, canbe written as
∂λ∂D
� cos2 φ · cos�θB − i − φ� · cos�γ�f imager · m · g
: (11)
Tables 7 and 8 give for both channels the dispersion forthe central wavelengths λc , for some orders, expressed incm−1 permm. Knowing the width of the detector pixels in thespectral direction, the spectral sampling interval can be easilycalculated (see below). The value of the focal length of theimager f imager is a compromise value resulting in the best pos-sible spectral sampling over the complete wavelength range.
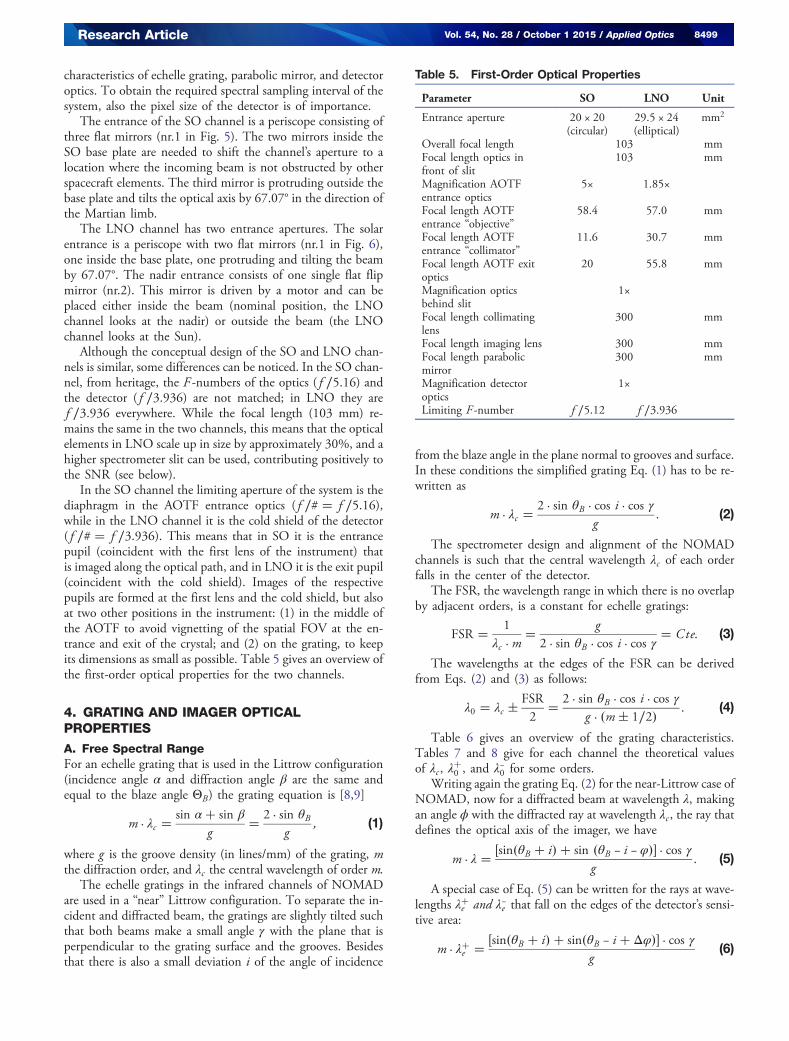
C. Imager OpticsThe imager optics in NOMAD’s infrared channels consistsof three elements (see Fig. 7): (1) a focusing off-axis parabolicmirror; (2) a flat mirror that bends the light path in order to staywithin the dimensional constraints of the instrument; and (3) alens module called detector optics. As mentioned earlier, theparabolic mirror has a double use. It serves as a collimator forthe light that goes toward the grating, and as an imager for thelight that reflects from it. In both channels this mirror has afocal length of 300 mm and is used off-axis, 19° in SO and20.75° in LNO. The light is partly reflected out of the hori-zontal plane, in SO by 1.46°, in LNO by 1.75°. The detectoroptics image the entrance pupil and the grating on the coldshield of the detector. They project the image formed by theparabolic mirror on the detector with 1× magnification. Thelenses used in the module are spherical. To compensate for
the aberrations of the parabolic mirror the module is dividedin two lens groups that are both tilted and decentered. In SOthe lenses are made of Ge, ZnSe, Si, Ge and Si, respectively,with clear apertures varying between 20 and 30.5 mm. InLNO the lens materials are Ge, Si, ZnSe, Ge and Si, respec-tively, with clear apertures between 22.1 and 28.2 mm.
D. Manufacturing and Verification of GratingsWorldwide only a few companies are capable of manufacturinglow-groove-density large-area gratings with high enough preci-sion [10]. In Table 6 it is seen that stringent accuracies areimposed on crucial grating parameters. Especially the accuracyon the groove-to-groove distance (�1 nm) over the total grooveheight is challenging. This high pitch accuracy is needed to getusable wavefronts, but not easy to achieve due to high tool loadand consequent elastic deformations during the ruling process.
Not only the echelle groove pitch needs to be very precise, alsothe quality (flatness/roughness) of the groove facets is of utmostimportance as well as the overall flatness of the grating. Followingthe DIN3140 standard, the grating surface should have at maxi-mum 0.5 fringes over the total length of the grating (deviationrequirement), with at maximum 0.25 fringes difference betweentwo perpendicular directions on the surface (irregularity require-ment). Additionally the RMS surface error, measured in reflec-tion, has to be ≤λ∕15, and the slope error ≤0.1 mrad. All theserequirements are valid at a verification wavelength of 547 nm.The NOMAD grating is manufactured at AMOS, Belgium.
The NOMAD gratings and their mechanical support aremonolithic, manufactured from one block of 6061-T6 alumi-num alloy with hollowed honeycomb back. This results in anon-negligible mass reduction of approximately 20%, it avoidsa delicate grating-to-holder gluing process and assures a morehomogeneous thermal distribution. The block passed througha double heat treatment for stress relief and stabilization of thesubstrate, before diamond machining was started. All nonruledsurfaces of the grating underwent a protective chromate passi-vation conversion (Alodine-1200 coating) while the echellegrooves received first a 20 nm thick Cr transition coating, fol-lowed by a final 300 nm thick Au coating (CSL, Belgium).
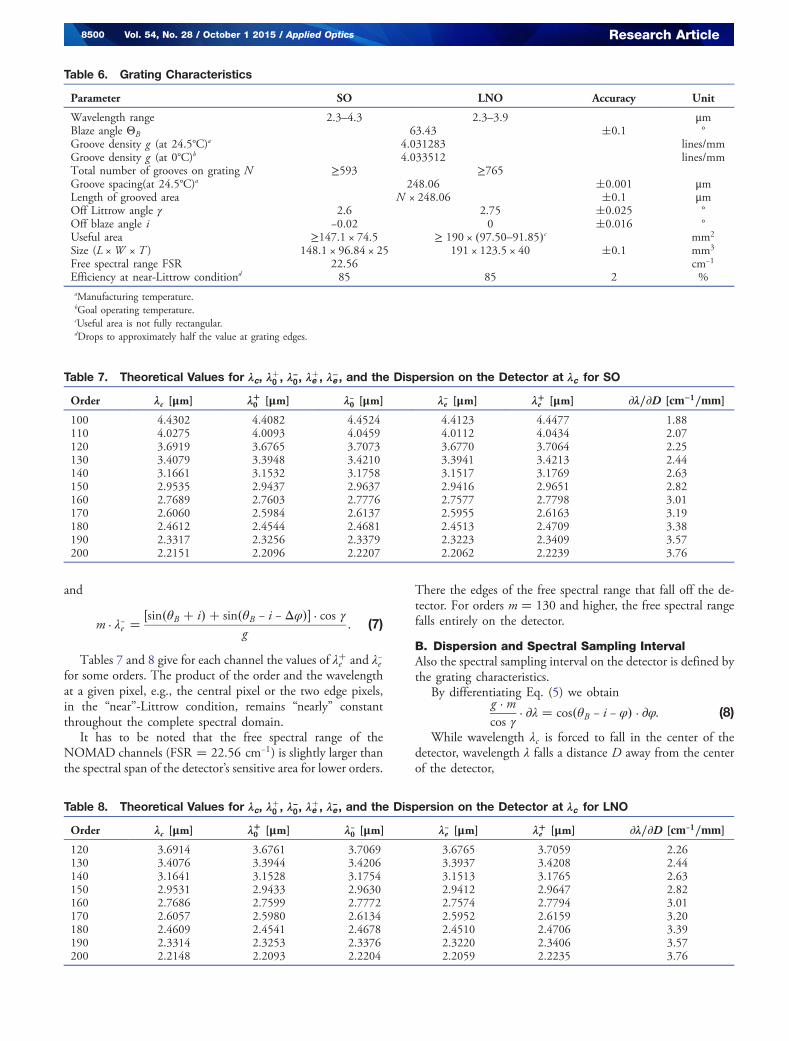
In order to avoid scattering of light on the adjacent surfacesof the grooves and in the bottom corners (due to rounding bythe tip radius R of the manufacturing tool), the angle betweenthe reflective surface and the adjacent surface is not 90°, butlowered by a maximum of 6° (Fig. 8).
Fig. 7. Optical layout of imager: (a) SO channel and (b) LNOchannel. Fig. 8. Grating section with slightly over-tilted adjacent surfaces.
Research Article Vol. 54, No. 28 / October 1 2015 / Applied Optics 8501
For alignment purposes the grating body is foreseen withtwo mirroring surfaces. Their position has to be known withrespect to the reference plane of the grating with an accuracy of10 arcsec. The mirrors have a reflectivity of ≥70% for visiblelight and a flatness ≤λ∕2 at 632.8 nm.
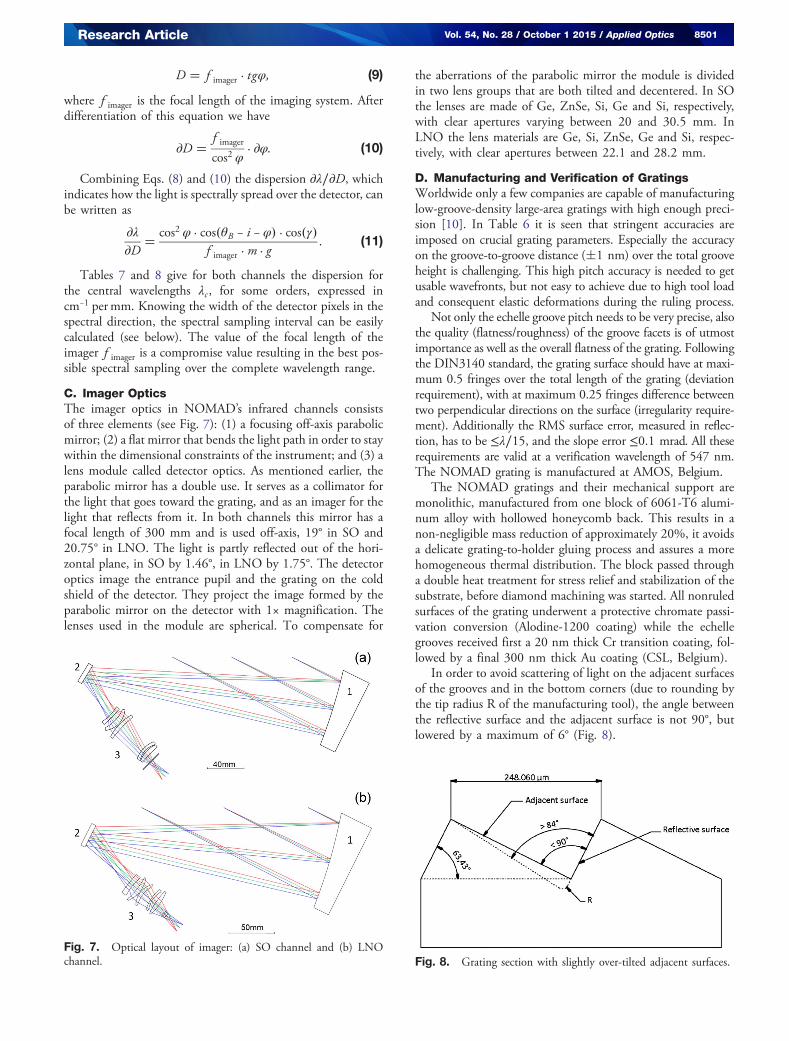
AMOS produced gratings that, after verification with visiblelight at 632.8 nm on a laser ZYGO Verifire (for SO) and anRTI 4100 WYKO (for LNO) interferometer through a densitypellicle, show full compliance to the surface quality specifica-tions. A comparative test has been performed after delivery ofthe gratings in order to assess their spectral performance, espe-cially the appearance of unwanted ghost peaks, and their effi-ciency. The flight spare model of SOIR was used as test setup,first with a SOIR grating, then with the new NOMAD grating(Fig. 9). A laser line at 3.39 μm was guided through the system.While on the SOIR grating a clear ghost peak can be distin-guished, the NOMAD grating remained free of ghosts. It canalso be seen that the NOMAD grating is twice as efficient asthe SOIR grating (comparison of the relative main peak inten-sity). On the other hand the main peak is broader on theNOMAD grating. This last effect can be completely correctedby a detector refocusing.
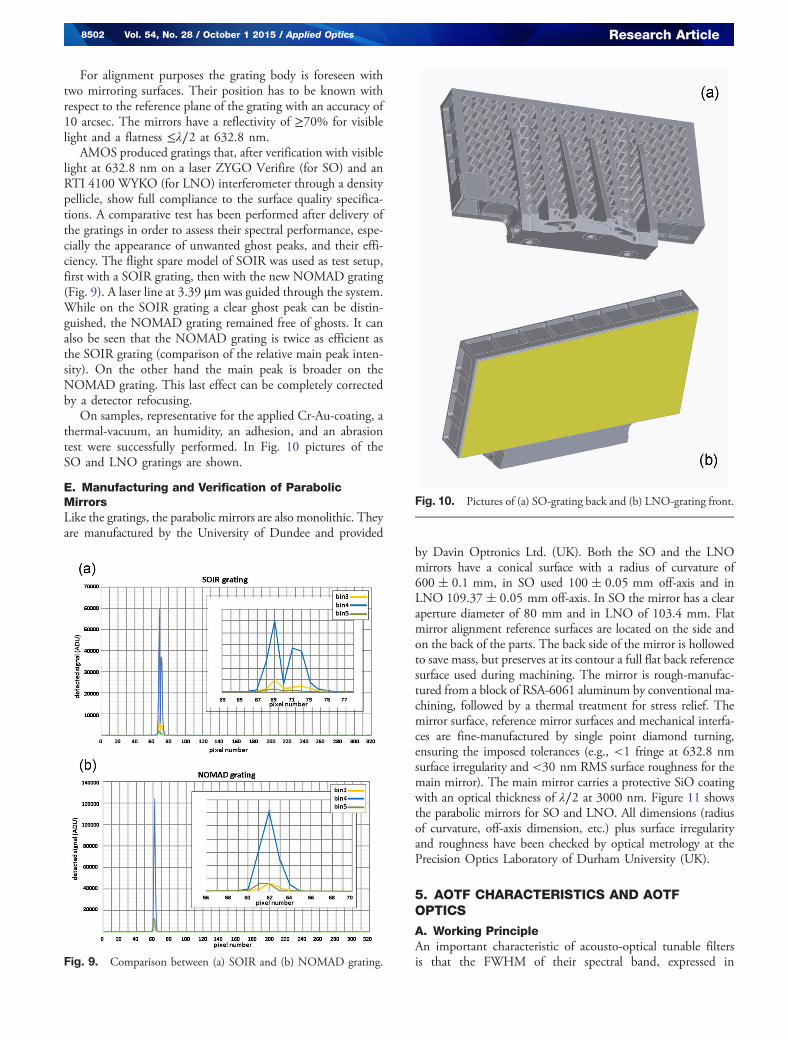
On samples, representative for the applied Cr-Au-coating, athermal-vacuum, an humidity, an adhesion, and an abrasiontest were successfully performed. In Fig. 10 pictures of theSO and LNO gratings are shown.
E. Manufacturing and Verification of ParabolicMirrorsLike the gratings, the parabolic mirrors are also monolithic. Theyare manufactured by the University of Dundee and provided
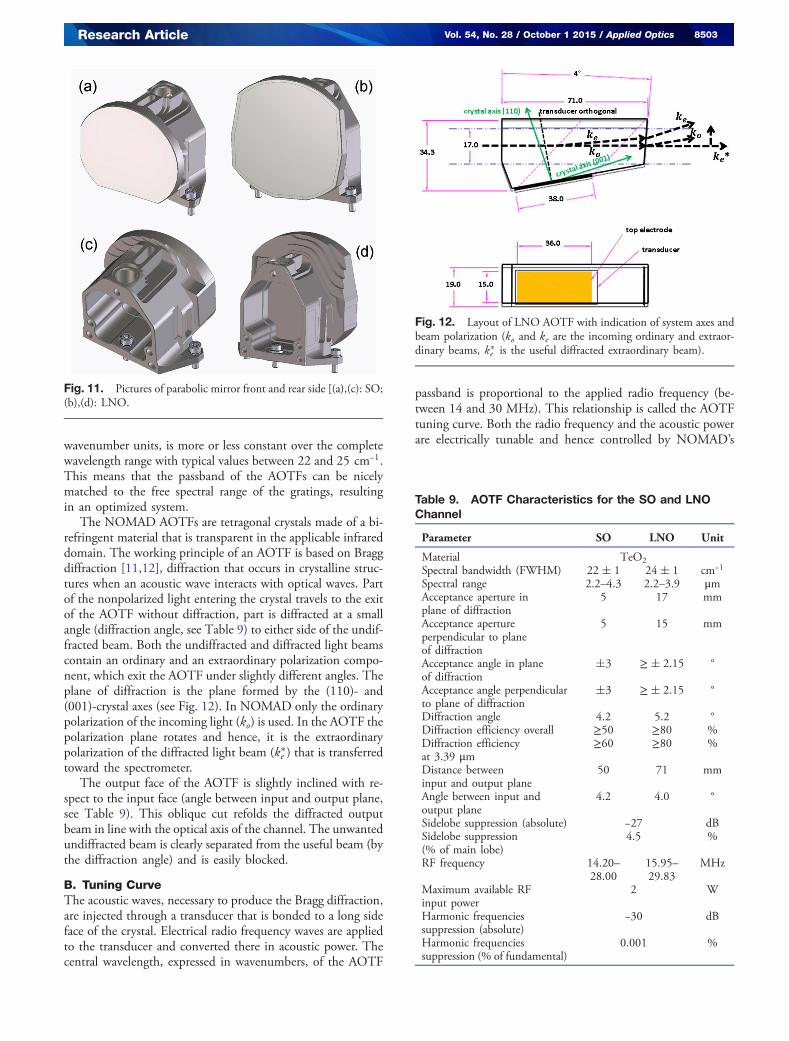
by Davin Optronics Ltd. (UK). Both the SO and the LNOmirrors have a conical surface with a radius of curvature of600� 0.1 mm, in SO used 100� 0.05 mm off-axis and inLNO 109.37� 0.05 mm off-axis. In SO the mirror has a clearaperture diameter of 80 mm and in LNO of 103.4 mm. Flatmirror alignment reference surfaces are located on the side andon the back of the parts. The back side of the mirror is hollowedto save mass, but preserves at its contour a full flat back referencesurface used during machining. The mirror is rough-manufac-tured from a block of RSA-6061 aluminum by conventional ma-chining, followed by a thermal treatment for stress relief. Themirror surface, reference mirror surfaces and mechanical interfa-ces are fine-manufactured by single point diamond turning,ensuring the imposed tolerances (e.g., <1 fringe at 632.8 nmsurface irregularity and <30 nm RMS surface roughness for themain mirror). The main mirror carries a protective SiO coatingwith an optical thickness of λ∕2 at 3000 nm. Figure 11 showsthe parabolic mirrors for SO and LNO. All dimensions (radiusof curvature, off-axis dimension, etc.) plus surface irregularityand roughness have been checked by optical metrology at thePrecision Optics Laboratory of Durham University (UK).
5. AOTF CHARACTERISTICS AND AOTFOPTICS
A. Working PrincipleAn important characteristic of acousto-optical tunable filtersis that the FWHM of their spectral band, expressed inFig. 9. Comparison between (a) SOIR and (b) NOMAD grating.
Fig. 10. Pictures of (a) SO-grating back and (b) LNO-grating front.
8502 Vol. 54, No. 28 / October 1 2015 / Applied Optics Research Article
wavenumber units, is more or less constant over the completewavelength range with typical values between 22 and 25 cm−1.This means that the passband of the AOTFs can be nicelymatched to the free spectral range of the gratings, resultingin an optimized system.
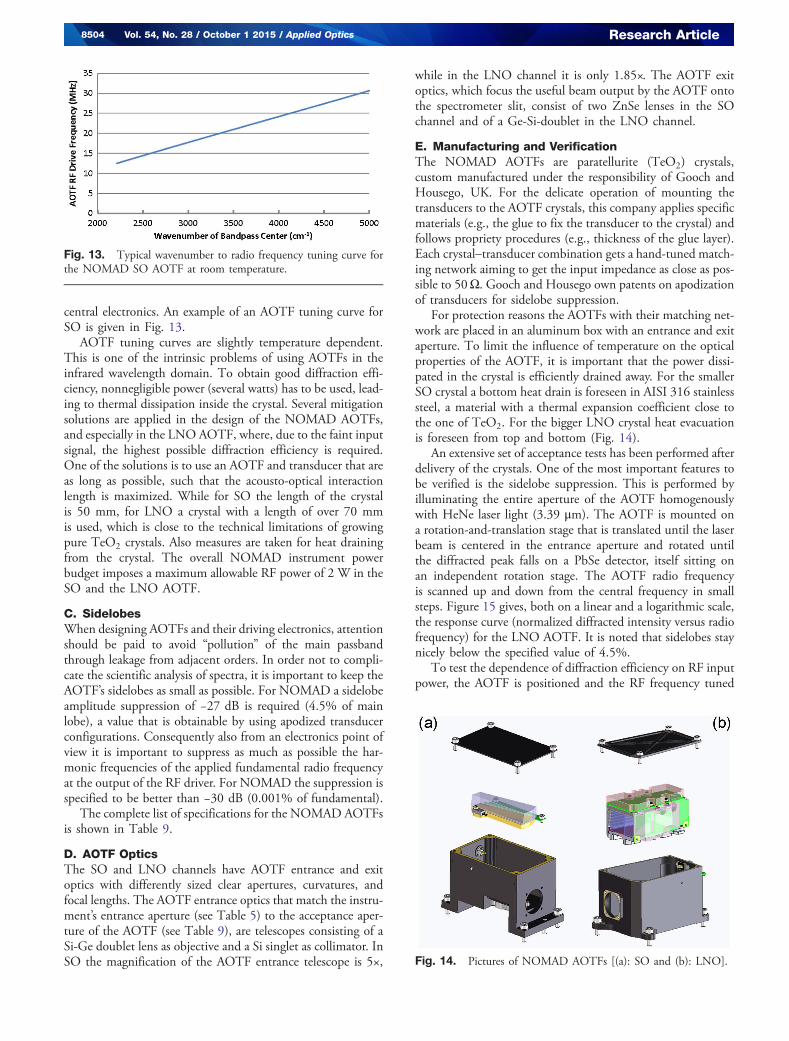
The NOMAD AOTFs are tetragonal crystals made of a bi-refringent material that is transparent in the applicable infrareddomain. The working principle of an AOTF is based on Braggdiffraction [11,12], diffraction that occurs in crystalline struc-tures when an acoustic wave interacts with optical waves. Partof the nonpolarized light entering the crystal travels to the exitof the AOTF without diffraction, part is diffracted at a smallangle (diffraction angle, see Table 9) to either side of the undif-fracted beam. Both the undiffracted and diffracted light beamscontain an ordinary and an extraordinary polarization compo-nent, which exit the AOTF under slightly different angles. Theplane of diffraction is the plane formed by the (110)- and(001)-crystal axes (see Fig. 12). In NOMAD only the ordinarypolarization of the incoming light (ko) is used. In the AOTF thepolarization plane rotates and hence, it is the extraordinarypolarization of the diffracted light beam (ke ) that is transferredtoward the spectrometer.
The output face of the AOTF is slightly inclined with re-spect to the input face (angle between input and output plane,see Table 9). This oblique cut refolds the diffracted outputbeam in line with the optical axis of the channel. The unwantedundiffracted beam is clearly separated from the useful beam (bythe diffraction angle) and is easily blocked.
B. Tuning CurveThe acoustic waves, necessary to produce the Bragg diffraction,are injected through a transducer that is bonded to a long sideface of the crystal. Electrical radio frequency waves are appliedto the transducer and converted there in acoustic power. Thecentral wavelength, expressed in wavenumbers, of the AOTF
passband is proportional to the applied radio frequency (be-tween 14 and 30 MHz). This relationship is called the AOTFtuning curve. Both the radio frequency and the acoustic powerare electrically tunable and hence controlled by NOMAD’s
Fig. 11. Pictures of parabolic mirror front and rear side [(a),(c): SO;(b),(d): LNO.
Fig. 12. Layout of LNO AOTF with indication of system axes andbeam polarization (ko and ke are the incoming ordinary and extraor-dinary beams, ke is the useful diffracted extraordinary beam).
Table 9. AOTF Characteristics for the SO and LNOChannel
Parameter SO LNO Unit
Material TeO2
Spectral bandwidth (FWHM) 22� 1 24� 1 cm−1
Spectral range 2.2–4.3 2.2–3.9 μmAcceptance aperture inplane of diffraction
5 17 mm
Acceptance apertureperpendicular to planeof diffraction
5 15 mm
Acceptance angle in planeof diffraction
�3 ≥� 2.15 °
Acceptance angle perpendicularto plane of diffraction
�3 ≥� 2.15 °
Diffraction angle 4.2 5.2 °Diffraction efficiency overall ≥50 ≥80 %Diffraction efficiencyat 3.39 μm
≥60 ≥80 %
Distance betweeninput and output plane
50 71 mm
Angle between input andoutput plane
4.2 4.0 °
Sidelobe suppression (absolute) −27 dBSidelobe suppression(% of main lobe)
4.5 %
RF frequency 14.20–28.00
15.95–29.83
MHz
Maximum available RFinput power
2 W
Harmonic frequenciessuppression (absolute)
−30 dB
Harmonic frequenciessuppression (% of fundamental)
0.001 %
Research Article Vol. 54, No. 28 / October 1 2015 / Applied Optics 8503
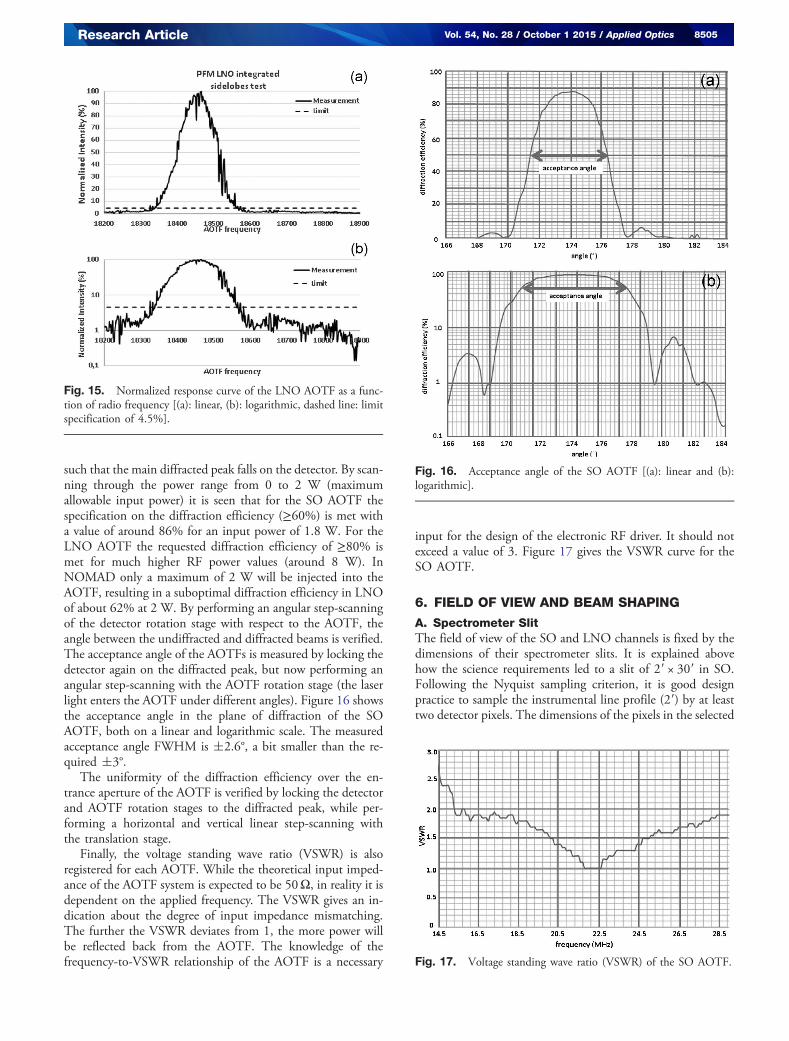
central electronics. An example of an AOTF tuning curve forSO is given in Fig. 13.
AOTF tuning curves are slightly temperature dependent.This is one of the intrinsic problems of using AOTFs in theinfrared wavelength domain. To obtain good diffraction effi-ciency, nonnegligible power (several watts) has to be used, lead-ing to thermal dissipation inside the crystal. Several mitigationsolutions are applied in the design of the NOMAD AOTFs,and especially in the LNO AOTF, where, due to the faint inputsignal, the highest possible diffraction efficiency is required.One of the solutions is to use an AOTF and transducer that areas long as possible, such that the acousto-optical interactionlength is maximized. While for SO the length of the crystalis 50 mm, for LNO a crystal with a length of over 70 mmis used, which is close to the technical limitations of growingpure TeO2 crystals. Also measures are taken for heat drainingfrom the crystal. The overall NOMAD instrument powerbudget imposes a maximum allowable RF power of 2 W in theSO and the LNO AOTF.
C. SidelobesWhen designing AOTFs and their driving electronics, attentionshould be paid to avoid “pollution” of the main passbandthrough leakage from adjacent orders. In order not to compli-cate the scientific analysis of spectra, it is important to keep theAOTF’s sidelobes as small as possible. For NOMAD a sidelobeamplitude suppression of −27 dB is required (4.5% of mainlobe), a value that is obtainable by using apodized transducerconfigurations. Consequently also from an electronics point ofview it is important to suppress as much as possible the har-monic frequencies of the applied fundamental radio frequencyat the output of the RF driver. For NOMAD the suppression isspecified to be better than −30 dB (0.001% of fundamental).
The complete list of specifications for the NOMAD AOTFsis shown in Table 9.
D. AOTF OpticsThe SO and LNO channels have AOTF entrance and exitoptics with differently sized clear apertures, curvatures, andfocal lengths. The AOTF entrance optics that match the instru-ment’s entrance aperture (see Table 5) to the acceptance aper-ture of the AOTF (see Table 9), are telescopes consisting of aSi-Ge doublet lens as objective and a Si singlet as collimator. InSO the magnification of the AOTF entrance telescope is 5×,
while in the LNO channel it is only 1.85×. The AOTF exitoptics, which focus the useful beam output by the AOTF ontothe spectrometer slit, consist of two ZnSe lenses in the SOchannel and of a Ge-Si-doublet in the LNO channel.
E. Manufacturing and VerificationThe NOMAD AOTFs are paratellurite (TeO2) crystals,custom manufactured under the responsibility of Gooch andHousego, UK. For the delicate operation of mounting thetransducers to the AOTF crystals, this company applies specificmaterials (e.g., the glue to fix the transducer to the crystal) andfollows propriety procedures (e.g., thickness of the glue layer).Each crystal–transducer combination gets a hand-tuned match-ing network aiming to get the input impedance as close as pos-sible to 50Ω. Gooch and Housego own patents on apodizationof transducers for sidelobe suppression.
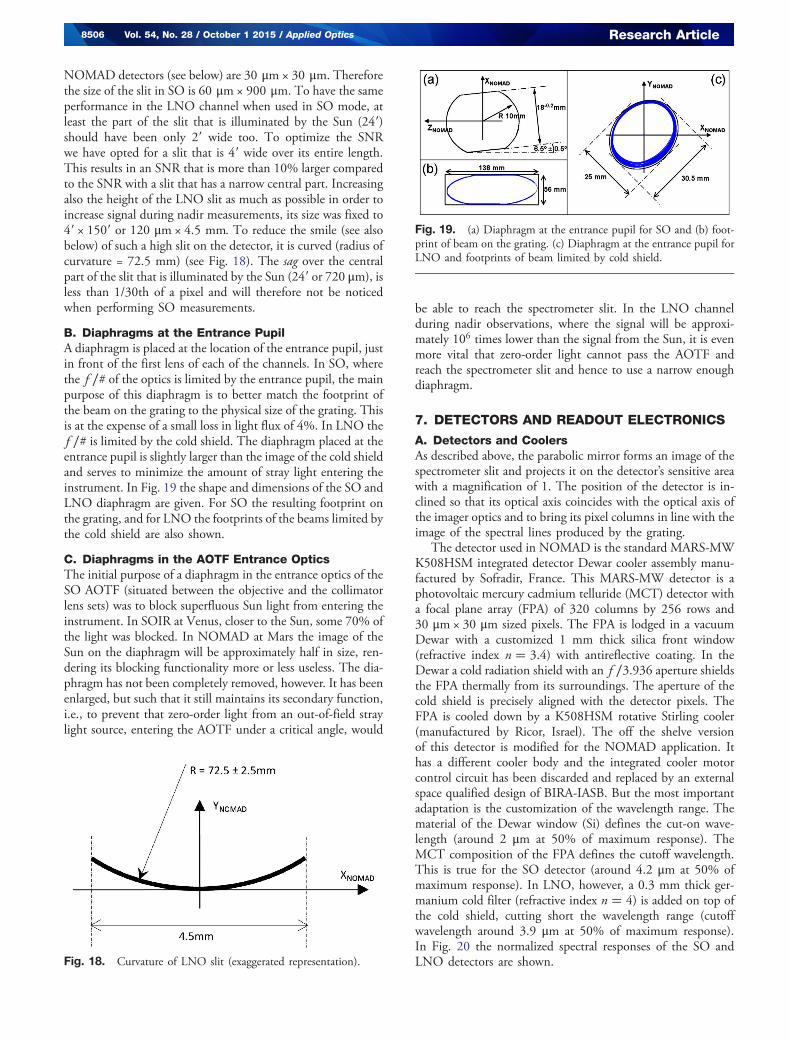
For protection reasons the AOTFs with their matching net-work are placed in an aluminum box with an entrance and exitaperture. To limit the influence of temperature on the opticalproperties of the AOTF, it is important that the power dissi-pated in the crystal is efficiently drained away. For the smallerSO crystal a bottom heat drain is foreseen in AISI 316 stainlesssteel, a material with a thermal expansion coefficient close tothe one of TeO2. For the bigger LNO crystal heat evacuationis foreseen from top and bottom (Fig. 14).
An extensive set of acceptance tests has been performed afterdelivery of the crystals. One of the most important features tobe verified is the sidelobe suppression. This is performed byilluminating the entire aperture of the AOTF homogenouslywith HeNe laser light (3.39 μm). The AOTF is mounted ona rotation-and-translation stage that is translated until the laserbeam is centered in the entrance aperture and rotated untilthe diffracted peak falls on a PbSe detector, itself sitting onan independent rotation stage. The AOTF radio frequencyis scanned up and down from the central frequency in smallsteps. Figure 15 gives, both on a linear and a logarithmic scale,the response curve (normalized diffracted intensity versus radiofrequency) for the LNO AOTF. It is noted that sidelobes staynicely below the specified value of 4.5%.
To test the dependence of diffraction efficiency on RF inputpower, the AOTF is positioned and the RF frequency tuned
Fig. 13. Typical wavenumber to radio frequency tuning curve forthe NOMAD SO AOTF at room temperature.
Fig. 14. Pictures of NOMAD AOTFs [(a): SO and (b): LNO].
8504 Vol. 54, No. 28 / October 1 2015 / Applied Optics Research Article
such that the main diffracted peak falls on the detector. By scan-ning through the power range from 0 to 2 W (maximumallowable input power) it is seen that for the SO AOTF thespecification on the diffraction efficiency (≥60%) is met witha value of around 86% for an input power of 1.8 W. For theLNO AOTF the requested diffraction efficiency of ≥80% ismet for much higher RF power values (around 8 W). InNOMAD only a maximum of 2 W will be injected into theAOTF, resulting in a suboptimal diffraction efficiency in LNOof about 62% at 2 W. By performing an angular step-scanningof the detector rotation stage with respect to the AOTF, theangle between the undiffracted and diffracted beams is verified.The acceptance angle of the AOTFs is measured by locking thedetector again on the diffracted peak, but now performing anangular step-scanning with the AOTF rotation stage (the laserlight enters the AOTF under different angles). Figure 16 showsthe acceptance angle in the plane of diffraction of the SOAOTF, both on a linear and logarithmic scale. The measuredacceptance angle FWHM is �2.6°, a bit smaller than the re-quired �3°.
The uniformity of the diffraction efficiency over the en-trance aperture of the AOTF is verified by locking the detectorand AOTF rotation stages to the diffracted peak, while per-forming a horizontal and vertical linear step-scanning withthe translation stage.
Finally, the voltage standing wave ratio (VSWR) is alsoregistered for each AOTF. While the theoretical input imped-ance of the AOTF system is expected to be 50Ω, in reality it isdependent on the applied frequency. The VSWR gives an in-dication about the degree of input impedance mismatching.The further the VSWR deviates from 1, the more power willbe reflected back from the AOTF. The knowledge of thefrequency-to-VSWR relationship of the AOTF is a necessary
input for the design of the electronic RF driver. It should notexceed a value of 3. Figure 17 gives the VSWR curve for theSO AOTF.
6. FIELD OF VIEW AND BEAM SHAPING
A. Spectrometer SlitThe field of view of the SO and LNO channels is fixed by thedimensions of their spectrometer slits. It is explained abovehow the science requirements led to a slit of 2 0 × 30 0 in SO.Following the Nyquist sampling criterion, it is good designpractice to sample the instrumental line profile (2 0) by at leasttwo detector pixels. The dimensions of the pixels in the selected
Fig. 15. Normalized response curve of the LNO AOTF as a func-tion of radio frequency [(a): linear, (b): logarithmic, dashed line: limitspecification of 4.5%].
Fig. 16. Acceptance angle of the SO AOTF [(a): linear and (b):logarithmic].
Fig. 17. Voltage standing wave ratio (VSWR) of the SO AOTF.
Research Article Vol. 54, No. 28 / October 1 2015 / Applied Optics 8505
NOMAD detectors (see below) are 30 μm × 30 μm. Thereforethe size of the slit in SO is 60 μm × 900 μm. To have the sameperformance in the LNO channel when used in SO mode, atleast the part of the slit that is illuminated by the Sun (24 0)should have been only 2 0 wide too. To optimize the SNRwe have opted for a slit that is 4 0 wide over its entire length.This results in an SNR that is more than 10% larger comparedto the SNR with a slit that has a narrow central part. Increasingalso the height of the LNO slit as much as possible in order toincrease signal during nadir measurements, its size was fixed to4 0 × 150 0 or 120 μm × 4.5 mm. To reduce the smile (see alsobelow) of such a high slit on the detector, it is curved (radius ofcurvature = 72.5 mm) (see Fig. 18). The sag over the centralpart of the slit that is illuminated by the Sun (24 0 or 720 μm), isless than 1/30th of a pixel and will therefore not be noticedwhen performing SO measurements.
B. Diaphragms at the Entrance PupilA diaphragm is placed at the location of the entrance pupil, justin front of the first lens of each of the channels. In SO, wherethe f ∕# of the optics is limited by the entrance pupil, the mainpurpose of this diaphragm is to better match the footprint ofthe beam on the grating to the physical size of the grating. Thisis at the expense of a small loss in light flux of 4%. In LNO thef ∕# is limited by the cold shield. The diaphragm placed at theentrance pupil is slightly larger than the image of the cold shieldand serves to minimize the amount of stray light entering theinstrument. In Fig. 19 the shape and dimensions of the SO andLNO diaphragm are given. For SO the resulting footprint onthe grating, and for LNO the footprints of the beams limited bythe cold shield are also shown.
C. Diaphragms in the AOTF Entrance OpticsThe initial purpose of a diaphragm in the entrance optics of theSO AOTF (situated between the objective and the collimatorlens sets) was to block superfluous Sun light from entering theinstrument. In SOIR at Venus, closer to the Sun, some 70% ofthe light was blocked. In NOMAD at Mars the image of theSun on the diaphragm will be approximately half in size, ren-dering its blocking functionality more or less useless. The dia-phragm has not been completely removed, however. It has beenenlarged, but such that it still maintains its secondary function,i.e., to prevent that zero-order light from an out-of-field straylight source, entering the AOTF under a critical angle, would
be able to reach the spectrometer slit. In the LNO channelduring nadir observations, where the signal will be approxi-mately 106 times lower than the signal from the Sun, it is evenmore vital that zero-order light cannot pass the AOTF andreach the spectrometer slit and hence to use a narrow enoughdiaphragm.
7. DETECTORS AND READOUT ELECTRONICS
A. Detectors and CoolersAs described above, the parabolic mirror forms an image of thespectrometer slit and projects it on the detector’s sensitive areawith a magnification of 1. The position of the detector is in-clined so that its optical axis coincides with the optical axis ofthe imager optics and to bring its pixel columns in line with theimage of the spectral lines produced by the grating.
The detector used in NOMAD is the standard MARS-MWK508HSM integrated detector Dewar cooler assembly manu-factured by Sofradir, France. This MARS-MW detector is aphotovoltaic mercury cadmium telluride (MCT) detector witha focal plane array (FPA) of 320 columns by 256 rows and30 μm × 30 μm sized pixels. The FPA is lodged in a vacuumDewar with a customized 1 mm thick silica front window(refractive index n � 3.4) with antireflective coating. In theDewar a cold radiation shield with an f ∕3.936 aperture shieldsthe FPA thermally from its surroundings. The aperture of thecold shield is precisely aligned with the detector pixels. TheFPA is cooled down by a K508HSM rotative Stirling cooler(manufactured by Ricor, Israel). The off the shelve versionof this detector is modified for the NOMAD application. Ithas a different cooler body and the integrated cooler motorcontrol circuit has been discarded and replaced by an externalspace qualified design of BIRA-IASB. But the most importantadaptation is the customization of the wavelength range. Thematerial of the Dewar window (Si) defines the cut-on wave-length (around 2 μm at 50% of maximum response). TheMCT composition of the FPA defines the cutoff wavelength.This is true for the SO detector (around 4.2 μm at 50% ofmaximum response). In LNO, however, a 0.3 mm thick ger-manium cold filter (refractive index n � 4) is added on top ofthe cold shield, cutting short the wavelength range (cutoffwavelength around 3.9 μm at 50% of maximum response).In Fig. 20 the normalized spectral responses of the SO andLNO detectors are shown.Fig. 18. Curvature of LNO slit (exaggerated representation).
Fig. 19. (a) Diaphragm at the entrance pupil for SO and (b) foot-print of beam on the grating. (c) Diaphragm at the entrance pupil forLNO and footprints of beam limited by cold shield.
8506 Vol. 54, No. 28 / October 1 2015 / Applied Optics Research Article
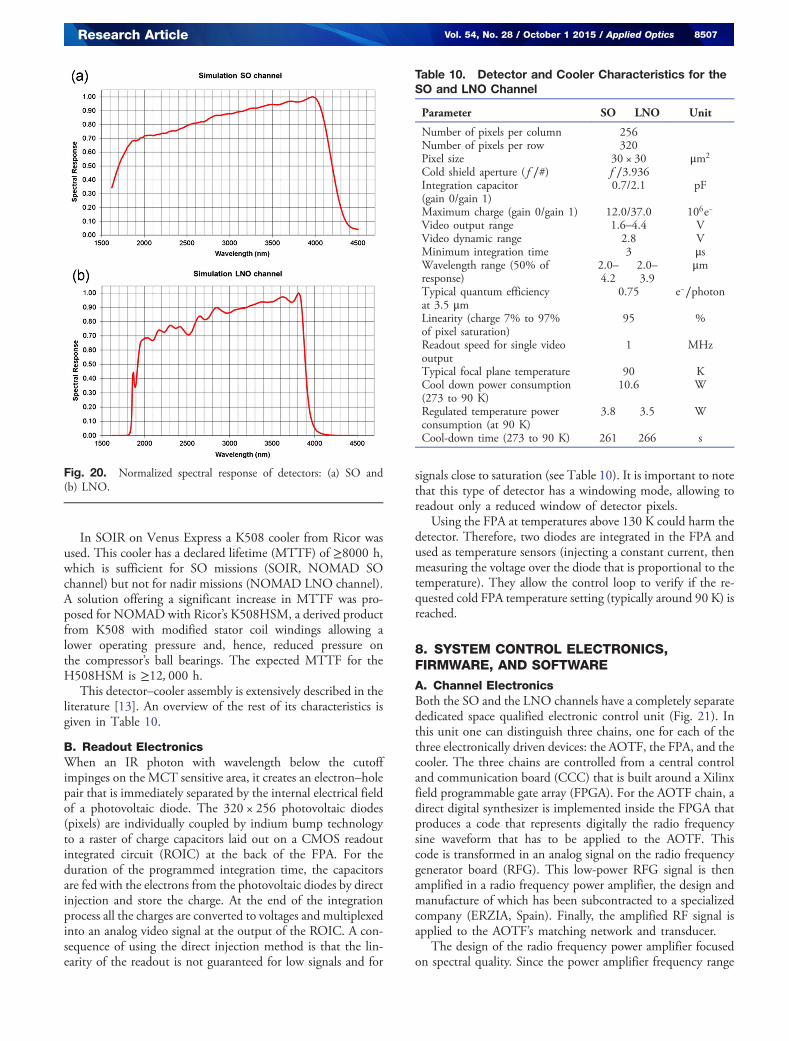
In SOIR on Venus Express a K508 cooler from Ricor wasused. This cooler has a declared lifetime (MTTF) of ≥8000 h,which is sufficient for SO missions (SOIR, NOMAD SOchannel) but not for nadir missions (NOMAD LNO channel).A solution offering a significant increase in MTTF was pro-posed for NOMAD with Ricor’s K508HSM, a derived productfrom K508 with modified stator coil windings allowing alower operating pressure and, hence, reduced pressure onthe compressor’s ball bearings. The expected MTTF for theH508HSM is ≥12; 000 h.
This detector–cooler assembly is extensively described in theliterature [13]. An overview of the rest of its characteristics isgiven in Table 10.
B. Readout ElectronicsWhen an IR photon with wavelength below the cutoffimpinges on the MCT sensitive area, it creates an electron–holepair that is immediately separated by the internal electrical fieldof a photovoltaic diode. The 320 × 256 photovoltaic diodes(pixels) are individually coupled by indium bump technologyto a raster of charge capacitors laid out on a CMOS readoutintegrated circuit (ROIC) at the back of the FPA. For theduration of the programmed integration time, the capacitorsare fed with the electrons from the photovoltaic diodes by directinjection and store the charge. At the end of the integrationprocess all the charges are converted to voltages and multiplexedinto an analog video signal at the output of the ROIC. A con-sequence of using the direct injection method is that the lin-earity of the readout is not guaranteed for low signals and for
signals close to saturation (see Table 10). It is important to notethat this type of detector has a windowing mode, allowing toreadout only a reduced window of detector pixels.
Using the FPA at temperatures above 130 K could harm thedetector. Therefore, two diodes are integrated in the FPA andused as temperature sensors (injecting a constant current, thenmeasuring the voltage over the diode that is proportional to thetemperature). They allow the control loop to verify if the re-quested cold FPA temperature setting (typically around 90 K) isreached.
8. SYSTEM CONTROL ELECTRONICS,FIRMWARE, AND SOFTWARE
A. Channel ElectronicsBoth the SO and the LNO channels have a completely separatededicated space qualified electronic control unit (Fig. 21). Inthis unit one can distinguish three chains, one for each of thethree electronically driven devices: the AOTF, the FPA, and thecooler. The three chains are controlled from a central controland communication board (CCC) that is built around a Xilinxfield programmable gate array (FPGA). For the AOTF chain, adirect digital synthesizer is implemented inside the FPGA thatproduces a code that represents digitally the radio frequencysine waveform that has to be applied to the AOTF. Thiscode is transformed in an analog signal on the radio frequencygenerator board (RFG). This low-power RFG signal is thenamplified in a radio frequency power amplifier, the design andmanufacture of which has been subcontracted to a specializedcompany (ERZIA, Spain). Finally, the amplified RF signal isapplied to the AOTF’s matching network and transducer.
The design of the radio frequency power amplifier focusedon spectral quality. Since the power amplifier frequency range
Fig. 20. Normalized spectral response of detectors: (a) SO and(b) LNO.
Table 10. Detector and Cooler Characteristics for theSO and LNO Channel
Parameter SO LNO Unit
Number of pixels per column 256Number of pixels per row 320Pixel size 30 × 30 μm2
Cold shield aperture (f ∕#) f ∕3.936Integration capacitor(gain 0/gain 1)
0.7/2.1 pF
Maximum charge (gain 0/gain 1) 12.0/37.0 106e−
Video output range 1.6–4.4 VVideo dynamic range 2.8 VMinimum integration time 3 μsWavelength range (50% ofresponse)
2.0–4.2
2.0–3.9
μm
Typical quantum efficiencyat 3.5 μm
0.75 e−∕photon
Linearity (charge 7% to 97%of pixel saturation)
95 %
Readout speed for single videooutput
1 MHz
Typical focal plane temperature 90 KCool down power consumption(273 to 90 K)
10.6 W
Regulated temperature powerconsumption (at 90 K)
3.8 3.5 W
Cool-down time (273 to 90 K) 261 266 s
Research Article Vol. 54, No. 28 / October 1 2015 / Applied Optics 8507
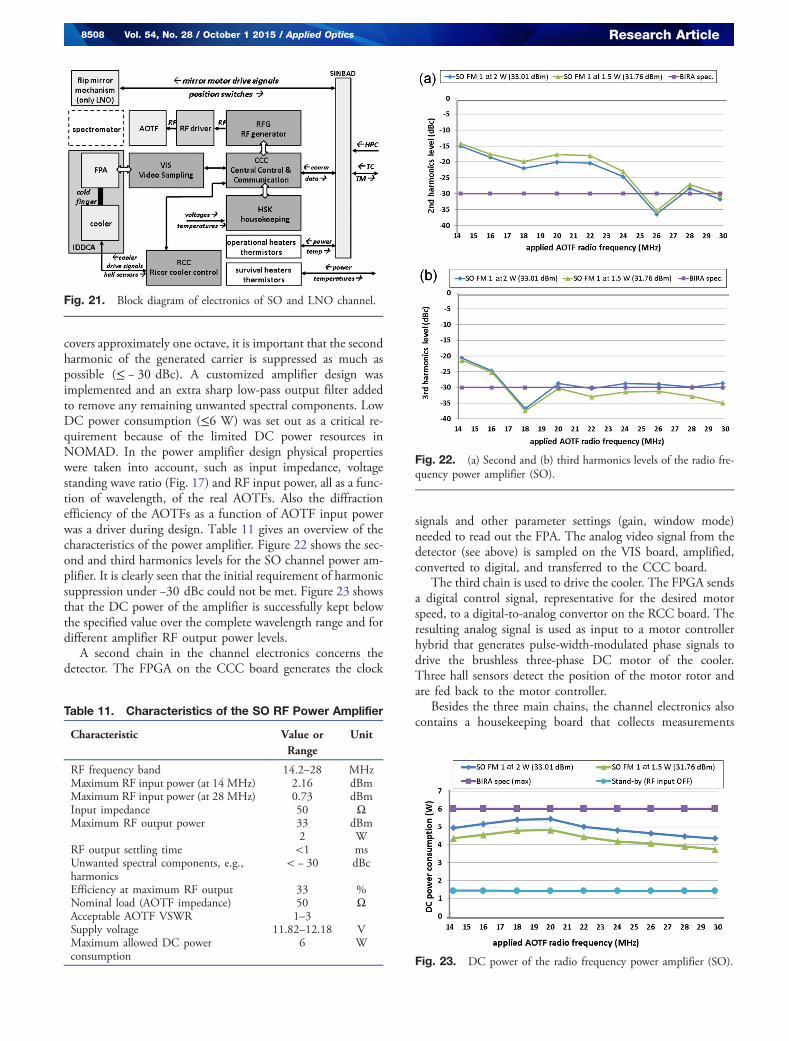
covers approximately one octave, it is important that the secondharmonic of the generated carrier is suppressed as much aspossible (≤ − 30 dBc). A customized amplifier design wasimplemented and an extra sharp low-pass output filter addedto remove any remaining unwanted spectral components. LowDC power consumption (≤6 W) was set out as a critical re-quirement because of the limited DC power resources inNOMAD. In the power amplifier design physical propertieswere taken into account, such as input impedance, voltagestanding wave ratio (Fig. 17) and RF input power, all as a func-tion of wavelength, of the real AOTFs. Also the diffractionefficiency of the AOTFs as a function of AOTF input powerwas a driver during design. Table 11 gives an overview of thecharacteristics of the power amplifier. Figure 22 shows the sec-ond and third harmonics levels for the SO channel power am-plifier. It is clearly seen that the initial requirement of harmonicsuppression under −30 dBc could not be met. Figure 23 showsthat the DC power of the amplifier is successfully kept belowthe specified value over the complete wavelength range and fordifferent amplifier RF output power levels.
A second chain in the channel electronics concerns thedetector. The FPGA on the CCC board generates the clock
signals and other parameter settings (gain, window mode)needed to read out the FPA. The analog video signal from thedetector (see above) is sampled on the VIS board, amplified,converted to digital, and transferred to the CCC board.
The third chain is used to drive the cooler. The FPGA sendsa digital control signal, representative for the desired motorspeed, to a digital-to-analog convertor on the RCC board. Theresulting analog signal is used as input to a motor controllerhybrid that generates pulse-width-modulated phase signals todrive the brushless three-phase DC motor of the cooler.Three hall sensors detect the position of the motor rotor andare fed back to the motor controller.
Besides the three main chains, the channel electronics alsocontains a housekeeping board that collects measurements
Fig. 21. Block diagram of electronics of SO and LNO channel.
Table 11. Characteristics of the SO RF Power Amplifier
Characteristic Value orRange
Unit
RF frequency band 14.2–28 MHzMaximum RF input power (at 14 MHz) 2.16 dBmMaximum RF input power (at 28 MHz) 0.73 dBmInput impedance 50 ΩMaximum RF output power 33 dBm
2 WRF output settling time <1 msUnwanted spectral components, e.g.,harmonics
< − 30 dBc
Efficiency at maximum RF output 33 %Nominal load (AOTF impedance) 50 ΩAcceptable AOTF VSWR 1–3Supply voltage 11.82–12.18 VMaximum allowed DC powerconsumption
6 W
Fig. 22. (a) Second and (b) third harmonics levels of the radio fre-quency power amplifier (SO).
Fig. 23. DC power of the radio frequency power amplifier (SO).
8508 Vol. 54, No. 28 / October 1 2015 / Applied Optics Research Article
from temperature, voltage and current sensors, digitalizes themand returns them over multiplexers to the FPGA on theCCC board.
B. Front Line Power and Control Unit (SINBAD)The electrical interface between the NOMAD instrument andthe spacecraft is not situated in the channels themselves. TheSO, LNO, and UVIS electronics interface to NOMAD’sfront line power and control unit (SINBAD). SINBAD canbe switched on and off by the spacecraft through high powercommands. While on, it is powered by an unregulated voltageand can interact with the spacecraft through a MIL-standard1553 bus (uploading telecommands, downloading housekeep-ing data) and a SpaceWire link (downloading science data).SINBAD switches on and off each of the three NOMADchannels depending on the imposed observation timeline(see below). It regulates the primary power and offers a stablevoltage to the channels. SINBAD is built around two ActelFPGAs. The primary FPGA (Shireen) contains a firmwareLEON3 microprocessor running a real-time operating system(RTEMS) to which a series of software management functionsare added, among which are a telecommand interpreter and afile operation management system allowing versatile use of theavailable on-board memory. The secondary FPGA (Chimera)controls the flip mirror mechanism (only in LNO) andNOMAD’s operational heaters and thermistors (see below), buthas to be seen primarily as a firmware extension of the SO andLNO channels. Chimera streamlines the registration of spectrain these channels by sending them in a timely manner com-mand packets and by capturing in memory, at high speed, thedata stream they send back on the fly.
During ground testing, the instrument can be operated froma dedicated electrical ground support equipment, running auser-friendly software interface developed in Python.
Electrical components in NOMAD are selected to be radi-ation tolerant, compliant to the total dose requirement of theTGO mission, and immune against latch-up and single eventeffects. During mechanical design sufficient aluminum shield-ing has been foreseen. It is confirmed by sector analysis thatNOMAD is radiation protected throughout the mission.
9. OBSERVATION SEQUENCES AND MODES
The science operations during one orbit around Mars can besplit in four distinct observations. At dayside NOMAD willperform nadir observations with the LNO and UVIS channels.At the sunset terminator a SO measurement will be performedwith the SO and UVIS channels. At nightside atmosphericemission measurements can be done with LNO and UVIS.At the sunrise terminator a SO measurement will be performedwith SO and UVIS. Thanks to the presence of the flip mirror inLNO, it is also possible to use LNO instead of SO during SOs.Using SO and LNO at the same time is excluded due to space-craft power limitations.
Just before starting a nadir observation or SO measurementwith one of the infrared channels it is necessary to cool thedetector down to its operating temperature of approximately90 K. A command packet is sent to the channel to start thisprecooling phase. This packet contains parameters such as
the cooler temperature set point, an open or closed loop flag,and some cooler coefficients allowing smooth regulation.During precooling (duration is maximum 600 s, depending onthe temperature of the environment) no spectra are recorded,only housekeeping is sent every second. At the end of the pre-cooling phase, the channel starts a science observation uponreception of a new command packet. This time the commandcontains parameters that will permit the channel to do “real”measurements, such as the AOTF frequency and AOTF powerset points, the detector integration time, window frame dimen-sions, the binning factor, and more. For nadir, longer integra-tion times are anticipated and therefore the typical samplingtime is 15 s. During SOs integration times will be much shorterand the sampling time is 1 s.
The on-board software of the channels offers a wide rangeof features to tailor the measurements to the scientific needs.During one measurement, i.e., in the time frame of 1 s (SO)or 15 s (nadir), it is possible to perform up to six consecutivemeasurements, each with different parameter settings. In thisso-called hopping mode it is, e.g., possible to measure in sixrandomly chosen spectral domains (six AOTF frequency set-tings corresponding to six grating orders). It could be an optionto dedicate one of the “domains” to a dark measurement withthe AOTF switched off. Moreover, it is possible to switch froma set of six initial subdomains (used during the first half of theobservation) to six totally different subdomains in the secondhalf. This is especially useful during SO where the science in-terest in the upper atmosphere can be quite different from thatin the lower atmosphere.
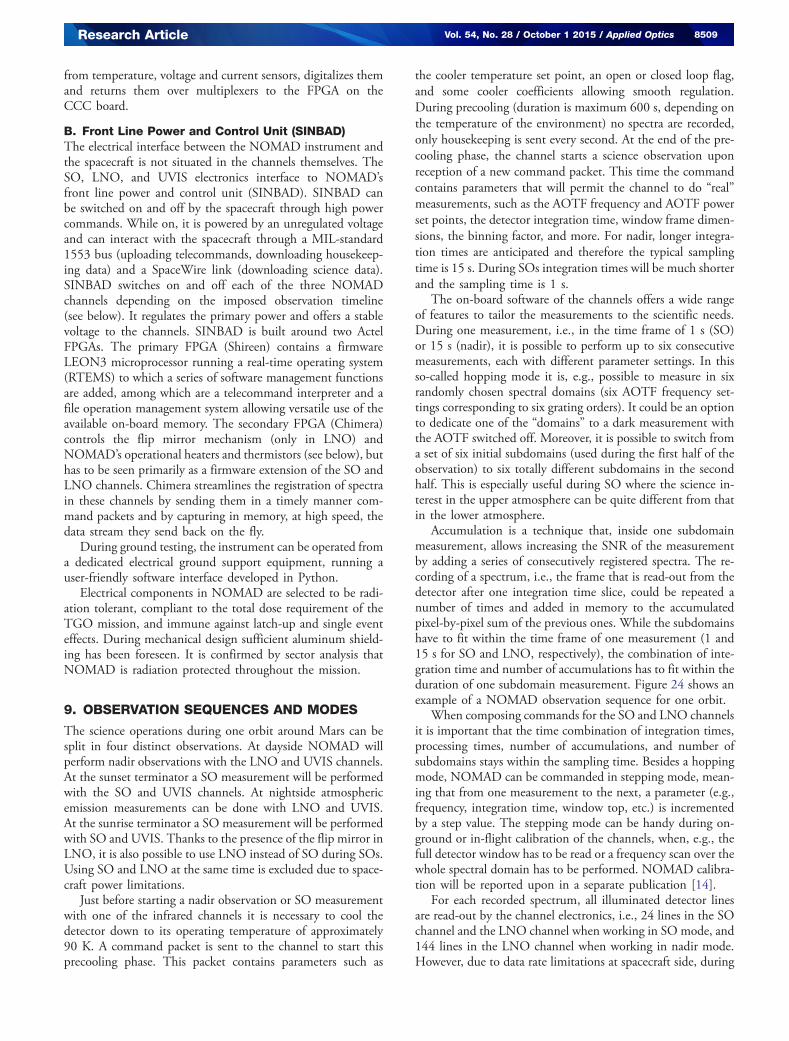
Accumulation is a technique that, inside one subdomainmeasurement, allows increasing the SNR of the measurementby adding a series of consecutively registered spectra. The re-cording of a spectrum, i.e., the frame that is read-out from thedetector after one integration time slice, could be repeated anumber of times and added in memory to the accumulatedpixel-by-pixel sum of the previous ones. While the subdomainshave to fit within the time frame of one measurement (1 and15 s for SO and LNO, respectively), the combination of inte-gration time and number of accumulations has to fit within theduration of one subdomain measurement. Figure 24 shows anexample of a NOMAD observation sequence for one orbit.
When composing commands for the SO and LNO channelsit is important that the time combination of integration times,processing times, number of accumulations, and number ofsubdomains stays within the sampling time. Besides a hoppingmode, NOMAD can be commanded in stepping mode, mean-ing that from one measurement to the next, a parameter (e.g.,frequency, integration time, window top, etc.) is incrementedby a step value. The stepping mode can be handy during on-ground or in-flight calibration of the channels, when, e.g., thefull detector window has to be read or a frequency scan over thewhole spectral domain has to be performed. NOMAD calibra-tion will be reported upon in a separate publication [14].
For each recorded spectrum, all illuminated detector linesare read-out by the channel electronics, i.e., 24 lines in the SOchannel and the LNO channel when working in SO mode, and144 lines in the LNO channel when working in nadir mode.However, due to data rate limitations at spacecraft side, during
Research Article Vol. 54, No. 28 / October 1 2015 / Applied Optics 8509
one sampling time only the equivalent of 24 detector lines canbe processed by the spacecraft and transmitted to Earth. Thishas a number of consequences on NOMAD’s observation phi-losophy. First of all, this means that in LNO the 144 read lineswill be always reduced to 24 “superlines” through binning bysix. If a measurement consists of only one subdomain the 24read (super)lines will all be transmitted to Earth. If a highernumber of subdomains is used per measurement, a correspond-ing line binning will be applied. For the example at the rightside of Fig. 24, where a measurement consists of six subdo-mains, binning by six will be applied to the lines, and only four“superlines” will be processed per subdomain. Binning of lineshas an impact on the spatial resolution of the channel.
The severe limitation in allowable number of payload tele-commands during this ExoMars mission (≤10 telecommandsper orbit for NOMAD) has resulted in the implementation ofon-board channel observation parameter tables with a nearlyunlimited number of preprogrammed combinations of instru-mental parameters. If modifications still appear to be necessary,these tables can be patched from ground.
10. MECHANICAL STRUCTURE, STRUCTURALANALYSIS, AND ALIGNMENT
A. Mechanical StructureNOMAD is housed in an aluminum structure, consisting oftwo base plates, the bottom one serving as an optical benchfor the SO channel, the top one for the LNO channel. Aset of carrier walls interconnects the SO and LNO base plates.The base plates are flat topped but have a ribbed structure at thebottom in order to reduce weight but maintain strength andstiffness. The useful surfaces are 428 × 306 mm2 for the SOoptical bench and 439 × 316 mm2 for the LNO bench. Onthe SO base plate an area is kept free where the UVIS channel,which sits on its own intermediate base plate, is located. The
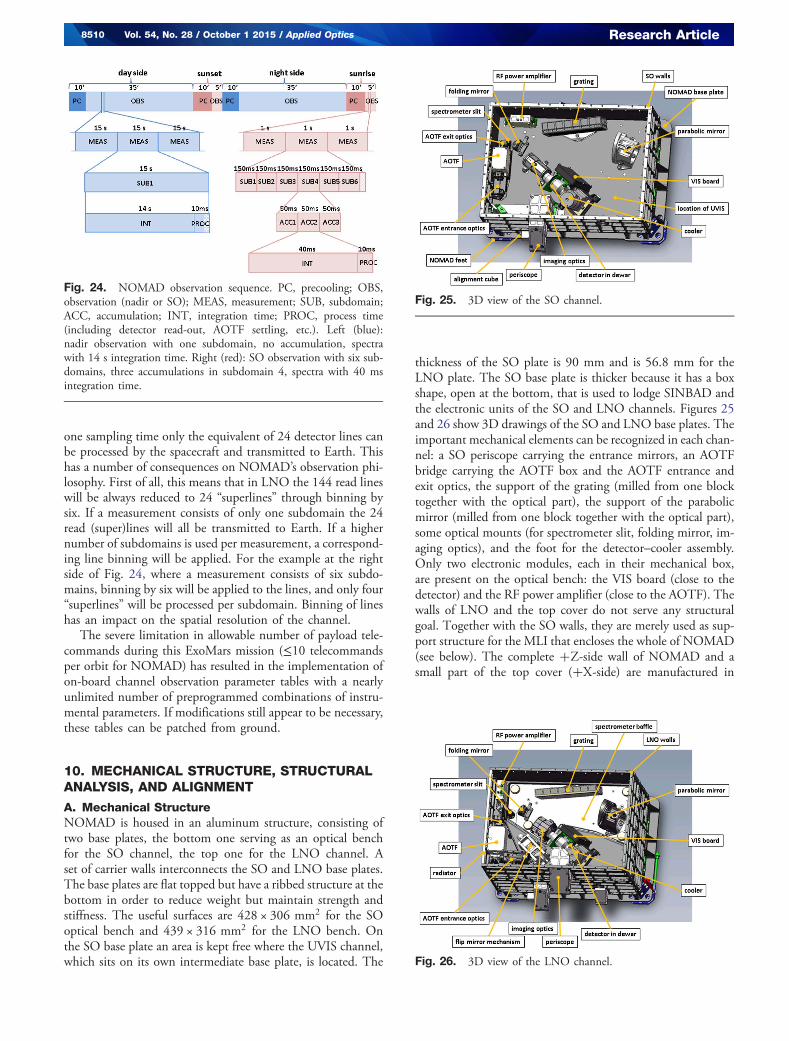
thickness of the SO plate is 90 mm and is 56.8 mm for theLNO plate. The SO base plate is thicker because it has a boxshape, open at the bottom, that is used to lodge SINBAD andthe electronic units of the SO and LNO channels. Figures 25and 26 show 3D drawings of the SO and LNO base plates. Theimportant mechanical elements can be recognized in each chan-nel: a SO periscope carrying the entrance mirrors, an AOTFbridge carrying the AOTF box and the AOTF entrance andexit optics, the support of the grating (milled from one blocktogether with the optical part), the support of the parabolicmirror (milled from one block together with the optical part),some optical mounts (for spectrometer slit, folding mirror, im-aging optics), and the foot for the detector–cooler assembly.Only two electronic modules, each in their mechanical box,are present on the optical bench: the VIS board (close to thedetector) and the RF power amplifier (close to the AOTF). Thewalls of LNO and the top cover do not serve any structuralgoal. Together with the SO walls, they are merely used as sup-port structure for the MLI that encloses the whole of NOMAD(see below). The complete �Z-side wall of NOMAD and asmall part of the top cover (�X-side) are manufactured in
Fig. 24. NOMAD observation sequence. PC, precooling; OBS,observation (nadir or SO); MEAS, measurement; SUB, subdomain;ACC, accumulation; INT, integration time; PROC, process time(including detector read-out, AOTF settling, etc.). Left (blue):nadir observation with one subdomain, no accumulation, spectrawith 14 s integration time. Right (red): SO observation with six sub-domains, three accumulations in subdomain 4, spectra with 40 msintegration time.
Fig. 25. 3D view of the SO channel.
Fig. 26. 3D view of the LNO channel.
8510 Vol. 54, No. 28 / October 1 2015 / Applied Optics Research Article
one piece and serve as radiator (see below), as it is directed to-ward deep space in most phases of the mission.
In the electronic section, at the bottom of the SO base plate,all the electronic boards are protected by individual mechanicalboxes. From this section the harness, which is manufactured byGlenair, UK, is routed up to the three channels.
Nearly all mechanical parts are made in 7075-T7351 ther-mally pretreated aluminum. For better manufacturability someoptical parts are made from 6061-T6 aluminum (gratings, flipmirror) or RSA-6061 aluminum (parabolic mirrors). Most ofthe mechanical elements, and especially those close to the op-tical path, have undergone a space qualified optically blackanodization (Protection des Métaux, France). This should limitscattering of light and keep the influence of thermal back-ground as low as possible. Contact surfaces between mechanicalparts are kept free of anodization but have been treated withalodine 1200 for good electrical conductivity. In order toachieve good thermal contact between base plates, walls andoptical mounts, mechanical provisions are foreseen in thecontact planes where thermal filler can be placed. The outsideof the radiator part has been painted white (see below).
The most noticeable exceptions to the all-aluminum ap-proach are the three NOMAD feet that form the mechanicalinterface to the spacecraft. In order to insure the thermome-chanical stability of the spacecraft instrument deck, a very lowthermal conductance is imposed between the instrument andthe spacecraft. Therefore, the feet are made from titanium,which has a 10 times lower thermal conductivity than alumi-num, and contain a double intrinsic thermal barrier, one in themounting plane to the spacecraft (3 ×M8 screws) and one atthe interface of the feet with the instrument (4 ×M5 screws).Despite the dedicated mechanical design a noncompliance is re-ported on the thermal conductance between NOMAD and thespacecraft (see below). The three feet have crumple zones givingthem sufficient elasticity to act together as isostatic mount for theinstrument, limiting the transfer of elastic deformation from thespacecraft deck to the instrument and vice versa.
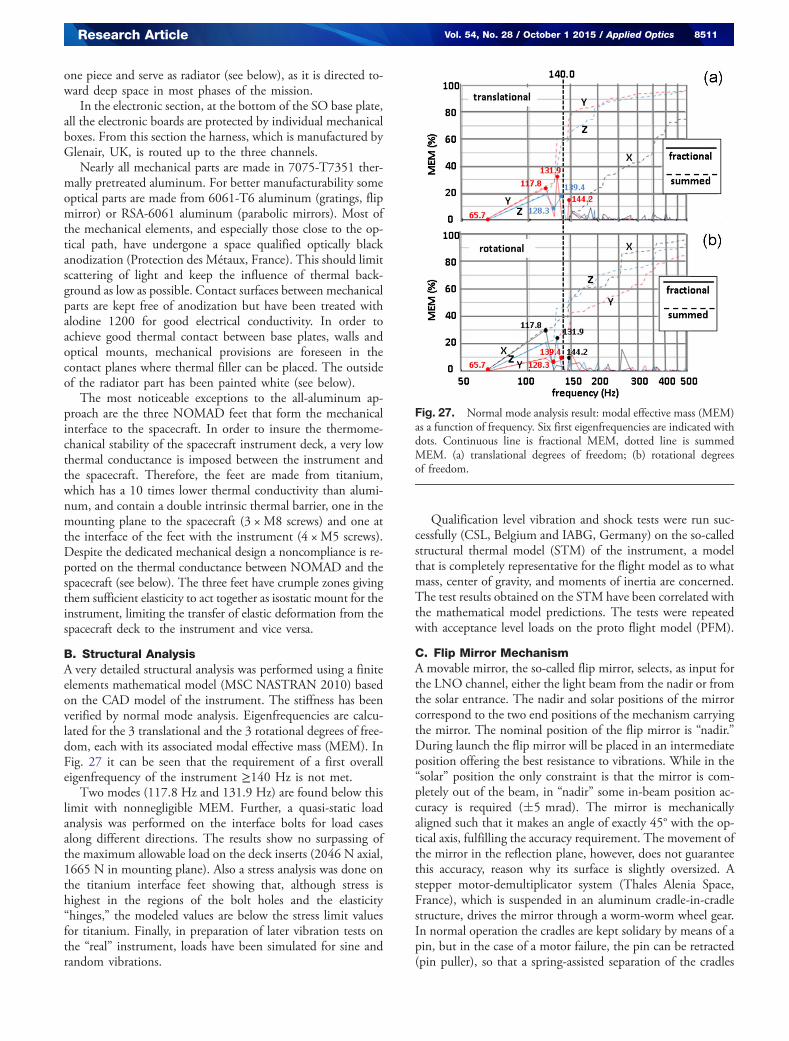
B. Structural AnalysisA very detailed structural analysis was performed using a finiteelements mathematical model (MSC NASTRAN 2010) basedon the CAD model of the instrument. The stiffness has beenverified by normal mode analysis. Eigenfrequencies are calcu-lated for the 3 translational and the 3 rotational degrees of free-dom, each with its associated modal effective mass (MEM). InFig. 27 it can be seen that the requirement of a first overalleigenfrequency of the instrument ≥140 Hz is not met.
Two modes (117.8 Hz and 131.9 Hz) are found below thislimit with nonnegligible MEM. Further, a quasi-static loadanalysis was performed on the interface bolts for load casesalong different directions. The results show no surpassing ofthe maximum allowable load on the deck inserts (2046 N axial,1665 N in mounting plane). Also a stress analysis was done onthe titanium interface feet showing that, although stress ishighest in the regions of the bolt holes and the elasticity“hinges,” the modeled values are below the stress limit valuesfor titanium. Finally, in preparation of later vibration tests onthe “real” instrument, loads have been simulated for sine andrandom vibrations.
Qualification level vibration and shock tests were run suc-cessfully (CSL, Belgium and IABG, Germany) on the so-calledstructural thermal model (STM) of the instrument, a modelthat is completely representative for the flight model as to whatmass, center of gravity, and moments of inertia are concerned.The test results obtained on the STM have been correlated withthe mathematical model predictions. The tests were repeatedwith acceptance level loads on the proto flight model (PFM).
C. Flip Mirror MechanismA movable mirror, the so-called flip mirror, selects, as input forthe LNO channel, either the light beam from the nadir or fromthe solar entrance. The nadir and solar positions of the mirrorcorrespond to the two end positions of the mechanism carryingthe mirror. The nominal position of the flip mirror is “nadir.”During launch the flip mirror will be placed in an intermediateposition offering the best resistance to vibrations. While in the“solar” position the only constraint is that the mirror is com-pletely out of the beam, in “nadir” some in-beam position ac-curacy is required (�5 mrad). The mirror is mechanicallyaligned such that it makes an angle of exactly 45° with the op-tical axis, fulfilling the accuracy requirement. The movement ofthe mirror in the reflection plane, however, does not guaranteethis accuracy, reason why its surface is slightly oversized. Astepper motor-demultiplicator system (Thales Alenia Space,France), which is suspended in an aluminum cradle-in-cradlestructure, drives the mirror through a worm-worm wheel gear.In normal operation the cradles are kept solidary by means of apin, but in the case of a motor failure, the pin can be retracted(pin puller), so that a spring-assisted separation of the cradles
Fig. 27. Normal mode analysis result: modal effective mass (MEM)as a function of frequency. Six first eigenfrequencies are indicated withdots. Continuous line is fractional MEM, dotted line is summedMEM. (a) translational degrees of freedom; (b) rotational degreesof freedom.
Research Article Vol. 54, No. 28 / October 1 2015 / Applied Optics 8511
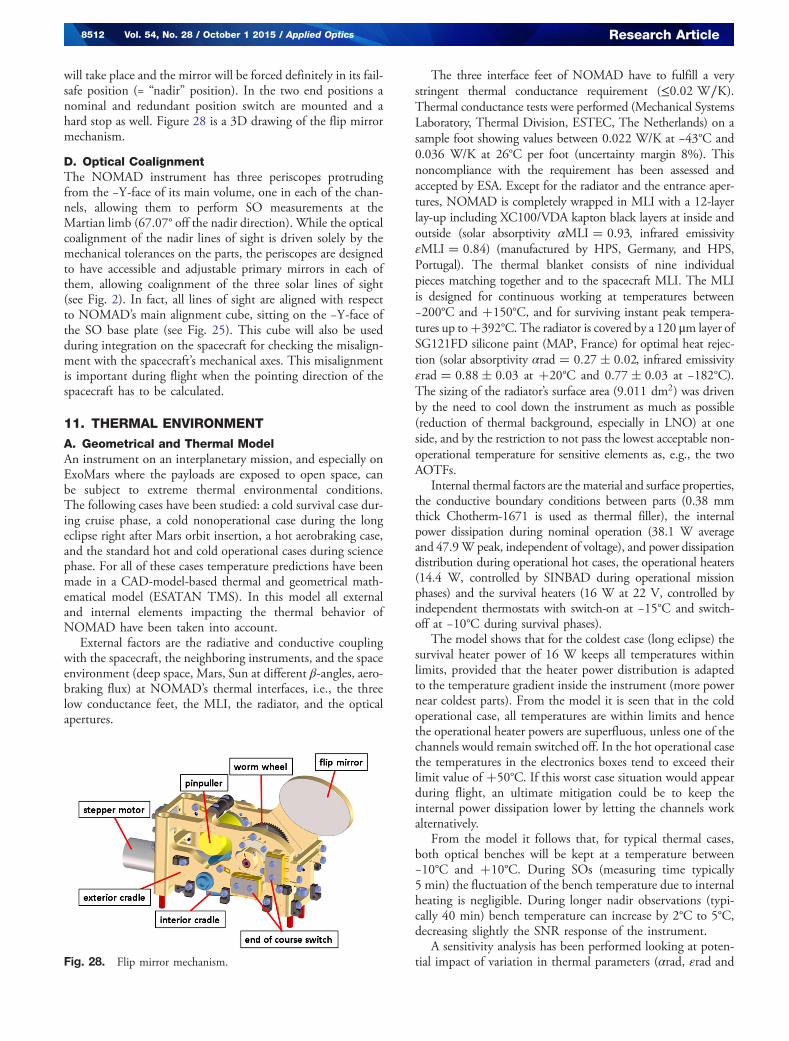
will take place and the mirror will be forced definitely in its fail-safe position (= “nadir” position). In the two end positions anominal and redundant position switch are mounted and ahard stop as well. Figure 28 is a 3D drawing of the flip mirrormechanism.
D. Optical CoalignmentThe NOMAD instrument has three periscopes protrudingfrom the −Y-face of its main volume, one in each of the chan-nels, allowing them to perform SO measurements at theMartian limb (67.07° off the nadir direction). While the opticalcoalignment of the nadir lines of sight is driven solely by themechanical tolerances on the parts, the periscopes are designedto have accessible and adjustable primary mirrors in each ofthem, allowing coalignment of the three solar lines of sight(see Fig. 2). In fact, all lines of sight are aligned with respectto NOMAD’s main alignment cube, sitting on the −Y-face ofthe SO base plate (see Fig. 25). This cube will also be usedduring integration on the spacecraft for checking the misalign-ment with the spacecraft’s mechanical axes. This misalignmentis important during flight when the pointing direction of thespacecraft has to be calculated.
11. THERMAL ENVIRONMENT
A. Geometrical and Thermal ModelAn instrument on an interplanetary mission, and especially onExoMars where the payloads are exposed to open space, canbe subject to extreme thermal environmental conditions.The following cases have been studied: a cold survival case dur-ing cruise phase, a cold nonoperational case during the longeclipse right after Mars orbit insertion, a hot aerobraking case,and the standard hot and cold operational cases during sciencephase. For all of these cases temperature predictions have beenmade in a CAD-model-based thermal and geometrical math-ematical model (ESATAN TMS). In this model all externaland internal elements impacting the thermal behavior ofNOMAD have been taken into account.
External factors are the radiative and conductive couplingwith the spacecraft, the neighboring instruments, and the spaceenvironment (deep space, Mars, Sun at different β-angles, aero-braking flux) at NOMAD’s thermal interfaces, i.e., the threelow conductance feet, the MLI, the radiator, and the opticalapertures.
The three interface feet of NOMAD have to fulfill a verystringent thermal conductance requirement (≤0.02 W∕K).Thermal conductance tests were performed (Mechanical SystemsLaboratory, Thermal Division, ESTEC, The Netherlands) on asample foot showing values between 0.022 W/K at −43°C and0.036 W/K at 26°C per foot (uncertainty margin 8%). Thisnoncompliance with the requirement has been assessed andaccepted by ESA. Except for the radiator and the entrance aper-tures, NOMAD is completely wrapped in MLI with a 12-layerlay-up including XC100/VDA kapton black layers at inside andoutside (solar absorptivity αMLI � 0.93, infrared emissivityεMLI � 0.84) (manufactured by HPS, Germany, and HPS,Portugal). The thermal blanket consists of nine individualpieces matching together and to the spacecraft MLI. The MLIis designed for continuous working at temperatures between−200°C and �150°C, and for surviving instant peak tempera-tures up to�392°C. The radiator is covered by a 120 μm layer ofSG121FD silicone paint (MAP, France) for optimal heat rejec-tion (solar absorptivity αrad � 0.27� 0.02, infrared emissivityεrad � 0.88� 0.03 at �20°C and 0.77� 0.03 at −182°C).The sizing of the radiator’s surface area (9.011 dm2) was drivenby the need to cool down the instrument as much as possible(reduction of thermal background, especially in LNO) at oneside, and by the restriction to not pass the lowest acceptable non-operational temperature for sensitive elements as, e.g., the twoAOTFs.
Internal thermal factors are the material and surface properties,the conductive boundary conditions between parts (0.38 mmthick Chotherm-1671 is used as thermal filler), the internalpower dissipation during nominal operation (38.1 W averageand 47.9W peak, independent of voltage), and power dissipationdistribution during operational hot cases, the operational heaters(14.4 W, controlled by SINBAD during operational missionphases) and the survival heaters (16 W at 22 V, controlled byindependent thermostats with switch-on at −15°C and switch-off at −10°C during survival phases).
The model shows that for the coldest case (long eclipse) thesurvival heater power of 16 W keeps all temperatures withinlimits, provided that the heater power distribution is adaptedto the temperature gradient inside the instrument (more powernear coldest parts). From the model it is seen that in the coldoperational case, all temperatures are within limits and hencethe operational heater powers are superfluous, unless one of thechannels would remain switched off. In the hot operational casethe temperatures in the electronics boxes tend to exceed theirlimit value of �50°C. If this worst case situation would appearduring flight, an ultimate mitigation could be to keep theinternal power dissipation lower by letting the channels workalternatively.
From the model it follows that, for typical thermal cases,both optical benches will be kept at a temperature between−10°C and �10°C. During SOs (measuring time typically5 min) the fluctuation of the bench temperature due to internalheating is negligible. During longer nadir observations (typi-cally 40 min) bench temperature can increase by 2°C to 5°C,decreasing slightly the SNR response of the instrument.
A sensitivity analysis has been performed looking at poten-tial impact of variation in thermal parameters (αrad, εrad andFig. 28. Flip mirror mechanism.
8512 Vol. 54, No. 28 / October 1 2015 / Applied Optics Research Article
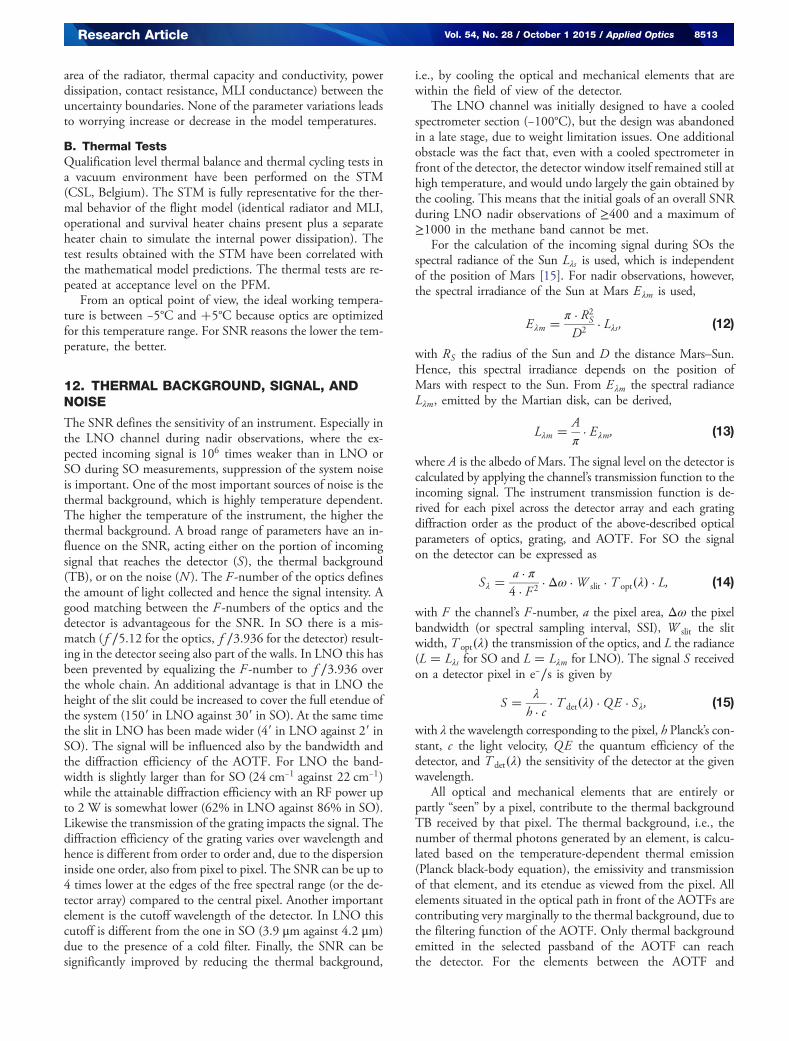
area of the radiator, thermal capacity and conductivity, powerdissipation, contact resistance, MLI conductance) between theuncertainty boundaries. None of the parameter variations leadsto worrying increase or decrease in the model temperatures.
B. Thermal TestsQualification level thermal balance and thermal cycling tests ina vacuum environment have been performed on the STM(CSL, Belgium). The STM is fully representative for the ther-mal behavior of the flight model (identical radiator and MLI,operational and survival heater chains present plus a separateheater chain to simulate the internal power dissipation). Thetest results obtained with the STM have been correlated withthe mathematical model predictions. The thermal tests are re-peated at acceptance level on the PFM.
From an optical point of view, the ideal working tempera-ture is between −5°C and �5°C because optics are optimizedfor this temperature range. For SNR reasons the lower the tem-perature, the better.
12. THERMAL BACKGROUND, SIGNAL, ANDNOISE
The SNR defines the sensitivity of an instrument. Especially inthe LNO channel during nadir observations, where the ex-pected incoming signal is 106 times weaker than in LNO orSO during SO measurements, suppression of the system noiseis important. One of the most important sources of noise is thethermal background, which is highly temperature dependent.The higher the temperature of the instrument, the higher thethermal background. A broad range of parameters have an in-fluence on the SNR, acting either on the portion of incomingsignal that reaches the detector (S), the thermal background(TB), or on the noise (N ). The F -number of the optics definesthe amount of light collected and hence the signal intensity. Agood matching between the F -numbers of the optics and thedetector is advantageous for the SNR. In SO there is a mis-match (f ∕5.12 for the optics, f ∕3.936 for the detector) result-ing in the detector seeing also part of the walls. In LNO this hasbeen prevented by equalizing the F -number to f ∕3.936 overthe whole chain. An additional advantage is that in LNO theheight of the slit could be increased to cover the full etendue ofthe system (150 0 in LNO against 30 0 in SO). At the same timethe slit in LNO has been made wider (4 0 in LNO against 2 0 inSO). The signal will be influenced also by the bandwidth andthe diffraction efficiency of the AOTF. For LNO the band-width is slightly larger than for SO (24 cm−1 against 22 cm−1)while the attainable diffraction efficiency with an RF power upto 2 W is somewhat lower (62% in LNO against 86% in SO).Likewise the transmission of the grating impacts the signal. Thediffraction efficiency of the grating varies over wavelength andhence is different from order to order and, due to the dispersioninside one order, also from pixel to pixel. The SNR can be up to4 times lower at the edges of the free spectral range (or the de-tector array) compared to the central pixel. Another importantelement is the cutoff wavelength of the detector. In LNO thiscutoff is different from the one in SO (3.9 μm against 4.2 μm)due to the presence of a cold filter. Finally, the SNR can besignificantly improved by reducing the thermal background,
i.e., by cooling the optical and mechanical elements that arewithin the field of view of the detector.
The LNO channel was initially designed to have a cooledspectrometer section (−100°C), but the design was abandonedin a late stage, due to weight limitation issues. One additionalobstacle was the fact that, even with a cooled spectrometer infront of the detector, the detector window itself remained still athigh temperature, and would undo largely the gain obtained bythe cooling. This means that the initial goals of an overall SNRduring LNO nadir observations of ≥400 and a maximum of≥1000 in the methane band cannot be met.
For the calculation of the incoming signal during SOs thespectral radiance of the Sun Lλs is used, which is independentof the position of Mars [15]. For nadir observations, however,the spectral irradiance of the Sun at Mars E λm is used,
Eλm � π · R2S
D2 · Lλs ; (12)
with RS the radius of the Sun and D the distance Mars–Sun.Hence, this spectral irradiance depends on the position ofMars with respect to the Sun. From E λm the spectral radianceLλm, emitted by the Martian disk, can be derived,
Lλm � Aπ· Eλm; (13)
where A is the albedo of Mars. The signal level on the detector iscalculated by applying the channel’s transmission function to theincoming signal. The instrument transmission function is de-rived for each pixel across the detector array and each gratingdiffraction order as the product of the above-described opticalparameters of optics, grating, and AOTF. For SO the signalon the detector can be expressed as
Sλ �a · π4 · F 2 · Δω ·W slit · T opt�λ� · L; (14)
with F the channel’s F -number, a the pixel area, Δω the pixelbandwidth (or spectral sampling interval, SSI), W slit the slitwidth, T opt�λ� the transmission of the optics, and L the radiance(L � Lλs for SO and L � Lλm for LNO). The signal S receivedon a detector pixel in e−∕s is given by
S � λ
h · c· T det�λ� · QE · Sλ; (15)
with λ the wavelength corresponding to the pixel, h Planck’s con-stant, c the light velocity, QE the quantum efficiency of thedetector, and T det�λ� the sensitivity of the detector at the givenwavelength.
All optical and mechanical elements that are entirely orpartly “seen” by a pixel, contribute to the thermal backgroundTB received by that pixel. The thermal background, i.e., thenumber of thermal photons generated by an element, is calcu-lated based on the temperature-dependent thermal emission(Planck black-body equation), the emissivity and transmissionof that element, and its etendue as viewed from the pixel. Allelements situated in the optical path in front of the AOTFs arecontributing very marginally to the thermal background, due tothe filtering function of the AOTF. Only thermal backgroundemitted in the selected passband of the AOTF can reachthe detector. For the elements between the AOTF and
Research Article Vol. 54, No. 28 / October 1 2015 / Applied Optics 8513
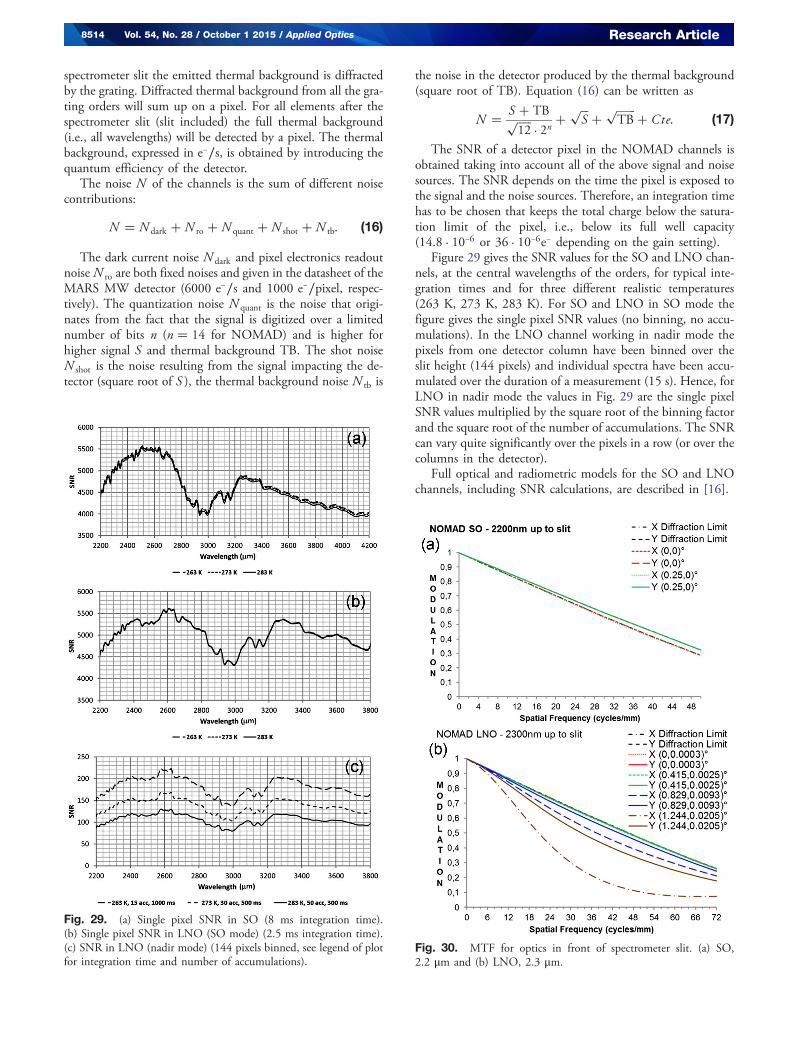
spectrometer slit the emitted thermal background is diffractedby the grating. Diffracted thermal background from all the gra-ting orders will sum up on a pixel. For all elements after thespectrometer slit (slit included) the full thermal background(i.e., all wavelengths) will be detected by a pixel. The thermalbackground, expressed in e−∕s, is obtained by introducing thequantum efficiency of the detector.
The noise N of the channels is the sum of different noisecontributions:
N � N dark � N ro � N quant � N shot � N tb: (16)
The dark current noise N dark and pixel electronics readoutnoise N ro are both fixed noises and given in the datasheet of theMARS MW detector (6000 e−∕s and 1000 e−∕pixel, respec-tively). The quantization noise N quant is the noise that origi-nates from the fact that the signal is digitized over a limitednumber of bits n (n � 14 for NOMAD) and is higher forhigher signal S and thermal background TB. The shot noiseN shot is the noise resulting from the signal impacting the de-tector (square root of S ), the thermal background noise N tb is
the noise in the detector produced by the thermal background(square root of TB). Equation (16) can be written as
N � S � TBffiffiffiffiffi
12p
· 2n�
ffiffiffi
Sp
�ffiffiffiffiffiffiffi
TBp
� Cte: (17)
The SNR of a detector pixel in the NOMAD channels isobtained taking into account all of the above signal and noisesources. The SNR depends on the time the pixel is exposed tothe signal and the noise sources. Therefore, an integration timehas to be chosen that keeps the total charge below the satura-tion limit of the pixel, i.e., below its full well capacity(14.8 · 10−6 or 36 · 10−6e− depending on the gain setting).
Figure 29 gives the SNR values for the SO and LNO chan-nels, at the central wavelengths of the orders, for typical inte-gration times and for three different realistic temperatures(263 K, 273 K, 283 K). For SO and LNO in SO mode thefigure gives the single pixel SNR values (no binning, no accu-mulations). In the LNO channel working in nadir mode thepixels from one detector column have been binned over theslit height (144 pixels) and individual spectra have been accu-mulated over the duration of a measurement (15 s). Hence, forLNO in nadir mode the values in Fig. 29 are the single pixelSNR values multiplied by the square root of the binning factorand the square root of the number of accumulations. The SNRcan vary quite significantly over the pixels in a row (or over thecolumns in the detector).
Full optical and radiometric models for the SO and LNOchannels, including SNR calculations, are described in [16].
Fig. 29. (a) Single pixel SNR in SO (8 ms integration time).(b) Single pixel SNR in LNO (SO mode) (2.5 ms integration time).(c) SNR in LNO (nadir mode) (144 pixels binned, see legend of plotfor integration time and number of accumulations).
Fig. 30. MTF for optics in front of spectrometer slit. (a) SO,2.2 μm and (b) LNO, 2.3 μm.
8514 Vol. 54, No. 28 / October 1 2015 / Applied Optics Research Article
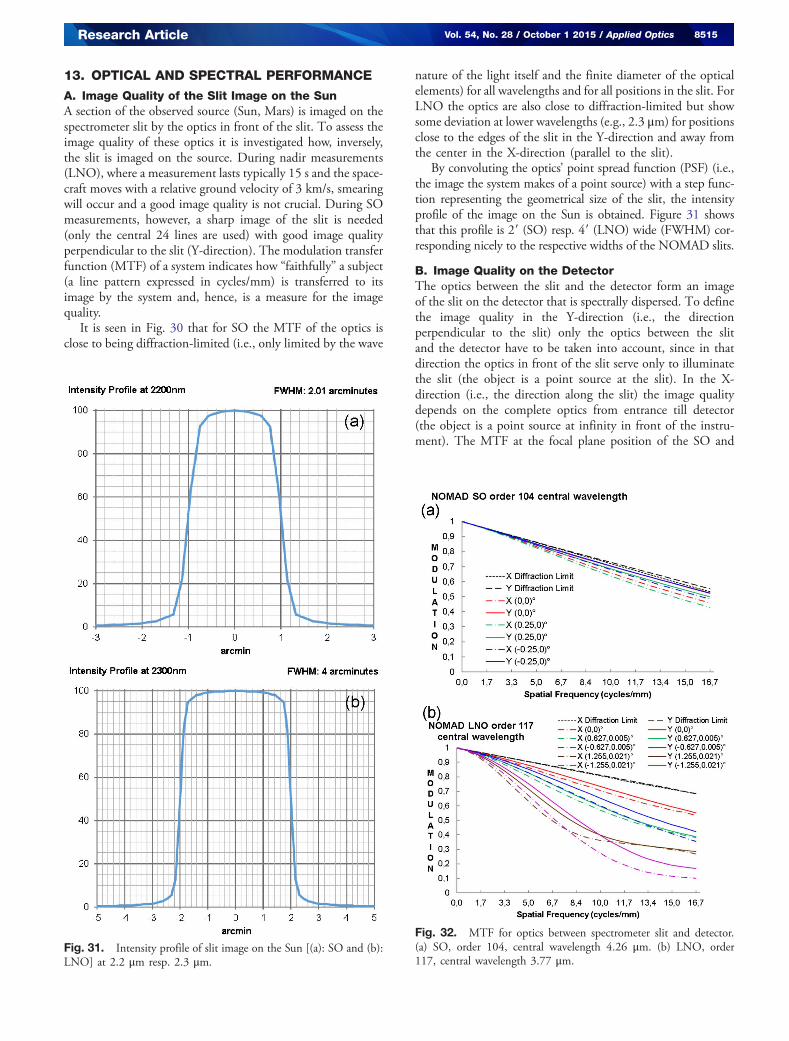
13. OPTICAL AND SPECTRAL PERFORMANCE
A. Image Quality of the Slit Image on the SunA section of the observed source (Sun, Mars) is imaged on thespectrometer slit by the optics in front of the slit. To assess theimage quality of these optics it is investigated how, inversely,the slit is imaged on the source. During nadir measurements(LNO), where a measurement lasts typically 15 s and the space-craft moves with a relative ground velocity of 3 km/s, smearingwill occur and a good image quality is not crucial. During SOmeasurements, however, a sharp image of the slit is needed(only the central 24 lines are used) with good image qualityperpendicular to the slit (Y-direction). The modulation transferfunction (MTF) of a system indicates how “faithfully” a subject(a line pattern expressed in cycles/mm) is transferred to itsimage by the system and, hence, is a measure for the imagequality.
It is seen in Fig. 30 that for SO the MTF of the optics isclose to being diffraction-limited (i.e., only limited by the wave
nature of the light itself and the finite diameter of the opticalelements) for all wavelengths and for all positions in the slit. ForLNO the optics are also close to diffraction-limited but showsome deviation at lower wavelengths (e.g., 2.3 μm) for positionsclose to the edges of the slit in the Y-direction and away fromthe center in the X-direction (parallel to the slit).
By convoluting the optics’ point spread function (PSF) (i.e.,the image the system makes of a point source) with a step func-tion representing the geometrical size of the slit, the intensityprofile of the image on the Sun is obtained. Figure 31 showsthat this profile is 2 0 (SO) resp. 4 0 (LNO) wide (FWHM) cor-responding nicely to the respective widths of the NOMAD slits.
B. Image Quality on the DetectorThe optics between the slit and the detector form an imageof the slit on the detector that is spectrally dispersed. To definethe image quality in the Y-direction (i.e., the directionperpendicular to the slit) only the optics between the slitand the detector have to be taken into account, since in thatdirection the optics in front of the slit serve only to illuminatethe slit (the object is a point source at the slit). In the X-direction (i.e., the direction along the slit) the image qualitydepends on the complete optics from entrance till detector(the object is a point source at infinity in front of the instru-ment). The MTF at the focal plane position of the SO and
Fig. 31. Intensity profile of slit image on the Sun [(a): SO and (b):LNO] at 2.2 μm resp. 2.3 μm.
Fig. 32. MTF for optics between spectrometer slit and detector.(a) SO, order 104, central wavelength 4.26 μm. (b) LNO, order117, central wavelength 3.77 μm.
Research Article Vol. 54, No. 28 / October 1 2015 / Applied Optics 8515
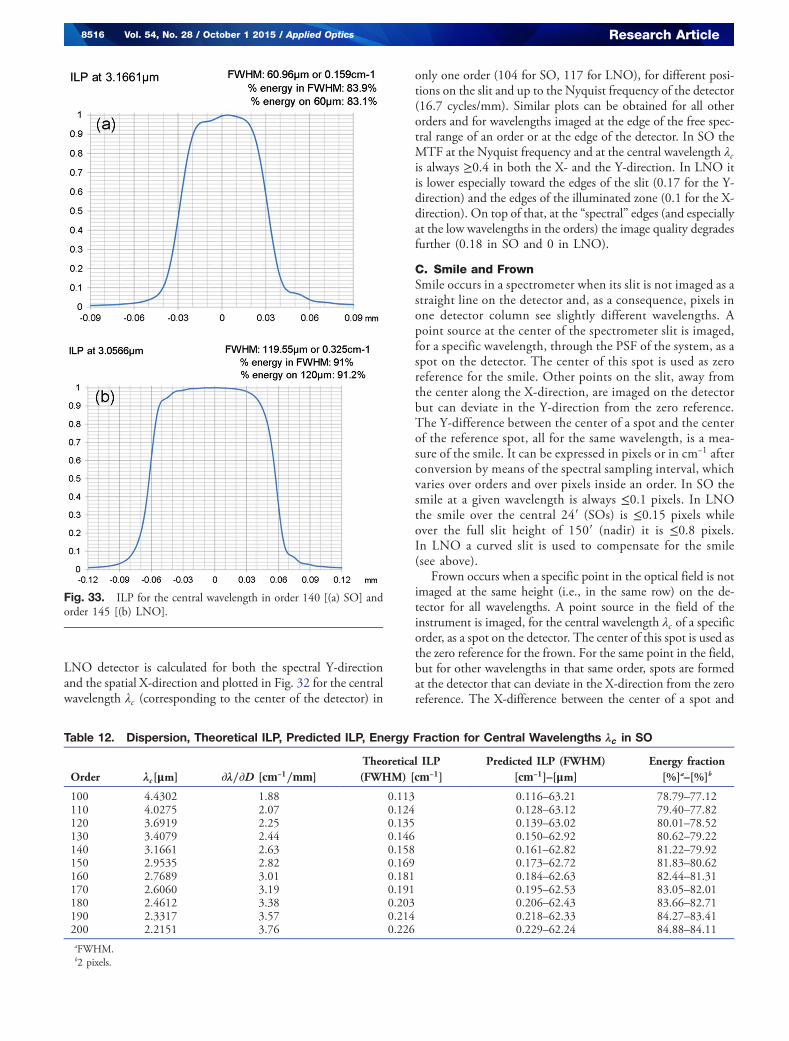
LNO detector is calculated for both the spectral Y-directionand the spatial X-direction and plotted in Fig. 32 for the centralwavelength λc (corresponding to the center of the detector) in
only one order (104 for SO, 117 for LNO), for different posi-tions on the slit and up to the Nyquist frequency of the detector(16.7 cycles/mm). Similar plots can be obtained for all otherorders and for wavelengths imaged at the edge of the free spec-tral range of an order or at the edge of the detector. In SO theMTF at the Nyquist frequency and at the central wavelength λcis always ≥0.4 in both the X- and the Y-direction. In LNO itis lower especially toward the edges of the slit (0.17 for the Y-direction) and the edges of the illuminated zone (0.1 for the X-direction). On top of that, at the “spectral” edges (and especiallyat the low wavelengths in the orders) the image quality degradesfurther (0.18 in SO and 0 in LNO).
C. Smile and FrownSmile occurs in a spectrometer when its slit is not imaged as astraight line on the detector and, as a consequence, pixels inone detector column see slightly different wavelengths. Apoint source at the center of the spectrometer slit is imaged,for a specific wavelength, through the PSF of the system, as aspot on the detector. The center of this spot is used as zeroreference for the smile. Other points on the slit, away fromthe center along the X-direction, are imaged on the detectorbut can deviate in the Y-direction from the zero reference.The Y-difference between the center of a spot and the centerof the reference spot, all for the same wavelength, is a mea-sure of the smile. It can be expressed in pixels or in cm−1 afterconversion by means of the spectral sampling interval, whichvaries over orders and over pixels inside an order. In SO thesmile at a given wavelength is always ≤0.1 pixels. In LNOthe smile over the central 24 0 (SOs) is ≤0.15 pixels whileover the full slit height of 150 0 (nadir) it is ≤0.8 pixels.In LNO a curved slit is used to compensate for the smile(see above).
Frown occurs when a specific point in the optical field is notimaged at the same height (i.e., in the same row) on the de-tector for all wavelengths. A point source in the field of theinstrument is imaged, for the central wavelength λc of a specificorder, as a spot on the detector. The center of this spot is used asthe zero reference for the frown. For the same point in the field,but for other wavelengths in that same order, spots are formedat the detector that can deviate in the X-direction from the zeroreference. The X-difference between the center of a spot and
Fig. 33. ILP for the central wavelength in order 140 [(a) SO] andorder 145 [(b) LNO].
Table 12. Dispersion, Theoretical ILP, Predicted ILP, Energy Fraction for Central Wavelengths λc in SO
Order λc[μm] ∂λ∕∂D [cm−1∕mm]Theoretical ILP(FWHM) [cm−1]
Predicted ILP (FWHM)[cm−1]–[μm]
Energy fraction[%]a–[%]b
100 4.4302 1.88 0.113 0.116–63.21 78.79–77.12110 4.0275 2.07 0.124 0.128–63.12 79.40–77.82120 3.6919 2.25 0.135 0.139–63.02 80.01–78.52130 3.4079 2.44 0.146 0.150–62.92 80.62–79.22140 3.1661 2.63 0.158 0.161–62.82 81.22–79.92150 2.9535 2.82 0.169 0.173–62.72 81.83–80.62160 2.7689 3.01 0.181 0.184–62.63 82.44–81.31170 2.6060 3.19 0.191 0.195–62.53 83.05–82.01180 2.4612 3.38 0.203 0.206–62.43 83.66–82.71190 2.3317 3.57 0.214 0.218–62.33 84.27–83.41200 2.2151 3.76 0.226 0.229–62.24 84.88–84.11aFWHM.b2 pixels.
8516 Vol. 54, No. 28 / October 1 2015 / Applied Optics Research Article
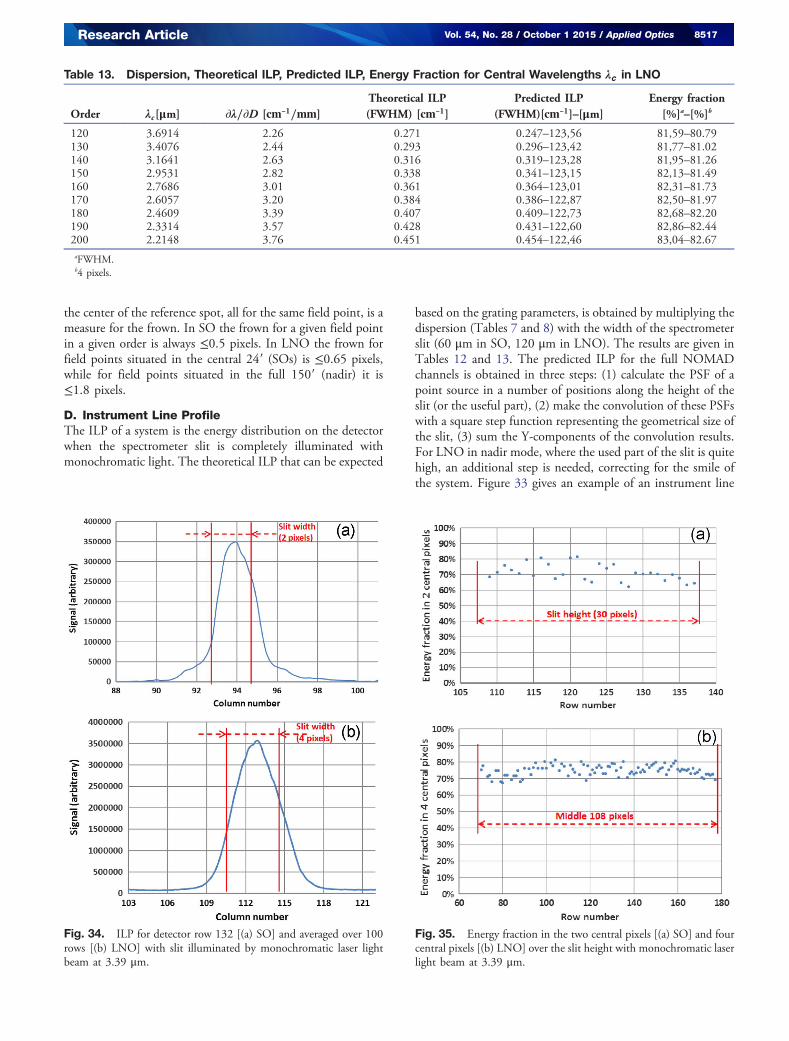
the center of the reference spot, all for the same field point, is ameasure for the frown. In SO the frown for a given field pointin a given order is always ≤0.5 pixels. In LNO the frown forfield points situated in the central 24 0 (SOs) is ≤0.65 pixels,while for field points situated in the full 150 0 (nadir) it is≤1.8 pixels.
D. Instrument Line ProfileThe ILP of a system is the energy distribution on the detectorwhen the spectrometer slit is completely illuminated withmonochromatic light. The theoretical ILP that can be expected
based on the grating parameters, is obtained by multiplying thedispersion (Tables 7 and 8) with the width of the spectrometerslit (60 μm in SO, 120 μm in LNO). The results are given inTables 12 and 13. The predicted ILP for the full NOMADchannels is obtained in three steps: (1) calculate the PSF of apoint source in a number of positions along the height of theslit (or the useful part), (2) make the convolution of these PSFswith a square step function representing the geometrical size ofthe slit, (3) sum the Y-components of the convolution results.For LNO in nadir mode, where the used part of the slit is quitehigh, an additional step is needed, correcting for the smile ofthe system. Figure 33 gives an example of an instrument line
Table 13. Dispersion, Theoretical ILP, Predicted ILP, Energy Fraction for Central Wavelengths λc in LNO
Order λc[μm] ∂λ∕∂D [cm−1∕mm]Theoretical ILP(FWHM) [cm−1]
Predicted ILP(FWHM)[cm−1]–[μm]
Energy fraction[%]a–[%]b
120 3.6914 2.26 0.271 0.247–123,56 81,59–80.79130 3.4076 2.44 0.293 0.296–123,42 81,77–81.02140 3.1641 2.63 0.316 0.319–123,28 81,95–81.26150 2.9531 2.82 0.338 0.341–123,15 82,13–81.49160 2.7686 3.01 0.361 0.364–123,01 82,31–81.73170 2.6057 3.20 0.384 0.386–122,87 82,50–81.97180 2.4609 3.39 0.407 0.409–122,73 82,68–82.20190 2.3314 3.57 0.428 0.431–122,60 82,86–82.44200 2.2148 3.76 0.451 0.454–122,46 83,04–82.67aFWHM.b4 pixels.
Fig. 34. ILP for detector row 132 [(a) SO] and averaged over 100rows [(b) LNO] with slit illuminated by monochromatic laser lightbeam at 3.39 μm.
Fig. 35. Energy fraction in the two central pixels [(a) SO] and fourcentral pixels [(b) LNO] over the slit height with monochromatic laserlight beam at 3.39 μm.
Research Article Vol. 54, No. 28 / October 1 2015 / Applied Optics 8517
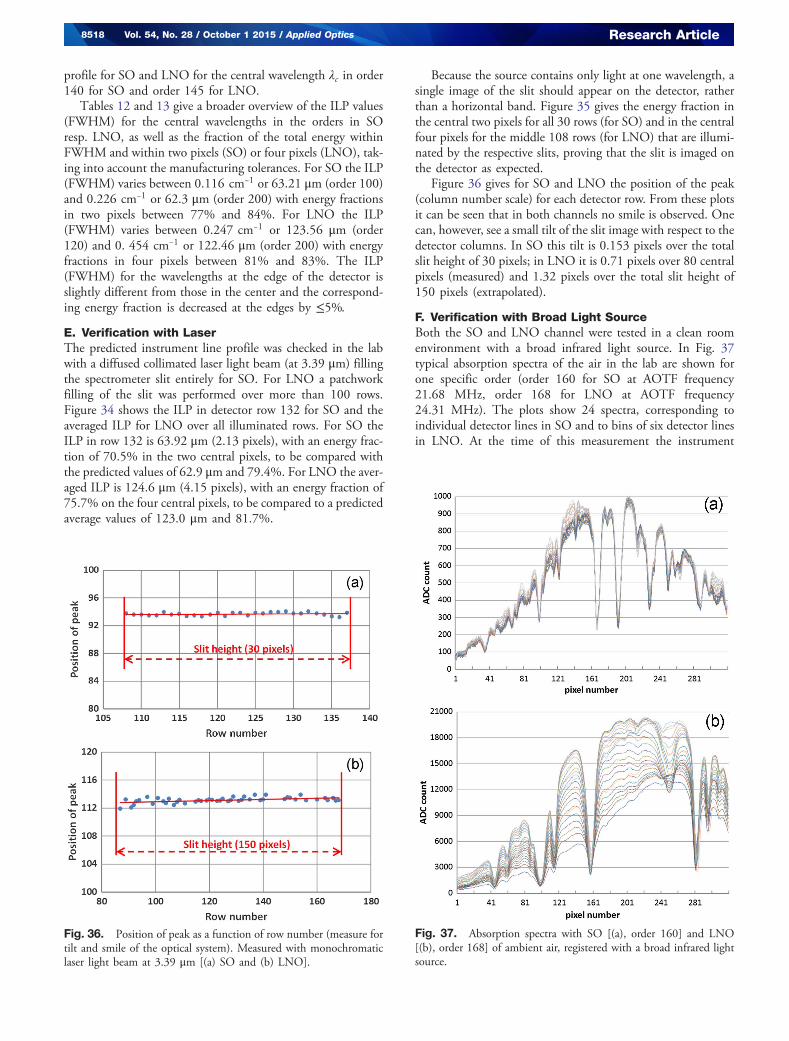
profile for SO and LNO for the central wavelength λc in order140 for SO and order 145 for LNO.
Tables 12 and 13 give a broader overview of the ILP values(FWHM) for the central wavelengths in the orders in SOresp. LNO, as well as the fraction of the total energy withinFWHM and within two pixels (SO) or four pixels (LNO), tak-ing into account the manufacturing tolerances. For SO the ILP(FWHM) varies between 0.116 cm−1 or 63.21 μm (order 100)and 0.226 cm−1 or 62.3 μm (order 200) with energy fractionsin two pixels between 77% and 84%. For LNO the ILP(FWHM) varies between 0.247 cm−1 or 123.56 μm (order120) and 0. 454 cm−1 or 122.46 μm (order 200) with energyfractions in four pixels between 81% and 83%. The ILP(FWHM) for the wavelengths at the edge of the detector isslightly different from those in the center and the correspond-ing energy fraction is decreased at the edges by ≤5%.
E. Verification with LaserThe predicted instrument line profile was checked in the labwith a diffused collimated laser light beam (at 3.39 μm) fillingthe spectrometer slit entirely for SO. For LNO a patchworkfilling of the slit was performed over more than 100 rows.Figure 34 shows the ILP in detector row 132 for SO and theaveraged ILP for LNO over all illuminated rows. For SO theILP in row 132 is 63.92 μm (2.13 pixels), with an energy frac-tion of 70.5% in the two central pixels, to be compared withthe predicted values of 62.9 μm and 79.4%. For LNO the aver-aged ILP is 124.6 μm (4.15 pixels), with an energy fraction of75.7% on the four central pixels, to be compared to a predictedaverage values of 123.0 μm and 81.7%.
Because the source contains only light at one wavelength, asingle image of the slit should appear on the detector, ratherthan a horizontal band. Figure 35 gives the energy fraction inthe central two pixels for all 30 rows (for SO) and in the centralfour pixels for the middle 108 rows (for LNO) that are illumi-nated by the respective slits, proving that the slit is imaged onthe detector as expected.
Figure 36 gives for SO and LNO the position of the peak(column number scale) for each detector row. From these plotsit can be seen that in both channels no smile is observed. Onecan, however, see a small tilt of the slit image with respect to thedetector columns. In SO this tilt is 0.153 pixels over the totalslit height of 30 pixels; in LNO it is 0.71 pixels over 80 centralpixels (measured) and 1.32 pixels over the total slit height of150 pixels (extrapolated).
F. Verification with Broad Light SourceBoth the SO and LNO channel were tested in a clean roomenvironment with a broad infrared light source. In Fig. 37typical absorption spectra of the air in the lab are shown forone specific order (order 160 for SO at AOTF frequency21.68 MHz, order 168 for LNO at AOTF frequency24.31 MHz). The plots show 24 spectra, corresponding toindividual detector lines in SO and to bins of six detector linesin LNO. At the time of this measurement the instrument
Fig. 36. Position of peak as a function of row number (measure fortilt and smile of the optical system). Measured with monochromaticlaser light beam at 3.39 μm [(a) SO and (b) LNO].
Fig. 37. Absorption spectra with SO [(a), order 160] and LNO[(b), order 168] of ambient air, registered with a broad infrared lightsource.
8518 Vol. 54, No. 28 / October 1 2015 / Applied Optics Research Article
was not yet calibrated, hence the figures are just qualitative in-dications of the good functioning of the infrared channels.Extensive reporting on instrumental calibration is the subjectof a separate paper [14].
14. CONCLUSIONS
In the conclusion of the paper that described the SOIR instru-ment on Venus Express [1] the following statement was made.“It is obvious that the field of applications for the spectrometerdescribed is not limited to the Venus Express mission only. Itcould be extremely useful to study the presence of methane inthe Martian atmosphere by solar occultation (SO), and thisspectrometer could perform such a task with a 10-times-higherspectral resolution than is possible with present instruments inorbit around Mars.” With the trace gas orbiter of ExoMars, tobe launched in January 2016, ESA offered a wonderful occasionto achieve this goal. This is why the first objective during theconception of NOMAD was to fly to Mars a one-to-one copyof the extremely successful SOIR instrument. The SO channelof NOMAD, which is described in this paper, will offer goodspectral resolution, high vertical sampling, and excellent sensi-tivity during SOs.
While SOIR was limited to SO measurements only, massand volume settings for NOMAD allowed for a significantupgrade of the instrument. It was the goal to add, on top ofthe SO channel, a second SOIR-like instrument, with more orless the same spectral characteristics but increased sensitivity,capable of performing measurements with much weaker lightsources than the Sun (nadir, limb). A key element to come tothis unprecedented performance was an extreme cooling of thespectrometer section to −100°C. The LNO channel, describedin this paper, does not have this capability. The cryoradiatorand spectrometer cryosection, the development of which wasalready far set, was descoped due to programmatic constraintsand resource limitations. A suite of other measures has beentaken to increase the SNR of the LNO channel so that nadirmeasurements with NOMAD will at least partially complywith the initial requirements.
All in all the NOMAD instrument, which besides the twoinfrared channels also contains a channel operating in the ultra-violet and visible wavelength range (not described in thispaper), is bound to deliver Martian atmospheric science beyondthe present knowledge thanks to a unique combination of spec-trometric performances.
Funding. Belgian Science Policy Office (BELSPO)(4000103401, 4000103402); ESA Prodex Office; Ministeriode Ciencia e Innovación (MICINN) (AYA2012-39691-C02-01, AYA2012-39691-C02-02); Science and TechnologyFacilities Council (STFC) (ST/I003061/1); UK SpaceAgency (UKSA).
Acknowledgment. The NOMAD instrument has beendeveloped under the responsibility of a Belgian principal inves-tigator team (BIRA-IASB, Brussels), assisted by Co-PI teamsfrom Spain (IAA-CSIC, Granada) and the United Kingdom(OU, Milton-Keynes). Associated teams contributing to the de-sign and development of NOMADwere CSL (Liège, Belgium),
IFSI (Rome, Italy), and IDR-UPM (Madrid, Spain). We thankall engineering and supporting personnel in these teams for thehard and solid work. Several industrial partners were associatedwith the above-mentioned teams. The industrial efforts werecoordinated by a Belgian prime contractor (OIP, Oudenaarde).The following industrial associates, partners, or subcontractorshave contributed to NOMAD: AMOS (Liège, Belgium),Deforche (Izegem, Belgium), ERZIA (Santander, Spain),ESTEC (Noordwijk-aan-Zee, Netherlands), Glenair (Mansfield,United Kingdom), Gooch and Housego (Ilminster, UnitedKingdom), HPS (München, Germany), Lambda-X (Nivelles,Belgium), MAP (Pamiers, France), Protection des Métaux(Noisy le Sec, France), Sener (Barcelona, Spain), Sofradir(Grenoble, France), Thales Alenia Space Belgium (Charleroi,Belgium), Thales Alenia Space France (Conflans SainteHonorine, France), Vaskon (Oudenaarde, Belgium). An impor-tant part of the work described in this paper, and especially theoutstanding optical design work, has been conducted by WouterMoelans and Ludovic Aballea at OIP. Our gratitude also goes toDennis Nevejans and Emiel van Ransbeeck, who, although re-tired, gave invaluable advice and support to the team at BIRA-IASB. Finally, our deepest respect to Stefan Lesschaeve, systemengineer at OIP, who sailed NOMAD safely through heavyweather. We are very grateful to ESA for giving the scientificcommunity the chance to go to Mars (once more) and forpersisting when the project was in danger. Our warmest thanksto the ExoMars TGO project team at ESA and especially toAndré Debus, who followed the development of NOMAD fromstart to finish.
REFERENCES1. D. Nevejans, E. Neefs, E. Van Ransbeeck, S. Berkenbosch, R.
Clairquin, L. De Vos, W. Moelans, S. Glorieux, A. Baeke, O.Korablev, I. Vinogradov, Y. Kalinnikov, B. Bach, J.-P. Dubois, andE. Villard, “Compact high-resolution spaceborne echelle gratingspectrometer with acousto-optical tunable filter based order sortingfor the infrared domain from 2.2 to 4.3 μm,” Appl. Opt. 45, 5191–5206 (2006).
2. A. Mahieux, A. C. Vandaele, S. Robert, V. Wilquet, R. Drummond,F. Montmessin, and J. L. Bertaux, “Densities and temperatures inthe Venus mesosphere and lower thermosphere retrieved fromSOIR on board Venus Express: carbon dioxide measurements atthe Venus terminator,” J. Geophys. Res. 117, E07001 (2012).
3. V. Wilquet, R. Drummond, A. Mahieux, S. Robert, A. C. Vandaele, andJ. L. Bertaux, “Optical extinction due to aerosols in the upper haze ofVenus: four years of SOIR/VEX observations from 2006 to 2010,”Icarus 217, 875–881 (2012).
4. A. C. Vandaele, A. Mahieux, S. Robert, R. Drummond, V. Wilquet, andJ. L. Bertaux, “Carbon monoxide short term variability observed onVenus with SOIR/VEX,” Planet. Space Sci. (to be published).
5. M. Patel, “The NOMAD spectrometer on the ExoMars tracegas orbiter mission: part 2—design and testing of the ultravioletand visible channel,” (in preparation).
6. “EXOMARS. Planetary exploration mission. Mars planet in-situ,”smsc.cnes.fr/EXOMARS/OLD/GP_lander.htm.
7. A. C. Vandaele, E. Neefs, R. Drummond, I. R. Thomas, F. Daerden,J.-J. Lopez-Moreno, J. Rodriguez, M. R. Patel, G. Bellucci, M. Allen,F. Altieri, D. Bolsée, T. Clancy, S. Delanoye, C. Depiesse, E. Cloutis,A. Fedorova, V. Formisano, B. Funke, D. Fussen, A. Geminale,J.-C. Gérard, M. Giuranna, N. Ignatiev, J. Kaminski, O. Karatekin,F. Lefèvre, M. López-Puertas, M. López-Valverde, A. Mahieux, J.McConnell, M. Mumma, L. Neary, E. Renotte, B. Ristic, S. Robert,M. Smith, S. Trokhimovsky, J. Vander, Auwera, G. Villanueva, J.
Research Article Vol. 54, No. 28 / October 1 2015 / Applied Optics 8519

Whiteway, V. Wilquet, and M. Wolff, The NOMAD Team, “NOMAD, aspectrometer suite for the ExoMars mission,” in preparation.
8. C. Palmer, Diffraction Grating Handbook, 6th ed. (Newport, 2005).9. M. C. Hutley, “Diffraction gratings,” in Techniques of Physics (Academic,
1982), Vol. 6, pp. 76.10. B. W. Bach, Jr., K. G. Bach, M. Schulze, and B. Bach, Jr., “Modern
echelons and echelles for infrared spectroscopy,” Proc. SPIE 5901,184–190 (2005).
11. M. S. Gottlieb, “Acousto-optic tunable filters,” in Design andFabrication of Acousto-Optic Devices, A. P. Gotzoulis, D. R. Pape,and S. V. Kulakov, eds. (Marcel Dekker, 1994), pp. 197–283.
12. I. C. Chang, “Non-collinear acousto-optic filter with large angularaperture,” Appl. Phys. Lett. 25, 370–372 (1974).
13. “MARS MW 320 × 256—30 μm pitch—MCT. The reference for MWIR320 × 256 detectors,” www.sofradir.com.
14. I. Thomas and C. Depiesse, “NOMAD, calibration of three spectrom-eter channels,” in preparation.
15. “ASTM E490–00a(2014) standard solar constant and zero air masssolar spectral irradiance tables,” www.astm.org.
16. I. R. Thomas, A. C. Vandaele, S. Robert, E. Neefs, R. Drummond,F. Daerden, S. Delanoye, C. Depiesse, B. Ristic, A. Mahieux, L.Neary, Y. Willame, V. Wilquet, L. Aballea, W. Moelans, L. De Vos,S. Lesschaeve, N. Van Vooren, J.-J. Lopez-Moreno, M. Patel, andG. Bellucci, The NOMAD Team, “Optical and radiometric models ofthe NOMAD instrument. Part II: the infrared channels, SO andLNO,” in preparation.
8520 Vol. 54, No. 28 / October 1 2015 / Applied Optics Research Article