Embed Size (px)
Citation preview
Partial Oxidation of Etheneto Ethylene Oxide in
Microchannel Reactors
von der Fakultat fur Naturwissenschaften der TechnischenUniversitat Chemnitz genehmigte Dissertation zur
Erlangung des akademischen Grades
doctor rerum naturalium
(Dr. rer. nat.)
vorgelegt von Dipl.-Chem. Ansgar Kursawe
geboren am 25. April 1971 in Esseneingereicht am 13. Januar 2009
Gutachter Prof. Dr.-Ing. Elias KlemmProf. Dr. Werner A. Goedel
Tag der Verteidigung 11. Dezember 2009
http://archiv.tu-chemnitz.de/pub/2010/0121

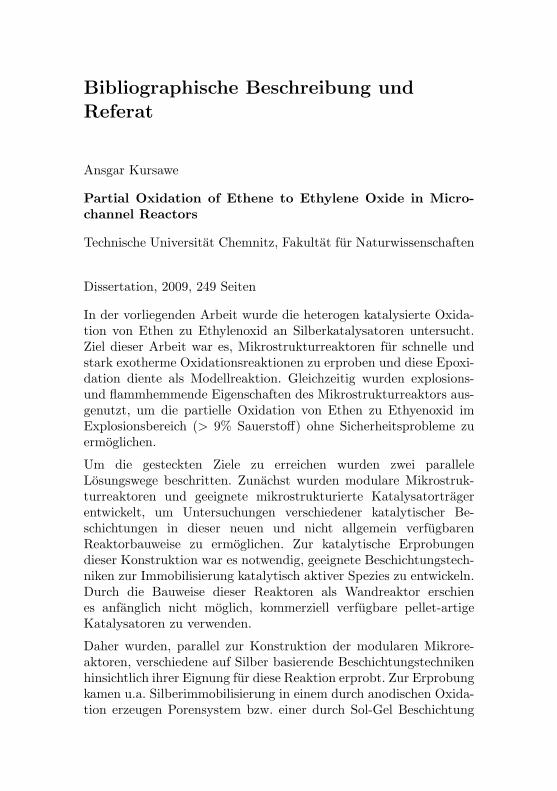
Bibliographische Beschreibung undReferat
Ansgar Kursawe
Partial Oxidation of Ethene to Ethylene Oxide in Micro-channel Reactors
Technische Universitat Chemnitz, Fakultat fur Naturwissenschaften
Dissertation, 2009, 249 Seiten
In der vorliegenden Arbeit wurde die heterogen katalysierte Oxida-tion von Ethen zu Ethylenoxid an Silberkatalysatoren untersucht.Ziel dieser Arbeit war es, Mikrostrukturreaktoren fur schnelle undstark exotherme Oxidationsreaktionen zu erproben und diese Epoxi-dation diente als Modellreaktion. Gleichzeitig wurden explosions-und flammhemmende Eigenschaften des Mikrostrukturreaktors aus-genutzt, um die partielle Oxidation von Ethen zu Ethyenoxid imExplosionsbereich (> 9% Sauerstoff) ohne Sicherheitsprobleme zuermoglichen.
Um die gesteckten Ziele zu erreichen wurden zwei paralleleLosungswege beschritten. Zunachst wurden modulare Mikrostruk-turreaktoren und geeignete mikrostrukturierte Katalysatortragerentwickelt, um Untersuchungen verschiedener katalytischer Be-schichtungen in dieser neuen und nicht allgemein verfugbarenReaktorbauweise zu ermoglichen. Zur katalytische Erprobungendieser Konstruktion war es notwendig, geeignete Beschichtungstech-niken zur Immobilisierung katalytisch aktiver Spezies zu entwickeln.Durch die Bauweise dieser Reaktoren als Wandreaktor erschienes anfanglich nicht moglich, kommerziell verfugbare pellet-artigeKatalysatoren zu verwenden.
Daher wurden, parallel zur Konstruktion der modularen Mikrore-aktoren, verschiedene auf Silber basierende Beschichtungstechnikenhinsichtlich ihrer Eignung fur diese Reaktion erprobt. Zur Erprobungkamen u.a. Silberimmobilisierung in einem durch anodischen Oxida-tion erzeugen Porensystem bzw. einer durch Sol-Gel Beschichtung
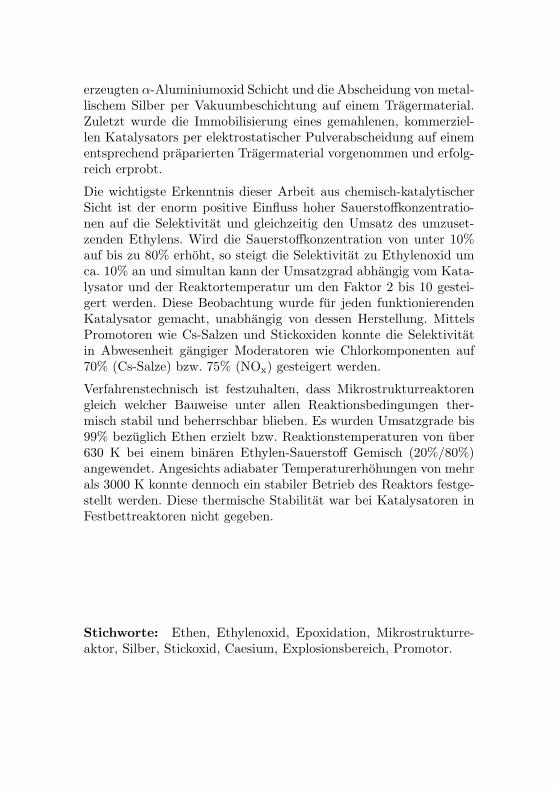
erzeugten α-Aluminiumoxid Schicht und die Abscheidung von metal-lischem Silber per Vakuumbeschichtung auf einem Tragermaterial.Zuletzt wurde die Immobilisierung eines gemahlenen, kommerziel-len Katalysators per elektrostatischer Pulverabscheidung auf einementsprechend praparierten Tragermaterial vorgenommen und erfolg-reich erprobt.
Die wichtigste Erkenntnis dieser Arbeit aus chemisch-katalytischerSicht ist der enorm positive Einfluss hoher Sauerstoffkonzentratio-nen auf die Selektivitat und gleichzeitig den Umsatz des umzuset-zenden Ethylens. Wird die Sauerstoffkonzentration von unter 10%auf bis zu 80% erhoht, so steigt die Selektivitat zu Ethylenoxid umca. 10% an und simultan kann der Umsatzgrad abhangig vom Kata-lysator und der Reaktortemperatur um den Faktor 2 bis 10 gestei-gert werden. Diese Beobachtung wurde fur jeden funktionierendenKatalysator gemacht, unabhangig von dessen Herstellung. MittelsPromotoren wie Cs-Salzen und Stickoxiden konnte die Selektivitatin Abwesenheit gangiger Moderatoren wie Chlorkomponenten auf70% (Cs-Salze) bzw. 75% (NOx) gesteigert werden.
Verfahrenstechnisch ist festzuhalten, dass Mikrostrukturreaktorengleich welcher Bauweise unter allen Reaktionsbedingungen ther-misch stabil und beherrschbar blieben. Es wurden Umsatzgrade bis99% bezuglich Ethen erzielt bzw. Reaktionstemperaturen von uber630 K bei einem binaren Ethylen-Sauerstoff Gemisch (20%/80%)angewendet. Angesichts adiabater Temperaturerhohungen von mehrals 3000 K konnte dennoch ein stabiler Betrieb des Reaktors festge-stellt werden. Diese thermische Stabilitat war bei Katalysatoren inFestbettreaktoren nicht gegeben.
Stichworte: Ethen, Ethylenoxid, Epoxidation, Mikrostrukturre-aktor, Silber, Stickoxid, Caesium, Explosionsbereich, Promotor.
Dank
Mein besonderer Dank gilt Herrn Prof. Honicke fur die hochinteres-sante Aufgabenstellung, seine stete konstruktive Diskussionsbereit-schaft wahrend der Erstellung der Arbeit, wertvolle Ratschlage undHinweise sowie fur die außergewohnliche Freiheit bei der Planungund Durchfuhrung der Versuche. Besonders mochte ich mich fur sei-ne Unterstutzung bezuglich des Entwurfs und des Baus der modu-laren Reaktoren sowie der dazugehorigen mikrostrukturierten Bau-teile mit den an einer Universitat verfugbaren Mitteln bedanken.Ohne diese Ruckendeckung ware die schnelle und unburokratischeUmsetzung eines spontanen interdisziplinaren Entwicklungsprojek-tes im Niemandsland zwischen Chemie und Fertigungstechnik nichtmoglich gewesen.
Diese modulare Reaktorenentwicklung und die dadurch ermoglichtenumfangreichen katalytischen Erprobungen und Erkenntnisse warenohne die konstruktive Mithilfe und den Erfahrungsschatz der me-chanischen Werkstatten der TU-Chemnitz nicht moglich gewesen.Deswegen gilt mein Dank hier stellvertretend fur alle Beteiligtendem Werkstattleiter, Herrn Arnold.
Dem Lehrstuhl fur Fertigungstechnik und Schweißtechnik und da-mit den Herren Professor Durr, Professor Matthes sowie Dr. Pilzdanke ich fur die Anfertigung der durch Drahterosion hergestelltenmikrostrukturierten Wafer und die gewahrte unburokratische Un-terstutzung. Den Herren Dipl.-Ing. Letsch und Dipl.-Ing. Meyer dan-ke ich fur ihr Engagement bei Laserschweiss- und Schneidarbeitenan Aluminiumbauteilen und diversen Dichtungsmaterialien.
Der Fa. CRI-Cataysts und damit Dr. McAteer, Dr. Rubinstein undHerrn TeRaa danke ich fur die Bereitstellung eines kommerziellenEthylenoxid-Katalysators.
Diese Arbeiten wurden im Rahmen des vom BMWI geforderten AiFProjektes ”Heterogen katalysierte Gasphasenoxidationen in Mikro-reaktoren” durchgefuhrt. Fur die finanzielle Unterstutzung sei andieser Stelle gedankt.
Fur die Anfertigung der elektronenmikroskopischen SEM Aufnah-men sowie Hilfestellungen bei der Bewaltigung der Tucken einerInline-Gaschromatographie mochte ich mich besonders bei Herrn Dr.

Enrico Dietzsch bedanken. Herrn Thomas Kittel vom Otto-SchottInstitut fur Glaschemie der Universitat Jena sei fur aufschlussreicheelektronenmikroskopische Cs-Backscatter Aufnahmen gedankt. Oh-ne Ihre Hilfe ware eine schnelle und aussagekraftige Kontrolle derbeschichteten Wafer nur schwer moglich gewesen.
Mein besonderer Dank gilt an dieser Stelle Frau Benndorf undFrau Wienzek fur die Betreuung der automatisiert arbeitenden Ver-suchsanlage sowie die GC/MS Kontrolle der Kuhlfallenkondensateund Frau Reichardt fur die Praparation dutzender Meter anodischoxidierter Aluminiumdrahte bzw. Wafer. Herrn Schauer danke ichfur die Hilfestellung beim elektrischen und elektronischen Aufbauder Versuchsanlage und sowie die erfolgreiche Eliminierung diverserKupferwurmer.
Nicht zuletzt bedanke ich mich bei meinen Eltern, Verwandten undFreunden fur die moralische Unterstutzung dieser Arbeit.
Contents
1 Introduction 13
1.1 Industrial production of ethylene oxide . . . . . . . . 14
1.1.1 Wurtz-process . . . . . . . . . . . . . . . . . . 14
1.1.2 Direct oxidation process . . . . . . . . . . . . 16
1.2 Handling of ethene oxide . . . . . . . . . . . . . . . . 19
1.3 Usage of ethylene oxide . . . . . . . . . . . . . . . . 21
2 Objectives 23
3 Theory 25
3.1 Reaction mechanism of the direct oxidation process . 25
3.2 Kinetics of the ethene epoxidation . . . . . . . . . . 27
3.3 Catalyst design . . . . . . . . . . . . . . . . . . . . . 30
3.4 Reactor design and heat management . . . . . . . . 34
3.4.1 Reactor design in industrial plants . . . . . . 34
3.4.2 Laboratory and microreactor design . . . . . 41
3.4.3 Advantages of using microchannel reactors . 46
7
8 Contents
4 Results 51
4.1 Epoxidation of ethene in microchannel reactors . . . 53
4.1.1 MCR1: Bulk silver microchannel reactor . . 53
4.1.2 Silver supported on aluminum wafers:MMCR1-5, MCR2, MCR3 . . . . . . . . . . . 62
4.1.2.1 Test of Ag/Al as a suitable, catalyticactive coating (MMCR1) . . . . . . 62
4.1.2.2 Short term aging of an Ag/Al acti-vated microchannel reactor (MMCR2) 65
4.1.2.3 Thermal stability of an Ag/Al acti-vated microchannel reactor (MMCR2) 69
4.1.2.4 Influence of the Ag layer thicknesson selectivity and conversion degree(MMCR3) . . . . . . . . . . . . . . 72
4.1.2.5 Influence of the aluminum pretreat-ment on selectivity and conversiondegree (MMCR4,MMCR5) . . . . . 76
4.1.2.6 Silver supported on anodicpreoxidized aluminum surface(Ag/Al2O3/Al, MCR2) . . . . . . . 78
4.1.2.7 Silver supported on metallic Al(Ag/Al, MCR3) . . . . . . . . . . . 83
4.1.3 Silver supported on α-Al2O3 surface . . . . . 93
4.1.3.1 Silver sputtered on ANOF preparedα-Al2O3 surface (MMCR6) . . . . . 93
4.1.3.2 Silver sputtered on α-Al2O3 (sol-gelcoating) . . . . . . . . . . . . . . . 95
4.1.3.3 Silver impregnated on α-Al2O3 sur-face by sol-gel coating (MMCR8) . 96
4.1.3.4 Usage of a commercial SHELL-800Series, α-Al2O3 based EO silvercatalyst in microchannel reactors(MMCR9, MMCR10) . . . . . . . . 104
Contents 9
4.1.4 Silver supported on stainless steel surfaces(MMCR11) . . . . . . . . . . . . . . . . . . . 110
4.1.5 Influence of promotors on Ag/Al coatings(MMCR12, MMCR13, MCR2Cs) . . . . . . . 112
4.1.5.1 Influence of NO2 and Cs on anAg/Al coated microchannel reactor(MMCR12, MMCR13) . . . . . . . 112
4.1.5.2 Regeneration of MCR2 by immobi-lization of Cs (MCR2Cs) . . . . . . 120
4.2 Epoxidation in traditional tube-type fixed bed reactors124
4.2.1 Bulk silver catalysts (FBR1, similar MCR1) . 124
4.2.2 Silver supported on Al2O3/Al (FBR2, similarMCR2) . . . . . . . . . . . . . . . . . . . . . 127
4.2.3 Silver on Al (FBR3, similar to MCR3) . . . . 129
4.2.4 Silver supported on α-Al2O3 . . . . . . . . . 132
4.2.4.1 Silver immobilized on α-Al2O3 byimpregnation . . . . . . . . . . . . . 132
4.2.4.2 Use of a commercial SHELL-800 Se-ries, α-Al2O3 based EO silver cata-lyst in a fixed bed reactor (FBR4) . 132
4.3 Heat management in microchannel reactors . . . . . 136
4.3.1 Changes of the temperature profile applyingstationary reaction conditions . . . . . . . . . 137
4.3.1.1 Temperature gradients caused bychanges in the reactor temperature 138
4.3.1.2 Temperature gradients caused bychanges of the flow rate . . . . . . . 140
4.3.1.3 Temperature gradients causedby changes in the ethene feedconcentration . . . . . . . . . . . . . 143
4.3.2 Changes of the temperature profile applyingdynamic reaction conditions . . . . . . . . . 145
10 Contents
4.4 Design aspects of modular microchannel reactors . . 149
5 Discussion 153
5.1 Computation of selectivity vs. conversion behavior . 154
5.1.1 Computation based on published kinetic data 154
5.1.2 Computation based on a triangular reactionscheme . . . . . . . . . . . . . . . . . . . . . . 157
5.2 Catalytic performance of different silver coatings . . 159
5.3 Influence of the reaction conditions on catalytic per-formance . . . . . . . . . . . . . . . . . . . . . . . . . 160
5.3.1 Impact of different oxygen concentrations . . 160
5.3.2 Impact of different ethene concentrations . . 162
5.3.3 Impact of the total pressure . . . . . . . . . . 163
5.3.4 Selectivity and conversion behavior of differ-ent silver catalysts . . . . . . . . . . . . . . . 164
5.3.4.1 Experimental findings . . . . . . . . 164
5.3.4.2 Computations . . . . . . . . . . . . 166
5.3.5 Calculation of activation energies . . . . . . . 173
5.4 Heat effects and reaction engineering aspects . . . . 176
5.4.1 Temperature profiles and heat effects in mi-crochannel reactors . . . . . . . . . . . . . . . 176
5.4.2 Reactor construction . . . . . . . . . . . . . . 179
5.4.3 Performance parameters of fixed-bed and mi-crochannel reactors . . . . . . . . . . . . . . . 180
5.4.3.1 Comparison of tube type and cor-responding microchannel reactors(FBR1-3, MCR1-3) . . . . . . . . . 181
5.4.3.2 Comparison of reactor performance 182
6 Experimental 187
6.1 Flow apparatus . . . . . . . . . . . . . . . . . . . . . 187
Contents 11
6.1.1 Flow control . . . . . . . . . . . . . . . . . . 187
6.1.2 Analytics . . . . . . . . . . . . . . . . . . . . 189
6.2 Reactor design . . . . . . . . . . . . . . . . . . . . . 191
6.2.1 Pressure resistant laboratory tube type reac-tor (FBR1-4) . . . . . . . . . . . . . . . . . . 191
6.2.2 Commercial microchannel reactors(MCR1-3) . . . . . . . . . . . . . . . . . . . . 192
6.2.3 Modular microchannel reactors . . . . . . . . 194
6.2.3.1 Modular Microchannel ReactorType I . . . . . . . . . . . . . . . . 194
6.2.3.2 Modular Microchannel ReactorType II . . . . . . . . . . . . . . . . 198
6.3 Design and manufacturing of microstructured wafers 202
6.3.1 Wire electro discharge machining . . . . . . . 202
6.3.2 Parallel multiple milling method . . . . . . . 204
6.4 Catalyst preparation and coating procedures . . . . 206
6.4.1 Physical immobilization methods . . . . . . . 207
6.4.2 Anodic oxidation & impregnation . . . . . . . 207
6.4.3 Sol-gel coatings . . . . . . . . . . . . . . . . . 209
6.4.4 Electrostatic powder deposition . . . . . . . . 210
7 Appendix 213
7.1 Chemical properties of ethylene oxide . . . . . . . . 213
7.2 Environmental effects of ethylene oxide . . . . . . . 215
7.3 Physical properties of ethylene oxide . . . . . . . . . 217
7.4 Additional figures and measurements for MCR2 . . . 218
7.5 Additional figures and measurements for MCR3 . . . 222
7.6 Additional figures and measurements for MMCR8 . 226
7.7 Additional figures and measurements for MMCR9/10 229
7.8 Additional figures and measurements for MCR2Cs . 233

12 Contents
7.9 Additional figures and measurements for FBR4 . . . 237
Bibliography 239
Chapter 1
Introduction
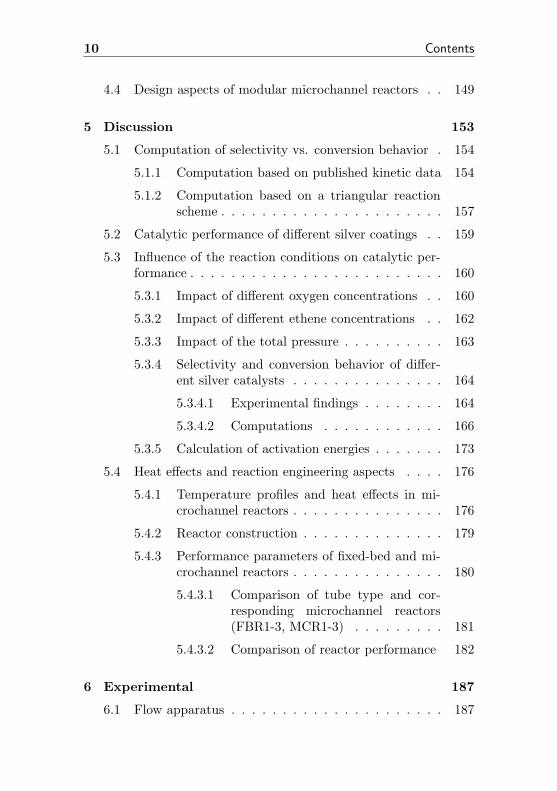
Ethylene oxide, otherwise known as ethene oxide or oxirane, is themost simple cyclic ether and is very reactive. Its highly strained ring(Fig. 1.1) with a COC angle of only 61.62o can be opened easily.Thus, it is one of the most versatile chemical intermediates and has awidespread use in the pharmaceutical and chemical industry. Ethy-lene oxide (EO) was first discovered by Wurtz [1] in 1859 by liquidphase oxidation using potassium hydroxide to eliminate hydrochlo-ric acid from ethylene chlorohydrin and nowadays, a heterogeneouscatalyzed gas phase oxidation is exclusively used. The worldwideannular production was about 11 million tons in 1986 and raisedto 16 million tons in 2000. With approximately 4 million tons itranked in the top 25 among all chemicals produced in the United
Figure 1.1: Structure, binding angels and atomic distances of ethyleneoxide.
13
14 Chapter 1. Introduction
States [2, 3]. In Germany, approximately 715.000t ethylene oxidewere produced in Ludwigshafen (BASF), Dormagen (Erdolchemie),Gendorf (Clariant) and Marl (DEA) [3].
The epoxidation of ethene with oxygen is a highly exothermicreaction, which requires cooling of the reactor in order to preventa runaway. Furthermore, ethylene and oxygen may form explosivemixtures, which is in combination with potential hot spots a severethread to safe operation.
The microchannel reactor (MCR) is a very new reactor type,which emerged in the 80s and found soon a widespread use in re-search departments. This reactor concept emerged from the devel-opment of small counter-current or cross-flow micro heat exchangers.The very small distance between heat source and coolant with typ-ically only some 10 to some hundred micrometers and channel sizesin the same range result in large surface areas per volume, even lowtemperature gradients allow high heat transfer rates.
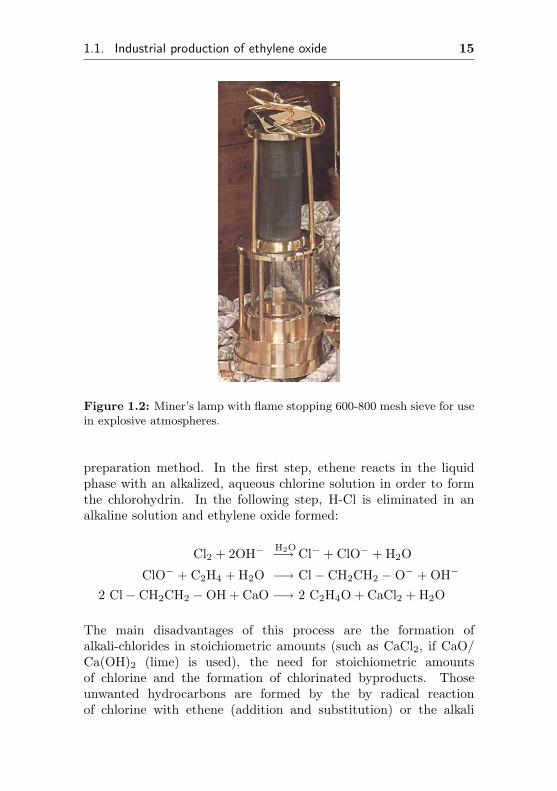
The principle of a wall reactor eliminates heat transfer problemsbetween catalyst and heat exchanger surface. Furthermore, the highratio of the reactor’s inner surface to the total volume of the reac-tor combined with the small channel size proved to function as aflame and explosion stopping construction, very similar to the wellknown 600-800 mesh sieves i.e. for acetylene or petroleum lampsused in mining since 1816 [4] and invented by Sir Humphrey Davy.Those lamps (see Fig. 1.2) allow the use of an open flame even inatmospheres with potentially explosive hydrocarbon concentrations,utilizing the flame stopping and quenching effect of narrow sieveson the radical combustion reaction, preventing flame propagationthrough the sieve.
1.1 Industrial production of ethylene ox-ide
1.1.1 Wurtz-process
The industrial production of ethylene oxide started in 1914 [5] withthe chlorohydrin process, a route very similar to Wurtz’ original
1.1. Industrial production of ethylene oxide 15
Figure 1.2: Miner’s lamp with flame stopping 600-800 mesh sieve for usein explosive atmospheres.
preparation method. In the first step, ethene reacts in the liquidphase with an alkalized, aqueous chlorine solution in order to formthe chlorohydrin. In the following step, H-Cl is eliminated in analkaline solution and ethylene oxide formed:
Cl2 + 2OH− H2O−→ Cl− + ClO− + H2O
ClO− + C2H4 + H2O −→ Cl− CH2CH2 −O− + OH−
2 Cl− CH2CH2 −OH + CaO −→ 2 C2H4O + CaCl2 + H2O
The main disadvantages of this process are the formation ofalkali-chlorides in stoichiometric amounts (such as CaCl2, if CaO/Ca(OH)2 (lime) is used), the need for stoichiometric amountsof chlorine and the formation of chlorinated byproducts. Thoseunwanted hydrocarbons are formed by the by radical reactionof chlorine with ethene (addition and substitution) or the alkali
16 Chapter 1. Introduction
catalyzed hydrolysis of ethylene oxide to ethylene glycol.
Cl2 + C2H4 −→ C2H4Cl2HCl + C2H4 −→ C2H3Cl
C2H4O + H2O −→ HOCH2CH2OH
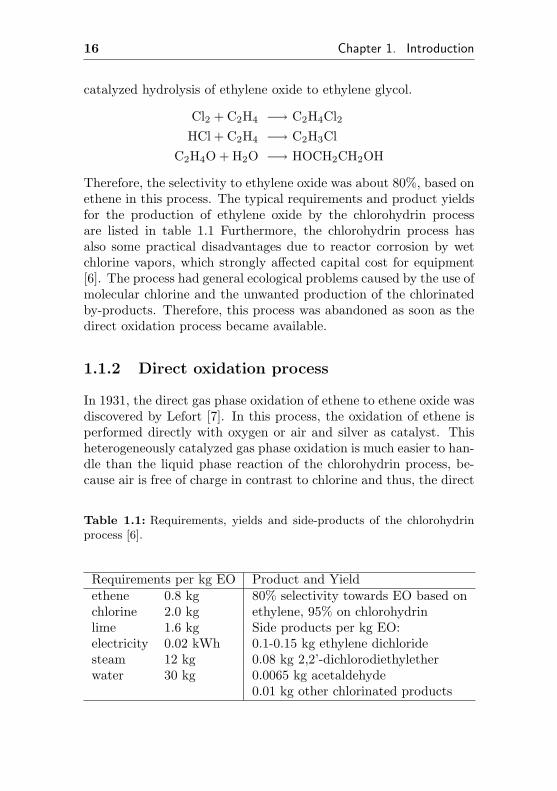
Therefore, the selectivity to ethylene oxide was about 80%, based onethene in this process. The typical requirements and product yieldsfor the production of ethylene oxide by the chlorohydrin processare listed in table 1.1 Furthermore, the chlorohydrin process hasalso some practical disadvantages due to reactor corrosion by wetchlorine vapors, which strongly affected capital cost for equipment[6]. The process had general ecological problems caused by the use ofmolecular chlorine and the unwanted production of the chlorinatedby-products. Therefore, this process was abandoned as soon as thedirect oxidation process became available.
1.1.2 Direct oxidation process
In 1931, the direct gas phase oxidation of ethene to ethene oxide wasdiscovered by Lefort [7]. In this process, the oxidation of ethene isperformed directly with oxygen or air and silver as catalyst. Thisheterogeneously catalyzed gas phase oxidation is much easier to han-dle than the liquid phase reaction of the chlorohydrin process, be-cause air is free of charge in contrast to chlorine and thus, the direct
Table 1.1: Requirements, yields and side-products of the chlorohydrinprocess [6].
Requirements per kg EO Product and Yieldethene 0.8 kg 80% selectivity towards EO based onchlorine 2.0 kg ethylene, 95% on chlorohydrinlime 1.6 kg Side products per kg EO:electricity 0.02 kWh 0.1-0.15 kg ethylene dichloridesteam 12 kg 0.08 kg 2,2’-dichlorodiethyletherwater 30 kg 0.0065 kg acetaldehyde
0.01 kg other chlorinated products
1.1. Industrial production of ethylene oxide 17
oxidation is more cost efficiant than the chlorohydrin route. There-fore, the chlorohydrin route was abandoned in the 1950s [6, 8]. Upto now, silver is the only catalytic active component for this oxida-tion process. Initially, about 50% selectivity to ethene oxide wereachieved. The discovery of alkali promoters such as cesium saltsand gaseous moderators as vinylchloride and 1,2-dichloroethane im-proved the selectivity to nearly 68% in the 1960s and with ongo-ing research, the selectivity increased to 75-85% within the ’70 and’80s [8]. Presently, the application of highly promoted silver cata-lysts allows selectivities of initially 90% [3, 9].
Historically, there have been two types of direct oxidation pro-cesses used for the production of ethylene oxide. The first and formerwidespread process type uses air, the other and newer one is basedon oxygen for the epoxidation.
The air-based process requires low ethene concentrations in thefeed, which is converted with air to ethylene oxide. In this setup,two (or in larger plants three) reactors are subsequently arrangedwith increasing degree of ethene conversion until nearly completeconversion of ethene (about 95%) is achieved. Therefore, the firstreactor operates at low conversion degree, but higher selectivitiesand the last reactor operates at high conversion degrees, but lowselectivities [10]. The advantage of this process is, that air is free ofcharge and as already mentioned, the investment cost is low. Thedisadvantage is, that several reactors are required with lower etheneselectivities. Only low ethene concentrations (< 5%) can be applied[6] in order to stay out of the explosion range.
In contrast, the oxygen-based process requires only a single re-actor. In this setup, high concentrations of ethene (up to 40% [5]) aremixed with oxygen and an inert gas resulting in a mixture having lessthan 8% oxygen in order to stay below the lower explosion bound-ary. This mixture is passed through a single reactor at low ethene(and oxygen) conversion degrees [10]. After absorption of ethyleneoxide and venting a small purge stream to prevent inert gas enrich-ment, some carbon dioxide is washed out. The remaining ethylene,oxygen and inert gas containing stream is enriched with fresh ethy-lene and oxygen and recycled into the reactor again. Therefore, theepoxidation takes place in a single reactor with a limited conversiondegree of ethene per cycle and therefore, high selectivities to ethene
18 Chapter 1. Introduction
a
b
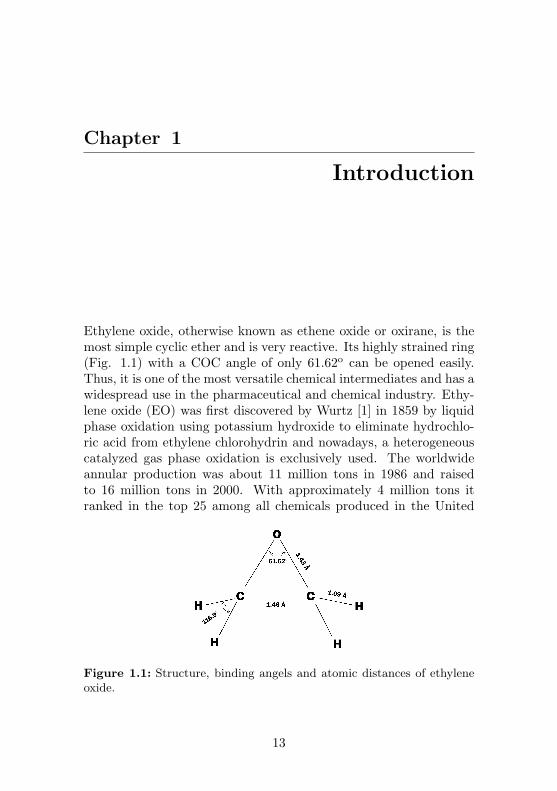
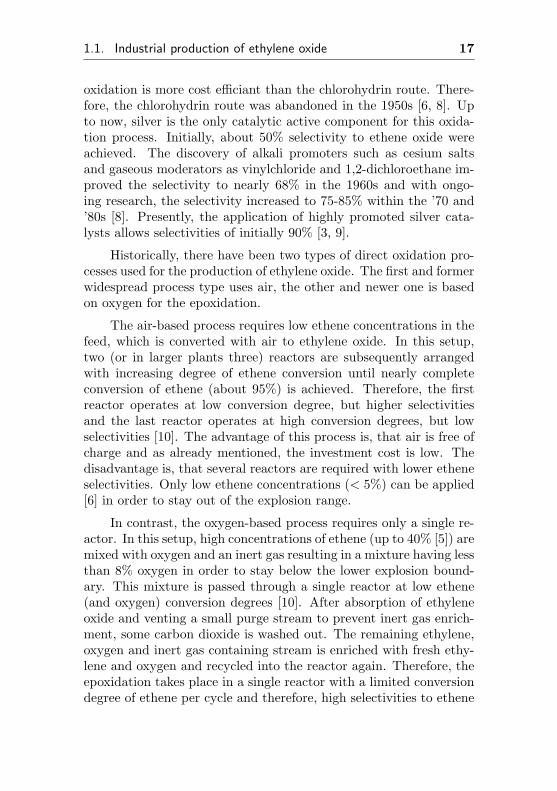
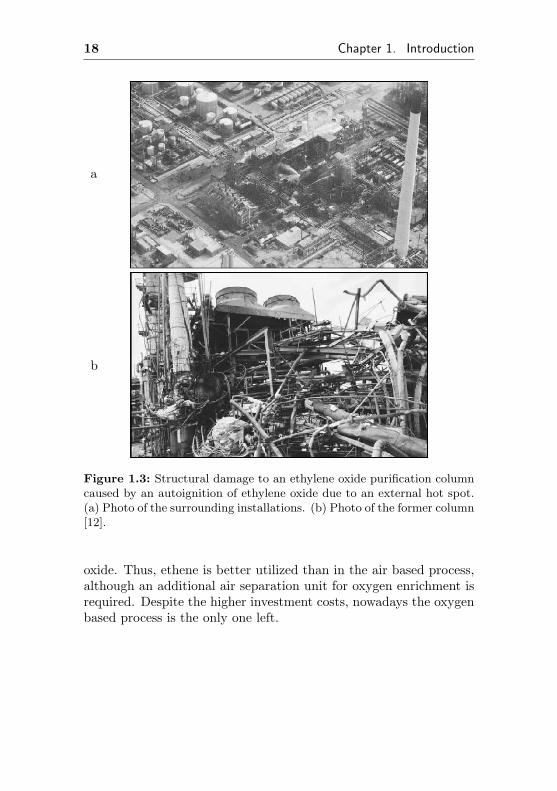
Figure 1.3: Structural damage to an ethylene oxide purification columncaused by an autoignition of ethylene oxide due to an external hot spot.(a) Photo of the surrounding installations. (b) Photo of the former column[12].
oxide. Thus, ethene is better utilized than in the air based process,although an additional air separation unit for oxygen enrichment isrequired. Despite the higher investment costs, nowadays the oxygenbased process is the only one left.
1.2. Handling of ethene oxide 19
1.2 Handling of ethene oxide
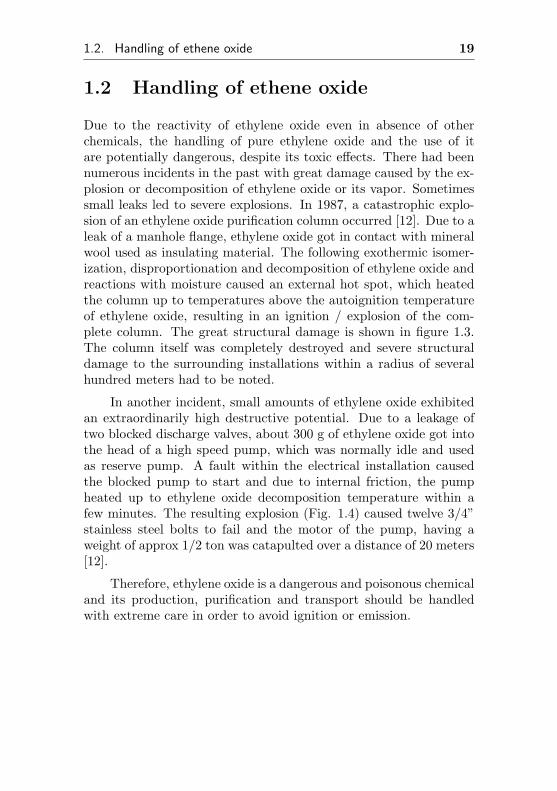
Due to the reactivity of ethylene oxide even in absence of otherchemicals, the handling of pure ethylene oxide and the use of itare potentially dangerous, despite its toxic effects. There had beennumerous incidents in the past with great damage caused by the ex-plosion or decomposition of ethylene oxide or its vapor. Sometimessmall leaks led to severe explosions. In 1987, a catastrophic explo-sion of an ethylene oxide purification column occurred [12]. Due to aleak of a manhole flange, ethylene oxide got in contact with mineralwool used as insulating material. The following exothermic isomer-ization, disproportionation and decomposition of ethylene oxide andreactions with moisture caused an external hot spot, which heatedthe column up to temperatures above the autoignition temperatureof ethylene oxide, resulting in an ignition / explosion of the com-plete column. The great structural damage is shown in figure 1.3.The column itself was completely destroyed and severe structuraldamage to the surrounding installations within a radius of severalhundred meters had to be noted.
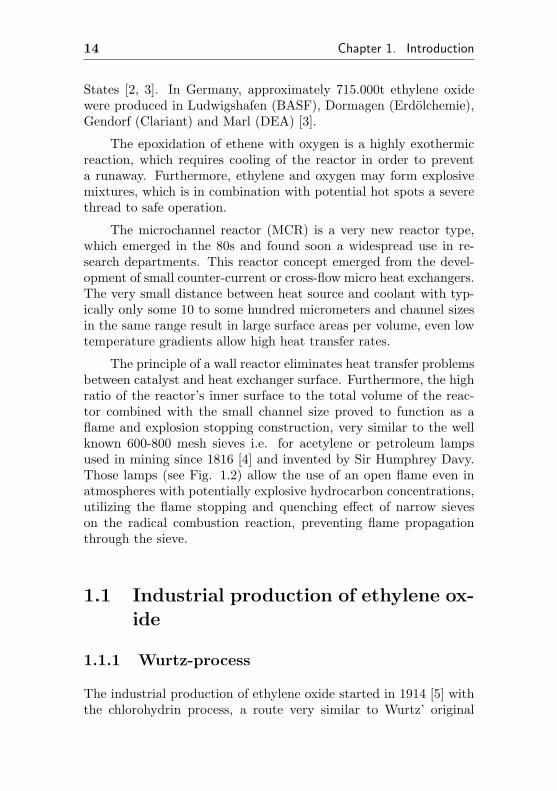
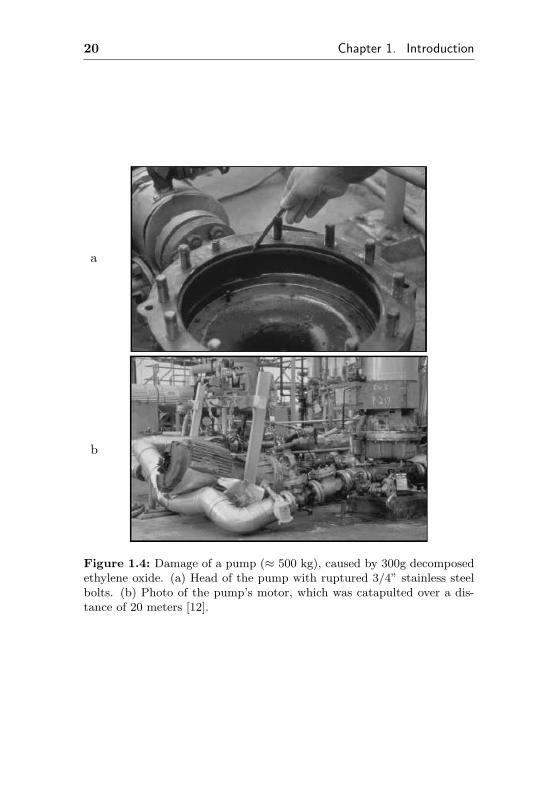
In another incident, small amounts of ethylene oxide exhibitedan extraordinarily high destructive potential. Due to a leakage oftwo blocked discharge valves, about 300 g of ethylene oxide got intothe head of a high speed pump, which was normally idle and usedas reserve pump. A fault within the electrical installation causedthe blocked pump to start and due to internal friction, the pumpheated up to ethylene oxide decomposition temperature within afew minutes. The resulting explosion (Fig. 1.4) caused twelve 3/4”stainless steel bolts to fail and the motor of the pump, having aweight of approx 1/2 ton was catapulted over a distance of 20 meters[12].
Therefore, ethylene oxide is a dangerous and poisonous chemicaland its production, purification and transport should be handledwith extreme care in order to avoid ignition or emission.
20 Chapter 1. Introduction
a
b
Figure 1.4: Damage of a pump (≈ 500 kg), caused by 300g decomposedethylene oxide. (a) Head of the pump with ruptured 3/4” stainless steelbolts. (b) Photo of the pump’s motor, which was catapulted over a dis-tance of 20 meters [12].
1.3. Usage of ethylene oxide 21
1.3 Usage of ethylene oxide
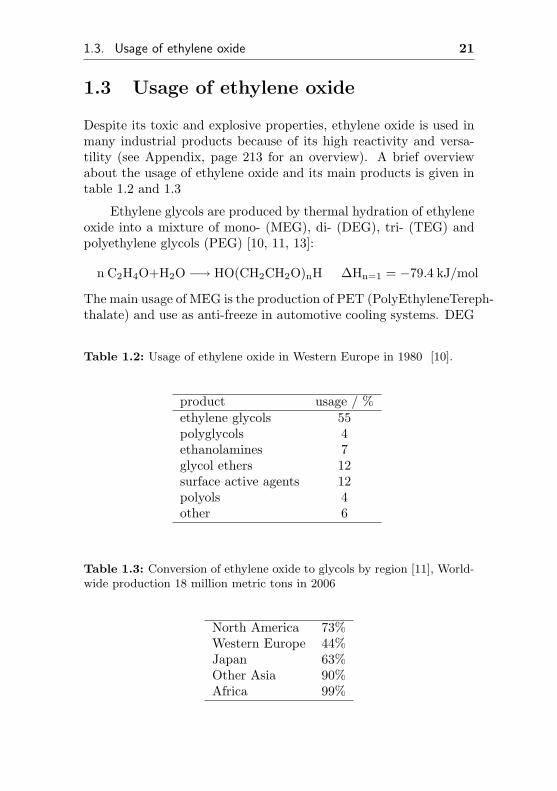
Despite its toxic and explosive properties, ethylene oxide is used inmany industrial products because of its high reactivity and versa-tility (see Appendix, page 213 for an overview). A brief overviewabout the usage of ethylene oxide and its main products is given intable 1.2 and 1.3
Ethylene glycols are produced by thermal hydration of ethyleneoxide into a mixture of mono- (MEG), di- (DEG), tri- (TEG) andpolyethylene glycols (PEG) [10, 11, 13]:
n C2H4O+H2O −→ HO(CH2CH2O)nH ∆Hn=1 = −79.4 kJ/mol
The main usage of MEG is the production of PET (PolyEthyleneTereph-thalate) and use as anti-freeze in automotive cooling systems. DEG
Table 1.2: Usage of ethylene oxide in Western Europe in 1980 [10].
product usage / %ethylene glycols 55polyglycols 4ethanolamines 7glycol ethers 12surface active agents 12polyols 4other 6
Table 1.3: Conversion of ethylene oxide to glycols by region [11], World-wide production 18 million metric tons in 2006
North America 73%Western Europe 44%Japan 63%Other Asia 90%Africa 99%
22 Chapter 1. Introduction
and TEG are used for gas treatment as absorbent and TEG isfurthermore needed for production of cellophane. PEG is usedin the cosmetic and pharmaceutical industry as base material forcarrying the active ingredients [10].
Ethanolamines, which are also widely used in pharmaceuticaland cosmetic products are obtained by the reaction of ethylene oxideand ammonia:
n C2H4O + NH3 −→ Hn−3N(C2H4OH)n n = 1 − 3
Glycolethers are produced by the reaction of ethylene oxide andethers such as Dimethylether [5]:
CH3OCH3 + nC2H4O −→ CH3O(CH2CH2O)nCH3
n = 1− 4
Those ethers are mainly used as solvents, detergents, brake fluid andextracting agent for SO2,H2S,CO2 and mercaptanes from naturalgas. Minor amounts of ethylene oxide are directly used as sterilizingagent in hospitals and the food industry [12, 14] (see Appendix, page215 for toxicity and environmental data) .
Chapter 2
Objectives
At the end of 1996, there were few successful performed reactions inmicrochannel reactors, and most of them concentrated on testing theconcept of the microchannel reactor with relatively simple reactionssuch as total combustion or hydrogenation reactions. The formerlacked any selectivity problem and the latter lacked sufficient heatproduction to justify the use of a microchannel reactor. Therefore,microchannel reactors had to be characterized for their suitabilityof performing highly exothermic reactions with potential selectivityproblems.
In the present study, the partial oxidation of ethene as anexothermic and fast reaction was chosen as a model reaction in orderto evaluate the performance of microchannel reactors. Furthermore,there is few data available in the open scientific literature about thepartial oxidation of ethene applying oxygen feed concentrations inthe explosion range, although this reaction has been under investi-gation for now more than 50 years. It is normally too dangerous toapply suchlike reaction conditions in conventional reactors, becausea single hot spot will result in an uncontrolled runaway, likely endingin an explosion.
Therefore, the exothermic partial oxidation of ethene was uti-lized both to evaluate the performance of microchannel reactors andto investigate the ethene epoxidation at oxygen concentrations inthe explosion range.
23
24 Chapter 2. Objectives
In order to achieve these goals, this work concentrated on a few,but important steps. First of all, it was necessary to develop a newcatalyst preparation method, because normal silver based and indus-trially available catalysts are meant to be used in a fixed bed andseemed unsuitable for the use at the walls of a microchannel. Second,a suchlike immobilized catalyst had to be used and characterized ina fixed bed before similar experiments applying comparable reactionconditions, had to be performed in corresponding microchannel re-actors having the same catalytic surface. In parallel, it was intendedto increase the oxygen concentration within the explosion range inorder to gain experience with the catalytic properties of silver cata-lysts using high oxygen concentrations in the feed.
Due to the limited number of available, commercially manufac-tured microchannel reactors for solid-gas catalysis, the initial cat-alyst screening should be performed in a conventional fixed bedreactor. In parallel, it was tried to manufacture reactors havingremovable microstructured parts in order to allow more and non de-structive tests. As a side effect, the flexibility allowed access andexchange of the activated microstructured parts for analytical inves-tigations applying surface science techniques without destroying theexpensive welded commercial reactors.
Chapter 3
Theory
In this chapter, assumptions about the potential reaction mechanismof the direct epoxidation of ethene are made. The influence of reac-tion parameters like reactant partial pressure, reactor temperatureand selectivity enhancing additives is discussed and the preparationof commonly used catalysts described. Due to the exothermic re-action, the reactor design plays an important role in the industrialperformance of this reaction. Therefore, results from a Dutch re-search group dealing with the heat management of a conventional,industry size tubular reactor are presented. Based on their kineticmodels, the influence of reaction parameters like ethene and oxygenconcentration on the selectivity and conversion degree was calcu-lated. Eventually, the concept of a microchannel reactor, its use inindustry with its advantages and disadvantages is discussed.
3.1 Reaction mechanism of the direct ox-idation process
The reaction mechanism of the ethene epoxidation has been exten-sively studied, but up to now there is no common agreement aboutthe mechanism. In the 1970, a reaction mechanism strongly sup-ported by Kilty and Sachtler [15] was proposed, who predicted thefollowing mechanism involving atomically (Ag−O) and molecularly
25
26 Chapter 3. Theory
(Ag−O2) absorbed oxygen species on on catalytic active silver sur-faces (Ag∗):
6 O2 + 6 Ag∗ −→ 6 (Ag −O2)3 O2 + 6 Ag∗ −→ 6 (Ag −O)
6 (Ag −O2) + 6 C2H4 −→ 6 C2H4O + 6 (Ag −O)6 (Ag −O) + C2H4 −→ 2 CO2 + 2 H2O + 6 Ag∗
It is suggested, that chlorine blocks the dissociative adsorption ofoxygen and therefore, enhances selectivity. Assuming a completelyblocked dissociative adsorption of ethene on silver, the former re-action steps can be summarized and the following equation for theformation of ethylene oxide is obtained:
7 C2H4 + 6 O2,ads −→ 6 C2H4O + 2 CO2 + 2 H2O
Thus, the maximum selectivity to ethene oxide is 6/7 or 85.7% if theassumption of this reaction mechanism is correct. Basically, thereare numerous TPD-studies [16, 17] dealing with the state of oxy-gen adsorbed on silver surfaces and it was shown, that both typesof adsorption take place when silver is exposed to oxygen at highertemperatures. Furthermore, this reaction mechanism is supportedby a study of Herzog [18], who performed the epoxidation with ni-trous oxide instead of oxygen. The decomposition of N2O yieldsatomically adsorbed oxygen and it showed, that the only productsobserved were CO2 and H2O.
6 N2O + 6 Ag∗ −→ 6 (Ag −O) + 6 N2
6 (Ag −O) + C2H4 −→ 2 CO2 + 2 H2O + 6 Ag∗
Later, a scheme of a different reaction mechanism emerged af-ter several authors found by surface science and especially isotopeexchange techniques, that atomically adsorbed oxygen rather thanmolecular is involved in the selective oxidation of ethene [19, 20].Furthermore, the role of subsurface oxygen, which is definitely in-volved in the epoxidation [21] remained unconsidered in this model.Eventually, the 6/7 selectivity ”barrier” predicted by the old mech-anism had been substantially broken and thus, the mechanism wasobsolete.
3.2. Kinetics of the ethene epoxidation 27
Results from TAP-experiments1 [22] indicated, that the forma-tion of ethylene oxide requires a pretreatment of the clean silver sur-face with oxygen. An oxygen free silver powder proved to be initiallyinactive for ethene epoxidation. Only after several oxygen / ethylenegas-pulses, ethylene oxide formation was observed and the initiallydominating total oxidation suppressed. This is ascribed to the for-mation of subsurface oxygen, which allows the stabilization or for-mation of a certain oxygen surface species, which is in turn requiredfor the stabilisation of an epoxidation active and selective surface-oxygen species. Results obtained by Grant & Lambert [23] supportthis theory, because it showed necessary to pretreat an Ag(111) sin-gle crystal with oxygen in order to activate it for ethene epoxida-tion. Isotope exchange experiments with 16O2 and 18O2 by Bertole& Mims showed, that the selectivity to ethylene oxide is directlycorrelated with the availability of subsurface oxygen [24].
Another hint of atomically absorbed oxygen being the crucialepoxidation active species are calculations performed by Salazaret.al [25]. The authors found, that caesium lowers the dissocia-tion barrier between molecular and atomically absorbed oxygen andproved a correlation between their calculated barrier height, whichis a function of the caesium coverage, and the observed selectiv-ity toward ethylene oxide, again as a function of caesium coverage.Therefore, current investigations aim toward a better understand-ing of surface/subsurface oxygen interactions and the influence ofknown promoters such as Cs and Cl on the specific oxygen ad- andabsorption on silver [26].
3.2 Kinetics of the ethene epoxidation
In commercial ethylene oxide plants, the partial pressures of ethene,oxygen and reaction-modifier may be varied. In many scientific pub-lications, the ethene epoxidation was investigated in absence of chlo-rine or other reaction modifiers. The selectivity is expected to in-crease with increasing oxygen partial pressure as shown by Akella &Lee [27], Cant & Hall [28] and Klugherz & Harriott [8]. It was ob-served the epoxidation reaction rate increasing faster with increasing
1Temporal Analysis of Products, a fast and time resolved product detectionby mass spectroscopy of gas-pulses passing a catalyst in a vacuum chamber.
28 Chapter 3. Theory
oxygen partial pressure than the rate of the total oxidation. There-fore, higher oxygen partial pressures improve the degree of conver-sion as well as the selectivity to ethylene oxide Contrary, Borman &Westerterp [29] found in more recent investigations, that there is nodifference in the reaction rate whether 7% or 12% oxygen are used,applying 1% C2H4 in the feed.
Furthermore, the reaction rate of ethene to ethylene oxide onthe one hand and to carbon dioxide on the other increase nearlysimultaneously with increasing ethene partial pressure, showing amaximum in both reaction rates [8]. After passing the maximum,the reaction rate of the total oxidation drops faster the rate of theepoxidation, suggesting increased selectivities with increasing ethenepartial pressures. Similar observations were made by Khasin [30]as well as Cant & Hall [28]. Again contrary, Borman & Westerterpfound, that the selectivity to ethylene oxide decreases with increasingethene partial pressure [29].
There is also little common agreement about the influence ofthe reaction products on selectivity and conversion degree, althoughmany authors (but not all) agree, that in absence of chlorine com-pounds, carbon dioxide enhances selectivity and decreases the overallreaction rate [31, 32]. In order to get a brief insight of the influence ofC2H4 and O2 partial pressures on selectivity and conversion degree,a kinetic model had to be adapted. Recently, a Dutch research groupperformed extensive investigations [63, 64] and published a kineticmodel [29, 31], which was derived from experiments with a tube-type(single pass) and a Berty / Bobo reactor (internal gas recirculation)using a commercial ethylene oxide catalyst based on Ag/α-Al2O3.The authors tested four different kinetic models, generally assuming
• a parallel reaction of ethene to ethylene oxide and carbon diox-ide having the same mechanism and therefore, the same kineticmodel,
• no consecutive combustion of ethylene oxide supporting theplain parallel reaction scheme and
• an adsorption of the reaction products ethylene oxide, waterand carbon dioxide on the surface of the catalyst.
Two different kinetic models in each two variations were tested,
3.2. Kinetics of the ethene epoxidation 29
based on an Eley-Rideal and a Langmuir-Hinshelwood mechanism.In each kinetic model, one was formulated for atomic oxygen andthe other for molecular oxygen as the active component involved inthe rate determining step. All tests were performed in several reac-tor types to exclude arbitrary reactor specific effects supporting onemodel in favor of the other. It was found, that the kinetic equationsresulting from the Langmuir-Hinshelwood mechanism showed betterfitting quality than those derived from the Eley-Rideal one. Eventu-ally, the authors decided to use an equation assuming the Langmuir-Hinshelwood mechanism having molecular oxygen involved in therate determining step:
r =k ·KC2H4 ·KO2 · pC2H4 · pO2
(1 +∑
Ki · pi)2(3.1)
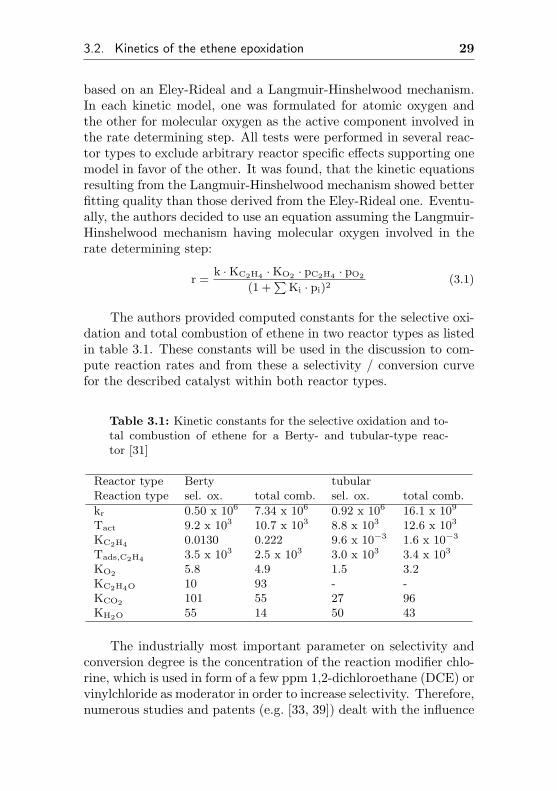
The authors provided computed constants for the selective oxi-dation and total combustion of ethene in two reactor types as listedin table 3.1. These constants will be used in the discussion to com-pute reaction rates and from these a selectivity / conversion curvefor the described catalyst within both reactor types.
Table 3.1: Kinetic constants for the selective oxidation and to-tal combustion of ethene for a Berty- and tubular-type reac-tor [31]
Reactor type Berty tubularReaction type sel. ox. total comb. sel. ox. total comb.
kr 0.50 x 10⁶ 7.34 x 10⁶ 0.92 x 10⁶ 16.1 x 10⁹
Tact 9.2 x 10³ 10.7 x 10³ 8.8 x 10³ 12.6 x 10³
KC2H4 0.0130 0.222 9.6 x 10⁻³ 1.6 x 10⁻³
Tads,C2H4 3.5 x 10³ 2.5 x 10³ 3.0 x 10³ 3.4 x 10³
KO2 5.8 4.9 1.5 3.2KC2H4O 10 93 - -KCO2 101 55 27 96KH2O 55 14 50 43
The industrially most important parameter on selectivity andconversion degree is the concentration of the reaction modifier chlo-rine, which is used in form of a few ppm 1,2-dichloroethane (DCE) orvinylchloride as moderator in order to increase selectivity. Therefore,numerous studies and patents (e.g. [33, 39]) dealt with the influence
30 Chapter 3. Theory
of chlorine on the selectivity of the epoxidation or application ofchlorine in order to attain as high selectivities as possible. The se-lectivity of pure silver powder or crystals in absence of promotingagents is reported to be between 30% and 40% at low conversiondegrees [40]. Unmodified and unpromoted Ag/α-Al2O3catalysts ex-hibit higher selectivities between 40% and 60% [35, 41], dependingon reaction conditions. With increasing degree of chlorine coverage,the selectivity increases to 75-85%, depending on the investigatedsilver crystallite surface and reactor temperature [35, 36, 40, 42].Actually, chlorine promoted industrial catalysts exhibit selectivitiesof initially slightly better than 90% [9].
Ag/α-Al2O3 catalyst gain approximately 20% selectivityin presence of DCE. Unfortunately, the TON2 and thus, thedegree of conversion decreases with increasing chlorine cover-age [35, 42, 43]. It is believed, chlorine enhances the concentrationof an epoxidation-selective oxygen surface species, which is requiredfor the epoxidation and exists predominantly at high surface andsubsurface oxygen coverage [8]. Campbell and Paffett [43] showed,an increasing chlorine coverage decreased the rate of dissociativeoxygen absorption. Furthermore, Tan, Grant and Lambert [44]found an enhancement of oxygen diffusion into the bulk silver bychlorine absorption.
3.3 Catalyst design
All modern industrial ethylene oxide catalysts are based on α-Al2O3,having surface areas below 2 m2/g. Such low surface areas are ob-tained when alumina is fired at high temperatures for a long time.Experiments from Vannice et. al. [41, 45] proved, that an α-Al2O3
support material specially prepared with a high surface area up to50 m2 and impregnated with silver yields no ethylene oxide but onlycarbon dioxide. Even when such a catalyst is placed behind a selec-tive ethylene oxide catalyst, the ethylene oxide produced by the firstcatalyst is completely oxidized to carbon dioxide and water by thefollowing high surface area catalyst. Therefore, high specific sur-face areas are to be avoided, even if the support material itself is
2Turn-Over-Number
3.3. Catalyst design 31
suitable. It is generally assumed, Lewis acid sites support the iso-merization and consecutive combustion of ethylene oxide. Therefore,many support materials are treated with HCl or alkali hydroxides /halogenides to minimize the number of those sites before immobi-lization of silver is performed [36, 46]. Sometimes up to 10% TiO2
is used as co-support material [47]. Early investigations revealed,that silicon carbide and silica can be also used as support. γ-Al2O3,pumice, silica gel, carbon, magnesia and high surface supports ingeneral are not suitable [6].
Silver is a unique catalyst for the epoxidation of ethene [48].In order to yield high selectivities, there are many promoters andco-promoters in use, which have a strong effect on the selectivity assoon as chlorine is involved. Caesium [49] and/or rubidium combinedwith other alkali like barium are used in nearly every promoted cat-alyst. An example for such a promoter / co-promoter combination isRhenium [50], which may be co-promoted with phosphorus and/orboron [9, 37]. Niob and/or tantal, which is co-promoted by sulfurin presence of alkali is another example [51]. Several patents andpublications such as [52, 53] describe a process to reactivate a silvercatalyst for ethene epoxidation by passing a Rb and/or Cs salt con-taining solution at ambient temperatures through the reactor. It canbe assumed, that α-Al2O3 surface is re-passivated by alkali. Mina-han [54] showed, the surface of a fresh (and selective) ethylene oxidecatalysts is nearly completely covered with silver, whereas uncoveredα-Al2O3 surface is observed on an aged (and less selective) catalystdue to agglomeration of the silver particles, exposing the supportmaterial’s surface, effectively lowering the selectivity towards ethy-lene oxide.
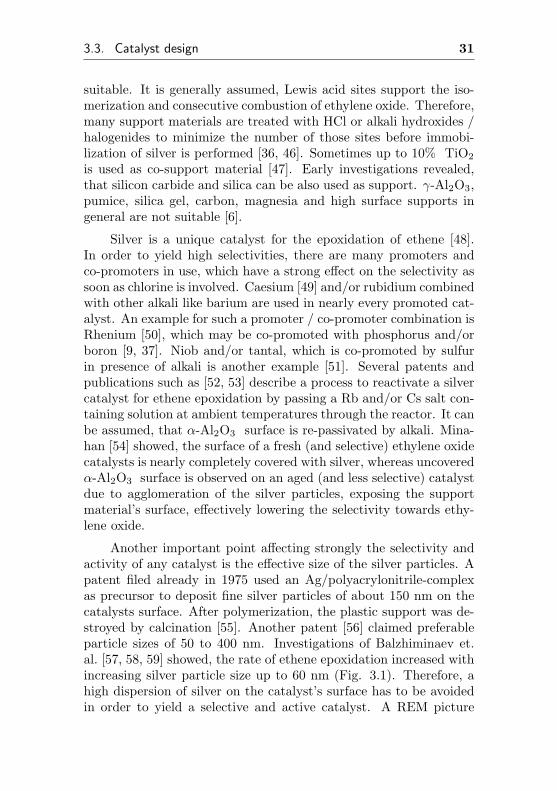
Another important point affecting strongly the selectivity andactivity of any catalyst is the effective size of the silver particles. Apatent filed already in 1975 used an Ag/polyacrylonitrile-complexas precursor to deposit fine silver particles of about 150 nm on thecatalysts surface. After polymerization, the plastic support was de-stroyed by calcination [55]. Another patent [56] claimed preferableparticle sizes of 50 to 400 nm. Investigations of Balzhiminaev et.al. [57, 58, 59] showed, the rate of ethene epoxidation increased withincreasing silver particle size up to 60 nm (Fig. 3.1). Therefore, ahigh dispersion of silver on the catalyst’s surface has to be avoidedin order to yield a selective and active catalyst. A REM picture
32 Chapter 3. Theory
0 20 40 60 80 100 1000 16,0
16,5
17,0
17,5
18,0
Ag/Al 2 O
3
Ag/SiO 2
Ag powder
lg r
C 2 H
4 O /
a.u.
particle diameter / nm
Figure 3.1: Reaction rate of ethylene oxide formation as a function ofthe average silver particle size [57].
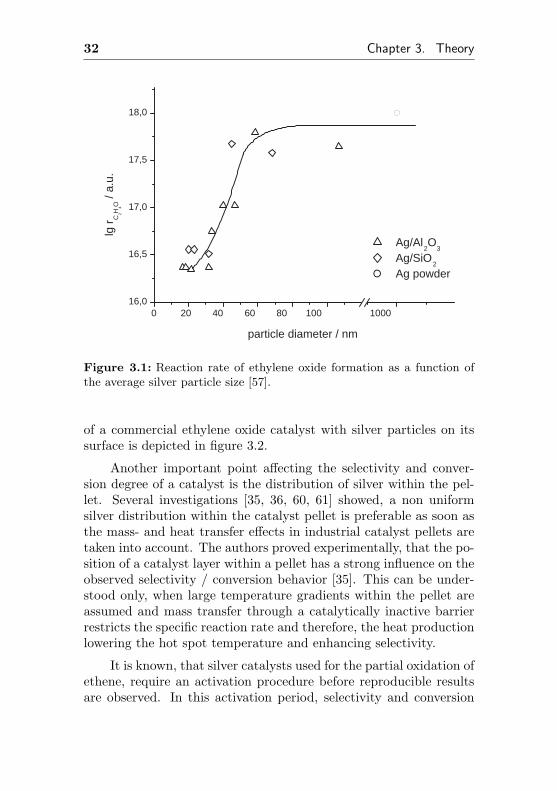
of a commercial ethylene oxide catalyst with silver particles on itssurface is depicted in figure 3.2.
Another important point affecting the selectivity and conver-sion degree of a catalyst is the distribution of silver within the pel-let. Several investigations [35, 36, 60, 61] showed, a non uniformsilver distribution within the catalyst pellet is preferable as soon asthe mass- and heat transfer effects in industrial catalyst pellets aretaken into account. The authors proved experimentally, that the po-sition of a catalyst layer within a pellet has a strong influence on theobserved selectivity / conversion behavior [35]. This can be under-stood only, when large temperature gradients within the pellet areassumed and mass transfer through a catalytically inactive barrierrestricts the specific reaction rate and therefore, the heat productionlowering the hot spot temperature and enhancing selectivity.
It is known, that silver catalysts used for the partial oxidation ofethene, require an activation procedure before reproducible resultsare observed. In this activation period, selectivity and conversion
3.3. Catalyst design 33
Figure 3.2: REM picture of a commercial ethylene oxide catalyst (α-Al2O3) having evenly distributed silver particles on its surface [5].
degree increase with increasing time on stream. Schouten et.al. [62]reported activation times of about 3-4 days for a commercial ethyleneoxide catalyst before reproducible results were obtained.
34 Chapter 3. Theory
3.4 Reactor design and heat manage-ment
This section deals with the reactor design and heat effects withinlarger tubular reactors. All findings are results previously published( [63, 64]), but some data points are plotted in a different way topoint out interesting temperature gradients and heat effects (Fig.3.3, 3.4, 3.6, 3.8).
3.4.1 Reactor design in industrial plants
The partial oxidation of ethene is a highly exothermic reaction. Theexothermy of the total combustion is more than ten times higherthan that of the selective oxidation. Therefore, there is always a risk,that local hot spots emerge, combusting precious ethylene. Thus,this reaction requires a good heat management as already stated ina patent by Law et al. in 1942 [33]. Generally, there are two types ofreactors suitable for highly exothermic reactions. The first reactortype is the multi-tube, fixed-bed reactor. In this reactor type, thecatalyst is located in tubes having a length of several meters, butonly a few cm in diameter. The tubes are kept in a liquid mediumsuch as molten salts, metals, water or high boiling liquids to removethe heat produced by the reaction. The second reactor type is thefluidized bed or bubbling bed reactor. The advantage of this reactortype is a very high heat transfer ability, but at the cost of a non uni-form residence time distribution due to formation of bubbles in thefluidized bed and high attrition of the catalyst. Today, all ethyleneoxide plants use multi-tube, fixed bed reactors, because the attritionproblem remained unsolved for this reaction [10].
In order to study heat effects in industrial multitube reactors,the Dutch research group around Westerterp constructed a reactorhaving a design similar to a single industrial reactor tube [62]. Thisreactor consisted of a single tube, having a length of 1.19 m anda diameter of 53 mm. The reactor was packed with an industrialethylene oxide catalyst and cooled with pressurized, boiling waterto remove the heat. In order to measure temperature profiles, thereactor was equipped with 24 thermocouples to monitor local tem-peratures in axial and radial direction.
3.4. Reactor design and heat management 35
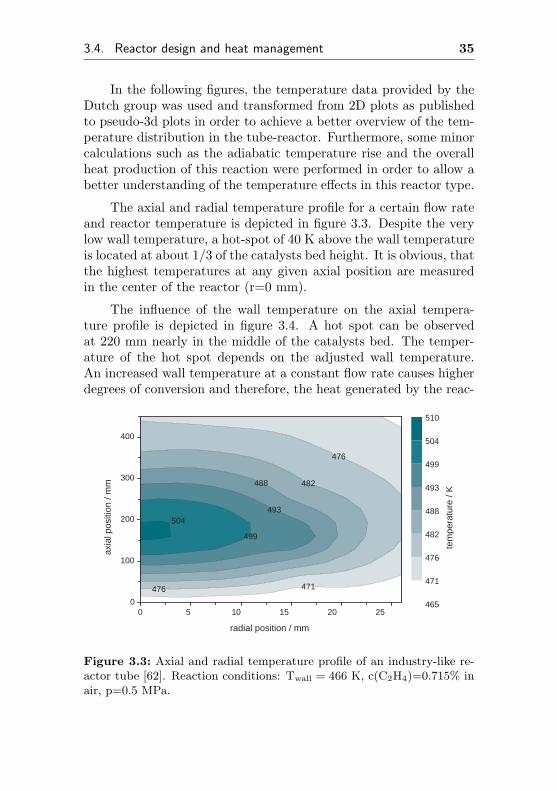
In the following figures, the temperature data provided by theDutch group was used and transformed from 2D plots as publishedto pseudo-3d plots in order to achieve a better overview of the tem-perature distribution in the tube-reactor. Furthermore, some minorcalculations such as the adiabatic temperature rise and the overallheat production of this reaction were performed in order to allow abetter understanding of the temperature effects in this reactor type.
The axial and radial temperature profile for a certain flow rateand reactor temperature is depicted in figure 3.3. Despite the verylow wall temperature, a hot-spot of 40 K above the wall temperatureis located at about 1/3 of the catalysts bed height. It is obvious, thatthe highest temperatures at any given axial position are measuredin the center of the reactor (r=0 mm).
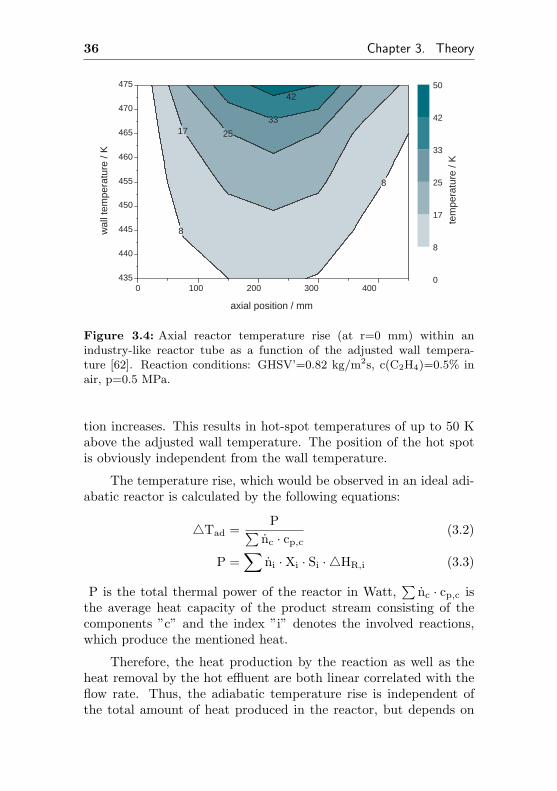
The influence of the wall temperature on the axial tempera-ture profile is depicted in figure 3.4. A hot spot can be observedat 220 mm nearly in the middle of the catalysts bed. The temper-ature of the hot spot depends on the adjusted wall temperature.An increased wall temperature at a constant flow rate causes higherdegrees of conversion and therefore, the heat generated by the reac-
471 476
482 488
493
476
499
0 5 10 15 20 25 0
100
200
300
400
tem
pera
ture
/ K
504
radial position / mm
axia
l pos
ition
/ m
m
465
471
476
482
488
493
499
504
510
Figure 3.3: Axial and radial temperature profile of an industry-like re-actor tube [62]. Reaction conditions: Twall = 466 K, c(C2H4)=0.715% inair, p=0.5 MPa.
36 Chapter 3. Theory
8
17 25
8
33
0 100 200 300 400 435
440
445
450
455
460
465
470
475
42
tem
pera
ture
/ K
axial position / mm
wal
l tem
pera
ture
/ K
0
8
17
25
33
42
50
Figure 3.4: Axial reactor temperature rise (at r=0 mm) within anindustry-like reactor tube as a function of the adjusted wall tempera-ture [62]. Reaction conditions: GHSV’=0.82 kg/m2s, c(C2H4)=0.5% inair, p=0.5 MPa.
tion increases. This results in hot-spot temperatures of up to 50 Kabove the adjusted wall temperature. The position of the hot spotis obviously independent from the wall temperature.
The temperature rise, which would be observed in an ideal adi-abatic reactor is calculated by the following equations:
4Tad =P∑
nc · cp,c(3.2)
P =∑
ni ·Xi · Si · 4HR,i (3.3)
P is the total thermal power of the reactor in Watt,∑
nc · cp,c isthe average heat capacity of the product stream consisting of thecomponents ”c” and the index ”i” denotes the involved reactions,which produce the mentioned heat.
Therefore, the heat production by the reaction as well as theheat removal by the hot effluent are both linear correlated with theflow rate. Thus, the adiabatic temperature rise is independent ofthe total amount of heat produced in the reactor, but depends on
3.4. Reactor design and heat management 37
the concentrations / partial pressures, the enthalpy, selectivity andconversion degree of the involved reactions.
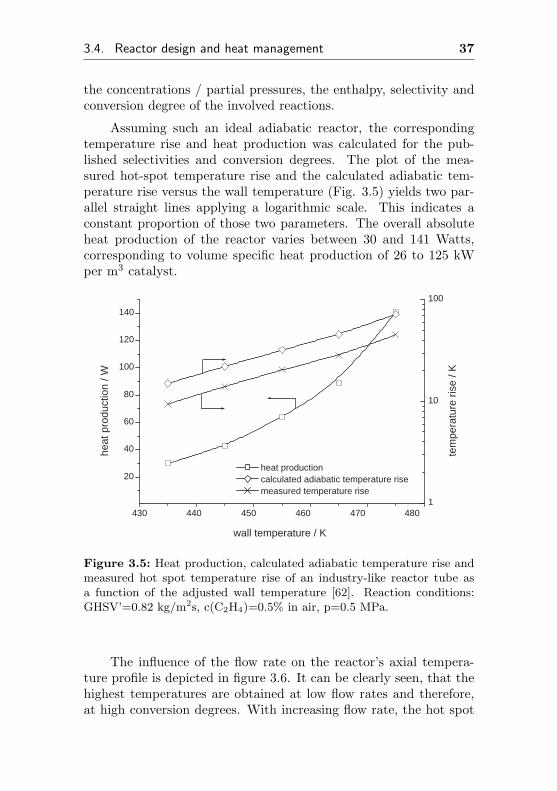
Assuming such an ideal adiabatic reactor, the correspondingtemperature rise and heat production was calculated for the pub-lished selectivities and conversion degrees. The plot of the mea-sured hot-spot temperature rise and the calculated adiabatic tem-perature rise versus the wall temperature (Fig. 3.5) yields two par-allel straight lines applying a logarithmic scale. This indicates aconstant proportion of those two parameters. The overall absoluteheat production of the reactor varies between 30 and 141 Watts,corresponding to volume specific heat production of 26 to 125 kWper m3 catalyst.
430 440 450 460 470 480
20
40
60
80
100
120
140
heat production calculated adiabatic temperature rise measured temperature rise
heat
pro
duct
ion
/ W
wall temperature / K
1
10
100
tem
pera
ture
ris
e / K
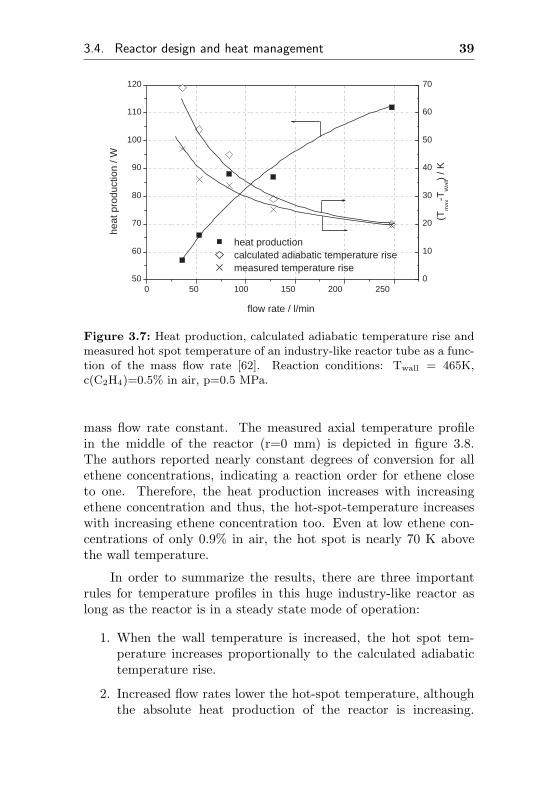
Figure 3.5: Heat production, calculated adiabatic temperature rise andmeasured hot spot temperature rise of an industry-like reactor tube asa function of the adjusted wall temperature [62]. Reaction conditions:GHSV’=0.82 kg/m2s, c(C2H4)=0.5% in air, p=0.5 MPa.
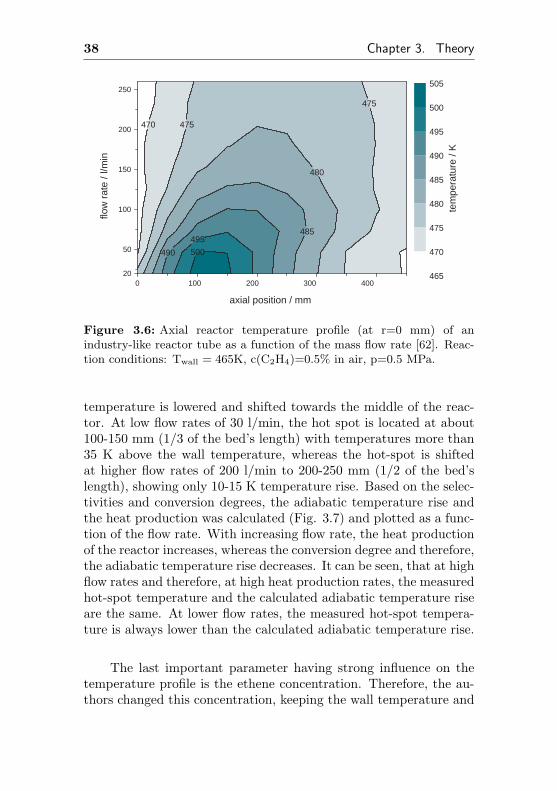
The influence of the flow rate on the reactor’s axial tempera-ture profile is depicted in figure 3.6. It can be clearly seen, that thehighest temperatures are obtained at low flow rates and therefore,at high conversion degrees. With increasing flow rate, the hot spot
38 Chapter 3. Theory
480
485
475
475
490
495
470
500
0 100 200 300 400 20
50
100
150
200
250
tem
pera
ture
/ K
axial position / mm
flow
rat
e / l
/min
465
470
475
480
485
490
495
500
505
Figure 3.6: Axial reactor temperature profile (at r=0 mm) of anindustry-like reactor tube as a function of the mass flow rate [62]. Reac-tion conditions: Twall = 465K, c(C2H4)=0.5% in air, p=0.5 MPa.
temperature is lowered and shifted towards the middle of the reac-tor. At low flow rates of 30 l/min, the hot spot is located at about100-150 mm (1/3 of the bed’s length) with temperatures more than35 K above the wall temperature, whereas the hot-spot is shiftedat higher flow rates of 200 l/min to 200-250 mm (1/2 of the bed’slength), showing only 10-15 K temperature rise. Based on the selec-tivities and conversion degrees, the adiabatic temperature rise andthe heat production was calculated (Fig. 3.7) and plotted as a func-tion of the flow rate. With increasing flow rate, the heat productionof the reactor increases, whereas the conversion degree and therefore,the adiabatic temperature rise decreases. It can be seen, that at highflow rates and therefore, at high heat production rates, the measuredhot-spot temperature and the calculated adiabatic temperature riseare the same. At lower flow rates, the measured hot-spot tempera-ture is always lower than the calculated adiabatic temperature rise.
The last important parameter having strong influence on thetemperature profile is the ethene concentration. Therefore, the au-thors changed this concentration, keeping the wall temperature and
3.4. Reactor design and heat management 39
0 50 100 150 200 250 50
60
70
80
90
100
110
120
heat production calculated adiabatic temperature rise measured temperature rise
heat
pro
duct
ion
/ W
flow rate / l/min
0
10
20
30
40
50
60
70
(T m
ax -T
Wal
l ) / K
Figure 3.7: Heat production, calculated adiabatic temperature rise andmeasured hot spot temperature of an industry-like reactor tube as a func-tion of the mass flow rate [62]. Reaction conditions: Twall = 465K,c(C2H4)=0.5% in air, p=0.5 MPa.
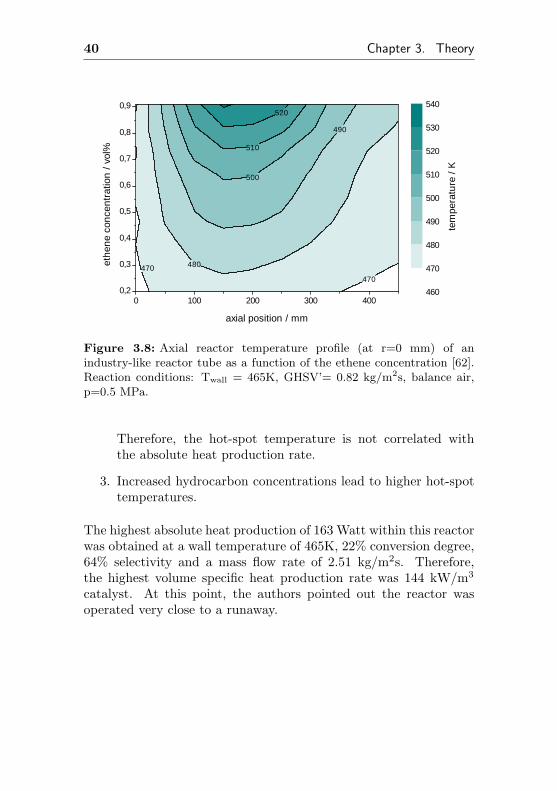
mass flow rate constant. The measured axial temperature profilein the middle of the reactor (r=0 mm) is depicted in figure 3.8.The authors reported nearly constant degrees of conversion for allethene concentrations, indicating a reaction order for ethene closeto one. Therefore, the heat production increases with increasingethene concentration and thus, the hot-spot-temperature increaseswith increasing ethene concentration too. Even at low ethene con-centrations of only 0.9% in air, the hot spot is nearly 70 K abovethe wall temperature.
In order to summarize the results, there are three importantrules for temperature profiles in this huge industry-like reactor aslong as the reactor is in a steady state mode of operation:
1. When the wall temperature is increased, the hot spot tem-perature increases proportionally to the calculated adiabatictemperature rise.
2. Increased flow rates lower the hot-spot temperature, althoughthe absolute heat production of the reactor is increasing.
40 Chapter 3. Theory
470 480
490
500
510
520
470
0 100 200 300 4000,2
0,3
0,4
0,5
0,6
0,7
0,8
0,9
tem
pera
ture
/ K
axial position / mm
eth
ene
con
cen
trat
ion
/ v
ol%
460
470
480
490
500
510
520
530
540
Figure 3.8: Axial reactor temperature profile (at r=0 mm) of anindustry-like reactor tube as a function of the ethene concentration [62].Reaction conditions: Twall = 465K, GHSV’= 0.82 kg/m2s, balance air,p=0.5 MPa.
Therefore, the hot-spot temperature is not correlated withthe absolute heat production rate.
3. Increased hydrocarbon concentrations lead to higher hot-spottemperatures.
The highest absolute heat production of 163 Watt within this reactorwas obtained at a wall temperature of 465K, 22% conversion degree,64% selectivity and a mass flow rate of 2.51 kg/m2s. Therefore,the highest volume specific heat production rate was 144 kW/m3
catalyst. At this point, the authors pointed out the reactor wasoperated very close to a runaway.
3.4. Reactor design and heat management 41
3.4.2 Laboratory and microreactor design
In laboratory reactors, there are typically fewer problems with hot-spots. This is mainly ascribed to the smaller dimensions of thereactor, because the heat conductivity of the material is the same,but the distance from the reactor axis to the wall is much shorter.Furthermore, there is the possibility to dilute the catalyst with lotsof inert material in order to lower the number of active sites per vol-ume and therefore, the heat production and with it the temperaturegradient. Thus, it is much easier to diminish heat gradients in smalllaboratory type reactors than in larger pilot-plant sized tubes. Thestandard reactor for laboratory use is the tube reactor, consisting ofa simple tube (steel or glass), which is heated by a suitable device.In most applications, a resistance heating wire fitted directly to thetube is applied, but other heat sources like indirectly heated highboiling liquids or bubbling beds may be also applied. A disadvan-tage of the reactor is still the low heat conductivity of the catalyticactive material, which guarantees temperature gradients if high spe-cific heat production rates are applied and cannot be avoided.
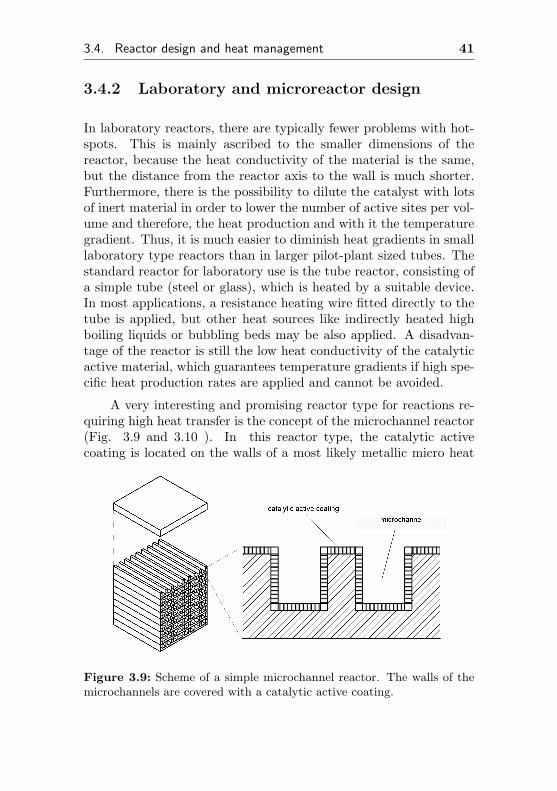
A very interesting and promising reactor type for reactions re-quiring high heat transfer is the concept of the microchannel reactor(Fig. 3.9 and 3.10 ). In this reactor type, the catalytic activecoating is located on the walls of a most likely metallic micro heat
Figure 3.9: Scheme of a simple microchannel reactor. The walls of themicrochannels are covered with a catalytic active coating.
42 Chapter 3. Theory
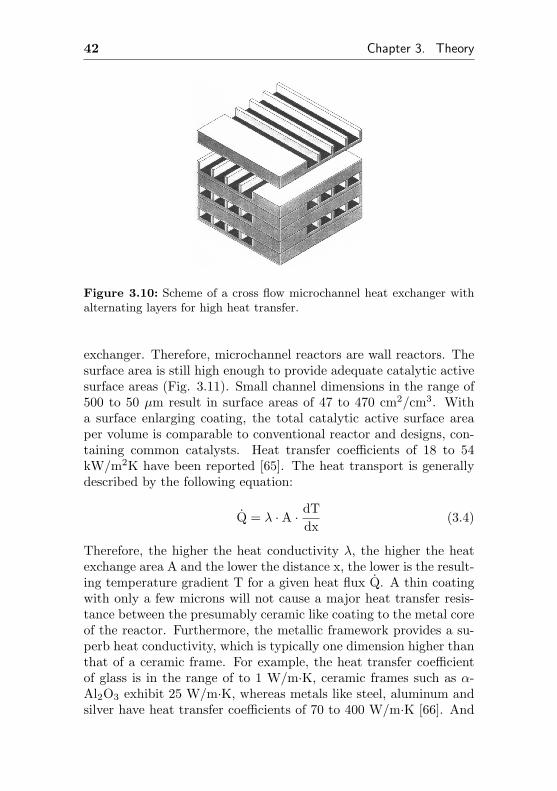
Figure 3.10: Scheme of a cross flow microchannel heat exchanger withalternating layers for high heat transfer.
exchanger. Therefore, microchannel reactors are wall reactors. Thesurface area is still high enough to provide adequate catalytic activesurface areas (Fig. 3.11). Small channel dimensions in the range of500 to 50 µm result in surface areas of 47 to 470 cm2/cm3. Witha surface enlarging coating, the total catalytic active surface areaper volume is comparable to conventional reactor and designs, con-taining common catalysts. Heat transfer coefficients of 18 to 54kW/m2K have been reported [65]. The heat transport is generallydescribed by the following equation:
Q = λ ·A · dTdx
(3.4)
Therefore, the higher the heat conductivity λ, the higher the heatexchange area A and the lower the distance x, the lower is the result-ing temperature gradient T for a given heat flux Q. A thin coatingwith only a few microns will not cause a major heat transfer resis-tance between the presumably ceramic like coating to the metal coreof the reactor. Furthermore, the metallic framework provides a su-perb heat conductivity, which is typically one dimension higher thanthat of a ceramic frame. For example, the heat transfer coefficientof glass is in the range of to 1 W/m·K, ceramic frames such as α-Al2O3 exhibit 25 W/m·K, whereas metals like steel, aluminum andsilver have heat transfer coefficients of 70 to 400 W/m·K [66]. And
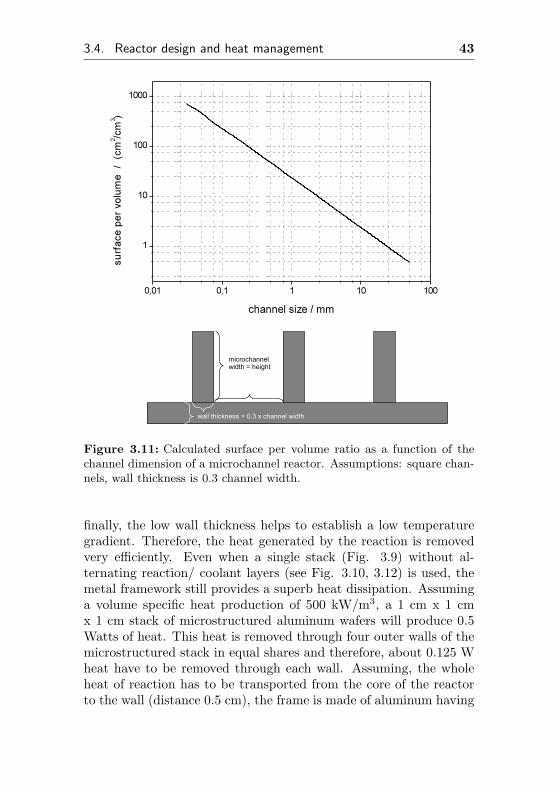
3.4. Reactor design and heat management 43
Figure 3.11: Calculated surface per volume ratio as a function of thechannel dimension of a microchannel reactor. Assumptions: square chan-nels, wall thickness is 0.3 channel width.
finally, the low wall thickness helps to establish a low temperaturegradient. Therefore, the heat generated by the reaction is removedvery efficiently. Even when a single stack (Fig. 3.9) without al-ternating reaction/ coolant layers (see Fig. 3.10, 3.12) is used, themetal framework still provides a superb heat dissipation. Assuminga volume specific heat production of 500 kW/m3, a 1 cm x 1 cmx 1 cm stack of microstructured aluminum wafers will produce 0.5Watts of heat. This heat is removed through four outer walls of themicrostructured stack in equal shares and therefore, about 0.125 Wheat have to be removed through each wall. Assuming, the wholeheat of reaction has to be transported from the core of the reactorto the wall (distance 0.5 cm), the frame is made of aluminum having
44 Chapter 3. Theory
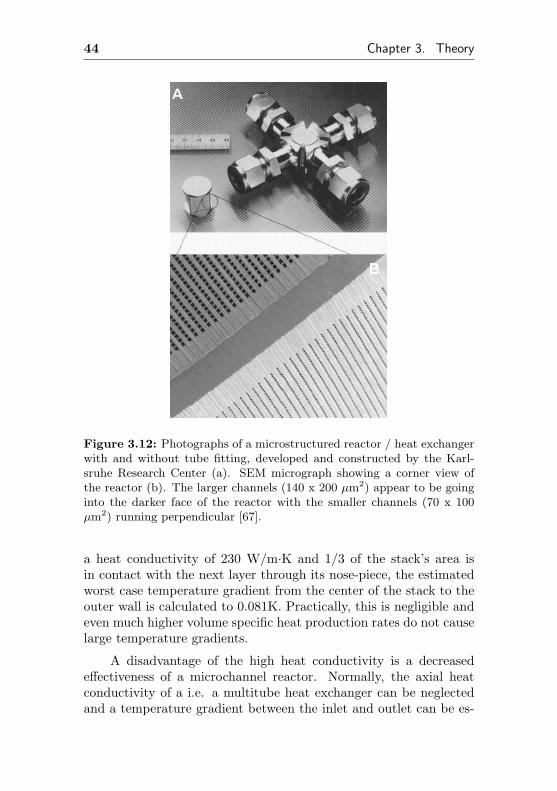
Figure 3.12: Photographs of a microstructured reactor / heat exchangerwith and without tube fitting, developed and constructed by the Karl-sruhe Research Center (a). SEM micrograph showing a corner view ofthe reactor (b). The larger channels (140 x 200 µm2) appear to be goinginto the darker face of the reactor with the smaller channels (70 x 100µm2) running perpendicular [67].
a heat conductivity of 230 W/m·K and 1/3 of the stack’s area isin contact with the next layer through its nose-piece, the estimatedworst case temperature gradient from the center of the stack to theouter wall is calculated to 0.081K. Practically, this is negligible andeven much higher volume specific heat production rates do not causelarge temperature gradients.
A disadvantage of the high heat conductivity is a decreasedeffectiveness of a microchannel reactor. Normally, the axial heatconductivity of a i.e. a multitube heat exchanger can be neglectedand a temperature gradient between the inlet and outlet can be es-
3.4. Reactor design and heat management 45
tablished. This gradient is responsible for a high overall efficiencyof countercurrent operated heat exchangers - the temperature dif-ference between the outlet of the process side and the inlet of thecoolant side is high. With their typically strong axial heat dissipa-tion, metallic microchannel reactors act as a thermal shortcut andeliminate the differences between concurrent and countercurrent op-erated heat exchangers. Although this affects the economy of acommercial heat exchanger, this effect helps to dissipate heat gener-ated in potential local hot spots across the device. Computations ofStief [68] proof this general consideration. He showed, the maximumefficiency of 84.5% for a microstructured heat exchanger is achievedat heat conductivities of 0.5 to 1 W/mK, which is typical for glass.Copper as an excellent heat conductor allows the expected 50% ef-ficiency. Stainless steel having a heat conductivity of 15 W/mKallows efficiencies of approximately 65%.
Actually, microreactors3 and microchannel reactors are widelyspread in the analytical chemistry. A typical example is the meth-anizer, which is used since the 1970ies in the analytical chemistry
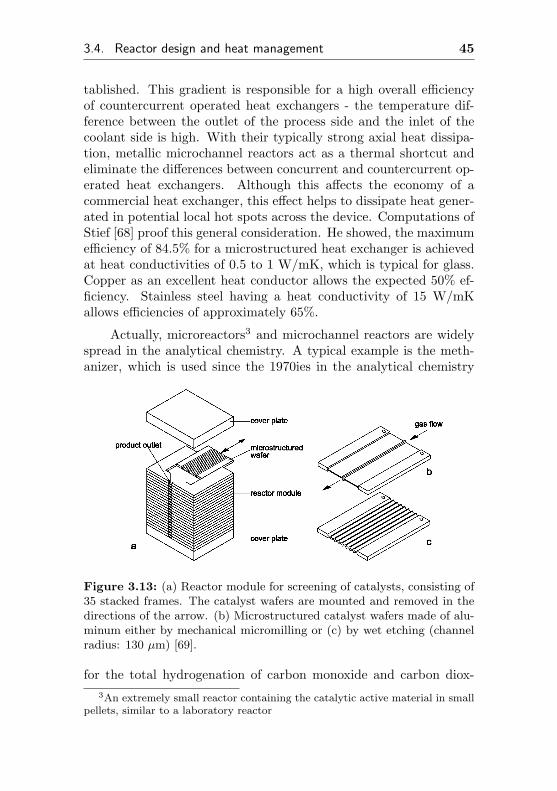
Figure 3.13: (a) Reactor module for screening of catalysts, consisting of35 stacked frames. The catalyst wafers are mounted and removed in thedirections of the arrow. (b) Microstructured catalyst wafers made of alu-minum either by mechanical micromilling or (c) by wet etching (channelradius: 130 µm) [69].
for the total hydrogenation of carbon monoxide and carbon diox-3An extremely small reactor containing the catalytic active material in small
pellets, similar to a laboratory reactor
46 Chapter 3. Theory
ide (utilizing hydrogen from the carrier gas) in order to make themvisible in the sensitive flame ionization detector [70]. Another ex-ample is the application of microreactors and microchannel reactorsin screening devices for rapid discovery and evaluation of catalysts.In order to keep the effort for synthesizing huge numbers of catalystsamples low, microchannel reactor have successfully been utilized forsuchlike systems (Fig. 3.13) [69, 71].
Another interesting feature of a microchannel reactor is its suit-ability for handling explosive mixtures. Recently, the oxidation ofhydrogen was performed in a 1 cm3 microchannel reactor (Fig. 3.12)providing a crossflow cooling and having a microchannel cross sec-tion of 140 x 200 µm2 [67]. In this reactor, a stoichiometric mix-ture of undiluted H2 and O2 was converted neither with runawaynor explosion. The authors reported, that the microchannels aresmaller than the quenching distance of hydrogen, which is reportedto be 1 mm in capillary tubes. Therefore, possible explosions arequenched immediately in the narrow channels of the reactor.
3.4.3 Advantages of using microchannel reactors
Besides safety considerations, microchannel reactors may have re-markable advantages in the following applications:
Screening devices: For most screening devices, material con-sumption is a critical design issue. The lower the material con-sumption and the higher the number of experiments, the better thedevice’s efficiency. Microreactors as well as microchannel reactorswith their low volume and sharp residence time distribution are verysuitable for screening of i.e. catalysts or active pharmaceutical inter-mediates. Especially for the latter, starting materials are typicallylimited and precious [72].
Catalytic investigations: The potential and likely hot spot for-mation of tube type reactors make measurements of reaction kineticsmore complex than necessary. Having an exothermic and fast reac-tion resulting in a temperature gradient across the catalysts bed,any reaction rate is affected by the local temperature profile. Hav-
3.4. Reactor design and heat management 47
ing a practically isothermal reactor type available, the rates maybe measured without having temperature gradients to be taken intoaccount.
Continuous production of chemicals: Besides these formertwo research applications, microchannel reactors may be used evenfor continuous production of fine chemicals or pharmaceuticalcompounds. Traditionally, these compounds are synthesized inmulti-purpose batch reactors.
Despite the small volume of the microchannel reactor, continu-ous operation allows remarkable production capacities. For example,having a 10wt% product mixture, synthesis of 1000 kg product re-quires a throughput of approximately 10.000 kg. Assuming 8000 has time on stream per year and a density of 0.8 g/ml, the result-ing flow rate is as low as 26 ml/min. Therefore, even small devicesmay be used to synthesize continuously pharmaceutical componentsor intermediates by making use of the advantages of microchannelreactors.
Besides their small volume, the high heat transfer capacity ofmicrochannel reactors and their capability of continuous operationmay result in a pay off within a production process. This will beillustrated in the following example:
Given a ”typical” organic reaction, which requires 5 minutes for95% completion. Furthermore, a starting material concentration of 2moles per liter for each reagent will be assumed as well as 100 kJ/molheat release by the reaction and a heat capacity of 2.2 J/gK. Havingthis data on hand, the adiabatic temperature rise is calculated to be86 K.
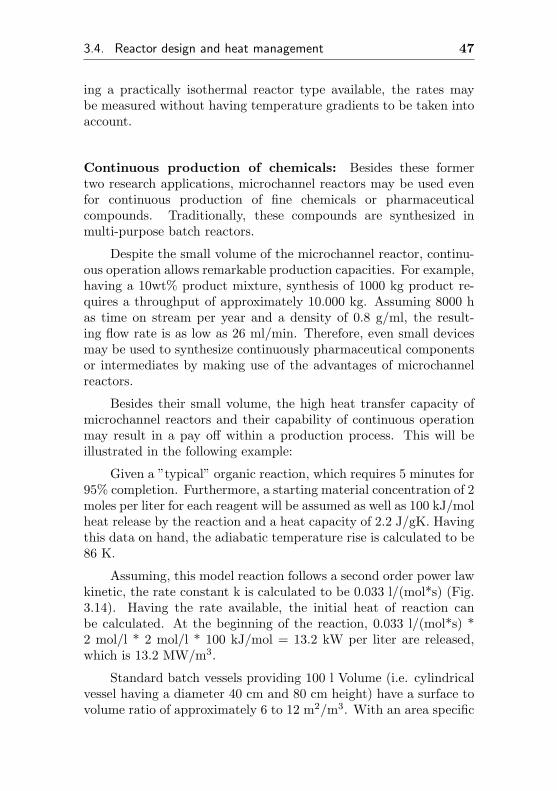
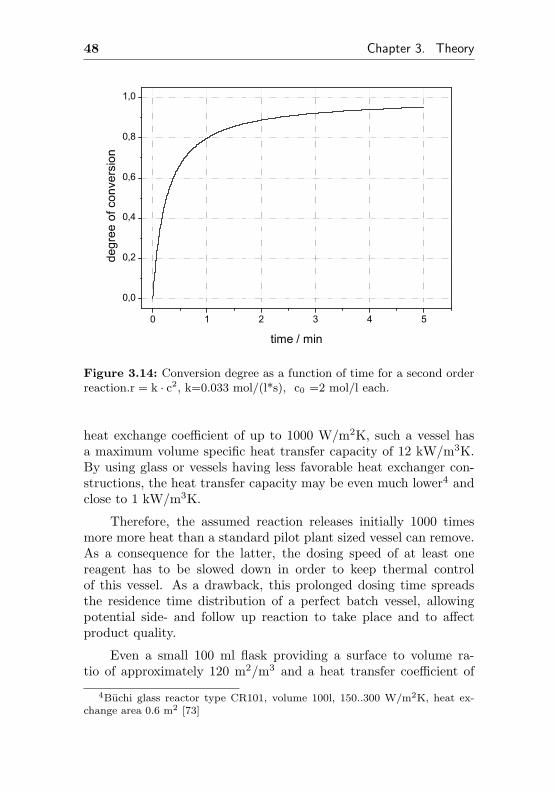
Assuming, this model reaction follows a second order power lawkinetic, the rate constant k is calculated to be 0.033 l/(mol*s) (Fig.3.14). Having the rate available, the initial heat of reaction canbe calculated. At the beginning of the reaction, 0.033 l/(mol*s) *2 mol/l * 2 mol/l * 100 kJ/mol = 13.2 kW per liter are released,which is 13.2 MW/m3.
Standard batch vessels providing 100 l Volume (i.e. cylindricalvessel having a diameter 40 cm and 80 cm height) have a surface tovolume ratio of approximately 6 to 12 m2/m3. With an area specific
48 Chapter 3. Theory
0 1 2 3 4 5
0,0
0,2
0,4
0,6
0,8
1,0de
gree
of c
onve
rsio
n
time / min
Figure 3.14: Conversion degree as a function of time for a second orderreaction.r = k · c2, k=0.033 mol/(l*s), c0 =2 mol/l each.
heat exchange coefficient of up to 1000 W/m2K, such a vessel hasa maximum volume specific heat transfer capacity of 12 kW/m3K.By using glass or vessels having less favorable heat exchanger con-structions, the heat transfer capacity may be even much lower4 andclose to 1 kW/m3K.
Therefore, the assumed reaction releases initially 1000 timesmore more heat than a standard pilot plant sized vessel can remove.As a consequence for the latter, the dosing speed of at least onereagent has to be slowed down in order to keep thermal controlof this vessel. As a drawback, this prolonged dosing time spreadsthe residence time distribution of a perfect batch vessel, allowingpotential side- and follow up reaction to take place and to affectproduct quality.
Even a small 100 ml flask providing a surface to volume ra-tio of approximately 120 m2/m3 and a heat transfer coefficient of
4Buchi glass reactor type CR101, volume 100l, 150..300 W/m2K, heat ex-change area 0.6 m2 [73]
3.4. Reactor design and heat management 49
200 W/m2K would allow only 36 kW/m3K. Thus, smaller lab-sizedequipment is not applicable for safe continuous production of finechemicals as soon as high reaction rates are expected and such areaction requires better heat transfer to ensure safe and trouble-freeoperation.
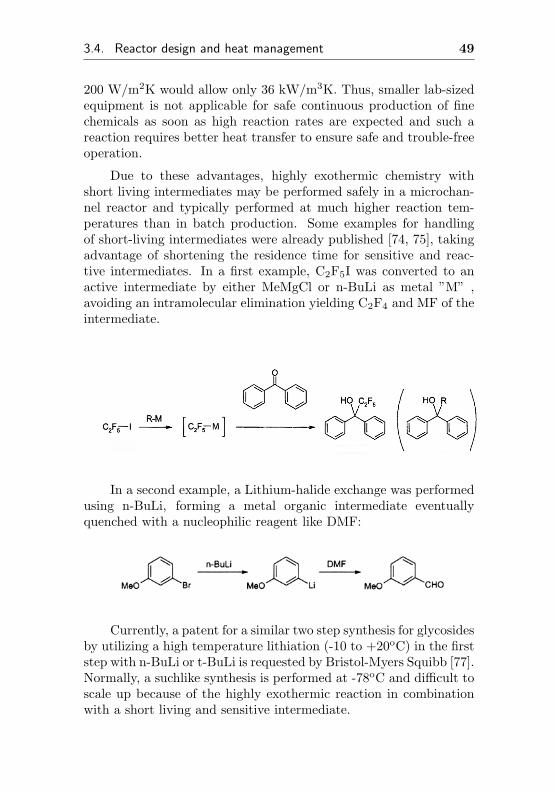
Due to these advantages, highly exothermic chemistry withshort living intermediates may be performed safely in a microchan-nel reactor and typically performed at much higher reaction tem-peratures than in batch production. Some examples for handlingof short-living intermediates were already published [74, 75], takingadvantage of shortening the residence time for sensitive and reac-tive intermediates. In a first example, C2F5I was converted to anactive intermediate by either MeMgCl or n-BuLi as metal ”M” ,avoiding an intramolecular elimination yielding C2F4 and MF of theintermediate.
In a second example, a Lithium-halide exchange was performedusing n-BuLi, forming a metal organic intermediate eventuallyquenched with a nucleophilic reagent like DMF:
Currently, a patent for a similar two step synthesis for glycosidesby utilizing a high temperature lithiation (-10 to +20oC) in the firststep with n-BuLi or t-BuLi is requested by Bristol-Myers Squibb [77].Normally, a suchlike synthesis is performed at -78oC and difficult toscale up because of the highly exothermic reaction in combinationwith a short living and sensitive intermediate.
50 Chapter 3. Theory
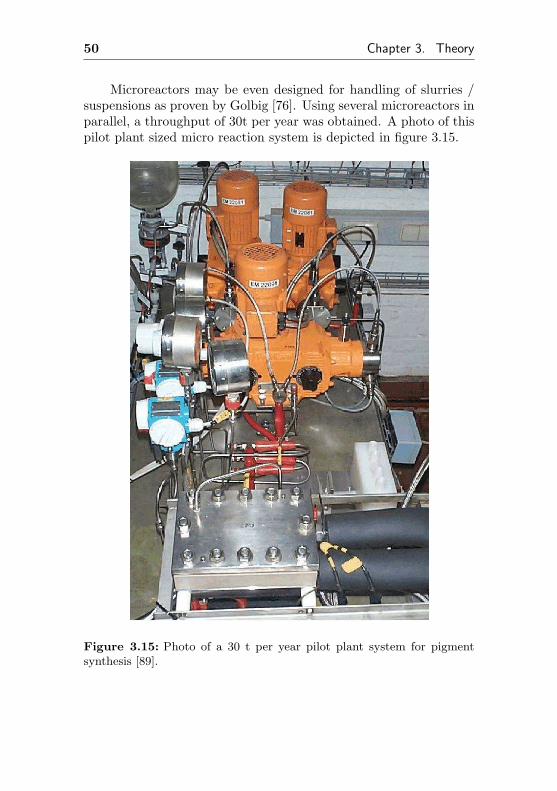
Microreactors may be even designed for handling of slurries /suspensions as proven by Golbig [76]. Using several microreactors inparallel, a throughput of 30t per year was obtained. A photo of thispilot plant sized micro reaction system is depicted in figure 3.15.
Figure 3.15: Photo of a 30 t per year pilot plant system for pigmentsynthesis [89].
Chapter 4
Results
In this chapter, results of the partial oxidation of ethene to etheneoxide in microchannel reactors (MCR), modular microchannel reac-tor (MMCR) and traditional tube type fixed bed reactors (FBR) arepresented.
The presentation is divided into four main parts. First, the cat-alytic examination of potentially suitable silver coating methods formicrochannel reactors and closer catalytic examinations of selectedcoatings were performed (chapter 4.1).
Second, similar investigations were performed with the sametype of catalyst/coating but utilizing a traditional fixed bed reactorto point out differences between the two competing reactor concepts(chapter 4.2)
Chapter 4.3 and 4.4 deal with reaction engineering issues ofreactor construction. Heat effects and temperature gradients in mi-crochannel reactors were studied as well as the influence of reactorconstruction on temperature distribution and catalytic propertiessuch as unwanted product combustion.
51
52 Chapter 4. Results
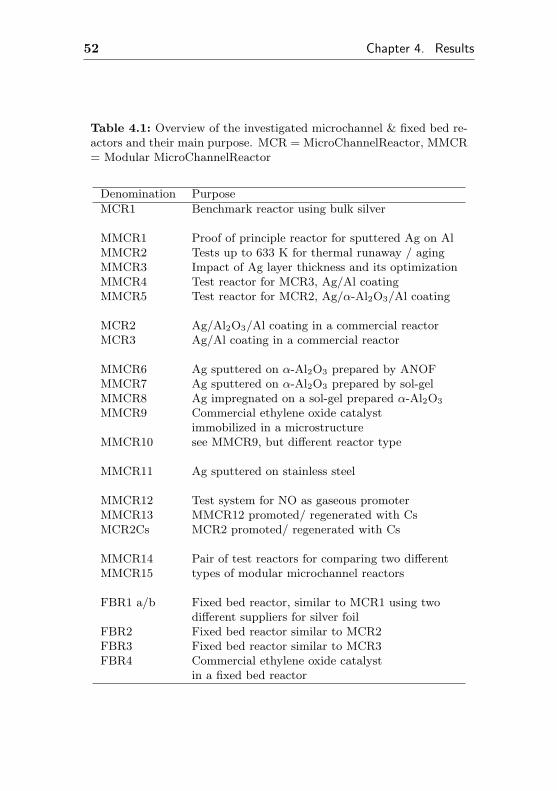
Table 4.1: Overview of the investigated microchannel & fixed bed re-actors and their main purpose. MCR = MicroChannelReactor, MMCR= Modular MicroChannelReactor
Denomination Purpose
MCR1 Benchmark reactor using bulk silver
MMCR1 Proof of principle reactor for sputtered Ag on AlMMCR2 Tests up to 633 K for thermal runaway / agingMMCR3 Impact of Ag layer thickness and its optimizationMMCR4 Test reactor for MCR3, Ag/Al coatingMMCR5 Test reactor for MCR2, Ag/α-Al2O3/Al coating
MCR2 Ag/Al2O3/Al coating in a commercial reactorMCR3 Ag/Al coating in a commercial reactor
MMCR6 Ag sputtered on α-Al2O3 prepared by ANOFMMCR7 Ag sputtered on α-Al2O3 prepared by sol-gelMMCR8 Ag impregnated on a sol-gel prepared α-Al2O3
MMCR9 Commercial ethylene oxide catalystimmobilized in a microstructure
MMCR10 see MMCR9, but different reactor type
MMCR11 Ag sputtered on stainless steel
MMCR12 Test system for NO as gaseous promoterMMCR13 MMCR12 promoted/ regenerated with CsMCR2Cs MCR2 promoted/ regenerated with Cs
MMCR14 Pair of test reactors for comparing two differentMMCR15 types of modular microchannel reactors
FBR1 a/b Fixed bed reactor, similar to MCR1 using twodifferent suppliers for silver foil
FBR2 Fixed bed reactor similar to MCR2FBR3 Fixed bed reactor similar to MCR3FBR4 Commercial ethylene oxide catalyst
in a fixed bed reactor
4.1. Epoxidation of ethene in microchannel reactors 53
4.1 Epoxidation of ethene in microchan-nel reactors
In this section, experimental results of potential suitable catalyticactive silver coatings in the partial oxidation of ethene are presented.In general, the selectivity / conversion behavior was monitored byvarying the residence time. Furthermore, the influence of the oxygenand the ethene partial pressure as well as the impact of reactortemperature and operating pressure on selectivity and conversionwas investigated at different reactor temperatures.
Standard investigations were performed in absence of purposelyadded promoters such as NOx and Cs to avoid different impacts ondifferent types of catalytic active coatings. In some cases, investiga-tions were performed also in presence of these promoters to identifythe impact on the catalytic properties.
A disadvantage of microchannel reactors is the time consumingimmobilization of suitable catalytic active species on the walls of thechannels. Therefore, suitable catalytic active coatings and coatingmethods had to be developed.
The easiest way having silver as surface material of microchan-nels is to manufacture these structures directly from silver sheets.Therefore, the whole microstructure is made of silver and there isno need to develop a coating method. Such a reactor will be usedas a benchmark for all following reactor types and coatings.
4.1.1 MCR1: Bulk silver microchannel reactor
The first microchannel reactor, denominated as MCR1, is made ofmicrostructured silver wafers having a purity of 99.97%. Its chan-nel size was chosen as 200 x 200 µm2 with a channel length of50 mm. Each wafer (width 10 mm) has 33 channels and 26 wafersare mounted in one stack forming the microchannel reactor. A moredetailed reactor description including a photo of the assembled re-actor is given in the experimental section of this paper. The mostimportant geometric parameters are listed in table 4.2.
54 Chapter 4. Results
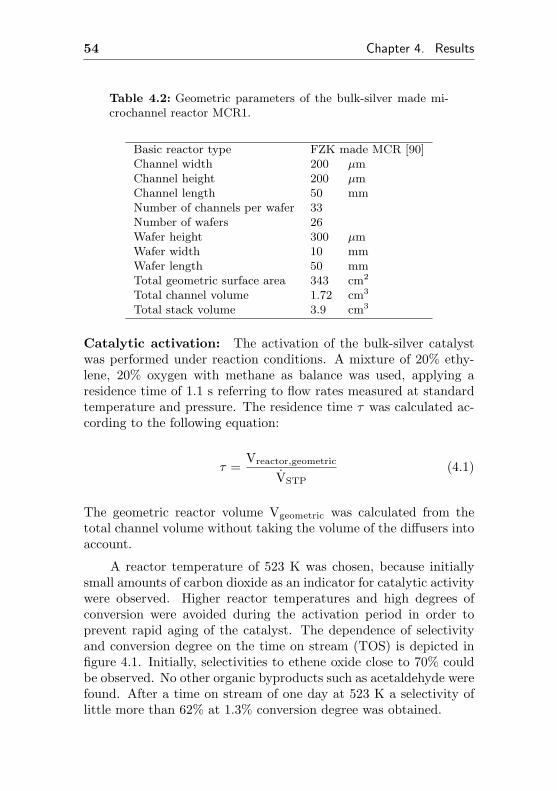
Table 4.2: Geometric parameters of the bulk-silver made mi-crochannel reactor MCR1.
Basic reactor type FZK made MCR [90]Channel width 200 µmChannel height 200 µmChannel length 50 mmNumber of channels per wafer 33Number of wafers 26Wafer height 300 µmWafer width 10 mmWafer length 50 mmTotal geometric surface area 343 cm2
Total channel volume 1.72 cm3
Total stack volume 3.9 cm3
Catalytic activation: The activation of the bulk-silver catalystwas performed under reaction conditions. A mixture of 20% ethy-lene, 20% oxygen with methane as balance was used, applying aresidence time of 1.1 s referring to flow rates measured at standardtemperature and pressure. The residence time τ was calculated ac-cording to the following equation:
τ =Vreactor,geometric
VSTP
(4.1)
The geometric reactor volume Vgeometric was calculated from thetotal channel volume without taking the volume of the diffusers intoaccount.
A reactor temperature of 523 K was chosen, because initiallysmall amounts of carbon dioxide as an indicator for catalytic activitywere observed. Higher reactor temperatures and high degrees ofconversion were avoided during the activation period in order toprevent rapid aging of the catalyst. The dependence of selectivityand conversion degree on the time on stream (TOS) is depicted infigure 4.1. Initially, selectivities to ethene oxide close to 70% couldbe observed. No other organic byproducts such as acetaldehyde werefound. After a time on stream of one day at 523 K a selectivity oflittle more than 62% at 1.3% conversion degree was obtained.
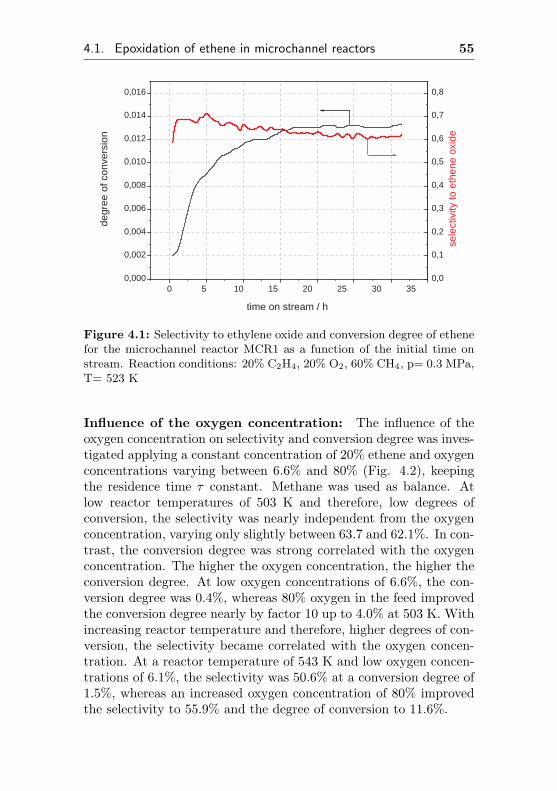
4.1. Epoxidation of ethene in microchannel reactors 55
0 5 10 15 20 25 30 35 0,000
0,002
0,004
0,006
0,008
0,010
0,012
0,014
0,016 de
gree
of c
onve
rsio
n
time on stream / h
0,0
0,1
0,2
0,3
0,4
0,5
0,6
0,7
0,8
sele
ctiv
ity to
eth
ene
oxid
e
Figure 4.1: Selectivity to ethylene oxide and conversion degree of ethenefor the microchannel reactor MCR1 as a function of the initial time onstream. Reaction conditions: 20% C2H4, 20% O2, 60% CH4, p= 0.3 MPa,T= 523 K
Influence of the oxygen concentration: The influence of theoxygen concentration on selectivity and conversion degree was inves-tigated applying a constant concentration of 20% ethene and oxygenconcentrations varying between 6.6% and 80% (Fig. 4.2), keepingthe residence time τ constant. Methane was used as balance. Atlow reactor temperatures of 503 K and therefore, low degrees ofconversion, the selectivity was nearly independent from the oxygenconcentration, varying only slightly between 63.7 and 62.1%. In con-trast, the conversion degree was strong correlated with the oxygenconcentration. The higher the oxygen concentration, the higher theconversion degree. At low oxygen concentrations of 6.6%, the con-version degree was 0.4%, whereas 80% oxygen in the feed improvedthe conversion degree nearly by factor 10 up to 4.0% at 503 K. Withincreasing reactor temperature and therefore, higher degrees of con-version, the selectivity became correlated with the oxygen concen-tration. At a reactor temperature of 543 K and low oxygen concen-trations of 6.1%, the selectivity was 50.6% at a conversion degree of1.5%, whereas an increased oxygen concentration of 80% improvedthe selectivity to 55.9% and the degree of conversion to 11.6%.
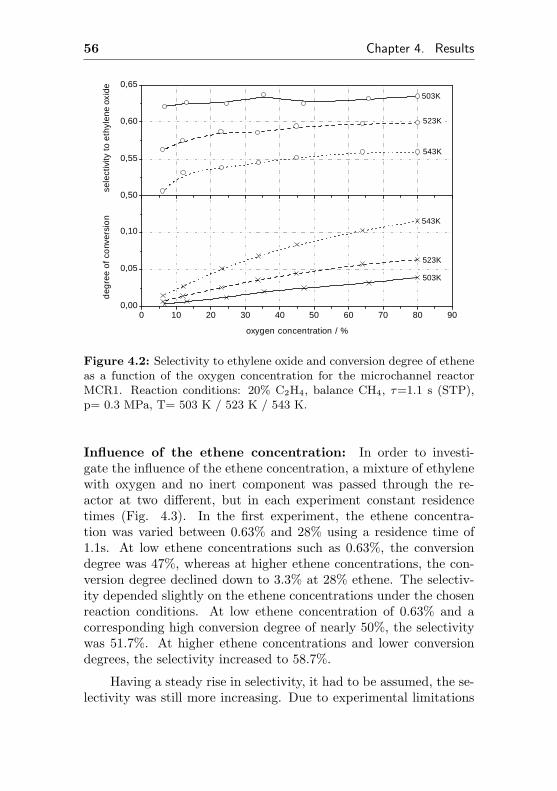
56 Chapter 4. Results
0 10 20 30 40 50 60 70 80 900,00
0,05
0,10
543K
523K
543K
523K
503K
sele
ctiv
ity t
o e
thyl
ene
oxid
e503K
deg
ree
of
conv
ersi
on
oxygen concentration / %
0,50
0,55
0,60
0,65
Figure 4.2: Selectivity to ethylene oxide and conversion degree of etheneas a function of the oxygen concentration for the microchannel reactorMCR1. Reaction conditions: 20% C2H4, balance CH4, τ=1.1 s (STP),p= 0.3 MPa, T= 503 K / 523 K / 543 K.
Influence of the ethene concentration: In order to investi-gate the influence of the ethene concentration, a mixture of ethylenewith oxygen and no inert component was passed through the re-actor at two different, but in each experiment constant residencetimes (Fig. 4.3). In the first experiment, the ethene concentra-tion was varied between 0.63% and 28% using a residence time of1.1s. At low ethene concentrations such as 0.63%, the conversiondegree was 47%, whereas at higher ethene concentrations, the con-version degree declined down to 3.3% at 28% ethene. The selectiv-ity depended slightly on the ethene concentrations under the chosenreaction conditions. At low ethene concentration of 0.63% and acorresponding high conversion degree of nearly 50%, the selectivitywas 51.7%. At higher ethene concentrations and lower conversiondegrees, the selectivity increased to 58.7%.
Having a steady rise in selectivity, it had to be assumed, the se-lectivity was still more increasing. Due to experimental limitations
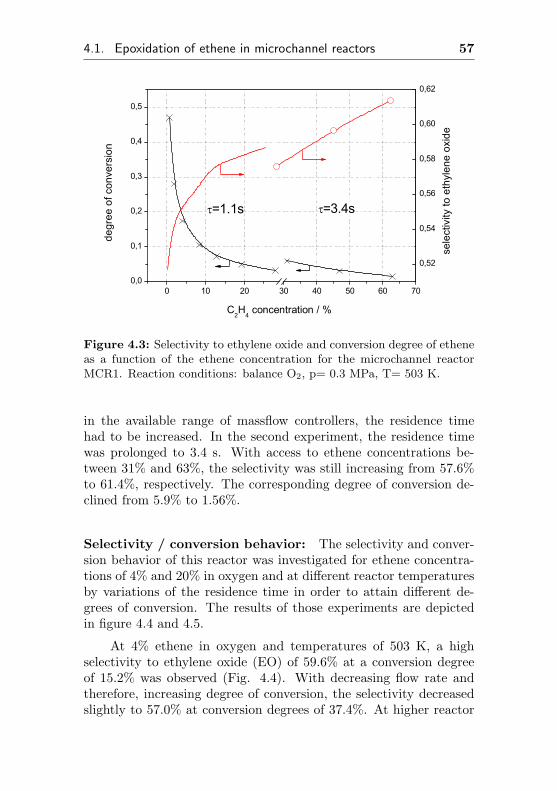
4.1. Epoxidation of ethene in microchannel reactors 57
0 10 20 30 40 50 60 700,0
0,1
0,2
0,3
0,4
0,5
=3.4s=1.1s
degr
ee o
f con
versio
n
C2H
4 concentration / %
0,52
0,54
0,56
0,58
0,60
0,62
sel
ectivity
to e
thyl
ene
oxid
e
Figure 4.3: Selectivity to ethylene oxide and conversion degree of etheneas a function of the ethene concentration for the microchannel reactorMCR1. Reaction conditions: balance O2, p= 0.3 MPa, T= 503 K.
in the available range of massflow controllers, the residence timehad to be increased. In the second experiment, the residence timewas prolonged to 3.4 s. With access to ethene concentrations be-tween 31% and 63%, the selectivity was still increasing from 57.6%to 61.4%, respectively. The corresponding degree of conversion de-clined from 5.9% to 1.56%.
Selectivity / conversion behavior: The selectivity and conver-sion behavior of this reactor was investigated for ethene concentra-tions of 4% and 20% in oxygen and at different reactor temperaturesby variations of the residence time in order to attain different de-grees of conversion. The results of those experiments are depictedin figure 4.4 and 4.5.
At 4% ethene in oxygen and temperatures of 503 K, a highselectivity to ethylene oxide (EO) of 59.6% at a conversion degreeof 15.2% was observed (Fig. 4.4). With decreasing flow rate andtherefore, increasing degree of conversion, the selectivity decreasedslightly to 57.0% at conversion degrees of 37.4%. At higher reactor
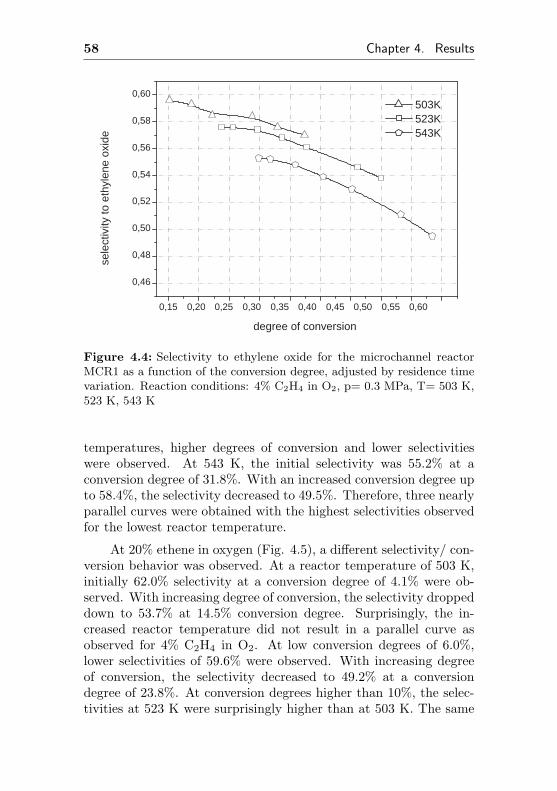
58 Chapter 4. Results
0,15 0,20 0,25 0,30 0,35 0,40 0,45 0,50 0,55 0,60
0,46
0,48
0,50
0,52
0,54
0,56
0,58
0,60 503K 523K 543K
sele
ctiv
ity to
eth
ylen
e ox
ide
degree of conversion
Figure 4.4: Selectivity to ethylene oxide for the microchannel reactorMCR1 as a function of the conversion degree, adjusted by residence timevariation. Reaction conditions: 4% C2H4 in O2, p= 0.3 MPa, T= 503 K,523 K, 543 K
temperatures, higher degrees of conversion and lower selectivitieswere observed. At 543 K, the initial selectivity was 55.2% at aconversion degree of 31.8%. With an increased conversion degree upto 58.4%, the selectivity decreased to 49.5%. Therefore, three nearlyparallel curves were obtained with the highest selectivities observedfor the lowest reactor temperature.
At 20% ethene in oxygen (Fig. 4.5), a different selectivity/ con-version behavior was observed. At a reactor temperature of 503 K,initially 62.0% selectivity at a conversion degree of 4.1% were ob-served. With increasing degree of conversion, the selectivity droppeddown to 53.7% at 14.5% conversion degree. Surprisingly, the in-creased reactor temperature did not result in a parallel curve asobserved for 4% C2H4 in O2. At low conversion degrees of 6.0%,lower selectivities of 59.6% were observed. With increasing degreeof conversion, the selectivity decreased to 49.2% at a conversiondegree of 23.8%. At conversion degrees higher than 10%, the selec-tivities at 523 K were surprisingly higher than at 503 K. The same
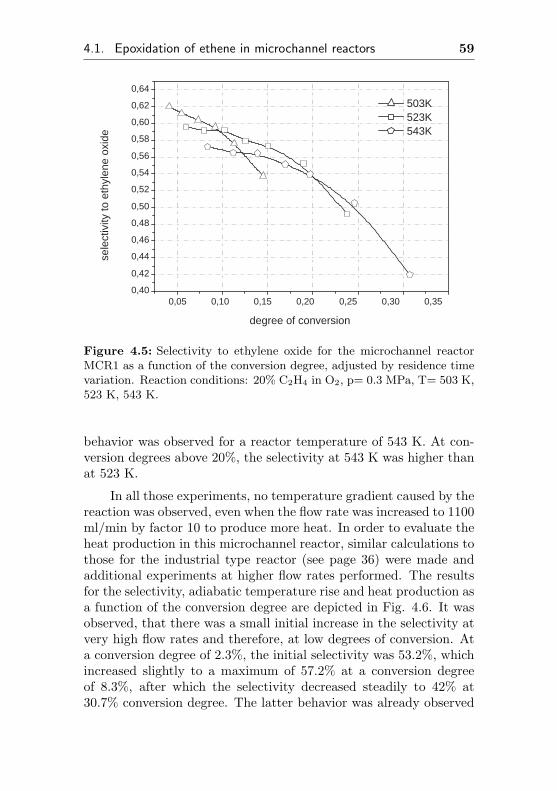
4.1. Epoxidation of ethene in microchannel reactors 59
0,05 0,10 0,15 0,20 0,25 0,30 0,35 0,40
0,42
0,44
0,46
0,48
0,50
0,52
0,54
0,56
0,58
0,60
0,62
0,64
503K 523K 543K
sele
ctiv
ity to
eth
ylen
e ox
ide
degree of conversion
Figure 4.5: Selectivity to ethylene oxide for the microchannel reactorMCR1 as a function of the conversion degree, adjusted by residence timevariation. Reaction conditions: 20% C2H4 in O2, p= 0.3 MPa, T= 503 K,523 K, 543 K.
behavior was observed for a reactor temperature of 543 K. At con-version degrees above 20%, the selectivity at 543 K was higher thanat 523 K.
In all those experiments, no temperature gradient caused by thereaction was observed, even when the flow rate was increased to 1100ml/min by factor 10 to produce more heat. In order to evaluate theheat production in this microchannel reactor, similar calculations tothose for the industrial type reactor (see page 36) were made andadditional experiments at higher flow rates performed. The resultsfor the selectivity, adiabatic temperature rise and heat production asa function of the conversion degree are depicted in Fig. 4.6. It wasobserved, that there was a small initial increase in the selectivity atvery high flow rates and therefore, at low degrees of conversion. Ata conversion degree of 2.3%, the initial selectivity was 53.2%, whichincreased slightly to a maximum of 57.2% at a conversion degreeof 8.3%, after which the selectivity decreased steadily to 42% at30.7% conversion degree. The latter behavior was already observed
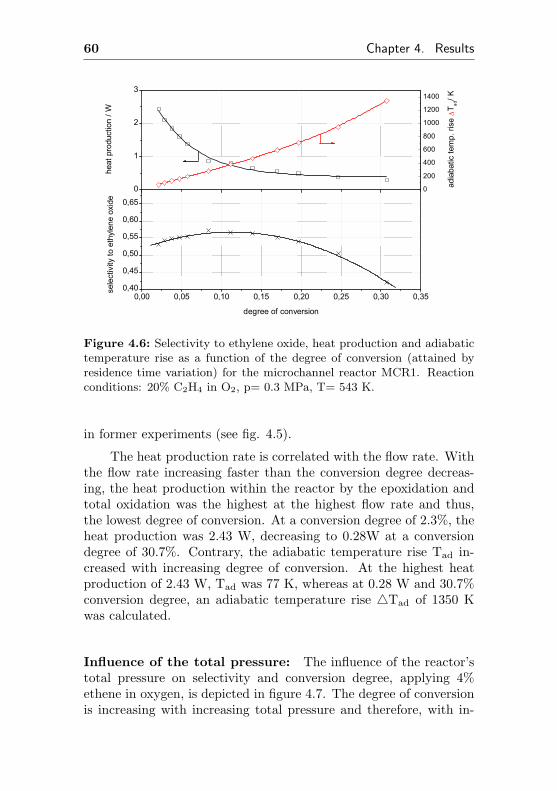
60 Chapter 4. Results
0,00 0,05 0,10 0,15 0,20 0,25 0,30 0,350,40
0,45
0,50
0,55
0,60
0,65
heat
pro
duct
ion
/ Wse
lect
ivity
to e
thyl
ene
oxid
e
degree of conversion
0
1
2
3
0
200
400
600
800
1000
1200
1400
adi
abat
ic te
mp.
rise
T ad
/ K
Figure 4.6: Selectivity to ethylene oxide, heat production and adiabatictemperature rise as a function of the degree of conversion (attained byresidence time variation) for the microchannel reactor MCR1. Reactionconditions: 20% C2H4 in O2, p= 0.3 MPa, T= 543 K.
in former experiments (see fig. 4.5).
The heat production rate is correlated with the flow rate. Withthe flow rate increasing faster than the conversion degree decreas-ing, the heat production within the reactor by the epoxidation andtotal oxidation was the highest at the highest flow rate and thus,the lowest degree of conversion. At a conversion degree of 2.3%, theheat production was 2.43 W, decreasing to 0.28W at a conversiondegree of 30.7%. Contrary, the adiabatic temperature rise Tad in-creased with increasing degree of conversion. At the highest heatproduction of 2.43 W, Tad was 77 K, whereas at 0.28 W and 30.7%conversion degree, an adiabatic temperature rise 4Tad of 1350 Kwas calculated.
Influence of the total pressure: The influence of the reactor’stotal pressure on selectivity and conversion degree, applying 4%ethene in oxygen, is depicted in figure 4.7. The degree of conversionis increasing with increasing total pressure and therefore, with in-
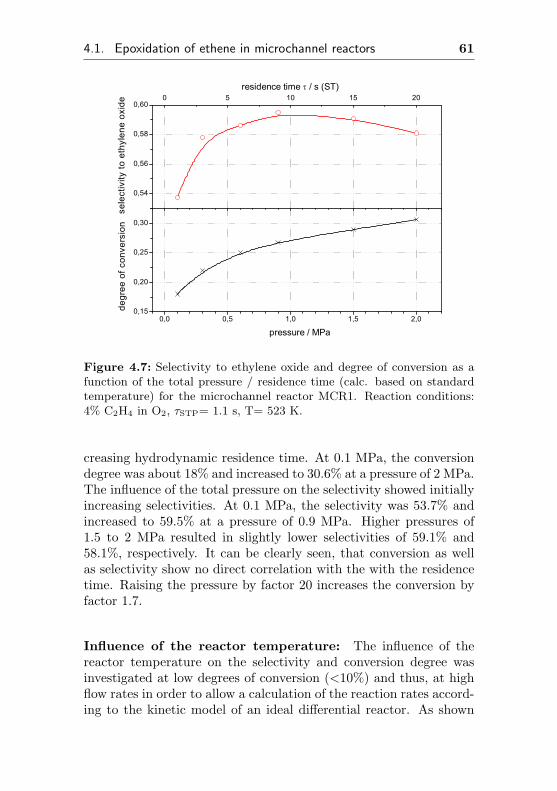
4.1. Epoxidation of ethene in microchannel reactors 61
0,0 0,5 1,0 1,5 2,00,15
0,20
0,25
0,30
degr
ee o
f con
vers
ion
pressure / MPa
0 5 10 15 20residence time / s (ST)
0,54
0,56
0,58
0,60
sel
ectiv
ity to
eth
ylen
e ox
ide
Figure 4.7: Selectivity to ethylene oxide and degree of conversion as afunction of the total pressure / residence time (calc. based on standardtemperature) for the microchannel reactor MCR1. Reaction conditions:4% C2H4 in O2, τSTP= 1.1 s, T= 523 K.
creasing hydrodynamic residence time. At 0.1 MPa, the conversiondegree was about 18% and increased to 30.6% at a pressure of 2 MPa.The influence of the total pressure on the selectivity showed initiallyincreasing selectivities. At 0.1 MPa, the selectivity was 53.7% andincreased to 59.5% at a pressure of 0.9 MPa. Higher pressures of1.5 to 2 MPa resulted in slightly lower selectivities of 59.1% and58.1%, respectively. It can be clearly seen, that conversion as wellas selectivity show no direct correlation with the with the residencetime. Raising the pressure by factor 20 increases the conversion byfactor 1.7.
Influence of the reactor temperature: The influence of thereactor temperature on the selectivity and conversion degree wasinvestigated at low degrees of conversion (<10%) and thus, at highflow rates in order to allow a calculation of the reaction rates accord-ing to the kinetic model of an ideal differential reactor. As shown
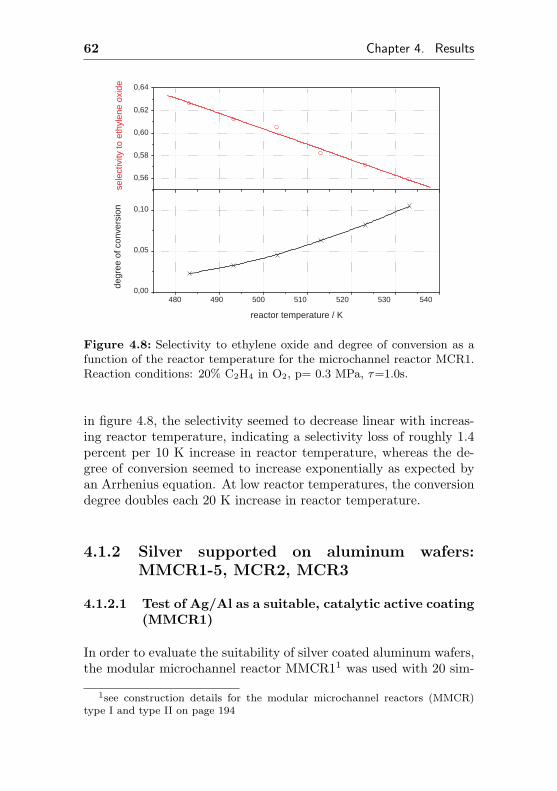
62 Chapter 4. Results
480 490 500 510 520 530 540 0,00
0,05
0,10
sele
ctiv
ity to
eth
ylen
e ox
ide
degr
ee o
f con
vers
ion
reactor temperature / K
0,56
0,58
0,60
0,62
0,64
Figure 4.8: Selectivity to ethylene oxide and degree of conversion as afunction of the reactor temperature for the microchannel reactor MCR1.Reaction conditions: 20% C2H4 in O2, p= 0.3 MPa, τ=1.0s.
in figure 4.8, the selectivity seemed to decrease linear with increas-ing reactor temperature, indicating a selectivity loss of roughly 1.4percent per 10 K increase in reactor temperature, whereas the de-gree of conversion seemed to increase exponentially as expected byan Arrhenius equation. At low reactor temperatures, the conversiondegree doubles each 20 K increase in reactor temperature.
4.1.2 Silver supported on aluminum wafers:MMCR1-5, MCR2, MCR3
4.1.2.1 Test of Ag/Al as a suitable, catalytic active coating(MMCR1)
In order to evaluate the suitability of silver coated aluminum wafers,the modular microchannel reactor MMCR11 was used with 20 sim-
1see construction details for the modular microchannel reactors (MMCR)type I and type II on page 194
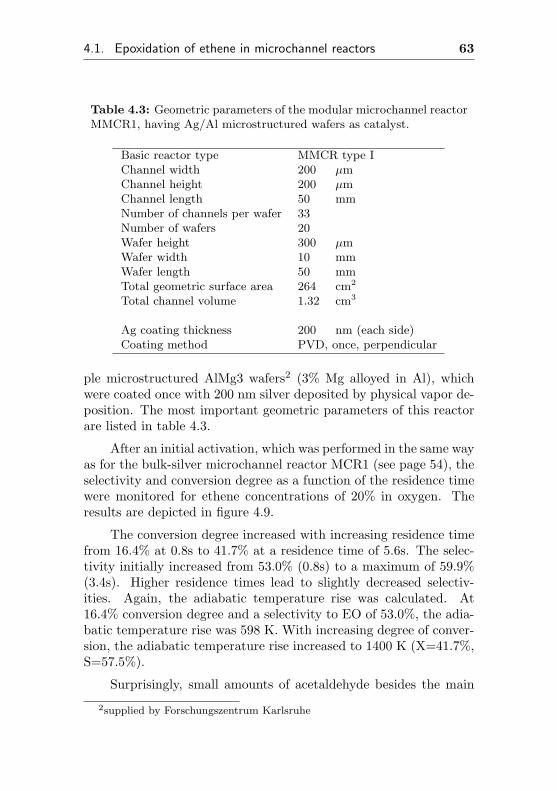
4.1. Epoxidation of ethene in microchannel reactors 63
Table 4.3: Geometric parameters of the modular microchannel reactorMMCR1, having Ag/Al microstructured wafers as catalyst.
Basic reactor type MMCR type IChannel width 200 µmChannel height 200 µmChannel length 50 mmNumber of channels per wafer 33Number of wafers 20Wafer height 300 µmWafer width 10 mmWafer length 50 mmTotal geometric surface area 264 cm2
Total channel volume 1.32 cm3
Ag coating thickness 200 nm (each side)Coating method PVD, once, perpendicular
ple microstructured AlMg3 wafers2 (3% Mg alloyed in Al), whichwere coated once with 200 nm silver deposited by physical vapor de-position. The most important geometric parameters of this reactorare listed in table 4.3.
After an initial activation, which was performed in the same wayas for the bulk-silver microchannel reactor MCR1 (see page 54), theselectivity and conversion degree as a function of the residence timewere monitored for ethene concentrations of 20% in oxygen. Theresults are depicted in figure 4.9.
The conversion degree increased with increasing residence timefrom 16.4% at 0.8s to 41.7% at a residence time of 5.6s. The selec-tivity initially increased from 53.0% (0.8s) to a maximum of 59.9%(3.4s). Higher residence times lead to slightly decreased selectiv-ities. Again, the adiabatic temperature rise was calculated. At16.4% conversion degree and a selectivity to EO of 53.0%, the adia-batic temperature rise was 598 K. With increasing degree of conver-sion, the adiabatic temperature rise increased to 1400 K (X=41.7%,S=57.5%).
Surprisingly, small amounts of acetaldehyde besides the main
2supplied by Forschungszentrum Karlsruhe
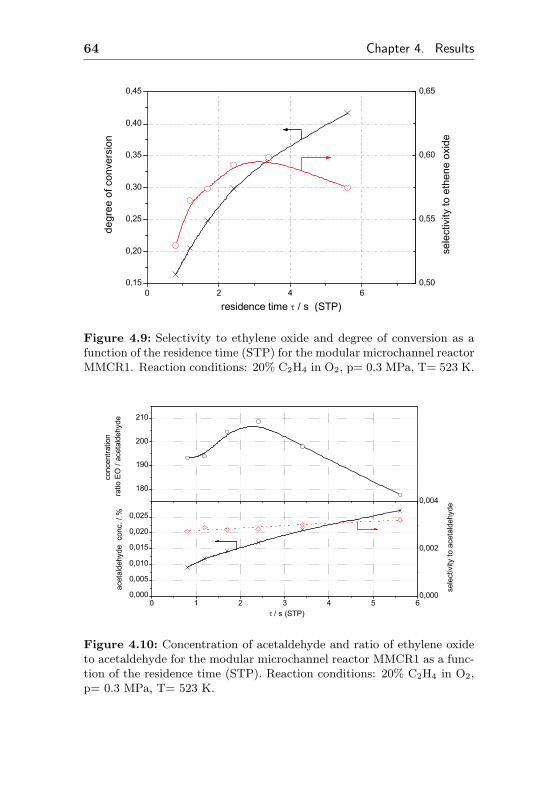
64 Chapter 4. Results
0 2 4 60,15
0,20
0,25
0,30
0,35
0,40
0,45
degr
ee o
f con
vers
ion
residence time / s (STP)
0,50
0,55
0,60
0,65
sele
ctiv
ity to
eth
ene
oxid
e
Figure 4.9: Selectivity to ethylene oxide and degree of conversion as afunction of the residence time (STP) for the modular microchannel reactorMMCR1. Reaction conditions: 20% C2H4 in O2, p= 0.3 MPa, T= 523 K.
0 1 2 3 4 5 60,000
0,005
0,010
0,015
0,020
0,025
conc
entra
tion
ratio
EO
/ ac
etal
dehy
deac
etal
dehy
de c
onc.
/ %
/ s (STP)
180
190
200
210
0,000
0,002
0,004
sel
ectiv
ity to
ace
tald
ehyd
e
Figure 4.10: Concentration of acetaldehyde and ratio of ethylene oxideto acetaldehyde for the modular microchannel reactor MMCR1 as a func-tion of the residence time (STP). Reaction conditions: 20% C2H4 in O2,p= 0.3 MPa, T= 523 K.
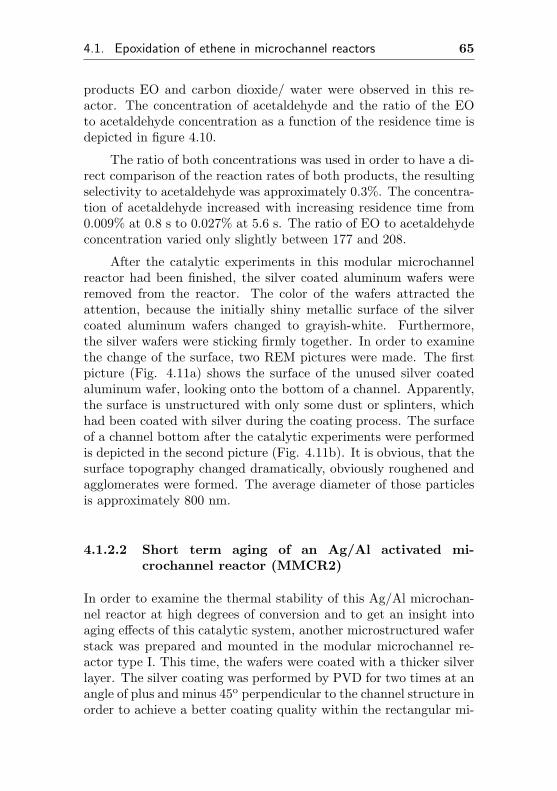
4.1. Epoxidation of ethene in microchannel reactors 65
products EO and carbon dioxide/ water were observed in this re-actor. The concentration of acetaldehyde and the ratio of the EOto acetaldehyde concentration as a function of the residence time isdepicted in figure 4.10.
The ratio of both concentrations was used in order to have a di-rect comparison of the reaction rates of both products, the resultingselectivity to acetaldehyde was approximately 0.3%. The concentra-tion of acetaldehyde increased with increasing residence time from0.009% at 0.8 s to 0.027% at 5.6 s. The ratio of EO to acetaldehydeconcentration varied only slightly between 177 and 208.
After the catalytic experiments in this modular microchannelreactor had been finished, the silver coated aluminum wafers wereremoved from the reactor. The color of the wafers attracted theattention, because the initially shiny metallic surface of the silvercoated aluminum wafers changed to grayish-white. Furthermore,the silver wafers were sticking firmly together. In order to examinethe change of the surface, two REM pictures were made. The firstpicture (Fig. 4.11a) shows the surface of the unused silver coatedaluminum wafer, looking onto the bottom of a channel. Apparently,the surface is unstructured with only some dust or splinters, whichhad been coated with silver during the coating process. The surfaceof a channel bottom after the catalytic experiments were performedis depicted in the second picture (Fig. 4.11b). It is obvious, that thesurface topography changed dramatically, obviously roughened andagglomerates were formed. The average diameter of those particlesis approximately 800 nm.
4.1.2.2 Short term aging of an Ag/Al activated mi-crochannel reactor (MMCR2)
In order to examine the thermal stability of this Ag/Al microchan-nel reactor at high degrees of conversion and to get an insight intoaging effects of this catalytic system, another microstructured waferstack was prepared and mounted in the modular microchannel re-actor type I. This time, the wafers were coated with a thicker silverlayer. The silver coating was performed by PVD for two times at anangle of plus and minus 45o perpendicular to the channel structure inorder to achieve a better coating quality within the rectangular mi-
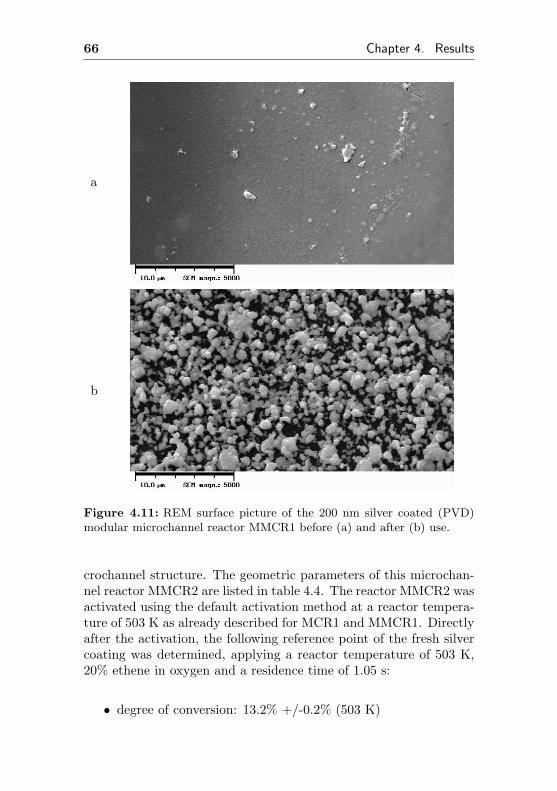
66 Chapter 4. Results
a
b
Figure 4.11: REM surface picture of the 200 nm silver coated (PVD)modular microchannel reactor MMCR1 before (a) and after (b) use.
crochannel structure. The geometric parameters of this microchan-nel reactor MMCR2 are listed in table 4.4. The reactor MMCR2 wasactivated using the default activation method at a reactor tempera-ture of 503 K as already described for MCR1 and MMCR1. Directlyafter the activation, the following reference point of the fresh silvercoating was determined, applying a reactor temperature of 503 K,20% ethene in oxygen and a residence time of 1.05 s:
• degree of conversion: 13.2% +/-0.2% (503 K)
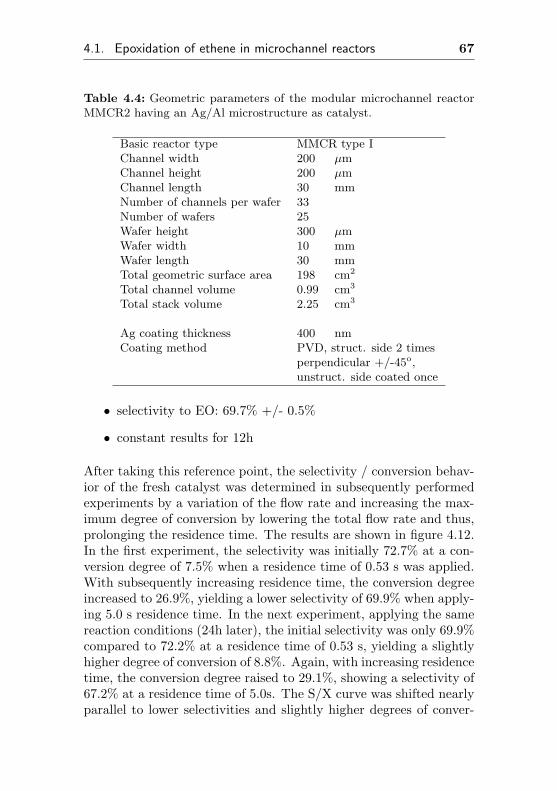
4.1. Epoxidation of ethene in microchannel reactors 67
Table 4.4: Geometric parameters of the modular microchannel reactorMMCR2 having an Ag/Al microstructure as catalyst.
Basic reactor type MMCR type IChannel width 200 µmChannel height 200 µmChannel length 30 mmNumber of channels per wafer 33Number of wafers 25Wafer height 300 µmWafer width 10 mmWafer length 30 mmTotal geometric surface area 198 cm2
Total channel volume 0.99 cm3
Total stack volume 2.25 cm3
Ag coating thickness 400 nmCoating method PVD, struct. side 2 times
perpendicular +/-45o,unstruct. side coated once
• selectivity to EO: 69.7% +/- 0.5%
• constant results for 12h
After taking this reference point, the selectivity / conversion behav-ior of the fresh catalyst was determined in subsequently performedexperiments by a variation of the flow rate and increasing the max-imum degree of conversion by lowering the total flow rate and thus,prolonging the residence time. The results are shown in figure 4.12.In the first experiment, the selectivity was initially 72.7% at a con-version degree of 7.5% when a residence time of 0.53 s was applied.With subsequently increasing residence time, the conversion degreeincreased to 26.9%, yielding a lower selectivity of 69.9% when apply-ing 5.0 s residence time. In the next experiment, applying the samereaction conditions (24h later), the initial selectivity was only 69.9%compared to 72.2% at a residence time of 0.53 s, yielding a slightlyhigher degree of conversion of 8.8%. Again, with increasing residencetime, the conversion degree raised to 29.1%, showing a selectivity of67.2% at a residence time of 5.0s. The S/X curve was shifted nearlyparallel to lower selectivities and slightly higher degrees of conver-
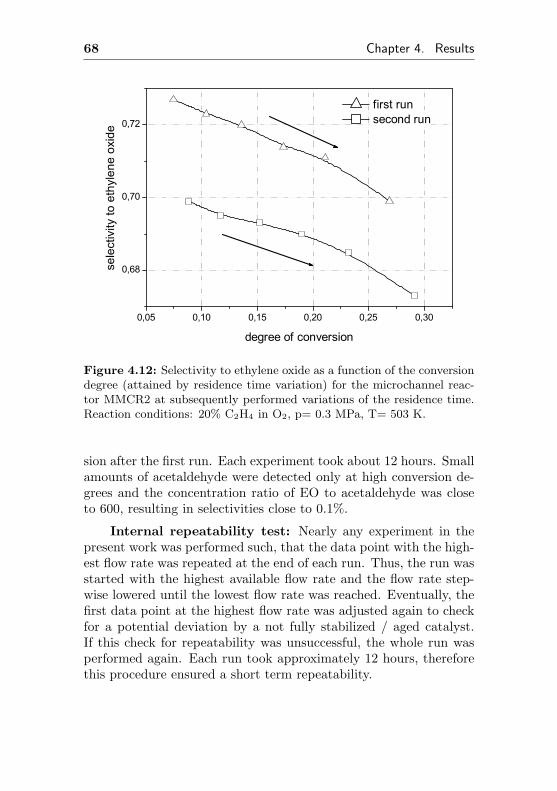
68 Chapter 4. Results
0,05 0,10 0,15 0,20 0,25 0,30
0,68
0,70
0,72
first run second run
sele
ctiv
ity to
eth
ylen
e ox
ide
degree of conversion
Figure 4.12: Selectivity to ethylene oxide as a function of the conversiondegree (attained by residence time variation) for the microchannel reac-tor MMCR2 at subsequently performed variations of the residence time.Reaction conditions: 20% C2H4 in O2, p= 0.3 MPa, T= 503 K.
sion after the first run. Each experiment took about 12 hours. Smallamounts of acetaldehyde were detected only at high conversion de-grees and the concentration ratio of EO to acetaldehyde was closeto 600, resulting in selectivities close to 0.1%.
Internal repeatability test: Nearly any experiment in thepresent work was performed such, that the data point with the high-est flow rate was repeated at the end of each run. Thus, the run wasstarted with the highest available flow rate and the flow rate step-wise lowered until the lowest flow rate was reached. Eventually, thefirst data point at the highest flow rate was adjusted again to checkfor a potential deviation by a not fully stabilized / aged catalyst.If this check for repeatability was unsuccessful, the whole run wasperformed again. Each run took approximately 12 hours, thereforethis procedure ensured a short term repeatability.
4.1. Epoxidation of ethene in microchannel reactors 69
4.1.2.3 Thermal stability of an Ag/Al activated mi-crochannel reactor (MMCR2)
In following experiments, this reactor (MMCR2) was heated up frombetween 463 K in steps to 633 K and cooled down back, again step-wise to the starting temperature of 463 K. The flow rate was keptconstant, a 20% ethene in oxygen mixture was applied and the to-tal pressure 0.1 MPa. The selectivity and corresponding degree ofconversion were constantly monitored.
This experiment should answer two important questions. Thefirst and most important question deals with the thermal stabilityof this reactor. With a constant reagent flow and increasing reactortemperature, the conversion degree is expected to increase whereasthe selectivity decreases, causing large heat effects within the explo-sion range of the ethylene/ oxygen mixture. The second question isabout the thermal stability of that coating. With increasing reactortemperature and steadily increasing amounts of water (formed by thetotal oxidation), the coating is chemically and thermally stressed. Ifthe selectivity at the beginning and at the end is still the same, thiswould prove the usefulness of this catalytic coating.
Unfortunately, it proved practically impossible to perform theexperiments at elevated pressures of 0.3 MPa, because after passingthe dew-point of the by-product water, the pressure controller wasplugged by condensate and therefore, the experiment failed. Dueto the technical specifications of the pressure controller, it was im-possible to heat the pressure controller to temperatures higher than333 K to avoid this condensation problem. Therefore, only pressuresof 0.1 MPa were applied in this experiment.
The results of those temperature stress tests are depicted infigure 4.13. The experiment with increasing reactor temperature ismarked with a solid line and open, up-pointing triangles, whereasthe experiment with decreasing reactor temperatures is marked witha dashed and a solid triangle, pointing down. At the beginning andtherefore, at low reactor temperatures of 463 K, the selectivity was69.5% at a conversion degree of 3.8%. Initially, the selectivity de-creased with increasing reactor temperature. In the middle of theinvestigated temperature range between 523 K and 583 K, the se-lectivity was quite constant and even slightly increasing from 55.2%
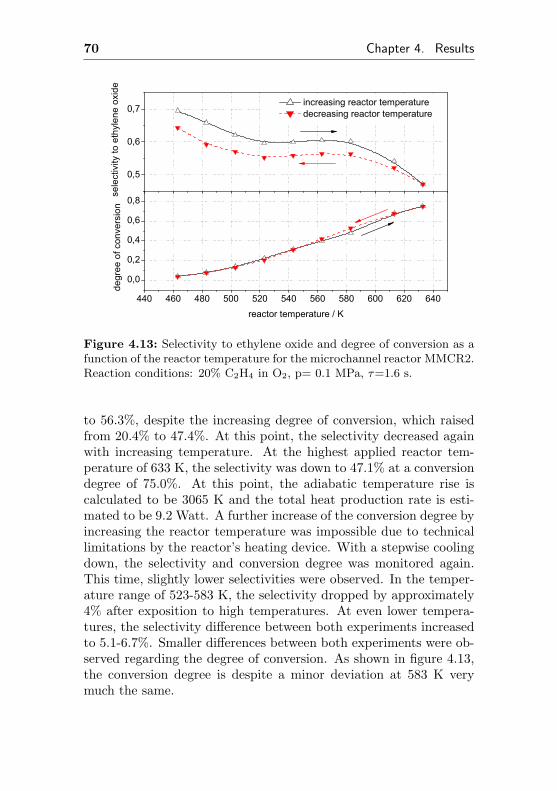
70 Chapter 4. Results
440 460 480 500 520 540 560 580 600 620 640
0,0
0,2
0,4
0,6
0,8
increasing reactor temperature decreasing reactor temperature
sele
ctiv
ity to
eth
ylen
e ox
ide
degr
ee o
f con
vers
ion
reactor temperature / K
0,5
0,6
0,7
Figure 4.13: Selectivity to ethylene oxide and degree of conversion as afunction of the reactor temperature for the microchannel reactor MMCR2.Reaction conditions: 20% C2H4 in O2, p= 0.1 MPa, τ=1.6 s.
to 56.3%, despite the increasing degree of conversion, which raisedfrom 20.4% to 47.4%. At this point, the selectivity decreased againwith increasing temperature. At the highest applied reactor tem-perature of 633 K, the selectivity was down to 47.1% at a conversiondegree of 75.0%. At this point, the adiabatic temperature rise iscalculated to be 3065 K and the total heat production rate is esti-mated to be 9.2 Watt. A further increase of the conversion degree byincreasing the reactor temperature was impossible due to technicallimitations by the reactor’s heating device. With a stepwise coolingdown, the selectivity and conversion degree was monitored again.This time, slightly lower selectivities were observed. In the temper-ature range of 523-583 K, the selectivity dropped by approximately4% after exposition to high temperatures. At even lower tempera-tures, the selectivity difference between both experiments increasedto 5.1-6.7%. Smaller differences between both experiments were ob-served regarding the degree of conversion. As shown in figure 4.13,the conversion degree is despite a minor deviation at 583 K verymuch the same.
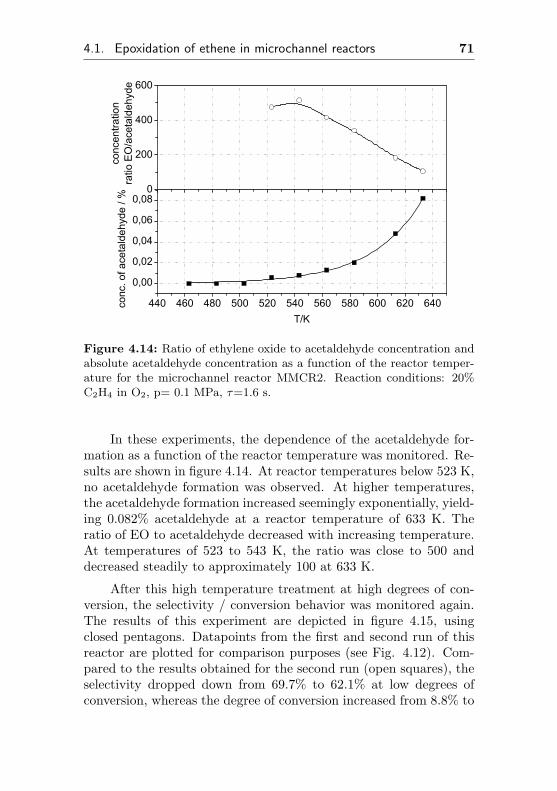
4.1. Epoxidation of ethene in microchannel reactors 71
440 460 480 500 520 540 560 580 600 620 640
0,00
0,02
0,04
0,06
0,08
conc
entra
tion
ratio
EO
/ace
tald
ehyd
eco
nc. o
f ace
tald
ehyd
e / %
T/K
0
200
400
600
Figure 4.14: Ratio of ethylene oxide to acetaldehyde concentration andabsolute acetaldehyde concentration as a function of the reactor temper-ature for the microchannel reactor MMCR2. Reaction conditions: 20%C2H4 in O2, p= 0.1 MPa, τ=1.6 s.
In these experiments, the dependence of the acetaldehyde for-mation as a function of the reactor temperature was monitored. Re-sults are shown in figure 4.14. At reactor temperatures below 523 K,no acetaldehyde formation was observed. At higher temperatures,the acetaldehyde formation increased seemingly exponentially, yield-ing 0.082% acetaldehyde at a reactor temperature of 633 K. Theratio of EO to acetaldehyde decreased with increasing temperature.At temperatures of 523 to 543 K, the ratio was close to 500 anddecreased steadily to approximately 100 at 633 K.
After this high temperature treatment at high degrees of con-version, the selectivity / conversion behavior was monitored again.The results of this experiment are depicted in figure 4.15, usingclosed pentagons. Datapoints from the first and second run of thisreactor are plotted for comparison purposes (see Fig. 4.12). Com-pared to the results obtained for the second run (open squares), theselectivity dropped down from 69.7% to 62.1% at low degrees ofconversion, whereas the degree of conversion increased from 8.8% to
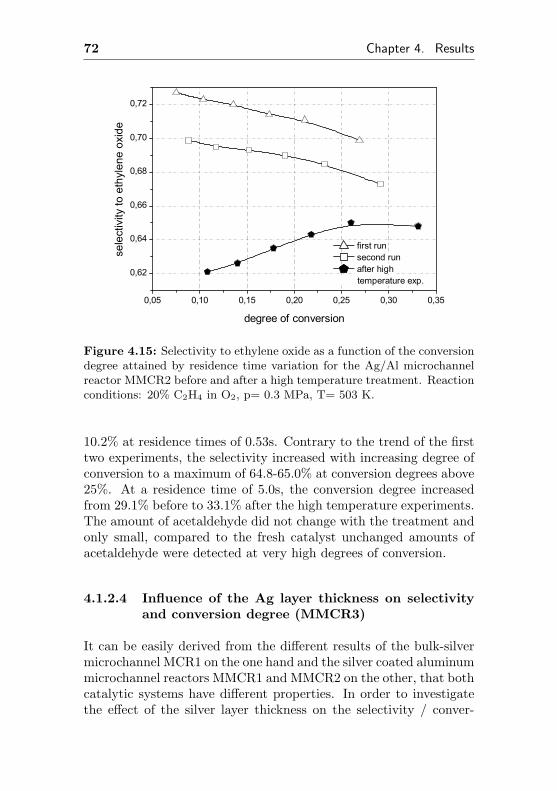
72 Chapter 4. Results
0,05 0,10 0,15 0,20 0,25 0,30 0,35
0,62
0,64
0,66
0,68
0,70
0,72
first run second run after high
temperature exp.
sele
ctiv
ity to
eth
ylen
e ox
ide
degree of conversion
Figure 4.15: Selectivity to ethylene oxide as a function of the conversiondegree attained by residence time variation for the Ag/Al microchannelreactor MMCR2 before and after a high temperature treatment. Reactionconditions: 20% C2H4 in O2, p= 0.3 MPa, T= 503 K.
10.2% at residence times of 0.53s. Contrary to the trend of the firsttwo experiments, the selectivity increased with increasing degree ofconversion to a maximum of 64.8-65.0% at conversion degrees above25%. At a residence time of 5.0s, the conversion degree increasedfrom 29.1% before to 33.1% after the high temperature experiments.The amount of acetaldehyde did not change with the treatment andonly small, compared to the fresh catalyst unchanged amounts ofacetaldehyde were detected at very high degrees of conversion.
4.1.2.4 Influence of the Ag layer thickness on selectivityand conversion degree (MMCR3)
It can be easily derived from the different results of the bulk-silvermicrochannel MCR1 on the one hand and the silver coated aluminummicrochannel reactors MMCR1 and MMCR2 on the other, that bothcatalytic systems have different properties. In order to investigatethe effect of the silver layer thickness on the selectivity / conver-
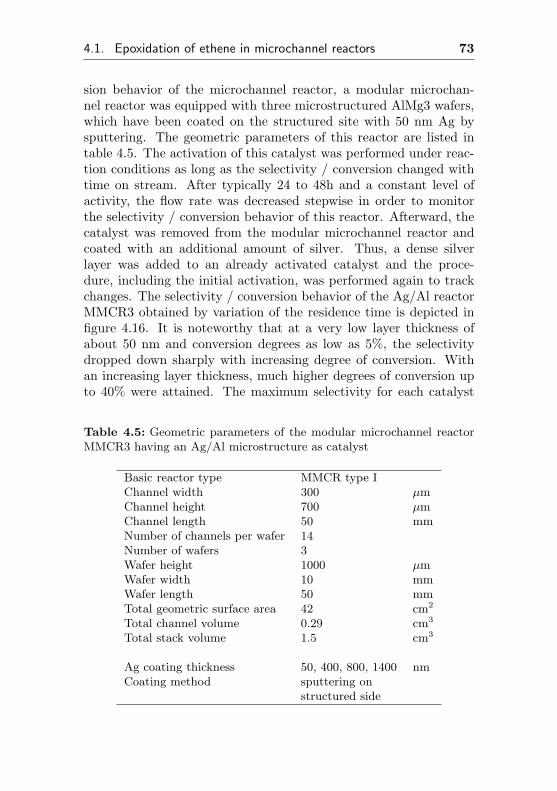
4.1. Epoxidation of ethene in microchannel reactors 73
sion behavior of the microchannel reactor, a modular microchan-nel reactor was equipped with three microstructured AlMg3 wafers,which have been coated on the structured site with 50 nm Ag bysputtering. The geometric parameters of this reactor are listed intable 4.5. The activation of this catalyst was performed under reac-tion conditions as long as the selectivity / conversion changed withtime on stream. After typically 24 to 48h and a constant level ofactivity, the flow rate was decreased stepwise in order to monitorthe selectivity / conversion behavior of this reactor. Afterward, thecatalyst was removed from the modular microchannel reactor andcoated with an additional amount of silver. Thus, a dense silverlayer was added to an already activated catalyst and the proce-dure, including the initial activation, was performed again to trackchanges. The selectivity / conversion behavior of the Ag/Al reactorMMCR3 obtained by variation of the residence time is depicted infigure 4.16. It is noteworthy that at a very low layer thickness ofabout 50 nm and conversion degrees as low as 5%, the selectivitydropped down sharply with increasing degree of conversion. Withan increasing layer thickness, much higher degrees of conversion upto 40% were attained. The maximum selectivity for each catalyst
Table 4.5: Geometric parameters of the modular microchannel reactorMMCR3 having an Ag/Al microstructure as catalyst
Basic reactor type MMCR type IChannel width 300 µmChannel height 700 µmChannel length 50 mmNumber of channels per wafer 14Number of wafers 3Wafer height 1000 µmWafer width 10 mmWafer length 50 mmTotal geometric surface area 42 cm2
Total channel volume 0.29 cm3
Total stack volume 1.5 cm3
Ag coating thickness 50, 400, 800, 1400 nmCoating method sputtering on
structured side
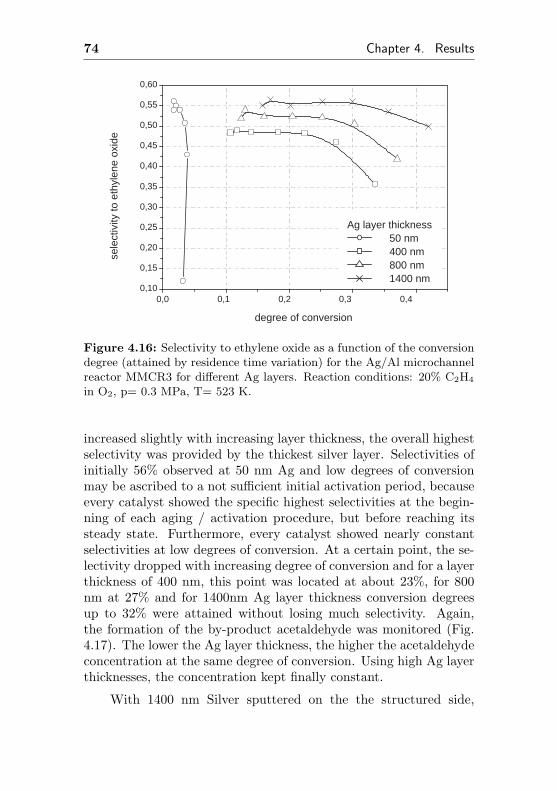
74 Chapter 4. Results
0,0 0,1 0,2 0,3 0,4 0,10
0,15
0,20
0,25
0,30
0,35
0,40
0,45
0,50
0,55
0,60
Ag layer thickness 50 nm 400 nm 800 nm 1400 nm
sele
ctiv
ity to
eth
ylen
e ox
ide
degree of conversion
Figure 4.16: Selectivity to ethylene oxide as a function of the conversiondegree (attained by residence time variation) for the Ag/Al microchannelreactor MMCR3 for different Ag layers. Reaction conditions: 20% C2H4
in O2, p= 0.3 MPa, T= 523 K.
increased slightly with increasing layer thickness, the overall highestselectivity was provided by the thickest silver layer. Selectivities ofinitially 56% observed at 50 nm Ag and low degrees of conversionmay be ascribed to a not sufficient initial activation period, becauseevery catalyst showed the specific highest selectivities at the begin-ning of each aging / activation procedure, but before reaching itssteady state. Furthermore, every catalyst showed nearly constantselectivities at low degrees of conversion. At a certain point, the se-lectivity dropped with increasing degree of conversion and for a layerthickness of 400 nm, this point was located at about 23%, for 800nm at 27% and for 1400nm Ag layer thickness conversion degreesup to 32% were attained without losing much selectivity. Again,the formation of the by-product acetaldehyde was monitored (Fig.4.17). The lower the Ag layer thickness, the higher the acetaldehydeconcentration at the same degree of conversion. Using high Ag layerthicknesses, the concentration kept finally constant.
With 1400 nm Silver sputtered on the the structured side,
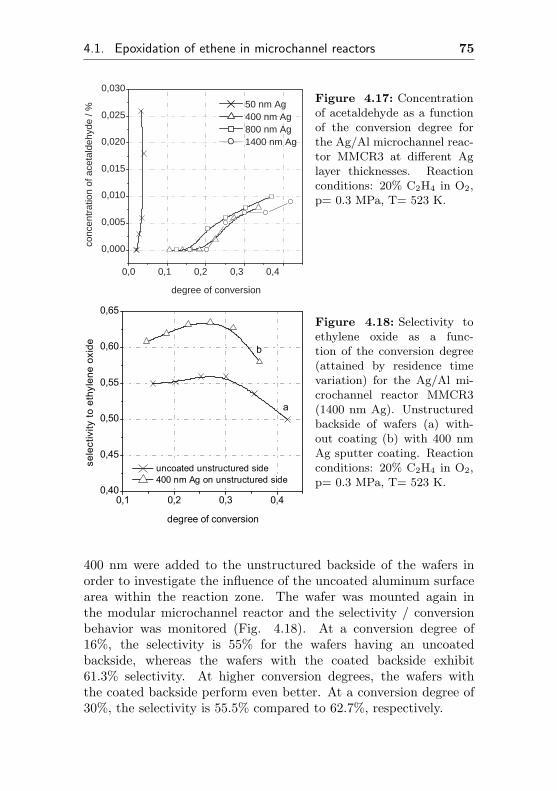
4.1. Epoxidation of ethene in microchannel reactors 75
0,0 0,1 0,2 0,3 0,4
0,000
0,005
0,010
0,015
0,020
0,025
0,030
50 nm Ag 400 nm Ag 800 nm Ag 1400 nm Ag
conc
entr
atio
n of
ace
tald
ehyd
e / %
degree of conversion
Figure 4.17: Concentrationof acetaldehyde as a functionof the conversion degree forthe Ag/Al microchannel reac-tor MMCR3 at different Aglayer thicknesses. Reactionconditions: 20% C2H4 in O2,p= 0.3 MPa, T= 523 K.
0,1 0,2 0,3 0,40,40
0,45
0,50
0,55
0,60
0,65
b
uncoated unstructured side 400 nm Ag on unstructured side
sele
ctiv
ity to
eth
ylen
e ox
ide
degree of conversion
a
Figure 4.18: Selectivity toethylene oxide as a func-tion of the conversion degree(attained by residence timevariation) for the Ag/Al mi-crochannel reactor MMCR3(1400 nm Ag). Unstructuredbackside of wafers (a) with-out coating (b) with 400 nmAg sputter coating. Reactionconditions: 20% C2H4 in O2,p= 0.3 MPa, T= 523 K.
400 nm were added to the unstructured backside of the wafers inorder to investigate the influence of the uncoated aluminum surfacearea within the reaction zone. The wafer was mounted again inthe modular microchannel reactor and the selectivity / conversionbehavior was monitored (Fig. 4.18). At a conversion degree of16%, the selectivity is 55% for the wafers having an uncoatedbackside, whereas the wafers with the coated backside exhibit61.3% selectivity. At higher conversion degrees, the wafers withthe coated backside perform even better. At a conversion degree of30%, the selectivity is 55.5% compared to 62.7%, respectively.
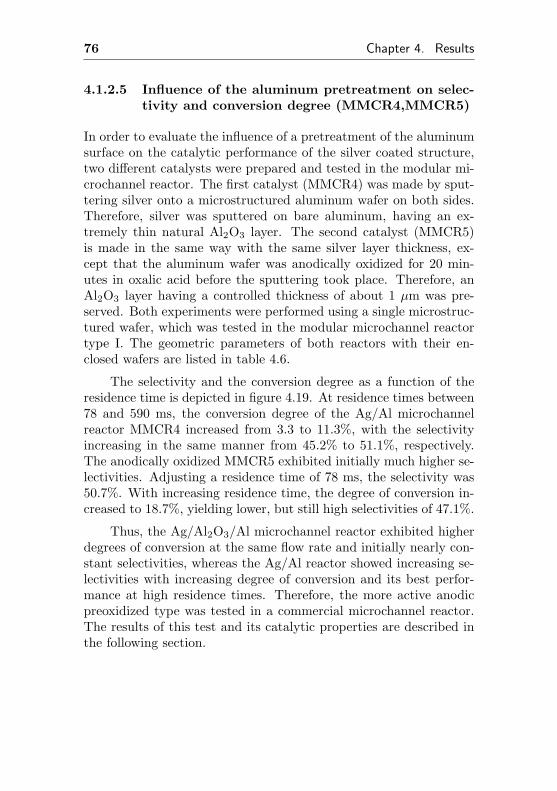
76 Chapter 4. Results
4.1.2.5 Influence of the aluminum pretreatment on selec-tivity and conversion degree (MMCR4,MMCR5)
In order to evaluate the influence of a pretreatment of the aluminumsurface on the catalytic performance of the silver coated structure,two different catalysts were prepared and tested in the modular mi-crochannel reactor. The first catalyst (MMCR4) was made by sput-tering silver onto a microstructured aluminum wafer on both sides.Therefore, silver was sputtered on bare aluminum, having an ex-tremely thin natural Al2O3 layer. The second catalyst (MMCR5)is made in the same way with the same silver layer thickness, ex-cept that the aluminum wafer was anodically oxidized for 20 min-utes in oxalic acid before the sputtering took place. Therefore, anAl2O3 layer having a controlled thickness of about 1 µm was pre-served. Both experiments were performed using a single microstruc-tured wafer, which was tested in the modular microchannel reactortype I. The geometric parameters of both reactors with their en-closed wafers are listed in table 4.6.
The selectivity and the conversion degree as a function of theresidence time is depicted in figure 4.19. At residence times between78 and 590 ms, the conversion degree of the Ag/Al microchannelreactor MMCR4 increased from 3.3 to 11.3%, with the selectivityincreasing in the same manner from 45.2% to 51.1%, respectively.The anodically oxidized MMCR5 exhibited initially much higher se-lectivities. Adjusting a residence time of 78 ms, the selectivity was50.7%. With increasing residence time, the degree of conversion in-creased to 18.7%, yielding lower, but still high selectivities of 47.1%.
Thus, the Ag/Al2O3/Al microchannel reactor exhibited higherdegrees of conversion at the same flow rate and initially nearly con-stant selectivities, whereas the Ag/Al reactor showed increasing se-lectivities with increasing degree of conversion and its best perfor-mance at high residence times. Therefore, the more active anodicpreoxidized type was tested in a commercial microchannel reactor.The results of this test and its catalytic properties are described inthe following section.
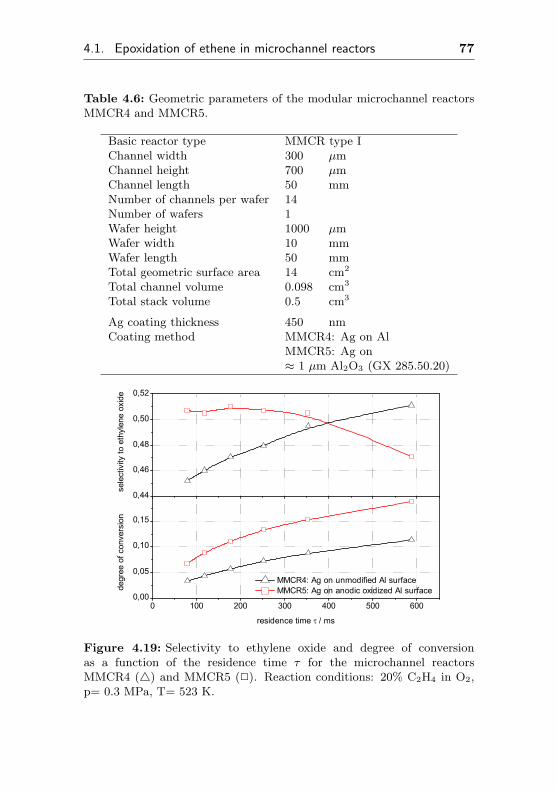
4.1. Epoxidation of ethene in microchannel reactors 77
Table 4.6: Geometric parameters of the modular microchannel reactorsMMCR4 and MMCR5.
Basic reactor type MMCR type IChannel width 300 µmChannel height 700 µmChannel length 50 mmNumber of channels per wafer 14Number of wafers 1Wafer height 1000 µmWafer width 10 mmWafer length 50 mmTotal geometric surface area 14 cm2
Total channel volume 0.098 cm3
Total stack volume 0.5 cm3
Ag coating thickness 450 nmCoating method MMCR4: Ag on Al
MMCR5: Ag on≈ 1 µm Al2O3 (GX 285.50.20)
0 100 200 300 400 500 6000,00
0,05
0,10
0,15
MMCR4: Ag on unmodified Al surface MMCR5: Ag on anodic oxidized Al surface
sele
ctiv
ity to
eth
ylen
e ox
ide
degr
ee o
f con
vers
ion
residence time / ms
0,44
0,46
0,48
0,50
0,52
Figure 4.19: Selectivity to ethylene oxide and degree of conversionas a function of the residence time τ for the microchannel reactorsMMCR4 (4) and MMCR5 (2). Reaction conditions: 20% C2H4 in O2,p= 0.3 MPa, T= 523 K.
78 Chapter 4. Results
4.1.2.6 Silver supported on anodic preoxidized aluminumsurface (Ag/Al2O3/Al, MCR2)
According to the high activity observed with the modular mi-crochannel reactor MMCR5, a commercial made microchannelreactor was ordered. The activation of the microstructured AlMg3wafers was performed by an anodic oxidation of the bare aluminumfollowed by immobilization of silver (800 nm layer thickness) bysputtering. To compare the results obtained in the first bulk silvermade microchannel reactor MCR1, the same reactor and channelgeometry was chosen. The most important parameters of thismicrochannel reactor MCR2 are listed in table 4.7
The activation of this microchannel reactor MCR2 was per-formed using a similar method as for MCR1, except the reactortemperature was set to 503 K to take the expected higher activityinto account Further experiments showed a typical behavior for avariation of oxygen concentration, ethene concentration and the to-tal pressure are depicted and described in the appendix, see Fig.7.1to 7.4.
Table 4.7: Geometric parameters of the Ag/Al2O3/Al microchannel re-actor MCR2.
Basic reactor type FZ K made MCRChannel width 200 µmChannel height 200 µmChannel length 50 mmNumber of channels per wafer 33Number of wafers 26Wafer height 300 µmWafer width 10 mmWafer length 50 mmTotal geometric surface area 343 cm2
Total channel volume 1.72 cm3
Total stack volume 3.9 cm3
Ag coating thickness 800 nmCoating method sputtering of Ag
≈ 1 µm Al2O3 (GX 285.50.20)wafers. Coating on both sides.
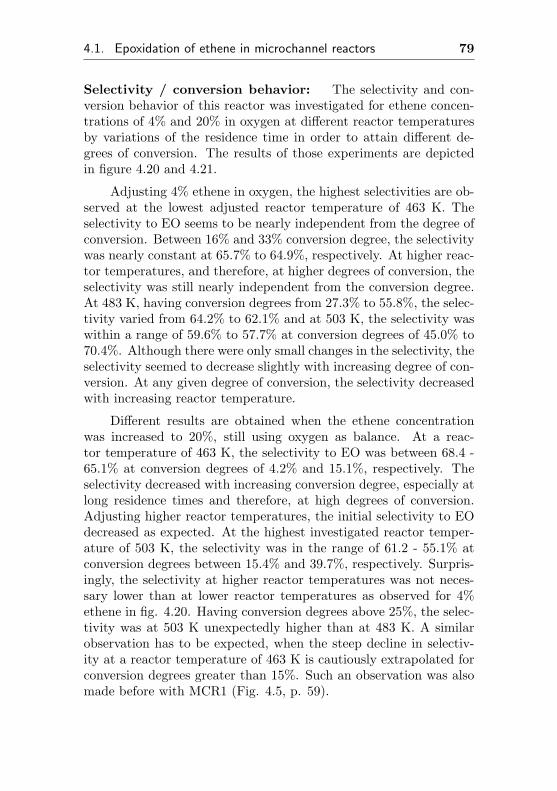
4.1. Epoxidation of ethene in microchannel reactors 79
Selectivity / conversion behavior: The selectivity and con-version behavior of this reactor was investigated for ethene concen-trations of 4% and 20% in oxygen at different reactor temperaturesby variations of the residence time in order to attain different de-grees of conversion. The results of those experiments are depictedin figure 4.20 and 4.21.
Adjusting 4% ethene in oxygen, the highest selectivities are ob-served at the lowest adjusted reactor temperature of 463 K. Theselectivity to EO seems to be nearly independent from the degree ofconversion. Between 16% and 33% conversion degree, the selectivitywas nearly constant at 65.7% to 64.9%, respectively. At higher reac-tor temperatures, and therefore, at higher degrees of conversion, theselectivity was still nearly independent from the conversion degree.At 483 K, having conversion degrees from 27.3% to 55.8%, the selec-tivity varied from 64.2% to 62.1% and at 503 K, the selectivity waswithin a range of 59.6% to 57.7% at conversion degrees of 45.0% to70.4%. Although there were only small changes in the selectivity, theselectivity seemed to decrease slightly with increasing degree of con-version. At any given degree of conversion, the selectivity decreasedwith increasing reactor temperature.
Different results are obtained when the ethene concentrationwas increased to 20%, still using oxygen as balance. At a reac-tor temperature of 463 K, the selectivity to EO was between 68.4 -65.1% at conversion degrees of 4.2% and 15.1%, respectively. Theselectivity decreased with increasing conversion degree, especially atlong residence times and therefore, at high degrees of conversion.Adjusting higher reactor temperatures, the initial selectivity to EOdecreased as expected. At the highest investigated reactor temper-ature of 503 K, the selectivity was in the range of 61.2 - 55.1% atconversion degrees between 15.4% and 39.7%, respectively. Surpris-ingly, the selectivity at higher reactor temperatures was not neces-sary lower than at lower reactor temperatures as observed for 4%ethene in fig. 4.20. Having conversion degrees above 25%, the selec-tivity was at 503 K unexpectedly higher than at 483 K. A similarobservation has to be expected, when the steep decline in selectiv-ity at a reactor temperature of 463 K is cautiously extrapolated forconversion degrees greater than 15%. Such an observation was alsomade before with MCR1 (Fig. 4.5, p. 59).
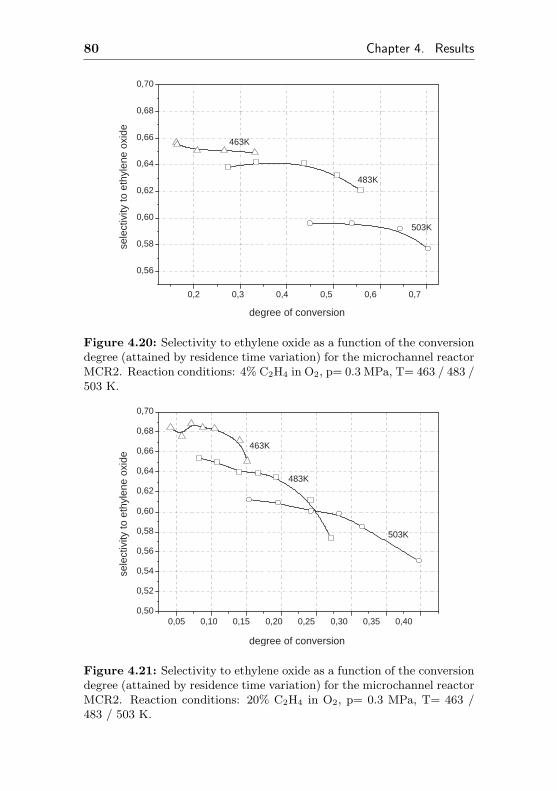
80 Chapter 4. Results
0,2 0,3 0,4 0,5 0,6 0,7
0,56
0,58
0,60
0,62
0,64
0,66
0,68
0,70
483K
503K
463K
sele
ctiv
ity to
eth
ylen
e ox
ide
degree of conversion
Figure 4.20: Selectivity to ethylene oxide as a function of the conversiondegree (attained by residence time variation) for the microchannel reactorMCR2. Reaction conditions: 4% C2H4 in O2, p= 0.3 MPa, T= 463 / 483 /503 K.
0,05 0,10 0,15 0,20 0,25 0,30 0,35 0,40 0,50
0,52
0,54
0,56
0,58
0,60
0,62
0,64
0,66
0,68
0,70
503K
483K
463K
sele
ctiv
ity to
eth
ylen
e ox
ide
degree of conversion
Figure 4.21: Selectivity to ethylene oxide as a function of the conversiondegree (attained by residence time variation) for the microchannel reactorMCR2. Reaction conditions: 20% C2H4 in O2, p= 0.3 MPa, T= 463 /483 / 503 K.
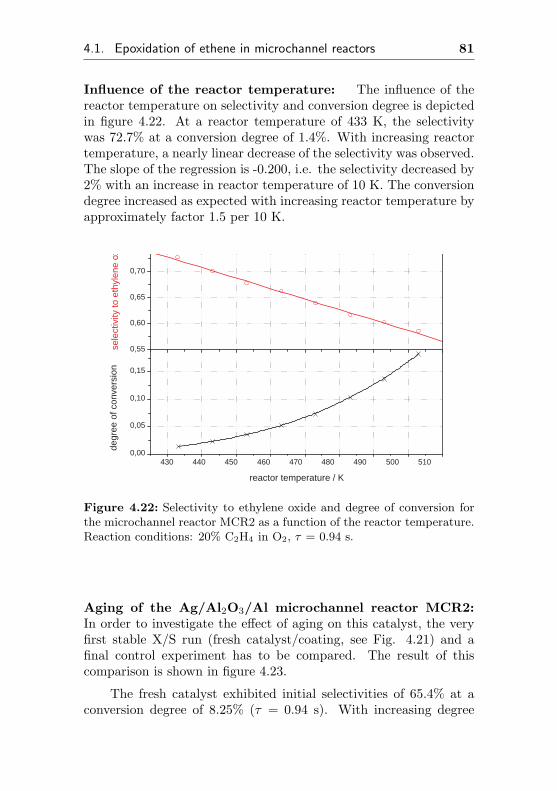
4.1. Epoxidation of ethene in microchannel reactors 81
Influence of the reactor temperature: The influence of thereactor temperature on selectivity and conversion degree is depictedin figure 4.22. At a reactor temperature of 433 K, the selectivitywas 72.7% at a conversion degree of 1.4%. With increasing reactortemperature, a nearly linear decrease of the selectivity was observed.The slope of the regression is -0.200, i.e. the selectivity decreased by2% with an increase in reactor temperature of 10 K. The conversiondegree increased as expected with increasing reactor temperature byapproximately factor 1.5 per 10 K.
430 440 450 460 470 480 490 500 510 0,00
0,05
0,10
0,15
sele
ctiv
ity to
eth
ylen
e ox
ide
degr
ee o
f con
vers
ion
reactor temperature / K
0,55
0,60
0,65
0,70
Figure 4.22: Selectivity to ethylene oxide and degree of conversion forthe microchannel reactor MCR2 as a function of the reactor temperature.Reaction conditions: 20% C2H4 in O2, τ = 0.94 s.
Aging of the Ag/Al2O3/Al microchannel reactor MCR2:In order to investigate the effect of aging on this catalyst, the veryfirst stable X/S run (fresh catalyst/coating, see Fig. 4.21) and afinal control experiment has to be compared. The result of thiscomparison is shown in figure 4.23.
The fresh catalyst exhibited initial selectivities of 65.4% at aconversion degree of 8.25% (τ = 0.94 s). With increasing degree
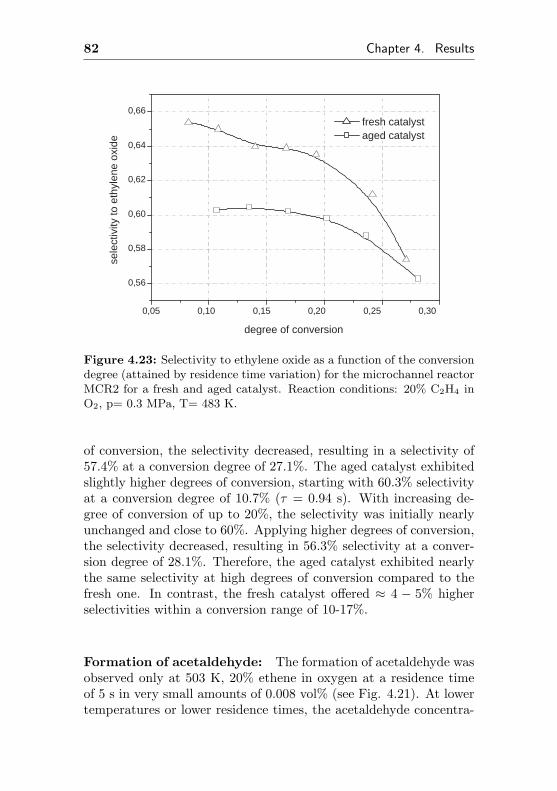
82 Chapter 4. Results
0,05 0,10 0,15 0,20 0,25 0,30
0,56
0,58
0,60
0,62
0,64
0,66 fresh catalyst aged catalyst
sele
ctiv
ity to
eth
ylen
e ox
ide
degree of conversion
Figure 4.23: Selectivity to ethylene oxide as a function of the conversiondegree (attained by residence time variation) for the microchannel reactorMCR2 for a fresh and aged catalyst. Reaction conditions: 20% C2H4 inO2, p= 0.3 MPa, T= 483 K.
of conversion, the selectivity decreased, resulting in a selectivity of57.4% at a conversion degree of 27.1%. The aged catalyst exhibitedslightly higher degrees of conversion, starting with 60.3% selectivityat a conversion degree of 10.7% (τ = 0.94 s). With increasing de-gree of conversion of up to 20%, the selectivity was initially nearlyunchanged and close to 60%. Applying higher degrees of conversion,the selectivity decreased, resulting in 56.3% selectivity at a conver-sion degree of 28.1%. Therefore, the aged catalyst exhibited nearlythe same selectivity at high degrees of conversion compared to thefresh one. In contrast, the fresh catalyst offered ≈ 4 − 5% higherselectivities within a conversion range of 10-17%.
Formation of acetaldehyde: The formation of acetaldehyde wasobserved only at 503 K, 20% ethene in oxygen at a residence timeof 5 s in very small amounts of 0.008 vol% (see Fig. 4.21). At lowertemperatures or lower residence times, the acetaldehyde concentra-
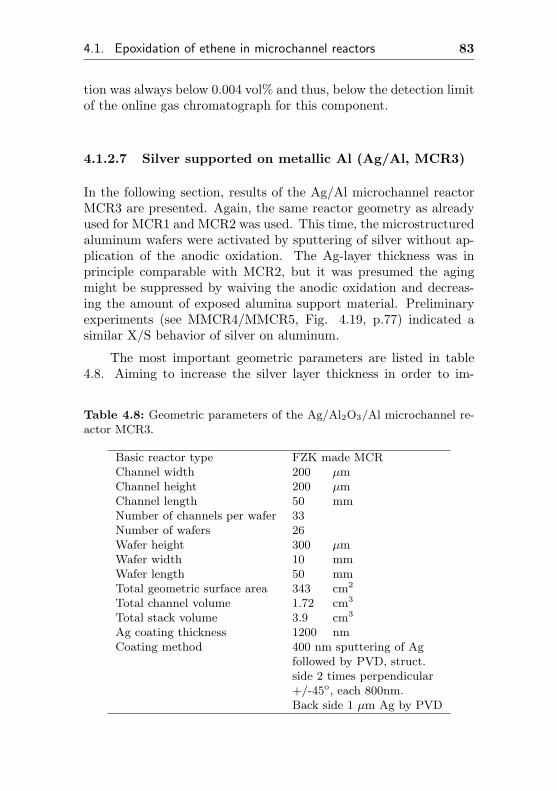
4.1. Epoxidation of ethene in microchannel reactors 83
tion was always below 0.004 vol% and thus, below the detection limitof the online gas chromatograph for this component.
4.1.2.7 Silver supported on metallic Al (Ag/Al, MCR3)
In the following section, results of the Ag/Al microchannel reactorMCR3 are presented. Again, the same reactor geometry as alreadyused for MCR1 and MCR2 was used. This time, the microstructuredaluminum wafers were activated by sputtering of silver without ap-plication of the anodic oxidation. The Ag-layer thickness was inprinciple comparable with MCR2, but it was presumed the agingmight be suppressed by waiving the anodic oxidation and decreas-ing the amount of exposed alumina support material. Preliminaryexperiments (see MMCR4/MMCR5, Fig. 4.19, p.77) indicated asimilar X/S behavior of silver on aluminum.
The most important geometric parameters are listed in table4.8. Aiming to increase the silver layer thickness in order to im-
Table 4.8: Geometric parameters of the Ag/Al2O3/Al microchannel re-actor MCR3.
Basic reactor type FZK made MCRChannel width 200 µmChannel height 200 µmChannel length 50 mmNumber of channels per wafer 33Number of wafers 26Wafer height 300 µmWafer width 10 mmWafer length 50 mmTotal geometric surface area 343 cm2
Total channel volume 1.72 cm3
Total stack volume 3.9 cm3
Ag coating thickness 1200 nmCoating method 400 nm sputtering of Ag
followed by PVD, struct.side 2 times perpendicular+/-45o, each 800nm.Back side 1 µm Ag by PVD
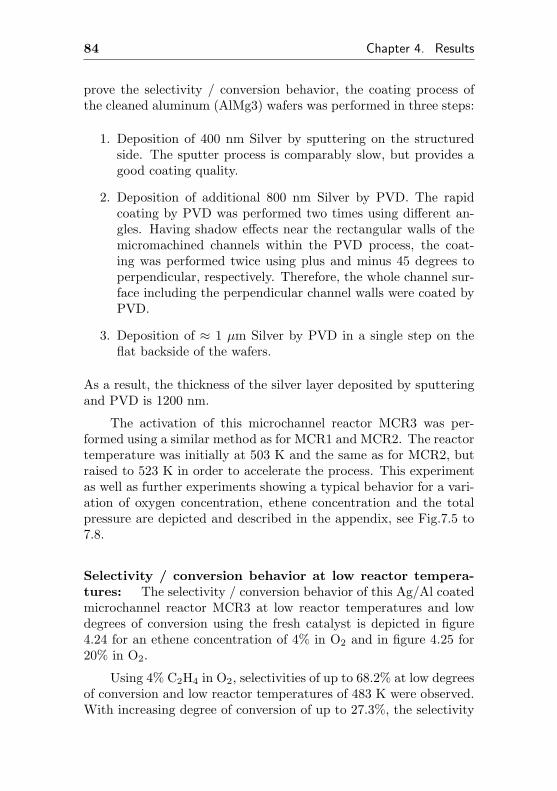
84 Chapter 4. Results
prove the selectivity / conversion behavior, the coating process ofthe cleaned aluminum (AlMg3) wafers was performed in three steps:
1. Deposition of 400 nm Silver by sputtering on the structuredside. The sputter process is comparably slow, but provides agood coating quality.
2. Deposition of additional 800 nm Silver by PVD. The rapidcoating by PVD was performed two times using different an-gles. Having shadow effects near the rectangular walls of themicromachined channels within the PVD process, the coat-ing was performed twice using plus and minus 45 degrees toperpendicular, respectively. Therefore, the whole channel sur-face including the perpendicular channel walls were coated byPVD.
3. Deposition of ≈ 1 µm Silver by PVD in a single step on theflat backside of the wafers.
As a result, the thickness of the silver layer deposited by sputteringand PVD is 1200 nm.
The activation of this microchannel reactor MCR3 was per-formed using a similar method as for MCR1 and MCR2. The reactortemperature was initially at 503 K and the same as for MCR2, butraised to 523 K in order to accelerate the process. This experimentas well as further experiments showing a typical behavior for a vari-ation of oxygen concentration, ethene concentration and the totalpressure are depicted and described in the appendix, see Fig.7.5 to7.8.
Selectivity / conversion behavior at low reactor tempera-tures: The selectivity / conversion behavior of this Ag/Al coatedmicrochannel reactor MCR3 at low reactor temperatures and lowdegrees of conversion using the fresh catalyst is depicted in figure4.24 for an ethene concentration of 4% in O2 and in figure 4.25 for20% in O2.
Using 4% C2H4 in O2, selectivities of up to 68.2% at low degreesof conversion and low reactor temperatures of 483 K were observed.With increasing degree of conversion of up to 27.3%, the selectivity
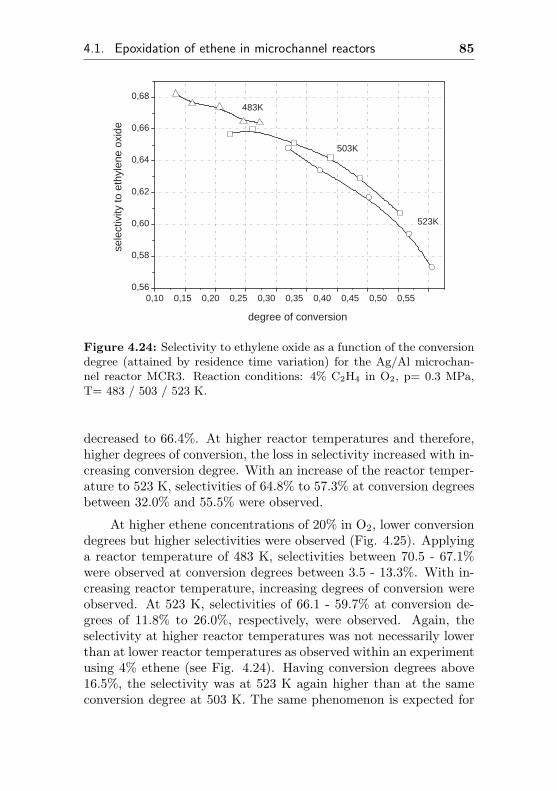
4.1. Epoxidation of ethene in microchannel reactors 85
0,10 0,15 0,20 0,25 0,30 0,35 0,40 0,45 0,50 0,55 0,56
0,58
0,60
0,62
0,64
0,66
0,68
503K
523K
483K se
lect
ivity
to e
thyl
ene
oxid
e
degree of conversion
Figure 4.24: Selectivity to ethylene oxide as a function of the conversiondegree (attained by residence time variation) for the Ag/Al microchan-nel reactor MCR3. Reaction conditions: 4% C2H4 in O2, p= 0.3 MPa,T= 483 / 503 / 523 K.
decreased to 66.4%. At higher reactor temperatures and therefore,higher degrees of conversion, the loss in selectivity increased with in-creasing conversion degree. With an increase of the reactor temper-ature to 523 K, selectivities of 64.8% to 57.3% at conversion degreesbetween 32.0% and 55.5% were observed.
At higher ethene concentrations of 20% in O2, lower conversiondegrees but higher selectivities were observed (Fig. 4.25). Applyinga reactor temperature of 483 K, selectivities between 70.5 - 67.1%were observed at conversion degrees between 3.5 - 13.3%. With in-creasing reactor temperature, increasing degrees of conversion wereobserved. At 523 K, selectivities of 66.1 - 59.7% at conversion de-grees of 11.8% to 26.0%, respectively, were observed. Again, theselectivity at higher reactor temperatures was not necessarily lowerthan at lower reactor temperatures as observed within an experimentusing 4% ethene (see Fig. 4.24). Having conversion degrees above16.5%, the selectivity was at 523 K again higher than at the sameconversion degree at 503 K. The same phenomenon is expected for
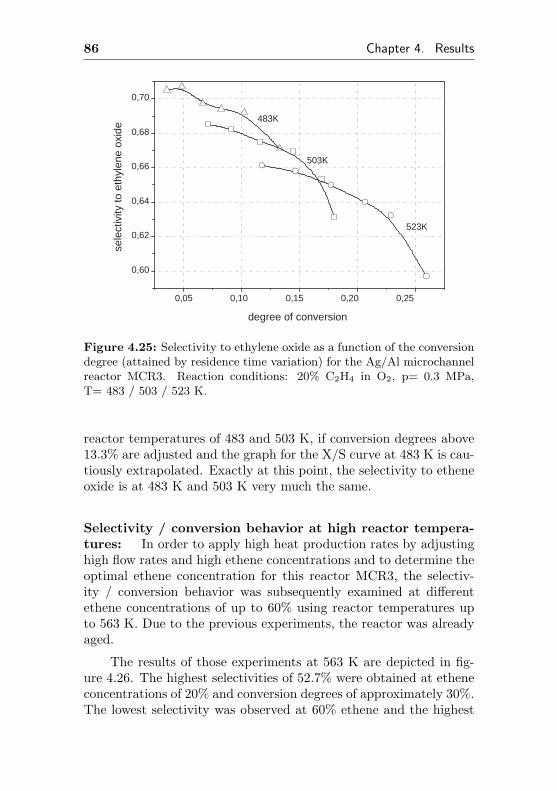
86 Chapter 4. Results
0,05 0,10 0,15 0,20 0,25
0,60
0,62
0,64
0,66
0,68
0,70
523K
503K
483K se
lect
ivity
to e
thyl
ene
oxid
e
degree of conversion
Figure 4.25: Selectivity to ethylene oxide as a function of the conversiondegree (attained by residence time variation) for the Ag/Al microchannelreactor MCR3. Reaction conditions: 20% C2H4 in O2, p= 0.3 MPa,T= 483 / 503 / 523 K.
reactor temperatures of 483 and 503 K, if conversion degrees above13.3% are adjusted and the graph for the X/S curve at 483 K is cau-tiously extrapolated. Exactly at this point, the selectivity to etheneoxide is at 483 K and 503 K very much the same.
Selectivity / conversion behavior at high reactor tempera-tures: In order to apply high heat production rates by adjustinghigh flow rates and high ethene concentrations and to determine theoptimal ethene concentration for this reactor MCR3, the selectiv-ity / conversion behavior was subsequently examined at differentethene concentrations of up to 60% using reactor temperatures upto 563 K. Due to the previous experiments, the reactor was alreadyaged.
The results of those experiments at 563 K are depicted in fig-ure 4.26. The highest selectivities of 52.7% were obtained at etheneconcentrations of 20% and conversion degrees of approximately 30%.The lowest selectivity was observed at 60% ethene and the highest
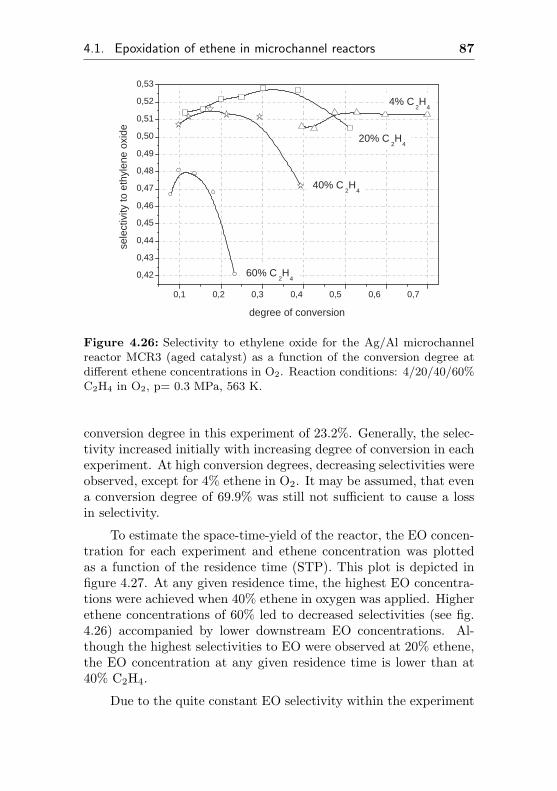
4.1. Epoxidation of ethene in microchannel reactors 87
0,1 0,2 0,3 0,4 0,5 0,6 0,7
0,42
0,43
0,44
0,45
0,46
0,47
0,48
0,49
0,50
0,51
0,52
0,53
20% C 2 H
4
40% C 2 H
4
4% C 2 H
4
60% C 2 H
4
sele
ctiv
ity to
eth
ylen
e ox
ide
degree of conversion
Figure 4.26: Selectivity to ethylene oxide for the Ag/Al microchannelreactor MCR3 (aged catalyst) as a function of the conversion degree atdifferent ethene concentrations in O2. Reaction conditions: 4/20/40/60%C2H4 in O2, p= 0.3 MPa, 563 K.
conversion degree in this experiment of 23.2%. Generally, the selec-tivity increased initially with increasing degree of conversion in eachexperiment. At high conversion degrees, decreasing selectivities wereobserved, except for 4% ethene in O2. It may be assumed, that evena conversion degree of 69.9% was still not sufficient to cause a lossin selectivity.
To estimate the space-time-yield of the reactor, the EO concen-tration for each experiment and ethene concentration was plottedas a function of the residence time (STP). This plot is depicted infigure 4.27. At any given residence time, the highest EO concentra-tions were achieved when 40% ethene in oxygen was applied. Higherethene concentrations of 60% led to decreased selectivities (see fig.4.26) accompanied by lower downstream EO concentrations. Al-though the highest selectivities to EO were observed at 20% ethene,the EO concentration at any given residence time is lower than at40% C2H4.
Due to the quite constant EO selectivity within the experiment
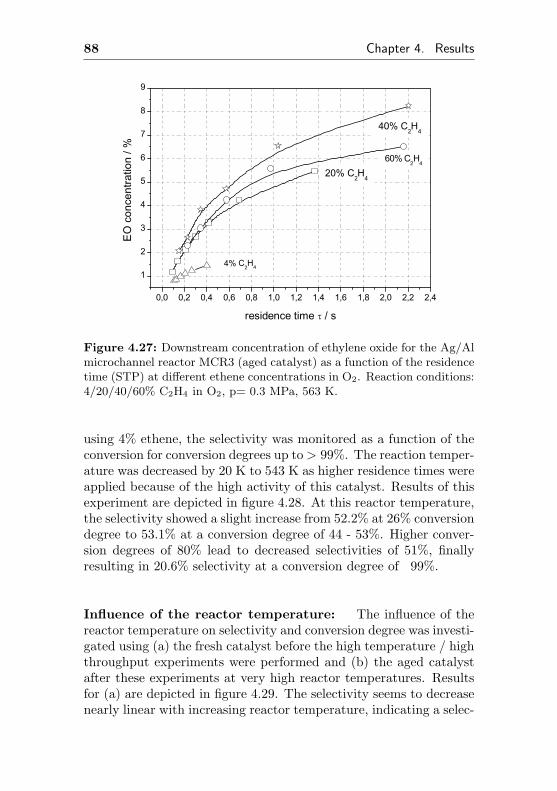
88 Chapter 4. Results
0,0 0,2 0,4 0,6 0,8 1,0 1,2 1,4 1,6 1,8 2,0 2,2 2,4
1
2
3
4
5
6
7
8
9
60% C2H
4
40% C2H
4
20% C2H
4
4% C2H4
EO
con
cent
ratio
n / %
residence time / s
Figure 4.27: Downstream concentration of ethylene oxide for the Ag/Almicrochannel reactor MCR3 (aged catalyst) as a function of the residencetime (STP) at different ethene concentrations in O2. Reaction conditions:4/20/40/60% C2H4 in O2, p= 0.3 MPa, 563 K.
using 4% ethene, the selectivity was monitored as a function of theconversion for conversion degrees up to> 99%. The reaction temper-ature was decreased by 20 K to 543 K as higher residence times wereapplied because of the high activity of this catalyst. Results of thisexperiment are depicted in figure 4.28. At this reactor temperature,the selectivity showed a slight increase from 52.2% at 26% conversiondegree to 53.1% at a conversion degree of 44 - 53%. Higher conver-sion degrees of 80% lead to decreased selectivities of 51%, finallyresulting in 20.6% selectivity at a conversion degree of 99%.
Influence of the reactor temperature: The influence of thereactor temperature on selectivity and conversion degree was investi-gated using (a) the fresh catalyst before the high temperature / highthroughput experiments were performed and (b) the aged catalystafter these experiments at very high reactor temperatures. Resultsfor (a) are depicted in figure 4.29. The selectivity seems to decreasenearly linear with increasing reactor temperature, indicating a selec-
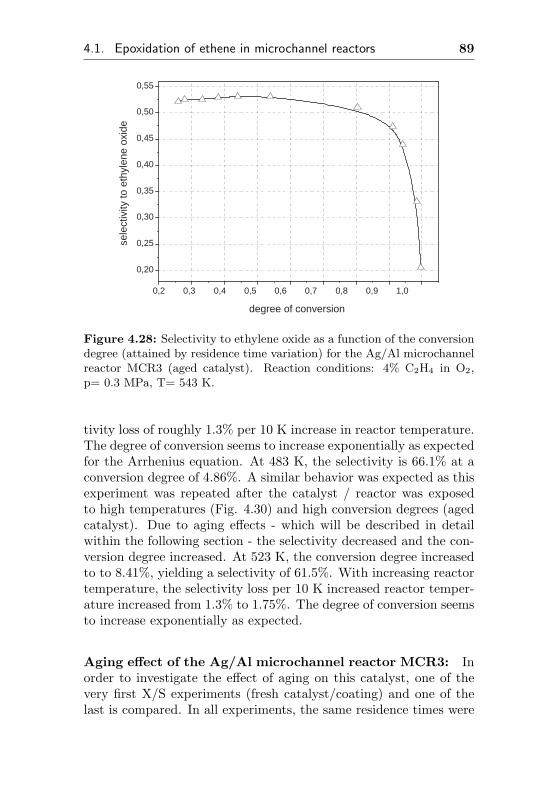
4.1. Epoxidation of ethene in microchannel reactors 89
0,2 0,3 0,4 0,5 0,6 0,7 0,8 0,9 1,0
0,20
0,25
0,30
0,35
0,40
0,45
0,50
0,55
sele
ctiv
ity to
eth
ylen
e ox
ide
degree of conversion
Figure 4.28: Selectivity to ethylene oxide as a function of the conversiondegree (attained by residence time variation) for the Ag/Al microchannelreactor MCR3 (aged catalyst). Reaction conditions: 4% C2H4 in O2,p= 0.3 MPa, T= 543 K.
tivity loss of roughly 1.3% per 10 K increase in reactor temperature.The degree of conversion seems to increase exponentially as expectedfor the Arrhenius equation. At 483 K, the selectivity is 66.1% at aconversion degree of 4.86%. A similar behavior was expected as thisexperiment was repeated after the catalyst / reactor was exposedto high temperatures (Fig. 4.30) and high conversion degrees (agedcatalyst). Due to aging effects - which will be described in detailwithin the following section - the selectivity decreased and the con-version degree increased. At 523 K, the conversion degree increasedto to 8.41%, yielding a selectivity of 61.5%. With increasing reactortemperature, the selectivity loss per 10 K increased reactor temper-ature increased from 1.3% to 1.75%. The degree of conversion seemsto increase exponentially as expected.
Aging effect of the Ag/Al microchannel reactor MCR3: Inorder to investigate the effect of aging on this catalyst, one of thevery first X/S experiments (fresh catalyst/coating) and one of thelast is compared. In all experiments, the same residence times were
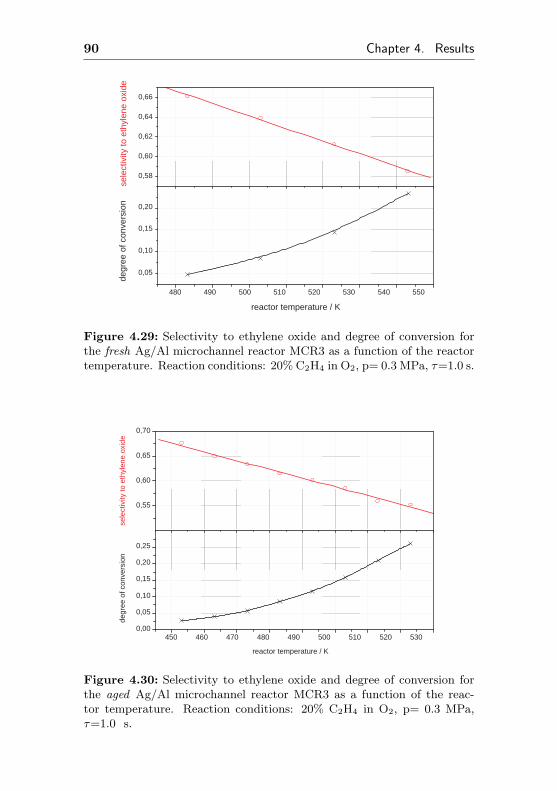
90 Chapter 4. Results
480 490 500 510 520 530 540 550
0,05
0,10
0,15
0,20
sele
ctiv
ity to
eth
ylen
e ox
ide
degr
ee o
f con
vers
ion
reactor temperature / K
0,58
0,60
0,62
0,64
0,66
Figure 4.29: Selectivity to ethylene oxide and degree of conversion forthe fresh Ag/Al microchannel reactor MCR3 as a function of the reactortemperature. Reaction conditions: 20% C2H4 in O2, p= 0.3 MPa, τ=1.0 s.
450 460 470 480 490 500 510 520 530 0,00
0,05
0,10
0,15
0,20
0,25
sele
ctiv
ity to
eth
ylen
e ox
ide
degr
ee o
f con
vers
ion
reactor temperature / K
0,55
0,60
0,65
0,70
Figure 4.30: Selectivity to ethylene oxide and degree of conversion forthe aged Ag/Al microchannel reactor MCR3 as a function of the reac-tor temperature. Reaction conditions: 20% C2H4 in O2, p= 0.3 MPa,τ=1.0 s.
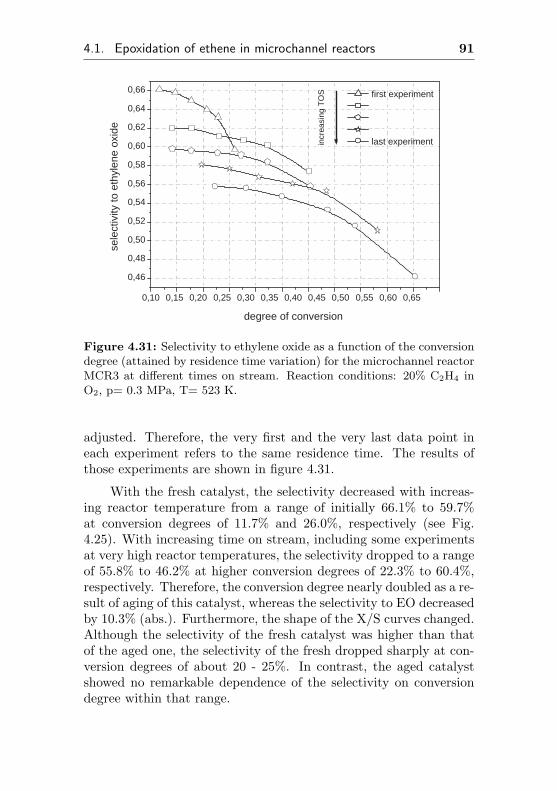
4.1. Epoxidation of ethene in microchannel reactors 91
0,10 0,15 0,20 0,25 0,30 0,35 0,40 0,45 0,50 0,55 0,60 0,65
0,46
0,48
0,50
0,52
0,54
0,56
0,58
0,60
0,62
0,64
0,66
incr
easi
ng T
OS
first experiment last experiment
sele
ctiv
ity to
eth
ylen
e ox
ide
degree of conversion
Figure 4.31: Selectivity to ethylene oxide as a function of the conversiondegree (attained by residence time variation) for the microchannel reactorMCR3 at different times on stream. Reaction conditions: 20% C2H4 inO2, p= 0.3 MPa, T= 523 K.
adjusted. Therefore, the very first and the very last data point ineach experiment refers to the same residence time. The results ofthose experiments are shown in figure 4.31.
With the fresh catalyst, the selectivity decreased with increas-ing reactor temperature from a range of initially 66.1% to 59.7%at conversion degrees of 11.7% and 26.0%, respectively (see Fig.4.25). With increasing time on stream, including some experimentsat very high reactor temperatures, the selectivity dropped to a rangeof 55.8% to 46.2% at higher conversion degrees of 22.3% to 60.4%,respectively. Therefore, the conversion degree nearly doubled as a re-sult of aging of this catalyst, whereas the selectivity to EO decreasedby 10.3% (abs.). Furthermore, the shape of the X/S curves changed.Although the selectivity of the fresh catalyst was higher than thatof the aged one, the selectivity of the fresh dropped sharply at con-version degrees of about 20 - 25%. In contrast, the aged catalystshowed no remarkable dependence of the selectivity on conversiondegree within that range.
92 Chapter 4. Results
Formation of acetaldehyde: In this Ag/Al microchannel reac-tor MCR3, no formation of acetaldehyde was observed. Even at highreactor temperatures of 563 K and EO concentrations close to 9%,the acetaldehyde concentration was below 0.002%. Therefore, therate of acetaldehyde formation must have been at least 4500 timesslower than the rate of EO formation.
4.1. Epoxidation of ethene in microchannel reactors 93
4.1.3 Silver supported on α-Al2O3 surface
α-Al2O3 is the only support material used in industrial EO catalysts.Therefore, efforts were made to prepare a silver catalyst supportedon α-Al2O3 surface in microchannels. In the following section, threedifferent methods are described, which result in the immobilizationof silver supported on α-Al2O3 surface in a microchannel reactor.Similar to the experiments with the Ag/Al system, no promoterswere applied in order to study the basic performance of this silvercatalyst and to avoid errors by different impacts of promoters ondifferent catalysts.
4.1.3.1 Silver sputtered on ANOF prepared α-Al2O3 sur-face (MMCR6)
One method to prepare an alumina layer on aluminum is to makeuse of a suitable plasma-chemical oxidation of the aluminum surfacein order to yield α-Al2O3. Therefore, the ANOF-method3 [91] wasused to coat a WEDM4 made aluminum wafer with a thin aluminafilm. On this α-Al2O3 layer, silver was immobilized by sputtering.
In order to test this catalytic system, three aluminum wafers,each having 14 channels of 50 mm x 0.3 mm x 0.7 mm, were plasma-chemically oxidized and coated with 450 nm silver by sputtering.Those coated wafers were used in the modular microchannel reactortype I in order to evaluate the performance of this coating. The acti-vation of this system (MMCR6) was performed at 548 K (first tracesof CO2 as indicator for catalytic activity), using 20% C2H4 and 20%O2 in CH4 at a residence time of 260 ms. The resulting selectivity toEO and the degree of conversion as a function of the time on streamduring the activation is depicted in figure 4.32. With increasing timeon stream, the selectivity declined steadily from 55 -57% directly atthe beginning down to 41% after nearly 12 hours time on stream.In contrast, the degree of conversion initially increased as expectedfrom 0.1 - 0.5% at the beginning to a maximum of 1.4% at 3.3h,after which decreasing conversion degrees were observed. After 12hours, 0.7% conversion degree were left, still with a decreasing trend.
3Anodic oxidation by spark discharge4Wire electro discharge machined
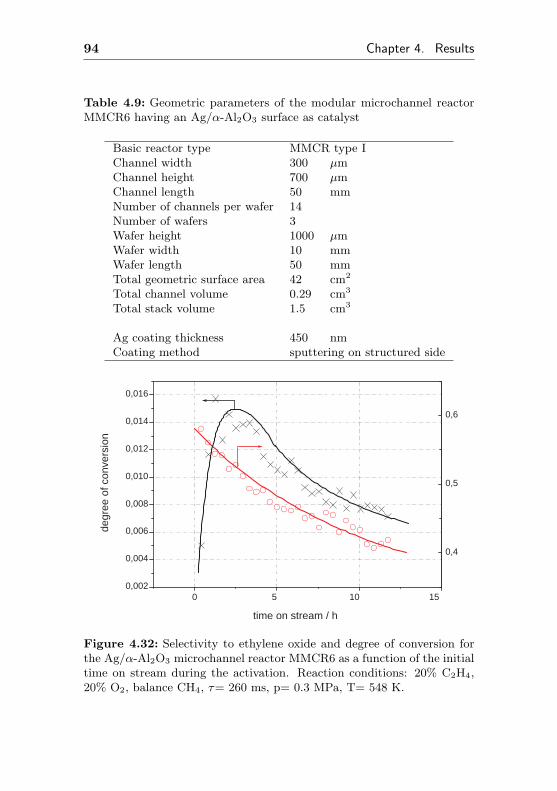
94 Chapter 4. Results
Table 4.9: Geometric parameters of the modular microchannel reactorMMCR6 having an Ag/α-Al2O3 surface as catalyst
Basic reactor type MMCR type IChannel width 300 µmChannel height 700 µmChannel length 50 mmNumber of channels per wafer 14Number of wafers 3Wafer height 1000 µmWafer width 10 mmWafer length 50 mmTotal geometric surface area 42 cm2
Total channel volume 0.29 cm3
Total stack volume 1.5 cm3
Ag coating thickness 450 nmCoating method sputtering on structured side
0 5 10 15 0,002
0,004
0,006
0,008
0,010
0,012
0,014
0,016
degr
ee o
f con
vers
ion
time on stream / h
0,4
0,5
0,6
Figure 4.32: Selectivity to ethylene oxide and degree of conversion forthe Ag/α-Al2O3 microchannel reactor MMCR6 as a function of the initialtime on stream during the activation. Reaction conditions: 20% C2H4,20% O2, balance CH4, τ= 260 ms, p= 0.3 MPa, T= 548 K.
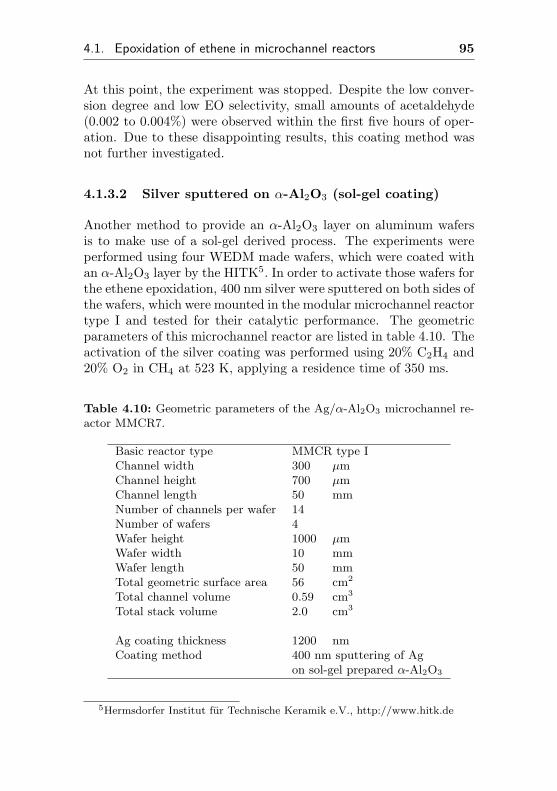
4.1. Epoxidation of ethene in microchannel reactors 95
At this point, the experiment was stopped. Despite the low conver-sion degree and low EO selectivity, small amounts of acetaldehyde(0.002 to 0.004%) were observed within the first five hours of oper-ation. Due to these disappointing results, this coating method wasnot further investigated.
4.1.3.2 Silver sputtered on α-Al2O3 (sol-gel coating)
Another method to provide an α-Al2O3 layer on aluminum wafersis to make use of a sol-gel derived process. The experiments wereperformed using four WEDM made wafers, which were coated withan α-Al2O3 layer by the HITK5. In order to activate those wafers forthe ethene epoxidation, 400 nm silver were sputtered on both sides ofthe wafers, which were mounted in the modular microchannel reactortype I and tested for their catalytic performance. The geometricparameters of this microchannel reactor are listed in table 4.10. Theactivation of the silver coating was performed using 20% C2H4 and20% O2 in CH4 at 523 K, applying a residence time of 350 ms.
Table 4.10: Geometric parameters of the Ag/α-Al2O3 microchannel re-actor MMCR7.
Basic reactor type MMCR type IChannel width 300 µmChannel height 700 µmChannel length 50 mmNumber of channels per wafer 14Number of wafers 4Wafer height 1000 µmWafer width 10 mmWafer length 50 mmTotal geometric surface area 56 cm2
Total channel volume 0.59 cm3
Total stack volume 2.0 cm3
Ag coating thickness 1200 nmCoating method 400 nm sputtering of Ag
on sol-gel prepared α-Al2O3
5Hermsdorfer Institut fur Technische Keramik e.V., http://www.hitk.de
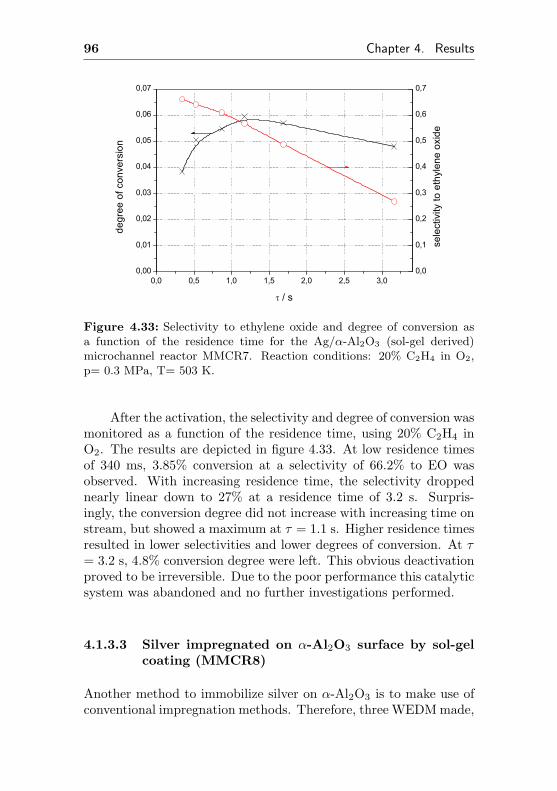
96 Chapter 4. Results
0,0 0,5 1,0 1,5 2,0 2,5 3,00,00
0,01
0,02
0,03
0,04
0,05
0,06
0,07
degr
ee o
f con
vers
ion
/ s
0,0
0,1
0,2
0,3
0,4
0,5
0,6
0,7
sele
ctiv
ity to
eth
ylen
e ox
ide
Figure 4.33: Selectivity to ethylene oxide and degree of conversion asa function of the residence time for the Ag/α-Al2O3 (sol-gel derived)microchannel reactor MMCR7. Reaction conditions: 20% C2H4 in O2,p= 0.3 MPa, T= 503 K.
After the activation, the selectivity and degree of conversion wasmonitored as a function of the residence time, using 20% C2H4 inO2. The results are depicted in figure 4.33. At low residence timesof 340 ms, 3.85% conversion at a selectivity of 66.2% to EO wasobserved. With increasing residence time, the selectivity droppednearly linear down to 27% at a residence time of 3.2 s. Surpris-ingly, the conversion degree did not increase with increasing time onstream, but showed a maximum at τ = 1.1 s. Higher residence timesresulted in lower selectivities and lower degrees of conversion. At τ= 3.2 s, 4.8% conversion degree were left. This obvious deactivationproved to be irreversible. Due to the poor performance this catalyticsystem was abandoned and no further investigations performed.
4.1.3.3 Silver impregnated on α-Al2O3 surface by sol-gelcoating (MMCR8)
Another method to immobilize silver on α-Al2O3 is to make use ofconventional impregnation methods. Therefore, three WEDM made,
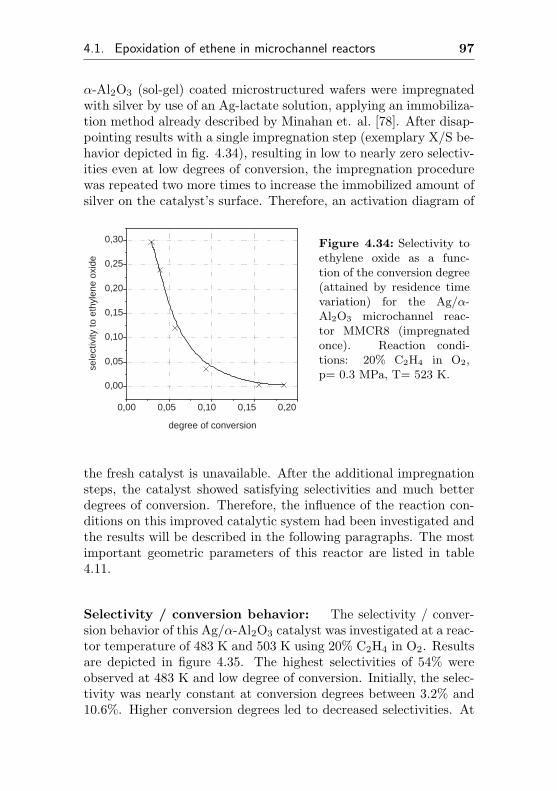
4.1. Epoxidation of ethene in microchannel reactors 97
α-Al2O3 (sol-gel) coated microstructured wafers were impregnatedwith silver by use of an Ag-lactate solution, applying an immobiliza-tion method already described by Minahan et. al. [78]. After disap-pointing results with a single impregnation step (exemplary X/S be-havior depicted in fig. 4.34), resulting in low to nearly zero selectiv-ities even at low degrees of conversion, the impregnation procedurewas repeated two more times to increase the immobilized amount ofsilver on the catalyst’s surface. Therefore, an activation diagram of
0,00 0,05 0,10 0,15 0,20
0,00
0,05
0,10
0,15
0,20
0,25
0,30
sele
ctiv
ity to
eth
ylen
e ox
ide
degree of conversion
Figure 4.34: Selectivity toethylene oxide as a func-tion of the conversion degree(attained by residence timevariation) for the Ag/α-Al2O3 microchannel reac-tor MMCR8 (impregnatedonce). Reaction condi-tions: 20% C2H4 in O2,p= 0.3 MPa, T= 523 K.
the fresh catalyst is unavailable. After the additional impregnationsteps, the catalyst showed satisfying selectivities and much betterdegrees of conversion. Therefore, the influence of the reaction con-ditions on this improved catalytic system had been investigated andthe results will be described in the following paragraphs. The mostimportant geometric parameters of this reactor are listed in table4.11.
Selectivity / conversion behavior: The selectivity / conver-sion behavior of this Ag/α-Al2O3 catalyst was investigated at a reac-tor temperature of 483 K and 503 K using 20% C2H4 in O2. Resultsare depicted in figure 4.35. The highest selectivities of 54% wereobserved at 483 K and low degree of conversion. Initially, the selec-tivity was nearly constant at conversion degrees between 3.2% and10.6%. Higher conversion degrees led to decreased selectivities. At
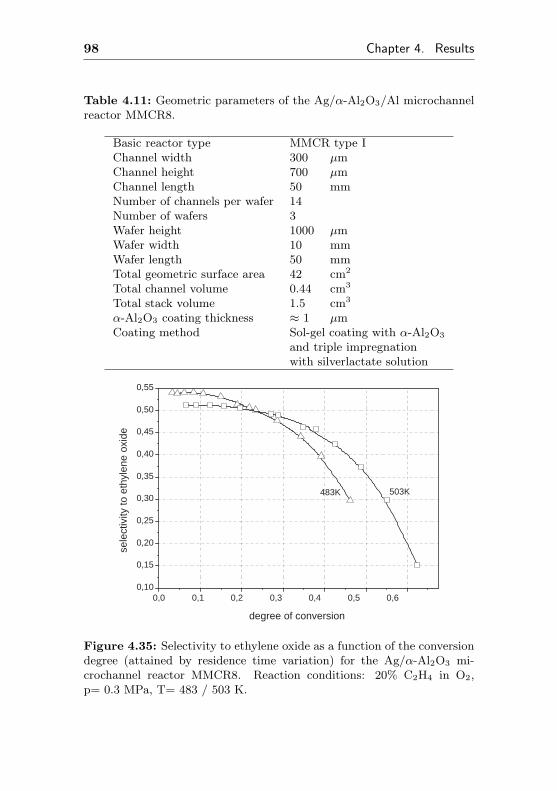
98 Chapter 4. Results
Table 4.11: Geometric parameters of the Ag/α-Al2O3/Al microchannelreactor MMCR8.
Basic reactor type MMCR type IChannel width 300 µmChannel height 700 µmChannel length 50 mmNumber of channels per wafer 14Number of wafers 3Wafer height 1000 µmWafer width 10 mmWafer length 50 mmTotal geometric surface area 42 cm2
Total channel volume 0.44 cm3
Total stack volume 1.5 cm3
α-Al2O3 coating thickness ≈ 1 µmCoating method Sol-gel coating with α-Al2O3
and triple impregnationwith silverlactate solution
0,0 0,1 0,2 0,3 0,4 0,5 0,6 0,10
0,15
0,20
0,25
0,30
0,35
0,40
0,45
0,50
0,55
483K 503K
sele
ctiv
ity to
eth
ylen
e ox
ide
degree of conversion
Figure 4.35: Selectivity to ethylene oxide as a function of the conversiondegree (attained by residence time variation) for the Ag/α-Al2O3 mi-crochannel reactor MMCR8. Reaction conditions: 20% C2H4 in O2,p= 0.3 MPa, T= 483 / 503 K.
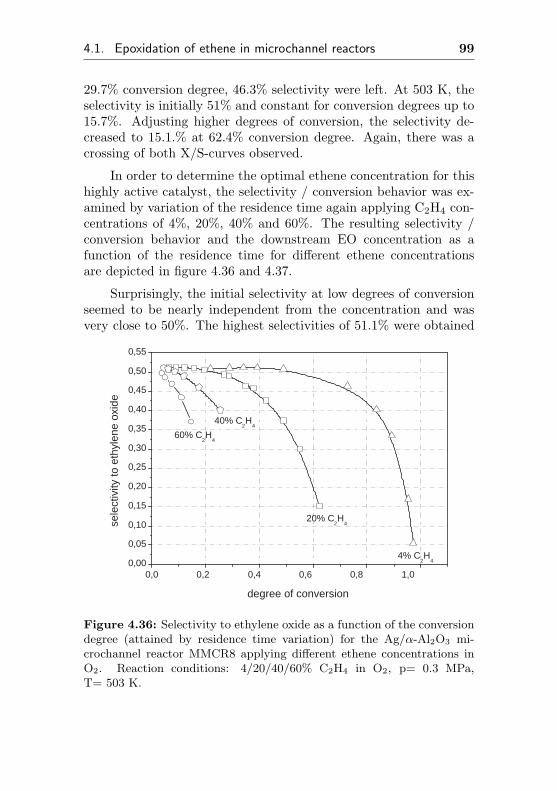
4.1. Epoxidation of ethene in microchannel reactors 99
29.7% conversion degree, 46.3% selectivity were left. At 503 K, theselectivity is initially 51% and constant for conversion degrees up to15.7%. Adjusting higher degrees of conversion, the selectivity de-creased to 15.1.% at 62.4% conversion degree. Again, there was acrossing of both X/S-curves observed.
In order to determine the optimal ethene concentration for thishighly active catalyst, the selectivity / conversion behavior was ex-amined by variation of the residence time again applying C2H4 con-centrations of 4%, 20%, 40% and 60%. The resulting selectivity /conversion behavior and the downstream EO concentration as afunction of the residence time for different ethene concentrationsare depicted in figure 4.36 and 4.37.
Surprisingly, the initial selectivity at low degrees of conversionseemed to be nearly independent from the concentration and wasvery close to 50%. The highest selectivities of 51.1% were obtained
0,0 0,2 0,4 0,6 0,8 1,0 0,00
0,05
0,10
0,15
0,20
0,25
0,30
0,35
0,40
0,45
0,50
0,55
60% C 2 H
4
40% C 2 H
4
20% C 2 H
4
4% C 2 H
4
sele
ctiv
ity to
eth
ylen
e ox
ide
degree of conversion
Figure 4.36: Selectivity to ethylene oxide as a function of the conversiondegree (attained by residence time variation) for the Ag/α-Al2O3 mi-crochannel reactor MMCR8 applying different ethene concentrations inO2. Reaction conditions: 4/20/40/60% C2H4 in O2, p= 0.3 MPa,T= 503 K.
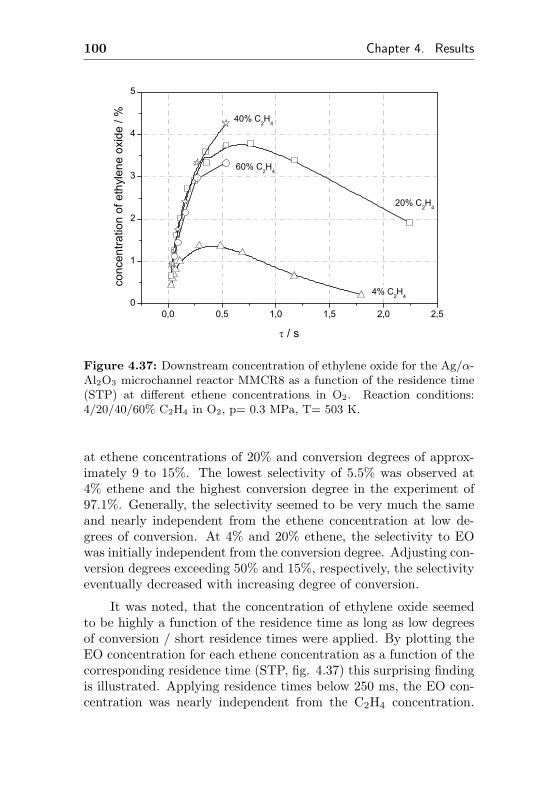
100 Chapter 4. Results
0,0 0,5 1,0 1,5 2,0 2,50
1
2
3
4
5
40% C2H
4
60% C2H
4
20% C2H
4
conc
entra
tion of
ethylen
e ox
ide
/ %
/ s
4% C2H
4
Figure 4.37: Downstream concentration of ethylene oxide for the Ag/α-Al2O3 microchannel reactor MMCR8 as a function of the residence time(STP) at different ethene concentrations in O2. Reaction conditions:4/20/40/60% C2H4 in O2, p= 0.3 MPa, T= 503 K.
at ethene concentrations of 20% and conversion degrees of approx-imately 9 to 15%. The lowest selectivity of 5.5% was observed at4% ethene and the highest conversion degree in the experiment of97.1%. Generally, the selectivity seemed to be very much the sameand nearly independent from the ethene concentration at low de-grees of conversion. At 4% and 20% ethene, the selectivity to EOwas initially independent from the conversion degree. Adjusting con-version degrees exceeding 50% and 15%, respectively, the selectivityeventually decreased with increasing degree of conversion.
It was noted, that the concentration of ethylene oxide seemedto be highly a function of the residence time as long as low degreesof conversion / short residence times were applied. By plotting theEO concentration for each ethene concentration as a function of thecorresponding residence time (STP, fig. 4.37) this surprising findingis illustrated. Applying residence times below 250 ms, the EO con-centration was nearly independent from the C2H4 concentration.
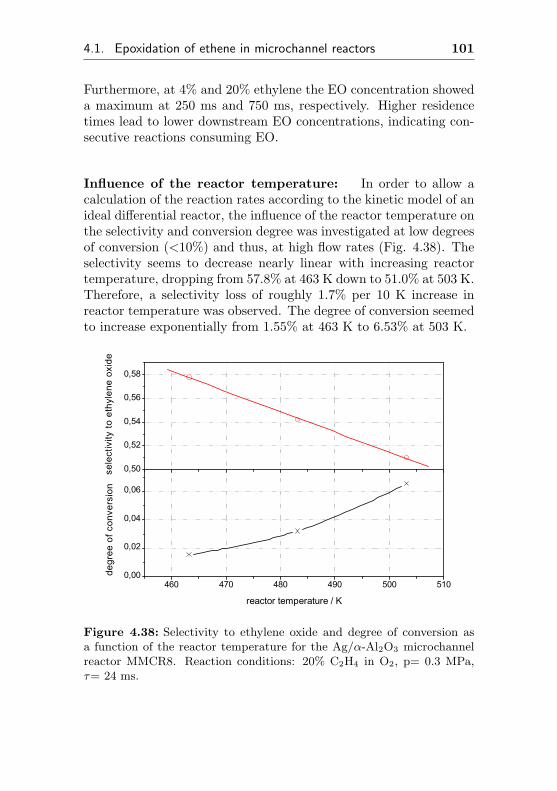
4.1. Epoxidation of ethene in microchannel reactors 101
Furthermore, at 4% and 20% ethylene the EO concentration showeda maximum at 250 ms and 750 ms, respectively. Higher residencetimes lead to lower downstream EO concentrations, indicating con-secutive reactions consuming EO.
Influence of the reactor temperature: In order to allow acalculation of the reaction rates according to the kinetic model of anideal differential reactor, the influence of the reactor temperature onthe selectivity and conversion degree was investigated at low degreesof conversion (<10%) and thus, at high flow rates (Fig. 4.38). Theselectivity seems to decrease nearly linear with increasing reactortemperature, dropping from 57.8% at 463 K down to 51.0% at 503 K.Therefore, a selectivity loss of roughly 1.7% per 10 K increase inreactor temperature was observed. The degree of conversion seemedto increase exponentially from 1.55% at 463 K to 6.53% at 503 K.
460 470 480 490 500 5100,00
0,02
0,04
0,06
sele
ctiv
ity to
eth
ylen
e ox
ide
degr
ee o
f con
vers
ion
reactor temperature / K
0,50
0,52
0,54
0,56
0,58
Figure 4.38: Selectivity to ethylene oxide and degree of conversion asa function of the reactor temperature for the Ag/α-Al2O3 microchannelreactor MMCR8. Reaction conditions: 20% C2H4 in O2, p= 0.3 MPa,τ= 24 ms.
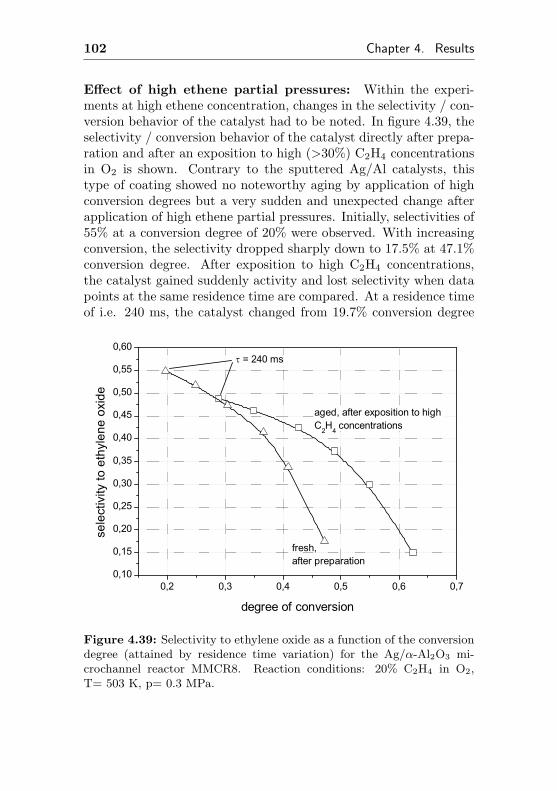
102 Chapter 4. Results
Effect of high ethene partial pressures: Within the experi-ments at high ethene concentration, changes in the selectivity / con-version behavior of the catalyst had to be noted. In figure 4.39, theselectivity / conversion behavior of the catalyst directly after prepa-ration and after an exposition to high (>30%) C2H4 concentrationsin O2 is shown. Contrary to the sputtered Ag/Al catalysts, thistype of coating showed no noteworthy aging by application of highconversion degrees but a very sudden and unexpected change afterapplication of high ethene partial pressures. Initially, selectivities of55% at a conversion degree of 20% were observed. With increasingconversion, the selectivity dropped sharply down to 17.5% at 47.1%conversion degree. After exposition to high C2H4 concentrations,the catalyst gained suddenly activity and lost selectivity when datapoints at the same residence time are compared. At a residence timeof i.e. 240 ms, the catalyst changed from 19.7% conversion degree
0,2 0,3 0,4 0,5 0,6 0,70,10
0,15
0,20
0,25
0,30
0,35
0,40
0,45
0,50
0,55
0,60 = 240 ms
aged, after exposition to high C2H4 concentrations
fresh, after preparation
sele
ctiv
ity to
eth
ylen
e ox
ide
degree of conversion
Figure 4.39: Selectivity to ethylene oxide as a function of the conversiondegree (attained by residence time variation) for the Ag/α-Al2O3 mi-crochannel reactor MMCR8. Reaction conditions: 20% C2H4 in O2,T= 503 K, p= 0.3 MPa.
4.1. Epoxidation of ethene in microchannel reactors 103
and 54.9% selectivity to 28.9% conversion degree at a selectivity of48.9%. The latter state was stable and no further change in activityor selectivity was observed when high C2H4 or O2 concentrationswere applied again. In this altered / aged state, higher conversiondegrees and lower selectivities were observed. Applying the same res-idence times as in the former experiment, conversion degrees from28.9% to 62.4% were observed and the selectivity decreased from48.9% to 15.1%, respectively. Applying conversion degrees above28%, the catalyst exhibits higher selectivities after the C2H4 treat-ment than before. A cautious extrapolation of the curves towardslow degrees of conversion suggests, that as long as high selectivi-ties are favored and low degrees of conversion acceptable, the freshstate should be preferred. As soon as ≈ 28% conversion degree isexceeded, the aged state shows better results. Unless not otherwisenoted, all experiments in this section refer to the latter stable stateof the catalyst (after initial reduction).
Formation of acetaldehyde The formation of acetaldehyde wasobserved at concentrations of about 0.004% only at 503 K and 20%C2H4 in O2 applying high degrees of conversion. This suggests aratio of rEO/rAcal of at least 1200 to 1500 and selectivities towardsacetaldehyde of 0.03% at the most. Neither at 4%, nor at 40%or 60% C2H4 in O2, the acetaldehyde concentration exceeded thedetection limit of the GC.
104 Chapter 4. Results
4.1.3.4 Usage of a commercial SHELL-800 Series, α-Al2O3 based EO silver catalyst in microchannelreactors (MMCR9, MMCR10)
Up to now, it seemed impossible to investigate commercial availablecatalysts in microchannel reactors, because this reactor type requiresa catalytic active coating on the walls of the channels. There is noevidence of a a commercial ”ready to run” catalyst being successfullyapplied in a microchannel reactor. Thus, microchannel reactors hadto be catalytically activated by using i.e. sol-gel coatings, anodicoxidation of aluminum followed by impregnation or coating withPVD/CVD techniques. The resulting layers have typically a goodadhesion strength, but the catalyst and its deposition method hadto be developed and optimized again in a time consuming manner.
In order to make use of a commercial EO catalyst in a mi-crochannel reactor, the application of a suitable kind of adhesive inorder to immobilize a fine crushed conventional catalyst at the wallsof the microchannels and sol-gel coatings seems to make sense. Dueto the nature of the silver catalyst and the reaction itself, the use sil-icon and aluminum based sol-gel coatings as adhesive was excluded,because:
• Silicon based sol-gels exhibit a high surface area, which makesthem inapplicable for isomerization/ combustion-sensitive re-action products.
• Boehmit sol-gel recipes, which form α−Al2O3 layers in pres-ence of α−Al2O3 particles [79] contain large amounts of water,but silver catalysts are according to the manufacturer’s infor-mation very sensitive towards H2O.
• Water free aluminum sol-gels tend to form amorphous aluminaor even γ − Al2O3 layers, which catalyze the isomerization ofethene oxide to acetaldehyde followed by combustion.
Thus, it is not advised to use silicon or aluminum sol-gels asglue. Instead, an electrostatic deposition method was utilized inorder to immobilize the fine crushed silver catalyst on the walls ofmicrostructured aluminum wafers without application of any bind-ing material. Preliminary investigations showed, the resulting layer
4.1. Epoxidation of ethene in microchannel reactors 105
had a low adhesion strength and mechanical stress such as touch-ing or wiping should be strictly avoided. But the adhesion was stillsufficient to prevent a blow out or leaching of catalyst during the ex-periments. Thus, simple microstructured aluminum wafers (AlMg3)having a metallic surface were coated with the crushed Shell 800Series Catalyst and used in the modular microchannel reactors.
In these experiments, a different type of microstructure wasused. The material, AlMg3 was the same, but the manufacturingprocess of the wafers changed. Instead of a time consuming andexpensive electro discharge machined wafer type, micro milled wafershaving a channel geometry of 300 x 300 µm2 and a wafer thicknessof 500 µm were used (for details see page 204).
Up to now, the selectivity/conversion curves at low tempera-tures and high residence times were sometimes lower than at highertemperatures and lower residence times - an observation being dif-ficult to understand from a kinetic point of view (see e.g. Fig.4.5,p.59). This observation was independent from the reactor type andtype of coating. Plain Ag-surfaces in a commercial reactor were af-fected as well as Ag/Al and Ag/Al2O3 and Ag/α-Al2O3-surfaces incommercial as well as self-made reactors. To test post-catalytic EOcombustion in the diffusers of commercial and mentioned self-mademodular reactors, a new type of a modular reactor was tested hav-ing an optimized dead volume in the diffusers to minimize residencetime in the post catalytic zone.
In order to allow a comparison of different modular microchan-nel reactor types, the same wafers were used in the modular mi-crochannel reactors type I and type II (see page 149 for details),which are referred as MMCR9 and MMCR10, respectively. Bothreactor types have slightly different geometries, but the catalytic ac-tive coating and even the wafers in both microchannel reactors werethe same. The geometric parameters of both reactors are listed intable 4.12.
Activation: The activation of this commercial catalyst was per-formed similar to the activation of the previously investigated mi-crochannel reactors under reaction conditions. In contrast to theactivation of all (modular) microchannel reactors investigated untilnow and following an advice from the manufacturer, the oxygen par-
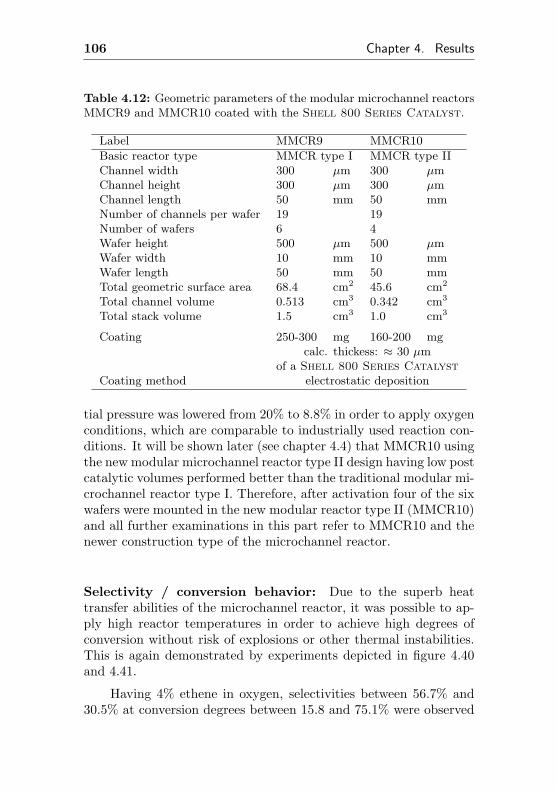
106 Chapter 4. Results
Table 4.12: Geometric parameters of the modular microchannel reactorsMMCR9 and MMCR10 coated with the Shell 800 Series Catalyst.
Label MMCR9 MMCR10
Basic reactor type MMCR type I MMCR type IIChannel width 300 µm 300 µmChannel height 300 µm 300 µmChannel length 50 mm 50 mmNumber of channels per wafer 19 19Number of wafers 6 4Wafer height 500 µm 500 µmWafer width 10 mm 10 mmWafer length 50 mm 50 mmTotal geometric surface area 68.4 cm2 45.6 cm2
Total channel volume 0.513 cm3 0.342 cm3
Total stack volume 1.5 cm3 1.0 cm3
Coating 250-300 mg 160-200 mgcalc. thickess: ≈ 30 µm
of a Shell 800 Series CatalystCoating method electrostatic deposition
tial pressure was lowered from 20% to 8.8% in order to apply oxygenconditions, which are comparable to industrially used reaction con-ditions. It will be shown later (see chapter 4.4) that MMCR10 usingthe new modular microchannel reactor type II design having low postcatalytic volumes performed better than the traditional modular mi-crochannel reactor type I. Therefore, after activation four of the sixwafers were mounted in the new modular reactor type II (MMCR10)and all further examinations in this part refer to MMCR10 and thenewer construction type of the microchannel reactor.
Selectivity / conversion behavior: Due to the superb heattransfer abilities of the microchannel reactor, it was possible to ap-ply high reactor temperatures in order to achieve high degrees ofconversion without risk of explosions or other thermal instabilities.This is again demonstrated by experiments depicted in figure 4.40and 4.41.
Having 4% ethene in oxygen, selectivities between 56.7% and30.5% at conversion degrees between 15.8 and 75.1% were observed
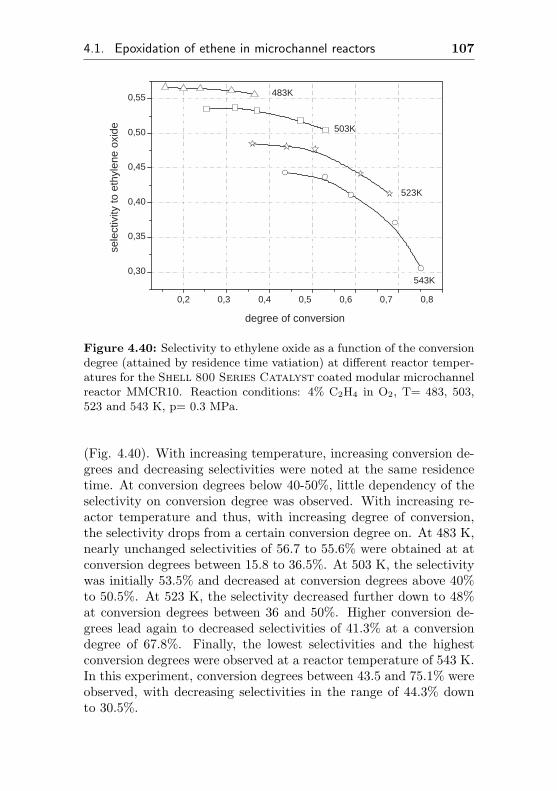
4.1. Epoxidation of ethene in microchannel reactors 107
0,2 0,3 0,4 0,5 0,6 0,7 0,8
0,30
0,35
0,40
0,45
0,50
0,55
543K
523K
503K
483K
sele
ctiv
ity to
eth
ylen
e ox
ide
degree of conversion
Figure 4.40: Selectivity to ethylene oxide as a function of the conversiondegree (attained by residence time vatiation) at different reactor temper-atures for the Shell 800 Series Catalyst coated modular microchannelreactor MMCR10. Reaction conditions: 4% C2H4 in O2, T= 483, 503,523 and 543 K, p= 0.3 MPa.
(Fig. 4.40). With increasing temperature, increasing conversion de-grees and decreasing selectivities were noted at the same residencetime. At conversion degrees below 40-50%, little dependency of theselectivity on conversion degree was observed. With increasing re-actor temperature and thus, with increasing degree of conversion,the selectivity drops from a certain conversion degree on. At 483 K,nearly unchanged selectivities of 56.7 to 55.6% were obtained at atconversion degrees between 15.8 to 36.5%. At 503 K, the selectivitywas initially 53.5% and decreased at conversion degrees above 40%to 50.5%. At 523 K, the selectivity decreased further down to 48%at conversion degrees between 36 and 50%. Higher conversion de-grees lead again to decreased selectivities of 41.3% at a conversiondegree of 67.8%. Finally, the lowest selectivities and the highestconversion degrees were observed at a reactor temperature of 543 K.In this experiment, conversion degrees between 43.5 and 75.1% wereobserved, with decreasing selectivities in the range of 44.3% downto 30.5%.
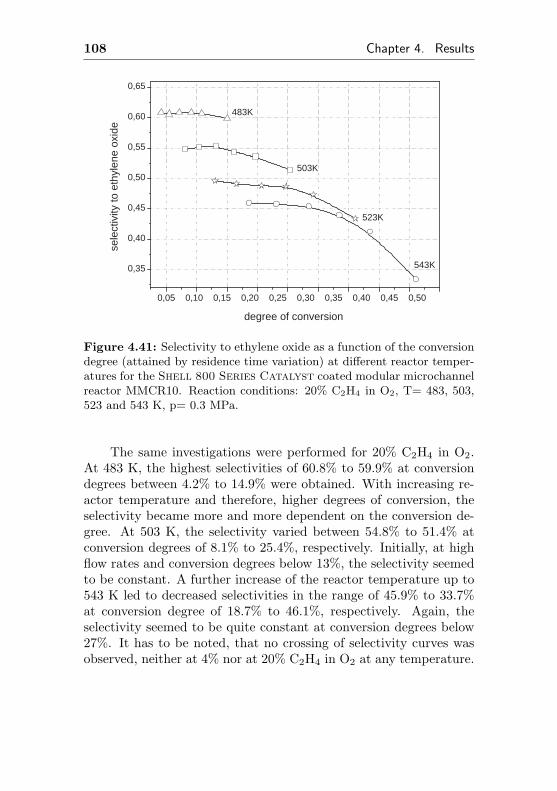
108 Chapter 4. Results
0,05 0,10 0,15 0,20 0,25 0,30 0,35 0,40 0,45 0,50
0,35
0,40
0,45
0,50
0,55
0,60
0,65
543K
523K
503K
483K se
lect
ivity
to e
thyl
ene
oxid
e
degree of conversion
Figure 4.41: Selectivity to ethylene oxide as a function of the conversiondegree (attained by residence time variation) at different reactor temper-atures for the Shell 800 Series Catalyst coated modular microchannelreactor MMCR10. Reaction conditions: 20% C2H4 in O2, T= 483, 503,523 and 543 K, p= 0.3 MPa.
The same investigations were performed for 20% C2H4 in O2.At 483 K, the highest selectivities of 60.8% to 59.9% at conversiondegrees between 4.2% to 14.9% were obtained. With increasing re-actor temperature and therefore, higher degrees of conversion, theselectivity became more and more dependent on the conversion de-gree. At 503 K, the selectivity varied between 54.8% to 51.4% atconversion degrees of 8.1% to 25.4%, respectively. Initially, at highflow rates and conversion degrees below 13%, the selectivity seemedto be constant. A further increase of the reactor temperature up to543 K led to decreased selectivities in the range of 45.9% to 33.7%at conversion degree of 18.7% to 46.1%, respectively. Again, theselectivity seemed to be quite constant at conversion degrees below27%. It has to be noted, that no crossing of selectivity curves wasobserved, neither at 4% nor at 20% C2H4 in O2 at any temperature.
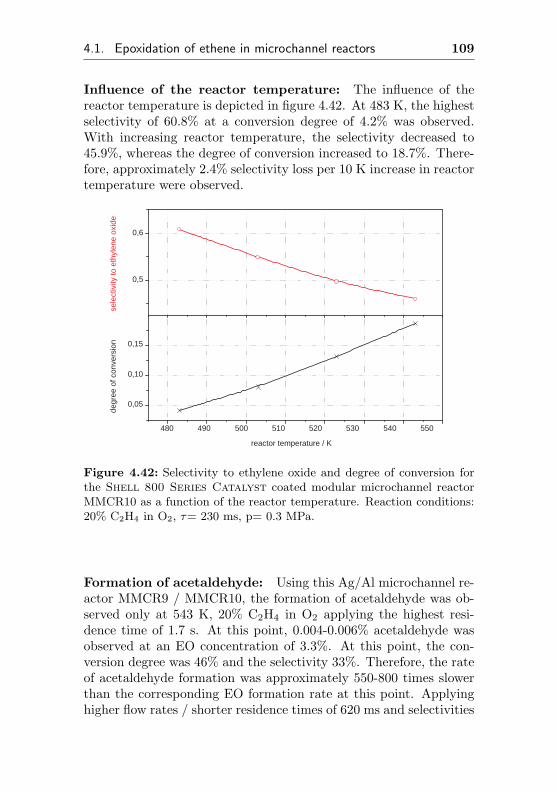
4.1. Epoxidation of ethene in microchannel reactors 109
Influence of the reactor temperature: The influence of thereactor temperature is depicted in figure 4.42. At 483 K, the highestselectivity of 60.8% at a conversion degree of 4.2% was observed.With increasing reactor temperature, the selectivity decreased to45.9%, whereas the degree of conversion increased to 18.7%. There-fore, approximately 2.4% selectivity loss per 10 K increase in reactortemperature were observed.
480 490 500 510 520 530 540 550
0,05
0,10
0,15
sele
ctiv
ity to
eth
ylen
e ox
ide
degr
ee o
f con
vers
ion
reactor temperature / K
0,5
0,6
Figure 4.42: Selectivity to ethylene oxide and degree of conversion forthe Shell 800 Series Catalyst coated modular microchannel reactorMMCR10 as a function of the reactor temperature. Reaction conditions:20% C2H4 in O2, τ= 230 ms, p= 0.3 MPa.
Formation of acetaldehyde: Using this Ag/Al microchannel re-actor MMCR9 / MMCR10, the formation of acetaldehyde was ob-served only at 543 K, 20% C2H4 in O2 applying the highest resi-dence time of 1.7 s. At this point, 0.004-0.006% acetaldehyde wasobserved at an EO concentration of 3.3%. At this point, the con-version degree was 46% and the selectivity 33%. Therefore, the rateof acetaldehyde formation was approximately 550-800 times slowerthan the corresponding EO formation rate at this point. Applyinghigher flow rates / shorter residence times of 620 ms and selectivities
110 Chapter 4. Results
above 40% (but comparable EO concentrations), no acetaldehydewas monitored. Therefore, the ratio rEO/rAcal was normally higherthan 1500, indicating selectivities to acetaldehyde of 0.03% at themost.
4.1.4 Silver supported on stainless steel surfaces(MMCR11)
The suitability of stainless steel as a potential support material forsilver was evaluated. Many commercial available microchannel re-actors / heat exchangers are made of stainless steel instead of alu-minum, because diffusion bonding of steel is much more simple andreliable than bonding of aluminum. Therefore, a thin silver layersupported on steel would be a good activation method for thosedevices. In order to investigate the suitability of silver-on-steel, astainless steel Betamesh 75 net as support was coated with 300 nmAg by sputtering and mounted in the modular microchannel reactortype I. The porous structure of the stacked steel nets formed some-thing similar to a microchannel system, but exhibiting a more ir-regular channel geometry [80]. Nevertheless, this structure is cheap,easy to handle and suitable for performing preliminary catalytic in-vestigations. The most important parameters for this structure arelisted in table 4.13. The activation of this Ag/Fe catalytic systemwas performed under reaction conditions, using 20% ethene, 20%oxygen in methane at a reactor temperature of 548 K. Results aredepicted in figure 4.43. Initially, high selectivities to EO of 67 - 69%were observed and the conversion degree varied between 3.7 - 3.9%.This level was reached after only 1.5 hours time on stream and nofurther activation was observed. Contrary, the selectivity decreasedrapidly with increasing time on stream and after 14 hours, only 45%selectivity at conversion degree of 3.5% were left. At this time, theoxygen concentration was increased from 20% to 80%, keeping theflow rate (100 ml/min) and the reactor temperature on the samelevel. The selectivity jumped to 49% and the degree of conversionto 5.6%. Again, with increasing time on stream, the selectivity de-creased to 45% at conversion degrees of 4.6% at 26 h time on stream.Due to the steadily declining selectivities with time on stream, thiscatalytic system was abandoned and no further investigations per-formed.
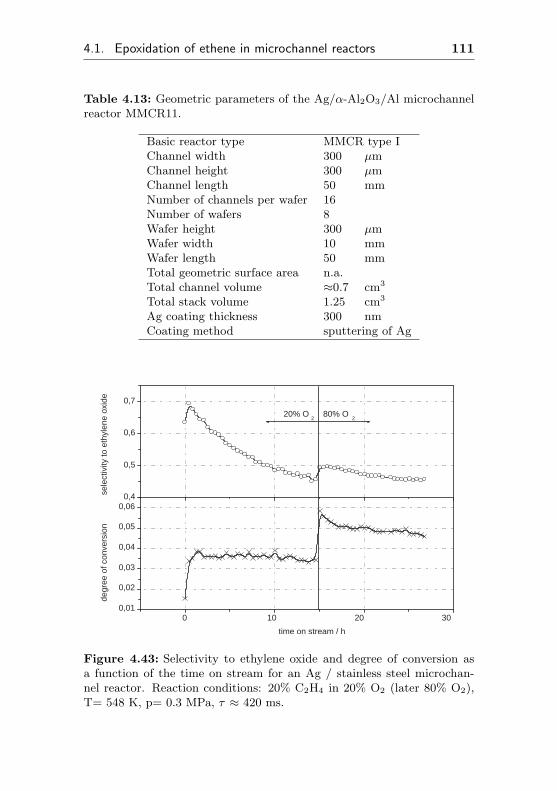
4.1. Epoxidation of ethene in microchannel reactors 111
Table 4.13: Geometric parameters of the Ag/α-Al2O3/Al microchannelreactor MMCR11.
Basic reactor type MMCR type IChannel width 300 µmChannel height 300 µmChannel length 50 mmNumber of channels per wafer 16Number of wafers 8Wafer height 300 µmWafer width 10 mmWafer length 50 mmTotal geometric surface area n.a.Total channel volume ≈0.7 cm3
Total stack volume 1.25 cm3
Ag coating thickness 300 nmCoating method sputtering of Ag
0 10 20 30 0,01
0,02
0,03
0,04
0,05
0,06
20% O 2 80% O
2
sele
ctiv
ity to
eth
ylen
e ox
ide
degr
ee o
f con
vers
ion
time on stream / h
0,4
0,5
0,6
0,7
Figure 4.43: Selectivity to ethylene oxide and degree of conversion asa function of the time on stream for an Ag / stainless steel microchan-nel reactor. Reaction conditions: 20% C2H4 in 20% O2 (later 80% O2),T= 548 K, p= 0.3 MPa, τ ≈ 420 ms.
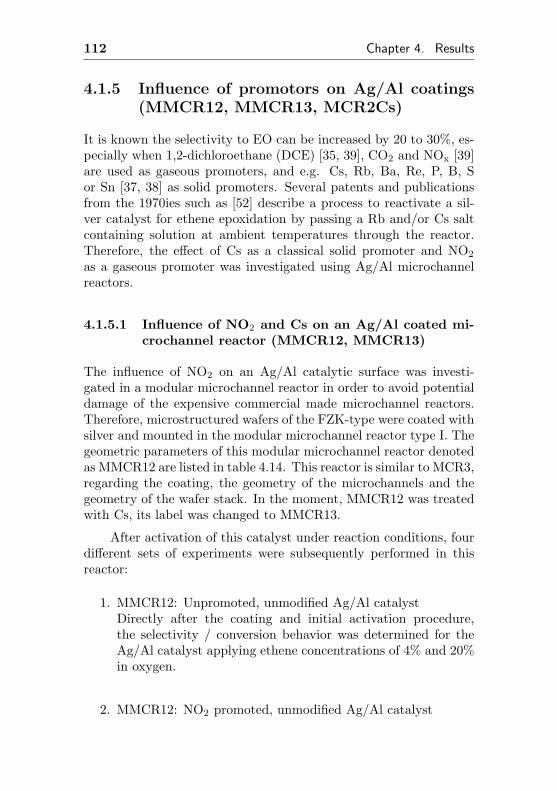
112 Chapter 4. Results
4.1.5 Influence of promotors on Ag/Al coatings(MMCR12, MMCR13, MCR2Cs)
It is known the selectivity to EO can be increased by 20 to 30%, es-pecially when 1,2-dichloroethane (DCE) [35, 39], CO2 and NOx [39]are used as gaseous promoters, and e.g. Cs, Rb, Ba, Re, P, B, Sor Sn [37, 38] as solid promoters. Several patents and publicationsfrom the 1970ies such as [52] describe a process to reactivate a sil-ver catalyst for ethene epoxidation by passing a Rb and/or Cs saltcontaining solution at ambient temperatures through the reactor.Therefore, the effect of Cs as a classical solid promoter and NO2
as a gaseous promoter was investigated using Ag/Al microchannelreactors.
4.1.5.1 Influence of NO2 and Cs on an Ag/Al coated mi-crochannel reactor (MMCR12, MMCR13)
The influence of NO2 on an Ag/Al catalytic surface was investi-gated in a modular microchannel reactor in order to avoid potentialdamage of the expensive commercial made microchannel reactors.Therefore, microstructured wafers of the FZK-type were coated withsilver and mounted in the modular microchannel reactor type I. Thegeometric parameters of this modular microchannel reactor denotedas MMCR12 are listed in table 4.14. This reactor is similar to MCR3,regarding the coating, the geometry of the microchannels and thegeometry of the wafer stack. In the moment, MMCR12 was treatedwith Cs, its label was changed to MMCR13.
After activation of this catalyst under reaction conditions, fourdifferent sets of experiments were subsequently performed in thisreactor:
1. MMCR12: Unpromoted, unmodified Ag/Al catalystDirectly after the coating and initial activation procedure,the selectivity / conversion behavior was determined for theAg/Al catalyst applying ethene concentrations of 4% and 20%in oxygen.
2. MMCR12: NO2 promoted, unmodified Ag/Al catalyst
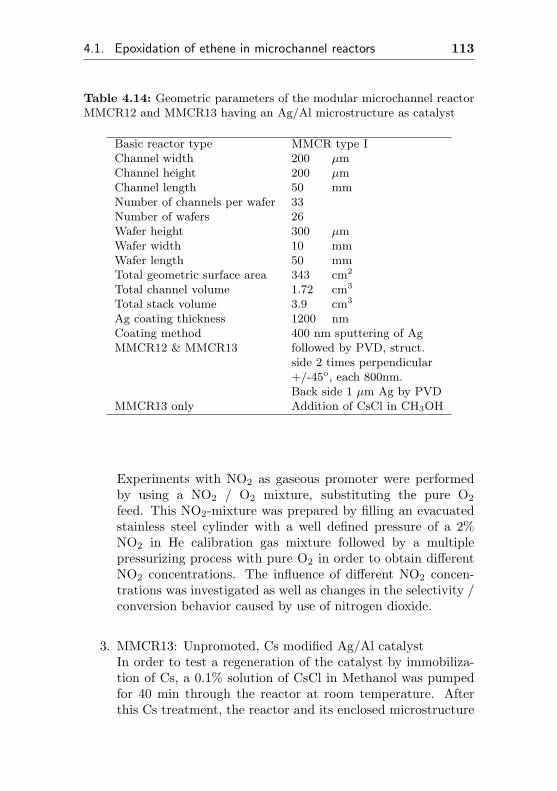
4.1. Epoxidation of ethene in microchannel reactors 113
Table 4.14: Geometric parameters of the modular microchannel reactorMMCR12 and MMCR13 having an Ag/Al microstructure as catalyst
Basic reactor type MMCR type IChannel width 200 µmChannel height 200 µmChannel length 50 mmNumber of channels per wafer 33Number of wafers 26Wafer height 300 µmWafer width 10 mmWafer length 50 mmTotal geometric surface area 343 cm2
Total channel volume 1.72 cm3
Total stack volume 3.9 cm3
Ag coating thickness 1200 nmCoating method 400 nm sputtering of AgMMCR12 & MMCR13 followed by PVD, struct.
side 2 times perpendicular+/-45o, each 800nm.Back side 1 µm Ag by PVD
MMCR13 only Addition of CsCl in CH3OH
Experiments with NO2 as gaseous promoter were performedby using a NO2 / O2 mixture, substituting the pure O2
feed. This NO2-mixture was prepared by filling an evacuatedstainless steel cylinder with a well defined pressure of a 2%NO2 in He calibration gas mixture followed by a multiplepressurizing process with pure O2 in order to obtain differentNO2 concentrations. The influence of different NO2 concen-trations was investigated as well as changes in the selectivity /conversion behavior caused by use of nitrogen dioxide.
3. MMCR13: Unpromoted, Cs modified Ag/Al catalystIn order to test a regeneration of the catalyst by immobiliza-tion of Cs, a 0.1% solution of CsCl in Methanol was pumpedfor 40 min through the reactor at room temperature. Afterthis Cs treatment, the reactor and its enclosed microstructure
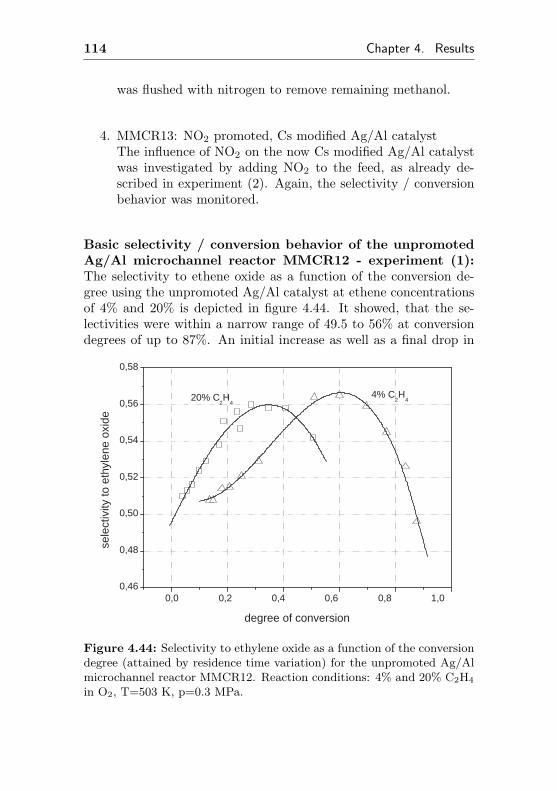
114 Chapter 4. Results
was flushed with nitrogen to remove remaining methanol.
4. MMCR13: NO2 promoted, Cs modified Ag/Al catalystThe influence of NO2 on the now Cs modified Ag/Al catalystwas investigated by adding NO2 to the feed, as already de-scribed in experiment (2). Again, the selectivity / conversionbehavior was monitored.
Basic selectivity / conversion behavior of the unpromotedAg/Al microchannel reactor MMCR12 - experiment (1):The selectivity to ethene oxide as a function of the conversion de-gree using the unpromoted Ag/Al catalyst at ethene concentrationsof 4% and 20% is depicted in figure 4.44. It showed, that the se-lectivities were within a narrow range of 49.5 to 56% at conversiondegrees of up to 87%. An initial increase as well as a final drop in
0,0 0,2 0,4 0,6 0,8 1,0 0,46
0,48
0,50
0,52
0,54
0,56
0,58
4% C 2 H
4 20% C 2 H
4
degree of conversion
sele
ctiv
ity to
eth
ylen
e ox
ide
Figure 4.44: Selectivity to ethylene oxide as a function of the conversiondegree (attained by residence time variation) for the unpromoted Ag/Almicrochannel reactor MMCR12. Reaction conditions: 4% and 20% C2H4
in O2, T=503 K, p=0.3 MPa.
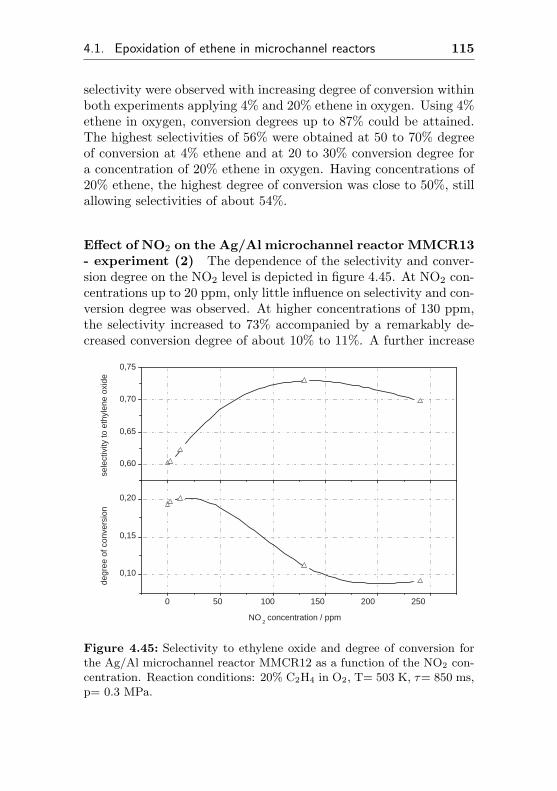
4.1. Epoxidation of ethene in microchannel reactors 115
selectivity were observed with increasing degree of conversion withinboth experiments applying 4% and 20% ethene in oxygen. Using 4%ethene in oxygen, conversion degrees up to 87% could be attained.The highest selectivities of 56% were obtained at 50 to 70% degreeof conversion at 4% ethene and at 20 to 30% conversion degree fora concentration of 20% ethene in oxygen. Having concentrations of20% ethene, the highest degree of conversion was close to 50%, stillallowing selectivities of about 54%.
Effect of NO2 on the Ag/Al microchannel reactor MMCR13- experiment (2) The dependence of the selectivity and conver-sion degree on the NO2 level is depicted in figure 4.45. At NO2 con-centrations up to 20 ppm, only little influence on selectivity and con-version degree was observed. At higher concentrations of 130 ppm,the selectivity increased to 73% accompanied by a remarkably de-creased conversion degree of about 10% to 11%. A further increase
0 50 100 150 200 250
0,10
0,15
0,20
sele
ctiv
ity to
eth
ylen
e ox
ide
degr
ee o
f con
vers
ion
NO 2 concentration / ppm
0,60
0,65
0,70
0,75
Figure 4.45: Selectivity to ethylene oxide and degree of conversion forthe Ag/Al microchannel reactor MMCR12 as a function of the NO2 con-centration. Reaction conditions: 20% C2H4 in O2, T= 503 K, τ= 850 ms,p= 0.3 MPa.
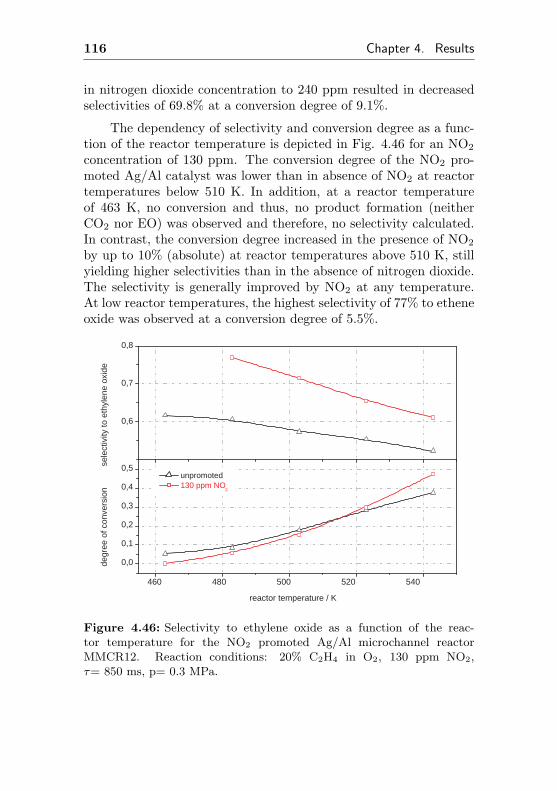
116 Chapter 4. Results
in nitrogen dioxide concentration to 240 ppm resulted in decreasedselectivities of 69.8% at a conversion degree of 9.1%.
The dependency of selectivity and conversion degree as a func-tion of the reactor temperature is depicted in Fig. 4.46 for an NO2
concentration of 130 ppm. The conversion degree of the NO2 pro-moted Ag/Al catalyst was lower than in absence of NO2 at reactortemperatures below 510 K. In addition, at a reactor temperatureof 463 K, no conversion and thus, no product formation (neitherCO2 nor EO) was observed and therefore, no selectivity calculated.In contrast, the conversion degree increased in the presence of NO2
by up to 10% (absolute) at reactor temperatures above 510 K, stillyielding higher selectivities than in the absence of nitrogen dioxide.The selectivity is generally improved by NO2 at any temperature.At low reactor temperatures, the highest selectivity of 77% to etheneoxide was observed at a conversion degree of 5.5%.
460 480 500 520 540
0,0
0,1
0,2
0,3
0,4
0,5 unpromoted 130 ppm NO
2
degr
ee o
f con
vers
ion
sel
ectiv
ity to
eth
ylen
e ox
ide
reactor temperature / K
0,6
0,7
0,8
Figure 4.46: Selectivity to ethylene oxide as a function of the reac-tor temperature for the NO2 promoted Ag/Al microchannel reactorMMCR12. Reaction conditions: 20% C2H4 in O2, 130 ppm NO2,τ= 850 ms, p= 0.3 MPa.
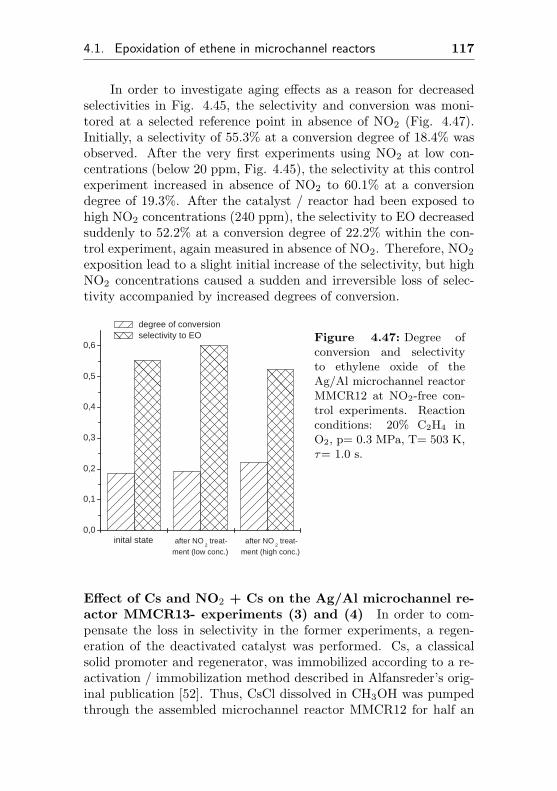
4.1. Epoxidation of ethene in microchannel reactors 117
In order to investigate aging effects as a reason for decreasedselectivities in Fig. 4.45, the selectivity and conversion was moni-tored at a selected reference point in absence of NO2 (Fig. 4.47).Initially, a selectivity of 55.3% at a conversion degree of 18.4% wasobserved. After the very first experiments using NO2 at low con-centrations (below 20 ppm, Fig. 4.45), the selectivity at this controlexperiment increased in absence of NO2 to 60.1% at a conversiondegree of 19.3%. After the catalyst / reactor had been exposed tohigh NO2 concentrations (240 ppm), the selectivity to EO decreasedsuddenly to 52.2% at a conversion degree of 22.2% within the con-trol experiment, again measured in absence of NO2. Therefore, NO2
exposition lead to a slight initial increase of the selectivity, but highNO2 concentrations caused a sudden and irreversible loss of selec-tivity accompanied by increased degrees of conversion.
0,0
0,1
0,2
0,3
0,4
0,5
0,6
after NO 2 treat-
ment (low conc.)
inital state after NO 2 treat-
ment (high conc.)
degree of conversion selectivity to EO Figure 4.47: Degree of
conversion and selectivityto ethylene oxide of theAg/Al microchannel reactorMMCR12 at NO2-free con-trol experiments. Reactionconditions: 20% C2H4 inO2, p= 0.3 MPa, T= 503 K,τ= 1.0 s.
Effect of Cs and NO2 + Cs on the Ag/Al microchannel re-actor MMCR13- experiments (3) and (4) In order to com-pensate the loss in selectivity in the former experiments, a regen-eration of the deactivated catalyst was performed. Cs, a classicalsolid promoter and regenerator, was immobilized according to a re-activation / immobilization method described in Alfansreder’s orig-inal publication [52]. Thus, CsCl dissolved in CH3OH was pumpedthrough the assembled microchannel reactor MMCR12 for half an
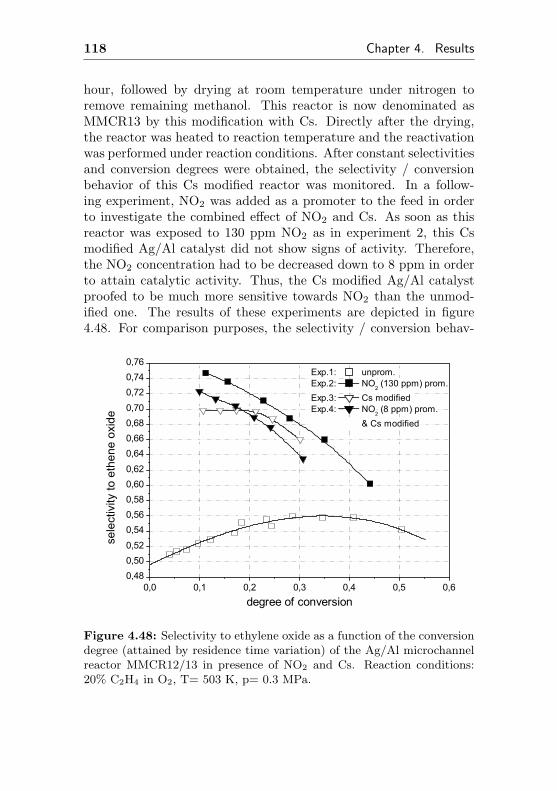
118 Chapter 4. Results
hour, followed by drying at room temperature under nitrogen toremove remaining methanol. This reactor is now denominated asMMCR13 by this modification with Cs. Directly after the drying,the reactor was heated to reaction temperature and the reactivationwas performed under reaction conditions. After constant selectivitiesand conversion degrees were obtained, the selectivity / conversionbehavior of this Cs modified reactor was monitored. In a follow-ing experiment, NO2 was added as a promoter to the feed in orderto investigate the combined effect of NO2 and Cs. As soon as thisreactor was exposed to 130 ppm NO2 as in experiment 2, this Csmodified Ag/Al catalyst did not show signs of activity. Therefore,the NO2 concentration had to be decreased down to 8 ppm in orderto attain catalytic activity. Thus, the Cs modified Ag/Al catalystproofed to be much more sensitive towards NO2 than the unmod-ified one. The results of these experiments are depicted in figure4.48. For comparison purposes, the selectivity / conversion behav-
0,0 0,1 0,2 0,3 0,4 0,5 0,60,480,500,520,540,560,580,600,620,640,660,680,700,720,740,76
Exp.1: unprom.Exp.2: NO
2 (130 ppm) prom.
Exp.3: Cs modified Exp.4: NO
2 (8 ppm) prom.
& Cs modified
selectivity
to ethen
e ox
ide
degree of conversion
Figure 4.48: Selectivity to ethylene oxide as a function of the conversiondegree (attained by residence time variation) of the Ag/Al microchannelreactor MMCR12/13 in presence of NO2 and Cs. Reaction conditions:20% C2H4 in O2, T= 503 K, p= 0.3 MPa.
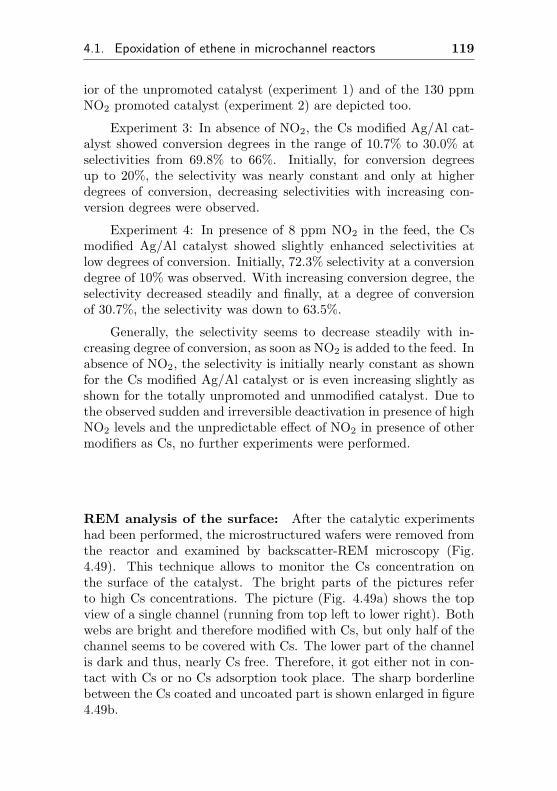
4.1. Epoxidation of ethene in microchannel reactors 119
ior of the unpromoted catalyst (experiment 1) and of the 130 ppmNO2 promoted catalyst (experiment 2) are depicted too.
Experiment 3: In absence of NO2, the Cs modified Ag/Al cat-alyst showed conversion degrees in the range of 10.7% to 30.0% atselectivities from 69.8% to 66%. Initially, for conversion degreesup to 20%, the selectivity was nearly constant and only at higherdegrees of conversion, decreasing selectivities with increasing con-version degrees were observed.
Experiment 4: In presence of 8 ppm NO2 in the feed, the Csmodified Ag/Al catalyst showed slightly enhanced selectivities atlow degrees of conversion. Initially, 72.3% selectivity at a conversiondegree of 10% was observed. With increasing conversion degree, theselectivity decreased steadily and finally, at a degree of conversionof 30.7%, the selectivity was down to 63.5%.
Generally, the selectivity seems to decrease steadily with in-creasing degree of conversion, as soon as NO2 is added to the feed. Inabsence of NO2, the selectivity is initially nearly constant as shownfor the Cs modified Ag/Al catalyst or is even increasing slightly asshown for the totally unpromoted and unmodified catalyst. Due tothe observed sudden and irreversible deactivation in presence of highNO2 levels and the unpredictable effect of NO2 in presence of othermodifiers as Cs, no further experiments were performed.
REM analysis of the surface: After the catalytic experimentshad been performed, the microstructured wafers were removed fromthe reactor and examined by backscatter-REM microscopy (Fig.4.49). This technique allows to monitor the Cs concentration onthe surface of the catalyst. The bright parts of the pictures referto high Cs concentrations. The picture (Fig. 4.49a) shows the topview of a single channel (running from top left to lower right). Bothwebs are bright and therefore modified with Cs, but only half of thechannel seems to be covered with Cs. The lower part of the channelis dark and thus, nearly Cs free. Therefore, it got either not in con-tact with Cs or no Cs adsorption took place. The sharp borderlinebetween the Cs coated and uncoated part is shown enlarged in figure4.49b.
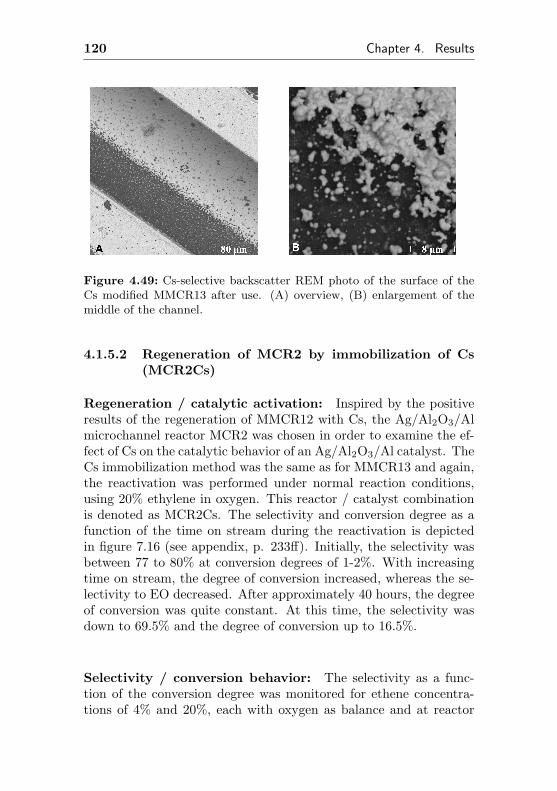
120 Chapter 4. Results
Figure 4.49: Cs-selective backscatter REM photo of the surface of theCs modified MMCR13 after use. (A) overview, (B) enlargement of themiddle of the channel.
4.1.5.2 Regeneration of MCR2 by immobilization of Cs(MCR2Cs)
Regeneration / catalytic activation: Inspired by the positiveresults of the regeneration of MMCR12 with Cs, the Ag/Al2O3/Almicrochannel reactor MCR2 was chosen in order to examine the ef-fect of Cs on the catalytic behavior of an Ag/Al2O3/Al catalyst. TheCs immobilization method was the same as for MMCR13 and again,the reactivation was performed under normal reaction conditions,using 20% ethylene in oxygen. This reactor / catalyst combinationis denoted as MCR2Cs. The selectivity and conversion degree as afunction of the time on stream during the reactivation is depictedin figure 7.16 (see appendix, p. 233ff). Initially, the selectivity wasbetween 77 to 80% at conversion degrees of 1-2%. With increasingtime on stream, the degree of conversion increased, whereas the se-lectivity to EO decreased. After approximately 40 hours, the degreeof conversion was quite constant. At this time, the selectivity wasdown to 69.5% and the degree of conversion up to 16.5%.
Selectivity / conversion behavior: The selectivity as a func-tion of the conversion degree was monitored for ethene concentra-tions of 4% and 20%, each with oxygen as balance and at reactor
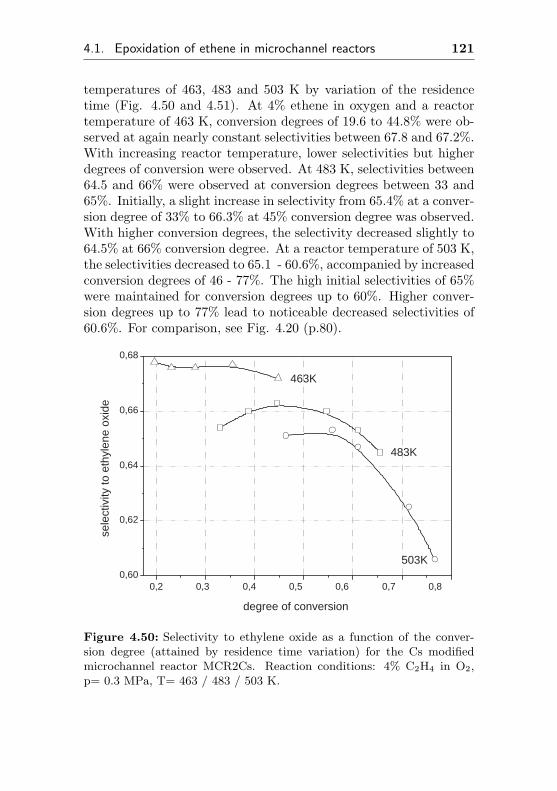
4.1. Epoxidation of ethene in microchannel reactors 121
temperatures of 463, 483 and 503 K by variation of the residencetime (Fig. 4.50 and 4.51). At 4% ethene in oxygen and a reactortemperature of 463 K, conversion degrees of 19.6 to 44.8% were ob-served at again nearly constant selectivities between 67.8 and 67.2%.With increasing reactor temperature, lower selectivities but higherdegrees of conversion were observed. At 483 K, selectivities between64.5 and 66% were observed at conversion degrees between 33 and65%. Initially, a slight increase in selectivity from 65.4% at a conver-sion degree of 33% to 66.3% at 45% conversion degree was observed.With higher conversion degrees, the selectivity decreased slightly to64.5% at 66% conversion degree. At a reactor temperature of 503 K,the selectivities decreased to 65.1 - 60.6%, accompanied by increasedconversion degrees of 46 - 77%. The high initial selectivities of 65%were maintained for conversion degrees up to 60%. Higher conver-sion degrees up to 77% lead to noticeable decreased selectivities of60.6%. For comparison, see Fig. 4.20 (p.80).
0,2 0,3 0,4 0,5 0,6 0,7 0,8 0,60
0,62
0,64
0,66
0,68
503K
483K
463K
sele
ctiv
ity to
eth
ylen
e ox
ide
degree of conversion
Figure 4.50: Selectivity to ethylene oxide as a function of the conver-sion degree (attained by residence time variation) for the Cs modifiedmicrochannel reactor MCR2Cs. Reaction conditions: 4% C2H4 in O2,p= 0.3 MPa, T= 463 / 483 / 503 K.
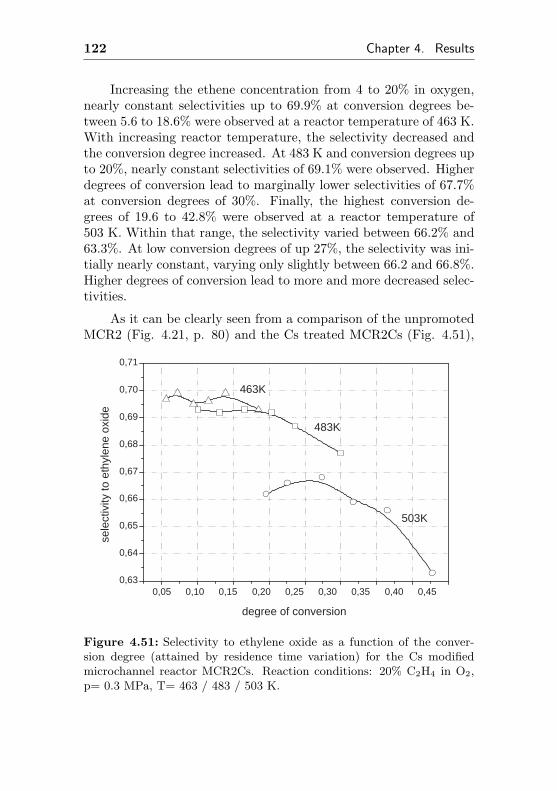
122 Chapter 4. Results
Increasing the ethene concentration from 4 to 20% in oxygen,nearly constant selectivities up to 69.9% at conversion degrees be-tween 5.6 to 18.6% were observed at a reactor temperature of 463 K.With increasing reactor temperature, the selectivity decreased andthe conversion degree increased. At 483 K and conversion degrees upto 20%, nearly constant selectivities of 69.1% were observed. Higherdegrees of conversion lead to marginally lower selectivities of 67.7%at conversion degrees of 30%. Finally, the highest conversion de-grees of 19.6 to 42.8% were observed at a reactor temperature of503 K. Within that range, the selectivity varied between 66.2% and63.3%. At low conversion degrees of up 27%, the selectivity was ini-tially nearly constant, varying only slightly between 66.2 and 66.8%.Higher degrees of conversion lead to more and more decreased selec-tivities.
As it can be clearly seen from a comparison of the unpromotedMCR2 (Fig. 4.21, p. 80) and the Cs treated MCR2Cs (Fig. 4.51),
0,05 0,10 0,15 0,20 0,25 0,30 0,35 0,40 0,45 0,63
0,64
0,65
0,66
0,67
0,68
0,69
0,70
0,71
503K
483K
463K
sele
ctiv
ity to
eth
ylen
e ox
ide
degree of conversion
Figure 4.51: Selectivity to ethylene oxide as a function of the conver-sion degree (attained by residence time variation) for the Cs modifiedmicrochannel reactor MCR2Cs. Reaction conditions: 20% C2H4 in O2,p= 0.3 MPa, T= 463 / 483 / 503 K.
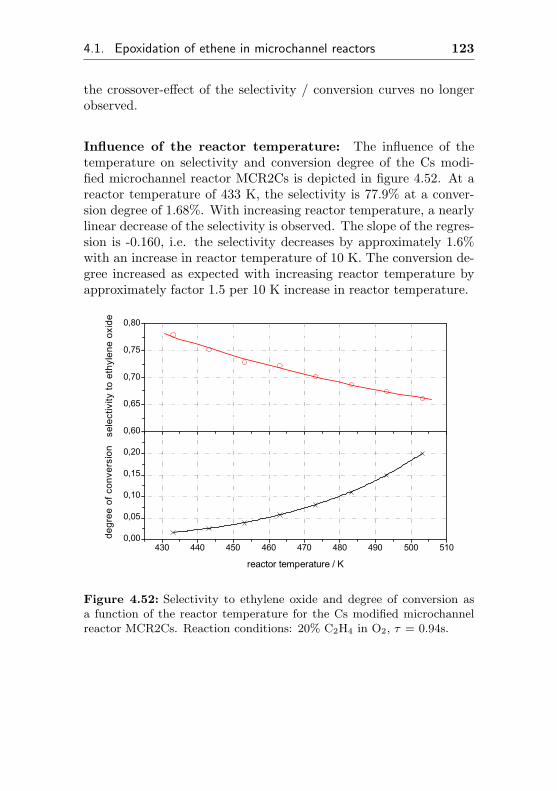
4.1. Epoxidation of ethene in microchannel reactors 123
the crossover-effect of the selectivity / conversion curves no longerobserved.
Influence of the reactor temperature: The influence of thetemperature on selectivity and conversion degree of the Cs modi-fied microchannel reactor MCR2Cs is depicted in figure 4.52. At areactor temperature of 433 K, the selectivity is 77.9% at a conver-sion degree of 1.68%. With increasing reactor temperature, a nearlylinear decrease of the selectivity is observed. The slope of the regres-sion is -0.160, i.e. the selectivity decreases by approximately 1.6%with an increase in reactor temperature of 10 K. The conversion de-gree increased as expected with increasing reactor temperature byapproximately factor 1.5 per 10 K increase in reactor temperature.
430 440 450 460 470 480 490 500 5100,00
0,05
0,10
0,15
0,20
sele
ctiv
ity to
eth
ylen
e ox
ide
degr
ee o
f con
vers
ion
reactor temperature / K
0,60
0,65
0,70
0,75
0,80
Figure 4.52: Selectivity to ethylene oxide and degree of conversion asa function of the reactor temperature for the Cs modified microchannelreactor MCR2Cs. Reaction conditions: 20% C2H4 in O2, τ = 0.94s.
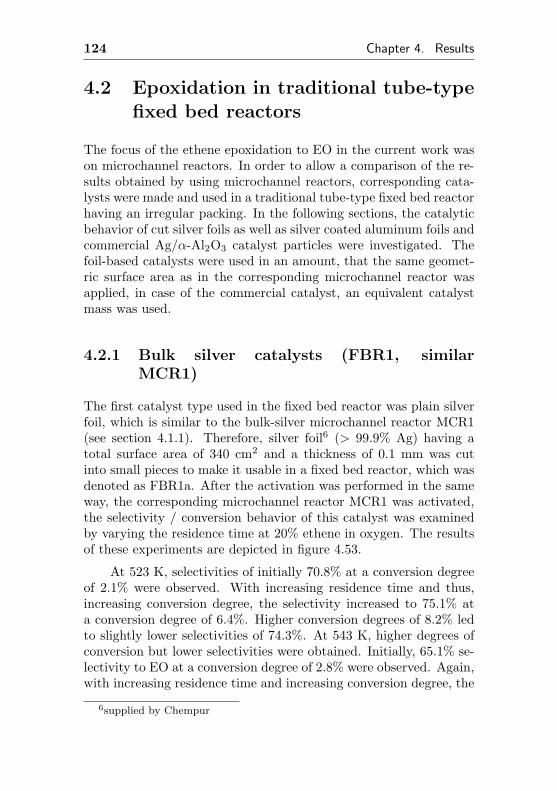
124 Chapter 4. Results
4.2 Epoxidation in traditional tube-typefixed bed reactors
The focus of the ethene epoxidation to EO in the current work wason microchannel reactors. In order to allow a comparison of the re-sults obtained by using microchannel reactors, corresponding cata-lysts were made and used in a traditional tube-type fixed bed reactorhaving an irregular packing. In the following sections, the catalyticbehavior of cut silver foils as well as silver coated aluminum foils andcommercial Ag/α-Al2O3 catalyst particles were investigated. Thefoil-based catalysts were used in an amount, that the same geomet-ric surface area as in the corresponding microchannel reactor wasapplied, in case of the commercial catalyst, an equivalent catalystmass was used.
4.2.1 Bulk silver catalysts (FBR1, similarMCR1)
The first catalyst type used in the fixed bed reactor was plain silverfoil, which is similar to the bulk-silver microchannel reactor MCR1(see section 4.1.1). Therefore, silver foil6 (> 99.9% Ag) having atotal surface area of 340 cm2 and a thickness of 0.1 mm was cutinto small pieces to make it usable in a fixed bed reactor, which wasdenoted as FBR1a. After the activation was performed in the sameway, the corresponding microchannel reactor MCR1 was activated,the selectivity / conversion behavior of this catalyst was examinedby varying the residence time at 20% ethene in oxygen. The resultsof these experiments are depicted in figure 4.53.
At 523 K, selectivities of initially 70.8% at a conversion degreeof 2.1% were observed. With increasing residence time and thus,increasing conversion degree, the selectivity increased to 75.1% ata conversion degree of 6.4%. Higher conversion degrees of 8.2% ledto slightly lower selectivities of 74.3%. At 543 K, higher degrees ofconversion but lower selectivities were obtained. Initially, 65.1% se-lectivity to EO at a conversion degree of 2.8% were observed. Again,with increasing residence time and increasing conversion degree, the
6supplied by Chempur
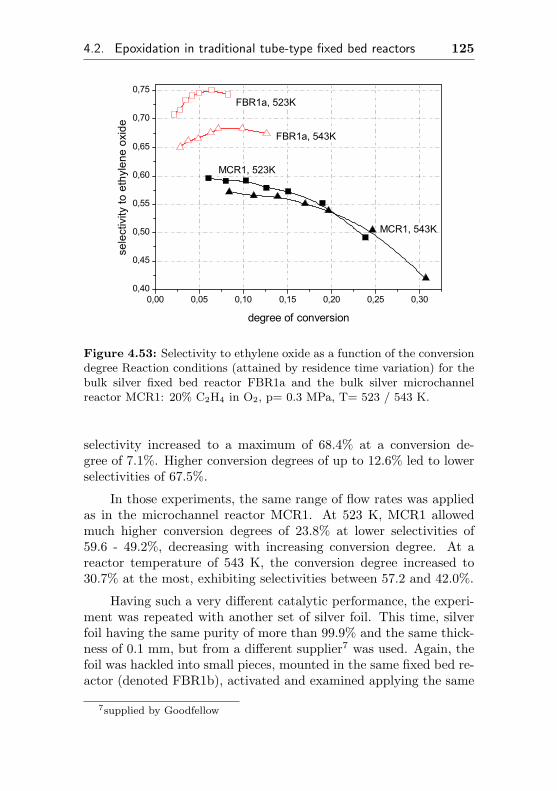
4.2. Epoxidation in traditional tube-type fixed bed reactors 125
0,00 0,05 0,10 0,15 0,20 0,25 0,300,40
0,45
0,50
0,55
0,60
0,65
0,70
0,75
MCR1, 543K
MCR1, 523K
FBR1a, 543K
FBR1a, 523K
selectivity
to ethylen
e ox
ide
degree of conversion
Figure 4.53: Selectivity to ethylene oxide as a function of the conversiondegree Reaction conditions (attained by residence time variation) for thebulk silver fixed bed reactor FBR1a and the bulk silver microchannelreactor MCR1: 20% C2H4 in O2, p= 0.3 MPa, T= 523 / 543 K.
selectivity increased to a maximum of 68.4% at a conversion de-gree of 7.1%. Higher conversion degrees of up to 12.6% led to lowerselectivities of 67.5%.
In those experiments, the same range of flow rates was appliedas in the microchannel reactor MCR1. At 523 K, MCR1 allowedmuch higher conversion degrees of 23.8% at lower selectivities of59.6 - 49.2%, decreasing with increasing conversion degree. At areactor temperature of 543 K, the conversion degree increased to30.7% at the most, exhibiting selectivities between 57.2 and 42.0%.
Having such a very different catalytic performance, the experi-ment was repeated with another set of silver foil. This time, silverfoil having the same purity of more than 99.9% and the same thick-ness of 0.1 mm, but from a different supplier7 was used. Again, thefoil was hackled into small pieces, mounted in the same fixed bed re-actor (denoted FBR1b), activated and examined applying the same
7supplied by Goodfellow
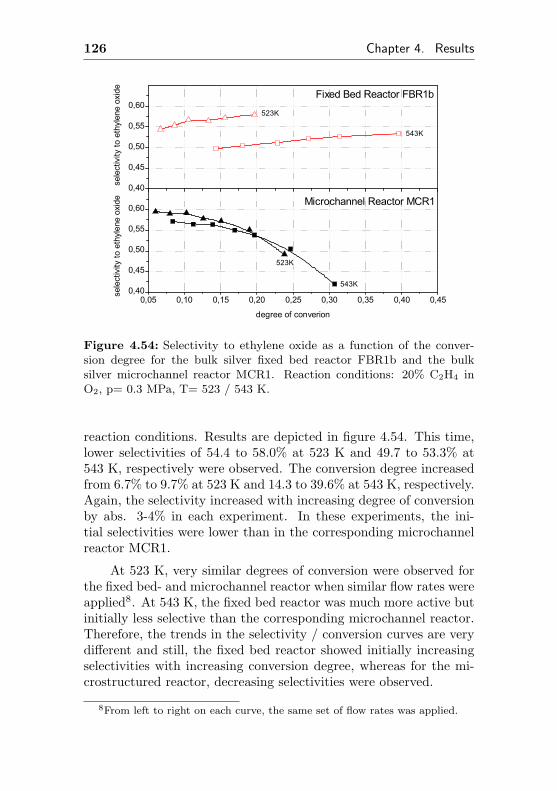
126 Chapter 4. Results
0,05 0,10 0,15 0,20 0,25 0,30 0,35 0,40 0,450,40
0,45
0,50
0,55
0,60
Fixed Bed Reactor FBR1b
Microchannel Reactor MCR1
543K
523K
543K
523Kse
lect
ivity
to e
thyl
ene
oxid
e se
lect
ivity
to e
thyl
ene
oxid
e
degree of converion
0,40
0,45
0,50
0,55
0,60
Figure 4.54: Selectivity to ethylene oxide as a function of the conver-sion degree for the bulk silver fixed bed reactor FBR1b and the bulksilver microchannel reactor MCR1. Reaction conditions: 20% C2H4 inO2, p= 0.3 MPa, T= 523 / 543 K.
reaction conditions. Results are depicted in figure 4.54. This time,lower selectivities of 54.4 to 58.0% at 523 K and 49.7 to 53.3% at543 K, respectively were observed. The conversion degree increasedfrom 6.7% to 9.7% at 523 K and 14.3 to 39.6% at 543 K, respectively.Again, the selectivity increased with increasing degree of conversionby abs. 3-4% in each experiment. In these experiments, the ini-tial selectivities were lower than in the corresponding microchannelreactor MCR1.
At 523 K, very similar degrees of conversion were observed forthe fixed bed- and microchannel reactor when similar flow rates wereapplied8. At 543 K, the fixed bed reactor was much more active butinitially less selective than the corresponding microchannel reactor.Therefore, the trends in the selectivity / conversion curves are verydifferent and still, the fixed bed reactor showed initially increasingselectivities with increasing conversion degree, whereas for the mi-crostructured reactor, decreasing selectivities were observed.
8From left to right on each curve, the same set of flow rates was applied.
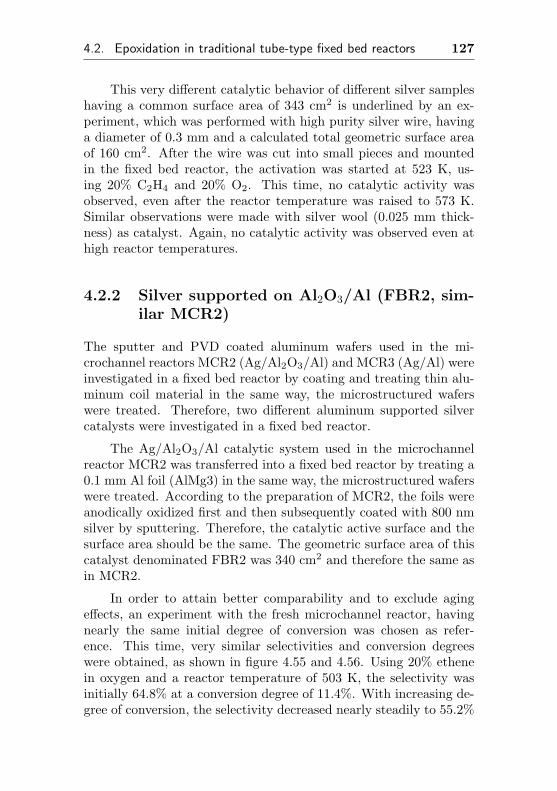
4.2. Epoxidation in traditional tube-type fixed bed reactors 127
This very different catalytic behavior of different silver sampleshaving a common surface area of 343 cm2 is underlined by an ex-periment, which was performed with high purity silver wire, havinga diameter of 0.3 mm and a calculated total geometric surface areaof 160 cm2. After the wire was cut into small pieces and mountedin the fixed bed reactor, the activation was started at 523 K, us-ing 20% C2H4 and 20% O2. This time, no catalytic activity wasobserved, even after the reactor temperature was raised to 573 K.Similar observations were made with silver wool (0.025 mm thick-ness) as catalyst. Again, no catalytic activity was observed even athigh reactor temperatures.
4.2.2 Silver supported on Al2O3/Al (FBR2, sim-ilar MCR2)
The sputter and PVD coated aluminum wafers used in the mi-crochannel reactors MCR2 (Ag/Al2O3/Al) and MCR3 (Ag/Al) wereinvestigated in a fixed bed reactor by coating and treating thin alu-minum coil material in the same way, the microstructured waferswere treated. Therefore, two different aluminum supported silvercatalysts were investigated in a fixed bed reactor.
The Ag/Al2O3/Al catalytic system used in the microchannelreactor MCR2 was transferred into a fixed bed reactor by treating a0.1 mm Al foil (AlMg3) in the same way, the microstructured waferswere treated. According to the preparation of MCR2, the foils wereanodically oxidized first and then subsequently coated with 800 nmsilver by sputtering. Therefore, the catalytic active surface and thesurface area should be the same. The geometric surface area of thiscatalyst denominated FBR2 was 340 cm2 and therefore the same asin MCR2.
In order to attain better comparability and to exclude agingeffects, an experiment with the fresh microchannel reactor, havingnearly the same initial degree of conversion was chosen as refer-ence. This time, very similar selectivities and conversion degreeswere obtained, as shown in figure 4.55 and 4.56. Using 20% ethenein oxygen and a reactor temperature of 503 K, the selectivity wasinitially 64.8% at a conversion degree of 11.4%. With increasing de-gree of conversion, the selectivity decreased nearly steadily to 55.2%
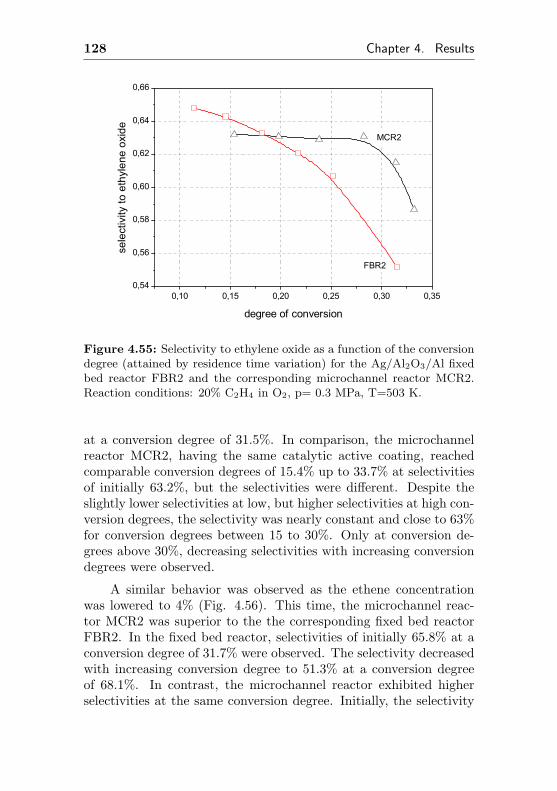
128 Chapter 4. Results
0,10 0,15 0,20 0,25 0,30 0,350,54
0,56
0,58
0,60
0,62
0,64
0,66
FBR2
MCR2
sele
ctiv
ity to
eth
ylen
e ox
ide
degree of conversion
Figure 4.55: Selectivity to ethylene oxide as a function of the conversiondegree (attained by residence time variation) for the Ag/Al2O3/Al fixedbed reactor FBR2 and the corresponding microchannel reactor MCR2.Reaction conditions: 20% C2H4 in O2, p= 0.3 MPa, T=503 K.
at a conversion degree of 31.5%. In comparison, the microchannelreactor MCR2, having the same catalytic active coating, reachedcomparable conversion degrees of 15.4% up to 33.7% at selectivitiesof initially 63.2%, but the selectivities were different. Despite theslightly lower selectivities at low, but higher selectivities at high con-version degrees, the selectivity was nearly constant and close to 63%for conversion degrees between 15 to 30%. Only at conversion de-grees above 30%, decreasing selectivities with increasing conversiondegrees were observed.
A similar behavior was observed as the ethene concentrationwas lowered to 4% (Fig. 4.56). This time, the microchannel reac-tor MCR2 was superior to the the corresponding fixed bed reactorFBR2. In the fixed bed reactor, selectivities of initially 65.8% at aconversion degree of 31.7% were observed. The selectivity decreasedwith increasing conversion degree to 51.3% at a conversion degreeof 68.1%. In contrast, the microchannel reactor exhibited higherselectivities at the same conversion degree. Initially, the selectivity
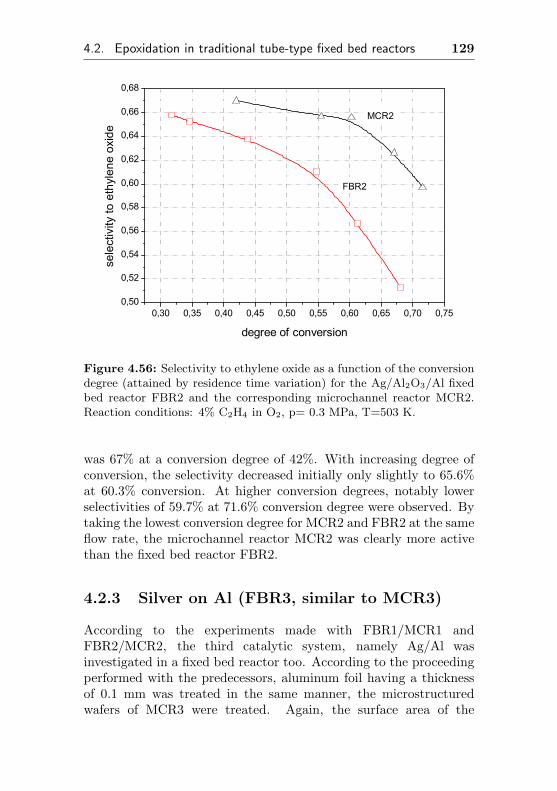
4.2. Epoxidation in traditional tube-type fixed bed reactors 129
0,30 0,35 0,40 0,45 0,50 0,55 0,60 0,65 0,70 0,750,50
0,52
0,54
0,56
0,58
0,60
0,62
0,64
0,66
0,68
FBR2
MCR2se
lect
ivity
to e
thyl
ene
oxid
e
degree of conversion
Figure 4.56: Selectivity to ethylene oxide as a function of the conversiondegree (attained by residence time variation) for the Ag/Al2O3/Al fixedbed reactor FBR2 and the corresponding microchannel reactor MCR2.Reaction conditions: 4% C2H4 in O2, p= 0.3 MPa, T=503 K.
was 67% at a conversion degree of 42%. With increasing degree ofconversion, the selectivity decreased initially only slightly to 65.6%at 60.3% conversion. At higher conversion degrees, notably lowerselectivities of 59.7% at 71.6% conversion degree were observed. Bytaking the lowest conversion degree for MCR2 and FBR2 at the sameflow rate, the microchannel reactor MCR2 was clearly more activethan the fixed bed reactor FBR2.
4.2.3 Silver on Al (FBR3, similar to MCR3)
According to the experiments made with FBR1/MCR1 andFBR2/MCR2, the third catalytic system, namely Ag/Al wasinvestigated in a fixed bed reactor too. According to the proceedingperformed with the predecessors, aluminum foil having a thicknessof 0.1 mm was treated in the same manner, the microstructuredwafers of MCR3 were treated. Again, the surface area of the
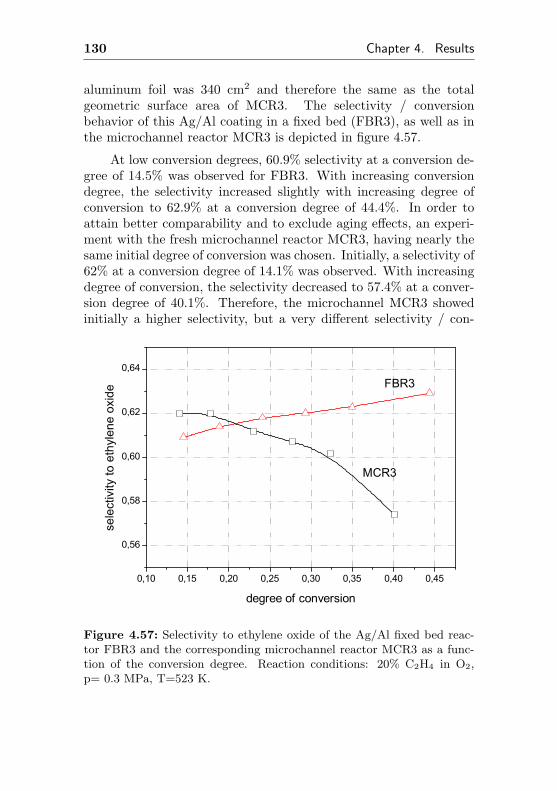
130 Chapter 4. Results
aluminum foil was 340 cm2 and therefore the same as the totalgeometric surface area of MCR3. The selectivity / conversionbehavior of this Ag/Al coating in a fixed bed (FBR3), as well as inthe microchannel reactor MCR3 is depicted in figure 4.57.
At low conversion degrees, 60.9% selectivity at a conversion de-gree of 14.5% was observed for FBR3. With increasing conversiondegree, the selectivity increased slightly with increasing degree ofconversion to 62.9% at a conversion degree of 44.4%. In order toattain better comparability and to exclude aging effects, an experi-ment with the fresh microchannel reactor MCR3, having nearly thesame initial degree of conversion was chosen. Initially, a selectivity of62% at a conversion degree of 14.1% was observed. With increasingdegree of conversion, the selectivity decreased to 57.4% at a conver-sion degree of 40.1%. Therefore, the microchannel MCR3 showedinitially a higher selectivity, but a very different selectivity / con-
0,10 0,15 0,20 0,25 0,30 0,35 0,40 0,45
0,56
0,58
0,60
0,62
0,64
MCR3
FBR3
sele
ctiv
ity to
eth
ylen
e ox
ide
degree of conversion
Figure 4.57: Selectivity to ethylene oxide of the Ag/Al fixed bed reac-tor FBR3 and the corresponding microchannel reactor MCR3 as a func-tion of the conversion degree. Reaction conditions: 20% C2H4 in O2,p= 0.3 MPa, T=523 K.
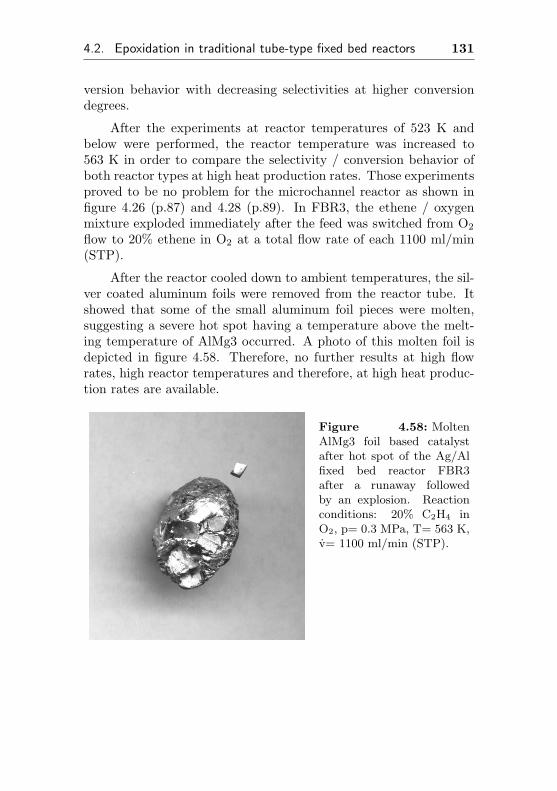
4.2. Epoxidation in traditional tube-type fixed bed reactors 131
version behavior with decreasing selectivities at higher conversiondegrees.
After the experiments at reactor temperatures of 523 K andbelow were performed, the reactor temperature was increased to563 K in order to compare the selectivity / conversion behavior ofboth reactor types at high heat production rates. Those experimentsproved to be no problem for the microchannel reactor as shown infigure 4.26 (p.87) and 4.28 (p.89). In FBR3, the ethene / oxygenmixture exploded immediately after the feed was switched from O2
flow to 20% ethene in O2 at a total flow rate of each 1100 ml/min(STP).
After the reactor cooled down to ambient temperatures, the sil-ver coated aluminum foils were removed from the reactor tube. Itshowed that some of the small aluminum foil pieces were molten,suggesting a severe hot spot having a temperature above the melt-ing temperature of AlMg3 occurred. A photo of this molten foil isdepicted in figure 4.58. Therefore, no further results at high flowrates, high reactor temperatures and therefore, at high heat produc-tion rates are available.
Figure 4.58: MoltenAlMg3 foil based catalystafter hot spot of the Ag/Alfixed bed reactor FBR3after a runaway followedby an explosion. Reactionconditions: 20% C2H4 inO2, p= 0.3 MPa, T= 563 K,v= 1100 ml/min (STP).
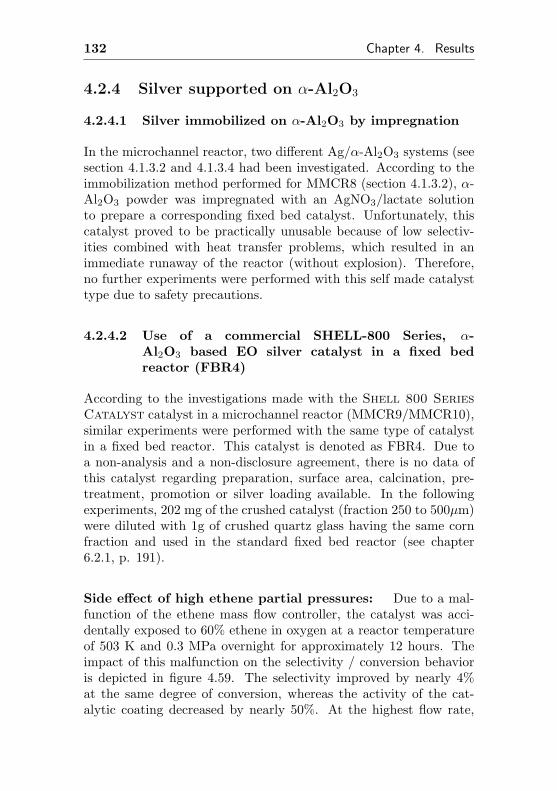
132 Chapter 4. Results
4.2.4 Silver supported on α-Al2O3
4.2.4.1 Silver immobilized on α-Al2O3 by impregnation
In the microchannel reactor, two different Ag/α-Al2O3 systems (seesection 4.1.3.2 and 4.1.3.4 had been investigated. According to theimmobilization method performed for MMCR8 (section 4.1.3.2), α-Al2O3 powder was impregnated with an AgNO3/lactate solutionto prepare a corresponding fixed bed catalyst. Unfortunately, thiscatalyst proved to be practically unusable because of low selectiv-ities combined with heat transfer problems, which resulted in animmediate runaway of the reactor (without explosion). Therefore,no further experiments were performed with this self made catalysttype due to safety precautions.
4.2.4.2 Use of a commercial SHELL-800 Series, α-Al2O3 based EO silver catalyst in a fixed bedreactor (FBR4)
According to the investigations made with the Shell 800 SeriesCatalyst catalyst in a microchannel reactor (MMCR9/MMCR10),similar experiments were performed with the same type of catalystin a fixed bed reactor. This catalyst is denoted as FBR4. Due toa non-analysis and a non-disclosure agreement, there is no data ofthis catalyst regarding preparation, surface area, calcination, pre-treatment, promotion or silver loading available. In the followingexperiments, 202 mg of the crushed catalyst (fraction 250 to 500µm)were diluted with 1g of crushed quartz glass having the same cornfraction and used in the standard fixed bed reactor (see chapter6.2.1, p. 191).
Side effect of high ethene partial pressures: Due to a mal-function of the ethene mass flow controller, the catalyst was acci-dentally exposed to 60% ethene in oxygen at a reactor temperatureof 503 K and 0.3 MPa overnight for approximately 12 hours. Theimpact of this malfunction on the selectivity / conversion behavioris depicted in figure 4.59. The selectivity improved by nearly 4%at the same degree of conversion, whereas the activity of the cat-alytic coating decreased by nearly 50%. At the highest flow rate,
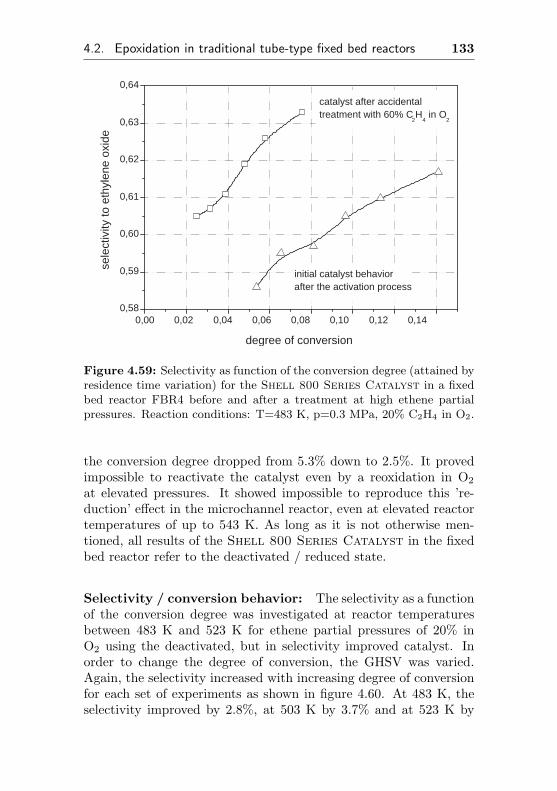
4.2. Epoxidation in traditional tube-type fixed bed reactors 133
0,00 0,02 0,04 0,06 0,08 0,10 0,12 0,14 0,58
0,59
0,60
0,61
0,62
0,63
0,64
initial catalyst behavior after the activation process
catalyst after accidental treatment with 60% C
2 H
4 in O
2
sele
ctiv
ity to
eth
ylen
e ox
ide
degree of conversion
Figure 4.59: Selectivity as function of the conversion degree (attained byresidence time variation) for the Shell 800 Series Catalyst in a fixedbed reactor FBR4 before and after a treatment at high ethene partialpressures. Reaction conditions: T=483 K, p=0.3 MPa, 20% C2H4 in O2.
the conversion degree dropped from 5.3% down to 2.5%. It provedimpossible to reactivate the catalyst even by a reoxidation in O2
at elevated pressures. It showed impossible to reproduce this ’re-duction’ effect in the microchannel reactor, even at elevated reactortemperatures of up to 543 K. As long as it is not otherwise men-tioned, all results of the Shell 800 Series Catalyst in the fixedbed reactor refer to the deactivated / reduced state.
Selectivity / conversion behavior: The selectivity as a functionof the conversion degree was investigated at reactor temperaturesbetween 483 K and 523 K for ethene partial pressures of 20% inO2 using the deactivated, but in selectivity improved catalyst. Inorder to change the degree of conversion, the GHSV was varied.Again, the selectivity increased with increasing degree of conversionfor each set of experiments as shown in figure 4.60. At 483 K, theselectivity improved by 2.8%, at 503 K by 3.7% and at 523 K by
134 Chapter 4. Results
0,00 0,05 0,10 0,15 0,20 0,54
0,56
0,58
0,60
0,62
0,64
523K
503K 483K se
lect
ivity
to e
thyl
ene
oxid
e
degree of conversion
Figure 4.60: Selectivity as function of the conversion degree (attainedby residence time variation) of the Shell 800 Series Catalyst in afixed bed reactor (FBR4) at different temperatures. Reaction conditions:p=0.3 MPa, 20% C2H4 in O2.
5.6% (abs.). After each GHSV variation, the reactor was switchedfrom minimum throughput (highest conversion degree, lowest heatproduction rate) to maximum throughput (lowest conversion degree,highest heat production rate) to check for potential deactivation. Onthis occasion, the reactor had a runaway followed by an explosion ofthe C2H4 / O2 mixture in the cooling traps - directly after switchingbetween the two flow rates in the last experiment at 523 K. At thispoint, the experiments with the fixed bed catalyst were stopped.
Comparison of the fixed bed reactor FBR4 with the mi-crochannel reactor MMCR10: The selectivity as a function ofthe conversion degree had been determined for the Shell 800 Se-ries Catalyst used in a crushed form within the fixed bed reactorFBR4 as well as in form of a catalytic active coat on the walls offour microstructured wafers within the modular microchannel reac-tor MMCR10 see Fig. 4.61). The flow rates used in these exper-
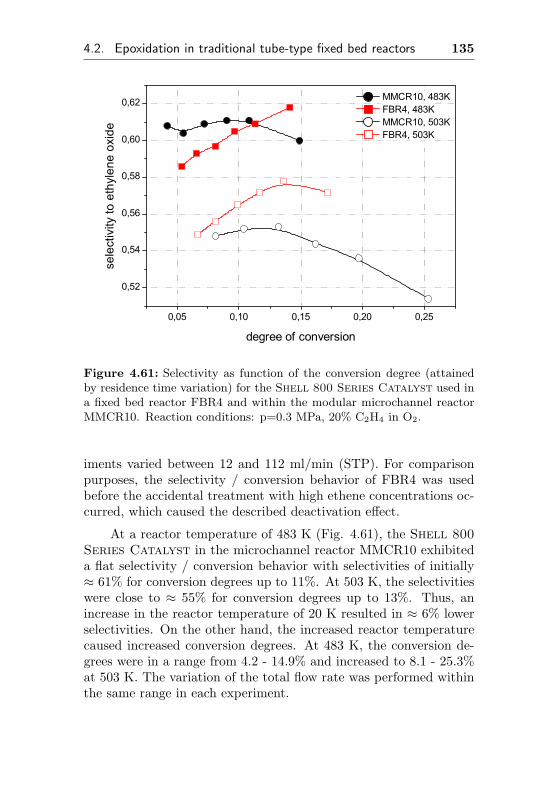
4.2. Epoxidation in traditional tube-type fixed bed reactors 135
0,05 0,10 0,15 0,20 0,25
0,52
0,54
0,56
0,58
0,60
0,62 MMCR10, 483K FBR4, 483K MMCR10, 503K FBR4, 503K
selectivity
to ethylen
e ox
ide
degree of conversion
Figure 4.61: Selectivity as function of the conversion degree (attainedby residence time variation) for the Shell 800 Series Catalyst used ina fixed bed reactor FBR4 and within the modular microchannel reactorMMCR10. Reaction conditions: p=0.3 MPa, 20% C2H4 in O2.
iments varied between 12 and 112 ml/min (STP). For comparisonpurposes, the selectivity / conversion behavior of FBR4 was usedbefore the accidental treatment with high ethene concentrations oc-curred, which caused the described deactivation effect.
At a reactor temperature of 483 K (Fig. 4.61), the Shell 800Series Catalyst in the microchannel reactor MMCR10 exhibiteda flat selectivity / conversion behavior with selectivities of initially≈ 61% for conversion degrees up to 11%. At 503 K, the selectivitieswere close to ≈ 55% for conversion degrees up to 13%. Thus, anincrease in the reactor temperature of 20 K resulted in ≈ 6% lowerselectivities. On the other hand, the increased reactor temperaturecaused increased conversion degrees. At 483 K, the conversion de-grees were in a range from 4.2 - 14.9% and increased to 8.1 - 25.3%at 503 K. The variation of the total flow rate was performed withinthe same range in each experiment.
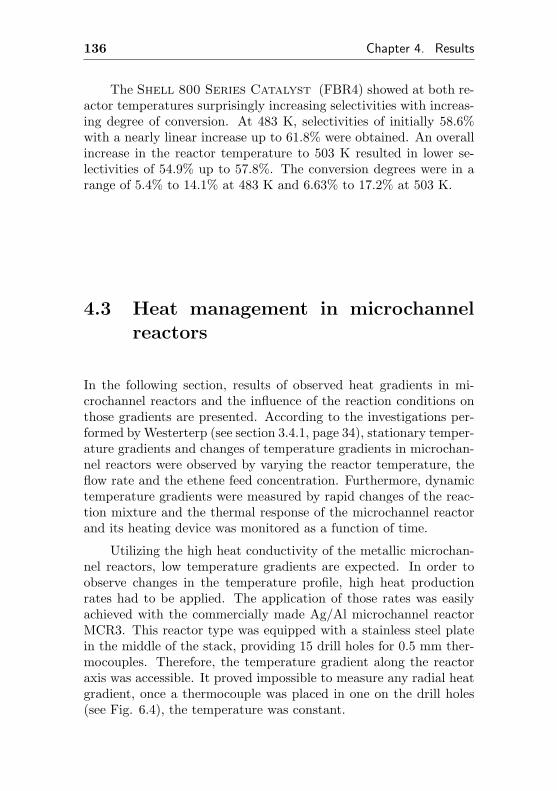
136 Chapter 4. Results
The Shell 800 Series Catalyst (FBR4) showed at both re-actor temperatures surprisingly increasing selectivities with increas-ing degree of conversion. At 483 K, selectivities of initially 58.6%with a nearly linear increase up to 61.8% were obtained. An overallincrease in the reactor temperature to 503 K resulted in lower se-lectivities of 54.9% up to 57.8%. The conversion degrees were in arange of 5.4% to 14.1% at 483 K and 6.63% to 17.2% at 503 K.
4.3 Heat management in microchannelreactors
In the following section, results of observed heat gradients in mi-crochannel reactors and the influence of the reaction conditions onthose gradients are presented. According to the investigations per-formed by Westerterp (see section 3.4.1, page 34), stationary temper-ature gradients and changes of temperature gradients in microchan-nel reactors were observed by varying the reactor temperature, theflow rate and the ethene feed concentration. Furthermore, dynamictemperature gradients were measured by rapid changes of the reac-tion mixture and the thermal response of the microchannel reactorand its heating device was monitored as a function of time.
Utilizing the high heat conductivity of the metallic microchan-nel reactors, low temperature gradients are expected. In order toobserve changes in the temperature profile, high heat productionrates had to be applied. The application of those rates was easilyachieved with the commercially made Ag/Al microchannel reactorMCR3. This reactor type was equipped with a stainless steel platein the middle of the stack, providing 15 drill holes for 0.5 mm ther-mocouples. Therefore, the temperature gradient along the reactoraxis was accessible. It proved impossible to measure any radial heatgradient, once a thermocouple was placed in one on the drill holes(see Fig. 6.4), the temperature was constant.
4.3. Heat management in microchannel reactors 137
4.3.1 Changes of the temperature profile apply-ing stationary reaction conditions
The stationary temperature profile of the microchannel reactorMCR3 was monitored at 563 K using 500 ml/min preheated O2 toget the temperature profiles in absence of a reaction and afterwardsusing 500 ml/min, preheated 20% C2H4 in O2 as feed in presenceof the reaction. The temperature of the preheating tube was30 K lower than the reactor temperature and not self-tuning, thetemperature in the reactor was adjusted by a fuzzy logic andself optimizing PID controller9. Both temperature profiles aredepicted in figure 4.62. In pure O2 and therefore, in absence of
0 10 20 30 40 50-2,0
-1,5
-1,0
-0,5
0,0
0,5
1,0
O2
20% C2H
4 in O
2
T/K
T / K
position in the wafer stack / mminlet = 0 mm, outlet = 50 mm
560
562
564
566
Figure 4.62: Axial temperature profile within the microchannel reactorMCR3 with and without heat production by reaction. Reaction condi-tions: 20% C2H4 in O2, T= 563 K, τ= 200 ms, p= 0.3 MPa, X= 0.22,S=0.51, Tad= 779 K, P= 11W.
9A thermocouple mounted in the middle of the stack and attached to theheating device was used as reference. The heating device always adjusted thispoint in the middle of the reactor to the ’setpoint’ temperature
138 Chapter 4. Results
any heat production by reaction, the microchannel reactor exhibitsa temperature profile having the highest temperature of 565.4 Kat the inlet and the lowest temperature of 561.6 K directly at theoutlet. Therefore, the temperature profile caused by the heatingdevice itself is 3.8 K. As soon as the feed was switched to 20%ethene in oxygen while keeping the flow rate constant, changesin the temperature profile were observed. At the reactor inlet, ahigher inlet temperature of 565.9 K was observed as well as a loweroutlet temperature of 559.8 K. Therefore, the total temperaturegradient was 6.1 K with chemical heat production present. Inorder to compare both gradients and to compensate small drifts ofthe total reactor temperature caused by the heating device, eachgradient was normalized to the thermocouple, located in the middleof the reactor (25 mm from inlet), because the thermocouple usedas the reactor reference temperature for the heating device waslocated next to it. Therefore, the difference between both gradientsyields the thermal gradient caused by the heat of reaction. Theresults, shown in the lower graph of figure 4.62 indicate, that theinlet temperature was raised by 0.9 K and the outlet temperaturelowered by 1.6 K due to the exothermic reaction.
In the following contour graphs, this reaction caused temper-ature gradient was assigned a color in order to illustrate changesin temperature gradients (reactor inlet on top of Y-axis, outlet atY-bottom) as a function of an input function as gas flow rate, tem-perature or C2H4 concentration plotted on the X-axis.
4.3.1.1 Temperature gradients caused by changes in thereactor temperature
Changes in the temperature profile of the microchannel reactorMCR3 were monitored at a constant ethene concentration of 20%in O2, a constant residence time of 200 ms (STP), but varyingthe reactor temperature and therefore, the heat generated by thereaction. For each reactor temperature, the temperature profilewith and without ethene in the feed was measured (at a constantflow rate), both gradients normalized and the difference of bothgradients calculated as explained before. Therefore, the reactioncaused temperature profile change along the axis was measured andplotted as a function of the reactor temperature. The corresponding
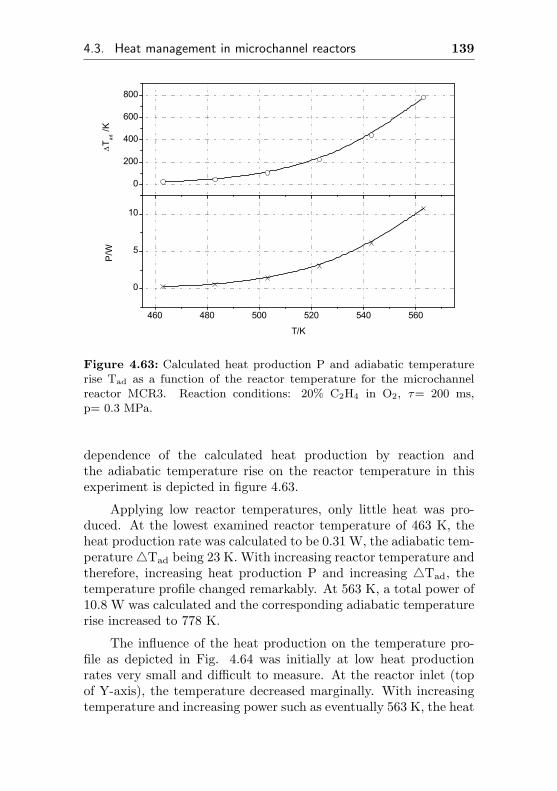
4.3. Heat management in microchannel reactors 139
460 480 500 520 540 560
0
5
10
T ad /K
P/W
T/K
0
200
400
600
800
Figure 4.63: Calculated heat production P and adiabatic temperaturerise Tad as a function of the reactor temperature for the microchannelreactor MCR3. Reaction conditions: 20% C2H4 in O2, τ= 200 ms,p= 0.3 MPa.
dependence of the calculated heat production by reaction andthe adiabatic temperature rise on the reactor temperature in thisexperiment is depicted in figure 4.63.
Applying low reactor temperatures, only little heat was pro-duced. At the lowest examined reactor temperature of 463 K, theheat production rate was calculated to be 0.31 W, the adiabatic tem-perature4Tad being 23 K. With increasing reactor temperature andtherefore, increasing heat production P and increasing 4Tad, thetemperature profile changed remarkably. At 563 K, a total power of10.8 W was calculated and the corresponding adiabatic temperaturerise increased to 778 K.
The influence of the heat production on the temperature pro-file as depicted in Fig. 4.64 was initially at low heat productionrates very small and difficult to measure. At the reactor inlet (topof Y-axis), the temperature decreased marginally. With increasingtemperature and increasing power such as eventually 563 K, the heat
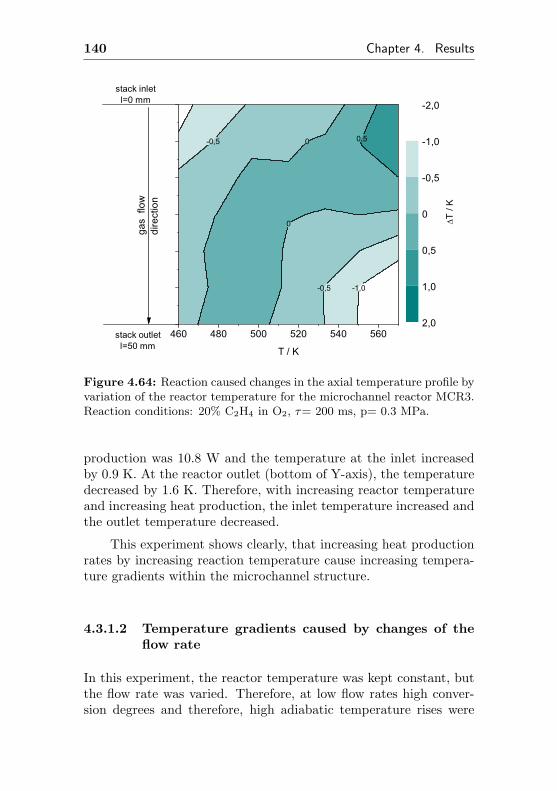
140 Chapter 4. Results
-0,5 0
0
-0,5 -1,0
0,5
460 480 500 520 540 560
T / K
stack outletl=50 mm
stack inletl=0 mm
T / K
-2,0
-1,0
-0,5
0
0,5
1,0
2,0
gas
flow
direct
ion
Figure 4.64: Reaction caused changes in the axial temperature profile byvariation of the reactor temperature for the microchannel reactor MCR3.Reaction conditions: 20% C2H4 in O2, τ= 200 ms, p= 0.3 MPa.
production was 10.8 W and the temperature at the inlet increasedby 0.9 K. At the reactor outlet (bottom of Y-axis), the temperaturedecreased by 1.6 K. Therefore, with increasing reactor temperatureand increasing heat production, the inlet temperature increased andthe outlet temperature decreased.
This experiment shows clearly, that increasing heat productionrates by increasing reaction temperature cause increasing tempera-ture gradients within the microchannel structure.
4.3.1.2 Temperature gradients caused by changes of theflow rate
In this experiment, the reactor temperature was kept constant, butthe flow rate was varied. Therefore, at low flow rates high conver-sion degrees and therefore, high adiabatic temperature rises were
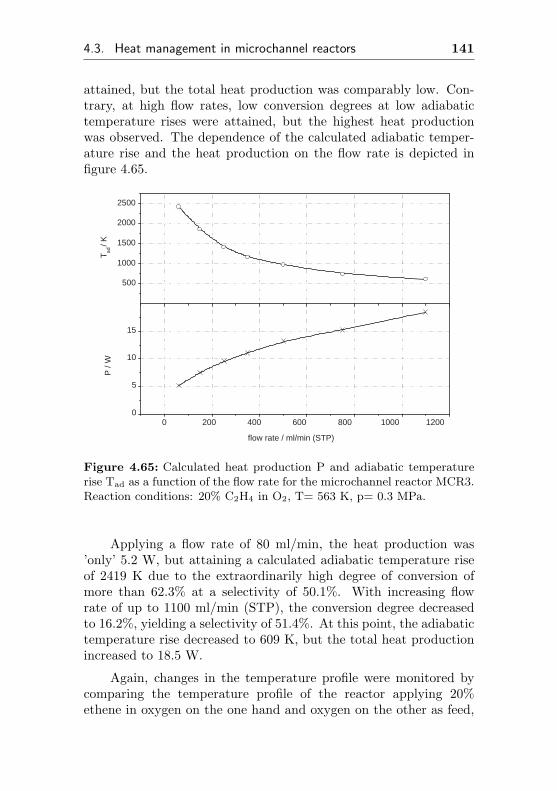
4.3. Heat management in microchannel reactors 141
attained, but the total heat production was comparably low. Con-trary, at high flow rates, low conversion degrees at low adiabatictemperature rises were attained, but the highest heat productionwas observed. The dependence of the calculated adiabatic temper-ature rise and the heat production on the flow rate is depicted infigure 4.65.
0 200 400 600 800 1000 1200 0
5
10
15
T ad
/ K
P
/ W
flow rate / ml/min (STP)
500
1000
1500
2000
2500
Figure 4.65: Calculated heat production P and adiabatic temperaturerise Tad as a function of the flow rate for the microchannel reactor MCR3.Reaction conditions: 20% C2H4 in O2, T= 563 K, p= 0.3 MPa.
Applying a flow rate of 80 ml/min, the heat production was’only’ 5.2 W, but attaining a calculated adiabatic temperature riseof 2419 K due to the extraordinarily high degree of conversion ofmore than 62.3% at a selectivity of 50.1%. With increasing flowrate of up to 1100 ml/min (STP), the conversion degree decreasedto 16.2%, yielding a selectivity of 51.4%. At this point, the adiabatictemperature rise decreased to 609 K, but the total heat productionincreased to 18.5 W.
Again, changes in the temperature profile were monitored bycomparing the temperature profile of the reactor applying 20%ethene in oxygen on the one hand and oxygen on the other as feed,
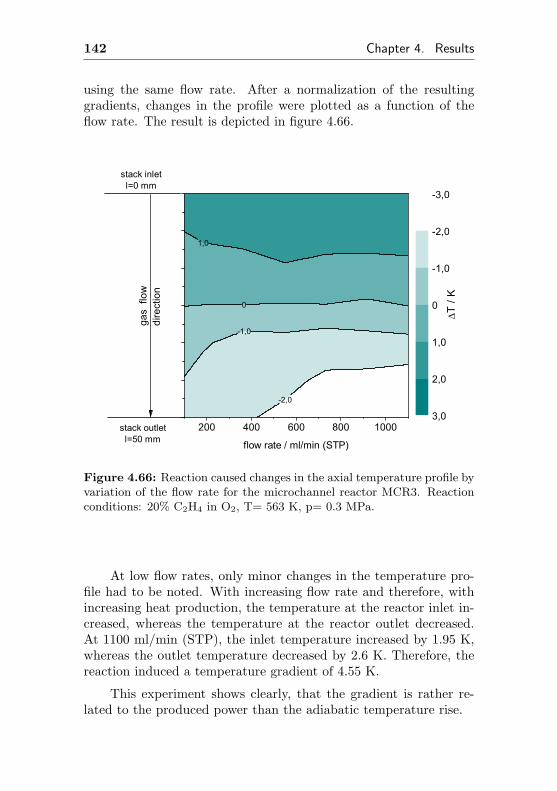
142 Chapter 4. Results
using the same flow rate. After a normalization of the resultinggradients, changes in the profile were plotted as a function of theflow rate. The result is depicted in figure 4.66.
1,0
0
-1,0
-2,0
200 400 600 800 1000
T / K
stack outletl=50 mm
stack inletl=0 mm
flow rate / ml/min (STP)
-3,0
-2,0
-1,0
0
1,0
2,0
3,0
gas
flow
direct
ion
Figure 4.66: Reaction caused changes in the axial temperature profile byvariation of the flow rate for the microchannel reactor MCR3. Reactionconditions: 20% C2H4 in O2, T= 563 K, p= 0.3 MPa.
At low flow rates, only minor changes in the temperature pro-file had to be noted. With increasing flow rate and therefore, withincreasing heat production, the temperature at the reactor inlet in-creased, whereas the temperature at the reactor outlet decreased.At 1100 ml/min (STP), the inlet temperature increased by 1.95 K,whereas the outlet temperature decreased by 2.6 K. Therefore, thereaction induced a temperature gradient of 4.55 K.
This experiment shows clearly, that the gradient is rather re-lated to the produced power than the adiabatic temperature rise.
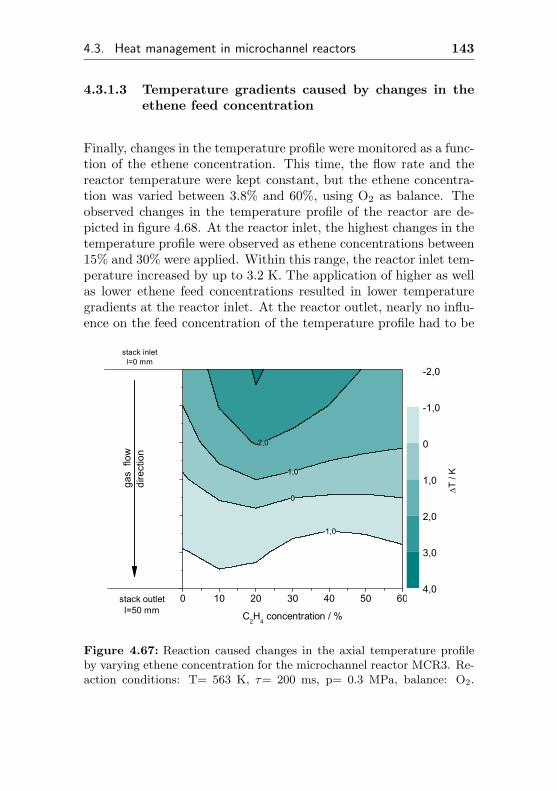
4.3. Heat management in microchannel reactors 143
4.3.1.3 Temperature gradients caused by changes in theethene feed concentration
Finally, changes in the temperature profile were monitored as a func-tion of the ethene concentration. This time, the flow rate and thereactor temperature were kept constant, but the ethene concentra-tion was varied between 3.8% and 60%, using O2 as balance. Theobserved changes in the temperature profile of the reactor are de-picted in figure 4.68. At the reactor inlet, the highest changes in thetemperature profile were observed as ethene concentrations between15% and 30% were applied. Within this range, the reactor inlet tem-perature increased by up to 3.2 K. The application of higher as wellas lower ethene feed concentrations resulted in lower temperaturegradients at the reactor inlet. At the reactor outlet, nearly no influ-ence on the feed concentration of the temperature profile had to be
1,0
0
-1,0
2,0
0 10 20 30 40 50 60
gas
flow
dire
ctio
n
T / K
stack outletl=50 mm
stack inletl=0 mm
C2H
4 concentration / %
-2,0
-1,0
0
1,0
2,0
3,0
4,0
Figure 4.67: Reaction caused changes in the axial temperature profileby varying ethene concentration for the microchannel reactor MCR3. Re-action conditions: T= 563 K, τ= 200 ms, p= 0.3 MPa, balance: O2.

144 Chapter 4. Results
noted. The adiabatic temperature rise as well as the chemical heatproduction as a function of the ethene partial pressure is depictedin figure ??.
With increasing ethene concentration, the thermal heat pro-duction increased from 6.3 Watt at 3.8% C2H4 in O2 to 15.9 Wat 44.5% ethene. A further increase in the ethene concentration to60% led to a slightly lower heat production of 14.6 W. Similar tothe trend observed with the heat production, the adiabatic temper-ature rise increased at low ethene concentrations and decreased athigh ethene concentrations with increasing C2H4 partial pressure.At 3.8% C2H4, the adiabatic temperature rise was 533 K and in-creased to 1029 K at 30% C2H4. Higher ethene concentrations ofup to 60% resulted in decreasing temperature rises of 794 K at 60%ethene.
1,0
0
-1,0
2,0
0 10 20 30 40 50 60
gas
flow
dire
ctio
n
T / K
stack outletl=50 mm
stack inletl=0 mm
C2H
4 concentration / %
-2,0
-1,0
0
1,0
2,0
3,0
4,0
Figure 4.68: Reaction caused changes in the axial temperature profileby varying ethene concentration for the microchannel reactor MCR3. Re-action conditions: T= 563 K, τ= 200 ms, p= 0.3 MPa, balance: O2.
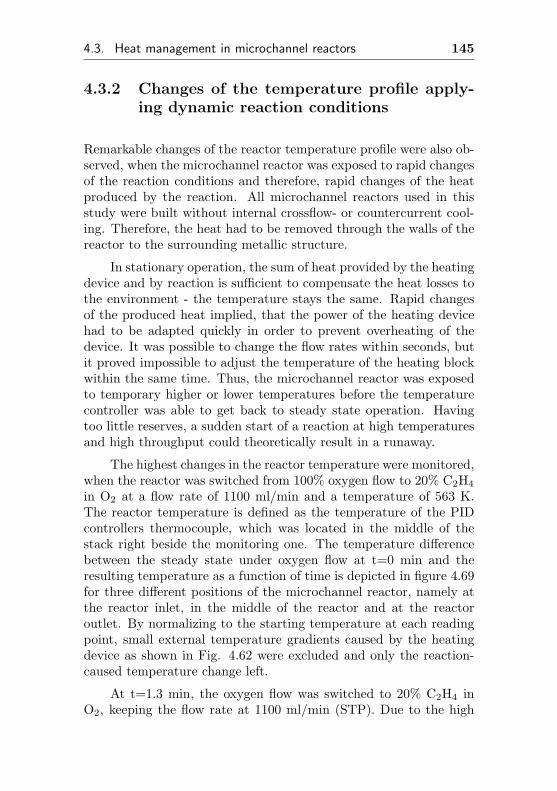
4.3. Heat management in microchannel reactors 145
4.3.2 Changes of the temperature profile apply-ing dynamic reaction conditions
Remarkable changes of the reactor temperature profile were also ob-served, when the microchannel reactor was exposed to rapid changesof the reaction conditions and therefore, rapid changes of the heatproduced by the reaction. All microchannel reactors used in thisstudy were built without internal crossflow- or countercurrent cool-ing. Therefore, the heat had to be removed through the walls of thereactor to the surrounding metallic structure.
In stationary operation, the sum of heat provided by the heatingdevice and by reaction is sufficient to compensate the heat losses tothe environment - the temperature stays the same. Rapid changesof the produced heat implied, that the power of the heating devicehad to be adapted quickly in order to prevent overheating of thedevice. It was possible to change the flow rates within seconds, butit proved impossible to adjust the temperature of the heating blockwithin the same time. Thus, the microchannel reactor was exposedto temporary higher or lower temperatures before the temperaturecontroller was able to get back to steady state operation. Havingtoo little reserves, a sudden start of a reaction at high temperaturesand high throughput could theoretically result in a runaway.
The highest changes in the reactor temperature were monitored,when the reactor was switched from 100% oxygen flow to 20% C2H4
in O2 at a flow rate of 1100 ml/min and a temperature of 563 K.The reactor temperature is defined as the temperature of the PIDcontrollers thermocouple, which was located in the middle of thestack right beside the monitoring one. The temperature differencebetween the steady state under oxygen flow at t=0 min and theresulting temperature as a function of time is depicted in figure 4.69for three different positions of the microchannel reactor, namely atthe reactor inlet, in the middle of the reactor and at the reactoroutlet. By normalizing to the starting temperature at each readingpoint, small external temperature gradients caused by the heatingdevice as shown in Fig. 4.62 were excluded and only the reaction-caused temperature change left.
At t=1.3 min, the oxygen flow was switched to 20% C2H4 inO2, keeping the flow rate at 1100 ml/min (STP). Due to the high
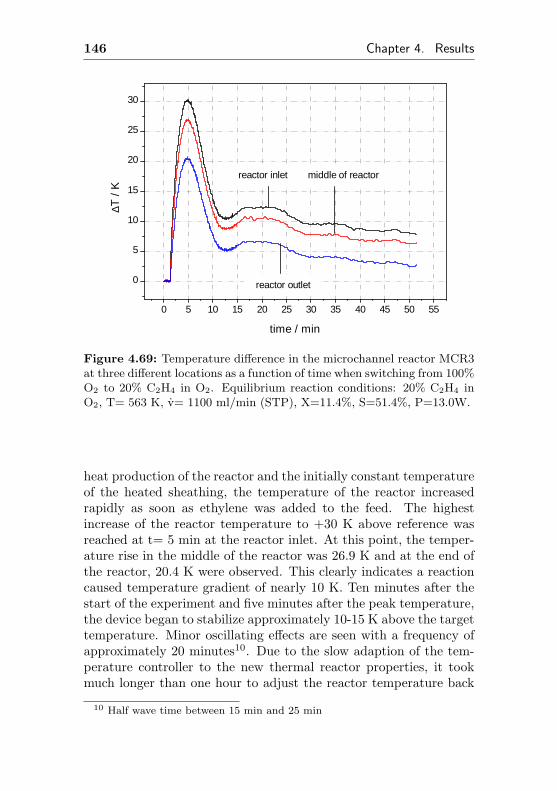
146 Chapter 4. Results
0 5 10 15 20 25 30 35 40 45 50 55
0
5
10
15
20
25
30
reactor outlet
reactor inlet middle of reactor
∆T /
K
time / min
Figure 4.69: Temperature difference in the microchannel reactor MCR3at three different locations as a function of time when switching from 100%O2 to 20% C2H4 in O2. Equilibrium reaction conditions: 20% C2H4 inO2, T= 563 K, v= 1100 ml/min (STP), X=11.4%, S=51.4%, P=13.0W.
heat production of the reactor and the initially constant temperatureof the heated sheathing, the temperature of the reactor increasedrapidly as soon as ethylene was added to the feed. The highestincrease of the reactor temperature to +30 K above reference wasreached at t= 5 min at the reactor inlet. At this point, the temper-ature rise in the middle of the reactor was 26.9 K and at the end ofthe reactor, 20.4 K were observed. This clearly indicates a reactioncaused temperature gradient of nearly 10 K. Ten minutes after thestart of the experiment and five minutes after the peak temperature,the device began to stabilize approximately 10-15 K above the targettemperature. Minor oscillating effects are seen with a frequency ofapproximately 20 minutes10. Due to the slow adaption of the tem-perature controller to the new thermal reactor properties, it tookmuch longer than one hour to adjust the reactor temperature back
10 Half wave time between 15 min and 25 min
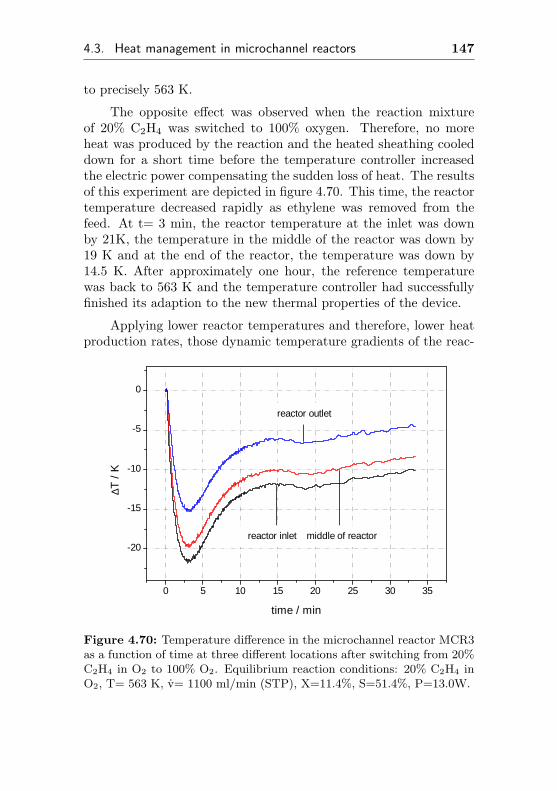
4.3. Heat management in microchannel reactors 147
to precisely 563 K.
The opposite effect was observed when the reaction mixtureof 20% C2H4 was switched to 100% oxygen. Therefore, no moreheat was produced by the reaction and the heated sheathing cooleddown for a short time before the temperature controller increasedthe electric power compensating the sudden loss of heat. The resultsof this experiment are depicted in figure 4.70. This time, the reactortemperature decreased rapidly as ethylene was removed from thefeed. At t= 3 min, the reactor temperature at the inlet was downby 21K, the temperature in the middle of the reactor was down by19 K and at the end of the reactor, the temperature was down by14.5 K. After approximately one hour, the reference temperaturewas back to 563 K and the temperature controller had successfullyfinished its adaption to the new thermal properties of the device.
Applying lower reactor temperatures and therefore, lower heatproduction rates, those dynamic temperature gradients of the reac-
0 5 10 15 20 25 30 35
-20
-15
-10
-5
0
reactor outlet
reactor inlet middle of reactor
∆T /
K
time / min
Figure 4.70: Temperature difference in the microchannel reactor MCR3as a function of time at three different locations after switching from 20%C2H4 in O2 to 100% O2. Equilibrium reaction conditions: 20% C2H4 inO2, T= 563 K, v= 1100 ml/min (STP), X=11.4%, S=51.4%, P=13.0W.
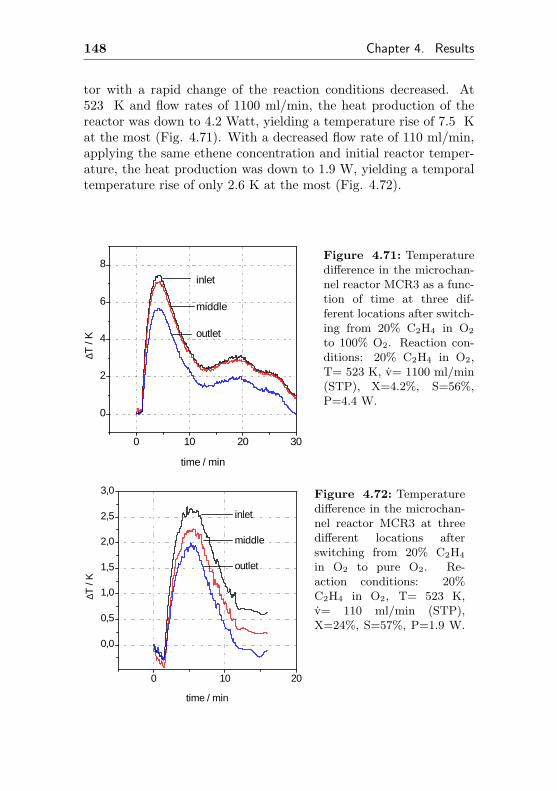
148 Chapter 4. Results
tor with a rapid change of the reaction conditions decreased. At523 K and flow rates of 1100 ml/min, the heat production of thereactor was down to 4.2 Watt, yielding a temperature rise of 7.5 Kat the most (Fig. 4.71). With a decreased flow rate of 110 ml/min,applying the same ethene concentration and initial reactor temper-ature, the heat production was down to 1.9 W, yielding a temporaltemperature rise of only 2.6 K at the most (Fig. 4.72).
0 10 20 30
0
2
4
6
8
inlet
middle
outlet
∆T /
K
time / min
Figure 4.71: Temperaturedifference in the microchan-nel reactor MCR3 as a func-tion of time at three dif-ferent locations after switch-ing from 20% C2H4 in O2
to 100% O2. Reaction con-ditions: 20% C2H4 in O2,T= 523 K, v= 1100 ml/min(STP), X=4.2%, S=56%,P=4.4 W.
0 10 20
0,0
0,5
1,0
1,5
2,0
2,5
3,0
inlet
middle
outlet
∆T /
K
time / min
Figure 4.72: Temperaturedifference in the microchan-nel reactor MCR3 at threedifferent locations afterswitching from 20% C2H4
in O2 to pure O2. Re-action conditions: 20%C2H4 in O2, T= 523 K,v= 110 ml/min (STP),X=24%, S=57%, P=1.9 W.
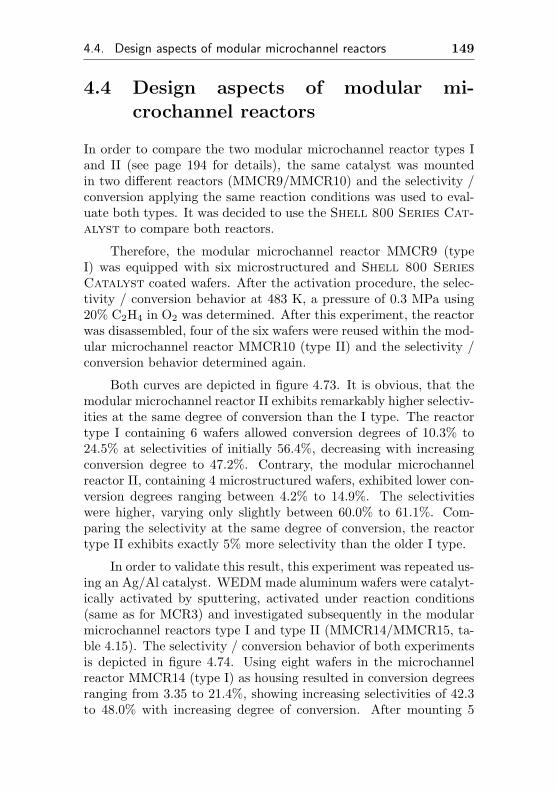
4.4. Design aspects of modular microchannel reactors 149
4.4 Design aspects of modular mi-crochannel reactors
In order to compare the two modular microchannel reactor types Iand II (see page 194 for details), the same catalyst was mountedin two different reactors (MMCR9/MMCR10) and the selectivity /conversion applying the same reaction conditions was used to eval-uate both types. It was decided to use the Shell 800 Series Cat-alyst to compare both reactors.
Therefore, the modular microchannel reactor MMCR9 (typeI) was equipped with six microstructured and Shell 800 SeriesCatalyst coated wafers. After the activation procedure, the selec-tivity / conversion behavior at 483 K, a pressure of 0.3 MPa using20% C2H4 in O2 was determined. After this experiment, the reactorwas disassembled, four of the six wafers were reused within the mod-ular microchannel reactor MMCR10 (type II) and the selectivity /conversion behavior determined again.
Both curves are depicted in figure 4.73. It is obvious, that themodular microchannel reactor II exhibits remarkably higher selectiv-ities at the same degree of conversion than the I type. The reactortype I containing 6 wafers allowed conversion degrees of 10.3% to24.5% at selectivities of initially 56.4%, decreasing with increasingconversion degree to 47.2%. Contrary, the modular microchannelreactor II, containing 4 microstructured wafers, exhibited lower con-version degrees ranging between 4.2% to 14.9%. The selectivitieswere higher, varying only slightly between 60.0% to 61.1%. Com-paring the selectivity at the same degree of conversion, the reactortype II exhibits exactly 5% more selectivity than the older I type.
In order to validate this result, this experiment was repeated us-ing an Ag/Al catalyst. WEDM made aluminum wafers were catalyt-ically activated by sputtering, activated under reaction conditions(same as for MCR3) and investigated subsequently in the modularmicrochannel reactors type I and type II (MMCR14/MMCR15, ta-ble 4.15). The selectivity / conversion behavior of both experimentsis depicted in figure 4.74. Using eight wafers in the microchannelreactor MMCR14 (type I) as housing resulted in conversion degreesranging from 3.35 to 21.4%, showing increasing selectivities of 42.3to 48.0% with increasing degree of conversion. After mounting 5
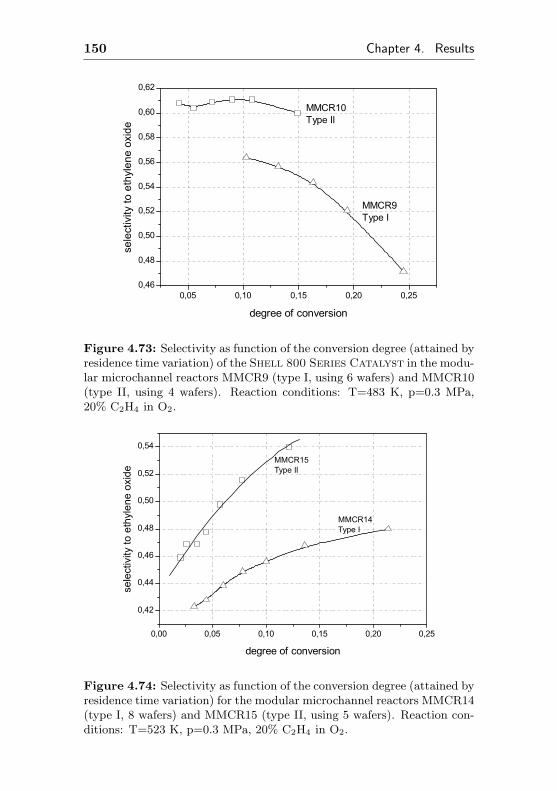
150 Chapter 4. Results
0,05 0,10 0,15 0,20 0,250,46
0,48
0,50
0,52
0,54
0,56
0,58
0,60
0,62
MMCR9Type I
MMCR10Type II
sele
ctiv
ity to
eth
ylen
e ox
ide
degree of conversion
Figure 4.73: Selectivity as function of the conversion degree (attained byresidence time variation) of the Shell 800 Series Catalyst in the modu-lar microchannel reactors MMCR9 (type I, using 6 wafers) and MMCR10(type II, using 4 wafers). Reaction conditions: T=483 K, p=0.3 MPa,20% C2H4 in O2.
0,00 0,05 0,10 0,15 0,20 0,25
0,42
0,44
0,46
0,48
0,50
0,52
0,54
MMCR14Type I
sele
ctiv
ity to
eth
ylen
e ox
ide
degree of conversion
MMCR15Type II
Figure 4.74: Selectivity as function of the conversion degree (attained byresidence time variation) for the modular microchannel reactors MMCR14(type I, 8 wafers) and MMCR15 (type II, using 5 wafers). Reaction con-ditions: T=523 K, p=0.3 MPa, 20% C2H4 in O2.
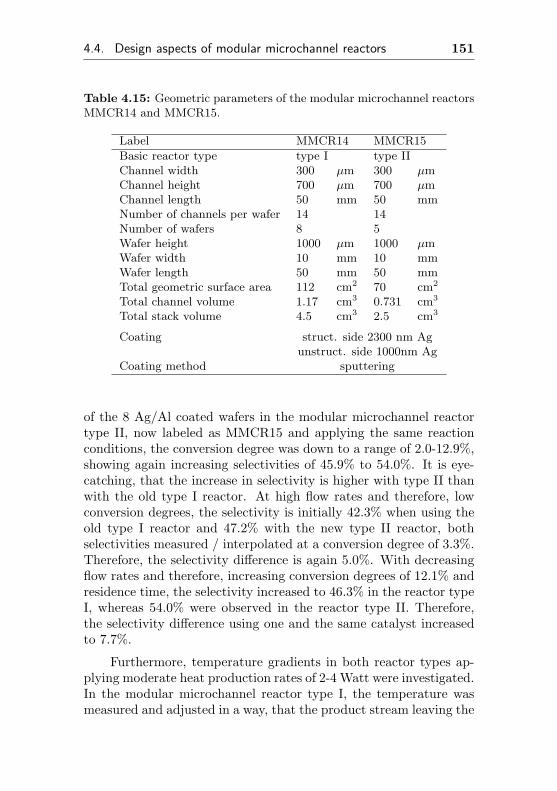
4.4. Design aspects of modular microchannel reactors 151
Table 4.15: Geometric parameters of the modular microchannel reactorsMMCR14 and MMCR15.
Label MMCR14 MMCR15
Basic reactor type type I type IIChannel width 300 µm 300 µmChannel height 700 µm 700 µmChannel length 50 mm 50 mmNumber of channels per wafer 14 14Number of wafers 8 5Wafer height 1000 µm 1000 µmWafer width 10 mm 10 mmWafer length 50 mm 50 mmTotal geometric surface area 112 cm2 70 cm2
Total channel volume 1.17 cm3 0.731 cm3
Total stack volume 4.5 cm3 2.5 cm3
Coating struct. side 2300 nm Agunstruct. side 1000nm Ag
Coating method sputtering
of the 8 Ag/Al coated wafers in the modular microchannel reactortype II, now labeled as MMCR15 and applying the same reactionconditions, the conversion degree was down to a range of 2.0-12.9%,showing again increasing selectivities of 45.9% to 54.0%. It is eye-catching, that the increase in selectivity is higher with type II thanwith the old type I reactor. At high flow rates and therefore, lowconversion degrees, the selectivity is initially 42.3% when using theold type I reactor and 47.2% with the new type II reactor, bothselectivities measured / interpolated at a conversion degree of 3.3%.Therefore, the selectivity difference is again 5.0%. With decreasingflow rates and therefore, increasing conversion degrees of 12.1% andresidence time, the selectivity increased to 46.3% in the reactor typeI, whereas 54.0% were observed in the reactor type II. Therefore,the selectivity difference using one and the same catalyst increasedto 7.7%.
Furthermore, temperature gradients in both reactor types ap-plying moderate heat production rates of 2-4 Watt were investigated.In the modular microchannel reactor type I, the temperature wasmeasured and adjusted in a way, that the product stream leaving the
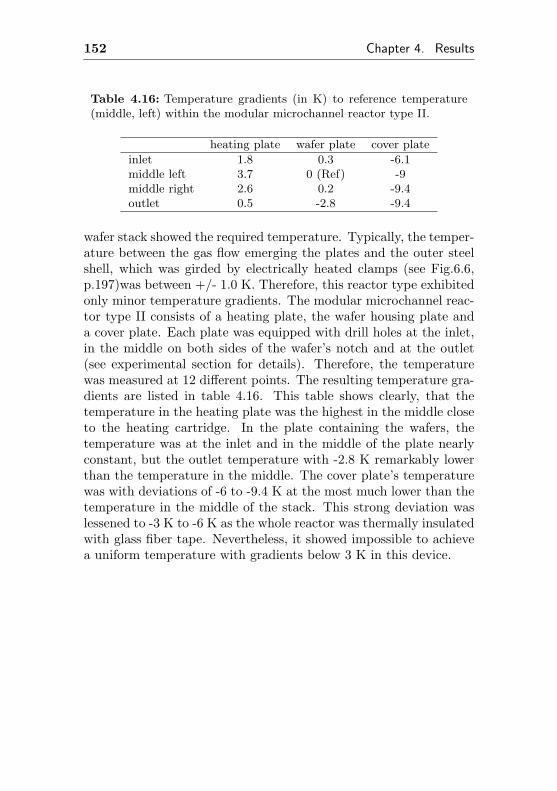
152 Chapter 4. Results
Table 4.16: Temperature gradients (in K) to reference temperature(middle, left) within the modular microchannel reactor type II.
heating plate wafer plate cover plate
inlet 1.8 0.3 -6.1middle left 3.7 0 (Ref) -9middle right 2.6 0.2 -9.4outlet 0.5 -2.8 -9.4
wafer stack showed the required temperature. Typically, the temper-ature between the gas flow emerging the plates and the outer steelshell, which was girded by electrically heated clamps (see Fig.6.6,p.197)was between +/- 1.0 K. Therefore, this reactor type exhibitedonly minor temperature gradients. The modular microchannel reac-tor type II consists of a heating plate, the wafer housing plate anda cover plate. Each plate was equipped with drill holes at the inlet,in the middle on both sides of the wafer’s notch and at the outlet(see experimental section for details). Therefore, the temperaturewas measured at 12 different points. The resulting temperature gra-dients are listed in table 4.16. This table shows clearly, that thetemperature in the heating plate was the highest in the middle closeto the heating cartridge. In the plate containing the wafers, thetemperature was at the inlet and in the middle of the plate nearlyconstant, but the outlet temperature with -2.8 K remarkably lowerthan the temperature in the middle. The cover plate’s temperaturewas with deviations of -6 to -9.4 K at the most much lower than thetemperature in the middle of the stack. This strong deviation waslessened to -3 K to -6 K as the whole reactor was thermally insulatedwith glass fiber tape. Nevertheless, it showed impossible to achievea uniform temperature with gradients below 3 K in this device.
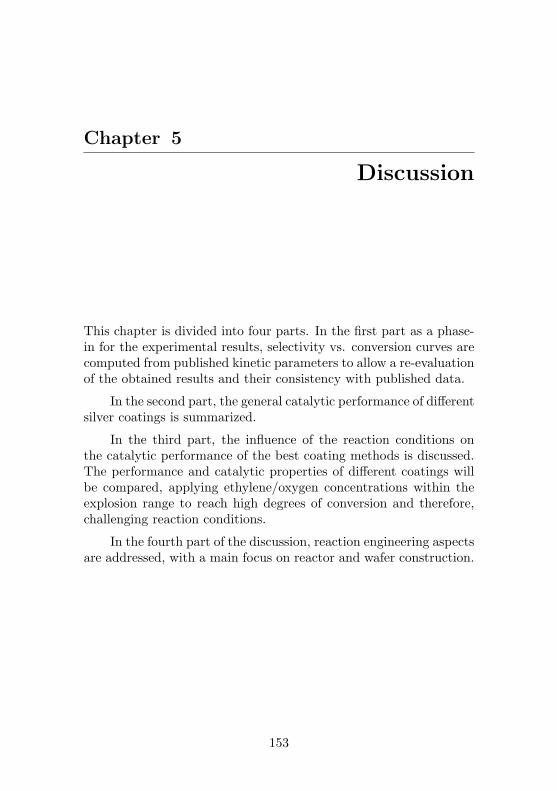
Chapter 5
Discussion
This chapter is divided into four parts. In the first part as a phase-in for the experimental results, selectivity vs. conversion curves arecomputed from published kinetic parameters to allow a re-evaluationof the obtained results and their consistency with published data.
In the second part, the general catalytic performance of differentsilver coatings is summarized.
In the third part, the influence of the reaction conditions onthe catalytic performance of the best coating methods is discussed.The performance and catalytic properties of different coatings willbe compared, applying ethylene/oxygen concentrations within theexplosion range to reach high degrees of conversion and therefore,challenging reaction conditions.
In the fourth part of the discussion, reaction engineering aspectsare addressed, with a main focus on reactor and wafer construction.
153
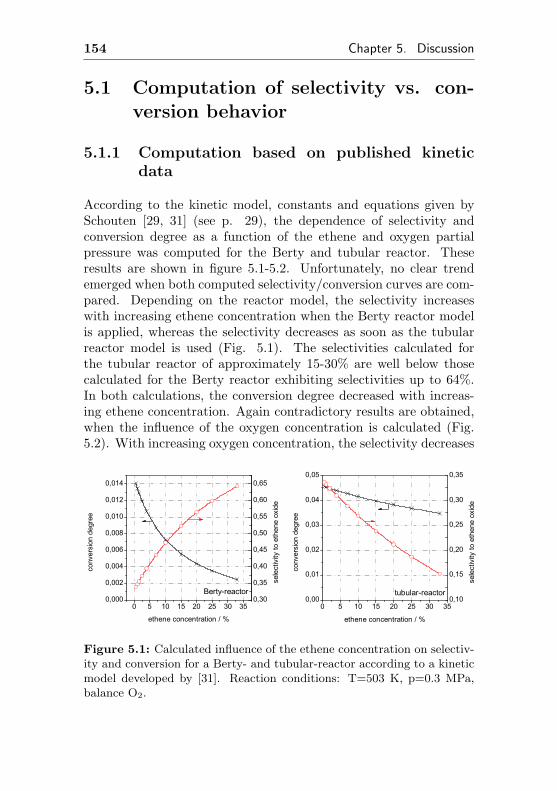
154 Chapter 5. Discussion
5.1 Computation of selectivity vs. con-version behavior
5.1.1 Computation based on published kineticdata
According to the kinetic model, constants and equations given bySchouten [29, 31] (see p. 29), the dependence of selectivity andconversion degree as a function of the ethene and oxygen partialpressure was computed for the Berty and tubular reactor. Theseresults are shown in figure 5.1-5.2. Unfortunately, no clear trendemerged when both computed selectivity/conversion curves are com-pared. Depending on the reactor model, the selectivity increaseswith increasing ethene concentration when the Berty reactor modelis applied, whereas the selectivity decreases as soon as the tubularreactor model is used (Fig. 5.1). The selectivities calculated forthe tubular reactor of approximately 15-30% are well below thosecalculated for the Berty reactor exhibiting selectivities up to 64%.In both calculations, the conversion degree decreased with increas-ing ethene concentration. Again contradictory results are obtained,when the influence of the oxygen concentration is calculated (Fig.5.2). With increasing oxygen concentration, the selectivity decreases
0 5 10 15 20 25 30 350,000
0,002
0,004
0,006
0,008
0,010
0,012
0,014
0 5 10 15 20 25 30 350,00
0,01
0,02
0,03
0,04
0,05
conv
ersi
on d
egre
e
ethene concentration / %
0,30
0,35
0,40
0,45
0,50
0,55
0,60
0,65
tubular-reactorBerty-reactor
sele
ctiv
ity to
eth
ene
oxid
e
conv
ersi
on d
egre
e
ethene concentration / %
0,10
0,15
0,20
0,25
0,30
0,35se
lect
ivity
to e
then
e ox
ide
Figure 5.1: Calculated influence of the ethene concentration on selectiv-ity and conversion for a Berty- and tubular-reactor according to a kineticmodel developed by [31]. Reaction conditions: T=503 K, p=0.3 MPa,balance O2.
5.1. Computation of selectivity vs. conversion behavior 155
0 10 20 30 40 50 60 700,00
0,01
0,02
0,03
0,04
0,05
0,06
0,07
0,08
0,09
0,10
0 10 20 30 40 50 60 700,00
0,02
0,04
0,06
0,08
0,10
0,12co
nver
sion
deg
ree
oxygen concentration / %
0,35
0,40
0,45
0,50
0,55
tubular-reactorBerty-reactor
sele
ctiv
ity to
eth
ene
oxid
e
conv
ersi
on d
egre
e
oxygen concentration / %
0,12
0,16
0,20
0,24
0,28
0,32
sel
ectiv
ity to
eth
ene
oxid
e
Figure 5.2: Calculated influence of the oxygen concentration on selectiv-ity and conversion for a Berty- and tubular-reactor according to a kineticmodel developed by [31]. Reaction conditions: T=503 K, c(C2H4) = 1%,p=0.3 MPa.
in the Berty reactor, whereas an increasing selectivity is obtainedfor the tubular reactor. In both calculations, the conversion degreeshows a maximum close to 10% oxygen. Higher oxygen concentra-tions lead to decreased conversion degrees in both models. Obvi-ously, the surface of the catalyst seems to be predominantly coveredwith oxygen, causing a decreased ethene coverage and therefore, adecreased overall reaction rate.
In order to calculate the selectivity / conversion behavior ofthe given kinetic equations and parameters, a reactor was simulatedand its selectivity-conversion behavior calculated using a simple fi-nite element approach. The effect of the reaction products carbondioxide, water and ethylene oxide were taken into account as longas constants for absorption were provided (see table 3.1, p. 29).The results are depicted in figure 5.3. Again, different trends haveto be noted. In the Berty-reactor, the selectivity decreases from areasonably high level with increasing degree of conversion, whereasin the tubular reactor, the selectivity increases starting from a verylow level. The different trends may be ascribed to the fact that ethy-lene oxide adsorption was not taken into account within the tubularreactor model. The low selectivity of the ethylene epoxidation evenat low conversion degrees is in agreement with the published kineticparameters, although the set of experiments yielding these kinetic
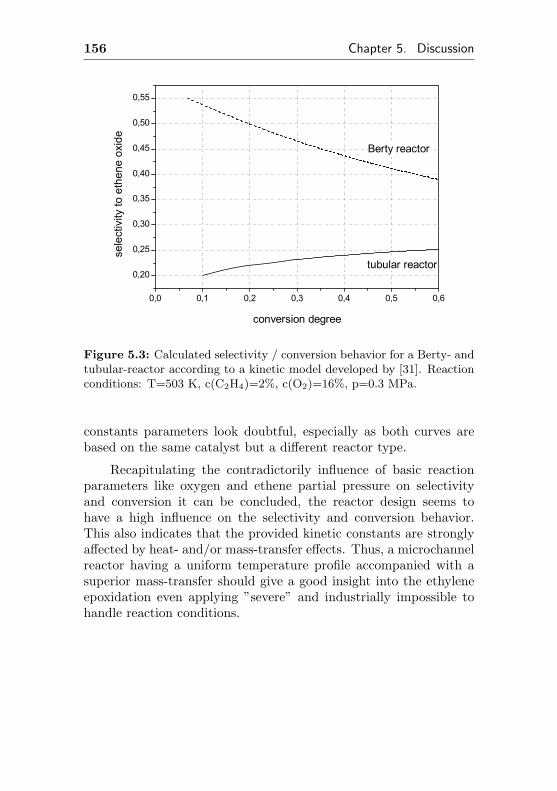
156 Chapter 5. Discussion
0,0 0,1 0,2 0,3 0,4 0,5 0,6
0,20
0,25
0,30
0,35
0,40
0,45
0,50
0,55
tubular reactor
Berty reactor
sele
ctiv
ity to
eth
ene
oxid
e
conversion degree
Figure 5.3: Calculated selectivity / conversion behavior for a Berty- andtubular-reactor according to a kinetic model developed by [31]. Reactionconditions: T=503 K, c(C2H4)=2%, c(O2)=16%, p=0.3 MPa.
constants parameters look doubtful, especially as both curves arebased on the same catalyst but a different reactor type.
Recapitulating the contradictorily influence of basic reactionparameters like oxygen and ethene partial pressure on selectivityand conversion it can be concluded, the reactor design seems tohave a high influence on the selectivity and conversion behavior.This also indicates that the provided kinetic constants are stronglyaffected by heat- and/or mass-transfer effects. Thus, a microchannelreactor having a uniform temperature profile accompanied with asuperior mass-transfer should give a good insight into the ethyleneepoxidation even applying ”severe” and industrially impossible tohandle reaction conditions.
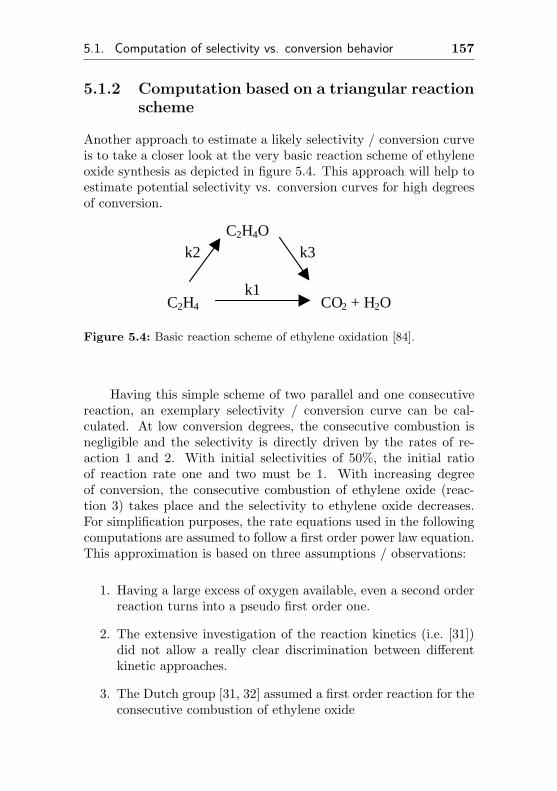
5.1. Computation of selectivity vs. conversion behavior 157
5.1.2 Computation based on a triangular reactionscheme
Another approach to estimate a likely selectivity / conversion curveis to take a closer look at the very basic reaction scheme of ethyleneoxide synthesis as depicted in figure 5.4. This approach will help toestimate potential selectivity vs. conversion curves for high degreesof conversion.
C2H4O
C2H4 CO2 + H2Ok1
k3k2
Figure 5.4: Basic reaction scheme of ethylene oxidation [84].
Having this simple scheme of two parallel and one consecutivereaction, an exemplary selectivity / conversion curve can be cal-culated. At low conversion degrees, the consecutive combustion isnegligible and the selectivity is directly driven by the rates of re-action 1 and 2. With initial selectivities of 50%, the initial ratioof reaction rate one and two must be 1. With increasing degreeof conversion, the consecutive combustion of ethylene oxide (reac-tion 3) takes place and the selectivity to ethylene oxide decreases.For simplification purposes, the rate equations used in the followingcomputations are assumed to follow a first order power law equation.This approximation is based on three assumptions / observations:
1. Having a large excess of oxygen available, even a second orderreaction turns into a pseudo first order one.
2. The extensive investigation of the reaction kinetics (i.e. [31])did not allow a really clear discrimination between differentkinetic approaches.
3. The Dutch group [31, 32] assumed a first order reaction for theconsecutive combustion of ethylene oxide
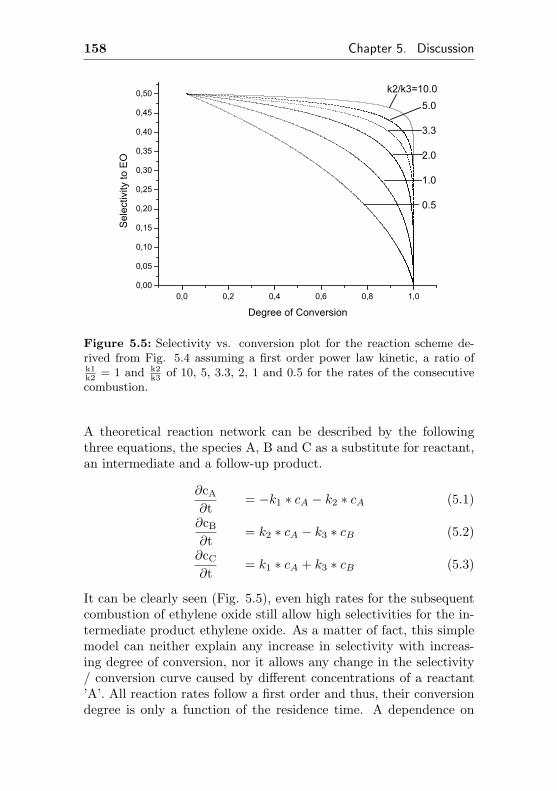
158 Chapter 5. Discussion
0,0 0,2 0,4 0,6 0,8 1,00,00
0,05
0,10
0,15
0,20
0,25
0,30
0,35
0,40
0,45
0,50
Sel
ectiv
ity to
EO
Degree of Conversion
k2/k3=10.05.0
3.3
2.0
1.0
0.5
Figure 5.5: Selectivity vs. conversion plot for the reaction scheme de-rived from Fig. 5.4 assuming a first order power law kinetic, a ratio ofk1k2
= 1 and k2k3
of 10, 5, 3.3, 2, 1 and 0.5 for the rates of the consecutivecombustion.
A theoretical reaction network can be described by the followingthree equations, the species A, B and C as a substitute for reactant,an intermediate and a follow-up product.
∂cA
∂t= −k1 ∗ cA − k2 ∗ cA (5.1)
∂cB
∂t= k2 ∗ cA − k3 ∗ cB (5.2)
∂cC
∂t= k1 ∗ cA + k3 ∗ cB (5.3)
It can be clearly seen (Fig. 5.5), even high rates for the subsequentcombustion of ethylene oxide still allow high selectivities for the in-termediate product ethylene oxide. As a matter of fact, this simplemodel can neither explain any increase in selectivity with increas-ing degree of conversion, nor it allows any change in the selectivity/ conversion curve caused by different concentrations of a reactant’A’. All reaction rates follow a first order and thus, their conversiondegree is only a function of the residence time. A dependence on
5.2. Catalytic performance of different silver coatings 159
reagent concentration requires at least a second order (power law)approach. As soon as the selectivity / conversion curve changeswith different ethene concentration, a more complex mechanistic as-sumption like a Langmuir-Hinshelwood approach, inhibition termsfor certain reaction pathways by reaction products or even differentreaction orders for some reactions are required.
5.2 Catalytic performance of differentsilver coatings
The majority of the prepared catalysts were suitable for the partialoxidation of ethene and allowed high selectivities and yields of ethy-lene oxide. Nevertheless, silver supported on steel proved to be notsuitable (see chapter 4.1.4), because its initial high selectivity to-ward ethylene oxide declined rapidly and nearly steadily within thevery first hours of operation. Surprisingly, this coating was initiallyhighly active and selective for the ethene epoxidation - contraryto the results observed for other, on the longer term well workingcoatings. Those coatings required several dozen hours of activationunder reaction conditions showing increasing conversion degrees be-fore constant and high conversion degrees and selectivities could beobserved.
Another unsuitable type of coating was silver impregnated alu-minum oxide (regardless of the immobilization method), prepared byanodic oxidation of aluminum. Details have been published [100].Ethylene oxide was observed only at very low conversion degrees insmall amounts. With increasing conversion degree, those coatingsexhibited rapidly decreasing selectivities. It is known, those highlyporous alumina coatings exhibit a comparably high surface area onthe one hand and they are acidic on the other hand [87]. Both fea-tures are not favorable as long as the isomerization-sensitive ethyleneoxide is present.
However, microchannel reactors with bulk silver, silver de-posited by PVD, silver impregnated on α-Al2O3 or an immobilizedcommercial ethylene oxide catalyst proved to be suitable for ethy-lene oxide production and showed very similar catalytic properties.Details will be discussed in the next section.
160 Chapter 5. Discussion
5.3 Influence of the reaction conditionson catalytic performance
At first, the performance of the different catalytic silver coatingsis summarized. Later, the effect of the reactant concentrations onselectivity, conversion degree and space-time-yield (STY) will be dis-cussed. The space-time-yield will be defined as an integral reactionrate (moles ethylene oxide per second), which is normalized on thetotal channel volume of the reactor (in ml) in order to avoid aninfluence of the wafer’s micromachining method and therefore, thewafer’s bulk material on this parameter. Thus, the space-time-yieldwas calculated according to the following equation:
STY =nC2H4 ·X · SC2H4O
Vchannels(5.4)
5.3.1 Impact of different oxygen concentrations
Increased oxygen concentrations proved their highly positive effecton the conversion degree with every single coating. Generally, theoxygen concentration was varied between 5-7% (which is close tooxygen concentrations used in industrial reactors) up to 80% result-ing in binary ethylene/oxygen mixtures. As shown in i.e. figure 4.2for the bulk-silver microchannel reactor MCR1 at low reactor tem-peratures (503 K), the conversion degree raised from 0.4% to 4% byfactor 10. Similar observations were made with every other well per-forming catalytic active coating. The microchannel reactor MCR3as an example for an Ag/Al coating showed an increase in the con-version degree by factor 3-4, depending on the reactor temperature(Fig. 7.6). Even the sol-gel prepared and silver impregnated Ag/α-Al2O3/Al microchannel reactor MMCR8 behaved similar, yieldingimproved conversion degrees by factor 2.5 to 3.4 (Fig. 7.9), depend-ing slightly on the reactor temperature. Eventually, the promotedcatalysts and coatings like the Shell 800 Series Catalyst andthe Cs promoted microchannel reactor MCR2Cs performed in thesame way. With the Shell 800 Series Catalyst, improved con-version degrees of factor 3.2 were observed and the MCR2Cs showeda comparable improvement of the conversion degree by factor 3.3.
The influence of the oxygen concentration on the selectivity to
5.3. Influence of the reaction conditions on catalytic performance161
ethylene oxide is more complicated. At low reactor temperaturesand therefore, low degrees of conversion, only little influence of theoxygen concentration had to be noted. With increasing reactor tem-perature, the selectivity became more and more a function of theoxygen concentration, as shown in Fig. 4.2 (Ag), 7.6 (Ag/Al), 7.17(Cs promoted Ag/Al2O3/Al) and 7.13 (SHELL Ag/α-Al2O3 cata-lyst). Therefore, high oxygen concentrations are essential as soon asethene conversion degrees with favorable high selectivities to ethy-lene oxide are required. The space-time-yield of the catalyst at agiven flow rate is improved by several hundred percent when theoxygen concentration is increased. Thus, three conclusions have tobe drawn:
1. The higher the reactor temperature, the higher the gain in con-version degree as soon as the oxygen concentration is increased(e.g. Fig. 4.2, 7.2, 7.6, 7.9, 7.13). Generally, improvements ofthe conversion degree by several hundred percent in compari-son to the ”typical” 8-9% O2 have been observed.
2. High oxygen concentrations eventually resulting in binaryC2H4/O2 mixtures result in higher selectivities, especially athigh degrees of conversion.
3. Those positive effects of the oxygen concentration were ob-served with every single type of coating and seemed to be un-affected by commonly used promoters.
In these investigations, the oxygen partial pressure was typically0.24 MPa (80% O2, 0.3 MPa total pressure) and therefore, similaroxygen partial pressures are obtained at 3 MPa and 8% oxygen.Thus, in the vast majority of all experiments, the oxygen partialpressure applied in a microchannel reactor was comparable to theavailable oxygen partial pressure in industrial ethylene oxide plants.The applied peak partial pressures were much higher than thosein commercial reactors. These high oxygen partial pressures of upto 1.9 MPa (96% O2 at 20 MPa total pressure, Fig. 4.7) are notavailable in commercial ethylene oxide plants. Given, the oxygenconcentration in a production plant is approximately 8%, a totalpressure of 23 MPa would be required to attain a similar oxygenpartial pressure.
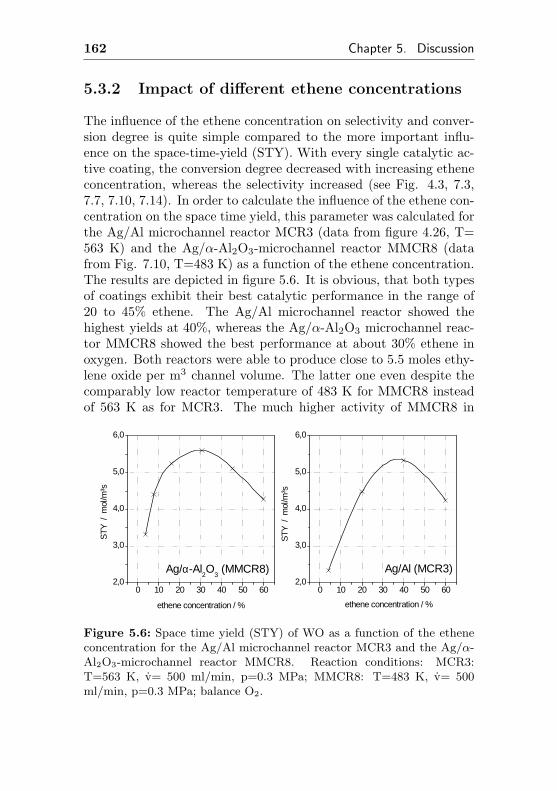
162 Chapter 5. Discussion
5.3.2 Impact of different ethene concentrations
The influence of the ethene concentration on selectivity and conver-sion degree is quite simple compared to the more important influ-ence on the space-time-yield (STY). With every single catalytic ac-tive coating, the conversion degree decreased with increasing etheneconcentration, whereas the selectivity increased (see Fig. 4.3, 7.3,7.7, 7.10, 7.14). In order to calculate the influence of the ethene con-centration on the space time yield, this parameter was calculated forthe Ag/Al microchannel reactor MCR3 (data from figure 4.26, T=563 K) and the Ag/α-Al2O3-microchannel reactor MMCR8 (datafrom Fig. 7.10, T=483 K) as a function of the ethene concentration.The results are depicted in figure 5.6. It is obvious, that both typesof coatings exhibit their best catalytic performance in the range of20 to 45% ethene. The Ag/Al microchannel reactor showed thehighest yields at 40%, whereas the Ag/α-Al2O3 microchannel reac-tor MMCR8 showed the best performance at about 30% ethene inoxygen. Both reactors were able to produce close to 5.5 moles ethy-lene oxide per m3 channel volume. The latter one even despite thecomparably low reactor temperature of 483 K for MMCR8 insteadof 563 K as for MCR3. The much higher activity of MMCR8 in
0 10 20 30 40 50 602,0
3,0
4,0
5,0
6,0
Ag/Al (MCR3)Ag/α-Al2O
3 (MMCR8)
ethene concentration / %
STY
/ m
ol/m
³s
ethene concentration / %
0 10 20 30 40 50 602,0
3,0
4,0
5,0
6,0
STY
/ m
ol/m
³s
Figure 5.6: Space time yield (STY) of WO as a function of the etheneconcentration for the Ag/Al microchannel reactor MCR3 and the Ag/α-Al2O3-microchannel reactor MMCR8. Reaction conditions: MCR3:T=563 K, v= 500 ml/min, p=0.3 MPa; MMCR8: T=483 K, v= 500ml/min, p=0.3 MPa; balance O2.
5.3. Influence of the reaction conditions on catalytic performance163
comparison to the Ag/Al microchannel reactor MCR3 may be par-tially ascribed to the slightly porous structure of the sol-gel supportmaterial, resulting in an enhanced surface area of the coating. Thisethylene oxide production rate corresponds to an annular productionof approximately 7000 tons ethylene oxide per m3 channel volume.This demonstrates the potential performance of microchannel reac-tors and the advantage of being able to handle high heat produc-tion rates and ethylene / oxygen concentrations within the explosionrange.
5.3.3 Impact of the total pressure
The influence of the total pressure on selectivity and conversion de-gree, keeping the mass flow rate constant, was investigated for nearlyevery single catalyst. In every experiment, initially increasing selec-tivities accompanied by increasing degrees of conversion were ob-served. At a certain point between 0.7 to 1.5 MPa, the selectivitystopped increasing and kept on a nearly constant level (see e.g. Fig.7.4) or even decreased slightly (see e.g. Fig. 4.7). Two potentialexplanations for this behavior will be discussed.
It is generally assumed, that the surface reaction between ab-sorbed ethene and absorbed oxygen follows a Langmuir-Hinshelwoodmechanism. At very high total pressures and therefore, at highethene and oxygen partial pressures, the selectivity was nearly con-stant but with still increasing degrees of conversion. Caused bystrong absorption of oxygen on silver surfaces and very little ab-sorption of ethene, this behavior may be ascribed to the oxygensaturation of silver particles. According to e.g. Gleaves [22] inves-tigations, this saturation is a crucial factor for the selectivity of theepoxidation. The assumption, high oxygen partial pressures improvethe saturation of silver particles with surface and subsurface oxygen,is in agreement with the experimental observations. At higher oxy-gen partial pressures, the selectivities were constant or even slightlydecreasing. Assuming, that the subsurface of the silver particles issaturated at high oxygen partial pressure (1.2 MPa O2 partial pres-sure at ptotal of 1.5 MPa), the surface gets more and more saturatedwith oxygen, eventually accelerating the total oxidation in favor ofthe selective epoxidation reaction.
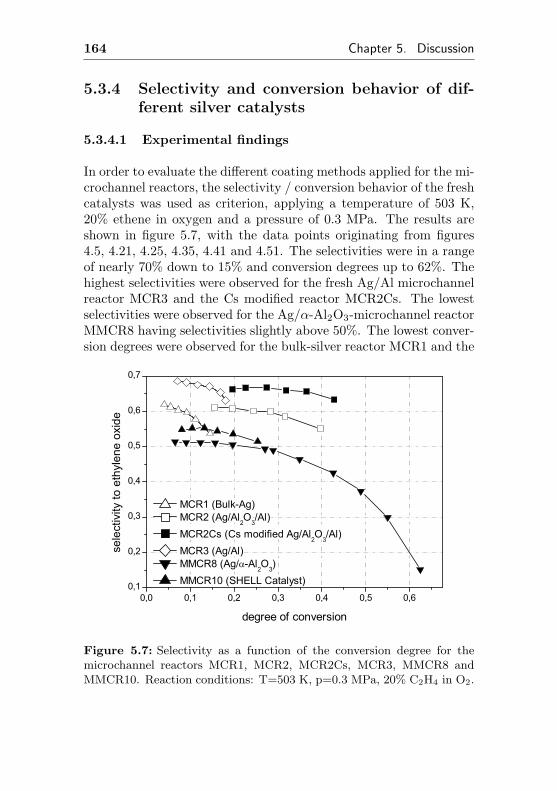
164 Chapter 5. Discussion
5.3.4 Selectivity and conversion behavior of dif-ferent silver catalysts
5.3.4.1 Experimental findings
In order to evaluate the different coating methods applied for the mi-crochannel reactors, the selectivity / conversion behavior of the freshcatalysts was used as criterion, applying a temperature of 503 K,20% ethene in oxygen and a pressure of 0.3 MPa. The results areshown in figure 5.7, with the data points originating from figures4.5, 4.21, 4.25, 4.35, 4.41 and 4.51. The selectivities were in a rangeof nearly 70% down to 15% and conversion degrees up to 62%. Thehighest selectivities were observed for the fresh Ag/Al microchannelreactor MCR3 and the Cs modified reactor MCR2Cs. The lowestselectivities were observed for the Ag/α-Al2O3-microchannel reactorMMCR8 having selectivities slightly above 50%. The lowest conver-sion degrees were observed for the bulk-silver reactor MCR1 and the
0,0 0,1 0,2 0,3 0,4 0,5 0,60,1
0,2
0,3
0,4
0,5
0,6
0,7
MCR1 (Bulk-Ag) MCR2 (Ag/Al
2O
3/Al)
MCR2Cs (Cs modified Ag/Al2O
3/Al)
MCR3 (Ag/Al) MMCR8 (Ag/ -Al
2O
3)
MMCR10 (SHELL Catalyst)
sele
ctiv
ity to
eth
ylen
e ox
ide
degree of conversion
Figure 5.7: Selectivity as a function of the conversion degree for themicrochannel reactors MCR1, MCR2, MCR2Cs, MCR3, MMCR8 andMMCR10. Reaction conditions: T=503 K, p=0.3 MPa, 20% C2H4 in O2.
5.3. Influence of the reaction conditions on catalytic performance165
Ag/Al reactor MCR3, although the latter gained a some activity andlost selectivity with increasing time on stream (see Fig. 4.31). Thisaging effect makes it difficult to compare the Ag/Al based catalystsMCR2 and MCR3 with each other, because the catalytic proper-ties depend on the time on stream and treatment of the reactor.It showed, that the selectivity as well as the conversion degree wasinitially constant for hours, as long as the flow rate was kept con-stant. As soon as the flow rate was decreased and thus, the degree ofconversion increased, selectivity was irreversibly lost (see Fig. 4.12,page 68). Probably, the reaction by-product water is responsible forthis effect. It is known, that aluminum surfaces are sensitive towardsteam, especially at higher temperatures.
All microchannel reactors had in common, that the selectivitywas nearly independent from the degree of conversion as long asthe degree of conversion was kept low. This initially flat selectiv-ity/ conversion curve indicates an initially similar reaction order ofthe partial and the total oxidation reaction as long as simple tri-angular scheme (Fig. 5.4) is assumed. Therefore, with increasingreaction progress and decreasing ethylene concentrations, the ratioof both rates stays similar. With further progress, remarkable selec-tivity losses are observed. One of the highest degrees of conversionapplying 20% C2H4 in O2 of 62.4% was observed for the unpromotedand unmodified Ag/α-Al2O3catalyst MMCR8 as depicted in figure4.35.
It can be clearly seen, the self made Ag/α-Al2O3 microchannelreactor MMCR8 exhibited slightly lower selectivities at the samedegree of conversion than the commercial made Shell 800 SeriesCatalyst in the microchannel reactor MMCR10. Concerning thespace time yield, this commercial catalyst is even inferior. At aconversion degree of 8.1%, a reactor temperature of 503 K and apressure of 0.3 MPa, the Shell 800 Series Catalyst in the mi-crochannel reactor MMCR10 yielded 2.12 mol/m3s EO, whereas aspace-time-yield of 12.45 mol/m3s EO was calculated for MMCR8,adjusting the same pressure, temperature and conversion degree. Itcannot be excluded, that the SHELL catalyst performs better inpresence of chlorine containing modifiers, for which it was intention-ally designed.
Decreasing selectivities with increasing degree of conversion
166 Chapter 5. Discussion
cannot be ascribed to a lack of oxygen or oxygen partial pressure.Having 62.4% conversion degree and 15.1% selectivity left (MMCR8,Fig. 5.7), about 2 vol% ethylene were formed, consuming 1 vol%O2. The dominant total oxidation consumed 10.8% of the availableethylene, requiring close to 33 vol% oxygen. With 80% oxygen inthe feed, only 41% of the available O2 was converted. Therefore,lack of oxygen is an unlikely explanation for this remarkable loss ofselectivity, especially since O2 concentrations of 40 to 50% resultedin still good selectivities (see Fig. 7.9). Very similar calculations canbe performed for Fig. 4.36. This graph shows clearly, that lossesin selectivity (with the same degree of conversion) are increasingwith ethene concentration having still sufficient amounts of oxygenavailable.
5.3.4.2 Computations
Some very basic approaches for a better kinetic understanding of thereaction mechanism will be tested for their validity. The selectivityvs. conversion plots looking like a simple triangular reaction schemeas computed (Fig. 5.3) may be capable to describe the kineticsof this reaction. In the following, the reagents C2H4 and O2 aredenominated as A1 and A2, the intermediate product EO as B andthe total combustion products H2O and CO2 as each C (equimolar).The direct oxidation of C2H4 will be described by reaction 1 (r1), theEO formation by reaction 2 (r2) and the consecutive EO combustionby reaction 3 (r3).
The observation of an initially constant selectivity / conversionbehavior is in agreement with the assumption of having the same re-action orders for the selective and total oxidation of ethylene. Thisis experimentally confirmed with practically close to constant se-lectivities at low conversion degrees. The calculations for oxygenconsumption (see above) suggest a large excess of oxygen. Thus,a pseudo first order kinetic for the selective and total oxidation isagain in agreement with the experimental observations, although adifferent kinetic approach is likely and cannot be excluded.
Contrarily to a plain first-order approach for all three reactions,a dependency of the selectivity / conversion curve on the initialethene concentration was found. The selectivity to EO as inter-
5.3. Influence of the reaction conditions on catalytic performance167
mediate product B (keeping the same degree of conversion) was thelower, the higher the reactant concentration (A1 and A2) was chosenand thus, the higher the concentration of the resulting intermediateproduct got1. Therefore, one of the reaction products seems to cat-alyze or support the follow up reaction of B (combustion of ethyleneoxide) and a textbook first order kinetic for the total combustionreaction path has to be discarded. Theoretically, there are threespecies formed:
1. Ethylene oxide (B). An impact of this species on the selectivitywould be possible, if adsorbed EO would react and combustwith gaseous EO similar to an Eley-Rideal mechanism of oneabsorbed and one gaseous species or if two absorbed ethyleneoxide species would react with each other. This option wouldbe described by the following equations, using a plain secondorder reaction scheme for this approach (Model 1):
∂cA1
∂t= −k1 ∗ cA1 ∗ cA2 − k2 ∗ cA1 ∗ cA2 (5.5)
∂cB
∂t= k2 ∗ cA1 ∗ cA2 − k3 ∗ cA2 ∗ cB2 (5.6)
∂cC
∂t= k1 ∗ cA1 ∗ cA2 + k3 ∗ cA2 ∗ cB2 (5.7)
In this approach the decomposition rate is proportional thesecond power of the ethylene oxide concentration.
2. Water (C). Water may absorb on alumina, forming Lewis-acidic sites and these catalyze an isomerization of ethyleneoxide to acetaldehyde in a rate determining step. This compo-nent is oxidation sensitive and will rapidly subsequently com-bust (Model 2):
∂cA1
∂t= −k1 ∗ cA1 ∗ cA2 − k2 ∗ cA1 ∗ cA2 (5.8)
∂cB
∂t= k2 ∗ cA1 ∗ cA2 − k3 ∗ cB ∗ cC ∗ cA2 (5.9)
∂cC
∂t= k1 ∗ cA1 ∗ cA2 + k3 ∗ cB ∗ cC ∗ cA2 (5.10)
1see e.g. Fig. 4.36, p.99
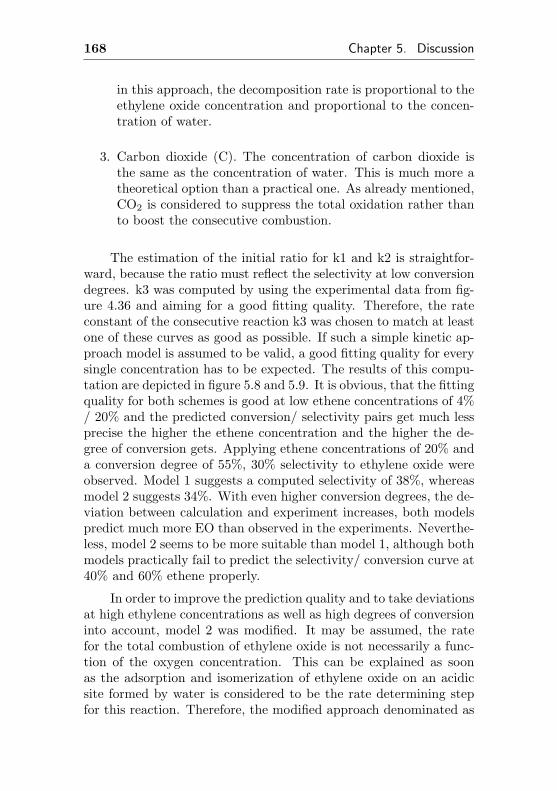
168 Chapter 5. Discussion
in this approach, the decomposition rate is proportional to theethylene oxide concentration and proportional to the concen-tration of water.
3. Carbon dioxide (C). The concentration of carbon dioxide isthe same as the concentration of water. This is much more atheoretical option than a practical one. As already mentioned,CO2 is considered to suppress the total oxidation rather thanto boost the consecutive combustion.
The estimation of the initial ratio for k1 and k2 is straightfor-ward, because the ratio must reflect the selectivity at low conversiondegrees. k3 was computed by using the experimental data from fig-ure 4.36 and aiming for a good fitting quality. Therefore, the rateconstant of the consecutive reaction k3 was chosen to match at leastone of these curves as good as possible. If such a simple kinetic ap-proach model is assumed to be valid, a good fitting quality for everysingle concentration has to be expected. The results of this compu-tation are depicted in figure 5.8 and 5.9. It is obvious, that the fittingquality for both schemes is good at low ethene concentrations of 4%/ 20% and the predicted conversion/ selectivity pairs get much lessprecise the higher the ethene concentration and the higher the de-gree of conversion gets. Applying ethene concentrations of 20% anda conversion degree of 55%, 30% selectivity to ethylene oxide wereobserved. Model 1 suggests a computed selectivity of 38%, whereasmodel 2 suggests 34%. With even higher conversion degrees, the de-viation between calculation and experiment increases, both modelspredict much more EO than observed in the experiments. Neverthe-less, model 2 seems to be more suitable than model 1, although bothmodels practically fail to predict the selectivity/ conversion curve at40% and 60% ethene properly.
In order to improve the prediction quality and to take deviationsat high ethylene concentrations as well as high degrees of conversioninto account, model 2 was modified. It may be assumed, the ratefor the total combustion of ethylene oxide is not necessarily a func-tion of the oxygen concentration. This can be explained as soonas the adsorption and isomerization of ethylene oxide on an acidicsite formed by water is considered to be the rate determining stepfor this reaction. Therefore, the modified approach denominated as
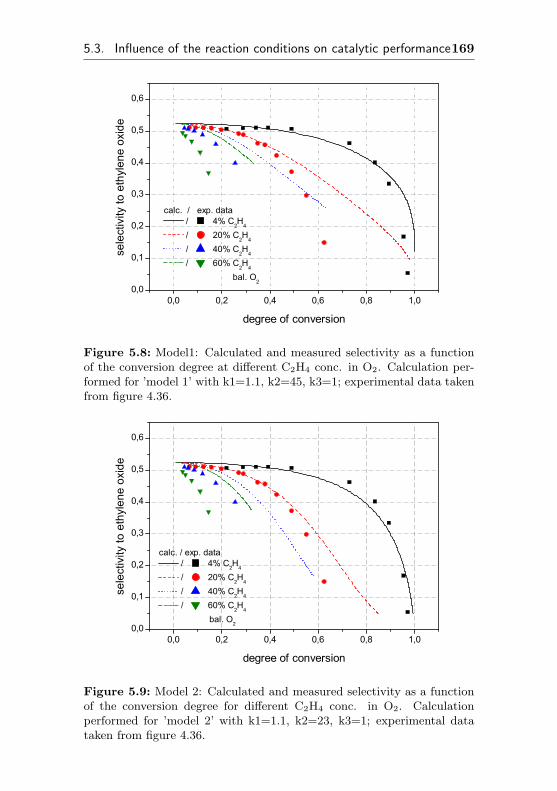
5.3. Influence of the reaction conditions on catalytic performance169
0,0 0,2 0,4 0,6 0,8 1,00,0
0,1
0,2
0,3
0,4
0,5
0,6
calc. / exp. data / 4% C
2H
4
/ 20% C2H
4
/ 40% C2H
4
/ 60% C2H
4
bal. O2
sele
ctiv
ity to
eth
ylen
e ox
ide
degree of conversion
Figure 5.8: Model1: Calculated and measured selectivity as a functionof the conversion degree at different C2H4 conc. in O2. Calculation per-formed for ’model 1’ with k1=1.1, k2=45, k3=1; experimental data takenfrom figure 4.36.
0,0 0,2 0,4 0,6 0,8 1,00,0
0,1
0,2
0,3
0,4
0,5
0,6
calc. / exp. data / 4% C
2H
4
/ 20% C2H
4
/ 40% C2H
4
/ 60% C2H
4
bal. O2
sele
ctiv
ity to
eth
ylen
e ox
ide
degree of conversion
Figure 5.9: Model 2: Calculated and measured selectivity as a functionof the conversion degree for different C2H4 conc. in O2. Calculationperformed for ’model 2’ with k1=1.1, k2=23, k3=1; experimental datataken from figure 4.36.
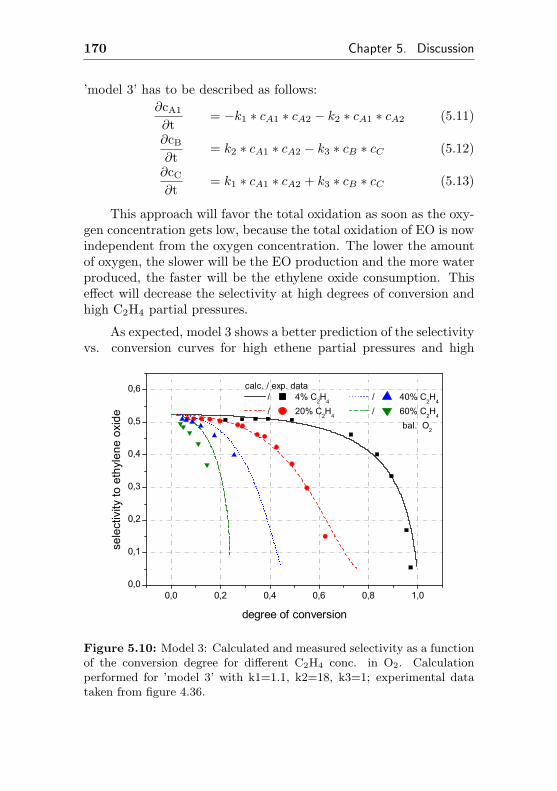
170 Chapter 5. Discussion
’model 3’ has to be described as follows:∂cA1
∂t= −k1 ∗ cA1 ∗ cA2 − k2 ∗ cA1 ∗ cA2 (5.11)
∂cB
∂t= k2 ∗ cA1 ∗ cA2 − k3 ∗ cB ∗ cC (5.12)
∂cC
∂t= k1 ∗ cA1 ∗ cA2 + k3 ∗ cB ∗ cC (5.13)
This approach will favor the total oxidation as soon as the oxy-gen concentration gets low, because the total oxidation of EO is nowindependent from the oxygen concentration. The lower the amountof oxygen, the slower will be the EO production and the more waterproduced, the faster will be the ethylene oxide consumption. Thiseffect will decrease the selectivity at high degrees of conversion andhigh C2H4 partial pressures.
As expected, model 3 shows a better prediction of the selectivityvs. conversion curves for high ethene partial pressures and high
0,0 0,2 0,4 0,6 0,8 1,00,0
0,1
0,2
0,3
0,4
0,5
0,6 calc. / exp. data / 4% C
2H
4 / 40% C
2H
4
/ 20% C2H
4 / 60% C
2H
4
bal. O2
sele
ctiv
ity to
eth
ylen
e ox
ide
degree of conversion
Figure 5.10: Model 3: Calculated and measured selectivity as a functionof the conversion degree for different C2H4 conc. in O2. Calculationperformed for ’model 3’ with k1=1.1, k2=18, k3=1; experimental datataken from figure 4.36.
5.3. Influence of the reaction conditions on catalytic performance171
conversion degrees (see Fig. 5.10). Applying ethene concentrationsof 4% in O2, the prediction is close to a perfect match. At 20%and conversion degrees up to 62%, the prediction is at the most 5%higher than the experimental data and it follows the experimentaldata points with only a few percent error. The fitting quality for 40%and especially 60% is still not satisfying, but remarkably better thanfor model 1 and 2. Therefore, this approach seems to describe theobservations made for MMCR8, but still showing some mismatch assoon as the C2H4 concentration as well as the degree of conversiongets high. The simulated selectivities are higher than the measuredones.
In order check oxygen being the source of mismatch, the selec-tivity and conversion degrees were calculated for a constant residencetime and a constant ethene feed concentration, but with decreasingoxygen concentration. The experimental data for this set is depictedin figure 7.9. If this kinetic model 3 and the reaction scheme is reallyapplicable for this reaction, a high quality of predicted and measuredselectivities and conversion degrees has to be expected.
Unfortunately, the simple kinetic model fails as soon as theoxygen concentration decreases as shown in figure 5.11. Using thismodel, decreasing degrees of conversion cause lower concentrationsof water and therefore, the selectivity is expected to increase withdecreasing oxygen concentration as it can be seen in Fig. 5.11. Asknown from every single investigated ethylene oxide catalyst, re-markable selectivity losses are expected as soon as the initial oxygenconcentration is lowered. Therefore, the fitted data to the modifiedtriangular scheme looks like a good description and prediction of theexperimental data, but the prediction of selectivity and conversiondegrees relies more on a coincidence rather than on a proven model.
As already pointed out, subsurface oxygen plays an importantrole in the selective oxidation of ethene. In every single (simple)model following a triangular scheme, the formation of subsurfaceoxygen is not of importance. With increasing ethylene concentra-tion and high conversion degrees, the demand for reactive and se-lective oxygen species increases. Therefore, a potential explanationfor this lack of fitting quality may be a lack of reactive and selective(subsurface) oxygen species. With increasing demand, the diffusionrate of oxygen into the silver particles regenerating subsurface oxy-
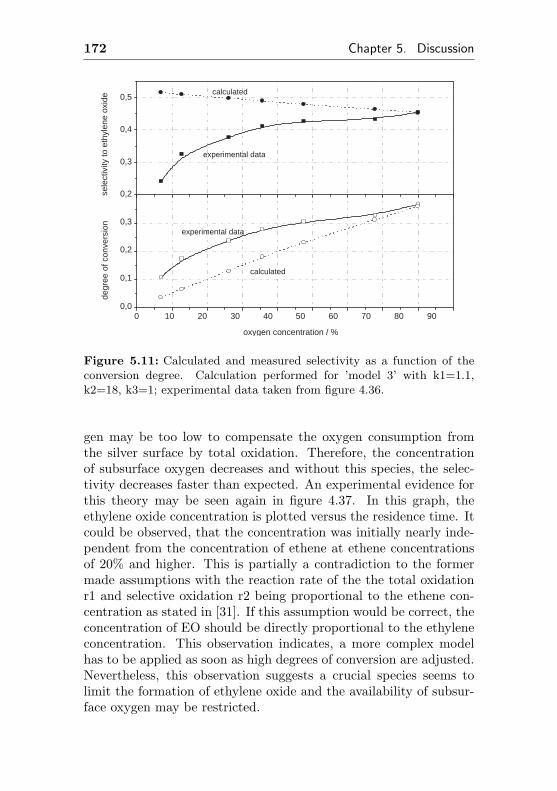
172 Chapter 5. Discussion
0 10 20 30 40 50 60 70 80 90 0,0
0,1
0,2
0,3
experimental data
calculated
experimental data
sele
ctiv
ity to
eth
ylen
e ox
ide calculated
degr
ee o
f con
vers
ion
oxygen concentration / %
0,2
0,3
0,4
0,5
Figure 5.11: Calculated and measured selectivity as a function of theconversion degree. Calculation performed for ’model 3’ with k1=1.1,k2=18, k3=1; experimental data taken from figure 4.36.
gen may be too low to compensate the oxygen consumption fromthe silver surface by total oxidation. Therefore, the concentrationof subsurface oxygen decreases and without this species, the selec-tivity decreases faster than expected. An experimental evidence forthis theory may be seen again in figure 4.37. In this graph, theethylene oxide concentration is plotted versus the residence time. Itcould be observed, that the concentration was initially nearly inde-pendent from the concentration of ethene at ethene concentrationsof 20% and higher. This is partially a contradiction to the formermade assumptions with the reaction rate of the the total oxidationr1 and selective oxidation r2 being proportional to the ethene con-centration as stated in [31]. If this assumption would be correct, theconcentration of EO should be directly proportional to the ethyleneconcentration. This observation indicates, a more complex modelhas to be applied as soon as high degrees of conversion are adjusted.Nevertheless, this observation suggests a crucial species seems tolimit the formation of ethylene oxide and the availability of subsur-face oxygen may be restricted.
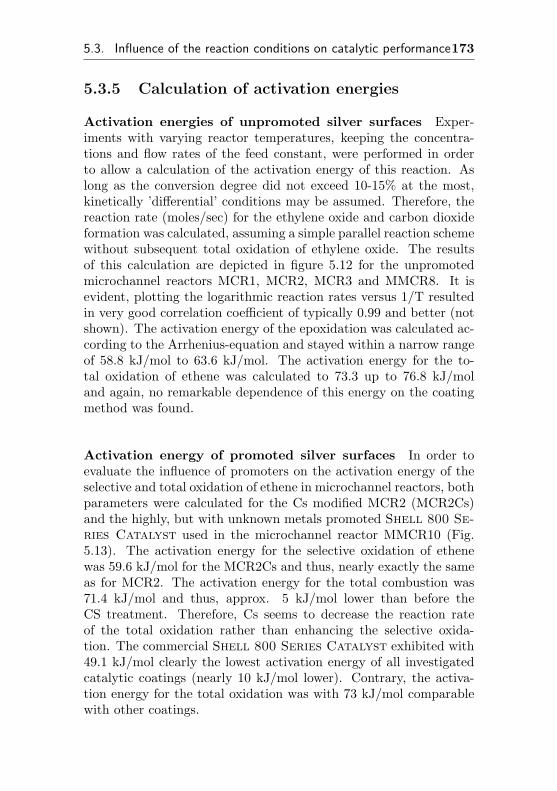
5.3. Influence of the reaction conditions on catalytic performance173
5.3.5 Calculation of activation energies
Activation energies of unpromoted silver surfaces Exper-iments with varying reactor temperatures, keeping the concentra-tions and flow rates of the feed constant, were performed in orderto allow a calculation of the activation energy of this reaction. Aslong as the conversion degree did not exceed 10-15% at the most,kinetically ’differential’ conditions may be assumed. Therefore, thereaction rate (moles/sec) for the ethylene oxide and carbon dioxideformation was calculated, assuming a simple parallel reaction schemewithout subsequent total oxidation of ethylene oxide. The resultsof this calculation are depicted in figure 5.12 for the unpromotedmicrochannel reactors MCR1, MCR2, MCR3 and MMCR8. It isevident, plotting the logarithmic reaction rates versus 1/T resultedin very good correlation coefficient of typically 0.99 and better (notshown). The activation energy of the epoxidation was calculated ac-cording to the Arrhenius-equation and stayed within a narrow rangeof 58.8 kJ/mol to 63.6 kJ/mol. The activation energy for the to-tal oxidation of ethene was calculated to 73.3 up to 76.8 kJ/moland again, no remarkable dependence of this energy on the coatingmethod was found.
Activation energy of promoted silver surfaces In order toevaluate the influence of promoters on the activation energy of theselective and total oxidation of ethene in microchannel reactors, bothparameters were calculated for the Cs modified MCR2 (MCR2Cs)and the highly, but with unknown metals promoted Shell 800 Se-ries Catalyst used in the microchannel reactor MMCR10 (Fig.5.13). The activation energy for the selective oxidation of ethenewas 59.6 kJ/mol for the MCR2Cs and thus, nearly exactly the sameas for MCR2. The activation energy for the total combustion was71.4 kJ/mol and thus, approx. 5 kJ/mol lower than before theCS treatment. Therefore, Cs seems to decrease the reaction rateof the total oxidation rather than enhancing the selective oxida-tion. The commercial Shell 800 Series Catalyst exhibited with49.1 kJ/mol clearly the lowest activation energy of all investigatedcatalytic coatings (nearly 10 kJ/mol lower). Contrary, the activa-tion energy for the total oxidation was with 73 kJ/mol comparablewith other coatings.
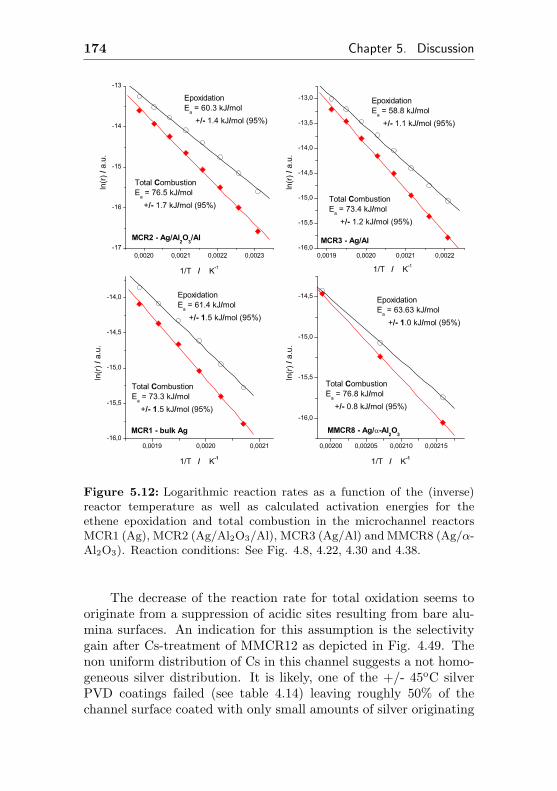
174 Chapter 5. Discussion
0,0020 0,0021 0,0022 0,0023-17
-16
-15
-14
-13
0,0019 0,0020 0,0021 0,0022-16,0
-15,5
-15,0
-14,5
-14,0
-13,5
-13,0
0,0019 0,0020 0,0021-16,0
-15,5
-15,0
-14,5
-14,0
0,00200 0,00205 0,00210 0,00215
-16,0
-15,5
-15,0
-14,5
MCR2 - Ag/Al2O3/Al
Total CombustionE
a = 76.5 kJ/mol
+/- 1.7 kJ/mol (95%)
EpoxidationE
a = 60.3 kJ/mol
+/- 1.4 kJ/mol (95%)
ln(r)
/ a.u.
1/T / K-1
MCR3 - Ag/Al
Total CombustionE
a = 73.4 kJ/mol
+/- 1.2 kJ/mol (95%)
Epoxidation E
a = 58.8 kJ/mol
+/- 1.1 kJ/mol (95%)
ln(r)
/ a.u.
1/T / K-1
MCR1 - bulk Ag
Total CombustionE
a = 73.3 kJ/mol
+/- 1.5 kJ/mol (95%)
EpoxidationE
a = 61.4 kJ/mol
+/- 1.5 kJ/mol (95%)
ln(r)
/ a.u.
1/T / K-1
MMCR8 - Ag/ -Al2O3
Total CombustionE
a = 76.8 kJ/mol
+/- 0.8 kJ/mol (95%)
EpoxidationE
a = 63.63 kJ/mol
+/- 1.0 kJ/mol (95%)
ln(r)
/ a.u.
1/T / K-1
Figure 5.12: Logarithmic reaction rates as a function of the (inverse)reactor temperature as well as calculated activation energies for theethene epoxidation and total combustion in the microchannel reactorsMCR1 (Ag), MCR2 (Ag/Al2O3/Al), MCR3 (Ag/Al) and MMCR8 (Ag/α-Al2O3). Reaction conditions: See Fig. 4.8, 4.22, 4.30 and 4.38.
The decrease of the reaction rate for total oxidation seems tooriginate from a suppression of acidic sites resulting from bare alu-mina surfaces. An indication for this assumption is the selectivitygain after Cs-treatment of MMCR12 as depicted in Fig. 4.49. Thenon uniform distribution of Cs in this channel suggests a not homo-geneous silver distribution. It is likely, one of the +/- 45oC silverPVD coatings failed (see table 4.14) leaving roughly 50% of thechannel surface coated with only small amounts of silver originating
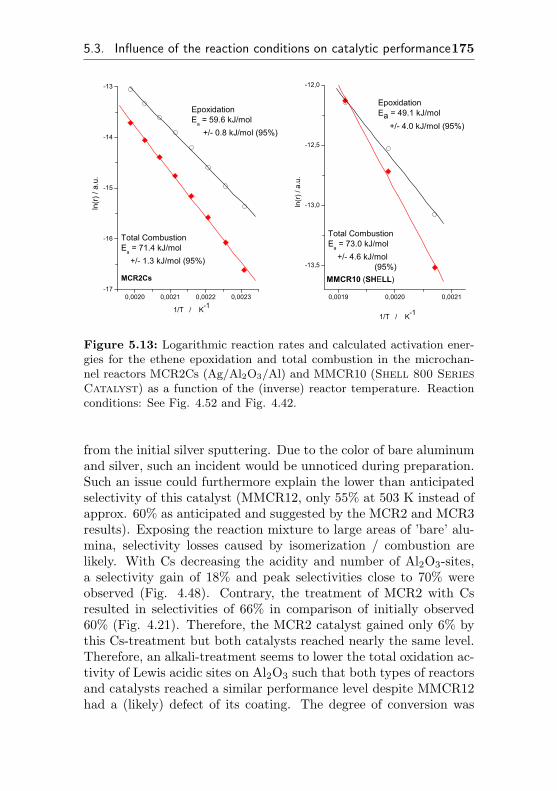
5.3. Influence of the reaction conditions on catalytic performance175
0,0020 0,0021 0,0022 0,0023-17
-16
-15
-14
-13
0,0019 0,0020 0,0021
-13,5
-13,0
-12,5
-12,0
1/T / K-1
MCR2Cs
Total CombustionEa = 71.4 kJ/mol +/- 1.3 kJ/mol (95%)
EpoxidationEa = 59.6 kJ/mol +/- 0.8 kJ/mol (95%)
ln(r
) / a
.u.
1/T / K-1
MMCR10 (SHELL)
Total CombustionEa = 73.0 kJ/mol +/- 4.6 kJ/mol (95%)
EpoxidationEa = 49.1 kJ/mol +/- 4.0 kJ/mol (95%)
ln(r
) / a
.u.
Figure 5.13: Logarithmic reaction rates and calculated activation ener-gies for the ethene epoxidation and total combustion in the microchan-nel reactors MCR2Cs (Ag/Al2O3/Al) and MMCR10 (Shell 800 SeriesCatalyst) as a function of the (inverse) reactor temperature. Reactionconditions: See Fig. 4.52 and Fig. 4.42.
from the initial silver sputtering. Due to the color of bare aluminumand silver, such an incident would be unnoticed during preparation.Such an issue could furthermore explain the lower than anticipatedselectivity of this catalyst (MMCR12, only 55% at 503 K instead ofapprox. 60% as anticipated and suggested by the MCR2 and MCR3results). Exposing the reaction mixture to large areas of ’bare’ alu-mina, selectivity losses caused by isomerization / combustion arelikely. With Cs decreasing the acidity and number of Al2O3-sites,a selectivity gain of 18% and peak selectivities close to 70% wereobserved (Fig. 4.48). Contrary, the treatment of MCR2 with Csresulted in selectivities of 66% in comparison of initially observed60% (Fig. 4.21). Therefore, the MCR2 catalyst gained only 6% bythis Cs-treatment but both catalysts reached nearly the same level.Therefore, an alkali-treatment seems to lower the total oxidation ac-tivity of Lewis acidic sites on Al2O3 such that both types of reactorsand catalysts reached a similar performance level despite MMCR12had a (likely) defect of its coating. The degree of conversion was
176 Chapter 5. Discussion
nearly unaffected by this treatment. The aged MCR2 showed 10.6%conversion at a selectivity 60.3% (483 K, 20% C2H4 in O2, Fig. 4.23,p.82). Applying the same flow rate and reaction conditions, the se-lectivity was up by 9% to to 69.3% after Cs treatment at a nearlyunchanged conversion degree of 10.1% (Fig. 4.51, p.122). There-fore, the influence of Cs on the catalytic properties of silver particlesseems to be limited.
A very different result was obtained for the commercial Shell800 Series Catalyst. The activation energy for the total oxi-dation was calculated to 73.0 kJ/mol and therefore comparable toevery other investigated silver catalyst. The activation energy forthe selective oxidation was calculated to 49.1 kJ/mol and approxi-mately 10 kJ/mol lower than for every other investigated catalyticsurface. Therefore, the good selectivity of this commercial catalystespecially at low temperatures is based on an enhancement of theselective oxidation, whereas the activation energy of the competingtotal combustion is similar to conventional catalysts.
These findings for the activation energies of the commercial cat-alyst are consistent with results reported for a similar commercialcatalyst used by [31]. Their kinetic experiments applying very lowconversion degrees suggested activation energies of 48.1 kJ/mol forthe epoxidation and 76.5 kJ/mol for the total combustion. Con-trary, Hall and Neubauer [21] found a lower activation energy of 35kJ/mol for total oxidation and epoxidation single crystal silver cata-lysts and applying vacuum conditions. Generally, activation energiesof 35 kJ/mol up to 90 kJ/mol were reported for the epoxidation anda range of 35 kJ/mol to 122 kJ/mol for the total oxidation [85].
5.4 Heat effects and reaction engineeringaspects
5.4.1 Temperature profiles and heat effects in mi-crochannel reactors
Temperature profiles of an industrial multi-tube type reactor werealready described in the theory section (see p.34ff). The influenceof the wall temperature, flow rate and ethene concentration had
5.4. Heat effects and reaction engineering aspects 177
been investigated. The most important finding was, that the hot-spot temperature is strongly correlated with the conversion degreeand not with absolute heat production of the reactor. Increased walltemperature as well as increased hydrocarbon concentration resultedin higher hot-spot temperatures.
As shown in chapter 4.3 (see p.136ff), similar investigations wereperformed for the microchannel reactor MCR3.
Applying only O2 gas flow in absence of C2H4, a temperatureprofile had to be noted along the reactor axis as shown in figure4.62. This is likely caused by the outer electric heating device, whichseems to show a non uniform heat distribution although it was madeof aluminum because of its high heat conductivity. Nevertheless,there must be a contact area between the reactor’s housing and theheating device with its cartridges and minor differences in local heatconductivities caused by non uniform clearance between the twodevices may result in small but measurable heat transfer issues.
After switching to an ethylene/oxygen mixture, the tempera-ture profile changed slightly. The difference between the maximumand minimum temperature in absence of a reaction was approx-imately 3.8 K, with this highly exothermic reaction the gradientincreased to 6.1 K. Furthermore, it was observed that in presenceof an exothermic reaction, the temperature at the reactor inlet in-creased and the temperature at the outlet decreased. This can beunderstood, as soon as the behavior of electrical heating supportis taken into account. The reactor temperature is measured by athermocouple located in the middle of the reactor and a self opti-mizing PID controller adjusts the electrical energy in the heatingcartridges in a way that the temperature at this point is exactly asadjusted. In presence of an exothermic reaction, fewer electrical en-ergy is required to keep the reactor on temperature and the gradientcaused by the exothermic chemistry evolves. The reactor’s inlet withthe highest reaction rate may be therefore slightly hotter than be-fore and the reactor’s outlet with a lower reaction rate gets slightlycooler. Nevertheless, this gradient of 6K at the most is despite thehigh heat production per reactor volume by far lower than that ofthe industrial reactor tube, having gradients of up to 50 K.
In order to compare microchannel with fixed bed reactors, thegradient across the reactor is therefore used to characterize the mi-
178 Chapter 5. Discussion
crochannel reactor thermally whereas the hot spot temperature isused for thermal characterization of the tube reactor. It has to bekept in mind, that roughly 50% of the microchannel reactor’s overallgradient is caused by an inhomogeneous heating.
The influence of the hydrocarbon concentration on the tempera-ture profile of each device is depicted in Fig. 3.8 (p.40) and Fig. 4.68(p.144). It can be clearly seen, that the higher the ethene concentra-tion, the higher the hot spot temperature in the industrial tube typereactor. Using a wall temperature of 465 K, the hot spot tempera-ture was roughly 530 K at 0.9% C2H4 (in air). The microchannelreactor MCR3 showed only minor changes of the temperature profile,having an extra gradient of roughly 1K as hot spot at the reactor’sinlet. Therefore, this reactor type is practically insensitive towardschanges of the feed composition as expected.
Similar observations were made for changes of the mass flowrate. The influence of this parameter on the temperature profile wasinvestigated for both reactor types and again, interesting differencescan be easily worked out. Having a look at the axial temperatureprofile of the tube type reactor (Fig. 3.6, p.38), the hot spot gets thehigher the lower the adjusted flow rate is. At the lowest investigatedflow rate, the hot spot is roughly 35 K above the wall temperaturecompared with 10 K at a 10 times higher flow rate. A completecontrary behavior was observed for the microchannel reactor MCR3as depicted in Fig. 4.66 (p.142). With increasing flow rate, the tem-perature of the reactor’s inlet is practically constant and only thetemperature of the reactor’s outlet decreases with increasing flowrate (and therefore heat production rate). Thus, the hot spot tem-perature of a conventional tube type reactor is very strong correlatedwith the adiabatic temperature rise (see Fig.3.5, p.37 for details),whereas the temperature gradient across a microchannel reactor isonly a function of the heat production rate of the device. Further-more, the tube type reactor showed a shift of the hot spot from thereactor inlet to the middle of the reactor with increasing flow rate.This phenomenon was unnoticed in the microchannel reactor, whichexhibited only some minor changes to the temperature profile.
Changes in the reactor temperature have little effect on thetemperature profile of the microchannel reactor as shown in Fig. 4.64(p.140). With an increase of the reactor temperature from 463 K
5.4. Heat effects and reaction engineering aspects 179
to 563 K, the reaction caused temperature gradient increased fromnearly +/-0 K to 2.6 K. The corresponding experiment in the tubetype reactor showed a hot spot temperature of approximately 8 Kfor wall temperatures of 435 K up to 50 K for wall temperatures of475 K (Fig.3.4, p.36). Again, there are very large gradients withinthe tube reactor and negligible gradients within the microchannelreactor.
As a consequence, every single microchannel reactor was insen-sitive towards sudden changes of flow rates and/or reagent concen-trations. Every single incident in tube type reactors was observed assoon as the flow rate was changed, preferably when changing fromlow flow rates back to high flow rates. An explanation for this in-stability may be result from a conclusion, drawn from the industrialfixed bed reactor. Due to the comparably poor heat transfer betweenthe catalyst particle and the heat exchanger/reactor wall, these re-actors exhibit a partially adiabatic behavior as shown in figure 3.5.At low flow rates and high conversion degrees, the overall heat pro-duction rate is low, but the spot temperature is very high. As soonas the flow rate is increased, a still hot particle may encounter in-creased flow rates and therefore, increased overall heat production.This may result in such a runaway.
5.4.2 Reactor construction
Many microchannel reactors showed an unexpected selectiv-ity/conversion behavior. With increasing degree of conversionand increasing residence time, the selectivity/conversion curvesfor different temperatures had crossovers (e.g. Fig. 4.5, p. 59),which can not be explained by textbook kinetic approaches. Thisunexpected behavior is most likely caused by a total oxidationactivity of the reactor material (especially within the diffusors)towards the oxidation sensitive ethylene oxide. Therefore, at highresidence times ethylene oxide was combusted in the post catalyticzone and some selectivity lost. At higher reactor temperatures andhigher total flow rate (keeping the degree of conversion constant),the residence time in the post catalytic zone was therefore lower,resulting in less combustion and higher overall selectivities. Thistheory is supported by observations made with the modular mi-
180 Chapter 5. Discussion
crochannel reactors MMCR type I and type II (see Fig. 4.73). Thereactor type II is designed for a low diffusor volume, providing verylow residence times in the post catalytic zone. This type provedto be more selective (by 5%) when compared to the older MMCRtype I with its large diffusors using the same flow rate in bothdevices. Therefore, post catalytic total oxidation of ethylene oxidehas to be assumed in every single reactor having large diffusors.Similar observations were found by co-workers [86]. Cs salts seemto suppress even total oxidation activity of stainless steel diffusors.When comparing the selectivity/conversion curves for MCR2 andMCR2Cs (Fig. 4.21 and 4.51), the previously observed crossoverbetween curves for 483 K and 503 K is surprisingly missing after Cstreatment.
The modular reactor type II showed much higher temperaturegradients due to its construction and especially at the bottom ofthe device with its attached heating cartridge. In comparison to theMMCR type I with its heating device enclosing the whole reactorhousing, temperature gradients of several Kelvin are unnecessarilyhigh. In order to decrease the temperature gradients it would beadvisable to attach a second heating device to the reactor, preferablyon the top side. Therefore, the wafers would be heated from the topand bottom simultaneously. Such an improvement would result ina reactor having low temperature gradients and a low post-catalyticvolume at the same time. Thus, the advantages of both modularreactor designs could be combined in a single device if these reactorstypes are used in further investigations.
5.4.3 Performance parameters of fixed-bed andmicrochannel reactors
In the present work, several tube type and microchannel reactorshave been tested using the same or similar prepared catalysts. Thus,the only major difference between both kinds of reactors is the re-actor itself, the catalyst size, form and arrangement.
5.4. Heat effects and reaction engineering aspects 181
5.4.3.1 Comparison of tube type and corresponding mi-crochannel reactors (FBR1-3, MCR1-3)
MCR1/FBR1: At the beginning of the present work, the likelymost simple catalyst was used - bulk silver. Such a catalyst wasused in the fixed bed reactors FBR1a and FBR1b as well as in themicrochannel reactor MCR1. Unfortunately, the comparison of thismost simple type of catalyst failed, because the catalytic resultsand especially the selectivity/conversion curves were too different.Obviously, the catalytic performance of silver is not really constantand selectivity as well as conversion degree depend strongly uponthe ’history’ of the silver and its manufacturing process. As seenin Fig. 4.53 (p.125), the selectivity of silver foils used in the tubetype reactor is remarkably higher than that of silver used in themicrochannel reactor MCR1, but the overall activity of the last isway lower. Exactly the opposite behavior is observed as soon assilver foils from a different supplier (Goodfellow instead of Chempur)were used (FBR1b). As seen in Fig. 4.54 (p.126), the selectivity ofthe tube type reactor is lower than that of the microchannel, butthe obtained maximum degrees of conversion using the same testprocedure were higher. Taking the completely negative experimentswith silver wire and silver wool into account (p.126), the assumptionof the manufacturing process of silver being crucial for the selectivityand activity of bulk silver is supported.
Therefore, the experiments using bulk silver as catalyst cannotbe used to proof any advantage or disadvantage of a reactor con-struction. In this experiment, no thermal instabilities have beenobserved for the fixed bed reactor - likely supported by the highheat conductivity of silver allowing a sufficient heat transport fromthe catalyst to the walls.
MCR2/MCR3 and FBR2/FBR3: Both reactor types showedsimilar performance as shown in figure 4.55 to 4.57 (p.128 to 130).Although different trends of the selectivity as a function of the con-version degree have been observed, the catalytic performance of bothreactor types seems to be similar. This has to be expected as longas the same catalyst is used and the same surface area is exposedto the same flow rates. The differences in selectivity and conversioncurves of the fixed bed reactor FBR2 and FBR3 may be ascribed
182 Chapter 5. Discussion
to evolving hot spot effects. Although both catalyst beds consistof Aluminum pieces and are supposed to have a much higher innerheat transfer than a traditional tube type reactor, a hot spot canstill emerge. Small changes in the thermal environment (such as thehomogeneity of the heating coils as well as the exact location of thethermocouple in the pile of catalytic activated aluminum foils) willhave a major influence on the temperature profile. Such a tempera-ture profile is required if a runaway as depicted in Fig. 4.58 (p.131)is encountered.
The most important observation within the present work wasthe operational safety of the investigated microchannel reactors. Aslong as similar catalysts were used and the overall reaction condi-tions were not demanding, any catalyst showed very similar perfor-mance regardless of the reactor type. This has to be expected aslong as heat and/or mass transfer issues do not affect the reaction.The difference between both types can be clearly seen as soon asthe reaction conditions are chosen to challenge the catalyst/ reac-tor combination. With its inferior heat transfer capacity, hot spotsresulting in an explosion of the C2H4/O2 mixture were likely in thefixed bed reactor, whereas even the most severe reaction conditionsdid not affect any of the microchannel reactors.
5.4.3.2 Comparison of reactor performance
In order to allow a comparison between different reactor types, someparameters such as heat production rate per volume, ethylene oxideproduction rate and adiabatic temperature rise were calculated. Inorder to allow a comparison between microchannel reactors and theirconventional counterpart, a normalization onto a single parameterhas to be performed.
The most appropriate method seems to be a normalization onthe reactor volume. For the conventional reactor, the tube volumeis used whereas the stack volume excluding heat exchangers is takenfor the microchannel reactors. The advantage of this method is,that a comparison will be performed on the basis of the requiredreactor volume including the support material (which is importantfor the microchannel structure). The disadvantage is, that thinnerchannel walls (i.e. optimized structuring method) will affect the
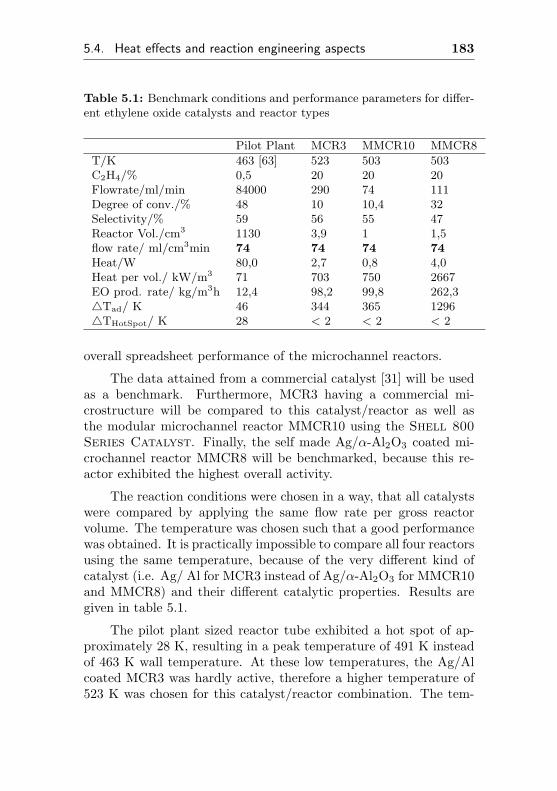
5.4. Heat effects and reaction engineering aspects 183
Table 5.1: Benchmark conditions and performance parameters for differ-ent ethylene oxide catalysts and reactor types
Pilot Plant MCR3 MMCR10 MMCR8
T/K 463 [63] 523 503 503C2H4/% 0,5 20 20 20Flowrate/ml/min 84000 290 74 111Degree of conv./% 48 10 10,4 32Selectivity/% 59 56 55 47Reactor Vol./cm3 1130 3,9 1 1,5flow rate/ ml/cm3min 74 74 74 74Heat/W 80,0 2,7 0,8 4,0Heat per vol./ kW/m3 71 703 750 2667EO prod. rate/ kg/m3h 12,4 98,2 99,8 262,34Tad/ K 46 344 365 12964THotSpot/ K 28 < 2 < 2 < 2
overall spreadsheet performance of the microchannel reactors.
The data attained from a commercial catalyst [31] will be usedas a benchmark. Furthermore, MCR3 having a commercial mi-crostructure will be compared to this catalyst/reactor as well asthe modular microchannel reactor MMCR10 using the Shell 800Series Catalyst. Finally, the self made Ag/α-Al2O3 coated mi-crochannel reactor MMCR8 will be benchmarked, because this re-actor exhibited the highest overall activity.
The reaction conditions were chosen in a way, that all catalystswere compared by applying the same flow rate per gross reactorvolume. The temperature was chosen such that a good performancewas obtained. It is practically impossible to compare all four reactorsusing the same temperature, because of the very different kind ofcatalyst (i.e. Ag/ Al for MCR3 instead of Ag/α-Al2O3 for MMCR10and MMCR8) and their different catalytic properties. Results aregiven in table 5.1.
The pilot plant sized reactor tube exhibited a hot spot of ap-proximately 28 K, resulting in a peak temperature of 491 K insteadof 463 K wall temperature. At these low temperatures, the Ag/Alcoated MCR3 was hardly active, therefore a higher temperature of523 K was chosen for this catalyst/reactor combination. The tem-
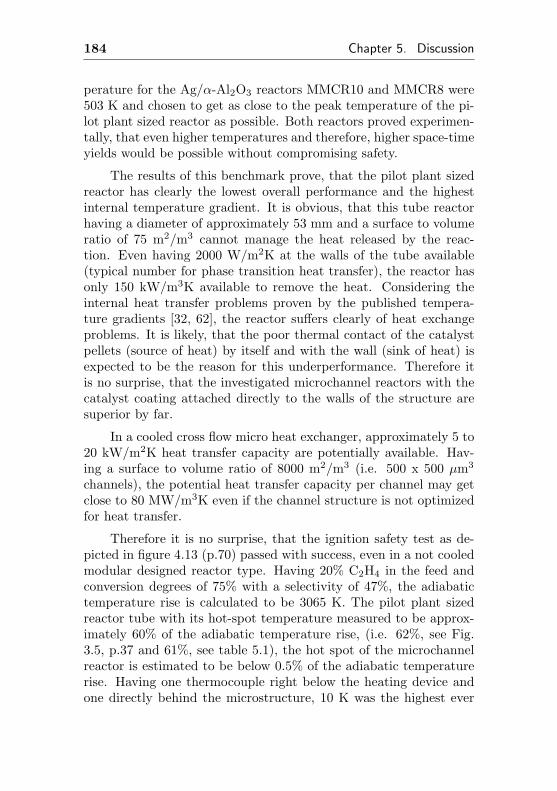
184 Chapter 5. Discussion
perature for the Ag/α-Al2O3 reactors MMCR10 and MMCR8 were503 K and chosen to get as close to the peak temperature of the pi-lot plant sized reactor as possible. Both reactors proved experimen-tally, that even higher temperatures and therefore, higher space-timeyields would be possible without compromising safety.
The results of this benchmark prove, that the pilot plant sizedreactor has clearly the lowest overall performance and the highestinternal temperature gradient. It is obvious, that this tube reactorhaving a diameter of approximately 53 mm and a surface to volumeratio of 75 m2/m3 cannot manage the heat released by the reac-tion. Even having 2000 W/m2K at the walls of the tube available(typical number for phase transition heat transfer), the reactor hasonly 150 kW/m3K available to remove the heat. Considering theinternal heat transfer problems proven by the published tempera-ture gradients [32, 62], the reactor suffers clearly of heat exchangeproblems. It is likely, that the poor thermal contact of the catalystpellets (source of heat) by itself and with the wall (sink of heat) isexpected to be the reason for this underperformance. Therefore itis no surprise, that the investigated microchannel reactors with thecatalyst coating attached directly to the walls of the structure aresuperior by far.
In a cooled cross flow micro heat exchanger, approximately 5 to20 kW/m2K heat transfer capacity are potentially available. Hav-ing a surface to volume ratio of 8000 m2/m3 (i.e. 500 x 500 µm3
channels), the potential heat transfer capacity per channel may getclose to 80 MW/m3K even if the channel structure is not optimizedfor heat transfer.
Therefore it is no surprise, that the ignition safety test as de-picted in figure 4.13 (p.70) passed with success, even in a not cooledmodular designed reactor type. Having 20% C2H4 in the feed andconversion degrees of 75% with a selectivity of 47%, the adiabatictemperature rise is calculated to be 3065 K. The pilot plant sizedreactor tube with its hot-spot temperature measured to be approx-imately 60% of the adiabatic temperature rise, (i.e. 62%, see Fig.3.5, p.37 and 61%, see table 5.1), the hot spot of the microchannelreactor is estimated to be below 0.5% of the adiabatic temperaturerise. Having one thermocouple right below the heating device andone directly behind the microstructure, 10 K was the highest ever
5.4. Heat effects and reaction engineering aspects 185
measured deviation between both thermocouples. Therefore, thesestructures allow increased reaction rates by application of high oxy-gen partial pressures without hot spot formation. Thus, even clearlyexplosive binary C2H4 / O2 mixtures could be handled safely regard-less of the applied reaction conditions.

Chapter 6
Experimental
6.1 Flow apparatus
The apparatus as depicted in figure 6.1 is divided into three parts,namely the gas-supply with pressure- and flow-controllers, the reac-tor unit equipped with a back-pressure controller and the analyticdevices, consisting of an online-GC, an online-IR and some coolingtraps for collection and offline-analysis of volatile compounds.
6.1.1 Flow control
The reactants ethene, oxygen and methane (only if required) arefed into the reactor by PIC 1..3 and FIC 1..3 via a long and thin1/8” stainless steel tube to allow diffusional mixing of the reagents.All flow controllers (type ”Brooks 5850S”) are controlled by a PCallowing automated operation of the whole setup. After a shortpreheating zone (TIC2), the reagents are passed through the reac-tor. The pressure within this device is controlled by the followingbackpressure-regulator PIC4 allowing a maximum pressure of up to25 bar. The product mixture leaving the regulator is passed via thesafety valve V5 (to avoid over-pressures) and split into two sepa-rate streams for analysis purposes. All tubing behind the reactoris heated to approximately 80oC to avoid condensation of products,especially water.
187
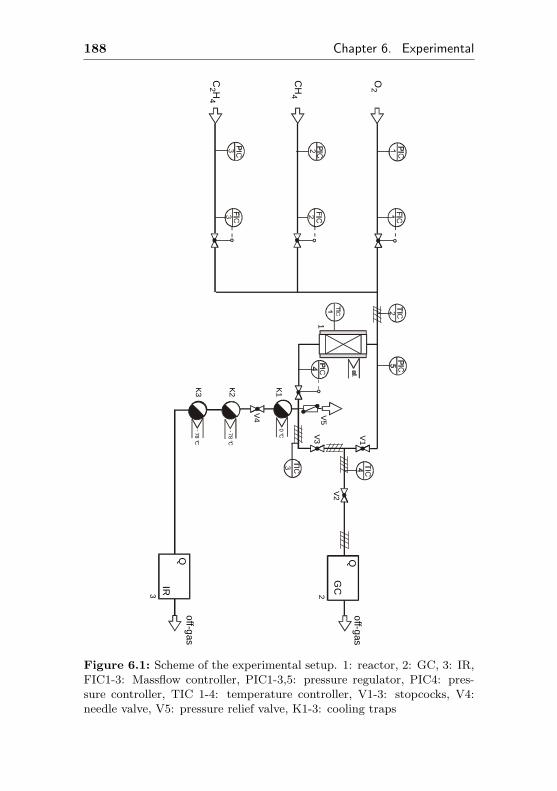
188 Chapter 6. Experimental
-78 °C
0 °C78 °C
-
O2
CH
4
CH2
4
off-gas
off-gasQ Q
IR
GC
V1
V3
V2
V4 V5
K1
K2
K3
123
Figure 6.1: Scheme of the experimental setup. 1: reactor, 2: GC, 3: IR,FIC1-3: Massflow controller, PIC1-3,5: pressure regulator, PIC4: pres-sure controller, TIC 1-4: temperature controller, V1-3: stopcocks, V4:needle valve, V5: pressure relief valve, K1-3: cooling traps
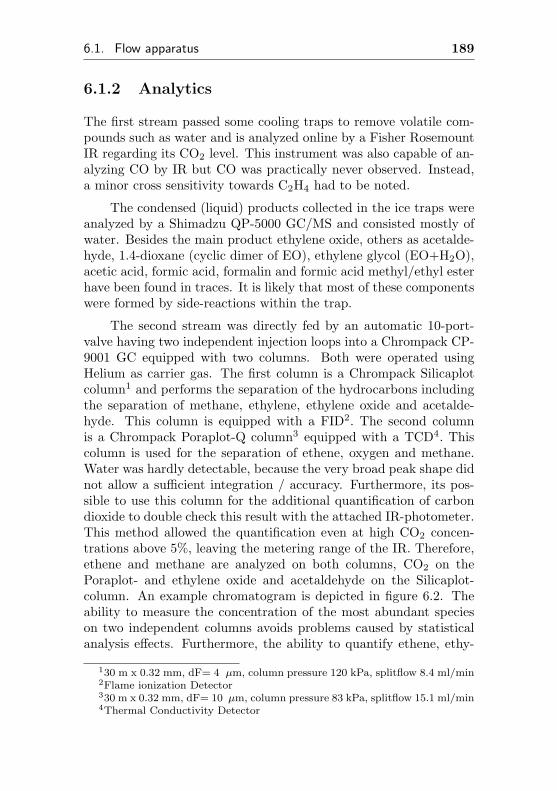
6.1. Flow apparatus 189
6.1.2 Analytics
The first stream passed some cooling traps to remove volatile com-pounds such as water and is analyzed online by a Fisher RosemountIR regarding its CO2 level. This instrument was also capable of an-alyzing CO by IR but CO was practically never observed. Instead,a minor cross sensitivity towards C2H4 had to be noted.
The condensed (liquid) products collected in the ice traps wereanalyzed by a Shimadzu QP-5000 GC/MS and consisted mostly ofwater. Besides the main product ethylene oxide, others as acetalde-hyde, 1.4-dioxane (cyclic dimer of EO), ethylene glycol (EO+H2O),acetic acid, formic acid, formalin and formic acid methyl/ethyl esterhave been found in traces. It is likely that most of these componentswere formed by side-reactions within the trap.
The second stream was directly fed by an automatic 10-port-valve having two independent injection loops into a Chrompack CP-9001 GC equipped with two columns. Both were operated usingHelium as carrier gas. The first column is a Chrompack Silicaplotcolumn1 and performs the separation of the hydrocarbons includingthe separation of methane, ethylene, ethylene oxide and acetalde-hyde. This column is equipped with a FID2. The second columnis a Chrompack Poraplot-Q column3 equipped with a TCD4. Thiscolumn is used for the separation of ethene, oxygen and methane.Water was hardly detectable, because the very broad peak shape didnot allow a sufficient integration / accuracy. Furthermore, its pos-sible to use this column for the additional quantification of carbondioxide to double check this result with the attached IR-photometer.This method allowed the quantification even at high CO2 concen-trations above 5%, leaving the metering range of the IR. Therefore,ethene and methane are analyzed on both columns, CO2 on thePoraplot- and ethylene oxide and acetaldehyde on the Silicaplot-column. An example chromatogram is depicted in figure 6.2. Theability to measure the concentration of the most abundant specieson two independent columns avoids problems caused by statisticalanalysis effects. Furthermore, the ability to quantify ethene, ethy-
130 m x 0.32 mm, dF= 4 µm, column pressure 120 kPa, splitflow 8.4 ml/min2Flame ionization Detector330 m x 0.32 mm, dF= 10 µm, column pressure 83 kPa, splitflow 15.1 ml/min4Thermal Conductivity Detector
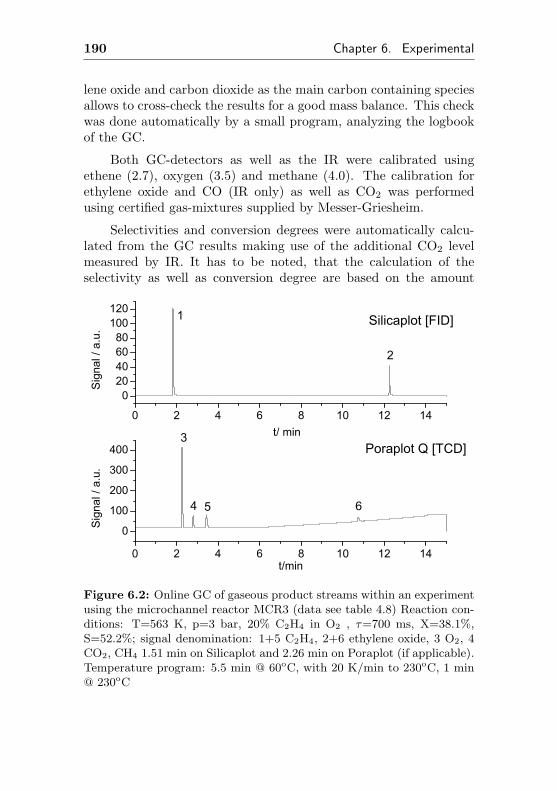
190 Chapter 6. Experimental
lene oxide and carbon dioxide as the main carbon containing speciesallows to cross-check the results for a good mass balance. This checkwas done automatically by a small program, analyzing the logbookof the GC.
Both GC-detectors as well as the IR were calibrated usingethene (2.7), oxygen (3.5) and methane (4.0). The calibration forethylene oxide and CO (IR only) as well as CO2 was performedusing certified gas-mixtures supplied by Messer-Griesheim.
Selectivities and conversion degrees were automatically calcu-lated from the GC results making use of the additional CO2 levelmeasured by IR. It has to be noted, that the calculation of theselectivity as well as conversion degree are based on the amount
0 2 4 6 8 10 12 14
020406080
100120
0 2 4 6 8 10 12 14
0
100
200
300
400
6
Silicaplot [FID]
Sig
nal /
a.u
.
t/ min
54
3
2
1
Poraplot Q [TCD]
Sig
nal /
a.u
.
t/min
Figure 6.2: Online GC of gaseous product streams within an experimentusing the microchannel reactor MCR3 (data see table 4.8) Reaction con-ditions: T=563 K, p=3 bar, 20% C2H4 in O2 , τ=700 ms, X=38.1%,S=52.2%; signal denomination: 1+5 C2H4, 2+6 ethylene oxide, 3 O2, 4CO2, CH4 1.51 min on Silicaplot and 2.26 min on Poraplot (if applicable).Temperature program: 5.5 min @ 60oC, with 20 K/min to 230oC, 1 min@ 230oC
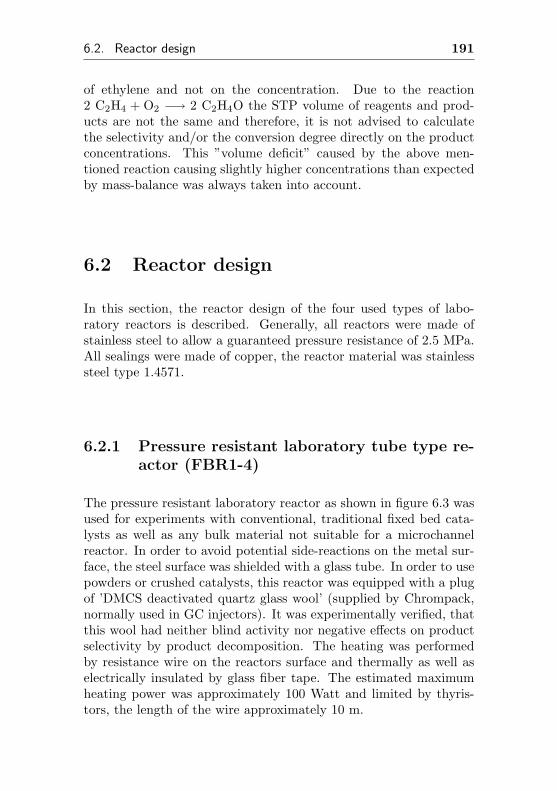
6.2. Reactor design 191
of ethylene and not on the concentration. Due to the reaction2 C2H4 + O2 −→ 2 C2H4O the STP volume of reagents and prod-ucts are not the same and therefore, it is not advised to calculatethe selectivity and/or the conversion degree directly on the productconcentrations. This ”volume deficit” caused by the above men-tioned reaction causing slightly higher concentrations than expectedby mass-balance was always taken into account.
6.2 Reactor design
In this section, the reactor design of the four used types of labo-ratory reactors is described. Generally, all reactors were made ofstainless steel to allow a guaranteed pressure resistance of 2.5 MPa.All sealings were made of copper, the reactor material was stainlesssteel type 1.4571.
6.2.1 Pressure resistant laboratory tube type re-actor (FBR1-4)
The pressure resistant laboratory reactor as shown in figure 6.3 wasused for experiments with conventional, traditional fixed bed cata-lysts as well as any bulk material not suitable for a microchannelreactor. In order to avoid potential side-reactions on the metal sur-face, the steel surface was shielded with a glass tube. In order to usepowders or crushed catalysts, this reactor was equipped with a plugof ’DMCS deactivated quartz glass wool’ (supplied by Chrompack,normally used in GC injectors). It was experimentally verified, thatthis wool had neither blind activity nor negative effects on productselectivity by product decomposition. The heating was performedby resistance wire on the reactors surface and thermally as well aselectrically insulated by glass fiber tape. The estimated maximumheating power was approximately 100 Watt and limited by thyris-tors, the length of the wire approximately 10 m.
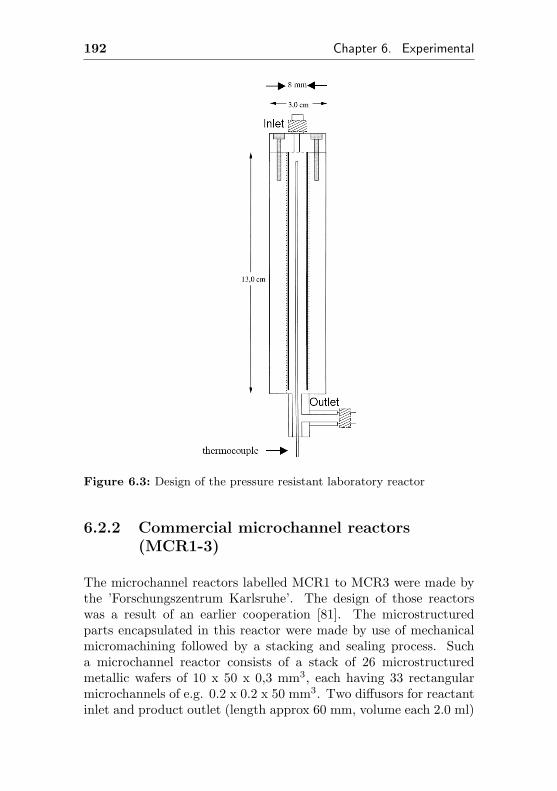
192 Chapter 6. Experimental
Figure 6.3: Design of the pressure resistant laboratory reactor
6.2.2 Commercial microchannel reactors(MCR1-3)
The microchannel reactors labelled MCR1 to MCR3 were made bythe ’Forschungszentrum Karlsruhe’. The design of those reactorswas a result of an earlier cooperation [81]. The microstructuredparts encapsulated in this reactor were made by use of mechanicalmicromachining followed by a stacking and sealing process. Sucha microchannel reactor consists of a stack of 26 microstructuredmetallic wafers of 10 x 50 x 0,3 mm3, each having 33 rectangularmicrochannels of e.g. 0.2 x 0.2 x 50 mm3. Two diffusors for reactantinlet and product outlet (length approx 60 mm, volume each 2.0 ml)
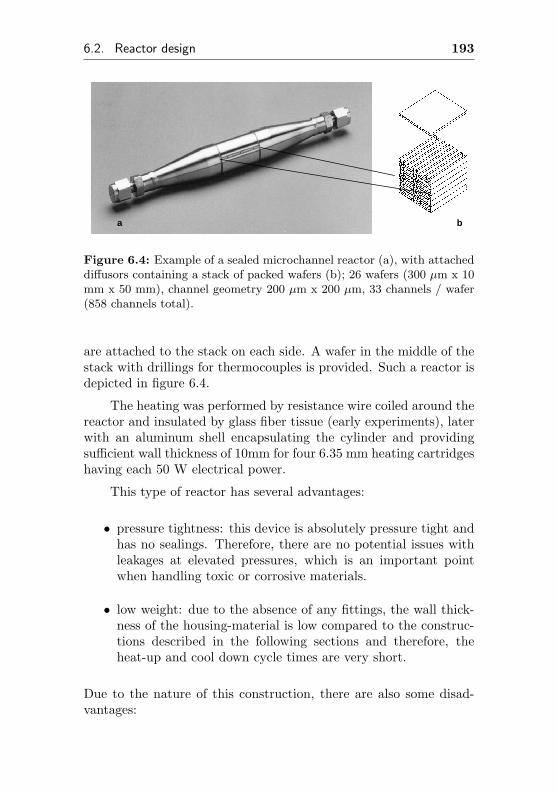
6.2. Reactor design 193
a b
Figure 6.4: Example of a sealed microchannel reactor (a), with attacheddiffusors containing a stack of packed wafers (b); 26 wafers (300 µm x 10mm x 50 mm), channel geometry 200 µm x 200 µm, 33 channels / wafer(858 channels total).
are attached to the stack on each side. A wafer in the middle of thestack with drillings for thermocouples is provided. Such a reactor isdepicted in figure 6.4.
The heating was performed by resistance wire coiled around thereactor and insulated by glass fiber tissue (early experiments), laterwith an aluminum shell encapsulating the cylinder and providingsufficient wall thickness of 10mm for four 6.35 mm heating cartridgeshaving each 50 W electrical power.
This type of reactor has several advantages:
• pressure tightness: this device is absolutely pressure tight andhas no sealings. Therefore, there are no potential issues withleakages at elevated pressures, which is an important pointwhen handling toxic or corrosive materials.
• low weight: due to the absence of any fittings, the wall thick-ness of the housing-material is low compared to the construc-tions described in the following sections and therefore, theheat-up and cool down cycle times are very short.
Due to the nature of this construction, there are also some disad-vantages:
194 Chapter 6. Experimental
• fixed housing: it is impossible to change the catalytic materialenclosed in the reactor or even to get access for later analysis.The development or improvement of a certain catalytic systemrequires access to the coated wavers and the ability to changethe catalytic material quickly is greatly appreciated.
• the pricing: as mentioned above, access to the enclosed waverseither for analysis with surface-science techniques or exchangerequires destruction of the reactor. Therefore, this reactor isvery suitable for completely developed systems, but during thedevelopment of a catalyst and/or process, other constructionsare more favorable and cheaper.
6.2.3 Modular microchannel reactors
Due to the above mentioned disadvantages of commercial availablemicrochannel reactors and the urgent requirement to have nearlyinstant access to the wafers during the development of suitable cat-alytic coatings, two types of modular microchannel reactors havebeen developed and evaluated.
6.2.3.1 Modular Microchannel Reactor Type I
The first modular microchannel reactor was developed to overcomethe restrictions by the commercial made reactors without seriouschanges to fluidics of this reactor type. Therefore, the constructionwas made in a way, that the wafer stack was enclosed in a specialcylindric housing with two diffusors attached to each side.
The modular microchannel reactor type I consists of five dif-ferent assembly groups (fig. 6.5). The microstructured wafers, theinner housing in which the wafers are mounted, the two diffusorsfor a proper flow distribution and the outer shell with the flange.The microstructured wafers are mounted within in a cylindrical in-ner housing, which has a rectangular millcut of 12 x 10 x 50 mm3
with a cover plate on its top.
Two identical diffusors (1.15 cm3 volume each) are attached oneach side of the housing providing an accurate, distributed gas-flowfrom the cylindric 1/8” tube connectors at the reactor inlet/outlet to
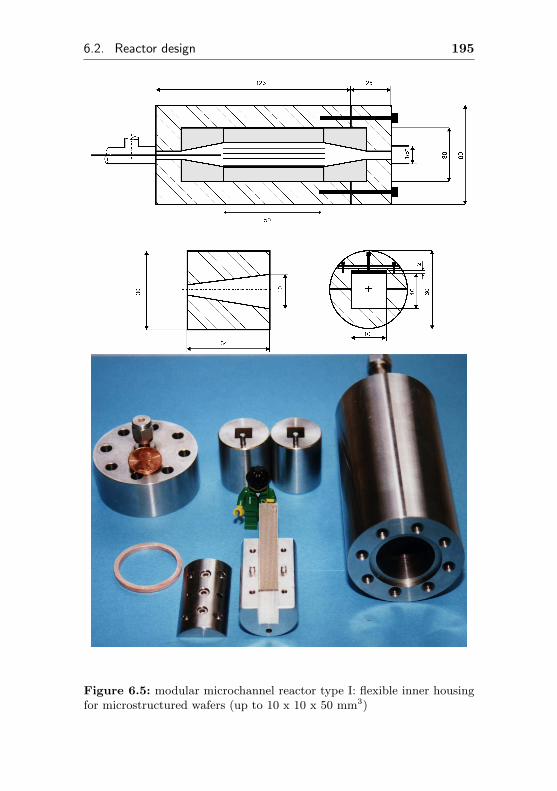
6.2. Reactor design 195
Figure 6.5: modular microchannel reactor type I: flexible inner housingfor microstructured wafers (up to 10 x 10 x 50 mm3)
196 Chapter 6. Experimental
the rectangular millcut. As shown in the sketch, this part is placedin a cylindrical outer shell having a flange, which is bolted with six5 mm screws and tightened using a sealing gasket made of copper toguarantee gas-tightness even towards hydrogen at pressures up to 5MPa. All parts (except of the copper gasket) are made of stainlesssteel SS316Ti (1.4571) and manufactured with an accuracy of betterthan 1/10 mm in order to diminish bypass flow between the innerhousing enclosing the microstructured parts and the outer pressuretight shell. This system has proven its usability in laboratory forroughly four years and no severe problems occurred even at tem-peratures up to 600 Kelvin. Specific heat production rates of 10 to20 Watts were controlled without heat transfer problems. At highertemperatures, the oxidation of the steel surface caused some trou-ble and required higher tolerances between the inner housing andouter shell. Using this modular microchannel reactor it is possibleto exchange the microstructured wafers within 15 to 30 minutes aftercooling down to ambient temperatures.
Heating was performed by two nozzle band heaters type ”DGM”made by ”Keller, Ihne & Tesch GmbH”, having a total heating powerof more than 500 W and restricted by thyristors to approximately100 W (Fig. 6.6)
The advantage of this construction is its modularity, allowingvarious numbers of microstructured wafers and the low area with itssealing gasket, allowing the application of large pressures onto thegasket by thoroughly tightening the 5 mm screws.
The disadvantage of this construction is the potential bypassflow not only between the wafers and the housing, but between theinner housing and outer shell. Using very small channel diametersand a low number of channels, the pressure drop above the mi-crostructure increases and therefore, the amount of gas bypassingthe channels increases.
Therefore, a small amount of gas passes the catalyst/wafer hous-ing and causes certain problems. With gas bypassing, the maximumconversion degree is always below 100%, because the stainless steelis practically inert for the reagents at reaction temperature. Thiscauses trouble when comparing two catalysts, because the appar-ent conversion degree observed at the outlet of the reactor is alwaysbelow the one observed directly above the catalyst. On the other
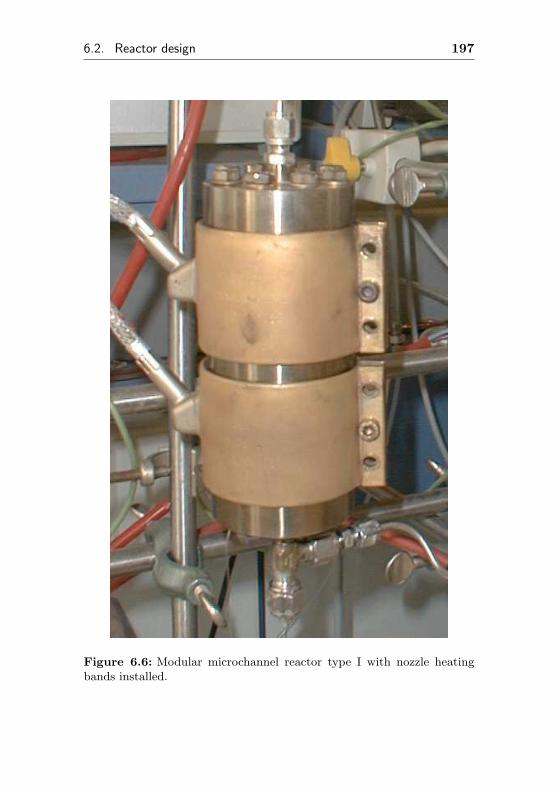
6.2. Reactor design 197
Figure 6.6: Modular microchannel reactor type I with nozzle heatingbands installed.
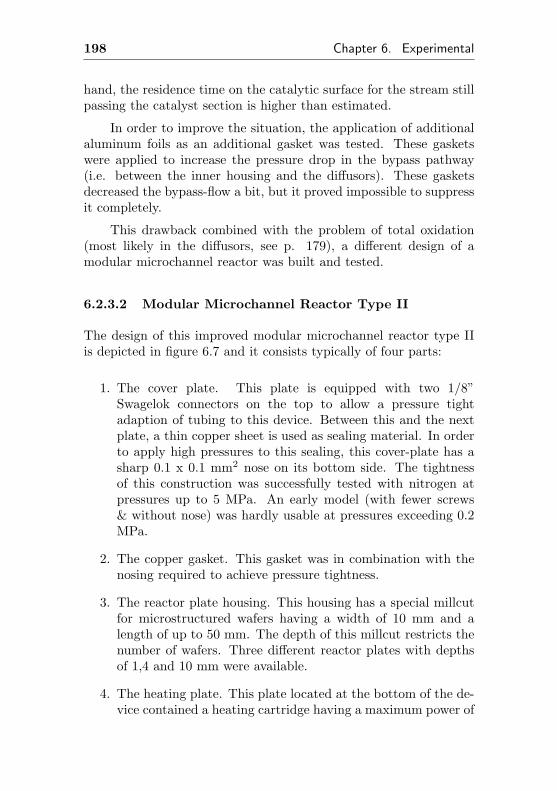
198 Chapter 6. Experimental
hand, the residence time on the catalytic surface for the stream stillpassing the catalyst section is higher than estimated.
In order to improve the situation, the application of additionalaluminum foils as an additional gasket was tested. These gasketswere applied to increase the pressure drop in the bypass pathway(i.e. between the inner housing and the diffusors). These gasketsdecreased the bypass-flow a bit, but it proved impossible to suppressit completely.
This drawback combined with the problem of total oxidation(most likely in the diffusors, see p. 179), a different design of amodular microchannel reactor was built and tested.
6.2.3.2 Modular Microchannel Reactor Type II
The design of this improved modular microchannel reactor type IIis depicted in figure 6.7 and it consists typically of four parts:
1. The cover plate. This plate is equipped with two 1/8”Swagelok connectors on the top to allow a pressure tightadaption of tubing to this device. Between this and the nextplate, a thin copper sheet is used as sealing material. In orderto apply high pressures to this sealing, this cover-plate has asharp 0.1 x 0.1 mm2 nose on its bottom side. The tightnessof this construction was successfully tested with nitrogen atpressures up to 5 MPa. An early model (with fewer screws& without nose) was hardly usable at pressures exceeding 0.2MPa.
2. The copper gasket. This gasket was in combination with thenosing required to achieve pressure tightness.
3. The reactor plate housing. This housing has a special millcutfor microstructured wafers having a width of 10 mm and alength of up to 50 mm. The depth of this millcut restricts thenumber of wafers. Three different reactor plates with depthsof 1,4 and 10 mm were available.
4. The heating plate. This plate located at the bottom of the de-vice contained a heating cartridge having a maximum power of
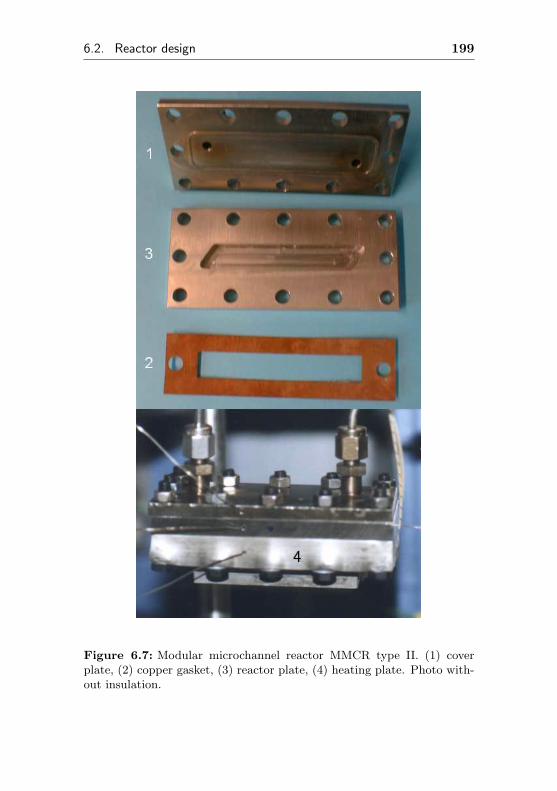
6.2. Reactor design 199
Figure 6.7: Modular microchannel reactor MMCR type II. (1) coverplate, (2) copper gasket, (3) reactor plate, (4) heating plate. Photo with-out insulation.
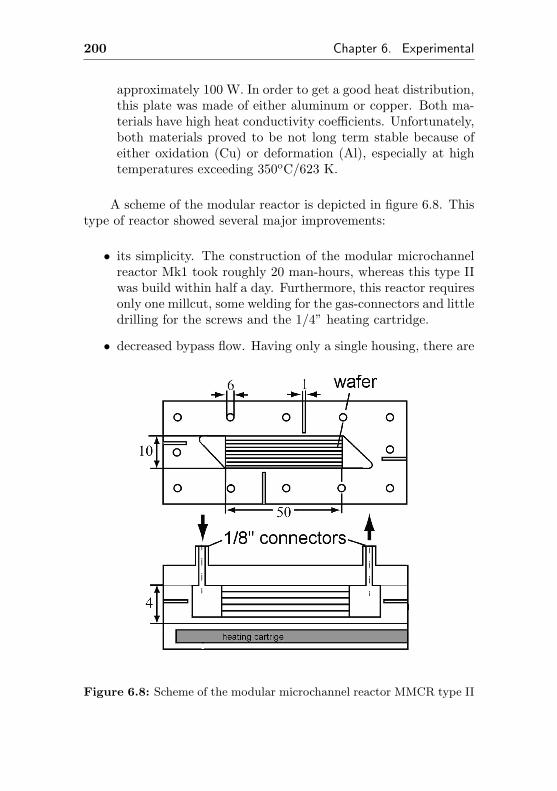
200 Chapter 6. Experimental
approximately 100 W. In order to get a good heat distribution,this plate was made of either aluminum or copper. Both ma-terials have high heat conductivity coefficients. Unfortunately,both materials proved to be not long term stable because ofeither oxidation (Cu) or deformation (Al), especially at hightemperatures exceeding 350oC/623 K.
A scheme of the modular reactor is depicted in figure 6.8. Thistype of reactor showed several major improvements:
• its simplicity. The construction of the modular microchannelreactor Mk1 took roughly 20 man-hours, whereas this type IIwas build within half a day. Furthermore, this reactor requiresonly one millcut, some welding for the gas-connectors and littledrilling for the screws and the 1/4” heating cartridge.
• decreased bypass flow. Having only a single housing, there are
Figure 6.8: Scheme of the modular microchannel reactor MMCR type II
6.2. Reactor design 201
no more opportunities for the gas-flow to bypass between theinner housing and outer shell. With an improved manufactur-ing accuracy of 0.05 mm, the gap between the wafers and thehousing itself was decreased. Therefore, overall bypass flowwas decreased.
• lower thermal mass. This reactor has roughly 1/3 of the weightof the Mk1 type and therefore, faster heating up and coolingdown cycles were possible.
• improved reliability. With time on stream, the type I reactorfailed by oxidation of the surface causing friction when tryingto remove the inner housing from the outer shell. Due to sur-face defects (especially at temperatures above 623 K/350oC)by oxidation, the inner housing was sometimes struck in theouter shell and quite difficult to remove.
• lower dead volume. With the very different flow distribution,the dead volume within the diffusors was reduced and there-fore, the residence time within the diffusors decreased - poten-tial decomposition of products resulting in lower selectivitieswas suppressed. The diffusor volume was not constant butvaried with the number of wafers installed. Each millimeterwafer height required a corresponding diffusor volume of ap-proximately 2 x 70 µl. Thus a small stack of four wafers (height4 mm) with 280 µl post catalytic diffusor volume had only aquarter of the contact time as the MMCR type I with 1.15 mlper diffusor, independent from the number of installed wafers.
This design revealed also some practical disadvantages:
• pressure tightness. Having a larger sealing area, it proved to bemore difficult to get this reactor really pressure tight. It provedthat a kind of nose on the stainless-steel top cover was requiredto decrease the sealing area and increasing the overall pressureapplied to the sealing gasket. Without that nose, it proved im-possible to get this reactor virtually leak-free. Therefore, onlythe later model was used in catalytic tests. It was also triedto make use of a silicon based high-tech glue5 to get the reac-tor tight, but the silver catalyst was irreversibly deactivated
5Delo-Gum, www.delo.com.
202 Chapter 6. Experimental
and destroyed by chlorine components in this glue. For cata-lysts, which are not affected by chlorine, a bit of silicone basedhigh temperature glue as sealing (instead of copper) seems tobe a very practical and reliable method to get such a deviceleak free. Experiments with glue as sealing proved pressuretightness of more than 5 MPa without failure.
• a higher surface to volume ratio. Although it was easily pos-sible to heat this reactor up to 573 K with the single heatingcartridge build in the bottom plate of the reactor, the temper-ature gradient across the reactor was much larger than that ofthe MK1 type. This problem was partially solved by a thickinsulation with glass-wool. In order to really overcome thisissue, the design should change a bit and a second heatingcartridge on top of the device should be installed.
6.3 Design and manufacturing of mi-crostructured wafers
The microstructured wafers are the heart of the reactor andoffered by several manufacturers like ”IMM Mainz” and the”Forschungszentrum Karlsruhe” with different product manufac-turing technologies like punching, etching or micromachining. Atthe beginning of the present work, it proved that a lot of catalytictests were necessary in order to develop a good ethylene oxidecatalyst. With every single catalyst and its supporting waferbeing inseparably integrated and forming one piece, every catalystrequires its own wafer. Due to the huge number of tests and thelimited availability of commercially available structures, it showedthat a comparably cheap manufacturing process ”on-site” utilizingavailable machinery was inescapable.
6.3.1 Wire electro discharge machining
At the beginning of this work, microstructured wafers were manu-factured by the wire electro discharge machining (fig. 6.9). Thismethod is very suitable for aluminum or aluminum alloys such as
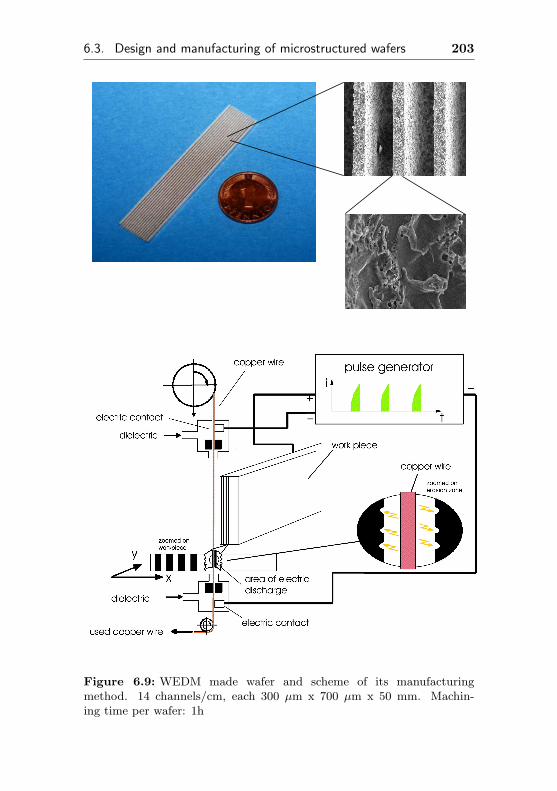
6.3. Design and manufacturing of microstructured wafers 203
Figure 6.9: WEDM made wafer and scheme of its manufacturingmethod. 14 channels/cm, each 300 µm x 700 µm x 50 mm. Machin-ing time per wafer: 1h
204 Chapter 6. Experimental
Dural, AlMg3 or AlMg4.5Mn. Other conducting materials such assteel and titan are also suitable for this kind of machining. Aftersome preliminary tests and solving some problems with deformationof wafers by thermal stress caused by the production process, a ge-ometry evolved which was easy to manufacture, had channel sizesof 300 µm x 700 µm x 50 mm, and a high yield with nearly no re-jects of structures caused by manufacturing defects. Furthermore,one wafer took roughly one hour of machine time and therefore, theoperating expense was acceptable. Generally, an aluminum blockhaving a geometry of 10 x 50 mm was used for production. In thefront wall of this block, microchannels with a depth of 700 µm weremachined. The width is mainly controlled by the wire diameter.Using a 250 µm wire, the channel width was approximately 300 µm.After the last channel was made, the wire was used to cut off thewafer from this block, resulting in the wafer to drop down. Afterthat, the next wafer was made using a recursion programming tech-nique in the machine control. Therefore, the machine was able tomanufacture a sufficient number of wafers overnight without need ofreadjustments.
Each wafer made by this method has a thickness of 1 mm, awidth of 10 mm and a length of up to 50 mm. 14 parallel microchan-nels, each 300 µm wide and 700 µm deep are machined in each waferusing a commonly available 250 µm copper wire. Channels with adifferent width are also producible using wires with different diam-eters. Due to the nature of this production process, the surface ofthe microchannels was very rough. This roughness is very suitableand desired for high adhesion strength of sol-gel or other coatings ascatalytic active layers.
6.3.2 Parallel multiple milling method
This method was developed in order to achieve three major goals.The most important drawback of the WEDM machined wafers was,that the outer Al surface contains a lot of copper caused by thespark erosion of the WEDM machine. In different applications ofco-workers, this copper contamination of the Al-surface caused un-expected catalytic trouble [80]. Second, WEDM machining is a quiteexpensive method and therefore, the production cost should be low-
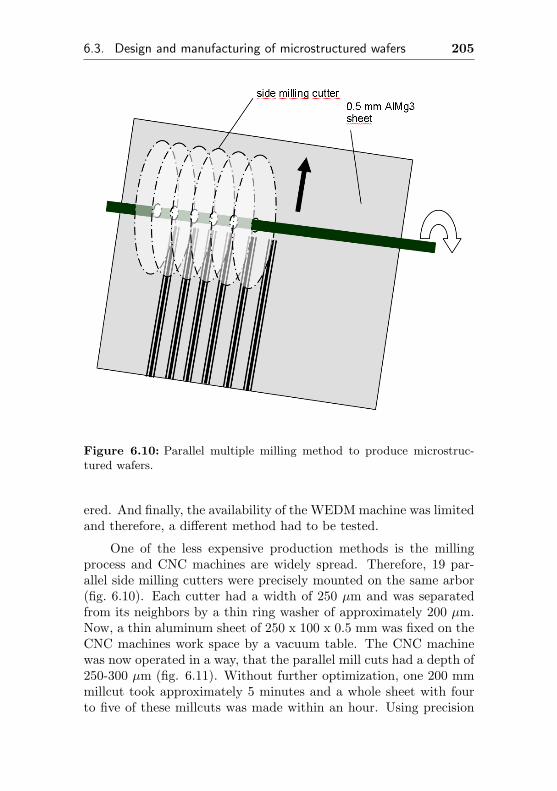
6.3. Design and manufacturing of microstructured wafers 205
Figure 6.10: Parallel multiple milling method to produce microstruc-tured wafers.
ered. And finally, the availability of the WEDM machine was limitedand therefore, a different method had to be tested.
One of the less expensive production methods is the millingprocess and CNC machines are widely spread. Therefore, 19 par-allel side milling cutters were precisely mounted on the same arbor(fig. 6.10). Each cutter had a width of 250 µm and was separatedfrom its neighbors by a thin ring washer of approximately 200 µm.Now, a thin aluminum sheet of 250 x 100 x 0.5 mm was fixed on theCNC machines work space by a vacuum table. The CNC machinewas now operated in a way, that the parallel mill cuts had a depth of250-300 µm (fig. 6.11). Without further optimization, one 200 mmmillcut took approximately 5 minutes and a whole sheet with fourto five of these millcuts was made within an hour. Using precision
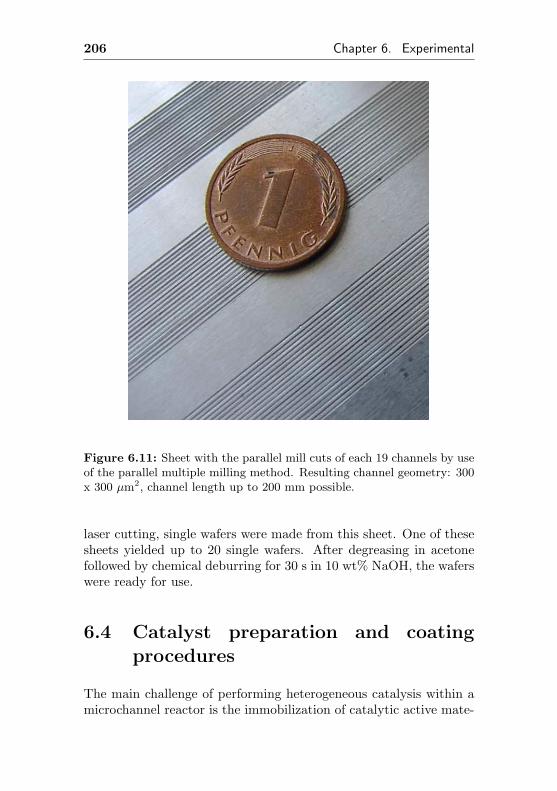
206 Chapter 6. Experimental
Figure 6.11: Sheet with the parallel mill cuts of each 19 channels by useof the parallel multiple milling method. Resulting channel geometry: 300x 300 µm2, channel length up to 200 mm possible.
laser cutting, single wafers were made from this sheet. One of thesesheets yielded up to 20 single wafers. After degreasing in acetonefollowed by chemical deburring for 30 s in 10 wt% NaOH, the waferswere ready for use.
6.4 Catalyst preparation and coatingprocedures
The main challenge of performing heterogeneous catalysis within amicrochannel reactor is the immobilization of catalytic active mate-
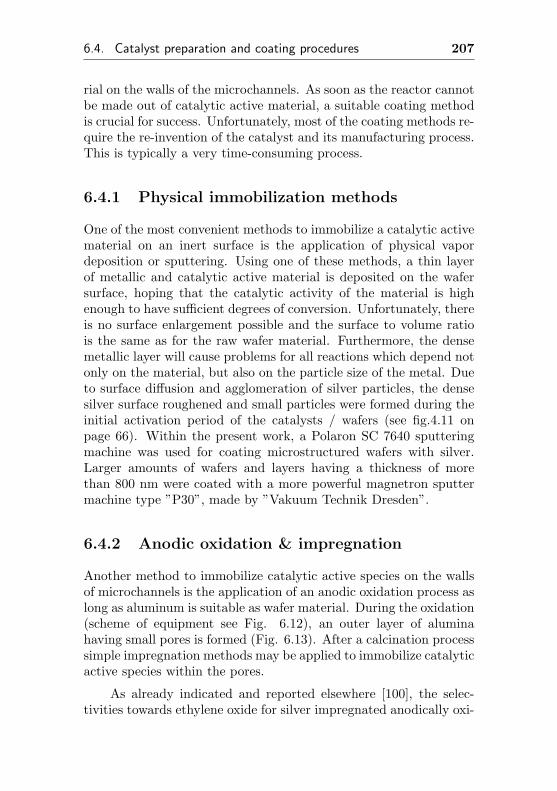
6.4. Catalyst preparation and coating procedures 207
rial on the walls of the microchannels. As soon as the reactor cannotbe made out of catalytic active material, a suitable coating methodis crucial for success. Unfortunately, most of the coating methods re-quire the re-invention of the catalyst and its manufacturing process.This is typically a very time-consuming process.
6.4.1 Physical immobilization methods
One of the most convenient methods to immobilize a catalytic activematerial on an inert surface is the application of physical vapordeposition or sputtering. Using one of these methods, a thin layerof metallic and catalytic active material is deposited on the wafersurface, hoping that the catalytic activity of the material is highenough to have sufficient degrees of conversion. Unfortunately, thereis no surface enlargement possible and the surface to volume ratiois the same as for the raw wafer material. Furthermore, the densemetallic layer will cause problems for all reactions which depend notonly on the material, but also on the particle size of the metal. Dueto surface diffusion and agglomeration of silver particles, the densesilver surface roughened and small particles were formed during theinitial activation period of the catalysts / wafers (see fig.4.11 onpage 66). Within the present work, a Polaron SC 7640 sputteringmachine was used for coating microstructured wafers with silver.Larger amounts of wafers and layers having a thickness of morethan 800 nm were coated with a more powerful magnetron sputtermachine type ”P30”, made by ”Vakuum Technik Dresden”.
6.4.2 Anodic oxidation & impregnation
Another method to immobilize catalytic active species on the wallsof microchannels is the application of an anodic oxidation process aslong as aluminum is suitable as wafer material. During the oxidation(scheme of equipment see Fig. 6.12), an outer layer of aluminahaving small pores is formed (Fig. 6.13). After a calcination processsimple impregnation methods may be applied to immobilize catalyticactive species within the pores.
As already indicated and reported elsewhere [100], the selec-tivities towards ethylene oxide for silver impregnated anodically oxi-
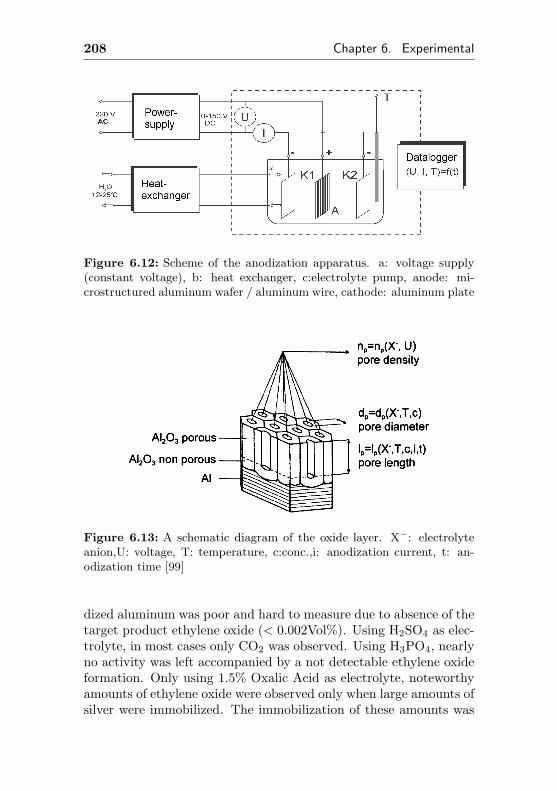
208 Chapter 6. Experimental
Figure 6.12: Scheme of the anodization apparatus. a: voltage supply(constant voltage), b: heat exchanger, c:electrolyte pump, anode: mi-crostructured aluminum wafer / aluminum wire, cathode: aluminum plate
Figure 6.13: A schematic diagram of the oxide layer. X−: electrolyteanion,U: voltage, T: temperature, c:conc.,i: anodization current, t: an-odization time [99]
dized aluminum was poor and hard to measure due to absence of thetarget product ethylene oxide (< 0.002Vol%). Using H2SO4 as elec-trolyte, in most cases only CO2 was observed. Using H3PO4, nearlyno activity was left accompanied by a not detectable ethylene oxideformation. Only using 1.5% Oxalic Acid as electrolyte, noteworthyamounts of ethylene oxide were observed only when large amounts ofsilver were immobilized. The immobilization of these amounts was
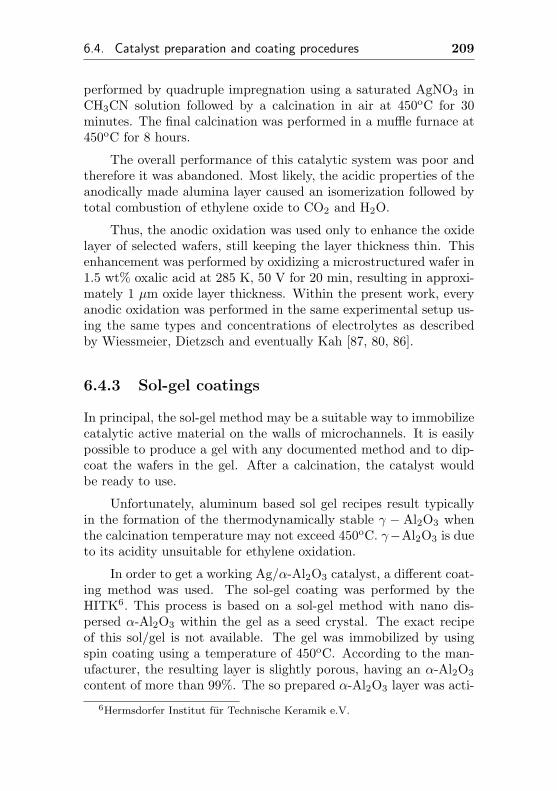
6.4. Catalyst preparation and coating procedures 209
performed by quadruple impregnation using a saturated AgNO3 inCH3CN solution followed by a calcination in air at 450oC for 30minutes. The final calcination was performed in a muffle furnace at450oC for 8 hours.
The overall performance of this catalytic system was poor andtherefore it was abandoned. Most likely, the acidic properties of theanodically made alumina layer caused an isomerization followed bytotal combustion of ethylene oxide to CO2 and H2O.
Thus, the anodic oxidation was used only to enhance the oxidelayer of selected wafers, still keeping the layer thickness thin. Thisenhancement was performed by oxidizing a microstructured wafer in1.5 wt% oxalic acid at 285 K, 50 V for 20 min, resulting in approxi-mately 1 µm oxide layer thickness. Within the present work, everyanodic oxidation was performed in the same experimental setup us-ing the same types and concentrations of electrolytes as describedby Wiessmeier, Dietzsch and eventually Kah [87, 80, 86].
6.4.3 Sol-gel coatings
In principal, the sol-gel method may be a suitable way to immobilizecatalytic active material on the walls of microchannels. It is easilypossible to produce a gel with any documented method and to dip-coat the wafers in the gel. After a calcination, the catalyst wouldbe ready to use.
Unfortunately, aluminum based sol gel recipes result typicallyin the formation of the thermodynamically stable γ − Al2O3 whenthe calcination temperature may not exceed 450oC. γ−Al2O3 is dueto its acidity unsuitable for ethylene oxidation.
In order to get a working Ag/α-Al2O3 catalyst, a different coat-ing method was used. The sol-gel coating was performed by theHITK6. This process is based on a sol-gel method with nano dis-persed α-Al2O3 within the gel as a seed crystal. The exact recipeof this sol/gel is not available. The gel was immobilized by usingspin coating using a temperature of 450oC. According to the man-ufacturer, the resulting layer is slightly porous, having an α-Al2O3
content of more than 99%. The so prepared α-Al2O3 layer was acti-
6Hermsdorfer Institut fur Technische Keramik e.V.
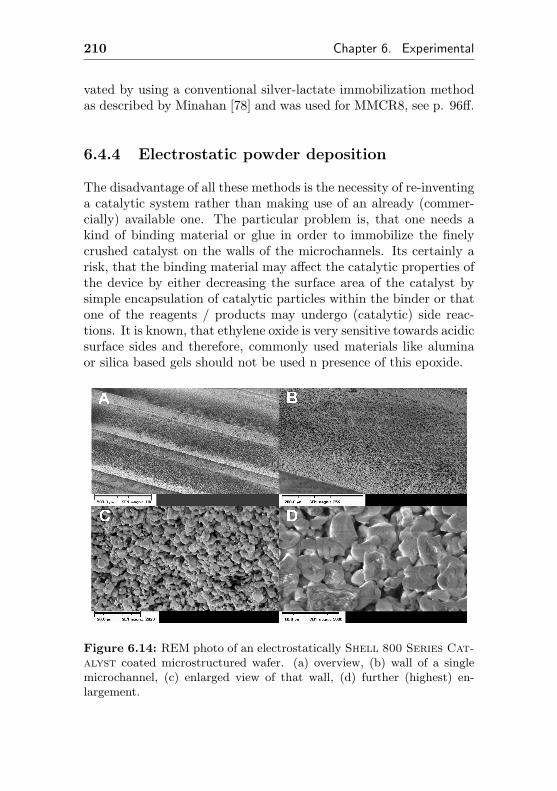
210 Chapter 6. Experimental
vated by using a conventional silver-lactate immobilization methodas described by Minahan [78] and was used for MMCR8, see p. 96ff.
6.4.4 Electrostatic powder deposition
The disadvantage of all these methods is the necessity of re-inventinga catalytic system rather than making use of an already (commer-cially) available one. The particular problem is, that one needs akind of binding material or glue in order to immobilize the finelycrushed catalyst on the walls of the microchannels. Its certainly arisk, that the binding material may affect the catalytic properties ofthe device by either decreasing the surface area of the catalyst bysimple encapsulation of catalytic particles within the binder or thatone of the reagents / products may undergo (catalytic) side reac-tions. It is known, that ethylene oxide is very sensitive towards acidicsurface sides and therefore, commonly used materials like aluminaor silica based gels should not be used n presence of this epoxide.� �
� �
Figure 6.14: REM photo of an electrostatically Shell 800 Series Cat-alyst coated microstructured wafer. (a) overview, (b) wall of a singlemicrochannel, (c) enlarged view of that wall, (d) further (highest) en-largement.
6.4. Catalyst preparation and coating procedures 211
In order to overcome this problem, it was tried to immobilizea commercial catalyst on the walls of a microchannel without mak-ing use of any binding material such as water-glass. Therefore, adifferent bonding method had to be used. Aluminum has typicallya protective oxidic layer on its surface. As soon as this surface istreated with 10 wt% NaOH solution at room temperature for a shorttime (roughly 90 sec), a less stable surface consisting of fresh andvery reactive Al-OH groups emerges. These functional groups allowto immobilize a thin layer of powder. Its sticky enough to handlethe wafer with its coating, but definitely neither long term stablenor scratch-proof.
Directly after the etching process by NaOH, the aluminum wafermust be subsequently cleaned with distilled water (to remove NaOH)and acetone (to remove water) and immediately placed for coating ina stirred vessel. This vessel contains a suspension of 600 mg crushed& ball-milled catalyst powder dispensed in 100 ml acetone. Thewafer is located in the middle of two electrodes, which are electricallyused as cathode (-). The wafer itself is electrically used as anode(+), the applied voltage7 was 100 V with a distance between anodeand cathode of roughly 17 mm. The current was typically 6 mAor below and it decreased during the coating process - which tookapproximately 90-120 seconds per wafer.
Using this setup, a homogeneous coating quality was obtained.REM pictures of this coating are depicted in figure 6.14. Unfortu-nately, the adhesion strength of the coating is far away from beingscratch resistant, but the quality is good enough to be used in gasphase catalysis for testing purposes for some weeks.
7Standard laboratory DC power supply, adjustable voltage and current lim-iter

Chapter 7
Appendix
7.1 Chemical properties of ethylene ox-ide
Ethylene oxide is a hazardous, highly flammable and, under certainconditions, a violently explosive chemical. Due to its exothermic dis-proportionation, polymerization and isomerization ability combinedwith a low flammability limit and an exothermic decomposition andcombustion, there is always a risk of a severe incident even in ab-sence of oxygen. Pure ethylene oxide is involved in several basicreactions, which affect the handling of this chemical:
• Combustion
C2H4O +52
O2 −→ 2 CO2 + 2 H2O
The combustion is highly exothermic and yields -1210 kJ/molor -27469 kJ/kg. The lowest flammability limit is 2.6% in Air.Even solutions of ethylene oxide in water support combustionfor concentrations above 5 wt%. Therefore, a dilution of 1:100is necessary if ethylene oxide has to be removed by water [12].
• Decomposition
213
214 Chapter 7. Appendix
C2H4O −→ CO + CH4
The reaction yields 3051 kJ/kg (134 kJ/mol), causing apressure rise in closed systems. This decomposition reactionis known to proceed explosively under certain circumstances.TNT for example has a maximum decomposition energy of4600 kJ/kg [96].
• Disproportionation
6 C2H4O −→ 5 C2H4 + 2 CO2 + 2 H2OC2H4O −→ CO + CH4
2 C2H4O −→ 2 CO + C2H4 + 2 H2
2 C2H4O −→ 2 CO + C2H6 + H2
The disproportionation of ethene oxide can occur in presenceof high surface area metal oxides such as γ − Fe2O3 causinga strong local temperature rise even above the decompo-sition temperature of ethylene oxide. Thus, rust mightcause severe incidents and should be avoided when handlingethylene oxide. It was found, that in presence of rust temper-atures of 140oC are high enough to initiate an EO ignition [88].
• Isomerisation
C2H4O −→ CH3CHO
Ethylene oxide can be isomerized to acetaldehyde, yielding areaction enthalpy of 2621 kJ/kg (115 kJ/mol). This reactionis normally performed by use of acidic and / or high surfacematerials, such as γ − Al2O3, SiO2, iron oxides or phosphoricacid [92].
• Polymerisation
n C2H4O −→ −(CH2 − CH2 −O)n−
7.2. Environmental effects of ethylene oxide 215
Ethylene oxide can be polymerized to polyethyleneglycol (withtraces of water) using catalysts such as strong alkali or evenrust. The latter causes clogging of equipment if improper steelsare used. This exothermic reaction takes place at temperaturesof approx. 200oC even under non catalytic conditions. Thereaction enthalpy is approximately -2093 kJ/kg (-92 kJ/mol).
• Insertion into polarized bonds
R−NH2 + 2 C2H4O −→ R−N(−C2H5 −OH)2
The insertion of ethylene oxide into polarized bonds such asN-H, R-OH or R-X is the most important technical applicationof this chemical. More examples are discussed in section 1.3.
7.2 Environmental effects of ethylene ox-ide
Because of its high reactivity, ethylene oxide is a highly toxic chem-ical. According to US-OSHA1 regulations, the maximum exposurelimit is 0.5 ppm as time-weighted average and has excursion limitof 5ppm at the most. In Germany, the ”TA-Luft” concentrationis 5 mg/m3 (2.8 ppm) [93]. According to the German regulationTRGS-900, the maximum tolerable concentration at a workplace is2 mg/m3 (1.1 ppm) [93, 94].
The high odor threshold of about 250 ppm prohibits nor-mal protection by sense of smell. The LC50Rat concentration is5000 ppm /1h [12] and 1460 ppm for 4h exposition time [12, 95].
Skin contact should be avoided, because the evaporative cool-ing can cause freezing. Ethylene oxide is highly irritating to eyesand skin and even diluted ethylene oxide solutions are dangerousand may cause severe injuries. The LC50
2 value for fish is only 84mg/l (exposition time: 4d). Due to hydrolysis, biodegradation and
1United States, Occupational Safety and Hygiene Act2LD50 is the amount of a material, given all at once (solid or liquid), which
causes the death of 50% (one half) of a group of test animals. The LC50 refersto a concentration of a chemical in air that kills 50% of the test animals in agiven time (usually four hours)
216 Chapter 7. Appendix
evaporation, the ethylene oxide concentration in free flowing wateris reduced by 95% within 4h (at 25oC) [5]. Furthermore, ethyleneoxide penetrates cloth, leather or rubber easily and thus, appropri-ate protective clothing should be used and contaminated clothingremoved. Ethylene oxide is known to
• be harmful to embryos (teratogenic)
• increase incidents of cancer (mutagenic, especially leukemia,stomach, brain)
• poisoning, especially of the central nerve system, liver, kidneys
• damage the lungs (pneumonia).
Thus, due to its toxicity, ethylene oxide should be handled withextreme care and emission of ethylene oxide should be avoided.
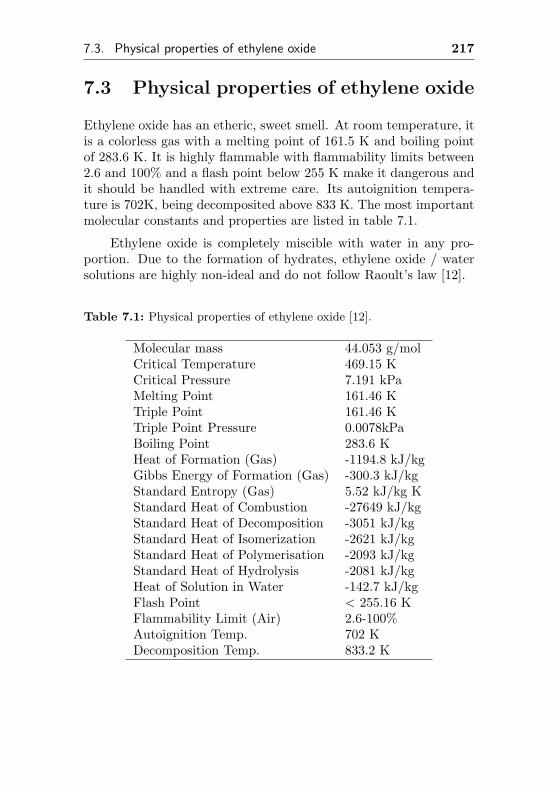
7.3. Physical properties of ethylene oxide 217
7.3 Physical properties of ethylene oxide
Ethylene oxide has an etheric, sweet smell. At room temperature, itis a colorless gas with a melting point of 161.5 K and boiling pointof 283.6 K. It is highly flammable with flammability limits between2.6 and 100% and a flash point below 255 K make it dangerous andit should be handled with extreme care. Its autoignition tempera-ture is 702K, being decomposited above 833 K. The most importantmolecular constants and properties are listed in table 7.1.
Ethylene oxide is completely miscible with water in any pro-portion. Due to the formation of hydrates, ethylene oxide / watersolutions are highly non-ideal and do not follow Raoult’s law [12].
Table 7.1: Physical properties of ethylene oxide [12].
Molecular mass 44.053 g/molCritical Temperature 469.15 KCritical Pressure 7.191 kPaMelting Point 161.46 KTriple Point 161.46 KTriple Point Pressure 0.0078kPaBoiling Point 283.6 KHeat of Formation (Gas) -1194.8 kJ/kgGibbs Energy of Formation (Gas) -300.3 kJ/kgStandard Entropy (Gas) 5.52 kJ/kg KStandard Heat of Combustion -27649 kJ/kgStandard Heat of Decomposition -3051 kJ/kgStandard Heat of Isomerization -2621 kJ/kgStandard Heat of Polymerisation -2093 kJ/kgStandard Heat of Hydrolysis -2081 kJ/kgHeat of Solution in Water -142.7 kJ/kgFlash Point < 255.16 KFlammability Limit (Air) 2.6-100%Autoignition Temp. 702 KDecomposition Temp. 833.2 K
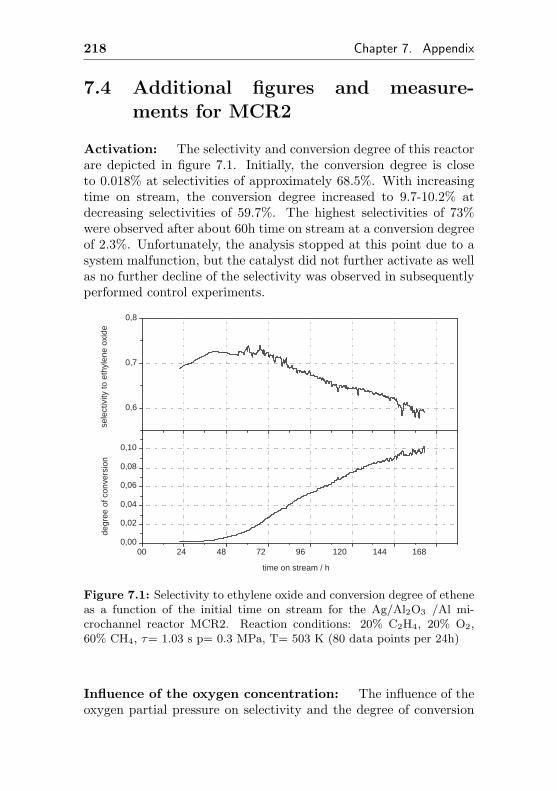
218 Chapter 7. Appendix
7.4 Additional figures and measure-ments for MCR2
Activation: The selectivity and conversion degree of this reactorare depicted in figure 7.1. Initially, the conversion degree is closeto 0.018% at selectivities of approximately 68.5%. With increasingtime on stream, the conversion degree increased to 9.7-10.2% atdecreasing selectivities of 59.7%. The highest selectivities of 73%were observed after about 60h time on stream at a conversion degreeof 2.3%. Unfortunately, the analysis stopped at this point due to asystem malfunction, but the catalyst did not further activate as wellas no further decline of the selectivity was observed in subsequentlyperformed control experiments.
00 24 48 72 96 120 144 168 0,00
0,02
0,04
0,06
0,08
0,10
sele
ctiv
ity to
eth
ylen
e ox
ide
degr
ee o
f con
vers
ion
time on stream / h
0,6
0,7
0,8
Figure 7.1: Selectivity to ethylene oxide and conversion degree of etheneas a function of the initial time on stream for the Ag/Al2O3 /Al mi-crochannel reactor MCR2. Reaction conditions: 20% C2H4, 20% O2,60% CH4, τ= 1.03 s p= 0.3 MPa, T= 503 K (80 data points per 24h)
Influence of the oxygen concentration: The influence of theoxygen partial pressure on selectivity and the degree of conversion
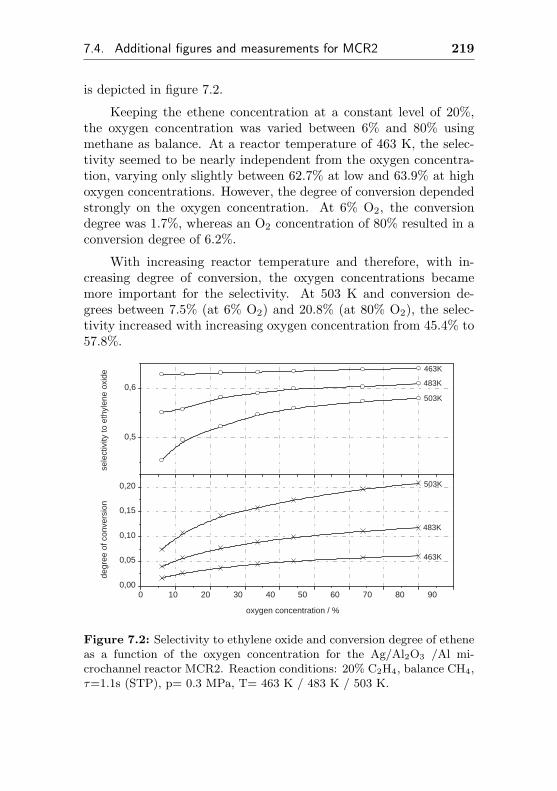
7.4. Additional figures and measurements for MCR2 219
is depicted in figure 7.2.
Keeping the ethene concentration at a constant level of 20%,the oxygen concentration was varied between 6% and 80% usingmethane as balance. At a reactor temperature of 463 K, the selec-tivity seemed to be nearly independent from the oxygen concentra-tion, varying only slightly between 62.7% at low and 63.9% at highoxygen concentrations. However, the degree of conversion dependedstrongly on the oxygen concentration. At 6% O2, the conversiondegree was 1.7%, whereas an O2 concentration of 80% resulted in aconversion degree of 6.2%.
With increasing reactor temperature and therefore, with in-creasing degree of conversion, the oxygen concentrations becamemore important for the selectivity. At 503 K and conversion de-grees between 7.5% (at 6% O2) and 20.8% (at 80% O2), the selec-tivity increased with increasing oxygen concentration from 45.4% to57.8%.
0 10 20 30 40 50 60 70 80 90 0,00
0,05
0,10
0,15
0,20
503K
483K
503K
483K
463K
sele
ctiv
ity to
eth
ylen
e ox
ide 463K
degr
ee o
f con
vers
ion
oxygen concentration / %
0,5
0,6
Figure 7.2: Selectivity to ethylene oxide and conversion degree of etheneas a function of the oxygen concentration for the Ag/Al2O3 /Al mi-crochannel reactor MCR2. Reaction conditions: 20% C2H4, balance CH4,τ=1.1s (STP), p= 0.3 MPa, T= 463 K / 483 K / 503 K.
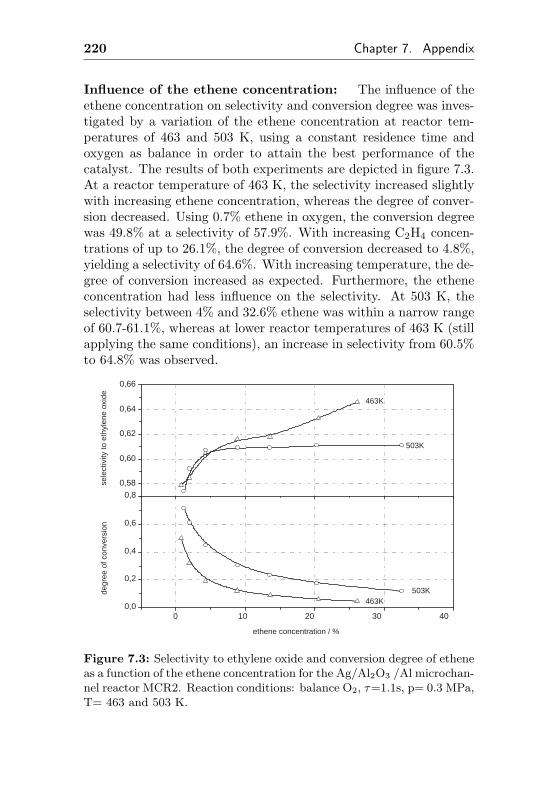
220 Chapter 7. Appendix
Influence of the ethene concentration: The influence of theethene concentration on selectivity and conversion degree was inves-tigated by a variation of the ethene concentration at reactor tem-peratures of 463 and 503 K, using a constant residence time andoxygen as balance in order to attain the best performance of thecatalyst. The results of both experiments are depicted in figure 7.3.At a reactor temperature of 463 K, the selectivity increased slightlywith increasing ethene concentration, whereas the degree of conver-sion decreased. Using 0.7% ethene in oxygen, the conversion degreewas 49.8% at a selectivity of 57.9%. With increasing C2H4 concen-trations of up to 26.1%, the degree of conversion decreased to 4.8%,yielding a selectivity of 64.6%. With increasing temperature, the de-gree of conversion increased as expected. Furthermore, the etheneconcentration had less influence on the selectivity. At 503 K, theselectivity between 4% and 32.6% ethene was within a narrow rangeof 60.7-61.1%, whereas at lower reactor temperatures of 463 K (stillapplying the same conditions), an increase in selectivity from 60.5%to 64.8% was observed.
0 10 20 30 40 0,0
0,2
0,4
0,6
0,8
463K
463K 503K
sele
ctiv
ity to
eth
ylen
e ox
ide
503K
degr
ee o
f con
vers
ion
ethene concentration / %
0,58
0,60
0,62
0,64
0,66
Figure 7.3: Selectivity to ethylene oxide and conversion degree of etheneas a function of the ethene concentration for the Ag/Al2O3 /Al microchan-nel reactor MCR2. Reaction conditions: balance O2, τ=1.1s, p= 0.3 MPa,T= 463 and 503 K.
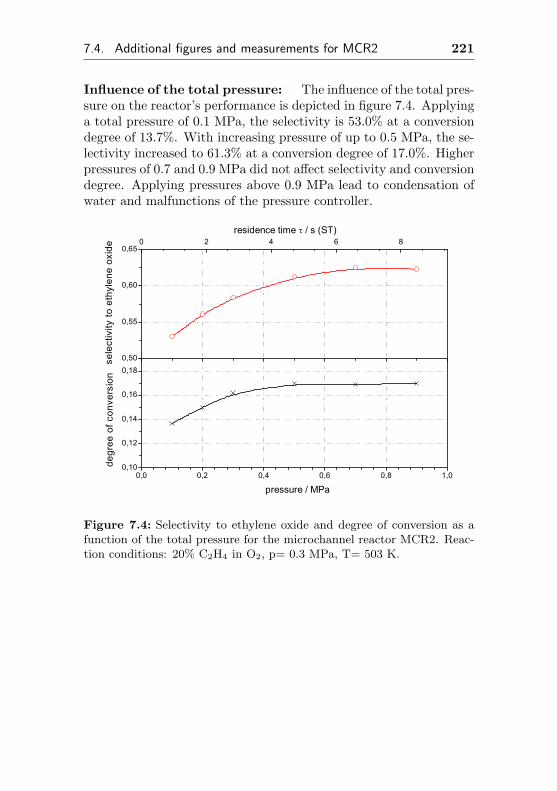
7.4. Additional figures and measurements for MCR2 221
Influence of the total pressure: The influence of the total pres-sure on the reactor’s performance is depicted in figure 7.4. Applyinga total pressure of 0.1 MPa, the selectivity is 53.0% at a conversiondegree of 13.7%. With increasing pressure of up to 0.5 MPa, the se-lectivity increased to 61.3% at a conversion degree of 17.0%. Higherpressures of 0.7 and 0.9 MPa did not affect selectivity and conversiondegree. Applying pressures above 0.9 MPa lead to condensation ofwater and malfunctions of the pressure controller.
0,0 0,2 0,4 0,6 0,8 1,00,10
0,12
0,14
0,16
0,18
degr
ee o
f con
vers
ion
pressure / MPa
0 2 4 6 8residence time / s (ST)
0,50
0,55
0,60
0,65
sel
ectiv
ity to
eth
ylen
e ox
ide
Figure 7.4: Selectivity to ethylene oxide and degree of conversion as afunction of the total pressure for the microchannel reactor MCR2. Reac-tion conditions: 20% C2H4 in O2, p= 0.3 MPa, T= 503 K.
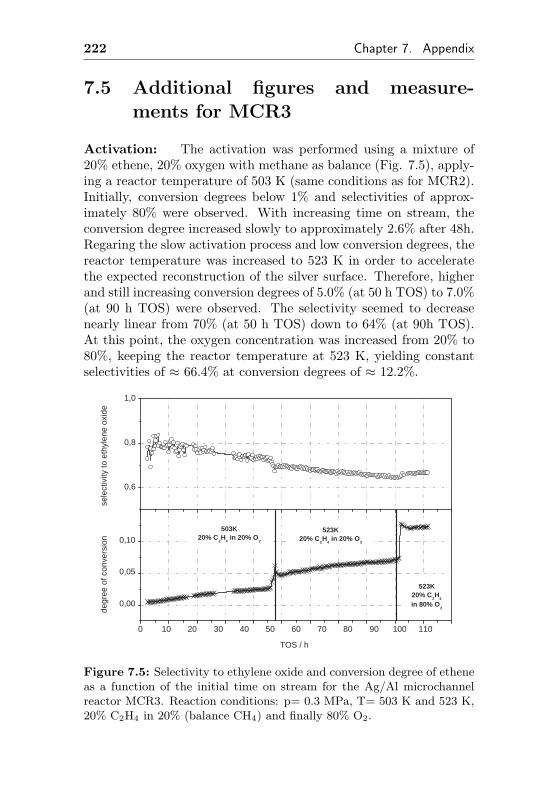
222 Chapter 7. Appendix
7.5 Additional figures and measure-ments for MCR3
Activation: The activation was performed using a mixture of20% ethene, 20% oxygen with methane as balance (Fig. 7.5), apply-ing a reactor temperature of 503 K (same conditions as for MCR2).Initially, conversion degrees below 1% and selectivities of approx-imately 80% were observed. With increasing time on stream, theconversion degree increased slowly to approximately 2.6% after 48h.Regaring the slow activation process and low conversion degrees, thereactor temperature was increased to 523 K in order to acceleratethe expected reconstruction of the silver surface. Therefore, higherand still increasing conversion degrees of 5.0% (at 50 h TOS) to 7.0%(at 90 h TOS) were observed. The selectivity seemed to decreasenearly linear from 70% (at 50 h TOS) down to 64% (at 90h TOS).At this point, the oxygen concentration was increased from 20% to80%, keeping the reactor temperature at 523 K, yielding constantselectivities of ≈ 66.4% at conversion degrees of ≈ 12.2%.
0 10 20 30 40 50 60 70 80 90 100 110
0,00
0,05
0,10
523K 20% C
2 H
4
in 80% O 2
503K 20% C
2 H
4 in 20% O
2
523K 20% C
2 H
4 in 20% O
2
sele
ctiv
ity to
eth
ylen
e ox
ide
degr
ee o
f con
vers
ion
TOS / h
0,6
0,8
1,0
Figure 7.5: Selectivity to ethylene oxide and conversion degree of etheneas a function of the initial time on stream for the Ag/Al microchannelreactor MCR3. Reaction conditions: p= 0.3 MPa, T= 503 K and 523 K,20% C2H4 in 20% (balance CH4) and finally 80% O2.
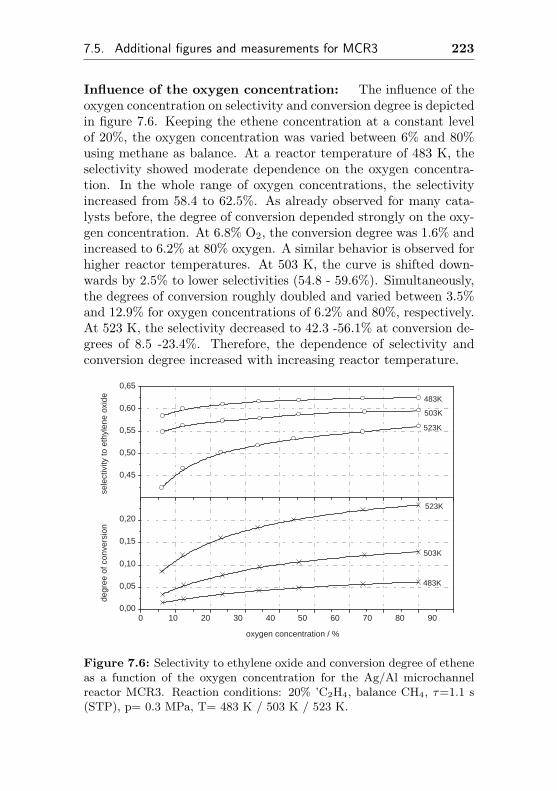
7.5. Additional figures and measurements for MCR3 223
Influence of the oxygen concentration: The influence of theoxygen concentration on selectivity and conversion degree is depictedin figure 7.6. Keeping the ethene concentration at a constant levelof 20%, the oxygen concentration was varied between 6% and 80%using methane as balance. At a reactor temperature of 483 K, theselectivity showed moderate dependence on the oxygen concentra-tion. In the whole range of oxygen concentrations, the selectivityincreased from 58.4 to 62.5%. As already observed for many cata-lysts before, the degree of conversion depended strongly on the oxy-gen concentration. At 6.8% O2, the conversion degree was 1.6% andincreased to 6.2% at 80% oxygen. A similar behavior is observed forhigher reactor temperatures. At 503 K, the curve is shifted down-wards by 2.5% to lower selectivities (54.8 - 59.6%). Simultaneously,the degrees of conversion roughly doubled and varied between 3.5%and 12.9% for oxygen concentrations of 6.2% and 80%, respectively.At 523 K, the selectivity decreased to 42.3 -56.1% at conversion de-grees of 8.5 -23.4%. Therefore, the dependence of selectivity andconversion degree increased with increasing reactor temperature.
0 10 20 30 40 50 60 70 80 90 0,00
0,05
0,10
0,15
0,20
523K
503K
523K
503K
483K
sele
ctiv
ity to
eth
ylen
e ox
ide 483K
degr
ee o
f con
vers
ion
oxygen concentration / %
0,45
0,50
0,55
0,60
0,65
Figure 7.6: Selectivity to ethylene oxide and conversion degree of etheneas a function of the oxygen concentration for the Ag/Al microchannelreactor MCR3. Reaction conditions: 20% ’C2H4, balance CH4, τ=1.1 s(STP), p= 0.3 MPa, T= 483 K / 503 K / 523 K.
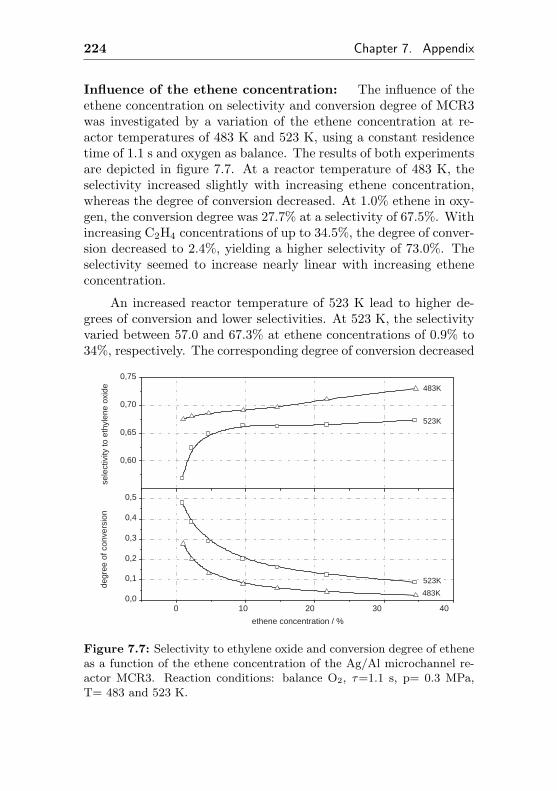
224 Chapter 7. Appendix
Influence of the ethene concentration: The influence of theethene concentration on selectivity and conversion degree of MCR3was investigated by a variation of the ethene concentration at re-actor temperatures of 483 K and 523 K, using a constant residencetime of 1.1 s and oxygen as balance. The results of both experimentsare depicted in figure 7.7. At a reactor temperature of 483 K, theselectivity increased slightly with increasing ethene concentration,whereas the degree of conversion decreased. At 1.0% ethene in oxy-gen, the conversion degree was 27.7% at a selectivity of 67.5%. Withincreasing C2H4 concentrations of up to 34.5%, the degree of conver-sion decreased to 2.4%, yielding a higher selectivity of 73.0%. Theselectivity seemed to increase nearly linear with increasing etheneconcentration.
An increased reactor temperature of 523 K lead to higher de-grees of conversion and lower selectivities. At 523 K, the selectivityvaried between 57.0 and 67.3% at ethene concentrations of 0.9% to34%, respectively. The corresponding degree of conversion decreased
0 10 20 30 40 0,0
0,1
0,2
0,3
0,4
0,5
483K
523K
523K
sele
ctiv
ity to
eth
ylen
e ox
ide 483K
degr
ee o
f con
vers
ion
ethene concentration / %
0,60
0,65
0,70
0,75
Figure 7.7: Selectivity to ethylene oxide and conversion degree of etheneas a function of the ethene concentration of the Ag/Al microchannel re-actor MCR3. Reaction conditions: balance O2, τ=1.1 s, p= 0.3 MPa,T= 483 and 523 K.
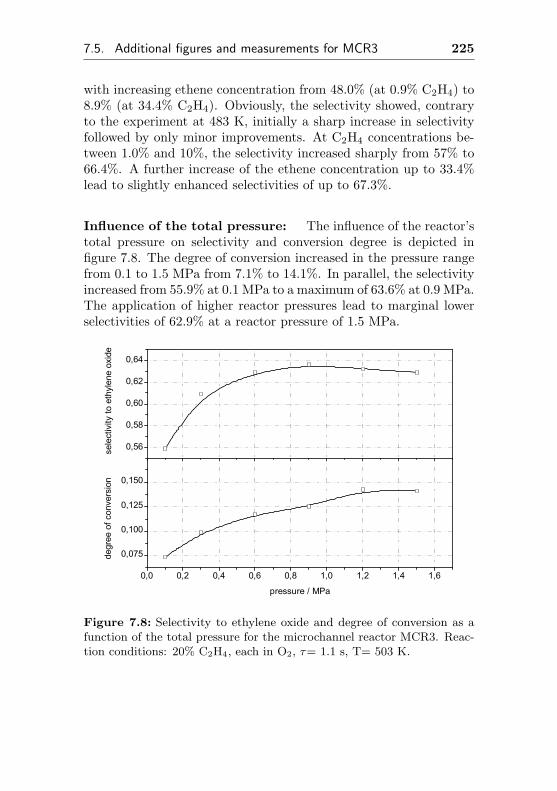
7.5. Additional figures and measurements for MCR3 225
with increasing ethene concentration from 48.0% (at 0.9% C2H4) to8.9% (at 34.4% C2H4). Obviously, the selectivity showed, contraryto the experiment at 483 K, initially a sharp increase in selectivityfollowed by only minor improvements. At C2H4 concentrations be-tween 1.0% and 10%, the selectivity increased sharply from 57% to66.4%. A further increase of the ethene concentration up to 33.4%lead to slightly enhanced selectivities of up to 67.3%.
Influence of the total pressure: The influence of the reactor’stotal pressure on selectivity and conversion degree is depicted infigure 7.8. The degree of conversion increased in the pressure rangefrom 0.1 to 1.5 MPa from 7.1% to 14.1%. In parallel, the selectivityincreased from 55.9% at 0.1 MPa to a maximum of 63.6% at 0.9 MPa.The application of higher reactor pressures lead to marginal lowerselectivities of 62.9% at a reactor pressure of 1.5 MPa.
0,0 0,2 0,4 0,6 0,8 1,0 1,2 1,4 1,6
0,075
0,100
0,125
0,150
sele
ctiv
ity to
eth
ylen
e ox
ide
degr
ee o
f con
vers
ion
pressure / MPa
0,56
0,58
0,60
0,62
0,64
Figure 7.8: Selectivity to ethylene oxide and degree of conversion as afunction of the total pressure for the microchannel reactor MCR3. Reac-tion conditions: 20% C2H4, each in O2, τ= 1.1 s, T= 503 K.
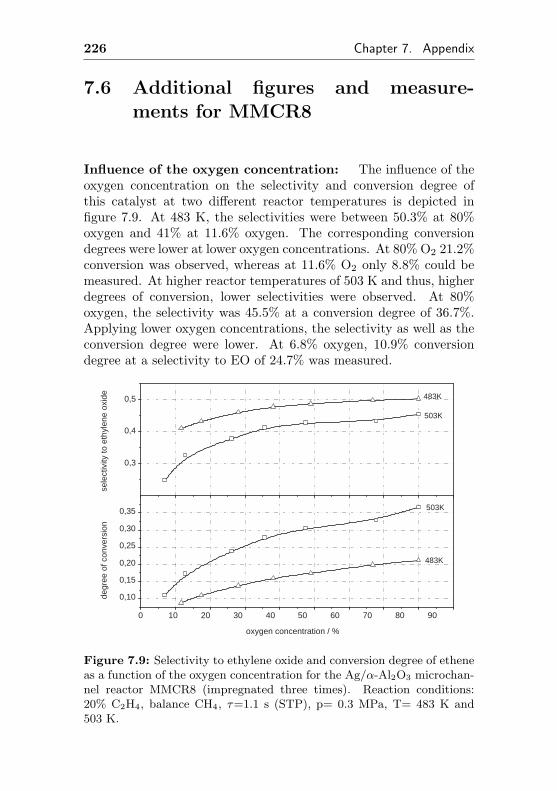
226 Chapter 7. Appendix
7.6 Additional figures and measure-ments for MMCR8
Influence of the oxygen concentration: The influence of theoxygen concentration on the selectivity and conversion degree ofthis catalyst at two different reactor temperatures is depicted infigure 7.9. At 483 K, the selectivities were between 50.3% at 80%oxygen and 41% at 11.6% oxygen. The corresponding conversiondegrees were lower at lower oxygen concentrations. At 80% O2 21.2%conversion was observed, whereas at 11.6% O2 only 8.8% could bemeasured. At higher reactor temperatures of 503 K and thus, higherdegrees of conversion, lower selectivities were observed. At 80%oxygen, the selectivity was 45.5% at a conversion degree of 36.7%.Applying lower oxygen concentrations, the selectivity as well as theconversion degree were lower. At 6.8% oxygen, 10.9% conversiondegree at a selectivity to EO of 24.7% was measured.
0 10 20 30 40 50 60 70 80 90
0,10
0,15
0,20
0,25
0,30
0,35
503K
503K
483K
sele
ctiv
ity to
eth
ylen
e ox
ide 483K
degr
ee o
f con
vers
ion
oxygen concentration / %
0,3
0,4
0,5
Figure 7.9: Selectivity to ethylene oxide and conversion degree of etheneas a function of the oxygen concentration for the Ag/α-Al2O3 microchan-nel reactor MMCR8 (impregnated three times). Reaction conditions:20% C2H4, balance CH4, τ=1.1 s (STP), p= 0.3 MPa, T= 483 K and503 K.
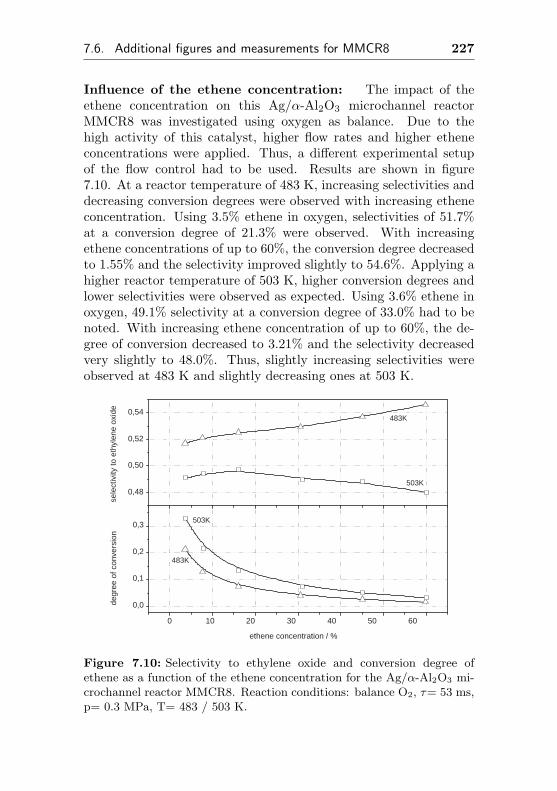
7.6. Additional figures and measurements for MMCR8 227
Influence of the ethene concentration: The impact of theethene concentration on this Ag/α-Al2O3 microchannel reactorMMCR8 was investigated using oxygen as balance. Due to thehigh activity of this catalyst, higher flow rates and higher etheneconcentrations were applied. Thus, a different experimental setupof the flow control had to be used. Results are shown in figure7.10. At a reactor temperature of 483 K, increasing selectivities anddecreasing conversion degrees were observed with increasing etheneconcentration. Using 3.5% ethene in oxygen, selectivities of 51.7%at a conversion degree of 21.3% were observed. With increasingethene concentrations of up to 60%, the conversion degree decreasedto 1.55% and the selectivity improved slightly to 54.6%. Applying ahigher reactor temperature of 503 K, higher conversion degrees andlower selectivities were observed as expected. Using 3.6% ethene inoxygen, 49.1% selectivity at a conversion degree of 33.0% had to benoted. With increasing ethene concentration of up to 60%, the de-gree of conversion decreased to 3.21% and the selectivity decreasedvery slightly to 48.0%. Thus, slightly increasing selectivities wereobserved at 483 K and slightly decreasing ones at 503 K.
0 10 20 30 40 50 60
0,0
0,1
0,2
0,3
503K
503K
483K
sele
ctiv
ity to
eth
ylen
e ox
ide
483K
degr
ee o
f con
vers
ion
ethene concentration / %
0,48
0,50
0,52
0,54
Figure 7.10: Selectivity to ethylene oxide and conversion degree ofethene as a function of the ethene concentration for the Ag/α-Al2O3 mi-crochannel reactor MMCR8. Reaction conditions: balance O2, τ= 53 ms,p= 0.3 MPa, T= 483 / 503 K.
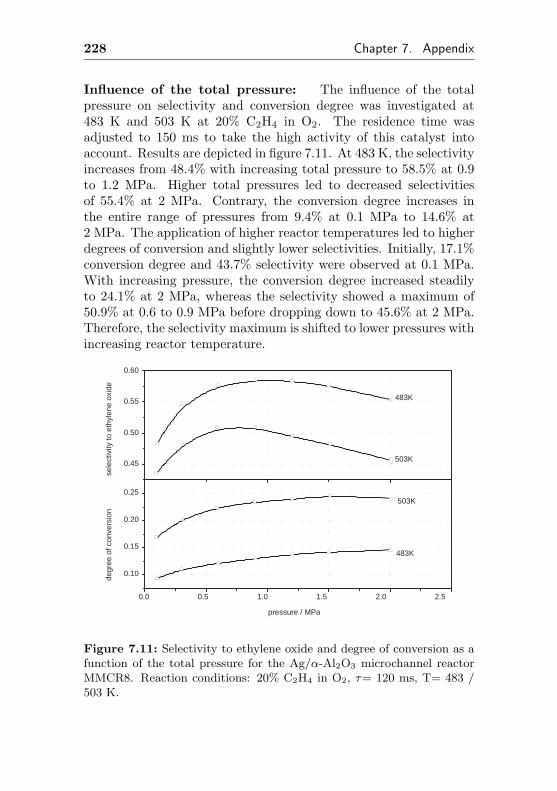
228 Chapter 7. Appendix
Influence of the total pressure: The influence of the totalpressure on selectivity and conversion degree was investigated at483 K and 503 K at 20% C2H4 in O2. The residence time wasadjusted to 150 ms to take the high activity of this catalyst intoaccount. Results are depicted in figure 7.11. At 483 K, the selectivityincreases from 48.4% with increasing total pressure to 58.5% at 0.9to 1.2 MPa. Higher total pressures led to decreased selectivitiesof 55.4% at 2 MPa. Contrary, the conversion degree increases inthe entire range of pressures from 9.4% at 0.1 MPa to 14.6% at2 MPa. The application of higher reactor temperatures led to higherdegrees of conversion and slightly lower selectivities. Initially, 17.1%conversion degree and 43.7% selectivity were observed at 0.1 MPa.With increasing pressure, the conversion degree increased steadilyto 24.1% at 2 MPa, whereas the selectivity showed a maximum of50.9% at 0.6 to 0.9 MPa before dropping down to 45.6% at 2 MPa.Therefore, the selectivity maximum is shifted to lower pressures withincreasing reactor temperature.
0.0 0.5 1.0 1.5 2.0 2.5
0.10
0.15
0.20
0.25
483K
503K
503K
483K
sele
ctiv
ity to
eth
ylen
e ox
ide
degr
ee o
f con
vers
ion
pressure / MPa
0.45
0.50
0.55
0.60
Figure 7.11: Selectivity to ethylene oxide and degree of conversion as afunction of the total pressure for the Ag/α-Al2O3 microchannel reactorMMCR8. Reaction conditions: 20% C2H4 in O2, τ= 120 ms, T= 483 /503 K.
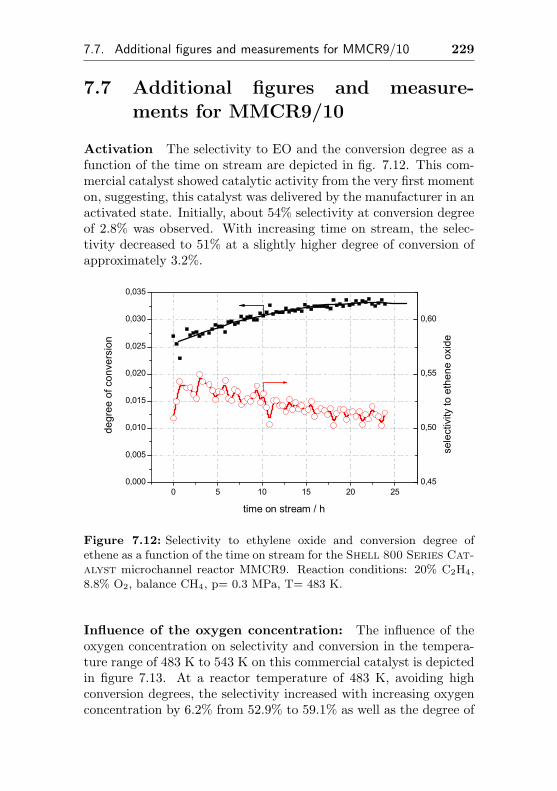
7.7. Additional figures and measurements for MMCR9/10 229
7.7 Additional figures and measure-ments for MMCR9/10
Activation The selectivity to EO and the conversion degree as afunction of the time on stream are depicted in fig. 7.12. This com-mercial catalyst showed catalytic activity from the very first momenton, suggesting, this catalyst was delivered by the manufacturer in anactivated state. Initially, about 54% selectivity at conversion degreeof 2.8% was observed. With increasing time on stream, the selec-tivity decreased to 51% at a slightly higher degree of conversion ofapproximately 3.2%.
0 5 10 15 20 250,000
0,005
0,010
0,015
0,020
0,025
0,030
0,035
degr
ee o
f con
vers
ion
time on stream / h
0,45
0,50
0,55
0,60
sele
ctiv
ity to
eth
ene
oxid
e
Figure 7.12: Selectivity to ethylene oxide and conversion degree ofethene as a function of the time on stream for the Shell 800 Series Cat-alyst microchannel reactor MMCR9. Reaction conditions: 20% C2H4,8.8% O2, balance CH4, p= 0.3 MPa, T= 483 K.
Influence of the oxygen concentration: The influence of theoxygen concentration on selectivity and conversion in the tempera-ture range of 483 K to 543 K on this commercial catalyst is depictedin figure 7.13. At a reactor temperature of 483 K, avoiding highconversion degrees, the selectivity increased with increasing oxygenconcentration by 6.2% from 52.9% to 59.1% as well as the degree of
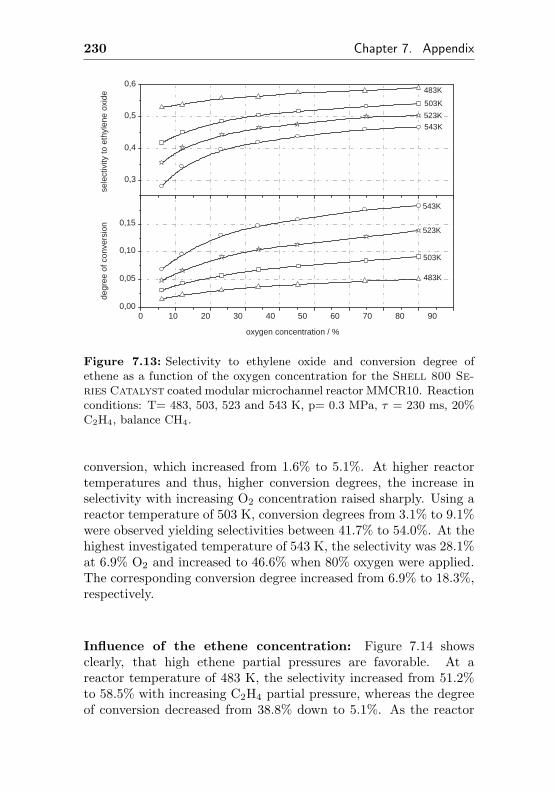
230 Chapter 7. Appendix
0 10 20 30 40 50 60 70 80 90 0,00
0,05
0,10
0,15
543K
523K
543K
523K
503K
503K
483K
sele
ctiv
ity to
eth
ylen
e ox
ide 483K
degr
ee o
f con
vers
ion
oxygen concentration / %
0,3
0,4
0,5
0,6
Figure 7.13: Selectivity to ethylene oxide and conversion degree ofethene as a function of the oxygen concentration for the Shell 800 Se-ries Catalyst coated modular microchannel reactor MMCR10. Reactionconditions: T= 483, 503, 523 and 543 K, p= 0.3 MPa, τ = 230 ms, 20%C2H4, balance CH4.
conversion, which increased from 1.6% to 5.1%. At higher reactortemperatures and thus, higher conversion degrees, the increase inselectivity with increasing O2 concentration raised sharply. Using areactor temperature of 503 K, conversion degrees from 3.1% to 9.1%were observed yielding selectivities between 41.7% to 54.0%. At thehighest investigated temperature of 543 K, the selectivity was 28.1%at 6.9% O2 and increased to 46.6% when 80% oxygen were applied.The corresponding conversion degree increased from 6.9% to 18.3%,respectively.
Influence of the ethene concentration: Figure 7.14 showsclearly, that high ethene partial pressures are favorable. At areactor temperature of 483 K, the selectivity increased from 51.2%to 58.5% with increasing C2H4 partial pressure, whereas the degreeof conversion decreased from 38.8% down to 5.1%. As the reactor
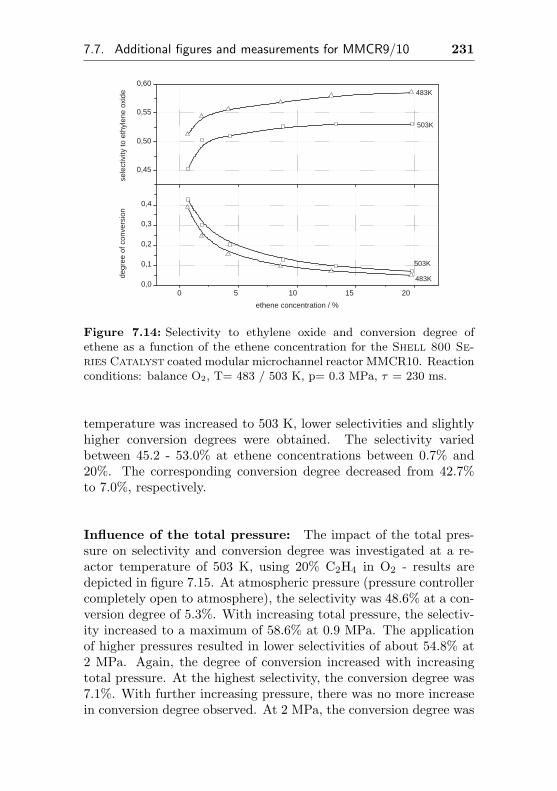
7.7. Additional figures and measurements for MMCR9/10 231
0 5 10 15 20 0,0
0,1
0,2
0,3
0,4
503K
503K
483K
sele
ctiv
ity to
eth
ylen
e ox
ide 483K
degr
ee o
f con
vers
ion
ethene concentration / %
0,45
0,50
0,55
0,60
Figure 7.14: Selectivity to ethylene oxide and conversion degree ofethene as a function of the ethene concentration for the Shell 800 Se-ries Catalyst coated modular microchannel reactor MMCR10. Reactionconditions: balance O2, T= 483 / 503 K, p= 0.3 MPa, τ = 230 ms.
temperature was increased to 503 K, lower selectivities and slightlyhigher conversion degrees were obtained. The selectivity variedbetween 45.2 - 53.0% at ethene concentrations between 0.7% and20%. The corresponding conversion degree decreased from 42.7%to 7.0%, respectively.
Influence of the total pressure: The impact of the total pres-sure on selectivity and conversion degree was investigated at a re-actor temperature of 503 K, using 20% C2H4 in O2 - results aredepicted in figure 7.15. At atmospheric pressure (pressure controllercompletely open to atmosphere), the selectivity was 48.6% at a con-version degree of 5.3%. With increasing total pressure, the selectiv-ity increased to a maximum of 58.6% at 0.9 MPa. The applicationof higher pressures resulted in lower selectivities of about 54.8% at2 MPa. Again, the degree of conversion increased with increasingtotal pressure. At the highest selectivity, the conversion degree was7.1%. With further increasing pressure, there was no more increasein conversion degree observed. At 2 MPa, the conversion degree was
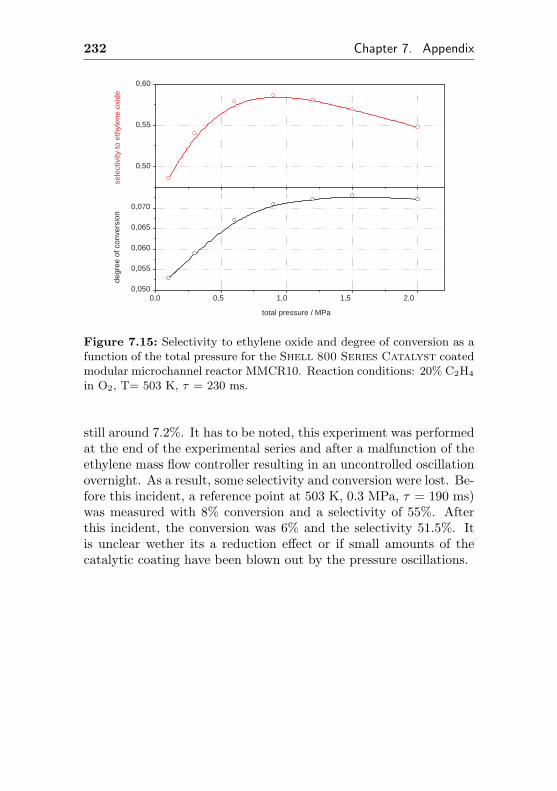
232 Chapter 7. Appendix
0,0 0,5 1,0 1,5 2,0 0,050
0,055
0,060
0,065
0,070
sele
ctiv
ity to
eth
ylen
e ox
ide
degr
ee o
f con
vers
ion
total pressure / MPa
0,50
0,55
0,60
Figure 7.15: Selectivity to ethylene oxide and degree of conversion as afunction of the total pressure for the Shell 800 Series Catalyst coatedmodular microchannel reactor MMCR10. Reaction conditions: 20% C2H4
in O2, T= 503 K, τ = 230 ms.
still around 7.2%. It has to be noted, this experiment was performedat the end of the experimental series and after a malfunction of theethylene mass flow controller resulting in an uncontrolled oscillationovernight. As a result, some selectivity and conversion were lost. Be-fore this incident, a reference point at 503 K, 0.3 MPa, τ = 190 ms)was measured with 8% conversion and a selectivity of 55%. Afterthis incident, the conversion was 6% and the selectivity 51.5%. Itis unclear wether its a reduction effect or if small amounts of thecatalytic coating have been blown out by the pressure oscillations.
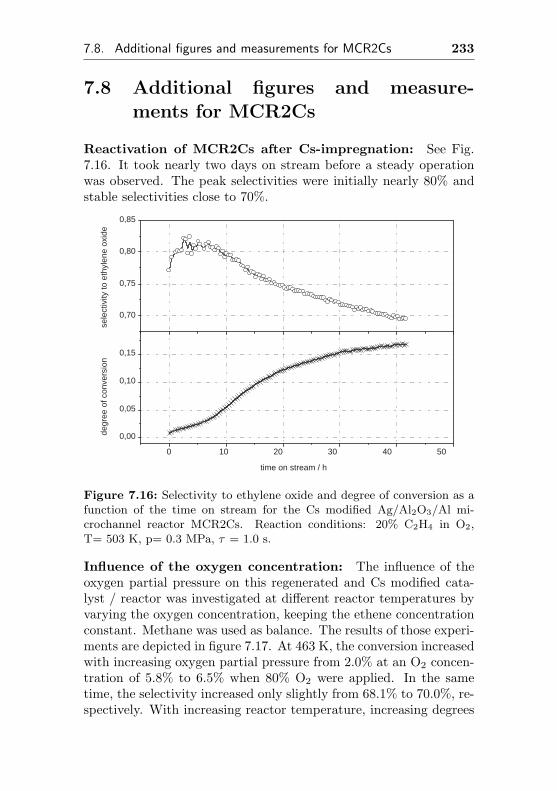
7.8. Additional figures and measurements for MCR2Cs 233
7.8 Additional figures and measure-ments for MCR2Cs
Reactivation of MCR2Cs after Cs-impregnation: See Fig.7.16. It took nearly two days on stream before a steady operationwas observed. The peak selectivities were initially nearly 80% andstable selectivities close to 70%.
0 10 20 30 40 50
0,00
0,05
0,10
0,15
sele
ctiv
ity to
eth
ylen
e ox
ide
degr
ee o
f con
vers
ion
time on stream / h
0,70
0,75
0,80
0,85
Figure 7.16: Selectivity to ethylene oxide and degree of conversion as afunction of the time on stream for the Cs modified Ag/Al2O3/Al mi-crochannel reactor MCR2Cs. Reaction conditions: 20% C2H4 in O2,T= 503 K, p= 0.3 MPa, τ = 1.0 s.
Influence of the oxygen concentration: The influence of theoxygen partial pressure on this regenerated and Cs modified cata-lyst / reactor was investigated at different reactor temperatures byvarying the oxygen concentration, keeping the ethene concentrationconstant. Methane was used as balance. The results of those experi-ments are depicted in figure 7.17. At 463 K, the conversion increasedwith increasing oxygen partial pressure from 2.0% at an O2 concen-tration of 5.8% to 6.5% when 80% O2 were applied. In the sametime, the selectivity increased only slightly from 68.1% to 70.0%, re-spectively. With increasing reactor temperature, increasing degrees
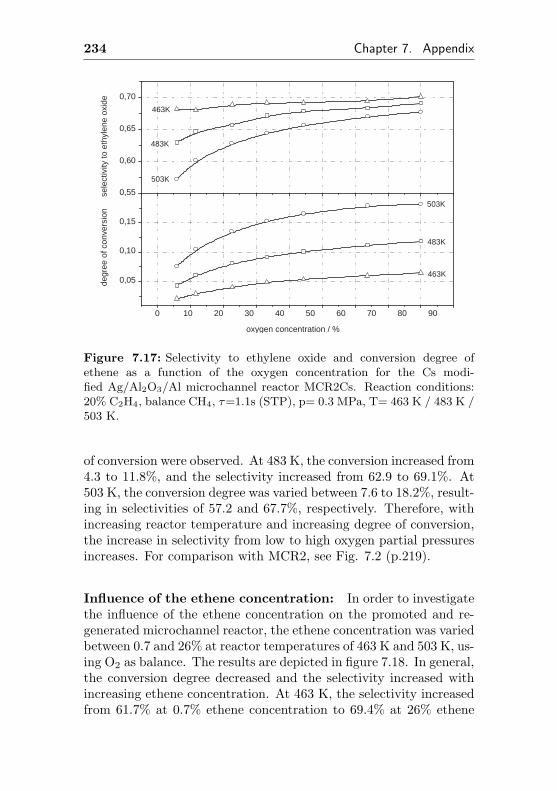
234 Chapter 7. Appendix
0 10 20 30 40 50 60 70 80 90
0,05
0,10
0,15
483K
483K
463K
503K
503K
463K de
gree
of c
onve
rsio
n
sel
ectiv
ity to
eth
ylen
e ox
ide
oxygen concentration / %
0,55
0,60
0,65
0,70
Figure 7.17: Selectivity to ethylene oxide and conversion degree ofethene as a function of the oxygen concentration for the Cs modi-fied Ag/Al2O3/Al microchannel reactor MCR2Cs. Reaction conditions:20% C2H4, balance CH4, τ=1.1s (STP), p= 0.3 MPa, T= 463 K / 483 K /503 K.
of conversion were observed. At 483 K, the conversion increased from4.3 to 11.8%, and the selectivity increased from 62.9 to 69.1%. At503 K, the conversion degree was varied between 7.6 to 18.2%, result-ing in selectivities of 57.2 and 67.7%, respectively. Therefore, withincreasing reactor temperature and increasing degree of conversion,the increase in selectivity from low to high oxygen partial pressuresincreases. For comparison with MCR2, see Fig. 7.2 (p.219).
Influence of the ethene concentration: In order to investigatethe influence of the ethene concentration on the promoted and re-generated microchannel reactor, the ethene concentration was variedbetween 0.7 and 26% at reactor temperatures of 463 K and 503 K, us-ing O2 as balance. The results are depicted in figure 7.18. In general,the conversion degree decreased and the selectivity increased withincreasing ethene concentration. At 463 K, the selectivity increasedfrom 61.7% at 0.7% ethene concentration to 69.4% at 26% ethene
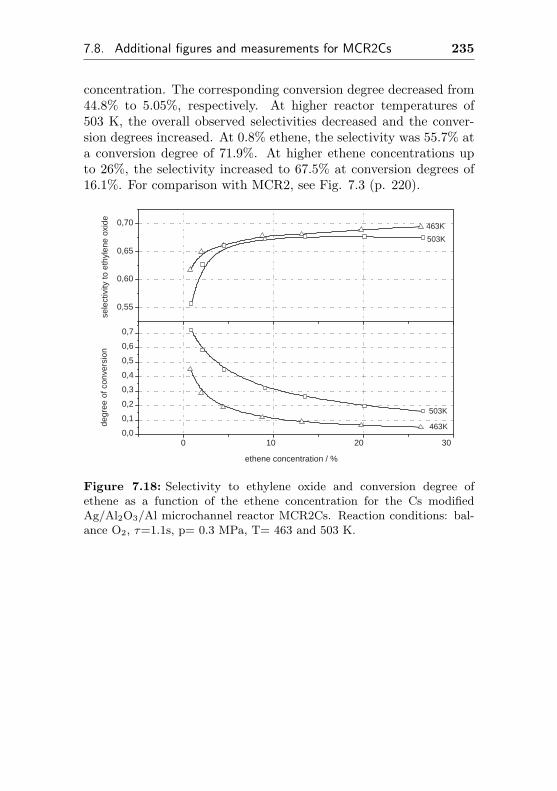
7.8. Additional figures and measurements for MCR2Cs 235
concentration. The corresponding conversion degree decreased from44.8% to 5.05%, respectively. At higher reactor temperatures of503 K, the overall observed selectivities decreased and the conver-sion degrees increased. At 0.8% ethene, the selectivity was 55.7% ata conversion degree of 71.9%. At higher ethene concentrations upto 26%, the selectivity increased to 67.5% at conversion degrees of16.1%. For comparison with MCR2, see Fig. 7.3 (p. 220).
0 10 20 30 0,0
0,1
0,2
0,3
0,4
0,5
0,6
0,7
463K
503K
503K
sele
ctiv
ity to
eth
ylen
e ox
ide
463K
degr
ee o
f con
vers
ion
ethene concentration / %
0,55
0,60
0,65
0,70
Figure 7.18: Selectivity to ethylene oxide and conversion degree ofethene as a function of the ethene concentration for the Cs modifiedAg/Al2O3/Al microchannel reactor MCR2Cs. Reaction conditions: bal-ance O2, τ=1.1s, p= 0.3 MPa, T= 463 and 503 K.
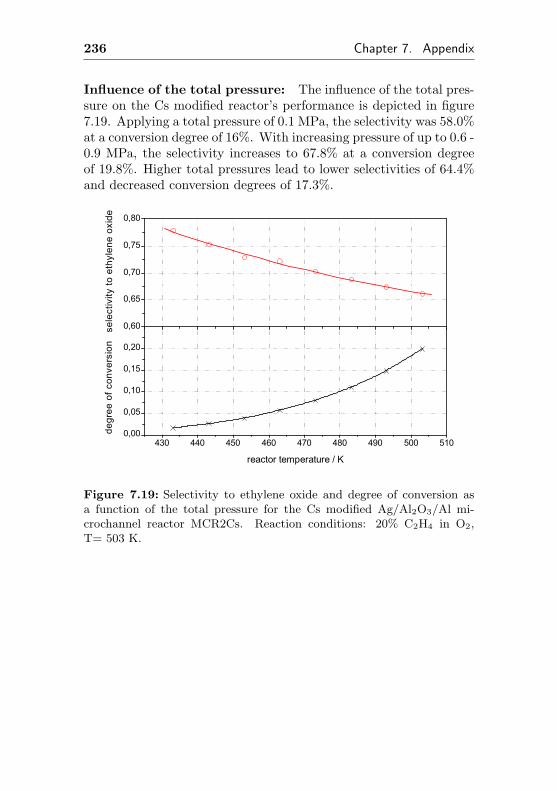
236 Chapter 7. Appendix
Influence of the total pressure: The influence of the total pres-sure on the Cs modified reactor’s performance is depicted in figure7.19. Applying a total pressure of 0.1 MPa, the selectivity was 58.0%at a conversion degree of 16%. With increasing pressure of up to 0.6 -0.9 MPa, the selectivity increases to 67.8% at a conversion degreeof 19.8%. Higher total pressures lead to lower selectivities of 64.4%and decreased conversion degrees of 17.3%.
430 440 450 460 470 480 490 500 5100,00
0,05
0,10
0,15
0,20
sele
ctiv
ity to
eth
ylen
e ox
ide
degr
ee o
f con
vers
ion
reactor temperature / K
0,60
0,65
0,70
0,75
0,80
Figure 7.19: Selectivity to ethylene oxide and degree of conversion asa function of the total pressure for the Cs modified Ag/Al2O3/Al mi-crochannel reactor MCR2Cs. Reaction conditions: 20% C2H4 in O2,T= 503 K.
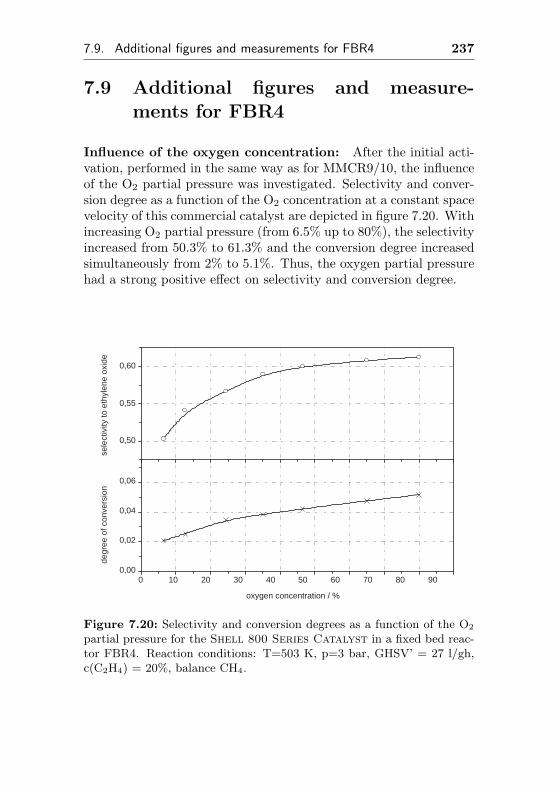
7.9. Additional figures and measurements for FBR4 237
7.9 Additional figures and measure-ments for FBR4
Influence of the oxygen concentration: After the initial acti-vation, performed in the same way as for MMCR9/10, the influenceof the O2 partial pressure was investigated. Selectivity and conver-sion degree as a function of the O2 concentration at a constant spacevelocity of this commercial catalyst are depicted in figure 7.20. Withincreasing O2 partial pressure (from 6.5% up to 80%), the selectivityincreased from 50.3% to 61.3% and the conversion degree increasedsimultaneously from 2% to 5.1%. Thus, the oxygen partial pressurehad a strong positive effect on selectivity and conversion degree.
0 10 20 30 40 50 60 70 80 90 0,00
0,02
0,04
0,06
sele
ctiv
ity to
eth
ylen
e ox
ide
degr
ee o
f con
vers
ion
oxygen concentration / %
0,50
0,55
0,60
Figure 7.20: Selectivity and conversion degrees as a function of the O2
partial pressure for the Shell 800 Series Catalyst in a fixed bed reac-tor FBR4. Reaction conditions: T=503 K, p=3 bar, GHSV’ = 27 l/gh,c(C2H4) = 20%, balance CH4.
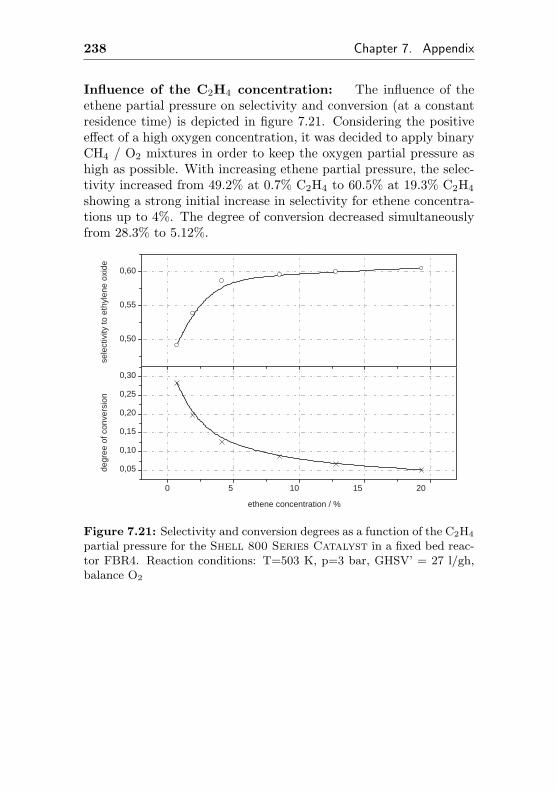
238 Chapter 7. Appendix
Influence of the C2H4 concentration: The influence of theethene partial pressure on selectivity and conversion (at a constantresidence time) is depicted in figure 7.21. Considering the positiveeffect of a high oxygen concentration, it was decided to apply binaryCH4 / O2 mixtures in order to keep the oxygen partial pressure ashigh as possible. With increasing ethene partial pressure, the selec-tivity increased from 49.2% at 0.7% C2H4 to 60.5% at 19.3% C2H4
showing a strong initial increase in selectivity for ethene concentra-tions up to 4%. The degree of conversion decreased simultaneouslyfrom 28.3% to 5.12%.
0 5 10 15 20
0,05
0,10
0,15
0,20
0,25
0,30
sele
ctiv
ity to
eth
ylen
e ox
ide
degr
ee o
f con
vers
ion
ethene concentration / %
0,50
0,55
0,60
Figure 7.21: Selectivity and conversion degrees as a function of the C2H4
partial pressure for the Shell 800 Series Catalyst in a fixed bed reac-tor FBR4. Reaction conditions: T=503 K, p=3 bar, GHSV’ = 27 l/gh,balance O2
Bibliography
[1] A.Wurtz, Justus Liebigs Ann. Chem., 110 (1859), p.125−128
[2] ”Occupational Exposure to Ethylene Oxide”, US Federal Reg-ister, June 22, 49 (1984), 25734−809; Information provided bythe Occupational Safety & Health Adimistration, US. Depar-tent of Labor.
[3] Ullmann’s Encyclopaedia of Industrial Chemistry, Release 2002,6th Edition (CDROM).
[4] Francis Whellan, ”The History, Topography, and Directory ofthe County Palatine of Durham”, 2nd. Edition (1894) (partialreprint, pictures and summary found at the Durham MiningMuseum)
[5] Ullmann’s Encyclopaedia of Industrial Chemistry, 5th Edition,Volume A10 (1987), VCH Weinheim , ISBN 3−527−20110−6,p.117−135
[6] S.A. Miller, ”Ethylene and its Industrial Derivatives”, ErnestBrenn Limited, London (1969), p.524−562
[7] T.E. Lefort, French patent 729952, 1931, to Societe Francaisede Catalyse Generale
[8] R.A. Van Santen, H.P.C.E. Kuipers, Adv. Catal. 35 (1987),p.265−321
239
240 Bibliography
[9] A.M.Lauritzen, US patent 4766105, 1986 and EP 0 226 015,1987, to Shell Oil Company
[10] J.C.Zomerdijk, M.W.Hall, Catal. Rev.−Sci. Eng. 23 (1981),p.163−185
[11] Report by M.T. Devanney, SRI Consulting / Access IntelligenceLLC (4/2007), http://www.sriconsulting.com
[12] Ethyleneoxide User’s Guide, 2nd Edition, published byC.Buckles, P.Chipman, M.Cubillas et al. for Shell Chemicals,August 1999.
[13] Ullmann’s Encyclopaedia of Industrial Chemistry, 5th Edition,Volume A10 (1987), VCH Weinheim , ISBN 3−527−20110−6,p.101−115
[14] Sterigenics Food Safety, 344 Bonnie Circle, Corona, CA: Online:http://www.sterigenics.com
[15] P.A. Kilty, W.M.H.Sachtler, Cat. Rev.−Sci−.Eng. 10 (1)(1974), p.1−16
[16] A. Michaelides, M.−L. Bocquet, P. Sautet, A. Alavi, D.A. King,Chemical Physics Letters 367 (2003), p.344−350
[17] V.I.Bukhtiyarov, V.V.Kaichev, Journal of Molecular CatalysisA 158 1 (2000), p.167−172
[18] W.Herzog, Ber.Bunsenges. Phys. Chem. 74 (1974), p.216−220
[19] R.A. van Santen, C.P.M. De Groot, J. Catal. 98 (1986),p.530−539
[20] A.V.Khasin, Kinetics and Catalysis 34 No. 1 (1993), p.42−53(ISSN: 0023−1584/93/3401−0042)
[21] R.Hall, G.Neubauer, J. Catal. 105 (1987), p.39−54
[22] N.C.Rigas, G.D.Svoboda, J.T.Gleaves, ACS Symp. Series 523(1993), ISBN 0−8412−2637−7, p.183−203
[23] R.B.Grant, R.M.Lambert, J.Chem.Soc. Chem. Comm. 1983,p.662−663
Bibliography 241
[24] C.J.Bertole, C.A.Mims, J.Catal. 184 (1999), p.224−235
[25] M.R.Salzar, J.D.Kress, A.Redondo, Surf. Sci. 469 (2000),p.80−90
[26] M.V.Badani, M.A.Vannice, App. Cat. A 204 (2000), p.129−142
[27] L.M.Akella, H.H.Lee, J.Catal. 86 (1984), p.465−472
[28] N.W.Cant, W.K.Hall, J.Catal. 52 (1978), p.81−94
[29] P.C.Borman, K.R.Westerterp, Ind. Eng. Chem. Res. 34 (1995),p.49−58
[30] S.N.Goncharova, A.V.Khasin, S.N.Filimonova, D.A.Bulushev,Kinetics and Catalysis 32 4 (1991), p.852−859 (ISSN0023−1584/91/3204−0768)
[31] E.P.S.Schouten, P.C.Borman, K.R.Westerterp, Chem. Eng.Proc. 35 (1996), p.107−120
[32] P.C.Borman, K.R.Westerterp, Chem. Eng. Sci. 47 (1992) 9−11,p.2541−2546
[33] G.H.Law, S.Charleston, H.C.Chitwood, US patent 2279470,1942, to Carbide and Carbon Chemicals Corporation, USA.
[34] G.L.Montrasi, G.C.Battiston, Ox. Comm. 3 (1983), p.259−267
[35] K.L.Yeung, A.Gavriilidis, A.Varma, M.M.Bhasin, J. Catal. 174(1998), p. 1−12
[36] D.Lafarga, A.Varma, Chem. Eng. Sci 55 (2000), p.749−758
[37] R.A.Kemp, US patent 5545603, 1996, to Shell Oil Company
[38] N.Rizkalla, US patent 5945551, 1999, to Scientific Design Com-pany
[39] M.Nakajima, US patent 4831162, 1989, to Mitsui Toatsu Chem-icals, Inc., Japan
[40] C.T.Campbell, J.Catal. 99 (1986), p.28−38
[41] C.F.Mao, M.A.Vannice, App. Cat. A 122 (1995), p.61−76
242 Bibliography
[42] C.T.Campbell, B.E.Koel, J.Catal. 92 (1985), p.272−283
[43] C.T.Campbell, M.T.Paffett, Appl. Surf. Sci. 19 (1984), p.28−41
[44] S.A.Tan, R.B.Grant, R.M.Lambert, J.Catal. 100 (1986),p.383−391
[45] C.F.Mao, M.A.Vannice, App. Cat. A 122(1995), p.41−59
[46] G.Boxhoorn, O.M. Velthuis, A.H.Klazinga, US patent 4731350,1987, to Shell Oil Company
[47] J.R.Lockemeyer, US Patent 5929259, 1997, to Shell Oil Com-pany
[48] H. Nakatsuji, H.Nakai, K.Ikeda, Y.Yanamoto, Surf. Sci. 384(1997), p.315−333
[49] M.C.N.A. Carvalho, C.A.Perez, R.Simao, F.B. Passos andM.Schmal, Anais da Academia Brasileira de Ciencias 76(1)(2004) p.19−27
[50] Y. Jun, D.Jingfa, App. Cat. A 92 (1995), p.73−80
[51] N.Rizkalla, US patent 5736483, 1198, to Scientific Design Com-pany
[52] J.Alfansreder, US Patent 4335014, 1982, to Hoechst Aktienge-sellschaft, Germany
[53] E.Vangermain, C.D.Mengler, R.Elm, H.Ueberschaer,W.Brauckmann, US patent 4409394, 1983, to ChemischeWerke Huls AG, Germany
[54] G.B.Hoflund, D.M.Minahan, J. Catal. 162 (1996), p.48−53
[55] H.V.Holler, US patent 3892679, 1975, to Shell Oil Company
[56] N.Nojiri, Y.Sakai, US patent 4786624, 1988, to MitsubishiPetrochemical Co, Japan
[57] V.M.Mastikhin, S.N.Goncharova, V.M.Taplilin, V.V.Terskikh,B.S.Balzhiminaev, J.Mol.Cat. A 96 (1995), p.175−179
[58] D.A.Bulushev, E.A.Paukshtis, Y.N.Nogin, B.S.Bal’zhinimaev,App. Cat. A 123 (1995), p.301−322
Bibliography 243
[59] D.A.Bulushev, S.N.Goncharova, E.A.Paukshtis,B.S.Bal’zhinimaev, App. Cat. A 126 (1995), p.67−84
[60] R.Baratti, A.Gavriilidis, M.Morbidelli, A.Varma, Chem. Eng.Sci. 49 (1994), p.1925−1936
[61] M.Morbidelli, A.Servida, R.Paludetto, S.Carra, J.Catal. 87(1984), p.116−125
[62] E.P.S.Schouten, P.C.Borman, K.R.Westerterp, Chem. Eng. Sci.No. 24a 49 (1994), p. 4725−4747
[63] P.C.Borman, K.R.Westerterp, Chem. Eng. Sci. 47 (1992)p.2541−2546
[64] P.C.Borman, K.R.Westerterp, Chem. Eng. & Chem. Res. 34(1995) p.49−58
[65] J.Brandner, M.Fichtner, U.Schygulla, K.Schubert, IMRET 4Proceedings, AIChE National Spring Meeting, Atlanta 2000,p.244−249 (ISBN 0−8169−9882−5)
[66] H.O.Kuchling, Taschenbuch der Physik (13. Auflage), Fach-buchverlag Leipzig, 1991, ISBN 3−343−00759−5, p.612-613
[67] M.T.Janicke, H.Kestenbaum, U.Hagendorf, F.Schuth,M.Fichtner, K.Schubert, J. Catal. 191 (2000), p.282–293
[68] T.Stief, PhD thesis, Uni−Dortmund (2001), Shaker VerlagAachen, ISBN 3-8265-9334-0
[69] T.Zech, D.Honicke, IMRET 3 Proceedings (Ed: W.Ehrfeld),Springer Verlag 2000, ISBN 3−540−66964−7, 2000, p.260−266
[70] L.J.Rogers, US patent 3840341, 1974, to Ionics Inc.
[71] J.W.Parce, A.R.Kopf−Sill, L.J.Bousse, US patent 6150180,2000, to Caliper Tech Corp.
[72] S.H.DeWitt, Current Opinion in Chemical Biology 3 (1999),p.350−356.
[73] Buchi technical information data sheet, ”Pilot plant with BuchiChemreactors”, document ID 40.9P211.E004, p.9. Reprinthttp://www.buchiglas.ch/pdf-files/glass/pilot plant e.pdf
244 Bibliography
[74] T. Schwalbe, V. Autze, G. Wille, Chemical Synthesis in Mi-croreactors, CHIMICA 56 (2002) 636−646
[75] T.Schwalbe, V.Autze, M.Hohmann, W.Stirner, Organic ProcessResearch and Development 8 (2004), p.440−454
[76] S.Taghavi−Moghadam, A.Kleemann, K.Golbig, Organic Pro-cess Research & Development 5 (2001), p.652−658
[77] L.Shen, S.Kiang, G.Zhenrong, US Patent Application20040230045 for Bristol−Myers Squibb
[78] David M. Minahan, Gar. B. Hoflund , J. Catal. 158 (1996),p.109−115
[79] A.Kursawe, R.Pilz, H.Durr, D.Honicke, IMRET 4 Proceedings,AIChE National Spring Meeting, Atlanta 2000, p. 227−235(ISBN 0−8169−9882−5)
[80] E.Dietzsch, PhD thesis, TU−Chemnitz (2004), online availablehttp://http://archiv.tu−chemnitz.de/pub/2005/0095
[81] G.Wiessmeier, K.Schubert, D.Honicke, IMRET 1 Proceedings(Ed. W.Ehrfeld), Springer Verlag 1998, p.20−26
[82] A.Kursawe, E.Dietzsch, S.Kah, D.Honicke, M.Fichtner,K.Schubert, G.Wiessmeier, IMRET 3 Proceedings (Ed.W.Ehrfeld), Springer Verlag 2000, ISBN 3−540−66964−7,p.213−223
[83] G.Patermarakis, C.Pavlidou, J. Catal. 147 (1994), p.140−155
[84] A.Gavriilidis, A.Varma, ACS Symp. Series 523 (1992), p.410−415
[85] R.B.Grant, R.M.Lambert, J.Catal. 92 (1985), p.364−375
[86] S.Kah, PhD Thesis, TU−Chemnitz, 2004, online availablehttp://archiv.tu−chemnitz.de/pub/2004/0098/
[87] G.Wiessmeier, D.Honicke, J.Micromech. Microeng. 6 (1996),p.285−289
[88] L.G.Britton, Plant/Operations Progress 9 (1990), p.75−86
Bibliography 245
[89] Photo courtsey of CPC−Systems GmbH, Germany. Device in-stalled at Clariant facilities in Frankfurt−Hoechst.
[90] Forschungszentrum Karlsruhe GmbH, Mitglied der Hermannvon Helmholtz−Gemeinschaft Deutscher Forschungszen-tren (HGF), Hermann−von−Helmholtz−Platz 1, 76344Eggenstein−Leopoldshafen. http://www.fzk.de/
[91] K.−H.Dittrich, W.Krysmann, P.Kurze, H.G.Schneider, CrystalResearch and Technology 19 1 (1984), p. 93−99
[92] K. Fischer, K. Vester, US Patent 3067256, 1959.
[93] ”GESTIS Stoffdatenbank” − Database of the ”Berufsgenossen-schaftliches Institut fur Arbeitssicherheit”, Sankt Augustin /Germany (2001)
[94] ”PS Gefahrstoffe 2.4” Database published by ”WEKA Fachver-lag fur technische Fuhrungskrafte”, Augsburg / Germany(1997)
[95] ”Chemikalieninformationssystem fur verbraucherrelevanteStoffe (CIVS)” of the German ”Bundesinstitut fur gesund-heitlichen Verbraucherschutz und Veterinarmedizin” (BgVV)(2001)
[96] SRAG − Chemical Warehouses Version 6, 26 June 2002, p.37http://www.hse.gov.uk/comah/sragcwh/hazards/images/hazards.pdf
[97] A.Kursawe, D.Honicke, IMRET 4 Proceedings, AIChE Na-tional Spring Meeting, Atlanta 2000, ISBN 0−8169−9882−5,p.153−166
[98] A.Kursawe, D.Honicke in ”Microreaction Technology”, IM-RET 5 Conference Proceedings (Ed: Matlosz, Ehrfeld, Baselt),p.240−251 ISBN 3−540−42498−9, Springer Verlag 2001.
[99] F.Keller, M.S.Hunter, D.L.Robinson, J. Electrochem. Soc. 11(1953), S. 411–419
[100] S.Kah, A.Kursawe, D.Honicke, Final Report for the AiFProject 11148B/1 ”heterogen katalysierte Gasphasenoxidatio-nen in Mikroreaktoren” (http://www.aif.de)
[101] Y.S.Yong, N.W.Cant, Applied Catalysis 48 (1989), p.37−50
Lebenslauf
Name Ansgar KursaweAdresse Am Schafersberg 32
65527 Niedernhausen
Geburtstag 25.4.1971Geburtsort EssenEltern Hildegard und Hans-Theo KursaweFamilienstand ledigNationalitat deutsch
BerufserfahrungSiemens AG seit 05/2007CPC-Systems GmbH 02/2002 bis 05/2007
AusbildungPromotion Experimenteller Teil 10/1996 - 01/2002
Technische Universitat Chemnitz
Studium 10/1991 - 7/1996Chemie, Ruhr-Universitat Bochum
Abschluss DiplomVertiefungsausbildung Technische Chemie
Grundwehrdienst 7/1990 - 7/1991Gymnasium 1981 - 1990Grundschule 1977 - 1981
Selbstandigkeitserklarung
Ich erklare hiermit, daß ich die vorliegende Arbeit selbstandig undnur unter Verwendung der angegebenen Literatur und Hilfsmittelverfasst habe.
Niedernhausen, den 27. September 2008 Ansgar Kursawe
Veroffentlichungen
A.Kursawe, E.Dietzsch, S.Kah, D.Honicke, M.Fichtner, K.Schubert,G.Wiessmeier: ’Selective Reactions in Microchannel Reactors’,IMRET 3 Proceedings, W.Ehrfeld (Ed.), Springer Verlag 2000,ISBN 3-540-66964-7, p. 213-223
A.Kursawe, D.Honicke: ’Epoxidation of Ethene with pure Oxygen’,IMRET 4 Proceedings, AIChE Spring National Meeting, Atlanta2000, ISBN 0-8169-9882-5, p. 153-166
A.Kursawe, R.Pilz, H.Durr, D.Honicke: ’Development and Designof a Modular Microchannel Reactor for Laboratory use’, IMRET 4Proceedings, AIChE Spring National Meeting, Atlanta 2000, ISBN0-8169-9882-5, p. 227-235
A.Kursawe, D.Honicke: ’Comparison of Ag/Al– and Ag/α-Al2O3
Catalytic Surfaces for the Partial Oxidation of Ethene in Mi-crochannel Reactors’, IMRET 5 proceedings, Springer Verlag 2005,ISBN 3-540-42498-9, p. 240-251
A.Kursawe, D.Honicke, ’Ethene epoxidation in Ag/Al microchannelreactors: Effects of NO2 and Cs’, Catalysis Communications 2(2001), p. 347-351
R.Fodisch, A.Kursawe, D.Honicke: ’Immobilizing heterogeneouscatalysts in microchannel reactors’, IMRET 6 Proceedings, AIChESpring Meeting, New Orleans 2002, ISBN 0-8169-9779-9, p. 140-146
T.Schwalbe, V.Autze, K.Sahin, S.Oberbeck, A.Kursawe: ’A NewTechnology for Accelerating Scale-Up from Bench to Pilot Plantby Continuous Reaction’, 2003 AIChE Annual Meeting ConferenceProceedings, New York, AIChE (ISBN 0-8169-0941-5)
K.Golbig, M.Hohmann, A.Kursawe, T.Schwalbe: ’Verweilzeitver-halten in Mikrokanalen als Vorraussetzung fur den Bau sequenziellarbeitender Syntheseautomaten’, Chemie Ingenieur Technik 76(2004), No. 5, p. 598-603
K.Golbig, A.Kursawe, M.Hohmann: ’Designing Microreactors inChemical Synthesis Residence-time Distribution of MicrochannelDevices’, Chemical Engineering Communications 192 No.5 (2005),p. 620-629
T.Schwalbe, A.Kursawe, J.Sommer: ’Application Report onOperating Cellular Process Chemistry Plants in Fine Chemicaland Contract Manufacturing Industries’, Chemical EngineeringTechnology 28 No.4 (2005), p. 408-419
US Patent 7101515, T.Schwalbe, V.Autze, S.Oberbeck, A.Kursawe,K.H.Sahin: System and method for determining optimal reaction pa-rameters using continuously running process, see also EP1618372A2