Embed Size (px)
Citation preview
Supporting Information
of
Precise and reversible protein microtubule-like structure with
helicity driven by dual supramolecular interactions
Guang Yanga, Xiang Zhang
d, Zdravko Kochovski
b,c, Yufei Zhang
a, Bin Dai
d, Fuji Sakai
a,
Lin Jiangf, Yan Lu
b, Matthias Ballauff
b, Xueming Li
e, Cong Liu
d*, Guosong Chen
a*,
Ming Jianga
aThe State Key Laboratory of Molecular Engineering of Polymers and Department of
Macromolecular Science, Fudan University, Shanghai 200433, China
bSoft Matter and Functional Materials, Helmholtz-Zentrum Berlin für Materialien und
Energie, 14109 Berlin, Germany cTEM Group, Institute of Physics, Humboldt-Universität zu Berlin, 12489 Berlin,
Germany dInterdisciplinary Research Center on Biology and Chemistry, Shanghai Institute of
Organic Chemistry, Chinese Academy of Sciences, Shanghai 200032, China eMinistry of Education Key Laboratory of Protein Science, Center for Structural Biology,
Tsinghua-Peking Joint Center for Life Sciences, School of Life Sciences, Tsinghua
University, Beijing 100084, China fDepartment of Neurology, Easton Center for Alzheimer’s Disease Research, David
Geffen School of Medicine, University of California, Los Angeles, California 90095,
USA
S2
Sample preparation
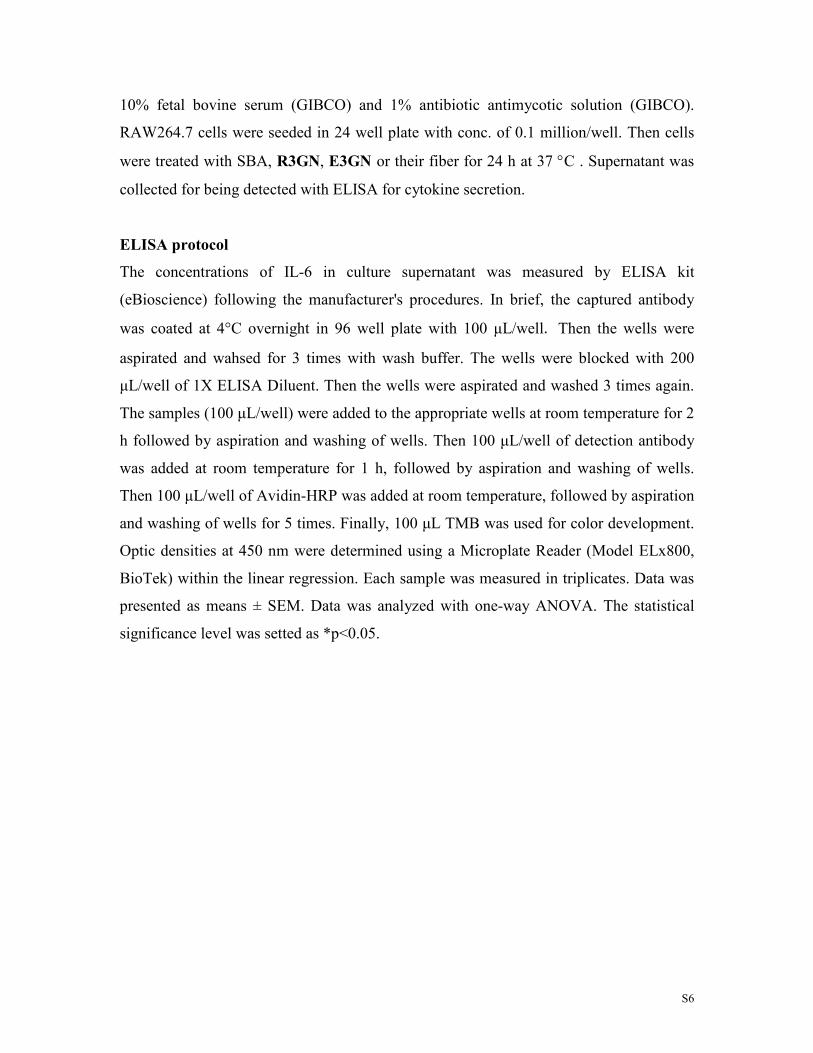
The small molecules were synthesized and characterized as described in supporting
information (Scheme S1 and Figure S22-42). SBA protein was purchased from Sigma-
Adrich. All chemicals and proteins are used as received. The buffer solution was
prepared with HEPES {4-(2-hydroxyethyl)-1-piperazineethanesulfonic acid} buffer
containing 20 mM HEPES, 5 mM CaCl2, 5 mM MnCl2 and 40 mM NaCl. The SBA
solution was prepared by dissolving SBA (lyophilized powder) in buffer and was stored
over 2 h at 5 °C. R3GN or RnG was also dissolved in buffer separately. The solutions
were filtered through a Millipore 0.45 µm membrane before mixing. The SBA/R3GN
protein tube was prepared by mixing SBA and R3GN together in buffer solution, fixing
the concentrition of SBA and R3GN both at 0.2 mM and then the mixture was stored at
4 °C for 24 h. The protein tube at this condition can be stable for more than one year. The
SBA/RnG (n = 2, 3, 4) protein tubes were prepared under the same condition.
Characterization
Nuclear magnetic resonance (NMR) was taken by AVANCE III HD 400 MHz of
Bruker BioSpin International. Matrix Assisted Laser Desorption Ionization-Time Of
Flight (Maldi-TOF) Mass Spectrum was taken on a AB SCIEX 5800 instrument.
Ultraviolet–vis (UV-vis) absorption spectra were recorded by a Shimadzu UV-2550
spectrophotometer with a 1 mm cuvette. Circular dicroism spectra was taken by a
JASCO-815 instrument with a 1 mm cuvette. Small Angle X-ray Scattering expeiment
was conducted on a NanoStar U SAXS System. Isothermal titration calorimetry (ITC)
experiments were conducted on a MicroCal VP-ITC system at 20.00±0.01°C. Dynamic
light scattering (DLS) was taken by Zetasizer Nano ZS90 from Malvern Instruments
(UK).
Sample preparation and data collection by electron microscopy
For the preparation of negatively stained samples, a drop of the mixture solution was
applied onto a copper grid and the excess solvent was blotted away. Samples were
subsequently stained with 1 wt% uranyl acetate. Samples for Cryo-EM were prepared by
applying 4 µL drop of mixture solution to holey carbon grids (Quantifoil R2/1) and
S3
plunge-frozen into liquid ethane with an FEI vitrobot Mark IV set at 4°C and 95%
humidity. In the case of samples for Cryo-ET, 3 µL drop of 10 nm colloidal gold solution
(Aurion) was applied to the grids and allowed to dry before plunge freezing. Vitrified
grids were either transferred directly to the microscope cryoholder or stored in liquid
nitrogen. All grids were glow-discharged before use.
Cryo-EM and negative stain micrographs were acquired at a number of
magnifications on a JEOL JEM-2100 equipped with a 4 k × 4 k CMOS digital camera
(TVIPS TemCam-F416), operated at 200 kV and on a Philips CM120 operated at 80
kV. Tomographic data were acquired on a JEOL JEM-2100 equipped with a 4 k × 4 k
CMOS digital camera (TVIPS TemCam-F416), operated at 200 kV. Tilt series were
collected to ± 60° with a 2° angular increment and a total dose of either 100 e−/Å2 or 300
e−/Å2 for vitrified or negatively stained samples respectively. In all cases tilt series were
collected at a magnification of 30,000 x, corresponding to a pixel size of 3.9 Å at the
specimen level.
Cryo-EM Data Acquisition for 3D reconstruction
Cryo-EM grids were prepared with Vitrobot Mark IV (FEI), using 8 °C and 100
percent humidity. 4 µL of sample were applied to glow-discharged Quantifoil Cu
R1.2/1.3 grids, blotted for 2.5 s, and plunged into liquid ethane cooled by liquid nitrogen.
Images were taken by an FEI Titan Krios electron microscope operating at 300 kV with a
nominal magnification of 22,500x. Images were recorded by a Gatan K2 Summit detector
(Gatan Company) with the super-resolution mode, and binned to a pixel size of 1.32 Å.
Defocus values varied from 1.1 to 2.2 µm. Each image was dose-fractionated to 32
frames with a dose rate of ~8 counts per second per physical pixel (~6 e−/sÅ2), a total
exposure time of 8 s, and 0.25 s per frame. UCSF Image41 was used for all data
collection.
Image Processing and single particle reconstruction
The images were aligned and summed using the whole image motion correction2. The
defocus value of each image was determined by ctffind33. Micrographs were selected
S4
based on the quality of the micrograph and protein microtube. Protein microtube quality
was defined by length and straightness. A total of 2303 protein microtubes were
segmented by using EMAN2′s e2helixboxer program with step size of 6.34 nm (10%
overlap), resulting in an image stack of 65035 images of 63.4 × 63.4 nm. The segement
images was binned to the pixel size of 2.64 Å for the further 3D alignment and
reconstruction.
The helical symmety was roughly measeasured based on the layer lines in the power
spectrum of a single tube. Then IHRSR4 was used for further refinement. A cylinder was
used as the initial model. After 100 cycles of IHRSR refinement, a more accurate helical
parameters was determined. The helical rotation per subunit is -36.90o and the helical rise
per subunit is 21.22 Å. The 3D reconsturction was then improved by using FREALIGN
v8.095 and finally reach the resolution of 7.9 Å. The final reconstruction was sharpened
by applying an empirical negative B-factor of -700 Å and low-pass filered to 7.9 Å with a
soft cosine edge.
Notice that although the final density map showed a left-handed twisted helical
microtube structure, we observed both left- and right-handed helical microtube from 2D
classification. However, the resolution remained relatively low when we used a right-
handed helical model, which might due to the hetergenous structures of the right-handed
SBA microtube co-exist in solution.
Model building of SBA protein microtube without ligand
The B-factor sharpened map were used for model building in UCSF Chimera. The
crystal structure of SBA from Glycine max (PDB accession code: 1SBE) was first
docked into the density map as a single rigid-body tetramer defined as the biological
assembly. Individual monomers within the tetramer were then locally fitted into the
density to maximize the correlation between the model and the map. Finally the fitted
tetramer was used as a building block to build the whole filament.
Computational modeling of designed ligands in the protein microtube
The structure of R3GN ligand was built into our 7.9 Å density map based on crystal
structure of the previously designed RhB dimer and the complex of SBA tetramer
S5
binding to the sugar ring GalNAc (PDB entries: 4P9W and 1SBE). The whole modelling
process consists of several iterative rounds of two optimization steps: 1) internal ligand
minimization: the conformation of R3GN pair is generated from the crystal structure of
RhB dimer. In order to fit the R3GN pair into the density map, we miminized the pair
while kept the rigid body orientation between two GalNAc match with the sugar binding
sites of two adjacent SBA tetramer in the density map (Figure S12). The small molecule
modelling and minimization was using the Clean feature of WebLab Viewer Pro. 2)
protein-ligand docking: The R3GN pair was then docked into two adjacent SBA tetramer
in the density map by Rosetta6. During docking, the SBA sidechain conformation at
binding site was repacked and small pertubation of rigid body degree of freedom was
refined. Several iterative optimization rounds of internal ligand minimization and
protein-ligand docking were carried until there is no steric clash between SBA tube and
R3GN ligand. Finally the R3GN ligands were fitted into the SBA tube density map to
ensure reasonable interactions at the dimer interface of R3GN pair.
Atomic force microscopy (AFM)
AFM was operated in air on a Bruker Multimode VIII SPM equipped with a J
scanner. Experiments were performed in tapping mode with NSC11 tip (spring constant
48 N·m-1, MikroMasch). Sample (5 µL) was placed on a freshly cleaved mica for AFM
test under dry conditions. Sample solution was allowed to adsorb for 5 min and then it
was washed gently with 1 mL buffer followed by air drying.
Small Angle X-ray Scattering (SAXS)
0.2 mM SBA and equimolar R3GN was mixed together in buffer solution, and the
mixture was stored at 4 °C for 48 h, then the mixture was freeze-dried to obtain red
powder for SAXS experiment. Small Angle X-ray Scattering (SAXS) results were
performed on a Nanostar U small-angle X-ray scattering system (Germany) by using Cu
Ka radiation (40 kV, 35 mA) at room temperature.
Cell experiment
RAW264.7 macrophage cell line was cultured in RPMI 1640, supplemented with
S6
10% fetal bovine serum (GIBCO) and 1% antibiotic antimycotic solution (GIBCO).
RAW264.7 cells were seeded in 24 well plate with conc. of 0.1 million/well. Then cells
were treated with SBA, R3GN, E3GN or their fiber for 24 h at 37 °C . Supernatant was
collected for being detected with ELISA for cytokine secretion.
ELISA protocol
The concentrations of IL-6 in culture supernatant was measured by ELISA kit
(eBioscience) following the manufacturer's procedures. In brief, the captured antibody
was coated at 4°C overnight in 96 well plate with 100 µL/well. Then the wells were
aspirated and wahsed for 3 times with wash buffer. The wells were blocked with 200
µL/well of 1X ELISA Diluent. Then the wells were aspirated and washed 3 times again.
The samples (100 µL/well) were added to the appropriate wells at room temperature for 2
h followed by aspiration and washing of wells. Then 100 µL/well of detection antibody
was added at room temperature for 1 h, followed by aspiration and washing of wells.
Then 100 µL/well of Avidin-HRP was added at room temperature, followed by aspiration
and washing of wells for 5 times. Finally, 100 µL TMB was used for color development.
Optic densities at 450 nm were determined using a Microplate Reader (Model ELx800,
BioTek) within the linear regression. Each sample was measured in triplicates. Data was
presented as means ± SEM. Data was analyzed with one-way ANOVA. The statistical
significance level was setted as *p<0.05.
S7
S8
Scheme S1. Synthetic procedure of small molecules used in this paper.
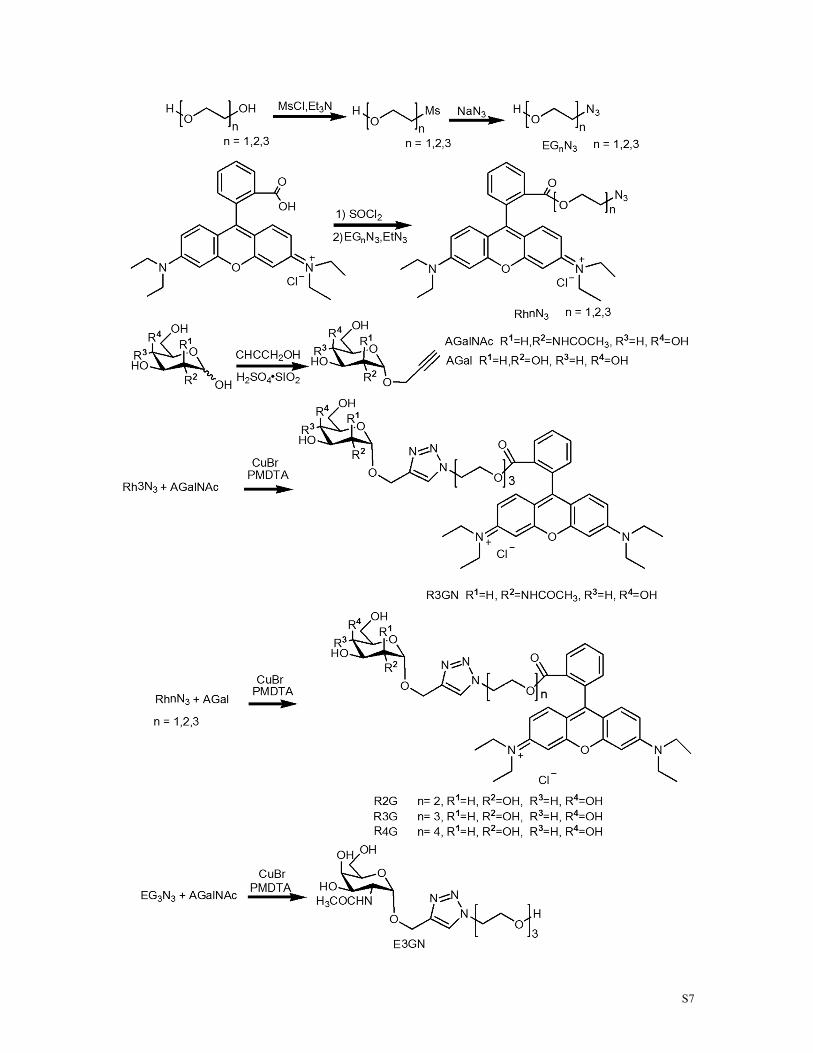
Figure S1. ITC data of titration of 1.2 mM E3GN into 0.1 mM SBA (calculated as
monomer) at 20°C in aqueous solution.
Figure S2. DLS results of SBA and SBA/R3GN mixture after 72 h incubation at 4 °C.
S9
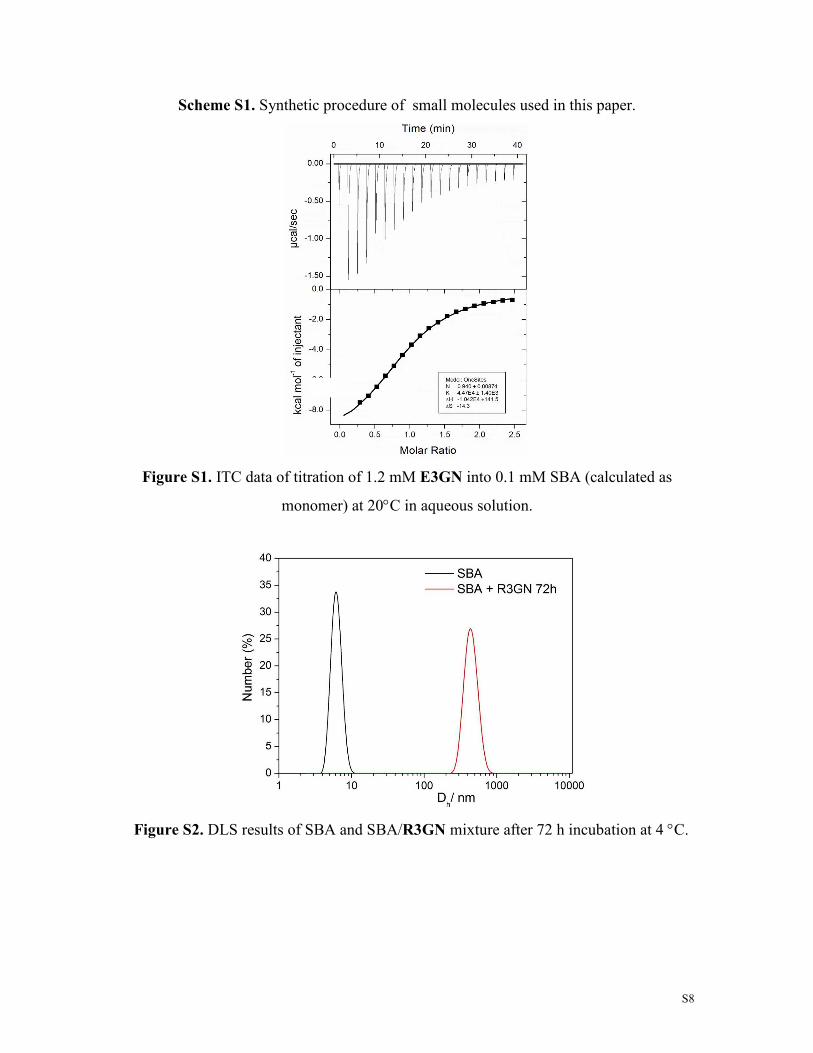
Figure S3. The diameter distribution of SBA/R3GN microtubes observed under cryo-
EM.
Figure S4. 3-nm-thick xy, xz and yz orthogonal slices through the 3D tomographic
reconstruction of frozen-hydrated protein microtubes. The red cross marks the same
voxel in all slices. Inset: enlarged version of marked area. Scale bars: 100 nm in main
panel and 50 nm in inset.
S10
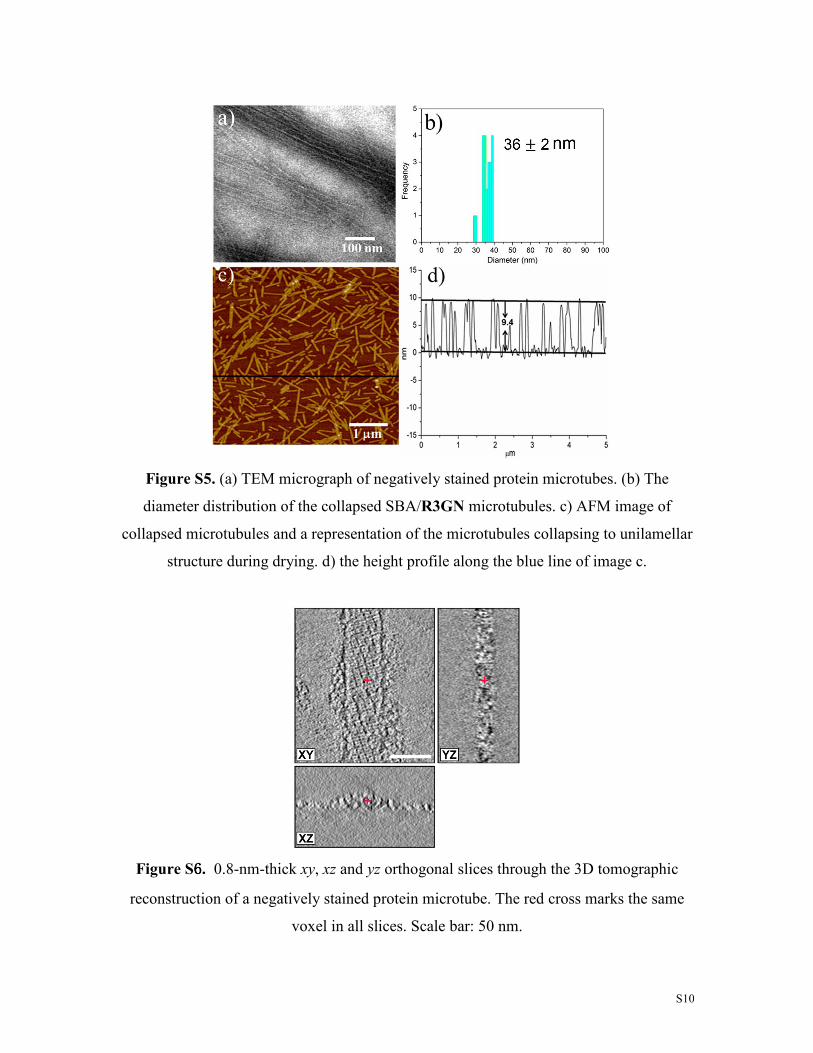
Figure S5. (a) TEM micrograph of negatively stained protein microtubes. (b) The
diameter distribution of the collapsed SBA/R3GN microtubules. c) AFM image of
collapsed microtubules and a representation of the microtubules collapsing to unilamellar
structure during drying. d) the height profile along the blue line of image c.
Figure S6666. 0.8-nm-thick xy, xz and yz orthogonal slices through the 3D tomographic
reconstruction of a negatively stained protein microtube. The red cross marks the same
voxel in all slices. Scale bar: 50 nm.
S11
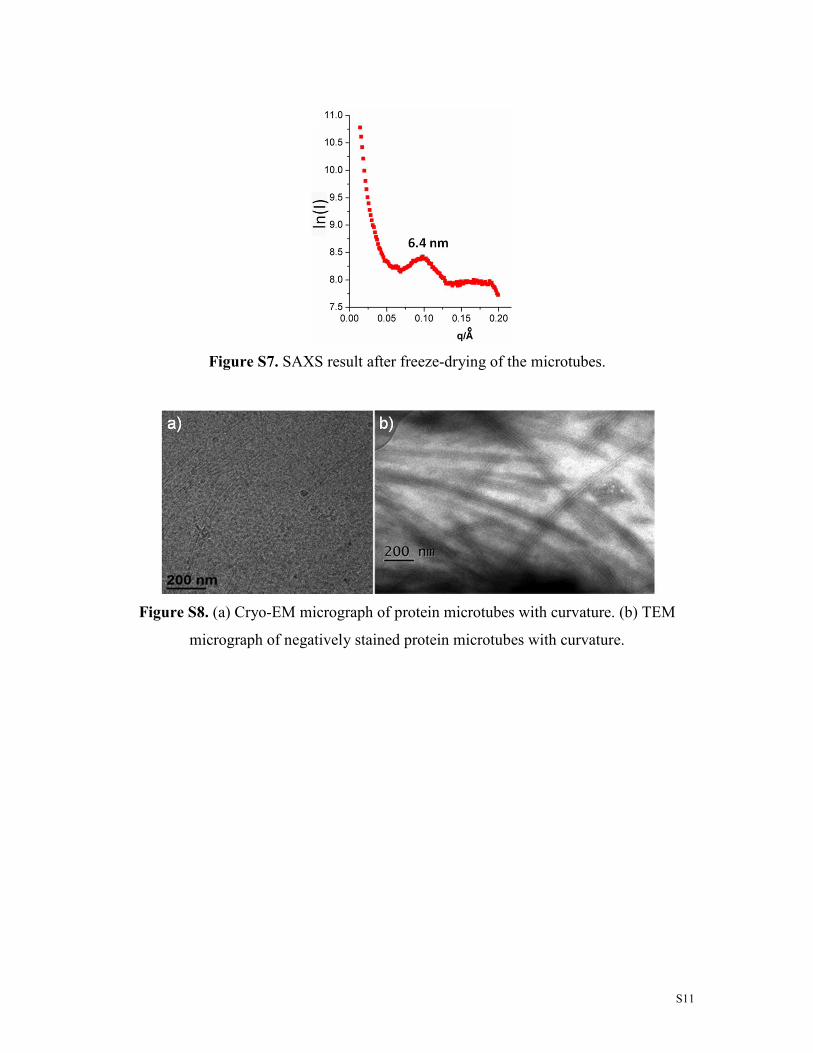
Figure S7. SAXS result after freeze-drying of the microtubes.
Figure S8. (a) Cryo-EM micrograph of protein microtubes with curvature. (b) TEM
micrograph of negatively stained protein microtubes with curvature.
S12
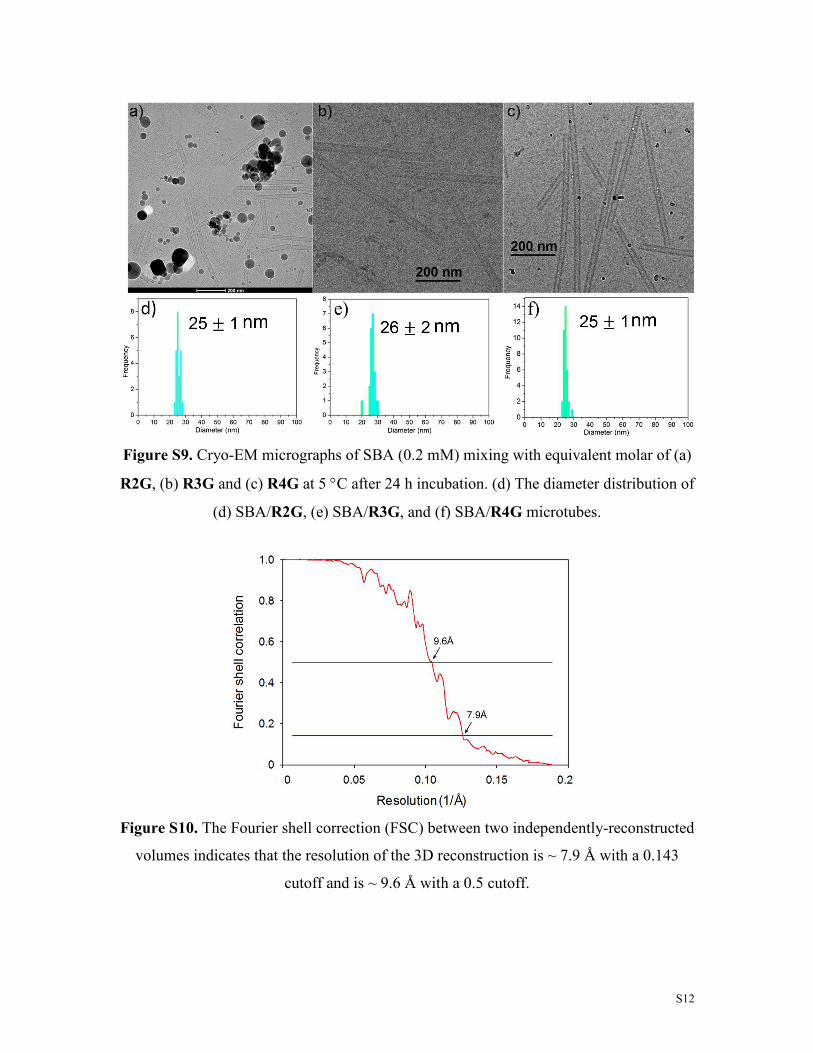
Figure S9. Cryo-EM micrographs of SBA (0.2 mM) mixing with equivalent molar of (a)
R2G, (b) R3G and (c) R4G at 5 °C after 24 h incubation. (d) The diameter distribution of
(d) SBA/R2G, (e) SBA/R3G, and (f) SBA/R4G microtubes.
Figure S10. The Fourier shell correction (FSC) between two independently-reconstructed
volumes indicates that the resolution of the 3D reconstruction is ~ 7.9 Å with a 0.143
cutoff and is ~ 9.6 Å with a 0.5 cutoff.
S13
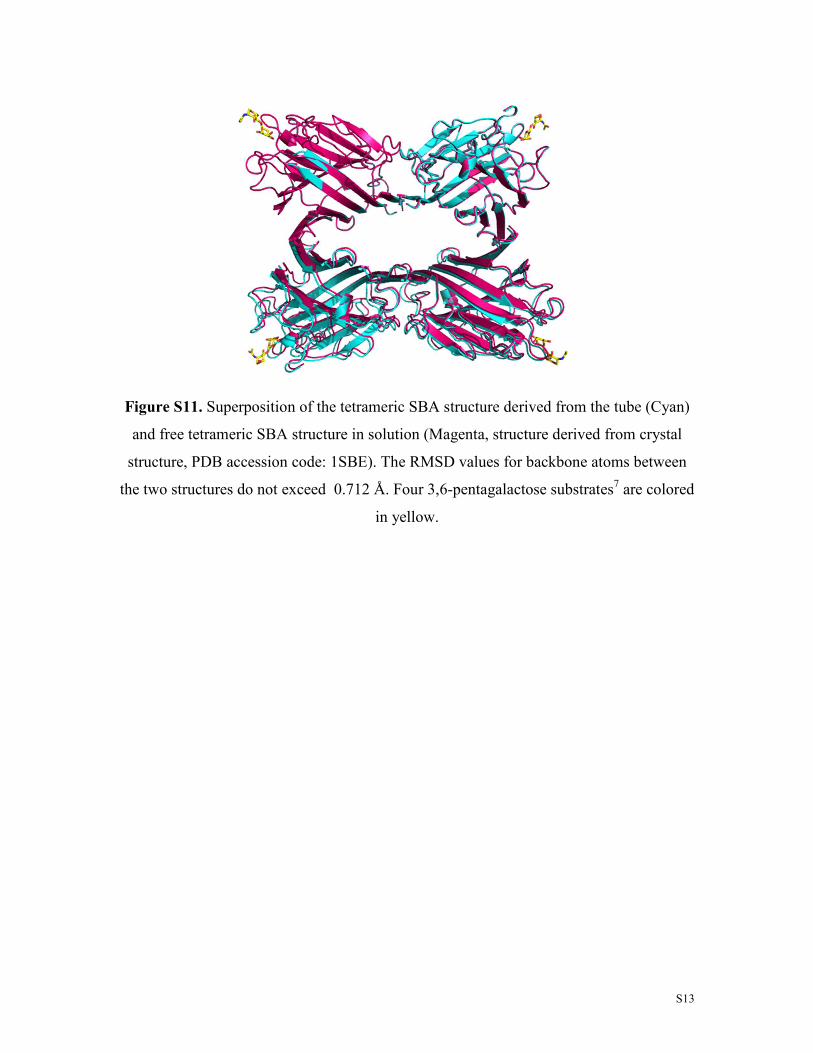
Figure S11. Superposition of the tetrameric SBA structure derived from the tube (Cyan)
and free tetrameric SBA structure in solution (Magenta, structure derived from crystal
structure, PDB accession code: 1SBE). The RMSD values for backbone atoms between
the two structures do not exceed 0.712 Å. Four 3,6-pentagalactose substrates7 are colored
in yellow.
S14
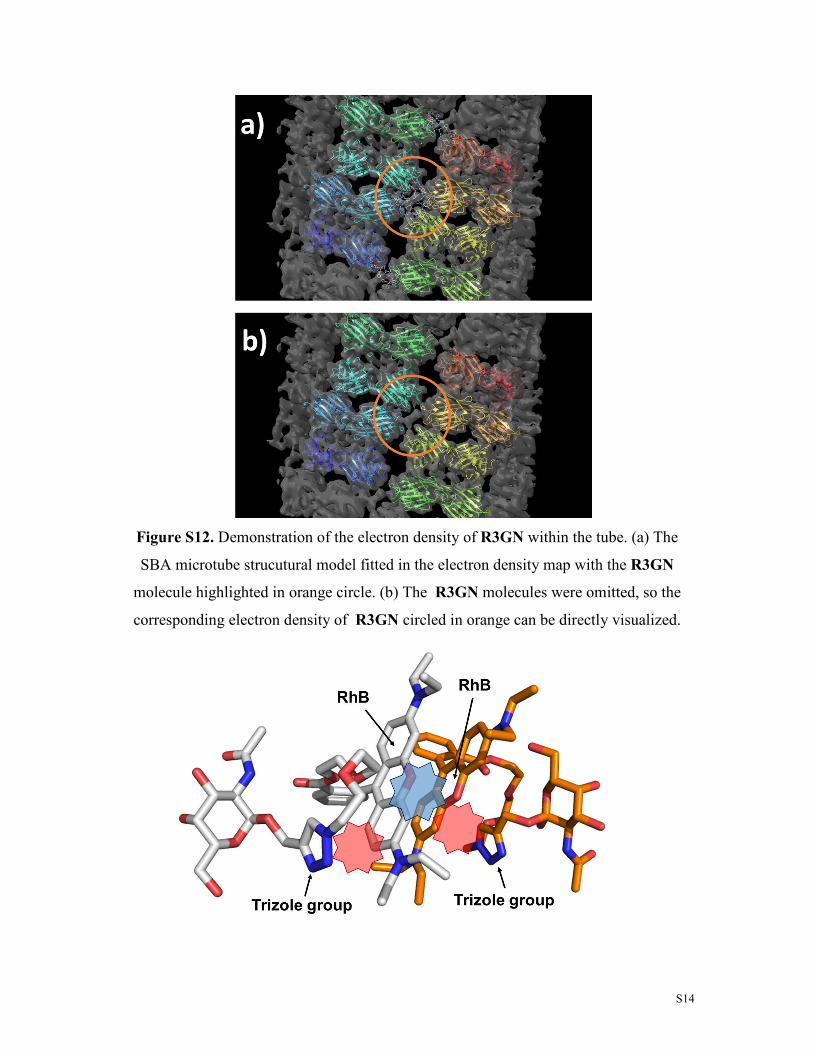
Figure S12. Demonstration of the electron density of R3GN within the tube. (a) The
SBA microtube strucutural model fitted in the electron density map with the R3GN
molecule highlighted in orange circle. (b) The R3GN molecules were omitted, so the
corresponding electron density of R3GN circled in orange can be directly visualized.
S15
Figure S13 Demonstration of the inter and intra-molecular interactions in R3GN dimeric
structure. The π-π interaction between trizole group and RhB within the same R3GN is
highlighted in red. The π-π interaction between neighbooring RhB is colored in blue.
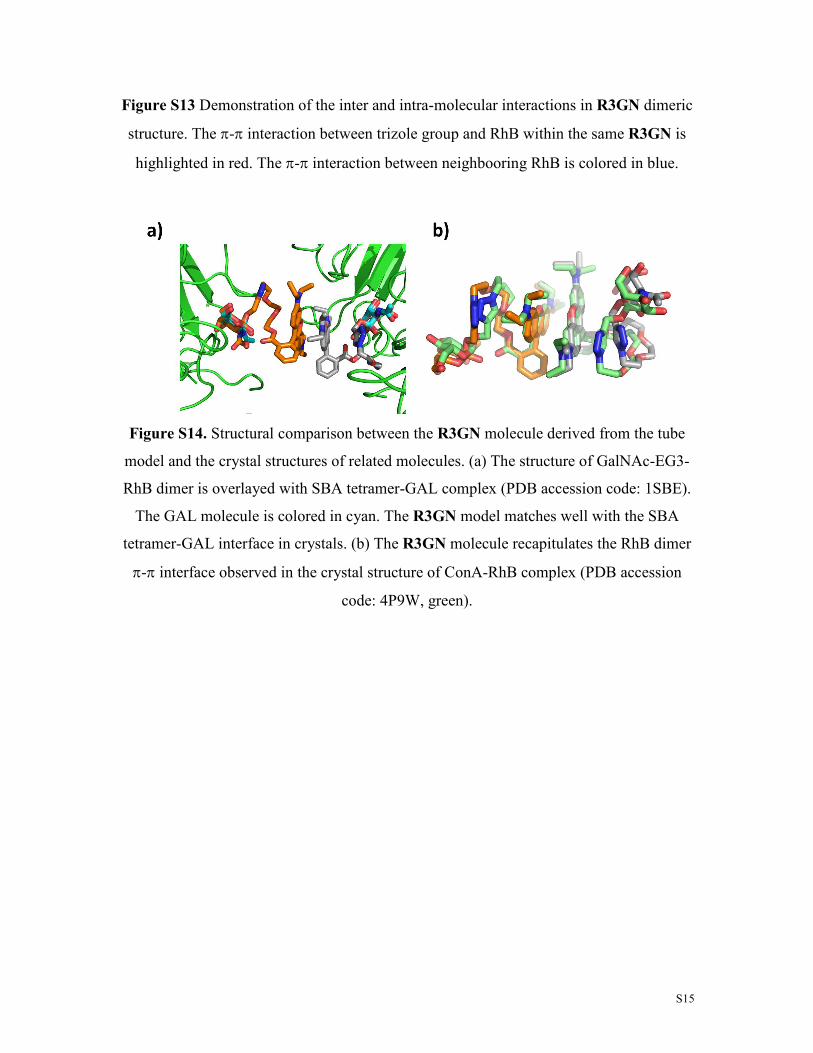
Figure S14. Structural comparison between the R3GN molecule derived from the tube
model and the crystal structures of related molecules. (a) The structure of GalNAc-EG3-
RhB dimer is overlayed with SBA tetramer-GAL complex (PDB accession code: 1SBE).
The GAL molecule is colored in cyan. The R3GN model matches well with the SBA
tetramer-GAL interface in crystals. (b) The R3GN molecule recapitulates the RhB dimer
π-π interface observed in the crystal structure of ConA-RhB complex (PDB accession
code: 4P9W, green).
S16
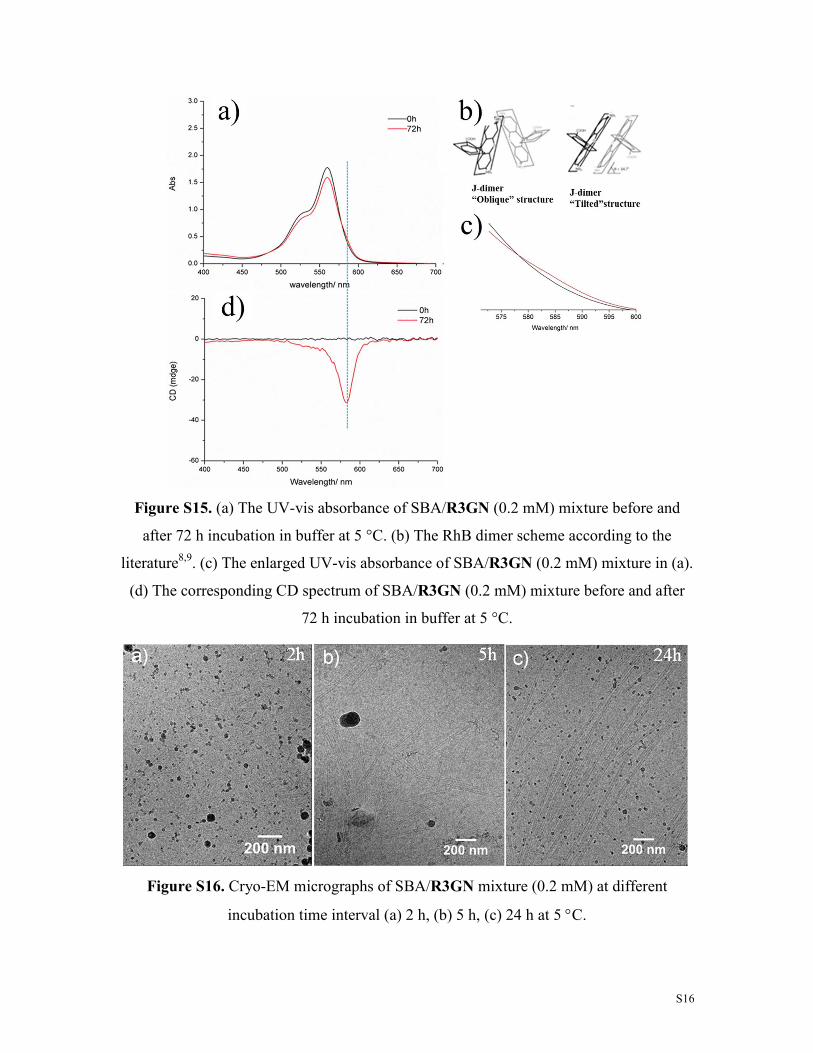
Figure S15. (a) The UV-vis absorbance of SBA/R3GN (0.2 mM) mixture before and
after 72 h incubation in buffer at 5 °C. (b) The RhB dimer scheme according to the
literature8,9. (c) The enlarged UV-vis absorbance of SBA/R3GN (0.2 mM) mixture in (a).
(d) The corresponding CD spectrum of SBA/R3GN (0.2 mM) mixture before and after
72 h incubation in buffer at 5 °C.
Figure S16. Cryo-EM micrographs of SBA/R3GN mixture (0.2 mM) at different
incubation time interval (a) 2 h, (b) 5 h, (c) 24 h at 5 °C.
S17
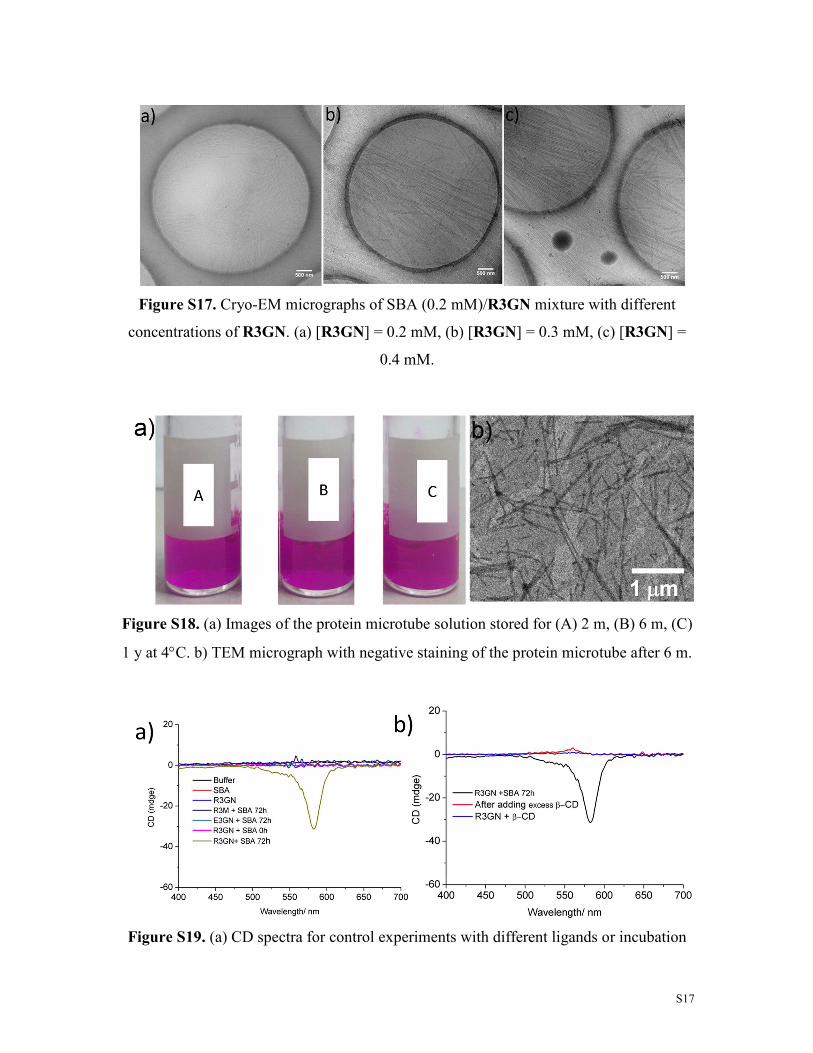
Figure S17. Cryo-EM micrographs of SBA (0.2 mM)/R3GN mixture with different
concentrations of R3GN. (a) [R3GN] = 0.2 mM, (b) [R3GN] = 0.3 mM, (c) [R3GN] =
0.4 mM.
Figure S18. (a) Images of the protein microtube solution stored for (A) 2 m, (B) 6 m, (C)
1 y at 4°C. b) TEM micrograph with negative staining of the protein microtube after 6 m.
Figure S19. (a) CD spectra for control experiments with different ligands or incubation
S18
time. (b) CD spectra of R3GN/SBA mixture (after 72 h incubation) in the absence (black
line) and presence of β-cyclodextrin (red line).
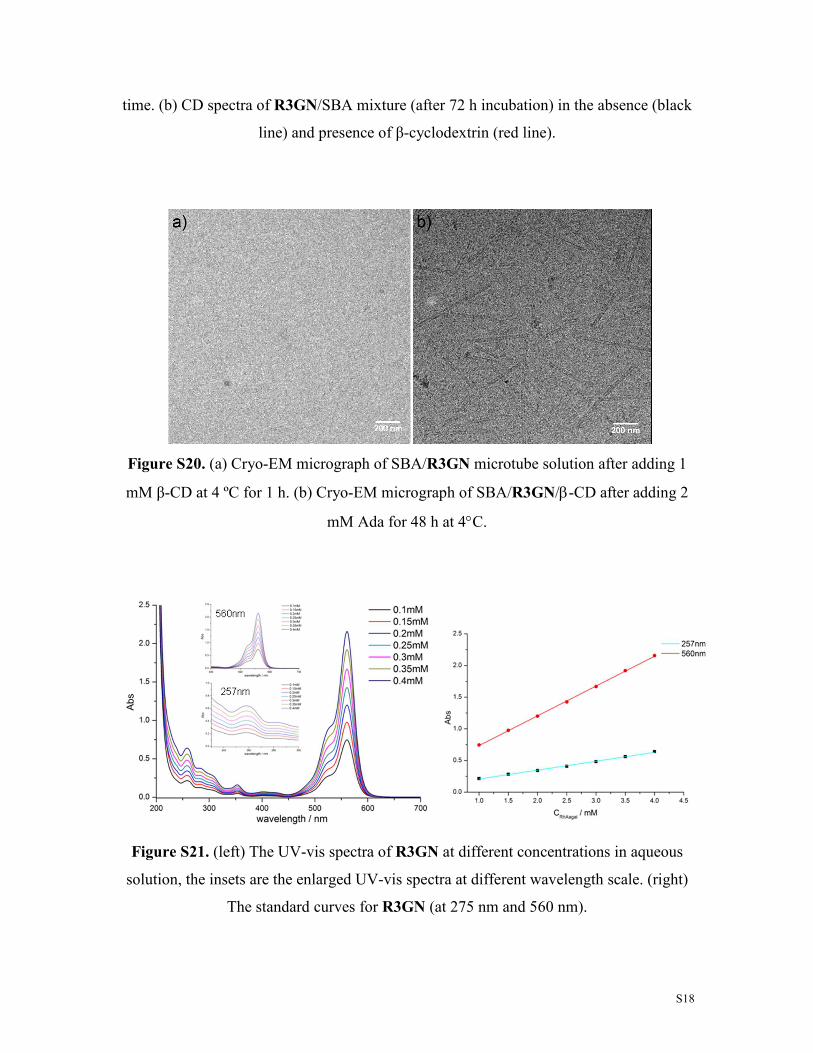
Figure S20. (a) Cryo-EM micrograph of SBA/R3GN microtube solution after adding 1
mM β-CD at 4 ºC for 1 h. (b) Cryo-EM micrograph of SBA/R3GN/β-CD after adding 2
mM Ada for 48 h at 4°C.
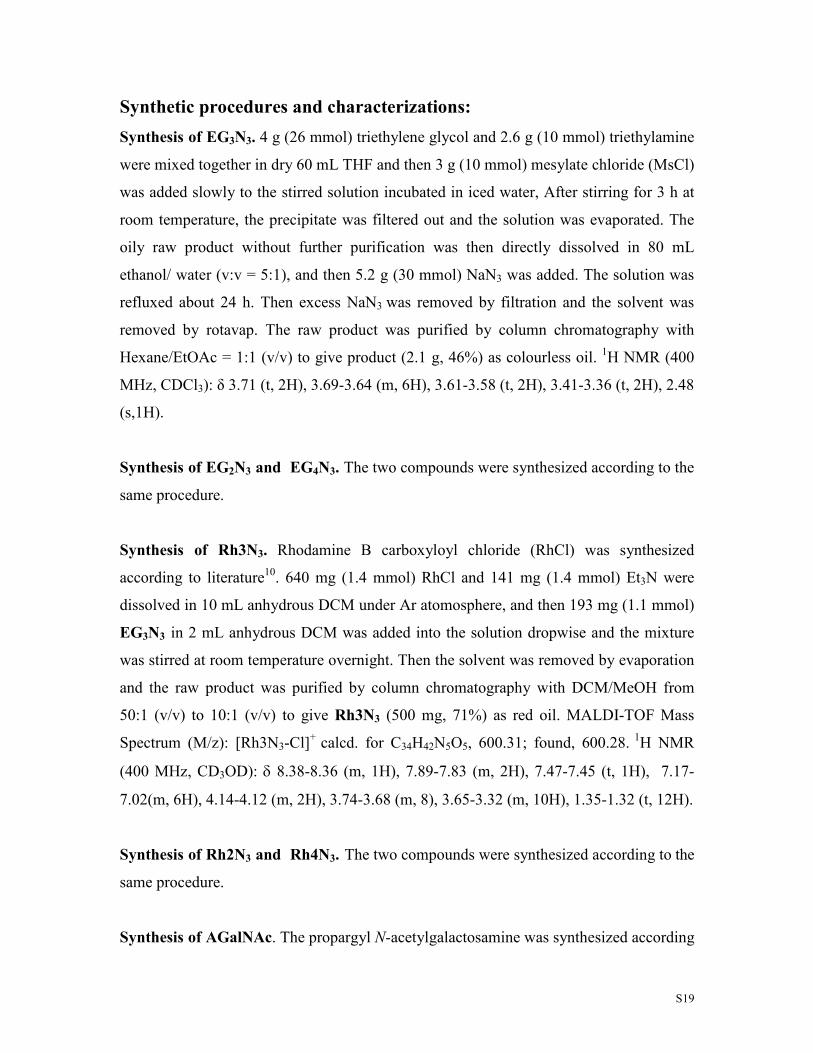
Figure S21. (left) The UV-vis spectra of R3GN at different concentrations in aqueous
solution, the insets are the enlarged UV-vis spectra at different wavelength scale. (right)
The standard curves for R3GN (at 275 nm and 560 nm).
S19
Synthetic procedures and characterizations:
Synthesis of EG3N3. 4 g (26 mmol) triethylene glycol and 2.6 g (10 mmol) triethylamine
were mixed together in dry 60 mL THF and then 3 g (10 mmol) mesylate chloride (MsCl)
was added slowly to the stirred solution incubated in iced water, After stirring for 3 h at
room temperature, the precipitate was filtered out and the solution was evaporated. The
oily raw product without further purification was then directly dissolved in 80 mL
ethanol/ water (v:v = 5:1), and then 5.2 g (30 mmol) NaN3 was added. The solution was
refluxed about 24 h. Then excess NaN3 was removed by filtration and the solvent was
removed by rotavap. The raw product was purified by column chromatography with
Hexane/EtOAc = 1:1 (v/v) to give product (2.1 g, 46%) as colourless oil. 1H NMR (400
MHz, CDCl3): δ 3.71 (t, 2H), 3.69-3.64 (m, 6H), 3.61-3.58 (t, 2H), 3.41-3.36 (t, 2H), 2.48
(s,1H).
Synthesis of EG2N3 and EG4N3. The two compounds were synthesized according to the
same procedure.
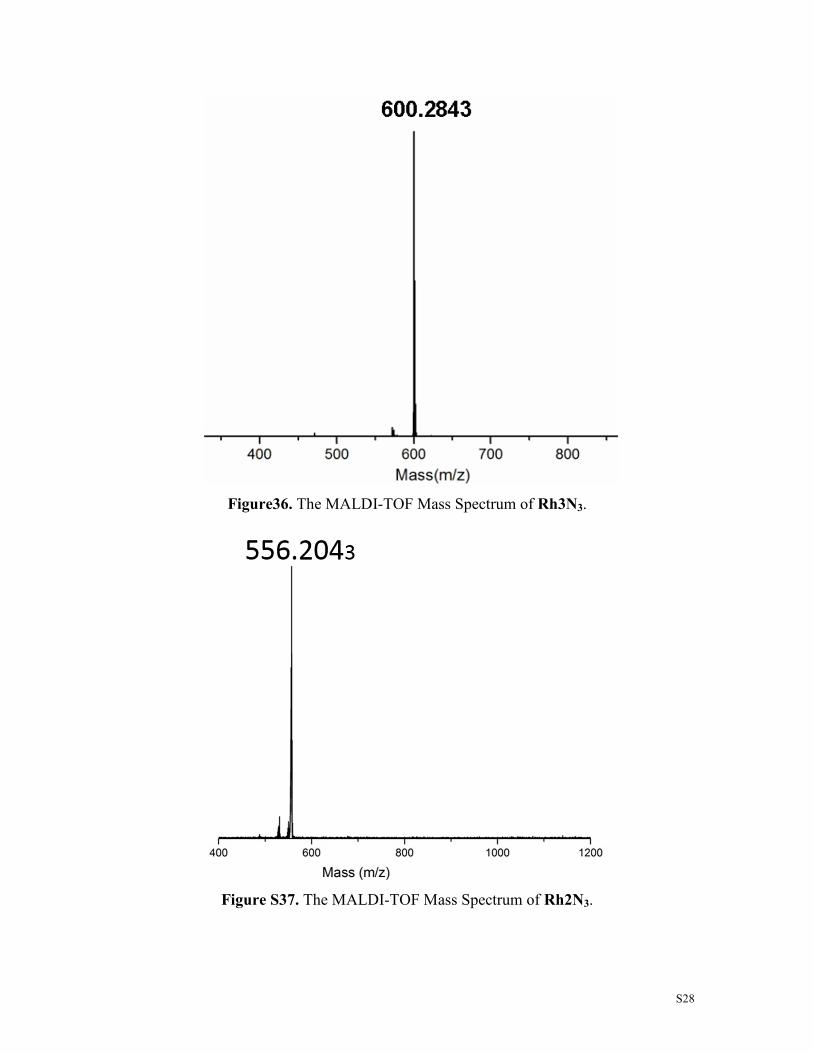
Synthesis of Rh3N3. Rhodamine B carboxyloyl chloride (RhCl) was synthesized
according to literature10. 640 mg (1.4 mmol) RhCl and 141 mg (1.4 mmol) Et3N were
dissolved in 10 mL anhydrous DCM under Ar atomosphere, and then 193 mg (1.1 mmol)
EG3N3 in 2 mL anhydrous DCM was added into the solution dropwise and the mixture
was stirred at room temperature overnight. Then the solvent was removed by evaporation
and the raw product was purified by column chromatography with DCM/MeOH from
50:1 (v/v) to 10:1 (v/v) to give Rh3N3 (500 mg, 71%) as red oil. MALDI-TOF Mass
Spectrum (M/z): [Rh3N3-Cl]+ calcd. for C34H42N5O5, 600.31; found, 600.28. 1H NMR
(400 MHz, CD3OD): δ 8.38-8.36 (m, 1H), 7.89-7.83 (m, 2H), 7.47-7.45 (t, 1H), 7.17-
7.02(m, 6H), 4.14-4.12 (m, 2H), 3.74-3.68 (m, 8), 3.65-3.32 (m, 10H), 1.35-1.32 (t, 12H).
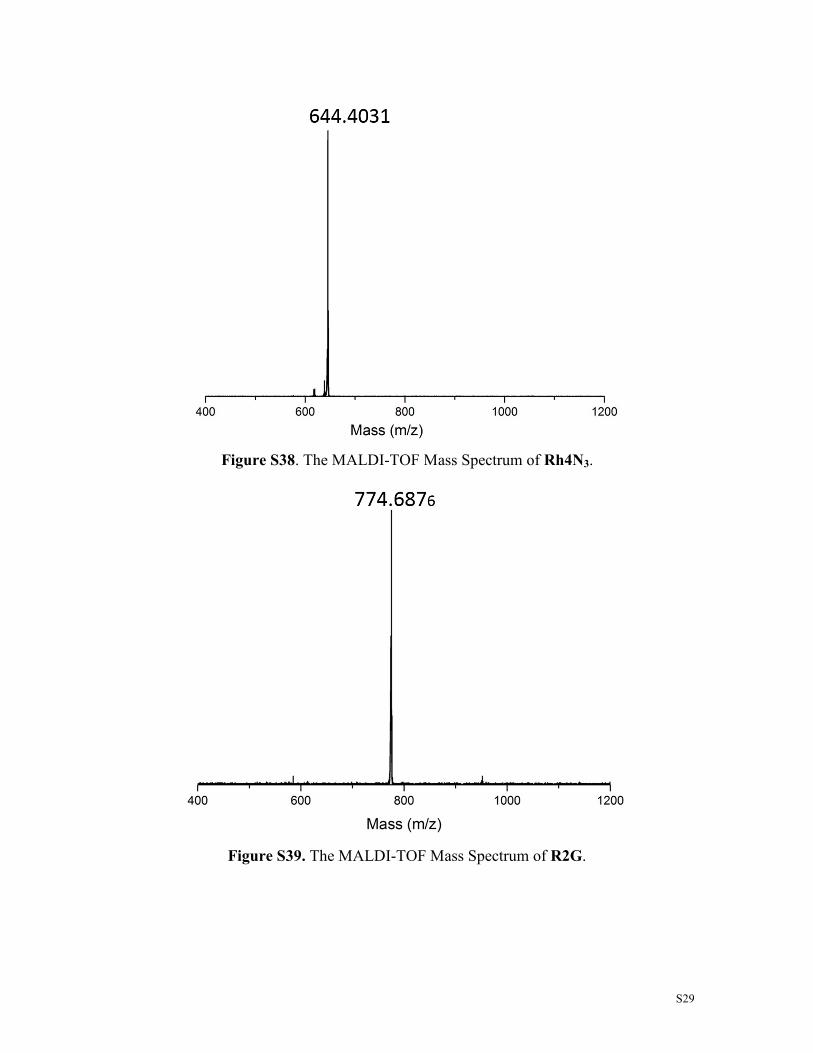
Synthesis of Rh2N3 and Rh4N3. The two compounds were synthesized according to the
same procedure.
Synthesis of AGalNAc. The propargyl N-acetylgalactosamine was synthesized according
S20
to the literature11. The ratio of α and β isomer was 9:1. 1H NMR of AGalNAc (400 MHz,
CD3OD-d4): δ 5.09-5.03 (m, 1H), 4.35-4.27 (m, 3H), 3.92-3.90 (t, 1H), 3.83-3.72 (m, 4H),
3.37 (s, 1H), 2.88-2.86 (t, 1H), 2.01(s, 3H).
Synthesis of propargyl α-galactopyranoside and propargyl α-mannopyranoside. The two
compounds were synthesized according to the same procedure.
Synthesis of R3GN. 200 mg (0.31 mmol) Rh3N3, 55 mg (0.31 mmol) AGalNAc and 26
mg (0.15 mmol) N,N,N',N'',N''-Pentamethyldiethylenetriamine (PMDTA) were added to
5 mL DMF and then after bubbling Ar for 5 min, 11 mg (0.075 mmol) CuBr was added
accompanied by bubbling Ar for another 10 min. The mixture was then heated to 50°C
for 24 h. Then the solvent was removed by evaporation and the raw product was purified
by column chromatography with DCM/MeOH from 50:1 (v/v) to 10:1 (v/v) to give
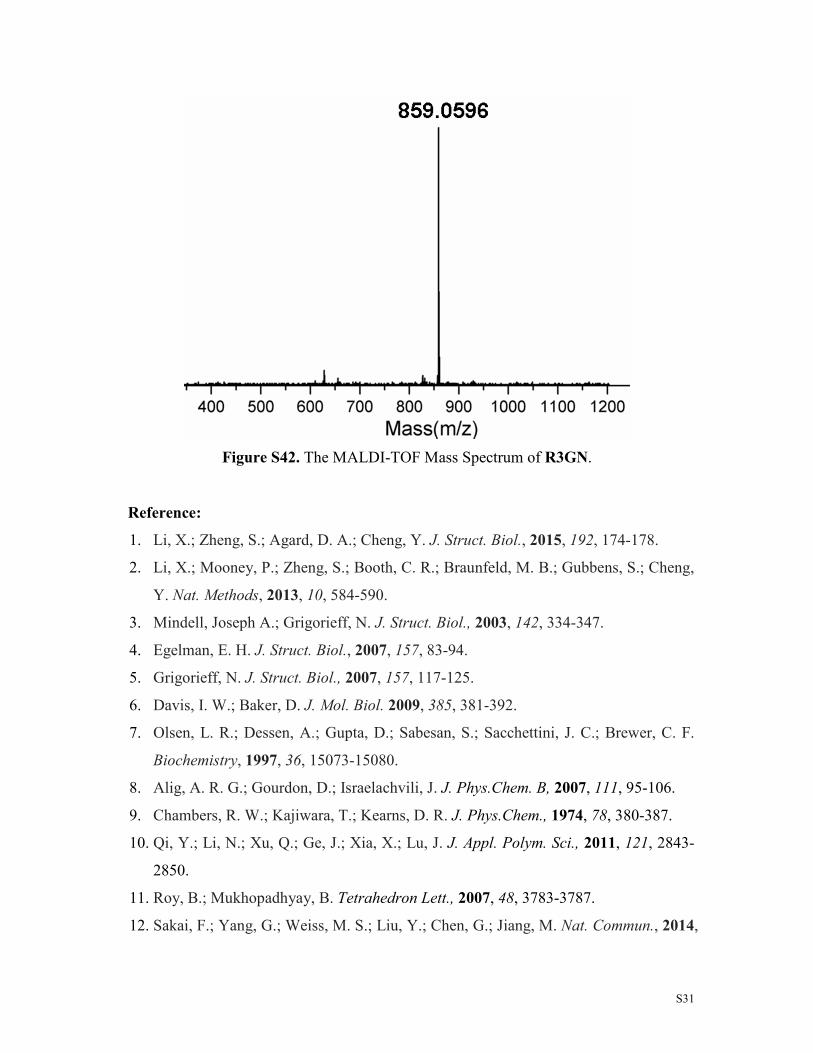
R3GN (109 mg, 39%) as red solid. MALDI-TOF Mass Spectrum (M/z): [RGN – Cl]+
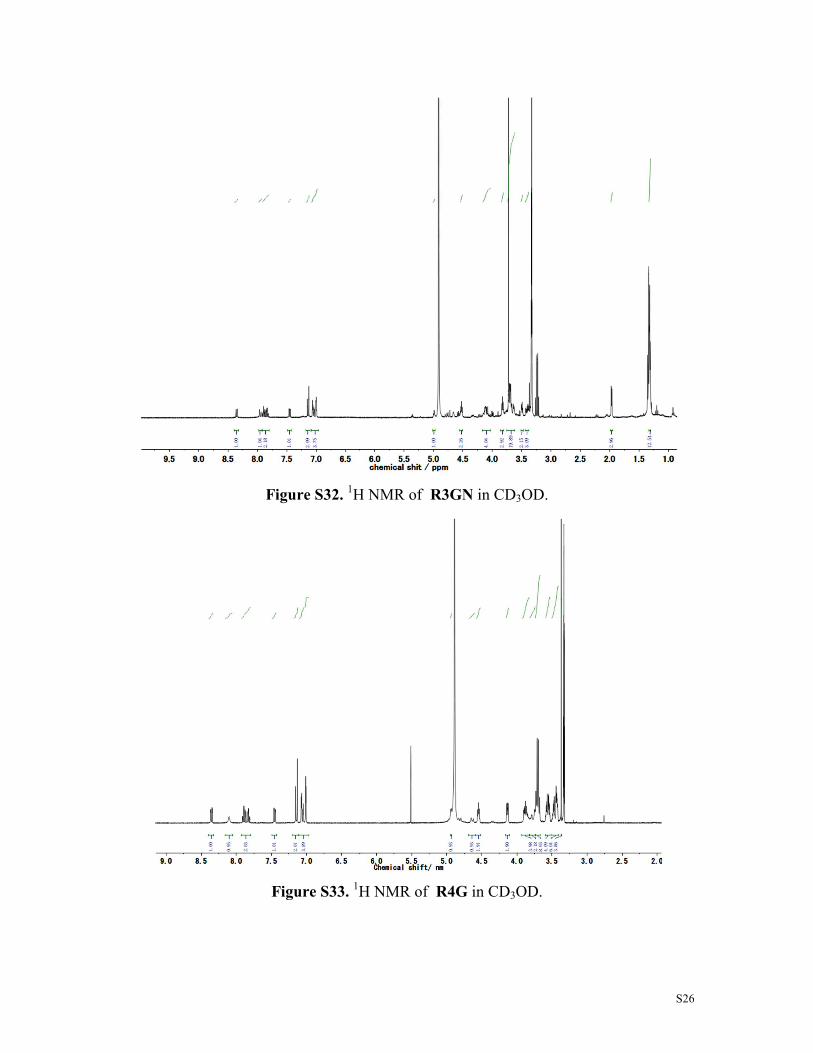
calcd. for C45H59N6O11, 859.42; found, 859.06. 1H NMR (400 MHz, CD3OD): δ 8.36-
8.34 (m, 1H), 7.97-7.89 (d, 1H), 7.87-7.83 (m, 2H), 7.46-7.44 (m, 1H), 7.15-76.99 (m,
6H), 5.00-4.99 (d, 2H), 4.54-4.51 (m, 2H), 4.13-4.08 (m, 4H), 3.84-3.80 (t, 3H), 3.72-
3.69 (m, 20H), 3.50-3.43 (m, 2H), 3.42-3.37 (m, 3H), 1.97-1.92 (d, 3H), 1.34-1.32 (t,
12H).
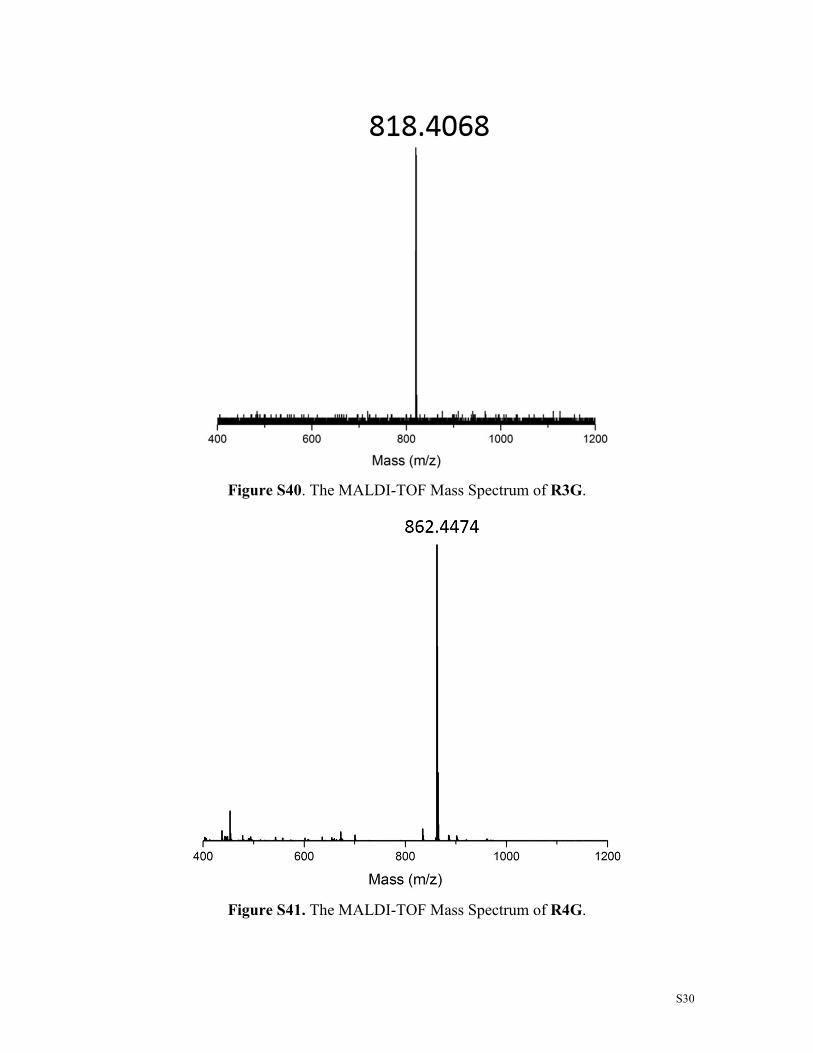
Synthesis of R2G, R3G and R4G. The three compounds were synthesized according the
same procedure as R3GN. RM was reported in our previous paper11.
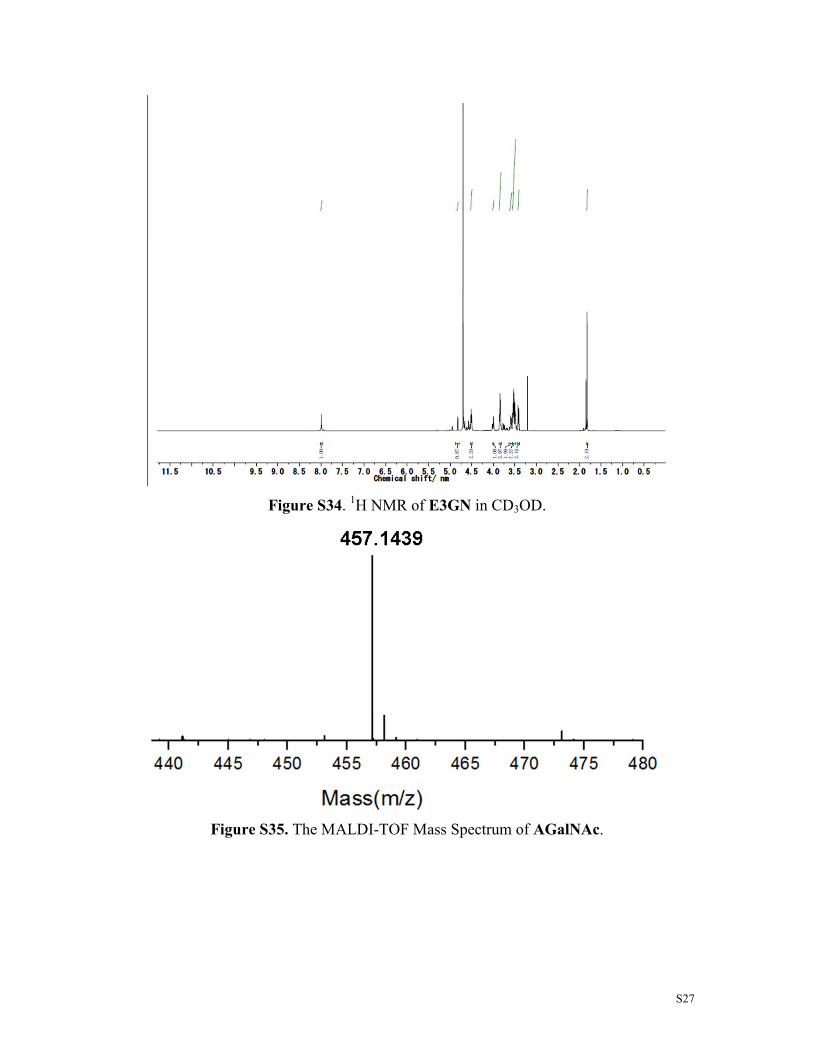
Synthesis of E3GN. 100 mg (0.38 mmol) EG3N3, 70 mg (0.4 mmol) AGalNAc and 34.6
mg (0.2 mmol) N,N,N',N'',N''-Pentamethyldiethylenetriamine (PMDTA) in 5 mL DMF
was stirred after bubbling Ar for 5 min, then 14.3 mg (0.1 mmol) CuBr was added
accompanied by bubbling Ar for another 10 min. The mixture was heated to 50°C for 24
h. Then the solvent was removed by evaporation and the raw product was purified by
column chromatography with DCM/MeOH from 20:1 (v/v) to 10:1 (v/v) to give E3GN
(68 mg, 41%) as colourless solid. MALDI-TOF Mass Spectrum (M/z): [E3GN + Na]+
calcd. for C17H30N4O9Na, 457.20; found, 457.14. 1H NMR (400 MHz, CD3OD-d4): δ
S21
8.03 (s, 1H), 4.81 (d, 1H), 4.04-3.98 (d, 2H), 3.85-3.82 (m, 4H), 3.62-3.58 (t, 2), 3.55-
3.47 (m, 8H), 3.42-3.39 (m, 2H), 1.84 (s, 3H).
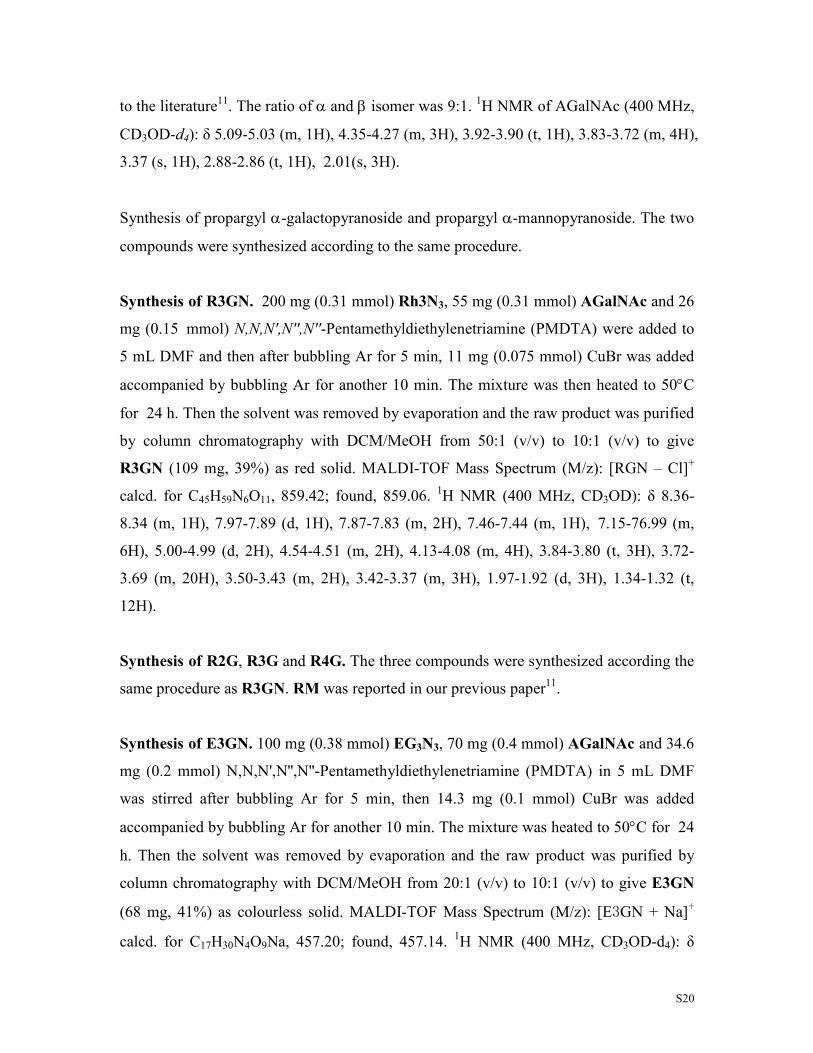
Figure S22. 1H NMR of EG3N3 in CDCl3.
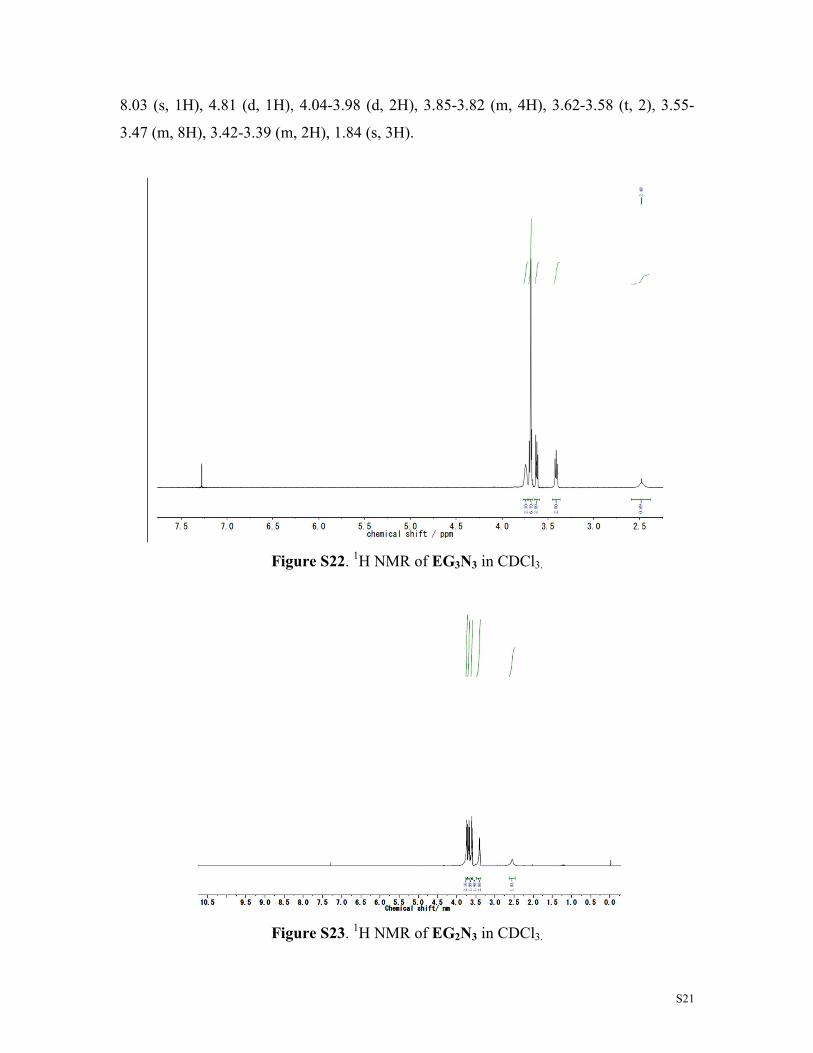
Figure S23. 1H NMR of EG2N3 in CDCl3.
S22
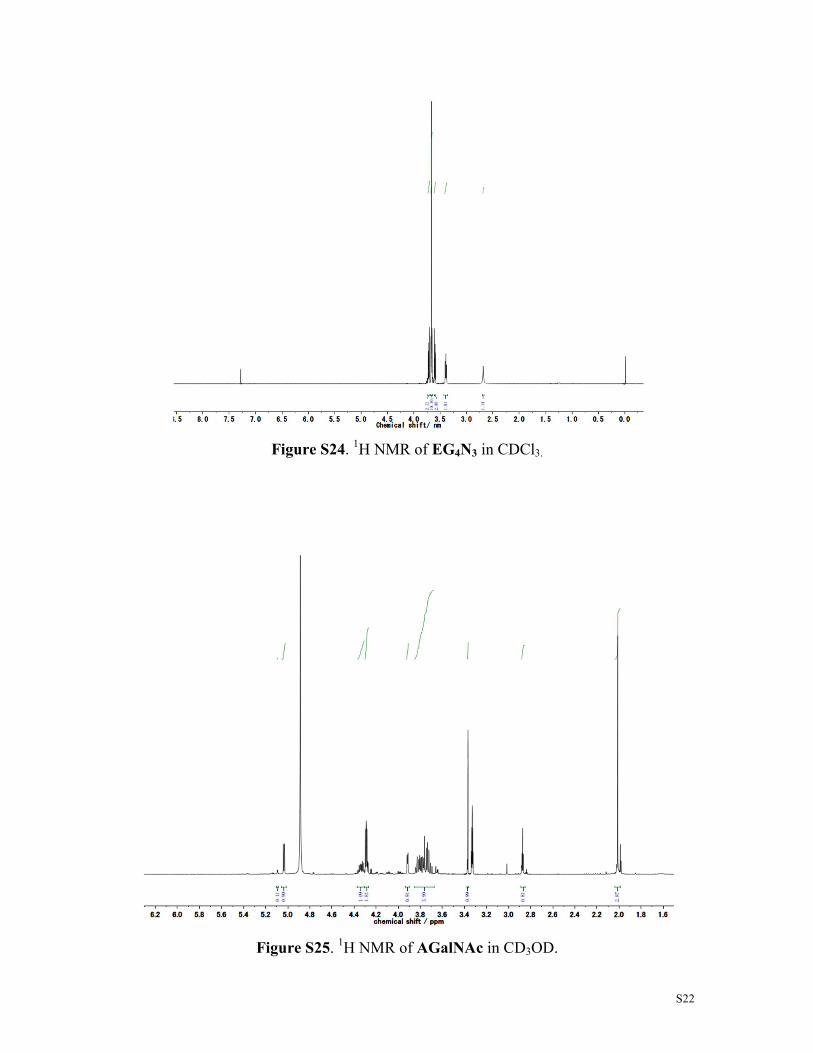
Figure S24. 1H NMR of EG4N3 in CDCl3.
Figure S25. 1H NMR of AGalNAc in CD3OD.
S23
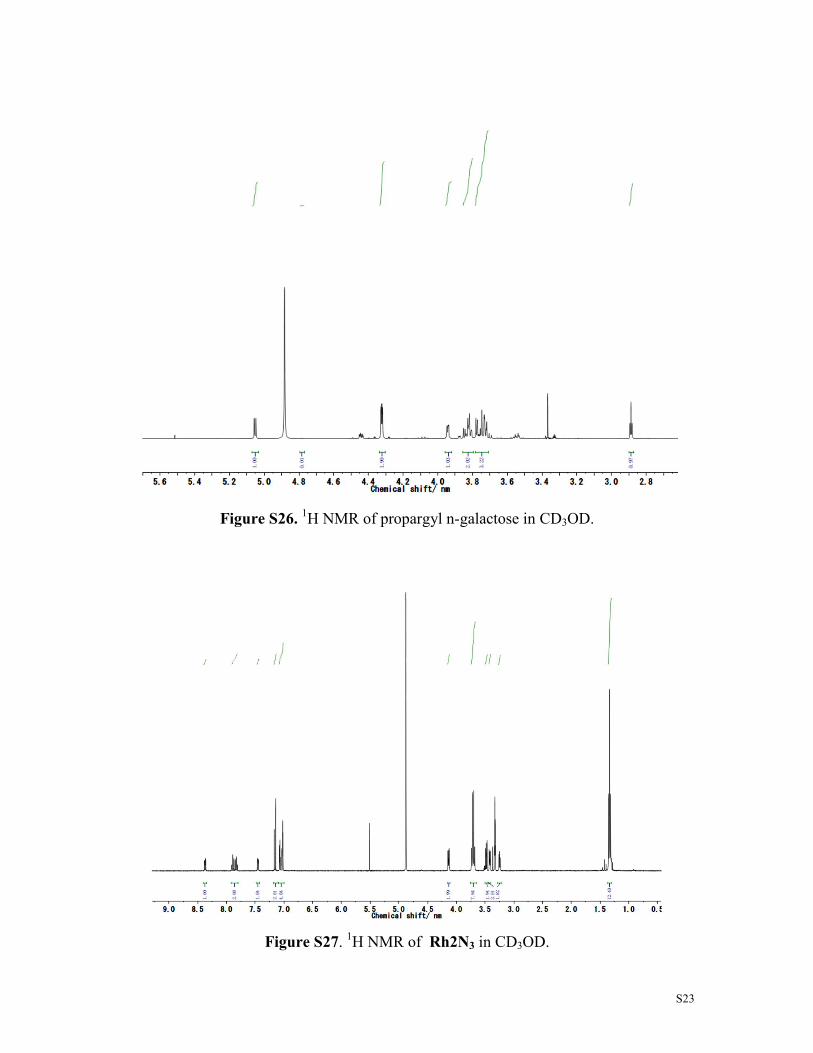
Figure S26. 1H NMR of propargyl n-galactose in CD3OD.
Figure S27. 1H NMR of Rh2N3 in CD3OD.
S24
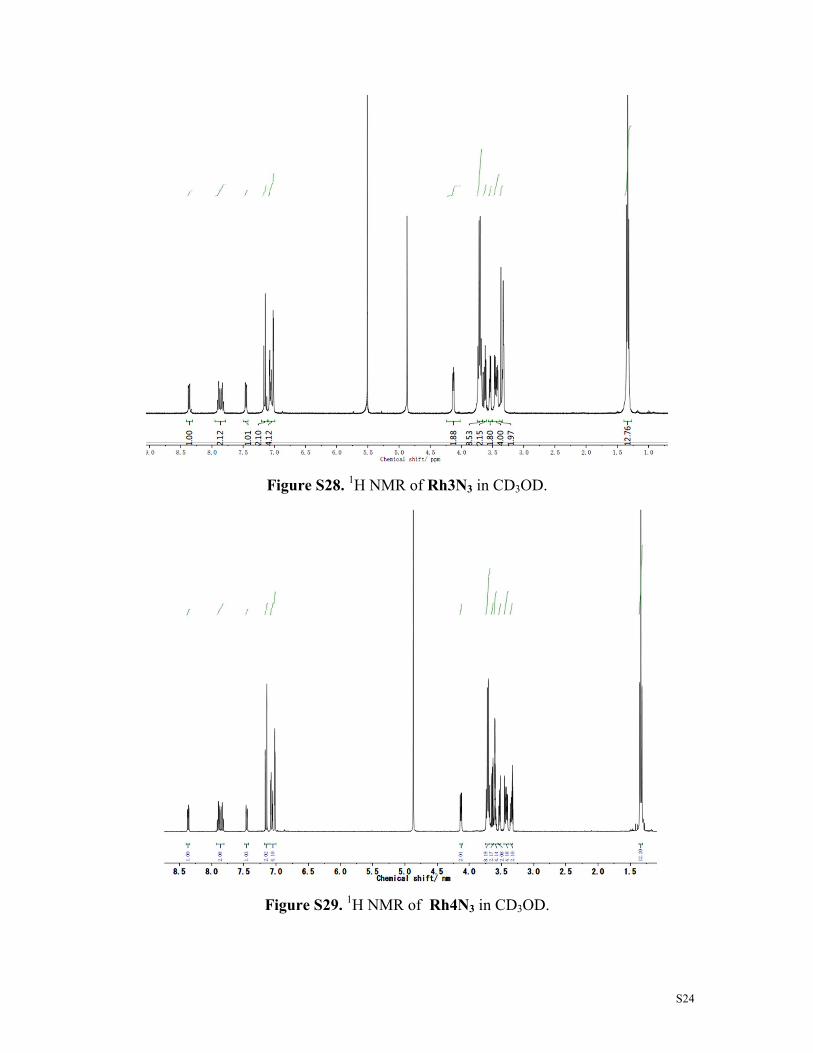
Figure S28. 1H NMR of Rh3N3 in CD3OD.
Figure S29. 1H NMR of Rh4N3 in CD3OD.
S25
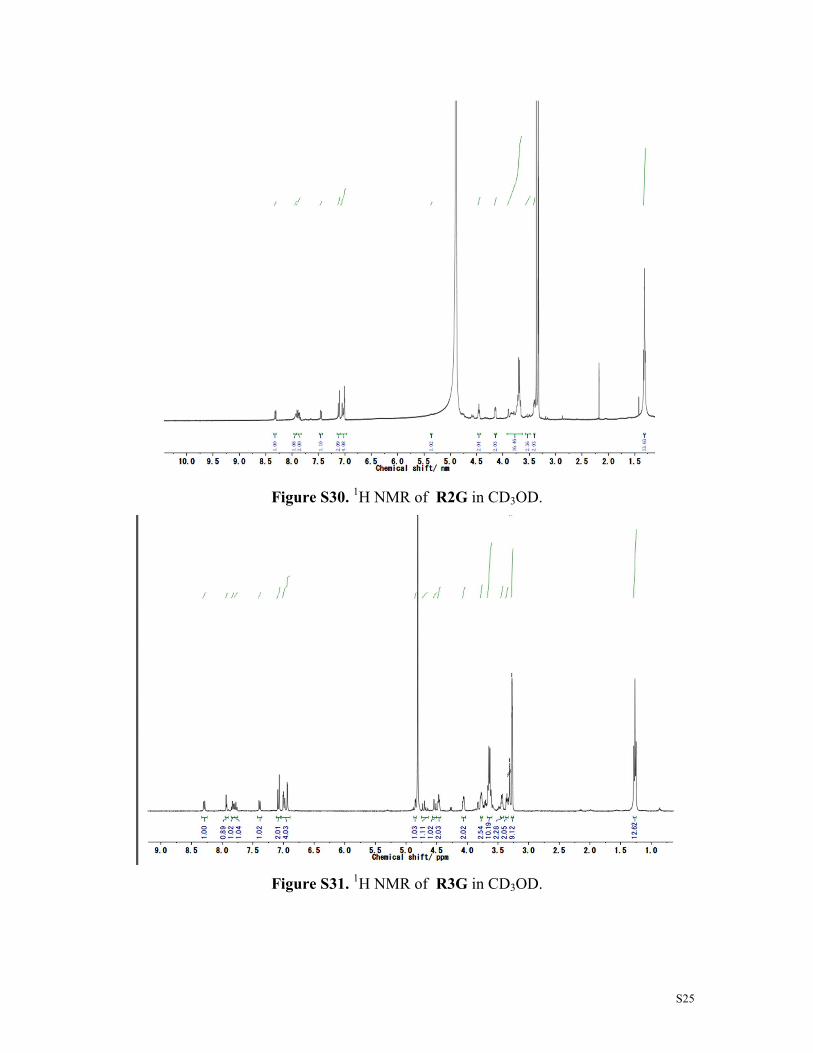
Figure S30. 1H NMR of R2G in CD3OD.
Figure S31. 1H NMR of R3G in CD3OD.
S26
Figure S32. 1H NMR of R3GN in CD3OD.
Figure S33. 1H NMR of R4G in CD3OD.
S27
Figure S34. 1H NMR of E3GN in CD3OD.
Figure S35. The MALDI-TOF Mass Spectrum of AGalNAc.
S28
Figure36. The MALDI-TOF Mass Spectrum of Rh3N3.
Figure S37. The MALDI-TOF Mass Spectrum of Rh2N3.
S29
Figure S38. The MALDI-TOF Mass Spectrum of Rh4N3.
Figure S39. The MALDI-TOF Mass Spectrum of R2G.
S30
Figure S40. The MALDI-TOF Mass Spectrum of R3G.
Figure S41. The MALDI-TOF Mass Spectrum of R4G.
S31
Figure S42. The MALDI-TOF Mass Spectrum of R3GN.
Reference:
1. Li, X.; Zheng, S.; Agard, D. A.; Cheng, Y. J. Struct. Biol., 2015, 192, 174-178.
2. Li, X.; Mooney, P.; Zheng, S.; Booth, C. R.; Braunfeld, M. B.; Gubbens, S.; Cheng,
Y. Nat. Methods, 2013, 10, 584-590.
3. Mindell, Joseph A.; Grigorieff, N. J. Struct. Biol., 2003, 142, 334-347.
4. Egelman, E. H. J. Struct. Biol., 2007, 157, 83-94.
5. Grigorieff, N. J. Struct. Biol., 2007, 157, 117-125.
6. Davis, I. W.; Baker, D. J. Mol. Biol. 2009, 385, 381-392.
7. Olsen, L. R.; Dessen, A.; Gupta, D.; Sabesan, S.; Sacchettini, J. C.; Brewer, C. F.
Biochemistry, 1997, 36, 15073-15080.
8. Alig, A. R. G.; Gourdon, D.; Israelachvili, J. J. Phys.Chem. B, 2007, 111, 95-106.
9. Chambers, R. W.; Kajiwara, T.; Kearns, D. R. J. Phys.Chem., 1974, 78, 380-387.
10. Qi, Y.; Li, N.; Xu, Q.; Ge, J.; Xia, X.; Lu, J. J. Appl. Polym. Sci., 2011, 121, 2843-
2850.
11. Roy, B.; Mukhopadhyay, B. Tetrahedron Lett., 2007, 48, 3783-3787.
12. Sakai, F.; Yang, G.; Weiss, M. S.; Liu, Y.; Chen, G.; Jiang, M. Nat. Commun., 2014,

S32
5, 4634.