Embed Size (px)
Citation preview

Preparation and scoring of protein nano- and
microcrystals for synchrotron and free-electron
laser X-ray radiation sources
DISSERTATION
zur Erlangung des Doktorgrades der Naturwissenschaften (Dr. rer. nat.)
an der Fakultät für Mathematik, Informatik und Naturwissenschaften
der Universität Hamburg, Fachbereich Chemie
vorgelegt von
Robin Schubert
Hamburg, August 2016


Die vorliegende Arbeit wurde im Zeitraum von Juli 2013 bis Juli 2016 in der Arbeitsgruppe von
Prof. Dr. C. Betzel im Laboratorium für Strukturbiologie von Infektion und Entzündung am Institut für
Biochemie und Molekularbiologie des Fachbereichs Chemie der Universität Hamburg durchgeführt.
1. Gutachter: Prof. Christian Betzel
2. Gutachter: Prof. Henning Tidow
Datum der Disputation: 09.09.2016
Datum der Druckfreigabe: 12.09.2016


TABLE OF CONTENTS
I
TABLE OF CONTENTS
TABLE OF CONTENTS ...................................................................................................................... I
TABLE OF FIGURES........................................................................................................................ V
PUBLICATIONS ASSOCIATED WITH THIS THESIS ................................................................................. VII
SUMMARY .................................................................................................................................. 1
ZUSAMMENFASSUNG .................................................................................................................... 3
INTRODUCTORY PREFACE – CRYSTALLOGRAPHY TODAY .......................................................................... 5
OUTLINE AND AIMS OF THE THESIS ..................................................................................................... 9
SECTION A ....................................................................................................................................11
DEVELOPMENT AND ADAPTATION OF NOVEL METHODS FOR NANO- AND MICROCRYSTAL PREPARATION....11
CHAPTER 1 ...............................................................................................................................13
1. THERMOFLUOR AND DYNAMIC LIGHT SCATTERING FOR SAMPLE BUFFER OPTIMIZATION PRIOR CRYSTALLIZATION
1.1 Introduction ............................................................................................................................13
1.2 Material and Methods ............................................................................................................14
1.2.1 Sample preparation ..........................................................................................................14
1.2.2 Thermofluor experiments ................................................................................................15
1.2.3 DLS experiments................................................................................................................15
1.3 Results and Discussion............................................................................................................16
1.3.1 Optimization of sample buffer pH based on Thermofluor and DLS ..............................16
1.3.2 Identifying useful buffer additives for protein stabilization ..........................................19
1.4 Conclusions..............................................................................................................................20
CHAPTER 2 ...............................................................................................................................21
2. THE NUCLEATION PROCESS OF MACROMOLECULE CRYSTALLIZATION
2.1 Investigation of the nucleation process using the XtalController technology ...................24
2.1.1 Introduction.......................................................................................................................24
2.1.2 Material and Methods ......................................................................................................25
2.1.2.1 Protein sample preparation .......................................................................................25
2.1.2.2 XtalController Setup....................................................................................................26
2.1.2.3 Experimental procedure .............................................................................................27
2.1.2.4 Electron microscopy for sample characterization ....................................................28
2.1.3 Results and Discussion ......................................................................................................29

TABLE OF CONTENTS
II
2.1.3.1 Following the nucleation process using the XtalController technology..................29
2.1.3.2 Sample characterization using electron microscopy ................................................35
2.1.4 Conclusion .........................................................................................................................39
2.2 Monitoring protein crystallization in microfluidic devices by dynamic light scattering ....40
2.2.1 Introduction.......................................................................................................................40
2.2.2 Material and Methods ......................................................................................................41
2.2.2.1 Mask Design ................................................................................................................41
2.2.2.2 Photolithography ........................................................................................................42
2.2.2.3 PDMS mold ..................................................................................................................43
2.2.2.4 Chip assembly..............................................................................................................44
2.2.2.5 Chip surface treatment and handling ........................................................................46 2.2.2.6 Sample preparation ....................................................................................................47
2.2.2.7 DLS measurements .....................................................................................................47
2.2.3 Results and Discussion ......................................................................................................48
2.2.3.1 Establishing DLS measurements in microfluidic chips..............................................48
2.2.3.2 Optimizing Chip design for dynamic light scattering measurements......................50
2.2.3.3 Towards a Phase Chip for controlled navigation in phase diagram ........................51
2.2.4 Conclusion .........................................................................................................................54
CHAPTER 3............................................................................................................................... 55
3. RELIABLY DISTINGUISHING PROTEIN NANOCRYSTALS FROM AMORPHOUS PRECIPITATE BY DDLS
3.1 Introduction ............................................................................................................................55
3.2 Material and Methods ............................................................................................................57
3.2.1 Sample preparations .........................................................................................................57
3.2.2 Batch crystallization in a DDLS cuvette............................................................................57
3.2.3 Setup of the depolarized dynamic light scattering instrument .....................................59
3.2.4 Evaluation of the depolarized dynamic light scattering data ........................................60
3.2.5 Second harmonic generation and ultraviolet two-photon excited fluorescence.........61
3.2.6 X-Ray diffraction analysis..................................................................................................61
3.2.7 Scanning electron microscopy .........................................................................................62
3.3 Results and Discussion............................................................................................................62
3.3.1 Characterizing size and shape of nanoparticles..............................................................62
3.3.2 Contribution of multiple scattering to depolarized signal .............................................64
3.3.3 Monitoring crystal growth and distinguishing between protein nanocrystals and
amorphous precipitate .....................................................................................................65
3.3.4 Verification of DDLS results with complementary methods ..........................................67
3.4 Conclusion ...............................................................................................................................69

TABLE OF CONTENTS
III
CHAPTER 4 ...............................................................................................................................70
4. APPLICATIONS OF PROTEIN MICROCRYSTALS FOR SYNCHROTRON RADIATION
4.1 A multicrystal data collection approach for studying structural dynamics with millisecond
temporal resolution ................................................................................................................70
4.1.1 Introduction.......................................................................................................................70
4.1.2 Material and Methods ......................................................................................................72
4.1.2.1 Sample preparations ...................................................................................................72
4.1.2.2 Setup of the fixed target kapton sandwich ...............................................................72
4.1.2.3 Data collection and evaluation ..................................................................................73
4.1.2.4 Decay of diffraction power .........................................................................................74
4.1.2.5 Crystal orientations .....................................................................................................74
4.1.2.6 Site specific radiation damage ...................................................................................75
4.1.3 Results and Discussion ......................................................................................................75
4.1.3.1 Diffraction data collection using the kapton foil sandwich approach.....................75
4.1.3.2 Data quality and statistics ..........................................................................................76
4.1.3.3 Diffraction intensity decay .........................................................................................79
4.1.3.4 Crystal orientations .....................................................................................................80
4.1.3.5 Time-resolved changes in electron density...............................................................81
4.1.4 Conclusion .........................................................................................................................82
4.2 Multi-crystal radiation damage induced phasing .................................................................84
4.2.1 Introduction.......................................................................................................................84
4.2.2 Material and Methods ......................................................................................................85
4.2.2.1 Sample preparation ....................................................................................................85
4.2.2.2 Sample loading ............................................................................................................86
4.2.2.3 Data collection and evaluation ..................................................................................86
4.2.3 Results and Discussion ......................................................................................................87
4.2.3.1 Diffraction data collection and statistics ...................................................................87
4.2.4 Using radiation damage for phasing of a multi-crystal thaumatin dataset ..................89
4.2.5 Conclusions ........................................................................................................................94
SECTION B ....................................................................................................................................95
AMINOPEPTIDASE P FROM P. FALCIPARUM ......................................................................................95
5. STRUCTURAL CHARACTERIZATION OF PLASMODIUM FALCIPARUM APP
5.1 Introduction ............................................................................................................................96
5.2 Material and Methods ............................................................................................................97
5.2.1 Cloning and expression of APP.........................................................................................97
5.2.2 APP purification protocol .................................................................................................98
5.2.3 DLS measurements ...........................................................................................................99
5.2.4 CD spectroscopy ................................................................................................................99
5.2.5 Crystallization ................................................................................................................. 100
5.2.6 Data collection, evaluation, phasing and refinement ................................................. 100
TABLE OF CONTENTS
IV
5.3 Results and Discussion......................................................................................................... 101
5.3.1 Recombinant expression, purification and characterization ...................................... 101
5.3.2 Crystallization, data collection and refinement ........................................................... 104
5.3.3 Structural model interpretation.................................................................................... 106
5.4 Conclusions........................................................................................................................... 111
APPENDIX ................................................................................................................................... 112
LIST OF ABBREVIATIONS ............................................................................................................. 113
SCRIPTS .................................................................................................................................. 114
AMINO ACID SEQUENCE OF P. FALCIPARUM APP ........................................................................... 117
INSTRUMENTATION AND CHEMICALS............................................................................................ 118
INSTRUMENTATION ............................................................................................................... 118
GHS AND RISK SYMBOLS ........................................................................................................ 119
CHEMICALS USED (GHS CLASSIFICATION) ...................................................................................... 120
PROTEIN CRYSTALLIZATION AND STABILITY SCREENS ........................................................................... 123
GHS HAZARD STATEMENTS ..................................................................................................... 124
GHS PRECAUTIONARY STATEMENTS ........................................................................................... 125
ACKNOWLEDGEMENTS .................................................................................................................. 126
CURRICULUM VITAE ..................................................................................................................... 128
EIDESSTATTLICHE ERKLÄRUNG ........................................................................................................ 129
REFERENCES ................................................................................................................................ 130

TABLE OF FIGURES
V
TABLE OF FIGURES
Figure 1-1: Melting curves of thioredoxin obtained from Thermofluor experiments with RUBIC buffer
screen. ..................................................................................................................... 17
Figure 1-2: Identifying a pH-dependent aggregation of thioredoxin by DLS. ....................................... 18
Figure 1-3: Additive compound screening by Thermofluor (TF) and Dynamic Light Scattering (DLS). ..... 19
Figure 2-1: Schematic presentation of the two-step mechanism of nucleation. .................................. 22
Figure 2-2: Setup of the XtalController instrument. ........................................................................ 26
Figure 2-3: Controlled induction of APP nucleation by the XtalController. ......................................... 31
Figure 2-4: Controlled induction of thioredoxin nucleation by the XtalController................................ 33
Figure 2-5: Controlled induction of ML1 nucleation by the XtalController. ......................................... 34
Figure 2-6: Controlled induction of nucleation by the XtalController with the proteins thaumatin and
ThiM. ....................................................................................................................... 35
Figure 2-7: Transmission electron microscopy images of a ML1 sample obtained from the XtalController
experiment shown in Figure 2-5 B. ............................................................................... 36
Figure 2-8: Transmission electron microscopy images of a ML1 sample obtained from the XtalController
experiment shown in Figure 2-5 C. ............................................................................... 37
Figure 2-9: Transmission electron microscopy images of (A) thaumatin, (B) thioredoxin and (C) ML1
samples obtained from XtalController experiment. ........................................................ 38
Figure 2-10: Scanning electron microscopy images of a thioredoxin sample obtained from the XtalController
experiment shown in Figure 2-4 C. ............................................................................... 38
Figure 2-11: Photolithography masks used for preparing silicon wafers of the Phase Chip..................... 42
Figure 2-12: Silicon wafer preparation by photolithography. ............................................................. 43
Figure 2-13: Schematic presentation of the PDMS chip. .................................................................... 44
Figure 2-14: Photographic images of the three components of the Phase chip. ................................... 45
Figure 2-15: Vertical cross-section of the individual steps during Phase chip preparation. ..................... 46
Figure 2-16: Following the crystallization process of thioredoxin by DLS measurements in a PDMS chip. 49
Figure 2-17: Observation of solvent evaporation in an optimized PDMS chip filled with a thaumatin protein
solution. ................................................................................................................... 50
Figure 2-18: Automated DLS measurements in a microfluidic PDMS chip with optimized design. ........... 52
Figure 2-19: Photographic presentation of the individual steps of Phase Chip preparation. ................... 53
Figure 3-1: Depolarized dynamic light scattering (DDLS) instrument. ................................................ 59
Figure 3-2: Approximating particles as rotational ellipsoids. ............................................................ 61
Figure 3-3: Size and shape determination based on the autocorrelation function (ACF) recorded by the
DDLS instrument of the translational (black) and rotational (red) diffusion. ...................... 63
Figure 3-4: Contribution of multiple scattering to the intensity of the detected depolarized signal. ...... 65

TABLE OF FIGURES
VI
Figure 3-5: Radius distribution and signal intensity evolution for DLS and DDLS over time.................... 66
Figure 3-6: Evaluation of the contribution of multiple scattering to the DDLS signal intensity in the
crystallization experiments. ......................................................................................... 67
Figure 3-7: Verification of sample content after crystallization experiments with the DDLS instrument. 68
Figure 4-1: Schematic presentation of the experimental design of the kapton foil sandwich. ............... 73
Figure 4-2: Diffraction data collection of thaumatin microcrystals in a kapton foil sandwich at a
synchrotron X-ray radiation source. .............................................................................. 75
Figure 4-3: Data statistics from the room-temperature data collection of thaumatin microcrystals in the
kapton foil sandwich. .................................................................................................. 76
Figure 4-4: Effect of global X-ray radiation damage over time for the low dose-rate (blue) and high dose-
rate (red) diffraction data. ........................................................................................... 79
Figure 4-5: Distribution of crystal orientations of thaumatin in the kapton foil sandwich in respect to the
laboratory coordinate system. ..................................................................................... 80
Figure 4-6: Time-resolved observation of specific radiation damage around all sulfur atoms of thaumatin
over time. ................................................................................................................. 82
Figure 4-7: Sample mounting for UV-RIP experiments at ESRF beamline ID23-2. ................................. 87
Figure 4-8: Results of substructure determination for various scaling factors by SHELXD. .................... 90
Figure 4-9: Comparison of obtained substructures with known substructures from thaumatin data. ..... 91
Figure 4-10: Substructure determination for best scaling factor. ........................................................ 92
Figure 4-11: Difference Fourier peaks between before 1 and before 2 data around all sulfur atoms of
thaumatin. ................................................................................................................ 93
Figure 4-12: Fo-Fc electron density of the structural model of Thaumatin phased by X-ray RIP using multi-
crystal diffraction data (contoured at 2 rmsd). ............................................................... 93
Figure 5-1: Simplified schematic of the hemoglobin degradation pathway in P. falciparum. ................. 96
Figure 5-2: SDS-PAGE showing the expression of APP and fractions from its purification.................... 102
Figure 5-3: Second purification step of APP and biophysical characterization of elution fractions........ 103
Figure 5-4: Protein crystal of P. falciparum APP used for X-ray diffraction data collection. ................. 104
Figure 5-5: Multiple sequence alignment of Pf APP with closest structurally known homologues. ....... 107
Figure 5-6: Surface illustration of the dimer interface of P. falciparum APP. ..................................... 108
Figure 5-7: Cartoon representation of the structural model of P. falciparum APP. ............................. 108
Figure 5-8: Schematic presentation of the topology details of the APP domains. .............................. 109
Figure 5-9: Active site of P. falciparum APP. ................................................................................. 110

VII
PUBLICATIONS ASSOCIATED WITH THIS THESIS
Robin Schubert, Arne Meyer, Karsten Dierks, Svetlana Kapis, Rudolph Reimer, Howard Einspahr, Markus
Perbandt and Christian Betzel, Reliably distinguishing protein nanocrystals from amorphous
precipitate by means of depolarized dynamic light scattering, Journal of Applied Crystallography
(2015) 48, 1476–1484
Robin Schubert, Svetlana Kapis, Yannig Giquel, Gleb Bourenkov, Thomas R Schneider, Michael Heymann,
Christian Betzel, Markus Perbandt, A multicrystal diffraction data-collection approach for studying
structural dynamics with millisecond temporal resolution. IUCrJ (2016). 3, 393–401
Robin Schubert, Sandra Koszak, Markus Perbandt, Rob Meijers, Stephane Boivin, Complementarity of
Thermofluor and Dynamic Light Scattering for protein buffer optimization. In preparation for
submission to the Journal of Structural Biology
Robin Schubert, Arne Meyer, Karsten Dierks, Markus Perbandt, Christian Betzel, Dynamic light scattering
provides new insights into the process of nucleation monitored by feedback-controlled protein
crystallization. In preparation for submission to the Journal Angewandte Chemie
Related publications:
Chen-Yan Zhang, Yan Wang, Robin Schubert, Yue Liu, Li-Xue Yang, Meng-Ying Wang, Hui-Meng Lu, Yong-
Ming Liu, Yun-Zhu Guo, Zi-Qing Wu, Ke-An Chen, Christian Betzel, Da-Chuan Yin, The effect of audible
sound on protein crystallization, Crystal Growth and Design (2016) 16 (2), 705–713
Clemens Falker, Alexander Hartmann, Inga Guett, Frank Dohler, Hermann Altmeppen, Christian Betzel,
Robin Schubert, Dana Thurm, Florian Wegwitz, Pooja Joshi, Claudia Verderio, Susanne Krasemann,
Markus Glatzel, Exosomal PrPC drives fibrillization of amyloid beta and counteracts amyloid beta-
mediated neurotoxicity, Journal of Neurochemistry (2016) 137 (1), 88-100

VIII
SUMMARY
1
SUMMARY
Accompanying with the construction of high brilliant X-ray radiation sources like third generation
synchrotrons and free-electron lasers (FELs) it became possible to use protein micro- and nanocrystals
for protein structure determination. Therefore, the interest in nano- and microcrystals increased
substantially and a strong demand arose in developing new methods for preparation and scoring of
protein crystals with this size. In this study, several methods related to nano- and microcrystal
production and scoring could be established or adapted, including protein buffer optimization,
controlled induction of nucleation, non-invasive reliable nanocrystal detection in solution and
potential applications of microcrystals for X-ray crystallography at synchrotrons.
It could be demonstrated that the protein buffer composition, which is a crucial parameter for
maintaining protein stability, homogeneity and purity, can be optimized in a multi-condition approach
with the use of Dynamic Light Scattering (DLS). Further, it was shown that DLS and Thermofluor provide
complementary information and thus both methods should be combined in order to identify an ideal
buffer composition that fulfils all criteria known to be beneficial for crystal formation.
Furthermore, DLS was used to obtain new information about the nucleation process of
macromolecules. The growth kinetics of protein clusters were analyzed and revealed that the rate of
mass-transport during cluster evolution is mainly diffusion-limited. The obtained results support the
proposed theory of a two-step mechanism of nucleation and might demonstrate the first microscopic
evidence of a transition from a cluster with high protein concentration to a crystal with higher
structural order. Further, is was shown that DLS measurements can also be performed in micro-sized
cavities of microfluidic devices and might circumvent the current limitation that the qualitative and
quantitative evaluation of the crystallization process in microfluidic devices is solely based on visual
inspection using a light microscope.
Beyond that, a novel and unique non-invasive and non-destructive method called Depolarized Dynamic
Light Scattering (DDLS) could be established, which is capable of identifying nanocrystals in solution
and allows following the nucleation and early stages of protein crystallization in real time. The obtained
results provide clear evidence, that DDLS allows distinguishing between well-ordered crystalline
particles and amorphous protein aggregates online during the crystallization process.
Additional emphasis was placed on developing new promissing applications of microcrystals for data
collection at synchrotrons. A simple fixed target approach and data collection protocol was established
that allows the rapid collection of complete diffraction data sets from less than 50 microcrystals at
room-temperature. Due to the high temporal resolution of 40 milliseconds between each dataset,
dynamic processes like site-specific or global radiation damage and potentially also chemical reactions,
SUMMARY
2
catalyzed by biological macromolecules, can be followed using this approach. Furthermore, it was
shown that site-specific X-ray radiation damage can be used for phasing a multi-microcrystal diffraction
dataset, when recording diffraction data at cryogenic temperature. This is particularly interesting,
because it was not known if the non-isomorphism from multiple crystals would disguise the differences
in structure factors upon induced radiation damage.
Accessorily, the structure of aminopeptidase P (APP) from the human malaria parasite
Plasmodium falciparum was solved to high resolution using X-ray crystallography. The APP exhibits a
three-domain architecture and was found as a homodimer in the crystal as well as in solution. The
resulting structural APP model shows a high structural homology to human APP and Caenorhabditis
elegans APP and in particular, the active site with a di-nuclear manganese cluster is highly conserved.
The information indicates that P. falciparum and human APP share a common mode of substrate
binding and a similar catalytic mechanism. The results contribute and support the development of
antimalarial drugs.

ZUSAMMENFASSUNG
3
ZUSAMMENFASSUNG
Einhergehend mit der Entwicklung von hoch brillanten Röntgenquellen wie Synchrotrons der dritten
Generation und Freien-Elektronen Lasern (FELs) wurde es möglich, Nano- und Mikrokristalle zur
Strukturaufklärung von Proteinen zu verwenden. Daher nahm das Interesse an Nano- und
Mikrokristallen substantiell zu und es entstand ein großer Bedarf an der Entwicklung von neuen
Methoden für deren Herstellung und Qualitätsabschätzung. Im Rahmen dieser Promotionsarbeit
wurden mehrere Methoden entwickelt oder adaptiert, die sich mit der Nano- und
Mikrokristallherstellung und -identifizierung beschäftigen. Dies umfasst Methoden zur Proteinpuffer-
Optimierung, zur kontrollierten Induktion der Nukleation und zur nicht-invasiven verlässlichen
Detektion von Nanokristallen in Lösung, sowie möglichen Anwendungen von Mikrokristallen für die
Diffraktionsdatensammlung an Synchrotrons.
Es konnte gezeigt werden, dass die Proteinpufferzusammensetzung, die einen entscheidenden
Parameter für den Erhalt der Proteinstabilität, -homogenität und -reinheit darstellt, in einem
multifunktionalen Ansatz unter Verwendung der dynamischen Lichtstreuung (DLS) optimiert werden
kann. Außerdem wurde gezeigt, dass mittel DLS und Thermofluor komplementäre Informationen
erhalten werden. Daher sollten beide Methoden kombiniert werden, um eine
Pufferzusammensetzung, die alle für die Kristallisation vorteilhaften Kriterien erfüllt, zu identifizieren.
Des Weiteren wurde DLS verwendet, um neue Informationen über den Nukleationsprozess von
Makromolekülen zu gewinnen. Es wurde die Wachstumskinetik von Proteinclustern analysiert und die
Ergebnisse zeigten, dass der Massenzuwachs während der Cluster-Evolution hauptsächlich
diffusionslimitiert ist. Die erhaltenen Ergebnisse unterstützen zudem die Hypothese eines Zwei-Schritt-
Mechanismus der Nukleation und stellen möglicherweise den ersten mikroskopischen Nachweis eines
Übergangs von einem Cluster mit hoher Proteindichte zu einem Cluster mit hoher struktureller
Ordnung dar. Zudem konnte gezeigt werden, dass DLS Messungen ebenfalls in den kleinen Kavitäten
eines Mikrofluidikchips durchgeführt werden können. Die derzeitige Einschränkung von Mikrofluidik
Anordnungen ist, dass die qualitative und quantitative Evaluation des Kristallisationsprozesses nur
aufgrund einer visuellen Begutachtung mit Hilfe eines Lichtmikroskops durchgeführt werden kann.
Durch den Einsatz von DLS kann diese Limitierung nun umgangen werden.
Darüber hinaus wurde eine einzigartige nicht-invasive und nicht-destruktive Methode basierend auf
dem Prinzip der depolarisierten dynamischen Lichtstreuung (DDLS) etabliert. DDLS ermöglicht es,
Nanokristalle in Lösung zu identifizieren und deren frühzeitiges Wachstum während der Kristallisation
in Echtzeit zu verfolgen. Zudem zeigen die erhaltenen Ergebnisse, dass eine Unterscheidung zwischen
ZUSAMMENFASSUNG
4
kristallinen Partikeln mit hoher intrinsischer Ordnung und amorphen Aggregaten während des
Kristallisationsprozesses mit Hilfe von DDLS möglich ist.
Ein weiterer Schwerpunkt wurde auf die Entwicklung von neuen vielversprechenden Anwendungen
von Mikrokristallen zur Datensammlung an Synchrotrons gelegt. Es wurde ein Ansatz zur
Probenmontage sowie eines Datensammelprotokolls etabliert, über den mit kurzem Zeitaufwand
vollständige Datensätze von Mikrokristallen bei Raumtemperatur gesammelt werden können. Der
Ansatz zeichnet sich dadurch aus, dass eine zeitliche Auflösung von 40 Millisekunden zwischen den
einzelnen Datensätzen erreicht wird. Dies ermöglicht die Verfolgung von dynamischen Prozessen wie
ortsspezifischem und globalem Strahlenschaden oder die Beobachtung von chemischer Reaktionen,
die über Enzyme katalysiert werden. Darüber hinaus wurde demonstriert, dass die Phaseninformation
eines bei kryogenen Temperaturen aufgenommen Multi-Mikrokristall-Diffraktionsdatensatzes anhand
von ortsspezifischem Strahlenschaden ermittelt werden kann. Dies ist im Besonderen interessant, da
bislang unklar war, ob der Nicht-Isomorphismus zwischen den einzelnen Kristallen die durch den
Strahlenschaden hervorgerufenen Unterschiede in den Strukturfaktoren überlagern würde.
Zusätzlich wurde die Röntgenstruktur der Aminopeptidase P (APP) des humanen Malariaerregers
Plasmodium falciparum zu hoher Auflösung aufgeklärt. Es zeigte sich, dass APP aus drei Domänen
aufgebaut ist und sowohl im Kristall als auch in Lösung als Dimer vorliegt. Das erhaltene Strukturmodell
von APP weist eine hohe strukturelle Homologie zu humanem APP und zu APP von Caenorhabditis
elegans auf. Besonders das aktive Zentrum, welches ein zweikernigen Mangan-Cluster enthält, ist hoch
konserviert. Die Ergebnisse weisen darauf hin, dass P. falciparum APP und humanes APP ein
gemeinsames Muster der Substratbindung haben und ihr katalytischer Mechanismus ähnlich ist. Diese
Informationen können dazu beitragen neue Wirkstoffe gegen Malaria zu entwickeln.

INTRODUCTORY PREFACE – CRYSTALLOGRAPHY TODAY
5
INTRODUCTORY PREFACE – CRYSTALLOGRAPHY TODAY
The discovery of X-rays by Wilhelm Conrad Röntgen in 1895 was of fundamental importance for the
understanding of molecular processes and investigation of atomic structures (Röntgen, 1898). The era
of X-ray crystallography was born in 1912 when a copper sulfate crystal was placed in the X-ray beam
to test the wave-like nature of the X-rays in an experiment proposed by Max von Laue (Friedrich et al.,
1913). The experiment, nowadays called Laue-Crystallography, was interpreted and improved by W. L.
Bragg and W. H. Bragg, who thereby solved the first crystal structure of sodium chloride in 1913 (Bragg
& Bragg, 1913). This was the first technique that allows determining atomic bond distances, bond
angles as well as dihedral angles and turned out to be one of the most important scientific
breakthroughs in chemistry, physics and biology of the last century.
However, it took several years until the first crystal structure of a macromolecule was solved. The first
enzyme, jack bean urease, was crystallized by James Sumner in 1926, but the first protein from which
a crystal structure could be determined was sperm whale myoglobin in 1958 (Kendrew et al., 1958).
From the 1990s onwards the number of deposited macromolecular structures, archived online at the
Protein Data Bank (PDB), started to grow rapidly. Today more than 120000 entries are deposited
(rcsb.org). The remarkably increasing number became possible with substantial achievements in the
fields of molecular biology and protein purification as well as a better understanding of the
crystallization process and the constant development of improved X-ray radiation sources. Currently
synchrotrons are the most commonly used radiation sources for experiments requiring high intense X-
ray beams. Synchrotrons of the first generation with an electron storage ring were built in the 1970s
and nowadays synchrotrons of the third generation are used. The largest and most powerful radiation
sources among these are DIAMOND (Oxfordshire, England), Spring-8 (Harima Science Park City, Japan),
APS (Chicago, USA), ESRF (Grenoble, France) and PETRA III (Hamburg, Germany).
In classical protein crystallography, one single protein crystal with dimensions between 50 µm and 500
µm is mounted on a goniometer at cryogenic temperature and rotated in the X-ray beam, while
recording many diffraction patterns. With increasing flux of the new synchrotron radiation sources,
the minimal required crystals size to measure reliable Bragg intensities at high diffraction angles
constantly decreased. At modern micro-focus beamlines, a monochromatic X-ray beam is focused on
a spot with a diameter about 5 µm and delivers about 1012 photons per second (Smith et al., 2012).
Such high flux densities lead to the problem, that the total X-ray dose has to be distributed by either
exposing multiple positions of a single crystal (Riekel et al., 2005) or by exposing several microcrystals
(Coulibaly et al., 2007), in order to avoid global and specific radiation damage multiple partial datasets

INTRODUCTORY PREFACE – CRYSTALLOGRAPHY TODAY
6
are merged to obtain complete data sets. To facilitate this, a new sample mounting system for in-situ
crystallography has been developed by McPherson in 2000 and several others were published over the
last years. Among these are also many approaches to collect diffraction data at room-temperature,
which have the benefit of avoiding artefacts due to the cryo-freezing process and allow studying
dynamic processes. Low X-ray absorbing 96-well plates have been developed in order to reduce sample
manipulation after crystal formation (Kisselman et al., 2011; Axford et al., 2012; Axford et al., 2016).
Microfluidic chips are used as X-ray compatible multilayer crystallization platforms or as counter-
diffusion crystallization devices (Guha et al., 2012; Pinker et al., 2013; Perry et al., 2013; Mueller et al.,
2015). Also other fixed target approaches have been tested (Coquelle et al., 2015; Huang et al., 2015)
and capillaries have been used in which microcrystals are slowly flowing though the X-ray beam
(Stellato et al., 2014). All these methods facilitate the collection of complete diffraction data-sets by
recording a limited number of diffraction patterns from suspensions of microcrystals.
In parallel, X-ray sources of the fourth generation have been designed and are currently constructed
at several locations worldwide. These instruments are called free-electron lasers (FELs) and in contrast
to synchrotrons they consist of a high-energy electron linear accelerator, equipped with very long
undulators to produce X-rays in a microbunching process (Tremaine et al., 2002). The emitted hard X-
rays are delivered in pulses and each pulse contains up to about 1013 coherent photons and has a
duration of 100 fs or even less. The resulting peak brilliance is about ten orders of magnitude higher
compared to third-generation synchrotrons (Su et al., 2015). Currently only four XFELs are in operation
worldwide, the Free Electron laser Radiation for Multidisciplinary Investigations (FERMNI, ELETTRA,
Italy), the Free-electron LASer in Hamburg (FLASH, DESY, Germany), the Spring-8 Angstrom Compact
free electron LAser (SACLA, RIKEN, Japan) and the Linac Coherent Light Source (LCLS, SLAC, USA). But
several more are under construction, like the SwissFEL at the Paul Scherrer Institute and the European-
XFEL in Hamburg, which will be operational in 2017. Along with these new radiation sources a
revolutionary new method called serial femtosecond X-ray crystallography (SFX) has been developed
(Chapman et al., 2011; Schlichting, 2015; Martin-Garcia et al., 2016). The first reported protein
structure with high resolution determined by SFX has been published by Boutet et al. (Boutet et al.,
2012). In SFX the X-ray pulses are focused on protein micro- or nanocrystals to record the Bragg
intensities (reflections). The transferred electromagnetic energy of the high intense X-ray exposure
fully ionizes all atoms of the molecule and thus the crystal is destructed by a coulomb burst. However,
the required exposure time for a diffraction pattern is short enough to record a single diffraction
pattern before the crystal order gets lost. Therefore, this phenomenon is called diffraction before
destruction (Chapman et al., 2011; Neutze et al., 2000). Consequently, only one single diffraction
pattern can be recorded from each exposed crystal and several thousand different crystals have to be
INTRODUCTORY PREFACE – CRYSTALLOGRAPHY TODAY
7
exposed to X-rays in random orientation to obtain a complete dataset by merging all individual
diffraction pattern (Boutet et al., 2012; Liu et al., 2013; White et al., 2012).
In order to record sufficient amount of diffraction pattern sample delivery methods are required which
allow a rapid replenishment of microcrystals in the focal point of the X-ray beam. The most successfully
used method uses a gas dynamic virtual nozzle (GDVN), which focusses a liquid jet by a surrounding
helium stream (DePonte et al., 2008). The nozzle is based on mounting a small capillary inside a larger
one. While the crystal suspension is delivered in the inner one, the outer capillary accommodates the
high-pressured gas, resulting in a jet with a diameter of a few micrometer (Weierstall et al., 2012).
Typical problems are clogging of the nozzle, damage of fragile crystals due to sheer stress and a high
sample consumption (Stevenson et al., 2014a; Schlichting & Miao, 2012). To reduce the sample
consumption an electrospinning liquid microjet has been developed, which uses an electric field
instead of a stream of gas to focus the crystal suspension (Sierra et al., 2012). The disadvantage is that
the samples have to be suspended in a high viscous medium. A viscous medium like LCP is also used in
slow jet injectors, where a viscous crystal suspension is extruded either with (Botha et al., 2015) or
without (Sugahara et al., 2015) a surrounding gas stream for jet focusing. Alternatively, also solid
support approaches have been tested with the benefit of a strongly increased hit rate of the X-ray
beam with the protein crystal. Microfluidic devices have been used for this approach (Mueller et al.,
2015) as well as polymer fixed targets (Zarrine-Afsar et al., 2012; Feld et al., 2015). The bottleneck of
the latter methods is the slow data acquisition due to the limited speed of the sample holder
movement.
Both, serial crystallography approaches at third generation synchrotrons as well as free-electron lasers
have extended the range of usable crystal sizes for macromolecular crystallography to the low micro-
and nanometer regime. Therefore, the conventional goal to produce a single protein crystal with a size
as big as possible does not hold true anymore if serial crystallography is applied.
In general, the use of nano- and microcrystals for X-ray crystallography comprises several advantages
over large protein crystals. Small protein crystals, containing only a few hundred up to a few thousand
unit cells, are expected to show a reduced long-range disorder compared to larger crystals. Due to the
reduced mosaicity the diffraction data is of higher quality and allows for improved structure
determination (Martin-Garcia et al., 2016). Further, depending on the data collection strategy the
contribution of radiation damage can be significantly reduced by exposing multiple crystals to X-rays
while keeping the total amount of crystalline sample low. And most importantly, multi-crystal
approaches at room-temperature imply substantial advantages when following biological processes
by time-resolved experiments. When using light sensitive proteins or photoactivatable compounds a
small crystal size is beneficial, because it allows a homogenous activation upon light irradiation, even
if the penetration depth of the electromagnetic wave is limited (Levantino et al., 2015). For

INTRODUCTORY PREFACE – CRYSTALLOGRAPHY TODAY
8
experiments relying on diffusion of a substrate into the crystal for initiation of the reaction, the crystal
size is directly related to the diffusion time of the substrate to reach the center of the crystal, which
limits the maximal temporal resolution of the experiment (Schmidt, 2013).

OUTLINE AND AIMS
9
OUTLINE AND AIMS OF THE THESIS
Beginning with the invention of a revolutionary new method called serial femtosecond X-ray
crystallography (SFX) (Chapman et al., 2011; Schlichting, 2015; Martin-Garcia et al., 2016) the general
interest in protein micro and nanocrystals for protein structure determination did substantially
increase. In SFX protein nano- or microcrystals are exposed to highly intense X-ray pulses produced by
X-ray free electron lasers (XFELs). Because all atoms inside the crystal are fully ionized by the
transferred electromagnetic energy of the X-ray pulse only one single diffraction image can be
recorded from each crystal (Neutze et al., 2000). Consequently, several thousands of nano- or
microcrystals with homogeneous size have to be exposed by X-rays to obtain a complete dataset.
Therefore, a strong demand exists in adapting and developing new methods for preparation and
scoring of protein nano- and microcrystals.
This thesis is subdivided into two sections, A and B. Section A contains the main part of the thesis and
deals with the development and adaptation of novel methods for nano- and microcrystal preparation,
their identification, as well as their application for X-ray crystallography. In particular, the method of
Dynamic Light Scattering (DLS) should be applied, because the size range of particles that can be
investigated with this technique covers the complete size range that is relevant in nanocrystallography,
from monomeric protein up to nanocrystals and small microcrystals. The first part of the thesis
focusses on optimizing protein buffer components, because an optimal solvent composition is a crucial
step towards the growth of protein crystals. It is intended to use DLS to assess buffer quality in large
scale screenings and the results are expected to provide insights whether the obtained information
are complementary or consistent to those from Thermofluor experiments.
The next core aspect in this work aims to provide new insights into some fundamental aspects of the
protein nucleation process. For this, the XtalController technology shall be used, because it allows a
unique feedback controlled navigation in the phase diagram. It is intended to gain new information
about the nucleation process and its application in nanocrystallography. In particular, the results might
provide new experimental insights into the theory of a two-step mechanism in nucleation. Moreover,
opportunities of microfluidics are to be considered because they can provide a similar flexibility to
navigate through the phase diagram. However, up to now the evaluation of the crystallization
experiment in microfluidic approaches is based on visual inspection of the droplets. Therefore, it is
investigated whether DLS measurements can be performed in the nano-sized volumes of microfluidic
devices to get faster feedback information during crystallization experiments.

OUTLINE AND AIMS
10
The second core aspect of this study represents the development of a novel, fast and reliable
biophysical method for nanocrystal detection. For this, the potential of non-invasive Depolarized
Dynamic Light Scattering (DDLS) is illuminated. Crystallization experiments are monitored online to
distinguish between the nucleation and growth of ordered crystals and the formation of amorphous
precipitation in solution.
Further focus will be placed on elucidating applications of protein microcrystals for X-ray
crystallography at synchrotron radiation sources. A simple fixed target approach and data collection
protocol shall be established for micro-focus beamlines that facilitates the diffraction data collection
from microcrystals at room-temperature. Potential applications of this approach towards monitoring
site-specific radiation damage, conformational changes and possibly even enzymatic reactions should
be elucidated. Additional emphasis is placed on the investigation of site-specific radiation damage in
multi-crystal diffraction datasets as a potential source for obtaining phase information.
In terms of this investigation the protein APP, which is a key enzyme in the hemoglobin degradation
pathway of the human malaria parasite Plasmodium falciparum, shall be structurally characterized.
For this, a protocol for the expression and purification of APP has to be established and crystallization
conditions are screened in case a sufficiently pure protein solution can be obtained. X-ray
Crystallography might provide interesting information about the still poorly understood substrate
specificity of APP and can contribute towards the development of new inhibitors that are specific for
P. falciparum APP. Additionally, the methods developed within section A can potentially be applied to
characterize APP.

SECTION A
11
SECTION A
DEVELOPMENT AND ADAPTATION OF NOVEL METHODS FOR
NANO- AND MICROCRYSTAL PREPARATION
Before the development of the SFX method, nanocrystals have been mostly seen as a first step towards
the growth of single large crystals. Consequently, the growth of nanocrystals has been largely
unexplored so far. With SFX the interest to obtain nanocrystals and small microcrystals in large
quantities and great size homogeneity has increased strongly over the last years. It results in a great
demand in the development and adaptation of existing methods for the preparation and
characterization of small crystals. A fundamental understanding of the phase diagram of the target
protein and a better general understanding of the thermodynamics of the crystallization process is of
great importance to obtain well-ordered nano- and microcrystals instead of amorphous precipitate.
Instead of slowly decreasing the solubility of the protein, in nanocrystallization the solubility is typically
decreased rapidly in order to induce multiple nucleation events in the same time and thus obtaining
showers of microcrystals (Kupitz et al., 2014; McPherson & Cudney, 2014).
Several approaches have been published where commonly used crystallization methods have been
adapted towards the preparation of nanocrystals. Certainly, ordinary vapor diffusion techniques can
be used for nanocrystallization, yet resulting in samples volumes which are too low for many
applications. The batch method has been used for rapid mixing of high concentrated protein and
precipitant solutions resulting in a different starting point in the phase diagram, compared to setups
for large protein crystals (Schlichting, 2015). It has also been shown that suitable crystal slurries can
be obtained by simply crushing larger protein crystals (Stevenson et al., 2014b). However, the success
rate of this approach strongly depends on the protein and eventually leads to a decreased diffraction
power in many cases. When free interface diffusion is used for nanocrystal preparation a protein
solution is added in small increments to a highly concentrated precipitant solution. After entering the
precipitant, nucleation events take place at the interface of the protein droplet and the surrounding

SECTION A
12
precipitant. A further crystal growth is quenched by fast sedimentation of the nanocrystals in the
precipitant solution and can be regulated varying the gravity force in a centrifuge (Kupitz et al., 2014).
A very innovative approach for preparation of nano- and microcrystals has also been demonstrated by
crystallizing proteins in vivo using insect cells or yeast cells (Redecke et al., 2013; Jakobi et al., 2016).
It could be shown that these crystals are also suitable for X-ray diffraction experiments. It is assumed
that the crystallization occurs upon accumulation of the target protein in compartments and
organelles, like the endoplasmic reticulum or peroxisomes (Koopmann et al., 2012; Duszenko et al.,
2015; Doye & Poon, 2006). However, the general mechanism of the crystallization process and the
broad application to a variety of different proteins has to be further elucidated.
In addition to the preparation methods, the reliable identification of sub-micrometer sized crystals is
challenging, because they are too small to be identified by light microscopy. Therefore, ultraviolet
florescence as well as two-photon ultraviolet florescence has been used to differentiate between
macromolecules and salt particles (Dierks et al., 2010), but the recorded intensity greatly depends on
the number of disulfide bonds or aromatic residues within the macromolecule and the method does
not identify crystallinity. Second harmonic generation (SHG) has been demonstrated as a suitable
technique for crystal detection (Wampler et al., 2008). Nevertheless, the method can only be applied
to crystals with low symmetry and considerable size in order to produce a sufficiently intense SHG
signal (Kissick et al., 2011). Recently, the method has been extended to the nanocrystal size regime by
combining the SHG signal with a correlation spectroscopy approach (Dow et al., 2016). Transmission
electron microscopy can be used to identify and visualize protein nanocrystals as well (Stevenson et
al., 2014b; Falkner et al., 2005), although it requires a labor-intensive sample preparation involving
chemical crosslinking or a cryo-preparation. Therefore, X-ray powder diffraction is still the most
powerful method for sample characterization and widely used, because it provides qualitative
information about the diffraction power of the protein crystals (Dreele, 2007). However, it is an
invasive method which requires a rather large sample volume and a readily available X-ray source.
Although each characterization method has its potential, the individual limitations lead to the fact that
none of them has been established as a gold standard. Therefore, the development of novel, fast and
reliable methods for nanocrystal preparation and quality assessment are of great demand.
CHAPTER 1: SAMPLE BUFFER OPTIMIZATION
13
CHAPTER 1
THERMOFLUOR AND DYNAMIC LIGHT SCATTERING FOR SAMPLE BUFFER
OPTIMIZATION PRIOR CRYSTALLIZATION
1.1 Introduction
The structural characterization of proteins often requires a large scale production and purification of
the protein of interest. Throughout all purification steps it is important to stabilize the recombinant
protein, because degradation and folding instability leads to aggregation or precipitation of the
protein. Therefore, the protein has to be isolated in an environment that contains stabilizing factors in
order to maintain the proteins function and homogeneity. It is in particular critical for the growth of
well-diffracting protein crystals to obtain information about the proteins biophysical properties like
solubility, homogeneity and stability (Segelke, 2001). Hence for yielding an optimized solvent
environment for the protein of interest it is important to screen a wide range of solvent parameters,
such as buffer pH, ionic strength, ligands and additives (Vedadi et al., 2006; Mezzasalma et al., 2007).
Further, it has been shown that the thermal stability of a protein is a helpful measure to identify
stabilizing additives which increase the success rate in crystallization experiments (Ericsson et al., 2006;
Santos et al., 2012). It has also been demonstrated that a low or multistep melting temperature is
unfavorable for the formation of protein crystals (Dupeux et al., 2011). A widely used method to assess
the thermal stability of a protein is called Differential Scanning Fluorimetry (Pantoliano et al., 2001),
which was later commonly named Thermofluor (TF) (Matulis et al., 2005). The method is based on
detecting fluorescence from a fluorescent dye that is binding to exposed hydrophobic regions of a
protein. While in solution the fluorescent dye (SYPRO orange) is quenched, but it regains its
fluorescence when binding in a hydrophobic pocket (Steinberg et al., 1996a; Steinberg et al., 1996b).
When the temperature of a protein solution is constantly increased, the protein starts to unfold
gradually. Thereby, the detected fluorescence signal increases because the fraction of the dye that can
bind to hydrophobic areas is increasing. As a result, the melting temperature of the protein can be
calculated from the melting curve. The values can be compared by screening different buffer
compositions and thus a comparative identification of stabilizing agents can be achieved.

CHAPTER 1: SAMPLE BUFFER OPTIMIZATION
14
A complementary method for characterizing a protein sample in solution before crystallization is
Dynamic Light Scattering (DLS). It has been shown that a small size distribution of particles in solution
increases the probability for successful crystallization and therefore is favored compared to a
polydisperse sample (Baldwin et al., 1986; Zulauf & D'Arcy, 1992; Ferré-D'Amaré & Burley, 1994;
D'Arcy, 1994; Niesen et al., 2008; Price et al., 2009). Additionally, for the proteins acyl coenzyme A
(Yoshida et al., 2005), MnmG (Shi et al., 2009), HypE (Rangarajan et al., 2008), Cj1293 (Goon et al.,
2003) and YdiF (Rangarajan et al., 2005) among others it has been demonstrated that DLS can be used
to optimize the buffer composition of the proteins before crystallization, resulting in well diffracting
protein crystals.
This chapter is hence reporting the investigation of utilizing DLS for high-throughput buffer compound
screening. More precisely, it was tested whether the commercially available RUBIC screens (Boivin et
al., 2013), which have been specifically designed for Thermofluor screenings, can be used for DLS based
scoring as well. TF is based on hydrophobic patch exposition and consequently reports about the
protein stability without addressing the dispersity of the solution. In contrast, DLS measurements can
identify the distribution of particle sizes in a specific buffer environment and be used for a comparative
analysis of protein dispersity. It was investigated to what extend the obtained information are
consistent, or if advanced information regarding an optimization of the buffer composition can be
obtained by the complementary DLS approach. For this, the protein thioredoxin from Wuchereria
bancrofti was used as a model protein, which could be readily produced in sufficient amounts.
1.2 Material and Methods
1.2.1 Sample preparation
The protocol for the recombinant production and purification of the protein thioredoxin (Wuchereria
bancrofti) has been initially established by Dr. Nasser Yousef (University Hamburg) and was adapted
by Svetlana Kapis (University Hamburg). For the production of thioredoxin the plasmid pRSET-B
containing the thioredoxin gene was transformed into the Escherichia coli strain BL21(DE3)pLysS
(Novagen, Schwalbach, Germany). The E. coli cells have been grown at 310 K in lysogeny Broth-Lennox
medium supplemented with 34 mg mL-1 chloramphenicol and 100 mg mL-1 ampicillin for plasmid
selection. After the cell suspension reached an OD600 of 0.6 gene expression was induced with 0.5 mM
Isopropyl-β-D-thiogalactopyranosid (IPTG). Four hours after initiation of expression the cells were
harvested by centrifugation and the resulting cell pellet was resuspended in lysis buffer (20 mM
Tris-HCl, pH 8.0, 5 mM EDTA). Bacterial cells have been disrupted by sonication and clarified from cell
debris by 40 min centrifugation at 17,000 x g at 4 °C. Soluble thioredoxin was obtained in the
CHAPTER 1: SAMPLE BUFFER OPTIMIZATION
15
supernatant and purified by anion-exchange chromatography using a Q-Sepharose fast flow column
(GE Healthcare Life Sciences, Freiburg, Germany). After equilibration of the column with lysis buffer
(see above) the protein solution was incubated for 1 h at 4 °C on the matrix. Subsequently, the matrix
was first washed with lysis buffer to remove unbound protein and then with wash buffer (20 mM
Tris-HCl, pH 8.0, 5 mM EDTA, 20 mM NaCl) in order to remove unspecifically bound protein. Finally,
thioredoxin was eluted using elution buffer (20 mM Tris-HCl, pH 8.0, 5 mM EDTA, 150 mM NaCl). In a
second purification step a size exclusion chromatography (HiLoad 16/600 Superdex 200 prep grade,
GE Healthcare, Freiburg, Germany) was performed with elution buffer (see above). The purified
recombinant thioredoxin was obtained from the elution fractions containing the monomeric protein
and was concentrated up to 34 mg mL-1. For concentrating the protein an Amicon centrifugal filter
concentrator (Merck Millipore, Schwalbach, Germany) with a 3 kDa molecular weight cutoff was used.
Before using the purified protein for Thermofluor (TF) or Dynamic Light Scattering (DLS) experiments
it was filtered by using a 0.2 µm centrifugal filter (VWR, Darmstadt, Germany) and was centrifuged for
15 minutes at 16100 x g at 4 °C.
1.2.2 Thermofluor experiments
The thermal stability of thioredoxin was determined by TF experiments from all conditions of the
RUBIC buffer (MD1-96) and RUBIC additive screen (MD1-97) (Molecular Dimensions, Suffolk, UK),
according to the recommended protocol (Boivin et al., 2013). A relatively high protein concentration
of 3 mg mL-1 (180 µM) was used for the experiments, because of the small molecular weight
(≈16 kDa). For the TF experiments with the RUBIC buffer screen, 2 µL of the thioredoxin solution were
mixed with 2 µL SYPRO Orange (62X stock) and 21 µL of the buffer screen condition. For the RUBIC
additive screen 2 µL of thioredoxin were added to 2 µL SYPRO Orange (62-X stock), 5 µL ultrapure
water and 16 µL of the additive screen condition. The Thermofluor assay was performed in 96-well
PCR plates in a MyiQ RT-PCR machine (Biorad, Schwabing-Freimann, Germany) with a temperature
gradient sampling from 5 °C to 95 °C with a stepwise increment of 1 °C per minute after a 5-minute
equilibration at 5 °C. The normalized detected fluorescence intensity was plotted versus temperature
by using the software Origin (OriginPro 9.1, OriginLab, Northampton, USA). Melting temperature in
each screen condition is derived from the temperature at which the normalized fluorescence intensity
reached 50 %.
1.2.3 DLS experiments
DLS experiments of thioredoxin were performed in microbatch plates (HR3-081, Hampton Research,
Aliso Viejo, USA). To fit the RUBIC buffer screen as well as the RUBIC additive screen into the target

CHAPTER 1: SAMPLE BUFFER OPTIMIZATION
16
microbatch plate, each screen was divided into two plates with 48 conditions each. The plates were
prepared by using the micro dispensing system Oryx4 (Douglas instruments, Hungerford, UK) in
microbatch mode and were covered with paraffin oil to avoid sample evaporation. For the RUBIC
buffer screen, 160 nl protein were mixed with 840 nl buffer stock in order to obtain the recommended
final concentration of the buffer condition. The RUBIC additive screen was prepared by pipetting 640
nl additive screen condition, 200 nl ultrapure water and 160 nl protein. The resulting protein
concentration for both screens was 4.25 mg mL-1 and the total amount of used protein was similar to
the Thermofluor experiments. DLS experiments were performed using the DLS plate reader
SpecroLight600 (XtalConcepts, Hamburg, Germany). The autocorrelator of the instruments covers a
sample time range from 0.4 μs to 30 s. For the subsequent calculations the refractive index of water
(1.33) was used due to the low molar concentration of buffer components. The decay time constant,
used for the calculation of the hydrodynamic radius (RH), is derived from the autocorrelation function
(ACF) by using the CONTIN algorithm (Provencher, 1982) in the instrument software package. Each DLS
measurement was performed for 20 seconds and was conducted three times in order to obtain reliable
results. The temperature was kept constant at 20 °C during the measurements. For visual inspection
of the obtained data, a radius distribution of the particles in solution was created by plotting the
relative signal intensity versus the hydrodynamic radius using the software Origin (OriginPro 9.1,
OriginLab, Northampton, USA).
1.3 Results and Discussion
1.3.1 Optimization of sample buffer pH based on Thermofluor and DLS
Protein stability and homogeneity are factors that are highly correlated with the protein solubility and
the probability of a protein to assemble to well-ordered crystals. Therefore, the composition of the
protein buffer is a crucial variable for successful crystallization experiments. In order to facilitate the
optimization of the buffer components the RUBIC buffer and additive screens have been developed
and cover a broad range of buffer components, pH values, ionic strengths, additives and ligands.
By using the RUBIC buffer screen the effect of different buffer substances and pH on thioredoxin was
tested. From all 96 screening conditions a significant fluorescence signal was detected with increasing
temperature, resulting in evaluable melting curves of the TF experiment. The screen contains a set of
conditions, which allow investigating the effect of the pH without altering the buffer chemistry. For
this, a complex buffer system composed of succinic acid, sodium phosphate monobasic monohydrate
and glycine (SPG) is used and can be adjusted to a pH range of 4.0 to 10.0. The results from the TF
experiments are presented in Figure 1-1 and reveal a clear trend of higher thermal stability towards

CHAPTER 1: SAMPLE BUFFER OPTIMIZATION
17
higher pH values. A melting temperature of 36 °C was determined at pH 4.0 and increased constantly
with higher pH values, up to 74 °C at pH 10.0. This difference of 38 °C reveals a strong pH dependency
of the thioredoxin protein and a preference for basic pH regarding protein stability.
However, TF experiments only yield relative information on thermal stability of proteins by comparing
among different buffer environments, but will not result in information on aggregation states of
proteins under these conditions. Therefore, the aggregation behavior of the protein was investigated
in parallel by DLS for the same conditions. The DLS measurements have been conducted in microbatch
plates under paraffin oil, to improve the optical path of the DLS laser and therewith increase the
reliability of the measurements. The distribution of the hydrodynamic radius of the thioredoxin in
solution could be successfully determined from all 96 conditions of the RUBIC buffer screen. Similar to
the TF results in Figure 1-1, the pH dependency of thioredoxin with SPG buffer is presented in Figure
1-2. The results show that at low pH values a significant fraction of the protein is aggregated. This is in
good agreement with the low melting temperature at low pH valued determined by TF. Around pH 6.0
no larger aggregates with a hydrodynamic radius above 10 nm have been detected. Interestingly, the
amount of aggregated thioredoxin strongly increased again at higher pH values. This demonstrates
that for protein crystallization experiments a distinct optimum around pH 6 can be identified by DLS,
Figure 1-1: Melting curves of thioredoxin obtained from Thermofluor experiments with RUBIC buffer screen. The normalized fluorescence intensity is plotted against the temperature. On the basis of the complex buffer system (SPG) a broad range of pH values can be tested without changing the buffer chemistry. A strong pH dependency for thioredoxin can be seen with a higher thermal stability towards higher pH values.

CHAPTER 1: SAMPLE BUFFER OPTIMIZATION
18
based on a monodisperse radius distribution, which has been shown to be beneficial for the
crystallization success rate (Zulauf & D'Arcy, 1992). It should be noted that the thioredoxin protein is
known to crystallize well in a condition containing SPG buffer with a pH of 6.5 in the presence of
PEG 1500 (see section 3.2.2). Contrarily, in the TF experiments a melting temperature of 67 °C was
measured at pH 6.0 and the highest thermal stability was obtained at the highest pH values (74 °C at
pH 10.0). Thus, a buffer with a pH of 10 would have been chosen for crystallization trials, although DLS
shows that the protein is not monodisperse in this condition. Consequently, the obtained results
demonstrate that DLS can provide highly valuable complementary information for the determination
of the optimal buffer composition.
Figure 1-2: Identifying a pH-dependent aggregation of thioredoxin by DLS. By plotting the relative intensity versus the hydrodynamic radius, the radius distribution of thioredoxin particles in solution is shown for various pH values. At low and high pH values a significant fraction of the protein is aggregated, while around pH 6 (red box) no particles with a radius larger than 10 nm are detected.
CHAPTER 1: SAMPLE BUFFER OPTIMIZATION
19
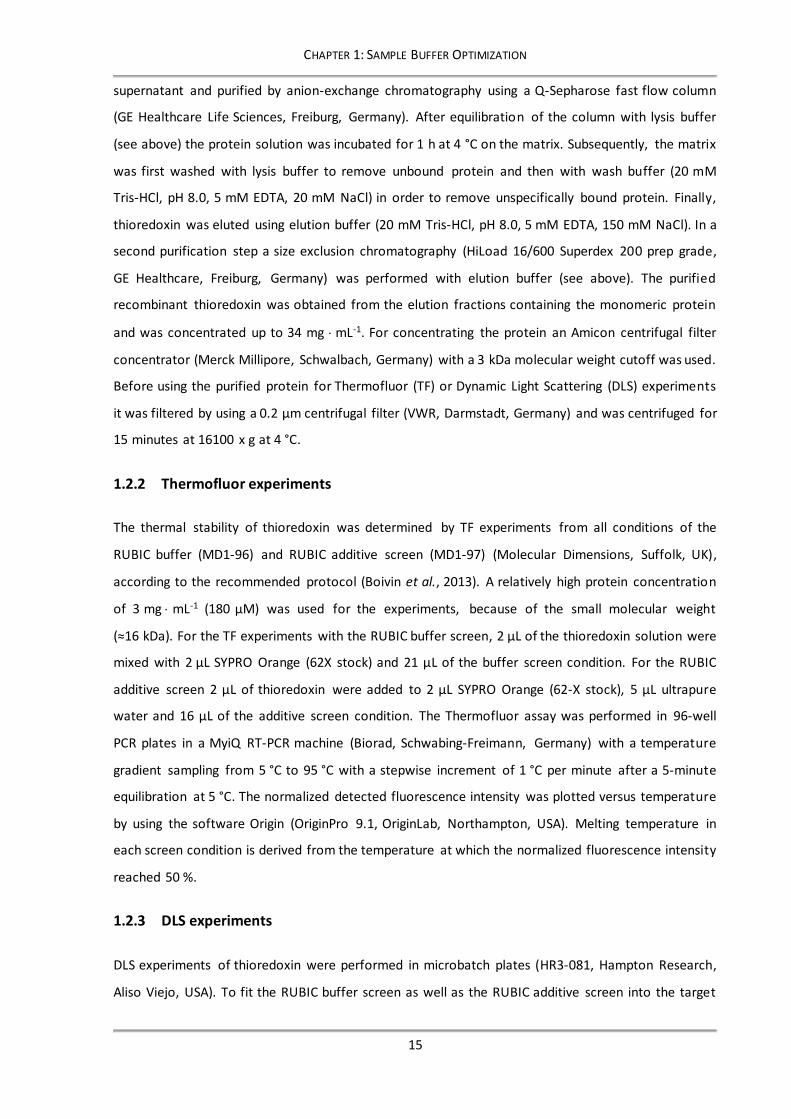
1.3.2 Identifying useful buffer additives for protein stabilization
In addition to the RUBIC buffer screen, also the RUBIC additive screen was used for sample buffer
optimization and it was tested whether or not DLS can provide additional information to the
Thermofluor experiments. The TF experiments provided evaluable melting curves for 92 out of the 96
screening conditions. The four non-evaluable conditions showed strong background fluorescence at
low temperatures and did not show a typical melting curve progression (conditions contained 1 mM
FeCl2, 1 mM DDM, 5 mM Betaine and 5 mM Oxaloacetate). For all other conditions a melting
temperature could be determined from the melting curves. Compared to the water control (Tm = 64 °C)
increasing as well as decreasing thermal stability was observed.
Figure 1-3: Additive compound screening by Thermofluor (TF) and Dynamic Light Scattering (DLS). The melting curves from the Thermofluor experiments are obtained by plotting the normalized fluorescence intensity against the temperature (upper graphs). The melting temperature is derived from the point where the normalized signal intensity reaches 50 % and the valued are compared to the water control (dashed line). For comparison, the hydrodynamic radius distributions from the same samples, obtained by DLS measurements, are presented (lower graphs). [A] Sodium malonate leads to a stabilized (ΔTm=9 °C) and monodisperse thioredoxin protein. [B] Sodium bromide results in stabilized (ΔTm=6 °C) but aggregated protein. [C] EGTA destabilizes the protein (ΔTm=-29 °C) but the thioredoxin remains monodisperse. [D] Nicotinic acid leads to destabilization (ΔTm=-30 °C) and aggregation of the protein.

CHAPTER 1: SAMPLE BUFFER OPTIMIZATION
20
In parallel, DLS measurements have been performed at all conditions of the RUBIC additive screen.
Exemplarily, the TF and DLS results of some meaningful screening conditions are presented in Figure
1-3.In condition A and B it can be seen that the components increased the thermal stability of
thioredoxin, while other conditions (C and D) strongly destabilized the protein. Interestingly, the
obtained hydrodynamic radius distributions of the conditions with increased thermal stability showed
that the thioredoxin protein remained monodisperse in some cases (Figure 1-3 A), while it was strongly
aggregated in others (Figure 1-3 B). Also the opposed case was observed, monodisperse (Figure 1-3 C)
as well as aggregated (Figure 1-3 D) protein has been identified in conditions with strongly decreased
stability. This means, that regarding thermal stability and aggregation state all combinations can occur,
stabilized and monodisperse protein (A), stabilized and aggregated protein (B), destabilized but still
monodisperse protein (C), as well as destabilized and aggregated protein (D). Unambiguously, the first
case is the most promising condition for subsequent crystallization trails, because stabilized and
monodisperse protein provides the highest chance for successful crystal formation (Niesen et al.,
2008). The obtained results clearly demonstrate that aggregated protein will not necessarily lead to an
increased accessibility of hydrophobic patches for the fluorescent dye SYPRO-Orange and therewith to
a decreased melting temperature in TF experiments. Further, it was shown that DLS can provide
valuable additional information for identifying the optimal buffer composition for crystallization trials.
It could be shown that both methods, DLS and TF, should be combined to find the most promising
conditions during sample buffer optimization.
1.4 Conclusions
It is well known that the composition of the protein sample buffer is crucial for maintaining protein
stability, homogeneity as well as purity and that these factors have a great impact on the success rate
of conducted crystallization experiments. The results presented in this chapter show that DLS can be
successfully applied as a high-throughput screening method using the RUBIC sample buffer and
additive screens. Importantly, the total amount of used protein for the DLS measurements was
identical to the TF assays, which has been conducted according manufacturer protocol. The presented
data of the complementary methods DLS and TF demonstrate, that the thermal stability of a protein
in solution is not related to its oligomeric state or tendency to aggregate. In the buffer screen a clear
pH optimum regarding monodisperse protein was identified by DLS, whereas the melting temperature
determined by TF revealed a different trend. In the additive screen all combinations were found in
terms of decreased or increased thermal stability and monodisperse and aggregated protein. This
clearly demonstrates that both methods should be combined in order to identify a buffer composition
that fulfills all criteria known to be beneficial for crystal formation.

CHAPTER 2: NUCLEATION PROCESS IN CRYSATLLIZATION
21
CHAPTER 2
THE NUCLEATION PROCESS OF MACROMOLECULE CRYSTALLIZATION
In protein crystallography a protein solution is typically brought into supersaturation to induce the
thermodynamically driven crystal formation. Over the last decades a variety of methods were
developed to gradually decrease the solubility of a protein solution by increasing the precipitant
concentration. In classical crystallography the formation of a few crystal nuclei, which can than grow
to individual large protein crystals by addition of free protein from the bulk, is favored (McPherson,
1999). For the preparation of protein nanocrystals these methods need to be modified in order to
increase the number of nucleation events in the crystallization droplet (Kupitz et al., 2014; McPherson
& Cudney, 2014). Additionally, a better understanding of the nucleation process itself is of great use
to adapt the existing methods to the new requirements in nanocrystallography. Albeit the fact that the
field of protein crystallography already exists for several decades, the fundamental understanding of
the nucleation process is still incomplete and an active area of ongoing research (Sleutel & van
Driessche, 2014; Ataka & Asai, 1990; Chayen et al., 2006; Feher & Kam, 1985; Galkin & Vekilov, 1999,
2001; Haas, 2000; Malkin & McPherson, 1994; Nicolis & Maes, 2012; Penkova et al., 2006; Wolde,
1997; Yau & Vekilov, 2001).
In the classical nucleation theory, the crystal formation is considered to be a first-order phase
transition. Consequently, it is characterized by the crystallization enthalpy (ΔH°cryst) and the surface
free energy (α) with both being non-zero. The thermodynamics of this theory has first been described
by J. W. Gibbs (Gibbs, 1876, 1878). According to this theory a nucleation event in a supersaturated
solution is non-favored because of the positive surface free energy. P. Vekilov (2010) described the
surface free energy gain upon phase boundary creation in a nucleation event for a cubic crystal by
6a2n(2/3)α (n being the number of molecules in the cluster with size a). In addition to this, the cluster
formation leads to a free energy loss of -n∆µ when the chemical potential (µ) of the supersaturated
solution is higher than that of a protein in a crystal nucleus (∆µ > 0). Consequently, the formation of a
crystal nucleus will lead to an increase in free energy and is unfavorable until a critical size (n*) is
reached. For nuclei overcoming this size barrier by fluctuations, further crystal growth occurs
spontaneously and is accompanied by a decrease in free energy.

CHAPTER 2: NUCLEATION PROCESS IN CRYSATLLIZATION
22
The dependency described in this paragraph is visualized in Figure 2-1 A and can be summarized by
the following equation
∆𝑮(𝒏) = −𝒏∆µ + 𝟔𝒂𝟐𝒏𝟐/𝟑𝜶. (1)
A simplified version of the phase diagram can be defined by three phases (Figure 2-1 B), the dilute
solution, a dense liquid and a crystalline state. These states can be described by the two parameters
concentration and internal order. According to the classical theory a nucleation event can be
considered as a simultaneous transition of both parameters, from the dilute solution with low
concentration and low internal order to a crystalline state with high concentration and high internal
order. This path is visualized by the diagonal arrow shown in Figure 2-1 B. Based on this, the classical
theory was extended to a theory of a two-step mechanism of nucleation, proposed by P. Vekilov
(2004). In this theory it is assumed that for many proteins the nucleation process occurs in two
consecutive steps. Firstly, a transition to a higher concentration by the formation of a dense liquid and
secondly, the transition to a higher order inside these clusters (Figure 2-1 B) (Vekilov, 2010; Sleutel &
van Driessche, 2014; Gliko et al., 2005; Pan et al., 2007). This two-step nucleation theory has additional
plausibility, because it allows to explain the large discrepancy between the predicted nucleation rates
by the classical nucleation theory and the experimentally determined nucleation rates (Vekilov, 2004,
2010). The size of the formed clusters was identified to range between onehundred and a few hundred
nanometers, while their volume fraction in solution remains low (< 10-3 %) (Gliko et al., 2007).
Figure 2-1: Schematic presentation of the two-step mechanism of nucleation. (A) Thermodynamic effects during crystal nucleation (n = number of molecules in crystal; Δµ = solution supersaturation; α = surface free energy; ΔG = free energy; n* critical cluster). (B) The nucleation process of particles in solution can be considered as a transition of two parameters, concentration and internal order. In classical nucleation theory both transitions occur simultaneously (diagonal path), while in the two-step mechanism protein dense clusters occur before the transition to a higher order takes place inside these clusters (Modified from Vekilov 2010).
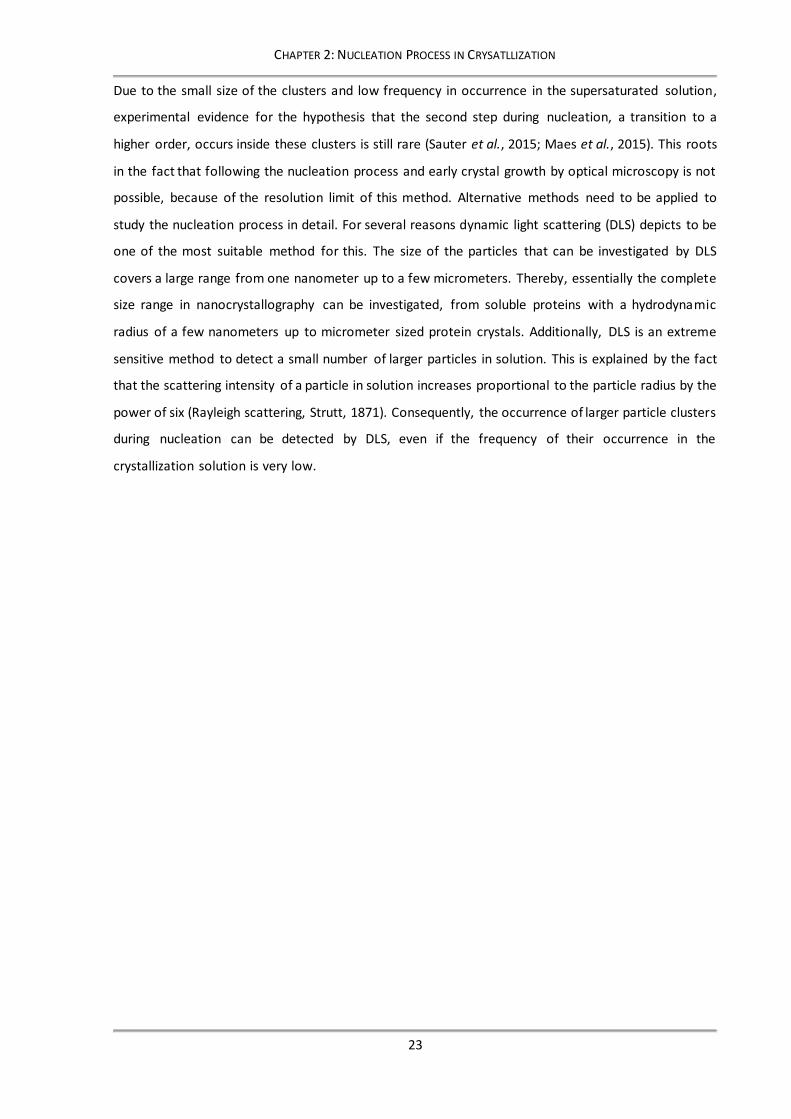
CHAPTER 2: NUCLEATION PROCESS IN CRYSATLLIZATION
23
Due to the small size of the clusters and low frequency in occurrence in the supersaturated solution,
experimental evidence for the hypothesis that the second step during nucleation, a transition to a
higher order, occurs inside these clusters is still rare (Sauter et al., 2015; Maes et al., 2015). This roots
in the fact that following the nucleation process and early crystal growth by optical microscopy is not
possible, because of the resolution limit of this method. Alternative methods need to be applied to
study the nucleation process in detail. For several reasons dynamic light scattering (DLS) depicts to be
one of the most suitable method for this. The size of the particles that can be investigated by DLS
covers a large range from one nanometer up to a few micrometers. Thereby, essentially the complete
size range in nanocrystallography can be investigated, from soluble proteins with a hydrodynamic
radius of a few nanometers up to micrometer sized protein crystals. Additionally, DLS is an extreme
sensitive method to detect a small number of larger particles in solution. This is explained by the fact
that the scattering intensity of a particle in solution increases proportional to the particle radius by the
power of six (Rayleigh scattering, Strutt, 1871). Consequently, the occurrence of larger particle clusters
during nucleation can be detected by DLS, even if the frequency of their occurrence in the
crystallization solution is very low.

CHAPTER 2.1: INVESTIGATING NUCLEATION BY DLS
24
2.1 Investigation of the nucleation process using the XtalController technology
2.1.1 Introduction
In protein crystallography, the protein solution has to be dragged into supersaturation to overcome
the energy barrier and to induce the nucleation process as well as crystal growth. Unfortunately, the
phase diagram looks different for every protein and cannot be predicted a priori. Therefore, many
different methods have been developed to increase the precipitant concentration over time allowing
charting different paths through the phase diagram. Among these are vapor diffusion techniques,
batch methods and various types of free interface diffusion (McPherson, 1999). They all have in
common that only limited control is obtained about the active manipulation of the solution in the
phase diagram after the experiment is initiated. Since the region for inducing many nucleation events
and those resulting in amorphous precipitate are not far apart in the phase diagram, a precise
knowledge and control about the position in the phase diagram is highly beneficial.
In order to allow a feedback controlled navigation in the phase diagram the XtalController technology
was developed by the group of Prof. Betzel in collaboration with the university of Lübeck and the
company XtalConcepts (Meyer et al., 2012). In the instrument a single droplet of protein solution is
placed on a highly sensitive microbalance in a precisely temperature and humidity controlled
experiment chamber. Two piezoelectric pumps are placed above the droplet and allow a contact-free
nanoliter increment addition of water and precipitant. By recording the weight of the droplet, the
evaporation rate can be determined and counteracted by a water pump. In general, the position in the
phase diagram can be followed and controlled during all experimental steps, like precipitant or water
addition and evaporation or dilution of the droplet. Additionally, macroscopic changes in the
crystallization droplet are recorded by a CCD camera and DLS measurements can be continuously
performed throughout the whole experiment, providing information about the radius distribution of
the particles in solution. By this combination, a unique feedback control about the navigation in the
phase diagram is obtained. Based on initial findings in previous experiments, conducted by Dr. Arne
Meyer (XtalConcepts), this setup will now be used to obtain new information about the nucleation
process and its application in nanocrystallography. In the experiments described in this chapter it was
intended to induce the nucleation process by a single-step injection of precipitant and to follow the
process online by DLS, in order to obtain new experimental insights into the theory of a two-step
mechanism in nucleation. The proteins APP (Plasmodium falciparum), TRX (Wuchereria bancrofti),
ML1 (Viscum album), ThiM (Staphylococcus aureus) and thaumatin (Thaumatococcus daniellii) were
investigated to enhance the validity of drawn conclusions about general nucleation mechanisms.

CHAPTER 2.1: INVESTIGATING NUCLEATION BY DLS
25
2.1.2 Material and Methods
2.1.2.1 Protein sample preparation
The protein sample mistletoe lectin 1 (ML1) from Viscum album was purified by Dr. Arne Meyer
(XtalConcepts, Hamburg, Germany) as described previously (Meyer et al., 2008). In brief, the
protein was isolated from crude material of the European mistletoe by flash-freezing, grinding
into powder and dissolving in ultrapure water. After centrifugation, ML1 was purified from the
supernatant by aminophenyl-boronic-acid affinity chromatography. Finally, ML1 was dialyzed
against 0.2 M glycine–HCl buffer at pH 2.5 and was concentrated up to 3.2 mg mL-1 using a
Amicon centrifugal filter concentrator (Merck Millipore, Schwalbach, Germany) with an
MWCO = 3 kDa.
The protein thioredoxin (TRX) from Wuchereria bancrofti was produced and purified as described
in section 1.2.1.
The protein 5-(hydroxyethyl)-4-methylthiazole kinase (ThiM) from Staphylococcus aureus was
produced and purified by Dr. Madeleine Künz (University Hamburg) as described with small
modifications previously (Drebes et al., 2016; Drebes et al., 2011). In brief, the protein ThiM was
produced by gene expression in E. coli BLR (DE3) (Stratagene, Germany) grown in LB-medium
containing 100 mg mL-1 ampicillin. Gene expression was induced by 200 ng mL-1 AHT at OD600 of
0.5 at 37 °C for 4 hours. The cell pellet was resuspended in lysis buffer (50 mM Tris buffer pH 8.0,
150 mM NaCl, 10 mM imidazole), sonicated and centrifuged for 1 hour at 4 °C with 17 000 x g.
The ThiM protein was purified using affinity chromatography (Ni-NTA) and eluted using elution
buffer (50 mM Tris buffer pH 8.0, 150 mM NaCl, 10 mM imidazole) after washing with lysis buffer
(see above). After dialysis over night against imidazole free lysis buffer a second purification step
was performed using size exclusion chromatography with lysis buffer (see above). The protein was
concentrated from the elution fractions up to 24 mg mL-1 using a Amicon centrifugal filter
concentrator (Merck Millipore, Schwalbach, Germany) with an MWCO = 10 kDa.
The protein aminopeptidase P (APP) from Plasmodium falciparum was produced according to the
protocol described in section 5.2.1 and 5.2.2.
The protein thaumatin from Thaumatococcus daniellii was purchased (Sigma, Taufkirchen,
Germany). The lyophilized protein was dissolved in buffer containing 50 mM Bis-Tris pH 6.5 to a
concentration of 34 mg mL-1.
For all proteins the final protein concentration was determined using a Nanodrop ND-2000 (Thermo-
Scientific, Erlangen, Germany). The protein solution was filtered through a 0.2 µm centrifugal filter

CHAPTER 2.1: INVESTIGATING NUCLEATION BY DLS
26
(VWR, Darmstadt, Germany) and was centrifuged for 15 minutes at 16100 x g prior usage for
crystallization experiments with the XtalController.
2.1.2.2 XtalController Setup
The XtalController instrument has been developed in collaboration with the university Lübeck,
Institute of Biochemistry, and was manufactured by XtalConcepts (Hamburg, Germany). The
instrument consists of an experimental chamber, which is precisely temperature and humidity
controlled with 0.01 °C resolution, as well as the microscope and laser optics. A schematic illustration
of the experimental chamber as well a photographic presentation of the XtalController instrument is
shown in Figure 2-2.
Figure 2-2: Setup of the XtalController instrument. (A) Photographic presentation of the XtalController instrument and the experimental chamber with the piezoelectric pumps, crystallization droplet and DLS laser. (B) Schematic presentation of the temperature- and humidity-controlled experimental chamber of the XtalController instrument.

CHAPTER 2.1: INVESTIGATING NUCLEATION BY DLS
27
The crystallization experiment is performed as a sitting drop on a cover slip, placed on a microbalance
with a resolution of 0.1 µg. The microbalance allows to calculate the actual protein and precipitant
concentration in the droplet over time, based on mass changes due to evaporation or addition of
precipitant. Water as well as precipitant can be added to the droplet via contact free piezoelectric
pumps. The volume of a single injected droplet is around 70 pL and a repetition rate of 10000 droplets
per second can be achieved. The small increment injection of precipitant allows to minimize
concentration gradients and convection within the crystallization droplet. The microscope optics is
equipped with different magnifications lenses resulting in a maximal spatial resolution of 2.5 µm,
recorded on a CCD camera. For the DLS measurements a laser with a wavelength of 660 nm and an
output power of 100 mW is used and the scattered light is detected at an angle of 150 degrees. For all
calculations the refractive index of water (1.33) was used. The autocorrelator of the instrument covers
a time range from 0.4 µs to 30 s. From the recorded autocorrelation function (ACF) the decay time
constants of the different particles in solution is derived using the CONTIN algorithm (Provencher,
1982). The viscosity of the sample solution is taken into account for the hydrodynamic radius
calculation of the particles using the Stokes-Einstein equation (equation 2 in 3.2.4).
2.1.2.3 Experimental procedure
In the experimental setup a clean and siliconized cover slip was placed on the microbalance in the
experimental chamber of the XtalController. The temperature was precisely controlled and constantly
kept at 20 °C for all crystallization experiments and the value of the dew point was set just below the
temperature in order to reach a relative humidity near 99 %. The high relative humidity was chosen in
order to minimize the evaporation of water from the crystallization droplet and therewith the
convection. In a typical XtalController experiment a sample volume of 5 µL to 10 µL was placed in the
middle of the cover slip. The water pump was programmed to compensate for evaporation, based on
the initially recorded weight of the microbalance, in order to keep the protein concentration in the
droplet stable. DLS measurements were performed regularly in a time interval of one minute during
the first 100 minutes of any experiment, followed by longer time intervals of five minutes in the later
phase of the experiment. A camera image of the sample droplet was recorded in between two DLS
measurements to observe macroscopic changes during the crystallization experiment. Each DLS
measurement was conducted for 30 seconds. The first DLS measurements are used to determine the
hydrodynamic radius of the protein prior addition of precipitant. Subsequently, an automatic
sequence, typically consisting of three steps, was started for the precipitant injection. In the first step
the droplet was kept constant for 100 seconds. During this time the speed of water evaporation is
determined and used to compensate for water evaporation during precipitant injection. In the second
step the precipitant injection is performed. The duration of this step varied from 20 minutes to one

CHAPTER 2.1: INVESTIGATING NUCLEATION BY DLS
28
hour, depending on the precipitant stock concentration (Table 1) and the final target concentration
after injection. Finally, the droplet condition was kept constant until the end of the experiment unless
further precipitant injection was necessary. The exact values for the initial sample volume, protein and
precipitant concentration can be read from the experimental curves of the XtalController experiments
in the result section.
In a separate experiment, isotropic particle counter standards with a diameter of 400 nm (3K-400,
Sigma-Aldrich, Taufkirchen, Germany) have been used to calculate the viscosity of the different
precipitant stock solutions. For this, a correction factor was determined from the difference of the
measured hydrodynamic radius of the particles in water and the precipitant stock. In combination with
the calculated precipitant concentration in the crystallization droplet for all time points of an
XtalController experiment, the correct viscosity was taken into account for the calculation of the
hydrodynamic radius of the particles in solution.
Table 1: List of precipitant stocks used for XtalController experiments.
Protein Precipitant composition Precipitant viscosity
ML1 3.0 M ammonium sulfate 1.40 cP
TRX 0.05 M SPG buffer pH 6.5, 20 % (w/v) PEG 1500 3.73 cP
ThiM 0.1 M HEPES pH 7.5, 0.9 M lithium sulfate 1.61 cP
Thaumatin 1.4 M sodium tartrate 3.27 cP
APP 0.05 M HEPES pH 7.5, 20 % (w/v) PEG 1500 3.73 cP
2.1.2.4 Electron microscopy for sample characterization
The characterization of the sample content from the XtalController experiments was performed by
electron microscopy imaging at the Heinrich-Pette-Institute for experimental virology (Hamburg,
Germany) in collaboration with Dr. Rudolph Reimer. All protein samples were transferred from the
cover slip in the experimental chamber of the XtalController to a 1.5 ml Eppendorf tube and prepared
as mentioned in the following paragraph. The tube was centrifuged at 2600 x g for 5 minutes at 20 °C
in order to pelletize all larger particles in solution. The supernatant was exchanged by a solution
containing the exact precipitant concentration at the end of the experiment, which has been derived
from the curves of the XtalController, supplemented with 2.5 % (v/v) glutaraldehyde, gently mixed and
incubated for 48 hours to stabilize the particles in solution. After chemical cross-linking samples have
been centrifuged for 5 minutes at 2600 x g at 20 °C and the supernatant was replaced by ultrapure
water in order to get rid of all salts in solution. The sample was centrifuged again for 5 minutes at

CHAPTER 2.1: INVESTIGATING NUCLEATION BY DLS
29
2600 x g at 20 °C and the volume of the sample was reduced to 5 µL to concentrate the particles for
electron microscopy imaging.
For the scanning electron microscopy, the specimens were prepared by drying 5 µL of the stabilized
aqueous solutions on round glass cover slips (10 mm diameter). The cover slips were fixed on SEM
specimen mount stubs (Electron Microscopy Sciences, Hatfield, USA) and a film of gold with a thickness
of approximately 10 nm was sputtered onto the sample by using a Q150T sputter coater (Quorum
Technologies, East Sussex, UK) in order to avoid charging during electron microscopy. Images of the
samples were recorded using a Philips XL-30 environmental scanning electron microscope operated at
10 to 15 kV in high vacuum mode and a specimen distance of 8 mm.
For the transmission electron microscopy, a negative stain of the sample was performed to increase
the contrast for imaging. A volume of 2 µL of the sample was pipetted onto the carbon film of a mesh
copper grid (400 x 400 µm squares) (Electron Microscopy Sciences). Before loading the sample, the
grid was freshly glow-discharged for 1 minute at 25 mV (EmiTech KX100). Subsequently, 2 μL of sample
were applied on the grid and have been incubated for 60 seconds before blotting the liquid with
Whatman paper. For the negative staining with 2 % (w/v) uranyl acetate the inverted grid was applied
onto a droplet of staining solution and incubated for 30 seconds, followed by two washing steps with
ultrapure water. An FEI Tecnai G20 transmission electron microscope operated at 120 kV was used for
imaging, equipped with a single-tilt specimen holder. Images were recorded with a FEI Eagle 4k CCD
camera.
2.1.3 Results and Discussion
2.1.3.1 Following the nucleation process using the XtalController technology
The XtalController allows the nanoliter increment addition of precipitant to the protein droplet while
constantly evaluating the particle radius distribution by means of DLS. Experiments using the
XtalController have been performed with different proteins in order to obtain new insights into the
process of nucleation during the crystallization process.
The first experiment has been conducted using the protein APP from Plasmodium falciparum
(see Chapter 5). For the experiments 5 µL of the APP protein solution with a concentration of
11.6 mg mL-1 was placed on the cover slip sitting on a microbalance. The initial hydrodynamic radius
of the protein was about 6 nm, corresponding to a molecular weight of around 190 kDa, which is in
agreement to the APP dimer with a molecular weight of 152 kDa. The radius distribution as well as the
recorded weight and the calculated concentration of protein and precipitant over time can be seen in

CHAPTER 2.1: INVESTIGATING NUCLEATION BY DLS
30
Figure 2-3 A. After a few initial DLS measurements the injection of precipitant (Table 1) was started
and continued until a change in the radius distribution was observed. A second radius fraction around
150 nm became visible after approximately 45 minutes, when the precipitant concentration reached
5 % PEG1500 and the protein concentration decreased to 8.5 mg mL-1. From this time point onwards
the condition of the droplet was kept constant by counteracting evaporation with water injection. Over
4 hours no significant change in the radius distribution pattern was visible. The second radius fraction
indicates low supersaturation and might result in single large crystals after a long incubation time, or
if the drop volume is slowly further decreased. In order to produce protein nanocrystals a higher
supersaturation is needed, leading to many nucleation events. Therefore, in a second experiment the
precipitant injection was continued until a concentration of 12 % PEG1500 was reached (Figure 2-3 B).
The resulting protein concentration after precipitant injection decreased to 4.5 mg mL-1. During the
precipitant injection a second radius fraction became visible and its size continued to grow while more
precipitant was added. After the injection was finished the radius of the particles in this fraction was
determined to be approximately 700 nm. The size of the particles grew further over time and three
hours after initiation of the experiment particles with a radius of approximately 5 µm were detected.
Simultaneously, the intensity of the lower radius fraction, corresponding to an APP dimer, diminished
until no more particles with this size could be detected after 3.5 hours. At this stage, also precipitation
was observed in the camera image, indicating that the supersaturation of the protein in the droplet
was too high. Consequently, a precipitant concentration between the values of the first two
experiments was chosen for the third experiment. Precipitant was injected to a final concentration of
9 % PEG1500, resulting in a protein concentration of 6 mg mL-1 (Figure 2-3 C). As expected, also in this
experiment a second radius fraction with a size around 100 nm became visible, indicating
supersaturation of the protein solution. In contrast to the previous experiments, this radius fraction
became more complex over time. Initially the size of the particles in this fraction increased to
approximately 2 µm after 3 hours. Additionally, a third fraction with a size around 150 nm formed
between the large particles and the dimer-fraction. In contrast to the experiment in Figure 2-3 B, also
the radius fraction corresponding to the APP dimer, with a size below 10 nm, remained constant
throughout the whole experiment duration. In order to visualize the transition from the dimeric APP
in the beginning of the experiment to the complex radius distribution after injection of precipitant, the
recorded autocorrelation function (ACF) is plotted over time for the first 2.5 hours of the experiment
(Figure 2-3 C). It can be seen, that the ACF changed from a monomodal decay with a decay time
constant of 27 µs to a multimodal decay, from which three decay time constants have been fitted by
the CONTIN algorithm (12.7 ms, 1.4 ms and 81 µs). Although the change in viscosity during precipitant
injection has been taken into account for the hydrodynamic radius calculation, a slight increase in the
radius of the APP dimer fraction is observed.
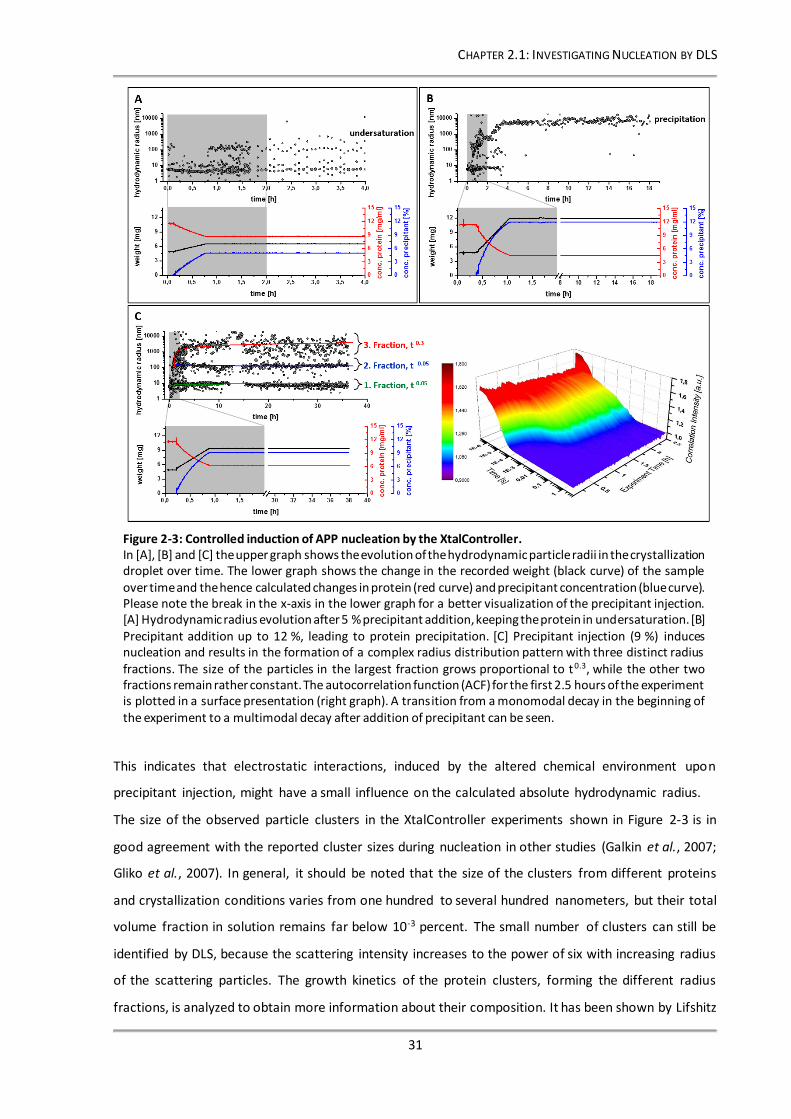
CHAPTER 2.1: INVESTIGATING NUCLEATION BY DLS
31
This indicates that electrostatic interactions, induced by the altered chemical environment upon
precipitant injection, might have a small influence on the calculated absolute hydrodynamic radius.
The size of the observed particle clusters in the XtalController experiments shown in Figure 2-3 is in
good agreement with the reported cluster sizes during nucleation in other studies (Galkin et al., 2007;
Gliko et al., 2007). In general, it should be noted that the size of the clusters from different proteins
and crystallization conditions varies from one hundred to several hundred nanometers, but their total
volume fraction in solution remains far below 10-3 percent. The small number of clusters can still be
identified by DLS, because the scattering intensity increases to the power of six with increasing radius
of the scattering particles. The growth kinetics of the protein clusters, forming the different radius
fractions, is analyzed to obtain more information about their composition. It has been shown by Lifshitz
Figure 2-3: Controlled induction of APP nucleation by the XtalController. In [A], [B] and [C] the upper graph shows the evolution of the hydrodynamic particle radii in the crystallization droplet over time. The lower graph shows the change in the recorded weight (black curve) of the sample over time and the hence calculated changes in protein (red curve) and precipitant concentration (blue curve). Please note the break in the x-axis in the lower graph for a better visualization of the precipitant injection. [A] Hydrodynamic radius evolution after 5 % precipitant addition, keeping the protein in undersaturation. [B] Precipitant addition up to 12 %, leading to protein precipitation. [C] Precipitant injection (9 %) induces nucleation and results in the formation of a complex radius distribution pattern with three distinct radius fractions. The size of the particles in the largest fraction grows proportional to t0.3, while the other two fractions remain rather constant. The autocorrelation function (ACF) for the first 2.5 hours of the experiment is plotted in a surface presentation (right graph). A transition from a monomodal decay in the beginning of the experiment to a multimodal decay after addition of precipitant can be seen.

CHAPTER 2.1: INVESTIGATING NUCLEATION BY DLS
32
& Slezov (1959) that the particle size of clusters increases asymptotically with the cube root of time
when diffusion-limited growth in supersaturated solutions is present (t0.33). This theory was extended
by Wagner (1961), who described that the size evolves with t0.5 in case of interface-limited growth.
This LSW-theory presents the first quantitative description of a phenomenon called Oswald Ripening.
In the experiment shown in Figure 2-3 C the size of the largest radius fraction (3. fraction) increases
proportional to t0.3. This demonstrates that the rate of mass increase during cluster evolution is
constant and reveals that the cluster aggregation is mainly diffusion-limited. Therefore, it can be
assumed that the larger clusters grow on behalf of released protein from smaller clusters by Oswald
ripening and the process is driven by a minimization of surface free energy. However, in the presented
experiment no significant reduction of the presence of the smaller radius fraction (2. fraction) is visible
during the observed period. Interestingly, the size of the second radius fraction remains rather
constant throughout the experiment and only occasionally particle sizes between fraction 2 and
fraction 3 are observed. Presumably, the particles of the second radius fraction represent the smallest
stable nuclei size (critical nuclei, n*) according to the scheme in Figure 2-1 A.
Another Xtalcontroller experiment was conducted with thioredoxin and no supersaturation was
obtained after injection of precipitant resulting in a final concentration of 3 % PEG1500 and a protein
concentration of 14 mg mL-1 (Figure 2-4 A). In contrast, the protein precipitated after a two-step
injection of precipitant resulting in a concentration of 15 % PEG1500 and a corresponding protein
concentration of 7 mg mL-1 (Figure 2-4 B). In a third experiment a complex radius distribution pattern
was obtained when injecting precipitant to a concentration of 10 % PEG1500 within 30 minutes, while
the protein concentration only decreased to 16 mg mL-1 (Figure 2-4 C). During the precipitant
injection a second radius fraction occurred with a size of approximately 70 nm, which quickly grew to
a few hundred nanometers. After approximately two hours the radius fraction separated into two
fractions, with a smaller fraction remaining rather constant at a hydrodynamic radius of approximately
100 nm (2. fraction) and a larger fraction growing to approximately 1 µm (3. fraction). The growth
kinetic of the larger fraction over time can again be well fitted by t0.33. The emergence of the complex
radius distribution pattern upon precipitant addition can also be observed in the transition from the
monomodal ACF to a multimodal ACF, as shown in Figure 2-4 C.
Ammonium sulfate was used as precipitant for the XtalController experiments with ML1 and the
formation of a second radius fraction could be observed after addition of precipitant to a concentration
of 0.4 M (Figure 2-5 A). Rapidly, larger particles with a size above 1 µm were identified by DLS. To avoid
precipitation of the sample water was added to the droplet to dilute the precipitant to a concentration
of 0.3 M. The final protein concentration at this stage was 2 mg mL-1. The size of the second radius
fraction remained stable for a long time and only grew towards the end of the experiment.
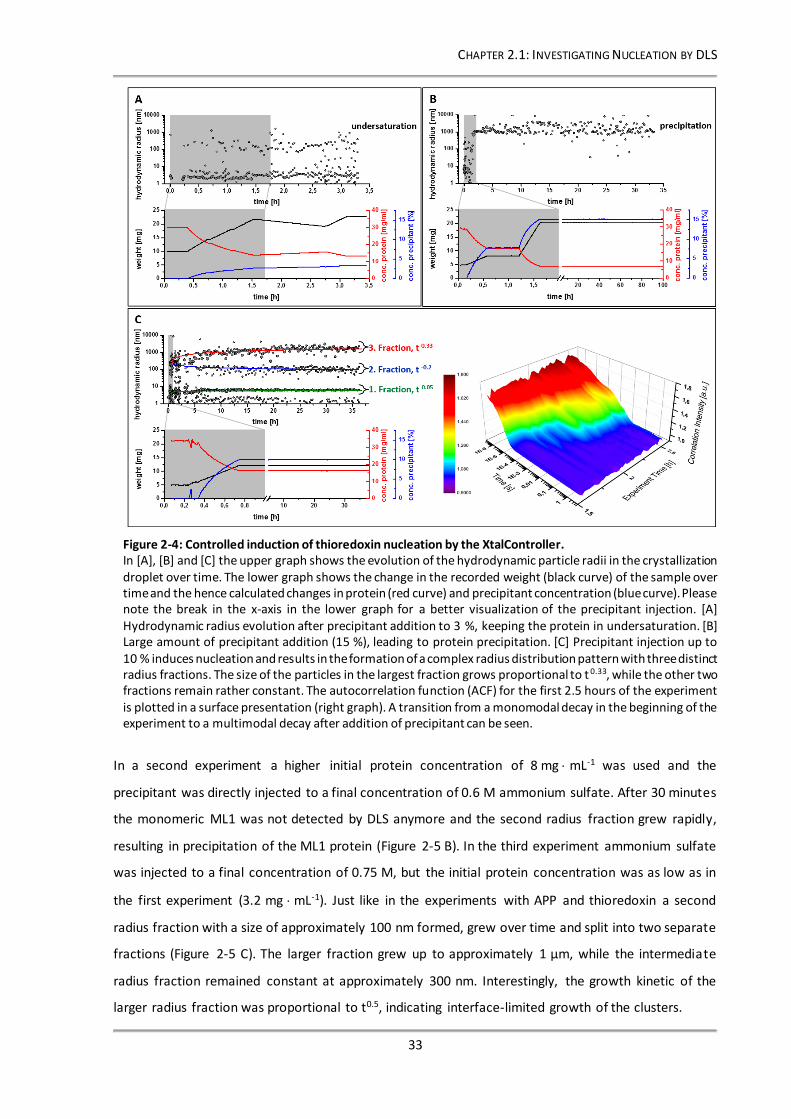
CHAPTER 2.1: INVESTIGATING NUCLEATION BY DLS
33
In a second experiment a higher initial protein concentration of 8 mg mL-1 was used and the
precipitant was directly injected to a final concentration of 0.6 M ammonium sulfate. After 30 minutes
the monomeric ML1 was not detected by DLS anymore and the second radius fraction grew rapidly,
resulting in precipitation of the ML1 protein (Figure 2-5 B). In the third experiment ammonium sulfate
was injected to a final concentration of 0.75 M, but the initial protein concentration was as low as in
the first experiment (3.2 mg mL-1). Just like in the experiments with APP and thioredoxin a second
radius fraction with a size of approximately 100 nm formed, grew over time and split into two separate
fractions (Figure 2-5 C). The larger fraction grew up to approximately 1 µm, while the intermediate
radius fraction remained constant at approximately 300 nm. Interestingly, the growth kinetic of the
larger radius fraction was proportional to t0.5, indicating interface-limited growth of the clusters.
Figure 2-4: Controlled induction of thioredoxin nucleation by the XtalController. In [A], [B] and [C] the upper graph shows the evolution of the hydrodynamic particle radii in the crystallization droplet over time. The lower graph shows the change in the recorded weight (black curve) of the sample over time and the hence calculated changes in protein (red curve) and precipitant concentration (blue curve). Please note the break in the x-axis in the lower graph for a better visualization of the precipitant injection. [A] Hydrodynamic radius evolution after precipitant addition to 3 %, keeping the protein in undersaturation. [B] Large amount of precipitant addition (15 %), leading to protein precipitation. [C] Precipitant injection up to 10 % induces nucleation and results in the formation of a complex radius distribution pattern with three distinct radius fractions. The size of the particles in the largest fraction grows proportional to t 0.33, while the other two fractions remain rather constant. The autocorrelation function (ACF) for the first 2.5 hours of the experiment is plotted in a surface presentation (right graph). A transition from a monomodal decay in the beginning of the experiment to a multimodal decay after addition of precipitant can be seen.
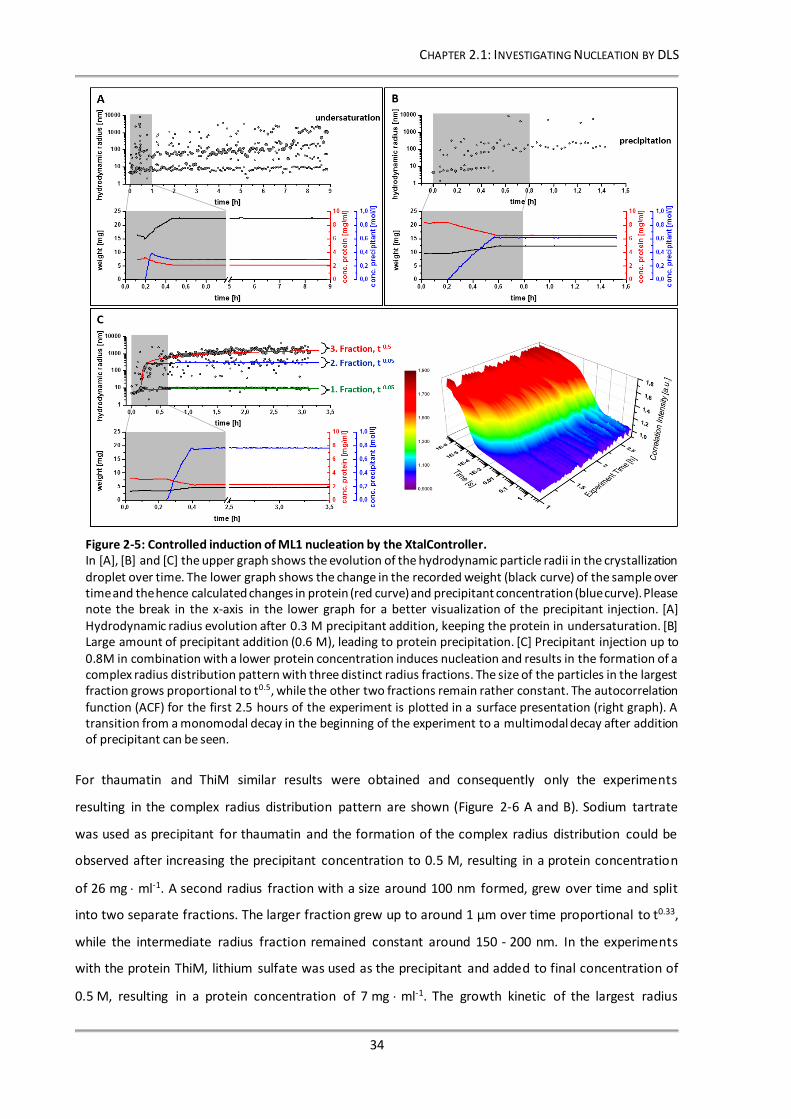
CHAPTER 2.1: INVESTIGATING NUCLEATION BY DLS
34
For thaumatin and ThiM similar results were obtained and consequently only the experiments
resulting in the complex radius distribution pattern are shown (Figure 2-6 A and B). Sodium tartrate
was used as precipitant for thaumatin and the formation of the complex radius distribution could be
observed after increasing the precipitant concentration to 0.5 M, resulting in a protein concentration
of 26 mg ml-1. A second radius fraction with a size around 100 nm formed, grew over time and split
into two separate fractions. The larger fraction grew up to around 1 µm over time proportional to t0.33,
while the intermediate radius fraction remained constant around 150 - 200 nm. In the experiments
with the protein ThiM, lithium sulfate was used as the precipitant and added to final concentration of
0.5 M, resulting in a protein concentration of 7 mg ml-1. The growth kinetic of the largest radius
Figure 2-5: Controlled induction of ML1 nucleation by the XtalController. In [A], [B] and [C] the upper graph shows the evolution of the hydrodynamic particle radii in the crystallization droplet over time. The lower graph shows the change in the recorded weight (black curve) of the sample over time and the hence calculated changes in protein (red curve) and precipitant concentration (blue curve). Please note the break in the x-axis in the lower graph for a better visualization of the precipitant injection. [A] Hydrodynamic radius evolution after 0.3 M precipitant addition, keeping the protein in undersaturation. [B] Large amount of precipitant addition (0.6 M), leading to protein precipitation. [C] Precipitant injection up to 0.8M in combination with a lower protein concentration induces nucleation and results in the formation of a complex radius distribution pattern with three distinct radius fractions. The size of the particles in the largest fraction grows proportional to t0.5, while the other two fractions remain rather constant. The autocorrelation function (ACF) for the first 2.5 hours of the experiment is plotted in a surface presentation (right graph). A transition from a monomodal decay in the beginning of the experiment to a multimodal decay after addition of precipitant can be seen.

CHAPTER 2.1: INVESTIGATING NUCLEATION BY DLS
35
fraction was different than in the previous experiments and was proportional to t0.15 (Figure 2-6 B). The
content of the individual radius fractions from different proteins is further evaluated by electron
microscopy and presented in section 2.1.3.2.
2.1.3.2 Sample characterization using electron microscopy
It has been proposed by Vekilov (2004) that the nucleation process of crystallization for many proteins
is a two-step mechanism, where the transition to a higher order occurs subsequently to a transition to
a higher concentration. He proposed that liquid-liquid dense cluster form as stable intermediates in
supersaturated protein solutions and that the nucleation of crystals occurs within these clusters
Figure 2-6: Controlled induction of nucleation by the XtalController with the proteins thaumatin and ThiM. In [A], [B] the upper graph shows the evolution of the hydrodynamic particle radiii in the crystallization droplet over time. The lower graph shows the change in the recorded weight (black curve) of the sample over time and the hence calculated changes in protein (red curve) and precipitant concentration (blue curve). Please note the break in the x-axis in the lower graph for a better visualization of the precipitant injection. Precipitant injection induces nucleation and results in the formation of a complex radius distribution pattern with three distinct radius fractions. [A] The size of the thaumatin particles in the largest fraction grow proportional to t0.33, while the other two fractions remain rather constant. [B] From ThiM the size of the particles in the largest fraction grows proportional to t0.15, while the other two fractions remain rather constant. The autocorrelation function (ACF) for the first 2.5 hours of both experiments is plotted in a surface presentation (right graph). A transition from a monomodal decay in the beginning of the experiment to a multimodal decay after addition of precipitant can be seen.

CHAPTER 2.1: INVESTIGATING NUCLEATION BY DLS
36
(Vekilov, 2010). This theory is supported by a study where the nucleation within protein clusters could
be followed by depolarized oblique illumination dark-field microscopy (Maes et al., 2015).
A detailed analysis of the particles detected by DLS in the XtalController experiments by visualizing
methods is challenging. Evaluation by light microscopy methods is not possible because of the small
particle size and the low contrast, but electron microscopy provides a promising tool for
characterization of the different radius fraction contents. For this, the labile samples need to be
chemically cross-linked to stabilize the particles in the high vacuum of the electron microscope. Firstly,
the precipitated sample from ML1 (Figure 2-5 B) was evaluated by transmission electron microscopy
to test if nanocrystals are present in the precipitate as well. The recorded images of the ML1 sample,
negative stained with uranyl acetate, are shown in Figure 2-7. It can be seen that only amorphous
aggregates are found in the sample and no crystalline particles are visible. By this. The assumption is
confirmed that the disappearance of particles from the smallest radius fraction, corresponding to the
hydrodynamic radius of the protein prior precipitant addition, is a clear indication of a beginning
precipitation of the protein.
From the XtalController experiments with ML1 also the sample with the complex radius distribution
pattern (Figure 2-5 C) could be successfully stabilized by chemical crosslinking. In the transmission
electron microscopy images shown in Figure 2-8 A, the protein clusters from the larger radius fractions
are visible. Corresponding to the radius pattern determined by DLS, particles with the size of 200 nm
to around 1 µm are visible. Most of the particles have an irregular spherical shape, comparable to
macroscopic phase separation commonly seen in crystallization experiments. However, in the same
sample also particles with a defined triangular shape are visible (Figure 2-8 B). A similar morphology
was observed in an transmission electron microscopy image of a ML1 crystal produced by a
crystallization experiment at the XtalController published by Meyer et al. (2012). Therefore, it can be
concluded that the shaping structure in these particles are nuclei of ML1 crystals, which have formed
Figure 2-7: Transmission electron microscopy images of a ML1 sample obtained from the XtalController experiment shown in Figure 2-5 B. The sample is negative stained with uranyl acetate and shows amorphous aggregates of the protein ML1.

CHAPTER 2.1: INVESTIGATING NUCLEATION BY DLS
37
inside a protein dense liquid cluster. The images might demonstrate the first microscopic observation
of the transition from a cluster with high protein concentration to a crystal with higher order, as
postulated by the two-step nucleation theory by Vekilov in 2004 already. Additionally, the particles
possessing a geometrical order are always smaller in size compared to the spherical particles. It can be
hypothesized that the size of a clusters gets slightly reduced when a nucleation event occurs inside,
because the crystal nuclei consumes the surrounding protein of the cluster over time, leading to a
higher packing density of protein in an ordered lattice, compared to an amorphous cluster.
Figure 2-8: Transmission electron microscopy images of a ML1 sample obtained from the XtalController experiment shown in Figure 2-5 C. [A] The sample is negative stained with uranyl acetate and shows protein dense liquid clusters with a size of 200 nm to 1 µm, as identified in the radius distribution pattern from the DLS measurements. The particles mostly possess an irregular spherical shape. [B] Additionally, geometrically ordered particles with triangular shape and surrounded by amorphous protein are visible. This provides additional indication that the nucleation occurs in protein dense-liquid clusters during the two-step mechanism of nucleation.

CHAPTER 2.1: INVESTIGATING NUCLEATION BY DLS
38
Because of the different chemical environments in the various crystallization conditions of the
XtalController experiments the efficiency of stabilization has not been the same for all investigated
proteins. Therefore, the larger clusters of the other investigated proteins could not be successful
stabilized for visualization using transmission electron microscopy (TEM). However, carbon grids with
negative stained samples, produced in XtalController experiments with thaumatin, thioredoxin and
ML1, showed clearly crystalline particles (Figure 2-9). The size of the crystals was very small and varied
between 50 nm am 200 nm. Unfortunately, no crystal lattice similar to those demonstrated by other
groups investigating protein nanocrystals by electron microscopy can be seen (Stevenson et al.,
2014b). Therefore, a determination of the unit cell size is not possible and consequently the crystals
cannot be identified as protein crystals with absolute certainty.
Figure 2-9: Transmission electron microscopy images of (A) thaumatin, (B) thioredoxin and (C) ML1 samples obtained from XtalController experiment. The sample is negative stained with uranyl acetate and the images show crystalline particles with different shapes.
Figure 2-10: Scanning electron microscopy images of a thioredoxin sample obtained from the XtalController experiment shown in Figure 2-4 C. The sample is sputtered with gold to enhance the contrast. The images show spherical particles with a size ranging from around 500 nm to 3 µm.
CHAPTER 2.1: INVESTIGATING NUCLEATION BY DLS
39
Samples produced in the XtalController experiment with thioredoxin, shown in Figure 2-4 C, were
additionally analyzed by scanning electron microscopy, which benefits from a lower vacuum compared
to TEM. The recorded images shown in Figure 2-10 reveal spherical particles with a size range between
500 nm and 3 µm. In this sample no geometrically ordered particles were found, indicating that the
second step of the nucleation process, the transition to a higher order, might has not yet occurred in
the sample.
2.1.4 Conclusion
The XtalController technology allows a feedback controlled navigation in the phase diagram and was
applied to gain new information about the nucleation behavior of proteins during crystallization. It was
demonstrated that DLS can be used to obtain valuable information about the early processes going
along with nucleation events, which were initiated by injection of precipitant. After initial formation of
particle clusters with a hydrodynamic radius of approximately 100 nm a complex radius distribution
pattern evolved over time. The growth kinetics of the protein clusters, forming the different radius
fractions, were analyzed. The data reveals that the rate of mass increase during cluster evolution is
constant and provides evidence that the cluster aggregation is mainly diffusion-limited. Therefore, it
can be hypothesized that the larger clusters grow on behalf of released protein from smaller clusters
by Oswald ripening and the process is driven by a minimization of surface free energy. Further, it can
be assumed that the particles of the second radius fraction represent the smallest stable nuclei size,
called critical nuclei.
Characterization of the samples by scanning electron microscopy and transmission electron
microscopy indicates that the observed radius distribution pattern is a result of the two-step
mechanism of nucleation, proposed by Vekilov (2010). He assumed that liquid-liquid dense cluster
form as stable intermediates in supersaturated protein solutions, which has been observed in the
electron microscopy images of this study as well. Further, his postulation of crystal nucleation
occurring within these clusters can be supported by the presence of geometrically ordered nuclei in
the XtalController samples. Therefore, the presented results might demonstrate the first microscopic
observation of the transition from a cluster with high protein concentration to a crystal with higher
structural order.

CHAPTER 2.2: DLS IN MICROFLUIDIS
40
2.2 Monitoring protein crystallization in microfluidic devices by dynamic light scattering
2.2.1 Introduction
Over the last 15 years, a lot of research was performed to transform a wet laboratory into a micro-
sized device that is called lab-on-a-chip (Mitchell, 2001; Thorsen et al., 2002). In most cases classical
laboratory experiments are mimicked with the advantage of a greater control about the transport
phenomena (Squires & Quake, 2005; Vilkner et al., 2004; Stone et al., 2004). For this, the microfluidic
technology is used to manipulate small volumes of liquids in networks of micro-channels. In protein
crystallography, where the preparation of a pure and monodisperse protein sample is required but
laborious, a reduction of the used sample volume for the crystallization trials implies a great benefit.
Therefore, methods have been developed to perform crystallization trials in microfluidic devices for
high-throughput screening with only microliter sample consumption in free interface diffusion,
microbatch and vapor diffusion approaches (Hansen et al., 2002; Du et al., 2009; Li & Ismagilov, 2010;
Zheng et al., 2005).
The free interface diffusion in a microscale format was the first application of microfluidics in protein
crystallography (Hansen et al., 2002). It benefits from the fact that convection is absent in the small
volumes normally used by microfluidics. Therefore, after bringing protein in contact with precipitant,
their exchange is solely based on diffusion. Precise tuning of the supersaturation was achieved by a
combination of vapor diffusion and free interface diffusion (Hansen et al., 2006). A different
application of FID was developed in a system called SlipChip, where protein and precipitant are loaded
in different chambers of a microfluidic chip. Subsequently, a connection between both chambers is
established by slipping the connecting channels of the chip (Du et al., 2009).
In the microbatch method protein and precipitant are mixed to form small droplets of 10 nL volume in
microfluidic channels (Zheng et al., 2004; Zheng et al., 2005; Li et al., 2006). By mixing various ratios of
protein and precipitant, a broad area of the phase diagram can be covered. The individual droplets are
separated from each other by chemically inert fluorocarbon oil, which is immiscible to the aqueous
solution. The technique allows setting up thousands of individual crystallization trials, that can be
stored in X-ray transparent capillaries. Crystals that have grown in the individual droplets can be
analyzed by X-ray diffraction straight within the capillaries.
A similar approach is used in different vapor diffusion applications of microfluidic devices (Lau et al.,
2007; Zheng et al., 2004). Contrary to the microbatch method, a water permeable carrier fluid is used
which allows dehydration of the formed droplets containing a mixture of protein and precipitant.
Dehydration and therewith supersaturation is achieved by placing the complete microfluidic device in

CHAPTER 2.2: DLS IN MICROFLUIDIS
41
an osmotic bath. Alternatively, droplets containing solely protein can be dehydrated by adjacent
precipitant droplets with higher salt concentration.
Despite the great advantage of very low sample consumption, these microfluidic approaches have the
drawback that they rely on irreversible kinetic processes which cannot be controlled easily. In an effort
to decouple nucleation and growth of protein crystals, a new microfluidic system has been developed
and was named Phase Chip (Shim et al., 2007). The aim of this design was to allow an optimization of
the kinetic pathway of crystallization. In the Phase Chip all crystallization wells are separated from the
reservoir by a thin (poly)dimethylsiloxane (PDMS) membrane, which is permeable to water and small
non-polar molecules. The volume of the droplet in the crystallization well can be reversibly controlled
by changing the concentration of the solutes in the reservoir. In a later enhancement, the PDMS
membrane was exchanged by a regenerated cellulose membrane in order to obtain a membrane which
is permeable to the precipitant as well (Michael Heymann, 2014). In this stage the Phase Chip allows
navigating through the phase diagram in a variety of dynamic paths and thereby offers a comparable
flexibility as achieved with the XtalController, presented in section 2.1. However, up to now the
evaluation of the crystallization experiment in all microfluidic approaches is based on visual inspection
of the droplets with a microscope. This leads to the fact that an occurring nucleation event or
precipitation of the protein can only be observed with a significant time delay. In order to overcome
this drawback of a response delay it is investigated, if Dynamic Light Scattering measurements can be
performed in the nano-sized volumes of microfluidic devices. The aim is to get an earlier feedback
information during crystallization experiments in microfluidic devices and the results are presented in
this chapter.
2.2.2 Material and Methods
2.2.2.1 Mask Design
The photolithography masks, used for preparing silicon wafers, are designed by Dr. Michael Heymann
(Center for Free Electron Laser Science, Hamburg) using the AutoCAD 2015 software (Autodesk, Inc.,
San Rafael, USA). The chip structure is imprinted on the silicon wafer in multiple layers of negative
photoresist, while an individual mask is used for each layer. Vernier Caliper alignment marks allow the
exact positioning of the layers with an error of around 10 µm (Heymann et al., 2014). The CAD-designs
are translated into foil masks by the company JD Photo Data (Hitchin, UK). Designed masks for the
Phase Chip (2.2.2.4) approach are shown in Figure 2-11.

CHAPTER 2.2: DLS IN MICROFLUIDIS
42
2.2.2.2 Photolithography
The silicon wafer was either imprinted with the positive or the negative features of the microfluidic
chip by using photolithography. A negative master was used for structures directly casted in
(poly)dimethylsiloxane (PDMS) (Figure 2-12 D) and a positive master was used for epoxy structures,
where an intermediate negative PDMS replica was casted to print the final epoxy pattern (Figure
2-12 F). For this, the negative photoresist SU-8 (MicroChem, Westborough, USA) was spincoated on a
3-inch sized silicon wafer (Figure 2-12 A) (University Wafer, Boston, USA). The thickness of the
photoresist layer was controlled by tuning the spinning speed and duration according to the manual
and is shown in Table 2. Prior UV-light exposure, a soft bake was performed by heating to 65 °C and
95 °C in order to reduce the solvent concentration and to improve the photoresist adhesion to the
silicon wafer. The wafer and the corresponding photoresist mask (Figure 2-11) were aligned using a
mask aligner (Figure 2-12 B and C) (MJB4, SÜSS MicroTec). The photoreaction was initiated by exposing
the photoresist to UV-light in the mask aligner and the reaction was catalytically completed by a
subsequent hard bake at 65 °C and 95 °C (Figure 2-12 D). Exposure and baking durations are listed in
Table 2. Finally, the photoresist, which have been shielded from UV-exposure by the photolithography
masks, was washed off by using propylene glycol methyl ether acetate (PGMEA). The described
protocol was repeated for each consecutive photoresist layer.
Figure 2-11: Photolithography masks used for preparing silicon wafers of the Phase Chip. The masks are designed by Dr. Michael Heymann (Center for Free Electron Laser Science, Hamburg) using the AutoCAD 2015 software (Autodesk, Inc., San Rafael, USA). The silicon wafer for the crystallization-well structure of the Phase Chip is made by three layers ([A], [B] and [C]) and the reservoir wafer by one [D].

CHAPTER 2.2: DLS IN MICROFLUIDIS
43
Table 2: Protocol for the preparation of a multilayer photoresist on a silicon wafer by photolithography.
Desired
thickness
Photoresist Spincoating Soft bake UV exposure Hard bake
5 µm SU-8 3005 1: 500 rpm, 5 s
2. 3000 rpm, 30 s
1: 1 min, 65 °C
2: 3 min, 95 °C
9 s 1: 1 min, 65 °C
2: 3 min, 95 °C
40 µm SU-8 3025 1: 500 rpm, 5 s
2: 1800 rpm, 30 s
1: 1 min, 65 °C
2: 15 min, 95 °C
11.5 s 1: 1 min, 65 °C
2: 5 min, 95 °C
50 µm SU-8 3025 1: 500 rpm, 5 s
2: 1300 rpm, 30 s
1: 15 min, 95 °C 12.5 s 1: 1 min, 65 °C
2: 5 min, 95 °C
2.2.2.3 PDMS mold
The PDMS mold was casted in a petri dish. For this, the petri dish was lined with aluminum foil to
facilitate the removal of the cured PDMS from the petri dish. The PDMS, consisting of a mixture of
silicone base with 10 % (w/w) curing agent (Sylgard® 184, Dow Corning), was thoroughly mixed (Thinky
ARE-250). After placing the silicon wafer in the petri dish, 20 g PDMS were poured on the wafer and
degassed in a vacuum desiccator for 5 min in order to avoid bubble formation in the PDMS. The PDMS
was cured in an oven for 1 h at 70 °C and was subsequently peeled from the silicon master. Access
holes for the fluid were punched through the PDMS with a 0.75 µm biopsy punch (UniCore, Harrison).
Figure 2-12: Silicon wafer preparation by photolithography. [A] SU-8 photoresist is spincoated on a silicon wafer. [B] The wafer and the corresponding photoresist mask were aligned using a mask aligner (MJB4, SÜSS MicroTec). [C] Consecutive layers are aligned using Vernier Caliper alignment marks (Heymann et al. 2014). [D] Wafer with positive structures for the crystallization wells. [E] Wafer with negative features of the reservoir structure for direct casting in PDMS. [F] Casting of an
intermediate negative PDMS replica used for printing the final epoxy pattern as described in section 2.2.2.3.

CHAPTER 2.2: DLS IN MICROFLUIDIS
44
2.2.2.4 Chip assembly
PDMS chip
In order to enable dynamic light scattering measurements inside the individual wells of the microfluidic
chip, the PDMS mold was bonded onto a glass slide (Corning). For this, the glass slide was thoroughly
cleaned and both, the glass slide and the PDMS mold, were plasma activated by 0.4 mbar O2 plasma
(Zepto, Diener electronic) for 30 s. The microfluidic channels in the PDMS structure were carefully
orienting parallel to the edges of the glass slide and both were shortly pressed together for bonding.
A vertical section scheme of the individual steps of the PDMS chip preparation is shown in Figure
2-13 A. A detailed illustration of the microfluidic structure of the PDMS chip is shown in Figure 2-13 B.
Figure 2-13: Schematic presentation of the PDMS chip. [A] A vertical cross-section of the PDMS demonstrates how three layers of photoresist are build up on the silicon wafer. PDMS is casted on the structured wafer and is finally bonded on a glass slide. [B] Three-dimensional presentation of the PDMS chip shows the architecture and dimensions of the microfluidic structures.

CHAPTER 2.2: DLS IN MICROFLUIDIS
45
Phase chip
The phase chip consists of three components: 1) the crystallization wells and fluidic channels, 2) the
PDMS membrane and 3) the reservoir. In order to enable dynamic light scattering measurements
comparable to those in the PDMS chip, the layer containing the crystallization wells has to point
towards a glass slide. To achieve this, the crystallization well structure was imprinted in epoxy glue
(UHU Plus Schnellfest 5 min, UHU GmbH Co. KG, DE). The viscosity of the two component glue was
reduced by separate dilution with ethanol in an epoxy to ethanol ratio of 10:1. The PDMS mold,
containing the negative structures casted from the positive silicon wafer, was degassed in a vacuum
desiccator for 30 min. By this, the PDMS mold can absorb small bubbles from the epoxy resin during
the molding step. Both components of the epoxy glue were thoroughly mixed and a small droplet was
applied in the middle of a clean glass slide. The PDMS mold was pressed on the glass slide and weighted
with metal weights for 1 h, until the epoxy resin was cured (Figure 2-14 A).
For the second layer, a 10 µm thick PDMS membrane was prepared by spincoating PDMS on the
backside of a petri dish. The PDMS, consisting of a mixture of silicone base with 10 % (w/w) curing
agent (Sylgard® 184, Dow Corning), was thoroughly mixed (Thinky ARE-250). Spincoating was
performed using a rotation speed of 500 rpm for 5 s, followed by 3000 rpm for 30 s. The PDMS
membrane was cured for 30 minutes at 70 °C.
The third layer contained the reservoir structure and was prepared by a PDMS mold from a silicon
wafer containing the positive structure features (Figure 2-14 B). Bonding of the PDMS membrane to
the third layer was achieved by pressing together both pieces after plasma activation with 0.4 mbar O2
plasma (Zepto, Diener electronic) for 30 s (Figure 2-14 C).
Figure 2-14: Photographic images of the three components of the Phase chip. [A] Weighting the PDMS mold during epoxy structure imprinting of crystallization well structures. [B] Casting a PDMS mold of the positive reservoir structures. [C] Oxygen plasma activation (Zepto, Diener electronic) of the PDMS membrane, which separates the crystallization wells and the reservoir structure.

CHAPTER 2.2: DLS IN MICROFLUIDIS
46
The bonded structure of the PDMS membrane and the PDMS reservoir mold was finally bonded to the
epoxy structure on the glass slide by (3-Glycidyloxypropyl)trimethoxysilane (GPTS) /
(3-Aminopropyl)trimethoxysilane (APTS) chemistry. For this, an aqueous solution of APTS (1 % v/v) and
GPTS (1 % v/v) was prepared separately. The glass slide with the epoxy structure and the PDMS
membrane/reservoir mold was plasma activated at 0.4 mbar O2 plasma (Zepto, Diener electronic) for
30 s. One part (e.g. the glass slide with epoxy structures) was incubated in the APTS solution for 5 min,
while the other (e.g. the PDMS membrane and reservoir) was incubated in the GTPS solution for 5 min.
Both were subsequently dried and pressed together, resulting in the completely assembled phase chip.
A vertical section scheme of the individual steps of the phase chip preparation is shown in Figure 2-15.
2.2.2.5 Chip surface treatment and handling
Prior filling the chips with protein or reservoir solution, the surface was coated with a hydrophobic
reactant. Thus, an interaction of the aqueous protein solution with the surface as well as an emerging
of the fluid through the capillary valves into the exit channel can be avoided. For the coating, a solution
of 9 % (w/w) CTX-109AE (AGC Chemicals, Exton, USA) in CT-Solv 100 (AGC Chemicals, USA) was used
and injected into the chip. In order to allow the solvent to evaporate, the chip was placed on a 190 °C
heating plate for 5 min.
Figure 2-15: Vertical cross-section of the individual steps during Phase chip preparation. The three components of the Phase chip are prepared separately before they are assembled to form the complete chip. The crystallization wells build up on the silicon wafer by three layers of photoresist. PDMS is casted on the structured wafer and subsequently used to imprint the crystallization well structure in epoxy on a glass slide. In parallel, the reservoir structure is made of a PDMS mold which is casted on a second silicon wafer. Both components are separated by a thin PDMS membrane, spincoated on a petri dish. Final assembly is performed by plasma activation bonding and APTS/GPTS chemistry.
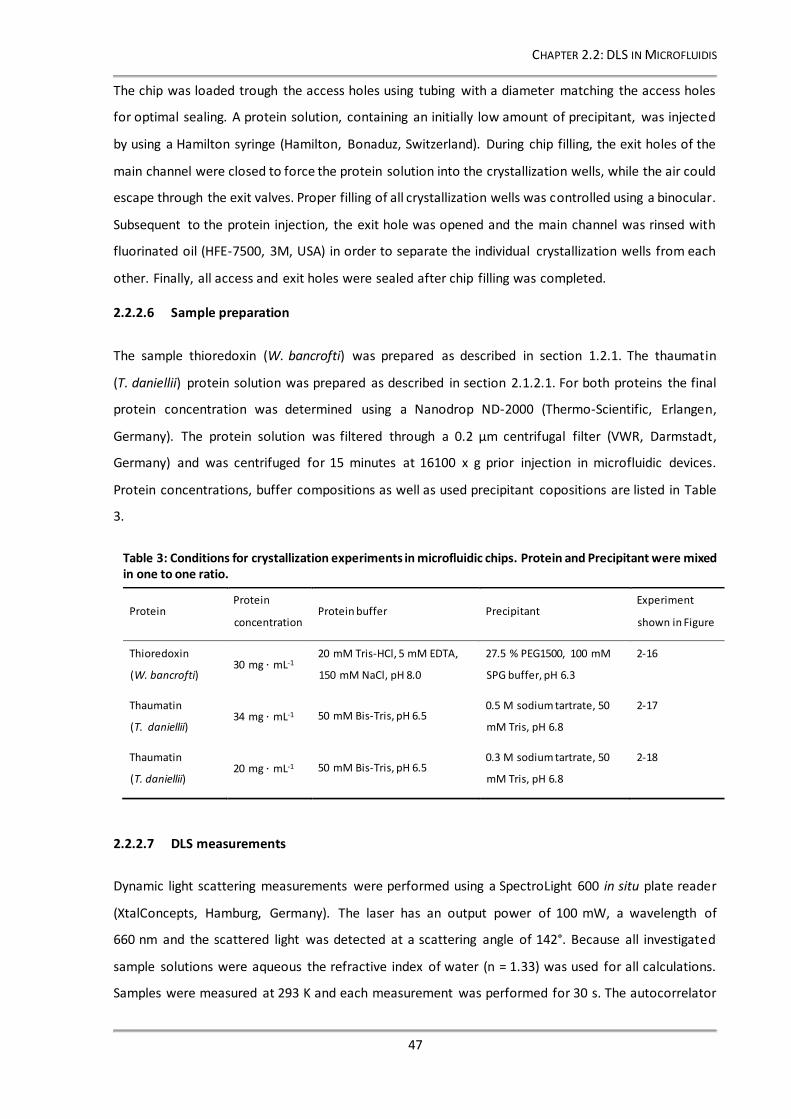
CHAPTER 2.2: DLS IN MICROFLUIDIS
47
The chip was loaded trough the access holes using tubing with a diameter matching the access holes
for optimal sealing. A protein solution, containing an initially low amount of precipitant, was injected
by using a Hamilton syringe (Hamilton, Bonaduz, Switzerland). During chip filling, the exit holes of the
main channel were closed to force the protein solution into the crystallization wells, while the air could
escape through the exit valves. Proper filling of all crystallization wells was controlled using a binocular.
Subsequent to the protein injection, the exit hole was opened and the main channel was rinsed with
fluorinated oil (HFE-7500, 3M, USA) in order to separate the individual crystallization wells from each
other. Finally, all access and exit holes were sealed after chip filling was completed.
2.2.2.6 Sample preparation
The sample thioredoxin (W. bancrofti) was prepared as described in section 1.2.1. The thaumatin
(T. daniellii) protein solution was prepared as described in section 2.1.2.1. For both proteins the final
protein concentration was determined using a Nanodrop ND-2000 (Thermo-Scientific, Erlangen,
Germany). The protein solution was filtered through a 0.2 µm centrifugal filter (VWR, Darmstadt,
Germany) and was centrifuged for 15 minutes at 16100 x g prior injection in microfluidic devices.
Protein concentrations, buffer compositions as well as used precipitant copositions are listed in Table
3.
Table 3: Conditions for crystallization experiments in microfluidic chips. Protein and Precipitant were mixed in one to one ratio.
Protein Protein
concentration Protein buffer Precipitant
Experiment
shown in Figure
Thioredoxin
(W. bancrofti) 30 mg mL-1
20 mM Tris-HCl, 5 mM EDTA,
150 mM NaCl, pH 8.0
27.5 % PEG1500, 100 mM
SPG buffer, pH 6.3
2-16
Thaumatin
(T. daniellii) 34 mg mL-1 50 mM Bis-Tris, pH 6.5
0.5 M sodium tartrate, 50
mM Tris, pH 6.8
2-17
Thaumatin
(T. daniellii) 20 mg mL-1 50 mM Bis-Tris, pH 6.5
0.3 M sodium tartrate, 50
mM Tris, pH 6.8
2-18
2.2.2.7 DLS measurements
Dynamic light scattering measurements were performed using a SpectroLight 600 in situ plate reader
(XtalConcepts, Hamburg, Germany). The laser has an output power of 100 mW, a wavelength of
660 nm and the scattered light was detected at a scattering angle of 142°. Because all investigated
sample solutions were aqueous the refractive index of water (n = 1.33) was used for all calculations.
Samples were measured at 293 K and each measurement was performed for 30 s. The autocorrelator

CHAPTER 2.2: DLS IN MICROFLUIDIS
48
(XtalConcepts) of the instrument covers a sample time range from 0.4 µs to 30 s. The decay time
constants of the scattering signal are derived from the autocorrelation function by using the CONTIN
algorithm (Provencher, 1982). From this, the translational diffusion constant Dt as well as the particle
radius can be derived by using the Stokes–Einstein equation (equation 2).
A calibration file was written to find the position of each individual crystallization well in the
microfluidic chip and to allow automated DLS measurements over time. When inserting a new chip
into the instrument, the measurement position in each well can be screened automatically. For this,
five measurement positions were tested in the xy-plane and at each position five z-planes were tested.
In case a reliable DLS measurement position was identified, which is defined by an autocorrelation
curve with a high intercept and a smooth tail towards large correlation times, the coordinates were
saved for later measurements. The calibration file, as well as the search pattern can be found in the
Appendix.
2.2.3 Results and Discussion
2.2.3.1 Establishing DLS measurements in microfluidic chips
First attempts to perform DLS measurements in small compartments of a microfluidic chip were
performed in a chip provided by Dr. Michael Heymann (Center for Free-Electron Laser Science,
Hamburg). The chip consisted of a PDMS mold bonded on a glass slide in order to provide an optically
transparent entry side for the DLS laser. The microfluidic chip had a serial design of circular
crystallization wells with a diameter of 500 µm and a height of 50 µm. The chip was filled with a
premixed solution of thioredoxin (W. bancrofti) and corresponding precipitant (Table 3).
For the first DLS experiments the laser was manually aligned in a single crystallization well. Due to the
small height of the wells an automated positioning of the laser in different wells was not successful.
The ACF of the DLS measurement showed a high intercept of approximately 1.8 and no oscillation in
the tail of the curve. This demonstrated that a DLS measurement in a PDMS chip bonded to a glass
slide can be successfully performed. The radius distribution of the protein solution in a single
crystallization well was monitored over 20 hours (Figure 2-16 B). Already in the beginning of the
experiment a second radius fraction with a size around 200 nm is visible. This can be explained by the
fact that protein and precipitant have already been mixed before both were loaded into the chip,
comparable to microbatch crystallization trials under oil. Protein crystals become macroscopically
visible 12 hours after mixing of protein and precipitant (Figure 2-16 A). Interestingly, a strong increase
in the DLS signal intensity can be observed after 10 hours, corresponding to larger crystal nuclei in
solution (Figure 2-16 C). The volume of the droplet in the crystallization well of the microfluidic chip
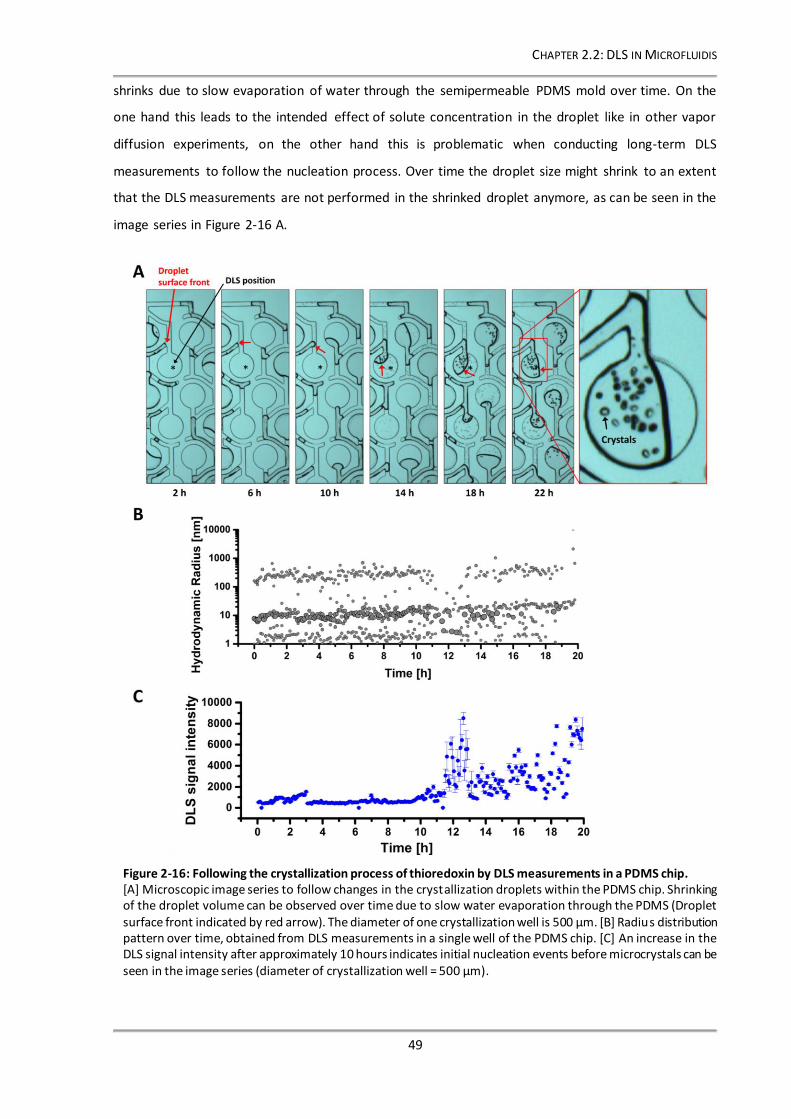
CHAPTER 2.2: DLS IN MICROFLUIDIS
49
shrinks due to slow evaporation of water through the semipermeable PDMS mold over time. On the
one hand this leads to the intended effect of solute concentration in the droplet like in other vapor
diffusion experiments, on the other hand this is problematic when conducting long-term DLS
measurements to follow the nucleation process. Over time the droplet size might shrink to an extent
that the DLS measurements are not performed in the shrinked droplet anymore, as can be seen in the
image series in Figure 2-16 A.
Figure 2-16: Following the crystallization process of thioredoxin by DLS measurements in a PDMS chip. [A] Microscopic image series to follow changes in the crystallization droplets within the PDMS chip. Shrinking of the droplet volume can be observed over time due to slow water evaporation through the PDMS (Droplet surface front indicated by red arrow). The diameter of one crystallization well is 500 µm. [B] Radius distribution pattern over time, obtained from DLS measurements in a single well of the PDMS chip. [C] An increase in the DLS signal intensity after approximately 10 hours indicates initial nucleation events before microcrystals can be seen in the image series (diameter of crystallization well = 500 µm).

CHAPTER 2.2: DLS IN MICROFLUIDIS
50
2.2.3.2 Optimizing Chip design for dynamic light scattering measurements
Based on the findings of the initial experiment, the microfluidic chip geometry was optimized for DLS
measurements. In a new and improved parallel chip design an evaporation zone was included on both
sides of the crystallization well (Figure 2-17 A). By this, the crystallization well, where the DLS
measurement is performed, is not immediately affected by shrinking of the fluid volume in the
compartment upon evaporation. Additionally, the thickness of the crystallization well is increased from
50 µm to 100 µm to allow an automated search of the DLS measurement position. In order to test the
new design, a PDMS chip bonded on a glass slide (Figure 2-13) is filled with a one-to-one ratio of
thaumatin (34 mg mL-1) and sodium tartrate (0.5 M) (Table 3). The evaporation is followed over 18
hours (Figure 2-17 B) and reveals, that the volume reduction upon solvent evaporation starts from the
main channel and does not affect the crystallization well throughout the experiment.
Figure 2-17: Observation of solvent evaporation in an optimized PDMS chip filled with a thaumatin protein solution.
[A] A schematic presentation of the new PDMS chip design reveals the architecture and dimensions of the microfluidic structures. Evaporation zones on both sides of the crystallization well are added in order to allow solvent evaporation without affecting the crystallization well where the DLS measurements are performed. [B] The image series of the evaporation process reveals that the droplet shrinks from the side of the main channel and not from the exit channel. The crystallization well remains unaffected from evaporation until larger Thaumatin crystals have grown.
CHAPTER 2.2: DLS IN MICROFLUIDIS
51
However, no shrinking from the side of the exit valves is observed. Consequently, the position of the
crystallization well can be relocated towards the side of the exit valves, in order to maximize the use
of the evaporation zone. The large evaporation zone and stronger volume shrinking allows a significant
shift towards supersaturation in the phase diagram. Therefore, the PDMS chip can be filled with an
initially lower protein and precipitant concentration and the oligomeric state of the protein in the
under-saturated zone of the phase diagram can be monitored. This enhances the possibility to observe
nucleation and crystal growth by DLS in microfluidic devices.
Based on the initial results, a PDMS chip was designed with crystallization wells located next to the exit
valves. The new chip (Figure 2-13) was filled with a lower protein and precipitant concentration in a
one-to-one ratio of thaumatin (20 mg mL-1) and sodium tartrate (0.3 M) (Table 3). The automated
search of the DLS measurement position in each well of the complete PDMS chip was successful. The
recorded ACFs showed reliable DLS measurements with an intercept around 1.8 and a smooth tail in
the beginning of the experiment (Figure 2-18 C). Exemplarily, the evolution of the size distribution as
a function of time of the thaumatin particles in a single crystallization well is shown in Figure 2-18 B
together with the corresponding recorded camera images (Figure 2-18 A). As expected, it can be seen
that the shrinking of the volume starts from the main channel and keeps the crystallization
compartment unaffected throughout the experiment. Due to the lower initial precipitant
concentration in the beginning of the crystallization experiment the hydrodynamic radius of thaumatin
can be followed while the protein is still undersaturated and before nucleation starts. After
approximately two hours a second radius fraction becomes visible and more distinct over time (Figure
2-18 B). This demonstrates that the nucleation can be observed far before macroscopic crystals are
observed in the camera image (after 4 hours). The results provide evidence that automated DLS
measurements can be performed inside individual compartments of a microfluidic chip in a volume as
small as 24 nL and allows to follow the nucleation process during protein crystallization.
2.2.3.3 Towards a Phase Chip for controlled navigation in phase diagram
The results demonstrate that the nucleation of protein crystals can be observed by DLS in the PDMS
chip. However, the used PDMS design does not provide a high degree of flexibility in controlled
positioning the protein solution in the phase diagram. The solution in the chip undergoes a typical path
in the phase diagram, as known from other vapor diffusion approaches. In order to enable controlled
navigation in the phase diagram by using a microfluidic device, like it can be done with the
XtalController (2.1), a more complex chip design has to be used. By introducing a permeable
membrane into the chip which separates the crystallization compartment from a reservoir, a reversible
concentration and dilution of the crystallization condition becomes possible by changing the

CHAPTER 2.2: DLS IN MICROFLUIDIS
52
Concentration of the reservoir solution (Figure 2-15) (Shim et al., 2007). Thus, immediately after
entering the nucleation zone in the phase diagram the supersaturation can be reduced to keep the
solution in the meta-phase and thereby to facilitate crystal growth. The water flux through a PDMS
membrane with a thickness of 15 μm to dry air is about 2 nL per hour in a 100 µm by 100 μm surface
area of PDMS membrane (Shim et al., 2007). To allow this mass exchange rate, the established chip
design permitting for DLS measurements was extended to a phase chip approach (for preparation see
Figure 2-18: Automated DLS measurements in a microfluidic PDMS chip with optimized design.
[A] Microscopic images of the crystallization process and the concentration of the solution over time. Initial microcrystals can be observed after 4 hours. [B] Hydrodynamic radius distribution over time of the Thaumatin particles during the crystallization process. The formation of a second radius fraction, indicating initial nucleation events can be seen after approximately 2 hours. [C] Surface presentation of the recorded ACF of the DLS measurements over time.

CHAPTER 2.2: DLS IN MICROFLUIDIS
53
section 2.2.2.4). In order to preserve the good optical properties for the DLS laser, the chip needs to
be bonded on a glass slide. Therefore, the structures of the crystallization compartments are stamped
in a thin epoxy film directly on the glass slide. For the reservoir structure a PDMS mold is casted and
the reservoir side is sealed with the thin permeable PDMS membrane. Finally, both parts are combined
to assemble the complete phase chip. A photographic documentation of the individual steps is shown
in Figure 2-19.
A critical parameter for the stability of the chip is the design of the reservoir structures. Support
structures have to be embedded inside the reservoir, in order to support the thin PDMS membrane. If
these are not present, pressure fluctuations during loading of the chip can easily disrupt the
membrane. Four different types of reservoir structures have been tested and preliminary experience
from the manufacturing process suggest that the design number 3 in Figure 2-19 is most suitable. The
architecture combines a large reservoir surface, needed for rapid exchange between crystallization
wells and reservoir, with sufficiently large support structures for the PDMS membrane.
Instead of using several separated reservoir channels also a microfluidic gradient structure could be
used to induce a concentration gradient over the chip area. The usablility of the Phase Chip has to be
further elucidated with precise microfluidic pumps that are needed for chip filling and continuous and
controlled exchange of the reservoir condition during the crystallization experiment.
Figure 2-19: Photographic presentation of the individual steps of Phase Chip preparation. The chip contains three components, the reservoir structure casted as a PDMS mold, the crystallization wells imprinted in epoxy on a glass slide and a thin PDMS membrane between both to allow for water exchange. The final Phase Chip facilitates in-chip DLS measurements to get feedback information about the crystallization processes during controlled navigation in the phase diagram.

CHAPTER 2.2: DLS IN MICROFLUIDIS
54
2.2.4 Conclusion
It could be shown that DLS measurements can be successfully performed inside a microfluidic device
in individual wells with a volume of 24 nL. Furthermore, an optimized chip design facilitates automated
measurements in over hundred different crystallization wells, which allows for simultaneous
monitoring of the crystallization processes in multiple buffer conditions while keeping the sample
consumption low. The integration of an evaporation zone facilitates long term measurements without
disturbing the DLS measurement itself. However, determining the concentration of protein and
precipitant during the crystallization experiment is not as straight forward as with the XtalController,
where the required information about changes in the droplet are obtained from the microbalance.
Measuring the volume of the droplet in the microfluidic chip during shrinking, based on an automated
evaluation of the microscope images using software like ImageJ, can possibly circumvent this limitation
in the future.
In general, up to now the qualitative and quantitative evaluation of the crystallization process in
microfluidic device is solely based on visual inspection with a microscope. By measuring DLS in
microfluidic devices highly valuable feedback information can be obtained. In combination with the
presented microfluidic Phase-Chip, it results in a high degree of flexibility when charting a course
through the phase diagram. After this first proof-of-principle measurements, this method can be
further extended by exchanging the PDMS membrane with a regenerated cellulose dialysis membrane.
This would allow for a change of the precipitant composition, addition of cryo-protectant after crystal
formation or introduction of ligands for crystal soaking experiments.

CHAPTER 3: DISTINGUISHING NANOCRYSTALS FROM AGGREGATES
55
CHAPTER 3
RELIABLY DISTINGUISHING PROTEIN NANOCRYSTALS FROM AMORPHOUS
PRECIPITATE BY DEPOLARIZED DYNAMIC LIGHT SCATTERING
3.1 Introduction
The interest in protein nano- and microcrystals for protein structure determination did substantially
increase over the last years. This is particularly related to the invention of a revolutionary new method
called serial femtosecond X-ray crystallography (SFX) (Chapman et al., 2011; Schlichting, 2015; Martin-
Garcia et al., 2016). For SFX ultrashort X-ray pulses of very high brilliance produced by X-ray free
electron lasers (XFELs) are focused on protein micro- or nanocrystals. From each exposed crystal in
random orientation only one single diffraction image can be recorded. Because all atoms inside the
crystal are fully ionized by the transferred electromagnetic energy of the FEL X-ray pulse, the crystal is
destructed by a coulomb burst. However, the exposure time to record a diffraction pattern is short
enough to record a single image before the atoms have significantly moved (Chapman et al., 2011;
Neutze et al., 2000). Consequently, several thousand crystals have to be exposed by X-rays in random
orientation and all single diffraction pattern have to be merged in order to obtain a complete dataset
(Boutet et al., 2012; Liu et al., 2013; White et al., 2012). Because of this, the conventional goal in
protein crystallization to produce one single large protein crystal is shifted to the production of
thousands of nano- or microcrystals with homogeneous size, when SFX experiments are performed.
Additionally, a careful sample characterization and verification is essential in order to use XFEL beam
time most effectively. So far, quality assessment of sample suspensions used for SFX data collection
relies on time and labor intensive interpretation of electron-microscopy images or powder diffraction
patterns.
Therefore, the development of novel, fast and reliable methods for nanocrystal preparation and
quality control are of great demand. Crucial properties in the characterization of nanocrystal
suspensions are the size distribution of the crystals, the total amount and concentration of the crystals
in the suspension and the quality in terms of internal order. For the preparation of protein nanocrystals
several methods have been developed including batch methods (Wu et al., 2015), crushing of larger
crystals (Stevenson et al., 2014b; Stevenson et al., 2014a), free interface diffusion (Kupitz et al., 2014)
CHAPTER 3: DISTINGUISHING NANOCRYSTALS FROM AGGREGATES
56
and manipulative techniques using vapor diffusion as described in section (2.1). Additionally, in vivo
crystallization in SF9 insect cells has been successfully used for SFX experiments (Koopmann et al.,
2012; Redecke et al., 2013), although the application of in vivo crystallization to a variety of proteins
still needs to be evaluated.
Up to now, methods for identification and characterization of nano- or microcrystals are mainly limited
to ultraviolet fluorescence (Dierks et al., 2010), second harmonic generation (SHG) (Wampler et al.,
2008), X ray powder diffraction (Dreele, 2007) and electron microscopy (Stevenson et al., 2014b;
Falkner et al., 2005). All these methods have a great potential, but also suffer from some fundamental
limitations. So far only crystals with low symmetry and considerable size produce a sufficiently intense
second harmonic (SHG) signal that can be detected (Kissick et al., 2011). For ultraviolet fluorescence
the recorded intensity greatly depends on the number of disulfide bonds or aromatic residues within
the macromolecule, and for electron microscopy a labor-intensive sample preparation involving
chemical crosslinking is required. Therefore, X-ray powder diffraction is still the most powerful method
for sample characterization, because it provides qualitative information about the protein crystals.
However, it is an invasive method which requires a rather large sample volume and a readily available
X-ray source.
In this chapter, an alternative novel and non-invasive method is presented which is called depolarized
dynamic light scattering (DDLS). Its potential to identify the presence of nanocrystals already in early
stages of the crystallization process is tested. The detection method is based on optical properties like
birefringence that leads to the ability of crystalline material to depolarize laser light. Birefringence can
be defined as a variation in refractive index, sensitive to direction in a geometrically ordered material.
The detected depolarized signal in the DDLS instrument is a combination of form birefringence and
intrinsic birefringence (Oldenbourg & Ruiz, 1989; Bragg & Pippard, 1953). The first, form birefringence,
is a result of the crystal morphology itself, while the latter, intrinsic birefringence, is based on the
anisotropy of the individual macromolecules in the crystal lattice (Owen & Garman, 2005). In the
presented DDLS method a crystallization experiment is monitored online and the number of
depolarized and polarized photons from the scattered light is quantitatively analyzed. By this, it
becomes possible to distinguish between the initial growth of ordered crystal and amorphous
precipitation in solution. Additionally, the obtained results can give further information about the
suggested theory of a two-step nucleation mechanism with a transition to a higher concentration prior
to a transition to a higher order (Vekilov, 2004). This becomes possible, because the DLS signal reports
about a formation of protein-dense liquid clusters, while the detected depolarized DLS signal
specifically reports about the transition to a higher order within these clusters.

CHAPTER 3: DISTINGUISHING NANOCRYSTALS FROM AGGREGATES
57
3.2 Material and Methods
3.2.1 Sample preparations
Crystallization trials with various proteins as well as a set of measurements with different reference
samples have been performed with the newly constructed DDLS instrument (in collaboration with
XtalConcepts, Hamburg, Germany) in order to investigate the capabilities of the instrument to monitor
the nucleation and growth of protein nanocrystals.
Adjusting the DDLS setup was performed by using anisotropic gold nanoparticles (A12-25-600 and
A12-40-750), in the following referred as Au-600 and Au-750, which have been obtained from the
company Nanopartz (Loveland, USA). The particle solutions have been diluted with ultrapure water to
a concentration of approximately 2.1 x 10¹⁰ particles mL-1 and were sonicated (ultrasonic bath,
Branson, Danbury, USA) for 10 min before use for shape determination experiments by DDLS.
The isotropic particle counter standards (3020A, 3K-400, 3K-600, 3K-1000 and 4K-02) have been
purchased from Sigma-Aldrich (Taufkirchen, Germany). The initial particle concentration of 1 x 10⁹
particles mL-1 has been sequentially diluted after each measurement with ultrapure water, until a DLS
signal intensity below 100 kHz was reached.
The proteins lysozyme (Gallus gallus), thaumatin (T. daniellii) (both Sigma-Aldrich, Taufkirchen,
Germany) as well as glucose isomerase (Streptomyces rubiginosus) (Hampton Research, Aliso Viejo,
USA) have been purchased. The protocol for the production and purification of the protein thioredoxin
(W. bancrofti) has been described in section 1.2.1. All final protein concentrations are verified
photometrically using a Nanodrop ND-2000 (Thermo-Scientific, Erlangen, Germany) and are listed
conjointly with all used buffers in Table 4.
3.2.2 Batch crystallization in a DDLS cuvette
For online monitoring of nucleation and crystals growth via DDLS, the protein crystals were grown
within a small cuvette (101.015-QS, Hellma Analytics, Müllheim, Germany). By siliconizing the cuvette,
capillary effects at the inner edges of the cuvette have been avoided. For the siliconization the cuvette
was incubated for 1 min in an isopropanol solution containing silicone (Serva Electrophoresis,
Heidelberg, Germany). Consequently, the surface of the solution can be considered to be equal to the
base area of the cuvette, which is 9 mm2, and thereby extensive evaporation is prevented. After
removing the cuvette remaining isopropanol was evaporated, the cuvette was washed with ultrapure
water and dried prior usage. For the crystallization experiments all protein solutions have been
centrifuged for 15 min at 16100 x g at 20 °C. After this, 20 µL of the buffered protein solution were
pipetted into the cuvette, the cuvette was placed in the holder of the DDLS instrument and the initial

CHAPTER 3: DISTINGUISHING NANOCRYSTALS FROM AGGREGATES
58
hydrodynamic radius of the investigated protein was determined. To induce supersaturation of the
protein solution, the corresponding precipitant was pipetted into the cuvette and the solution was
thoroughly mixed. For all proteins the individual precipitant conditions as well as the used volumes are
listed in Table 4. All utilized solutions were prepared using ultrapure water and have been filtered
through a 0.2 µm filter (Sartorius, Göttingen, Germany) before use. The DLS and DDLS measurements
have been performed continuously at 20 °C with a duration of 30 s and a time interval of 30 s between
consecutive measurements.
Table 4: Batch crystallization conditions of all investigated proteins with space groups of the resulting crystals.
Protein Protein
concentration Protein buffer precipitant
Precipitant
volume
added
Space group
and PDB
code
Lysozyme (Hen
egg white
lysozyme, Gallus
gallus)
100 mg mL-1 100 mM sodium
acetate, pH 4.3
0.9 M sodium chloride,
1 % PEG8000, 0.1 M
sodium acetate, pH 3
20 µL P43212
Thioredoxin
(Wuchereria
bancrofti)
30 mg mL-1
20 mM Tris-HCl,
5 mM EDTA,
150 mM NaCl,
pH 8.0
27.5 % PEG1500, 100
mM SPG buffer, pH 6.3 20 µL P41212
Thaumatin
(Thaumatococcus
daniellii)
34 mg mL-1 50 mM Bis-Tris,
pH 6.5
0.5 M sodium tartrate,
50 mM Tris, pH 6.8 20 µL I4222
Glucose
isomerase
(Streptomyces
rubiginosus)
28 mg mL-1
10 mM HEPES,
1 mM MgCl2,
pH 7.0
100 mM Bis-Tris, 2.7 M
ammonium sulfate,
pH 5.7
35 µL I222
Glucose
isomerase
(Streptomyces
rubiginosus)
28 mg mL-1
10 mM HEPES,
1 mM MgCl2,
pH 7.0
100 mM Bis-Tris, 1.35
M ammonium sulfate,
pH 5.7
30 µL I222
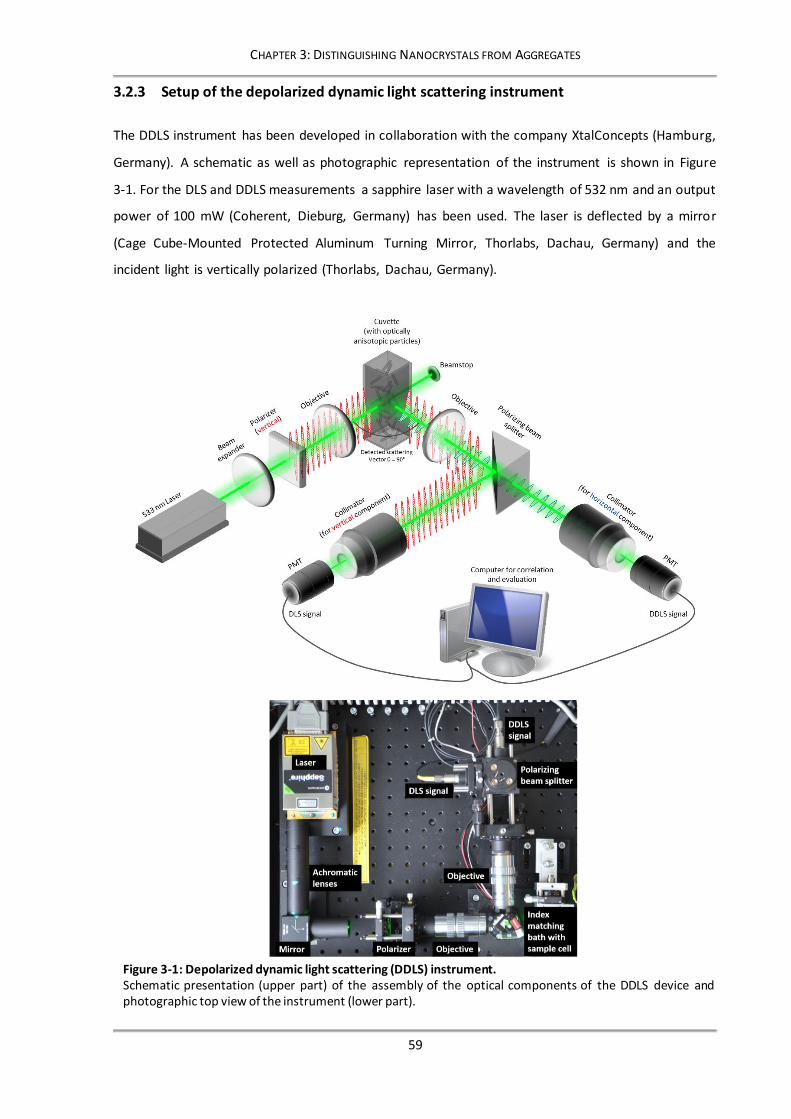
CHAPTER 3: DISTINGUISHING NANOCRYSTALS FROM AGGREGATES
59
3.2.3 Setup of the depolarized dynamic light scattering instrument
The DDLS instrument has been developed in collaboration with the company XtalConcepts (Hamburg,
Germany). A schematic as well as photographic representation of the instrument is shown in Figure
3-1. For the DLS and DDLS measurements a sapphire laser with a wavelength of 532 nm and an output
power of 100 mW (Coherent, Dieburg, Germany) has been used. The laser is deflected by a mirror
(Cage Cube-Mounted Protected Aluminum Turning Mirror, Thorlabs, Dachau, Germany) and the
incident light is vertically polarized (Thorlabs, Dachau, Germany).
Figure 3-1: Depolarized dynamic light scattering (DDLS) instrument. Schematic presentation (upper part) of the assembly of the optical components of the DDLS device and photographic top view of the instrument (lower part).
CHAPTER 3: DISTINGUISHING NANOCRYSTALS FROM AGGREGATES
60
After expanding the beam by a factor of two, using two achromatic lenses, it is focused into the sample
cell by an objective (Plan APO ELWD 20x 0.42 WD=20) in order to obtain a small DLS measurement
volume. The sample cuvette (3 x 3 x 21 mm) was placed in an index matching bath with plane parallel
walls (thickness 1 mm) and a size of 5 mm around the focal point, which was filled with prefiltered (0.2
µm Filter, Sartorius, Göttingen, Germany) ultrapure water. The focal spot of the laser and detector
channel have been aligned by two tilt adjusters. A scattering angle of 90° was used and the scattered
light was collected by an objective (Plan APO ELWD 20x 0.42 WD=20), resulting in a scattering vector
q of 2.22 × 10⁷ m−1 or 4.5 10-8 m-1 for a wavelength of 532 nm and a refractive index of 1.33. The
collected scattered light was separated by a polarizing beam splitter (Qioptic Photonics, Göttingen,
Germany) into the horizontally and vertically polarized components providing the depolarized (DDLS)
and polarized (DLS) signal, respectively. The light was than guided from the beam splitter to the
photomultiplier tubes (Hamamatsu, Herrsching am Ammersee, Germany) by fiber cables. The
autocorrelators of the DDLS instrument have been manufactured by XtalConcepts (Hamburg,
Germany) and cover a sample time range from 0.4 μs to 30 s.
3.2.4 Evaluation of the depolarized dynamic light scattering data
For the evaluation of the DLS measurements the refractive index of water (1.33) was used, because all
investigated sample solutions were aqueous. From the autocorrelation functions (ACF) of the DLS and
DDLS signal the decay time constants of the translational diffusion and rotational diffusion are derived
by using the CONTIN algorithm (Provencher, 1982), respectively. From this, the translational diffusion
constant Dt is derived by the Stokes–Einstein equation,
The rotational diffusion constant Dr can be determined from the rotational decay time constant by the
Stokes-Einstein-Debye equation,
For both equations KB is the Boltzmann constant, η is the viscosity, T is the temperature and r is the
particle radius. Consequently, both diffusion constants, Dr and Dt, were measured independently by
this method. Because of this, DDLS can be used to obtain shape information (e.g. of gold nanoparticles)
in solution by approximating the particles as rotational ellipsoids. The particle radius (r) is replaced by
two minor half-axes (a1 and a2) and one major half-axis (b) as shown in Figure 3-2. The values can be
calculated by an iterative procedure applying Perrin’s equation that has been previously described in
detail (Chayen et al., 2004).
𝑫𝒕 =𝒌𝑩𝑻
𝟔𝝅𝜼𝒓 . (2)
𝑫𝒓 =𝒌𝑩𝑻
𝟖𝝅𝜼𝒓𝟑 . (3)

CHAPTER 3: DISTINGUISHING NANOCRYSTALS FROM AGGREGATES
61
3.2.5 Second harmonic generation and ultraviolet two-photon excited fluorescence
Second harmonic generation is a specific signal that only occurs if laser light passes a chiral crystalline
material. Testing the batch crystallization samples from the DDLS experiments on the presence of
crystalline material has been performed using the SONICC instrument (Formulatrix, Bedford,
Germany). For this, 400 nL of each individual sample were pipetted onto a Lipid Cubic Phase Sandwich
Set (Hampton Research, Aliso Viejo, USA) and the individual wells have been sealed with siliconized
cover slips. Images were recorded in bright field (exposure time: 15 ms), ultraviolet two-photon excited
fluorescence (UVTPEF) (laser intensity: 37 mW, exposure time: 1.789 s) and SHG mode (laser intensity:
195 mW, exposure time: 1.789 s) with a gain of 1.
3.2.6 X-Ray diffraction analysis
The DDLS samples have also been analyzed by X-ray powder diffraction to analyze and verify
crystallinity. For this, 20 μL of each sample suspension from an DDLS experiment were transferred from
the cuvette to a quartz capillary tube with a diameter of 0.3 µm (HR6-108, Hampton Research, Aliso
Viejo, USA) and solid components of the sample were pelletized by centrifugation (20 min, 3600 x g).
After cutting the capillaries to appropriate length by a capillary stone (Hampton Research, Aliso Viejo,
USA) they were sealed with wax (Harvard Dental International). Diffraction images were recorded after
mounting the capillary onto a 3-axis goniometer and aligning the sample pellet in the X-ray beam. A
MAR image plate detector in combination with a Rigaku RU 200 X-ray generator (Cu Kα = 1.54 Å) was
used to record powder diffraction pattern at room-temperature. Each sample was exposed to X-rays
for 20 min and oscillated for 2 degrees during exposure. The sample to detector distance was 250 mm.
Figure 3-2: Approximating particles as rotational ellipsoids. Two minor half-axes (a1 and a2) and one major half-axis (b) are introduced to distinguish between prolate and oblate particle shapes.
CHAPTER 3: DISTINGUISHING NANOCRYSTALS FROM AGGREGATES
62
3.2.7 Scanning electron microscopy
For evaluating the sample content of the DDLS experiments by scanning electron microscopy the
sample needs to be stabilized by chemical cross-linking. For this, 15 µL of each solution were
transferred into a 1.5 mL Eppendorf tube and centrifuged for 5 min at 2600 x g. After discarding the
supernatant 1 mL of the sample buffer, containing the final precipitant concentration supplemented
with 2.5 % (w/v) glutaraldehyde, were added to the tube and the solution was mixed thoroughly. The
samples were incubated for 48 hours at room-temperature and have been centrifuged for 5 min at
2600 x g, subsequently. The supernatant was replaced by ultrapure water and the washing process
was repeated two times. The washed crystal pellet was resuspended in 50 µL ultrapure water. For
preparing the microscopy specimens, 5 µL of the aqueous crystal solution was pipetted and dried onto
round glass cover slips (10 mm diameter). The cover slips were fixed on SEM specimen mount stubs
(Electron Microscopy Sciences, Hatfield, USA) and the sample has been sputtered with a thin film of
gold by using a Q150T Sputter coater (Quorum Technologies, Laughton, UK) in order to reduce charging
during electron microscopy. Scanning electron microscopy images were recorded using a FEI XL-30
Environmental Scanning Electron Microscope which was operated at 15 kV with a specimen distance
of 6 mm.
3.3 Results and Discussion
3.3.1 Characterizing size and shape of nanoparticles
The functionality of the experimental setup was verified by using anisotropic gold nanoparticles
(section 3.2.1). These particles are a good reference control, because their dielectric constant leads to
a strong depolarized component of the scattered light. The recorded autocorrelation functions reveal
that the dominant decay time constant of the DLS autocorrelation function (ACF) is 183.9 ± 26.5 µs
and 112.6 ± 36.3 µs, for Au-600 and Au-750 respectively. Thereby, for Au-600 it is 97.8 µs and for
Au-750 it is 144.6 µsec slower in comparison to the DDLS ACF (14.8 ± 4.5 for Au-600 and 39.3 ± 8.6 µs
for Au-750) (Table 5). The mean signal intensity from 10 measurements of the Au-600 sample was
16327 ± 594 photons per second in the DLS channel and 3088 ± 164 photons per second in the DDLS
channel. Similar values were obtained for the Au-750 sample (DLS: 12925 ± 495 photons s-1; DDLS:
3950 ± 129 photons s-1). Using the decay time constants of the gold nanoparticles, the shape of the
particles can be calculated in an iterative procedure visualized in Figure 3-3. Several values for the
semiaxis a are tested and a correct solution is defined when an intercept of semiaxis b is found with
the same semiaxis a value for the translational and rotational diffusion constants.

CHAPTER 3: DISTINGUISHING NANOCRYSTALS FROM AGGREGATES
63
Table 5: DDLS results of gold nanorods Au-600 and Au-750. Measurement parameters are DLS and DDLS signal intensities (count rates Г) as well as translational and rotational time constants (τ). Calculated diameter and length of the particles in comparison to the values provided by the manufacturer (Nanopartz), shown in parentheses.
Sample Г tr. [kHz] Г rot. [kHz] τ tr. [µs] τ rot. [µs] Semi axis a [nm] Semi axis b [nm] Aspect
ratio
Au-600 16327 ± 594 3088 ± 164 112.6 ± 36.3 14.8 ± 4.5 17.6 ± 8.5 (12.5) 44.1 ± 1.7 (23.5) 2.5 (1.9)
Au-750 12925 ± 495 3950 ± 129 183.9 ± 26.5 39.3 ± 8.6 30.75 ± 9.7 (20) 56.0 ± 4.3 (69) 1.8 (3.5)
By this, for Au-600 the length of the minor half-axis was determined to be 17.6 nm ± 8.5 nm and the
length of the major half-axis was calculated to be 44.1 nm ± 1.7 nm, as shown in Figure 3-3 A. For
Au-750 rod shaped particles with a minor half-axis of 30.8 nm ± 9.7 nm and a major half-axis of 56.0
nm ± 17.4 nm was identified (Figure 3-3 B). The identified size dimensions are in acceptable agreement
Figure 3-3: Size and shape determination based on the autocorrelation function (ACF) recorded by the DDLS instrument of the translational (black) and rotational (red) diffusion. [A] The rotational (red) and translational (black) diffusion time constants of the Au-600 sample are taken for the iterative shape determination procedure by testing several values for the semiaxis a (in blue). A correct solution is defined when an intercept of semiaxis b (green line) is found with the same semiaxis a value (between 15 nm and 20 nm) for the translational and rotational diffusion constants. [B] Similar procedure as
described in [A] for Au-750.

CHAPTER 3: DISTINGUISHING NANOCRYSTALS FROM AGGREGATES
64
with those provided by the manufacturer, determined with transmission electron microscopy (values
are listed in Table 5). The measurements with both gold nanoparticles validate that the DDLS setup is
adjusted correctly. Additionally, it demonstrates that DDLS could be used as a valuable method to
determine the shape of biological particles like viruses or even protein monomers, after further
optimization of the instrument for this approach.
3.3.2 Contribution of multiple scattering to depolarized signal
The detected DDLS signal intensity depends on the intensity of the incoming laser light, the radius and
concentration of the sample and the ability of the sample to turn the polarization plane. At high sample
concentrations multiple scattering might occur and can easily dominate the DDLS signal. Therefore,
perfectly isotropic particles, which provide a very weak DDLS signal, are used to determine the
contribution of multiple scattering to the intensity of the depolarized signal. The monodisperse
isotropic particles are polystyrene spheres with well-defined size (Sample diameter: 20 nm, 400 nm,
600 nm, 1000 nm and 2000 nm). From each sample a serial dilution was prepared and the DLS as well
as the DDLS signal intensities was measured from all concentrations. By plotting the fraction of the
DDLS signal from the DLS signal against the particle concentration a strong dependence becomes
apparent (Figure 3-4). The reason for this is, that multiple scattering occurs at higher particle
concentrations and leads to an increase of the DDLS signal in respect to the DLS signal. Additionally, a
disproportional dependency on the particle size becomes apparent for particle concentrations where
multiple scattering dominates the depolarized signal. Because larger particles scatter more light,
multiple scattering already occurs at lower particle concentrations. Consequently, the measured DLS
signal intensity, which is proportional to the amount of scattered light, can be used to identify a
threshold indicating when multiple scattering dominates the recorded depolarized signal. From the
performed experiments with isotropic particles it can be seen, that the fraction of the DDLS signal
remains constantly small as long as the DLS intensity remains below 5000 photons per second (kHz).
This is represented as a roughly horizontal line connecting each measured concentration in Figure 3-4.
In contrast, multiple scattering leads to a strong increase in the fraction of the DDLS signal, as observed
in measurements of higher particle concentrations with DLS signal intensities above 5000 kHz, shown
as empty squares in Figure 3-4. Because the refractive index of protein crystals (tetragonal lysozyme:
1.54-1.58 at 589 nm (Cervelle et al., 1974)) and the used isotropic polystyrene spheres (polystyrene
spheres: 1.59 at 589 nm) is in the same range, the identified DLS signal intensity threshold of 5000 kHz
can be applied for all experiments of monitoring protein crystallization. Consequently, in the following
measurements are only considered, when the DLS signal intensity stays well below 5000 kHz.
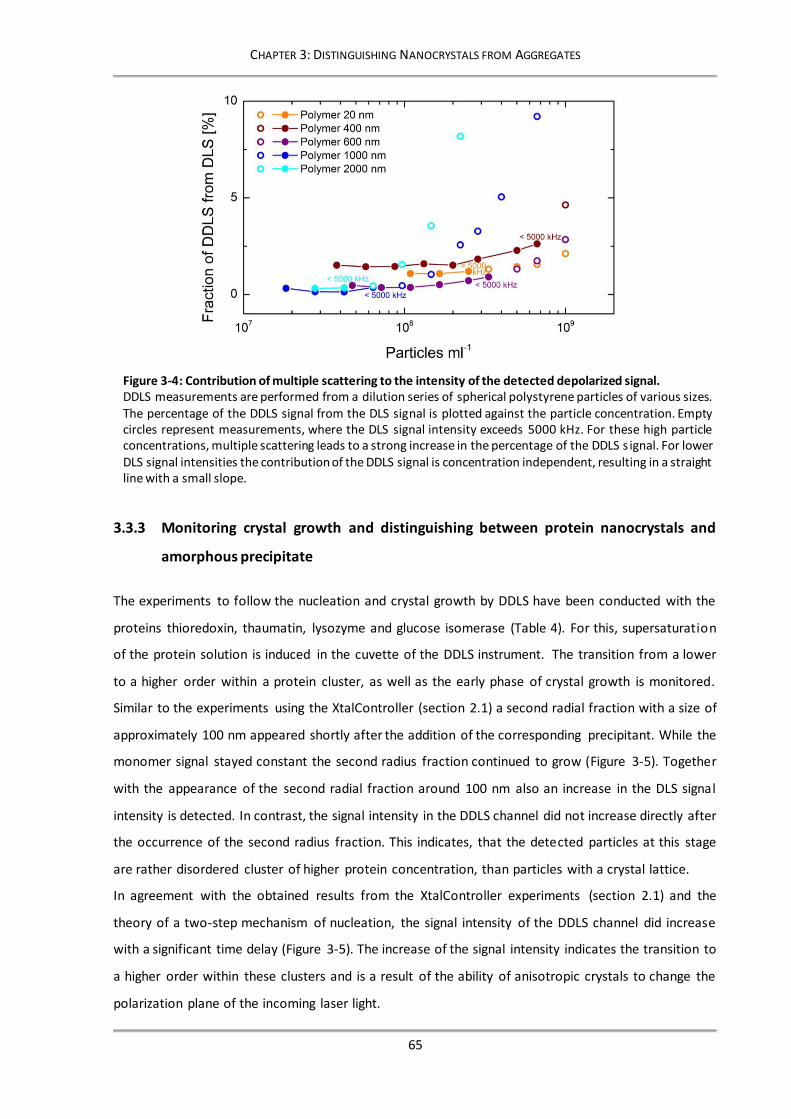
CHAPTER 3: DISTINGUISHING NANOCRYSTALS FROM AGGREGATES
65
3.3.3 Monitoring crystal growth and distinguishing between protein nanocrystals and
amorphous precipitate
The experiments to follow the nucleation and crystal growth by DDLS have been conducted with the
proteins thioredoxin, thaumatin, lysozyme and glucose isomerase (Table 4). For this, supersaturation
of the protein solution is induced in the cuvette of the DDLS instrument. The transition from a lower
to a higher order within a protein cluster, as well as the early phase of crystal growth is monitored.
Similar to the experiments using the XtalController (section 2.1) a second radial fraction with a size of
approximately 100 nm appeared shortly after the addition of the corresponding precipitant. While the
monomer signal stayed constant the second radius fraction continued to grow (Figure 3-5). Together
with the appearance of the second radial fraction around 100 nm also an increase in the DLS signal
intensity is detected. In contrast, the signal intensity in the DDLS channel did not increase directly after
the occurrence of the second radius fraction. This indicates, that the detected particles at this stage
are rather disordered cluster of higher protein concentration, than particles with a crystal lattice.
In agreement with the obtained results from the XtalController experiments (section 2.1) and the
theory of a two-step mechanism of nucleation, the signal intensity of the DDLS channel did increase
with a significant time delay (Figure 3-5). The increase of the signal intensity indicates the transition to
a higher order within these clusters and is a result of the ability of anisotropic crystals to change the
polarization plane of the incoming laser light.
Figure 3-4: Contribution of multiple scattering to the intensity of the detected depolarized signal. DDLS measurements are performed from a dilution series of spherical polystyrene particles of various sizes. The percentage of the DDLS signal from the DLS signal is plotted against the particle concentration. Empty circles represent measurements, where the DLS signal intensity exceeds 5000 kHz. For these high particle concentrations, multiple scattering leads to a strong increase in the percentage of the DDLS s ignal. For lower DLS signal intensities the contribution of the DDLS signal is concentration independent, resulting in a straight line with a small slope.

CHAPTER 3: DISTINGUISHING NANOCRYSTALS FROM AGGREGATES
66
It is important to mention, that a contribution of multiple scattering to the DDLS signal intensity can
be neglected because the DLS signal intensity remains well below the identified threshold of 5000 kHz.
Additionally, a control experiment was conducted with glucose isomerase where a precipitant
concentration was chosen that is known to produce amorphous precipitate instead of protein crystals
(Echalier et al., 2004). As expected no increase in the DDLS signal intensity was observed during the
whole experiment. This demonstrates that no DDLS signal is detected from amorphous aggregates,
whereas anisotropic crystals give a strong DDLS signal.
After performing the experiments in the cuvette of the DDLS instrument a small volume of each sample
was sequentially diluted with the appropriate crystallization solution. By this, it was confirmed that the
increase in the DDLS signal intensity is not attributed to multiple scattering. It can be seen that after
diluting the sample back below a DLS signal intensity of 5000 kHz, the percentage fraction of the DDLS
signal intensity from the DLS signal for the lysozyme sample was constantly around 2.5 % (Figure 3-6).
In contrast, no significant DDLS signal was recorded after dilution of the glucose isomerase sample.
Figure 3-5: Radius distribution and signal intensity evolution for DLS and DDLS over time. The upper graph shows the radius distribution of the proteins (a) thioredoxin, (b) thaumatin, (c), lysozyme and (d) glucose isomerase. The radius in the beginning of the experiment is representing the monomeric protein. A second radius fraction with a size of around 100 nm occurs after addition of the precipitant (black arrows) and was slowly increasing further. The corresponding signal intensities for the polarized (black) and depolarized (red) signal are shown in the lower graphs. An increase in the DDLS signal intensity can be detected for thioredoxin, thaumatin and lysozyme towards the end of the experiments, while the DLS signal intensity was still well below 5000 kHz. No increase in the DDLS signal intensity was detected for glucose isomerase. (reprinted with permission of the IUCr Journal of Applied Crystallography from Schubert et al.,
2015).

CHAPTER 3: DISTINGUISHING NANOCRYSTALS FROM AGGREGATES
67
Additionally, the DDLS signal intensity of the strongly depolarizing gold nanorods is shown for
comparison. After dilution of the Au-650 sample below a signal intensity of 5000 kHz the DDLS fraction
of the DLS signal was around 7.5 % (Figure 3-6).
3.3.4 Verification of DDLS results with complementary methods
Following the crystallization experiments in the DDLS instrument, aliquots of each sample were
investigated by using X-ray powder diffraction, bright field imaging, second harmonic generation
imaging, intrinsic fluorescence imaging, and scanning electron microscopy. Microscopy analysis in
bright field mode revealed, that granular particles with a size of a few micrometers were found in the
samples of thioredoxin, thaumatin and lysozyme (Figure 3-7 B). Additionally, intrinsic fluorescence was
detected from these particles by ultraviolet two-photon excited fluorescence (Figure 3-7 D). In
contrast, only some faint particles, which cannot be identified to be crystalline, are visible in the bright
field image of glucose isomerase. Also the fluorescence signal was less defined compared to the other
samples. The intensity of the recorded second harmonic generation (SHG) signal strongly depends on
the symmetry as well as the orientation of the crystal. The intensity of a SHG signal decreases with
increasing symmetry of the crystal. The crystals of thioredoxin, lysozyme and thaumatin have a
tetragonal space group (Table 4) and consequently a very weak SHG signal is expected, in particular if
the crystals are small. Only from glucose isomerase, which is expected to crystallize in an orthorhombic
space group, a strong SHG signal can be seen in the control experiment (Figure 3-7 C). However, in all
samples from the DDLS experiments no SHG signal is detected in the images recorded with the SONICC
Figure 3-6: Evaluation of the contribution of multiple scattering to the DDLS signal intensity in the crystallization experiments. A serial dilution was performed from the lysozyme (red) and glucose isomerase (green) sample after the experiments in the DDLS cuvette. Measurements with DLS signal intensities larger than 5000 kHz are displayed in empty symbols. For lysozyme a DDLS signal intensity of around 2.5 % was determined, while no significant DDLS signal was recorded for glucose isomerase after dilution below a DLS signal intensity of 5000 kHz. For comparison Au-650 (blue) is shown to provide a DDLS signal intensity of around 7.5 %.
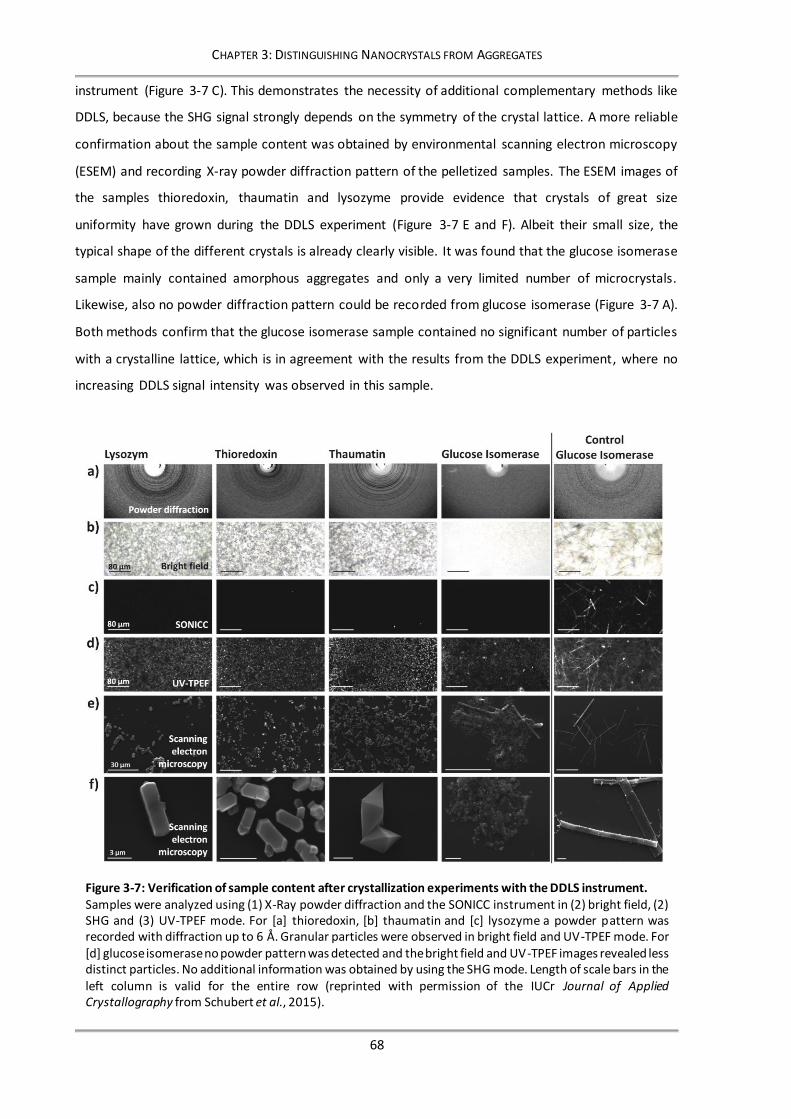
CHAPTER 3: DISTINGUISHING NANOCRYSTALS FROM AGGREGATES
68
instrument (Figure 3-7 C). This demonstrates the necessity of additional complementary methods like
DDLS, because the SHG signal strongly depends on the symmetry of the crystal lattice. A more reliable
confirmation about the sample content was obtained by environmental scanning electron microscopy
(ESEM) and recording X-ray powder diffraction pattern of the pelletized samples. The ESEM images of
the samples thioredoxin, thaumatin and lysozyme provide evidence that crystals of great size
uniformity have grown during the DDLS experiment (Figure 3-7 E and F). Albeit their small size, the
typical shape of the different crystals is already clearly visible. It was found that the glucose isomerase
sample mainly contained amorphous aggregates and only a very limited number of microcrystals.
Likewise, also no powder diffraction pattern could be recorded from glucose isomerase (Figure 3-7 A).
Both methods confirm that the glucose isomerase sample contained no significant number of particles
with a crystalline lattice, which is in agreement with the results from the DDLS experiment, where no
increasing DDLS signal intensity was observed in this sample.
Figure 3-7: Verification of sample content after crystallization experiments with the DDLS instrument. Samples were analyzed using (1) X-Ray powder diffraction and the SONICC instrument in (2) bright field, (2) SHG and (3) UV-TPEF mode. For [a] thioredoxin, [b] thaumatin and [c] lysozyme a powder pattern was recorded with diffraction up to 6 Å. Granular particles were observed in bright field and UV-TPEF mode. For [d] glucose isomerase no powder pattern was detected and the bright field and UV-TPEF images revealed less distinct particles. No additional information was obtained by using the SHG mode. Length of scale bars in the left column is valid for the entire row (reprinted with permission of the IUCr Journal of Applied Crystallography from Schubert et al., 2015).
CHAPTER 3: DISTINGUISHING NANOCRYSTALS FROM AGGREGATES
69
From the samples of thioredoxin, thaumatin and lysozyme, where an increase in the DDLS signal
intensity was observed, a powder diffraction pattern could be recorded (Figure 3-7 A). Powder
diffraction rings are visible up to a resolution of approximately 6 Å, which provide evidence that the
samples contain well-ordered protein crystals.
An additional experiment has been performed to verify, that the formation of amorphous aggregates
in the glucose isomerase sample is a consequence of the high precipitant concentration and not the
protein preparation itself. For this a 50 % diluted precipitant solution was used and the outcome of the
crystallization experiment demonstrates, that well-ordered needle-shaped protein crystals can be
produced using the same protein batch (Figure 3-7).
3.4 Conclusion
The results obtained from experiments performed with the newly developed depolarized dynamic light
scattering instrument demonstrate, that the translational and rotational decay time constants of gold
nanoparticles can be measured and used to determine the size and shape of gold nanoparticles.
Furthermore, by performing a set of measurements with isotropic polystyrene particles, the
contribution of multiple scattering to the recorded depolarized signal was identified. A particle
concentration dependent signal intensity threshold was determined and can be used to judge the bias
of multiple scattering on the DDLS signal. By applying this threshold, several batch crystallization
experiments could be performed and the formation of protein crystals could be followed. In particular,
it could be shown that DDLS represents the first method which allows distinguishing between well-
ordered crystalline particles and amorphous protein aggregates online and in solution. Additionally,
the measurements are non-invasive and non-destructive. In comparison with other methods DDLS has
a great potential in identifying and following the early stages of protein crystallization and the
formation of nanocrystals in solution in real time.
CHAPTER 4.1: MULTI-CRYSTAL DATA COLLECTION
70
CHAPTER 4
APPLICATIONS OF PROTEIN MICROCRYSTALS FOR SYNCHROTRON RADIATION
Although alternative methods like NMR and cryo-electron microscopy are available, X-ray
crystallography remains the most extensively used method for structure determination of biological
macromolecules. Over the last decades X-ray crystallography greatly helped to understand the
chemical mechanisms underlying biological functions. The field has revolutionized within the last years
upon the development of X-ray free electron lasers (FELs) and micro-focus crystallography beamlines
at synchrotron radiation (SR) sources. Today, high-resolution diffraction patterns can be already
obtained from well-ordered micro- and nanocrystals (Moukhametzianov et al., 2008; Weckert, 2015;
Neutze & Moffat, 2012; Spence et al., 2012; Gruner & Lattman, 2015; Chapman et al., 2011; Boutet et
al., 2012; Redecke et al., 2013; Riekel et al., 2005; Smith et al., 2012). In Chapter 2.1 and 2.2, new
methods were presented that can be used to prepare protein nano- and microcrystals and to follow
their nucleation and growth online. This chapter now presents potential applications of these
microcrystalline samples for X-ray crystallography.
4.1 A multicrystal data collection approach for studying structural dynamics with millisecond temporal resolution
4.1.1 Introduction
Although the sample handling has been automated at many microfocus beamlines by using crystal
mounting robots, mechanical stress is introduced to the crystals by sample transfer from the growth
environment as well as buffer and temperature changes. Sample handling is especially difficult for
fragile crystals and therefore several methods are proposed to minimize the extent of manual handling
during this procedure (Cipriani et al., 2012). Although diffraction data collection predominantly has
been performed at cryogenic temperatures, cryo-cooling can hinder straightforward data collection at
SR beamlines in some cases. Identification of the optimal composition of a cryo-protectant can be
cumbersome and may have a detrimental effect on crystal quality and its diffraction properties (Axford
et al., 2012), but also diminished conformational diversity and different conformations were observed
at cryogenic temperatures (Fraser et al., 2011; Juers & Matthews, 2004; Rasmussen et al., 1992; Tilton,
JR et al., 1992; Fraser et al., 2009). These effects can be minimized by new data collection strategies at

CHAPTER 4.1: MULTI-CRYSTAL DATA COLLECTION
71
room-temperature that additionally pave the road to follow biological reactions of proteins in a
crystalline lattice by kinetic crystallography. To address this, new sample mounting systems for in-situ
crystallography (McPherson, 2000) like microfluidic chips (Pinker et al., 2013; Guha et al., 2012; Perry
et al., 2013; Heymann et al., 2014; Mueller et al., 2015), low X-ray absorbing 96-well plates (Axford et
al., 2012; Kisselman et al., 2011), capillaries (Stellato et al., 2014) as well as other fixed targets
(Coquelle et al., 2015; Huang et al., 2015) have been developed in order to record diffraction pattern
from protein microcrystals at room-temperature.
Serial femtosecond crystallography (SFX) at free-electron laser radiation sources lead to the
development of a liquid jet technology to rapidly deliver microcrystals in suspension to the X-ray beam.
However, this sample delivery approach may not be applicable for many crystalline samples, because
of the relatively low hit rates as well as the high sample consumption (Redecke et al., 2013; Schlichting,
2015; Martin-Garcia et al., 2016). Therefore, a jet technology using viscous lipidic cubic phase (LCP) as
sample delivery medium has been realized to reduce sample consumption (Weierstall et al., 2014). In
contrast to liquid jets, which usually have a diameter of 5 µm and smaller, viscos jets are much harder
to focus and typically jet diameters of 25 µm and larger are used. Therefore, they result in an increased
overall background to noise ratio, with additional background scattering from the media used to
increase viscosity (Conrad et al., 2015). In general, the experimental approaches aiming to perform
serial crystallography with microcrystals at the more prevalent and readily accessible SR sources has
been catalyzed upon the success of the serial femtosecond crystallography at FELs (Gati et al., 2014;
Stellato et al., 2014; Botha et al., 2015; Nogly et al., 2015; Zander et al., 2015; Roedig et al., 2015;
Roedig et al., 2016).
Radiation damage can be either classified as specific or global and occurs at room-temperature to an
even higher extent and thereby limits the number of diffraction patterns that can be recorded from
one single protein crystal. Typically, the total X-ray dose is spread over the ensemble by collecting data
from a large number of crystals. At a third generation SR source micro-focus beamline the X-ray flux,
which is about 5 1012 photons per second with an energy of 12 keV, is focused to an area of a few µm2.
Consequently, the tolerated X-ray dose of each microcrystal at room-temperature is limited to a few
milliseconds exposure time to avoid significant crystal damage. Therefore, the diffraction data from a
succession of microcrystals is merged to acquire complete datasets. The success of the so far presented
methods for room-temperature micro-crystallography is limited either by the crystal quality which
suffers from the introduced mechanical stress or by the high sample consumption. In some of these
methods an increased background signal reduces the signal to noise ratio (Panneels et al., 2015; Liu et
al., 2013).

CHAPTER 4.1: MULTI-CRYSTAL DATA COLLECTION
72
In this chapter a minimalistic fixed target approach and a corresponding data collection protocol is
established that can be easily adapted at appropriate microfocus synchrotron beamlines. Additionally,
the used protocol minimizes the crystal manipulation prior to data collection and extirpates the need
for cryo-protectants, which in case no optimal cryo-protectant is found might reduce diffraction
quality. For this purpose, a kapton foil sandwich for in situ crystallization is used which requires only
one microliter of sample containing a few hundred microcrystals. The kapton sandwich is easily
mounted onto a plastic frame and can be directly used for diffraction data collection from microcrystals
at room-temperature. It is tested if high quality structural information and complete diffraction
datasets can be recorded by this approach when merging diffraction data from multiple crystals within
only a few minutes of beamtime. By choosing suitable X-ray beam attenuations or exposure times
significant radiation damage can be avoided. Additionally, the analysis of the data collected as
described here allows time-resolved observation of site specific radiation damage, structural changes
and possibly enzymatic reactions. To address the question, thaumatin from T. daniellii containing eight
intramolecular disulfide bonds is used as crystallization target, because it is a well characterized
standard protein in radiation damage studies (Garman, 2010).
4.1.2 Material and Methods
4.1.2.1 Sample preparations
Lyophilized thaumatin (T. daniellii) (Sigma Aldrich) was purchased and used without further
purification. It was dissolved to a final protein concentration of 34 mg mL-1 in a buffer containing 50
mM Bis-Tris, pH 6.5. The obtained protein concentration was verified photometrically by using a
Nanodrop (Thermo Scientific). For the precipitant and reservoir solution of the crystallization
experiment 1.3 M sodium tartrate and 50 mM Tris, pH 6.8 was used. All solutions were prepared using
ultrapure water, have been filtered through a 0.2 µm filter (Sartorius Stedim) and were centrifuged for
15 min at 16100 x g before use.
4.1.2.2 Setup of the fixed target kapton sandwich
Thaumatin was crystallized in a vapor-diffusion hanging drop approach on a pre-greased Linbro plate.
For the crystallization 2 µL reservoir solution and 2 µL protein solution were pipetted directly on an
8 µm thin kapton foil (American durafilm®) and the well was then sealed by a cover slip. To facilitate
assembly, a small drop of water was placed on the glass lid to aid mounting of the foil. Since both
Kapton foil and glass slide are hydrophilic the water droplet pulls foil and slide together through
capillary force. Since the mounting droplet evaporates away over a few hours, separation of slide and

CHAPTER 4.1: MULTI-CRYSTAL DATA COLLECTION
73
foil was trivial after crystallization. After a few hours multiple crystals with dimensions of 20 – 50 µm
were grown. Directly at the synchrotron beamline the cover slip was lifted, excessive grease was
removed and a second kapton foil layer was applied to seal the drop, resulting in a thin sample film
between both kapton layers. The sample is automatically prevented from drying out by the remaining
grease that seals the liquid between the kapton layers. The kapton-foil sandwich was either fixed on a
frame in SBS format, in case a plate goniometer was used for data collection, or it was fixed on a small
frame (1 cm x 1 cm) equipped with a base for an ordinary 3 axis goniometer by double sided adhesive
tape. Both types of frames have been produced by using a 3D printer (Ultimaker). The design of the
kapton foil sandwich and the process of sample mounting is illustrated in Figure 4-1.
4.1.2.3 Data collection and evaluation
Diffraction data collection was performed on EMBL beamline P14 at the DESY storage ring PETRA III
(Hamburg, Germany), using a micro focused X-ray beam with a size of 10 x 5 µm (FWHM of Gaussian
profile) at 293 K. The energy of the X-rays was 12.8 keV and a flux density of 2.2 1012 photons s-1 in
the non-attenuated beam were used. Diffraction pattern were recorded using a Pilatus 6M hybrid pixel
detector and either a kappa goniometer or a plate goniometer were used to rotate the chip mounted
on the frame. In each experiment 60 crystals of thaumatin were exposed to X-rays and 20 frames were
recorded from each crystal within 800 ms in shutterless operation. An exposure time per image of
40 ms was used, limited by the maximum frame rate of the detector. The frame with the kapton foil
was rotated by 1° during each exposure, resulting in a three-dimensional wedge rather than a thin slice
of the reciprocal lattice. By this, the amount of crystals needed to record a complete data set was
greatly reduced. Two separate data collections were performed from different set of crystals in order
to determine the maximum tolerated X-ray dose. For the first data collection run a transmission of
Figure 4-1: Schematic presentation of the experimental design of the kapton foil sandwich. The thaumatin protein was crystallized in a hanging drop vapor diffusion approach directly on a kapton foil. After the crystals were grown the foil was lifted, sealed with a second kapton foil and mounted on a frame using a double-sided tape.

CHAPTER 4.1: MULTI-CRYSTAL DATA COLLECTION
74
50 % (1.1 1012 photons s-1), while the transmission in the second run was further reduced to 5 %
(1.1 1011 photons s-1).
For the data evaluation each single diffraction pattern of thaumatin was individually processed using
the program XDS (Kabsch, 2010). For each time interval (frame) individual HKL files from all crystals
were created and scaled using the software XSCALE. The resulting correlation coefficients between
datasets from the individual crystals during scaling were larger than 90 %, which indicates a high
degree of isomorphism. The data processing was automated by using self-written bash scripts
(Appendix). The phases for model building were obtained by Molecular Replacement (Vagin &
Teplyakov, 2010) from the CCP4 suite (Winn et al., 2011) using the 3D coordinates of the Protein Data
Bank (PDB) entry 1LR2 (Charron et al., 2002) as a search model. The structures were refined isotopically
using Refmac5 (Murshudov et al., 2011; Winn et al., 2011), and COOT (Emsley et al., 2010) for visual
inspection of the final model. The highest resolution shell was determined by applying the conservative
‹I/σ(I)› (>2) criteria. Solvent molecules were automatically added at the refinement process and
checked to confirm chemically reasonable positions, where also difference electron density exceeded
a 3 σ level. All models were inspected for Ramachandran outliers. The coordinates for the structures,
as well as the experimental diffraction amplitudes have been deposited at the Protein Databank
(http://www.rcsb.org) with entry codes 5LH0, 5LH1 and 5LMI for the low dose run as well as 5LH3,
5LH5, 5LMH, 5LH6 and 5LH7 for the high dose run. The software RADDOSE (Zeldin et al., 2013) was
used to calculate the applied X ray dose of each crystal at different time points.
4.1.2.4 Decay of diffraction power
The decay of diffraction power over time was determined by plotting the sum total of I/σ(I) against
time. For this, the intensity of all indexed reflections of a single time point, given by XDS (Kabsch, 2010),
was taken from all exposed crystals. The diffraction power of each crystal was then normalized to the
mean diffraction power of the first recorded image from all crystals (Owen et al., 2014). By plotting
the decay of diffraction power from all exposed crystals over time, a statistical distribution of the decay
can be observed.
4.1.2.5 Crystal orientations
The distribution of the crystal lattice orientation in respect to the laboratory coordinate system was
evaluated. For this the Euler angles were determined from the XDS orientation matrix, given in the XDS
output file XPARM (Kabsch, 1988), using Matlab (2007a, The MathWorks). A detailed description of
the calculation has been published by (Zarrine-Afsar et al., 2012). The calculated Euler angles for the
three rotation planes xy, xz and zy are grouped in classes of 10° and plotted in a histogram.
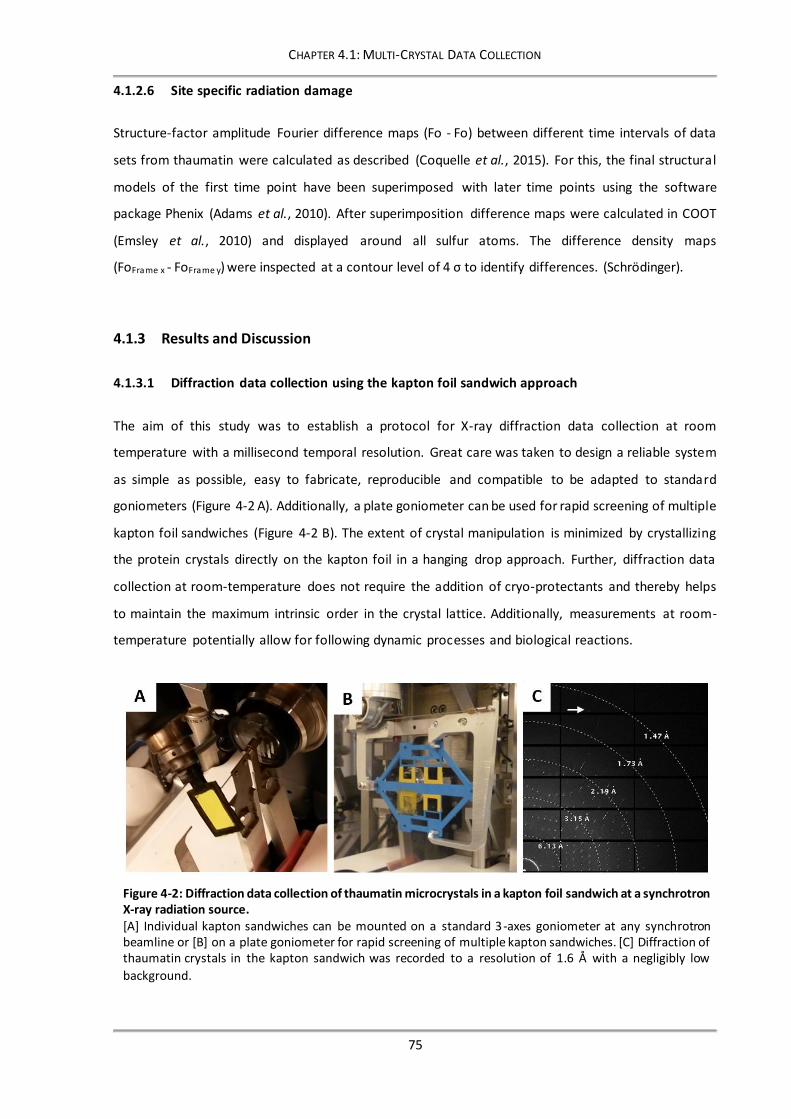
CHAPTER 4.1: MULTI-CRYSTAL DATA COLLECTION
75
4.1.2.6 Site specific radiation damage
Structure-factor amplitude Fourier difference maps (Fo - Fo) between different time intervals of data
sets from thaumatin were calculated as described (Coquelle et al., 2015). For this, the final structural
models of the first time point have been superimposed with later time points using the software
package Phenix (Adams et al., 2010). After superimposition difference maps were calculated in COOT
(Emsley et al., 2010) and displayed around all sulfur atoms. The difference density maps
(FoFrame x - FoFrame y) were inspected at a contour level of 4 σ to identify differences. (Schrödinger).
4.1.3 Results and Discussion
4.1.3.1 Diffraction data collection using the kapton foil sandwich approach
The aim of this study was to establish a protocol for X-ray diffraction data collection at room
temperature with a millisecond temporal resolution. Great care was taken to design a reliable system
as simple as possible, easy to fabricate, reproducible and compatible to be adapted to standard
goniometers (Figure 4-2 A). Additionally, a plate goniometer can be used for rapid screening of multiple
kapton foil sandwiches (Figure 4-2 B). The extent of crystal manipulation is minimized by crystallizing
the protein crystals directly on the kapton foil in a hanging drop approach. Further, diffraction data
collection at room-temperature does not require the addition of cryo-protectants and thereby helps
to maintain the maximum intrinsic order in the crystal lattice. Additionally, measurements at room-
temperature potentially allow for following dynamic processes and biological reactions.
Figure 4-2: Diffraction data collection of thaumatin microcrystals in a kapton foil sandwich at a synchrotron X-ray radiation source. [A] Individual kapton sandwiches can be mounted on a standard 3-axes goniometer at any synchrotron beamline or [B] on a plate goniometer for rapid screening of multiple kapton sandwiches. [C] Diffraction of thaumatin crystals in the kapton sandwich was recorded to a resolution of 1.6 Å with a negligibly low
background.

CHAPTER 4.1: MULTI-CRYSTAL DATA COLLECTION
76
The exposed microcrystals of thaumatin in the kapton foil sandwich diffracted up to a resolution of
1.6 Å (Figure 4-2 C). It can be seen that the background contribution of the thin kapton double layer is
minimal and mainly limited to a scattering at 33 Å (2θ ≈ 1.7°) and at 11 Å (2θ ≈ 5°) for a wavelength of
0.97 Å.
4.1.3.2 Data quality and statistics
In two separate experiments diffraction data was collected by exposing thaumatin crystals at low and
at high X-ray photon flux, which corresponds to 1.1 1012 photons s-1 and 1.1 1012 photons s-1,
respectively. In order to study possible radiation damage effects 20 consecutive exposures have been
recorded from each crystal in the low-dose and high-dose run. Diffraction data from identical time
intervals have been indexed and merged from 46 crystals, resulting in 20 complete data sets collected
from 20 time intervals covering an exposure time range of 800 ms (Table 6 and Table 7). The total dose
for the high dose and low dose runs after recording 20 consecutive diffraction patterns was calculated
to be 2.32 MGy (2.9 MGy · s-1) and 0.23 MGy (0.29 MGy · s-1), respectively. For the low dose data only
a minor decrease in the integrated high resolution Bragg reflection intensities have been observed.
The maximum resolution decreased from 1.88 Å for the first data set (0 – 40 ms) to 1.96 Å for the last
data set (760 – 800 ms). The statistics (Table 6) demonstrate that reliable and complete diffraction
data sets without significant global radiation damage for each time interval have been recorded. In
contrast, for the high dose experiments the comparison of the first (0-40 ms, total average dose of
0.12 MGy) to the last (760-800 ms, total average dose of 2.32 MGy) data set revealed, that the
maximum resolution decreased from 1.65 Å to 2.28 Å, indicating significant global radiation damage
(Table 7). Accordingly, also the CC1/2 value dropped at lower resolution in the last time slice frame
(760 – 800 ms) of the high dose experiment, compared to the first exposure (0 – 40 ms) (Figure 4-3).
Figure 4-3: Data statistics from the room-temperature data collection of thaumatin microcrystals in the kapton foil sandwich. CC1/2 values (line plots) of the recorded diffraction data for low dose-rate (blue) and high dose-rate (red) experiment are plotted as a function of resolution.

CHAPTER 4.1: MULTI-CRYSTAL DATA COLLECTION
77
Table 6: Data collection and refinement statistics for thaumatin with low dose X-ray photon flux at different time points
Data collection statisticsa
1. Frame
(0 – 40 ms)
10. Frame
(360 – 400 ms)
20. Frame
(760 – 800 ms)
Beamline P14
Wavelength [Å] 0.96863
Space group P41212
Unit cell: a = b, c [Å] 58.44, 151.58 58.43,151.53 58.45, 151.59
Number of crystals 46
Resolution [Å] 30 - 1.88
(1.95 – 1.88)
30 - 1.90
(1.97 – 1.90)
30 - 1.96
(2.02 – 1.95)
Total average dose [MGy] 0.01 0.12 0.23
Temperature [K] 296 296 296
R p.i.m.b 9.0 (30.6) 8.8 (31.0) 8.3 (31.9)
Measured reflections 62822 63464 54468
Unique reflections 19955 19881 17759
Average I/σ(I) 5.3 (2.0) 6.3 (2.1) 6.0 (2.0)
Mn(I) half-set correlation CC(1/2) 97.9 (71.5) 99.0 (78.2) 98.7 (72.9)
Completeness [%] 92.6 (93.6) 92.5 (93.0) 91.5 (92.8)
Redundancy 3.15 3.19 3.07
Refinement statistics
Resolution range [Å] 30 - 1.88 30 - 1.90 30 - 1.96 R/ Rfree [%] 18.8/23.9 18.1/22.8 18.9/22.1
Protein atoms 1550 1550 1550
Water molecules 51 44 33
Ligand molecules 20 20 20
Rms deviation
Bond-length [Å] 0.020 0.021 0.021
Bond angle [°] 2.04 2.12 2.20
B factor [Å2]
Protein 22.6 25.0 28.1
Water 23.2 24.8 24.5
Ligand 20.4 47.1 59.2
Ramachandran plot analysis
Most favored regions [%] 97.67 99.51 98.53
Allowed regions [%] 2.44 0.49 1.47
Generously allowed regions [%] 0.49 0.00 0.00
PDB entry 5LH0 5LH1 5LH2
a Values in parentheses are for the highest resolution shell.
b R p.i.m. =∑ √
1
𝑛−1∑ |𝐼𝑖(ℎ𝑘𝑙)−⟨𝐼(ℎ𝑘𝑙)⟩|𝑛
𝑖=1ℎ𝑘𝑙
∑ ∑ 𝐼𝑖 (ℎ𝑘𝑙)𝑖ℎ𝑘𝑙, where I (hkl) is the mean intensity of the reflections hkl, Σhkl is
the sum over all reflections and Σi is the sum over i measurements of reflection hkl.

CHAPTER 4.1: MULTI-CRYSTAL DATA COLLECTION
78
Table 7: Data collection and refinement statistics for thaumatin with high dose X-ray photon flux at different time points
Data collection statisticsa
1. Frame
(0 – 40 ms)
2. Frame
(40 – 80 ms)
5. Frame
(160 –200 ms)
10. Frame
(360 – 400 ms)
20. Frame
(760 – 800 ms)
Beamline P14
Wavelength [Å] 0.96863
Space group P41212
Unit cell: a = b, c [Å] 58.43, 151.58 58.42, 151.59 58.42, 151.59 58.49, 151.77 58.45, 151.62
Number of crystals: 46
Resolution [Å] 30 - 1.65
(1.71 – 1.65)
30 – 1.69
(1.75 – 1.69)
30 – 1.96
(2.03 – 1.96)
30 - 2.15
(2.23 – 2.15)
30 - 2.28
(2.36 – 2.28)
Total average dose [MGy] 0.12 0.23 0.57 1.16 2.32
Temperature [K] 296 296 296 296 296
R p.i.m.b 8.2 (33.2) 6.8 (43.5) 8.5 (39.5) 10.2 (46.6) 11.6 (49.3)
Measured reflections 94713 90316 59357 41592 32153
Unique reflections 29947 28198 18364 13192 10726
Average I/σ(I) 5.6 (2.1) 7.1 (2.1) 5.8 (1.9) 6.1 (2.1) 5.9 (2.0)
Mn(I) half-set correlation CC(1/2)
97.3 (70.7) 99.0 (71.2) 98.6 (65.0) 98.3 (66.9) 97.9 (61.7)
Completeness [%] 92.0 (92.0) 92.9 (93.8) 93.1 (93.4) 91.1 (90.6) 90.1 (90.1)
Redundancy 3.16 3.20 3.20 3.15 3.00
Refinement statistics
Resolution range [Å] 30 - 1.65 30 – 1.69 30 – 1.96 30 - 2.15 30 - 2.28
R/ Rfree [%] 19.3/22.9 17.6/20.1 17.6/22.0 17.0/23.6 17.2/23.2
Protein atoms 1550 1550 1550 1550 1550
Water molecules 64 68 71 62 46
Ligand molecules 20 20 20 20 20
Rms deviation
Bond-length [Å] 0.025 0.025 0.015 0.019 0.019
Bond angle [°] 2.29 2.63 1.68 2.08 2.07
B factor [Å2]
Protein 22.3 25.1 29.6 31.1 30.6
Water 26.0 21.3 50.2 35.2 34.3
Ligand 34.1 43.3 34.5 91.8 115.7
Ramachandran plot analysis
Most favored regions [%] 98.53 98.53 97.07 97.56 97.07
Allowed regions [%] 1.47 1.47 2.44 2.44 2.93
Generously allowed regions [%]
0.00 0.00 0.49 0.00 0.00
PDB entry 5LH3 5LH5 5LH6 5LH7
a Values in parentheses are for the highest resolution shell.
b R p.i.m. =∑ √
1
𝑛−1∑ |𝐼𝑖(ℎ𝑘𝑙)−⟨𝐼(ℎ𝑘𝑙)⟩|𝑛
𝑖=1ℎ𝑘𝑙
∑ ∑ 𝐼𝑖 (ℎ𝑘𝑙)𝑖ℎ𝑘𝑙, where I (hkl) is the mean intensity of the reflections hkl, Σhkl is the sum
over all reflections and Σi is the sum over i measurements of reflection hkl.

CHAPTER 4.1: MULTI-CRYSTAL DATA COLLECTION
79
4.1.3.3 Diffraction intensity decay
The intensity decay of the normalized diffraction power over time has been evaluated in order to
visualize potential X-ray radiation damage during diffraction data collection. The total X-ray dose for
the high dose-rate and low dose-rate runs after recording 20 consecutive diffraction pattern was
calculated to be 2.32 MGy (dose-rate: 2.9 MGy s-1) and 0.23 MGy (dose-rate: 0.29 MGy s-1),
respectively. The diffraction intensity decay for the high dose-rate and low dose-rate X-ray exposure
experiments of thaumatin crystals is shown in Figure 4-4 A. The diffraction power in the high dose
experiment already started to decrease after the first exposure and was below 50% after
approximately 4 images (160 ms, ≈ 500 kGy dose).
Figure 4-4: Effect of global X-ray radiation damage over time for the low dose-rate (blue) and high dose-rate (red) diffraction data. [A] Normalized diffraction intensity decay of thaumatin microcrystals exposed to X-rays with low dose-rate (0.29 MGy s-1) and high dose-rate (2.9 MGy s-) at room-temperature. [B] Evolution of the Rmeas value s of the individual crystals over time. The box plots in [A] and [B] with quartiles (mean, upper [75%], median [50%] and lower values [25%]) represent the decay of diffraction intensity and Rmeas of
all exposed crystals (n = 46).
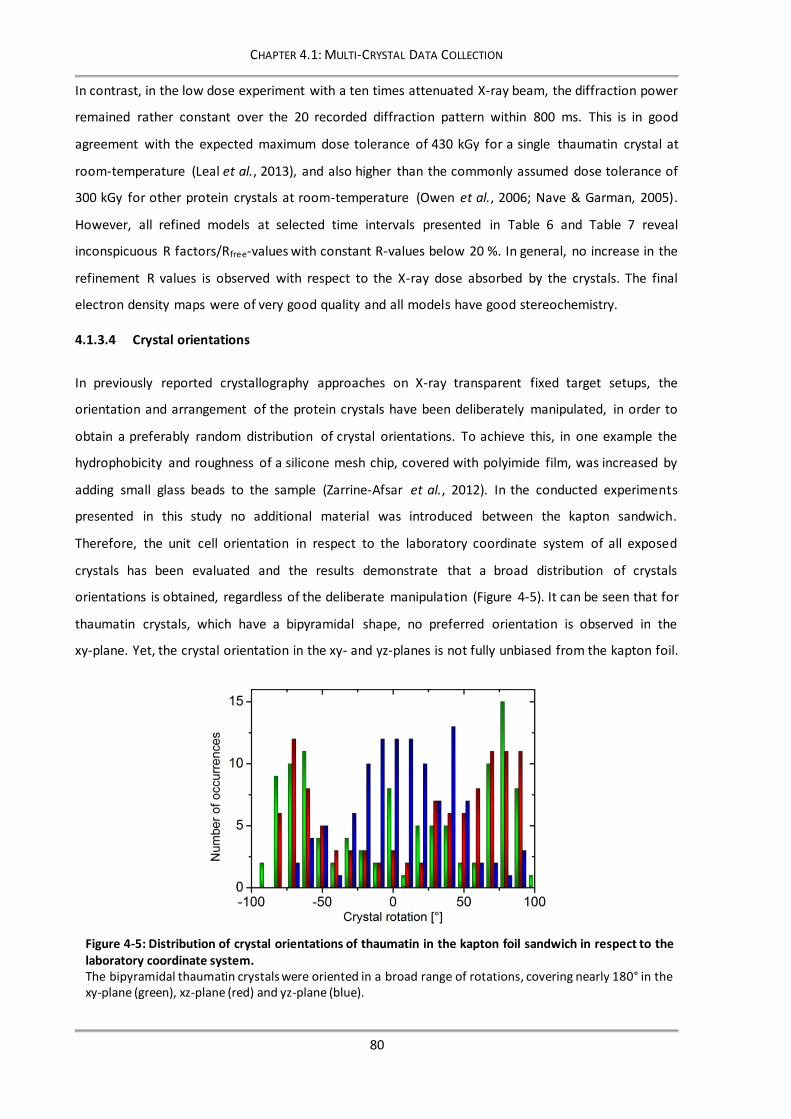
CHAPTER 4.1: MULTI-CRYSTAL DATA COLLECTION
80
In contrast, in the low dose experiment with a ten times attenuated X-ray beam, the diffraction power
remained rather constant over the 20 recorded diffraction pattern within 800 ms. This is in good
agreement with the expected maximum dose tolerance of 430 kGy for a single thaumatin crystal at
room-temperature (Leal et al., 2013), and also higher than the commonly assumed dose tolerance of
300 kGy for other protein crystals at room-temperature (Owen et al., 2006; Nave & Garman, 2005).
However, all refined models at selected time intervals presented in Table 6 and Table 7 reveal
inconspicuous R factors/Rfree-values with constant R-values below 20 %. In general, no increase in the
refinement R values is observed with respect to the X-ray dose absorbed by the crystals. The final
electron density maps were of very good quality and all models have good stereochemistry.
4.1.3.4 Crystal orientations
In previously reported crystallography approaches on X-ray transparent fixed target setups, the
orientation and arrangement of the protein crystals have been deliberately manipulated, in order to
obtain a preferably random distribution of crystal orientations. To achieve this, in one example the
hydrophobicity and roughness of a silicone mesh chip, covered with polyimide film, was increased by
adding small glass beads to the sample (Zarrine-Afsar et al., 2012). In the conducted experiments
presented in this study no additional material was introduced between the kapton sandwich.
Therefore, the unit cell orientation in respect to the laboratory coordinate system of all exposed
crystals has been evaluated and the results demonstrate that a broad distribution of crystals
orientations is obtained, regardless of the deliberate manipulation (Figure 4-5). It can be seen that for
thaumatin crystals, which have a bipyramidal shape, no preferred orientation is observed in the
xy-plane. Yet, the crystal orientation in the xy- and yz-planes is not fully unbiased from the kapton foil.
Figure 4-5: Distribution of crystal orientations of thaumatin in the kapton foil sandwich in respect to the laboratory coordinate system. The bipyramidal thaumatin crystals were oriented in a broad range of rotations, covering nearly 180° in the xy-plane (green), xz-plane (red) and yz-plane (blue).

CHAPTER 4.1: MULTI-CRYSTAL DATA COLLECTION
81
Nevertheless, a sufficiently good coverage of the reciprocal space is obtained from the broad range of
crystal rotations. The recorded diffraction data resulted in complete datasets even if no care was taken
while selecting exceptionally oriented crystals for X-ray exposure.
4.1.3.5 Time-resolved changes in electron density
The disulfide bridges in thaumatin are known to be sensitive to radiation damage (Garman, 2010; Yorke
et al., 2014). To visualize the effect of the site-specific component of the radiation damage on the
electron density, structure-factor amplitude Fourier difference maps (Fo - Fo) have been calculated
between datasets of the first recorded diffraction pattern and later time intervals. The temporal
resolution in our experiment was limited to 40 ms, based on to the maximal frame rate of the detector.
However, our experiment can potentially be combined by the additional use of Hadamard transform
based X-ray probe-pulse sequences (Yorke et al., 2014) easily. Thereby, the temporal resolution for
tracking biological processes may be further reduced drastically to the low microsecond regime. The
data statistics indicate that strong radiation damage has occurred in the high dose diffraction data sets,
while only minor radiation damage has emerged in the low dose experiment. The site specific
component of the radiation damage becomes visible by monitoring the difference density contoured
at ±4 σ in the proximity of all thaumatin sulfur atoms (Figure 4-6). Site specific damage was prominently
observed for the sulfur atoms and a minor damage was observed for the oxygen atoms of some
carboxyl groups.
As expected from the small decay of the diffraction intensity in the low dose run, no specific radiation
damage was observed for the data set collected in the time interval between 360-400 ms (~ 0.12 MGy
total average dose). Even for the data set, collected in the time interval between 760-800 ms
(~ 0.23 MGy total average dose), only minor difference density could be detected around some of the
disulfide bridges. This shows that the bonds between cysteines are still intact and only presumably
start to become destabilized. This observation holds also true for data collected in the high dose run
within the time interval of 40-80 ms exposure time, with the same total absorbed average dose of
~ 0.23 MGy. In contrast, more significant site specific damage could be observed already for the data
set collected within 160-200 ms exposure time (~ 0.57 MGy total average dose) in the high dose
experiment (Figure 4-6). All of the eight disulfide bonds reveal significant radiation damage. In contrast
to our results, it was very recently reported, that for insulin no indications of site specific radiation
damage up to the same absorbed dose of 0.57 MGy were observed (Roedig et al., 2016). Roedig et al.
concluded, that specific radiation damage – and here in particular cleavage of disulfide bridges – is less
temperature dependent than global radiation damage and generally occurs only at higher doses. They
assumed further, that disulfide bond breakage was not the preferred damage pathway at room

CHAPTER 4.1: MULTI-CRYSTAL DATA COLLECTION
82
temperature, where global radiation damage to the lattice was clearly the dominating effect. However,
our data do not support this hypothesis.
4.1.4 Conclusion
The data presented in this study demonstrate that complete diffraction datasets with a temporal
resolution of 40 milliseconds can be recorded with the kapton foil approach at room-temperature by
merging data from less than 50 protein microcrystals. Additionally, it was found that 20 diffraction
datasets over a total X-ray exposure period of 800 milliseconds can be recorded with no significant
site-specific or global radiation damage when using an attenuated X-ray beam, if the maximum dose
Figure 4-6: Time-resolved observation of specific radiation damage around all sulfur atoms of thaumatin over time. Structure-factor amplitude Fourier difference (Fo - Fo) maps were calculated between different time points of X-ray exposure of the low dose (left side in black) and high dose (right side in red) experiments. The maps
are displayed with red and green contours at 4 σ indicating negative and positive density, respectively.

CHAPTER 4.1: MULTI-CRYSTAL DATA COLLECTION
83
tolerance up to 400 kGy is considered. At doses higher than 550 kGy, beside the expected global
radiation damage, we were able to observe dose-dependent site specific damage most prominently at
the radiation sensitive disulfide bonds. The temporal resolution could be further reduced by using the
newest generation of pixel detectors of the EIGER 4M series, where diffraction patterns can be
recorded with a repetition rate of 750 Hz. In the resulting significantly shorter exposure time of 1.5
milliseconds the same number of photons (4.32 x 10⁹) can be detected as in the presented low dose-
rate experiments by using a non-attenuated X-ray beam. Thereby, the temporal resolution for tracing
biological processes applying the presented kapton foil approach would be reduced to the low
millisecond regime. Moreover, the protocol can be combined with the use of Hadamard transform
based X-ray probe-pulse sequences (Yorke et al., 2014). By this, the temporal resolution of diffraction
experiments can be dramatically increased for cases when detectors with low frame rate or flux limited
X-ray sources are available.

CHAPTER 4.2: MULTI-CRYSTAL RADIATION DAMAGE INDUCED PHASING
84
4.2 Multi-crystal radiation damage induced phasing
4.2.1 Introduction
A fundamental constraint in macromolecular crystallography is, that the phase information cannot be
retrieved from the diffraction data mathematically - unless the diffraction is recorded to atomic
resolution. To overcome this, the most commonly used method for obtaining phase information is
called molecular replacement and requires the availability of already known highly homologue
structures. For de novo phasing of diffraction data from proteins where no homolog is available,
several different methods have been developed. In a method called isomorphous replacement (SIR:
single isomorphous replacement; MIR: multiple isomorphous replacement), a small number of heavy
atoms is introduced into the crystal artificially and two or more datasets are collected from the
isomorphous native and derivative crystals. Typically selenomethionine is used to introduce atoms into
the crystal which have a different scattering power than in the native crystal (Hendrickson et al., 1990).
Alternatively, in anomalous methods the wavelength of the X-rays is changed between the collection
of different datasets and moved to the absorption edge of the introduced atoms (SAD: single-
wavelength anomalous diffraction; MAD: multiple-wavelength anomalous diffraction) (Hendrickson &
Teeter, 1981). In general, differences in the structure factors of both recorded datasets are used for
the calculation of the phases. Over the last years, alternative methods have been developed to avoid
the laborious derivatization of the native crystal. Among these are methods called free energy
minimization (Castleden, 1992), iterated projections (Elser, 2003), three-beam X-ray diffraction
(Weckert & Hümmer, 1997) and radiation damage induced phasing (RIP) (Ravelli et al., 2003).
The fact that specific radiation damage can be used to phase diffraction data de novo has first been
demonstrated by Ravelli et al. (2003). In many cases a combination of radiation damage and
anomalous scattering has been used to obtain phase information (RIPAS) (Evans et al., 2003;
Banumathi et al., 2004; Weiss et al., 2004; Zwart et al., 2004; Ravelli et al., 2005). Different strategies
for performing such experiments have been applied over the last years. In some studies, continuous
data collection over a large oscillation range has been used for recording highly redundant data.
Comparable with the SIR approach, the phase information is obtained by analyzing the intensity
difference between a complete dataset merged from the first images and a complete dataset merged
from the last images (Sanctis & Nanao, 2012; Schiltz et al., 2004). In other cases, two low dose
diffraction datasets are collected and interleaved with a high flux X-ray exposure to induce stronger
radiation damage (Nanao et al., 2005). In general, a labor-intensive derivatization of the isomorphous
crystal in SIR experiments is rewarded by large differences in the structure factors between both
datasets. In contrast, the intensity difference upon site specific radiation damage of X-ray susceptible

CHAPTER 4.2: MULTI-CRYSTAL RADIATION DAMAGE INDUCED PHASING
85
chemical groups in RIP experiments is small. Additionally, non-isomorphism is introduced in RIP
experiments by global radiation damage, resulting in translation and rotation of molecules and minor
changes of the unit cell parameters (Burmeister, 2000; Ravelli & McSweeney, 2000). This makes RIP
significantly more difficult than SIR and requires a careful evaluation and improvement of the obtained
substructures.
An alternative approach of inducing radiation damage for solving the phase problem of
macromolecular diffraction data has been tested with UV-light and was called UV-RIP (Nanao & Ravelli,
2006). UV-light has the advantage that it does not ionize water molecules in the crystals and therefore
does not induce reactive oxygen species, which are a major source of global radiation damage. Instead,
UV-light mainly destabilizes or breaks disulfide and thioester bonds and affects the occupancy of
bound heavy metal atoms in the protein (Sanctis et al., 2011; Pereira et al., 2013). Therefore, UV-light
has some superior capacities for the introduction of site specific radiation damage compared to X-rays.
Interestingly, it could be shown that UV-RIP experiments are also possible with the usage of high-
power UV-LEDs, instead of using a sophisticated and cost intensive UV-laser setup (Sanctis et al., 2016).
In chapter 4.1 it has been shown, that the occurrence of specific radiation damage can be followed
over time by evaluating data from multiple crystals which were exposed to X-rays at room-
temperature. Up to now no experiment of radiation damage induced phasing from multi-crystal
diffraction data has been published. One of the reasons is that the non-isomorphism is greatly
increased when using multiple crystals, instead of evaluating the diffraction data from only one single
crystal. Initial experiments on testing (UV)-RIP with a multi-crystal diffraction dataset have already
been performed by Dr. Max Nanao (ESRF, France) and the results of continued experiments are
presented in this chapter. Multiple microcrystals of thaumatin (T daniellii) were exposed to X-rays as
well as UV-light at cryogenic temperature in order to induce site-specific radiation damage which can
be used for phasing.
4.2.2 Material and Methods
4.2.2.1 Sample preparation
The protein thaumatin from T. daniellii was purchased (Sigma-Aldrich, Germany). The lyophilized
protein was dissolved in buffer containing 50 mM Bis-Tris pH 6.5 to a concentration of 40 mg mL-1,
verified photometrically by using a Nanodrop (Thermo Scientific). Sodium tartrate was used as a
precipitant with a concentration of 1.4 M. The protein and precipitant solutions were prepared using
ultrapure water and have been filtered through a 0.2 µm filter (Sartorius Stedim). The thaumatin
microcrystal samples were freshly prepared at the beamline a few hours before X-ray exposure. For
the crystallization 2 µL protein solution were mixed with 2 µL precipitant in a hanging drop vapor
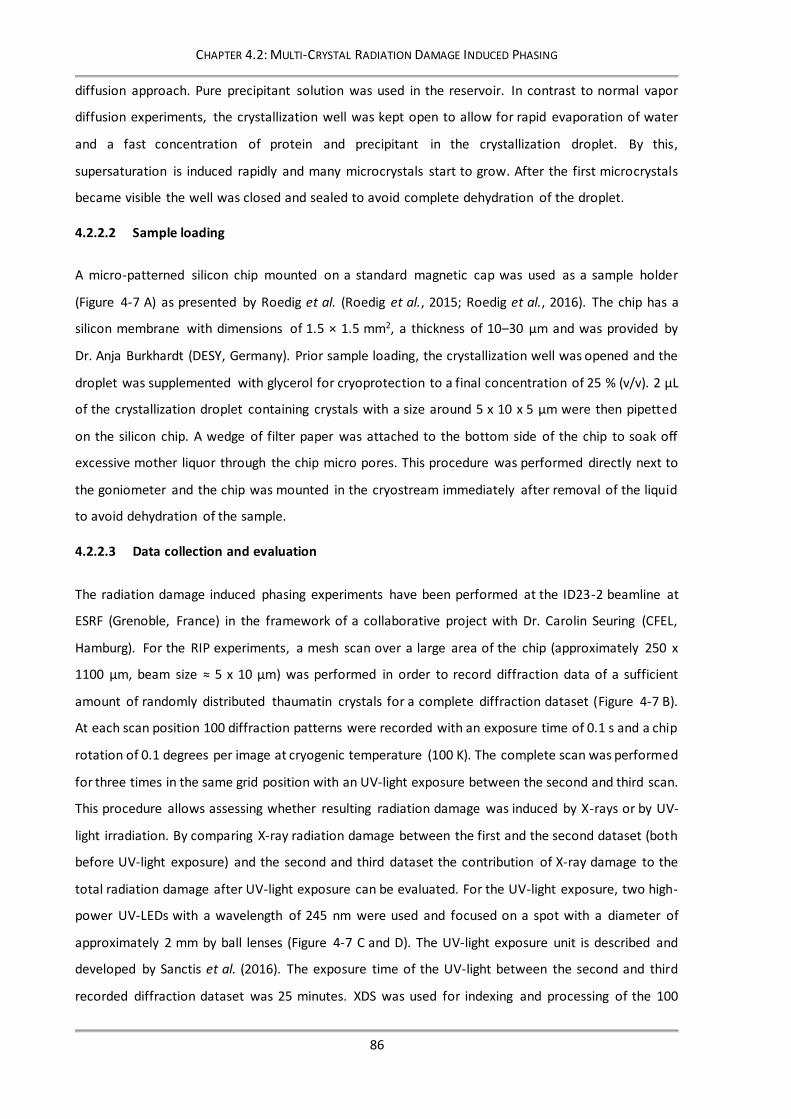
CHAPTER 4.2: MULTI-CRYSTAL RADIATION DAMAGE INDUCED PHASING
86
diffusion approach. Pure precipitant solution was used in the reservoir. In contrast to normal vapor
diffusion experiments, the crystallization well was kept open to allow for rapid evaporation of water
and a fast concentration of protein and precipitant in the crystallization droplet. By this,
supersaturation is induced rapidly and many microcrystals start to grow. After the first microcrystals
became visible the well was closed and sealed to avoid complete dehydration of the droplet.
4.2.2.2 Sample loading
A micro-patterned silicon chip mounted on a standard magnetic cap was used as a sample holder
(Figure 4-7 A) as presented by Roedig et al. (Roedig et al., 2015; Roedig et al., 2016). The chip has a
silicon membrane with dimensions of 1.5 × 1.5 mm2, a thickness of 10–30 μm and was provided by
Dr. Anja Burkhardt (DESY, Germany). Prior sample loading, the crystallization well was opened and the
droplet was supplemented with glycerol for cryoprotection to a final concentration of 25 % (v/v). 2 µL
of the crystallization droplet containing crystals with a size around 5 x 10 x 5 µm were then pipetted
on the silicon chip. A wedge of filter paper was attached to the bottom side of the chip to soak off
excessive mother liquor through the chip micro pores. This procedure was performed directly next to
the goniometer and the chip was mounted in the cryostream immediately after removal of the liquid
to avoid dehydration of the sample.
4.2.2.3 Data collection and evaluation
The radiation damage induced phasing experiments have been performed at the ID23-2 beamline at
ESRF (Grenoble, France) in the framework of a collaborative project with Dr. Carolin Seuring (CFEL,
Hamburg). For the RIP experiments, a mesh scan over a large area of the chip (approximately 250 x
1100 µm, beam size ≈ 5 x 10 µm) was performed in order to record diffraction data of a sufficient
amount of randomly distributed thaumatin crystals for a complete diffraction dataset (Figure 4-7 B).
At each scan position 100 diffraction patterns were recorded with an exposure time of 0.1 s and a chip
rotation of 0.1 degrees per image at cryogenic temperature (100 K). The complete scan was performed
for three times in the same grid position with an UV-light exposure between the second and third scan.
This procedure allows assessing whether resulting radiation damage was induced by X-rays or by UV-
light irradiation. By comparing X-ray radiation damage between the first and the second dataset (both
before UV-light exposure) and the second and third dataset the contribution of X-ray damage to the
total radiation damage after UV-light exposure can be evaluated. For the UV-light exposure, two high-
power UV-LEDs with a wavelength of 245 nm were used and focused on a spot with a diameter of
approximately 2 mm by ball lenses (Figure 4-7 C and D). The UV-light exposure unit is described and
developed by Sanctis et al. (2016). The exposure time of the UV-light between the second and third
recorded diffraction dataset was 25 minutes. XDS was used for indexing and processing of the 100
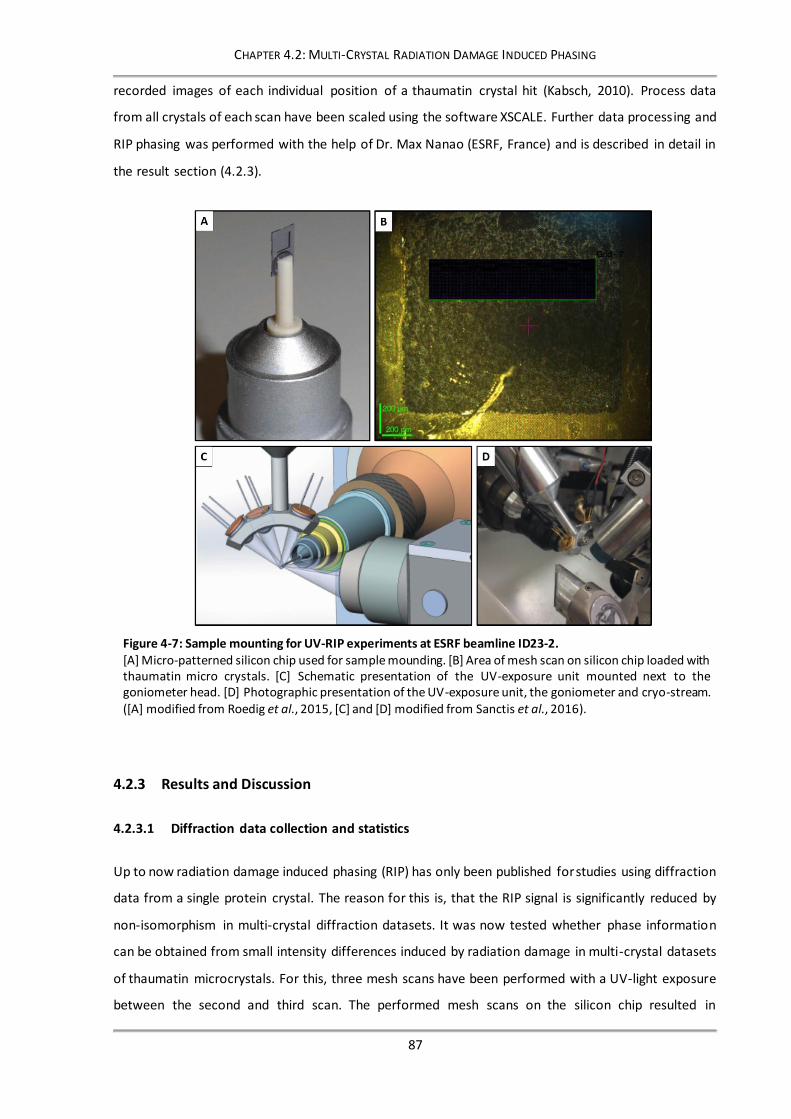
CHAPTER 4.2: MULTI-CRYSTAL RADIATION DAMAGE INDUCED PHASING
87
recorded images of each individual position of a thaumatin crystal hit (Kabsch, 2010). Process data
from all crystals of each scan have been scaled using the software XSCALE. Further data processing and
RIP phasing was performed with the help of Dr. Max Nanao (ESRF, France) and is described in detail in
the result section (4.2.3).
4.2.3 Results and Discussion
4.2.3.1 Diffraction data collection and statistics
Up to now radiation damage induced phasing (RIP) has only been published for studies using diffraction
data from a single protein crystal. The reason for this is, that the RIP signal is significantly reduced by
non-isomorphism in multi-crystal diffraction datasets. It was now tested whether phase information
can be obtained from small intensity differences induced by radiation damage in multi-crystal datasets
of thaumatin microcrystals. For this, three mesh scans have been performed with a UV-light exposure
between the second and third scan. The performed mesh scans on the silicon chip resulted in
Figure 4-7: Sample mounting for UV-RIP experiments at ESRF beamline ID23-2. [A] Micro-patterned silicon chip used for sample mounding. [B] Area of mesh scan on silicon chip loaded with thaumatin micro crystals. [C] Schematic presentation of the UV-exposure unit mounted next to the goniometer head. [D] Photographic presentation of the UV-exposure unit, the goniometer and cryo-stream. ([A] modified from Roedig et al., 2015, [C] and [D] modified from Sanctis et al., 2016).
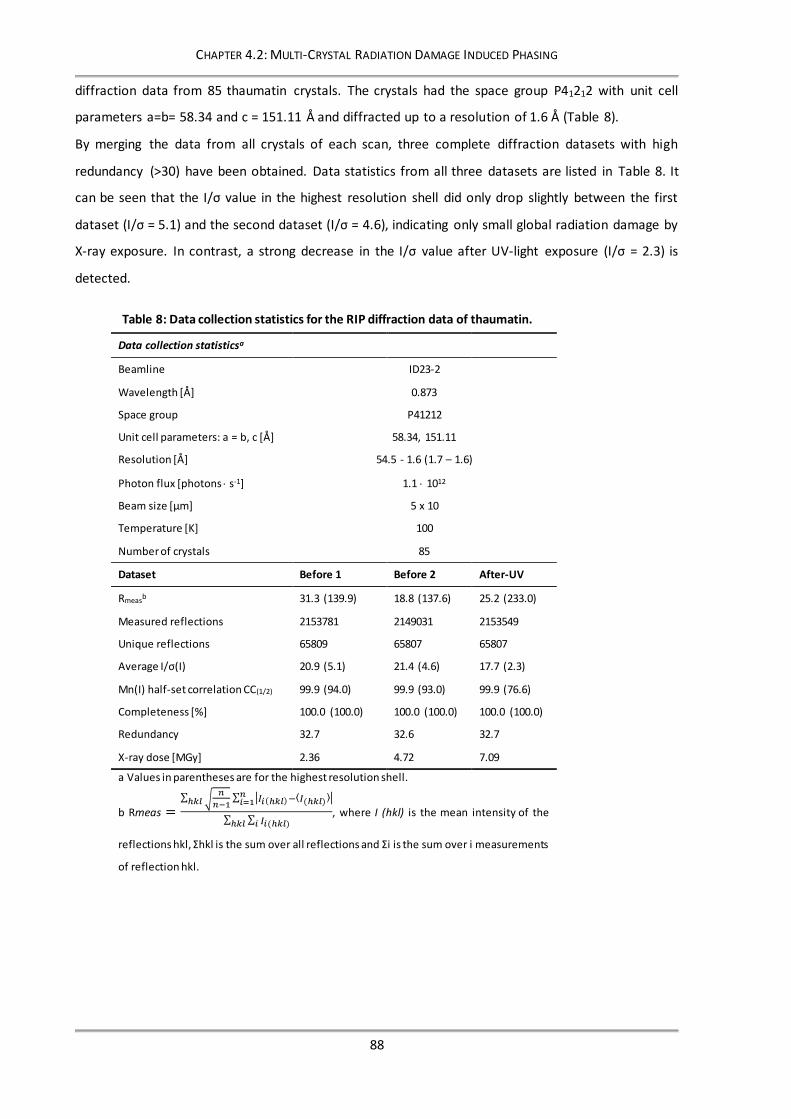
CHAPTER 4.2: MULTI-CRYSTAL RADIATION DAMAGE INDUCED PHASING
88
diffraction data from 85 thaumatin crystals. The crystals had the space group P41212 with unit cell
parameters a=b= 58.34 and c = 151.11 Å and diffracted up to a resolution of 1.6 Å (Table 8).
By merging the data from all crystals of each scan, three complete diffraction datasets with high
redundancy (>30) have been obtained. Data statistics from all three datasets are listed in Table 8. It
can be seen that the I/σ value in the highest resolution shell did only drop slightly between the first
dataset (I/σ = 5.1) and the second dataset (I/σ = 4.6), indicating only small global radiation damage by
X-ray exposure. In contrast, a strong decrease in the I/σ value after UV-light exposure (I/σ = 2.3) is
detected.
Table 8: Data collection statistics for the RIP diffraction data of thaumatin.
Data collection statisticsa
Beamline ID23-2
Wavelength [Å] 0.873
Space group P41212
Unit cell parameters: a = b, c [Å] 58.34, 151.11
Resolution [Å] 54.5 - 1.6 (1.7 – 1.6)
Photon flux [photons s-1] 1.1 1012
Beam size [µm] 5 x 10
Temperature [K] 100
Number of crystals 85
Dataset Before 1 Before 2 After-UV
Rmeasb 31.3 (139.9) 18.8 (137.6) 25.2 (233.0)
Measured reflections 2153781 2149031 2153549
Unique reflections 65809 65807 65807
Average I/σ(I) 20.9 (5.1) 21.4 (4.6) 17.7 (2.3)
Mn(I) half-set correlation CC(1/2) 99.9 (94.0) 99.9 (93.0) 99.9 (76.6)
Completeness [%] 100.0 (100.0) 100.0 (100.0) 100.0 (100.0)
Redundancy 32.7 32.6 32.7
X-ray dose [MGy] 2.36 4.72 7.09
a Values in parentheses are for the highest resolution shell.
b Rmeas =∑ √
𝑛
𝑛−1∑ |𝐼𝑖(ℎ𝑘𝑙) −⟨𝐼(ℎ𝑘𝑙) ⟩|𝑛
𝑖=1ℎ𝑘𝑙
∑ ∑ 𝐼𝑖(ℎ𝑘𝑙)𝑖ℎ𝑘𝑙, where I (hkl) is the mean intensity of the
reflections hkl, Σhkl is the sum over all reflections and Σi is the sum over i measurements
of reflection hkl.
CHAPTER 4.2: MULTI-CRYSTAL RADIATION DAMAGE INDUCED PHASING
89
4.2.4 Using radiation damage for phasing of a multi-crystal thaumatin dataset
Similar to the procedure in single isomorphous replacement (SIR), a scaling factor k needs to be applied
to the second dataset after X-ray or UV-light induced radiation damage in order to put both onto a
common scale. Consequently, the undamaged diffraction data corresponds to the derivative data and
the damaged data to the native data according SIR terminology. Unfortunately, the k value has to be
determined empirically and typically varies between 0.97 and 1.01. SHELXC was used for the
preparation of the data for substructure determination and the calculation of the difference signal (ΔF)
(Sheldrick, 2008). Both combinations have been tested, “before 1” - “before 2” for assessing the X-ray
radiation damage, and “before 2” - “after-UV” for the UV-light induced radiation damage. Surprisingly ,
already between the first two datasets the model-phased Fbefore 1 - Fbefore 2 map peak heights reached a
maximum of 15 σ, calculated by the software AnoDe (Thorn & Sheldrick, 2011). Therefore, SHELXD was
used for substructure determination of the “before 1” - “before 2” data and the results are evaluated
by plotting the correlation coefficient for all reflections (CCal l) against weak reflections (CCweak)
(Sheldrick, 2010). The presence of clusters with maximal CCall versus CCweak values gives a good estimate
about correct solutions and is complemented with the best combined figure of merit (CFOM) value as
described by Sanctis et al., 2016. The results for various scaling factors (k) are comparatively shown in
Figure 4-8. In general, several good solutions were found between scaling factors ranging from 0.98793
to 0.99897. One of the highest values is obtained for a scaling factor of 0.99207, as indicated by the
black box in Figure 4-8. A detailed view of the CCall vs CCweak values of this scaling factor is shown in
Figure 4-10 A and reveals, that the cluster is rather streaked out at high values than a well separated
cluster is observed. In Figure 4-9, the obtained substructures are compared with the known
substructures determined by peak-searching the model-phased Fbefore 1 - Fbefore 2 map. Naturally, this
can only be done because the thaumatin structure is already known. It is apparent, that for the
structure factor 0.99207 the number of correct sites, representing Sγ atoms of some cysteines, which
are present in the SHELXD solution and indicated by purple spheres, is maximal. It can be seen, that
the substructures are incomplete because of negatively occupied sites (due to atom movements) and
low-occupancy sites. To improve this, peak-searching, based on difference Fourier maps calculated
from the initial substructures, and phase improvement is performed in five iterative rounds in SHELXE
as introduced by (Nanao et al., 2005). The difference in the obtained substructures between the first
run and the last run is presented in Figure 4-10 B. Sites are indicated by the red arrows, which initially
were not identified, but are present after the iterative optimization.
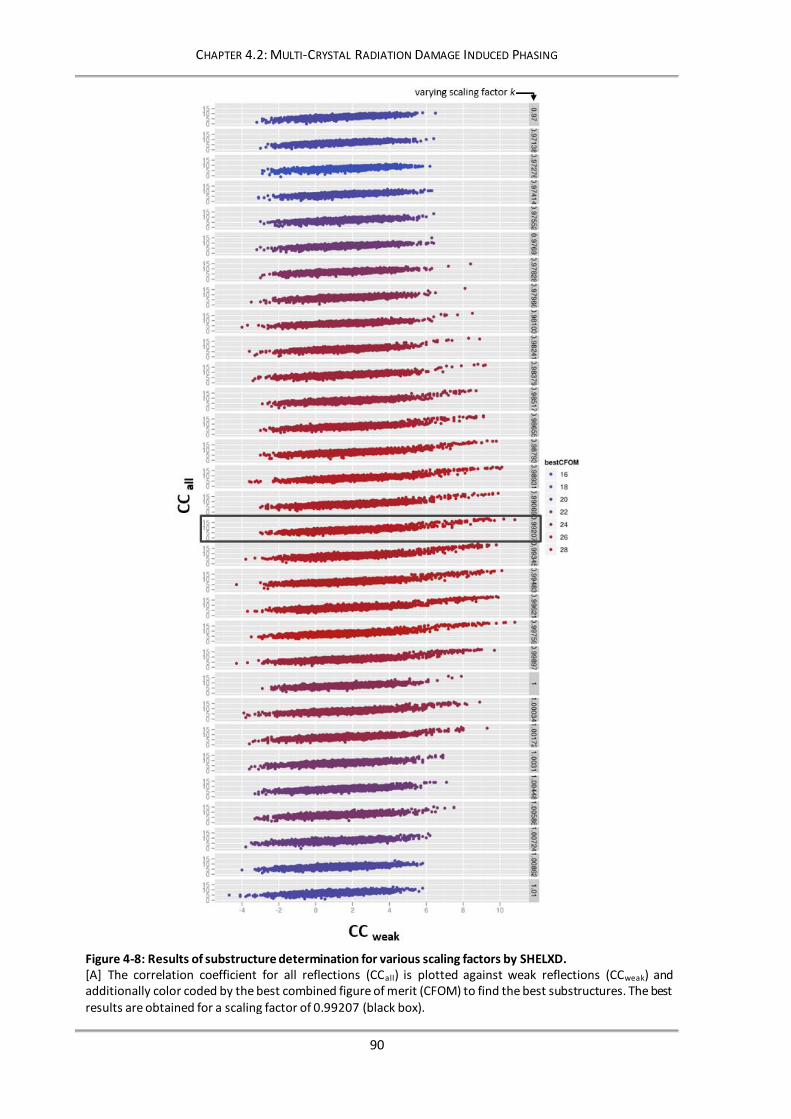
CHAPTER 4.2: MULTI-CRYSTAL RADIATION DAMAGE INDUCED PHASING
90
Figure 4-8: Results of substructure determination for various scaling factors by SHELXD. [A] The correlation coefficient for all reflections (CCall) is plotted against weak reflections (CCweak) and additionally color coded by the best combined figure of merit (CFOM) to find the best substructures. The best results are obtained for a scaling factor of 0.99207 (black box).
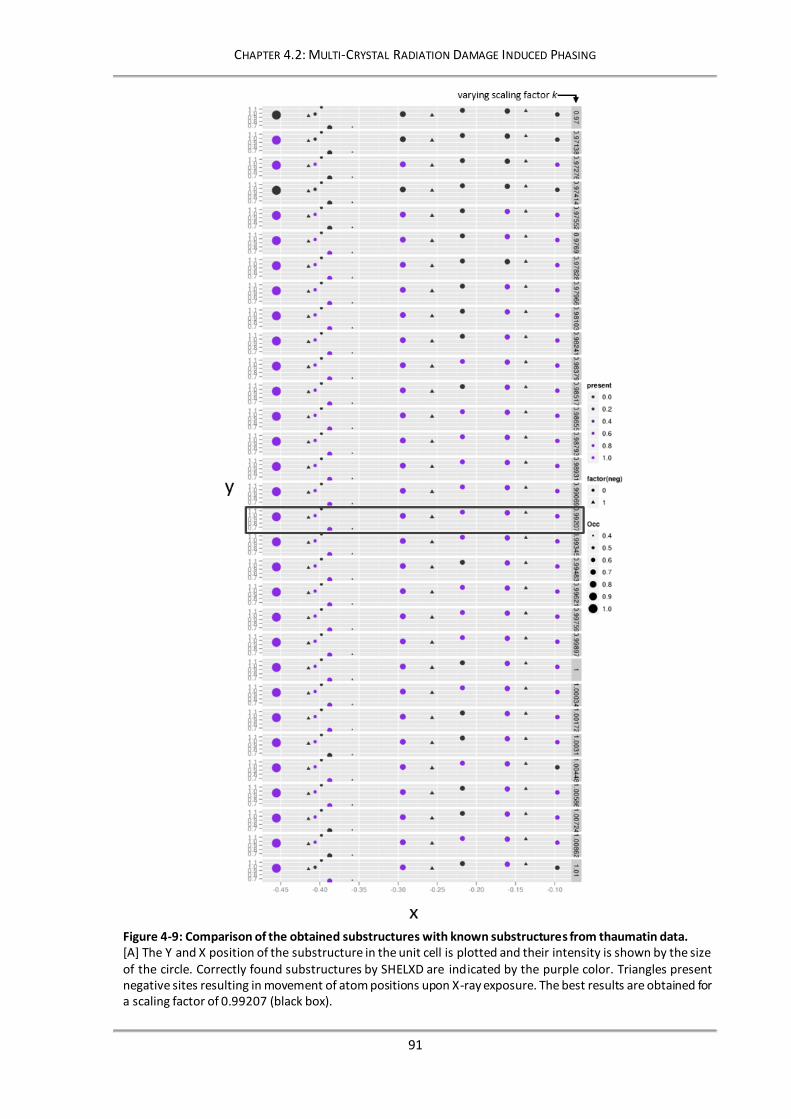
CHAPTER 4.2: MULTI-CRYSTAL RADIATION DAMAGE INDUCED PHASING
91
Figure 4-9: Comparison of the obtained substructures with known substructures from thaumatin data. [A] The Y and X position of the substructure in the unit cell is plotted and their intensity is shown by the size of the circle. Correctly found substructures by SHELXD are indicated by the purple color. Triangles present negative sites resulting in movement of atom positions upon X-ray exposure. The best results are obtained for a scaling factor of 0.99207 (black box).
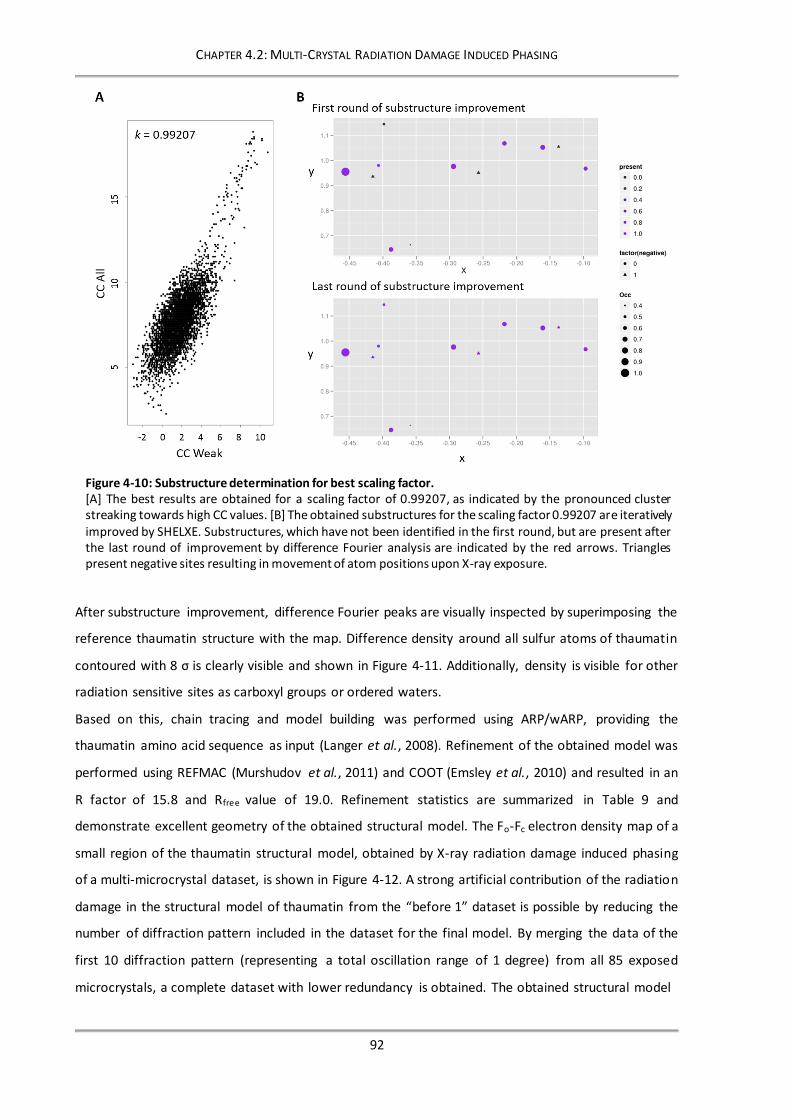
CHAPTER 4.2: MULTI-CRYSTAL RADIATION DAMAGE INDUCED PHASING
92
After substructure improvement, difference Fourier peaks are visually inspected by superimposing the
reference thaumatin structure with the map. Difference density around all sulfur atoms of thaumatin
contoured with 8 σ is clearly visible and shown in Figure 4-11. Additionally, density is visible for other
radiation sensitive sites as carboxyl groups or ordered waters.
Based on this, chain tracing and model building was performed using ARP/wARP, providing the
thaumatin amino acid sequence as input (Langer et al., 2008). Refinement of the obtained model was
performed using REFMAC (Murshudov et al., 2011) and COOT (Emsley et al., 2010) and resulted in an
R factor of 15.8 and Rfree value of 19.0. Refinement statistics are summarized in Table 9 and
demonstrate excellent geometry of the obtained structural model. The Fo-Fc electron density map of a
small region of the thaumatin structural model, obtained by X-ray radiation damage induced phasing
of a multi-microcrystal dataset, is shown in Figure 4-12. A strong artificial contribution of the radiation
damage in the structural model of thaumatin from the “before 1” dataset is possible by reducing the
number of diffraction pattern included in the dataset for the final model. By merging the data of the
first 10 diffraction pattern (representing a total oscillation range of 1 degree) from all 85 exposed
microcrystals, a complete dataset with lower redundancy is obtained. The obtained structural model
Figure 4-10: Substructure determination for best scaling factor. [A] The best results are obtained for a scaling factor of 0.99207, as indicated by the pronounced cluster streaking towards high CC values. [B] The obtained substructures for the scaling factor 0.99207 are iteratively improved by SHELXE. Substructures, which have not been identified in the first round, but are present after the last round of improvement by difference Fourier analysis are indicated by the red arrows. Triangles present negative sites resulting in movement of atom positions upon X-ray exposure.

CHAPTER 4.2: MULTI-CRYSTAL RADIATION DAMAGE INDUCED PHASING
93
of thaumatin from the X-ray RIP phasing can now be used as a search model for molecular
replacement. By this, a structural model of thaumatin is obtained from microcrystals which were
exposed to a total X-ray dose of 236 kGy, according to RADDOSE. The same radiation damage induced
phasing approach could also be successfully used for the ”before 2” – “after-UV” data. However, it is
not possible to derive additional information from this, because the contribution of X-ray damage to
the total induced radiation damage after UV-light exposure cannot be determined and separated.
Table 9: Refinement statistics of thaumatin RIP data.
Refinement statistics
Resolution range [Å] 54.5 - 1.6
R/ Rfree [%] 15.8/19.0
Protein atoms 2959
Water molecules 268
Rms deviation
Bond-length [Å] 0.0317
Bond angle [°] 2.751
B factor [Å2]
Protein 15.03
Water 29.25
Ramachandran plot analysis
Most favored regions [%] 99.02
Allowed regions [%] 0.98
Generously allowed regions [%] 0.0
Figure 4-11: Difference Fourier peaks between before 1 and before 2 data around all sulfur atoms of thaumatin. [A]-[H] Difference density is shown as blue meshes contoured at 8 σ, after iterative phase improvement with SHELXE.
Figure 4-12: Fo-Fc electron density of the structural model of Thaumatin phased by X-ray RIP using multi-crystal diffraction data (contoured at 2 rmsd).

CHAPTER 4.2: MULTI-CRYSTAL RADIATION DAMAGE INDUCED PHASING
94
Consequently, for phasing diffraction data by UV-light induced radiation damage rather than X-ray
damage, a lower X-ray dose has to be used when exposing microcrystals. This can be done by reducing
the exposure time, the photon flux, or by scanning a larger grid on the chip with fewer frames per
crystal. It would also be possible to use a larger oscillation increment per frame to obtain the same
high redundancy from fewer diffraction pattern.
4.2.5 Conclusions
The presented data clearly show that X-ray induced radiation damage can successfully be used for
phasing of a multi-microcrystal diffraction dataset collected at cryogenic temperatures. This is
particularly interesting, because it was not known if the non-isomorphism from multiple crystals would
diminish the differences in structure factors induced by radiation damage. It turned out, that between
the first two diffraction datasets the X-ray induced radiation damage was already sufficient for phasing.
Thus, an evaluation of the UV-light induced radiation damage is not possible, because the contribution
of X-ray damage cannot be determined and separated.
Additionally, it should be noted that also the multi-crystal diffraction data collected at room-
temperature in the kapton sandwich, as presented in section 4.1, was tested by this approach.
However, the RIP signal obtained from this data could not be used successfully for phasing. A probable
explanation for this is, that radiation damage propagates rather quickly at room-temperature, resulting
in increased global damage which cannot be used for phasing. It needs to further elucidated if UV-RIP
experiments conducted at X-ray free electron lasers can overcome this limitation.

SECTION B
95
SECTION B
AMINOPEPTIDASE P FROM P. FALCIPARUM
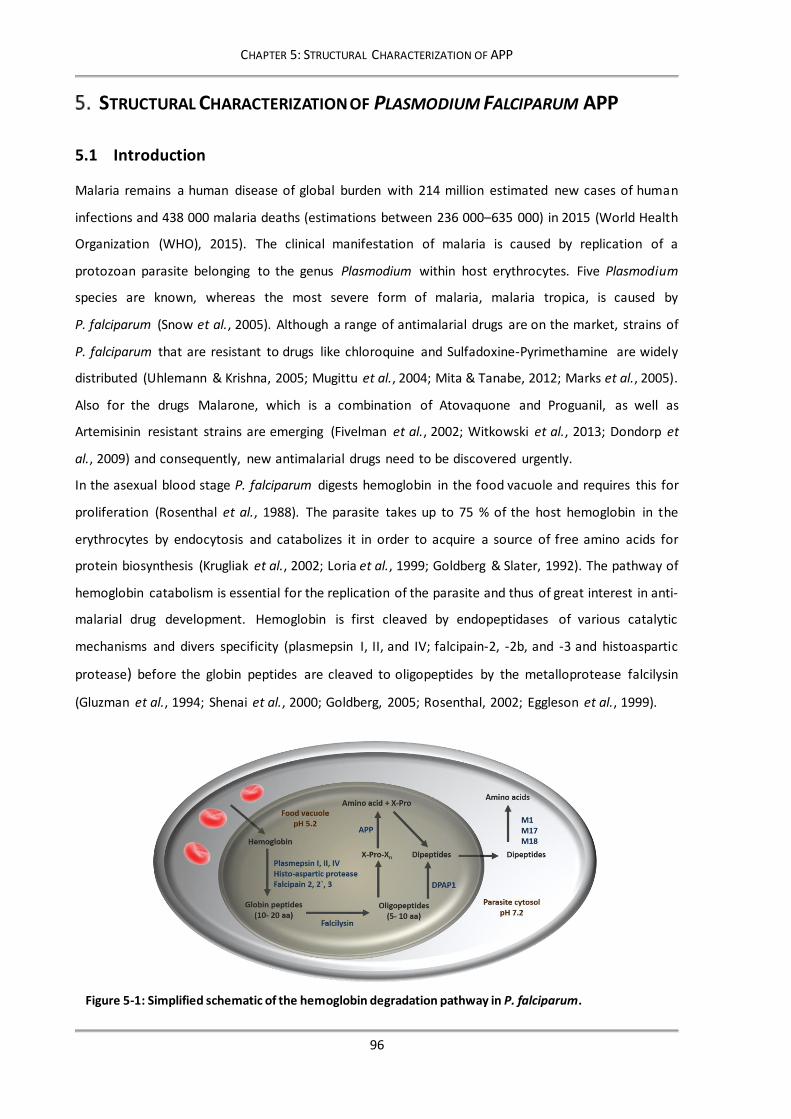
CHAPTER 5: STRUCTURAL CHARACTERIZATION OF APP
96
STRUCTURAL CHARACTERIZATION OF PLASMODIUM FALCIPARUM APP
5.1 Introduction
Malaria remains a human disease of global burden with 214 million estimated new cases of human
infections and 438 000 malaria deaths (estimations between 236 000–635 000) in 2015 (World Health
Organization (WHO), 2015). The clinical manifestation of malaria is caused by replication of a
protozoan parasite belonging to the genus Plasmodium within host erythrocytes. Five Plasmodium
species are known, whereas the most severe form of malaria, malaria tropica, is caused by
P. falciparum (Snow et al., 2005). Although a range of antimalarial drugs are on the market, strains of
P. falciparum that are resistant to drugs like chloroquine and Sulfadoxine-Pyrimethamine are widely
distributed (Uhlemann & Krishna, 2005; Mugittu et al., 2004; Mita & Tanabe, 2012; Marks et al., 2005).
Also for the drugs Malarone, which is a combination of Atovaquone and Proguanil, as well as
Artemisinin resistant strains are emerging (Fivelman et al., 2002; Witkowski et al., 2013; Dondorp et
al., 2009) and consequently, new antimalarial drugs need to be discovered urgently.
In the asexual blood stage P. falciparum digests hemoglobin in the food vacuole and requires this for
proliferation (Rosenthal et al., 1988). The parasite takes up to 75 % of the host hemoglobin in the
erythrocytes by endocytosis and catabolizes it in order to acquire a source of free amino acids for
protein biosynthesis (Krugliak et al., 2002; Loria et al., 1999; Goldberg & Slater, 1992). The pathway of
hemoglobin catabolism is essential for the replication of the parasite and thus of great interest in anti-
malarial drug development. Hemoglobin is first cleaved by endopeptidases of various catalytic
mechanisms and divers specificity (plasmepsin I, II, and IV; falcipain-2, -2b, and -3 and histoaspartic
protease) before the globin peptides are cleaved to oligopeptides by the metalloprotease falcilysin
(Gluzman et al., 1994; Shenai et al., 2000; Goldberg, 2005; Rosenthal, 2002; Eggleson et al., 1999).
Figure 5-1: Simplified schematic of the hemoglobin degradation pathway in P. falciparum.

CHAPTER 5: STRUCTURAL CHARACTERIZATION OF APP
97
The oligopeptides are then hydrolyzed to dipeptides by a dipeptidyl Aminopeptidase (Klemba et al.,
2004) and subsequently the dipeptides are cleaved to individual amino acids by aminopeptidases M1
and M17 (Kolakovich et al., 1997).
However, peptides containing a X-Pro sequence do not bind in the active sites of aminopeptidases with
broad specificity, due to the cyclic structure of proline. Because human hemoglobin contains seven
proline residues a third aminopeptidase, which is called Aminopeptidase P (APP), plays an important
role in the hemoglobin degradation. APP possesses a high specificity for a substrate with proline in P1´
position and appears to be the only enzyme of Plasmodium that is capable to hydrolyze an N-terminal
amino acid from X-Pro-containing peptides (Cunningham & O'Connor, 1997; Ragheb et al., 2009).
APP is a metallopeptidase whose activity is strongly dependent on manganese (Ragheb et al., 2009).
For human APP1 and E. coli APP structural studies have revealed a di-Mn2+-cluster (Graham et al., 2004;
Li et al., 2008), while for C. elegans APP a di-Zn2+-cluster was identified (Iyer et al., 2015). The
structurally known homologues with the highest sequence identity to P. falciparum APP have a three-
domain structure and form a dimer as catalytically active form. As a distinguishing feature,
P. falciparum APP contains a non-conserved N-terminal extension of 128 amino acids. Based on protein
isolations from parasite extracts it is speculated, that APP is translated and directed to the food vacuole
as a full length variant and then processed to its mature form in this compartment (Ragheb et al.,
2009).
In this chapter it is intended to structurally characterize the key enzyme APP from P. falciparum. A
protocol for the protein expression and purification is established and the protein is further analyzed
by CD-spectroscopy, Dynamic Light Scattering and X-ray crystallography.
5.2 Material and Methods
5.2.1 Cloning and expression of APP
The sequence of the Aminopeptidase P (APP) from Plasmodium falciparum was obtained in a IBA3+
plasmid from Prof. Dr. Carsten Wrenger (University of Sao Paulo, Brazil). Based on information from
nucleotide sequence homology (Blastn, Altschul et al., 1990), structural homology modelling (ITASSER
and PHYRE2) and crystallizability prediction (XtalPred-RF) a truncated version of the APP protein was
designed. The APP was truncated by 128 amino acids (384 bp) N-terminally and by 6 amino acids
(18 bp) C-terminally, resulting in a construct with 643 amino acids (1929 bp). Additionally, the presence
of rare codons for E. coli in the APP coding nucleotide sequence was analyzed. The sequence has been
optimized in order to avoid the occurrence of these rare codons and the gene was synthesized by the
company GenScript (Piscataway, USA). The codon optimized sequence was C-terminally extended by

CHAPTER 5: STRUCTURAL CHARACTERIZATION OF APP
98
a 6x His tag followed by a TEV cleavage site (27 amino acids, 81 bp), to allow for protease cleavage of
the affinity tag, and contained EcoR1 and BamH1 restriction sites. The synthetized gene sequence had
a complete length of 2010 nucleotides (670 amino acids) and was obtained subcloned in a pUC57
bacterial expression vector. The protein sequence of full-length APP as well as an overview of the
truncated regions is listed in the Appendix.
The APP gene was then recloned in a IBA3+ bacterial expression vector and transformed into E. coli
BLR(DE3) cells from Novagen (Merck, Darmstadt, Germany). A single colony of the cells, grown on a
LB-agar plate with tetracycline (17 μg mL-1) and ampicillin (100 μg mL-1) over night at 37 °C, was used
to inoculate a 20 ml preculture with LB-medium containing the same antibiotics. The preculture was
grown for 16 hours at 37 °C at 180 rpm and subsequently used to inoculate the expression culture (1L
LB-medium at 37 °C und 180 rpm, supplemented with the same antibiotics selection and 1 mM MnCl2).
Gene expression was induced at an OD600 of 0.6-0.8 by addition of 1 mM IPTG, the temperature was
reduced to 20 °C and the expression was conducted for 16 hours. The cells were harvested after 16
hours by centrifugation at 4000 x g for 20 minutes at 4 °C and the cell pellet was stored at -20 °C until
usage.
5.2.2 APP purification protocol
For the purification of APP the cell pellet was resuspended in lysis buffer (50 mM Tris, pH 8.0, 150 mM
NaCl, 1 mM MnCl2 and 1 mM PMSF), supplemented with a spatula tip lysozyme (Gallus gallus, Sigma
Aldrich, Germany). The cells were disrupted by sonication on ice for three minutes each (30 % duty
cycle) and the procedure was repeated three times. The lysate was centrifuged at 4 °C at 17 000 x g
for 40 minutes to remove cell debris and APP was obtained in the supernatant. Metal ion affinity
chromatography using a Ni-NTA column with gravity flow was applied as a first purification step. The
column was equilibrated with lysis buffer and the cleared lysate was incubated with the matrix for 30
to 60 minutes at 4 °C. The flow-through was collected and the resin was washed three times with 20 ml
lysis buffer supplemented with 20 mM imidazole, 1 mM ATP and 1 mM MgCl2 to remove unspecifically
bound protein. The protein was eluted in several steps with 10 ml elution buffer containing 50 mM
Tris, pH 8.0, 150 mM NaCl, 100 mM Imidazole, 1 mM MnCl2. The elution fractions were analyzed by
SDS-PAGE and suitable fractions were combined. The combined fraction was dialyzed over night
against imidazole free elution buffer at 4 °C. Subsequently, the sample was concentrated to a volume
of 5 ml and a second purification step using a size exclusion chromatography (SEC) was applied and
operated by an ÄKTA FPLC system (ÄKTA Purifier P-901; GE Healthcare, UK). For the SEC a Hi-Load
16/60 Superdex 200 (GE Healthcare, UK) column was used at 4 °C and equilibrated with APP-buffer (50
mM Tris, pH 8.0, 150 mM NaCl and 1 mM MnCl2.). SEC was used to separate the catalytically active
CHAPTER 5: STRUCTURAL CHARACTERIZATION OF APP
99
APP dimer from larger oligomers and aggregates. Finally, the purified APP was concentrated using a
Amicon centrifugal filter concentrator (Merck Millipore, Schwalbach, Germany) with an
MWCO = 10 kDa. Native page was performed according to the manufacture protocol by using a kit
containing precasted gradient gels and buffer solutions (#43204.01, SERVA Electrophoresis,
Heidelberg, Germany)
5.2.3 DLS measurements
Dynamic light scattering measurements with a SpectroLight 300 cuvette instrument (XtalConcepts,
Hamburg, Germany) were performed to determine the hydrodynamic radius of the APP protein in
solution. The laser has an output power of 100 mW, a wavelength of 660 nm and the scattered light
was detected at a scattering angle of 90°. The autocorrelator (XtalConcepts) of the instrument covers
a sample time range from 0.4 µs to 30 s. Samples were measured at 20 °C and each measurement was
performed for 30 s and repeated 20 times in order to get highly reliable results. The refractive index
of water (n = 1.33) and a viscosity of 1.016 cP were used for all calculations. The decay time constants
of the scattering signal are derived from the autocorrelation function by using the CONTIN algorithm
(Provencher, 1982). The hydrodynamic radius (RH) of the particles in solution was calculated from the
decay time constant. The molecular weight of the particles was approximated applying the formula
𝑹𝑯 = (𝟑𝑴 ∙ (𝑽𝑺+𝒉)
(𝟒𝝅 ∙ 𝑵𝑨))
𝟏
𝟑 ,
(4)
with M being the molecular weight, VS the specific particle volume, h the hydration volume and NA the
Avogadro constant.
5.2.4 CD spectroscopy
Circular Dichroism (CD) spectroscopy measurements were performed using a J-815 CD-Spectrometer
(Jasco, Gross-Umstadt, Germany). Prior recording of far-UV spectra the APP sample was dialyzed
against a buffer containing 10 mM Tris, pH 8.0. Subsequently, the sample was diluted 20 times with
ultrapure water, resulting a protein concentration of 2 µM. 100 µL of this sample were filled into a
quartz glass cuvette with 1 mm pathlengh (Hellma-Analystics, Müllheim, Germany). 15 individual
spectra were recorded and merged from a wavelength range of 190 – 260 nm with a data pitch of
0.1 nm a bandwidth of 1 nm and a scanning speed of 50 nm min-1. The spetra were cut at a
wavelength of 195 nm, because the absorption exceeded 3 at lower wavelength. The spectra were
evaluated in the Software Spectra Manager from Jasco to estimate the secondary structure content of
APP.
CHAPTER 5: STRUCTURAL CHARACTERIZATION OF APP
100
5.2.5 Crystallization
For the crystallization of the purified APP (5.2.2) the protein solution was concentrated to a range of
7 to 11 mg mL-1 by using a Amicon centrifugal filter concentrator (Merck Millipore, Schwalbach,
Germany) with an MWCO =10 kDa. Before crystallization trials have been conducted the protein
solution was centrifuged for 30 minutes at 16100 x g and DLS (5.2.3) was used to determine the particle
size distribution of the particles in solution. Crystallization trials were performed as vapor diffusion
method in a sitting drop approach and seeding experiments were set up in microbatch mode under
oil.
For the vapor diffusion experiments 96-well SWISSCI MRC2 plates were used (Hampton Research, Aliso
Viejo, USA) and pipetted by a Honeybee 961 pipetting robot (Genomic Solutions, Huntingdon, UK).
45 µL of precipitant were used in the reservoir well and 400 nl protein were mixed with 400 nl
precipitant on the sitting shelf. The commercial crystallization screens PACT premier (MD1-36), JCSG-
plus (MD1-40), Morpheus (MD1-47), Stura FootPrint (MD1-20) (all Molecular Dimensions, Suffolk, UK)
and AmSO4 (Quiagen) were tested. The plates were sealed, stored at 289 K and regularly inspected for
crystal formation using a microscope.
The microbatch experiments have been set up by using the Oryx4 pipetting robot (Douglas
Instruments, Hungerford, UK). Hydrophobic vapor batch plates (VBATCH 1/1 PHO, Douglas
Instruments, Hungerford, UK) were set up using a 3-bore tip with 300 nl protein, 200 nl reservoir and
100 nl seed stock. The plate was flooded with Al´s oil, which is a 50:50 (v/v) mixture of Paraffin Oil and
Silicon Oil (Hampton Research, Aliso Viejo, USA), to allow for a slow solvent evaporation. Seed stocks
have been prepared by using seed-beads (Jena Bioscience, Jena, Germany) according manufacturer
protocol.
5.2.6 Data collection, evaluation, phasing and refinement
Before diffraction data collection the crystallization droplet was supplemented with 25 % glycerol for
cryo protection. The crystals in nylon loops were mounted on the kappa-goniostat of the EMBL P14
beamline at the synchrotron source PETRA III in Hamburg, Germany. The protein crystals have been
exposed to an X-ray beam with an approximate flux of 1.2 1011 photons s-1. The beam size was 90 by
124 µm, adjusted to the crystal size in order to obtain an optimal signal to noise ratio. The exposure
time of each diffraction pattern was 40 milliseconds and the crystal was rotated by 180 ° in 0.05°
increments.
The diffraction data was integrated and processed by the programs XDS (Kabsch, 2010) and SCALA
(Evans, 2006). Structure solution and refinement was done by using programs from the CCP4 suite
(Winn et al., 2011). Molecular replacement was performed with the PDB entry 3CTZ as a search model,

CHAPTER 5: STRUCTURAL CHARACTERIZATION OF APP
101
which has a sequence identity of 35 %, to obtain phase information by using the software MOLREP
(Vagin & Teplyakov, 2010). Refinement was done with REFMAC5 (Murshudov et al., 2011) and COOT
(Emsley et al., 2010) was used for visual inspection and improvement of the structural model. Figures
were drawn by using the program PYMOL (DeLano Scientific, San Carlos, USA).
5.3 Results and Discussion
5.3.1 Recombinant expression, purification and characterization
A sequence homology analysis of P. falciparum APP with homologue proteins by using the Basic Local
Alignment Search Tool (BLAST) (Altschul et al., 1990) revealed, that the first 128 amino acids from the
N-terminus are not conserved and absent in any homologue protein. The highest sequence identity of
truncated APP to a protein with known structure was identified from Homo sapiens APP (35 %) (pdb
code: 3CTZ) followed by APP from Caenorhabditis elegans (30 %), determined by the modeling and
prediction server Phyre2 (Kelley et al., 2015). Additionally, a long disordered region was predicted at
the N-terminus by the server XtalPred (Slabinski et al., 2007), resulting in a a rather poor predicted
crystallizability. The N-terminal extension might be involved in signaling of the premature APP to the
food vacuole, where it is further processed to its mature form.
Based on this, a truncated version of APP was designed by removing 128 amino acids on the N-terminus
and six amino acids on the C-terminus (sequence listed in Appendix). However, expression of truncated
APP resulted in a relatively low protein yield and the soluble fraction of APP was mainly aggregated
after purification and could not be concentrated without inducing further aggregation. Because
optimization of the purification protocol was not successful, a codon optimization of the gene was
performed. The original APP gene from P. falciparum was analyzed for the presence of rare codons for
E. coli and the codons were modified to obtain an improved codon usage without changing the amino
acid sequence after translation of the mRNA. After codon optimization the truncated APP was
expressed recombinantly in E. coli BLR pLysS cells for 16 hours and an expression profile before and
after induction of expression is shown in Figure 5-2 A. The APP protein was purified from the cleared
lysate by Ni-NTA affinity chromatography and the resulting eluate fractions contained around 90 %
pure APP protein, as can be seen on the SDS-PAGE in Figure 5-2 B. No significant amount of APP is
observed in the flow through (FT) and first washing step (W1). A small amount of APP is detected in
the washing steps with buffer containing 1 mM ATP and MgCl2 (W2 and W3). In the elution fractions
(E1 and E2) a single band is visible, revealing that the APP sample contained a relatively low amount of
impurities.

CHAPTER 5: STRUCTURAL CHARACTERIZATION OF APP
102
Subsequently, a second purification step was performed by size exclusion chromatography in order to
remove remaining impurities and to separate different oligomeric states of APP from each other. The
resulting chromatogram is shown in Figure 5-3 A and revealed three distinct peaks. For comparison, a
chromatogram before codon optimization is presented (blue curve), demonstrating a significantly
reduced height of the void peak and the improved separation of latter peaks after codon optimization
(red curve). In the chromatogram after codon optimization (red curve) the first peak (I) represents the
void fraction containing aggregated APP as well as other impurities and the peaks II and III were further
analyzed by native page (Figure 5-3 B). The native page of the elution fractions revealed, that the third
fraction contained predominantly dimeric APP (155.6 kDa) and only trace amounts of monomeric (77.8
kDa) and tetrameric (311.2 kDa) APP (Figure 5-3 B). In the fraction of the second peak of the size
exclusion chromatogram a mixture of dimeric and tetrameric APP was identified, together with higher
oligomeric assemblies, presumably hexamers and octamers.
For structural characterization of APP, the central fractions under peak III were combined and further
concentrated (typically five fractions with 10 mL volume in total). DLS was used to analyze the
dispersity of the protein after concentration and a representative radius distribution pattern from a
sample concentrated to 5.3 mg mL-1 is shown in Figure 5-3 C. The determined hydrodynamic radius
calculated from 20 measurements was 4.8 nm (≈125 kDa) and showed a highly monodisperse solution
(PDI = 18 %). The results demonstrate, that APP preferably forms a dimer in solution, which has already
been reported to be the catalytically active form for other aminopeptidases (Li et al., 2008; Iyer et al.,
2015). The recorded CD-spectrum shows two distinct minima at 220 nm and 208 nm, a zero crossing
at 203 nm and a maximum towards 195 nm. Based on these curve characteristics it can be concluded
that APP is well folded. By using a set of reference spectra and the algorithm developed by Venyaminov
Figure 5-2: SDS-PAGE showing the expression of APP and fractions from its purification. [A] Expression profile of APP in E. coli BLR pLysS cells before and 16 h after induction of expression by IPTG at 20 °C. A strong band corresponding to P. falciparum APP becomes visible in the sample after expression (M = molecular weight marker). [B] Elution fraction of the first purification step, the Ni-NTA affinity chromatography (M = molecular weight marker, FT = flow through, W = washing step, E = elution step).

CHAPTER 5: STRUCTURAL CHARACTERIZATION OF APP
103
et al. (1991), a secondary structure content of 40 % α-helices, 23 % β-sheets, 13 % turns and 24 %
random coil was approximated.
An activity assay with APP was conducted by Jasmin Lindner (University Hamburg/University of Sao
Paulo) and revealed that the protein is active (Data not shown). For this, a penta-peptide derived from
human hemoglobin was used as a substrate containing a proline in P1´ position. The substrate was
incubated with APP and the amount of uncleaved peptide was identified by mass-spectrometry
followed by taking aliquots over a period of 2 hours. A penta-peptide with glycine in P1´ position
instead of a proline was used as a control to verify the substrate specificity of the enzyme.
Figure 5-3: Second purification step of APP and biophysical characterization of elution fractions. [A] Chromatogram of the size exclusion chromatography before (blue curve) and after (red curve) codon optimization. After codon optimization the void peak (I) was small and the protein mainly eluted in two major peaks at a retention volume of 64 ml (II) and 75 ml (III). [B] Native page revealed that the elution fractions from peak II contained APP in dimeric, tetrameric and presumably hexameric and octameric state, while in elution fractions from peak III mainly dimeric APP was identified. [C] Hydrodynamic radius distribution obtained by DLS measurements of an APP sample from fractions of peak III, which was concentrated up to
5.3 mg mL-1. The solution was highly monodispers and a RH value of 4.8 ± 0.03 nm was calculated. [D] CD-spectrum of APP shows typical characteristics for a well-folded protein and allows a secondary structure content approximation. The graphs are created with Origin (OriginPro 9.1, OriginLab, Northampton, USA).

CHAPTER 5: STRUCTURAL CHARACTERIZATION OF APP
104
The results showed, that after 30 minutes no significant amount of proline containing penta-peptide
was identified, while the amount of glycine containing penta-peptide remained constant throughout
the duration of two hours.
5.3.2 Crystallization, data collection and refinement
Crystallization trials were performed using commercially available crystallization screens according to
the protocol described in section 5.2.5. APP protein crystals have formed after a few days in several
crystallization conditions containing high molecular weight PEG (>1500), predominantly at pH values
between 7 and 8 (theoretical isoelectric point of APP is 5.9). Successful crystal formation has been
observed in crystallization experiments, which have been set up with a protein concentration ranging
from 7.4 to 11.6 mg mL-1. APP crystals were colorless and possessed a rhombical shape with side
dimensions up to 200 µm, while the thickness remained significantly smaller. Best diffracting crystals
were obtained in a condition containing 0.2 M sodium fluoride, 0.1 M Bis-Tris propane pH 6.5 and 20%
PEG 3350 with a protein concentration of 11.6 mg mL-1 (Figure 5-4 A).
For X-ray diffraction data collection, crystals were cryo-protected by supplementation of 26 % (v/v)
glycerol, fished in a nylon loop, flash cooled in gaseous nitrogen at 100 K and mounted at the P14 EMBL
beamline at the PETRA III synchrotron (Figure 5-4 B). Diffraction was recorded up to a resolution of
1.7 Å (Figure 5-4 C) and the data were cut at 1.89 Å resolution based on monitoring I/σ, Rmerge and CC1/2
after indexing, integration and scaling. The data collection statistics are shown in Table 10.
Figure 5-4: Protein crystal of P. falciparum APP used for X-ray diffraction data collection. [A] APP crystals grown in 0.2 M sodium fluoride, 0.1 M Bis-Tris propane pH 6.5 and 20% PEG 3350 with a
protein concentration of 11.6 mg mL-1 possessed a rhombical shape. [B] Crystals were fished with a nylon loop and flash frozen in gaseous nitrogen (100 K). [C] APP crystals diffracted up to a resolution of 1.7 Å,
recorded at the P14 EMBL beamline at PETRA III.
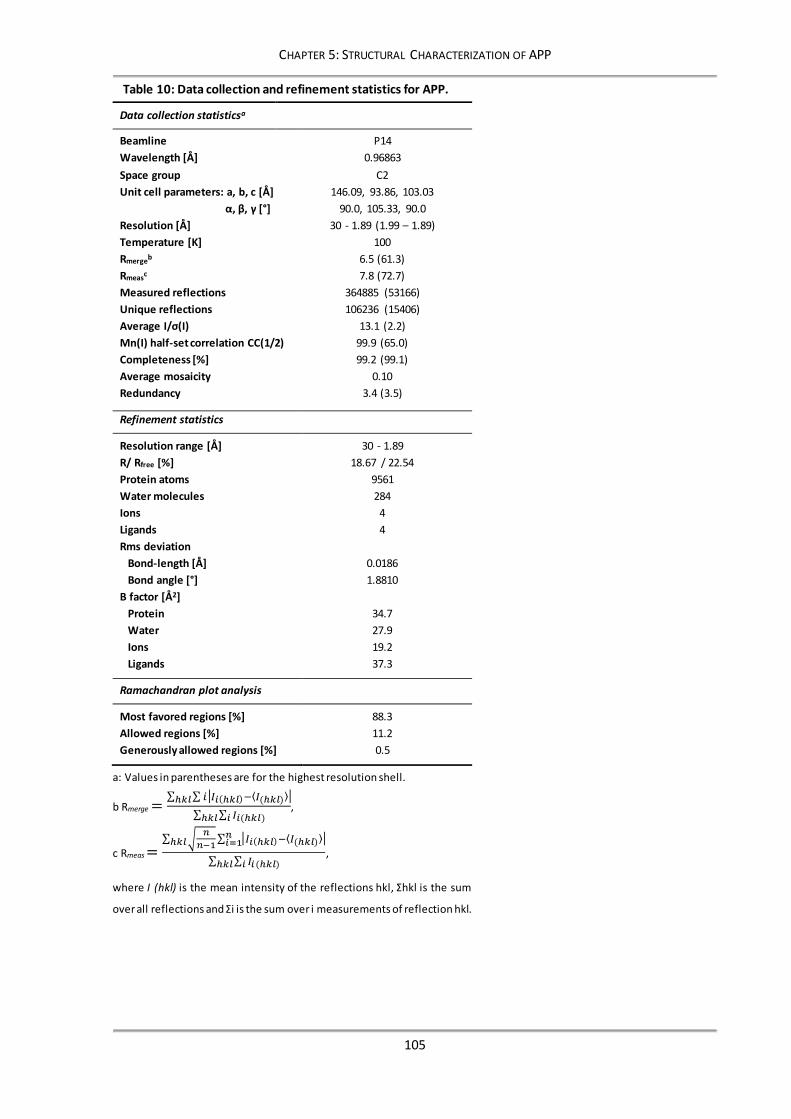
CHAPTER 5: STRUCTURAL CHARACTERIZATION OF APP
105
Table 10: Data collection and refinement statistics for APP.
Data collection statisticsa
Beamline P14
Wavelength [Å] 0.96863
Space group C2
Unit cell parameters: a, b, c [Å]
α, β, γ [°]
146.09, 93.86, 103.03
90.0, 105.33, 90.0
Resolution [Å] 30 - 1.89 (1.99 – 1.89)
Temperature [K] 100
Rmergeb 6.5 (61.3)
Rmeasc 7.8 (72.7)
Measured reflections 364885 (53166)
Unique reflections 106236 (15406)
Average I/σ(I) 13.1 (2.2)
Mn(I) half-set correlation CC(1/2) 99.9 (65.0)
Completeness [%] 99.2 (99.1)
Average mosaicity 0.10
Redundancy 3.4 (3.5)
Refinement statistics
Resolution range [Å] 30 - 1.89
R/ Rfree [%] 18.67 / 22.54
Protein atoms 9561
Water molecules 284
Ions 4
Ligands 4
Rms deviation
Bond-length [Å] 0.0186
Bond angle [°] 1.8810
B factor [Å2]
Protein 34.7
Water 27.9
Ions 19.2
Ligands 37.3
Ramachandran plot analysis
Most favored regions [%] 88.3
Allowed regions [%] 11.2
Generously allowed regions [%] 0.5
a: Values in parentheses are for the highest resolution shell.
b Rmerge =∑ ∑ 𝑖|𝐼𝑖(ℎ𝑘𝑙)−⟨𝐼(ℎ𝑘𝑙)⟩|ℎ𝑘𝑙
∑ ∑ 𝐼𝑖(ℎ𝑘𝑙)𝑖ℎ𝑘𝑙,
c Rmeas =∑ √
𝑛
𝑛−1∑ |𝐼𝑖(ℎ𝑘𝑙)−⟨𝐼(ℎ𝑘𝑙)⟩|𝑛
𝑖=1ℎ𝑘𝑙
∑ ∑ 𝐼𝑖 (ℎ𝑘𝑙)𝑖ℎ𝑘𝑙,
where I (hkl) is the mean intensity of the reflections hkl, Σhkl is the sum
over all reflections and Σi is the sum over i measurements of reflection hkl.

CHAPTER 5: STRUCTURAL CHARACTERIZATION OF APP
106
The monoclinic space group C2 was identified for the crystal with unit cell dimensions of a = 146.09 Å,
b = 93.86 Å, c = 103.03 Å and β = 105.30°. Based on the calculated Matthews coefficient of 2.19 Å3Da-1
and a solvent content of 43.9 %, two molecules in the asymmetric unit were identified by using the
software MATTPROB (Kantardjieff & Rupp, 2003; Weichenberger & Rupp, 2014). The phase problem
was solved by molecular replacement using one monomer from human APP (PDB: 3CTZ) as a search
model, resulting in a contrast value of 7.44, a correlation coefficient of 60 % and a R-factor of 44.5 %
(Wisedchaisri & Gonen, 2013). Further refinement with isotropic B factors was done by REFMAC5
(Murshudov et al., 2011), two TLS group were defined and the TLS contribution was included in the
final structural model of APP. The R-factor of the final model is 18.7 % and the Rfree-factor is 22.5 %. In
chain A of the structural model amino acids 1-28, 101-102, 178-180, 199-205, 328-333 are not visible
in the electron density and consequently excluded from the final model. Most of the missing loops are
located in the N-terminal domain I, which also has a higher B-factor compared to domain II and domain
III. In chain B the amino acids 1-53, 72-73, 97-135, 172-187. 195-202 and 332-333 are not visible in the
electron density, including a large fraction of domain I. The larger fraction of missing amino acids
compared to chain A can be explained by the fact, that chain A is stabilized by crystal contacts which
are absent in chain B. The missing regions in both, chain A and B, are visualized in the amino acid
sequence shown in the Appendix. The resulting model demonstrates excellent geometry and no
Ramachandran outliers are identified using PROCHECK (Laskowski et al., 1993). Processing and
refinement statistics are summarized in Table 10.
5.3.3 Structural model interpretation
A sequence alignment of APP has been performed with known homologue structures by the server
Clustal Omega (Sievers et al., 2011) and was visualized by the ESPript server (Robert & Gouet, 2014)
(Figure 5-5). For human APP, which has a sequence identity of 35 %, an Cα RMSD value of 2.1 Å has
been calculated by superimposing the structure with the structural model of APP (PDBeFold, (Krissinel
& Henrick, 2004). The Cα RMSD value from the structure comparison with C. elegans APP, which has a
lower sequence identity (30 %), was calculated to be 1.7 Å.
As expected from the data of the biophysical characterization, APP forms a homodimer in the crystal
(Figure 5-7 A). The overall size of the dimer is approximately 85 x 70 x 55 Å3. The stabilization of the
dimer is mostly based on hydrophobic interactions and four hydrogen bonds. The dimer interface
consists of three hydrophobic patches, a large patch between the domains III of chain A and B and two
small patches in domain I and domain II. The largest patch in domain III is build up by side chains of the
residues I512, F513, Y516, L522, F524, I525, F531, F534, P560, K597 and Y605, as shown in Figure 5-6. Additional
hydrophobic patches are created by L156, P160, K161 and K163 of domain I in chain A, interacting with P334

CHAPTER 5: STRUCTURAL CHARACTERIZATION OF APP
107
and F336 of domain II in chain B and vice versa. Hydrogen bonds further stabilize the dimer interaction
and are found between D536 of chain A and Y516 of chain B as well as for the symmetry equivalent
(distance 2.5 Å) and additionally between E528 of chain A/B and R507 of chain B/A (distance 2.9 Å). As a
result of these interactions, approximately 1580 Å2 from each subunit are buried from the total solvent
accessible surface area (28350 Å2) upon dimer formation.
Figure 5-5: Multiple sequence alignment of P. falciparum APP with closest structurally known homologues. The multiple sequence alignment was performed with the web server Clustal Omega (Sievers et al., 2011) and the graphical presentation was generated using the ESPript 3.0 server (Robert & Gouet, 2014). The secondary structure of APP is displayed above the alignment with α-helices (spirals), β-strands (arrows), turns (T) and 310 helices (µ). Identical residues are indicated by a red background and similar residues by yellow background. The residues contributing to the active site are highlighted by green circles (below) and a dashed blue line indicates amino acids located at the dimer interface.

CHAPTER 5: STRUCTURAL CHARACTERIZATION OF APP
108
Figure 5-6: Surface illustration of the dimer interface of P. falciparum APP. The overall surface of the three domains (I, II and III) is colored gray. The dimer interface consists of three hydrophobic patches (green) and 4 hydrogen bonds (red and blue). The figure was created with PyMOL (Schrödinger, LLC).
Figure 5-7: Cartoon representation of the structural model of P. falciparum APP. [A] APP is found in a homodimer assembly in the crystal with dimensions 85 x 70 x 55 Å3. [B] One APP monomer consist of three domains, domain I from the N-terminus to residue 203, domain II from residue 204 to 374 and domain III from residue 375 to the C-terminus. In the cartoon representation β-strands are colored yellow, α-helices in red and green is used for turns and loops. The figure was created with PyMOL (Schrödinger, LLC).

CHAPTER 5: STRUCTURAL CHARACTERIZATION OF APP
109
Similar to human APP and C. elegans APP, each monomer of P. falciparum APP possesses a three
domain architecture (Figure 5-7 B). The N-terminal domain (domain I) includes residues 1-203, the
middle domain (domain II) consist of residues 204-374 and the C-terminal domain (domain III) spans
from residue 375 to 670 (C-terminus). The general fold of domain I is composed of a central seven-
stranded β-sheet in the topological order 4 3 2 1 5 7 6, with strand β2 being antiparallel. The β-sheet is
flanked by four α-helices, with α3 and α4 located on the concave side and α1 and α2 on the convex side.
The arrangement of the secondary structure elements is visualized in Figure 5-8 A. The fold of domain II
is similar to that of domain I with some small modifications. The central β-sheet contains five strands
in the order 11 10 9 8 12 13 with β9 pointing in the opposite direction. In addition, seven α-helices are
present, α9 and α10 on one side and α5, α6, α7, α8 and α11 on the other side (Figure 5-8 B). An alignment
of 101 amino acids from both domains (I & II) resulted in a RMSD value of 2.4 Å.
Figure 5-8: Schematic presentation of the topology details of the APP domains. [A] The architecture of domain I reveals a central seven-stranded β-sheet (4-3-2-1-5-7-6, β2 being antiparallel), flanked by the helices α3 and α4 on the one and α1 and α2 on the other side. [B] Domain I possesses a similar fold as domain I with six central β-strands (11-10-9-8-12-13, β9 antiparallel) surrounded by the helices α9 and α10 on one side and α5, α6, α7, α8 and α11 on the other side. [C] Domain III contains two β-sheets, the first is built of four antiparallel strands (β14 extends to β15, β16 (antiparallel) and β17) and the second β-sheet has a long strand (β20) which is flanked on the top end by β19 and on the bottom end by β18 and β21. The first β-sheet is flanked by the α-helices α12 α13 and α14 and the second β-sheet is surrounded by α15 α16 and α17. Two α-helices (α18 α19) bridge the two β sheets in perpendicular orientation. Α-helices in red andβ-sheets in yellow are to scale, while the turns and loops (grey) are not to scale.

CHAPTER 5: STRUCTURAL CHARACTERIZATION OF APP
110
Domain III exhibits a “pita-bread” fold, which is typical for methionine aminopeptidases,
aminopeptidase P and prolidases (Lowther & Matthews, 2002), and comprises of two central
antiparallel β-sheets. The first one is four-stranded and contains the strands β14 which extends to β15,
β16 (antiparallel) and β17. The second β-sheet is nearly perpendicular to the direction of the first β-sheet
and contains a long curved strand β20 which on the top end is flanked by a short antiparallel strand β19
and on the bottom end on both sides by the antiparallel strands β18 and β21. The first β-sheet is
surrounded by three α-helices, α12 α13 and α14, while the second β-sheet is enclosed by α15 α16 and α17.
Towards the C-terminus of APP two α-helices (α18 and α19) bridge the two β-sheets in perpendicular
orientation. The architecture of domain III is displayed in Figure 5-8 C.
The active site is formed by the conserved amino acids D469, D480, H542, H543, E575 and E589 in the center
of the pseudo 2-fold-symmetric C-terminal domain. All six amino acids contribute to the coordination
of two metal ions of a dinuclear center. The metal ions are most likely manganese ions because they
are identified in human APP (Li et al., 2008) and shown to be required for activity in P. Falciparum APP
(Ragheb et al., 2009). The first Mn2+ ion (named Mn1 in Figure 5-9) is coordinated by D469 (2.2 Å and
2.5 Å), D480 (2.0 Å) and E589 (2.1 Å) as well as by two water molecules (W1 and W3) with distances to
the Mn2+ of 2.4 Å and 2.2 Å. The second Mn2+ is coordinated by D480 (2.1 Å), E589 (1.9 Å), E575 (2.2 Å),
H543 (2.3 Å) and H552 via a water molecule (2.6 Å), which has a distance to the Mn2+ of 2.1 Å.
Additionally, the Mn2+ is stabilized by a second water (W3, 2.3 Å), which is coordinated by E575 (2.6 Å).
This results in octahedral coordination of both Mn2+ ions and B-factors of 19.6 and 20.5.
Figure 5-9: Active site of P. falciparum APP. [A] Active site of APP with amino acids in stick representation colored by atom types (carbon in green, oxygen in red and nitrogen in blue). Two Mn2+ ions and three water molecules are shown as purple and red spheres, respectively. The 2Fo - Fc electron density map is superimposed (blue mesh), contoured at 2σ. Residues are labeled and distances between atoms are shown in angstrom. The figure was created with PyMOL (Schrödinger, LLC). [B] Schematic 2D representation of the molecular interactions between the amino acids in the active site and the Mn2+ ions. Distances are given in angstrom and for clarity reason water molecules are not shown. The figure has been prepared with Ligplot (Wallace et al., 1995).

CHAPTER 5: STRUCTURAL CHARACTERIZATION OF APP
111
In previous studies of human and E. coli APP it was postulated that the manganese cluster is bridged
by a water molecule (corresponding to W3 in Figure 5-9), which thereby is able to perform a
nucleophilic attack on the X-pro bond of the substrate peptide (Li et al., 2008; Graham et al., 2004).
5.4 Conclusions
Codon optimization and truncation of the unfolded part of the N-terminal domain were the key steps
that allowed establishing a protocol for APP expression and purification. Further, supplementation of
manganese in the expression medium and protein buffer are substantial for correct APP folding. After
improvement of the protocol, highly pure and active APP was obtained and showed a predominantly
dimeric assembly in solution. Screening of crystallization conditions was successful and resulted in APP
crystals with rhombical shape that diffracted up to 1.7 Å. The diffraction data could be indexed, scaled
and merged and a structural model of APP was refined up to 1.89 Å resolution. The APP was found as
a homodimer in the crystal and revealed the expected three-domain architecture. Domain I and
domain II exhibit a similar fold and can be superimposed with an RMSD value of 2.4 Å. Domain III shows
a typical “pita-bread” fold, which is known from other aminopeptidases. The resulting structural APP
model shows a high structural homology to human APP (Cα RMSD = 2.1 Å) and to C. elegans APP
(Cα RMSD = 1.7 Å). In particular, the active site is highly conserved and the di-nuclear Mn2+ cluster is
coordinated similar to the human APP, which indicates that both enzymes share a common mode of
substrate binding and a similar catalytic mechanism. In the future, highly interesting information about
the still poorly understood substrate specificity for peptides with proline in P1` position can be
obtained by co-crystallizing the APP with a non-cleavable peptide substrate. Also co-crystals with the
known aminopeptidase inhibitors apstatin and bestatin might provide valuable insights into the
mechanism of the enzymatic function of APP. By analyzing the structural differences and similarities
between the enzyme-inhibitor complexes, new inhibitors can potentially be designed that are specific
for P. falciparum APP.

APPENDIX
112
APPENDIX

LIST OF ABBREVIATIONS
113
LIST OF ABBREVIATIONS
α Alpha Å Angstrom ACF Autocorrelation function
AHT Anhydrotetracycline APTS (3-Aminopropyl)trimethoxysilane APP Aminopeptidase P β Beta
C Celsius CCD Charge-coupled device Da Dalton
DLS Dynamic l ight scattering DDLS Depolarized dynamic l ight scattering fs Femtosecond γ Gamma
g Gram G Gravitational constant GPTS (3-Glycidyloxypropyl)trimethoxysilane h Hour
IPTG Isopropyl-β-D-thiogalactopyranosid k Kilo K Kelvin
l Liter LB Lennox-Broth LSW-theory Lifshitz/Slezov/Wagner theory m Meter
min Minute Ni-NTA Nickel-Nitrilotriacetic acid mm Mill imeter
ms Mill isecond M Molar M Mega MWCO Molecular weight cutoff
ML1 Mistletoe lectin 1 µ Micro nm Nanometer ns Nanosecond
O2 Oxygen OD Optical density p Pico
PDB Protein Data Bank PDMS (Poly)dimethylsiloxane PGMEA Propylene glycol methyl ether acetate Rpm Rounds per minute
s Second σ Sigma ThiM 5-(hydroxyethyl)-4-methylthiazole kinase TF Thermofluor
TRX Thioredoxin UV Ultraviolet V Volt
v/v Volume per volume W Watt w/v Weight per volume

SCRIPTS
114
SCRIPTS
Bash scripts for automated data processing with XDS and XSCALE, in parts modified from Yorke et al., 2014.
####################################### PREPARE FOLDER STRUCTURE #####################################
#!/bin/sh
PROCDIR= # processing directory
l=1 # starting scan number
k=60 # ending scan number
n=20 # number of images per scan
i=1
j=1
mkdir ./$PROCDIR
while [ $l -le $k ]
do
mkdir ./$PROCDIR/run-$i
while ((j<=$n))
do
cp PATH_TO_IMAGES/?_${l}_????$j.cbf ./$PROCDIR/run-$i/
cp PATH_TO_IMAGES/?_${l}_???$j.cbf ./$PROCDIR/run-$i/ << EOF
EOF
let j=j+1
done
let l=l+1
let j=1
let i=i+1
done
##################################### CREATE XDS.INP FILE FROM CBF HEADER ############################
#!/bin/bash
# A script to generate an XDS.INP for a pilatus header and integrate batches of a dataset
# RLO 07/11/2011, edited by ARP 14/07/2015
TOPDIR= # insert path to image files here
OUTDIR= # insert path to output directory here
WEDGEID=run- # insert wedge ID
NUMBEROFWEDGES=20 # insert number of wedges
NUMBERIMAGE=20 #Total number of images collected
NBATCH=20 #Number of batches to split this into
#To integrate single images set NBATCH=NUMBERIMAGE
# NUMBERIMAGE/NBATCH MUST be an integer
# Spacegroup and unit cell
SPACEGROUPNUMBER=0
A=
B=
C=
ALPHA=
BETA=
GAMMA=
# Set Friedels law
FRIEDELSLAW=TRUE
# Set min and max resolution
MINIMUMRES=
MAXIMUMRES=
# Set beam centre.
BEAMX=
BEAMY=
mkdir $OUTDIR
for (( i=1; i<=NUMBEROFWEDGES; i++))
do
#Comment below in for individual image integration
for (( j=1; j<=NBATCH; j++))
do
cd $OUTDIR
mkdir run-$i > /dev/null
cd run-$i > /dev/null
touch XDS.INP
FULLLOCATION=$TOPDIR/$WEDGEID$i
FILE=$(ls $TOPDIR/$WEDGEID$i/*.cbf | head -1 | awk -F"/" '{print $NF}')
FILENAME=$(echo $FILE | awk -F"/" '{print $(NF)}')
LEADINGNAME=$(echo $FILE | awk -F"_000" '{print $1}')
#LOCALFILENAME=$(echo $LEADINGNAME"_"$i"_####.cbf")
STARTNUMBER=$(( 1+ ($j-1) * ($NUMBERIMAGE/$NBATCH) ))
FINISHNUMBER=$(( $j*($NUMBERIMAGE/$NBATCH) ))
ln -s $FULLLOCATION images
SILICONTHICKNESS=$(head -31 $FULLLOCATION/$FILENAME | grep "Silicon sensor, thickness" | awk -F" " '{print
$5}')
SILICONTHICKNESS=$(echo "$SILICONTHICKNESS*1000" | bc)
SILICONTHICKNESS="0"$SILICONTHICKNESS
EXPOSUREPERIOD=$(head -31 $FULLLOCATION/$FILENAME | grep "Exposure_period" | awk -F" " '{print $3}')
WAVELENGTH=$(head -31 $FULLLOCATION/$FILENAME | grep "Wavelength" | awk -F" " '{print $3}')
DETECTORDISTANCE=$(head -31 $FULLLOCATION/$FILENAME | grep "Detector_distance" | awk -F" " '{print $3}')

SCRIPTS
115
DETECTORDISTANCE=$(echo "$DETECTORDISTANCE * 1000" | bc)
if [ "$BEAMCENTERFROMIMAGE" = "TRUE" ]; then
BEAMX=$(head -31 $FULLLOCATION/$FILENAME | grep "Beam_xy" | awk -F"(" '{print $2}' | awk -F"," '{print$1}')
BEAMY=$(head -31 $FULLLOCATION/$FILENAME | grep "Beam_xy" | awk -F"," '{print $2}' | awk -F")" '{print$1}')
fi
FLUX=$(head -31 $FULLLOCATION/$FILENAME | grep "Flux" | awk -F" " '{print $3}')
FILTERTRANSMITTION=$(head -31 $FULLLOCATION/$FILENAME | grep "Filter_transmission" | awk -F" " '{print
$3}')
OSCILLATIONANGLE=$(head -31 $FULLLOCATION/$FILENAME | grep "Angle_increment" | awk -F" " '{print $3}')
POLARIZATION=$(head -31 $FULLLOCATION/$FILENAME | grep "Polarization" | awk -F" " '{print $3}')
echo " JOB= ALL " >> XDS.INP
echo " NAME_TEMPLATE_OF_DATA_FRAMES=images/${LEADINGNAME}_?????.cbf CBF" >> XDS.INP
echo " DATA_RANGE=$STARTNUMBER $FINISHNUMBER >> XDS.INP
echo " SPOT_RANGE=$STARTNUMBER $FINISHNUMBER >> XDS.INP
echo " BACKGROUND_RANGE=$STARTNUMBER $FINISHNUMBER >> XDS.INP
echo " OSCILLATION_RANGE= $OSCILLATIONANGLE !degrees (>0) " >> XDS.INP
echo " X-RAY_WAVELENGTH= $WAVELENGTH !(Angstroem) " >> XDS.INP
echo " DETECTOR_DISTANCE= $DETECTORDISTANCE !(mm)" >> XDS.INP
echo " ORGX=$BEAMX ORGY=$BEAMY !Detector origin (pixels). ORGX=NX/2; ORGY=NY/2" >> XDS.INP
echo " SPACE_GROUP_NUMBER=$SPACEGROUPNUMBER >> XDS.INP
echo " UNIT_CELL_CONSTANTS= $A $B $C $ALPHA $BETA $GAMMA " >> XDS.INP
echo " FRIEDEL'S_LAW= $FRIEDELSLAW !Default is TRUE" >> XDS.INP
echo " DIRECTION_OF_DETECTOR_X-AXIS= 1 0 0" >> XDS.INP
echo " DIRECTION_OF_DETECTOR_Y-AXIS= 0 1 0" >> XDS.INP
echo " ROTATION_AXIS= 0.0 -1.0 0.0" >> XDS.INP
echo " INCIDENT_BEAM_DIRECTION=-0.0 0.0 1.0" >> XDS.INP
echo " FRACTION_OF_POLARIZATION=0.98" >> XDS.INP
echo " POLARIZATION_PLANE_NORMAL= 0 1 0" >> XDS.INP
echo " DETECTOR=PILATUS NX=2463 NY=2527 QX=0.172 QY=0.172" >> XDS.INP
echo " MINIMUM_VALID_PIXEL_VALUE=-1 OVERLOAD=1048500" >> XDS.INP
echo " MINIMUM_NUMBER_OF_PIXELS_IN_A_SPOT=3 ! Default is 6" >> XDS.INP
echo " !MINIMUM_ZETA=0.05" >> XDS.INP
echo " STRONG_PIXEL=3" >> XDS.INP
echo " SENSOR_THICKNESS=$SILICONTHICKNESS" >> XDS.INP
echo " !SILICON=0.0 >> XDS.INP
echo " TRUSTED_REGION=0.0 1.15 !Relative radii limiting trusted detector region" >> XDS.INP
echo " UNTRUSTED_RECTANGLE= 487 495 0 2528" >> XDS.INP
echo " UNTRUSTED_RECTANGLE= 981 989 0 2528" >> XDS.INP
echo " UNTRUSTED_RECTANGLE=1475 1483 0 2528" >> XDS.INP
echo " UNTRUSTED_RECTANGLE=1969 1977 0 2528" >> XDS.INP
echo " UNTRUSTED_RECTANGLE= 0 2464 195 213" >> XDS.INP
echo " UNTRUSTED_RECTANGLE= 0 2464 407 425" >> XDS.INP
echo " UNTRUSTED_RECTANGLE= 0 2464 619 637" >> XDS.INP
echo " UNTRUSTED_RECTANGLE= 0 2464 831 849" >> XDS.INP
echo " UNTRUSTED_RECTANGLE= 0 2464 1043 1061" >> XDS.INP
echo " UNTRUSTED_RECTANGLE= 0 2464 1255 1273" >> XDS.INP
echo " UNTRUSTED_RECTANGLE= 0 2464 1467 1485" >> XDS.INP
echo " UNTRUSTED_RECTANGLE= 0 2464 1679 1697" >> XDS.INP
echo " UNTRUSTED_RECTANGLE= 0 2464 1891 1909" >> XDS.INP
echo " UNTRUSTED_RECTANGLE= 0 2464 2103 2121" >> XDS.INP
echo " UNTRUSTED_RECTANGLE= 0 2464 2315 2333" >> XDS.INP
echo "!REFINE(IDXREF)=BEAM AXIS ORIENTATION CELL !DISTANCE" >> XDS.INP
echo "REFINE(INTEGRATE)=BEAM ORIENTATION CELL !DISTANCE AXIS" >> XDS.INP
echo "!REFINE(CORRECT)=DISTANCE BEAM ORIENTATION CELL AXIS" >> XDS.INP
echo "!MINUTE=1" >> XDS.INP
echo "!MAXIMUM_NUMBER_OF_JOBS=8 !Speeds-up COLSPOT & INTEGRATE on a Linux-cluster" >> XDS.INP
echo "!MAXIMUM_NUMBER_OF_PROCESSORS=8!<25;ignored by single cpu version of xds" >> XDS.INP
echo " VALUE_RANGE_FOR_TRUSTED_DETECTOR_PIXELS= 7000 30000 !Used by DEFPIX" >> XDS.INP
echo "INCLUDE_RESOLUTION_RANGE=$MINIMUMRES $MAXIMUMRES >> XDS.INP
chmod 755 XDS.INP
xds_par
cp XDS_ASCII.HKL XDS_ASCII_$j.HKL
cp CORRECT.LP CORRECT_$j.LP
cd - > /dev/null
done
done
####################################### CREATE INPUT FILE FOR XSCALE #################################
#!/bin/sh
l= # Space group number of datasets
j= # Number of wedge
i= # Reference dataset name
grep -r --include \CORRECT_$j.LP "SPACE_GROUP_NUMBER=...*$l" >>temp1.txt
sed -r -e 's/^.{0}/&'INPUT_FILE='/' <temp1.txt >temp2.txt
cat temp2.txt >> temp3.txt
echo "FRIEDEL'S_LAW= TRUE
MERGE= FALSE
REFERENCE_DATA_SET=$i
MINIMUM_I/SIGMA=3" >> temp3.txt
rm temp1.txt
rm temp2.txt
sed -i '1i\\' temp3.txt
sed '1,1s/^/OUTPUT_FILE= xscale.hkl /' temp3.txt > temp4.txt
rm temp3.txt
sed -r -e 's/CORRECT.LP: SPACE_GROUP_NUMBER= '$l'/XDS_ASCII.HKL/' <temp4.txt >temp5.txt
sed -i '/as used in the INTEGRATE step/d' temp5.txt
sed -i '/(0: unknown symmetry and unit cell)/d' temp5.txt
awk '!a[$0]++' temp5.txt > XSCALE.INP
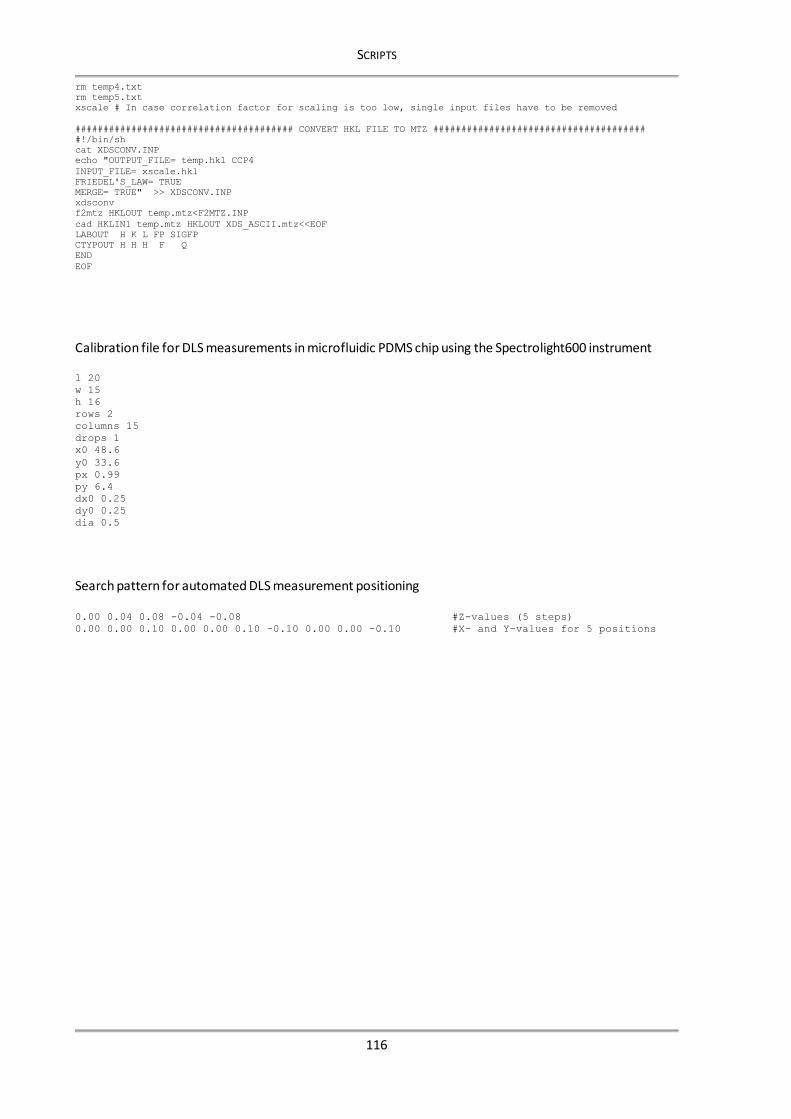
SCRIPTS
116
rm temp4.txt
rm temp5.txt
xscale # In case correlation factor for scaling is too low, single input files have to be removed
####################################### CONVERT HKL FILE TO MTZ ######################################
#!/bin/sh
cat XDSCONV.INP
echo "OUTPUT_FILE= temp.hkl CCP4
INPUT_FILE= xscale.hkl
FRIEDEL'S_LAW= TRUE
MERGE= TRUE" >> XDSCONV.INP
xdsconv
f2mtz HKLOUT temp.mtz<F2MTZ.INP
cad HKLIN1 temp.mtz HKLOUT XDS_ASCII.mtz<<EOF
LABOUT H K L FP SIGFP
CTYPOUT H H H F Q
END
EOF
Calibration file for DLS measurements in microfluidic PDMS chip using the Spectrolight600 instrument
l 20
w 15
h 16
rows 2
columns 15
drops 1
x0 48.6
y0 33.6
px 0.99
py 6.4
dx0 0.25
dy0 0.25
dia 0.5
Search pattern for automated DLS measurement positioning
0.00 0.04 0.08 -0.04 -0.08 #Z-values (5 steps)
0.00 0.00 0.10 0.00 0.00 0.10 -0.10 0.00 0.00 -0.10 #X- and Y-values for 5 positions

SEQUENCE
117
AMINO ACID SEQUENCE OF P. FALCIPARUM APP -101 Trunc_APP_ChainA ------------------------------------------------------------ 0 Trunc_APP_ChainB ------------------------------------------------------------ 0 Full-length_APP MQLNFLLFVFIFLMVFHLNIFNKGKRQNLVSAYLNHFKKSYFSGVTSGSDCVNKSEVSSD -42 1 Trunc_APP_ChainA -----------------------------------------MHNHNHNHNHNHNDYDIPT 19 Trunc_APP_ChainB -----------------------------------------MHNHNHNHNHNHNDYDIPT 19 Full-length_APP NNNNNNNNNNKIAHNFFSKKYQRNFENNNLSENQENNKNIIYSGSNIFKNIYNTEMMSNN 19 Trunc_APP_ChainA TENLYFQSDNNPAARLEELRTIMKKNKIDVYILINSDEHNSEIINEKDKKIVKITNYSGA 79 Trunc_APP_ChainB TENLYFQSDNNPAARLEELRTIMKKNKIDVYILINSDEHNSEIINEKDKKIVKITNYSGA 79 Full-length_APP NTVDVNMMDNNPAARLEELRTIMKKNKIDVYILINSDEHNSEIINEKDKKIVKITNYSGA 79 **************************************************** Trunc_APP_ChainA DGILIVTKDKPILYVNALYELQAMNELDQNLFTLRISRIDNRDEIFETISSLEFNTIAFD 139 Trunc_APP_ChainB DGILIVTKDKPILYVNALYELQAMNELDQNLFTLRISRIDNRDEIFETISSLEFNTIAFD 139 Full-length_APP DGILIVTKDKPILYVNALYELQAMNELDQNLFTLRISRIDNRDEIFETISSLEFNTIAFD 139 ************************************************************ Trunc_APP_ChainA GKNTSVVFYEKLRKALLNAYPKKKIVEKIIYNNNFDDVNKKDDENVLNFLVLEKSLVEIK 199 Trunc_APP_ChainB GKNTSVVFYEKLRKALLNAYPKKKIVEKIIYNNNFDDVNKKDDENVLNFLVLEKSLVEIK 199 Full-length_APP GKNTSVVFYEKLRKALLNAYPKKKIVEKIIYNNNFDDVNKKDDENVLNFLVLEKSLVEIK 199 ************************************************************ Trunc_APP_ChainA DYPVNNKTLYIHDRKYNGACAGEKIDKLKQSLMYDIKNVDNLLLSELDEIAYLLNLRGYD 259 Trunc_APP_ChainB DYPVNNKTLYIHDRKYNGACAGEKIDKLKQSLMYDIKNVDNLLLSELDEIAYLLNLRGYD 259 Full-length_APP DYPVNNKTLYIHDRKYNGACAGEKIDKLKQSLMYDIKNVDNLLLSELDEIAYLLNLRGYD 259 ************************************************************ Trunc_APP_ChainA YQYSPLFYSYLLFQFDREEQDFSKIVFFTTVKNLPADVKNLLEINKVIVKEYEEIVPYLR 319 Trunc_APP_ChainB YQYSPLFYSYLLFQFDREEQDFSKIVFFTTVKNLPADVKNLLEINKVIVKEYEEIVPYLR 319 Full-length_APP YQYSPLFYSYLLFQFDREEQDFSKIVFFTTVKNLPADVKNLLEINKVIVKEYEEIVPYLR 319 ************************************************************ Trunc_APP_ChainA DVVIPSIPKHNDDNPDFKKYDISLSPYINLMIYKLFDRKNVLLQNSPVVKMKAVKNDVEI 379 Trunc_APP_ChainB DVVIPSIPKHNDDNPDFKKYDISLSPYINLMIYKLFDRKNVLLQNSPVVKMKAVKNDVEI 379 Full-length_APP DVVIPSIPKHNDDNPDFKKYDISLSPYINLMIYKLFDRKNVLLQNSPVVKMKAVKNDVEI 379 ************************************************************ Trunc_APP_ChainA DNMKQAHILDGLALLQFFHWCEQKRKTKELFNETEMSLRHKVDYFRSTKKNFIFPSFSTI 439 Trunc_APP_ChainB DNMKQAHILDGLALLQFFHWCEQKRKTKELFNETEMSLRHKVDYFRSTKKNFIFPSFSTI 439 Full-length_APP DNMKQAHILDGLALLQFFHWCEQKRKTKELFNETEMSLRHKVDYFRSTKKNFIFPSFSTI 439 ************************************************************ Trunc_APP_ChainA SASGPNAAVIHYECTDKTNATIKPAIYLLDSGGQYLHGTTDVTRTTHFGEPTAEEKRIYT 499 Trunc_APP_ChainB SASGPNAAVIHYECTDKTNATIKPAIYLLDSGGQYLHGTTDVTRTTHFGEPTAEEKRIYT 499 Full-length_APP SASGPNAAVIHYECTDKTNATIKPAIYLLDSGGQYLHGTTDVTRTTHFGEPTAEEKRIYT 499 ************************************************************ Trunc_APP_ChainA LVLKGHLRLRKVIFASYTNSSALDFIARENLFNNFMDYNHGTGHGVGLTLNVHEGGCSIG 559 Trunc_APP_ChainB LVLKGHLRLRKVIFASYTNSSALDFIARENLFNNFMDYNHGTGHGVGLTLNVHEGGCSIG 559 Full-length_APP LVLKGHLRLRKVIFASYTNSSALDFIARENLFNNFMDYNHGTGHGVGLTLNVHEGGCSIG 559 ************************************************************ Trunc_APP_ChainA PVGGAPLKKNMVLSNEPGYYMKDKFGVRIENMQYVISKEITDTTEYLSFDDLTMYPYEKK 619 Trunc_APP_ChainB PVGGAPLKKNMVLSNEPGYYMKDKFGVRIENMQYVISKEITDTTEYLSFDDLTMYPYEKK 619 Full-length_APP PVGGAPLKKNMVLSNEPGYYMKDKFGVRIENMQYVISKEITDTTEYLSFDDLTMYPYEKK 619 ************************************************************ Trunc_APP_ChainA LLDFSLLTNQEIKELNEYHTTIRNTLLPLVKQSPQEYGESVEKYLIEITEP------ 670 Trunc_APP_ChainB LLDFSLLTNQEIKELNEYHTTIRNTLLPLVKQSPQEYGESVEKYLIEITEP------ 670 Full-length_APP LLDFSLLTNQEIKELNEYHTTIRNTLLPLVKQSPQEYGESVEKYLIEITEPIAIHNN 676 ***************************************************
Deleted N- and C-terminal regions (128 amino acids at N-terminus and 6 amino acids at C-terminus)
N-terminal His-tag with TEV cleavage site
Missing loops in the electron density

INSTRUMENTATION AND CHEMICALS
118
INSTRUMENTATION AND CHEMICALS
Instrumentation
Table 11: Instrumentation (listed alphabetically).
Instrument Manufacturer
Agarose gel electrophoresis - PerfectBlueTM Mini S (Peqlab, Germany)
- PowerPac 200 (Bio-Rad, Germany)
- PerfectBlueTM Mini S (Peqlab, Germany)
Äkta purifier Äkta purifier 900 (GE Healthcare, USA)
Beamlines - P13, EMBL, PETRA III, DESY, Hamburg
- P14, EMBL, PETRA III, DESY, Hamburg
- ID-23-2, EMBL, ESRF, Grenoble
Centrifuges - 5415R/5415C/5804R/5810R MinispinPlus (Eppendorf, Germany)
- Thinky ARE-250 (Intertronics, UK)
Crystallization robots - Honeybee 961 (Genomic Solutions, USA)
- Oryx4 (Douglas Instruments, UK)
CD-Spectrometer J-815 (Jasco, UK)
DLS instrumentation - Spectrolight300 (XtalConcepts, Germany)
- Spectrolight600 (XtalConcepts, Germany)
DDLS instrument Development project (XtalConcepts, Germany)
Freezer -20 °C - Liebherr premium (Liebherr, Germany)
- B35-85 (FRYKA-Kältetechnik, Germany)
Imaging - CLSM Zeiss
- CrystalScore (Diversified Scientific Inc., USA)
- Microscope SZX12 with camera DP10 (Olympus, Japan)
Incubator - RUMED 3001 (Rubarth, Germany)
- Heraeus B6120 (Heraeus, Germany)
Mask Aligner MJB4 (SÜSS Microtec, Germany)
Microbalance Sartorius TE3102S (Sartorius, Germany)
pH Meter SevenEasy (Mettler-Toledo, Switzerland
Photospectrometry Nanodrop 2000c (ThermoScientific, Peqlab, Germany)
Pipetting robots Lissy (Zinsser, Germany)

INSTRUMENTATION AND CHEMICALS
119
Plasma cleaner Zepto (Diener electronic, Germany)
Real-Time PCR instrument MyiQ-RT (Biorad, Germany)
Scanning electron microscope FEI XL-30 (FEI, Germany)
SDS-PAGE - Four Gel Caster (SE275)
- EV 231 (Peqlab, Germany)
- SE260 Mighty Small II Deluxe Mini (Hoefer, US)
SONICC SONICC (Formulatrix, Germany)
Sonifier ultrasonic cell disruptor Sonifier S-250A 200 W (Emerson Electric Co, US)
Sputter coater Q150T (Quorum Technologies, UK)
Thermocycler Mastercycler gradient (Eppendorf, Germany)
Transmission electron microscope FEI Tecnai G20 (FEI, Germany)
UV-light source CrystalLIGHT 100 (Nabitec, Germany)
X-ray source RU 200 X-ray generator (Rigaku, Germany)
XtalController Spectrolight900 (XtalConcepts, Germany)
GHS and Risk Symbols
Figure Appendix 1: GHS pictograms (from https://www.ohsa.gov)

INSTRUMENTATION AND CHEMICALS
120
Chemicals used (GHS classification)
Table 12: Chemicals (listed alphabetically).
Compound CAS-No. Supplier GHS
hazard
Hazard
Statements Precautionary Statements
Acetic acid 64-19-7 Chem-solute
GHS02 GHS05
H226, H314 P280,
P305+351+338, P310
Acrylamide 37% 79-06-1 Carl Roth GHS06 GHS08
H301, H312, H315, H317, H319, H332, H340, H350, H361f, H372
P201, P280, P301+310, P305+351+338, P308+313
AHT 13803-65-1 IBA GHS07 GHS08
H319, H361d
P264, P281, P305+P351+P338, P337+P313
APTS 919-30-2 Sigma GHS05 GHS07
H302-H314-H317
P280-P305 +P351 +P338-P310
ATP 34369-07-8 Sigma - - -
Agarose 9012-36-6 Serva - - -
(NH4)2SO4 7283-20-2 Carl Roth - - -
NH4NO3 6484-52-2 Applichem GHS03 H272 P210
Ampicillin 69-52-3 Carl Roth GHS08 H334, H317 P280, P261, P302+352, P342+311
APS 7727-54-0 Carl Roth GHS03 GHS07 GHS08
H272, H302, H315, H317, H319, H334, H335
P280,
P305+351+338, P302+352, P304+341, P342+311
Bromphenol
blue
115-39-9 Applichem - - -
CaCl2 10043-52-4 Merck GHS07 H319 P305+351+338
Ca(H3CCOO)2 114460-21-
8
Sigma - H315, H319, H335
P261,
P305+351+3 38
Chloramphenicol 56-75-7
Citric acid 77-92-9 Sigma GHS05 H318 P305+351+338,
P311
Coomassie
Brilliant Blue R250
6104-59-2 Serva - - -
Desthiobiotin 533-48-2 Sigma - - -
DTT 578517 Applichem GHS07 H302, H315, H319, H335
P302+352,
P305+351+338
EDTA 60-00-4 Sigma GHS07 H319 P305+351+338
Ethanol 64-17-5 Carl Roth GHS02 H225 P210

INSTRUMENTATION AND CHEMICALS
121
Compound CAS-No. Supplier GHS
hazard
Hazard
Statements Precautionary Statements
Ethidium
bromide
1239-45-8 Sigma GHS06
GHS08
H302, H331, H341
P260, P281,
P284, P310
Glutaraldehyde 111-30-8 Sigma GHS05 GHS06 GHS08 GHS09
H301+H331, H314-H317, H334-H335, H400-H411
P221-P273-P280-P301 +P310-P305 +P351 +P338-P310
Glycerol 56-81-5 Sigma - - -
GPTS 2530-83-8 Sigma GHS05 H318 P280-P305 +P351 +P338
HABA 1634-82-8 Fluka GHS07 H315, H319, H335
P261, P305+351+338
Hepes 7365-45-9 Sigma
Aldrich
- - -
Hydrochloric acid >25 %
7647-01-0 Merck GHS05
GHS07
H314, H335 P261, P280,
P310, P305+351+338
Imidazole 288-32-4 Carl Roth GHS05
GHS06
GHS08
H301, H314, H361
P260, P281, P303+361+353, P301+330+3 31, P305+351+3 38, P308+313
IPTG 367-93-1 Sigma - - -
Isopropanol 67-63-0 Carl Roth GHS02
GHS07
H225, H319, H336.
P210, P233,
P305+351+338
KCl 7447-40-7 Carl Roth - - -
LiCl 7447-41-8 Merck GHS07 H302, H315, H319, H335
P302+352, P305+351+338
Li2SO4 10102-25-7 Merck GHS07 H302 -
Malonic acid 141-82-2 Sigma GHS05
GHS07
H318, H302, H335, H315
P261, P280, P304+340, P305+351+338, P405, P501
Mg(HCOO)2 6150-82-9 Fluka - - -
MgCl2 7786-30-3 Carl Roth - - -
MPD 107-41-5 Carl Roth GHS07 H315, H319 -
2-Mercaptoethanol 60-24-2 Fisher Scientific
GHS06 GHS09
H302, H411, H315, H335, H311, H319
P280, P312,
P302+350, P261, P273, P301+312, P305+351+338
NaOAc 127-09-3 Applichem - - -
NaCl 7647-14-5 Carl Roth - - -
NaH2PO4 10049-21-5 Applichem - - -
NaOH 1310-73-2 Merck GHS05 H314 P280, P310,
P305+351+338
Na3 citrate 6132-04-3 Sigma - - -

INSTRUMENTATION AND CHEMICALS
122
Compound CAS-No. Supplier GHS
hazard
Hazard
Statements Precautionary Statements
Ni(II)SO4 10101-97-0 Applichem GHS07
GHS08
GHS09
H302+332, H315, H317, H334, H341, H350i, H360d, H372 H410
P201, P261, P273,
P280, P284, P304+340+312
Paraffin 8002-74-2 Applichem - - -
PDMS 63148-62-9 Sigma - H413 -
PEG 10000 25322-68-3 Merck - - -
PEG 1500 25322-68-3 Fluka - - -
PEG 2000 MME 25322-68-3 Fluka - - -
PEG 300 25322-68-3 Applichem - - -
PEG 3350 25322-68-3 Sigma - - -
PEG 400 25322-68-3 Sigma - - -
PEG 4000 25322-68-3 Merck - - -
PEG 6000 25322-68-3 Merck - - -
PEG 8000 25322-68-3 Sigma - - -
PGMEA 108-65-6 Sigma GHS02 H226 P210-P403+P235
PMSF 329-98-6 Applichem GHS06 GHS05
H301, H314 P280,
P305 + P351 + P338, P310
SDS 151-21-3 Sigma GHS02 GHS06
H228, H302, H311, H315, H319, H335
P210, P261,
P280, P312, P305+351+338
Sodium borate 1303-96-4 Sigma GHS08 H360FD P201, P308 +313
Sodium citrate 1545832 Sigma - - -
Sodium
tartrate
868-18-8 Applichem - - -
SU-8 3000 96-48-0
89452-37-9
71449-78-0
108-32-7
28906-96-9
MicroChem GHS02 GHS07 GHS08 GHS09
H226, H302+H332, H315, H317, H319, H341, H411
P210, P261, P280, P233, P273, P201, P305+P351+P338, P312, P363, P308+P313, P333+P313, P337+P313, P370, P378, P391, P403+P235, P501
SYPRO Orange 67-68-5 Sigma - - -
TEMED 110-18-9 Merck GHS02 GHS05 GHS07
H225, H302, H314, H332
P261, P280, P305+351+338
Tris 1185-53-1 Fluka GHS07 H315, H319, H335
P261, P305+351+338
Yeast Extract 8013-01-2 Serva - - -

INSTRUMENTATION AND CHEMICALS
123
Protein crystallization and stability screens
Table 13: Protein crystallization and stability screens (listed alphabetically).
Compound Supplier GHS hazard Hazard
Statements
Precautionary
Statements
AmSO4 Suite Qiagen GHS02 GHS06 GHS08 GHS09
H225, H301, H330, H350, H340, H360FD, H372, H411
P101, P201, P273, P280, P309+311
Classics Suite Qiagen GHS02 GHS06 GHS07 GHS08 GHS09
H225, H301, H302, H315, H319, H331, H332, H335, H340, H350, H360FD, H373, H411
P101, P201, P270, P280, P305+351+338, P309+311, P313
Cryos Suite Qiagen GHS02 GHS06 GHS07 GHS08 GHS09
H225, H301, H302, H315, H319, H331, H332, H335, H340, H350, H360FD, H373, H411
P101, P201, P270, P273, P280, P305+351+338, P309+311, P313
JCSG-plus Molecular Dimensions
GHS02 GHS05 GHS06 GHS07 GHS08
H225, H301, H312, H315, H318, H331, H335, H350, H411
P101, P201, P270, P280, P305+351+338, P309+311, P313
Morpheus Molecular Dimensions
GHS02 GHS06 GHS07 GHS08 GHS09
H225, H301, H302, H315, H319, H331, H332, H335, H340, H350, H360Fd, H361d, H373, H411
P101, P201, P270, P273, P280, P305+351+338, P309+311, P313
PACT premier Molecular Dimensions
GHS06 H301, H331, H412 P101, P270, P273, P280, P309+311
Stura FootPrint & MacroSol
Molecular Dimensions
GHS02 GHS06 GHS07 GHS08 GHS09
H225, H301, H302, H315, H319, H332, H335, H340, H350, H360FD, H373, H411
P101, P201, P270, P273, P280, P305+351+338, P309+311, P313
RUBIC buffer screen
Molecular Dimensions
GHS05 GHS07 GHS08
H315, H319, H302, H314, H318, H335, H360D
P261, P305+P351+P338, P201, P280, P310
RUBIC additive screen
Molecular Dimensions
GHS02 GHS05 GHS06 GHS07 GHS08 GHS09
H315, H225, H302, H301, H319, H316, H290, H303, H314, H272, H301+H311+H331, H311, H317, H313, H318, H335, H370, H331, H334, H360D, H333, H400, H410, H341, H412, EUH032, H336, H350i, EUH066, H360F, H372
P261, P305+P351+P338, P280, P201, P273, P301+P310, P220, P302+P352, P310, P311, P308+P313, P501

INSTRUMENTATION AND CHEMICALS
124
GHS Hazard Statements
H225 Highly flammable liquid and vapor H226 Flammable liquid and vapor H228 Flammable solid H272 May intensify fire; oxidizer H290 May be corrosive to metals H301 Toxic if swallowed H302 Harmful if swallowed H303 May be harmful if swallowed H311 Toxic in contact with skin H312 Harmful in contact with skin H313 May be harmful in contact with skin H314 Causes severe skin burns and eye damage H315 Causes skin irritation H316 Causes mild skin irritation H317 May cause an allergic skin reaction H318 Causes serious eye damage H319 Causes serious eye irritation H330 Fatal if inhaled H331 Toxic if inhaled H332 Harmful if inhaled H333 May be harmful if inhaled H334 May cause allergy or asthma symptoms or breathing difficulties if inhaled H335 May cause respiratory irritation H336 May cause drowsiness or dizziness H340 May cause genetic defects H341 Suspected of causing genetic defects H350 May cause cancer H350i May cause cancer by inhalation H360 May damage fertility or the unborn child H360D May damage the unborn child H360F May damage fertility H360Fd May damage fertility. Suspected of damaging the unborn child H360FD May damage fertility. May damage the unborn child H361 Suspected of damaging fertility or the unborn child H361d Suspected of damaging the unborn child. H361f Suspected of damaging fertility H370 Cause damage to organs H372 Causes damage to organs through prolonged or repeated exposure H373 May cause damage to organs through prolonged or repeated exposure. H400 Very toxic to aquatic life with long-lasting effects H410 Very toxic to aquatic life with long lasting effects H411 Toxic to aquatic life with long lasting effects H412 Harmful to aquatic life with long lasting effects. EUH032 Contact with acids liberates very toxic gas EUH066 Repeated exposure may cause skin dryness or cracking

INSTRUMENTATION AND CHEMICALS
125
GHS Precautionary Statements
P101 If medical advice is needed, have product container or label at hand P201 Obtain special instructions before use P210 Keep away from heat/sparks/open flames/hot surfaces – No smoking P233 Keep container tightly closed P260 Do not breathe dust/fume/gas/mist/vapors/spray P261 Avoid breathing dust/fume/gas/mist/vapors/spray P264 Wash thoroughly after handling P270 Do not eat, drink or smoke when using this product P273 Avoid release to the environment P281 Use personal protective equipment as required P280 Wear protective gloves/protective clothing/eye protection/face protection P284 Wear respiratory protection P309 IF exposed or you feel unwell P310 Immediately call a POISON CENTER or doctor/physician P311 Call a POISON CENTER or doctor/physician P312 Call a POISON CENTER or doctor/physician if you feel unwell P321 Specific treatment (see respective MSDS) P330 Rinse mouth P362 Take off contaminated clothing and wash before reuse P391 Collect spillage. P405 Store locked up P501 Dispose of contents/container in accordance with
local/regional/national/international regulations P301+P310 IF SWALLOWED: Immediately call a POISON CENTER or doctor/physician P301+P312 IF SWALLOWED: Call a POISON CENTER or doctor/physician if you feel unwell P301+P330+P331 IF SWALLOWED: Rinse mouth. Do NOT induce vomiting P302+P352 IF ON SKIN: Wash with soap and water P303+P361+P353 IF ON SKIN (or hair): Remove/Take off immediately all contaminated clothing. Rinse
skin with water/shower P304+P341 IF INHALED: lf breathing is difficult, remove victim to fresh air and keep at rest in a
position comfortable for breathing P305+P351+P338 IF IN EYES: Rinse cautiously with water for several minutes. Remove contact lenses if
present and easy to do - continue rinsing P308+P313 IF exposed or concerned: Get medical advice/attention P309+P311 IF exposed or you feel unwell: Call a POISON CENTER or doctor/physician P332+P313 lf skin irritation occurs: Get medical advice/attention P333+P313 If skin irritation or rash occurs: Get medical advice/attention P337+P313 If eye irritation persists: Get medical advice/attention. P342+P311 Call a POISON CENTER or doctor/physician P370+P378 In case of fire: Use for extinction: Alcohol resistant foam. P370+P378 In case of fire: Use for extinction: Fire-extinguishing powder. P370+P378 In case of fire: Use for extinction: Carbon dioxide. P403+P233 Store in a well-ventilated place. Keep container tightly closed P403+P235 Store in a well-ventilated place. Keep cool

ACKNOWLEDGEMENTS
126
ACKNOWLEDGEMENTS
Ich danke meinem Doktorvater Prof. Dr. Dr. Christian Betzel für die Überlassung des spannenden
Themas, die Betreuung und die Begutachtung meiner Arbeit. Die Freiheiten bei der selbstständigen
wissenschaftlichen Arbeit in seinem Arbeitskreis, die Teilnahme an diversen Konferenzen und
Workshops, sowie verschiedene Auslandsaufenthalte haben mir exzellente Möglichkeiten gegeben
mich fachlich weiter zu bilden und mich gleichermaßen persönlich bereichert.
Ebenso danke ich meinem Zeitbetreuer PD Dr. Markus Perbandt für seine großartige Unterstützung
während meiner Zeit als Doktorand und die unzähligen fachlichen Diskussionen, die meine Arbeit
maßgeblich beeinflusst und geprägt haben.
Ich möchte Herrn Prof. Dr. Henning Tidow recht herzlich dafür danken, dass er sich bereitgestellt hat
das Zweitgutachten zu verfassen, sowie auch meinen Disputationsgutachtern Prof. Dr. Andrew Torda
und Dr. Thomas Hackl.
Ein großer Dank geht zudem an Herrn Prof. Dr. Carsten Wrenger für die Möglichkeit in seinem Labor
in Sao Paulo arbeiten zu dürfen und die wirklich tolle Unterstützung bei der Organisation meiner
Aufenthalte vor Ort. In diesem Zuge möchte ich ebenfalls Jasmin Lindner für die super Zusammenarbeit
im APP-Projekt, sowie allen weiteren Kollegen aus Sao Paulo für die tolle Atmosphäre im Labor und
die Zeit in Sao Paulo danken.
Likewise, I would like to thank Dr. Claude Sauter and his colleagues for giving me the opportunity to
work in his lab in Strasbourg and the various interesting discussions throughout my stays there.
Ich möchte mich ganz herzlich bei Dr. Arne Meyer und Dr. Karsten Dierks, sowie den weiteren
Mitarbeitern von XtalConcepts, bedanken. Die unzähligen Diskussionen zum DDLS, zum XtalController
und zur Interpretation der Ergebnisse waren für diese Arbeit essentiell und von der guten
Zusammenarbeit in den letzten Jahren habe ich sehr profitiert. Ich danke Euch für Eure Bemühungen,
auftretende Probleme mit den Instrumenten kurzfristig zu beheben.
Vielen Dank an Dr. Rudolph Reimer und Carola Schneider für die Möglichkeit die Elektronen
Mikroskope bei Euch nutzen zu dürfen und die tolle Unterstützung bei der Probenvorbereitung und
der Bedienung der Instrumente.
Ich möchte Dr. Michael Heymann und Yannig Giquel für die sehr interessanten Einblicke in das Feld
der Microfluidics und die umfangreiche Unterstützung bei der Herstellung der Komponenten danken.

ACKNOWLEDGEMENTS
127
Furthermore, I would like to thank Dr. Stephane Boivin, Rob Meiers and the members of the EMBL
crystallization facility for their support in terms of sample preparation for Thermofluor and DLS
experiments.
Likewise, I would like to thank Dr. Max Nanao for his great support at the ID-23 beamline at ESRF and
the highly valuable contribution in the RIP-data processing. Additionally, I would like to thank
Dr. Carolin Seuring for the opportunity to join this highly interesting collaborative project.
Außerdem möchte ich auch allen Mitarbeitern des CUI Cluster Office sowie der CUI Graduate School
für die herausragende Unterstützung bei allen organisatorischen Fragen und Anliegen danken, sowie
Ihrem steten Bemühen eine optimale Umgebung für die Doktorandenausbildung zu schaffen.
Ganz besonders möchte ich auch meinen studentischen Mitarbeiterinnen Rutineia Ferraz-Jansen und
Berfin Tuku sowie Lars Thormann für die tolle und ausdauernde Unterstützung im Projekt danken.
Durch Eure motivierte und vor allem sehr verlässliche Arbeitsweise habt Ihr einen wichtigen Beitrag zu
dieser Arbeit geliefert.
Ich möchte mich zudem sehr herzlich bei Thomas Seine, Madeleine Künz und Julius Nietsche bedanken.
Nicht nur für das fleißige Korrekturlesen dieser Arbeit und die wirklich wertvollen fachlichen
Diskussionen, sondern vor allem für die vielen außeruniversitären Aktivitäten, die mir immer wieder
neue Energie für die Promotion gegeben haben. Ich bin wirklich froh, dass Ihr dabei wart!
Ebenso möchte ich mich bei allen nicht namentlich erwähnten Kollegen der Arbeitsgruppe für die tolle
Unterstützung in allen Belangen des Laboralltags bedanken. Ich danke Euch für die super
Zusammenarbeit, die vielen Diskussionen und die sehr angenehme Atmosphäre im Labor.
Ein besonderer Dank gilt meinen Eltern Rita Schubert und Rudolf Hoppe-Schubert, meinen Schwestern
Mascha Schubert und Katharina Heßler und meinen Freunden für Ihr Interesse an meiner Arbeit, den
vielen Ermutigungen und die tolle Unterstützung in allen Lebenslagen. Mein größter Dank geht an
Svenja Ganteför, weil Sie mich einfach glücklich macht und in den letzten Jahren auch in stressigen
Phasen immer unterstützt und Kraft gegeben hat. Ich weiß es sehr zu schätzen, wie Du mir besonders
in der Endphase dieser Arbeit so sehr den Rücken freigehalten hast. Was auch immer in Zukunft
kommen mag, ich freue mich einfach es mit Dir erleben zu dürfen!

CURRICULUM VITAE
128
CURRICULUM VITAE
Education / Professional Career
07/2013 – 09/2016 Research Assistant (PhD student)
Excellence Cluster: Hamburg Center for Ultrafast Imaging (CUI)
“Laboratory for Structural Biology of Infection and Inflammation”
University of Hamburg, Germany
Project title: „Preparation and scoring of protein micro- and nano-
crystals for FEL and synchrotron applications”, Prof. Dr. Christian
Betzel
10/2010 – 12/2012 Study of Molecular Life Sciences (Master of Science), University of
Hamburg, Germany
Master thesis with the topic: „Functional and structural
characterisation of pre-processed polyproteins in SARS-
Coronavirus”, Prof. Dr. Christian Betzel
10/2006 – 09/2009 Study of Cell biology (Bachelor of Science), University of
Osnabrück, Germany
Bachelor thesis with the topic: „Diffusion dynamics in polymer
supported membranes“, Prof. Dr. Piehler

EIDESSTATTLICHE ERKLÄRUNG
129
EIDESSTATTLICHE ERKLÄRUNG
Hiermit versichere ich an Eides statt, die vorliegende Dissertation selbst verfasst und keine anderen als
die angegebenen Hilfsmittel benutzt zu haben. Ich versichere, dass diese Dissertation nicht in einem
früheren Promotionsverfahren eingereicht wurde. Ferner versichere ich, dass ich noch keine
Promotionsversuche an anderen Universitäten unternommen habe.
Hamburg, 15.08.2016

REFERENCES
130
REFERENCES
Adams, P. D., Afonine, P. V., Bunkoczi, G., Chen, V. B., Davis, I. W., Echols, N., Headd, J. J., Hung, L. -
W., Kapral, G. J., Grosse-Kunstleve, R. W., McCoy, A. J., Moriarty, N. W., Oeffner, R., Read, R. J.,
Richardson, D. C., Richardson, J. S., Terwilliger, T. C. & Zwart, P. H. (2010). Acta Crystallographica
Section D - Biological Crystallography. 66, 213–221, doi:10.1107/S0907444909052925.
Altschul, S. F., Gish, W., Miller, W., Myers, E. W. & Lipman, D. J. (1990). Journal of Molecular Biology.
215, 403–410, doi:10.1016/S0022-2836(05)80360-2.
Ataka, M. & Asai, M. (1990). Biophysical journal. 58, 807–811, doi:10.1016/S0006-3495(90)82425-5.
Axford, D., Aller, P., Sanchez-Weatherby, J. & Sandy, J. (2016). Acta crystallographica. Section F,
Structural biology communications. 72, 313–319, doi:10.1107/S2053230X16004386.
Axford, D., Owen, R. L., Aishima, J., Foadi, J., Morgan, A. W., Robinson, J. I., Nettleship, J. E., Owens,
R. J., Moraes, I., Fry, E. E., Grimes, J. M., Harlos, K., Kotecha, A., Ren, J., Sutton, G., Walter, T. S.,
Stuart, D. I. & Evans, G. (2012). Acta Crystallographica Section D - Biological Crystallography. 68,
592–600, doi:10.1107/S0907444912006749.
Baldwin, E. T., Crumley, K. V. & Carter, C. W. (1986). Biophysical journal. 49, 47–48.
Banumathi, S., Zwart, P. H., Ramagopal, U. A., Dauter, M. & Dauter, Z. (2004). Acta crystallographica.
Section D, Biological crystallography. 60, 1085–1093, doi:10.1107/S0907444904007917.
Boivin, S., Kozak, S. & Meijers, R. (2013). Protein expression and purification. 91, 192–206,
doi:10.1016/j.pep.2013.08.002.
Botha, S., Nass, K., Barends, T. R. M., Kabsch, W., Latz, B., Dworkowski, F., Foucar, L., Panepucci, E.,
Wang, M., Shoeman, R. L., Schlichting, I. & Doak, R. B. (2015). Acta Crystallographica Section D -
Biological Crystallography. 71, 387–397, doi:10.1107/S1399004714026327.
Boutet, S., Lomb, L., Williams, G. J., Barends, T. R. M., Aquila, A., Doak, R. B., Weierstall, U., DePonte,
D. P., Steinbrener, J., Shoeman, R. L., Messerschmidt, M., Barty, A., White, T. A., Kassemeyer, S.,
Kirian, R. A., Seibert, M. M., Montanez, P. A., Kenney, C., Herbst, R., Hart, P., Pines, J., Haller, G.,
Gruner, S. M., Philipp, H. T., Tate, M. W., Hromalik, M., Koerner, L. J., van Bakel, N., Morse, J.,
Ghonsalves, W., Arnlund, D., Bogan, M. J., Caleman, C., Fromme, R., Hampton, C. Y., Hunter, M. S.,
Johansson, L. C., Katona, G., Kupitz, C., Liang, M., Martin, A. V., Nass, K., Redecke, L., Stellato, F.,
Timneanu, N., Wang, D., Zatsepin, N. A., Schafer, D., Defever, J., Neutze, R., Fromme, P., Spence, J.
C. H., Chapman, H. N. & Schlichting, I. (2012). Science (New York, N.Y.). 337, 362–364,
doi:10.1126/science.1217737.
Bragg, W. H. & Bragg, W. L. (1913). Proceedings of the Royal Society A: Mathematical, Physical and
Engineering Sciences. 88, 428–438, doi:10.1098/rspa.1913.0040.

REFERENCES
131
Bragg, W. L. & Pippard, A. B. (1953). Acta Cryst. 6, 865–867, doi:10.1107/S0365110X53002519.
Burmeister, W. P. (2000). Acta Crystallogr D Biol Crystallogr. 56, 328–341,
doi:10.1107/S0907444999016261.
Castleden, I. R. (1992). Acta Crystallogr A Found Crystallogr. 48, 197–209,
doi:10.1107/S0108767391007274.
Cervelle, B., Cesbron, F., Berthou, J. & Jolles, P. (1974). Acta Crystallographica Section A. 30, 645–648,
doi:10.1107/S0567739474001550.
Chapman, H. N., Fromme, P., Barty, A., White, T. A., Kirian, R. A., Aquila, A., Hunter, M. S., Schulz, J.,
DePonte, D. P., Weierstall, U., Doak, R. B., Maia, Filipe R N C, Martin, A. V., Schlichting, I., Lomb, L.,
Coppola, N., Shoeman, R. L., Epp, S. W., Hartmann, R., Rolles, D., Rudenko, A., Foucar, L., Kimmel,
N., Weidenspointner, G., Holl, P., Liang, M., Barthelmess, M., Caleman, C., Boutet, S., Bogan, M. J.,
Krzywinski, J., Bostedt, C., Bajt, S., Gumprecht, L., Rudek, B., Erk, B., Schmidt, C., Homke, A., Reich,
C., Pietschner, D., Struder, L., Hauser, G., Gorke, H., Ullrich, J., Herrmann, S., Schaller, G.,
Schopper, F., Soltau, H., Kuhnel, K.-U., Messerschmidt, M., Bozek, J. D., Hau-Riege, S. P., Frank, M.,
Hampton, C. Y., Sierra, R. G., Starodub, D., Williams, G. J., Hajdu, J., Timneanu, N., Seibert, M. M.,
Andreasson, J., Rocker, A., Jonsson, O., Svenda, M., Stern, S., Nass, K., Andritschke, R., Schroter,
C.-D., Krasniqi, F., Bott, M., Schmidt, K. E., Wang, X., Grotjohann, I., Holton, J. M., Barends, T. R.
M., Neutze, R., Marchesini, S., Fromme, R., Schorb, S., Rupp, D., Adolph, M., Gorkhover, T.,
Andersson, I., Hirsemann, H., Potdevin, G., Graafsma, H., Nilsson, B. & Spence, J. C. H. (2011).
Nature. 470, 73–77, doi:10.1038/nature09750.
Charron, C., Robert, M. C., Capelle, B., Kadri, A., Jenner, G., Giege, R. & Lorber, B. (2002). Journal of
Crystal Growth. 245, 321–333.
Chayen, N. E., Dieckmann, M., Dierks, K. & Fromme, P. (2004). Annals of the New York Academy of
Sciences. 1027, 20–27, doi:10.1196/annals.1324.003.
Chayen, N. E., Saridakis, E. & Sear, R. P. (2006). Proceedings of the National Academy of Sciences of
the United States of America. 103, 597–601, doi:10.1073/pnas.0504860102.
Cipriani, F., Rower, M., Landret, C., Zander, U., Felisaz, F. & Marquez, J. A. (2012). Acta
Crystallographica Section D - Biological Crystallography. 68, 1393–1399,
doi:10.1107/S0907444912031459.
Conrad, C. E., Basu, S., James, D., Wang, D., Schaffer, A., Roy-Chowdhury, S., Zatsepin, N. A., Aquila,
A., Coe, J., Gati, C., Hunter, M. S., Koglin, J. E., Kupitz, C., Nelson, G., Subramanian, G., White, T. A.,
Zhao, Y., Zook, J., Boutet, S., Cherezov, V., Spence, J. C. H., Fromme, R., Weierstall, U. & Fromme,
P. (2015). IUCrJ. 2, 421–430, doi:10.1107/S2052252515009811.

REFERENCES
132
Coquelle, N., Brewster, A. S., Kapp, U., Shilova, A., Weinhausen, B., Burghammer, M. & Colletier, J. P.
(2015). Acta Crystallographica Section D - Biological Crystallography. 71, 1184–1196,
doi:10.1107/S1399004715004514.
Coulibaly, F., Chiu, E., Ikeda, K., Gutmann, S., Haebel, P. W., Schulze-Briese, C., Mori, H. & Metcalf, P.
(2007). Nature. 446, 97–101, doi:10.1038/nature05628.
Cunningham, D. F. & O'Connor, B. (1997). Biochimica et biophysica acta. 1343, 160–186.
D'Arcy, A. (1994). Acta crystallographica. Section D, Biological crystallography. 50, 469–471,
doi:10.1107/S0907444993014362.
DePonte, D. P., Weierstall, U., Schmidt, K., Warner, J., Starodub, D., Spence, J. C. H. & Doak, R. B.
(2008). J. Phys. D: Appl. Phys. 41, 195505, doi:10.1088/0022-3727/41/19/195505.
Dierks, K., Meyer, A., Oberthur, D., Rapp, G., Einspahr, H. & Betzel, C. (2010). Acta crystallographica.
Section F, Structural biology and crystallization communications. 66, 478–484,
doi:10.1107/S1744309110007153.
Dondorp, A. M., Nosten, F., Yi, P., Das, D., Phyo, A. P., Tarning, J., Lwin, K. M., Ariey, F.,
Hanpithakpong, W., Lee, S. J., Ringwald, P., Silamut, K., Imwong, M., Chotivanich, K., Lim, P.,
Herdman, T., An, S. S., Yeung, S., Singhasivanon, P., Day, N. P. J., Lindegardh, N., Socheat, D. &
White, N. J. (2009). The New England journal of medicine. 361, 455–467,
doi:10.1056/NEJMoa0808859.
Dow, X. Y., Dettmar, C. M., DeWalt, E. L., Newman, J. A., Dow, A. R., Roy-Chowdhury, S., Coe, J. D.,
Kupitz, C., Fromme, P. & Simpson, G. J. (2016). Acta crystallographica. Section D, Structural
biology. 72, 849–859, doi:10.1107/S205979831600841X.
Doye, J. & Poon, W. (2006). Current Opinion in Colloid & Interface Science. 11, 40–46,
doi:10.1016/j.cocis.2005.10.002.
Drebes, J., Kunz, M., Windshugel, B., Kikhney, A. G., Muller, I. B., Eberle, R. J., Oberthur, D., Cang, H.,
Svergun, D. I., Perbandt, M., Betzel, C. & Wrenger, C. (2016). Scientific reports. 6, 22871,
doi:10.1038/srep22871.
Drebes, J., Perbandt, M., Wrenger, C. & Betzel, C. (2011). Acta crystallographica. Section F, Structural
biology and crystallization communications. 67, 479–481, doi:10.1107/S1744309111004192.
Dreele, R. B. von (2007). J Appl Crystallogr. 40, 133–143, doi:10.1107/S0021889806045493.
Du, W., Li, L., Nichols, K. P. & Ismagilov, R. F. (2009). Lab on a chip. 9, 2286–2292,
doi:10.1039/b908978k.
Dupeux, F., Rower, M., Seroul, G., Blot, D. & Marquez, J. A. (2011). Acta crystallographica. Section D,
Biological crystallography. 67, 915–919, doi:10.1107/S0907444911036225.

REFERENCES
133
Duszenko, M., Redecke, L., Mudogo, C. N., Sommer, B. P., Mogk, S., Oberthuer, D. & Betzel, C. (2015).
Acta crystallographica. Section F, Structural biology communications. 71, 929–937,
doi:10.1107/S2053230X15011450.
Echalier, A., Glazer, R. L., Fulop, V. & Geday, M. A. (2004). Acta crystallographica. Section D, Biological
crystallography. 60, 696–702, doi:10.1107/S0907444904003154.
Eggleson, K. K., Duffin, K. L. & Goldberg, D. E. (1999). The Journal of biological chemistry. 274, 32411–
32417.
Elser, V. (2003). Acta Crystallogr A Found Crystallogr. 59, 201–209, doi:10.1107/S0108767303002812.
Emsley, P., Lohkamp, B., Scott, W. G. & Cowtan, K. (2010). Acta Crystallographica Section D -
Biological Crystallography. 66, 486–501, doi:10.1107/S0907444910007493.
Ericsson, U. B., Hallberg, B. M., Detitta, G. T., Dekker, N. & Nordlund, P. (2006). Analytical
biochemistry. 357, 289–298, doi:10.1016/j.ab.2006.07.027.
Evans, G., Polentarutti, M., Djinovic Carugo, K. & Bricogne, G. (2003). Acta Crystallogr D Biol
Crystallogr. 59, 1429–1434, doi:10.1107/S0907444903012526.
Evans, P. (2006). Acta crystallographica. Section D, Biological crystallography. 62, 72–82,
doi:10.1107/S0907444905036693.
Falkner, J. C., Al-Somali, A. M., Jamison, J. A., Zhang, J., Adrianse, S. L., Simpson, R. L., Calabretta, M.
K., Radding, W., Phillips,, George N. & Colvin, V. L. (2005). Chem. Mater. 17, 2679–2686,
doi:10.1021/cm047924w.
Feld, G. K., Heymann, M., Benner, W. H., Pardini, T., Tsai, C.-J., Boutet, S., Coleman, M. A., Hunter, M.
S., Li, X., Messerschmidt, M., Opathalage, A., Pedrini, B., Williams, G. J., Krantz, B. A., Fraden, S.,
Hau-Riege, S., Evans, J. E., Segelke, B. W. & Frank, M. (2015). J Appl Crystallogr. 48, 1072–1079,
doi:10.1107/S1600576715010493.
Ferré-D'Amaré, A. R. & Burley, S. K. (1994). Structure. 2, 357–359, doi:10.1016/S0969-
2126(00)00037-X.
Fivelman, Q. L., Butcher, G. A., Adagu, I. S., Warhurst, D. C. & Pasvol, G. (2002). Malaria journal. 1, 1.
Fraser, J. S., Clarkson, M. W., Degnan, S. C., Erion, R., Kern, D. & Alber, T. (2009). Nature. 462, 669–
673, doi:10.1038/nature08615.
Fraser, J. S., van den Bedem, H., Samelson, A. J., Lang, P. T., Holton, J. M., Echols, N. & Alber, T.
(2011). Proceedings of the National Academy of Sciences of the United States of America. 108,
16247–16252, doi:10.1073/pnas.1111325108.
Friedrich, W., Knipping, P. & Laue, M. (1913). Ann. Phys. 346, 971–988,
doi:10.1002/andp.19133461004.
Galkin, O., Pan, W., Filobelo, L., Hirsch, R. E., Nagel, R. L. & Vekilov, P. G. (2007). Biophysical journal.
93, 902–913, doi:10.1529/biophysj.106.103705.

REFERENCES
134
Galkin, O. & Vekilov, P. G. (1999). J. Phys. Chem. B. 103, 10965–10971, doi:10.1021/jp992786x.
Galkin, O. & Vekilov, P. G. (2001). Journal of Crystal Growth. 232, 63–76, doi:10.1016/S0022-
0248(01)01052-1.
Garman, E. F. (2010). Acta Crystallographica Section D - Biological Crystallography. 66, 339–351,
doi:10.1107/S0907444910008656.
Gati, C., Bourenkov, G., Klinge, M., Rehders, D., Stellato, F., Oberthur, D., Yefanov, O., Sommer, B. P.,
Mogk, S., Duszenko, M., Betzel, C., Schneider, T. R., Chapman, H. N. & Redecke, L. (2014). IUCrJ. 1,
87–94, doi:10.1107/S2052252513033939.
Gibbs, J. W. (1876). Trans. Connect. Acad. Sci. 3, 108–248.
Gibbs, J. W. (1878). Trans. Connect. Acad. Sci. 16, 343–524.
Gliko, O., Neumaier, N., Pan, W., Haase, I., Fischer, M., Bacher, A., Weinkauf, S. & Vekilov, P. G.
(2005). Journal of the American Chemical Society. 127, 3433–3438, doi:10.1021/ja043218k.
Gliko, O., Pan, W., Katsonis, P., Neumaier, N., Galkin, O., Weinkauf, S. & Vekilov, P. G. (2007). The
journal of physical chemistry. B. 111, 3106–3114, doi:10.1021/jp068827o.
Gluzman, I. Y., Francis, S. E., Oksman, A., Smith, C. E., Duffin, K. L. & Goldberg, D. E. (1994). The
Journal of clinical investigation. 93, 1602–1608, doi:10.1172/JCI117140.
Goldberg, D. E. (2005). Current topics in microbiology and immunology. 295, 275–291.
Goldberg, D. E. & Slater, A. (1992). Parasitology Today. 8, 280–283, doi:10.1016/0169-
4758(92)90146-S.
Goon, S., Kelly, J. F., Logan, S. M., Ewing, C. P. & Guerry, P. (2003). Molecular Microbiology. 50, 659–
671, doi:10.1046/j.1365-2958.2003.03725.x.
Graham, S. C., Maher, M. J., Simmons, W. H., Freeman, H. C. & Guss, J. M. (2004). Acta
crystallographica. Section D, Biological crystallography. 60, 1770–1779,
doi:10.1107/S0907444904018724.
Gruner, S. M. & Lattman, E. E. (2015). Annual review of biophysics. 44, 33–51, doi:10.1146/annurev-
biophys-060414-033813.
Guha, S., Perry, S. L., Pawate, A. S. & Kenis, P. J. A. (2012). Ssensors and Actuators B-Chemical. 174, 1–
9, doi:10.1016/j.snb.2012.08.048.
Haas, C. (2000). J. Phys. Chem. B. 104, 368–377, doi:10.1021/jp993210a.
Hansen, C. L., Classen, S., Berger, J. M. & Quake, S. R. (2006). Journal of the American Chemical
Society. 128, 3142–3143, doi:10.1021/ja0576637.
Hansen, C. L., Skordalakes, E., Berger, J. M. & Quake, S. R. (2002). Proceedings of the National
Academy of Sciences of the United States of America. 99, 16531–16536,
doi:10.1073/pnas.262485199.
Hendrickson, W. A., Horton, J. R. & LeMaster D. M. (1990). The EMBO Journal. 9, 1665–1672.
REFERENCES
135
Hendrickson, W. A. & Teeter, M. M. (1981). Nature. 290, 107–113, doi:10.1038/290107a0.
Heymann, M., Fraden, S. & Kim, D. (2014). J. Microelectromech. Syst. 23, 424–427,
doi:10.1109/JMEMS.2013.2279231.
Huang, C. Y., Olieric, V., Ma, P., Panepucci, E., Diederichs, K., Wang, M. & Caffrey, M. (2015). Acta
Crystallographica Section D - Biological Crystallography. 71, 1238–1256,
doi:10.1107/S1399004715005210.
Iyer, S., La-Borde, P. J., Payne, K. A. P., Parsons, M. R., Turner, A. J., Isaac, R. E. & Acharya, K. R.
(2015). FEBS open bio. 5, 292–302, doi:10.1016/j.fob.2015.03.013.
Jakobi, A. J., Passon, D. M., Knoops, K., Stellato, F., Liang, M., White, T. A., Seine, T., Messerschmidt,
M., Chapman, H. N. & Wilmanns, M. (2016). IUCrJ. 3, 88–95, doi:10.1107/S2052252515022927.
Juers, D. H. & Matthews, B. W. (2004). Acta Crystallographica Section D - Biological Crystallography.
60, 412–421, doi:10.1107/S0907444903027938.
Kabsch, W. (1988). Jorunal of Applied Crystallography. 21, 67–71.
Kabsch, W. (2010). Acta Crystallographica Section D - Biological Crystallography. 66, 125–132,
doi:10.1107/S0907444909047337.
Kantardjieff, K. A. & Rupp, B. (2003). Protein science : a publication of the Protein Society. 12, 1865–
1871, doi:10.1110/ps.0350503.
Kelley, L. A., Mezulis, S., Yates, C. M., Wass, M. N. & Sternberg, M. J. E. (2015). Nature protocols. 10,
845–858, doi:10.1038/nprot.2015.053.
Kendrew, J. C., Bodo, G., Dintzis, H. M., Parrish, R. G., Wyckoff, H. & Phillips, D. C. (1958). Nature. 181,
662–666.
Kisselman, G., Qiu, W., Romanov, V., Thompson, C. M., Lam, R., Battaile, K. P., Pai, E. F. & Chirgadze,
N. Y. (2011). Acta Crystallographica Section D - Biological Crystallography. 67, 533–539,
doi:10.1107/S0907444911011589.
Kissick, D. J., Wanapun, D. & Simpson, G. J. (2011). Annual review of analytical chemistry (Palo Alto,
Calif.). 4, 419–437, doi:10.1146/annurev.anchem.111808.073722.
Klemba, M., Gluzman, I. & Goldberg, D. E. (2004). The Journal of biological chemistry. 279, 43000–
43007, doi:10.1074/jbc.M408123200.
Kolakovich, K. A., Gluzman, I. Y., Duffin, K. L. & Goldberg, D. E. (1997). Molecular and biochemical
parasitology. 87, 123–135.
Koopmann, R., Cupelli, K., Redecke, L., Nass, K., DePonte, D. P., White, T. A., Stellato, F., Rehders, D.,
Liang, M., Andreasson, J., Aquila, A., Bajt, S., Barthelmess, M., Barty, A., Bogan, M. J., Bostedt, C.,
Boutet, S., Bozek, J. D., Caleman, C., Coppola, N., Davidsson, J., Doak, R. B., Ekeberg, T., Epp, S. W.,
Erk, B., Fleckenstein, H., Foucar, L., Graafsma, H., Gumprecht, L., Hajdu, J., Hampton, C. Y.,
Hartmann, A., Hartmann, R., Hauser, G., Hirsemann, H., Holl, P., Hunter, M. S., Kassemeyer, S.,
REFERENCES
136
Kirian, R. A., Lomb, L., Maia, Filipe R N C, Kimmel, N., Martin, A. V., Messerschmidt, M., Reich, C.,
Rolles, D., Rudek, B., Rudenko, A., Schlichting, I., Schulz, J., Seibert, M. M., Shoeman, R. L., Sierra,
R. G., Soltau, H., Stern, S., Struder, L., Timneanu, N., Ullrich, J., Wang, X., Weidenspointner, G.,
Weierstall, U., Williams, G. J., Wunderer, C. B., Fromme, P., Spence, J. C. H., Stehle, T., Chapman,
H. N., Betzel, C. & Duszenko, M. (2012). Nature methods. 9, 259–262, doi:10.1038/nmeth.1859.
Krissinel, E. & Henrick, K. (2004). Acta crystallographica. Section D, Biological crystallography. 60,
2256–2268, doi:10.1107/S0907444904026460.
Krugliak, M., Zhang, J. & Ginsburg, H. (2002). Molecular and biochemical parasitology. 119, 249–256.
Kupitz, C., Grotjohann, I., Conrad, C. E., Roy-Chowdhury, S., Fromme, R. & Fromme, P. (2014).
Philosophical transactions of the Royal Society of London. Series B, Biological sciences. 369,
20130316, doi:10.1098/rstb.2013.0316.
Langer, G., Cohen, S. X., Lamzin, V. S. & Perrakis, A. (2008). Nature protocols. 3, 1171–1179,
doi:10.1038/nprot.2008.91.
Laskowski, R. A., MacArthur, M. W., Moss, D. S. & Thornton, J. M. (1993). J Appl Crystallogr. 26, 283–
291, doi:10.1107/S0021889892009944.
Lau, B. T. C., Baitz, C. A., Dong, X. P. & Hansen, C. L. (2007). Journal of the American Chemical Society.
129, 454–455, doi:10.1021/ja065855b.
Leal, R. M. F., Bourenkov, G., Russi, S. & Popov, A. N. (2013). Journal of synchrotron radiation. 20, 14–
22, doi:10.1107/S0909049512049114.
Levantino, M., Yorke, B. A., Monteiro, D. C., Cammarata, M. & Pearson, A. R. (2015). Current opinion
in structural biology. 35, 41–48, doi:10.1016/j.sbi.2015.07.017.
Li, L. & Ismagilov, R. F. (2010). Annual review of biophysics. 39, 139–158,
doi:10.1146/annurev.biophys.050708.133630.
Li, L., Mustafi, D., Fu, Q., Tereshko, V., Chen, D. L., Tice, J. D. & Ismagilov, R. F. (2006). Proceedings of
the National Academy of Sciences of the United States of America. 103, 19243–19248,
doi:10.1073/pnas.0607502103.
Li, X., Lou, Z., Li, X., Zhou, W., Ma, M., Cao, Y., Geng, Y., Bartlam, M., Zhang, X. C. & Rao, Z. (2008). The
Journal of biological chemistry. 283, 22858–22866, doi:10.1074/jbc.M710274200.
Lifshitz, M. & Slezov, V. V. (1959). Journal of Experimental and Theoretical Physics. 8, 331–339.
Liu, W., Wacker, D., Gati, C., Han, G. W., James, D., Wang, D., Nelson, G., Weierstall, U., Katritch, V.,
Barty, A., Zatsepin, N. A., Li, D., Messerschmidt, M., Boutet, S., Williams, G. J., Koglin, J. E., Seibert,
M. M., Wang, C., Shah, S. T. A., Basu, S., Fromme, R., Kupitz, C., Rendek, K. N., Grotjohann, I.,
Fromme, P., Kirian, R. A., Beyerlein, K. R., White, T. A., Chapman, H. N., Caffrey, M., Spence, J. C.
H., Stevens, R. C. & Cherezov, V. (2013). Science (New York, N.Y.). 342, 1521–1524,
doi:10.1126/science.1244142.

REFERENCES
137
Loria, P., Miller, S., Foley, M. & Tilley, L. (1999). The Biochemical journal. 339 ( Pt 2), 363–370.
Lowther, W. T. & Matthews, B. W. (2002). Chem. Rev. 102, 4581–4608, doi:10.1021/cr0101757.
Maes, D., Vorontsova, M. A., Potenza, M. A. C., Sanvito, T., Sleutel, M., Giglio, M. & Vekilov, P. G.
(2015). Acta crystallographica. Section F, Structural biology communications. 71, 815–822,
doi:10.1107/S2053230X15008997.
Malkin, A. J. & McPherson, A. (1994). Acta crystallographica. Section D, Biological crystallography. 50,
385–395, doi:10.1107/S0907444993013319.
Marks, F., Kalckreuth, V. von, Kobbe, R., Adjei, S., Adjei, O., Horstmann, R. D., Meyer, C. G. & May, J.
(2005). The Journal of infectious diseases. 192, 1962–1965, doi:10.1086/497698.
Martin-Garcia, J. M., Conrad, C. E., Coe, J., Roy-Chowdhury, S. & Fromme, P. (2016). Archives of
biochemistry and biophysics, doi:10.1016/j.abb.2016.03.036.
Matulis, D., Kranz, J. K., Salemme, F. R. & Todd, M. J. (2005). Biochemistry. 44, 5258–5266,
doi:10.1021/bi048135v.
McPherson, A. (1999). Crystallization of biological macromolecules. Cold Spring Harbor, NY: Cold
Spring Harbor Laboratory Press.
McPherson, A. (2000). J Appl Crystallogr. 33, 397–400, doi:10.1107/S0021889800001254.
McPherson, A. & Cudney, B. (2014). Acta crystallographica. Section F, Structural biology
communications. 70, 1445–1467, doi:10.1107/S2053230X14019670.
Meyer, A., Dierks, K., Hilterhaus, D., Klupsch, T., Muhlig, P., Kleesiek, J., Schopflin, R., Einspahr, H.,
Hilgenfeld, R. & Betzel, C. (2012). Acta crystallographica. Section F, Structural biology and
crystallization communications. 68, 994–998, doi:10.1107/S1744309112024074.
Meyer, A., Rypniewski, W., Szymanski, M., Voelter, W., Barciszewski, J. & Betzel, C. (2008). Biochimica
et biophysica acta. 1784, 1590–1595, doi:10.1016/j.bbapap.2008.07.010.
Mezzasalma, T. M., Kranz, J. K., Chan, W., Struble, G. T., Schalk-Hihi, C., Deckman, I. C., Springer, B. A.
& Todd, M. J. (2007). Journal of biomolecular screening. 12, 418–428,
doi:10.1177/1087057106297984.
Michael Heymann (2014). Dissertation, Brandeis University.
Mita, T. & Tanabe, K. (2012). Japanese journal of infectious diseases. 65, 465–475.
Mitchell, P. (2001). Nature biotechnology. 19, 717–721, doi:10.1038/90754.
Moukhametzianov, R., Burghammer, M., Edwards, P. C., Petitdemange, S., Popov, D., Fransen, M.,
McMullan, G., Schertler, G. F. X. & Riekel, C. (2008). Acta Crystallographica Section D - Biological
Crystallography. 64, 158–166, doi:10.1107/S090744490705812X.
Mueller, C., Marx, A., Epp, S. W., Zhong, Y., Kuo, A., Balo, A. R., Soman, J., Schotte, F., Lemke, H. T.,
Owen, R. L., Pai, E. F., Pearson, A. R., Olson, J. S., Anfinrud, P. A., Ernst, O. P. & Dwayne Miller, R. J.
(2015). Structural dynamics (Melville, N.Y.). 2, 54302, doi:10.1063/1.4928706.
REFERENCES
138
Mugittu, K., Ndejembi, M., Malisa, A., Lemnge, M., Premji, Z., Mwita, A., Nkya, W., Kataraihya, J.,
Abdulla, S., Beck, H. P. & Mshinda, H. (2004). The American journal of tropical medicine and
hygiene. 71, 696–702.
Murshudov, G. N., Skubak, P., Lebedev, A. A., Pannu, N. S., Steiner, R. A., Nicholls, R. A., Winn, M. D.,
Long, F. & Vagin, A. A. (2011). Acta Crystallographica Section D - Biological Crystallography. 67,
355–367, doi:10.1107/S0907444911001314.
Nanao, M. H. & Ravelli, R. B. G. (2006). Structure (London, England : 1993). 14, 791–800,
doi:10.1016/j.str.2006.02.007.
Nanao, M. H., Sheldrick, G. M. & Ravelli, R. B. G. (2005). Acta crystallographica. Section D, Biological
crystallography. 61, 1227–1237, doi:10.1107/S0907444905019360.
Nave, C. & Garman, E. F. (2005). Journal of synchrotron radiation. 12, 257–260,
doi:10.1107/S0909049505007132.
Neutze, R. & Moffat, K. (2012). Current opinion in structural biology. 22, 651–659,
doi:10.1016/j.sbi.2012.08.006.
Neutze, R., Wouts, R., van der Spoel, D., Weckert, E. & Hajdu, J. (2000). Nature. 406, 752–757,
doi:10.1038/35021099.
Nicolis, G. & Maes, D. (2012). Kinetics and Thermodynamics of Multistep Nucleation and Self-
Assembly in Nanoscale Materials. Hoboken, NJ, USA: John Wiley & Sons, Inc.
Niesen, F. H., Koch, A., Lenski, U., Harttig, U., Roske, Y., Heinemann, U. & Hofmann, K. P. (2008).
Journal of structural biology. 162, 451–459, doi:10.1016/j.jsb.2008.03.007.
Nogly, P., James, D., Wang, D., White, T. A., Zatsepin, N., Shilova, A., Nelson, G., Liu, H., Johansson, L.,
Heymann, M., Jaeger, K., Metz, M., Wickstrand, C., Wu, W., Bath, P., Berntsen, P., Oberthuer, D.,
Panneels, V., Cherezov, V., Chapman, H., Schertler, G., Neutze, R., Spence, J., Moraes, I.,
Burghammer, M., Standfuss, J. & Weierstall, U. (2015). IUCrJ. 2, 168–176,
doi:10.1107/S2052252514026487.
Oldenbourg, R. & Ruiz, T. (1989). Biophysical journal. 56, 195–205, doi:10.1016/S0006-
3495(89)82664-5.
Owen, R. L. & Garman, E. (2005). Acta crystallographica. Section D, Biological crystallography. 61,
130–140, doi:10.1107/S0907444904029567.
Owen, R. L., Paterson, N., Axford, D., Aishima, J., Schulze-Briese, C., Ren, J., Fry, E. E., Stuart, D. I. &
Evans, G. (2014). Acta crystallographica. Section D, Biological crystallography. 70, 1248–1256,
doi:10.1107/S1399004714005379.
Owen, R. L., Rudino-Pinera, E. & Garman, E. F. (2006). Proceedings of the National Academy of
Sciences of the United States of America. 103, 4912–4917, doi:10.1073/pnas.0600973103.

REFERENCES
139
Pan, W., Galkin, O., Filobelo, L., Nagel, R. L. & Vekilov, P. G. (2007). Biophysical journal. 92, 267–277,
doi:10.1529/biophysj.106.094854.
Panneels, V., Wu, W., Tsai, C.-J., Nogly, P., Rheinberger, J., Jaeger, K., Cicchetti, G., Gati, C., Kick, L. M.,
Sala, L., Capitani, G., Milne, C., Padeste, C., Pedrini, B., Li, X.-D., Standfuss, J., Abela, R. & Schertler,
G. (2015). Structural dynamics (Melville, N.Y.). 2, 41718, doi:10.1063/1.4922774.
Pantoliano, M. W., Petrella, E. C., Kwasnoski, J. D., Lobanov, V. S., Myslik, J., Graf, E., Carver, T., Asel,
E., Springer, B. A., Lane, P. & Salemme, F. R. (2001). Journal of biomolecular screening. 6, 429–440,
doi:10.1089/108705701753364922.
Penkova, A., Pan, W., Hodjaoglu, F. & Vekilov, P. G. (2006). Annals of the New York Academy of
Sciences. 1077, 214–231, doi:10.1196/annals.1362.048.
Pereira, P. J. B., Royant, A., Panjikar, S. & Sanctis, D. de (2013). Journal of structural biology. 181, 89–
94, doi:10.1016/j.jsb.2012.11.003.
Perry, S. L., Guha, S., Pawate, A. S., Bhaskarla, A., Agarwal, V., Nair, S. K. & Kenis, P. J. A. (2013). Lab
on a chip. 13, 3183–3187, doi:10.1039/c3lc50276g.
Pinker, F., Brun, M., Morin, P., Deman, A.-L., Chateaux, J.-F., Olieric, V., Stirnimann, C., Lorber, B.,
Terrier, N., Ferrigno, R. & Sauter, C. (2013). Crystal Growth & Design. 13, 3333–3340,
doi:10.1021/cg301757g.
Price, W. N. 2., Chen, Y., Handelman, S. K., Neely, H., Manor, P., Karlin, R., Nair, R., Liu, J., Baran, M.,
Everett, J., Tong, S. N., Forouhar, F., Swaminathan, S. S., Acton, T., Xiao, R., Luft, J. R., Lauricella,
A., Detitta, G. T., Rost, B., Montelione, G. T. & Hunt, J. F. (2009). Nature biotechnology. 27, 51–57,
doi:10.1038/nbt.1514.
Provencher, S. W. (1982). Computer Physics Communications. 27, 229–242, doi:10.1016/0010-
4655(82)90174-6.
Ragheb, D., Bompiani, K., Dalal, S. & Klemba, M. (2009). The Journal of biological chemistry. 284,
24806–24815, doi:10.1074/jbc.M109.018424.
Rangarajan, E. S., Asinas, A., Proteau, A., Munger, C., Baardsnes, J., Iannuzzi, P., Matte, A. & Cygler,
M. (2008). Journal of bacteriology. 190, 1447–1458, doi:10.1128/JB.01610-07.
Rangarajan, E. S., Li, Y., Ajamian, E., Iannuzzi, P., Kernaghan, S. D., Fraser, M. E., Cygler, M. & Matte,
A. (2005). The Journal of biological chemistry. 280, 42919–42928, doi:10.1074/jbc.M510522200.
Rasmussen, B. F., Stock, A. M., Ringe, D. & Petsko, G. A. (1992). Nature. 357, 423–424,
doi:10.1038/357423a0.
Ravelli, R. B., Leiros, H.-K. S., Pan, B., Caffrey, M. & McSweeney, S. (2003). Structure. 11, 217–224,
doi:10.1016/S0969-2126(03)00006-6.
Ravelli, R. B. G. & McSweeney, S. M. (2000). Structure. 8, 315–328, doi:10.1016/S0969-
2126(00)00109-X.
REFERENCES
140
Ravelli, R. B. G., Nanao, M. H., Lovering, A., White, S. & McSweeney, S. (2005). Journal of synchrotron
radiation. 12, 276–284, doi:10.1107/S0909049505003286.
Redecke, L., Nass, K., DePonte, D. P., White, T. A., Rehders, D., Barty, A., Stellato, F., Liang, M.,
Barends, T. R. M., Boutet, S., Williams, G. J., Messerschmidt, M., Seibert, M. M., Aquila, A.,
Arnlund, D., Bajt, S., Barth, T., Bogan, M. J., Caleman, C., Chao, T.-C., Doak, R. B., Fleckenstein, H.,
Frank, M., Fromme, R., Galli, L., Grotjohann, I., Hunter, M. S., Johansson, L. C., Kassemeyer, S.,
Katona, G., Kirian, R. A., Koopmann, R., Kupitz, C., Lomb, L., Martin, A. V., Mogk, S., Neutze, R.,
Shoeman, R. L., Steinbrener, J., Timneanu, N., Wang, D., Weierstall, U., Zatsepin, N. A., Spence, J.
C. H., Fromme, P., Schlichting, I., Duszenko, M., Betzel, C. & Chapman, H. N. (2013). Science (New
York, N.Y.). 339, 227–230, doi:10.1126/science.1229663.
Riekel, C., Burghammer, M. & Schertler, G. (2005). Current opinion in structural biology. 15, 556–562,
doi:10.1016/j.sbi.2005.08.013.
Robert, X. & Gouet, P. (2014). Nucleic acids research. 42, W320-4, doi:10.1093/nar/gku316.
Roedig, P., Duman, R., Sanchez-Weatherby, J., Vartiainen, I., Burkhardt, A., Warmer, M., David, C.,
Wagner, A. & Meents, A. (2016). Jorunal of Applied Crystallography. 49, 968–975,
doi:10.1107/S1600576716006348.
Roedig, P., Vartiainen, I., Duman, R., Panneerselvam, S., Stube, N., Lorbeer, O., Warmer, M., Sutton,
G., Stuart, D. I., Weckert, E., David, C., Wagner, A. & Meents, A. (2015). Scientific reports. 5,
10451, doi:10.1038/srep10451.
Röntgen, W. C. (1898). Ann. Phys. 300, 1–11, doi:10.1002/andp.18983000102.
Rosenthal, P. J. (2002). Current opinion in hematology. 9, 140–145.
Rosenthal, P. J., McKerrow, J. H., Aikawa, M., Nagasawa, H. & Leech, J. H. (1988). The Journal of
clinical investigation. 82, 1560–1566, doi:10.1172/JCI113766.
Sanctis, D. de & Nanao, M. H. (2012). Acta crystallographica. Section D, Biological crystallography. 68,
1152–1162, doi:10.1107/S0907444912023475.
Sanctis, D. de, Tucker, P. A. & Panjikar, S. (2011). Journal of synchrotron radiation. 18, 374–380,
doi:10.1107/S0909049511004092.
Sanctis, D. de, Zubieta, C., Felisaz, F., Caserotto, H. & Nanao, M. H. (2016). Acta crystallographica.
Section D, Structural biology. 72, 395–402, doi:10.1107/S2059798315021658.
Santos, S. P., Bandeiras, T. M., Pinto, A. F., Teixeira, M., Carrondo, M. A. & Romao, C. V. (2012).
Protein expression and purification. 81, 193–200, doi:10.1016/j.pep.2011.10.001.
Sauter, A., Roosen-Runge, F., Zhang, F., Lotze, G., Jacobs, R. M. J. & Schreiber, F. (2015). Journal of
the American Chemical Society. 137, 1485–1491, doi:10.1021/ja510533x.

REFERENCES
141
Schiltz, M., Dumas, P., Ennifar, E., Flensburg, C., Paciorek, W., Vonrhein, C. & Bricogne, G. (2004).
Acta crystallographica. Section D, Biological crystallography. 60, 1024–1031,
doi:10.1107/S0907444904006377.
Schlichting, I. (2015). IUCrJ. 2, 246–255, doi:10.1107/S205225251402702X.
Schlichting, I. & Miao, J. (2012). Current opinion in structural biology. 22, 613–626,
doi:10.1016/j.sbi.2012.07.015.
Schmidt, M. (2013). Advances in Condensed Matter Physics. 2013, 1–10, doi:10.1155/2013/167276.
Segelke, B. W. (2001). Journal of Crystal Growth. 232, 553–562, doi:10.1016/S0022-0248(01)01154-X.
Sheldrick, G. M. (2008). Acta crystallographica. Section A, Foundations of crystallography. 64, 112–
122, doi:10.1107/S0108767307043930.
Sheldrick, G. M. (2010). Acta crystallographica. Section D, Biological crystallography. 66, 479–485,
doi:10.1107/S0907444909038360.
Shenai, B. R., Sijwali, P. S., Singh, A. & Rosenthal, P. J. (2000). The Journal of biological chemistry. 275,
29000–29010, doi:10.1074/jbc.M004459200.
Shi, R., Villarroya, M., Ruiz-Partida, R., Li, Y., Proteau, A., Prado, S., Moukadiri, I., Benitez-Paez, A.,
Lomas, R., Wagner, J., Matte, A., Velazquez-Campoy, A., Armengod, M.-E. & Cygler, M. (2009).
Journal of bacteriology. 191, 7614–7619, doi:10.1128/JB.00650-09.
Shim, J.-U., Cristobal, G., Link, D. R., Thorsen, T. & Fraden, S. (2007). Crystal Growth & Design. 7,
2192–2194, doi:10.1021/cg700688f.
Sierra, R. G., Laksmono, H., Kern, J., Tran, R., Hattne, J., Alonso-Mori, R., Lassalle-Kaiser, B., Glockner,
C., Hellmich, J., Schafer, D. W., Echols, N., Gildea, R. J., Grosse-Kunstleve, R. W., Sellberg, J.,
McQueen, T. A., Fry, A. R., Messerschmidt, M. M., Miahnahri, A., Seibert, M. M., Hampton, C. Y.,
Starodub, D., Loh, N. D., Sokaras, D., Weng, T.-C., Zwart, P. H., Glatzel, P., Milathianaki, D., White,
W. E., Adams, P. D., Williams, G. J., Boutet, S., Zouni, A., Messinger, J., Sauter, N. K., Bergmann, U.,
Yano, J., Yachandra, V. K. & Bogan, M. J. (2012). Acta crystallographica. Section D, Biological
crystallography. 68, 1584–1587, doi:10.1107/S0907444912038152.
Sievers, F., Wilm, A., Dineen, D., Gibson, T. J., Karplus, K., Li, W., Lopez, R., McWilliam, H., Remmert,
M., Soding, J., Thompson, J. D. & Higgins, D. G. (2011). Molecular systems biology. 7, 539,
doi:10.1038/msb.2011.75.
Slabinski, L., Jaroszewski, L., Rychlewski, L., Wilson, I. A., Lesley, S. A. & Godzik, A. (2007).
Bioinformatics (Oxford, England). 23, 3403–3405, doi:10.1093/bioinformatics/btm477.
Sleutel, M. & van Driessche, A. (2014). Proceedings of the National Academy of Sciences of the United
States of America. 111, E546-53, doi:10.1073/pnas.1309320111.
Smith, J. L., Fischetti, R. F. & Yamamoto, M. (2012). Current opinion in structural biology. 22, 602–
612, doi:10.1016/j.sbi.2012.09.001.
REFERENCES
142
Snow, R. W., Guerra, C. A., Noor, A. M., Myint, H. Y. & Hay, S. I. (2005). Nature. 434, 214–217,
doi:10.1038/nature03342.
Spence, J. C. H., Weierstall, U. & Chapman, H. N. (2012). Reports on progress in physics. Physical
Society (Great Britain). 75, 102601, doi:10.1088/0034-4885/75/10/102601.
Squires, T. M. & Quake, S. R. (2005). Rev. Mod. Phys. 77, 977–1026,
doi:10.1103/RevModPhys.77.977.
Steinberg, T. H., Haugland, R. P. & Singer, V. L. (1996a). Analytical biochemistry. 239, 238–245,
doi:10.1006/abio.1996.0320.
Steinberg, T. H., Jones, L. J., Haugland, R. P. & Singer, V. L. (1996b). Analytical biochemistry. 239, 223–
237, doi:10.1006/abio.1996.0319.
Stellato, F., Oberthur, D., Liang, M., Bean, R., Gati, C., Yefanov, O., Barty, A., Burkhardt, A., Fischer, P.,
Galli, L., Kirian, R. A., Meyer, J., Panneerselvam, S., Yoon, C. H., Chervinskii, F., Speller, E., White, T.
A., Betzel, C., Meents, A. & Chapman, H. N. (2014). IUCrJ. 1, 204–212,
doi:10.1107/S2052252514010070.
Stevenson, H. P., DePonte, D. P., Makhov, A. M., Conway, J. F., Zeldin, O. B., Boutet, S., Calero, G. &
Cohen, A. E. (2014a). Philosophical transactions of the Royal Society of London. Series B, Biological
sciences. 369, 20130322, doi:10.1098/rstb.2013.0322.
Stevenson, H. P., Makhov, A. M., Calero, M., Edwards, A. L., Zeldin, O. B., Mathews, I. I., Lin, G.,
Barnes, C. O., Santamaria, H., Ross, T. M., Soltis, S. M., Khosla, C., Nagarajan, V., Conway, J. F.,
Cohen, A. E. & Calero, G. (2014b). Proceedings of the National Academy of Sciences of the United
States of America. 111, 8470–8475, doi:10.1073/pnas.1400240111.
Stone, H. A., Stroock, A. D. & Ajdari, A. (2004). Annual Review of Fluid Mechanics. 36, 381–411,
doi:10.1146/annurev.fluid.36.050802.122124.
Strutt, H. J. W. (1871). Philosophical Magazines Series 4. 41, 447–454.
Su, X.-D., Zhang, H., Terwilliger, T. C., Liljas, A., Xiao, J. & Dong, Y. (2015). Crystallography reviews. 21,
122–153, doi:10.1080/0889311X.2014.973868.
Sugahara, M., Mizohata, E., Nango, E., Suzuki, M., Tanaka, T., Masuda, T., Tanaka, R., Shimamura, T.,
Tanaka, Y., Suno, C., Ihara, K., Pan, D., Kakinouchi, K., Sugiyama, S., Murata, M., Inoue, T., Tono, K.,
Song, C., Park, J., Kameshima, T., Hatsui, T., Joti, Y., Yabashi, M. & Iwata, S. (2015). Nature
methods. 12, 61–63, doi:10.1038/nmeth.3172.
Thorn, A. & Sheldrick, G. M. (2011). JOURNAL OF APPLIED CRYSTALLOGRAPHY. 44, 1285–1287,
doi:10.1107/S0021889811041768.
Thorsen, T., Maerkl, S. J. & Quake, S. R. (2002). Science. 298, 580–584, doi:10.1126/science.1076996.
Tilton, R. F., JR, Dewan, J. C. & Petsko, G. A. (1992). Biochemistry. 31, 2469–2481.
REFERENCES
143
Tremaine, A., Wang, X. J., Babzien, M., Ben-Zvi, I., Cornacchia, M., Murokh, A., Nuhn, H.-D., Malone,
R., Pellegrini, C., Reiche, S., Rosenzweig, J., Skaritka, J. & Yakimenko, V. (2002). Physical review. E,
Statistical, nonlinear, and soft matter physics. 66, 36503, doi:10.1103/PhysRevE.66.036503.
Uhlemann, A. C. & Krishna, S. (2005). Current topics in microbiology and immunology. 295, 39–53.
Vagin, A. & Teplyakov, A. (2010). Acta Crystallographica Section D - Biological Crystallography. 66,
22–25, doi:10.1107/S0907444909042589.
Vedadi, M., Niesen, F. H., Allali-Hassani, A., Fedorov, O. Y., Finerty, P. J., JR, Wasney, G. A., Yeung, R.,
Arrowsmith, C., Ball, L. J., Berglund, H., Hui, R., Marsden, B. D., Nordlund, P., Sundstrom, M.,
Weigelt, J. & Edwards, A. M. (2006). Proceedings of the National Academy of Sciences of the
United States of America. 103, 15835–15840, doi:10.1073/pnas.0605224103.
Vekilov, P. G. (2004). Crystal Growth & Design. 4, 671–685, doi:10.1021/cg049977w.
Vekilov, P. G. (2010). Nanoscale. 2, 2346–2357, doi:10.1039/c0nr00628a.
Venyaminov, S., Baikalov, I. A., Wu, C. S. & Yang, J. T. (1991). Analytical biochemistry. 198, 250–255.
Vilkner, T., Janasek, D. & Manz, A. (2004). Analytical chemistry. 76, 3373–3385,
doi:10.1021/ac040063q.
Wagner, C. (1961). Zeitschrift Für Elektrochemie. 65, 581–591.
Wampler, R. D., Kissick, D. J., Dehen, C. J., Gualtieri, E. J., Grey, J. L., Wang, H.-F., Thompson, D. H.,
Cheng, J.-X. & Simpson, G. J. (2008). Journal of the American Chemical Society. 130, 14076–14077,
doi:10.1021/ja805983b.
Weckert, E. (2015). IUCrJ. 2, 230–245, doi:10.1107/S2052252514024269.
Weckert, E. & Hümmer, K. (1997). Acta Crystallogr A Found Crystallogr. 53, 108–143,
doi:10.1107/S0108767396011117.
Weichenberger, C. X. & Rupp, B. (2014). Acta crystallographica. Section D, Biological crystallography.
70, 1579–1588, doi:10.1107/S1399004714005550.
Weierstall, U., James, D., Wang, C., White, T. A., Wang, D., Liu, W., Spence, J. C. H., Bruce Doak, R.,
Nelson, G., Fromme, P., Fromme, R., Grotjohann, I., Kupitz, C., Zatsepin, N. A., Liu, H., Basu, S.,
Wacker, D., Han, G. W., Katritch, V., Boutet, S., Messerschmidt, M., Williams, G. J., Koglin, J. E.,
Marvin Seibert, M., Klinker, M., Gati, C., Shoeman, R. L., Barty, A., Chapman, H. N., Kirian, R. A.,
Beyerlein, K. R., Stevens, R. C., Li, D., Shah, S. T. A., Howe, N., Caffrey, M. & Cherezov, V. (2014).
Nature communications. 5, 3309, doi:10.1038/ncomms4309.
Weierstall, U., Spence, J. C. H. & Doak, R. B. (2012). The Review of scientific instruments. 83, 35108,
doi:10.1063/1.3693040.
Weiss, M. S., Mander, G., Hedderich, R., Diederichs, K., Ermler, U. & Warkentin, E. (2004). Acta
crystallographica. Section D, Biological crystallography. 60, 686–695,
doi:10.1107/S0907444904003002.

REFERENCES
144
White, T. A., Kirian, R. A., Martin, A. V., Aquila, A., Nass, K., Barty, A. & Chapman, H. N. (2012). J Appl
Crystallogr. 45, 335–341, doi:10.1107/S0021889812002312.
Winn, M. D., Ballard, C. C., Cowtan, K. D., Dodson, E. J., Emsley, P., Evans, P. R., Keegan, R. M.,
Krissinel, E. B., Leslie, A. G. W., McCoy, A., McNicholas, S. J., Murshudov, G. N., Pannu, N. S.,
Potterton, E. A., Powell, H. R., Read, R. J., Vagin, A. & Wilson, K. S. (2011). Acta Crystallographica
Section D - Biological Crystallography. 67, 235–242, doi:10.1107/S0907444910045749.
Wisedchaisri, G. & Gonen, T. (2013). Methods in molecular biology (Clifton, N.J.). 955, 243–272,
doi:10.1007/978-1-62703-176-9_14.
Witkowski, B., Khim, N., Chim, P., Kim, S., Ke, S., Kloeung, N., Chy, S., Duong, S., Leang, R., Ringwald,
P., Dondorp, A. M., Tripura, R., Benoit-Vical, F., Berry, A., Gorgette, O., Ariey, F., Barale, J.-C.,
Mercereau-Puijalon, O. & Menard, D. (2013). Antimicrobial agents and chemotherapy. 57, 914–
923, doi:10.1128/AAC.01868-12.
Wolde, P. R. t. (1997). Science. 277, 1975–1978, doi:10.1126/science.277.5334.1975.
World Health Organization (WHO) (2015). World Malaria Report 2015. Geneva, Switzerland: World
Health Organization.
Wu, W., Nogly, P., Rheinberger, J., Kick, L. M., Gati, C., Nelson, G., Deupi, X., Standfuss, J., Schertler,
G. & Panneels, V. (2015). Acta crystallographica. Section F, Structural biology communications. 71,
856–860, doi:10.1107/S2053230X15009966.
Diffraction methods for biological macromolecules. Part A (1985), edited by H. W. Wyckoff, Hirs, C H
W. Ed & Timasheff, Serge N. Ed, pp. 77–112. Orlando: Acedmic Press.
Yau, S.-T. & Vekilov, P. G. (2001). J. Am. Chem. Soc. 123, 1080–1089, doi:10.1021/ja003039c.
Yorke, B. A., Beddard, G. S., Owen, R. L. & Pearson, A. R. (2014). Nature methods. 11, 1131–1134,
doi:10.1038/nmeth.3139.
Yoshida, H., Hensgens, C. M. H., van der Laan, Jan Metske, Sutherland, J. D., Hart, D. J. & Dijkstra, B.
W. (2005). Protein expression and purification. 41, 61–67, doi:10.1016/j.pep.2005.02.007.
Zander, U., Bourenkov, G., Popov, A. N., Sanctis, D. de, Svensson, O., McCarthy, A. A., Round, E.,
Gordeliy, V., Mueller-Dieckmann, C. & Leonard, G. A. (2015). Acta Crystallographica Section D -
Biological Crystallography. 71, 2328–2343, doi:10.1107/S1399004715017927.
Zarrine-Afsar, A., Barends, T. R. M., Muller, C., Fuchs, M. R., Lomb, L., Schlichting, I. & Miller, R. J. D.
(2012). Acta Crystallographica Section D - Biological Crystallography. 68, 321–323,
doi:10.1107/S0907444911055296.
Zeldin, O. B., Gerstel, M. & Garman, E. F. (2013). J Appl Crystallogr. 46, 1225–1230,
doi:10.1107/S0021889813011461.
Zheng, B., Gerdts, C. J. & Ismagilov, R. F. (2005). Current opinion in structural biology. 15, 548–555,
doi:10.1016/j.sbi.2005.08.009.

REFERENCES
145
Zheng, B., Tice, J. D., Roach, L. S. & Ismagilov, R. F. (2004). Angewandte Chemie (International ed. in
English). 43, 2508–2511, doi:10.1002/anie.200453974.
Zulauf, M. & D'Arcy, A. (1992). Journal of Crystal Growth. 122, 102–106, doi:10.1016/0022-
0248(92)90232-8.
Zwart, P. H., Banumathi, S., Dauter, M. & Dauter, Z. (2004). Acta crystallographica. Section D,
Biological crystallography. 60, 1958–1963, doi:10.1107/S0907444904021730.