Embed Size (px)
Citation preview
7/27/2019 Spe 107918
http://slidepdf.com/reader/full/spe-107918 1/7
This paper was prepared for presentation at the SPE Latin American & Caribbean PetroleumEngineering Conference held in Buenos Aires, Argentina, 15–18 April 2007.
This paper was selected for presentation by an SPE Program Committee following review of information contained in a proposal submitted by the author(s). Contents of the paper, aspresented, have not been reviewed by the Society of Petroleum Engineers and are subject tocorrection by the author(s). The material, as presented, does not necessarily reflect anyposition of the Society of Petroleum Engineers, its officers, or members. Papers presented atSPE meetings are subject to publication review by Editorial Committees of the Society of Petroleum Engineers. Electronic reproduction, distribution, or storage of any part of this paper
for commercial purposes without the written consent of the Society of Petroleum Engineers isprohibited. Permission to reproduce in print is restricted to a proposal of not more than 300
words; illustrations may not be copied. The proposal must contain conspicuousacknowledgment of where and by whom the paper was presented. Write Librarian, SPE, P.O.Box 833836, Richardson, TX 75083-3836, U.S.A., fax 01-972-952-9435.
ProposalCerro Dragon is a mature Area located in the Argentine
Republic, 90 km to the West of Comodoro Rivadavia and 1,900 km to the South of Buenos Aires, with a surface of
3,480 km² and with 3,738 perforated wells.
Since its discovery in1958, and after a long history of production, a change of strategy on 1999 resulted in animportant increase in Production and Reserves
Decision making at every level, such as people health,environment care, and strategic, organizational, structural,operative and technological planning, was key for the rebirth
of this field.
The work is centered in how we handle the information, theentailment of the data bases and the use of systems we have
built to contribute to maintain the production growth of theCerro Dragón Asset.
Based on the field complexity we recognized that it wasnecessary to implement new tools that would allow us to make production and investments prognoses, integrating informationfrom different sources, as well as to detect improvement
opportunities.
The selected software tools allowed us to perform simulationsand dynamically survey the projects. The information used came from geological, geophysical, physical production,interventions, measurements, and automation databases,
among others. Some of them were developed during the 2
The selected software tools additionally let us integrate the
projects into the Long Term Plan, and Budget, takingadvantage of the virtuous Circle of Plan-Do-Control-Learn.
A project simulation is solved in a period substantially shorter
than the one it demands a conventional simulator, which is of great advantage at the time of analyzing different scenarios in
an area where the structural complexity and the meager petrophysical information are important barriers at the time of making a study.
The control and daily pursuit of the Projects through thesesystems have favored substantially the fast decision making,the correct lease of resources and a better operative answer.
To complete the description of our Optimization options other
tools and practices are described.
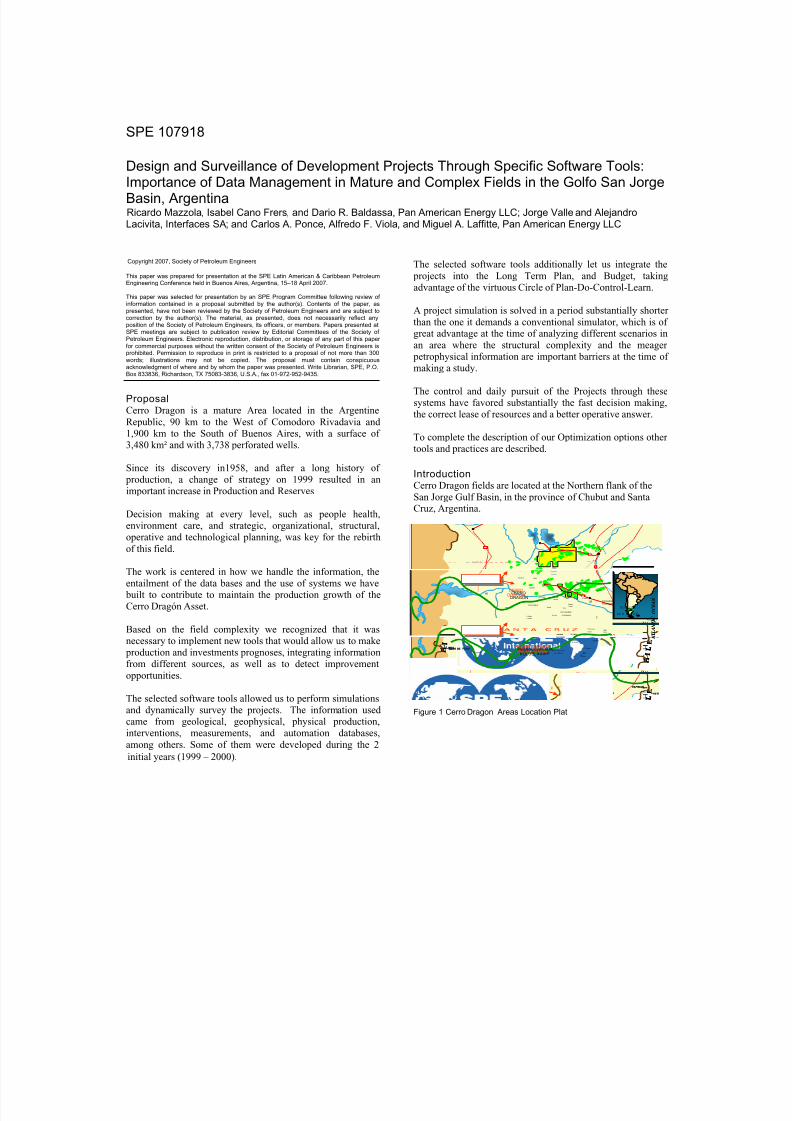
IntroductionCerro Dragon fields are located at the Northern flank of the
San Jorge Gulf Basin, in the province of Chubut and SantaCruz, Argentina.
Figure 1 Cerro Dragon Areas Location Plat
SPE 107918
Design and Surveillance of Development Projects Through Specific Software Tools:Importance of Data Management in Mature and Complex Fields in the Golfo San JorgeBasin, ArgentinaRicardo Mazzola, Isabel Cano Frers, and Dario R. Baldassa, Pan American Energy LLC; Jorge Valle and AlejandroLacivita, Interfaces SA; and Carlos A. Ponce, Alfredo F. Viola, and Miguel A. Laffitte, Pan American Energy LLC
R í o S e n g u e r
R ío D e s e a d o
R
ío
C h
i co
LagoMusters
Lago
Colhué
Huapi
PIEDRACLAVADA
KOLUEL KAIKE
EL VALLE
ANT.GRANDE
C.DRAGÓN
ANT.FUNES
El Cordón
L.Perales
L.Mesetas
El Tordillo
Escalante
Manantiales
Behr
C.Vasco
M.Magallanes
M.Espinosa
C.León
P.Truncado
El Huemul
CerroDragón
Zorro
LasFlores
Escorial
Ant.Grande
Cañadon
GrandeOriental
Buenos Aires
C.Minerales
PicoTruncado
LasHeras
Sarmiento
26
3
43
Valle
Hermoso
C.Perdido
40
PeritoMoreno
0 100 km
OIL FIELDS
CERRODRAGON
CERRO
DRAGON
Caleta
Olivia
SA N J OR G E
Comodoro
G O LF O
Rivadavia
ATLANTIC
OCEAN
ATLANTIC
OCEAN
PIEDRA CLAVADAKOLUEL KAIKE
PIEDRA CLAVADAKOLUEL KAIKE
Lago
R í o S e n g u e r
R ío D e s e a d o
R
ío
C h
i co
LagoMusters
Lago
Colhué
Huapi
PIEDRACLAVADA
KOLUEL KAIKE
EL VALLE
ANT.GRANDE
C.DRAGÓN
ANT.FUNES
El Cordón
L.Perales
L.Mesetas
El Tordillo
Escalante
Manantiales
Behr
C.Vasco
M.Magallanes
M.Espinosa
C.León
P.Truncado
El Huemul
CerroDragón
Zorro
LasFlores
Escorial
Ant.Grande
Cañadon
GrandeOriental
Buenos Aires
C.Minerales
PicoTruncado
LasHeras
Sarmiento
26
3
43
Valle
Hermoso
C.Perdido
40
PeritoMoreno
0 100 km
OIL FIELDSOIL FIELDS
CERRODRAGON
CERRO
DRAGON
Caleta
Olivia
SA N J OR G E
Comodoro
G O LF O
Rivadavia
ATLANTIC
OCEAN
ATLANTIC
OCEAN
PIEDRA CLAVADAKOLUEL KAIKE
PIEDRA CLAVADAKOLUEL KAIKE
Lago
Copyright 2007, Society of Petroleum Engineers
initial years (1999 – 2000).
7/27/2019 Spe 107918
http://slidepdf.com/reader/full/spe-107918 2/7
2 SPE 107918
The Cerro Dragón Contract Area, consists of approximately 50fields. The area has been operated by Amoco since 1959. In
1997, Pan American Energy, become the operator followingthe formation of a joint venture between Amoco (now BPAmoco) and Bridas. Cerro Dragon has been under development as an oil producing area since 1959 through a
combination of infill and extension drilling for additional primary oil production and Waterflooding Projects in some
selected fields. Approximately 60% of the area is now under water flood. Cumulative oil recovery to date from both primary and secondary development exceeds 760 million barrels. There are currently 2410 Oil producing wells and 405water injection wells in the area.
General Geologic Setting & Reservoir Description
The Cerro Dragon asset comprises 800,000 acres in a roughlyrectangular block located on the north flank of the Golfo SanJorge Basin, a Mesozoic extensional basin filled with Jurassiclacustrian and Cretaceous fluvial deposit with Tertiary
compression and wrenching superimposed on earlier extensional features.
The main reservoir consists of sandstones of the ComodoroRivadavia Formation and altered tuffaceous sandstones and siltstones in the Mina Del Carmen Formation.
Hidrocarbons Traps consist of tilted horst blocks, faulted
anticlines and structurally enhanced stratigraphic pinch outs.
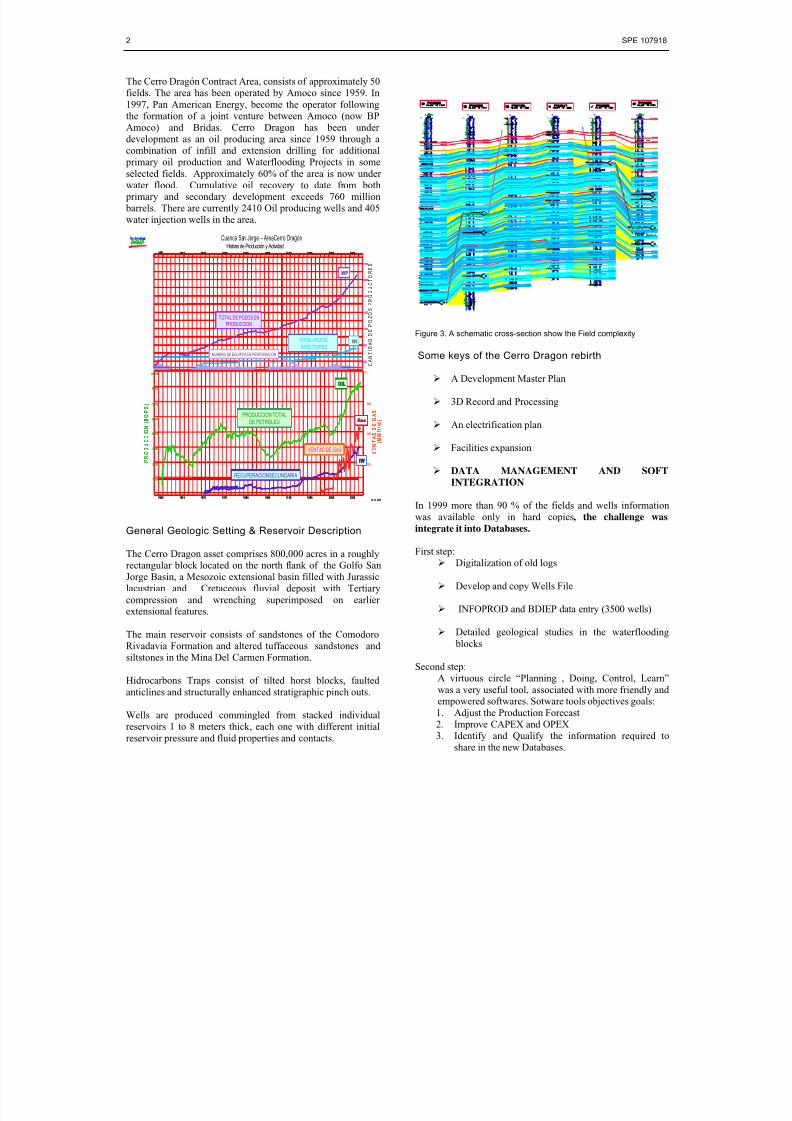
Wells are produced commingled from stacked individualreservoirs 1 to 8 meters thick, each one with different initial
reservoir pressure and fluid properties and contacts.
Figure 3. A schematic cross-section show the Field complexity
Some keys of the Cerro Dragon rebirth
A Development Master Plan
3D Record and Processing
An electrification plan
Facilities expansion
DATA MANAGEMENT AND SOFT
INTEGRATION
In 1999 more than 90 % of the fields and wells informationwas available only in hard copies, the challenge was
integrate it into Databases.
First step: Digitalization of old logs
Develop and copy Wells File
INFOPROD and BDIEP data entry (3500 wells)
Detailed geological studies in the waterflooding
blocks
Second step:A virtuous circle “Planning , Doing, Control, Learn”
was a very useful tool, associated with more friendly and empowered softwares. Sotware tools objectives goals:
1. Adjust the Production Forecast2. Improve CAPEX and OPEX3. Identify and Qualify the information required to
share in the new Databases.
30 JUL 200630 JUL 2006
Cuenca San Jorge – AreaCerro DragónHistoria de Producción y Actividad
C
A N
T I D
A D
D
E P
O
Z O
S
P R O
D
U
C T O
R E
S
5
10
200
1400
1000
600
1800
2000
2200
5
10
200
1400
1000
600
1800
2000
2200
1960 197519701965 1980 1985 1990 20001995 2005
TOTAL DE POZOS EN
PRODUCCION
TOTAL POZOS
INYECTORES
WI
NUMERO DE EQUIPOS DE PERFORACION
WP
1960 197519701965 1980 1985 1990 20001995 20051960 197519701965 1980 1985 1990 20001995 2005
TOTAL DE POZOS EN
PRODUCCION
TOTAL POZOS
INYECTORES
WI
NUMERO DE EQUIPOS DE PERFORACION
WP
400
1960 197519701965 1980 1985 1990 20001995 20051960 197519701965 1980 1985 1990 20001995 20051960 197519701965 1980 1985 1990 20001995 2005
P R
O
D U
C
C
I O
N
( B O
P D
)
12500
25000
50000
62500
75000
37500
87500
100000
200
V E N
T A S D
E G
A S
( M
M
f t 3 / d )
100
PRODUCCION TOTAL
DE PETROLEO
VENTAS DE GAS
RECUPERACION SECUNDARIA
300
OILOIL
IWIW
GasGas
P R
O
D U
C
C
I O
N
( B O
P D
)
12500
25000
50000
62500
75000
37500
87500
100000
200
V E N
T A S D
E G
A S
( M
M
f t 3 / d )
100
PRODUCCION TOTAL
DE PETROLEO
VENTAS DE GAS
RECUPERACION SECUNDARIA
300
OILOIL
IWIW
GasGas
7/27/2019 Spe 107918
http://slidepdf.com/reader/full/spe-107918 3/7
SPE 107918 3
Figure 4. A virtuous circle
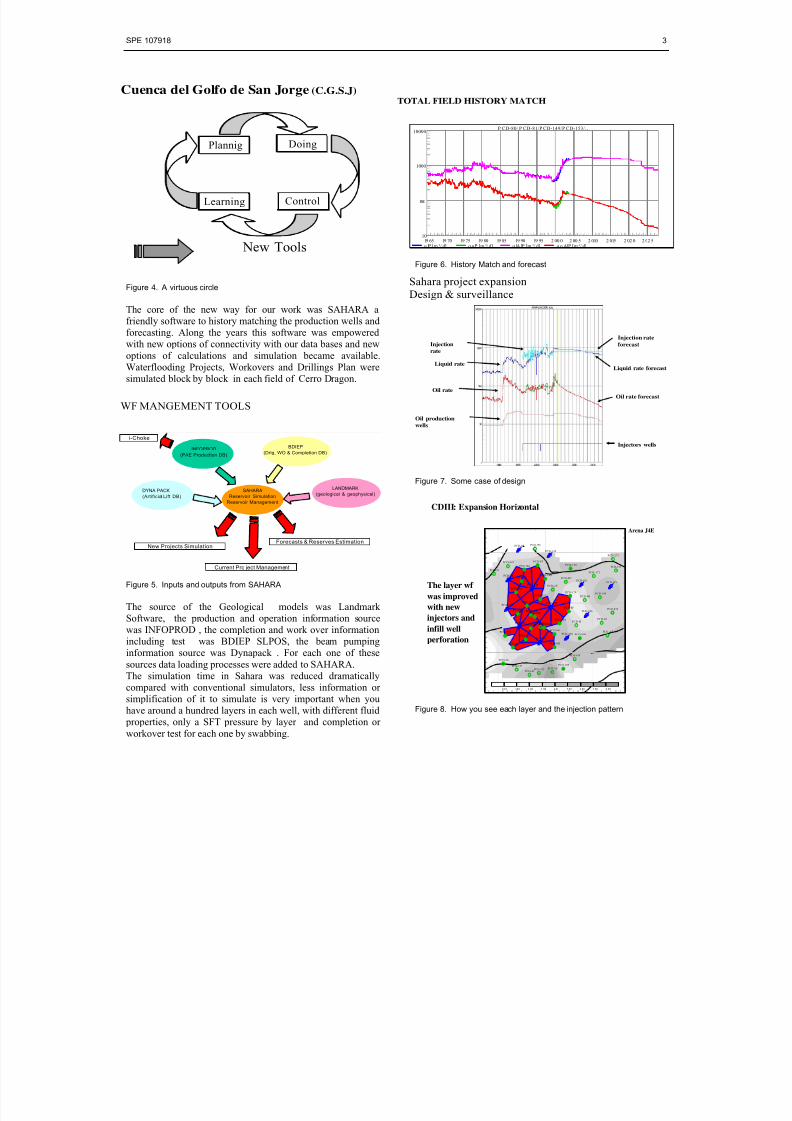
The core of the new way for our work was SAHARA afriendly software to history matching the production wells and forecasting. Along the years this software was empowered with new options of connectivity with our data bases and new
options of calculations and simulation became available.Waterflooding Projects, Workovers and Drillings Plan weresimulated block by block in each field of Cerro Dragon.
Figure 5. Inputs and outputs from SAHARA
The source of the Geological models was Landmark Software, the production and operation information sourcewas INFOPROD , the completion and work over informationincluding test was BDIEP SLPOS, the beam pumpinginformation source was Dynapack . For each one of these
sources data loading processes were added to SAHARA.The simulation time in Sahara was reduced dramaticallycompared with conventional simulators, less information or simplification of it to simulate is very important when youhave around a hundred layers in each well, with different fluid properties, only a SFT pressure by layer and completion or
workover test for each one by swabbing.
Figure 6. History Match and forecast
Figure 7. Some case of design
Figure 8. How you see each layer and the injection pattern
WF MANGEMENT TOOLS
INFOPROD(PAE Production DB)
DYNA PACK(Artificial Lift DB)
LANDMARK(geological & geophysical)
BDIEP(Drlg, WO & Completion DB)
SAHARAReservoir Simulation
Reservoir Management
New Projects Simulation
Current Pro ject Management
Forecasts & Reserves Estimation
i-Choke
Cuenca del Golfo de San Jorge (C.G.S.J)
Control
DoingPlannig
Learning Control
DoingPlannig
Learning
New Tools
TOTAL FIELD HISTORY MATCH
q lP [m ³/ d] q o P [m ³/ d] q lA lP [m ³/ d] q o AlP [m ³/ d]
10
100
1000
10000P C D-80/P C D-81/P C D-149/P C D-153/...
19 65 19 70 19 75 19 80 19 85 19 90 19 95 2 00 0 2 00 5 2 010 2 015 2 02 0 2 02 5
Liquid rate
Oil rate
Oil rate forecast
Liquid rate forecast
Oil production
wells
Injectors wells
Injection rate
forecastInjection
rate
Sahara project expansion
Design & surveillance
CDIII: Expansion Horizontal
0.00 1.00 2.00 3.00 4.00 5.00 6.00 7.00 8.00
PCD-80
PCD-81
PCD-149
PCD-153PCD-159
PCD-160
PCD-164
PCD-173
PCD-179
PCD-180
PCD-183
PCD-184
PCD-186
PCD-187
PCD-190
PCD-191
PCD-192
PCD-195
PCD-196
PCD-220
PCD-240 PCD-257
PCD-258
PCD-259
PCD-273
PCD-274PCD-804
PCD-832
PCD-845
PCD-847
PCD-848
PCG-26
PCG-86
PCG-109
PCG -113
PCG-153
PCG-157PCG-251
PCG-819
PCD-850
PCD-852
PCD-851
PCD-0A PCD-0B
PCD-0D
PCD-0F
PCD-0H
PCD-0IPCD-0J
PCD-0K
PCD-0L
PCD-0M
PCD-0P
PCD-0O
PCD-0R
PCD-0T
Arena J4E
The layer wf
was improvedwith new
injectors and
infill well
perforation
7/27/2019 Spe 107918
http://slidepdf.com/reader/full/spe-107918 4/7
4 SPE 107918
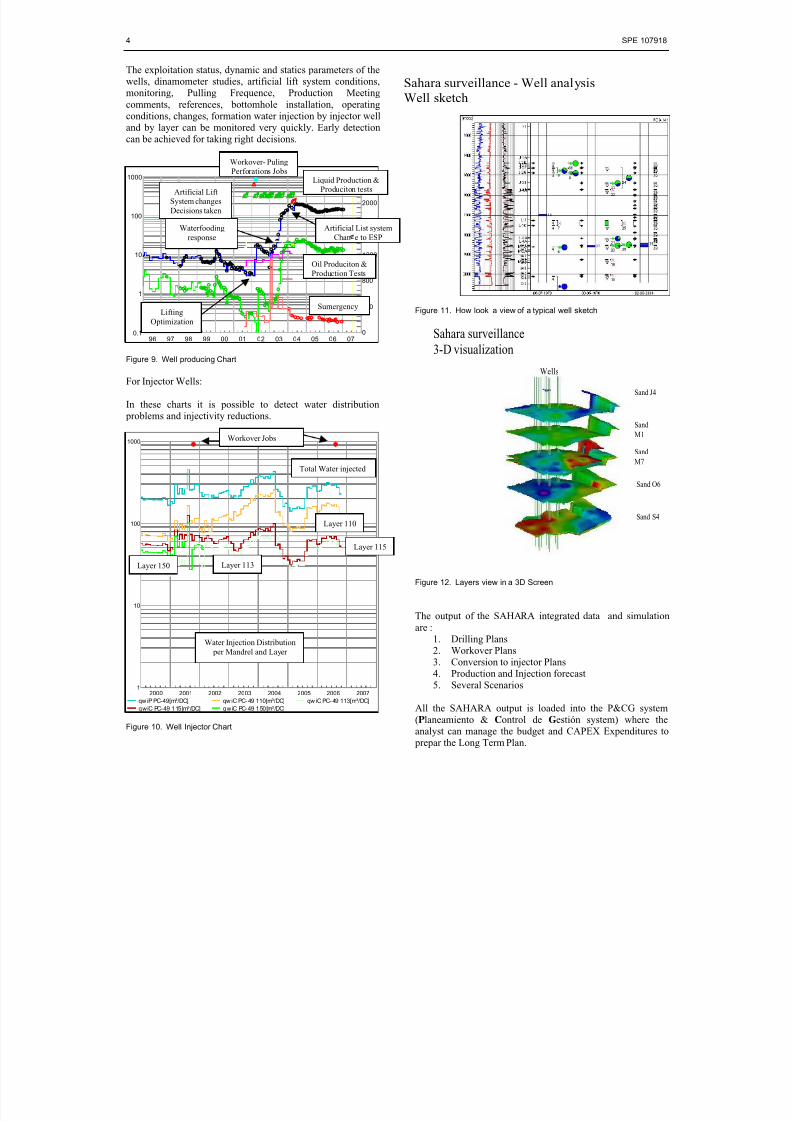
The exploitation status, dynamic and statics parameters of thewells, dinamometer studies, artificial lift system conditions,monitoring, Pulling Frequence, Production Meeting
comments, references, bottomhole installation, operatingconditions, changes, formation water injection by injector welland by layer can be monitored very quickly. Early detectioncan be achieved for taking right decisions.
0
400
800
1200
1600
2000
2400
0.1
1
10
100
1000PCD-172
96 97 98 99 00 01 02 03 04 05 06 07
Figure 9. Well producing Chart
For Injector Wells:
In these charts it is possible to detect water distribution problems and injectivity reductions.
qw iP PC-49[m³/DC] qw iC PC- 49 110[m³/DC] qw iC PC- 49 113[m³/DC]
qwiC PC-49 115[m³/DC] qwiC PC-49 150[m³/DC]
1
10
100
1000PC-49
2000 2001 2002 2003 2004 2005 2006 2007
Figure 10. Well Injector Chart
Figure 11. How look a view of a typical well sketch
Figure 12. Layers view in a 3D Screen
The output of the SAHARA integrated data and simulation
are :1. Drilling Plans2. Workover Plans3. Conversion to injector Plans4. Production and Injection forecast5. Several Scenarios
All the SAHARA output is loaded into the P&CG system(Planeamiento & Control de Gestión system) where theanalyst can manage the budget and CAPEX Expenditures to
prepar the Long Term Plan.
Sahara surveillance - Well analysis
Well sketch
Sahara surveillance
3-D visualization
Wells
Sand J4
Sand
M1
Sand
M7
Sand O6
Sand S4
Workover- Puling
Perforations JobsLiquid Production &
Produciton tests
Oil Produciton &
Production Tests
Sumergency
Artificial Lift
System changes
Decisions taken
Total Water injected
Layer 115
Layer 110
Layer 113Layer 150
Workover Jobs
Waterfooding
response
Artificial List system
Chan e to ESP
Lifting
Optimization
Water Injection Distribution
per Mandrel and Layer
7/27/2019 Spe 107918
http://slidepdf.com/reader/full/spe-107918 5/7
SPE 107918 5
Figure 13. Sumergency Map
Figure 14. Quickly visualization of Drilling and WO Programs
Figure 16. Underdeveloped status screen – Bubble map
Figure 15. Underdeveloped status screen
Which tools are currently under development :
Facilities visualization
WETS ™module evaluation
Which are the challenges to addres in the future:
Export data to BDRC (Certified Reserves Data Base)
Software utilities integration as:
o Well type design
o Dynamic Pressure Calculation in pipes
o Gas material balance
Other systems and software developments support our daily
work
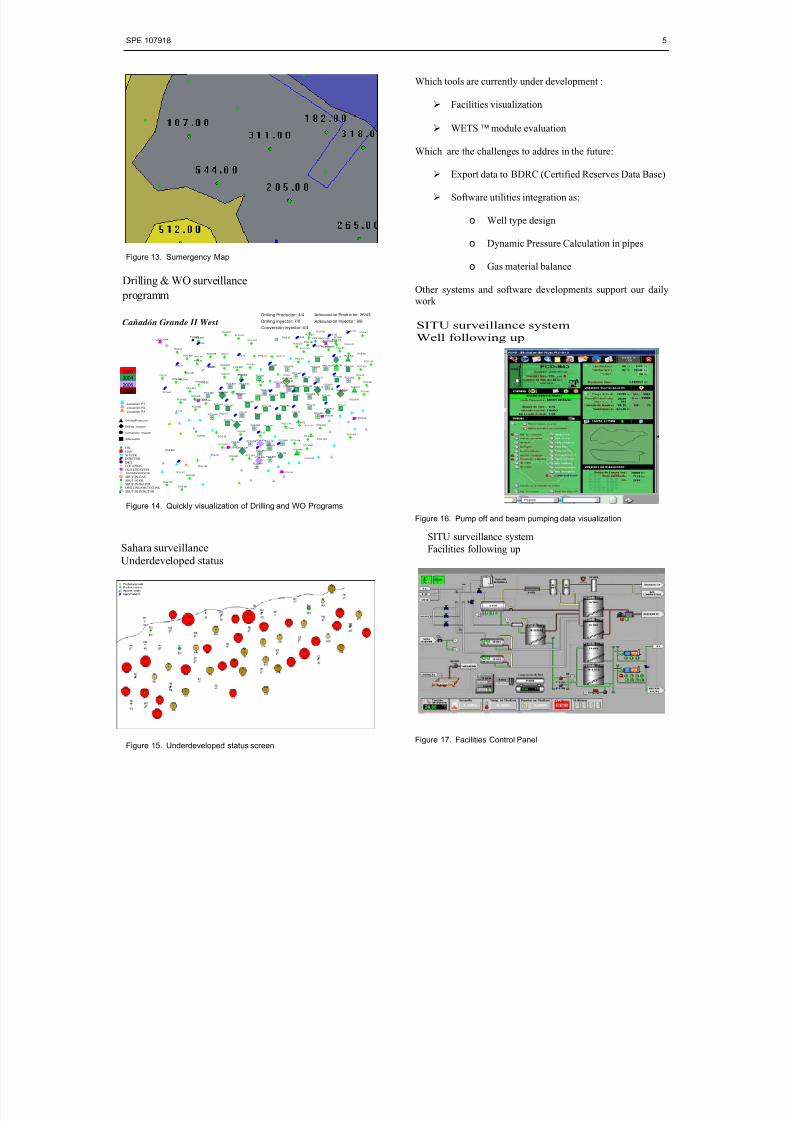
Figure 16. Pump off and beam pumping data visualization
Figure 17. Facilities Control Panel
Drilling & WO surveillance
programm
0000000000000000000000000000000000000000000000000000000000000000000000000000000000000000000000000000000000000000000000000000000000000000000000000000000000000000000000000000000000000000000000000000000000000000000000000000000000000000000000000000000000000000000000000000000000000000000000000000000000000000000000000000000000000000000000000000000000000000000000000000000000000000000000
I-3
I-2I-1
PCG-949
PCG-948
PCG-924
PCG-939
PCG-938
PCG-937
PCG-935
PCG-936
PCG-934
PCG-895
PCG-927
PCG-868
PCG-920
PCG-922
PCG-919 PCG-921
PCG-892
PCG-888
PCG-891
PCG-889
PCG-890
PCG-884PCG-882
PCG-878
PCG-875
PCG-874
PCG-876
LOCPCG-94
LOCPCG-68
LOCPCG-64
LOCPCG-52
LOCPCG-208
LOCPCG-104
LOCPCG-102
PCG-872
PCG-871
T-116
T-106
PCG-866
PCG-865
PCG-864
PCG-858
PCG-856
PCG-855
PCG-854
PCG-853
PCG-852
PCG-850
PCG-845
PCG-844
PCG-841
PCG-840
PCG-838
PCG-835
PCG-828
PCG-826
PCG-816
PCG-815
PCG-812
PCG-811
PCG-810
PCG-809
PCG-808
PCG-807
PCG-802
PCG-801
PCG-710
PCG-709
PCG-708
PCG-707
PCG-704
PCG-703
PCG-702
PCG-281
PCG-280
PCG-279
PCG-277
PCG-276
PCG-275
PCG-267
PCG-266
PCG-264
PCG-261
PCG-243
PCG-236
PCG-229
PCG-224
PCG-223
PCG-222
PCG-221
PCG-220
PCG-219
PCG-213
PCG-212
PCG-209
PCG-205
PCG-188
PCG-187
PCG-183
PCG-162
PCG-161PCG-159
PCG-156
PCG-154
PCG-147 PCG-146
PCG-145PCG-144
PCG-142
PCG-138
PCG-137
PCG-136
PCG-128
PCG-125
PCG-121
PCG-112
PCG-107
PCG-93
PCG-91
PCG-90PCG-87
PCG-81
PCG-79
PCG-78
PCG-71
PCG-70
PCG-69
PCG-65
PCG-63
PCG-61
PCG-60
PCG-59
PCG-54
PCG-51
PCG-49
PCG-48
PCG-47
PCG-46
PCG-45
PCG-42
PCG-41PCG-40
PCG-39
PCG-38
PCG-37
PCG-36
PCG-25
PCG-23
PCG-22
PCG-21
PCG-20
PCG-19
PCG-18
PCG-17
PCG-16
PCG-15
PCG-14PCG-12PCG-11
PCG-10
PCG-9PCG-8 PCG-7
PCG-6PCG-5PCG-4
PCG-3
PCG-2PCG-1
ICG-1
productor
Cañadón Grande II West
2005
2003
2006
2004
Drilling Productor
Adecuación
Conversión Inyector
Drilling Inyector
OIL
GASWATER INJECTOR
DRYLOCATIONOLD LOCATIONABANDONED-OILSHUT-IN-GASSHUT-IN-OILSHUT-IN-WATER DRILLING-OR-TESTING
SHUT-IN-INJECTOR
Drilling Productor: 4/4
Drilling Inyector: 7/8
Conversión Inyector: 4/4
Adecuaci ón Produc tor: 26/43
Adecuaci ón Inyector : 9/9
Locación P1
Locación P2
Locación P3
Sahara surveillance
Underdeveloped status
SITU surveillance system
Well following up
SITU surveillance system
Facilities following up
7/27/2019 Spe 107918
http://slidepdf.com/reader/full/spe-107918 6/7
6 SPE 107918
Figure 18. Beam pumping data visualization
THE PRODUCTION CYCLE AND INJECTIONCOMPLEXITY IN TWO FIGURES
Figure 19. Cerro Dragon production cycle
1,850 Beam pumped wells
30 PCP pumped wells
450 ESP pumped wells
2 Gas production wells
70 Oil and gas Stations
2 Oil treatment Plants
1 Gas Treatment Plant
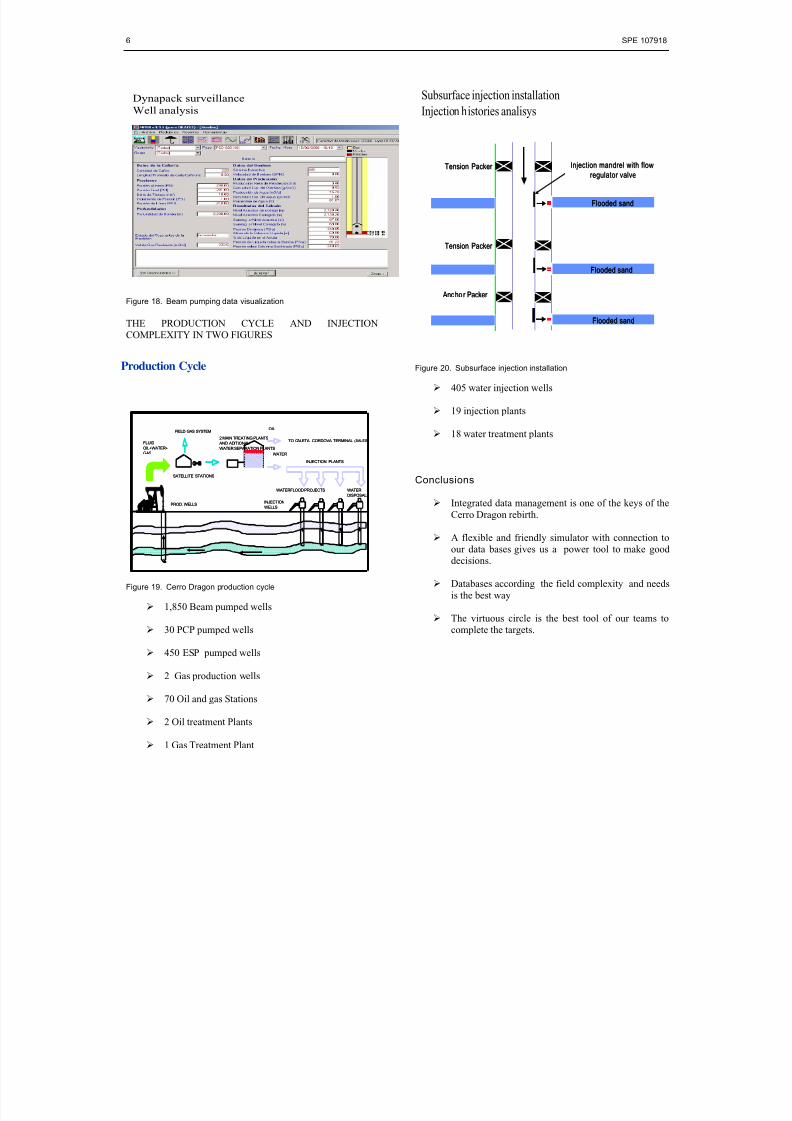
Figure 20. Subsurface injection installation
405 water injection wells
19 injection plants
18 water treatment plants
Conclusions
Integrated data management is one of the keys of the
Cerro Dragon rebirth.
A flexible and friendly simulator with connection toour data bases gives us a power tool to make good decisions.
Databases according the field complexity and needs
is the best way
The virtuous circle is the best tool of our teams tocomplete the targets.
Dynapack surveillance
Well analysis
Production Cycle
2 MAIN TREATING PLANTS
AND ADITIONAL
WATER SEPARATION PLANTS
TO CALETA CORDOVA TERMINAL (SALES)
WATER
WATERFLOOD PROJECTS
INJECTION PLANTS
OIL
WATER
DISPOSALS
PROD. WELLS
SATELLITE STATIONS
FLUID
OIL+WATER+
GAS
INJECTION
WELLS
FIELD GAS SYSTEM
2 MAIN TREATING PLANTS
AND ADITIONAL
WATER SEPARATION PLANTS
TO CALETA CORDOVA TERMINAL (SALES)
WATER
WATERFLOOD PROJECTS
INJECTION PLANTS
OIL
WATER
DISPOSALS
PROD. WELLS
SATELLITE STATIONS
FLUID
OIL+WATER+
GAS
INJECTION
WELLS
FIELD GAS SYSTEM
Flooded sandFlooded sand
Flooded sandFlooded sand
Flooded sandFlooded sand
Tension Packer Tension Packer Injection mandrel with flowInjection mandrel with flow
regulator valveregulator valve
Tension Packer Tension Packer
Ancho r Packer Ancho r Packer
Subsurface injection installation
Injection histories analisys

7/27/2019 Spe 107918
http://slidepdf.com/reader/full/spe-107918 7/7
SPE 107918 7
Acknowledgements
Thanks are due to:
PAE Cerro Dragon Development Reserves Teams becausethis paper reflect their hard daily work.
The PAE facilities and automation team for improving the data
loading and databases operation.
The PAE IT Team for high quality systems and communications.
INTERFACES Management and design Team because
they’ve working along many years to improve and integrateinto customized software for their and our ideas and needs.
References
1. Ezequiel Massaglia, Dario Baldassa, Carlos Ponce,
Bernabé Zalazar. Injector-Well Completion Designs for Selectively Waterflooding up to 18 Zones in aMultilayered Reservoir: Experience in the CerroDragón Field. SPE paper 99997 presented at the 2006SPE/DOE Symposium on Improved Oil Recovery held in Tulsa, Oklahoma, U.S.A., 20–26 April 2006.
2. J.P. Martins, SPE, J.M. MacDonald, C.G. Stewart, SPE,and C.J. Phillips, SPE, BPExploration (Alaska) Inc. TheManagement and Optimization of a Major Wellwork Program at Prudhoe Bay. SPE paper 30649 , 1995.