Embed Size (px)
Citation preview

MAGISTERARBEIT
Titel der Magisterarbeit
“Socially Responsible Investments – a comparative analysis of the
SRI process of Erste Sparinvest”
Verfasserin
Lekha Geevarughese (B.A.)
angestrebter akademischer Grad Magistra der Sozial- und Wirtschaftswissenschaften
(Mag. rer. soc. oec.)
Wien, im August 2010
Studienkennzahl lt. Studienblatt: A 066 915
Studienrichtung lt. Studienblatt: Magisterstudium Betriebswirtschaft
Betreuerin: Univ.-Prof. Dr. Gyöngyi Lóránth

Contents
1. INTRODUCTION 9
1.1 CONTEXT OF THESIS 11
2. SOCIALLY RESPONSIBLE INVESTMENTS 12
2.1 DEFINITION IN GENERAL TERMS 12
2.2 EVOLUTION OF SRI 14
2.3 THE CONCEPT OF SOCIALLY RESPONSIBLE INVESTING 16
2.3.1 SRI Approaches 16
2.4 SRI MARKET 21
2.5 MAIN DRIVERS OF SRI AND TRENDS 23
2.6 PERFORMANCE 28
2.6.1 Five Arguments on SRI 28
2.6.2 Review of the Main Literature Findings 32
3. SRI – A COMPETITIVE ANALYSIS OF ERSTE SPARINVEST 36
3.1 ERSTE SPARINVEST 37
3.1.1 ESPA – An Overview and the SRI Approach 37
3.1.2 ESPA – SRI Investment Process 38
3.2 SARASIN 47
3.2.1 Sarasin – An Overview and the SRI Approach 47
3.2.2 Sarasin - SRI Process 48
3.3 SAM 55
3.3.1 SAM – An Overview and the SRI Approach 55

3.3.2 SAM - SRI Process 56
4. CONCLUSION 65
BIBLIOGRAPHY 69
DIAGRAMS 78
ABBREVIATIONS 80
APPENDIX 81

Abstract
The paper in-hand shows an analysis of the socially responsible investing (SRI)
from three different players on the SRI market.
The first part covers the main literature findings concerning SRI. The different
definitions and the main evolution stages are given as an introduction to the
topic.
Later, the concept of SRI is discussed in detail. There are currently four main
approaches to track sustainable investments: avoidance, positive screening,
engagement and integration.
Furthermore, the current SRI market and the main drivers are given to
highlight the significance of the topic.
On the basis of different academic findings, the performance aspect is
discussed in detail. The paper demonstrates that socially responsible
investments do not have a negative impact on the performance compared to
the conventional investments.
The second part of the paper presents a comparative analysis of the SRI
process on the Erste Sparinvest with Sarasin and Sustainable Asset
Management (SAM). In the first step the different investment processes of SRI
are discussed and later the major differentiations among the players are
pointed out.
Acknowledgements
This thesis would not have been possible without the support from several
people.
In first respect I would like to thank the Erste Asset Management -
Institutional Distribution team, where I have received tremendous
encouragement throughout the thesis and lots of advice on several occasions.
A special thanks goes to Mr. Wolfgang Pinner who supported me in the
systematic approach of my thesis and for giving me an insight into SRI
investment process.
Finally, I would like to thank all the people who joint me with the research and
contributed towards my thesis.

“The future belongs to those able to
provide creative answers to the
challenges ahead.”
(Sarasin)


9/81
1. Introduction
“The social responsibility of a business is to increase it’s profits – the one and
only social responsibility of a business is to use resources and engage in
activities designed to increase profits.”1
“…companies that conduct their operations with an eye on causing the least
amount of harm to the environment and sustainability of our
habitat…companies that minimize negative externalities and accentuate
positive externalities…”2
The view that an institution should solely centre on the generation of profit is
now switched to a view where the companies are expected to be a societal
actor of economic, environmental and social relevance. The responsibility of a
corporation goes beyond the maximization of wealth and so it should further
more consider the environmental, social and governmental (ESG) side of
business.
Especially the recent financial crisis or corporate scandals, rising concerns
regarding sustainability challenges, like global warming or resource and water
scarcity, have enforced the attention of the investors and companies.3
Corporate related issues like poor governance and regulations, misaligned
compensation or lack of transparency are being more addressed now.4
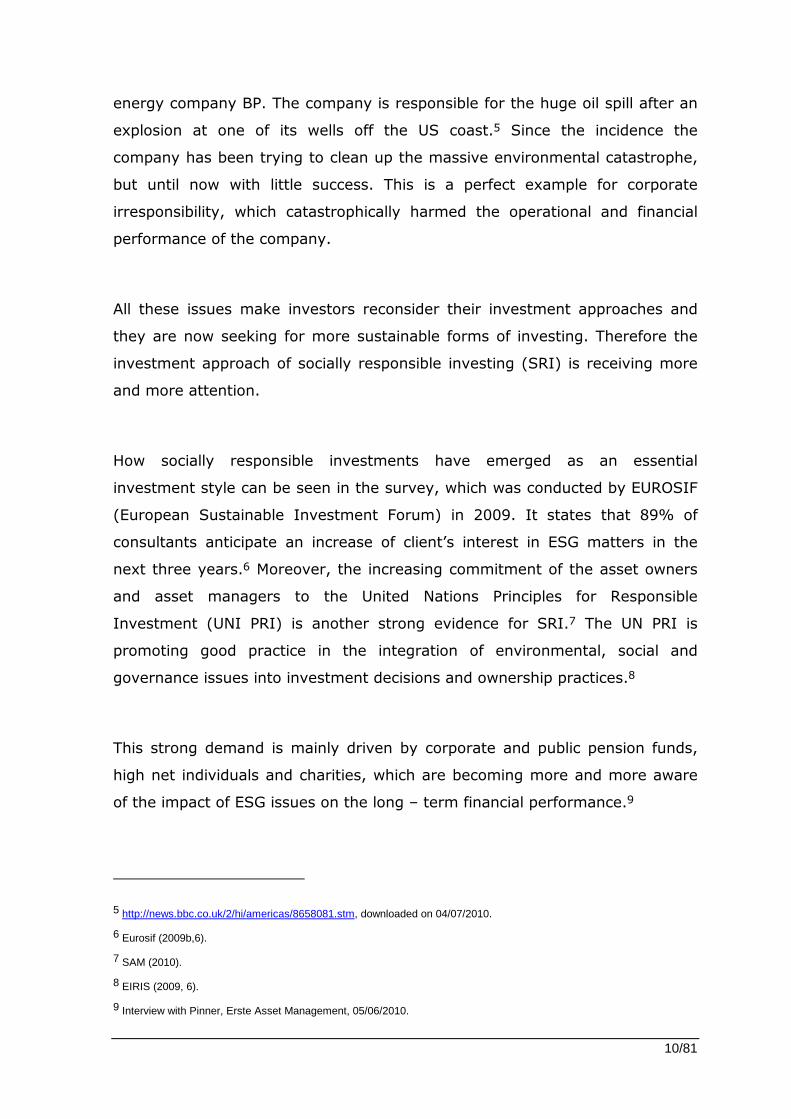
To give a recent example for a corporate scandal which will further emphasize
the significance of corporate responsibility toward environment is the British
1 Friedman (1970, 218).
2 Sethi (2005, 101).
3 SAM (2010, 7).
4 Eurosif (2009).
10/81
energy company BP. The company is responsible for the huge oil spill after an
explosion at one of its wells off the US coast.5 Since the incidence the
company has been trying to clean up the massive environmental catastrophe,
but until now with little success. This is a perfect example for corporate
irresponsibility, which catastrophically harmed the operational and financial
performance of the company.
All these issues make investors reconsider their investment approaches and
they are now seeking for more sustainable forms of investing. Therefore the
investment approach of socially responsible investing (SRI) is receiving more
and more attention.
How socially responsible investments have emerged as an essential
investment style can be seen in the survey, which was conducted by EUROSIF
(European Sustainable Investment Forum) in 2009. It states that 89% of
consultants anticipate an increase of client’s interest in ESG matters in the
next three years.6 Moreover, the increasing commitment of the asset owners
and asset managers to the United Nations Principles for Responsible
Investment (UNI PRI) is another strong evidence for SRI.7 The UN PRI is
promoting good practice in the integration of environmental, social and
governance issues into investment decisions and ownership practices.8
This strong demand is mainly driven by corporate and public pension funds,
high net individuals and charities, which are becoming more and more aware
of the impact of ESG issues on the long – term financial performance.9
5 http://news.bbc.co.uk/2/hi/americas/8658081.stm, downloaded on 04/07/2010.
6 Eurosif (2009b,6).
7 SAM (2010).
8 EIRIS (2009, 6).
9 Interview with Pinner, Erste Asset Management, 05/06/2010.
11/81
All these issues are emphasizing the necessity of socially responsible
investment.
1.1 Context of Thesis
The thesis focuses mainly on the concept of SRI. The first part of the thesis
covers the literature review of SRI. In the second part the different SRI
approaches of three asset manager companies (Erste Sparinvest, Sarasin,
Sustainable Asset Management - SAM) are analysed.
The thesis is structured as follows:
The second chapter covers the theoretical part of the thesis and is dividend
into six sub - chapters.
2.1 gives a general introduction to the different definitions of SRI, followed by
2.2. with the important evolution stages of SRI.
The next subchapter (2.3) focuses on the concept of SRI. In doing so, I will
explain the different investment approaches.
2.4 deals with the current SRI market and in 2.5 the main drivers and trends
of SRI are summarized.
The final part of chapter 2 focuses on the performance aspect. Here the main
literature and academic findings are reviewed.
The second chapter gives the reader the theoretical background information,
before entering the empirical part of the thesis.
The third chapter solely concentrates on the different SRI investment
strategies applied by Erste Sparinvest, Sarasin and SAM. The main differences
among the strategies will be explained and pointed out.
12/81
2. Socially Responsible Investments
2.1 Definition in General Terms
Different definitions are used in the literature for SRI.
Kinder defines SRI in the following way: “Socially responsible investing is the
incorporation of the investor’s social or ethical criteria in the investment
decision making process”.10
The Social Investment Forum describes SRI as: “SRI involves evaluating
companies on CSR (Corporate Social Responsibility) issues, analyzing
corporate social and environmental risks, and engaging corporations to
improve their CSR policies and practises”.11
The most commonly used definition, which I personally see as the most
appropriate one is: “SRI is a generic term covering ethical investments,
responsible investments, sustainable investments, and any other investment
process that combines investor’s financial objectives with their concerns about
environmental, social and governance issues.”12
There are authors who see an apparent difference between responsible
investment and ethical investment. Whereas “ethical investment” excludes
specific companies, responsible investing is seeking out particular companies
to invest in.13
There is usually a confusion regarding SRI and CSR. According to Kinder the
one side of a coin would be SRI and the other one CSR. We can say that SRI is
10 Kinder (2007,4).
11 Statman (2007, 2).
12 Eurosif (2008,6).
13 Pinner (2007, 47).

13/81
the personal responsibility of investors to align their social views with the
investments and CSR is about corporation and the aspiration of its people.14
Assessments for SRI investments are in general based on the CSR ratings of
companies.15
The different definitions for SRI show us the extended diversity of the
investment approach. There is not a general guideline for SRI. Some investors
focus more on the social or on the environmental issues and some want to
enhance corporate governance issues in their investments. Also the
interpretation of ethical or social norms differ from investor to investor
because to some extent this is a subjective view. So, SRI is often criticised for
its lack of uniformed standards.16
Here is a short example which illustrates the problem when a company is
assessed after its social responsibility: McDonalds is a decently run company
with forward looking employment policies and a commitment to reduce
environment unfriendly packaging. In that context the company has a good
sustainable performance. But at the same time McDonalds encourages junk
food with obesity rising in the world, especially in the US.17 This shows us that
the investments are determined by different point of views and therefore it can
not lead to a uniform way of investing. Certainly the conventional investors
have their different views of the market or companies. However, the
differently applied financial measurements for a company’s performance, like
the price earnings, price to book or return to equity ratios, provide a kind of
standardisation or orientation for the conventional investments.
After this general introduction to the topic, I will focus in the next section on
the evolution of SRI.
14 Kinder (2007,16f).
15 Pinner (2008, 4).
16 Kinder (2007).
14/81
2.2 Evolution of SRI
The first milestones toward sustainable development were established in the
forestry business in the 18th century. In order to prevent uncontrolled
deforestation people were told that the amount of trees cut should never
exceed the amount of new trees planted. 18
This idea was further developed by the UN World Commission on Environment
and Development, the so called Brundtland Commission, in 1987. Since then
sustainable development has been defined as: “Sustainable development is a
development that meets the needs of the present generation without
compromising the ability of future generations to meet their own needs.”19
The first steps toward sustainable investment funds were made in the 20th
century and can be traced back to America. In the 1920s various religious
communities excluded “sin stocks” which were involved in areas such as
tobacco, gambling, weapons or alcohol, from their investments. 20
With time the focus expanded on green, ecological and also on shareholder
issues. Shareholder activism appeared at first with Saul Alinsky at Eastman
Kodak in 1966, followed by the first screened portfolio investing in 1971 with
the Pax World Fund.21
Only in the 90s the concept of “socially responsible investing” was introduced.
Until that time responsible investments did only exist in connection with one or
other exclusionary criteria or with regards to ecological criteria, but not on the
17 Kinder (2007).
18 Sarasin ”The future in your portfolio.” (6).
19 Sarasin ”The future in your portfolio.” (6).
20 Sarasin ”The future in your portfolio.”(6).
21 Kinder (2007,8).

15/81
basis of a holistic concept.22 In 1994 the “tipple bottom line” idea that
sustainable investments should include economic, environmental and social
factors into the investment process, was brought up.23 With the new
millennium, responsible investments began to attract the interest of more and
more investors. The evolution of SRI was especially supported by the strong
corporate governance and engagement movement that started in the U.S.24
Since then SRI began to spread from traditional asset classes like equities and
bonds into alternative segments. The concept of SRI as an evolving topic is
still in change.25
In the next section of the thesis I will focus more on the concept of SRI.
22 Pinner (2007, 63).
23 Sarasin ”The future in your portfolio.”
24 Pinner (2007).
25 Pinner (2007, 63).

16/81
Screening: Exclusionary
criteriaScreeing: Positive
criteriaScreeing: Best-in-
classShareholder activism &
engagement IntegrationNumber of stocks in
universe Rather low Rather low Rather high High High
Deviation/ Tracking error versus total market High High Rather low Low Low
Typical name of productIn general "ethical fund" Thematic fund
In general "Sustainability fund"
Conventional fund name with reference to engagement
Conventional fund name with reference to integration
Characteristics of productHigh degree of responsibility
Positive thinking and a clear goal in focus
Alternative to conventional fund product
Low to marginal degree of responsibility
Low to marginal defree of responsibility
2.3 The Concept of Socially Responsible Investing
Investors are using different kinds of sustainable investment approaches to
differentiate sustainable companies from the conventional ones. The following
section will give an overview of the approaches.
2.3.1 SRI Approaches
Hutton defines types of SRI as shareholder activism, community development
investing and guideline portfolio investing.26 Similar to Hutton, UKSIF
(Sustainable Investment and Finance Association) distinguishes between the
following three main approaches:
- negative and positive screening
- shareholder activism and engagement
- integration. 27
The following table gives you an overview of the different SRI approaches,
which can be used individually or in combination:
Table 1: SRI Investment Approaches
Source: Pinner (2008, 3).
26 Hutton (1998).
27 Pinner (2007, 49f).
17/81
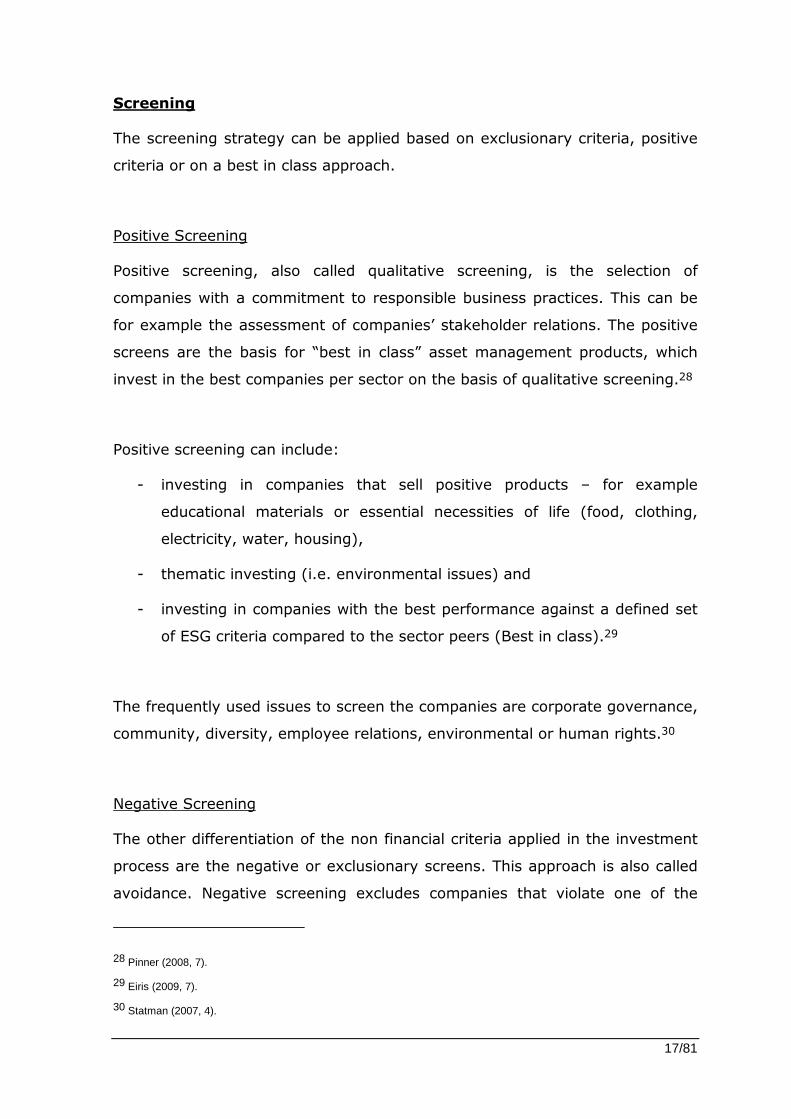
Screening
The screening strategy can be applied based on exclusionary criteria, positive
criteria or on a best in class approach.
Positive Screening
Positive screening, also called qualitative screening, is the selection of
companies with a commitment to responsible business practices. This can be
for example the assessment of companies’ stakeholder relations. The positive
screens are the basis for “best in class” asset management products, which
invest in the best companies per sector on the basis of qualitative screening.28
Positive screening can include:
- investing in companies that sell positive products – for example
educational materials or essential necessities of life (food, clothing,
electricity, water, housing),
- thematic investing (i.e. environmental issues) and
- investing in companies with the best performance against a defined set
of ESG criteria compared to the sector peers (Best in class).29
The frequently used issues to screen the companies are corporate governance,
community, diversity, employee relations, environmental or human rights.30
Negative Screening
The other differentiation of the non financial criteria applied in the investment
process are the negative or exclusionary screens. This approach is also called
avoidance. Negative screening excludes companies that violate one of the
28 Pinner (2008, 7).
29 Eiris (2009, 7).
30 Statman (2007, 4).

18/81
negative criteria or do not meet the ESG criteria.31 Companies from tobacco
industries are the most excluded investments, followed by companies
associated with alcohol, gambling and weapons.32
Best in class
In the best in class approach the investor selects the best company per sector
according to a SRI ranking. Usually SRI agencies set up questionnaires for
particular sectors and discuss them with the respective companies. Issues like
stakeholder relations, sector, product or service impacts are discussed.33
An example for a global rating agency, which provides best in class data to
investors, is Innovest. Innovest evaluates the company with regard to more
than 120 performance factors, including innovation capacity, product liability,
governance, human capital, emerging market , and environmental
opportunities and risk. The overall performance of the company is
communicated via a simple rating signal of AAA to CCC. The Dow Jones
Sustainability Index is one of the best known indices based on the best in class
methodology. The index tracks the financial performance of the leading
sustainability driven companies worldwide, excluding companies involved with
tobacco, alcohol, armament, firearms or gaming.34
Engagement
Engagement is a long term process of dialogues with companies to influence
company behaviour in relation to their social, ethical and environmental
practices.35 Investors are contributing an active part to a better sustainable
performance. Mostly it takes the form of dialogues with companies or voting at
31 Pinner (2008).
32 Eirsi (2009).
33 Pinner (2007, 51).
34 Pinner (2007, 51).
35 Eurosif (2008, 54).

19/81
Annual General Meetings. Within the engagement approach, fund managers
are mainly focusing on corporate governance issues around the management
of the company (i.e. director’s remuneration, separation of chair and chief
executive functions, non-executive directors and audit committees). For
example Black Rock states that they are focusing on raising standards in
corporate governance and protecting the economic interests of clients. The
company is engaging in a dialogue with executive management, non –
executive directors and company advisers. 36
The following table shows the different engagement strategies that are mostly
used by the European SRI fund managers.
Figure 1: Engagement % of European SRI Fund Managers Practicing
Source: Eurosif (2008, 13)
Integration
The integration approach incorporates potentially material ESG risks and
opportunities into normal investment analysis, stock weighting and/or stock
selection processes. The launch of the UNPRI in 2006 played a major role for
the increasing integration of the ESG.37
36 Eiris (2009).
37 Eiris (2009, 23).

20/81
The different SRI approaches are segmented into two sub groups by Eurosif: a
core and broad SRI market. The core strategy includes the ethical exclusions,
positive screening, including Best in class and SRI theme funds and the
combination of both. The broad strategy composes simple screening, including
norms based screening (up to two negative criteria), engagement and
integration.38
The following part will focus more in detail on the strong divergence of the
strategies regarding market volume.
38 Eurosif (2008).
21/81
2.4 SRI Market
The total assets under management invested in SRI have reached €6.8 trillion
as of December 2008. Especially the European market had a significant growth
over the last years. Compared to the U.S. SRI market, the European market
had a relative late development. The invested volume in SRI represented
17.5% of the asset management industry in Europe as of 2007 and this
reflected a growth of 102% in two years. 39
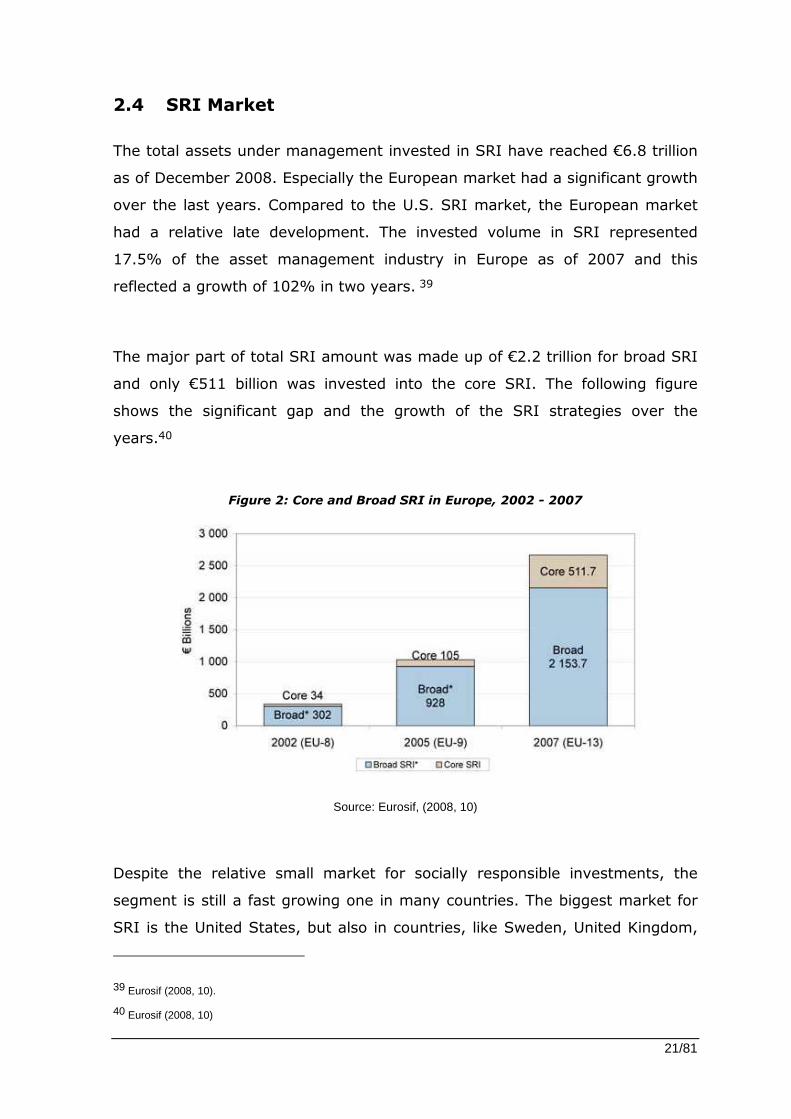
The major part of total SRI amount was made up of €2.2 trillion for broad SRI
and only €511 billion was invested into the core SRI. The following figure
shows the significant gap and the growth of the SRI strategies over the
years.40
Figure 2: Core and Broad SRI in Europe, 2002 - 2007
Source: Eurosif, (2008, 10)
Despite the relative small market for socially responsible investments, the
segment is still a fast growing one in many countries. The biggest market for
SRI is the United States, but also in countries, like Sweden, United Kingdom,
39 Eurosif (2008, 10).
40 Eurosif (2008, 10)

22/81
the Netherlands and Switzerland SRI has risen significantly over the last
decades.41
Within the European countries sustainable investing differs considerably in
size, growth and market share. The following figure compares the SRI
investment volume for each European country as of December 2007. The
United Kingdom holds the largest market share in the overall SRI market,
while the Netherlands has the largest share in the core SRI market. Compared
to the Scandinavian market, countries like Germany, Austria and Switzerland
have a relatively small share on the SRI market. One of the main reasons for
this strong variation in the investment volume within the European countries is
the different investment philosophy of the institutional investors. 42
Figure 3: SRI in Europe (EUR - bn,December 2007)
Source: Eurosif (2008a)43
The following sub - chapter will cover the main driving forces of SRI.
41 Schroeders (2003, 2).
42Deutsche Bank (2010).
43 Figure is only available in German.

23/81
2.5 Main Drivers of SRI and Trends
Investors have different motives to invest in ethical funds. Especially social
norms seem to have a significant pressure on the investors, particularly for
institutional investors.
Harrison Hong (2007) published a paper where he tested whether sin stocks,
like tobacco, alcohol and gambling, are less favoured by institutions due to
social norm pressure. His number of findings support his hypothesis that sin
stocks have less institutional ownership and less analyst coverage than the
conventional stocks. In contrast to that the mutual funds and hedge funds are
more willing to hold sin stocks compared to other stocks. In conclusion it can
be said that the social norms have an important influence on the behaviour of
investors and on markets.44
As Hong (2007) has demonstrated in his paper, social norms, but also the
environmental and governance issues have an enormous impact on the asset
management industry in the last years. Schwartz (2003) points out that
factors like investor concerns regarding environmental issues or product
safety, growth of business ethics and CSR movement have contributed to the
growth of SRI.45 Beal et al. (2005) sees three motivations for ethical
investments. The possibility to achieve superior financial returns, to gain non
– wealth returns and finally to contribute to social changes.46
Solomon et al (2002) differentiates two main sources of drivers. The first are
internal drivers, like fund managers, clients and institutional investors and the
other drivers are external, like lobby groups, government or society’s
interest.47 Another study by Worthington et al. (2007) identifies legislative and
44 Hong (2007).
45 Schwartz (2003).
46 Beal et al. (2005).
47 Solomon (2002).

24/81
policy development, economic imperatives, stakeholder pressures and ethical
influences as forces for engaging in socially responsible activities.48 According
to Williams (2005), SRI may be driven more by investors attitudes to the
social aims of firms rather than by financial returns. He has conducted a large
survey of investors across five countries to reveal the determinates of social
responsible investment decision.49
Other important SRI drivers, which were also recognized by several authors,
are engagement and activism. Dillenburg et al. (2003) shows that the SRI is
turning to a comprehensive paradigm that seeks to affect corporate
behaviour.50 Graves et al. (2001) strengthens the assertion by highlighting the
fact that shareholder resolutions on social and environmental issues have
become commonplace in US over the last 30 years.51 Furthermore a study by
the US Social Investment Forum resulted that SRI funds are stronger
proponents of corporate governance that conventional funds. SRI funds are
more likely to support social or governance issues or to withhold votes from
directors. This finding can be underpinned by Rivoli (2003) who reports that
since the mid 1990s there have been two hundred and fifty to three hundred
shareholder resolutions per year from religious groups, SRI funds and pension
funds. Between 1997 and 2000, 27% of the resolutions were withdrawn due to
satisfactory agreement with the management.52
Also Sparkes (2001) highlights the connection between SRI and engagement
with the following statement “SRI is generally considered to be an equity-
based activity, as one of its core aims is to use the power and influence of
shareholders to positively affect corporate behaviour.”53 Sparkes and Cowton
48 Worthington et al. (2007).
49 Williams (2005).
50 Dillenburg (2003).
51 Graves et al. (2001).
52 Rivoli (2003).
53 Sparkes (2001, p.195),

25/81
(2004) demonstrates that the shift in SRI from margin to mainstream is a
major step in maturing of SRI. It offers the prospect of putting important
pressure on the companies to address CSR issues. The corporate executives
can no more ignore the SRI issues since those are mainly embraced by
institutional investors, which is the most important ownership group.54
As mentioned before, one of the main internal drivers are the institutional
investors, represented by 94% of the total EU SRI market as of December
2007. Those investors were mainly from Netherlands and the UK, but also
Scandinavia, France and Spain were playing an important role for the
development of the SRI market.55 The strong demand has been mostly
intensified by the enforcement of the sustainable investment philosophy in the
pension funds. One of the pioneers in this area was Great Britain, where in
2000 a reporting commitment about the sustainable investments of the
pension funds was implemented. Due to the increased transparency, more
pension funds were being motivated to consider the ESG criteria into the
investment process.56
The other increasing force for the huge demand is driven by the high net
wealth individuals (HNWI) in the European market. This growth can be
translated into further institutional interest as the HNWI market normally acts
as an early signal of investing appetite for the more mainstream institutions.57
Main triggers are also coming from the regulatory requirements and from the
external pressure by Non-Governmental Organizations (NGO) and media. More
and more countries have specific national SRI regulations that cover their
pension systems: the UK, France, Germany, Sweden, Belgium, Norway,
54 Sparkes & Cowton (2004).
55 Eurosif (2008, 18).
56 Deutsche Bank (2008).
57 Eurosif (2008, 18).
26/81
Austria and Italy.58 However, there are no generally mandatory transparency
laws at the EU level and so the investors do not have to disclose the ESG
issues of their investments. Many institutions, like Eurosif, are trying to
introduce a law for more transparency.59 Also with the successful introduction
of the UNPRI, sustainable investment is getting increasingly significant among
the investors. This can be seen in the increasing number of the members who
are committing themselves to the principles.60 In the meantime, a total
volume of $20.000 trillion are invested under the UNPRI.61
On the retail market UKSIF defines following major issues which influenced the
SRI market:
- change in society’s values,
- major economic trends,
- an increased awareness of SRI,
- disclosure & recognitions of the business case for CSR and
- the increased interest of fund managers in SRI.62
The following table summarizes the main key drivers for SRI demand in the
next 3 years.
58 Eurosif (2008, 18).
59 Eurosif (2008).
60 Eurosif (2008, 18).
61 SAM (2010, 8).
62 Pinner (2007, 67f).

27/81
Figure 4: Key drivers for SRI Demand in the next 3 years
Source: Eurosif, (2008, 10)
In the next sup - chapter I will give an overview of the main literature and
academic findings on the performance aspect of socially responsible
investments.

28/81
2.6 Performance
2.6.1 Five Arguments on SRI
One of the major discussion point of socially responsible investment is its
performance aspect. The question if sustainable funds perform better or worse
than traditional benchmarks is being discussed in many papers and studies.
The idea that sustainable investing can actually “kill two birds with one stone”,
i.e. to do good while generating an attractive return, is for many investors an
illusion. They believe that sustainability in the companies compromise their
financial performance.63
In principal there are five technical arguments for and against SRI. Sparkes
(1995) defines them as:
- diversification effect,
- small company effect,
- anticipation effect,
- information effect and
- positive selection effect”.64
The diversification effect is based on the capital market theory. The theory
states that a portfolio constructed from a much widely held investment
universe is more efficient than any other portfolio. Since the sustainability filter
restricts the investment universe, the diversification opportunity of a portfolio
is limited. Consequently, the optimal risk/return relationship of a sustainable
portfolio is undermined.65 Therefore the markets, which represent all the
63 Sarasin (2008).
64 Sparkes (1995).
65 Sarasin (2008).
29/81
investable companies, will outperform all subsets of portfolios if markets are
efficient.66 However, Cobb et al (2005) concludes in his paper that investors
are unlikely to be worse off by restricting their investment universe, and may
well be better off as there is no significant evidence that the (SRI) indices
underperform.67 Havemann & Webster (1999) see also effects of reduced
diversification, but also a higher tracking error. Sectors like service, tobacco,
pharmaceuticals, engineering and banks seem to have an overweight in an
ethical universe.68 A further support against the reduced diversification effect
is given by Barnett and Salomon (2005). The study is based on the hypothesis
that “the financial loss borne by an SRI fund due to poor diversification is
offset as social screening intensifies because better managed and more stable
firms are selected into its portfolio.” An empirical test on 61 SRI funds from
1972 – 2000 was conducted and it reveals that as the number of social
screens used by the funds increases, financial returns decline first, but then
rebound as the number of screens reaches a maximum.69 The general counter
argument by SRI investors against the diversification effect is that a limited
investment universe is not relevant in practice, since many sustainable
investment universes comprise around 700 international shares and this is big
enough to assemble a well diversified fund. Moreover, a conventional manager
is also working with a limited universe of investable stocks. 70
The small – cap effect argues that SRI investments are more skewed toward
companies with smaller market capitalization.71 Consequently the stronger
small cap exposure has detrimental effects on liquidity and therefore also
66 Pinner (2008,8).
67 Cobb et al (2005).
68 Havemann & Webster (1999).
69 Barnett and Salomon (2005,1).
70 Pinner (2007,56).
71 Gregory (1997).

30/81
harms trading opportunities.72 However, on the long term small caps will
outperform on a risk adjusted basis.73
The anticipation effect describes argument that investors tend to anticipate
future legal actions and financial problems by using qualitative screens.74
These qualitative screens enable the selection of companies which for example
adjust to future environmental trends. The opponents of SRI arguing that
companies considering environmental improvement or social benefits above
the legal requirements can have a competitive disadvantage due to the
additional costs. Consequently, the value of the company is impacted
negatively and will underperform compared to the market. However, all the
impacts of companies regarding environmental, social or government issues
are potential risks over the long run and also opportunities that could at some
point become financially relevant as well. The following example will
demonstrate this75:
One of the key issues in our current society is the climate change and to
reduce the energy consumption. Companies with energy intensive products,
such as carmakers, are increasingly facing risks in the form of tougher
environmental regulations. The decision by the EU to impose limits to reduce
the greenhouse gas emissions of vehicles has increased the financial relevance
of the sustainability aspect. Technological changes and reposition of the model
ranges to cut fuel consumption and CO2 emissions are now demanded from
the carmakers. This leads to additional costs. Companies that have already
switched to energy efficient vehicles or new appropriate technologies have a
competitive advantage with new business opportunities. Here we can see the
transformation of environmental and social risks into financial risks and that
new opportunities can be achieved by an early consideration of the
72 Pinner (2007).
73 Fama & French (1992).
74 Pinner (2007, 8).
75 Sarasin (2008, 10).
31/81
environmental issues.76 Investors who have anticipated the sustainable
performance of such companies will be rewarded on the long term. This is also
approved by the study of Klassen & McLaughlin (1996) which discovered that
companies investing in areas such as new products and processes are
rewarded by the market.77 A further finding by Gunthorpe (1997) shows that
firms which conduct unethical business practices are penalised by the
market.78
The information effect of the SRI investments is due to integration of the ESG
factors. The incorporation of these additional information of the companies,
which is not widely known by the market, gives more chance for an
outperformance of the SRI funds.79
The positive selection effect says that the positive criteria applied leads to
investments in well run companies.80 Sustainable managers are able to
generate new stock ideas since most of them are not working with a pre-
defined share universe. In this way new companies that usually do not appear
on the radar screen of financial analysts are considered and consequently the
universe can be expanded. This investment process leads to companies with
good environmental and social performance.81 One of the studies on the
positive selection effect was conducted by McWilliams (2000). He proves high
positive correlation between R&D investment and CSR, because both are
associated with product and process innovation. R&D investment is an
important determinant of firm development and improving long-run economic
performance.82
76 Sarasin (2008, 10).
77 Klassen & McLaughlin (1996).
78 Gunthorpe (1997).
79 Pinner (2008.8).
80 Pinner (2009, 8).
81 Sarasin (2008,6).
82 McWilliams (2000).

32/81
2.6.2 Review of the Main Literature Findings
There are numerous studies on the performance aspect of the SRI.
Webley & More (2003) assessed companies with published code of ethics
regarding their market value added (MVA), economic value added (EVA), price
earnings ratio (PE) and return on capital employed (ROCE). The results
suggests that companies with a code of ethics have a better MVA and EVA
rating from 1997 to 2000. ROCE figures for companies without code were
higher in the same period, but the situation changed in 2001. The P/E ratio
was more stable for companies with codes. The findings ensure the indication
that companies with an ethical code are associated with higher and more
stable returns.83
Morgenson (2003) strengthens Webley’s findings and shows that companies
with the highest measures of good governance outperformed their peers
across a number of performance measures.84 Also Picou and Rubach (2006)
approved that companies, which announced the enactment of corporate
governance guidelines had a positively affected stock performance.85
Orlitzky et al (2003) conducted a metastudy, which inquired the relationship
between corporate social/environmental performance (CSP) and corporate
financial performance (CFP) on the basis of a meta analysis. The findings
reveal that corporate and environmental responsibility are profitable for the
companies. CSP seems to be positively correlated with CFP.86
A further study by Schroeder (2007) analyzed 29 sustainability indices with
conventional benchmarks. The findings show that there is no difference in the
performance of sustainability indices and the benchmark. The hypothesis that
83 Webley & More (2003).
84 Morgenson (2003).
85 Picou and Rubach (2006).
86 Orlitzky (2003).

33/81
SRI funds have a worse performance than those of conventional assets can be
rejected.87
Alexander Kempf and Peer Osthoff (2006) examined the influence of different
sustainable criteria on the performance of synthetically constructed portfolios.
Therefore, a high-rated (low rated) portfolio consisting of stocks with high
(lower) sustainable ratings was formed. The findings show that the
performance of the socially responsible portfolios is never significantly
negative. This means that the hypothesis that socially responsible investors do
suffer a performance loss can be once again rejected. In contrast, the low
rated portfolio with the screens like community, diversity or employee
relations had a significant performance loss. This can be explained as a failure
of the market in pricing companies with low social responsibility correctly.88
The finding of Kempf and Osthoff was also supported by Derwall’s (2005)
study in 2005. He compared a portfolio of companies with the best CSR rating
with a portfolio of companies with the worst CSR ratings. The analysis
demonstrates that sustainable shares had a higher return compared to the
shares with negative sustainability ratings.89
Another study of Tsoutsoura (2004) addressed the effect of corporate social
performance on the financial performance. The results reveal a positive
significant relationship between the CRS and financial performance.90 The
positive relationship can also be caused by the fact that companies with a
strong financial performance are able to invest more in social issues, like
employee relations or other services for the community. A company with
financial problems is most likely to stick to projects with a short horizon.91
87 Schroeder (2007).
88 Kempf and Osthoff (2006).
89 Derwall (2005).
90 Tsoutsoura (2004).
91 Tsoutsoura (2004).
34/81
Another reason according to Waddock and Graves (1997) is that companies
with a good social performance have an enhanced brand image and attract
therefore employees, customers and business partners.92 All these positive
factors can be transformed to a better financial performance.
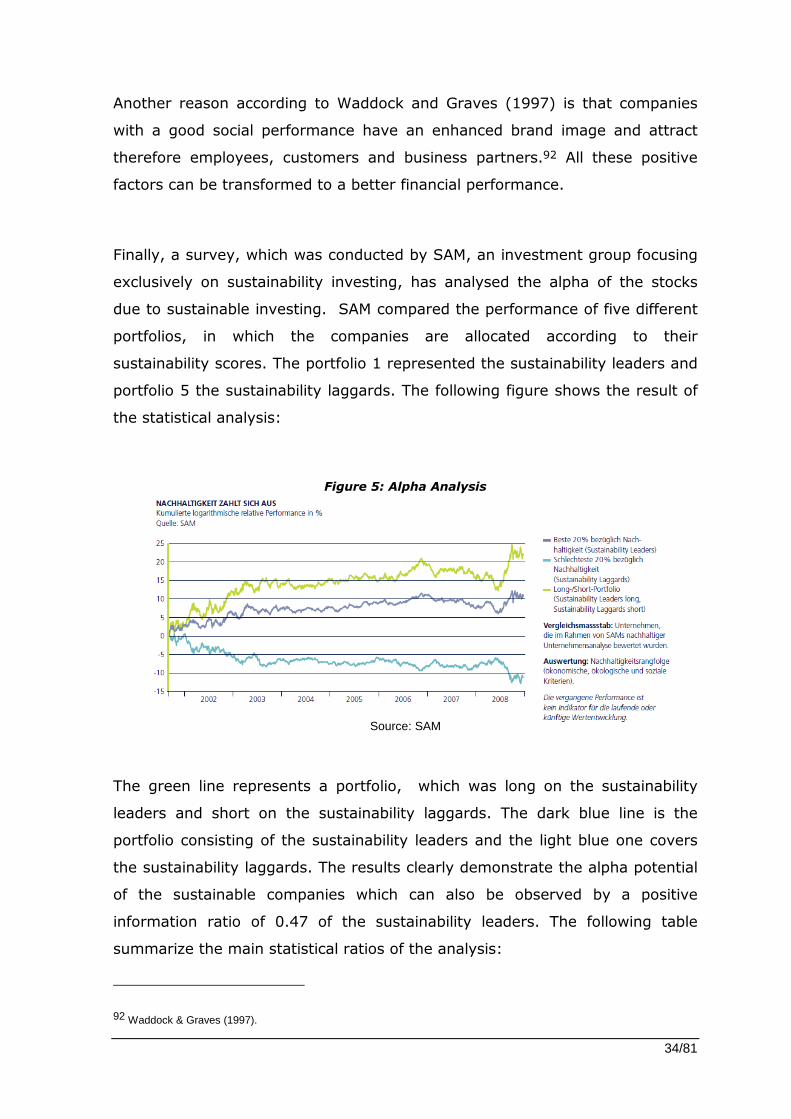
Finally, a survey, which was conducted by SAM, an investment group focusing
exclusively on sustainability investing, has analysed the alpha of the stocks
due to sustainable investing. SAM compared the performance of five different
portfolios, in which the companies are allocated according to their
sustainability scores. The portfolio 1 represented the sustainability leaders and
portfolio 5 the sustainability laggards. The following figure shows the result of
the statistical analysis:
Figure 5: Alpha Analysis
Source: SAM
The green line represents a portfolio, which was long on the sustainability
leaders and short on the sustainability laggards. The dark blue line is the
portfolio consisting of the sustainability leaders and the light blue one covers
the sustainability laggards. The results clearly demonstrate the alpha potential
of the sustainable companies which can also be observed by a positive
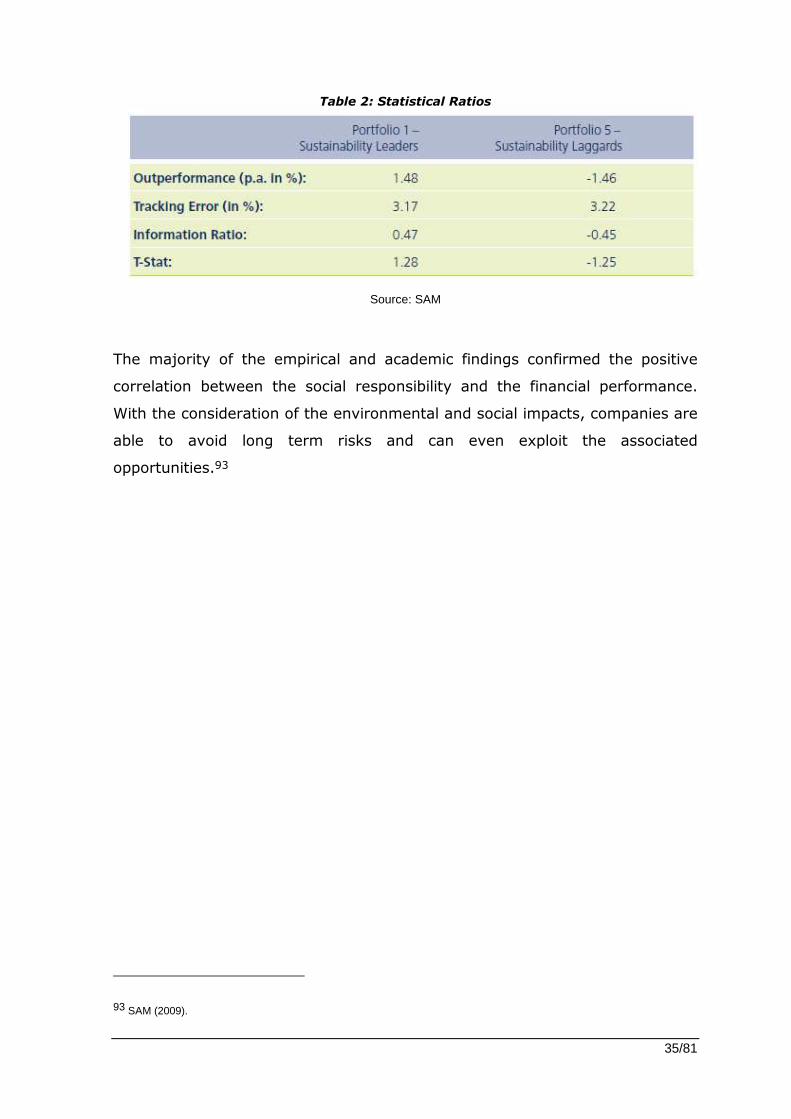
information ratio of 0.47 of the sustainability leaders. The following table
summarize the main statistical ratios of the analysis:
92 Waddock & Graves (1997).
35/81
Table 2: Statistical Ratios
Source: SAM
The majority of the empirical and academic findings confirmed the positive
correlation between the social responsibility and the financial performance.
With the consideration of the environmental and social impacts, companies are
able to avoid long term risks and can even exploit the associated
opportunities.93
93 SAM (2009).
36/81
3. SRI – A Competitive Analysis of Erste Sparinvest
This chapter presents a comparative analysis of the SRI process on the Erste
Sparinvest (ESPA) with Sarasin and SAM. In the first step the different
investment processes of SRI are discussed and afterwards the major
differentiations among the players are pointed out.

37/81
3.1 Erste Sparinvest
3.1.1 ESPA – An Overview and the SRI Approach94
Erste Sparinvest is one of the leading asset managers in the Austrian and the
CEE market. Since 2001 Erste Sparinvest is represented on the SRI market
with the ESPA VINIS funds. The VINIS funds are based on the SRI/ESG
methodology and offer an integrative approach, which is comprised of four
sustainability styles.
The team applies avoidance, positive screening, best in class and engagement.
The following figure demonstrates the integrative SRI approach.
Figure 6: An Integrative SRI Approach
Source: Erste Sparinvest
94 Social Responsible Investments (2010, 14ff).

38/81
Avoidance includes exclusionary and negative criteria.95 Companies that are
engaging with nuclear power, green gene technology, child labour, business
malpractice, pornography, military devices/weapons, tobacco, (avoidable)
animal testing, death penalty and violation of ILO protocol are excluded
immediately from the universe. However, when the negative criteria apply, the
companies achieve a downgrade in the universe.
The remaining companies are screened on positive criteria based on the three
dimensions, which are environment, stakeholders and corporate governance/
ethics. The following ones are used for the assessment: work place conditions,
corporate governance, energy and water consumption, use of renewable
energies, avoidance of environmental pollution, medical care and healthcare,
eco-efficiency, leadership in environmental technology and water treatment.
The best in class determines the best companies in each sector. The
companies are assessed on the positive criteria and rated relatively to their
peers.
The final part of the SRI approach is engagement, which is described during
the investment process.
3.1.2 ESPA – SRI Investment Process
The investment process of the VINIS funds can be divided into four layers. The
first two layers incorporate the SRI issues and the remaining layers represent
the classic portfolio creation process. The focus will be on the first two layers.
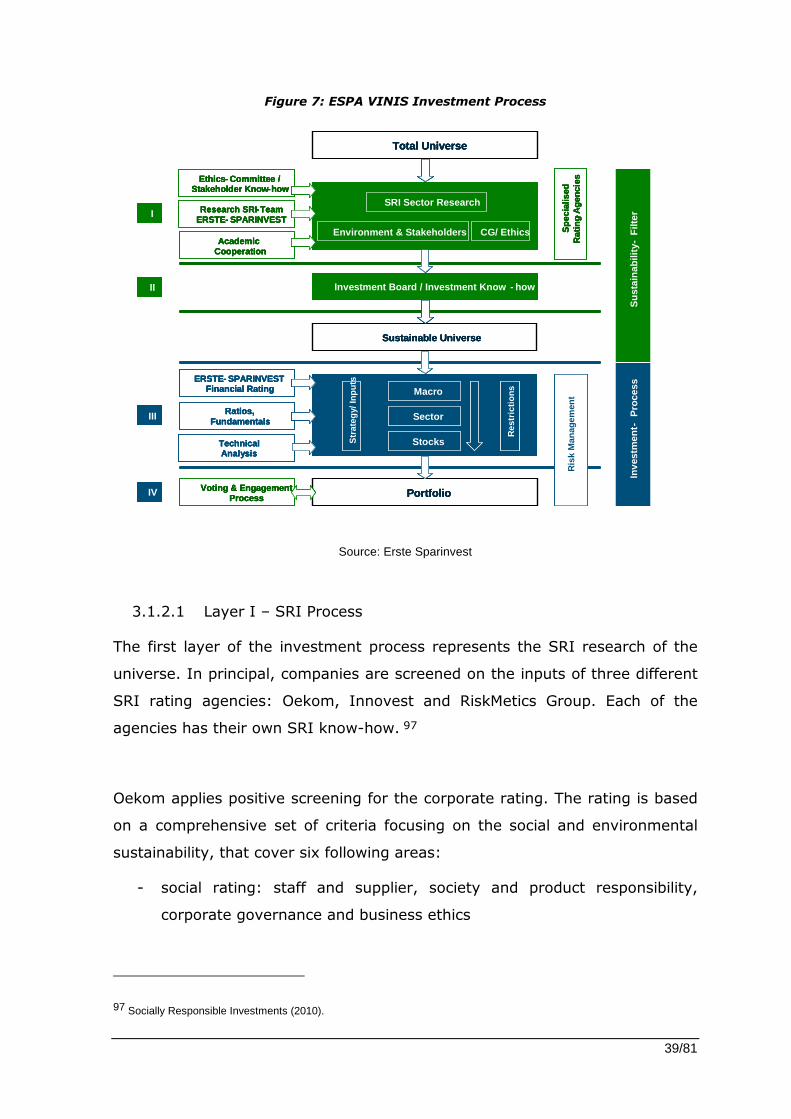
Figure 7 illustrates the investment process.96
95 Differentiation between negative and exclusionary criteria only in the case of ESPA.
96 Socially Responsible Investments (2010).
39/81
Total Universe
Sustainable Universe
Portfolio
Ratios, Fundamentals
TechnicalAnalysis
Ethics- Committee / Stakeholder Know-how
SRI Sector Research
Environment & Stakeholders CG/ Ethics
Investment Board / Investment Know - how
Academic Cooperation
Sus
tain
abili
ty-
Filt
er
ERSTE- SPARINVESTFinancial Rating
Voting & Engagement Process
Research SRI-Team ERSTE- SPARINVEST
Spe
cial
ised
Rat
ing-
Age
ncie
s
HOLD
Ris
kM
anag
emen
t
Inve
stm
ent -
Pro
cess
I
II
III
IV
Res
tric
tions
Str
ateg
y/ In
puts
Sector
Macro
Stocks
Figure 7: ESPA VINIS Investment Process
Source: Erste Sparinvest
3.1.2.1 Layer I – SRI Process
The first layer of the investment process represents the SRI research of the
universe. In principal, companies are screened on the inputs of three different
SRI rating agencies: Oekom, Innovest and RiskMetics Group. Each of the
agencies has their own SRI know-how. 97
Oekom applies positive screening for the corporate rating. The rating is based
on a comprehensive set of criteria focusing on the social and environmental
sustainability, that cover six following areas:
- social rating: staff and supplier, society and product responsibility,
corporate governance and business ethics
97 Socially Responsible Investments (2010).

40/81
- environmental rating: environmental management, products and
services, eco efficiency. 98
The criteria are defined by a pool of approximately 500 indicators and for each
company an average of 100 indicators are selected on an industry – specific
basis in order to analyse the company. A practical example of a corporate
rating can be seen in figure 8.99
98 Oekom: http://www.oekom-research.de/index_en.php?content=investment-services , downloaded on 05/07/2010.
99 Oekom: http://www.oekom-research.de/index_en.php?content=investment-services , downloaded on 05/07/2010.

41/81
Figure 8: Example Microsoft (1)
Source: Oekom Corporate Rating Microsoft
Oekom assessed Microsoft based on a set of positive criteria with an overall
sustainability rating of C. For example, one of the assessment criteria for social
rating was “Management/ Staff”. An indicator for that criterion is an
examination of the corporate policy regarding staff relations coverage and
labour standards (e.g. health and safety, non – discrimination, etc). The
weighting is set by 33% and the company achieved for that indicator a rating

42/81
of A. The sum of the scores of the indicators determines the total rating of the
criterion management/ staff, which again impacts the overall social rating.100
Moreover, Oekom has a rating scale from A+ to F. However, the ESPA team
considers only the companies rated from A+ to C from the Oekom universe.101
We can also see that the social rating is weighted by 70% in contrast to the
environmental one which is by 30%. This indicates that social factors have
much more impact on the industry Internet & Software than the environmental
factors.
The fundamental differentiation of Oekom’s SRI approach compared to the
other two agencies is that Oekom applies an in-depth analysis based on a
scientifically developed list of criteria. In this way a company is holistically
analysed, irrespective to its peers.102
The assessed universe of Oekom represents the starting point of the VINIS
SRI Investment process. For the following part the universe is referred as
“VINIS SRI Universe”.103
The second step of the investment process is the incorporation of the industry
key issues of the “Intangible Value Assessment” (IVA) provided by Innovest.
Innovest’s research is focused on those factors which contribute most heavily
to the financial out – performance.104 Innovest, which has been acquired by
100 Oekom Corporate Rating “Microsoft”.
101 Interview with Osojnik (2010).
102 Interview with Osojnik (2010).
103 Interview with Osojnik (2010).
104 Innovest http://i-ratings.innovestgroup.com/index.php?option=com_isva&func=iva&action=home&Itemid=40), downloaded on 09/07/2010.
43/81
MSCI Barra, is specialized in SRI sector research and identification of risks
from non-responsible activities.105
The industry key issues are identified in the in – depth industry analysis. The
industries are assessed on competitive dynamics with particular emphasis on
the special risks and opportunities created by environmental and social factors.
Thereby Innovest considers ESG criteria as leading indicators for the
analysis.106
Finally, the ESPA team makes any necessary adjustments on the weightings to
the respective criteria as a result of assessment of the industry key issues. The
following example will demonstrate this procedure.107
Example: Microsoft (2) 108
Innovest identified the key issue “human resources” for the industry “Software
& IT Services”. The impact on human resource programs is enormous since
the sector has mainly young and specialized employees. Leading companies in
this sector that take human capital programs, such as recruitment, retention
and motivation seriously should have a higher score in this area since they are
more likely to outperform their sector peers.
The ESPA team considers the key issue “human resource” into the Microsoft
Company rating which was originally provided by Oekom. The criterion for
human resource is adjusted according to the result of Innovest and
consequently the overall rating of Microsoft in the VINIS SRI universe will
change.
105 Interview with Osojnik (2010).
106 Risk Metrics Group (2009, 4).
107 Interview with Osojnik (2010).
108 Oekom Corporate Rating “Microsoft”.

44/81
In addition to the industry analysis, Innovest provides best in class companies,
that fulfil the key issues of the respective industries. These selected companies
are achieving additional points in the VINIS SRI universe.109
The final step is the incorporation of the inputs provided by RiskMetrics (in
table 3 referred as ISS Index/Sector). This rating agency is specialised solely
on corporate governance issues. The corporate governance rating of the
companies is considered in the VINIS SRI universe and this procedure changes
the overall rating of the respective companies.110
Now the VINIS SRI universe embodies an intersection of the universe of
Oekom, Innovest and RiskMetrics. The last step is now to apply the negative
screening on the VINIS SRI universe.
The selective approach by the ESPA team qualitatively and quantitatively
reduces the Oekom universe of 1000 equities to a VINIS SRI universe of 500
equities.111
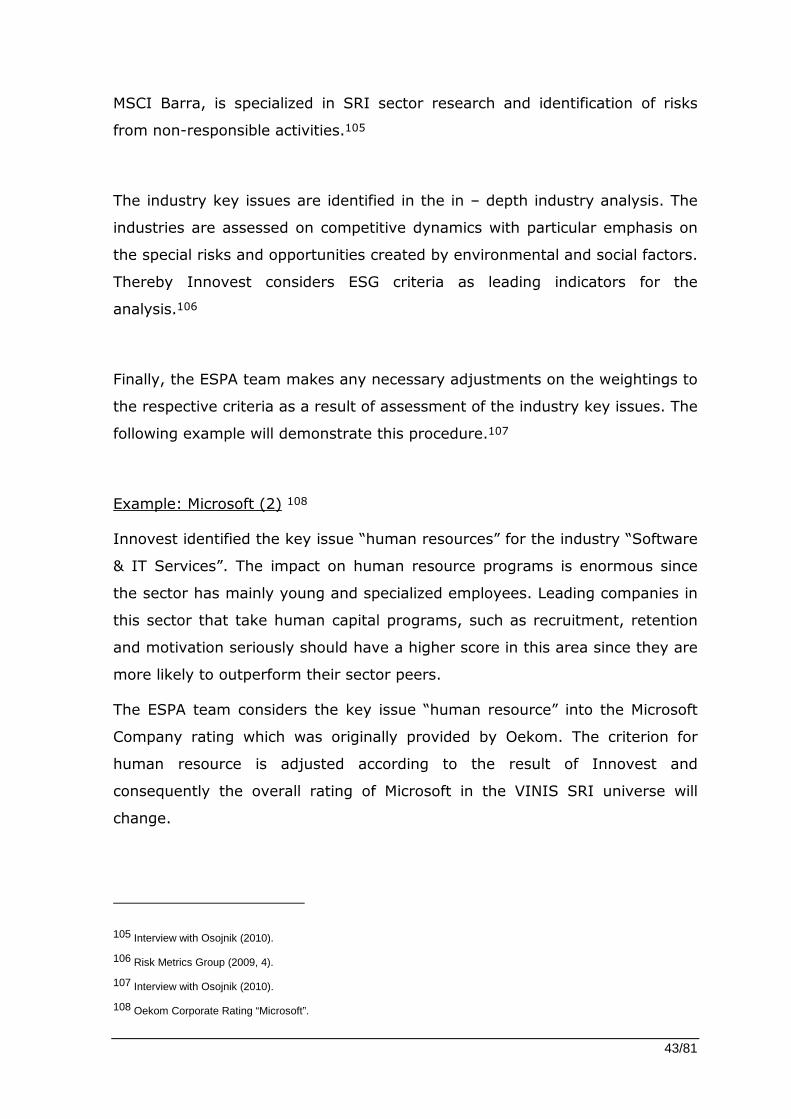
The following table shows the Microsoft Corporate Rating with all the
adjustments made by the ESPA team. Here we can see that the original
corporate rating of Microsoft was a C and with all the adjustments the
company receives a rating of B-. However, the company is excluded from the
VINIS SRI universe due to the violation of labour rights.
109 Interview with Osojnik (2010).
110 Interview with Osojnik (2010).
45/81
Table 3 : VINIS Universe – Microsoft Corporate Rating
Source: Erste Sparinvest
Due to this primary external research by the three rating agencies the team is
able to integrate positive criteria, best in class approach and negative criteria
into their VINIS SRI approach.
In addition to the primary research, the team also includes an ethics
committee, which is mainly responsible for the criteriology and for the ongoing
consultation and discussion with stakeholders and NGOs.112
With this multiple sourcing by the rating agencies, ethics committee and in –
house team, a holistic and objective SRI approach can be ensured. 113
3.1.2.2 Layer II – Investment Board114
The second layer of the investment process represents the investment board.
The investment board meets on a regular basis and verifies the result of the
SRI filter applied in the first layer. It ensures that the “approved list” of
investment opportunities is aligned to the objectives of the team. In addition
to that the board discusses about the further focus on academic and in-house
research. They are also responsible for the verification and monitoring of the
process and analytical basis.
111 Interview with Osojnik (2010).
112 Pinner W. (2008, 12).
113 Socially Responsible Investments (2010, 28).
46/81
The board includes members from the Erste Sparinvest, the non – SRI team,
the employed rating agencies and the SRI team. The mix of the members
ensures that the valuation process is not solely based on one point of view.
With level 2, the final SRI universe for the VINIS funds are constructed.
3.1.2.3 Layer III & Layer IV – Investment Process115
After the SRI investment universe is defined, the portfolio construction takes
place. Layer III is the selection process of equities. Since the focus is on SRI
issues, the layer III is not further described.
The last layer incorporates the engagement and voting strategy of the ESPA
VINIS team. The team is responsible for the voting and engagement strategies
for the domestic market. In terms of the international voting and engagement
strategy a renowned partner supports the team in its tasks.
114 Pinner (2008, 12).
115 Pinner (2008).

47/81
3.2 Sarasin
3.2.1 Sarasin – An Overview and the SRI Approach
Since 1989 Sarasin is represented on the SRI market and its first sustainable
product was established in 1994. 116 The team follows a sustainable philosophy
which is based on a risk oriented analysis. Industry- and company specific
risks of a firm are considered in the analysis.117
The sustainability rating of a company is based on a two dimensional rating
system, consisting of an industry and a company rating. Each rating dimension
incorporates an environmental and social analysis. The combined company
and industry rating determines the sustainable investment universe of Sarasin.
The team uses a Sustainability Matrix where the eligible universe is displayed.
The following figure shows the matrix.118
Figure 9: Sarasin Sustainability Matrix
Source: Sarasin Questionnaire (2010).
116 Sarasin Questionnaire (2010).
117 Sarasin “The future in your portfolio” (8).

48/81
The X-axis represents the industry rating and the Y-axis is the company rating.
The selected investment universe demonstrates that only the top sustainability
performers from high - risk industries are considered, while the barrier for
entry to the investment universe is lower for industries presenting less of a
sustainability risk. 119
Sarasin integrates in its SRI approach avoidance, best of classes, best in class
and engagement strategies, which are explained during the investment
process.
3.2.2 Sarasin - SRI Process
The first step is the industry and a company research. The team employs
mainly secondary research, like monitoring of newspapers, research reports,
industry specific catalogues and so on. This pool of information is the
fundament of the SRI analysis.120
Before the social and environmental analysis is conducted on the universe, the
avoidance approach rules out the companies, that violate the exclusionary
criteria. In contrast to Erste Sparinvest, Sarasin has a milder avoidance
approach. The companies are only excluded if they earn more than five
percent of their sales from the manufacture of the following products: nuclear
power, weapons, chlorine and agrochemicals, tobacco and pornography.121
In the next step the social and environmental analysis is applied. As
mentioned before, Sarasin focuses on a risk oriented approach. The
environmental and social risks are closely linked to the products and to the
118 Sarasin “The future in your portfolio”(8f).
119 Sarasin Industry Rating (2006, 5ff)
120 Sarasin Questionnaire (2010).
121 Sarasin Questionnaire (2010).

49/81
respective industry of the companies. Therefore the sustainability rating of the
industry in terms of its contributions towards environmental and social risks is
determined in the beginning of the analysis. Sarasin classifies this as the best
of classes approach.122
A set of selected environmental and social criteria are used to determine the
industry specific risks. The environmental risk is valued through the criteria:
“resource use and emissions”. The social risk is determined by the criteria
“internal and external conflicts”. The internal conflict potential can be caused
by the downsizing of the workforce in certain industrialised countries and by
inadequate working conditions, like low wages, low working hours and so on.
The external conflict potential is caused by health risks due to the products
and production methods, corruption and ethical conflicts.123
Based on the criteria the risk potential of an industry is determined. For
example the chemical industry is an industry with high risk potential and as a
result the industry sustainability rating will be very low, meaning that the
smaller the environmental and social risks of an industry, the higher its
sustainability rating. The analysis is done throughout the whole product
lifecycle, from the upstream production stages, through the production
process, to the use of the products. Not only direct effects arising from the
production is taking into account, but also the effects caused by the whole
product lifecycle are considered.
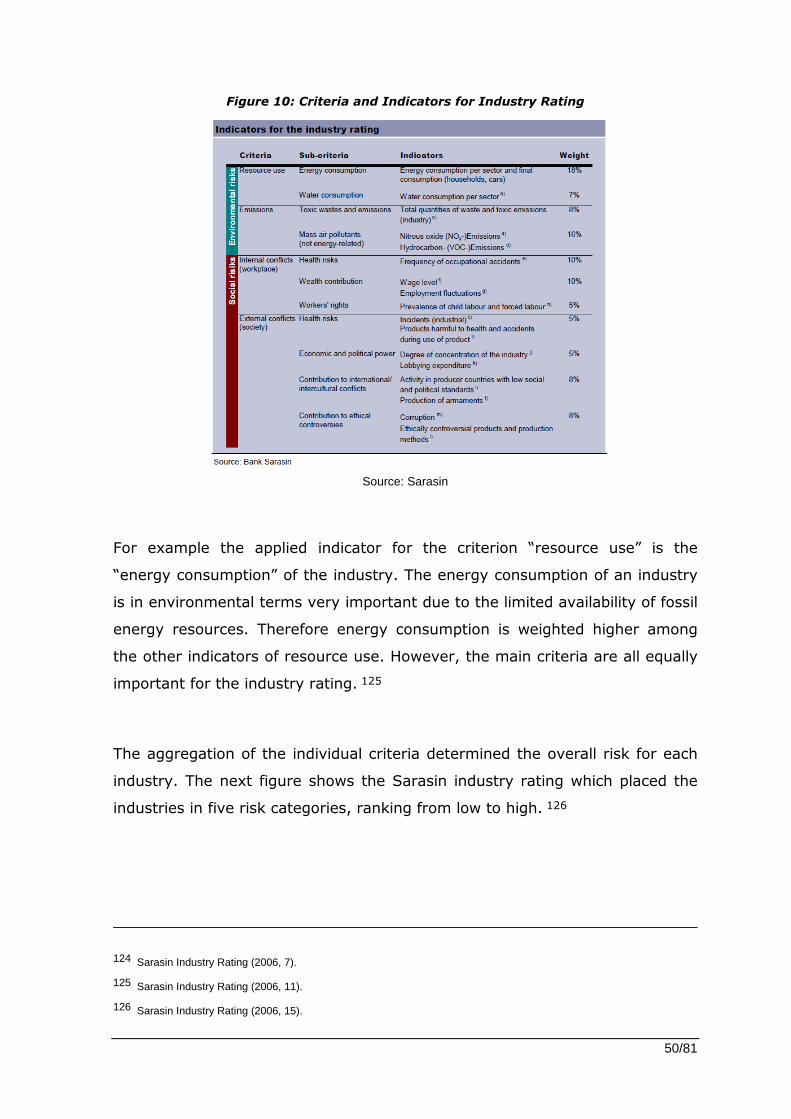
The following figure shows the four standardized main criteria, that are used
for the entire product lifecycle and the indicators to quantify the criteria. 124
122 Sarasin Industry Rating (2006, 4)
123 Sarasin Industry Rating (2006, 6).
50/81
Figure 10: Criteria and Indicators for Industry Rating
Source: Sarasin
For example the applied indicator for the criterion “resource use” is the
“energy consumption” of the industry. The energy consumption of an industry
is in environmental terms very important due to the limited availability of fossil
energy resources. Therefore energy consumption is weighted higher among
the other indicators of resource use. However, the main criteria are all equally
important for the industry rating. 125
The aggregation of the individual criteria determined the overall risk for each
industry. The next figure shows the Sarasin industry rating which placed the
industries in five risk categories, ranking from low to high. 126
124 Sarasin Industry Rating (2006, 7).
125 Sarasin Industry Rating (2006, 11).
126 Sarasin Industry Rating (2006, 15).

51/81
Figure 11: Sarasin Industry Rating
Source: Sarasin
Here we can see that the primary industries that incorporate a higher risk
include chemicals, energy, construction, consumer electronics or pharmacy
have the lowest sustainability rating. Industries with lower risks like service
sector, telecommunications, insurance, renewable energies or healthcare
services have the highest sustainability rating. 127
The industry sustainability rating defines the threshold of eligibility for
investment. The lower the rating of the industry, the higher are the demands
that companies must meet in order to qualify. The leading thought behind this
approach is that companies in less sustainable industries can achieve large
economic benefits by engaging in sustainable practices. For example,
companies in energy intensive primary industries can cut their costs by
increasing their energy efficiency. Those companies with above average
127 Sarasin Industry Rating (2006, 15).

52/81
sustainability ratings will tend to deliver an above average share
performance.128
In the next step, the sustainability of the companies toward the industry
specific environmental and social risks is assessed. The main question here is
how does the company deal with the industry – specific risk compared to its
peers? This is assessed by the best in class approach.
The environmental rating measures the contribution of a company to reduce
its pollution throughout the product lifecycle. Criteria like energy consumption,
water consumption, toxic emissions, waste, material intensity, durability and
so on are all considered for the analysis.129
Figure 12: Environmental Rating
Source: Sarasin
The social rating incorporates the stakeholder approach of a company. It
reflects how the company manages the different interests of the stakeholder in
terms of the sub criteria “health”, “participation” and “distribution of wealth
128 Sarasin Industry Rating (2006, 4).
129 Sarasin Company Rating (2007,8f).

53/81
and knowledge”. Participation takes into consideration whether the company
permits stakeholders to participate in decisions that affect them. If a company
gives the stakeholders the possibility to improve their education and know-
how, it will be positively assessed in terms of knowledge. The sub criterion
health measures if companies reduce health risks for their stakeholders and
the sub criteria wealth reflects the companies’ contribution to reduce material
imbalances for stakeholders. The stakeholders, who represent the main criteria
of the social analysis, are employees, suppliers, investors, general public,
customers and competitors. 130
Figure 13: Social Rating
Source: Sarasin
After the company and industry rating of the companies are positioned in the
Sustainability Matrix, the sustainable investment universe is determined for
the further investment process.
Another important part of the SRI approach is the engagement strategy of
Sarasin. The team tries to enhance the awareness of the management of the
companies toward the interests of the shareholders. Secondly the voting rights
130 Sarasin Company Rating (2007, 12f).
54/81
of the invested companies are perceived. The voting policy is based on the
recommendation of Sarasin’s partners.131
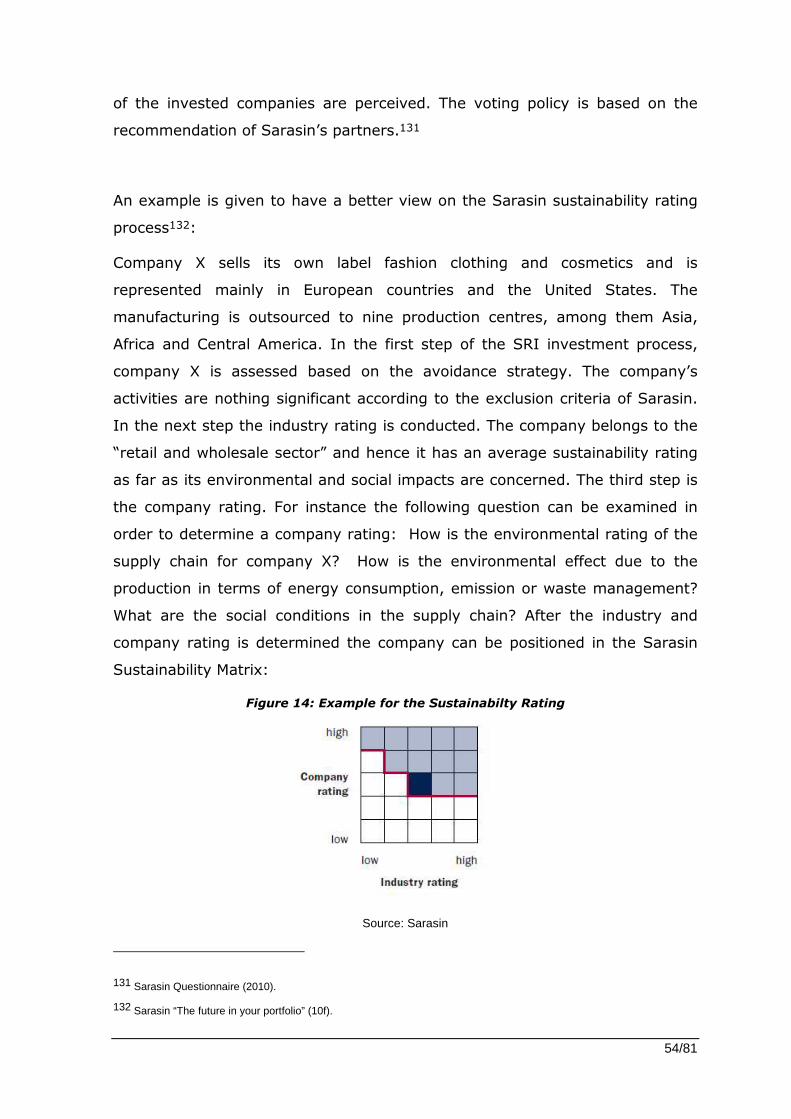
An example is given to have a better view on the Sarasin sustainability rating
process132:
Company X sells its own label fashion clothing and cosmetics and is
represented mainly in European countries and the United States. The
manufacturing is outsourced to nine production centres, among them Asia,
Africa and Central America. In the first step of the SRI investment process,
company X is assessed based on the avoidance strategy. The company’s
activities are nothing significant according to the exclusion criteria of Sarasin.
In the next step the industry rating is conducted. The company belongs to the
“retail and wholesale sector” and hence it has an average sustainability rating
as far as its environmental and social impacts are concerned. The third step is
the company rating. For instance the following question can be examined in
order to determine a company rating: How is the environmental rating of the
supply chain for company X? How is the environmental effect due to the
production in terms of energy consumption, emission or waste management?
What are the social conditions in the supply chain? After the industry and
company rating is determined the company can be positioned in the Sarasin
Sustainability Matrix:
Figure 14: Example for the Sustainabilty Rating
Source: Sarasin
131 Sarasin Questionnaire (2010).
132 Sarasin “The future in your portfolio” (10f).

55/81
3.3 SAM
3.3.1 SAM – An Overview and the SRI Approach
SAM is an investment group that focuses exclusively on sustainability investing
since its foundation in 1995. Furthermore, SAM has the right for publication
and licensing of the Dow Jones Sustainability Index (DJSI). 133
SAM defines corporate sustainability as an approach to business creating long
term shareholder value by embracing opportunities and managing risks
deriving from economic, environmental and social developments.134
In principal SAM mainly distinguishes between socially responsible and
sustainable investments. According to SAM, socially responsible investments
incorporate the negative screening of companies, which can lead to an
exclusion of specific industries. In contrast to that the sustainable investments
use solely the best in class approach. SAM counts itself to the sustainable
investors since the team applies best in class without a pre - screening of the
companies. The blue marked part of figure 16 illustrates the positioning of SAM
among the different SRI investing styles.135
133 http://www.sam-group.com/htmle/about/portrait.cfm, downloaded on 04.07.2010.
134 https://assessments.sam-group.com/documents/DJSI_KeyFacts_2010_Final.pdfc, downloaded on 11/07/2010.
135 SAM Questionnaire (2010).

56/81
Figure 15: Positioning of SAM (the blue area)
Source: SAM - Questionnaire 2010136
The SRI approach incorporates best in class, sustainability theme investing,
engagement and integration. Since the theme investing is not a major topic in
this thesis, this investing style is not described here.137
3.3.2 SAM - SRI Process
The corporate sustainability assessment is the core part of SAM’s sustainability
investments. The first step is to gather information from companies based on
an extensive questionnaire. Qualitative and quantitative criteria are examined
in the questionnaire to measure the sustainability performance of more than
1,200 companies.138
Sam’s assessment criteria are divided in two classes: general and sector
specific. The general criteria can be applied to companies across all sectors,
136 Figure is only available in German.
137 SAM Questionnaire (2010).
138 SAM (2010,7).
57/81
whereas industry specific ones differ between sectors. The criteria are
allocated to economic, environmental and social dimensions.139 The
assessment covers issues, such as: operational efficiency & risk reduction,
aligning & attracting employees, new markets, innovation and reputation &
brands.140 A detailed set of criteria for each dimension is given in table 4.
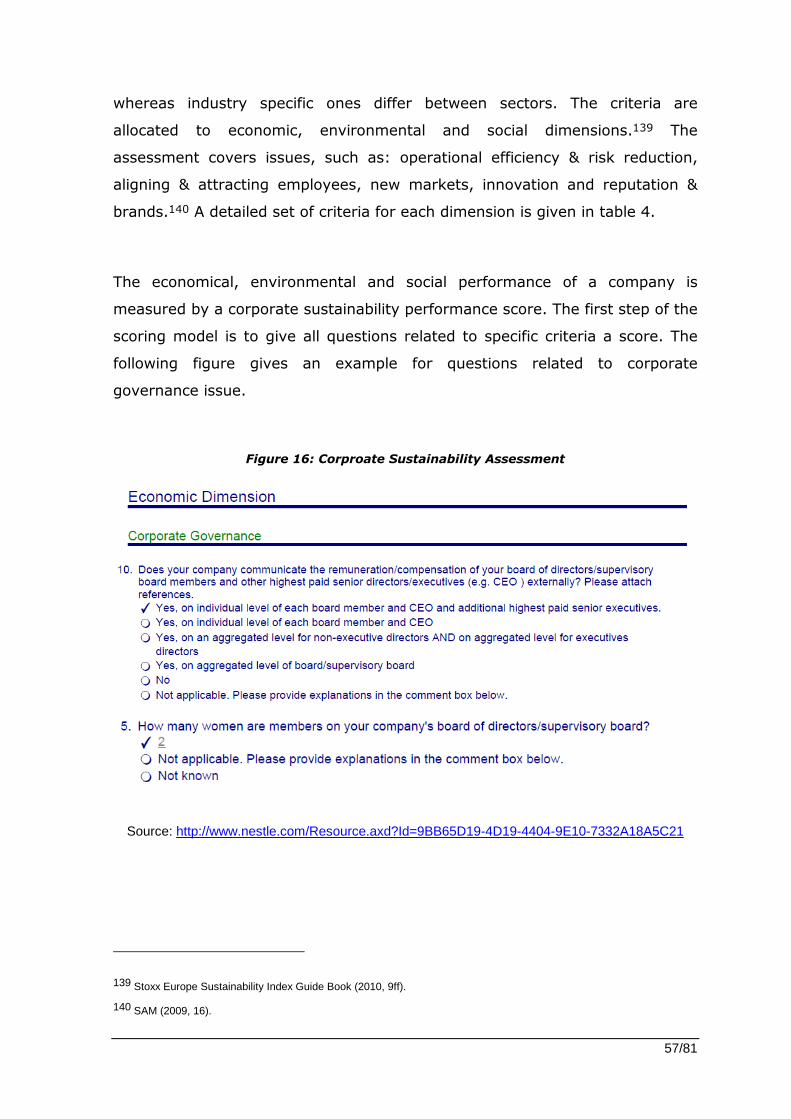
The economical, environmental and social performance of a company is
measured by a corporate sustainability performance score. The first step of the
scoring model is to give all questions related to specific criteria a score. The
following figure gives an example for questions related to corporate
governance issue.
Figure 16: Corproate Sustainability Assessment
Source: http://www.nestle.com/Resource.axd?Id=9BB65D19-4D19-4404-9E10-7332A18A5C21
139 Stoxx Europe Sustainability Index Guide Book (2010, 9ff).
140 SAM (2009, 16).

58/81
Table 4: Assessment Criteria
Source: Stoxx Europe Sustainability Index Guide Book
59/81
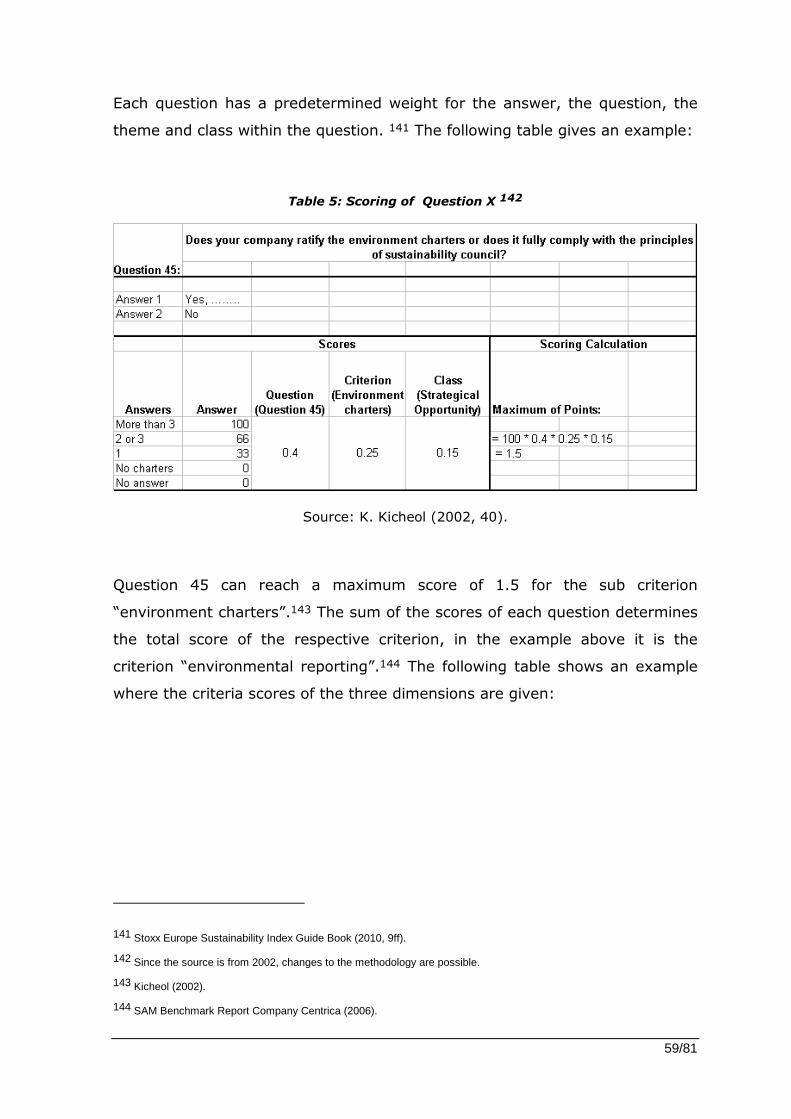
Each question has a predetermined weight for the answer, the question, the
theme and class within the question. 141 The following table gives an example:
Table 5: Scoring of Question X 142
Source: K. Kicheol (2002, 40).
Question 45 can reach a maximum score of 1.5 for the sub criterion
“environment charters”.143 The sum of the scores of each question determines
the total score of the respective criterion, in the example above it is the
criterion “environmental reporting”.144 The following table shows an example
where the criteria scores of the three dimensions are given:
141 Stoxx Europe Sustainability Index Guide Book (2010, 9ff).
142 Since the source is from 2002, changes to the methodology are possible.
143 Kicheol (2002).
144 SAM Benchmark Report Company Centrica (2006).

60/81
Table 6: Example for a Corporate Sustainabilty Rating (1)
Source: SAM Benchmark Report Company Centrica (2006)
The company score is the actual score for the respective criterion and the
average one represents the industry’s group average score. The last column of
the table gives the different weighting for the general and industry specific
criteria. The general criteria have a pre - defined weighting scheme and the
sector specific weighting depends on the industry.145
145 SAM Benchmark Report Company Centrica (2006)
61/81
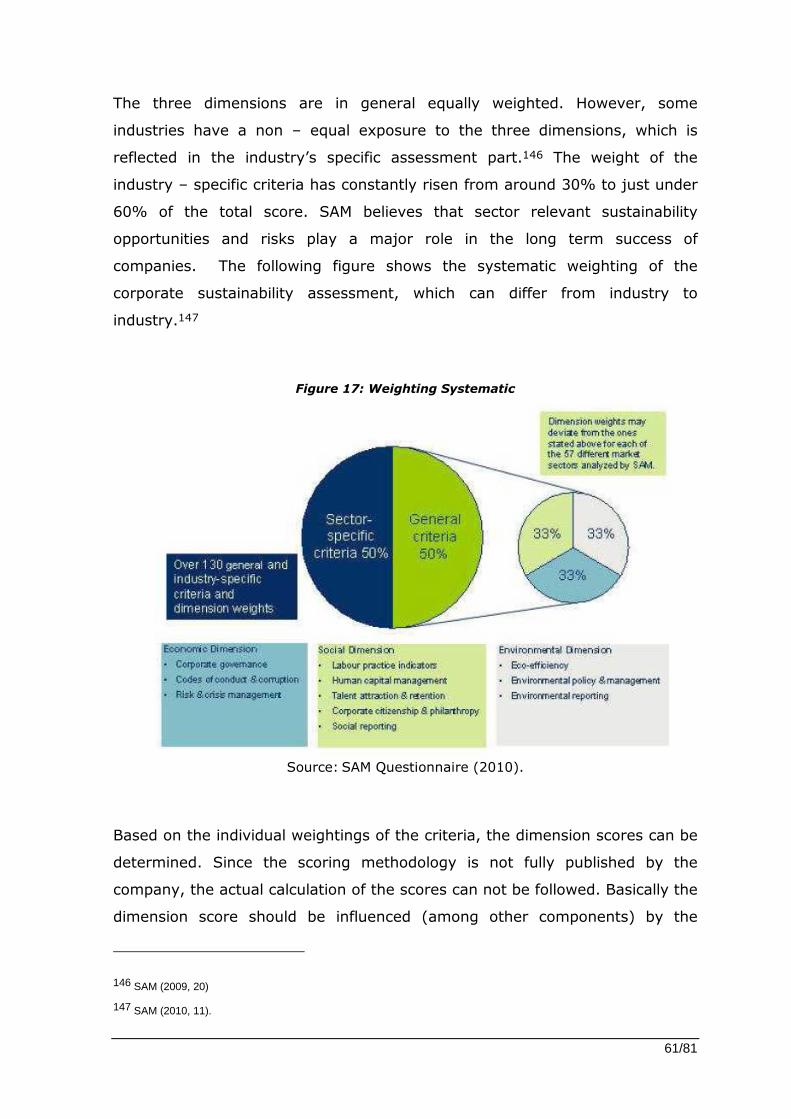
The three dimensions are in general equally weighted. However, some
industries have a non – equal exposure to the three dimensions, which is
reflected in the industry’s specific assessment part.146 The weight of the
industry – specific criteria has constantly risen from around 30% to just under
60% of the total score. SAM believes that sector relevant sustainability
opportunities and risks play a major role in the long term success of
companies. The following figure shows the systematic weighting of the
corporate sustainability assessment, which can differ from industry to
industry.147
Figure 17: Weighting Systematic
Source: SAM Questionnaire (2010).
Based on the individual weightings of the criteria, the dimension scores can be
determined. Since the scoring methodology is not fully published by the
company, the actual calculation of the scores can not be followed. Basically the
dimension score should be influenced (among other components) by the
146 SAM (2009, 20)
147 SAM (2010, 11).
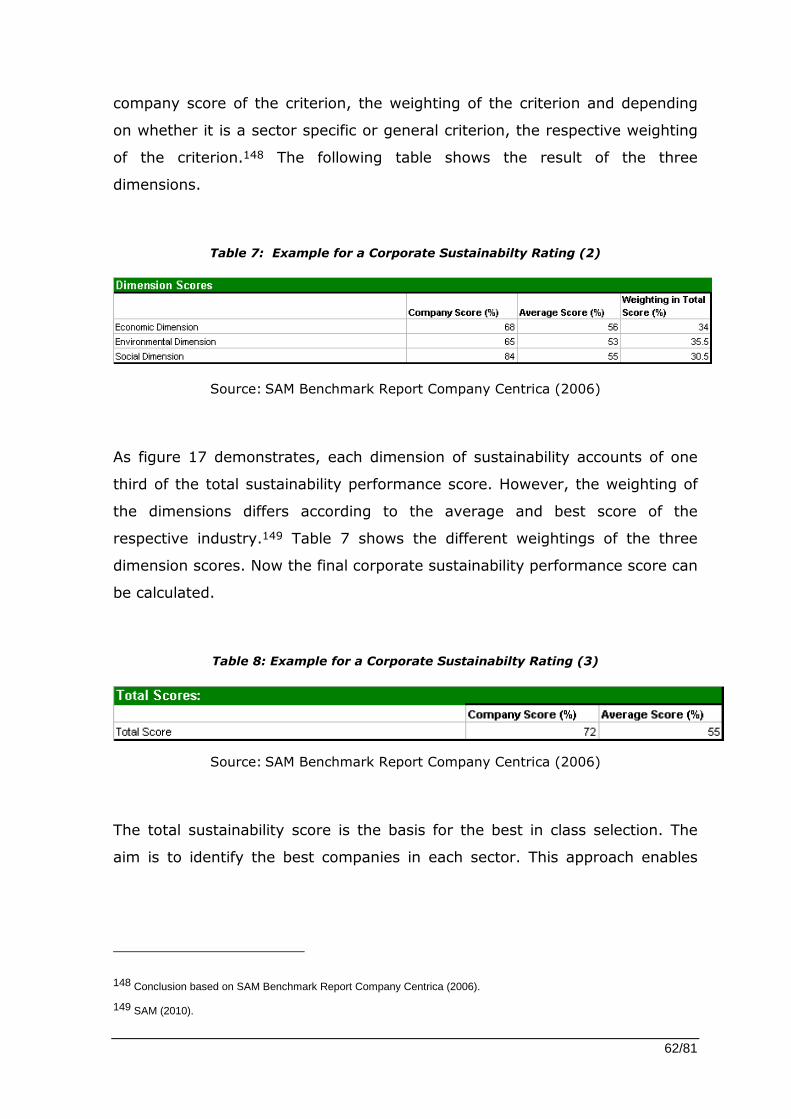
62/81
company score of the criterion, the weighting of the criterion and depending
on whether it is a sector specific or general criterion, the respective weighting
of the criterion.148 The following table shows the result of the three
dimensions.
Table 7: Example for a Corporate Sustainabilty Rating (2)
Source: SAM Benchmark Report Company Centrica (2006)
As figure 17 demonstrates, each dimension of sustainability accounts of one
third of the total sustainability performance score. However, the weighting of
the dimensions differs according to the average and best score of the
respective industry.149 Table 7 shows the different weightings of the three
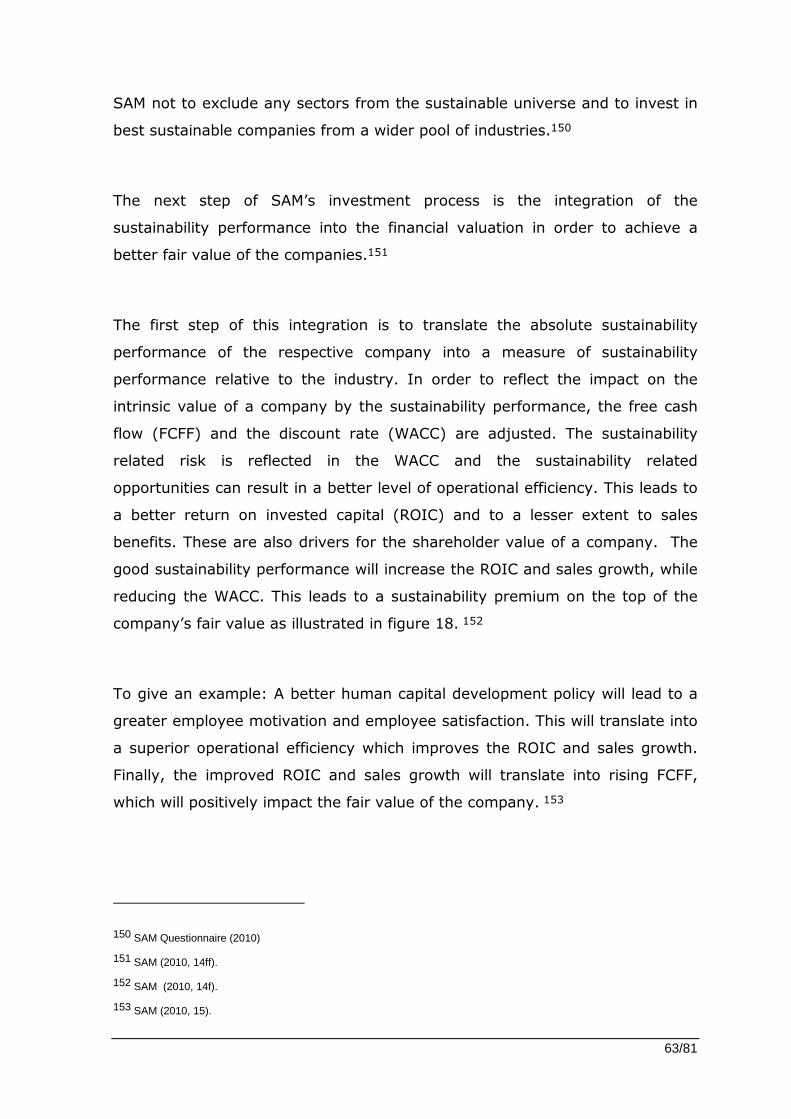
dimension scores. Now the final corporate sustainability performance score can
be calculated.
Table 8: Example for a Corporate Sustainabilty Rating (3)
Source: SAM Benchmark Report Company Centrica (2006)
The total sustainability score is the basis for the best in class selection. The
aim is to identify the best companies in each sector. This approach enables
148 Conclusion based on SAM Benchmark Report Company Centrica (2006).
149 SAM (2010).
63/81
SAM not to exclude any sectors from the sustainable universe and to invest in
best sustainable companies from a wider pool of industries.150
The next step of SAM’s investment process is the integration of the
sustainability performance into the financial valuation in order to achieve a
better fair value of the companies.151
The first step of this integration is to translate the absolute sustainability
performance of the respective company into a measure of sustainability
performance relative to the industry. In order to reflect the impact on the
intrinsic value of a company by the sustainability performance, the free cash
flow (FCFF) and the discount rate (WACC) are adjusted. The sustainability
related risk is reflected in the WACC and the sustainability related
opportunities can result in a better level of operational efficiency. This leads to
a better return on invested capital (ROIC) and to a lesser extent to sales
benefits. These are also drivers for the shareholder value of a company. The
good sustainability performance will increase the ROIC and sales growth, while
reducing the WACC. This leads to a sustainability premium on the top of the
company’s fair value as illustrated in figure 18. 152
To give an example: A better human capital development policy will lead to a
greater employee motivation and employee satisfaction. This will translate into
a superior operational efficiency which improves the ROIC and sales growth.
Finally, the improved ROIC and sales growth will translate into rising FCFF,
which will positively impact the fair value of the company. 153
150 SAM Questionnaire (2010)
151 SAM (2010, 14ff).
152 SAM (2010, 14f).
153 SAM (2010, 15).
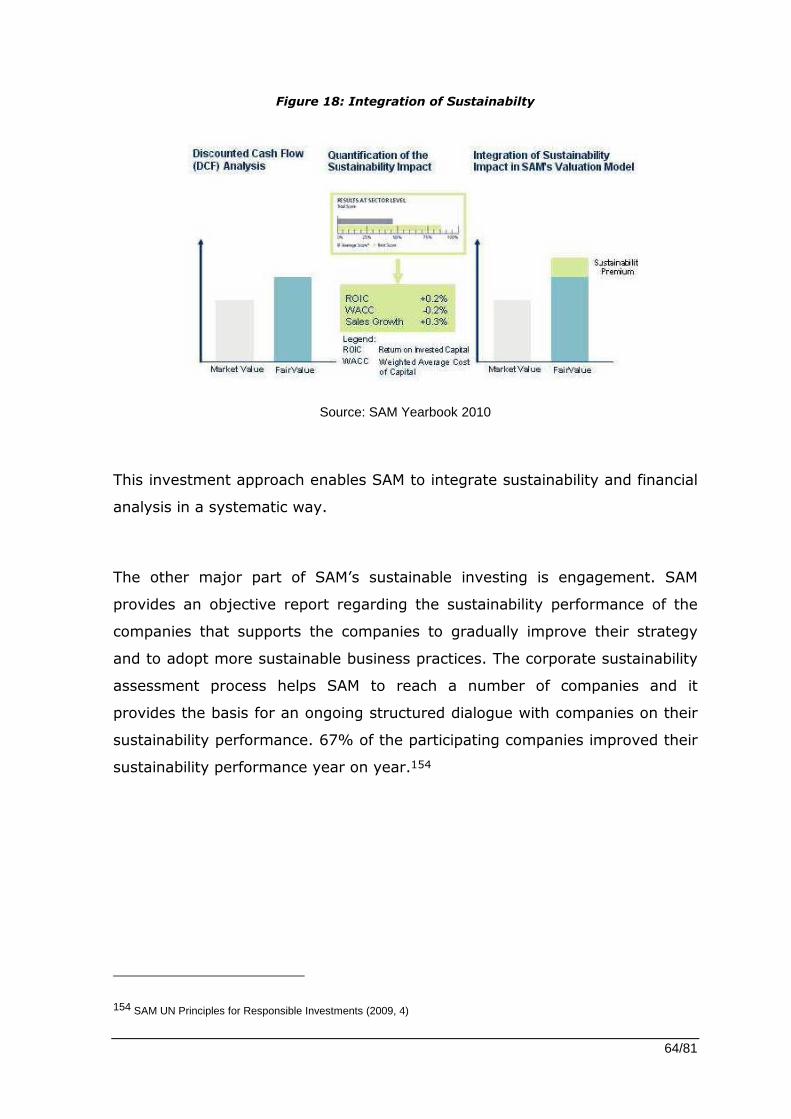
64/81
Figure 18: Integration of Sustainabilty
Source: SAM Yearbook 2010
This investment approach enables SAM to integrate sustainability and financial
analysis in a systematic way.
The other major part of SAM’s sustainable investing is engagement. SAM
provides an objective report regarding the sustainability performance of the
companies that supports the companies to gradually improve their strategy
and to adopt more sustainable business practices. The corporate sustainability
assessment process helps SAM to reach a number of companies and it
provides the basis for an ongoing structured dialogue with companies on their
sustainability performance. 67% of the participating companies improved their
sustainability performance year on year.154
154 SAM UN Principles for Responsible Investments (2009, 4)
65/81
4. Conclusion
In this thesis I have focused on the concept of SRI. My aim was to give an
insight into the different approaches of SRI that are employed in practice.
The evolution of SRI can be traced back to the 18th century. The traditional
view was that the responsibility of a corporation is only the maximization of
wealth. However, investors are now more aware of the corporate responsibility
and seeking for more sustainable forms of investing. Issues like financial crisis,
corporate scandals or sustainability challenges have enforced more the
importance of SRI.
We have also seen that the definition of SRI differs from investor to investor
according to time and country. From my point of view, which is supported by
the definition of Eurosif, SRI is a combination of ethical, sustainable and social
investments. The investor considers non - financial criteria like environmental,
social and governance issues into the investment decision in order to have a
comprehensive view of the company and the respective industry.
Principally SRI can be divided into three main investment approaches. The first
is screening of the companies, which can be based on positive or negative
criteria. The negative ones are mostly used for the exclusion of the companies.
The positive screening is based on a set of criteria concerning environmental,
social and governance issues. The second approach is engagement, which is a
long - term process of dialogue with companies to influence them toward
socially responsible business practises. Finally, we can conclude with the
integration, which is the incorporation of ESG risks and opportunities into the
investment process.
The strong demand of socially responsible investments comes from the
institutional side, especially from the pension funds. This is mainly due to the
66/81
enforcement of responsible investment philosophy in pension funds. Further
drivers are regulatory requirements, NGO’s and media.
On the performance side, the main criticism is that traditional benchmarks
achieve a better performance than the SRI funds. Based on the referred
findings it can be concluded that there is no significant evidence for an
underperformance of socially responsible investments.
Given the theoretical background information about the topic, the socially
responsible investment process in practise is introduced. Erste Sparinvest,
Sarasin and SAM are given as examples, with a special focus on Erste
Sparinvest.
Basically ESPA and Sarasin have a similar approach compared to SAM. The
main differentiation is the application of avoidance, whereas SAM considers
every industry based on best in class. This enables SAM to invest from a wider
pool of industries, whether it is the tobacco or energy sector.
Sarasin has a milder avoidance approach than ESPA since the companies are
only excluded if they earn more than five percent of sales from non -
responsible activities. ESPA applies exclusionary criteria, where specific
companies are immediately ruled out. However, the Sarasin Sustainability
Matrix restricts further the universe depending on the industry specific risk
potential. The higher the risk of an industry regarding its environmental and
social sustainability, the more is the barrier for companies of the respective
industries to enter the universe.
In terms of the ESG methodology all the three players are incorporating
environmental, social and governmental issues into the sustainability
assessment.
67/81
Another crucial differentiation of the ESPA SRI process is the holistic and
objective SRI approach based on a multiple sourcing by the rating agencies,
ethics committee and in house team. Different expertises and methodologies
are incorporated in the investment process. Especially the application of the
qualitative screening based on a comprehensive set of criteria, irrespective of
the industry, outlines the ESPA SRI approach from the other two competitors.
The combination with positive screening, best in class, avoidance and
engagement leads to a multi dimensional approach. The measurement of
sustainability of SAM and Sarasin is done by best in class, whereas Sarasin
additionally combines it with the best of class strategy.
However, SAM’s corporate sustainability assessment process is based on
primary research, where the companies are directly questioned in order to
gather the information. The questionnaire provides the basis for an ongoing
structured dialogue with companies on their overall sustainability performance.
In that way SAM has as extensive engagement strategy with the companies
compared to the other competitors and is able to collect a comprehensive pool
of information for the corporate sustainability assessment.
Compared to ESPA and Sarasin, SAM incorporates the approach integration
into all of its investment strategies. The in-house sustainability analysis is
considered in proprietary valuation models in order to achieve a fair value of
sustainable companies.
The main findings are given in the following table below:

68/81
Table 9: Summary of the Main Findings

69/81
Bibliography
Books and Articles:
Barnet, M. & Salomon, R. (2005): “Throwing a curve at socially responsible
investing research – a new pitch at an old debate.”, Organizational &
Environmental, Vol. 16 No.3, pp.381 – 389.
Beal, D J, Goyen, M & Phillips, P (2005): “Why Do We Invest Ethically?”, The
Journal of Investing, fall 2005, pp. 66-75.
Cobb, G et al. (2005). FTSE4Good: “Perceptions and Performance.”, ACCA
Research Report No.88, Certified Accountants Educational Trust, London.
Derwall, J et al. (2005): “The Eco-Efficiency Premium Puzzle”, Financial
Analysts Journal, 61, 2, pp. 51-63.
Dillenburg, S, Greene, T & Erekson, H (2003): “Approaching Socially
Responsible Investment with a Comprehensive Ratings Scheme: Total Social
Impact”, Journal of Business Ethics, 43, pp. 167-177.
Eurosif (2009). “Public Policy Position Paper related to Sustainable and
Responsible Investment (SRI).“ Available at :
www.eurosif.org/.../Eurosif+Public+Policy+Position+Paper+2009.pdf [May
2010)
Fama, E F & French, K R (1992): “The Cross-Section of Expected Stock
Returns”, The Journal of Finance, 47, 2, pp. 427-465.
Friedman, M (1970): “The Social Responsibility of Business is to Increase Its
Profits”, NewYork Times Magazine 113.IX.1970.
70/81
Graves, S B, Rehbein, K & Waddock, S (2001): “Fad and Fashion in
Shareholder Activism: The Landscape of Shareholder Resolutions, 1988-1998”,
Business and Society Review, 106, 4, pp. 293-314.
Gregory, A, Matatko, J & Luther, R (1997): “Ethical Unit Trust Financial
Performance: Small Company Effects and Fund Size Effects”, Journal of
Business Finance & Accounting, 24 (5), pp. 705-725.
Gunthorpe, D L (1997): “Business Ethics: A Quantitative Analysis of the
Impact of Unethical Behavior by Publicly Traded Corporations”, Journal of
Business Ethics, 16, pp. 537-543.
Hellsten, S & Mallin C (2006): “Are ‘Ethical’ or ‘Socially Responsible’
Investments Socially Responsible?”, Journal of Business Ethics, 66, pp. 393-
406.
Hong, H. & Kacperczyk, M. (2007): “ The price of sin: The effects of social
norms on markets.”, Journal of Financial Economics, 93, pp. 15 – 36.
Hutton, R B, D’Antonio, L & Johnsen, T (1998): “Socially Responsible
Investing”, Business and Society, 1, 37, 3, pp. 281-305.
Kempf, A & Osthoff, P (2006): “The Effect of Socially Responsible Investing on
Financial Performance”, CFR-Working Paper No.06-10, Centre for Financial
Research/ University of Cologne (Universität Köln).
Kinder, P. (2007): “Socially Responsible Investing: An Evolving Concept in a
Changing World”. KLD Research & Analytics, Inc. .

71/81
Klassen, R D & McLaughlin, C P (1996): “The Impact of Environmental
Management on Firm Performance”, Management Science, 42, 8, pp. 1199-
1214.
McLaren, D (2004): “Global stakeholders: corporate accountability and
investor engagement”, Corporate Governance: An International Review, 12, 2,
pp. 191-201.
McWilliams, A & Siegel, D (2000): “Corporate Social Responsibility and
Financial Performance: Correlation or Misspecification?”, Strategic
Management Journal, 21, pp. 603- 609.
Orlitzky, M et al. (2003): “Corporate Social and Financial Performance: A
Meta-analysis”, London/ Sage Publications.
Picou, A & Rubach, M J (2006): “Does Good Governance Matter to Institutional
Investors? Evidence from the Enactment of Corporate Governance Guidelines”,
Journal of Business Ethics, 65, pp. 55-67.
Pinner, W. (2007): “Responsible Hedge Funds – Assessment of an SRI
concept.”
Rivoli, P (2003): “Making a Difference or Making a Statement: Finance
Research and Socially Responsible Investment”, Business Ethics Quarterly, 13,
3, pp. 271-287.
Schroeder, M (2003): “Socially Responsible Investments in Germany,
Switzerland and the United States - An Analysis of Investment Funds and
Indices”, Discussion Paper No. 03-10, ZEW/ Centre for European Economic
Research.

72/81
Schroeder, M (2005): “Is there a Difference? The Performance Characteristics
of SRI Equity Indexes”, Discussion Paper No. 05-50, ZEW/ Centre for
European Economic Research.
Schwartz, M S (2003): “The ‘Ethics’ of Ethical Investing”, Journal of Business
Ethics, 43, pp. 195-213.
Sethi, S P (2005): “Investing in Socially Responsible Companies is a Must for
Public Pension Funds – Because There is no Better Alternative”, Journal of
Business Ethics, 56, pp. 99-129.
Solomon, J F, Solomon, A & Norton, S D (2002): “Socially responsible
investment in the UK: Drivers and current issues”, Journal of General
Management, November.
Sparkes, R (1995): “The Ethical Investor”, Harper Collins/ London.
Sparkes, R (2001): “Ethical investment: whose ethics, which investment?”,
Business Ethics: A European Review, 10 (3), pp. 194-205.
Statman, M (2000): “Socially Responsible Mutual Funds”, Association for
Investment Management and Research. May/ June.
Statman, M. (2007): “Socially Responsible Investmetns”, Santa Clara
University.
Taylor, R (2000): “How new is socially responsible investment?”, Business
Ethics: A European Review, 9 (3), pp. 174-179.
73/81
Tsoutsoura, A. (2004): “AppliedFinancial Project.” Berkeley University.
Waddock, S and Graves, S (1997): “The Corporate Social Performance –
financial performance link”, Strategic Management Journal, 18, pp. 303-319.
Waddock, S (2003): “Myths and Realities of Social Investing”, Organisation &
Environment, 16, 3, pp. 369-380.
Wartick, S L & Cochran, P L (1985): “The Evolution of the Corporate Social
Performance Model”, Academy of Management Review, 10, 4, pp. 758-769.
Webley, S & More, E (2003): “Does Business Ethics Pay?”, London: Institute of
Business Ethics.
Williams G. (2005): “Some Determinants of the Socially Responsible
Investment Decision: A Cross Country Study.”, Nottingham University
Business School.
Worthington I. & Monder R. & Harvinder B. & Mayank S. (2007): “Researching
the Drivers of Socially Responsible Purchasing: A Cross – National Study of
Supplier Diversity Initiatives.”, Journal of Business Ethics (2008) 79, pp. 319 –
331.

74/81
Studies
Deutsche Bank Research (2010): “Responsible Investments. Mehr als eine
Modeerscheinung.“ [17 May, 2010].
EIRIS/ Havemann, R & Webster, P (1999): “Does Ethical Investment Pay?”
EIRIS research and other studies of ethical investment and financial
performance.
Eiris (2009): “Responsible Investment by Charities: the Role of Pooled Funds.
A guide for charity trustees.” 2nd edition. EIRIS Foundation Charity Project.
Eurosif (2006): „European SRI Study 2006“.
Eurosif (2007): “European Legal Briefing: A current view of SRI & CSR issues
relating to recent European laws”, 2007.
Eurosif (2008): “European SRI Study”.
Eurosif (2009b): “Investment Consultants & Responsible Investment Study”.
Kicheol K. (2002): “Methoden zur Evaluation der Nachhaltigkeit von
Unternehmen. Kategorisierung und Analyse ihrer Stakeholderorientierung“,
Centre for Sustainability Management.
Social Investment Forum (2006): “2005 Report on Socially Responsible
Investing Trends in the United States”.
WestLB (2007): “What really counts. The materiality of extra financial factors.
Pan European Equity Europe.”

75/81
Company Presentations and Publications:
Erste Asset Management (2010): “Social Responsible Investments (SRI) –
How to benefit from social and ecological trends.”
Dow Jones Sustainability Indexes. (2010): “STOXX Europe Sustainability
Index. Guide Book.”
Oekom Research (2010): Corporate Rating “Microsoft”.
Pinner W. (2008): “ESPA Responsible Investments. ESPA – VINIS
Sustainability Funds”.
Pinner W. (2008b): “ESPA Responsible Investments. ESPA – VINIS
Sustainability Funds in CEE”.
RiskMetics Group (2009): “Intangible Value Assessment (IVA) Methodology. A
Concise Explanation of our Sustainability Rating Model.”
SAM (2006): Benchmark Report Company Centrica.
SAM (2009): “SAM’s Corporate Sustainability Assessment for the Dow Jones
Sustainability Indexes 2009. Key Facts”. Available at: https://secure2.sam-
group.com/online/documents/DJSI_Assessment_2009_CD_Final.pdf
SAM & Price Waterhouse Coopers (2010): “ The Sustainability Yearbook 2010.”
SAM: “Un Principles for Responsible Investment. SAM’s Approach on
Integration the SIX Principles”.

76/81
Sarasin (2006): “Background Paper. The Sarasin Industry Rating. Methodology
and results of sector sustainability analysis”.
Sarasin (2007): “Background Paper. Assessing corporate sustainability.
Methodology of an Sarasin company rating”.
Sarasin (2008): “Sustainability and share performance – a long – running
debate revisted.” Center for Corporate Responsibility and Sustainability,
Zentrum für Europäische Wirtschaftsforschung GmbH.
Sarasin Prospect: “The future in your portfolio. Sustainable investment with
Bank Sarasin”.
Internet articles:
BBC News (03/05/2010): “BP vows to clean up Gulf of Mexico oil slick” by
Hayward Tony. Available at:http://news.bbc.co.uk/2/hi/americas/8658081.stm
Questionnaire:
Sarasin Questionnaire 2010. Conducted by Geevarughese, L.
SAM Questionnaire 2010. Conducted by Geevarughese, L.
Interviews:
Osojnik, A. (25.06.2010), Analyst of Erste Sparinvest SRI Team
Pinner, W. (17.06.2010), Head of Erste Sparinvest SRI Team

77/81
Other internet sources:
Innovest: Available at: http://i-
ratings.innovestgroup.com/index.php?option=com_isva&func=iva&action=ho
me&Itemid=40, Downloaded on : 09/07/2010. (Restricted Page)
Oekom Research: “Investment Services”: Available at: http://www.oekom-
research.de/index_en.php?content=investment-services, Downloaded on:
05/07/2010.
SAM: Available at: http://www.sam-group.com/htmle/about/portrait.cfm
Downloaded on : 04/07/2010.
SAM: Available at: https://assessments.sam-
group.com/documents/DJSI_KeyFacts_2010_Final.pdfc, Downloaded on :
11/07/2010.
Social Investment Forum: www.socialinvest.org
78/81
Diagrams
Figures
Figure 1: Engagement % of European SRI fund managers Practicing
Figure 2: Core and Broad SRI in Europe, 2002 – 2007
Figure 3: SRI in Europe (EUR – bn, December 2007)
Figure 4: Key drivers for SRI Demand in the next 3 years
Figure 5: Alpha Analysis
Figure 6: An Integrative SRI Approach
Figure 7: ESPA VINIS Investment Process
Figure 8: Example Microsoft (1)
Figure 9: Sarasin Sustainability Matrix
Figure 10: Criteria and Indicators for Industry Rating
Figure 11: Sarasin Industry Rating
Figure 12: Environmental Rating
Figure 13: Social Rating
Figure 14: Example for the Sustainability Rating
Figure 15: Positioning of SAM
Figure 16: Corporate Sustainability Assessment
Figure 17: Weighting Systematic
Figure 18: Integration of Sustainability
79/81
Tables
Table 1: SRI Investment Approaches
Table 2: Statistical Ratios
Table 3: VINIV Universe – Microsoft Corporate Rating
Table 4: Assessment Criteria
Table 5: Scoring of Question X
Table 6: Example for a Corporate Sustainability Rating (1)
Table 7: Example for a Corporate Sustainability Rating (2)
Table 8: Example for a Corporate Sustainability Rating (3)
Table 9: Summary of the Main Findings

80/81
Abbreviations
ESG (Environmental Social Governance)
SRI (Socially Responsible Investing)
Eurosif (European Sustainable Investment Forum)
UN PRI (United Nations Principles for Responsible Investment)
CSR (Corporate Sustainability Rating)
UKSIF (Sustainable Investment and Finance Association)
HNWI (High Net Wealth Individuals)
NGO (Non-Governmental Organizations)
MVA (Market Value Added)
EVA (Economic Value Added)
PE (Price Earnings Ratio)
ROCE (Return on Capital Employed)
CSP (Corporate Social/Environmental Performance)
CFP (Corporate Financial Performance)
ESPA (Este Sparinvest)
IVA (Intangible Value Assessment)
SAM (Sustainable Asset Management)
FCFF (Free Cash Flow)
WACC (Weighted Average Cost of Capital)
ROIC (Return on Invested Capital)
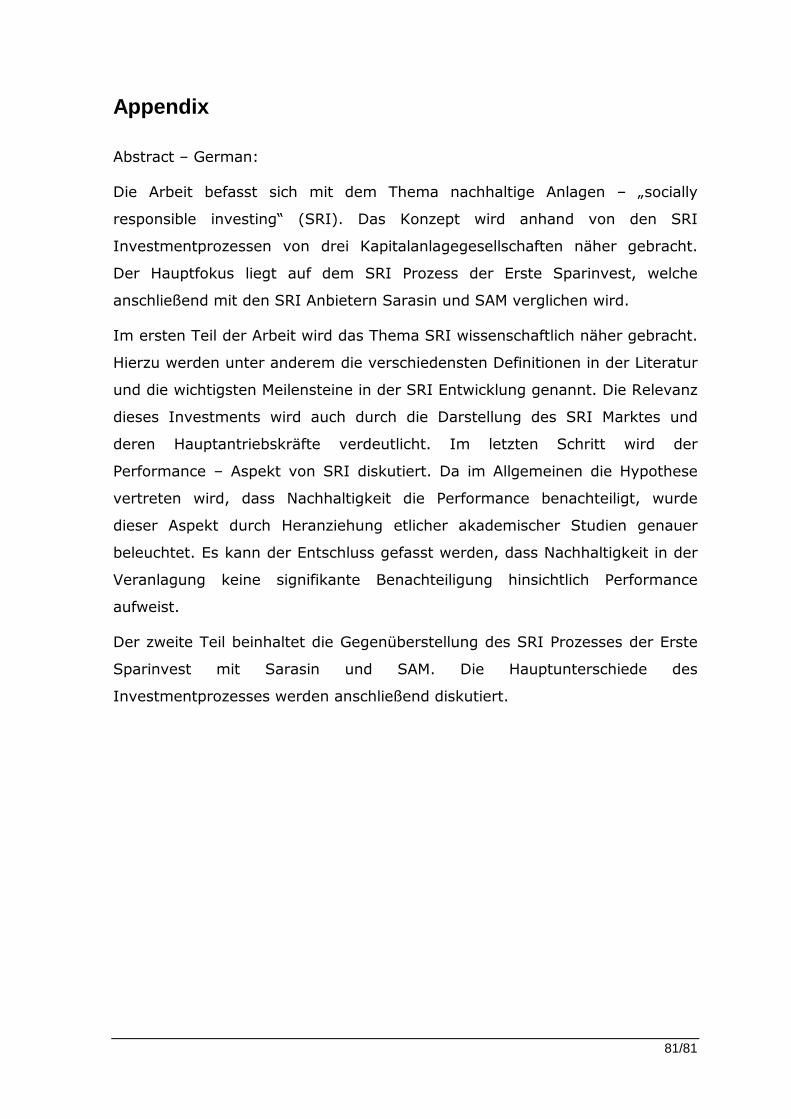
81/81
Appendix
Abstract – German:
Die Arbeit befasst sich mit dem Thema nachhaltige Anlagen – „socially
responsible investing“ (SRI). Das Konzept wird anhand von den SRI
Investmentprozessen von drei Kapitalanlagegesellschaften näher gebracht.
Der Hauptfokus liegt auf dem SRI Prozess der Erste Sparinvest, welche
anschließend mit den SRI Anbietern Sarasin und SAM verglichen wird.
Im ersten Teil der Arbeit wird das Thema SRI wissenschaftlich näher gebracht.
Hierzu werden unter anderem die verschiedensten Definitionen in der Literatur
und die wichtigsten Meilensteine in der SRI Entwicklung genannt. Die Relevanz
dieses Investments wird auch durch die Darstellung des SRI Marktes und
deren Hauptantriebskräfte verdeutlicht. Im letzten Schritt wird der
Performance – Aspekt von SRI diskutiert. Da im Allgemeinen die Hypothese
vertreten wird, dass Nachhaltigkeit die Performance benachteiligt, wurde
dieser Aspekt durch Heranziehung etlicher akademischer Studien genauer
beleuchtet. Es kann der Entschluss gefasst werden, dass Nachhaltigkeit in der
Veranlagung keine signifikante Benachteiligung hinsichtlich Performance
aufweist.
Der zweite Teil beinhaltet die Gegenüberstellung des SRI Prozesses der Erste
Sparinvest mit Sarasin und SAM. Die Hauptunterschiede des
Investmentprozesses werden anschließend diskutiert.