Embed Size (px)
Citation preview
Stabilization and dynamics of soil organic matter
in response to long-term mineral and organic fertilization
Dissertation
(kumulativ)
zur Erlangung des akademischen Grades doctor rerum naturalium
(Dr. rer. nat.)
vorgelegt dem Rat der Chemisch-Geowissenschaftlichen Fakultät
der Friedrich-Schiller-Universität Jena
von Dipl.-Biologin Jana Schmidt
geboren am 20.03.1977 in Suhl
Gutachter 1: Prof. Dr. Beate Michalzik
Friedrich-Schiller-Universität Jena, Institut für Geografie,
Löbdergraben 32, 07743 Jena
Gutachter 2: Prof. Dr. Franҫois Buscot
UFZ - Helmholtz Zentrum für Umweltforschung, Department Bodenökologie
Theodor-Lieser-Str. 4, 06120 Halle
Tag der öffentlichen Verteidigung: 19.12.2018
I
Acknowledgements
After this long period of work, today is the day on which I can give my dissertation the final touch by
writing this note. The completion of this work would not have been possible without the support of the
many people whom I would like to thank in the following.
This thesis was kindly supported by the Helmholtz Impulse and Networking Fund through Helmholtz
Interdisciplinary Graduate School for Environmental Research (HIGRADE) and conducted at the
Department of Soil Ecology of the Helmholtz Centre for Environmental Research, Halle/Saale.
First of all, I would like to thank Prof. Dr. François Buscot as head of this Department for providing
excellent working facilities but moreover, for his support in many different ways. The same applies to my
supervisors Dr. Elke Schulz, Dr. Jessica Gutknecht, and Prof. Dr. Beate Michalzik, who I would like to
thank for their patience and encouragement as well as their reviews of my manuscripts, and constructive
criticisms improving this work.
I was lucky to have had really nice colleagues at the UfZ Halle, who helped me a lot not only in the
scientific arena, but also on a personal level: first of all, Julia Sandow – the good soul of the department
who was always helpful with administrative problems, Yvonne Eckstein, who became a good friend to
me, Stephan König, Beatrice Schnabel, Gabriele Henning, Jaqueline Rose, Renate Rudloff, Dr. Björn
Hoppe, Prof. Dr. Ingolf Kühn, and Dr. Martin Schädler, who supported me in the lab or gave me
assistance in scientific and statistical questions, and all other members of the Soil Ecology Department
for having a great time together.
Special thanks go to Dr. Ines Merbach as technical coordinator of the Experimental research station Bad
Lauchstädt.
Ohne Eure Unterstützung, Friederike, Christiane, Fanny und Anne hätte ich es wahrscheinlich nicht
geschafft, die Kraft aufzubringen, um diese Arbeit zu beenden. Vielen Dank dafür!
Ganz besonders möchte ich meiner Familie danken. Meinen beiden großartigen Mädels, die mich allein
dadurch angespornt haben ihnen ein Vorbild sein zu wollen, die aber auch oft zurückstecken mussten,
Conny und Holger, meiner Schwester, meinen Großeltern und Eltern, die alle fest an mich geglaubt und
mir so oft durch finanzielle Unterstützung, besonders in den ersten drei Jahren meiner Doktorarbeit den
Rücken freigehalten haben. Mama, ich weiß, Du wärst sehr stolz auf mich gewesen.
Thank you very much, everyone!
II
Table of Contents
Acknowledgements .......................................................................................................................... I
Table of Contents ........................................................................................................................... II
List of Tables .................................................................................................................................. V
List of Figures ............................................................................................................................... VI
List of Abbreviations .................................................................................................................. VIII
1 General introduction ....................................................................................................... 1
1.1 Carbon sequestration and stabilization of soil organic matter (SOM) .............................. 2
1.2 Functional SOM pools and measurable SOM fractions .................................................... 4
1.3 Biomarkers as tools to assess the role of soil microorganisms as source of
stabilized SOM and drivers of SOM turnover .................................................................. 7
1.4 Study site – the Static Fertilization Experiment Bad Lauchstädt .................................... 14
1.5 Objectives and thesis organization .................................................................................. 19
2 Carbon input and crop-related changes in microbial biomarker levels
strongly affect the turnover and composition of soil organic carbon ....................... 22
2.1 Introduction ..................................................................................................................... 23
2.2 Materials and methods .................................................................................................... 27
2.2.1 Study site description and sampling ................................................................................ 27
2.2.2 Chemical and physical characterization of the soil ......................................................... 29
2.2.2.1 SOC, TN and labile OC and N ........................................................................................ 29
2.2.2.2 Additional soil chemical parameters ............................................................................... 29
2.2.3 Analysis of biomarkers ................................................................................................... 30
2.2.3.1 Phospholipid fatty acids .................................................................................................. 30
2.2.3.2 Amino acids .................................................................................................................... 31
2.2.3.3 Monosaccharides ............................................................................................................. 32
2.2.3.4 Amino sugars and muramic acid ..................................................................................... 33
2.2.3.5 Gas chromatographic analysis of biomarkers and calculation of biomarker C and
N contents ....................................................................................................................... 33
III
2.2.4 Statistical analysis ........................................................................................................... 34
2.3 Results ............................................................................................................................. 35
2.3.1 Influence of crop type and fertilization on SOC, labile OC, and other abiotic
parameters ....................................................................................................................... 35
2.3.2 Biomarker C and N contents and their contributions to SOC and TN ............................ 36
2.3.3 Relationships among total and relative abundances of microbial biomarkers ................ 40
2.3.4 Relationship of biomarkers with SOC and labile OC ..................................................... 44
2.4 Discussion ....................................................................................................................... 47
2.4.1 Responses of SOC and labile OC to fertilization ............................................................ 47
2.4.2 Influence of fertilization and crop type on SOC and TN composition ........................... 47
2.4.3 The effects of fertilization and crop type on microbial biomass and OC turnover ......... 48
2.4.4 The relationships of AA, MS, and AS with microbial biomass, SOC and
labile OC ......................................................................................................................... 51
2.5 Conclusions ..................................................................................................................... 54
3 Effects of plant-symbiotic relationships on the living soil microbial
community and microbial necromass in a long-term agro-ecosystem ..................... 55
3.1 Introduction. .................................................................................................................... 56
3.2 Materials and methods .................................................................................................... 59
3.2.1 Study site description and sampling ................................................................................ 59
3.2.2 Soil parameters ................................................................................................................ 61
3.2.2.1 SOC, TN and labile OC and N ........................................................................................ 61
3.2.3 Analysis of microbial biochemical indicators ................................................................. 62
3.2.4 Root nodules and estimation of arbuscular mycorrhizal colonization rates ................... 64
3.2.5 Statistical analysis ........................................................................................................... 64
3.3 Results ............................................................................................................................. 66
3.3.1 Composition of the microbial biomass and community structure .................................. 66
3.3.2 Fungal and bacterial biomass .......................................................................................... 71
3.3.3 Legume associated symbiotic interactions with AMF and rhizobia ............................... 73
3.3.4 Fungal and bacterial necromass ...................................................................................... 76
3.4 Discussion ....................................................................................................................... 78
3.5 Conclusions ..................................................................................................................... 84
IV
4 Biomarker levels of soil organic matter fractions indicate long-term
fertilization effects on C stabilization and turnover ....... ………………………85
4.1 Introduction .......... …………………………………………………………………86
4.2 Materials and Methods ......... ………………………………………………………89
4.2.1 Study site description and sampling ......... …………………………………………89
4.2.2 Soil-fractionation.......... ……………………………………………………………91
4.2.3 SOC, TN and labile OC and N ..... …………………………………………………92
4.2.4 Biomarker analysis ....... ……………………………………………………………93
4.2.5 Calculation of carbon enrichment factors (ESOC-fraction, EHWC, EAA-C,
EAS-C, EMS-C, EPLFA-C) ................ …………...………………………………………94
4.2.6 Statistical analysis .................................................................................................... 95
4.3 Results .............. ……………………………………………………………………95
4.3.1 SOC, TN and labile OC and N ............. ……………………………………………95
4.3.2 ESOC-fraction, EHWC, and Ebiomarker-C ............. …………..……………………………100
4.3.3 Biomarker levels and biomass composition of SOM fractions .. …………………100
4.4 Discussion ...... ……………………………………………………………………106
4.5 Conclusion ......... …………………………………………………………………108
5 Synthesis and Conclusion .... ……………………………………………………110
5.1 Influence of fertilization on the stable/stabilized SOM pool . ……………………111
5.2 Influence of fertilization on the decomposable/labile SOM pool .. ………………112
5.3 Overall conclusion and research perspectives.... …………………………………115
6 Summary ............................................................................................................... 117
7 Kurzzusammenfassung .......................................................................................... 122
8 References .............................................................................................................. 128
9 Author Contributions ............................................................................................. 142
10 Erklärungen ............................................................................................................ 144
V
List of Tables
Table 1: Origin, interpretation, and relevance for SOM of frequently used biomarkers ........................... 10
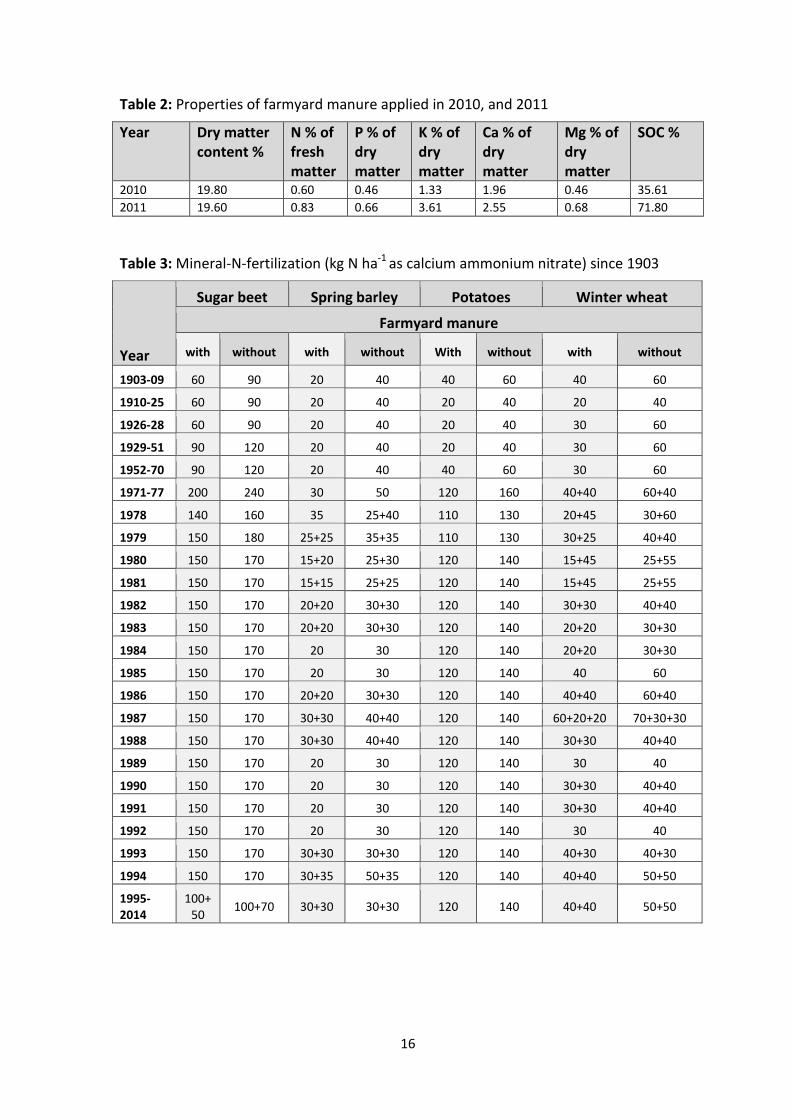
Table 2: Properties of farmyard manure applied in 2010, and 2011 .......................................................... 16
Table 3: Mineral-N-fertilization (kg N ha-1 as calcium ammonium nitrate) since 1903 .............................. 16
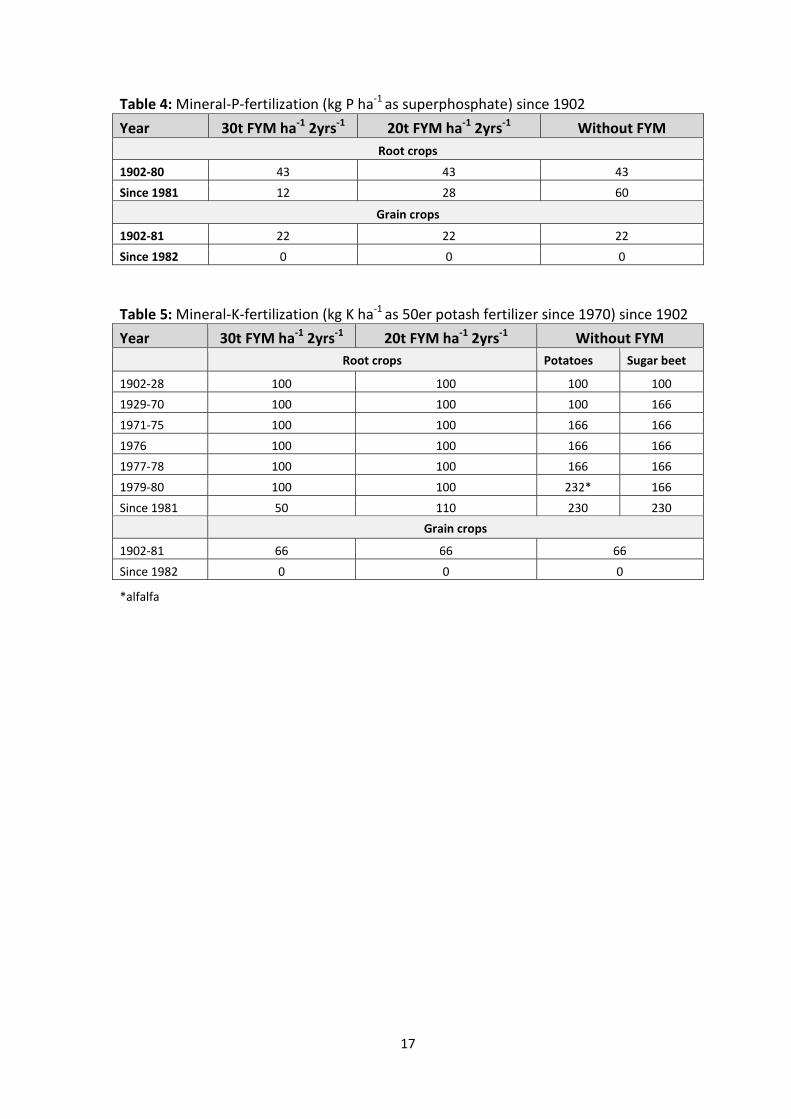
Table 4: Mineral-P-fertilization (kg P ha-1 as superphosphate) since 1902 ................................................. 17
Table 5: Mineral-K-fertilization (kg K ha-1 as 50er potash fertilizer since 1970) since 1902 ....................... 17
Table 6: Abiotic and physical soil properties under the studied treatments .............................................. 36
Table 7: C and N contents of individual biomarkers (mg kg-1 soil) under the studied treatments for
both crop types ........................................................................................................................................... 38
Table 8: Relationships between amino acid-, monosaccharide-, and amino sugar carbon and carbon
from microbe-derived phospholipid fatty acids among treatments involving exclusively organic
fertilization (NIL, FYM1, FYM2) and mineral fertilized treatments (NPK, FYM1+NPK, FYM2+NPK) for
both crop types. .......................................................................................................................................... 40
Table 9: Monosaccharide C6:C5 (mannose + galactose) / (xylose + arabinose) and deoxyC6:C5
(rhamnose + fucose)/(xylose + arabinose) ratios for the studied treatments. .......................................... 43
Table 10: Relationships of biomarker C with the SOC and labile OC (HWC) under treatments involving
exclusively organic fertilization (NIL, FYM1, FYM2) and mineral fertilization (NPK, FYM1+NPK,
FYM2+NPK) for both crop types. ................................................................................................................. 46
Table 11: Output of the function envfit showing the relationship between the investigated abiotic
parameters and the first and second axes of phospholipid nonmetric multidimensional scaling
(NMDS) scores ............................................................................................................................................. 68
Table 12: Similarity percentage analysis (SIMPER) of microbial related fatty acid contribution to the
dissimilarity between the investigated crop rotation types (n=2) and treatments (n=6). ......................... 70
Table 13: P-values of two-way analysis of variance (ANOVA) determining the effects of farmyard
manure, mineral fertilizer as well as their interaction on the lipid biomass of certain taxonomic
groups (nmol lipid g dry soil-1), on the ratio of fungal to bacterial and Gram-negative to Gram-positive
biomass ........................................................................................................................................................ 72
Table 14: PLFA biomass of different microbial groups, ratios of Gram-negative to Gram-positive
bacteria, and fungal to bacterial biomass in comparison to amino sugar ratios indicating the fungal
and bacterial contribution to SOM .............................................................................................................. 73
Table 15: Ratios of neutrallipid- to phospholipid- (NLFA/PLFA) key indicator fatty acids 16:1ω5c (AMF
= arbusculuar mycorrhizal fungi) and 18:2ω6,9c (general fungi) and AMF root colonization (%).............. 75
Table 16: Contents of total and labile C and N of bulk soil and soil fractions for the fertilized and non-
fertilized soil, including the proportion of each fraction on bulk soil regarding mass and C content ........ 98
Table 17: Enrichment factors for total and labile C and N as well as for biomarker C and N of each
fraction in response to fertilization ............................................................................................................. 99
Table 18: Changes in the relative abundances of microbial taxa indicated by key indicator PLFA in
response to fertilization. Differences between FM and NIL samples were highly significant for all taxa
(p<0.001). .................................................................................................................................................. 105
VI
List of Figures
Figure 1: Overview of different soil fractions (chemical: CWE and HWE; physical: Free POM, LF1, LF2, CF1, CF2) as well as biomarkers (PLFA, neutral sugars, amino sugars, amino acids) extracted from bulk soil representing related SOM pools. ................................................................. 13
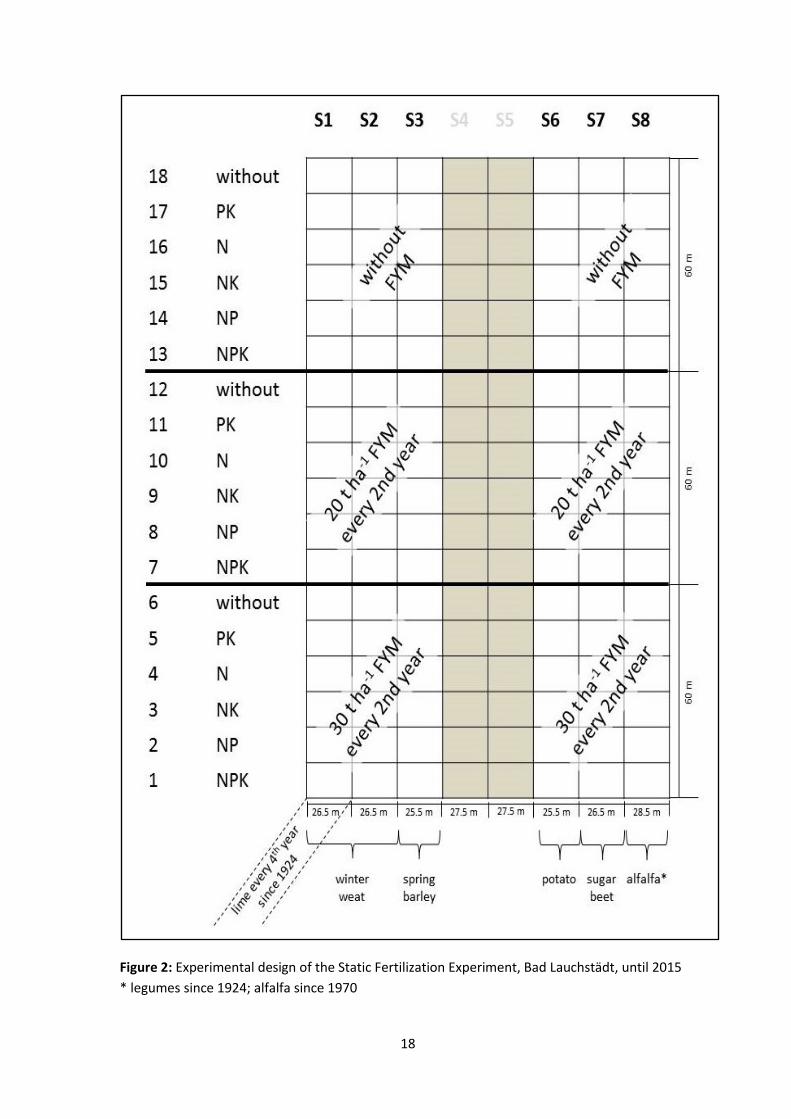
Figure 2: Experimental design of the Static Fertilization Experiment, Bad Lauchstädt, until 2015 ..................................................................................................................................................... 18
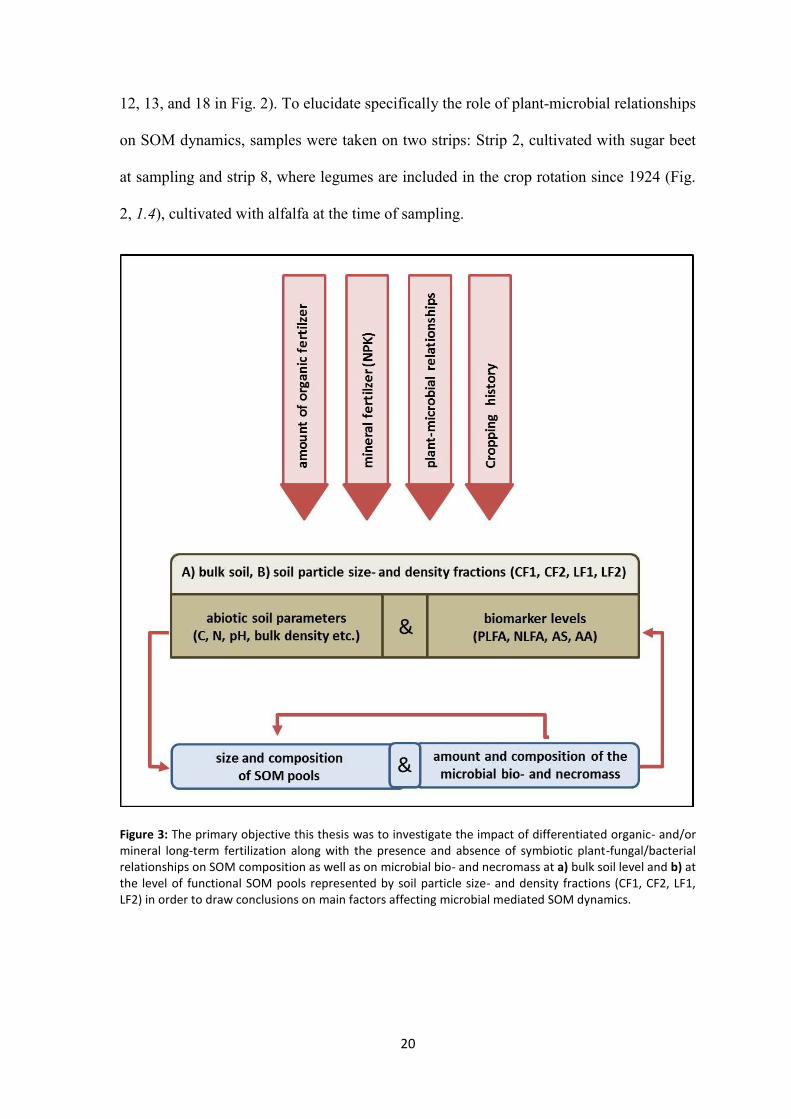
Figure 3: The primary objective this thesis was to investigate the impact of differentiated organic- and/or mineral long-term fertilization along with the presence and absence of symbiotic plant-fungal/bacterial relationships on SOM composition as well as on microbial bio- and necromass at a) bulk soil level and b) at the level of functional SOM pools represented by soil particle size- and density fractions (CF1, CF2, LF1, LF2) in order to draw conclusions on main factors affecting microbial mediated SOM dynamics. ..................................... 20
Figure 4: Contributions of individual biomarkers and combined biomarker groups (ΣCbiomarker and ΣNbiomarker) to SOC and TN for each fertilization regime and crop type. a+c) alfalfa strip; b+d) sugar beet strip. Bars labelled with different letters correspond to values of ΣCbiomarker and ΣNbiomarker that differ significantly according to Tukey´s honestly significant difference test (P<0.05). Multiple comparisons of means were conducted separately for each strip. ..................................................................................................................... 39
Figure 5: Ratios of amino acid (a+b) and monosaccharide carbon (c+d), respectively, to phospholipid fatty acid carbon for each studied treatments in both strips. a+c) alfalfa strip; b+d) sugar beet strip. Bars labelled with different letters correspond to values that differ significantly according to Tukey´s honestly significant difference test (P<0.05). Multiple comparisons of means were conducted separately for each strip. ................................................... 42
Figure 6: Ratios of amino sugar carbon to microbial carbon for each studied treatment in both strips. a) alfalfa strip; b) sugar beet strip. Bars labelled with different letters correspond to values that differ significantly according to Tukey´s honestly significant difference test (P<0.05). Multiple comparisons of means were conducted separately for each strip. ..................... 43
Figure 7: Total (mg kg soil-1) and relative abundances of meso-Diaminopimelic acid (% of the
sum of all determined amino acids) for each studied treatment in both strips. a+c) alfalfa
strip; b+d) sugar beet strip. Bars labelled with different letters correspond to values that
differ significantly according to Tukey´s honestly significant difference test (P<0.05). Multiple
comparisons of means were conducted separately for each strip. .................................................... 44
Figure 8 NMDS ordination of total phospholipid profiles based on relative abundances of all
determined PLFAs from the investigated treatments on both rotation types. Fitted
environmental variables: pH; CWC = cold water extractable carbon (mg kg-1); CWN = cold
water extractable nitrogen (mg kg-1); NH4+ = ammonia (mg kg-1); NO3
- = nitrate (mg kg-1).
Treatment labels: FYM2+NPK = 30t manure ha-1 2yrs-1 plus mineral fertilizer; FYM2 = 30t
manure ha-1 2yrs-1; FYM1+NPK = 20t manure ha-1 2yrs-1 plus mineral fertilizer; FYM1 = 20t
VII
manure ha-1 2yrs-1; NPK = mineral fertilizer; NIL = unfertilized control. Stress (according to
Clarke, 1993): <0.05 = excellent, <0.10 = good, <0.20 = usable, >0.20 = not acceptable ................... 67
Figure 9: Effect of fertilization on nodule formation (number of nodules) on roots of Alfalfa, determined at the end of the cultivation period. Treatment labels: FYM2+NPK = 30t manure ha-1 2yrs-1 plus mineral fertilizer; FYM2 = 30t manure ha-1 2yrs-1; FYM1+NPK = 20t manure ha-1 2yrs-1 plus mineral fertilizer; FYM1 = 20t manure ha-1 2yrs-1; NPK = mineral fertilizer; NIL = unfertilized control. Error bars represent standard errors. Different letters in each column represent significant differences according to Tukey´s honestly significant difference tests (P<0.05). .............................................................................................................................................. 74
Figure 10: Total amounts of GluN (glucosamine), GalN (galactosamine), ManN (mannosamine) and MurA (muramic acid) (mg kg-1) in the investigated treatments and rotation types. a) ManN and MurA in the rotation type cultivated with Alfalfa; b) ManN and MurA in the rotation type cultivated with Sugar beet; c) GluN and GalN in the rotation type cultivated with Alfalfa; d) GluN and GalN in the rotation type cultivated with Sugar beet. Treatment labels: FYM2+NPK = 30t manure ha-1 2yrs-1 plus mineral fertilizer; FYM2 = 30t manure ha-1 2yrs-1; FYM1+NPK = 20t manure ha-1 2yrs-1 plus mineral fertilizer; FYM1 = 20t manure ha-1 2yrs-1; NPK = mineral fertilizer; NIL = unfertilized control. Error bars represent standard errors. Different letters in each column represent significant differences according to Tukey´s honestly significant difference tests (P<0.05). .................................................................. 77
Figure 11: Percentage of the A) total OC and B) total N of each fraction explained by the C and N of the extracted biomarkers (AA, AS, MS, PLFA). ..................................................................... 97
Figure 12: Effect of fertilization on the distribution of biomarker-C within a fraction; % of biomarker compound class on total biomarker-C (=sum of AA-C, AS-C, MS-C). PLFA-C not included since it was not determined for the light fractions and contributes <1% to the clay fractions (FM-CF1 = 0.43%, FM-CF2 = 0.97%, NIL-CF1 = 0.38%, NIL-CF2 = 0.55%). Bars labelled with different letters correspond to values of biomarker-C that differ significantly according to Tukey´s honestly significant difference test (P<0.05). .................................................................. 101
Figure 13: Effect of fertilization on the ratio of of individual SOM pools. Bars labelled with different letters correspond to C6:C5 ratios that differ significantly according to Tukey´s honestly significant difference test (P<0.05). .................................................................................... 103
Figure 14: Ratio of A) GalN : MurA, and B) GluN : MurA of different SOM pools as affected by fertilization. Bars labelled with different letters indicate significant differences according to Tukey´s honestly significant difference test (P<0.05). ...................................................................... 104
VIII
I. List of Abbreviations
AA amino acids
actino actinomycetes
AM, AMF arbuscular mycorrhizal fungi
ANOVA analysis of variance
Ara Arabinose
AS amino sugars
bac Bacterial
BSTFA N,O-Bis(trimethylsilyl)trifluoroacetamide
CF1 clay fraction <1 µm
CF2 clay fraction 1-2 µm
CWC cold water extractable carbon
CWE cold water extracts
CWN cold water extractable nitrogen
DAP meso-Diaminopimelic acid
DFG German Science Foundation
DOM dissolved organic matter
FA fatty acid
FAO Food and Agriculture Organization of the United Nations
Fuc Fucose
fung Fungal
FYM farmyard manure
Gal Galactose
GalN Galactosamine
GC/MS Gas chromatography mass spectrometry
GF general fungi
GHG greenhouse gas
GluN Glucosamine
Gm- Gram-negative bacteria
Gm+ Gram-positive bacteria
IX
HWC hot water extractable carbon
HWE hot water extracts
HWN hot water extractable nitrogen
IPCC Intergovernmental Panel on Climate Change
LF1 light fraction <1.8 g cm-3
LF2 light fraction 1.8-2.0 g cm-3
Man Mannose
ManN Mannosamine
MS Monosaccharides
MurA muramic acid
NLFA neutrallipid fatty acids
NMDS Nonmetric Multidimensional Scaling
OBS organische Bodensubstanz
OM organic matter
PLFA phospholipid fatty acids
POM particulate organic matter
Py-FIMS pyrolysis-field ionization mass spectrometry
Py-GC/MS pyrolysis-gas chromatography mass spectrometry
Rham Rhamnose
SFEBL Static Fertilization Experiment Bad Lauchstädt
SOC soil organic carbon
SOM soil organic matter
TC total carbon
t-FA total fatty acids
USDA United States Department of Agriculture
Xyl Xylose
1
1. General introduction
Around 10.000 years BC, agriculture commenced independently in different parts of the
globe along with the rise of sedentary societies. The following centuries were marked by
rapid growth of the human population, accompanied by an intensified conversion of natural
into cultivated land for food production. Today over one third of land on earth is in
agriculture (WorldBank 2015). Still 100 years ago, developments of agricultural techniques
and practices focused mainly on the optimization of crop yields. In contrast, the todays
understanding of a modern agriculture includes a sustainable use of the soil in order to ensure
soil quality and thus, the ability of soil to perform a broad range of ecosystem services
besides of food production. One of the soil functions being of global importance is the ability
to act as a sink or source for atmospheric CO2 and other greenhouse gases. According to the
Intergovernmental Panel on Climate Change (IPCC), substantial reductions in anthropogenic
carbon and greenhouse gas (GHG) emissions only will not be sufficient to ensure levels of
atmospheric CO2, low enough to mitigate the global climate change. In addition, further
efforts are necessary to achieve a re-sequestration of previously emitted carbon following the
intensification of land use (Smith et al. 2014).
It is undeniable that any conversion of natural into cultivated land leads first to a drastic
decrease in soil organic carbon (SOC) stocks and a release of high amounts of CO2 (Van
Wesemael et al. 2010; Wei et al. 2014). However, once changed, even an agricultural soil
bears great potential to act as carbon sink. According to Lal (2004) up to 0.8 Gtons C per
year can be sequestered at a global scale in cropland soils, while there is a broad range of
estimates across the literature depending on the management practice used (Conant et al.
2001; Jarecki and Lal 2003; Lal et al. 2003).
2
1.1. Carbon sequestration and stabilization of soil organic matter (SOM)
In principle, an increase of SOC-levels can be achieved either by increasing the amount of
organic matter entering the soil and/or by reducing the microbial degradation of soil organic
matter (SOM), which represents the total organic content of a soil. SOM is a heterogeneous
mixture of simple as well as complex organic material, originating from different sources,
such as plant root debris, root exudates, organic fertilizers, or soil dwelling organisms.
Beside of this, SOM is also heterogeneously regarding its age, its degree of disintegration,
and its bioavailability, which is standing, in turn, directly in relation to the mechanisms
responsible for C-stabilization in soil. Lützow et al. (2006) defined three mechanisms of
SOM stabilization in soil:
a) primary/secondary recalcitrance,
b) spatial inaccessibility
c) interactions with surfaces and metal ions.
Recalcitrance describes the stabilization of organic matter based on its intrinsic biochemical
properties, whereas this does not mean that an organic compound is not decomposable at all.
Recalcitrance is characterized by long turnover times, while in some cases degradation is
even only possible in presence of specific degraders or under specific environmental
conditions. Degradability can be hampered based on the molecular structure, for example by
the presence of one or more aromatic rings, ether-bridges, quaternary C-atoms, halogen
substituents or increased molecule size (Loonen et al. 1999; Lützow et al. 2006). Thus,
organic polymers or molecules containing long chains of hydrophobic hydrocarbons show
3
longer turnover times than simple organic molecules. Besides of that, some organic
compounds can resist degradation by inhibiting enzymatic activities due to complexation
with degradation enzymes (Dungait et al. 2012). While Lützow et al. (2006) refer primary
recalcitrance exclusively to the above- and belowground plant material, such as plant litter
and rhizodeposits, this can be in principle extended on the original form of all organic matter,
which is entering the soil, i.e. also on non-herbal ingredients of organic fertilizers or on
pesticides. Once being in soil, organic material can be transformed via biological (synthesis
of biomass) or chemical processes (f.ex. Maillard reaction, polycondensation) into new
organic compounds, which can resist degradation due to the same reasons as mention above,
possessing now secondary recalcitrance. It should be noted, that recalcitrance is increasingly
considered to fail as a concept in understanding SOM stability, since it was shown that even
simple and decomposable organic molecules contribute to very old SOM in soils, while on
the other hand “recalcitrant” compounds, such as lignin, were found in fast cycling fractions
of SOM (Derrien and Amelung 2011; Dungait et al. 2012; Jenkinson et al. 2008). Following
Kleber (2010), recalcitrance is not more than a semantic convenience, since degradability is
always based on the interaction between the organic compound and the microbial degrading
enzyme, whereas this interaction is controlled by a number of abiotic factors, resulting in a
wide range of possible turnover rates for one and the same organic compound under different
environmental conditions.
Spatial inaccessibility comprises all cases where organic matter is protected from
degradation due to physical barriers, preventing access of microbial enzymes to their
substrates. Thereby, the spatial isolation of organic matter can be based on intercalation
within phyllosilicates, its inclusion into organic macromolecules or its entrapment within
4
organo-mineral complexes in form of aggregates. Soil aggregation is assumed to follow an
hierarchical order, starting with the formation of microaggregates by adherence of clay-
particles and silt-aggregates (<20µm), which is strongly mediated by organic binding agents,
such as fungal glomalin, microbial polysaccharides, or plant mucilage (Czarnes et al. 2000;
Oades 1984; Spohn and Giani 2010). Besides of the mentioned binding agents, fungal
hyphae or plant roots support further agglomeration of microaggregates, leading to the
formation of macroaggregates (> 250µm), which provide only a minimal amount of physical
protection and are susceptible against disturbances, such as tillage, than microaggregates (Six
et al. 2004).
Interactions with surfaces and metal ions hamper the microbial degradation of organic
compounds by reducing their bioavailability. OM can interact with mineral particles or
metals as well as with other OM in several ways, which differ regarding reversibility and
bonding force. In opposite to the temporary adsorption of OM via ionic interactions,
hydrogen bonding, charge-transfer, ligand exchange, van-der-Waals forces, and hydrophobic
bonding, the covalent bonding, resulting in ether, ester, or carbon–carbon linkages, is
considered very stable and almost irreversible (Kästner et al. 2014; Senesi 1992). Beside of
chemical catalysis and radical reactions, microbial enzymes can act as mediators of covalent
bonding (Gevao et al. 2000; Senesi 1992).
1.2. Functional SOM pools and measurable SOM fractions
The decay of organic matter is generally assumed to follow first order kinetics, where the
transformation rate is proportionally to the substrate concentration. However, turnover rates
are altered by the different mechanisms of OM stabilization as mentioned above. Already the
5
fact that simple and easily degradable components, such as neutral sugars can be degraded in
soil within of hours but can also resist mineralization for hundreds of years (Derrien et al.
2006; Fischer et al. 2010) implies that OM decomposition in soil cannot be described by only
one equation or turnover rate. Thus, conceptual models describing SOM dynamics
differentiate at least three functional SOM pools - a labile, intermediate, and passive SOM
pool - each possessing an own turnover rate based on the underlying stabilization
mechanisms (Six et al. 2002). In order to investigate SOM pool dynamics it is necessary to
characterize size and composition of separated SOM fractions as proxy for functional SOM
pools, which led to the development of a range of chemical and/or physical fractionation
methods over the past decades. Chemical fractionation methods, such as mild oxidation,
hydrolysis using weak acids as well as cold and hot-water extraction (CWE, HWE) are
commonly used as proxy for labile SOM pools (Landgraf et al. 2006). Introduced in the
1980s, cold water-extraction methods deliver SOM which largely corresponds to the
dissolved organic matter fraction (DOM) collected in situ (Kalbitz et al. 2007). Dissolved
organic matter is defined as organic matter that pass through a filter size of <0.45 µm and is
transported in soil solution (Kalbitz et al. 2000), consequently serving as important energy
source for microorganisms even in the soil subsurface. Cold water extracted DOM comprises
low as well as high-molecular weight compounds and is thermally more stable than DOM
gained from a hot-water extraction. The hot water extracted fraction, in turn, is dominated by
carbohydrates, lignin- and phenol-monomers and is considered to represent a pool of easily
decomposable SOM (Landgraf et al. 2006; Schulz 2004).
While chemical fractionation methods are primarily useful to isolate mineral-particle free
fractions of easily decomposable (Schulz and Körschens 1998) up to very old and stable
6
SOM (Helfrich et al. 2007), physical fractionation methods allow elucidating the effects of
interactions between OM and the soil mineral matrix on SOM dynamics (Christensen 2001).
Physical fractionation using density or size separation provide chemically less altered
fractions, representing uncomplexed OM or organomineral associations of various sizes,
respectively. Labile SOM can be assessed successfully by particulate organic matter (POM)
fractions, densiometrically obtained using liquid mixtures based on polytungstates, iodates,
or bromoform/ethanol mixtures with densities of 1.6 – 2.0 g cm-3
(Gregorich et al. 2006;
Lützow et al. 2006). POM represents uncomplexed, free or occluded and hence, physically
protected SOM, which is not or only less associated with minerals. Whereas labile SOM in
temperate arable soils is generally characterized by intermediate to high turnover rates, the
stable/stabilized SOM pool is associated with half-live times from decades to centuries. The
major part of SOM is present in the stable/stabilized pool, bound to clay- (50-75%) and silt-
sized (20-40%) particles. Physical separation of the soil enables to measure stable SOM by
providing primary and secondary complexed SOM, depending on the applied method and
degree of dispersion. Thus, secondary complexed SOM can be obtained by sieving into
micro- (< 250 μm) and macroaggregates (> 250 μm) (Denef et al. 2010). Complete
dispersion of the soil, for example using ultrasonication, allows the separation of primary
complexed SOM, comprising SOM associated with clay- and silt sized particles and smallest
microaggregates (Lützow et al. 2006; Schulz 2004; Shaymukhametov et al. 1985).
In the present work, a size-density fractionation approach was used in order to investigate the
labile, intermediate and stable SOM pool, respectively (Fig. 1). The applied method was
devised by Shaymukhametov et al. (1985) and later modified by Schulz (2004). Two
particle-size fractions were gained by repeated ultrasonic treatment followed by two
7
centrifugation steps: 1.) CF2 with a diameter of 1-2 µm; still containing OM entrapped
within smallest microaggregates; 2.) CF1 with a diameter < 1 µm; representign OM bound on
primary and secondary clay particles (Lützow et al. 2006; Totsche et al. 2018). By
subsequent density-fractionation OM was separated, which was formerly occluded in small
to large microaggregates (> 2-250 µm diameter) and released by the ultrasonic treatment.
These so called “light” fractions were obtained using two density mixtures of bromoform
(tribrommethane)/ethanol. The LF1, with a density of < 1.8 g cm-3
, thereby contains mineral
free OM, whereas some of the OM within the LF2 (1.8-2.0 g cm-3
) is loosely associated with
Fe- and Al-oxides or hydroxides.
1.3. Biomarkers as tools to assess the role of soil microorganisms as source of
stabilized SOM and drivers of SOM turnover
Soil microorganisms play a key role in soil genesis and soil functioning. They are the main
drivers of nutrient cycling as well as of energy and matter fluxes in soil. Besides, they are
contributing to the formation of soil aggregates, which, in turn, alters soil physical conditions
and promotes C-stabilization (Buscot and Varma 2005). The soil dwelling microbiota also
influence plant growth by a range of plant-microbial relationships (e.g. symbiosis or
parasitism) or simply by controlling SOM turnover and thus, the availability of mineral
nutrients (Caravaca et al. 2015; Wardle et al. 2004). For a long time, microbial contribution
to SOM was estimated to correspond to the amount of living microbial biomass C, making up
around 1-5% of total SOC (Jenkinson and Ladd 1981). However, during the past two decades
it became increasingly apparent that the proportion of microbial derived SOM must be much
higher. Currently, it is estimated that up to 80% of the organic C in soils is of microbial
8
origin, representing transformed and non-transformed residues of the microbial biomass and
metabolism (Liang et al. 2011; Miltner et al. 2011).
This finding would not have been made without the analysis of biomarkers, representing
organic components of microbial cells and useful tools in order to elucidate the fate of
organic C along the soil foodweb. First evidence for a significant contribution of microbial
biomass C to the pool of stabilized SOM was gained from studies investigating the
decomposition of 14
C-labeled environmental contaminants (e.g. phenanthrene, anthracene)
(Kästner et al. 1999; Richnow et al. 1999). In these studies, a part of the C-label was found to
be incorporated in fatty and amino acids extracted from the soil residue after performance of
alkaline hydrolysis. Outgoing from this, Kindler et al. (2006) intended to elucidate the
contribution of microbial residues to SOM using isotopically (13
C) and genetically (lux gene)
labeled E. coli cells in a mesocosm experiment. Phospholipid fatty acids (PLFA) and total
fatty acids (t-FA) were used as biomarkers in order to assess 13
C-enrichment within the living
microbial biomass and C of non-living, stabilized SOM, respectively (Kindler et al. 2009).
Besides, also the fate of microbial derived amino acids was investigated (Miltner et al. 2009).
The results showed that only 56% of the introduced C was mineralized, while around one
fourth of the remaining C was associated with the indigenous microbial biomass or stabilized
with SOM, respectively.
Incorporation of plant derived organic material into bacterial biomass was also proven on
amino sugars and muramic acid, which were found to accumulate with ongoing
decomposition of plant litter (Amelung et al. 2001b). Since amino sugars are contained in
plants only in negligible amounts and persist after microbial cell lysis, these biomarkers are
suitable tools to investigate the fate of microbial necromass derived C and N. The fact that
9
muramic acid exclusively occurs in bacteria, additionally allows to roughly differentiate
between bacterial and fungal derived C (Joergensen and Wichern 2008). Furthermore, the
simultaneous analysis of the microbial biomass based on f.ex. chloroform-fumigation
extraction, or PLFA-extraction, supported the hypothesis that organic matter derived from
dead fungi or bacteria largely exceeds the proportion representing living microbial biomass.
Thus, calculations by Appuhn and Joergensen (2006) suggested that around 50% of SOM in
the rhizosphere soil of a pot experiment was dead matter of bacteria and fungi, while only
6% was attributed to the microbial biomass.
Finally, also discrimination between plant and bacterial SOC is possible using neutral sugars.
The composition of plant and microbial saccharides in soil differs from one another
regarding the contained monosaccharides. Hexoses and deoxy-hexoses are predominately
synthesized by microorganisms, while pentoses are more frequent in plant material. The
commonly observed shift from plant to microbial derived saccharides in soil along with
decomposition of exogenous substrates, and the fact that fine fractions frequently show
higher hexose-to-pentose ratios than coarse fractions also supports the transformation of
plant into microbial SOM and its subsequent stabilization in soil (Kiem and Kögel-Knabner
2003; Murayama 1984).
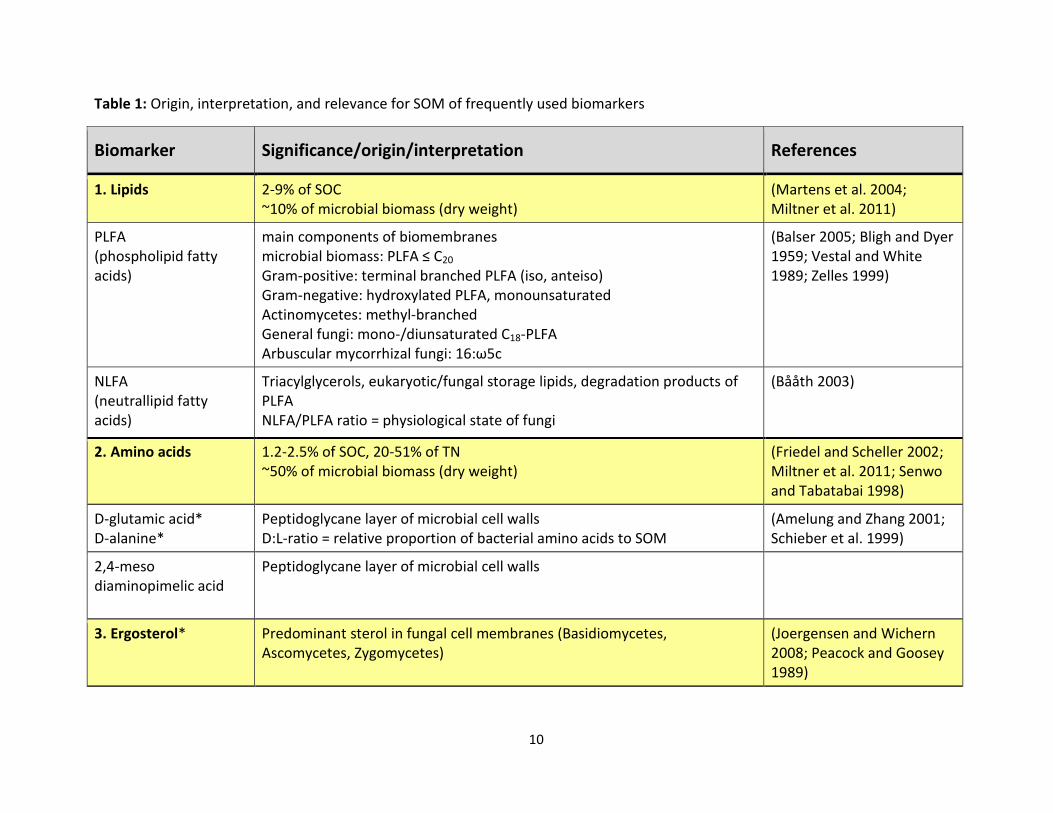
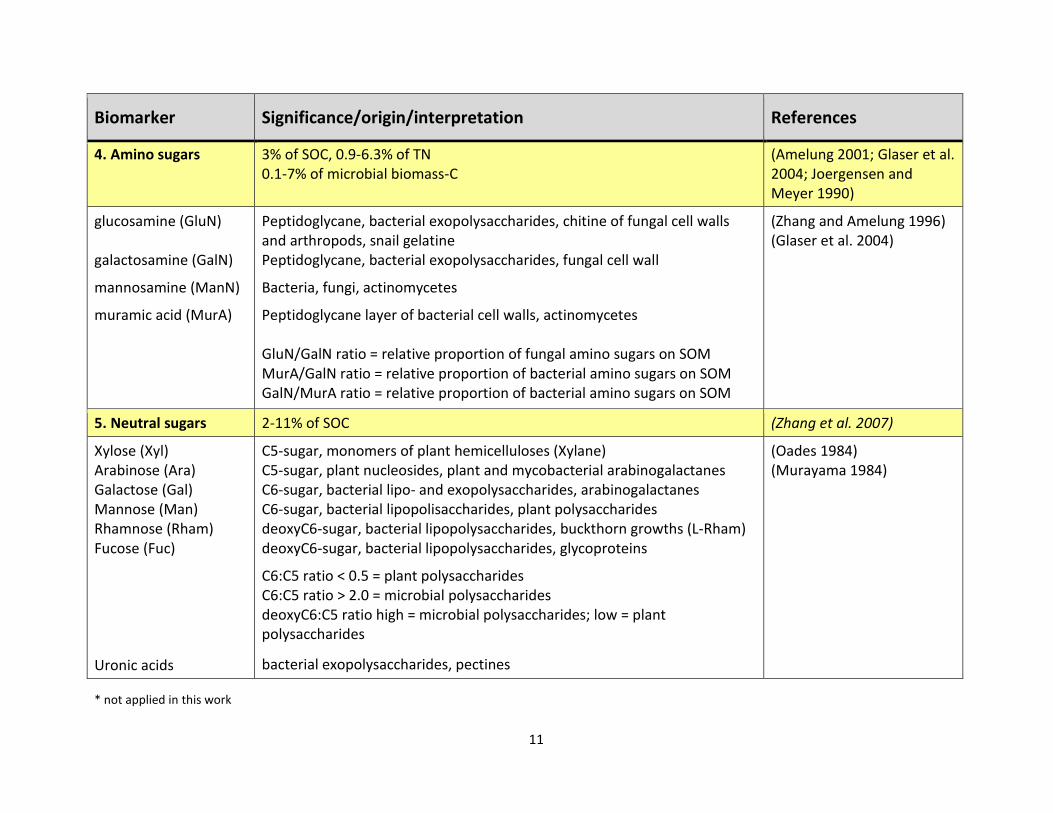
Table 1 provides an overview about origin, interpretation, and relevance for SOM of the most
frequently used biomarkers.
10
Table 1: Origin, interpretation, and relevance for SOM of frequently used biomarkers
Biomarker Significance/origin/interpretation References
1. Lipids 2-9% of SOC ~10% of microbial biomass (dry weight)
(Martens et al. 2004; Miltner et al. 2011)
PLFA (phospholipid fatty acids)
main components of biomembranes microbial biomass: PLFA ≤ C20 Gram-positive: terminal branched PLFA (iso, anteiso) Gram-negative: hydroxylated PLFA, monounsaturated Actinomycetes: methyl-branched General fungi: mono-/diunsaturated C18-PLFA Arbuscular mycorrhizal fungi: 16:ω5c
(Balser 2005; Bligh and Dyer 1959; Vestal and White 1989; Zelles 1999)
NLFA (neutrallipid fatty acids)
Triacylglycerols, eukaryotic/fungal storage lipids, degradation products of PLFA NLFA/PLFA ratio = physiological state of fungi
(Bååth 2003)
2. Amino acids
1.2-2.5% of SOC, 20-51% of TN ~50% of microbial biomass (dry weight)
(Friedel and Scheller 2002; Miltner et al. 2011; Senwo and Tabatabai 1998)
D-glutamic acid* D-alanine*
Peptidoglycane layer of microbial cell walls D:L-ratio = relative proportion of bacterial amino acids to SOM
(Amelung and Zhang 2001; Schieber et al. 1999)
2,4-meso diaminopimelic acid
Peptidoglycane layer of microbial cell walls
3. Ergosterol*
Predominant sterol in fungal cell membranes (Basidiomycetes, Ascomycetes, Zygomycetes)
(Joergensen and Wichern 2008; Peacock and Goosey 1989)
11
Biomarker Significance/origin/interpretation References
4. Amino sugars 3% of SOC, 0.9-6.3% of TN 0.1-7% of microbial biomass-C
(Amelung 2001; Glaser et al. 2004; Joergensen and Meyer 1990)
glucosamine (GluN) galactosamine (GalN)
mannosamine (ManN)
muramic acid (MurA)
Peptidoglycane, bacterial exopolysaccharides, chitine of fungal cell walls and arthropods, snail gelatine Peptidoglycane, bacterial exopolysaccharides, fungal cell wall
Bacteria, fungi, actinomycetes
Peptidoglycane layer of bacterial cell walls, actinomycetes GluN/GalN ratio = relative proportion of fungal amino sugars on SOM MurA/GalN ratio = relative proportion of bacterial amino sugars on SOM GalN/MurA ratio = relative proportion of bacterial amino sugars on SOM
(Zhang and Amelung 1996) (Glaser et al. 2004)
5. Neutral sugars 2-11% of SOC (Zhang et al. 2007)
Xylose (Xyl) Arabinose (Ara) Galactose (Gal) Mannose (Man) Rhamnose (Rham) Fucose (Fuc) Uronic acids
C5-sugar, monomers of plant hemicelluloses (Xylane) C5-sugar, plant nucleosides, plant and mycobacterial arabinogalactanes C6-sugar, bacterial lipo- and exopolysaccharides, arabinogalactanes C6-sugar, bacterial lipopolisaccharides, plant polysaccharides deoxyC6-sugar, bacterial lipopolysaccharides, buckthorn growths (L-Rham) deoxyC6-sugar, bacterial lipopolysaccharides, glycoproteins
C6:C5 ratio < 0.5 = plant polysaccharides C6:C5 ratio > 2.0 = microbial polysaccharides deoxyC6:C5 ratio high = microbial polysaccharides; low = plant polysaccharides
bacterial exopolysaccharides, pectines
(Oades 1984) (Murayama 1984)
* not applied in this work
12
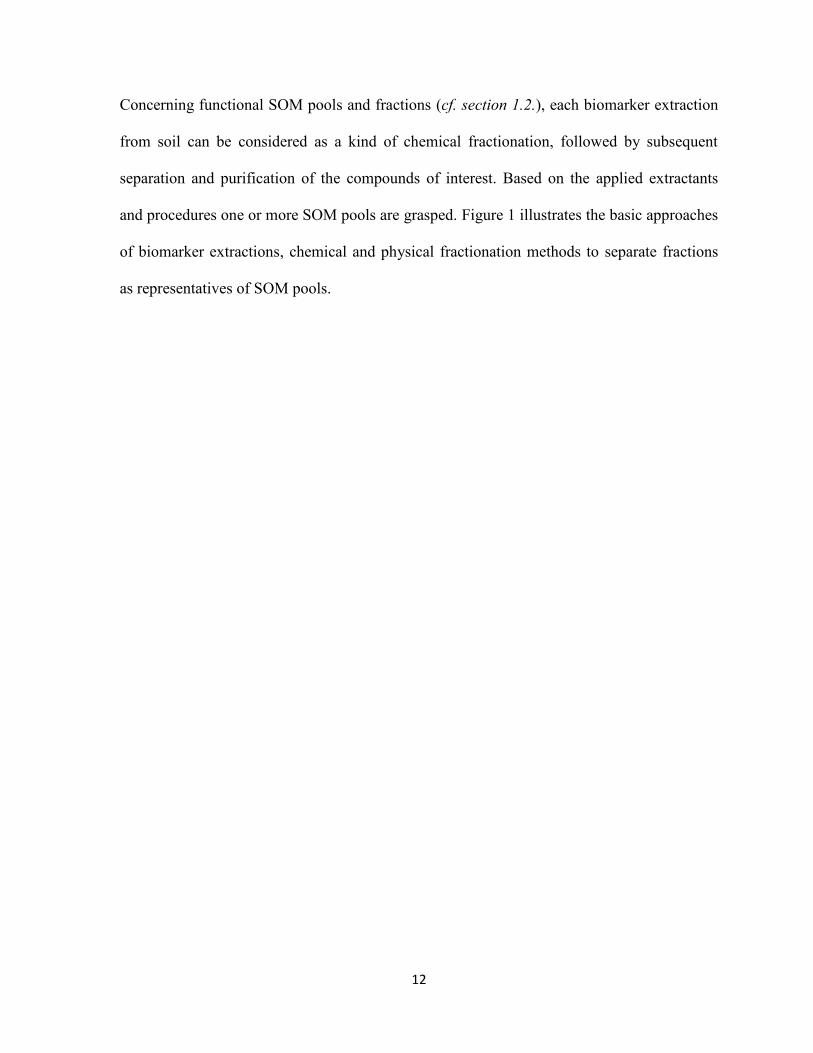
Concerning functional SOM pools and fractions (cf. section 1.2.), each biomarker extraction
from soil can be considered as a kind of chemical fractionation, followed by subsequent
separation and purification of the compounds of interest. Based on the applied extractants
and procedures one or more SOM pools are grasped. Figure 1 illustrates the basic approaches
of biomarker extractions, chemical and physical fractionation methods to separate fractions
as representatives of SOM pools.
13
Figure 1: Overview of different soil fractions (chemical: CWE and HWE; physical: Free POM, LF1, LF2, CF1, CF2) as well as biomarkers (PLFA, neutral sugars, amino sugars, amino acids) extracted from bulk soil representing related SOM pools.
14
1.4. Study site – the Static Fertilization Experiment Bad Lauchstädt
Soil is not a homogenous system but highly variable regarding its chemical and physical
properties over time and space. Since soil processes run very slowly, significant changes
can be quantified often only after decades. In long-term experiments, the spatial
heterogeneity gets reduced due to the constant treatment for many years, resulting in a
dynamic equilibrium of formation and degradation of SOM. This, in turn, provides an
ideal experimental background to study effects on SOM pools and their dynamics.
The Static Fertilization Experiment Bad Lauchstädt (SFEBL) is one of the ten oldest
long-term field experiments in the world with duration of more than100 years.
Established in 1902, the experiment serves as suitable platform to investigate the
responses of soil quality and fertility to a differentiated organic and mineral fertilization
remaining consistent over a long-term. The soil is classified as Haplic Chernozem (FAO),
characterized by high natural soil fertility at an average SOM content of 3.5% (2.0%
SOC). Situated in the climatic region of the Börde and Central German continental
climate, the typical annual temperature of this area lies between 8.5 and 9.0°C on average.
The average annual precipitation is 470-540 mm, reaching its maximum between June
and August. The experiment comprises eighteen different fertilization treatments
including the unfertilized control (Fig. 2). These treatments represent: Three levels of
organic fertilization (without, 20t FYM ha-1
2yrs-1
and 30t FYM ha-1
2yrs-1
), six different
treatments of mineral fertilizers (without, PK, N, NK, NP, NPK), and finally, the
respective combination of each level of organic and mineral fertilization. The amount of
added mineral N fertilization with calcium ammonium nitrate is corresponding to the
requirements of the individual crop (Tab. 2). All fertilization treatments are established on
six of the eight strips in total (S1, S2, S3, S6, S7, and S8). Therein, strip S1 is getting lime
every 4th
year since 1924, and on strip S8 legumes are replacing potato and winter wheat
15
every 7th
and 8th
year within the general crop rotation of sugar beet, spring barley, potato,
and winter wheat. Since 1978, strips S4 and S5 were excluded from the original
experiment and used for establishing a new separate experiment “Static Fertilization
Experiment Bad Lauchstädt after extension of the experimental issue” where the
treatments of organic and mineral fertilizer were turned to the opposite and fife levels of
N fertilization were introduced.
Over an experimental area of 4 ha, extreme spans regarding individual soil conditions
such as SOC, TN, pH, P and K have been manifested as a result of the long-term
differentiated fertilization. For example, SOC and TN differ up to 0.9% and 0.09%,
respectively, between the highest fertilization level (30t FYM ha-1
2yrs-1
plus NPK) and
the unfertilized control. Due to this, the SFEBL is of importance not only for agricultural
but also for fundamental ecological research of soils and their ecosystem services in
general.
16
Table 2: Properties of farmyard manure applied in 2010, and 2011
Year
Dry matter content %
N % of fresh matter
P % of dry matter
K % of dry matter
Ca % of dry matter
Mg % of dry matter
SOC %
2010 19.80 0.60 0.46 1.33 1.96 0.46 35.61
2011 19.60 0.83 0.66 3.61 2.55 0.68 71.80
Table 3: Mineral-N-fertilization (kg N ha-1 as calcium ammonium nitrate) since 1903
Year
Sugar beet Spring barley Potatoes Winter wheat
Farmyard manure
with without with without With without with without
1903-09 60 90 20 40 40 60 40 60
1910-25 60 90 20 40 20 40 20 40
1926-28 60 90 20 40 20 40 30 60
1929-51 90 120 20 40 20 40 30 60
1952-70 90 120 20 40 40 60 30 60
1971-77 200 240 30 50 120 160 40+40 60+40
1978 140 160 35 25+40 110 130 20+45 30+60
1979 150 180 25+25 35+35 110 130 30+25 40+40
1980 150 170 15+20 25+30 120 140 15+45 25+55
1981 150 170 15+15 25+25 120 140 15+45 25+55
1982 150 170 20+20 30+30 120 140 30+30 40+40
1983 150 170 20+20 30+30 120 140 20+20 30+30
1984 150 170 20 30 120 140 20+20 30+30
1985 150 170 20 30 120 140 40 60
1986 150 170 20+20 30+30 120 140 40+40 60+40
1987 150 170 30+30 40+40 120 140 60+20+20 70+30+30
1988 150 170 30+30 40+40 120 140 30+30 40+40
1989 150 170 20 30 120 140 30 40
1990 150 170 20 30 120 140 30+30 40+40
1991 150 170 20 30 120 140 30+30 40+40
1992 150 170 20 30 120 140 30 40
1993 150 170 30+30 30+30 120 140 40+30 40+30
1994 150 170 30+35 50+35 120 140 40+40 50+50
1995-2014
100+50
100+70 30+30 30+30 120 140 40+40 50+50
17
Table 4: Mineral-P-fertilization (kg P ha-1 as superphosphate) since 1902
Year 30t FYM ha-1 2yrs-1 20t FYM ha-1 2yrs-1 Without FYM
Root crops
1902-80 43 43 43
Since 1981 12 28 60
Grain crops
1902-81 22 22 22
Since 1982 0 0 0
Table 5: Mineral-K-fertilization (kg K ha-1 as 50er potash fertilizer since 1970) since 1902
Year 30t FYM ha-1 2yrs-1 20t FYM ha-1 2yrs-1 Without FYM
Root crops Potatoes Sugar beet
1902-28 100 100 100 100
1929-70 100 100 100 166
1971-75 100 100 166 166
1976 100 100 166 166
1977-78 100 100 166 166
1979-80 100 100 232* 166
Since 1981 50 110 230 230
Grain crops
1902-81 66 66 66
Since 1982 0 0 0
*alfalfa
18
Figure 2: Experimental design of the Static Fertilization Experiment, Bad Lauchstädt, until 2015
* legumes since 1924; alfalfa since 1970
19
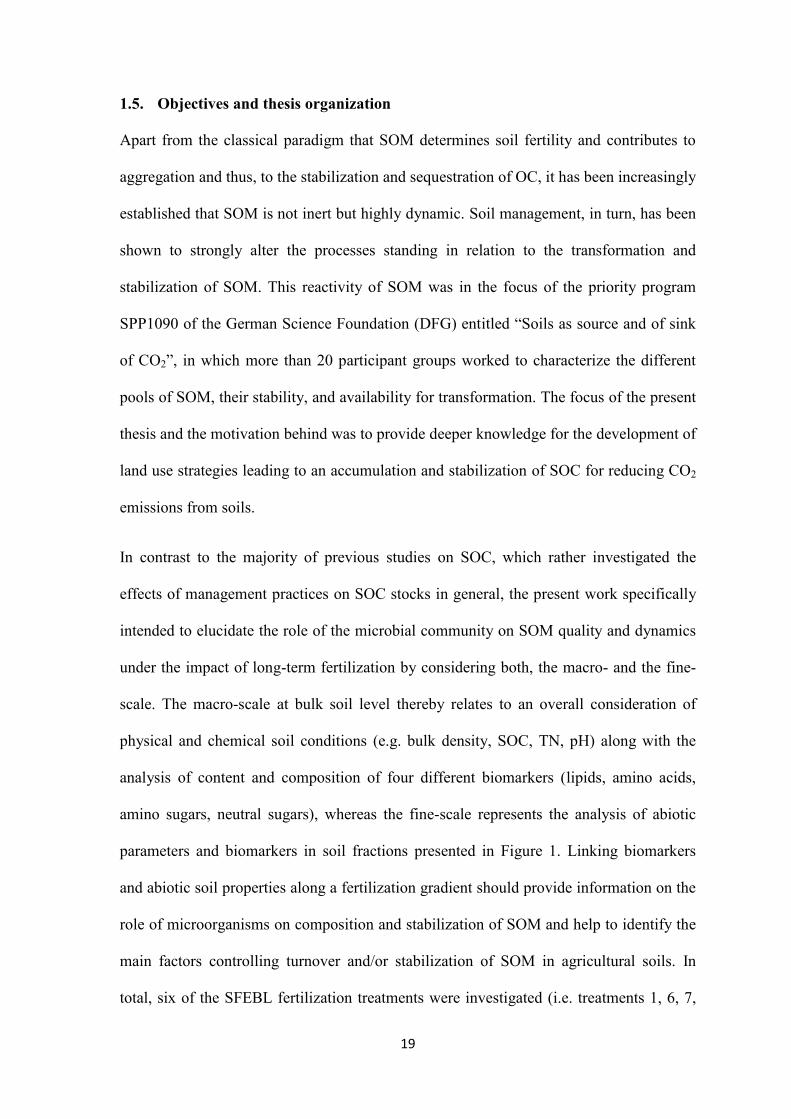
1.5. Objectives and thesis organization
Apart from the classical paradigm that SOM determines soil fertility and contributes to
aggregation and thus, to the stabilization and sequestration of OC, it has been increasingly
established that SOM is not inert but highly dynamic. Soil management, in turn, has been
shown to strongly alter the processes standing in relation to the transformation and
stabilization of SOM. This reactivity of SOM was in the focus of the priority program
SPP1090 of the German Science Foundation (DFG) entitled “Soils as source and of sink
of CO2”, in which more than 20 participant groups worked to characterize the different
pools of SOM, their stability, and availability for transformation. The focus of the present
thesis and the motivation behind was to provide deeper knowledge for the development of
land use strategies leading to an accumulation and stabilization of SOC for reducing CO2
emissions from soils.
In contrast to the majority of previous studies on SOC, which rather investigated the
effects of management practices on SOC stocks in general, the present work specifically
intended to elucidate the role of the microbial community on SOM quality and dynamics
under the impact of long-term fertilization by considering both, the macro- and the fine-
scale. The macro-scale at bulk soil level thereby relates to an overall consideration of
physical and chemical soil conditions (e.g. bulk density, SOC, TN, pH) along with the
analysis of content and composition of four different biomarkers (lipids, amino acids,
amino sugars, neutral sugars), whereas the fine-scale represents the analysis of abiotic
parameters and biomarkers in soil fractions presented in Figure 1. Linking biomarkers
and abiotic soil properties along a fertilization gradient should provide information on the
role of microorganisms on composition and stabilization of SOM and help to identify the
main factors controlling turnover and/or stabilization of SOM in agricultural soils. In
total, six of the SFEBL fertilization treatments were investigated (i.e. treatments 1, 6, 7,
20
12, 13, and 18 in Fig. 2). To elucidate specifically the role of plant-microbial relationships
on SOM dynamics, samples were taken on two strips: Strip 2, cultivated with sugar beet
at sampling and strip 8, where legumes are included in the crop rotation since 1924 (Fig.
2, 1.4), cultivated with alfalfa at the time of sampling.
Figure 3: The primary objective this thesis was to investigate the impact of differentiated organic- and/or mineral long-term fertilization along with the presence and absence of symbiotic plant-fungal/bacterial relationships on SOM composition as well as on microbial bio- and necromass at a) bulk soil level and b) at the level of functional SOM pools represented by soil particle size- and density fractions (CF1, CF2, LF1, LF2) in order to draw conclusions on main factors affecting microbial mediated SOM dynamics.
21
According to the objectives and research scales the thesis is structured into three results
chapters:
Chapter 2 primarily focuses on effects of long-term fertilization on SOC and total N
dynamics under two different crop types (sugar beet, alfalfa) by examining the SOM
composition with respect to the percentage contribution of each biomarker class to SOC
and TN. The relationships between PLFA and the other biomarkers were analyzed to
elucidate whether biomarker levels were associated with the living microbial biomass
rather than stabilized SOM. Analysis of abiotic parameters, such as hot-water extractable
carbon and nitrogen (HWC, HWN), NO3--N, NH4
+-N, and pH should further provide
information about changes in the availability of labile OC, mineral nutrients, and other
soil conditions influenced by fertilization and/or crop type, thereby specifically taking
into account the presence of plant-symbiotic relationships with rhizobia and arbuscular
mycorrhizal fungi in association with alfalfa as crop.
Chapter 3 describes the composition of the living microbial biomass (PLFA) in presence
of the legume (alfalfa) and a non-legume crop (sugar beet) to compare the effects of
long-term fertilization vs. cropping history (legume included/not included in rotation) on
the soil microbial necromass composition (amino sugar ratios).
While the investigations, described in the previous result chapters, were performed at
bulk soil level, Chapter 4 provides a more detailed look on the effects of long-term
fertilization on the composition and microbial shape of SOM pools. In this context,
biomarker levels were determined in two particle size, i.e. clay fractions (CF1: <1µm,
CF2: 1-2µm) and two density fractions (LF1: <1.8 g cm-3
, LF2: 1.8-2 g cm-3
), which were
generated from soil of the highest fertilization level (1) and the control (18) of the strip
cultivated with alfalfa (strip 8).
22
2. Carbon input and crop-related changes in microbial
biomarker levels strongly affect the turnover and
composition of soil organic carbon
Chapter source: Schmidt et al. 2015. Carbon input and crop-related changes in microbial
biomarker levels strongly affect the turnover and composition of soil
organic carbon. Soil Biology and Biochemistry (accepted version of the
manuscript)
Abstract
It is increasingly recognized that a detailed understanding of the impacts of land use on
soil carbon pools and microbial mediated carbon dynamics is required in order to
accurately describe terrestrial carbon budgets and improve soil carbon retention. Toward
this understanding, we analyzed the levels of biomarkers such as phospholipid fatty acids,
amino acids, monosaccharides, amino sugars, and several indicators of labile and
stabilized carbon in soil samples from a long-term agricultural field experiment. Our
results imply that the composition of soil organic carbon (SOC) depends strongly on both
the applied fertilization regime and the cultivated crop. In addition, our approach allowed
us to identify possible mechanisms of microbial growth and contributions to soil carbon
storage under different long-term agricultural management regimes.
Amino acids and monosaccharides were quantitatively the most dominant biomarkers and
their levels correlated strongly positively with microbial biomass. The relative
contributions of the studied biomarkers to the total SOC varied only slightly among the
treatments other than in cases of extreme fertilization and without any fertilizer. Under
the case of extreme fertilization and with alfalfa as crop type, we found evidence for
accumulation of microbially derived monosaccharides and amino acids within the labile
23
OC pool, probably resulting from soil C saturation. Interestingly, we also found an
accumulation of microbially derived monosaccharides and amino acids in completely
unfertilized plots, which we assumed to be caused by the lower pore space size and
subsequent oxygen limitation for microbial growth. Mineral fertilization also had
substantial effects on soil organic N when applied to plots containing alfalfa, a
leguminous plant. Our results demonstrate that over-fertilization, fertilizer type, and the
cultivated crop type can have major impacts on the turnover and composition of soil
organic carbon, and should be considered when assessing management effects on soil C
dynamics.
Keywords: SOC quality, microbial biomass, amino acids, amino sugars,
monosaccharides, long-term fertilization
2.1 Introduction
Terrestrial ecosystems represent the largest global pool of organic carbon (Batjes 1998;
Janzen 2005). There is an increasing need to understand the cycling and storage potential
of organic carbon in terrestrial ecosystems to mitigate climate change and improve
sustainability, especially in agriculturally managed systems since these represent around
40% of all land on earth (Smith et al. 2008). Efficient management of carbon and nitrogen
flows will be required to reduce CO2, CH4, and N2O emissions due to agriculture and to
increase carbon stocks in agricultural ecosystems (IPCC 2007). However, it is difficult to
evaluate the efficiency of a specific management strategy if one cannot account for all of
the factors that may affect the dynamics of C and N in the soil and their interactions with
one-another. One such factor is the use of organic and inorganic fertilizers, which directly
or indirectly increase the input of C into the soil and change the availability of nutrients,
24
the soil structure, and the abiotic conditions in the soil environment (Campbell et al.
1991; Marschner et al. 2003). The crop type can also influence soil organic carbon (SOC)
turnover due to the different physiological and morphological characteristics of different
plant species. Important characteristics can include root architecture, nutrient demand,
water use efficiency, and the quantity and composition of root exudate (Dakora and
Phillips 2002; Jastrow et al. 2007; Marschner 2012). Due to the close interactions
between plants and soil microorganisms, plant-microbe interactions and the growth,
activity and composition of crop-specific microbial communities have profound effects
on C and N dynamics. A well-known example of this is that legumes are often used in
agriculture to improve the availability of N and other mineral nutrients based on their
ability to form symbioses with N-fixing bacteria and arbuscular mycorrhizal fungi (Lal
2010; Paustian et al. 1997a; Wilson et al. 2009).
Investigations of soil properties using pyrolytic techniques (Py-FIMS, Py-GC/MS) have
demonstrated that fertilization and crop rotation affect the SOC composition by altering C
and N dynamics within or between several organic carbon pools (Leinweber et al. 2008;
Schmidt et al. 2000). The organic carbon (OC) content of non-protected or labile carbon
pools is affected directly by the supply of new nutrients and microbial growth, and can be
rapidly degraded (Wander 2004). Management-induced effects on the availability of C, N
and P or the oxygen content, pH or temperature of the soil can change the rates of
microbial metabolism and decomposition, which can result in quantitative and qualitative
changes in the labile OC pool (Curiel Yuste et al. 2007; Davidson and Janssens 2006;
Hartman and Richardson 2013; Knorr et al. 2005; Rousk et al. 2009; Tiedje et al. 1984).
Since rates of OC production and utilization may compensate each other, variations in
contents of total labile OC may not be measurable. Even though the total labile OC
content may not change, the decomposition and incorporation of plant derived labile OC
25
into microbial biomass may cause a shift in the proportions of OC from different sources,
resulting in an altered composition of SOC .
Conversely, OC in protected carbon pools is more resistant to depletion and such pools
exhibit low turnover rates. Factors that impede the decomposition of organic constituents
include formation of stable complex chemical structures, physical protection by occlusion
into micro-aggregates, and chemical protection by interaction with minerals and metal
ions (Lützow et al. 2006; Sollins et al. 1996). Microorganisms can enhance the proportion
of OC in the protected pool by producing complex organic compounds and promoting
aggregate formation around fungal hyphae or bacterial exopolysaccharides. While
estimates of total soil organic C are generally based on the size of the protected or
stabilized OC pool, most C models predict that SOC levels increase linearly with C input,
which has been confirmed for a large number of long-term agricultural field experiments
(Huggins et al. 1998; Kong et al. 2005; Paustian et al. 1997b). However, the protective
capacity of the soil may be limited, especially if it was originally rich in OC, resulting in
C saturation, or in other words, a limit to observed linear responses despite further
increase of C input (Hassink 1997; Hassink et al. 1997; Six et al. 2002; Wiesmeier et al.
2014). It is currently not entirely clear how saturation of the protected pool affects OC
turnover within the non-protected OC pool. In addition, little is known about how
microbial mediation of OC stabilization and cycling are influenced by the impact of
fertilization on plant-microbe interactions. To address these questions, it is necessary to
consider physical, chemical and microbiological factors simultaneously.
Biomarkers such as phospholipid fatty acids (PLFA) and amino sugars (AS) have been
used extensively to study environmental impacts on living microbial communities and the
accumulation of microbial residues, respectively (Amelung 2003; Amelung et al. 2001a;
26
Bossio et al. 1998; Guggenberger et al. 1999; Jangid et al. 2008). Although
monosaccharides (MS) and amino acids (AA) are ubiquitous in the biosphere, they can
also be used as biomarkers for microbially derived C and N to some extent. For instance,
proportions of bacterial to plant derived monosaccharides can be reflected by the ratios of
C6:C5 (mannose + galactose)/(xylose + arabinose) and deoxyC6:C5 (rhamnose +
fucose)/(xylose + arabinose) (Murayama, 1984; Oades, 1984). For amino acids, meso-
Diaminopimelic acid as well as D-enantiomers of alanine and glutamic acid build up the
peptidoglycane layer of bacterial cell walls and have been used to indicate bacterial
residues (Amelung 2001; Amelung and Zhang 2001; Grant and West 1986). However, it
is important to recall that MS and AA account for a significant proportion of both
microbial biomass C and SOC and TN (Friedel and Scheller 2002; Martens et al. 2004;
Neidhardt 1990; Senwo and Tabatabai 1998). At present, little is known about the
mechanisms that are responsible for the stabilization or destabilization of the biomarkers
mentioned above, and the factors that govern these mechanisms are similarly challenging
to understand.
Our aim in this study was to investigate the effects of long-term fertilization on C and N
dynamics under different crop types, and the resulting impacts on SOC composition. This
was done using an integrated approach in which chemical and physical parameters were
monitored along with four separate biomarkers: PLFA, AS, MS, and AA. We
hypothesized that high C inputs due to the long-term addition of organic and/or mineral
fertilizer would enhance the stabilization of AA, MS and AS in the soil and increase the
contribution of C from the selected biomarkers to the total SOC. We also expected the
crop type to influence SOC composition by affecting OC decomposition rates, via plant-
induced changes in the availability of labile OC and mineral nutrients, interactions with
associated microbial communities, and changes in soil structure.
27
2.2. Materials and methods
2.2.1. Study site description and sampling
The experimental basis for the study was the Static Fertilization Experiment Bad
Lauchstädt (SFEBL), Sachsen-Anhalt (Germany). This long-term experiment was
initiated in 1902 in order to investigate the effects of organic and mineral fertilization on
crop yield, crop quality, and soil fertility. The experiment’s soil type is a Haplic
Chernozem (FAO) (USDA: Mollisol) consisting of 21.0% clay, 67.8% silt and 11.2%
sand. The mean annual temperature and precipitation at the site are 8.8°C and 480 mm,
respectively (Körschens 2002). A comprehensive description of the experimental site and
treatments has been given by Körschens (2002). The crop rotation is sugar beet, spring
barley, potatoes, and winter wheat. On one of the six strips of the experiment, legumes
have been included in the rotation since 1924, replacing sugar beet and spring barley
every 7th
and 8th
year. Since 1970 alfalfa (Medicago sativa) has been the only legume
species cultivated during this 7th
and 8th
year legume rotation. The level of mineral
fertilization (NPK) depends on the crop that is being cultivated and the amount of
farmyard manure (FYM) that is applied, and ranges from 60 to 170 kg ha-1
yr-1
N, 12 to
60 kg ha-1
yr-1
P, and 50 to 230 kg ha-1
yr-1
K. Farmyard manure is applied every second
year during the cultivation of root crops (i.e. potatoes or sugar beet). When alfalfa is
cultivated, it generally follows winter wheat and receives farmyard manure and only PK
in the mineral fertilized treatments before seed drilling. The treatment effects on soil
organic carbon and nitrogen as well as on crop yields are proved on the basis of repeated
soil samplings (annually or biannually since the 70th
of the last century) and annual
measurements of crop yields and nutrient uptake by the crops and documented in a range
28
of research articles (Böhme and Böhme 2006; Kandeler et al. 1999; Merbach and Schulz
2012).
This work focused on five different fertilizer treatments and an unfertilized control
treatment (NIL). The five fertilization regimes were: mineral fertilizer alone (NPK), 20 t
FYM ha-1
2yrs-1
(FYM1), 20 t FYM ha-1
2yrs-1
plus NPK (FYM1+NPK), 30 t FYM ha-1
2yrs-1
(FYM2), and 30 t FYM ha-1
2yrs-1
plus NPK (FYM2+NPK). The influence of the
crop type as a biotic factor was investigated by sampling soil from one strip that was
cultivated with alfalfa (Medicago sativa) and another that was cultivated with sugar beet
(Beta vulgaris) at the time of sampling, for each of the fertilization treatments listed
above. Because the specific crops we sampled were from within the context of long-term
management that was equal, with the exception of the 7th
and 8th
year alfalfa cultivation
on the alfalfa strip, we were able to investigate both a long-term and immediate influence
of including alfalfa in crop rotations. Further, while “sugar beet” is discussed, it must be
noted that our sampling of sugar beet represents both immediate effects of this crop, and
long-term effects of a crop rotation absent of alfalfa. Five representative subsamples per
treatment were taken from the plough horizon (0-20 cm) at the end of cultivation (June
2010 for alfalfa, October 2011 for sugar beet). Soil samples were sieved to < 2 mm, and
stones and visible plant residues were removed. Portions of the fresh and sieved soil were
frozen at -20 °C immediately after the sampling for biomarker analysis (see below).
Mineral N was analysed in fresh and frozen soil samples. Other chemical parameters were
determined using air-dried soil samples.
29
2.2.2. Chemical and physical characterization of the soil
2.2.2.1. SOC, TN and labile OC and N
Total carbon (TC) and total nitrogen (TN) were determined via combustion in a C/H/N
analyser (Vario El III, Elementar-Hanau). No inorganic C was detected, so the reported
TC values represent the total soil organic carbon (SOC).
Hot water extraction was performed to quantify the labile OC pool, i.e. the potentially
mineralizable and decomposable fraction of the total SOC (Weigel et al. 1998). This was
done by boiling a soil/water suspension (1:5, w/v) for 1 h under reflux, according to the
method of Schulz (2002). After cooling to room temperature, 0.1 ml of 1 M MgSO4 was
added to facilitate soil sedimentation, followed by centrifugation for 10 min at 6700 g to
obtain clear extracts. All water extracts were filtered (0.45 µm Minisart single-use syringe
membrane filters RC 25, PP-housing, Sartorius AG, Göttingen, Germany) prior to the
determination of their hot water extractable C and N (HWC, HWN) concentrations (mg
kg-1
), which was done using an elemental analyser for liquid samples (Micro N/C and
Multi N/C, Analytik Jena, Germany).
2.2.2.2. Additional soil chemical parameters
Fresh soil samples from each treatment were used for the determination of the pH,
ammonium-N (NH4+-N), and nitrate-N (NO3-N). NH4
+-N and NO3-N were extracted with
1 M KCl (1:4 w/v, soil: KCl) from 10 g soil by shaking for 1.5 h. After sample filtration
(Whatman Schleicher & Schuell 595 1/5 Ø 270 mm), the concentrations of NH4+-N and
NO3--N were measured using a flow injection analyser (FIAstar 5000, Foss GmbH,
Rellingen, Germany). The soil pH was measured from slurries prepared by mixing 25 ml
of 0.01 M CaCl2 and 10 g of air-dried soil. The soil bulk density was determined by
measuring five soil cores of 5 cm depth and 5.6 cm diameter that were taken from each
30
plot after removing the uppermost 10 cm of soil. This was done to ensure that the
measured bulk density was representative of the ploughing layer, which is located 10 to
15 cm below the soil surface.
2.2.3. Analysis of biomarkers
2.2.3.1. Phospholipid fatty acids
Phospholipid fatty acids were analysed using a modified variant of the method described
by Bligh and Dyer (1959). In brief, soil samples (2 g each) were extracted three times
using a chloroform–methanol–citrate buffer mixture (2:4:1.8 v/v/v). After phase
separation, the chloroform layer dried under a flow of N2 and redissolved in a smaller 300
µl volume of chloroform. Phospholipids were then separated from neutral- and
glycolipids by solid phase extraction columns pre-conditioned with chloroform (SPE-SI;
Bond 207 Elute, Varian, Palo Alto, USA). Phospholipids were converted into fatty acid
methyl esters by mild alkaline methanolysis in a KOH solution prior identification and
quantification.
Individual PLFA peaks were identified and quantified using coupled gas
chromatography-mass spectrometry (GC/MS) with a 13:0 internal standard (Frostegård
and Bååth 1996; Vestal and White 1989; Zelles et al. 1992). To ensure that PLFA-C
levels could also be used to represent microbial biomass C, only phospholipid fatty acids
with alkyl chains of fewer than 20 carbon atoms were considered.
31
2.2.3.2. Amino acids
For the determination of amino acids, 2 g of soil was hydrolysed with 6 M HCl for 22 h at
110°C (Macko et al. 1997). Trans-4-(aminomethyl)-cyclohexanecarboxylic acid was
added to each sample prior to hydrolysis as an internal standard, at a concentration of 400
µg per sample. The hydrolysates were then filtered (GF6, Schleicher & Schuell, FRG),
dried (Multivapor P-12, Büchi, Essen, Germany) and redissolved in 4 ml 0.1 M HCl.
Prior to the first purification step a cation exchange resin DOWEX 50W-X8 (50-100
mesh) was filled in a glass column and prepared with 2 M NaOH, followed by 2 M HCl.
Finally distilled water was added until the eluate was neutral (Boas 1953). After the
samples had passed the column, the resin was washed with 0.1 M oxalic acid (pH 1.6-
1.8), 0.01 M HCl, and distilled water. Amino acids were eluted from the column by an
excess of 2.5 M NH4OH (Amelung and Zhang 2001). The eluates were dried under a flow
of N2 after which the samples were redissolved in 0.1 M HCl and mineral particles were
removed by centrifugation for 15 min at 4200 g. The carboxyl groups of the amino acids
were esterified using acetyl chloride in isopropanol, and their amino groups were
trifluoroacetylated using trifluoracetic anhydride in dichloromethane. The derivatized
amino acids were then re-purified by the addition of phosphate buffer and chloroform,
followed by centrifugation for 10 min at 11 000 g (Ueda et al. 1989). The lower, organic
phase was dried again under an N2 stream. The final extracts were redissolved in 500 µl
of an 8:1 ethyl acetate: hexane mixture prior to GC/MS analysis. Individual amino acids
were identified and quantified with reference to a standard mixture.
32
2.2.3.3. Monosaccharides
Monosaccharides were determined as described previously (Amelung et al. 1996). In
brief, 10 ml of 4 M trifluoracetic acid was added to 0.5 g of soil and the resulting
suspension was heated for 4 h at 105 °C. Myo-inositol (100 µg) was used as an internal
standard and added to the mixture prior to hydrolysis. After filtration (GF6, Schleicher &
Schuell, FRG), the hydrolysates were evaporated to dryness (Multivapor P-12, Büchi,
Essen, Germany) and redissolved in 10 ml of water. To remove humic-like material, iron,
and amino sugars, samples were passed through XAD-7 resin, eluting with 15 ml of
water, followed by a further purification step using a cation exchange resin (Dowex 50W-
X8). Saccharides were released from the resin by washing with 20 ml of water, after
which the eluate was freeze dried. Sugar oxime derivatives were prepared by mixing the
dried samples with 200 µl of the derivatisation reagent (a 20 mg ml-1
solution of O-
methylhydroxylamine hydrochloride in pyridine) and heating the resulting mixture at
75 °C for 30 minutes. BSTFA (400 µl) was then added, and the mixture was maintained
at 75 °C for another five minutes. Analyte recovery was determined using 3-O
methylglucose as a second standard (200 µl per sample at a concentration of 5 mg in 25
ml N-methyl-pyrrolidone), which was added to the samples just before derivatization. A
standard mixture of D-(+)-xylose, L-(+)-arabinose, L-(+)-rhamnose, L-(-)-fucose, D-(+)-
mannose, D-(+)-galactose and D-(+)-glucose was used to identify and quantify individual
monosaccharides.
The proportion of microbial sugars in the samples was determined from the ratios of
C6:C5 sugars, i.e. (mannose + galactose)/(xylose + arabinose), and deoxyC6:C5 sugars,
i.e. (rhamnose + fucose)/(xylose + arabinose), as described by Oades (1984) and
Murayama (1984).
33
2.2.3.4. Amino sugars and muramic acid
Amino sugars and muramic acid were extracted as described by Zhang and Amelung
(1996). Myo-inositol (100 µg) was added to a 1 g soil sample as an internal standard and
the resulting mixture was hydrolysed by heating in 10 ml of 6 M HCl at 105 °C for 8 h.
The sample was then filtered (GF6, Schleicher & Schuell, FRG) and evaporated to
dryness (Multivapor P-12, Büchi, Essen, Germany). To remove salts, the dried samples
were neutralized with 0.4 M KOH and centrifuged at 1750 g for 10 min. The supernatant
was then freeze-dried, redissolved in 3 ml methanol and centrifuged again for 10 min at
1750 g. N-methylglucamine (100 µg) was added to the samples immediately prior to
derivatisation and used as a standard to determine the percent recovery. Aldononitrile
derivatives of the amino sugars were prepared according to Guerrant and Moss (1984)
using 300 µl of the derivatisation reagent (32 mg ml-1
of hydroxylamine hydrochloride
and 40 mg ml-1
of 4-dimethylaminopyridine in 4:1 pyridine-methanol). After heating for
30 min at 75 °C, 1 ml of acetic anhydride was added and the samples were heated for an
additional 20 min. Excess derivatisation reagent was removed by adding 1.5 ml of
dichloromethane to the cooled samples and washing the organic phase four times with
1ml of 1M HCl and 1ml of water each. The organic phase was then evaporated to dryness
and redissolved in 300 µl ethyl acetate-hexane (1:1) prior to GC/MS analysis.
2.2.3.5. Gas chromatographic analysis of biomarkers and calculation of biomarker
C and N contents
All of the biomarker derivatives discussed above were determined by gas
chromatography–mass spectrometry (GC/MS) using a HP 6890 gas chromatograph
coupled to a HP 5973 mass-selective detector (Hewlett Packard, Wilmington, USA). The
34
GC/MS was equipped with a DB-5ms column (60 m x 0.25 mm x 0.25 µm film
thickness). The temperature programs were adapted individually for each compound class
of interest.
Because the biomarkers considered in this work are groups of individual compounds, the
terms PLFA-C, AA-C, AS-C and MS-C refer to the summed carbon of individual
compounds within the relevant group (µg carbon per mol compound), expressed in mg
kg-1
. AA-N and AS-N were calculated in the same way. Finally, the carbon and nitrogen
contents across biomarkers were summed; these sums are denoted ΣCbiomarker and
ΣNbiomarker, respectively.
2.2.4. Statistical analysis
When the Static Fertilization Experiment Bad Lauchstädt was established in 1902, no
replicate plots were included in the experimental design. It is therefore important to point
out that our results are based on pseudoreplicates and that our ANOVA analyses may
suffer from type I and type II errors. All statistical analyses were conducted using R
version 2.15.1 (RCoreTeam 2012). Data were analysed for normality and, if necessary,
transformed. Pseudoreplicates were tested for homogeneity of variances within the plots.
For regression analyses, treatments were separated into a) plots without mineral fertilizer
(NIL, FYM1, FYM2) and b) plots with added mineral fertilizer (NPK, FYM1+NPK,
FYM2+NPK). Multiple comparisons of means were based on the conservative Tukey´s
honest significant difference test (P<0.05) to reduce the risk of type I errors.
35
2.3. Results
2.3.1. Influence of crop type and fertilization on SOC, labile OC, and other abiotic
parameters
SOC and TN levels were similar for both crops. Increasing the amount of fertilizers
beyond that applied in the FYM1+NPK treatment did not cause appreciable increases in
SOC values (Tab. 6). The SOC levels achieved under the FYM1+NPK, FYM2, and
FYM2+NPK treatments were clearly separated from those observed in the control plots
and in those treated with NPK alone or FYM alone. In general, the SOC and TN only
responded significantly to treatment with greater quantities of FYM in cases without NPK
fertilization: the SOC values for plots treated with both mineral and organic fertilizers
were similar irrespective of the amount of applied FYM (Tab. 6). On average, the labile
OC (HWC) content of the soil in plots planted with sugar beet was 12% lower than in
plots planted with alfalfa (Tab. 6). In addition, it was only in the alfalfa strips that the
labile OC increased with the amount of added FYM. The greatest differences between the
crop types were found for NH4+-N and NO3
--N: the levels of these forms of nitrogen in
the soil were 38% and 52% lower, respectively, in the strip planted with sugar beet.
Although NH4+-N and NO3
--N both responded generally positively to fertilizer addition,
the differences between fertilized treatments and the control were larger with alfalfa. In
contrast, the soil pH in the sugar beet strip was generally higher than in the alfalfa strip
and decreased with increasing fertilization; the opposite occurred in the alfalfa strip. The
bulk density of the soil did not differ significantly between any of the investigated
treatments under either crop, but did tend to decline as the intensity of fertilization
increased (Tab. 6).
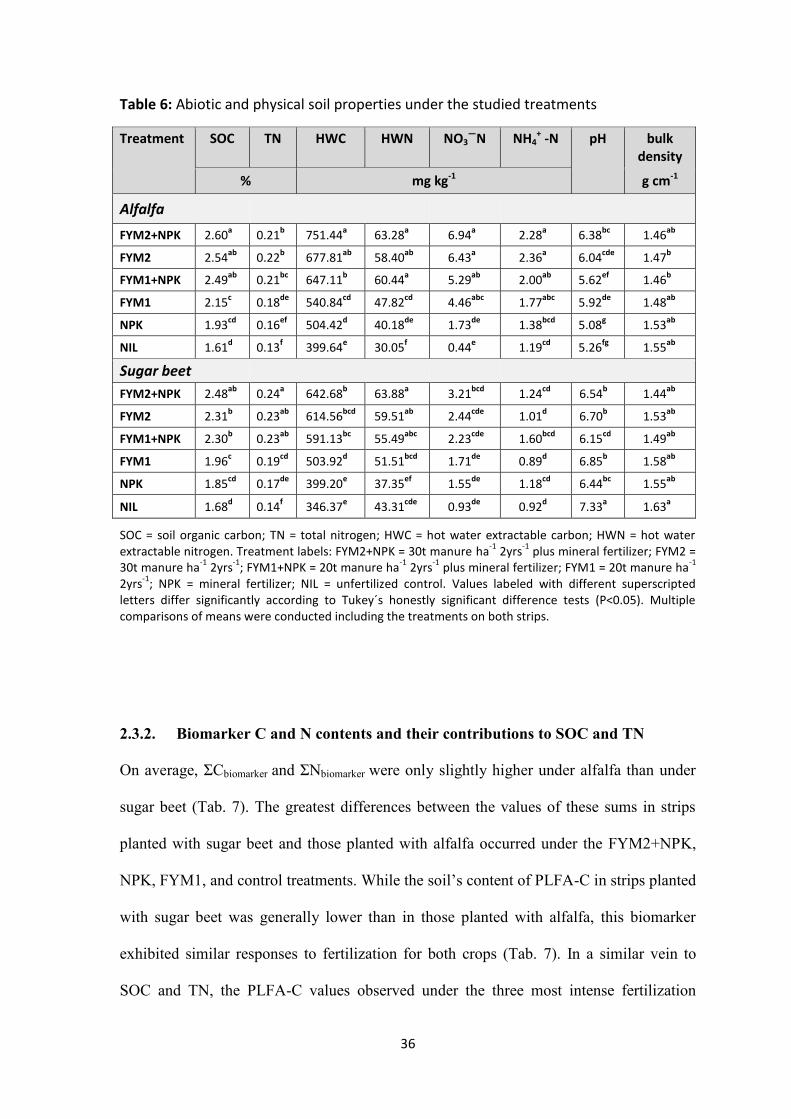
36
Table 6: Abiotic and physical soil properties under the studied treatments
Treatment SOC TN HWC HWN NO3—N NH4
+ -N pH bulk density
% mg kg-1 g cm-1
Alfalfa
FYM2+NPK 2.60a 0.21
b 751.44
a 63.28
a 6.94
a 2.28
a 6.38
bc 1.46
ab
FYM2 2.54ab
0.22b 677.81
ab 58.40
ab 6.43
a 2.36
a 6.04
cde 1.47
b
FYM1+NPK 2.49ab
0.21bc
647.11b 60.44
a 5.29
ab 2.00
ab 5.62
ef 1.46
b
FYM1 2.15c 0.18
de 540.84
cd 47.82
cd 4.46
abc 1.77
abc 5.92
de 1.48
ab
NPK 1.93cd
0.16ef
504.42d 40.18
de 1.73
de 1.38
bcd 5.08
g 1.53
ab
NIL 1.61d 0.13
f 399.64
e 30.05
f 0.44
e 1.19
cd 5.26
fg 1.55
ab
Sugar beet
FYM2+NPK 2.48ab
0.24a 642.68
b 63.88
a 3.21
bcd 1.24
cd 6.54
b 1.44
ab
FYM2 2.31b 0.23
ab 614.56
bcd 59.51
ab 2.44
cde 1.01
d 6.70
b 1.53
ab
FYM1+NPK 2.30b 0.23
ab 591.13
bc 55.49
abc 2.23
cde 1.60
bcd 6.15
cd 1.49
ab
FYM1 1.96c 0.19
cd 503.92
d 51.51
bcd 1.71
de 0.89
d 6.85
b 1.58
ab
NPK 1.85cd
0.17de
399.20e 37.35
ef 1.55
de 1.18
cd 6.44
bc 1.55
ab
NIL 1.68d 0.14
f 346.37
e 43.31
cde 0.93
de 0.92
d 7.33
a 1.63
a
SOC = soil organic carbon; TN = total nitrogen; HWC = hot water extractable carbon; HWN = hot water extractable nitrogen. Treatment labels: FYM2+NPK = 30t manure ha
-1 2yrs
-1 plus mineral fertilizer; FYM2 =
30t manure ha-1
2yrs-1
; FYM1+NPK = 20t manure ha-1
2yrs-1
plus mineral fertilizer; FYM1 = 20t manure ha-1
2yrs
-1; NPK = mineral fertilizer; NIL = unfertilized control. Values labeled with different superscripted
letters differ significantly according to Tukey´s honestly significant difference tests (P<0.05). Multiple comparisons of means were conducted including the treatments on both strips.
2.3.2. Biomarker C and N contents and their contributions to SOC and TN
On average, ΣCbiomarker and ΣNbiomarker were only slightly higher under alfalfa than under
sugar beet (Tab. 7). The greatest differences between the values of these sums in strips
planted with sugar beet and those planted with alfalfa occurred under the FYM2+NPK,
NPK, FYM1, and control treatments. While the soil’s content of PLFA-C in strips planted
with sugar beet was generally lower than in those planted with alfalfa, this biomarker
exhibited similar responses to fertilization for both crops (Tab. 7). In a similar vein to
SOC and TN, the PLFA-C values observed under the three most intense fertilization
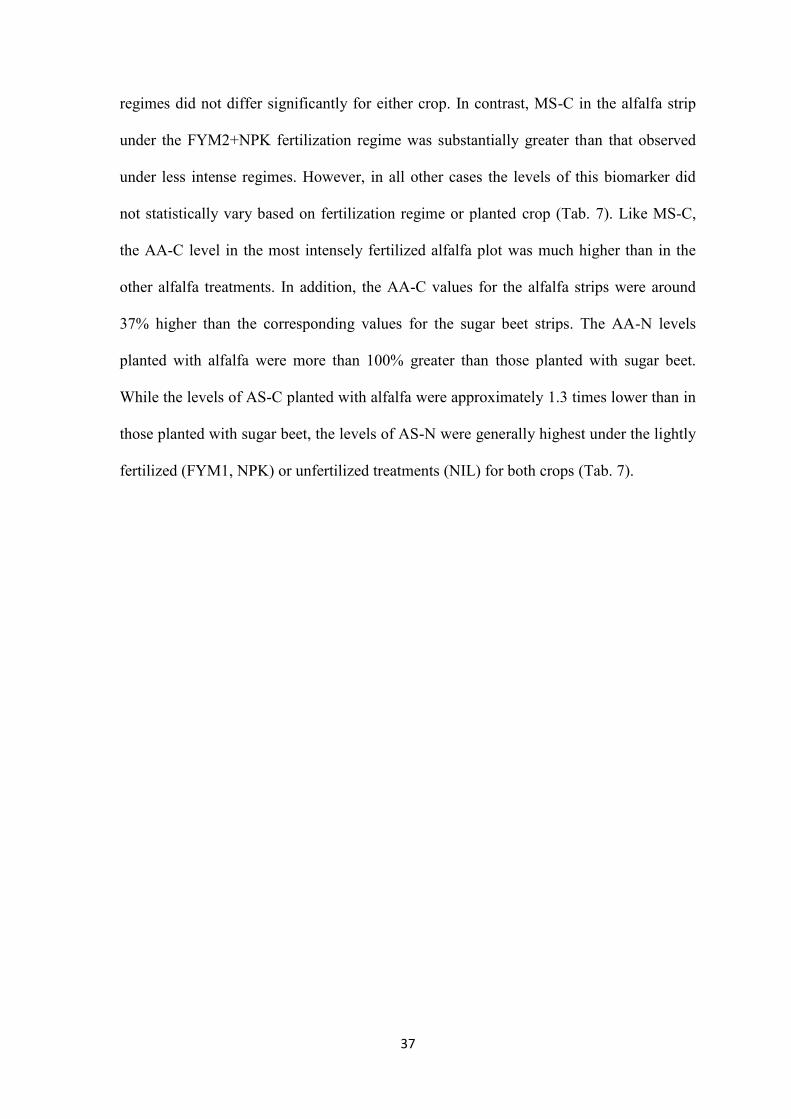
37
regimes did not differ significantly for either crop. In contrast, MS-C in the alfalfa strip
under the FYM2+NPK fertilization regime was substantially greater than that observed
under less intense regimes. However, in all other cases the levels of this biomarker did
not statistically vary based on fertilization regime or planted crop (Tab. 7). Like MS-C,
the AA-C level in the most intensely fertilized alfalfa plot was much higher than in the
other alfalfa treatments. In addition, the AA-C values for the alfalfa strips were around
37% higher than the corresponding values for the sugar beet strips. The AA-N levels
planted with alfalfa were more than 100% greater than those planted with sugar beet.
While the levels of AS-C planted with alfalfa were approximately 1.3 times lower than in
those planted with sugar beet, the levels of AS-N were generally highest under the lightly
fertilized (FYM1, NPK) or unfertilized treatments (NIL) for both crops (Tab. 7).
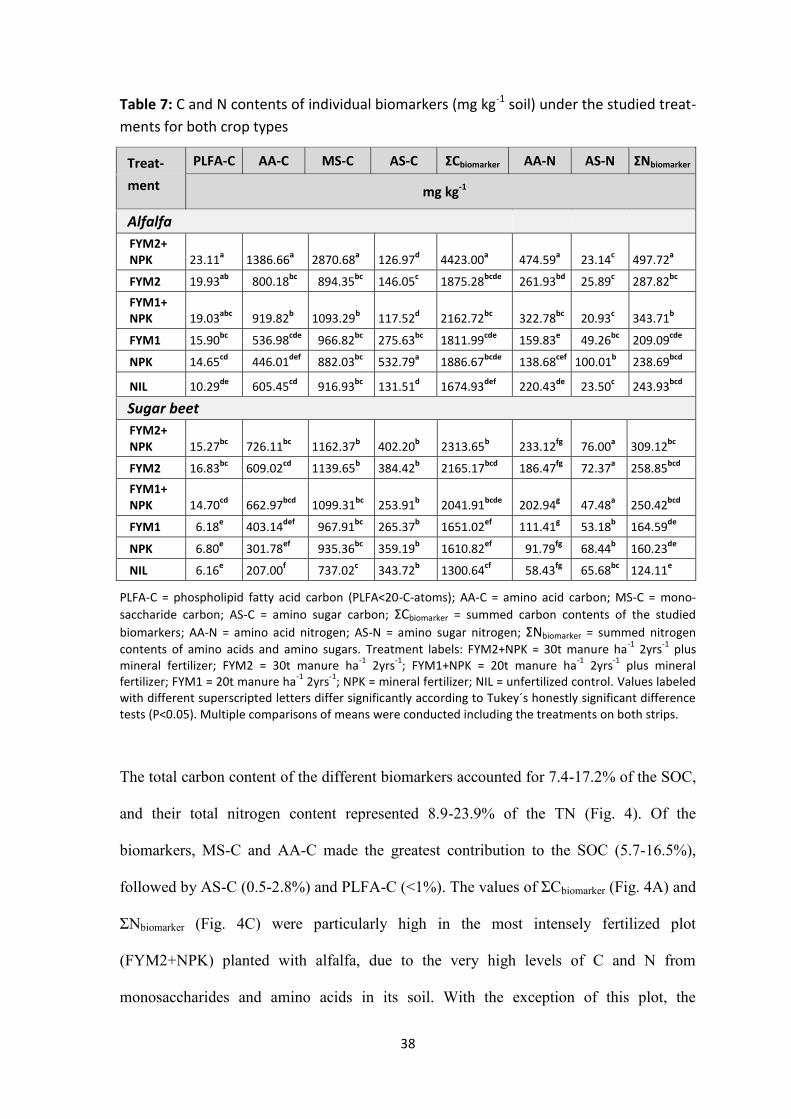
38
Table 7: C and N contents of individual biomarkers (mg kg-1 soil) under the studied treat-
ments for both crop types
Treat- PLFA-C AA-C MS-C AS-C ΣCbiomarker AA-N AS-N ΣNbiomarker
ment mg kg-1
Alfalfa
FYM2+ NPK 23.11
a 1386.66
a 2870.68
a 126.97
d 4423.00
a 474.59
a 23.14
c 497.72
a
FYM2 19.93ab
800.18bc
894.35bc
146.05c 1875.28
bcde 261.93
bd 25.89
c 287.82
bc
FYM1+ NPK 19.03
abc 919.82
b 1093.29
b 117.52
d 2162.72
bc 322.78
bc 20.93
c 343.71
b
FYM1 15.90bc
536.98cde
966.82bc
275.63bc
1811.99cde
159.83e 49.26
bc 209.09
cde
NPK 14.65cd
446.01def
882.03bc
532.79a 1886.67
bcde 138.68
cef 100.01
b 238.69
bcd
NIL 10.29de
605.45cd
916.93bc
131.51d 1674.93
def 220.43
de 23.50
c 243.93
bcd
Sugar beet
FYM2+ NPK 15.27
bc 726.11
bc 1162.37
b 402.20
b 2313.65
b 233.12
fg 76.00
a 309.12
bc
FYM2 16.83bc
609.02cd
1139.65b 384.42
b 2165.17
bcd 186.47
fg 72.37
a 258.85
bcd
FYM1+ NPK 14.70
cd 662.97
bcd 1099.31
bc 253.91
b 2041.91
bcde 202.94
g 47.48
a 250.42
bcd
FYM1 6.18e 403.14
def 967.91
bc 265.37
b 1651.02
ef 111.41
g 53.18
b 164.59
de
NPK 6.80e 301.78
ef 935.36
bc 359.19
b 1610.82
ef 91.79
fg 68.44
b 160.23
de
NIL 6.16e 207.00
f 737.02
c 343.72
b 1300.64
cf 58.43
fg 65.68
bc 124.11
e
PLFA-C = phospholipid fatty acid carbon (PLFA<20-C-atoms); AA-C = amino acid carbon; MS-C = mono-
saccharide carbon; AS-C = amino sugar carbon; ΣCbiomarker = summed carbon contents of the studied
biomarkers; AA-N = amino acid nitrogen; AS-N = amino sugar nitrogen; ΣNbiomarker = summed nitrogen
contents of amino acids and amino sugars. Treatment labels: FYM2+NPK = 30t manure ha-1
2yrs-1
plus mineral fertilizer; FYM2 = 30t manure ha
-1 2yrs
-1; FYM1+NPK = 20t manure ha
-1 2yrs
-1 plus mineral
fertilizer; FYM1 = 20t manure ha-1
2yrs-1
; NPK = mineral fertilizer; NIL = unfertilized control. Values labeled with different superscripted letters differ significantly according to Tukey´s honestly significant difference tests (P<0.05). Multiple comparisons of means were conducted including the treatments on both strips.
The total carbon content of the different biomarkers accounted for 7.4-17.2% of the SOC,
and their total nitrogen content represented 8.9-23.9% of the TN (Fig. 4). Of the
biomarkers, MS-C and AA-C made the greatest contribution to the SOC (5.7-16.5%),
followed by AS-C (0.5-2.8%) and PLFA-C (<1%). The values of ΣCbiomarker (Fig. 4A) and
ΣNbiomarker (Fig. 4C) were particularly high in the most intensely fertilized plot
(FYM2+NPK) planted with alfalfa, due to the very high levels of C and N from
monosaccharides and amino acids in its soil. With the exception of this plot, the
39
contribution of ΣCbiomarker to the SOC decreased with increasing fertilizer addition in the
alfalfa strip whereas the opposite was observed in the sugar beet strip (Fig. 4B). The
contribution of ΣNbiomarker to the TN did not differ significantly between fertilization
regimes in the sugar beet strip (Fig. 4D). However, the contributions of amino sugars to
the SOC and TN were generally highest under the control treatment and the treatments
with FYM alone (FYM1) or NPK alone (NPK; Fig. 4).
Figure 4: Contributions of individual biomarkers and combined biomarker groups (ΣCbiomarker and ΣNbiomarker) to SOC and TN for each fertilization regime and crop type. a+c) alfalfa strip; b+d) sugar beet strip. Bars labelled with different letters correspond to values of ΣCbiomarker and ΣNbiomarker that differ significantly according to Tukey´s honestly significant difference test (P<0.05). Multiple comparisons of means were conducted separately for each strip.
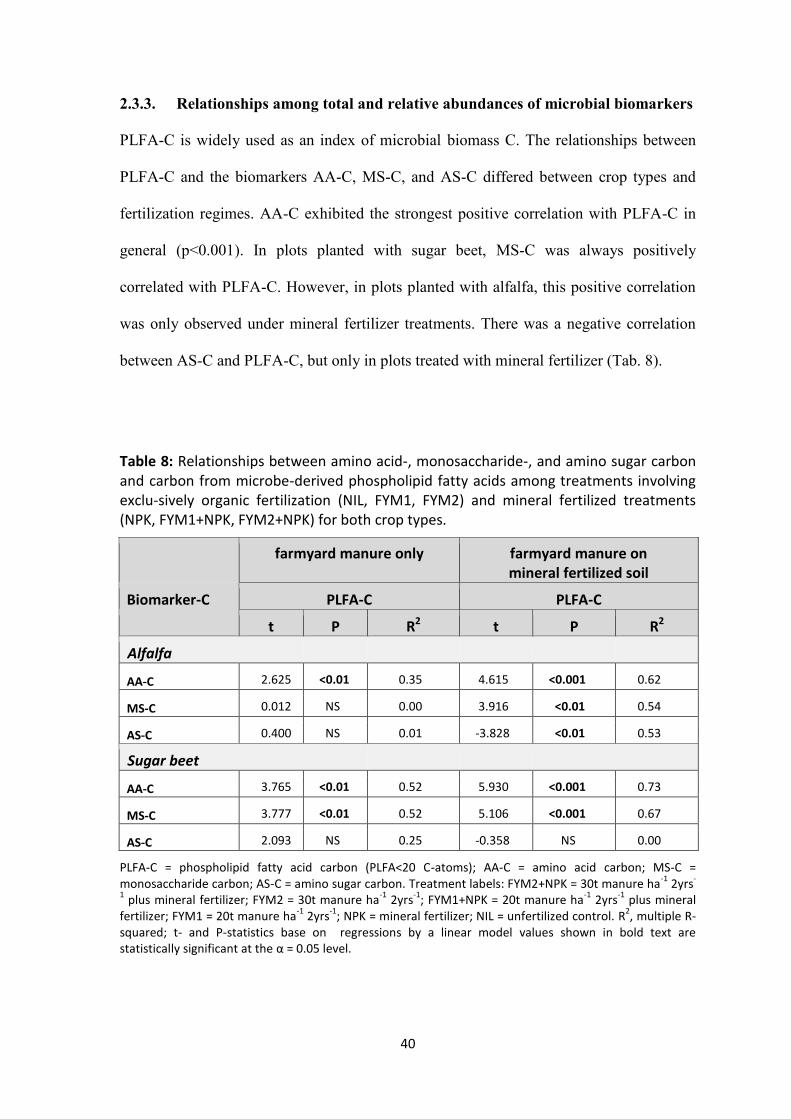
40
2.3.3. Relationships among total and relative abundances of microbial biomarkers
PLFA-C is widely used as an index of microbial biomass C. The relationships between
PLFA-C and the biomarkers AA-C, MS-C, and AS-C differed between crop types and
fertilization regimes. AA-C exhibited the strongest positive correlation with PLFA-C in
general (p<0.001). In plots planted with sugar beet, MS-C was always positively
correlated with PLFA-C. However, in plots planted with alfalfa, this positive correlation
was only observed under mineral fertilizer treatments. There was a negative correlation
between AS-C and PLFA-C, but only in plots treated with mineral fertilizer (Tab. 8).
Table 8: Relationships between amino acid-, monosaccharide-, and amino sugar carbon and carbon from microbe-derived phospholipid fatty acids among treatments involving exclu-sively organic fertilization (NIL, FYM1, FYM2) and mineral fertilized treatments (NPK, FYM1+NPK, FYM2+NPK) for both crop types.
farmyard manure only farmyard manure on mineral fertilized soil
Biomarker-C PLFA-C PLFA-C
t P R2 t P R2
Alfalfa
AA-C 2.625 <0.01 0.35 4.615 <0.001 0.62
MS-C 0.012 NS 0.00 3.916 <0.01 0.54
AS-C 0.400 NS 0.01 -3.828 <0.01 0.53
Sugar beet
AA-C 3.765 <0.01 0.52 5.930 <0.001 0.73
MS-C 3.777 <0.01 0.52 5.106 <0.001 0.67
AS-C 2.093 NS 0.25 -0.358 NS 0.00
PLFA-C = phospholipid fatty acid carbon (PLFA<20 C-atoms); AA-C = amino acid carbon; MS-C = monosaccharide carbon; AS-C = amino sugar carbon. Treatment labels: FYM2+NPK = 30t manure ha
-1 2yrs
-
1 plus mineral fertilizer; FYM2 = 30t manure ha
-1 2yrs
-1; FYM1+NPK = 20t manure ha
-1 2yrs
-1 plus mineral
fertilizer; FYM1 = 20t manure ha-1
2yrs-1
; NPK = mineral fertilizer; NIL = unfertilized control. R2, multiple R-
squared; t- and P-statistics base on regressions by a linear model values shown in bold text are statistically significant at the α = 0.05 level.
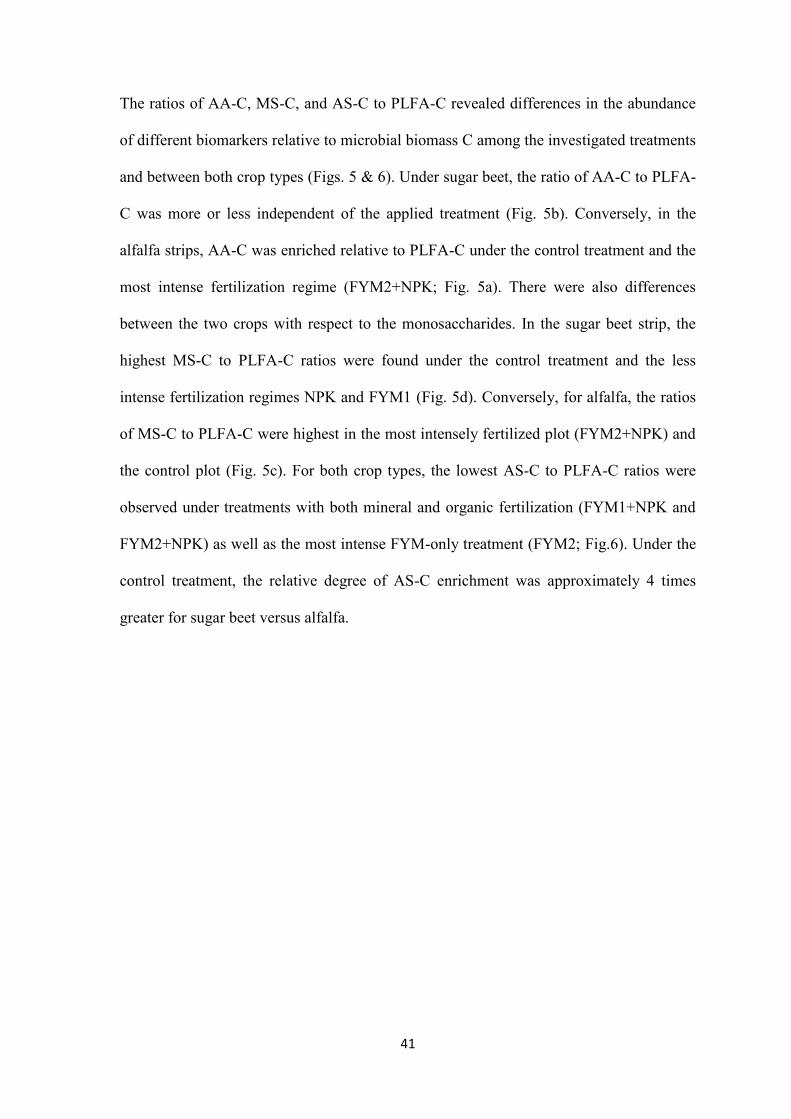
41
The ratios of AA-C, MS-C, and AS-C to PLFA-C revealed differences in the abundance
of different biomarkers relative to microbial biomass C among the investigated treatments
and between both crop types (Figs. 5 & 6). Under sugar beet, the ratio of AA-C to PLFA-
C was more or less independent of the applied treatment (Fig. 5b). Conversely, in the
alfalfa strips, AA-C was enriched relative to PLFA-C under the control treatment and the
most intense fertilization regime (FYM2+NPK; Fig. 5a). There were also differences
between the two crops with respect to the monosaccharides. In the sugar beet strip, the
highest MS-C to PLFA-C ratios were found under the control treatment and the less
intense fertilization regimes NPK and FYM1 (Fig. 5d). Conversely, for alfalfa, the ratios
of MS-C to PLFA-C were highest in the most intensely fertilized plot (FYM2+NPK) and
the control plot (Fig. 5c). For both crop types, the lowest AS-C to PLFA-C ratios were
observed under treatments with both mineral and organic fertilization (FYM1+NPK and
FYM2+NPK) as well as the most intense FYM-only treatment (FYM2; Fig.6). Under the
control treatment, the relative degree of AS-C enrichment was approximately 4 times
greater for sugar beet versus alfalfa.
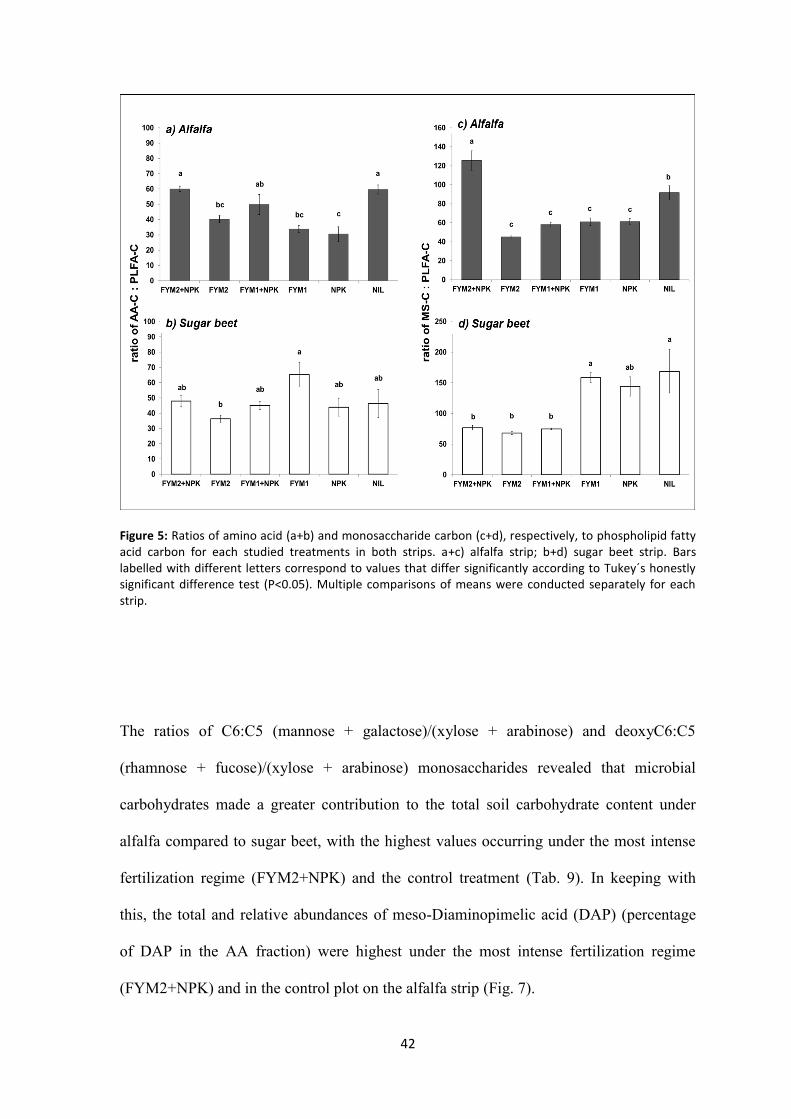
42
Figure 5: Ratios of amino acid (a+b) and monosaccharide carbon (c+d), respectively, to phospholipid fatty acid carbon for each studied treatments in both strips. a+c) alfalfa strip; b+d) sugar beet strip. Bars labelled with different letters correspond to values that differ significantly according to Tukey´s honestly significant difference test (P<0.05). Multiple comparisons of means were conducted separately for each strip.
The ratios of C6:C5 (mannose + galactose)/(xylose + arabinose) and deoxyC6:C5
(rhamnose + fucose)/(xylose + arabinose) monosaccharides revealed that microbial
carbohydrates made a greater contribution to the total soil carbohydrate content under
alfalfa compared to sugar beet, with the highest values occurring under the most intense
fertilization regime (FYM2+NPK) and the control treatment (Tab. 9). In keeping with
this, the total and relative abundances of meso-Diaminopimelic acid (DAP) (percentage
of DAP in the AA fraction) were highest under the most intense fertilization regime
(FYM2+NPK) and in the control plot on the alfalfa strip (Fig. 7).
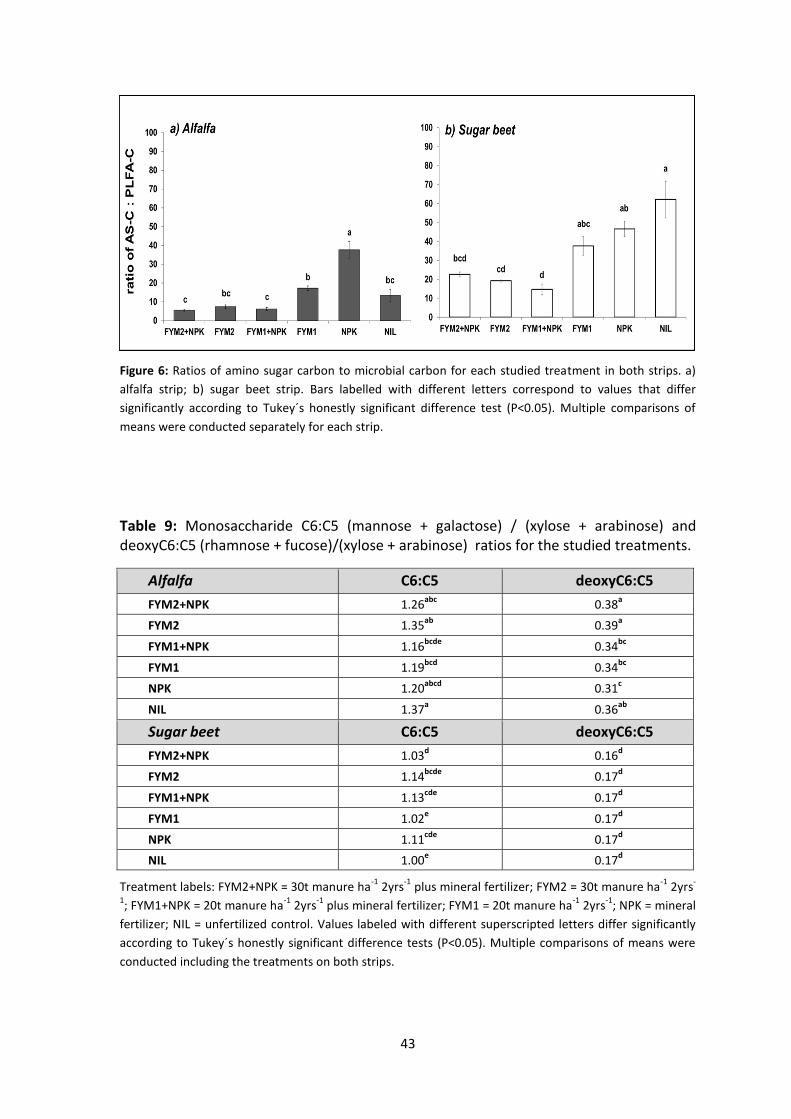
43
Figure 6: Ratios of amino sugar carbon to microbial carbon for each studied treatment in both strips. a)
alfalfa strip; b) sugar beet strip. Bars labelled with different letters correspond to values that differ
significantly according to Tukey´s honestly significant difference test (P<0.05). Multiple comparisons of
means were conducted separately for each strip.
Table 9: Monosaccharide C6:C5 (mannose + galactose) / (xylose + arabinose) and deoxyC6:C5 (rhamnose + fucose)/(xylose + arabinose) ratios for the studied treatments.
Alfalfa C6:C5 deoxyC6:C5
FYM2+NPK 1.26abc
0.38a
FYM2 1.35ab
0.39a
FYM1+NPK 1.16bcde
0.34bc
FYM1 1.19bcd
0.34bc
NPK 1.20abcd
0.31c
NIL 1.37a 0.36
ab
Sugar beet C6:C5 deoxyC6:C5
FYM2+NPK 1.03d 0.16
d
FYM2 1.14bcde
0.17d
FYM1+NPK 1.13cde
0.17d
FYM1 1.02e 0.17
d
NPK 1.11cde
0.17d
NIL 1.00e 0.17
d
Treatment labels: FYM2+NPK = 30t manure ha-1
2yrs-1
plus mineral fertilizer; FYM2 = 30t manure ha-1
2yrs-
1; FYM1+NPK = 20t manure ha
-1 2yrs
-1 plus mineral fertilizer; FYM1 = 20t manure ha
-1 2yrs
-1; NPK = mineral
fertilizer; NIL = unfertilized control. Values labeled with different superscripted letters differ significantly
according to Tukey´s honestly significant difference tests (P<0.05). Multiple comparisons of means were
conducted including the treatments on both strips.
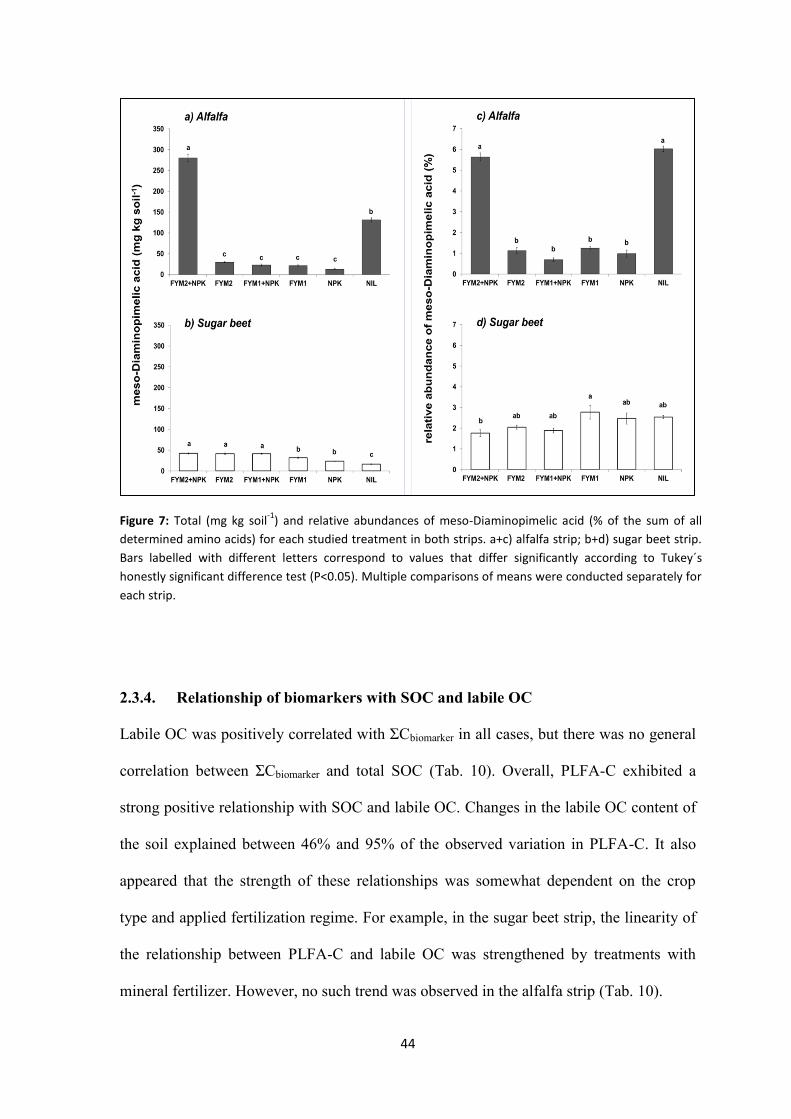
44
Figure 7: Total (mg kg soil-1
) and relative abundances of meso-Diaminopimelic acid (% of the sum of all
determined amino acids) for each studied treatment in both strips. a+c) alfalfa strip; b+d) sugar beet strip.
Bars labelled with different letters correspond to values that differ significantly according to Tukey´s
honestly significant difference test (P<0.05). Multiple comparisons of means were conducted separately for
each strip.
2.3.4. Relationship of biomarkers with SOC and labile OC
Labile OC was positively correlated with ΣCbiomarker in all cases, but there was no general
correlation between ΣCbiomarker and total SOC (Tab. 10). Overall, PLFA-C exhibited a
strong positive relationship with SOC and labile OC. Changes in the labile OC content of
the soil explained between 46% and 95% of the observed variation in PLFA-C. It also
appeared that the strength of these relationships was somewhat dependent on the crop
type and applied fertilization regime. For example, in the sugar beet strip, the linearity of
the relationship between PLFA-C and labile OC was strengthened by treatments with
mineral fertilizer. However, no such trend was observed in the alfalfa strip (Tab. 10).
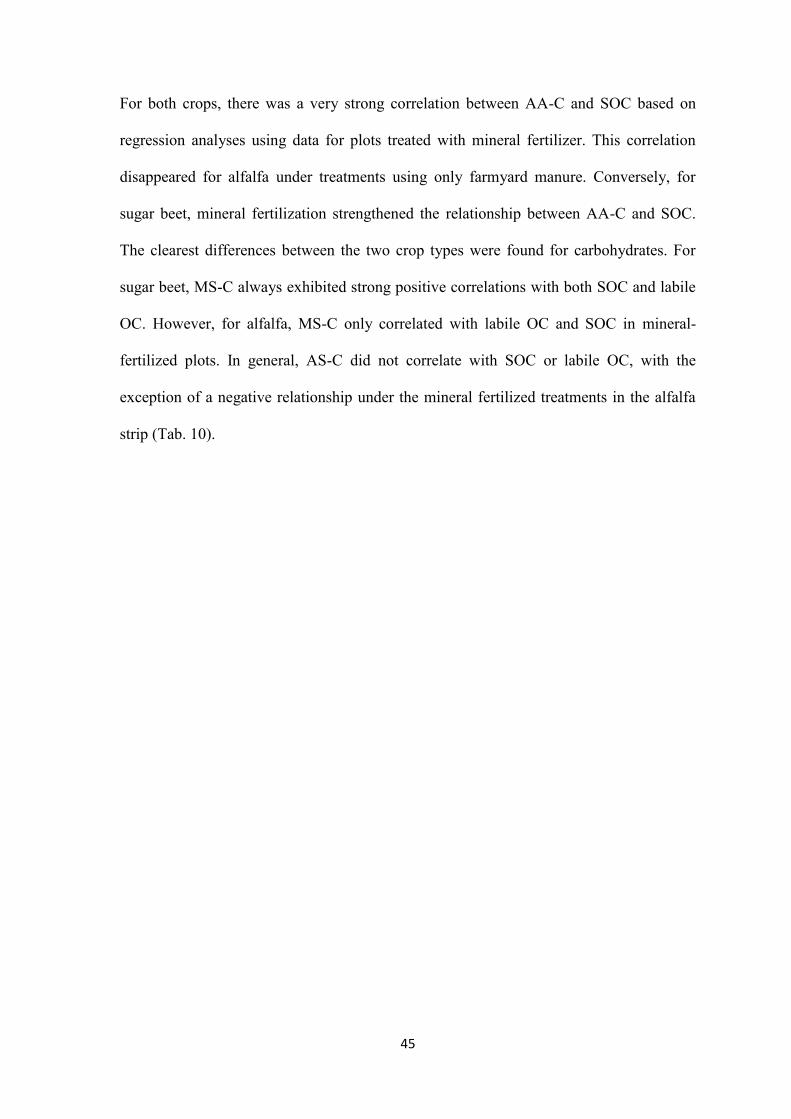
45
For both crops, there was a very strong correlation between AA-C and SOC based on
regression analyses using data for plots treated with mineral fertilizer. This correlation
disappeared for alfalfa under treatments using only farmyard manure. Conversely, for
sugar beet, mineral fertilization strengthened the relationship between AA-C and SOC.
The clearest differences between the two crop types were found for carbohydrates. For
sugar beet, MS-C always exhibited strong positive correlations with both SOC and labile
OC. However, for alfalfa, MS-C only correlated with labile OC and SOC in mineral-
fertilized plots. In general, AS-C did not correlate with SOC or labile OC, with the
exception of a negative relationship under the mineral fertilized treatments in the alfalfa
strip (Tab. 10).
46
Table 10: Relationships of biomarker C with the SOC and labile OC (HWC) under
treatments involving exclusively organic fertilization (NIL, FYM1, FYM2) and mineral
fertilization (NPK, FYM1+NPK, FYM2+NPK) for both crop types.
SOC HWC
Alfalfa t P R2 T P R2
farmyard manure only
PLFA-C 8.706 <0.001 0.86 6.538 <0.001 0.76
AA-C 2.035 NS 0.24 2.740 <0.05 0.37
MS-C -0.320 NS 0.01 -0.308 NS. 0.01
AS-C 0.390 NS 0.01 0.499 NS. 0.02
ΣCbiomarker 1.848 NS 0.21 2.482 <0.05 0.32
farmyard manure on mineral fertilized soil
PLFA-C 4.008 <0.01 0.55 5.801 <0.001 0.72
AA-C 6.472 <0.001 0.76 6.535 <0.001 0.77
MS-C 2.621 <0.05 0.34 3.531 <0.01 0.49
AS-C -7.054 <0.001 0.79 -5.043 <0.001 0.66
ΣCbiomarker 2.878 <0.05 0.39 3.813 <0.01 0.53
SOC HWC
Sugar beet t P R2 T P R2
farmyard manure only
PLFA-C 3.113 <0.01 0.43 3.328 <0.01 0.46
AA-C 3.095 <0.01 0.42 5.862 <0.001 0.73
MS-C 5.905 <0.001 0.73 13.054 <0.001 0.93
AS-C 0.452 NS 0.02 0.225 NS. 0.00
ΣCbiomarker 4.086 <0.01 0.56 6.994 <0.001 0.79
farmyard manure on mineral fertilized soil
PLFA-C 9.681 <0.001 0.88 15.885 <0.001 0.95
AA-C 5.705 <0.001 0.71 5.428 <0.001 0.69
MS-C 7.142 <0.001 0.80 5.664 <0.001 0.71
AS-C -0.011 NS 0.00 -0.157 NS 0.00
ΣCbiomarker 6.718 <0.01 0.78 5.725 <0.001 0.72
SOC = soil organic carbon; HWC = hot water extractable carbon; PLFA-C = phospholipid fatty acid carbon
(<20 C-atoms); AA-C = amino acid carbon; MS-C = monosaccharide carbon; AS-C = amino sugar carbon;
ΣCbiomarker = summed carbon contents of the investigated biomarkers. Treatment labels: FYM2+NPK = 30t
manure ha-1
2yrs-1
plus mineral fertilizer; FYM2 = 30t manure ha-1
2yrs-1
; FYM1+NPK = 20t manure ha-1
2yrs-1
plus mineral fertilizer; FYM1 = 20t manure ha-1
2yrs-1
; NPK = mineral fertilizer; NIL = unfertilized
control. R2 = multiple R-squared; t- and P-statistics were estimated by regression using a linear model.
Values shown in bold text are statistically significant at the α = 0.05 level.
47
2.4. Discussion
2.4.1. Responses of SOC and labile OC to fertilization
No differences in SOC for either crop were observed between the three most intense
fertilization regimes (FYM1+NPK, FYM2, FYM2+NPK). It has been hypothesized that
no or only little increase of SOC despite of increased C inputs, indicates C saturation of
the given soil system (Hassink et al. 1997; Six et al. 2002). Indeed, there is already
complementary evidence that C saturation may be occurring at the SFEBL in the most
intensively fertilized plots (Eden et al., 2012). Similar phenomena have also been
observed for SOC in various other long-term experiments (Campbell et al. 1991; Gulde et
al. 2008; Solberg 1998).
In accordance with this logic, the labile OC pool at the sugar beet strip also appears C
saturated, showing no further increase in HWC contents in the three most intensely
fertilized treatments (FYM1+NPK, FYM2, FYM2+NPK). However with alfalfa, all
increases in the intensity of fertilization led to corresponding increases of HWC. This is
consistent with the findings of Stewart et al. (2008) and Gulde et al. (2008), which
provided evidence that labile OC can continue to accumulate even when mineral-
associated C fractions appear to be C-saturated in some cases. In the following sections
we will discuss underlying mechanisms, considering possible influencing factors in
relation to the crop type, such as differences in root exudation, root architecture, and
increased nitrogen fertility based on the symbiotic relationship of alfalfa to N-fixing
bacteria and mycorrhizal fungi.
2.4.2. Influence of fertilization and crop type on SOC and TN composition
The different contributions of biomarker C and N to SOC and TN across our study plots
support our hypothesis that both fertilization level and crop type affect SOC composition.
48
Direct or indirect increases in C input based on higher plant productivity due to organic
fertilization may have increased the contribution of ∑Cbiomarker to the SOC. Our results
imply that mineral fertilization alone also had a noticeable effect on SOC in the alfalfa
strip, together with changes in the SOC composition that presumably stemmed from
changes in the nitrogen budget. Notably, the application of NPK alongside organic
fertilizer seems to have caused a pronounced increase in the contribution of amino acids
to TN. There is increasing evidence that mycorrhizal fungi assimilate and transfer soil
organic N to their host plant to considerable degree (Leigh et al. 2009; Talbot and
Treseder 2010; Whiteside et al. 2012a; Whiteside et al. 2012b; Whiteside et al. 2009). We
have complementary evidence to believe that AMF dynamics play a role in our treatment
responses, based on colonization rates of mycorrhiza (unpublished data). Thus, it is likely
that treatment with mineral fertilizer would have reduced either the fungal acquisition of
N or the degree of mycorrhization, in either case reducing uptake from the AA pool
(Gryndler et al. 2006; Olsson et al. 1997; Whiteside et al. 2012b). Our results also imply
though that the general microbial community may counterbalance the consumption of
amino acids when organic N acquisition by AM-fungi is reduced, except in cases of
extremely high fertilization, since the differences in ∑Nbiomarker and amino acid N
percentages between the mineral and organic fertilized treatments were only significant
under the most intense fertilization regime (FYM2+NPK).
2.4.3. The effects of fertilization and crop type on microbial biomass and OC
turnover
The generally strong relationship between PLFA-C and SOC is consistent with past
observations from long-term agricultural experiments and reflects a strong adaptation of
the living microbial community to C input due to long-term fertilization in the SFEBL
49
(Smith et al. 1990; Witter et al. 1993). PLFA-C also correlated closely with labile OC,
indicating that the size of the labile OC pool is related to a high degree by the growth and
associated metabolism of soil microorganisms and their responses to changes in
management and site conditions (Ghani et al. 2003; Hoffmann et al. 2006; Kalbitz et al.
2000; McDowell 2003). This result also confirms that microbial biomass represents a
considerable part of the labile OC pool (Ghani et al. 2003; Hoffmann et al. 2006; Sparling
et al. 1998).
The availability of mineral nutrients to microorganisms in agricultural soils depends on
the type and amount of fertilizer amendment and the specific needs of the cultivated crop
(Fageria et al. 2011; Marschner 2012). Because the strength of the relationship between
PLFA-C and labile OC differed between crop types and between mineral and non-mineral
fertilized soils, microbial biomass was likely affected by both crop- and fertilization-
related variations in the availability of mineral nutrients. In this work, PLFA-C levels
indicated that treatment with NPK caused an increase in microbial biomass. However, the
only significant difference was found on the sugar beet strip, when mineral fertilizer was
added to 20 t FYM ha-1
2yrs-1
. Thus, in keeping with previous studies, there was no clear
and consistent evidence that the addition of mineral N or full mineral fertilizer increased
the microbial biomass (Allison et al. 2008; Bardgett et al. 1999; Moore et al. 2000;
Smolander et al. 1994; Treseder 2008).
However, the standing microbial biomass does not necessarily reflect growth rates.
Growth rates may increase even with no apparent change in total microbial biomass if
death rates remain similar to growth rates (Stapleton et al. 2005). Analyses of the other
biomarkers examined in this work did indeed suggest that the addition of NPK enhanced
microbial growth in the presence of high C inputs due to fertilization. With alfalfa as the
planted crop and within the crop rotation, treatment with 30 t FYM ha-1
2yrs-1
+ NPK
50
(FYM2+NPK) caused strong increases in the C6:C5 and deoxyC6:C5 ratios and in DAP.
This suggests a strong increase in the contribution of bacteria-derived monosaccharides
and amino acids to the SOC (Grant and West 1986; Murayama 1984; Oades 1984),
implying microbial synthesis of these compounds through growth.
In addition to evidence of increased microbial growth under the most intensive
fertilization regime with alfalfa, we observed increases in the levels of soil MS-C and
AA-C contents not only in total, but also relative to PLFA-C. This implies that MS-C and
AA-C were increasing beyond what can be explained by microbial growth alone. Taking
together all individual indications we hypothesized that under intense fertilization there
was initially a rapid increase in microbial growth and respiration that was then suppressed
when soil pore space became enriched in carbon dioxide and oxygen became limiting
(Dixon and Kell 1989a; Gök and Ottow 1988).
In the absence of any fertilization, we found evidence that nitrogen promotes the
degradation and incorporation of labile carbon into microbial biomass. The AA-N levels
under the control treatment with alfalfa were approximately four times higher than those
with sugar beet, suggesting that the legume improved the availability of organic N due to
symbiotic N-fixation. This enhanced N availability in the alfalfa strip might have
promoted the transformation of plant into microbial organic carbon to a greater degree
than would have been the case without alfalfa. This would explain the results of
monosaccharide C6:C5 and deoxyC6:C5 ratios, and DAP contents, which were clearly
higher in the alfalfa control plot than in the sugar beet strip under equivalent conditions.
The microbial contributions to MS and AA were also higher under the control treatment
of alfalfa than under any fertilization regime other than the most intense (i.e.
FYM2+NPK). Despite the low productivity of control plots (Körschens and Pfefferkorn
1998), alfalfa has a root architecture that promotes labile carbon and microbial activity in
51
the rhizosphere. Therefore, the predominance of microbial OC compounds under the
control treatment may be due to a greater proportion of microbe- versus plant-derived
carbon, and/or to preferential consumption of plant-derived carbon by microorganisms.
As discussed previously, the ratios of MS-C and AA-C to PLFA-C were enriched in
control plots relative to most treated plots, although PLFA-C, and thus microbial biomass,
was lowest in controls. However, there was a non-significant tendency for control plots to
have higher soil bulk densities than the fertilized plots. Eden et al. (2012) also found that
the control plots of the SFEBL had smaller pore volumes, lower air-filled porosities and
lower levels of relative diffusivity at field capacity than their fertilized counterparts,
which were attributed to the low levels of organic matter input. The control plots were
thus more likely to have experienced critical pO2 or pCO2 levels, which inhibit aerobic
catabolism (Bronick and Lal 2005; Haynes and Naidu 1998).
2.4.4. The relationships of AA, MS, and AS with microbial biomass, SOC and
labile OC
Because microbial amino acid biosynthesis is tightly regulated (Wendisch 2007), soil
amino acid levels are tightly coupled to microbial growth and activity. This was reflected
in the general and significant correlation between AA-C and PLFA-C observed in this
work and in the studies of Friedel and Scheller (2002), who reported a close relationship
between amino acid contents from bulk soil and microbial amino acid-N levels from
chloroform fumigation extracts across soil types. As discussed above, deviations from
this normally strong correlation are indicative of changes in microbial physiology and
catabolism under no or extreme fertilization. It was also striking, that the correlations
between AA-C and PLFA-C and between AA-C and SOC were stronger on plots treated
with mineral fertilizer than on those without, regardless of crop type. There are two
52
possible explanations for this trend. The first is that mineral fertilization may affect the
interactions between AA and clay minerals. Clays can retain significant amounts of
ammonium (Dontsova et al. 2005; Shen et al. 1997). It is therefore possible that mineral
fertilization causes the occupation of clay binding sites by inorganic cations, which could
increase the concentration of organic molecules in solution and better reflect microbial
growth. Thus, we would see a stronger correlation between PLFA-C (always extracted
with a high-ionic strength buffer for the same result), and AA-C under mineral
fertilization. Alternatively, decreased enzyme production under mineral fertilization, with
less AA-C present as degradation products, may explain this result. The suppression of
soil enzyme production and activity following N and P addition has been observed in
several studies (Bandick and Dick 1999; Dick et al. 1988; Marschner et al. 2003; Olander
and Vitousek 2000).
Reducing the scope for interaction with the clay surface would also affect the stabilization
of poly- and monosaccharides. In keeping with this observation, the correlations of MS-C
with PLFA-C and SOC were also stronger in soils treated with mineral fertilizer. The
correlations of MS-C with PLFA-C and SOC on the alfalfa strip were generally weaker
than in the sugar beet strip, and became non-significant in the absence of mineral
fertilizer. This may have been due to a greater contribution of non-biomass related MS-C:
monosaccharides account for ten times less of the dry mass of bacteria than amino acids
(Neidhardt 1990). This decrease in the relationship between MS-C and PLFA-C would be
further strengthened by any increase in the mineralization of carbohydrates or any
reduction in their utilization as C-sources with increasing fertilizer concentrations
(Fischer et al. 2010).
Of the tested biomarkers, amino sugars had the least significant relationship to PLFA-C.
This supports the assumption that AS mainly represent accumulated microbial necromass
53
(Amelung et al. 2001a; Glaser et al. 2004; Zhang et al. 1999; Zhang et al. 1998). With the
exception of the negative correlation between AS-C and PLFA-C in the alfalfa strip under
mineral fertilization, AS-C appeared to be independent of both SOC and labile OC. This
stands in contrast to the findings of Liang et al. (2008); the apparent contradiction
between their results and ours may be because there were different amounts of clay in the
soils at the two sites. In addition, AS-C has been reported to account for only 0.1-7% of
microbial biomass C (Glaser et al. 2004), which is approximately one-tenth of the amount
contributed by MS. From this we conclude that the amino sugars extracted in this work
primarily reflect the stabilized microbial contribution to the OC, and that the acid
hydrolysis step during the extraction procedures caused the release of some mineral-
associated (i.e. stabilized) AS in the same way as for AA and MS. This implies that non-
protected AS that are not associated with biomass are rapidly degraded in the soil. The
proposed rapid degradation of non-protected AS is consistent with the findings of Liang
et al. (2007b), who reported a decrease in amino sugar contents after an initial increase
during a 12 week microcosm experiment involving maize stalks and soybean leafs.
However, it is perplexing that a fertilization regime that causes soil C-saturation (i.e.
FYM2+NPK) yielded a strong increase in the levels of MS-C and AA-C but had no effect
on AS-C in the alfalfa strip. This result becomes even more confusing when one
considers the high abundance of DAP, which is combined with N-acetylglucosamine and
N-acetylmuramic acid to form the peptidoglycan layer of bacterial cell walls. Since it
seems unlikely that non-protected amino sugars would have appreciably shorter half-lives
in the soil than either amino acids or neutral sugars, this difference may indicate that
amino sugars are rapidly transformed, possibly by enzymatic deamination. However, it is
not currently clear how or to what extent this mechanism contributes to the degradation of
amino sugars in soils.
54
2.5. Conclusions
We attempted to understand the result of both microbial metabolic and growth dynamics
under long-term management by linking data from simultaneous measurements of four
biomarkers with a large set of soil chemical and physical parameters. Under consideration
of all findings we concluded that including alfalfa into crop rotations can have a great
impact on carbon storage and microbial metabolism, despite underlying long-term
fertilization regimes. Especially in the case of fertilization beyond plant nutrient needs
(indicated from long-term assessments of SFEBL crop yields, nutrient contents, and
leaching), e.g. C saturation, the special characteristics of legumes might enable a greater
retention of soil labile C. Due to the lacking statistical power further investigation is
needed to substantiate our assumptions and, on the other hand to answer the questions
which emerged from this study.
55
3. Effects of plant-symbiotic relationships on the living
soil microbial community and microbial necromass in
a long-term agro-ecosystem
Chapter source: Schmidt et al. 2017. Effects of plant-symbiotic relationships on the
living soil microbial community and microbial necromass in a long-
term agro-ecosystem. Science of the Total Environment (accepted
version of the manuscript)
Abstract
We examined the impact of arbuscular mycorrhizal fungi and rhizobia on the living
microbial community and microbial necromass under different long-term fertilization
treatments at the long-term Static Fertilization Experiment Bad Lauchstädt (Germany).
Phospholipid fatty acids (PLFA) and amino sugars plus muramic acid, were used as
biomarkers for soil microbial bio- and necromass, respectively, and analysed from six
treatments imposed on two crop rotations, varying only in the inclusion/non-inclusion of
a legume. Treatments included: two levels of only farmyard manure (FYM), only mineral
fertilizer (NPK), the combined application of both fertilizer types and a non-fertilized
control. PLFA profiles differed clearly between the investigated crop rotations and were
significantly related to labile C, mineral N, and soil pH. This emphasizes the role of
carbon, and of mycorrhizal and rhizobial symbioses, as driver for changes in the
microbial community composition due to effects on the living conditions in soil. We
found some evidence that legume associated symbiosis with arbuscular mycorrhizal fungi
and rhizobia act as a buffer, reducing the impact of varying inputs of mineral nutrients on
the decomposer community. While our results support former findings that living
microbial populations vary within short-term periods and are reflective of a given crop
grown in a given year, soil necromass composition indicates longer term changes across
56
the two crop rotation types, mainly shaped by fertilizer related effects on the community
composition and C turnover. However, there was some evidence that specifically the
presence of a legume, affects the soil necromass composition not only over the whole
crop rotation but even in the short-term.
Keywords: long-term fertilization, AMF, rhizobia, PLFA, amino sugars
3.1. Introduction
Proper management of agricultural soils can contribute to the mitigation of atmospheric
CO2 increases both by reducing respiratory C losses from soil and by sequestering
photosynthetically fixed CO2 (Smith et al. 2014). These processes are mainly driven by
soil microorganisms, which play a central role for the functioning of terrestrial
ecosystems, encompassing much more than simply decomposition of organic matter or
cycling of mineral nutrients (Nannipieri and Badalucco 2003). Almost all organic
material which enters the soil passes through the pool of living microbes, where it gets
degraded, transformed, or incorporated into fungal or bacterial cells (Paterson et al.
2009). It is estimated that up to 80% of soil organic carbon (SOC) may be derived from
microbial cellular components, highlighting the significance of the soil microbial
community as source of soil organic matter (SOM) genesis and long-term C sequestration
(Liang et al. 2011). It is not fully understood, however, how specific management
practices affect the sequestration, or in turn, the mineralization of microbial residues in
soils. Some of these open questions might be answered by a direct comparison between
the living microbial biomass and long-term sequestered necromass.
Since most soil microorganisms are not cultivable, culture independent methods relying
on biochemical indicators, such as lipids or amino sugars, are frequently used to analyse
57
microbial communities (Frostegård and Bååth 1996; Liang and Balser 2012).
Phospholipid derived fatty acids (PLFA) are structural components of all cellular
membranes, constantly synthesized during microbial growth, and experiencing a rapid
turnover in the soil (White et al. 1979; Zelles 1999). Thus, PLFA’s can be applied as an
indicator for the living microbial biomass and for the current structure of the microbial
community. If neutral lipid fatty acids (NLFA) are also considered, it is possible to have
additional information about the physiological state of fungi, since NLFA mainly derive
from triacylglycerols, which are storage products of eukaryotic cells (Bååth 2003).
In contrast to PLFAs, amino sugars (AS) and muramic acid (MurA) are largely stabilized
in the soil and are assumed to represent mainly microbial necromass (Glaser et al. 2004).
While MurA occurs exclusively in the peptidoglycane layer of bacterial cell walls,
glucosamine (GluN) is the basic component of fungal chitin and is present to a lesser
extent in bacterial cell walls. Only negligible quantities of GluN in soil have been
assigned to sources not related to fungal or bacterial biomass, such as skeletons of
arthropods, earthworm gut lining, nematode egg shells, mollusk polysaccharides, or snail
gelatine (Amelung 2001; Chantigny et al. 1997). Galactosamine (GalN) is a frequent
component of bacterial capsular- or exopolysaccharides but also found in significant
amounts in fungi (Glaser et al. 2004). Little is known about the biological function of
mannosamine (ManN), which also seems to be derived mainly from bacteria (Kenne and
Lindburg 1983; Rüde and Goebel 1962). In the past, the ratios of GluN:MurA or
GluN:GalN have been used to estimate the contribution of fungal and bacterial residues
into the SOM pool (Said-Pullicino et al. 2007; Solomon et al. 2001).
Previous studies examining the role of microorganisms in SOM dynamics have either
focused only on structural and functional changes of the living microbial community or
on shifts in the bacterial and fungal contributions to SOM. Based on the need of
58
understanding SOM dynamics for sustainable food production, a large proportion of this
research has been performed in agricultural soils. The type and application rate of
fertilizers as well as the plant species and plant-microbe interactions have all been found
to affect the biomass, activity and structure of the microbial community (Fließbach et al.
2007; Lambers et al. 2009; Ngosong et al. 2010).
Compared to the great number of PLFA-based studies, the accumulation and turnover of
microbial residues in agricultural soils has been researched less intensively. Long-term
cropping has been found to reduce total AS contents, which was explained by microbial
substrate limitation due to cultivation (Zhang et al. 1998). In this context, a preferential
degradation of bacterial derived AS was assumed, resulting in a higher fungal
contribution (Zhang et al. 1999). Amelung et al. (2001a) even demonstrated that the
amount of C and N sequestered in the microbial necromass can be manipulated by
changing the input of labile C and N into soil. Finally, evidence on crop- and crop
rotation related effects on amounts of total and individual amino sugars in soil was
reported recently by Zhang et al. (2014).
To our knowledge, there are only a handful of studies in which the living (PLFA) and
non-living (AS) biomass has been measured simultaneously in relation to each other
(Appuhn and Joergensen 2006; Liang et al. 2008; Liang et al. 2015; Zhang et al. 2013),
while the impact of fertilization, crop, or symbiotic relationships of crops with rhizobia or
AMF in agricultural soils has not been considered. Such work, however, would improve
our knowledge about the production and stabilization of amino sugars and thus could
have the potential to increase our understanding of the microbial mediation of long-term
dynamics of soil organic C and N.
From the background of very long-term, likely steady state conditions at the Static
Fertilization Experiment Bad Lauchstädt (SFEBL) we compared the abundance and
59
composition of the living microbial community with the amount of microbial residues by
determining both PLFA and AS. In addition to fertilization treatments we considered
plant-microbe interactions as influencing factors by sampling two crop rotations that vary
only in the inclusion or exclusion of alfalfa (Medicago sativa) every 7th
and 8th
year
having a dual symbiosis (AMF and rhizobia) which has a huge impact on the rhizosphere
in terms of N and C exudates. We examined changes in crops and cropping history from
two perspectives using these different tools: first we examined the effects of long-term
fertilization treatments on the living, active microbial community associated with the
currently grown crop (alfalfa or sugar beet) using lipid analysis, AMF colonization, and
rhizobia nodulation rates. Second, we examined the effects of fertilization and cropping
history using the amino sugar microbial necromass pool, assumed to change more slowly
over time and reflect longer term patters associated with agricultural management.
3.2. Materials and methods
3.2.1. Study site description and sampling
This study took place at the long-term Static Fertilization Experiment Bad Lauchstädt
(SFEBL), Sachsen-Anhalt (Germany), which was initiated in 1902 (Körschens and
Pfefferkorn 1998). The soil is a Haplic Chernozem (FAO) (USDA: Mollisol) consisting
of 21% clay, 67.8% silt and 11.2% sand. The mean annual temperature and precipitation
are 8.8°C and 480 mm, respectively (Körschens 2002). The Static Fertilization
Experiment Bad Lauchstädt was laid out in a split plot design with the main-plot factor
FYM (three levels: no FYM, 20t FYM ha-1
2yrs-1
, 30t FYM ha-1
2yrs-1
) and mineral
fertilization as a sub-plot factor (6 levels: no, PK, N, NK, NP, NPK) which are all realised
in each main plot. The experiment is further stratified in 5 different cropping strips. Four
60
of the cropping strips represent different phases (a different crop on each strip, each year)
of a 4 crop rotation (sugar beet, spring barley, potatoes, and winter wheat). In addition,
legumes have been included in the crop rotation exclusively on the 5th strip of the
experiment since 1924, replacing sugar beet and spring barley every 7th
and 8th
year.
Since 1970 alfalfa (Medicago sativa) has been the only legume species cultivated on this
strip. Mineral fertilization (NPK) varies annually in adaption to the nutrient demand of
each crop (60 to 170 kg ha-1
yr-1
N, 12 to 60 kg ha-1
yr-1
P, 50 to 230 kg ha-1
yr-1
K).
Application of farmyard manure takes place every second year with the cultivation of root
crops (potatoes, sugar beet). Alfalfa follows winter wheat in the rotation, receives
farmyard manure before seed drilling, and only receives PK in the mineral fertilized
treatments.
Soil sampling was timed to correspond with plant maturity, which occurred in June under
alfalfa on the legume strip (sampled in 2010) and in October under sugar beet (Beta
vulgaris) on the non-legume crop rotation (sampled in 2011). Samples were taken from 6
plots of each rotation type, comprising five fertilization treatments with increasing
fertilizer addition as well as an unfertilized control (NIL). In detail the fertilized
treatments were: mineral fertilizer (NPK), 20t farmyard manure ha-1
2yrs-1
(FYM1), 20t
farmyard manure ha-1
2yrs-1
plus mineral fertilizer (FYM1+NPK), 30t farmyard manure
ha-1
2yrs-1
(FYM2) and 30t farmyard manure ha-1
2yrs-1
plus mineral fertilizer
(FYM2+NPK). Since the main-plot factor and the main-plot/sub-plot combinations were
not replicated, soil was taken directly next to five replicate plants in the plough horizon
(0-20 cm) in each plot and treated as replicates in further analysis. In the crop rotation
including legumes, roots from the same replicate alfalfa plants were removed gently from
the soil, washed and used for the determination of rhizobial nodule numbers and
arbuscular mycorrhizal colonization rates. Soil samples were sieved to < 2mm and stones
61
and visible plant residues were removed. Portions of the fresh and sieved soil were frozen
at -20°C immediately after sampling.
3.2.2. Soil parameters
3.2.2.1. SOC, TN and labile OC and N
Total carbon (TC) and total nitrogen (TN) were determined via combustion in a C/H/N
combustion analyzer (Vario El III, Elementar-Hanau). No inorganic C was detected; so
TC represents the total soil organic carbon (SOC).
Cold-water extraction was performed to assess the pool of labile and highly available
organic carbon, representing the nutritional conditions at the time of sampling (Zsolnay
1996). A volume of 30 ml of a 0.01 M CaCl2 - solution was added to 15 g air dried soil,
and samples were shaken for 10 min and centrifuged at 4000 rpm for 15 min. Water
extracts were filtered (0.45 µm Minisart single-use syringe membrane filters RC 25, PP-
housing, Sartorius AG, Göttingen, Germany) prior to the determination of labile C and N
concentrations (mg kg-1
) (CWC, CWN), using an elemental analyzer for liquid samples
(Micro N/C and Multi N/C, Analytik Jena, Germany).
Fresh soil was used for determination of pH, ammonium-N (NH4+-N) and nitrate-N (NO3-
N). NH4+-N and NO3-N were extracted with 1 M KCl (1:4 w/v, soil: KCl) from 10 g soil
by shaking for 1.5 h. After sample filtration (Whatman Schleicher & Schuell 595 1/5 Ø
270 mm) the concentrations of NH4+-N and NO3
--N were measured using a flow injection
analyzer (FIAstar 5000, Foss GmbH, Rellingen, Germany).
Soil pH was measured from a slurry of 25 ml of 0.01 M CaCl2 and 10 g air-dried soil.
62
3.2.3. Analysis of microbial biochemical indicators
A description of the extraction and quantification of the phospho- and neutral-lipid fatty
acids (PLFA and NLFA) and of amino sugars and muramic acid is given in Schmidt et al.
(2015). External standards were included in the GC/MS analysis to allow identification of
the individual fatty acids and amino sugars plus muramic acid, respectively, based on
their retention times.
From the obtained PLFA data we created three different data sets, to elucidate effects of
crop and fertilization on the composition of the microbial community as well as the size
and composition of the microbial biomass, including physiological aspects:
1.) Total PLFA profile used for NMDS: A data frame consisting of the relative
abundances (mol %) of all detected PLFA´s up to a chain length of 20 C-atoms,
representing the composition of the total microbial biomass. Beside the key-indicator
PLFA´s (see below) this data frame contains also non-specific PLFA´s, which are often
excluded from microbial community structure analysis, either because they are widely
distributed or, in contrast, rarely found. The total PLFA profile was assumed to include
information about both community changes and variations in the PLFA composition
triggered by microbial physiological responses to environmental factors (Russell and
Fukunaga 1990; Wixon and Balser 2013).
2.) Key-indicator PLFA profile used in SIMPER analysis: Contains the relative
abundances (mol%) of only those PLFA´s indicating specific microbial groups, as
follows: iso and anteiso-branched (e.g. i13:0, a13:0) = Gram-positive bacteria; methyl
branched (e.g. 16:0 10me, 16:0 11me, 17:0me, 18:1me, 18:0 12me) = actinomycetes;
hydroxy (e.g. 10:0 2OH, 14:0 3OH, 16:0 2OH, 18:1 2OH) and monounsaturated (14:1,
16:1ω9c, 16:1ω7c, 16:1ω7t, 17:1 11c or 9c, 17:1 7c or 8c, 18:1ω12c, 18:1ω9t, 18:1ω7c,
18:1ω5c, 19:1) = Gram-negative bacteria; 16:1ω5c = arbuscular mycorrhizal fungi
63
(AMF); 18:1ω9c, 18:2ω6,9c = general fungi (Balser 2005; Federle 1986; Frostegård et al.
1993; Frostegård et al. 1991; Stahl and Klug 1996; Vestal and White 1989; Wilkinson
1988; Zelles et al. 1992).
3.) The biomass (nmol lipid g dry soil-1
) of broad groups within the microbial
community, used for ANOVA analysis was indicated by considering the content of one
representative member of a respective group. This decision is based on the circumstance
that for AMF there is in general only one key-indicator PLFA available. The selected key
PLFA´s representing the biomass of a specific microbial group were: 16:1ω5c for AMF
(Balser 2005); 18:2ω6,9c for general fungi (GF) excluding AMF (Balser 2005; Frostegård
et al. 2011); 16:1ω7c for Gram-negative bacteria (Wilkinson et al. 2002); and i15:0 for
Gram-positive bacteria (Wilkinson et al. 2002).
Additionally, the neutral lipid fatty acids 16:1ω5c (AMF) and 18:2ω6,9c (GF) were used
as an indicator of storage lipids (nmol lipid g dry soil-1
) from arbuscular mycorrhizal and
general fungi, respectively. The physiological state of fungal communities was then
determined using the ratios of NLFA/PLFA (Bååth 2003). The fungal to bacterial ratio
was calculated by dividing the concentrations (nmol lipid g dry soil-1
) of phospholipids
indicative of general and AM fungi by the concentrations of phospholipid indicators for
actinomycetes, Gram-positive and Gram-negative bacteria (Frostegård and Bååth 1996).
Similar to this, the ratio of Gram-negative bacteria to Gram-positive (Gm-/Gm
+) was
calculated based on the biomass of both groups (see data set 3).
The relative contribution of fungal to bacterial residues was estimated by ratios of
GluN/MurA, (Zhang and Amelung 1996), GalN/MurA, and ManN/MurA (Glaser et al.
2004).
64
3.2.4. Root nodules and estimation of arbuscular mycorrhizal colonization rates
Root samples of alfalfa obtained as described above were used to estimate mycorrhizal
and rhizobial colonization rates. All samples were processed separately, with five
resultant replicates (one each from five samples plants) per plot. The numbers of root
nodules were counted under a stereomicroscope. Numbers were counted for two root size
classes (class 1: < 1 mm; class 2: >1 mm), and for the purpose of our analysis both size
classes have been added together. For estimation of arbuscular mycorrhizal root
colonization percentage, roots were stained according to (Vierheilig et al. 1998) using a
stain from Sheaffer (Sheaffer, Ft. Madison, IA, USA). Approximate colonization
percentage was determined under a stereomicroscope.
3.2.5. Statistical analysis
We are aware that the sampling design of the Static Fertilization Experiment Bad
Lauchstädt (1902) as described before (see study site description in chapter 2.1) can be
interpreted as pseudoreplication in the sense of Hurlbert (1984). It should be noted that
historical field experiments almost never fulfil the assumptions of statistical models. The
same is the case for studies on disturbance events, landscape studies and large-scale
manipulations. Following Davies and Gray (2015), adopting “a militant stance to
pseudoreplication” necessarily leads to lost opportunities to learn from such studies. In
the case of long-term experiments like ours, considerable treatment differences as a result
of long-term trends over decades represent the inherent value of the studies. We therefore
argue for a pragmatic solution of this problem and an adequate discussion of the results.
Conservative statistics using both univariate and multivariate methods were performed to
partially
65
compensate for the pseudoreplicated nature of our experiment. All statistical analysis
was carried out in R version 2.15.1 (RCoreTeam 2012). Farmyard manure, mineral
fertilizer, and their interactions were included as fixed effects in two-way analysis of
variance (ANOVA) of our microbial response variables, i.e. the lipid biomass of specific
microbial groups (nmol lipid g dry soil-1
), and the ratio of fungal to bacterial and Gram-
negative to Gram-positive biomass. For regression analyses of the bacterial PLFA
biomass and the contents of muramic acid, treatments were separated into a) plots without
mineral fertilizer (NIL, FYM1, FYM2) and b) plots with added mineral fertilizer (NPK,
FYM1+NPK, FYM2 +NPK). Multiple comparison of means was based on the
conservative Tukey´s honest significant difference test (p<0.05) to reduce the risk of type
I errors.
Nonmetric Multidimensional Scaling (NMDS) was used to determine the variation in
total PLFA profiles among the treatments and crop rotation type (McCune et al. 2002).
Soil physical and chemical parameters were included in the model as environmental
variables. Distance matrices for analysis were constructed based on binomial distance as
evaluated by the function rankindex (vegan package, (Oksanen 2011). Finally, NMDS
was performed using metaMDS (vegan package). Thirty independent runs were executed
on raw data to ensure that global solutions, and not local minima, were obtained.
Environmental factors were fitted onto the ordination with the function envfit, based on
1000 random permutations (vegan package). To complement NMDS, the Permanova
permutational analysis of variance was performed on total PLFA profiles using the adonis
function. Finally, the similarity percentages procedure (SIMPER) was applied on the key-
indicator PLFA profile in order to identify those individual PLFA’s which contributed
most to the average dissimilarity between the groups (Clarke 1993).
66
3.3. Results
3.3.1. Composition of the microbial biomass and community structure
Nonmetric multidimensional scaling demonstrated that total PLFA profiles were clearly
clustered according to the current crop at sampling time (Fig. 8). In addition, while total
PLFA profiles between fertilization treatments were fairly similar under alfalfa except the
NIL treatment, under sugar beet there were distinct separations between plots with high
(FYM2+NPK, FYM2, FYM1+NPK) and low or no fertilization (FYM1, NPK, NIL) (Fig.
8).
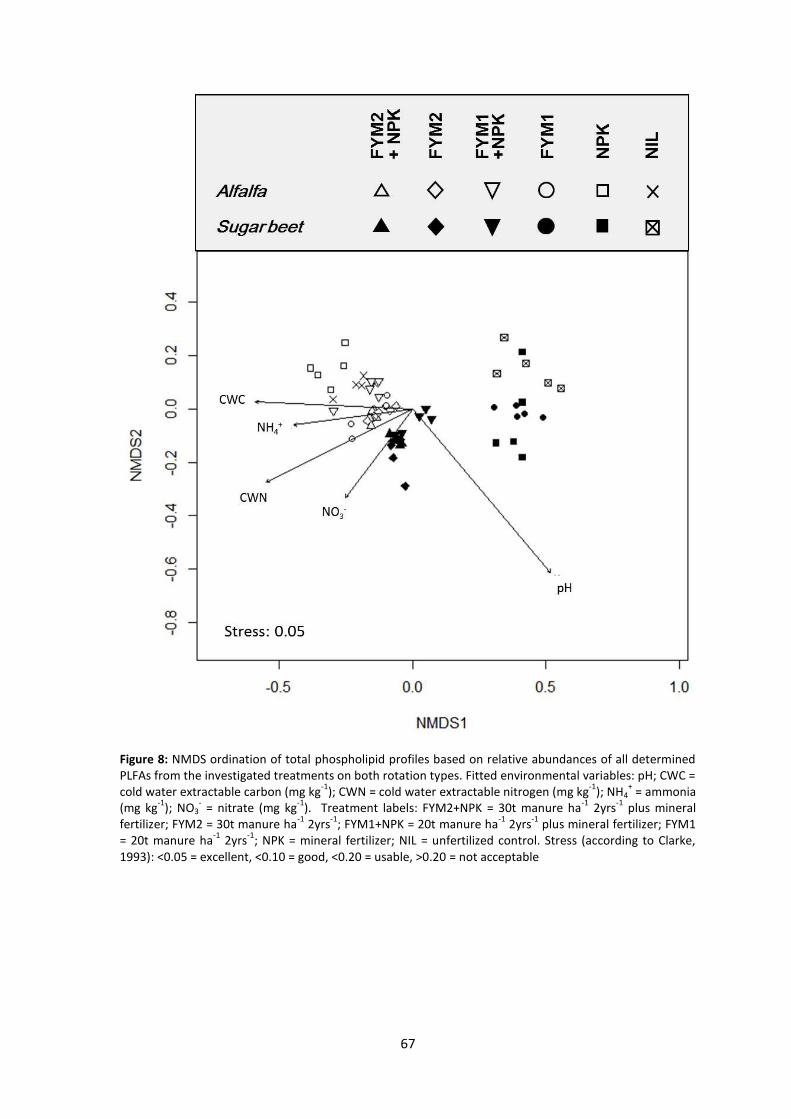
67
Figure 8: NMDS ordination of total phospholipid profiles based on relative abundances of all determined PLFAs from the investigated treatments on both rotation types. Fitted environmental variables: pH; CWC = cold water extractable carbon (mg kg
-1); CWN = cold water extractable nitrogen (mg kg
-1); NH4
+ = ammonia
(mg kg-1
); NO3- = nitrate (mg kg
-1). Treatment labels: FYM2+NPK = 30t manure ha
-1 2yrs
-1 plus mineral
fertilizer; FYM2 = 30t manure ha-1
2yrs-1
; FYM1+NPK = 20t manure ha-1
2yrs-1
plus mineral fertilizer; FYM1 = 20t manure ha
-1 2yrs
-1; NPK = mineral fertilizer; NIL = unfertilized control. Stress (according to Clarke,
1993): <0.05 = excellent, <0.10 = good, <0.20 = usable, >0.20 = not acceptable
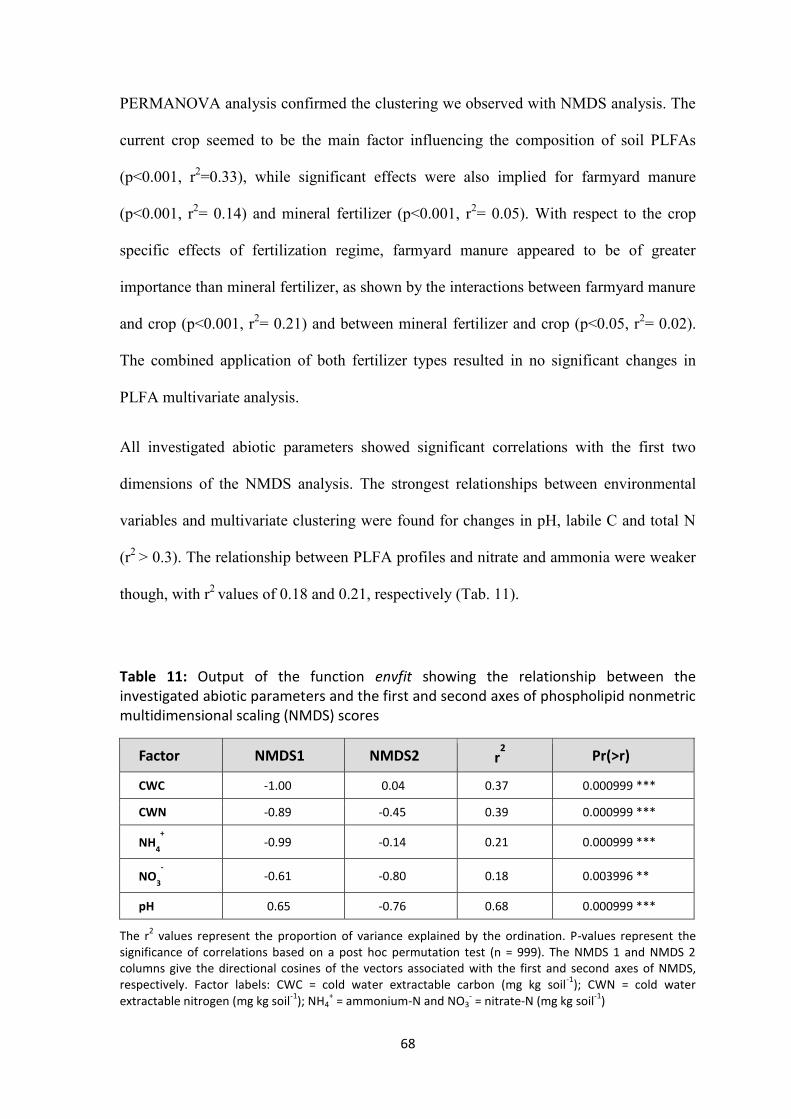
68
PERMANOVA analysis confirmed the clustering we observed with NMDS analysis. The
current crop seemed to be the main factor influencing the composition of soil PLFAs
(p<0.001, r2=0.33), while significant effects were also implied for farmyard manure
(p<0.001, r2= 0.14) and mineral fertilizer (p<0.001, r
2= 0.05). With respect to the crop
specific effects of fertilization regime, farmyard manure appeared to be of greater
importance than mineral fertilizer, as shown by the interactions between farmyard manure
and crop (p<0.001, r2= 0.21) and between mineral fertilizer and crop (p<0.05, r
2= 0.02).
The combined application of both fertilizer types resulted in no significant changes in
PLFA multivariate analysis.
All investigated abiotic parameters showed significant correlations with the first two
dimensions of the NMDS analysis. The strongest relationships between environmental
variables and multivariate clustering were found for changes in pH, labile C and total N
(r2
> 0.3). The relationship between PLFA profiles and nitrate and ammonia were weaker
though, with r2
values of 0.18 and 0.21, respectively (Tab. 11).
Table 11: Output of the function envfit showing the relationship between the investigated abiotic parameters and the first and second axes of phospholipid nonmetric multidimensional scaling (NMDS) scores
Factor NMDS1 NMDS2 r2 Pr(>r)
CWC -1.00 0.04 0.37 0.000999 ***
CWN -0.89 -0.45 0.39 0.000999 ***
NH4
+ -0.99 -0.14 0.21 0.000999 ***
NO3
- -0.61 -0.80 0.18 0.003996 **
pH 0.65 -0.76 0.68 0.000999 ***
The r2 values represent the proportion of variance explained by the ordination. P-values represent the
significance of correlations based on a post hoc permutation test (n = 999). The NMDS 1 and NMDS 2 columns give the directional cosines of the vectors associated with the first and second axes of NMDS, respectively. Factor labels: CWC = cold water extractable carbon (mg kg soil
-1); CWN = cold water
extractable nitrogen (mg kg soil-1
); NH4+ = ammonium-N and NO3
- = nitrate-N (mg kg soil
-1)
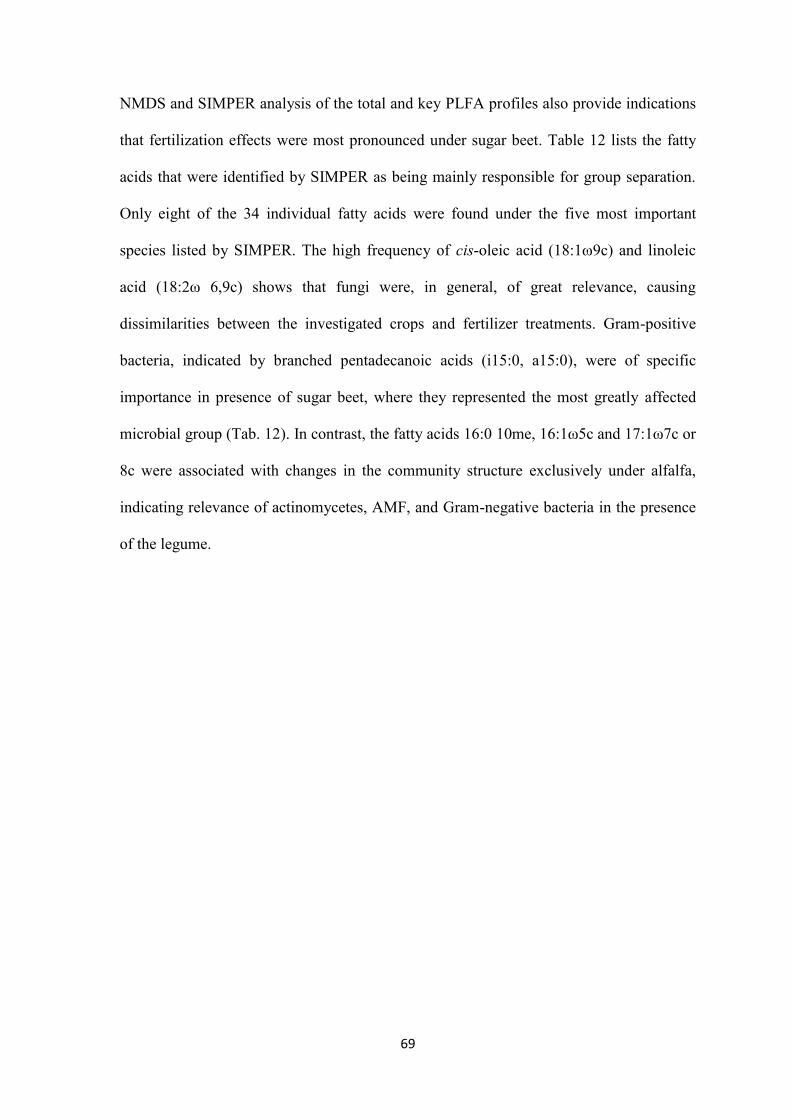
69
NMDS and SIMPER analysis of the total and key PLFA profiles also provide indications
that fertilization effects were most pronounced under sugar beet. Table 12 lists the fatty
acids that were identified by SIMPER as being mainly responsible for group separation.
Only eight of the 34 individual fatty acids were found under the five most important
species listed by SIMPER. The high frequency of cis-oleic acid (18:1ω9c) and linoleic
acid (18:2ω 6,9c) shows that fungi were, in general, of great relevance, causing
dissimilarities between the investigated crops and fertilizer treatments. Gram-positive
bacteria, indicated by branched pentadecanoic acids (i15:0, a15:0), were of specific
importance in presence of sugar beet, where they represented the most greatly affected
microbial group (Tab. 12). In contrast, the fatty acids 16:0 10me, 16:1ω5c and 17:1ω7c or
8c were associated with changes in the community structure exclusively under alfalfa,
indicating relevance of actinomycetes, AMF, and Gram-negative bacteria in the presence
of the legume.
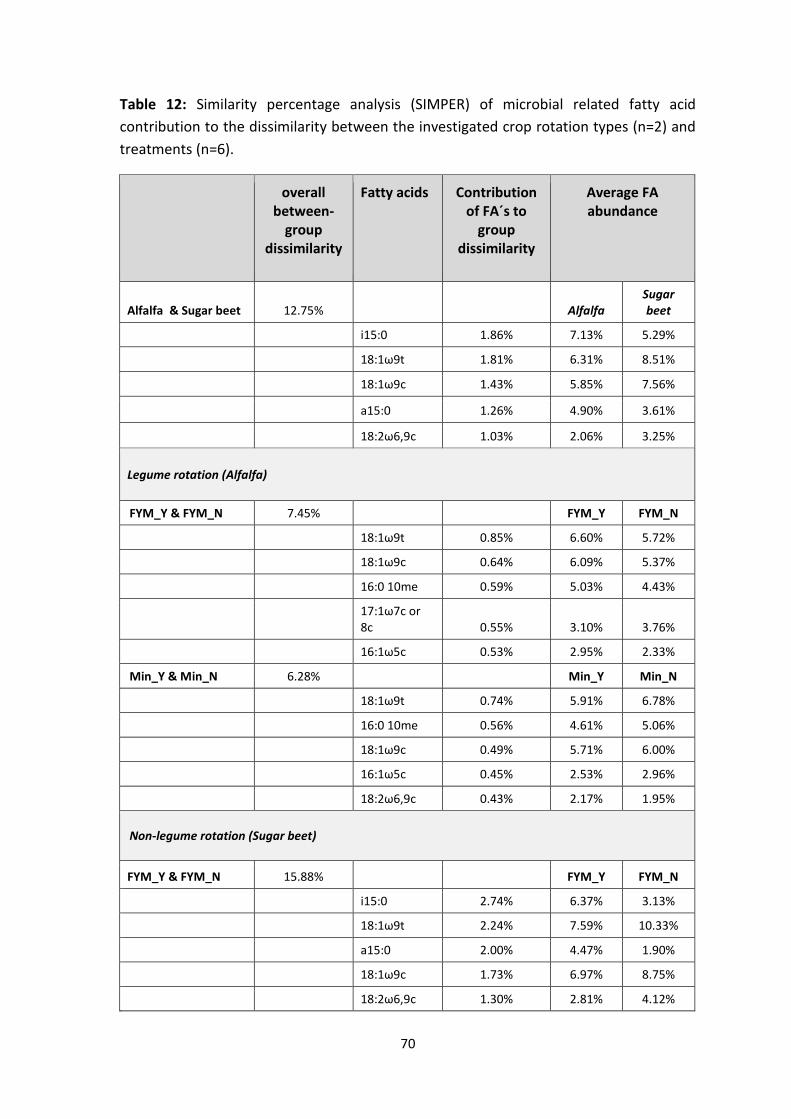
70
Table 12: Similarity percentage analysis (SIMPER) of microbial related fatty acid
contribution to the dissimilarity between the investigated crop rotation types (n=2) and
treatments (n=6).
overall between-
group dissimilarity
Fatty acids Contribution of FA´s to
group dissimilarity
Average FA abundance
Alfalfa & Sugar beet 12.75%
Alfalfa Sugar beet
i15:0 1.86% 7.13% 5.29%
18:1ω9t 1.81% 6.31% 8.51%
18:1ω9c 1.43% 5.85% 7.56%
a15:0 1.26% 4.90% 3.61%
18:2ω6,9c 1.03% 2.06% 3.25%
Legume rotation (Alfalfa)
FYM_Y & FYM_N 7.45% FYM_Y FYM_N
18:1ω9t 0.85% 6.60% 5.72%
18:1ω9c 0.64% 6.09% 5.37%
16:0 10me 0.59% 5.03% 4.43%
17:1ω7c or 8c 0.55% 3.10% 3.76%
16:1ω5c 0.53% 2.95% 2.33%
Min_Y & Min_N 6.28%
Min_Y Min_N
18:1ω9t 0.74% 5.91% 6.78%
16:0 10me 0.56% 4.61% 5.06%
18:1ω9c 0.49% 5.71% 6.00%
16:1ω5c 0.45% 2.53% 2.96%
18:2ω6,9c 0.43% 2.17% 1.95%
Non-legume rotation (Sugar beet)
FYM_Y & FYM_N 15.88%
FYM_Y FYM_N
i15:0 2.74% 6.37% 3.13%
18:1ω9t 2.24% 7.59% 10.33%
a15:0 2.00% 4.47% 1.90%
18:1ω9c 1.73% 6.97% 8.75%
18:2ω6,9c 1.30% 2.81% 4.12%
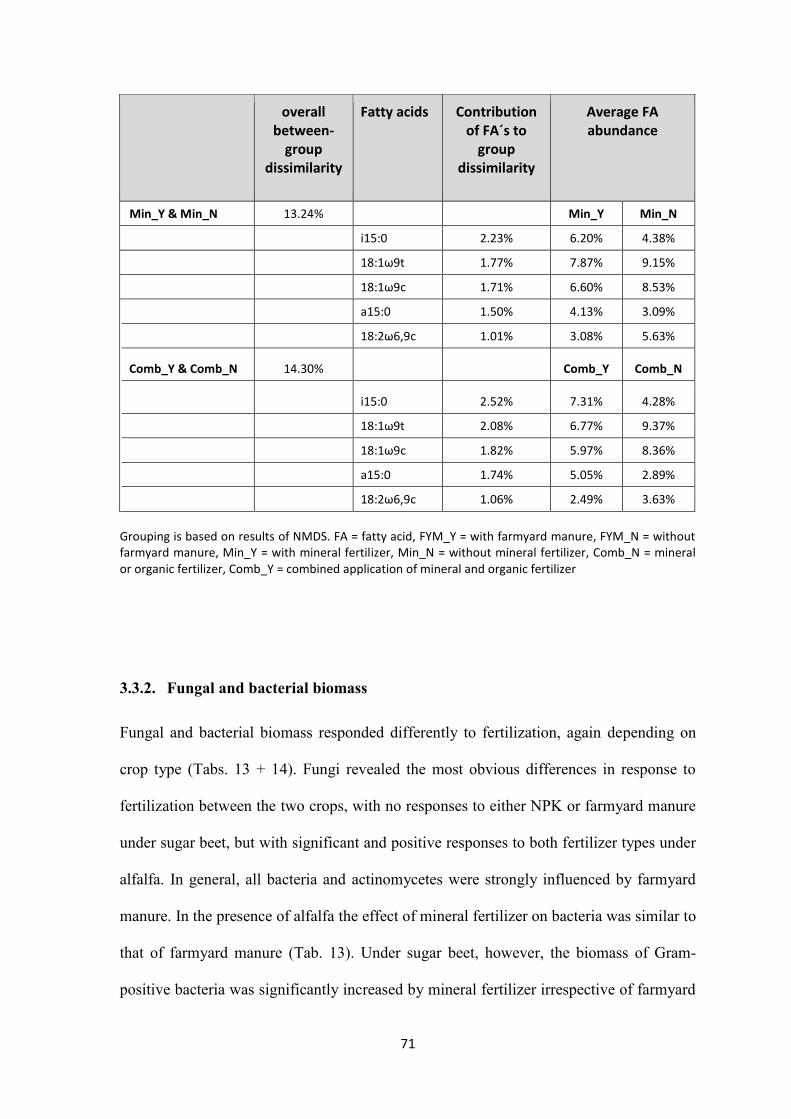
71
overall between-
group dissimilarity
Fatty acids Contribution of FA´s to
group dissimilarity
Average FA abundance
Min_Y & Min_N 13.24%
Min_Y Min_N
i15:0 2.23% 6.20% 4.38%
18:1ω9t 1.77% 7.87% 9.15%
18:1ω9c 1.71% 6.60% 8.53%
a15:0 1.50% 4.13% 3.09%
18:2ω6,9c 1.01% 3.08% 5.63%
Comb_Y & Comb_N 14.30%
Comb_Y Comb_N
i15:0 2.52% 7.31% 4.28%
18:1ω9t 2.08% 6.77% 9.37%
18:1ω9c 1.82% 5.97% 8.36%
a15:0 1.74% 5.05% 2.89%
18:2ω6,9c 1.06% 2.49% 3.63%
Grouping is based on results of NMDS. FA = fatty acid, FYM_Y = with farmyard manure, FYM_N = without farmyard manure, Min_Y = with mineral fertilizer, Min_N = without mineral fertilizer, Comb_N = mineral or organic fertilizer, Comb_Y = combined application of mineral and organic fertilizer
3.3.2. Fungal and bacterial biomass
Fungal and bacterial biomass responded differently to fertilization, again depending on
crop type (Tabs. 13 + 14). Fungi revealed the most obvious differences in response to
fertilization between the two crops, with no responses to either NPK or farmyard manure
under sugar beet, but with significant and positive responses to both fertilizer types under
alfalfa. In general, all bacteria and actinomycetes were strongly influenced by farmyard
manure. In the presence of alfalfa the effect of mineral fertilizer on bacteria was similar to
that of farmyard manure (Tab. 13). Under sugar beet, however, the biomass of Gram-
positive bacteria was significantly increased by mineral fertilizer irrespective of farmyard
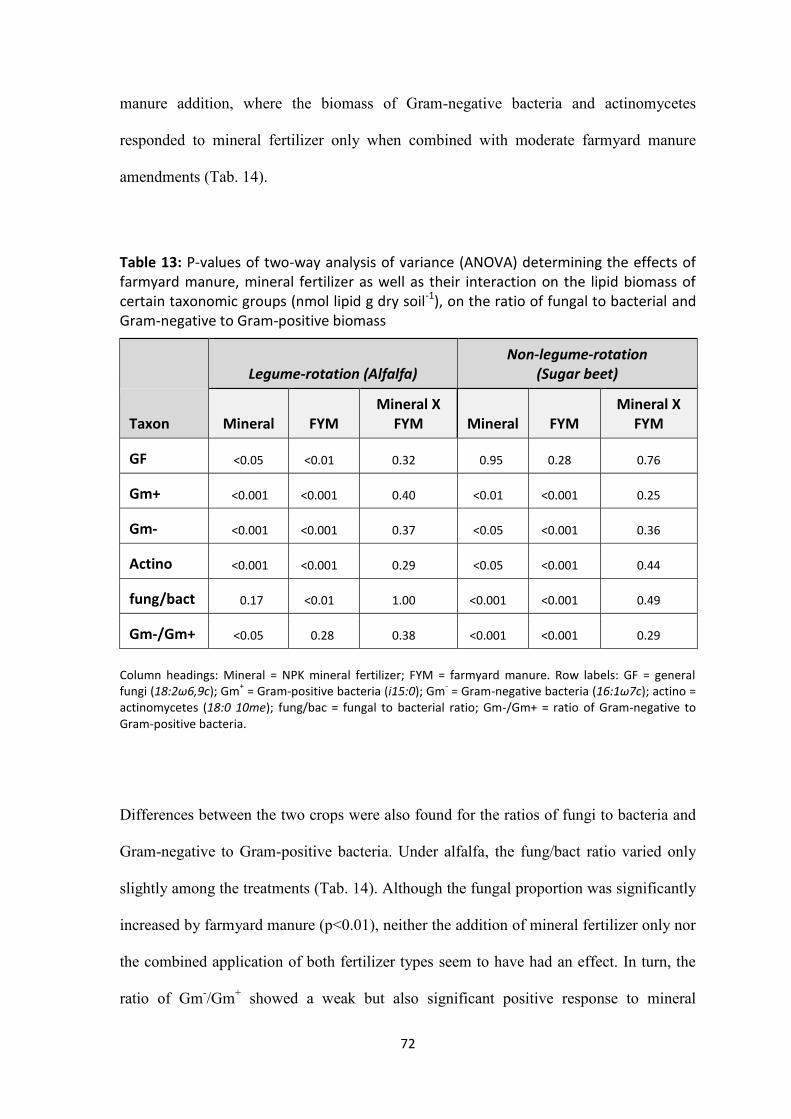
72
manure addition, where the biomass of Gram-negative bacteria and actinomycetes
responded to mineral fertilizer only when combined with moderate farmyard manure
amendments (Tab. 14).
Table 13: P-values of two-way analysis of variance (ANOVA) determining the effects of farmyard manure, mineral fertilizer as well as their interaction on the lipid biomass of certain taxonomic groups (nmol lipid g dry soil-1), on the ratio of fungal to bacterial and Gram-negative to Gram-positive biomass
Legume-rotation (Alfalfa)
Non-legume-rotation (Sugar beet)
Taxon Mineral FYM Mineral X
FYM Mineral FYM Mineral X
FYM
GF <0.05 <0.01 0.32 0.95 0.28 0.76
Gm+ <0.001 <0.001 0.40 <0.01 <0.001 0.25
Gm- <0.001 <0.001 0.37 <0.05 <0.001 0.36
Actino <0.001 <0.001 0.29 <0.05 <0.001 0.44
fung/bact 0.17 <0.01 1.00 <0.001 <0.001 0.49
Gm-/Gm+ <0.05 0.28 0.38 <0.001 <0.001 0.29
Column headings: Mineral = NPK mineral fertilizer; FYM = farmyard manure. Row labels: GF = general fungi (18:2ω6,9c); Gm
+ = Gram-positive bacteria (i15:0); Gm
- = Gram-negative bacteria (16:1ω7c); actino =
actinomycetes (18:0 10me); fung/bac = fungal to bacterial ratio; Gm-/Gm+ = ratio of Gram-negative to Gram-positive bacteria.
Differences between the two crops were also found for the ratios of fungi to bacteria and
Gram-negative to Gram-positive bacteria. Under alfalfa, the fung/bact ratio varied only
slightly among the treatments (Tab. 14). Although the fungal proportion was significantly
increased by farmyard manure (p<0.01), neither the addition of mineral fertilizer only nor
the combined application of both fertilizer types seem to have had an effect. In turn, the
ratio of Gm-/Gm
+ showed a weak but also significant positive response to mineral
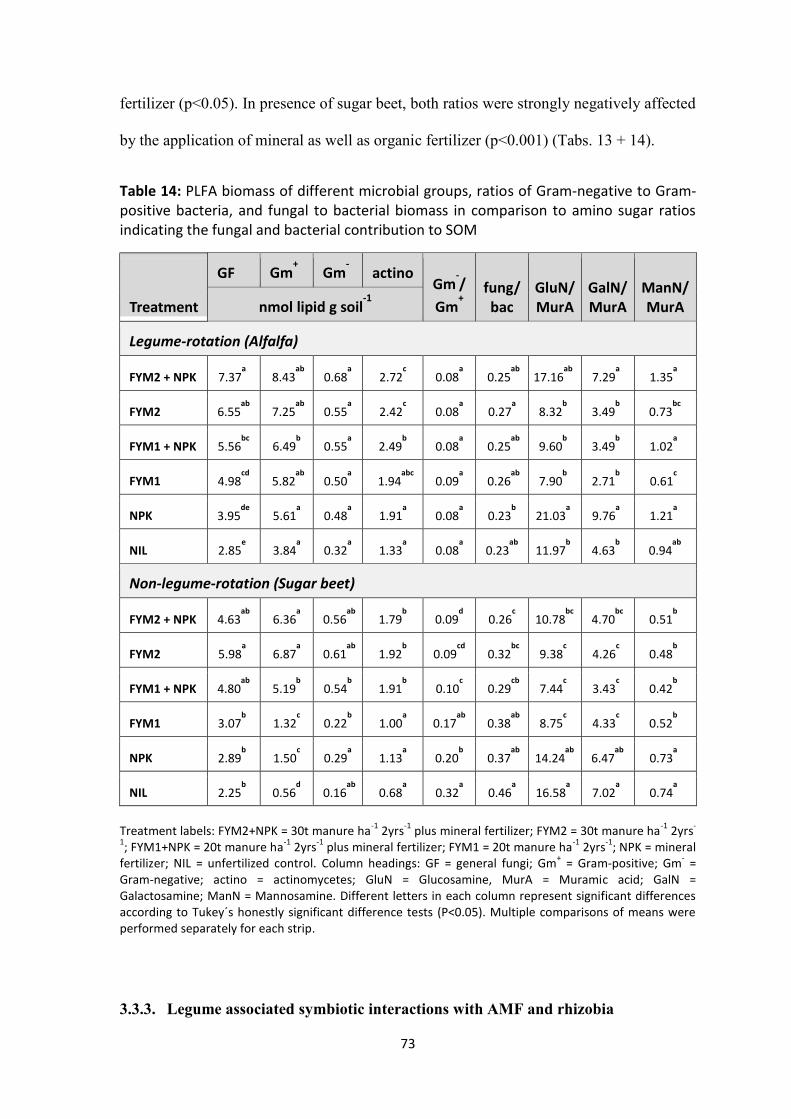
73
fertilizer (p<0.05). In presence of sugar beet, both ratios were strongly negatively affected
by the application of mineral as well as organic fertilizer (p<0.001) (Tabs. 13 + 14).
Table 14: PLFA biomass of different microbial groups, ratios of Gram-negative to Gram-positive bacteria, and fungal to bacterial biomass in comparison to amino sugar ratios indicating the fungal and bacterial contribution to SOM
Treatment
GF Gm+ Gm
- actino
Gm-/
Gm+
fung/ bac
GluN/ MurA
GalN/ MurA
ManN/ MurA nmol lipid g soil
-1
Legume-rotation (Alfalfa)
FYM2 + NPK 7.37a 8.43
ab 0.68
a 2.72
c 0.08
a 0.25
ab 17.16
ab 7.29
a 1.35
a
FYM2 6.55ab
7.25ab
0.55a 2.42
c 0.08
a 0.27
a 8.32
b 3.49
b 0.73
bc
FYM1 + NPK 5.56bc
6.49b 0.55
a 2.49
b 0.08
a 0.25
ab 9.60
b 3.49
b 1.02
a
FYM1 4.98cd
5.82ab
0.50a 1.94
abc 0.09
a 0.26
ab 7.90
b 2.71
b 0.61
c
NPK 3.95de
5.61a 0.48
a 1.91
a 0.08
a 0.23
b 21.03
a 9.76
a 1.21
a
NIL 2.85e 3.84
a 0.32
a 1.33
a 0.08
a 0.23
ab 11.97
b 4.63
b 0.94
ab
Non-legume-rotation (Sugar beet)
FYM2 + NPK 4.63ab
6.36a 0.56
ab 1.79
b 0.09
d 0.26
c 10.78
bc 4.70
bc 0.51
b
FYM2 5.98a 6.87
a 0.61
ab 1.92
b 0.09
cd 0.32
bc 9.38
c 4.26
c 0.48
b
FYM1 + NPK 4.80ab
5.19b 0.54
b 1.91
b 0.10
c 0.29
cb 7.44
c 3.43
c 0.42
b
FYM1 3.07b 1.32
c 0.22
b 1.00
a 0.17
ab 0.38
ab 8.75
c 4.33
c 0.52
b
NPK 2.89b 1.50
c 0.29
a 1.13
a 0.20
b 0.37
ab 14.24
ab 6.47
ab 0.73
a
NIL 2.25b 0.56
d 0.16
ab 0.68
a 0.32
a 0.46
a 16.58
a 7.02
a 0.74
a
Treatment labels: FYM2+NPK = 30t manure ha
-1 2yrs
-1 plus mineral fertilizer; FYM2 = 30t manure ha
-1 2yrs
-
1; FYM1+NPK = 20t manure ha
-1 2yrs
-1 plus mineral fertilizer; FYM1 = 20t manure ha
-1 2yrs
-1; NPK = mineral
fertilizer; NIL = unfertilized control. Column headings: GF = general fungi; Gm+ = Gram-positive; Gm
- =
Gram-negative; actino = actinomycetes; GluN = Glucosamine, MurA = Muramic acid; GalN = Galactosamine; ManN = Mannosamine. Different letters in each column represent significant differences according to Tukey´s honestly significant difference tests (P<0.05). Multiple comparisons of means were performed separately for each strip.
3.3.3. Legume associated symbiotic interactions with AMF and rhizobia

74
Mineral fertilization had a clear negative impact on the colonization of alfalfa roots by
arbuscular mycorrhizal fungi (Tab. 15). Correspondingly, NLFA/PLFA ratios of the AMF
key fatty acid (16:1ω5c) strongly declined under alfalfa in the presence of NPK and
reached values comparable to those found among the fertilized treatments under sugar
beet. The only significantly increased NLFA/PLFA ratio under sugar beet was found on
the control, which was, in turn, comparable to the NLFA/PLFA ratio determined for the
alfalfa control plot.
Figure 9: Effect of fertilization on nodule formation (number of nodules) on roots of Alfalfa, determined at the end of the cultivation period. Treatment labels: FYM2+NPK = 30t manure ha
-1 2yrs
-1 plus mineral
fertilizer; FYM2 = 30t manure ha-1
2yrs-1
; FYM1+NPK = 20t manure ha-1
2yrs-1
plus mineral fertilizer; FYM1 = 20t manure ha
-1 2yrs
-1; NPK = mineral fertilizer; NIL = unfertilized control. Error bars represent standard
errors. Different letters in each column represent significant differences according to Tukey´s honestly significant difference tests (P<0.05).
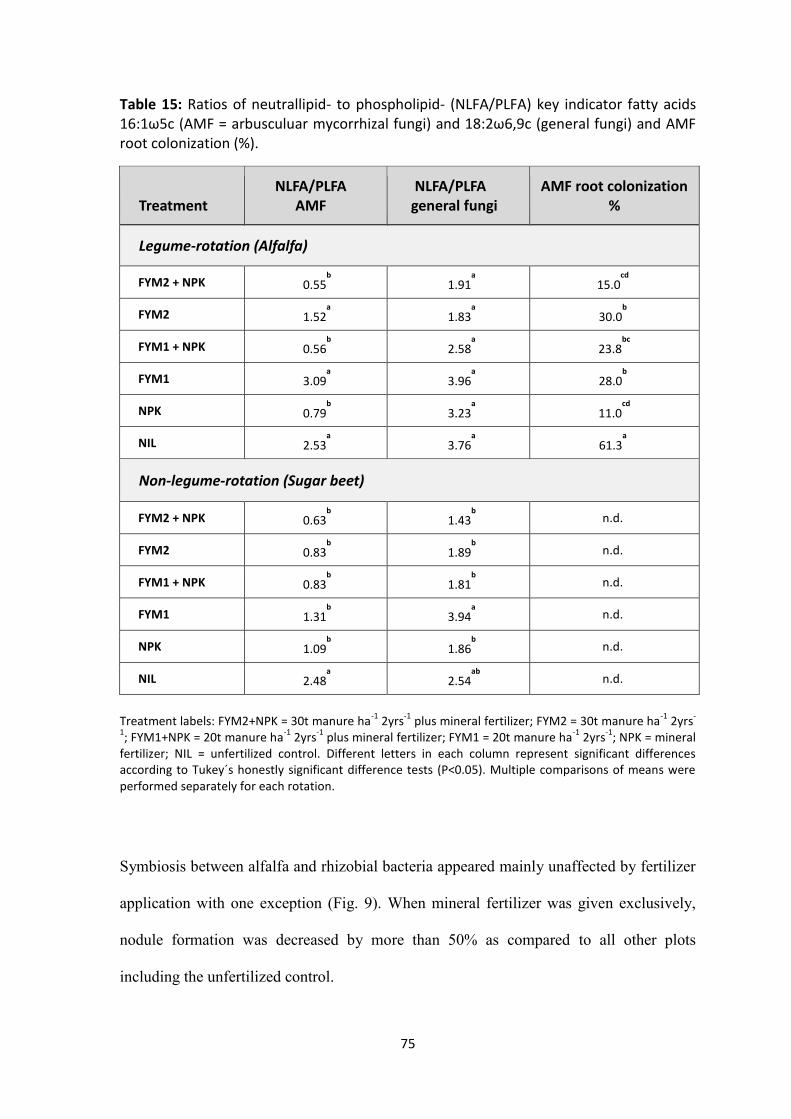
75
Table 15: Ratios of neutrallipid- to phospholipid- (NLFA/PLFA) key indicator fatty acids 16:1ω5c (AMF = arbusculuar mycorrhizal fungi) and 18:2ω6,9c (general fungi) and AMF root colonization (%).
Treatment NLFA/PLFA
AMF NLFA/PLFA general fungi
AMF root colonization %
Legume-rotation (Alfalfa)
FYM2 + NPK 0.55b
1.91a
15.0cd
FYM2 1.52a
1.83a
30.0b
FYM1 + NPK 0.56b
2.58a
23.8bc
FYM1 3.09a
3.96a
28.0b
NPK 0.79b
3.23a
11.0cd
NIL 2.53a
3.76a
61.3a
Non-legume-rotation (Sugar beet)
FYM2 + NPK 0.63b
1.43b
n.d.
FYM2 0.83b
1.89b
n.d.
FYM1 + NPK 0.83b
1.81b
n.d.
FYM1 1.31b
3.94a
n.d.
NPK 1.09b
1.86b
n.d.
NIL 2.48a
2.54ab
n.d.
Treatment labels: FYM2+NPK = 30t manure ha
-1 2yrs
-1 plus mineral fertilizer; FYM2 = 30t manure ha
-1 2yrs
-
1; FYM1+NPK = 20t manure ha
-1 2yrs
-1 plus mineral fertilizer; FYM1 = 20t manure ha
-1 2yrs
-1; NPK = mineral
fertilizer; NIL = unfertilized control. Different letters in each column represent significant differences according to Tukey´s honestly significant difference tests (P<0.05). Multiple comparisons of means were performed separately for each rotation.
Symbiosis between alfalfa and rhizobial bacteria appeared mainly unaffected by fertilizer
application with one exception (Fig. 9). When mineral fertilizer was given exclusively,
nodule formation was decreased by more than 50% as compared to all other plots
including the unfertilized control.
76
3.3.4. Fungal and bacterial necromass
Because of the slow turnover time, amino sugar data are described in terms of the longer
crop rotation type instead of the specific crop grown at the time of sampling, given the
longer term perspective of this microbial biomarker. On average, total amino sugars were
approximately 35% higher within the crop rotation without legumes as compared to the
rotation including legumes, specifically with MurA exhibiting the largest differences
between the two crop rotations. Within each rotation ManN, GluN, and GalN contents
were mostly similar among the investigated fertilization treatments (Fig. 10). Where
cropping did not include legumes (sugar beet grown at the time of sampling), these amino
sugars were only slightly decreased on plots that had received 20t manure ha-1
2yrs-1
,
irrespective of the addition of mineral fertilizer (Figs. 10, b + d). On the exclusively
mineral fertilized treatment of the rotation including legumes, however, ManN, GluN,
and GalN were approximately 1.7, 2.5, and 3 times higher, respectively, compared to the
average content of all other treatments (Figs. 10, a + c). The response of MurA to
fertilization was different than that of ManN, GluN, and GalN and varied between the two
crop rotations. Under sugar beet at the non-legume rotation, MurA increased consistently
with each increasing fertilization level and was, independently from the addition of NPK,
significantly positively correlated to the bacterial lipid biomass among the gradient of
FYM addition (p<0.001). At the crop rotation with legumes, however, there was a
significant negative relationship between MurA and bacterial lipid biomass in response to
the increase of farmyard manure among the mineral fertilized treatments (p<0.01).
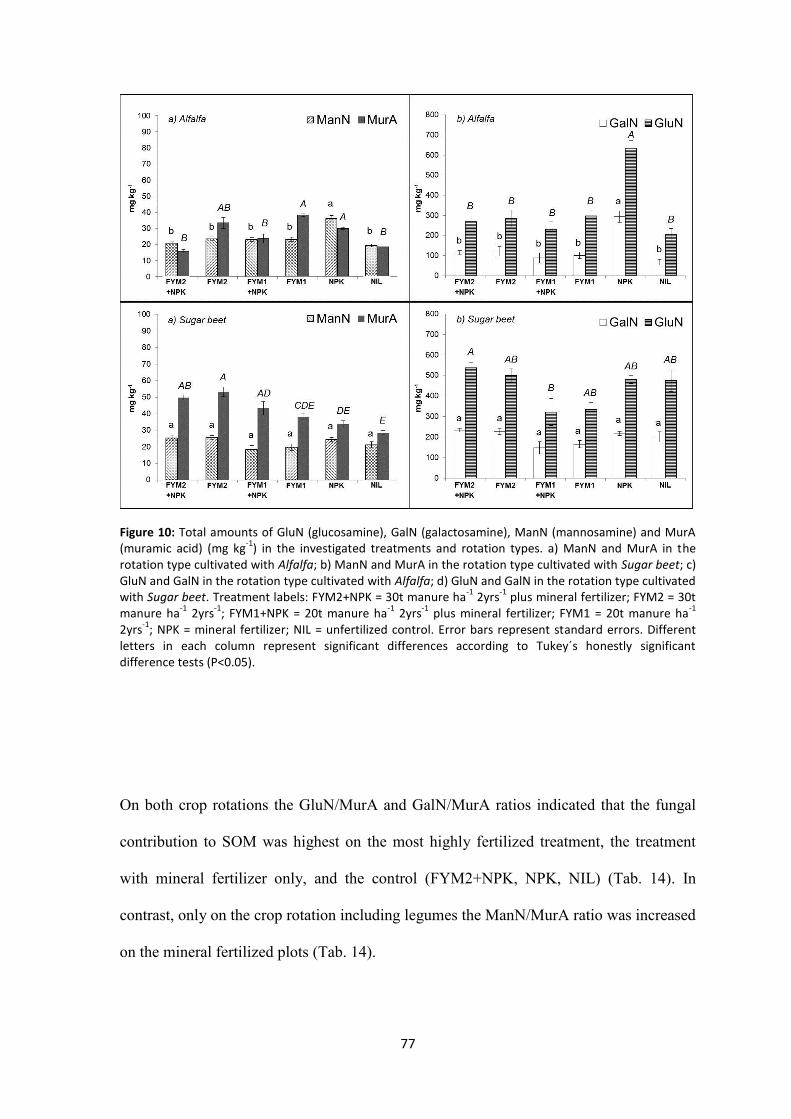
77
Figure 10: Total amounts of GluN (glucosamine), GalN (galactosamine), ManN (mannosamine) and MurA (muramic acid) (mg kg
-1) in the investigated treatments and rotation types. a) ManN and MurA in the
rotation type cultivated with Alfalfa; b) ManN and MurA in the rotation type cultivated with Sugar beet; c) GluN and GalN in the rotation type cultivated with Alfalfa; d) GluN and GalN in the rotation type cultivated with Sugar beet. Treatment labels: FYM2+NPK = 30t manure ha
-1 2yrs
-1 plus mineral fertilizer; FYM2 = 30t
manure ha-1
2yrs-1
; FYM1+NPK = 20t manure ha-1
2yrs-1
plus mineral fertilizer; FYM1 = 20t manure ha-1
2yrs
-1; NPK = mineral fertilizer; NIL = unfertilized control. Error bars represent standard errors. Different
letters in each column represent significant differences according to Tukey´s honestly significant difference tests (P<0.05).
On both crop rotations the GluN/MurA and GalN/MurA ratios indicated that the fungal
contribution to SOM was highest on the most highly fertilized treatment, the treatment
with mineral fertilizer only, and the control (FYM2+NPK, NPK, NIL) (Tab. 14). In
contrast, only on the crop rotation including legumes the ManN/MurA ratio was increased
on the mineral fertilized plots (Tab. 14).
78
3.4. Discussion
The composition of the living microbial biomass (PLFA pattern) differed clearly between
the two crops (Fig. 8). This implies a plant species specific microbial community,
however, it should be taken into account that our crop effects inherently include effects of
seasonality or annual variation, because each crop type was sampled on different dates in
our study, and seasonality is known to have a large impact on the soil microbial
community (Bossio et al. 1998). The development of plant species specific rhizosphere
communities is tightly associated with impacts by the plant on environmental and
nutritional conditions in the soil (Costa et al. 2006; O'Donnell et al. 2001), which are
assumed to be mediated primarily by root exudates (Berg and Smalla 2009a). This idea
matches well with the results of our study, showing a significant correlation between
multivariate PLFA profiles and soil pH, as well as labile C and N (Fig. 8, Tab. 11). These
factors have been widely demonstrated to influence soil microbial community structure
(de Graaff et al. 2010; Frostegård et al. 1993; Rousk et al. 2010).
Additionally, the clear separation between lower and higher levels of fertilization under
sugar beet, based on both permanova and NMDS (Fig. 8) implies that fertilization had a
strong impact on the composition of the microbial community, which was not the case in
the presence of alfalfa. This seems logical assuming that rhizosphere microorganisms
must compete for nutrients both with other soil organisms and with the sugar beet crop, in
contrast to alfalfa, which meets its nutrient demand with help of the symbiotic partners
and with less competition for nutrients between the plant and its symbionts. In line with
this is a plant dependent response of soil microorganisms to mineral fertilizer as implied
by our results, while microbial responses to farmyard manure were large in magnitude
regardless of the crop grown (Tab. 13). This varied response to different fertilizer sources,
i.e. levels of carbon and nutrient availabilities, has been previously documented
79
(Esperschütz et al. 2007; Widmer et al. 2006). Altogether under alfalfa, the similarity of
PLFA profiles, the higher total microbial biomass, the weak responses of Gm-/Gm+, and
fung/bac ratios to any form of fertilizer application imply that fertilization affected soil
nutrient availability only slightly in presence of the legume, which likely already had a
higher soil nutrient status based on the symbiotic N-fixation (Bais et al. 2006; Dakora and
Phillips 2002). Of much higher significance than mineral fertilizer, however, was the
microbial response to both labile C and organic fertilization in both crop rotations,
supporting that C availability, irrespective of its source, was the main abiotic factor
driving the observed changes in the size and composition of the microbial community
(Demoling et al. 2007).
A more detailed look at specific microbial fatty acid indicators provided a deeper insight
about how the microbial community was shaped by crop type (Tab. 12). In the legume
strip, the PLFA 16:1ω5c contributed greatly to group separation using SIMPER analysis.
This PLFA is often used as a key indicator of AM fungi, but because it also may be found
in bacteria, it should be used carefully as tool to interpret AM-fungal biomass (Frostegård
et al. 2011). This is especially of relevance in bacterial dominated sites, such as in
agricultural systems. In our study, however, there is evidence that in the presence of
alfalfa this key PLFA does indeed indicate AM fungal biomass. Thus, the declining
relative abundance of 16:1ω5c, but not of other Gram-negative indicators, with NPK
addition is consistent with the observed reduction in AMF root colonization (Tabs. 14 +
15), and the often reported negative impact of mineral fertilizer on AM-formation
(Gryndler et al. 2006; Olsson et al. 1997). A consequence of this negative impact is that
less carbon gets allocated to fungal storage structures, which is revealed by the low
NLFA/PLFA ratios of 16:1ω5c in the NPK treated plots of alfalfa. The PLFA 16:1ω5c
was detected also in the presence of sugar beet as non-host plant in the non-legume
80
rotation. In contrast to the legume strip, however, neither the PLFA nor the NLFA/PLFA
ratios of this FA varied among the fertilization treatments, supporting bacterial origin in
that case. Taking into account that neutral lipids are degradation products of
phospholipids (Bååth 2003) the similar ratios imply comparable rates of lipid degradation
in all treatments. In turn, the increased ratio of the control could result from a slowed OM
turnover. A possible explanation would be the higher soil compaction at this plot (Eden et
al. 2012; Schmidt et al. 2015), caused by the poorer soil aggregation in absence of any
fertilizers, and the less intensive root penetration by sugar beet.
Another PLFA, the methyl-branched 16:0 (10Me), indicating actinomycetes, was only
responsible for group separation under alfalfa. This finding supports the idea that there is
a strong relationship between actinomycetes and legumes associated with high
abundances of these bacteria in the plant rhizosphere (Sharma et al. 2005; Trujillo et al.
2010).
Within the non-legume strip grown with sugar beet during our sampling, the
dissimilarities between fertilization regimes were mainly based on Gram-positive bacteria
(iso and anteiso 15:0), Gram-negative bacteria (18:1w9t) and general fungi (18:1w9c,
18:2w6,9c). Gram-positive bacteria responded positively to all fertilization regimes, in
contrast to the behaviour of the Gram-negative bacteria. This is in line with previous
studies, in which it has been reported that the abundance of Gram-positive bacteria
increases relative to Gram-negative bacteria following the addition of manure or mineral
fertilizer (Giacometti et al. 2013).
In contrast with the variation in living fungal to bacterial biomass ratios in response to the
fertilization treatments and crop rotation type, the ratios of fungal to bacterial necromass
residues tended to respond in a similar way to the fertilization gradient on both rotation
81
types (Tab. 14). This could support the assumption that amino sugar ratios reflect the
community structure integrated over a longer time period (Glaser et al. 2004) rather than
lipids, which act more as a snap shot of the current biomass. These results also imply that
over long time periods, fertilization management may alter microbial communities more
than changes in crop rotation or inclusion of legumes. Both, GluN/MurA and GalN/MurA
ratios indicate an increased proportion of fungal residues on the exclusively mineral
fertilized plots and the extremes, e.g. the highest fertilization level (FYM2+NPK) and the
unfertilized control (NIL). This must not necessarily be caused by a higher production of
fungal in relation to bacterial biomass but can also simply result from a preferential
degradation of bacterial residues (Zhang et al. 1999) and/or a reduced bacterial activity
and biomass production in absence of manure. Thus, manure addition was reported to
increase the proportion of bacterial deposits over long-term due to positive effects on
microbial metabolism, such as the increased C input and an improved soil structure
(Bronick and Lal 2005). In a similar respect, soil compaction may reduce the production
and stabilization of muramic acid (Amelung et al. 2001a).
However, this does not explain the increased GluN/MurA and GalN/MurA ratios at the
fully-fertilized treatments which are in contrast to the more general patterns observed
along the fertilization gradient described above. More clarification on this issue was given
from observing the responses of MurA specifically, being different to that of GluN, GalN,
and ManN. Similar observations have been also made in a range of other studies (Bai et
al. 2013; Ding et al. 2013), suggesting faster degradation of MurA in contrast to a higher
recalcitrance of GluN and GalN.
Both the turnover and accumulation of amino sugars depend on the availability of labile C
and mineral nutrients. In agricultural soils labile C increases following the addition of
FYM, shifting the microbial community from dormancy into a state of higher metabolic
82
activity, where bacteria assimilate easily decomposable substrates faster than fungi
(Engelking et al. 2007; Meidute et al. 2008). Several studies have shown that MurA
contents rapidly increase during the first weeks after addition of readily mineralizable
substrates, such as glucose, followed by a constant decrease back to the initial value (He
et al. 2011; Liang et al. 2007a). This implies that MurA accumulates in soil only until
labile C sources are exhausted, after which it is used as a microbial source of C.
Interestingly, we found a significant positive relationship between MurA and PLFA
biomass under sugar beet in the crop rotation without legumes (p<0.001), supporting
MurA accumulation with the build-up of bacterial biomass. The positive relationship
between MurA and PLFA changed however in the crop rotation with a legume included,
where we found no (treatments without NPK) or even a negative relationship between
MurA and PLFA biomass (p<0.01, treatments with NPK) with increasing FYM
application rates (NIL, FYM1, FYM2). This could result from higher decomposition of
bacterial cell-wall residues in the presence of the legume, which might be additionally
enhanced by mineral N. In fact, there is a series of implications that C turnover was
accelerated in presence of alfalfa (Schmidt et al. 2015). From this one could conclude that
microbial residue decomposition rates are strongly influenced by the availability of N,
which is in line with other suggestions that N addition accelerates C cycling (Chen et al.
2014). Taking together the positive effect of labile C on microbial biomass production
with the positive effect of N on the decomposition of MurA, the increased GluN/MurA
and GalN/MurA ratios at the highest fertilization level (FYM+NPK) could again result
from faster decomposition of MurA due to the additional application of NPK. To validate
our hypothesis, however, further investigation is needed.
Higher amounts of fungal residues in the absence of manure on the one hand, and faster C
cycling with manure and NPK on the other, would also explain that net accumulation of
83
GluN, GalN, and ManN was comparable among the treatments for each strip. All of these
considerations, however, cannot explain the remarkably increased contents of these AS
on the plot with NPK only in the crop rotation with legumes. An explanation to this may
be provided in the evidence that we observed dramatically lower root nodule numbers in
the NPK treatment, taking into account that metabolites secreted as chemical signals from
plant roots and microorganisms within soil microbe interactions significantly contribute
to the pool of labile SOM in rhizospheres (Monreal 2015; Monreal and Schnitzer 2015).
Indeed, amino sugars play an important role in the establishment of the symbiosis
between rhizobia and their host plant. NOD-factors, which are signalling compounds
secreted by rhizobia, contain a backbone of 3-5 glucosamine molecules (Mylona et al.
1995). Attachment of NOD-factors onto the root hair surface elicits various plant
responses, including the process of nodule formation. GalN, in turn, occurs in capsular-
and exopolysaccharides, which are involved in the recognition and attachment of
rhizobial cells to the root surface of the host plant, and thus, are necessary for efficient
establishment of the legume–rhizobia symbiosis (Rinaudi et al. 2006; Smol´kina et al.
2012). In addition, ManN has been found to be a glycosyl component of
lipopolysaccharides in some rhizobia strains (Wang and Hollingsworth 1994).
The establishment of the symbiosis is mainly controlled by the plant, driven by the goal
of optimizing the cost–benefit ratio of nitrogen acquisition. Thus, it is conceivable that
the addition of mineral N could change the amount of those AS in the rhizosphere that are
involved in the multi-step process of nodulation. Effects on GluN, for instance, could be
related to the release of NOD-gene inducing flavonoids (Pan and Smith 2000), NOD-
factor perception (Broghammer et al. 2012; D´Haeze and Holsters 2002), and NOD-factor
degradation or abortion of infection threads (Staehelin et al. 1995; Vasse et al. 1993). The
accumulation of GluN could occur when N-feedback mechanisms within the symbiotic
84
relationship are primarily based on degradation but not expression of NOD-factors.
However, up to now the endogenous auto-regulation of the plant is not well understood
and there is no study available describing possible effects of mineral N on NOD-factor
concentrations in situ. Therefore it remains hypothetical whether a relationship exists
between the high contents of GluN, GalN and ManN and the plant-rhizobial interaction.
3.5. Conclusions
In this study, carbon, either from plants or organic fertilizers, was the main driver of
microbial community growth and structure in the soil. The general importance of organic
fertilization highlights the substantial effect of long-term C addition on the quantity and
quality of microbial populations in the rhizosphere. Short term (annual) effects are
primarily related to C-input via plant specific allocation of photosynthetically assimilated
carbon, to the availability of mineral nutrients, and to soil environmental conditions.
Multivariate analysis of PLFA data revealed that rhizobia and AMF are two further
factors besides of carbon driving dissimilarities for the microbial community in the
rhizosphere of the two study crop rotations: (i) the growth of the symbiotic partners is
enhanced by or even depends on the presence and nutritional state of a host, and (ii)
because of their impact on the amount of labile C and N in the soil, inducing direct and/or
plant mediated effects on decomposing microorganisms. In comparison to the living
community, there was evidence that mainly fertilization, and somewhat the composition
of crop rotations also shape the soil microbial necromass based on the amount of fungal
and bacterial biomass synthesized, and by controlling microbial decomposition rates in
association with the supply of nitrogen and labile carbon. From our results it may be
hypothesized that rhizobia serve as a significant source of amino sugars, but this idea is
still in need of further examination.
85
4. Biomarker levels of soil organic matter fractions
indicate long-term fertilization effects on C
stabilization and turnover
Chapter source: Schmidt et al. 2018. Biomarker levels of soil organic matter fractions
indicate long-term fertilization effects on C stabilization and turnover
(submitted in Biology and Fertility of Soils)
Abstract
Identifying factors influencing the processes of microbial-mediated carbon storage in soil
is important for understanding how soil C sequestration in agricultural lands can be
improved. Previously, we found that biomarker C responded in varying degrees to long-
term fertilization regimes within bulk soil samples from the Static Fertilization
Experiment, Bad Lauchstädt. Here, for a more detailed analysis, we investigated whether
fertilization also affects the enrichment and abundance of biomarkers in specific soil
organic matter (SOM) pools. We extracted amino acids (AA), amino sugars (AS), and
monosaccharides (MS) from the following fractions: <1µm clay sized (CF1), 1-2µm clay
sized (CF2), a <1.8 g cm-3
density fraction (LF1) and a 1.8-2 g cm-3
density fraction
(LF2). These fractions individually represent pools of stabilized, passive, active and
intermediate SOM, respectively. Phospholipid fatty acids (PLFA) were only extracted
from clay fractions. All soil fractions were subjected to a hot-water-extraction in order to
determine the potentially labile and easily degradable part of OC (HWC) within each
fraction. Enrichment factors were calculated to indicate accumulation or depletion of OC,
labile C, or biomarker-C in the investigated fractions as compared to the bulk soil.
Biomarkers contributed between 5% and 19% to SOC and up to 44% to total N of the
investigated fractions. Buildup and stabilization of microbial-derived OM in response to
86
fertilization was indicated by an enrichment of PLFA-C in the CF2 fraction and a shift to
higher proportions of AA-C from the total biomarker-C of both clay fractions. In general,
stabilized SOM was characterized by a higher share of microbial-derived OM than non-
stabilized SOM, as reflected by higher C6:C5 ratios in clay as compared to light fractions.
Among microbial groups, Gram-positive bacteria seem to benefit most from fertilization,
suggesting that these bacteria play an important role in the process of C-stabilization.
Keywords: long-term fertilization, SOM-fractions, PLFA, amino acids, carbohydrates
4.1. Introduction
Depending on management practices and soil type, carbon can be re-sequestered in
agricultural soils, partially compensating for the immense historical losses of soil organic
carbon (SOC) following the conversion of natural land to cultivation (Lal et al. 2007).
However, just a direct or indirect increase in C-input, for example by addition of
fertilizers, does not necessarily lead to higher SOC stocks. In contrast to organic
fertilization, which may increase SOC to levels even exceeding natural ones (Six et al.
2002), inorganic fertilization, especially if applied intensively, may exacerbate C-loss by
accelerating the decomposition of labile SOM despite ongoing C stabilization (Neff et al.
2002).
Whether a management strategy will successfully increase SOC stocks, directly depends
on how it affects microbial activity and soil C turnover. Each management induced
change in soil aeration, water balance or the availability of readily degradable soil organic
matter (SOM) and essential nutrients will alter the metabolism and growth of the soil
microbial community (Amelung et al. 2001a; Joergensen et al. 2010; Lehmann et al.
87
2011; O'Donnell et al. 2001). Thus, even labile and easily decomposable SOM will
accumulate in soil if microbial activity is reduced due to unfavorable conditions, such as
oxygen depletion (Dixon and Kell 1989b; Schmidt et al. 2015; Veen and Kuikman 1990).
This kind of C storage is sensitive to management though, and any disturbance, for
instance tillage, may revive microbial activity and lead to rapid consumption of the
accumulated SOM. In contrast, stable retention of soil C ultimately depends on
protection of SOM from microbial decomposition either by association with the soil
mineral matrix, i.e. clay, or by inclusion in soil aggregates (Lützow et al. 2006; Schmidt
et al. 2011).
Soil fractionation methods have been used to assess management effects on certain
hypothetical pools of rapidly and easily decomposable vs. stabilized SOM (Hoffmann et
al. 2006; Schulz 2004; von Lützow et al. 2007). Most of these investigations have
evaluated effects of management practices at a quantitative level, i.e. C- and N-contents,
while only a handful of studies have focused on qualitative changes using different
techniques, such as Fourier transform spectroscopy (FTIR and DRIFTS) (Demyan et al.
2012; Poirier et al. 2005), nuclear magnetic resonance spectroscopy (NMR)
(Guggenberger et al. 1995), or the analysis of individual organic compounds (lignin,
amino acids, monosaccharides) (Guggenberger et al. 1994; Poirier et al. 2005). Although
these studies revealed remarkable differences in the SOM composition between light- and
organo-mineral fractions, land use was found to affect SOM composition of the
individual soil fractions only less and seemed to influence mainly the part of non-clay
associated SOM. In this context, Guggenberger et al. (1995) succeeded to recognize
differences by modifying the calculation of enrichment factors following Christensen
(2001) for individual C species, i.e. by relating the content of the C species in a fraction to
its content in bulk soil. Independently from this and from the fractionation method used,
88
many studies implied that SOM of clay fractions is supposed to be mainly of microbial
origin. Still limited, however, is our knowledge regarding the role of individual microbial
groups for SOM stabilization and C composition of the different SOM pools.
In order to contribute to opening this black box, we extracted amino acids (AA), amino
sugars (AS), and monosaccharides (MS) from two particle size, i.e. clay fractions (CF1:
<1 µm, CF2: 1-2 µm) and two density fractions (LF1: <1.8 g cm-3
, LF2: 1.8-2 g cm-3
) of a
long-term fertilized soil that has received 30t farmyard manure ha-1
2yrs-1
and NPK, as
well as a non-fertilized control at the Static Fertilization Experiment (SFEBL), Bad
Lauchstädt, Germany. In addition to the organic compounds mentioned above, phospho-
lipid fatty acids (PLFA) were also analyzed in the two clay fractions. The clay fractions
were considered to represent the “passive” pool of stabilized SOM, which is tightly
associated with the clay surface and therefore unavailable for degradation. Whereas the
CF2 still contains OM occluded in very small microaggregates, the CF1 represents a
fraction of OM bound on primary and secondary clay particles (Lützow et al. 2006;
Totsche et al. 2018). In contrast, the density fractions were considered to represent that
part of SOM which is not (LF1) or only loosely (LF2) associated with the soil mineral
matrix, thus representing “active” and “intermediate” SOM pools with more rapid C-
turnover rates (Böhm et al. 2010; Breulmann 2011; Christensen 2001; Lützow et al. 2006;
Schulz et al. 2011).
Even though the extracted organic compound classes (AA, AS, MS, PLFA) are
ubiquitous, they are also the most important ones within the total microbial biomass
regarding abundance and function. Thus, amino acids as basic components of proteins
account to around 50% (Miltner et al. 2011), while phospholipid fatty acids are essential
constituents of microbial biomembranes (Zelles 1999). Amino sugars, contained in
fungal- and bacterial cell walls, can make up, in turn, up to 7% of the total microbial
89
biomass C (Glaser et al. 2004). Beside of this, previous studies revealed, that they
significantly contribute to SOC and TN (Friedel and Scheller 2002; Martens et al. 2004;
Zhang et al. 2007) and can be used to characterize the structure of the microbial
community and/or the microbial contribution to SOC (Murayama 1984; Oades et al.
1970; Schmidt et al. 2015; Zelles 1999).
Based on the long-term, unchanged fertilization and cultivation practices, almost steady-
state conditions can be assumed at the SFEBL, supported by there having been no
significant increase in SOC contents for several decades (Merbach and Schulz 2012).
Since biomarker levels have been found to be strongly affected by fertilization at the bulk
soil level (Schmidt et al. 2015), we hypothesized that SOM composition of the different
soil fractions was significantly altered as well. Following the approach of Guggenberger
et al. (1995), enrichment factors were calculated for amino acids, amino sugars,
monosaccharides and fatty acids to indicate potential changes. In line with former
findings and indications, we also expected significant differences regarding SOM pool
sizes of the fertilized and non-fertilized soils (Schulz 2004).
4.2. Materials and Methods
4.2.1. Study site description and sampling
The study site is located at the long-term Static Fertilization Experiment Bad Lauchstädt
(SFEBL), Sachsen-Anhalt (Germany), which was initiated in 1902 (Körschens and
Pfefferkorn 1998). The soil is a Haplic Chernozem (FAO) (USDA: Mollisol) consisting
of 21% clay, 67.8% silt and 11.2% sand. The mean annual temperature and precipitation
are 8.8 °C and 480 mm, respectively (Körschens, 2002). The Static Fertilization
Experiment Bad Lauchstädt was laid out in a split plot design with the main-plot factor
FYM (three levels: no FYM, 20 t FYM ha−1
2 years−1
, 30 t FYM ha−1
2 years−1
) and
90
mineral fertilization as a sub-plot factor (6 levels: no, PK, N, NK, NP, NPK) which are all
realized in each main plot. Each sub-plot has a size of 28.5 m x 10 m. In a crop rotation,
sugar beet, spring barley, potatoes, and winter wheat are cultivated, while legumes have
been included in the rotation on one sampling strip since 1924, replacing sugar beet and
spring barley every 7th and 8th year, respectively. At the time of sampling, the soil was
cultivated with alfalfa (Medicago sativa). Amendments of mineral fertilizers (NPK) are
adapted to the nutrient demand of each specific crop in its year of cultivation (60 to 170
kg ha-1
yr-1
N, 12 to 60 kg ha-1
yr-1
P, 50 to 230 kg ha-1
yr-1
K). Alfalfa receives only PK
in the mineral fertilizer treatments. Every second year, farmyard manure is applied
together with the cultivation of root crops (potatoes, sugar beet), or before seed drilling in
the first year of cultivation with alfalfa.
Soil samples were taken from the most intensely fertilized treatment, receiving 30 t
farmyard manure ha-1
2yrs-1
plus mineral fertilizer (FM), and the unfertilized control
(NIL). The fertilized treatment chosen was originally implemented to represent an
extreme case of fertilizer application.
The sampling date was chosen to correspond with plant maturity of alfalfa and took place
in June 2010. Since the main-plot factor and the main-plot/sub-plot combinations were
not replicated, soil was taken directly next to four replicate plants in the plough horizon
(0–20 cm) in each plot and treated as replicates in further analysis. The soil was sieved to
< 2 mm and frozen at -20 °C immediately after sampling.
91
4.2.2. Soil-fractionation
The applied size-density fractionation method based on Shaymukhametov et al. (1985)
with modifications after Schulz (2004). It was used to isolate two fractions of clay-
associated SOM (CF1 <1 µm, CF2 = 1-2 µm) and two fractions of SOM with specific
densities (LF1 < 1.8 g cm-3
, LF2 = 1.8-2.0 g cm-3
) from the soil. The remaining
fractionation residue (FR) was almost free of SOM (OC <0.01%). In contrast to the
original method, fresh soil was used, defrosted shortly before fractionation. Fractionation
was performed using 20 g soil per subsample, which was initially dispersed in 60 ml dest.
H2O, and centrifuged for 10 min at 2000 rpm. The supernatant, containing undecomposed
plant and root residues was then decanted to remove POM (<1 g cm-3
).
The subsequent particle-size fractionation was performed in three steps: (1.) The soil
was again suspended in 60 ml of dest. H2O. Low energy ultrasonication (30.2 J sec-1) was
applied for 1 min to liberate the SOM associated with an easily dispersible clay fraction.
(2.) Following the ultrasonic treatment, the suspension was centrifuged at 1000 rpm for 3
min. The supernatant, now containing the clay fraction of < 2 µm particle size, was then
transferred into a second tube. (3.) By centrifugation for 3 min at 2000 rpm, this
suspension was again divided into the CF1 (supernatant) and the CF2 (pellet). The
supernatant was finally centrifuged at 4000 rpm for 10 min after addition of 500 µl 2N
MgSO4 solution to remove the water from CF1. Subsequently, each of the clay fractions
was transferred with ethanol into a pre-weighed glass dish and dried at 60°C in a water
bath. Steps 1-3 were repeated 15 times in total. The remaining solid phase after clay
separation was dissolved and transferred with ethanol into a Falcon tube. The suspension
was topped up with 50 ml ethanol, shaken, and centrifuged at 3000 rpm for 10 min. The
washing step was repeated three times.
92
Thereafter, density fractionation was performed in two steps. (1.) A mixture of
bromoform (tribrommethane)/ethanol with a density of 2.0 g cm-3
was added to the
washed residue. The sample was shaken for 10 min and centrifuged at 3000 rpm for 15
min. The supernatant was transferred into an Erlenmeyer flask, already filled with 50 ml
dest. H2O. The procedure was repeated until no sizable amounts of the fraction were
visible in the supernatant after centrifugation. The fractionation residue was again washed
with ethanol and dried in the water bath. (2.) After phase separation overnight, the lower,
OM-free phase was drained and the interphase, containing the OM, was collected in a
Falcon tube. Bromoform was removed from this suspension by repeated washing with
ethanol, shaking and centrifugation at 3000 rpm for 5 min. Separation of the LF1 from
LF2 was achieved by performing the same procedure as described above, this time using
a bromoform/ethanol mixture with a density of 1.8 g cm-3
. The LF2 remaining in the
Falcon tube was repeatedly washed with ethanol and subsequently dried in the water bath.
The same procedure was applied to the LF1, which was collected the next day from the
Erlenmeyer flask.
Weight was determined for all fractions and the fractionation residue after drying. Before
further analysis, all fractions were milled.
4.2.3. SOC, TN and labile OC and N
Total carbon (TC), total nitrogen (TN), labile C and labile N were determined for bulk
soil as well as for each fraction. TC and TN were measured via combustion (Vario El III,
Elementar-Hanau). No inorganic C was detected and thus TC represents TOC. Labile C
and N (HWC, HWN), i.e. the potentially mineralizable and decomposable part of the
organic carbon (Schulz et al. 2011; Weigel et al. 1998), were extracted with hot water for
one hour under reflux according to Schulz (2002). An elemental analyzer for liquid
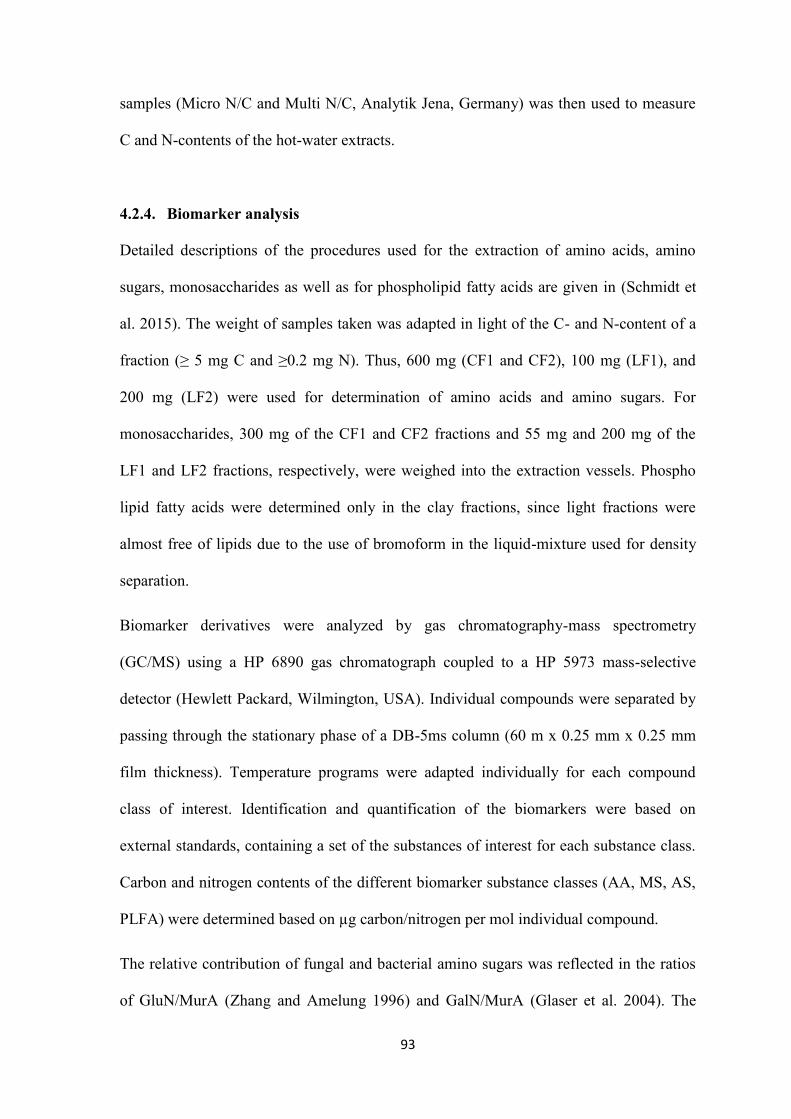
93
samples (Micro N/C and Multi N/C, Analytik Jena, Germany) was then used to measure
C and N-contents of the hot-water extracts.
4.2.4. Biomarker analysis
Detailed descriptions of the procedures used for the extraction of amino acids, amino
sugars, monosaccharides as well as for phospholipid fatty acids are given in (Schmidt et
al. 2015). The weight of samples taken was adapted in light of the C- and N-content of a
fraction (≥ 5 mg C and ≥0.2 mg N). Thus, 600 mg (CF1 and CF2), 100 mg (LF1), and
200 mg (LF2) were used for determination of amino acids and amino sugars. For
monosaccharides, 300 mg of the CF1 and CF2 fractions and 55 mg and 200 mg of the
LF1 and LF2 fractions, respectively, were weighed into the extraction vessels. Phospho
lipid fatty acids were determined only in the clay fractions, since light fractions were
almost free of lipids due to the use of bromoform in the liquid-mixture used for density
separation.
Biomarker derivatives were analyzed by gas chromatography-mass spectrometry
(GC/MS) using a HP 6890 gas chromatograph coupled to a HP 5973 mass-selective
detector (Hewlett Packard, Wilmington, USA). Individual compounds were separated by
passing through the stationary phase of a DB-5ms column (60 m x 0.25 mm x 0.25 mm
film thickness). Temperature programs were adapted individually for each compound
class of interest. Identification and quantification of the biomarkers were based on
external standards, containing a set of the substances of interest for each substance class.
Carbon and nitrogen contents of the different biomarker substance classes (AA, MS, AS,
PLFA) were determined based on µg carbon/nitrogen per mol individual compound.
The relative contribution of fungal and bacterial amino sugars was reflected in the ratios
of GluN/MurA (Zhang and Amelung 1996) and GalN/MurA (Glaser et al. 2004). The
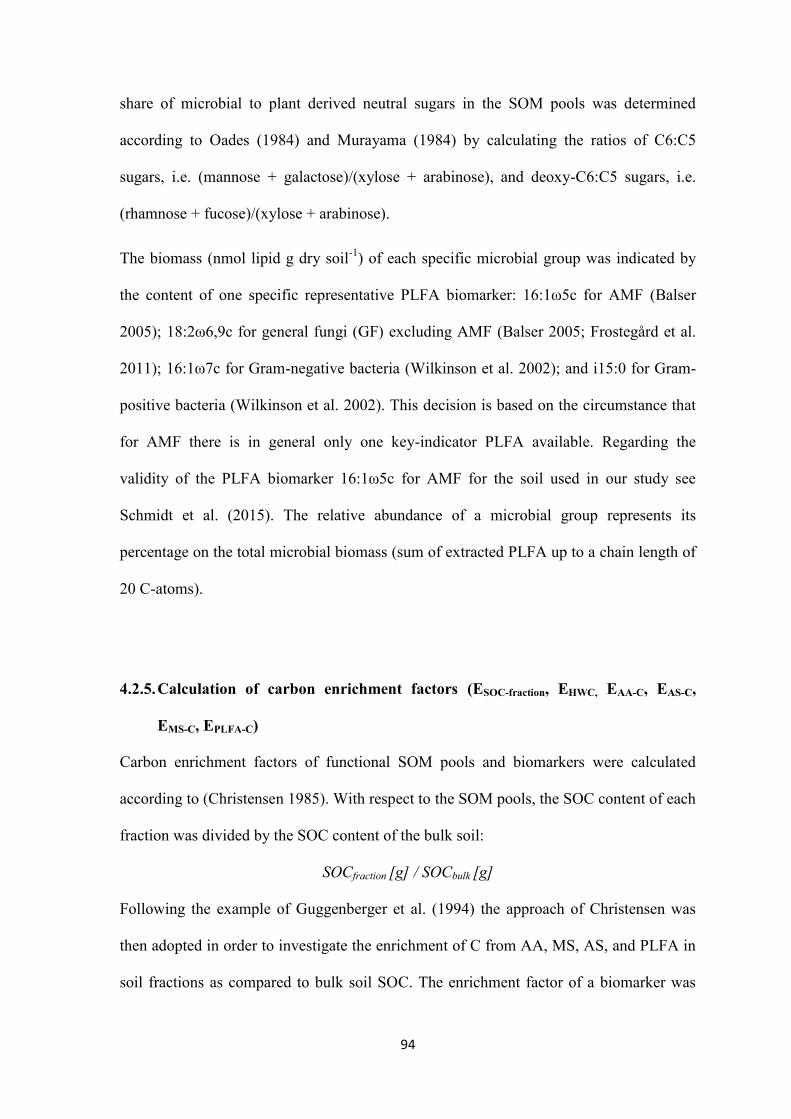
94
share of microbial to plant derived neutral sugars in the SOM pools was determined
according to Oades (1984) and Murayama (1984) by calculating the ratios of C6:C5
sugars, i.e. (mannose + galactose)/(xylose + arabinose), and deoxy-C6:C5 sugars, i.e.
(rhamnose + fucose)/(xylose + arabinose).
The biomass (nmol lipid g dry soil-1
) of each specific microbial group was indicated by
the content of one specific representative PLFA biomarker: 16:1ω5c for AMF (Balser
2005); 18:2ω6,9c for general fungi (GF) excluding AMF (Balser 2005; Frostegård et al.
2011); 16:1ω7c for Gram-negative bacteria (Wilkinson et al. 2002); and i15:0 for Gram-
positive bacteria (Wilkinson et al. 2002). This decision is based on the circumstance that
for AMF there is in general only one key-indicator PLFA available. Regarding the
validity of the PLFA biomarker 16:1ω5c for AMF for the soil used in our study see
Schmidt et al. (2015). The relative abundance of a microbial group represents its
percentage on the total microbial biomass (sum of extracted PLFA up to a chain length of
20 C-atoms).
4.2.5. Calculation of carbon enrichment factors (ESOC-fraction, EHWC, EAA-C, EAS-C,
EMS-C, EPLFA-C)
Carbon enrichment factors of functional SOM pools and biomarkers were calculated
according to (Christensen 1985). With respect to the SOM pools, the SOC content of each
fraction was divided by the SOC content of the bulk soil:
SOCfraction [g] / SOCbulk [g]
Following the example of Guggenberger et al. (1994) the approach of Christensen was
then adopted in order to investigate the enrichment of C from AA, MS, AS, and PLFA in
soil fractions as compared to bulk soil SOC. The enrichment factor of a biomarker was
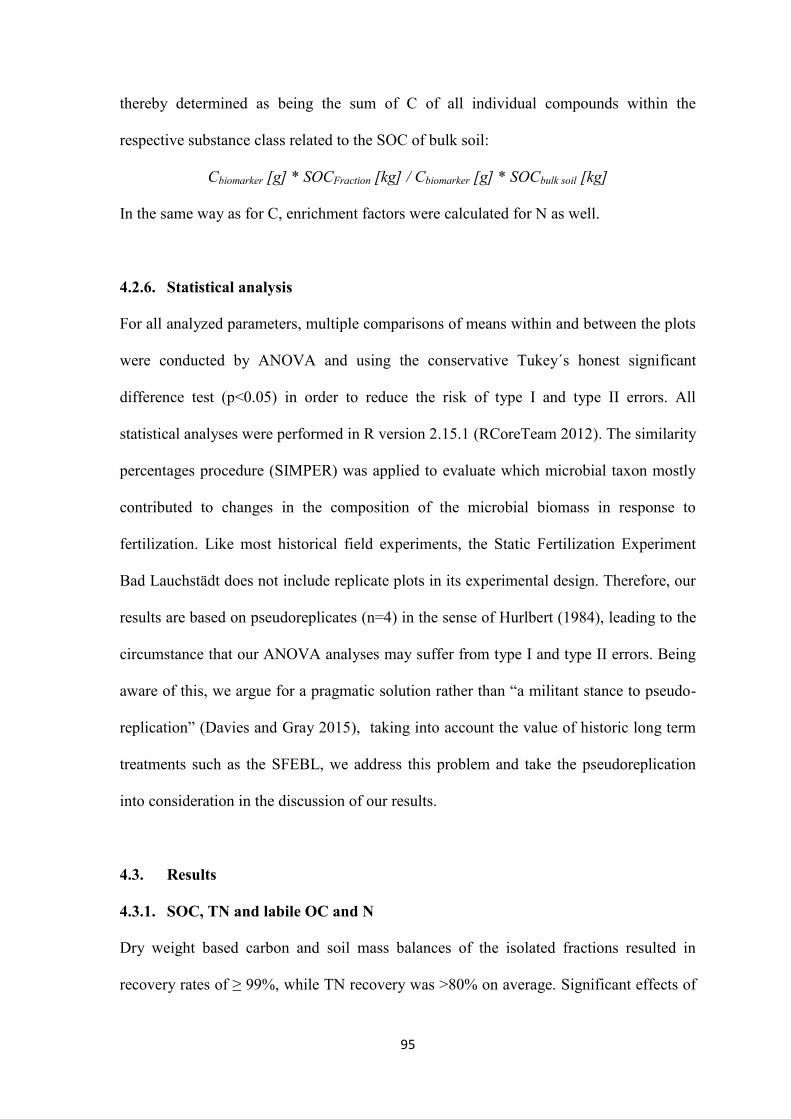
95
thereby determined as being the sum of C of all individual compounds within the
respective substance class related to the SOC of bulk soil:
Cbiomarker [g] * SOCFraction [kg] / Cbiomarker [g] * SOCbulk soil [kg]
In the same way as for C, enrichment factors were calculated for N as well.
4.2.6. Statistical analysis
For all analyzed parameters, multiple comparisons of means within and between the plots
were conducted by ANOVA and using the conservative Tukey´s honest significant
difference test (p<0.05) in order to reduce the risk of type I and type II errors. All
statistical analyses were performed in R version 2.15.1 (RCoreTeam 2012). The similarity
percentages procedure (SIMPER) was applied to evaluate which microbial taxon mostly
contributed to changes in the composition of the microbial biomass in response to
fertilization. Like most historical field experiments, the Static Fertilization Experiment
Bad Lauchstädt does not include replicate plots in its experimental design. Therefore, our
results are based on pseudoreplicates (n=4) in the sense of Hurlbert (1984), leading to the
circumstance that our ANOVA analyses may suffer from type I and type II errors. Being
aware of this, we argue for a pragmatic solution rather than “a militant stance to pseudo-
replication” (Davies and Gray 2015), taking into account the value of historic long term
treatments such as the SFEBL, we address this problem and take the pseudoreplication
into consideration in the discussion of our results.
4.3. Results
4.3.1. SOC, TN and labile OC and N
Dry weight based carbon and soil mass balances of the isolated fractions resulted in
recovery rates of ≥ 99%, while TN recovery was >80% on average. Significant effects of
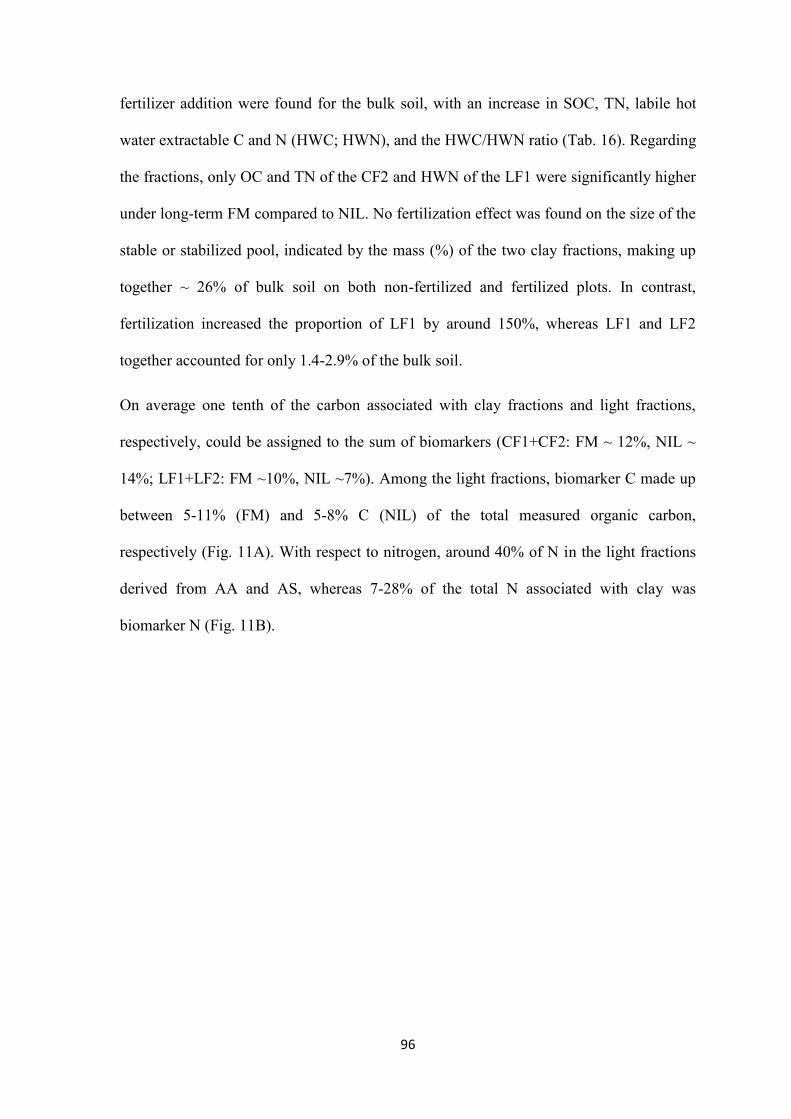
96
fertilizer addition were found for the bulk soil, with an increase in SOC, TN, labile hot
water extractable C and N (HWC; HWN), and the HWC/HWN ratio (Tab. 16). Regarding
the fractions, only OC and TN of the CF2 and HWN of the LF1 were significantly higher
under long-term FM compared to NIL. No fertilization effect was found on the size of the
stable or stabilized pool, indicated by the mass (%) of the two clay fractions, making up
together ~ 26% of bulk soil on both non-fertilized and fertilized plots. In contrast,
fertilization increased the proportion of LF1 by around 150%, whereas LF1 and LF2
together accounted for only 1.4-2.9% of the bulk soil.
On average one tenth of the carbon associated with clay fractions and light fractions,
respectively, could be assigned to the sum of biomarkers (CF1+CF2: FM ~ 12%, NIL ~
14%; LF1+LF2: FM ~10%, NIL ~7%). Among the light fractions, biomarker C made up
between 5-11% (FM) and 5-8% C (NIL) of the total measured organic carbon,
respectively (Fig. 11A). With respect to nitrogen, around 40% of N in the light fractions
derived from AA and AS, whereas 7-28% of the total N associated with clay was
biomarker N (Fig. 11B).
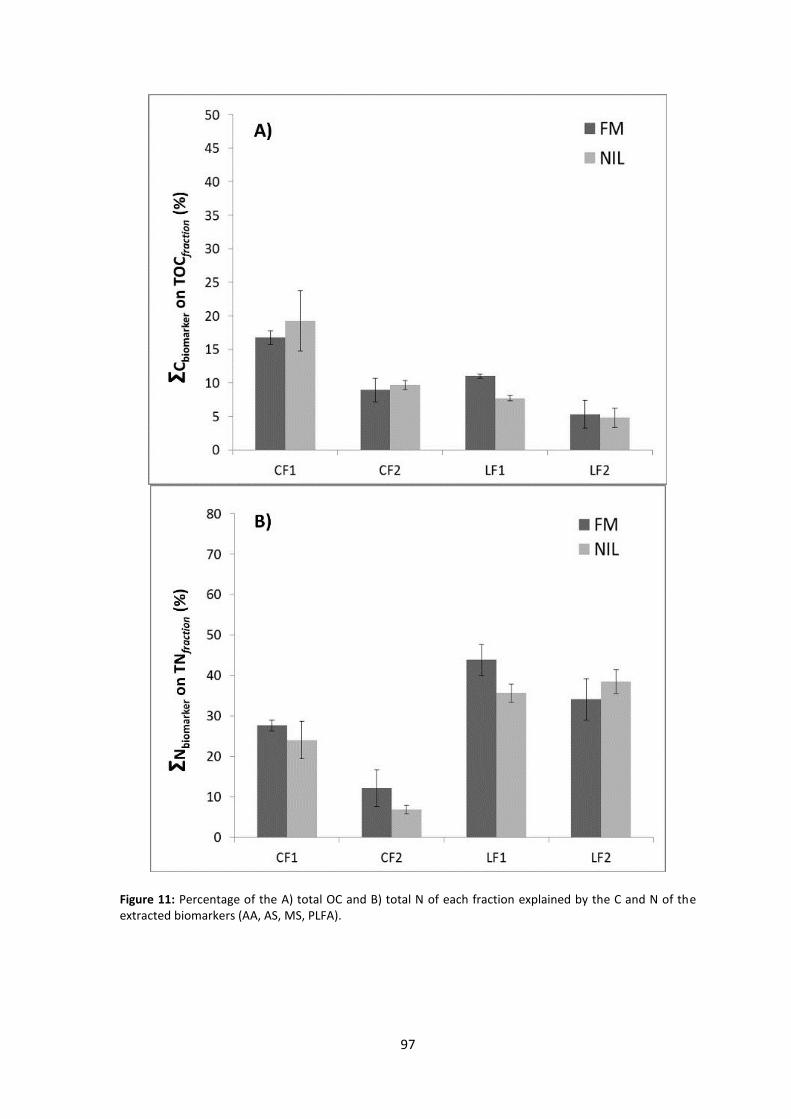
97
Figure 11: Percentage of the A) total OC and B) total N of each fraction explained by the C and N of the extracted biomarkers (AA, AS, MS, PLFA).
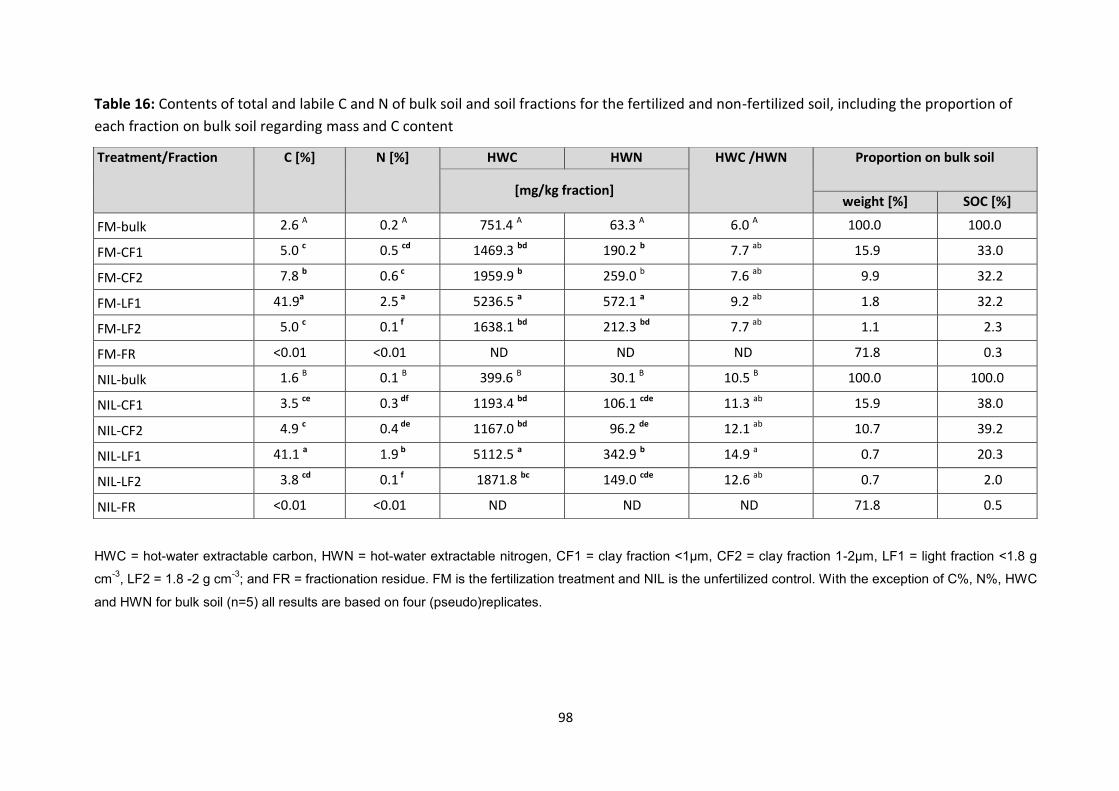
98
Table 16: Contents of total and labile C and N of bulk soil and soil fractions for the fertilized and non-fertilized soil, including the proportion of
each fraction on bulk soil regarding mass and C content
HWC = hot-water extractable carbon, HWN = hot-water extractable nitrogen, CF1 = clay fraction <1µm, CF2 = clay fraction 1-2µm, LF1 = light fraction <1.8 g
cm-3
, LF2 = 1.8 -2 g cm-3
; and FR = fractionation residue. FM is the fertilization treatment and NIL is the unfertilized control. With the exception of C%, N%, HWC
and HWN for bulk soil (n=5) all results are based on four (pseudo)replicates.
Treatment/Fraction C [%] N [%] HWC HWN HWC /HWN Proportion on bulk soil
[mg/kg fraction] weight [%] SOC [%]
FM-bulk 2.6 A 0.2 A 751.4 A 63.3 A 6.0 A 100.0 100.0
FM-CF1 5.0 c 0.5 cd 1469.3 bd 190.2 b 7.7 ab 15.9 33.0
FM-CF2 7.8 b 0.6 c 1959.9 b 259.0 b 7.6 ab 9.9 32.2
FM-LF1 41.9a 2.5 a 5236.5 a 572.1 a 9.2 ab 1.8 32.2
FM-LF2 5.0 c 0.1 f 1638.1 bd 212.3 bd 7.7 ab 1.1 2.3
FM-FR <0.01 <0.01 ND ND ND 71.8 0.3
NIL-bulk 1.6 B 0.1 B 399.6 B 30.1 B 10.5 B 100.0 100.0
NIL-CF1 3.5 ce 0.3 df 1193.4 bd 106.1 cde 11.3 ab 15.9 38.0
NIL-CF2 4.9 c 0.4 de 1167.0 bd 96.2 de 12.1 ab 10.7 39.2
NIL-LF1 41.1 a 1.9 b 5112.5 a 342.9 b 14.9 a 0.7 20.3
NIL-LF2 3.8 cd 0.1 f 1871.8 bc 149.0 cde 12.6 ab 0.7 2.0
NIL-FR <0.01 <0.01 ND ND ND 71.8 0.5
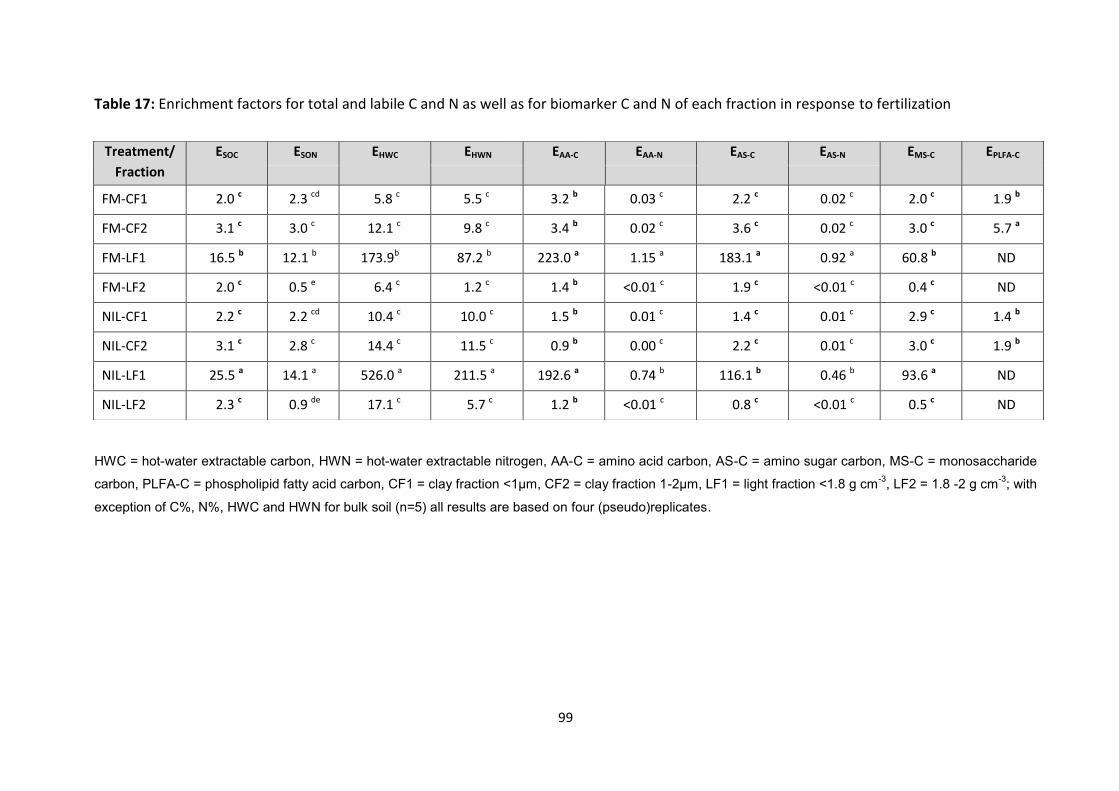
99
Table 17: Enrichment factors for total and labile C and N as well as for biomarker C and N of each fraction in response to fertilization
HWC = hot-water extractable carbon, HWN = hot-water extractable nitrogen, AA-C = amino acid carbon, AS-C = amino sugar carbon, MS-C = monosaccharide
carbon, PLFA-C = phospholipid fatty acid carbon, CF1 = clay fraction <1µm, CF2 = clay fraction 1-2µm, LF1 = light fraction <1.8 g cm-3
, LF2 = 1.8 -2 g cm-3
; with
exception of C%, N%, HWC and HWN for bulk soil (n=5) all results are based on four (pseudo)replicates.
Treatment/
Fraction
ESOC ESON EHWC EHWN EAA-C EAA-N EAS-C EAS-N EMS-C EPLFA-C
FM-CF1 2.0 c 2.3 cd 5.8 c 5.5 c 3.2 b 0.03 c 2.2 c 0.02 c 2.0 c 1.9 b
FM-CF2 3.1 c 3.0 c 12.1 c 9.8 c 3.4 b 0.02 c 3.6 c 0.02 c 3.0 c 5.7 a
FM-LF1 16.5 b 12.1 b 173.9b 87.2 b 223.0 a 1.15 a 183.1 a 0.92 a 60.8 b ND
FM-LF2 2.0 c 0.5 e 6.4 c 1.2 c 1.4 b <0.01 c 1.9 c <0.01 c 0.4 c ND
NIL-CF1 2.2 c 2.2 cd 10.4 c 10.0 c 1.5 b 0.01 c 1.4 c 0.01 c 2.9 c 1.4 b
NIL-CF2 3.1 c 2.8 c 14.4 c 11.5 c 0.9 b 0.00 c 2.2 c 0.01 c 3.0 c 1.9 b
NIL-LF1 25.5 a 14.1 a 526.0 a 211.5 a 192.6 a 0.74 b 116.1 b 0.46 b 93.6 a ND
NIL-LF2 2.3 c 0.9 de 17.1 c 5.7 c 1.2 b <0.01 c 0.8 c <0.01 c 0.5 c ND
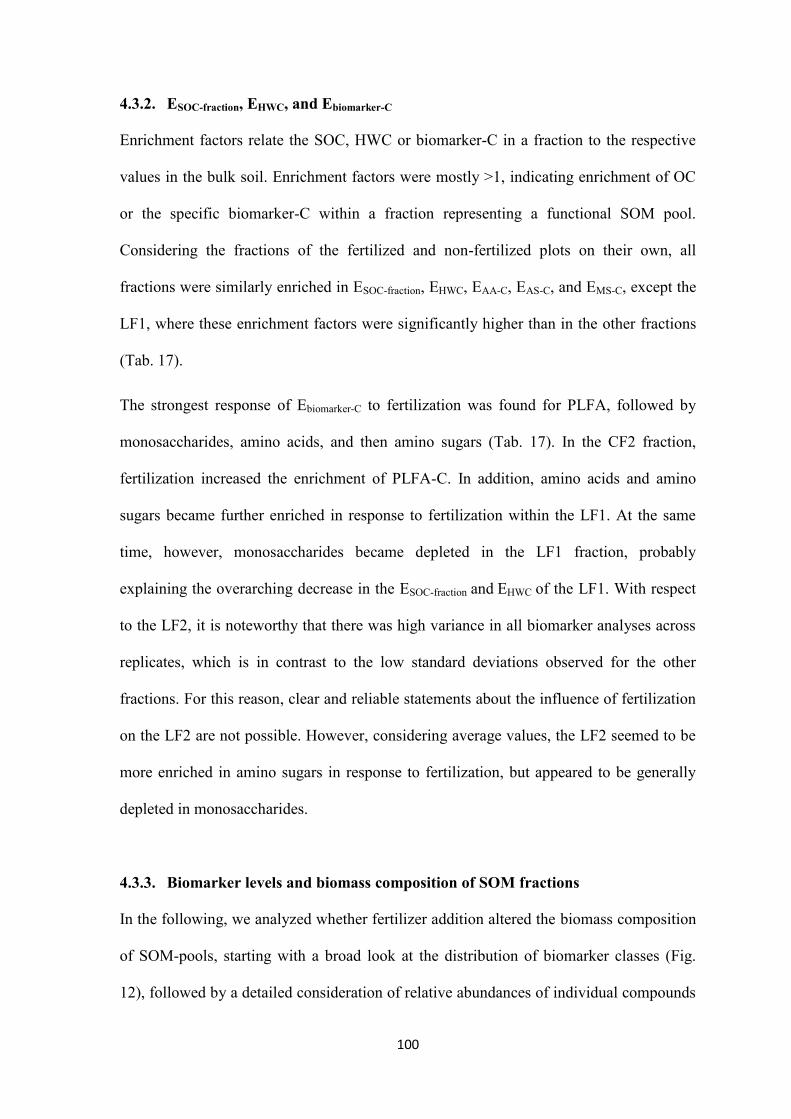
100
4.3.2. ESOC-fraction, EHWC, and Ebiomarker-C
Enrichment factors relate the SOC, HWC or biomarker-C in a fraction to the respective
values in the bulk soil. Enrichment factors were mostly >1, indicating enrichment of OC
or the specific biomarker-C within a fraction representing a functional SOM pool.
Considering the fractions of the fertilized and non-fertilized plots on their own, all
fractions were similarly enriched in ESOC-fraction, EHWC, EAA-C, EAS-C, and EMS-C, except the
LF1, where these enrichment factors were significantly higher than in the other fractions
(Tab. 17).
The strongest response of Ebiomarker-C to fertilization was found for PLFA, followed by
monosaccharides, amino acids, and then amino sugars (Tab. 17). In the CF2 fraction,
fertilization increased the enrichment of PLFA-C. In addition, amino acids and amino
sugars became further enriched in response to fertilization within the LF1. At the same
time, however, monosaccharides became depleted in the LF1 fraction, probably
explaining the overarching decrease in the ESOC-fraction and EHWC of the LF1. With respect
to the LF2, it is noteworthy that there was high variance in all biomarker analyses across
replicates, which is in contrast to the low standard deviations observed for the other
fractions. For this reason, clear and reliable statements about the influence of fertilization
on the LF2 are not possible. However, considering average values, the LF2 seemed to be
more enriched in amino sugars in response to fertilization, but appeared to be generally
depleted in monosaccharides.
4.3.3. Biomarker levels and biomass composition of SOM fractions
In the following, we analyzed whether fertilizer addition altered the biomass composition
of SOM-pools, starting with a broad look at the distribution of biomarker classes (Fig.
12), followed by a detailed consideration of relative abundances of individual compounds
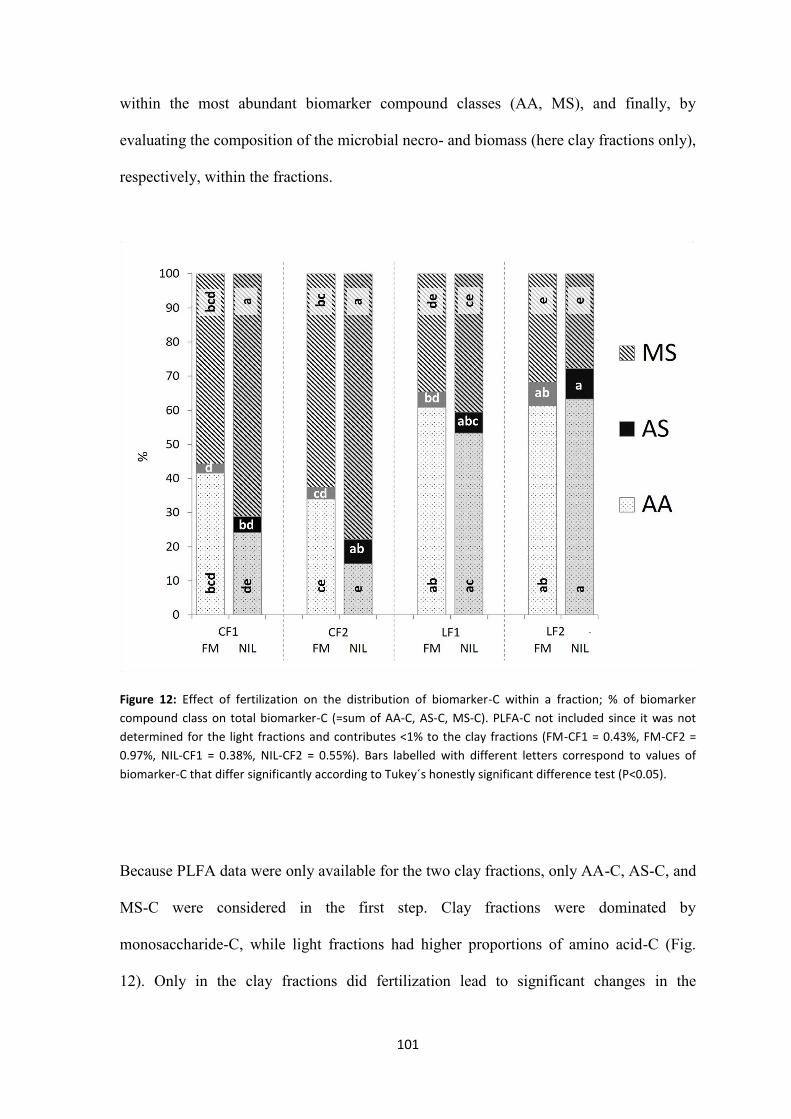
101
within the most abundant biomarker compound classes (AA, MS), and finally, by
evaluating the composition of the microbial necro- and biomass (here clay fractions only),
respectively, within the fractions.
Figure 12: Effect of fertilization on the distribution of biomarker-C within a fraction; % of biomarker
compound class on total biomarker-C (=sum of AA-C, AS-C, MS-C). PLFA-C not included since it was not
determined for the light fractions and contributes <1% to the clay fractions (FM-CF1 = 0.43%, FM-CF2 =
0.97%, NIL-CF1 = 0.38%, NIL-CF2 = 0.55%). Bars labelled with different letters correspond to values of
biomarker-C that differ significantly according to Tukey´s honestly significant difference test (P<0.05).
Because PLFA data were only available for the two clay fractions, only AA-C, AS-C, and
MS-C were considered in the first step. Clay fractions were dominated by
monosaccharide-C, while light fractions had higher proportions of amino acid-C (Fig.
12). Only in the clay fractions did fertilization lead to significant changes in the
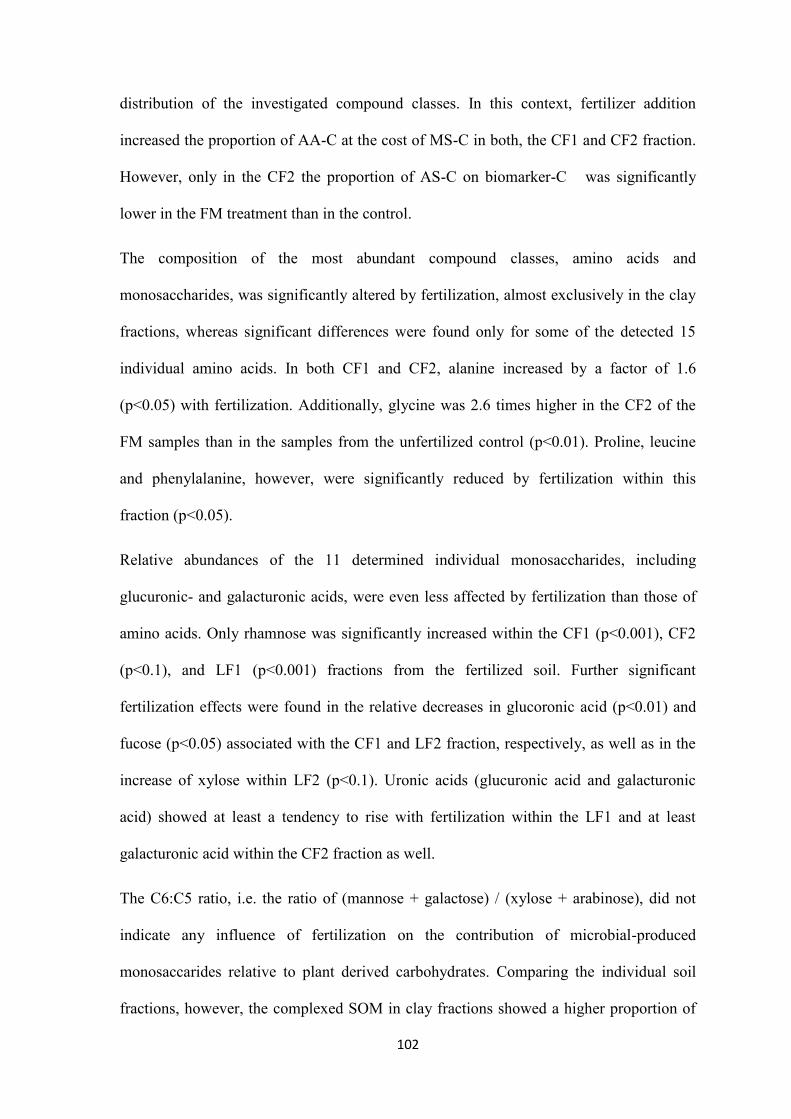
102
distribution of the investigated compound classes. In this context, fertilizer addition
increased the proportion of AA-C at the cost of MS-C in both, the CF1 and CF2 fraction.
However, only in the CF2 the proportion of AS-C on biomarker-C was significantly
lower in the FM treatment than in the control.
The composition of the most abundant compound classes, amino acids and
monosaccharides, was significantly altered by fertilization, almost exclusively in the clay
fractions, whereas significant differences were found only for some of the detected 15
individual amino acids. In both CF1 and CF2, alanine increased by a factor of 1.6
(p<0.05) with fertilization. Additionally, glycine was 2.6 times higher in the CF2 of the
FM samples than in the samples from the unfertilized control (p<0.01). Proline, leucine
and phenylalanine, however, were significantly reduced by fertilization within this
fraction (p<0.05).
Relative abundances of the 11 determined individual monosaccharides, including
glucuronic- and galacturonic acids, were even less affected by fertilization than those of
amino acids. Only rhamnose was significantly increased within the CF1 (p<0.001), CF2
(p<0.1), and LF1 (p<0.001) fractions from the fertilized soil. Further significant
fertilization effects were found in the relative decreases in glucoronic acid (p<0.01) and
fucose (p<0.05) associated with the CF1 and LF2 fraction, respectively, as well as in the
increase of xylose within LF2 (p<0.1). Uronic acids (glucuronic acid and galacturonic
acid) showed at least a tendency to rise with fertilization within the LF1 and at least
galacturonic acid within the CF2 fraction as well.
The C6:C5 ratio, i.e. the ratio of (mannose + galactose) / (xylose + arabinose), did not
indicate any influence of fertilization on the contribution of microbial-produced
monosaccarides relative to plant derived carbohydrates. Comparing the individual soil
fractions, however, the complexed SOM in clay fractions showed a higher proportion of
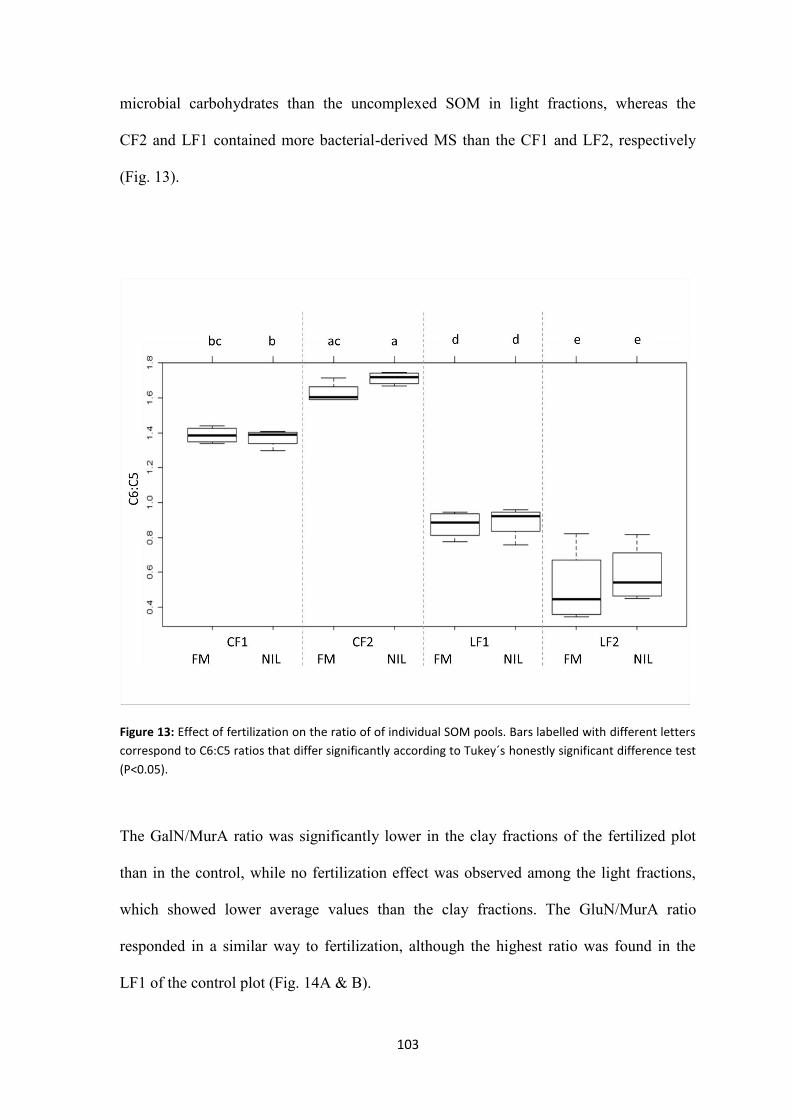
103
microbial carbohydrates than the uncomplexed SOM in light fractions, whereas the
CF2 and LF1 contained more bacterial-derived MS than the CF1 and LF2, respectively
(Fig. 13).
Figure 13: Effect of fertilization on the ratio of of individual SOM pools. Bars labelled with different letters
correspond to C6:C5 ratios that differ significantly according to Tukey´s honestly significant difference test
(P<0.05).
The GalN/MurA ratio was significantly lower in the clay fractions of the fertilized plot
than in the control, while no fertilization effect was observed among the light fractions,
which showed lower average values than the clay fractions. The GluN/MurA ratio
responded in a similar way to fertilization, although the highest ratio was found in the
LF1 of the control plot (Fig. 14A & B).
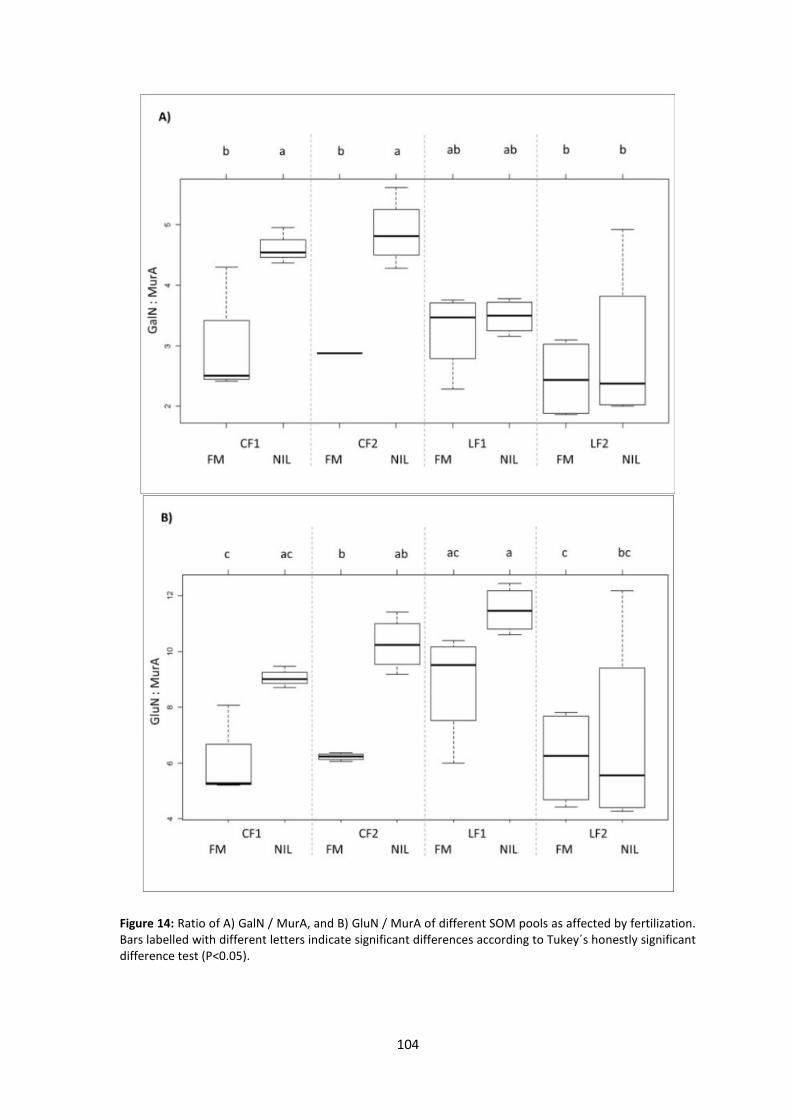
104
Figure 14: Ratio of A) GalN / MurA, and B) GluN / MurA of different SOM pools as affected by fertilization. Bars labelled with different letters indicate significant differences according to Tukey´s honestly significant difference test (P<0.05).
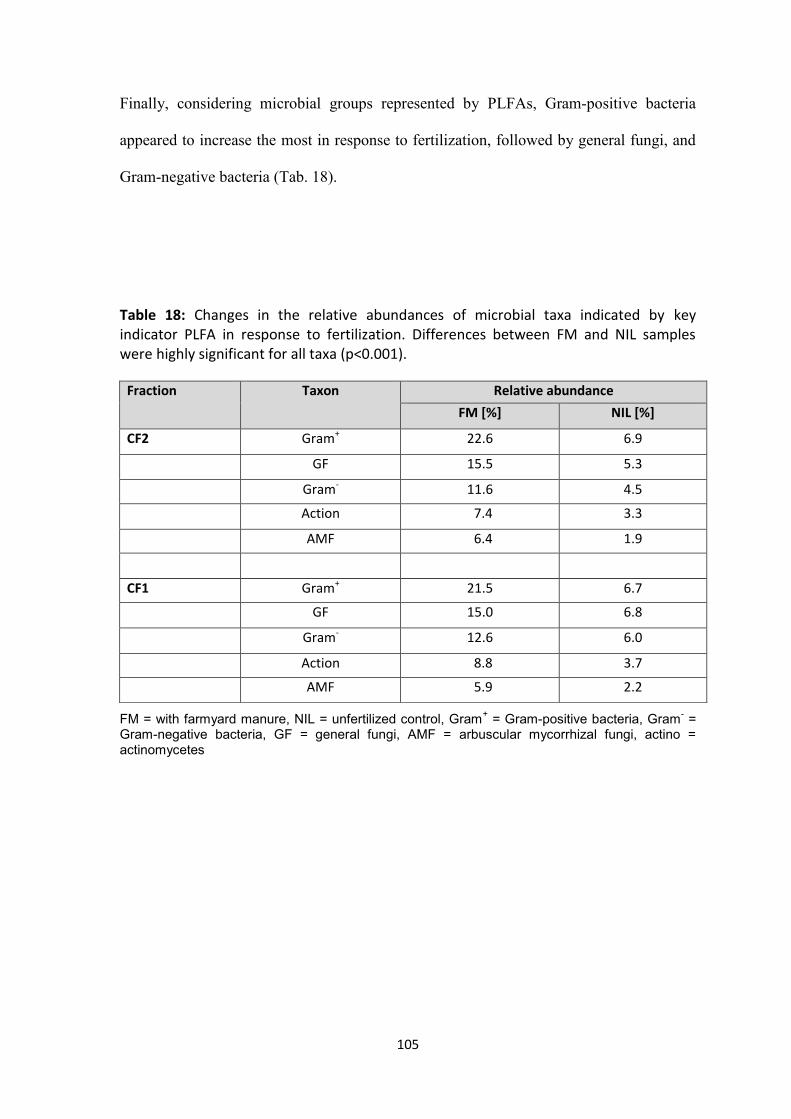
105
Finally, considering microbial groups represented by PLFAs, Gram-positive bacteria
appeared to increase the most in response to fertilization, followed by general fungi, and
Gram-negative bacteria (Tab. 18).
Table 18: Changes in the relative abundances of microbial taxa indicated by key indicator PLFA in response to fertilization. Differences between FM and NIL samples were highly significant for all taxa (p<0.001).
FM = with farmyard manure, NIL = unfertilized control, Gram+ = Gram-positive bacteria, Gram
- =
Gram-negative bacteria, GF = general fungi, AMF = arbuscular mycorrhizal fungi, actino = actinomycetes
Fraction Taxon
Relative abundance
FM [%] NIL [%]
CF2 Gram+ 22.6 6.9
GF 15.5 5.3
Gram- 11.6 4.5
Action 7.4 3.3
AMF 6.4 1.9
CF1 Gram+ 21.5 6.7
GF 15.0 6.8
Gram- 12.6 6.0
Action 8.8 3.7
AMF 5.9 2.2
106
4.4. Discussion
Among the investigated biomarkers, monosaccharides had the highest proportion on SOC
at bulk soil level, followed by amino acids, amino sugars and PLFA. The same
distribution of biomarkers was found for the clay fractions, implying that bulk SOC
composition is mainly shaped by the stable SOM pool. This is comprehensible, taking
into account that clay associated C makes up more than 60% of the SOC, in contrast to
around 30 % of SOC being present in the light fractions (Tab. 16). Clay plays a key role
in the long-term sequestration of OC and its proportion in soils determines the maximum
size of the stable C pool (Kool et al. 2007; Körschens et al. 1998; Six et al. 2002). While
SOM in light fractions responds rapidly to management changes, clay-associated SOM is
characterized by long turnover times since it is less susceptible to microbial attack. This is
well reflected in our finding of higher proportions of biomarker-derived C in the total OC
of the analyzed clay fractions compared to the light fractions. This finding provides field
evidence for the recent advancements in understanding that microorganisms and low
molecular weight microbial-derived molecules are sources and drivers of the long-term
accumulation of SOC (Kallenbach et al. 2016; Miltner et al. 2011)
Being the key driver for all OC turnover processes, the soil microbial community
generally benefits from any additional organic C input, responding with an increase in
biomass (Docherty et al. 2012; Marschner et al. 2003; Schnürer et al. 1985). Moreover,
microbial OC turnover is also controlled by the soil pore space, determining the gaseous
and liquid phase transport and hence, the availability of oxygen. Other than the
exclusively mineral fertilized treatments, the treatments with manure showed bulk
densities that clearly decreased in comparison to the control, at the SFEBL (Eden et al.
2012). Thus, enhanced mineralization following manure application may be one reason
for the observed depletion of total and labile C and N as well as the decline of EMS-C in
107
the LF1 in response to fertilization (Kuka et al. 2007) (Tab. 17). On the other hand, an
excess of N due to the application of mineral fertilizer on soil cultivated with a legume
may have caused the observed enrichment of organic N, i.e. AA-N and AS-N along with
in the fertilized plot (Schmidt et al. 2015).
Our results confirmed that both light fractions, in particular the LF1, represent a SOM
pool of mostly fresh and less decomposed, mainly plant-derived organic material
indicated by the overall high enrichment factors (Tab. 17), high C/N (Tab. 15) and low
C6:C5-ratios (Fig. 13). In addition, the active, unprotected microbial biomass is generally
considered to be part of the labile SOM pool represented by the light fractions (Schulz
2004; Wander 2004). Although there are no PLFA data available for the light fractions,
the high proportions of AA-C imply higher living microbial biomass as compared to the
clay fractions, bearing in mind that AA-C and PLFA-C, in particular, were closely related
at bulk soil level (Schmidt et al. 2015). With fertilization, proportions of plant- and
microbial biomass in the labile pool seemed to increase in the same way, as indicated by
the comparable C6:C5 ratios of the LF1 samples from the NIL and fertilized plots. This
also supports an increase in OC-turnover rates in response to fertilization, outbalancing
the higher input of plant-derived OM from manure and/or root exudates by increased
conversion into microbial biomass and subsequent mineralization of microbial residues.
Fertilization did not affect C6:C5 ratios of the clay fractions either, implying that
stabilization of plant- and microbial-derived OM was increased to the same extent. For
the stable SOM pool, however, an increase in microbial biomass and all microbial
indicator groups under fertilization were supported by the PLFA results (Tab. 17 + 18)
and by the shift to higher proportions of AA-C and AS-C in both clay fractions in the
fertilization treatment (Fig. 12). Stimulation of microbial growth is known to enhance
formation of water stable aggregates (Elmholt et al. 2008) through increased growth of
108
fungal hyphae, and increased production of bacterial exopolysaccharides binding the
negatively charged clay minerals (Czarnes et al. 2000). Thus, the higher relative
abundance of the bacterial polysaccharide galacturonic acid in the CF2 of the fertilized
plot potentially reflects the microbial contribution to physical protection of SOM (Benbi
et al. 1998; Czarnes et al. 2000; Norman 1950). Indeed, the microbial biomass increased
most within the CF2 fraction, as indicated by EPLFA-C, underpinning the importance of
microorganisms for aggregate formation. The relevance of bacteria for C-stabilization is
further corroborated by the significantly higher relative abundance of the desoxy-C6-
sugar rhamnose within the clay fractions of the fertilized plot (Murayama 1984; Oades et
al. 1970). It is noteworthy that rhamnose is particularly highly abundant in the cell-wall of
Gram-positive bacteria belonging to the genera Streptococcus, Enterococcus and
Lactococcus (Mistou et al. 2016), which suggests that besides the soil dwelling
microorganisms, manure-derived bacteria may play a relevant role in soil aggregation.
Finally, the significant increase in the amino acids alanine and glycine with fertilization
may be associated with the increased contribution of microbial biomass from Gram-
positives, since both amino acids are constituents of the peptidoglycane layer of these
bacteria.
4.5. Conclusion
This study supports former findings that management effects on SOC composition
become less visible at the level of individual soil fractions, although especially clay- and
light fractions differ clearly from each other. Thereby, SOC of bulk soil seems to reflect
mainly the stable SOM pool. From the few significant changes, we conclude that
microbial-derived molecules contribute to the stabilized pool of soil organic carbon, while
Gram-positive bacteria, in particular, may support C-stabilization by promoting the
109
formation of microaggregates. The specific promotion of this microbial group might
therefore be a tool to use for regaining decades of loss of soil C in arable lands.
Our results further imply that long-term intensive organic plus mineral fertilization causes
depletion of easily decomposable C within the labile SOM pool, probably resulting from
an accelerated C-turnover based on changes in soil structure. Turnover rates seem to
increase in such way that the higher input of plant-derived C and its conversion into
microbial biomass is outweighed, leading to proportions of plant and microbial OM in the
labile SOM pool similar to those in the unfertilized control.
110
5. Synthesis and Conclusion
Agricultural soils are assumed to bear great potential in acting as a sink for atmospheric
CO2, provided a proper soil management. SOC stocks can be increased by either
increasing the C-input and/or reducing the loss of C due to soil respiration. Both, the
stabilisation and release of soil C are directly linked to the soil microbial community,
standing at the centre of all nutrient cycles and driving a range of other ecological soil
functions. The activity of soil microorganisms, in turn, is influenced by a number of
environmental factors, such as physical- and chemical soil properties, climatic conditions,
as well as the availability of energy and nutrient sources. The main objective of this thesis
was to investigate the impact of long-term organic- and/or mineral fertilization treatments
on the microbial mediated stabilization and turnover of organic C. Since microbial
community structure is known to be significantly shaped by the plant type (Berg and
Smalla 2009b; Ngosong et al. 2010), most of the investigations were performed on two
strips of the SFEBL, differing in the crop type cultivated at sampling time (alfalfa vs.
sugar beet) as well as in the absence or inclusion of a legume within the crop rotation.
Interrelations between chemical- and physical soil properties, microbial growth and
activity were elucidated by the simultaneous analysis of a set of four biomarkers. The
relationships between the biomarkers and several abiotic factors were also determined.
The characterization of SOM, including an analysis of the microbial community
composition of both bulk soil and soil fractions further provides detailed information
regarding the microbial role within functional SOM pools and hence, soil SOM dynamics.
111
5.1. Influence of fertilization on the stable/stabilized SOM pool
Both, the application of organic as well as of mineral fertilizers are known to directly or
indirectly increase SOC levels (Powlson et al. 2011). At the SFEBL, a significant build-
up of SOC was achieved by either the long-term addition of farmyard manure or the
combined application of farmyard manure and NPK but not by solely application of NPK
(Chapter 2). The fact that even long-term addition of 30 t FYM ha-1
2yrs-1
did not
significantly increase C contents of the clay associated soil fraction CF1 (Chapter 4)
implies, that the SOC increase at bulk soil level following fertilization (Chapter 2) is de
facto rarely based on an increase in SOM complexed with clay. According to Dexter et al.
(2008) who set the threshold for soil C-saturation at a clay:OC ratio of ≥10, the potential
to stabilize C based on complexation with clay is exhausted in the highest fertilized
treatment (clay:OC ratios = 10) (Eden et al. 2012). Schjønning et al. (2010) then extended
the Dexter-threshold to ≥20 by considering the fraction of silt+clay (<20 µm) instead of
clay only, determining the soil specific surface area which can interact with OM. Based
on this, even the full-fertilized soil would have not yet reached C-saturation, which may
be one reason for the observed significant increase of C within the clay associated soil
fraction CF2 in response to fertilization (Chapter 4).
Another explanation is given by the fact that a layer of organic molecules covering
mineral particles possesses a much higher affinity to OM than the clay surface itself
(Kästner et al. 2014). Thus, initially adsorbed OM promotes the further association of
organo-mineral associates with each other, leading to the formation of microaggregates.
The results of the present study (Chapter 4) support this explanation, demonstrating that
exopolysaccharides and bacterial cell-wall components such as proteins and
glycopolymers mediate the bacterial adhesion onto mineral surfaces and the subsequent
formation of organo-mineral aggregates (Huang et al., 2015). The high abundances of
112
both, iso- and anteiso PLFA´s within the clay fractions along with significantly increased
amounts of rhamnose, alanine, and glycine within the CF2 of the fertilized plot imply that
Gram-positive bacteria were involved in microaggregate formation at the SFEBL in
response to fertilization. Assuming a key-role of Gram-positive bacteria for C-
stabilization, the question arises whether this microbial group is specifically promoted by
one of the investigated fertilization treatments, i.e. farmyard manure only, NPK only, or
the combined application of both types of fertilizers. The biomass of Gram-positives
seem to increase more than that of Gram-negatives in response to any treatment,
independent from the kind of applied fertilizer (Giacometti et al. 2013). Also in the
present study, biomass of Gram-positives responded more strongly to fertilization than
that of Gram-negatives at least on the strip cultivated with sugar beet, where a significant
increase versus the control was reached with FYM levels of 20t ha-1
2yrs-1
or NPK only,
implying that both types of fertilizers are basically equally suitable to promote the growth
of Gram-positive bacteria. An even higher abundance of these microorganisms and
concomitantly a crop-independent significant increase versus the control was found on
the plot treated with 20t ha-1
2yrs-1
+ NPK, leading to the conclusion that the combination
of both fertilizer types might enhance C-stabilization more successfully than the
application of a single type of fertilizer alone. However, this seem to be valid only in case
of moderate FYM levels, since the additional application of NPK did not significantly
alter the biomass of Gram-positives on the 30t FYM ha-1
2yrs-1
treatments (Chapter 3).
5.2. Influence of fertilization on the decomposable/labile SOM pool
Within the labile SOM pool, organic carbon is not or only loosely associated with
minerals and thus, not stabilized. However, it can still be retained and accumulate within
large micro- and macroaggregates, respectively, being reflected by the increase in the
113
proportion of the light density soil fraction LF1 in response to fertilization (Chapter 4).
Compartmentalization of substrate and microbial biomass along with lower oxygen levels
due to reduced air permeability provide some protection from microbial attack and
decrease the turnover rates of the intra-aggregate SOM (Schmidt et al. 2011; Six et al.
2002).
Sustainable application of fertilizers includes the prevention of unnecessary high releases
of CO2 and other greenhouse gases from soil in relation to SOM turnover. SOM turnover,
however, is a prerequisite to maintain microbial driven soil functions, being essential also
for crop growth through the subsequent release of plant-available nutrients from SOM
turnover. Thus, organic fertilization of cultivated soils is always a balancing act in
retaining as much C as possible within the soil on the one hand, while keeping nutrient
cycles and thus, SOM turnover going on, on the other (Janzen 2006). This, however,
appears much more difficult where the potential to protect SOM from microbial decay
based complexation of SOM with minerals are almost exhausted and newly added C will
increasingly be allocated into the labile SOM pool. In line with other studies, our results
imply that on this background, turnover rates will increase proportionally to the increase
of OM-input (Gulde et al. 2008). However, there is also limited potential of physical
SOM protection based on aggregate formation and thus, in allegory of an overflowing
barrel – excess organic C will flow off from the labile pool by respiration, resulting in a
stagnation of C accumulation, becoming apparent in the observation that SOC contents
show no further increase despite increased FYM levels (Chapter 2).
Only when soil pore space turns into anaerobic conditions, hence decreasing SOM
turnover rates, labile C will again accumulate (Chapter 2). Based on this, one can assume
that each further increase of fertilizer input on a soil near C-saturation will promote the
release of avoidable amounts of CO2 as well as of N2O, resulting from enhanced
114
denitrification in response to the ongoing oxygen limitation (Firestone and Davidson
1989; Powlson et al. 2014).
Any change in the availability of nutrients or C might affect microbial growth and could
therefore have consequences for soil respiration. Beside of labile C, being supported as
main driver for microbial biomass changes (Chapter 3), there were strong indications
that the application of NPK additionally stimulated microbial growth and respiration
(Chapter 2 & 3), probably being also the reason for the observed depletion of
monosaccharide-C within the labile pool (Chapter 4). This effect appeared to be
somewhat stronger in presence of the legume, where rhizobia and mycorrhizal fungi were
stabilizing N- and P-levels in the rhizosphere (Chapter 3).
Recent investigations on non-legume strips at the SFEBL showed, that the activity of
enzymes involved in N- and P-cycling (N-acetylglucosaminidase and phosphatase) were
considerably higher in response to NPK and NPK+FYM (Francioli et al. 2016). The
observed changes in enzyme production were assumed to result from a shift in microbial
community composition, which was found to be distinct among the investigated
fertilization treatments (NIL, NPK, 20t FYM ha-1
2yrs-1
, 20t FYM ha-1
2yrs-1
+ NPK).
This coincides with the results of the present work, showing a clear impact of fertilization
on the microbial community composition with sugar beet as crop, in contrast to a very
similar microbial community in presence of the legume (Chapter 3). In addition,
microbial biomass of Gram-positives, Gram-negatives, and actinomycetes was more
strongly positively correlated to NPK additions on the strip cultivated with alfalfa than
with sugar beet. Based on this one could assume that in absence of a legume, NPK
addition provokes microorganisms to increase their investment in exoenzymes rather than
biomass. This is only speculation, however, and would need to be tested by further
investigations. Beside of this, an enhancing effect on soil respiration by mineral N cannot
115
be generalized as shown by the very inconsistent results of other studies. Up to now, the
factors and their interactions driving the response of soil microorganisms to nutrient
addition are poorly understood and need further research to mechanistically test these
interactions.
5.3. Overall conclusion and research perspectives
The results of the present work basically demonstrate that both, organic and mineral
fertilization are suitable measures for promoting the re-sequestration of organic C in
cultivated soils. However, this study also makes clear that the success of a management
strategy in mitigating global climate change can only be assessed by comparing SOC
increases over the long term with losses of CO2 and other greenhouse gases over the long-
term. Finding an appropriate fertilization strategy will require land managers to take into
account the soil or site specific C-saturation deficit along with a consideration of the
nutrient demand of the cultivated crop type and the presence or absence of symbiotic
partners, which may alter the nutrient supply of the decomposer microbiota. In this
context, the results of this work imply that the determination of monosaccharides and
amino acids along with SOC could be a useful tool to detect changes in SOM turnover
rates within the labile SOM pool in response to management. However, due to the
circumstance that all investigations were based on pseudoreplicated samples taken from
only one soil type, this assumption cannot be generalized at the moment and would need
further validation. Hence, results of a high OC soil will likely not apply to low OC soils,
where bulk densities and thus, the availability of nutrients and oxygen for the decomposer
community are determined by OC rather than the clay content (Dexter et al. 2008).
In a similar way, more research is necessary to verify whether Gram-positives actually
support C-stabilization by enhancing the formation of microaggregates and hence, if
116
stabilization of C in cultivated soils can be supported by the specific promotion of this
microbial group. An integrated analysis of the OM composition (f.ex. by using
biomarkers) and microbial species diversity (f.ex. based on DNA-sequencing or at least
PLFAs) in microaggregates (53–250 µm) and the silt plus clay fraction (<53 µm) in
response to different fertilization strategies could bring further light to this issue.
As mentioned above, there is still a lack of knowledge regarding the effects of N
availability on soil C cycling. To uncover the complex dynamics behind an inhibition or
acceleration of SOM mineralization following the addition of mineral N will need to go
beyond an exploration of SOM composition along with changes in microbial enzyme
activities and appear to require first the development of high-resolution analysis methods
(f.ex. based on DNA), providing information on both the abundance and biomass of the
individual microbial species being affected.
117
6. Summary
Expecting a predicted world population of around nine billion people in 2050 and the
increasing threat of a global climate change, agriculture is forced to develop management
strategies which will ensure food security on the one hand and on the other, to promote
the soils ability to act as a sink for atmospheric CO2. The fertility of a soil strongly
depends on the activity of soil microorganisms as main drivers of all nutrient cycles. At
the same time, soil microorganisms also contribute to the stabilization of organic carbon
(OC) by promoting aggregate formation. There is also increasing evidence that soil
organic matter (SOM) is predominately of microbial origin. Although both, organic and
mineral fertilization have been reported to increase soil organic carbon (SOC) stocks, it is
not yet fully understood how and to which extent these different types of fertilizers affect
the composition and activity of soil microorganisms and thus, either the turnover or the
stabilization of SOM. The present thesis intended to contribute to answering this question
by the analysis of soil samples from five different fertilization treatments and a non-
fertilized control, taken from the Static Fertilization Experiment Bad Lauchstädt,
established in 1902. Due to the continuous constant organic and/or mineral fertilization
over a period of several decades, a dynamic equilibrium between formation and
degradation of soil organic matter can be assumed, making this experimental site ideal for
studying the effects of fertilization on SOM dynamics. To take into account the crop
specific fertilization and the presence of plant-symbiotic relationships as additional source
of mineral nutrients, most investigations were done on a strip cultivated with alfalfa
(Medicago sativa), a host-plant for rhizobia and arbuscular mycorrhizal fungi (AMF) as
well as on a strip cultivated with sugar beet (Beta vulgaris) as a non-host plant,
respectively.
118
SOM is heterogeneous regarding its origin, chemical composition, physical properties,
age, and bioavailability. While the chemical composition of OM is mainly determined by
its source and biotic transformation processes, bioavailability and thus, its degradability,
is mainly governed by the accessibility of OM to degradation enzymes, which can be
hampered by entrapment of OM within aggregates or interactions with soil minerals. First
and foremost, therefore, SOM can be distinguished into a decomposable/labile and a
stabilized/stable pool, which, however, are not sharply delineated, but represent a
continuum of different states of stabilization and associated turnover times.
In this work, the soil was fractionated according to particle-size and density and the
obtained fractions subjected to further investigations in order to assess a pool of
stable/stabilized (clay fractions: CF1 < 1µm, and CF2 1-2µm), intermediate (light fraction
2: LF2 1.8-2 g cm-3
), and decomposable/labile SOM (light fraction 1: LF1 < 1.8 g cm-3
),
respectively. Bulk soil and fractions were characterized by abiotic parameters like OC,
TN, labile OC and N. As a new approach, four biomarkers, i.e. amino acids (AA),
monosaccharides (MS), amino sugars (AS), phospho- and neutrallipid fatty acids (PLFA,
NLFA) were extracted from bulk soil and soil organic matter fractions to gain
information about both the origin and composition of SOM as well as the composition of
the microbial bio- and necromass under the different fertilization regimes.
Main aims of the thesis were:
- to test the hyptothesis that SOM of bulk soil and soil fractions differs depending
on fertilization in both in their organic-chemical composition and in their
proportions of plant, microbial or fungal bio- and necromass. Changes in the
organic-chemical composition should be recorded by determining the proportions
of the individual biomarkers (AA, MS, AS, PLFA) in the total OC content of the
soil or soil fractions (SOC, SOC fraction). Structural changes in the living
119
microbial community should be detected by PLFA analysis. An estimate of the
levels of fungal and bacterial OM in the necromass should be made by rationing
galactosamine and glucosamine to muramic acid. The ratio of deoxy-hexose or
hexose to pentose sugar should in turn provide information on plant or microbial
contributions to SOM.
- identifying the factors being responsible for the observed changes in microbial
biomarkers, and finally
- gaining information about the role that microorganisms play for C stabilization by
linking the results related to the compositions of SOM and the soil microbial
community at bulk soil level to that of the soil fractions.
In bulk soil up to 17.2% of the SOC and 23.9% of the TN could be explained by the
investigated biomarkers, thereby MS-C and AA-C contributed most to the SOC (5.7-
16.5%), followed by AS-C (0.5-2.8%) and PLFA-C (<1%). Similar distribution of the
individual biomarker groups within SOC-Fraction was found in case of the clay- but not
light fractions, implying that the SOM composition of the bulk soil is mainly determined
by the stable/stabilized SOM pool. The fact that the C content of CF1 was not
significantly increased by long-term fertilization is an indication that on the SFEBL the
capacity of the soil for C stabilization by complexation of OM with clay is already almost
exhausted on the unfertilized plot. Consequently, any significant change in the
composition of bulk soil SOM can primarily be attributed to changes within the
decomposable/labile pool. Among the treatments, the relative contributions of the studied
biomarkers to the total SOC varied only slightly except in two cases and only with alfalfa
as crop. Unusual high application rates of farmyard manure (FYM) in combination with
mineral fertilizer (NPK) as well as the absence of any fertilizer in the control led to an
accumulation of biomarker-C, which was hypothesized to be the final result of two
120
consecutive, opposite shifts in SOM turnover rates. There was some evidence that SOM
degradation on both plots was initially accelerated by increased availability of labile C
and mineral N, which was generally attributed to alfalfa root exudation and their
symbiotic relationship with rhizobia and AMF. In addition, the very high levels of FYM
along with the application of NPK played a decisive role at the highest fertilized
treatment. Based on evidence of a direct correlation between the increase in labile C and
the increase in microbial biomass, it was hypothesized that the oxygen content in soil
pore space decreased due to the increase in microbial respiration. The increasing
emergence of anaerobic areas in turn led to a slowdown in overall SOM turnover times.
The fact that biomarker C was accumulated in these plots despite considerable differences
in the availability of labile C might be due to differences in bulk density and the resulting
soil pore volume. Thus, beside of labile C and mineral N, the soil structure was assumed
as main driver for biomarker related changes in SOM composition.
Labile C and mineral N were also identified as main factors determining the composition
of the microbial community at the SFEBL, while the presence of plant-symbiotic
relationships was found to reduce the impact of varying inputs of mineral nutrients on the
decomposer community. PLFA results support earlier findings that the composition of
living microbial populations varies within a short period of time and depending on the
particular crop. In contrast, the composition of the microbial necromass seems to be
mainly determined by fertilization effects on the SOC-turnover. It was also confirmed
that the OM associated with clay is mainly of microbial origin. High levels of iso- and
anteiso-PLFAs as well as the significant increase of rhamnose, alanine and glycine within
the CF2 due to fertilization suggest that Gram-positive bacteria in particular play a role in
the formation of microaggregates and thus C-stabilization. The biomass of Gram-
positives reacted in turn to the individual application of FYM or NPK. However, even
121
greater stimulation of the growth of these microorganisms by the combined use of both
types of fertilizer was achieved only with moderate levels of FYM.
As a key finding of this work, both the individual and the combined use of FYM and
mineral fertilizers were found to be suitable for promoting C stabilization in agricultural
soils. However, the results make also clear that the capacity of a soil for C stabilization is
limited and that the soil-specific C saturation deficit should be considered in the search
for an appropriate fertilization strategy in addition to the plant-specific nutrient
requirement.
122
7. Kurzzusammenfassung
Mit einer prognostizierten Weltbevölkerung von rund neun Milliarden Menschen im Jahr
2050 und der zunehmenden Bedrohung durch einen globalen Klimawandel ist die
Landwirtschaft gezwungen, Managementstrategien zu entwickeln, die einerseits die
Ernährungssicherheit gewährleisten und andererseits die Fähigkeit der Böden fördern,
CO2 zu speichern. Die Fruchtbarkeit eines Bodens hängt stark von der Aktivität der
Bodenmikroorganismen als Hauptantrieb aller Nährstoffkreisläufe ab. Gleichzeitig tragen
Bodenmikroorganismen auch zur Stabilisierung von organischem Kohlenstoff (OC) bei,
indem sie die Aggregatbildung fördern. Darüber hinaus gibt es zunehmend Hinweise
darauf, dass die organische Bodensubstanz (OBS) vorwiegend mikrobiellen Ursprungs
ist. Obwohl es Hinweise darauf gibt, dass sowohl die organische als auch die
mineralische Düngung die Lagerbestände organischer Kohlenstoffvorräte kultivierter
Böden (SOC) erhöhen, ist noch nicht vollständig geklärt, wie und in welchem Umfang
diese unterschiedlichen Düngemittel die Zusammensetzung und Aktivität von
Bodenmikroorganismen und damit den Umsatz oder die Stabilisierung der OBS
beeinflussen. Die vorliegende Arbeit soll dazu beitragen, diese Frage durch die Analyse
von Bodenproben aus dem Statischen Düngungsexperiment Bad Lauchstädt zu
beantworten, wobei fünf verschiedene Düngungsbehandlungen sowie die nicht gedüngten
Kontrolle untersucht wurden. Aufgrund einer konstanten organischen und/oder
mineralischen Düngung über mehrere Jahrzehnte hinweg kann am Versuchsstandort von
einem dynamischen Gleichgewicht zwischen Bildung und Abbau der organischen
Bodensubstanz ausgegangen werden. Dies bietet wiederum ideale Voraussetzungen, um
den Einfluss von Düngung auf die Umwandlung/Stabilisierung der OBS zu untersuchen.
Um sowohl die kulturpflanzenspezifische Düngung als auch das Vorhandensein von
Symbiosen als zusätzliche Mineralstoffquelle zu berücksichtigen, wurden die Beprobung
123
auf zwei Schlägen durchgeführt, welche sich sowohl in der Fruchtart zum
Probenahmezeitpunkt (Luzerne als Wirtspflanze für Rhizobien und arbuskuläre
Mykorrhizapilze (AM) vs. Zuckerrübe als Nicht-Wirtspflanze) als auch in ihrer
Fruchtfolge (mit Leguminosen vs. ohne Leguminosen) unterschieden.
Die OBS ist sowohl in ihrer Herkunft, chemischen Zusammensetzung, ihren
physikalischen Eigenschaften, als auch bezüglich ihres Alters und ihrer Bioverfügbarkeit
sehr heterogen. Während die chemische Zusammensetzung des organischen Materials im
Boden hauptsächlich durch dessen Ursprung und bereits durchlaufene biotische
Transformationsprozesse bestimmt wird, hängt seine Bioverfügbarkeit und somit
Abbaubarkeit hauptsächlich davon ab, ob Abbauenzyme ungehindert auf das Substrat
zugreifen können oder ob es durch Einschluss in Aggregate oder Wechselwirkungen mit
der Mineralsubstanz vor mikrobiellem Angriff geschützt ist. In erster Linie kann die OBS
daher in einen zersetzbaren/labilen und einen stabilisierten/stabilen Pool unterschieden
werden, die jedoch nicht scharf voneinander abgegrenzt sind, sondern ein Kontinuum
unterschiedlicher Stabilisierungszustände- und damit verbundener Umsatzzeiten
darstellen.
In der vorliegenden Arbeit wurde der Boden nach Partikelgröße und Dichte fraktioniert
und die erhaltenen Fraktionen weiteren Untersuchungen unterzogen, um
stabilen/stabilisierten (Ton-Fraktionen: CF1 <1μm und CF2 1-2μm), intermediären
(leichte Fraktion 2: LF2 1.8-2 g cm-3
) und zersetzbaren/labilen (leichte Fraktion 1: LF1 <
1.8 g cm-3
) OBS pool zu bewerten. Der Boden wie auch die Bodenfraktionen wurde durch
abiotische Parameter wie OC, TN, labiler OC und N charakterisiert. Als neuer Ansatz
wurden vier Biomarker, i.e.S. Aminosäuren (AA), Monosaccharide (MS), Aminozucker
(AS), Phospho- und Neutrallipidfettsäuren (PLFA, NLFA) aus dem Gesamtboden und
den organischen Bodenfraktionen extrahiert, um Informationen über den Einfluss
124
organisch- und/oder mineralischer Düngung auf den Ursprung und die Zusammensetzung
der OBS sowie der mikrobiellen Bio- und Nekromasse zu erhalten.
Hauptziele der Arbeit waren:
- die Annahme zu überprüfen, dass die OBS des Gesamtbodens- und der
Bodenfraktionen sich je nach Düngungsbehandlung sowohl in ihrer organisch-
chemischen Zusammensetzung als auch hinsichtlich ihrer Anteile an pflanzlicher,
mikrobieller oder pilzlicher Bio- und Nekromasse unterscheidet. Änderungen in
der organisch-chemischen Zusammensetzung sollten dabei über die Bestimmung
der Anteile der einzelnen Biomarker (AA, MS, AS, PLFA) am gesamten
organischen Kohlenstoffgehalt des Bodens- bzw. der Bodenfraktionen (SOC,
SOC-Fraktion) erfasst werden. Strukturelle Veränderungen in der lebenden
mikrobiellen Gemeinschaft sollten mittels PLFA-Analyse nachgewiesen werden.
Eine Abschätzung der Anteile an pilzlicher und bakterieller organischer Substanz
in der Nekromasse sollte mittels Verhältnisbildung aus Galactosamin und
Glucosamin zu Muraminsäure erfolgen. Das Verhältnis von Deoxy-Hexose- bzw.
Hexose- zu Pentosezuckern sollte wiederum Aufschluss über pflanzliche bzw.
mikrobielle Beiträge an der OBS geben.
- die Identifizierung der für die Änderungen verantwortlichen Faktoren und
schließlich
- die Erlangung von Informationen bezüglich der Rolle von Mikroorganismen bei
der Stabilisierung von organischem C durch Verknüpfung der Ergebnisse des
Gesamtbodens mit denen Ergebnissen der Bodenfraktionen.
125
Für den Gesamtboden konnten bis zu 17,2% des SOC und 23,9% des TN durch die
untersuchten Biomarker erklärt werden, wobei MS-C und AA-C dabei den größten Anteil
ausmachten (5,7-16,5%), gefolgt von AS-C (0,5-2,8%) und PLFA-C (<1%). Eine
ähnliche Verteilung der Biomarker fand sich in den beiden Ton-, jedoch nicht in den
leichten Fraktionen, woraus sich schlussfolgern lässt, dass die Zusammensetzung der
OBS des Gesamtbodens hauptsächlich durch den stabilen/stabilisierten OBS-Pool
bestimmt wird. Dass der C-Gehalt der CF1 durch Langzeitdüngung nicht signifikant
erhöht wurde, ist dabei ein Hinweis darauf, dass auf dem SFEBL die Kapazität des
Bodens zur C Stabilisierung durch Komplexierung von OM mit Ton bereits auf dem
ungedüngten Plot nahezu ausgeschöpft ist. Folglich kann angenommen werden, dass jede
signifikante Änderung in der Zusammensetzung der OBS des Gesamtbodens in erster
Linie auf Veränderungen innerhalb des zersetzbaren/labilen Pools beruht. Anders als
ursprünglich vermutet, variierten die relativen Anteile der untersuchten Biomarker am
SOC nur geringfügig entlang der untersuchten Plots. Nur mit Luzerne als Fruchtart kam
es sowohl unter extrem hohen Stalldungapplikationen in Kombination mit Mineraldünger
als auch auf der ungedüngten Variante zu einer Akkumulation von Biomarker-C, welche
vermutlich aus zwei aufeinanderfolgenden Wechseln in den Abbauraten der OBS
resultierte. Es gab Hinweise, dass der Abbau der OBS auf beiden Plots durch eine erhöhte
Verfügbarkeit von labilem C und Mineralstickstoff (Mineral-N) zunächst beschleunigt
wurde, was im Allgemeinen auf die Freisetzung an Wurzelexsudaten durch die Luzerne
sowie auf deren symbiotische Beziehung zu Rhizobien und AM-Pilzen zurückgeführt
wurde. Auf der höchst gedüngten Variante spielten zusätzlich dazu die sehr hohen
Einträge an Stalldung und Mineralnährstoffen in Form von Mineraldünger eine
entscheidende Rolle. Basierend auf dem Nachweis einer direkten Korrelation zwischen
der Erhöhung an labilem C und dem Zuwachs der mikrobiellen Biomasse wurde
126
vermutet, dass sich der Sauerstoffgehalt im Bodenporenraum durch den Anstieg der
mikrobiellen Atmung verringerte. Die zunehmende Entstehung anaerober Bereiche hatte
wiederum eine Verlangsamung der OBS-Umsatzzeiten zur Folge. Dass es auf den
genannten Plots trotz starker Unterschiede in der Verfügbarkeit an labilem C zu einer
Akkumulation an Biomarker-C kam, könnte auf Unterschiede in der Lagerungsdichte und
des sich daraus ergebenden Bodenporenvolumens zurückzuführen sein. Neben labilem C
und Mineral-N ist die Bodenstruktur vermutlich ein weiterer Hauptfaktor für die mittels
Biomarkeranalyse detektierten Veränderungen in der Zusammensetzung der OBS.
Labiler C und Mineral-N wurden ebenfalls als Haupteinflussfaktoren für die
Zusammensetzung der mikrobiellen Gemeinschaft identifiziert. Dabei deuteten die
Ergebnisse darauf hin, dass die der mikrobiellen Zersetzergemeinschaft im Boden zur
Verfügung stehenden Mineralnährstofflevel durch die Symbiose zwischen Pflanze und
Rhizobien bzw. AM-Pilzen kontrolliert und somit Düngungseffekte auf die mikrobielle
Gemeinschaft reduziert werden.
PLFA-Ergebnisse unterstützen dabei frühere Befunde, dass die Zusammensetzung
lebender mikrobielle Populationen innerhalb kurzer Zeiträume und in Abhängigkeit von
der jeweiligen Fruchtart variiert. Im Gegensatz dazu scheint die Zusammensetzung der
mikrobiellen Nekromasse hauptsächlich durch Düngungseffekte auf den C-Umsatz im
Boden bestimmt zu werden. Es wurde ebenso bestätigt, dass die mit Ton assoziierte OBS
hauptsächlich mikrobiellen Ursprungs ist. Hohe Gehalte an iso- und anteiso-PLFAs sowie
die signifikante Zunahme an Rhamnose, Alanin und Glycin innerhalb des CF2 infolge
von Düngung lassen dabei vermuten, dass insbesondere Gram-positive Bakterien bei der
Bildung von Mikroaggregaten und damit der C-Stabilisierung eine Rolle spielen. Die
Biomasse von Gram-positiven reagierte wiederum grundsätzlich auf die individuelle
Anwendung von Stalldung oder NPK. Eine noch stärkere Stimulation des Wachstums
127
dieser Mikroorganismen durch die kombinierte Anwendung beider Düngemitteltypen
wurde jedoch nur unter moderaten Mengen an Stalldung erreicht.
Die wesentliche Erkenntnis dieser Arbeit ist, dass sowohl die individuelle als auch die
kombinierte Anwendung von Stallmist- und Mineraldünger geeignet sind, um die C-
Stabilisierung in landwirtschaftlichen Böden zu fördern. Die Ergebnisse machen jedoch
deutlich, dass die Kapazität eines Bodens zur C-Stabilisierung begrenzt ist und bei der
Suche nach einer geeigneten Düngestrategie neben dem pflanzenspezifischen
Nährstoffbedarf auch das bodenspezifische C-Sättigungsdefizit berücksichtigt werden
sollte.
128
8. References
Allison SD, Czimczik CI, Treseder KK (2008) Microbial activity and soil respiration under nitrogen addition in Alaskan boreal forest Global Change Biology 14:1156-1168 doi:10.1111/j.1365-2486.2008.01549.x
Amelung W (2001) Methods using amino sugars as markers for microbial residues in soil. In: Assessment Methods for Soil Carbon. Lewis Publishers, Boca Raton, pp 233-272
Amelung W (2003) Nitrogen biomarkers and their fate in soil Journal of Plant Nutrition and Soil Science 166:677-686 doi:10.1002/jpln.200321274
Amelung W, Cheshire MV, Guggenberger G (1996) Determination of neutral and acidic sugars in soil by capillary gas-liquid chromatography after trifluoroacetic acid hydrolysis Soil Biology and Biochemistry 28:1631-1639
Amelung W, Kimble JM, Samson-Liebig S, Follett RF (2001a) Restoration of microbial residues in soils of the conservation reserve program Soil Sci Soc Am J 65:1704-1709 doi:10.2136/sssaj2001.1704
Amelung W, Miltner A, Zhang X, Zech W (2001b) Fate of microbial residues during litter decomposition as affected by minerals Soil Science 166:598-606
Amelung W, Zhang X (2001) Determination of amino acid enantiomers in soils Soil Biology & Biochemistry 33:553-562
Appuhn A, Joergensen RG (2006) Microbial colonisation of roots as a function of plant species Soil Biology and Biochemistry 38:1040-1051 doi:http://dx.doi.org/10.1016/j.soilbio.2005.09.002
Bååth E (2003) The use of neutral lipid fatty acids to indicate the physiological conditions of soil fungi Microbial Ecology 45:373-383 doi:10.1007/s00248-003-2002-y
Bai Z, Bodé S, Huygens D, Zhang X, Boeckx P (2013) Kinetics of amino sugar formation from organic residues of different quality Soil Biology and Biochemistry 57:814-821 doi:http://dx.doi.org/10.1016/j.soilbio.2012.08.006
Bais HP, Weir TL, Perry LG, Gilroy S, Vivanco JM (2006) The role of root exudates in rhizosphere interactions with plants and other organisms Annual Review of Plant Biology 57:233-266 doi:doi:10.1146/annurev.arplant.57.032905.105159
Balser TC, Treseder, K. K. , Ekenler, M. (2005) Using lipid analysis and hyphal length to quantify AM and saprotrophic fungal abundance along a soil chronosequence Soil Biology and Biochemistry 37:601-604
Bandick AK, Dick RP (1999) Field management effects on soil enzyme activities Soil Biology and Biochemistry 31:1471-1479 doi:http://dx.doi.org/10.1016/S0038-0717(99)00051-6
Bardgett RD, Mawdsley JL, Edwards S, Hobbs PJ, Rodwell JS, Davies WJ (1999) Plant species and nitrogen effects on soil biological properties of temperate upland grasslands Functional Ecology 13:650-660 doi:10.1046/j.1365-2435.1999.00362.x
Batjes NH (1998) Mitigation of atmospheric CO2 concentrations by increased carbon sequestration in the soil Biology and Fertility of Soils 27:230-235 doi:10.1007/s003740050425
Benbi DK, Biswas CR, Bawa SS, Kumar K (1998) Influence of farmyard manure, inorganic fertilizers and weed control practices on some soil physical properties in a long-term experiment Soil Use and Management 14:52-54 doi:10.1111/j.1475-2743.1998.tb00610.x
Berg G, Smalla K (2009a) Plant species and soil type cooperatively shape the structure and function of microbial communities in the rhizosphere FEMS Microbiology Ecology 68:1-13 doi:10.1111/j.1574-6941.2009.00654.x
129
Berg G, Smalla K (2009b) Plant species and soil type cooperatively shape the structure and function of microbial communities in the rhizosphere FEMS Microbiol Ecol 68:1-13 doi:10.1111/j.1574-6941.2009.00654.x
Bligh EG, Dyer WJ (1959) A rapid method of total lipid extraction and purification Canadian Journal of Biochemistry and Physiology 37:911-917 doi:10.1139/o59-099
Boas NF (1953) Method for the determination of hexosamines in tissues Journal of Biological Chemistry 204:553-563
Böhm C, Landgraf D, Makeschin F (2010) Changes in total and labile carbon and nitrogen contents in a sandy soil after the conversion of a succession fallow to cultivated land Journal of Plant Nutrition and Soil Science 173:46-54 doi:10.1002/jpln.200625189
Böhme L, Böhme F (2006) Soil microbiological and biochemical properties affected by plant growth and different long-term fertilisation European Journal of Soil Biology 42:1-12 doi:http://dx.doi.org/10.1016/j.ejsobi.2005.08.001
Bossio DA, Scow KM, Gunapala N, Graham KJ (1998) Determinants of soil microbial communities: Effects of agricultural management, season, and soil type on phospholipid fatty acid profiles Microbial Ecology 36:1-12
Breulmann M (2011) Functional soil organic matter pools and soil organic carbon stocks in grasslands - an ecosystem perspective. Universität Hannover
Broghammer A et al. (2012) Legume receptors perceive the rhizobial lipochitin oligosaccharide signal molecules by direct binding Proceedings of the National Academy of Sciences 109:13859-13864 doi:10.1073/pnas.1205171109
Bronick CJ, Lal R (2005) Soil structure and management: A review Geoderma 124:3-22 doi:http://dx.doi.org/10.1016/j.geoderma.2004.03.005
Buscot F, Varma A (2005) Microorganisms in soils: roles in genesis and functions. Springer, Campbell CA, Bowren KE, Schnitzer M, Zentner RP, Townleysmith L (1991) Effect of crop
rotations and fertilization on soil organic-matter and some biochemical-properties of a thick black chernozem Canadian Journal of Soil Science 71:377-387
Caravaca F, Maboreke H, Kurth F, Herrmann S, Tarkka MT, Ruess L (2015) Synergists and antagonists in the rhizosphere modulate microbial communities and growth of Quercus robur L Soil Biology and Biochemistry 82:65-73 doi:http://dx.doi.org/10.1016/j.soilbio.2014.12.004
Chantigny MH, Angers DA, Prévost D, Vézina L-P, Chalifour F-P (1997) Soil aggregation and fungal and bacterial biomass under annual and perennial cropping systems Soil Science Society of America Journal 61:262-267 doi:10.2136/sssaj1997.03615995006100010037x
Chen R et al. (2014) Soil C and N availability determine the priming effect: Microbial N mining and stoichiometric decomposition theories Global Change Biology 20:2356-2367 doi:10.1111/gcb.12475
Christensen BT (1985) Carbon and Nitrogen in Particle Size Fractions Isolated from Danish Arable Soils by Ultrasonic Dispersion and Gravity-Sedimentation Acta Agriculturae Scandinavica 35:175-187 doi:10.1080/00015128509435773
Christensen BT (2001) Physical fractionation of soil and structural and functional complexity in organic matter turnover European Journal of Soil Science 52:345-353
Clarke KR (1993) Non-parametric multivariate analyses of changes in community structure Australian Journal of Ecology 18:117-143 doi:10.1111/j.1442-9993.1993.tb00438.x
Conant RT, Paustian K, Elliott ET (2001) Grassland management and conversion into grassland: Effects on soil carbon Ecological Applications 11:343-355 doi:10.1890/1051-0761(2001)011[0343:GMACIG]2.0.CO;2
Costa R, Götz M, Mrotzek N, Lottmann J, Berg G, Smalla K (2006) Effects of site and plant species on rhizosphere community structure as revealed by molecular analysis of microbial guilds FEMS Microbiology Ecology 56:236-249 doi:10.1111/j.1574-6941.2005.00026.x
130
Curiel Yuste J, Baldocchi DD, Gershenson A, Goldstein A, Misson L, Wong S (2007) Microbial soil respiration and its dependency on carbon inputs, soil temperature and moisture Global Change Biology 13:2018-2035 doi:10.1111/j.1365-2486.2007.01415.x
Czarnes S, Hallett PD, Bengough AG, Young IM (2000) Root- and microbial-derived mucilages affect soil structure and water transport European Journal of Soil Science 51:435-443 doi:10.1046/j.1365-2389.2000.00327.x
D´Haeze W, Holsters M (2002) Nod factor structures, responses, and perception during initiation of nodule development Glycobiology 12:79R-105R doi:10.1093/glycob/12.6.79R
Dakora FD, Phillips DA (2002) Root exudates as mediators of mineral acquisition in low-nutrient environments Plant and Soil 245:35-47 doi:10.1023/a:1020809400075
Davidson EA, Janssens IA (2006) Temperature sensitivity of soil carbon decomposition and feedbacks to climate change Nature 440:165-173
Davies GM, Gray A (2015) Don't let spurious accusations of pseudoreplication limit our ability to learn from natural experiments (and other messy kinds of ecological monitoring) Ecology and Evolution 5:5295-5304 doi:10.1002/ece3.1782
de Graaff M-A, Classen AT, Castro HF, Schadt CW (2010) Labile soil carbon inputs mediate the soil microbial community composition and plant residue decomposition rates New Phytologist 188:1055-1064 doi:10.1111/j.1469-8137.2010.03427.x
Demoling F, Figueroa D, Bååth E (2007) Comparison of factors limiting bacterial growth in different soils Soil Biology and Biochemistry 39:2485-2495 doi:http://dx.doi.org/10.1016/j.soilbio.2007.05.002
Demyan MS, Rasche F, Schulz E, Breulmann M, Müller T, Cadisch G (2012) Use of specific peaks obtained by diffuse reflectance Fourier transform mid-infrared spectroscopy to study the composition of organic matter in a Haplic Chernozem European Journal of Soil Science 63:189-199 doi:10.1111/j.1365-2389.2011.01420.x
Denef K, Plante AF, Six J (2010) Characterization of soil organic matter. In: Kutsch WL, Bahn M, Heinemeyer A (eds) Soil Carbon Dynamics: An Integrated Methodology. Cambridge University Press, Cambridge, pp 91-126. doi:10.1017/CBO9780511711794.007
Derrien D, Amelung W (2011) Computing the mean residence time of soil carbon fractions using stable isotopes: impacts of the model framework European Journal of Soil Science 62:237-252 doi:10.1111/j.1365-2389.2010.01333.x
Derrien D, Marol C, Balabane M, Balesdent J (2006) The turnover of carbohydrate carbon in a cultivated soil estimated by 13C natural abundances European Journal of Soil Science 57:547-557 doi:10.1111/j.1365-2389.2006.00811.x
Dexter AR, Richard G, Arrouays D, Czyż EA, Jolivet C, Duval O (2008) Complexed organic matter controls soil physical properties Geoderma 144:620-627 doi:https://doi.org/10.1016/j.geoderma.2008.01.022
Dick RP, Rasmussen PE, Kerle EA (1988) Influence of long-term residue management on soil enzyme activities in relation to soil chemical properties of a wheat-fallow system Biology and Fertility of Soils 6:159-164 doi:10.1007/bf00257667
Ding X, Han X, Zhang X (2013) Long-term impacts of manure, straw, and fertilizer on amino sugars in a silty clay loam soil under temperate conditions Biology and Fertility of Soils 49:949-954 doi:10.1007/s00374-012-0768-0
Dixon NM, Kell DB (1989a) The inhibition by CO2 of the growth and metabolism of micro-organisms Journal of Applied Microbiology 67:109-136 doi:10.1111/j.1365-2672.1989.tb03387.x
Dixon NM, Kell DB (1989b) The inhibition by CO2 of the growth and metabolism of micro‐organisms Journal of Applied Bacteriology 67:109-136
Docherty K, Balser T, Bohannan B, Gutknecht J (2012) Soil microbial responses to fire and interacting global change factors in a California annual grassland Biogeochemistry 109:63-83 doi:10.1007/s10533-011-9654-3
131
Dontsova KM, Norton LD, Johnston CT (2005) Calcium and magnesium effects on ammonia adsorption by soil clays Soil Science Society of America Journal 69:1225-1232 doi:10.2136/sssaj2004.0335
Dungait JAJ, Hopkins DW, Gregory AS, Whitmore AP (2012) Soil organic matter turnover is governed by accessibility not recalcitrance Global Change Biology 18:1781-1796 doi:10.1111/j.1365-2486.2012.02665.x
Eden M, Moldrup P, Schjønning P, Vogel H-J, Scow KM, de Jonge LW (2012) Linking soil physical parameters along a density gradient in a loess-soil long-term experiment Soil Science 177:1-11
Elmholt S, Schjønning P, Munkholm LJ, Debosz K (2008) Soil management effects on aggregate stability and biological binding Geoderma 144:455-467
Engelking B, Flessa H, Joergensen RG (2007) Shifts in amino sugar and ergosterol contents after addition of sucrose and cellulose to soil Soil Biology and Biochemistry 39:2111-2118
Esperschütz J, Gattinger A, Mäder P, Schloter M, Fließbach A (2007) Response of soil microbial biomass and community structures to conventional and organic farming systems under identical crop rotations FEMS Microbiology Ecology 61:26-37 doi:10.1111/j.1574-6941.2007.00318.x
Fageria NK, Baligar VC, Jones CA (2011) Growth and mineral nutrition of field crops. Books in soils, plants, and the environment. CRC, Boca Raton, FL [etc.]
Federle TW (1986) Microbial distribution in soil: New techniques. In: Perspectives in Microbial Ecology Slovene Society for Microbiology, Lubljana, pp 493-498
Firestone MK, Davidson EA (1989) Microbiological basis of NO and N2O production and consumption in soil Exchange of trace gases between terrestrial ecosystems and the atmosphere 47:7-21
Fischer H, Ingwersen J, Kuzyakov Y (2010) Microbial uptake of low-molecular-weight organic substances out-competes sorption in soil European Journal of Soil Science 61:504-513 doi:10.1111/j.1365-2389.2010.01244.x
Fließbach A, Oberholzer H-R, Gunst L, Mäder P (2007) Soil organic matter and biological soil quality indicators after 21 years of organic and conventional farming Agriculture, Ecosystems & Environment 118:273-284
Francioli D, Schulz E, Lentendu G, Wubet T, Buscot F, Reitz T (2016) Mineral vs. Organic Amendments: Microbial Community Structure, Activity and Abundance of Agriculturally Relevant Microbes Are Driven by Long-Term Fertilization Strategies Frontiers in Microbiology 7 doi:10.3389/fmicb.2016.01446
Friedel JK, Scheller E (2002) Composition of hydrolysable amino acids in soil organic matter and soil microbial biomass Soil Biology and Biochemistry 34:315-325
Frostegård A, Bååth E (1996) The use of phospholipid fatty acid analysis to estimate bacterial and fungal biomass in soil Biology and Fertility of Soils 22:59-65 doi:10.1007/bf00384433
Frostegård Å, Bååth E, Tunlid A (1993) Shifts in the structure of soil microbial communities in limed forests as revealed by phospholipid fatty acid analysis Soil Biology and Biochemistry 25:723-730 doi:http://dx.doi.org/10.1016/0038-0717(93)90113-P
Frostegård Å, Tunlid A, Bååth E (1991) Microbial biomass measured as total lipid phosphate in soils of different organic content Journal of Microbiological Methods 14:151-163
Frostegård Å, Tunlid A, Bååth E (2011) Use and misuse of PLFA measurements in soils Soil Biology and Biochemistry 43:1621-1625
Gevao B, Semple KT, Jones KC (2000) Bound pesticide residues in soils: a review Environmental Pollution 108:3-14 doi:http://dx.doi.org/10.1016/S0269-7491(99)00197-9
Ghani A, Dexter M, Perrott KW (2003) Hot-water extractable carbon in soils: A sensitive measurement for determining impacts of fertilisation, grazing and cultivation Soil Biology and Biochemistry 35:1231-1243
132
Giacometti C, Demyan MS, Cavani L, Marzadori C, Ciavatta C, Kandeler E (2013) Chemical and microbiological soil quality indicators and their potential to differentiate fertilization regimes in temperate agroecosystems Applied Soil Ecology 64:32-48 doi:http://dx.doi.org/10.1016/j.apsoil.2012.10.002
Glaser B, Turrion MB, Alef K (2004) Amino sugars and muramic acid - biomarkers for soil microbial community structure analysis Soil Biology & Biochemistry 36:399-407 doi:10.1016/j.soilbio.2003.10.013
Gök M, Ottow JCG (1988) Effect of cellulose and straw incorporation in soil on total denitrification and nitrogen immobilization at initially aerobic and permanent anaerobic conditions Biology and Fertility of Soils 5:317-322 doi:10.1007/bf00262139
Grant WD, West AW (1986) Measurement of ergosterol, diaminopimelic acid and glucosamine in soil: Evaluation as indicators of microbial biomass Journal of Microbiological Methods 6:47-53 doi:http://dx.doi.org/10.1016/0167-7012(86)90031-X
Gregorich EG, Beare MH, McKim UF, Skjemstad JO (2006) Chemical and Biological Characteristics of Physically Uncomplexed Organic Matter Soil Science Society of America Journal 70:975-985 doi:10.2136/sssaj2005.0116
Gryndler M, Larsen J, Hršelová H, Řezáčová V, Gryndlerová H, Kubát J (2006) Organic and mineral fertilization, respectively, increase and decrease the development of external mycelium of arbuscular mycorrhizal fungi in a long-term field experiment Mycorrhiza 16:159-166 doi:10.1007/s00572-005-0027-4
Guerrant GO, Moss CW (1984) Determination of monosaccharides as aldononitrile, O-methyloxime, alditol, and cyclitol acetate derivatives by gas chromatography Analytical Chemistry 56:633-638 doi:10.1021/ac00268a010
Guggenberger G, Christensen BT, Zech W (1994) Land-use effects on the composition of organic-matter in particle-size separates of soil, 1. Lignin and carbohydrate signature European Journal of Soil Science 45:449-458
Guggenberger G, Frey SD, Six J, Paustian K, Elliott ET (1999) Bacterial and fungal cell-wall residues in conventional and no-tillage agroecosystems Soil Sci Soc Am J 63:1188-1198 doi:10.2136/sssaj1999.6351188x
Guggenberger G, Zech W, Haumaier L, Christensen B (1995) Land-use effects on the composition of organic matter in particle-size separates of soils: II. CPMAS and solution 13C NMR analysis European Journal of Soil Science 46:147-158 doi:10.1111/j.1365-2389.1995.tb01821.x
Gulde S, Chung H, Amelung W, Chang C, Six J (2008) Soil carbon saturation controls labile and stable carbon pool dynamics Soil Sci Soc Am J 72:605-612 doi:10.2136/sssaj2007.0251
Hartman WH, Richardson CJ (2013) Differential nutrient limitation of soil microbial biomass and metabolic quotients (qCO2): Is there a biological stoichiometry of soil microbes? PLoS ONE 8:e57127
Hassink J (1997) The capacity of soils to preserve organic C and N by their association with clay and silt particles Plant and Soil 191:77-87 doi:10.1023/a:1004213929699
Hassink J, Whitmore AP, Kubát J, Ittersum MKv, Geijn SCvd (1997) Size and density fractionation of soil organic matter and the physical capacity of soils to protect organic matter. In: Developments in Crop Science, vol Volume 25. Elsevier, pp 245-255. doi:http://dx.doi.org/10.1016/S0378-519X(97)80025-6
Haynes RJ, Naidu R (1998) Influence of lime, fertilizer and manure applications on soil organic matter content and soil physical conditions: a review Nutrient Cycling in Agroecosystems 51:123-137 doi:10.1023/a:1009738307837
He HB, Li XB, Zhang W, Zhang XD (2011) Differentiating the dynamics of native and newly immobilized amino sugars in soil frequently amended with inorganic nitrogen and glucose European Journal of Soil Science 62:144-151 doi:10.1111/j.1365-2389.2010.01324.x
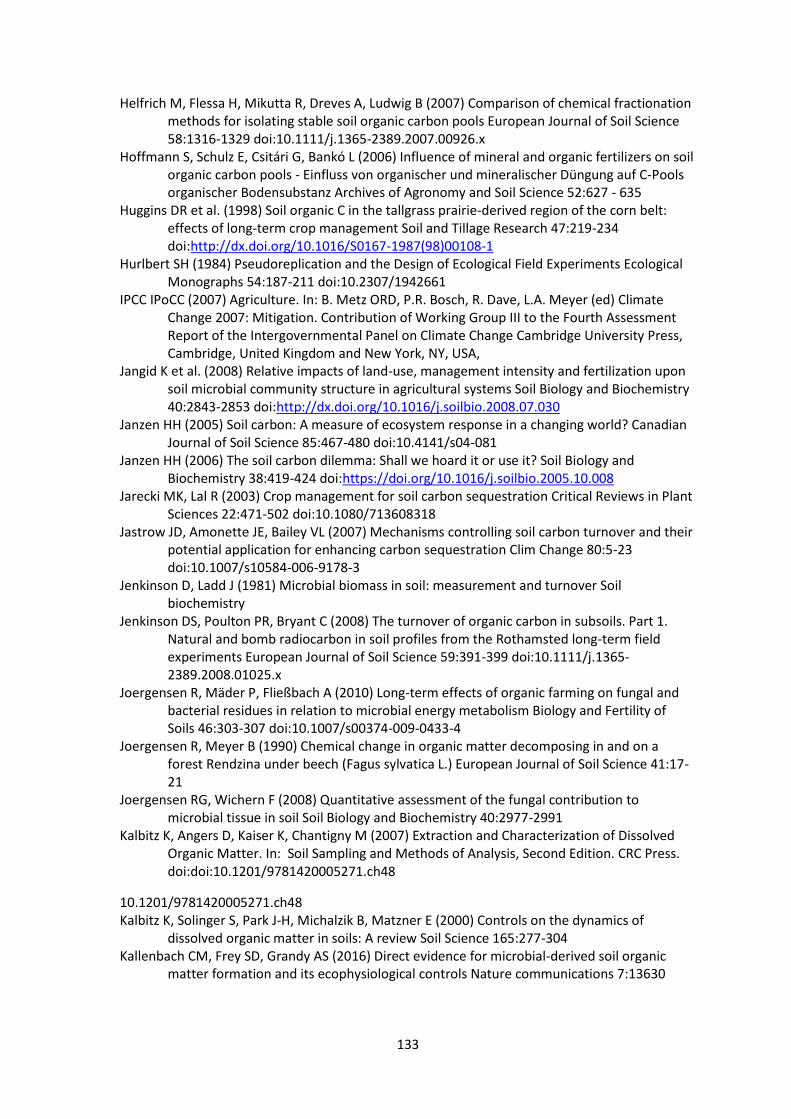
133
Helfrich M, Flessa H, Mikutta R, Dreves A, Ludwig B (2007) Comparison of chemical fractionation methods for isolating stable soil organic carbon pools European Journal of Soil Science 58:1316-1329 doi:10.1111/j.1365-2389.2007.00926.x
Hoffmann S, Schulz E, Csitári G, Bankó L (2006) Influence of mineral and organic fertilizers on soil organic carbon pools - Einfluss von organischer und mineralischer Düngung auf C-Pools organischer Bodensubstanz Archives of Agronomy and Soil Science 52:627 - 635
Huggins DR et al. (1998) Soil organic C in the tallgrass prairie-derived region of the corn belt: effects of long-term crop management Soil and Tillage Research 47:219-234 doi:http://dx.doi.org/10.1016/S0167-1987(98)00108-1
Hurlbert SH (1984) Pseudoreplication and the Design of Ecological Field Experiments Ecological Monographs 54:187-211 doi:10.2307/1942661
IPCC IPoCC (2007) Agriculture. In: B. Metz ORD, P.R. Bosch, R. Dave, L.A. Meyer (ed) Climate Change 2007: Mitigation. Contribution of Working Group III to the Fourth Assessment Report of the Intergovernmental Panel on Climate Change Cambridge University Press, Cambridge, United Kingdom and New York, NY, USA,
Jangid K et al. (2008) Relative impacts of land-use, management intensity and fertilization upon soil microbial community structure in agricultural systems Soil Biology and Biochemistry 40:2843-2853 doi:http://dx.doi.org/10.1016/j.soilbio.2008.07.030
Janzen HH (2005) Soil carbon: A measure of ecosystem response in a changing world? Canadian Journal of Soil Science 85:467-480 doi:10.4141/s04-081
Janzen HH (2006) The soil carbon dilemma: Shall we hoard it or use it? Soil Biology and Biochemistry 38:419-424 doi:https://doi.org/10.1016/j.soilbio.2005.10.008
Jarecki MK, Lal R (2003) Crop management for soil carbon sequestration Critical Reviews in Plant Sciences 22:471-502 doi:10.1080/713608318
Jastrow JD, Amonette JE, Bailey VL (2007) Mechanisms controlling soil carbon turnover and their potential application for enhancing carbon sequestration Clim Change 80:5-23 doi:10.1007/s10584-006-9178-3
Jenkinson D, Ladd J (1981) Microbial biomass in soil: measurement and turnover Soil biochemistry
Jenkinson DS, Poulton PR, Bryant C (2008) The turnover of organic carbon in subsoils. Part 1. Natural and bomb radiocarbon in soil profiles from the Rothamsted long-term field experiments European Journal of Soil Science 59:391-399 doi:10.1111/j.1365-2389.2008.01025.x
Joergensen R, Mäder P, Fließbach A (2010) Long-term effects of organic farming on fungal and bacterial residues in relation to microbial energy metabolism Biology and Fertility of Soils 46:303-307 doi:10.1007/s00374-009-0433-4
Joergensen R, Meyer B (1990) Chemical change in organic matter decomposing in and on a forest Rendzina under beech (Fagus sylvatica L.) European Journal of Soil Science 41:17-21
Joergensen RG, Wichern F (2008) Quantitative assessment of the fungal contribution to microbial tissue in soil Soil Biology and Biochemistry 40:2977-2991
Kalbitz K, Angers D, Kaiser K, Chantigny M (2007) Extraction and Characterization of Dissolved Organic Matter. In: Soil Sampling and Methods of Analysis, Second Edition. CRC Press. doi:doi:10.1201/9781420005271.ch48
10.1201/9781420005271.ch48 Kalbitz K, Solinger S, Park J-H, Michalzik B, Matzner E (2000) Controls on the dynamics of
dissolved organic matter in soils: A review Soil Science 165:277-304 Kallenbach CM, Frey SD, Grandy AS (2016) Direct evidence for microbial-derived soil organic
matter formation and its ecophysiological controls Nature communications 7:13630
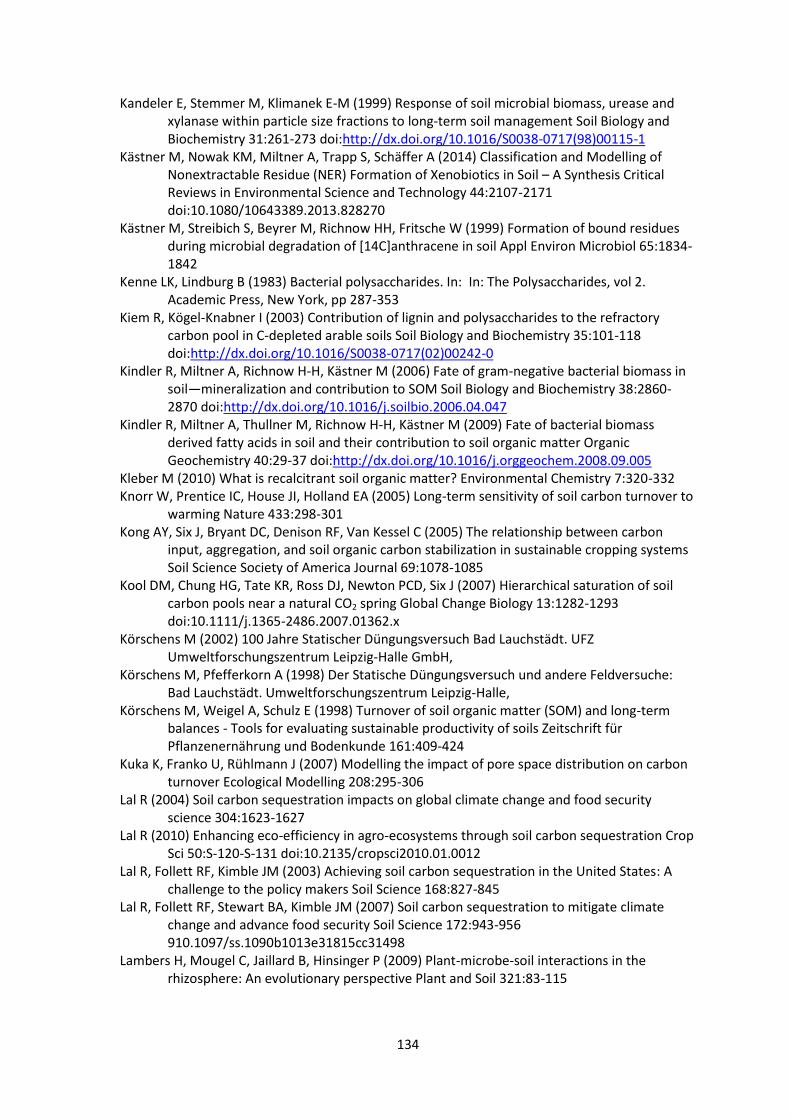
134
Kandeler E, Stemmer M, Klimanek E-M (1999) Response of soil microbial biomass, urease and xylanase within particle size fractions to long-term soil management Soil Biology and Biochemistry 31:261-273 doi:http://dx.doi.org/10.1016/S0038-0717(98)00115-1
Kästner M, Nowak KM, Miltner A, Trapp S, Schäffer A (2014) Classification and Modelling of Nonextractable Residue (NER) Formation of Xenobiotics in Soil – A Synthesis Critical Reviews in Environmental Science and Technology 44:2107-2171 doi:10.1080/10643389.2013.828270
Kästner M, Streibich S, Beyrer M, Richnow HH, Fritsche W (1999) Formation of bound residues during microbial degradation of [14C]anthracene in soil Appl Environ Microbiol 65:1834-1842
Kenne LK, Lindburg B (1983) Bacterial polysaccharides. In: In: The Polysaccharides, vol 2. Academic Press, New York, pp 287-353
Kiem R, Kögel-Knabner I (2003) Contribution of lignin and polysaccharides to the refractory carbon pool in C-depleted arable soils Soil Biology and Biochemistry 35:101-118 doi:http://dx.doi.org/10.1016/S0038-0717(02)00242-0
Kindler R, Miltner A, Richnow H-H, Kästner M (2006) Fate of gram-negative bacterial biomass in soil—mineralization and contribution to SOM Soil Biology and Biochemistry 38:2860-2870 doi:http://dx.doi.org/10.1016/j.soilbio.2006.04.047
Kindler R, Miltner A, Thullner M, Richnow H-H, Kästner M (2009) Fate of bacterial biomass derived fatty acids in soil and their contribution to soil organic matter Organic Geochemistry 40:29-37 doi:http://dx.doi.org/10.1016/j.orggeochem.2008.09.005
Kleber M (2010) What is recalcitrant soil organic matter? Environmental Chemistry 7:320-332 Knorr W, Prentice IC, House JI, Holland EA (2005) Long-term sensitivity of soil carbon turnover to
warming Nature 433:298-301 Kong AY, Six J, Bryant DC, Denison RF, Van Kessel C (2005) The relationship between carbon
input, aggregation, and soil organic carbon stabilization in sustainable cropping systems Soil Science Society of America Journal 69:1078-1085
Kool DM, Chung HG, Tate KR, Ross DJ, Newton PCD, Six J (2007) Hierarchical saturation of soil carbon pools near a natural CO2 spring Global Change Biology 13:1282-1293 doi:10.1111/j.1365-2486.2007.01362.x
Körschens M (2002) 100 Jahre Statischer Düngungsversuch Bad Lauchstädt. UFZ Umweltforschungszentrum Leipzig-Halle GmbH,
Körschens M, Pfefferkorn A (1998) Der Statische Düngungsversuch und andere Feldversuche: Bad Lauchstädt. Umweltforschungszentrum Leipzig-Halle,
Körschens M, Weigel A, Schulz E (1998) Turnover of soil organic matter (SOM) and long-term balances - Tools for evaluating sustainable productivity of soils Zeitschrift für Pflanzenernährung und Bodenkunde 161:409-424
Kuka K, Franko U, Rühlmann J (2007) Modelling the impact of pore space distribution on carbon turnover Ecological Modelling 208:295-306
Lal R (2004) Soil carbon sequestration impacts on global climate change and food security science 304:1623-1627
Lal R (2010) Enhancing eco-efficiency in agro-ecosystems through soil carbon sequestration Crop Sci 50:S-120-S-131 doi:10.2135/cropsci2010.01.0012
Lal R, Follett RF, Kimble JM (2003) Achieving soil carbon sequestration in the United States: A challenge to the policy makers Soil Science 168:827-845
Lal R, Follett RF, Stewart BA, Kimble JM (2007) Soil carbon sequestration to mitigate climate change and advance food security Soil Science 172:943-956 910.1097/ss.1090b1013e31815cc31498
Lambers H, Mougel C, Jaillard B, Hinsinger P (2009) Plant-microbe-soil interactions in the rhizosphere: An evolutionary perspective Plant and Soil 321:83-115
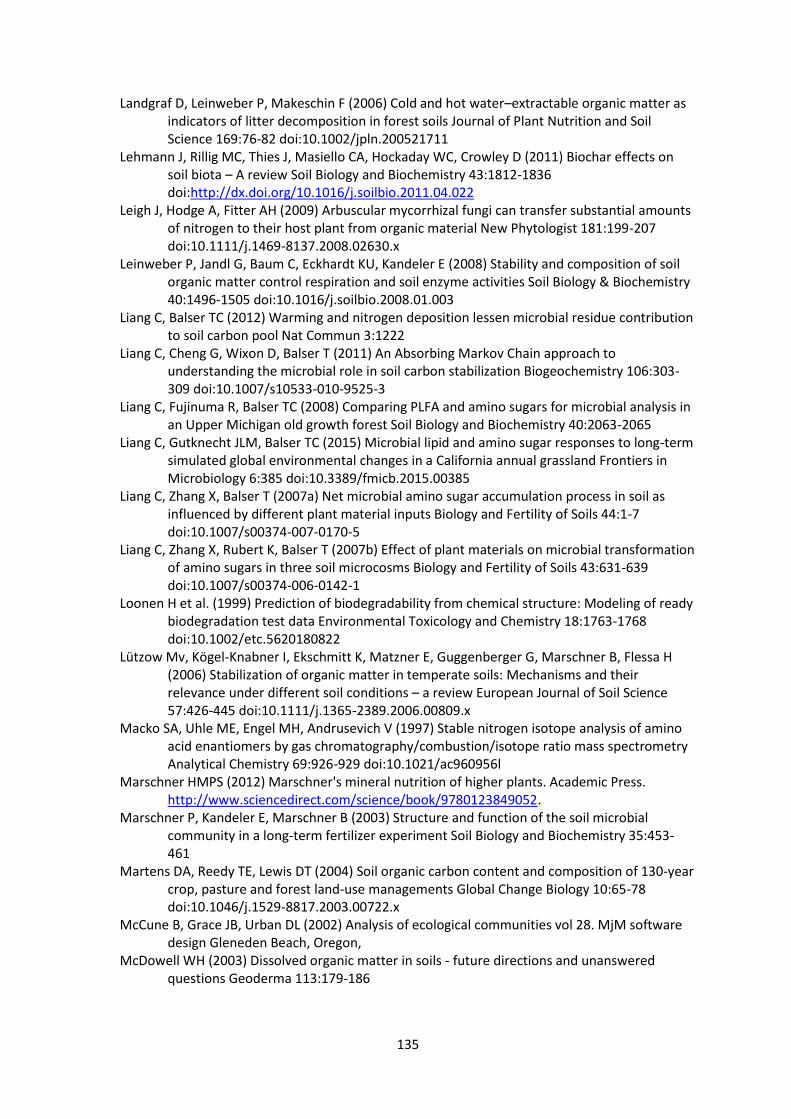
135
Landgraf D, Leinweber P, Makeschin F (2006) Cold and hot water–extractable organic matter as indicators of litter decomposition in forest soils Journal of Plant Nutrition and Soil Science 169:76-82 doi:10.1002/jpln.200521711
Lehmann J, Rillig MC, Thies J, Masiello CA, Hockaday WC, Crowley D (2011) Biochar effects on soil biota – A review Soil Biology and Biochemistry 43:1812-1836 doi:http://dx.doi.org/10.1016/j.soilbio.2011.04.022
Leigh J, Hodge A, Fitter AH (2009) Arbuscular mycorrhizal fungi can transfer substantial amounts of nitrogen to their host plant from organic material New Phytologist 181:199-207 doi:10.1111/j.1469-8137.2008.02630.x
Leinweber P, Jandl G, Baum C, Eckhardt KU, Kandeler E (2008) Stability and composition of soil organic matter control respiration and soil enzyme activities Soil Biology & Biochemistry 40:1496-1505 doi:10.1016/j.soilbio.2008.01.003
Liang C, Balser TC (2012) Warming and nitrogen deposition lessen microbial residue contribution to soil carbon pool Nat Commun 3:1222
Liang C, Cheng G, Wixon D, Balser T (2011) An Absorbing Markov Chain approach to understanding the microbial role in soil carbon stabilization Biogeochemistry 106:303-309 doi:10.1007/s10533-010-9525-3
Liang C, Fujinuma R, Balser TC (2008) Comparing PLFA and amino sugars for microbial analysis in an Upper Michigan old growth forest Soil Biology and Biochemistry 40:2063-2065
Liang C, Gutknecht JLM, Balser TC (2015) Microbial lipid and amino sugar responses to long-term simulated global environmental changes in a California annual grassland Frontiers in Microbiology 6:385 doi:10.3389/fmicb.2015.00385
Liang C, Zhang X, Balser T (2007a) Net microbial amino sugar accumulation process in soil as influenced by different plant material inputs Biology and Fertility of Soils 44:1-7 doi:10.1007/s00374-007-0170-5
Liang C, Zhang X, Rubert K, Balser T (2007b) Effect of plant materials on microbial transformation of amino sugars in three soil microcosms Biology and Fertility of Soils 43:631-639 doi:10.1007/s00374-006-0142-1
Loonen H et al. (1999) Prediction of biodegradability from chemical structure: Modeling of ready biodegradation test data Environmental Toxicology and Chemistry 18:1763-1768 doi:10.1002/etc.5620180822
Lützow Mv, Kögel-Knabner I, Ekschmitt K, Matzner E, Guggenberger G, Marschner B, Flessa H (2006) Stabilization of organic matter in temperate soils: Mechanisms and their relevance under different soil conditions – a review European Journal of Soil Science 57:426-445 doi:10.1111/j.1365-2389.2006.00809.x
Macko SA, Uhle ME, Engel MH, Andrusevich V (1997) Stable nitrogen isotope analysis of amino acid enantiomers by gas chromatography/combustion/isotope ratio mass spectrometry Analytical Chemistry 69:926-929 doi:10.1021/ac960956l
Marschner HMPS (2012) Marschner's mineral nutrition of higher plants. Academic Press. http://www.sciencedirect.com/science/book/9780123849052.
Marschner P, Kandeler E, Marschner B (2003) Structure and function of the soil microbial community in a long-term fertilizer experiment Soil Biology and Biochemistry 35:453-461
Martens DA, Reedy TE, Lewis DT (2004) Soil organic carbon content and composition of 130-year crop, pasture and forest land-use managements Global Change Biology 10:65-78 doi:10.1046/j.1529-8817.2003.00722.x
McCune B, Grace JB, Urban DL (2002) Analysis of ecological communities vol 28. MjM software design Gleneden Beach, Oregon,
McDowell WH (2003) Dissolved organic matter in soils - future directions and unanswered questions Geoderma 113:179-186
136
Meidute S, Demoling F, Bååth E (2008) Antagonistic and synergistic effects of fungal and bacterial growth in soil after adding different carbon and nitrogen sources Soil Biology and Biochemistry 40:2334-2343 doi:http://dx.doi.org/10.1016/j.soilbio.2008.05.011
Merbach I, Schulz E (2012) Long-term fertilization effects on crop yields, soil fertility and sustainability in the Static Fertilization Experiment Bad Lauchstädt under climatic conditions 2001–2010 Archives of Agronomy and Soil Science 59:1041-1057 doi:10.1080/03650340.2012.702895
Miltner A, Bombach P, Schmidt-Brücken B, Kästner M (2011) SOM genesis: microbial biomass as a significant source Biogeochemistry:1-15 doi:10.1007/s10533-011-9658-z
Miltner A, Kindler R, Knicker H, Richnow H-H, Kästner M (2009) Fate of microbial biomass-derived amino acids in soil and their contribution to soil organic matter Organic Geochemistry 40:978-985
Mistou M-Y, Sutcliffe IC, van Sorge NM (2016) Bacterial glycobiology: rhamnose-containing cell wall polysaccharides in Gram-positive bacteria FEMS Microbiology Reviews 40:464-479 doi:10.1093/femsre/fuw006
Monreal CM (2015) Labile Organic Matter in Soil Solution: I. Metabolites of Chemical Signaling Pathways from Plant–Microbe Interactions. In: Labile Organic Matter—Chemical Compositions, Function, and Significance in Soil and the Environment. SSSA Special Publication, vol 62. Soil Science Society of America, Inc., Madison, WI, pp 157-172. doi:10.2136/sssaspecpub62.2014.0073
Monreal CM, Schnitzer MI (2015) Labile Organic Matter in Soil Solution: II. Separation and Identification of Metabolites from Plant–Microbial Communication in Soil Solutions of Wheat Rhizospheres. In: Labile Organic Matter—Chemical Compositions, Function, and Significance in Soil and the Environment. SSSA Special Publication, vol 62. Soil Science Society of America, Inc., Madison, WI, pp 173-194. doi:10.2136/sssaspecpub62.2014.0074
Moore JM, Klose S, Tabatabai MA (2000) Soil microbial biomass carbon and nitrogen as affected by cropping systems Biology and Fertility of Soils 31:200-210 doi:10.1007/s003740050646
Murayama S (1984) Changes in the monosaccharide composition during the decomposition of straws under field conditions Soil Science and Plant Nutrition 30:367-381 doi:10.1080/00380768.1984.10434702
Mylona P, Pawlowski K, Bisseling T (1995) Symbiotic nitrogen fixation The Plant Cell 7:869 Nannipieri P, Badalucco L (2003) Biological processes. In: Benbi DK, Nieder R (eds) Handbook of
Processes and Modelling in the Soil–Plant System. Haworth Press, Binghamton, NY, pp pp. 57-82
Neff JC, Townsend AR, Gleixner G, Lehman SJ, Turnbull J, Bowman WD (2002) Variable effects of nitrogen additions on the stability and turnover of soil carbon Nature 419:915 doi:10.1038/nature01136
Neidhardt F, Ingraham, J. & Schaechter, M. (1990) Physiology of the Bacterial Cell: A Molecular Approach. Sinauer Associates, MA, U.S.A
Ngosong C, Jarosch M, Raupp J, Neumann E, Ruess L (2010) The impact of farming practice on soil microorganisms and arbuscular mycorrhizal fungi: Crop type versus long-term mineral and organic fertilization Applied Soil Ecology 46:134-142
Norman AG (1950) Advances in Agronomy. vol Bd. 7. Elsevier Science, O'Donnell A, Seasman M, Macrae A, Waite I, Davies J (2001) Plants and fertilisers as drivers of
change in microbial community structure and function in soils Plant and Soil 232:135-145 doi:10.1023/a:1010394221729
Oades J (1984) Soil organic matter and structural stability: Mechanisms and implications for management Plant and Soil 76:319-337 doi:10.1007/bf02205590
137
Oades JM, Kirkman MA, Wagner GH (1970) The use of gas-liquid chromatography for the determination of sugars extracted from soils by sulfuric acid Soil Sci Soc Am J 34:230-235 doi:10.2136/sssaj1970.03615995003400020017x
Vegan: Community Ecology Package." R package version XXX: pp 117e118. (2011) http://CRANRprojectorg/.
Olander LP, Vitousek PM (2000) Regulation of soil phosphatase and chitinase activityby N and P availability Biogeochemistry 49:175-191 doi:10.1023/a:1006316117817
Olsson PA, Bååth E, Jakobsen I (1997) Phosphorus effects on the mycelium and storage structures of an arbuscular mycorrhizal fungus as studied in the soil and roots by analysis of Fatty Acid signatures Appl Environ Microbiol 63:3531-3538
Pan B, Smith DL (2000) Preincubation of B. japonicum cells with genistein reduces the inhibitory effects of mineral nitrogen on soybean nodulation and nitrogen fixation under field conditions Plant and Soil 223:237-244 doi:10.1023/a:1004832422665
Paterson E, Midwood AJ, Millard P (2009) Through the eye of the needle: A review of isotope approaches to quantify microbial processes mediating soil carbon balance New Phytologist 184:19-33
Paustian K et al. (1997a) Agricultural soils as a sink to mitigate CO2 emissions Soil Use and Management 13:230-244 doi:10.1111/j.1475-2743.1997.tb00594.x
Paustian K, Collins HP, Paul EA (1997b) Management controls on soil carbon. In: al. EAPe (ed) Soil organic matter in temperate agroecosystems: Long-term experiments in North America. CRC Press, Boca Raton, FL, pp 15-49
Peacock GA, Goosey MW (1989) Separation of fungal sterols by normal-phase high-performance liquid chromatography : Application to the evaluation of ergosterol biosynthesis inhibitors Journal of Chromatography A 469:293-304 doi:http://dx.doi.org/10.1016/S0021-9673(01)96464-7
Poirier N, Sohi SP, Gaunt JL, Mahieu N, Randall EW, Powlson DS, Evershed RP (2005) The chemical composition of measurable soil organic matter pools Organic Geochemistry 36:1174-1189
Powlson DS, Stirling CM, Jat ML, Gerard BG, Palm CA, Sanchez PA, Cassman KG (2014) Limited potential of no-till agriculture for climate change mitigation Nature Climate Change 4:678 doi:10.1038/nclimate2292
Powlson DS, Whitmore AP, Goulding KWT (2011) Soil carbon sequestration to mitigate climate change: A critical re-examination to identify the true and the false European Journal of Soil Science 62:42-55 doi:10.1111/j.1365-2389.2010.01342.x
RCoreTeam (2012) R: A language and environment for statistical computing. Vienna, Austria Richnow HH, Eschenbach A, Mahro B, Kästner M, Annweiler E, Seifert R, Michaelis W (1999)
Formation of Nonextractable Soil Residues: A Stable Isotope Approach Environmental Science & Technology 33:3761-3767 doi:10.1021/es980927n
Rinaudi L, Fujishige NA, Hirsch AM, Banchio E, Zorreguieta A, Giordano W (2006) Effects of nutritional and environmental conditions on Sinorhizobium meliloti biofilm formation Research in Microbiology 157:867-875 doi:http://dx.doi.org/10.1016/j.resmic.2006.06.002
Rousk J, Brookes PC, Bååth E (2009) Contrasting soil pH effects on fungal and bacterial growth suggest functional redundancy in carbon mineralization Appl Environ Microbiol 75:1589-1596 doi:10.1128/aem.02775-08
Rousk J, Brookes PC, Bååth E (2010) The microbial PLFA composition as affected by pH in an arable soil Soil Biology and Biochemistry 42:516-520 doi:http://dx.doi.org/10.1016/j.soilbio.2009.11.026
Rüde E, Goebel WF (1962) Colicine K: V. The somatic antigen of a non-colicinogenic variant of E. Coli K235 The Journal of Experimental Medicine 116:73-107 doi:10.1084/jem.116.1.73
138
Russell NJ, Fukunaga N (1990) A comparison of thermal adaptation of membrane lipids in psychrophilic and thermophilic bacteria FEMS Microbiology Letters 75:171-182 doi:10.1111/j.1574-6968.1990.tb04093.x
Said-Pullicino D, Kaiser K, Guggenberger G, Gigliotti G (2007) Changes in the chemical composition of water-extractable organic matter during composting: Distribution between stable and labile organic matter pools Chemosphere 66:2166-2176 doi:http://dx.doi.org/10.1016/j.chemosphere.2006.09.010
Schieber A, Brückner H, Ling JR (1999) GC–MS analysis of diaminopimelic acid stereoisomers and amino acid enantiomers in rumen bacteria Biomedical Chromatography 13:46-50 doi:10.1002/(sici)1099-0801(199902)13:1<46::aid-bmc808>3.0.co;2-4
Schjønning P, de Jonge LW, Moldrup P, Christensen BT, Olesen JE Searching the critical soil organic carbon threshold for satisfactory tilth conditions–test of the Dexter clay: carbon hypothesis. In: Proceedings of the 1st international conference and exploratory workshop on soil architecture and physico-chemical functions" Cesar", 2010. Aarhus University, Faculty of Agricultural Sciences, pp 341-346
Schmidt J, Schulz E, Michalzik B, Buscot F, Gutknecht JLM (2015) Carbon input and crop-related changes in microbial biomarker levels strongly affect the turnover and composition of soil organic carbon Soil Biology and Biochemistry 85:39-50 doi:http://dx.doi.org/10.1016/j.soilbio.2015.02.024
Schmidt L, Warnstorff K, Dörfel H, Leinweber P, Lange H, Merbach W (2000) The influence of fertilization and rotation on soil organic matter and plant yields in the long-term Eternal Rye trial in Halle (Saale), Germany Journal of Plant Nutrition and Soil Science 163:639-648 doi:10.1002/1522-2624(200012)163:6<639::aid-jpln639>3.0.co;2-l
Schmidt MW et al. (2011) Persistence of soil organic matter as an ecosystem property Nature 478:49
Schnürer J, Clarholm M, Rosswall T (1985) Microbial biomass and activity in an agricultural soil with different organic matter contents Soil Biology and Biochemistry 17:611-618 doi:http://dx.doi.org/10.1016/0038-0717(85)90036-7
Schulz E (2002) Influence of extreme management on decomposable soil organic matter pool Archives of Agronomy and Soil Science 48:101 - 105
Schulz E (2004) Influence of site conditions and management on different soil organic matter (SOM) pools Archives of Agronomy and Soil Science 50:33 - 47
Schulz E, Breulmann M, Boettger T, Wang KR, Neue HU (2011) Effect of organic matter input on functional pools of soil organic carbon in a long-term double rice crop experiment in China European Journal of Soil Science 62:134-143 doi:10.1111/j.1365-2389.2010.01330.x
Schulz E, Körschens M (1998) Characterization of the decomposable part of soil organic matter (SOM) and transformation processes by hot water extraction Eurasian Soil Science 31:809-813
Senesi N (1992) Binding mechanisms of pesticides to soil humic substances Science of The Total Environment 123:63-76 doi:http://dx.doi.org/10.1016/0048-9697(92)90133-D
Senwo ZN, Tabatabai MA (1998) Amino acid composition of soil organic matter Biology and Fertility of Soils 26:235-242 doi:10.1007/s003740050373
Sharma S, Aneja MK, Mayer J, Munch JC, Schloter M (2005) Characterization of bacterial community structure in rhizosphere soil of grain legumes Microbial Ecology 49:407-415 doi:10.1007/s00248-004-0041-7
Shaymukhametov MS, Titova NA, Travnikova LS, Labenets YM (1985) Use of physical fractionation methods to characterize soil organic matter Pochvovedeniye 8:131–141
Shen S, Tu S-I, Kemper WD (1997) Equilibrium and kinetic study of ammonium adsorption and fixation in sodium-treated vermiculite Soil Science Society of America Journal 61:1611-1618
139
Six J, Bossuyt H, Degryze S, Denef K (2004) A history of research on the link between (micro)aggregates, soil biota, and soil organic matter dynamics Soil and Tillage Research 79:7-31 doi:http://dx.doi.org/10.1016/j.still.2004.03.008
Six J, Conant RT, Paul EA, Paustian K (2002) Stabilization mechanisms of soil organic matter: Implications for C-saturation of soils Plant and Soil 241:155-176
Smith J, Paul E, Bollag J, Stotzky G (1990) The significance of soil microbial biomass estimations Soil biochemistry Volume 6:357-396
Smith P et al. (2014) Agriculture, Forestry and Other Land Use (AFOLU). In: Climate Change 2014: Mitigation of Climate Change. Contribution of Working Group III to the Fifth Assessment Report of the Intergovernmental Panel on Climate Change Cambridge University Press, Cambridge, United Kingdom and New York, NY, USA,
Smith P et al. (2008) Greenhouse gas mitigation in agriculture Philosophical Transactions of the Royal Society B: Biological Sciences 363:789-813 doi:10.1098/rstb.2007.2184
Smol´kina ON, Shishonkova NS, Yurasov NA, Ignatov VV (2012) Capsular and extracellular polysaccharides of the diazotrophic rhizobacterium Herbaspirillum seropedicae Z78 Microbiology 81:317-323 doi:10.1134/s0026261712030113
Smolander A, Kurka A, Kitunen V, Mälkönen E (1994) Microbial biomass C and N, and respiratory activity in soil of repeatedly limed and N-and P-fertilized Norway spruce stands Soil Biology and Biochemistry 26:957-962 doi:http://dx.doi.org/10.1016/0038-0717(94)90109-0
Solberg EDN, M.; Izairralde, R.C.; Malhi, S.S.; Jansen, H.H.; Molina-Ayala, M. (1998) Carbon storage in soils under continuous cereal grain cropping: N fertilizer and straw. In: Management of carbon sequestration in soil. CRC Press Inc., Boca Raton, pp 235-254
Sollins P, Homann P, Caldwell BA (1996) Stabilization and destabilization of soil organic matter: Mechanisms and controls Geoderma 74:65-105 doi:http://dx.doi.org/10.1016/S0016-7061(96)00036-5
Solomon D, Lehmann J, Zech W (2001) Land use effects on amino sugar signature of chromic Luvisol in the semi-arid part of northern Tanzania Biology and Fertility of Soils 33:33-40
Sparling G, Vojvodic-Vukovic M, Schipper L (1998) Hot-water-soluble C as a simple measure of labile soil organic matter: the relationship with microbial biomass C Soil Biology and Biochemistry 30
Spohn M, Giani L (2010) Water-stable aggregates, glomalin-related soil protein, and carbohydrates in a chronosequence of sandy hydromorphic soils Soil Biology and Biochemistry 42:1505-1511
Staehelin C, Schultze M, Kondorosi E, Kondorosi A (1995) Lipo-chitooligosaccharide nodulation signals from Rhizobium meliloti induce their rapid degradation by the host plant alfalfa Plant Physiology 108:1607-1614 doi:10.1104/pp.108.4.1607
Stahl PD, Klug MJ (1996) Characterization and differentiation of filamentous fungi based on fatty acid composition Appl Environ Microbiol 62:4136-4146
Stapleton LM, Crout NMJ, Säwström C, Marshall WA, Poulton PR, Tye AM, Laybourn-Parry J (2005) Microbial carbon dynamics in nitrogen amended Arctic tundra soil: Measurement and model testing Soil Biology and Biochemistry 37:2088-2098 doi:http://dx.doi.org/10.1016/j.soilbio.2005.03.016
Stewart CE, Plante AF, Paustian K, Conant RT, Six J (2008) Soil carbon saturation: Linking concept and measurable carbon pools Soil Sci Soc Am J 72:379-392 doi:10.2136/sssaj2007.0104
Talbot JM, Treseder KK (2010) Controls over mycorrhizal uptake of organic nitrogen Pedobiologia 53:169-179 doi:http://dx.doi.org/10.1016/j.pedobi.2009.12.001
Tiedje JM, Sexstone AJ, Parkin TB, Revsbech NP (1984) Anaerobic processes in soil Plant and Soil 76:197-212 doi:10.1007/bf02205580
Totsche KU et al. (2018) Microaggregates in soils Journal of Plant Nutrition and Soil Science 181:104-136 doi:doi:10.1002/jpln.201600451
140
Treseder KK (2008) Nitrogen additions and microbial biomass: A meta-analysis of ecosystem studies Ecology Letters 11:1111-1120 doi:10.1111/j.1461-0248.2008.01230.x
Trujillo ME, Alonso-Vega P, Rodriguez R, Carro L, Cerda E, Alonso P, Martinez-Molina E (2010) The genus Micromonospora is widespread in legume root nodules: The example of Lupinus angustifolius ISME J 4:1265-1281 doi:http://www.nature.com/ismej/journal/v4/n10/suppinfo/ismej201055s1.html
Ueda K, Morgan SL, Fox A, Gilbart J, Sonesson A, Larsson L, Odham G (1989) D-Alanine as a chemical marker for the determination of streptococcal cell wall levels in mammalian tissues by gas chromatography/negative ion chemical ionization mass spectrometry Analytical Chemistry 61:265-270 doi:10.1021/ac00178a015
Van Wesemael B, Paustian K, Meersmans J, Goidts E, Barancikova G, Easter M (2010) Agricultural management explains historic changes in regional soil carbon stocks Proceedings of the National Academy of Sciences 107:14926-14930
Vasse J, de Billy F, Truchet G (1993) Abortion of infection during the Rhizobium meliloti—alfalfa symbiotic interaction is accompanied by a hypersensitive reaction The Plant Journal 4:555-566 doi:10.1046/j.1365-313X.1993.04030555.x
Veen JA, Kuikman PJ (1990) Soil structural aspects of decomposition of organic matter by micro-organisms Biogeochemistry 11:213-233 doi:10.1007/bf00004497
Vestal JR, White DC (1989) Lipid analysis in microbial ecology BioScience 39:535-541 Vierheilig H, Coughlan AP, Wyss U, Piché Y (1998) Ink and vinegar, a simple staining technique
for arbuscular-mycorrhizal fungi Appl Environ Microbiol 64:5004-5007 von Lützow M, Kögel-Knabner I, Ekschmitt K, Flessa H, Guggenberger G, Matzner E, Marschner B
(2007) SOM fractionation methods: Relevance to functional pools and to stabilization mechanisms Soil Biology and Biochemistry 39:2183-2207 doi:http://dx.doi.org/10.1016/j.soilbio.2007.03.007
Wander M (2004) Soil organic matter fractions and their relevance to soil function. In: Soil Organic Matter in Sustainable Agriculture. Advances in Agroecology. CRC Press. doi:doi:10.1201/9780203496374.ch3
Wang Y, Hollingsworth RI (1994) The structure of the O-antigenic chain of the lipopolysaccharide of Rhizobium trifolii 4s Carbohydrate Research 260:305-317 doi:http://dx.doi.org/10.1016/0008-6215(94)84048-2
Wardle DA, Bardgett RD, Klironomos JN, Setälä H, Van Der Putten WH, Wall DH (2004) Ecological linkages between aboveground and belowground biota Science 304:1629-1633
Wei X, Shao M, Gale W, Li L (2014) Global pattern of soil carbon losses due to the conversion of forests to agricultural land Scientific reports 4
Weigel A, Kubat J, Körschens M, Powlson DS, Mercik S (1998) Determination of the decomposable part of soil organic matter in arable soils Archives of Agronomy and Soil Science 43:123-143 doi:10.1080/03650349809366031
Wendisch VF (2007) Amino acid biosynthesis - pathways, regulation and metabolic engineering vol 5. Microbiology Monographs. Springer Berlin Heidelberg. doi:10.1007/978-3-540-48596-4
White DC, Davis WM, Nickels JS, King JD, Bobbie RJ (1979) Determination of the sedimentary microbial biomass by extractible lipid phosphate Oecologia 40:51-62 doi:10.1007/BF00388810
Whiteside MD, Digman MA, Gratton E, Treseder KK (2012a) Organic nitrogen uptake by arbuscular mycorrhizal fungi in a boreal forest Soil Biology and Biochemistry 55:7-13 doi:http://dx.doi.org/10.1016/j.soilbio.2012.06.001
Whiteside MD, Garcia MO, Treseder KK (2012b) Amino Acid Uptake in Arbuscular Mycorrhizal Plants PLoS ONE 7:e47643
Whiteside MD, Treseder KK, Atsatt PR (2009) The brighter side of soils: Quantum dots track organic nitrogen through fungi and plants Ecology 90:100-108 doi:10.1890/07-2115.1
141
Widmer F, Rasche F, Hartmann M, Fliessbach A (2006) Community structures and substrate utilization of bacteria in soils from organic and conventional farming systems of the DOK long-term field experiment Applied Soil Ecology 33:294-307 doi:http://dx.doi.org/10.1016/j.apsoil.2005.09.007
Wiesmeier M et al. (2014) Carbon sequestration potential of soils in southeast Germany derived from stable soil organic carbon saturation Global Change Biology 20:653-665 doi:10.1111/gcb.12384
Wilkinson SC, Anderson JM, Scardelis SP, Tisiafouli M, Taylor A, Wolters V (2002) PLFA profiles of microbial communities in decomposing conifer litters subject to moisture stress Soil Biology and Biochemistry 34:189-200
Wilkinson SG (1988) Gram-negative bacteria. In: In: Microbial Lipids, vol 1. Academic Press, London, pp 299-457
Wilson GWT, Rice CW, Rillig MC, Springer A, Hartnett DC (2009) Soil aggregation and carbon sequestration are tightly correlated with the abundance of arbuscular mycorrhizal fungi: Results from long-term field experiments Ecology Letters 12:452-461 doi:10.1111/j.1461-0248.2009.01303.x
Witter E, Mårtensson A, Garcia F (1993) Size of the soil microbial biomass in a long-term field experiment as affected by different N-fertilizers and organic manures Soil Biology and Biochemistry 25:659-669
Wixon DL, Balser TC (2013) Toward conceptual clarity: PLFA in warmed soils Soil Biology and Biochemistry 57:769-774
WorldBank (2015) Agricultural land (% of land area). Zelles L (1999) Fatty acid patterns of phospholipids and lipopolysaccharides in the
characterisation of microbial communities in soil: A review Biology and Fertility of Soils 29:111-129 doi:10.1007/s003740050533
Zelles L, Bai QY, Beck T, Beese F (1992) Signature fatty acids in phospholipids and lipopolysaccharides as indicators of microbial biomass and community structure in agricultural soils Soil Biology and Biochemistry 24:317-323 doi:http://dx.doi.org/10.1016/0038-0717(92)90191-Y
Zhang B, Drury CF, Yang X, Reynolds D, Zhang X (2014) Crop rotation, red clover and cropping history influences microbial amino sugars of a clay loam soil Soil Science Society of America Journal 78 doi:10.2136/sssaj2013.03.0098
Zhang B, Liang C, He H, Zhang X (2013) Variations in soil microbial communities and residues along an altitude gradient on the northern slope of Changbai Mountain, China PLoS ONE 8:e66184 doi:10.1371/journal.pone.0066184
Zhang W, He H, Zhang X (2007) Determination of neutral sugars in soil by capillary gas chromatography after derivatization to aldononitrile acetates Soil Biology and Biochemistry 39:2665-2669
Zhang X, Amelung W, Yuan Y, Samson-Liebig S, Brown L, Zech W (1999) Land-use effects on amino sugars in particle size fractions of an Argiudoll Applied Soil Ecology 11:271-275
Zhang XD, Amelung W (1996) Gas chromatographic determination of muramic acid, glucosamine, mannosamine, and galactosamine in soils Soil Biology & Biochemistry 28:1201-1206
Zhang XD, Amelung W, Ying YA, Zech W (1998) Amino sugar signature of particle-size fractions in soils of the native prairie as affected by climate Soil Science 163:220-229
Zsolnay Á (1996) Dissolved humus in soil waters. In: In: Humic substances in terrestrial ecosystems. Elsevier, Amsterdam, pp 171-224
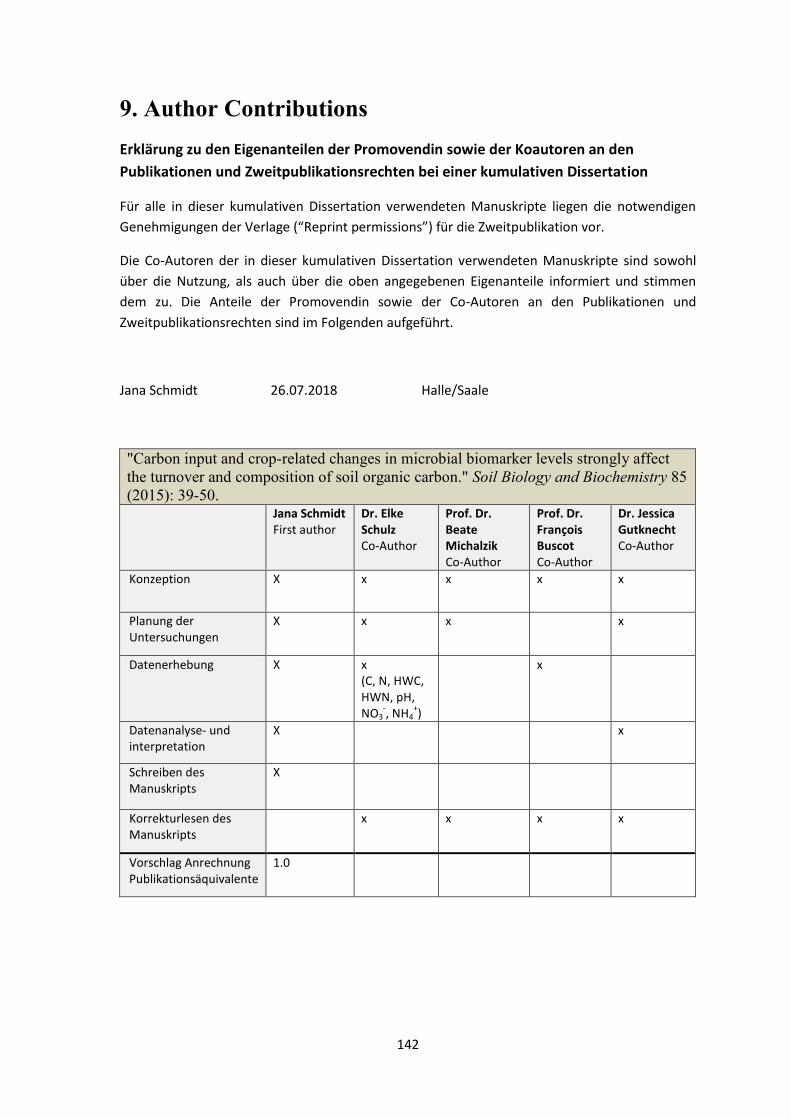
142
9. Author Contributions
Erklärung zu den Eigenanteilen der Promovendin sowie der Koautoren an den
Publikationen und Zweitpublikationsrechten bei einer kumulativen Dissertation
Für alle in dieser kumulativen Dissertation verwendeten Manuskripte liegen die notwendigen
Genehmigungen der Verlage (“Reprint permissions”) für die Zweitpublikation vor.
Die Co-Autoren der in dieser kumulativen Dissertation verwendeten Manuskripte sind sowohl
über die Nutzung, als auch über die oben angegebenen Eigenanteile informiert und stimmen
dem zu. Die Anteile der Promovendin sowie der Co-Autoren an den Publikationen und
Zweitpublikationsrechten sind im Folgenden aufgeführt.
Jana Schmidt 26.07.2018 Halle/Saale
"Carbon input and crop-related changes in microbial biomarker levels strongly affect
the turnover and composition of soil organic carbon." Soil Biology and Biochemistry 85
(2015): 39-50. Jana Schmidt
First author Dr. Elke Schulz Co-Author
Prof. Dr. Beate Michalzik Co-Author
Prof. Dr. François Buscot Co-Author
Dr. Jessica Gutknecht Co-Author
Konzeption X x x x x
Planung der Untersuchungen
X x x x
Datenerhebung X x (C, N, HWC, HWN, pH, NO3
-, NH4
+)
x
Datenanalyse- und interpretation
X x
Schreiben des Manuskripts
X
Korrekturlesen des Manuskripts
x x x x
Vorschlag Anrechnung Publikationsäquivalente
1.0
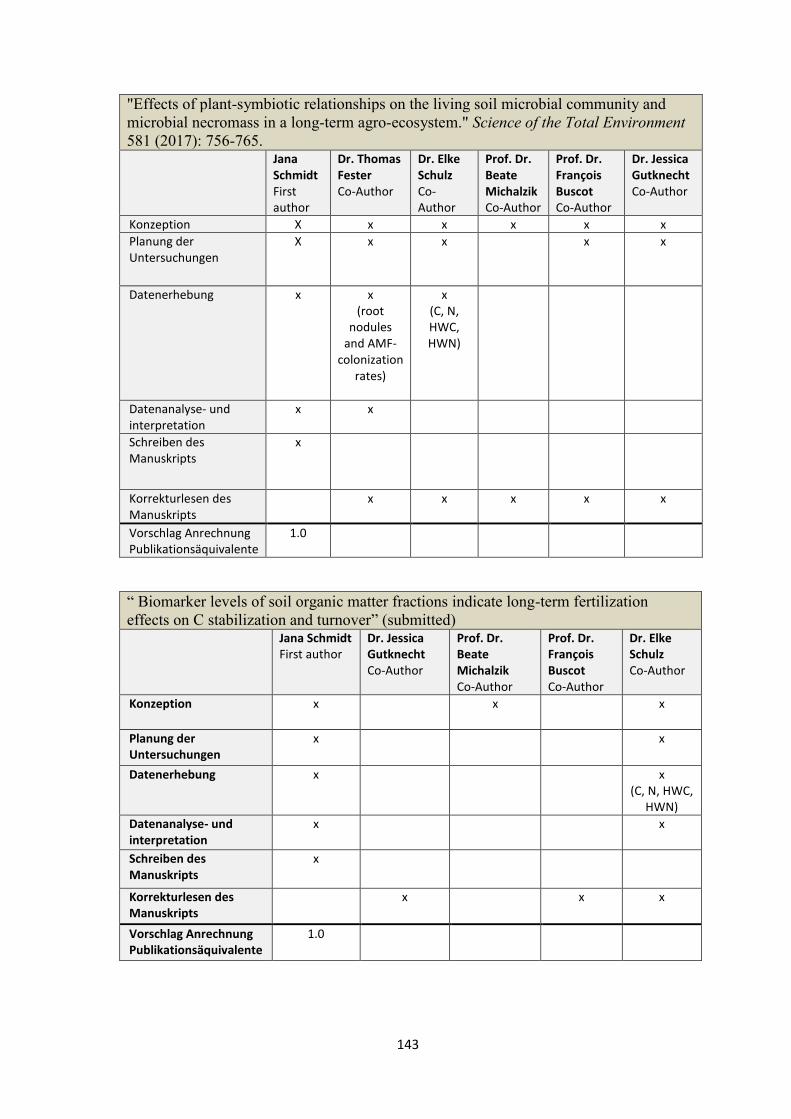
143
"Effects of plant-symbiotic relationships on the living soil microbial community and
microbial necromass in a long-term agro-ecosystem." Science of the Total Environment
581 (2017): 756-765. Jana
Schmidt First author
Dr. Thomas Fester Co-Author
Dr. Elke Schulz Co-Author
Prof. Dr. Beate Michalzik Co-Author
Prof. Dr. François Buscot Co-Author
Dr. Jessica Gutknecht Co-Author
Konzeption X x x x x x
Planung der Untersuchungen
X x x x x
Datenerhebung x x (root
nodules and AMF-
colonization rates)
x (C, N, HWC, HWN)
Datenanalyse- und interpretation
x x
Schreiben des Manuskripts
x
Korrekturlesen des Manuskripts
x x x x x
Vorschlag Anrechnung Publikationsäquivalente
1.0
“ Biomarker levels of soil organic matter fractions indicate long-term fertilization
effects on C stabilization and turnover” (submitted) Jana Schmidt
First author Dr. Jessica Gutknecht Co-Author
Prof. Dr. Beate Michalzik Co-Author
Prof. Dr. François Buscot Co-Author
Dr. Elke Schulz Co-Author
Konzeption x x x
Planung der Untersuchungen
x x
Datenerhebung x
x (C, N, HWC,
HWN)
Datenanalyse- und interpretation
x x
Schreiben des Manuskripts
x
Korrekturlesen des Manuskripts
x x x
Vorschlag Anrechnung Publikationsäquivalente
1.0
144
10. Erklärungen
Selbständigkeitserklärung
Ich erkläre, dass ich die vorliegende Arbeit selbständig und unter Verwendung der angegebenen
angefertigt Hilfsmittel, persönlichen Mitteilungen und Quellen angefertigt habe.
Halle, 26.07.2018
Jana Schmidt


![EVALUATION OF IMPACT OF SOIL COMPACTION IN DITCH …one of the main reasons that contribute to reduction of soil porosity [5]. Soil compaction intensity is directly dependent on the](https://img.pdfslide.org/doc/110x75/6087fd86f3300b5ca742e69d/evaluation-of-impact-of-soil-compaction-in-ditch-one-of-the-main-reasons-that-contribute.jpg)