Embed Size (px)
Citation preview
Systems of Innovation
Learning economy and innovation
Science & technology systems at national and regional levels
European policies
(EMIK presentation)
Jean-Alain HÉRAUD

Science, innovation & economy
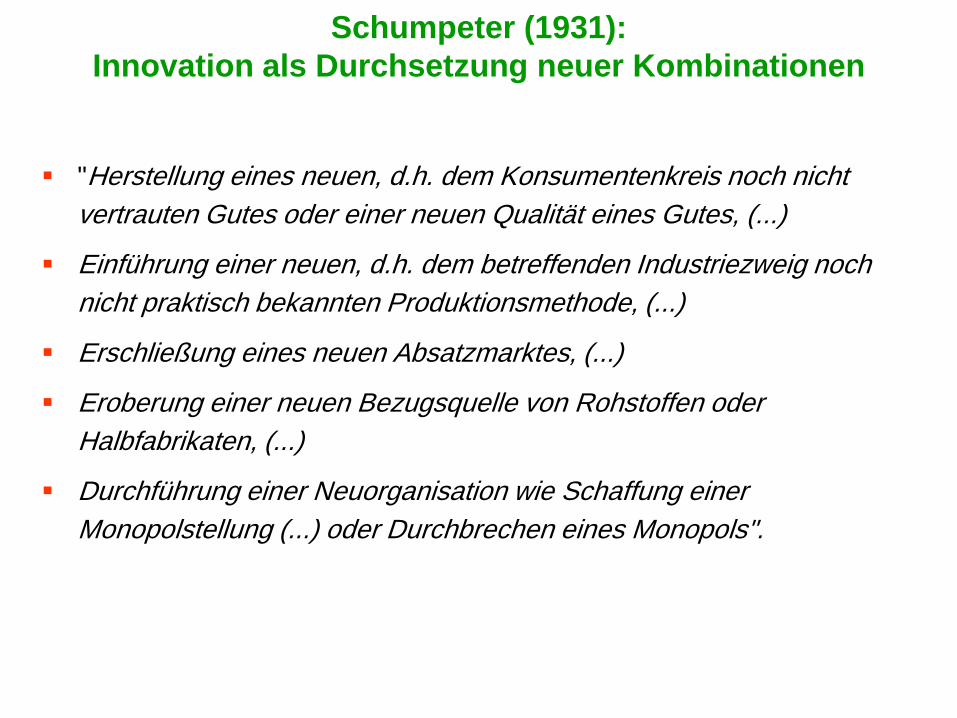
Schumpeter (1931):
Innovation als Durchsetzung neuer Kombinationen
"Herstellung eines neuen, d.h. dem Konsumentenkreis noch nicht
vertrauten Gutes oder einer neuen Qualität eines Gutes, (...)
Einführung einer neuen, d.h. dem betreffenden Industriezweig noch
nicht praktisch bekannten Produktionsmethode, (...)
Erschließung eines neuen Absatzmarktes, (...)
Eroberung einer neuen Bezugsquelle von Rohstoffen oder
Halbfabrikaten, (...)
Durchführung einer Neuorganisation wie Schaffung einer
Monopolstellung (...) oder Durchbrechen eines Monopols".
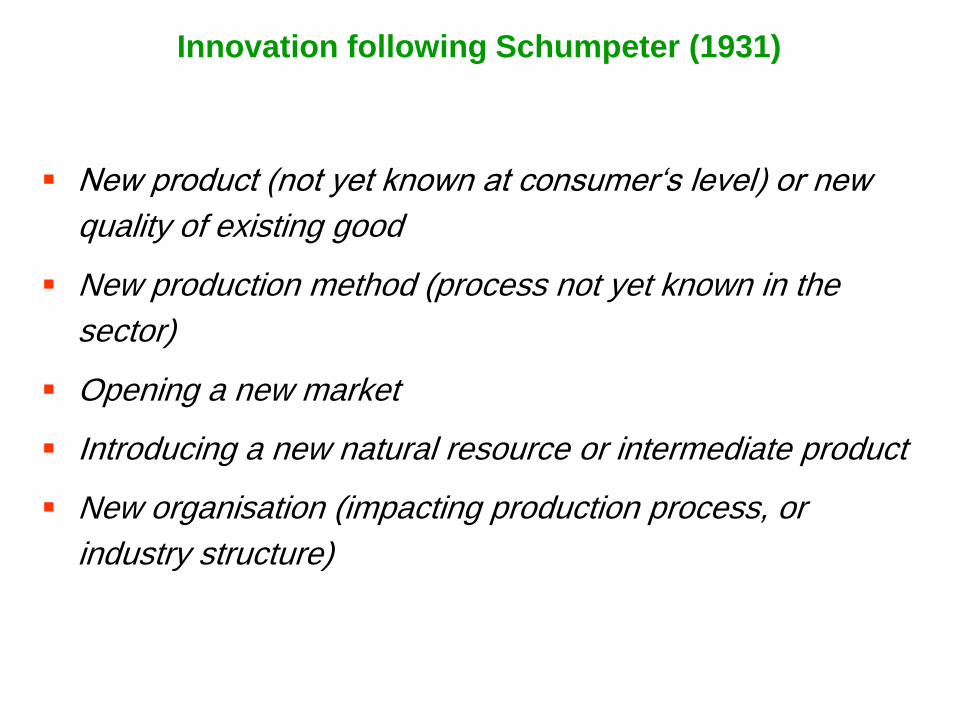
Innovation following Schumpeter (1931)
New product (not yet known at consumer„s level) or new
quality of existing good
New production method (process not yet known in the
sector)
Opening a new market
Introducing a new natural resource or intermediate product
New organisation (impacting production process, or
industry structure)
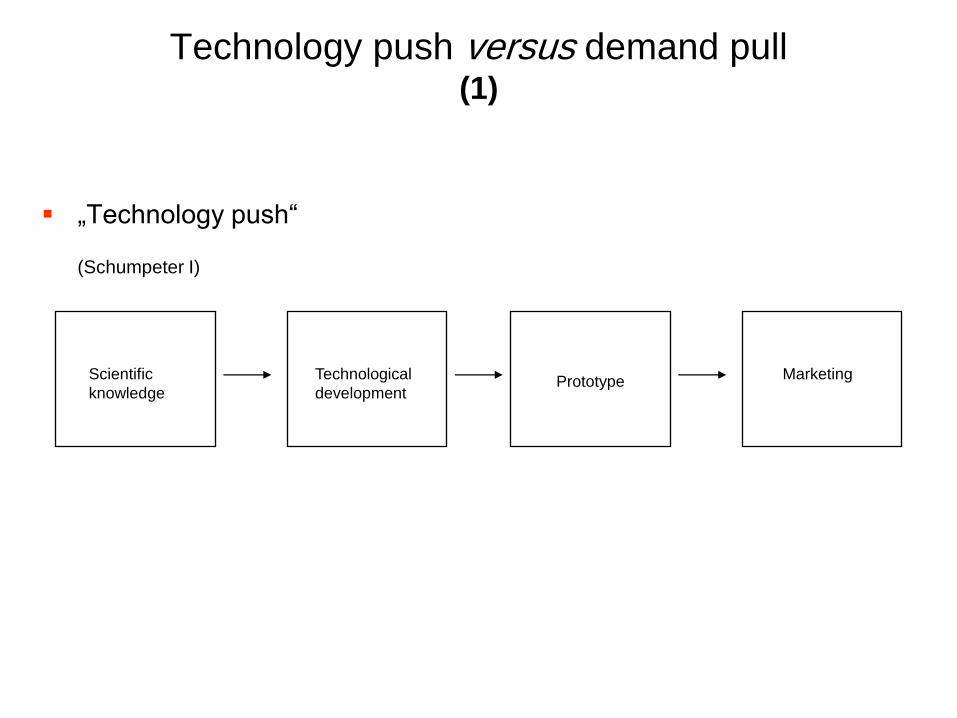
Technology push versus demand pull(1)
„Technology push“
(Schumpeter I)
Scientific
knowledge
Technological
developmentPrototype Marketing
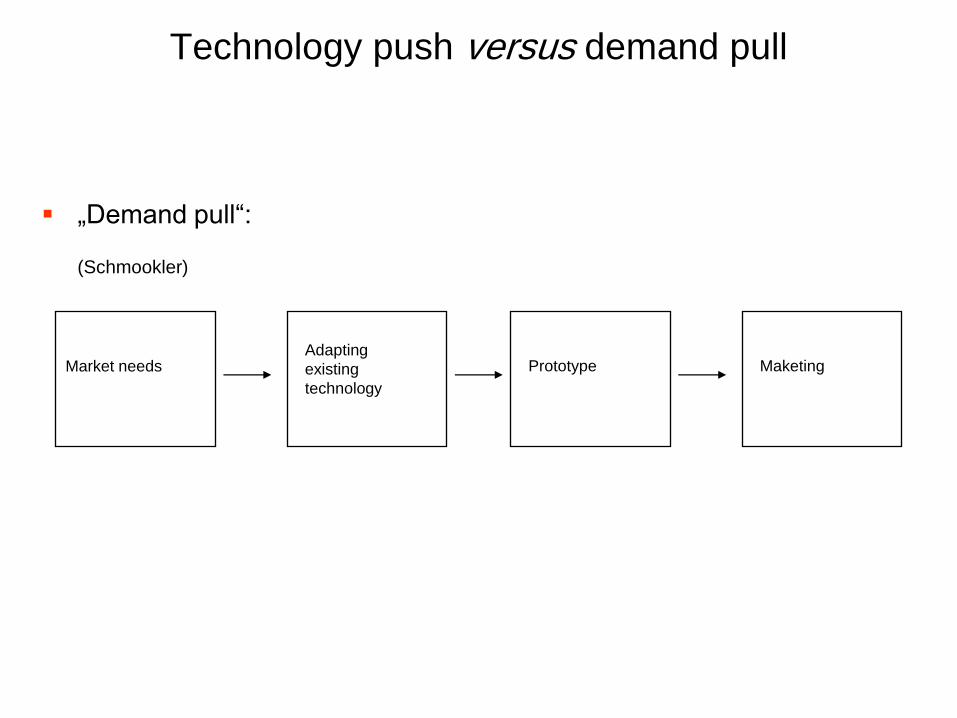
Technology push versus demand pull
„Demand pull“:
(Schmookler)
Prototype MaketingMarket needsAdapting
existing
technology
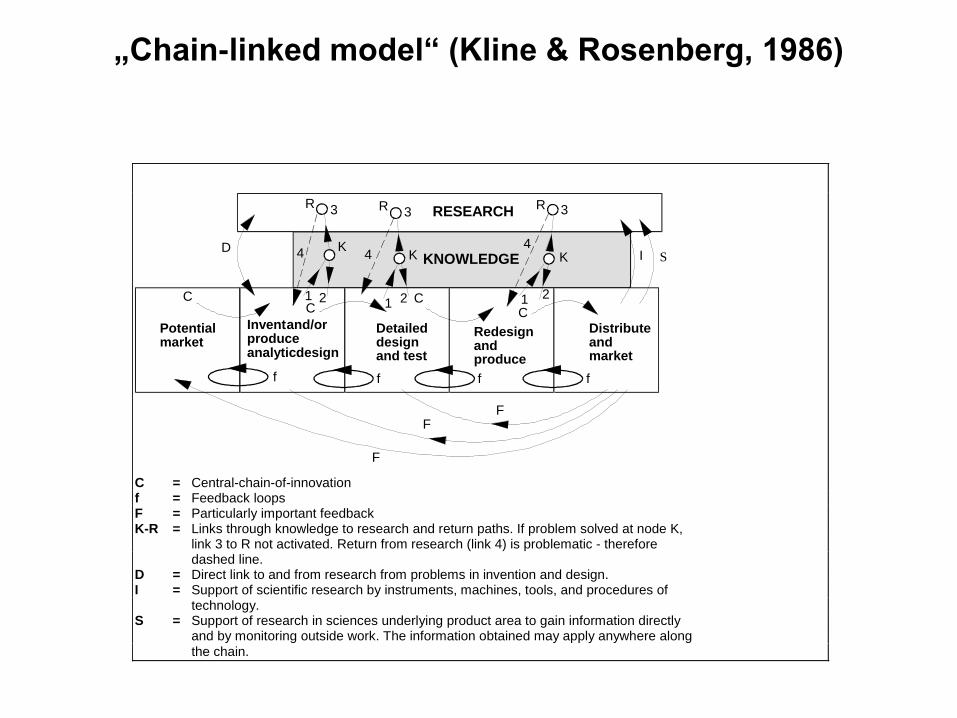
„Chain-linked model“ (Kline & Rosenberg, 1986)
RESEARCH
KNOWLEDGE
Potentialmarket
Inventand/orproduceanalyticdesign
Detaileddesignand test
Redesignandproduce
Distributeandmarket
C
CC
C
R RR
KKK
DI
F
FF
f fff
3 33
1 21 21 2
44
4 S
C = Central-chain-of-innovationf = Feedback loopsF = Particularly important feedbackK-R = Links through knowledge to research and return paths. If problem solved at node K,
link 3 to R not activated. Return from research (link 4) is problematic - therefore dashed line.D = Direct link to and from research from problems in invention and design.I = Support of scientific research by instruments, machines, tools, and procedures of technology.S = Support of research in sciences underlying product area to gain information directly
and by monitoring outside work. The information obtained may apply anywhere along
the chain.
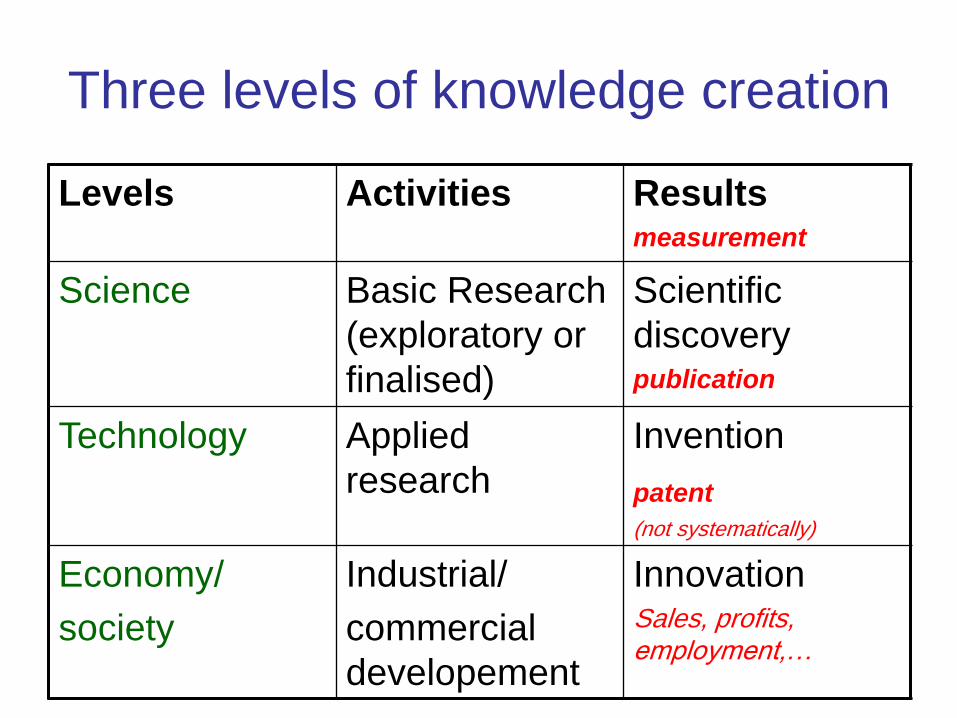
Three levels of knowledge creation
Levels Activities Resultsmeasurement
Science Basic Research
(exploratory or
finalised)
Scientific
discoverypublication
Technology Applied
research
Invention
patent
(not systematically)
Economy/
society
Industrial/
commercial
developement
InnovationSales, profits, employment,…
The stakes:Innovation: the European
challenge
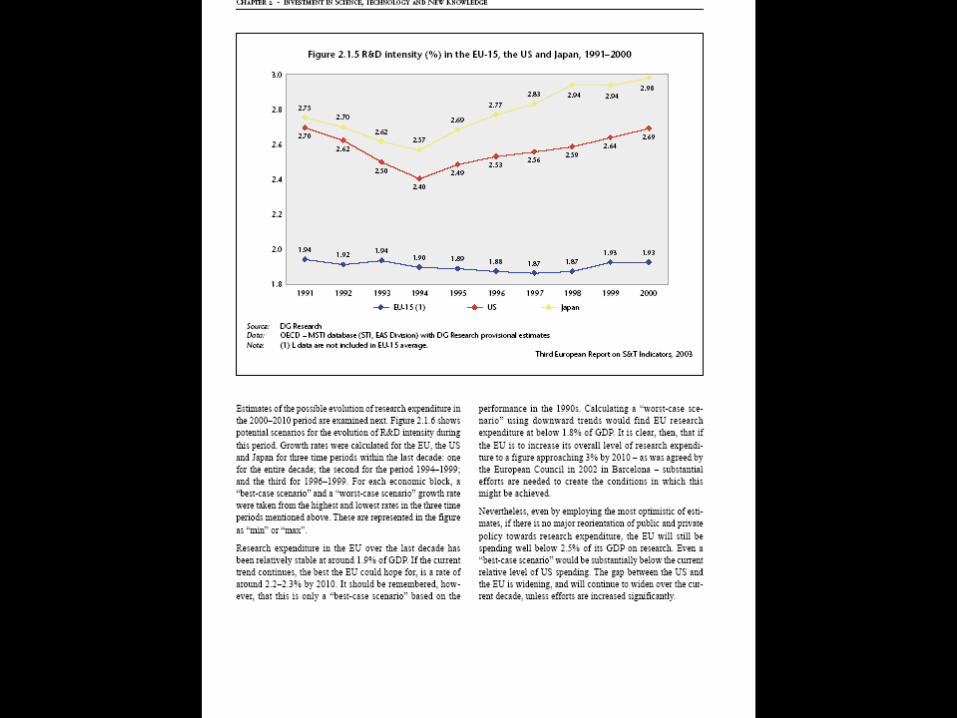
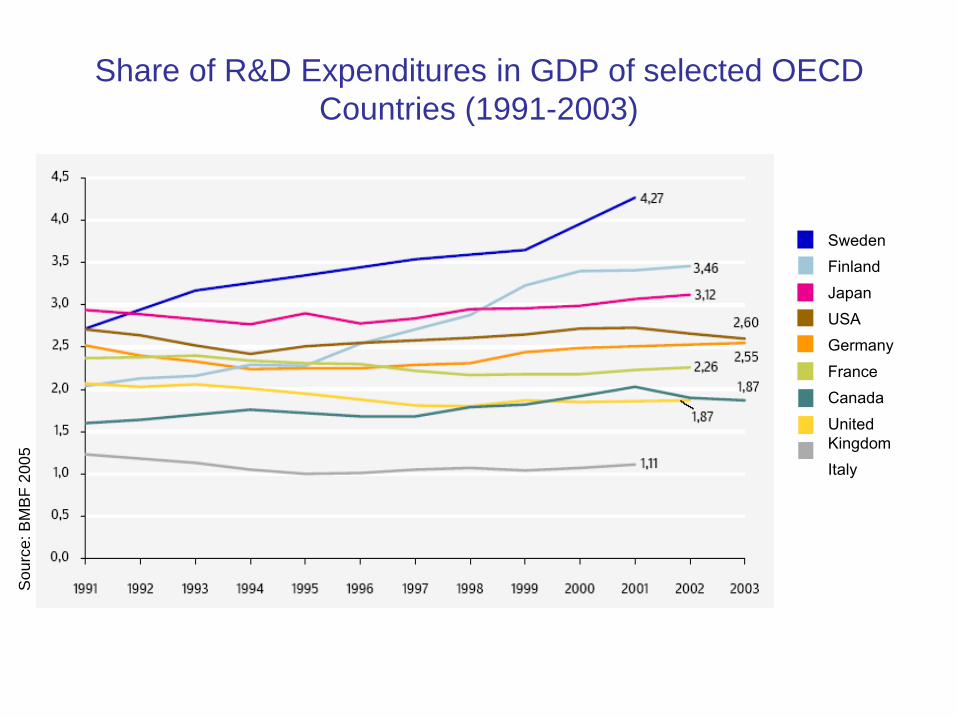
Sweden
Finland
Japan
USA
Germany
France
Canada
United
Kingdom
Italy
Share of R&D Expenditures in GDP of selected OECD
Countries (1991-2003)
So
urc
e: B
MB
F 2
00
5
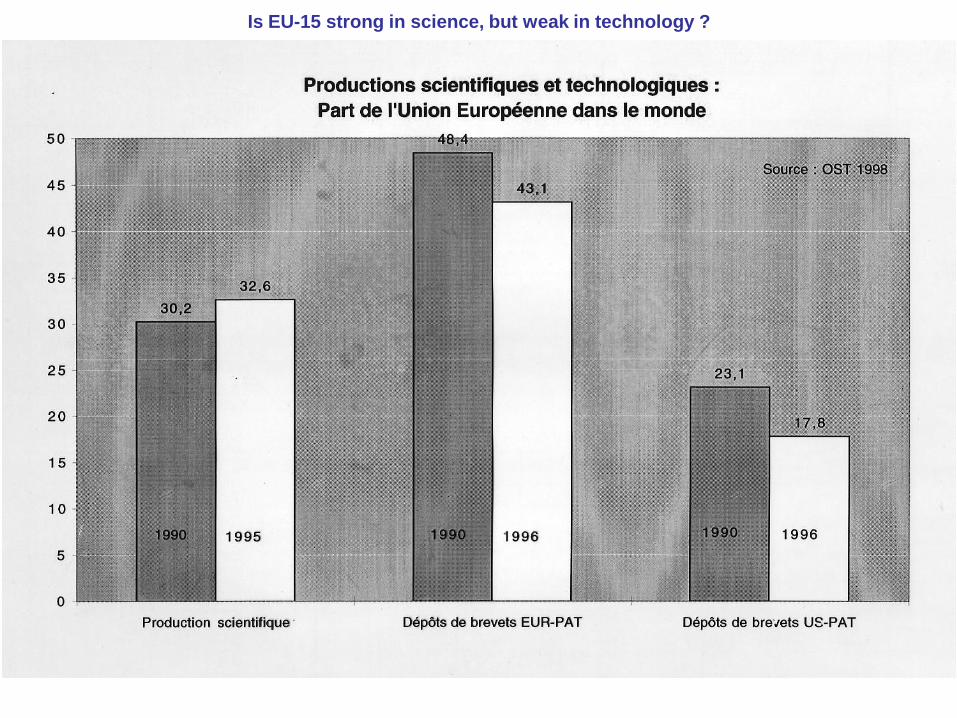
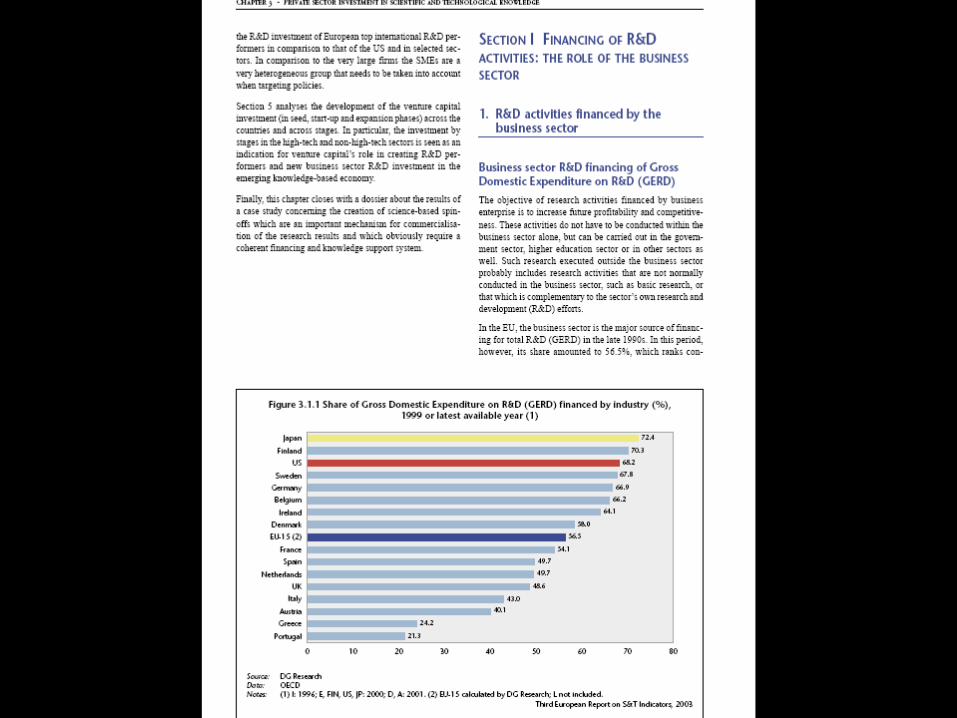
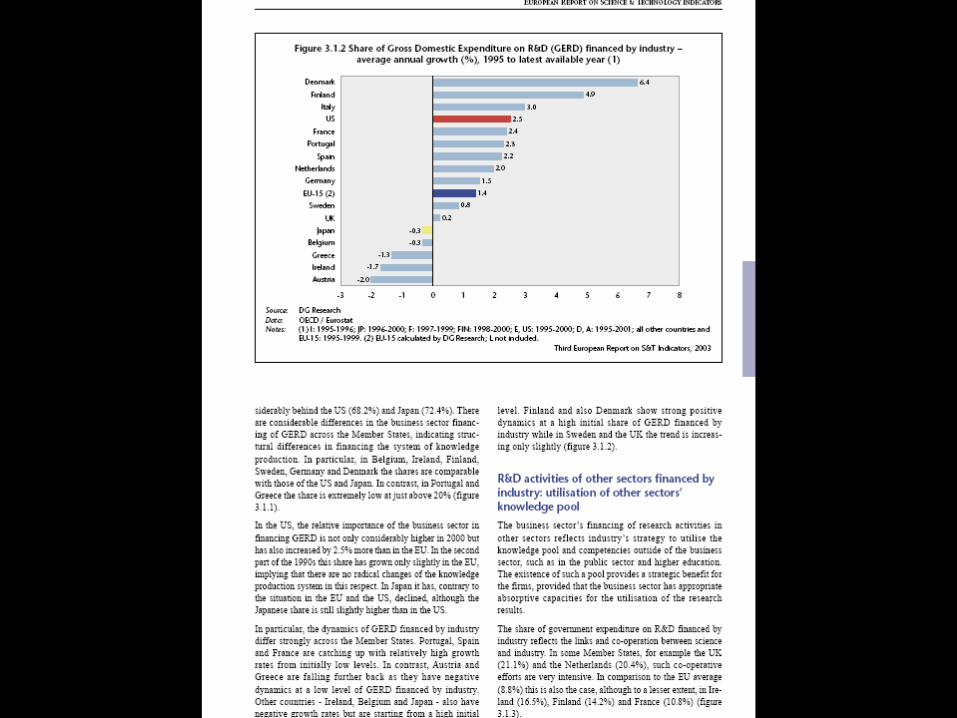
Is EU-15 strong in science, but weak in technology ?
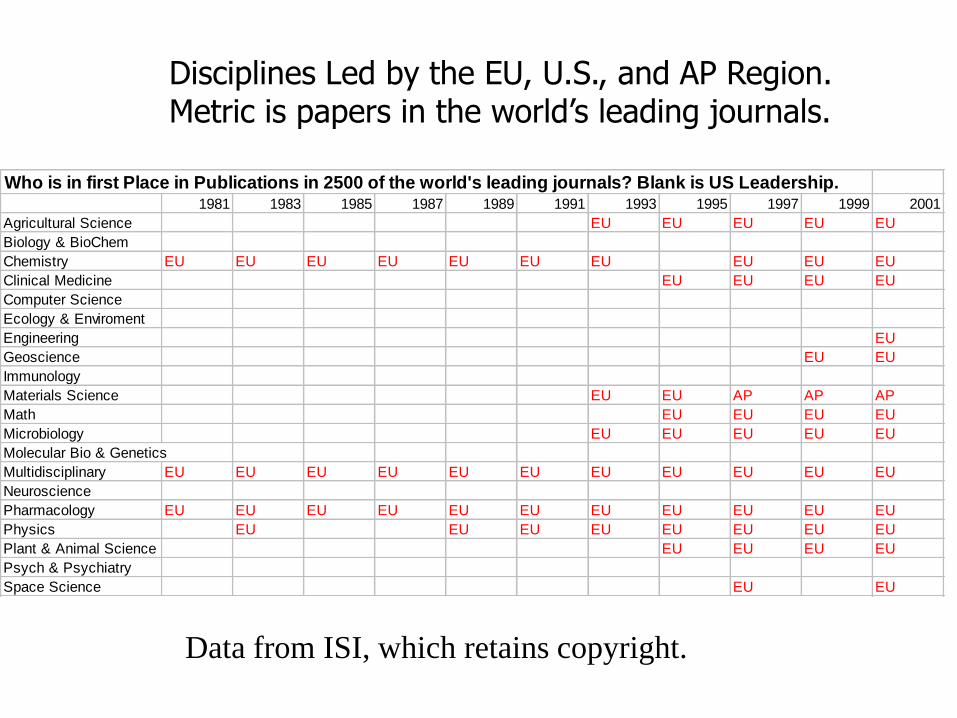
Who is in first Place in Publications in 2500 of the world's leading journals? Blank is US Leadership.1981 1983 1985 1987 1989 1991 1993 1995 1997 1999 2001
Agricultural Science EU EU EU EU EU
Biology & BioChem
Chemistry EU EU EU EU EU EU EU EU EU EU
Clinical Medicine EU EU EU EU
Computer Science
Ecology & Enviroment
Engineering EU
Geoscience EU EU
Immunology
Materials Science EU EU AP AP AP
Math EU EU EU EU
Microbiology EU EU EU EU EU
Molecular Bio & Genetics
Multidisciplinary EU EU EU EU EU EU EU EU EU EU EU
Neuroscience
Pharmacology EU EU EU EU EU EU EU EU EU EU EU
Physics EU EU EU EU EU EU EU EU
Plant & Animal Science EU EU EU EU
Psych & Psychiatry
Space Science EU EU
Disciplines Led by the EU, U.S., and AP Region. Metric is papers in the world’s leading journals.
Data from ISI, which retains copyright.
Source: Third European Report
Traitement: BETA
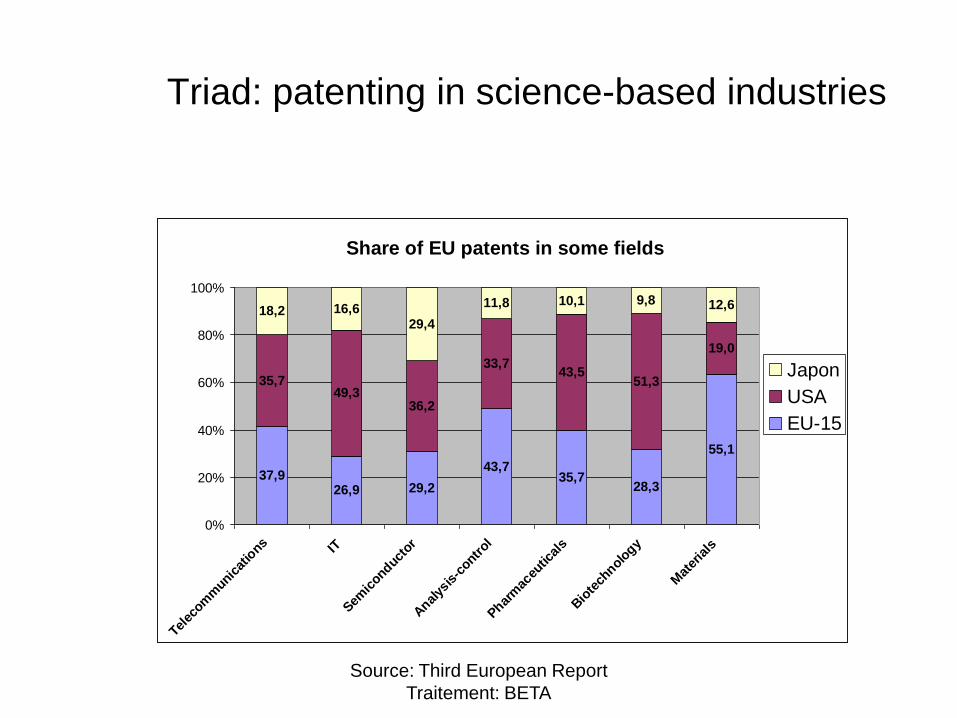
Triad: patenting in science-based industries
Share of EU patents in some fields
37,926,9 29,2
43,735,7
28,3
55,1
35,749,3
36,2
33,743,5
51,3
19,0
18,2 16,629,4
11,8 10,1 9,8 12,6
0%
20%
40%
60%
80%
100%
Telec
omm
unicat
ions IT
Semic
onductor
Anal
ysis
-contr
ol
Pharm
aceu
tical
s
Bio
tech
nology
Mat
eria
ls
Japon
USA
EU-15
Source: Third European Report
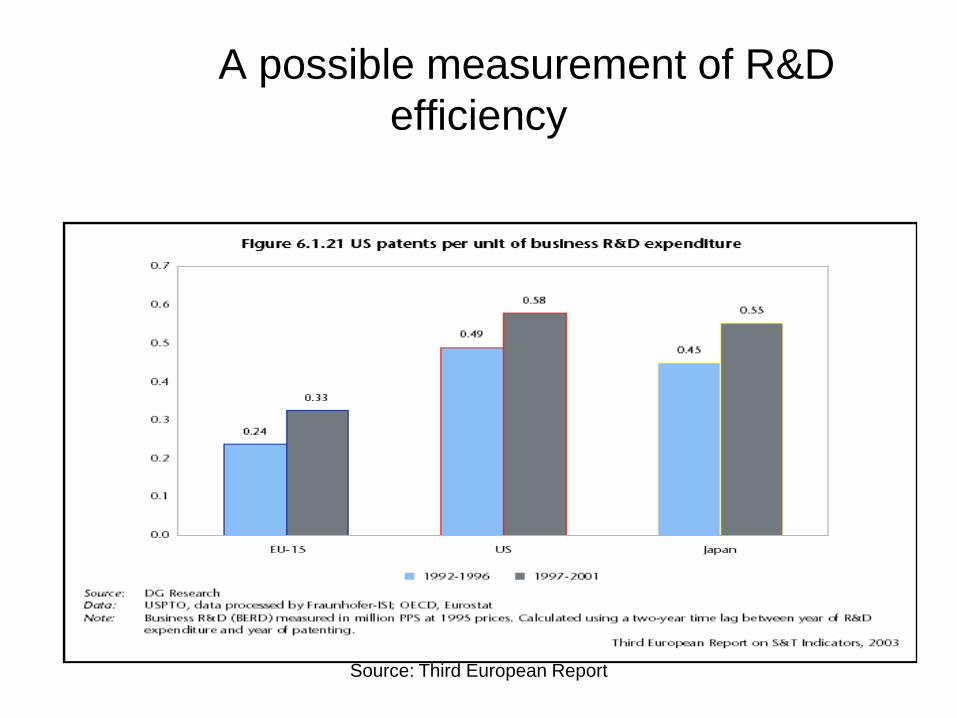
A possible measurement of R&D
efficiency
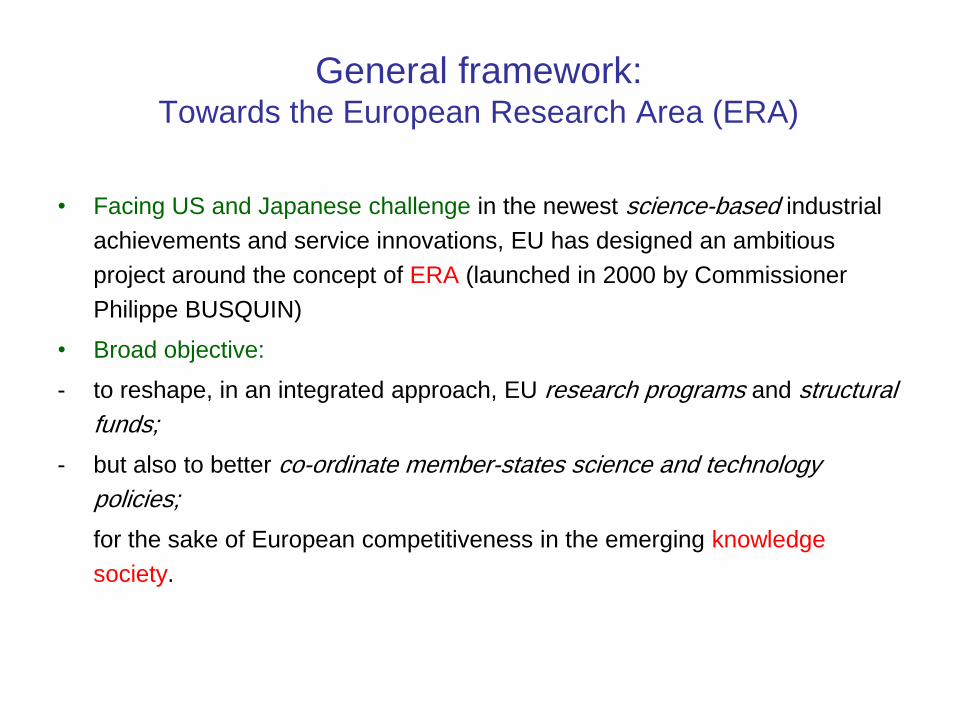
General framework: Towards the European Research Area (ERA)
• Facing US and Japanese challenge in the newest science-based industrial
achievements and service innovations, EU has designed an ambitious
project around the concept of ERA (launched in 2000 by Commissioner
Philippe BUSQUIN)
• Broad objective:
- to reshape, in an integrated approach, EU research programs and structural
funds;
- but also to better co-ordinate member-states science and technology
policies;
for the sake of European competitiveness in the emerging knowledge
society.
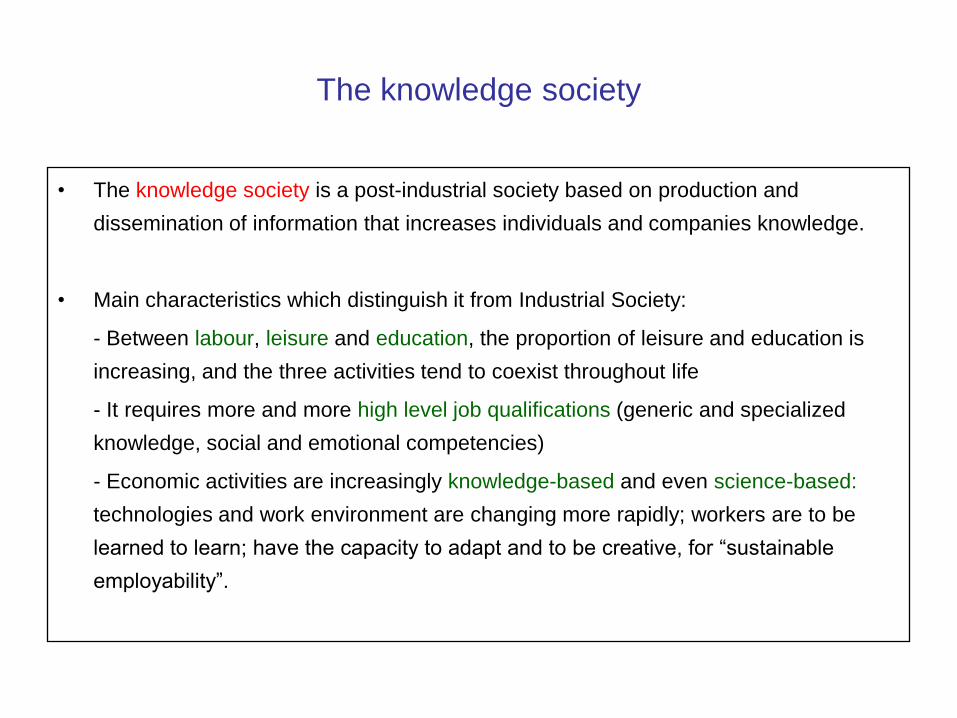
The knowledge society
• The knowledge society is a post-industrial society based on production and
dissemination of information that increases individuals and companies knowledge.
• Main characteristics which distinguish it from Industrial Society:
- Between labour, leisure and education, the proportion of leisure and education is
increasing, and the three activities tend to coexist throughout life
- It requires more and more high level job qualifications (generic and specialized
knowledge, social and emotional competencies)
- Economic activities are increasingly knowledge-based and even science-based:
technologies and work environment are changing more rapidly; workers are to be
learned to learn; have the capacity to adapt and to be creative, for “sustainable
employability”.
The necessity to reorient European structures and policies :
• Understanding where we come from: the situation in the „90s:
- Science indicators give a good image of Europe: a large share of the world
publications, this share being non declining. But technology indicators are
not good: declining share of world patents.
- Europe is a stronghold for several economic activities, but less in the most
promising ones than in traditional middle tech branches
• Conclusion in terms of innovation system:
Europe has interesting assets (industrial and cognitive) but they are not
efficiently linked. The science-technology-business chain is weak
The ERA challenge
• Europe must become in 10 years the most successful knowledge-based
economy. It means:
- More research in basic and applied science (from presently a little less
than 2% of GDP to 3% and more). See ERA doc
- Increasing absorptive capacity at firm level (and the willingness to take the
risk of breakthrough innovation)
- More education and training: initial as well as life-long
• This is not only for glory!
With our standards of living, the ageing population, and therefore the high
price of factors, a large part of economic activities that are not based on
new knowledge are at risk of being outsourced and displaced in the newly
developed countries of the world.
The ways towards ERA
• Better co-ordination of national policies is a way to do more with the same means. There is
certainly wasteful duplication of projects in public science and technology performed at national
level – and maybe also among firms – a situation leading to global efficiency lower than that of the
US system.
• It must be possible to build critical mass using existing facilities, teams and national systems, by
networking them. The idea is to focus EU intervention on networking the excellence. Whatever the
technical form (Networks of Excellence for research consortia of scientific teams accross Europe
or Integrated Programs including firms and research institutes), the European Commission will
concentrate its efforts(*)on a limited number of projects and of teams. For increasing the leverage,
EU finances only a part of the projects: the member states‟ administrations or the firms must
invest at least the half of the cost.
(*) efforts amounting for less than 5% of global European research expenses: there is
already a strong multiplier effect of EU RTD programs
• All levels of governance are likely to be involved: EU, states, regional/local authorities,
universities on their own budget, non-profit organizations...

National innovation systems:General approach
Some definitions of NSI
• Freeman 1987
The network of institutions in the public and private sectors whose activities and interactions initiate, import, modify and diffuse new technologies
• Lundvall 1992
The elements and relationships which interact in the production, diffusion and use of new, and economically useful, knowledge (…) and are either located within or rooted inside the borders of nation states.
• Nelson 1993
The national institutions whose interactions determine the innovative performance (…) of national firms
• Patel, Pavitt 1993
The national institutions, their incentive structures, and their competencies, that determine the rate and direction of technological learning in a country.
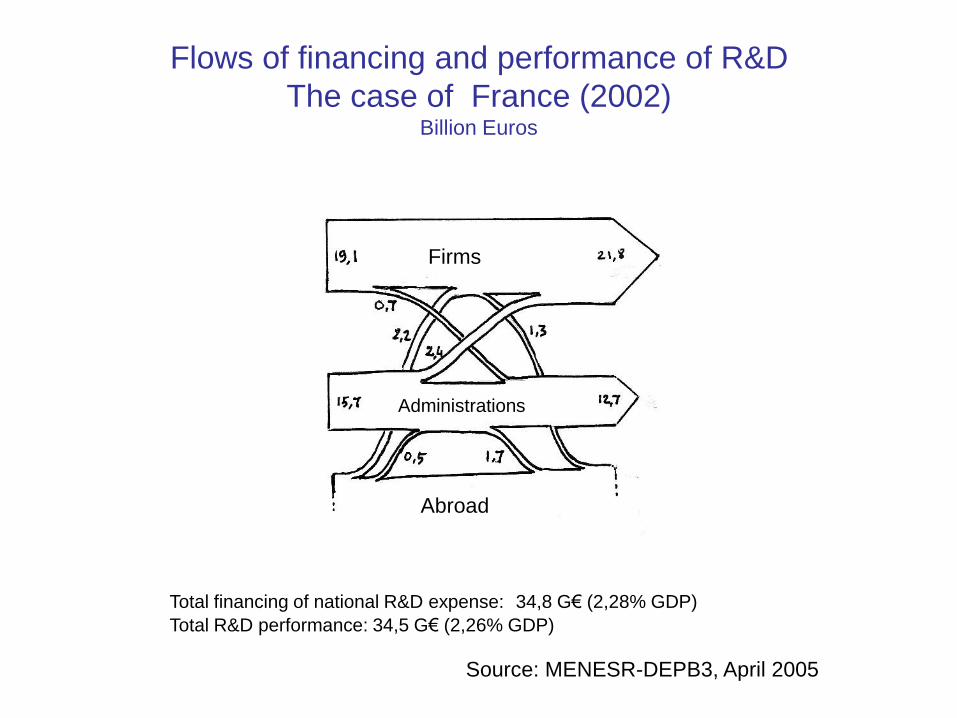
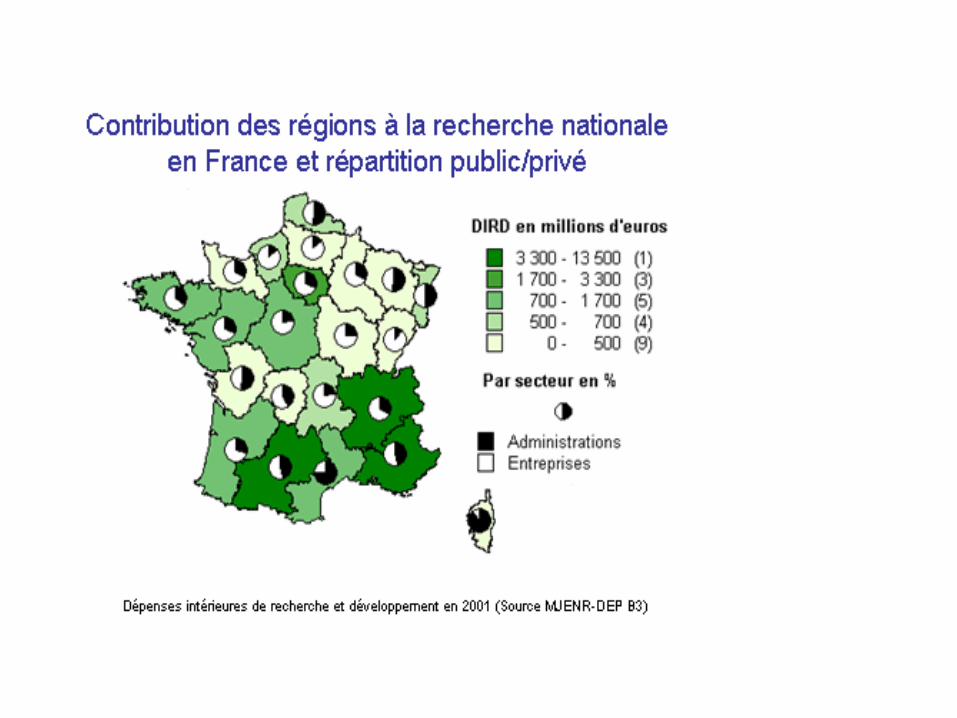
Flows of financing and performance of R&D
The case of France (2002) Billion Euros
Total financing of national R&D expense: 34,8 G€ (2,28% GDP)
Total R&D performance: 34,5 G€ (2,26% GDP)
Firms
Administrations
Abroad
Source: MENESR-DEPB3, April 2005
National
research
ministry
Other
national
ministries
Regional
govern-
ments
National
parlia-
ment
EU
Com-
mission
Multi-
national
companie
s
SME
asso-
ciations
Industrial
asso-
ciations
Uni-
versities
National
research
centers
Research
councils
Contract
research
institutes
Consumer
groups
Environ-
ment
groups
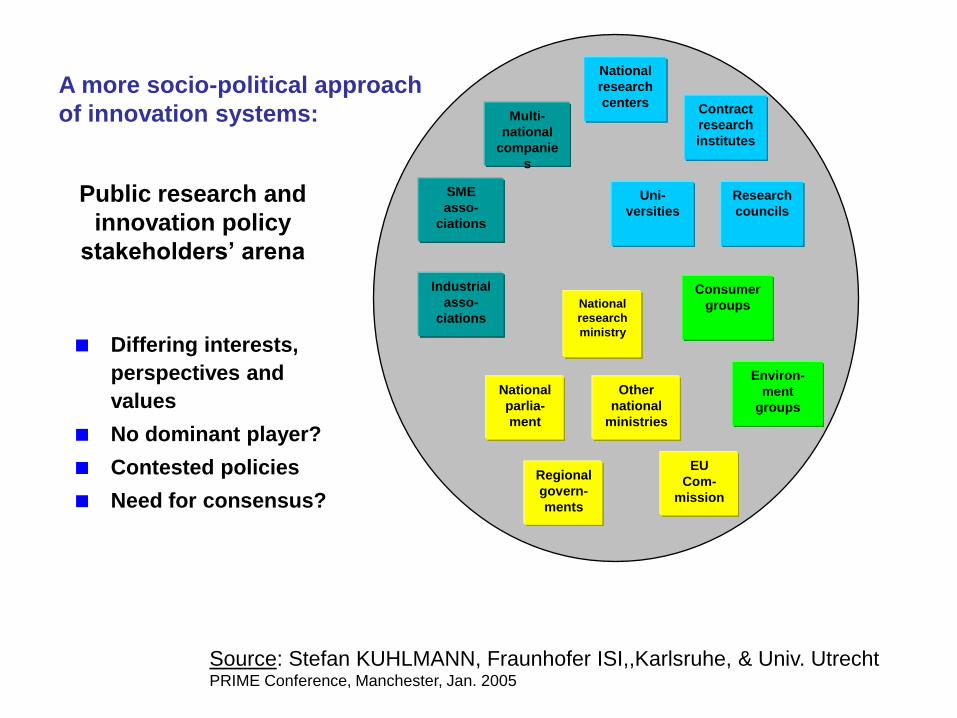
Differing interests,
perspectives and
values
No dominant player?
Contested policies
Need for consensus?
Public research and
innovation policy
stakeholders’ arena
Source: Stefan KUHLMANN, Fraunhofer ISI,,Karlsruhe, & Univ. UtrechtPRIME Conference, Manchester, Jan. 2005
A more socio-political approach
of innovation systems:
25
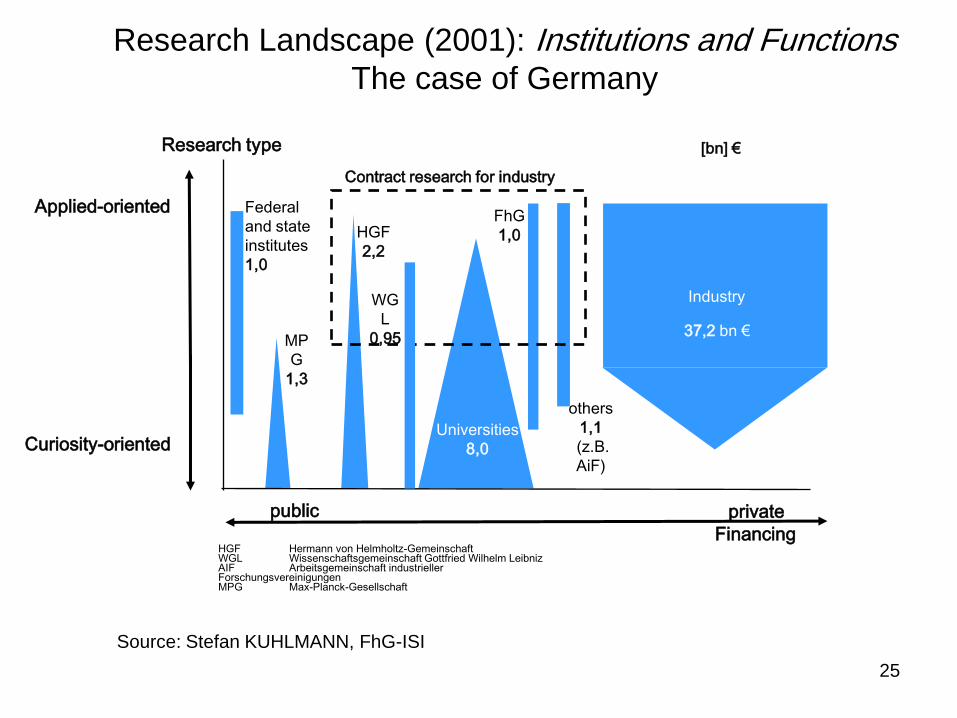
Research Landscape (2001): Institutions and FunctionsThe case of Germany
HGF Hermann von Helmholtz-GemeinschaftWGL Wissenschaftsgemeinschaft Gottfried Wilhelm LeibnizAIF Arbeitsgemeinschaft industrieller ForschungsvereinigungenMPG Max-Planck-Gesellschaft
MP
G
1,3
HGF
2,2
FhG
1,0
others
1,1
(z.B.
AiF)
Universities
8,0
Industry
37,2 bn €
Curiosity-oriented
Applied-oriented
private
Financing
Contract research for industry
public
WG
L
0,95
Research type
Federal
and state
institutes
1,0
[bn] €
Source: Stefan KUHLMANN, FhG-ISI
National innovation systems:The case of France
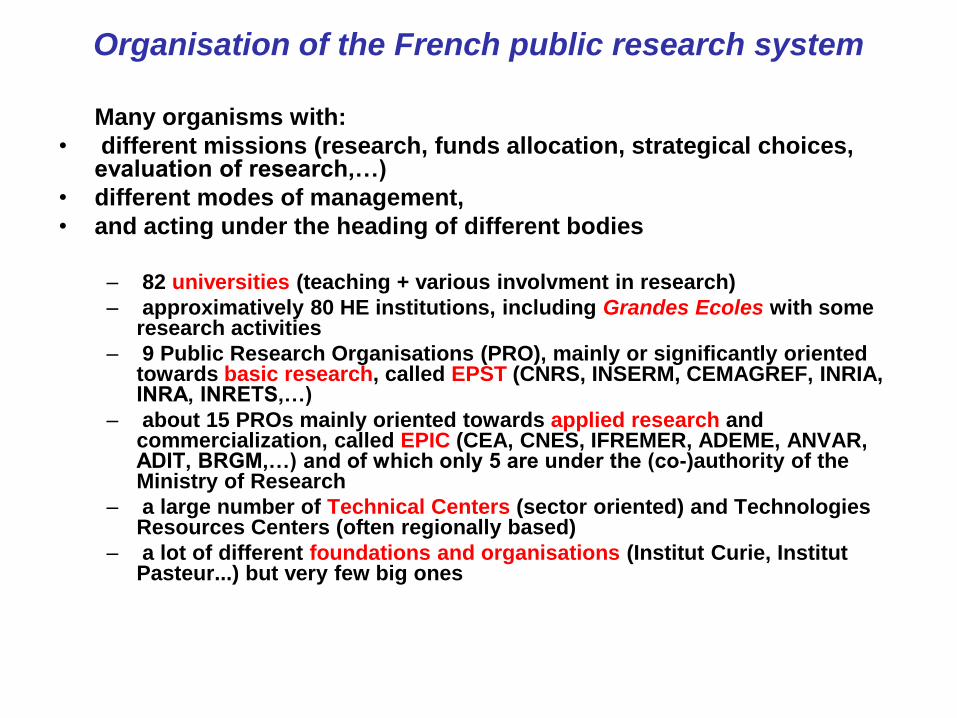
Organisation of the French public research system
Many organisms with:
• different missions (research, funds allocation, strategical choices, evaluation of research,…)
• different modes of management,
• and acting under the heading of different bodies
– 82 universities (teaching + various involvment in research)
– approximatively 80 HE institutions, including Grandes Ecoles with some research activities
– 9 Public Research Organisations (PRO), mainly or significantly oriented towards basic research, called EPST (CNRS, INSERM, CEMAGREF, INRIA, INRA, INRETS,…)
– about 15 PROs mainly oriented towards applied research and commercialization, called EPIC (CEA, CNES, IFREMER, ADEME, ANVAR, ADIT, BRGM,…) and of which only 5 are under the (co-)authority of the Ministry of Research
– a large number of Technical Centers (sector oriented) and Technologies Resources Centers (often regionally based)
– a lot of different foundations and organisations (Institut Curie, Institut Pasteur...) but very few big ones
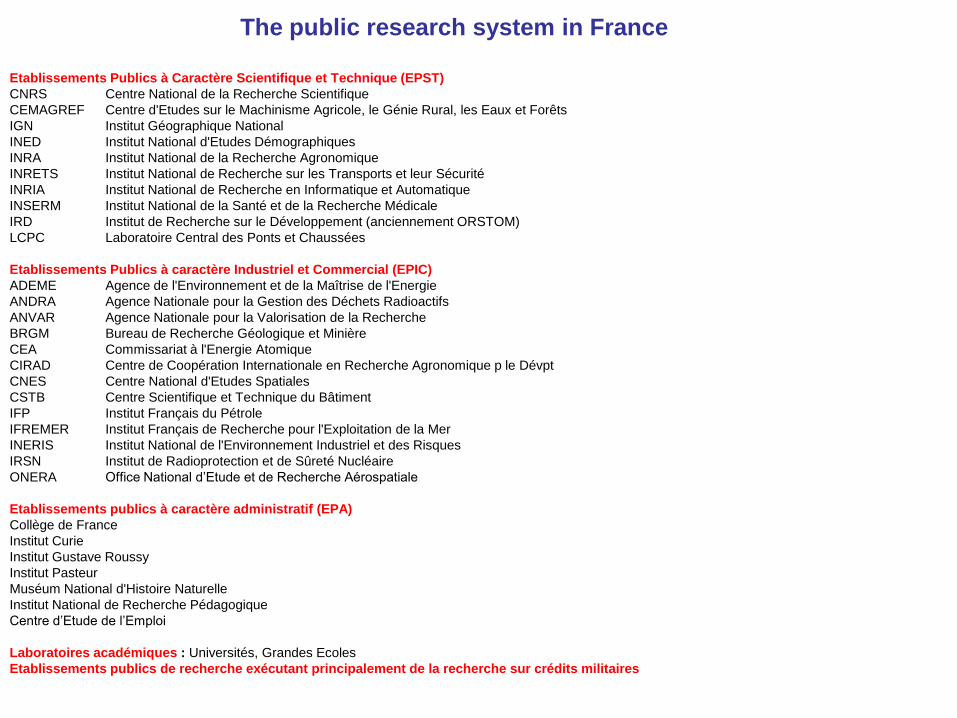
The public research system in France
Etablissements Publics à Caractère Scientifique et Technique (EPST)
CNRS Centre National de la Recherche Scientifique
CEMAGREF Centre d'Etudes sur le Machinisme Agricole, le Génie Rural, les Eaux et Forêts
IGN Institut Géographique National
INED Institut National d'Etudes Démographiques
INRA Institut National de la Recherche Agronomique
INRETS Institut National de Recherche sur les Transports et leur Sécurité
INRIA Institut National de Recherche en Informatique et Automatique
INSERM Institut National de la Santé et de la Recherche Médicale
IRD Institut de Recherche sur le Développement (anciennement ORSTOM)
LCPC Laboratoire Central des Ponts et Chaussées
Etablissements Publics à caractère Industriel et Commercial (EPIC)
ADEME Agence de l'Environnement et de la Maîtrise de l'Energie
ANDRA Agence Nationale pour la Gestion des Déchets Radioactifs
ANVAR Agence Nationale pour la Valorisation de la Recherche
BRGM Bureau de Recherche Géologique et Minière
CEA Commissariat à l'Energie Atomique
CIRAD Centre de Coopération Internationale en Recherche Agronomique p le Dévpt
CNES Centre National d'Etudes Spatiales
CSTB Centre Scientifique et Technique du Bâtiment
IFP Institut Français du Pétrole
IFREMER Institut Français de Recherche pour l'Exploitation de la Mer
INERIS Institut National de l'Environnement Industriel et des Risques
IRSN Institut de Radioprotection et de Sûreté Nucléaire
ONERA Office National d‟Etude et de Recherche Aérospatiale
Etablissements publics à caractère administratif (EPA)
Collège de France
Institut Curie
Institut Gustave Roussy
Institut Pasteur
Muséum National d'Histoire Naturelle
Institut National de Recherche Pédagogique
Centre d‟Etude de l‟Emploi
Laboratoires académiques : Universités, Grandes Ecoles
Etablissements publics de recherche exécutant principalement de la recherche sur crédits militaires
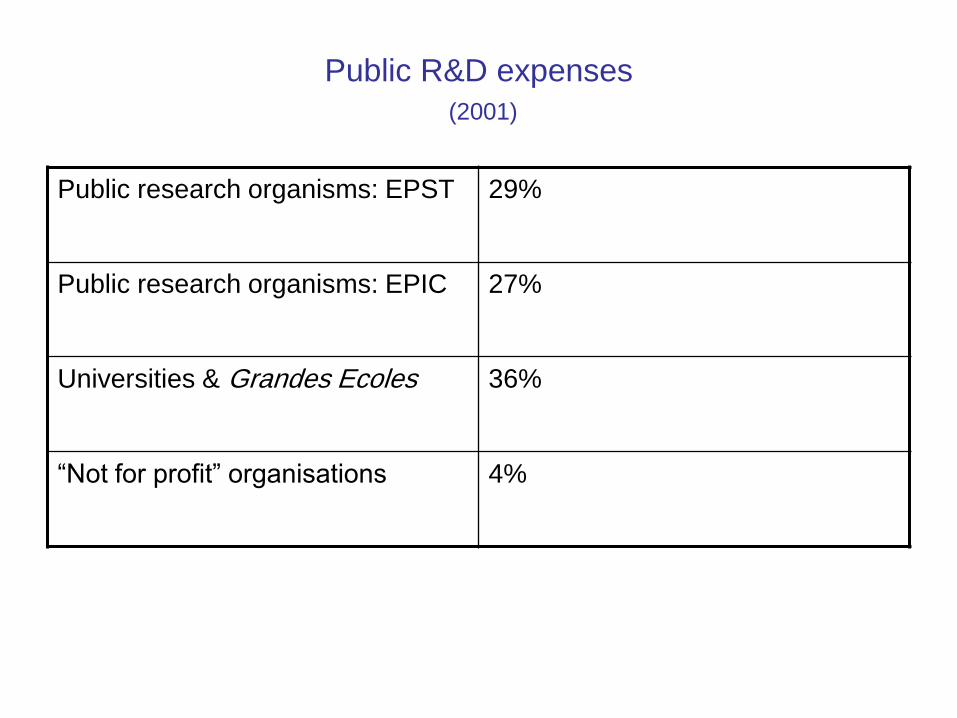
Public R&D expenses
(2001)
Public research organisms: EPST 29%
Public research organisms: EPIC 27%
Universities & Grandes Ecoles 36%
“Not for profit” organisations 4%
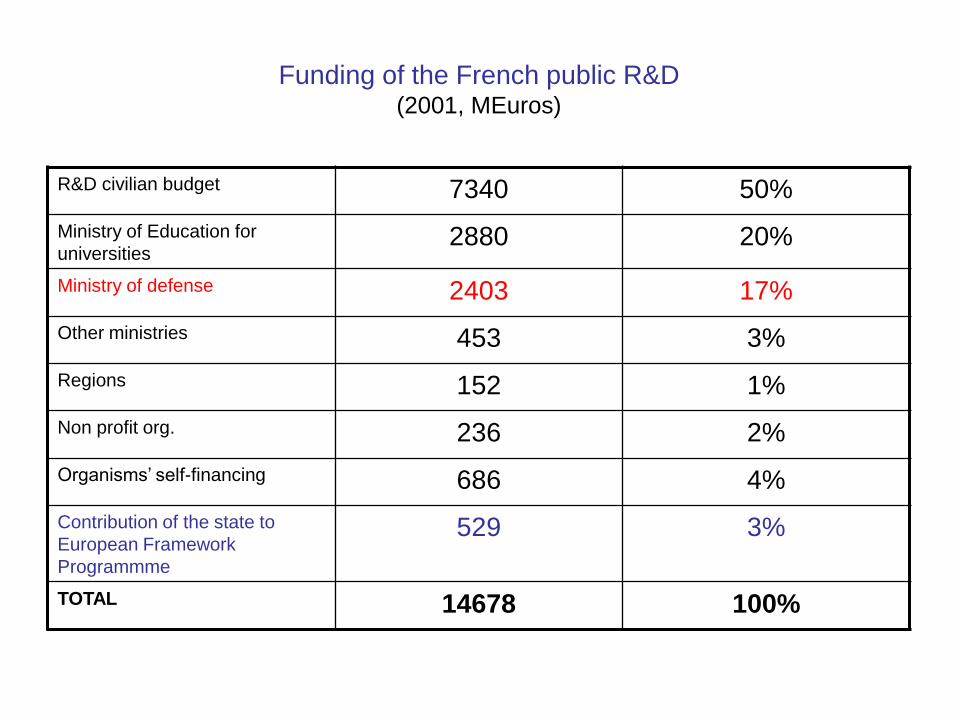
Funding of the French public R&D (2001, MEuros)
R&D civilian budget 7340 50%
Ministry of Education for
universities2880 20%
Ministry of defense 2403 17%
Other ministries 453 3%
Regions 152 1%
Non profit org. 236 2%
Organisms‟ self-financing 686 4%
Contribution of the state to
European Framework
Programmme
529 3%
TOTAL 14678 100%
National innovation systems:international comparisons
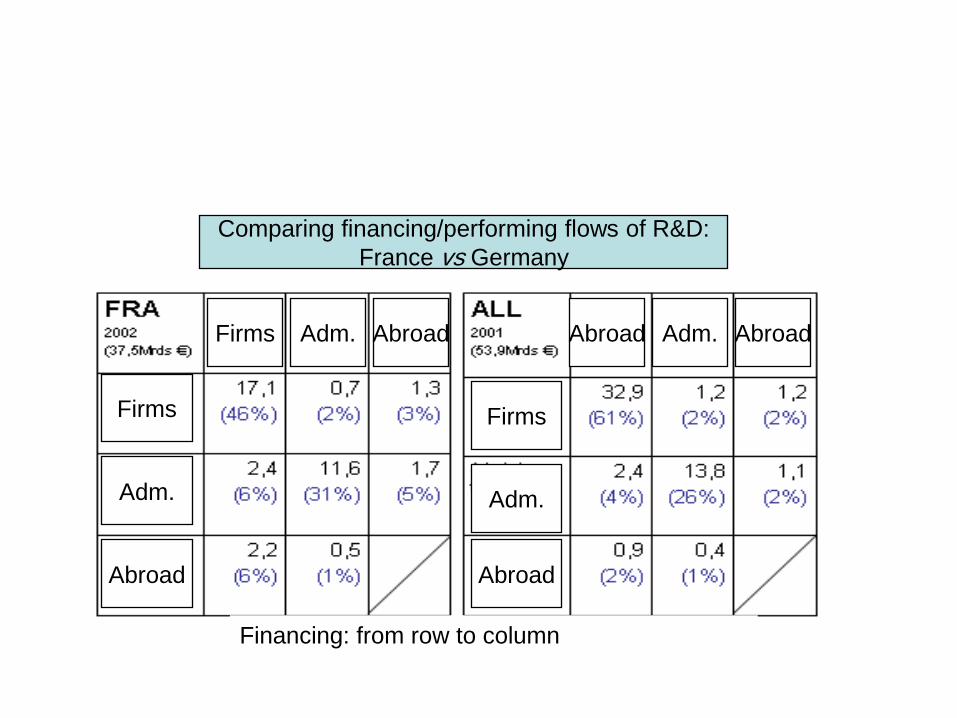
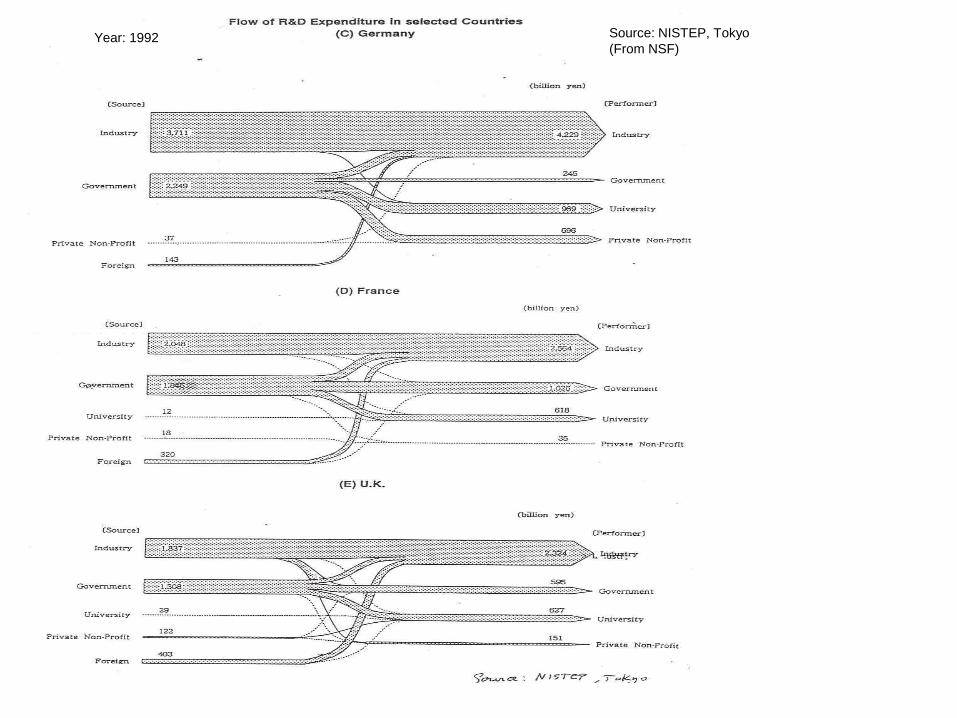
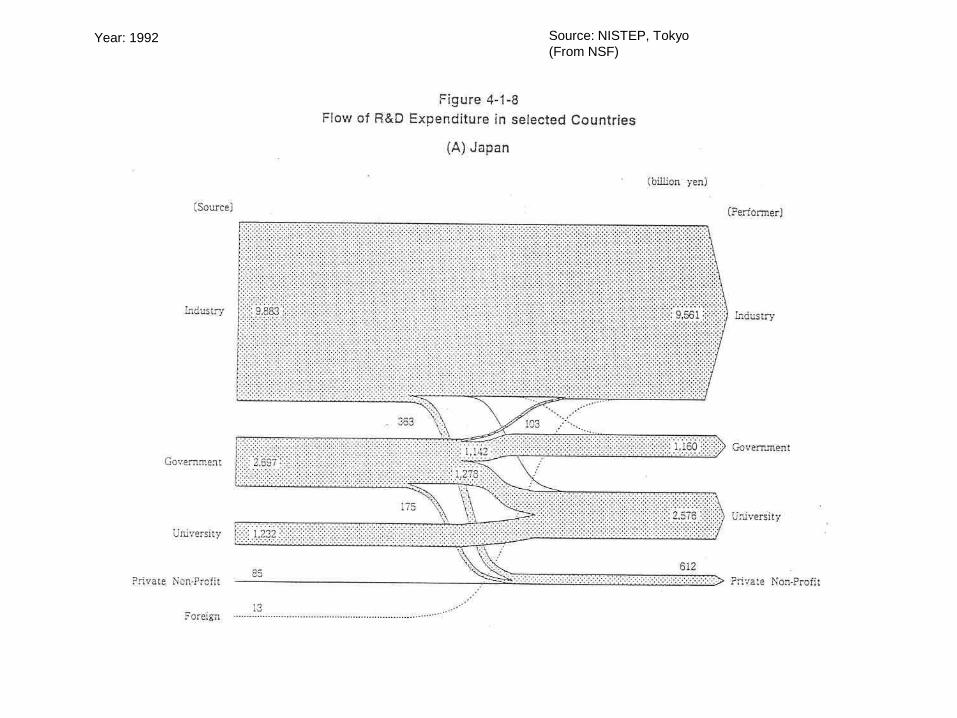
Comparing financing/performing flows of R&D:
France vs Germany
Firms Firms
Adm.
Abroad
Adm.
Abroad
AbroadAbroadAdm.Firms Adm.Abroad
Financing: from row to column
Source: NISTEP, Tokyo
(From NSF)Year: 1992
Year: 1992 Source: NISTEP, Tokyo
(From NSF)
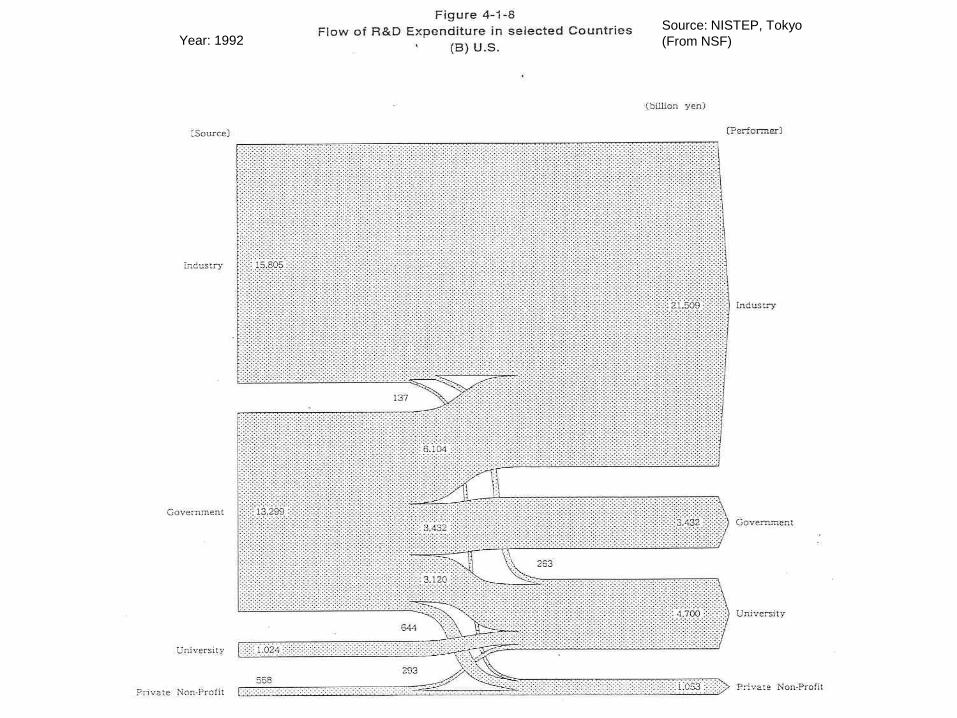
Year: 1992Source: NISTEP, Tokyo
(From NSF)
Regional innovation systems:General approach
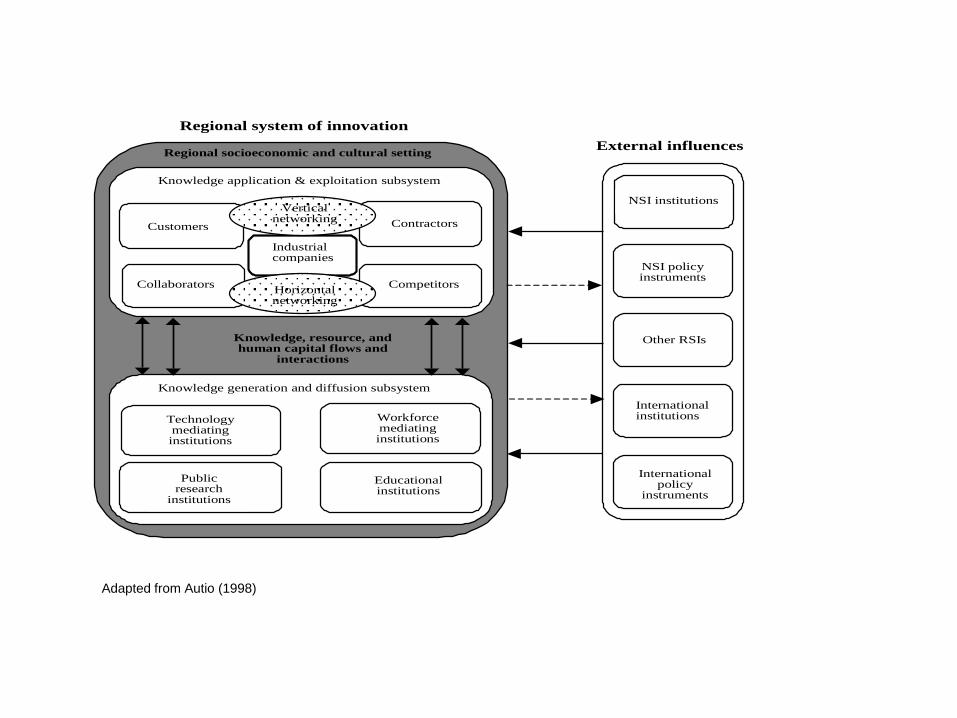
Customers
Collaborators
Contractors
Competitors
Industrialcompanies
Verticalnetworking
Horizontalnetworking
Knowledge application & exploitation subsystem
Technologymediatinginstitutions
Publicresearch
institutions
Workforcemediatinginstitutions
Educationalinstitutions
Knowledge generation and diffusion subsystem
Regional socioeconomic and cultural setting
Knowledge, resource, andhuman capital flows and
interactions
Regional system of innovation
NSI institutions
Internationalpolicy
instruments
Internationalinstitutions
Other RSIs
NSI policyinstruments
External influences
Adapted from Autio (1998)
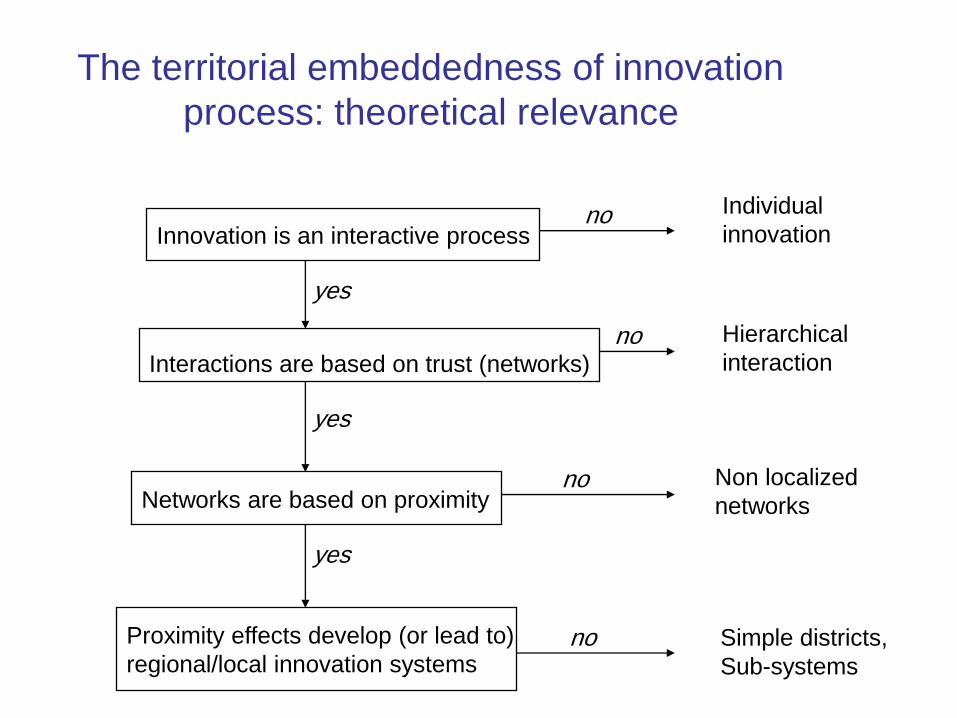
The territorial embeddedness of innovation
process: theoretical relevance
Innovation is an interactive process
Interactions are based on trust (networks)
Networks are based on proximity
Proximity effects develop (or lead to)
regional/local innovation systems
yes
yes
yes
no
no
no
no
Hierarchical
interaction
Non localized
networks
Individual
innovation
Simple districts,
Sub-systems
The regional dimension
• EU explicitly considers that regional (sometimes local) level is the optimal space for organising
innovation. This is a very important point (to be further explained) largely confirmed by empirical
and theoretical work: concepts of innovative milieu, of localized innovation system, of innovative
cluster, etc. Politically, it is also a way for EU to support directly the European regions (bypassing
the national level) for implementing its policy.
• Decentralization of governance is also a general tendency in European countries. The trend is not
limited to research and innovation policy. Even in very centralized nations like France and
England, a process of decision power devolution towards regional administrations is ongoing or
planned. Such a tendency boosts regional systems‟ self-organization – with the participation of
regional authorities as relevant public actors. We are therefore in a context of increased territorial
competition, but negotiation and co-financing with central government normally help keeping a
minimum of coherence and avoid wastefull duplication.
• The administration itself is sometimes involved in a «deconcentration» process. It is typically the
case in France where deconcentration of central administration comes along with decentralization.
That means for example more responsability and decision capacity for central government
representatives in regions in co-ordination with regional authorities. Another example is the larger
autonomy public universities will have in the future for defining their own strategy. Those
evolutions are important aspects of the rise of multi-level governance.
The possible contradiction between
regional and innovation policies
• In the game betweeen Regional and European actors, misunderstanding can arise. To sum up, in
the framework of the ERA project, EU is asking the regions the following question:
“What do you, regions, offer to contribute to the great network of knowledge-based Europe?”
It means implicitly: if you have nothing to offer, we can stop the discussion; if you have any asset
to be considered, we will help you to develop it.
Regions have often a long standing experience of being beneficiaries of “land planning” and other
supporting operations from higher level of governance (even EU contributes, through regional
funds policy, to support regions in various case of difficult situations). Such regions therefore will
think:
“What can Europe do to help developing my region?”
• To a certain extent, the new EU research policy is at odd with regional policy. The idea of picking
the winners and articulating them into a network is apparently in contradiction with another
important EU objective: regional convergence. It would not be a serious problem if research and
innovation were activities among other possible specializations. But if, by hypothesis, this field is
going to be essential to any economic and social development, then the policy principles of the
DG Research of the EU is not acceptable for a large part of European territories.

Increased regional concentration
• There are theoretical and empirical reasons to believe that the knowledge economy
leads to more concentration and inequality than the industrial economy. Industrial
revolution was largely based on economies of scale. It led to geographical
concentration (see Alfred Marshall‟s analysis of localized externalities and the
formation of industrial districts like in Manchester in the 19th Century). Knowledge
creation networks exploit powerful economies of variety: in areas where a large scope
of complementary knowledge and competence exist, creativity is considerable and
lead to ever more knowledge (in quantity and variety). Counter weighing effects
(increasing price of factors, congestion) are not so efficient to expand geographically
the development as in the case of classical industry.
• As a consequence, the regions of excellence will be in limited number and will trust
several knowledge fields. No doubt that the British «Golden Triangle» London-
Oxford-Cambridge, the greater Paris area, Munich and Frankfurt will host important
nodes of various networks of excellence (in ICT, biotechnology, advanced tertiary
activities, etc.). The interesting question is about most of the other regions.
Important actors and links in a learning region
• For multi-level governance it is important that central administration adopts a philosophy of
devolution and negotiation. Devolution in terms of decentralisation for part of the public
responsibilities plus internal deconcentration allowing good negotiation with local actors. It is also
important that central administration agents could help local administration (expertise) in a climate
of trust and mutual respect.
(this point is irrelevant for federal countries like Germany: their regions are real states)
• Good interaction of actors is critical. Public policy can help by supporting specifically mixt
consortia (typically university-enterprise co-operation, but also industrial co-operative research
among SMEs and between large and smaller firms). Regional authorities can also organize
foresight procedures in order to develop common understanding of the future and decide for
common strategy between all regional actors (including the public at large).
• Some key actors of learning regions: SMEs with increased absorption capacities for new
technologies; universities with increased conscience of their potential role on the territory; KIBS
(Knowledge Intensive Business Services) for their « catalyst » function in the system.
Conclusion in terms of policy
• Supporting well formed regional systems to become poles of
excellence in the future ERA.
• Developing interregional networks of competence and assets when
these elements are scattered.
• Boosting the restructuration of regions in difficulty.
- Regions with weak communication between actors : no structured
system
- Loked-in regions: existing system, but devoted to obsolete (low
tech) technologies and products
- Thin regions: the constituting elements of an innovation system
do not exist
Regional innovation systems:the case of France
Decentralization of governance is a general tendency
in European countries.
• The trend is not limited to research and innovation policy.
Even in very centralized nations like France and England,
a process of decision power devolution towards regional
administrations is ongoing or planned. Such a tendency
boosts regional systems‟ self-organization – with the
participation of regional authorities as relevant public
actors. We are therefore in a context of increased
territorial competition, but negotiation and co-financing
with central government normally help keeping a
minimum of coherence and avoid wastefull duplication.
The administration itself is sometimes involved in a
«deconcentration» process.
• It is typically the case in France where deconcentration
of central administration comes along with
decentralization. That means for example more
responsability and decision capacity for central
government representatives in regions in co-ordination
with regional authorities. Another example is the larger
autonomy public universities will have in the future for
defining their own strategy. Those evolutions are
important aspects of the rise of multi-level governance.
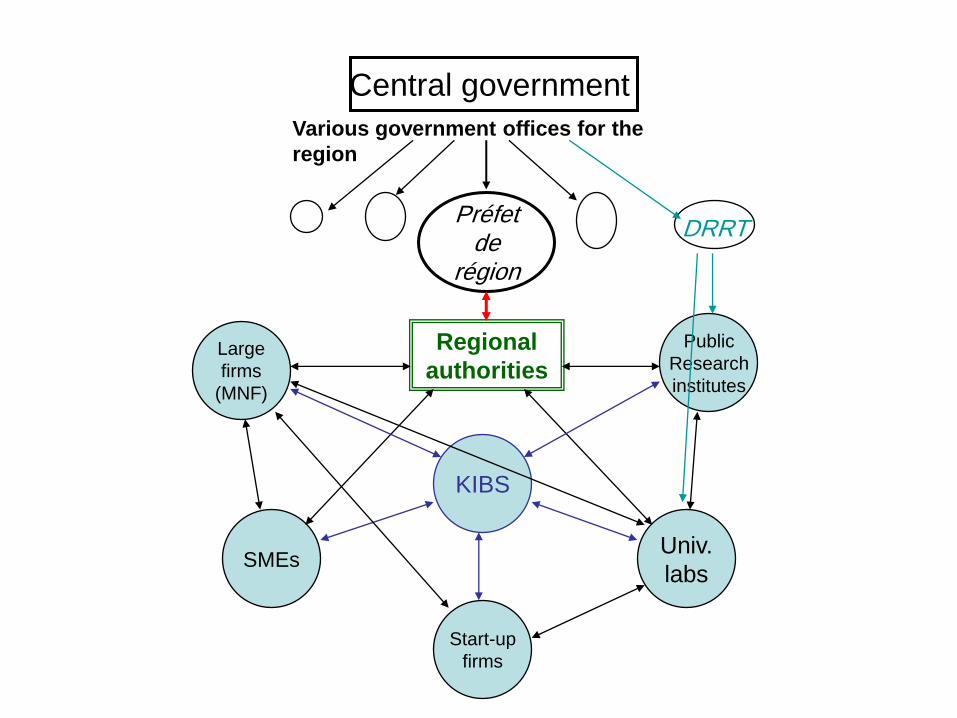
Préfetde
région
Central government
Regional
authorities
DRRT
Various government offices for the
region
Large
firms
(MNF)
SMEs
KIBS
Public
Research
institutes
Univ.
labs
Start-up
firms
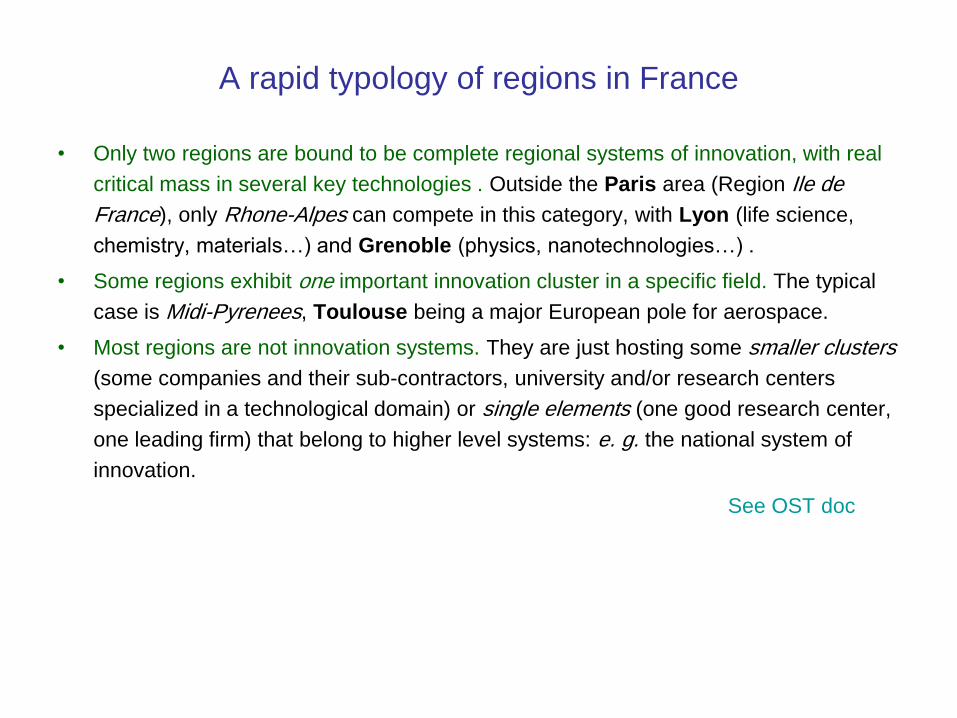
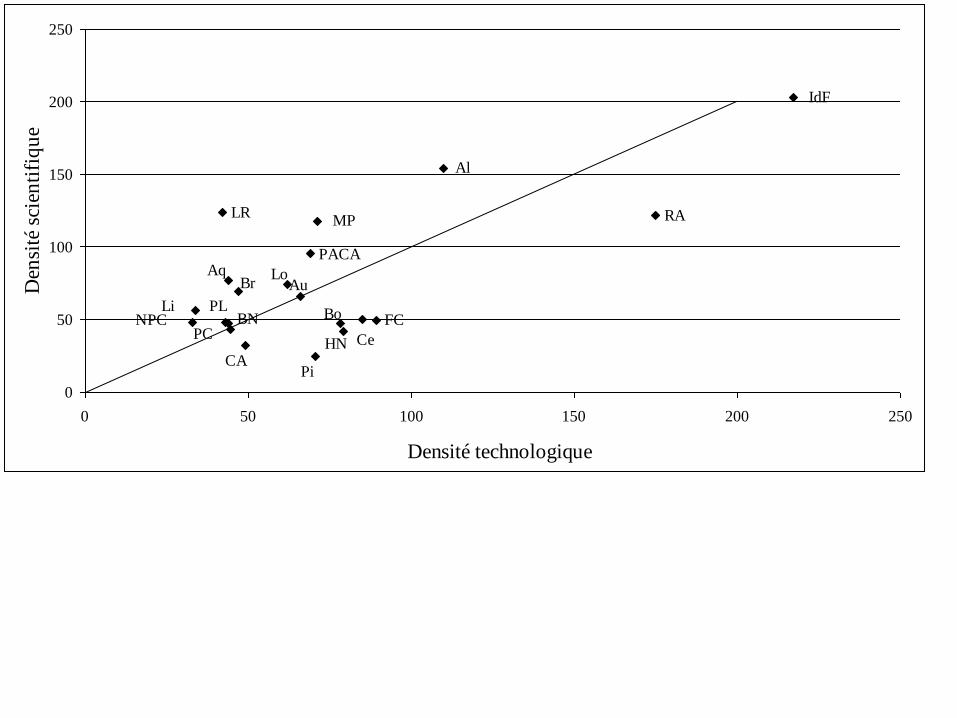
A rapid typology of regions in France
• Only two regions are bound to be complete regional systems of innovation, with real
critical mass in several key technologies . Outside the Paris area (Region Ile de
France), only Rhone-Alpes can compete in this category, with Lyon (life science,
chemistry, materials…) and Grenoble (physics, nanotechnologies…) .
• Some regions exhibit one important innovation cluster in a specific field. The typical
case is Midi-Pyrenees, Toulouse being a major European pole for aerospace.
• Most regions are not innovation systems. They are just hosting some smaller clusters
(some companies and their sub-contractors, university and/or research centers
specialized in a technological domain) or single elements (one good research center,
one leading firm) that belong to higher level systems: e. g. the national system of
innovation.
See OST doc
CePCNPC
Li
BrAq
Au
HN
FC
Lo
IdF
PACA
Bo
CAPi
LRMP
Al
RA
PLBN
0
50
100
150
200
250
0 50 100 150 200 250
Densité technologique
Den
sité
sci
enti
fiq
ue
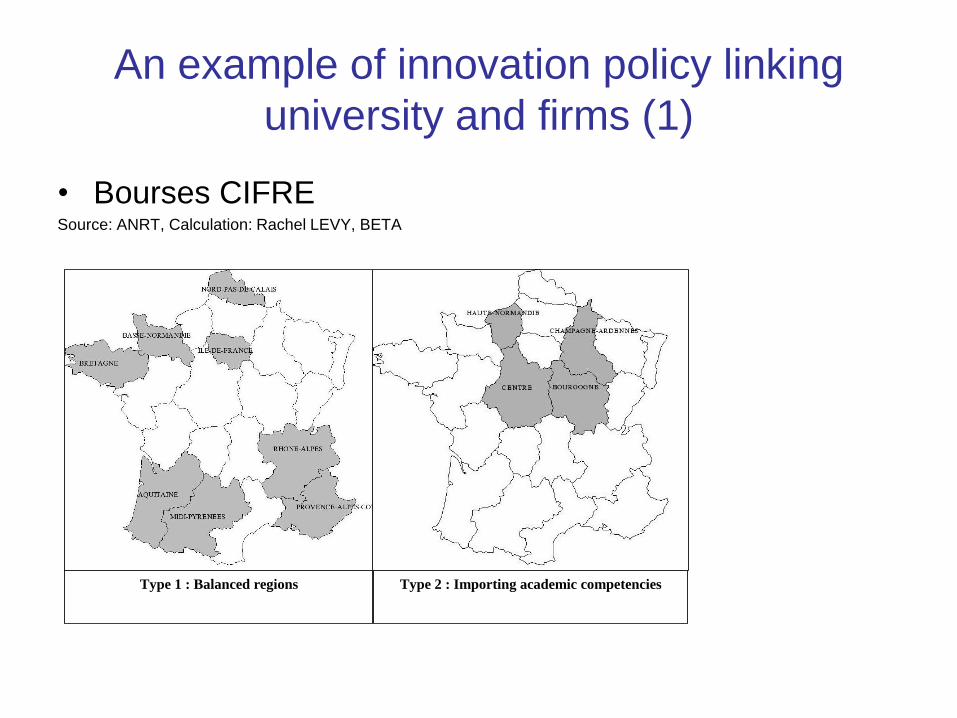
An example of innovation policy linking
university and firms (1)
• Bourses CIFRESource: ANRT, Calculation: Rachel LEVY, BETA
Type 1 : Balanced regions Type 2 : Importing academic competencies
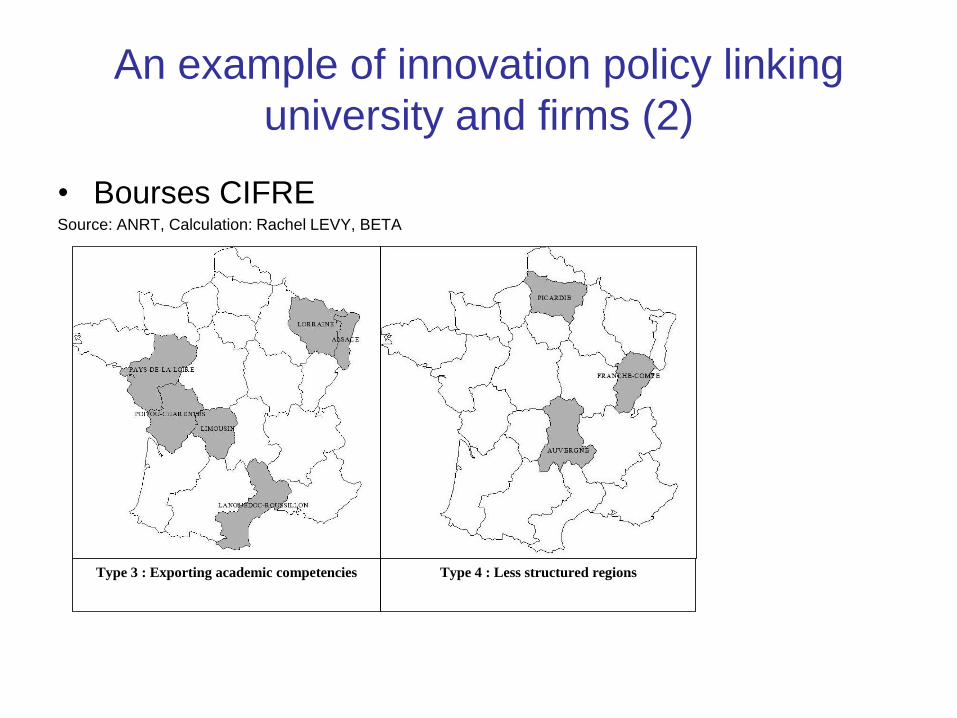
An example of innovation policy linking
university and firms (2)
• Bourses CIFRESource: ANRT, Calculation: Rachel LEVY, BETA
Type 3 : Exporting academic competencies Type 4 : Less structured regions
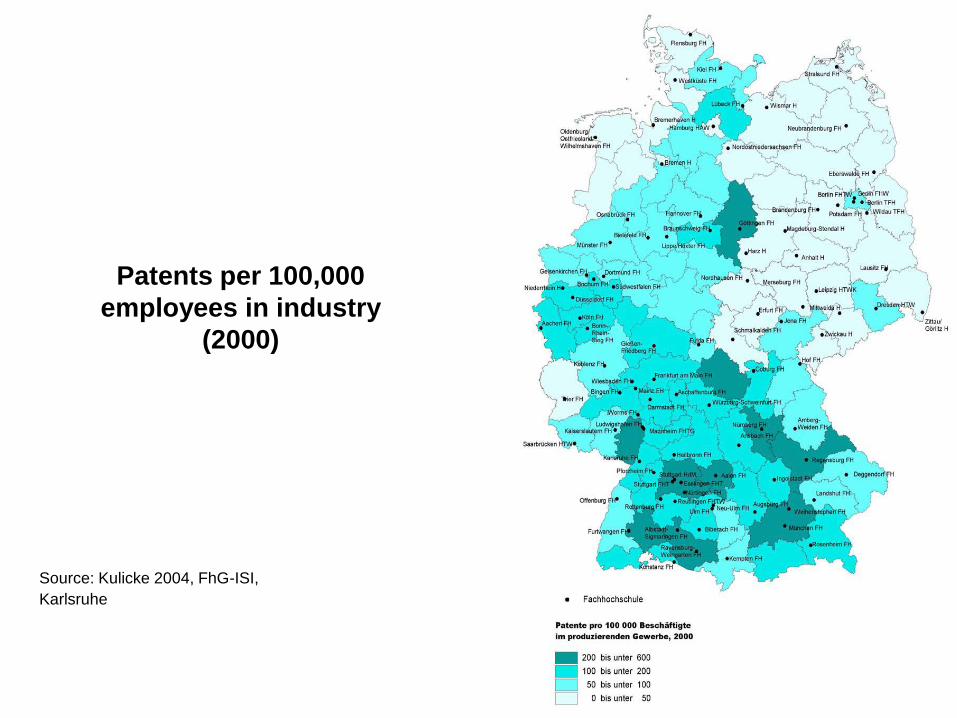
Patents per 100,000
employees in industry
(2000)
Source: Kulicke 2004, FhG-ISI,
Karlsruhe
(RU)
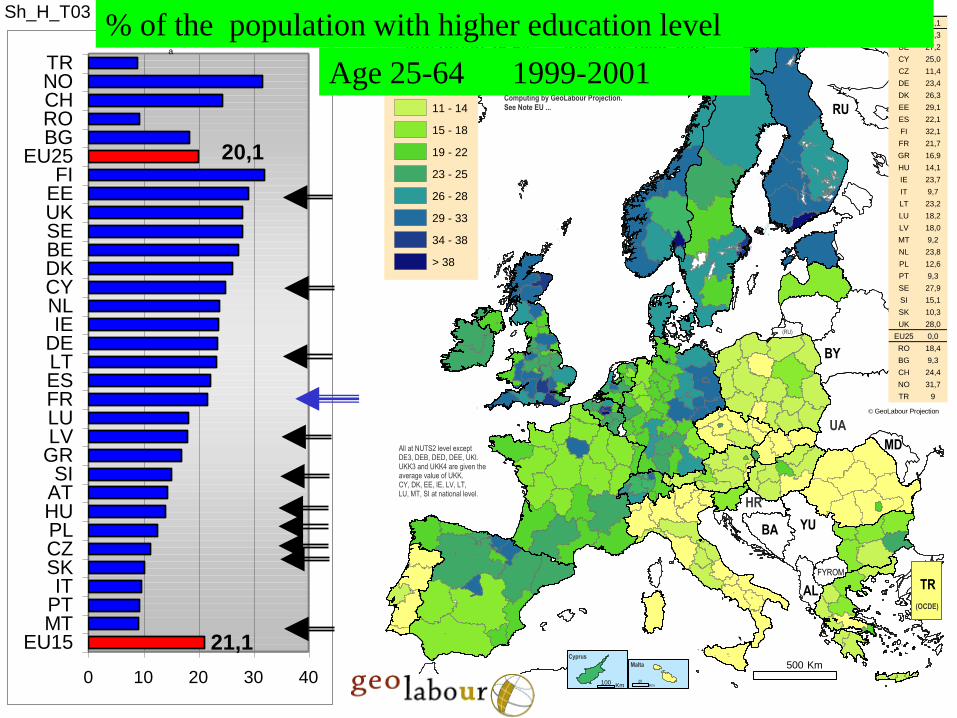
Share of the population with High EducationAge group 25-64 - Average 1999-2001
Malta
Cyprus
25Km
100 Km
< 10
11 - 14
15 - 18
19 - 22
23 - 25
26 - 28
29 - 33
34 - 38
> 38
RU
MD
UA
BY
YU
FYROM
BA
HR
AL
Map EU 23a
500 Km
Source: Eurostat Labour Force Survey (Spring)Computing by GeoLabour Projection.See Note EU ...
© GeoLabour Projection
TR
(OCDE)
EU15 21,1
AT 14,3
BE 27,2
CY 25,0
CZ 11,4
DE 23,4
DK 26,3
EE 29,1
ES 22,1
FI 32,1
FR 21,7
GR 16,9
HU 14,1
IE 23,7
IT 9,7
LT 23,2
LU 18,2
LV 18,0
MT 9,2
NL 23,8
PL 12,6
PT 9,3
SE 27,9
SI 15,1
SK 10,3
UK 28,0
EU25 0,0
RO 18,4
BG 9,3
CH 24,4
NO 31,7
TR 9
"
All at NUTS2 level exceptDE3, DEB, DED, DEE, UKI.UKK3 and UKK4 are given theaverage value of UKK.CY, DK, EE, IE, LV, LT, LU, MT, SI at national level.
Sh_H_T03
a
20,1
21,1
0 10 20 30 40
EU15MTPTIT
SKCZPLHUATSI
GRLVLUFRESLTDEIE
NLCYDKBESEUKEEFI
EU25BGROCHNOTR
% of the population with higher education level
Age 25-64 1999-2001
(RU)
Generational progression in education - Increasing share of "High" attainments
Malta
Cyprus
25Km
100 Km
-25,0 - -2,0
-1,9 - 2,0
2,1 - 5,0
5,1 - 8,0
8,1 - 12,0
12,1 - 16,0
16,1 - 20,0
20,1 - 25,0
25,1 - 48,0
RU
MD
UA
BY
YU
FYROM
BA
HR
AL
Map EU 31a
500 Km
Source: Eurostat Labour Force Survey (Spring)Computing by GeoLabour Projection.
© GeoLabour Projection
"
All at NUTS2 level exceptDE3, DEB, DED, DEE, UKI.UKK3 and UKK4 are given theaverage value of UKK.CY, DK, EE, IE, LV, LT, LU, MT, SI at national level.
(Difference (in points) of the sharesof "High" in the age group 25-34and the age group 55-64.Average 1999-2001.
TR
OECD
+ 4
EU15 10,3
AT 4,1
BE 19,1
CY 21,5
CZ 1,9
DE 1,8
DK 9,8
EE 2,1
ES 24,5
FI 15,4
FR 18,8
GR 15,3
HU 2,8
IE 19,9
IT 4,6
LT 9,2
LU 9,6
LV 1,7
MT 10,7
NL 8,2
PL 6,8
PT 8,0
SE 9,4
SI 6,3
SK 3,7
UK 8,7
EU25 6,4
RO 4,5
BG 1,6
CH 6,9
NO 17,7
GenProH_T
a
9,0
10,3
0 5 10 15 20 25
EU15LVDECZEEHUSKATITSIPLPTNLUKLTSELUDKMTGR
FIFRBEIE
CYES
EU25BGROCHNOTR
Generational progression in higher education
% HE in population [25-34] - % HE in population [55-64]