Embed Size (px)
Citation preview
Dissertation zur Erlangung des Doktorgrades der Fakultät für
Chemie und Pharmazie der Ludwig-Maximilians-Universität München
The Function of the Halophilic Dodecin
Martin Grininger
aus Linz
2006
Erklärung
Diese Dissertation wurde im Sinne von §13 Abs. 3 bzw. 4 der Promotionsordnung vom 29.
Januar 1998 von Herrn Prof. Dr. Dieter Oesterhelt betreut.
Ehrenwörtliche Versicherung
Diese Dissertation wurde selbstständig, ohne unerlaubte Hilfe erarbeitet.
München, am 27. Juni 2006
…………………………….
Martin Grininger
Dissertation eingereicht am:
1. Gutachter: Prof. Dr. Dieter Oesterhelt
2. Gutachter: Prof. Dr. Karl-Peter Hopfner
Mündliche Prüfung am: 25. Oktober 2006

Meinen Eltern und Geschwister

Table of Contents
1
1. Introduction..................................................................................................................................................... 4
1.1 Archaea and Extremophiles ................................................................................................................. 4 1.2 Principles of halophilicity .................................................................................................................... 5 1.3 Cofactors Broaden the Spectrum of Protein Functions ........................................................................ 7 1.4 The Chemistry of Flavins..................................................................................................................... 8 1.5 Biosynthesis of Flavins ........................................................................................................................ 9 1.6 Flavin Degradation............................................................................................................................. 11 1.7 Flavoproteins...................................................................................................................................... 12 1.8 Dodecin.............................................................................................................................................. 14 1.9 Scope of Work ................................................................................................................................... 16
2. Materials and Methods.................................................................................................................................. 18 2.1 Materials ............................................................................................................................................ 18
2.1.1 Instruments and Devices ............................................................................................................... 18 2.1.1.1 Centrifuges ............................................................................................................................... 18 2.1.1.2 High Pressure Liquid Chromatography (HPLC) System.......................................................... 18 2.1.1.3 High Pressure Liquid Chromatography (HPLC)/Mass Spectrometry (MS) System ................ 18 2.1.1.4 High Pressure Liquid Chromatography (HPLC)/Fluorescence Detection System ................... 19 2.1.1.5 Absorption Spectrometer.......................................................................................................... 19 2.1.1.6 Fluorescence Spectrometer....................................................................................................... 19 2.1.1.7 Spectro-electrochemical Cell.................................................................................................... 19 2.1.1.8 Devices for X-ray Data Collection ........................................................................................... 19 2.1.1.9 Additionally used Instruments and Devices ............................................................................. 20
2.1.2 Chemicals...................................................................................................................................... 20 2.1.3 Computional Support (Software) .................................................................................................. 21 2.1.4 Media, Buffers and Stock-Solutions.............................................................................................. 22
2.1.4.1 Growth Media........................................................................................................................... 22 2.1.4.2 Buffers ...................................................................................................................................... 23 2.1.4.3 Stock-Solutions ........................................................................................................................ 23
2.1.5 Strains, Vectors and Oligonucleotides .......................................................................................... 24 2.1.5.1 Strains....................................................................................................................................... 24 2.1.5.2 Vectors ..................................................................................................................................... 25 2.1.5.3 Oligonucleotides....................................................................................................................... 25
2.2 Methods ............................................................................................................................................. 26 2.2.1 Microbiological Methods .............................................................................................................. 26
2.2.1.1 Storage and Cultivation of E. coli ............................................................................................ 26 2.2.1.2 Storage and Cultivation of H. salinarum .................................................................................. 26 2.2.1.3 Recording Growth Curves by Optical Density ......................................................................... 27 2.2.1.4 Recording Growth Curves by Viable Cell Count ..................................................................... 27 2.2.1.5 Correlation of Optical Density and Internal Cell Volume ........................................................ 27
2.2.2 Molecularbiological Methods........................................................................................................ 28 2.2.2.1 Preparation and Transformation of Electro-Competent E. coli Cells ....................................... 28 2.2.2.2 Preparation and Transformation of Competent H. salinarum Cells ......................................... 28 2.2.2.3 Preparation of Genomic DNA from H. salinarum ................................................................... 29 2.2.2.4 Isolation of Vector-DNA from E. coli ...................................................................................... 29 2.2.2.5 Isolation of DNA form Preparative Agarose Gels.................................................................... 29 2.2.2.6 Polymerase Chain Reaction (PCR)........................................................................................... 29 2.2.2.7 Digest of DNA by Restriction Endonulceases.......................................................................... 30 2.2.2.8 Ligation of DNA Fragments..................................................................................................... 30 2.2.2.9 Gel-Electrophoresis of DNA .................................................................................................... 31 2.2.2.10 Determination of DNA-Concentration ..................................................................................... 31 2.2.2.11 Cloning of Dodecin from H. salinarum.................................................................................... 31 2.2.2.12 Site Directed Mutagenesis of Dodecin from H. salinarum....................................................... 32 2.2.2.13 Cloning of Dodecin from H. halophila..................................................................................... 33 2.2.2.14 DNA-Sequencing ..................................................................................................................... 33 2.2.2.15 Isolation of Total RNA from H. salinarum .............................................................................. 34 2.2.2.16 DNase I-Digestion of RNA-samples ........................................................................................ 34 2.2.2.17 Reverse Transcription (RT) and SybrGreen-Based RT-PCR ................................................... 34
2.2.3 Proteinchemical Methods.............................................................................................................. 36 2.2.3.1 SDS-Polyacrylamide Gel-Electrophoresis (SDS-PAGE) of Proteins....................................... 36 2.2.3.2 Electro-Blotting ........................................................................................................................ 37
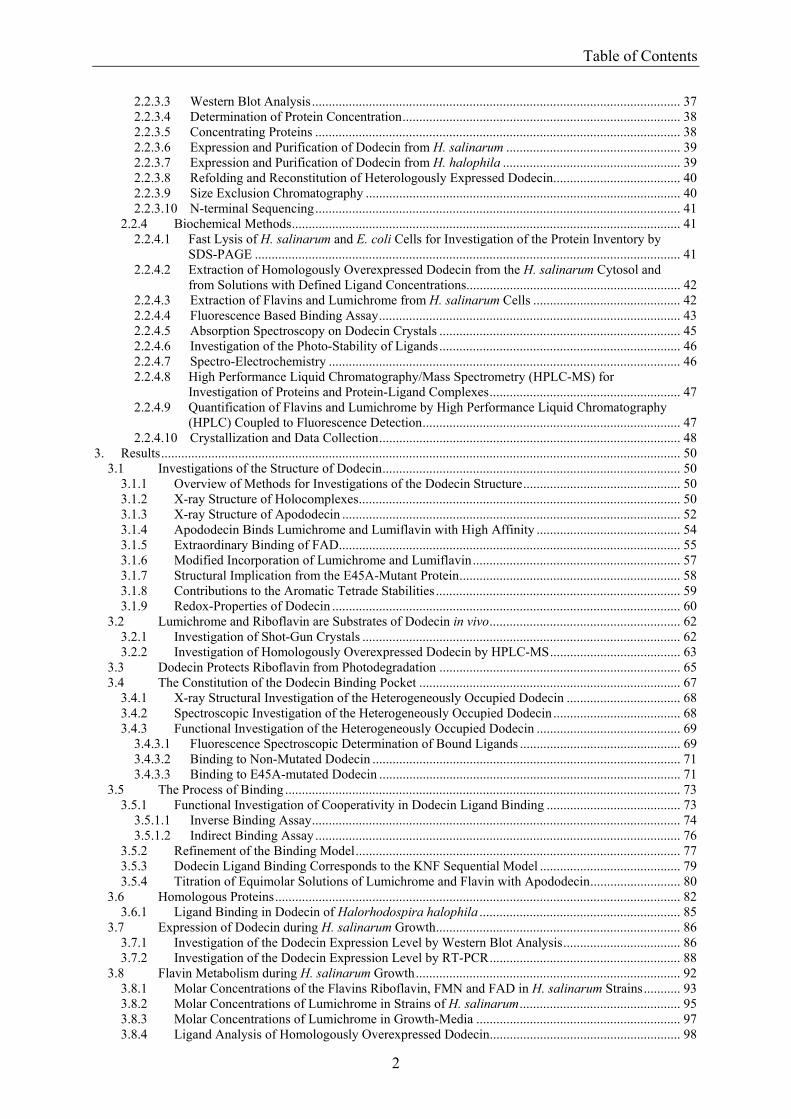
Table of Contents
2
2.2.3.3 Western Blot Analysis.............................................................................................................. 37 2.2.3.4 Determination of Protein Concentration................................................................................... 38 2.2.3.5 Concentrating Proteins ............................................................................................................. 38 2.2.3.6 Expression and Purification of Dodecin from H. salinarum .................................................... 39 2.2.3.7 Expression and Purification of Dodecin from H. halophila ..................................................... 39 2.2.3.8 Refolding and Reconstitution of Heterologously Expressed Dodecin...................................... 40 2.2.3.9 Size Exclusion Chromatography .............................................................................................. 40 2.2.3.10 N-terminal Sequencing............................................................................................................. 41
2.2.4 Biochemical Methods.................................................................................................................... 41 2.2.4.1 Fast Lysis of H. salinarum and E. coli Cells for Investigation of the Protein Inventory by
SDS-PAGE ............................................................................................................................... 41 2.2.4.2 Extraction of Homologously Overexpressed Dodecin from the H. salinarum Cytosol and
from Solutions with Defined Ligand Concentrations................................................................ 42 2.2.4.3 Extraction of Flavins and Lumichrome from H. salinarum Cells ............................................ 42 2.2.4.4 Fluorescence Based Binding Assay.......................................................................................... 43 2.2.4.5 Absorption Spectroscopy on Dodecin Crystals ........................................................................ 45 2.2.4.6 Investigation of the Photo-Stability of Ligands........................................................................ 46 2.2.4.7 Spectro-Electrochemistry ......................................................................................................... 46 2.2.4.8 High Performance Liquid Chromatography/Mass Spectrometry (HPLC-MS) for
Investigation of Proteins and Protein-Ligand Complexes......................................................... 47 2.2.4.9 Quantification of Flavins and Lumichrome by High Performance Liquid Chromatography
(HPLC) Coupled to Fluorescence Detection............................................................................. 47 2.2.4.10 Crystallization and Data Collection.......................................................................................... 48
3. Results........................................................................................................................................................... 50 3.1 Investigations of the Structure of Dodecin......................................................................................... 50
3.1.1 Overview of Methods for Investigations of the Dodecin Structure............................................... 50 3.1.2 X-ray Structure of Holocomplexes................................................................................................ 50 3.1.3 X-ray Structure of Apododecin ..................................................................................................... 52 3.1.4 Apododecin Binds Lumichrome and Lumiflavin with High Affinity ........................................... 54 3.1.5 Extraordinary Binding of FAD...................................................................................................... 55 3.1.6 Modified Incorporation of Lumichrome and Lumiflavin.............................................................. 57 3.1.7 Structural Implication from the E45A-Mutant Protein.................................................................. 58 3.1.8 Contributions to the Aromatic Tetrade Stabilities ......................................................................... 59 3.1.9 Redox-Properties of Dodecin ........................................................................................................ 60
3.2 Lumichrome and Riboflavin are Substrates of Dodecin in vivo......................................................... 62 3.2.1 Investigation of Shot-Gun Crystals ............................................................................................... 62 3.2.2 Investigation of Homologously Overexpressed Dodecin by HPLC-MS....................................... 63
3.3 Dodecin Protects Riboflavin from Photodegradation ........................................................................ 65 3.4 The Constitution of the Dodecin Binding Pocket .............................................................................. 67
3.4.1 X-ray Structural Investigation of the Heterogeneously Occupied Dodecin .................................. 68 3.4.2 Spectroscopic Investigation of the Heterogeneously Occupied Dodecin ...................................... 68 3.4.3 Functional Investigation of the Heterogeneously Occupied Dodecin ........................................... 69
3.4.3.1 Fluorescence Spectroscopic Determination of Bound Ligands ................................................ 69 3.4.3.2 Binding to Non-Mutated Dodecin ............................................................................................ 71 3.4.3.3 Binding to E45A-mutated Dodecin .......................................................................................... 71
3.5 The Process of Binding ...................................................................................................................... 73 3.5.1 Functional Investigation of Cooperativity in Dodecin Ligand Binding ........................................ 73
3.5.1.1 Inverse Binding Assay.............................................................................................................. 74 3.5.1.2 Indirect Binding Assay ............................................................................................................. 76
3.5.2 Refinement of the Binding Model................................................................................................. 77 3.5.3 Dodecin Ligand Binding Corresponds to the KNF Sequential Model .......................................... 79 3.5.4 Titration of Equimolar Solutions of Lumichrome and Flavin with Apododecin........................... 80
3.6 Homologous Proteins......................................................................................................................... 82 3.6.1 Ligand Binding in Dodecin of Halorhodospira halophila ............................................................ 85
3.7 Expression of Dodecin during H. salinarum Growth......................................................................... 86 3.7.1 Investigation of the Dodecin Expression Level by Western Blot Analysis................................... 86 3.7.2 Investigation of the Dodecin Expression Level by RT-PCR......................................................... 88
3.8 Flavin Metabolism during H. salinarum Growth............................................................................... 92 3.8.1 Molar Concentrations of the Flavins Riboflavin, FMN and FAD in H. salinarum Strains........... 93 3.8.2 Molar Concentrations of Lumichrome in Strains of H. salinarum................................................ 95 3.8.3 Molar Concentrations of Lumichrome in Growth-Media ............................................................. 97 3.8.4 Ligand Analysis of Homologously Overexpressed Dodecin......................................................... 98
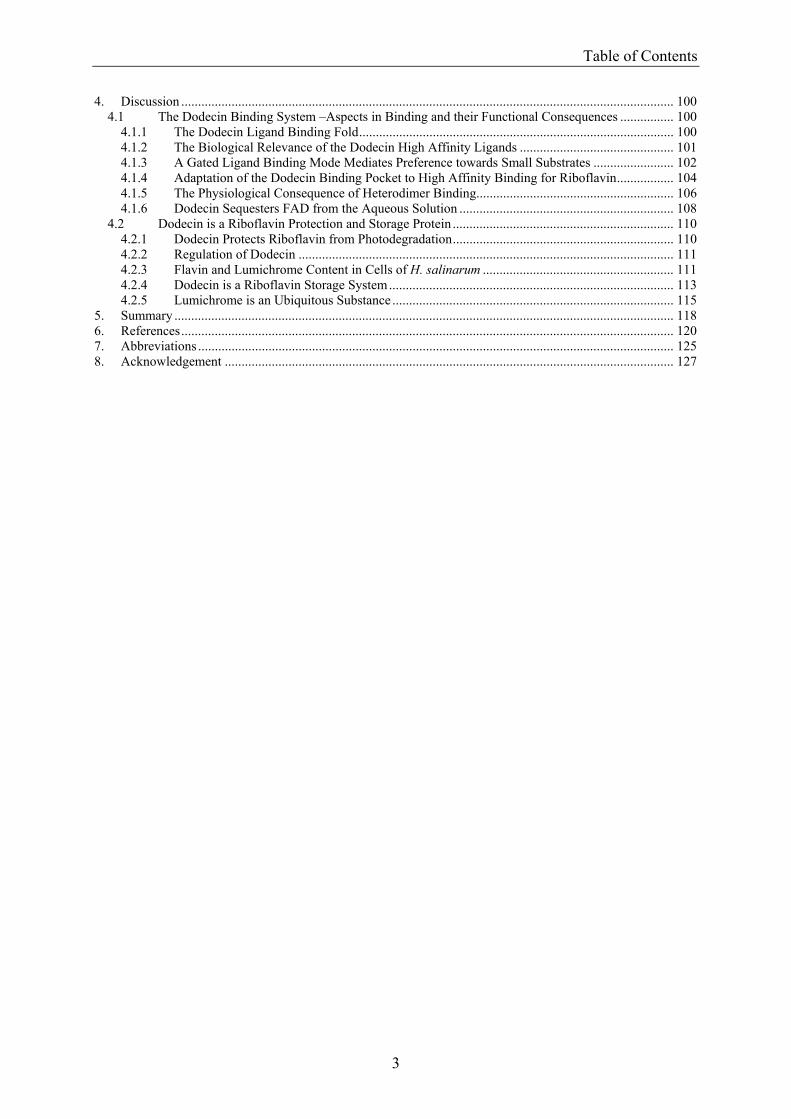
Table of Contents
3
4. Discussion ................................................................................................................................................... 100 4.1 The Dodecin Binding System –Aspects in Binding and their Functional Consequences ................ 100
4.1.1 The Dodecin Ligand Binding Fold.............................................................................................. 100 4.1.2 The Biological Relevance of the Dodecin High Affinity Ligands .............................................. 101 4.1.3 A Gated Ligand Binding Mode Mediates Preference towards Small Substrates ........................ 102 4.1.4 Adaptation of the Dodecin Binding Pocket to High Affinity Binding for Riboflavin................. 104 4.1.5 The Physiological Consequence of Heterodimer Binding........................................................... 106 4.1.6 Dodecin Sequesters FAD from the Aqueous Solution ................................................................ 108
4.2 Dodecin is a Riboflavin Protection and Storage Protein .................................................................. 110 4.2.1 Dodecin Protects Riboflavin from Photodegradation.................................................................. 110 4.2.2 Regulation of Dodecin ................................................................................................................ 111 4.2.3 Flavin and Lumichrome Content in Cells of H. salinarum ......................................................... 111 4.2.4 Dodecin is a Riboflavin Storage System..................................................................................... 113 4.2.5 Lumichrome is an Ubiquitous Substance .................................................................................... 115
5. Summary ..................................................................................................................................................... 118 6. References................................................................................................................................................... 120 7. Abbreviations .............................................................................................................................................. 125 8. Acknowledgement ...................................................................................................................................... 127
Introduction
4
1. Introduction
1.1 Archaea and Extremophiles Living organisms are classified in three domains: eukarya, bacteria and archaea. Archaeal
organisms were not recognized as constituting a discrete entity of life until the late 1970s
when Woese et al. found that among the prokaryotes there are two distinctly different groups,
the bacteria and the archaea. Archaea are now classified into two divisions on the basis of
their ribosomal 16S RNA, (I) the sulfur dependent thermophilic archaea (Crenarchaeota) and
(II) the methanogenic archaea and their relatives which comprise a considerable number of
extremophile organisms (Euryarchaeota). While the organisms in division I are all
phenotypically thermophilic, all three archaeal phenotypes, namely methanogenicity,
thermoacidophilicity and halophilicity occur in division II (Figure 1.A) (Woese and Fox,
1977; Woese and Olsen, 1986). In 2002, the archaeal microbe Nanoarchaeum equitans was
discovered in a hydrothermal vent off the coast of Iceland (Huber, 2002; Waters, 2003). It
was given its own phylum (Nanoarchaeota, division III); however, N. equitans is currently
discussed to belong to the Euryarchaeota phylum (Brochier, 2005). Halophilic archaea are
found all over the world under salt concentrations (NaCl) that exceed 2 M. The salt
concentration for optimal growth is about 4.5 M NaCl, which is ten times higher than the
salinity of seawater. Wherever such conditions are met, the presence of large halophilic
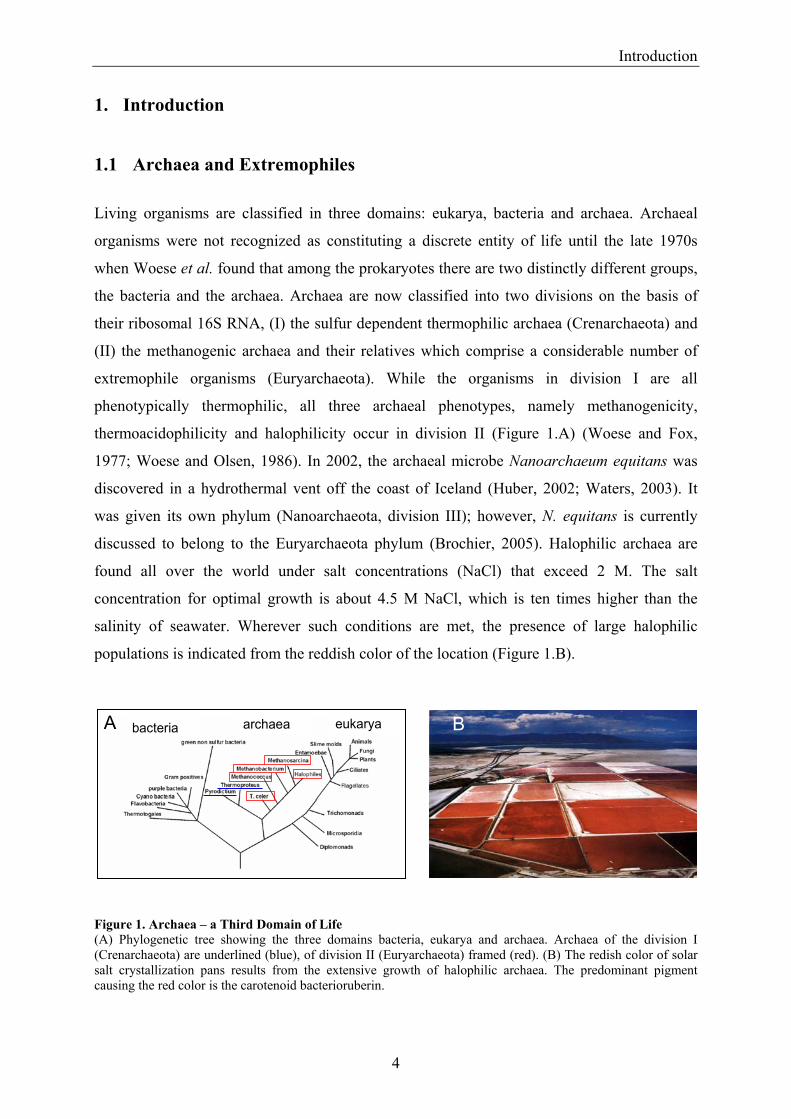
populations is indicated from the reddish color of the location (Figure 1.B). Figure 1. Archaea – a Third Domain of Life (A) Phylogenetic tree showing the three domains bacteria, eukarya and archaea. Archaea of the division I (Crenarchaeota) are underlined (blue), of division II (Euryarchaeota) framed (red). (B) The redish color of solar salt crystallization pans results from the extensive growth of halophilic archaea. The predominant pigment causing the red color is the carotenoid bacterioruberin.
bacteria archaea eukaryaA B
Introduction
5
1.2 Principles of Halophilicity The study of extremophile adaptation to extreme conditions in temperature, pressure, pH and
salt concentrations is a highly active area of scientific research. Halophilicity is thereby of
outstanding interest since not a thermodynamic parameter, but the composition of the
environment differs from mesophily (Jaenicke, 1991). Principally, halophilic organisms use
two strategies to resist the denaturing conditions: (I) a salt-in strategy, which is an uptake of
high levels of salt, exhibited by halophilic archaea and (II) accumulation of compatible
solutes. While in cells enriched with small molecules (compatible-solutes) the mesophilic
protein structures can be retained, the high-salt environment in halophilic organisms demands
for a high-salt adapted cell interior.
Halobacterium salinarum is a well investigated halophilic organism which accumulates 4 M
KCl and 1 M NaCl to maintain osmolarity. Concomitantly to the knowledge about the H.
salinarum physiology, insights from genomics and proteomics projects, as well as from
structural and functional analysis of proteins allow to account for molecular mechanisms to
resist the denaturing high-salt condition (www.halolex.mpg.de; Ng et al., 2000). For
halophilic proteins it was found that they are composed by a higher percentage of acidic
compared to mesophilic homologues (Lanyi, 1974). These results were supported in a first
statistically relevant comparative investigation on 26 proteins of halophilic and the
corresponding mesophilic origin. Madern et al. could show that the halophilic character of
proteins is established in the protein primary sequence by an increased level of acidic residues
along with a drastic reduction of lysine residues (Madern et al., 2000; Madern et al., 1995).
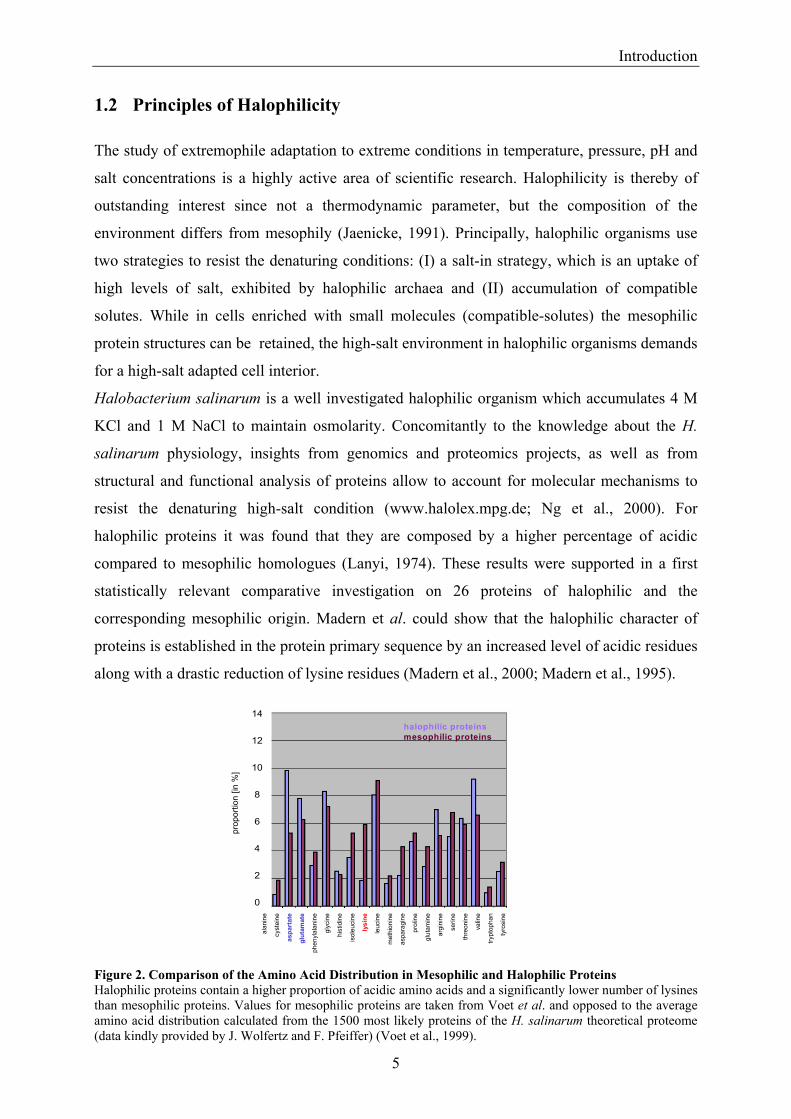
Figure 2. Comparison of the Amino Acid Distribution in Mesophilic and Halophilic Proteins Halophilic proteins contain a higher proportion of acidic amino acids and a significantly lower number of lysines than mesophilic proteins. Values for mesophilic proteins are taken from Voet et al. and opposed to the average amino acid distribution calculated from the 1500 most likely proteins of the H. salinarum theoretical proteome (data kindly provided by J. Wolfertz and F. Pfeiffer) (Voet et al., 1999).
alan
ine
cyst
eine
aspa
rtat
e
glut
amat
e
phen
ylal
anin
e
glyc
ine
hist
idin
e
isol
euci
ne
lysi
ne
leuc
ine
met
hion
ine
aspa
ragi
ne
prol
ine
glut
amin
e
argi
nine
serin
e
thre
onin
e
valin
e
trypt
opha
n
tyro
sine
prop
ortio
n[in
%]
halophilic proteinsmesophilic proteins
14
12
10
8
6
4
2
0
Introduction
6
Figure 2 illustrates the amino acid composition in mesophilic and halophilic proteins. Values
for halophilic proteins are calculated from a set of 1500 proteins of H. salinarum and support
the amino acid composition of halophilic proteins mentioned above.
The enhanced acidity of proteins is efficiently transferred into protein tertiary and quaternary
structures as negative charges are primarily positioned on protein surfaces (Bonnete et al.,
1993; Danson, 1988; Zaccai and Eisenberg, 1990). The average surface acidity of H.
salinarum proteins was calculated to one negative charge per 246 Å2 based on the structure
prediction from homologous proteins. In non-halophilic proteins the surfaces are significantly
less negatively charged with one negative charge per 350-400 Å2. For the halophilic protein
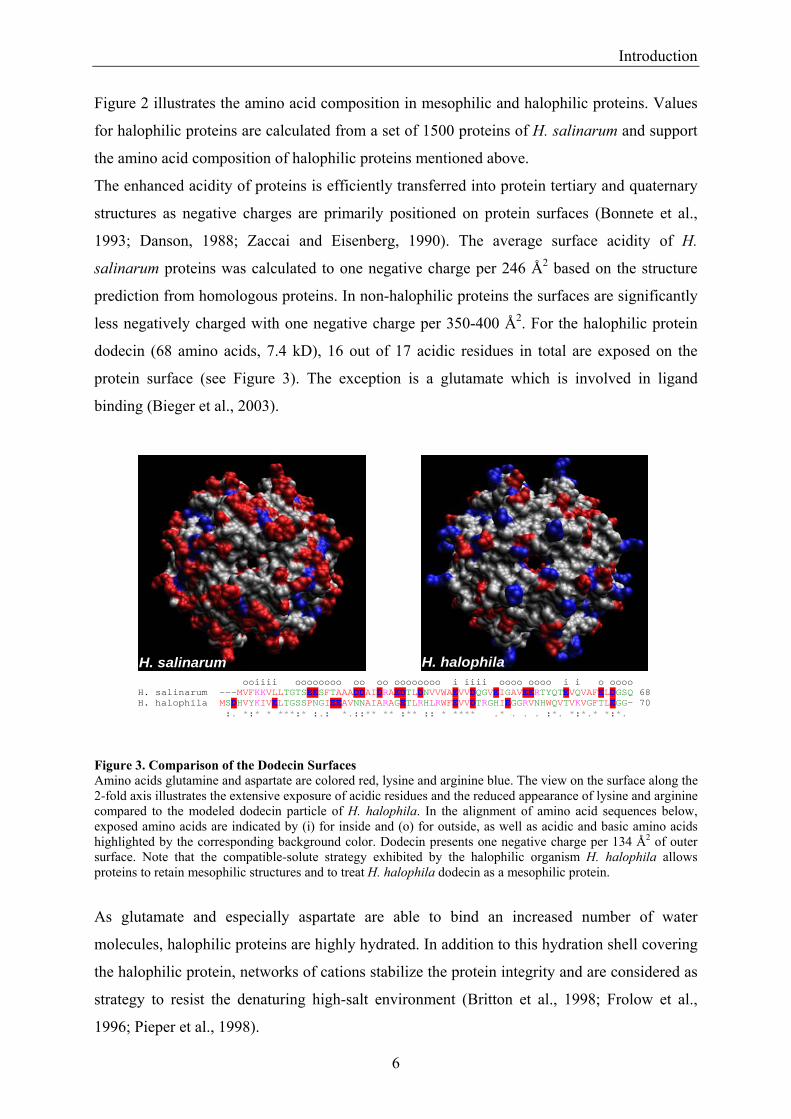
dodecin (68 amino acids, 7.4 kD), 16 out of 17 acidic residues in total are exposed on the
protein surface (see Figure 3). The exception is a glutamate which is involved in ligand
binding (Bieger et al., 2003).
Figure 3. Comparison of the Dodecin Surfaces Amino acids glutamine and aspartate are colored red, lysine and arginine blue. The view on the surface along the 2-fold axis illustrates the extensive exposure of acidic residues and the reduced appearance of lysine and arginine compared to the modeled dodecin particle of H. halophila. In the alignment of amino acid sequences below, exposed amino acids are indicated by (i) for inside and (o) for outside, as well as acidic and basic amino acids highlighted by the corresponding background color. Dodecin presents one negative charge per 134 Å2 of outer surface. Note that the compatible-solute strategy exhibited by the halophilic organism H. halophila allows proteins to retain mesophilic structures and to treat H. halophila dodecin as a mesophilic protein.
As glutamate and especially aspartate are able to bind an increased number of water
molecules, halophilic proteins are highly hydrated. In addition to this hydration shell covering
the halophilic protein, networks of cations stabilize the protein integrity and are considered as
strategy to resist the denaturing high-salt environment (Britton et al., 1998; Frolow et al.,
1996; Pieper et al., 1998).
H. salinarum H. halophila ooiiii oooooooo oo oo oooooooo i iiii oooo oooo i i o oooo H. salinarum ---MVFKKVLLTGTSEESFTAAADDAIDRAEDTLDNVVWAEVVDQGVEIGAVEERTYQTEVQVAFELDGSQ 68 H. halophila MSDHVYKIVELTGSSPNGIEEAVNNAIARAGETLRHLRWFEVVDTRGHIEGGRVNHWQVTVKVGFTLEGG- 70 :. *:* * ***:* :.: *.::** ** :** :: * **** .* . . . :*. *:*.* *:*.
Introduction
7
Two modes for the incorporation of negative charges are found in the halophilic proteins; the
“random” implementation throughout an amino acid sequence and the insertion of short
helical elements of about 20 amino acids with a high content of glutamates and aspartates.
Although these two concepts differ fundamentally on the level of the protein primary
sequence, they fuse into the principle of an enhanced protein surface charge (Marg et al.,
2005).
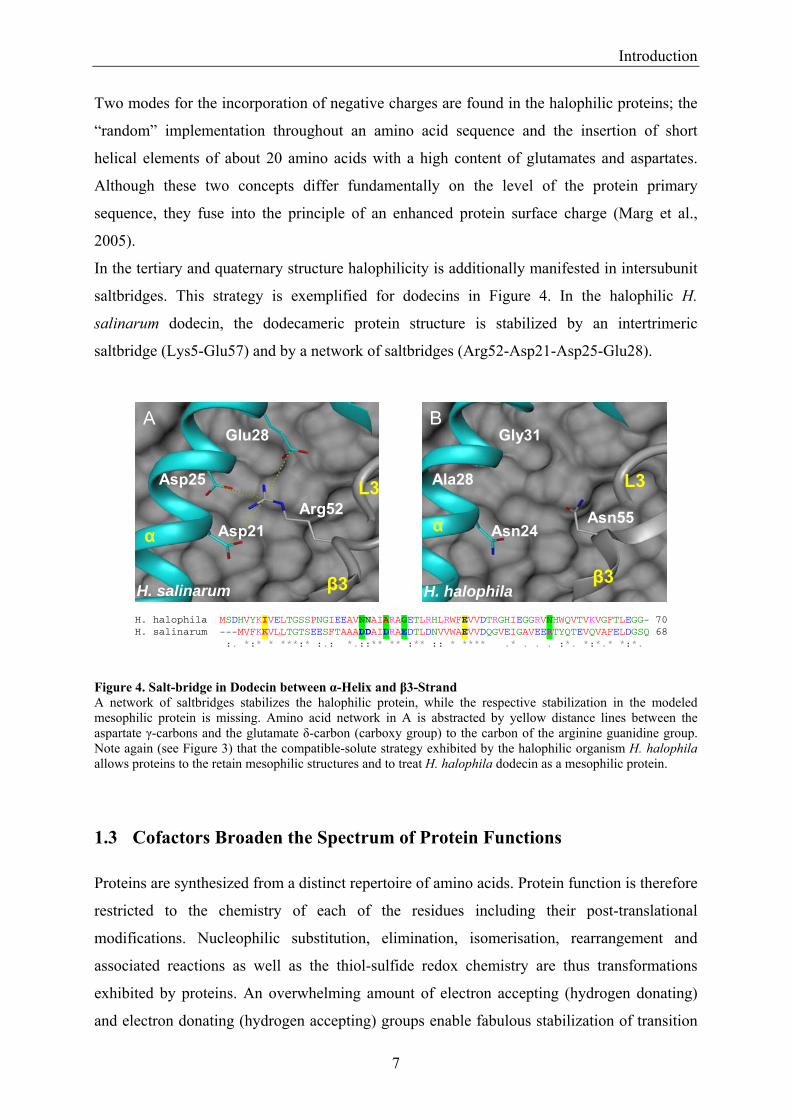
In the tertiary and quaternary structure halophilicity is additionally manifested in intersubunit
saltbridges. This strategy is exemplified for dodecins in Figure 4. In the halophilic H.
salinarum dodecin, the dodecameric protein structure is stabilized by an intertrimeric
saltbridge (Lys5-Glu57) and by a network of saltbridges (Arg52-Asp21-Asp25-Glu28).
Figure 4. Salt-bridge in Dodecin between α-Helix and β3-Strand A network of saltbridges stabilizes the halophilic protein, while the respective stabilization in the modeled mesophilic protein is missing. Amino acid network in A is abstracted by yellow distance lines between the aspartate γ-carbons and the glutamate δ-carbon (carboxy group) to the carbon of the arginine guanidine group. Note again (see Figure 3) that the compatible-solute strategy exhibited by the halophilic organism H. halophila allows proteins to the retain mesophilic structures and to treat H. halophila dodecin as a mesophilic protein.
1.3 Cofactors Broaden the Spectrum of Protein Functions Proteins are synthesized from a distinct repertoire of amino acids. Protein function is therefore
restricted to the chemistry of each of the residues including their post-translational
modifications. Nucleophilic substitution, elimination, isomerisation, rearrangement and
associated reactions as well as the thiol-sulfide redox chemistry are thus transformations
exhibited by proteins. An overwhelming amount of electron accepting (hydrogen donating)
and electron donating (hydrogen accepting) groups enable fabulous stabilization of transition
H. halophila MSDHVYKIVELTGSSPNGIEEAVNNAIARAGETLRHLRWFEVVDTRGHIEGGRVNHWQVTVKVGFTLEGG- 70 H. salinarum ---MVFKKVLLTGTSEESFTAAADDAIDRAEDTLDNVVWAEVVDQGVEIGAVEERTYQTEVQVAFELDGSQ 68 :. *:* * ***:* :.: *.::** ** :** :: * **** .* . . . :*. *:*.* *:*.
H. salinarum H. halophilaβ3
L3
β3
L3
α αAsp21
Asp25
Glu28
Arg52Asn24
Ala28
Gly31
Asn55
A B
Introduction
8
states of catalyzed reactions which results in rate constants up to the diffusion-controlled
limit.
However, a wealth of chemical transformations can just poorly if at all be catalyzed by the
naked protein. A prominent example is the sensing of radiation in the visible range, as the
long wavelength absorption maximum of proteins is limited to the 280 nm absorption band of
the indol group of tryptophan and some contribution by the aromatic residues of tyrosine and
phenylalanine. Moreover, the only functional group that is able to change the redox state
within the physiological range is the thiol group of cysteins. With a redox active range of
about -100 mV, cysteins are indeed involved in the regulation of the disulfide pattern of
periplasmatic proteins (Gross et al., 2004). For electron transfer reactions beyond this narrow
range, proteins adopt extra-functionalities by binding cofactors.
Flavins are a major class of cofactors which are able of both, accepting and donating electrons
as well as absorbing visible light. Reported functions of flavoproteins include transferring
electrons from and to reactions centers (e.g. in the respiratory chain; (Cecchini, 2003)),
absorbing light to forward this light energy for either the induction of radical reactions (e.g.
DNA-photolyase (Byrdin et al., 2003; Mees et al., 2004)) or distortions in protein structures
(e.g. phototropin; (Crosson and Moffat, 2002; Harper et al., 2003)).
1.4 The Chemistry of Flavins Flavins consist of a conserved aromatic isoalloxazine ring and aliphatic moieties, which are
attached to the N10 of the isoalloxazine (Figure 5.A). The functionally important subunit in
flavins is the aromatic isoalloxazine system, which can serve as the redox and/or light sensing
unit in many biological processes.
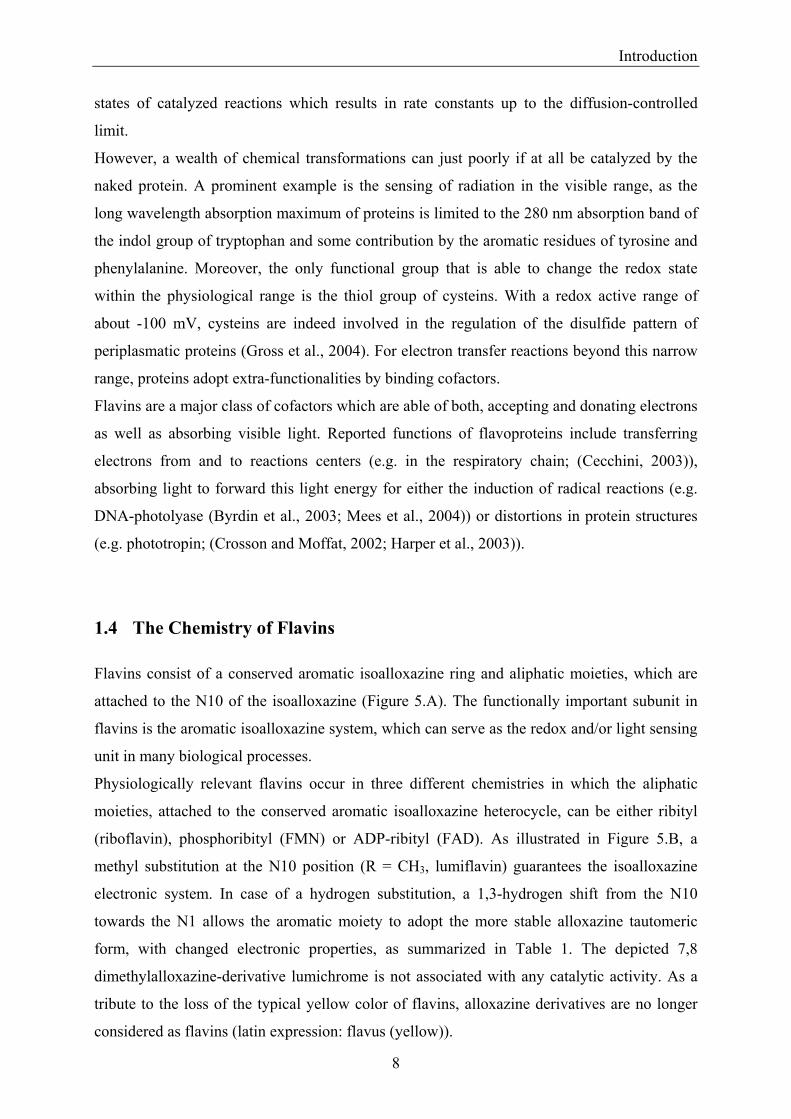
Physiologically relevant flavins occur in three different chemistries in which the aliphatic
moieties, attached to the conserved aromatic isoalloxazine heterocycle, can be either ribityl
(riboflavin), phosphoribityl (FMN) or ADP-ribityl (FAD). As illustrated in Figure 5.B, a
methyl substitution at the N10 position (R = CH3, lumiflavin) guarantees the isoalloxazine
electronic system. In case of a hydrogen substitution, a 1,3-hydrogen shift from the N10
towards the N1 allows the aromatic moiety to adopt the more stable alloxazine tautomeric
form, with changed electronic properties, as summarized in Table 1. The depicted 7,8
dimethylalloxazine-derivative lumichrome is not associated with any catalytic activity. As a
tribute to the loss of the typical yellow color of flavins, alloxazine derivatives are no longer
considered as flavins (latin expression: flavus (yellow)).
Introduction
9
Figure 5. The Chemistry of Flavins (A) The physiological important flavins; riboflavin, FMN and FAD, differ in their elongations at the ribityl O5’ position. Lumiflavin is the smallest flavin, as the methyl group is the minimal substitution of a hydrogen at position N10 to preserve the flavin character. The functionally important isoalloxazine ring is highlighted by a gray background. (B) Lumichrome is structurally similar to flavins; however, a 1,3-hydrogen shift from the N10 towards the N1 allows the aromatic moiety to adopt the more stable alloxazine tautomeric form, with changed electronic properties. Any substitution of the hydrogen in position N10 leads to a frozen isoalloxazine state. Table 1. Spectral and Electrochemical Data for Flavin and Lumichrome
a average data representing riboflavin, FMN and FAD
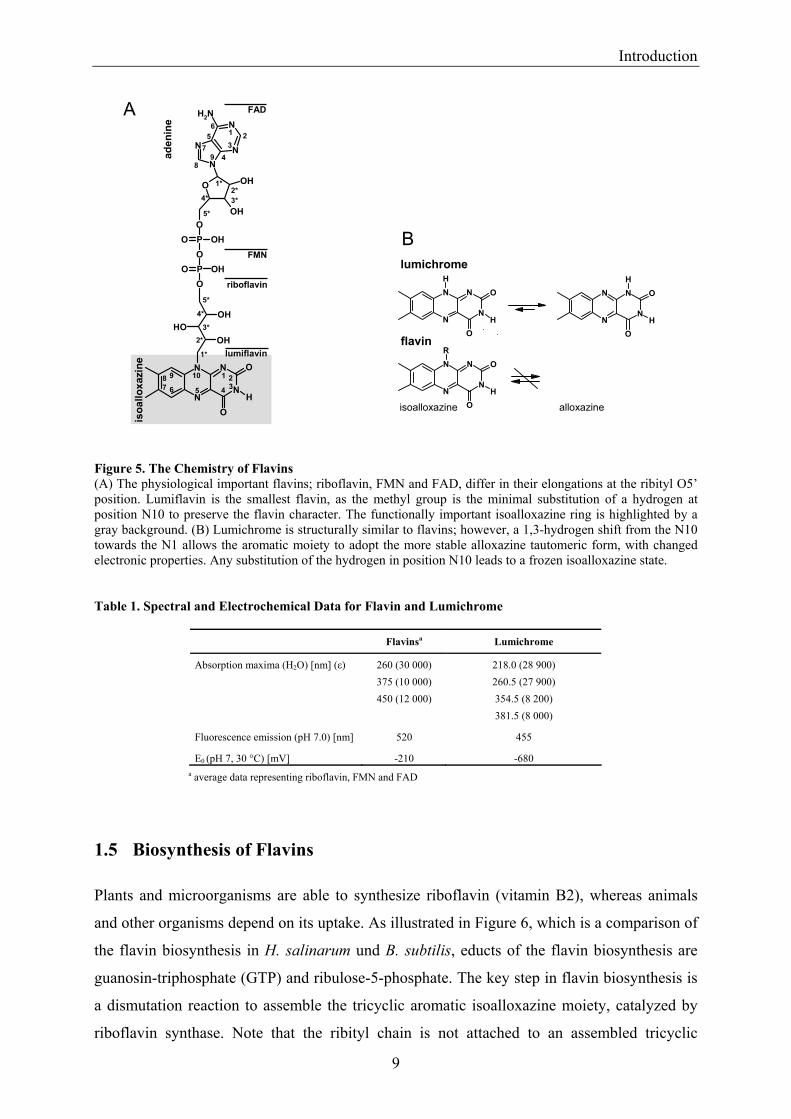
1.5 Biosynthesis of Flavins Plants and microorganisms are able to synthesize riboflavin (vitamin B2), whereas animals
and other organisms depend on its uptake. As illustrated in Figure 6, which is a comparison of
the flavin biosynthesis in H. salinarum und B. subtilis, educts of the flavin biosynthesis are
guanosin-triphosphate (GTP) and ribulose-5-phosphate. The key step in flavin biosynthesis is
a dismutation reaction to assemble the tricyclic aromatic isoalloxazine moiety, catalyzed by
riboflavin synthase. Note that the ribityl chain is not attached to an assembled tricyclic
Flavinsa Lumichrome
Absorption maxima (H2O) [nm] (ε) 260 (30 000) 218.0 (28 900) 375 (10 000) 260.5 (27 900) 450 (12 000) 354.5 (8 200) 381.5 (8 000)
Fluorescence emission (pH 7.0) [nm] 520 455
E0 (pH 7, 30 °C) [mV] -210 -680
isoalloxazine alloxazine N
N
N
N O
O
R
H
N
N
N
N O
OH
H
N
N
N
N O
O
H
H
flavin
lumichrome
O OH
OH
OPO OHOPO OHO
N
N
N
N
NH2
N
N
N
N
O
O
OHOH
OH
H
FMN
riboflavin
1 234567
8 9 10
1*
2*3*
4*
5*
1 2
5*
4* 3*2*
1*
4
56
37
89
isoa
lloxa
zine
aden
ine
FAD
lumiflavin
A
B
Introduction
10
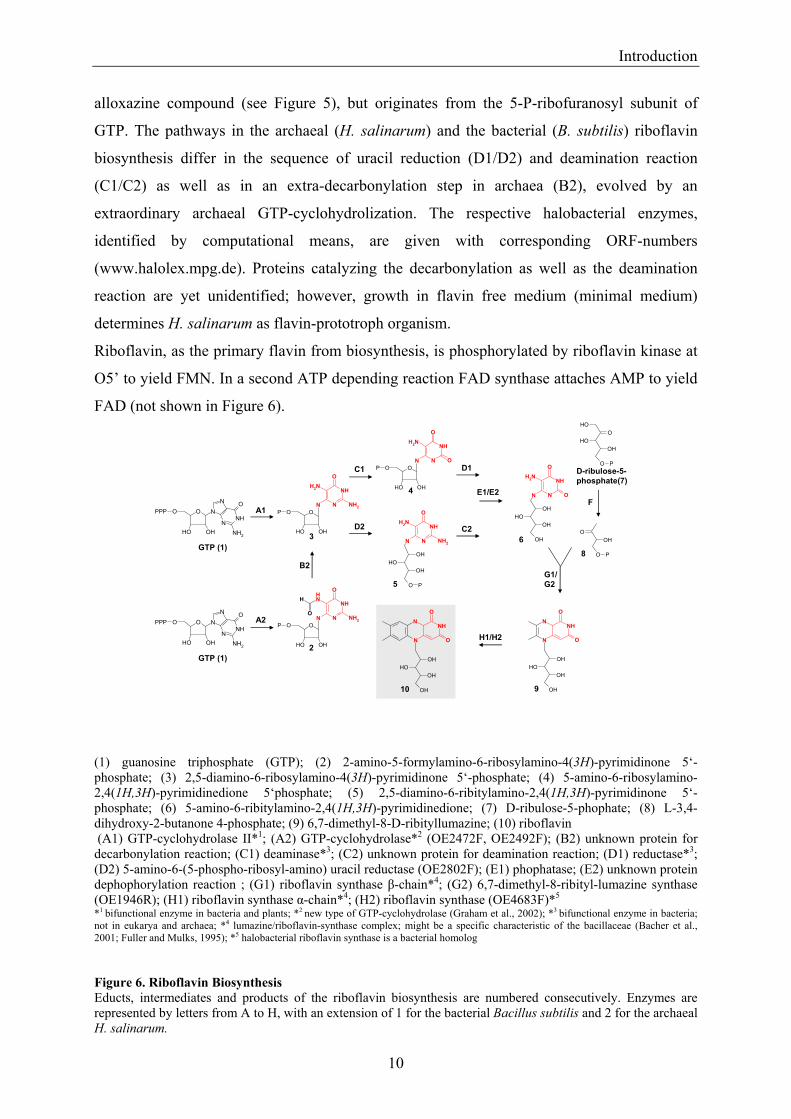
alloxazine compound (see Figure 5), but originates from the 5-P-ribofuranosyl subunit of
GTP. The pathways in the archaeal (H. salinarum) and the bacterial (B. subtilis) riboflavin
biosynthesis differ in the sequence of uracil reduction (D1/D2) and deamination reaction
(C1/C2) as well as in an extra-decarbonylation step in archaea (B2), evolved by an
extraordinary archaeal GTP-cyclohydrolization. The respective halobacterial enzymes,
identified by computational means, are given with corresponding ORF-numbers
(www.halolex.mpg.de). Proteins catalyzing the decarbonylation as well as the deamination
reaction are yet unidentified; however, growth in flavin free medium (minimal medium)
determines H. salinarum as flavin-prototroph organism.
Riboflavin, as the primary flavin from biosynthesis, is phosphorylated by riboflavin kinase at
O5’ to yield FMN. In a second ATP depending reaction FAD synthase attaches AMP to yield
FAD (not shown in Figure 6).
(1) guanosine triphosphate (GTP); (2) 2-amino-5-formylamino-6-ribosylamino-4(3H)-pyrimidinone 5‘-phosphate; (3) 2,5-diamino-6-ribosylamino-4(3H)-pyrimidinone 5‘-phosphate; (4) 5-amino-6-ribosylamino-2,4(1H,3H)-pyrimidinedione 5‘phosphate; (5) 2,5-diamino-6-ribitylamino-2,4(1H,3H)-pyrimidinone 5‘-phosphate; (6) 5-amino-6-ribitylamino-2,4(1H,3H)-pyrimidinedione; (7) D-ribulose-5-phophate; (8) L-3,4-dihydroxy-2-butanone 4-phosphate; (9) 6,7-dimethyl-8-D-ribityllumazine; (10) riboflavin (A1) GTP-cyclohydrolase II*1; (A2) GTP-cyclohydrolase*2 (OE2472F, OE2492F); (B2) unknown protein for decarbonylation reaction; (C1) deaminase*3; (C2) unknown protein for deamination reaction; (D1) reductase*3; (D2) 5-amino-6-(5-phospho-ribosyl-amino) uracil reductase (OE2802F); (E1) phophatase; (E2) unknown protein dephophorylation reaction ; (G1) riboflavin synthase β-chain*4; (G2) 6,7-dimethyl-8-ribityl-lumazine synthase (OE1946R); (H1) riboflavin synthase α-chain*4; (H2) riboflavin synthase (OE4683F)*5 *1 bifunctional enzyme in bacteria and plants; *2 new type of GTP-cyclohydrolase (Graham et al., 2002); *3 bifunctional enzyme in bacteria; not in eukarya and archaea; *4 lumazine/riboflavin-synthase complex; might be a specific characteristic of the bacillaceae (Bacher et al., 2001; Fuller and Mulks, 1995); *5 halobacterial riboflavin synthase is a bacterial homolog Figure 6. Riboflavin Biosynthesis Educts, intermediates and products of the riboflavin biosynthesis are numbered consecutively. Enzymes are represented by letters from A to H, with an extension of 1 for the bacterial Bacillus subtilis and 2 for the archaeal H. salinarum.
O
OH OH
N
N
NNH
O
NH2
OPPP
OOH
OH
O P
OH
OOH
O P
N
NNH
O
O
OHOH
OH
OH
OHOH
OH
OH
N
NNH
O
O
O
OH OH
N
N
NNH
O
NH2
OPPP
A1
A2
B2
C2D2
D1
FE1/E2
G1/G2
H1/H2
GTP (1)
GTP (1)
D-ribulose-5-phosphate(7)
2
3
4
5
68
910
NH2
N
NH
N
O
O
OHOH
OH
OH
NH2
N
NH
N
O
NH2
OHOH
OH
O P
NH2
N
NH
N
O
NH2O
OH OH
P O
NH
N
NH
N
O
NH2O
OH OH
P O
H
O
NH2
N
NH
N
O
OO
OH OH
P OC1
Introduction
11
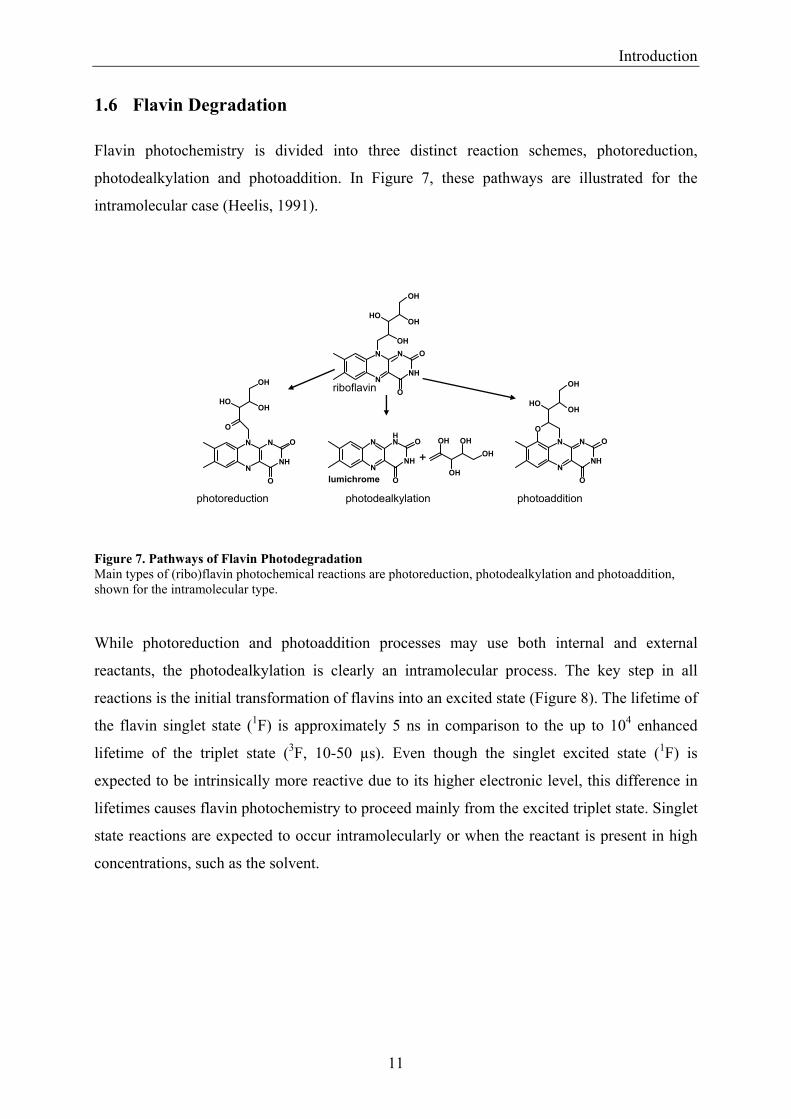
1.6 Flavin Degradation Flavin photochemistry is divided into three distinct reaction schemes, photoreduction,
photodealkylation and photoaddition. In Figure 7, these pathways are illustrated for the
intramolecular case (Heelis, 1991).
Figure 7. Pathways of Flavin Photodegradation Main types of (ribo)flavin photochemical reactions are photoreduction, photodealkylation and photoaddition, shown for the intramolecular type. While photoreduction and photoaddition processes may use both internal and external
reactants, the photodealkylation is clearly an intramolecular process. The key step in all
reactions is the initial transformation of flavins into an excited state (Figure 8). The lifetime of
the flavin singlet state (1F) is approximately 5 ns in comparison to the up to 104 enhanced
lifetime of the triplet state (3F, 10-50 µs). Even though the singlet excited state (1F) is
expected to be intrinsically more reactive due to its higher electronic level, this difference in
lifetimes causes flavin photochemistry to proceed mainly from the excited triplet state. Singlet
state reactions are expected to occur intramolecularly or when the reactant is present in high
concentrations, such as the solvent.
N
N
NH
N
O
OOH
OHOH
OH
N
N
NH
N
O
O
O
OHOH
OH
N
N
NH
N
O
OO
OHOH
OH
OHOH
OH
OH
N
N
NH
NH
O
O
+
photoreduction photodealkylation photoaddition
lumichrome
riboflavin
Introduction
12
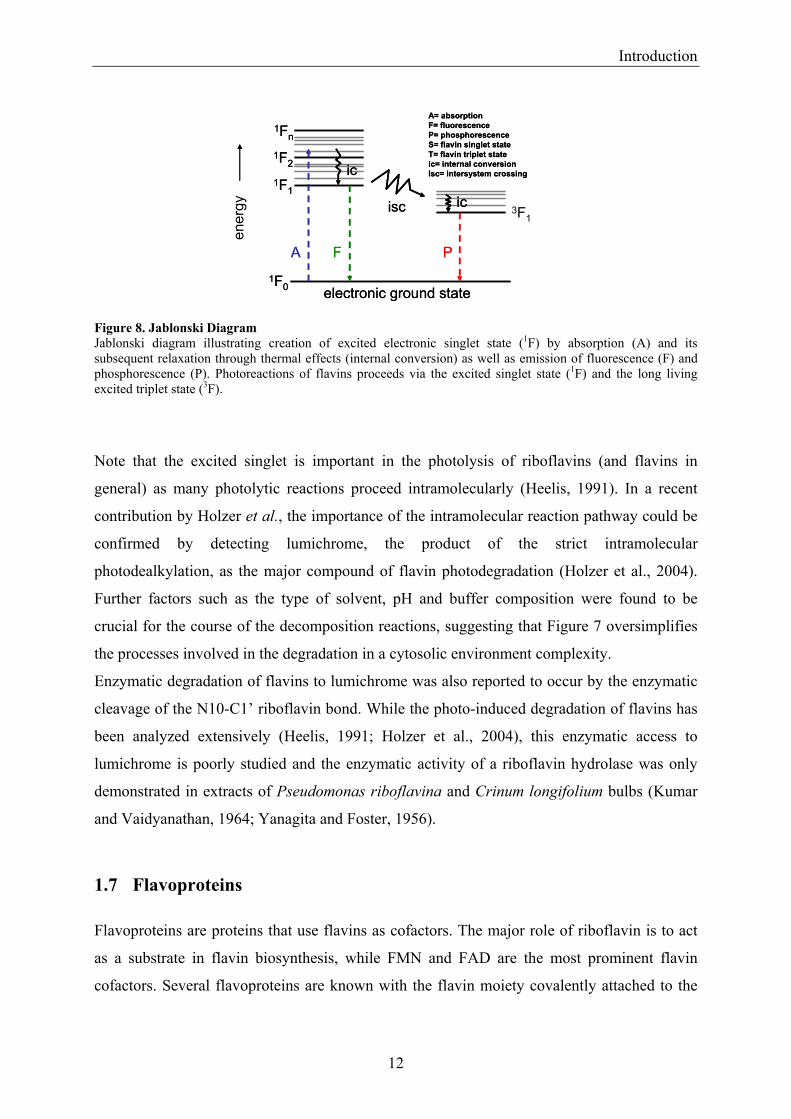
Figure 8. Jablonski Diagram Jablonski diagram illustrating creation of excited electronic singlet state (1F) by absorption (A) and its subsequent relaxation through thermal effects (internal conversion) as well as emission of fluorescence (F) and phosphorescence (P). Photoreactions of flavins proceeds via the excited singlet state (1F) and the long living excited triplet state (3F).
Note that the excited singlet is important in the photolysis of riboflavins (and flavins in
general) as many photolytic reactions proceed intramolecularly (Heelis, 1991). In a recent
contribution by Holzer et al., the importance of the intramolecular reaction pathway could be
confirmed by detecting lumichrome, the product of the strict intramolecular
photodealkylation, as the major compound of flavin photodegradation (Holzer et al., 2004).
Further factors such as the type of solvent, pH and buffer composition were found to be
crucial for the course of the decomposition reactions, suggesting that Figure 7 oversimplifies
the processes involved in the degradation in a cytosolic environment complexity.
Enzymatic degradation of flavins to lumichrome was also reported to occur by the enzymatic
cleavage of the N10-C1’ riboflavin bond. While the photo-induced degradation of flavins has
been analyzed extensively (Heelis, 1991; Holzer et al., 2004), this enzymatic access to
lumichrome is poorly studied and the enzymatic activity of a riboflavin hydrolase was only
demonstrated in extracts of Pseudomonas riboflavina and Crinum longifolium bulbs (Kumar
and Vaidyanathan, 1964; Yanagita and Foster, 1956).
1.7 Flavoproteins Flavoproteins are proteins that use flavins as cofactors. The major role of riboflavin is to act
as a substrate in flavin biosynthesis, while FMN and FAD are the most prominent flavin
cofactors. Several flavoproteins are known with the flavin moiety covalently attached to the
ener
gy 3F1
1Fn
electronic ground state
A F P
A= absorptionF= fluorescenceP= phosphorescenceS= flavin singlet stateT= flavin triplet stateic= internal conversionIsc= intersystem crossing
1F2
1F1
1F0
ic
icisc
1Fn
electronic ground state
A F P
A= absorptionF= fluorescenceP= phosphorescenceS= flavin singlet stateT= flavin triplet stateic= internal conversionIsc= intersystem crossing
1F2
1F1
1F0
ic
icisc
Introduction
13
protein; however, the majority contains the flavin tight, but non-covalently bound (Mewies et
al., 1998).
The broad utilization of flavins in nature is based on the versatile reactivity of the flavins and
on the proteins’ abilities to restrict this reactivity to defined reaction pathways (Lostao et al.,
1997; Nogues et al., 2004; Stockman et al., 1994; Swenson and Krey, 1994). Protein ligand
interactions involve electrostatic, hydrophobic and steric interactions, but also covalent
interactions, as the formation of the covalent flavin-cysteinyl adduct in the phototropin
reaction cycle (Crosson and Moffat, 2002).
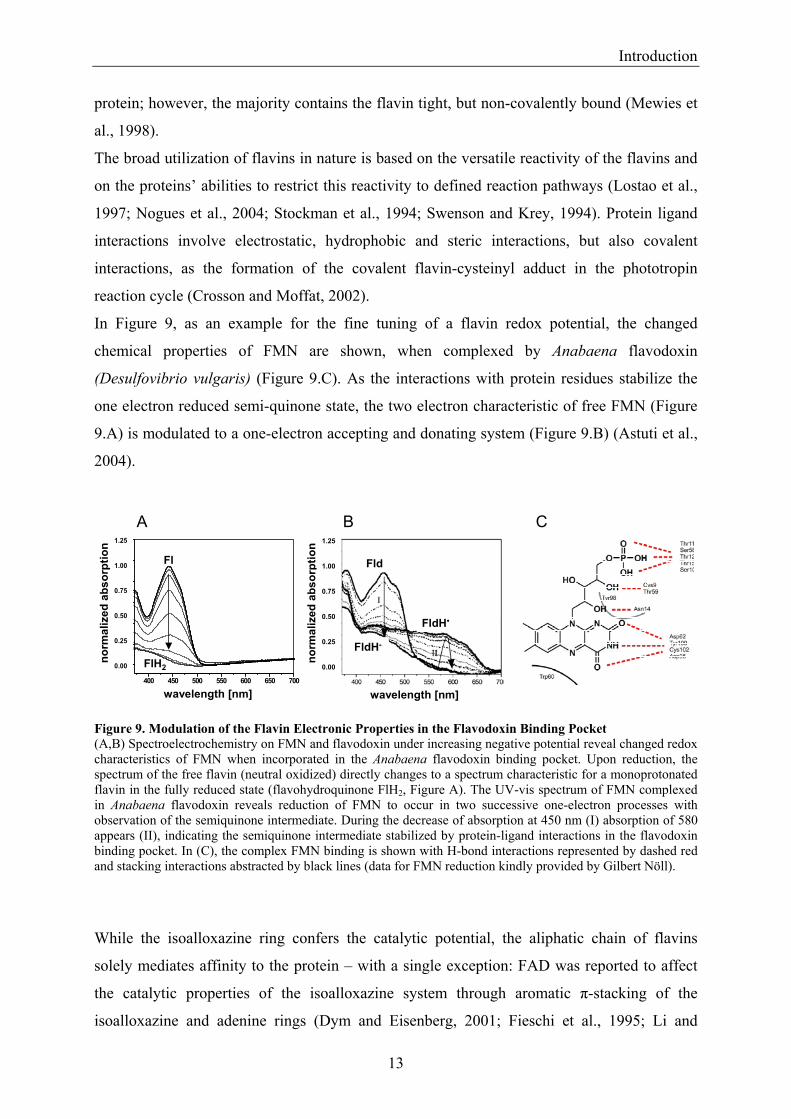
In Figure 9, as an example for the fine tuning of a flavin redox potential, the changed
chemical properties of FMN are shown, when complexed by Anabaena flavodoxin
(Desulfovibrio vulgaris) (Figure 9.C). As the interactions with protein residues stabilize the
one electron reduced semi-quinone state, the two electron characteristic of free FMN (Figure
9.A) is modulated to a one-electron accepting and donating system (Figure 9.B) (Astuti et al.,
2004).
Figure 9. Modulation of the Flavin Electronic Properties in the Flavodoxin Binding Pocket (A,B) Spectroelectrochemistry on FMN and flavodoxin under increasing negative potential reveal changed redox characteristics of FMN when incorporated in the Anabaena flavodoxin binding pocket. Upon reduction, the spectrum of the free flavin (neutral oxidized) directly changes to a spectrum characteristic for a monoprotonated flavin in the fully reduced state (flavohydroquinone FlH2, Figure A). The UV-vis spectrum of FMN complexed in Anabaena flavodoxin reveals reduction of FMN to occur in two successive one-electron processes with observation of the semiquinone intermediate. During the decrease of absorption at 450 nm (I) absorption of 580 appears (II), indicating the semiquinone intermediate stabilized by protein-ligand interactions in the flavodoxin binding pocket. In (C), the complex FMN binding is shown with H-bond interactions represented by dashed red and stacking interactions abstracted by black lines (data for FMN reduction kindly provided by Gilbert Nöll).
While the isoalloxazine ring confers the catalytic potential, the aliphatic chain of flavins
solely mediates affinity to the protein – with a single exception: FAD was reported to affect
the catalytic properties of the isoalloxazine system through aromatic π-stacking of the
isoalloxazine and adenine rings (Dym and Eisenberg, 2001; Fieschi et al., 1995; Li and
BA
wavelength [nm]
norm
aliz
ed a
bsor
ptio
n
Fld
FldH-
FldH•
1.25
1.00
0.75
0.50
0.25
0.00
wavelength [nm]
norm
aliz
ed a
bsor
ptio
n
400 450 500 550 600 650 700
Fl
FlH2
1.25
1.00
0.75
0.50
0.25
0.00
C
Introduction
14
Yeung, 2005; Serre et al., 1996). Although the modulation of functionality by the flavin
aliphatic moiety is unique to FAD, the physiologically most relevant flavins, FMN and FAD,
are nevertheless randomly distributed throughout the world of flavoproteins. Selection for
either FMN or FAD seems to be exclusively driven by the demand of the respective protein
(Vallon, 2000; van den Berg et al., 2002).
Sequence motifs which manifest this demand on a primary sequence are barely known.
Computational studies on different FAD binding proteins by Dym et al. identified conserved
sequence motifs likely to be involved in protein-cofactor interaction (Dym and Eisenberg,
2001). Hot spots in conservation of FAD binding motifs are involved particularly in the
binding of the pyrophosphate moiety which strongly contributes to the free energies of the
FAD holocomplexes. The negative charge of the phosphates is either neutralized by positively
charged amino groups to form saltbridges or the phosphate is extensively involved in H-
bonding. In contrast to residues interacting with the pyrophosphate group, amino acids
involved in the coordination of the catalytically active isoalloxazine and the adenine rings are
conserved weakly. Such amino acids adjust the catalytic properties of FAD to the individual
needs of different flavoproteins and their diversity reflects the versatility of the flavoprotein
fold.
In FMN containing proteins an analogous situation is found as the FMN orthophosphate
contributes extensively to the stability of the holoprotein complexes. For example, it was
shown for the flavodoxin complex of Anabaena that the interaction with the single phosphate
group contributes almost half of the total FMN binding energy (Lostao et al., 2000; Walsh et
al., 1998).
These observations suggest that the rare utilization of riboflavin as a cofactor might be
attributed to its lack of affinity providing entities. Thus, to attain high holoprotein stabilities in
riboflavin binding, the isoalloxazine catalytic subunit has to substitute the pyrophosphate or
orthophosphate (of FAD and FMN) in terms of providing binding energy. As a consequence
structural restrictions narrow the functional spectrum of the riboflavin’s isoalloxazine ring.
1.8 Dodecin Dodecin was initially crystallized by a shot gun approach as a riboflavin binding protein
(Bieger et al., 2003). Dodecin was named according to its dodecameric quartenary structure
and its flavin binding ability. The monomeric protein consists of 68 amino residues
representing the shortest flavoprotein known to date. Dodecin comprises an α-helix which is
Introduction
15
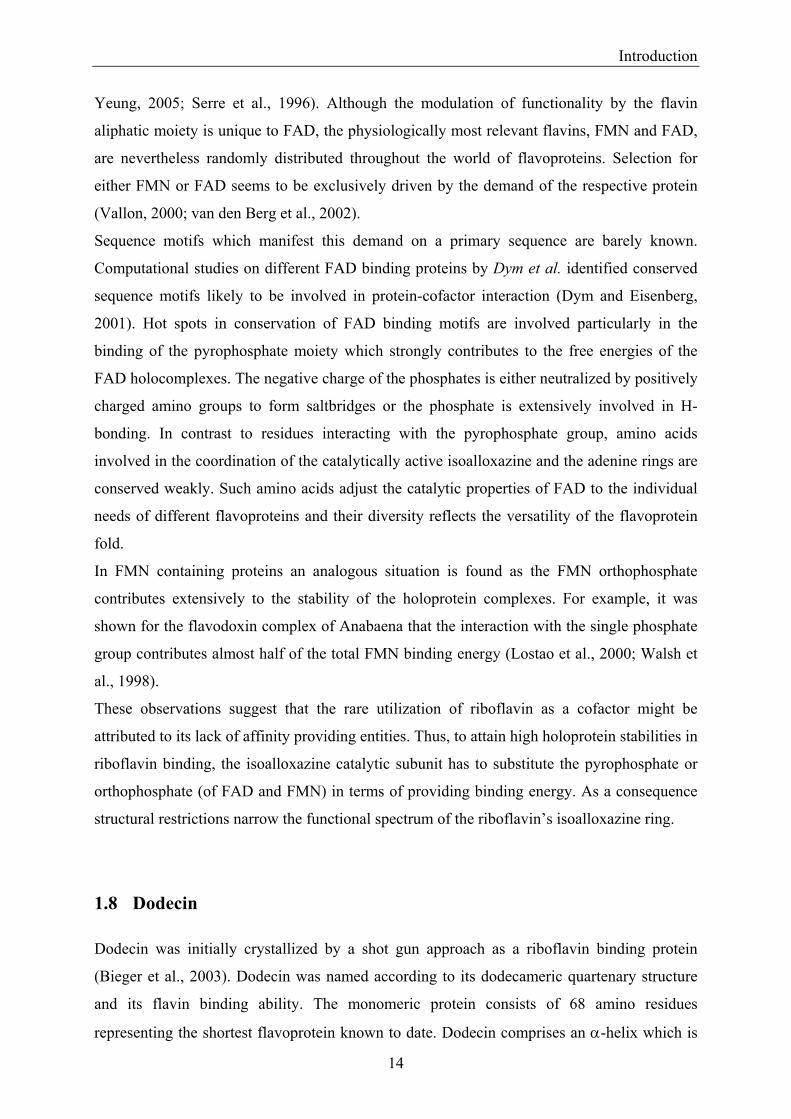
partly enveloped by a three-stranded antiparallel β-sheet (β1-α-β2-β3 core topology). Trimers
are formed through local interactions of the β2-strands from the monomers, and dodecamers
are assembled from four trimers interacting with their β1-strand sequences and via complexed
riboflavin. The resulting hollow sphere is dominated by an antiparallel β-sheet and by α-
helices which are exposed on the protein surface (Figure 10.A to D).
Figure 10. Overall Structure of H. salinarum Dodecin (A and B) View along the three-fold axis. One monomer is highlighted through its corresponding molecular surface. Monomers of a trimer are held in red, green and blue, the ligand (riboflavin) is colored in gold. Heteroatoms of residues important for binding as well as of the ligand are colored red (O) and blue (N). β-Strands of the monomers (β2A, β2B, β2C) mediate the contacts in the trimer, extending to a 5-stranded antiparallel β-sheet. Four trimers are arranged in a dodecamer of 23-cubic symmetry. Binding pockets are built upon the assembly of the trimers (A) to the dodecameric complex (B). (C and D) View on the arrangement of two trimers along the twofold axis. In (C) one trimer is highlighted through its corresponding molecular surface (D). In the riboflavin holocomplex (H-RBF), riboflavins occupy two binding positions per binding pocket with the riboflavin aromatic moieties embedded between the indole groups of tryptophans (Trp36). The resulting sandwich-like aromatic arrangement is stabilized through π-π interactions and polar interactions between glutamines (Gln55) and the isoalloxazine rings. Monomers of a dodecameric assembly are marked by superscript alphabetic characters.
Trp36
Trp36
Gln55
Gln55Glu45
Glu45
A B
C D
Introduction
16
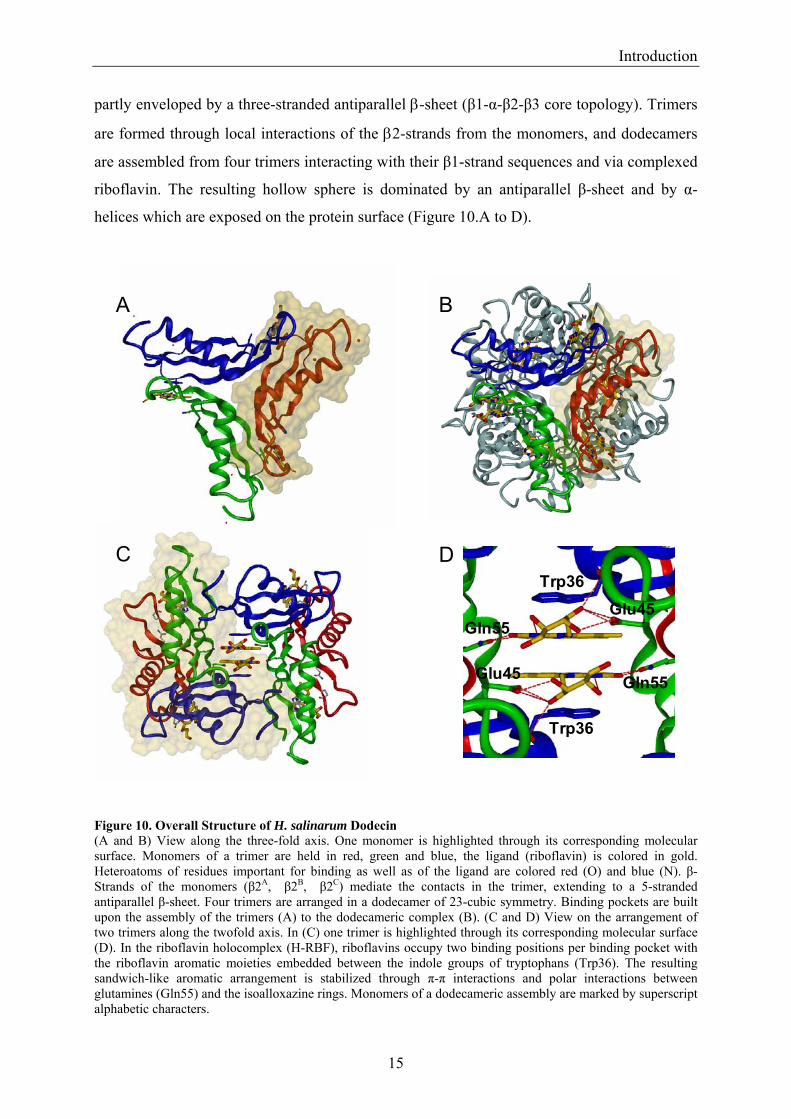
Flavin binding pockets are located along the twofold axis at the interfaces of trimers and are
predominantly formed by Trp36 and the amino acids of the sequence (Gly43-Val49). The L3
loop, connecting the β-strands β2 and β3, displays conformational flexibility, as indicated by
poor electron density of the sequence Gly47-Glu50 (Figure 11.A).
Riboflavin was found complexed in dimers with the isoalloxazine rings clamped between the
indol groups of Trp36 and aligned by Gln55, as shown in Figure 11.B for riboflavin. The
ribityl chain is H-bonded to the carboxy group of Glu45 and the carbonyl oxygen of Val35. Figure 11. The Dodecin Flavin Binding Manifold (A) Surface representations of the dodecin binding pocket uncovered by section of the holocomplex along a C2 axis. H-bonds are represented by red dashed lines. The 2Fobs-Fcalc electron density (at σ = 1.5) in yellow implies flexibility of the L3 loop and in gray illustrates the riboflavin traced by its electron density with the unrestricted ribityl chain end (O5’ not shown). (B) Schematic diagram of the aromatic tetrade reduced to the C2 related part in the same view as Figure (A). Binding interactions are colored in red. The residues (Trp36 and Gln55) mediate binding of the isoalloxazine ring; H-bonds between Glu45 and the ribityl chain (O2’ and O3’) direct the aliphatic moiety towards the outer surface. Due to an intramolecular interaction (O4’-N1), the ribityl chain conformation is stabilized up to the O4’ atom.
1.9 Scope of Work An interesting aspect in the dodecin structure is the binding of two riboflavin molecules in a
single binding pocket under the formation of a sandwich like π-stacking system of four
aromatic moieties. Although π-stacking systems in proteins have been reported (up to
aromatic hexades by Gross et. al), the incorporation of ligands as dimers to assemble stacked
aromatic systems is unprecedented (Gross et al., 2004; Gross et al., 2002). The elucidation of
this new (flavin) binding type provoked investigations towards a new protein function, which
riboflavin
Glu45C
Val35C
Gln55I
Trp36A
L3C
αA
β2C
β3C
β3I
Introduction
17
seemed particularly interesting with respect to the wide range of functions flavoproteins can
perform. Understanding the function of dodecin was thereby strongly embedded in the general
interest of the research in department of Prof. Oesterhelt. In the post-genome era of H.
salinarum (www.halolex.mpg.de; Ng et al., 2000; Tebbe et al., 2005), effort is spent into the
integration of proteome, transcriptome and interactome to encounter the H. salinarum
lifestyle. Thus, starting the project of elucidating the dodecin function was to start assigning a
coherent place for this protein within a well described network.
The strong emphasis on the dodecin structure was caused (besides a personal interest) by the
preliminary work of Boris Bieger and Lars-Oliver Essen (Bieger et al., 2003). Due to the
inverse approach of shot-gun crystallization, the X-ray structure of dodecin was available, but
molecular biology work almost absent. After establishing homologous and heterologous
expression systems, spectroscopic and X-ray structural investigation as well as functional
assays, all performed on the heterologous expressed and refolded dodecin, construct allowed
to determine the dodecin ligand spectrum and the dodecin binding mode. Homologously
(over)expressed and tagged dodecin contributed with ligand composition in vivo to evaluate
data from structural and functional investigations. Due to a detailed and constantly growing
knowledge of the dodecin binding behavior, key experiments towards the elucidation of the
dodecin function were efficiently guided by a theoretical functional spectrum of dodecin.
Analysis of the H. salinarum flavin metabolism and the H. salinarum transcriptome could
finally indeed place the dodecin function into the organism’s machinery.
Materials and Methods
18
2. Materials and Methods
2.1 Materials 2.1.1 Instruments and Devices
2.1.1.1 Centrifuges (a) Avanti J25 and corresponding rotors JLA-25.500 and JA-10.500; (b) Avanti J20-XP and
rotor JLA-8.100; (c) L7-55 Beckmann ultra centrifuge with corresponding rotors 45Ti, 50Ti
and 60Ti; (d) SIGMA 4K15 with a swing-out rotor for Falcon Tubes (Greiner); (e) Eppendorf
Centrifuge 5417R with rotor FA45-30-11 for centrifugation of 1.5 and 2 ml reaction tubes
(Eppendorf).
2.1.1.2 High Pressure Liquid Chromatography (HPLC) System (a) ÄKTA Explorer and ÄKTA Basis (Amersham Biotech) for large scale protein
purification; Columns: self-packed Ni-NTA column (16/60), pre-packed Superdex S200
16/60 and 26/60 gelfiltration columns, pre-packed Source Q 1/10 anion exchange column; (b)
SMART Chromatography System (Amersham Biotech) for molecular weight analysis of
proteins; Column: pre-packed Superdex 75 HR 3.2/30 gelfiltration column.
2.1.1.3 High Pressure Liquid Chromatography (HPLC)/Mass Spectrometry (MS) System
Chromatography System: Reversed Phase HPLC System (Perkin Elmer); Column: Nucleosil
100x5 mm C8 HD 125/5 reverse phase column (Macherey and Nagel); Pump: 140c pump
(Applied Biosystems); Mass Spectrometer: PE SCIEX API 165 single quadrupol (Perkin
Elmer).
Materials and Methods
19
2.1.1.4 High Pressure Liquid Chromatography (HPLC)/Fluorescence Detection System Chromatography System: Separation Module 2695 (Waters) with Photodiode Array Detector
996 (Waters) and Multi Wavelength Fluorescence Detector 2475 (Waters); Columns: Luna 5
µm, 150 x 2 mm C18(2) (Phenomenex) and XTerra 3.5µm, 100 x 2 mm, RP18 (Waters)
reverse phase columns.
2.1.1.5 Absorption Spectrometer (a) UV-1700 UV-VIS spectrophotometer (Shimadzu); Cuvettes: 105.251-QS (50 µl),
108.002B-QS (500 µl) and 110 (3500 µl) (Hellma); (b); UMSP 80 Microscope Spectral
Photometer (Zeiss) connected to a TIDAS-microscope-spectrometer (J&M) for absorption
spectroscopy on dodecin crystals (cryo-cooled by Oxford Cryosystems).
2.1.1.6 Fluorescence Spectrometer F-2000 Fluorescence Spectrophotometer (Hitachi); Cuvettes: 105.251-QS (50 µl) and 110-QS
(3500 µl) (Hellma).
2.1.1.7 Spectro-electrochemical Cell Cell: optically transparent electrode arrangement in a sandwich configuration mounted in the
compartment of the spectrometer; Potentiostat/Galvanostat: Amel 553; Function Generator:
Amel 568; Ag/AgCl quasi-reference electrode (Salbeck, 1993).
2.1.1.8 Devices for X-ray Data Collection X-ray structural data were investigated at the European Synchrotron Radiation Facility
(ESRF, Grenoble) and the Swiss Light Source (SLS, Zurich). For wavelength of synchrotron
radiation and detector systems see Crystallization and Data Collection (2.2.4.10) and Table 6
of data collection and refinement statistics.
Materials and Methods
20
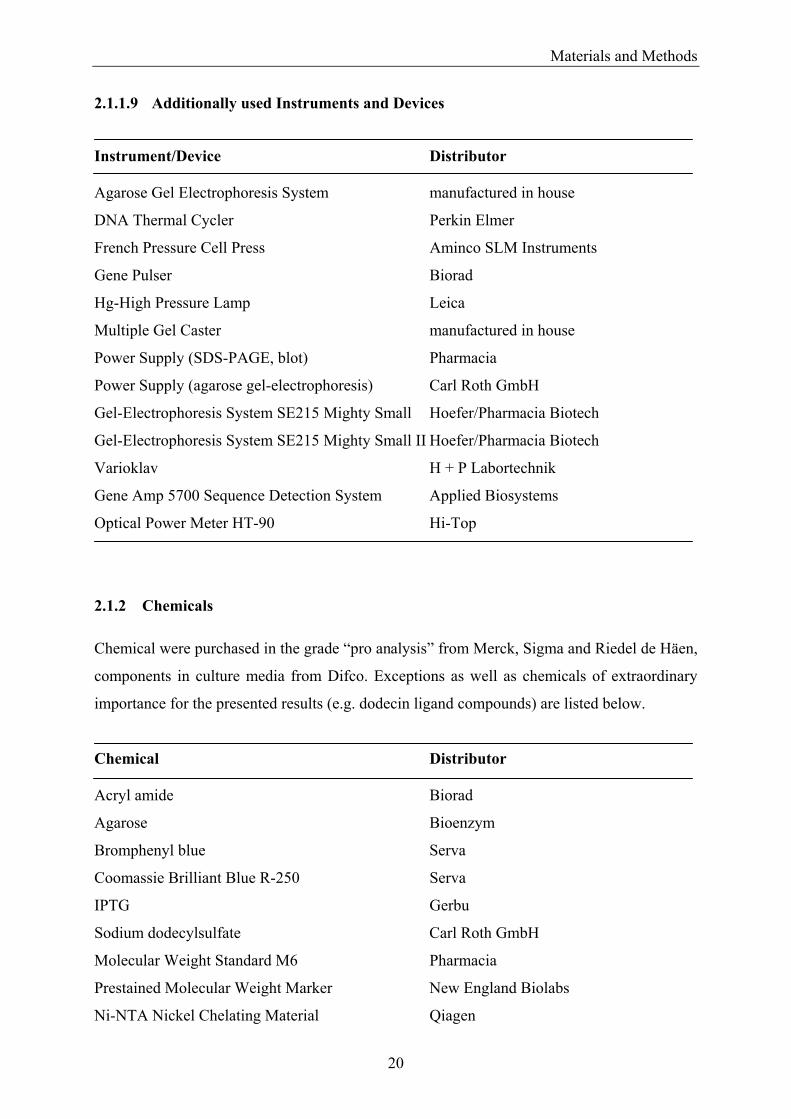
2.1.1.9 Additionally used Instruments and Devices Instrument/Device Distributor Agarose Gel Electrophoresis System manufactured in house
DNA Thermal Cycler Perkin Elmer
French Pressure Cell Press Aminco SLM Instruments
Gene Pulser Biorad
Hg-High Pressure Lamp Leica
Multiple Gel Caster manufactured in house
Power Supply (SDS-PAGE, blot) Pharmacia
Power Supply (agarose gel-electrophoresis) Carl Roth GmbH
Gel-Electrophoresis System SE215 Mighty Small Hoefer/Pharmacia Biotech
Gel-Electrophoresis System SE215 Mighty Small II Hoefer/Pharmacia Biotech
Varioklav H + P Labortechnik
Gene Amp 5700 Sequence Detection System Applied Biosystems
Optical Power Meter HT-90 Hi-Top
2.1.2 Chemicals Chemical were purchased in the grade “pro analysis” from Merck, Sigma and Riedel de Häen,
components in culture media from Difco. Exceptions as well as chemicals of extraordinary
importance for the presented results (e.g. dodecin ligand compounds) are listed below.
Chemical Distributor Acryl amide Biorad
Agarose Bioenzym
Bromphenyl blue Serva
Coomassie Brilliant Blue R-250 Serva
IPTG Gerbu
Sodium dodecylsulfate Carl Roth GmbH
Molecular Weight Standard M6 Pharmacia
Prestained Molecular Weight Marker New England Biolabs
Ni-NTA Nickel Chelating Material Qiagen
Materials and Methods
21
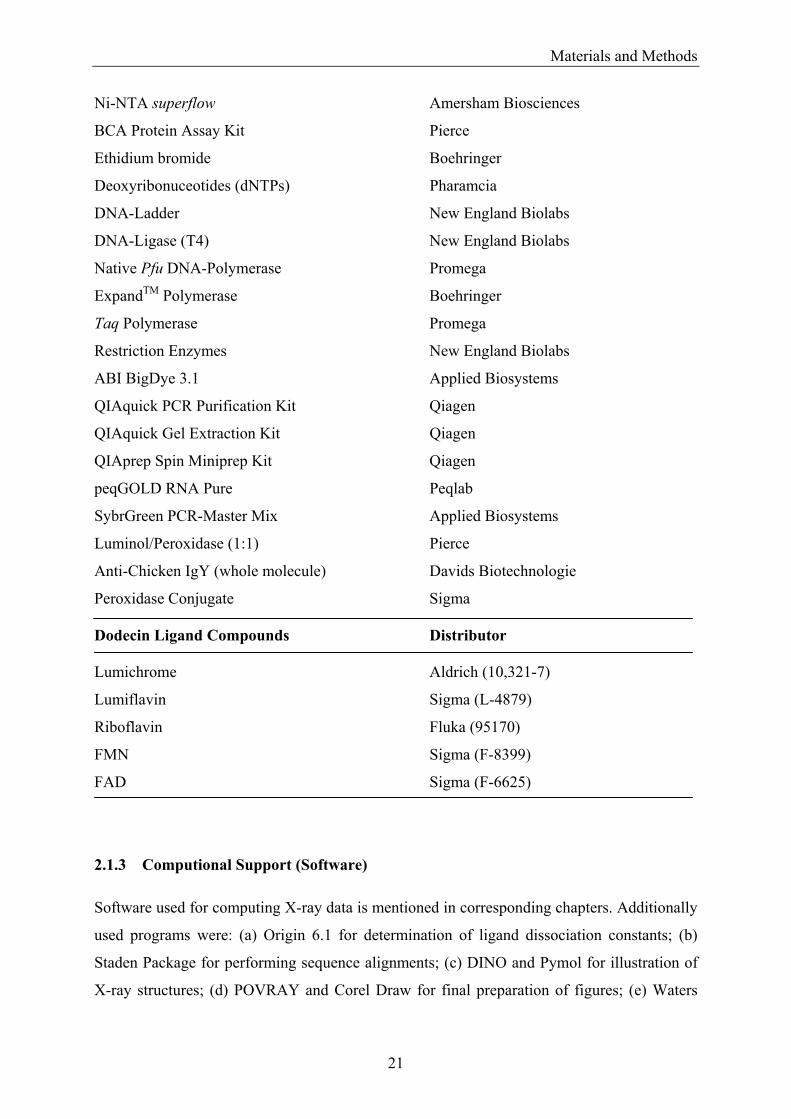
Ni-NTA superflow Amersham Biosciences
BCA Protein Assay Kit Pierce
Ethidium bromide Boehringer
Deoxyribonuceotides (dNTPs) Pharamcia
DNA-Ladder New England Biolabs
DNA-Ligase (T4) New England Biolabs
Native Pfu DNA-Polymerase Promega
ExpandTM Polymerase Boehringer
Taq Polymerase Promega
Restriction Enzymes New England Biolabs
ABI BigDye 3.1 Applied Biosystems
QIAquick PCR Purification Kit Qiagen
QIAquick Gel Extraction Kit Qiagen
QIAprep Spin Miniprep Kit Qiagen
peqGOLD RNA Pure Peqlab
SybrGreen PCR-Master Mix Applied Biosystems
Luminol/Peroxidase (1:1) Pierce
Anti-Chicken IgY (whole molecule) Davids Biotechnologie
Peroxidase Conjugate Sigma Dodecin Ligand Compounds Distributor Lumichrome Aldrich (10,321-7)
Lumiflavin Sigma (L-4879)
Riboflavin Fluka (95170)
FMN Sigma (F-8399)
FAD Sigma (F-6625)
2.1.3 Computional Support (Software) Software used for computing X-ray data is mentioned in corresponding chapters. Additionally
used programs were: (a) Origin 6.1 for determination of ligand dissociation constants; (b)
Staden Package for performing sequence alignments; (c) DINO and Pymol for illustration of
X-ray structures; (d) POVRAY and Corel Draw for final preparation of figures; (e) Waters
Materials and Methods
22
Millenium Package for peak integration of chromatograms (HPLC with Fluorescence
Detection).
2.1.4 Media, Buffers and Stock-Solutions Media were autoclaved for 20 min (121 °C and 2 bar) and stored at rt. For preparation of agar
plates, LB- as well as growth-medium for H. salinarum was enriched with 15 g per liter
bacto-agar before autoclaving. Antibiotics, if used for selection, were added at a temperature
of about 60 °C. Final molar concentrations of salt, buffer substances and chemicals (ligand
compounds, antibiotics) are given in brackets.
2.1.4.1 Growth Media LB-medium (Luria-Bertani medium), E. coli:
1% (w/v) bacto tryptone
0.5% (w/v) bacto-yeast extract
1% (w/v) NaCl (171 mM)
pH 7.0, adjusted with NaOH
TB-medium (Terrific broth medium), E. coli:
1.2% (w/v) bacto tryptone
2.4% (w/v) bacto-yeast extract
0.4% (w/v) glycerol
pH 7.5, adjusted with 100 mM sterile KH2PO4/K2HPO4-buffer
Growth-medium, H. salinarum (Oesterhelt and Krippahl, 1983):
25% (w/v) NaCl (4.3 M)
5% (w/v) MgSO4 (80 mM)
0.5% (w/v) KCl (27 mM)
0.33% (w/v) Na3-citrate (10 mM)
1% (w/v) bacto-peptone
pH 7.0-7.2, adjusted with NaOH
Materials and Methods
23
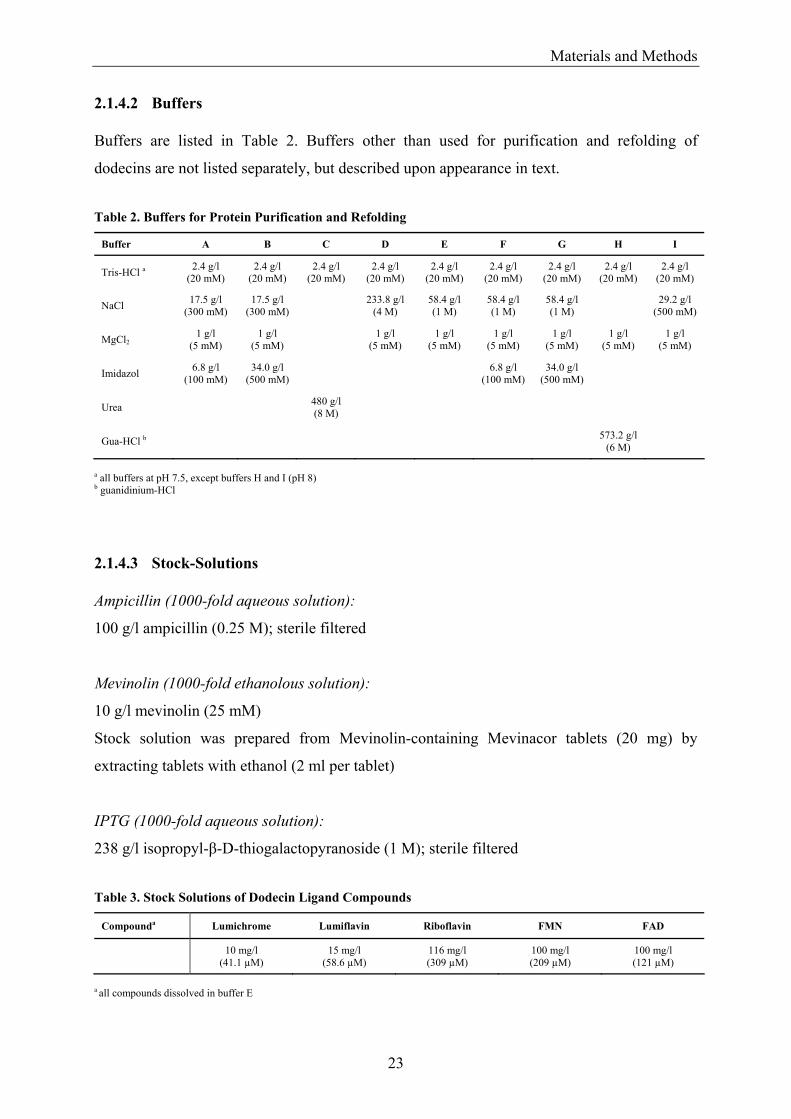
2.1.4.2 Buffers Buffers are listed in Table 2. Buffers other than used for purification and refolding of
dodecins are not listed separately, but described upon appearance in text.
Table 2. Buffers for Protein Purification and Refolding
Buffer A B C D E F G H I
Tris-HCl a 2.4 g/l (20 mM)
2.4 g/l (20 mM)
2.4 g/l (20 mM)
2.4 g/l (20 mM)
2.4 g/l (20 mM)
2.4 g/l (20 mM)
2.4 g/l (20 mM)
2.4 g/l (20 mM)
2.4 g/l (20 mM)
NaCl 17.5 g/l (300 mM)
17.5 g/l (300 mM) 233.8 g/l
(4 M) 58.4 g/l (1 M)
58.4 g/l (1 M)
58.4 g/l (1 M) 29.2 g/l
(500 mM)
MgCl2 1 g/l
(5 mM) 1 g/l
(5 mM) 1 g/l (5 mM)
1 g/l (5 mM)
1 g/l (5 mM)
1 g/l (5 mM)
1 g/l (5 mM)
1 g/l (5 mM)
Imidazol 6.8 g/l (100 mM)
34.0 g/l (500 mM) 6.8 g/l
(100 mM) 34.0 g/l
(500 mM)
Urea 480 g/l (8 M)
Gua-HCl b 573.2 g/l (6 M)
a all buffers at pH 7.5, except buffers H and I (pH 8) b guanidinium-HCl
2.1.4.3 Stock-Solutions Ampicillin (1000-fold aqueous solution):
100 g/l ampicillin (0.25 M); sterile filtered
Mevinolin (1000-fold ethanolous solution):
10 g/l mevinolin (25 mM)
Stock solution was prepared from Mevinolin-containing Mevinacor tablets (20 mg) by
extracting tablets with ethanol (2 ml per tablet)
IPTG (1000-fold aqueous solution):
238 g/l isopropyl-β-D-thiogalactopyranoside (1 M); sterile filtered
Table 3. Stock Solutions of Dodecin Ligand Compounds
Compounda
Lumichrome Lumiflavin Riboflavin FMN FAD
10 mg/l (41.1 µM)
15 mg/l (58.6 µM)
116 mg/l (309 µM)
100 mg/l (209 µM)
100 mg/l (121 µM)
a all compounds dissolved in buffer E
Materials and Methods
24
2.1.5 Strains, Vectors and Oligonucleotides
2.1.5.1 Strains BL21(DE3), E. coli (Stratagen):
F-, ompT, hsdSB(rB-mB
-), dcm+, Tetr, galλ(DE3) endA, Hte [argU ileY leuW Camr]
DH5α, E. coli (Gibco BRL):
F-, endoA1, hsdR17(rK-, rK
+), supE44, thi-1, recA1, gyrA96, relA1, ∆ (argF-laczya) U169,
Φ80dlacZ∆M15
R1 wildtype strain (DSM 671), H. salinarum:
TOM, H. salinarum (Besir, 2001)
BR-, HR-, SRI+, SRII+, Car-, Rub-, Ret+
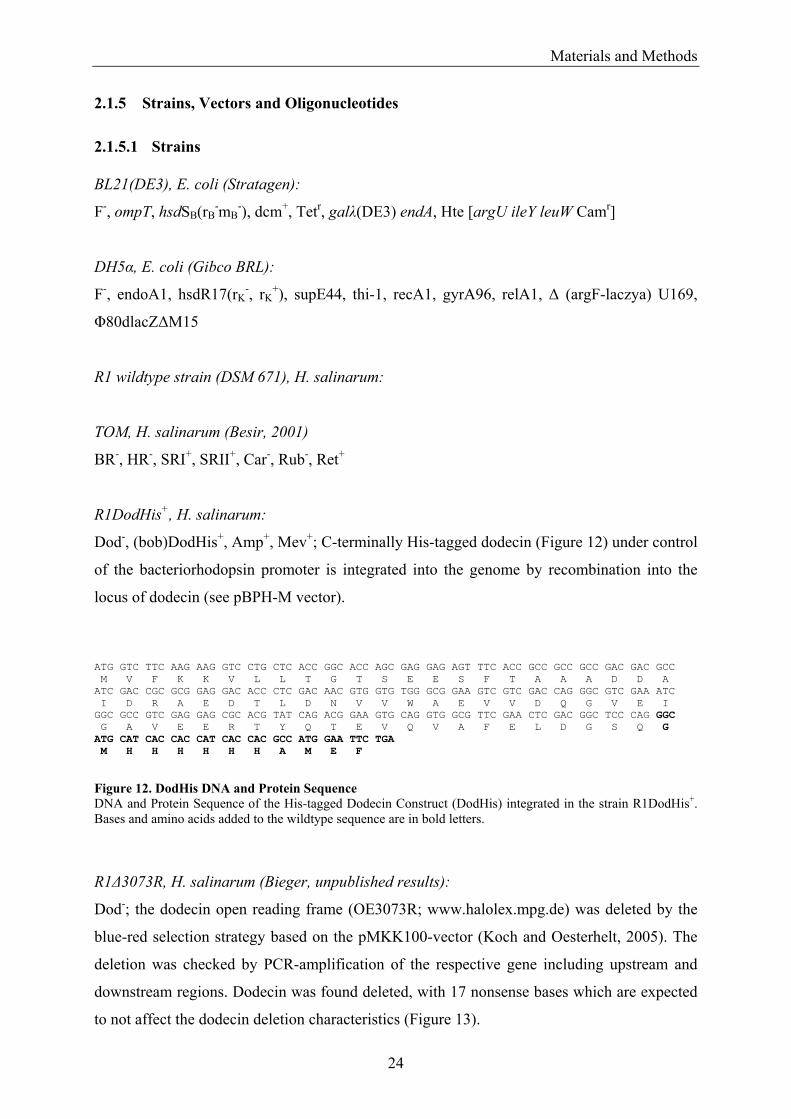
R1DodHis+, H. salinarum:
Dod-, (bob)DodHis+, Amp+, Mev+; C-terminally His-tagged dodecin (Figure 12) under control
of the bacteriorhodopsin promoter is integrated into the genome by recombination into the
locus of dodecin (see pBPH-M vector).
Figure 12. DodHis DNA and Protein Sequence DNA and Protein Sequence of the His-tagged Dodecin Construct (DodHis) integrated in the strain R1DodHis+. Bases and amino acids added to the wildtype sequence are in bold letters.
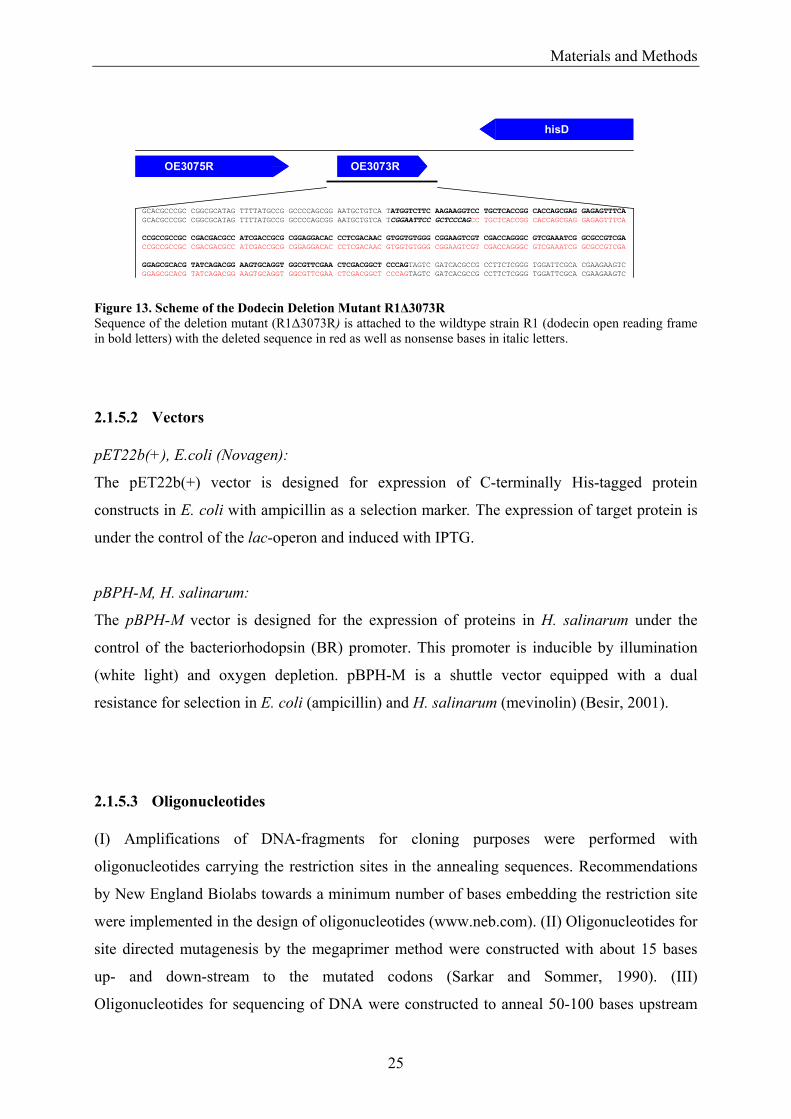
R1∆3073R, H. salinarum (Bieger, unpublished results):
Dod-; the dodecin open reading frame (OE3073R; www.halolex.mpg.de) was deleted by the
blue-red selection strategy based on the pMKK100-vector (Koch and Oesterhelt, 2005). The
deletion was checked by PCR-amplification of the respective gene including upstream and
downstream regions. Dodecin was found deleted, with 17 nonsense bases which are expected
to not affect the dodecin deletion characteristics (Figure 13).
ATG GTC TTC AAG AAG GTC CTG CTC ACC GGC ACC AGC GAG GAG AGT TTC ACC GCC GCC GCC GAC GAC GCC M V F K K V L L T G T S E E S F T A A A D D A ATC GAC CGC GCG GAG GAC ACC CTC GAC AAC GTG GTG TGG GCG GAA GTC GTC GAC CAG GGC GTC GAA ATC I D R A E D T L D N V V W A E V V D Q G V E I GGC GCC GTC GAG GAG CGC ACG TAT CAG ACG GAA GTG CAG GTG GCG TTC GAA CTC GAC GGC TCC CAG GGC G A V E E R T Y Q T E V Q V A F E L D G S Q G ATG CAT CAC CAC CAT CAC CAC GCC ATG GAA TTC TGA M H H H H H H A M E F
Materials and Methods
25
Figure 13. Scheme of the Dodecin Deletion Mutant R1∆3073R Sequence of the deletion mutant (R1∆3073R) is attached to the wildtype strain R1 (dodecin open reading frame in bold letters) with the deleted sequence in red as well as nonsense bases in italic letters.
2.1.5.2 Vectors pET22b(+), E.coli (Novagen):
The pET22b(+) vector is designed for expression of C-terminally His-tagged protein
constructs in E. coli with ampicillin as a selection marker. The expression of target protein is
under the control of the lac-operon and induced with IPTG.
pBPH-M, H. salinarum:
The pBPH-M vector is designed for the expression of proteins in H. salinarum under the
control of the bacteriorhodopsin (BR) promoter. This promoter is inducible by illumination
(white light) and oxygen depletion. pBPH-M is a shuttle vector equipped with a dual
resistance for selection in E. coli (ampicillin) and H. salinarum (mevinolin) (Besir, 2001).
2.1.5.3 Oligonucleotides (I) Amplifications of DNA-fragments for cloning purposes were performed with
oligonucleotides carrying the restriction sites in the annealing sequences. Recommendations
by New England Biolabs towards a minimum number of bases embedding the restriction site
were implemented in the design of oligonucleotides (www.neb.com). (II) Oligonucleotides for
site directed mutagenesis by the megaprimer method were constructed with about 15 bases
up- and down-stream to the mutated codons (Sarkar and Sommer, 1990). (III)
Oligonucleotides for sequencing of DNA were constructed to anneal 50-100 bases upstream
GCACGCCCGC CGGCGCATAG TTTTATGCCG GCCCCAGCGG AATGCTGTCA TATGGTCTTC AAGAAGGTCC TGCTCACCGG CACCAGCGAG GAGAGTTTCAGCACGCCCGC CGGCGCATAG TTTTATGCCG GCCCCAGCGG AATGCTGTCA TCGGAATTCC GCTCCCAGCC TGCTCACCGG CACCAGCGAG GAGAGTTTCA
CCGCCGCCGC CGACGACGCC ATCGACCGCG CGGAGGACAC CCTCGACAAC GTGGTGTGGG CGGAAGTCGT CGACCAGGGC GTCGAAATCG GCGCCGTCGACCGCCGCCGC CGACGACGCC ATCGACCGCG CGGAGGACAC CCTCGACAAC GTGGTGTGGG CGGAAGTCGT CGACCAGGGC GTCGAAATCG GCGCCGTCGA
GGAGCGCACG TATCAGACGG AAGTGCAGGT GGCGTTCGAA CTCGACGGCT CCCAGTAGTC GATCACGCCG CCTTCTCGGG TGGATTCGCA CGAAGAAGTC GGAGCGCACG TATCAGACGG AAGTGCAGGT GGCGTTCGAA CTCGACGGCT CCCAGTAGTC GATCACGCCG CCTTCTCGGG TGGATTCGCA CGAAGAAGTC
OE3073ROE3075R
hisD
Materials and Methods
26
to the sequence of interest. All nucleotides were purchased from Metabion, with purification
grade “desalted”. Melting temperatures were calculates by:
TM = 3 Σ(Ci + Gi) + 2 Σ(Ai + Ti) (1)
Oligonucleotides were stored at -20 °C.
2.2 Methods
2.2.1 Microbiological Methods
2.2.1.1 Storage and Cultivation of E. coli Storage: Storage of E. coli cells was solely realized on LB agar plates at 4 °C for up to a few
weeks, except of competent BL21(DE3) and DH5α E. coli cells which were stored as a
suspension in 60% glycerol at -80 °C (see Preparation and Transformation of Electro-
Competent E. coli Cells).
Cultivation: For isolation of vector DNA, E. coli cells were cultivated in LB-medium in scales
of 5 ml or 35 ml at 37 °C and 220 rpm. For expression of proteins in E. coli, 3 l of TB-
medium were inoculated with 35 ml of an E. coli over-night culture (LB-medium) and grown
at 37 °C and 180 rpm.
2.2.1.2 Storage and Cultivation of H. salinarum Storage: 10 ml of culture, grown to the stationary phase, were shut gas-tight in scintillation
vials and stored at rt in the dark for months. Alternatively, 50 µl of cultures, 106 to 107-fold
diluted, were plated on Halo-agar plates and similarly stored at rt in the dark for months.
Cultivation: Cultivation of H. salinarum cells was carried out in cultures of 35 ml, 1 l and 3 l
at 37 °C and 100 rpm in the dark. Cultures were successively inoculated with 1/20 to 1/50 of
the culture volume. (I) For analysis of cell growth, 35 ml cultures were grown at 37 °C in the
Materials and Methods
27
dark and in light (high-pressure xenon-lamp) as well as with and without lumichrome. (II)
Cultures of 1 l were grown in the dark and in light (high-pressure xenon-lamp) for analysis of
the flavin and lumichrome contents as well as the dodecin mRNA level at various times
during a growth curve. (III) Cultures of 3 l of were grown in the dark for homologous over-
expression of wildtype dodecin.
2.2.1.3 Recording Growth Curves by Optical Density The cell densities of E. coli and H. salinarum cultures (1 l and 3 l) were observed by light
dispersion at 600 nm and 578 nm, respectively. Cultures of 35 ml (for recording growth
curves of H. salinarum) were cultivated in 100 ml Klett-flasks and the optical densities taken
with a Klett-photometer (578 nm fixed wavelength).
2.2.1.4 Recording Growth Curves by Viable Cell Count For the determination of cell growth by viable H. salinarum cells, 200 µl of culture were
successively diluted in steps of 10-1 in basal salt (4.3 M NaCl, 80 mM MgSO4, 27 mM KCl,
10 mM Na3-citrate) and plated onto agar plates. Cells were counted after incubation for a
period of about 6 days at 37 °C.
2.2.1.5 Correlation of Optical Density and Internal Cell Volume Calculation of the internal cell volume was performed as published earlier: 1 ml of a culture
of H. salinarum at OD578 = 1 (≡ Klett 100) corresponds to 1.36 µl internal cell volume
(Hartmann et al., 1977; Michel and Oesterhelt, 1976). This was treated as a linear correlation,
even when in the late stationary phase precipitating salt as well as cell fragments obviously
contributed to the optical density.
Materials and Methods
28
2.2.2 Molecularbiological Methods
2.2.2.1 Preparation and Transformation of Electro-Competent E. coli Cells E. coli cultures were grown in LB medium (100 mg/ml ampicillin), over night at 37 °C at 220
rpm. One liter of LB medium was then inoculated with 10 ml of this pre-culture and grown to
the mid-log phase (OD600 of 0.6-0.8). The cell suspension was chilled to 4 °C (20 min) and
cells harvested by centrifugation at 4000 g (4 °C, 15 min). The supernatant was properly
removed and the cell pellet successively washed with 1, 0.5 and 0.25 l of a sterile solution of
10% glycerol in H2Obidest (centrifugation at 4000 g, 4 °C, 15 min). After the last centrifugation
step the pellet was resuspended in 700 µl (10% glycerol in H2Obidest), aliquoted in portions of
50 µl and immediately frozen in liquid nitrogen.
For transformation, 2 µl of ligation solution or 0.5 µl of plasmid DNA (3 mg/ml) were mixed
with an aliquot of competent cells (50 µl, thawed on ice) and this suspension subjected to
electroporation (Biorad; 25 µF, 1.5 kV, 800 Ω). Cells were regenerated in LB-medium (2 ml,
30-60 min) and plated on LB agar plates (100 mg/ml ampicillin) for incubation at 37 °C over
night.
2.2.2.2 Preparation and Transformation of Competent H. salinarum Cells To obtain a fast growing culture suitable for preparation of competent cells, 35 ml of growth
medium for H. salinarum were successively inoculated three times with H. salinarum cultures
in the early-log phase (after 1 to 2 days, cultured at 37 °C and 100 rpm) (Cline et al., 1989).
Cells of 2 ml of culture were harvested by centrifugation at 1700 g (5 min) and gently
resuspended in 200 µl of SPH buffer (2 M NaCl, 25 mM KCl, 15% (w/v) sucrose, 50 mM
Tris-HCl pH 8.75). Addition of 10 µl 0.5 M EDTA led to the formation of spheroplasts during
an incubation period of 20 min. Plasmid-DNA (1-2 µg diluted in 2 M NaCl) was then added
prior to 220 µl of a PEG600 solution in SPH buffer (60% (w/v)). Incubation for 20 min allows
the DNA to be adopted by cells. After addition of 1.5 ml SVL buffer (4.3 M NaCl, 80 mM
MgCl2, 10 mM Na3-citrate, 1.4 mM CaCl2, 15% (w/v) sucrose, 50 mM Tris-HCl pH 7.4) the
solution was centrifuged at 1700 g for 5 min. The cell pellet was finally resuspended in 2 ml
of growth medium for H. salinarum and incubated for two days. 100-200 µl were used per
plate for selection on agar plates containing mevinolin (37 °C). All steps during the
transformation of DNA were done at rt.
Materials and Methods
29
2.2.2.3 Preparation of Genomic DNA from H. salinarum 400 µl of a culture in the early-log phase (1-2 days) were centrifuged at 8000 g for 5 min. The
supernatant was carefully removed before lysing cells by addition of 600 µl of H2Obidest. This
solution was finally heated to 99 °C for 10 min and frozen at -20 °C.
2.2.2.4 Isolation of Vector-DNA from E. coli Single colonies were picked from LB agar plates for inoculation of 5 ml (alternatively 35 ml)
LB-medium containing antibiotic for selection (ampicillin). Cells were grown over night at 37
°C and 220 rpm and harvested by centrifugation (5000 g, 2 min). Isolation was performed
with the QIAprep Spin Miniprep Kit (Qiagen). A detailed guide is available from the
manufacturer and protocols are enclosed. Isolation is based on the method of alkaline lysis of
cells.
2.2.2.5 Isolation of DNA from Preparative Agarose Gels Preparative gels were performed for purification of PCR products and products of
endonuclease digests. The isolation of DNA fragments was carried out with the QIAprep Gel
Extraction Kit (Qiagen) according to the protocol of the manufacturer (see Isolation of
Vector-DNA from E. coli, 2.2.2.4).
2.2.2.6 Polymerase Chain Reaction (PCR) Depending on the scope of the PCR-reaction, Taq polymerase (qualitative PCR) or the proof
reading polymerases Pfu and Expand (preparative PCR) were used. The standard conditions
for a typical PCR given below worked well for a wide range of templates and oligonucleotide
primers. For optimization this protocol was modified with regard to annealing temperature,
template DNA concentration and DNA-polymerase. The reaction mixture was prepared on
ice, adding the DNA-polymerase immediately before reaction start.
Materials and Methods
30
PCR standard components:
~150 ng template DNA ~1 µl
Primer for/rev (10 µM) 2 x 1 µl
10 x buffer 5 µl
dNTPs (25 mM each) 1 µl
DMSO 2.5 µl
DNA-Polymerase 1 µl
H2Obidest 37.5 µl
PCR standard temperature profile:
Initial denaturation 94 °C, 5 min
Denaturation 94 °C, 1 min
Annealing 55 °C, 30 sec
Elongation 72 °C, 1 min/ 1000 bases
Final elongation 72 °C, 7 min
2.2.2.7 Digest of DNA by Restriction Endonulceases Endonucleases used for cloning purposes generally allowed reactions to be carried out as
double digests at 37 °C (4 h). In a typical digest reaction the total volume of restriction
enzymes was 4 µl, which corresponds to 10-20 U, with 4 µl of the corresponding ten-fold
buffer (40 µL of total volume). The concentrations of DNA were determined by (analytical)
agarose gel-electrophoresis to 3 µg of vector and 0.5 µg of PCR product.
2.2.2.8 Ligation of DNA Fragments Ligation reactions were performed with 100-500 ng DNA, 1 U of T4-ligase and the
appropriate amount of reaction buffer in total volumes of 10 µl. Before starting the reaction,
the concentrations of insert and vector as well as their purity were determined by (analytical)
agarose gel-electrophoresis. Inserts and vectors with compatible cohesive ends were usually
incubated in molar ratios of 5:1 to 3:1 over night at rt.
Materials and Methods
31
2.2.2.9 Gel-Electrophoresis of DNA Analytical and preparative separations of DNA were carried out by agarose gel-
electrophoresis, in which DNA migrates in an applied electric field due to its intrinsic
negative charge. Suspensions of 0.8-1.2% agarose in TBE buffer (1 M Tris, 0.83 M boric
acid, 10 mM EDTA) were melted to a clear, transparent solution. Prior to pouring the agarose
into the horizontal unit, ethidium bromide was added from a stock solution (10 mg/ml in
water) to a final concentration of 0.5 µg/ml ethidium bromide. For slots appropriate to the
scope of gel-electrophoresis (analytical or preparative), combs of different sizes were used.
After covering the gels with TBE puffer, slots were loaded with DNA samples (admixed gel-
loading buffer (0.2% (w/v) bromphenol blue, 30% glycerol). Gels were run at about 5 V/cm.
Bands of samples were examined by transillumination with ultraviolet light relative to a DNA
ladder developed in parallel.
2.2.2.10 Determination of DNA-Concentration DNA concentrations were solely determined by analytical agarose gel-electrophoresis. Up to
5 µl of the DNA samples were loaded onto a gel next to appropriate DNA ladders.
Specification of the concentration of the individual bands in the DNA ladder allowed an
accurate estimation of the DNA concentration of the sample in addition to the determination
of its purity.
2.2.2.11 Cloning of Dodecin from H. salinarum For heterologous overexpression of dodecin, the gene OE3073R (http://www.halolex.mpg.de)
was amplified by PCR using H. salinarum (strain R1, DSM 671) genomic DNA as a template
and 5’-GCGGAATGCTGTCATATGGTCTTCAAGAAGGTCC-3’ (mg3073for) and 5’-
CGAGAAGGCGGCGTGATCTCGAGCTGGGAGCCGTCG-3’ (mg3073rev) as primers.
The PCR product was digested with NdeI and XhoI and subcloned into a similarly treated
pET22b(+) expression plasmid (Novagen), to create pDOD-wt. Electro-competent
Escherichia coli (DH5α; Invitrogen) was used for amplification of the plasmid. All constructs
were confirmed by dye-terminator sequencing.
Materials and Methods
32
For homologous overexpression of dodecin, the PCR amplified gene OE3073R was
subcloned into the vector pBPH-M which allows the production of a C-terminally His6-
tagged protein under the control of the bacteriorhodopsin promotor (Marg et al., 2005). The
primers used for the PCR reaction were mg3073for and 5’-
CCCGAGAAGGCGGCGTGAGCATGCCCTGGGAGCCGTCG-3’ (mg3073Hsrev). The
resulting PCR product was cleared with the restriction enzymes NdeI and SphI and cloned
into the similarly digested pBPH-M vector to create pDODHs. The plasmid was transformed
into competent H. salinarum (strain R1, DSM 671) and plated on Halo-agar with 20 µl/ml
mevinoline (20 µl/ml) for selection.
2.2.2.12 Site Directed Mutagenesis of Dodecin from H. salinarum The megaprimer method was used to generate the E45A, E45K, E45R E45F, E45H, E45Q,
E45T, Q55A, and W36A point mutants of dodecin (Sarkar and Sommer, 1990). To generate
the megaprimers, PCR amplifications were performed with Pfu (Peqlab) and Expand-
Polymerase (Roche), with MP-1for and MP-MUT1rev or MP-MUT2for and MP-2rev as
primers, and the plasmid pDOD-wt as a template. After purification of the megaprimers by
agarose gel electrophoresis and gel extraction (Qiagen), the dodecin sequence was amplified
in a second PCR reaction with the ‘megaprimers’ and the MP-1for and MP-2rev primers.
Sequences of the synthetic oligonucleotides (Metabion) were as follows:
MP-1for: 5’-CCCAGTAGTAGGTTGAGGCCG-3’
MP-2rev: 5’-GTGGACTCCAACGTCAAAGGGCG-3’
MP-MUT1rev (pDOD-E45A): 5’-CGGCGCCGATTGCGACGCCCTGG-3’
MP-MUT2for (pDOD-E45A): 5’-CCAGGGCGTCGCAATCGGCGCCG-3’
MP-MUT1rev (pDOD-Q55A): 5’-GCACTTCCGTTGCATACGTGCGC-3’
MP-MUT2for (pDOD-Q55A): 5’-GCGCACGTATGCAACGGAAGTGC-3’
MP-MUT1rev (pDOD-W36A): 5’-CGACTTCCGCTGCCACCACGTTGTCG-3’
MP-MUT2for (pDOD-W36A): 5’-CGACAACGTGGTGGCAGCGGAAGTCG-3’
Mutated codons are in italic letters. The codons used for substitution were AAG for lysine,
TTT phenylalanine, CAC histidine, CAG glutamine, ACC threonine and CGC arginine. The
Materials and Methods
33
purified PCR products were digested with NdeI and XhoI and cloned into the pET22b(+)
expression plasmid as described above.
2.2.2.13 Cloning of Dodecin from H. halophila The dodecin gene from H. halophila was cloned into a pET22b(+) (yielding the plasmid
pHhDod-wt) by PCR using a clone from the shot-gun sequencing project of H. halophila
(Dieter Oesterhelt, unpublished results) as a template and 5’-
GCGCGCATATGAGCGATCACGTCTACAAGATTGTCG-3’ (mgHhalfor) and 5’-
CGCGCCTCGAGGCCCCCTTCCAGGGTAAACCC-3’ (mgHhalrev) as primers.
2.2.2.14 DNA-Sequencing DNA was sequenced with the chain-termination method with fluorescence labelled 2’,3’
dideoxynucleotides. The sequencing reaction was performed with a BigDye Terminator Cycle
Sequencing Ready Reaction Kit (Perkin Elmer Applied Biosystems). A typical reaction
mixture was prepared from 100-500 ng DNA of interest (vector and PCR-product), 2 µl of
primer (20 pmol), 3 µl of kit solution, 2 µl of betaine and H2Obidest to a final volume of 15 µl.
The standard cyclic temperature profile was composed of a 30 seconds period of denaturation
(95 °C) continued by 4 min of an annealing and elongation step (60 °C) in 30 cycles with an
initial step of denaturation (1 min, 95 °C). PCR samples were purified via Micro-Spin G-50
Columns (Pharmacia) according to the protocol of the manufacturer. Gel-electrophoresis was
performed in house (ABI Prism 377 DNA Sequencer). Oligonucleotide primers for
sequencing of pET22b(+) and pBPH-M based vector constructs:
pET22b(+): mgT7prom: 5’-CGAAATTAATACGACTCACTATAGGG-3’
mgT7term: 5’-GCTAGTTATTGCTCAGCGGTGG-3’
pBPH-M: mgBPfor: 5’-CCATGGCATGGTGATGGTGG-3’
mgBPterm: 5’-CACGAGCGTACCATACTGATTGGG-3’
Materials and Methods
34
2.2.2.15 Isolation of Total RNA from H. salinarum For the isolation of RNA, 1 ml of a H. salinarum culture was centrifuged for 5 min at 10500 g
and 21 °C. The cell pellet was resuspended in 600 µl peqGOLD RNA Pure (Peqlab) and this
suspension incubated at rt for 5 min before Chloroform (300 µl) was added. After shaking for
15 s, the solution was incubated at rt for 10 min. Centrifugation at 15000 g and 21 °C (5 min)
yielded proper phase separation. The upper aqueous phase was transferred into a new reaction
tube. 175 µl of isopropanol were added and this solution incubated at -20 °C (15 min) before
centrifuging again at 420 g (10 min). From the resulting pellet, isopropanol was removed by
washing twice with 1 ml of 96-100% ethanol (centrifugation at 15000 g for 10 min). The
pellet was finally dissolved in 30 µl of RNase-free water and stored at -80 °C.
The quality of the obtained RNA was controlled by agarose gel-electrophoresis. 3-5 µl of the
RNA solution with 1 µl loading buffer (see Gel-Electrophoresis of DNA, 2.2.2.9) were heated
for 5 min at 75 °C. The gel was developed at 65 V. Before running gels, the gel-
electrophoresis system was pre-soaked in a SDS-solution (1% SDS (w/v) in H2Obidest) for at
least 2 h.
2.2.2.16 DNase I-Digestion of RNA-samples 25 µl of RNA-solution (see Isolation of Total RNA from H. salinarum) were incubated with 2
µl DNase I (Ambion) in the corresponding buffer for 45 min at 37 °C followed by addition of
2.5 µl of inactivation reagent. After a further incubation for 2 min at rt, samples were
centrifuged at 20000 g and 4 °C (2 min). The supernatant (25 µl) was transferred into a new
reaction tube and stored at –80 °C. To ensure complete digestion a control-PCR was
performed with primers for GDH (glycerin dehydrogenase):
mgGDHfor: 5’-GCGCGCATATGACGAGCGTATTCAAATCGCCATCGACGTACG-3’
mgGDHrev: 5’-CGACGAGATGGGGCGGCGGGTTCGGCTCGAGGCGCG-3’
Genomic DNA of H. salinarum was used for a positive control.
2.2.2.17 Reverse Transcription (RT) and SybrGreen-Based RT-PCR For transcription of RNA (see 2.2.2.16) into cDNA by Reverse Transcriptase (RTase), 1 µg
RNA, 1 µl random primer (Promega), 1 µl dNTPs (10 mM each) and H2Obidest to 13 µl were
incubated for 5 min at 65 °C and 1 min on ice (primer annealing). 7 µl of a RT-mastermix (4
Materials and Methods
35
µl 5 x RTase buffer, 1 µl 0.1 M DTT, 1 µl H2Obidest, 1 µl SuperScript III; Invitrogen) were
then added and the reaction solution incubated for 10 min at rt. The reverse transcription
reaction was performed at 42 °C for 50 min and finally stopped by heat inactivation (15 min,
72 °C). 1 µl of the cDNA product was used as a template for real time PCR (RT-PCR). In the
RT-PCR reaction SybrGreen (Applied Biosystems) intercalates into newly synthesized
(double-stranded) DNA. As PCR continues to produce double stranded DNA, increasing
SybrGreen fluorescence intensity allows to determine the starting gene concentration and thus
the mRNA transcript level of dodecin and ferredoxin, respectively.
RT-PCR reaction:
12.5 µl 2x SybrGreen PCR-Master Mix (Applied Biosystems)
1.5 µl H2Obidest
5 µl primer (10 nM each)
1 µl cDNA
In the RT-PCR reaction genes were amplified with primer pairs of mgRTdod (dodecin) and
fdx-qRT (ferredoxin, as the reference house-keeping gene), respectively. Dodecin and
ferredoxin cDNA amounts (and thus the respective mRNA level) were assessed by Ct values,
which are the RT-PCR cycle numbers, when reaching a fluorescence intensity threshold.
∆Ct values were calculated from differences of the Ct values in the dodecin RT-PCR reaction
and the ferredoxin reference RT-PCR reaction and difference of ∆Ct values (∆∆Ct) taken for
the determination of relative expression level. To determine the background-fluorescence a
non-template control reaction (NTC) was performed with H2Obidest instead of a template RNA.
The RT-PCR was carried out with the Gene Amp 5700 Sequence Detection System (Applied
Biosystems).
RT-PCR-program temperature profile:
Activation of UNG 50 °C, 2 min
Activation Polymerase 95 °C, 10 min
Denaturation 95 °C, 30 sec
Annealing/Elongation 60 °C, 1 min
Materials and Methods
36
2.2.3 Proteinchemical Methods
2.2.3.1 SDS-Polyacrylamide Gel-Electrophoresis (SDS-PAGE) of Proteins Analytical gel-electrophoresis was performed with a discontinuous buffer system under the
denaturing conditions of sodium dodecylsulftate (SDS) and dithiothreitol (DTT). Gels of 13%
and 17% acrylamide were used. For the preparation of batches of 10 gels, the acrylamide
solutions (see below) were poured into a sandwich arrangement of glass plates (Teflon
spacer). Herein the acrylamide solution for the resolving gel was polymerized first before
adding the stacking gel slurry. Teflon combs were inserted into the stacking gel layer for
providing sample slots. SDS gel loading buffer (see below) was added to samples and sample
mixtures heated for 10 min to 99 °C. Separation of protein-SDS-complexes was performed in
an electric field of about 15 V/cm.
4-fold Stacking gel buffer 4-fold Resolving gel 5-fold SDS-PAGE sample
1.5 M Tris-HCl pH 8.8 0.5 M Tris-HCl pH 6.8 0.5 M Tris-HCl pH 6.8
0.5 mM EDTA 0.5 mM EDTA 10% glycerol
0.4% (w/v) SDS 0.4% (w/v) SDS 2.3% (w/v) SDS
5% DDT
0.1% bromphenyl blue
SDS-polyacrylamide stacking gel (5.4%) (for batches of 10 gels):
30% Protogel (30% acrylamide,
0.8% N,N’-methylenebisacrylamide) 4.8 ml
4 x buffer for stacking gel 8 ml
10% Ammoniumpersulfate 200 µl
TEMED 15 µl
H2Obidest 13.6 ml
SDS-polyacrylamide resolving gel (10 gels): 13.5% 17%
30% Protogel 27 ml 34 ml
4 x buffer for resolving gel 15 ml 15 ml
Glycerol 9 ml 2 ml
10% Ammoniumpersulfate 400 µl 400 µl
TEMED 50 µl 50 µl
H2Obidest 9 ml 9 ml
Materials and Methods
37
Protein bands were stained (and fixed) by immersing the gel in the staining solution
(water/methanol/glacial acid (45:45:10), 0.1% Coomassie) for several hours and subsequent
incubation for again several hours in a water/methanol/glacial acid (45:45:10) destaining
solution.
2.2.3.2 Electro-Blotting Direct electrophoretic transfer of proteins from the gel to a solid support was performed by
the semi-dry electro-blotting method. A PVDF membrane (Immobilon-P transfer membrane,
Millipore), incubated for 15 seconds in methanol and 2 min in H2Obidest, was used as a solid
support. Membrane and gel were sandwiched between pieces of Whatman 3MM paper, that
had been soaked in transfer buffers (see below). The sandwich was constructed as follows:
3MM paper (anodic buffer I) – 3MM paper (anodic buffer II) membrane (anodic buffer II) –
gel (cathodic buffer) – 3MM paper (cathodic buffer I). It was then placed between plate
electrodes with the PVDF membrane at the anode. Transfer of proteins was performed at rt
and 0.65 mA/cm2 for 1.5-2 h. Gels from SDS-PAGE were used directly (unfixed, unstained).
Anodic buffer I Anodic buffer II Cathodic buffer
0.3 M Tris-HCl pH 10.4 25 mM Tris-HCl pH 10.4 25 mM Tris-HCl pH 9.4
10% methanol 10% methanol 10% methanol
40 mM glycerol
Membranes were stained with a Ponceau S solution (2% (w/v) Ponceau S, 30%
trichloricacetic acid, 30% sulfosalicylic acid, H2Obidest), when further used for Western
Blotting. For N-terminal sequencing of immobilized proteins, membranes were stained with
Commassie analogously to gels of SDS-polyacrylamide gel-electrophoresis (see SDS-
Polyacrylamide Gel-Electrophoresis (SDS-PAGE) of Proteins).
2.2.3.3 Western Blot Analysis Polyclonal chicken anti-dodecin antibodies (IgY) purified from egg yolks were purchased
from Davids Biotechnology. For immunisation non-refolded heterologously expressed
dodecin was taken (trimeric state).
Materials and Methods
38
After the transfer (see Electro-Blotting, 2.2.3.2), I-block (0.2% (w/v), Tropix) diluted in
TBST (10 mM Tris-HCl, pH 7.5, 150 mM NaCl, 0.05% Tween-20) was used for blocking
uncovered areas on the membrane at 4 °C over night. The blot was first flushed with TBST
buffer and then incubated for 2 x15 min in TBST before incubating with the first antibody
(polyclonal anti-dodecin antibodies) for 1 h at rt. After again washing with TBST (flushed and
incubated twice for 15 min, similarly as described above) the membrane was incubated with
the second antibody (anti-chicken IgY peroxidase-conjugate) for 1 h at rt and again washed in
TBST (see above) before starting the chemiluminescence reaction with 2 ml of a
luminol/peroxide (1:1) solution. After developing the blot for 5 min, the luminol/peroxide
reaction solution was removed and the membrane sandwiched with X-ray films for various
times. For determination of the dodecin molar amounts in the H. salinarum cytosol,
heterologously overexpressed dodecin at various concentrations was loaded onto the same
gel.
2.2.3.4 Determination of Protein Concentration Protein concentrations were determined by spectroscopic means at a wavelength of 280 nm.
The extinction coefficients were calculated from the primary sequence (5690 per tryptophan
(Trp36) and 1280 per tyrosine (Tyr55) (http://www.basic.northwestern.edu/
biotools/ProteinCalc.html). Protein solutions were diluted, when the absorption exceed 1.
Alternatively, the concentration of proteins was analyzed by the BCA Protein Assay
according to the protocol of the manufacturer (Pierce). A coefficient correlating the
apododecin absorption at 280 nm and the protein concentration in the BCA assay was
determined to 1.1 for dodecin and its mutants (1.1 x A280 = concentration [mg/ml]), except for
the W36A-mutated dodecin (4.5).
2.2.3.5 Concentrating Proteins Several devices were used to concentrate protein solutions, depending on the volume and the
oligomeric state of the protein. Heterologlously expressed halobacterial dodecin was
concentrated with Centriprep 10 (10 kD cut-off membrane) prior to refolding and with
Centriprep 30 (30 kD) after refolding. Centrifugation as the driving force of the concentrating
Materials and Methods
39
process was performed at 2000 g for Centriprep 10 (which is lower than recommended
(3000 g) and 1500 g for Centriprep 30. For concentration of samples to final volumes smaller
than 600 µl, Centricons as well as Microcons were used (all devices from Amicon).
2.2.3.6 Expression and Purification of Dodecin from H. salinarum Single colonies of a BL21(DE3) E. coli expression strain carrying the recombinant plasmid
were chosen for further inoculation and cultivated at 37 °C in terrific broth medium (100
mg/ml ampicillin) until they reached an OD600 of 1.2. The temperature was lowered to 20 °C
and protein expression was induced by addition of IPTG to a final concentration of 1 mM.
After 3 h growth, the cells were harvested by centrifugation (15 min, 5000 g ; Beckman). The
cell pellet from 2.5 liters of culture was resuspended in 50 ml of buffer A (20 mM Tris-HCl
pH 7.5, 300 mM NaCl, 5 mM MgCl2, 100 mM imidazole). Phenylmethylsulfonyl fluoride
(PMSF) in 2-propanol was added to the suspension to a final concentration of 0.2 µM and the
cells were lyzed by French press. After centrifugation at 70000 g for 30 min the resulting
supernatant was diluted to a final volume of 200 ml with buffer A and incubated with Ni-
NTA Superflow resin (Qiagen). A linear gradient with buffer B (20 mM Tris-HCl pH 7.5, 300
mM NaCl, 5 mM MgCl2, 500 mM imidazole) was applied and dodecin eluted at an imidazole
concentrations of ~ 300 mM. The protein was >99% pure as judged by Coomassie staining of
SDS-PAGE gels and by HPLC analysis.
For homologous overexpression of dodecin, strain R1DodHis+ was grown in growth medium
for H. salinarum with mevinoline (20 µl/ml) at 37 °C. Cells were harvested by centrifugation
(45 min, 5000 g; Beckman) at an OD600 of 0.6 and broken by French press. The protein was
purified in an identical manner to the heterologously produced dodecin except of using buffer
F and G (see buffers A and B, but NaCl increased to 1 M) to maintain the native structure of
this halophilic protein. Elution point and purity of the preparation were similar to that
observed for the heterologously produced dodecin.
2.2.3.7 Expression and Purification of Dodecin from H. halophila Heterologous expression of H. halophila dodecin in E. coli was realized from plasmid
pHhDOD-wt, which led to the formation of orange coloured inclusion bodies. Inclusion
Materials and Methods
40
bodies were isolated, washed in buffer A and dissolved during dialysis against buffer H (20
mM Tris-HCl pH 8, 6 M guanidinium-HCl, 5 mM MgCl2) at 50 °C for 48 h. Buffer H was
repeatedly exchanged to remove flavins. Affinity purification was performed in buffers A and
B supplemented by 6 M guanidinium-HCl (pH 8). The protein was >99% pure as judged by
Coomassie staining of SDS-PAGE gels (see SDS-Polyacrylamide Gel-Electrophoresis (SDS-
PAGE) of Proteins, 2.2.3.1) and HPLC analysis (see High Performance Liquid
Chromatography/Mass Spectrometry (HPLC-MS) for Investigation of Proteins and Protein-
Ligand Complexes, 2.2.4.8).
2.2.3.8 Refolding and Reconstitution of Heterologously Expressed Dodecin Apododecin expressed in E. coli was refolded using a standard unfolding-refolding strategy.
Dodecin was concentrated up to 1 mg/ml and dialyzed successively against buffer C (8 M
urea, 20 mM Tris-HCl pH 7.5), D (4 M NaCl, 20 mM Tris-HCl pH 7.5, 5 mM MgCl2) and E
(1 M NaCl, 20 mM Tris-HCl pH 7.5, 5 mM MgCl2) for 3 h each. The refolding of apododecin
was evaluated by size exclusion chromatography (data not shown). For reconstitution of
apododecin with ligands, five equivalents of lumichrome, lumiflavin, riboflavin or FMN were
added to the refolded protein and dialyzed against buffer E over night.
Refolding of “mesophilic” dodecin from H. halophila was performed by dialysis against
buffer I (500 mM NaCl, 5 mM MgCl2, 20 mM Tris-HCl pH 8) and the dodecameric state
confirmed by size exclusion chromatography (see Size Exclusion Chromatography, 2.2.3.9).
2.2.3.9 Size Exclusion Chromatography The size exclusion chromatography was used for analyzing the oligomeric state to ensure
dodecameric dodecin to be used in crystallization trials and binding measurements and for
investigations of the integrity of the holododecin under reductive conditions. Reductive
conditions were realized by adding a fresh sodium dithionite solution (about 100 mM
Na2S2O4 x 2H2O, 100 mM Tris-HCl pH 8) to a solution of dodecin to reach final
concentrations of 0.2 mM dodecin and 10 mM Na2S2O4. The redox potential of sodium
dithionite in alkaline solution is -1.12 V (Holleman, 1995). Samples of 0.1 mg protein were
Materials and Methods
41
subjected to size exclusion chromatography on a Superdex 75 HR 3.2/30 column (Amersham
Biosciences) equilibrated and performed with buffer E.
2.2.3.10 N-terminal Sequencing N-terminal sequencing by the Edman degradation was performed by the service department in
house. Proteins were either sequenced from solution or from PVDF membranes as solid
support.
2.2.4 Biochemical Methods
2.2.4.1 Fast Lysis of H. salinarum and E. coli Cells for Investigation of the Protein Inventory by SDS-PAGE
H. salinarum:
This method describes the preparation of samples for the investigations of the protein
inventory by SDS-PAGE and determination of the dodecin copy number by Western Blot
Analysis. For lysis, 1 ml of cells were centrifuged at 5000 g for 15 min, washed with basal
salt. After another centrifugation (5000 g,15 min) cells were lyzed with 200 µl of 2.5 fold
SDS buffer at 99 °C for 10 min. Centrifugation at 20000 g and 15 min was done to clear
samples from cell fragments. When used for Western Blot Analysis, aliquots of supernatant
were loaded onto SDS-PAGE gels, which were normalized to internal cell volumes (see
Correlation Optical Density and Internal Cell Volume, 2.2.1.5).
E. coli:
For investigating the heterologous over-expression of wildtype and mutant dodecin, 200 µl of
an E. coli culture were centrifuged at 8000 g for 5 min. The cell pellet was washed in buffer A
and centrifuged for another 5 min. Resuspension of cells in 200 µl of 2.5 x SDS-PAGE
sample buffer and incubation at 99 °C for 10 min led to cell lysis. The suspension was cleared
upon centrifugation at 20000 g for 15 min and the supernatant loaded onto SDS-PAGE gels
(2-10 µl).
Materials and Methods
42
2.2.4.2 Extraction of Homologously Overexpressed Dodecin from the H. salinarum Cytosol and from Solutions with Defined Ligand Concentrations
H. salinarum cytosol:
Dodecin was isolated from H. salinarum by centrifuging 50 ml of a cell culture for 45 min at
5000 g. The pellet was resuspended in 1 ml buffer E and a small amount of DNAse I was
added. Cells were lyzed by two cycles of freezing in liquid nitrogen and thawing in room-
tempered water (freeze-thaw-lysis). This lysate was cleared by centrifugation at 100000 g (30
min) and the supernatant incubated for 30 min at 4 °C with 500 µl of Ni-NTA (Qiagen) for
the immobilization of the His-tagged protein. Dodecin was purified by two successive wash
steps with 1400 µl of buffer F and final elution with 200 µl of buffer G. Herein the Ni-NTA
matrix was incubated for 5 min in the respective volumes of buffer F and G and centrifuged at
2000 g for 5 min for separation of the Ni-NTA material. After eluting with buffer G the
supernatant was filtered (0.22 µm) and analyzed by HPLC with fluorescence detection.
Solutions with defined ligand concentration:
Apododecin (5 µM) was transferred into a solution of different molar ratios of the ligands
riboflavin and lumichrome (ligand minimum concentration of 8 µM each) and incubated for
10 min at rt. For determining the dodecin ligand spectrum relative to a “surrounding” ligand
environment, dodecin was extracted by its Ni-NTA affinity, as described above. This
procedure was solely modified by the usage of buffer E as a washing buffer.
2.2.4.3 Extraction of Flavins and Lumichrome from H. salinarum Cells FMN, FAD and riboflavin are highly water-soluble compounds, whereas lumichrome is
significantly less soluble in water (to about 10 µM in aqueous solution as determined from the
linearity of the lumichrome emission fluorescence). While FMN, FAD and riboflavin were
extracted by a water/ethanol (5:1) solution, lumichrome extraction was performed with
acetonitrile added to enhance the solubility of lumichrome (water/ethanol/acetonitrile
(~5:1:5)).
15 ml of cells were harvested by centrifuging for 30 min at 4 °C and 5300 g. The supernatant
was removed and the pellet resuspended in 1 ml of HEPES buffered basal-salt (20 mM
HEPES, pH 7). The volume of the suspension was increased with buffered basal-salt to 10 ml,
the suspension gently shaken to resolve the cell pellet and finally centrifuged for 30 min at 4
Materials and Methods
43
°C and 5300 g. After another wash step, the doubly washed pellet was resuspended in 500 µl
of Tris-HCl buffered H2Obidest (20 mM Tris-HCl pH 7.5) with DNase I added to degrade
DNA. This solution was incubated at rt in the dark until the DNA was found digested (about
20 min). To the non-viscous, homogenous solution 150 µl of ethanol (96%) were added and
heated to 80 °C for 20 min. 150 µl were separated for the analysis of the flavins (flavin
sample). The rest (about 600 µl) was mixed thoroughly with 500 µl acetonitrile and incubated
for 20 min at rt. Again a 150 µl aliquot was taken (lumichrome sample) and together with the
flavin sample centrifuged at 12000 g and 20 °C for 20 min to spin down cell fragments and
denatured proteins. For analysis by HPLC with fluorescence detection, centrifuged
lumichrome and flavin samples were diluted 1:1 with H2Obidest.
2.2.4.4 Fluorescence Based Binding Assay The dissociation constants (KDs) for ligand binding to dodecin were determined by titration of
the fluorescent ligands with the apoprotein at rt using a fluorescence spectrophotometer
(Hitachi F-2000). This approach, in which the quenching of the ligand fluorescence upon
incorporation into the apododecin binding pocket was measured, was chosen instead of
monitoring the protein’s tryptophan fluorescence as the special arrangement of the tryptophan
(Trp36) in dodecin may lead to non-linear phenomena (see Inverse Binding Assay, 3.5.1.1).
The excitation/emission wavelengths were set at 381/464 nm (lumichrome) and 450/520 nm
(flavins) with a slit width of 10 and 20 nm, respectively, and a potential of 400 V on the
photomultiplier. The ligands were purchased from Sigma-Aldrich with a purity of >95% and
used without further purification. In a typical titration experiment 500 µl of a 6 µM ligand
solution (in buffer E) was titrated with aliquots of apododecin to molar apoprotein/ligand
molar ratios of up to 30, depending on the stability of holocomplexes as judged in pre-
experiments. Due to photobleaching of the flavins each readout point was determined in a
separate preparation. In control experiments, ligands were titrated with the W36A mutant
apododecin. Due to the missing tryptophan this protein is not able to efficiently quench ligand
fluorescence if incorporation of ligands occurs (note the reduced affinity of W36A-mutated
dodecin). Unchanged fluorescence emission therefore implies that a putative unspecific
binding does not affect specific binding data. Dissociation constants are then provided, when
quenching of the chromophore fluorescence asymptotically reached an end point, otherwise
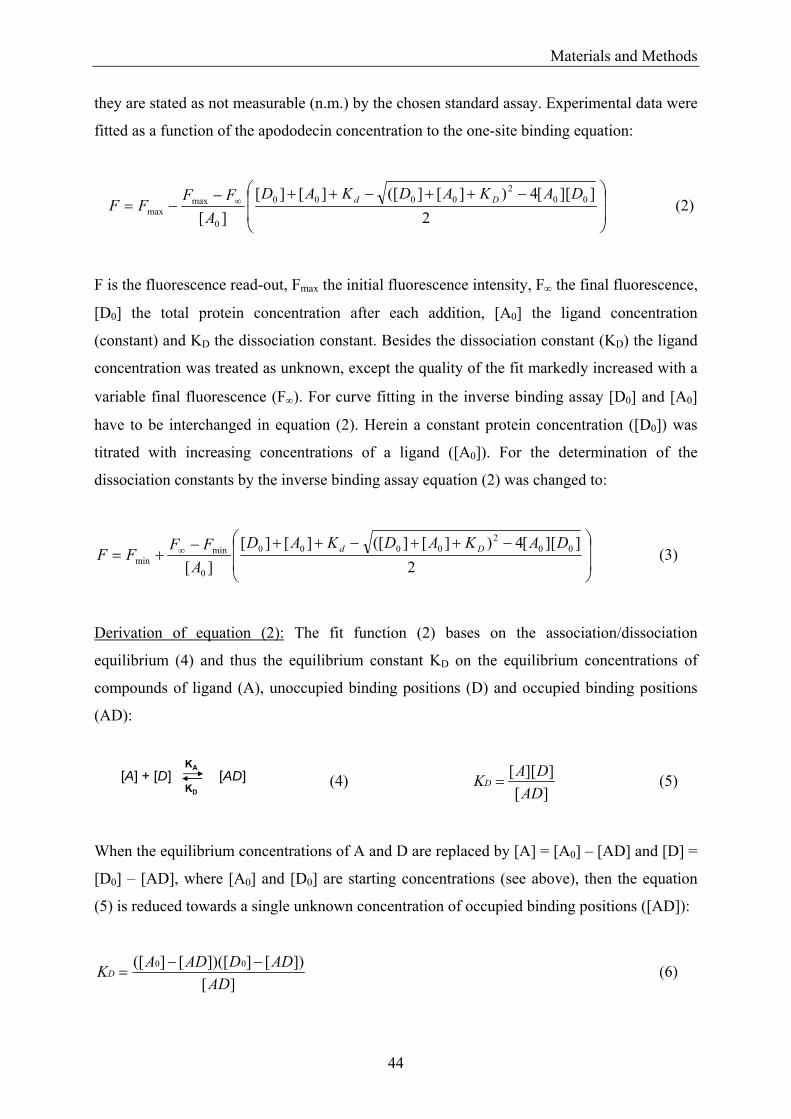
Materials and Methods
44
they are stated as not measurable (n.m.) by the chosen standard assay. Experimental data were
fitted as a function of the apododecin concentration to the one-site binding equation:
⎟⎟
⎠
⎞
⎜⎜
⎝
⎛ −++−++−−= ∞
2]][[4)][]([][][
][00
20000
0
maxmax
DAKADKADA
FFFF Dd (2)
F is the fluorescence read-out, Fmax the initial fluorescence intensity, F∞ the final fluorescence,
[D0] the total protein concentration after each addition, [A0] the ligand concentration
(constant) and KD the dissociation constant. Besides the dissociation constant (KD) the ligand
concentration was treated as unknown, except the quality of the fit markedly increased with a
variable final fluorescence (F∞). For curve fitting in the inverse binding assay [D0] and [A0]
have to be interchanged in equation (2). Herein a constant protein concentration ([D0]) was
titrated with increasing concentrations of a ligand ([A0]). For the determination of the
dissociation constants by the inverse binding assay equation (2) was changed to:
⎟⎟
⎠
⎞
⎜⎜
⎝
⎛ −++−++−+= ∞
2]][[4)][]([][][
][00
20000
0
minmin
DAKADKADA
FFFF Dd (3)
Derivation of equation (2): The fit function (2) bases on the association/dissociation
equilibrium (4) and thus the equilibrium constant KD on the equilibrium concentrations of
compounds of ligand (A), unoccupied binding positions (D) and occupied binding positions
(AD):
(4) ][]][[
ADDAKD = (5)
When the equilibrium concentrations of A and D are replaced by [A] = [A0] – [AD] and [D] =
[D0] – [AD], where [A0] and [D0] are starting concentrations (see above), then the equation
(5) is reduced towards a single unknown concentration of occupied binding positions ([AD]):
][])[]])([[]([ 00
ADADDADAKD
−−= (6)
[A] + [D] [AD]KA
KD
Materials and Methods
45
The aim of the binding assay is to solve equation (6) by correlating [AD] (the equilibrium
concentration of occupied binding positions) with a read-out value, determined as depending
on [A0] and [D0]. For the standard binding assay this was done by recording the ligand
fluorescence of sample solutions which decreases with a proceeding reduction of free ligands
(increasing [AD]). The development of the ligand emission fluorescence with respect to the
binding position concentration ([D0]) can be mathematically described by:
∞∞ +−= FFFDDF )(
][][
max0
(7)
Equation (7) can be rearranged to introduced the equilibrium concentration of occupied
binding positions ([AD]).
][(0
)maxmax AD
AFFFF ∞−
−= (8)
Substitution of [AD] by equation (6) yields fit function (2). Note that macroscopically the
dodecin binding system is not to distinguish from a monomeric protein adopting a single
ligand. Therefore, in spite of the structural complexity of ligand dimers incorporated into 6
binding pocket per dodecameric protein complex, dodecin can functionally be treated as a
monomeric protein with a single (independent) binding position. As a consequence, all
binding models used for the functional characterization of dodecin are reduced to this simplest
description.
2.2.4.5 Absorption Spectroscopy on Dodecin Crystals For absorption spectroscopy on dodecin crystals a microscope spectral photometer UMSP 80
(Zeiss) connected to a TIDAS-microscope-spectrometer (J&M) was used. Fifty spectra were
taken per second integrated for 5 s with 1024 diodes at a resolution of 0.8 nm (spectral band
width 2nm; wavelength accuracy ± 1 nm; wavelength reproducibility ± 0.07; noise (550 nm)
± 0.000025 AU; base line drift (550 nm) ± 0.0005 AU/h). A xenon light source allowed a
wavelength absorption limit below 300 nm. Spectra were taken at 100 K (Oxford
cryosystems) against air as a reference. Crystals were frozen with the mother liquor as a cryo-
protectant as reported below (see Crystallization and Data Collection, 2.2.4.10). The
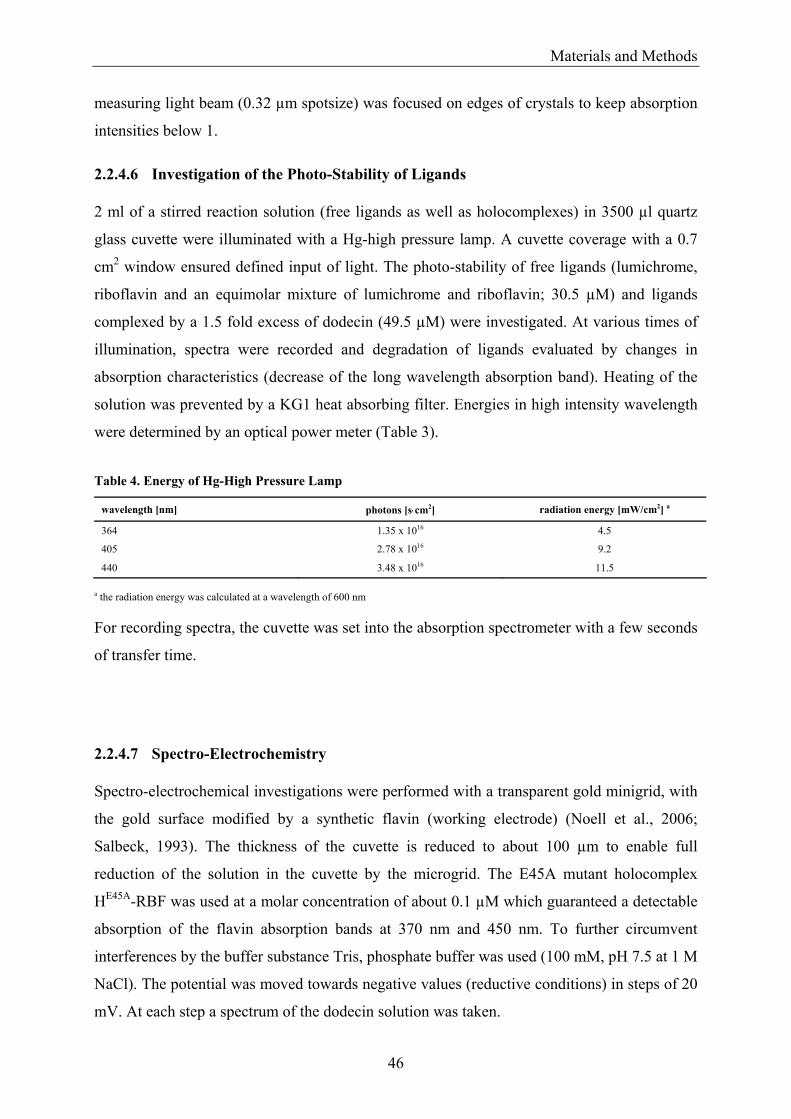
Materials and Methods
46
measuring light beam (0.32 µm spotsize) was focused on edges of crystals to keep absorption
intensities below 1.
2.2.4.6 Investigation of the Photo-Stability of Ligands 2 ml of a stirred reaction solution (free ligands as well as holocomplexes) in 3500 µl quartz
glass cuvette were illuminated with a Hg-high pressure lamp. A cuvette coverage with a 0.7
cm2 window ensured defined input of light. The photo-stability of free ligands (lumichrome,
riboflavin and an equimolar mixture of lumichrome and riboflavin; 30.5 µM) and ligands
complexed by a 1.5 fold excess of dodecin (49.5 µM) were investigated. At various times of
illumination, spectra were recorded and degradation of ligands evaluated by changes in
absorption characteristics (decrease of the long wavelength absorption band). Heating of the
solution was prevented by a KG1 heat absorbing filter. Energies in high intensity wavelength
were determined by an optical power meter (Table 3).
Table 4. Energy of Hg-High Pressure Lamp
a the radiation energy was calculated at a wavelength of 600 nm For recording spectra, the cuvette was set into the absorption spectrometer with a few seconds
of transfer time.
2.2.4.7 Spectro-Electrochemistry Spectro-electrochemical investigations were performed with a transparent gold minigrid, with
the gold surface modified by a synthetic flavin (working electrode) (Noell et al., 2006;
Salbeck, 1993). The thickness of the cuvette is reduced to about 100 µm to enable full
reduction of the solution in the cuvette by the microgrid. The E45A mutant holocomplex
HE45A-RBF was used at a molar concentration of about 0.1 µM which guaranteed a detectable
absorption of the flavin absorption bands at 370 nm and 450 nm. To further circumvent
interferences by the buffer substance Tris, phosphate buffer was used (100 mM, pH 7.5 at 1 M
NaCl). The potential was moved towards negative values (reductive conditions) in steps of 20
mV. At each step a spectrum of the dodecin solution was taken.
wavelength [nm] photons [s⋅cm2] radiation energy [mW/cm2] a
364 1.35 x 10¹⁶ 4.5
405 2.78 x 10¹⁶ 9.2
440 3.48 x 10¹⁶ 11.5
Materials and Methods
47
2.2.4.8 High Performance Liquid Chromatography/Mass Spectrometry (HPLC-MS) for Investigation of Proteins and Protein-Ligand Complexes
Reversed phase high performance liquid chromatography/mass spectrometry (HPLC/MS;
Perkin Elmer) was used for routinely analyzing the protein masses before determining
dissociation constants (KD) or starting crystallization trials. However, HPLC/MS was
additionally used for the identification of dodecin ligands, either as control for ligand purity
(reconstituted dodecins) or for determination of ligands, natively bound to dodecin
(homologously overexpressed dodecin). Protein samples were concentrated to about 1 mg/ml
when used for protein analysis or 3-5 mg/ml when the dodecin ligands were analyzed. For
gradient elution the HPLC was programmed as follows: equilibration at 5% solvent B; linear
gradient: 0 min, 5% solvent B; 15 min: 90% solvent B (solvent A: 0.05% (v/v) trifluoroacetic
acid (TFA) in water; solvent B: 0.05% (v/v) TFA in acetonitrile). The ligands and the protein
were detected as protonated molecules in the positive ion electrospray ionization (ESI) mode
as they elute from the 125/5 Nucleosil 100-5 C8 HD reverse phase column (Macherey and
Nagel) during the acetonitril/water gradient. Mass analysis of ligand and protein was done
separately at m/z-windows of 100-1000 (ion source 4900 V, orifice 10 V) and 2000-10000
(ion source 5000 V, orifice 30 V), respectively. Analysis with a photodiode array detector
(Agilent 1100) at wavelength 280, 370 and 450 nm prior to mass spectrometric detection
allowed spectroscopic investigations of the dodecin ligand composition.
2.2.4.9 Quantification of Flavins and Lumichrome by High Performance Liquid Chromatography (HPLC) Coupled to Fluorescence Detection
Reversed phase high performance liquid chromatography (HPLC)/fluorescence detection
(Waters) was performed at flow rates of 0.2 ml/min at 30 °C on the reversed phase columns
Luna (5 µm, 150 x 2 mm C18(2); Phenomenex) for the analysis of lumichrome (as well as
riboflavin when quantifying as complexed to dodecin) and XTerra (3.5µm, 100 x 2 mm,
RP18; Waters) for flavins. The mobile phase involved mixtures of water and acetonitrile with
gradients of 15% to 70% and 5% to 25% solvent B during 30 min (solvent A:
water/acetonitril (98:2); solvent B: water/acetonitril (10:90) plus 0.05% formic acid). Peaks
were monitored by simultaneous fluorescence detection at the wavelength couples 381/464
nm (lumichrome) and 450/520 nm (flavins). Quantification of ligands was performed by
plotting peak areas to calibration curves obtained with the pure compounds. The detection
limit of the setup was determined to about 5 nM (lumichrome, riboflavin and FMN) and about
Materials and Methods
48
25 nM for FAD. In the extraction of the H. salinarum cultures which involves a dilution of the
internal cell volume (see Extraction of Flavins and Lumichrome from H. salinarum Cells,
2.2.4.3) by approximately the factor 100, these detection limits equal cellular concentrations
of compounds of 0.5 and 2.5 µM, respectively. Thus, compounds could just be quantified
when the cellular concentrations exceeds these thresholds.
2.2.4.10 Crystallization and Data Collection Crystallization trials were performed with purified dodecins at concentrations of 3 mg/ml in
buffer E by the vapor diffusion hanging drop technique at 18 °C. Prior to crystallization
experiments the purity of the incorporated ligands was determined to be >95% (see also
Fluorescence Based Binding Assay, 2.2.4.4). Initial trials were performed using commercially
available screens (Hampton research) adjusted to 2 M NaCl. Well diffracting crystals grew in
0.2 M MgCl2, 2.0 M NaCl, 0.1 M Na HEPES pH 7.5 and 30% PEG400, and were further
optimized by increasing the PEG400 concentration. The protocol for purification and
crystallization of wildtype dodecin is described elsewhere (Bieger et al., 2003). X-ray
diffraction data were collected at beamlines Id14-4 (H-LUM, H-RBF and H-FMN), Id14-2
(H-LMF), Id29 (wt-dod) and Id14-1 (apo) at the European Synchrotron Radiation Facility
(ESRF, Grenoble) as well as at beamline PXI (H-FAD) at the Swiss Light Source (SLS,
Zurich) at 100 K with the mother liquor as a cryo-protection buffer. Data were recorded using
ADSC Q4R CCD (Id14-1, Id14-4), ADSC Q4 CCD (Id14-2), ADSC Q210 2D (Id29) and
mar225 mosaic (PXI) detectors at wavelengths of 0.9168 (Id14-4), 0.9330 (Id14-2), 0.9340
(Id14-1), 0.9310 (Id29) and 1.0056 Å (PXI) (Table 6). All crystals were tilted by 0.5 or 1
degree per 60 second exposure with an overall rotation of at least 30 degrees.25
Diffraction intensities were integrated by XDS, and scaled and merged by XSCALE (Table 6)
(Kabsch, 1988). The structures of dodecins were solved by molecular replacement using the
coordinates of the PDB-entry 1MOG and initial models were further refined by alternative
cycles of model rebuilding in O and automatic refinement in REFMAC (Brunger et al., 1998;
Jones et al., 1991; Murshudov et al., 1997).
The atomic coordinates and structure factors have been deposited in the Protein Data Bank,
http://www.pdb.org [PDB ID codes 2CC7 (H-LUM), 2CCC (H-LMF), 2CCB (H-RBF), 2CC8
(H-FMN), 2CC9 (apo), 2CC6 (wt-dod) and 2CJC (H-FAD)].
Mn2+-soaks were performed with crystals of H-LUM and crystals of dodecin reconstituted
with an equimolar mixture of lumichrome and riboflavin. Crystals were transferred into the
Materials and Methods
49
same drop of a crystallization solution identical to the original condition, except the
substitution of MgCl2 by MnCl2. Soaking periods longer than 24 h were found unsuited due to
a beginning (brownish) colouring of the soaking solutions.
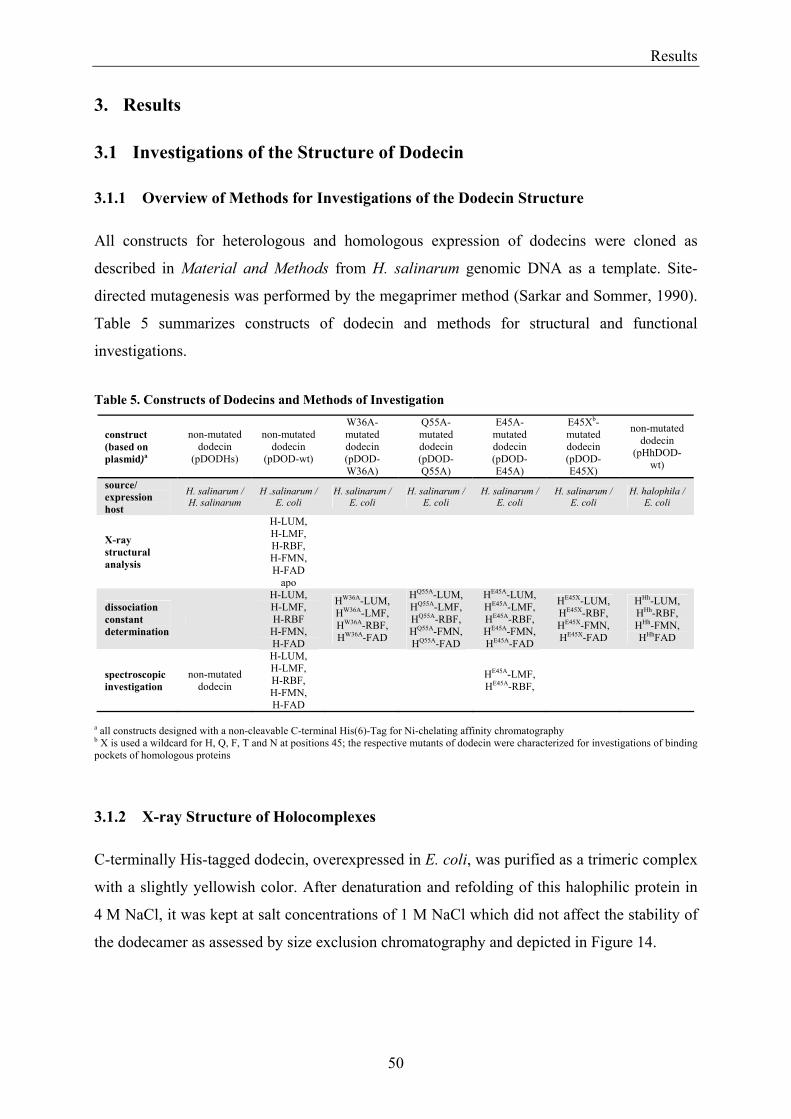
Results
50
3. Results 3.1 Investigations of the Structure of Dodecin 3.1.1 Overview of Methods for Investigations of the Dodecin Structure All constructs for heterologous and homologous expression of dodecins were cloned as
described in Material and Methods from H. salinarum genomic DNA as a template. Site-
directed mutagenesis was performed by the megaprimer method (Sarkar and Sommer, 1990).
Table 5 summarizes constructs of dodecin and methods for structural and functional
investigations.
Table 5. Constructs of Dodecins and Methods of Investigation
construct (based on plasmid)a
non-mutated dodecin
(pDODHs)
non-mutated dodecin
(pDOD-wt)
W36A-mutated dodecin (pDOD-W36A)
Q55A-mutated dodecin (pDOD-Q55A)
E45A-mutated dodecin (pDOD-E45A)
E45Xb- mutated dodecin (pDOD-E45X)
non-mutated dodecin
(pHhDOD-wt)
source/ expression host
H. salinarum / H. salinarum
H .salinarum / E. coli
H. salinarum / E. coli
H. salinarum / E. coli
H. salinarum / E. coli
H. salinarum / E. coli
H. halophila / E. coli
X-ray structural analysis
H-LUM, H-LMF, H-RBF, H-FMN, H-FAD
apo
dissociation constant determination
H-LUM, H-LMF, H-RBF
H-FMN, H-FAD
HW36A-LUM, HW36A-LMF, HW36A-RBF, HW36A-FAD
HQ55A-LUM, HQ55A-LMF, HQ55A-RBF, HQ55A-FMN, HQ55A-FAD
HE45A-LUM, HE45A-LMF, HE45A-RBF, HE45A-FMN, HE45A-FAD
HE45X-LUM, HE45X-RBF, HE45X-FMN, HE45X-FAD
HHh-LUM, HHh-RBF, HHh-FMN, HHhFAD
spectroscopic investigation
non-mutated dodecin
H-LUM, H-LMF, H-RBF, H-FMN, H-FAD
HE45A-LMF, HE45A-RBF,
a all constructs designed with a non-cleavable C-terminal His(6)-Tag for Ni-chelating affinity chromatography b X is used a wildcard for H, Q, F, T and N at positions 45; the respective mutants of dodecin were characterized for investigations of binding pockets of homologous proteins
3.1.2 X-ray Structure of Holocomplexes C-terminally His-tagged dodecin, overexpressed in E. coli, was purified as a trimeric complex
with a slightly yellowish color. After denaturation and refolding of this halophilic protein in
4 M NaCl, it was kept at salt concentrations of 1 M NaCl which did not affect the stability of
the dodecamer as assessed by size exclusion chromatography and depicted in Figure 14.
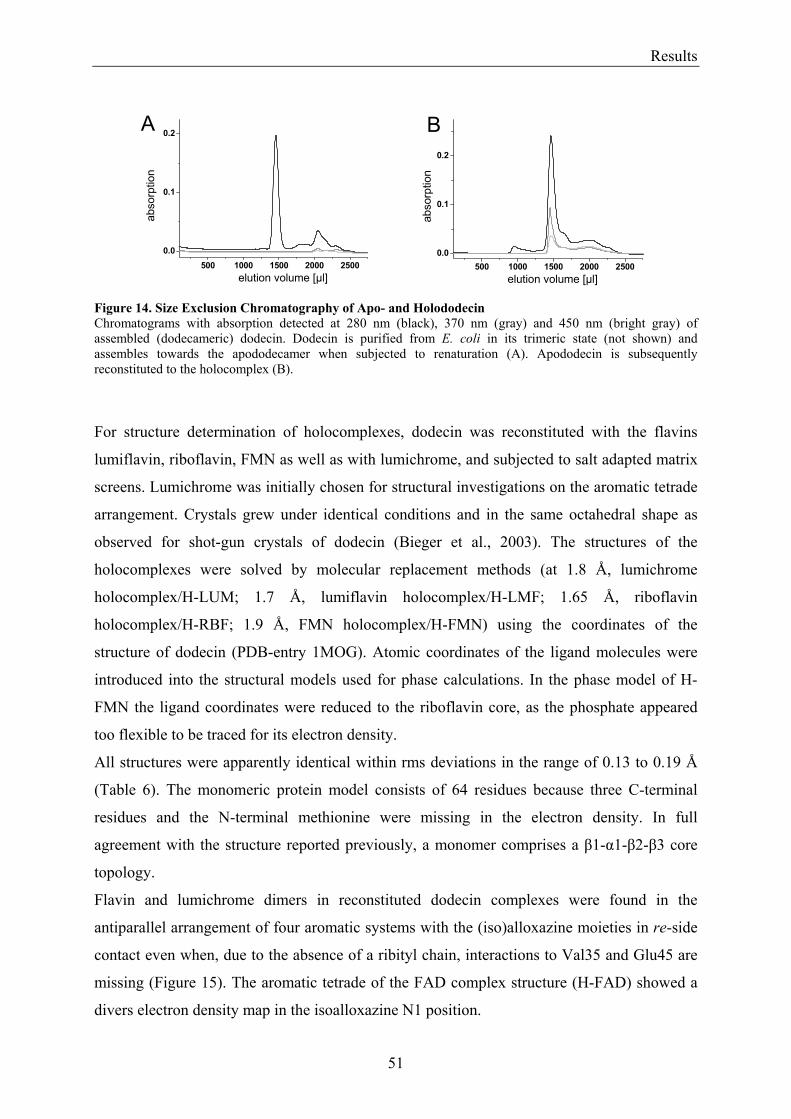
Results
51
Figure 14. Size Exclusion Chromatography of Apo- and Holododecin Chromatograms with absorption detected at 280 nm (black), 370 nm (gray) and 450 nm (bright gray) of assembled (dodecameric) dodecin. Dodecin is purified from E. coli in its trimeric state (not shown) and assembles towards the apododecamer when subjected to renaturation (A). Apododecin is subsequently reconstituted to the holocomplex (B).
For structure determination of holocomplexes, dodecin was reconstituted with the flavins
lumiflavin, riboflavin, FMN as well as with lumichrome, and subjected to salt adapted matrix
screens. Lumichrome was initially chosen for structural investigations on the aromatic tetrade
arrangement. Crystals grew under identical conditions and in the same octahedral shape as
observed for shot-gun crystals of dodecin (Bieger et al., 2003). The structures of the
holocomplexes were solved by molecular replacement methods (at 1.8 Å, lumichrome
holocomplex/H-LUM; 1.7 Å, lumiflavin holocomplex/H-LMF; 1.65 Å, riboflavin
holocomplex/H-RBF; 1.9 Å, FMN holocomplex/H-FMN) using the coordinates of the
structure of dodecin (PDB-entry 1MOG). Atomic coordinates of the ligand molecules were
introduced into the structural models used for phase calculations. In the phase model of H-
FMN the ligand coordinates were reduced to the riboflavin core, as the phosphate appeared
too flexible to be traced for its electron density.
All structures were apparently identical within rms deviations in the range of 0.13 to 0.19 Å
(Table 6). The monomeric protein model consists of 64 residues because three C-terminal
residues and the N-terminal methionine were missing in the electron density. In full
agreement with the structure reported previously, a monomer comprises a β1-α1-β2-β3 core
topology.
Flavin and lumichrome dimers in reconstituted dodecin complexes were found in the
antiparallel arrangement of four aromatic systems with the (iso)alloxazine moieties in re-side
contact even when, due to the absence of a ribityl chain, interactions to Val35 and Glu45 are
missing (Figure 15). The aromatic tetrade of the FAD complex structure (H-FAD) showed a
divers electron density map in the isoalloxazine N1 position.
A B
500 1000 1500 2000 25000.0
0.1
0.2
elution volume [µl]
abso
rptio
n
500 1000 1500 2000 25000.0
0.1
0.2
abso
rptio
n
elution volume [µl]
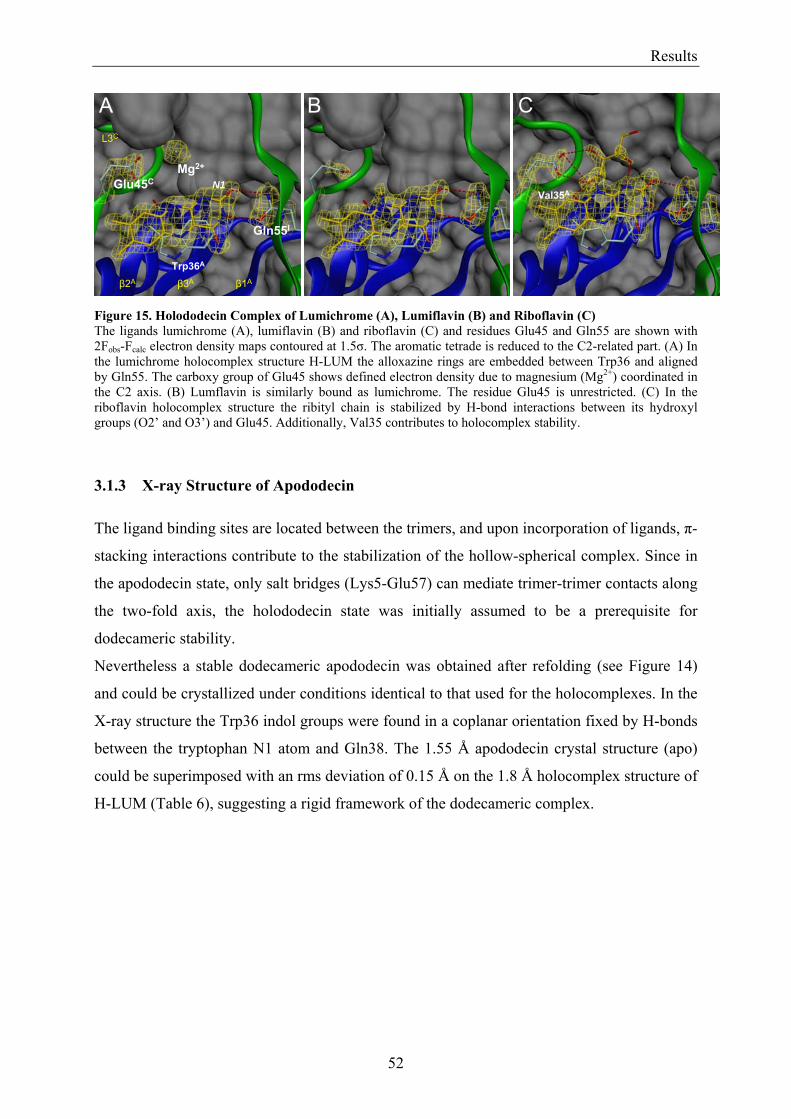
Results
52
Figure 15. Holododecin Complex of Lumichrome (A), Lumiflavin (B) and Riboflavin (C) The ligands lumichrome (A), lumiflavin (B) and riboflavin (C) and residues Glu45 and Gln55 are shown with 2Fobs-Fcalc electron density maps contoured at 1.5σ. The aromatic tetrade is reduced to the C2-related part. (A) In the lumichrome holocomplex structure H-LUM the alloxazine rings are embedded between Trp36 and aligned by Gln55. The carboxy group of Glu45 shows defined electron density due to magnesium (Mg2+) coordinated in the C2 axis. (B) Lumflavin is similarly bound as lumichrome. The residue Glu45 is unrestricted. (C) In the riboflavin holocomplex structure the ribityl chain is stabilized by H-bond interactions between its hydroxyl groups (O2’ and O3’) and Glu45. Additionally, Val35 contributes to holocomplex stability.
3.1.3 X-ray Structure of Apododecin The ligand binding sites are located between the trimers, and upon incorporation of ligands, π-
stacking interactions contribute to the stabilization of the hollow-spherical complex. Since in
the apododecin state, only salt bridges (Lys5-Glu57) can mediate trimer-trimer contacts along
the two-fold axis, the holododecin state was initially assumed to be a prerequisite for
dodecameric stability.
Nevertheless a stable dodecameric apododecin was obtained after refolding (see Figure 14)
and could be crystallized under conditions identical to that used for the holocomplexes. In the
X-ray structure the Trp36 indol groups were found in a coplanar orientation fixed by H-bonds
between the tryptophan N1 atom and Gln38. The 1.55 Å apododecin crystal structure (apo)
could be superimposed with an rms deviation of 0.15 Å on the 1.8 Å holocomplex structure of
H-LUM (Table 6), suggesting a rigid framework of the dodecameric complex.
BAGlu45C
Gln55I
Trp36A
L3C
β3A β1Aβ2A
N1Mg2+
Val35A
A CB
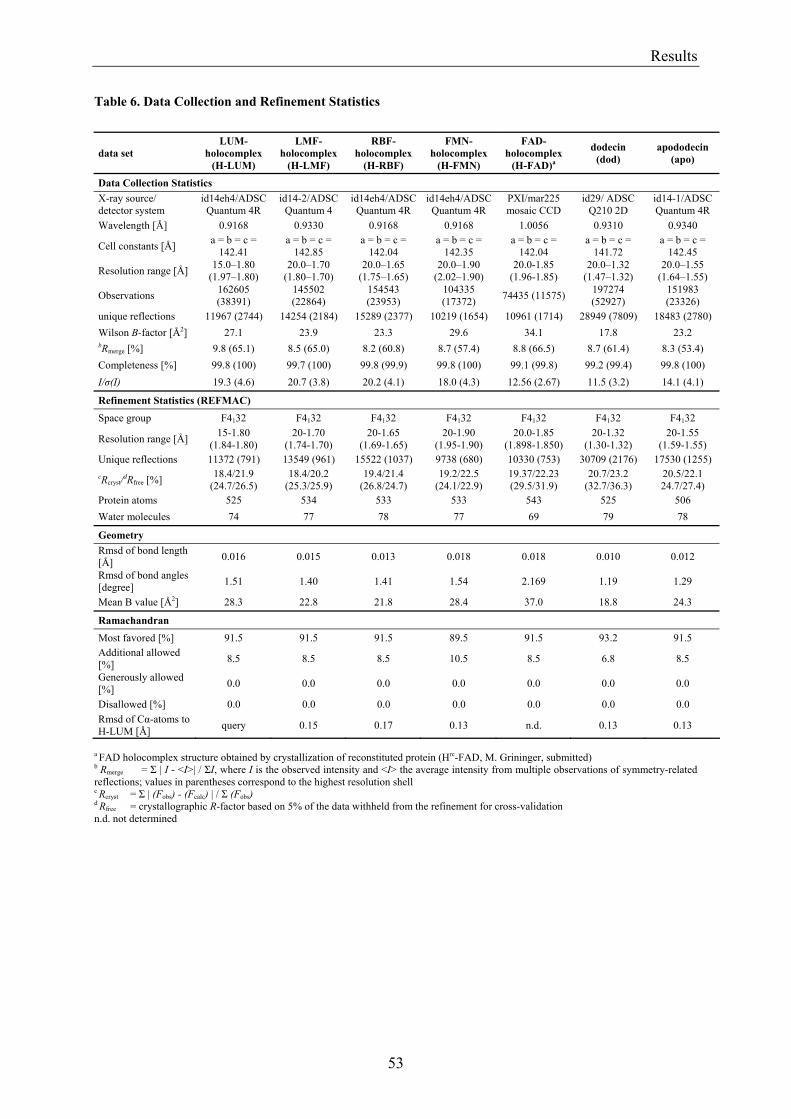
Results
53
Table 6. Data Collection and Refinement Statistics
data set LUM-
holocomplex (H-LUM)
LMF-holocomplex
(H-LMF)
RBF-holocomplex
(H-RBF)
FMN-holocomplex
(H-FMN)
FAD-holocomplex
(H-FAD)a
dodecin (dod)
apododecin (apo)
Data Collection Statistics X-ray source/ detector system
id14eh4/ADSC Quantum 4R
id14-2/ADSC Quantum 4
id14eh4/ADSC Quantum 4R
id14eh4/ADSC Quantum 4R
PXI/mar225 mosaic CCD
id29/ ADSC Q210 2D
id14-1/ADSC Quantum 4R
Wavelength [Å] 0.9168 0.9330 0.9168 0.9168 1.0056 0.9310 0.9340
Cell constants [Å] a = b = c = 142.41
a = b = c = 142.85
a = b = c = 142.04
a = b = c = 142.35
a = b = c = 142.04
a = b = c = 141.72
a = b = c = 142.45
Resolution range [Å] 15.0–1.80 (1.97–1.80)
20.0–1.70 (1.80–1.70)
20.0–1.65 (1.75–1.65)
20.0–1.90 (2.02–1.90)
20.0-1.85 (1.96-1.85)
20.0–1.32 (1.47–1.32)
20.0–1.55 (1.64–1.55)
Observations 162605 (38391)
145502 (22864)
154543 (23953)
104335 (17372) 74435 (11575) 197274
(52927) 151983 (23326)
unique reflections 11967 (2744) 14254 (2184) 15289 (2377) 10219 (1654) 10961 (1714) 28949 (7809) 18483 (2780) Wilson B-factor [Å2] 27.1 23.9 23.3 29.6 34.1 17.8 23.2 bRmerge [%] 9.8 (65.1) 8.5 (65.0) 8.2 (60.8) 8.7 (57.4) 8.8 (66.5) 8.7 (61.4) 8.3 (53.4) Completeness [%] 99.8 (100) 99.7 (100) 99.8 (99.9) 99.8 (100) 99.1 (99.8) 99.2 (99.4) 99.8 (100) I/σ(I) 19.3 (4.6) 20.7 (3.8) 20.2 (4.1) 18.0 (4.3) 12.56 (2.67) 11.5 (3.2) 14.1 (4.1)
Refinement Statistics (REFMAC)
Space group F4132 F4132 F4132 F4132 F4132 F4132 F4132
Resolution range [Å] 15-1.80 (1.84-1.80)
20-1.70 (1.74-1.70)
20-1.65 (1.69-1.65)
20-1.90 (1.95-1.90)
20.0-1.85 (1.898-1.850)
20-1.32 (1.30-1.32)
20-1.55 (1.59-1.55)
Unique reflections 11372 (791) 13549 (961) 15522 (1037) 9738 (680) 10330 (753) 30709 (2176) 17530 (1255) cRcryst/dRfree [%] 18.4/21.9
(24.7/26.5) 18.4/20.2
(25.3/25.9) 19.4/21.4
(26.8/24.7) 19.2/22.5
(24.1/22.9) 19.37/22.23 (29.5/31.9)
20.7/23.2 (32.7/36.3)
20.5/22.1 24.7/27.4)
Protein atoms 525 534 533 533 543 525 506 Water molecules 74 77 78 77 69 79 78
Geometry Rmsd of bond length [Å] 0.016 0.015 0.013 0.018 0.018 0.010 0.012
Rmsd of bond angles [degree] 1.51 1.40 1.41 1.54 2.169 1.19 1.29
Mean B value [Å2] 28.3 22.8 21.8 28.4 37.0 18.8 24.3
Ramachandran
Most favored [%] 91.5 91.5 91.5 89.5 91.5 93.2 91.5 Additional allowed [%] 8.5 8.5 8.5 10.5 8.5 6.8 8.5
Generously allowed [%] 0.0 0.0 0.0 0.0 0.0 0.0 0.0
Disallowed [%] 0.0 0.0 0.0 0.0 0.0 0.0 0.0 Rmsd of Cα-atoms to H-LUM [Å] query 0.15 0.17 0.13 n.d. 0.13 0.13
a FAD holocomplex structure obtained by crystallization of reconstituted protein (Hrc-FAD, M. Grininger, submitted) b Rmerge = Σ | I - <I>| / ΣI, where I is the observed intensity and <I> the average intensity from multiple observations of symmetry-related reflections; values in parentheses correspond to the highest resolution shell c Rcryst = Σ | (Fobs) - (Fcalc) | / Σ (Fobs) d Rfree = crystallographic R-factor based on 5% of the data withheld from the refinement for cross-validation n.d. not determined
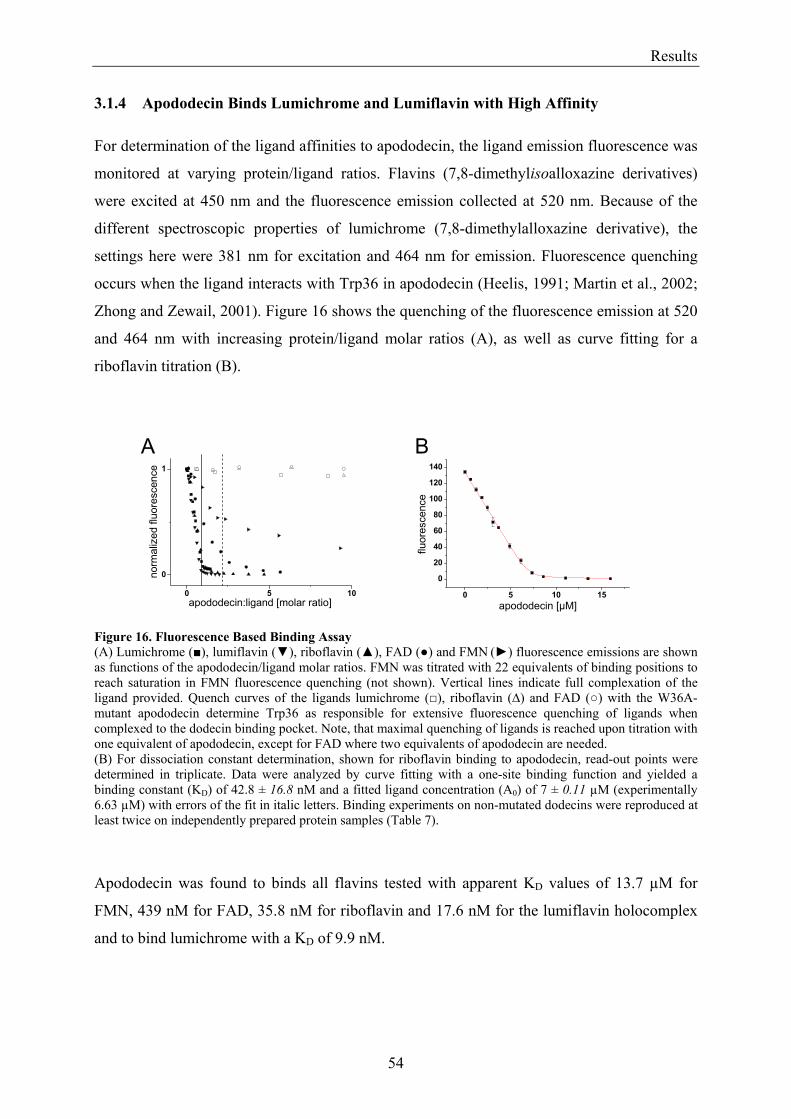
Results
54
3.1.4 Apododecin Binds Lumichrome and Lumiflavin with High Affinity For determination of the ligand affinities to apododecin, the ligand emission fluorescence was
monitored at varying protein/ligand ratios. Flavins (7,8-dimethylisoalloxazine derivatives)
were excited at 450 nm and the fluorescence emission collected at 520 nm. Because of the
different spectroscopic properties of lumichrome (7,8-dimethylalloxazine derivative), the
settings here were 381 nm for excitation and 464 nm for emission. Fluorescence quenching
occurs when the ligand interacts with Trp36 in apododecin (Heelis, 1991; Martin et al., 2002;
Zhong and Zewail, 2001). Figure 16 shows the quenching of the fluorescence emission at 520
and 464 nm with increasing protein/ligand molar ratios (A), as well as curve fitting for a
riboflavin titration (B). Figure 16. Fluorescence Based Binding Assay (A) Lumichrome (), lumiflavin (), riboflavin (), FAD () and FMN () fluorescence emissions are shown as functions of the apododecin/ligand molar ratios. FMN was titrated with 22 equivalents of binding positions to reach saturation in FMN fluorescence quenching (not shown). Vertical lines indicate full complexation of the ligand provided. Quench curves of the ligands lumichrome (), riboflavin (∆) and FAD () with the W36A-mutant apododecin determine Trp36 as responsible for extensive fluorescence quenching of ligands when complexed to the dodecin binding pocket. Note, that maximal quenching of ligands is reached upon titration with one equivalent of apododecin, except for FAD where two equivalents of apododecin are needed. (B) For dissociation constant determination, shown for riboflavin binding to apododecin, read-out points were determined in triplicate. Data were analyzed by curve fitting with a one-site binding function and yielded a binding constant (KD) of 42.8 ± 16.8 nM and a fitted ligand concentration (A0) of 7 ± 0.11 µM (experimentally 6.63 µM) with errors of the fit in italic letters. Binding experiments on non-mutated dodecins were reproduced at least twice on independently prepared protein samples (Table 7).
Apododecin was found to binds all flavins tested with apparent KD values of 13.7 µM for
FMN, 439 nM for FAD, 35.8 nM for riboflavin and 17.6 nM for the lumiflavin holocomplex
and to bind lumichrome with a KD of 9.9 nM.
0 5 10
0
1
apododecin:ligand [molar ratio]
norm
aliz
ed fl
uore
scen
ce
0 5 10 15
0
20
40
60
80
100
120
140
fluor
esce
nce
apododecin [µM]
BA
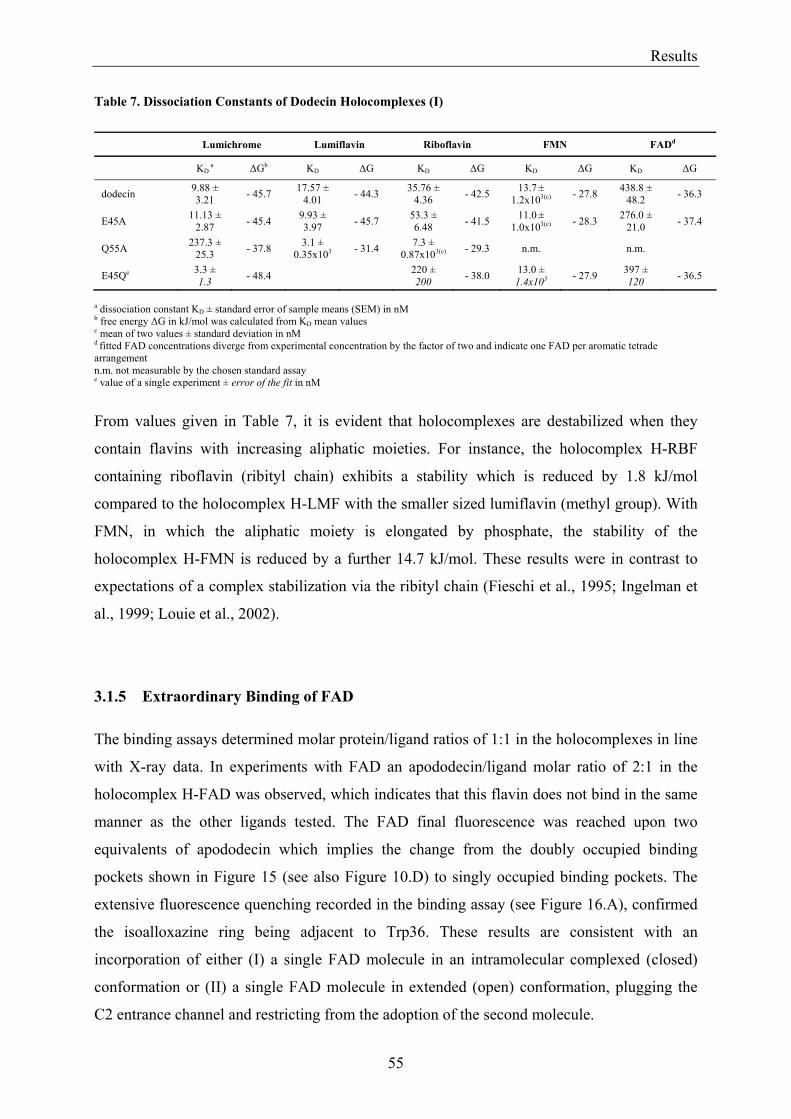
Results
55
Table 7. Dissociation Constants of Dodecin Holocomplexes (I)
Lumichrome Lumiflavin Riboflavin FMN FADd
KD a ∆Gb KD ∆G KD ∆G KD ∆G KD ∆G
dodecin 9.88 ± 3.21 - 45.7 17.57 ±
4.01 - 44.3 35.76 ± 4.36 - 42.5 13.7 ±
1.2x10³(c) - 27.8 438.8 ± 48.2 - 36.3
E45A 11.13 ± 2.87 - 45.4 9.93 ±
3.97 - 45.7 53.3 ± 6.48 - 41.5 11.0 ±
1.0x10³(c) - 28.3 276.0 ± 21.0 - 37.4
Q55A 237.3 ± 25.3 - 37.8 3.1 ±
0.35x10³ - 31.4 7.3 ± 0.87x10³(c) - 29.3 n.m. n.m.
E45Qe 3.3 ± 1.3 - 48.4 220 ±
200 - 38.0 13.0 ± 1.4x10³ - 27.9 397 ±
120 - 36.5
a dissociation constant KD ± standard error of sample means (SEM) in nM b free energy ∆G in kJ/mol was calculated from KD mean values c mean of two values ± standard deviation in nM d fitted FAD concentrations diverge from experimental concentration by the factor of two and indicate one FAD per aromatic tetrade arrangement n.m. not measurable by the chosen standard assay e value of a single experiment ± error of the fit in nM
From values given in Table 7, it is evident that holocomplexes are destabilized when they
contain flavins with increasing aliphatic moieties. For instance, the holocomplex H-RBF
containing riboflavin (ribityl chain) exhibits a stability which is reduced by 1.8 kJ/mol
compared to the holocomplex H-LMF with the smaller sized lumiflavin (methyl group). With
FMN, in which the aliphatic moiety is elongated by phosphate, the stability of the
holocomplex H-FMN is reduced by a further 14.7 kJ/mol. These results were in contrast to
expectations of a complex stabilization via the ribityl chain (Fieschi et al., 1995; Ingelman et
al., 1999; Louie et al., 2002).
3.1.5 Extraordinary Binding of FAD The binding assays determined molar protein/ligand ratios of 1:1 in the holocomplexes in line
with X-ray data. In experiments with FAD an apododecin/ligand molar ratio of 2:1 in the
holocomplex H-FAD was observed, which indicates that this flavin does not bind in the same
manner as the other ligands tested. The FAD final fluorescence was reached upon two
equivalents of apododecin which implies the change from the doubly occupied binding
pockets shown in Figure 15 (see also Figure 10.D) to singly occupied binding pockets. The
extensive fluorescence quenching recorded in the binding assay (see Figure 16.A), confirmed
the isoalloxazine ring being adjacent to Trp36. These results are consistent with an
incorporation of either (I) a single FAD molecule in an intramolecular complexed (closed)
conformation or (II) a single FAD molecule in extended (open) conformation, plugging the
C2 entrance channel and restricting from the adoption of the second molecule.
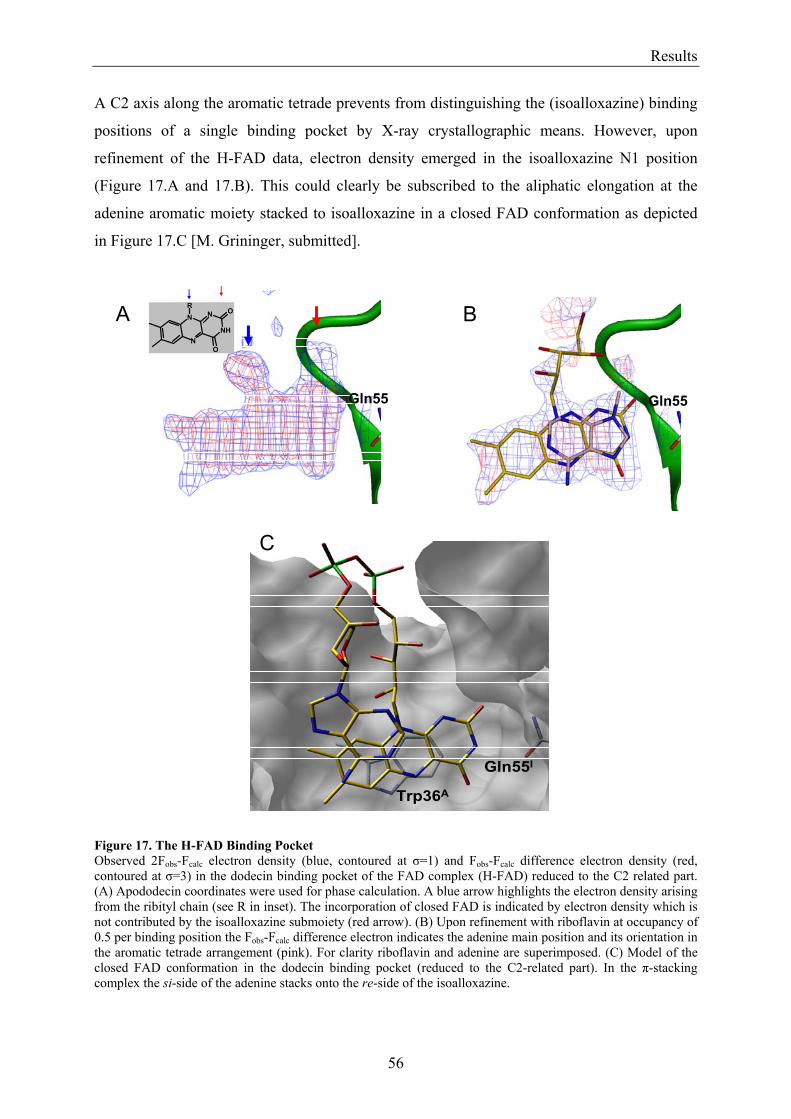
Results
56
A C2 axis along the aromatic tetrade prevents from distinguishing the (isoalloxazine) binding
positions of a single binding pocket by X-ray crystallographic means. However, upon
refinement of the H-FAD data, electron density emerged in the isoalloxazine N1 position
(Figure 17.A and 17.B). This could clearly be subscribed to the aliphatic elongation at the
adenine aromatic moiety stacked to isoalloxazine in a closed FAD conformation as depicted
in Figure 17.C [M. Grininger, submitted].
Figure 17. The H-FAD Binding Pocket Observed 2Fobs-Fcalc electron density (blue, contoured at σ=1) and Fobs-Fcalc difference electron density (red, contoured at σ=3) in the dodecin binding pocket of the FAD complex (H-FAD) reduced to the C2 related part. (A) Apododecin coordinates were used for phase calculation. A blue arrow highlights the electron density arising from the ribityl chain (see R in inset). The incorporation of closed FAD is indicated by electron density which is not contributed by the isoalloxazine submoiety (red arrow). (B) Upon refinement with riboflavin at occupancy of 0.5 per binding position the Fobs-Fcalc difference electron indicates the adenine main position and its orientation in the aromatic tetrade arrangement (pink). For clarity riboflavin and adenine are superimposed. (C) Model of the closed FAD conformation in the dodecin binding pocket (reduced to the C2-related part). In the π-stacking complex the si-side of the adenine stacks onto the re-side of the isoalloxazine.
Trp36A
Gln55I
Gln55
N
N
NH
N
O
OR
Gln55
BA
C
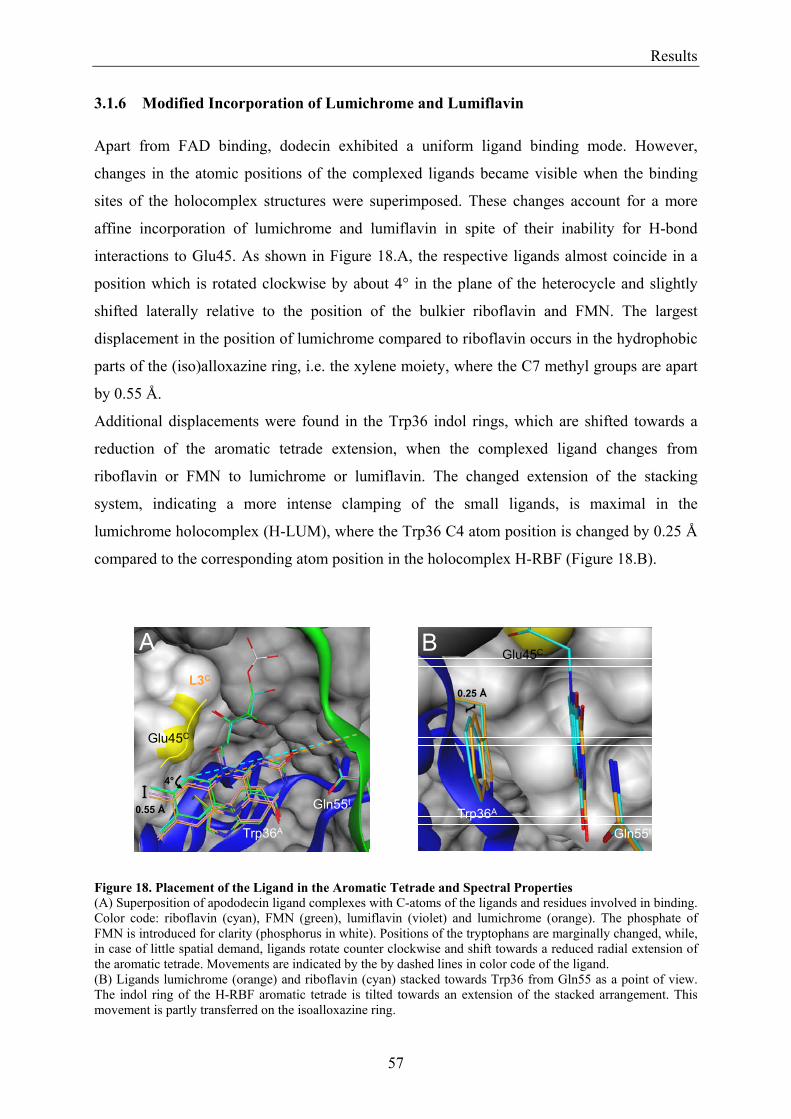
Results
57
3.1.6 Modified Incorporation of Lumichrome and Lumiflavin Apart from FAD binding, dodecin exhibited a uniform ligand binding mode. However,
changes in the atomic positions of the complexed ligands became visible when the binding
sites of the holocomplex structures were superimposed. These changes account for a more
affine incorporation of lumichrome and lumiflavin in spite of their inability for H-bond
interactions to Glu45. As shown in Figure 18.A, the respective ligands almost coincide in a
position which is rotated clockwise by about 4° in the plane of the heterocycle and slightly
shifted laterally relative to the position of the bulkier riboflavin and FMN. The largest
displacement in the position of lumichrome compared to riboflavin occurs in the hydrophobic
parts of the (iso)alloxazine ring, i.e. the xylene moiety, where the C7 methyl groups are apart
by 0.55 Å.
Additional displacements were found in the Trp36 indol rings, which are shifted towards a
reduction of the aromatic tetrade extension, when the complexed ligand changes from
riboflavin or FMN to lumichrome or lumiflavin. The changed extension of the stacking
system, indicating a more intense clamping of the small ligands, is maximal in the
lumichrome holocomplex (H-LUM), where the Trp36 C4 atom position is changed by 0.25 Å
compared to the corresponding atom position in the holocomplex H-RBF (Figure 18.B).
Figure 18. Placement of the Ligand in the Aromatic Tetrade and Spectral Properties (A) Superposition of apododecin ligand complexes with C-atoms of the ligands and residues involved in binding. Color code: riboflavin (cyan), FMN (green), lumiflavin (violet) and lumichrome (orange). The phosphate of FMN is introduced for clarity (phosphorus in white). Positions of the tryptophans are marginally changed, while, in case of little spatial demand, ligands rotate counter clockwise and shift towards a reduced radial extension of the aromatic tetrade. Movements are indicated by the by dashed lines in color code of the ligand. (B) Ligands lumichrome (orange) and riboflavin (cyan) stacked towards Trp36 from Gln55 as a point of view. The indol ring of the H-RBF aromatic tetrade is tilted towards an extension of the stacked arrangement. This movement is partly transferred on the isoalloxazine ring.
Glu45C
Gln55I
Trp36A
0.25 Å
4°
Trp36A
L3C
0.55 Å Gln55I
Glu45C
A B
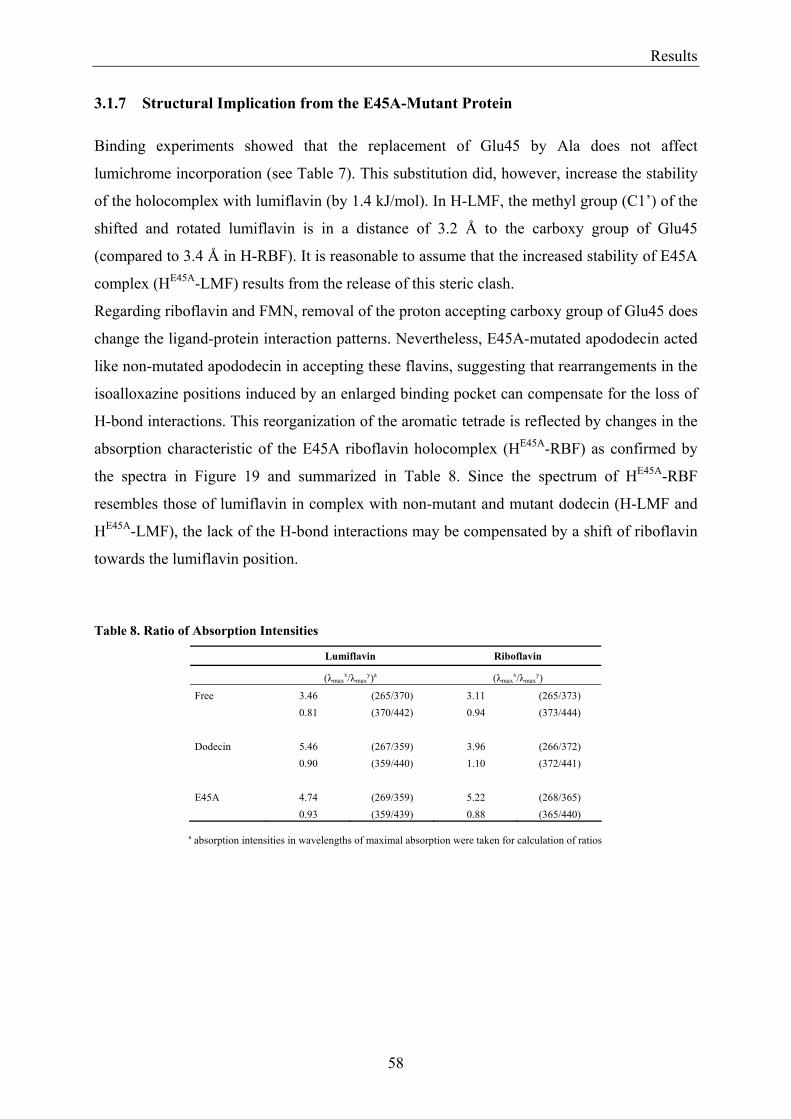
Results
58
3.1.7 Structural Implication from the E45A-Mutant Protein Binding experiments showed that the replacement of Glu45 by Ala does not affect
lumichrome incorporation (see Table 7). This substitution did, however, increase the stability
of the holocomplex with lumiflavin (by 1.4 kJ/mol). In H-LMF, the methyl group (C1’) of the
shifted and rotated lumiflavin is in a distance of 3.2 Å to the carboxy group of Glu45
(compared to 3.4 Å in H-RBF). It is reasonable to assume that the increased stability of E45A
complex (HE45A-LMF) results from the release of this steric clash.
Regarding riboflavin and FMN, removal of the proton accepting carboxy group of Glu45 does
change the ligand-protein interaction patterns. Nevertheless, E45A-mutated apododecin acted
like non-mutated apododecin in accepting these flavins, suggesting that rearrangements in the
isoalloxazine positions induced by an enlarged binding pocket can compensate for the loss of
H-bond interactions. This reorganization of the aromatic tetrade is reflected by changes in the
absorption characteristic of the E45A riboflavin holocomplex (HE45A-RBF) as confirmed by
the spectra in Figure 19 and summarized in Table 8. Since the spectrum of HE45A-RBF
resembles those of lumiflavin in complex with non-mutant and mutant dodecin (H-LMF and
HE45A-LMF), the lack of the H-bond interactions may be compensated by a shift of riboflavin
towards the lumiflavin position.
Table 8. Ratio of Absorption Intensities
Lumiflavin Riboflavin
(λmaxx/λmax
y)a (λmaxx/λmax
y)
Free 3.46 (265/370) 3.11 (265/373) 0.81 (370/442) 0.94 (373/444) Dodecin 5.46 (267/359) 3.96 (266/372) 0.90 (359/440) 1.10 (372/441) E45A 4.74 (269/359) 5.22 (268/365) 0.93 (359/439) 0.88 (365/440)
a absorption intensities in wavelengths of maximal absorption were taken for calculation of ratios
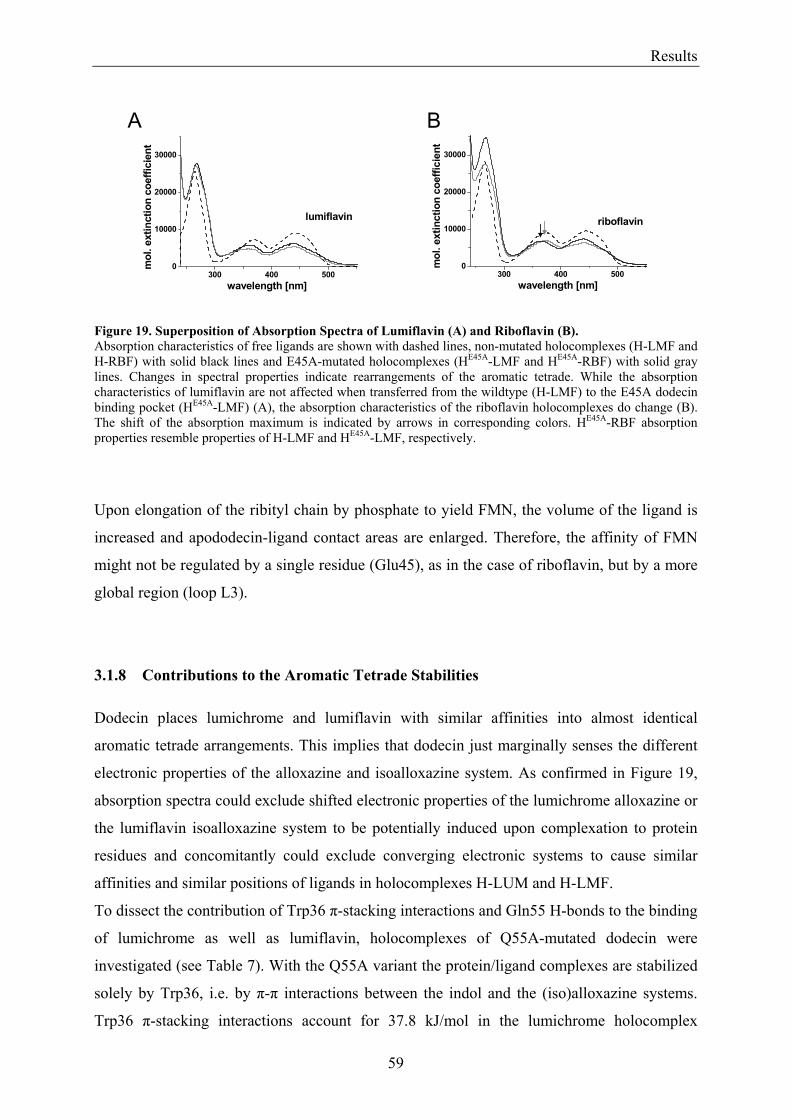
Results
59
Figure 19. Superposition of Absorption Spectra of Lumiflavin (A) and Riboflavin (B). Absorption characteristics of free ligands are shown with dashed lines, non-mutated holocomplexes (H-LMF and H-RBF) with solid black lines and E45A-mutated holocomplexes (HE45A-LMF and HE45A-RBF) with solid gray lines. Changes in spectral properties indicate rearrangements of the aromatic tetrade. While the absorption characteristics of lumiflavin are not affected when transferred from the wildtype (H-LMF) to the E45A dodecin binding pocket (HE45A-LMF) (A), the absorption characteristics of the riboflavin holocomplexes do change (B). The shift of the absorption maximum is indicated by arrows in corresponding colors. HE45A-RBF absorption properties resemble properties of H-LMF and HE45A-LMF, respectively.
Upon elongation of the ribityl chain by phosphate to yield FMN, the volume of the ligand is
increased and apododecin-ligand contact areas are enlarged. Therefore, the affinity of FMN
might not be regulated by a single residue (Glu45), as in the case of riboflavin, but by a more
global region (loop L3).
3.1.8 Contributions to the Aromatic Tetrade Stabilities Dodecin places lumichrome and lumiflavin with similar affinities into almost identical
aromatic tetrade arrangements. This implies that dodecin just marginally senses the different
electronic properties of the alloxazine and isoalloxazine system. As confirmed in Figure 19,
absorption spectra could exclude shifted electronic properties of the lumichrome alloxazine or
the lumiflavin isoalloxazine system to be potentially induced upon complexation to protein
residues and concomitantly could exclude converging electronic systems to cause similar
affinities and similar positions of ligands in holocomplexes H-LUM and H-LMF.
To dissect the contribution of Trp36 π-stacking interactions and Gln55 H-bonds to the binding
of lumichrome as well as lumiflavin, holocomplexes of Q55A-mutated dodecin were
investigated (see Table 7). With the Q55A variant the protein/ligand complexes are stabilized
solely by Trp36, i.e. by π-π interactions between the indol and the (iso)alloxazine systems.
Trp36 π-stacking interactions account for 37.8 kJ/mol in the lumichrome holocomplex
300 400 5000
10000
20000
30000
lumiflavin
wavelength [nm]
mol
. ext
inct
ion
coef
ficie
nt
300 400 5000
10000
20000
30000
riboflavin
wavelength [nm]
mol
. ext
inct
ion
coef
ficie
nt
A B
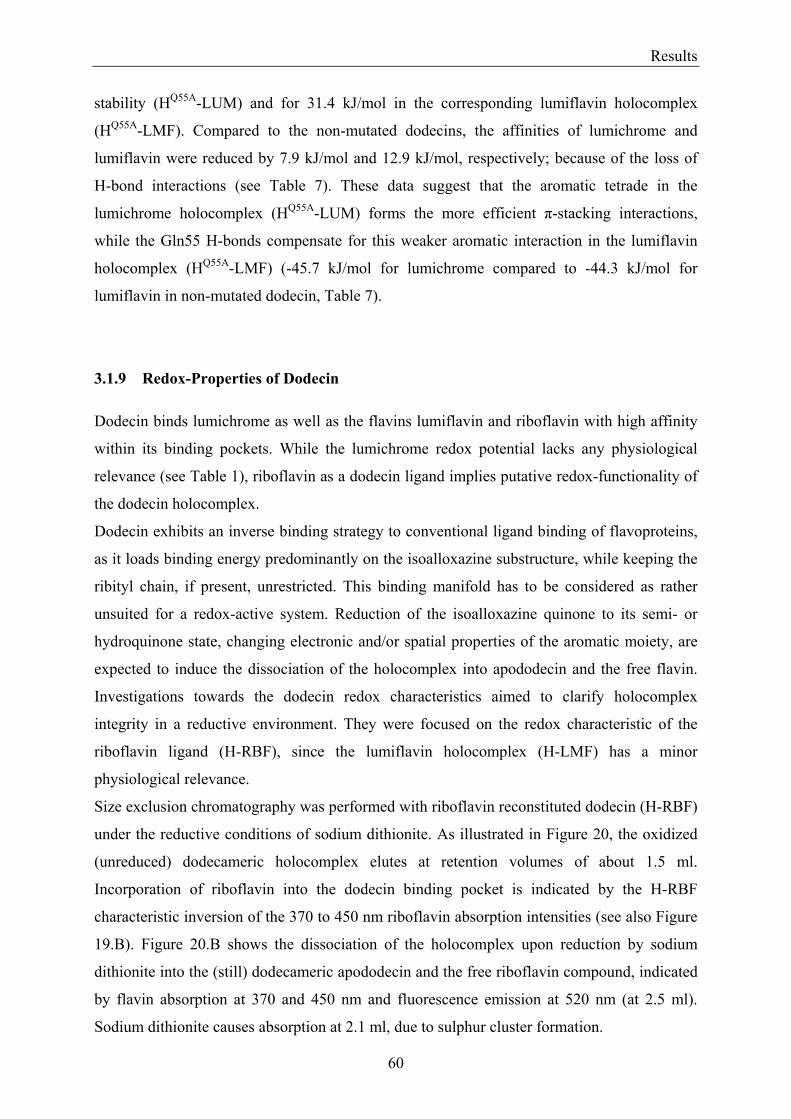
Results
60
stability (HQ55A-LUM) and for 31.4 kJ/mol in the corresponding lumiflavin holocomplex
(HQ55A-LMF). Compared to the non-mutated dodecins, the affinities of lumichrome and
lumiflavin were reduced by 7.9 kJ/mol and 12.9 kJ/mol, respectively; because of the loss of
H-bond interactions (see Table 7). These data suggest that the aromatic tetrade in the
lumichrome holocomplex (HQ55A-LUM) forms the more efficient π-stacking interactions,
while the Gln55 H-bonds compensate for this weaker aromatic interaction in the lumiflavin
holocomplex (HQ55A-LMF) (-45.7 kJ/mol for lumichrome compared to -44.3 kJ/mol for
lumiflavin in non-mutated dodecin, Table 7).
3.1.9 Redox-Properties of Dodecin Dodecin binds lumichrome as well as the flavins lumiflavin and riboflavin with high affinity
within its binding pockets. While the lumichrome redox potential lacks any physiological
relevance (see Table 1), riboflavin as a dodecin ligand implies putative redox-functionality of
the dodecin holocomplex.
Dodecin exhibits an inverse binding strategy to conventional ligand binding of flavoproteins,
as it loads binding energy predominantly on the isoalloxazine substructure, while keeping the
ribityl chain, if present, unrestricted. This binding manifold has to be considered as rather
unsuited for a redox-active system. Reduction of the isoalloxazine quinone to its semi- or
hydroquinone state, changing electronic and/or spatial properties of the aromatic moiety, are
expected to induce the dissociation of the holocomplex into apododecin and the free flavin.
Investigations towards the dodecin redox characteristics aimed to clarify holocomplex
integrity in a reductive environment. They were focused on the redox characteristic of the
riboflavin ligand (H-RBF), since the lumiflavin holocomplex (H-LMF) has a minor
physiological relevance.
Size exclusion chromatography was performed with riboflavin reconstituted dodecin (H-RBF)
under the reductive conditions of sodium dithionite. As illustrated in Figure 20, the oxidized
(unreduced) dodecameric holocomplex elutes at retention volumes of about 1.5 ml.
Incorporation of riboflavin into the dodecin binding pocket is indicated by the H-RBF
characteristic inversion of the 370 to 450 nm riboflavin absorption intensities (see also Figure
19.B). Figure 20.B shows the dissociation of the holocomplex upon reduction by sodium
dithionite into the (still) dodecameric apododecin and the free riboflavin compound, indicated
by flavin absorption at 370 and 450 nm and fluorescence emission at 520 nm (at 2.5 ml).
Sodium dithionite causes absorption at 2.1 ml, due to sulphur cluster formation.
Results
61
Figure 20. Size-Exclusion Chromatography of Reduced Dodecin Protein and ligand were detected by absorption at 280 nm (black), 370 nm (gray) and 450 nm (bright gray). The ligand fluorescence was determined in collected fractions of 80 µl (black dashed line). (A) Dodecin holocomplex (H-RBF) was reduced with sodium dithionite and subjected to size-exclusion chromatography. (B) The dodecin peak at 1500 µl shows depleted binding pockets. Free ligands elute in the dead volume as detected by absorption and fluorescence of compounds. Note that absorption at 370 and 450 nm indicates the reoxidation of the ligand during the chromatography run.
Dissociation of the holocomplex into apododecin and the riboflavin was also proven by
spectro-electrochemical investigations on a E45A-mutant protein (HE45A-RBF). A reductive
potential was generated in a three-electrode arrangement with a transparent gold minigrid
working electrode coated with the synthetic riboflavin analogue compound CoF6, to enhance
the electron transfer between electrode and protein (Figure 21.A. and 21.B) (Noell et al.,
2006; Salbeck, 1993). The transparent working electrode allows to record the spectroscopic
characteristic of the dodecin holocomplex with respect to the potential generated. The
potential was moved towards negative values (reductive conditions) in steps of 20 mV
(starting from 0 mV). At each step, a spectrum of the dodecin solution was taken. As shown
by the decreasing absorption at flavin bands 370 and 450 nm, the holocomplex was found to
be reduced at negative potentials (Figure 21.C). A missing isosbestic point as well as non-
reversibility of reduction indicates dissociation into apododecin and the reduced flavin
component. This is in full agreement with the dissociation of H-RBF shown by size-exclusion
chromatography (see Figure 20).
A
500 1000 1500 2000 25000.0
0.1
0.2
0.0
0.1
0.2
0.3
fluor
esce
nce
abso
rptio
n
elution volume [µl]500 1000 1500 2000 2500
0.0
0.3
0.6
3.3
3.6
0
4
8
12
fluor
esce
nce
abso
rptio
n
elution volume [µl]
B
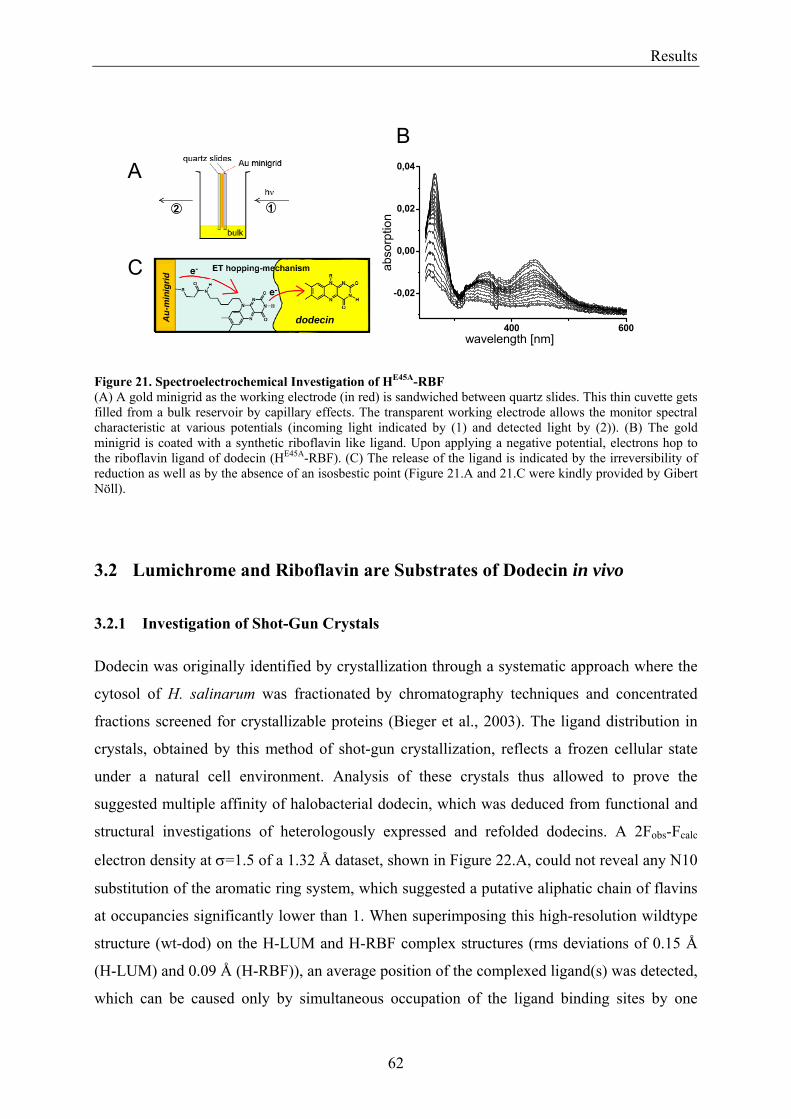
Results
62
Figure 21. Spectroelectrochemical Investigation of HE45A-RBF (A) A gold minigrid as the working electrode (in red) is sandwiched between quartz slides. This thin cuvette gets filled from a bulk reservoir by capillary effects. The transparent working electrode allows the monitor spectral characteristic at various potentials (incoming light indicated by (1) and detected light by (2)). (B) The gold minigrid is coated with a synthetic riboflavin like ligand. Upon applying a negative potential, electrons hop to the riboflavin ligand of dodecin (HE45A-RBF). (C) The release of the ligand is indicated by the irreversibility of reduction as well as by the absence of an isosbestic point (Figure 21.A and 21.C were kindly provided by Gibert Nöll). 3.2 Lumichrome and Riboflavin are Substrates of Dodecin in vivo
3.2.1 Investigation of Shot-Gun Crystals Dodecin was originally identified by crystallization through a systematic approach where the
cytosol of H. salinarum was fractionated by chromatography techniques and concentrated
fractions screened for crystallizable proteins (Bieger et al., 2003). The ligand distribution in
crystals, obtained by this method of shot-gun crystallization, reflects a frozen cellular state
under a natural cell environment. Analysis of these crystals thus allowed to prove the
suggested multiple affinity of halobacterial dodecin, which was deduced from functional and
structural investigations of heterologously expressed and refolded dodecins. A 2Fobs-Fcalc
electron density at σ=1.5 of a 1.32 Å dataset, shown in Figure 22.A, could not reveal any N10
substitution of the aromatic ring system, which suggested a putative aliphatic chain of flavins
at occupancies significantly lower than 1. When superimposing this high-resolution wildtype
structure (wt-dod) on the H-LUM and H-RBF complex structures (rms deviations of 0.15 Å
(H-LUM) and 0.09 Å (H-RBF)), an average position of the complexed ligand(s) was detected,
which can be caused only by simultaneous occupation of the ligand binding sites by one
400 600
-0,02
0,00
0,02
0,04
abso
rptio
n
wavelength [nm]dodecinA
u-m
inig
rid
12
AB
C
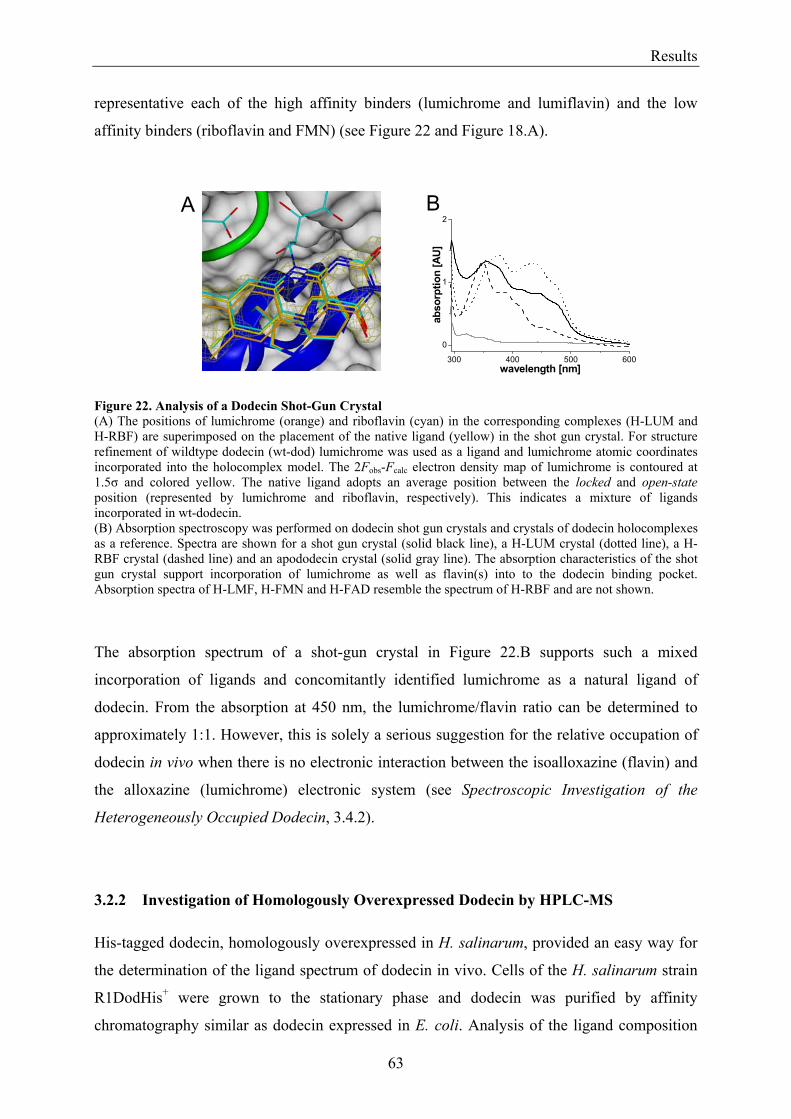
Results
63
representative each of the high affinity binders (lumichrome and lumiflavin) and the low
affinity binders (riboflavin and FMN) (see Figure 22 and Figure 18.A).
Figure 22. Analysis of a Dodecin Shot-Gun Crystal (A) The positions of lumichrome (orange) and riboflavin (cyan) in the corresponding complexes (H-LUM and H-RBF) are superimposed on the placement of the native ligand (yellow) in the shot gun crystal. For structure refinement of wildtype dodecin (wt-dod) lumichrome was used as a ligand and lumichrome atomic coordinates incorporated into the holocomplex model. The 2Fobs-Fcalc electron density map of lumichrome is contoured at 1.5σ and colored yellow. The native ligand adopts an average position between the locked and open-state position (represented by lumichrome and riboflavin, respectively). This indicates a mixture of ligands incorporated in wt-dodecin. (B) Absorption spectroscopy was performed on dodecin shot gun crystals and crystals of dodecin holocomplexes as a reference. Spectra are shown for a shot gun crystal (solid black line), a H-LUM crystal (dotted line), a H-RBF crystal (dashed line) and an apododecin crystal (solid gray line). The absorption characteristics of the shot gun crystal support incorporation of lumichrome as well as flavin(s) into to the dodecin binding pocket. Absorption spectra of H-LMF, H-FMN and H-FAD resemble the spectrum of H-RBF and are not shown.
The absorption spectrum of a shot-gun crystal in Figure 22.B supports such a mixed
incorporation of ligands and concomitantly identified lumichrome as a natural ligand of
dodecin. From the absorption at 450 nm, the lumichrome/flavin ratio can be determined to
approximately 1:1. However, this is solely a serious suggestion for the relative occupation of
dodecin in vivo when there is no electronic interaction between the isoalloxazine (flavin) and
the alloxazine (lumichrome) electronic system (see Spectroscopic Investigation of the
Heterogeneously Occupied Dodecin, 3.4.2).
3.2.2 Investigation of Homologously Overexpressed Dodecin by HPLC-MS His-tagged dodecin, homologously overexpressed in H. salinarum, provided an easy way for
the determination of the ligand spectrum of dodecin in vivo. Cells of the H. salinarum strain
R1DodHis+ were grown to the stationary phase and dodecin was purified by affinity
chromatography similar as dodecin expressed in E. coli. Analysis of the ligand composition
300 400 500 600
0
1
2
abso
rptio
n [A
U]
wavelength [nm]
A B
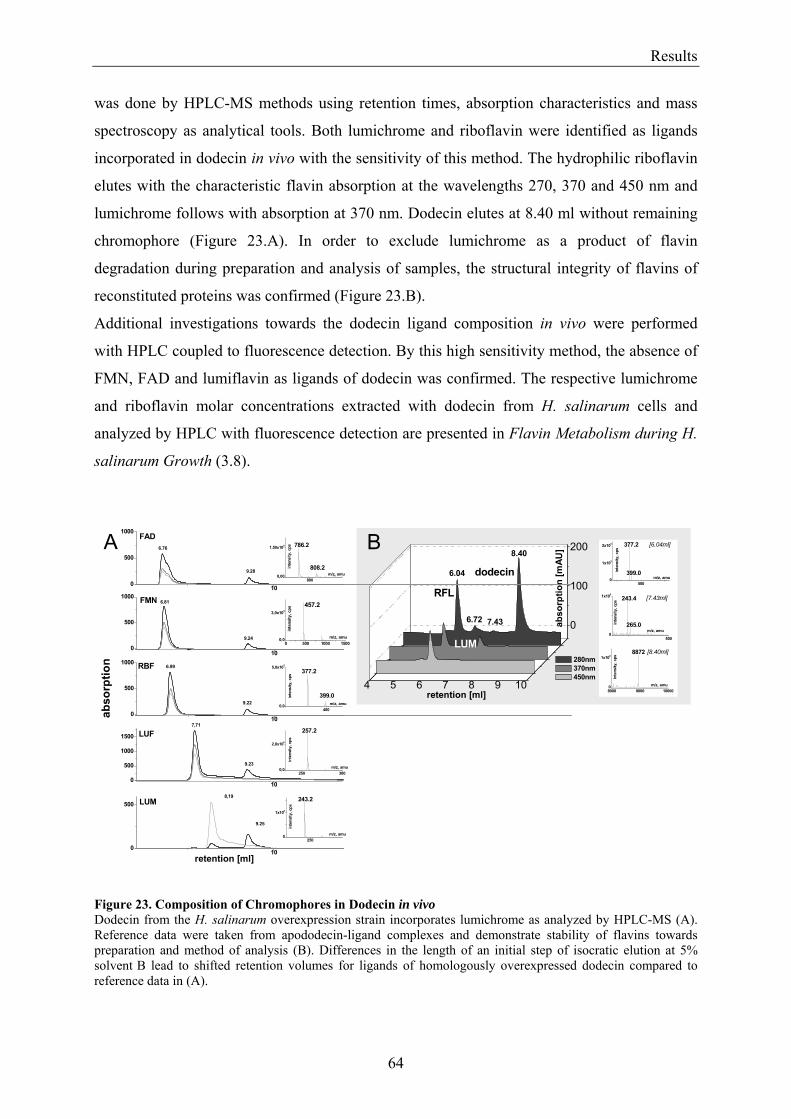
Results
64
was done by HPLC-MS methods using retention times, absorption characteristics and mass
spectroscopy as analytical tools. Both lumichrome and riboflavin were identified as ligands
incorporated in dodecin in vivo with the sensitivity of this method. The hydrophilic riboflavin
elutes with the characteristic flavin absorption at the wavelengths 270, 370 and 450 nm and
lumichrome follows with absorption at 370 nm. Dodecin elutes at 8.40 ml without remaining
chromophore (Figure 23.A). In order to exclude lumichrome as a product of flavin
degradation during preparation and analysis of samples, the structural integrity of flavins of
reconstituted proteins was confirmed (Figure 23.B).
Additional investigations towards the dodecin ligand composition in vivo were performed
with HPLC coupled to fluorescence detection. By this high sensitivity method, the absence of
FMN, FAD and lumiflavin as ligands of dodecin was confirmed. The respective lumichrome
and riboflavin molar concentrations extracted with dodecin from H. salinarum cells and
analyzed by HPLC with fluorescence detection are presented in Flavin Metabolism during H.
salinarum Growth (3.8).
Figure 23. Composition of Chromophores in Dodecin in vivo Dodecin from the H. salinarum overexpression strain incorporates lumichrome as analyzed by HPLC-MS (A). Reference data were taken from apododecin-ligand complexes and demonstrate stability of flavins towards preparation and method of analysis (B). Differences in the length of an initial step of isocratic elution at 5% solvent B lead to shifted retention volumes for ligands of homologously overexpressed dodecin compared to reference data in (A).
4 5 6 7 8 9 10
0
100
200
6.72
8.40
7.43
6.04 dodecin
LUM
RFL
280nm 370nm 450nm
250 3000,0
2,0x10⁶
257.2
inte
nsity
, cps
m/z, amu
2500
1x10⁶
243.2
inte
nsity
, cps
m/z, amu
8000,00
1,50x10⁵
808.2
786.2
inte
nsity
, cps
m/z, amu
abso
rptio
n
retention [ml]
100
500
1000
9.22
6.99RBF
100
500
1000
1500
9.23
7,71
LUF
100
500
1000
9.24
6.81FMN
retention [ml]
abso
rptio
n[m
AU]
5000
1x10⁵
2x10⁵ [6.04ml]
399.0
377.2
inte
nsity
, cps
m/z, amu
0 500 1000 15000,0
3,0x10⁵
457.2
inte
nsity
, cps
m/z, amu
4000,0
5,0x10⁵
399.0
377.2
inte
nsity
, cps
m/z, amu
100
500
280nm 370nm 450nm
9.25
8,19LUM
8000 9000 100000
1x10⁶[8.40ml]
8872
m/z, amu
inte
nsity
, cps
5000
1x10⁵
[7.43ml]
265.0
243.4
inte
nsity
, cps
m/z, amu
100
500
1000
9.28
6.76
FADA B
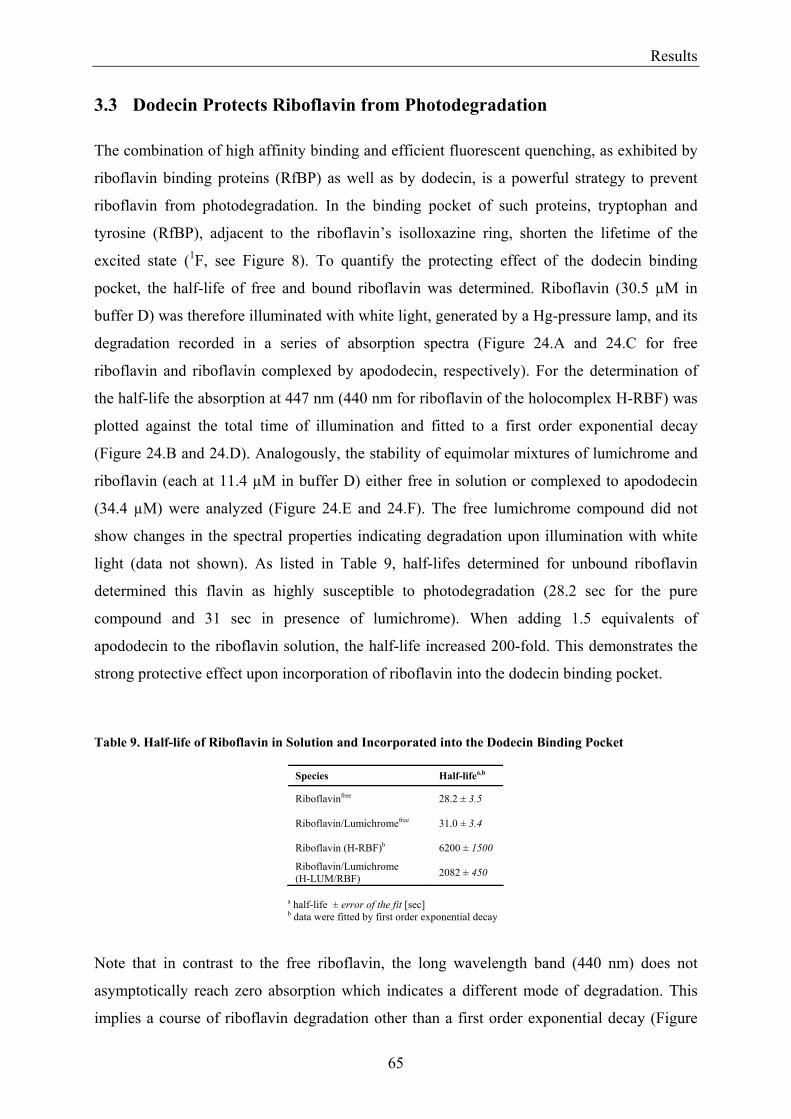
Results
65
3.3 Dodecin Protects Riboflavin from Photodegradation The combination of high affinity binding and efficient fluorescent quenching, as exhibited by
riboflavin binding proteins (RfBP) as well as by dodecin, is a powerful strategy to prevent
riboflavin from photodegradation. In the binding pocket of such proteins, tryptophan and
tyrosine (RfBP), adjacent to the riboflavin’s isolloxazine ring, shorten the lifetime of the
excited state (1F, see Figure 8). To quantify the protecting effect of the dodecin binding
pocket, the half-life of free and bound riboflavin was determined. Riboflavin (30.5 µM in
buffer D) was therefore illuminated with white light, generated by a Hg-pressure lamp, and its
degradation recorded in a series of absorption spectra (Figure 24.A and 24.C for free
riboflavin and riboflavin complexed by apododecin, respectively). For the determination of
the half-life the absorption at 447 nm (440 nm for riboflavin of the holocomplex H-RBF) was
plotted against the total time of illumination and fitted to a first order exponential decay
(Figure 24.B and 24.D). Analogously, the stability of equimolar mixtures of lumichrome and
riboflavin (each at 11.4 µM in buffer D) either free in solution or complexed to apododecin
(34.4 µM) were analyzed (Figure 24.E and 24.F). The free lumichrome compound did not
show changes in the spectral properties indicating degradation upon illumination with white
light (data not shown). As listed in Table 9, half-lifes determined for unbound riboflavin
determined this flavin as highly susceptible to photodegradation (28.2 sec for the pure
compound and 31 sec in presence of lumichrome). When adding 1.5 equivalents of
apododecin to the riboflavin solution, the half-life increased 200-fold. This demonstrates the
strong protective effect upon incorporation of riboflavin into the dodecin binding pocket.
Table 9. Half-life of Riboflavin in Solution and Incorporated into the Dodecin Binding Pocket
Species Half-lifea,b
Riboflavinfree 28.2 ± 3.5
Riboflavin/Lumichromefree 31.0 ± 3.4
Riboflavin (H-RBF)b 6200 ± 1500
Riboflavin/Lumichrome (H-LUM/RBF) 2082 ± 450
a half-life ± error of the fit [sec] b data were fitted by first order exponential decay
Note that in contrast to the free riboflavin, the long wavelength band (440 nm) does not
asymptotically reach zero absorption which indicates a different mode of degradation. This
implies a course of riboflavin degradation other than a first order exponential decay (Figure
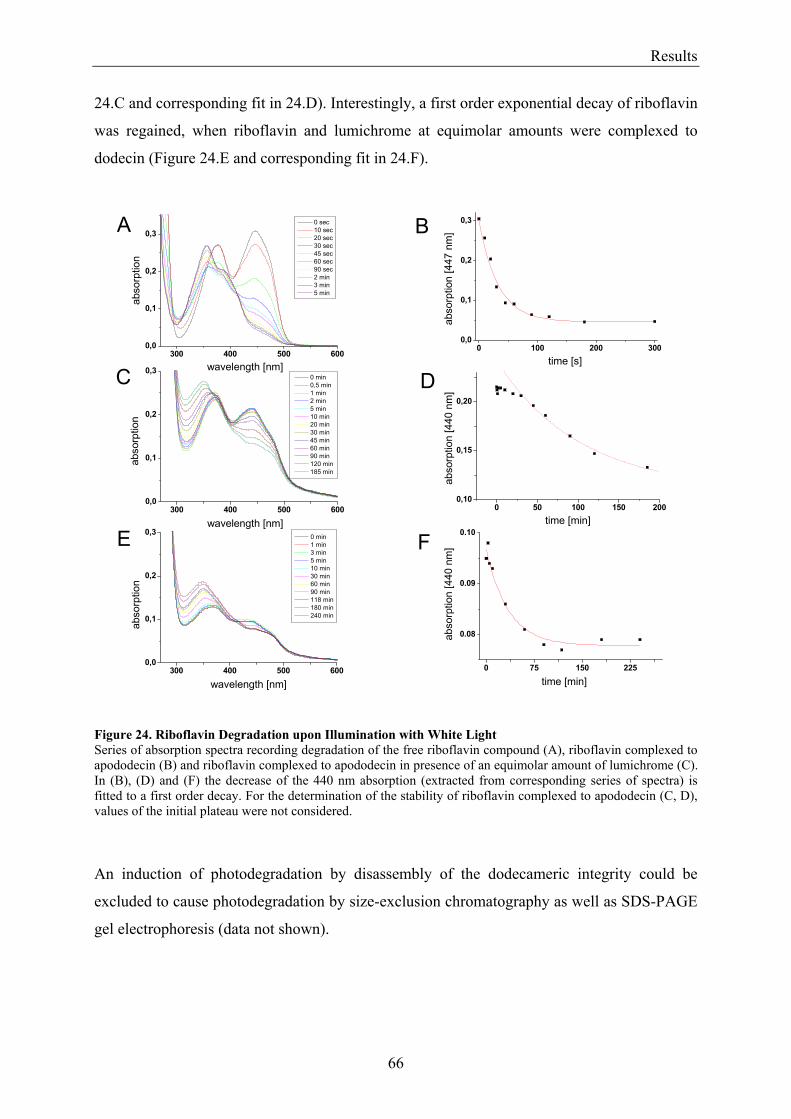
Results
66
24.C and corresponding fit in 24.D). Interestingly, a first order exponential decay of riboflavin
was regained, when riboflavin and lumichrome at equimolar amounts were complexed to
dodecin (Figure 24.E and corresponding fit in 24.F).
Figure 24. Riboflavin Degradation upon Illumination with White Light Series of absorption spectra recording degradation of the free riboflavin compound (A), riboflavin complexed to apododecin (B) and riboflavin complexed to apododecin in presence of an equimolar amount of lumichrome (C). In (B), (D) and (F) the decrease of the 440 nm absorption (extracted from corresponding series of spectra) is fitted to a first order decay. For the determination of the stability of riboflavin complexed to apododecin (C, D), values of the initial plateau were not considered.
An induction of photodegradation by disassembly of the dodecameric integrity could be
excluded to cause photodegradation by size-exclusion chromatography as well as SDS-PAGE
gel electrophoresis (data not shown).
300 400 500 6000,0
0,1
0,2
0,3 0 sec 10 sec 20 sec 30 sec 45 sec 60 sec 90 sec 2 min 3 min 5 min
abso
rptio
n
wavelength [nm]
0 100 200 3000,0
0,1
0,2
0,3
abso
rptio
n [4
47 n
m]
time [s]
300 400 500 6000,0
0,1
0,2
0,3 0 min 0,5 min 1 min 2 min 5 min 10 min 20 min 30 min 45 min 60 min 90 min 120 min 185 min
abso
rptio
n
wavelength [nm]
300 400 500 6000,0
0,1
0,2
0,3 0 min 1 min 3 min 5 min 10 min 30 min 60 min 90 min 118 min 180 min 240 min
abso
rptio
n
wavelength [nm]
0 50 100 150 2000,10
0,15
0,20
abso
rptio
n [4
40 n
m]
time [min]
A B
C D
E F
0 75 150 225
0.08
0.09
0.10
abso
rptio
n [4
40 n
m]
time [min]
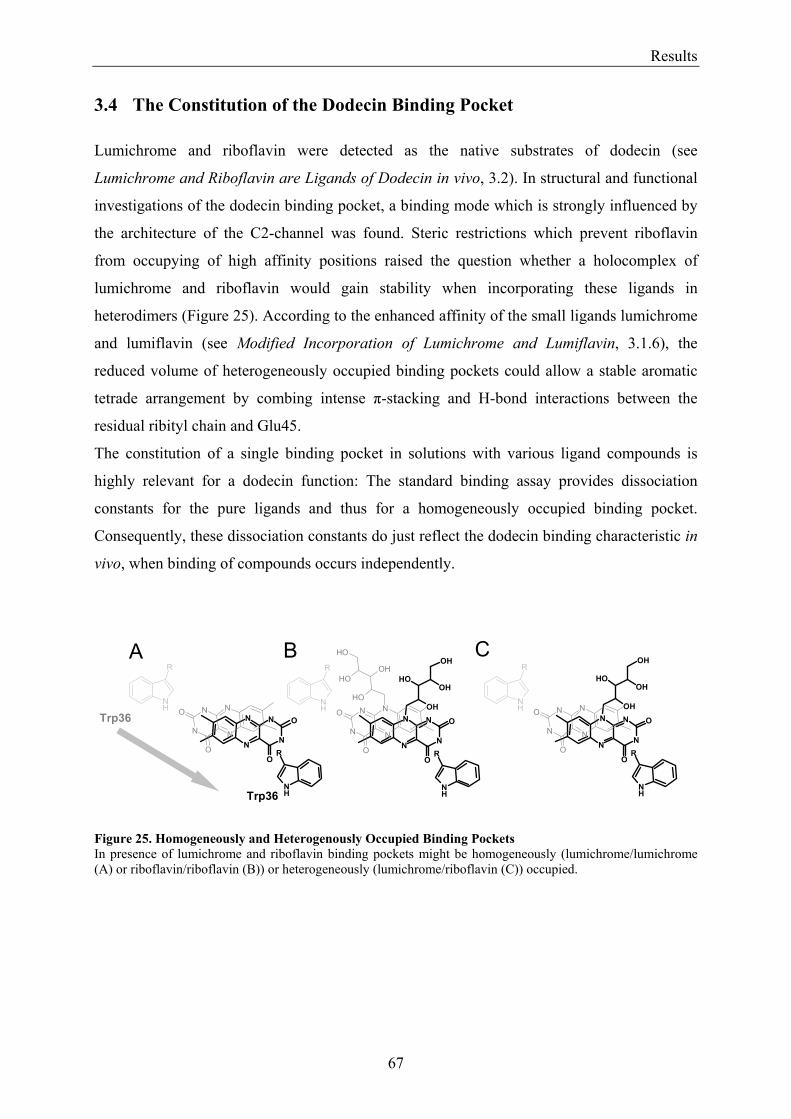
Results
67
3.4 The Constitution of the Dodecin Binding Pocket Lumichrome and riboflavin were detected as the native substrates of dodecin (see
Lumichrome and Riboflavin are Ligands of Dodecin in vivo, 3.2). In structural and functional
investigations of the dodecin binding pocket, a binding mode which is strongly influenced by
the architecture of the C2-channel was found. Steric restrictions which prevent riboflavin
from occupying of high affinity positions raised the question whether a holocomplex of
lumichrome and riboflavin would gain stability when incorporating these ligands in
heterodimers (Figure 25). According to the enhanced affinity of the small ligands lumichrome
and lumiflavin (see Modified Incorporation of Lumichrome and Lumiflavin, 3.1.6), the
reduced volume of heterogeneously occupied binding pockets could allow a stable aromatic
tetrade arrangement by combing intense π-stacking and H-bond interactions between the
residual ribityl chain and Glu45.
The constitution of a single binding pocket in solutions with various ligand compounds is
highly relevant for a dodecin function: The standard binding assay provides dissociation
constants for the pure ligands and thus for a homogeneously occupied binding pocket.
Consequently, these dissociation constants do just reflect the dodecin binding characteristic in
vivo, when binding of compounds occurs independently.
Figure 25. Homogeneously and Heterogenously Occupied Binding Pockets In presence of lumichrome and riboflavin binding pockets might be homogeneously (lumichrome/lumichrome (A) or riboflavin/riboflavin (B)) or heterogeneously (lumichrome/riboflavin (C)) occupied.
CBA
Trp36
Trp36
N
N
N
N
O
O
OH
OHOH
OH
N
N
N
NO
O
OHOH
OH
OH
NH
R
NH
R
N
N
N
N
O
O
OH
OHOH
OH
N
N
N
NO
O
NH
R
NH
R
N
N
N
N
O
ON
N
N
NO
O
NH
R
NH
R
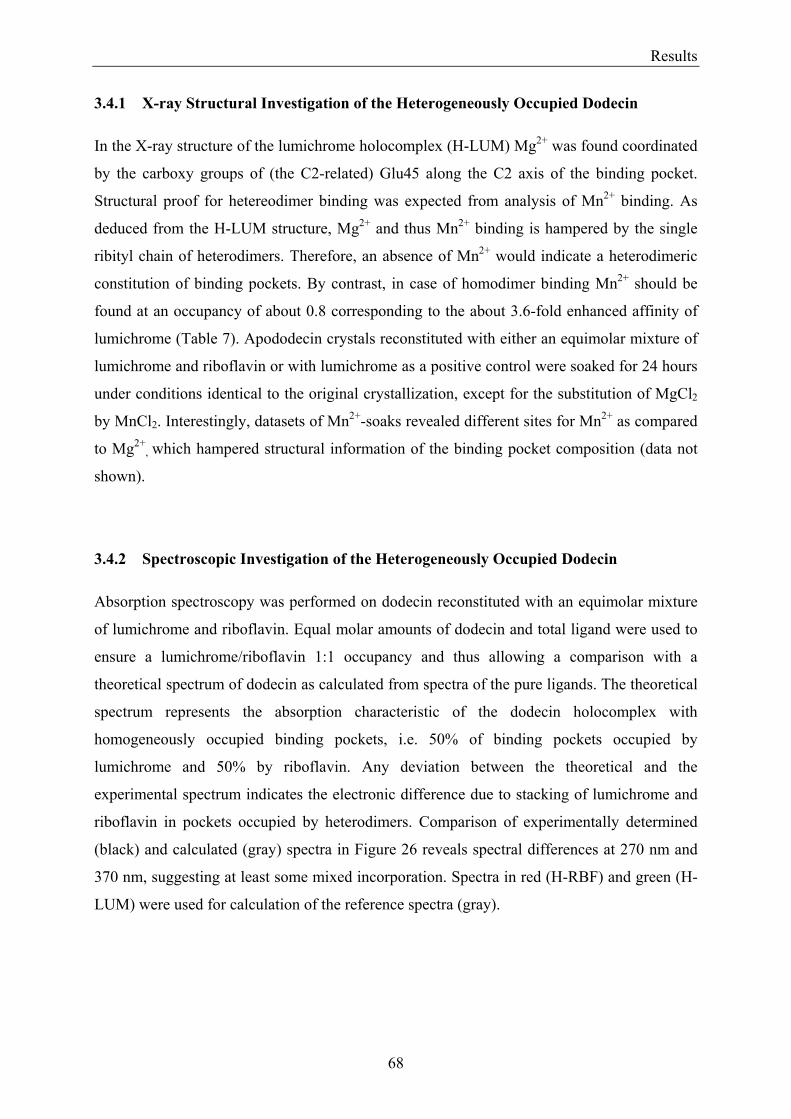
Results
68
3.4.1 X-ray Structural Investigation of the Heterogeneously Occupied Dodecin In the X-ray structure of the lumichrome holocomplex (H-LUM) Mg2+ was found coordinated
by the carboxy groups of (the C2-related) Glu45 along the C2 axis of the binding pocket.
Structural proof for hetereodimer binding was expected from analysis of Mn2+ binding. As
deduced from the H-LUM structure, Mg2+ and thus Mn2+ binding is hampered by the single
ribityl chain of heterodimers. Therefore, an absence of Mn2+ would indicate a heterodimeric
constitution of binding pockets. By contrast, in case of homodimer binding Mn2+ should be
found at an occupancy of about 0.8 corresponding to the about 3.6-fold enhanced affinity of
lumichrome (Table 7). Apododecin crystals reconstituted with either an equimolar mixture of
lumichrome and riboflavin or with lumichrome as a positive control were soaked for 24 hours
under conditions identical to the original crystallization, except for the substitution of MgCl2
by MnCl2. Interestingly, datasets of Mn2+-soaks revealed different sites for Mn2+ as compared
to Mg2+, which hampered structural information of the binding pocket composition (data not
shown).
3.4.2 Spectroscopic Investigation of the Heterogeneously Occupied Dodecin Absorption spectroscopy was performed on dodecin reconstituted with an equimolar mixture
of lumichrome and riboflavin. Equal molar amounts of dodecin and total ligand were used to
ensure a lumichrome/riboflavin 1:1 occupancy and thus allowing a comparison with a
theoretical spectrum of dodecin as calculated from spectra of the pure ligands. The theoretical
spectrum represents the absorption characteristic of the dodecin holocomplex with
homogeneously occupied binding pockets, i.e. 50% of binding pockets occupied by
lumichrome and 50% by riboflavin. Any deviation between the theoretical and the
experimental spectrum indicates the electronic difference due to stacking of lumichrome and
riboflavin in pockets occupied by heterodimers. Comparison of experimentally determined
(black) and calculated (gray) spectra in Figure 26 reveals spectral differences at 270 nm and
370 nm, suggesting at least some mixed incorporation. Spectra in red (H-RBF) and green (H-
LUM) were used for calculation of the reference spectra (gray).
Results
69
Figure 26. Absorption Characteristic of the Lumichrome/Riboflavin Holocomplex The experimentally determined absorption characteristic (blue) of apododecin reconstituted with 1:1 with lumichrome and riboflavin is superimposed onto a theoretical spectrum (gray) calculated from the spectra of the holocomplexes H-LUM (green) and H-RBF (red).
3.4.3 Functional Investigation of the Heterogeneously Occupied Dodecin
3.4.3.1 Fluorescence Spectroscopic Determination of Bound Ligands HPLC with fluorescence detection was performed to inspect the dodecin binding
characteristic in presence of lumichrome and riboflavin at varying molar ratios.
Heterologously expressed (His-tagged) apododecin was added to solutions of lumichrome and
riboflavin in defined molar ratios (initial ratios L0/R0) to finally extract holododecin and
determine the molar amounts of complexed ligands ([DR] and [DL]).
For homogeneously occupied binding pockets (independent binding), these lumichrome/
riboflavin molar ratios should correspond to the affinities of the pure ligands. Thus for an
initial 1:1 molar ratio of lumichrome/riboflavin ([L0]/[R0]), the lumichrome concentration
should by 3.6 fold exceed the riboflavin concentration due to its 3.6 fold enhanced affinity. In
contrast, binding in heterodimers would be detected by presence of equimolar amounts of
riboflavin and lumichrome incorporated into the dodecin binding pockets.
Alternatively to comparing molar amounts of bound ligands, binding of lumichrome and
riboflavin was analyzed by relating independent binding of lumichrome and riboflavin, as
illustrated in Figure 27. The fusion of equations (9) into a dissociation constant ratio (KD_H-
LUM/ KD_H-RBF) to yield equation (10) allowed to reduce the experimental complexity of this
approach as equation (11) solely depends on the quantitative determination of the bound
ligands (to determine [LD] and [RD], respectively). The efficient extraction of dodecin from
300 400 500 6000
10000
20000
30000
40000
mol
ar e
xtin
ctio
n co
effic
ient
wavelength [nm]
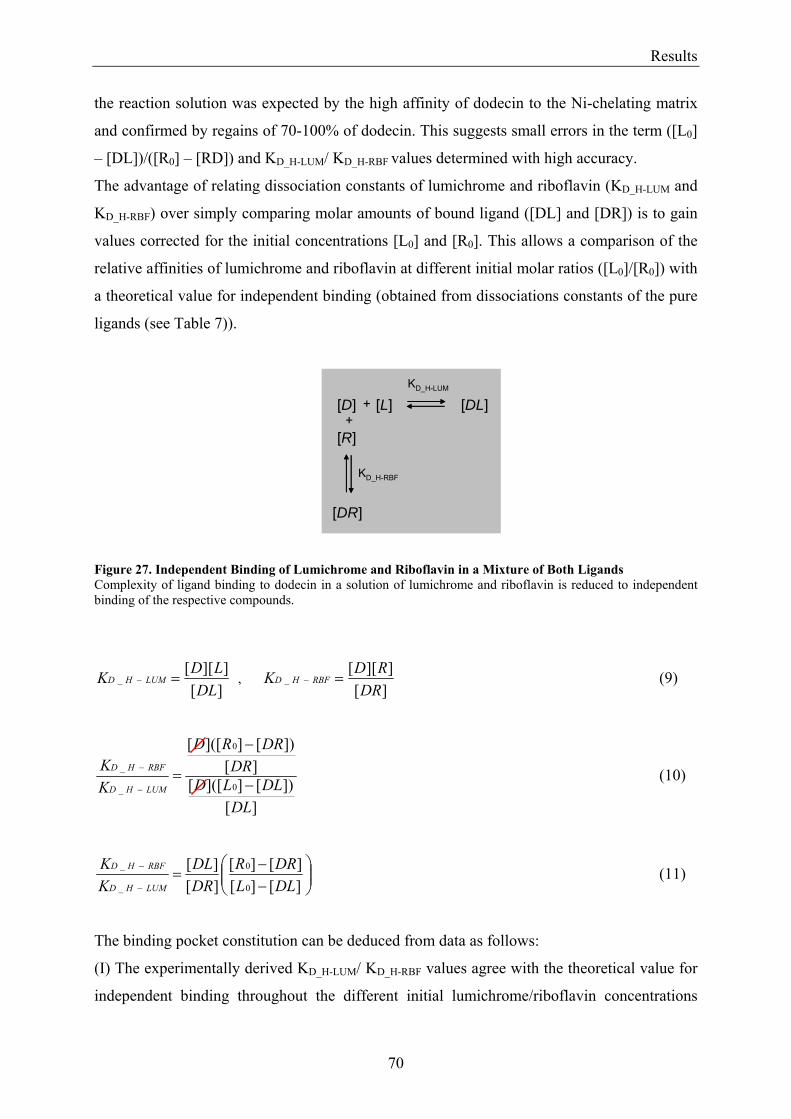
Results
70
the reaction solution was expected by the high affinity of dodecin to the Ni-chelating matrix
and confirmed by regains of 70-100% of dodecin. This suggests small errors in the term ([L0]
– [DL])/([R0] – [RD]) and KD_H-LUM/ KD_H-RBF values determined with high accuracy.
The advantage of relating dissociation constants of lumichrome and riboflavin (KD_H-LUM and
KD_H-RBF) over simply comparing molar amounts of bound ligand ([DL] and [DR]) is to gain
values corrected for the initial concentrations [L0] and [R0]. This allows a comparison of the
relative affinities of lumichrome and riboflavin at different initial molar ratios ([L0]/[R0]) with
a theoretical value for independent binding (obtained from dissociations constants of the pure
ligands (see Table 7)).
Figure 27. Independent Binding of Lumichrome and Riboflavin in a Mixture of Both Ligands Complexity of ligand binding to dodecin in a solution of lumichrome and riboflavin is reduced to independent binding of the respective compounds.
][]][[
_DL
LDK LUMHD =− , ][]][[
_DR
RDK RBFHD =− (9)
][])[]]([[
][])[]]([[
0
0
_
_
DLDLLD
DRDRRD
KK
LUMHD
RBFHD
−
−
=−
− (10)
⎟⎟⎠
⎞⎜⎜⎝
⎛−−
=−
−
][][][][
][][
0
0
_
_
DLLDRR
DRDL
KK
LUMHD
RBFHD (11)
The binding pocket constitution can be deduced from data as follows:
(I) The experimentally derived KD_H-LUM/ KD_H-RBF values agree with the theoretical value for
independent binding throughout the different initial lumichrome/riboflavin concentrations
[D] [L]
[R]
[DL]++
[DR]
KD_H-LUM
KD_H-RBF
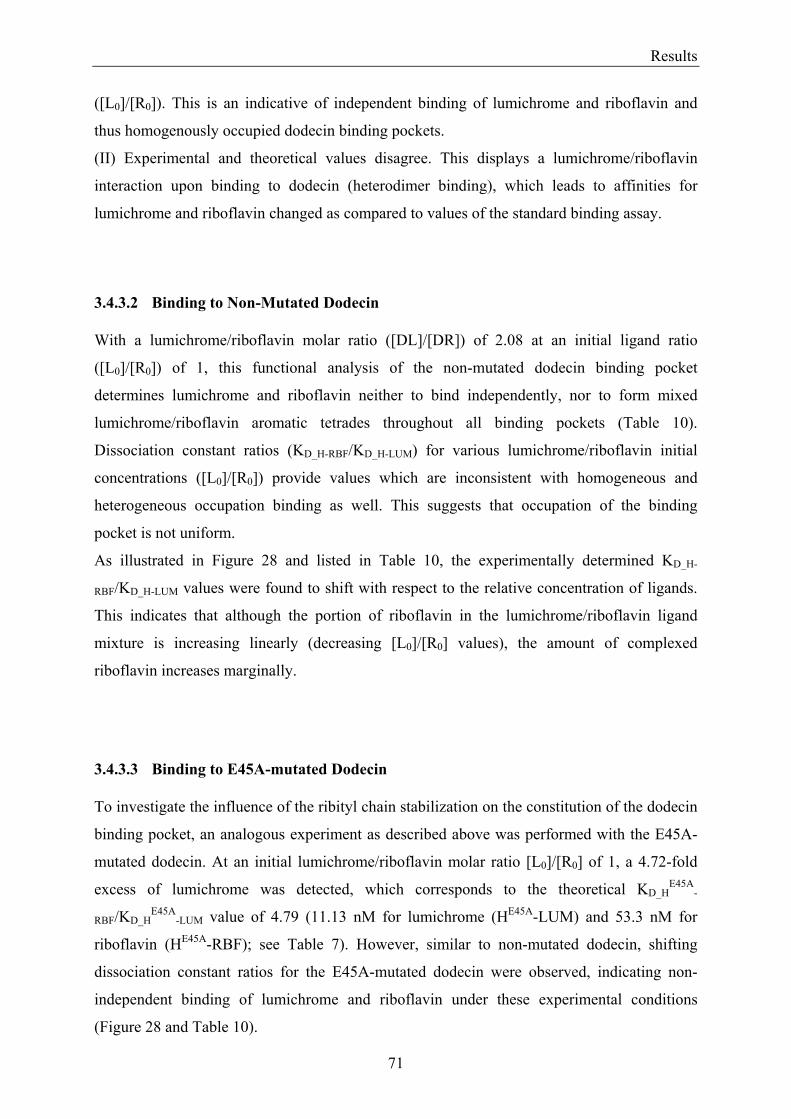
Results
71
([L0]/[R0]). This is an indicative of independent binding of lumichrome and riboflavin and
thus homogenously occupied dodecin binding pockets.
(II) Experimental and theoretical values disagree. This displays a lumichrome/riboflavin
interaction upon binding to dodecin (heterodimer binding), which leads to affinities for
lumichrome and riboflavin changed as compared to values of the standard binding assay.
3.4.3.2 Binding to Non-Mutated Dodecin With a lumichrome/riboflavin molar ratio ([DL]/[DR]) of 2.08 at an initial ligand ratio
([L0]/[R0]) of 1, this functional analysis of the non-mutated dodecin binding pocket
determines lumichrome and riboflavin neither to bind independently, nor to form mixed
lumichrome/riboflavin aromatic tetrades throughout all binding pockets (Table 10).
Dissociation constant ratios (KD_H-RBF/KD_H-LUM) for various lumichrome/riboflavin initial
concentrations ([L0]/[R0]) provide values which are inconsistent with homogeneous and
heterogeneous occupation binding as well. This suggests that occupation of the binding
pocket is not uniform.
As illustrated in Figure 28 and listed in Table 10, the experimentally determined KD_H-
RBF/KD_H-LUM values were found to shift with respect to the relative concentration of ligands.
This indicates that although the portion of riboflavin in the lumichrome/riboflavin ligand
mixture is increasing linearly (decreasing [L0]/[R0] values), the amount of complexed
riboflavin increases marginally.
3.4.3.3 Binding to E45A-mutated Dodecin To investigate the influence of the ribityl chain stabilization on the constitution of the dodecin
binding pocket, an analogous experiment as described above was performed with the E45A-
mutated dodecin. At an initial lumichrome/riboflavin molar ratio [L0]/[R0] of 1, a 4.72-fold
excess of lumichrome was detected, which corresponds to the theoretical KD_HE45A
-
RBF/KD_HE45A
-LUM value of 4.79 (11.13 nM for lumichrome (HE45A-LUM) and 53.3 nM for
riboflavin (HE45A-RBF); see Table 7). However, similar to non-mutated dodecin, shifting
dissociation constant ratios for the E45A-mutated dodecin were observed, indicating non-
independent binding of lumichrome and riboflavin under these experimental conditions
(Figure 28 and Table 10).
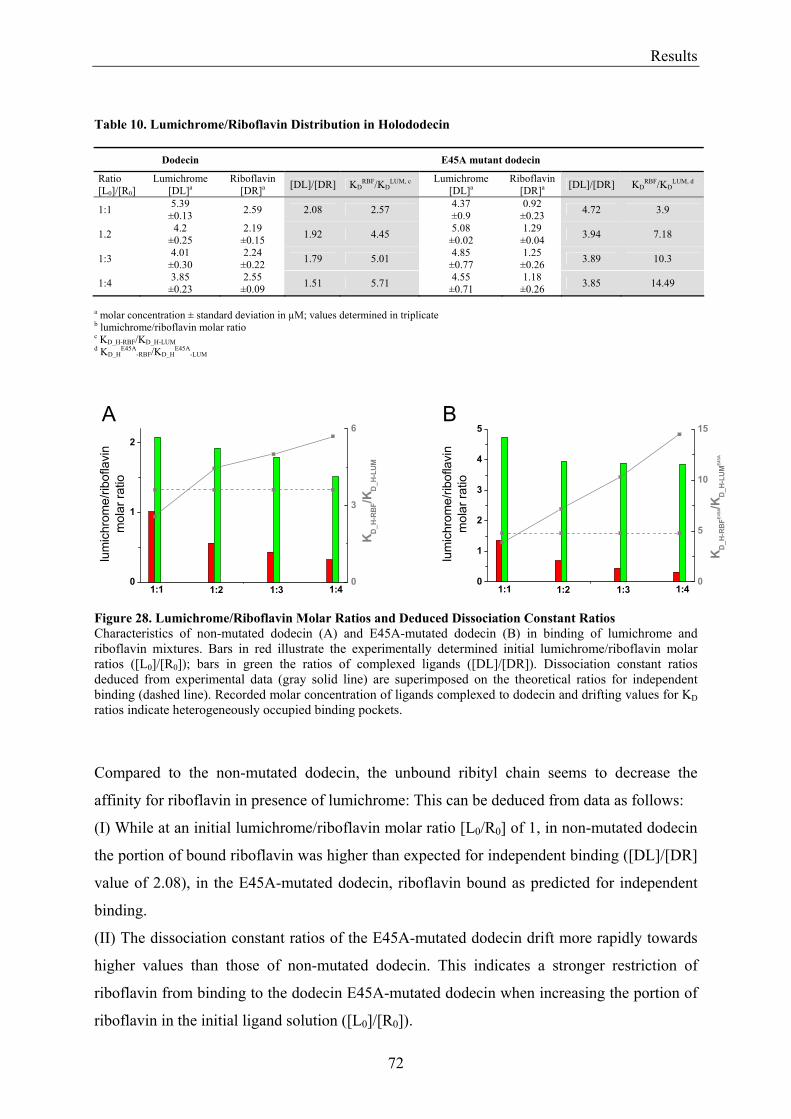
Results
72
Table 10. Lumichrome/Riboflavin Distribution in Holododecin Dodecin E45A mutant dodecin
Ratio [L0]/[R0]
Lumichrome [DL]a
Riboflavin [DR]a [DL]/[DR] KD
RBF/KDLUM, c Lumichrome
[DL]a Riboflavin
[DR]a [DL]/[DR] KDRBF/KD
LUM, d
1:1 5.39 ±0.13 2.59 2.08 2.57 4.37
±0.9 0.92
±0.23 4.72 3.9
1.2 4.2 ±0.25
2.19 ±0.15 1.92 4.45 5.08
±0.02 1.29
±0.04 3.94 7.18
1:3 4.01 ±0.30
2.24 ±0.22 1.79 5.01 4.85
±0.77 1.25
±0.26 3.89 10.3
1:4 3.85 ±0.23
2.55 ±0.09 1.51 5.71 4.55
±0.71 1.18
±0.26 3.85 14.49
a molar concentration ± standard deviation in µM; values determined in triplicate b lumichrome/riboflavin molar ratio c KD_H-RBF/KD_H-LUM d KD_H
E45A-RBF/KD_H
E45A-LUM
Figure 28. Lumichrome/Riboflavin Molar Ratios and Deduced Dissociation Constant Ratios Characteristics of non-mutated dodecin (A) and E45A-mutated dodecin (B) in binding of lumichrome and riboflavin mixtures. Bars in red illustrate the experimentally determined initial lumichrome/riboflavin molar ratios ([L0]/[R0]); bars in green the ratios of complexed ligands ([DL]/[DR]). Dissociation constant ratios deduced from experimental data (gray solid line) are superimposed on the theoretical ratios for independent binding (dashed line). Recorded molar concentration of ligands complexed to dodecin and drifting values for KD ratios indicate heterogeneously occupied binding pockets.
Compared to the non-mutated dodecin, the unbound ribityl chain seems to decrease the
affinity for riboflavin in presence of lumichrome: This can be deduced from data as follows:
(I) While at an initial lumichrome/riboflavin molar ratio [L0/R0] of 1, in non-mutated dodecin
the portion of bound riboflavin was higher than expected for independent binding ([DL]/[DR]
value of 2.08), in the E45A-mutated dodecin, riboflavin bound as predicted for independent
binding.
(II) The dissociation constant ratios of the E45A-mutated dodecin drift more rapidly towards
higher values than those of non-mutated dodecin. This indicates a stronger restriction of
riboflavin from binding to the dodecin E45A-mutated dodecin when increasing the portion of
riboflavin in the initial ligand solution ([L0]/[R0]).
0
1
2
3
4
5
1:41:31:21:1
K D_H
-RB
FE45A/K
D_H
-LU
ME4
5A
lum
ichr
ome/
ribof
lavi
nm
olar
ratio
0
5
10
15
0
1
2
1:41:31:21:1
K D_H-
RBF/K
D_H-
LUM
lum
ichr
ome/
ribof
lavi
nm
olar
ratio
0
3
6A B
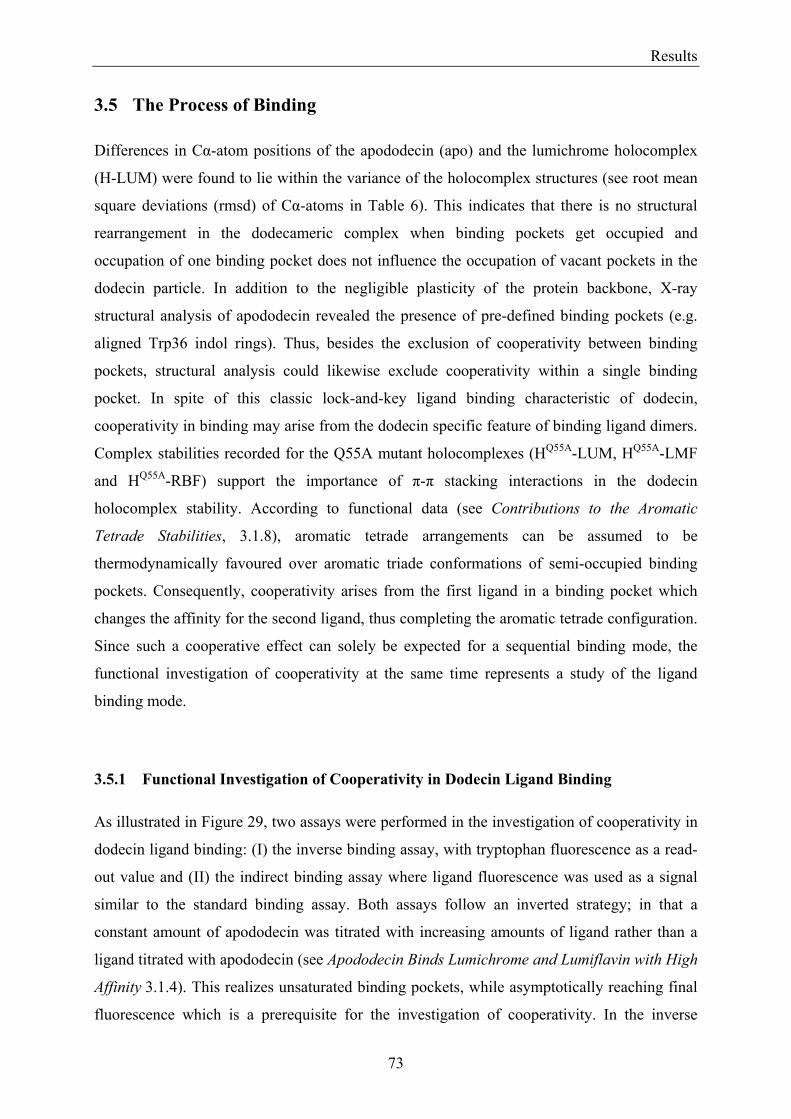
Results
73
3.5 The Process of Binding Differences in Cα-atom positions of the apododecin (apo) and the lumichrome holocomplex
(H-LUM) were found to lie within the variance of the holocomplex structures (see root mean
square deviations (rmsd) of Cα-atoms in Table 6). This indicates that there is no structural
rearrangement in the dodecameric complex when binding pockets get occupied and
occupation of one binding pocket does not influence the occupation of vacant pockets in the
dodecin particle. In addition to the negligible plasticity of the protein backbone, X-ray
structural analysis of apododecin revealed the presence of pre-defined binding pockets (e.g.
aligned Trp36 indol rings). Thus, besides the exclusion of cooperativity between binding
pockets, structural analysis could likewise exclude cooperativity within a single binding
pocket. In spite of this classic lock-and-key ligand binding characteristic of dodecin,
cooperativity in binding may arise from the dodecin specific feature of binding ligand dimers.
Complex stabilities recorded for the Q55A mutant holocomplexes (HQ55A-LUM, HQ55A-LMF
and HQ55A-RBF) support the importance of π-π stacking interactions in the dodecin
holocomplex stability. According to functional data (see Contributions to the Aromatic
Tetrade Stabilities, 3.1.8), aromatic tetrade arrangements can be assumed to be
thermodynamically favoured over aromatic triade conformations of semi-occupied binding
pockets. Consequently, cooperativity arises from the first ligand in a binding pocket which
changes the affinity for the second ligand, thus completing the aromatic tetrade configuration.
Since such a cooperative effect can solely be expected for a sequential binding mode, the
functional investigation of cooperativity at the same time represents a study of the ligand
binding mode.
3.5.1 Functional Investigation of Cooperativity in Dodecin Ligand Binding As illustrated in Figure 29, two assays were performed in the investigation of cooperativity in
dodecin ligand binding: (I) the inverse binding assay, with tryptophan fluorescence as a read-
out value and (II) the indirect binding assay where ligand fluorescence was used as a signal
similar to the standard binding assay. Both assays follow an inverted strategy; in that a
constant amount of apododecin was titrated with increasing amounts of ligand rather than a
ligand titrated with apododecin (see Apododecin Binds Lumichrome and Lumiflavin with High
Affinity 3.1.4). This realizes unsaturated binding pockets, while asymptotically reaching final
fluorescence which is a prerequisite for the investigation of cooperativity. In the inverse
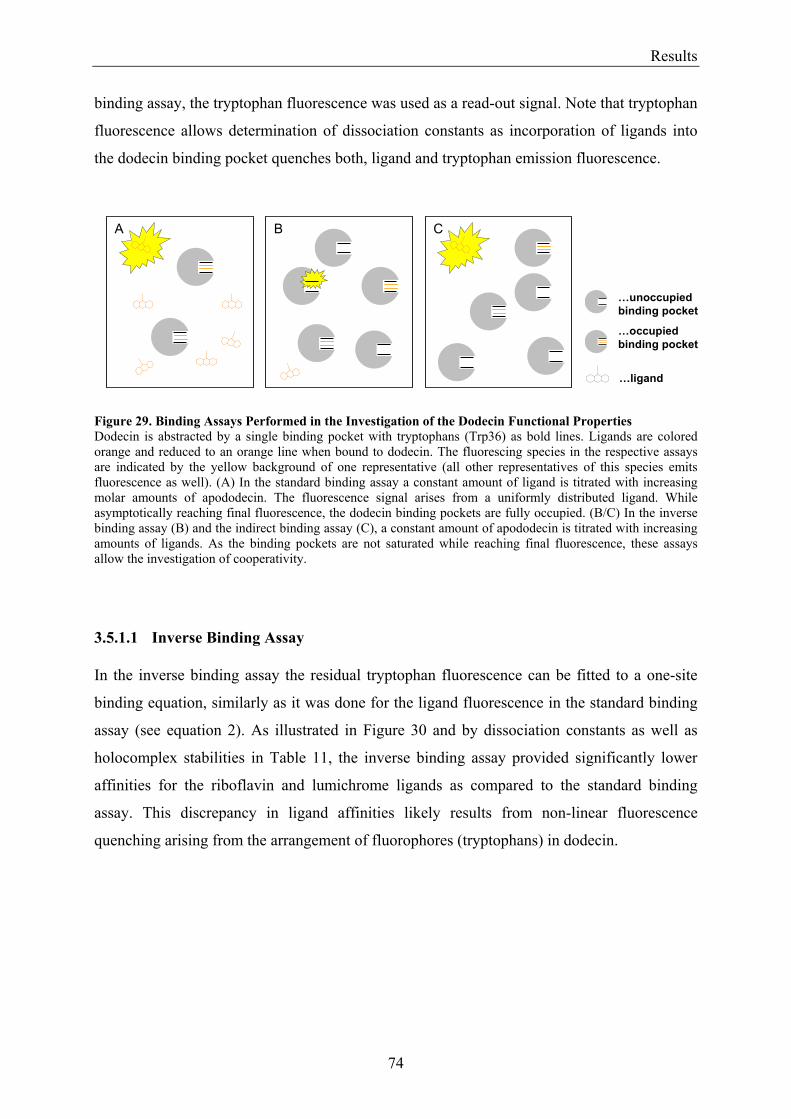
Results
74
binding assay, the tryptophan fluorescence was used as a read-out signal. Note that tryptophan
fluorescence allows determination of dissociation constants as incorporation of ligands into
the dodecin binding pocket quenches both, ligand and tryptophan emission fluorescence.
Figure 29. Binding Assays Performed in the Investigation of the Dodecin Functional Properties Dodecin is abstracted by a single binding pocket with tryptophans (Trp36) as bold lines. Ligands are colored orange and reduced to an orange line when bound to dodecin. The fluorescing species in the respective assays are indicated by the yellow background of one representative (all other representatives of this species emits fluorescence as well). (A) In the standard binding assay a constant amount of ligand is titrated with increasing molar amounts of apododecin. The fluorescence signal arises from a uniformly distributed ligand. While asymptotically reaching final fluorescence, the dodecin binding pockets are fully occupied. (B/C) In the inverse binding assay (B) and the indirect binding assay (C), a constant amount of apododecin is titrated with increasing amounts of ligands. As the binding pockets are not saturated while reaching final fluorescence, these assays allow the investigation of cooperativity.
3.5.1.1 Inverse Binding Assay In the inverse binding assay the residual tryptophan fluorescence can be fitted to a one-site
binding equation, similarly as it was done for the ligand fluorescence in the standard binding
assay (see equation 2). As illustrated in Figure 30 and by dissociation constants as well as
holocomplex stabilities in Table 11, the inverse binding assay provided significantly lower
affinities for the riboflavin and lumichrome ligands as compared to the standard binding
assay. This discrepancy in ligand affinities likely results from non-linear fluorescence
quenching arising from the arrangement of fluorophores (tryptophans) in dodecin.
…unoccupiedbinding pocket
…ligand
…occupiedbinding pocket
A B C
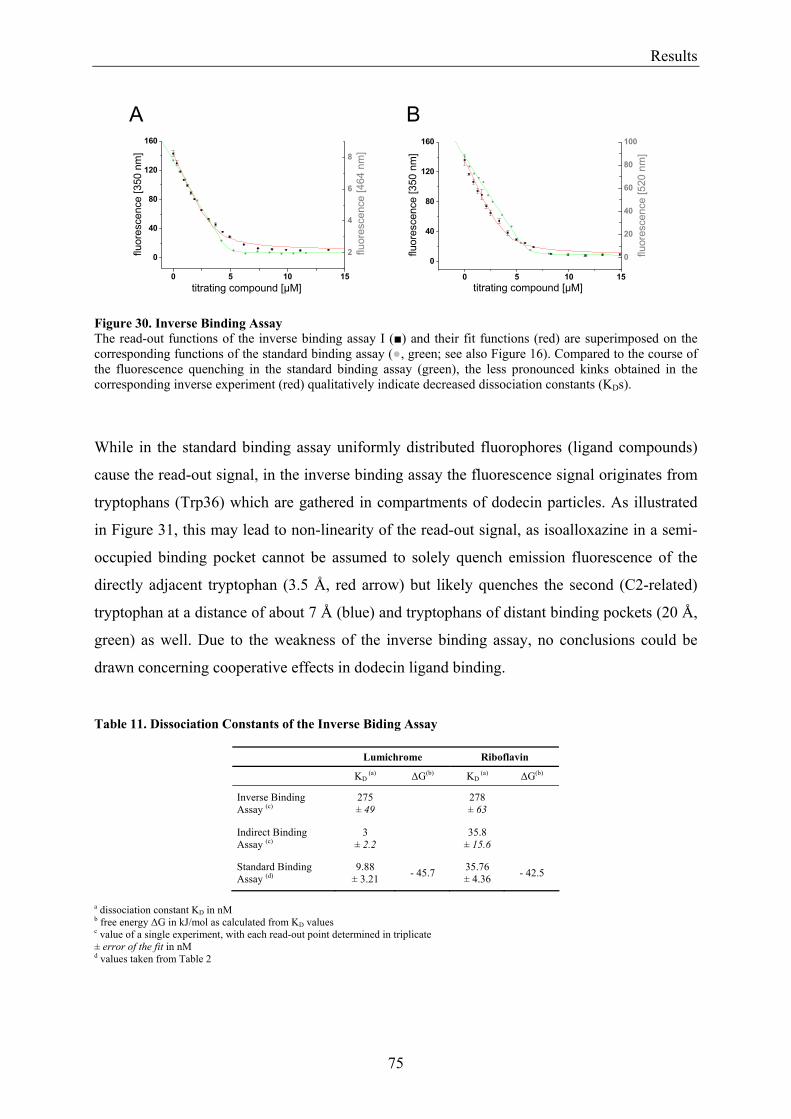
Results
75
Figure 30. Inverse Binding Assay The read-out functions of the inverse binding assay I () and their fit functions (red) are superimposed on the corresponding functions of the standard binding assay (, green; see also Figure 16). Compared to the course of the fluorescence quenching in the standard binding assay (green), the less pronounced kinks obtained in the corresponding inverse experiment (red) qualitatively indicate decreased dissociation constants (KDs).
While in the standard binding assay uniformly distributed fluorophores (ligand compounds)
cause the read-out signal, in the inverse binding assay the fluorescence signal originates from
tryptophans (Trp36) which are gathered in compartments of dodecin particles. As illustrated
in Figure 31, this may lead to non-linearity of the read-out signal, as isoalloxazine in a semi-
occupied binding pocket cannot be assumed to solely quench emission fluorescence of the
directly adjacent tryptophan (3.5 Å, red arrow) but likely quenches the second (C2-related)
tryptophan at a distance of about 7 Å (blue) and tryptophans of distant binding pockets (20 Å,
green) as well. Due to the weakness of the inverse binding assay, no conclusions could be
drawn concerning cooperative effects in dodecin ligand binding. Table 11. Dissociation Constants of the Inverse Biding Assay
Lumichrome Riboflavin
KD (a) ∆G(b) KD
(a) ∆G(b)
Inverse Binding Assay (c)
275 ± 49 278
± 63
Indirect Binding Assay (c)
3 ± 2.2 35.8
± 15.6
Standard Binding Assay (d)
9.88 ± 3.21 - 45.7 35.76
± 4.36 - 42.5
a dissociation constant KD in nM b free energy ∆G in kJ/mol as calculated from KD values c value of a single experiment, with each read-out point determined in triplicate ± error of the fit in nM d values taken from Table 2
0 5 10 15
0
40
80
120
160
2
4
6
8
titrating compound [µM]
fluor
esce
nce
[350
nm
]
fluor
esce
nce
[464
nm
]
0 5 10 15
0
40
80
120
160
0
20
40
60
80
100
titrating compound [µM]
fluor
esce
nce
[350
nm
]
fluor
esce
nce
[520
nm
]
A B
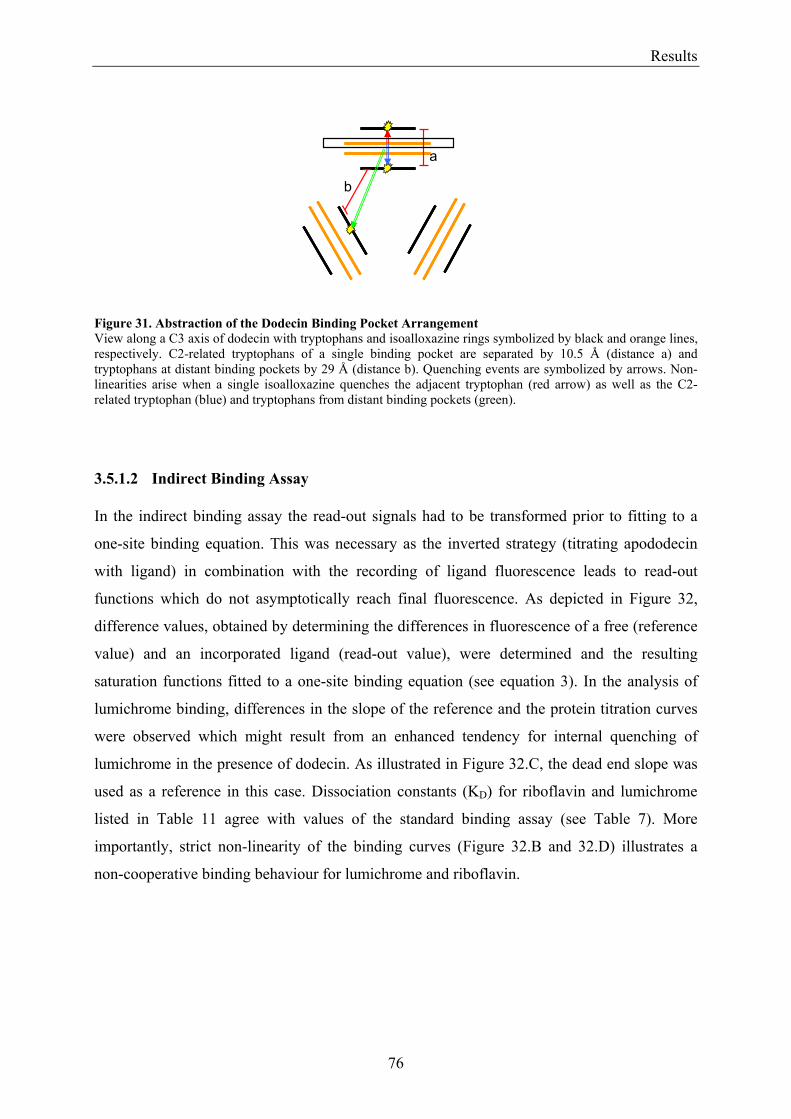
Results
76
Figure 31. Abstraction of the Dodecin Binding Pocket Arrangement View along a C3 axis of dodecin with tryptophans and isoalloxazine rings symbolized by black and orange lines, respectively. C2-related tryptophans of a single binding pocket are separated by 10.5 Å (distance a) and tryptophans at distant binding pockets by 29 Å (distance b). Quenching events are symbolized by arrows. Non-linearities arise when a single isoalloxazine quenches the adjacent tryptophan (red arrow) as well as the C2-related tryptophan (blue) and tryptophans from distant binding pockets (green).
3.5.1.2 Indirect Binding Assay In the indirect binding assay the read-out signals had to be transformed prior to fitting to a
one-site binding equation. This was necessary as the inverted strategy (titrating apododecin
with ligand) in combination with the recording of ligand fluorescence leads to read-out
functions which do not asymptotically reach final fluorescence. As depicted in Figure 32,
difference values, obtained by determining the differences in fluorescence of a free (reference
value) and an incorporated ligand (read-out value), were determined and the resulting
saturation functions fitted to a one-site binding equation (see equation 3). In the analysis of
lumichrome binding, differences in the slope of the reference and the protein titration curves
were observed which might result from an enhanced tendency for internal quenching of
lumichrome in the presence of dodecin. As illustrated in Figure 32.C, the dead end slope was
used as a reference in this case. Dissociation constants (KD) for riboflavin and lumichrome
listed in Table 11 agree with values of the standard binding assay (see Table 7). More
importantly, strict non-linearity of the binding curves (Figure 32.B and 32.D) illustrates a
non-cooperative binding behaviour for lumichrome and riboflavin.
a
b

Results
77
Figure 32. Indirect Binding Assay (A/C) Illustration of the indirect binding assay performed with riboflavin (A) and lumichrome (C) with read-out functions in black, reference titrations (free ligand) in red and the saturation function of difference values in green. For lumichrome (C) the reference slope was steeper than the dead-end slope and for calculation of the saturation function (green) the dead-end slope was used (black dashed line). (B/D) Difference values (read-out minus reference values) were fitted as a function of ligand concentration to the one-site binding equation. Saturation of the dodecin binding sites is indicated by the dashed black line.
The non-cooperativity in binding of lumichrome and riboflavin recorded in the indirect
binding assay is compatible with two binding mechanisms: (I) Ligands bind simultaneously as
a pre-coordinated dimer. (II) Ligands bind sequentially, but the uptake of the first ligand
strongly forces the second ligand to saturate the aromatic tetrade arrangement, Herein, the
strongly facilitated binding of the second ligand prevents from resolving both ligand binding
events which leads to a pseudo-simultaneous binding characteristic.
3.5.2 Refinement of the Binding Model Similar to binding studies with the pure ligands, the cooperativity of dodecin when binding a
mixture of lumichrome and riboflavin was investigated. This was done in analogy to the
inverse binding assays with the ligands lumichrome and riboflavin, respectively. As illustrated
in Figure 33, the data demonstrate a non-cooperative binding behaviour, even for
refere
nce sl
ope
dead-end slope
0 5 10 15 20
0
4
8
12
16
20
fluor
esce
nce
[464
nm
]
lumichrome [µM]
refere
nce sl
ope
dead-end slope
0 5 10 15 20
0
4
8
12
16
20
fluor
esce
nce
[464
nm
]
lumichrome [µM]
reference slope
dead-end slope
0 5 10 15
0
50
100
150
fluor
esce
nce
[520
nm
]
riboflavin [µM]
reference slope
dead-end slope
0 5 10 15
0
50
100
150
fluor
esce
nce
[520
nm
]
riboflavin [µM]0 5 10 15 20
0
20
40
60
80
100
fluor
esce
nce
diffe
renc
e
riboflavin [µM]0 5 10 15 20
0
20
40
60
80
100
fluor
esce
nce
diffe
renc
e
riboflavin [µM]
0 5 10 15 20
0
4
8
12
fluor
esce
nce
diffe
renc
elumichrome [µM]
0 5 10 15 20
0
4
8
12
fluor
esce
nce
diffe
renc
elumichrome [µM]
A B
C D
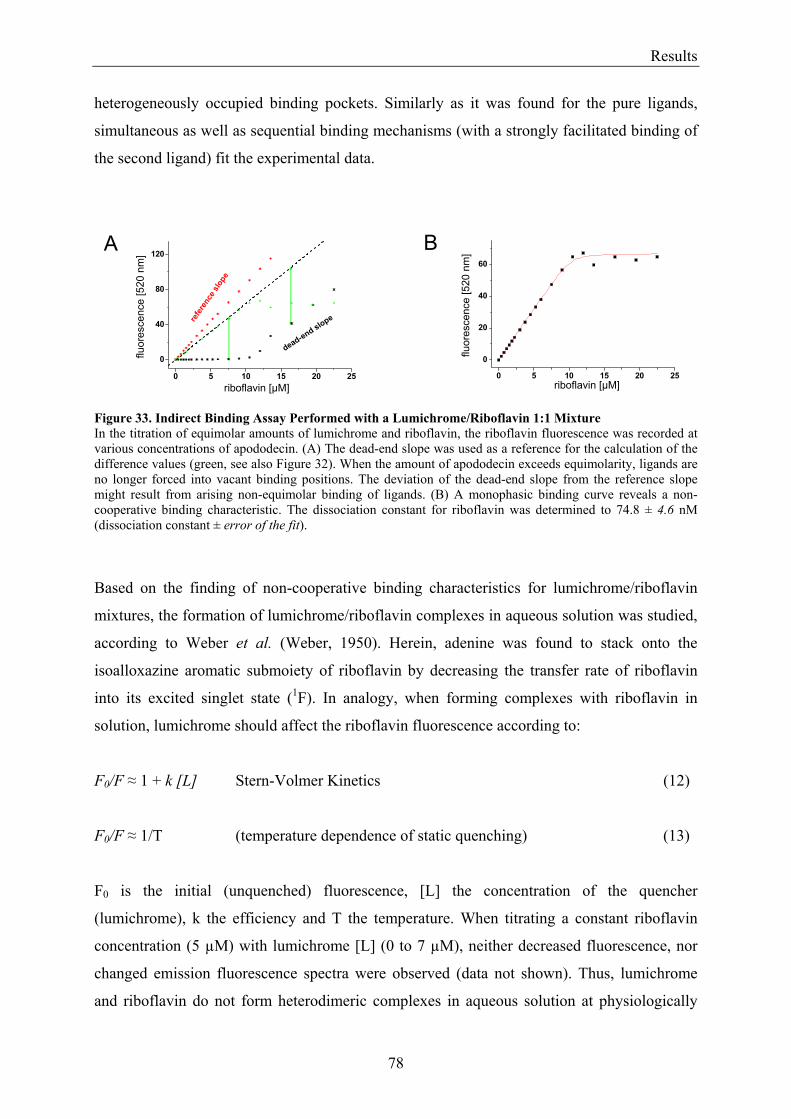
Results
78
heterogeneously occupied binding pockets. Similarly as it was found for the pure ligands,
simultaneous as well as sequential binding mechanisms (with a strongly facilitated binding of
the second ligand) fit the experimental data.
Figure 33. Indirect Binding Assay Performed with a Lumichrome/Riboflavin 1:1 Mixture In the titration of equimolar amounts of lumichrome and riboflavin, the riboflavin fluorescence was recorded at various concentrations of apododecin. (A) The dead-end slope was used as a reference for the calculation of the difference values (green, see also Figure 32). When the amount of apododecin exceeds equimolarity, ligands are no longer forced into vacant binding positions. The deviation of the dead-end slope from the reference slope might result from arising non-equimolar binding of ligands. (B) A monophasic binding curve reveals a non-cooperative binding characteristic. The dissociation constant for riboflavin was determined to 74.8 ± 4.6 nM (dissociation constant ± error of the fit).
Based on the finding of non-cooperative binding characteristics for lumichrome/riboflavin
mixtures, the formation of lumichrome/riboflavin complexes in aqueous solution was studied,
according to Weber et al. (Weber, 1950). Herein, adenine was found to stack onto the
isoalloxazine aromatic submoiety of riboflavin by decreasing the transfer rate of riboflavin
into its excited singlet state (1F). In analogy, when forming complexes with riboflavin in
solution, lumichrome should affect the riboflavin fluorescence according to:
F0/F ≈ 1 + k [L] Stern-Volmer Kinetics (12)
F0/F ≈ 1/T (temperature dependence of static quenching) (13)
F0 is the initial (unquenched) fluorescence, [L] the concentration of the quencher
(lumichrome), k the efficiency and T the temperature. When titrating a constant riboflavin
concentration (5 µM) with lumichrome [L] (0 to 7 µM), neither decreased fluorescence, nor
changed emission fluorescence spectra were observed (data not shown). Thus, lumichrome
and riboflavin do not form heterodimeric complexes in aqueous solution at physiologically
0 5 10 15 20 25
0
20
40
60
fluor
esce
nce
[520
nm
]
riboflavin [µM]
A B
refe
renc
e slo
pe
dead-end slope
0 5 10 15 20 25
0
40
80
120
fluor
esce
nce
[520
nm
]
riboflavin [µM]
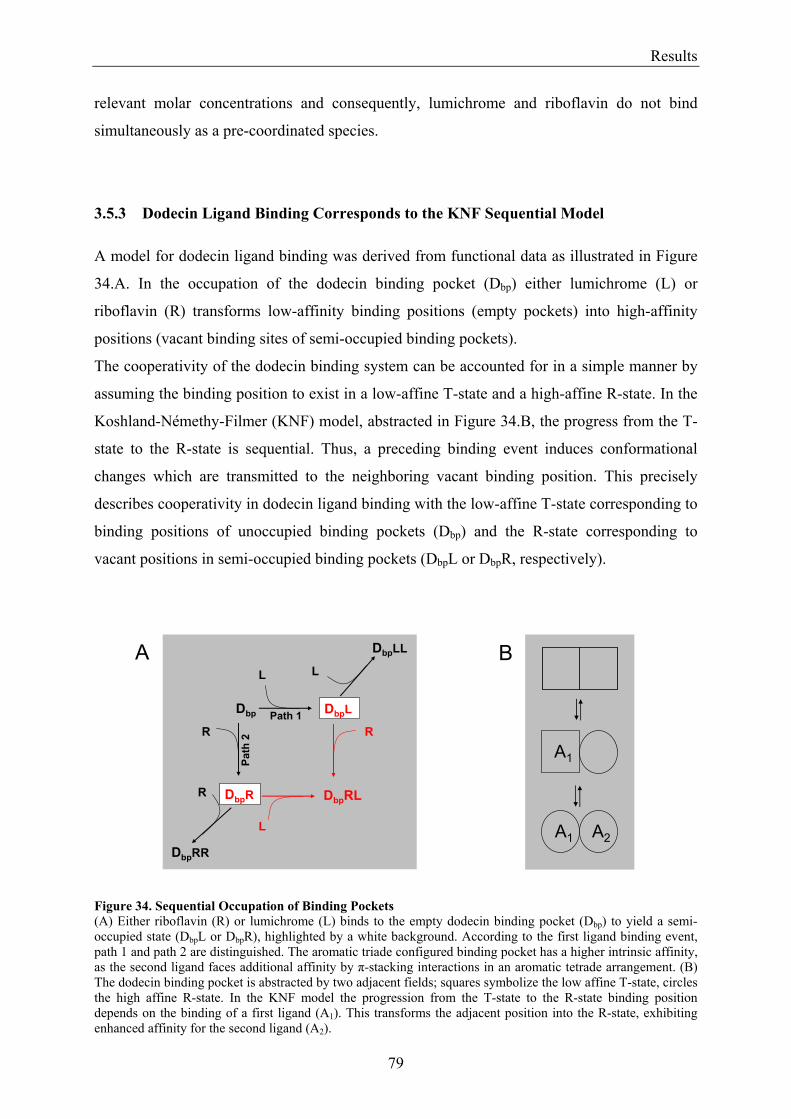
Results
79
relevant molar concentrations and consequently, lumichrome and riboflavin do not bind
simultaneously as a pre-coordinated species.
3.5.3 Dodecin Ligand Binding Corresponds to the KNF Sequential Model A model for dodecin ligand binding was derived from functional data as illustrated in Figure
34.A. In the occupation of the dodecin binding pocket (Dbp) either lumichrome (L) or
riboflavin (R) transforms low-affinity binding positions (empty pockets) into high-affinity
positions (vacant binding sites of semi-occupied binding pockets).
The cooperativity of the dodecin binding system can be accounted for in a simple manner by
assuming the binding position to exist in a low-affine T-state and a high-affine R-state. In the
Koshland-Némethy-Filmer (KNF) model, abstracted in Figure 34.B, the progress from the T-
state to the R-state is sequential. Thus, a preceding binding event induces conformational
changes which are transmitted to the neighboring vacant binding position. This precisely
describes cooperativity in dodecin ligand binding with the low-affine T-state corresponding to
binding positions of unoccupied binding pockets (Dbp) and the R-state corresponding to
vacant positions in semi-occupied binding pockets (DbpL or DbpR, respectively).
Figure 34. Sequential Occupation of Binding Pockets (A) Either riboflavin (R) or lumichrome (L) binds to the empty dodecin binding pocket (Dbp) to yield a semi-occupied state (DbpL or DbpR), highlighted by a white background. According to the first ligand binding event, path 1 and path 2 are distinguished. The aromatic triade configured binding pocket has a higher intrinsic affinity, as the second ligand faces additional affinity by π-stacking interactions in an aromatic tetrade arrangement. (B) The dodecin binding pocket is abstracted by two adjacent fields; squares symbolize the low affine T-state, circles the high affine R-state. In the KNF model the progression from the T-state to the R-state binding position depends on the binding of a first ligand (A1). This transforms the adjacent position into the R-state, exhibiting enhanced affinity for the second ligand (A2).
A1
A1 A2
Dbp DbpL
DbpR DbpRL
L
L
RR
R
L
DbpLL
DbpRR
Path 1
Path
2
A B
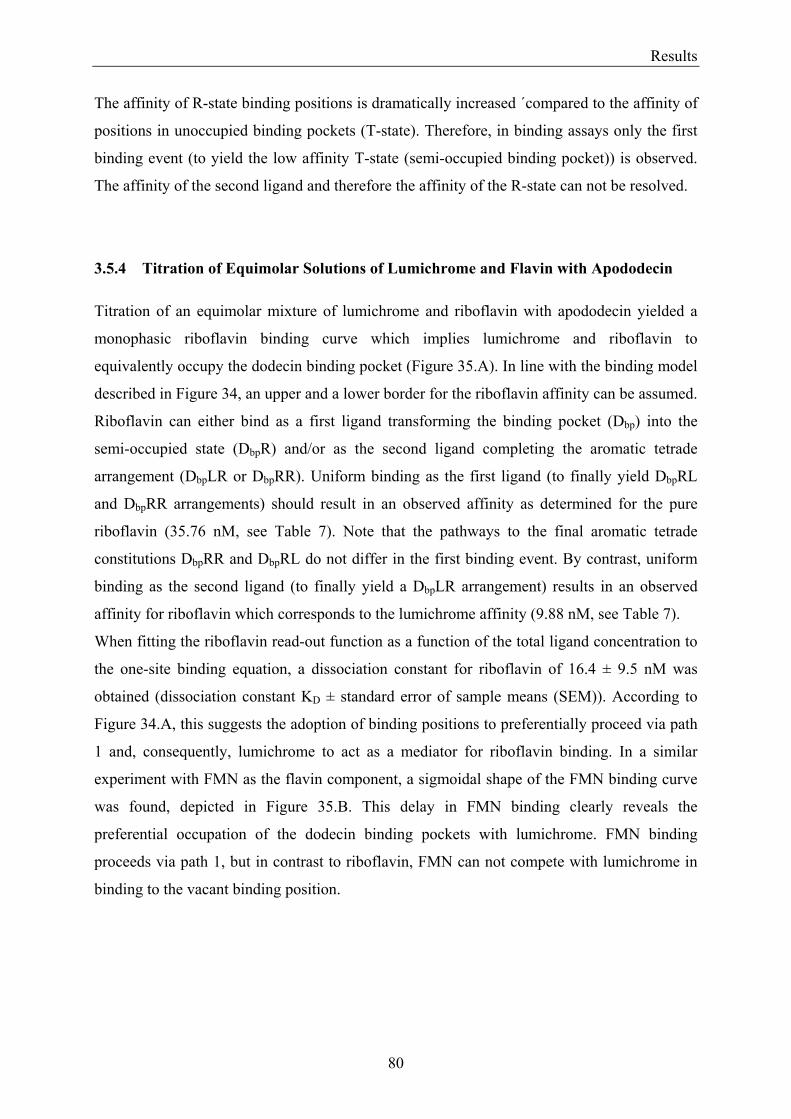
Results
80
The affinity of R-state binding positions is dramatically increased ´compared to the affinity of
positions in unoccupied binding pockets (T-state). Therefore, in binding assays only the first
binding event (to yield the low affinity T-state (semi-occupied binding pocket)) is observed.
The affinity of the second ligand and therefore the affinity of the R-state can not be resolved.
3.5.4 Titration of Equimolar Solutions of Lumichrome and Flavin with Apododecin Titration of an equimolar mixture of lumichrome and riboflavin with apododecin yielded a
monophasic riboflavin binding curve which implies lumichrome and riboflavin to
equivalently occupy the dodecin binding pocket (Figure 35.A). In line with the binding model
described in Figure 34, an upper and a lower border for the riboflavin affinity can be assumed.
Riboflavin can either bind as a first ligand transforming the binding pocket (Dbp) into the
semi-occupied state (DbpR) and/or as the second ligand completing the aromatic tetrade
arrangement (DbpLR or DbpRR). Uniform binding as the first ligand (to finally yield DbpRL
and DbpRR arrangements) should result in an observed affinity as determined for the pure
riboflavin (35.76 nM, see Table 7). Note that the pathways to the final aromatic tetrade
constitutions DbpRR and DbpRL do not differ in the first binding event. By contrast, uniform
binding as the second ligand (to finally yield a DbpLR arrangement) results in an observed
affinity for riboflavin which corresponds to the lumichrome affinity (9.88 nM, see Table 7).
When fitting the riboflavin read-out function as a function of the total ligand concentration to
the one-site binding equation, a dissociation constant for riboflavin of 16.4 ± 9.5 nM was
obtained (dissociation constant KD ± standard error of sample means (SEM)). According to
Figure 34.A, this suggests the adoption of binding positions to preferentially proceed via path
1 and, consequently, lumichrome to act as a mediator for riboflavin binding. In a similar
experiment with FMN as the flavin component, a sigmoidal shape of the FMN binding curve
was found, depicted in Figure 35.B. This delay in FMN binding clearly reveals the
preferential occupation of the dodecin binding pockets with lumichrome. FMN binding
proceeds via path 1, but in contrast to riboflavin, FMN can not compete with lumichrome in
binding to the vacant binding position.
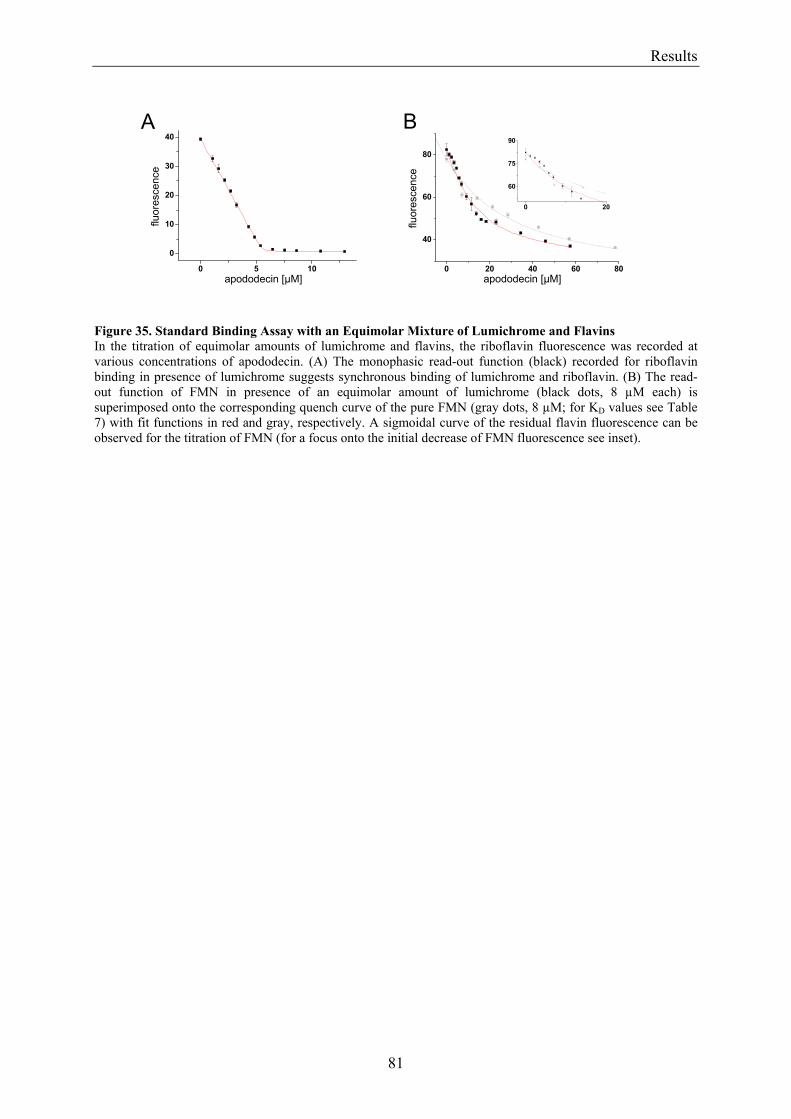
Results
81
Figure 35. Standard Binding Assay with an Equimolar Mixture of Lumichrome and Flavins In the titration of equimolar amounts of lumichrome and flavins, the riboflavin fluorescence was recorded at various concentrations of apododecin. (A) The monophasic read-out function (black) recorded for riboflavin binding in presence of lumichrome suggests synchronous binding of lumichrome and riboflavin. (B) The read-out function of FMN in presence of an equimolar amount of lumichrome (black dots, 8 µM each) is superimposed onto the corresponding quench curve of the pure FMN (gray dots, 8 µM; for KD values see Table 7) with fit functions in red and gray, respectively. A sigmoidal curve of the residual flavin fluorescence can be observed for the titration of FMN (for a focus onto the initial decrease of FMN fluorescence see inset).
0 5 10
0
10
20
30
40
fluor
esce
nce
apododecin [µM]0 20 40 60 80
40
60
80
0 20
60
75
90
fluor
esce
nce
apododecin [µM]
A B
Results
82
3.6 Homologous Proteins As listed in Figure 36, there are currently 28 homologous proteins in the database
(www.migenas.org), which bear significant homology to dodecin. Additionally, two
homologous sequences were found in the genomes of Halorhodospira halophila (Dieter
Oesterhelt, unpublished results) and Natronomonas pharaonis. All homologous proteins listed
share the isoalloxazine fixation pattern of the halophilic dodecin (Trp36 and Gln55), but
diverge in position 45 (Glu45). To derive hints about the binding properties in other
homologous proteins with special regard towards elucidating the role of residues in position
45, site directed mutagenesis of Glu45 was performed. This was done on the basis of
sequence identities of about 30% to the halobacterial dodecin, which allows to expect the
single mutated H. salinarum dodecins (position 45) to form identical binding pockets as the
homologous proteins. Thus, data obtained for these mutated dodecins were assumed to reflect
the functional characteristics of the respective homologous proteins. Figure 36. Sequence Alignment of Dodecin Amino acids are colored by ClustalW code with conservations per 10 species given below (star indicates full conservation). The conservation code is highlighted by background colors when corresponding amino acids are involved in the dodecameric assembly; green/blue for the assembly to the trimer, red for the assembly to the dodecamer. Secondary structure elements are indicated below. Homologous proteins are listed in the hierarchical order of sequence identity to the halobacterial dodecin (see Table 1). For the alignment, the protein sequences of Streptomyces avermilitis, Streptomyces coelicolor, Ralstonia metallidurans and Ralstonia solanacearum were truncated at the N- (#) or C-terminal end (+).
1 7 17 27 37 47 56 66 ooiiii ooooo oo oo oo oooooooo* i iiii *o ooo oooo* i i o o ooo H. salinarum OE3073 ----- ----MVFKKV LLTGTSEESF TAAADDAIDR AEDTLDNVVW AEVVDQGVEI –GAVEERTYQ TEVQVAFELD GSQ 68 H. salinarum Vng1446h MPAPA ECCHMVFKKV LLTGTSEESF TAAADDAIDR AEDTLDNVVW AEVVDQGVEI –GAVEERTYQ TEVQVAFELD GSQ 77 H. marismortui ----- ----MVFKKI TLIGTSSESF DKAADDAIER AEATLDNLKW VEVEELGVEI –ASVEGREYQ AEVVVAFELE A-- 66 N. pharaonis ----- ----MVFKKI TLIGTSDESF DAAADDALDR AEDTLDNIYW AEVEEFGVEV –ANADGREYQ AEVEVAFELE --- 65 T. thermophilus ----- MG--KVYKKV ELVGTSEEGL EAAIQAALAR ARKTLRHLDW FEVKEIRGTI GEAG-VKEYQ VVLEVGFRLE ET--69 H. halophila ----- MSD-HVYKIV ELTGSSPNGI EEAVNNAIAR AGETLRHLRW FEVVDTRGHI –EGGRVNHWQ VTVKVGFTLE GG- 70 G. sulfurreducens ----M YGKDRIYKKV EIIGVSGVSI EGAIETALVR ARNSLDKLSW FEVQEVRGHI GADGKVAEYQ VVLKVSFELK D-- 72 S. avermilitis(#) ERSTR MSD-HTYRVT EIVGTSTEGI DQAIRNGIAR AAQTLRNLDW FEVTQTRGQI –VNGQIEYYQ VGLKVGFRLD DGD 85 B. japonicum -MPTA EKD-HVYKIL ELVGSSETSI EDAIKNAVSR AAKTIREMKW FEVVQTRGHI –ENNAVRHYQ VTLRVGFTLE E---73 S. meliloti ----- MSE-HVYKKI ELIGSSPNSI DEAIEGAISR ASKTTRNLDW FEVDQIRGQI –VNGKVAHYQ VVMKVGFRID D-- 69 G. metallireducens ---MS YGDDRIYKKV EIIGVSKRGL EAAIQAAVAK AHKSLDKLSW FEVQDIRGHV GDDGMIAEYQ VVLKVAFEIK E-- 73 L. pneumophila ----- MTD-KVYQIV ELIGTSQEGI EKAIDNAIKQ VAKTHGKLDW FEVVETRGFI –DNNKVKYYQ VHLKVGCNV- --- 67 A. vinelandii ----- MSDHHTYKKI EIIGSSRNSI EDAISNALAE ASKTLDYLEW FEVVEIRGHL –ENGVVGHYQ VTLKVGFRLA DS- 71 P. aeruginosa ----- MSNHHTYKKI ELVGSSKTSI EDAINNALAE AAKSIQHLEW FEVVDTRGHI –ENGAVGHYQ VTLKVGFRIA NS- 71 B. fungorum ----- MSE-HVYKQI ELTGSSTKSI DDAISTAIAK ASKTLRNLHW FEVTETRGQI –ENDKVAFWQ VTIKVGLRID ----68 R. gelatinosus ----- MTD-HVYKTI ELTGSSKKGI EPAVQNAIAK AHETVRNIQW FEVTETRGHV –VKGKVAHWQ VSLKVGFTLD --- 68 B. cepacia ----- MSD-HVYKMI ELTGSSKQSS DDAIRNAISK AGKTLHNLHW FQVTETRGHI –EGDQVVHWQ VTLKVGMRID D-- 69 B. pseudomallei ------MND-HVYKLI ELTGSSRQSS DDAIRNAINK AAKTVRNLHW FEVTDMRGHI –EGDQVIHWQ VTLKVGLRIE D-- 69 B. parapertussis ----- MSS-HVYKQI ELVGSSAVSS DDAIAQAIAR ASDTLRHLDW FEVTETRGHI –KDGKVAHWQ VSLKIGMRLE ADD 71 M. capsulatus ------MPD-HVYKVI EIVGSSTVST DDAIRTAITK AGKTLRHMNW FEVVETRGHI –VDGEVAHFQ VTLKVGFRIE D-- 69 R. solanacearum(+) ----- MGS-HTYKMI ELVGSSPESS DAAIRNAIAR ASETLHYLDW FEVMETRGHL –VDGKIAHWQ VTLKVGMRLE QAE 83 P. putida ----- MTDHHTYKKI ELVGSSPTSI EEAINNALAE AGKSIKHLEW FEVVDTRGHI –RDNKAAHFQ VTLKVGFRIA NS- 71 Polaromonas ------MSS-HVYKQL ELTGSSATSI EDAVSTAIAK AHETVRNIQW FTVTETRGHV –VDGKVAHWQ VSMKIGFTLE --- 68 R. eutropha ----- MSD-HTYKLV EIVGSSPDGS DHAIRNAIAK AGETIKNIDW FEVVETRGHI –ENGKVGHFQ VTLKIGFRVT ----68 P. fluorescens ----- MSDHHTYKKV ELVGSSTTSI EDAINNALAE ANKSIKHLEW FEVTETRGHI –KDGKAAHFQ VTLKVGFRIA SS--71 P. syringea Psyr021074 ----- MSDHHTYKKV EIVGSSTTTI EDAINNALAE ASKSLDLMEW FEVTETRGHI –ENGKVAHFQ VTLKVGFRIT NS- 71 C. tepidum ----- MSA-HIYKKL EIVGSSATSI EEAVNNAVAK AAETIRNIRW VELVETRCHV –ENQKIAYWQ VTCKIGFTLD EN--70 P. syringea PSPTO0155 ----- MSDNHTYKKV EIVGSSTTTI EDAINNALAE ASKSLSHLEW FEVTETRGHI –ENGKVAHFQ VTLKVGFRIA AS- 71 S. coelicolor(#) GREHR MSN-HTYRVT EVVGTSPDGV DQAVRNAVTR ASQTLRKLDW FEVTQVRGQI –EDGQVAHWQ VGLKLGFRLE ESD-85 M. bovis ----- --------MI EIVGTSPDGV DAAIQGGLAR AAQTMRALDW FEVQSIRGHL –VDGAVAHFQ VTMKVGFRLE DS- 63 R. metallidurans(#) NRRRI MSN-HTYKLV EIVGSSADGS DAAIRNALAK ASESIKNIDW FEVVETRGHV –QDGKVAHFQ VTLKIGFRVN ----75 M. tuberculosis ----- MSN-HTYRVI EIVGTSPDGV DAAIQGGLAR AAQTMRALDW FEVQSIRGHL –VDGAVAHFQ VTMKVGFRLE DS- 70 : * * * .: . . : : * : . : :* . :. : ----- ----7588-- 865*6*--6- --*7-5956- 9--75--6-* 899-668877 ---6-756-* 8-6888765- ----
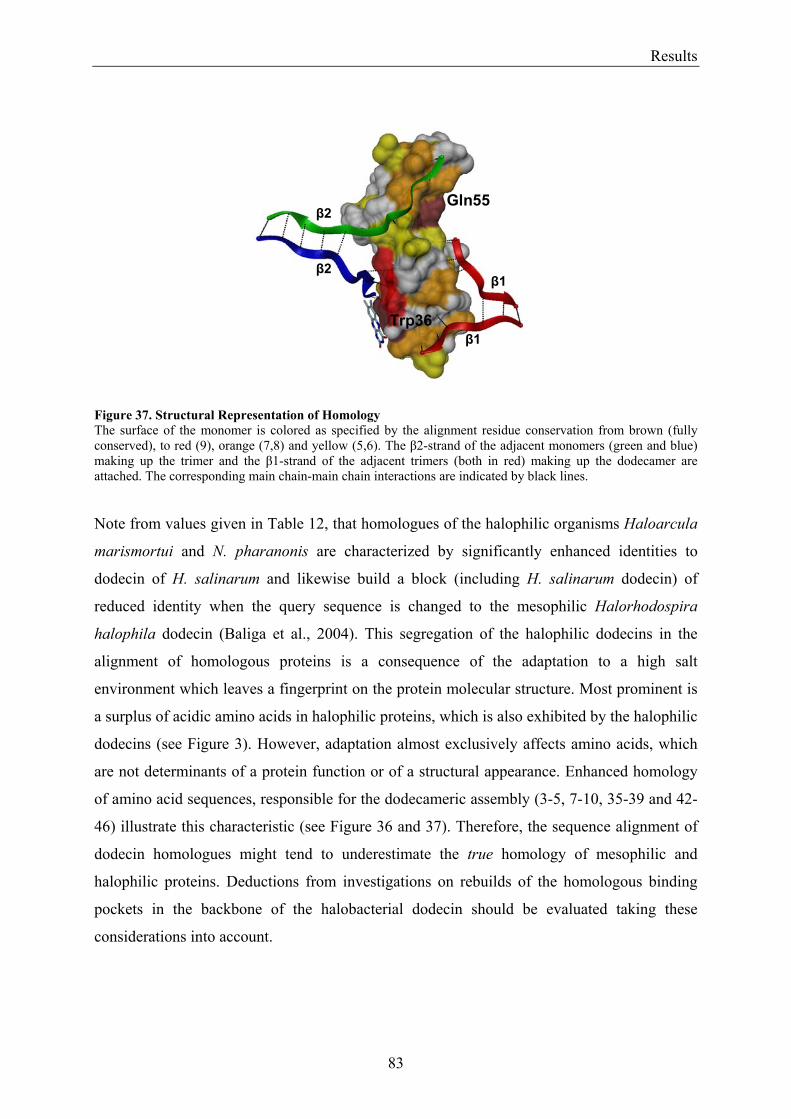
Results
83
Figure 37. Structural Representation of Homology The surface of the monomer is colored as specified by the alignment residue conservation from brown (fully conserved), to red (9), orange (7,8) and yellow (5,6). The β2-strand of the adjacent monomers (green and blue) making up the trimer and the β1-strand of the adjacent trimers (both in red) making up the dodecamer are attached. The corresponding main chain-main chain interactions are indicated by black lines. Note from values given in Table 12, that homologues of the halophilic organisms Haloarcula
marismortui and N. pharanonis are characterized by significantly enhanced identities to
dodecin of H. salinarum and likewise build a block (including H. salinarum dodecin) of
reduced identity when the query sequence is changed to the mesophilic Halorhodospira
halophila dodecin (Baliga et al., 2004). This segregation of the halophilic dodecins in the
alignment of homologous proteins is a consequence of the adaptation to a high salt
environment which leaves a fingerprint on the protein molecular structure. Most prominent is
a surplus of acidic amino acids in halophilic proteins, which is also exhibited by the halophilic
dodecins (see Figure 3). However, adaptation almost exclusively affects amino acids, which
are not determinants of a protein function or of a structural appearance. Enhanced homology
of amino acid sequences, responsible for the dodecameric assembly (3-5, 7-10, 35-39 and 42-
46) illustrate this characteristic (see Figure 36 and 37). Therefore, the sequence alignment of
dodecin homologues might tend to underestimate the true homology of mesophilic and
halophilic proteins. Deductions from investigations on rebuilds of the homologous binding
pockets in the backbone of the halobacterial dodecin should be evaluated taking these
considerations into account.
Gln55
Trp36
β1
β1
β2
β2
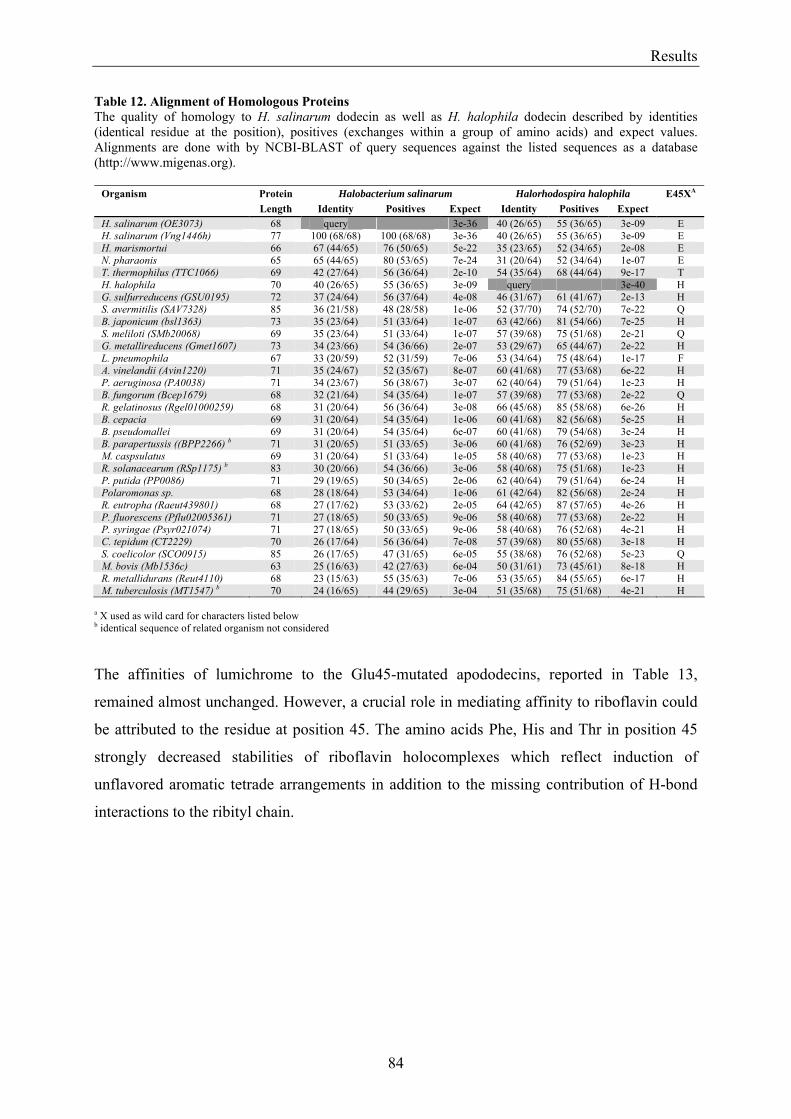
Results
84
Table 12. Alignment of Homologous Proteins The quality of homology to H. salinarum dodecin as well as H. halophila dodecin described by identities (identical residue at the position), positives (exchanges within a group of amino acids) and expect values. Alignments are done with by NCBI-BLAST of query sequences against the listed sequences as a database (http://www.migenas.org).
Organism Protein Halobacterium salinarum Halorhodospira halophila E45XA
Length Identity Positives Expect Identity Positives Expect H. salinarum (OE3073) 68 query 3e-36 40 (26/65) 55 (36/65) 3e-09 E H. salinarum (Vng1446h) 77 100 (68/68) 100 (68/68) 3e-36 40 (26/65) 55 (36/65) 3e-09 E H. marismortui 66 67 (44/65) 76 (50/65) 5e-22 35 (23/65) 52 (34/65) 2e-08 E N. pharaonis 65 65 (44/65) 80 (53/65) 7e-24 31 (20/64) 52 (34/64) 1e-07 E T. thermophilus (TTC1066) 69 42 (27/64) 56 (36/64) 2e-10 54 (35/64) 68 (44/64) 9e-17 T H. halophila 70 40 (26/65) 55 (36/65) 3e-09 query 3e-40 H G. sulfurreducens (GSU0195) 72 37 (24/64) 56 (37/64) 4e-08 46 (31/67) 61 (41/67) 2e-13 H S. avermitilis (SAV7328) 85 36 (21/58) 48 (28/58) 1e-06 52 (37/70) 74 (52/70) 7e-22 Q B. japonicum (bsl1363) 73 35 (23/64) 51 (33/64) 1e-07 63 (42/66) 81 (54/66) 7e-25 H S. meliloti (SMb20068) 69 35 (23/64) 51 (33/64) 1e-07 57 (39/68) 75 (51/68) 2e-21 Q G. metallireducens (Gmet1607) 73 34 (23/66) 54 (36/66) 2e-07 53 (29/67) 65 (44/67) 2e-22 H L. pneumophila 67 33 (20/59) 52 (31/59) 7e-06 53 (34/64) 75 (48/64) 1e-17 F A. vinelandii (Avin1220) 71 35 (24/67) 52 (35/67) 8e-07 60 (41/68) 77 (53/68) 6e-22 H P. aeruginosa (PA0038) 71 34 (23/67) 56 (38/67) 3e-07 62 (40/64) 79 (51/64) 1e-23 H B. fungorum (Bcep1679) 68 32 (21/64) 54 (35/64) 1e-07 57 (39/68) 77 (53/68) 2e-22 Q R. gelatinosus (Rgel01000259) 68 31 (20/64) 56 (36/64) 3e-08 66 (45/68) 85 (58/68) 6e-26 H B. cepacia 69 31 (20/64) 54 (35/64) 1e-06 60 (41/68) 82 (56/68) 5e-25 H B. pseudomallei 69 31 (20/64) 54 (35/64) 6e-07 60 (41/68) 79 (54/68) 3e-24 H B. parapertussis ((BPP2266) b 71 31 (20/65) 51 (33/65) 3e-06 60 (41/68) 76 (52/69) 3e-23 H M. caspsulatus 69 31 (20/64) 51 (33/64) 1e-05 58 (40/68) 77 (53/68) 1e-23 H R. solanacearum (RSp1175) b 83 30 (20/66) 54 (36/66) 3e-06 58 (40/68) 75 (51/68) 1e-23 H P. putida (PP0086) 71 29 (19/65) 50 (34/65) 2e-06 62 (40/64) 79 (51/64) 6e-24 H Polaromonas sp. 68 28 (18/64) 53 (34/64) 1e-06 61 (42/64) 82 (56/68) 2e-24 H R. eutropha (Raeut439801) 68 27 (17/62) 53 (33/62) 2e-05 64 (42/65) 87 (57/65) 4e-26 H P. fluorescens (Pflu02005361) 71 27 (18/65) 50 (33/65) 9e-06 58 (40/68) 77 (53/68) 2e-22 H P. syringae (Psyr021074) 71 27 (18/65) 50 (33/65) 9e-06 58 (40/68) 76 (52/68) 4e-21 H C. tepidum (CT2229) 70 26 (17/64) 56 (36/64) 7e-08 57 (39/68) 80 (55/68) 3e-18 H S. coelicolor (SCO0915) 85 26 (17/65) 47 (31/65) 6e-05 55 (38/68) 76 (52/68) 5e-23 Q M. bovis (Mb1536c) 63 25 (16/63) 42 (27/63) 6e-04 50 (31/61) 73 (45/61) 8e-18 H R. metallidurans (Reut4110) 68 23 (15/63) 55 (35/63) 7e-06 53 (35/65) 84 (55/65) 6e-17 H M. tuberculosis (MT1547) b 70 24 (16/65) 44 (29/65) 3e-04 51 (35/68) 75 (51/68) 4e-21 H
a X used as wild card for characters listed below b identical sequence of related organism not considered The affinities of lumichrome to the Glu45-mutated apododecins, reported in Table 13,
remained almost unchanged. However, a crucial role in mediating affinity to riboflavin could
be attributed to the residue at position 45. The amino acids Phe, His and Thr in position 45
strongly decreased stabilities of riboflavin holocomplexes which reflect induction of
unflavored aromatic tetrade arrangements in addition to the missing contribution of H-bond
interactions to the ribityl chain.
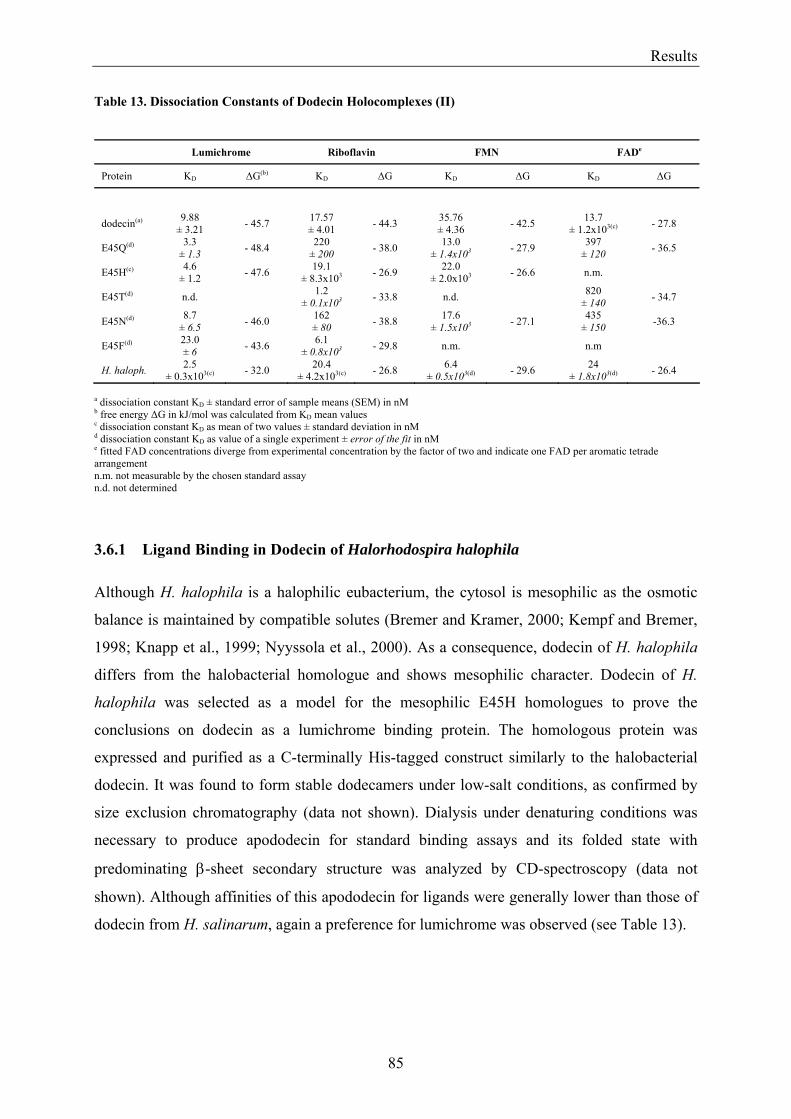
Results
85
Table 13. Dissociation Constants of Dodecin Holocomplexes (II)
Lumichrome Riboflavin FMN FADe
Protein KD ∆G(b) KD ∆G KD ∆G KD ∆G
dodecin(a) 9.88 ± 3.21 - 45.7 17.57
± 4.01 - 44.3 35.76 ± 4.36 - 42.5 13.7
± 1.2x10³(c) - 27.8
E45Q(d) 3.3 ± 1.3 - 48.4 220
± 200 - 38.0 13.0 ± 1.4x10³ - 27.9 397
± 120 - 36.5
E45H(c) 4.6 ± 1.2 - 47.6 19.1
± 8.3x10³ - 26.9 22.0 ± 2.0x10³ - 26.6 n.m.
E45T(d) n.d. 1.2 ± 0.1x10³ - 33.8 n.d. 820
± 140 - 34.7
E45N(d) 8.7 ± 6.5 - 46.0 162
± 80 - 38.8 17.6 ± 1.5x10³ - 27.1 435
± 150 -36.3
E45F(d) 23.0 ± 6 - 43.6 6.1
± 0.8x10³ - 29.8 n.m. n.m
H. haloph. 2.5 ± 0.3x10³(c) - 32.0 20.4
± 4.2x10³(c) - 26.8 6.4 ± 0.5x10³(d) - 29.6 24
± 1.8x10³(d) - 26.4
a dissociation constant KD ± standard error of sample means (SEM) in nM b free energy ∆G in kJ/mol was calculated from KD mean values c dissociation constant KD as mean of two values ± standard deviation in nM d dissociation constant KD as value of a single experiment ± error of the fit in nM e fitted FAD concentrations diverge from experimental concentration by the factor of two and indicate one FAD per aromatic tetrade arrangement n.m. not measurable by the chosen standard assay n.d. not determined
3.6.1 Ligand Binding in Dodecin of Halorhodospira halophila Although H. halophila is a halophilic eubacterium, the cytosol is mesophilic as the osmotic
balance is maintained by compatible solutes (Bremer and Kramer, 2000; Kempf and Bremer,
1998; Knapp et al., 1999; Nyyssola et al., 2000). As a consequence, dodecin of H. halophila
differs from the halobacterial homologue and shows mesophilic character. Dodecin of H.
halophila was selected as a model for the mesophilic E45H homologues to prove the
conclusions on dodecin as a lumichrome binding protein. The homologous protein was
expressed and purified as a C-terminally His-tagged construct similarly to the halobacterial
dodecin. It was found to form stable dodecamers under low-salt conditions, as confirmed by
size exclusion chromatography (data not shown). Dialysis under denaturing conditions was
necessary to produce apododecin for standard binding assays and its folded state with
predominating β-sheet secondary structure was analyzed by CD-spectroscopy (data not
shown). Although affinities of this apododecin for ligands were generally lower than those of
dodecin from H. salinarum, again a preference for lumichrome was observed (see Table 13).
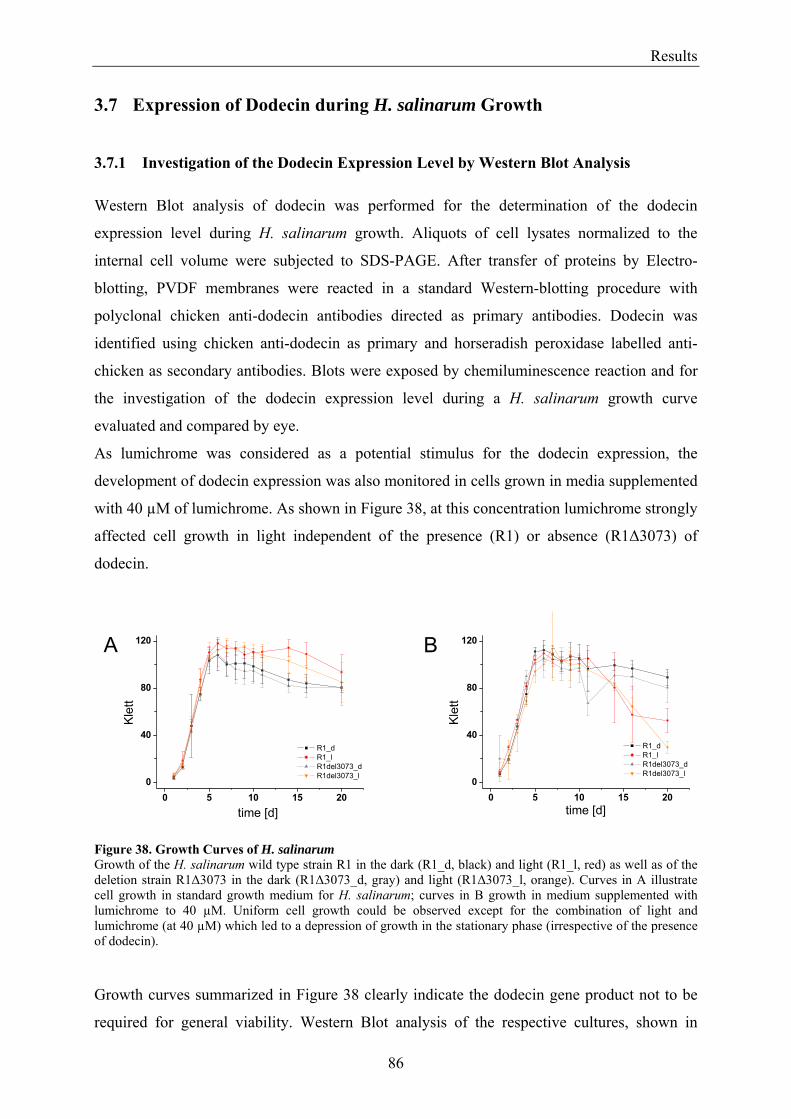
Results
86
3.7 Expression of Dodecin during H. salinarum Growth
3.7.1 Investigation of the Dodecin Expression Level by Western Blot Analysis Western Blot analysis of dodecin was performed for the determination of the dodecin
expression level during H. salinarum growth. Aliquots of cell lysates normalized to the
internal cell volume were subjected to SDS-PAGE. After transfer of proteins by Electro-
blotting, PVDF membranes were reacted in a standard Western-blotting procedure with
polyclonal chicken anti-dodecin antibodies directed as primary antibodies. Dodecin was
identified using chicken anti-dodecin as primary and horseradish peroxidase labelled anti-
chicken as secondary antibodies. Blots were exposed by chemiluminescence reaction and for
the investigation of the dodecin expression level during a H. salinarum growth curve
evaluated and compared by eye.
As lumichrome was considered as a potential stimulus for the dodecin expression, the
development of dodecin expression was also monitored in cells grown in media supplemented
with 40 µM of lumichrome. As shown in Figure 38, at this concentration lumichrome strongly
affected cell growth in light independent of the presence (R1) or absence (R1∆3073) of
dodecin.
Figure 38. Growth Curves of H. salinarum Growth of the H. salinarum wild type strain R1 in the dark (R1_d, black) and light (R1_l, red) as well as of the deletion strain R1∆3073 in the dark (R1∆3073_d, gray) and light (R1∆3073_l, orange). Curves in A illustrate cell growth in standard growth medium for H. salinarum; curves in B growth in medium supplemented with lumichrome to 40 µM. Uniform cell growth could be observed except for the combination of light and lumichrome (at 40 µM) which led to a depression of growth in the stationary phase (irrespective of the presence of dodecin). Growth curves summarized in Figure 38 clearly indicate the dodecin gene product not to be
required for general viability. Western Blot analysis of the respective cultures, shown in
0 5 10 15 200
40
80
120
R1_d R1_l R1del3073_d R1del3073_l
Klet
t
time [d]
A B
0 5 10 15 200
40
80
120
R1_d R1_l R1del3073_d R1del3073_l
Klet
t
time [d]
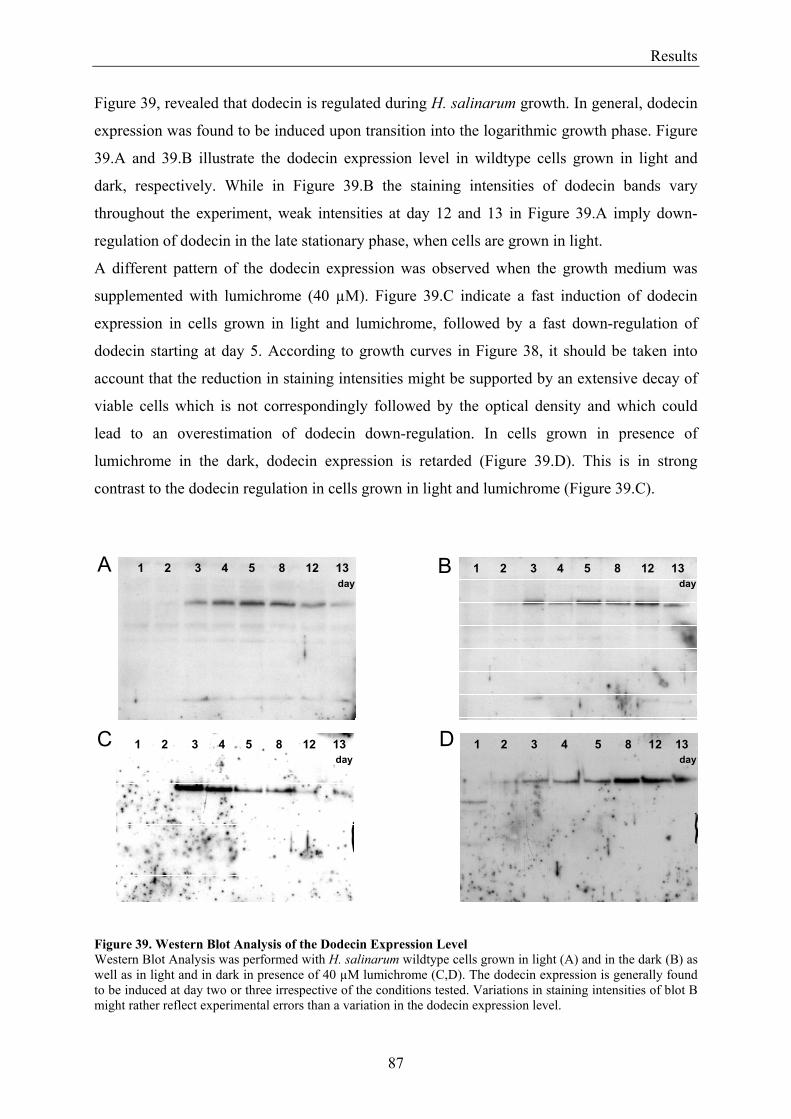
Results
87
Figure 39, revealed that dodecin is regulated during H. salinarum growth. In general, dodecin
expression was found to be induced upon transition into the logarithmic growth phase. Figure
39.A and 39.B illustrate the dodecin expression level in wildtype cells grown in light and
dark, respectively. While in Figure 39.B the staining intensities of dodecin bands vary
throughout the experiment, weak intensities at day 12 and 13 in Figure 39.A imply down-
regulation of dodecin in the late stationary phase, when cells are grown in light.
A different pattern of the dodecin expression was observed when the growth medium was
supplemented with lumichrome (40 µM). Figure 39.C indicate a fast induction of dodecin
expression in cells grown in light and lumichrome, followed by a fast down-regulation of
dodecin starting at day 5. According to growth curves in Figure 38, it should be taken into
account that the reduction in staining intensities might be supported by an extensive decay of
viable cells which is not correspondingly followed by the optical density and which could
lead to an overestimation of dodecin down-regulation. In cells grown in presence of
lumichrome in the dark, dodecin expression is retarded (Figure 39.D). This is in strong
contrast to the dodecin regulation in cells grown in light and lumichrome (Figure 39.C).
Figure 39. Western Blot Analysis of the Dodecin Expression Level Western Blot Analysis was performed with H. salinarum wildtype cells grown in light (A) and in the dark (B) as well as in light and in dark in presence of 40 µM lumichrome (C,D). The dodecin expression is generally found to be induced at day two or three irrespective of the conditions tested. Variations in staining intensities of blot B might rather reflect experimental errors than a variation in the dodecin expression level.
1 2 3 4 5 8 12 13day
1 2 3 4 5 8 12 13day
1 2 3 4 5 8 12 13day
1 2 3 4 5 8 12 13day
A B
C D
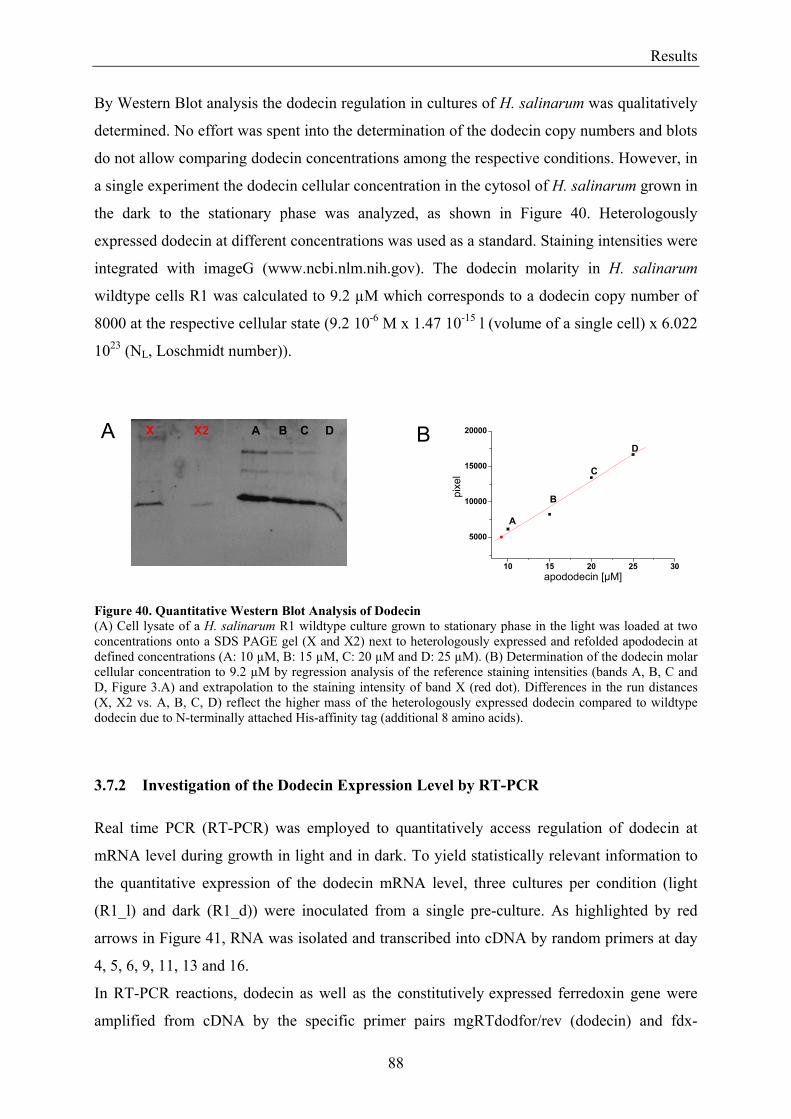
Results
88
By Western Blot analysis the dodecin regulation in cultures of H. salinarum was qualitatively
determined. No effort was spent into the determination of the dodecin copy numbers and blots
do not allow comparing dodecin concentrations among the respective conditions. However, in
a single experiment the dodecin cellular concentration in the cytosol of H. salinarum grown in
the dark to the stationary phase was analyzed, as shown in Figure 40. Heterologously
expressed dodecin at different concentrations was used as a standard. Staining intensities were
integrated with imageG (www.ncbi.nlm.nih.gov). The dodecin molarity in H. salinarum
wildtype cells R1 was calculated to 9.2 µM which corresponds to a dodecin copy number of
8000 at the respective cellular state (9.2 10-6 M x 1.47 10-15 l (volume of a single cell) x 6.022
1023 (NL, Loschmidt number)).
Figure 40. Quantitative Western Blot Analysis of Dodecin (A) Cell lysate of a H. salinarum R1 wildtype culture grown to stationary phase in the light was loaded at two concentrations onto a SDS PAGE gel (X and X2) next to heterologously expressed and refolded apododecin at defined concentrations (A: 10 µM, B: 15 µM, C: 20 µM and D: 25 µM). (B) Determination of the dodecin molar cellular concentration to 9.2 µM by regression analysis of the reference staining intensities (bands A, B, C and D, Figure 3.A) and extrapolation to the staining intensity of band X (red dot). Differences in the run distances (X, X2 vs. A, B, C, D) reflect the higher mass of the heterologously expressed dodecin compared to wildtype dodecin due to N-terminally attached His-affinity tag (additional 8 amino acids).
3.7.2 Investigation of the Dodecin Expression Level by RT-PCR Real time PCR (RT-PCR) was employed to quantitatively access regulation of dodecin at
mRNA level during growth in light and in dark. To yield statistically relevant information to
the quantitative expression of the dodecin mRNA level, three cultures per condition (light
(R1_l) and dark (R1_d)) were inoculated from a single pre-culture. As highlighted by red
arrows in Figure 41, RNA was isolated and transcribed into cDNA by random primers at day
4, 5, 6, 9, 11, 13 and 16.
In RT-PCR reactions, dodecin as well as the constitutively expressed ferredoxin gene were
amplified from cDNA by the specific primer pairs mgRTdodfor/rev (dodecin) and fdx-
A B C DX X2
A
B
C
D
10 15 20 25 30
5000
10000
15000
20000
pixe
l
apododecin [µM]
A B
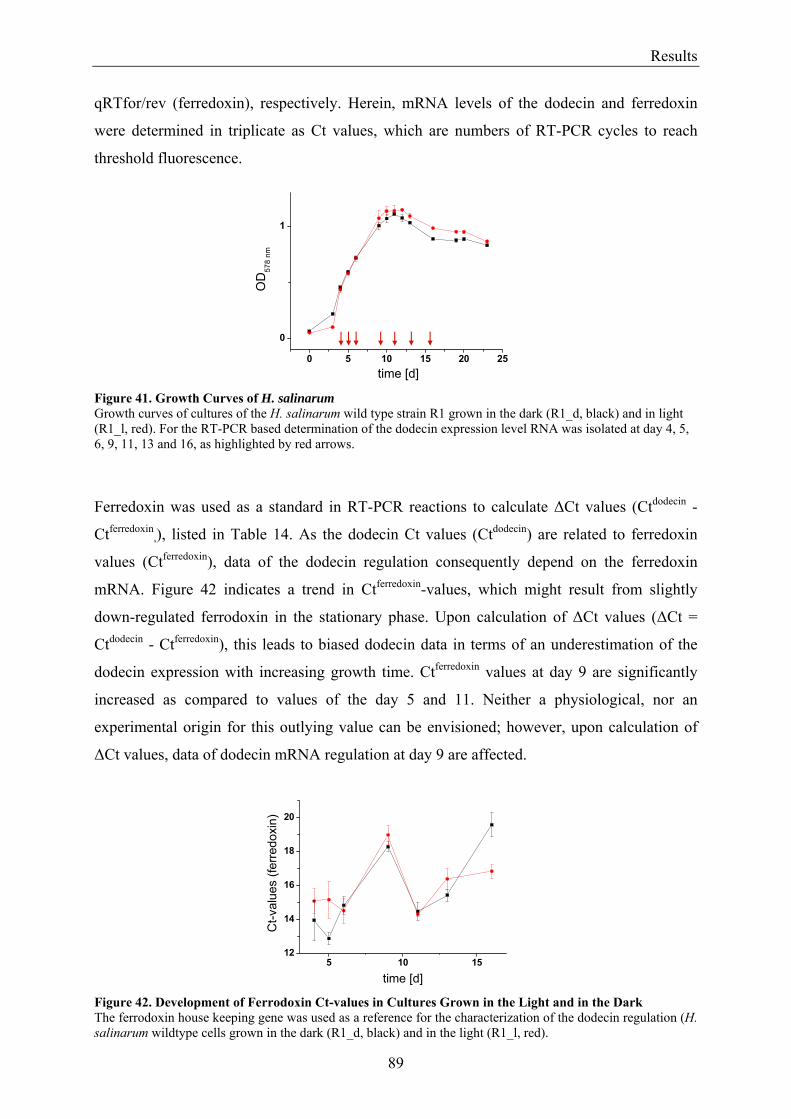
Results
89
qRTfor/rev (ferredoxin), respectively. Herein, mRNA levels of the dodecin and ferredoxin
were determined in triplicate as Ct values, which are numbers of RT-PCR cycles to reach
threshold fluorescence. Figure 41. Growth Curves of H. salinarum Growth curves of cultures of the H. salinarum wild type strain R1 grown in the dark (R1_d, black) and in light (R1_l, red). For the RT-PCR based determination of the dodecin expression level RNA was isolated at day 4, 5, 6, 9, 11, 13 and 16, as highlighted by red arrows.
Ferredoxin was used as a standard in RT-PCR reactions to calculate ∆Ct values (Ctdodecin -
Ctferredoxin,), listed in Table 14. As the dodecin Ct values (Ctdodecin) are related to ferredoxin
values (Ctferredoxin), data of the dodecin regulation consequently depend on the ferredoxin
mRNA. Figure 42 indicates a trend in Ctferredoxin-values, which might result from slightly
down-regulated ferrodoxin in the stationary phase. Upon calculation of ∆Ct values (∆Ct =
Ctdodecin - Ctferredoxin), this leads to biased dodecin data in terms of an underestimation of the
dodecin expression with increasing growth time. Ctferredoxin values at day 9 are significantly
increased as compared to values of the day 5 and 11. Neither a physiological, nor an
experimental origin for this outlying value can be envisioned; however, upon calculation of
∆Ct values, data of dodecin mRNA regulation at day 9 are affected.
Figure 42. Development of Ferrodoxin Ct-values in Cultures Grown in the Light and in the Dark The ferrodoxin house keeping gene was used as a reference for the characterization of the dodecin regulation (H. salinarum wildtype cells grown in the dark (R1_d, black) and in the light (R1_l, red).
5 10 1512
14
16
18
20
Ct-v
alue
s (fe
rredo
xin)
time [d]
0 5 10 15 20 25
0
1
OD
578
nm
time [d]
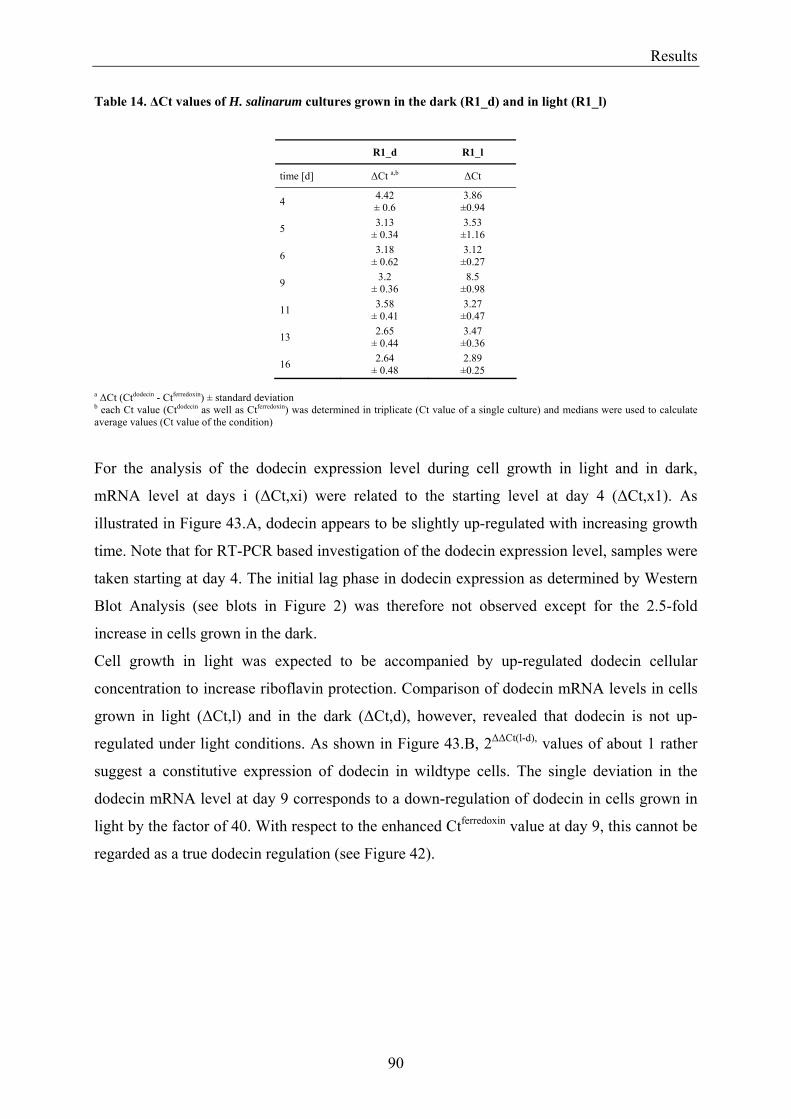
Results
90
Table 14. ∆Ct values of H. salinarum cultures grown in the dark (R1_d) and in light (R1_l)
R1_d R1_l
time [d] ∆Ct a,b ∆Ct
4 4.42 ± 0.6
3.86 ±0.94
5 3.13 ± 0.34
3.53 ±1.16
6 3.18 ± 0.62
3.12 ±0.27
9 3.2 ± 0.36
8.5 ±0.98
11 3.58 ± 0.41
3.27 ±0.47
13 2.65 ± 0.44
3.47 ±0.36
16 2.64 ± 0.48
2.89 ±0.25
a ∆Ct (Ctdodecin - Ctferredoxin) ± standard deviation b each Ct value (Ctdodecin as well as Ctferredoxin) was determined in triplicate (Ct value of a single culture) and medians were used to calculate average values (Ct value of the condition) For the analysis of the dodecin expression level during cell growth in light and in dark,
mRNA level at days i (∆Ct,xi) were related to the starting level at day 4 (∆Ct,x1). As
illustrated in Figure 43.A, dodecin appears to be slightly up-regulated with increasing growth
time. Note that for RT-PCR based investigation of the dodecin expression level, samples were
taken starting at day 4. The initial lag phase in dodecin expression as determined by Western
Blot Analysis (see blots in Figure 2) was therefore not observed except for the 2.5-fold
increase in cells grown in the dark.
Cell growth in light was expected to be accompanied by up-regulated dodecin cellular
concentration to increase riboflavin protection. Comparison of dodecin mRNA levels in cells
grown in light (∆Ct,l) and in the dark (∆Ct,d), however, revealed that dodecin is not up-
regulated under light conditions. As shown in Figure 43.B, 2∆∆Ct(l-d), values of about 1 rather
suggest a constitutive expression of dodecin in wildtype cells. The single deviation in the
dodecin mRNA level at day 9 corresponds to a down-regulation of dodecin in cells grown in
light by the factor of 40. With respect to the enhanced Ctferredoxin value at day 9, this cannot be
regarded as a true dodecin regulation (see Figure 42).
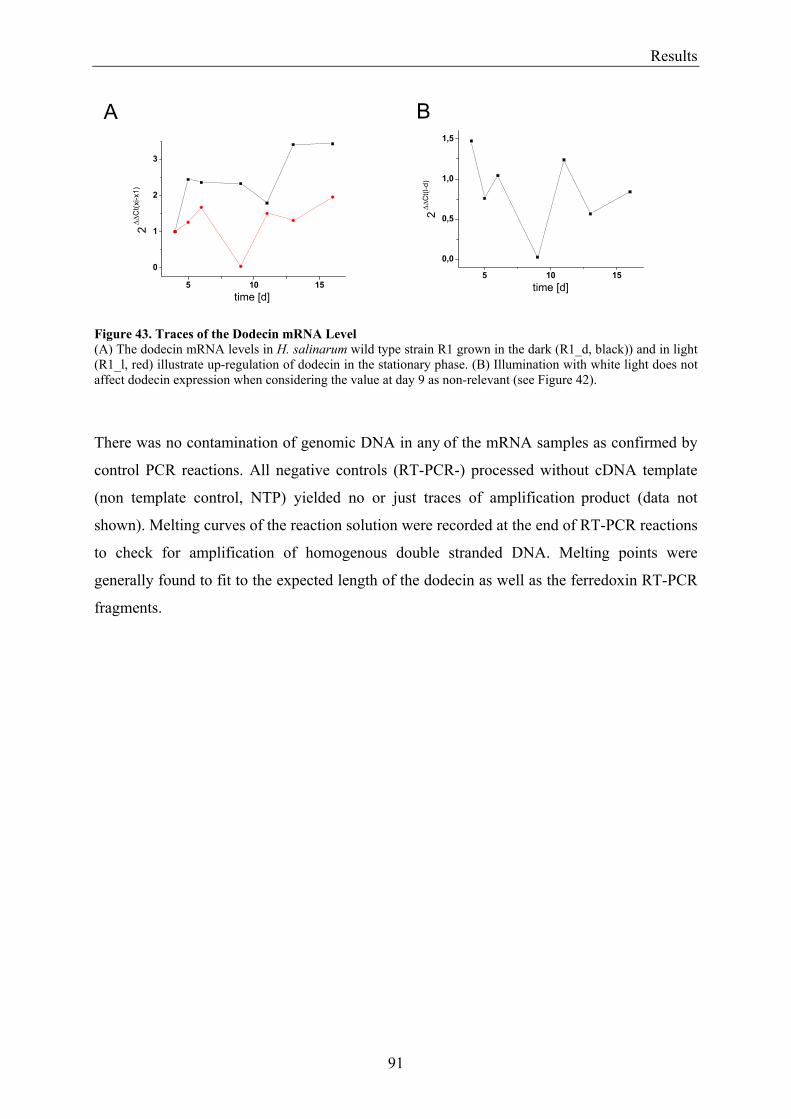
Results
91
Figure 43. Traces of the Dodecin mRNA Level (A) The dodecin mRNA levels in H. salinarum wild type strain R1 grown in the dark (R1_d, black)) and in light (R1_l, red) illustrate up-regulation of dodecin in the stationary phase. (B) Illumination with white light does not affect dodecin expression when considering the value at day 9 as non-relevant (see Figure 42).
There was no contamination of genomic DNA in any of the mRNA samples as confirmed by
control PCR reactions. All negative controls (RT-PCR-) processed without cDNA template
(non template control, NTP) yielded no or just traces of amplification product (data not
shown). Melting curves of the reaction solution were recorded at the end of RT-PCR reactions
to check for amplification of homogenous double stranded DNA. Melting points were
generally found to fit to the expected length of the dodecin as well as the ferredoxin RT-PCR
fragments.
5 10 15
0
1
2
3
2δδC
t(xi-x
1)
time [d]
2∆∆
Ct(x
i-x1)
5 10 15
0,0
0,5
1,0
1,5
2δδC
t(l-d
)
time [d]
2∆∆
Ct(l
-d)
A B
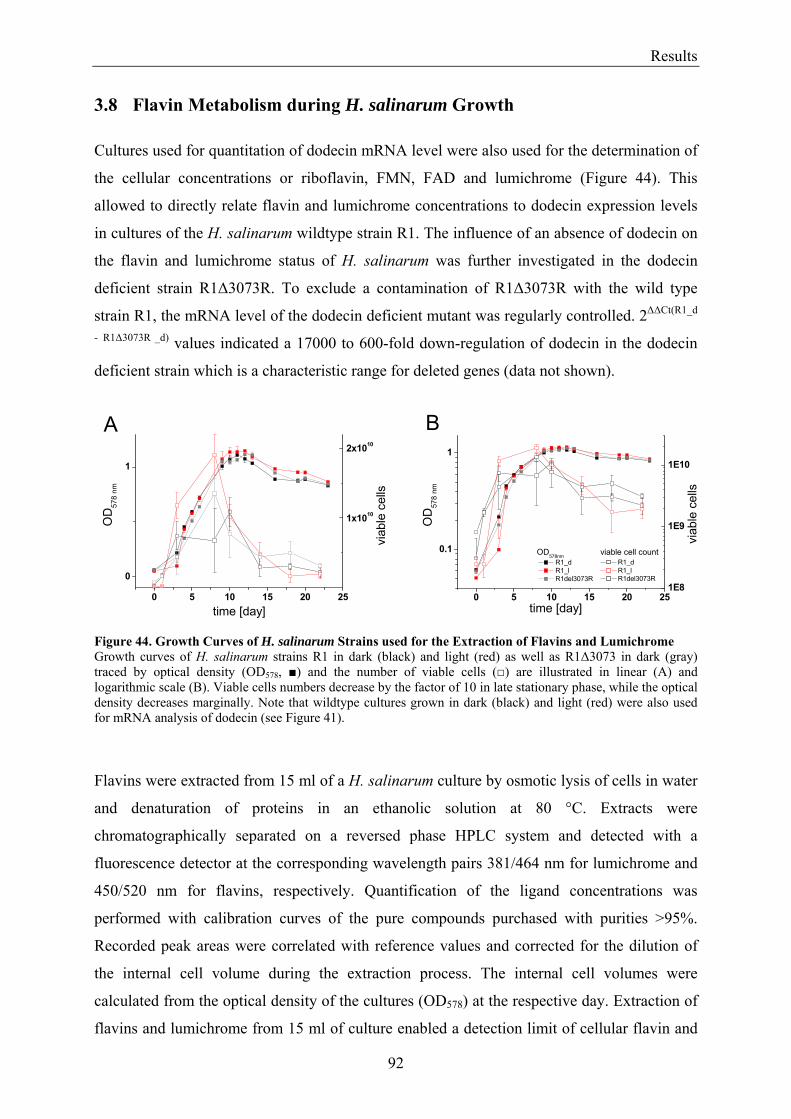
Results
92
3.8 Flavin Metabolism during H. salinarum Growth Cultures used for quantitation of dodecin mRNA level were also used for the determination of
the cellular concentrations or riboflavin, FMN, FAD and lumichrome (Figure 44). This
allowed to directly relate flavin and lumichrome concentrations to dodecin expression levels
in cultures of the H. salinarum wildtype strain R1. The influence of an absence of dodecin on
the flavin and lumichrome status of H. salinarum was further investigated in the dodecin
deficient strain R1∆3073R. To exclude a contamination of R1∆3073R with the wild type
strain R1, the mRNA level of the dodecin deficient mutant was regularly controlled. 2∆∆Ct(R1_d
- R1∆3073R _d) values indicated a 17000 to 600-fold down-regulation of dodecin in the dodecin
deficient strain which is a characteristic range for deleted genes (data not shown).
Figure 44. Growth Curves of H. salinarum Strains used for the Extraction of Flavins and Lumichrome Growth curves of H. salinarum strains R1 in dark (black) and light (red) as well as R1∆3073 in dark (gray) traced by optical density (OD578, ) and the number of viable cells () are illustrated in linear (A) and logarithmic scale (B). Viable cells numbers decrease by the factor of 10 in late stationary phase, while the optical density decreases marginally. Note that wildtype cultures grown in dark (black) and light (red) were also used for mRNA analysis of dodecin (see Figure 41).
Flavins were extracted from 15 ml of a H. salinarum culture by osmotic lysis of cells in water
and denaturation of proteins in an ethanolic solution at 80 °C. Extracts were
chromatographically separated on a reversed phase HPLC system and detected with a
fluorescence detector at the corresponding wavelength pairs 381/464 nm for lumichrome and
450/520 nm for flavins, respectively. Quantification of the ligand concentrations was
performed with calibration curves of the pure compounds purchased with purities >95%.
Recorded peak areas were correlated with reference values and corrected for the dilution of
the internal cell volume during the extraction process. The internal cell volumes were
calculated from the optical density of the cultures (OD578) at the respective day. Extraction of
flavins and lumichrome from 15 ml of culture enabled a detection limit of cellular flavin and
0 5 10 15 20 25
0.1
1
1E8
1E9
1E10
viable cell countOD578nm R1_d R1_l R1del3073R
viab
le c
ells
OD
578
nm
time [day]
R1_d R1_l R1del3073R
0 5 10 15 20 25
0
1
1x10¹⁰
2x10¹⁰
OD
578
nm
time [day]
viab
le c
ells
A B
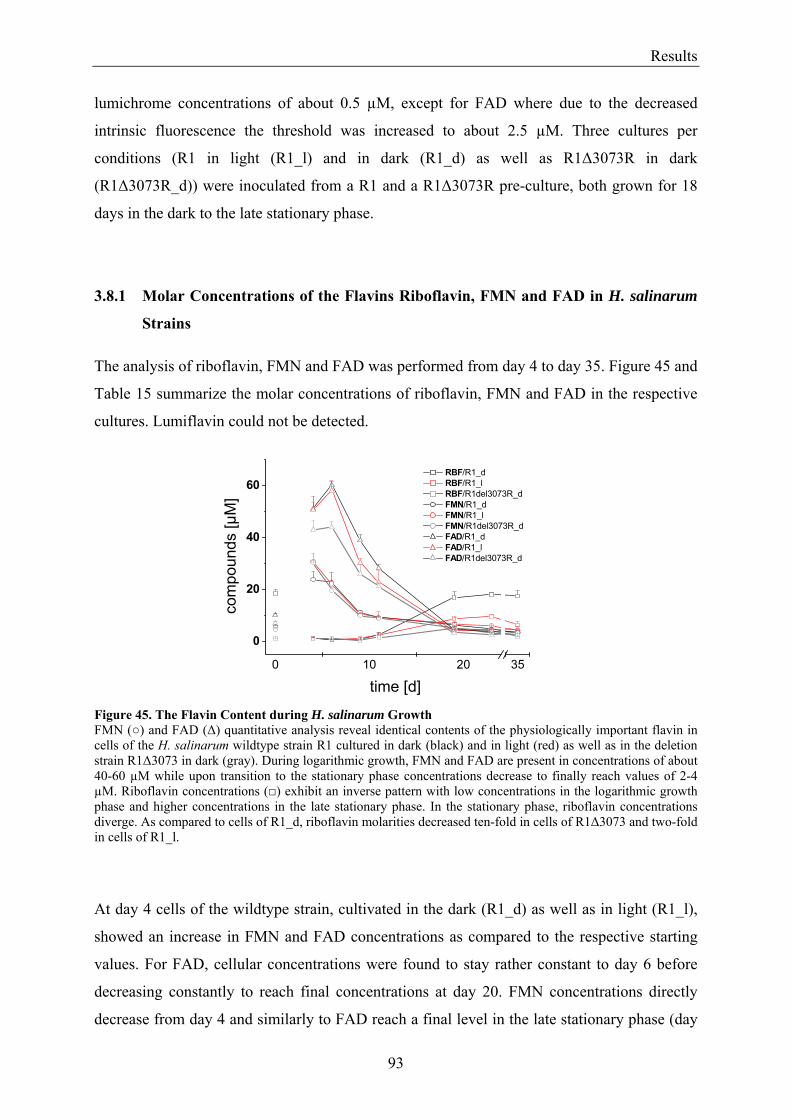
Results
93
lumichrome concentrations of about 0.5 µM, except for FAD where due to the decreased
intrinsic fluorescence the threshold was increased to about 2.5 µM. Three cultures per
conditions (R1 in light (R1_l) and in dark (R1_d) as well as R1∆3073R in dark
(R1∆3073R_d)) were inoculated from a R1 and a R1∆3073R pre-culture, both grown for 18
days in the dark to the late stationary phase.
3.8.1 Molar Concentrations of the Flavins Riboflavin, FMN and FAD in H. salinarum
Strains The analysis of riboflavin, FMN and FAD was performed from day 4 to day 35. Figure 45 and
Table 15 summarize the molar concentrations of riboflavin, FMN and FAD in the respective
cultures. Lumiflavin could not be detected.
Figure 45. The Flavin Content during H. salinarum Growth FMN () and FAD (∆) quantitative analysis reveal identical contents of the physiologically important flavin in cells of the H. salinarum wildtype strain R1 cultured in dark (black) and in light (red) as well as in the deletion strain R1∆3073 in dark (gray). During logarithmic growth, FMN and FAD are present in concentrations of about 40-60 µM while upon transition to the stationary phase concentrations decrease to finally reach values of 2-4 µM. Riboflavin concentrations () exhibit an inverse pattern with low concentrations in the logarithmic growth phase and higher concentrations in the late stationary phase. In the stationary phase, riboflavin concentrations diverge. As compared to cells of R1_d, riboflavin molarities decreased ten-fold in cells of R1∆3073 and two-fold in cells of R1_l.
At day 4 cells of the wildtype strain, cultivated in the dark (R1_d) as well as in light (R1_l),
showed an increase in FMN and FAD concentrations as compared to the respective starting
values. For FAD, cellular concentrations were found to stay rather constant to day 6 before
decreasing constantly to reach final concentrations at day 20. FMN concentrations directly
decrease from day 4 and similarly to FAD reach a final level in the late stationary phase (day
0 10 20 35
0
20
40
60 RBF/R1_d RBF/R1_l RBF/R1del3073R_d FMN/R1_d FMN/R1_l FMN/R1del3073R_d FAD/R1_d FAD/R1_l FAD/R1del3073R_d
com
poun
ds [µ
M]
time [d]
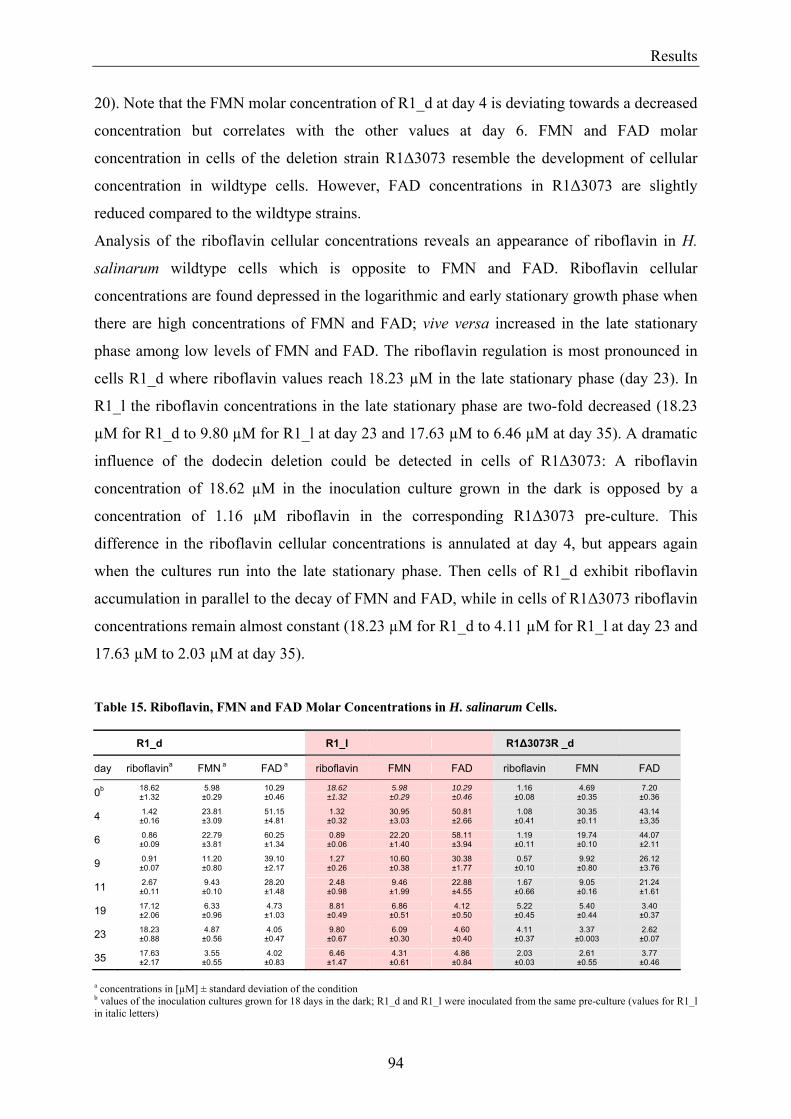
Results
94
20). Note that the FMN molar concentration of R1_d at day 4 is deviating towards a decreased
concentration but correlates with the other values at day 6. FMN and FAD molar
concentration in cells of the deletion strain R1∆3073 resemble the development of cellular
concentration in wildtype cells. However, FAD concentrations in R1∆3073 are slightly
reduced compared to the wildtype strains.
Analysis of the riboflavin cellular concentrations reveals an appearance of riboflavin in H.
salinarum wildtype cells which is opposite to FMN and FAD. Riboflavin cellular
concentrations are found depressed in the logarithmic and early stationary growth phase when
there are high concentrations of FMN and FAD; vive versa increased in the late stationary
phase among low levels of FMN and FAD. The riboflavin regulation is most pronounced in
cells R1_d where riboflavin values reach 18.23 µM in the late stationary phase (day 23). In
R1_l the riboflavin concentrations in the late stationary phase are two-fold decreased (18.23
µM for R1_d to 9.80 µM for R1_l at day 23 and 17.63 µM to 6.46 µM at day 35). A dramatic
influence of the dodecin deletion could be detected in cells of R1∆3073: A riboflavin
concentration of 18.62 µM in the inoculation culture grown in the dark is opposed by a
concentration of 1.16 µM riboflavin in the corresponding R1∆3073 pre-culture. This
difference in the riboflavin cellular concentrations is annulated at day 4, but appears again
when the cultures run into the late stationary phase. Then cells of R1_d exhibit riboflavin
accumulation in parallel to the decay of FMN and FAD, while in cells of R1∆3073 riboflavin
concentrations remain almost constant (18.23 µM for R1_d to 4.11 µM for R1_l at day 23 and
17.63 µM to 2.03 µM at day 35).
Table 15. Riboflavin, FMN and FAD Molar Concentrations in H. salinarum Cells. R1_d R1_l R1∆3073R _d
day riboflavina FMN a FAD a riboflavin FMN FAD riboflavin FMN FAD
0b 18.62 ±1.32
5.98 ±0.29
10.29 ±0.46
18.62 ±1.32
5.98 ±0.29
10.29 ±0.46
1.16 ±0.08
4.69 ±0.35
7.20 ±0.36
4 1.42 ±0.16
23.81 ±3.09
51.15 ±4.81
1.32 ±0.32
30.95 ±3.03
50.81 ±2.66
1.08 ±0.41
30.35 ±0.11
43.14 ±3,35
6 0.86 ±0.09
22.79 ±3.81
60.25 ±1.34
0.89 ±0.06
22.20 ±1.40
58.11 ±3.94
1.19 ±0.11
19.74 ±0.10
44.07 ±2.11
9 0.91 ±0.07
11.20 ±0.80
39.10 ±2.17
1.27 ±0.26
10.60 ±0.38
30.38 ±1.77
0.57 ±0.10
9.92 ±0.80
26.12 ±3.76
11 2.67 ±0.11
9.43 ±0.10
28.20 ±1.48
2.48 ±0.98
9.46 ±1.99
22.88 ±4.55
1.67 ±0.66
9.05 ±0.16
21.24 ±1.61
19 17.12 ±2.06
6.33 ±0.96
4.73 ±1.03
8.81 ±0.49
6.86 ±0.51
4.12 ±0.50
5.22 ±0.45
5.40 ±0.44
3.40 ±0.37
23 18.23 ±0.88
4.87 ±0.56
4.05 ±0.47
9.80 ±0.67
6.09 ±0.30
4.60 ±0.40
4.11 ±0.37
3.37 ±0.003
2.62 ±0.07
35 17.63 ±2.17
3.55 ±0.55
4.02 ±0.83
6.46 ±1.47
4.31 ±0.61
4.86 ±0.84
2.03 ±0.03
2.61 ±0.55
3.77 ±0.46
a concentrations in [µM] ± standard deviation of the condition b values of the inoculation cultures grown for 18 days in the dark; R1_d and R1_l were inoculated from the same pre-culture (values for R1_l in italic letters)
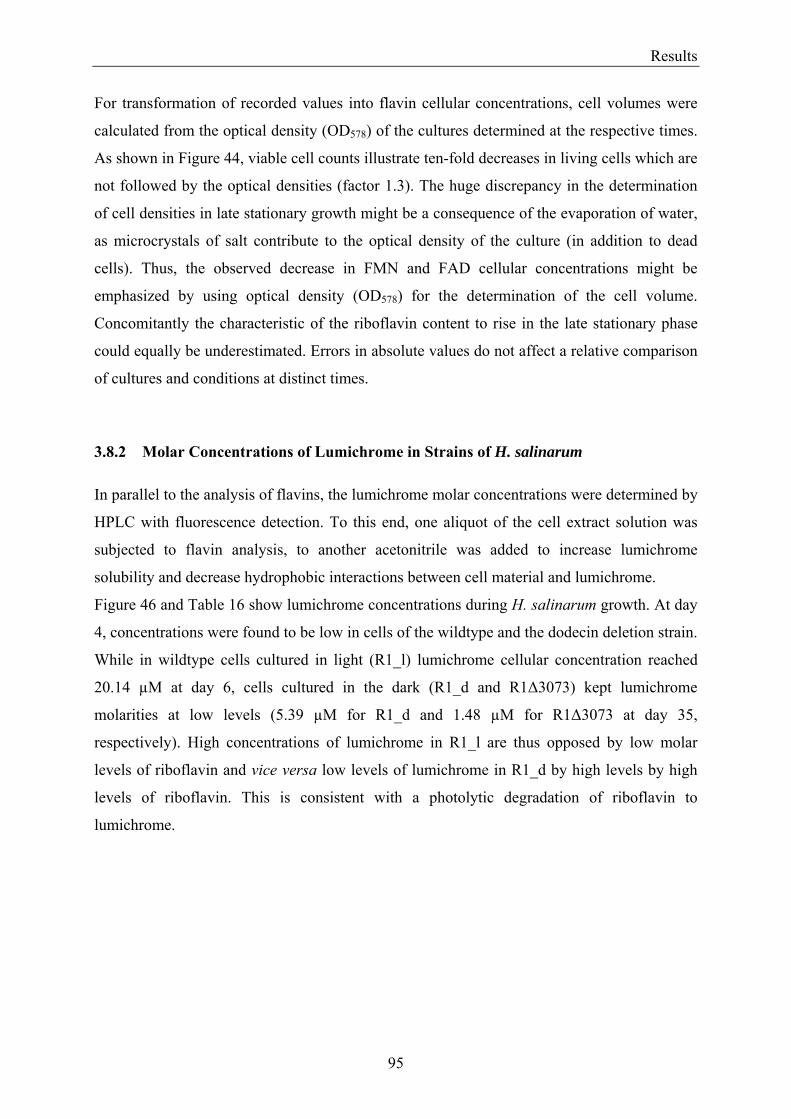
Results
95
For transformation of recorded values into flavin cellular concentrations, cell volumes were
calculated from the optical density (OD578) of the cultures determined at the respective times.
As shown in Figure 44, viable cell counts illustrate ten-fold decreases in living cells which are
not followed by the optical densities (factor 1.3). The huge discrepancy in the determination
of cell densities in late stationary growth might be a consequence of the evaporation of water,
as microcrystals of salt contribute to the optical density of the culture (in addition to dead
cells). Thus, the observed decrease in FMN and FAD cellular concentrations might be
emphasized by using optical density (OD578) for the determination of the cell volume.
Concomitantly the characteristic of the riboflavin content to rise in the late stationary phase
could equally be underestimated. Errors in absolute values do not affect a relative comparison
of cultures and conditions at distinct times.
3.8.2 Molar Concentrations of Lumichrome in Strains of H. salinarum In parallel to the analysis of flavins, the lumichrome molar concentrations were determined by
HPLC with fluorescence detection. To this end, one aliquot of the cell extract solution was
subjected to flavin analysis, to another acetonitrile was added to increase lumichrome
solubility and decrease hydrophobic interactions between cell material and lumichrome.
Figure 46 and Table 16 show lumichrome concentrations during H. salinarum growth. At day
4, concentrations were found to be low in cells of the wildtype and the dodecin deletion strain.
While in wildtype cells cultured in light (R1_l) lumichrome cellular concentration reached
20.14 µM at day 6, cells cultured in the dark (R1_d and R1∆3073) kept lumichrome
molarities at low levels (5.39 µM for R1_d and 1.48 µM for R1∆3073 at day 35,
respectively). High concentrations of lumichrome in R1_l are thus opposed by low molar
levels of riboflavin and vice versa low levels of lumichrome in R1_d by high levels by high
levels of riboflavin. This is consistent with a photolytic degradation of riboflavin to
lumichrome.
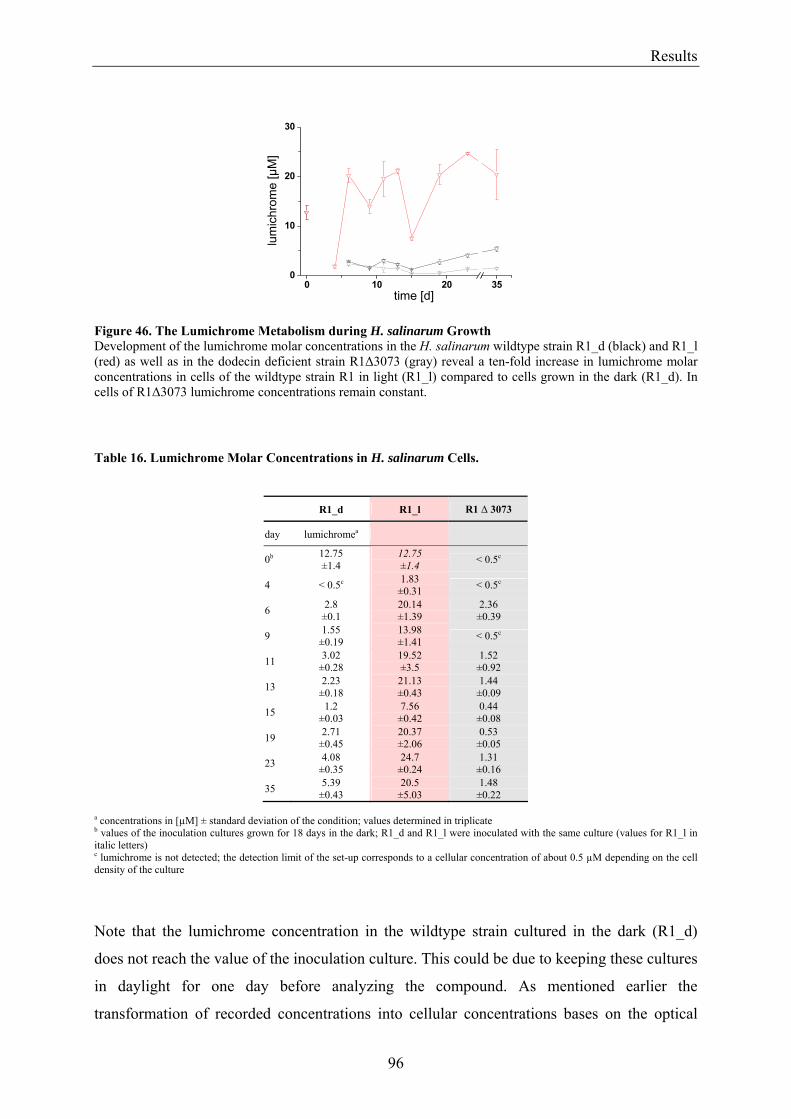
Results
96
Figure 46. The Lumichrome Metabolism during H. salinarum Growth Development of the lumichrome molar concentrations in the H. salinarum wildtype strain R1_d (black) and R1_l (red) as well as in the dodecin deficient strain R1∆3073 (gray) reveal a ten-fold increase in lumichrome molar concentrations in cells of the wildtype strain R1 in light (R1_l) compared to cells grown in the dark (R1_d). In cells of R1∆3073 lumichrome concentrations remain constant.
Table 16. Lumichrome Molar Concentrations in H. salinarum Cells.
R1_d R1_l R1 ∆ 3073
day lumichromea
0b 12.75 ±1.4
12.75 ±1.4 < 0.5c
4 < 0.5c 1.83 ±0.31 < 0.5c
6 2.8 ±0.1
20.14 ±1.39
2.36 ±0.39
9 1.55 ±0.19
13.98 ±1.41 < 0.5c
11 3.02 ±0.28
19.52 ±3.5
1.52 ±0.92
13 2.23 ±0.18
21.13 ±0.43
1.44 ±0.09
15 1.2 ±0.03
7.56 ±0.42
0.44 ±0.08
19 2.71 ±0.45
20.37 ±2.06
0.53 ±0.05
23 4.08 ±0.35
24.7 ±0.24
1.31 ±0.16
35 5.39 ±0.43
20.5 ±5.03
1.48 ±0.22
a concentrations in [µM] ± standard deviation of the condition; values determined in triplicate b values of the inoculation cultures grown for 18 days in the dark; R1_d and R1_l were inoculated with the same culture (values for R1_l in italic letters) c lumichrome is not detected; the detection limit of the set-up corresponds to a cellular concentration of about 0.5 µM depending on the cell density of the culture
Note that the lumichrome concentration in the wildtype strain cultured in the dark (R1_d)
does not reach the value of the inoculation culture. This could be due to keeping these cultures
in daylight for one day before analyzing the compound. As mentioned earlier the
transformation of recorded concentrations into cellular concentrations bases on the optical
0 10 20 350
10
20
30
lum
ichr
ome
[µM
]
time [d]
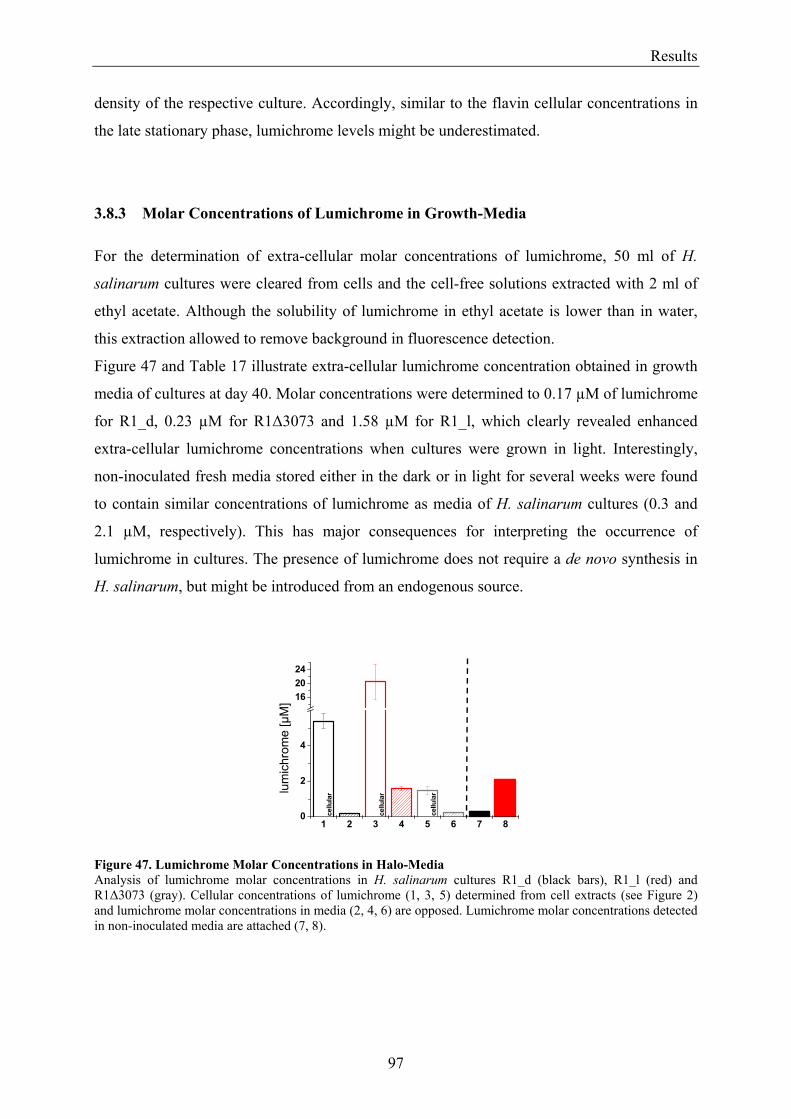
Results
97
density of the respective culture. Accordingly, similar to the flavin cellular concentrations in
the late stationary phase, lumichrome levels might be underestimated.
3.8.3 Molar Concentrations of Lumichrome in Growth-Media For the determination of extra-cellular molar concentrations of lumichrome, 50 ml of H.
salinarum cultures were cleared from cells and the cell-free solutions extracted with 2 ml of
ethyl acetate. Although the solubility of lumichrome in ethyl acetate is lower than in water,
this extraction allowed to remove background in fluorescence detection.
Figure 47 and Table 17 illustrate extra-cellular lumichrome concentration obtained in growth
media of cultures at day 40. Molar concentrations were determined to 0.17 µM of lumichrome
for R1_d, 0.23 µM for R1∆3073 and 1.58 µM for R1_l, which clearly revealed enhanced
extra-cellular lumichrome concentrations when cultures were grown in light. Interestingly,
non-inoculated fresh media stored either in the dark or in light for several weeks were found
to contain similar concentrations of lumichrome as media of H. salinarum cultures (0.3 and
2.1 µM, respectively). This has major consequences for interpreting the occurrence of
lumichrome in cultures. The presence of lumichrome does not require a de novo synthesis in
H. salinarum, but might be introduced from an endogenous source.
Figure 47. Lumichrome Molar Concentrations in Halo-Media Analysis of lumichrome molar concentrations in H. salinarum cultures R1_d (black bars), R1_l (red) and R1∆3073 (gray). Cellular concentrations of lumichrome (1, 3, 5) determined from cell extracts (see Figure 2) and lumichrome molar concentrations in media (2, 4, 6) are opposed. Lumichrome molar concentrations detected in non-inoculated media are attached (7, 8).
1 2 3 4 5 6 7 80
2
4
162024
cellu
lar
cellu
lar
cellu
larlu
mic
hrom
e [µ
M]
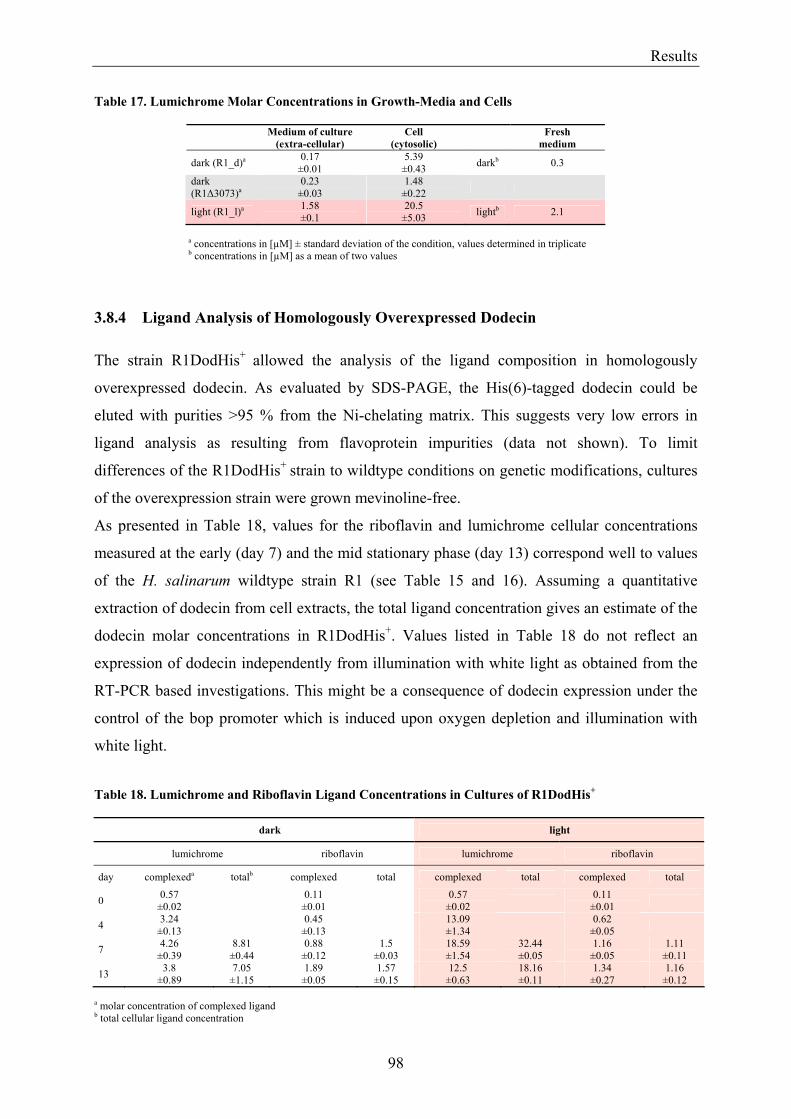
Results
98
Table 17. Lumichrome Molar Concentrations in Growth-Media and Cells
Medium of culture (extra-cellular)
Cell (cytosolic) Fresh
medium
dark (R1_d)a 0.17 ±0.01
5.39 ±0.43 darkb 0.3
dark (R1∆3073)a
0.23 ±0.03
1.48 ±0.22
light (R1_l)a 1.58 ±0.1
20.5 ±5.03 lightb 2.1
a concentrations in [µM] ± standard deviation of the condition, values determined in triplicate b concentrations in [µM] as a mean of two values
3.8.4 Ligand Analysis of Homologously Overexpressed Dodecin The strain R1DodHis+
allowed the analysis of the ligand composition in homologously
overexpressed dodecin. As evaluated by SDS-PAGE, the His(6)-tagged dodecin could be
eluted with purities >95 % from the Ni-chelating matrix. This suggests very low errors in
ligand analysis as resulting from flavoprotein impurities (data not shown). To limit
differences of the R1DodHis+ strain to wildtype conditions on genetic modifications, cultures
of the overexpression strain were grown mevinoline-free.
As presented in Table 18, values for the riboflavin and lumichrome cellular concentrations
measured at the early (day 7) and the mid stationary phase (day 13) correspond well to values
of the H. salinarum wildtype strain R1 (see Table 15 and 16). Assuming a quantitative
extraction of dodecin from cell extracts, the total ligand concentration gives an estimate of the
dodecin molar concentrations in R1DodHis+. Values listed in Table 18 do not reflect an
expression of dodecin independently from illumination with white light as obtained from the
RT-PCR based investigations. This might be a consequence of dodecin expression under the
control of the bop promoter which is induced upon oxygen depletion and illumination with
white light.
Table 18. Lumichrome and Riboflavin Ligand Concentrations in Cultures of R1DodHis+ dark light
lumichrome riboflavin lumichrome riboflavin
day complexeda totalb complexed total complexed total complexed total
0 0.57 ±0.02 0.11
±0.01 0.57 ±0.02 0.11
±0.01
4 3.24 ±0.13 0.45
±0.13 13.09 ±1.34 0.62
±0.05
7 4.26 ±0.39
8.81 ±0.44
0.88 ±0.12
1.5 ±0.03
18.59 ±1.54
32.44 ±0.05
1.16 ±0.05
1.11 ±0.11
13 3.8 ±0.89
7.05 ±1.15
1.89 ±0.05
1.57 ±0.15
12.5 ±0.63
18.16 ±0.11
1.34 ±0.27
1.16 ±0.12
a molar concentration of complexed ligand b total cellular ligand concentration
Results
99
Interestingly, the concentration of riboflavin complexed to dodecin was found to agree with
the total cellular riboflavin concentration, which suggests dodecin to quantitatively sequester
riboflavin in the H. salinarum cytosol. In contrast, solely 1/2 to 1/3 of the total cellular
lumichrome concentration was detected as complexed to dodecin.
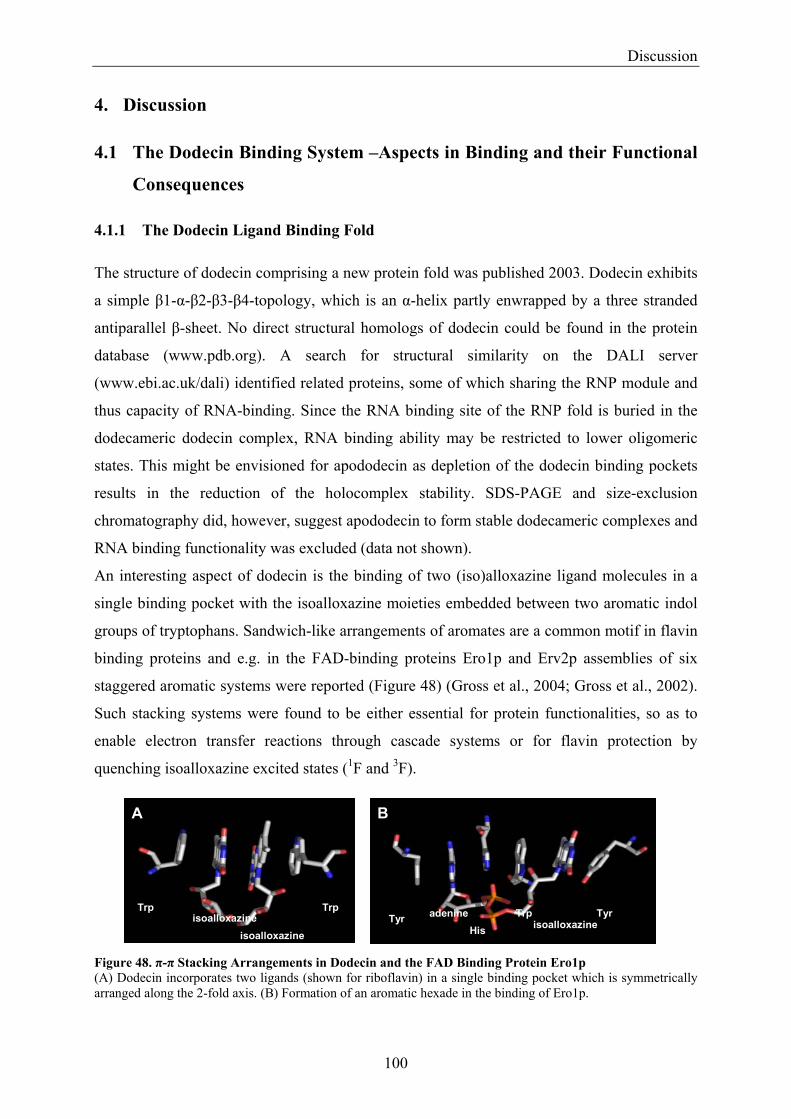
Discussion
100
4. Discussion 4.1 The Dodecin Binding System –Aspects in Binding and their Functional
Consequences 4.1.1 The Dodecin Ligand Binding Fold The structure of dodecin comprising a new protein fold was published 2003. Dodecin exhibits
a simple β1-α-β2-β3-β4-topology, which is an α-helix partly enwrapped by a three stranded
antiparallel β-sheet. No direct structural homologs of dodecin could be found in the protein
database (www.pdb.org). A search for structural similarity on the DALI server
(www.ebi.ac.uk/dali) identified related proteins, some of which sharing the RNP module and
thus capacity of RNA-binding. Since the RNA binding site of the RNP fold is buried in the
dodecameric dodecin complex, RNA binding ability may be restricted to lower oligomeric
states. This might be envisioned for apododecin as depletion of the dodecin binding pockets
results in the reduction of the holocomplex stability. SDS-PAGE and size-exclusion
chromatography did, however, suggest apododecin to form stable dodecameric complexes and
RNA binding functionality was excluded (data not shown).
An interesting aspect of dodecin is the binding of two (iso)alloxazine ligand molecules in a
single binding pocket with the isoalloxazine moieties embedded between two aromatic indol
groups of tryptophans. Sandwich-like arrangements of aromates are a common motif in flavin
binding proteins and e.g. in the FAD-binding proteins Ero1p and Erv2p assemblies of six
staggered aromatic systems were reported (Figure 48) (Gross et al., 2004; Gross et al., 2002).
Such stacking systems were found to be either essential for protein functionalities, so as to
enable electron transfer reactions through cascade systems or for flavin protection by
quenching isoalloxazine excited states (1F and 3F). Figure 48. π-π Stacking Arrangements in Dodecin and the FAD Binding Protein Ero1p (A) Dodecin incorporates two ligands (shown for riboflavin) in a single binding pocket which is symmetrically arranged along the 2-fold axis. (B) Formation of an aromatic hexade in the binding of Ero1p.
Trp Trpisoalloxazine
isoalloxazine
A
Trp Trpisoalloxazine
isoalloxazine
A
TrpTyr adenine TyrHis isoalloxazine
B
TrpTyr adenine TyrHis isoalloxazine
B
Discussion
101
Although π-stacking is widespread in flavin binding, the binding motif exhibited by dodecin
is unique. Dimers of ligands are involved in the staggered assembly of aromatic moieties with
a C2-axis in the center of the binding pocket. The dodecin binding pocket is not designed
complementary to the chemistry of a single ligand, but to the chemistry of ligand dimers.
Consequently, not only protein-ligand interactions are configured, but also ligand-ligand
interactions – thus representing a novel parameter in protein holocomplex stabilities.
4.1.2 The Biological Relevance of the Dodecin High Affinity Ligands Dodecin exhibits exceptional ligand binding. While riboflavin is a common ligand and
cofactor molecule, structural data on lumichrome and lumiflavin binding to proteins are rare.
At present, the PDB database contains two entries of protein structures with a lumichrome
ligand and there is no entry of a protein structure with a lumiflavin ligand (Pereira et al., 2001;
Wang et al., 2004). In one structure, lumichrome atomic coordinates were used to describe
riboflavin with an inherent flexibility of the ribityl chain (missing electron density). In the
second, a structure of lumichrome complexed to human biliverdin IXβ (BVR-B) is reported.
The BVR-B binding site architecture resembles the dodecin type, as the recognition of flavins
occurs through the isoalloxazine ring which allows lumichrome to competitively inhibit FMN
binding (Cunningham et al., 2000).
Investigation of the halophilic dodecin and binding pockets of homologous proteins revealed
a preference of the dodecin binding motif for the incorporation of lumichrome (see Table 13).
For H. salinarum dodecin also lumiflavin was shown to be adopted with high affinities but
analysis of the ligand spectrum in vivo excluded lumiflavin as a natural ligand of this dodecin.
Therefore, the high stability of the lumiflavin holocomplex H-LMF has to be regarded as
affinity due to the dodecin gated binding mode without binding significance in vivo. The
physiological irrelevance of the lumiflavin holocomplex (H-LMF) is not surprising, as to date
a biological function for lumiflavin has not been reported. Rather, this compound has been
used in inhibitory investigations of flavoproteins for its characteristic as smallest isoalloxazine
system. Derivatives of lumiflavin occur as riboflavin degradation products upon exposure to
light and were not found complexed to dodecin as well (Holzer et al., 2004).
A physiological importance of lumichrome was reported as (I) a Sinorhizobium meliloti signal
molecule enhancing root respiration in aflafla, (II) a mediator for the specific binding of target
molecules to their receptor in Sacrophaga peregrina and (III) a natural inductor of
metamorphosis in ascadian Halocynthia roretzi (Tsukamoto et al., 1999; Ueno and Natori,
Discussion
102
1987). While there is versatile use of flavin, lumichrome is rarely found in nature. This is a
consequence of the absence of an N10 elongation at the aromatic moiety which rearranges
electronic properties (Table 1). The interest of the biochemical community in lumichrome is
basically focused on its role as a photodegradation product of (ribo)flavin and as a
photosensitizer. In transferring excitation energy to substrates (photosensitization type 1) and
oxygen (photosensitization type 2), the primarily non-toxic lumichrome exerts a “secondary
toxic” effect (Sikorska et al., 2004, Sikorska, 2004 #65; Sikorski et al., 2001).
Riboflavin is of major physiological importance. Riboflavin’s primary function is to act as a
substrate in the biosynthesis of FMN and FAD rather than acting as a functionally active
compound itself (see Figure 6) (Massey, 2000). Accordingly, proteins binding riboflavin are
found in flavin biosynthesis (Bauer et al., 2002; Gerhardt et al., 2002; Gerhardt et al., 2002;
Karthikeyan et al., 2003; Liao et al., 2001; Truffault et al., 2001). There, riboflavin is either a
product (riboflavin synthase), a substrate (riboflavin kinase), or a regulator of activity as
discussed in feed-back inhibition of lumazine synthase. A second class of riboflavin binding
proteins are summarized as riboflavin binding and carrier proteins (RfBP). These proteins are
not involved in enzymatic processes but protect and distribute the highly redox-active and
photo-reactive riboflavin to maintain its role as a substrate in biosynthesis of FMN and FAD
(Foraker et al., 2003; White and Merrill, 1988).
4.1.3 A Gated Ligand Binding Mode Mediates Preference towards Small Substrates In functional assays, dodecin was found to exhibit high affinity towards the small substrates
lumichrome and lumiflavin as well as towards riboflavin whereas strongly decreased affinities
were observed towards the bulkier flavins, FMN and FAD (lumichrome (9.9 ± 3.2 nM),
lumiflavin (17.6 ± 4.0 nM), riboflavin (35.8 ± 4.4 nM), FAD (439 ± 48 nM), FMN (13.7 ± 1.2
µM). This affinity ranking points to a binding strategy of dodecin which is based on the
highly affine complexation of the (iso)alloxazine building block, but which is also coupled to
a destabilization depending on the volume of the aliphatic moiety (N10 substitution).
In principle, such a destabilizing contribution can evolve from (1) unfavorable interactions of
residues and aliphatic chain polarity or from (2) the aliphatic chain which sterically hinders
ligand arrangement. The induction of unfavourable interactions might partly be valid for the
low affinity of FMN, as in a FMN dimer highly negatively charged phosphate groups are
forced into spatial proximity. In dodecin, steric restrictions were clearly found as ultimately
determining ligand affinity. This is summarized in Figure 49, representing a model of the
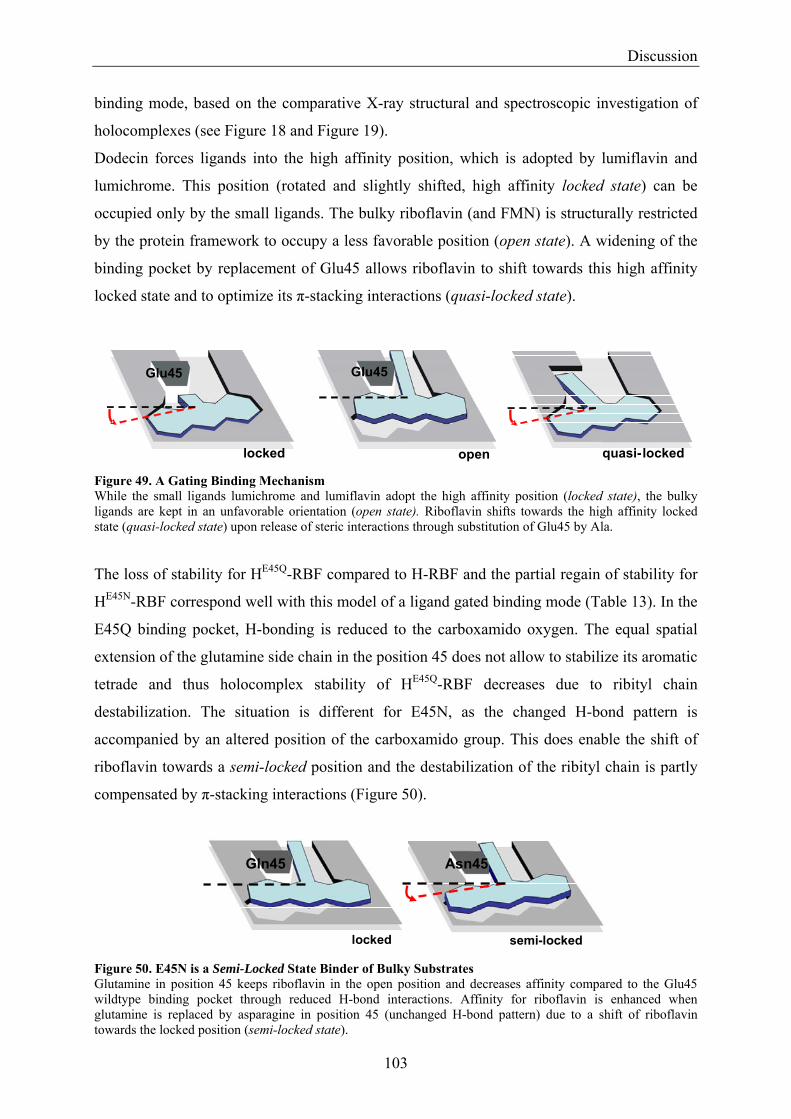
Discussion
103
binding mode, based on the comparative X-ray structural and spectroscopic investigation of
holocomplexes (see Figure 18 and Figure 19).
Dodecin forces ligands into the high affinity position, which is adopted by lumiflavin and
lumichrome. This position (rotated and slightly shifted, high affinity locked state) can be
occupied only by the small ligands. The bulky riboflavin (and FMN) is structurally restricted
by the protein framework to occupy a less favorable position (open state). A widening of the
binding pocket by replacement of Glu45 allows riboflavin to shift towards this high affinity
locked state and to optimize its π-stacking interactions (quasi-locked state). Figure 49. A Gating Binding Mechanism While the small ligands lumichrome and lumiflavin adopt the high affinity position (locked state), the bulky ligands are kept in an unfavorable orientation (open state). Riboflavin shifts towards the high affinity locked state (quasi-locked state) upon release of steric interactions through substitution of Glu45 by Ala. The loss of stability for HE45Q-RBF compared to H-RBF and the partial regain of stability for
HE45N-RBF correspond well with this model of a ligand gated binding mode (Table 13). In the
E45Q binding pocket, H-bonding is reduced to the carboxamido oxygen. The equal spatial
extension of the glutamine side chain in the position 45 does not allow to stabilize its aromatic
tetrade and thus holocomplex stability of HE45Q-RBF decreases due to ribityl chain
destabilization. The situation is different for E45N, as the changed H-bond pattern is
accompanied by an altered position of the carboxamido group. This does enable the shift of
riboflavin towards a semi-locked position and the destabilization of the ribityl chain is partly
compensated by π-stacking interactions (Figure 50).
Figure 50. E45N is a Semi-Locked State Binder of Bulky Substrates Glutamine in position 45 keeps riboflavin in the open position and decreases affinity compared to the Glu45 wildtype binding pocket through reduced H-bond interactions. Affinity for riboflavin is enhanced when glutamine is replaced by asparagine in position 45 (unchanged H-bond pattern) due to a shift of riboflavin towards the locked position (semi-locked state).
Glu45 Glu45
openlocked quasi-locked
Gln45 Asn45
locked semi-locked
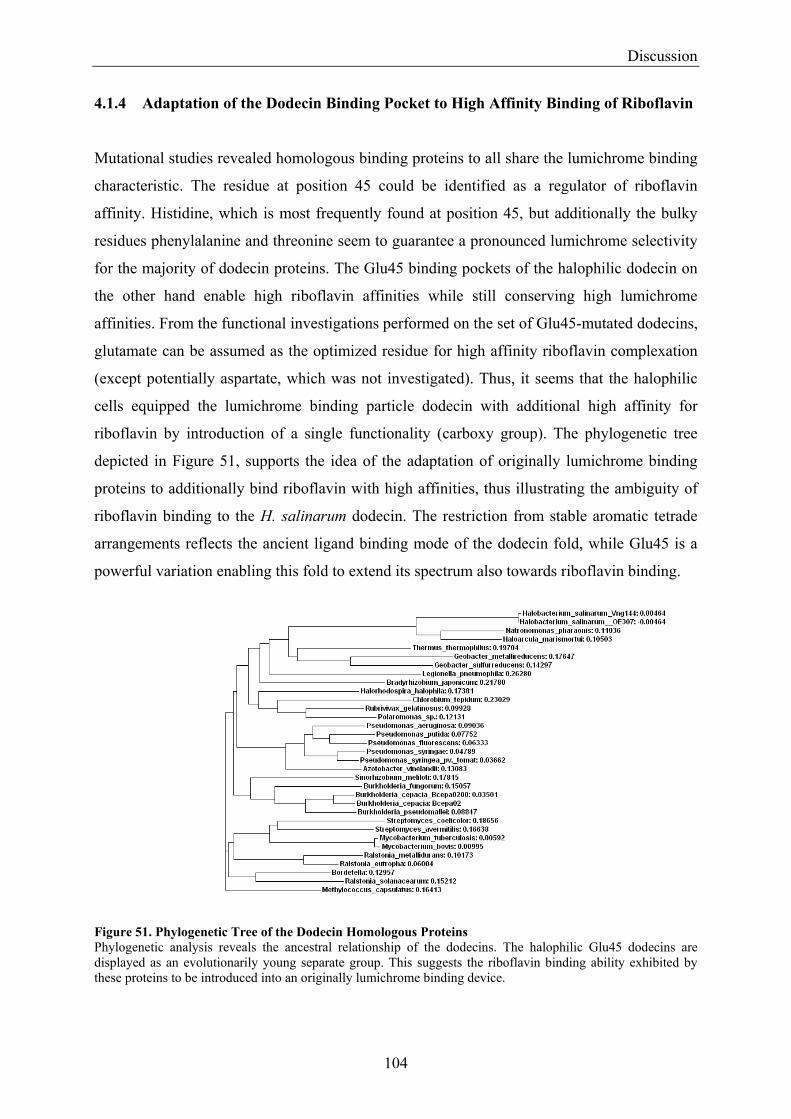
Discussion
104
4.1.4 Adaptation of the Dodecin Binding Pocket to High Affinity Binding of Riboflavin
Mutational studies revealed homologous binding proteins to all share the lumichrome binding
characteristic. The residue at position 45 could be identified as a regulator of riboflavin
affinity. Histidine, which is most frequently found at position 45, but additionally the bulky
residues phenylalanine and threonine seem to guarantee a pronounced lumichrome selectivity
for the majority of dodecin proteins. The Glu45 binding pockets of the halophilic dodecin on
the other hand enable high riboflavin affinities while still conserving high lumichrome
affinities. From the functional investigations performed on the set of Glu45-mutated dodecins,
glutamate can be assumed as the optimized residue for high affinity riboflavin complexation
(except potentially aspartate, which was not investigated). Thus, it seems that the halophilic
cells equipped the lumichrome binding particle dodecin with additional high affinity for
riboflavin by introduction of a single functionality (carboxy group). The phylogenetic tree
depicted in Figure 51, supports the idea of the adaptation of originally lumichrome binding
proteins to additionally bind riboflavin with high affinities, thus illustrating the ambiguity of
riboflavin binding to the H. salinarum dodecin. The restriction from stable aromatic tetrade
arrangements reflects the ancient ligand binding mode of the dodecin fold, while Glu45 is a
powerful variation enabling this fold to extend its spectrum also towards riboflavin binding.
Figure 51. Phylogenetic Tree of the Dodecin Homologous Proteins Phylogenetic analysis reveals the ancestral relationship of the dodecins. The halophilic Glu45 dodecins are displayed as an evolutionarily young separate group. This suggests the riboflavin binding ability exhibited by these proteins to be introduced into an originally lumichrome binding device.
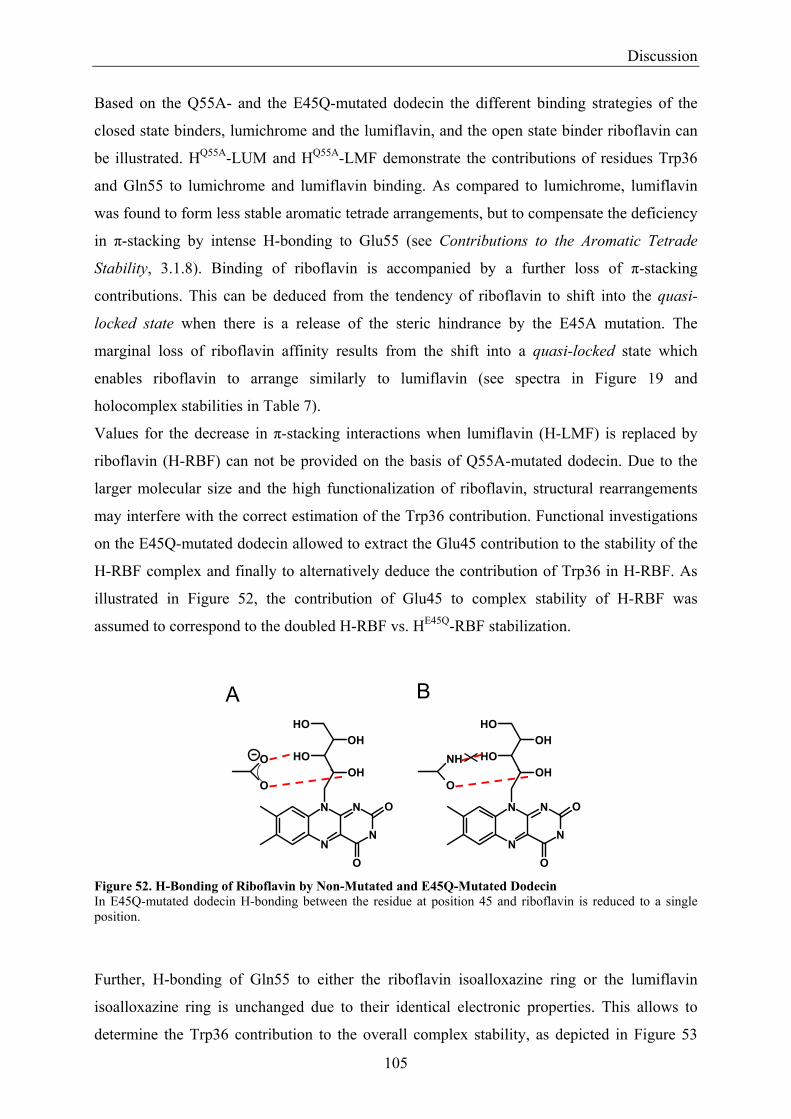
Discussion
105
Based on the Q55A- and the E45Q-mutated dodecin the different binding strategies of the
closed state binders, lumichrome and the lumiflavin, and the open state binder riboflavin can
be illustrated. HQ55A-LUM and HQ55A-LMF demonstrate the contributions of residues Trp36
and Gln55 to lumichrome and lumiflavin binding. As compared to lumichrome, lumiflavin
was found to form less stable aromatic tetrade arrangements, but to compensate the deficiency
in π-stacking by intense H-bonding to Glu55 (see Contributions to the Aromatic Tetrade
Stability, 3.1.8). Binding of riboflavin is accompanied by a further loss of π-stacking
contributions. This can be deduced from the tendency of riboflavin to shift into the quasi-
locked state when there is a release of the steric hindrance by the E45A mutation. The
marginal loss of riboflavin affinity results from the shift into a quasi-locked state which
enables riboflavin to arrange similarly to lumiflavin (see spectra in Figure 19 and
holocomplex stabilities in Table 7).
Values for the decrease in π-stacking interactions when lumiflavin (H-LMF) is replaced by
riboflavin (H-RBF) can not be provided on the basis of Q55A-mutated dodecin. Due to the
larger molecular size and the high functionalization of riboflavin, structural rearrangements
may interfere with the correct estimation of the Trp36 contribution. Functional investigations
on the E45Q-mutated dodecin allowed to extract the Glu45 contribution to the stability of the
H-RBF complex and finally to alternatively deduce the contribution of Trp36 in H-RBF. As
illustrated in Figure 52, the contribution of Glu45 to complex stability of H-RBF was
assumed to correspond to the doubled H-RBF vs. HE45Q-RBF stabilization.
Figure 52. H-Bonding of Riboflavin by Non-Mutated and E45Q-Mutated Dodecin In E45Q-mutated dodecin H-bonding between the residue at position 45 and riboflavin is reduced to a single position.
Further, H-bonding of Gln55 to either the riboflavin isoalloxazine ring or the lumiflavin
isoalloxazine ring is unchanged due to their identical electronic properties. This allows to
determine the Trp36 contribution to the overall complex stability, as depicted in Figure 53
N
N
N
N
O
O
OHOH
OHOH
NH
O
O
O
N
N
N
N
O
O
OHOH
OHOH
A B
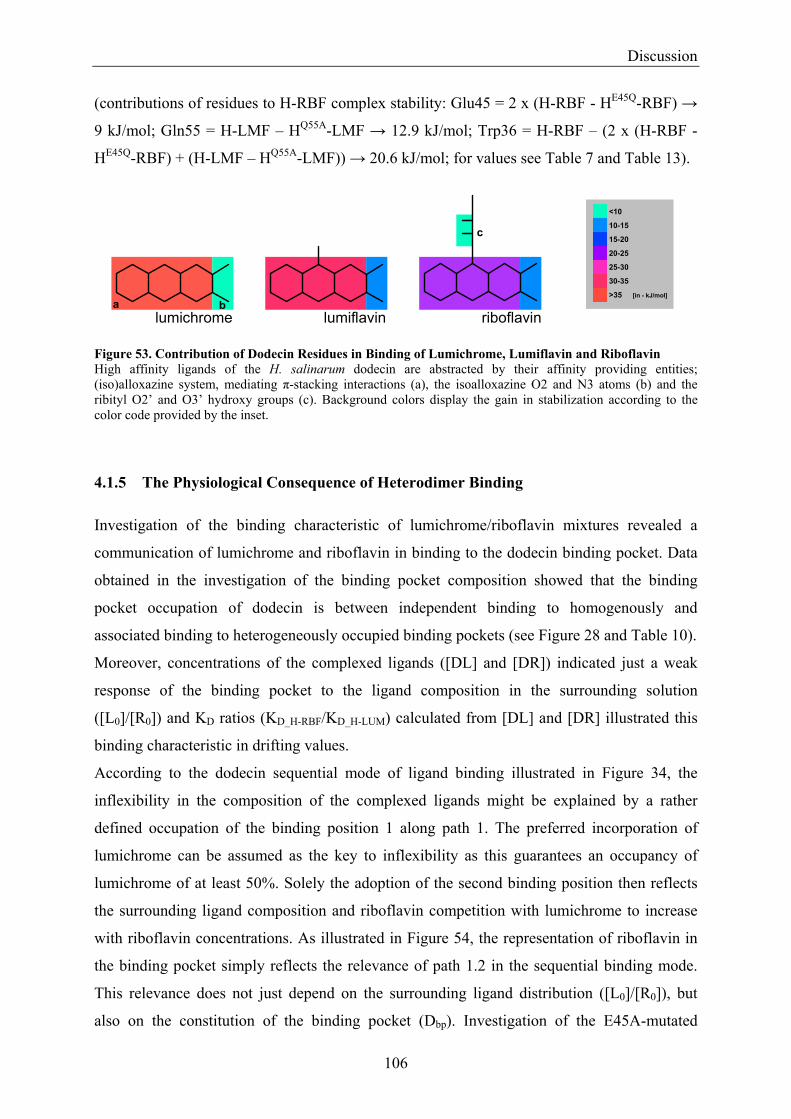
Discussion
106
(contributions of residues to H-RBF complex stability: Glu45 = 2 x (H-RBF - HE45Q-RBF) →
9 kJ/mol; Gln55 = H-LMF – HQ55A-LMF → 12.9 kJ/mol; Trp36 = H-RBF – (2 x (H-RBF -
HE45Q-RBF) + (H-LMF – HQ55A-LMF)) → 20.6 kJ/mol; for values see Table 7 and Table 13).
Figure 53. Contribution of Dodecin Residues in Binding of Lumichrome, Lumiflavin and Riboflavin High affinity ligands of the H. salinarum dodecin are abstracted by their affinity providing entities; (iso)alloxazine system, mediating π-stacking interactions (a), the isoalloxazine O2 and N3 atoms (b) and the ribityl O2’ and O3’ hydroxy groups (c). Background colors display the gain in stabilization according to the color code provided by the inset.
4.1.5 The Physiological Consequence of Heterodimer Binding Investigation of the binding characteristic of lumichrome/riboflavin mixtures revealed a
communication of lumichrome and riboflavin in binding to the dodecin binding pocket. Data
obtained in the investigation of the binding pocket composition showed that the binding
pocket occupation of dodecin is between independent binding to homogenously and
associated binding to heterogeneously occupied binding pockets (see Figure 28 and Table 10).
Moreover, concentrations of the complexed ligands ([DL] and [DR]) indicated just a weak
response of the binding pocket to the ligand composition in the surrounding solution
([L0]/[R0]) and KD ratios (KD_H-RBF/KD_H-LUM) calculated from [DL] and [DR] illustrated this
binding characteristic in drifting values.
According to the dodecin sequential mode of ligand binding illustrated in Figure 34, the
inflexibility in the composition of the complexed ligands might be explained by a rather
defined occupation of the binding position 1 along path 1. The preferred incorporation of
lumichrome can be assumed as the key to inflexibility as this guarantees an occupancy of
lumichrome of at least 50%. Solely the adoption of the second binding position then reflects
the surrounding ligand composition and riboflavin competition with lumichrome to increase
with riboflavin concentrations. As illustrated in Figure 54, the representation of riboflavin in
the binding pocket simply reflects the relevance of path 1.2 in the sequential binding mode.
This relevance does not just depend on the surrounding ligand distribution ([L0]/[R0]), but
also on the constitution of the binding pocket (Dbp). Investigation of the E45A-mutated
b
c
lumichrome lumiflavin riboflavina
<10
10-15
15-20
20-25
25-30
30-35
>35 [in - kJ/mol]
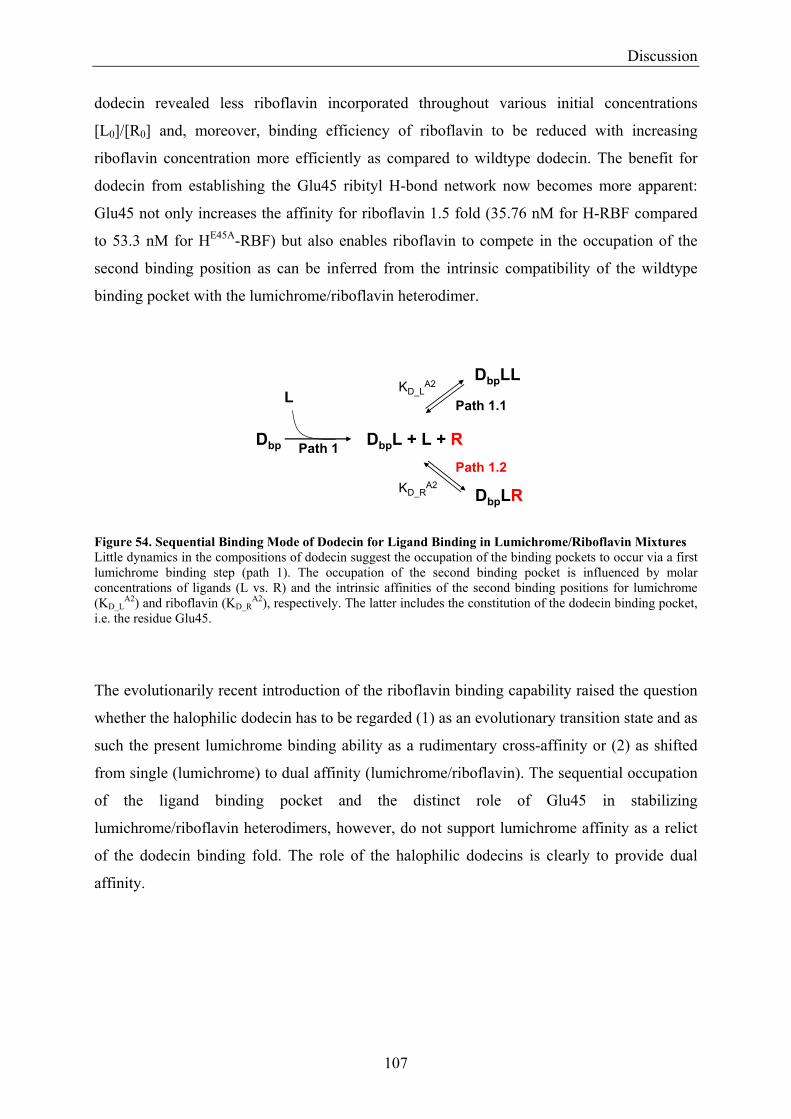
Discussion
107
dodecin revealed less riboflavin incorporated throughout various initial concentrations
[L0]/[R0] and, moreover, binding efficiency of riboflavin to be reduced with increasing
riboflavin concentration more efficiently as compared to wildtype dodecin. The benefit for
dodecin from establishing the Glu45 ribityl H-bond network now becomes more apparent:
Glu45 not only increases the affinity for riboflavin 1.5 fold (35.76 nM for H-RBF compared
to 53.3 nM for HE45A-RBF) but also enables riboflavin to compete in the occupation of the
second binding position as can be inferred from the intrinsic compatibility of the wildtype
binding pocket with the lumichrome/riboflavin heterodimer.
Figure 54. Sequential Binding Mode of Dodecin for Ligand Binding in Lumichrome/Riboflavin Mixtures Little dynamics in the compositions of dodecin suggest the occupation of the binding pockets to occur via a first lumichrome binding step (path 1). The occupation of the second binding pocket is influenced by molar concentrations of ligands (L vs. R) and the intrinsic affinities of the second binding positions for lumichrome (KD_L
A2) and riboflavin (KD_RA2), respectively. The latter includes the constitution of the dodecin binding pocket,
i.e. the residue Glu45.
The evolutionarily recent introduction of the riboflavin binding capability raised the question
whether the halophilic dodecin has to be regarded (1) as an evolutionary transition state and as
such the present lumichrome binding ability as a rudimentary cross-affinity or (2) as shifted
from single (lumichrome) to dual affinity (lumichrome/riboflavin). The sequential occupation
of the ligand binding pocket and the distinct role of Glu45 in stabilizing
lumichrome/riboflavin heterodimers, however, do not support lumichrome affinity as a relict
of the dodecin binding fold. The role of the halophilic dodecins is clearly to provide dual
affinity.
Dbp DbpL + L + R
DbpLR
LDbpLL
Path 1
Path 1.1
Path 1.2
KD_LA2
KD_RA2
Discussion
108
4.1.6 Dodecin Sequesters FAD from the Aqueous Solution For FAD an anomalous behavior in binding to the dodecin binding pocket was observed.
Functional and structural investigations revealed that the extraordinary binding mode of FAD
is due to the preorganization of FAD in its closed conformation in solution and incorporation
of this FAD to the formation of a thermodynamically stable holocomplex [M. Grininger,
submitted]. The enhanced stability of the holocomplex with FAD in a closed structure results
from a spatially more compatible ligand conformation, reducing the steric clash in the protein
C2 channel compared to two extended FAD molecules per binding pocket. Indeed, the
binding affinity can be assumed to be significantly enhanced when comparing the
holocomplex stability with a closed FAD ligand to that of the complex with an extended
(open) FAD (Hex-FAD) simulated by the FMN holocomplex (H-FMN). Correspondingly,
binding of FAD in its closed conformation can be estimated to increase the complex stability
by at least 8.8 kJ/mol (-36.3 kJ/mol (H-FAD) vs. -27.8 kJ/mol (H-FMN)). Note that the
occupation of the binding pocket by a FAD monomer in extended form would likewise reduce
the steric clashes in the C2 channel, but the loss of stacking interaction by the reduction to an
aromatic triade arrangement thermodynamically disfavors this holocomplex conformation. It
should not be ignored that upon incorporation of FAD into the dodecin binding pockets the
protein may exert structuring effects on the ligand. However, these should primarily involve
the flexible aliphatic chain, while reshuffling of the π-π stacking arrangement inside the
binding pocket should be sterically prevented. Moreover, restructuring effects resulting from
dynamics in oligomerization can be excluded. Apododecin crystals soaked with FAD display
an identical FAD closed conformation although in crystals the oligomeric state (the
dodecameric state of the binding protein dodecin) is frozen.
FAD is structurally outstanding in comparison to riboflavin and FMN. FAD comprises two
aromatic moieties linked by an aliphatic chain. This allows FAD to find alternative stable
(closed) conformations and thereby to self-modulate catalytic properties by stacking the
adenine subunit onto the functionally active isoalloxazine ring. The ultimate background of
FAD flexibility is the gain in stabilization upon π-π stacking of the aromatic moieties adenine
and riboflavin, which is manifested by the tendency of FAD to form intramolecular
complexes in aqueous solution. Time-resolved fluorescence measurements in the recent
literature yielded two major lifetime components of 2.7 ns (15%) and 9 ps (85%) for FAD in
aqueous solution which are associated with the respective amounts of the open and the closed
FAD state (Chosrowjan et al., 2003; van den Berg et al., 2002; Visser, 1984; Weber, 1948;
Weber, 1950).
Discussion
109
However, contributions to a structure of closed FAD are rare and are mainly derived from the
possibility of proton nuclear magnetic resonance spectroscopy (1H-NMR) to reveal hydrogen
atoms in spatial proximity to aromatic systems by their exceptional chemical shift behavior.
The high concentrations used for NMR structural analysis did not allow to exclude
intermolecular complexes which prevent unambiguous assignments of experimental data to a
stacked conformation of adenine and isoalloxazine (Kainosho and Kyogoku, 1972; Kotowycz
et al., 1969; Raszka and Kaplan, 1974; Sarma et al., 1968). Similarly, the alternating π-π
interactions observed in the X-ray structural analysis of a 1:1 mixture of adenine and
isoalloxazine derivatives could well represent an artefact of packing effects in the crystal
matrix. (Uehara et al., 1968; Voet and Rich, 1971). X-ray structures of protein/FAD
complexes, although confirming a parallel alignment of the two aromatic moieties, clearly
revealed their displacement from real π-π interacting positions, a fact that strongly suggests a
dominant structuring effect of the protein on the ligands and thus did not allow unambiguous
conclusions to be drawn about the FAD conformation in aqueous solution (Dym and
Eisenberg, 2001; Park et al., 1995).
In summary, due to the deficiencies in structural investigation on closed FAD in solution, the
X-ray structure of the FAD complexed to dodecin (H-FAD) shown here provides the first
time convincing structural evidence for intramolecular stacking of FAD. FAD was not shown
to be a ligand of dodecin in vivo, thus the adoption of this flavin has to be regarded as a cross-
affinity without any physiological meaning.
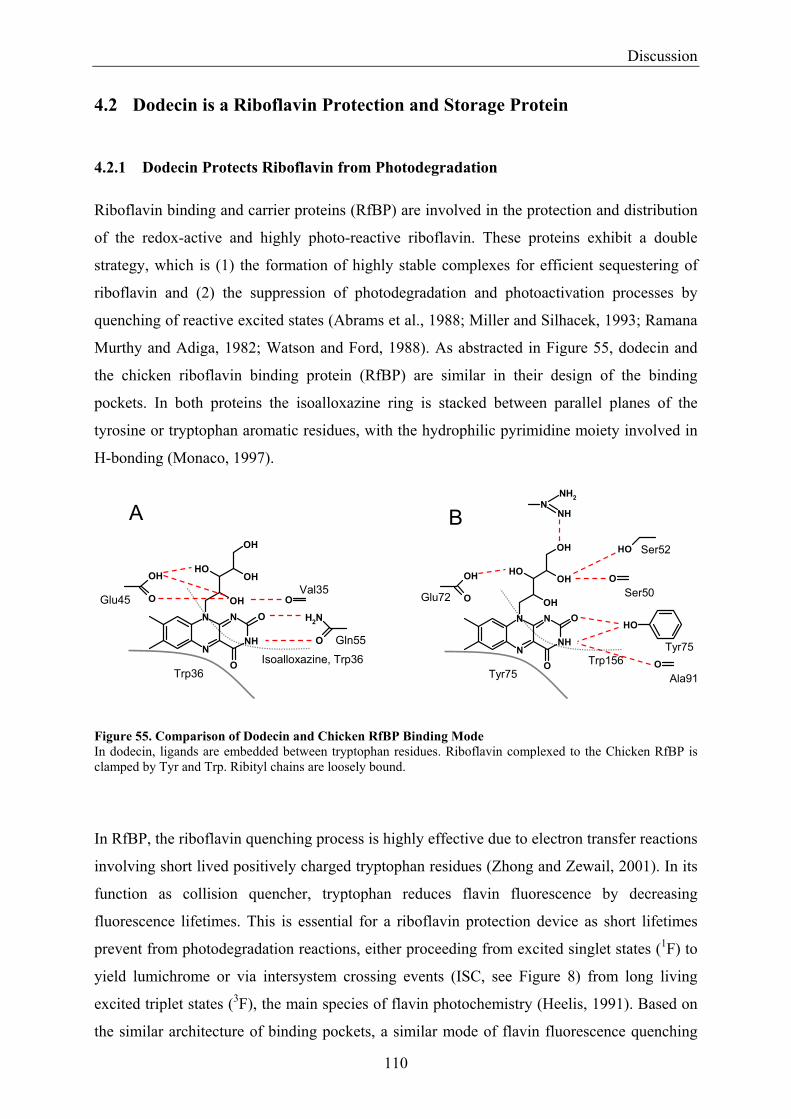
Discussion
110
4.2 Dodecin is a Riboflavin Protection and Storage Protein
4.2.1 Dodecin Protects Riboflavin from Photodegradation Riboflavin binding and carrier proteins (RfBP) are involved in the protection and distribution
of the redox-active and highly photo-reactive riboflavin. These proteins exhibit a double
strategy, which is (1) the formation of highly stable complexes for efficient sequestering of
riboflavin and (2) the suppression of photodegradation and photoactivation processes by
quenching of reactive excited states (Abrams et al., 1988; Miller and Silhacek, 1993; Ramana
Murthy and Adiga, 1982; Watson and Ford, 1988). As abstracted in Figure 55, dodecin and
the chicken riboflavin binding protein (RfBP) are similar in their design of the binding
pockets. In both proteins the isoalloxazine ring is stacked between parallel planes of the
tyrosine or tryptophan aromatic residues, with the hydrophilic pyrimidine moiety involved in
H-bonding (Monaco, 1997).
Figure 55. Comparison of Dodecin and Chicken RfBP Binding Mode In dodecin, ligands are embedded between tryptophan residues. Riboflavin complexed to the Chicken RfBP is clamped by Tyr and Trp. Ribityl chains are loosely bound.
In RfBP, the riboflavin quenching process is highly effective due to electron transfer reactions
involving short lived positively charged tryptophan residues (Zhong and Zewail, 2001). In its
function as collision quencher, tryptophan reduces flavin fluorescence by decreasing
fluorescence lifetimes. This is essential for a riboflavin protection device as short lifetimes
prevent from photodegradation reactions, either proceeding from excited singlet states (1F) to
yield lumichrome or via intersystem crossing events (ISC, see Figure 8) from long living
excited triplet states (3F), the main species of flavin photochemistry (Heelis, 1991). Based on
the similar architecture of binding pockets, a similar mode of flavin fluorescence quenching
Trp156
O
O
OH
N
N
NH
N
O
OOH
OHOH
OH
Tyr75
Glu72 Ser50
Ser52OH
OH
Tyr75O
Ala91
NNH2
NHA B
O
NH2
OO
OH
N
N
NH
N
O
OOH
OHOH
OH
Gln55
Glu45
Trp36Isoalloxazine, Trp36
Val35
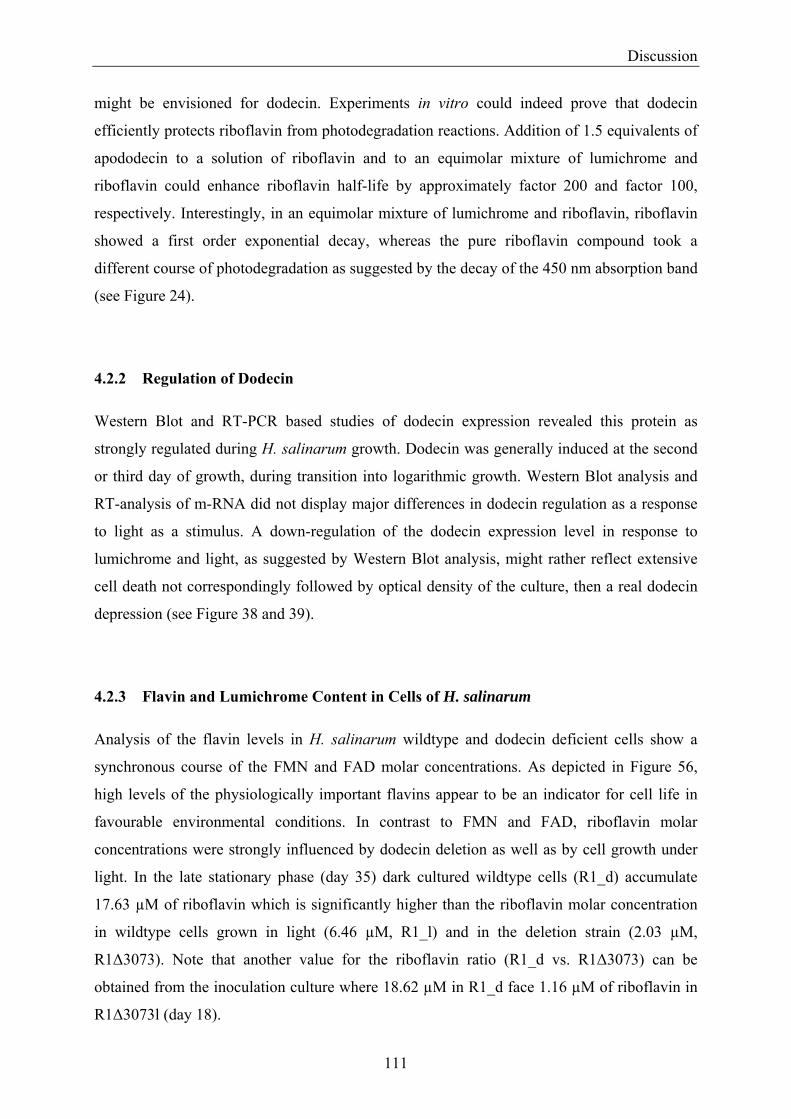
Discussion
111
might be envisioned for dodecin. Experiments in vitro could indeed prove that dodecin
efficiently protects riboflavin from photodegradation reactions. Addition of 1.5 equivalents of
apododecin to a solution of riboflavin and to an equimolar mixture of lumichrome and
riboflavin could enhance riboflavin half-life by approximately factor 200 and factor 100,
respectively. Interestingly, in an equimolar mixture of lumichrome and riboflavin, riboflavin
showed a first order exponential decay, whereas the pure riboflavin compound took a
different course of photodegradation as suggested by the decay of the 450 nm absorption band
(see Figure 24).
4.2.2 Regulation of Dodecin Western Blot and RT-PCR based studies of dodecin expression revealed this protein as
strongly regulated during H. salinarum growth. Dodecin was generally induced at the second
or third day of growth, during transition into logarithmic growth. Western Blot analysis and
RT-analysis of m-RNA did not display major differences in dodecin regulation as a response
to light as a stimulus. A down-regulation of the dodecin expression level in response to
lumichrome and light, as suggested by Western Blot analysis, might rather reflect extensive
cell death not correspondingly followed by optical density of the culture, then a real dodecin
depression (see Figure 38 and 39).
4.2.3 Flavin and Lumichrome Content in Cells of H. salinarum Analysis of the flavin levels in H. salinarum wildtype and dodecin deficient cells show a
synchronous course of the FMN and FAD molar concentrations. As depicted in Figure 56,
high levels of the physiologically important flavins appear to be an indicator for cell life in
favourable environmental conditions. In contrast to FMN and FAD, riboflavin molar
concentrations were strongly influenced by dodecin deletion as well as by cell growth under
light. In the late stationary phase (day 35) dark cultured wildtype cells (R1_d) accumulate
17.63 µM of riboflavin which is significantly higher than the riboflavin molar concentration
in wildtype cells grown in light (6.46 µM, R1_l) and in the deletion strain (2.03 µM,
R1∆3073). Note that another value for the riboflavin ratio (R1_d vs. R1∆3073) can be
obtained from the inoculation culture where 18.62 µM in R1_d face 1.16 µM of riboflavin in
R1∆3073l (day 18).
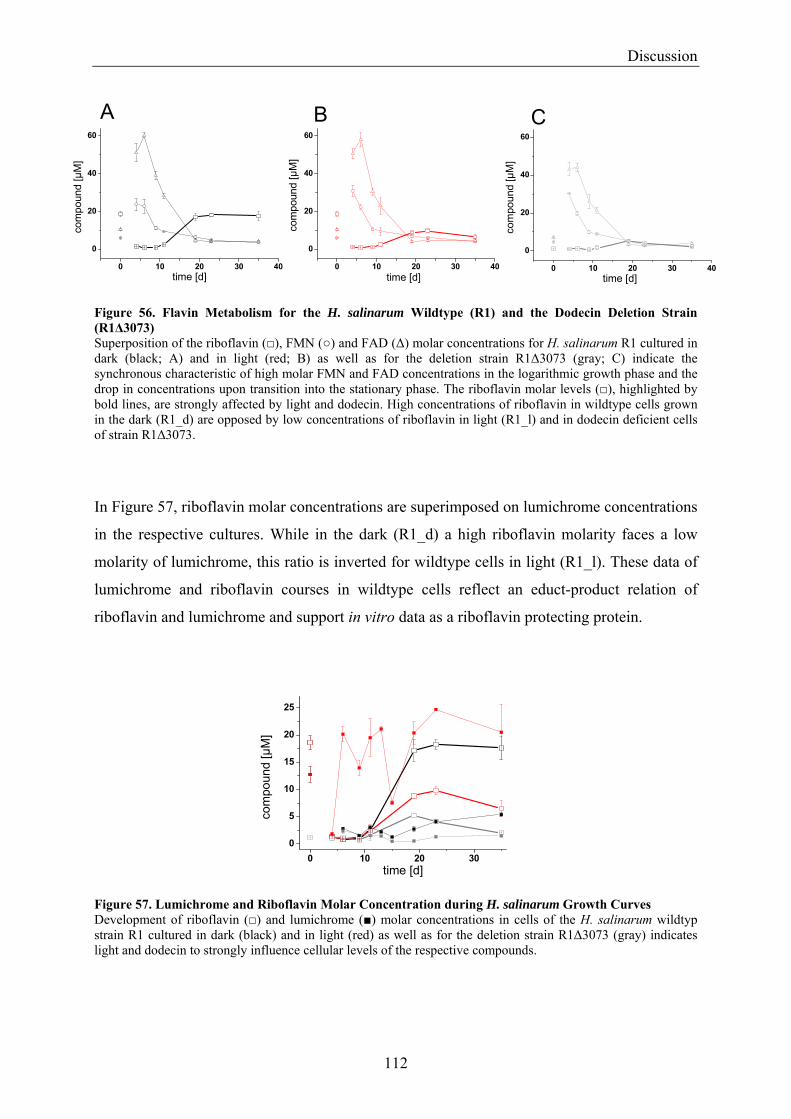
Discussion
112
Figure 56. Flavin Metabolism for the H. salinarum Wildtype (R1) and the Dodecin Deletion Strain (R1∆3073) Superposition of the riboflavin (), FMN () and FAD (∆) molar concentrations for H. salinarum R1 cultured in dark (black; A) and in light (red; B) as well as for the deletion strain R1∆3073 (gray; C) indicate the synchronous characteristic of high molar FMN and FAD concentrations in the logarithmic growth phase and the drop in concentrations upon transition into the stationary phase. The riboflavin molar levels (), highlighted by bold lines, are strongly affected by light and dodecin. High concentrations of riboflavin in wildtype cells grown in the dark (R1_d) are opposed by low concentrations of riboflavin in light (R1_l) and in dodecin deficient cells of strain R1∆3073.
In Figure 57, riboflavin molar concentrations are superimposed on lumichrome concentrations
in the respective cultures. While in the dark (R1_d) a high riboflavin molarity faces a low
molarity of lumichrome, this ratio is inverted for wildtype cells in light (R1_l). These data of
lumichrome and riboflavin courses in wildtype cells reflect an educt-product relation of
riboflavin and lumichrome and support in vitro data as a riboflavin protecting protein.
Figure 57. Lumichrome and Riboflavin Molar Concentration during H. salinarum Growth Curves Development of riboflavin () and lumichrome () molar concentrations in cells of the H. salinarum wildtyp strain R1 cultured in dark (black) and in light (red) as well as for the deletion strain R1∆3073 (gray) indicates light and dodecin to strongly influence cellular levels of the respective compounds.
0 10 20 30 40
0
20
40
60
com
poun
d [µ
M]
time [d]0 10 20 30 40
0
20
40
60
time [d]co
mpo
und
[µM
]
0 10 20 30 40
0
20
40
60
com
poun
d [µ
M]
time [d]
BA C
0 10 20 300
5
10
15
20
25
com
poun
d [µ
M]
time [d]
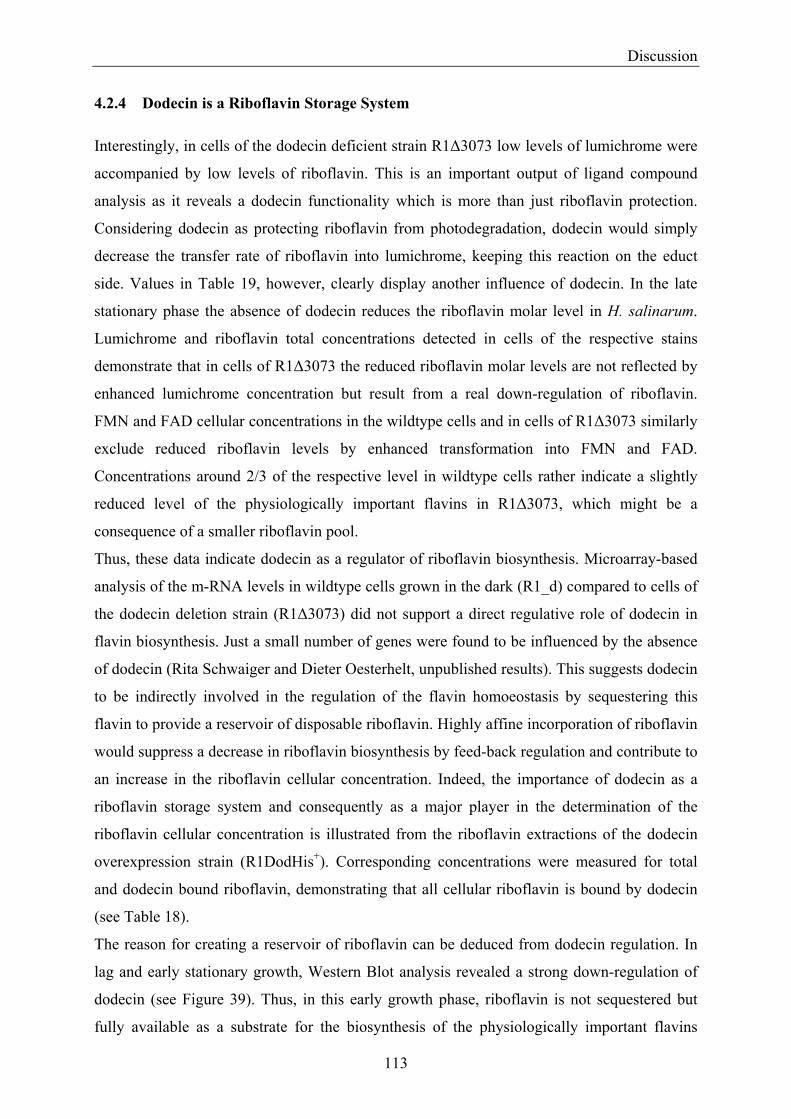
Discussion
113
4.2.4 Dodecin is a Riboflavin Storage System Interestingly, in cells of the dodecin deficient strain R1∆3073 low levels of lumichrome were
accompanied by low levels of riboflavin. This is an important output of ligand compound
analysis as it reveals a dodecin functionality which is more than just riboflavin protection.
Considering dodecin as protecting riboflavin from photodegradation, dodecin would simply
decrease the transfer rate of riboflavin into lumichrome, keeping this reaction on the educt
side. Values in Table 19, however, clearly display another influence of dodecin. In the late
stationary phase the absence of dodecin reduces the riboflavin molar level in H. salinarum.
Lumichrome and riboflavin total concentrations detected in cells of the respective stains
demonstrate that in cells of R1∆3073 the reduced riboflavin molar levels are not reflected by
enhanced lumichrome concentration but result from a real down-regulation of riboflavin.
FMN and FAD cellular concentrations in the wildtype cells and in cells of R1∆3073 similarly
exclude reduced riboflavin levels by enhanced transformation into FMN and FAD.
Concentrations around 2/3 of the respective level in wildtype cells rather indicate a slightly
reduced level of the physiologically important flavins in R1∆3073, which might be a
consequence of a smaller riboflavin pool.
Thus, these data indicate dodecin as a regulator of riboflavin biosynthesis. Microarray-based
analysis of the m-RNA levels in wildtype cells grown in the dark (R1_d) compared to cells of
the dodecin deletion strain (R1∆3073) did not support a direct regulative role of dodecin in
flavin biosynthesis. Just a small number of genes were found to be influenced by the absence
of dodecin (Rita Schwaiger and Dieter Oesterhelt, unpublished results). This suggests dodecin
to be indirectly involved in the regulation of the flavin homoeostasis by sequestering this
flavin to provide a reservoir of disposable riboflavin. Highly affine incorporation of riboflavin
would suppress a decrease in riboflavin biosynthesis by feed-back regulation and contribute to
an increase in the riboflavin cellular concentration. Indeed, the importance of dodecin as a
riboflavin storage system and consequently as a major player in the determination of the
riboflavin cellular concentration is illustrated from the riboflavin extractions of the dodecin
overexpression strain (R1DodHis+). Corresponding concentrations were measured for total
and dodecin bound riboflavin, demonstrating that all cellular riboflavin is bound by dodecin
(see Table 18).
The reason for creating a reservoir of riboflavin can be deduced from dodecin regulation. In
lag and early stationary growth, Western Blot analysis revealed a strong down-regulation of
dodecin (see Figure 39). Thus, in this early growth phase, riboflavin is not sequestered but
fully available as a substrate for the biosynthesis of the physiologically important flavins
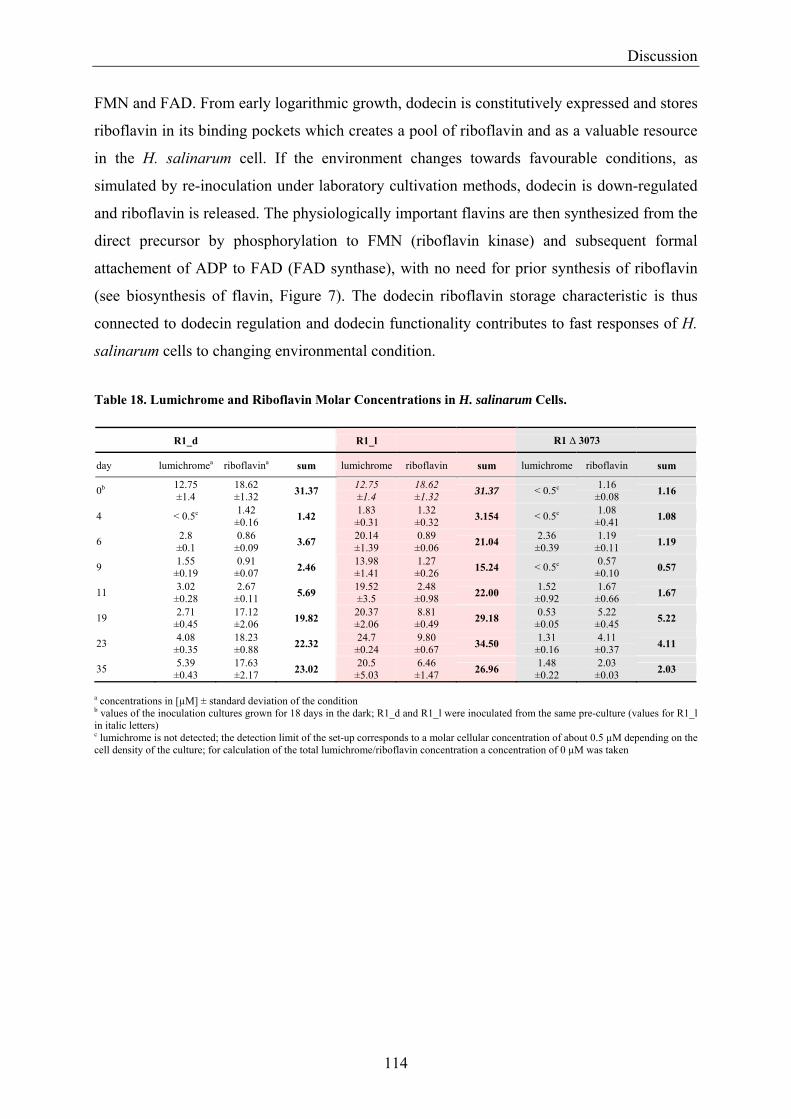
Discussion
114
FMN and FAD. From early logarithmic growth, dodecin is constitutively expressed and stores
riboflavin in its binding pockets which creates a pool of riboflavin and as a valuable resource
in the H. salinarum cell. If the environment changes towards favourable conditions, as
simulated by re-inoculation under laboratory cultivation methods, dodecin is down-regulated
and riboflavin is released. The physiologically important flavins are then synthesized from the
direct precursor by phosphorylation to FMN (riboflavin kinase) and subsequent formal
attachement of ADP to FAD (FAD synthase), with no need for prior synthesis of riboflavin
(see biosynthesis of flavin, Figure 7). The dodecin riboflavin storage characteristic is thus
connected to dodecin regulation and dodecin functionality contributes to fast responses of H.
salinarum cells to changing environmental condition.
Table 18. Lumichrome and Riboflavin Molar Concentrations in H. salinarum Cells.
R1_d R1_l R1 ∆ 3073
day lumichromea riboflavina sum lumichrome riboflavin sum lumichrome riboflavin sum
0b 12.75 ±1.4
18.62 ±1.32 31.37 12.75
±1.4 18.62 ±1.32 31.37 < 0.5c 1.16
±0.08 1.16
4 < 0.5c 1.42 ±0.16 1.42 1.83
±0.31 1.32
±0.32 3.154 < 0.5c 1.08 ±0.41 1.08
6 2.8 ±0.1
0.86 ±0.09 3.67 20.14
±1.39 0.89
±0.06 21.04 2.36 ±0.39
1.19 ±0.11 1.19
9 1.55 ±0.19
0.91 ±0.07 2.46 13.98
±1.41 1.27
±0.26 15.24 < 0.5c 0.57 ±0.10 0.57
11 3.02 ±0.28
2.67 ±0.11 5.69 19.52
±3.5 2.48
±0.98 22.00 1.52 ±0.92
1.67 ±0.66 1.67
19 2.71 ±0.45
17.12 ±2.06 19.82 20.37
±2.06 8.81
±0.49 29.18 0.53 ±0.05
5.22 ±0.45 5.22
23 4.08 ±0.35
18.23 ±0.88 22.32 24.7
±0.24 9.80
±0.67 34.50 1.31 ±0.16
4.11 ±0.37 4.11
35 5.39 ±0.43
17.63 ±2.17 23.02 20.5
±5.03 6.46
±1.47 26.96 1.48 ±0.22
2.03 ±0.03 2.03
a concentrations in [µM] ± standard deviation of the condition b values of the inoculation cultures grown for 18 days in the dark; R1_d and R1_l were inoculated from the same pre-culture (values for R1_l in italic letters) c lumichrome is not detected; the detection limit of the set-up corresponds to a molar cellular concentration of about 0.5 µM depending on the cell density of the culture; for calculation of the total lumichrome/riboflavin concentration a concentration of 0 µM was taken
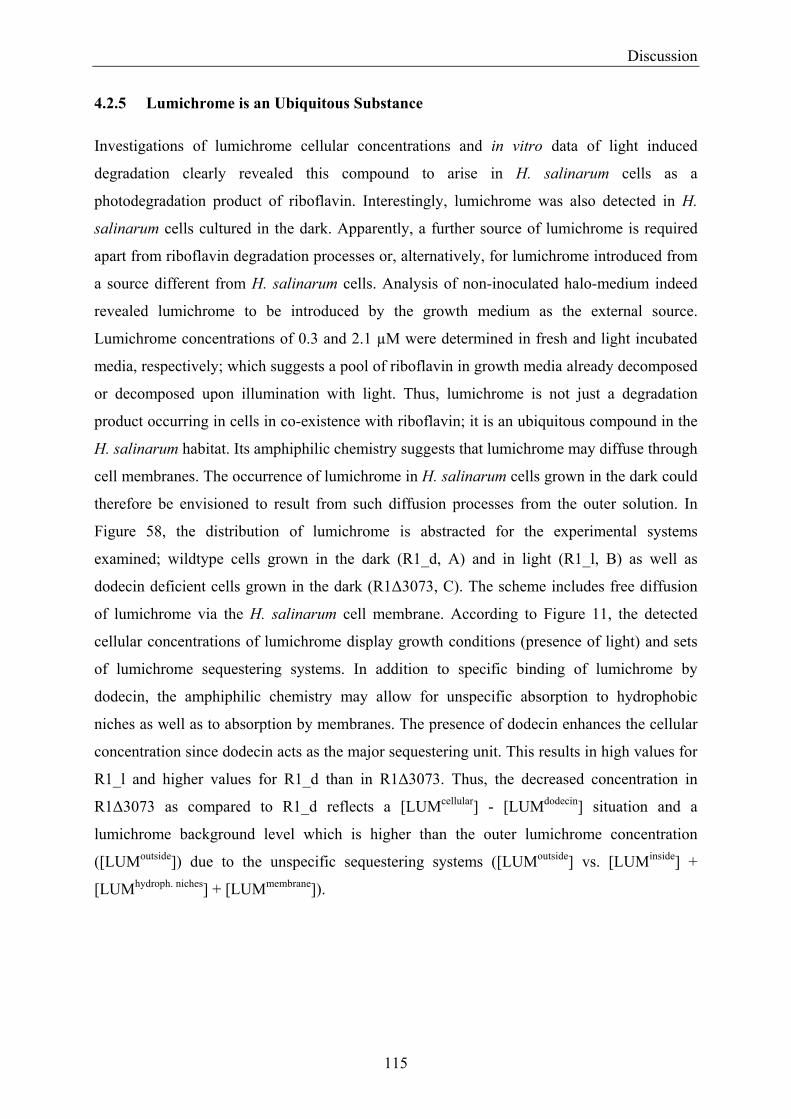
Discussion
115
4.2.5 Lumichrome is an Ubiquitous Substance Investigations of lumichrome cellular concentrations and in vitro data of light induced
degradation clearly revealed this compound to arise in H. salinarum cells as a
photodegradation product of riboflavin. Interestingly, lumichrome was also detected in H.
salinarum cells cultured in the dark. Apparently, a further source of lumichrome is required
apart from riboflavin degradation processes or, alternatively, for lumichrome introduced from
a source different from H. salinarum cells. Analysis of non-inoculated halo-medium indeed
revealed lumichrome to be introduced by the growth medium as the external source.
Lumichrome concentrations of 0.3 and 2.1 µM were determined in fresh and light incubated
media, respectively; which suggests a pool of riboflavin in growth media already decomposed
or decomposed upon illumination with light. Thus, lumichrome is not just a degradation
product occurring in cells in co-existence with riboflavin; it is an ubiquitous compound in the
H. salinarum habitat. Its amphiphilic chemistry suggests that lumichrome may diffuse through
cell membranes. The occurrence of lumichrome in H. salinarum cells grown in the dark could
therefore be envisioned to result from such diffusion processes from the outer solution. In
Figure 58, the distribution of lumichrome is abstracted for the experimental systems
examined; wildtype cells grown in the dark (R1_d, A) and in light (R1_l, B) as well as
dodecin deficient cells grown in the dark (R1∆3073, C). The scheme includes free diffusion
of lumichrome via the H. salinarum cell membrane. According to Figure 11, the detected
cellular concentrations of lumichrome display growth conditions (presence of light) and sets
of lumichrome sequestering systems. In addition to specific binding of lumichrome by
dodecin, the amphiphilic chemistry may allow for unspecific absorption to hydrophobic
niches as well as to absorption by membranes. The presence of dodecin enhances the cellular
concentration since dodecin acts as the major sequestering unit. This results in high values for
R1_l and higher values for R1_d than in R1∆3073. Thus, the decreased concentration in
R1∆3073 as compared to R1_d reflects a [LUMcellular] - [LUMdodecin] situation and a
lumichrome background level which is higher than the outer lumichrome concentration
([LUMoutside]) due to the unspecific sequestering systems ([LUMoutside] vs. [LUMinside] +
[LUMhydroph. niches] + [LUMmembrane]).
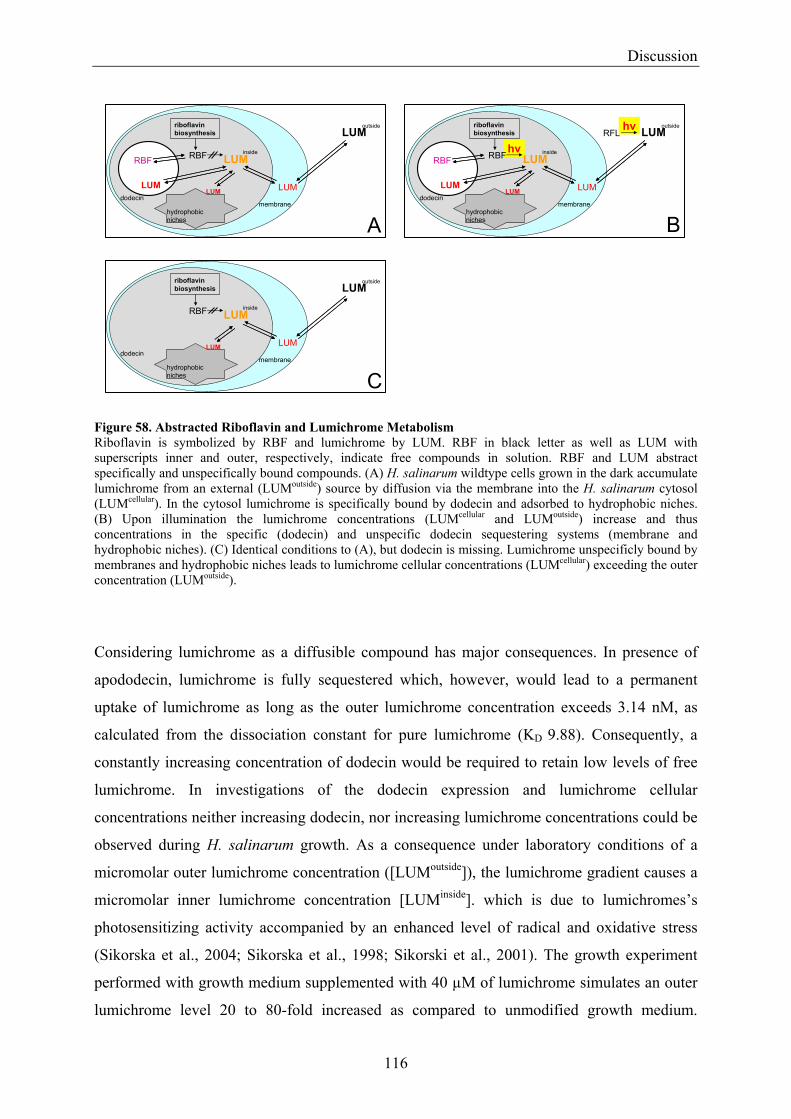
Discussion
116
Figure 58. Abstracted Riboflavin and Lumichrome Metabolism Riboflavin is symbolized by RBF and lumichrome by LUM. RBF in black letter as well as LUM with superscripts inner and outer, respectively, indicate free compounds in solution. RBF and LUM abstract specifically and unspecifically bound compounds. (A) H. salinarum wildtype cells grown in the dark accumulate lumichrome from an external (LUMoutside) source by diffusion via the membrane into the H. salinarum cytosol (LUMcellular). In the cytosol lumichrome is specifically bound by dodecin and adsorbed to hydrophobic niches. (B) Upon illumination the lumichrome concentrations (LUMcellular and LUMoutside) increase and thus concentrations in the specific (dodecin) and unspecific dodecin sequestering systems (membrane and hydrophobic niches). (C) Identical conditions to (A), but dodecin is missing. Lumichrome unspecificly bound by membranes and hydrophobic niches leads to lumichrome cellular concentrations (LUMcellular) exceeding the outer concentration (LUMoutside).
Considering lumichrome as a diffusible compound has major consequences. In presence of
apododecin, lumichrome is fully sequestered which, however, would lead to a permanent
uptake of lumichrome as long as the outer lumichrome concentration exceeds 3.14 nM, as
calculated from the dissociation constant for pure lumichrome (KD 9.88). Consequently, a
constantly increasing concentration of dodecin would be required to retain low levels of free
lumichrome. In investigations of the dodecin expression and lumichrome cellular
concentrations neither increasing dodecin, nor increasing lumichrome concentrations could be
observed during H. salinarum growth. As a consequence under laboratory conditions of a
micromolar outer lumichrome concentration ([LUMoutside]), the lumichrome gradient causes a
micromolar inner lumichrome concentration [LUMinside]. which is due to lumichromes’s
photosensitizing activity accompanied by an enhanced level of radical and oxidative stress
(Sikorska et al., 2004; Sikorska et al., 1998; Sikorski et al., 2001). The growth experiment
performed with growth medium supplemented with 40 µM of lumichrome simulates an outer
lumichrome level 20 to 80-fold increased as compared to unmodified growth medium.
RBF
LUM LUM
RBF LUM
LUM
LUM
inside
outside
dodecin
hydrophobicniches
membrane
riboflavinbiosynthesis
RBF
LUM LUM
RFL LUMhν
LUM
inside
outside
dodecin
hydrophobicniches
membrane
RBF
hν
LUM
riboflavinbiosynthesis
A B
C
LUM
RBF LUM
LUM
LUM
inside
outside
dodecin
hydrophobicniches
membrane
riboflavinbiosynthesis
Discussion
117
According to the models in Figure 58, the cytosol is saturated with lumichrome. As
lumichrome is a photosensitizing compound which causes radical and oxidative stress, this
toxic effect finally collapses the cell machinery.
While for cells investigated under laboratory conditions due to the high amount of
lumichrome introduced from an external source (growth medium) an artificial non-
physiological out-of-control situation was found, the situation is probably different for H.
salinarum cells grown in the natural habitat. H. salinarum cultures naturally grow on a
Dunaliella pre-culture. Similarly to growth medium for H. salinarum, degraded Dunaliella
cells probably introduce lumichrome into the system. In spite of this analogy to laboratory
conditions, the H. salinarum life-style is characterized by phototropic growth under bright
light condition. Long-term cultures of H. salinarum can be characterized as depleted from
nutrient and external lumichrome. This means that under native conditions lumichrome
almost exclusively originates from internal photodegradation processes. Consequently, a free
diffusion of lumichrome would rather result in a gradient directed towards the surrounding
solution to reduce the inner lumichrome concentration. Dodecin could then establish a
riboflavin storage and protection functionality as well as a lumichrome sequestering
characteristic.
As illustrated in Figure 59, these distinct functions are connected by a fine tuned binding
characteristic. The lumichrome binding functionality can on the one hand be regarded as a
functionality of protecting cell from lumichrome mediated radical and oxidative stress. On the
other hand, the dodecin ligand binding mode converts a lumichrome into a riboflavin
concentration and thus allows lumichrome to interfere with flavin homeostasis.
Figure 59. Dodecin Converts a Lumichrome into a Riboflavin Signal Riboflavin (RBF) evolves from flavin biosynthesis pathway as a direct precursor of the physiological important flavins FMN and FAD. By storage of riboflavin, dodecin co-regulates flavin biosynthesis and flavin homeostasis. Lumichrome (LUM), as the second native ligand of H. salinarum dodecin, interferes with this storage functionality.
( )
flavinbiosynthesis
RBF
LUM
RBFLUM
LUM
mem
bran
e
outsideinside
Summary
118
5. Summary Flavins are physiologically relevant cofactors that catalyze various redox and light-induced
reactions. Due to a high intrinsic reactivity, these compounds are found tightly bound to
proteins with the chemistry of the flavin either narrowed to a defined reaction channel
(flavoenzymes) or reduced to (almost) non-reactivity (flavin binding and carrier proteins).
Lumichrome is a product of flavin photodegradation. In spite of the structural similarity to
flavins, lumichrome has electronic properties which differ from flavins, preventing this
compound from any physiological relevance as a cofactor. The interest in lumichrome is
basically focussed on its role as a photosensitizing compound. Lumichrome is excited by the
absorption of visible light and relaxes by transferring electrons or electronic energy to
surrounding substrates and oxygen, exerting an unspecific toxic effect on the cellular
environment. Dodecin is a dodecameric flavin binding protein comprising a novel ligand
binding fold. It incorporates dimers of ligands arranged in antiparallel manner within each of
the six identical binding pockets.
In this thesis, structure and function of dodecin from the archaeal organism Halobacterium
salinarum are reported. X-ray structural investigations supplemented with functional data
revealed that this protein is an unspecific binder of flavins and binder of the flavin-like
compound lumichrome. Dissociation constants were obtained in the nanomolar to micromolar
range and found to correlate positively with the ligand size. The preference of dodecin for the
small ligands lumichrome and lumiflavin is described as a gated ligand binding mode, based
on the low plasticity of the dodecin binding pocket which sterically restricts the bulkier
ligands from arranging the flavin aromatic subunit in a high affinity position.
Site directed mutagenesis of the halophilic dodecin allowed to spread the idea of dodecin as a
small ligand binding particle among homologous proteins. These mutational studies could
moreover show that the halophilic type of dodecins is outstanding in additionally exhibiting a
high affinity for riboflavin. The stabilization of the ribityl chain by an H-bond network to a
single residue was found to suspend restrictions of the gated ligand binding mode and to
enable H. salinarum dodecin to exhibit multiple (high) affinity.
In Western-Blot and RT-PCR analysis of the dodecin expression level, it could be
demonstrated that after a short lag period dodecin is constitutively expressed in light and in
dark. In the late stationary phase, a clear influence of dodecin on the riboflavin cellular
concentrations could be observed. While high levels of riboflavin were found in H. salinarum
wild type cells, in cells of the dodecin deficient strain riboflavin cellular concentrations were
depressed. Lumichrome concentrations on the other hand were unaffected from dodecin;
Summary
119
however; increased concentrations of lumichrome were found in light, according to a
photolytic degradation of riboflavin. In vivo data fully agreed with the deductions from the
dodecin structural and functional investigations.
Dodecin is a riboflavin binding and carrier protein (RfBP). Its function is to store riboflavin
under non-favorable environmental conditions while preventing this flavin from
photodegradation. The lumichrome-collecting property represents an extra-feature which
allows binding of lumichrome if degradation of riboflavin occurs in order to protect the
cellular environment from high amounts of this photo-toxic compound.
References
120
6. References Abrams, V.A.M., McGahan, T.J., Rohrer, J.S., Bero, A.S. and White, H.B., III. (1988) Riboflavin-binding
protein from reptiles: a comparison with avian riboflavin-binding proteins. Comparative Biochemistry and Physiology, Part B, 908, 243-247.
Astuti, Y., Topoglidis, E., Briscoe, P.B., Fantuzzi, A., Gilardi, G. and Durrant, J.R. (2004) Proton-Coupled Electron Transfer of Flavodoxin Immobilized on Nanostructured Tin Dioxide Electrodes: Thermodynamics versus Kinetics Control of Protein Redox Function. Journal of the American Chemical Society, 126, 8001-8009.
Bacher, A., Eberhardt, S., Eisenreich, W., Fischer, M., Herz, S., Illarionov, B., Kis, K. and Richter, G. (2001) Biosynthesis of riboflavin. Vitamins and hormones, 61, 1-49.
Baliga, N.S., Bonneau, R., Facciotti, M.T., Pan, M., Glusman, G., Deutsch, E.W., Shannon, P., Chiu, Y., Weng, R.S., Gan, R.R., Hung, P., Date, S.V., Marcotte, E., Hood, L. and Ng, W.V. (2004) Genome sequence of Haloarcula marismortui: a halophilic archaeon from the Dead Sea. Genome Research, 14, 2221-2234.
Bauer, S., Huber, R., Steinbacher, S., Kemter, K., Bacher, A. and Fischer, M. (2002) Crystal structure of Schizosaccharomyces pombe riboflavin kinase. Flavins and Flavoproteins 2002, Proceedings of the International Symposium, 14th, Cambridge, United Kingdom, July 14-18, 2002, 33-38.
Besir, H.M.T., LMU. (2001) Investigation of lipid-mediated crystallization of the ion pumps bacteriorhodopsin and halorhodopsin from H. salinarum. Chemistry and Pharmacie. Ludwig-Maximilians-Universität, Munich.
Bieger, B., Essen, L.O. and Oesterhelt, D. (2003) Crystal structure of halophilic dodecin: A novel, dodecameric flavin binding protein from Halobacterium salinarum. Structure, 11, 375-385.
Bonnete, F., Ebel, C., Zaccal, G. and Eisenberg, H. (1993) Biophysical study of halophilic malate dehydrogenase in solution: Revised subunit structure and solvent interactions of native and recombinant enzyme. Journal of the Chemical Society, Faraday Transactions, 89, 2659-2666.
Bremer, E. and Kramer, R. (2000) Coping with osmotic challenges: Osmoregulation through accumulation and release of compatible solutes in bacteria. ASM Press, Washington D. C.
Britton, K.L., Stillman, T.J., Yip, K.S.P., Forterre, P., Engel, P.C. and Rice, D.W. (1998) Insights into the molecular basis of salt tolerance from the study of glutamate dehydrogenase from Halobacterium salinarum. Journal of Biological Chemistry, 273, 9023-9030.
Brochier, C., Gribaldo, S., Zivanovic, Y., Confaloniere, F., Forterre, P. (2005) Nanoarchaea: representatives of a novel archaeal phylum of a fast-evolving euryarchaeal lineage related to Thermococcales? Genome Biology, 6, 6:R42
Brunger, A.T., Adams, P.D., Clore, G.M., DeLano, W.L., Gros, P., Grosse-Kunstleve, R.W., Jiang, J.S., Kuszewski, J., Nilges, M., Pannu, N.S., Read, R.J., Rice, L.M., Simonson, T. and Warren, G.L. (1998) Crystallography & NMR system: A new software suite for macromolecular structure determination. Acta Crystallographica, Section D: Biological crystallography, 54, 905-921.
Byrdin, M., Eker, A.P.M., Vos, M.H. and Brettel, K. (2003) Dissection of the triple tryptophan electron transfer chain in Escherichia coli DNA photolyase: Trp382 is the primary donor in photoactivation. Proceedings of the National Academy of Sciences of the United States of America, 100, 8676-8681.
Cecchini, G. (2003) Function and structure of complex II of the respiratory chain. Annual Review of Biochemistry, 72, 77-109.
Chosrowjan, H., Taniguchi, S., Mataga, N., Tanaka, F. and Visser, A.J.W.G. (2003) The stacked flavin adenine dinucleotide conformation in water is fluorescent on picosecond timescale. Chemical Physics Letters, 378, 354-358.
Cline, S.W., Lam, W.L., Charlebois, R.L., Schalkwyk, L.C. and Doolittle, W.F. (1989) Transformation methods for halophilic archaebacteria. Canadian Journal of Microbiology, 35, 148-152.
Crosson, S. and Moffat, K. (2002) Photoexcited structure of a plant photoreceptor domain reveals a light-driven molecular switch. Plant Cell, 14, 1067-1075.
Cunningham, O., Gore, M.G. and Mantle, T.J. (2000) Initial-rate kinetics of the flavin reductase reaction catalyzed by human biliverdin-IXb reductase (BVR-B). Biochemical Journal, 345, 393-399.
Danson, M.J. (1988) Archaebacteria: the comparative enzymology of their central metabolic pathways. Advances in Microbial Physiology, 29, 165-231.
Dym, O. and Eisenberg, D. (2001) Sequence-structure analysis of FAD-containing proteins. Protein Science, 10, 1712-1728.
Fieschi, F., Niviere, V., Frier, C., Decout, J.L. and Fontecave, M. (1995) The mechanism and substrate specificity of the NADPH:flavin oxidoreductase from Escherichia coli. Journal of Biological Chemistry, 270, 30392-30400.
Foraker, A.B., Khantwal, C.M. and Swaan, P.W. (2003) Current perspectives on the cellular uptake and trafficking of riboflavin. Advanced drug delivery reviews, 55, 1467-83.
References
121
Frolow, F., Harel, M., Sussman, J.L., Mevarech, M. and Shoham, M. (1996) Insights into protein adaptation to a saturated salt environment from crystal structure of a halophilic 2Fe-2S ferredoxin. Nature Structural Biology, 3, 452-458.
Fuller, T.E. and Mulks, M.H. (1995) Characterization of Actinobacillus pleuropneumoniae riboflavin biosynthesis genes. Journal of Bacteriology, 177, 7265-7270.
Gerhardt, S., Haase, I., Steinbacher, S., Kaiser, J.T., Cushman, M., Bacher, A., Huber, R. and Fischer, M. (2002) The structural basis of riboflavin binding to Schizosaccharomyces pombe 6,7-dimethyl-8-ribityllumazine synthase. Journal of Molecular Biology, 318, 1317-1329.
Gerhardt, S., Steinbacher, S., Kaiser, J.T., Huber, R., Haase, I., Bacher, A., Fischer, M. and Cushman, M. (2002) The crystal structure of lumazine synthase from Schizosaccharomyces pombe reveals its binding mode to riboflavin. Flavins and Flavoproteins 2002, Proceedings of the International Symposium, 14th, Cambridge, United Kingdom, July 14-18, 2002, 857-862.
Graham, D.E., Xu, H. and White, R.H. (2002) A member of a new class of GTP cyclohydrolases produces formylaminopyrimidine nucleotide monophosphates. Biochemistry, 41, 15074-15084.
Gross, E., Kastner, D.B., Kaiser, C.A. and Fass, D. (2004) Structure of Ero1p, source of disulfide bonds for oxidative protein folding in the cell. Cell (Cambridge, MA, United States), 117, 601-610.
Gross, E., Sevier, C.S., Vala, A., Kaiser, C.A. and Fass, D. (2002) A new FAD-binding fold and intersubunit disulfide shuttle in the thiol oxidase Erv2p. Nature Structural Biology, 9, 61-67.
Harper, S.M., Neil, L.C. and Gardner, K.H. (2003) Structural basis of a phototropin light switch. Science (Washington, DC, United States), 301, 1541-1544.
Hartmann, R., Sickinger, H.D. and Oesterhelt, D. (1977) Quantitative aspects of energy conversion in halobacteria. FEBS Letters, 82, 1-6.
Heelis, P.F. (1991) The photochemistry of flavins. CRC Press, Boca Raton. Holleman, A.F. (1995) Lehrbuch der Anorganischen Chemie. de Gruyter, Berlin, New York. Holzer, W., Shirdel, J., Zirak, P., Penzkofer, A., Hegemann, P., Deutzmann, R. and Hochmuth, E. (2004)
Photoinduced degradation of some flavins in aqueous solution. Chemical Physics, 308, 69-78. Huber, H., Hohn, M.J., Rachel, R., Fuchs, T., Wimmer, V., Stetter, K.O. (2002) A new phylum of Archaea
represented by a nanosized hyperthermophilic symbiont. Nature, 417, 63-67 Ingelman, M., Ramaswamy, S., Niviere, V., Fontecave, M. and Eklund, H. (1999) Crystal structure of
NAD(P)H:flavin oxidoreductase from Escherichia coli. Biochemistry, 38, 7040-7049. Jaenicke, R. (1991) Protein stability and molecular adaptation to extreme conditions. European Journal of
Biochemistry, 202, 715-728. Jones, T.A., Zou, J.Y., Cowan, S.W. and Kjeldgaard, M. (1991) Improved methods for building protein models
in electron density maps and the location of errors in these models. Acta Crystallographica, Section A: Foundations of Crystallography, A47, 110-119.
Kabsch, W. (1988) Automatic indexing of rotation diffraction patterns. Journal of Applied Crystallography, 21, 67-71.
Kainosho, M. and Kyogoku, Y. (1972) High-resolution proton and phosphorus nuclear magnetic resonance spectra of flavine adenine dinucleotide and its conformation in aqueous solution. Biochemistry, 11, 741-752.
Karthikeyan, S., Zhou, Q., Mseeh, F., Grishin, N.V., Osterman, A.L. and Zhang, H. (2003) Crystal Structure of Human Riboflavin Kinase Reveals a b Barrel Fold and a Novel Active Site Arch. Structure (Cambridge, MA, United States), 11, 265-273.
Kempf, B. and Bremer, E. (1998) Uptake and synthesis of compatible solutes as microbial stress responses to high-osmolality environments. Archives of Microbiology, 170, 319-330.
Knapp, S., Ladenstein, R. and Galinski, E.A. (1999) Extrinsic protein stabilization by the naturally occurring osmolytes b-hydroxyectoine and betaine. Extremophiles, 3, 191-198.
Koch, M.K. and Oesterhelt, D. (2005) MpcT is the transducer for membrane potential changes in Halobacterium salinarum. Molecular Microbiology, 55, 1681-1694.
Kotowycz, G., Teng, N., Klein, M.P. and Calvin, M. (1969) 220 MHz nuclear magnetic resonance study of a solvent-induced conformational change in flavin adenine dinucleotide. Journal of Biological Chemistry, 244, 5656-5662.
Kumar, S.A. and Vaidyanathan, C.S. (1964) Hydrolysis of riboflavine in plants. Biochimica et Biophysica Acta, 89, 127-136.
Lanyi, J.K. (1974) Salt-dependent properties of proteins from extremely halophilic bacteria. Bacteriological Reviews, 38, 272-290.
Li, H.-W. and Yeung, E.S. (2005) Single-molecule dynamics of conformational changes in flavin adenine dinucleotide. Journal of Photochemistry and Photobiology, A: Chemistry, 172, 73-79.
Liao, D.I., Wawrzak, Z., Calabrese, J.C., Viitanen, P.V. and Jordan, D.B. (2001) Crystal Structure of Riboflavin Synthase. Structure (Cambridge, MA, United States), 9, 399-408.
Lostao, A., El Harrous, M., Daoudi, F., Romero, A., Parody-Morreale, A. and Sancho, J. (2000) Dissecting the energetics of the apoflavodoxin-FMN complex. Journal of Biological Chemistry, 275, 9518-9526.
References
122
Lostao, A., Gomez-Moreno, C., Mayhew, S.G. and Sancho, J. (1997) Differential stabilization of the three FMN redox forms by tyrosine 94 and tryptophan 57 in flavodoxin from Anabaena and its influence on the redox potentials. Biochemistry, 36, 14334-14344.
Louie, T.M., Yang, H., Karnchanaphanurach, P., Xie, X.S. and Xun, L. (2002) FAD Is a Preferred Substrate and an Inhibitor of Escherichia coli General NAD(P)H:Flavin Oxidoreductase. Journal of Biological Chemistry, 277, 39450-39455.
Madern, D., Ebel, C. and Zaccai, G. (2000) Halophilic adaptation of enzymes. Extremophiles: life under extreme conditions, 4, 91-98.
Madern, D., Pfister, C. and Zaccai, G. (1995) Mutation at a single acidic amino acid enhances the halophilic behaviour of malate dehydrogenase from Haloarcula marismortui in physiological salts. European journal of biochemistry, 230, 1088-1095.
Marg, B.-L., Schweimer, K., Sticht, H. and Oesterhelt, D. (2005) A Two-a-Helix Extra Domain Mediates the Halophilic Character of a Plant-Type Ferredoxin from Halophilic Archaea. Biochemistry, 44, 29-39.
Martin, C.B., Tsao, M.-L., Hadad, C.M. and Platz, M.S. (2002) The Reaction of Triplet Flavin with Indole. A Study of the Cascade of Reactive Intermediates Using Density Functional Theory and Time Resolved Infrared Spectroscopy. Journal of the American Chemical Society, 124, 7226-7234.
Massey, V. (2000) The chemical and biological versatility of riboflavin. Biochemical Society Transactions, 28, 283-296.
Mees, A., Klar, T., Gnau, P., Hennecke, U., Eker, A.P.M., Carell, T. and Essen, L.-O. (2004) Crystal structure of a photolyase bound to a CPD-like DNA lesion after in situ repair. Science (Washington, DC, United States), 306, 1789-1793.
Mewies, M., McIntire, W.S. and Scrutton, N.S. (1998) Covalent attachement of flavin adenine dinucleotide (FAD) and flavin mononucleotide to enzymes: The current state of affairs. Protein Science, 7, 7-20.
Michel, H. and Oesterhelt, D. (1976) Light-induced changes of the pH gradient and the membrane potential in H. halobium. FEBS Letters, 65, 175-178.
Miller, S.G. and Silhacek, D.L. (1993) Properties of two hemolymph riboflavin-binding proteins from Heliothis virescens. Insect Biochemistry and Molecular Biology, 23, 413-420.
Monaco, H.L. (1997) Crystal structure of chicken riboflavin-binding protein. EMBO Journal, 16, 1475-1483. Murshudov, G.N., Vagin, A.A. and Dodson, E.J. (1997) Refinement of macromolecular structures by the
maximum-likelihood method. Acta Crystallographica, Section D: Biological Crystallography, D53, 240-255.
Ng, W.V., Kennedy, S.P., Mahairas, G.G., Berquist, B., Pan, M., Shukla, H.D., Lasky, S.R., Baliga, N.S., Thorsson, V., Sbrogna, J., Swartzell, S., Weir, D., Hall, J., Dahl, T.A., Welti, R., Goo, Y.A., Leithauser, B., Keller, K., Cruz, R., Danson, M.J., Hough, D.W., Maddocks, D.G., Jablonski, P.E., Krebs, M.P., Angevine, C.M., Dale, H., Isenbarger, T.A., Peck, R.F., Pohlschroder, M., Spudich, J.L., Jung, K.-H., Alam, M., Freitas, T., Hou, S., Daniels, C.J., Dennis, P.P., Omer, A.D., Ebhardt, H., Lowe, T.M., Liang, P., Riley, M., Hood, L. and DasSarma, S. (2000) Genome sequence of Halobacterium species NRC-1. Proceedings of the National Academy of Sciences of the United States of America, 97, 12176-12181.
Noell, G., Kozma, E., Grandori, R., Carey, J., Schoedl, T., Hauska, G. and Daub, J. (2006) Spectroelectrochemical Investigation of a Flavoprotein with a Flavin-Modified Gold Electrode. Langmuir, 22, 2378-2383.
Nogues, I., Campos, L.A., Sancho, J., Gomez-Moreno, C., Mayhew, S.G. and Medina, M. (2004) Role of Neighboring FMN Side Chains in the Modulation of Flavin Reduction Potentials and in the Energetics of the FMN:Apoprotein Interaction in Anabaena Flavodoxin. Biochemistry, 43, 15111-15121.
Nyyssola, A., Kerovuo, J., Kaukinen, P., von Weymurni, N. and Reinikainen, T. (2000) Extreme halophiles synthesize betaine from glycine by methylation. Journal of Biological Chemistry, 275, 22196-22201.
Oesterhelt, D. and Krippahl, G. (1983) Phototrophic growth of halobacteria and its use for isolation of photosynthetically-deficient mutants. Annales de Microbiologie (Paris), 134B, 137-50.
Park, H.-W., Kim, S.-T., Sancar, A. and Deisenhofer, J. (1995) Crystal structure of DNA photolyase from Escherichia coli. Science (Washington, D. C.), 268, 1866-1872.
Pereira, P.J.B., Macedo-Ribeiro, S., Parraga, A., Perez-Luque, R., Cunningham, O., Darcy, K., Mantle, T.J. and Coll, M. (2001) Structure of human biliverdin IXb reductase, an early fetal bilirubin IXb producing enzyme. Nature Structural Biology, 8, 215-220.
Pieper, U., Kapadia, G., Mevarech, M. and Herzberg, O. (1998) Structural features of halophilicity derived from the crystal structure of dihydrofolate reductase from the Dead Sea halophilic archaeon, Haloferax volcanii. Structure (London), 6, 75-88.
Ramana Murthy, C.V. and Adiga, P.R. (1982) Isolation and characterization of a riboflavin-carrier protein from human pregnancy serum. Biochemistry International, 5, 289-296.
Raszka, M. and Kaplan, N.O. (1974) Intramolecular hydrogen bonding in flavine adenine dinucleotide. Proceedings of the National Academy of Sciences of the United States of America, 71, 4546-50.
Salbeck, J. (1993) Spectroelectrochemical thin-layer cell for nonaqueous solvent systems. Analytical Chemistry, 65, 2169-2173.
References
123
Sarkar, G. and Sommer, S.S. (1990) The "megaprimer" method of site-directed mutagenesis. BioTechniques, 8, 404-407.
Sarma, R.H., Dannies, P. and Kaplan, N.O. (1968) Investigations of inter- and intramolecular interactions in flavine-adenine dinucleotide by proton magnetic resonance. Biochemistry, 7, 4359-67.
Serre, L., Vellieux, F.M.D., Medina, M., Gomez-Moreno, C., Fontecilla-Camps, J.C. and Frey, M. (1996) X-ray structure of the ferredoxin:NADP+ reductase from the cyanobacterium Anabaena PCC 7119 at 1.8.ANG. resolution, and crystallographic studies of NADP+ binding at 2.25.ANG. resolution. Journal of Molecular Biology, 263, 20-39.
Sikorska, E., Khmelinskii, I.V., Prukala, W., Williams, S.L., Patel, M., Worrall, D.R., Bourdelande, J.L., Koput, J. and Sikorski, M. (2004) Spectroscopy and Photophysics of Lumiflavins and Lumichromes. Journal of Physical Chemistry A, 108, 1501-1508.
Sikorska, E., Sikorski, M., Steer, R.P., Wilkinson, F. and Worrall, D.R. (1998) Efficiency of singlet oxygen generation by alloxazines and isoalloxazines. Journal of the Chemical Society, Faraday Transactions, 94, 2347-2353.
Sikorski, M., Sikorska, E., Koziolowa, A., Gonzalez Moreno, R., Bourdelande, J.L., Steer, R.P. and Wilkinson, F. (2001) Photophysical properties of lumichromes in water. Journal of Photochemistry and Photobiology, B: Biology, 60, 114-119.
Stockman, B.J., Richardson, T.E. and Swenson, R.P. (1994) Structural changes caused by site-directed mutagenesis of tyrosine-98 in Desulfovibrio vulgaris flavodoxin delineated by 1H and 15N NMR spectroscopy: implications for redox potential modulation. Biochemistry, 33, 15298-15308.
Swenson, R.P. and Krey, G.D. (1994) Site-directed mutagenesis of tyrosine-98 in the flavodoxin from Desulfovibrio vulgaris (Hildenborough): regulation of oxidation-reduction properties of the bound FMN cofactor by aromatic, solvent, and electrostatic interactions. Biochemistry, 33, 8505-8514.
Tebbe, A., Klein, C., Bisle, B., Siedler, F., Scheffer, B., Garcia-Rizo, C., Wolfertz, J., Hickmann, V., Pfeiffer, F. and Oesterhelt, D. (2005) Analysis of the cytosolic proteome of Halobacterium salinarum and its implication for genome annotation. Proteomics, 5, 168-179.
Truffault, V., Coles, M., Diercks, T., Abelmann, K., Eberhardt, S., Luttgen, H., Bacher, A. and Kessler, H. (2001) The solution structure of the N-terminal domain of riboflavin synthase. Journal of Molecular Biology, 309, 949-960.
Tsukamoto, S., Kato, H., Hirota, H. and Fusetani, N. (1999) Lumichrome: a larval metamorphosis-inducing substance in the ascidian Halocynthia roretzi. European Journal of Biochemistry, 264, 785-789.
Uehara, K., Mizoguchi, T., Hosomi, S., Fujiwara, T. and Tomita, K. (1968) Formation of the crystalline molecular complex of riboflavin and adenine. The Journal of Biochemistry (Tokyo), 64, 589-93.
Ueno, K. and Natori, S. (1987) Possible involvement of lumichrome in the binding of storage protein to its receptor in Sarcophaga peregrina. Journal of Biological Chemistry, 262, 12780-12784.
Vallon, O. (2000) New sequence motifs in flavoproteins: evidence for common ancestry and tools to predict structure. Proteins: Structure, Function, and Genetics, 38, 95-114.
van den Berg, P.A.W., Feenstra, K.A., Mark, A.E., Berendsen, H.J.C. and Visser, A.J.W.G. (2002) Dynamic Conformations of Flavin Adenine Dinucleotide: Simulated Molecular Dynamics of the Flavin Cofactor Related to the Time-Resolved Fluorescence Characteristics. Journal of Physical Chemistry B, 106, 8858-8869.
Visser, A.J.W.G. (1984) Kinetics of stacking interactions in flavin adenine dinucleotide from time-resolved flavin fluorescence. Photochemistry and Photobiology, 40, 703-6.
Voet, D. and Rich, A. (1971) Crystal and molecular structure of an intermolecular complex between riboflavine and an adenosine derivative. Proceedings of the National Academy of Sciences of the United States of America, 68, 1151-1156.
Voet, D., Voet, J.G. and Pratt, C.W. (1999) Fundamentals in Biochemistry. John Wiliey and Sons, Inc. Walsh, M.A., McCarthy, A., O'Farrell, P.A., McArdle, P., Cunningham, P.D., Mayhew, S.G. and Higgins, T.M.
(1998) X-ray crystal structure of the Desulfovibrio vulgaris (Hildenborough) apoflavodoxin-riboflavin complex. European Journal of Biochemistry, 258, 362-371.
Wang, W., Kim, R., Yokota, H. and Kim, S.-H. (2004) Crystal structure of flavin binding to FAD synthetase of Thermotoga maritima. Proteins: Structure, Function, and Bioinformatics, 58, 246-248.
Waters, E., Hohn M.J., Ahel, I., Graham, D.E., Adams, M.D., Barnstead, M., Beeson, K.Y., Bibbs, L., Bolanos, R., Keller, M., Kretz, K., Xiaoying, L., Mathur, E., Ni, J., Podar, M., Richardson, T., Sutton, G.G., Simon, M., Söll, D., Stetter, K.O., Short, J.M., Noordewier, M. (2003) The genome of Nanoarchaeum equitans: Insights into early archaeal evolution and derived parasitism. Proceedings of the National Academy of Sciences of the United States of America, 100, 12984-12988
Watson, C.D. and Ford, H.C. (1988) High-affinity binding of riboflavin and FAD by immunoglobulins from normal human serum. Biochemistry International, 16, 1067-1074.
Weber, G. (1948) Quenching of fluorescence in liquids by complex formation. Determination of the mean life of the complex. Transactions of the Faraday Society, 44, 185-189.
Weber, G. (1950) Fluorescence of riboflavin and flavin adenine dinucleotide. Biochemical Journal, 47, 114-21.
References
124
White, H.B., III and Merrill, A.H., Jr. (1988) Riboflavin-binding proteins. Annual Review of Nutrition, 8, 279-299.
Woese, C.R. and Fox, G.E. (1977) The concept of cellular evolution. Journal of molecular evolution, 10, 1-6. Woese, C.R. and Olsen, G.J. (1986) Archaebacterial phylogeny: perspectives on the urkingdoms. Systematic and
applied microbiology, 7, 161-177. Yanagita, T. and Foster, J.W. (1956) A bacterial riboflavine hydrolase. Journal of Biological Chemistry, 221,
593-607. Zaccai, G. and Eisenberg, H. (1990) Halophilic proteins and the influence of solvent on protein stabilization.
Trends in Biochemical Sciences, 15, 333-337. Zhong, D. and Zewail, A.H. (2001) Femtosecond dynamics of flavoproteins: Charge separation and
recombination in riboflavin (vitamin B2)-binding protein and in glucose oxidase enzyme. Proceedings of the National Academy of Sciences of the United States of America, 98, 11867-11872.
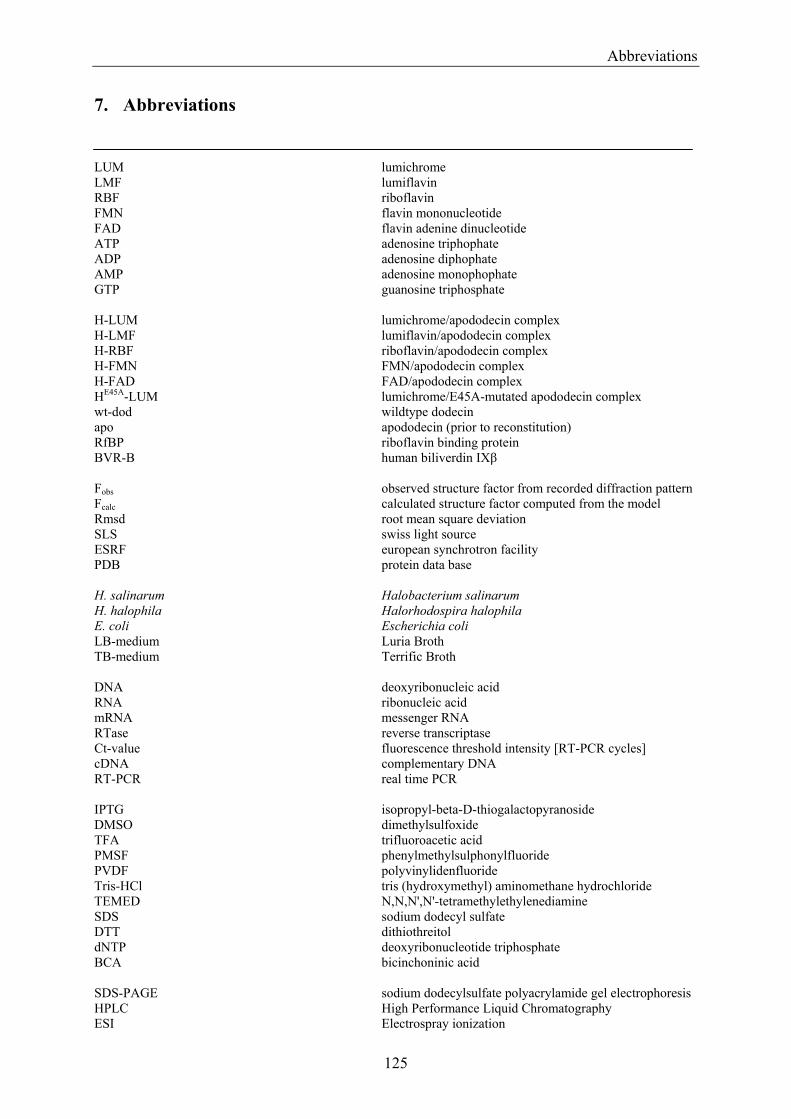
Abbreviations
125
7. Abbreviations
LUM lumichrome LMF lumiflavin RBF riboflavin FMN flavin mononucleotide FAD flavin adenine dinucleotide ATP adenosine triphophate ADP adenosine diphophate AMP adenosine monophophate GTP guanosine triphosphate H-LUM lumichrome/apododecin complex H-LMF lumiflavin/apododecin complex H-RBF riboflavin/apododecin complex H-FMN FMN/apododecin complex H-FAD FAD/apododecin complex HE45A-LUM lumichrome/E45A-mutated apododecin complex wt-dod wildtype dodecin apo apododecin (prior to reconstitution) RfBP riboflavin binding protein BVR-B human biliverdin IXβ Fobs observed structure factor from recorded diffraction pattern Fcalc calculated structure factor computed from the model Rmsd root mean square deviation SLS swiss light source ESRF european synchrotron facility PDB protein data base H. salinarum Halobacterium salinarum H. halophila Halorhodospira halophila E. coli Escherichia coli LB-medium Luria Broth TB-medium Terrific Broth DNA deoxyribonucleic acid RNA ribonucleic acid mRNA messenger RNA RTase reverse transcriptase Ct-value fluorescence threshold intensity [RT-PCR cycles] cDNA complementary DNA RT-PCR real time PCR IPTG isopropyl-beta-D-thiogalactopyranoside DMSO dimethylsulfoxide TFA trifluoroacetic acid PMSF phenylmethylsulphonylfluoride PVDF polyvinylidenfluoride Tris-HCl tris (hydroxymethyl) aminomethane hydrochloride TEMED N,N,N',N'-tetramethylethylenediamine SDS sodium dodecyl sulfate DTT dithiothreitol dNTP deoxyribonucleotide triphosphate BCA bicinchoninic acid SDS-PAGE sodium dodecylsulfate polyacrylamide gel electrophoresis HPLC High Performance Liquid Chromatography ESI Electrospray ionization
Abbreviations
126
MS mass spectrometry KNF-model model of Koshland, Nemethy, and Filmer KD dissociation constant n.m. not measurable with the standard methods n.d not determined Å Ångstrom V voltage A ampere rt room temperature
Acknowledgement
127
8. Acknowledgement
An erster Stelle danke ich meinem Doktorvater, Herrn Prof. Dieter Oesterhelt, für die
Möglichkeit meine Doktorarbeit unter seiner Betreuung anfertigen zu können. Viele
Diskussionen ermöglichten mir, seine Annäherungen an wissenschaftliche Fragestellungen zu
erfahren und zu erlernen. Ich freue mich in erweitertem Verantwortungsbereich in dieser
Abteilung bleiben zu können.
Auch Herrn Dr. Kornelius Zeth bin ich zu großen Dank verpflichtet. Die
Röntgenstrukturanalyse hat in meiner Arbeit einen großen Stellenwert. Für den strukturellen
Zugang zur Klärung der Funktion des Dodecins ist er maßgeblich verantwortlich. In
unerschöpflicher Geduld hat er mich in die Röntgenstrukturanalyse eingeführt und damit auch
meiner wissenschaftlichen Weiterentwicklung eine Richtung gegeben. In den ersten Monaten
war Frau Ursel Heider die für mich wohl wichtigste Anlaufstelle bei Fragen zu biochemischen
Methoden und der Organisation des Instituts beziehungsweise der Abteilung. Vielen
herzlichen Dank dafür und auch für die Erledigung von Bestellungen und Abrechnungen über
die mehr als dreieinhalb Jahre. An dieser Stelle danke ich auch meinen Laborkollegen, die
nach und nach zum Labor stießen: Petra Wollmann, Thomas Meins, Steffi Bleicken, Iris
Asen, Dr. Reinhard Albrecht und Kiki Weyrauch (mit bestem Wissen gereiht nach dem Tag
des Erscheinens) – es war eine nette Zeit. Außerhalb des Labors gibt es viele, die immer
wieder unterstützend gewirkt haben, wie Walter Erhard, Silvia Haslbeck, Dr. Frank Siedler,
Siggi Bauer, Dr. Peter Palm und Dr. Friedhelm Pfeiffer. Für meine Arbeit besonders wichtig
war Frau Lissy Weyher. Als Mitarbeiterin der anfangs noch Gruppe Moroder und schließlich
der Core Facility des Hauses, hat sie unzählige Male „mein“ Dodecin vermessen, damit ich
sicher gehen konnte mit den richtigen Konstrukten zu arbeiten. Auch war sie die erste, die mit
mir die Liganden des Dodecins in vivo bestimmte. Ergebnisse gab es bei Lissy immer sofort,
auch wenn diese Eile nicht notwendig war. Ich hatte zudem eine Reihe von Praktikanten, die
mir hilfreich zur Seite standen. Da gab es die große Fraktion der Tübinger Studenten, Marc
Siegert, Julia Schramm, Friederike Gieseke, Max Joesch, Florian Seiler, Oliver Schmidt,
Gabor Meser, Stefan Ebener und (2x) Evy Sauer, sowie den Praktikanten Ingo Brandt aus
Heidelberg und die Praktikantin und spätere Diplomandin Sibylle Trawöger aus Linz. Alle
waren gut und einige ausgezeichnet. Danken möchte hierbei Gabor Meser, der meine
Bindungskonstanten-Berechnungen durchdachte und auf mathematische Konsistenz prüfte.
Nicht bei allen Praktikanten war die Arbeit auf das Ziel „Klärung der Funktion des Dodecins“
ausgerichtet. Vor allem ist hier die Arbeiten von Sibylle Trawöger zu nennen, die auf eine
Acknowledgement
128
bio-/nanotechnologische Anwendung von Dodecin abzielte und in meine Doktorarbeit nicht
eingegangen ist. Es handelt sich um ein Projekt mit Herrn Dr. Gilbert Nöll, dem ich für viele
erschöpfende Gespräche und Labortage danken will. Es gibt einige, denen ich im
Zusammenhang mit dem Schriftstück „Doktorarbeit“ danken möchte: (1) Dem Erstleser
Herrn Dr. Jörg Tittor, der die Rohversion als sachlich korrekt beurteilte, beziehungsweise
mikrobiologische Fehler ausmerzte. (2) Peter Reichelt, der meinem Englisch die ersten
Schnitzer nahm und (3) vor allem Frau Dr. Ann-Katrin Werenskiold. Sie hat sich viel Zeit
genommen, zuerst beim Korrigieren und schließlich beim Durchgehen jeder ihrer
Verbesserungen. (4) Petra danke ich fürs Lay-out.
Einigen Menschen möchte ich danken, die wichtig für den von mir gewählten Weg waren. Da
gab es zwei Lehrer, Herrn Mag. Herbert Kirschner und Herrn Mag. Hans Gattringer. Hans
war mein Chemie-Lehrer und in Matura-Vorbereitungsstunden hat er mir begeistert und
begeisternd als erster Biochemie näher gebracht und mich so auch fürs Chemie-Studium
gewonnen. Während meines Studium wurde ich sehr wohlwollend vom Institut für
Organische Chemie (TU Graz) unterstützt. Besonders möchte ich mich bei Herrn Prof.
Herbert Hönig und Herrn Prof. Karl Dax bedanken. Eine der wichtigsten Personen in der
Endphase meines Studiums war Herr Dr. Martin Albert. Martin war mein Betreuer in Graz
und Weggefährte in Mülheim an der Ruhr bei Herrn Prof. Alois Fürstner. Wir haben viel
gemeinsam gemacht und er hat mich mit seiner Neugierde angesteckt. Zuletzt sei noch
Familie und Freunden gedankt: Meinen Eltern, Lieblingsschwester und Lieblingsbruder danke
ich für alles. Ihnen möchte ich meine Arbeit widmen. Mit Petra und Lara freue ich mich auf
vieles was noch kommt. Meiner erweiterten Familie soll die deutsche Zusammenfassung
zeigen, was ich die letzte Zeit gemacht habe, wenn ich nicht zu Hause in Österreich war.
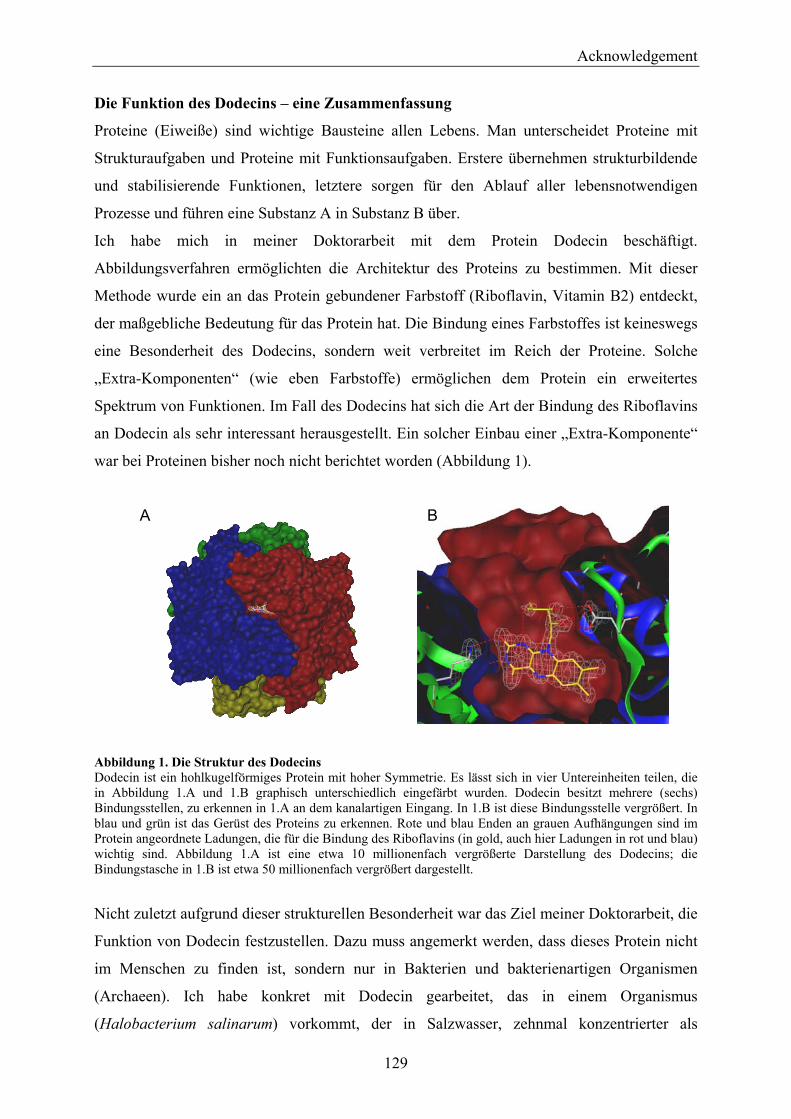
Acknowledgement
129
Die Funktion des Dodecins – eine Zusammenfassung
Proteine (Eiweiße) sind wichtige Bausteine allen Lebens. Man unterscheidet Proteine mit
Strukturaufgaben und Proteine mit Funktionsaufgaben. Erstere übernehmen strukturbildende
und stabilisierende Funktionen, letztere sorgen für den Ablauf aller lebensnotwendigen
Prozesse und führen eine Substanz A in Substanz B über.
Ich habe mich in meiner Doktorarbeit mit dem Protein Dodecin beschäftigt.
Abbildungsverfahren ermöglichten die Architektur des Proteins zu bestimmen. Mit dieser
Methode wurde ein an das Protein gebundener Farbstoff (Riboflavin, Vitamin B2) entdeckt,
der maßgebliche Bedeutung für das Protein hat. Die Bindung eines Farbstoffes ist keineswegs
eine Besonderheit des Dodecins, sondern weit verbreitet im Reich der Proteine. Solche
„Extra-Komponenten“ (wie eben Farbstoffe) ermöglichen dem Protein ein erweitertes
Spektrum von Funktionen. Im Fall des Dodecins hat sich die Art der Bindung des Riboflavins
an Dodecin als sehr interessant herausgestellt. Ein solcher Einbau einer „Extra-Komponente“
war bei Proteinen bisher noch nicht berichtet worden (Abbildung 1).
Abbildung 1. Die Struktur des Dodecins Dodecin ist ein hohlkugelförmiges Protein mit hoher Symmetrie. Es lässt sich in vier Untereinheiten teilen, die in Abbildung 1.A und 1.B graphisch unterschiedlich eingefärbt wurden. Dodecin besitzt mehrere (sechs) Bindungsstellen, zu erkennen in 1.A an dem kanalartigen Eingang. In 1.B ist diese Bindungsstelle vergrößert. In blau und grün ist das Gerüst des Proteins zu erkennen. Rote und blau Enden an grauen Aufhängungen sind im Protein angeordnete Ladungen, die für die Bindung des Riboflavins (in gold, auch hier Ladungen in rot und blau) wichtig sind. Abbildung 1.A ist eine etwa 10 millionenfach vergrößerte Darstellung des Dodecins; die Bindungstasche in 1.B ist etwa 50 millionenfach vergrößert dargestellt.
Nicht zuletzt aufgrund dieser strukturellen Besonderheit war das Ziel meiner Doktorarbeit, die
Funktion von Dodecin festzustellen. Dazu muss angemerkt werden, dass dieses Protein nicht
im Menschen zu finden ist, sondern nur in Bakterien und bakterienartigen Organismen
(Archaeen). Ich habe konkret mit Dodecin gearbeitet, das in einem Organismus
(Halobacterium salinarum) vorkommt, der in Salzwasser, zehnmal konzentrierter als
A B
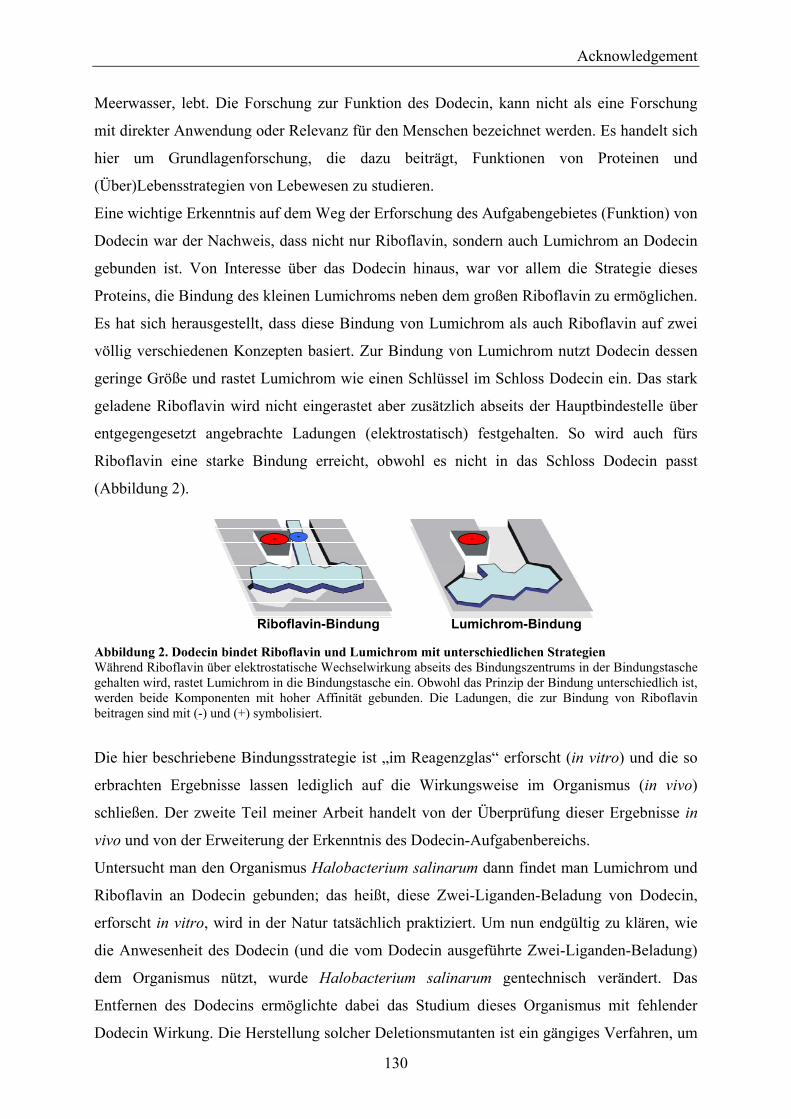
Acknowledgement
130
Meerwasser, lebt. Die Forschung zur Funktion des Dodecin, kann nicht als eine Forschung
mit direkter Anwendung oder Relevanz für den Menschen bezeichnet werden. Es handelt sich
hier um Grundlagenforschung, die dazu beiträgt, Funktionen von Proteinen und
(Über)Lebensstrategien von Lebewesen zu studieren.
Eine wichtige Erkenntnis auf dem Weg der Erforschung des Aufgabengebietes (Funktion) von
Dodecin war der Nachweis, dass nicht nur Riboflavin, sondern auch Lumichrom an Dodecin
gebunden ist. Von Interesse über das Dodecin hinaus, war vor allem die Strategie dieses
Proteins, die Bindung des kleinen Lumichroms neben dem großen Riboflavin zu ermöglichen.
Es hat sich herausgestellt, dass diese Bindung von Lumichrom als auch Riboflavin auf zwei
völlig verschiedenen Konzepten basiert. Zur Bindung von Lumichrom nutzt Dodecin dessen
geringe Größe und rastet Lumichrom wie einen Schlüssel im Schloss Dodecin ein. Das stark
geladene Riboflavin wird nicht eingerastet aber zusätzlich abseits der Hauptbindestelle über
entgegengesetzt angebrachte Ladungen (elektrostatisch) festgehalten. So wird auch fürs
Riboflavin eine starke Bindung erreicht, obwohl es nicht in das Schloss Dodecin passt
(Abbildung 2).
Abbildung 2. Dodecin bindet Riboflavin und Lumichrom mit unterschiedlichen Strategien Während Riboflavin über elektrostatische Wechselwirkung abseits des Bindungszentrums in der Bindungstasche gehalten wird, rastet Lumichrom in die Bindungstasche ein. Obwohl das Prinzip der Bindung unterschiedlich ist, werden beide Komponenten mit hoher Affinität gebunden. Die Ladungen, die zur Bindung von Riboflavin beitragen sind mit (-) und (+) symbolisiert.
Die hier beschriebene Bindungsstrategie ist „im Reagenzglas“ erforscht (in vitro) und die so
erbrachten Ergebnisse lassen lediglich auf die Wirkungsweise im Organismus (in vivo)
schließen. Der zweite Teil meiner Arbeit handelt von der Überprüfung dieser Ergebnisse in
vivo und von der Erweiterung der Erkenntnis des Dodecin-Aufgabenbereichs.
Untersucht man den Organismus Halobacterium salinarum dann findet man Lumichrom und
Riboflavin an Dodecin gebunden; das heißt, diese Zwei-Liganden-Beladung von Dodecin,
erforscht in vitro, wird in der Natur tatsächlich praktiziert. Um nun endgültig zu klären, wie
die Anwesenheit des Dodecin (und die vom Dodecin ausgeführte Zwei-Liganden-Beladung)
dem Organismus nützt, wurde Halobacterium salinarum gentechnisch verändert. Das
Entfernen des Dodecins ermöglichte dabei das Studium dieses Organismus mit fehlender
Dodecin Wirkung. Die Herstellung solcher Deletionsmutanten ist ein gängiges Verfahren, um
Lumichrom-BindungRiboflavin-Bindung
- + -
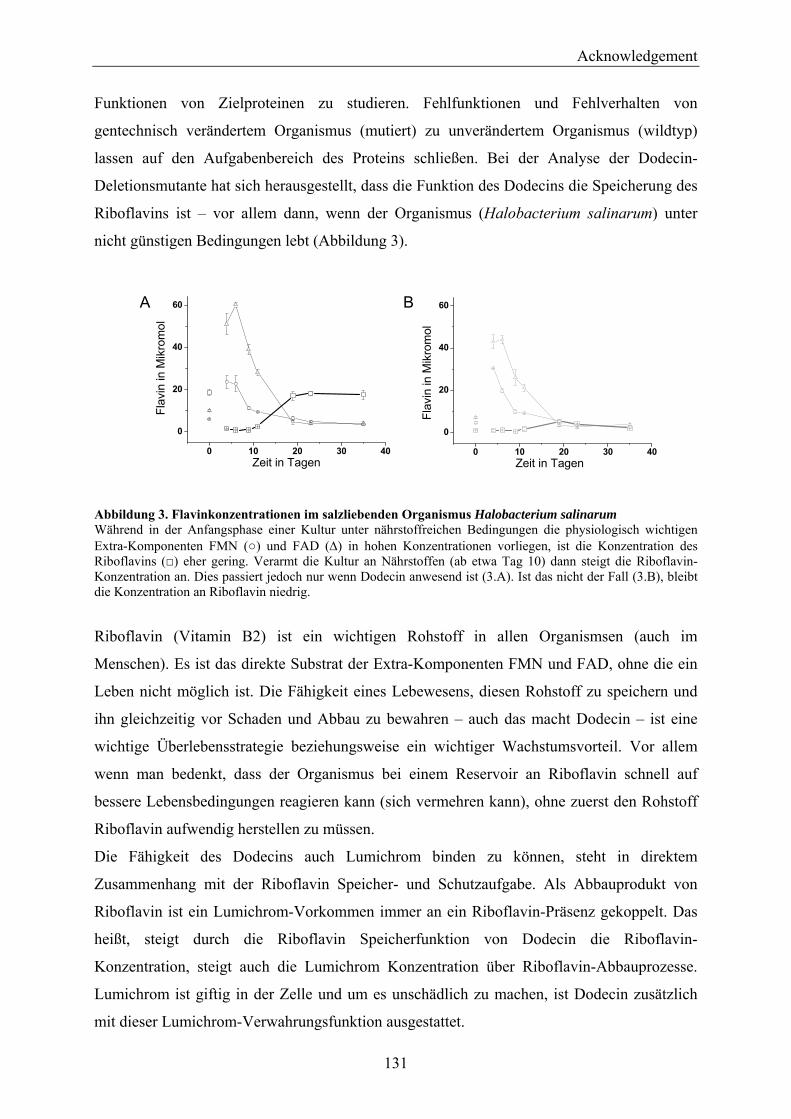
Acknowledgement
131
Funktionen von Zielproteinen zu studieren. Fehlfunktionen und Fehlverhalten von
gentechnisch verändertem Organismus (mutiert) zu unverändertem Organismus (wildtyp)
lassen auf den Aufgabenbereich des Proteins schließen. Bei der Analyse der Dodecin-
Deletionsmutante hat sich herausgestellt, dass die Funktion des Dodecins die Speicherung des
Riboflavins ist – vor allem dann, wenn der Organismus (Halobacterium salinarum) unter
nicht günstigen Bedingungen lebt (Abbildung 3).
Abbildung 3. Flavinkonzentrationen im salzliebenden Organismus Halobacterium salinarum Während in der Anfangsphase einer Kultur unter nährstoffreichen Bedingungen die physiologisch wichtigen Extra-Komponenten FMN () und FAD (∆) in hohen Konzentrationen vorliegen, ist die Konzentration des Riboflavins () eher gering. Verarmt die Kultur an Nährstoffen (ab etwa Tag 10) dann steigt die Riboflavin-Konzentration an. Dies passiert jedoch nur wenn Dodecin anwesend ist (3.A). Ist das nicht der Fall (3.B), bleibt die Konzentration an Riboflavin niedrig.
Riboflavin (Vitamin B2) ist ein wichtigen Rohstoff in allen Organismsen (auch im
Menschen). Es ist das direkte Substrat der Extra-Komponenten FMN und FAD, ohne die ein
Leben nicht möglich ist. Die Fähigkeit eines Lebewesens, diesen Rohstoff zu speichern und
ihn gleichzeitig vor Schaden und Abbau zu bewahren – auch das macht Dodecin – ist eine
wichtige Überlebensstrategie beziehungsweise ein wichtiger Wachstumsvorteil. Vor allem
wenn man bedenkt, dass der Organismus bei einem Reservoir an Riboflavin schnell auf
bessere Lebensbedingungen reagieren kann (sich vermehren kann), ohne zuerst den Rohstoff
Riboflavin aufwendig herstellen zu müssen.
Die Fähigkeit des Dodecins auch Lumichrom binden zu können, steht in direktem
Zusammenhang mit der Riboflavin Speicher- und Schutzaufgabe. Als Abbauprodukt von
Riboflavin ist ein Lumichrom-Vorkommen immer an ein Riboflavin-Präsenz gekoppelt. Das
heißt, steigt durch die Riboflavin Speicherfunktion von Dodecin die Riboflavin-
Konzentration, steigt auch die Lumichrom Konzentration über Riboflavin-Abbauprozesse.
Lumichrom ist giftig in der Zelle und um es unschädlich zu machen, ist Dodecin zusätzlich
mit dieser Lumichrom-Verwahrungsfunktion ausgestattet.
0 10 20 30 40
0
20
40
60
Flav
in in
Mik
rom
ol
Zeit in Tagen0 10 20 30 40
0
20
40
60
Flav
in in
Mik
rom
ol
Zeit in Tagen
A B

Acknowledgement
132
Dodecin reiht sich somit in eine Klasse von Proteinen ein, die man als Riboflavin-bindende-
und-transportierende-Proteine (RfBP) bezeichnet. RfBP sind Strukturproteine, deren
Funktion, die Stabilisierung und der Schutz von Riboflavin ist. Auch im menschlichen
Organismen gibt es Proteine mit solch einer Funktion. So stellen RfBP in der
Schwangerschaft sicher, dass der Embryo ausreichend mit Riboflavin versorgt wird. Innerhalb
der Familie der RfBP ist Dodecin nach heutigem Wissensstand um eine Funktion reicher als
alle anderen. In einer ersten Funktion bindet und schützt Dodecin Riboflavin – wird
Riboflavin jedoch zerstört, endet das Aufgabengebiet nicht, sondern Dodecin bindet in einer
weiteren Funktion das Zerfallsprodukt Lumichrom und bewahrt damit die Zelle vor
schädlichen Einflüssen. Dieser Dodecin-eigene Rückkopplungsmechanismus scheint bei dem
untersuchten salzliebenden Organismus von zentraler Bedeutung. Wie in Abbildung 4 zu
sehen, sind sie natürlichen Lebensbedingungen von Halobacterium salinarum, die hohen
Salzkonzentrationen, an starke Sonneneinstrahlung gekoppelt. Ein Zerfall von Riboflavin tritt
daher besonders häufig auf und die Bindung des Zerfallsproduktes Lumichrom ist gerade
deshalb von essentieller Bedeutung.
Abbildung 4. Kristallisationsbecken mit Halobacterium salinarum Population Meerwasser wird in Salzkristallisationsbecken geleitet und durch Sonnenenergie eingedampft. Halobacterium salinarum hat eine rot gefärbte Zellhülle und die rote Farbe der Kristallisationsbecken deutet eine starke Besiedelung an.
Lebenslauf
Name: Martin Clemens Grininger Geburtsdatum: 25. März 1976 Geburtsort: Linz (Österreich) Nationalität: Österreich Familienstand: ledig Schulbildung 1982-1986: Volksschule, Zwettl
1986-1990: Hauptschule, Oberneukirchen
1990-1995: Bundesoberstufenrealgymnasium für Leistungsport (Schilanglauf), Linz Grundwehrdienst 1997-1998: Grundwehrdienst im Leistungszentrum (HSNS) Linz Studium 1995-1997: Johannes Kepler Universität Linz Studium der Technischen Chemie
1998-11/2001: Erzherzog Johann Universität Graz (TU Graz), Weiterführung des Studiums der Technischen Chemie 11/2001- 06/2002: Max-Planck-Institut für Kohlenforschung (Mülheim an der Ruhr) Diplomarbeit (Studien zur Totalsynthese von Crocacin D) unter der Betreuung von Prof. Dr. Alois Fürstner Promotion seit 09/2002: Max-Planck-Institut für Biochemie (Martinsried bei München) Doktorarbeit (The Function of the Halophilic Dodecin) unter der Betreuung von Prof. Dr. Dieter Oesterhelt Martinsried, am 26.Juni 2006


![Organische Elektronik [.5ex] Elektronische Prozesse in ... · VomBausteinzumPolymer:EPR-SpektroskopieundDFT-Rechnungen TBT Entirely Dominates the Electronic Structure of the Conjugated](https://img.pdfslide.org/doc/110x75/5f4c45221f670c684b2999bd/organische-elektronik-5ex-elektronische-prozesse-in-vombausteinzumpolymerepr-spektroskopieunddft-rechnungen.jpg)