Embed Size (px)
Citation preview
Dissertation zur Erlangung des Doktorgradesder Fakultät für Chemie und Pharmazie
der Ludwig-Maximilians-Universität München
The Halobacterium salinarumTaxis Signal Transduction Network:a Protein-Protein Interaction Study
Matthias Schlesneraus Kiel
2008

Erklärung
Diese Dissertation wurde im Sinne von § 13 Abs. 3 bzw. 4 der Promotionsordnung vom29. Januar 1998 von Herrn Prof. Dr. Dieter Oesterhelt betreut.
Ehrenwörtliche Versicherung
Diese Dissertation wurde selbständig und ohne unerlaubte Hilfe angefertigt.
Martinsried, am 07.10.2008
Matthias Schlesner
Dissertation eingereicht am: 14.10.2008
1. Gutachter: Prof. Dr. Dieter Oesterhelt2. Gutachter: Prof. Dr. Wolfgang Marwan
Mündliche Prüfung am: 9.12.2008


Meiner Familie

Contents
Summary xvii
1 Background 11.1 H. salinarum, an archaeal model organism . . . . . . . . . . . . . . . . 1
1.1.1 Halobacterium salinarum . . . . . . . . . . . . . . . . . . . . . . 11.1.2 Archaea . . . . . . . . . . . . . . . . . . . . . . . . . . . . . . . 21.1.3 Halophiles and their ecology . . . . . . . . . . . . . . . . . . . . 31.1.4 Adaptation to hypersaline environments . . . . . . . . . . . . . 41.1.5 Bioenergetics . . . . . . . . . . . . . . . . . . . . . . . . . . . . 5
1.2 Signal transduction and taxis in prokaryotes . . . . . . . . . . . . . . . 71.2.1 Two-component systems . . . . . . . . . . . . . . . . . . . . . . 81.2.2 The principles of prokaryotic taxis . . . . . . . . . . . . . . . . 9
1.3 Protein-protein interaction analysis . . . . . . . . . . . . . . . . . . . . 101.4 Objectives . . . . . . . . . . . . . . . . . . . . . . . . . . . . . . . . . . 12
2 Materials and methods 152.1 General materials . . . . . . . . . . . . . . . . . . . . . . . . . . . . . . 15
2.1.1 Instruments . . . . . . . . . . . . . . . . . . . . . . . . . . . . . 152.1.2 Chemicals and Kits . . . . . . . . . . . . . . . . . . . . . . . . . 152.1.3 Enzymes . . . . . . . . . . . . . . . . . . . . . . . . . . . . . . . 152.1.4 Strains . . . . . . . . . . . . . . . . . . . . . . . . . . . . . . . . 172.1.5 Software . . . . . . . . . . . . . . . . . . . . . . . . . . . . . . . 17
2.2 General methods . . . . . . . . . . . . . . . . . . . . . . . . . . . . . . 172.2.1 Growth and storage of E. coli . . . . . . . . . . . . . . . . . . . 172.2.2 Growth and storage of H. salinarum . . . . . . . . . . . . . . . . 182.2.3 Separation of DNA fragments by agarose gel electrophoresis . . 182.2.4 Purification of DNA fragments . . . . . . . . . . . . . . . . . . . 182.2.5 Analytical and preparative restriction digestion . . . . . . . . . 182.2.6 Dephosphorylation of linearised plasmids . . . . . . . . . . . . . 192.2.7 Ligation . . . . . . . . . . . . . . . . . . . . . . . . . . . . . . . 202.2.8 In-Fusion™ cloning . . . . . . . . . . . . . . . . . . . . . . . . . 202.2.9 Gateway™ cloning . . . . . . . . . . . . . . . . . . . . . . . . . 202.2.10 Transformation of E. coli . . . . . . . . . . . . . . . . . . . . . . 222.2.11 Transformation of H. salinarum . . . . . . . . . . . . . . . . . . 232.2.12 Polymerase chain reaction (PCR) . . . . . . . . . . . . . . . . . 24
vii
Contents
2.2.13 DNA sequencing . . . . . . . . . . . . . . . . . . . . . . . . . . 242.2.14 Isolation of plasmid DNA . . . . . . . . . . . . . . . . . . . . . 252.2.15 Protein precipitation with TCA . . . . . . . . . . . . . . . . . . 252.2.16 SDS PAGE . . . . . . . . . . . . . . . . . . . . . . . . . . . . . 252.2.17 Coomassie staining of protein gels . . . . . . . . . . . . . . . . . 252.2.18 Silver staining of protein gels . . . . . . . . . . . . . . . . . . . 252.2.19 Western blot . . . . . . . . . . . . . . . . . . . . . . . . . . . . 262.2.20 Preparation of genomic DNA . . . . . . . . . . . . . . . . . . . 27
2.3 Materials and methods for yeast two-hybrid screening . . . . . . . . . . 282.3.1 Growth and storage of S. cerevisiae . . . . . . . . . . . . . . . . 282.3.2 Construction of two-hybrid expression plasmids . . . . . . . . . 282.3.3 Transformation of yeast . . . . . . . . . . . . . . . . . . . . . . 282.3.4 Protein interaction assay . . . . . . . . . . . . . . . . . . . . . . 31
2.4 Materials and methods for AP-MS of halobacterial protein complexes . 322.4.1 Construction of vectors . . . . . . . . . . . . . . . . . . . . . . . 322.4.2 Generation of bait expression and control strains . . . . . . . . 342.4.3 Establishing the affinity purification procedure . . . . . . . . . . 35
2.4.3.1 Purification from E. coli . . . . . . . . . . . . . . . . . 352.4.3.2 Purification from H. salinarum . . . . . . . . . . . . . 36
2.4.4 Affinity purification of CBD-tagged proteins . . . . . . . . . . . 372.4.5 CBD-AP and SILAC: Direct bait fishing . . . . . . . . . . . . . 382.4.6 CBD-AP and SILAC: Indirect bait fishing . . . . . . . . . . . . 382.4.7 Mass spectrometry: Sample preparation . . . . . . . . . . . . . 392.4.8 Mass spectrometry: Data acquisition . . . . . . . . . . . . . . . 412.4.9 Mass spectrometry: Data processing . . . . . . . . . . . . . . . 422.4.10 Determination of SILAC ratios . . . . . . . . . . . . . . . . . . 422.4.11 Thresholds and statistics . . . . . . . . . . . . . . . . . . . . . . 44
2.5 Materials and methods for the chemotaxis protein interaction network . 442.5.1 Generation of expression and control strains . . . . . . . . . . . 442.5.2 Bait fishing, mass spectrometry, data analysis . . . . . . . . . . 442.5.3 Che protein interactions in other organisms . . . . . . . . . . . 45
2.6 Materials and methods for identification of archaea-specific Che proteins 482.6.1 Construction of in frame deletion mutations . . . . . . . . . . . 482.6.2 Southern blot analysis . . . . . . . . . . . . . . . . . . . . . . . 492.6.3 Complementation of deletions . . . . . . . . . . . . . . . . . . . 502.6.4 Swarm plates . . . . . . . . . . . . . . . . . . . . . . . . . . . . 502.6.5 Computerised cell tracking (Motion analysis) . . . . . . . . . . . 502.6.6 Dark-field microscopy . . . . . . . . . . . . . . . . . . . . . . . . 532.6.7 Bioinformatic analysis . . . . . . . . . . . . . . . . . . . . . . . 53
viii
Contents
3 Yeast two-hybrid analysis of halobacterial proteins 573.1 Introduction . . . . . . . . . . . . . . . . . . . . . . . . . . . . . . . . . 573.2 Results and Discussion . . . . . . . . . . . . . . . . . . . . . . . . . . . 58
3.2.1 Analysis of a test set of proteins . . . . . . . . . . . . . . . . . . 583.2.2 Rescreening with higher stringency . . . . . . . . . . . . . . . . 593.2.3 Halobacterial proteins and yeast transcriptional activation . . . 60
3.3 Conclusions . . . . . . . . . . . . . . . . . . . . . . . . . . . . . . . . . 61
4 Affinity purification and mass spectrometry of halobacterial protein com-plexes 634.1 Introduction . . . . . . . . . . . . . . . . . . . . . . . . . . . . . . . . . 634.2 Results and Discussion . . . . . . . . . . . . . . . . . . . . . . . . . . . 66
4.2.1 Construction of vectors . . . . . . . . . . . . . . . . . . . . . . . 664.2.2 The purification procedure . . . . . . . . . . . . . . . . . . . . . 68
4.2.2.1 Expression in E. coli . . . . . . . . . . . . . . . . . . . 684.2.2.2 Expression in H. salinarum . . . . . . . . . . . . . . . 70
4.2.3 Identification by mass spectrometry . . . . . . . . . . . . . . . . 724.2.3.1 Identification by MALDI TOF PMF . . . . . . . . . . 724.2.3.2 Identification by LC MS/MS . . . . . . . . . . . . . . 74
4.2.4 SILAC: Discrimination of interaction partners from background 754.2.4.1 Direct bait fishing . . . . . . . . . . . . . . . . . . . . 754.2.4.2 The exchange problem . . . . . . . . . . . . . . . . . . 764.2.4.3 Indirect bait fishing . . . . . . . . . . . . . . . . . . . 784.2.4.4 Thresholds . . . . . . . . . . . . . . . . . . . . . . . . 79
4.3 Conclusions . . . . . . . . . . . . . . . . . . . . . . . . . . . . . . . . . 80
5 The bioinformatics environment 835.1 Introduction . . . . . . . . . . . . . . . . . . . . . . . . . . . . . . . . . 835.2 The databases . . . . . . . . . . . . . . . . . . . . . . . . . . . . . . . . 83
5.2.1 Bait DB . . . . . . . . . . . . . . . . . . . . . . . . . . . . . . . 835.2.2 Experiment DB . . . . . . . . . . . . . . . . . . . . . . . . . . . 855.2.3 Result DB . . . . . . . . . . . . . . . . . . . . . . . . . . . . . . 86
5.3 The applications . . . . . . . . . . . . . . . . . . . . . . . . . . . . . . 865.3.1 Bait management . . . . . . . . . . . . . . . . . . . . . . . . . . 875.3.2 Experiment management . . . . . . . . . . . . . . . . . . . . . . 885.3.3 Result evaluation . . . . . . . . . . . . . . . . . . . . . . . . . . 89
5.4 Conclusions . . . . . . . . . . . . . . . . . . . . . . . . . . . . . . . . . 90
6 Chemotaxis protein interaction network 916.1 Introduction . . . . . . . . . . . . . . . . . . . . . . . . . . . . . . . . . 91
6.1.1 The Che system: a specialised two-component system for taxissignalling . . . . . . . . . . . . . . . . . . . . . . . . . . . . . . 91
ix
Contents
6.1.1.1 Signal reception and transduction . . . . . . . . . . . . 916.1.1.2 Excitation . . . . . . . . . . . . . . . . . . . . . . . . . 926.1.1.3 Adaptation . . . . . . . . . . . . . . . . . . . . . . . . 946.1.1.4 Signal termination . . . . . . . . . . . . . . . . . . . . 956.1.1.5 Fumarate as switch factor . . . . . . . . . . . . . . . . 95
6.1.2 The components of the Che system of H. salinarum . . . . . . . 966.2 Results and Discussion . . . . . . . . . . . . . . . . . . . . . . . . . . . 99
6.2.1 Evaluation of experimental results . . . . . . . . . . . . . . . . . 1006.2.1.1 Contaminants . . . . . . . . . . . . . . . . . . . . . . . 1006.2.1.2 Reproducibility . . . . . . . . . . . . . . . . . . . . . . 1016.2.1.3 How to interprete the results . . . . . . . . . . . . . . 102
6.2.2 The interaction network . . . . . . . . . . . . . . . . . . . . . . 1036.2.2.1 The core: CheA, CheY, CheW1 . . . . . . . . . . . . . 1036.2.2.2 Different interactions of the two CheW proteins . . . . 1086.2.2.3 The transducers exhibit nonuniform interaction patterns1106.2.2.4 Other Che Proteins . . . . . . . . . . . . . . . . . . . . 1126.2.2.5 Connectors: Hubs or sticky background . . . . . . . . 1136.2.2.6 Unexpected interactors . . . . . . . . . . . . . . . . . . 1156.2.2.7 Not connected: ParA1 . . . . . . . . . . . . . . . . . . 116
6.2.3 Comparison with data from other organisms . . . . . . . . . . . 1176.3 Conclusions . . . . . . . . . . . . . . . . . . . . . . . . . . . . . . . . . 121
7 Identification of archaea-specific chemotaxis proteins 1237.1 Introduction . . . . . . . . . . . . . . . . . . . . . . . . . . . . . . . . . 123
7.1.1 The archaeal and bacterial flagellum are distinct structures . . . 1247.1.1.1 The bacterial flagellum . . . . . . . . . . . . . . . . . . 1247.1.1.2 The archaeal flagellum . . . . . . . . . . . . . . . . . . 124
7.1.2 The flagellar motor switch is the target of CheY-P . . . . . . . . 1287.2 Results and Discussion . . . . . . . . . . . . . . . . . . . . . . . . . . . 128
7.2.1 Interaction analysis revealed connectors of Che and Fla proteins 1287.2.2 Construction of in-frame deletion mutants . . . . . . . . . . . . 1307.2.3 OE2401F and OE2402F are essential for chemotaxis and photo-
taxis . . . . . . . . . . . . . . . . . . . . . . . . . . . . . . . . . 1317.2.4 ∆1, ∆2, and the double deletion ∆2-4 show almost 100% CW
rotational bias . . . . . . . . . . . . . . . . . . . . . . . . . . . . 1337.2.5 Interpretation of deletion phenotypes . . . . . . . . . . . . . . . 1347.2.6 Complementation of deletions reverted their phenotype to that
of wildtype . . . . . . . . . . . . . . . . . . . . . . . . . . . . . 1377.2.7 Bioinformatic analysis . . . . . . . . . . . . . . . . . . . . . . . 137
7.2.7.1 Occurrence of che and fla genes in archaeal genomes . 1387.2.7.2 Only few findings for OE2401F . . . . . . . . . . . . . 139
x
Contents
7.2.7.3 OE2402F and OE2404R belong to a family of uniquearchaeal Che proteins . . . . . . . . . . . . . . . . . . 140
7.3 Conclusions . . . . . . . . . . . . . . . . . . . . . . . . . . . . . . . . . 145
8 Concluding remarks 147
9 Supplementary material 149
Bibliography 161
Appendix 187List of abbreviations . . . . . . . . . . . . . . . . . . . . . . . . . . . . . . . 187Publications . . . . . . . . . . . . . . . . . . . . . . . . . . . . . . . . . . . . 189Danksagung . . . . . . . . . . . . . . . . . . . . . . . . . . . . . . . . . . . . 190
xi

Contents
xii
List of Figures
1.1 Electron micrograph of a H. salinarum cell . . . . . . . . . . . . . . . . 11.2 Phylogenetic tree showing the three domains of life . . . . . . . . . . . 21.3 Crystalliser pond in the abandoned salterns of Sečovlje, Slovenia . . . . 41.4 Halophilic adaptation of proteins . . . . . . . . . . . . . . . . . . . . . 61.5 The (biased) random walk . . . . . . . . . . . . . . . . . . . . . . . . . 9
3.1 The Y2H system . . . . . . . . . . . . . . . . . . . . . . . . . . . . . . 573.2 Y2H screen of known interactors . . . . . . . . . . . . . . . . . . . . . . 593.3 Y2H screen with higher stringency . . . . . . . . . . . . . . . . . . . . 60
4.1 Affinity purification of protein complexes combined with mass spec-trometry . . . . . . . . . . . . . . . . . . . . . . . . . . . . . . . . . . . 63
4.2 Extracted ion chromatograms from a SILAC AP-MS experiment . . . . 654.3 Plasmids for expression of CBD fusion proteins in H. salinarum . . . . 674.4 Plasmids for expression of CBD fusion proteins in H. salinarum . . . . 694.5 Establishing the CBD purification protocol . . . . . . . . . . . . . . . . 704.6 Purification of CBD fusion proteins from H. salinarum . . . . . . . . . 714.7 Identification of proteins after affinity purification . . . . . . . . . . . . 724.8 Spectrum from MALDI TOF PMF . . . . . . . . . . . . . . . . . . . . 734.9 Schematic of purification procedures applying SILAC . . . . . . . . . . 764.10 Discrimination of interaction partners and background proteins with
SILAC . . . . . . . . . . . . . . . . . . . . . . . . . . . . . . . . . . . . 77
5.1 Relationship schema of project’s databases . . . . . . . . . . . . . . . . 845.2 Bait Browser . . . . . . . . . . . . . . . . . . . . . . . . . . . . . . . . 875.3 Experiment Browser . . . . . . . . . . . . . . . . . . . . . . . . . . . . 885.4 Result Viewer . . . . . . . . . . . . . . . . . . . . . . . . . . . . . . . . 89
6.1 General model of prokaryotic chemotaxis systems . . . . . . . . . . . . 926.2 The Che system of H. salinarum . . . . . . . . . . . . . . . . . . . . . . 976.3 Chemotaxis protein interaction network . . . . . . . . . . . . . . . . . . 1046.4 Simplified chemotaxis protein interaction network . . . . . . . . . . . . 1056.5 Association patterns of the core proteins . . . . . . . . . . . . . . . . . 1066.6 Identification of CheA fished with CheW1 and OE4643R . . . . . . . . 1066.7 Comparative bait fishing with the two CheW proteins . . . . . . . . . . 1096.8 Comparison of the Che interaction network with other organisms . . . 117
xiii
List of Figures
7.1 Chemotaxis and motility gene cluster of H. salinarum . . . . . . . . . 1237.2 The bacterial flagellar apparatus . . . . . . . . . . . . . . . . . . . . . . 1257.3 The archaeal flagellar apparatus . . . . . . . . . . . . . . . . . . . . . . 1267.4 Interactions of the newly identified proteins . . . . . . . . . . . . . . . 1297.5 Southern blot analysis . . . . . . . . . . . . . . . . . . . . . . . . . . . 1307.6 Swarming ability of the deletion strains . . . . . . . . . . . . . . . . . . 1317.7 Motion analysis of deletion strains . . . . . . . . . . . . . . . . . . . . . 1327.8 Phenotype of complementations . . . . . . . . . . . . . . . . . . . . . . 1387.9 Organisation of chemotaxis genes in known archaeal genomes . . . . . . 1417.10 Multiple alignment of protein family DUF439 . . . . . . . . . . . . . . 1427.11 Phylogenetic analysis of DUF439 proteins . . . . . . . . . . . . . . . . 144
S1 Swarming ability of the deletion strains . . . . . . . . . . . . . . . . . . 156
xiv
List of Tables
2.1 Instruments . . . . . . . . . . . . . . . . . . . . . . . . . . . . . . . . . 152.2 Chemicals . . . . . . . . . . . . . . . . . . . . . . . . . . . . . . . . . . 162.3 Kits . . . . . . . . . . . . . . . . . . . . . . . . . . . . . . . . . . . . . 162.4 Enzymes . . . . . . . . . . . . . . . . . . . . . . . . . . . . . . . . . . . 162.5 Strains . . . . . . . . . . . . . . . . . . . . . . . . . . . . . . . . . . . . 172.6 Software . . . . . . . . . . . . . . . . . . . . . . . . . . . . . . . . . . . 172.7 Media and antibiotics for E. coli . . . . . . . . . . . . . . . . . . . . . . 182.8 Media and antibiotics for H. salinarum . . . . . . . . . . . . . . . . . . 192.9 Solutions for E. coli transformation . . . . . . . . . . . . . . . . . . . . 222.10 Solutions for H. salinarum transformation . . . . . . . . . . . . . . . . 232.11 Coomassie staining solutions . . . . . . . . . . . . . . . . . . . . . . . . 262.12 Silver staining protocol . . . . . . . . . . . . . . . . . . . . . . . . . . . 262.13 Buffers for western blot . . . . . . . . . . . . . . . . . . . . . . . . . . . 272.14 Media for S. cerevisiae . . . . . . . . . . . . . . . . . . . . . . . . . . . 292.15 Primer for two-hybrid plasmids . . . . . . . . . . . . . . . . . . . . . . 302.16 Plasmids and strains for Y2H analysis . . . . . . . . . . . . . . . . . . 302.17 Solutions for yeast transformation . . . . . . . . . . . . . . . . . . . . . 312.18 Primer for establishing AP-MS. . . . . . . . . . . . . . . . . . . . . . . 322.19 Plasmids and strains for establishing AP-MS . . . . . . . . . . . . . . . 332.20 nano-HPLC gradient for LC-MS/MS analysis . . . . . . . . . . . . . . 422.21 Parameters for Mascot Distiller . . . . . . . . . . . . . . . . . . . . . . 432.22 Oligonucleotides for Che protein interaction analysis . . . . . . . . . . . 462.23 Plasmids and strains for Che protein interaction analysis . . . . . . . . 472.24 Primer for construction of deletion mutations . . . . . . . . . . . . . . 482.25 Strains and plasmids . . . . . . . . . . . . . . . . . . . . . . . . . . . . 492.26 Instruments for motion analysis . . . . . . . . . . . . . . . . . . . . . . 512.27 Instruments for dark-field microscopy . . . . . . . . . . . . . . . . . . . 53
3.1 Proteins for Y2H . . . . . . . . . . . . . . . . . . . . . . . . . . . . . . 58
4.1 Proteins identified by MALDI TOF PMF . . . . . . . . . . . . . . . . . 734.2 Advantages and disadvantages of the bait fishing methods . . . . . . . 794.3 Definition of association rating . . . . . . . . . . . . . . . . . . . . . . . 80
6.1 Functions of the Che proteins of H. salinarum . . . . . . . . . . . . . . 986.2 Bait fishing experiments for the Che interaction network . . . . . . . . 99
xv
List of Tables
6.3 Proteins considered as background . . . . . . . . . . . . . . . . . . . . 1016.4 The halobacterial transducers as preys . . . . . . . . . . . . . . . . . . 1116.5 Interactions between Che proteins described in literature . . . . . . . . 118
7.1 Flagellar rotational bias of the deletion strains . . . . . . . . . . . . . . 1337.2 Summary of phenotypes . . . . . . . . . . . . . . . . . . . . . . . . . . 134
S1 Identification by MALDI TOF . . . . . . . . . . . . . . . . . . . . . . . 149S2 Interactions of the Che proteins . . . . . . . . . . . . . . . . . . . . . . 150S3 Reversal frequencies as measured by computer-based cell-tracking. . . . 157S4 che and fla genes in archaeal genomes . . . . . . . . . . . . . . . . . . 158
xvi
Summary
The archaeon Halobacterium salinarum grows optimally in saturated brine environ-ments like salt lakes and solar salterns. To survive in these harsh environments,H. salinarum actively seeks the places with the best growth conditions by moving ina biased random walk. This process, called taxis, is driven by two molecular systems:First, the motility apparatus, consisting of the flagellum, the flagellar motor, and itsswitch, which allows to change the direction of flagellar rotation. Second, the chemo-taxis signal transduction system, which targets the flagellar motor switch in order tomodulate the switching frequency in response to external stimuli. This modulation isthe fundamental basis for the biased random walk. Whereas the signal transductionsystem is conserved throughout Archaea and Bacteria, the archaeal motility apparatusis unique and only poorly understood on the molecular level. The proteins constitu-ting the flagellar motor and its switch in Archaea have not yet been identified, so thatthe connection between the bacterial-like chemotaxis signal transduction system andthe archaeal motility apparatus is not known.
The aim of this study was to extend the understanding of the taxis signal transduc-tion system of H. salinarum using protein-protein interaction (PPI) analysis. By this,the roles of several proteins involved in this signalling system like CheW1/CheW2,CheC1/CheC2/CheC3, or CheD should be enlightened, and previously unrecognisedproteins involved in or connected to the system identified. The unknown connectionto the archaeal flagellum was a further focus.
In the first step, a method had to be found that allows for the analysis of interac-tions of halophilic proteins. The yeast two-hybrid system was used to test a set ofknown interactors from H. salinarum, but here it failed in all cases. The main problemwas transcriptional activation by the (acidic) halobacterial proteins when fused to aDNA-binding domain, and probably also misfolding of the high-salt adapted proteinswhen expressed in yeast. Thus an affinity purification method for halobacterial proteincomplexes was established, which enables the identification of the complex componentsby mass spectrometry. As affinity tag a cellulose-binding domain from Clostridiumthermocellum is used, which binds cellulose even in the presence of multi-molar saltconcentrations, so that the whole purification can be performed under close to physio-logical conditions. Labelling with stable isotopes (SILAC) is applied to discriminatespecific interaction partners from unspecific contaminants. In test experiments withthe established method, it was possible to identify several known and new proteininteractions, so it was finally applied to analyse the interactions of all ten halobacte-rial chemotaxis (Che) proteins. To assist the laboratory work and the handling and
xvii
Summary
evaluation of results, a bioinformatics environment was created and integrated in thedepartment’s database system, HaloLex (http://www.halolex.mpg.de/).
The protein interaction study generally confirmed the expected topology of the coreof the taxis signalling system: interactions between CheA, CheW1, CheY, and severalhalobacterial transducers (Htrs) could be detected. With PurH/N and OE4643R twounexpected interactors of the core or CheA, respectively, have been identified, whoserole in taxis signalling is completely unclear. For the two CheW proteins, CheW1and CheW2, different interactions have been detected – CheW1 appeared as the maincoupling protein for the formation of stable signalling complexes between the Htrsand CheA. The Htrs as preys revealed nonuniform interaction patterns: some Htrswere associated to CheW1, CheW2, CheA, and CheY, others mainly with CheW2, athird group with CheA and CheY, but none of the two CheWs, and a fourth groupwas not fished at all. An unexpected finding was the central position of CheD inthe Che interaction network, indicating that this protein might play a key role in thehalobacterial taxis signalling system.
In the PPI analysis, three proteins were identified that connect the chemotaxis sys-tem and the archaeal flagellar apparatus. These proteins interact with the chemotaxisproteins CheY, CheD, and CheC2, as well as the the flagella accessory (Fla) proteinsFlaCE and FlaD. Two of the proteins are homologous to each other and belong to theprotein family DUF439, the third is a HEAT_PBS family protein. In-frame deletionstrains for all three proteins were generated and analysed for chemotaxis deficiencies:a) their photophobic responses were measured by a computer-based cell tracking sys-tem b) the flagellar rotational bias was determined by dark-field microscopy, and c)the chemotactic behaviour was analysed by a swarm plate assay.
Strains deleted for the HEAT_PBS protein or one of the DUF439 proteins provedunable to switch the direction of flagellar rotation. In these mutants, flagella rotateonly clockwise, which results in exclusively forward swimming cells. Accordingly,chemo- and phototactic responses are disabled. Deletion of the second DUF439 proteinhad only minimal effects. In none of the deletion strains swimming motility wasimpaired.
By homology searches, HEAT_PBS proteins could be identified in the chemotaxisgene regions of all motile haloarchaea sequenced so far, but not of other archaealspecies. DUF439 proteins, however, are inherent parts of archaeal chemotaxis generegions, and they are restricted to this genomic context. Altogether, these resultsdemonstrate that hitherto unrecognised archaea-specific Che proteins are essential forrelaying taxis signalling to the flagellar apparatus in the archaeal domain.
xviii
1 Background
1.1 H. salinarum, an archaeal model organism
1.1.1 Halobacterium salinarum
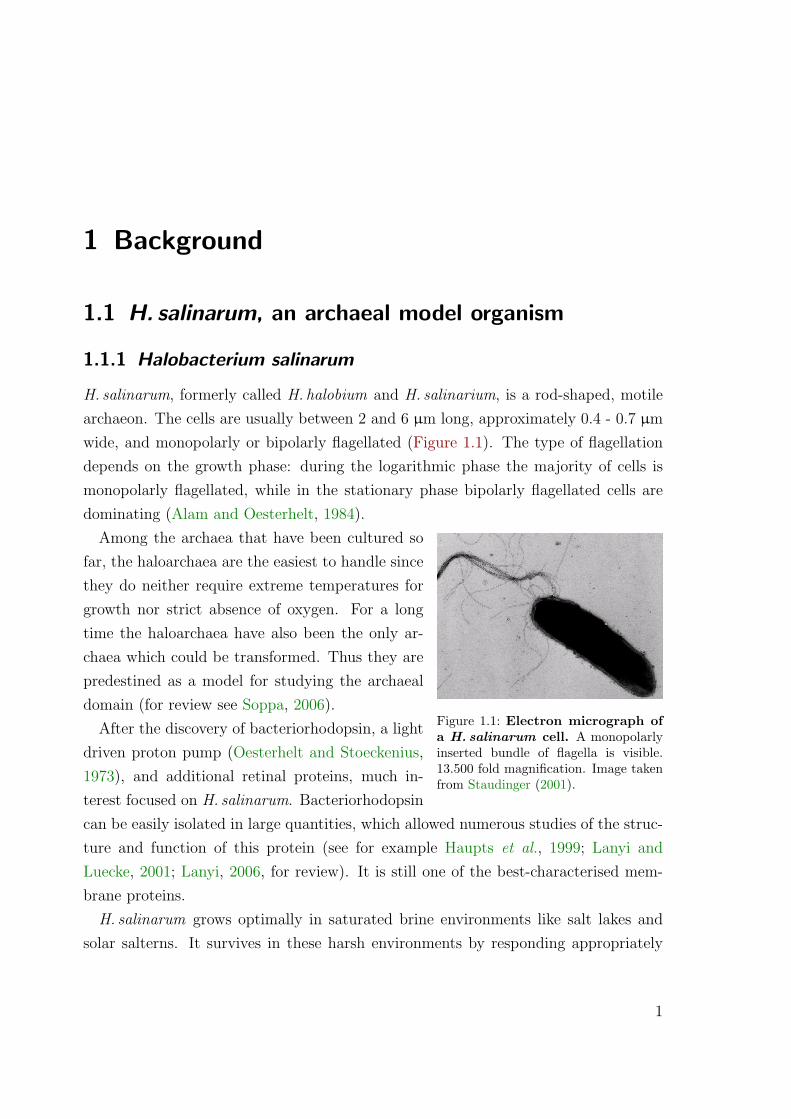
H. salinarum, formerly called H. halobium and H. salinarium, is a rod-shaped, motilearchaeon. The cells are usually between 2 and 6 µm long, approximately 0.4 - 0.7 µm
wide, and monopolarly or bipolarly flagellated (Figure 1.1). The type of flagellationdepends on the growth phase: during the logarithmic phase the majority of cells ismonopolarly flagellated, while in the stationary phase bipolarly flagellated cells aredominating (Alam and Oesterhelt, 1984).
Figure 1.1: Electron micrograph ofa H. salinarum cell. A monopolarlyinserted bundle of flagella is visible.13.500 fold magnification. Image takenfrom Staudinger (2001).
Among the archaea that have been cultured sofar, the haloarchaea are the easiest to handle sincethey do neither require extreme temperatures forgrowth nor strict absence of oxygen. For a longtime the haloarchaea have also been the only ar-chaea which could be transformed. Thus they arepredestined as a model for studying the archaealdomain (for review see Soppa, 2006).
After the discovery of bacteriorhodopsin, a lightdriven proton pump (Oesterhelt and Stoeckenius,1973), and additional retinal proteins, much in-terest focused on H. salinarum. Bacteriorhodopsincan be easily isolated in large quantities, which allowed numerous studies of the struc-ture and function of this protein (see for example Haupts et al., 1999; Lanyi andLuecke, 2001; Lanyi, 2006, for review). It is still one of the best-characterised mem-brane proteins.
H. salinarum grows optimally in saturated brine environments like salt lakes andsolar salterns. It survives in these harsh environments by responding appropriately
1
1 Background
to different stimuli, using chemotactic and phototactic sensors connected to a sophis-ticated signal transduction network (Marwan and Oesterhelt, 2000). Halobacterialchemo- and phototaxis have been the subject of intensive research for a long time, re-sulting in excellent knowledge of the cellular responses (Nutsch et al., 2003, 2005). Theapplication and removal of light stimuli to trigger phototactic responses can be donein a perfectly controlled manner, which makes this an optimal system for modelling ofbiological processes. Combined with its relative simplicity this makes H. salinarum animportant model organism for systems biology (e. g. Bonneau et al., 2007; del Rosarioet al., 2007; Gonzalez et al., 2008).
1.1.2 Archaea
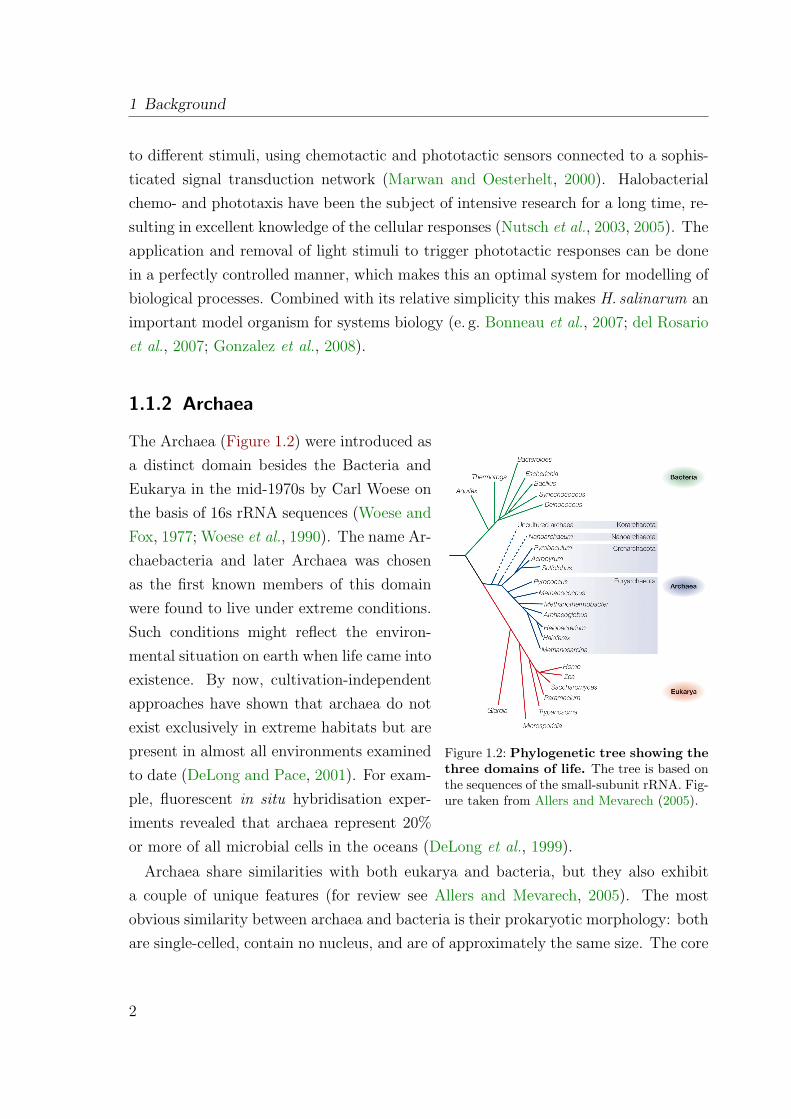
Figure 1.2: Phylogenetic tree showing thethree domains of life. The tree is based onthe sequences of the small-subunit rRNA. Fig-ure taken from Allers and Mevarech (2005).
The Archaea (Figure 1.2) were introduced asa distinct domain besides the Bacteria andEukarya in the mid-1970s by Carl Woese onthe basis of 16s rRNA sequences (Woese andFox, 1977; Woese et al., 1990). The name Ar-chaebacteria and later Archaea was chosenas the first known members of this domainwere found to live under extreme conditions.Such conditions might reflect the environ-mental situation on earth when life came intoexistence. By now, cultivation-independentapproaches have shown that archaea do notexist exclusively in extreme habitats but arepresent in almost all environments examinedto date (DeLong and Pace, 2001). For exam-ple, fluorescent in situ hybridisation exper-iments revealed that archaea represent 20%or more of all microbial cells in the oceans (DeLong et al., 1999).
Archaea share similarities with both eukarya and bacteria, but they also exhibita couple of unique features (for review see Allers and Mevarech, 2005). The mostobvious similarity between archaea and bacteria is their prokaryotic morphology: bothare single-celled, contain no nucleus, and are of approximately the same size. The core
2
1.1 H. salinarum, an archaeal model organism
metabolic functions of archaea like energy conversion and biosynthesis resemble thoseof bacteria, and both archaea and bacteria tend to organise their genes in polycistronicoperons.
In contrast, the archaeal information-processing functions such as transcription andtranslation are similar to the eukaryotic ones, although considerably simpler. However,archaeal genomes possess numerous homologs of bacterial transcription regulators sothat transcriptional regulation might be done in a bacterial-type mode (Geiduschekand Ouhammouch, 2005).
Among the unique features of archaea is their cell envelope, which became one of theearliest biochemical distinctions between the two prokaryotic domains (Woese et al.,1978). The archaeal cell envelope is composed of a lipid bilayer, which is, dependingon the genus, either surrounded by a proteinaceous surface layer (S-layer), or a rigidcell wall sacculus formed by polymers like pseudomurein or heteropolysaccharide, ornothing at all (for overview see Kandler, 1994). Unlike eubacterial and eukaryoticlipids, which usually consist of fatty acids that are linked to glycerol by ester bonds,the archaeal lipids are mainly isoprenyl glycerol ethers (Gambacorta et al., 1994).
The archaeal domain can be subdivided into the phyla Euryarchaeota, Crenar-chaeota, Korarchaeota, and Nanoarchaeota (Woese et al., 1990; Barns et al., 1996;Huber et al., 2002). H. salinarum is a member of the family Halobacteriaceae, whichbelongs to the phylum Euryarchaeota (class Halobacteria, order Halobacteriales). Allmembers of the Halobacteriaceae are obligate halophiles, that means they need ele-vated salt concentrations (2 M - 5.2 M for halobacteria) for growths (Oren, 1994).
1.1.3 Halophiles and their ecology
Most hypersaline environments originate either as a result of evaporation of seawater(thalassohaline environments) or they are formed by evaporative concentration of saltsin lakes (athalassohaline environments, e. g. soda lakes or the dead sea). Whereasthalassohaline environments are markedly similar with respect to ion composition(mainly sodium and chloride) and pH (neutral to slightly alkaline), athalassohalinebrines may differ greatly in their chemical composition. These differences, especiallyin the concentrations of the divalent cations calcium and magnesium as well as pH,require specific adaptations and therefore determine the range of organisms able tothrive in these brines (Oren, 1994; Kerkar, 2005).
3
1 Background
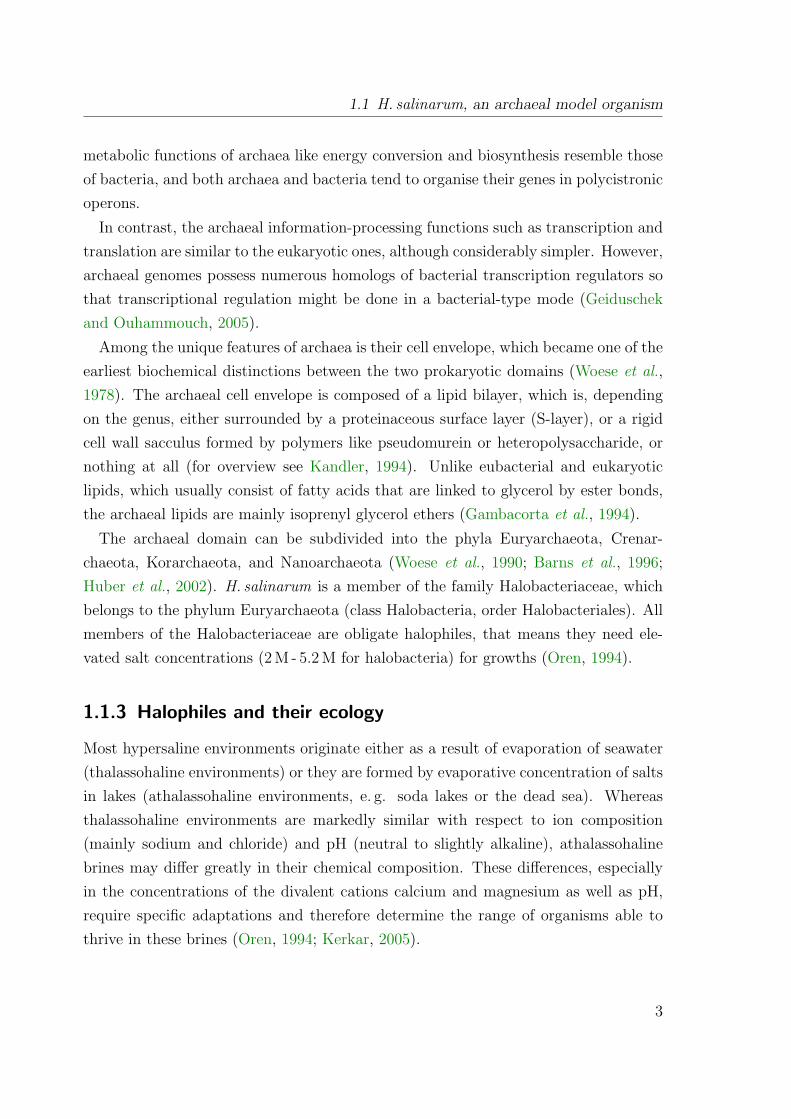
Figure 1.3: Crystalliser pondin the abandoned salterns ofSečovlje, Slovenia. The red colouris caused by microorganisms likehalobacteria.
Halophilic microorganisms are found in all threedomains of life (Oren, 2002). Among eukaryotes,there are only few halophiles; the most important oneis the green alga Dunaliella. This organism can befound almost ubiquitously in high-salt environments,and in many of them Dunaliella is the main or onlyprimary producer of biomass. In contrast, the do-main Bacteria contains a large number of halophilicmicroorganisms, spread over many different phylo-genetic groups. Most of the halophilic bacteria arerather moderate halophiles, but also a few extremehalophilic species (e. g. Halorhodospira) are known.Among the Archaea, halophiles are found in the or-der Halobacteriales and in the methanogenic branchof the euryarchaeota. Halophilic crenarchaeota have not yet been identified. Halobac-teriales are the main component of biomass in many extremely hypersaline waterbodies, and they are the main cause of the red coloration of such places due to largeconcentrations of C-50 carotenoid pigments in their membranes (Figure 1.3). Ad-ditional habitats of Halobacteriales are salted fish and hides treated with salt forpreservation.
1.1.4 Adaptation to hypersaline environments
In order to live at high salt concentrations, halophiles have to maintain a cytoplasmthat is at least isoosmotic with the outside medium; otherwise they would lose waterto their environment since biological membranes are permeable to water. To achievethis, two different strategies are used (Oren, 1999):
1. Cells maintain low salt concentrations within their cytoplasm and compensatethe osmotic pressure of the medium by organic compatible solutes (compatible-solute strategy).
2. The high extracellular ion concentration (normally mainly NaCl) is balanced byeven higher intracellular salt concentrations (mainly KCl). This is called thesalt-in strategy.
4
1.1 H. salinarum, an archaeal model organism
The compatible-solute strategy is found in organisms throughout all three domainsof life. Compatible solutes are typically low-molecular-weight compounds that aresoluble at high concentrations in water and are either uncharged or zwitterionic atphysiological pH. Examples are polyols like glycerol and arabitol, sugars and theirderivatives, amino acids and their derivatives, and quaternary amines such as glycinebetaine (da Costa et al., 1998). Compatible solutes do not interfere with proteinfunction even at high concentrations so that the compatible-solute strategy does notrequire specially adapted proteins. However, the compatible solutes need either to betaken up from the medium actively or they must be synthesised. Therefore this strat-egy is energetically unfavourable in environments with salt concentrations exceeding1.5 M (Dennis and Shimmin, 1997).
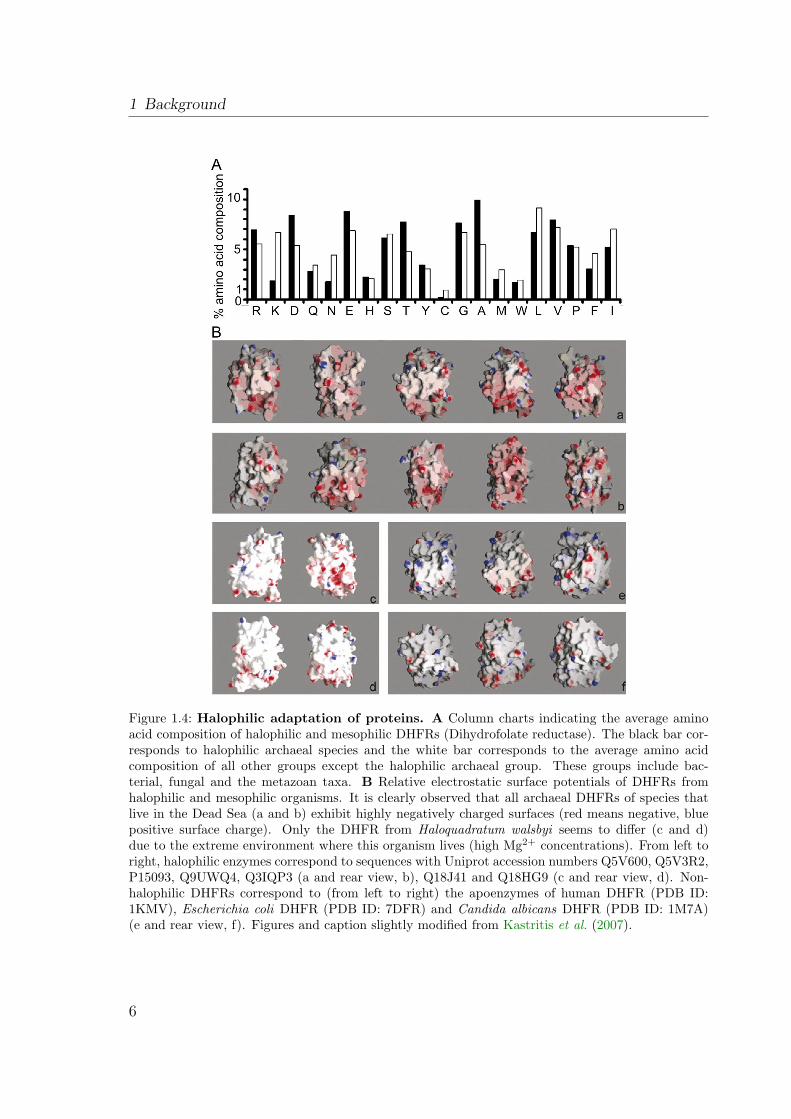
The salt-in strategy is only found in halophilic archaea of the order Halobacteri-ales and the anaerobic halophilic bacteria of the order Haloanaerobiales. The highintracellular salt concentrations raise the need for all enzymes and structural cell com-ponents to be adapted to ensure their function under these conditions (Lanyi, 1974;Eisenberg et al., 1992). Such halophilic proteins differ in amino acid composition fromtheir mesophilic counterparts (Figure 1.4 A). They contain an excess of acidic aminoacids, especially on the surface of the protein (Figure 1.4 B). The frequency of the basicamino acid lysine is reduced (Lanyi, 1974; Fukuchi et al., 2003). The acidic residues atthe surface are highly hydrated and thereby maintain an extensive hydration networkeven under competition with a multitude of small cations for free water (Frolow et al.,1996). The excess of acidic residues also reduces overall hydrophobicity and helpsto prevent aggregation (salting out) of the protein. The downside is that halophilicproteins often lose their physiological interactions and even denature in solutions oflow ionic strength (see Mevarech et al., 2000, and references therein).
1.1.5 Bioenergetics
To survive in its challenging habitat, H. salinarum is capable of multiple ways of energyproduction and possesses a simple but highly effective energy storage system.
If sufficient oxygen is available, H. salinarum gains energy by aerobic respiration.Organic compounds, mainly amino acids, are oxidised via the tricarboxylic acid (TCA)cycle (Ghosh and Sonawat, 1998) in combination with a respiratory electron trans-port chain (Schäfer et al., 1996) using oxygen as terminal electron acceptor. Since
5
1 Background
Figure 1.4: Halophilic adaptation of proteins. A Column charts indicating the average aminoacid composition of halophilic and mesophilic DHFRs (Dihydrofolate reductase). The black bar cor-responds to halophilic archaeal species and the white bar corresponds to the average amino acidcomposition of all other groups except the halophilic archaeal group. These groups include bac-terial, fungal and the metazoan taxa. B Relative electrostatic surface potentials of DHFRs fromhalophilic and mesophilic organisms. It is clearly observed that all archaeal DHFRs of species thatlive in the Dead Sea (a and b) exhibit highly negatively charged surfaces (red means negative, bluepositive surface charge). Only the DHFR from Haloquadratum walsbyi seems to differ (c and d)due to the extreme environment where this organism lives (high Mg2+ concentrations). From left toright, halophilic enzymes correspond to sequences with Uniprot accession numbers Q5V600, Q5V3R2,P15093, Q9UWQ4, Q3IQP3 (a and rear view, b), Q18J41 and Q18HG9 (c and rear view, d). Non-halophilic DHFRs correspond to (from left to right) the apoenzymes of human DHFR (PDB ID:1KMV), Escherichia coli DHFR (PDB ID: 7DFR) and Candida albicans DHFR (PDB ID: 1M7A)(e and rear view, f). Figures and caption slightly modified from Kastritis et al. (2007).
6
1.2 Signal transduction and taxis in prokaryotes
oxygen solubility is low in saturated brines, oxygen shortage is common in high saltenvironments. In such situations, H. salinarum can switch to anaerobic respiration us-ing alternative electron acceptors such as dimethyl sulfoxide, triethyl amine N-oxide,nitrate, or fumarate (Oren and Trüper, 1990; Oren, 1991).
Alternatively, H. salinarum can produce energy via substrate level phosphorylation.L-arginine is fermented via the arginine deiminase pathway (Hartmann et al., 1980;Ruepp and Soppa, 1996). Arginine deiminase converts arginine to citrulline, which,catalyzed by the catabolic ornithine transcarbamylase, reacts with inorganic phosphateto carbamoyl phosphate and ornithine. Carbamoyl phosphate is split into ammoniaand carbon dioxide by carbamate kinase under phosphorylation of ADP to ATP.
Finally, H. salinarum is capable of photosynthesis. Light powers the retinal proteinbacteriorhodopsin (BR) that pumps protons from the cytosol to the extracellular space.The resulting proton gradient can then be used by the ATPase to produce ATP (seeSchäfer et al., 1999, for review). Halorhodopsin (HR) is another retinal protein thatuses light to pump ions against the membrane potential across the cell membrane. Itpumps chloride ions into the cytosol, which helps to maintain the high intracellularchloride concentration required for osmotic balance. Furthermore, the electrogenictransport of chloride ions leads to a concomitant influx of potassium ions into thecytosol (Lindley and MacDonald, 1979; Schobert and Lanyi, 1982).
High intracellular potassium concentrations serve as energy storage to bridge periodsof low energy supply (“potassium battery”) (Wagner et al., 1978; Schäfer et al., 1999).The battery is charged as described above by the action of HR or by the protongradient, which drives an efflux of sodium through a sodium:proton antiport with theresulting influx of potassium through the potassium uniport. When energy supply islow, the flux of the sodium:proton antiport reverses: sodium flows in and protons arepumped out, thereby strengthening the proton gradient, which is then used for ATPsynthesis.
1.2 Signal transduction and taxis in prokaryotes
To sense environmental changes and respond appropriately is a basic prerequisite tosurvive in a dynamically changing environment. Changes in numerous intra- andextracellular parameters are monitored by sensory proteins. These proteins transmit
7
1 Background
the signals via different signalling pathways to effectors which generate the response,e. g. alterations in gene expression or movement to more favourable locations.
Whereas the majority of sensory pathways in eukaryotic organisms are based on ser-ine, threonine, or tyrosine phosphorylation, the most prominent pathways in prokary-otes are based on histidine-aspartate phosphorelay (HAP) systems (for review seeWadhams and Armitage, 2004). However, HAP systems were also identified in lowereukaryotes and plants (Wolanin et al., 2002), and serine, threonine and tyrosine phos-phorylation might play a considerable role in bacteria and archaea (see Kennelly, 2002,2003, and references therein).
1.2.1 Two-component systems
HAP systems are also called two-component systems as they consist at least of adimeric histidine kinase (HK) and a response regulator (RR). The basic workflowof HAP systems consists of trans-autophosphorylation of a histidine residue in onemonomer of the HPK dimer by the γ-phosphoryl group of an ATP molecule that isbound to the kinase domain of the other monomer. The phosphoryl group is thenpassed to an aspartate residue of the RR where it alters the conformation and activityof the RR’s output domain. Signal termination occurs by dephosphorylation of theRR, either spontaneously, by autodephosphorylation, or catalyzed by phosphatases.Transfer of the phosphoryl group back to the HK and then to another response regu-lator which acts as phosphate sink (Sourjik and Schmitt, 1998; Porter and Armitage,2002) might be a further way for signal removal.
Sensed signals typically change the activity of the HPK and influence thereby theamount of phosphorylated RR. Signal reception in HAP systems involved in tran-scriptional regulation is generally done by a N-terminal sensory domain of the HPK,whereas the HAP systems controlling the motility behaviour utilise independent sen-sory proteins. The separation of sensor proteins and HPK allows sensing of manydifferent parameters via different transducer proteins that act on one and the sameHPK, generating an unambiguous output to the motility system (for review see Parkin-son and Kofoid, 1992; Hoch, 2000; Stock et al., 2000; Wadhams and Armitage, 2004;Szurmant and Ordal, 2004).
8
1.2 Signal transduction and taxis in prokaryotes
1.2.2 The principles of prokaryotic taxis
Although most of the prokaryotic HAP systems are involved in the regulation of geneexpression, the most-studied pathway is the one that regulates flagella-driven taxis.Taxis is the biased movement in the direction of increasing concentrations of attrac-tants or decreasing concentrations of repellents. Stimuli that trigger a tactic responseinclude specific chemicals (chemotaxis), light (phototaxis), oxygen (aerotaxis), andsalinity (osmotaxis) (see Armitage, 1999; Marwan and Oesterhelt, 2000, for review).Bacteria achieve motility either by swimming driven by flagella or as surface-mediatedtranslocation (twitching motility, gliding motility), using type IV pili or other systems.Till now, in archaea only swimming motility driven by flagella has been observed(Bardy et al., 2003), so the following section will focus on this type of motility.
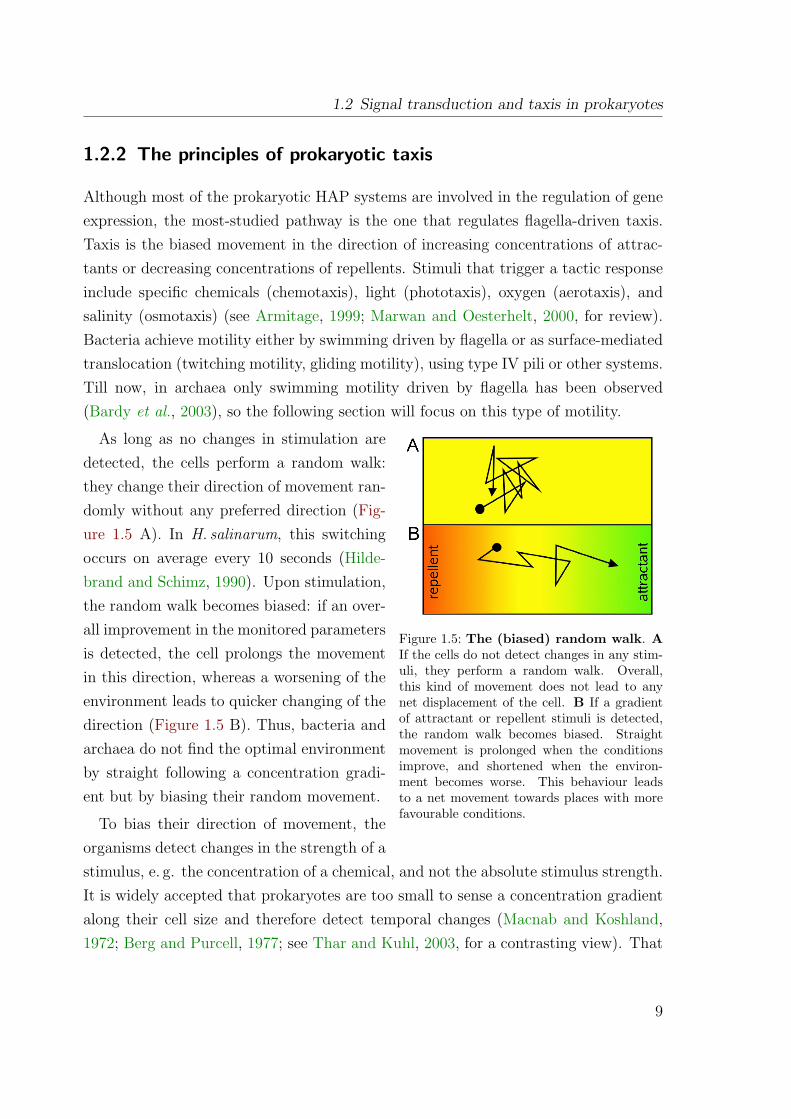
Figure 1.5: The (biased) random walk. AIf the cells do not detect changes in any stim-uli, they perform a random walk. Overall,this kind of movement does not lead to anynet displacement of the cell. B If a gradientof attractant or repellent stimuli is detected,the random walk becomes biased. Straightmovement is prolonged when the conditionsimprove, and shortened when the environ-ment becomes worse. This behaviour leadsto a net movement towards places with morefavourable conditions.
As long as no changes in stimulation aredetected, the cells perform a random walk:they change their direction of movement ran-domly without any preferred direction (Fig-ure 1.5 A). In H. salinarum, this switchingoccurs on average every 10 seconds (Hilde-brand and Schimz, 1990). Upon stimulation,the random walk becomes biased: if an over-all improvement in the monitored parametersis detected, the cell prolongs the movementin this direction, whereas a worsening of theenvironment leads to quicker changing of thedirection (Figure 1.5 B). Thus, bacteria andarchaea do not find the optimal environmentby straight following a concentration gradi-ent but by biasing their random movement.
To bias their direction of movement, theorganisms detect changes in the strength of astimulus, e. g. the concentration of a chemical, and not the absolute stimulus strength.It is widely accepted that prokaryotes are too small to sense a concentration gradientalong their cell size and therefore detect temporal changes (Macnab and Koshland,1972; Berg and Purcell, 1977; see Thar and Kuhl, 2003, for a contrasting view). That
9
1 Background
means that they need some kind of memory to be able to compare the actual strengthof a stimulus with the previous one. This memory is achieved by adaptation, whichlets the cell behave as if no stimulus were present after a short period of continuousexposure. The adaptation system is so efficient that a change in a few molecules canbe sensed in the presence of background concentrations that can vary over at least fiveorders of magnitude (Kim et al., 2001; Sourjik and Berg, 2002b).
Despite the overall similarity there are also fundamental differences between ar-chaeal and bacterial swimming motility. The left-handed helical flagellar filamentsof the bacterial prototypes E. coli, B. subtilis, and S. typhimurium form a coopera-tive bundle upon counterclockwise (CCW) rotation of the flagellar motor, leading tostraight forward swimming of the cell. When the motor changes its direction of rota-tion to clockwise (CW), the flagellar bundle disassembles and the cell tumbles. Whenthe motor turns back to clockwise rotation, the flagellar bundle reassembles and thecell starts swimming again, albeit in a different direction (Eisenbach, 1990).
In contrast, the right-handed flagellar bundle of H. salinarum stays intact indepen-dent of the rotational sense of the motor. CW rotation of the flagellum pushes the cell,whereas a CCW rotation pulls the cell, so the cell appears to swim with the flagella infront (Alam and Oesterhelt, 1984; Marwan et al., 1991). When the cell switches fromforward to backward movement or vice versa, there is a short stop phase of several100 ms in between, in which the cell is slightly displaced, so it does not swim back onthe same path (Marwan et al., 1991).
1.3 Protein-protein interaction analysis
Protein-protein interactions (PPI) are fundamental for most biological processes, asnearly all proteins are functioning as part of larger complexes rather than workingin isolation. The interactions between proteins may be static or transient, the latteroften occurring in signalling and metabolic pathways. As elementary constituents ofcellular complexes and pathways, protein interactions are intimately related to proteinfunctions. Therefore studying protein interactions can help to infer the function ofuncharacterised proteins (“guilt-by-association”, Semple et al., 2002). Knowledge ofprotein interactions is also invaluable for understanding a complex signal transduc-tion network like the chemotaxis signalling system. The rationale of PPI analysis is
10
1.3 Protein-protein interaction analysis
reviewed e. g. in Boulton et al. (2001); Titz et al. (2004); Collura and Boissy (2007).With the availability of the first large-scale PPI datasets the network-based analysis
of PPIs arised, with the aim to understand biological properties of the underlying sys-tem by studying network topology. For example, it has been found that PPI networksare scale-free (Barabasi and Albert, 1999), implying robustness to random componentfailure (Albert et al., 2000; Goh et al., 2002), and that the structure of the PPI net-work is related to whether or not a given protein is essential (Jeong et al., 2001; Hanet al., 2004). However, newer studies demonstrated that the observed network topol-ogy might not necessarily represent the underlying “true” PPI network, but is heavilyinfluenced by dataset biases (Hakes et al., 2005; Han et al., 2005; Stumpf et al., 2005).Therefore it is important to be very cautious with inferring biological significance fromnetwork properties. Hakes et al. (2008) gives a critical commentary on this topic.
Several methods have been developed to investigate protein interactions. X-raycrystallography and NMR spectroscopy can characterise interactions at the atomicscale, producing very detailed data that show the precise structural relationship be-tween interacting atoms and residues. In contrast, methods for studying interactionsat the molecular scale do not reveal the precise chemical nature of the interactionsbut simply report that an interaction takes place. These methods include the yeasttwo-hybrid (Y2H) system and its derivatives for binary interactions (i. e. interactionsbetween pairs of proteins) and affinity purification (AP) combined with mass spec-trometry (MS) for complex interactions (i. e. interactions between multiple proteins).Both methods are reviewed in Causier (2004). A third class are prediction methods.These methods are either based on genomic information (e. g. domain fusions, phy-logenetic profiles, gene neighbourhood), on interaction data on orthologous proteinsin other species, on evolutionary information (for example conservation and variationof certain residues in an interaction site in the in silico two-hybrid system, or thesimilarity of phylogenetic trees), or just on the protein sequence information (machinelearning on a large number of PPIs). An overview of the computational methods forPPI prediction is given for example in Valencia and Pazos (2002); Pitre et al. (2008).
Large scale protein interaction studies have been performed in S. cerevisiae usingY2H (Uetz et al., 2000; Ito et al., 2001) and AP-MS (Gavin et al., 2002, 2006; Hoet al., 2002; Krogan et al., 2006), C. elegans and D. melanogaster with Y2H (Li et al.,2004; Giot et al., 2003; Formstecher et al., 2005), in E. coli with AP-MS (Butlandet al., 2005; Arifuzzaman et al., 2006), in H. pylori, T. pallidum, and C. jejuni with
11
1 Background
Y2H (Rain et al., 2001; Rajagopala et al., 2007; Parrish et al., 2007), and some viruseswith Y2H (McCraith et al., 2000; Uetz et al., 2006).
The overlap between the different studies on the yeast interactome, the best studiedinteractome so far, is remarkably small (Bader et al., 2004). This can be explainedby considerable rates of false negatives and/or false positives in the single datasets(Hart et al., 2006; Huang et al., 2007). Furthermore, the different methods (Y2H vs.AP-MS) have dissimilar strengths and weaknesses (biases) (von Mering et al., 2002):Y2H works rather well with transient PPI as those in signalling pathways, but, dueto its binary character, loses interactions that need multiple proteins to participate.In contrast, the strength of AP-MS is the analysis of big, stable protein complexes,whereas short-lived, transient interactions might be lost. Neither of these methods isable to reproduce a comprehensive image of the underlying interactome.
The study of protein interactions in archaea is still at its beginning. To my knowl-edge, only one large-scale and a few mid-scale interaction studies have been carried outin archaeal organisms: Interactions of almost 1000 proteins from P. horikoshii wereanalysed using a mammalian two-hybrid system (Usui et al., 2005), the RNA poly-merase from P. furiosus by Far-Western blotting (Goede et al., 2006), and RNase Psubunits from M. thermoautotrophicus using Y2H (Hall and Brown, 2004). None ofthe commonly used techniques for PPI analysis has been described to be applicablefor high-salt adapted proteins.
Computational methods for PPI analysis are much less powerful in archaea thanin bacteria: till now only 52 archaeal genomes have been sequenced, compared to626 bacterial genomes (numbers from NCBI in April 2008), limiting the usabilityof genome-based methods. Sequence-based approaches or inferring interactions fromdatasets from other organisms are also difficult, because no large experimental datasetexists for an archaeal organism, and the organisms with large datasets are rather dif-ferent. Hence the analysis of PPI in H. salinarum should be based on an experimentalrather than a computational strategy.
1.4 Objectives
The purpose of this study was to improve the understanding of the chemotaxis sig-nal transduction system of H. salinarum through protein-protein interaction analysis.
12
1.4 Objectives
Several aspects of this system are not fully understood, e. g. why this organism codesfor two CheW and three CheC proteins. PPI analysis can help to recognise the roleof a protein by pointing to its interaction partners, and it can identify previouslyoverlooked proteins which are involved in a certain process.
The specific objectives of the research were to:
• Find a method for investigating the interactions of high-salt adapted proteins.None of the commonly used PPI analysis techniques has been shown to be ap-plicable to halophilic proteins.
• Apply this method to the proteins known to participate in taxis signalling. Bythis, the roles of several Che proteins like CheW1 and CheW2, CheC1, CheC2,and CheC3, or CheD should be enlightened, and previously unrecognised pro-teins involved in or connected to the Che system identified. The unknown con-nection between the Che system and the archaeal flagellum was a further focusof this work.
• Perform functional studies to put the found interactions into context. PPI anal-ysis will in most cases not be sufficient to elucidate the function of an unknownprotein, but it is a valuable tool for generating hypothesis for follow-up exper-iments. These experiments were based on the deletion of proteins of unknownfunction and the subsequent characterisation of the resulting phenotype.
13

1 Background
14
2 Materials and methods
2.1 General materials
2.1.1 Instruments
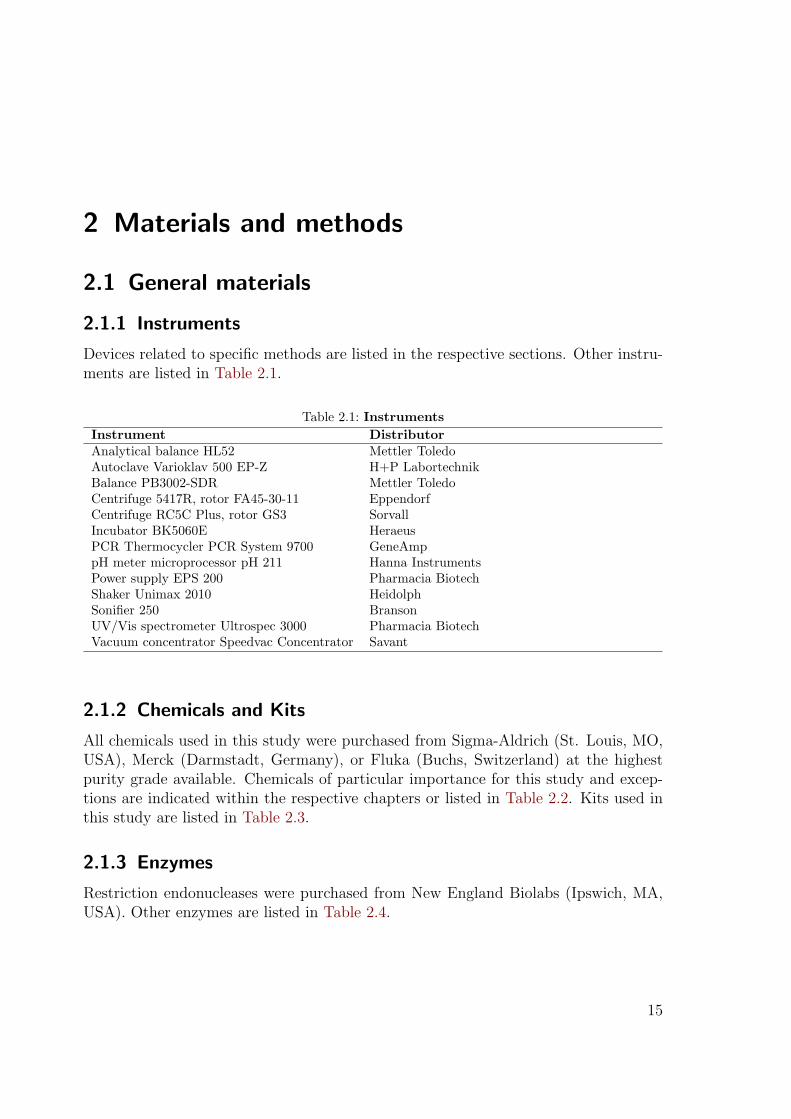
Devices related to specific methods are listed in the respective sections. Other instru-ments are listed in Table 2.1.
Table 2.1: InstrumentsInstrument DistributorAnalytical balance HL52 Mettler ToledoAutoclave Varioklav 500 EP-Z H+P LabortechnikBalance PB3002-SDR Mettler ToledoCentrifuge 5417R, rotor FA45-30-11 EppendorfCentrifuge RC5C Plus, rotor GS3 SorvallIncubator BK5060E HeraeusPCR Thermocycler PCR System 9700 GeneAmppH meter microprocessor pH 211 Hanna InstrumentsPower supply EPS 200 Pharmacia BiotechShaker Unimax 2010 HeidolphSonifier 250 BransonUV/Vis spectrometer Ultrospec 3000 Pharmacia BiotechVacuum concentrator Speedvac Concentrator Savant
2.1.2 Chemicals and Kits
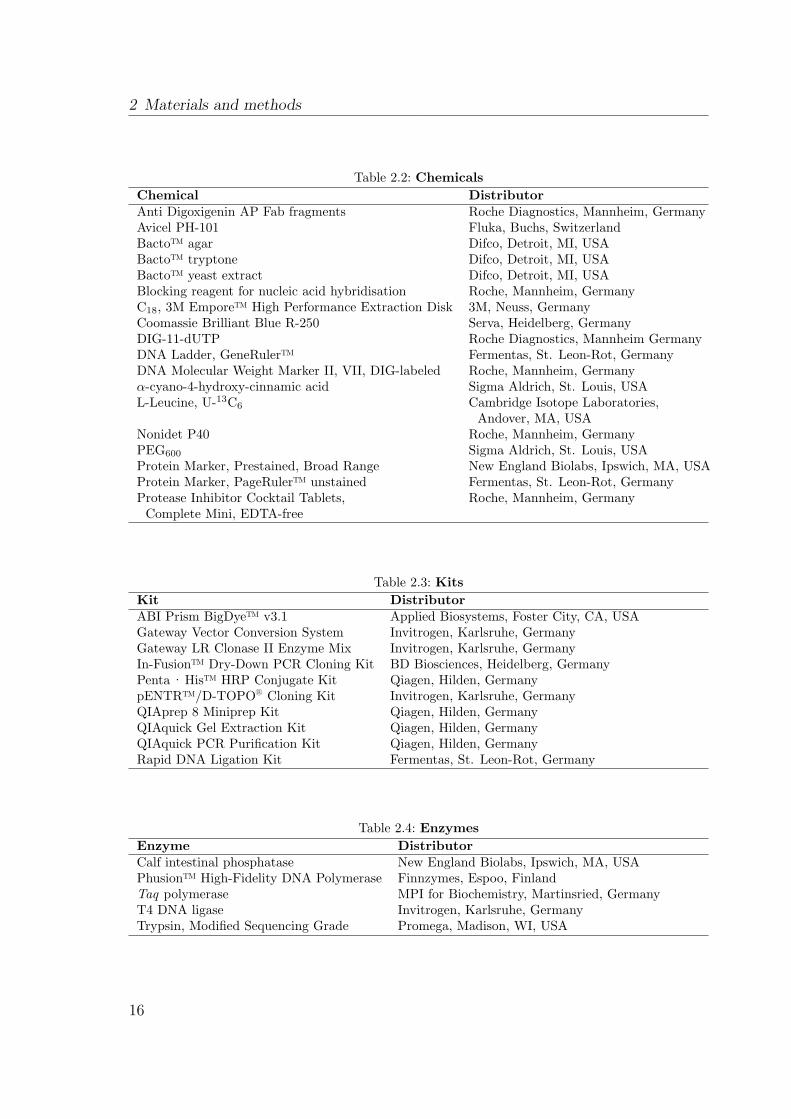
All chemicals used in this study were purchased from Sigma-Aldrich (St. Louis, MO,USA), Merck (Darmstadt, Germany), or Fluka (Buchs, Switzerland) at the highestpurity grade available. Chemicals of particular importance for this study and excep-tions are indicated within the respective chapters or listed in Table 2.2. Kits used inthis study are listed in Table 2.3.
2.1.3 Enzymes
Restriction endonucleases were purchased from New England Biolabs (Ipswich, MA,USA). Other enzymes are listed in Table 2.4.
15
2 Materials and methods
Table 2.2: ChemicalsChemical DistributorAnti Digoxigenin AP Fab fragments Roche Diagnostics, Mannheim, GermanyAvicel PH-101 Fluka, Buchs, SwitzerlandBacto™ agar Difco, Detroit, MI, USABacto™ tryptone Difco, Detroit, MI, USABacto™ yeast extract Difco, Detroit, MI, USABlocking reagent for nucleic acid hybridisation Roche, Mannheim, GermanyC18, 3M Empore™ High Performance Extraction Disk 3M, Neuss, GermanyCoomassie Brilliant Blue R-250 Serva, Heidelberg, GermanyDIG-11-dUTP Roche Diagnostics, Mannheim GermanyDNA Ladder, GeneRuler™ Fermentas, St. Leon-Rot, GermanyDNA Molecular Weight Marker II, VII, DIG-labeled Roche, Mannheim, Germanyα-cyano-4-hydroxy-cinnamic acid Sigma Aldrich, St. Louis, USAL-Leucine, U-13C6 Cambridge Isotope Laboratories,
Andover, MA, USANonidet P40 Roche, Mannheim, GermanyPEG600 Sigma Aldrich, St. Louis, USAProtein Marker, Prestained, Broad Range New England Biolabs, Ipswich, MA, USAProtein Marker, PageRuler™ unstained Fermentas, St. Leon-Rot, GermanyProtease Inhibitor Cocktail Tablets, Roche, Mannheim, Germany
Complete Mini, EDTA-free
Table 2.3: KitsKit DistributorABI Prism BigDye™ v3.1 Applied Biosystems, Foster City, CA, USAGateway Vector Conversion System Invitrogen, Karlsruhe, GermanyGateway LR Clonase II Enzyme Mix Invitrogen, Karlsruhe, GermanyIn-Fusion™ Dry-Down PCR Cloning Kit BD Biosciences, Heidelberg, GermanyPenta · His™ HRP Conjugate Kit Qiagen, Hilden, GermanypENTR™/D-TOPO® Cloning Kit Invitrogen, Karlsruhe, GermanyQIAprep 8 Miniprep Kit Qiagen, Hilden, GermanyQIAquick Gel Extraction Kit Qiagen, Hilden, GermanyQIAquick PCR Purification Kit Qiagen, Hilden, GermanyRapid DNA Ligation Kit Fermentas, St. Leon-Rot, Germany
Table 2.4: EnzymesEnzyme DistributorCalf intestinal phosphatase New England Biolabs, Ipswich, MA, USAPhusion™ High-Fidelity DNA Polymerase Finnzymes, Espoo, FinlandTaq polymerase MPI for Biochemistry, Martinsried, GermanyT4 DNA ligase Invitrogen, Karlsruhe, GermanyTrypsin, Modified Sequencing Grade Promega, Madison, WI, USA
16
2.2 General methods
2.1.4 Strains
Table 2.5: StrainsStrain Description Source or ReferenceH. salinarum R1 H. salinarum wt (DSM 671) DSMH. salinarum S9 Highly motile single colony isolate of the
S9 strainStoeckenius et al. (1979);selected for motility by Wei-dinger (2007)
E. coli DH5α F− Φ80dlacZ∆M15 ∆(lacZY A – argF )U169 recA1 endA1 hsdR17(rk
− , mk+ )
phoA suppE44 λ− thi -1 gyrA96 relA1
Invitrogen, Karlsruhe, Ger-many
E. coli BL21(DE3) F−, ompT, hsdSB(rB−mB
−), dcm+,Tetr, galλ(DE3) endA, Hte [argU ileYleuW Camr]
Stratagene, La Jolla, CA,USA
E. coli Mach1™T1R F− Φ80(lacZ)∆M15 ∆lacX74hsdR(rk
−mk+) ∆recA1398 endA1 tonA
Invitrogen, Karlsruhe, Ger-many
E. coli ccdBsurvival F− mcrA ∆(mrr-hsdRMS-mcrBC)Φ80lacZ∆M15 ∆lacX74 recA1 ara∆139∆(ara-leu)7697 galU galK rpsL (StrR)endA1 nupG tonA::Ptrc-ccdA
Invitrogen, Karlsruhe, Ger-many
2.1.5 Software
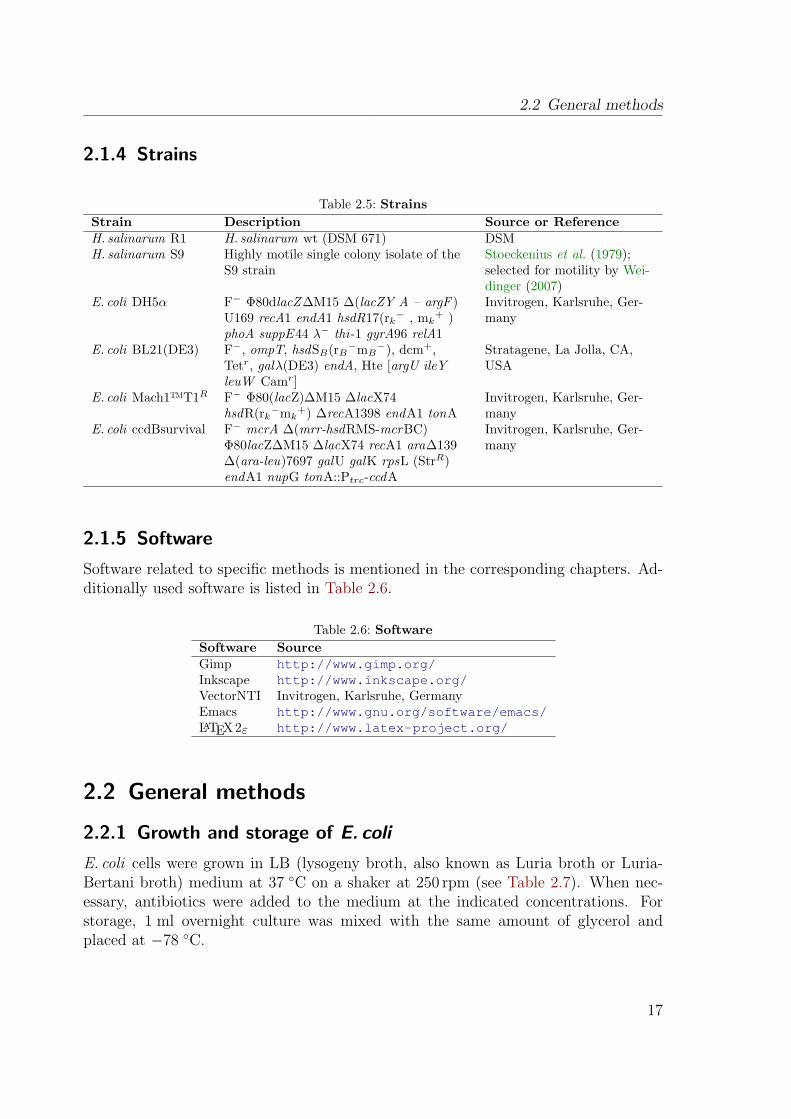
Software related to specific methods is mentioned in the corresponding chapters. Ad-ditionally used software is listed in Table 2.6.
Table 2.6: SoftwareSoftware SourceGimp http://www.gimp.org/Inkscape http://www.inkscape.org/VectorNTI Invitrogen, Karlsruhe, GermanyEmacs http://www.gnu.org/software/emacs/LATEX 2ε http://www.latex-project.org/
2.2 General methods
2.2.1 Growth and storage of E. coli
E. coli cells were grown in LB (lysogeny broth, also known as Luria broth or Luria-Bertani broth) medium at 37 ◦C on a shaker at 250 rpm (see Table 2.7). When nec-essary, antibiotics were added to the medium at the indicated concentrations. Forstorage, 1 ml overnight culture was mixed with the same amount of glycerol andplaced at −78 ◦C.
17
2 Materials and methods
Table 2.7: Media and antibiotics for E. coliLB medium 10 g bacto tryptone 1 % (w/v)
5 g yeast extract 0.5 % (w/v)10 g NaCl 1 % (w/v)ad 1 l H2Obidest
autoclavefor agar plates 15 g agar were added to 1 l of medium
Antibiotics ampicillin (100) 100 µg/mlampicillin (300) 300 µg/mlkanamycin 25 µg/mlchloramphenicol 50 µg/ml
2.2.2 Growth and storage of H. salinarum
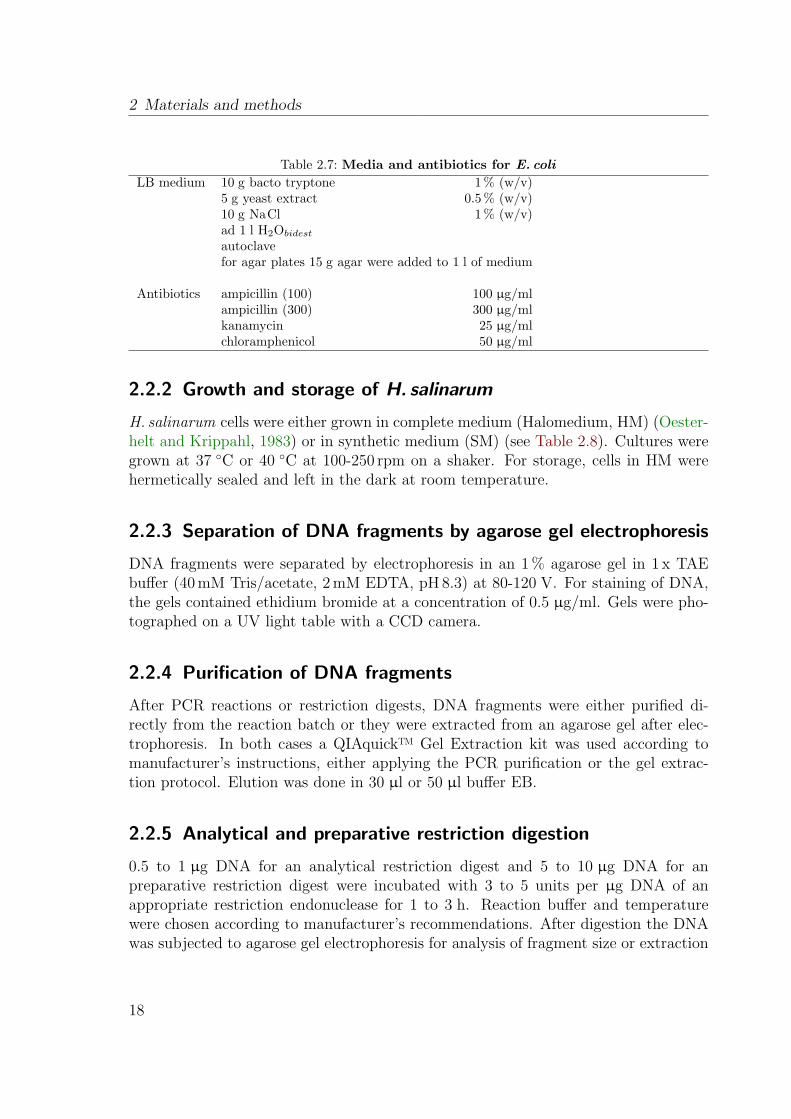
H. salinarum cells were either grown in complete medium (Halomedium, HM) (Oester-helt and Krippahl, 1983) or in synthetic medium (SM) (see Table 2.8). Cultures weregrown at 37 ◦C or 40 ◦C at 100-250 rpm on a shaker. For storage, cells in HM werehermetically sealed and left in the dark at room temperature.
2.2.3 Separation of DNA fragments by agarose gel electrophoresis
DNA fragments were separated by electrophoresis in an 1 % agarose gel in 1 x TAEbuffer (40 mM Tris/acetate, 2 mM EDTA, pH 8.3) at 80-120 V. For staining of DNA,the gels contained ethidium bromide at a concentration of 0.5 µg/ml. Gels were pho-tographed on a UV light table with a CCD camera.
2.2.4 Purification of DNA fragments
After PCR reactions or restriction digests, DNA fragments were either purified di-rectly from the reaction batch or they were extracted from an agarose gel after elec-trophoresis. In both cases a QIAquick™ Gel Extraction kit was used according tomanufacturer’s instructions, either applying the PCR purification or the gel extrac-tion protocol. Elution was done in 30 µl or 50 µl buffer EB.
2.2.5 Analytical and preparative restriction digestion
0.5 to 1 µg DNA for an analytical restriction digest and 5 to 10 µg DNA for anpreparative restriction digest were incubated with 3 to 5 units per µg DNA of anappropriate restriction endonuclease for 1 to 3 h. Reaction buffer and temperaturewere chosen according to manufacturer’s recommendations. After digestion the DNAwas subjected to agarose gel electrophoresis for analysis of fragment size or extraction
18
2.2 General methods
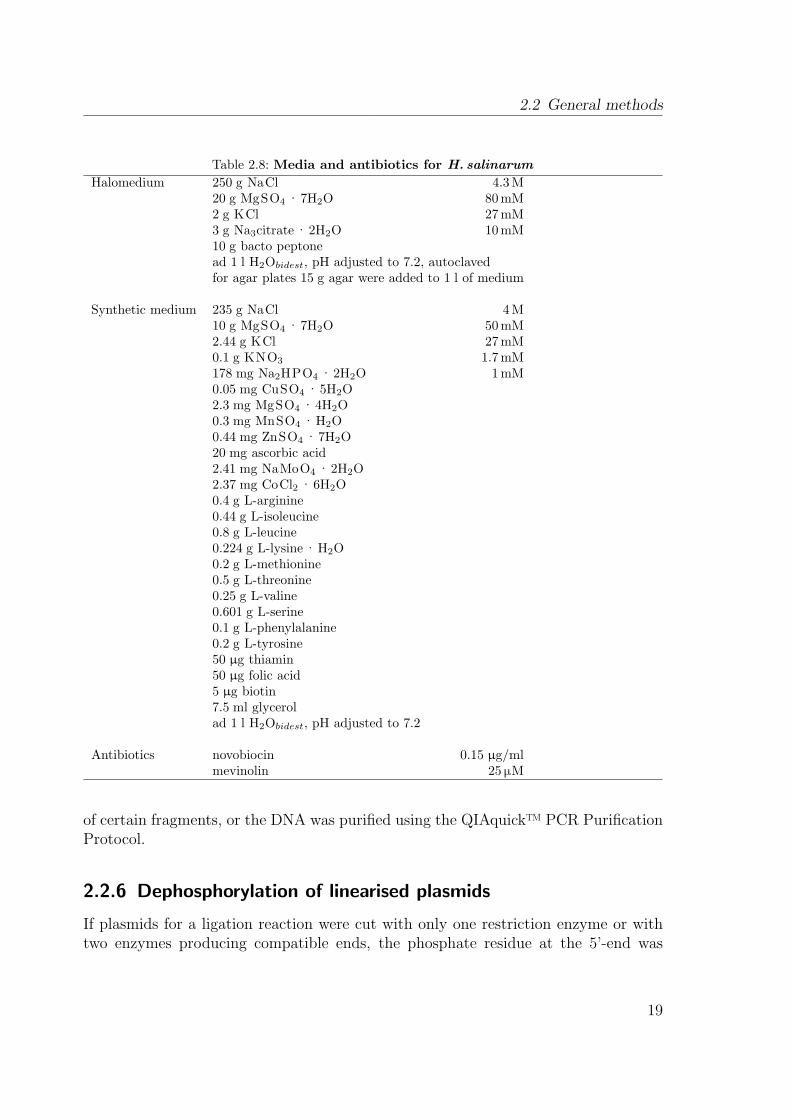
Table 2.8: Media and antibiotics for H. salinarumHalomedium 250 g NaCl 4.3 M
20 g MgSO4 · 7H2O 80 mM2 g KCl 27 mM3 g Na3citrate · 2H2O 10 mM10 g bacto peptonead 1 l H2Obidest, pH adjusted to 7.2, autoclavedfor agar plates 15 g agar were added to 1 l of medium
Synthetic medium 235 g NaCl 4 M10 g MgSO4 · 7H2O 50 mM2.44 g KCl 27 mM0.1 g KNO3 1.7 mM178 mg Na2HPO4 · 2H2O 1 mM0.05 mg CuSO4 · 5H2O2.3 mg MgSO4 · 4H2O0.3 mg MnSO4 · H2O0.44 mg ZnSO4 · 7H2O20 mg ascorbic acid2.41 mg NaMoO4 · 2H2O2.37 mg CoCl2 · 6H2O0.4 g L-arginine0.44 g L-isoleucine0.8 g L-leucine0.224 g L-lysine · H2O0.2 g L-methionine0.5 g L-threonine0.25 g L-valine0.601 g L-serine0.1 g L-phenylalanine0.2 g L-tyrosine50 µg thiamin50 µg folic acid5 µg biotin7.5 ml glycerolad 1 l H2Obidest, pH adjusted to 7.2
Antibiotics novobiocin 0.15 µg/mlmevinolin 25 µM
of certain fragments, or the DNA was purified using the QIAquick™ PCR PurificationProtocol.
2.2.6 Dephosphorylation of linearised plasmids
If plasmids for a ligation reaction were cut with only one restriction enzyme or withtwo enzymes producing compatible ends, the phosphate residue at the 5’-end was
19
2 Materials and methods
enzymatically removed to prevent recirculation of the plasmid by self-ligation. 5-10 µglinearised plasmid were incubated with 20-30 units calf intestine phosphatase (CIP) for1 h at 37 ◦C. The reaction was set up according to manufacturer’s instructions. Afterdephosphorylation, the DNA was purified with the QIAquick™ PCR purification kit.
2.2.7 Ligation
For ligation of a DNA fragment in a linearised plasmid T4 DNA ligase was used.50-100 ng plasmid and an appropriate amount of the DNA fragment were mixed in amolar ratio of 1:1 to 1:3 and incubated with 2-4 units T4 DNA ligase for 1 h at roomtemperature. Alternatively, ligation reactions were performed with the Rapid DNALigation Kit (Fermentas) according to manufacturer’s instructions.
2.2.8 In-Fusion™ cloning
In-Fusion™ (BD Biosciences) cloning allows the directional placement of genes intocloning vectors at almost any desired restriction site without introducing additionalbases to insert or vector.
15 bp extensions were added to the PCR primers that match the ends of the lin-earised target vector. The In-Fusion™ enzyme fuses these homologous regions with thecorresponding ends of the linearised vector by converting double-stranded extensionsinto single-stranded DNA. 1 µl of vector and 100-200 ng PCR product were mixedand H2O added to a total volume of 10 µl. The mixture was pipetted to an In-Fusiondry-down reaction tube, mixed by pipetting up and down several times, and then in-cubated at 42 ◦C for 30 min. After incubation, the reaction mixture was diluted with40 µl TE buffer (10 mM Tris, 1 mM EDTA, pH 8) and 2.5 µl of the diluted mixturetransformed to E. coli.
2.2.9 Gateway™ cloning
The Gateway® technology is a cloning system based on the site-specific recombinationproperties of bacteriophage lambda (Landy, 1989). It provides a fast way to cloneDNA sequences into multiple different vectors (Hartley et al., 2000).
In this study genes were first cloned into the entry vector pENTR™/D-TOPO viadirectional TOPO cloning. The resulting entry clones were then used to move thecloned genes to different destination vectors (e. g. pMS3-6).
Directional TOPO cloning
Genes were cloned with the pENTR™/D-TOPO® Cloning Kit, which directionallyclones a blunt-end PCR product into an entry vector for the Gateway system. TOPOCloning is based on Topoisomerase I from Vaccinia virus (Shuman, 1991). To achieve
20
2.2 General methods
directional cloning, four bases (CACC) are added to the 5’ end of the PCR product.A single-stranded overhang in the cloning vector (GTGG) invades the 5’ end of thePCR product and anneals to the added bases. This stabilises the PCR product in thecorrect orientation resulting in a high probability for proper cloning.
The reaction was set up as follows:
PCR product 1 µlSalt Solution 0.5 µlH2O 1 µlpENTR/D-TOPO vector 0.5 µl
3 µl
After 20 min of incubation at RT the tube was placed on ice and 2 µl of the mixturewere transformed to E. coli. Selection of transformants was done by growth on LBagar plates containing 30 µg/ml kanamycin.
Lambda recombination (LR)
LR recombination was used to move cloned genes from the Gateway entry vector toone or more destination vectors.
Lambda recombination occurs between specific attachment (att) sites, which serveas the binding site for the recombination proteins. Upon lambda integration by thelysogenic pathway, recombination occurs between attB on the E. coli chromosomeand attP on the lambda chromosome (BP recombination). The resulting prophageis bounded by hybrid attL and attR sites. Excisive recombination between attL andattR by the lytic pathway regenerates the original attB and attP sites (LR recombi-nation). In the Gateway system, the wild-type lambda att sites have been modified toimprove the efficiency of the recombination reactions and ensure specificity to maintainorientation and reading frame.
LR recombination reactions were catalyzed by LR Clonase™II enzyme mix, thatcontains the bacteriophage lambda Integrase (Int) and Excisionase (Xis), and theE. coli Integration Host Factor (IHF) protein.
The reaction was set up as follows:
Entry clone plasmid DNA 0.5 µlDestination vector 0.5 µlTE buffer (10 mM Tris, 1 mM EDTA, pH 8.0) 3 µlLR Clonase™II 1 µl
5 µl
The reaction was incubated for 1-2 h at 25 ◦C. Then 0.5 µl Proteinase K solution(2 µg/µl) were added and the mixture incubated at 37 ◦C for 10 min. This enzymedigests the recombination proteins and thereby improves transformation efficiency.E. coli cells were transformed with 1 µl of the reaction mixture.
21
2 Materials and methods
2.2.10 Transformation of E. coli
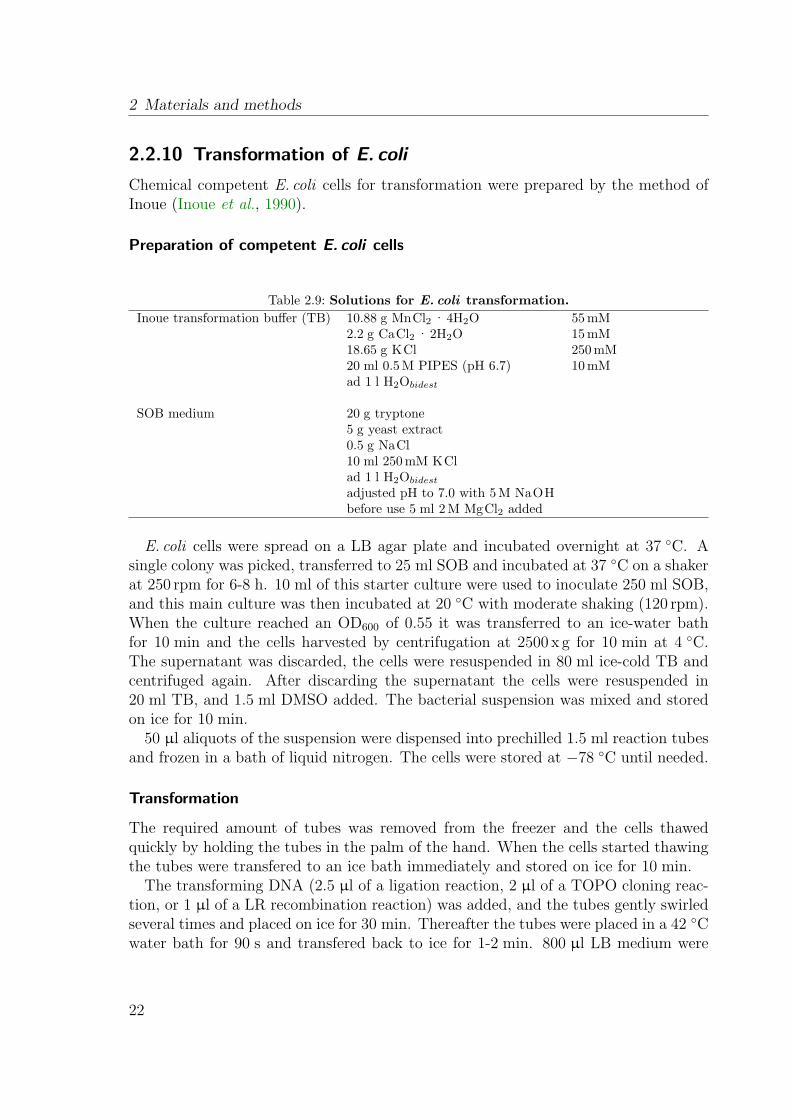
Chemical competent E. coli cells for transformation were prepared by the method ofInoue (Inoue et al., 1990).
Preparation of competent E. coli cells
Table 2.9: Solutions for E. coli transformation.Inoue transformation buffer (TB) 10.88 g MnCl2 · 4H2O 55 mM
2.2 g CaCl2 · 2H2O 15 mM18.65 g KCl 250 mM20 ml 0.5 M PIPES (pH 6.7) 10 mMad 1 l H2Obidest
SOB medium 20 g tryptone5 g yeast extract0.5 g NaCl10 ml 250 mM KClad 1 l H2Obidest
adjusted pH to 7.0 with 5 M NaOHbefore use 5 ml 2 M MgCl2 added
E. coli cells were spread on a LB agar plate and incubated overnight at 37 ◦C. Asingle colony was picked, transferred to 25 ml SOB and incubated at 37 ◦C on a shakerat 250 rpm for 6-8 h. 10 ml of this starter culture were used to inoculate 250 ml SOB,and this main culture was then incubated at 20 ◦C with moderate shaking (120 rpm).When the culture reached an OD600 of 0.55 it was transferred to an ice-water bathfor 10 min and the cells harvested by centrifugation at 2500 x g for 10 min at 4 ◦C.The supernatant was discarded, the cells were resuspended in 80 ml ice-cold TB andcentrifuged again. After discarding the supernatant the cells were resuspended in20 ml TB, and 1.5 ml DMSO added. The bacterial suspension was mixed and storedon ice for 10 min.
50 µl aliquots of the suspension were dispensed into prechilled 1.5 ml reaction tubesand frozen in a bath of liquid nitrogen. The cells were stored at −78 ◦C until needed.
Transformation
The required amount of tubes was removed from the freezer and the cells thawedquickly by holding the tubes in the palm of the hand. When the cells started thawingthe tubes were transfered to an ice bath immediately and stored on ice for 10 min.
The transforming DNA (2.5 µl of a ligation reaction, 2 µl of a TOPO cloning reac-tion, or 1 µl of a LR recombination reaction) was added, and the tubes gently swirledseveral times and placed on ice for 30 min. Thereafter the tubes were placed in a 42 ◦Cwater bath for 90 s and transfered back to ice for 1-2 min. 800 µl LB medium were
22
2.2 General methods
added to each tube and the cultures incubated in a shaking incubator (250 rpm, 37 ◦C)for 45 min. Up to 200 µl of the cultures were spread on LB agar plates containing theappropriate antibiotic. If a low yield was expected, the whole culture was centrifuged(1 min, 14000 rpm in a tabletop centrifuge) and the pellet resuspended in 150 µl LBand completely spread on LB agar plates. The plates were incubated overnight at37 ◦C.
Alternatively, One Shot® Mach1™-T1R Chemically Competent E. coli were used fortransformation according to manufacturer’s instructions.
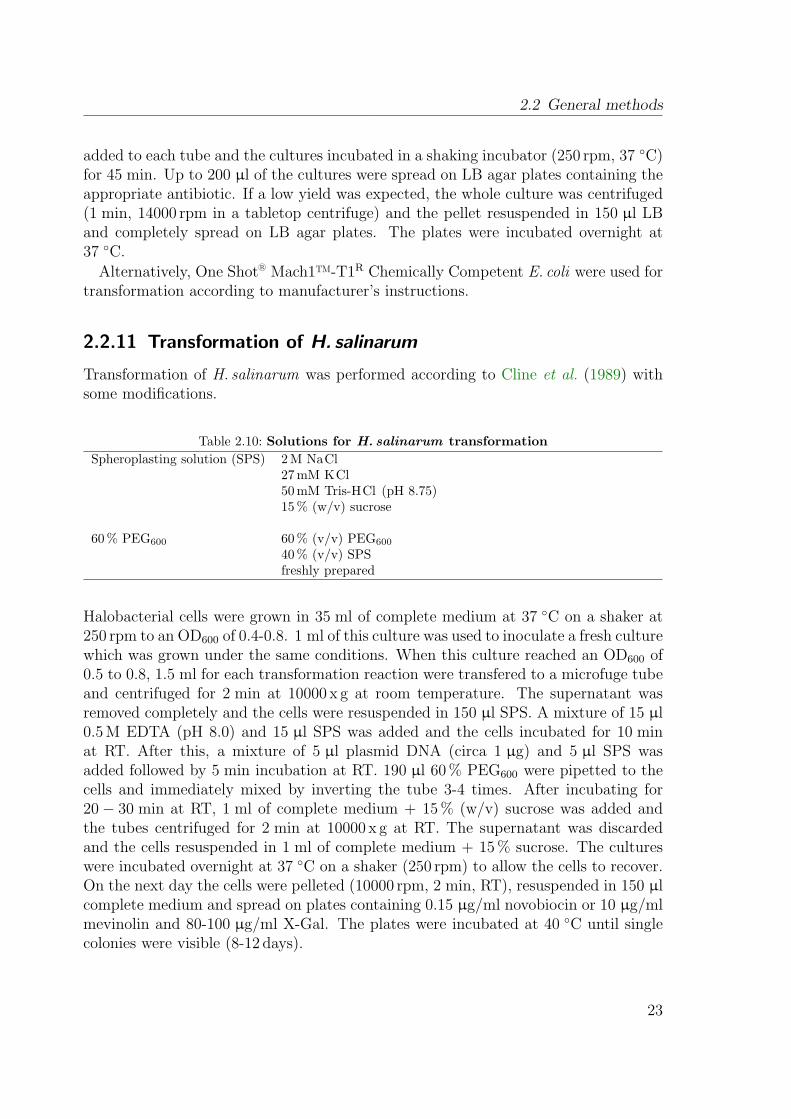
2.2.11 Transformation of H. salinarum
Transformation of H. salinarum was performed according to Cline et al. (1989) withsome modifications.
Table 2.10: Solutions for H. salinarum transformationSpheroplasting solution (SPS) 2 M NaCl
27 mM KCl50 mM Tris-HCl (pH 8.75)15 % (w/v) sucrose
60 % PEG600 60 % (v/v) PEG60040 % (v/v) SPSfreshly prepared
Halobacterial cells were grown in 35 ml of complete medium at 37 ◦C on a shaker at250 rpm to an OD600 of 0.4-0.8. 1 ml of this culture was used to inoculate a fresh culturewhich was grown under the same conditions. When this culture reached an OD600 of0.5 to 0.8, 1.5 ml for each transformation reaction were transfered to a microfuge tubeand centrifuged for 2 min at 10000 x g at room temperature. The supernatant wasremoved completely and the cells were resuspended in 150 µl SPS. A mixture of 15 µl0.5 M EDTA (pH 8.0) and 15 µl SPS was added and the cells incubated for 10 minat RT. After this, a mixture of 5 µl plasmid DNA (circa 1 µg) and 5 µl SPS wasadded followed by 5 min incubation at RT. 190 µl 60 % PEG600 were pipetted to thecells and immediately mixed by inverting the tube 3-4 times. After incubating for20− 30 min at RT, 1 ml of complete medium + 15 % (w/v) sucrose was added andthe tubes centrifuged for 2 min at 10000 x g at RT. The supernatant was discardedand the cells resuspended in 1 ml of complete medium + 15 % sucrose. The cultureswere incubated overnight at 37 ◦C on a shaker (250 rpm) to allow the cells to recover.On the next day the cells were pelleted (10000 rpm, 2 min, RT), resuspended in 150 µlcomplete medium and spread on plates containing 0.15 µg/ml novobiocin or 10 µg/mlmevinolin and 80-100 µg/ml X-Gal. The plates were incubated at 40 ◦C until singlecolonies were visible (8-12 days).
23
2 Materials and methods
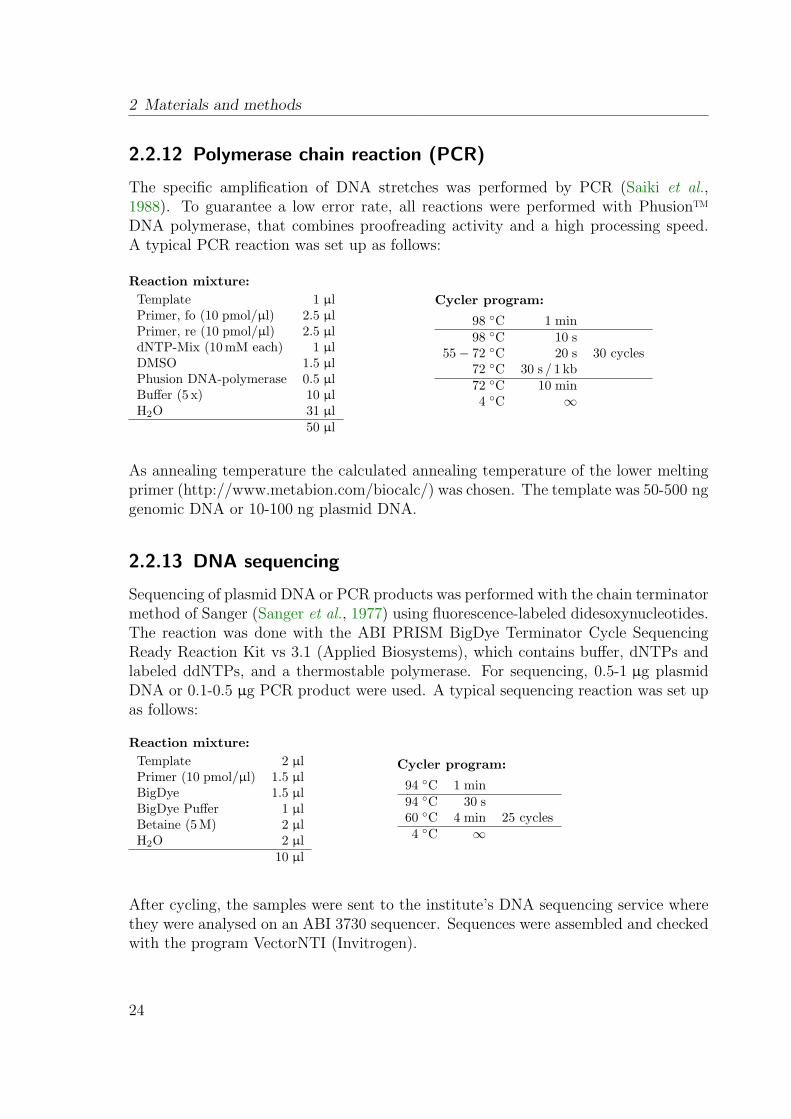
2.2.12 Polymerase chain reaction (PCR)
The specific amplification of DNA stretches was performed by PCR (Saiki et al.,1988). To guarantee a low error rate, all reactions were performed with Phusion™DNA polymerase, that combines proofreading activity and a high processing speed.A typical PCR reaction was set up as follows:
Reaction mixture:Template 1 µlPrimer, fo (10 pmol/µl) 2.5 µlPrimer, re (10 pmol/µl) 2.5 µldNTP-Mix (10 mM each) 1 µlDMSO 1.5 µlPhusion DNA-polymerase 0.5 µlBuffer (5 x) 10 µlH2O 31 µl
50 µl
Cycler program:
98 ◦C 1 min98 ◦C 10 s
55− 72 ◦C 20 s 30 cycles72 ◦C 30 s / 1 kb72 ◦C 10 min4 ◦C ∞
As annealing temperature the calculated annealing temperature of the lower meltingprimer (http://www.metabion.com/biocalc/) was chosen. The template was 50-500 nggenomic DNA or 10-100 ng plasmid DNA.
2.2.13 DNA sequencing
Sequencing of plasmid DNA or PCR products was performed with the chain terminatormethod of Sanger (Sanger et al., 1977) using fluorescence-labeled didesoxynucleotides.The reaction was done with the ABI PRISM BigDye Terminator Cycle SequencingReady Reaction Kit vs 3.1 (Applied Biosystems), which contains buffer, dNTPs andlabeled ddNTPs, and a thermostable polymerase. For sequencing, 0.5-1 µg plasmidDNA or 0.1-0.5 µg PCR product were used. A typical sequencing reaction was set upas follows:
Reaction mixture:Template 2 µlPrimer (10 pmol/µl) 1.5 µlBigDye 1.5 µlBigDye Puffer 1 µlBetaine (5 M) 2 µlH2O 2 µl
10 µl
Cycler program:
94 ◦C 1 min94 ◦C 30 s60 ◦C 4 min 25 cycles4 ◦C ∞
After cycling, the samples were sent to the institute’s DNA sequencing service wherethey were analysed on an ABI 3730 sequencer. Sequences were assembled and checkedwith the program VectorNTI (Invitrogen).
24
2.2 General methods
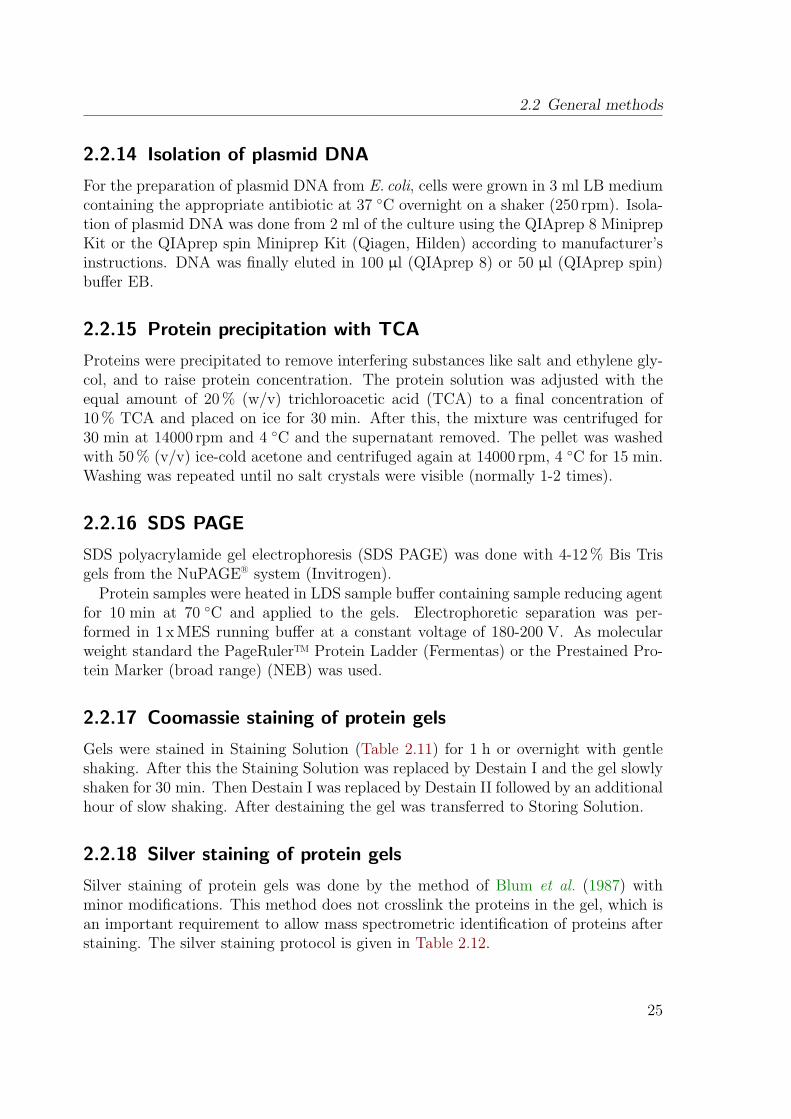
2.2.14 Isolation of plasmid DNA
For the preparation of plasmid DNA from E. coli, cells were grown in 3 ml LB mediumcontaining the appropriate antibiotic at 37 ◦C overnight on a shaker (250 rpm). Isola-tion of plasmid DNA was done from 2 ml of the culture using the QIAprep 8 MiniprepKit or the QIAprep spin Miniprep Kit (Qiagen, Hilden) according to manufacturer’sinstructions. DNA was finally eluted in 100 µl (QIAprep 8) or 50 µl (QIAprep spin)buffer EB.
2.2.15 Protein precipitation with TCA
Proteins were precipitated to remove interfering substances like salt and ethylene gly-col, and to raise protein concentration. The protein solution was adjusted with theequal amount of 20 % (w/v) trichloroacetic acid (TCA) to a final concentration of10 % TCA and placed on ice for 30 min. After this, the mixture was centrifuged for30 min at 14000 rpm and 4 ◦C and the supernatant removed. The pellet was washedwith 50 % (v/v) ice-cold acetone and centrifuged again at 14000 rpm, 4 ◦C for 15 min.Washing was repeated until no salt crystals were visible (normally 1-2 times).
2.2.16 SDS PAGE
SDS polyacrylamide gel electrophoresis (SDS PAGE) was done with 4-12 % Bis Trisgels from the NuPAGE® system (Invitrogen).
Protein samples were heated in LDS sample buffer containing sample reducing agentfor 10 min at 70 ◦C and applied to the gels. Electrophoretic separation was per-formed in 1 x MES running buffer at a constant voltage of 180-200 V. As molecularweight standard the PageRuler™ Protein Ladder (Fermentas) or the Prestained Pro-tein Marker (broad range) (NEB) was used.
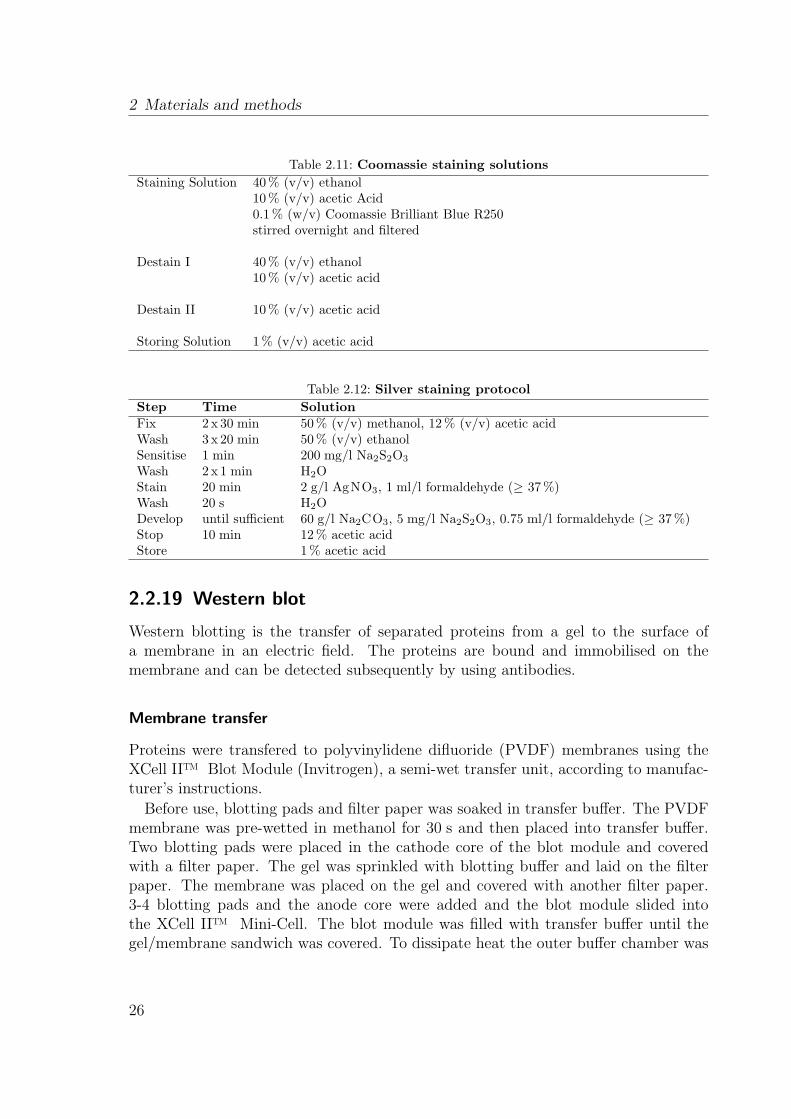
2.2.17 Coomassie staining of protein gels
Gels were stained in Staining Solution (Table 2.11) for 1 h or overnight with gentleshaking. After this the Staining Solution was replaced by Destain I and the gel slowlyshaken for 30 min. Then Destain I was replaced by Destain II followed by an additionalhour of slow shaking. After destaining the gel was transferred to Storing Solution.
2.2.18 Silver staining of protein gels
Silver staining of protein gels was done by the method of Blum et al. (1987) withminor modifications. This method does not crosslink the proteins in the gel, which isan important requirement to allow mass spectrometric identification of proteins afterstaining. The silver staining protocol is given in Table 2.12.
25
2 Materials and methods
Table 2.11: Coomassie staining solutionsStaining Solution 40 % (v/v) ethanol
10 % (v/v) acetic Acid0.1 % (w/v) Coomassie Brilliant Blue R250stirred overnight and filtered
Destain I 40 % (v/v) ethanol10 % (v/v) acetic acid
Destain II 10 % (v/v) acetic acid
Storing Solution 1 % (v/v) acetic acid
Table 2.12: Silver staining protocolStep Time SolutionFix 2 x 30 min 50 % (v/v) methanol, 12 % (v/v) acetic acidWash 3 x 20 min 50 % (v/v) ethanolSensitise 1 min 200 mg/l Na2S2O3
Wash 2 x 1 min H2OStain 20 min 2 g/l AgNO3, 1 ml/l formaldehyde (≥ 37 %)Wash 20 s H2ODevelop until sufficient 60 g/l Na2CO3, 5 mg/l Na2S2O3, 0.75 ml/l formaldehyde (≥ 37 %)Stop 10 min 12 % acetic acidStore 1 % acetic acid
2.2.19 Western blot
Western blotting is the transfer of separated proteins from a gel to the surface ofa membrane in an electric field. The proteins are bound and immobilised on themembrane and can be detected subsequently by using antibodies.
Membrane transfer
Proteins were transfered to polyvinylidene difluoride (PVDF) membranes using theXCell II™ Blot Module (Invitrogen), a semi-wet transfer unit, according to manufac-turer’s instructions.
Before use, blotting pads and filter paper was soaked in transfer buffer. The PVDFmembrane was pre-wetted in methanol for 30 s and then placed into transfer buffer.Two blotting pads were placed in the cathode core of the blot module and coveredwith a filter paper. The gel was sprinkled with blotting buffer and laid on the filterpaper. The membrane was placed on the gel and covered with another filter paper.3-4 blotting pads and the anode core were added and the blot module slided intothe XCell II™ Mini-Cell. The blot module was filled with transfer buffer until thegel/membrane sandwich was covered. To dissipate heat the outer buffer chamber was
26
2.2 General methods
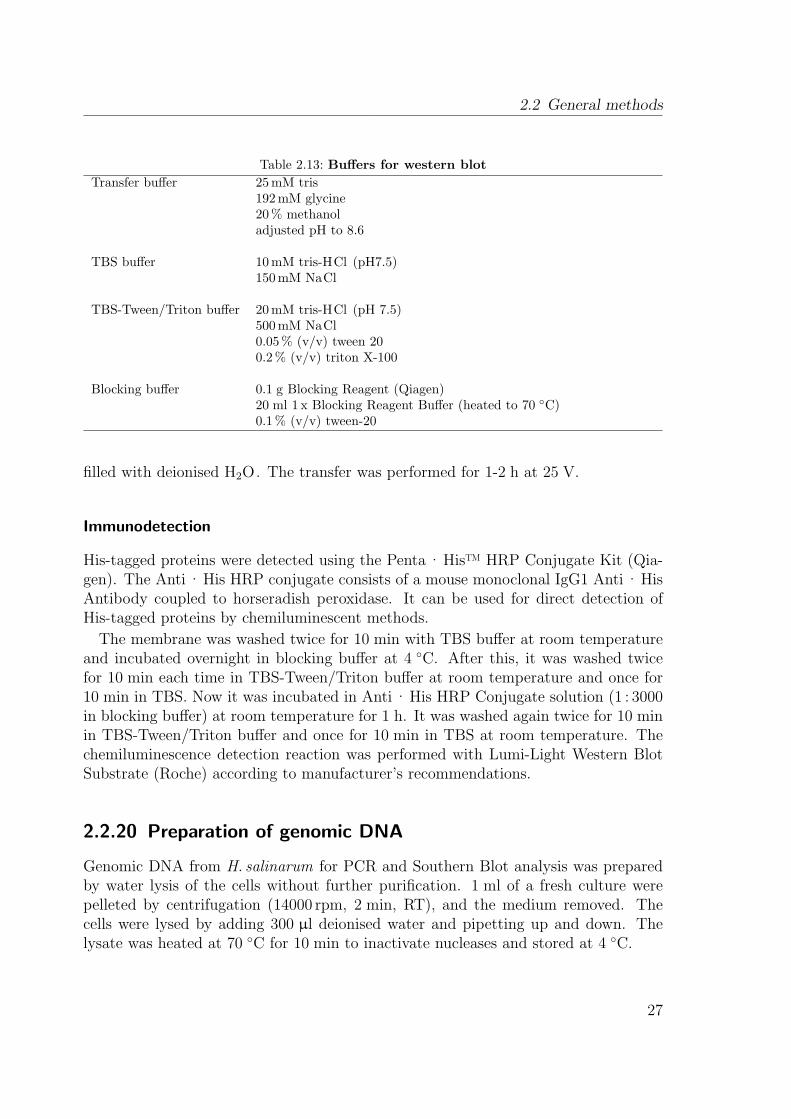
Table 2.13: Buffers for western blotTransfer buffer 25 mM tris
192 mM glycine20 % methanoladjusted pH to 8.6
TBS buffer 10 mM tris-HCl (pH7.5)150 mM NaCl
TBS-Tween/Triton buffer 20 mM tris-HCl (pH 7.5)500 mM NaCl0.05 % (v/v) tween 200.2 % (v/v) triton X-100
Blocking buffer 0.1 g Blocking Reagent (Qiagen)20 ml 1 x Blocking Reagent Buffer (heated to 70 ◦C)0.1 % (v/v) tween-20
filled with deionised H2O . The transfer was performed for 1-2 h at 25 V.
Immunodetection
His-tagged proteins were detected using the Penta · His™ HRP Conjugate Kit (Qia-gen). The Anti · His HRP conjugate consists of a mouse monoclonal IgG1 Anti · HisAntibody coupled to horseradish peroxidase. It can be used for direct detection ofHis-tagged proteins by chemiluminescent methods.
The membrane was washed twice for 10 min with TBS buffer at room temperatureand incubated overnight in blocking buffer at 4 ◦C. After this, it was washed twicefor 10 min each time in TBS-Tween/Triton buffer at room temperature and once for10 min in TBS. Now it was incubated in Anti · His HRP Conjugate solution (1 : 3000in blocking buffer) at room temperature for 1 h. It was washed again twice for 10 minin TBS-Tween/Triton buffer and once for 10 min in TBS at room temperature. Thechemiluminescence detection reaction was performed with Lumi-Light Western BlotSubstrate (Roche) according to manufacturer’s recommendations.
2.2.20 Preparation of genomic DNA
Genomic DNA from H. salinarum for PCR and Southern Blot analysis was preparedby water lysis of the cells without further purification. 1 ml of a fresh culture werepelleted by centrifugation (14000 rpm, 2 min, RT), and the medium removed. Thecells were lysed by adding 300 µl deionised water and pipetting up and down. Thelysate was heated at 70 ◦C for 10 min to inactivate nucleases and stored at 4 ◦C.
27
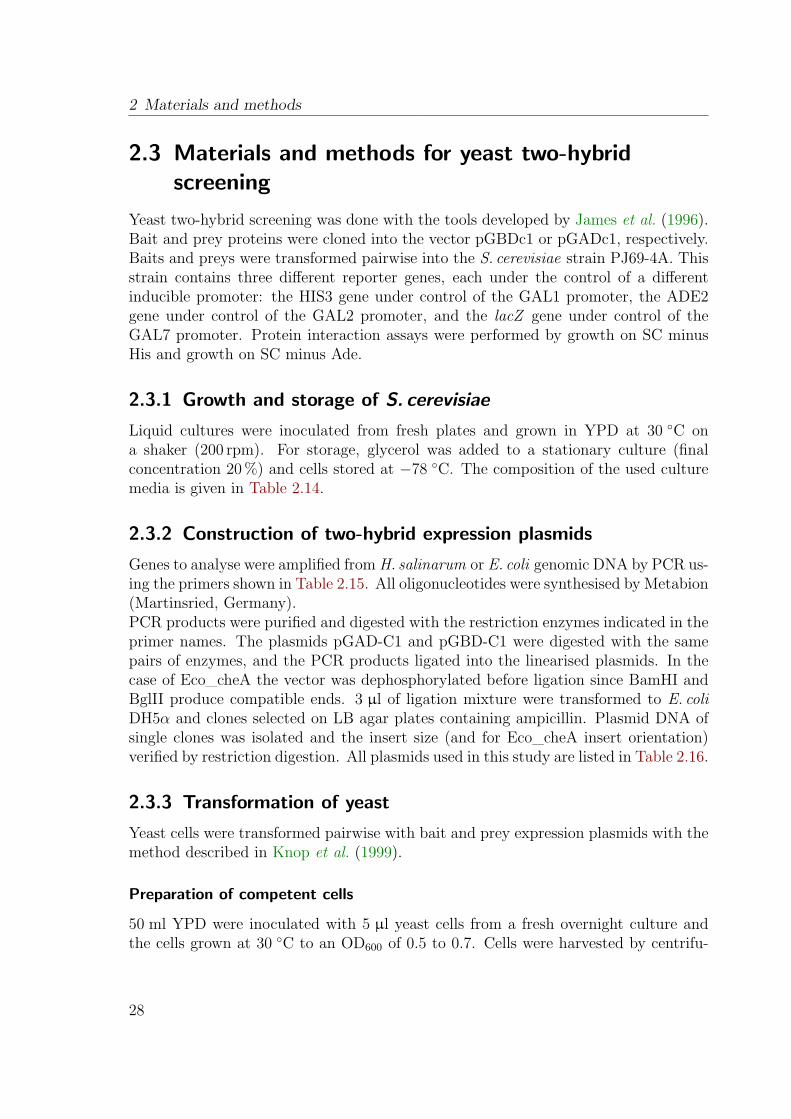
2 Materials and methods
2.3 Materials and methods for yeast two-hybridscreening
Yeast two-hybrid screening was done with the tools developed by James et al. (1996).Bait and prey proteins were cloned into the vector pGBDc1 or pGADc1, respectively.Baits and preys were transformed pairwise into the S. cerevisiae strain PJ69-4A. Thisstrain contains three different reporter genes, each under the control of a differentinducible promoter: the HIS3 gene under control of the GAL1 promoter, the ADE2gene under control of the GAL2 promoter, and the lacZ gene under control of theGAL7 promoter. Protein interaction assays were performed by growth on SC minusHis and growth on SC minus Ade.
2.3.1 Growth and storage of S. cerevisiae
Liquid cultures were inoculated from fresh plates and grown in YPD at 30 ◦C ona shaker (200 rpm). For storage, glycerol was added to a stationary culture (finalconcentration 20 %) and cells stored at −78 ◦C. The composition of the used culturemedia is given in Table 2.14.
2.3.2 Construction of two-hybrid expression plasmids
Genes to analyse were amplified from H. salinarum or E. coli genomic DNA by PCR us-ing the primers shown in Table 2.15. All oligonucleotides were synthesised by Metabion(Martinsried, Germany).PCR products were purified and digested with the restriction enzymes indicated in theprimer names. The plasmids pGAD-C1 and pGBD-C1 were digested with the samepairs of enzymes, and the PCR products ligated into the linearised plasmids. In thecase of Eco_cheA the vector was dephosphorylated before ligation since BamHI andBglII produce compatible ends. 3 µl of ligation mixture were transformed to E. coliDH5α and clones selected on LB agar plates containing ampicillin. Plasmid DNA ofsingle clones was isolated and the insert size (and for Eco_cheA insert orientation)verified by restriction digestion. All plasmids used in this study are listed in Table 2.16.
2.3.3 Transformation of yeast
Yeast cells were transformed pairwise with bait and prey expression plasmids with themethod described in Knop et al. (1999).
Preparation of competent cells
50 ml YPD were inoculated with 5 µl yeast cells from a fresh overnight culture andthe cells grown at 30 ◦C to an OD600 of 0.5 to 0.7. Cells were harvested by centrifu-
28
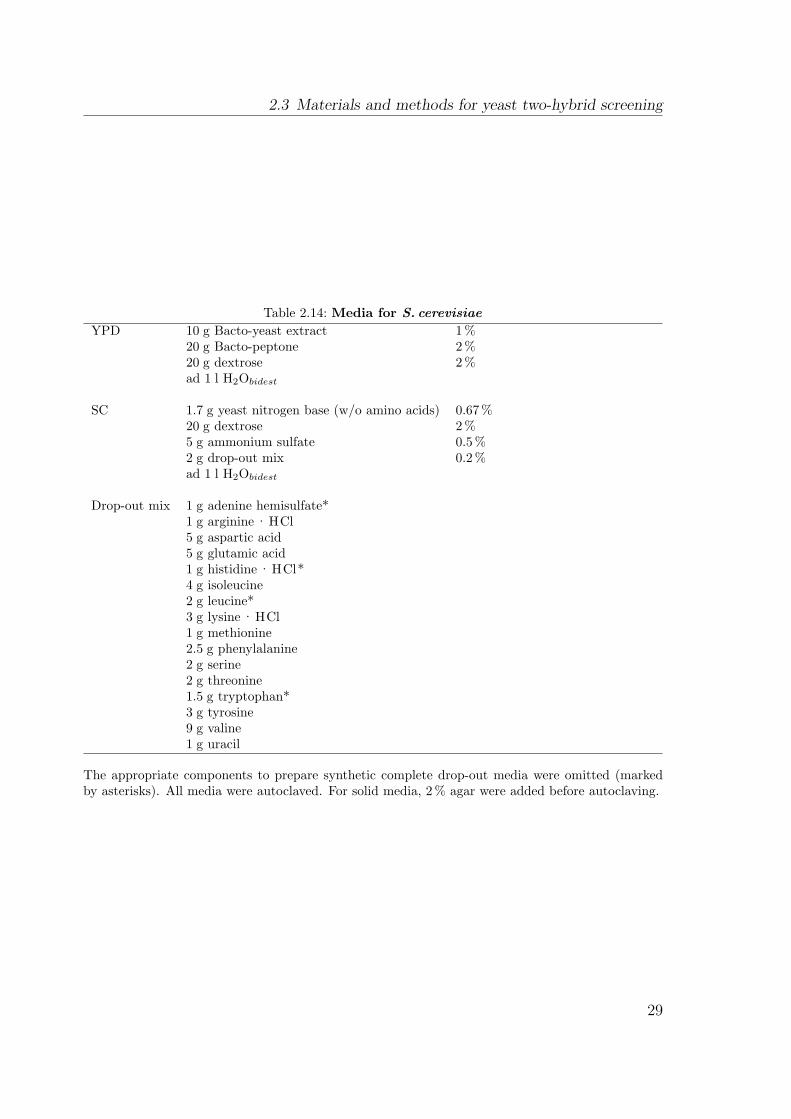
2.3 Materials and methods for yeast two-hybrid screening
Table 2.14: Media for S. cerevisiaeYPD 10 g Bacto-yeast extract 1 %
20 g Bacto-peptone 2 %20 g dextrose 2 %ad 1 l H2Obidest
SC 1.7 g yeast nitrogen base (w/o amino acids) 0.67 %20 g dextrose 2 %5 g ammonium sulfate 0.5 %2 g drop-out mix 0.2 %ad 1 l H2Obidest
Drop-out mix 1 g adenine hemisulfate*1 g arginine · HCl5 g aspartic acid5 g glutamic acid1 g histidine · HCl*4 g isoleucine2 g leucine*3 g lysine · HCl1 g methionine2.5 g phenylalanine2 g serine2 g threonine1.5 g tryptophan*3 g tyrosine9 g valine1 g uracil
The appropriate components to prepare synthetic complete drop-out media were omitted (markedby asterisks). All media were autoclaved. For solid media, 2 % agar were added before autoclaving.
29
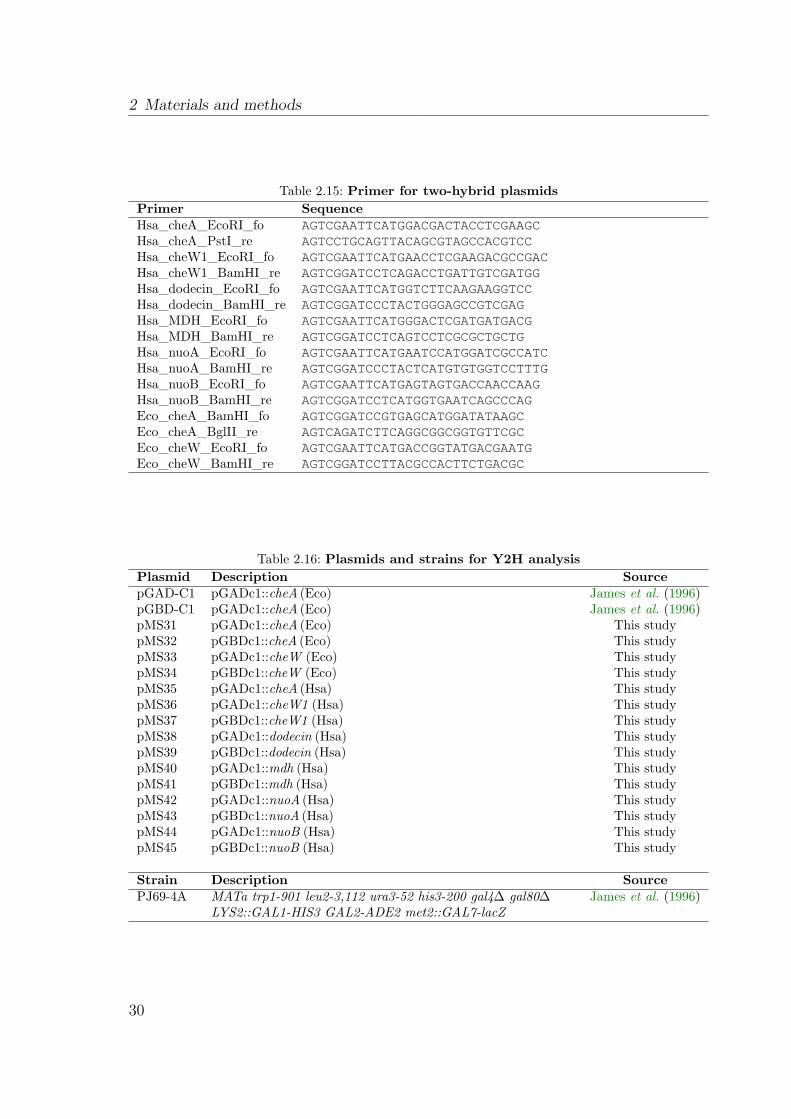
2 Materials and methods
Table 2.15: Primer for two-hybrid plasmidsPrimer SequenceHsa_cheA_EcoRI_fo AGTCGAATTCATGGACGACTACCTCGAAGCHsa_cheA_PstI_re AGTCCTGCAGTTACAGCGTAGCCACGTCCHsa_cheW1_EcoRI_fo AGTCGAATTCATGAACCTCGAAGACGCCGACHsa_cheW1_BamHI_re AGTCGGATCCTCAGACCTGATTGTCGATGGHsa_dodecin_EcoRI_fo AGTCGAATTCATGGTCTTCAAGAAGGTCCHsa_dodecin_BamHI_re AGTCGGATCCCTACTGGGAGCCGTCGAGHsa_MDH_EcoRI_fo AGTCGAATTCATGGGACTCGATGATGACGHsa_MDH_BamHI_re AGTCGGATCCTCAGTCCTCGCGCTGCTGHsa_nuoA_EcoRI_fo AGTCGAATTCATGAATCCATGGATCGCCATCHsa_nuoA_BamHI_re AGTCGGATCCCTACTCATGTGTGGTCCTTTGHsa_nuoB_EcoRI_fo AGTCGAATTCATGAGTAGTGACCAACCAAGHsa_nuoB_BamHI_re AGTCGGATCCTCATGGTGAATCAGCCCAGEco_cheA_BamHI_fo AGTCGGATCCGTGAGCATGGATATAAGCEco_cheA_BglII_re AGTCAGATCTTCAGGCGGCGGTGTTCGCEco_cheW_EcoRI_fo AGTCGAATTCATGACCGGTATGACGAATGEco_cheW_BamHI_re AGTCGGATCCTTACGCCACTTCTGACGC
Table 2.16: Plasmids and strains for Y2H analysisPlasmid Description SourcepGAD-C1 pGADc1::cheA (Eco) James et al. (1996)pGBD-C1 pGADc1::cheA (Eco) James et al. (1996)pMS31 pGADc1::cheA (Eco) This studypMS32 pGBDc1::cheA (Eco) This studypMS33 pGADc1::cheW (Eco) This studypMS34 pGBDc1::cheW (Eco) This studypMS35 pGADc1::cheA (Hsa) This studypMS36 pGADc1::cheW1 (Hsa) This studypMS37 pGBDc1::cheW1 (Hsa) This studypMS38 pGADc1::dodecin (Hsa) This studypMS39 pGBDc1::dodecin (Hsa) This studypMS40 pGADc1::mdh (Hsa) This studypMS41 pGBDc1::mdh (Hsa) This studypMS42 pGADc1::nuoA (Hsa) This studypMS43 pGBDc1::nuoA (Hsa) This studypMS44 pGADc1::nuoB (Hsa) This studypMS45 pGBDc1::nuoB (Hsa) This study
Strain Description SourcePJ69-4A MATa trp1-901 leu2-3,112 ura3-52 his3-200 gal4∆ gal80∆
LYS2::GAL1-HIS3 GAL2-ADE2 met2::GAL7-lacZJames et al. (1996)
30
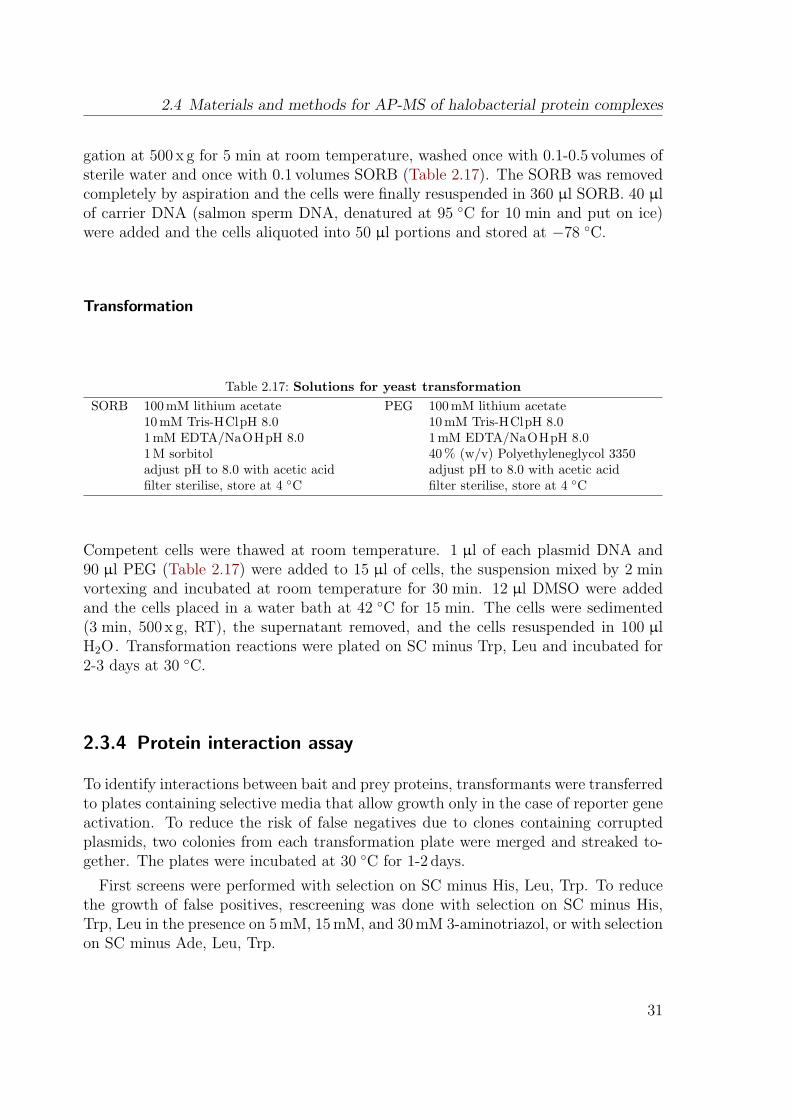
2.4 Materials and methods for AP-MS of halobacterial protein complexes
gation at 500 x g for 5 min at room temperature, washed once with 0.1-0.5 volumes ofsterile water and once with 0.1 volumes SORB (Table 2.17). The SORB was removedcompletely by aspiration and the cells were finally resuspended in 360 µl SORB. 40 µlof carrier DNA (salmon sperm DNA, denatured at 95 ◦C for 10 min and put on ice)were added and the cells aliquoted into 50 µl portions and stored at −78 ◦C.
Transformation
Table 2.17: Solutions for yeast transformationSORB 100 mM lithium acetate
10 mM Tris-HClpH 8.01 mM EDTA/NaOHpH 8.01 M sorbitoladjust pH to 8.0 with acetic acidfilter sterilise, store at 4 ◦C
PEG 100 mM lithium acetate10 mM Tris-HClpH 8.01 mM EDTA/NaOHpH 8.040 % (w/v) Polyethyleneglycol 3350adjust pH to 8.0 with acetic acidfilter sterilise, store at 4 ◦C
Competent cells were thawed at room temperature. 1 µl of each plasmid DNA and90 µl PEG (Table 2.17) were added to 15 µl of cells, the suspension mixed by 2 minvortexing and incubated at room temperature for 30 min. 12 µl DMSO were addedand the cells placed in a water bath at 42 ◦C for 15 min. The cells were sedimented(3 min, 500 x g, RT), the supernatant removed, and the cells resuspended in 100 µlH2O . Transformation reactions were plated on SC minus Trp, Leu and incubated for2-3 days at 30 ◦C.
2.3.4 Protein interaction assay
To identify interactions between bait and prey proteins, transformants were transferredto plates containing selective media that allow growth only in the case of reporter geneactivation. To reduce the risk of false negatives due to clones containing corruptedplasmids, two colonies from each transformation plate were merged and streaked to-gether. The plates were incubated at 30 ◦C for 1-2 days.
First screens were performed with selection on SC minus His, Leu, Trp. To reducethe growth of false positives, rescreening was done with selection on SC minus His,Trp, Leu in the presence on 5 mM, 15 mM, and 30 mM 3-aminotriazol, or with selectionon SC minus Ade, Leu, Trp.
31
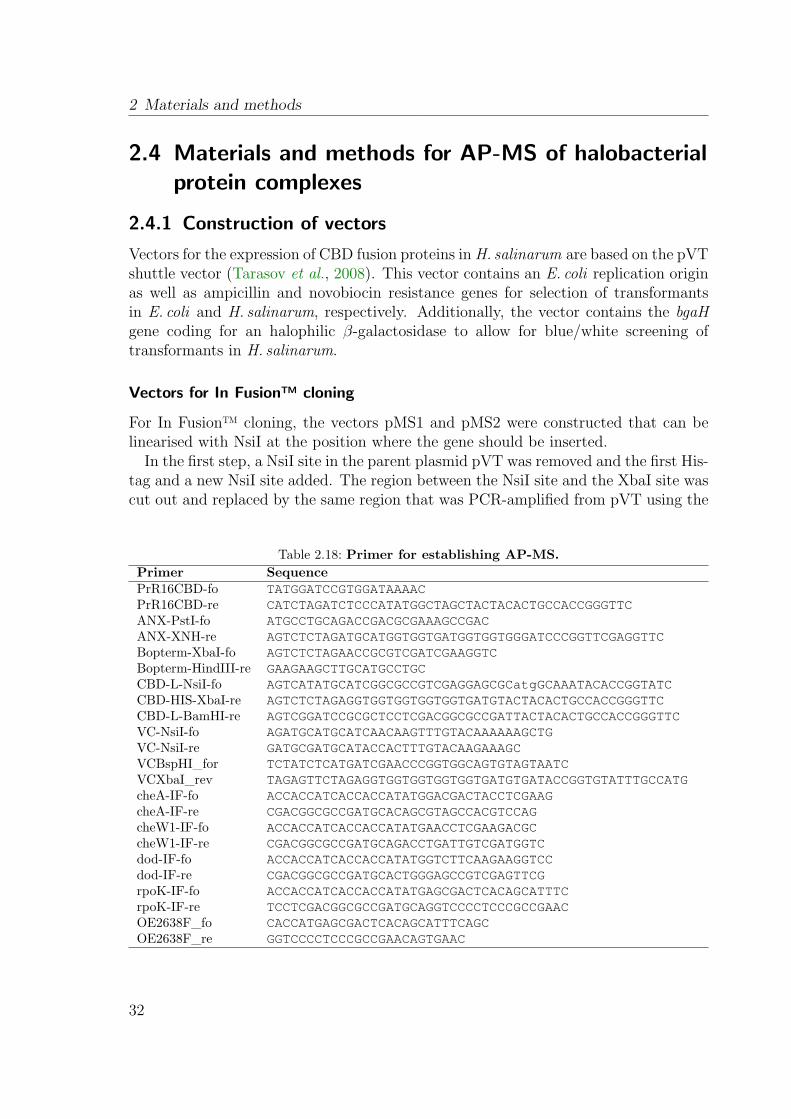
2 Materials and methods
2.4 Materials and methods for AP-MS of halobacterialprotein complexes
2.4.1 Construction of vectors
Vectors for the expression of CBD fusion proteins in H. salinarum are based on the pVTshuttle vector (Tarasov et al., 2008). This vector contains an E. coli replication originas well as ampicillin and novobiocin resistance genes for selection of transformantsin E. coli and H. salinarum, respectively. Additionally, the vector contains the bgaHgene coding for an halophilic β-galactosidase to allow for blue/white screening oftransformants in H. salinarum.
Vectors for In Fusion™ cloning
For In Fusion™ cloning, the vectors pMS1 and pMS2 were constructed that can belinearised with NsiI at the position where the gene should be inserted.
In the first step, a NsiI site in the parent plasmid pVT was removed and the first His-tag and a new NsiI site added. The region between the NsiI site and the XbaI site wascut out and replaced by the same region that was PCR-amplified from pVT using the
Table 2.18: Primer for establishing AP-MS.Primer SequencePrR16CBD-fo TATGGATCCGTGGATAAAACPrR16CBD-re CATCTAGATCTCCCATATGGCTAGCTACTACACTGCCACCGGGTTCANX-PstI-fo ATGCCTGCAGACCGACGCGAAAGCCGACANX-XNH-re AGTCTCTAGATGCATGGTGGTGATGGTGGTGGGATCCCGGTTCGAGGTTCBopterm-XbaI-fo AGTCTCTAGAACCGCGTCGATCGAAGGTCBopterm-HindIII-re GAAGAAGCTTGCATGCCTGCCBD-L-NsiI-fo AGTCATATGCATCGGCGCCGTCGAGGAGCGCatgGCAAATACACCGGTATCCBD-HIS-XbaI-re AGTCTCTAGAGGTGGTGGTGGTGGTGATGTACTACACTGCCACCGGGTTCCBD-L-BamHI-re AGTCGGATCCGCGCTCCTCGACGGCGCCGATTACTACACTGCCACCGGGTTCVC-NsiI-fo AGATGCATGCATCAACAAGTTTGTACAAAAAAGCTGVC-NsiI-re GATGCGATGCATACCACTTTGTACAAGAAAGCVCBspHI_for TCTATCTCATGATCGAACCCGGTGGCAGTGTAGTAATCVCXbaI_rev TAGAGTTCTAGAGGTGGTGGTGGTGGTGATGTGATACCGGTGTATTTGCCATGcheA-IF-fo ACCACCATCACCACCATATGGACGACTACCTCGAAGcheA-IF-re CGACGGCGCCGATGCACAGCGTAGCCACGTCCAGcheW1-IF-fo ACCACCATCACCACCATATGAACCTCGAAGACGCcheW1-IF-re CGACGGCGCCGATGCAGACCTGATTGTCGATGGTCdod-IF-fo ACCACCATCACCACCATATGGTCTTCAAGAAGGTCCdod-IF-re CGACGGCGCCGATGCACTGGGAGCCGTCGAGTTCGrpoK-IF-fo ACCACCATCACCACCATATGAGCGACTCACAGCATTTCrpoK-IF-re TCCTCGACGGCGCCGATGCAGGTCCCCTCCCGCCGAACOE2638F_fo CACCATGAGCGACTCACAGCATTTCAGCOE2638F_re GGTCCCCTCCCGCCGAACAGTGAAC
32
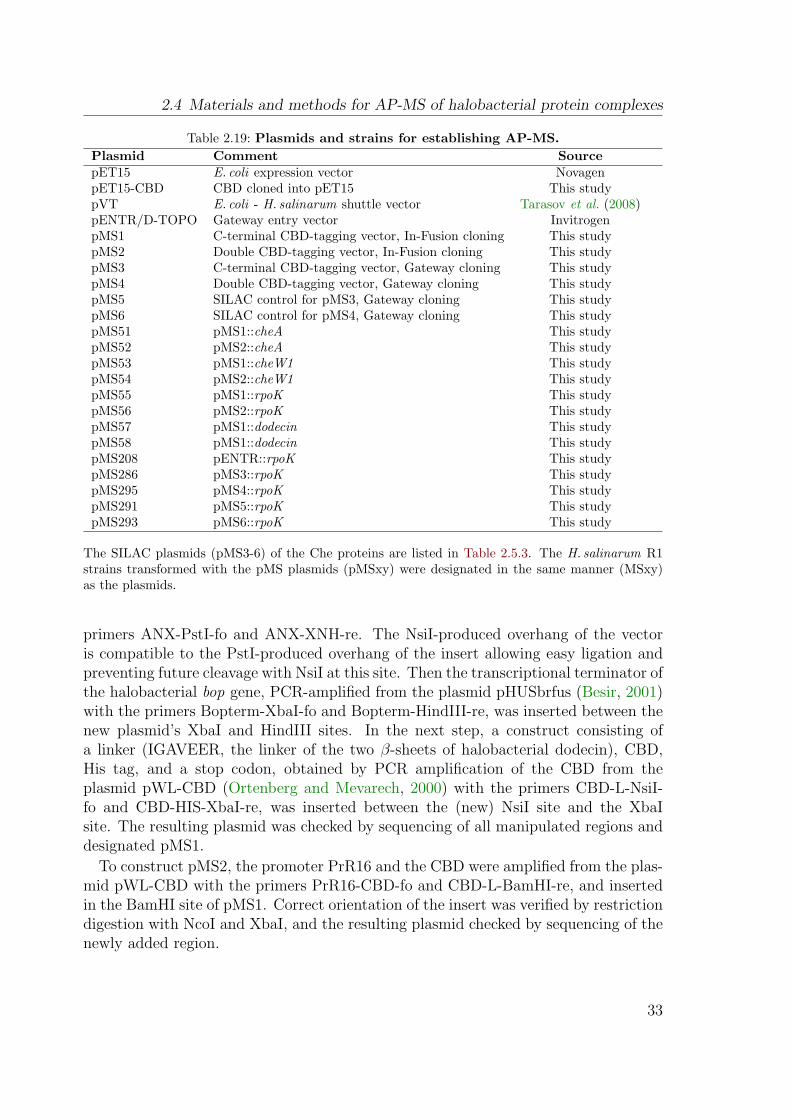
2.4 Materials and methods for AP-MS of halobacterial protein complexes
Table 2.19: Plasmids and strains for establishing AP-MS.Plasmid Comment SourcepET15 E. coli expression vector NovagenpET15-CBD CBD cloned into pET15 This studypVT E. coli - H. salinarum shuttle vector Tarasov et al. (2008)pENTR/D-TOPO Gateway entry vector InvitrogenpMS1 C-terminal CBD-tagging vector, In-Fusion cloning This studypMS2 Double CBD-tagging vector, In-Fusion cloning This studypMS3 C-terminal CBD-tagging vector, Gateway cloning This studypMS4 Double CBD-tagging vector, Gateway cloning This studypMS5 SILAC control for pMS3, Gateway cloning This studypMS6 SILAC control for pMS4, Gateway cloning This studypMS51 pMS1::cheA This studypMS52 pMS2::cheA This studypMS53 pMS1::cheW1 This studypMS54 pMS2::cheW1 This studypMS55 pMS1::rpoK This studypMS56 pMS2::rpoK This studypMS57 pMS1::dodecin This studypMS58 pMS1::dodecin This studypMS208 pENTR::rpoK This studypMS286 pMS3::rpoK This studypMS295 pMS4::rpoK This studypMS291 pMS5::rpoK This studypMS293 pMS6::rpoK This study
The SILAC plasmids (pMS3-6) of the Che proteins are listed in Table 2.5.3. The H. salinarum R1strains transformed with the pMS plasmids (pMSxy) were designated in the same manner (MSxy)as the plasmids.
primers ANX-PstI-fo and ANX-XNH-re. The NsiI-produced overhang of the vectoris compatible to the PstI-produced overhang of the insert allowing easy ligation andpreventing future cleavage with NsiI at this site. Then the transcriptional terminator ofthe halobacterial bop gene, PCR-amplified from the plasmid pHUSbrfus (Besir, 2001)with the primers Bopterm-XbaI-fo and Bopterm-HindIII-re, was inserted between thenew plasmid’s XbaI and HindIII sites. In the next step, a construct consisting ofa linker (IGAVEER, the linker of the two β-sheets of halobacterial dodecin), CBD,His tag, and a stop codon, obtained by PCR amplification of the CBD from theplasmid pWL-CBD (Ortenberg and Mevarech, 2000) with the primers CBD-L-NsiI-fo and CBD-HIS-XbaI-re, was inserted between the (new) NsiI site and the XbaIsite. The resulting plasmid was checked by sequencing of all manipulated regions anddesignated pMS1.
To construct pMS2, the promoter PrR16 and the CBD were amplified from the plas-mid pWL-CBD with the primers PrR16-CBD-fo and CBD-L-BamHI-re, and insertedin the BamHI site of pMS1. Correct orientation of the insert was verified by restrictiondigestion with NcoI and XbaI, and the resulting plasmid checked by sequencing of thenewly added region.
33
2 Materials and methods
Vectors for Gateway™ cloning
The vectors pMS3 and pMS4 for Gateway™ cloning were derived from pMS1 andpMS2, respectively, by insertion of the Gateway Vector conversion cassette, whichcontains the att sites necessary for Gateway cloning, the ccdB gene and a chloram-phenicol resistance gene. The cassette was PCR-amplified with the primers VC-NsiI-foand VC-NsiI-re and cloned into the NsiI site. Correct orientation of the insert wasverified by restriction digestion with NotI and the resulting plasmids checked by DNAsequencing.
Plasmids pMS5 and pMS6 for background control in SILAC experiments were de-rived from pMS3 and pMS4, respectively, by removing the CBD(s). Both pMS3and pMS4 were cut with NcoI and XbaI. For pMS3, this removes part of the vectorconversion cassette and the CBD, for pMS4 both CBDs and the whole vector con-version cassette. To reconstitute the Gateway features, the vector conversion cassettewas PCR-amplified with the primers VCBspHI_for and VCXbaI_rev. For the miss-ing part in the digested pMS3, the PCR product was digested with NcoI and XbaI,the respective fragment extracted from a gel and ligated into the digested plasmid,gaining the vector pMS5. For pMS4, the PCR product was digested with BspHI (giv-ing an overhang compatible to the NcoI-derived overhang in the plasmid) and XbaI,and ligated into the digested plasmid. This new vector was designated pMS6. Cellstransformed with the Gateway destination vectors were grown in LB medium withchloramphenicol, as after growth in LB Amp defective plasmids were prepared.
2.4.2 Generation of bait expression and control strains
Bait proteins were cloned into the expression vectors with the appropriate cloningmethod: In Fusion cloning (2.2.8) for pMS1 and pMS2, and Gateway cloning (2.2.9)for pMS3-6. Plasmids were verified by restriction digestion, and the inserts sequencedafter In-Fusion cloning and in the entry vector after Gateway cloning.
Expression plasmids were transformed in H. salinarum R1 (2.2.11). Expression ofthe tagged bait protein was verified by affinity purification. Control strains trans-formed with pMS5 and pMS6 were checked by western blot with an anti-penta-hisantibody (2.2.19).
The background strain for indirect bait fishing, expressing the plain CBD, wasgenerated by transformation of empty pMS4 (without any bait) into H. salinarum R1.The expression of the CBD was verified by affinity purification. The site of integrationinto the genome was not determined.
34
2.4 Materials and methods for AP-MS of halobacterial protein complexes
2.4.3 Establishing the affinity purification procedure
2.4.3.1 Purification from E. coli
The CBD was PCR-amplified from pWL-CBD using the primers PrR16CBD-fo andPrR16CBD-re. The PCR product was digested with NcoI and NdeI, and the CBDcloned into the respective sites of pET15. The resulting plasmid was verified bysequencing the manipulated regions and transformed to E. coli strain BL21.
Purification was done according to the following protocols:
Protocol Eco1 A preculture (25 ml LB with ampicillin) was grown overnight on ashaker (150 rpm) at 37 ◦C. 3 ml preculture were used to inoculate the main culture(100 ml LB Amp), which was grown under identical conditions. When an OD600 of 0.6was reached, the expression was induced by addition of IPTG to a final concentrationof 1 mM. After 4 h the cells were pelleted by centrifugation at 4000 x g, 4 ◦C for 20 min.They were resuspended in 1 ml resuspension buffer (RB: 300 mM KCl , 100 mM NaCl ,2 mM Pi, 0.5 mM PMSF, pH 7.5), and sonified (6 x 20 s, output control 5, duty cycle50 %) on ice-water. The lysate was cleared by centrifugation (14000 rpm, 20 min,4 ◦C), and the supernatant transfered to a fresh tube. 50 µl 10 % (w/v) cellulosesuspension (fibrous medium, Sigma) in RB were added and the mixture incubatedfor 1 h in an overhead shaker. The cellulose was spun down (3000 rpm, 3 min, RT),and the pellet washed with 200 µl RB. The cellulose was pelleted as before and thesupernatant removed. The washing step was repeated three times. Now the pelletwas resuspended in 40 µl LDS sample buffer and the suspension boiled for 5 min at100 ◦C. The tube was centrifuged (5000 rpm, 5 min) and the supernatant transferedto a fresh tube. 7.5 µl lysate and supernatant (after cellulose incubation) and 15 µl ofthe washing and elution (boiling) fractions were loaded on a gel.
Protocol Eco2 Expression and lysate preparation were done as described above. Acellulose column was prepared by pipetting 350 µl cellulose suspension (10 % (w/v)Sigma fibrous medium in RB) into a Mobicol empty spin column. The column was cen-trifuged (300 x g, 1 min, RT), washed with 500 µl RB to remove fines, and centrifugedagain.
600 µl lysate were applied to the column and the cellulose resuspended. After 1 minthe column was centrifuged (2000 x g, 1 min), and the flowthrough discarded. Thisstep was repeated with the rest of the lysate. The column was washed five times with500 µl CFE and centrifuged as before. For elution, 100 µl ethylene glycol were added,the cellulose resuspended, and after 1 min incubation the column was centrifuged asbefore. The eluate was collected in a fresh reaction tube. The elution was repeatedtwice. 15 µl of the washing and elution fractions were loaded on a gel.
35
2 Materials and methods
Protocol Eco3 Essentially the same as protocol 2. The differences were the useof microcrystalline cellulose (Avicel PH-101, Fluka) as matrix, and the column wascentrifuged only with 300 x g for 20 s in all centrifugation steps.
2.4.3.2 Purification from H. salinarum
Protocol Hsa1 The bait expression strain was precultured in 35 ml Halomedium con-taining 0.15 µg/ml novobiocin at 37 ◦C on a shaker (150 rpm) until an OD600 of 0.5-1.0was reached. 1 ml of this preculture was used to inoculate 100 ml Halomedium. Themain culture was incubated on a shaker (110 rpm) at 37 ◦C. When the main culturehad reached an OD600 of 0.6 to 1.0, cells were harvested by centrifugation (8000 rpm,15 min, 8 ◦C) and resuspended in 1-2 ml CFE buffer (3 M KCl , 1 M NaCl , 400 mMNH4Cl , 40 mM MgCl2, 10 mM Tris/HCl , pH 7.5) + 0.01 % Triton X100 + 0.5 mMPMSF. Cells were lysed by sonication on ice water (2 x 20 s, Branson sonifier 250, 3 mmdisruptor horn, output level 2, constant) and the lysate cleared by centrifugation at14000 rpm, 4 ◦C for 20 min in a tabletop centrifuge.
In the meantime a cellulose column was prepared by pipetting 300 µl cellulose sus-pension (10 % (w/v) Avicel PH-101 in CFE) into a Mobicol empty spin column. Thecolumn was centrifuged (300 x g, 1 min, RT), washed with 600 µl CFE to remove fines,and centrifuged again.
The cleared lysate was applied to the column in 600 µl portions and the celluloseresuspended by vortexing. After 1 min incubation at room temperature the columnwas centrifuged (300 x g, 1 min, RT) and the flow-through discarded. The cellulose waswashed twice with 600 µl CFE. After each washing step the column was centrifuged(300 x g, 1 min, RT) and the flow-through discarded. An additional centrifugation(770 x g, 30 s, RT) was performed after the last washing step to reduce the amountof retained buffer. For elution, 200 µl ethylene glycol were applied to the column,the cellulose resuspended, and the column centrifuged. The eluate was collected in afresh microfuge tube and elution repeated. Proteins were precipitated with ice-coldacetone. 3 µl lysate and flow-through, 15 µl of the washing fraction, and the totaleluted protein were loaded on a gel.
Protocol Hsa2 Similar to protocol Hsa1. The main culture had a volume of 1 l, andthe resulting cell pellet was resuspended in 3 ml CFE + 0.1 % Triton X100. Elutionfractions were pooled.
Protocol Hsa3 Similar to protocol Hsa2. Elution was performed twice with 400 µlethylene glycol.
Protocol Hsa4 A main culture of 200 ml Halomedium was grown as described above.At an OD600 of around 1.0, cells were harvested by centrifugation (8000 rpm, 15 min,
36
2.4 Materials and methods for AP-MS of halobacterial protein complexes
15 ◦C) and resuspended in 1.6 ml CFE + 0.1 % Triton X100. Cells were lysed bysonication on ice water (2 x 20 s, Branson sonifier 250, 3 mm disruptor horn, outputlevel 2, constant), and the lysate cleared by centrifugation at 14000 rpm, 18 ◦C for20 min in a tabletop centrifuge. Cellulose columns were prepared as described before.
The cleared lysate was applied to the column in 600 µl portions and the celluloseresuspended by pipetting up and down. After 1 min incubation at room temperaturethe column was centrifuged (300 x g, 1 min, RT) and the flow-through discarded. Thecellulose was washed twice with 600 µl CFE + 0.1 % Triton X100 and once with CFE.After each washing step the column was centrifuged (300 x g, 1 min, RT) and the flow-through discarded. An additional centrifugation (770 x g, 30 s, RT) was performedafter the last washing step to reduce the amount of retained buffer. For elution, 600 µlethylene glycol were applied to the column, the cellulose resuspended by pipetting upand down, and the column centrifuged. The eluate was collected in a fresh microfugetube and proteins were precipitated with ice-cold acetone. The total eluted proteinwas loaded on a gel.
2.4.4 Affinity purification of CBD-tagged proteins
The bait expression strain was precultured in 35 ml Halomedium containing 0.15 µg/mlnovobiocin at 37 ◦C on a shaker (150 rpm) until an OD600 of 0.5-1.0 was reached. Thispreculture was used to inoculate 100 ml Halomedium to an OD600 of 0.01. The mainculture was incubated on a shaker (110 rpm) at 37 ◦C. When the main culture hadreached an OD600 of 0.6 to 1.0, cells were harvested by centrifugation (8000 rpm,15 min, 15 ◦C) and resuspended in 1-2 ml CFE buffer (3 M KCl , 1 M NaCl , 400 mMNH4Cl , 40 mM MgCl2, 10 mM Tris/HCl , pH 7.5) plus complete protease inhibitor(Complete Mini, EDTA-free, Roche). Cells were lysed by sonication on ice water (2 x20 s, Branson sonifier 250, 3 mm disruptor horn, output level 2, constant), and thelysate cleared by centrifugation at 14000 rpm, 18 ◦C for 20 min in a tabletop centrifuge.
In the meantime a cellulose column was prepared by pipetting 300 µl cellulose sus-pension (10 % (w/v) Avicel PH-101 in CFE) into a Mobicol empty spin column. Thecolumn was centrifuged (300 x g, 1 min, RT), washed with 600 µl CFE to remove fines,and centrifuged again.
The cleared lysate was applied to the column in 600 µl portions and the celluloseresuspended by pipetting up and down. After 1 min incubation at room temperaturethe column was centrifuged (300 x g, 1 min, RT) and the flow-through discarded. Thecellulose was washed three times with 600 µl CFE + 0.5 % NP40 and once with CFE.After each washing step the column was centrifuged (300 x g, 1 min, RT) and the flow-through discarded. An additional centrifugation (770 x g, 1 min, RT) was performedafter the last washing step to reduce the amount of retained buffer. For elution, 600 µlethylene glycol were applied to the column, the cellulose resuspended, and the columncentrifuged. The eluate was collected in a fresh microfuge tube and proteins wereprecipitated with TCA (2.2.15).
37
2 Materials and methods
2.4.5 CBD-AP and SILAC: Direct bait fishing
The bait expression strain and the control strain were precultured in 35 ml Halomediumcontaining 0.15 µg/ml novobiocin at 37 ◦C on a shaker (150 rpm) until an OD600 of0.5-1.0 was reached. 500 µl of these first precultures were used to inoculate secondprecultures that were grown under identical conditions. When the second precultureshad reached an OD600 of 0.8-1.0, the main cultures were inoculated. For the bait ex-pression strain, 100 ml synthetic Halomedium containing 13C6-leucine were inoculatedto an OD600 of 0.01, for the control culture 100 ml synthetic Halomedium contain-ing 12C6-leucine. To guarantee identical conditions for both the bait and the controlculture, the inoculum for both cultures was brought to a total volume of 1.5 ml withcomplex medium.
The main cultures were incubated on a shaker (110 rpm) at 37 ◦C in the dark untilthey had reached an OD600 of around 0.8. In order to work with roughly the samenumber of cells from both cultures, differences in the OD of bait and control culturewere compensated by reducing the volume used from the culture with higher densityaccordingly. Cells were harvested by centrifugation (8000 rpm, 15 ◦C, 15 min) andpellets resuspended in 1 ml CFE with complete protease inhibitor. Cells were lysed bysonication on ice water as described above, and the lysate cleared by centrifugation at14000 rpm, 18 ◦C for 20 min in a tabletop centrifuge. The supernatant was transferedto a fresh reaction tube.
Cellulose columns were prepared as described in 2.4.4. 300 µl lysate from each cul-ture were applied to the column, the cellulose resuspended, and after 1 min incubationthe column centrifuged (300 x g, 1 min, RT). This step was repeated two times, fol-lowed by washing, elution, and protein precipitation as described in 2.4.4. The proteinpellet was stored at −78 ◦C.
2.4.6 CBD-AP and SILAC: Indirect bait fishing
H. salinarum R1 was precultured in 35 ml Halomedium at 37 ◦C on a shaker (150 rpm)until an OD600 of 0.5-1.0 was reached. 500 µl of this first preculture were used toinoculate a second one that was grown under identical conditions. When the secondpreculture had reached an OD600 of 0.8-1.0, it was used to inoculate two cultures with100 ml synthetic medium, one containing 13C6-leucine, the other one containing 12C6-leucine, to an OD600 of 0.01. The inoculum was brought to a total volume of 1.5 mlwith complex medium. The cultures were incubated on a shaker (110 rpm) at 37 ◦Cin the dark until they had reached an OD600 of around 0.8.
In parallel, the bait expression strain and the pMS4 control strain were precul-tured in 35 ml Halomedium containing 0.15 µg/ml novobiocin at 37 ◦C on a shaker(150 rpm) until an OD600 of 0.5-1.0 was reached. A second preculture was grown asdescribed before. When an OD600 of 0.8-1.0 was reached, the main cultures (200 mlHalomedium; the culture volumes were chosen larger to ensure saturation of the cel-
38
2.4 Materials and methods for AP-MS of halobacterial protein complexes
lulose in each column by bait or CBD, respectively) were inoculated to an OD600 of0.01 and incubated at 37 ◦C on a shaker (110 rpm). The main cultures were harvestedat an OD600 of around 1.0.
Cells of all four cultures were pelleted by centrifugation (8000 rpm, 15 ◦C, 15 min)and pellets resuspended in 1 ml CFE with complete protease inhibitor. Cells werelysed by sonication on ice water as described above, and the lysate cleared by cen-trifugation at 14000 rpm, 18 ◦C for 20 min in a tabletop centrifuge. The supernatantwas transfered to a fresh reaction tube.
Two cellulose columns were prepared as described in 2.4.4. 600 µl lysate from thebait expression culture and the pMS4 control culture were applied to the columns, thecellulose resuspended, and after 1 min incubation the column was centrifuged (300 x g,1 min, RT). This step was repeated, and the columns washed three times with CFE+ 1 % NP40 + 20 % ethylene glycol and once with CFE.
Lysate from the H. salinarum R1 wt cells was applied to these columns in 600 µlportions, the cellulose resuspended, and after 1 min incubation the column centrifuged(300 x g, 1 min, RT). Washing, elution and protein precipitation was done as describedin 2.4.4. The protein pellet was stored at −78 ◦C.
2.4.7 Mass spectrometry: Sample preparation
Cutting of gel slices
For MALDI-TOF PMF analysis, single bands were removed from 1 D gels with ascalpel and cut in pieces of circa 1 mm3. Depending on the number of samples, gelpieces were either transfered to 0.5 ml reaction tubes or into 96 well microtiter platesfor subsequent in-gel digestion.
For LC-MS/MS analysis, the whole lane was cut out of the gel and divided into 10-15 slices. Size of the slices was chosen according to the estimated amount of trypticpeptides derived from the respective part of the lane. Additionally, very thick bandswere separated from weaker ones to prevent masking of low-abundance proteins. Sliceswere cut into pieces of circa 1 mm3 and transfered to 0.5 ml reaction tubes.
Tryptic in-gel digestion
Samples from silver-stained gels were destained by oxidation of the silver before di-gestion (Gharahdaghi et al., 1999). The gel pieces were shaken in 30 µl destaining so-lution (15 mM potassium hexacyanoferrate III, 50 mM sodium thiosulfate) until theywere colourless. Subsequently, they were washed three times for five minutes with100 µl H2O . Coomassie stained gels were used directly for digestion.
Tryptic in-gel digestion was performed by a protocol modified from Shevchenko et al.(1996). Gel pieces were washed alternately in 50 µl 50 % acetonitrile and 50 µl 50 mMammonium bicarbonate, each three times for 10 min. After this, they were incubated
39
2 Materials and methods
in 50 µl 10 mM dithiothreitol (DTT), 50 mM ammonium bicarbonate for 45 min at56 ◦C and in 50 µl 55 mM iodacetamide, 50 mM ammonium bicarbonate for 30 minat room temperature in the dark. The gel pieces were washed again alternately in50 µl 50 % acetonitrile and 50 µl 50 mM ammonium bicarbonate, each three times for10 min. To digest proteins, the gel pieces were incubated overnight in 25 µl trypsinsolution (20 µg trypsin solved in 20 µl storage buffer and diluted with 5.2 ml 50 mMammonium bicarbonate) at 37 ◦C on a shaker.
The supernatant was transfered to a 0.5 ml reaction tube and remaining peptideswere eluted in three steps by incubation in 50 µl H2O , 50 µl 50 % acetonitrile, and50 µl 50 % acetonitrile, 0.1 % TFA on a shaker for 20 min each time. The supernatantof the digestion and all elution steps was pooled, frozen in liquid nitrogen, and drieddown in a vacuum concentrator.
Desalting
Salts remaining from the tryptic digestion (mainly ammonium bicarbonate) need tobe removed from the sample prior to mass spectrometric measurements.
Samples for MALDI-TOF PMF were desalted by repeated dissolving in H2Oanddrying down in the vacuum concentrator, until no salt was visible (normally 2-3 times).
Samples for Nano-LC MS/MS require a higher purity and therefore they were de-salted by reversed-phase (RP) chromatography using self-packed Stage tips (STop AndGo Extraction, Rappsilber et al., 2003). A small disk (app. 0.5 mm diameter) waspunched out of Teflon embedded C18 material (C18 Empore™ Extraction Disk, 3M)and placed in a GELoader® pipette tip. Solutions were pressed through this columnby applying pressure with a 1 ml syringe or by centrifugation (1500 x g for bindingpeptides, 3000 x g for all other steps). The C18 material was equilibrated with 10 µlisopropanol and washed with 10 µl 10 % formic acid. The peptides were dissolved in1 µl formic acid, diluted with 9 µl H2O , and passed through the column. The tipswere washed twice with 10 µl 10 % formic acid and peptides eluted with 5 µl 80 %methanol, 10 % TFA into a 0.5 ml reaction tube. Eluted peptides were dried down ina vacuum concentrator.
MALDI target preparation
Peptides from tryptic digests were spotted on 384 spot MALDI targets using a MAP IIpipetting robot (Bruker Daltonics). Peptides were dissolved in 10 µl 33 % acetonitrile,0.1 % TFA in an ultrasound bath for 30 s. 0.5 µl sample were mixed with 0.5 µl matrixsolution (saturated α-cyano-4-hydroxy-cinnamic acid in 40 % acetonitrile, 0.1 % TFA)and pipetted to the target. Cocristallisation was achieved by drying at the air (drieddroplet method).
In every ninth position a peptide standard was spotted that was used for cali-bration of the mass spectrometer. The peptide standard solution was a mixture of
40
2.4 Materials and methods for AP-MS of halobacterial protein complexes
the following peptides (each 100 pmol/µl; the numbers in brackets are the molecu-lar mass in g/mol): bradykinin fragment 1-7 (757.3998), angiotensin 2 acetate hu-man (1046.542), angiotensin 1 acetate human (1296.6853), substance P (1347.7361),bombesin (1619.823), ACTH (1-17) (2093.0868), ACTH (18-39) (2465.199), somato-statin 28 (3147.4714), insulin chain B oxidised f. bovine (3494.651) (all purchasedfrom Sigma Aldrich, St. Louis, USA). 3 µl of peptide standard solution were dilutedwith 18 µl 33 % acetonitrile, 0.1 % TFA and spotted in the same way as the samples.
2.4.8 Mass spectrometry: Data acquisition
MALDI-TOF peptide mass fingerprinting (PMF)
MALDI-TOF peptide mass fingerprint spectra were acquired on a Bruker Reflex IIImass spectrometer in reflex mode with a detector voltage of 1851 V. Spectra acquisitionwas done automatically using Fuzzy Control. The output of the laser (337 nm) wasset to 15 % in the beginning and 50 % at maximum. For each sample 200 shots andfor each standard 100 shots were summed up, with a maximum of 20 shots on onetarget position. The mass window was set between 800 and 4000 m/z.
Nano-LC MS/MS (Q-TOF)
Peptides were chromatographically separated on a CapLC system (Waters) and theeluate directly injected into a Q-TOF ultimate mass spectrometer (Waters). The driedpeptides were dissolved in 20 µl 5 % formic acid, and 1-6 µl (depending on the amountof protein estimated by the intensity of the Coomassie stained gel) were loaded intothe CapLC using an auto sampler. They were bound to the precolumn (self-packed,100 µm x 25 mm ReproSil-Pur 200 C18-AQ, 5 µm, Dr. Maisch GmbH, Ammerbuch-Entringen, Germany) with a flow of 2 µl/min and analysed on the main column (self-packed, 75 µm x 150 mm ReproSil-Pur 200 C18-AQ, 3 µm) with a flow of 200 nl/min.Bound peptides were eluted in an acetonitrile gradient (Table 2.20) and injected intothe mass spectrometer.
Mass spectrometric analysis was performed in the positive ion mode with a capillaryvoltage of 2.3 kV. The mass window was set to 300-2000 Da in MS mode and 50-2000 Da in MS/MS mode. Survey scans were acquired for 1.5 s. From each surveyscan up to two peptides were chosen for fragmentation by CID; selection criteria werethe signal intensity and the charge state (at least two-fold). CID was performed witha collision voltage between 16 and 40 kV (depending on peptide mass and charge) andhelium as collision gas.
41
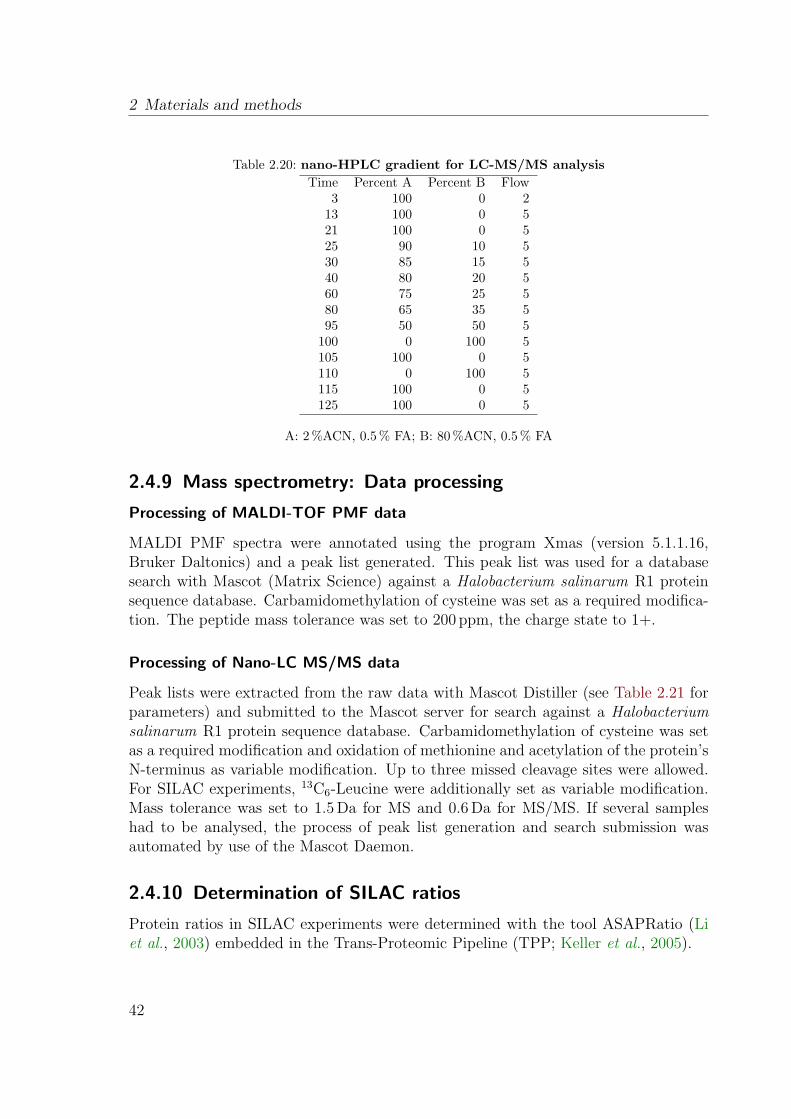
2 Materials and methods
Table 2.20: nano-HPLC gradient for LC-MS/MS analysisTime Percent A Percent B Flow
3 100 0 213 100 0 521 100 0 525 90 10 530 85 15 540 80 20 560 75 25 580 65 35 595 50 50 5
100 0 100 5105 100 0 5110 0 100 5115 100 0 5125 100 0 5
A: 2 %ACN, 0.5 % FA; B: 80 %ACN, 0.5 % FA
2.4.9 Mass spectrometry: Data processing
Processing of MALDI-TOF PMF data
MALDI PMF spectra were annotated using the program Xmas (version 5.1.1.16,Bruker Daltonics) and a peak list generated. This peak list was used for a databasesearch with Mascot (Matrix Science) against a Halobacterium salinarum R1 proteinsequence database. Carbamidomethylation of cysteine was set as a required modifica-tion. The peptide mass tolerance was set to 200 ppm, the charge state to 1+.
Processing of Nano-LC MS/MS data
Peak lists were extracted from the raw data with Mascot Distiller (see Table 2.21 forparameters) and submitted to the Mascot server for search against a Halobacteriumsalinarum R1 protein sequence database. Carbamidomethylation of cysteine was setas a required modification and oxidation of methionine and acetylation of the protein’sN-terminus as variable modification. Up to three missed cleavage sites were allowed.For SILAC experiments, 13C6-Leucine were additionally set as variable modification.Mass tolerance was set to 1.5 Da for MS and 0.6 Da for MS/MS. If several sampleshad to be analysed, the process of peak list generation and search submission wasautomated by use of the Mascot Daemon.
2.4.10 Determination of SILAC ratios
Protein ratios in SILAC experiments were determined with the tool ASAPRatio (Liet al., 2003) embedded in the Trans-Proteomic Pipeline (TPP; Keller et al., 2005).
42
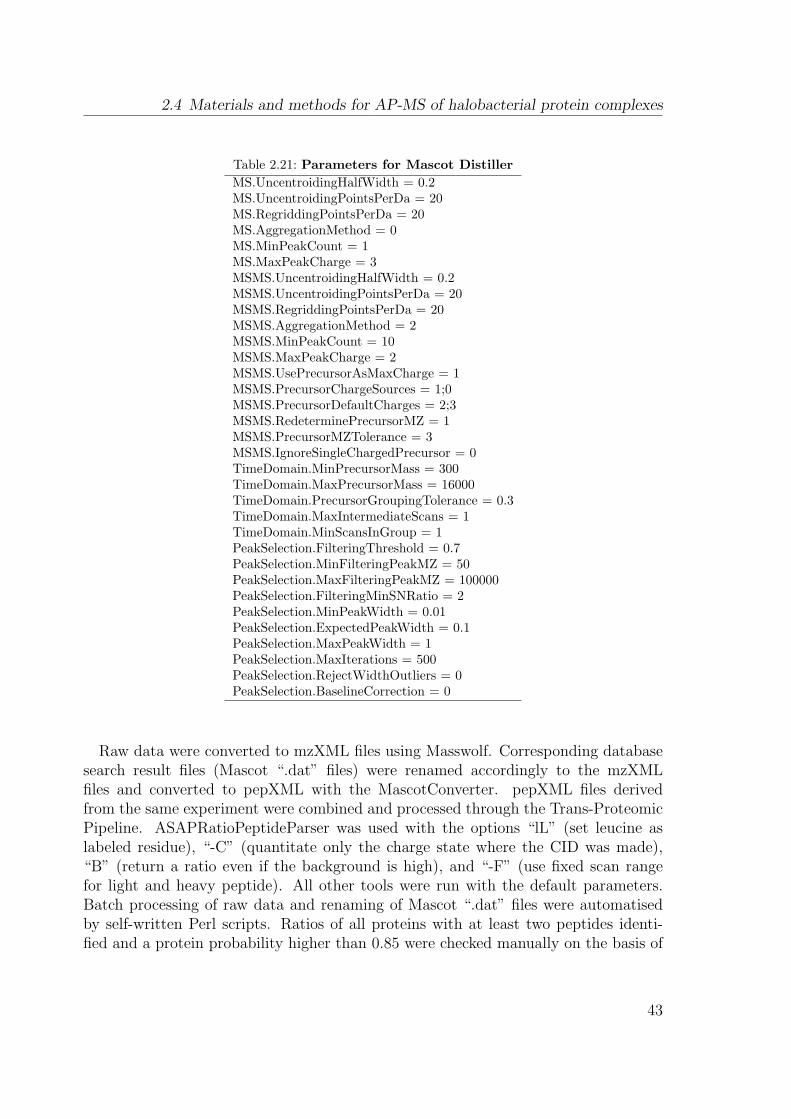
2.4 Materials and methods for AP-MS of halobacterial protein complexes
Table 2.21: Parameters for Mascot DistillerMS.UncentroidingHalfWidth = 0.2MS.UncentroidingPointsPerDa = 20MS.RegriddingPointsPerDa = 20MS.AggregationMethod = 0MS.MinPeakCount = 1MS.MaxPeakCharge = 3MSMS.UncentroidingHalfWidth = 0.2MSMS.UncentroidingPointsPerDa = 20MSMS.RegriddingPointsPerDa = 20MSMS.AggregationMethod = 2MSMS.MinPeakCount = 10MSMS.MaxPeakCharge = 2MSMS.UsePrecursorAsMaxCharge = 1MSMS.PrecursorChargeSources = 1;0MSMS.PrecursorDefaultCharges = 2;3MSMS.RedeterminePrecursorMZ = 1MSMS.PrecursorMZTolerance = 3MSMS.IgnoreSingleChargedPrecursor = 0TimeDomain.MinPrecursorMass = 300TimeDomain.MaxPrecursorMass = 16000TimeDomain.PrecursorGroupingTolerance = 0.3TimeDomain.MaxIntermediateScans = 1TimeDomain.MinScansInGroup = 1PeakSelection.FilteringThreshold = 0.7PeakSelection.MinFilteringPeakMZ = 50PeakSelection.MaxFilteringPeakMZ = 100000PeakSelection.FilteringMinSNRatio = 2PeakSelection.MinPeakWidth = 0.01PeakSelection.ExpectedPeakWidth = 0.1PeakSelection.MaxPeakWidth = 1PeakSelection.MaxIterations = 500PeakSelection.RejectWidthOutliers = 0PeakSelection.BaselineCorrection = 0
Raw data were converted to mzXML files using Masswolf. Corresponding databasesearch result files (Mascot “.dat” files) were renamed accordingly to the mzXMLfiles and converted to pepXML with the MascotConverter. pepXML files derivedfrom the same experiment were combined and processed through the Trans-ProteomicPipeline. ASAPRatioPeptideParser was used with the options “lL” (set leucine aslabeled residue), “-C” (quantitate only the charge state where the CID was made),“B” (return a ratio even if the background is high), and “-F” (use fixed scan rangefor light and heavy peptide). All other tools were run with the default parameters.Batch processing of raw data and renaming of Mascot “.dat” files were automatisedby self-written Perl scripts. Ratios of all proteins with at least two peptides identi-fied and a protein probability higher than 0.85 were checked manually on the basis of
43
2 Materials and methods
the extracted ion chromatograms and adjusted if necessary (e. g. background level orscan range). To accomplish a better presentability of the protein ratios a symmetricalmeasure, called ASAP Score, was introduced. ASAP Score was calculated as follows:
ASAPScore =
{ASAPRatio(H/L)− 1 if ASAPRatio(H/L) ≥ 11− 1
ASAPRatio(H/L)if ASAPRatio(H/L) < 1
2.4.11 Thresholds and statistics
In the results from SILAC experiments only proteins were included that were identifiedwith at least two different peptides, had a ProteinProphet probability of 0.95 or higher(5 % false identification rate), and were quantifiable by ASAPRatio (at least one ofthe identified peptides had to contain leucine, and the extracted ion chromatogramshad to be utilisable).
The SILAC ratios were tested for standard normal distribution with the Shapiro-Wilk normality test, implemented as module shapiro.test in the statistic package R(R Development Core Team, 2008).
2.5 Materials and methods for the chemotaxis proteininteraction network
2.5.1 Generation of expression and control strains
The complete coding regions of all bait proteins were amplified with the primers listedin Table 2.22 and cloned into pMS3 - pMS6 as described in 2.4.2. The resulting plas-mids (Table 2.5.3) were transformed into H. salinarum R1. At least two clones ofthe pMS3 and pMS4 strains were verified by a test affinity purification according tothe protocol given in 2.4.4, and subsequent evaluation of the eluted proteins on asilver-stained gel. Clones which have shown a band in the expected height (pMS3)or the characteristic double band (bait + CBD, bait + 2 x CBD for pMS4) were usedfor further analysis. At least two clones of the pMS5 and pMS6 strains were verifiedby western blotting (2.2.19) with an anti-His antibody (anti-His HRP conjugate, QI-AGEN). Clones which showed a band in the height of the bait protein were used infurther experiments.
2.5.2 Bait fishing, mass spectrometry, data analysis
Direct and indirect bait fishing experiments were performed as described in 2.4.5 and2.4.6, respectively. Eluted proteins were separated by gel electrophoresis, and thelanes cut into 10 -15 slices. Samples were prepared for mass spectrometric analysisas described in 2.4.7 and measured on a QTOF mass spectrometer (see 2.4.8 for
44
2.5 Materials and methods for the chemotaxis protein interaction network
details). Mass spectra were searched against a H. salinarum R1 protein database,and the results processed through the Trans-Proteomic Pipeline (TPP) for proteinquantification and validation of results (2.4.9, 2.4.10). The identifications meetingthe criteria given in 2.4.11 were uploaded into the Result DB and the experimentsevaluated with the Result Viewer (5.3.3). Finally, the interactions were exported fromthe ResultViewer and illustrated as networks using Cytoscape (Shannon et al., 2003).
2.5.3 Che protein interactions in other organisms
Interactions from other organisms were fetched from the STRING (von Mering et al.,2007) and BIND (Alfarano et al., 2005) databases. STRING was queried in COG modewith the COGs: COG0632 (CheA), COG2201 (CheB), COG3143 (CheZ), COG0835(CheW), COG1352 (CheR), COG1776 (CheC/FliY), COG1871 (CheD), COG0784(CheY and other RRs), COG0840 (MCP). Only interactions with experimental ev-idence were accepted. The prediction methods were not useful for the purpose ofthis study because they connect all Che proteins (all in gene neighbourhood, stronggenomic co-occurrence). The same is true for evidence from databases (mainly fromKEGG: all in the same pathway), and textmining (registers co-mentioning in one ab-stract). The BIND database was queried by keyword search for CheA, CheB, CheZ,CheW, CheR, CheC, CheD, CheY, and MCP. Functional interactions were collectedby literature search in PubMed.
45
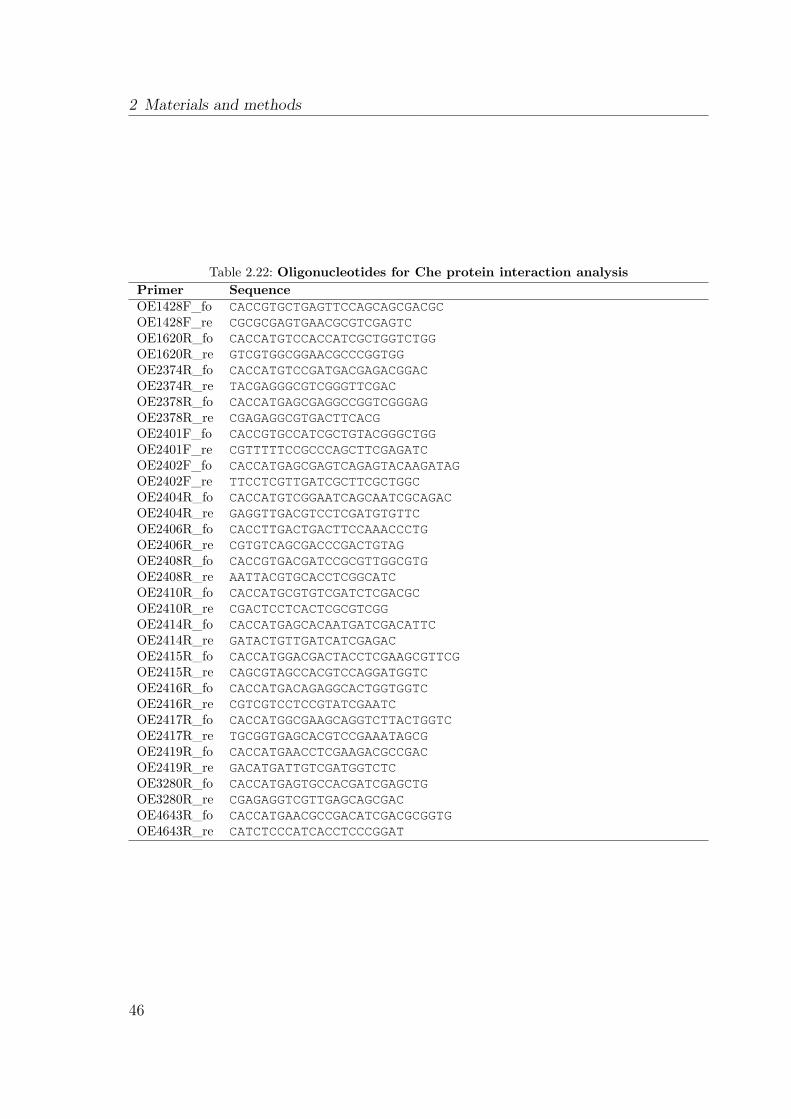
2 Materials and methods
Table 2.22: Oligonucleotides for Che protein interaction analysisPrimer SequenceOE1428F_fo CACCGTGCTGAGTTCCAGCAGCGACGCOE1428F_re CGCGCGAGTGAACGCGTCGAGTCOE1620R_fo CACCATGTCCACCATCGCTGGTCTGGOE1620R_re GTCGTGGCGGAACGCCCGGTGGOE2374R_fo CACCATGTCCGATGACGAGACGGACOE2374R_re TACGAGGGCGTCGGGTTCGACOE2378R_fo CACCATGAGCGAGGCCGGTCGGGAGOE2378R_re CGAGAGGCGTGACTTCACGOE2401F_fo CACCGTGCCATCGCTGTACGGGCTGGOE2401F_re CGTTTTTCCGCCCAGCTTCGAGATCOE2402F_fo CACCATGAGCGAGTCAGAGTACAAGATAGOE2402F_re TTCCTCGTTGATCGCTTCGCTGGCOE2404R_fo CACCATGTCGGAATCAGCAATCGCAGACOE2404R_re GAGGTTGACGTCCTCGATGTGTTCOE2406R_fo CACCTTGACTGACTTCCAAACCCTGOE2406R_re CGTGTCAGCGACCCGACTGTAGOE2408R_fo CACCGTGACGATCCGCGTTGGCGTGOE2408R_re AATTACGTGCACCTCGGCATCOE2410R_fo CACCATGCGTGTCGATCTCGACGCOE2410R_re CGACTCCTCACTCGCGTCGGOE2414R_fo CACCATGAGCACAATGATCGACATTCOE2414R_re GATACTGTTGATCATCGAGACOE2415R_fo CACCATGGACGACTACCTCGAAGCGTTCGOE2415R_re CAGCGTAGCCACGTCCAGGATGGTCOE2416R_fo CACCATGACAGAGGCACTGGTGGTCOE2416R_re CGTCGTCCTCCGTATCGAATCOE2417R_fo CACCATGGCGAAGCAGGTCTTACTGGTCOE2417R_re TGCGGTGAGCACGTCCGAAATAGCGOE2419R_fo CACCATGAACCTCGAAGACGCCGACOE2419R_re GACATGATTGTCGATGGTCTCOE3280R_fo CACCATGAGTGCCACGATCGAGCTGOE3280R_re CGAGAGGTCGTTGAGCAGCGACOE4643R_fo CACCATGAACGCCGACATCGACGCGGTGOE4643R_re CATCTCCCATCACCTCCCGGAT
46
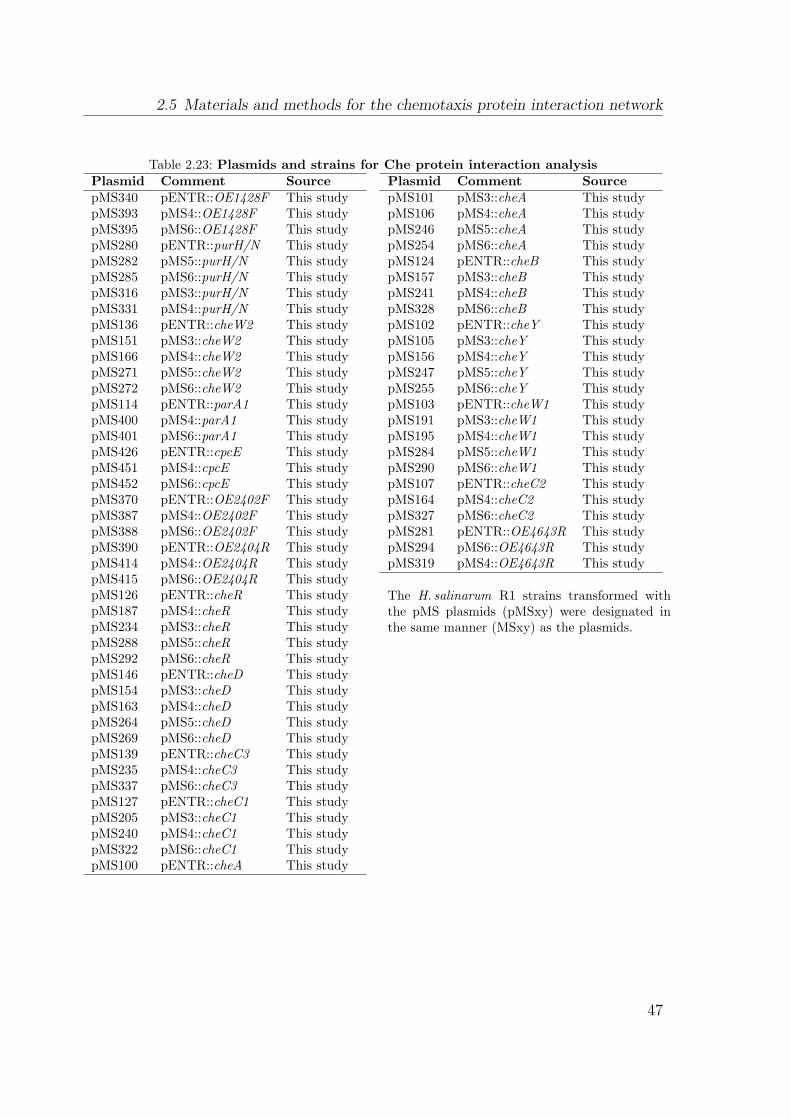
2.5 Materials and methods for the chemotaxis protein interaction network
Table 2.23: Plasmids and strains for Che protein interaction analysisPlasmid Comment SourcepMS340 pENTR::OE1428F This studypMS393 pMS4::OE1428F This studypMS395 pMS6::OE1428F This studypMS280 pENTR::purH/N This studypMS282 pMS5::purH/N This studypMS285 pMS6::purH/N This studypMS316 pMS3::purH/N This studypMS331 pMS4::purH/N This studypMS136 pENTR::cheW2 This studypMS151 pMS3::cheW2 This studypMS166 pMS4::cheW2 This studypMS271 pMS5::cheW2 This studypMS272 pMS6::cheW2 This studypMS114 pENTR::parA1 This studypMS400 pMS4::parA1 This studypMS401 pMS6::parA1 This studypMS426 pENTR::cpcE This studypMS451 pMS4::cpcE This studypMS452 pMS6::cpcE This studypMS370 pENTR::OE2402F This studypMS387 pMS4::OE2402F This studypMS388 pMS6::OE2402F This studypMS390 pENTR::OE2404R This studypMS414 pMS4::OE2404R This studypMS415 pMS6::OE2404R This studypMS126 pENTR::cheR This studypMS187 pMS4::cheR This studypMS234 pMS3::cheR This studypMS288 pMS5::cheR This studypMS292 pMS6::cheR This studypMS146 pENTR::cheD This studypMS154 pMS3::cheD This studypMS163 pMS4::cheD This studypMS264 pMS5::cheD This studypMS269 pMS6::cheD This studypMS139 pENTR::cheC3 This studypMS235 pMS4::cheC3 This studypMS337 pMS6::cheC3 This studypMS127 pENTR::cheC1 This studypMS205 pMS3::cheC1 This studypMS240 pMS4::cheC1 This studypMS322 pMS6::cheC1 This studypMS100 pENTR::cheA This study
Plasmid Comment SourcepMS101 pMS3::cheA This studypMS106 pMS4::cheA This studypMS246 pMS5::cheA This studypMS254 pMS6::cheA This studypMS124 pENTR::cheB This studypMS157 pMS3::cheB This studypMS241 pMS4::cheB This studypMS328 pMS6::cheB This studypMS102 pENTR::cheY This studypMS105 pMS3::cheY This studypMS156 pMS4::cheY This studypMS247 pMS5::cheY This studypMS255 pMS6::cheY This studypMS103 pENTR::cheW1 This studypMS191 pMS3::cheW1 This studypMS195 pMS4::cheW1 This studypMS284 pMS5::cheW1 This studypMS290 pMS6::cheW1 This studypMS107 pENTR::cheC2 This studypMS164 pMS4::cheC2 This studypMS327 pMS6::cheC2 This studypMS281 pENTR::OE4643R This studypMS294 pMS6::OE4643R This studypMS319 pMS4::OE4643R This study
The H. salinarum R1 strains transformed withthe pMS plasmids (pMSxy) were designated inthe same manner (MSxy) as the plasmids.
47
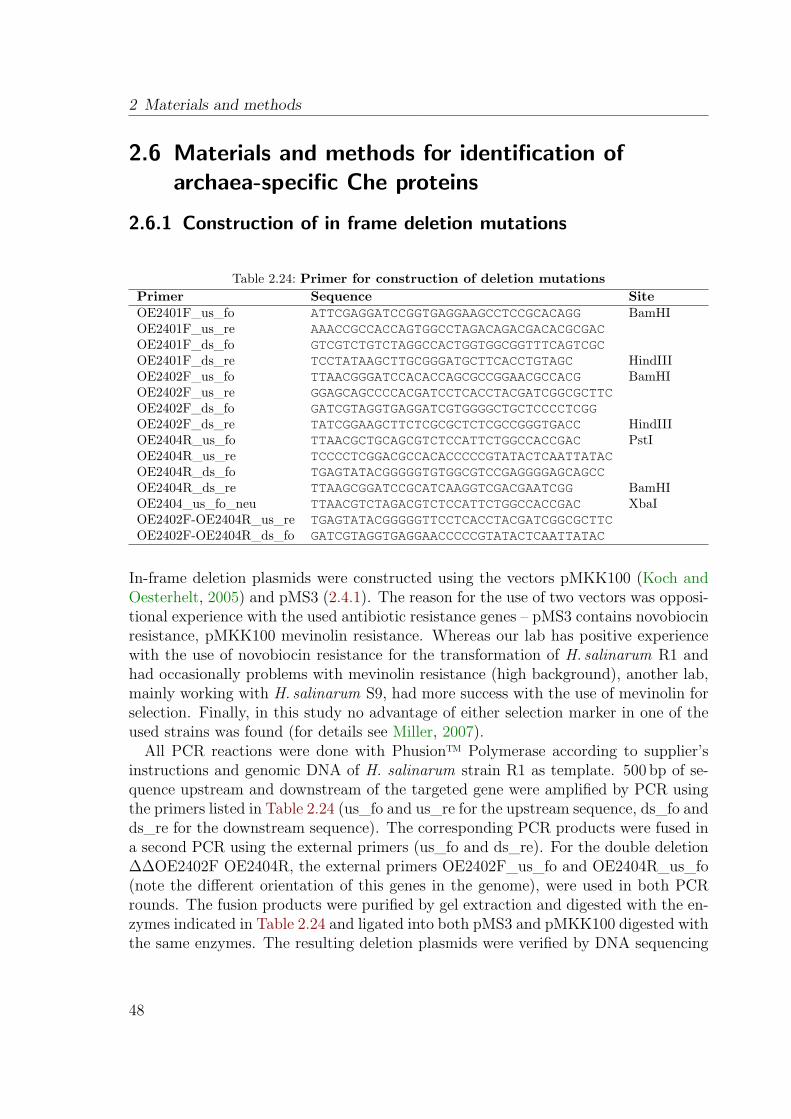
2 Materials and methods
2.6 Materials and methods for identification ofarchaea-specific Che proteins
2.6.1 Construction of in frame deletion mutations
Table 2.24: Primer for construction of deletion mutationsPrimer Sequence SiteOE2401F_us_fo ATTCGAGGATCCGGTGAGGAAGCCTCCGCACAGG BamHIOE2401F_us_re AAACCGCCACCAGTGGCCTAGACAGACGACACGCGACOE2401F_ds_fo GTCGTCTGTCTAGGCCACTGGTGGCGGTTTCAGTCGCOE2401F_ds_re TCCTATAAGCTTGCGGGATGCTTCACCTGTAGC HindIIIOE2402F_us_fo TTAACGGGATCCACACCAGCGCCGGAACGCCACG BamHIOE2402F_us_re GGAGCAGCCCCACGATCCTCACCTACGATCGGCGCTTCOE2402F_ds_fo GATCGTAGGTGAGGATCGTGGGGCTGCTCCCCTCGGOE2402F_ds_re TATCGGAAGCTTCTCGCGCTCTCGCCGGGTGACC HindIIIOE2404R_us_fo TTAACGCTGCAGCGTCTCCATTCTGGCCACCGAC PstIOE2404R_us_re TCCCCTCGGACGCCACACCCCCGTATACTCAATTATACOE2404R_ds_fo TGAGTATACGGGGGTGTGGCGTCCGAGGGGAGCAGCCOE2404R_ds_re TTAAGCGGATCCGCATCAAGGTCGACGAATCGG BamHIOE2404_us_fo_neu TTAACGTCTAGACGTCTCCATTCTGGCCACCGAC XbaIOE2402F-OE2404R_us_re TGAGTATACGGGGGTTCCTCACCTACGATCGGCGCTTCOE2402F-OE2404R_ds_fo GATCGTAGGTGAGGAACCCCCGTATACTCAATTATAC
In-frame deletion plasmids were constructed using the vectors pMKK100 (Koch andOesterhelt, 2005) and pMS3 (2.4.1). The reason for the use of two vectors was opposi-tional experience with the used antibiotic resistance genes – pMS3 contains novobiocinresistance, pMKK100 mevinolin resistance. Whereas our lab has positive experiencewith the use of novobiocin resistance for the transformation of H. salinarum R1 andhad occasionally problems with mevinolin resistance (high background), another lab,mainly working with H. salinarum S9, had more success with the use of mevinolin forselection. Finally, in this study no advantage of either selection marker in one of theused strains was found (for details see Miller, 2007).
All PCR reactions were done with Phusion™ Polymerase according to supplier’sinstructions and genomic DNA of H. salinarum strain R1 as template. 500 bp of se-quence upstream and downstream of the targeted gene were amplified by PCR usingthe primers listed in Table 2.24 (us_fo and us_re for the upstream sequence, ds_fo andds_re for the downstream sequence). The corresponding PCR products were fused ina second PCR using the external primers (us_fo and ds_re). For the double deletion∆∆OE2402F OE2404R, the external primers OE2402F_us_fo and OE2404R_us_fo(note the different orientation of this genes in the genome), were used in both PCRrounds. The fusion products were purified by gel extraction and digested with the en-zymes indicated in Table 2.24 and ligated into both pMS3 and pMKK100 digested withthe same enzymes. The resulting deletion plasmids were verified by DNA sequencing
48
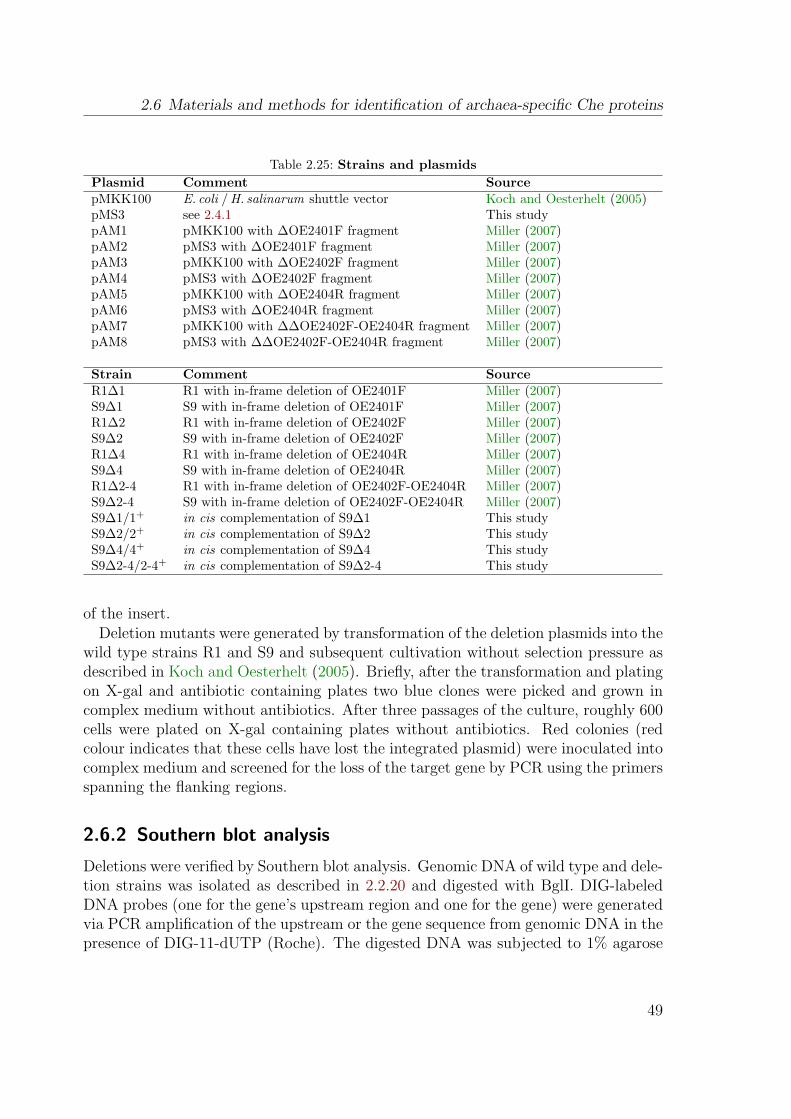
2.6 Materials and methods for identification of archaea-specific Che proteins
Table 2.25: Strains and plasmidsPlasmid Comment SourcepMKK100 E. coli / H. salinarum shuttle vector Koch and Oesterhelt (2005)pMS3 see 2.4.1 This studypAM1 pMKK100 with ∆OE2401F fragment Miller (2007)pAM2 pMS3 with ∆OE2401F fragment Miller (2007)pAM3 pMKK100 with ∆OE2402F fragment Miller (2007)pAM4 pMS3 with ∆OE2402F fragment Miller (2007)pAM5 pMKK100 with ∆OE2404R fragment Miller (2007)pAM6 pMS3 with ∆OE2404R fragment Miller (2007)pAM7 pMKK100 with ∆∆OE2402F-OE2404R fragment Miller (2007)pAM8 pMS3 with ∆∆OE2402F-OE2404R fragment Miller (2007)
Strain Comment SourceR1∆1 R1 with in-frame deletion of OE2401F Miller (2007)S9∆1 S9 with in-frame deletion of OE2401F Miller (2007)R1∆2 R1 with in-frame deletion of OE2402F Miller (2007)S9∆2 S9 with in-frame deletion of OE2402F Miller (2007)R1∆4 R1 with in-frame deletion of OE2404R Miller (2007)S9∆4 S9 with in-frame deletion of OE2404R Miller (2007)R1∆2-4 R1 with in-frame deletion of OE2402F-OE2404R Miller (2007)S9∆2-4 S9 with in-frame deletion of OE2402F-OE2404R Miller (2007)S9∆1/1+ in cis complementation of S9∆1 This studyS9∆2/2+ in cis complementation of S9∆2 This studyS9∆4/4+ in cis complementation of S9∆4 This studyS9∆2-4/2-4+ in cis complementation of S9∆2-4 This study
of the insert.Deletion mutants were generated by transformation of the deletion plasmids into the
wild type strains R1 and S9 and subsequent cultivation without selection pressure asdescribed in Koch and Oesterhelt (2005). Briefly, after the transformation and platingon X-gal and antibiotic containing plates two blue clones were picked and grown incomplex medium without antibiotics. After three passages of the culture, roughly 600cells were plated on X-gal containing plates without antibiotics. Red colonies (redcolour indicates that these cells have lost the integrated plasmid) were inoculated intocomplex medium and screened for the loss of the target gene by PCR using the primersspanning the flanking regions.
2.6.2 Southern blot analysis
Deletions were verified by Southern blot analysis. Genomic DNA of wild type and dele-tion strains was isolated as described in 2.2.20 and digested with BglI. DIG-labeledDNA probes (one for the gene’s upstream region and one for the gene) were generatedvia PCR amplification of the upstream or the gene sequence from genomic DNA in thepresence of DIG-11-dUTP (Roche). The digested DNA was subjected to 1% agarose
49
2 Materials and methods
gel electrophoresis, blotted to Hybond-N nylon membrane (Amersham Biosciences)and then UV-crosslinked. The use of blocking reagent, hybridisation procedure andchemiluminescent detection with CSPD® chemiluminescent substrate (Roche) was ac-cording to standard protocols. For a detailed description see Miller (2007).
2.6.3 Complementation of deletions
Deleted genes were reintroduced into all deletion strains in cis. Complementation plas-mids for each deletion were constructed by PCR amplification of the deleted gene(s)together with the flanking regions from H. salinarum R1 genomic DNA using the ex-ternal primers (us_fo, ds_re). For the complementation of ∆4 and ∆2-4, the primerOE2404R_us_fo_neu had to be used due to a PstI cutting site in the gene. Insertswere digested with the respective restriction enzymes and cloned into pMS3, and theresulting plasmids were verified by sequencing of the insert.
Each deletion strain was transformed with the corresponding complementation plas-mid and a double crossover triggered as described above. Red colonies were inoculatedinto complex medium and screened for reintroduction of the target gene by PCR usingthe primers spanning the flanking regions.
2.6.4 Swarm plates
Semi-solid agar plates were prepared from complex medium with 0.25 % agar. Wildtype and deletion cultures were grown to an OD600 of 0.6 - 0.8 and reinoculated twicewith equal amounts of cells to achieve equal cell densities in the final cultures. 10 µlof culture with an OD600 of 0.6 - 0.8 were injected with a pipette tip into the soft agar.The plates were incubated for 3 - 6 days at 37 ◦C in the dark.
2.6.5 Computerised cell tracking (Motion analysis)
The HaloTrack system
Reversal frequencies of unstimulated cells and after application of a photophobic stimu-lus were measured with a computerised cell tracking system (Stefan Streif, Max PlanckInstitute for Dynamics of Complex Technical Systems, Magdeburg; unpublished). Thesystem consists of a phase-contrast microscope equipped with a CCD camera, whichallows stimulus-free observation of the cells using infrared light. The camera transmitsthe stream of images to a data-processing computer, which constructs a time-resolvedcell track for each cell in the frame.
To measure the response to light stimuli, the light from two computer-controlledlight sources can be applied to the cells. In this study, two photophobic stimuli wereused: a blue light pulse and a orange light step-down. The blue light was appliedthrough the objective, thereby only stimulating the cells in the visual field. This
50
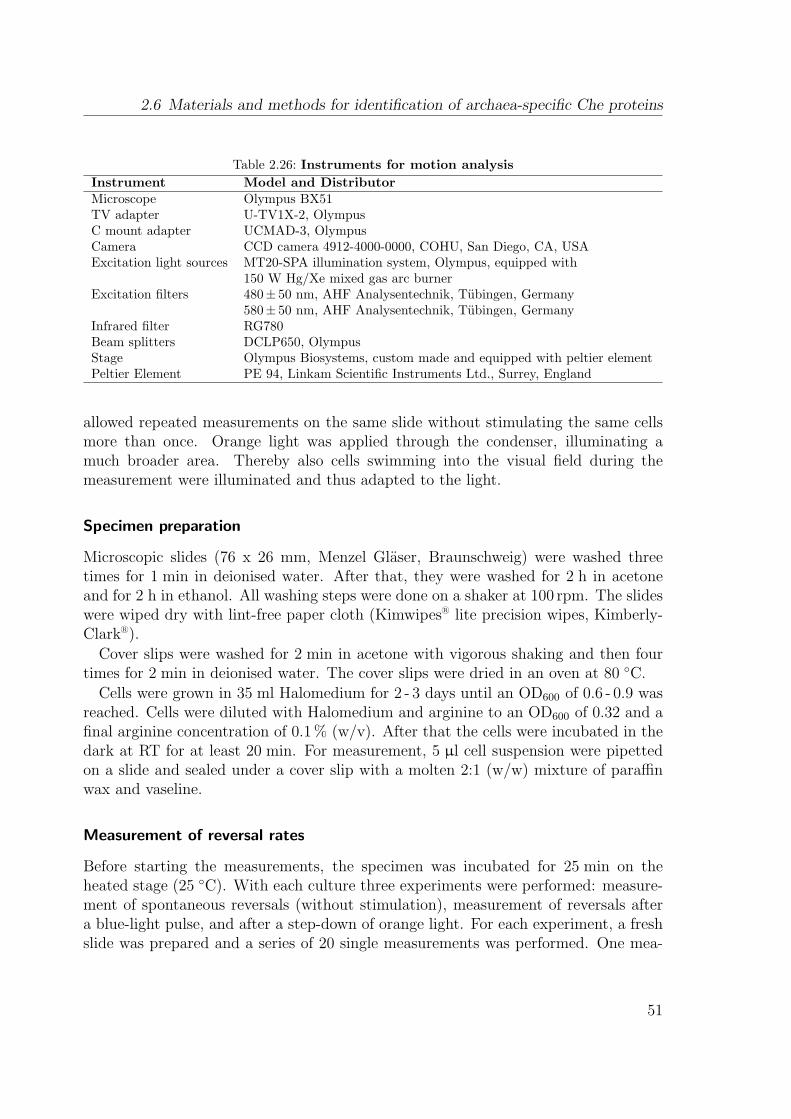
2.6 Materials and methods for identification of archaea-specific Che proteins
Table 2.26: Instruments for motion analysisInstrument Model and DistributorMicroscope Olympus BX51TV adapter U-TV1X-2, OlympusC mount adapter UCMAD-3, OlympusCamera CCD camera 4912-4000-0000, COHU, San Diego, CA, USAExcitation light sources MT20-SPA illumination system, Olympus, equipped with
150 W Hg/Xe mixed gas arc burnerExcitation filters 480± 50 nm, AHF Analysentechnik, Tübingen, Germany
580± 50 nm, AHF Analysentechnik, Tübingen, GermanyInfrared filter RG780Beam splitters DCLP650, OlympusStage Olympus Biosystems, custom made and equipped with peltier elementPeltier Element PE 94, Linkam Scientific Instruments Ltd., Surrey, England
allowed repeated measurements on the same slide without stimulating the same cellsmore than once. Orange light was applied through the condenser, illuminating amuch broader area. Thereby also cells swimming into the visual field during themeasurement were illuminated and thus adapted to the light.
Specimen preparation
Microscopic slides (76 x 26 mm, Menzel Gläser, Braunschweig) were washed threetimes for 1 min in deionised water. After that, they were washed for 2 h in acetoneand for 2 h in ethanol. All washing steps were done on a shaker at 100 rpm. The slideswere wiped dry with lint-free paper cloth (Kimwipes® lite precision wipes, Kimberly-Clark®).
Cover slips were washed for 2 min in acetone with vigorous shaking and then fourtimes for 2 min in deionised water. The cover slips were dried in an oven at 80 ◦C.
Cells were grown in 35 ml Halomedium for 2 - 3 days until an OD600 of 0.6 - 0.9 wasreached. Cells were diluted with Halomedium and arginine to an OD600 of 0.32 and afinal arginine concentration of 0.1 % (w/v). After that the cells were incubated in thedark at RT for at least 20 min. For measurement, 5 µl cell suspension were pipettedon a slide and sealed under a cover slip with a molten 2:1 (w/w) mixture of paraffinwax and vaseline.
Measurement of reversal rates
Before starting the measurements, the specimen was incubated for 25 min on theheated stage (25 ◦C). With each culture three experiments were performed: measure-ment of spontaneous reversals (without stimulation), measurement of reversals aftera blue-light pulse, and after a step-down of orange light. For each experiment, a freshslide was prepared and a series of 20 single measurements was performed. One mea-
51
2 Materials and methods
surement included 5 s recording of cell movement of which finally a 4 s interval wasanalysed for cell reversal.
For measuring the blue light response, a blue light pulse (0.5 s duration, 5 % inten-sity) was applied at the beginning of the tracking interval. After each measurementthe position on the slide was changed to avoid repeated stimulation of the same cells.
For measurement of the response to an orange light step-down, the cells were initiallyadapted to orange light for 5 min. At the beginning of the tracking interval, the orangelight was switched off for 4 s. Prior to the next measurement, the cells were adaptedagain for 45 s. Orange light was applied with maximum intensity. Since the orangelight is applied through the condenser, it illuminates almost the whole specimen.Thereby it is ensured that no cells that have not been completely adapted enter thevisual field during the tracking interval. The drawback is that the cells are repeatedlystimulated during the 20 measurements, which might cause unwanted side effects.Such effects have, however, not yet been observed.
Detection of reversals
Reversals are detected by an algorithm based on a Kalman filter (Stefan Streif, un-published). Briefly, for each time point, a prediction of the cell position for sometime span in the future is made based on the last measurements. The prediction iscompared with the actual position after the time span has elapsed. Reversals are de-tected by this comparison (see also Marwan and Oesterhelt, 1990) with a false positiveand false negative rate of 2 and 2.5%, respectively (Stefan Streif, unpublished). The95% confidence intervals were calculated assuming a binomial distribution accordingto Lorenz (1996).
By measuring known straight-swimming mutants (cheY**; del Rosario et al., 2007),the false positive detection of reversal events (tracking error) was determined to bemaximally 2.5-5 % in a 4 s observation interval (Stefan Streif, unpublished).
Calculation of confidence intervals for the reversal rates
The 95 % confidence interval for the reversal rates were calculated. As reversal eventsfollow the binomial distribution, the borders of the confidence interval could be cal-culated with the following equation:
PU
PL
}=
1
n + c2
k ± 1
2+
c2
2± c
√(k ± 1
2
) (1−
k ± 12
n
)+
c2
4
PU and PL are the upper and lower limit of the confidence interval. k is the number ofcells that reversed, n is the total number of evaluated cells. c is a coefficient dependingon the confidence level. For the chosen confidence level of 95 %, c = 1.96.
52
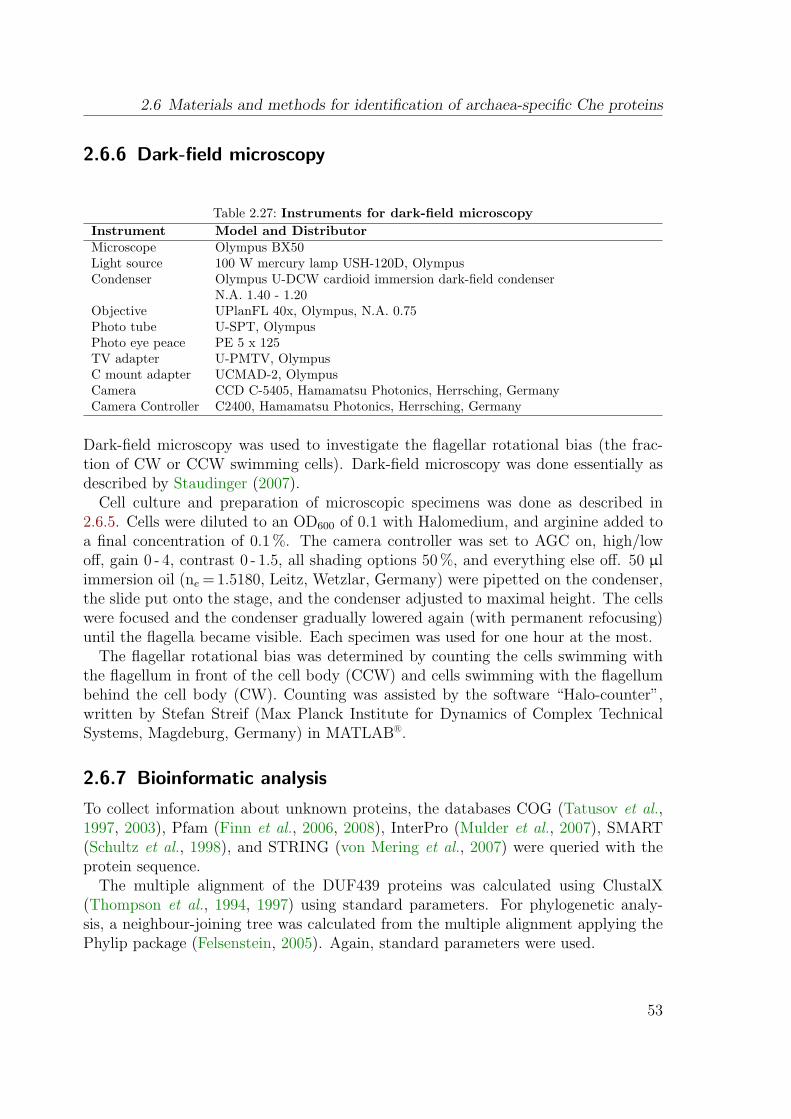
2.6 Materials and methods for identification of archaea-specific Che proteins
2.6.6 Dark-field microscopy
Table 2.27: Instruments for dark-field microscopyInstrument Model and DistributorMicroscope Olympus BX50Light source 100 W mercury lamp USH-120D, OlympusCondenser Olympus U-DCW cardioid immersion dark-field condenser
N.A. 1.40 - 1.20Objective UPlanFL 40x, Olympus, N.A. 0.75Photo tube U-SPT, OlympusPhoto eye peace PE 5 x 125TV adapter U-PMTV, OlympusC mount adapter UCMAD-2, OlympusCamera CCD C-5405, Hamamatsu Photonics, Herrsching, GermanyCamera Controller C2400, Hamamatsu Photonics, Herrsching, Germany
Dark-field microscopy was used to investigate the flagellar rotational bias (the frac-tion of CW or CCW swimming cells). Dark-field microscopy was done essentially asdescribed by Staudinger (2007).
Cell culture and preparation of microscopic specimens was done as described in2.6.5. Cells were diluted to an OD600 of 0.1 with Halomedium, and arginine added toa final concentration of 0.1 %. The camera controller was set to AGC on, high/lowoff, gain 0 - 4, contrast 0 - 1.5, all shading options 50 %, and everything else off. 50 µlimmersion oil (ne = 1.5180, Leitz, Wetzlar, Germany) were pipetted on the condenser,the slide put onto the stage, and the condenser adjusted to maximal height. The cellswere focused and the condenser gradually lowered again (with permanent refocusing)until the flagella became visible. Each specimen was used for one hour at the most.
The flagellar rotational bias was determined by counting the cells swimming withthe flagellum in front of the cell body (CCW) and cells swimming with the flagellumbehind the cell body (CW). Counting was assisted by the software “Halo-counter”,written by Stefan Streif (Max Planck Institute for Dynamics of Complex TechnicalSystems, Magdeburg, Germany) in MATLAB®.
2.6.7 Bioinformatic analysis
To collect information about unknown proteins, the databases COG (Tatusov et al.,1997, 2003), Pfam (Finn et al., 2006, 2008), InterPro (Mulder et al., 2007), SMART(Schultz et al., 1998), and STRING (von Mering et al., 2007) were queried with theprotein sequence.
The multiple alignment of the DUF439 proteins was calculated using ClustalX(Thompson et al., 1994, 1997) using standard parameters. For phylogenetic analy-sis, a neighbour-joining tree was calculated from the multiple alignment applying thePhylip package (Felsenstein, 2005). Again, standard parameters were used.
53
2 Materials and methods
Table of Che and Fla orthologs
For identification of Che and Fla orthologs in archaeal genomes, a combination ofhomology search, genome region analysis, and cluster analysis based on pairwise sim-ilarity was applied.
First, che and fla gene regions were identified by Psi-Blast against an archaeal pro-tein sequence database using H. salinarum CheD and FlaH as queries. The databasecontained the predicted proteins from all complete archaeal genomes available in Gen-Bank in October 2007, except for Halobacterium salinarum NRC-1, which containsthe same che and fla genes as H. salinarum R1 (Ng et al., 2000; Pfeiffer et al., 2008b).CheD and FlaH were chosen as queries because a former study had demonstratedthat they are highly conserved throughout all chemotactic or motile archaea, and theyhave no close non-orthologous homologs, which would make result evaluation difficult(Klein, 2005). All hits with an e-value of 10−8 or lower were accepted. This cut-off,however, was not critical, as there were no hits with e-values between 10−10 and 10−2
for CheD and 10−10 and 10−5 for FlaH.Second, the genes in the neighbourhood of the identified cheD and flaH genes were
examined by BlastP against the archaeal protein sequence database, and queryingCDS and Pfam. Based on homology or identified domains, the genes were assignedto pools. The pools were: CheA, CheB, CheC, CheD, CheR, CheW, CheY, DUF439,FlaC, FlaD/E (FlaD and FlaE could not be distinguished), FlaF, FlaG, FlaH, FlaI,FlaJ. The examination of neighbouring genes was repeated until on each side of theregion three genes with no obvious relation to chemotaxis or flagellation were found.
Third, the pools were extended to identify homologs located apart from the maingenome regions. For this, each member of a pool was used as query in a Blast searchagainst the archaeal protein sequence database. All hits with an e-value of 10−3 orsmaller were included into the extended pools. Fetching the query sequences from anarchaeal protein database, performing the blast runs, and writing the extended poolswas automated using self-written Perl scripts.
Fourth, the extended pools were clustered based on pairwise similarity. This wasdone with the CLANS application (Frickey and Lupas, 2004). CLANS takes a setof sequences (in this case all sequences from the extended pools) as input, performsall-against-all BLAST searches, and displays the pairwise similarities as 3D graph. Se-quences are represented as vertices in the graph. BLAST high-scoring segment pairs(HSPs) are shown as edges between the vertices and provide attractive forces pro-portional to the negative logarithm of the HSPs P -value. The attractive forces arebalanced by a mild repulsive force between all vertices. Vertices positions are deter-mined in an iterative process, in which the vertices, after initial random placement,are moved along the force vectors resulting from all pairwise interactions. By thisapproach, sequence groups with high similarities between all sequences come closetogether (form clusters), whereas sequences from different groups are separated evenwhen single pairs between the groups build high-scoring alignments. Iteration was run
54

2.6 Materials and methods for identification of archaea-specific Che proteins
until movement of vertices became negligible. The cluster in which the members of thenon-extended pools were found was extracted and the members considered as the finalgroup of orthologs. Proteins which were not included into this ortholog cluster butdid also not cluster with any other proteins and had only connections to the orthologcluster, were included into the final ortholog group as well (marked with an asteriskin Table S4). The applicability of the method was supported by the fact that in allcases the members of the non-extended pools were found in one cluster.
55

2 Materials and methods
56
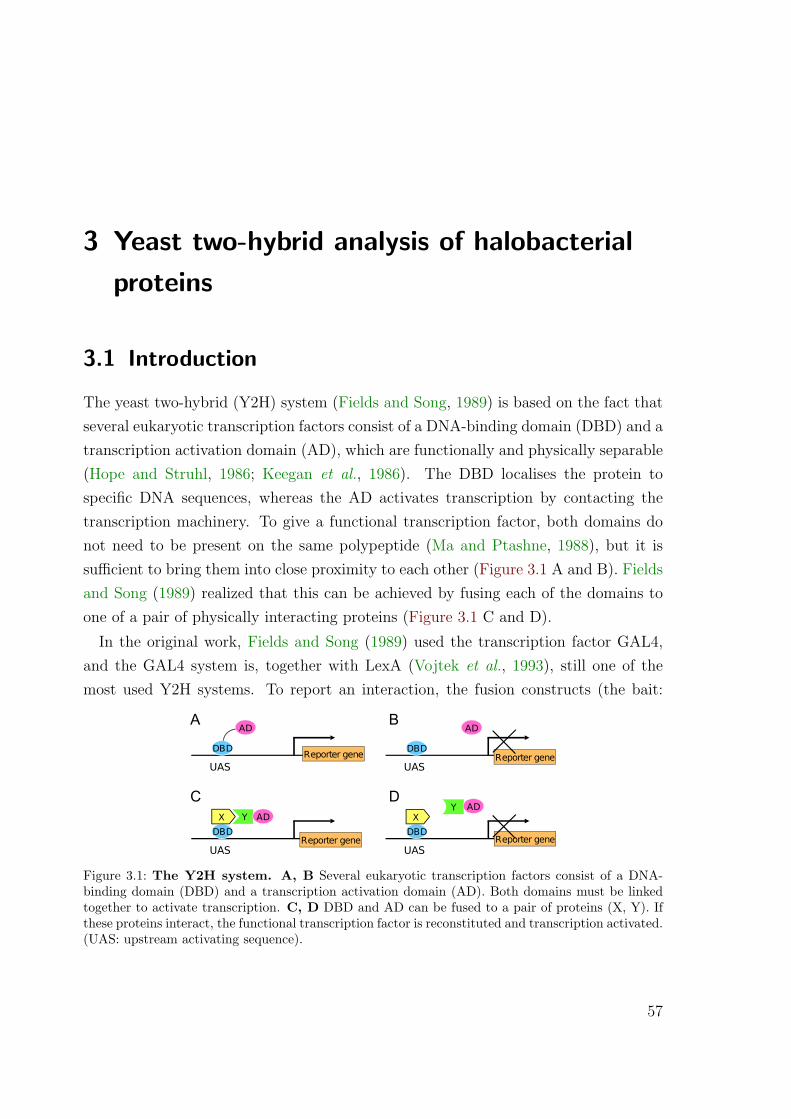
3 Yeast two-hybrid analysis of halobacterialproteins
3.1 Introduction
The yeast two-hybrid (Y2H) system (Fields and Song, 1989) is based on the fact thatseveral eukaryotic transcription factors consist of a DNA-binding domain (DBD) and atranscription activation domain (AD), which are functionally and physically separable(Hope and Struhl, 1986; Keegan et al., 1986). The DBD localises the protein tospecific DNA sequences, whereas the AD activates transcription by contacting thetranscription machinery. To give a functional transcription factor, both domains donot need to be present on the same polypeptide (Ma and Ptashne, 1988), but it issufficient to bring them into close proximity to each other (Figure 3.1 A and B). Fieldsand Song (1989) realized that this can be achieved by fusing each of the domains toone of a pair of physically interacting proteins (Figure 3.1 C and D).
In the original work, Fields and Song (1989) used the transcription factor GAL4,and the GAL4 system is, together with LexA (Vojtek et al., 1993), still one of themost used Y2H systems. To report an interaction, the fusion constructs (the bait:
UAS
DBD
AD
Reporter geneUAS
DBD
AD
Reporter gene
UAS
DBD
X ADY
Reporter geneUAS
DBD
XY
Reporter gene
AD
A B
DC
Figure 3.1: The Y2H system. A, B Several eukaryotic transcription factors consist of a DNA-binding domain (DBD) and a transcription activation domain (AD). Both domains must be linkedtogether to activate transcription. C, D DBD and AD can be fused to a pair of proteins (X, Y). Ifthese proteins interact, the functional transcription factor is reconstituted and transcription activated.(UAS: upstream activating sequence).
57
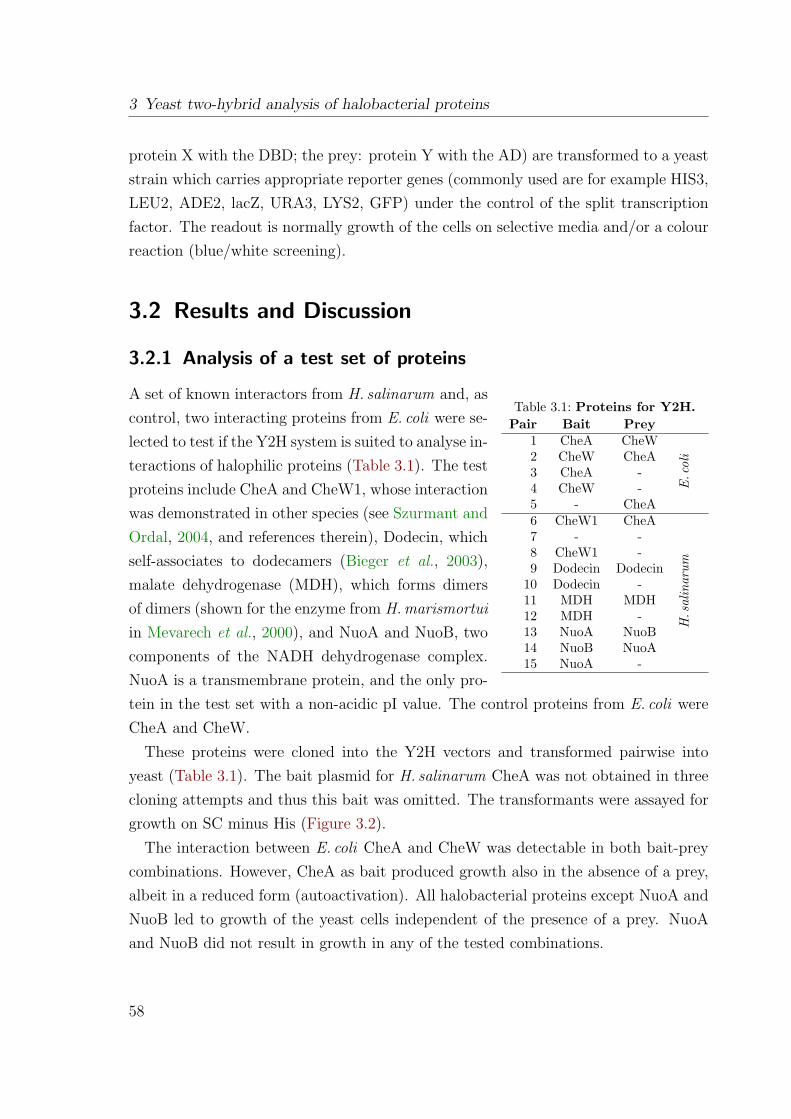
3 Yeast two-hybrid analysis of halobacterial proteins
protein X with the DBD; the prey: protein Y with the AD) are transformed to a yeaststrain which carries appropriate reporter genes (commonly used are for example HIS3,LEU2, ADE2, lacZ, URA3, LYS2, GFP) under the control of the split transcriptionfactor. The readout is normally growth of the cells on selective media and/or a colourreaction (blue/white screening).
3.2 Results and Discussion
3.2.1 Analysis of a test set of proteins
Table 3.1: Proteins for Y2H.Pair Bait Prey
1 CheA CheW
E.c
oli2 CheW CheA
3 CheA -4 CheW -5 - CheA6 CheW1 CheA
H.s
alin
arum
7 - -8 CheW1 -9 Dodecin Dodecin
10 Dodecin -11 MDH MDH12 MDH -13 NuoA NuoB14 NuoB NuoA15 NuoA -
A set of known interactors from H. salinarum and, ascontrol, two interacting proteins from E. coli were se-lected to test if the Y2H system is suited to analyse in-teractions of halophilic proteins (Table 3.1). The testproteins include CheA and CheW1, whose interactionwas demonstrated in other species (see Szurmant andOrdal, 2004, and references therein), Dodecin, whichself-associates to dodecamers (Bieger et al., 2003),malate dehydrogenase (MDH), which forms dimersof dimers (shown for the enzyme from H. marismortuiin Mevarech et al., 2000), and NuoA and NuoB, twocomponents of the NADH dehydrogenase complex.NuoA is a transmembrane protein, and the only pro-tein in the test set with a non-acidic pI value. The control proteins from E. coli wereCheA and CheW.
These proteins were cloned into the Y2H vectors and transformed pairwise intoyeast (Table 3.1). The bait plasmid for H. salinarum CheA was not obtained in threecloning attempts and thus this bait was omitted. The transformants were assayed forgrowth on SC minus His (Figure 3.2).
The interaction between E. coli CheA and CheW was detectable in both bait-preycombinations. However, CheA as bait produced growth also in the absence of a prey,albeit in a reduced form (autoactivation). All halobacterial proteins except NuoA andNuoB led to growth of the yeast cells independent of the presence of a prey. NuoAand NuoB did not result in growth in any of the tested combinations.
58
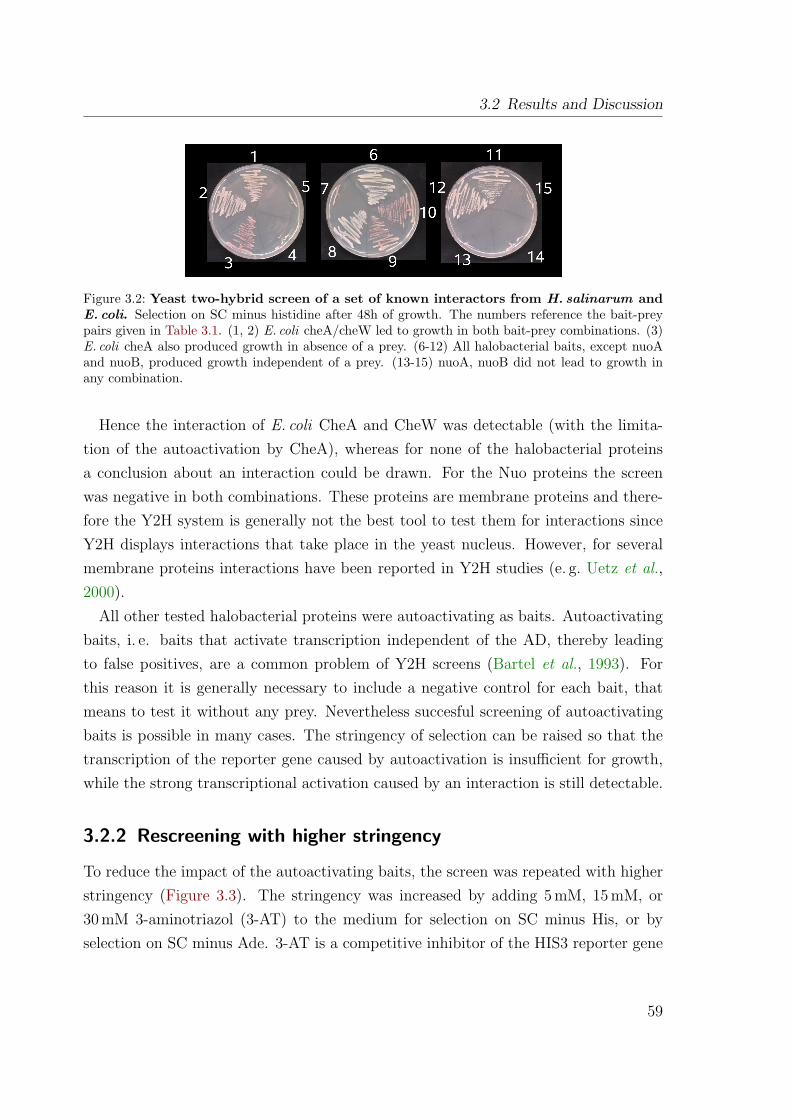
3.2 Results and Discussion
Figure 3.2: Yeast two-hybrid screen of a set of known interactors from H. salinarum andE. coli. Selection on SC minus histidine after 48h of growth. The numbers reference the bait-preypairs given in Table 3.1. (1, 2) E. coli cheA/cheW led to growth in both bait-prey combinations. (3)E. coli cheA also produced growth in absence of a prey. (6-12) All halobacterial baits, except nuoAand nuoB, produced growth independent of a prey. (13-15) nuoA, nuoB did not lead to growth inany combination.
Hence the interaction of E. coli CheA and CheW was detectable (with the limita-tion of the autoactivation by CheA), whereas for none of the halobacterial proteinsa conclusion about an interaction could be drawn. For the Nuo proteins the screenwas negative in both combinations. These proteins are membrane proteins and there-fore the Y2H system is generally not the best tool to test them for interactions sinceY2H displays interactions that take place in the yeast nucleus. However, for severalmembrane proteins interactions have been reported in Y2H studies (e. g. Uetz et al.,2000).
All other tested halobacterial proteins were autoactivating as baits. Autoactivatingbaits, i. e. baits that activate transcription independent of the AD, thereby leadingto false positives, are a common problem of Y2H screens (Bartel et al., 1993). Forthis reason it is generally necessary to include a negative control for each bait, thatmeans to test it without any prey. Nevertheless succesful screening of autoactivatingbaits is possible in many cases. The stringency of selection can be raised so that thetranscription of the reporter gene caused by autoactivation is insufficient for growth,while the strong transcriptional activation caused by an interaction is still detectable.
3.2.2 Rescreening with higher stringency
To reduce the impact of the autoactivating baits, the screen was repeated with higherstringency (Figure 3.3). The stringency was increased by adding 5 mM, 15 mM, or30 mM 3-aminotriazol (3-AT) to the medium for selection on SC minus His, or byselection on SC minus Ade. 3-AT is a competitive inhibitor of the HIS3 reporter gene
59
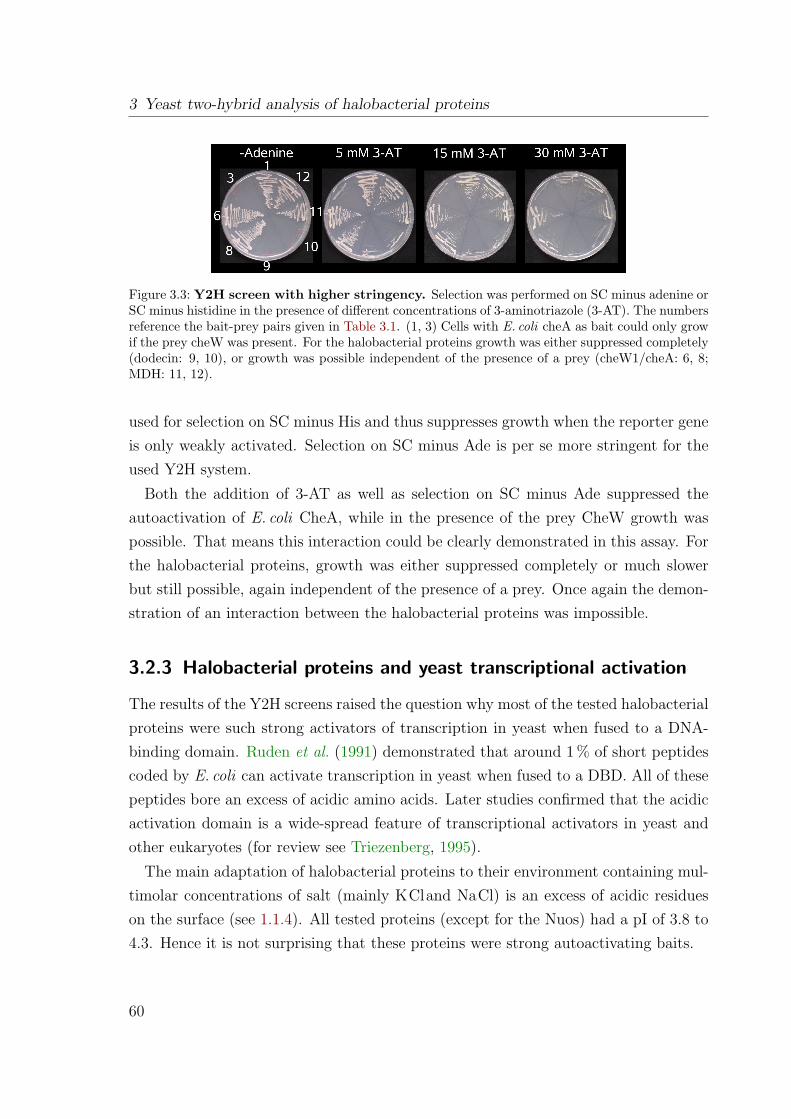
3 Yeast two-hybrid analysis of halobacterial proteins
Figure 3.3: Y2H screen with higher stringency. Selection was performed on SC minus adenine orSC minus histidine in the presence of different concentrations of 3-aminotriazole (3-AT). The numbersreference the bait-prey pairs given in Table 3.1. (1, 3) Cells with E. coli cheA as bait could only growif the prey cheW was present. For the halobacterial proteins growth was either suppressed completely(dodecin: 9, 10), or growth was possible independent of the presence of a prey (cheW1/cheA: 6, 8;MDH: 11, 12).
used for selection on SC minus His and thus suppresses growth when the reporter geneis only weakly activated. Selection on SC minus Ade is per se more stringent for theused Y2H system.
Both the addition of 3-AT as well as selection on SC minus Ade suppressed theautoactivation of E. coli CheA, while in the presence of the prey CheW growth waspossible. That means this interaction could be clearly demonstrated in this assay. Forthe halobacterial proteins, growth was either suppressed completely or much slowerbut still possible, again independent of the presence of a prey. Once again the demon-stration of an interaction between the halobacterial proteins was impossible.
3.2.3 Halobacterial proteins and yeast transcriptional activation
The results of the Y2H screens raised the question why most of the tested halobacterialproteins were such strong activators of transcription in yeast when fused to a DNA-binding domain. Ruden et al. (1991) demonstrated that around 1 % of short peptidescoded by E. coli can activate transcription in yeast when fused to a DBD. All of thesepeptides bore an excess of acidic amino acids. Later studies confirmed that the acidicactivation domain is a wide-spread feature of transcriptional activators in yeast andother eukaryotes (for review see Triezenberg, 1995).
The main adaptation of halobacterial proteins to their environment containing mul-timolar concentrations of salt (mainly KCland NaCl) is an excess of acidic residueson the surface (see 1.1.4). All tested proteins (except for the Nuos) had a pI of 3.8 to4.3. Hence it is not surprising that these proteins were strong autoactivating baits.
60
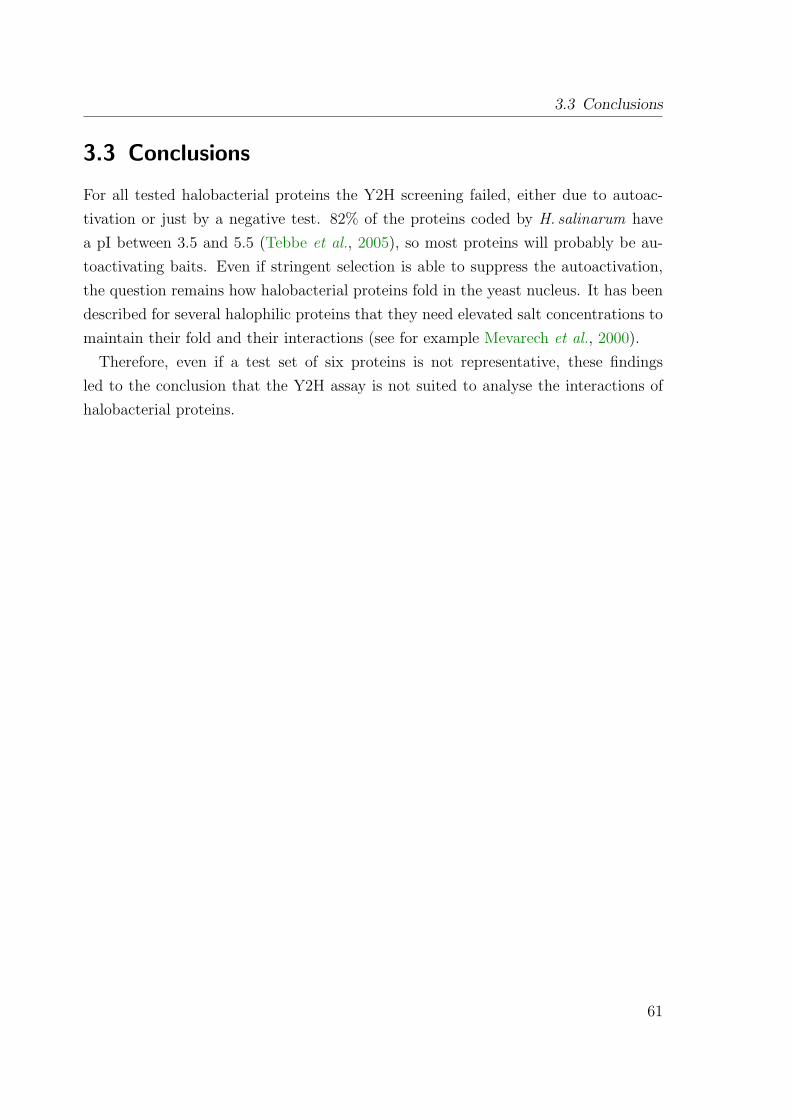
3.3 Conclusions
3.3 Conclusions
For all tested halobacterial proteins the Y2H screening failed, either due to autoac-tivation or just by a negative test. 82% of the proteins coded by H. salinarum havea pI between 3.5 and 5.5 (Tebbe et al., 2005), so most proteins will probably be au-toactivating baits. Even if stringent selection is able to suppress the autoactivation,the question remains how halobacterial proteins fold in the yeast nucleus. It has beendescribed for several halophilic proteins that they need elevated salt concentrations tomaintain their fold and their interactions (see for example Mevarech et al., 2000).
Therefore, even if a test set of six proteins is not representative, these findingsled to the conclusion that the Y2H assay is not suited to analyse the interactions ofhalobacterial proteins.
61

3 Yeast two-hybrid analysis of halobacterial proteins
62
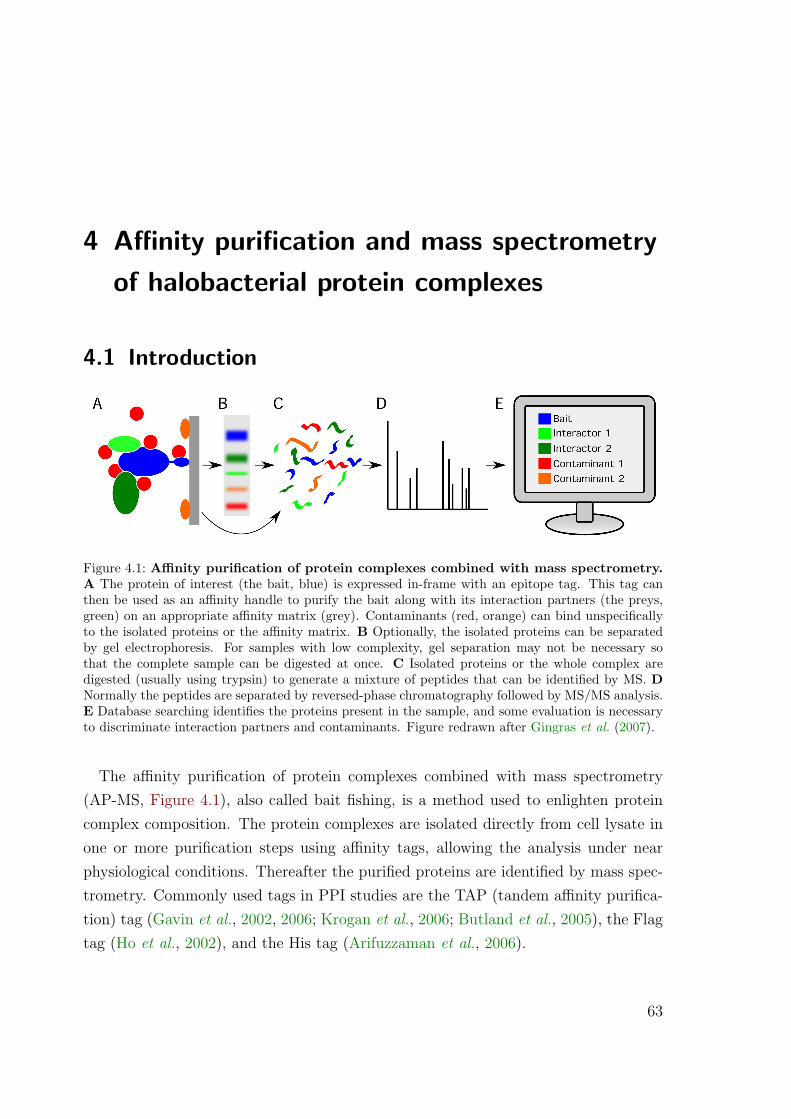
4 Affinity purification and mass spectrometryof halobacterial protein complexes
4.1 Introduction
Figure 4.1: Affinity purification of protein complexes combined with mass spectrometry.A The protein of interest (the bait, blue) is expressed in-frame with an epitope tag. This tag canthen be used as an affinity handle to purify the bait along with its interaction partners (the preys,green) on an appropriate affinity matrix (grey). Contaminants (red, orange) can bind unspecificallyto the isolated proteins or the affinity matrix. B Optionally, the isolated proteins can be separatedby gel electrophoresis. For samples with low complexity, gel separation may not be necessary sothat the complete sample can be digested at once. C Isolated proteins or the whole complex aredigested (usually using trypsin) to generate a mixture of peptides that can be identified by MS. DNormally the peptides are separated by reversed-phase chromatography followed by MS/MS analysis.E Database searching identifies the proteins present in the sample, and some evaluation is necessaryto discriminate interaction partners and contaminants. Figure redrawn after Gingras et al. (2007).
The affinity purification of protein complexes combined with mass spectrometry(AP-MS, Figure 4.1), also called bait fishing, is a method used to enlighten proteincomplex composition. The protein complexes are isolated directly from cell lysate inone or more purification steps using affinity tags, allowing the analysis under nearphysiological conditions. Thereafter the purified proteins are identified by mass spec-trometry. Commonly used tags in PPI studies are the TAP (tandem affinity purifica-tion) tag (Gavin et al., 2002, 2006; Krogan et al., 2006; Butland et al., 2005), the Flagtag (Ho et al., 2002), and the His tag (Arifuzzaman et al., 2006).
63
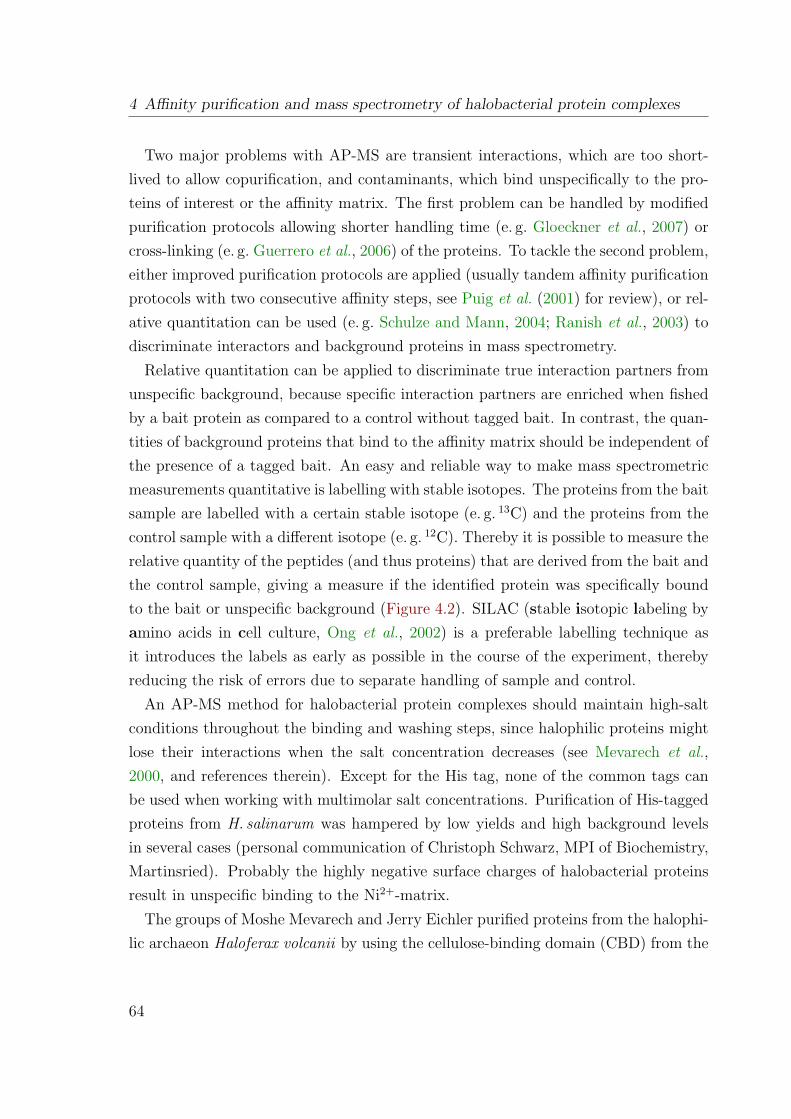
4 Affinity purification and mass spectrometry of halobacterial protein complexes
Two major problems with AP-MS are transient interactions, which are too short-lived to allow copurification, and contaminants, which bind unspecifically to the pro-teins of interest or the affinity matrix. The first problem can be handled by modifiedpurification protocols allowing shorter handling time (e. g. Gloeckner et al., 2007) orcross-linking (e. g. Guerrero et al., 2006) of the proteins. To tackle the second problem,either improved purification protocols are applied (usually tandem affinity purificationprotocols with two consecutive affinity steps, see Puig et al. (2001) for review), or rel-ative quantitation can be used (e. g. Schulze and Mann, 2004; Ranish et al., 2003) todiscriminate interactors and background proteins in mass spectrometry.
Relative quantitation can be applied to discriminate true interaction partners fromunspecific background, because specific interaction partners are enriched when fishedby a bait protein as compared to a control without tagged bait. In contrast, the quan-tities of background proteins that bind to the affinity matrix should be independent ofthe presence of a tagged bait. An easy and reliable way to make mass spectrometricmeasurements quantitative is labelling with stable isotopes. The proteins from the baitsample are labelled with a certain stable isotope (e. g. 13C) and the proteins from thecontrol sample with a different isotope (e. g. 12C). Thereby it is possible to measure therelative quantity of the peptides (and thus proteins) that are derived from the bait andthe control sample, giving a measure if the identified protein was specifically boundto the bait or unspecific background (Figure 4.2). SILAC (stable isotopic labeling byamino acids in cell culture, Ong et al., 2002) is a preferable labelling technique asit introduces the labels as early as possible in the course of the experiment, therebyreducing the risk of errors due to separate handling of sample and control.
An AP-MS method for halobacterial protein complexes should maintain high-saltconditions throughout the binding and washing steps, since halophilic proteins mightlose their interactions when the salt concentration decreases (see Mevarech et al.,2000, and references therein). Except for the His tag, none of the common tags canbe used when working with multimolar salt concentrations. Purification of His-taggedproteins from H. salinarum was hampered by low yields and high background levelsin several cases (personal communication of Christoph Schwarz, MPI of Biochemistry,Martinsried). Probably the highly negative surface charges of halobacterial proteinsresult in unspecific binding to the Ni2+-matrix.
The groups of Moshe Mevarech and Jerry Eichler purified proteins from the halophi-lic archaeon Haloferax volcanii by using the cellulose-binding domain (CBD) from the
64
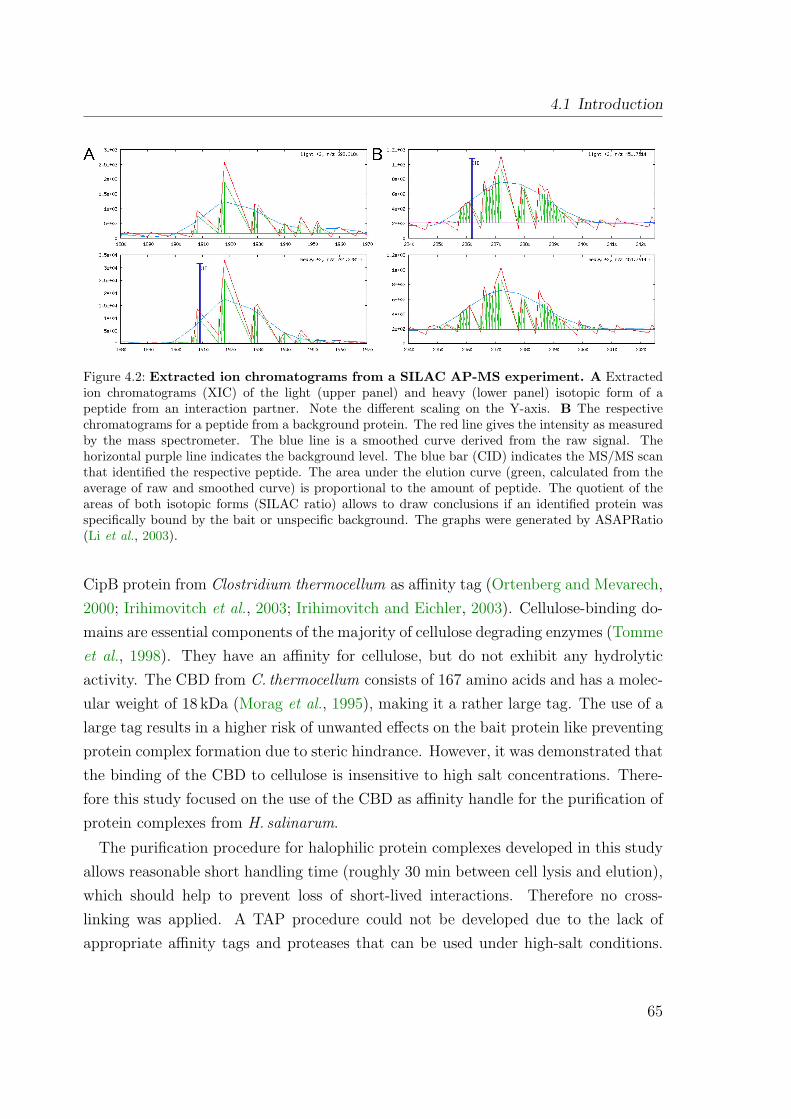
4.1 Introduction
Figure 4.2: Extracted ion chromatograms from a SILAC AP-MS experiment. A Extractedion chromatograms (XIC) of the light (upper panel) and heavy (lower panel) isotopic form of apeptide from an interaction partner. Note the different scaling on the Y-axis. B The respectivechromatograms for a peptide from a background protein. The red line gives the intensity as measuredby the mass spectrometer. The blue line is a smoothed curve derived from the raw signal. Thehorizontal purple line indicates the background level. The blue bar (CID) indicates the MS/MS scanthat identified the respective peptide. The area under the elution curve (green, calculated from theaverage of raw and smoothed curve) is proportional to the amount of peptide. The quotient of theareas of both isotopic forms (SILAC ratio) allows to draw conclusions if an identified protein wasspecifically bound by the bait or unspecific background. The graphs were generated by ASAPRatio(Li et al., 2003).
CipB protein from Clostridium thermocellum as affinity tag (Ortenberg and Mevarech,2000; Irihimovitch et al., 2003; Irihimovitch and Eichler, 2003). Cellulose-binding do-mains are essential components of the majority of cellulose degrading enzymes (Tommeet al., 1998). They have an affinity for cellulose, but do not exhibit any hydrolyticactivity. The CBD from C. thermocellum consists of 167 amino acids and has a molec-ular weight of 18 kDa (Morag et al., 1995), making it a rather large tag. The use of alarge tag results in a higher risk of unwanted effects on the bait protein like preventingprotein complex formation due to steric hindrance. However, it was demonstrated thatthe binding of the CBD to cellulose is insensitive to high salt concentrations. There-fore this study focused on the use of the CBD as affinity handle for the purification ofprotein complexes from H. salinarum.
The purification procedure for halophilic protein complexes developed in this studyallows reasonable short handling time (roughly 30 min between cell lysis and elution),which should help to prevent loss of short-lived interactions. Therefore no cross-linking was applied. A TAP procedure could not be developed due to the lack ofappropriate affinity tags and proteases that can be used under high-salt conditions.
65
4 Affinity purification and mass spectrometry of halobacterial protein complexes
Hence SILAC was applied to identify specific interaction partners regardless of highlevels of background proteins.
In a first step, vectors were created that enable the expression of CBD-tagged pro-teins in H. salinarum. In parallel, E. coli -expressed CBD was used to establish a basicpurification protocol. This protocol was then adapted for the expression in and purifi-cation from H. salinarum. With such a protocol in hands, the focus was shifted to theidentification of interaction partners. First, MALDI TOF peptide mass fingerprint-ing was used for protein identification. Since this method showed major problemswith the tested samples, the more powerful ESI LC MS/MS technique was chosenas identification method. Finally, the procedure was modified to make use of SILACfor discrimination of interaction partners from background. For the determination ofSILAC ratios, the tool ASAPRatio (Li et al., 2003) embedded in the Trans-ProteomicPipeline (Keller et al., 2005) was used.
4.2 Results and Discussion
4.2.1 Construction of vectors
Vectors needed to be constructed that allow the expression of CBD-fused bait proteinsin H. salinarum (Figure 4.3 A, B). The commonly used vectors for transformation ofH. salinarum are not maintained as plasmids but integrated into the genome. Thisfact can be used to achieve the expression of the tagged bait protein by integratingan appropriate plasmid into the genome at the site of the bait gene (Figure 4.3 C, D).Thereby the expression of C-terminally tagged bait protein under the control of theendogenous promoter, N-terminally tagged bait protein under control of an exogenouspromoter, or both versions at once in one cell can be achieved. In this study, only theexpression of the C-terminally tagged bait (single tagging) and of C- and N-terminallytagged bait at once (double tagging) was done.
For the expression of the N-terminally tagged construct the modified ferredoxinpromoter PrR16 is used (Danner and Soppa, 1996). This promoter leads to high ex-pression levels so that most proteins are overexpressed when under its control. Baitoverexpression can be problematic since it might lead to misfolding and thereby to theassociation with non-physiological interaction partners. Furthermore, the stoichiome-try between bait and interactors is lost. On the other hand, bait overexpression might
66
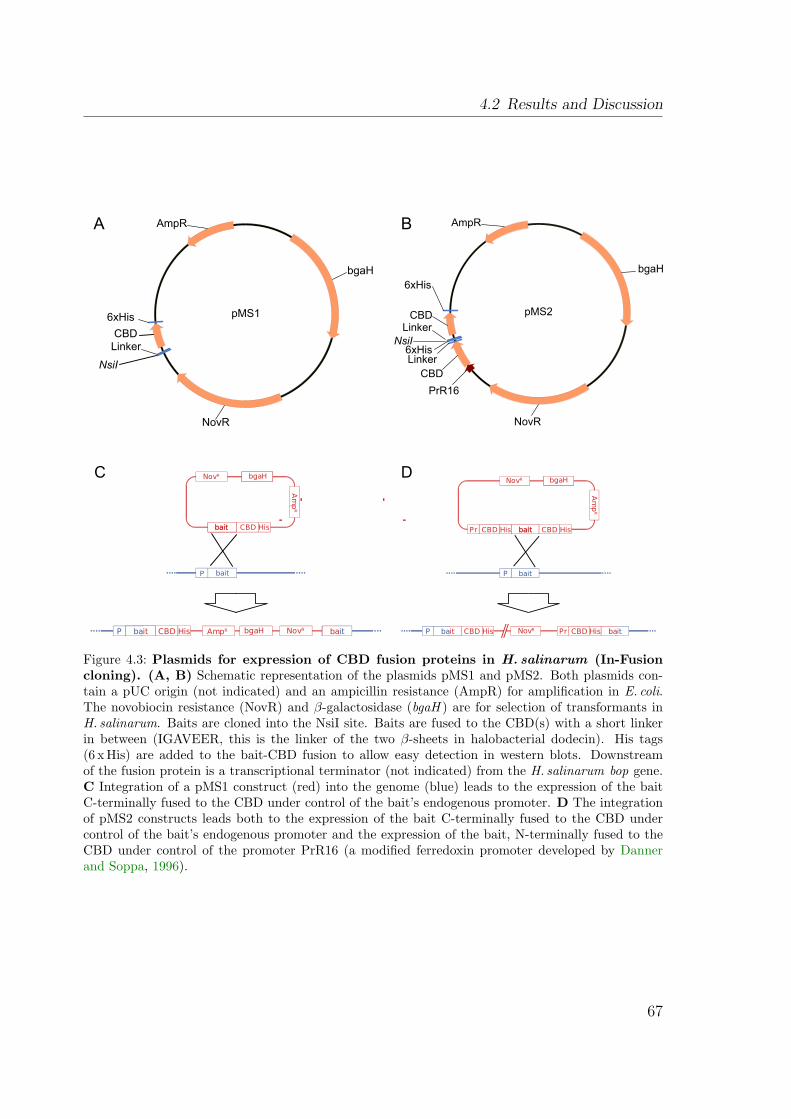
4.2 Results and Discussion
C D
baitNovRbaitbait CBD HisP AmpR bgaH
NovR bgaH
AmpR
baitbait CBD His
P bait baitP
NovR
baitbait CBD HisCBDPr His
AmpR
bgaH
baitbaitbait CBD HisP CBDPr HisNovR
NsiI
NovR
bgaH
AmpR
6xHis
CBDLinker
pMS1
NsiI
NovR
bgaH
AmpR
6xHis
CBDLinker
6xHis
pMS2
PrR16
CBDLinker
A B
Figure 4.3: Plasmids for expression of CBD fusion proteins in H. salinarum (In-Fusioncloning). (A, B) Schematic representation of the plasmids pMS1 and pMS2. Both plasmids con-tain a pUC origin (not indicated) and an ampicillin resistance (AmpR) for amplification in E. coli.The novobiocin resistance (NovR) and β-galactosidase (bgaH ) are for selection of transformants inH. salinarum. Baits are cloned into the NsiI site. Baits are fused to the CBD(s) with a short linkerin between (IGAVEER, this is the linker of the two β-sheets in halobacterial dodecin). His tags(6 x His) are added to the bait-CBD fusion to allow easy detection in western blots. Downstreamof the fusion protein is a transcriptional terminator (not indicated) from the H. salinarum bop gene.C Integration of a pMS1 construct (red) into the genome (blue) leads to the expression of the baitC-terminally fused to the CBD under control of the bait’s endogenous promoter. D The integrationof pMS2 constructs leads both to the expression of the bait C-terminally fused to the CBD undercontrol of the bait’s endogenous promoter and the expression of the bait, N-terminally fused to theCBD under control of the promoter PrR16 (a modified ferredoxin promoter developed by Dannerand Soppa, 1996).
67
4 Affinity purification and mass spectrometry of halobacterial protein complexes
also be an advantage because it allows to work with smaller cultures (especially forlow-abundance proteins). Even though the preys are not overexpressed, the higherconcentration of an overexpressed bait can help to fish weak interactors by shiftingthe dissociation equilibrium towards associated (of course, this can again lead to theidentification of non-physiological interactions).
All expression plasmids were derived from pVT (Tarasov et al., 2008) as described in2.4.1. The first generation of vectors (Figure 4.3) was designed for In-Fusion Cloning™(2.2.8). The plasmids can be linearised by cutting with the restriction endonucleaseNsiI. The PCR-amplified bait, bearing 15 bp overhangs homologous to the ends of thelinearised vector, can then be recombined into the linear vector to create the desiredplasmid.
These vectors were used in the experiments performed for establishing the method,but overall the efficiency of In-Fusion Cloning™ was low and most baits needed severalattempts for succesful cloning. The problem were not clones with the wrong insert,but no clones at all. The reason for the low success rate is not known, but otherpeople in the lab had problems as well. Possibly, the In-Fusion system does not workwell with the GC-rich DNA from H. salinarum. To improve cloning, the plasmidswere converted to Gateway™ destination vectors (see 2.2.9 for Gateway cloning). Theresulting vectors, pMS3 for single tagging and pMS4 for double tagging, are shownin Figure 4.4 A and B. From these vectors appropriate SILAC control plasmids werederived by removing the CBD(s) and designated pMS5 and pMS6.
4.2.2 The purification procedure
4.2.2.1 Expression in E. coli
To have a fast and effective expression system to test the cellulose-based purificationprocedure, the CBD was cloned into the expression vector pET15 (Novagen) andtransformed to E. coli strain BL21. The generated expression strain was then used toestablish a basic CBD purification protocol.
Starting point for protocol development were the methods used by the groups ofMevarech and Eichler (Ortenberg and Mevarech, 2000; Irihimovitch and Eichler, 2003),and the protocol for the formerly commercially available Cbind™ kit (Novagen). Themajor development steps are given in the protocols Eco1-3 (2.4.3.1). Correspondingresults are shown in Figure 4.5. The most important improvements were the use of
68
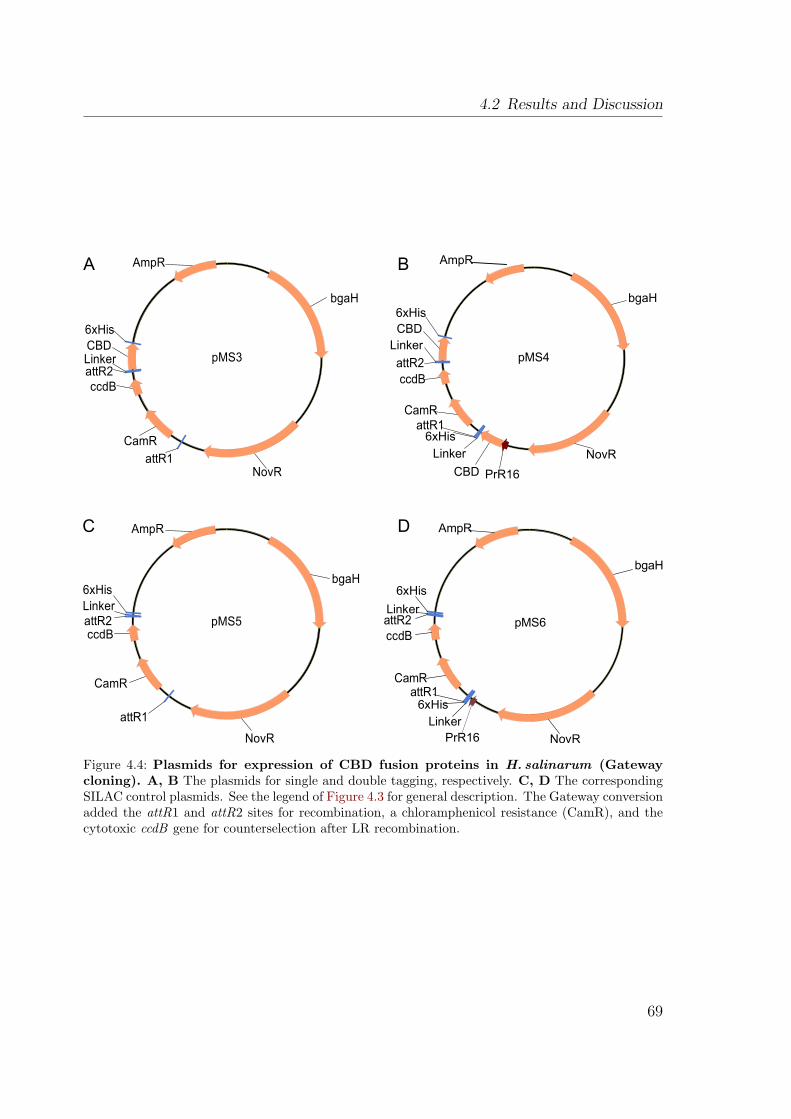
4.2 Results and Discussion
NovR
bgaH
AmpR
6xHis
Linker
6xHis
pMS6
PrR16Linker
attR1
attR2ccdB
CamR
NovR
bgaH
AmpR
6xHisCBDLinker pMS3
attR1
CamR
attR2ccdB
NovR
bgaH
AmpR
6xHisCBDLinker
pMS4
6xHisLinker
CBD PrR16
attR1
attR2ccdB
CamR
NovR
bgaH
AmpR
6xHisLinker
pMS5
attR1
CamR
attR2ccdB
A B
DC
Figure 4.4: Plasmids for expression of CBD fusion proteins in H. salinarum (Gatewaycloning). A, B The plasmids for single and double tagging, respectively. C, D The correspondingSILAC control plasmids. See the legend of Figure 4.3 for general description. The Gateway conversionadded the attR1 and attR2 sites for recombination, a chloramphenicol resistance (CamR), and thecytotoxic ccdB gene for counterselection after LR recombination.
69
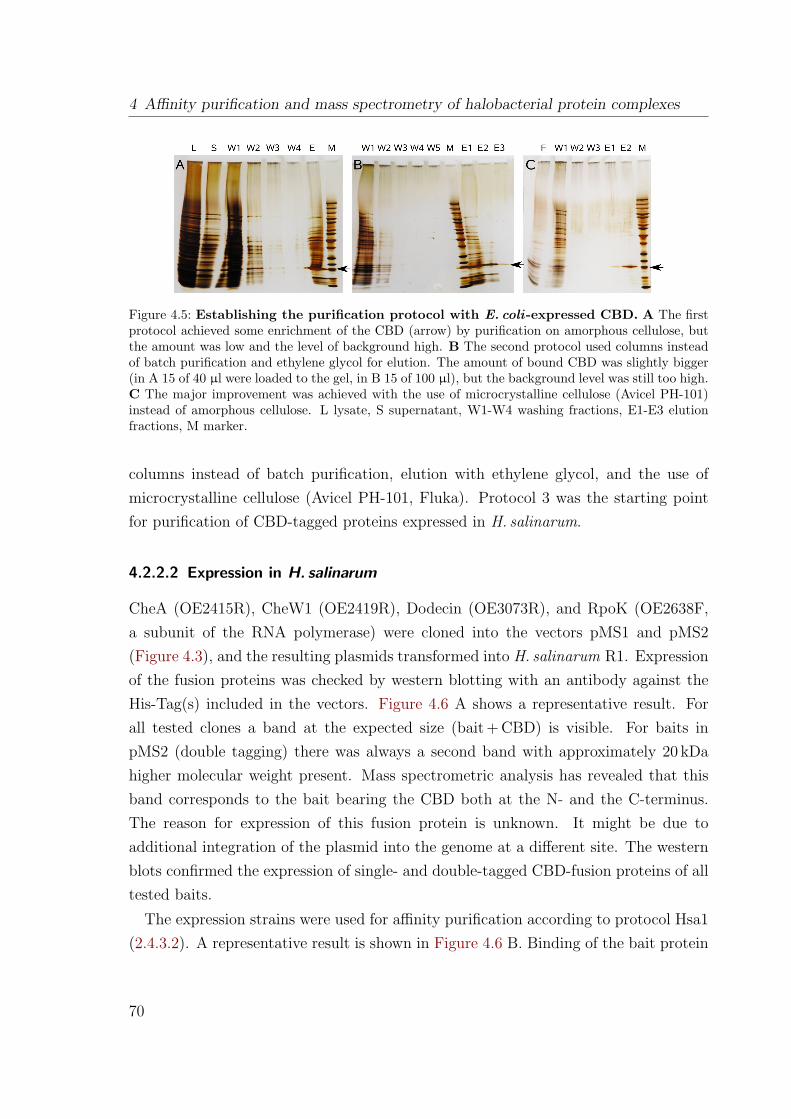
4 Affinity purification and mass spectrometry of halobacterial protein complexes
Figure 4.5: Establishing the purification protocol with E. coli-expressed CBD. A The firstprotocol achieved some enrichment of the CBD (arrow) by purification on amorphous cellulose, butthe amount was low and the level of background high. B The second protocol used columns insteadof batch purification and ethylene glycol for elution. The amount of bound CBD was slightly bigger(in A 15 of 40 µl were loaded to the gel, in B 15 of 100 µl), but the background level was still too high.C The major improvement was achieved with the use of microcrystalline cellulose (Avicel PH-101)instead of amorphous cellulose. L lysate, S supernatant, W1-W4 washing fractions, E1-E3 elutionfractions, M marker.
columns instead of batch purification, elution with ethylene glycol, and the use ofmicrocrystalline cellulose (Avicel PH-101, Fluka). Protocol 3 was the starting pointfor purification of CBD-tagged proteins expressed in H. salinarum.
4.2.2.2 Expression in H. salinarum
CheA (OE2415R), CheW1 (OE2419R), Dodecin (OE3073R), and RpoK (OE2638F,a subunit of the RNA polymerase) were cloned into the vectors pMS1 and pMS2(Figure 4.3), and the resulting plasmids transformed into H. salinarum R1. Expressionof the fusion proteins was checked by western blotting with an antibody against theHis-Tag(s) included in the vectors. Figure 4.6 A shows a representative result. Forall tested clones a band at the expected size (bait + CBD) is visible. For baits inpMS2 (double tagging) there was always a second band with approximately 20 kDahigher molecular weight present. Mass spectrometric analysis has revealed that thisband corresponds to the bait bearing the CBD both at the N- and the C-terminus.The reason for expression of this fusion protein is unknown. It might be due toadditional integration of the plasmid into the genome at a different site. The westernblots confirmed the expression of single- and double-tagged CBD-fusion proteins of alltested baits.
The expression strains were used for affinity purification according to protocol Hsa1(2.4.3.2). A representative result is shown in Figure 4.6 B. Binding of the bait protein
70
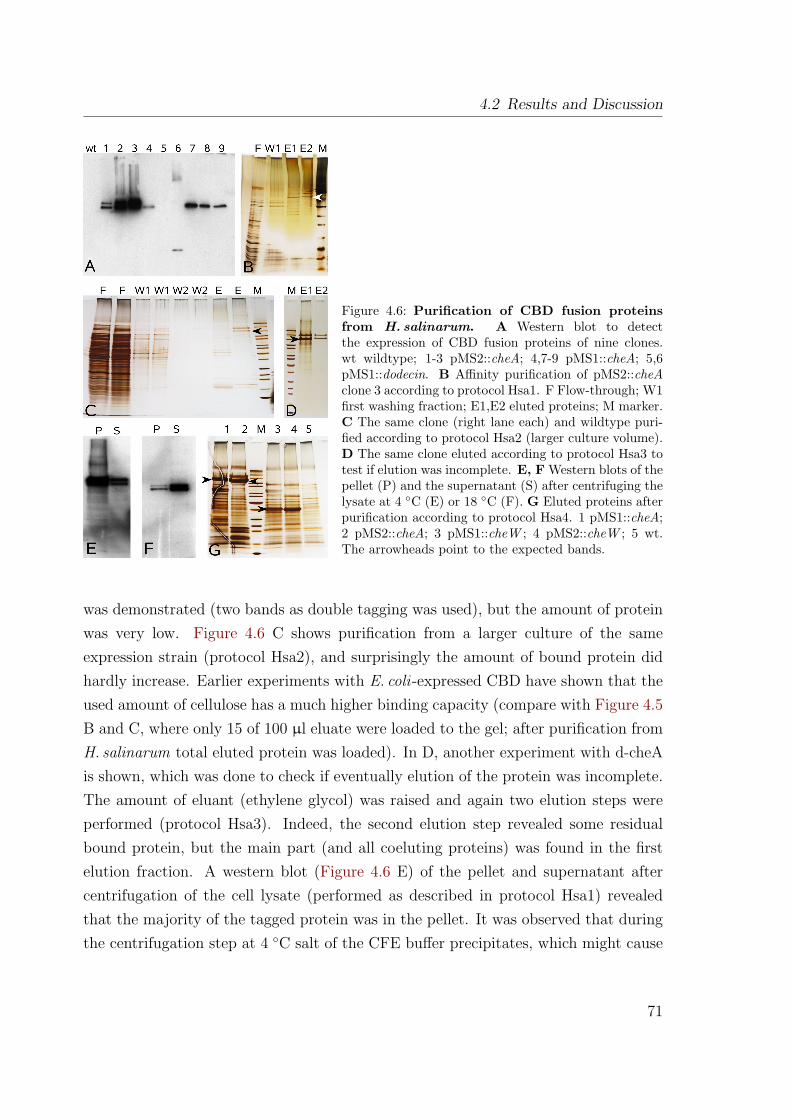
4.2 Results and Discussion
Figure 4.6: Purification of CBD fusion proteinsfrom H. salinarum. A Western blot to detectthe expression of CBD fusion proteins of nine clones.wt wildtype; 1-3 pMS2::cheA; 4,7-9 pMS1::cheA; 5,6pMS1::dodecin. B Affinity purification of pMS2::cheAclone 3 according to protocol Hsa1. F Flow-through; W1first washing fraction; E1,E2 eluted proteins; M marker.C The same clone (right lane each) and wildtype puri-fied according to protocol Hsa2 (larger culture volume).D The same clone eluted according to protocol Hsa3 totest if elution was incomplete. E, F Western blots of thepellet (P) and the supernatant (S) after centrifuging thelysate at 4 ◦C (E) or 18 ◦C (F). G Eluted proteins afterpurification according to protocol Hsa4. 1 pMS1::cheA;2 pMS2::cheA; 3 pMS1::cheW ; 4 pMS2::cheW ; 5 wt.The arrowheads point to the expected bands.
was demonstrated (two bands as double tagging was used), but the amount of proteinwas very low. Figure 4.6 C shows purification from a larger culture of the sameexpression strain (protocol Hsa2), and surprisingly the amount of bound protein didhardly increase. Earlier experiments with E. coli -expressed CBD have shown that theused amount of cellulose has a much higher binding capacity (compare with Figure 4.5B and C, where only 15 of 100 µl eluate were loaded to the gel; after purification fromH. salinarum total eluted protein was loaded). In D, another experiment with d-cheAis shown, which was done to check if eventually elution of the protein was incomplete.The amount of eluant (ethylene glycol) was raised and again two elution steps wereperformed (protocol Hsa3). Indeed, the second elution step revealed some residualbound protein, but the main part (and all coeluting proteins) was found in the firstelution fraction. A western blot (Figure 4.6 E) of the pellet and supernatant aftercentrifugation of the cell lysate (performed as described in protocol Hsa1) revealedthat the majority of the tagged protein was in the pellet. It was observed that duringthe centrifugation step at 4 ◦C salt of the CFE buffer precipitates, which might cause
71
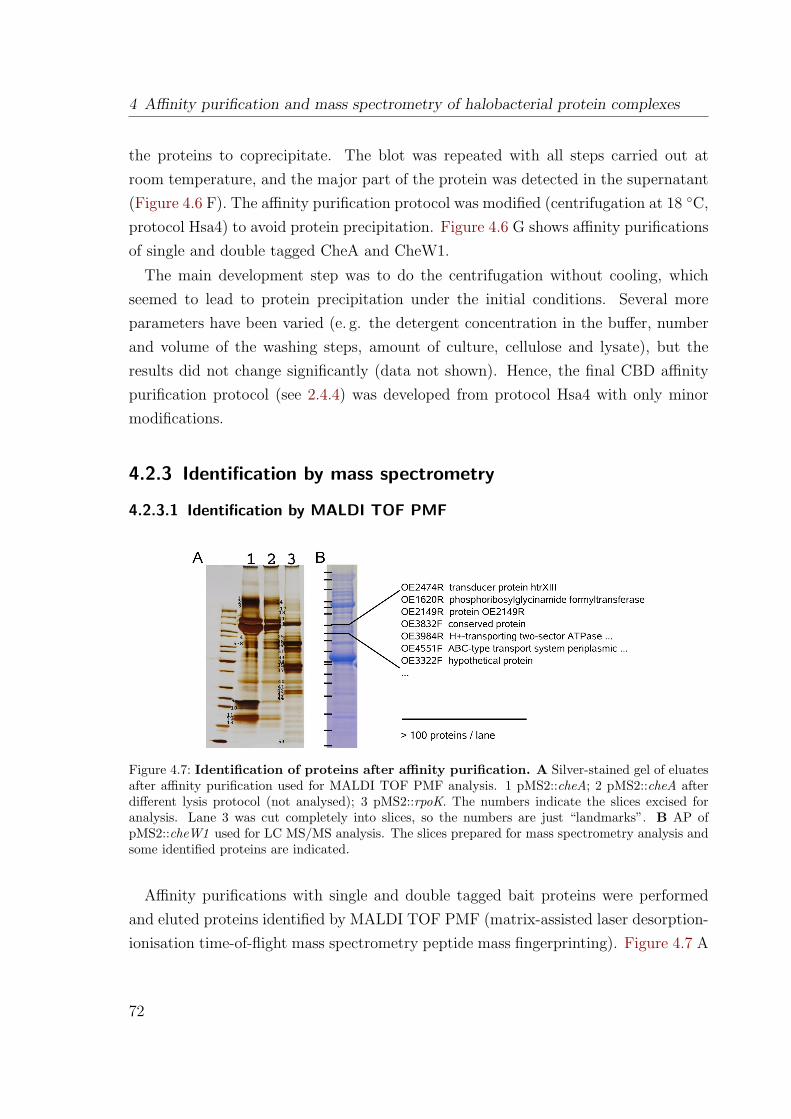
4 Affinity purification and mass spectrometry of halobacterial protein complexes
the proteins to coprecipitate. The blot was repeated with all steps carried out atroom temperature, and the major part of the protein was detected in the supernatant(Figure 4.6 F). The affinity purification protocol was modified (centrifugation at 18 ◦C,protocol Hsa4) to avoid protein precipitation. Figure 4.6 G shows affinity purificationsof single and double tagged CheA and CheW1.
The main development step was to do the centrifugation without cooling, whichseemed to lead to protein precipitation under the initial conditions. Several moreparameters have been varied (e. g. the detergent concentration in the buffer, numberand volume of the washing steps, amount of culture, cellulose and lysate), but theresults did not change significantly (data not shown). Hence, the final CBD affinitypurification protocol (see 2.4.4) was developed from protocol Hsa4 with only minormodifications.
4.2.3 Identification by mass spectrometry
4.2.3.1 Identification by MALDI TOF PMF
Figure 4.7: Identification of proteins after affinity purification. A Silver-stained gel of eluatesafter affinity purification used for MALDI TOF PMF analysis. 1 pMS2::cheA; 2 pMS2::cheA afterdifferent lysis protocol (not analysed); 3 pMS2::rpoK. The numbers indicate the slices excised foranalysis. Lane 3 was cut completely into slices, so the numbers are just “landmarks”. B AP ofpMS2::cheW1 used for LC MS/MS analysis. The slices prepared for mass spectrometry analysis andsome identified proteins are indicated.
Affinity purifications with single and double tagged bait proteins were performedand eluted proteins identified by MALDI TOF PMF (matrix-assisted laser desorption-ionisation time-of-flight mass spectrometry peptide mass fingerprinting). Figure 4.7 A
72
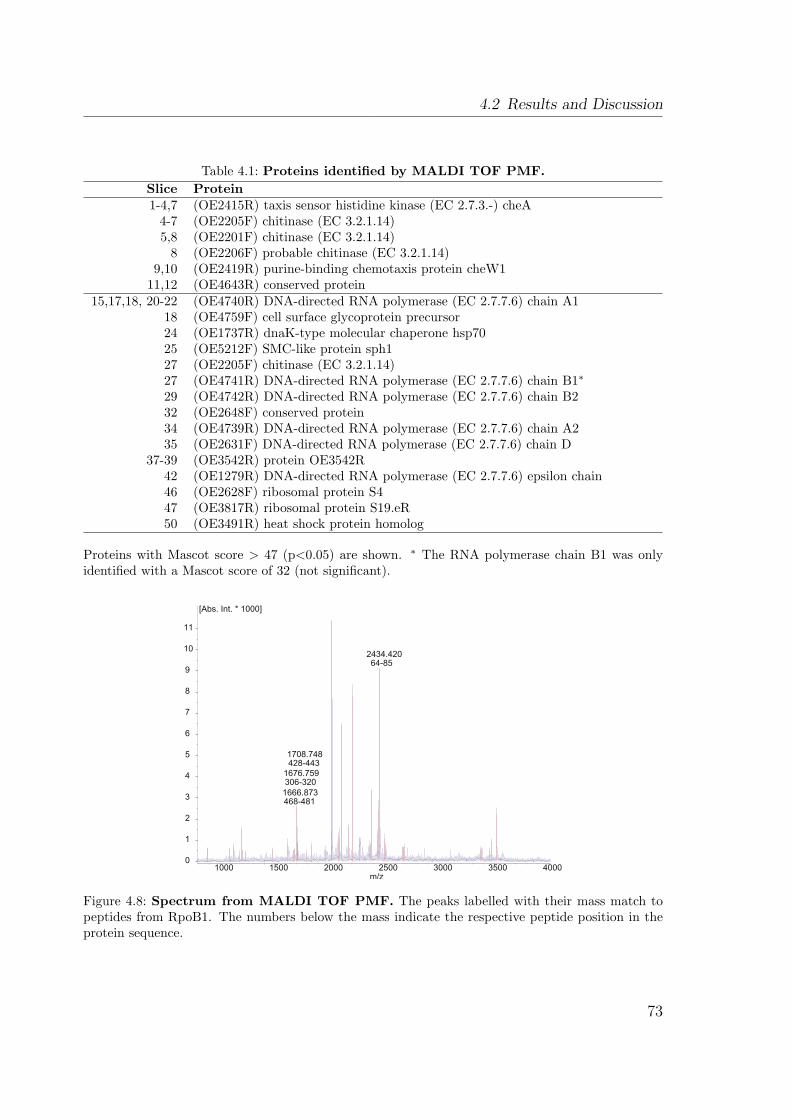
4.2 Results and Discussion
Table 4.1: Proteins identified by MALDI TOF PMF.Slice Protein1-4,7 (OE2415R) taxis sensor histidine kinase (EC 2.7.3.-) cheA
4-7 (OE2205F) chitinase (EC 3.2.1.14)5,8 (OE2201F) chitinase (EC 3.2.1.14)
8 (OE2206F) probable chitinase (EC 3.2.1.14)9,10 (OE2419R) purine-binding chemotaxis protein cheW1
11,12 (OE4643R) conserved protein15,17,18, 20-22 (OE4740R) DNA-directed RNA polymerase (EC 2.7.7.6) chain A1
18 (OE4759F) cell surface glycoprotein precursor24 (OE1737R) dnaK-type molecular chaperone hsp7025 (OE5212F) SMC-like protein sph127 (OE2205F) chitinase (EC 3.2.1.14)27 (OE4741R) DNA-directed RNA polymerase (EC 2.7.7.6) chain B1∗29 (OE4742R) DNA-directed RNA polymerase (EC 2.7.7.6) chain B232 (OE2648F) conserved protein34 (OE4739R) DNA-directed RNA polymerase (EC 2.7.7.6) chain A235 (OE2631F) DNA-directed RNA polymerase (EC 2.7.7.6) chain D
37-39 (OE3542R) protein OE3542R42 (OE1279R) DNA-directed RNA polymerase (EC 2.7.7.6) epsilon chain46 (OE2628F) ribosomal protein S447 (OE3817R) ribosomal protein S19.eR50 (OE3491R) heat shock protein homolog
Proteins with Mascot score > 47 (p<0.05) are shown. ∗ The RNA polymerase chain B1 was onlyidentified with a Mascot score of 32 (not significant).
m/z1000 1500 2000 2500 3000 3500 4000
0
1
2
3
4
5
6
7
8
9
10
11
[Abs. Int. * 1000]
1666.873468-481
1676.759306-320
1708.748428-443
2434.42064-85
Figure 4.8: Spectrum from MALDI TOF PMF. The peaks labelled with their mass match topeptides from RpoB1. The numbers below the mass indicate the respective peptide position in theprotein sequence.
73
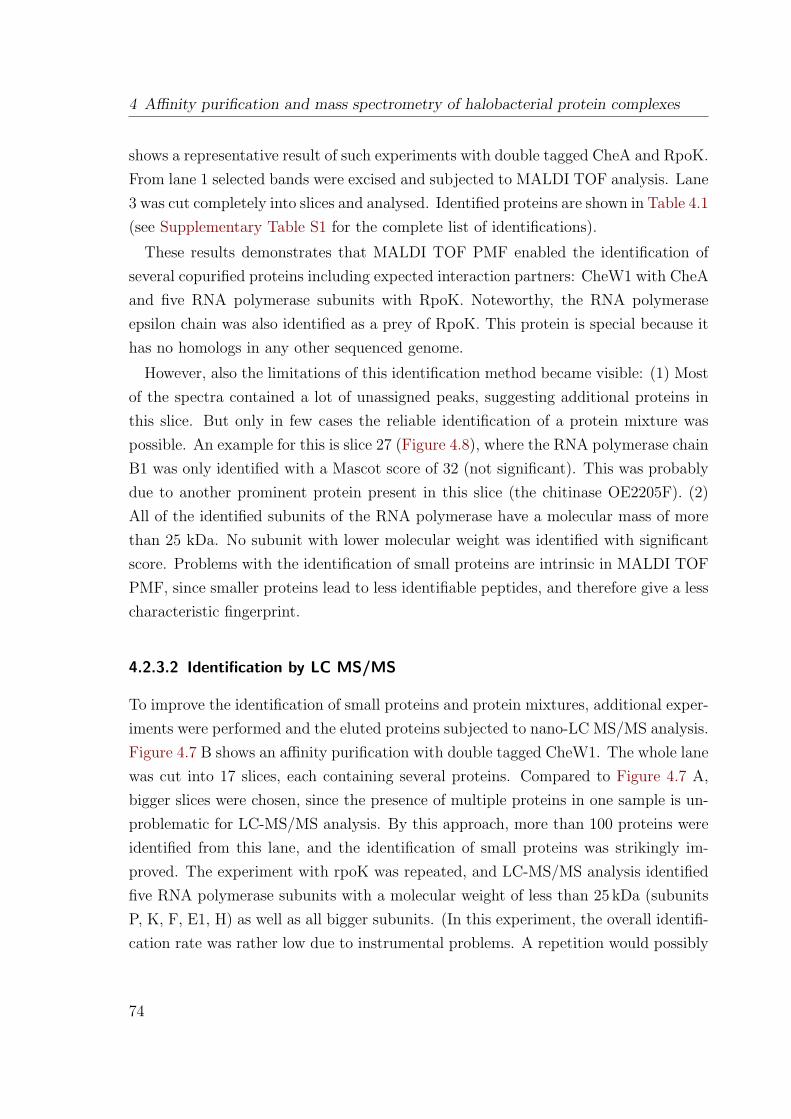
4 Affinity purification and mass spectrometry of halobacterial protein complexes
shows a representative result of such experiments with double tagged CheA and RpoK.From lane 1 selected bands were excised and subjected to MALDI TOF analysis. Lane3 was cut completely into slices and analysed. Identified proteins are shown in Table 4.1(see Supplementary Table S1 for the complete list of identifications).
These results demonstrates that MALDI TOF PMF enabled the identification ofseveral copurified proteins including expected interaction partners: CheW1 with CheAand five RNA polymerase subunits with RpoK. Noteworthy, the RNA polymeraseepsilon chain was also identified as a prey of RpoK. This protein is special because ithas no homologs in any other sequenced genome.
However, also the limitations of this identification method became visible: (1) Mostof the spectra contained a lot of unassigned peaks, suggesting additional proteins inthis slice. But only in few cases the reliable identification of a protein mixture waspossible. An example for this is slice 27 (Figure 4.8), where the RNA polymerase chainB1 was only identified with a Mascot score of 32 (not significant). This was probablydue to another prominent protein present in this slice (the chitinase OE2205F). (2)All of the identified subunits of the RNA polymerase have a molecular mass of morethan 25 kDa. No subunit with lower molecular weight was identified with significantscore. Problems with the identification of small proteins are intrinsic in MALDI TOFPMF, since smaller proteins lead to less identifiable peptides, and therefore give a lesscharacteristic fingerprint.
4.2.3.2 Identification by LC MS/MS
To improve the identification of small proteins and protein mixtures, additional exper-iments were performed and the eluted proteins subjected to nano-LC MS/MS analysis.Figure 4.7 B shows an affinity purification with double tagged CheW1. The whole lanewas cut into 17 slices, each containing several proteins. Compared to Figure 4.7 A,bigger slices were chosen, since the presence of multiple proteins in one sample is un-problematic for LC-MS/MS analysis. By this approach, more than 100 proteins wereidentified from this lane, and the identification of small proteins was strikingly im-proved. The experiment with rpoK was repeated, and LC-MS/MS analysis identifiedfive RNA polymerase subunits with a molecular weight of less than 25 kDa (subunitsP, K, F, E1, H) as well as all bigger subunits. (In this experiment, the overall identifi-cation rate was rather low due to instrumental problems. A repetition would possibly
74
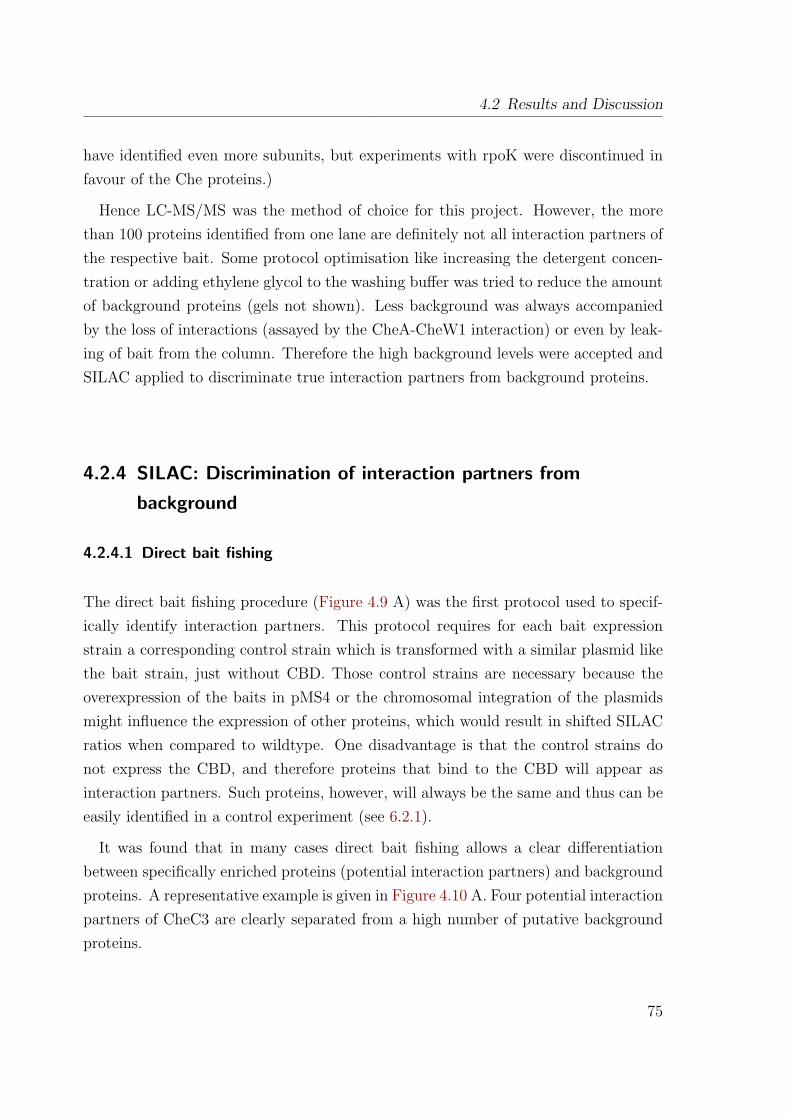
4.2 Results and Discussion
have identified even more subunits, but experiments with rpoK were discontinued infavour of the Che proteins.)
Hence LC-MS/MS was the method of choice for this project. However, the morethan 100 proteins identified from one lane are definitely not all interaction partners ofthe respective bait. Some protocol optimisation like increasing the detergent concen-tration or adding ethylene glycol to the washing buffer was tried to reduce the amountof background proteins (gels not shown). Less background was always accompaniedby the loss of interactions (assayed by the CheA-CheW1 interaction) or even by leak-ing of bait from the column. Therefore the high background levels were accepted andSILAC applied to discriminate true interaction partners from background proteins.
4.2.4 SILAC: Discrimination of interaction partners from
background
4.2.4.1 Direct bait fishing
The direct bait fishing procedure (Figure 4.9 A) was the first protocol used to specif-ically identify interaction partners. This protocol requires for each bait expressionstrain a corresponding control strain which is transformed with a similar plasmid likethe bait strain, just without CBD. Those control strains are necessary because theoverexpression of the baits in pMS4 or the chromosomal integration of the plasmidsmight influence the expression of other proteins, which would result in shifted SILACratios when compared to wildtype. One disadvantage is that the control strains donot express the CBD, and therefore proteins that bind to the CBD will appear asinteraction partners. Such proteins, however, will always be the same and thus can beeasily identified in a control experiment (see 6.2.1).
It was found that in many cases direct bait fishing allows a clear differentiationbetween specifically enriched proteins (potential interaction partners) and backgroundproteins. A representative example is given in Figure 4.10 A. Four potential interactionpartners of CheC3 are clearly separated from a high number of putative backgroundproteins.
75
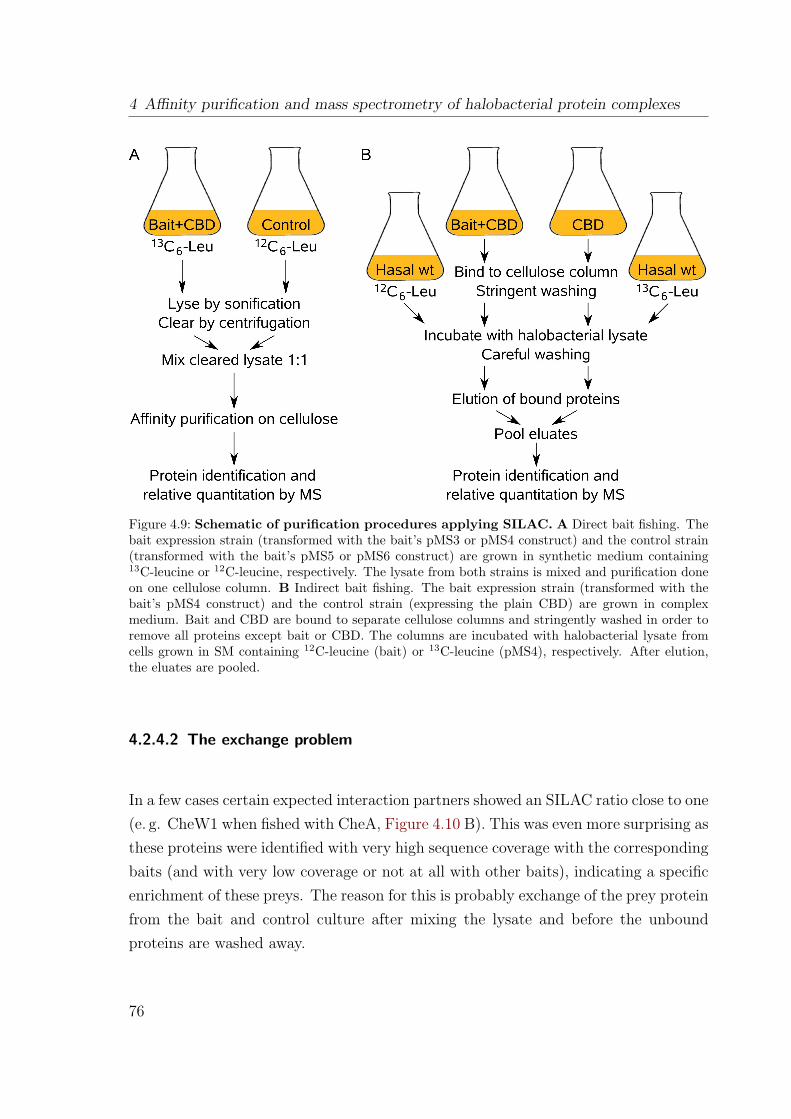
4 Affinity purification and mass spectrometry of halobacterial protein complexes
Figure 4.9: Schematic of purification procedures applying SILAC. A Direct bait fishing. Thebait expression strain (transformed with the bait’s pMS3 or pMS4 construct) and the control strain(transformed with the bait’s pMS5 or pMS6 construct) are grown in synthetic medium containing13C-leucine or 12C-leucine, respectively. The lysate from both strains is mixed and purification doneon one cellulose column. B Indirect bait fishing. The bait expression strain (transformed with thebait’s pMS4 construct) and the control strain (expressing the plain CBD) are grown in complexmedium. Bait and CBD are bound to separate cellulose columns and stringently washed in order toremove all proteins except bait or CBD. The columns are incubated with halobacterial lysate fromcells grown in SM containing 12C-leucine (bait) or 13C-leucine (pMS4), respectively. After elution,the eluates are pooled.
4.2.4.2 The exchange problem
In a few cases certain expected interaction partners showed an SILAC ratio close to one(e. g. CheW1 when fished with CheA, Figure 4.10 B). This was even more surprising asthese proteins were identified with very high sequence coverage with the correspondingbaits (and with very low coverage or not at all with other baits), indicating a specificenrichment of these preys. The reason for this is probably exchange of the prey proteinfrom the bait and control culture after mixing the lysate and before the unboundproteins are washed away.
76
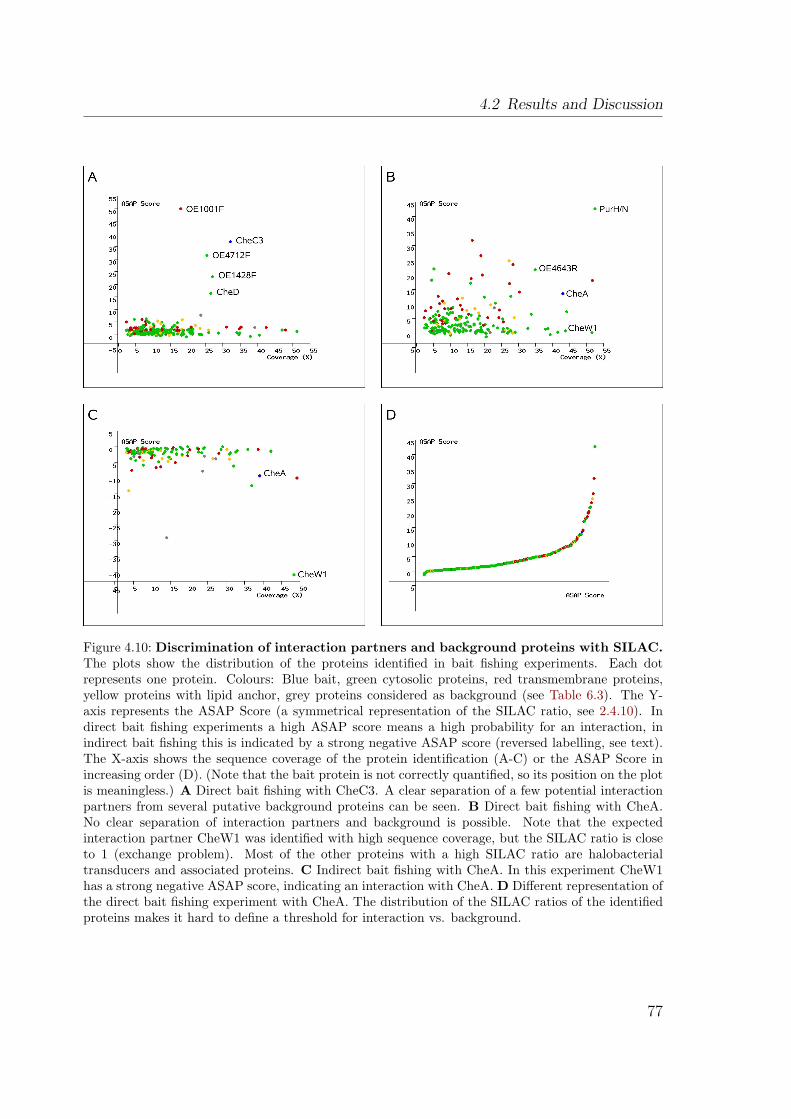
4.2 Results and Discussion
Figure 4.10: Discrimination of interaction partners and background proteins with SILAC.The plots show the distribution of the proteins identified in bait fishing experiments. Each dotrepresents one protein. Colours: Blue bait, green cytosolic proteins, red transmembrane proteins,yellow proteins with lipid anchor, grey proteins considered as background (see Table 6.3). The Y-axis represents the ASAP Score (a symmetrical representation of the SILAC ratio, see 2.4.10). Indirect bait fishing experiments a high ASAP score means a high probability for an interaction, inindirect bait fishing this is indicated by a strong negative ASAP score (reversed labelling, see text).The X-axis shows the sequence coverage of the protein identification (A-C) or the ASAP Score inincreasing order (D). (Note that the bait protein is not correctly quantified, so its position on the plotis meaningless.) A Direct bait fishing with CheC3. A clear separation of a few potential interactionpartners from several putative background proteins can be seen. B Direct bait fishing with CheA.No clear separation of interaction partners and background is possible. Note that the expectedinteraction partner CheW1 was identified with high sequence coverage, but the SILAC ratio is closeto 1 (exchange problem). Most of the other proteins with a high SILAC ratio are halobacterialtransducers and associated proteins. C Indirect bait fishing with CheA. In this experiment CheW1has a strong negative ASAP score, indicating an interaction with CheA. D Different representation ofthe direct bait fishing experiment with CheA. The distribution of the SILAC ratios of the identifiedproteins makes it hard to define a threshold for interaction vs. background.
77
4 Affinity purification and mass spectrometry of halobacterial protein complexes
4.2.4.3 Indirect bait fishing
To tackle this problem, the indirect bait fishing method (Figure 4.9 B) was developed.Here the bait and control purification are performed in separate columns, preventingany exchange between the proteins. Furthermore, the prey proteins are purified fromgenetically unmodified cells. This is an advantage because it is possible that thechromosomal integration of the tagging vector at the locus of the bait protein interfereswith prey protein expression (interacting proteins are often found directly adjacent oreven in one operon, see Dandekar et al., 1998).
In the first indirect bait fishing experiments labelling was done as in direct fish-ing: 13C-leucine for the bait, and 12C-leucine for control. In these experiments someproteins, that were identified as interaction partners in direct fishing, came up witha strong negative ASAPScore (data not shown). That means the SILAC ratio wasshifted towards the control and not the bait. The reason for this was probably resid-ual bound prey protein after the stringent washing step, before the lysate was appliedto the column (remember that the bait for indirect fishing is expressed in complexmedium and therefore always 12C-labelled). To circumvent this problem, the labellingwas reversed: in indirect experiments the bait was incubated with 12C-labelled and thecontrol with 13C-labelled lysate. The drawback of this approach is that proteins boundto the CBD in the control culture will appear as interactors. But again these proteinsshould always be the same and thus easily be identified in control experiments.
With indirect bait fishing, the CheA - CheW1 interaction could be clearly demon-strated (Figure 4.10 C). However, direct fishing (Figure 4.10 B) revealed PurH/N andOE4643R as potential interaction partners of CheA. Both were later confirmed as in-teractors by reciprocal fishing (i. e. using a prey as bait in an additional experiment).These proteins were not even identified in the indirect experiment. So the indirectmethod has also intrinsic disadvantages compared to the direct fishing. Table 4.2gives a comparison of the advantages and disadvantages of both methods. As a conse-quence both methods should be applied to each bait to identify as many interactionsas possible.
In principle also an intermediate method would be possible: direct fishing withthe purification on two columns. However, for this approach the development of anadequate SILAC control would be rather difficult (such control strain should haveroughly the same genomic modifications at the bait locus like the bait strain, and
78
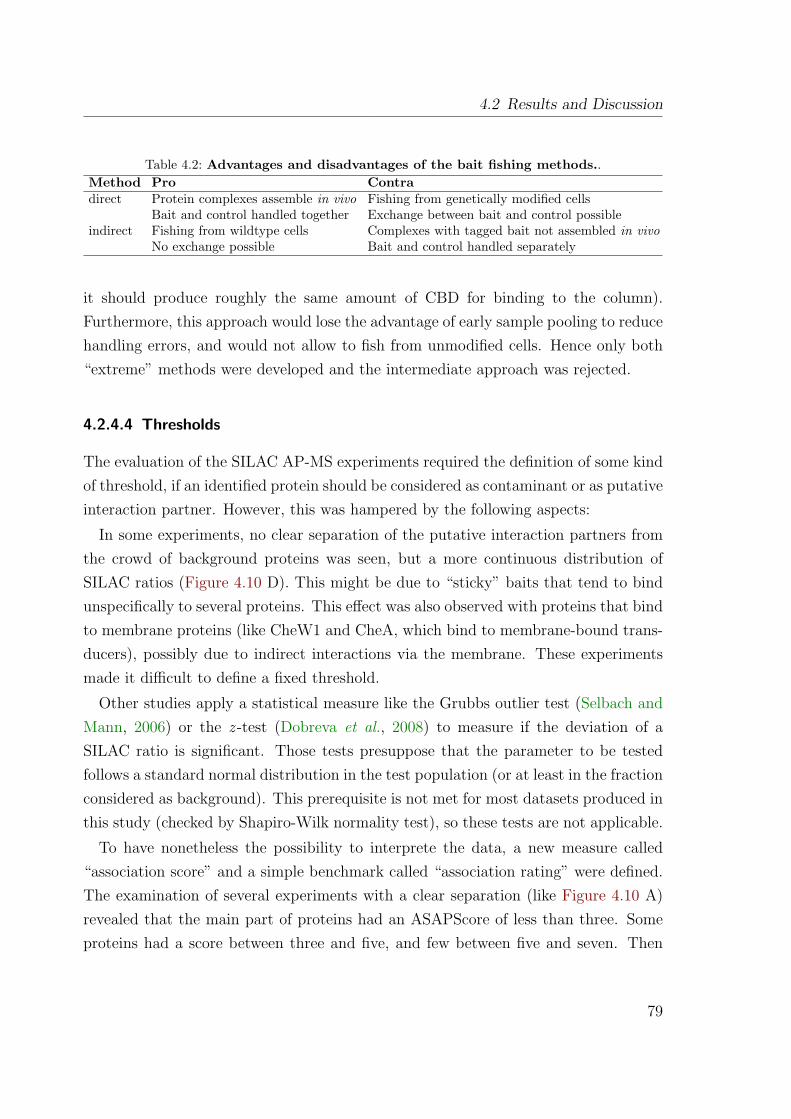
4.2 Results and Discussion
Table 4.2: Advantages and disadvantages of the bait fishing methods..Method Pro Contradirect Protein complexes assemble in vivo Fishing from genetically modified cells
Bait and control handled together Exchange between bait and control possibleindirect Fishing from wildtype cells Complexes with tagged bait not assembled in vivo
No exchange possible Bait and control handled separately
it should produce roughly the same amount of CBD for binding to the column).Furthermore, this approach would lose the advantage of early sample pooling to reducehandling errors, and would not allow to fish from unmodified cells. Hence only both“extreme” methods were developed and the intermediate approach was rejected.
4.2.4.4 Thresholds
The evaluation of the SILAC AP-MS experiments required the definition of some kindof threshold, if an identified protein should be considered as contaminant or as putativeinteraction partner. However, this was hampered by the following aspects:
In some experiments, no clear separation of the putative interaction partners fromthe crowd of background proteins was seen, but a more continuous distribution ofSILAC ratios (Figure 4.10 D). This might be due to “sticky” baits that tend to bindunspecifically to several proteins. This effect was also observed with proteins that bindto membrane proteins (like CheW1 and CheA, which bind to membrane-bound trans-ducers), possibly due to indirect interactions via the membrane. These experimentsmade it difficult to define a fixed threshold.
Other studies apply a statistical measure like the Grubbs outlier test (Selbach andMann, 2006) or the z -test (Dobreva et al., 2008) to measure if the deviation of aSILAC ratio is significant. Those tests presuppose that the parameter to be testedfollows a standard normal distribution in the test population (or at least in the fractionconsidered as background). This prerequisite is not met for most datasets produced inthis study (checked by Shapiro-Wilk normality test), so these tests are not applicable.
To have nonetheless the possibility to interprete the data, a new measure called“association score” and a simple benchmark called “association rating” were defined.The examination of several experiments with a clear separation (like Figure 4.10 A)revealed that the main part of proteins had an ASAPScore of less than three. Someproteins had a score between three and five, and few between five and seven. Then
79
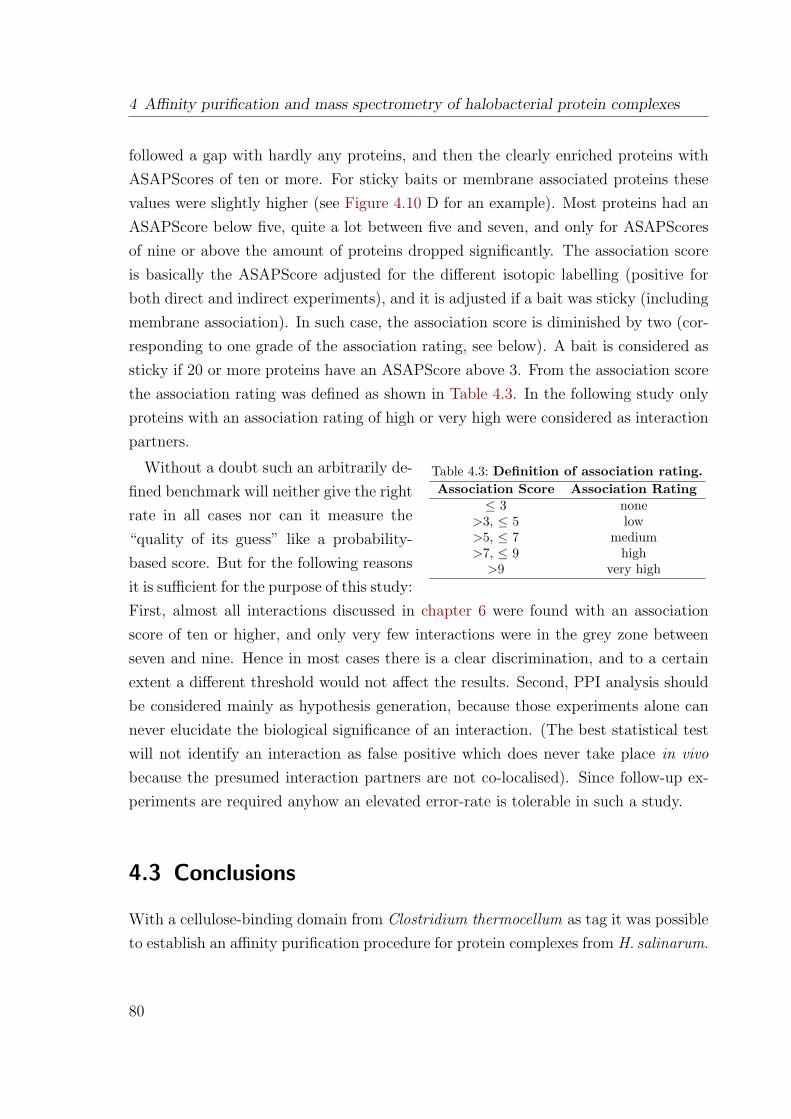
4 Affinity purification and mass spectrometry of halobacterial protein complexes
followed a gap with hardly any proteins, and then the clearly enriched proteins withASAPScores of ten or more. For sticky baits or membrane associated proteins thesevalues were slightly higher (see Figure 4.10 D for an example). Most proteins had anASAPScore below five, quite a lot between five and seven, and only for ASAPScoresof nine or above the amount of proteins dropped significantly. The association scoreis basically the ASAPScore adjusted for the different isotopic labelling (positive forboth direct and indirect experiments), and it is adjusted if a bait was sticky (includingmembrane association). In such case, the association score is diminished by two (cor-responding to one grade of the association rating, see below). A bait is considered assticky if 20 or more proteins have an ASAPScore above 3. From the association scorethe association rating was defined as shown in Table 4.3. In the following study onlyproteins with an association rating of high or very high were considered as interactionpartners.
Table 4.3: Definition of association rating.Association Score Association Rating
≤ 3 none>3, ≤ 5 low>5, ≤ 7 medium>7, ≤ 9 high
>9 very high
Without a doubt such an arbitrarily de-fined benchmark will neither give the rightrate in all cases nor can it measure the“quality of its guess” like a probability-based score. But for the following reasonsit is sufficient for the purpose of this study:First, almost all interactions discussed in chapter 6 were found with an associationscore of ten or higher, and only very few interactions were in the grey zone betweenseven and nine. Hence in most cases there is a clear discrimination, and to a certainextent a different threshold would not affect the results. Second, PPI analysis shouldbe considered mainly as hypothesis generation, because those experiments alone cannever elucidate the biological significance of an interaction. (The best statistical testwill not identify an interaction as false positive which does never take place in vivobecause the presumed interaction partners are not co-localised). Since follow-up ex-periments are required anyhow an elevated error-rate is tolerable in such a study.
4.3 Conclusions
With a cellulose-binding domain from Clostridium thermocellum as tag it was possibleto establish an affinity purification procedure for protein complexes from H. salinarum.
80
4.3 Conclusions
Both the expression of the bait under its endogenous promoter (close to physiologicalexpression levels) as well as bait overexpression is possible. The developed protocolmaintains high-salt concentrations throughout the whole purification process. Theprocessing time of 30 min is reasonably short, which increases the chance to copurifylow-affinity interaction partners.
Because the single-step purification procedure lead to a high level of contaminantproteins, relative quantitation by isotopic labelling was applied to enable the discrimi-nation of specific interaction partners from background. Two protocols were developedfor this: direct and indirect bait fishing. Both of these procedures have intrinsic advan-tages and disadvantages, and both were demonstrated to work for certain interactionsand fail for others. That means both direct and indirect fishing should be performedfor each bait.
Overall, the established procedure enabled the copurification of several expectedinteraction partners.
81

4 Affinity purification and mass spectrometry of halobacterial protein complexes
82
5 The bioinformatics environment
5.1 Introduction
The scope of the project made a bioinformatics infrastructure necessary to managebaits and plasmids, store information about experiments, assist data analysis, andmake results accessible. Furthermore, it was desirable to have the ability to inte-grate the experimental results with existing knowledge, for example on protein func-tion or protein properties. Hence the developed system was integrated into HaloLex(http://www.halolex.mpg.de/; Pfeiffer et al., 2008a). HaloLex is the depart-ment’s information system for genomic and experimental data on H. salinarum, otherhaloarchaea, and by now also other prokaryotes.
The information is stored in three databases: the Bait DB, the Experiment DB,and the Result DB. The databases are accessed via web applications implemented asCGI scripts in Perl. The functionalities of the implemented system will be presentedin the next sections.
5.2 The databases
To store the required information, three databases were created: the Bait DB, storinginformation on baits, vectors, primers, and plasmids; the Experiment DB for informa-tion about experiments, protocols, MS runs, and the generated result files; and theResult DB that collects the generated results. The implementation was done as rela-tional databases in MySQL. Figure 5.1 shows a relationship scheme for the databases.
5.2.1 Bait DB
The central tables of this DB are bait and bait_simple. bait stores only the baitname and sequence. bait_simple stores additional information: which gene the baitcorresponds to (parent), the chromosomal position (nstart, nstop), if it is the complete
83
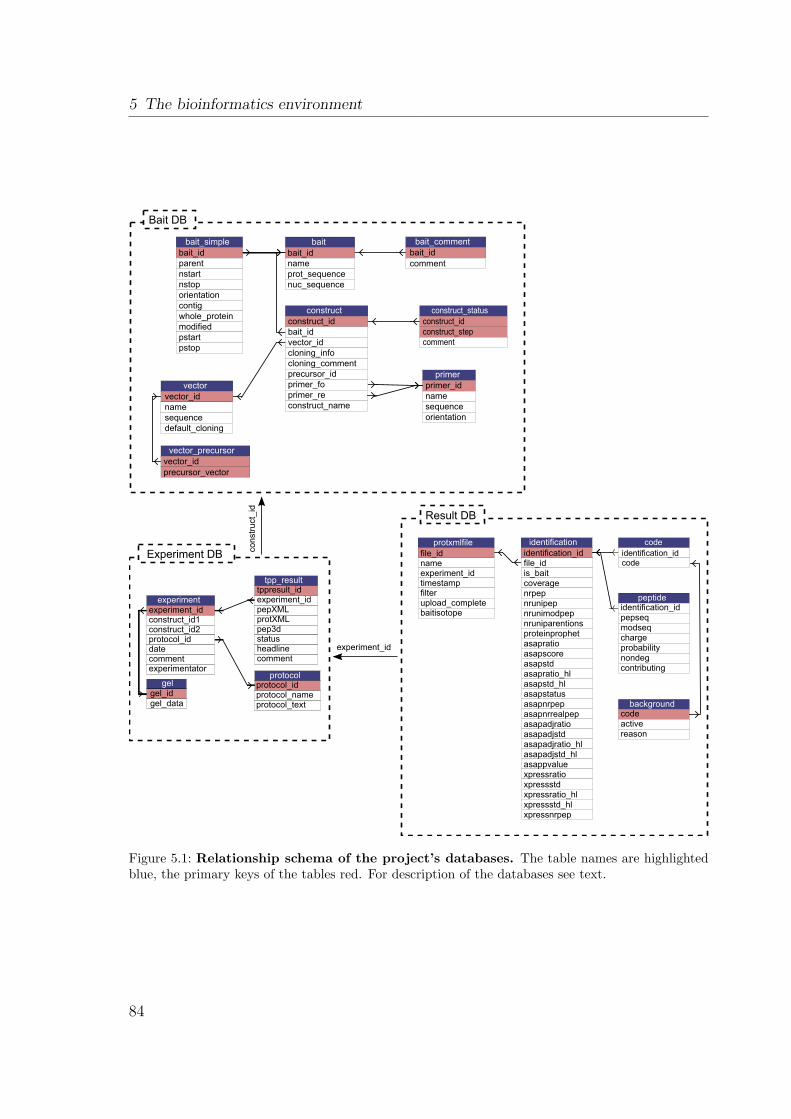
5 The bioinformatics environment
bait_simple bait bait_comment
construct_status
primer
construct
vector
vector_precursor
bait_idparentnstartnstoporientationcontigwhole_proteinmodifiedpstartpstop
vector_idnamesequencedefault_cloning
vector_idprecursor_vector
bait_idnameprot_sequencenuc_sequence
construct_idbait_idvector_idcloning_infocloning_commentprecursor_idprimer_foprimer_reconstruct_name
bait_idcomment
construct_idconstruct_stepcomment
primer_idnamesequenceorientation
construct_id
Bait DB
experiment
gel
tpp_result
protocol
experiment_idconstruct_id1construct_id2protocol_iddatecommentexperimentator
gel_idgel_data
tppresult_idexperiment_idpepXMLprotXMLpep3dstatusheadlinecomment
protocol_idprotocol_nameprotocol_text
Experiment DBprotxmlfile identification
file_idnameexperiment_idtimestampfilterupload_completebaitisotope
identification_idfile_idis_baitcoveragenrpepnrunipepnrunimodpepnruniparentionsproteinprophetasapratioasapscoreasapstdasapratio_hlasapstd_hlasapstatusasapnrpepasapnrrealpepasapadjratioasapadjstdasapadjratio_hlasapadjstd_hlasappvaluexpressratioxpressstdxpressratio_hlxpressstd_hlxpressnrpep
codeidentification_idcode
peptideidentification_idpepseqmodseqchargeprobabilitynondegcontributing
Result DB
experiment_id
backgroundcodeactivereason
Figure 5.1: Relationship schema of the project’s databases. The table names are highlightedblue, the primary keys of the tables red. For description of the databases see text.
84
5.2 The databases
protein, contains mutations, and the position of the parent on the bait (the baitcan contain additional sequences like an extra linker or tag). With this table baitscorresponding to a complete halobacterial protein, or to a part of a protein, can berepresented. The tables bait and bait_simple can also account for mutated baits andbaits containing additional sequence. Not representable with these tables are artificialbaits (e. g. domain fusions). (For this a table bait_complex was foreseen, but notimplemented as there was no need for such baits).
Each bait can have one or more constructs (i. e. plasmids). Constructs are juststored as a reference to the bait (bait_id) and to a vector (vector_id), and the usedcloning method. With these informations, the nucleotide sequence of the constructcan be assembled if required. A construct can also store links to two cloning primers.Each construct can be linked to n cloning steps (stored in construct status). Vectorsare stored in the table vector with name, sequence, and the vectors default cloningmethod (this allows automation when entering constructs). The additional table vec-tor_precursor is important for gateway cloning: it links gateway destination vectorsto all possible entry vectors. Again, this allows automation when entering constructs,because the software can guess which construct was the entry clone used in LR re-combination. Overall this structure allows the reconstruction of every cloning stepperformed in the lab: the entry clone refers to the primers used for PCR amplificationof the bait and thus takes into account any sequence variations introduced with theprimers. All follow-up constructs refer to the entry clone so that they inherit suchvariations.
5.2.2 Experiment DB
The main table of the experiment DB is experiment. An experiment refers to one ortwo constructs from the Bait DB (the plasmid(s) for transformation of the strain(s)used in the experiment). Additionally, the date of the experiment, the experimentator(both together make it easy to find the experiment in a lab journal), and a commentcan be entered. Each experiment refers to one protocol (stored as HTML-formatedtext in protocol), and one gel image (stored in gel). An experiment can be linked toone or more results of the trans-proteomic pipeline (TPP). These are referenced inthe table tpp_result just by the file names of the generated files, and furnished withadditional information (status shows for example if the result was already manually
85
5 The bioinformatics environment
verified and should be used for further analysis, and a comment – divided into headlineand comment – can be added).
5.2.3 Result DB
The Result DB stores the output generated by the TPP. The information is parsedfrom the resulting protxml file. The table protxmlfile takes some general informationon the uploaded file: the file name, the identifier of the corresponding experiment,the time of upload (timestamp), the filtering criteria applied during upload (e. g. onlyproteins above a certain identification probability), the isotopic state of the bait (lightor heavy), and a tag which is set after the upload is completed to prevent the workwith incomplete files (for example, if the connection was aborted during upload).
The table identifications lists the identified proteins. The columns are identifica-tion_id (unique id), file_id (refers to the corresponding result file), is_bait (if theprotein was bait in this experiment), coverage (sequence coverage), nrpep, nrunipep,nrunimodpep, nruniparentions (the number of total peptide identifications includingmultiple identifications of the same peptide, the number of unique peptides discardingmodifications and charge state, the number of unique peptides considering modifi-cations, but not charge state, and the number of unique peptides considering bothmodifications and charge state), proteinprophet (the identification probability), andthe results of the two quantification tools ASAPRatio and XPress.
The table code links an identification to one or more codes (i. e. gene identifiers likeOE1234F; more than one code can occur for duplicated gene regions). Peptide storesthe peptides which were identified, and background is a user-editable table with thepurpose to classify certain proteins as contaminants.
5.3 The applications
The tools to access and modify the content of the databases were implemented asweb applications with CGI scripts in Perl. With this approach the use of the toolsis platform-independent and does not require the installation of additional software.The scripts make use of the module CGI.pm (written by Lincoln D. Stein), BioPerl(Stajich et al., 2002), and, for graphical output, of the GD library.
86
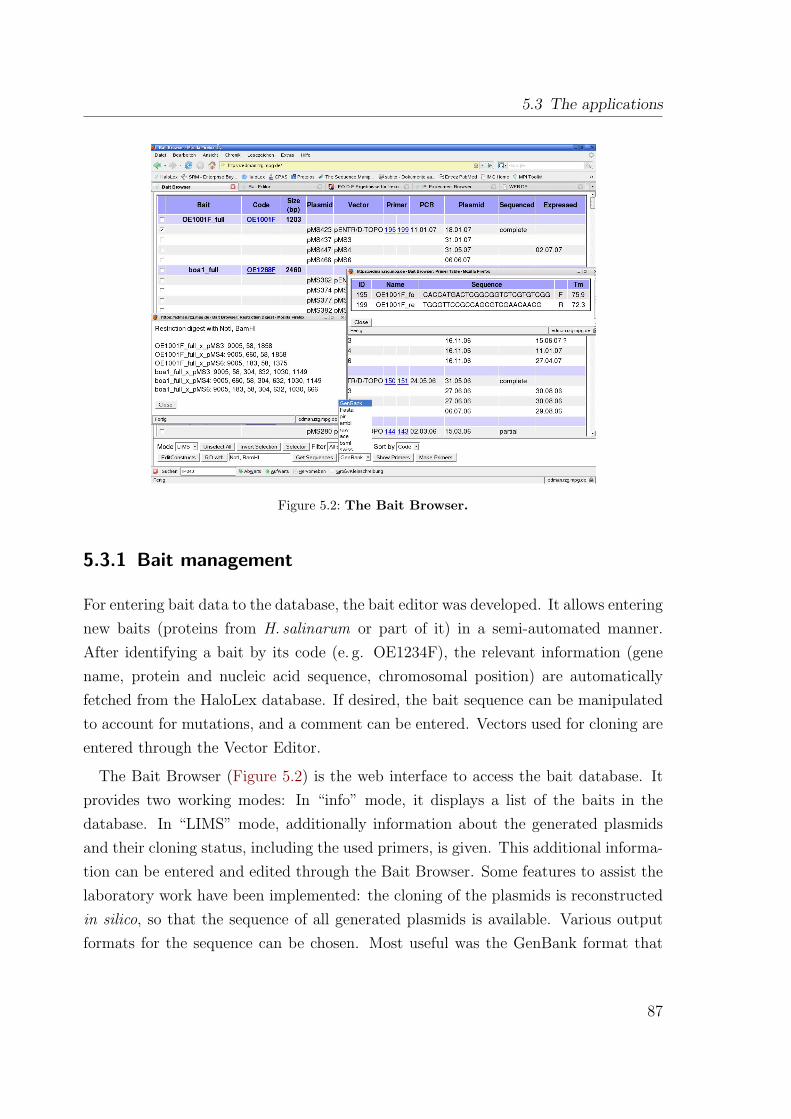
5.3 The applications
Figure 5.2: The Bait Browser.
5.3.1 Bait management
For entering bait data to the database, the bait editor was developed. It allows enteringnew baits (proteins from H. salinarum or part of it) in a semi-automated manner.After identifying a bait by its code (e. g. OE1234F), the relevant information (genename, protein and nucleic acid sequence, chromosomal position) are automaticallyfetched from the HaloLex database. If desired, the bait sequence can be manipulatedto account for mutations, and a comment can be entered. Vectors used for cloning areentered through the Vector Editor.
The Bait Browser (Figure 5.2) is the web interface to access the bait database. Itprovides two working modes: In “info” mode, it displays a list of the baits in thedatabase. In “LIMS” mode, additionally information about the generated plasmidsand their cloning status, including the used primers, is given. This additional informa-tion can be entered and edited through the Bait Browser. Some features to assist thelaboratory work have been implemented: the cloning of the plasmids is reconstructedin silico, so that the sequence of all generated plasmids is available. Various outputformats for the sequence can be chosen. Most useful was the GenBank format that
87
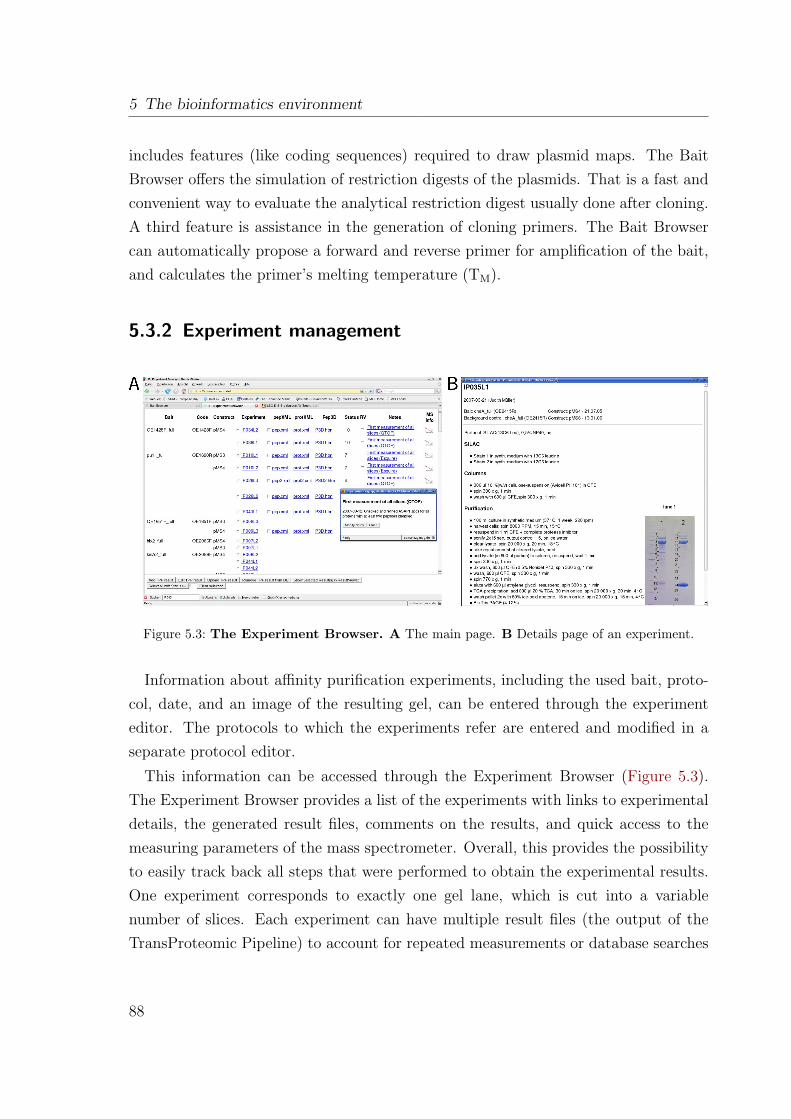
5 The bioinformatics environment
includes features (like coding sequences) required to draw plasmid maps. The BaitBrowser offers the simulation of restriction digests of the plasmids. That is a fast andconvenient way to evaluate the analytical restriction digest usually done after cloning.A third feature is assistance in the generation of cloning primers. The Bait Browsercan automatically propose a forward and reverse primer for amplification of the bait,and calculates the primer’s melting temperature (TM).
5.3.2 Experiment management
Figure 5.3: The Experiment Browser. A The main page. B Details page of an experiment.
Information about affinity purification experiments, including the used bait, proto-col, date, and an image of the resulting gel, can be entered through the experimenteditor. The protocols to which the experiments refer are entered and modified in aseparate protocol editor.
This information can be accessed through the Experiment Browser (Figure 5.3).The Experiment Browser provides a list of the experiments with links to experimentaldetails, the generated result files, comments on the results, and quick access to themeasuring parameters of the mass spectrometer. Overall, this provides the possibilityto easily track back all steps that were performed to obtain the experimental results.One experiment corresponds to exactly one gel lane, which is cut into a variablenumber of slices. Each experiment can have multiple result files (the output of theTransProteomic Pipeline) to account for repeated measurements or database searches
88
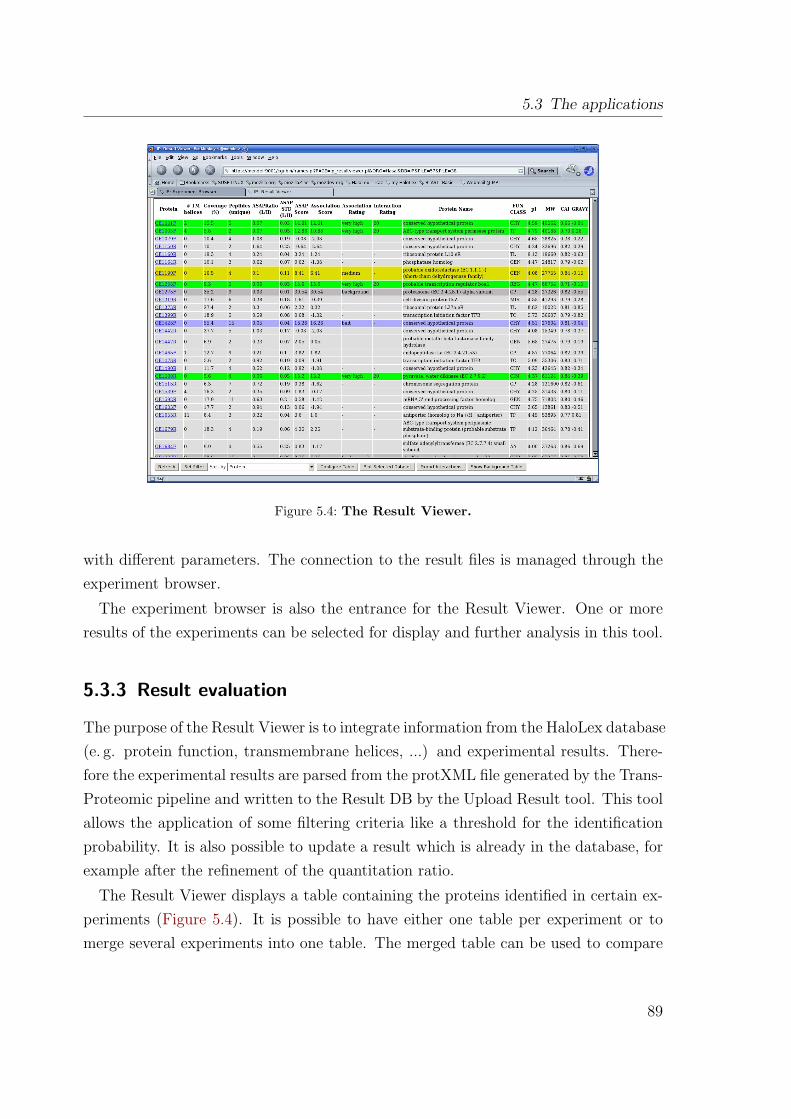
5.3 The applications
Figure 5.4: The Result Viewer.
with different parameters. The connection to the result files is managed through theexperiment browser.
The experiment browser is also the entrance for the Result Viewer. One or moreresults of the experiments can be selected for display and further analysis in this tool.
5.3.3 Result evaluation
The purpose of the Result Viewer is to integrate information from the HaloLex database(e. g. protein function, transmembrane helices, ...) and experimental results. There-fore the experimental results are parsed from the protXML file generated by the Trans-Proteomic pipeline and written to the Result DB by the Upload Result tool. This toolallows the application of some filtering criteria like a threshold for the identificationprobability. It is also possible to update a result which is already in the database, forexample after the refinement of the quantitation ratio.
The Result Viewer displays a table containing the proteins identified in certain ex-periments (Figure 5.4). It is possible to have either one table per experiment or tomerge several experiments into one table. The merged table can be used to compare
89
5 The bioinformatics environment
results from different experiments or to identify proteins that were identified in a sus-picious high number of experiments (promiscuous preys). The table of the ResultViewer is highly configurable. The user can choose which columns should be dis-played in order to identify a correlation between the experimental results and certainproperties of the identified proteins (function class, domains, size, ...).
The Result Viewer can also generate scatter plots of the results from one experiment.This is useful to get an overview of the distribution of SILAC ratios of the identifiedproteins, or to see correlations between some properties of the identified proteins. Thevariables to be plotted on the x- and y-axis can be chosen by the user, and differentcolour schemes can be applied. Examples for plots generated by the Result Viewercan be seen in Figure 4.10.
5.4 Conclusions
The developed environment is a valuable resource for both performing the AP-MSexperiments as well as accessing and evaluating the results. The Bait Browser is mostuseful for laboratory work since it allows to keep track of the cloning progress, and itassists the work with some special features like construct sequence assembly, primerdesign, and restriction analysis. The Experiment Browser makes the raw experimen-tal results accessible via links to the TPP result files, and it also provides requiredbackground information (protocols, instrumental settings). Thus the main task of theExperiment Browser is to point to the results and make transparent how they wereobtained. The Result Viewer assists the evaluation of the results by providing ad-ditional information on the identified proteins, by giving the possibility to compareresults from multiple experiments, and by graphical representation.
90
6 Chemotaxis protein interaction network
6.1 Introduction
6.1.1 The Che system: a specialised two-component system for
taxis signalling
The two-component system mediating tactic responses is commonly referred to as theChe system. The Che system in Archaea is basically similar to the correspondingbacterial system, and the proteins involved are homologs of the respective bacterialproteins. However, there are minor and major variations in this system, both betweendifferent bacterial clades and between Bacteria and Archaea (for review see Szurmantand Ordal, 2004). A universal scheme of the Che system is shown in Figure 6.1.
The overall workflow of taxis signalling can be divided into four steps – signalreception and transduction, excitation, adaptation, and signal termination. Thesesteps are described in the next sections. An additional section is about fumarate,which is also involved in flagellar motor switching.
6.1.1.1 Signal reception and transduction
Signals are recognised and transduced by a certain class of proteins called halobacte-rial transducer proteins (Htrs) in H. salinarum or methyl-accepting chemotaxis pro-teins (MCPs) in other archaea and bacteria. The transducers control the activityof the histidine kinase CheA and thereby the level of CheY-P, the output moleculeof the Che system. MCPs/transducers usually contain a cytoplasmic signalling re-gion where the histidine kinase CheA and the coupling protein CheW bind, a methy-lation/demethylation region that is critical for adaptation, and one or two HAMP(histidine kinase, adenylyl cyclase, methyl-accepting chemotaxis protein, and phos-phatase) domains. The HAMP domains convey the signal of ligand binding from thesensor domain or protein to the output module. The way the signal is transduced
91
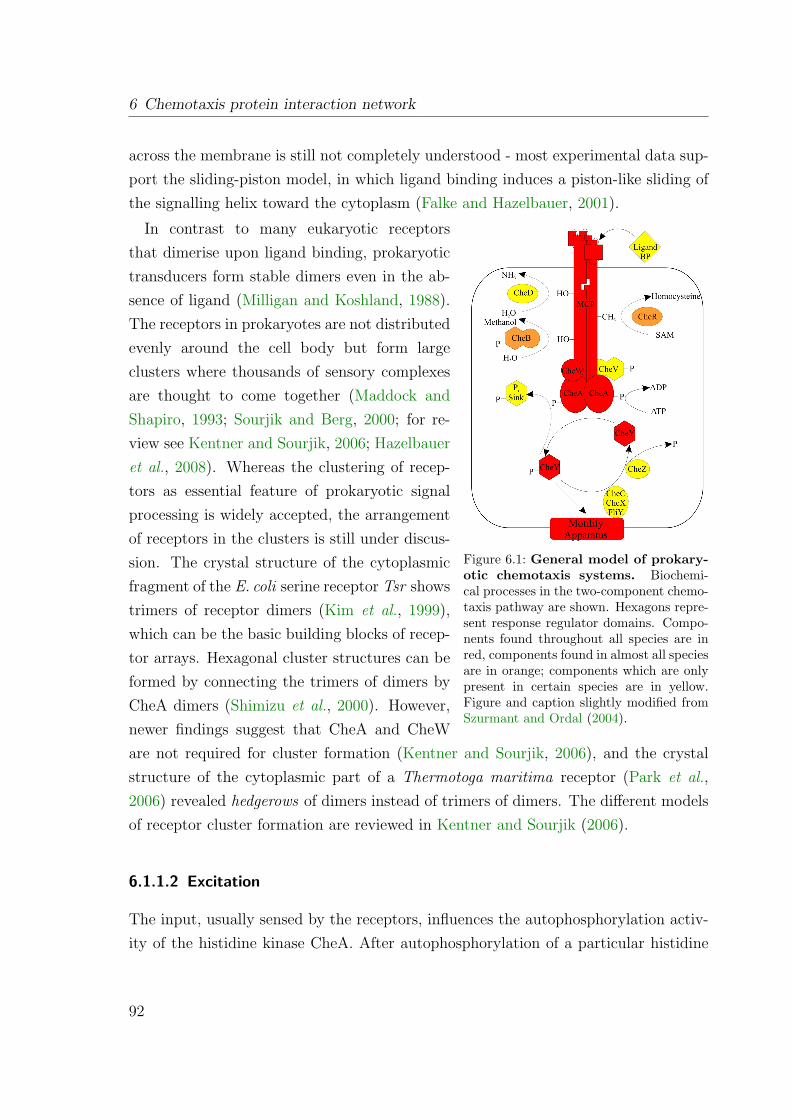
6 Chemotaxis protein interaction network
across the membrane is still not completely understood - most experimental data sup-port the sliding-piston model, in which ligand binding induces a piston-like sliding ofthe signalling helix toward the cytoplasm (Falke and Hazelbauer, 2001).
Figure 6.1: General model of prokary-otic chemotaxis systems. Biochemi-cal processes in the two-component chemo-taxis pathway are shown. Hexagons repre-sent response regulator domains. Compo-nents found throughout all species are inred, components found in almost all speciesare in orange; components which are onlypresent in certain species are in yellow.Figure and caption slightly modified fromSzurmant and Ordal (2004).
In contrast to many eukaryotic receptorsthat dimerise upon ligand binding, prokaryotictransducers form stable dimers even in the ab-sence of ligand (Milligan and Koshland, 1988).The receptors in prokaryotes are not distributedevenly around the cell body but form largeclusters where thousands of sensory complexesare thought to come together (Maddock andShapiro, 1993; Sourjik and Berg, 2000; for re-view see Kentner and Sourjik, 2006; Hazelbaueret al., 2008). Whereas the clustering of recep-tors as essential feature of prokaryotic signalprocessing is widely accepted, the arrangementof receptors in the clusters is still under discus-sion. The crystal structure of the cytoplasmicfragment of the E. coli serine receptor Tsr showstrimers of receptor dimers (Kim et al., 1999),which can be the basic building blocks of recep-tor arrays. Hexagonal cluster structures can beformed by connecting the trimers of dimers byCheA dimers (Shimizu et al., 2000). However,newer findings suggest that CheA and CheWare not required for cluster formation (Kentner and Sourjik, 2006), and the crystalstructure of the cytoplasmic part of a Thermotoga maritima receptor (Park et al.,2006) revealed hedgerows of dimers instead of trimers of dimers. The different modelsof receptor cluster formation are reviewed in Kentner and Sourjik (2006).
6.1.1.2 Excitation
The input, usually sensed by the receptors, influences the autophosphorylation activ-ity of the histidine kinase CheA. After autophosphorylation of a particular histidine
92
6.1 Introduction
residue, the phosphoryl group is immediately transferred from CheA to the responseregulator CheY. Phosphorylated CheY (CheY-P) is the output signal for the flagel-lar motor. Hence CheA integrates the different stimuli to generate an unambiguousoutput to the flagellar motor. In E. coli (Borkovich et al., 1989), S. meliloti (Schmitt,2002), R. spheroides (Shah et al., 2000), and H. salinarum (Rudolph and Oesterhelt,1996) attractants decrease and repellents increase CheA activity, in B. subtilis CheAregulation is reversed (Garrity and Ordal, 1997).
CheA consists of five domains (P1-P5) (Bilwes et al., 1999). The P1, or Hpt (histi-dine phosphotransfer), domain contains the histidine residue that is phosphorylated.P2 is the docking site for CheY and CheB, which receive the phosphoryl group fromCheA-P. P3 is the dimerisation domain. Dimerisation of CheA is crucial since CheAautophosphorylates in trans. On P4 (HATPase_c: Histidine kinase-like ATPases)ATP binding and catalysis occurs, and P5 (also called CheW domain due to homol-ogy to this protein) is where CheA binds the receptors and the coupling protein CheW.
For activation of CheA at the receptors, the coupling protein CheW is required.CheW proteins are found in all bacterial and archaeal species with a chemotaxis system(judged by the presence of CheA and receptors). H. salinarum contains two CheWparalogues. The exact role of these is not clear, but deletion of CheW1 and CheW2results in different phenotypes (Aregger, 2003).
As implied above, the output of the chemotaxis signalling system is CheY-P. Ele-vated CheY-P levels cause CCW flagellar rotation (smooth swimming) in B. subtilisand CW flagellar rotation (tumbling) in E. coli. Therefore the overall outcome is thesame in both species – attractants cause smooth swimming, repellents cause tumblingand reorientation. In H. salinarum, CheY-P causes reversals and is required for CCWswimming as were shown by the constantly CW swimming phenotype of CheY andCheA deletion strains (Rudolph and Oesterhelt, 1996).
In flagellated bacteria, the target of CheY-P is the protein FliM (Welch et al.,1993), which builds together with FliN and FliG the flagellar motor switch complex.The binding site of CheY-P is the highly conserved N-terminal peptide of FliM (Brenand Eisenbach, 1998). Archaea, although using CheY-P as switch factor in a similarfashion, do not possess FliM homologs. Also no equivalent to the CheY-P bindingpeptide has been identified. The site of interaction of CheY-P in Archaea is unknown(Nutsch et al., 2003; Szurmant and Ordal, 2004; Ng et al., 2006).
93
6 Chemotaxis protein interaction network
6.1.1.3 Adaptation
Prokaryotic taxis requires a memory to decide whether during a move the conditionsimproved or worsened. That means that the actual stimulus strength is permanentlycompared to the stimulus strength as it was before (Koshland, 1977). This is achievedby the adaptation system(s). The best understood adaptational mechanism is themethylation system of CheR and CheB, but other systems, e. g. involving CheC andCheD (Muff and Ordal, 2007), exist.
The methyltransferase CheR transfers methyl groups from S-adenosylmethionineto certain glutamate residues in the methylation region of the receptors (Kehry andDahlquist, 1982; Nowlin et al., 1987). Methylation of receptors increases and demethy-lation decreases the activity of the signalling complex (Ninfa et al., 1991; Borkovichet al., 1992). CheB is a methylesterase that demethylates the same residues which aremethylated by CheR. The methyl groups are released as methanol. Whereas CheRis constitutively active, the activity of CheB is regulated via phosphorylation of itsresponse regulator domain by CheA: CheB-P is 100fold as active as unphosphorylatedCheB (Lupas and Stock, 1989). That means that CheB forms a feedback loop be-tween CheA and the receptors. In H. salinarum and E. coli, but not in B. subtilis,CheB functions also as receptor glutamine deamidase. Glutamines have roughly thesame effect on the signalling complex activity as methyl esterified glutamates (Rollinsand Dahlquist, 1981; Kehry et al., 1983; Koch, 2005; Koch et al., 2008). In B. subtilis,this reaction is catalysed by CheD (Kristich and Ordal, 2002).
Several bacteria like B. subtilis and H. pylori contain CheV, a two-domain proteinconsisting of a N-terminal domain homologous to CheW and a C-terminal responseregulator domain (Fredrick and Helmann, 1994). In CheV, phosphorylation of theresponse regulator domain seems to affect the conformation of the coupling domain,thereby decoupling CheA and the receptors. Thus the signalling complexes of ligand-bound receptors can reassume their prestimulus activity (Karatan et al., 2001). Agene coding for CheV was not yet found in any archaeal genome.
In B. subtilis, a third way of adaptation is described involving the proteins CheC andCheD (Muff and Ordal, 2007). CheC is a CheY-P phosphatase (Szurmant et al., 2003),CheD catalyses the deamidation of glutamines at the receptors (Kristich and Ordal,2002). Both proteins were shown to form a heterodimer (Rosario and Ordal, 1996).This interaction increases the CheC phosphatase activity (Szurmant et al., 2004) and
94
6.1 Introduction
inhibits the deamidation activity of CheD (Chao et al., 2006). CheY-P was shown tostabilise the CheC:CheD interaction, and thus CheC and CheD form a third feedbackloop to the receptors (Muff and Ordal, 2007). H. salinarum possesses both a CheDand CheC homologs. However, receptor deamidation activity in this organism hasbeen demonstrated for CheB and not CheD (Koch, 2005; Koch et al., 2008), and thefunction of CheD is unclear. It remains to be elucidated if other adaptation systemsthan the CheR/CheB methylation system play a role in archaeal chemotaxis.
6.1.1.4 Signal termination
The chemotaxis system must be able to respond to changing stimuli within seconds toeffectively direct the movement towards the best places. This is in part achieved bya short half-life of CheY-P, which is, depending on the species, in the range of a fewseconds (Rudolph et al., 1995) to almost one minute (Hess et al., 1988; Stock et al.,1988). CheY was found to actively catalyse autodephosphorylation (Lukat et al., 1990;Silversmith et al., 1997).
To further accelerate signal removal, several chemotactic organisms express CheY-Pphosphatases. In the γ- and β-proteobacteria, this is done by the protein CheZ (Hesset al., 1988; Zhao et al., 2002). In other chemotactic eubacteria and all chemotacticarchaea, CheC in combination with CheD seems to be involved in CheY-P dephospho-rylation (Szurmant et al., 2004). Furthermore, in B. subtilis the flagellar motor switchprotein FliY, a distinct homolog of CheC and the CheX protein (a CheY-P phos-phatase present for example in T. maritima), was found to have CheY-P phosphataseactivity (Szurmant et al., 2004).
In α-proteobacteria like S. meliloti, a third mechanism of signal termination ispresent. A second CheY acts as phosphate sink and thereby possibly assists thephosphate removal from the “main” CheY (Sourjik and Schmitt, 1998).
6.1.1.5 Fumarate as switch factor
The first evidence for fumarate as switch factor was found in H. salinarum, where itrestored wild-type behaviour in a straight-swimming mutant (Marwan et al., 1990). Itwas demonstrated that fumarate is released to the cytoplasm from membrane-boundpools after light stimulation (Marwan et al., 1991; Montrone et al., 1993). Almostto the same time, Barak and Eisenbach (1992b) observed that fumarate and CheY
95
6 Chemotaxis protein interaction network
are required for switching in cell envelopes of E. coli and S. typhimurium. Using anE. coli strain with increased cytoplasmic fumarate concentrations due to a deletion ofsuccinate dehydrogenase (SDH), which acts on fumarate, a correlation between thecytoplasmic fumarate level and both the switching frequency and the fraction of cellsrotating clockwise could be established (Montrone et al., 1996, 1998; Prasad et al.,1998). Prasad et al. (1998) also demonstrated that the target of fumarate is theswitch and not CheY, and that it acts, at least in part, by lowering the free energydifference between the CW and the CCW state of the motor. In a recent work, fu-marate reductase (FRD) was identified as target of fumarate at the motor in E. coli(Cohen-Ben-Lulu et al., 2008). This enzyme, otherwise functioning in anaerobic respi-ration, interacts with the flagellar motor switch protein FliG. However, H. salinarumdoes neither code for FRD (which is mainly found in obligate or facultative anaerobicbacteria) nor for FliG. So in this species fumarate must act by a different, till nowunknown, mechanism. The excitation part of fumarate signalling, i. e. when and howit is released, has not yet been identified either.
6.1.2 The components of the Che system of H. salinarum
Regarding the coded proteins, the taxis pathway of H. salinarum is more similar tothat from the gram-positive soil bacterium B. subtilis than to that from the gram-negative enterobacterium E. coli. Functionally, however, this is not always the case.As mentioned above, CheA in H. salinarum is activated by repellents, similar to E. coliand different from B. subtilis.
In the genome of H. salinarum, 18 Htrs have been identified due to homology oftheir signalling region to eubacterial MCPs (Ng et al., 2000; Pfeiffer et al., 2008b).The transducers either include an own sensing domain so that they act as receptorsand transducers in one molecule, or they interact with separate receptor proteins(Kokoeva and Oesterhelt, 2000; Kokoeva et al., 2002). Five of the Htrs were predictedto contain no transmembrane domain, so they are thought to recognise their signalsintracellularly. The other transducers contain two or more transmembrane helices andrecognise their signals at the membrane or extracellularly.
Until now the function of only eight of these transducers could be assigned: Thetransducers HtrI and HtrII are coupled to the sensory rhodopsins I and II (SRI, SRII),respectively (Spudich and Spudich, 1993; Zhang et al., 1996). The sensory rhodopsins
96
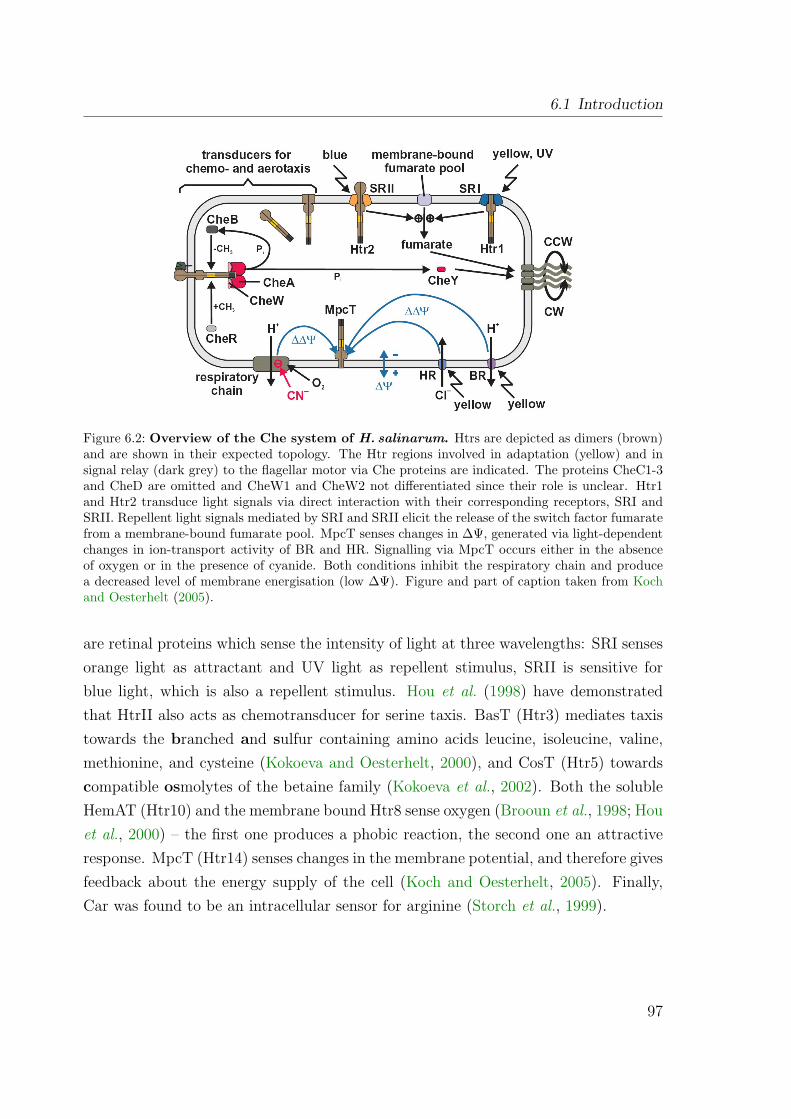
6.1 Introduction
Figure 6.2: Overview of the Che system of H. salinarum. Htrs are depicted as dimers (brown)and are shown in their expected topology. The Htr regions involved in adaptation (yellow) and insignal relay (dark grey) to the flagellar motor via Che proteins are indicated. The proteins CheC1-3and CheD are omitted and CheW1 and CheW2 not differentiated since their role is unclear. Htr1and Htr2 transduce light signals via direct interaction with their corresponding receptors, SRI andSRII. Repellent light signals mediated by SRI and SRII elicit the release of the switch factor fumaratefrom a membrane-bound fumarate pool. MpcT senses changes in ∆Ψ, generated via light-dependentchanges in ion-transport activity of BR and HR. Signalling via MpcT occurs either in the absenceof oxygen or in the presence of cyanide. Both conditions inhibit the respiratory chain and producea decreased level of membrane energisation (low ∆Ψ). Figure and part of caption taken from Kochand Oesterhelt (2005).
are retinal proteins which sense the intensity of light at three wavelengths: SRI sensesorange light as attractant and UV light as repellent stimulus, SRII is sensitive forblue light, which is also a repellent stimulus. Hou et al. (1998) have demonstratedthat HtrII also acts as chemotransducer for serine taxis. BasT (Htr3) mediates taxistowards the branched and sulfur containing amino acids leucine, isoleucine, valine,methionine, and cysteine (Kokoeva and Oesterhelt, 2000), and CosT (Htr5) towardscompatible osmolytes of the betaine family (Kokoeva et al., 2002). Both the solubleHemAT (Htr10) and the membrane bound Htr8 sense oxygen (Brooun et al., 1998; Houet al., 2000) – the first one produces a phobic reaction, the second one an attractiveresponse. MpcT (Htr14) senses changes in the membrane potential, and therefore givesfeedback about the energy supply of the cell (Koch and Oesterhelt, 2005). Finally,Car was found to be an intracellular sensor for arginine (Storch et al., 1999).
97
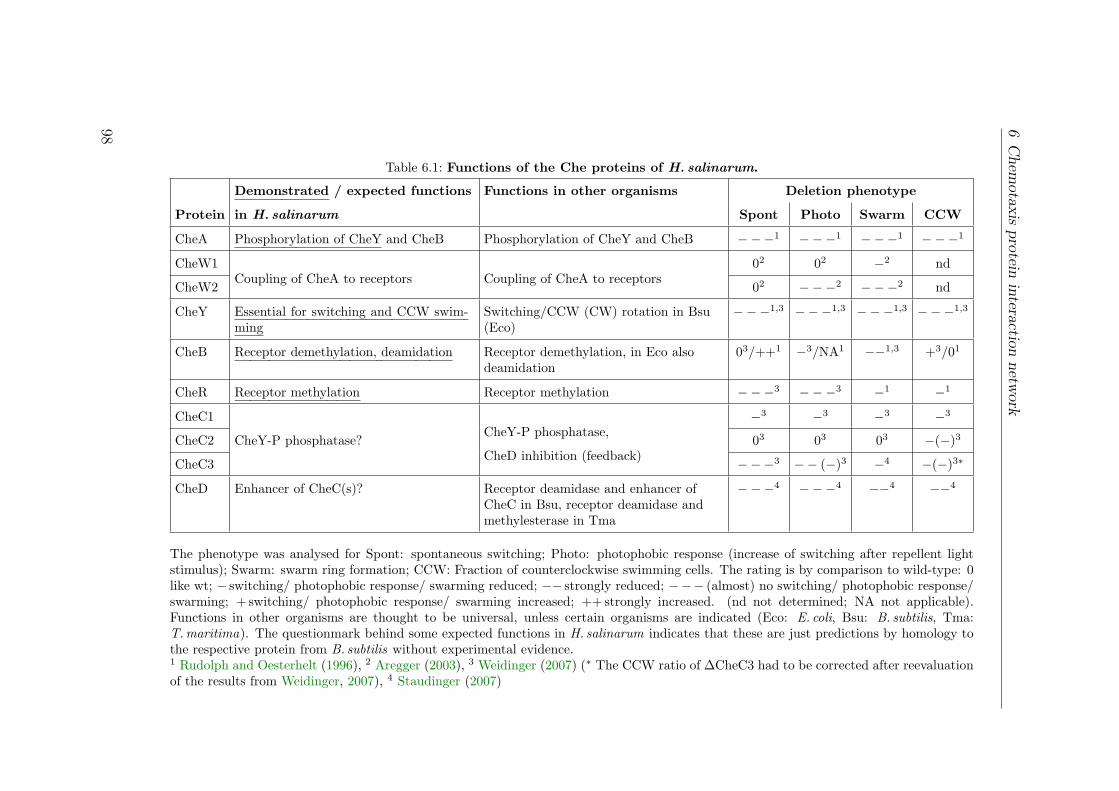
6C
hemotaxis
proteininteraction
network
Table 6.1: Functions of the Che proteins of H. salinarum.
Demonstrated / expected functions Functions in other organisms Deletion phenotype
Protein in H. salinarum Spont Photo Swarm CCW
CheA Phosphorylation of CheY and CheB Phosphorylation of CheY and CheB −−−1 −−−1 −−−1 −−−1
CheW1 02 02 −2 nd
CheW2Coupling of CheA to receptors Coupling of CheA to receptors
02 −−−2 −−−2 nd
CheY Essential for switching and CCW swim-ming
Switching/CCW (CW) rotation in Bsu(Eco)
−−−1,3 −−−1,3 −−−1,3 −−−1,3
CheB Receptor demethylation, deamidation Receptor demethylation, in Eco alsodeamidation
03/++1 −3/NA1 −−1,3 +3/01
CheR Receptor methylation Receptor methylation −−−3 −−−3 −1 −1
CheC1 −3 −3 −3 −3
CheC2 CheY-P phosphatase?CheY-P phosphatase,
03 03 03 −(−)3
CheC3CheD inhibition (feedback) −−−3 −− (−)3 −4 −(−)3∗
CheD Enhancer of CheC(s)? Receptor deamidase and enhancer ofCheC in Bsu, receptor deamidase andmethylesterase in Tma
−−−4 −−−4 −−4 −−4
The phenotype was analysed for Spont: spontaneous switching; Photo: photophobic response (increase of switching after repellent lightstimulus); Swarm: swarm ring formation; CCW: Fraction of counterclockwise swimming cells. The rating is by comparison to wild-type: 0like wt; − switching/ photophobic response/ swarming reduced; −− strongly reduced; −−− (almost) no switching/ photophobic response/swarming; + switching/ photophobic response/ swarming increased; ++ strongly increased. (nd not determined; NA not applicable).Functions in other organisms are thought to be universal, unless certain organisms are indicated (Eco: E. coli, Bsu: B. subtilis, Tma:T. maritima). The questionmark behind some expected functions in H. salinarum indicates that these are just predictions by homology tothe respective protein from B. subtilis without experimental evidence.1 Rudolph and Oesterhelt (1996), 2 Aregger (2003), 3 Weidinger (2007) (∗ The CCW ratio of ∆CheC3 had to be corrected after reevaluationof the results from Weidinger, 2007), 4 Staudinger (2007)
98
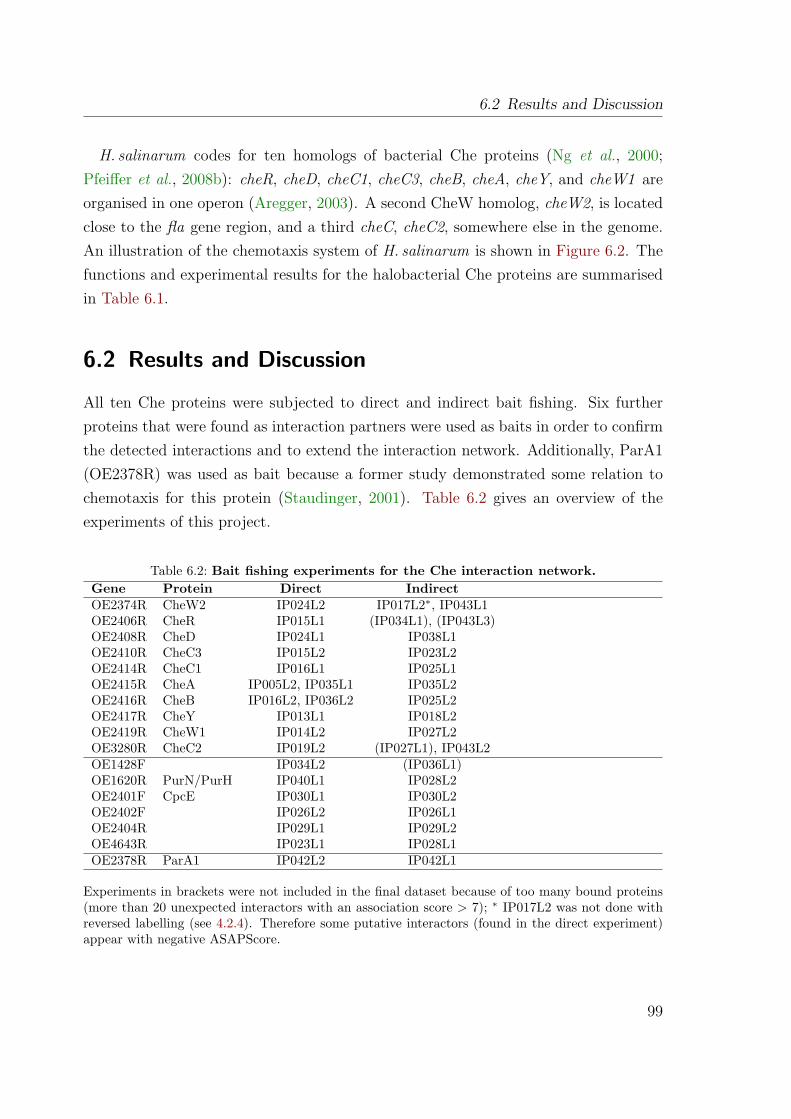
6.2 Results and Discussion
H. salinarum codes for ten homologs of bacterial Che proteins (Ng et al., 2000;Pfeiffer et al., 2008b): cheR, cheD, cheC1, cheC3, cheB, cheA, cheY, and cheW1 areorganised in one operon (Aregger, 2003). A second CheW homolog, cheW2, is locatedclose to the fla gene region, and a third cheC, cheC2, somewhere else in the genome.An illustration of the chemotaxis system of H. salinarum is shown in Figure 6.2. Thefunctions and experimental results for the halobacterial Che proteins are summarisedin Table 6.1.
6.2 Results and Discussion
All ten Che proteins were subjected to direct and indirect bait fishing. Six furtherproteins that were found as interaction partners were used as baits in order to confirmthe detected interactions and to extend the interaction network. Additionally, ParA1(OE2378R) was used as bait because a former study demonstrated some relation tochemotaxis for this protein (Staudinger, 2001). Table 6.2 gives an overview of theexperiments of this project.
Table 6.2: Bait fishing experiments for the Che interaction network.Gene Protein Direct IndirectOE2374R CheW2 IP024L2 IP017L2∗, IP043L1OE2406R CheR IP015L1 (IP034L1), (IP043L3)OE2408R CheD IP024L1 IP038L1OE2410R CheC3 IP015L2 IP023L2OE2414R CheC1 IP016L1 IP025L1OE2415R CheA IP005L2, IP035L1 IP035L2OE2416R CheB IP016L2, IP036L2 IP025L2OE2417R CheY IP013L1 IP018L2OE2419R CheW1 IP014L2 IP027L2OE3280R CheC2 IP019L2 (IP027L1), IP043L2OE1428F IP034L2 (IP036L1)OE1620R PurN/PurH IP040L1 IP028L2OE2401F CpcE IP030L1 IP030L2OE2402F IP026L2 IP026L1OE2404R IP029L1 IP029L2OE4643R IP023L1 IP028L1OE2378R ParA1 IP042L2 IP042L1
Experiments in brackets were not included in the final dataset because of too many bound proteins(more than 20 unexpected interactors with an association score > 7); ∗ IP017L2 was not done withreversed labelling (see 4.2.4). Therefore some putative interactors (found in the direct experiment)appear with negative ASAPScore.
99
6 Chemotaxis protein interaction network
Direct bait fishing experiments with pMS3/pMS5 were stopped early in the courseof the project, because it was found in test expressions that several proteins wereexpressed at too low levels (e. g. CheB, the CheCs) to allow succesful purificationfrom 100 ml cultures. Larger culture volumes would have been necessary so that themethod were too expensive with SILAC labelling. And, for CheA and CheW1, hardlyany differences were detectable between experiments performed with either pMS3 orpMS4 (data not shown). So only experiments with pMS4/pMS6 were continued.
Overall, in the experiments 597 unique proteins were identified (overall 5505 proteinidentifications) according to the criteria given in 2.4.11. Of the total identifications,267 were rated with an association score of “high” or “very high” and thus classifiedas interactions. Merging multiply identified interactions results in a final set of 201interactions. A list of all detected interactions is given in Supplementary Table S2, thecomplete data set can be accessed via HaloLex (http://www.halolex.mpg.de/;Pfeiffer et al., 2008a).
6.2.1 Evaluation of experimental results
6.2.1.1 Contaminants
To identify contaminants that bind to the CBD and therefore appear as interactors,a direct and an indirect bait fishing experiment were performed in which the CBDexpression strain (MS4) was tested against wildtype. The proteins detected as “inter-actors” of the CBD in these controls were included in the background table (see 5.2.3)and thus ignored in the results of all further experiments. Furthermore, some otherproteins were added to the background table because they either bound to the cellulosecolumn when incubated with wildtype cell lysate (the chitinases OE2201F, OE2205F,and OE2206F), or they were highly promiscuous (found in almost every experiment)and are involved in protein folding or degradation. As the bait is overexpressed andthe CBD is from a non-halophilic organism, the bait might be partially misfolded sothat proteins involved in protein folding and degradation bind to it. The complete listof background proteins is shown in Table 6.3.
Additionally, five preys were marked as promiscuous as they were interactors ofat least three not directly interacting baits. These proteins could either be hubs inthe interaction network (and thus be particular important) or unspecific binders. See6.2.2.5 for details on these proteins.
100
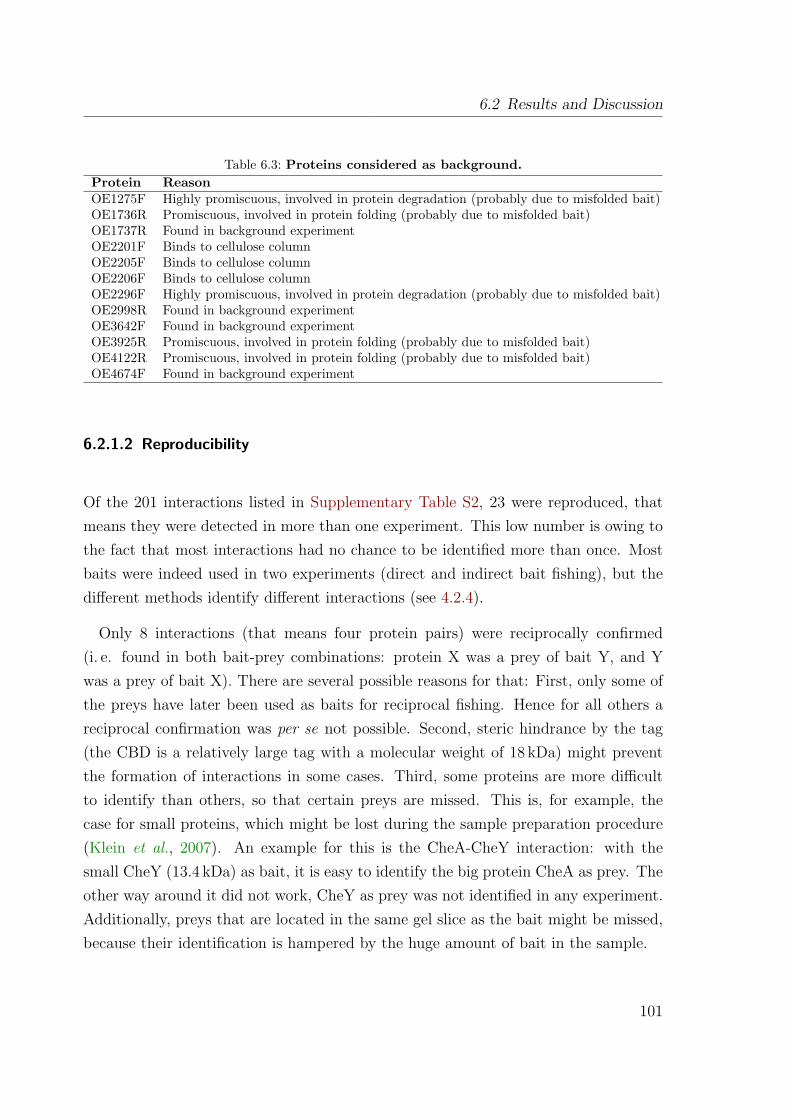
6.2 Results and Discussion
Table 6.3: Proteins considered as background.Protein ReasonOE1275F Highly promiscuous, involved in protein degradation (probably due to misfolded bait)OE1736R Promiscuous, involved in protein folding (probably due to misfolded bait)OE1737R Found in background experimentOE2201F Binds to cellulose columnOE2205F Binds to cellulose columnOE2206F Binds to cellulose columnOE2296F Highly promiscuous, involved in protein degradation (probably due to misfolded bait)OE2998R Found in background experimentOE3642F Found in background experimentOE3925R Promiscuous, involved in protein folding (probably due to misfolded bait)OE4122R Promiscuous, involved in protein folding (probably due to misfolded bait)OE4674F Found in background experiment
6.2.1.2 Reproducibility
Of the 201 interactions listed in Supplementary Table S2, 23 were reproduced, thatmeans they were detected in more than one experiment. This low number is owing tothe fact that most interactions had no chance to be identified more than once. Mostbaits were indeed used in two experiments (direct and indirect bait fishing), but thedifferent methods identify different interactions (see 4.2.4).
Only 8 interactions (that means four protein pairs) were reciprocally confirmed(i. e. found in both bait-prey combinations: protein X was a prey of bait Y, and Ywas a prey of bait X). There are several possible reasons for that: First, only some ofthe preys have later been used as baits for reciprocal fishing. Hence for all others areciprocal confirmation was per se not possible. Second, steric hindrance by the tag(the CBD is a relatively large tag with a molecular weight of 18 kDa) might preventthe formation of interactions in some cases. Third, some proteins are more difficultto identify than others, so that certain preys are missed. This is, for example, thecase for small proteins, which might be lost during the sample preparation procedure(Klein et al., 2007). An example for this is the CheA-CheY interaction: with thesmall CheY (13.4 kDa) as bait, it is easy to identify the big protein CheA as prey. Theother way around it did not work, CheY as prey was not identified in any experiment.Additionally, preys that are located in the same gel slice as the bait might be missed,because their identification is hampered by the huge amount of bait in the sample.
101
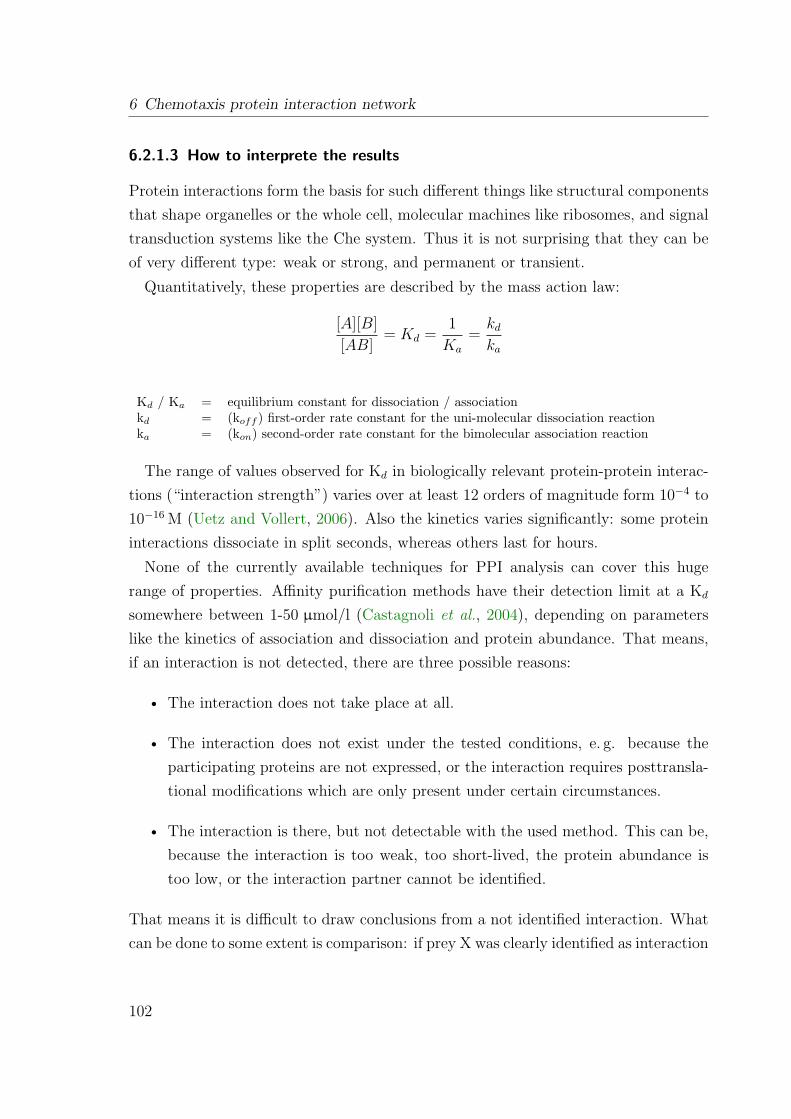
6 Chemotaxis protein interaction network
6.2.1.3 How to interprete the results
Protein interactions form the basis for such different things like structural componentsthat shape organelles or the whole cell, molecular machines like ribosomes, and signaltransduction systems like the Che system. Thus it is not surprising that they can beof very different type: weak or strong, and permanent or transient.
Quantitatively, these properties are described by the mass action law:
[A][B]
[AB]= Kd =
1
Ka
=kd
ka
Kd / Ka = equilibrium constant for dissociation / associationkd = (koff ) first-order rate constant for the uni-molecular dissociation reactionka = (kon) second-order rate constant for the bimolecular association reaction
The range of values observed for Kd in biologically relevant protein-protein interac-tions (“interaction strength”) varies over at least 12 orders of magnitude form 10−4 to10−16 M (Uetz and Vollert, 2006). Also the kinetics varies significantly: some proteininteractions dissociate in split seconds, whereas others last for hours.
None of the currently available techniques for PPI analysis can cover this hugerange of properties. Affinity purification methods have their detection limit at a Kd
somewhere between 1-50 µmol/l (Castagnoli et al., 2004), depending on parameterslike the kinetics of association and dissociation and protein abundance. That means,if an interaction is not detected, there are three possible reasons:
• The interaction does not take place at all.
• The interaction does not exist under the tested conditions, e. g. because theparticipating proteins are not expressed, or the interaction requires posttransla-tional modifications which are only present under certain circumstances.
• The interaction is there, but not detectable with the used method. This can be,because the interaction is too weak, too short-lived, the protein abundance istoo low, or the interaction partner cannot be identified.
That means it is difficult to draw conclusions from a not identified interaction. Whatcan be done to some extent is comparison: if prey X was clearly identified as interaction
102
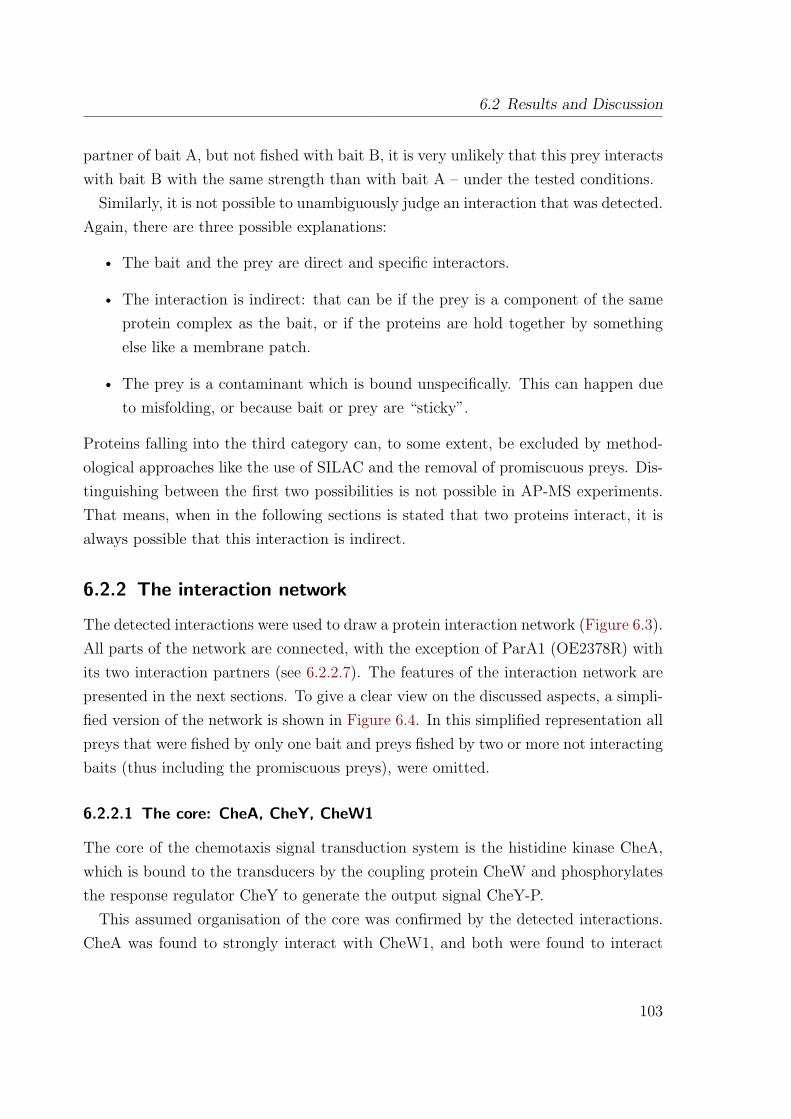
6.2 Results and Discussion
partner of bait A, but not fished with bait B, it is very unlikely that this prey interactswith bait B with the same strength than with bait A – under the tested conditions.
Similarly, it is not possible to unambiguously judge an interaction that was detected.Again, there are three possible explanations:
• The bait and the prey are direct and specific interactors.
• The interaction is indirect: that can be if the prey is a component of the sameprotein complex as the bait, or if the proteins are hold together by somethingelse like a membrane patch.
• The prey is a contaminant which is bound unspecifically. This can happen dueto misfolding, or because bait or prey are “sticky”.
Proteins falling into the third category can, to some extent, be excluded by method-ological approaches like the use of SILAC and the removal of promiscuous preys. Dis-tinguishing between the first two possibilities is not possible in AP-MS experiments.That means, when in the following sections is stated that two proteins interact, it isalways possible that this interaction is indirect.
6.2.2 The interaction network
The detected interactions were used to draw a protein interaction network (Figure 6.3).All parts of the network are connected, with the exception of ParA1 (OE2378R) withits two interaction partners (see 6.2.2.7). The features of the interaction network arepresented in the next sections. To give a clear view on the discussed aspects, a simpli-fied version of the network is shown in Figure 6.4. In this simplified representation allpreys that were fished by only one bait and preys fished by two or more not interactingbaits (thus including the promiscuous preys), were omitted.
6.2.2.1 The core: CheA, CheY, CheW1
The core of the chemotaxis signal transduction system is the histidine kinase CheA,which is bound to the transducers by the coupling protein CheW and phosphorylatesthe response regulator CheY to generate the output signal CheY-P.
This assumed organisation of the core was confirmed by the detected interactions.CheA was found to strongly interact with CheW1, and both were found to interact
103
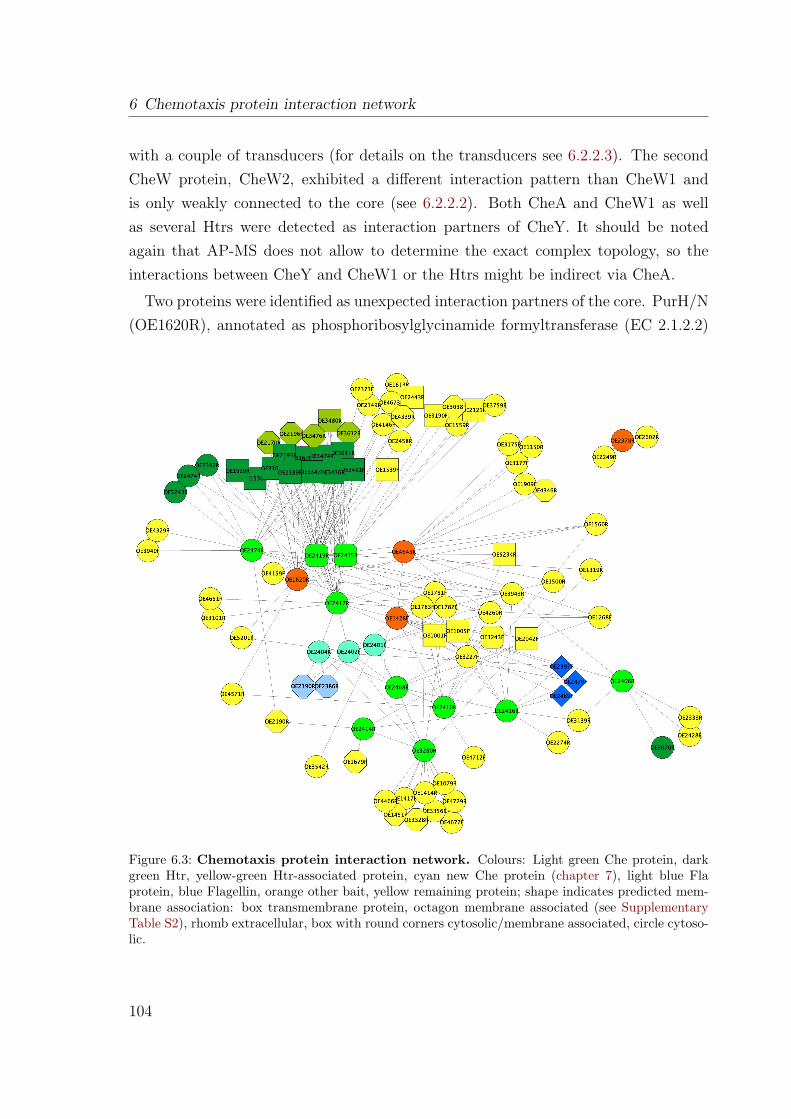
6 Chemotaxis protein interaction network
with a couple of transducers (for details on the transducers see 6.2.2.3). The secondCheW protein, CheW2, exhibited a different interaction pattern than CheW1 andis only weakly connected to the core (see 6.2.2.2). Both CheA and CheW1 as wellas several Htrs were detected as interaction partners of CheY. It should be notedagain that AP-MS does not allow to determine the exact complex topology, so theinteractions between CheY and CheW1 or the Htrs might be indirect via CheA.
Two proteins were identified as unexpected interaction partners of the core. PurH/N(OE1620R), annotated as phosphoribosylglycinamide formyltransferase (EC 2.1.2.2)
Figure 6.3: Chemotaxis protein interaction network. Colours: Light green Che protein, darkgreen Htr, yellow-green Htr-associated protein, cyan new Che protein (chapter 7), light blue Flaprotein, blue Flagellin, orange other bait, yellow remaining protein; shape indicates predicted mem-brane association: box transmembrane protein, octagon membrane associated (see SupplementaryTable S2), rhomb extracellular, box with round corners cytosolic/membrane associated, circle cytoso-lic.
104
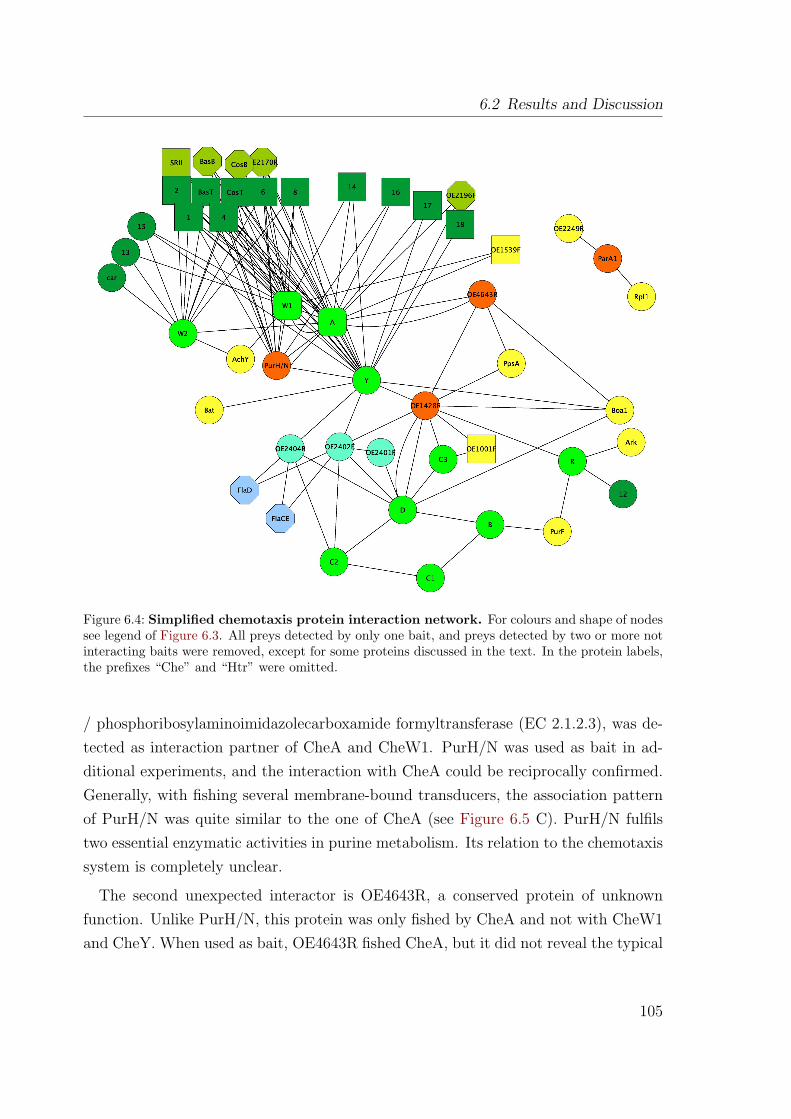
6.2 Results and Discussion
Figure 6.4: Simplified chemotaxis protein interaction network. For colours and shape of nodessee legend of Figure 6.3. All preys detected by only one bait, and preys detected by two or more notinteracting baits were removed, except for some proteins discussed in the text. In the protein labels,the prefixes “Che” and “Htr” were omitted.
/ phosphoribosylaminoimidazolecarboxamide formyltransferase (EC 2.1.2.3), was de-tected as interaction partner of CheA and CheW1. PurH/N was used as bait in ad-ditional experiments, and the interaction with CheA could be reciprocally confirmed.Generally, with fishing several membrane-bound transducers, the association patternof PurH/N was quite similar to the one of CheA (see Figure 6.5 C). PurH/N fulfilstwo essential enzymatic activities in purine metabolism. Its relation to the chemotaxissystem is completely unclear.
The second unexpected interactor is OE4643R, a conserved protein of unknownfunction. Unlike PurH/N, this protein was only fished by CheA and not with CheW1and CheY. When used as bait, OE4643R fished CheA, but it did not reveal the typical
105
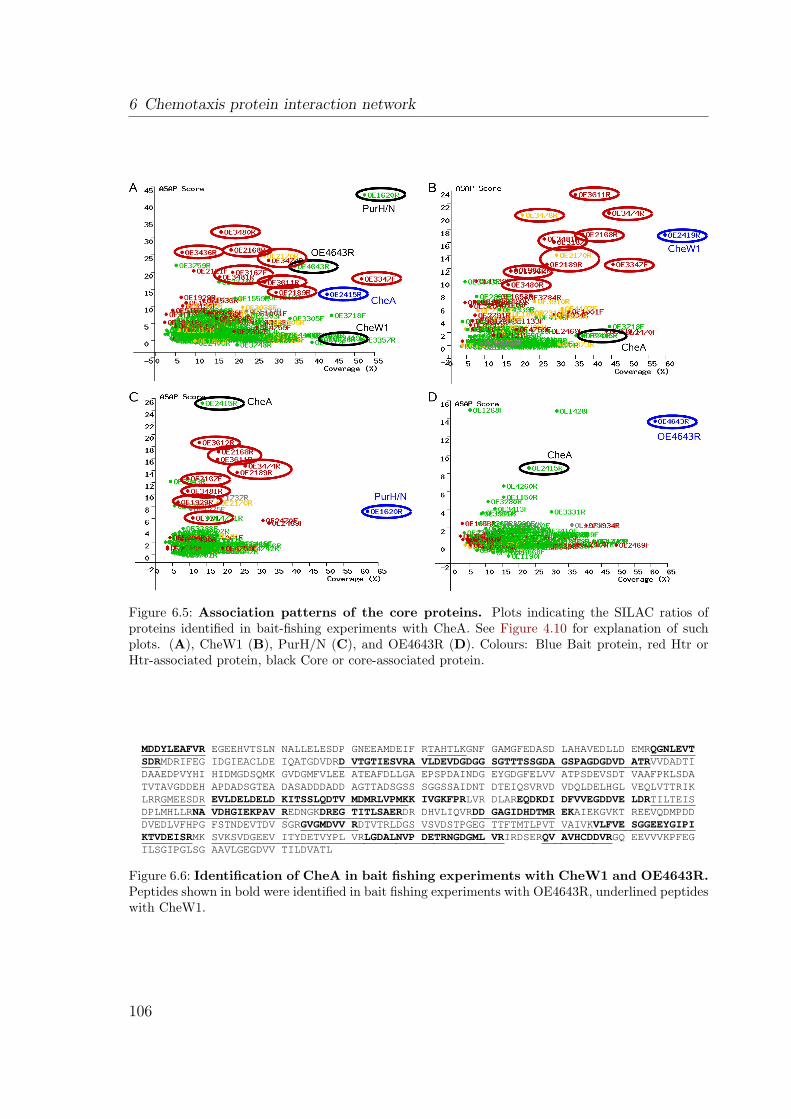
6 Chemotaxis protein interaction network
Figure 6.5: Association patterns of the core proteins. Plots indicating the SILAC ratios ofproteins identified in bait-fishing experiments with CheA. See Figure 4.10 for explanation of suchplots. (A), CheW1 (B), PurH/N (C), and OE4643R (D). Colours: Blue Bait protein, red Htr orHtr-associated protein, black Core or core-associated protein.
MDDYLEAFVR EGEEHVTSLN NALLELESDP GNEEAMDEIF RTAHTLKGNF GAMGFEDASD LAHAVEDLLD EMRQGNLEVTSDRMDRIFEG IDGIEACLDE IQATGDVDRD VTGTIESVRA VLDEVDGDGG SGTTTSSGDA GSPAGDGDVD ATRVVDADTIDAAEDPVYHI HIDMGDSQMK GVDGMFVLEE ATEAFDLLGA EPSPDAINDG EYGDGFELVV ATPSDEVSDT VAAFPKLSDATVTAVGDDEH APDADSGTEA DASADDDADD AGTTADSGSS SGGSSAIDNT DTEIQSVRVD VDQLDELHGL VEQLVTTRIKLRRGMEESDR EVLDELDELD KITSSLQDTV MDMRLVPMKK IVGKFPRLVR DLAREQDKDI DFVVEGDDVE LDRTILTEISDPLMHLLRNA VDHGIEKPAV REDNGKDREG TITLSAERDR DHVLIQVRDD GAGIDHDTMR EKAIEKGVKT REEVQDMPDDDVEDLVFHPG FSTNDEVTDV SGRGVGMDVV RDTVTRLDGS VSVDSTPGEG TTFTMTLPVT VAIVKVLFVE SGGEEYGIPIKTVDEISRMK SVKSVDGEEV ITYDETVYPL VRLGDALNVP DETRNGDGML VRIRDSERQV AVHCDDVRGQ EEVVVKPFEGILSGIPGLSG AAVLGEGDVV TILDVATL
Figure 6.6: Identification of CheA in bait fishing experiments with CheW1 and OE4643R.Peptides shown in bold were identified in bait fishing experiments with OE4643R, underlined peptideswith CheW1.
106
6.2 Results and Discussion
association pattern of the core proteins (see Figure 6.5 D, no CheW1, no Htrs withtheir associated proteins). So this protein seems to interact with a not transducer-associated form of CheA. In enterobacteria, two forms of the CheA protein exist:CheAL, the full length protein, and CheAS, a N-terminally truncated form, whichhas an alternative translation initiation site (McNamara and Wolfe, 1997). A similarscenario as reason for the different interaction pattern can be rejected here, as forboth the Htr-bound form (fished with CheW1) and the cytosolic form (fished withOE4643R) the N-terminal peptide was identified (see Figure 6.6).
OE4643R belongs to the Pfam (Finn et al., 2006, 2008) protein family DUF151(DUF means “domain of unknown function”), and the cluster of orthologous groups(Tatusov et al., 1997, 2003) COG1259 (“uncharacterised conserved protein”). A ho-molog of this protein from Thermotoga maritima, TM0160, has been crystallised andthe structure solved to 1.9 Å resolution (Spraggon et al., 2004). Unfortunately, evenwith the structure in hands it was not possible to deduce the function of this protein.Spraggon et al. (2004) propose that there is putatively a novel type of active site inthis protein, so it might possess an unknown enzymatic activity. By the evaluation ofthe genomic context of homologs of TM0160 in 19 species, these authors found a pre-ponderance of enzymes involved in amino acid metabolism, which indicates a possiblerole in this process for this protein family.
The background of the interactions of these two proteins with the core or CheA, re-spectively, is not yet known. Similar interactions have not been described in any otherorganism. In several bacterial species, the phosphoenolpyruvate-dependent carbohy-drate phosphotransferase systems (PTSs) can mediate positive chemotaxis towardsPTS carbohydrates (see Postma et al., 1993, and references therein). Responses to-wards carbohydrates are mediated by two pathways: The first pathway is based oncarbohydrate binding to periplasmic binding proteins which are components of theATP-binding cassette transporters for the carbohydrates. With their bound ligands,the periplasmic binding proteins bind to certain MCPs, leading to a tactic response(Hazelbauer and Adler, 1971). The second pathway uses the PTSs, which relay taxissignalling when the substrate is transported (for review see Lengeler and Jahreis, 1996).A PTS consists of a substrate-specific, membrane-bound Enzyme II (EII) complex,which is phosphorylated by a cytoplasmic donor phosphorelay and phosphorylates thesubstrate during transport. The phosphorelay is made from Enzyme I (EI), a phos-phoenolpyruvate (PEP)-dependent histidine kinase, and a phosphohistidine carrier
107
6 Chemotaxis protein interaction network
protein (HPr). Taxis signalling through PTSs in E. coli requires CheA, CheW, andCheY, but no MCPs (Rowsell et al., 1995). It was demonstrated in vitro that EI,but not EI-P, inhibits CheA autophosphorylation (Lux et al., 1995). In a more recentwork, Lux et al. (1999) found that the PTS signal acts to inhibit MCP-bound CheA.Hence the unexpected interactions of CheA described in this study might belong tosimilar, yet unknown, taxis signalling pathways that target CheA.
6.2.2.2 Different interactions of the two CheW proteins
In none of the bait fishing experiments with CheW2, CheA was identified as prey. Theother way around, with CheA as bait, CheW2 was found as prey in one experiment.This means, unlike CheA-CheW1, this interaction was not reciprocally reproducible,nor seemed CheW2 to be such an outstanding interactor (in terms of SILAC ratio andsequence coverage) of CheA as CheW1 is. These findings suggest that CheW1 is themain coupling protein to tie CheA to several transducers. This is inconsistent with thephenotypic characterisations of deletion mutants by Aregger (2003). In that study,the deletion of CheW2 led to severe defects in phototaxis and chemotaxis (assayedby computer-assisted cell tracking and swarm plates), whereas the deletion of CheW1had hardly any impact on phototaxis and only small impact on chemotaxis.
To further study the roles of the two CheW proteins, a comparative bait fishingexperiment with both proteins as bait was done (Figure 6.7). This experiment wasperformed as indirect bait fishing in which instead of the control pMS4 the secondCheW was used – CheW1 was bound to one cellulose column and incubated withlight (12C) cell lysate, CheW2 to a second column and incubated with heavy (13C) celllysate.
In this experiment, the light form (12C) of CheA and PurH/N (might be indirectvia CheA) was present in a relatively high amount, whereas the heavy form (13C)was hardly detectable (see Figure 6.7 B for a representative chromatogram of a CheApeptide). This means, these proteins were strongly bound to CheW1, whereas thebinding to CheW2 was very weak or short-lived. It is even possible that the interactionof CheW2 and CheA detected here and with CheA as bait was just indirect via theHtrs.
The three (soluble) transducers Htr11 (Car), Htr13, and Htr15 showed the oppositebehaviour. From these proteins the heavy form was detected in large quantities,
108
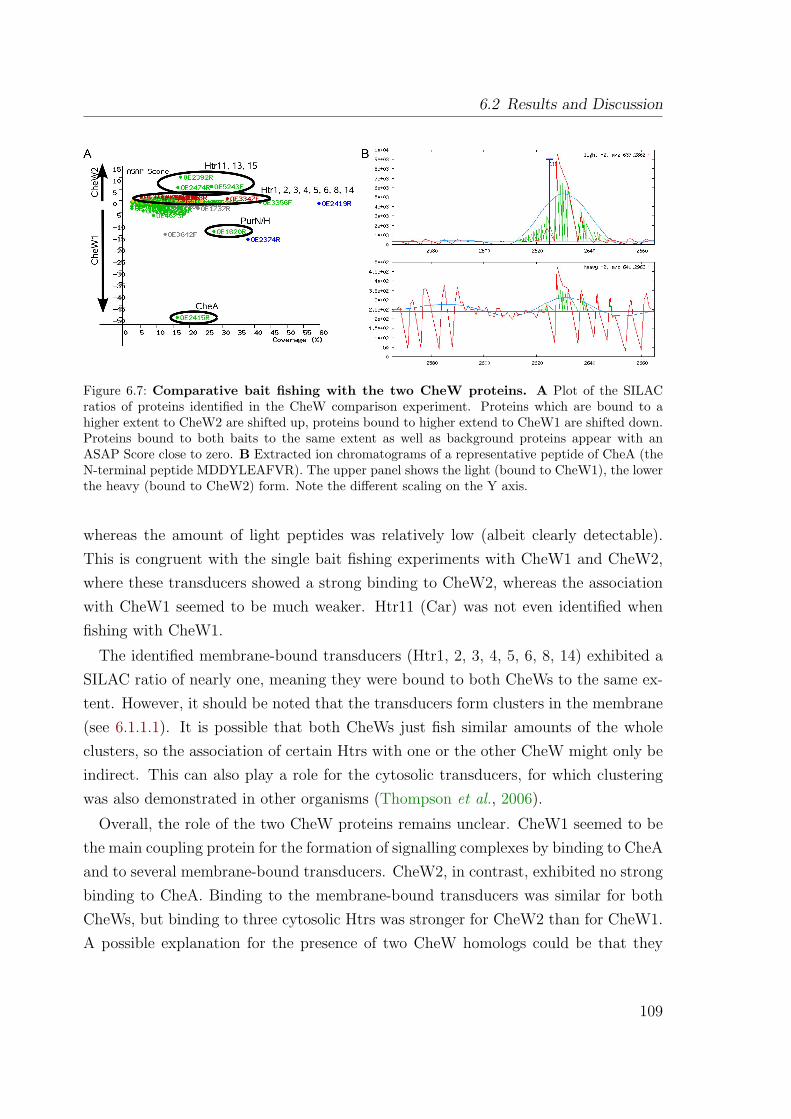
6.2 Results and Discussion
Figure 6.7: Comparative bait fishing with the two CheW proteins. A Plot of the SILACratios of proteins identified in the CheW comparison experiment. Proteins which are bound to ahigher extent to CheW2 are shifted up, proteins bound to higher extend to CheW1 are shifted down.Proteins bound to both baits to the same extent as well as background proteins appear with anASAP Score close to zero. B Extracted ion chromatograms of a representative peptide of CheA (theN-terminal peptide MDDYLEAFVR). The upper panel shows the light (bound to CheW1), the lowerthe heavy (bound to CheW2) form. Note the different scaling on the Y axis.
whereas the amount of light peptides was relatively low (albeit clearly detectable).This is congruent with the single bait fishing experiments with CheW1 and CheW2,where these transducers showed a strong binding to CheW2, whereas the associationwith CheW1 seemed to be much weaker. Htr11 (Car) was not even identified whenfishing with CheW1.
The identified membrane-bound transducers (Htr1, 2, 3, 4, 5, 6, 8, 14) exhibited aSILAC ratio of nearly one, meaning they were bound to both CheWs to the same ex-tent. However, it should be noted that the transducers form clusters in the membrane(see 6.1.1.1). It is possible that both CheWs just fish similar amounts of the wholeclusters, so the association of certain Htrs with one or the other CheW might only beindirect. This can also play a role for the cytosolic transducers, for which clusteringwas also demonstrated in other organisms (Thompson et al., 2006).
Overall, the role of the two CheW proteins remains unclear. CheW1 seemed to bethe main coupling protein for the formation of signalling complexes by binding to CheAand to several membrane-bound transducers. CheW2, in contrast, exhibited no strongbinding to CheA. Binding to the membrane-bound transducers was similar for bothCheWs, but binding to three cytosolic Htrs was stronger for CheW2 than for CheW1.A possible explanation for the presence of two CheW homologs could be that they
109
6 Chemotaxis protein interaction network
allow a different weighting of certain signals under different conditions (for example,when light and/or oxygen are present in sufficient amounts, arginine taxis should bemuch less important than in the dark with oxygen shortage). This weighting could beregulated e. g. by different expression levels or posttranslational modifications. It isalso possible that CheW2 is the connection to an additional, not yet elucidated partof the taxis signalling system (compare 6.1.1.5). A third explanation may be thatCheW2 forms an alternative adaptational mechanism. Thereby it would decouple thesignalling complexes on certain transducers by competition with CheW1. Additionalexperiments will be needed to enlighten the functions of the two CheW proteins.
6.2.2.3 The transducers exhibit nonuniform interaction patterns
The 18 transducers of H. salinarum show a quite nonuniform image when comparedthrough all experiments (Table 6.4). As mentioned above, eight membrane-boundtransducers (Htr1, 2, 3, 4, 5, 6, 8, 14) were fished by CheW1 and CheW2 to a similarextent, and they were also fished by CheA and CheY. Three cytosolic transducers,Htr11 (car), Htr13, and Htr15, were fished by CheW2 and to lesser extent also byCheW1. Htr15 was also a prey of CheY. Htr16, Htr17, and Htr18 were only foundassociated with CheA and CheY, and Htr7, Htr9, Htr10 were not identified as inter-action partners at all (see note in the legend of Table 6.4 regarding CheW2). Htr12was only fished with CheR, and this was the only transducer found with this bait. Aninteraction between the transducers and CheB was not detected. The interaction ofCheR and CheB with the Htrs is probably too short-lived to be detected by AP-MS.
The interpretation of the different interaction patterns is difficult, especially sincethe signals for only eight Htrs are known. A simple correlation (e. g. attractantvs. repellent signalling, or phototaxis vs. chemotaxis) could not be found. Again,different affinities could give the possibility for different weighting of certain signalsunder different conditions. It should be investigated in further experiments, if Htr16,Htr17, and Htr18 indeed form signalling complexes without one of the CheWs, as wellas the role of the Htr12-CheR interaction.
With the transducers Htr2, BasT, CosT, Htr6, and Htr18, the putative associatedproteins sensory rhodopsin II (SRII), BasB, CosB, OE2170R, and OE2196F (the lattertwo are putative periplasmic substrate binding proteins like BasB and CosB) werecopurified.
110
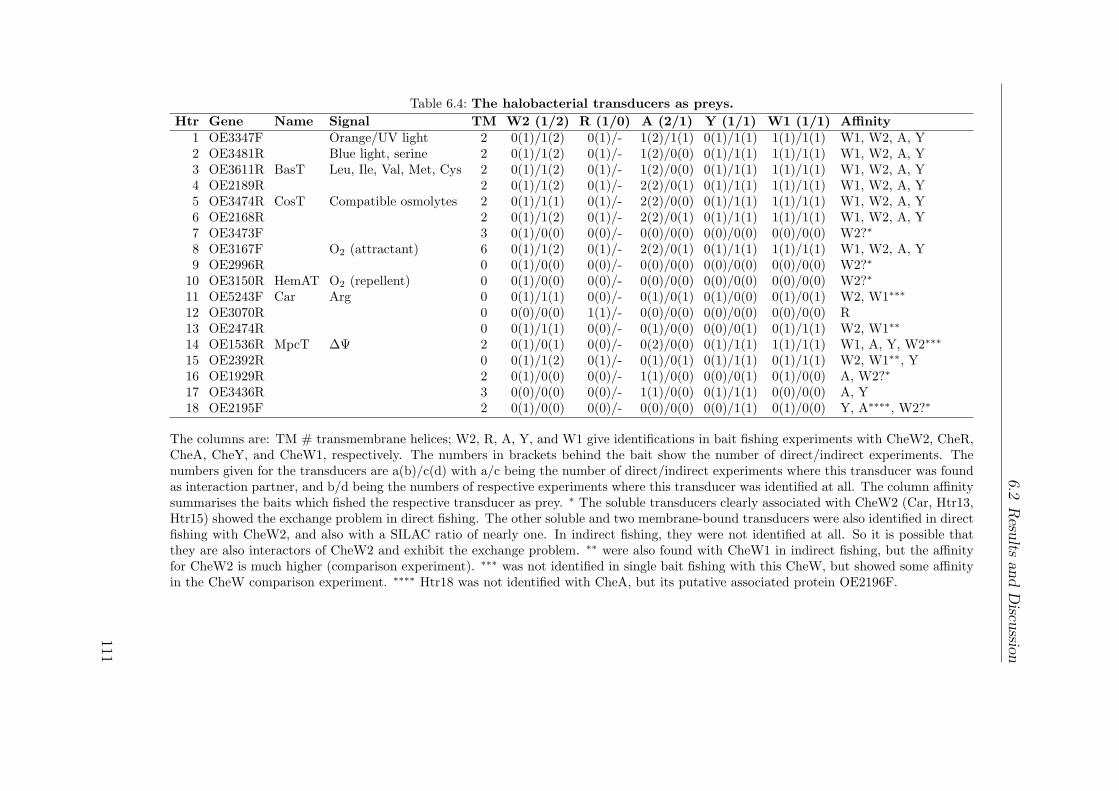
6.2R
esultsand
Discussion
Table 6.4: The halobacterial transducers as preys.Htr Gene Name Signal TM W2 (1/2) R (1/0) A (2/1) Y (1/1) W1 (1/1) Affinity
1 OE3347F Orange/UV light 2 0(1)/1(2) 0(1)/- 1(2)/1(1) 0(1)/1(1) 1(1)/1(1) W1, W2, A, Y2 OE3481R Blue light, serine 2 0(1)/1(2) 0(1)/- 1(2)/0(0) 0(1)/1(1) 1(1)/1(1) W1, W2, A, Y3 OE3611R BasT Leu, Ile, Val, Met, Cys 2 0(1)/1(2) 0(1)/- 1(2)/0(0) 0(1)/1(1) 1(1)/1(1) W1, W2, A, Y4 OE2189R 2 0(1)/1(2) 0(1)/- 2(2)/0(1) 0(1)/1(1) 1(1)/1(1) W1, W2, A, Y5 OE3474R CosT Compatible osmolytes 2 0(1)/1(1) 0(1)/- 2(2)/0(0) 0(1)/1(1) 1(1)/1(1) W1, W2, A, Y6 OE2168R 2 0(1)/1(2) 0(1)/- 2(2)/0(1) 0(1)/1(1) 1(1)/1(1) W1, W2, A, Y7 OE3473F 3 0(1)/0(0) 0(0)/- 0(0)/0(0) 0(0)/0(0) 0(0)/0(0) W2?∗8 OE3167F O2 (attractant) 6 0(1)/1(2) 0(1)/- 2(2)/0(1) 0(1)/1(1) 1(1)/1(1) W1, W2, A, Y9 OE2996R 0 0(1)/0(0) 0(0)/- 0(0)/0(0) 0(0)/0(0) 0(0)/0(0) W2?∗
10 OE3150R HemAT O2 (repellent) 0 0(1)/0(0) 0(0)/- 0(0)/0(0) 0(0)/0(0) 0(0)/0(0) W2?∗11 OE5243F Car Arg 0 0(1)/1(1) 0(0)/- 0(1)/0(1) 0(1)/0(0) 0(1)/0(1) W2, W1∗∗∗12 OE3070R 0 0(0)/0(0) 1(1)/- 0(0)/0(0) 0(0)/0(0) 0(0)/0(0) R13 OE2474R 0 0(1)/1(1) 0(0)/- 0(1)/0(0) 0(0)/0(1) 0(1)/1(1) W2, W1∗∗14 OE1536R MpcT ∆Ψ 2 0(1)/0(1) 0(0)/- 0(2)/0(0) 0(1)/1(1) 1(1)/1(1) W1, A, Y, W2∗∗∗15 OE2392R 0 0(1)/1(2) 0(1)/- 0(1)/0(1) 0(1)/1(1) 0(1)/1(1) W2, W1∗∗, Y16 OE1929R 2 0(1)/0(0) 0(0)/- 1(1)/0(0) 0(0)/0(1) 0(1)/0(0) A, W2?∗17 OE3436R 3 0(0)/0(0) 0(0)/- 1(1)/0(0) 0(1)/1(1) 0(0)/0(0) A, Y18 OE2195F 2 0(1)/0(0) 0(0)/- 0(0)/0(0) 0(0)/1(1) 0(1)/0(0) Y, A∗∗∗∗, W2?∗
The columns are: TM # transmembrane helices; W2, R, A, Y, and W1 give identifications in bait fishing experiments with CheW2, CheR,CheA, CheY, and CheW1, respectively. The numbers in brackets behind the bait show the number of direct/indirect experiments. Thenumbers given for the transducers are a(b)/c(d) with a/c being the number of direct/indirect experiments where this transducer was foundas interaction partner, and b/d being the numbers of respective experiments where this transducer was identified at all. The column affinitysummarises the baits which fished the respective transducer as prey. ∗ The soluble transducers clearly associated with CheW2 (Car, Htr13,Htr15) showed the exchange problem in direct fishing. The other soluble and two membrane-bound transducers were also identified in directfishing with CheW2, and also with a SILAC ratio of nearly one. In indirect fishing, they were not identified at all. So it is possible thatthey are also interactors of CheW2 and exhibit the exchange problem. ∗∗ were also found with CheW1 in indirect fishing, but the affinityfor CheW2 is much higher (comparison experiment). ∗∗∗ was not identified in single bait fishing with this CheW, but showed some affinityin the CheW comparison experiment. ∗∗∗∗ Htr18 was not identified with CheA, but its putative associated protein OE2196F.
111
6 Chemotaxis protein interaction network
OE1539F, a conserved protein of unknown function, was fished by the same baits asHtr14 to which it is in genomic proximity, so it might be a Htr14-associated protein.But, unlike the other transducer-associated proteins, it is not directly adjacent in thegenome or exhibits even an overlap. OE1539F homologs in N. pharaonis and H. walsbyiare not in proximity to any transducer (H. walsbyi is neither chemotactic nor motile atall, so it does not code for chemotaxis proteins), which further decreases the likelihoodthat OE1539F is a transducer-associated protein.
6.2.2.4 Other Che Proteins
The other Che proteins are not directly connected to the core. Indirect connectionsto the core occur from CheD and CheC2 to OE2402F and OE2404R, which interactwith CheY, and via some connectors (see 6.2.2.5).
CheD appeared not only as connector to the core, but also as a hub for the otherChe proteins. It was found to interact with CheC2, CheC3, CheB, and the unknownproteins OE2401F, OE2402F, and OE2404R. This important place in the network is inagreement with the high conservation of CheD throughout chemotactic bacteria andarchaea (Szurmant and Ordal, 2004), and also with the severe phenotype of a CheDdeletion (compare Table 6.1). However, the function of the CheD protein remains to beelucidated – in B. subtilis and T. maritima, receptor deamidase activity of CheD wasdemonstrated (Kristich and Ordal, 2002; Chao et al., 2006), but this is not the casefor H. salinarum (Koch, 2005). The study performed in T. maritima demonstratedalso receptor methylesterase activity for CheD. This function of CheD has not beendescribed for any other organism, and it is not clear if CheD demethylates receptorsin H. salinarum (Koch et al., 2008).
H. salinarum expresses three CheC proteins. From these, CheC1 and CheC2, bothconsisting of one CheC domain, were found to interact. CheC3, which consists of twoCheC domains, was not detected to interact with another CheC. So it can be specu-lated that there are two functional CheC units in H. salinarum: one is the heterodimerbuilt from CheC1 and CheC2, the other one is CheC3. The deletion of either CheC1or CheC2, however, results in different phenotypes (see Table 6.1), meaning that theremaining partner is still able to perform some function. Both CheC2 and CheC3,but not CheC1, were shown to interact with CheD, so that both putative CheC unitsinteract with CheD.
112
6.2 Results and Discussion
An interaction between CheC2 and the proteins OE2402F and OE2404R was de-tected. These proteins were demonstrated to belong to a new class of archaeal chemo-taxis proteins that might act at the interface between the Che system and the archaealflagellum (see chapter 7).
CheC1 was shown to interact with CheB. CheB is as receptor methylesterase a keyplayer in adaptation. The methylesterase activity is controlled by the phosphorylationstatus of its response regulator domain. So it can be speculated that one of theCheCs, which are thought to be CheY-P phosphatases, also dephosphorylates CheB-P.Additionally, CheB exhibited an interaction with CheD. Together, these interactionsmight provide some regulation of or feedback to the reception and adaptation system.Such a feedback mechanism in B. subtilis is described in 6.2.3.
CheR showed no direct connection to any of the other Che proteins. This is not thatsurprising since CheR is thought to be constitutively active (Simms et al., 1987). Asmentioned above, an interaction of CheR and CheB with the halobacterial transducerswas, with the exception of CheR-Htr12, not detectable.
The proteins OE2401F, OE2402F, and OE2404R, which were identified as interac-tors of CheY, CheD, and CheC2, have been characterised further by follow-up exper-iments and bioinformatic analysis. These results are presented in chapter 7.
6.2.2.5 Connectors: Hubs or sticky background
Some preys came up as interactors in several experiments. The proteins OE1428F,OE1560R, OE1783F, OE3227F, OE3943R, and OE4260R were found with at leastthree not directly interacting baits and therefore considered as promiscuous. Theseproteins might either be hubs in the network and therefore are of particular impor-tance, or they are unspecific binders and possibly totally unrelated. One of theseproteins, OE1428F, was used as bait for reciprocal fishing, and the interaction withone Che protein, CheD, could be confirmed. The confirmed interaction is a strongevidence that OE1428F is indeed connected to the Che proteins. The other proteinshave not been tested as baits, and their place in the network should be viewed withcaution.
OE1428F was fished with CheY, OE2402F, CheD, CheC3, CheR, and OE4643R.The interaction with CheD could be reciprocally confirmed. OE1428F is a protein ofunknown function, without any known domain or motif. Homologs were only detected
113
6 Chemotaxis protein interaction network
in the halophilic archaea Haloarcula marismortui and Halorubrum lacusprofundi. Thetotal lack of information about this protein makes it impossible to draw conclusionsabout its role in the Che network.
OE1560R was associated with CheC3, OE1620R, OE4643R, and CheW1. It is an-notated as conserved hypothetical protein. Homologs are found in several archaealspecies, including non-chemotactic ones like H. walsbyi. Domain search with the pro-tein sequence of OE1560R against InterPro (Mulder et al., 2007) and Pfam (Finnet al., 2006, 2008) finds significant hits to DUF516 (InterPro; DUF means domain ofunknown function) and the family tRNA_deacylase (Pfam entry PF04414).
OE1783F was a prey of CheW2, CheC3, CheB, and CheC2. It is annotated as SufBdomain protein. SufB is the permease component of an ABC-type transport systeminvolved in Fe-S cluster assembly. In the genome, OE1783F is located next to theother components of this transport system. Homologs are found in many archaea andbacteria, including non-chemotactic archaea.
OE3227F is annotated as “homolog to nicotinate-nucleotide dimethylbenzimidazolephosphoribosyltransferase”. It was fished by CheA, CheB, CheC3, and CheY. Byhomology search (Psi-Blast), it was not possible to find any confirmation for thisannotation, but OE3227F is located at the end of the cobalamin biosynthesis operon,and the enzymatic activity in the annotation is involved in cobalamin biosynthesis.Homologs are found in H. marismortui, N. pharaonis, and the three Methanosarcinaspecies. All of these species contain chemotaxis genes.
OE3943R was fished with OE1620R, CheW2, OE2401F, CheR, CheC3, CheB,CheY, and CheW1. It is annotated as conserved hypothetical protein. Domainsearching revealed that it contains the Pfam domain DUF1743, which is “found inmany hypothetical proteins and predicted DNA-binding proteins such as transcription-associated proteins” (Pfam). This protein also belongs to the cluster of orthologousgroups (Tatusov et al., 1997, 2003) COG1571 (“Predicted DNA-binding protein con-taining a Zn-ribbon domain”). Homologs are found in many archaea and bacteria,including non-chemotactic archaea.
OE4260R was a prey of CheW2, OE2402F, CheB, and OE4643R. Its annotation is“probable N-acetyltransferase (EC 2.3.1.-)”. OE4260R belongs to COG1670 (“RimL,Acetyltransferases, including N-acetylases of ribosomal proteins”) and the Pfam familyAcetyltransf_1 (PF00583). Homologs are found in a variety of bacteria and, withweaker homology, in some archaea, including non-chemotactic species.
114
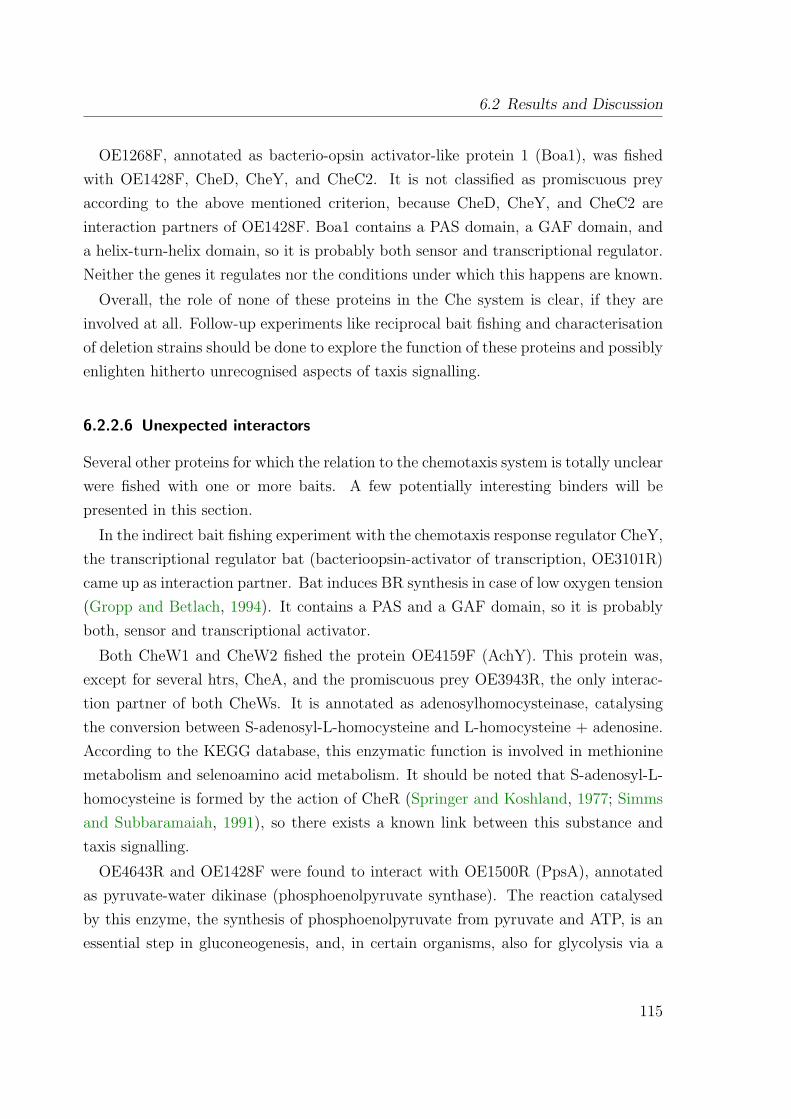
6.2 Results and Discussion
OE1268F, annotated as bacterio-opsin activator-like protein 1 (Boa1), was fishedwith OE1428F, CheD, CheY, and CheC2. It is not classified as promiscuous preyaccording to the above mentioned criterion, because CheD, CheY, and CheC2 areinteraction partners of OE1428F. Boa1 contains a PAS domain, a GAF domain, anda helix-turn-helix domain, so it is probably both sensor and transcriptional regulator.Neither the genes it regulates nor the conditions under which this happens are known.
Overall, the role of none of these proteins in the Che system is clear, if they areinvolved at all. Follow-up experiments like reciprocal bait fishing and characterisationof deletion strains should be done to explore the function of these proteins and possiblyenlighten hitherto unrecognised aspects of taxis signalling.
6.2.2.6 Unexpected interactors
Several other proteins for which the relation to the chemotaxis system is totally unclearwere fished with one or more baits. A few potentially interesting binders will bepresented in this section.
In the indirect bait fishing experiment with the chemotaxis response regulator CheY,the transcriptional regulator bat (bacterioopsin-activator of transcription, OE3101R)came up as interaction partner. Bat induces BR synthesis in case of low oxygen tension(Gropp and Betlach, 1994). It contains a PAS and a GAF domain, so it is probablyboth, sensor and transcriptional activator.
Both CheW1 and CheW2 fished the protein OE4159F (AchY). This protein was,except for several htrs, CheA, and the promiscuous prey OE3943R, the only interac-tion partner of both CheWs. It is annotated as adenosylhomocysteinase, catalysingthe conversion between S-adenosyl-L-homocysteine and L-homocysteine + adenosine.According to the KEGG database, this enzymatic function is involved in methioninemetabolism and selenoamino acid metabolism. It should be noted that S-adenosyl-L-homocysteine is formed by the action of CheR (Springer and Koshland, 1977; Simmsand Subbaramaiah, 1991), so there exists a known link between this substance andtaxis signalling.
OE4643R and OE1428F were found to interact with OE1500R (PpsA), annotatedas pyruvate-water dikinase (phosphoenolpyruvate synthase). The reaction catalysedby this enzyme, the synthesis of phosphoenolpyruvate from pyruvate and ATP, is anessential step in gluconeogenesis, and, in certain organisms, also for glycolysis via a
115
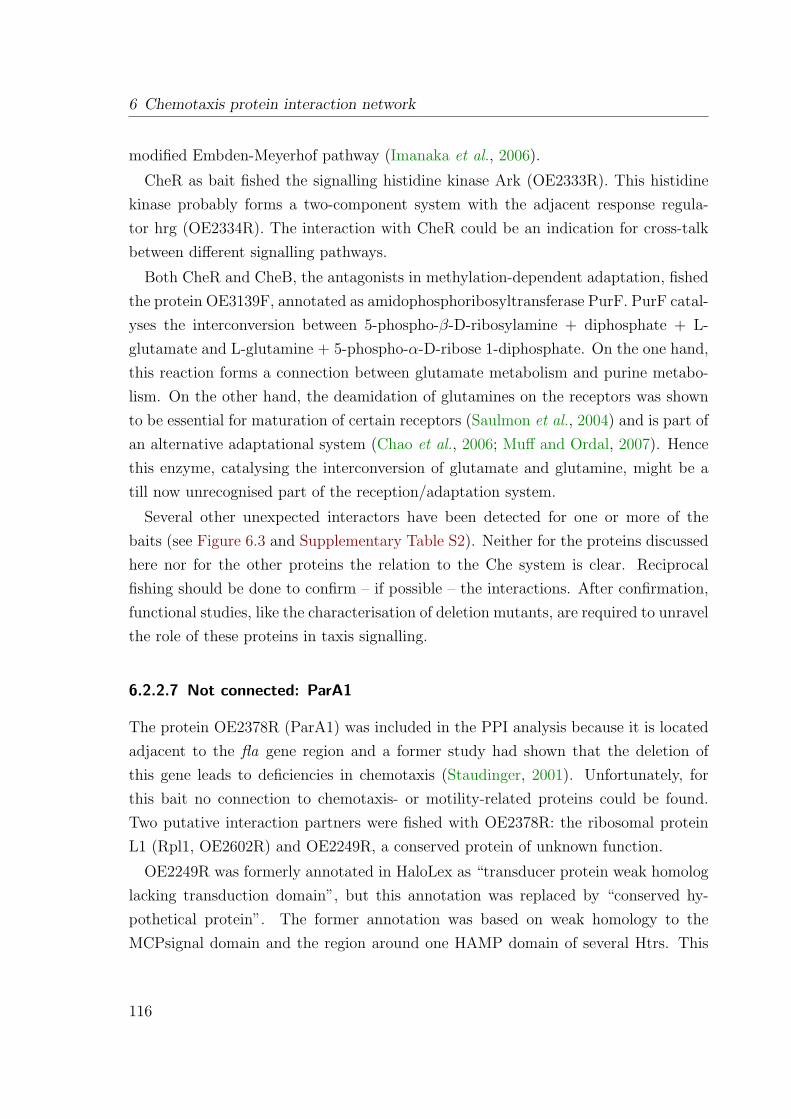
6 Chemotaxis protein interaction network
modified Embden-Meyerhof pathway (Imanaka et al., 2006).
CheR as bait fished the signalling histidine kinase Ark (OE2333R). This histidinekinase probably forms a two-component system with the adjacent response regula-tor hrg (OE2334R). The interaction with CheR could be an indication for cross-talkbetween different signalling pathways.
Both CheR and CheB, the antagonists in methylation-dependent adaptation, fishedthe protein OE3139F, annotated as amidophosphoribosyltransferase PurF. PurF catal-yses the interconversion between 5-phospho-β-D-ribosylamine + diphosphate + L-glutamate and L-glutamine + 5-phospho-α-D-ribose 1-diphosphate. On the one hand,this reaction forms a connection between glutamate metabolism and purine metabo-lism. On the other hand, the deamidation of glutamines on the receptors was shownto be essential for maturation of certain receptors (Saulmon et al., 2004) and is part ofan alternative adaptational system (Chao et al., 2006; Muff and Ordal, 2007). Hencethis enzyme, catalysing the interconversion of glutamate and glutamine, might be atill now unrecognised part of the reception/adaptation system.
Several other unexpected interactors have been detected for one or more of thebaits (see Figure 6.3 and Supplementary Table S2). Neither for the proteins discussedhere nor for the other proteins the relation to the Che system is clear. Reciprocalfishing should be done to confirm – if possible – the interactions. After confirmation,functional studies, like the characterisation of deletion mutants, are required to unravelthe role of these proteins in taxis signalling.
6.2.2.7 Not connected: ParA1
The protein OE2378R (ParA1) was included in the PPI analysis because it is locatedadjacent to the fla gene region and a former study had shown that the deletion ofthis gene leads to deficiencies in chemotaxis (Staudinger, 2001). Unfortunately, forthis bait no connection to chemotaxis- or motility-related proteins could be found.Two putative interaction partners were fished with OE2378R: the ribosomal proteinL1 (Rpl1, OE2602R) and OE2249R, a conserved protein of unknown function.
OE2249R was formerly annotated in HaloLex as “transducer protein weak homologlacking transduction domain”, but this annotation was replaced by “conserved hy-pothetical protein”. The former annotation was based on weak homology to theMCPsignal domain and the region around one HAMP domain of several Htrs. This
116
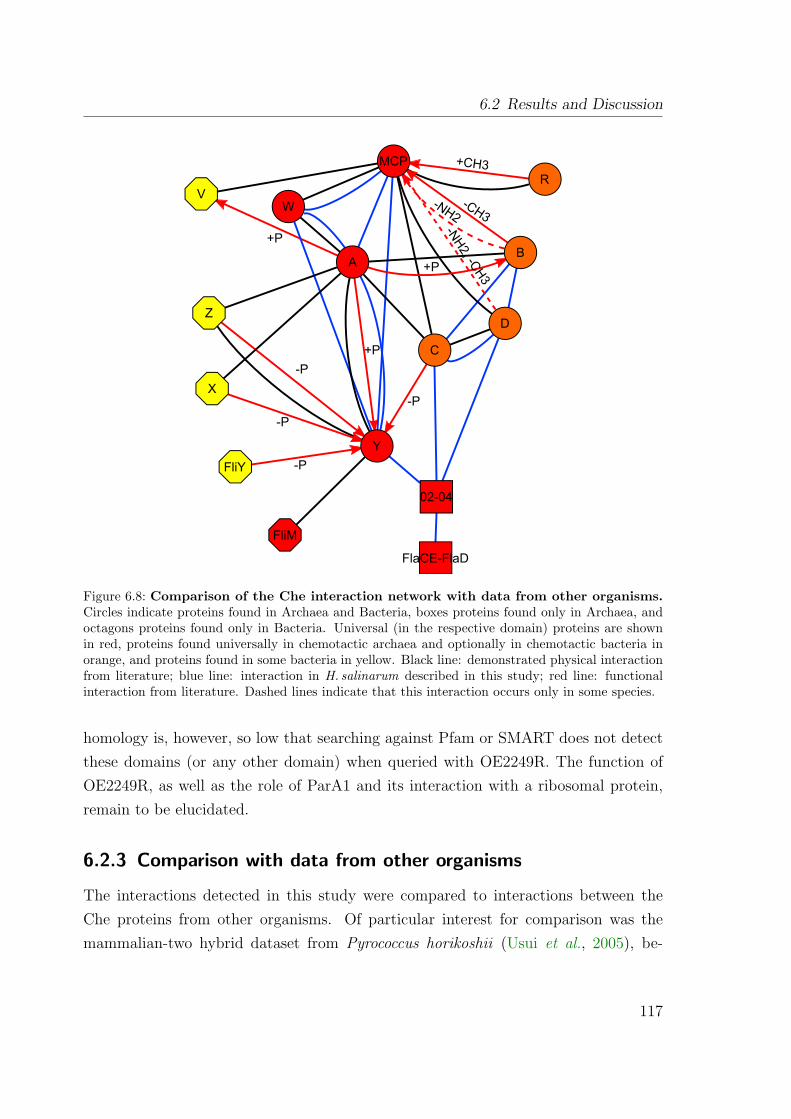
6.2 Results and Discussion
MCP
A
WV
Z
X
FliY
FliM
Y
C
D
B
R
02-04
FlaCE-FlaD
+CH3
-CH3-NH2
-NH
2, -CH
3
+P
+P
-P
-P
+P
-P
-P
Figure 6.8: Comparison of the Che interaction network with data from other organisms.Circles indicate proteins found in Archaea and Bacteria, boxes proteins found only in Archaea, andoctagons proteins found only in Bacteria. Universal (in the respective domain) proteins are shownin red, proteins found universally in chemotactic archaea and optionally in chemotactic bacteria inorange, and proteins found in some bacteria in yellow. Black line: demonstrated physical interactionfrom literature; blue line: interaction in H. salinarum described in this study; red line: functionalinteraction from literature. Dashed lines indicate that this interaction occurs only in some species.
homology is, however, so low that searching against Pfam or SMART does not detectthese domains (or any other domain) when queried with OE2249R. The function ofOE2249R, as well as the role of ParA1 and its interaction with a ribosomal protein,remain to be elucidated.
6.2.3 Comparison with data from other organisms
The interactions detected in this study were compared to interactions between theChe proteins from other organisms. Of particular interest for comparison was themammalian-two hybrid dataset from Pyrococcus horikoshii (Usui et al., 2005), be-
117
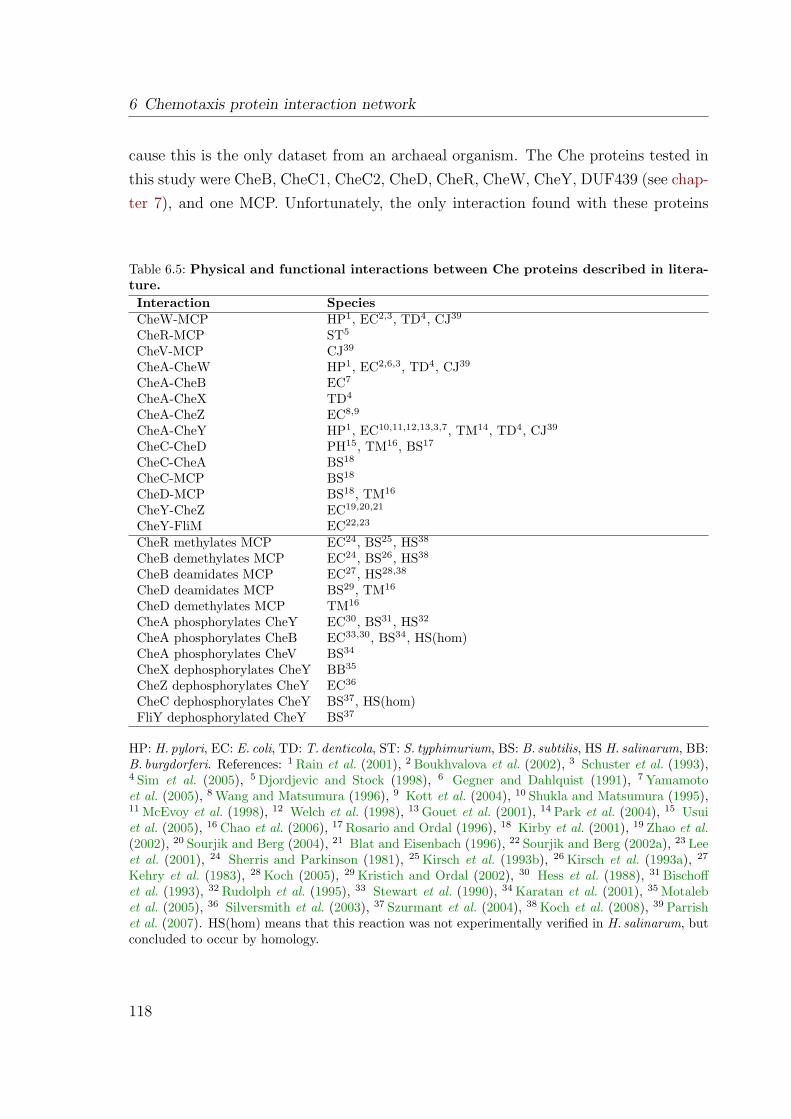
6 Chemotaxis protein interaction network
cause this is the only dataset from an archaeal organism. The Che proteins tested inthis study were CheB, CheC1, CheC2, CheD, CheR, CheW, CheY, DUF439 (see chap-ter 7), and one MCP. Unfortunately, the only interaction found with these proteins
Table 6.5: Physical and functional interactions between Che proteins described in litera-ture.
Interaction SpeciesCheW-MCP HP1, EC2,3, TD4, CJ39
CheR-MCP ST5
CheV-MCP CJ39
CheA-CheW HP1, EC2,6,3, TD4, CJ39
CheA-CheB EC7
CheA-CheX TD4
CheA-CheZ EC8,9
CheA-CheY HP1, EC10,11,12,13,3,7, TM14, TD4, CJ39
CheC-CheD PH15, TM16, BS17
CheC-CheA BS18
CheC-MCP BS18
CheD-MCP BS18, TM16
CheY-CheZ EC19,20,21
CheY-FliM EC22,23
CheR methylates MCP EC24, BS25, HS38
CheB demethylates MCP EC24, BS26, HS38
CheB deamidates MCP EC27, HS28,38
CheD deamidates MCP BS29, TM16
CheD demethylates MCP TM16
CheA phosphorylates CheY EC30, BS31, HS32
CheA phosphorylates CheB EC33,30, BS34, HS(hom)CheA phosphorylates CheV BS34
CheX dephosphorylates CheY BB35
CheZ dephosphorylates CheY EC36
CheC dephosphorylates CheY BS37, HS(hom)FliY dephosphorylated CheY BS37
HP: H. pylori, EC: E. coli, TD: T. denticola, ST: S. typhimurium, BS: B. subtilis, HS H. salinarum, BB:B. burgdorferi. References: 1 Rain et al. (2001), 2 Boukhvalova et al. (2002), 3 Schuster et al. (1993),4 Sim et al. (2005), 5 Djordjevic and Stock (1998), 6 Gegner and Dahlquist (1991), 7 Yamamotoet al. (2005), 8 Wang and Matsumura (1996), 9 Kott et al. (2004), 10 Shukla and Matsumura (1995),11 McEvoy et al. (1998), 12 Welch et al. (1998), 13 Gouet et al. (2001), 14 Park et al. (2004), 15 Usuiet al. (2005), 16 Chao et al. (2006), 17 Rosario and Ordal (1996), 18 Kirby et al. (2001), 19 Zhao et al.(2002), 20 Sourjik and Berg (2004), 21 Blat and Eisenbach (1996), 22 Sourjik and Berg (2002a), 23 Leeet al. (2001), 24 Sherris and Parkinson (1981), 25 Kirsch et al. (1993b), 26 Kirsch et al. (1993a), 27
Kehry et al. (1983), 28 Koch (2005), 29 Kristich and Ordal (2002), 30 Hess et al. (1988), 31 Bischoffet al. (1993), 32 Rudolph et al. (1995), 33 Stewart et al. (1990), 34 Karatan et al. (2001), 35 Motalebet al. (2005), 36 Silversmith et al. (2003), 37 Szurmant et al. (2004), 38 Koch et al. (2008), 39 Parrishet al. (2007). HS(hom) means that this reaction was not experimentally verified in H. salinarum, butconcluded to occur by homology.
118
6.2 Results and Discussion
was CheC1-CheD, so that a detailed comparison with the H. salinarum dataset is notpossible. Generally, the interaction detection in that study was rather low; the mam-malian two-hybrid system might not be the optimal method to analyse interactions ofproteins from a hyperthermophilic archaeon.
In the two large-scale studies carried out in E. coli by Butland et al. (2005) andArifuzzaman et al. (2006), only interactions between CheW and two MCPs were iden-tified, and several proteins not expected to be related to chemotaxis fished with someChe proteins. There was, however, no overlap with the unexpected proteins fished inthe present study.
Another large-scale dataset was produced in H. pylori by Y2H analysis. This or-ganism has a rather simple chemotaxis system, with only four MCPs, CheA, CheW,CheY, and three CheVs (Tomb et al., 1997; O’Toole et al., 2000). In this study theinteractions MCP-CheW-CheA-CheY were detected, as well as interactions with someunexpected proteins (no overlap to E. coli and H. salinarum unexpected proteins).Further large-scale Y2H datasets exist for Campylobacter jejuni (Parrish et al., 2007)and Treponema pallidum (Rajagopala et al., 2007). In C. jejuni, interactions betweenMCPs-CheV and MCPs-CheW-CheA-CheY were detected. Although this organismcodes for CheR and CheB (Parkhill et al., 2000), no interactions for these proteinswere reported. CheC and CheD are not present in C. jejuni. The T. pallidum datasetdoes not contain interactions between Che proteins.
Since large-scale studies did not deliver adequate data for comparison, the STRING(von Mering et al., 2007) and BIND (Alfarano et al., 2005) databases were queriedfor respective data from smaller studies carried out in any prokaryotic organism, andliterature searching was done. Additionally, functional interactions (i. e. enzymaticreactions) between the Che and related proteins were collected from PubMed. Result-ing data (Table 6.5) was used to draw a general Che protein interaction network (Fig-ure 6.8). Most of the reported interactions were found in E. coli and the spirochaeteT. denticola, only four physical interactions were reported for B. subtilis. This weak-ens the comparison with the H. salinarum network, which is with regard to the usedproteins more closely related to the one from B. subtilis. For example, neither E. colinor T. denticola code for a CheC or CheD protein.
The interactions of the core are generally in agreement between H. salinarum andother organism’s data. The H. salinarum dataset contains probably indirect interac-tions (CheY-CheW, CheY-MCP) because it was generated by AP-MS. In the data-
119
6 Chemotaxis protein interaction network
bases, no direct interaction between CheA and MCPs is deposited. In literature, it isreported that the CheA-MCP association generally depends on CheW (Gegner et al.,1992). A direct (weak) CheA-MCP interaction was suggested for inhibitory signalling(Ames and Parkinson, 1994) in E. coli. A direct interaction with CheA, however, islikely to occur in H. salinarum, because some transducers were fished with CheA, butnot with either of the CheWs (see 6.2.2.3).
Interactions of CheR and CheB with Htrs could not be demonstrated in H. salinarum(except CheR-Htr12). In the databases, there is only one reference for a physical inter-action between CheR and a MCP, based on a crystal structure after co-crystallisation.That means that these interactions seem to be hard to detect with PPI analysis meth-ods.
CheD plays an important role in the H. salinarum interaction network: it was foundto interact with CheC2, CheC3, CheB, and OE2401F, OE2402F, and OE2404R (seechapter 7). Of these, only the interaction with CheC has been described before. In-stead of this, in B. subtilis an interaction of CheD with the MCPs was identified by Y2Hanalysis (Kirby et al., 2001). Such an interaction was not detected in H. salinarum.This might be due to different functions of CheD in both organisms (see subsubsec-tion 6.1.1.3).
The interaction between CheC and CheD was earlier demonstrated in B. subtilis andinterpreted as feedback loop to the transducers via CheD’s deamidase activity, whichis decreased by CheC binding (Muff and Ordal, 2007). Furthermore, the interactionwith CheD increased the CheY-P dephosphorylation activity of CheC 5-fold (Szurmantet al., 2004). CheY-P stabilises the CheC-CheD complex, thus closing the feedbackcircuit. The role of the CheC-CheD interaction in H. salinarum remains unclear. Aneffect on the activity of CheC is possible, whereas a feedback loop to the transducersin unlikely due to the lack of receptor deamidase activity of CheD.
Such a feedback loop could be formed by the CheD-CheB and CheC1-CheB in-teractions detected in this study. CheC1-CheB-CheD in H. salinarum might thus beanalogue to CheD-CheC in B. subtilis.
In this study, an interaction between CheC2 and the proteins OE2402F and OE2404Rwas detected. These proteins were found to interact both with Che proteins (CheY,CheD, CheC2) and with the flagella-accessory proteins FlaCE and FlaD (these pro-teins are discussed in detail in chapter 7). Hence they might be constituents of orbe associated with the archaeal flagellar motor switch. Provided that this hypothesis
120
6.3 Conclusions
holds true, the interaction with CheC2 might reflect a situation similar to B. subtilis :In this organism, FliY, the main CheY-P phosphatase, is localised at the flagellarmotor switch, and CheC, the second CheY-P phosphatase, at the signalling complex(Szurmant et al., 2004). A direct or indirect interaction of one of the CheCs withthe signalling complex was, however, not identified in H. salinarum. Generally, phos-phatase localisation turned out to be a conserved and important principle in bacterialchemotaxis systems (Rao et al., 2005).
6.3 Conclusions
The protein interaction study generally confirmed the expected topology of the coreof the taxis signalling system: interactions between CheA, CheW1, CheY, and severalHtrs could be detected. With PurH/N and OE4643R two unexpected interactorsof the core or CheA, respectively, have been identified, whose functional role shouldbe enlightened in follow-up experiments. For the two CheW proteins, CheW1 andCheW2, different interactions have been detected. CheW1 seems to be the maincoupling protein for the formation of stable signalling complexes between the Htrs andCheA. The different Htrs as preys revealed nonuniform interaction patterns: some Htrswere associated to CheW1, CheW2, CheA, and CheY, others mainly with CheW2, athird group with CheA and CheY, but none of the two CheWs, and a fourth group wasnot fished at all. The underlying principle behind these different affinities remainedunclear. The interactions of the other Che proteins were difficult to interprete becausefor most of these proteins the function is not or not completely known. An unexpectedfinding was the central position of CheD in the Che interaction network, indicatingthat this protein might play a key role in the halobacterial taxis signalling system.
Overall, the results of this study demonstrate that the halobacterial taxis signallingsystem exhibits numerous facets that have not been discovered so far. Even thoughthe PPI analysis alone did not allow to explain any of these new aspects, it delivered agreat amount of starting points for follow-up experiments, and it contributed valuableknowledge for the understanding of this signal transduction network.
121

6 Chemotaxis protein interaction network
122
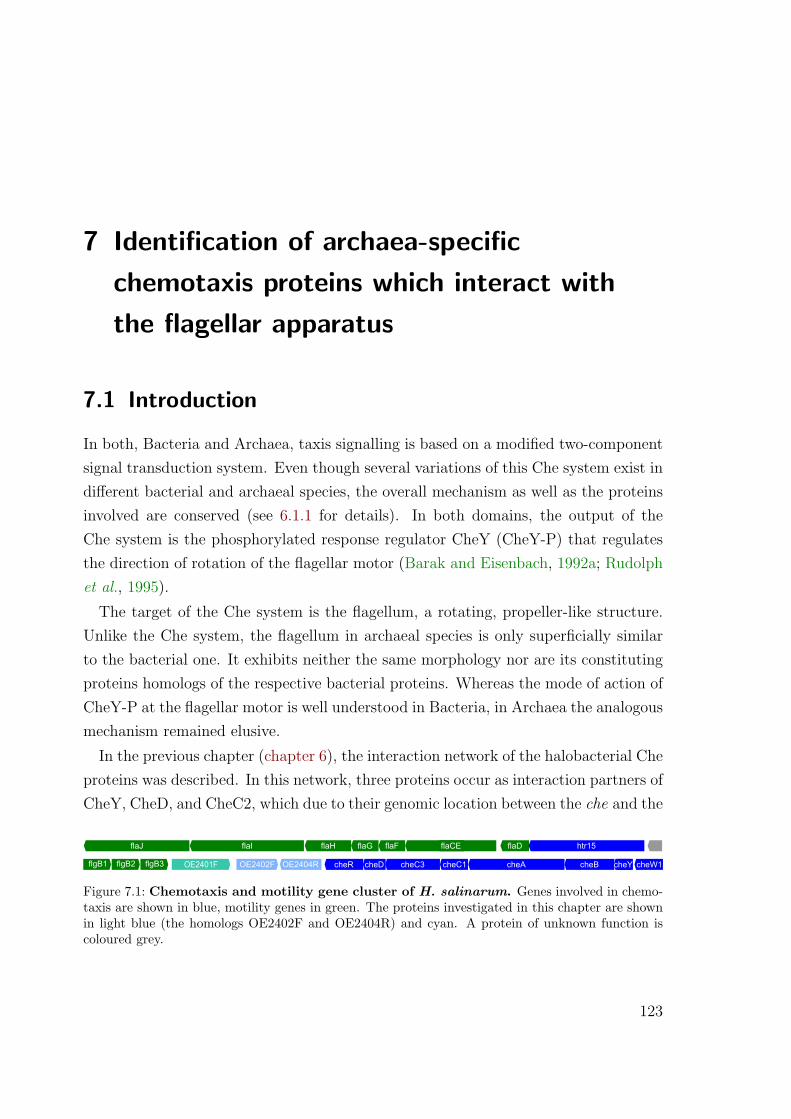
7 Identification of archaea-specificchemotaxis proteins which interact withthe flagellar apparatus
7.1 Introduction
In both, Bacteria and Archaea, taxis signalling is based on a modified two-componentsignal transduction system. Even though several variations of this Che system exist indifferent bacterial and archaeal species, the overall mechanism as well as the proteinsinvolved are conserved (see 6.1.1 for details). In both domains, the output of theChe system is the phosphorylated response regulator CheY (CheY-P) that regulatesthe direction of rotation of the flagellar motor (Barak and Eisenbach, 1992a; Rudolphet al., 1995).
The target of the Che system is the flagellum, a rotating, propeller-like structure.Unlike the Che system, the flagellum in archaeal species is only superficially similarto the bacterial one. It exhibits neither the same morphology nor are its constitutingproteins homologs of the respective bacterial proteins. Whereas the mode of action ofCheY-P at the flagellar motor is well understood in Bacteria, in Archaea the analogousmechanism remained elusive.
In the previous chapter (chapter 6), the interaction network of the halobacterial Cheproteins was described. In this network, three proteins occur as interaction partners ofCheY, CheD, and CheC2, which due to their genomic location between the che and the
flaJ flaI flaH flaG flaF flaCE flaD htr15
flgB1 flgB2 flgB3 OE2401F OE2402F OE2404R cheR cheD cheC3 cheC1 cheA cheB cheY cheW1
Figure 7.1: Chemotaxis and motility gene cluster of H. salinarum. Genes involved in chemo-taxis are shown in blue, motility genes in green. The proteins investigated in this chapter are shownin light blue (the homologs OE2402F and OE2404R) and cyan. A protein of unknown function iscoloured grey.
123
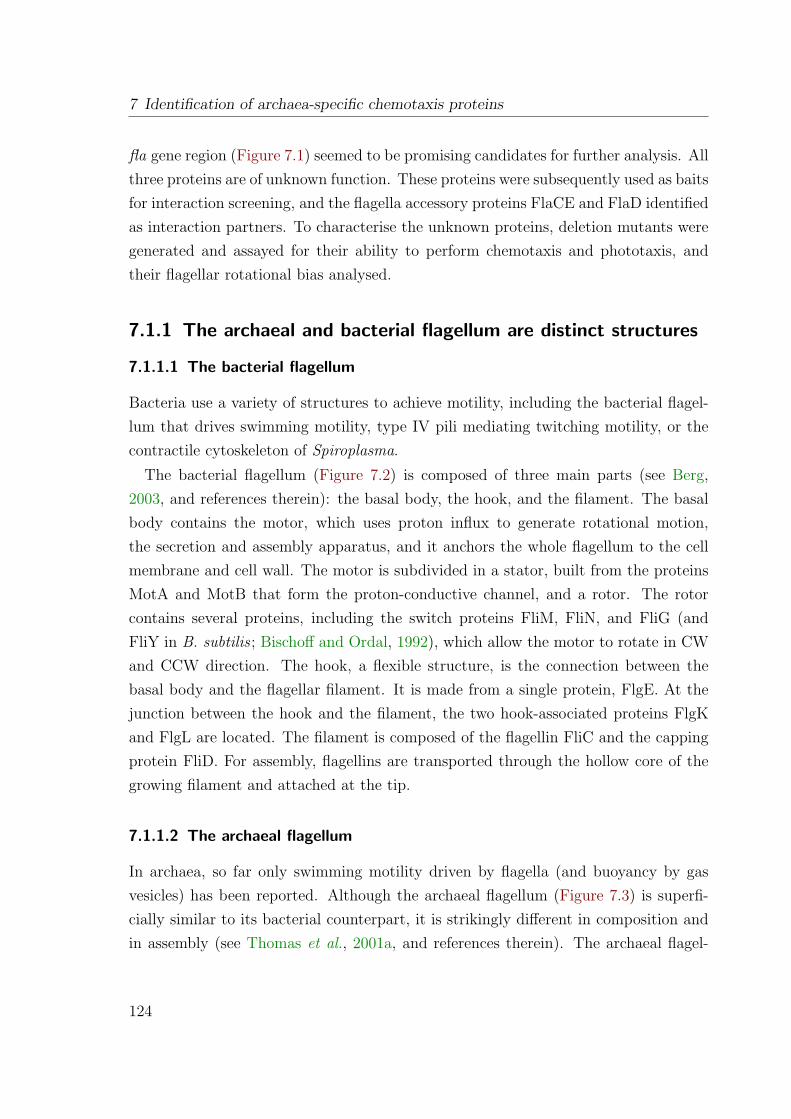
7 Identification of archaea-specific chemotaxis proteins
fla gene region (Figure 7.1) seemed to be promising candidates for further analysis. Allthree proteins are of unknown function. These proteins were subsequently used as baitsfor interaction screening, and the flagella accessory proteins FlaCE and FlaD identifiedas interaction partners. To characterise the unknown proteins, deletion mutants weregenerated and assayed for their ability to perform chemotaxis and phototaxis, andtheir flagellar rotational bias analysed.
7.1.1 The archaeal and bacterial flagellum are distinct structures
7.1.1.1 The bacterial flagellum
Bacteria use a variety of structures to achieve motility, including the bacterial flagel-lum that drives swimming motility, type IV pili mediating twitching motility, or thecontractile cytoskeleton of Spiroplasma.
The bacterial flagellum (Figure 7.2) is composed of three main parts (see Berg,2003, and references therein): the basal body, the hook, and the filament. The basalbody contains the motor, which uses proton influx to generate rotational motion,the secretion and assembly apparatus, and it anchors the whole flagellum to the cellmembrane and cell wall. The motor is subdivided in a stator, built from the proteinsMotA and MotB that form the proton-conductive channel, and a rotor. The rotorcontains several proteins, including the switch proteins FliM, FliN, and FliG (andFliY in B. subtilis ; Bischoff and Ordal, 1992), which allow the motor to rotate in CWand CCW direction. The hook, a flexible structure, is the connection between thebasal body and the flagellar filament. It is made from a single protein, FlgE. At thejunction between the hook and the filament, the two hook-associated proteins FlgKand FlgL are located. The filament is composed of the flagellin FliC and the cappingprotein FliD. For assembly, flagellins are transported through the hollow core of thegrowing filament and attached at the tip.
7.1.1.2 The archaeal flagellum
In archaea, so far only swimming motility driven by flagella (and buoyancy by gasvesicles) has been reported. Although the archaeal flagellum (Figure 7.3) is superfi-cially similar to its bacterial counterpart, it is strikingly different in composition andin assembly (see Thomas et al., 2001a, and references therein). The archaeal flagel-
124
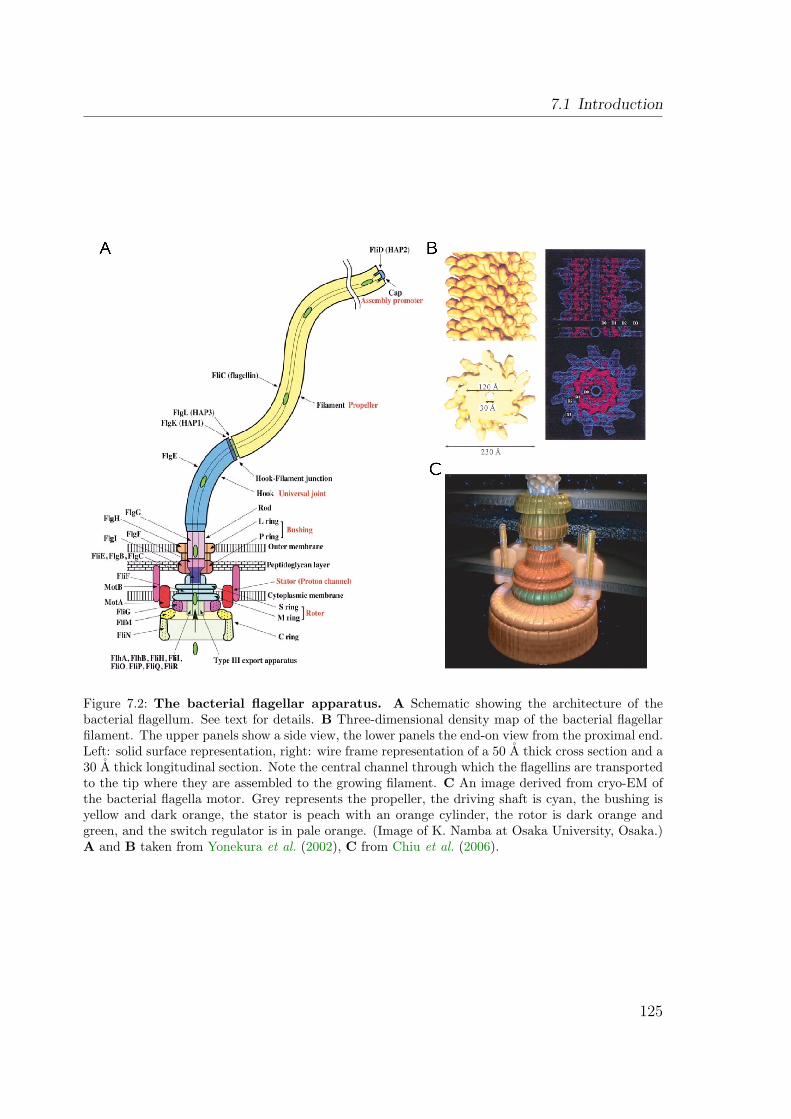
7.1 Introduction
Figure 7.2: The bacterial flagellar apparatus. A Schematic showing the architecture of thebacterial flagellum. See text for details. B Three-dimensional density map of the bacterial flagellarfilament. The upper panels show a side view, the lower panels the end-on view from the proximal end.Left: solid surface representation, right: wire frame representation of a 50 Å thick cross section and a30 Å thick longitudinal section. Note the central channel through which the flagellins are transportedto the tip where they are assembled to the growing filament. C An image derived from cryo-EM ofthe bacterial flagella motor. Grey represents the propeller, the driving shaft is cyan, the bushing isyellow and dark orange, the stator is peach with an orange cylinder, the rotor is dark orange andgreen, and the switch regulator is in pale orange. (Image of K. Namba at Osaka University, Osaka.)A and B taken from Yonekura et al. (2002), C from Chiu et al. (2006).
125
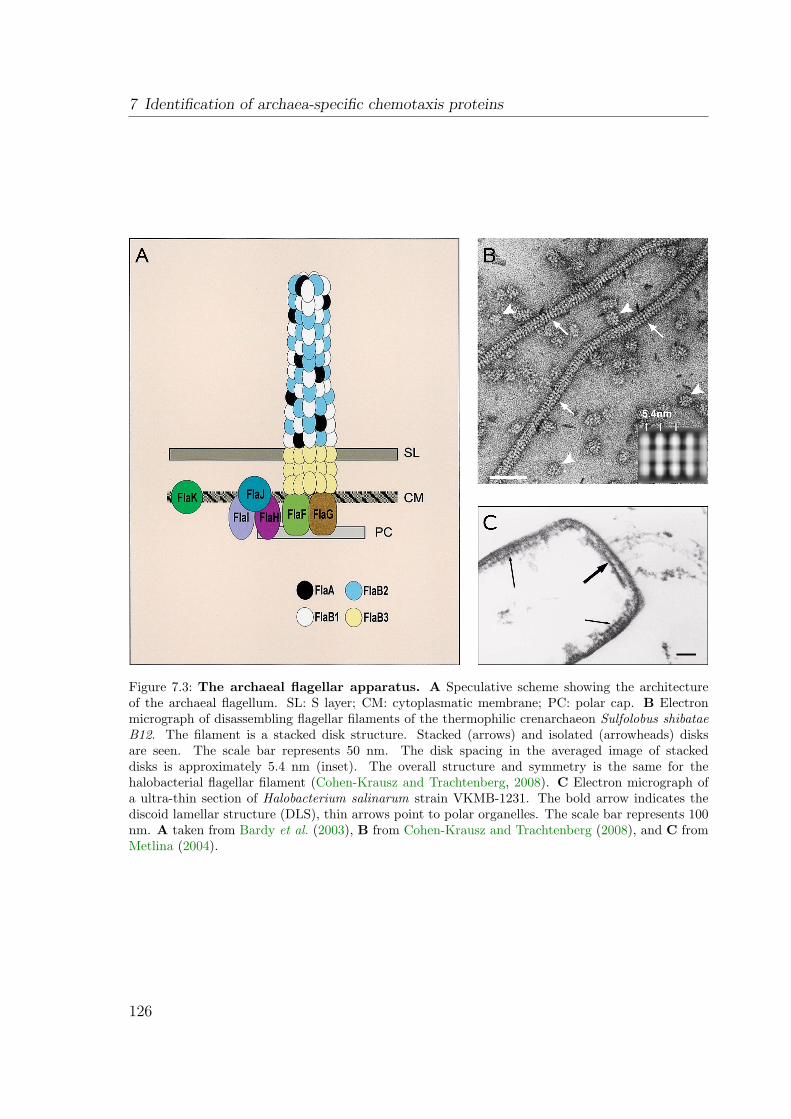
7 Identification of archaea-specific chemotaxis proteins
Figure 7.3: The archaeal flagellar apparatus. A Speculative scheme showing the architectureof the archaeal flagellum. SL: S layer; CM: cytoplasmatic membrane; PC: polar cap. B Electronmicrograph of disassembling flagellar filaments of the thermophilic crenarchaeon Sulfolobus shibataeB12. The filament is a stacked disk structure. Stacked (arrows) and isolated (arrowheads) disksare seen. The scale bar represents 50 nm. The disk spacing in the averaged image of stackeddisks is approximately 5.4 nm (inset). The overall structure and symmetry is the same for thehalobacterial flagellar filament (Cohen-Krausz and Trachtenberg, 2008). C Electron micrograph ofa ultra-thin section of Halobacterium salinarum strain VKMB-1231. The bold arrow indicates thediscoid lamellar structure (DLS), thin arrows point to polar organelles. The scale bar represents 100nm. A taken from Bardy et al. (2003), B from Cohen-Krausz and Trachtenberg (2008), and C fromMetlina (2004).
126
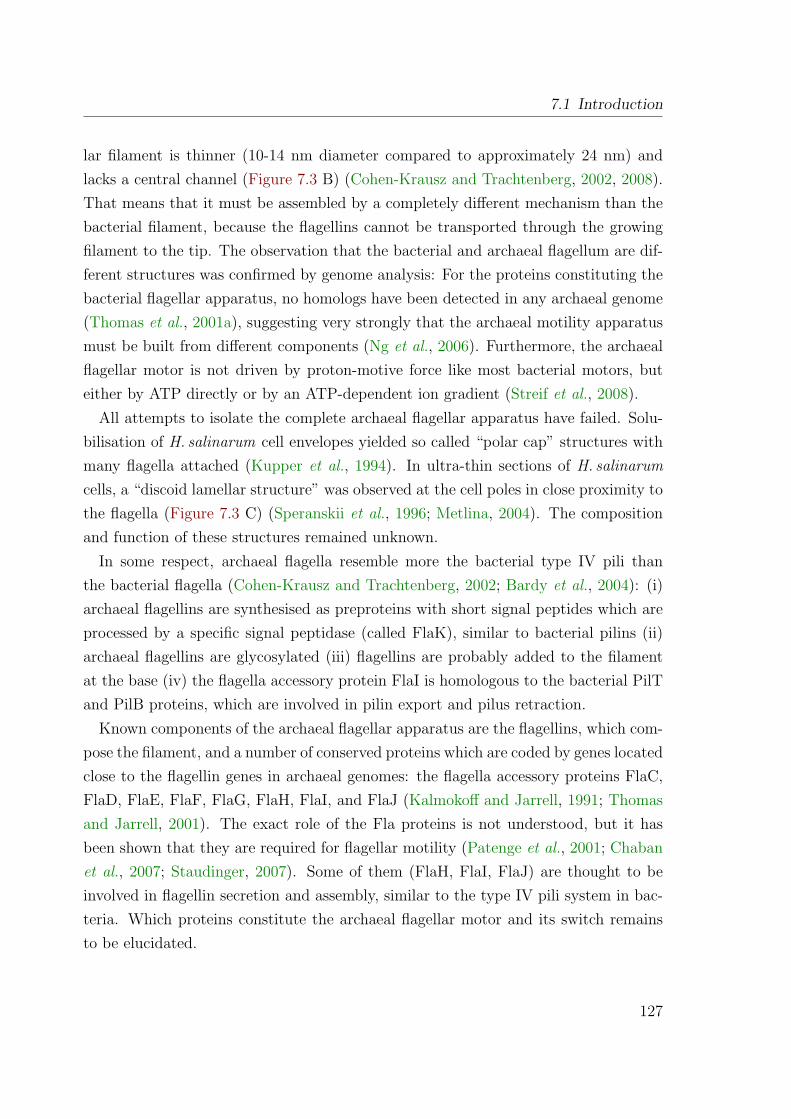
7.1 Introduction
lar filament is thinner (10-14 nm diameter compared to approximately 24 nm) andlacks a central channel (Figure 7.3 B) (Cohen-Krausz and Trachtenberg, 2002, 2008).That means that it must be assembled by a completely different mechanism than thebacterial filament, because the flagellins cannot be transported through the growingfilament to the tip. The observation that the bacterial and archaeal flagellum are dif-ferent structures was confirmed by genome analysis: For the proteins constituting thebacterial flagellar apparatus, no homologs have been detected in any archaeal genome(Thomas et al., 2001a), suggesting very strongly that the archaeal motility apparatusmust be built from different components (Ng et al., 2006). Furthermore, the archaealflagellar motor is not driven by proton-motive force like most bacterial motors, buteither by ATP directly or by an ATP-dependent ion gradient (Streif et al., 2008).
All attempts to isolate the complete archaeal flagellar apparatus have failed. Solu-bilisation of H. salinarum cell envelopes yielded so called “polar cap” structures withmany flagella attached (Kupper et al., 1994). In ultra-thin sections of H. salinarumcells, a “discoid lamellar structure” was observed at the cell poles in close proximity tothe flagella (Figure 7.3 C) (Speranskii et al., 1996; Metlina, 2004). The compositionand function of these structures remained unknown.
In some respect, archaeal flagella resemble more the bacterial type IV pili thanthe bacterial flagella (Cohen-Krausz and Trachtenberg, 2002; Bardy et al., 2004): (i)archaeal flagellins are synthesised as preproteins with short signal peptides which areprocessed by a specific signal peptidase (called FlaK), similar to bacterial pilins (ii)archaeal flagellins are glycosylated (iii) flagellins are probably added to the filamentat the base (iv) the flagella accessory protein FlaI is homologous to the bacterial PilTand PilB proteins, which are involved in pilin export and pilus retraction.
Known components of the archaeal flagellar apparatus are the flagellins, which com-pose the filament, and a number of conserved proteins which are coded by genes locatedclose to the flagellin genes in archaeal genomes: the flagella accessory proteins FlaC,FlaD, FlaE, FlaF, FlaG, FlaH, FlaI, and FlaJ (Kalmokoff and Jarrell, 1991; Thomasand Jarrell, 2001). The exact role of the Fla proteins is not understood, but it hasbeen shown that they are required for flagellar motility (Patenge et al., 2001; Chabanet al., 2007; Staudinger, 2007). Some of them (FlaH, FlaI, FlaJ) are thought to beinvolved in flagellin secretion and assembly, similar to the type IV pili system in bac-teria. Which proteins constitute the archaeal flagellar motor and its switch remainsto be elucidated.
127
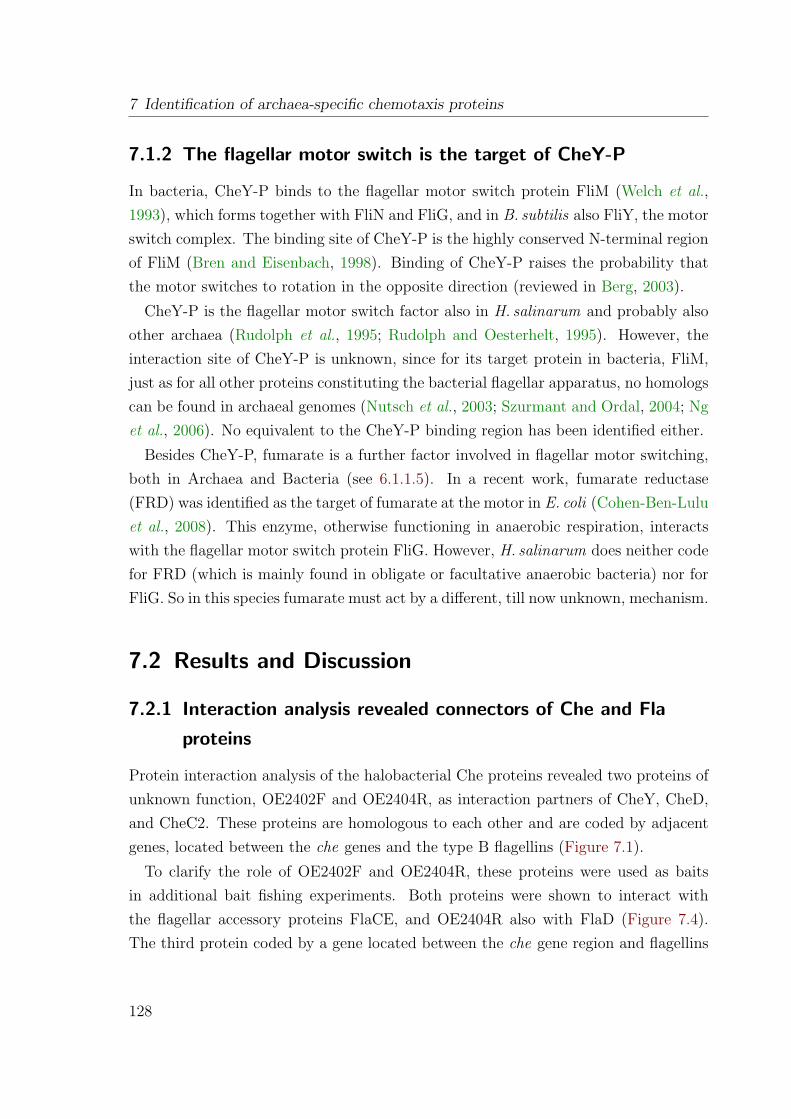
7 Identification of archaea-specific chemotaxis proteins
7.1.2 The flagellar motor switch is the target of CheY-P
In bacteria, CheY-P binds to the flagellar motor switch protein FliM (Welch et al.,1993), which forms together with FliN and FliG, and in B. subtilis also FliY, the motorswitch complex. The binding site of CheY-P is the highly conserved N-terminal regionof FliM (Bren and Eisenbach, 1998). Binding of CheY-P raises the probability thatthe motor switches to rotation in the opposite direction (reviewed in Berg, 2003).
CheY-P is the flagellar motor switch factor also in H. salinarum and probably alsoother archaea (Rudolph et al., 1995; Rudolph and Oesterhelt, 1995). However, theinteraction site of CheY-P is unknown, since for its target protein in bacteria, FliM,just as for all other proteins constituting the bacterial flagellar apparatus, no homologscan be found in archaeal genomes (Nutsch et al., 2003; Szurmant and Ordal, 2004; Nget al., 2006). No equivalent to the CheY-P binding region has been identified either.
Besides CheY-P, fumarate is a further factor involved in flagellar motor switching,both in Archaea and Bacteria (see 6.1.1.5). In a recent work, fumarate reductase(FRD) was identified as the target of fumarate at the motor in E. coli (Cohen-Ben-Luluet al., 2008). This enzyme, otherwise functioning in anaerobic respiration, interactswith the flagellar motor switch protein FliG. However, H. salinarum does neither codefor FRD (which is mainly found in obligate or facultative anaerobic bacteria) nor forFliG. So in this species fumarate must act by a different, till now unknown, mechanism.
7.2 Results and Discussion
7.2.1 Interaction analysis revealed connectors of Che and Fla
proteins
Protein interaction analysis of the halobacterial Che proteins revealed two proteins ofunknown function, OE2402F and OE2404R, as interaction partners of CheY, CheD,and CheC2. These proteins are homologous to each other and are coded by adjacentgenes, located between the che genes and the type B flagellins (Figure 7.1).
To clarify the role of OE2402F and OE2404R, these proteins were used as baitsin additional bait fishing experiments. Both proteins were shown to interact withthe flagellar accessory proteins FlaCE, and OE2404R also with FlaD (Figure 7.4).The third protein coded by a gene located between the che gene region and flagellins
128
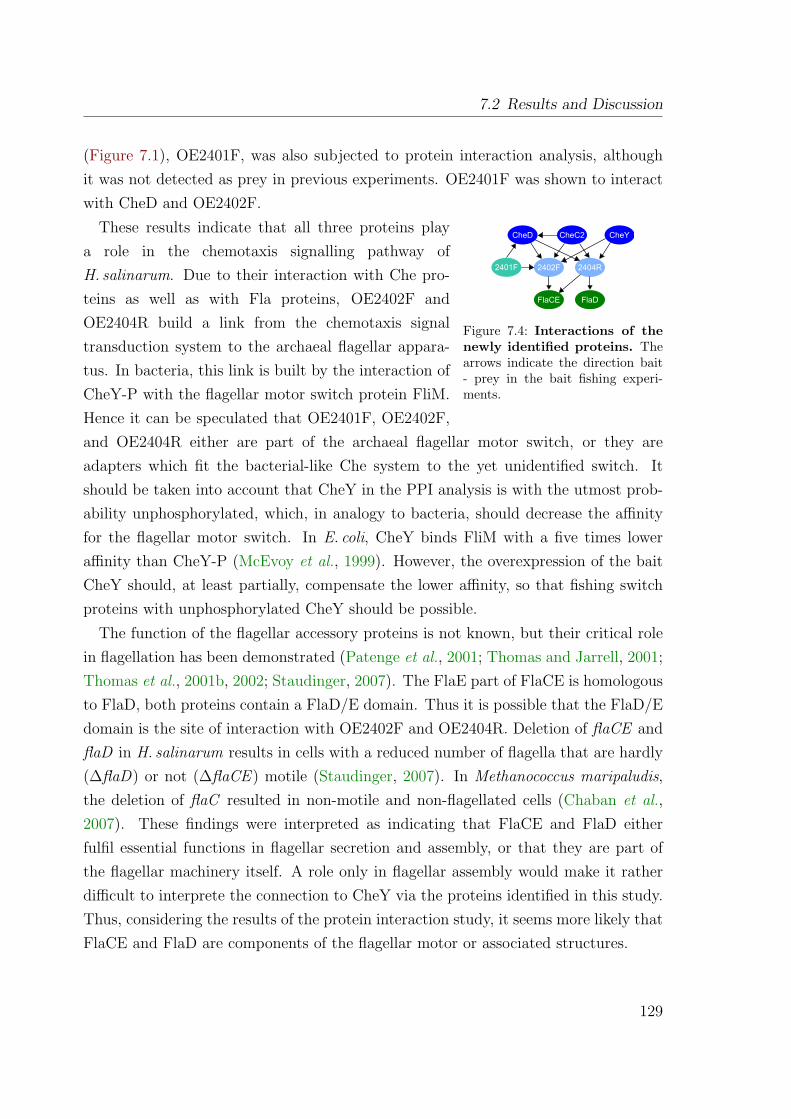
7.2 Results and Discussion
(Figure 7.1), OE2401F, was also subjected to protein interaction analysis, althoughit was not detected as prey in previous experiments. OE2401F was shown to interactwith CheD and OE2402F.
CheD CheY
2401F 2402F 2404R
FlaCE FlaD
CheC2
Figure 7.4: Interactions of thenewly identified proteins. Thearrows indicate the direction bait- prey in the bait fishing experi-ments.
These results indicate that all three proteins playa role in the chemotaxis signalling pathway ofH. salinarum. Due to their interaction with Che pro-teins as well as with Fla proteins, OE2402F andOE2404R build a link from the chemotaxis signaltransduction system to the archaeal flagellar appara-tus. In bacteria, this link is built by the interaction ofCheY-P with the flagellar motor switch protein FliM.Hence it can be speculated that OE2401F, OE2402F,and OE2404R either are part of the archaeal flagellar motor switch, or they areadapters which fit the bacterial-like Che system to the yet unidentified switch. Itshould be taken into account that CheY in the PPI analysis is with the utmost prob-ability unphosphorylated, which, in analogy to bacteria, should decrease the affinityfor the flagellar motor switch. In E. coli, CheY binds FliM with a five times loweraffinity than CheY-P (McEvoy et al., 1999). However, the overexpression of the baitCheY should, at least partially, compensate the lower affinity, so that fishing switchproteins with unphosphorylated CheY should be possible.
The function of the flagellar accessory proteins is not known, but their critical rolein flagellation has been demonstrated (Patenge et al., 2001; Thomas and Jarrell, 2001;Thomas et al., 2001b, 2002; Staudinger, 2007). The FlaE part of FlaCE is homologousto FlaD, both proteins contain a FlaD/E domain. Thus it is possible that the FlaD/Edomain is the site of interaction with OE2402F and OE2404R. Deletion of flaCE andflaD in H. salinarum results in cells with a reduced number of flagella that are hardly(∆flaD) or not (∆flaCE ) motile (Staudinger, 2007). In Methanococcus maripaludis,the deletion of flaC resulted in non-motile and non-flagellated cells (Chaban et al.,2007). These findings were interpreted as indicating that FlaCE and FlaD eitherfulfil essential functions in flagellar secretion and assembly, or that they are part ofthe flagellar machinery itself. A role only in flagellar assembly would make it ratherdifficult to interprete the connection to CheY via the proteins identified in this study.Thus, considering the results of the protein interaction study, it seems more likely thatFlaCE and FlaD are components of the flagellar motor or associated structures.
129
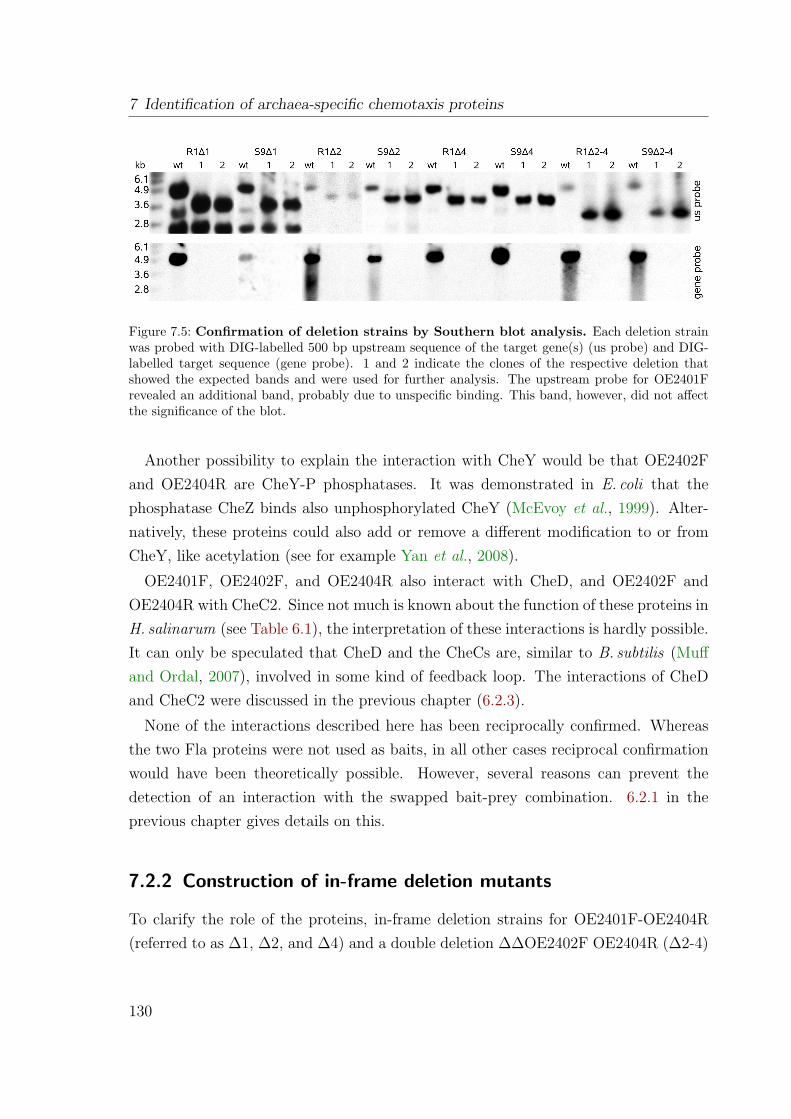
7 Identification of archaea-specific chemotaxis proteins
Figure 7.5: Confirmation of deletion strains by Southern blot analysis. Each deletion strainwas probed with DIG-labelled 500 bp upstream sequence of the target gene(s) (us probe) and DIG-labelled target sequence (gene probe). 1 and 2 indicate the clones of the respective deletion thatshowed the expected bands and were used for further analysis. The upstream probe for OE2401Frevealed an additional band, probably due to unspecific binding. This band, however, did not affectthe significance of the blot.
Another possibility to explain the interaction with CheY would be that OE2402Fand OE2404R are CheY-P phosphatases. It was demonstrated in E. coli that thephosphatase CheZ binds also unphosphorylated CheY (McEvoy et al., 1999). Alter-natively, these proteins could also add or remove a different modification to or fromCheY, like acetylation (see for example Yan et al., 2008).
OE2401F, OE2402F, and OE2404R also interact with CheD, and OE2402F andOE2404R with CheC2. Since not much is known about the function of these proteins inH. salinarum (see Table 6.1), the interpretation of these interactions is hardly possible.It can only be speculated that CheD and the CheCs are, similar to B. subtilis (Muffand Ordal, 2007), involved in some kind of feedback loop. The interactions of CheDand CheC2 were discussed in the previous chapter (6.2.3).
None of the interactions described here has been reciprocally confirmed. Whereasthe two Fla proteins were not used as baits, in all other cases reciprocal confirmationwould have been theoretically possible. However, several reasons can prevent thedetection of an interaction with the swapped bait-prey combination. 6.2.1 in theprevious chapter gives details on this.
7.2.2 Construction of in-frame deletion mutants
To clarify the role of the proteins, in-frame deletion strains for OE2401F-OE2404R(referred to as ∆1, ∆2, and ∆4) and a double deletion ∆∆OE2402F OE2404R (∆2-4)
130
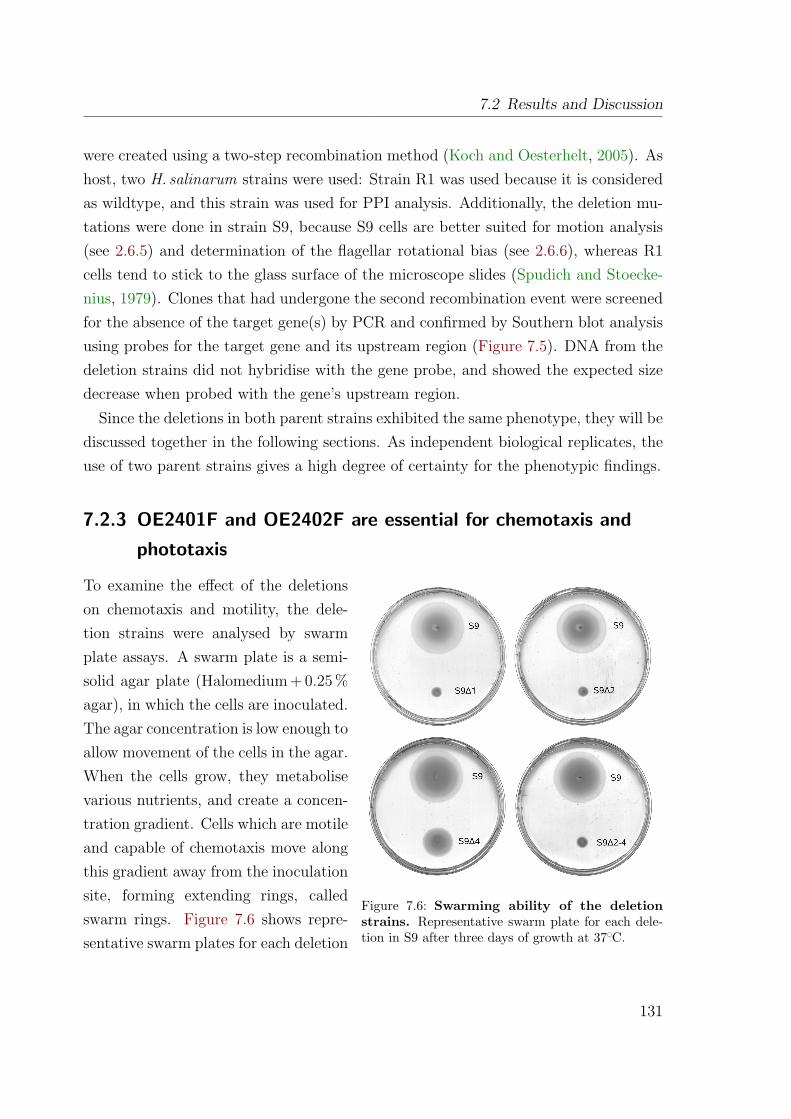
7.2 Results and Discussion
were created using a two-step recombination method (Koch and Oesterhelt, 2005). Ashost, two H. salinarum strains were used: Strain R1 was used because it is consideredas wildtype, and this strain was used for PPI analysis. Additionally, the deletion mu-tations were done in strain S9, because S9 cells are better suited for motion analysis(see 2.6.5) and determination of the flagellar rotational bias (see 2.6.6), whereas R1cells tend to stick to the glass surface of the microscope slides (Spudich and Stoecke-nius, 1979). Clones that had undergone the second recombination event were screenedfor the absence of the target gene(s) by PCR and confirmed by Southern blot analysisusing probes for the target gene and its upstream region (Figure 7.5). DNA from thedeletion strains did not hybridise with the gene probe, and showed the expected sizedecrease when probed with the gene’s upstream region.
Since the deletions in both parent strains exhibited the same phenotype, they will bediscussed together in the following sections. As independent biological replicates, theuse of two parent strains gives a high degree of certainty for the phenotypic findings.
7.2.3 OE2401F and OE2402F are essential for chemotaxis and
phototaxis
Figure 7.6: Swarming ability of the deletionstrains. Representative swarm plate for each dele-tion in S9 after three days of growth at 37°C.
To examine the effect of the deletionson chemotaxis and motility, the dele-tion strains were analysed by swarmplate assays. A swarm plate is a semi-solid agar plate (Halomedium + 0.25 %agar), in which the cells are inoculated.The agar concentration is low enough toallow movement of the cells in the agar.When the cells grow, they metabolisevarious nutrients, and create a concen-tration gradient. Cells which are motileand capable of chemotaxis move alongthis gradient away from the inoculationsite, forming extending rings, calledswarm rings. Figure 7.6 shows repre-sentative swarm plates for each deletion
131
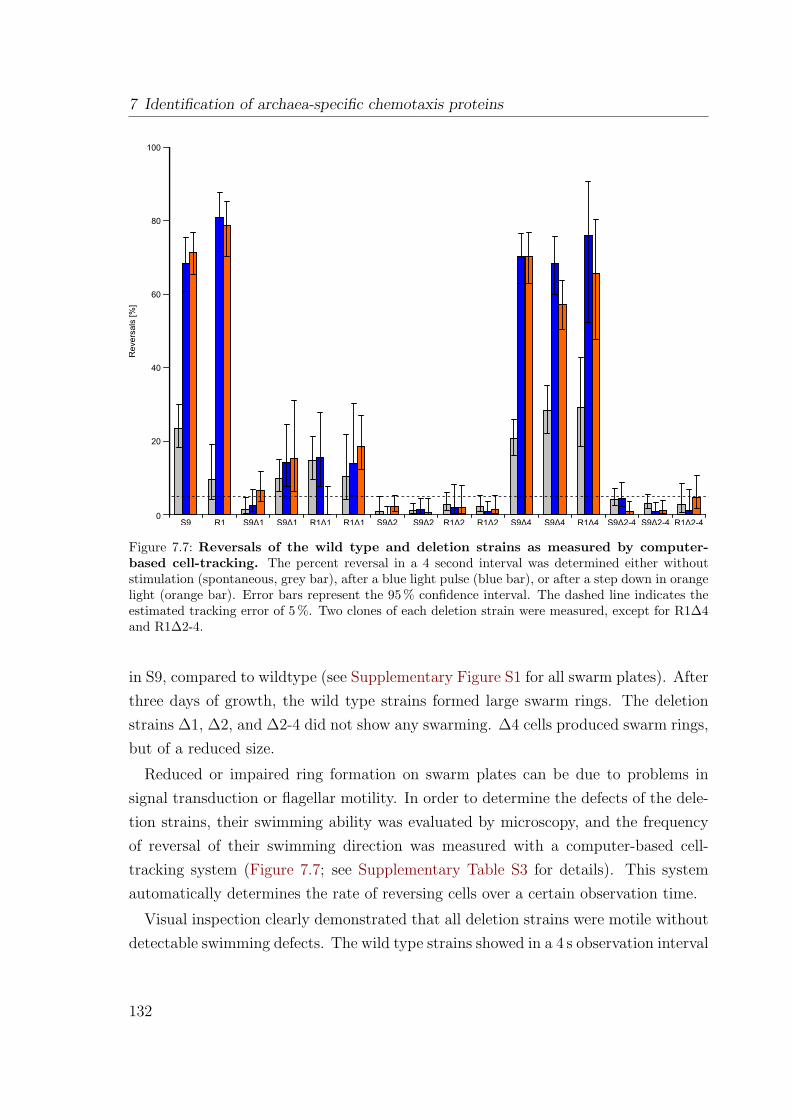
7 Identification of archaea-specific chemotaxis proteinsR
ever
sals
[%]
0
20
40
60
80
100
S9 S9Δ1 S9Δ2 S9Δ2 S9Δ4 S9Δ4 S9Δ2-4 S9Δ2-4R1 R1Δ1 R1Δ1 R1Δ2 R1Δ2 R1Δ4 R1Δ2-4S9Δ1
Figure 7.7: Reversals of the wild type and deletion strains as measured by computer-based cell-tracking. The percent reversal in a 4 second interval was determined either withoutstimulation (spontaneous, grey bar), after a blue light pulse (blue bar), or after a step down in orangelight (orange bar). Error bars represent the 95 % confidence interval. The dashed line indicates theestimated tracking error of 5 %. Two clones of each deletion strain were measured, except for R1∆4and R1∆2-4.
in S9, compared to wildtype (see Supplementary Figure S1 for all swarm plates). Afterthree days of growth, the wild type strains formed large swarm rings. The deletionstrains ∆1, ∆2, and ∆2-4 did not show any swarming. ∆4 cells produced swarm rings,but of a reduced size.
Reduced or impaired ring formation on swarm plates can be due to problems insignal transduction or flagellar motility. In order to determine the defects of the dele-tion strains, their swimming ability was evaluated by microscopy, and the frequencyof reversal of their swimming direction was measured with a computer-based cell-tracking system (Figure 7.7; see Supplementary Table S3 for details). This systemautomatically determines the rate of reversing cells over a certain observation time.
Visual inspection clearly demonstrated that all deletion strains were motile withoutdetectable swimming defects. The wild type strains showed in a 4 s observation interval
132
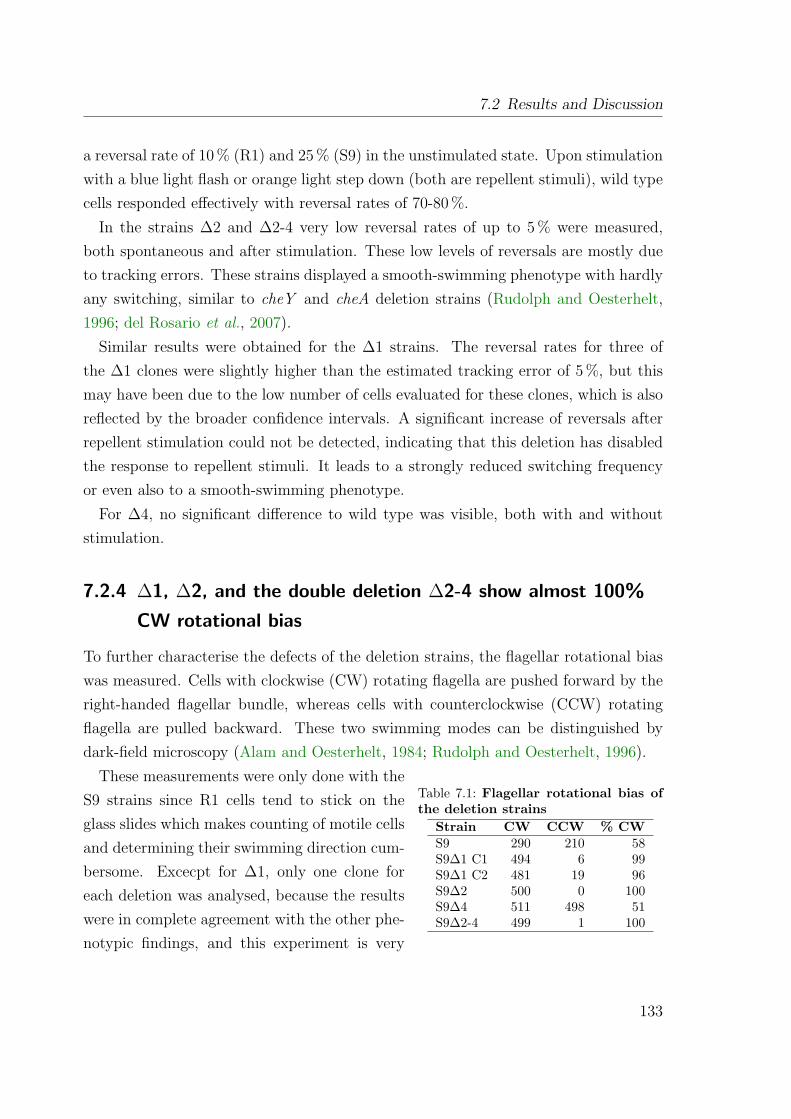
7.2 Results and Discussion
a reversal rate of 10 % (R1) and 25 % (S9) in the unstimulated state. Upon stimulationwith a blue light flash or orange light step down (both are repellent stimuli), wild typecells responded effectively with reversal rates of 70-80 %.
In the strains ∆2 and ∆2-4 very low reversal rates of up to 5 % were measured,both spontaneous and after stimulation. These low levels of reversals are mostly dueto tracking errors. These strains displayed a smooth-swimming phenotype with hardlyany switching, similar to cheY and cheA deletion strains (Rudolph and Oesterhelt,1996; del Rosario et al., 2007).
Similar results were obtained for the ∆1 strains. The reversal rates for three ofthe ∆1 clones were slightly higher than the estimated tracking error of 5 %, but thismay have been due to the low number of cells evaluated for these clones, which is alsoreflected by the broader confidence intervals. A significant increase of reversals afterrepellent stimulation could not be detected, indicating that this deletion has disabledthe response to repellent stimuli. It leads to a strongly reduced switching frequencyor even also to a smooth-swimming phenotype.
For ∆4, no significant difference to wild type was visible, both with and withoutstimulation.
7.2.4 ∆1, ∆2, and the double deletion ∆2-4 show almost 100%
CW rotational bias
To further characterise the defects of the deletion strains, the flagellar rotational biaswas measured. Cells with clockwise (CW) rotating flagella are pushed forward by theright-handed flagellar bundle, whereas cells with counterclockwise (CCW) rotatingflagella are pulled backward. These two swimming modes can be distinguished bydark-field microscopy (Alam and Oesterhelt, 1984; Rudolph and Oesterhelt, 1996).
Table 7.1: Flagellar rotational bias ofthe deletion strains
Strain CW CCW % CWS9 290 210 58S9∆1 C1 494 6 99S9∆1 C2 481 19 96S9∆2 500 0 100S9∆4 511 498 51S9∆2-4 499 1 100
These measurements were only done with theS9 strains since R1 cells tend to stick on theglass slides which makes counting of motile cellsand determining their swimming direction cum-bersome. Excecpt for ∆1, only one clone foreach deletion was analysed, because the resultswere in complete agreement with the other phe-notypic findings, and this experiment is very
133
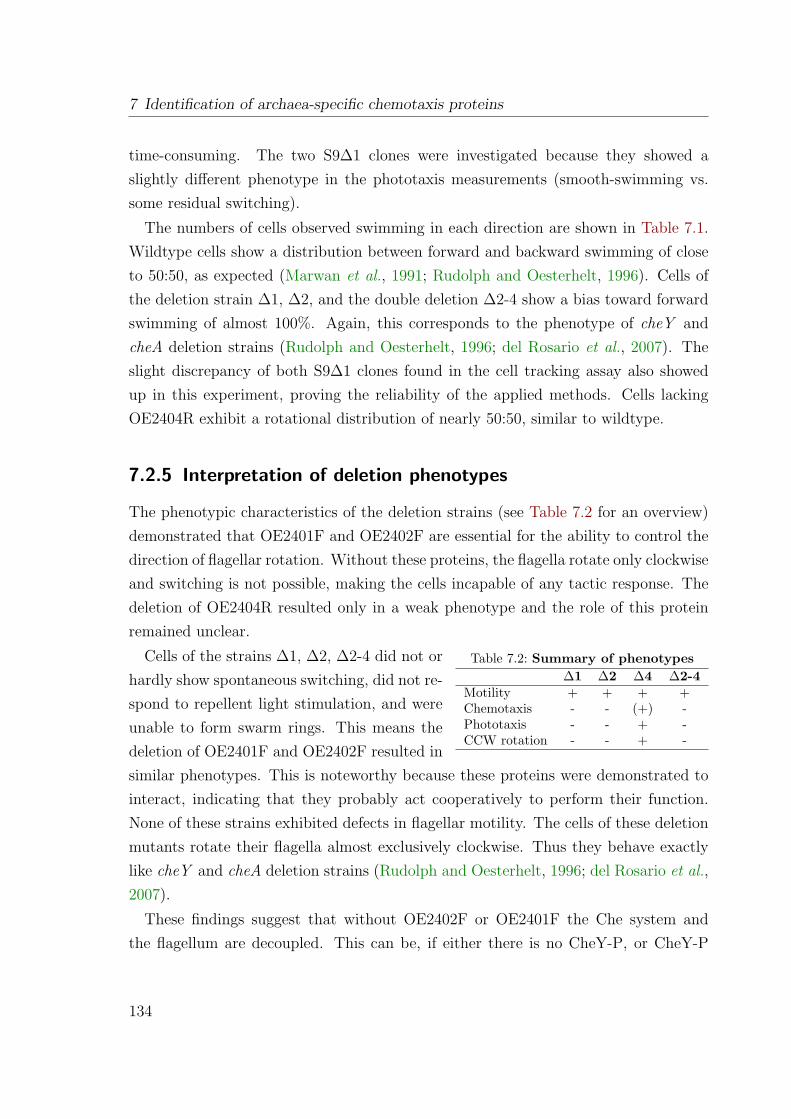
7 Identification of archaea-specific chemotaxis proteins
time-consuming. The two S9∆1 clones were investigated because they showed aslightly different phenotype in the phototaxis measurements (smooth-swimming vs.some residual switching).
The numbers of cells observed swimming in each direction are shown in Table 7.1.Wildtype cells show a distribution between forward and backward swimming of closeto 50:50, as expected (Marwan et al., 1991; Rudolph and Oesterhelt, 1996). Cells ofthe deletion strain ∆1, ∆2, and the double deletion ∆2-4 show a bias toward forwardswimming of almost 100%. Again, this corresponds to the phenotype of cheY andcheA deletion strains (Rudolph and Oesterhelt, 1996; del Rosario et al., 2007). Theslight discrepancy of both S9∆1 clones found in the cell tracking assay also showedup in this experiment, proving the reliability of the applied methods. Cells lackingOE2404R exhibit a rotational distribution of nearly 50:50, similar to wildtype.
7.2.5 Interpretation of deletion phenotypes
The phenotypic characteristics of the deletion strains (see Table 7.2 for an overview)demonstrated that OE2401F and OE2402F are essential for the ability to control thedirection of flagellar rotation. Without these proteins, the flagella rotate only clockwiseand switching is not possible, making the cells incapable of any tactic response. Thedeletion of OE2404R resulted only in a weak phenotype and the role of this proteinremained unclear.
Table 7.2: Summary of phenotypes∆1 ∆2 ∆4 ∆2-4
Motility + + + +Chemotaxis - - (+) -Phototaxis - - + -CCW rotation - - + -
Cells of the strains ∆1, ∆2, ∆2-4 did not orhardly show spontaneous switching, did not re-spond to repellent light stimulation, and wereunable to form swarm rings. This means thedeletion of OE2401F and OE2402F resulted insimilar phenotypes. This is noteworthy because these proteins were demonstrated tointeract, indicating that they probably act cooperatively to perform their function.None of these strains exhibited defects in flagellar motility. The cells of these deletionmutants rotate their flagella almost exclusively clockwise. Thus they behave exactlylike cheY and cheA deletion strains (Rudolph and Oesterhelt, 1996; del Rosario et al.,2007).
These findings suggest that without OE2402F or OE2401F the Che system andthe flagellum are decoupled. This can be, if either there is no CheY-P, or CheY-P
134
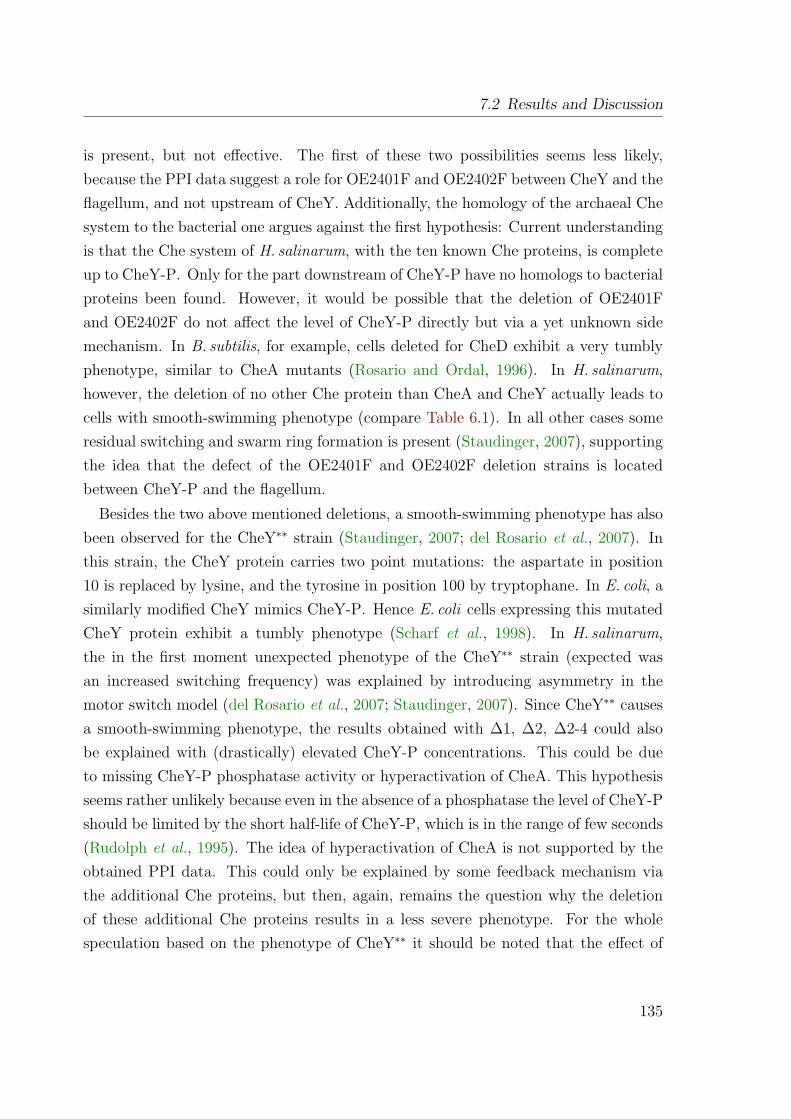
7.2 Results and Discussion
is present, but not effective. The first of these two possibilities seems less likely,because the PPI data suggest a role for OE2401F and OE2402F between CheY and theflagellum, and not upstream of CheY. Additionally, the homology of the archaeal Chesystem to the bacterial one argues against the first hypothesis: Current understandingis that the Che system of H. salinarum, with the ten known Che proteins, is completeup to CheY-P. Only for the part downstream of CheY-P have no homologs to bacterialproteins been found. However, it would be possible that the deletion of OE2401Fand OE2402F do not affect the level of CheY-P directly but via a yet unknown sidemechanism. In B. subtilis, for example, cells deleted for CheD exhibit a very tumblyphenotype, similar to CheA mutants (Rosario and Ordal, 1996). In H. salinarum,however, the deletion of no other Che protein than CheA and CheY actually leads tocells with smooth-swimming phenotype (compare Table 6.1). In all other cases someresidual switching and swarm ring formation is present (Staudinger, 2007), supportingthe idea that the defect of the OE2401F and OE2402F deletion strains is locatedbetween CheY-P and the flagellum.
Besides the two above mentioned deletions, a smooth-swimming phenotype has alsobeen observed for the CheY∗∗ strain (Staudinger, 2007; del Rosario et al., 2007). Inthis strain, the CheY protein carries two point mutations: the aspartate in position10 is replaced by lysine, and the tyrosine in position 100 by tryptophane. In E. coli, asimilarly modified CheY mimics CheY-P. Hence E. coli cells expressing this mutatedCheY protein exhibit a tumbly phenotype (Scharf et al., 1998). In H. salinarum,the in the first moment unexpected phenotype of the CheY∗∗ strain (expected wasan increased switching frequency) was explained by introducing asymmetry in themotor switch model (del Rosario et al., 2007; Staudinger, 2007). Since CheY∗∗ causesa smooth-swimming phenotype, the results obtained with ∆1, ∆2, ∆2-4 could alsobe explained with (drastically) elevated CheY-P concentrations. This could be dueto missing CheY-P phosphatase activity or hyperactivation of CheA. This hypothesisseems rather unlikely because even in the absence of a phosphatase the level of CheY-Pshould be limited by the short half-life of CheY-P, which is in the range of few seconds(Rudolph et al., 1995). The idea of hyperactivation of CheA is not supported by theobtained PPI data. This could only be explained by some feedback mechanism viathe additional Che proteins, but then, again, remains the question why the deletionof these additional Che proteins results in a less severe phenotype. For the wholespeculation based on the phenotype of CheY∗∗ it should be noted that the effect of
135
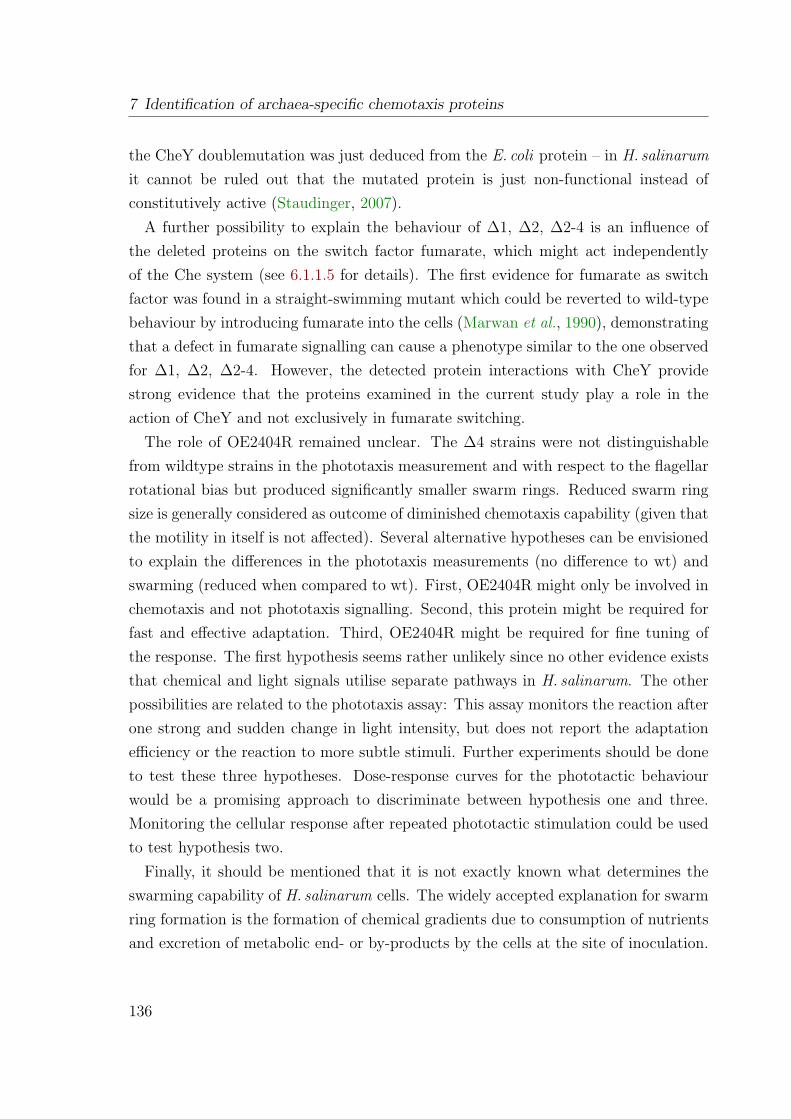
7 Identification of archaea-specific chemotaxis proteins
the CheY doublemutation was just deduced from the E. coli protein – in H. salinarumit cannot be ruled out that the mutated protein is just non-functional instead ofconstitutively active (Staudinger, 2007).
A further possibility to explain the behaviour of ∆1, ∆2, ∆2-4 is an influence ofthe deleted proteins on the switch factor fumarate, which might act independentlyof the Che system (see 6.1.1.5 for details). The first evidence for fumarate as switchfactor was found in a straight-swimming mutant which could be reverted to wild-typebehaviour by introducing fumarate into the cells (Marwan et al., 1990), demonstratingthat a defect in fumarate signalling can cause a phenotype similar to the one observedfor ∆1, ∆2, ∆2-4. However, the detected protein interactions with CheY providestrong evidence that the proteins examined in the current study play a role in theaction of CheY and not exclusively in fumarate switching.
The role of OE2404R remained unclear. The ∆4 strains were not distinguishablefrom wildtype strains in the phototaxis measurement and with respect to the flagellarrotational bias but produced significantly smaller swarm rings. Reduced swarm ringsize is generally considered as outcome of diminished chemotaxis capability (given thatthe motility in itself is not affected). Several alternative hypotheses can be envisionedto explain the differences in the phototaxis measurements (no difference to wt) andswarming (reduced when compared to wt). First, OE2404R might only be involved inchemotaxis and not phototaxis signalling. Second, this protein might be required forfast and effective adaptation. Third, OE2404R might be required for fine tuning ofthe response. The first hypothesis seems rather unlikely since no other evidence existsthat chemical and light signals utilise separate pathways in H. salinarum. The otherpossibilities are related to the phototaxis assay: This assay monitors the reaction afterone strong and sudden change in light intensity, but does not report the adaptationefficiency or the reaction to more subtle stimuli. Further experiments should be doneto test these three hypotheses. Dose-response curves for the phototactic behaviourwould be a promising approach to discriminate between hypothesis one and three.Monitoring the cellular response after repeated phototactic stimulation could be usedto test hypothesis two.
Finally, it should be mentioned that it is not exactly known what determines theswarming capability of H. salinarum cells. The widely accepted explanation for swarmring formation is the formation of chemical gradients due to consumption of nutrientsand excretion of metabolic end- or by-products by the cells at the site of inoculation.
136
7.2 Results and Discussion
Cells capable of chemotaxis and motility sense these gradients and bias their movementfrom the site of inoculation to the periphery. However, straight-swimming mutantsdo not form swarm rings at all, although straight movement in any direction is thefastest way to reach the periphery. Thus switching seems to be crucial for movementin semi-solid agar. Theoretically random switching should also lead to spreading ofthe cells, similar to diffusion driven by Brownian motion with its randomly occurringturnarounds after collisions. To what extent biasing the switching events in responseto chemical concentrations increases the swarm ring size has not been investigated forH. salinarum. For E. coli, Wolfe and Berg (1989) demonstrated that nonchemotacticcells can form swarm rings if they rotate their flagella both CW and CCW. Thecells spread more effectively when tumbles were more frequent. This behaviour wasexplained by the observation that cells that do not tumble tend to get trapped in theagar. If these findings can be transfered to H. salinarum cells, which do not tumble atall but swim forward and backward, remains to be investigated.
Overall, it can be said that OE2404R is involved in taxis signal transduction inH. salinarum, but it either fulfils a non-essential function or it can be replaced by itshomolog, OE2402F, with only minor constraints.
7.2.6 Complementation of deletions reverted their phenotype to
that of wildtype
All deletions in S9 background were complemented by reintroducing the deleted gene(s)in cis. The phenotype of the complementations was examined by swarm plates, andfor the single deletions by phototaxis measurements. All complementations behavedexactly like the wild-type strains (see Figure 7.8), confirming that the phenotypesobserved in the mutants were a direct result of their gene deletions.
7.2.7 Bioinformatic analysis
Bioinformatics analysis was done to collect information on the three unknown proteins.Starting point for this was a homology search, and querying databases like COG(Tatusov et al., 1997, 2003), Pfam (Finn et al., 2006, 2008), InterPro (Mulder et al.,2007), SMART (Schultz et al., 1998), and STRING (von Mering et al., 2007). Thegoal of homology search was to identify orthologs from other organisms for which some
137
7 Identification of archaea-specific chemotaxis proteins
Figure 7.8: Phenotype of complementations. A Swarm plate assay. On each plate the comple-mentation strain (bottom) is compared to the respective wildtype strain (top). B Computer-basedcell tracking for the complementations of each single deletion. The percent reversal in a 4 secondinterval was determined either without stimulation (spontaneous, grey bar) or after a blue light pulse(blue bar). Error bars represent the 95 % confidence interval.
knowledge might exist, and to unravel correlations between the occurrence of the hereinvestigated proteins and Che and Fla proteins.
7.2.7.1 Occurrence of che and fla genes in archaeal genomes
To have a reference for such co-occurrence comparisons, an exhaustive search for or-thologs of Che and Fla proteins in all completely sequenced archaeal genomes pub-lished until October 2007 was done. Since homology searches using Psi-Blast werenot sufficient to comprehensively identify homologs of some proteins (especially smallproteins with rather low conservation like FlaC, D, E, F, and G were problematic),and did not allow the discrimination between orthologs and other homologs for otherproteins (e. g. CheY and other response regulators), a combination of different meth-ods was used for ortholog identification (see 2.6.7 for details). The resulting table oforthologs is shown in Supplementary Table S4.
As observed before (Klein, 2005), no che genes were detected in any archaeal genomewithout fla and flagellin genes. In contrast, several archaeal species contain fla genesand flagellins, but no che genes, leading to the conclusion that these species are motile,but their motility is not controlled by a Che system. che genes have not been detectedin a crenarchaeal genome. If che genes were found, there is always the whole set
138
7.2 Results and Discussion
consisting of cheA, cheB, cheC, cheD, cheR, cheW, and cheY present. An exceptionis Methanosarcina barkeri, which has lost the cheC gene (the genomic position wherecheC is located in the other Methanosarcina species still contains remnants of theN-terminus of cheC ). Several archaeal species contain multiple copies of various chegenes; the front-runner is Methanospirillum hungatei with 35 genes classified as cheorthologs by the used method. A noteworthy finding is a CheA-CheC fusion proteindetected in the genome of M. hungatei.
If in a crenarchaeal genome fla genes were identified, there were at least one flagellin,flaG, flaH, flaI, and flaJ, and usually also flaF (except in Aeropyrum pernix ) present.The flaG gene in the sequenced strain of Sulfolobus solfataricus is interrupted by atransposase, but this insertion is neither stable under laboratory conditions nor isit found in a closely related strain (Szabó et al., 2007). In euryarchaeota, there isadditionally always a flaD/E gene present, if they possess fla genes. flaD and flaEgenes could not be discriminated by the applied method, so they were merged intoone ortholog group. Two versions of flaD/E genes can be distinguished: The speciesof the classes Methanomicrobia and Archaeoglobi code for a version of a FlaD/Eprotein (referred to as FlaD/EM in the following) with only low homology to the FlaDand FlaE proteins found in other euryarchaeal genomes (Ng et al., 2006; Desmondet al., 2007). A special case is Methanococcoides burtonii (class Methanomicrobia),which possesses both the versions of FlaD/E proteins, each in a complete fla generegion. This is an indication of lateral gene transfer (LGT) of a whole fla gene region.Such an LGT has also been proposed in a detailed study of the phylogenomics of thearchaeal flagellum (Desmond et al., 2007). In genomes with flaD/EM (or in the caseof Methanococcoides burtonii the genome region with flaD/EM), no flaC gene, or flaCdomain fused to a flaE gene, was found. In all other euryarchaeota with fla genes,FlaC is either coded as separate protein or as domain fused to an FlaD/E domain.Like the che genes, also the fla genes and flagellins are present in multiple copies insome genomes.
7.2.7.2 Only few findings for OE2401F
OE2401F was formerly annotated as “phycocyanin alpha phycocyanobilin lyase ho-molog” due to homology with this protein from cyanobacteria and red algae. Theannotation was now changed to “conserved che operon protein”. By Pfam, it is classi-
139
7 Identification of archaea-specific chemotaxis proteins
fied as a HEAT_PBS or HEAT family protein. These proteins are predicted to containshort bi-helical repeats. Several, but not all members of this family are thought tohave lyase activity (Finn et al., 2008).
For OE2401F, homology search turned out to be difficult because the repeats ledto a high number of non-significant matches. Thus it was not possible to identify areliable set of orthologs from other organisms and no conclusions about co-occurrenceof this protein family with che or fla genes could be drawn. Close homologs wereidentified in the che and fla gene regions of the halophilic archaea N. pharaonis andH. marismortui. The idea that OE2401F and OE2402F act cooperatively to performtheir function is also supported by the genomic location of OE2401F and its homologsin the haloarchaeal che gene regions, where it is always adjacent to a DUF439 pro-tein. Additionally, HEAT-like repeat proteins are present in all sequenced haloarchaealgenomes (the above mentioned, H. walsbyi, and H. salinarum) in other genomic con-text. For none of these proteins any functional knowledge could be obtained. In thechemotaxis gene regions of other archaeal species, no homologs of OE2401F were found.Hence it remains to be investigated if these proteins are restricted to haloarchaea, orif similar proteins, coded elsewhere in the genome, play a role in taxis signalling alsoin other archaeal species.
Although homology search revealed no correlation between OE2401F homologs andche or fla genes, the examination of the archaeal fla gene regions resulted in a note-worthy finding. Adjacent to the flagellin genes in several archaeal genomes (severalMethanococci and Thermococci), a protein belonging to the Adaptin_N family islocated. Adaptin_N belongs to the same superfamily as HEAT/HEAT_PBS, the Ar-madillo repeat superfamily (Finn et al., 2008). If the Adaptin_N proteins adjacent tothe flagellins fulfil a similar function as OE2401F and its homologs and, if so, whichfunction this is, remains elusive.
7.2.7.3 OE2402F and OE2404R belong to a family of unique archaeal Cheproteins
OE2402F and OE2404R, both annotated as conserved hypothetical protein, are ho-mologous to each other and belong to the protein family DUF439 (Finn et al., 2008)and the cluster of orthologous groups COG2469. DUF439 is described as “archaealprotein of unknown function”, COG2469 as “uncharacterized conserved protein”.
140
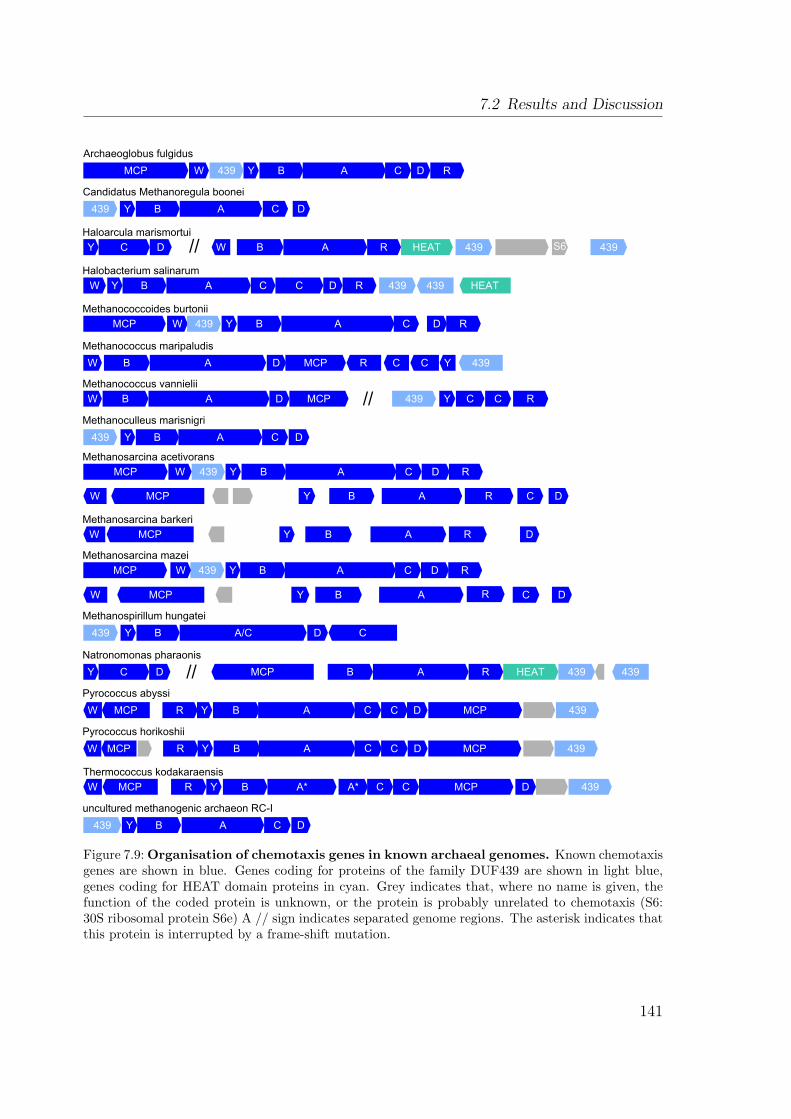
7.2 Results and Discussion
RDCABY439WMCP
DCABY439
DCY flaBW B A R HEAT 439 S6 439
HEAT439439RDCCABYW
RDCABY439WMCP
DCRABYMCPW
DRABYMCPW
MCP W 439 Y B A C D R
DCABY439
W B A D MCP R C C Y 439
RDCABY439WMCP
DCRABYMCPW
439 Y B A/C D C
439MCPDCCABYRMCPW
W MCP R Y B A C C D MCP 439
W MCP R Y B A* A* C C MCP D 439
DCABY439
Archaeoglobus fulgidus
Candidatus Methanoregula boonei
Haloarcula marismortui
Halobacterium salinarum
Methanococcoides burtonii
Methanococcus maripaludis
Methanococcus vannielii
Methanoculleus marisnigri
Methanosarcina acetivorans
Methanosarcina barkeri
Methanosarcina mazei
Methanospirillum hungatei
Natronomonas pharaonis
Pyrococcus abyssi
Pyrococcus horikoshii
Thermococcus kodakaraensis
uncultured methanogenic archaeon RC-I
Y C D 439439HEATRABMCP//
W B A D MCP 439 Y C C R//
//
Figure 7.9: Organisation of chemotaxis genes in known archaeal genomes. Known chemotaxisgenes are shown in blue. Genes coding for proteins of the family DUF439 are shown in light blue,genes coding for HEAT domain proteins in cyan. Grey indicates that, where no name is given, thefunction of the coded protein is unknown, or the protein is probably unrelated to chemotaxis (S6:30S ribosomal protein S6e) A // sign indicates separated genome regions. The asterisk indicates thatthis protein is interrupted by a frame-shift mutation.
141
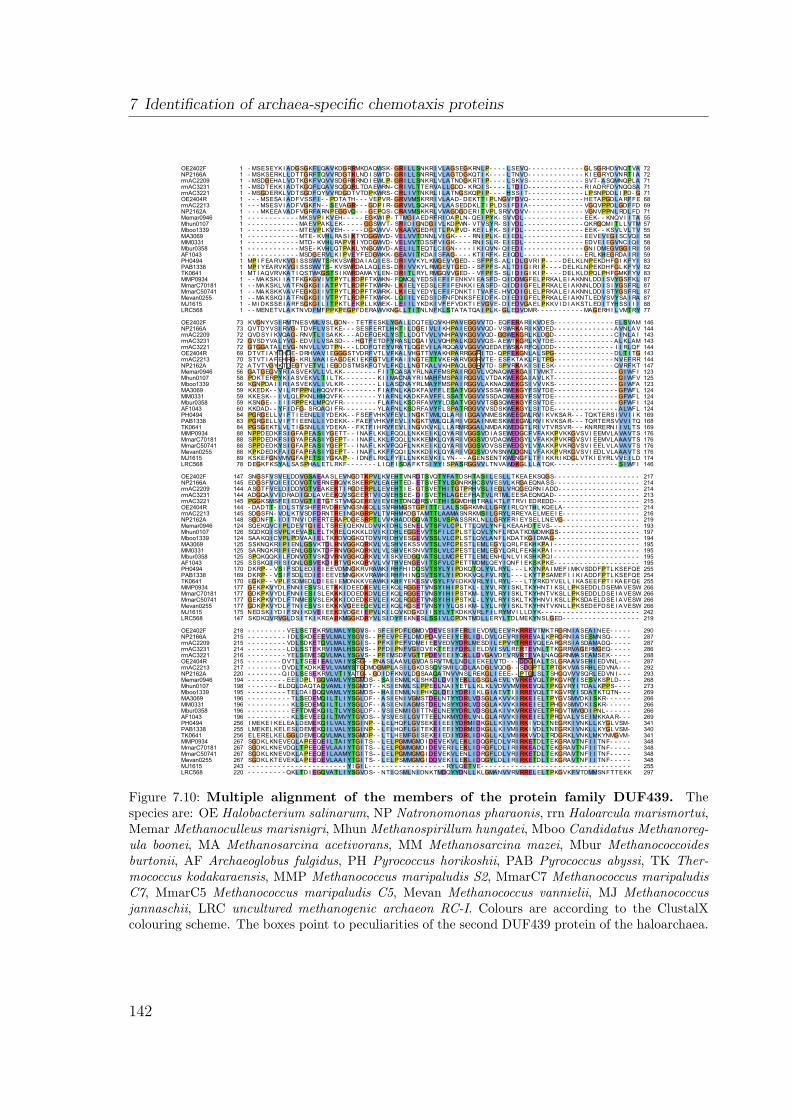
7 Identification of archaea-specific chemotaxis proteins
OE2402FNP2166ArrnAC2209rrnAC3231rrnAC3221OE2404RrrnAC2213NP2162AMemar0946Mhun0107Mboo1339MA3069MM0331Mbur0358AF1043PH0494PAB1338TK0641MMP0934MmarC70181MmarC50741Mevan0255MJ1615LRC568
OE2402FNP2166ArrnAC2209rrnAC3231rrnAC3221OE2404RrrnAC2213NP2162AMemar0946Mhun0107Mboo1339MA3069MM0331Mbur0358AF1043PH0494PAB1338TK0641MMP0934MmarC70181MmarC50741Mevan0255MJ1615LRC568
OE2402FNP2166ArrnAC2209rrnAC3231rrnAC3221OE2404RrrnAC2213NP2162AMemar0946Mhun0107Mboo1339MA3069MM0331Mbur0358AF1043PH0494PAB1338TK0641MMP0934MmarC70181MmarC50741Mevan0255MJ1615LRC568
OE2402FNP2166ArrnAC2209rrnAC3231rrnAC3221OE2404RrrnAC2213NP2162AMemar0946Mhun0107Mboo1339MA3069MM0331Mbur0358AF1043PH0494PAB1338TK0641MMP0934MmarC70181MmarC50741Mevan0255MJ1615LRC568
111111111111111111111111
727271717168697155575558585859838283878787878877
- MSESEYK I ADGSGKFLQAVKDGRRMKDAQWSK- GRI L LSNKRI VLAGSEGKRNLP- - - - L SEVQ- - - - - - - - - - - - - GLSGRHDVNQTVA- MSKSERKL LDTTGRFTQVVRDGTKLND I SWTD- GRI L LSNRRLVLAGTDGKQT I K- - - - L TNVD- - - - - - - - - - - - - K I EGRYDVNRT I A- MSDGEHALVDTKGKFVQVVSDGRKRND I EWLP- GRI L LSNKRLVLATNDGKRT I P- - - - L SKVS- - - - - - - - - - - - - SVT- ASQMNQPLA- MSDTEKK I ADTKGQFLQAVSQGQRLTDAEWRN- CRI VL TTERVAL LGDD- KRQ I S- - - - L TD I D- - - - - - - - - - - - - RI ADRFDVNQQSA- MSGDERKLVDTSGDFQYVVRDGDTVTDPKWRS- CRL I VTNKRL I LATNGSKQP I P- - - - HSS I T- - - - - - - - - - - - - L PSNPDDL I PD- G- - - MSESA I ADFVSSF I - - PDTATH- - - VEPVR- GRVVMSKRRI VLAAD- DEKTT I PLNGVFDVQ- - - - - - - - - - - - - HETAPGDLARFFE- - - MSESV I ADFVGKFN- - SEVAGR- - - GDP I R- GRVVLSQKRLVLAASEDDKLT I PLDS I FD I A - - - - - - - - - - - - - VGQVPPDLGDFFD- - - MKEEAVADFVGRFARNPEGGVQ- - - GEPQS- CRAVMSKKRLVVAGDGDERI TVPLSRVVDVV- - - - - - - - - - - - - VGNVPPNLRDLFD- - - - - - - - - - - - MKSVP I KVEH- - - - - EGKWI P- TTMG I AEDRFRI DAPLN- QE I PYK- SVVDL - - - - - - - - - - - - - - EEK- - KNQV I I TA- - - - - - - - - - - - MAEVPAKLEK- - - - - GGSWVT- SRI D I GNDG I VLKDPWN- VTVSYR- S I VDL - - - - - - - - - - - - - - QKRGQMI TL LVTM- - - - - - - - - - - - MTEVPLKVEH- - - - - DGKWVV- VKAAVGEDRI TLPAPVD- KE I L FK- S I FDL - - - - - - - - - - - - - - EEK- - KSVLVLTV- - - - - - - - - - - - MTE- KVHLRAS I KTYDGGWVD- VELVVTDNNLV I GK- - - - RN I PLK- E I EDL - - - - - - - - - - - - - - EEVEVEG I SCVQ I- - - - - - - - - - - - MTD- KVHLRAPVK I YDDGWVD- VELVVTDSSFV I GK- - - - RN I SLR- E I EDL - - - - - - - - - - - - - - EDVE I EGVNC I Q I- - - - - - - - - - - - MSE- KVHLQTPAKLYNGQWVD- AEL I L TEQTLC I GN- - - - I K I QVN- Q I ED I - - - - - - - - - - - - - - GN I DMEGVGG I RI- - - - - - - - - - - - MSDGERVLK I PVEYFEDGWKK- GEAV I TKDA I SFAG- - - - KT I RFK- E I QDL - - - - - - - - - - - - - - ERLKHEGRDA I RIMP I FEARVKVG I SSSWVTSRKVSWRDA I AQ I ES- DRI VVKYLKMGEVVGED- - SFPFS- A L I DLGVRI P- - - - DELKLNPEKDHFG I KFY IMP I YEARVKVG I SSSWVTS- KVSWRDALAQLES- DRI VVKYLRMGEVTGED- - SFPFS- A L TD I G I RI P- - - - DELKLNPEKDHFGLKFYVMT I AQVRVKAT I QSTWKGSTS I KWRDAMAYLEN- DRI TLRYLRMGQVVGED- - VFPFS- SL I D I G I K I P- - - - DELKLDPQLPHFGMKFYV- - MAKSK I I A TFKGKGV I VTPYTLRDPFTKWKN- FQMQLYEDS I EF I FENKV I EASFD- Q I DDMGFELPRKALE I AKNNLDD I SVYGSFKL- - MAKSKLVATFNGKG I I A TPYTLRDPFTKWRN- LK I ELYEDSLEF I FENKK I EASFD- Q I DD I GFELPRKALE I AKNNLDD I S I YGSFRL- - MAKSKKVAVFEGKG I I VTPYTLRDPFTKWRK- LK I ELYEDYLEF I FDNKT I TVAFE- HVDD I GLELPRKALE I AKNNLDD I STYGSFRL- - MAKSKQ I ATFNGKG I I VTPYTLRDPFTKWRK- LQ I I L YEDS I DFNFDNKSFE I DFK- D I ED I GFELPRKALE I AKNTLEDVSVYSA I RA- MI DKSSE I ARFSGKG I L I TPKTLEKPL LKWEK- LE I I L YKDK I VFEFVDKT I EVGVE- D I EDVGAELPKKV I D I AKSTLED I TYHSS I I I- - MENETVLAKTNVDFMFPPKPEGPFDERAWVKNGLLT I TNLNFKLSTATATQA I PLK- GLEDVDMR- - - - - - - - - - - MAGERH I LVMTRY
737372727269707256585659595960848384888888888978
146144143143144143144147123125123124124124124169168169176176176176174146
KVGNYVS I RMTNESVMLVSLGDN- - TETFESKLYGAL LDQTELQVKHPAVEGGVVTD- EQFERARI KVDES- - - - - - - - - - - - - - ELSVAMQVTDYVS I RVG- TDVFLVSTKE- - - SESFERTLHKT I LDGE I VL I KHPA I EGGVVQD- VSWRKARI KVDED- - - - - - - - - - - - - - AVNLAVQVDSY I KVQAG- RNVTL I SAKK- - - ADEFQEKLYSTL LDQTVVLVNHPAVKGGVVQD- GGWEKGRLKLDGD- - - - - - - - - - - - - - C I NLA IGVSDYVALYVG- EDV I L VSASD- - - HGTFETDFYRASLDGA I VLVQHPALKGGVVQS- AEWTKGRLKVTDE- - - - - - - - - - - - - - A LKLAMGTGGATALEVG- NNVL LVDTPN- - - LDDFQTEYVRATLQGEV I LARQQAVVGGVVQEDAEWSKARFQLDDD- - - - - - - - - - - - - - I I RLQFDTVT I AYEHDE- DRHVAV I EGGGSTVDRFVTLVFKALVHGTTVYAKHPARRGGRI TD- QPFEKGNLALSPG- - - - - - - - - - - - - - DL T I TGSTVT I AFEHRG- KRLVAA I EAGDEK I EKFGTVLFKA I I NGTETTVKERARVGGRVTE- ESFKTAKLFLTPG- - - - - - - - - - - - - - NVEFRRATVTVGYKTDEGTVETVL I EGDDSTMSKFQTVLFKCL LNGTKALVKHPAQLGGRVTD- SPVRKAK I S I ESK- - - - - - - - - - - - - - QVRFKTGATGEGVYRI ASVEKVL LVLKK- - - - - - - - F I I TQASAYRLNAFFMSPA I RGGVLVQNAQWEKGA I TVMKT- - - - - - - - - - - - - - - G I WF IPDKTERPYK I ASVEKVLT I L TK- - - - - - - - K I I MACNAYRI MAHFMSPA I RGGVLVTDAKWEKGA I AVLKT- - - - - - - - - - - - - - - G I WFVKGNPDA I I RI ASVEKVL I VLKR- - - - - - - - L I LASCNAYRLMAYFMSPA I RGGVLAKNAQWEKGS I VVVKS- - - - - - - - - - - - - - - G I WFAKKEDK- - V I LRFPPNLHQQVFK- - - - - - - - F I A FNLKADKFAVFFLESATVGGVVSSSARWEKGYFSVTDE- - - - - - - - - - - - - - - GFWFLKKESK- - I VLQLPKNLHHQVFK- - - - - - - - Y I A FNLKADKFAVFFLSSATVGGVVSSDAQWEKGYFSVTDE- - - - - - - - - - - - - - - GFWFLKSNGE- - I I I RPPEKLMPQVFR- - - - - - - - FLAFNLKSDRFAVYYLDSATVGGVVTSGSQWEKGYFSVTDE- - - - - - - - - - - - - - - GFWF IKKDAD- - YF I DFG- SRQAQ I FR- - - - - - - - YLAFNLKSDRFAVYFLSPATRGGVVVSDSKWEKGYLS I TDE- - - - - - - - - - - - - - - A LWFLPGRGELLV I FT I EENL L I YDEKK- - FSEFVHKVFEVL I NGKTVMLQLARI I GGAVNMESKWEEGWLRV I KVKSAR- - - TQKTERS I VV I I KPGRGELLV I FT I EENL L I YDEKK- - FAEFVHKVFEVL I NGKTVMLQLARI VGGA I NMESKWEEGWLRV I KVKSAR- - - TQRTERSVVV I TQPGSGEKTLVLT I GSNL L I YDEKA - - FKTF I HRVFEVL I NGVKVKL L LARMRGGALNMDAKWEDGTLRI VTVRSVR- - - KNRRERN I I VL TSNPPDEDKFS I GFAPEAS I YGETT- - I NAFLKKLFQQLLNKKE I KLQYARI VGGSVD I ASEWEDGCFVFAKKPVKKGVSV I EEMVLAVAVTSSPPDEDKFS I GYAPEAS I YGEPT- - I NAFLKKLFQQLLNKKEMKLQYARI VGGSVDVDAQWEDGYLVFAKKPVKRGVSV I EEMVLAAAVTSSPPDEDKYS I GFAPEAS I YGEPT- - I NAFLKKVFQQFLNKKE I KLQYARI VGGSVDVSSEWEDGYLVYAKKPVKRGVSV I EELVLAVAVTSKPKDEDKFA I GFAPEAS I YGEPT- - I NAFLKKFFQQ I LNKKD I KLQYARI VGGSVDVNSNWQDGNLVFAKKPVRKGVSV I EDLVLAAAVTSKSKEFGNVMVGFAPETS I YGKAP- - I DNFLRKLFY I L LNKKEVK I L YN- - - AGENSENTKWENGFLTF I KKRI KDGLVTK I EYRLVVE I LDDEGKFKSYALSASPHALETLRKF- - - - - - - L I QF I SDAFKTS I YY I SPASRGGVVLTNVAWDKGLL LATQK- - - - - - - - - - - - - - - S I WF I
147145144144145144145148124126124125125125125170169170177177177177175147
217214214213215214216219193197194195195195195255254255266266266266242219
SNGSFVSVELDDVGSAEAASLEVNGDTKPVLKVEHTVNRDTSVQTYFATDSHTAS I L ESL LTKEAEKSQGS- - - - - - - - - - - - - - - - - - - -EDGSFVQ I E I DDVGTVERNERQVKSKERPVLEAEHTED- ETSVETYLSGNRKHCSVVESVLKRGAEQNASS- - - - - - - - - - - - - - - - - - - -ASGTFVELD I DDVGTVEAKEKT I RGDERPL LEVEHT I E- GTSVETH I TGTPRHVSL I EGLVRQGEQRN I ADD- - - - - - - - - - - - - - - - - - -ADGQAVV I DRAD I GDLAVEEKQVSGEERTV I QVEHSEE- D I SVETHLAGEEFHATVLRTMLEESAEQNQAD- - - - - - - - - - - - - - - - - - - -PGGKSMSFE I EDVGT I ETGTSTVMGQEREV I EVEHTDNQDRSVETH I SGMDHHTRALKTLFTRV I EDREDD- - - - - - - - - - - - - - - - - - - -- DADTT- I DLSTVSHFERVDREVNGSNKQLLSVRHMGSTGP I TTELALSSGRKMNLLGRY I RLQYTHLKQELA - - - - - - - - - - - - - - - - - -SDGSFN- VDLKTVSDFDRNTRE I NGKGRPVLTVRHMKDGTAMTTLAAMASNRKMS I LGRYLRREYAELMEE I E- - - - - - - - - - - - - - - - - -SGDNFT- I D I TNV I DFERTERAPDGESRPTLVVKHADDGQVATSLVSPASSRKLNL LGRYFRI EYSEL LNEVG- - - - - - - - - - - - - - - - - -SQEKQVC I PLDEVTG I EL TSRE I QEKNLDVVK I DHLSENELVTSFVLCPLTTLQVLYNFLKEAAHDTEVS- - - - - - - - - - - - - - - - - - - - -SQDKQ I SVPLKEVASLELTKRELQKKKLDV I K I DHLEGGEVVTSF I LCPLSTLQVLYNFLRDATKDMDMKGS- - - - - - - - - - - - - - - - - - -SAAKQ I CVPLPDVAA I EL TKRDVQGKQTDVVRI DHVESGEVVSSLVLCPLSTLQVLANFLKDATKG I DMAG- - - - - - - - - - - - - - - - - - - -SSKNQKRI P I ENLGSVKTDLRNVGGKQRKVLVLSHVEKSSVVTSLVFCPESTLEMLEGYLQRLFEKHKPA I - - - - - - - - - - - - - - - - - - - -SARNQKRI P I ENLGSVKTDFRNVGGKQRKVLVLSHVEKSNVVTSLVLCPESTLEMLEGYLQRLFEKHKPA I - - - - - - - - - - - - - - - - - - - -SPQKQQK I L FDNVGTVSKDVRNVGGKQRKVLV I SKVEDGQVATSL LMCPETTLEMLENHLNLV I KSHKPQ I - - - - - - - - - - - - - - - - - - - -SSSKQ I RI S I QNLGSVEKD I RTVGKKQRVVLVVTHVENGEV I TSFVLCPETTMDMLQEY I QNF I EKSKPKE- - - - - - - - - - - - - - - - - - - -DKRP- - VS I FSDLED I E I EEVDMNGKRVRAWK I RHFH I DQSVTSYLY I PDKQTQLYVLRYL - - - L KYNPA I MEF I MKVSDDFPTLKSEFQEDKRP- - VS I FSDLED I E I EEVEMNGKKVRAWK I RHFH I NQSVTSYLY I PDKKVQLFVLRYL - - - L KYTPSAMEF I I K I ADDFPTLKSEFQEEGKP- - VPLFSDMEDLD I EE I EMDNKKVEAWK I KHFYEKESVVSYLFVEDKKVRLY I LRYL - - - L TYRKDYVEL L I KASEEFPT I KAEFQEGEKPKVYDLFNN I ESVSLETKK I DEEDKEVLE I KQLRGGETVNSY I H I PSTKL - L YVLRY I SKLTKYHNT I KSL LPKSEDDLDSEMAVESWGDKPKVYDLFNN I ES I SLEKKK I DDEDKDVLE I KQLRGGETVNSY I H I PSTKM- LYVLRY I SKLTKYHNTVKSL LPKSEDDLDSE I AVESWGEKPKVYDLFTNMESVSLEKKK I DDEDKEVLE I KQLRGGETVNSY I H I PSTKL - L YVLRY I SKLTKYHNV I KSL LPKSDAELDSE I AVESWGDKPKVYDLFTN I ESVS I EKKKVGEEEQEVLE I KQLRGSETVNSY I YLQS I KM- LYL LRY I SKLTKYHNTVKNL LPKSEDEFDSE I AVESWNEDSK I YD I FSN I KDVE I EEKDVDGE I EPVLK I LQVKDGKD I I SYLYTKDKKVRLF I LRYMV I L LDYK- - - - - - - - - - - - - - - - - - - - - - -SKDKQVRVGLDS I TK I KREARKMGGKDRYVLS I DYFEKNESLSS I VLCPDNTMDLLERYLTDLMEKYNSLGED- - - - - - - - - - - - - - - - - -
218215215214216215217220194198195196196196196256255256267267267267243220
290287287286288287292293268273269266266266269341340341348348348348255297
- - - - - - - - - VELSETEKRVLMALYSGVS- - SFE I PDFLGMDVDEVES I FERL I EVDVLEEVRKRREVTMKTRGRN I ASEA I NEE- - - - -- - - - - - - - - I DLSKDEEEVLMALYSGVS- - PFEVPEFLDMDPDAVEE I YERL I DLDVLQEVRI RREVALKPRGRN I ASESMNSQ- - - - -- - - - - - - - - VDLSDKETQVLMALYSG I S- - PFK I PEFVDME I EEVEDVYDRLMESD I LEPVRTRREVQLEARGRS I ASDAMADQ- - - - -- - - - - - - - - LDLSSTEKRV I MALHSGVS- - PFD I PNFVG I DVEKTEE I FDRL I ELDV I SVLRERTEVNLTTKGRRVAGERMGEQ- - - - -- - - - - - - - - YELSEMESQVLMALYSGVS- - PFEMSDFVGTTPDEVEE I YQKL LDVGAVDEVRVRTEVALNAQGRNMASEAMSEK- - - - -- - - - - - - - DVTLTSEE I EALVA I YSSG- - PNASLAAVLGVDASRVTMLLNDL I EKELVTD- - - DDG I A L TSLGRAAVSEH I EDVNL - - -- - - - - - - - DVDLTKDKKEVLVAMYSTGDMDGMPLAS I LGKDSSQVSMI LQDLAADGLVQDG- - SDGPTLTPTGKVVASRHLEDVNA - - -- - - - - - - - Q I DLSESEKRVLVT I YATG- - GD I DFKNVLDGSAAQATNVVNSLREKGL I EEE- - PTGLSLTSHGQVVVSQRLEDVN I - - -- - - - - - - - - EE I DPLTGQVAMLVYSGMDS- - SA I ENMLKLSHKDLDV I YEKL LGSGLAEVLYVRKEVQLTPKGVRY I SESVKSPLD- - -- - - - - - - ELDQLDAQTAQVAML I YSGMDT- - KS I ENMLSLPPEELNA I YETL LKLKLVDVVMVRKEVQLTPKGVRY I TDALKPPS- - - -- - - - - - - - - TELDA I DQQVAMLVYSGMDS- - HA I ENMLN I PHKQLDE I YDRI I KLG I AEVT I I RREVQLTTKGVRY I SDATKTQTN- - -- - - - - - - - - - TL SEDEMQ I L TL I YSGLDF- - AS I EN I VGMSTDELNTYYDRLVDSGLAKVVK I RKE I EL TPYGVSMVDK I SKR- - - - - -- - - - - - - - - - KLSEDEMQ I L TL I YSGLDF- - AS I EN I AGMSTDELNSYYDRLVDSGLAKVVK I RKE I EL TPHGVSMVDK I SKR- - - - - -- - - - - - - - - - EFTDMEKQ I L TLVYSGLDF- - VS I ENMI G I TTNELNEYYDRLVDSGLAK I VKVRKEVELTPRGVTMVGD I PNL - - - - - -- - - - - - - - - - KLSEVEEQ I L TMVYTGVDS- - VSVES I LGVTTEELNKMYDRLVNLGLARVVK I RKE I EL TPRGVALVSE I MKKAAR- - -I MEKE I KELEALDEMEKQ I LVALYSG I NP- - L ELHQFLGVSEKE I EE I YDRMI DKGLLK I VMI RK I VDLTNEGRK I VNKL LKYGLVSM-LMEKELKELESLDEMEKQ I LVALYSG I NP- - L ELHQFLG I TEKE I EE I YDRMI DKGLLK I VMI RK I VDLTNEGRK I VNKL LKYGLVSM-ELERELKELGGLDEMEQQVLMALYSGMDP- - L TLHEMFG I SEKE I ED I YDRL I DKGLLKLVMI RKVVDLTRDGRKLVNKLMKYNMGVM-SGDKLKNEVEQLAPEEQE I L TA I YTG I TS- - L ELPGMMGMD I DEVEKVLEKL I DQGFLDLVRI RKETDLTEKGRAVTNF I I TNF- - - - -SGDKLKNEVDQLTPEEQEVLAA I YTG I TS- - L ELPGMMGMD I DEVERI LEKL I DRGFLDL I RI RKEADLTEKGRAVTNF I I TNF- - - - -SGDKLKNEVDKLAPEEQE I LAAMYTG I TS- - L ELPGMMGMG I DEVEKVLENL I DRGFLDLVRI RKETDLTEKGRAVTNF I I TNF- - - - -SGDKLKTEVEKLAPEEQEVLAA I YTG I TS- - L ELPSMMGMG I DDVEK I L EKL I DQGYLDL I RI RKETDLTEKGRAVTNF I I TNF- - - - -- - - - - - - - - - - - - - - - - - - - - - - Y I G I L - - - - - - - - - - - - - - - - - - RYLQETVE- - - - - - - - - - - - - - - - - - - - - - - - - - - - - - - - - - -- - - - - - - - - QKLTD I EGQVATL I YSGVDS- - NT I QSMLN I DNKTMDQYYDNLLKLGMANVVRVRRELELTPKGVKFVTDMMSNFTTEKK
Figure 7.10: Multiple alignment of the members of the protein family DUF439. Thespecies are: OE Halobacterium salinarum, NP Natronomonas pharaonis, rrn Haloarcula marismortui,Memar Methanoculleus marisnigri, Mhun Methanospirillum hungatei, Mboo Candidatus Methanoreg-ula boonei, MA Methanosarcina acetivorans, MM Methanosarcina mazei, Mbur Methanococcoidesburtonii, AF Archaeoglobus fulgidus, PH Pyrococcus horikoshii, PAB Pyrococcus abyssi, TK Ther-mococcus kodakaraensis, MMP Methanococcus maripaludis S2, MmarC7 Methanococcus maripaludisC7, MmarC5 Methanococcus maripaludis C5, Mevan Methanococcus vannielii, MJ Methanococcusjannaschii, LRC uncultured methanogenic archaeon RC-I. Colours are according to the ClustalXcolouring scheme. The boxes point to peculiarities of the second DUF439 protein of the haloarchaea.
142
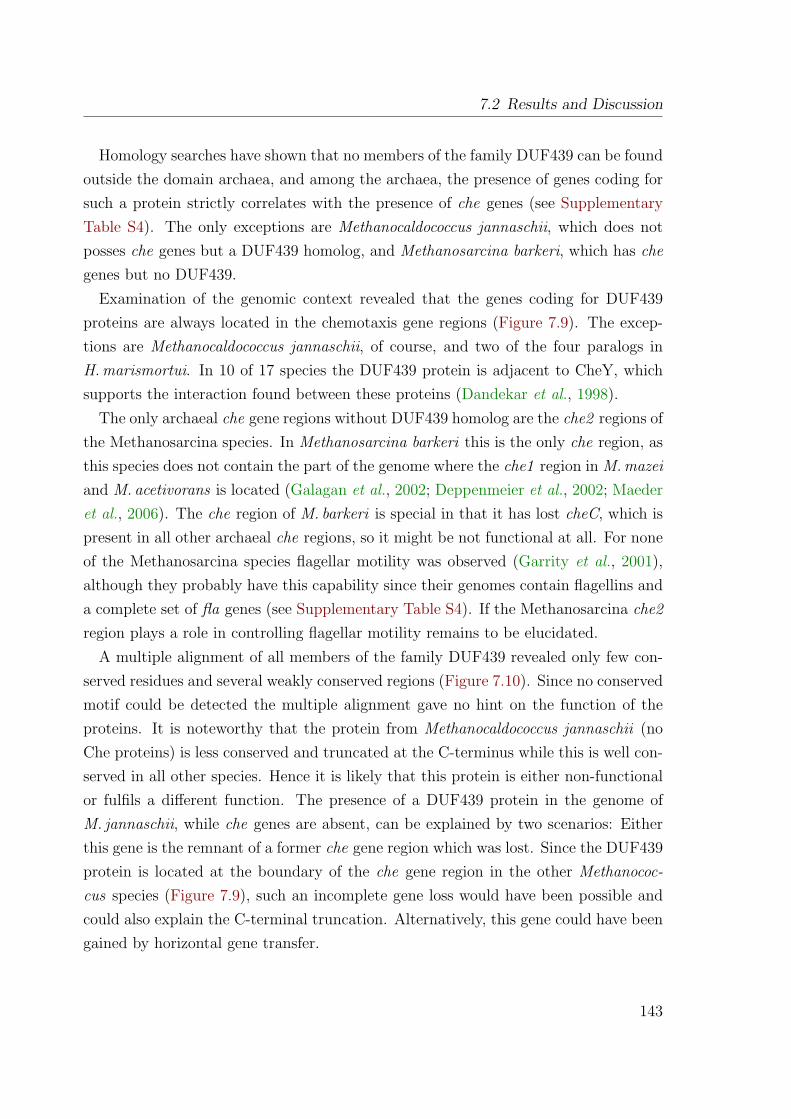
7.2 Results and Discussion
Homology searches have shown that no members of the family DUF439 can be foundoutside the domain archaea, and among the archaea, the presence of genes coding forsuch a protein strictly correlates with the presence of che genes (see SupplementaryTable S4). The only exceptions are Methanocaldococcus jannaschii, which does notposses che genes but a DUF439 homolog, and Methanosarcina barkeri, which has chegenes but no DUF439.
Examination of the genomic context revealed that the genes coding for DUF439proteins are always located in the chemotaxis gene regions (Figure 7.9). The excep-tions are Methanocaldococcus jannaschii, of course, and two of the four paralogs inH. marismortui. In 10 of 17 species the DUF439 protein is adjacent to CheY, whichsupports the interaction found between these proteins (Dandekar et al., 1998).
The only archaeal che gene regions without DUF439 homolog are the che2 regions ofthe Methanosarcina species. In Methanosarcina barkeri this is the only che region, asthis species does not contain the part of the genome where the che1 region in M. mazeiand M. acetivorans is located (Galagan et al., 2002; Deppenmeier et al., 2002; Maederet al., 2006). The che region of M. barkeri is special in that it has lost cheC, which ispresent in all other archaeal che regions, so it might be not functional at all. For noneof the Methanosarcina species flagellar motility was observed (Garrity et al., 2001),although they probably have this capability since their genomes contain flagellins anda complete set of fla genes (see Supplementary Table S4). If the Methanosarcina che2region plays a role in controlling flagellar motility remains to be elucidated.
A multiple alignment of all members of the family DUF439 revealed only few con-served residues and several weakly conserved regions (Figure 7.10). Since no conservedmotif could be detected the multiple alignment gave no hint on the function of theproteins. It is noteworthy that the protein from Methanocaldococcus jannaschii (noChe proteins) is less conserved and truncated at the C-terminus while this is well con-served in all other species. Hence it is likely that this protein is either non-functionalor fulfils a different function. The presence of a DUF439 protein in the genome ofM. jannaschii, while che genes are absent, can be explained by two scenarios: Eitherthis gene is the remnant of a former che gene region which was lost. Since the DUF439protein is located at the boundary of the che gene region in the other Methanococ-cus species (Figure 7.9), such an incomplete gene loss would have been possible andcould also explain the C-terminal truncation. Alternatively, this gene could have beengained by horizontal gene transfer.
143
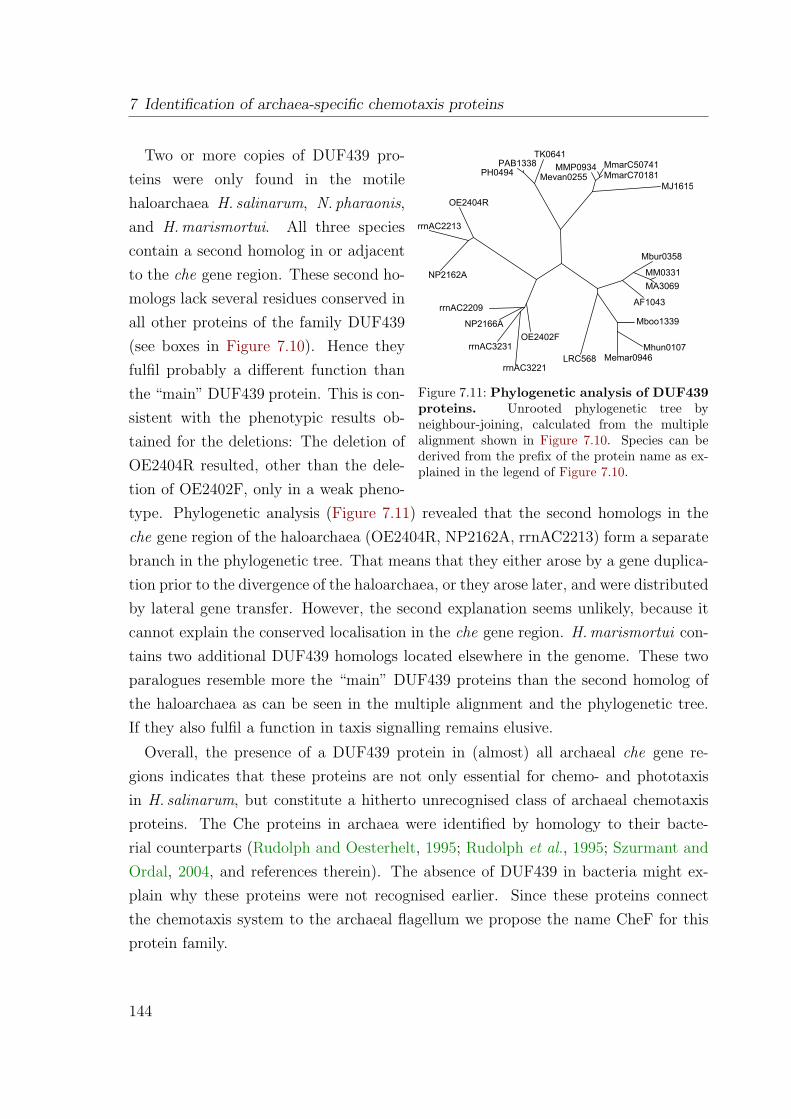
7 Identification of archaea-specific chemotaxis proteins
rrnAC3221
rrnAC3231
NP2166A
rrnAC2209
NP2162A
rrnAC2213
OE2404R
PH0494PAB1338
TK0641
Mevan0255MMP0934 MmarC50741
MmarC70181MJ1615
Mbur0358
MM0331
MA3069
AF1043
Mboo1339
Mhun0107Memar0946LRC568
OE2402F
Figure 7.11: Phylogenetic analysis of DUF439proteins. Unrooted phylogenetic tree byneighbour-joining, calculated from the multiplealignment shown in Figure 7.10. Species can bederived from the prefix of the protein name as ex-plained in the legend of Figure 7.10.
Two or more copies of DUF439 pro-teins were only found in the motilehaloarchaea H. salinarum, N. pharaonis,and H. marismortui. All three speciescontain a second homolog in or adjacentto the che gene region. These second ho-mologs lack several residues conserved inall other proteins of the family DUF439(see boxes in Figure 7.10). Hence theyfulfil probably a different function thanthe “main” DUF439 protein. This is con-sistent with the phenotypic results ob-tained for the deletions: The deletion ofOE2404R resulted, other than the dele-tion of OE2402F, only in a weak pheno-type. Phylogenetic analysis (Figure 7.11) revealed that the second homologs in theche gene region of the haloarchaea (OE2404R, NP2162A, rrnAC2213) form a separatebranch in the phylogenetic tree. That means that they either arose by a gene duplica-tion prior to the divergence of the haloarchaea, or they arose later, and were distributedby lateral gene transfer. However, the second explanation seems unlikely, because itcannot explain the conserved localisation in the che gene region. H. marismortui con-tains two additional DUF439 homologs located elsewhere in the genome. These twoparalogues resemble more the “main” DUF439 proteins than the second homolog ofthe haloarchaea as can be seen in the multiple alignment and the phylogenetic tree.If they also fulfil a function in taxis signalling remains elusive.
Overall, the presence of a DUF439 protein in (almost) all archaeal che gene re-gions indicates that these proteins are not only essential for chemo- and phototaxisin H. salinarum, but constitute a hitherto unrecognised class of archaeal chemotaxisproteins. The Che proteins in archaea were identified by homology to their bacte-rial counterparts (Rudolph and Oesterhelt, 1995; Rudolph et al., 1995; Szurmant andOrdal, 2004, and references therein). The absence of DUF439 in bacteria might ex-plain why these proteins were not recognised earlier. Since these proteins connectthe chemotaxis system to the archaeal flagellum we propose the name CheF for thisprotein family.
144
7.3 Conclusions
7.3 Conclusions
Although the taxis signal transduction system in Archaea is similar to its bacterialcounterpart, its target, the archaeal flagellar apparatus, is a completely different struc-ture than the bacterial one. The connection between the bacterial-like signal transduc-tion system and the unique archaeal flagellar motor has remained elusive (see Thomaset al., 2001a; Szurmant and Ordal, 2004, for review).
Using protein-protein interaction analysis, we have identified three proteins in Ha-lobacterium salinarum that connect the chemotaxis system and the archaeal flagellarapparatus. These proteins interact with the chemotaxis proteins CheY, CheD, andCheC2, as well as the flagella accessory proteins FlaCE and FlaD. Thereby they con-stitute the first known link between these systems. Two of the proteins belong to theprotein family DUF439, the third is a HEAT_PBS family protein.
Strains deleted for the HEAT_PBS protein or one of the DUF439 proteins provedunable to switch the direction of flagellar rotation. In these mutants, flagella rotateonly clockwise, which results in exclusively forward swimming cells that are unable torespond to tactic signals. Deletion of the second DUF439 protein had only minimaleffects.
By homology searches, HEAT_PBS proteins could be identified in the chemotaxisgene regions of all motile haloarchaea sequenced so far, but not of other archaealspecies. DUF439 proteins, however, are inherent parts of archaeal chemotaxis generegions, and they are restricted to this genomic context. Altogether, these resultsdemonstrate that we have identified hitherto unrecognised archaea-specific Che pro-teins that are essential for relaying taxis signalling to the flagellar apparatus in thearchaeal domain.
145

7 Identification of archaea-specific chemotaxis proteins
146
8 Concluding remarks
The aim of this study was to improve the understanding of the taxis signal transductionsystem of H. salinarum by protein protein interaction analysis.
To achieve this goal, it was first necessary to find an appropriate method whichenables the detection of interactions between halophilic proteins. It was tried if theyeast two-hybrid system can be used for this purpose. This assay was used to screena test set of known interactors from H. salinarum, but here it failed in all cases.The reason was probably the halophilic adaptation of the proteins. Hence it wasconcluded that the yeast two-hybrid system is not the tool of choice to approachthe problem of this study. Next, an affinity purification method for halobacterialprotein complexes was developed which enables the identification of protein interactionpartners by mass spectrometry. This method allowed the succesful detection of knownand new interactions between halobacterial proteins. Therewith evidence was providedthat the developed method can be used to address the main question of this study.
With this method, the protein interactions of the ten known chemotaxis proteinsfrom H. salinarum were investigated and an interaction network of the halobacterialtaxis signal transduction system constructed. This network points to several newaspects and components of the system. However, the knowledge of protein interactionsalone was not sufficient to unravel the exact meaning of these new facets.
For this, a more in-depth analysis is needed. This was done for three proteins whichwere found to interact both with proteins of the taxis signal transduction system as wellas the motility apparatus. Examination of deletion mutants revealed that two of themare essential for relaying taxis signalling to the flagellum. By homology searches, it wasdemonstrated that two of the new interaction partners belong to a family of proteinswhich are inherent components of archaeal chemotaxis gene regions and which arerestricted to this genomic context. Overall, the combination of a top-down approachto examine a complete cellular module, followed by a bottom-up approach to havea closer look on some details proved succesful. With this strategy, it was possible
147

8 Concluding remarks
to identify overlooked archaeal chemotaxis proteins, which build the first known linkfrom the taxis signal transduction system to the archaeal flagellar apparatus.
148
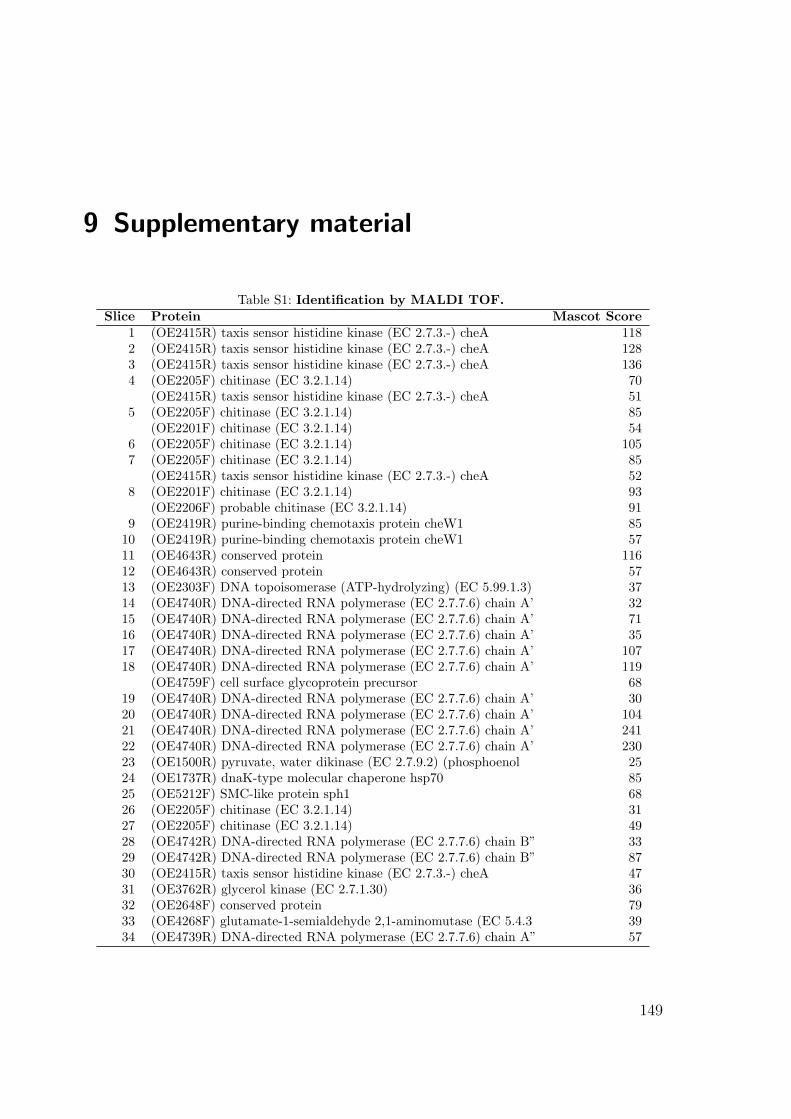
9 Supplementary material
Table S1: Identification by MALDI TOF.Slice Protein Mascot Score
1 (OE2415R) taxis sensor histidine kinase (EC 2.7.3.-) cheA 1182 (OE2415R) taxis sensor histidine kinase (EC 2.7.3.-) cheA 1283 (OE2415R) taxis sensor histidine kinase (EC 2.7.3.-) cheA 1364 (OE2205F) chitinase (EC 3.2.1.14) 70
(OE2415R) taxis sensor histidine kinase (EC 2.7.3.-) cheA 515 (OE2205F) chitinase (EC 3.2.1.14) 85
(OE2201F) chitinase (EC 3.2.1.14) 546 (OE2205F) chitinase (EC 3.2.1.14) 1057 (OE2205F) chitinase (EC 3.2.1.14) 85
(OE2415R) taxis sensor histidine kinase (EC 2.7.3.-) cheA 528 (OE2201F) chitinase (EC 3.2.1.14) 93
(OE2206F) probable chitinase (EC 3.2.1.14) 919 (OE2419R) purine-binding chemotaxis protein cheW1 85
10 (OE2419R) purine-binding chemotaxis protein cheW1 5711 (OE4643R) conserved protein 11612 (OE4643R) conserved protein 5713 (OE2303F) DNA topoisomerase (ATP-hydrolyzing) (EC 5.99.1.3) 3714 (OE4740R) DNA-directed RNA polymerase (EC 2.7.7.6) chain A’ 3215 (OE4740R) DNA-directed RNA polymerase (EC 2.7.7.6) chain A’ 7116 (OE4740R) DNA-directed RNA polymerase (EC 2.7.7.6) chain A’ 3517 (OE4740R) DNA-directed RNA polymerase (EC 2.7.7.6) chain A’ 10718 (OE4740R) DNA-directed RNA polymerase (EC 2.7.7.6) chain A’ 119
(OE4759F) cell surface glycoprotein precursor 6819 (OE4740R) DNA-directed RNA polymerase (EC 2.7.7.6) chain A’ 3020 (OE4740R) DNA-directed RNA polymerase (EC 2.7.7.6) chain A’ 10421 (OE4740R) DNA-directed RNA polymerase (EC 2.7.7.6) chain A’ 24122 (OE4740R) DNA-directed RNA polymerase (EC 2.7.7.6) chain A’ 23023 (OE1500R) pyruvate, water dikinase (EC 2.7.9.2) (phosphoenol 2524 (OE1737R) dnaK-type molecular chaperone hsp70 8525 (OE5212F) SMC-like protein sph1 6826 (OE2205F) chitinase (EC 3.2.1.14) 3127 (OE2205F) chitinase (EC 3.2.1.14) 4928 (OE4742R) DNA-directed RNA polymerase (EC 2.7.7.6) chain B” 3329 (OE4742R) DNA-directed RNA polymerase (EC 2.7.7.6) chain B” 8730 (OE2415R) taxis sensor histidine kinase (EC 2.7.3.-) cheA 4731 (OE3762R) glycerol kinase (EC 2.7.1.30) 3632 (OE2648F) conserved protein 7933 (OE4268F) glutamate-1-semialdehyde 2,1-aminomutase (EC 5.4.3 3934 (OE4739R) DNA-directed RNA polymerase (EC 2.7.7.6) chain A” 57
149
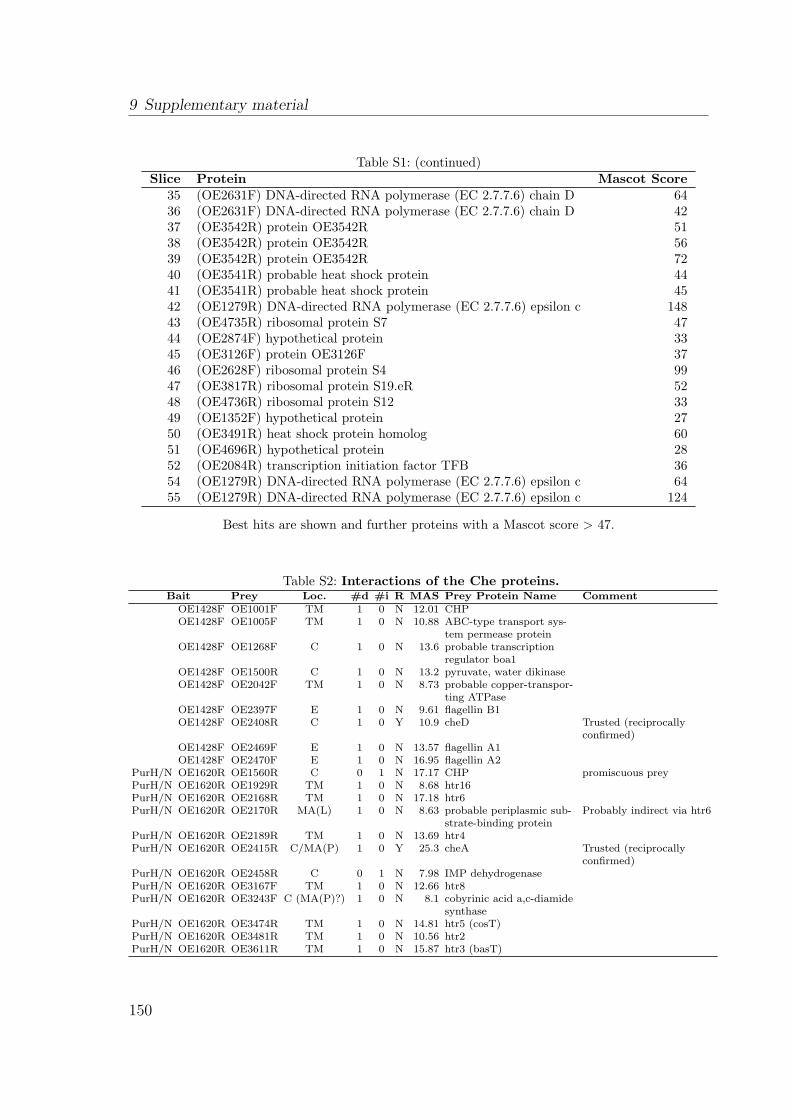
9 Supplementary material
Table S1: (continued)Slice Protein Mascot Score
35 (OE2631F) DNA-directed RNA polymerase (EC 2.7.7.6) chain D 6436 (OE2631F) DNA-directed RNA polymerase (EC 2.7.7.6) chain D 4237 (OE3542R) protein OE3542R 5138 (OE3542R) protein OE3542R 5639 (OE3542R) protein OE3542R 7240 (OE3541R) probable heat shock protein 4441 (OE3541R) probable heat shock protein 4542 (OE1279R) DNA-directed RNA polymerase (EC 2.7.7.6) epsilon c 14843 (OE4735R) ribosomal protein S7 4744 (OE2874F) hypothetical protein 3345 (OE3126F) protein OE3126F 3746 (OE2628F) ribosomal protein S4 9947 (OE3817R) ribosomal protein S19.eR 5248 (OE4736R) ribosomal protein S12 3349 (OE1352F) hypothetical protein 2750 (OE3491R) heat shock protein homolog 6051 (OE4696R) hypothetical protein 2852 (OE2084R) transcription initiation factor TFB 3654 (OE1279R) DNA-directed RNA polymerase (EC 2.7.7.6) epsilon c 6455 (OE1279R) DNA-directed RNA polymerase (EC 2.7.7.6) epsilon c 124
Best hits are shown and further proteins with a Mascot score > 47.
Table S2: Interactions of the Che proteins.Bait Prey Loc. #d #i R MAS Prey Protein Name Comment
OE1428F OE1001F TM 1 0 N 12.01 CHPOE1428F OE1005F TM 1 0 N 10.88 ABC-type transport sys-
tem permease proteinOE1428F OE1268F C 1 0 N 13.6 probable transcription
regulator boa1OE1428F OE1500R C 1 0 N 13.2 pyruvate, water dikinaseOE1428F OE2042F TM 1 0 N 8.73 probable copper-transpor-
ting ATPaseOE1428F OE2397F E 1 0 N 9.61 flagellin B1OE1428F OE2408R C 1 0 Y 10.9 cheD Trusted (reciprocally
confirmed)OE1428F OE2469F E 1 0 N 13.57 flagellin A1OE1428F OE2470F E 1 0 N 16.95 flagellin A2
PurH/N OE1620R OE1560R C 0 1 N 17.17 CHP promiscuous preyPurH/N OE1620R OE1929R TM 1 0 N 8.68 htr16PurH/N OE1620R OE2168R TM 1 0 N 17.18 htr6PurH/N OE1620R OE2170R MA(L) 1 0 N 8.63 probable periplasmic sub-
strate-binding proteinProbably indirect via htr6
PurH/N OE1620R OE2189R TM 1 0 N 13.69 htr4PurH/N OE1620R OE2415R C/MA(P) 1 0 Y 25.3 cheA Trusted (reciprocally
confirmed)PurH/N OE1620R OE2458R C 0 1 N 7.98 IMP dehydrogenasePurH/N OE1620R OE3167F TM 1 0 N 12.66 htr8PurH/N OE1620R OE3243F C (MA(P)?) 1 0 N 8.1 cobyrinic acid a,c-diamide
synthasePurH/N OE1620R OE3474R TM 1 0 N 14.81 htr5 (cosT)PurH/N OE1620R OE3481R TM 1 0 N 10.56 htr2PurH/N OE1620R OE3611R TM 1 0 N 15.87 htr3 (basT)
150
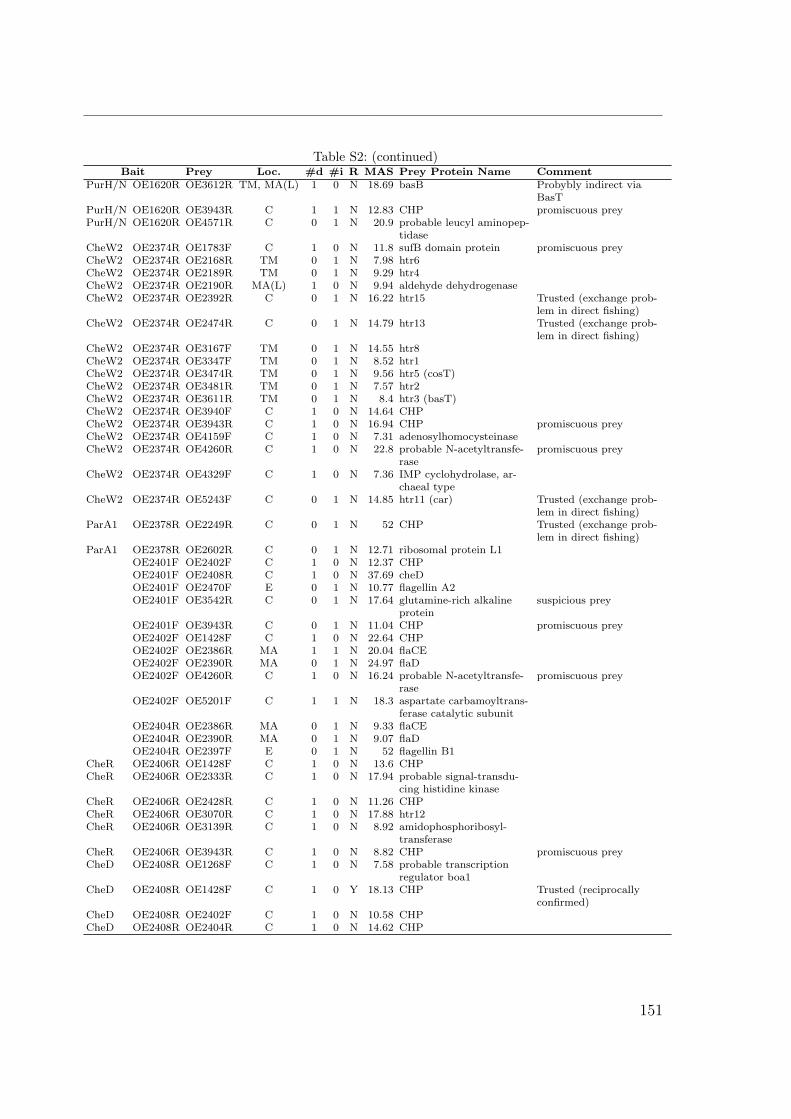
Table S2: (continued)Bait Prey Loc. #d #i R MAS Prey Protein Name Comment
PurH/N OE1620R OE3612R TM, MA(L) 1 0 N 18.69 basB Probybly indirect viaBasT
PurH/N OE1620R OE3943R C 1 1 N 12.83 CHP promiscuous preyPurH/N OE1620R OE4571R C 0 1 N 20.9 probable leucyl aminopep-
tidaseCheW2 OE2374R OE1783F C 1 0 N 11.8 sufB domain protein promiscuous preyCheW2 OE2374R OE2168R TM 0 1 N 7.98 htr6CheW2 OE2374R OE2189R TM 0 1 N 9.29 htr4CheW2 OE2374R OE2190R MA(L) 1 0 N 9.94 aldehyde dehydrogenaseCheW2 OE2374R OE2392R C 0 1 N 16.22 htr15 Trusted (exchange prob-
lem in direct fishing)CheW2 OE2374R OE2474R C 0 1 N 14.79 htr13 Trusted (exchange prob-
lem in direct fishing)CheW2 OE2374R OE3167F TM 0 1 N 14.55 htr8CheW2 OE2374R OE3347F TM 0 1 N 8.52 htr1CheW2 OE2374R OE3474R TM 0 1 N 9.56 htr5 (cosT)CheW2 OE2374R OE3481R TM 0 1 N 7.57 htr2CheW2 OE2374R OE3611R TM 0 1 N 8.4 htr3 (basT)CheW2 OE2374R OE3940F C 1 0 N 14.64 CHPCheW2 OE2374R OE3943R C 1 0 N 16.94 CHP promiscuous preyCheW2 OE2374R OE4159F C 1 0 N 7.31 adenosylhomocysteinaseCheW2 OE2374R OE4260R C 1 0 N 22.8 probable N-acetyltransfe-
rasepromiscuous prey
CheW2 OE2374R OE4329F C 1 0 N 7.36 IMP cyclohydrolase, ar-chaeal type
CheW2 OE2374R OE5243F C 0 1 N 14.85 htr11 (car) Trusted (exchange prob-lem in direct fishing)
ParA1 OE2378R OE2249R C 0 1 N 52 CHP Trusted (exchange prob-lem in direct fishing)
ParA1 OE2378R OE2602R C 0 1 N 12.71 ribosomal protein L1OE2401F OE2402F C 1 0 N 12.37 CHPOE2401F OE2408R C 1 0 N 37.69 cheDOE2401F OE2470F E 0 1 N 10.77 flagellin A2OE2401F OE3542R C 0 1 N 17.64 glutamine-rich alkaline
proteinsuspicious prey
OE2401F OE3943R C 0 1 N 11.04 CHP promiscuous preyOE2402F OE1428F C 1 0 N 22.64 CHPOE2402F OE2386R MA 1 1 N 20.04 flaCEOE2402F OE2390R MA 0 1 N 24.97 flaDOE2402F OE4260R C 1 0 N 16.24 probable N-acetyltransfe-
rasepromiscuous prey
OE2402F OE5201F C 1 1 N 18.3 aspartate carbamoyltrans-ferase catalytic subunit
OE2404R OE2386R MA 0 1 N 9.33 flaCEOE2404R OE2390R MA 0 1 N 9.07 flaDOE2404R OE2397F E 0 1 N 52 flagellin B1
CheR OE2406R OE1428F C 1 0 N 13.6 CHPCheR OE2406R OE2333R C 1 0 N 17.94 probable signal-transdu-
cing histidine kinaseCheR OE2406R OE2428R C 1 0 N 11.26 CHPCheR OE2406R OE3070R C 1 0 N 17.88 htr12CheR OE2406R OE3139R C 1 0 N 8.92 amidophosphoribosyl-
transferaseCheR OE2406R OE3943R C 1 0 N 8.82 CHP promiscuous preyCheD OE2408R OE1268F C 1 0 N 7.58 probable transcription
regulator boa1CheD OE2408R OE1428F C 1 0 Y 18.13 CHP Trusted (reciprocally
confirmed)CheD OE2408R OE2402F C 1 0 N 10.58 CHPCheD OE2408R OE2404R C 1 0 N 14.62 CHP
151
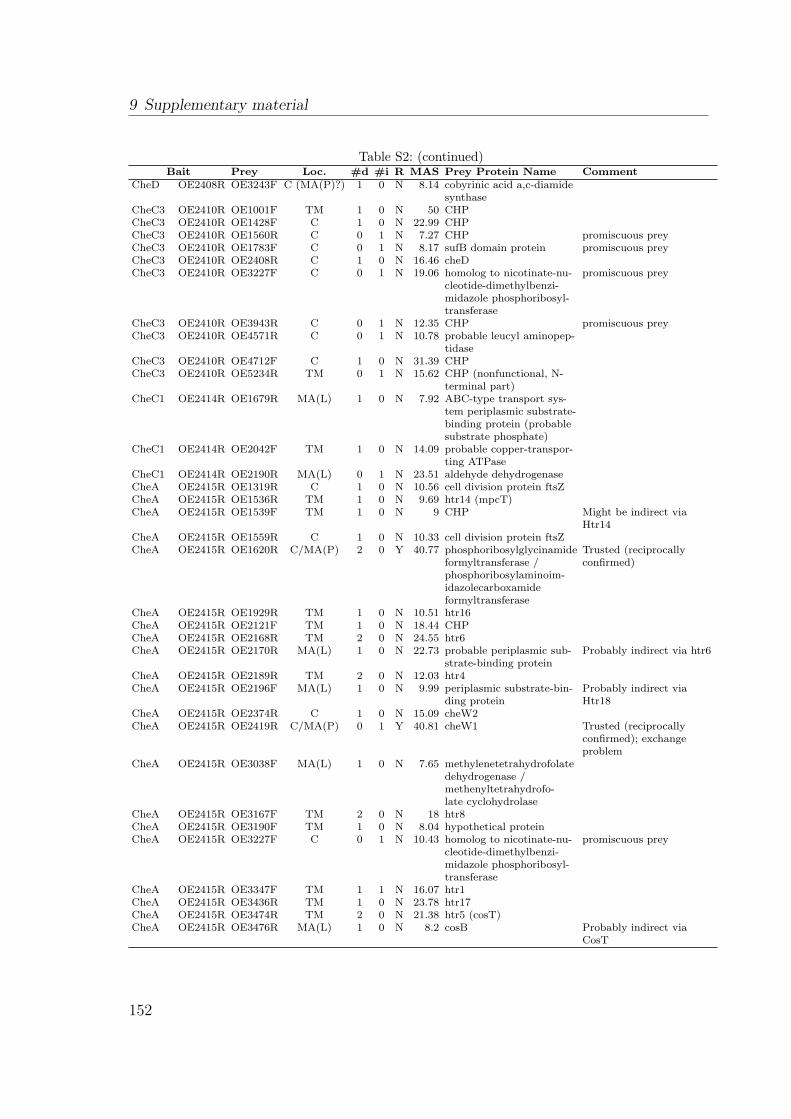
9 Supplementary material
Table S2: (continued)Bait Prey Loc. #d #i R MAS Prey Protein Name Comment
CheD OE2408R OE3243F C (MA(P)?) 1 0 N 8.14 cobyrinic acid a,c-diamidesynthase
CheC3 OE2410R OE1001F TM 1 0 N 50 CHPCheC3 OE2410R OE1428F C 1 0 N 22.99 CHPCheC3 OE2410R OE1560R C 0 1 N 7.27 CHP promiscuous preyCheC3 OE2410R OE1783F C 0 1 N 8.17 sufB domain protein promiscuous preyCheC3 OE2410R OE2408R C 1 0 N 16.46 cheDCheC3 OE2410R OE3227F C 0 1 N 19.06 homolog to nicotinate-nu-
cleotide-dimethylbenzi-midazole phosphoribosyl-transferase
promiscuous prey
CheC3 OE2410R OE3943R C 0 1 N 12.35 CHP promiscuous preyCheC3 OE2410R OE4571R C 0 1 N 10.78 probable leucyl aminopep-
tidaseCheC3 OE2410R OE4712F C 1 0 N 31.39 CHPCheC3 OE2410R OE5234R TM 0 1 N 15.62 CHP (nonfunctional, N-
terminal part)CheC1 OE2414R OE1679R MA(L) 1 0 N 7.92 ABC-type transport sys-
tem periplasmic substrate-binding protein (probablesubstrate phosphate)
CheC1 OE2414R OE2042F TM 1 0 N 14.09 probable copper-transpor-ting ATPase
CheC1 OE2414R OE2190R MA(L) 0 1 N 23.51 aldehyde dehydrogenaseCheA OE2415R OE1319R C 1 0 N 10.56 cell division protein ftsZCheA OE2415R OE1536R TM 1 0 N 9.69 htr14 (mpcT)CheA OE2415R OE1539F TM 1 0 N 9 CHP Might be indirect via
Htr14CheA OE2415R OE1559R C 1 0 N 10.33 cell division protein ftsZCheA OE2415R OE1620R C/MA(P) 2 0 Y 40.77 phosphoribosylglycinamide
formyltransferase /phosphoribosylaminoim-idazolecarboxamideformyltransferase
Trusted (reciprocallyconfirmed)
CheA OE2415R OE1929R TM 1 0 N 10.51 htr16CheA OE2415R OE2121F TM 1 0 N 18.44 CHPCheA OE2415R OE2168R TM 2 0 N 24.55 htr6CheA OE2415R OE2170R MA(L) 1 0 N 22.73 probable periplasmic sub-
strate-binding proteinProbably indirect via htr6
CheA OE2415R OE2189R TM 2 0 N 12.03 htr4CheA OE2415R OE2196F MA(L) 1 0 N 9.99 periplasmic substrate-bin-
ding proteinProbably indirect viaHtr18
CheA OE2415R OE2374R C 1 0 N 15.09 cheW2CheA OE2415R OE2419R C/MA(P) 0 1 Y 40.81 cheW1 Trusted (reciprocally
confirmed); exchangeproblem
CheA OE2415R OE3038F MA(L) 1 0 N 7.65 methylenetetrahydrofolatedehydrogenase /methenyltetrahydrofo-late cyclohydrolase
CheA OE2415R OE3167F TM 2 0 N 18 htr8CheA OE2415R OE3190F TM 1 0 N 8.04 hypothetical proteinCheA OE2415R OE3227F C 0 1 N 10.43 homolog to nicotinate-nu-
cleotide-dimethylbenzi-midazole phosphoribosyl-transferase
promiscuous prey
CheA OE2415R OE3347F TM 1 1 N 16.07 htr1CheA OE2415R OE3436R TM 1 0 N 23.78 htr17CheA OE2415R OE3474R TM 2 0 N 21.38 htr5 (cosT)CheA OE2415R OE3476R MA(L) 1 0 N 8.2 cosB Probably indirect via
CosT
152
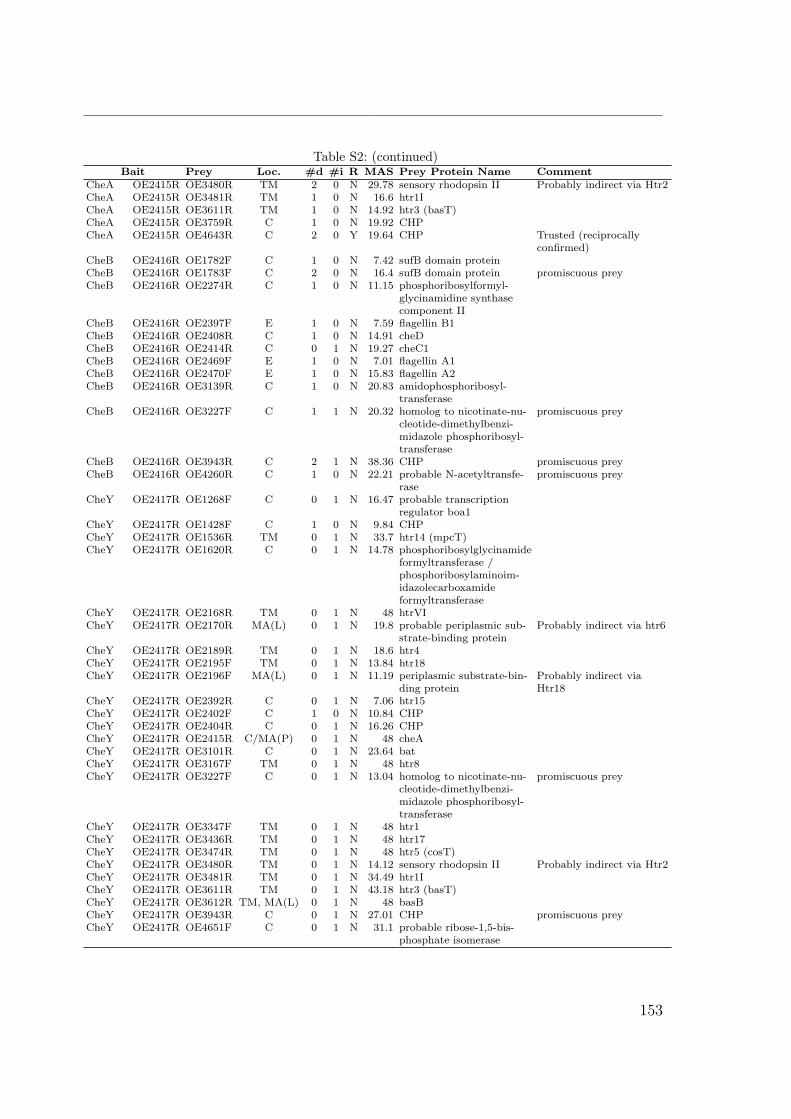
Table S2: (continued)Bait Prey Loc. #d #i R MAS Prey Protein Name Comment
CheA OE2415R OE3480R TM 2 0 N 29.78 sensory rhodopsin II Probably indirect via Htr2CheA OE2415R OE3481R TM 1 0 N 16.6 htr1ICheA OE2415R OE3611R TM 1 0 N 14.92 htr3 (basT)CheA OE2415R OE3759R C 1 0 N 19.92 CHPCheA OE2415R OE4643R C 2 0 Y 19.64 CHP Trusted (reciprocally
confirmed)CheB OE2416R OE1782F C 1 0 N 7.42 sufB domain proteinCheB OE2416R OE1783F C 2 0 N 16.4 sufB domain protein promiscuous preyCheB OE2416R OE2274R C 1 0 N 11.15 phosphoribosylformyl-
glycinamidine synthasecomponent II
CheB OE2416R OE2397F E 1 0 N 7.59 flagellin B1CheB OE2416R OE2408R C 1 0 N 14.91 cheDCheB OE2416R OE2414R C 0 1 N 19.27 cheC1CheB OE2416R OE2469F E 1 0 N 7.01 flagellin A1CheB OE2416R OE2470F E 1 0 N 15.83 flagellin A2CheB OE2416R OE3139R C 1 0 N 20.83 amidophosphoribosyl-
transferaseCheB OE2416R OE3227F C 1 1 N 20.32 homolog to nicotinate-nu-
cleotide-dimethylbenzi-midazole phosphoribosyl-transferase
promiscuous prey
CheB OE2416R OE3943R C 2 1 N 38.36 CHP promiscuous preyCheB OE2416R OE4260R C 1 0 N 22.21 probable N-acetyltransfe-
rasepromiscuous prey
CheY OE2417R OE1268F C 0 1 N 16.47 probable transcriptionregulator boa1
CheY OE2417R OE1428F C 1 0 N 9.84 CHPCheY OE2417R OE1536R TM 0 1 N 33.7 htr14 (mpcT)CheY OE2417R OE1620R C 0 1 N 14.78 phosphoribosylglycinamide
formyltransferase /phosphoribosylaminoim-idazolecarboxamideformyltransferase
CheY OE2417R OE2168R TM 0 1 N 48 htrVICheY OE2417R OE2170R MA(L) 0 1 N 19.8 probable periplasmic sub-
strate-binding proteinProbably indirect via htr6
CheY OE2417R OE2189R TM 0 1 N 18.6 htr4CheY OE2417R OE2195F TM 0 1 N 13.84 htr18CheY OE2417R OE2196F MA(L) 0 1 N 11.19 periplasmic substrate-bin-
ding proteinProbably indirect viaHtr18
CheY OE2417R OE2392R C 0 1 N 7.06 htr15CheY OE2417R OE2402F C 1 0 N 10.84 CHPCheY OE2417R OE2404R C 0 1 N 16.26 CHPCheY OE2417R OE2415R C/MA(P) 0 1 N 48 cheACheY OE2417R OE3101R C 0 1 N 23.64 batCheY OE2417R OE3167F TM 0 1 N 48 htr8CheY OE2417R OE3227F C 0 1 N 13.04 homolog to nicotinate-nu-
cleotide-dimethylbenzi-midazole phosphoribosyl-transferase
promiscuous prey
CheY OE2417R OE3347F TM 0 1 N 48 htr1CheY OE2417R OE3436R TM 0 1 N 48 htr17CheY OE2417R OE3474R TM 0 1 N 48 htr5 (cosT)CheY OE2417R OE3480R TM 0 1 N 14.12 sensory rhodopsin II Probably indirect via Htr2CheY OE2417R OE3481R TM 0 1 N 34.49 htr1ICheY OE2417R OE3611R TM 0 1 N 43.18 htr3 (basT)CheY OE2417R OE3612R TM, MA(L) 0 1 N 48 basBCheY OE2417R OE3943R C 0 1 N 27.01 CHP promiscuous preyCheY OE2417R OE4651F C 0 1 N 31.1 probable ribose-1,5-bis-
phosphate isomerase
153
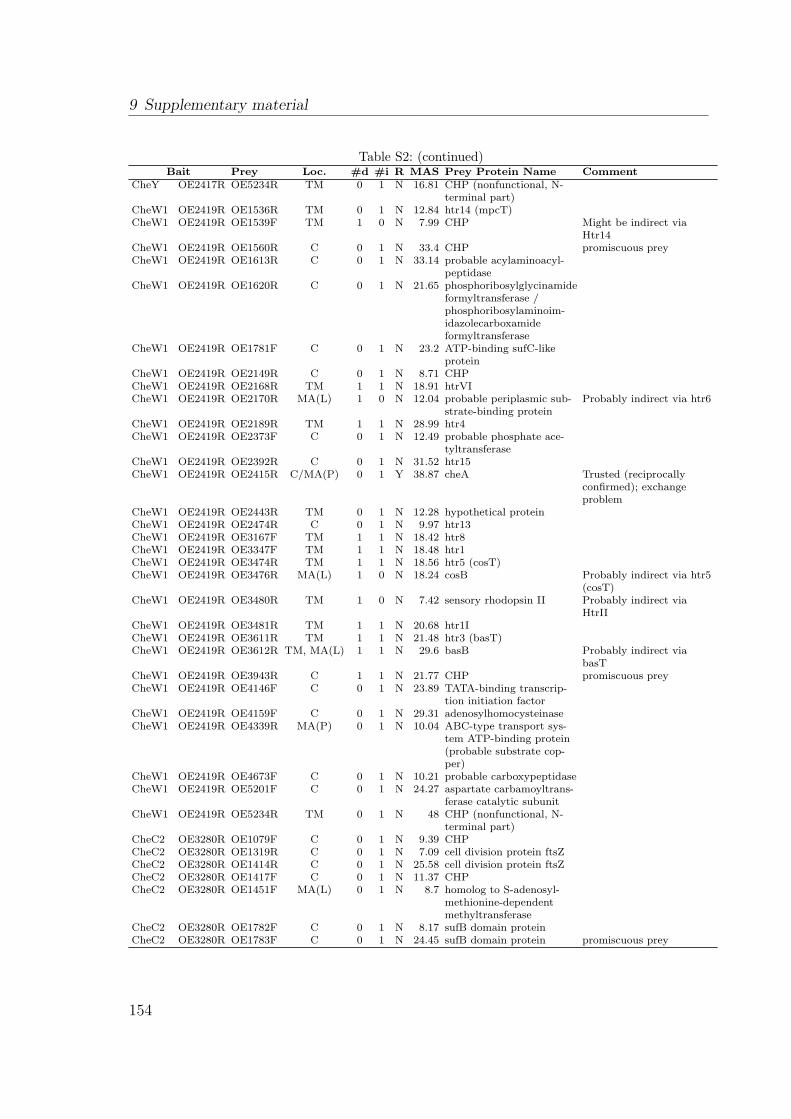
9 Supplementary material
Table S2: (continued)Bait Prey Loc. #d #i R MAS Prey Protein Name Comment
CheY OE2417R OE5234R TM 0 1 N 16.81 CHP (nonfunctional, N-terminal part)
CheW1 OE2419R OE1536R TM 0 1 N 12.84 htr14 (mpcT)CheW1 OE2419R OE1539F TM 1 0 N 7.99 CHP Might be indirect via
Htr14CheW1 OE2419R OE1560R C 0 1 N 33.4 CHP promiscuous preyCheW1 OE2419R OE1613R C 0 1 N 33.14 probable acylaminoacyl-
peptidaseCheW1 OE2419R OE1620R C 0 1 N 21.65 phosphoribosylglycinamide
formyltransferase /phosphoribosylaminoim-idazolecarboxamideformyltransferase
CheW1 OE2419R OE1781F C 0 1 N 23.2 ATP-binding sufC-likeprotein
CheW1 OE2419R OE2149R C 0 1 N 8.71 CHPCheW1 OE2419R OE2168R TM 1 1 N 18.91 htrVICheW1 OE2419R OE2170R MA(L) 1 0 N 12.04 probable periplasmic sub-
strate-binding proteinProbably indirect via htr6
CheW1 OE2419R OE2189R TM 1 1 N 28.99 htr4CheW1 OE2419R OE2373F C 0 1 N 12.49 probable phosphate ace-
tyltransferaseCheW1 OE2419R OE2392R C 0 1 N 31.52 htr15CheW1 OE2419R OE2415R C/MA(P) 0 1 Y 38.87 cheA Trusted (reciprocally
confirmed); exchangeproblem
CheW1 OE2419R OE2443R TM 0 1 N 12.28 hypothetical proteinCheW1 OE2419R OE2474R C 0 1 N 9.97 htr13CheW1 OE2419R OE3167F TM 1 1 N 18.42 htr8CheW1 OE2419R OE3347F TM 1 1 N 18.48 htr1CheW1 OE2419R OE3474R TM 1 1 N 18.56 htr5 (cosT)CheW1 OE2419R OE3476R MA(L) 1 0 N 18.24 cosB Probably indirect via htr5
(cosT)CheW1 OE2419R OE3480R TM 1 0 N 7.42 sensory rhodopsin II Probably indirect via
HtrIICheW1 OE2419R OE3481R TM 1 1 N 20.68 htr1ICheW1 OE2419R OE3611R TM 1 1 N 21.48 htr3 (basT)CheW1 OE2419R OE3612R TM, MA(L) 1 1 N 29.6 basB Probably indirect via
basTCheW1 OE2419R OE3943R C 1 1 N 21.77 CHP promiscuous preyCheW1 OE2419R OE4146F C 0 1 N 23.89 TATA-binding transcrip-
tion initiation factorCheW1 OE2419R OE4159F C 0 1 N 29.31 adenosylhomocysteinaseCheW1 OE2419R OE4339R MA(P) 0 1 N 10.04 ABC-type transport sys-
tem ATP-binding protein(probable substrate cop-per)
CheW1 OE2419R OE4673F C 0 1 N 10.21 probable carboxypeptidaseCheW1 OE2419R OE5201F C 0 1 N 24.27 aspartate carbamoyltrans-
ferase catalytic subunitCheW1 OE2419R OE5234R TM 0 1 N 48 CHP (nonfunctional, N-
terminal part)CheC2 OE3280R OE1079F C 0 1 N 9.39 CHPCheC2 OE3280R OE1319R C 0 1 N 7.09 cell division protein ftsZCheC2 OE3280R OE1414R C 0 1 N 25.58 cell division protein ftsZCheC2 OE3280R OE1417F C 0 1 N 11.37 CHPCheC2 OE3280R OE1451F MA(L) 0 1 N 8.7 homolog to S-adenosyl-
methionine-dependentmethyltransferase
CheC2 OE3280R OE1782F C 0 1 N 8.17 sufB domain proteinCheC2 OE3280R OE1783F C 0 1 N 24.45 sufB domain protein promiscuous prey
154
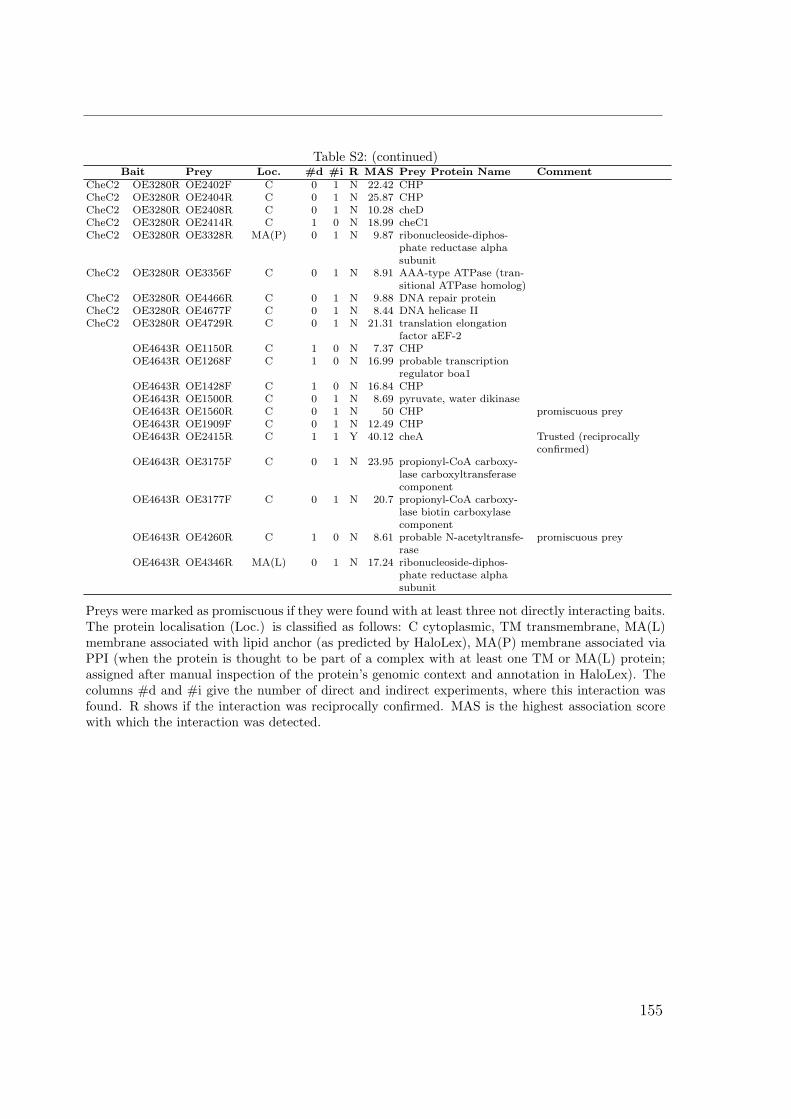
Table S2: (continued)Bait Prey Loc. #d #i R MAS Prey Protein Name Comment
CheC2 OE3280R OE2402F C 0 1 N 22.42 CHPCheC2 OE3280R OE2404R C 0 1 N 25.87 CHPCheC2 OE3280R OE2408R C 0 1 N 10.28 cheDCheC2 OE3280R OE2414R C 1 0 N 18.99 cheC1CheC2 OE3280R OE3328R MA(P) 0 1 N 9.87 ribonucleoside-diphos-
phate reductase alphasubunit
CheC2 OE3280R OE3356F C 0 1 N 8.91 AAA-type ATPase (tran-sitional ATPase homolog)
CheC2 OE3280R OE4466R C 0 1 N 9.88 DNA repair proteinCheC2 OE3280R OE4677F C 0 1 N 8.44 DNA helicase IICheC2 OE3280R OE4729R C 0 1 N 21.31 translation elongation
factor aEF-2OE4643R OE1150R C 1 0 N 7.37 CHPOE4643R OE1268F C 1 0 N 16.99 probable transcription
regulator boa1OE4643R OE1428F C 1 0 N 16.84 CHPOE4643R OE1500R C 0 1 N 8.69 pyruvate, water dikinaseOE4643R OE1560R C 0 1 N 50 CHP promiscuous preyOE4643R OE1909F C 0 1 N 12.49 CHPOE4643R OE2415R C 1 1 Y 40.12 cheA Trusted (reciprocally
confirmed)OE4643R OE3175F C 0 1 N 23.95 propionyl-CoA carboxy-
lase carboxyltransferasecomponent
OE4643R OE3177F C 0 1 N 20.7 propionyl-CoA carboxy-lase biotin carboxylasecomponent
OE4643R OE4260R C 1 0 N 8.61 probable N-acetyltransfe-rase
promiscuous prey
OE4643R OE4346R MA(L) 0 1 N 17.24 ribonucleoside-diphos-phate reductase alphasubunit
Preys were marked as promiscuous if they were found with at least three not directly interacting baits.The protein localisation (Loc.) is classified as follows: C cytoplasmic, TM transmembrane, MA(L)membrane associated with lipid anchor (as predicted by HaloLex), MA(P) membrane associated viaPPI (when the protein is thought to be part of a complex with at least one TM or MA(L) protein;assigned after manual inspection of the protein’s genomic context and annotation in HaloLex). Thecolumns #d and #i give the number of direct and indirect experiments, where this interaction wasfound. R shows if the interaction was reciprocally confirmed. MAS is the highest association scorewith which the interaction was detected.
155
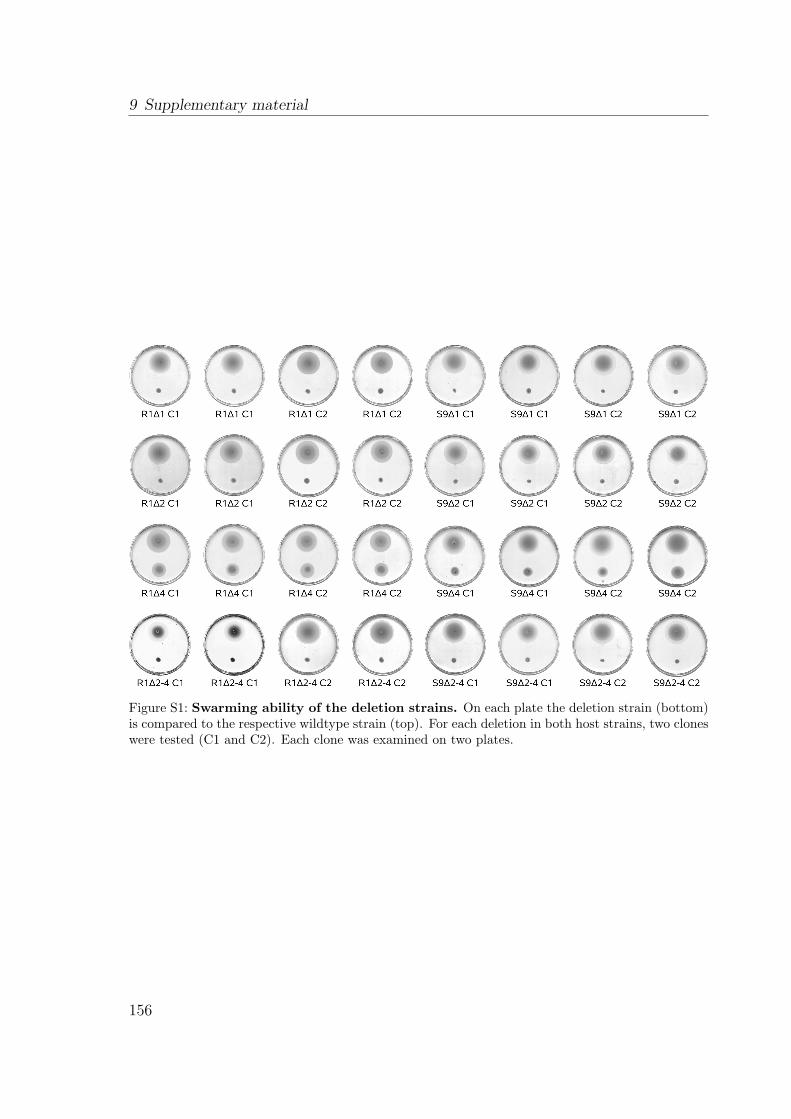
9 Supplementary material
Figure S1: Swarming ability of the deletion strains. On each plate the deletion strain (bottom)is compared to the respective wildtype strain (top). For each deletion in both host strains, two cloneswere tested (C1 and C2). Each clone was examined on two plates.
156
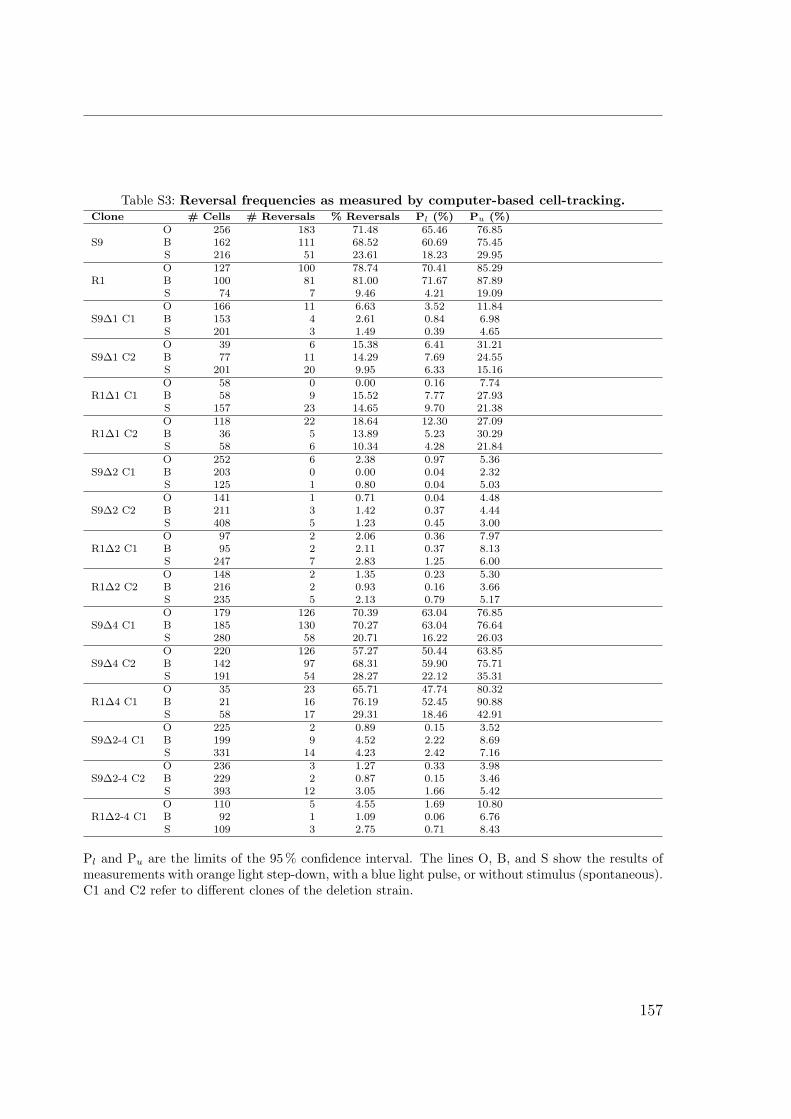
Table S3: Reversal frequencies as measured by computer-based cell-tracking.Clone # Cells # Reversals % Reversals Pl (%) Pu (%)
O 256 183 71.48 65.46 76.85S9 B 162 111 68.52 60.69 75.45
S 216 51 23.61 18.23 29.95O 127 100 78.74 70.41 85.29
R1 B 100 81 81.00 71.67 87.89S 74 7 9.46 4.21 19.09O 166 11 6.63 3.52 11.84
S9∆1 C1 B 153 4 2.61 0.84 6.98S 201 3 1.49 0.39 4.65O 39 6 15.38 6.41 31.21
S9∆1 C2 B 77 11 14.29 7.69 24.55S 201 20 9.95 6.33 15.16O 58 0 0.00 0.16 7.74
R1∆1 C1 B 58 9 15.52 7.77 27.93S 157 23 14.65 9.70 21.38O 118 22 18.64 12.30 27.09
R1∆1 C2 B 36 5 13.89 5.23 30.29S 58 6 10.34 4.28 21.84O 252 6 2.38 0.97 5.36
S9∆2 C1 B 203 0 0.00 0.04 2.32S 125 1 0.80 0.04 5.03O 141 1 0.71 0.04 4.48
S9∆2 C2 B 211 3 1.42 0.37 4.44S 408 5 1.23 0.45 3.00O 97 2 2.06 0.36 7.97
R1∆2 C1 B 95 2 2.11 0.37 8.13S 247 7 2.83 1.25 6.00O 148 2 1.35 0.23 5.30
R1∆2 C2 B 216 2 0.93 0.16 3.66S 235 5 2.13 0.79 5.17O 179 126 70.39 63.04 76.85
S9∆4 C1 B 185 130 70.27 63.04 76.64S 280 58 20.71 16.22 26.03O 220 126 57.27 50.44 63.85
S9∆4 C2 B 142 97 68.31 59.90 75.71S 191 54 28.27 22.12 35.31O 35 23 65.71 47.74 80.32
R1∆4 C1 B 21 16 76.19 52.45 90.88S 58 17 29.31 18.46 42.91O 225 2 0.89 0.15 3.52
S9∆2-4 C1 B 199 9 4.52 2.22 8.69S 331 14 4.23 2.42 7.16O 236 3 1.27 0.33 3.98
S9∆2-4 C2 B 229 2 0.87 0.15 3.46S 393 12 3.05 1.66 5.42O 110 5 4.55 1.69 10.80
R1∆2-4 C1 B 92 1 1.09 0.06 6.76S 109 3 2.75 0.71 8.43
Pl and Pu are the limits of the 95 % confidence interval. The lines O, B, and S show the results ofmeasurements with orange light step-down, with a blue light pulse, or without stimulus (spontaneous).C1 and C2 refer to different clones of the deletion strain.
157
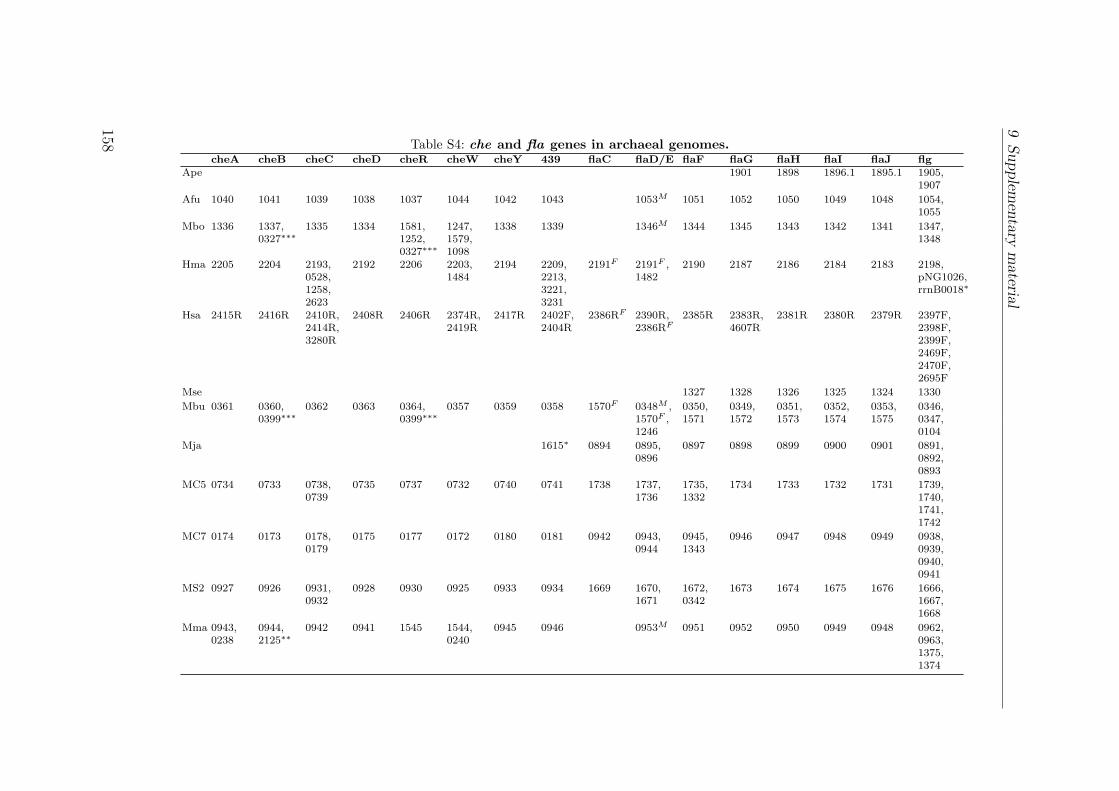
9Supplem
entarym
aterial
Table S4: che and fla genes in archaeal genomes.cheA cheB cheC cheD cheR cheW cheY 439 flaC flaD/E flaF flaG flaH flaI flaJ flg
Ape 1901 1898 1896.1 1895.1 1905,1907
Afu 1040 1041 1039 1038 1037 1044 1042 1043 1053M 1051 1052 1050 1049 1048 1054,1055
Mbo 1336 1337,0327∗∗∗
1335 1334 1581,1252,0327∗∗∗
1247,1579,1098
1338 1339 1346M 1344 1345 1343 1342 1341 1347,1348
Hma 2205 2204 2193,0528,1258,2623
2192 2206 2203,1484
2194 2209,2213,3221,3231
2191F 2191F ,1482
2190 2187 2186 2184 2183 2198,pNG1026,rrnB0018∗
Hsa 2415R 2416R 2410R,2414R,3280R
2408R 2406R 2374R,2419R
2417R 2402F,2404R
2386RF 2390R,2386RF
2385R 2383R,4607R
2381R 2380R 2379R 2397F,2398F,2399F,2469F,2470F,2695F
Mse 1327 1328 1326 1325 1324 1330Mbu 0361 0360,
0399∗∗∗0362 0363 0364,
0399∗∗∗0357 0359 0358 1570F 0348M ,
1570F ,1246
0350,1571
0349,1572
0351,1573
0352,1574
0353,1575
0346,0347,0104
Mja 1615∗ 0894 0895,0896
0897 0898 0899 0900 0901 0891,0892,0893
MC5 0734 0733 0738,0739
0735 0737 0732 0740 0741 1738 1737,1736
1735,1332
1734 1733 1732 1731 1739,1740,1741,1742
MC7 0174 0173 0178,0179
0175 0177 0172 0180 0181 0942 0943,0944
0945,1343
0946 0947 0948 0949 0938,0939,0940,0941
MS2 0927 0926 0931,0932
0928 0930 0925 0933 0934 1669 1670,1671
1672,0342
1673 1674 1675 1676 1666,1667,1668
Mma 0943,0238
0944,2125∗∗
0942 0941 1545 1544,0240
0945 0946 0953M 0951 0952 0950 0949 0948 0962,0963,1375,1374
158
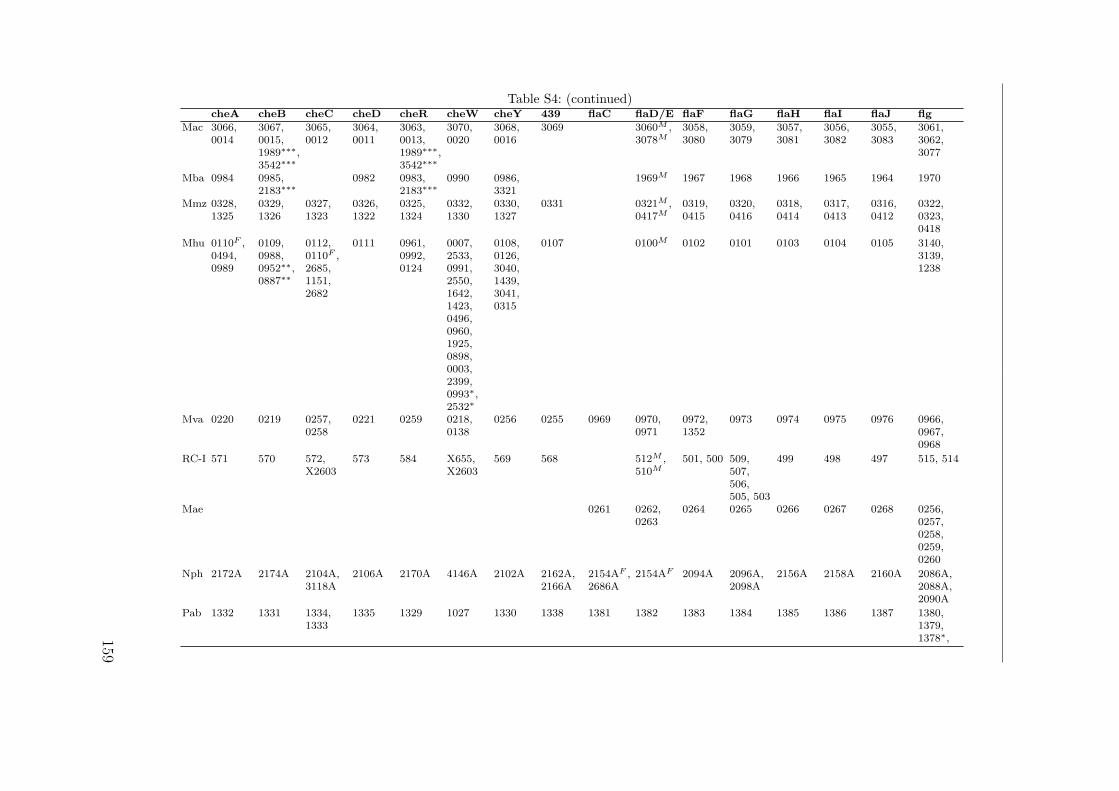
Table S4: (continued)cheA cheB cheC cheD cheR cheW cheY 439 flaC flaD/E flaF flaG flaH flaI flaJ flg
Mac 3066,0014
3067,0015,1989∗∗∗,3542∗∗∗
3065,0012
3064,0011
3063,0013,1989∗∗∗,3542∗∗∗
3070,0020
3068,0016
3069 3060M ,3078M
3058,3080
3059,3079
3057,3081
3056,3082
3055,3083
3061,3062,3077
Mba 0984 0985,2183∗∗∗
0982 0983,2183∗∗∗
0990 0986,3321
1969M 1967 1968 1966 1965 1964 1970
Mmz 0328,1325
0329,1326
0327,1323
0326,1322
0325,1324
0332,1330
0330,1327
0331 0321M ,0417M
0319,0415
0320,0416
0318,0414
0317,0413
0316,0412
0322,0323,0418
Mhu 0110F ,0494,0989
0109,0988,0952∗∗,0887∗∗
0112,0110F ,2685,1151,2682
0111 0961,0992,0124
0007,2533,0991,2550,1642,1423,0496,0960,1925,0898,0003,2399,0993∗,2532∗
0108,0126,3040,1439,3041,0315
0107 0100M 0102 0101 0103 0104 0105 3140,3139,1238
Mva 0220 0219 0257,0258
0221 0259 0218,0138
0256 0255 0969 0970,0971
0972,1352
0973 0974 0975 0976 0966,0967,0968
RC-I 571 570 572,X2603
573 584 X655,X2603
569 568 512M ,510M
501, 500 509,507,506,505, 503
499 498 497 515, 514
Mae 0261 0262,0263
0264 0265 0266 0267 0268 0256,0257,0258,0259,0260
Nph 2172A 2174A 2104A,3118A
2106A 2170A 4146A 2102A 2162A,2166A
2154AF ,2686A
2154AF 2094A 2096A,2098A
2156A 2158A 2160A 2086A,2088A,2090A
Pab 1332 1331 1334,1333
1335 1329 1027 1330 1338 1381 1382 1383 1384 1385 1386 1387 1380,1379,1378∗,159
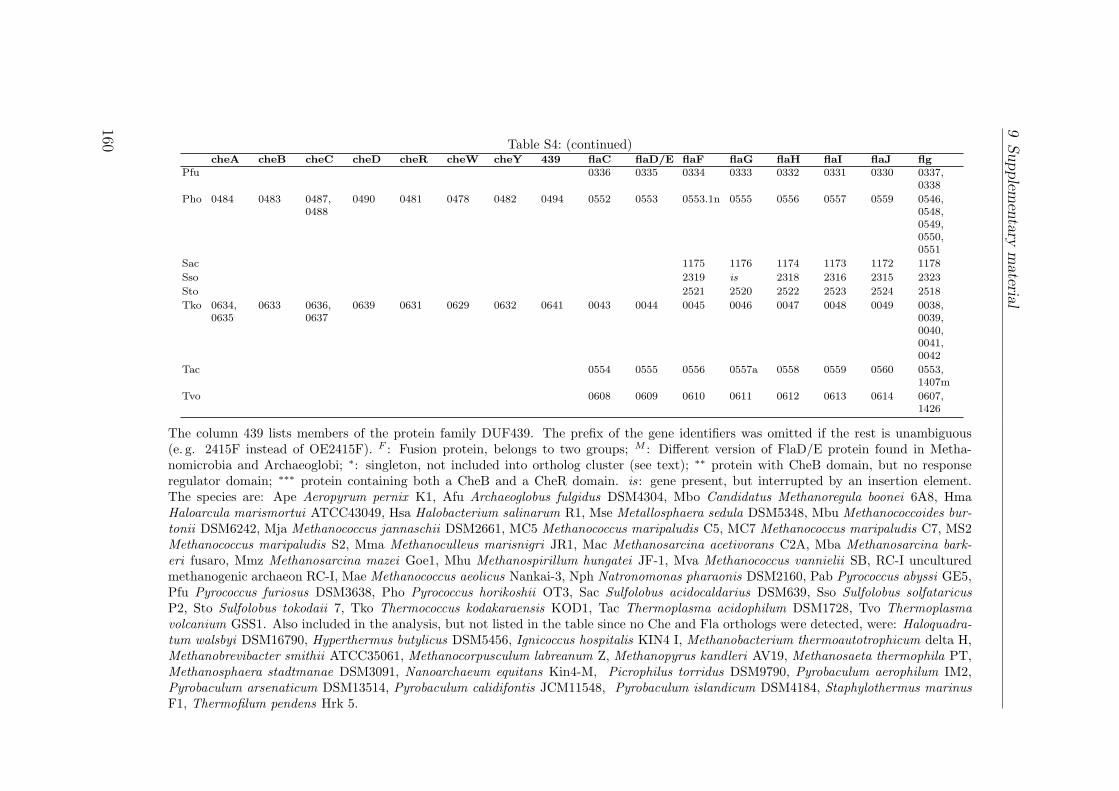
9Supplem
entarym
aterial
Table S4: (continued)cheA cheB cheC cheD cheR cheW cheY 439 flaC flaD/E flaF flaG flaH flaI flaJ flg
Pfu 0336 0335 0334 0333 0332 0331 0330 0337,0338
Pho 0484 0483 0487,0488
0490 0481 0478 0482 0494 0552 0553 0553.1n 0555 0556 0557 0559 0546,0548,0549,0550,0551
Sac 1175 1176 1174 1173 1172 1178Sso 2319 is 2318 2316 2315 2323Sto 2521 2520 2522 2523 2524 2518Tko 0634,
06350633 0636,
06370639 0631 0629 0632 0641 0043 0044 0045 0046 0047 0048 0049 0038,
0039,0040,0041,0042
Tac 0554 0555 0556 0557a 0558 0559 0560 0553,1407m
Tvo 0608 0609 0610 0611 0612 0613 0614 0607,1426
The column 439 lists members of the protein family DUF439. The prefix of the gene identifiers was omitted if the rest is unambiguous(e. g. 2415F instead of OE2415F). F : Fusion protein, belongs to two groups; M : Different version of FlaD/E protein found in Metha-nomicrobia and Archaeoglobi; ∗: singleton, not included into ortholog cluster (see text); ∗∗ protein with CheB domain, but no responseregulator domain; ∗∗∗ protein containing both a CheB and a CheR domain. is: gene present, but interrupted by an insertion element.The species are: Ape Aeropyrum pernix K1, Afu Archaeoglobus fulgidus DSM4304, Mbo Candidatus Methanoregula boonei 6A8, HmaHaloarcula marismortui ATCC43049, Hsa Halobacterium salinarum R1, Mse Metallosphaera sedula DSM5348, Mbu Methanococcoides bur-tonii DSM6242, Mja Methanococcus jannaschii DSM2661, MC5 Methanococcus maripaludis C5, MC7 Methanococcus maripaludis C7, MS2Methanococcus maripaludis S2, Mma Methanoculleus marisnigri JR1, Mac Methanosarcina acetivorans C2A, Mba Methanosarcina bark-eri fusaro, Mmz Methanosarcina mazei Goe1, Mhu Methanospirillum hungatei JF-1, Mva Methanococcus vannielii SB, RC-I unculturedmethanogenic archaeon RC-I, Mae Methanococcus aeolicus Nankai-3, Nph Natronomonas pharaonis DSM2160, Pab Pyrococcus abyssi GE5,Pfu Pyrococcus furiosus DSM3638, Pho Pyrococcus horikoshii OT3, Sac Sulfolobus acidocaldarius DSM639, Sso Sulfolobus solfataricusP2, Sto Sulfolobus tokodaii 7, Tko Thermococcus kodakaraensis KOD1, Tac Thermoplasma acidophilum DSM1728, Tvo Thermoplasmavolcanium GSS1. Also included in the analysis, but not listed in the table since no Che and Fla orthologs were detected, were: Haloquadra-tum walsbyi DSM16790, Hyperthermus butylicus DSM5456, Ignicoccus hospitalis KIN4 I, Methanobacterium thermoautotrophicum delta H,Methanobrevibacter smithii ATCC35061, Methanocorpusculum labreanum Z, Methanopyrus kandleri AV19, Methanosaeta thermophila PT,Methanosphaera stadtmanae DSM3091, Nanoarchaeum equitans Kin4-M, Picrophilus torridus DSM9790, Pyrobaculum aerophilum IM2,Pyrobaculum arsenaticum DSM13514, Pyrobaculum calidifontis JCM11548, Pyrobaculum islandicum DSM4184, Staphylothermus marinusF1, Thermofilum pendens Hrk 5.
160
BibliographyAlam, M. and Oesterhelt, D. (1984) Morphology, function and isolation of halobacterial flagella. J
Mol Biol 176: 459–475, URL http://www.ncbi.nlm.nih.gov/pubmed/6748081.
Albert, R., Jeong, H., and Barabasi, A.-L. (2000) Error and attack tolerance of complex networks.Nature 406: 378–382, URL http://dx.doi.org/10.1038/35019019.
Alfarano, C., Andrade, C. E., Anthony, K., Bahroos, N., Bajec, M., Bantoft, K., Betel, D., Bobechko,B., Boutilier, K., Burgess, E., Buzadzija, K., Cavero, R., D’Abreo, C., Donaldson, I., Dorairajoo,D., Dumontier, M. J., Dumontier, M. R., Earles, V., Farrall, R., Feldman, H., Garderman, E.,Gong, Y., Gonzaga, R., Grytsan, V., Gryz, E., Gu, V., Haldorsen, E., Halupa, A., Haw, R.,Hrvojic, A., Hurrell, L., Isserlin, R., Jack, F., Juma, F., Khan, A., Kon, T., Konopinsky, S.,Le, V., Lee, E., Ling, S., Magidin, M., Moniakis, J., Montojo, J., Moore, S., Muskat, B., Ng,I., Paraiso, J. P., Parker, B., Pintilie, G., Pirone, R., Salama, J. J., Sgro, S., Shan, T., Shu,Y., Siew, J., Skinner, D., Snyder, K., Stasiuk, R., Strumpf, D., Tuekam, B., Tao, S., Wang, Z.,White, M., Willis, R., Wolting, C., Wong, S., Wrong, A., Xin, C., Yao, R., Yates, B., Zhang,S., Zheng, K., Pawson, T., Ouellette, B. F. F., and Hogue, C. W. V. (2005) The BiomolecularInteraction Network Database and related tools 2005 update. Nucleic Acids Res 33: D418–D424,URL http://dx.doi.org/10.1093/nar/gki051.
Allers, T. and Mevarech, M. (2005) Archaeal genetics - the third way. Nat Rev Genet 6: 58–73, URLhttp://dx.doi.org/10.1038/nrg1504.
Ames, P. and Parkinson, J. S. (1994) Constitutively signaling fragments of Tsr, the Escherichia coliserine chemoreceptor. J Bacteriol 176: 6340–6348, URL http://www.ncbi.nlm.nih.gov/pubmed/7929006.
Aregger, M. (2003) Charakterisierung von cheW-Deletionsmutanten in Halobacterium salinarum.Ph.D. thesis, Ludwigs-Maximilians-Universität München.
Arifuzzaman, M., Maeda, M., Itoh, A., Nishikata, K., Takita, C., Saito, R., Ara, T., Nakahigashi, K.,Huang, H.-C., Hirai, A., Tsuzuki, K., Nakamura, S., Altaf-Ul-Amin, M., Oshima, T., Baba, T.,Yamamoto, N., Kawamura, T., Ioka-Nakamichi, T., Kitagawa, M., Tomita, M., Kanaya, S., Wada,C., and Mori, H. (2006) Large-scale identification of protein-protein interaction of Escherichia coliK-12. Genome Res 16: 686–691, URL http://dx.doi.org/10.1101/gr.4527806.
Armitage, J. P. (1999) Bacterial tactic responses. Adv Microb Physiol 41: 229–289, URL http://www.ncbi.nlm.nih.gov/pubmed/10500847.
Bader, J. S., Chaudhuri, A., Rothberg, J. M., and Chant, J. (2004) Gaining confidence in high-throughput protein interaction networks. Nat Biotechnol 22: 78–85, URL http://dx.doi.org/10.1038/nbt924.
Barabasi, A.-L. and Albert, R. (1999) Emergence of scaling in random networks. Science 286: 509–512, URL http://www.ncbi.nlm.nih.gov/pubmed/10521342.
161
Bibliography
Barak, R. and Eisenbach, M. (1992a) Correlation between phosphorylation of the chemotaxis proteinCheY and its activity at the flagellar motor. Biochemistry 31: 1821–1826, URL http://www.ncbi.nlm.nih.gov/pubmed/1737035.
Barak, R. and Eisenbach, M. (1992b) Fumarate or a fumarate metabolite restores switching abilityto rotating flagella of bacterial envelopes. J Bacteriol 174: 643–645, URL http://www.ncbi.nlm.nih.gov/pubmed/1729255.
Bardy, S. L., Ng, S. Y. M., and Jarrell, K. F. (2003) Prokaryotic motility structures. Microbiology149: 295–304, URL http://www.ncbi.nlm.nih.gov/pubmed/12624192.
Bardy, S. L., Ng, S. Y. M., and Jarrell, K. F. (2004) Recent advances in the structure and assemblyof the archaeal flagellum. J Mol Microbiol Biotechnol 7: 41–51, URL http://dx.doi.org/10.1159/000077868.
Barns, S. M., Delwiche, C. F., Palmer, J. D., and Pace, N. R. (1996) Perspectives on archaealdiversity, thermophily and monophyly from environmental rRNA sequences. Proc Natl Acad SciU S A 93: 9188–9193, URL http://www.ncbi.nlm.nih.gov/pubmed/8799176.
Bartel, P., Chien, C. T., Sternglanz, R., and Fields, S. (1993) Elimination of false positives that arisein using the two-hybrid system. Biotechniques 14: 920–924, URL http://www.ncbi.nlm.nih.gov/pubmed/8333960.
Berg, H. C. (2003) The rotary motor of bacterial flagella. Annu Rev Biochem 72: 19–54, URLhttp://dx.doi.org/10.1146/annurev.biochem.72.121801.161737.
Berg, H. C. and Purcell, E. M. (1977) Physics of chemoreception. Biophys J 20: 193–219, URLhttp://www.ncbi.nlm.nih.gov/pubmed/911982.
Besir, H. (2001) Untersuchung der lipidvermittelten Kristallisation der Ionenpumpen Bakteri-orhodopsin und Halorhodopsin aus Halobacterium salinarum. Ph.D. thesis, Ludwig-Maximilians-Universität München, URL http://edoc.ub.uni-muenchen.de/196/.
Bieger, B., Essen, L.-O., and Oesterhelt, D. (2003) Crystal structure of halophilic dodecin: a novel,dodecameric flavin binding protein from Halobacterium salinarum. Structure 11: 375–385, URLhttp://www.ncbi.nlm.nih.gov/pubmed/12679016.
Bilwes, A. M., Alex, L. A., Crane, B. R., and Simon, M. I. (1999) Structure of CheA, a signal-transducing histidine kinase. Cell 96: 131–141, URL http://www.ncbi.nlm.nih.gov/pubmed/9989504.
Bischoff, D. S., Bourret, R. B., Kirsch, M. L., and Ordal, G. W. (1993) Purification and character-ization of Bacillus subtilis CheY. Biochemistry 32: 9256–9261, URL http://www.ncbi.nlm.nih.gov/pubmed/8369293.
Bischoff, D. S. and Ordal, G. W. (1992) Identification and characterization of FliY, a novel componentof the Bacillus subtilis flagellar switch complex. Mol Microbiol 6: 2715–2723, URL http://www.ncbi.nlm.nih.gov/pubmed/1447979.
Blat, Y. and Eisenbach, M. (1996) Oligomerization of the phosphatase CheZ upon interaction withthe phosphorylated form of CheY. The signal protein of bacterial chemotaxis. J Biol Chem 271:1226–1231, URL http://www.ncbi.nlm.nih.gov/pubmed/8557654.
162
Bibliography
Blum, H., Beier, H., and Gross, H. J. (1987) Improved silver staining of plant proteins, RNA andDNA in polyacrylamide gels. Electrophoresis 8: 93–99, URL http://dx.doi.org/10.1002/elps.1150080203.
Bonneau, R., Facciotti, M. T., Reiss, D. J., Schmid, A. K., Pan, M., Kaur, A., Thorsson, V., Shannon,P., Johnson, M. H., Bare, J. C., Longabaugh, W., Vuthoori, M., Whitehead, K., Madar, A., Suzuki,L., Mori, T., Chang, D.-E., Diruggiero, J., Johnson, C. H., Hood, L., and Baliga, N. S. (2007) Apredictive model for transcriptional control of physiology in a free living cell. Cell 131: 1354–1365,URL http://dx.doi.org/10.1016/j.cell.2007.10.053.
Borkovich, K. A., Alex, L. A., and Simon, M. I. (1992) Attenuation of sensory receptor signaling bycovalent modification. Proc Natl Acad Sci U S A 89: 6756–6760, URL http://www.ncbi.nlm.nih.gov/pubmed/1495964.
Borkovich, K. A., Kaplan, N., Hess, J. F., and Simon, M. I. (1989) Transmembrane signal transductionin bacterial chemotaxis involves ligand-dependent activation of phosphate group transfer. Proc NatlAcad Sci U S A 86: 1208–1212, URL http://www.ncbi.nlm.nih.gov/pubmed/2645576.
Boukhvalova, M. S., Dahlquist, F. W., and Stewart, R. C. (2002) CheW binding interactions withCheA and Tar. Importance for chemotaxis signaling in Escherichia coli. J Biol Chem 277: 22251–22259, URL http://dx.doi.org/10.1074/jbc.M110908200.
Boulton, S. J., Vincent, S., and Vidal, M. (2001) Use of protein-interaction maps to formulatebiological questions. Curr Opin Chem Biol 5: 57–62, URL http://www.ncbi.nlm.nih.gov/pubmed/11166649.
Bren, A. and Eisenbach, M. (1998) The N terminus of the flagellar switch protein, FliM, is thebinding domain for the chemotactic response regulator, CheY. J Mol Biol 278: 507–514, URLhttp://dx.doi.org/10.1006/jmbi.1998.1730.
Brooun, A., Bell, J., Freitas, T., Larsen, R. W., and Alam, M. (1998) An archaeal aerotaxis trans-ducer combines subunit I core structures of eukaryotic cytochrome c oxidase and eubacterialmethyl-accepting chemotaxis proteins. J Bacteriol 180: 1642–1646, URL http://www.ncbi.nlm.nih.gov/pubmed/9537358.
Butland, G., Peregrín-Alvarez, J. M., Li, J., Yang, W., Yang, X., Canadien, V., Starostine, A.,Richards, D., Beattie, B., Krogan, N., Davey, M., Parkinson, J., Greenblatt, J., and Emili, A.(2005) Interaction network containing conserved and essential protein complexes in Escherichiacoli. Nature 433: 531–537, URL http://dx.doi.org/10.1038/nature03239.
Castagnoli, L., Costantini, A., Dall’Armi, C., Gonfloni, S., Montecchi-Palazzi, L., Panni, S., Paoluzi,S., Santonico, E., and Cesareni, G. (2004) Selectivity and promiscuity in the interaction networkmediated by protein recognition modules. FEBS Lett 567: 74–79, URL http://dx.doi.org/10.1016/j.febslet.2004.03.116.
Causier, B. (2004) Studying the interactome with the yeast two-hybrid system and mass spectrometry.Mass Spectrom Rev 23: 350–367, URL http://dx.doi.org/10.1002/mas.10080.
Chaban, B., Ng, S. Y. M., Kanbe, M., Saltzman, I., Nimmo, G., Aizawa, S.-I., and Jarrell, K. F. (2007)Systematic deletion analyses of the fla genes in the flagella operon identify several genes essential forproper assembly and function of flagella in the archaeon, Methanococcus maripaludis. Mol Microbiol66: 596–609, URL http://dx.doi.org/10.1111/j.1365-2958.2007.05913.x.
163
Bibliography
Chao, X., Muff, T. J., Park, S.-Y., Zhang, S., Pollard, A. M., Ordal, G. W., Bilwes, A. M., and Crane,B. R. (2006) A receptor-modifying deamidase in complex with a signaling phosphatase reveals re-ciprocal regulation. Cell 124: 561–571, URL http://dx.doi.org/10.1016/j.cell.2005.11.046.
Chiu, W., Baker, M. L., and Almo, S. C. (2006) Structural biology of cellular machines. Trends CellBiol 16: 144–150, URL http://dx.doi.org/10.1016/j.tcb.2006.01.002.
Cline, S. W., Lam, W. L., Charlebois, R. L., Schalkwyk, L. C., and Doolittle, W. F. (1989)Transformation methods for halophilic archaebacteria. Can J Microbiol 35: 148–152, URLhttp://www.ncbi.nlm.nih.gov/pubmed/2497937.
Cohen-Ben-Lulu, G. N., Francis, N. R., Shimoni, E., Noy, D., Davidov, Y., Prasad, K., Sagi, Y.,Cecchini, G., Johnstone, R. M., and Eisenbach, M. (2008) The bacterial flagellar switch complex isgetting more complex. EMBO J 27: 1134–1144, URL http://dx.doi.org/10.1038/emboj.2008.48.
Cohen-Krausz, S. and Trachtenberg, S. (2002) The structure of the archeabacterial flagellar filamentof the extreme halophile Halobacterium salinarum R1M1 and its relation to eubacterial flagellarfilaments and type IV pili. J Mol Biol 321: 383–395, URL http://www.ncbi.nlm.nih.gov/pubmed/12162953.
Cohen-Krausz, S. and Trachtenberg, S. (2008) The flagellar filament structure of the extreme aci-dothermophile Sulfolobus shibatae B12 suggests that archaeabacterial flagella have a unique andcommon symmetry and design. J Mol Biol 375: 1113–1124, URL http://dx.doi.org/10.1016/j.jmb.2007.10.048.
Collura, V. and Boissy, G. (2007) From protein-protein complexes to interactomics. Subcell Biochem43: 135–183, URL http://www.ncbi.nlm.nih.gov/pubmed/17953394.
da Costa, M. S., Santos, H., and Galinski, E. A. (1998) An overview of the role and diversity ofcompatible solutes in Bacteria and Archaea. Adv Biochem Eng Biotechnol 61: 117–153, URLhttp://www.ncbi.nlm.nih.gov/pubmed/9670799.
Dandekar, T., Snel, B., Huynen, M., and Bork, P. (1998) Conservation of gene order: a fingerprintof proteins that physically interact. Trends Biochem Sci 23: 324–328, URL http://www.ncbi.nlm.nih.gov/pubmed/9787636.
Danner, S. and Soppa, J. (1996) Characterization of the distal promoter element of halobacteriain vivo using saturation mutagenesis and selection. Mol Microbiol 19: 1265–1276, URL http://www.ncbi.nlm.nih.gov/pubmed/8730868.
del Rosario, R. C. H., Staudinger, W. F., Streif, S., Pfeiffer, F., Mendoza, E., and Oesterhelt, D.(2007) Modelling the CheY(D10K,Yl00W) Halobacterium salinarum mutant: sensitivity analysisallows choice of parameter to be modified in the phototaxis model. IET Syst Biol 1: 207–221,URL http://www.ncbi.nlm.nih.gov/pubmed/17708428.
DeLong, E. F. and Pace, N. R. (2001) Environmental diversity of bacteria and archaea. Syst Biol 50:470–478, URL http://www.ncbi.nlm.nih.gov/pubmed/12116647.
DeLong, E. F., Taylor, L. T., Marsh, T. L., and Preston, C. M. (1999) Visualization and enumerationof marine planktonic archaea and bacteria by using polyribonucleotide probes and fluorescent insitu hybridization. Appl Environ Microbiol 65: 5554–5563, URL http://www.ncbi.nlm.nih.gov/pubmed/10584017.
164
Bibliography
Dennis, P. P. and Shimmin, L. C. (1997) Evolutionary divergence and salinity-mediated selectionin halophilic archaea. Microbiol Mol Biol Rev 61: 90–104, URL http://www.ncbi.nlm.nih.gov/pubmed/9106366.
Deppenmeier, U., Johann, A., Hartsch, T., Merkl, R., Schmitz, R. A., Martinez-Arias, R., Henne,A., Wiezer, A., Bäumer, S., Jacobi, C., Brüggemann, H., Lienard, T., Christmann, A., Bömeke,M., Steckel, S., Bhattacharyya, A., Lykidis, A., Overbeek, R., Klenk, H.-P., Gunsalus, R. P.,Fritz, H.-J., and Gottschalk, G. (2002) The genome of Methanosarcina mazei : evidence for lateralgene transfer between bacteria and archaea. J Mol Microbiol Biotechnol 4: 453–461, URL http://www.ncbi.nlm.nih.gov/pubmed/12125824.
Desmond, E., Brochier-Armanet, C., and Gribaldo, S. (2007) Phylogenomics of the archaeal flagellum:rare horizontal gene transfer in a unique motility structure. BMC Evol Biol 7: 106, URL http://dx.doi.org/10.1186/1471-2148-7-106.
Djordjevic, S. and Stock, A. M. (1998) Chemotaxis receptor recognition by protein methyltrans-ferase CheR. Nat Struct Biol 5: 446–450, URL http://www.ncbi.nlm.nih.gov/pubmed/9628482.
Dobreva, I., Fielding, A., Foster, L., and Dedhar, S. (2008) Mapping the Integrin-Linked Kinase In-teractome Using SILAC. J Proteome Res 7: 1740–1749, URL http://dx.doi.org/10.1021/pr700852r.
Eisenbach, M. (1990) Functions of the flagellar modes of rotation in bacterial motility and chemotaxis.Mol Microbiol 4: 161–167, URL http://www.ncbi.nlm.nih.gov/pubmed/2187141.
Eisenberg, H., Mevarech, M., and Zaccai, G. (1992) Biochemical, structural, and molecular geneticaspects of halophilism. Adv Protein Chem 43: 1–62, URL http://www.ncbi.nlm.nih.gov/pubmed/1442321.
Falke, J. J. and Hazelbauer, G. L. (2001) Transmembrane signaling in bacterial chemorecep-tors. Trends Biochem Sci 26: 257–265, URL http://www.ncbi.nlm.nih.gov/pubmed/11295559.
Felsenstein, J. (2005) PHYLIP (Phylogeny Inference Package) version 3.6. Distributed by the author,URL http://evolution.genetics.washington.edu/phylip.html.
Fields, S. and Song, O. (1989) A novel genetic system to detect protein-protein interactions. Nature340: 245–246, URL http://dx.doi.org/10.1038/340245a0.
Finn, R. D., Mistry, J., Schuster-Böckler, B., Griffiths-Jones, S., Hollich, V., Lassmann, T., Moxon,S., Marshall, M., Khanna, A., Durbin, R., Eddy, S. R., Sonnhammer, E. L. L., and Bateman,A. (2006) Pfam: clans, web tools and services. Nucleic Acids Res 34: D247–D251, URL http://dx.doi.org/10.1093/nar/gkj149.
Finn, R. D., Tate, J., Mistry, J., Coggill, P. C., Sammut, S. J., Hotz, H.-R., Ceric, G., Forslund, K.,Eddy, S. R., Sonnhammer, E. L. L., and Bateman, A. (2008) The Pfam protein families database.Nucleic Acids Res 36: D281–D288, URL http://dx.doi.org/10.1093/nar/gkm960.
Formstecher, E., Aresta, S., Collura, V., Hamburger, A., Meil, A., Trehin, A., Reverdy, C., Betin,V., Maire, S., Brun, C., Jacq, B., Arpin, M., Bellaiche, Y., Bellusci, S., Benaroch, P., Bor-nens, M., Chanet, R., Chavrier, P., Delattre, O., Doye, V., Fehon, R., Faye, G., Galli, T.,
165
Bibliography
Girault, J.-A., Goud, B., de Gunzburg, J., Johannes, L., Junier, M.-P., Mirouse, V., Mukher-jee, A., Papadopoulo, D., Perez, F., Plessis, A., Rossé, C., Saule, S., Stoppa-Lyonnet, D.,Vincent, A., White, M., Legrain, P., Wojcik, J., Camonis, J., and Daviet, L. (2005) Pro-tein interaction mapping: a Drosophila case study. Genome Res 15: 376–384, URL http://dx.doi.org/10.1101/gr.2659105.
Fredrick, K. L. and Helmann, J. D. (1994) Dual chemotaxis signaling pathways in Bacillus subtilis: asigma D-dependent gene encodes a novel protein with both CheW and CheY homologous domains.J Bacteriol 176: 2727–2735, URL http://www.ncbi.nlm.nih.gov/pubmed/8169223.
Frickey, T. and Lupas, A. (2004) CLANS: a Java application for visualizing protein families basedon pairwise similarity. Bioinformatics 20: 3702–3704, URL http://dx.doi.org/10.1093/bioinformatics/bth444.
Frolow, F., Harel, M., Sussman, J. L., Mevarech, M., and Shoham, M. (1996) Insights into pro-tein adaptation to a saturated salt environment from the crystal structure of a halophilic 2Fe-2S ferredoxin. Nat Struct Biol 3: 452–458, URL http://www.ncbi.nlm.nih.gov/pubmed/8612076.
Fukuchi, S., Yoshimune, K., Wakayama, M., Moriguchi, M., and Nishikawa, K. (2003) Unique aminoacid composition of proteins in halophilic bacteria. J Mol Biol 327: 347–357, URL http://www.ncbi.nlm.nih.gov/pubmed/12628242.
Galagan, J. E., Nusbaum, C., Roy, A., Endrizzi, M. G., Macdonald, P., FitzHugh, W., Calvo, S.,Engels, R., Smirnov, S., Atnoor, D., Brown, A., Allen, N., Naylor, J., Stange-Thomann, N.,DeArellano, K., Johnson, R., Linton, L., McEwan, P., McKernan, K., Talamas, J., Tirrell, A.,Ye, W., Zimmer, A., Barber, R. D., Cann, I., Graham, D. E., Grahame, D. A., Guss, A. M.,Hedderich, R., Ingram-Smith, C., Kuettner, H. C., Krzycki, J. A., Leigh, J. A., Li, W., Liu, J.,Mukhopadhyay, B., Reeve, J. N., Smith, K., Springer, T. A., Umayam, L. A., White, O., White,R. H., de Macario, E. C., Ferry, J. G., Jarrell, K. F., Jing, H., Macario, A. J. L., Paulsen, I.,Pritchett, M., Sowers, K. R., Swanson, R. V., Zinder, S. H., Lander, E., Metcalf, W. W., andBirren, B. (2002) The genome of M. acetivorans reveals extensive metabolic and physiologicaldiversity. Genome Res 12: 532–542, URL http://dx.doi.org/10.1101/gr.223902.
Gambacorta, A., Trincone, A., Nicolaus, B., Lama, L., and Derosa, M. (1994) Unique Features OfLipids Of Archaea. Systematic And Applied Microbiology 16: 518–527.
Garrity, G. M., Boone, D. R., and Castenholz, R. W., editors (2001) Bergey’s Manual of SystematicBacteriology. Springer.
Garrity, L. F. and Ordal, G. W. (1997) Activation of the CheA kinase by asparagine in Bacillussubtilis chemotaxis. Microbiology 143: 2945–2951, URL http://www.ncbi.nlm.nih.gov/pubmed/12094812.
Gavin, A.-C., Aloy, P., Grandi, P., Krause, R., Boesche, M., Marzioch, M., Rau, C., Jensen, L. J.,Bastuck, S., Dümpelfeld, B., Edelmann, A., Heurtier, M.-A., Hoffman, V., Hoefert, C., Klein, K.,Hudak, M., Michon, A.-M., Schelder, M., Schirle, M., Remor, M., Rudi, T., Hooper, S., Bauer,A., Bouwmeester, T., Casari, G., Drewes, G., Neubauer, G., Rick, J. M., Kuster, B., Bork, P.,Russell, R. B., and Superti-Furga, G. (2006) Proteome survey reveals modularity of the yeast cellmachinery. Nature 440: 631–636, URL http://dx.doi.org/10.1038/nature04532.
166
Bibliography
Gavin, A.-C., Bösche, M., Krause, R., Grandi, P., Marzioch, M., Bauer, A., Schultz, J., Rick, J. M.,Michon, A.-M., Cruciat, C.-M., Remor, M., Höfert, C., Schelder, M., Brajenovic, M., Ruffner,H., Merino, A., Klein, K., Hudak, M., Dickson, D., Rudi, T., Gnau, V., Bauch, A., Bastuck, S.,Huhse, B., Leutwein, C., Heurtier, M.-A., Copley, R. R., Edelmann, A., Querfurth, E., Rybin, V.,Drewes, G., Raida, M., Bouwmeester, T., Bork, P., Seraphin, B., Kuster, B., Neubauer, G., andSuperti-Furga, G. (2002) Functional organization of the yeast proteome by systematic analysis ofprotein complexes. Nature 415: 141–147, URL http://dx.doi.org/10.1038/415141a.
Gegner, J. A. and Dahlquist, F. W. (1991) Signal transduction in bacteria: CheW forms a reversiblecomplex with the protein kinase CheA. Proc Natl Acad Sci U S A 88: 750–754, URL http://www.ncbi.nlm.nih.gov/pubmed/1992467.
Gegner, J. A., Graham, D. R., Roth, A. F., and Dahlquist, F. W. (1992) Assembly of an MCP re-ceptor, CheW, and kinase CheA complex in the bacterial chemotaxis signal transduction pathway.Cell 70: 975–982, URL http://www.ncbi.nlm.nih.gov/pubmed/1326408.
Geiduschek, E. P. and Ouhammouch, M. (2005) Archaeal transcription and its regulators. Mol Micro-biol 56: 1397–1407, URL http://dx.doi.org/10.1111/j.1365-2958.2005.04627.x.
Gharahdaghi, F., Weinberg, C. R., Meagher, D. A., Imai, B. S., and Mische, S. M. (1999) Massspectrometric identification of proteins from silver-stained polyacrylamide gel: a method for theremoval of silver ions to enhance sensitivity. Electrophoresis 20: 601–605, URL http://dx.doi.org/10.1002/(SICI)1522-2683(19990301)20:3<601::AID-ELPS601>3.0.CO;2-6.
Ghosh, M. and Sonawat, H. M. (1998) Kreb’s TCA cycle in Halobacterium salinarum investigatedby 13C nuclear magnetic resonance spectroscopy. Extremophiles 2: 427–433, URL http://www.ncbi.nlm.nih.gov/pubmed/9827332.
Gingras, A.-C., Gstaiger, M., Raught, B., and Aebersold, R. (2007) Analysis of protein complexesusing mass spectrometry. Nat Rev Mol Cell Biol 8: 645–654, URL http://dx.doi.org/10.1038/nrm2208.
Giot, L., Bader, J. S., Brouwer, C., Chaudhuri, A., Kuang, B., Li, Y., Hao, Y. L., Ooi, C. E., Godwin,B., Vitols, E., Vijayadamodar, G., Pochart, P., Machineni, H., Welsh, M., Kong, Y., Zerhusen,B., Malcolm, R., Varrone, Z., Collis, A., Minto, M., Burgess, S., McDaniel, L., Stimpson, E.,Spriggs, F., Williams, J., Neurath, K., Ioime, N., Agee, M., Voss, E., Furtak, K., Renzulli, R.,Aanensen, N., Carrolla, S., Bickelhaupt, E., Lazovatsky, Y., DaSilva, A., Zhong, J., Stanyon,C. A., Finley, R. L., White, K. P., Braverman, M., Jarvie, T., Gold, S., Leach, M., Knight, J.,Shimkets, R. A., McKenna, M. P., Chant, J., and Rothberg, J. M. (2003) A protein interaction mapof Drosophila melanogaster. Science 302: 1727–1736, URL http://dx.doi.org/10.1126/science.1090289.
Gloeckner, C. J., Boldt, K., Schumacher, A., Roepman, R., and Ueffing, M. (2007) A novel tandemaffinity purification strategy for the efficient isolation and characterisation of native protein com-plexes. Proteomics 7: 4228–4234, URL http://dx.doi.org/10.1002/pmic.200700038.
Goede, B., Naji, S., von Kampen, O., Ilg, K., and Thomm, M. (2006) Protein-protein interactions inthe archaeal transcriptional machinery: binding studies of isolated RNA polymerase subunits andtranscription factors. J Biol Chem 281: 30581–30592, URL http://dx.doi.org/10.1074/jbc.M605209200.
167
Bibliography
Goh, K.-I., Oh, E., Jeong, H., Kahng, B., and Kim, D. (2002) Classification of scale-free networks.Proc Natl Acad Sci U S A 99: 12583–12588, URL http://dx.doi.org/10.1073/pnas.202301299.
Gonzalez, O., Gronau, S., Falb, M., Pfeiffer, F., Mendoza, E., Zimmer, R., and Oesterhelt, D. (2008)Reconstruction, modeling & analysis of Halobacterium salinarum R-1 metabolism. Mol Biosyst 4:148–159, URL http://dx.doi.org/10.1039/b715203e.
Gouet, P., Chinardet, N., Welch, M., Guillet, V., Cabantous, S., Birck, C., Mourey, L., and Samama,J. P. (2001) Further insights into the mechanism of function of the response regulator CheY fromcrystallographic studies of the CheY–CheA(124–257) complex. Acta Crystallogr D Biol Crystallogr57: 44–51, URL http://www.ncbi.nlm.nih.gov/pubmed/11134926.
Gropp, F. and Betlach, M. C. (1994) The bat gene of Halobacterium halobium encodes a trans-actingoxygen inducibility factor. Proc Natl Acad Sci U S A 91: 5475–5479, URL http://www.ncbi.nlm.nih.gov/pubmed/8202511.
Guerrero, C., Tagwerker, C., Kaiser, P., and Huang, L. (2006) An integrated mass spectrometry-basedproteomic approach: quantitative analysis of tandem affinity-purified in vivo cross-linked proteincomplexes (QTAX) to decipher the 26 S proteasome-interacting network. Mol Cell Proteomics 5:366–378, URL http://dx.doi.org/10.1074/mcp.M500303-MCP200.
Hakes, L., Pinney, J. W., Robertson, D. L., and Lovell, S. C. (2008) Protein-protein interactionnetworks and biology–what’s the connection? Nat Biotechnol 26: 69–72, URL http://dx.doi.org/10.1038/nbt0108-69.
Hakes, L., Robertson, D. L., and Oliver, S. G. (2005) Effect of dataset selection on the topologicalinterpretation of protein interaction networks. BMC Genomics 6: 131, URL http://dx.doi.org/10.1186/1471-2164-6-131.
Hall, T. A. and Brown, J. W. (2004) Interactions between RNase P protein subunits in Archaea.Archaea 1: 247–253, URL http://archaea.ws/archive/summaries/volume1/a1-247.html.
Han, J.-D. J., Bertin, N., Hao, T., Goldberg, D. S., Berriz, G. F., Zhang, L. V., Dupuy, D., Walhout,A. J. M., Cusick, M. E., Roth, F. P., and Vidal, M. (2004) Evidence for dynamically organizedmodularity in the yeast protein-protein interaction network. Nature 430: 88–93, URL http://dx.doi.org/10.1038/nature02555.
Han, J.-D. J., Dupuy, D., Bertin, N., Cusick, M. E., and Vidal, M. (2005) Effect of sampling ontopology predictions of protein-protein interaction networks. Nat Biotechnol 23: 839–844, URLhttp://dx.doi.org/10.1038/nbt1116.
Hart, G. T., Ramani, A. K., and Marcotte, E. M. (2006) How complete are current yeast andhuman protein-interaction networks? Genome Biol 7: 120, URL http://dx.doi.org/10.1186/gb-2006-7-11-120.
Hartley, J. L., Temple, G. F., and Brasch, M. A. (2000) DNA cloning using in vitro site-specificrecombination. Genome Res 10: 1788–1795, URL http://www.ncbi.nlm.nih.gov/pubmed/11076863.
168
Bibliography
Hartmann, R., Sickinger, H. D., and Oesterhelt, D. (1980) Anaerobic growth of halobacteria.Proc Natl Acad Sci U S A 77: 3821–3825, URL http://www.ncbi.nlm.nih.gov/pubmed/6933439.
Haupts, U., Tittor, J., and Oesterhelt, D. (1999) Closing in on bacteriorhodopsin: progressin understanding the molecule. Annu Rev Biophys Biomol Struct 28: 367–399, URL http://dx.doi.org/10.1146/annurev.biophys.28.1.367.
Hazelbauer, G. L. and Adler, J. (1971) Role of the galactose binding protein in chemotaxis of Es-cherichia coli toward galactose. Nat New Biol 230: 101–104, URL http://www.ncbi.nlm.nih.gov/pubmed/4927373.
Hazelbauer, G. L., Falke, J. J., and Parkinson, J. S. (2008) Bacterial chemoreceptors: high-performance signaling in networked arrays. Trends Biochem Sci 33: 9–19, URL http://dx.doi.org/10.1016/j.tibs.2007.09.014.
Hess, J. F., Oosawa, K., Kaplan, N., and Simon, M. I. (1988) Phosphorylation of three proteins inthe signaling pathway of bacterial chemotaxis. Cell 53: 79–87, URL http://www.ncbi.nlm.nih.gov/pubmed/3280143.
Hildebrand, E. and Schimz, A. (1990) The lifetime of photosensory signals in Halobacterium halobiumand its dependence on protein methylation. Biochim Biophys Acta 1052: 96–105, URL http://www.ncbi.nlm.nih.gov/pubmed/2322596.
Ho, Y., Gruhler, A., Heilbut, A., Bader, G. D., Moore, L., Adams, S.-L., Millar, A., Taylor, P.,Bennett, K., Boutilier, K., Yang, L., Wolting, C., Donaldson, I., ren Schandorff, S., Shewnarane,J., Vo, M., Taggart, J., Goudreault, M., Muskat, B., Alfarano, C., Dewar, D., Lin, Z., Michalickova,K., Willems, A. R., Sassi, H., Nielsen, P. A., Rasmussen, K. J., Andersen, J. R., Johansen, L. E.,Hansen, L. H., Jespersen, H., Podtelejnikov, A., Nielsen, E., Crawford, J., Poulsen, V., rensen,B. D. S., Matthiesen, J., Hendrickson, R. C., Gleeson, F., Pawson, T., Moran, M. F., Durocher,D., Mann, M., Hogue, C. W. V., Figeys, D., and Tyers, M. (2002) Systematic identification ofprotein complexes in Saccharomyces cerevisiae by mass spectrometry. Nature 415: 180–183, URLhttp://dx.doi.org/10.1038/415180a.
Hoch, J. A. (2000) Two-component and phosphorelay signal transduction. Curr Opin Microbiol 3:165–170, URL http://www.ncbi.nlm.nih.gov/pubmed/10745001.
Hope, I. A. and Struhl, K. (1986) Functional dissection of a eukaryotic transcriptional activatorprotein, GCN4 of yeast. Cell 46: 885–894, URL http://www.ncbi.nlm.nih.gov/pubmed/3530496.
Hou, S., Brooun, A., Yu, H. S., Freitas, T., and Alam, M. (1998) Sensory rhodopsin II transducerHtrII is also responsible for serine chemotaxis in the archaeon Halobacterium salinarum. J Bacteriol180: 1600–1602, URL http://www.ncbi.nlm.nih.gov/pubmed/9515936.
Hou, S., Larsen, R. W., Boudko, D., Riley, C. W., Karatan, E., Zimmer, M., Ordal, G. W., and Alam,M. (2000) Myoglobin-like aerotaxis transducers in Archaea and Bacteria. Nature 403: 540–544,URL http://dx.doi.org/10.1038/35000570.
Huang, H., Jedynak, B. M., and Bader, J. S. (2007) Where have all the interactions gone? Estimatingthe coverage of two-hybrid protein interaction maps. PLoS Comput Biol 3: e214, URL http://dx.doi.org/10.1371/journal.pcbi.0030214.
169
Bibliography
Huber, H., Hohn, M. J., Rachel, R., Fuchs, T., Wimmer, V. C., and Stetter, K. O. (2002) A newphylum of Archaea represented by a nanosized hyperthermophilic symbiont. Nature 417: 63–67,URL http://dx.doi.org/10.1038/417063a.
Imanaka, H., Yamatsu, A., Fukui, T., Atomi, H., and Imanaka, T. (2006) Phosphoenolpyruvatesynthase plays an essential role for glycolysis in the modified Embden-Meyerhof pathway in Ther-mococcus kodakarensis. Mol Microbiol 61: 898–909, URL http://dx.doi.org/10.1111/j.1365-2958.2006.05287.x.
Inoue, H., Nojima, H., and Okayama, H. (1990) High efficiency transformation of Escherichia coliwith plasmids. Gene 96: 23–28, URL http://www.ncbi.nlm.nih.gov/pubmed/2265755.
Irihimovitch, V. and Eichler, J. (2003) Post-translational secretion of fusion proteins in the halophilicarchaea Haloferax volcanii. J Biol Chem 278: 12881–12887, URL http://dx.doi.org/10.1074/jbc.M210762200.
Irihimovitch, V., Ring, G., Elkayam, T., Konrad, Z., and Eichler, J. (2003) Isolation of fusion proteinscontaining SecY and SecE, components of the protein translocation complex from the halophilicarchaeon Haloferax volcanii. Extremophiles 7: 71–77, URL http://dx.doi.org/10.1007/s00792-002-0297-0.
Ito, T., Chiba, T., Ozawa, R., Yoshida, M., Hattori, M., and Sakaki, Y. (2001) A comprehensive two-hybrid analysis to explore the yeast protein interactome. Proc Natl Acad Sci U S A 98: 4569–4574,URL http://dx.doi.org/10.1073/pnas.061034498.
James, P., Halladay, J., and Craig, E. A. (1996) Genomic libraries and a host strain designed for highlyefficient two-hybrid selection in yeast. Genetics 144: 1425–1436, URL http://www.ncbi.nlm.nih.gov/pubmed/8978031.
Jeong, H., Mason, S. P., Barabási, A. L., and Oltvai, Z. N. (2001) Lethality and centrality in proteinnetworks. Nature 411: 41–42, URL http://dx.doi.org/10.1038/35075138.
Kalmokoff, M. L. and Jarrell, K. F. (1991) Cloning and sequencing of a multigene family encodingthe flagellins of Methanococcus voltae. J Bacteriol 173: 7113–7125, URL http://www.ncbi.nlm.nih.gov/pubmed/1718944.
Kandler, O. (1994) Cell-Wall Biochemistry And 3-Domain Concept Of Life. Systematic And AppliedMicrobiology 16: 501–509.
Karatan, E., Saulmon, M. M., Bunn, M. W., and Ordal, G. W. (2001) Phosphorylation of the responseregulator CheV is required for adaptation to attractants during Bacillus subtilis chemotaxis. J BiolChem 276: 43618–43626, URL http://dx.doi.org/10.1074/jbc.M104955200.
Kastritis, P. L., Papandreou, N. C., and Hamodrakas, S. J. (2007) Haloadaptation: insights fromcomparative modeling studies of halophilic archaeal DHFRs. Int J Biol Macromol 41: 447–453,URL http://dx.doi.org/10.1016/j.ijbiomac.2007.06.005.
Keegan, L., Gill, G., and Ptashne, M. (1986) Separation of DNA binding from the transcription-activating function of a eukaryotic regulatory protein. Science 231: 699–704, URL http://www.ncbi.nlm.nih.gov/pubmed/3080805.
170
Bibliography
Kehry, M. R., Bond, M. W., Hunkapiller, M. W., and Dahlquist, F. W. (1983) Enzymatic deamidationof methyl-accepting chemotaxis proteins in Escherichia coli catalyzed by the cheB gene product.Proc Natl Acad Sci U S A 80: 3599–3603, URL http://www.ncbi.nlm.nih.gov/pubmed/6304723.
Kehry, M. R. and Dahlquist, F. W. (1982) The methyl-accepting chemotaxis proteins of Escherichiacoli. Identification of the multiple methylation sites on methyl-accepting chemotaxis protein I. JBiol Chem 257: 10378–10386, URL http://www.ncbi.nlm.nih.gov/pubmed/6213619.
Keller, A., Eng, J., Zhang, N., jun Li, X., and Aebersold, R. (2005) A uniform proteomics MS/MSanalysis platform utilizing open XML file formats. Mol Syst Biol 1: 2005.0017, URL http://dx.doi.org/10.1038/msb4100024.
Kennelly, P. J. (2002) Protein kinases and protein phosphatases in prokaryotes: a genomic per-spective. FEMS Microbiol Lett 206: 1–8, URL http://www.ncbi.nlm.nih.gov/pubmed/11786249.
Kennelly, P. J. (2003) Archaeal protein kinases and protein phosphatases: insights from genomics andbiochemistry. Biochem J 370: 373–389, URL http://dx.doi.org/10.1042/BJ20021547.
Kentner, D. and Sourjik, V. (2006) Spatial organization of the bacterial chemotaxis system. CurrOpin Microbiol 9: 619–624, URL http://dx.doi.org/10.1016/j.mib.2006.10.012.
Kerkar, S. (2005) Ecology of Hypersaline Microorganisms. In: Marine Microbiology: Facets & Oppor-tunities, chap. 5. National Institute of Oceanography, Goa, 37–47, URL http://hdl.handle.net/2264/70.
Kim, C., Jackson, M., Lux, R., and Khan, S. (2001) Determinants of chemotactic signal amplificationin Escherichia coli. J Mol Biol 307: 119–135, URL http://dx.doi.org/10.1006/jmbi.2000.4389.
Kim, K. K., Yokota, H., and Kim, S. H. (1999) Four-helical-bundle structure of the cytoplasmicdomain of a serine chemotaxis receptor. Nature 400: 787–792, URL http://dx.doi.org/10.1038/23512.
Kirby, J. R., Kristich, C. J., Saulmon, M. M., Zimmer, M. A., Garrity, L. F., Zhulin, I. B., and Ordal,G. W. (2001) CheC is related to the family of flagellar switch proteins and acts independentlyfrom CheD to control chemotaxis in Bacillus subtilis. Mol Microbiol 42: 573–585, URL http://www.ncbi.nlm.nih.gov/pubmed/11722727.
Kirsch, M. L., Peters, P. D., Hanlon, D. W., Kirby, J. R., and Ordal, G. W. (1993a) Chemotacticmethylesterase promotes adaptation to high concentrations of attractant in Bacillus subtilis. J BiolChem 268: 18610–18616, URL http://www.ncbi.nlm.nih.gov/pubmed/8395512.
Kirsch, M. L., Zuberi, A. R., Henner, D., Peters, P. D., Yazdi, M. A., and Ordal, G. W. (1993b)Chemotactic methyltransferase promotes adaptation to repellents in Bacillus subtilis. J Biol Chem268: 25350–25356, URL http://www.ncbi.nlm.nih.gov/pubmed/8244966.
Klein, A. (2005) Vergleichende Analyse halophiler Genome. Diploma thesis, Fachhochschule Bingen.
Klein, C., Aivaliotis, M., Olsen, J. V., Falb, M., Besir, H., Scheffer, B., Bisle, B., Tebbe, A.,Konstantinidis, K., Siedler, F., Pfeiffer, F., Mann, M., and Oesterhelt, D. (2007) The lowmolecular weight proteome of Halobacterium salinarum. J Proteome Res 6: 1510–1518, URLhttp://dx.doi.org/10.1021/pr060634q.
171
Bibliography
Knop, M., Siegers, K., Pereira, G., Zachariae, W., Winsor, B., Nasmyth, K., and Schiebel,E. (1999) Epitope tagging of yeast genes using a PCR-based strategy: more tags and im-proved practical routines. Yeast 15: 963–972, URL http://dx.doi.org/10.1002/(SICI)1097-0061(199907)15:10B<963::AID-YEA399>3.0.CO;2-W.
Koch, M. (2005) Investigations on halobacterial transducers with respect to membrane potentialsensing and adaptive methylation. Ph.D. thesis, Ludwig-Maximilians-Universität München, URLhttp://edoc.ub.uni-muenchen.de/4954/.
Koch, M. K. and Oesterhelt, D. (2005) MpcT is the transducer for membrane potential changes inHalobacterium salinarum. Mol Microbiol 55: 1681–1694, URL http://dx.doi.org/10.1111/j.1365-2958.2005.04516.x.
Koch, M. K., Staudinger, W. F., Siedler, F., and Oesterhelt, D. (2008) Physiological sites of deami-dation and methyl esterification in sensory transducers of Halobacterium salinarum. J Mol Biol380: 285–302, URL http://dx.doi.org/10.1016/j.jmb.2008.04.063.
Kokoeva, M. V. and Oesterhelt, D. (2000) BasT, a membrane-bound transducer protein for aminoacid detection in Halobacterium salinarum. Mol Microbiol 35: 647–656, URL http://www.ncbi.nlm.nih.gov/pubmed/10672186.
Kokoeva, M. V., Storch, K.-F., Klein, C., and Oesterhelt, D. (2002) A novel mode of sensory trans-duction in archaea: binding protein-mediated chemotaxis towards osmoprotectants and aminoacids. EMBO J 21: 2312–2322, URL http://dx.doi.org/10.1093/emboj/21.10.2312.
Koshland, D. E. (1977) A response regulator model in a simple sensory system. Science 196: 1055–1063, URL http://www.ncbi.nlm.nih.gov/pubmed/870969.
Kott, L., Braswell, E. H., Shrout, A. L., and Weis, R. M. (2004) Distributed subunit interactionsin CheA contribute to dimer stability: a sedimentation equilibrium study. Biochim Biophys Acta1696: 131–140, URL http://www.ncbi.nlm.nih.gov/pubmed/14726213.
Kristich, C. J. and Ordal, G. W. (2002) Bacillus subtilis CheD is a chemoreceptor modificationenzyme required for chemotaxis. J Biol Chem 277: 25356–25362, URL http://dx.doi.org/10.1074/jbc.M201334200.
Krogan, N. J., Cagney, G., Yu, H., Zhong, G., Guo, X., Ignatchenko, A., Li, J., Pu, S., Datta, N.,Tikuisis, A. P., Punna, T., Peregrín-Alvarez, J. M., Shales, M., Zhang, X., Davey, M., Robinson,M. D., Paccanaro, A., Bray, J. E., Sheung, A., Beattie, B., Richards, D. P., Canadien, V., Lalev,A., Mena, F., Wong, P., Starostine, A., Canete, M. M., Vlasblom, J., Wu, S., Orsi, C., Collins,S. R., Chandran, S., Haw, R., Rilstone, J. J., Gandi, K., Thompson, N. J., Musso, G., Onge, P. S.,Ghanny, S., Lam, M. H. Y., Butland, G., Altaf-Ul, A. M., Kanaya, S., Shilatifard, A., O’Shea, E.,Weissman, J. S., Ingles, C. J., Hughes, T. R., Parkinson, J., Gerstein, M., Wodak, S. J., Emili, A.,and Greenblatt, J. F. (2006) Global landscape of protein complexes in the yeast Saccharomycescerevisiae. Nature 440: 637–643, URL http://dx.doi.org/10.1038/nature04670.
Kupper, J., Marwan, W., Typke, D., Grünberg, H., Uwer, U., Gluch, M., and Oesterhelt, D. (1994)The flagellar bundle of Halobacterium salinarium is inserted into a distinct polar cap structure. JBacteriol 176: 5184–5187, URL http://www.pubmedcentral.nih.gov/articlerender.fcgi?tool=pubmed&pubmedid=8051038.
172
Bibliography
Landy, A. (1989) Dynamic, structural, and regulatory aspects of lambda site-specific recombina-tion. Annu Rev Biochem 58: 913–949, URL http://dx.doi.org/10.1146/annurev.bi.58.070189.004405.
Lanyi, J. K. (1974) Salt-dependent properties of proteins from extremely halophilic bacteria. BacteriolRev 38: 272–290, URL http://www.ncbi.nlm.nih.gov/pubmed/4607500.
Lanyi, J. K. (2006) Proton transfers in the bacteriorhodopsin photocycle. Biochim Biophys Acta1757: 1012–1018, URL http://dx.doi.org/10.1016/j.bbabio.2005.11.003.
Lanyi, J. K. and Luecke, H. (2001) Bacteriorhodopsin. Curr Opin Struct Biol 11: 415–419, URLhttp://www.ncbi.nlm.nih.gov/pubmed/11495732.
Lee, S. Y., Cho, H. S., Pelton, J. G., Yan, D., Henderson, R. K., King, D. S., Huang, L., Kustu,S., Berry, E. A., and Wemmer, D. E. (2001) Crystal structure of an activated response regulatorbound to its target. Nat Struct Biol 8: 52–56, URL http://dx.doi.org/10.1038/83053.
Lengeler, J. and Jahreis, K. (1996) Phosphotransferase systems or PTS as carbohydrate transportand as signal transduction systems., chap. Vol. 2. Elsevier Science, 573–598.
Li, S., Armstrong, C. M., Bertin, N., Ge, H., Milstein, S., Boxem, M., Vidalain, P.-O., Han, J.-D. J.,Chesneau, A., Hao, T., Goldberg, D. S., Li, N., Martinez, M., Rual, J.-F., Lamesch, P., Xu, L.,Tewari, M., Wong, S. L., Zhang, L. V., Berriz, G. F., Jacotot, L., Vaglio, P., Reboul, J., Hirozane-Kishikawa, T., Li, Q., Gabel, H. W., Elewa, A., Baumgartner, B., Rose, D. J., Yu, H., Bosak,S., Sequerra, R., Fraser, A., Mango, S. E., Saxton, W. M., Strome, S., Heuvel, S. V. D., Piano,F., Vandenhaute, J., Sardet, C., Gerstein, M., Doucette-Stamm, L., Gunsalus, K. C., Harper,J. W., Cusick, M. E., Roth, F. P., Hill, D. E., and Vidal, M. (2004) A map of the interactomenetwork of the metazoan C. elegans. Science 303: 540–543, URL http://dx.doi.org/10.1126/science.1091403.
Li, X.-J., Zhang, H., Ranish, J. A., and Aebersold, R. (2003) Automated statistical analysis of proteinabundance ratios from data generated by stable-isotope dilution and tandem mass spectrometry.Anal Chem 75: 6648–6657, URL http://dx.doi.org/10.1021/ac034633i.
Lindley, E. V. and MacDonald, R. E. (1979) A second mechanism for sodium extrusion in Halobac-terium halobium: a light-driven sodium pump. Biochem Biophys Res Commun 88: 491–499, URLhttp://www.ncbi.nlm.nih.gov/pubmed/465050.
Lorenz, R. J. (1996) Grundbegriffe der Biometrie. Gustav Fischer Verlag.
Lukat, G. S., Stock, A. M., and Stock, J. B. (1990) Divalent metal ion binding to the CheY proteinand its significance to phosphotransfer in bacterial chemotaxis. Biochemistry 29: 5436–5442, URLhttp://www.ncbi.nlm.nih.gov/pubmed/2201404.
Lupas, A. and Stock, J. (1989) Phosphorylation of an N-terminal regulatory domain activates theCheB methylesterase in bacterial chemotaxis. J Biol Chem 264: 17337–17342, URL http://www.ncbi.nlm.nih.gov/pubmed/2677005.
Lux, R., Jahreis, K., Bettenbrock, K., Parkinson, J. S., and Lengeler, J. W. (1995) Coupling thephosphotransferase system and the methyl-accepting chemotaxis protein-dependent chemotaxissignaling pathways of Escherichia coli. Proc Natl Acad Sci U S A 92: 11583–11587, URL http://www.ncbi.nlm.nih.gov/pubmed/8524808.
173
Bibliography
Lux, R., Munasinghe, V. R., Castellano, F., Lengeler, J. W., Corrie, J. E., and Khan, S. (1999)Elucidation of a PTS-carbohydrate chemotactic signal pathway in Escherichia coli using a time-resolved behavioral assay. Mol Biol Cell 10: 1133–1146, URL http://www.ncbi.nlm.nih.gov/pubmed/10198062.
Ma, J. and Ptashne, M. (1988) Converting a eukaryotic transcriptional inhibitor into an activator.Cell 55: 443–446, URL http://www.ncbi.nlm.nih.gov/pubmed/3180218.
Macnab, R. M. and Koshland, D. E. (1972) The gradient-sensing mechanism in bacterial chemotaxis.Proc Natl Acad Sci U S A 69: 2509–2512, URL http://www.ncbi.nlm.nih.gov/pubmed/4560688.
Maddock, J. R. and Shapiro, L. (1993) Polar location of the chemoreceptor complex in the Escherichiacoli cell. Science 259: 1717–1723, URL http://www.ncbi.nlm.nih.gov/pubmed/8456299.
Maeder, D. L., Anderson, I., Brettin, T. S., Bruce, D. C., Gilna, P., Han, C. S., Lapidus, A.,Metcalf, W. W., Saunders, E., Tapia, R., and Sowers, K. R. (2006) The Methanosarcina bark-eri genome: comparative analysis with Methanosarcina acetivorans and Methanosarcina mazeireveals extensive rearrangement within methanosarcinal genomes. J Bacteriol 188: 7922–7931,URL http://dx.doi.org/10.1128/JB.00810-06.
Marwan, W., Alam, M., and Oesterhelt, D. (1991) Rotation and switching of the flagellar mo-tor assembly in Halobacterium halobium. J Bacteriol 173: 1971–1977, URL http://www.pubmedcentral.nih.gov/articlerender.fcgi?tool=pubmed&pubmedid=2002000.
Marwan, W. and Oesterhelt, D. (1990) Quantitation of photochromism of sensory rhodopsin-I bycomputerized tracking of Halobacterium halobium cells. J Mol Biol 215: 277–285, URL http://www.ncbi.nlm.nih.gov/pubmed/2213884.
Marwan, W. and Oesterhelt, D. (2000) Archaeal Vision and Bacterial Smelling. ASM News 66:83–89, URL http://newsarchive.asm.org/feb00/feature3.asp.
Marwan, W., Schäfer, W., and Oesterhelt, D. (1990) Signal transduction in Halobacterium depends onfumarate. EMBO J 9: 355–362, URL http://www.ncbi.nlm.nih.gov/pubmed/2303030.
McCraith, S., Holtzman, T., Moss, B., and Fields, S. (2000) Genome-wide analysis of vaccinia virusprotein-protein interactions. Proc Natl Acad Sci U S A 97: 4879–4884, URL http://dx.doi.org/10.1073/pnas.080078197.
McEvoy, M. M., Bren, A., Eisenbach, M., and Dahlquist, F. W. (1999) Identification of the bindinginterfaces on CheY for two of its targets, the phosphatase CheZ and the flagellar switch proteinFliM. J Mol Biol 289: 1423–1433, URL http://dx.doi.org/10.1006/jmbi.1999.2830.
McEvoy, M. M., Hausrath, A. C., Randolph, G. B., Remington, S. J., and Dahlquist, F. W. (1998)Two binding modes reveal flexibility in kinase/response regulator interactions in the bacterialchemotaxis pathway. Proc Natl Acad Sci U S A 95: 7333–7338, URL http://www.ncbi.nlm.nih.gov/pubmed/9636149.
McNamara, B. P. and Wolfe, A. J. (1997) Coexpression of the long and short forms of CheA, thechemotaxis histidine kinase, by members of the family Enterobacteriaceae. J Bacteriol 179: 1813–1818, URL http://www.ncbi.nlm.nih.gov/pubmed/9045846.
174
Bibliography
Metlina, A. L. (2004) Bacterial and archaeal flagella as prokaryotic motility organelles. Biochemistry(Mosc) 69: 1203–1212, URL http://protein.bio.msu.ru/biokhimiya/contents/v69/full/69111477.html.
Mevarech, M., Frolow, F., and Gloss, L. M. (2000) Halophilic enzymes: proteins with a grain ofsalt. Biophys Chem 86: 155–164, URL http://dx.doi.org/10.1016/S0301-4622(00)00126-5.
Miller, A. (2007) Untersuchung von putativen archaealen Chemotaxisproteinen durch Proteininterak-tionsstudien und Charakterisierung von Deletionsmutanten in Halobacterium salinarum. Diplomathesis, Hochschule Darmstadt - University of Applied Sciences.
Milligan, D. L. and Koshland, D. E. (1988) Site-directed cross-linking. Establishing the dimericstructure of the aspartate receptor of bacterial chemotaxis. J Biol Chem 263: 6268–6275, URLhttp://www.ncbi.nlm.nih.gov/pubmed/2834370.
Montrone, M., Eisenbach, M., Oesterhelt, D., and Marwan, W. (1998) Regulation of switching fre-quency and bias of the bacterial flagellar motor by CheY and fumarate. J Bacteriol 180: 3375–3380, URL http://www.ncbi.nlm.nih.gov/pubmed/9642190.
Montrone, M., Marwan, W., Grünberg, H., Musseleck, S., Starostzik, C., and Oesterhelt, D. (1993)Sensory rhodopsin-controlled release of the switch factor fumarate in Halobacterium salinarium.Mol Microbiol 10: 1077–1085, URL http://www.ncbi.nlm.nih.gov/pubmed/7934858.
Montrone, M., Oesterhelt, D., and Marwan, W. (1996) Phosphorylation-independent bacterialchemoresponses correlate with changes in the cytoplasmic level of fumarate. J Bacteriol 178:6882–6887, URL http://www.ncbi.nlm.nih.gov/pubmed/8955310.
Morag, E., Lapidot, A., Govorko, D., Lamed, R., Wilchek, M., Bayer, E. A., and Shoham,Y. (1995) Expression, purification, and characterization of the cellulose-binding domain ofthe scaffoldin subunit from the cellulosome of Clostridium thermocellum. Appl Environ Micro-biol 61: 1980–1986, URL http://www.pubmedcentral.nih.gov/articlerender.fcgi?tool=pubmed&pubmedid=7646033.
Motaleb, M. A., Miller, M. R., Li, C., Bakker, R. G., Goldstein, S. F., Silversmith, R. E., Bourret,R. B., and Charon, N. W. (2005) CheX is a phosphorylated CheY phosphatase essential forBorrelia burgdorferi chemotaxis. J Bacteriol 187: 7963–7969, URL http://dx.doi.org/10.1128/JB.187.23.7963-7969.2005.
Muff, T. J. and Ordal, G. W. (2007) The CheC phosphatase regulates chemotactic adaptationthrough CheD. J Biol Chem 282: 34120–34128, URL http://dx.doi.org/10.1074/jbc.M706432200.
Mulder, N. J., Apweiler, R., Attwood, T. K., Bairoch, A., Bateman, A., Binns, D., Bork, P., Buil-lard, V., Cerutti, L., Copley, R., Courcelle, E., Das, U., Daugherty, L., Dibley, M., Finn, R.,Fleischmann, W., Gough, J., Haft, D., Hulo, N., Hunter, S., Kahn, D., Kanapin, A., Kejariwal,A., Labarga, A., Langendijk-Genevaux, P. S., Lonsdale, D., Lopez, R., Letunic, I., Madera, M.,Maslen, J., McAnulla, C., McDowall, J., Mistry, J., Mitchell, A., Nikolskaya, A. N., Orchard, S.,Orengo, C., Petryszak, R., Selengut, J. D., Sigrist, C. J. A., Thomas, P. D., Valentin, F., Wilson,D., Wu, C. H., and Yeats, C. (2007) New developments in the InterPro database. Nucleic AcidsRes 35: D224–D228, URL http://dx.doi.org/10.1093/nar/gkl841.
175
Bibliography
Ng, S. Y. M., Chaban, B., and Jarrell, K. F. (2006) Archaeal flagella, bacterial flagella and type IVpili: a comparison of genes and posttranslational modifications. J Mol Microbiol Biotechnol 11:167–191, URL http://dx.doi.org/10.1159/000094053.
Ng, W. V., Kennedy, S. P., Mahairas, G. G., Berquist, B., Pan, M., Shukla, H. D., Lasky, S. R.,Baliga, N. S., Thorsson, V., Sbrogna, J., Swartzell, S., Weir, D., Hall, J., Dahl, T. A., Welti,R., Goo, Y. A., Leithauser, B., Keller, K., Cruz, R., Danson, M. J., Hough, D. W., Maddocks,D. G., Jablonski, P. E., Krebs, M. P., Angevine, C. M., Dale, H., Isenbarger, T. A., Peck, R. F.,Pohlschroder, M., Spudich, J. L., Jung, K. W., Alam, M., Freitas, T., Hou, S., Daniels, C. J.,Dennis, P. P., Omer, A. D., Ebhardt, H., Lowe, T. M., Liang, P., Riley, M., Hood, L., andDasSarma, S. (2000) Genome sequence of Halobacterium species NRC-1. Proc Natl Acad Sci U SA 97: 12176–12181, URL http://dx.doi.org/10.1073/pnas.190337797.
Ninfa, E. G., Stock, A., Mowbray, S., and Stock, J. (1991) Reconstitution of the bacterial chemotaxissignal transduction system from purified components. J Biol Chem 266: 9764–9770, URL http://www.ncbi.nlm.nih.gov/pubmed/1851755.
Nowlin, D. M., Bollinger, J., and Hazelbauer, G. L. (1987) Sites of covalent modification in Trg, asensory transducer of Escherichia coli. J Biol Chem 262: 6039–6045, URL http://www.ncbi.nlm.nih.gov/pubmed/3032955.
Nutsch, T., Marwan, W., Oesterhelt, D., and Gilles, E. D. (2003) Signal processing and flagellarmotor switching during phototaxis of Halobacterium salinarum. Genome Res 13: 2406–2412, URLhttp://dx.doi.org/10.1101/gr.1241903.
Nutsch, T., Oesterhelt, D., Gilles, E. D., and Marwan, W. (2005) A quantitative model of theswitch cycle of an archaeal flagellar motor and its sensory control. Biophys J 89: 2307–2323, URLhttp://dx.doi.org/10.1529/biophysj.104.057570.
Oesterhelt, D. and Krippahl, G. (1983) Phototrophic growth of halobacteria and its use for isolationof photosynthetically-deficient mutants. Ann Microbiol (Paris) 134B: 137–150, URL http://www.ncbi.nlm.nih.gov/pubmed/6638758.
Oesterhelt, D. and Stoeckenius, W. (1973) Functions of a new photoreceptor membrane. Proc NatlAcad Sci U S A 70: 2853–2857, URL http://www.ncbi.nlm.nih.gov/pubmed/4517939.
Ong, S.-E., Blagoev, B., Kratchmarova, I., Kristensen, D. B., Steen, H., Pandey, A., and Mann, M.(2002) Stable isotope labeling by amino acids in cell culture, SILAC, as a simple and accurateapproach to expression proteomics. Mol Cell Proteomics 1: 376–386, URL http://www.ncbi.nlm.nih.gov/pubmed/12118079.
Oren, A. (1991) Anaerobic growth of halophilic archaeobacteria by reduction of fumarate. J GenMicrobiol 137: 1387–1390.
Oren, A. (1994) The Ecology Of The Extremely Halophilic Archaea. Fems Microbiology Reviews 13:415–439.
Oren, A. (1999) Bioenergetic aspects of halophilism. Microbiol Mol Biol Rev 63: 334–348, URLhttp://www.ncbi.nlm.nih.gov/pubmed/10357854.
Oren, A. (2002) Diversity of halophilic microorganisms: environments, phylogeny, physiology, andapplications. J Ind Microbiol Biotechnol 28: 56–63, URL http://dx.doi.org/10.1038/sj/jim/7000176.
176
Bibliography
Oren, A. and Trüper, H. G. (1990) Anaerobic growth of halophilic archaeobacteria by reduction ofdimethysulfoxide and trimethylamine N-oxide. FEMS Microbiology Letters 70: 33–36, URL http://www.blackwell-synergy.com/doi/abs/10.1111/j.1574-6968.1990.tb03772.x.
Ortenberg, R. and Mevarech, M. (2000) Evidence for post-translational membrane insertion ofthe integral membrane protein bacterioopsin expressed in the heterologous halophilic archaeonHaloferax volcanii. J Biol Chem 275: 22839–22846, URL http://dx.doi.org/10.1074/jbc.M908916199.
O’Toole, P. W., Lane, M. C., and Porwollik, S. (2000) Helicobacter pylori motility. Microbes Infect2: 1207–1214, URL http://www.ncbi.nlm.nih.gov/pubmed/11008110.
Park, S.-Y., Beel, B. D., Simon, M. I., Bilwes, A. M., and Crane, B. R. (2004) In different organisms,the mode of interaction between two signaling proteins is not necessarily conserved. Proc Natl AcadSci U S A 101: 11646–11651, URL http://dx.doi.org/10.1073/pnas.0401038101.
Park, S.-Y., Borbat, P. P., Gonzalez-Bonet, G., Bhatnagar, J., Pollard, A. M., Freed, J. H., Bilwes,A. M., and Crane, B. R. (2006) Reconstruction of the chemotaxis receptor-kinase assembly. NatStruct Mol Biol 13: 400–407, URL http://dx.doi.org/10.1038/nsmb1085.
Parkhill, J., Wren, B. W., Mungall, K., Ketley, J. M., Churcher, C., Basham, D., Chillingworth, T.,Davies, R. M., Feltwell, T., Holroyd, S., Jagels, K., Karlyshev, A. V., Moule, S., Pallen, M. J.,Penn, C. W., Quail, M. A., Rajandream, M. A., Rutherford, K. M., van Vliet, A. H., Whitehead,S., and Barrell, B. G. (2000) The genome sequence of the food-borne pathogen Campylobacterjejuni reveals hypervariable sequences. Nature 403: 665–668, URL http://dx.doi.org/10.1038/35001088.
Parkinson, J. S. and Kofoid, E. C. (1992) Communication modules in bacterial signaling pro-teins. Annu Rev Genet 26: 71–112, URL http://dx.doi.org/10.1146/annurev.ge.26.120192.000443.
Parrish, J. R., Yu, J., Liu, G., Hines, J. A., Chan, J. E., Mangiola, B. A., Zhang, H., Pacifico,S., Fotouhi, F., DiRita, V. J., Ideker, T., Andrews, P., and Finley, R. L. (2007) A proteome-wideprotein interaction map for Campylobacter jejuni. Genome Biol 8: R130, URL http://dx.doi.org/10.1186/gb-2007-8-7-r130.
Patenge, N., Berendes, A., Engelhardt, H., Schuster, S. C., and Oesterhelt, D. (2001) The fla genecluster is involved in the biogenesis of flagella in Halobacterium salinarum. Mol Microbiol 41:653–663, URL http://www.ncbi.nlm.nih.gov/pubmed/11532133.
Pfeiffer, F., Broicher, A., Gillich, T., Klee, K., Mejía, J., Rampp, M., and Oesterhelt, D. (2008a)Genome information management and integrated data analysis with HaloLex. Arch Microbiol 190:281–299, URL http://dx.doi.org/10.1007/s00203-008-0389-z.
Pfeiffer, F., Schuster, S. C., Broicher, A., Falb, M., Palm, P., Rodewald, K., Ruepp, A., Soppa, J.,Tittor, J., and Oesterhelt, D. (2008b) Evolution in the laboratory: The genome of Halobacteriumsalinarum strain R1 compared to that of strain NRC-1. Genomics 91: 335–346, URL http://dx.doi.org/10.1016/j.ygeno.2008.01.001.
Pitre, S., Alamgir, M., Green, J., Dumontier, M., Dehne, F., and Golshani, A. (2008) ComputationalMethods For Predicting Protein-Protein Interactions. Adv Biochem Eng Biotechnol URL http://dx.doi.org/10.1007/10_2007_089.
177
Bibliography
Porter, S. L. and Armitage, J. P. (2002) Phosphotransfer in Rhodobacter sphaeroides chemotaxis. JMol Biol 324: 35–45, URL http://www.ncbi.nlm.nih.gov/pubmed/12421557.
Postma, P. W., Lengeler, J. W., and Jacobson, G. R. (1993) Phosphoenolpyruvate:carbohydratephosphotransferase systems of bacteria. Microbiol Rev 57: 543–594, URL http://www.ncbi.nlm.nih.gov/pubmed/8246840.
Prasad, K., Caplan, S. R., and Eisenbach, M. (1998) Fumarate modulates bacterial flagellar rotationby lowering the free energy difference between the clockwise and counterclockwise states of themotor. J Mol Biol 280: 821–828, URL http://dx.doi.org/10.1006/jmbi.1998.1922.
Puig, O., Caspary, F., Rigaut, G., Rutz, B., Bouveret, E., Bragado-Nilsson, E., Wilm, M., andSéraphin, B. (2001) The tandem affinity purification (TAP) method: a general procedure of pro-tein complex purification. Methods 24: 218–229, URL http://dx.doi.org/10.1006/meth.2001.1183.
R Development Core Team (2008) R: A Language and Environment for Statistical Computing. RFoundation for Statistical Computing, Vienna, Austria, URL http://www.R-project.org,ISBN 3-900051-07-0.
Rain, J. C., Selig, L., Reuse, H. D., Battaglia, V., Reverdy, C., Simon, S., Lenzen, G., Petel, F.,Wojcik, J., Schächter, V., Chemama, Y., Labigne, A., and Legrain, P. (2001) The protein-proteininteraction map of Helicobacter pylori. Nature 409: 211–215, URL http://dx.doi.org/10.1038/35051615.
Rajagopala, S. V., Titz, B., Goll, J., Parrish, J. R., Wohlbold, K., McKevitt, M. T., Palzkill, T.,Mori, H., Finley, R. L., and Uetz, P. (2007) The protein network of bacterial motility. Mol SystBiol 3: 128, URL http://dx.doi.org/10.1038/msb4100166.
Ranish, J. A., Yi, E. C., Leslie, D. M., Purvine, S. O., Goodlett, D. R., Eng, J., and Aebersold,R. (2003) The study of macromolecular complexes by quantitative proteomics. Nat Genet 33:349–355, URL http://dx.doi.org/10.1038/ng1101.
Rao, C. V., Kirby, J. R., and Arkin, A. P. (2005) Phosphatase localization in bacterial chemotaxis:divergent mechanisms, convergent principles. Phys Biol 2: 148–158, URL http://dx.doi.org/10.1088/1478-3975/2/3/002.
Rappsilber, J., Ishihama, Y., and Mann, M. (2003) Stop and go extraction tips for matrix-assistedlaser desorption/ionization, nanoelectrospray, and LC/MS sample pretreatment in proteomics.Anal Chem 75: 663–670, URL http://www.ncbi.nlm.nih.gov/pubmed/12585499.
Rollins, C. and Dahlquist, F. W. (1981) The methyl-accepting chemotaxis proteins of E. coli : arepellent-stimulated, covalent modification, distinct from methylation. Cell 25: 333–340, URLhttp://www.ncbi.nlm.nih.gov/pubmed/7026041.
Rosario, M. M. and Ordal, G. W. (1996) CheC and CheD interact to regulate methylation of Bacillussubtilis methyl-accepting chemotaxis proteins. Mol Microbiol 21: 511–518, URL http://www.ncbi.nlm.nih.gov/pubmed/8866475.
Rowsell, E. H., Smith, J. M., Wolfe, A., and Taylor, B. L. (1995) CheA, CheW, and CheY arerequired for chemotaxis to oxygen and sugars of the phosphotransferase system in Escherichiacoli. J Bacteriol 177: 6011–6014, URL http://www.ncbi.nlm.nih.gov/pubmed/7592359.
178
Bibliography
Ruden, D. M., Ma, J., Li, Y., Wood, K., and Ptashne, M. (1991) Generating yeast transcriptionalactivators containing no yeast protein sequences. Nature 350: 250–252, URL http://dx.doi.org/10.1038/350250a0.
Rudolph, J. and Oesterhelt, D. (1995) Chemotaxis and phototaxis require a CheA histidine kinase inthe archaeon Halobacterium salinarium. EMBO J 14: 667–673, URL http://www.ncbi.nlm.nih.gov/pubmed/7882970.
Rudolph, J. and Oesterhelt, D. (1996) Deletion analysis of the che operon in the archaeon Halobac-terium salinarium. J Mol Biol 258: 548–554, URL http://dx.doi.org/10.1006/jmbi.1996.0267.
Rudolph, J., Tolliday, N., Schmitt, C., Schuster, S. C., and Oesterhelt, D. (1995) Phospho-rylation in halobacterial signal transduction. EMBO J 14: 4249–4257, URL http://www.pubmedcentral.nih.gov/articlerender.fcgi?tool=pubmed&pubmedid=7556066.
Ruepp, A. and Soppa, J. (1996) Fermentative arginine degradation in Halobacterium salinarium (for-merly Halobacterium halobium): genes, gene products, and transcripts of the arcRACB gene clus-ter. J Bacteriol 178: 4942–4947, URL http://www.ncbi.nlm.nih.gov/pubmed/8759859.
Saiki, R. K., Gelfand, D. H., Stoffel, S., Scharf, S. J., Higuchi, R., Horn, G. T., Mullis, K. B.,and Erlich, H. A. (1988) Primer-directed enzymatic amplification of DNA with a thermostableDNA polymerase. Science 239: 487–491, URL http://www.ncbi.nlm.nih.gov/pubmed/2448875.
Sanger, F., Nicklen, S., and Coulson, A. R. (1977) DNA sequencing with chain-terminating inhibitors.Proc Natl Acad Sci U S A 74: 5463–5467, URL http://www.ncbi.nlm.nih.gov/pubmed/271968.
Saulmon, M. M., Karatan, E., and Ordal, G. W. (2004) Effect of loss of CheC and other adaptationalproteins on chemotactic behaviour in Bacillus subtilis. Microbiology 150: 581–589, URL http://www.ncbi.nlm.nih.gov/pubmed/14993307.
Schäfer, G., Engelhard, M., and Müller, V. (1999) Bioenergetics of the Archaea. Microbiol Mol BiolRev 63: 570–620, URL http://www.ncbi.nlm.nih.gov/pubmed/10477309.
Schäfer, G., Purschke, W. G., Gleissner, M., and Schmidt, C. L. (1996) Respiratory chains of archaeaand extremophiles. Biochim Biophys Acta 1275: 16–20, URL http://www.ncbi.nlm.nih.gov/pubmed/8688447.
Scharf, B. E., Fahrner, K. A., Turner, L., and Berg, H. C. (1998) Control of direction of flagellarrotation in bacterial chemotaxis. Proc Natl Acad Sci U S A 95: 201–206, URL http://www.ncbi.nlm.nih.gov/pubmed/9419353.
Schmitt, R. (2002) Sinorhizobial chemotaxis: a departure from the enterobacterial paradigm. Micro-biology 148: 627–631, URL http://www.ncbi.nlm.nih.gov/pubmed/11882696.
Schobert, B. and Lanyi, J. K. (1982) Halorhodopsin is a light-driven chloride pump. J Biol Chem257: 10306–10313, URL http://www.ncbi.nlm.nih.gov/pubmed/7107607.
Schultz, J., Milpetz, F., Bork, P., and Ponting, C. P. (1998) SMART, a simple modular architectureresearch tool: identification of signaling domains. Proc Natl Acad Sci U S A 95: 5857–5864, URLhttp://www.ncbi.nlm.nih.gov/pubmed/9600884.
179
Bibliography
Schulze, W. X. and Mann, M. (2004) A novel proteomic screen for peptide-protein interactions. JBiol Chem 279: 10756–10764, URL http://dx.doi.org/10.1074/jbc.M309909200.
Schuster, S. C., Swanson, R. V., Alex, L. A., Bourret, R. B., and Simon, M. I. (1993) Assembly andfunction of a quaternary signal transduction complex monitored by surface plasmon resonance.Nature 365: 343–347, URL http://dx.doi.org/10.1038/365343a0.
Selbach, M. and Mann, M. (2006) Protein interaction screening by quantitative immunoprecipitationcombined with knockdown (QUICK). Nat Methods 3: 981–983, URL http://dx.doi.org/10.1038/nmeth972.
Semple, J. I., Sanderson, C. M., and Campbell, R. D. (2002) The jury is out on "guilt by associ-ation" trials. Brief Funct Genomic Proteomic 1: 40–52, URL http://www.ncbi.nlm.nih.gov/pubmed/15251065.
Shah, D. S., Porter, S. L., Martin, A. C., Hamblin, P. A., and Armitage, J. P. (2000) Fine tuningbacterial chemotaxis: analysis of Rhodobacter sphaeroides behaviour under aerobic and anaerobicconditions by mutation of the major chemotaxis operons and cheY genes. EMBO J 19: 4601–4613,URL http://dx.doi.org/10.1093/emboj/19.17.4601.
Shannon, P., Markiel, A., Ozier, O., Baliga, N. S., Wang, J. T., Ramage, D., Amin, N., Schwikowski,B., and Ideker, T. (2003) Cytoscape: a software environment for integrated models of biomolecularinteraction networks. Genome Res 13: 2498–2504, URL http://dx.doi.org/10.1101/gr.1239303.
Sherris, D. and Parkinson, J. S. (1981) Posttranslational processing of methyl-accepting chemotaxisproteins in Escherichia coli. Proc Natl Acad Sci U S A 78: 6051–6055, URL http://www.ncbi.nlm.nih.gov/pubmed/6458812.
Shevchenko, A., Wilm, M., Vorm, O., and Mann, M. (1996) Mass spectrometric sequencing of proteinssilver-stained polyacrylamide gels. Anal Chem 68: 850–858, URL http://www.ncbi.nlm.nih.gov/pubmed/8779443.
Shimizu, T. S., Novère, N. L., Levin, M. D., Beavil, A. J., Sutton, B. J., and Bray, D. (2000) Molecularmodel of a lattice of signalling proteins involved in bacterial chemotaxis. Nat Cell Biol 2: 792–796,URL http://dx.doi.org/10.1038/35041030.
Shukla, D. and Matsumura, P. (1995) Mutations leading to altered CheA binding cluster on a faceof CheY. J Biol Chem 270: 24414–24419, URL http://www.ncbi.nlm.nih.gov/pubmed/7592655.
Shuman, S. (1991) Recombination mediated by vaccinia virus DNA topoisomerase I in Escherichiacoli is sequence specific. Proc Natl Acad Sci U S A 88: 10104–10108, URL http://www.ncbi.nlm.nih.gov/pubmed/1658796.
Silversmith, R. E., Appleby, J. L., and Bourret, R. B. (1997) Catalytic mechanism of phosphorylationand dephosphorylation of CheY: kinetic characterization of imidazole phosphates as phosphodonorsand the role of acid catalysis. Biochemistry 36: 14965–14974, URL http://dx.doi.org/10.1021/bi9715573.
Silversmith, R. E., Guanga, G. P., Betts, L., Chu, C., Zhao, R., and Bourret, R. B. (2003) CheZ-mediated dephosphorylation of the Escherichia coli chemotaxis response regulator CheY: role forCheY glutamate 89. J Bacteriol 185: 1495–1502, URL http://www.ncbi.nlm.nih.gov/pubmed/12591865.
180
Bibliography
Sim, J.-H., Shi, W., and Lux, R. (2005) Protein-protein interactions in the chemotaxis signallingpathway of Treponema denticola. Microbiology 151: 1801–1807, URL http://dx.doi.org/10.1099/mic.0.27622-0.
Simms, S. A., Stock, A. M., and Stock, J. B. (1987) Purification and characterization of the S-adenosylmethionine:glutamyl methyltransferase that modifies membrane chemoreceptor proteinsin bacteria. J Biol Chem 262: 8537–8543, URL http://www.ncbi.nlm.nih.gov/pubmed/3298235.
Simms, S. A. and Subbaramaiah, K. (1991) The kinetic mechanism of S-adenosyl-L-methionine:glutamylmethyltransferase from Salmonella typhimurium. J Biol Chem 266: 12741–12746, URLhttp://www.ncbi.nlm.nih.gov/pubmed/2061337.
Soppa, J. (2006) From genomes to function: haloarchaea as model organisms. Microbiology 152:585–590, URL http://dx.doi.org/10.1099/mic.0.28504-0.
Sourjik, V. and Berg, H. C. (2000) Localization of components of the chemotaxis machinery ofEscherichia coli using fluorescent protein fusions. Mol Microbiol 37: 740–751, URL http://www.ncbi.nlm.nih.gov/pubmed/10972797.
Sourjik, V. and Berg, H. C. (2002a) Binding of the Escherichia coli response regulator CheY to itstarget measured in vivo by fluorescence resonance energy transfer. Proc Natl Acad Sci U S A 99:12669–12674, URL http://dx.doi.org/10.1073/pnas.192463199.
Sourjik, V. and Berg, H. C. (2002b) Receptor sensitivity in bacterial chemotaxis. Proc Natl Acad SciU S A 99: 123–127, URL http://dx.doi.org/10.1073/pnas.011589998.
Sourjik, V. and Berg, H. C. (2004) Functional interactions between receptors in bacterial chemotaxis.Nature 428: 437–441, URL http://dx.doi.org/10.1038/nature02406.
Sourjik, V. and Schmitt, R. (1998) Phosphotransfer between CheA, CheY1, and CheY2 in thechemotaxis signal transduction chain of Rhizobium meliloti. Biochemistry 37: 2327–2335, URLhttp://dx.doi.org/10.1021/bi972330a.
Speranskii, V., Metlina, A., Novikova, T., and Bakeyeva, L. (1996) Disk-like lamellar structure aspart of the archaeal flagellar apparatus. Biophysics 41: 167–173.
Spraggon, G., Pantazatos, D., Klock, H. E., Wilson, I. A., Woods, V. L., and Lesley, S. A. (2004) Onthe use of DXMS to produce more crystallizable proteins: structures of the T. maritima proteinsTM0160 and TM1171. Protein Sci 13: 3187–3199, URL http://dx.doi.org/10.1110/ps.04939904.
Springer, W. R. and Koshland, D. E. (1977) Identification of a protein methyltransferase as thecheR gene product in the bacterial sensing system. Proc Natl Acad Sci U S A 74: 533–537, URLhttp://www.ncbi.nlm.nih.gov/pubmed/322131.
Spudich, E. N. and Spudich, J. L. (1993) The photochemical reactions of sensory rhodopsin I arealtered by its transducer. J Biol Chem 268: 16095–16097.
Spudich, J. L. and Stoeckenius, W. (1979) Photosensory and chemosensory behavior of Halobacteriumhalobium. Photobiochemistry and Photobiophysics 1: 43–53.
181
Bibliography
Stajich, J. E., Block, D., Boulez, K., Brenner, S. E., Chervitz, S. A., Dagdigian, C., Fuellen, G.,Gilbert, J. G. R., Korf, I., Lapp, H., Lehväslaiho, H., Matsalla, C., Mungall, C. J., Osborne, B. I.,Pocock, M. R., Schattner, P., Senger, M., Stein, L. D., Stupka, E., Wilkinson, M. D., and Birney,E. (2002) The Bioperl toolkit: Perl modules for the life sciences. Genome Res 12: 1611–1618,URL http://dx.doi.org/10.1101/gr.361602.
Staudinger, W. (2001) Funktionsanalyse des Gens flaK in Halobacterium salinarum durch Deletionund Komplementation. Diploma thesis, Julius-Maximilians-Universität Würzburg.
Staudinger, W. (2007) Investigations on Flagellar Biogenesis, Motility and Signal Transduction ofHalobacterium salinarum. Ph.D. thesis, Ludwig-Maximilians-Universität München.
Stewart, R. C., Roth, A. F., and Dahlquist, F. W. (1990) Mutations that affect control of themethylesterase activity of CheB, a component of the chemotaxis adaptation system in Escherichiacoli. J Bacteriol 172: 3388–3399, URL http://www.ncbi.nlm.nih.gov/pubmed/2188960.
Stock, A. M., Robinson, V. L., and Goudreau, P. N. (2000) Two-component signal transduction.Annu Rev Biochem 69: 183–215, URL http://dx.doi.org/10.1146/annurev.biochem.69.1.183.
Stock, A. M., Wylie, D. C., Mottonen, J. M., Lupas, A. N., Ninfa, E. G., Ninfa, A. J., Schutt, C. E.,and Stock, J. B. (1988) Phosphoproteins involved in bacterial signal transduction. Cold SpringHarb Symp Quant Biol 53 Pt 1: 49–57, URL http://www.ncbi.nlm.nih.gov/pubmed/3076087.
Stoeckenius, W., Lozier, R. H., and Bogomolni, R. A. (1979) Bacteriorhodopsin and the purplemembrane of halobacteria. Biochim Biophys Acta 505: 215–278, URL http://dx.doi.org/10.1016/0304-4173(79)90006-5.
Storch, K. F., Rudolph, J., and Oesterhelt, D. (1999) Car: a cytoplasmic sensor responsible forarginine chemotaxis in the archaeon Halobacterium salinarum. EMBO J 18: 1146–1158, URLhttp://dx.doi.org/10.1093/emboj/18.5.1146.
Streif, S., Staudinger, W. F., Marwan, W., and Oesterhelt, D. (2008) Flagellar rotation in thearchaeon Halobacterium salinarum depends on ATP. Journal of Molecular Biology URL http://dx.doi.org/10.1016/j.jmb.2008.08.057.
Stumpf, M. P. H., Wiuf, C., and May, R. M. (2005) Subnets of scale-free networks are not scale-free: sampling properties of networks. Proc Natl Acad Sci U S A 102: 4221–4224, URL http://dx.doi.org/10.1073/pnas.0501179102.
Szabó, Z., Sani, M., Groeneveld, M., Zolghadr, B., Schelert, J., Albers, S.-V., Blum, P., Boekema,E. J., and Driessen, A. J. M. (2007) Flagellar motility and structure in the hyperthermoacidophilicarchaeon Sulfolobus solfataricus. J Bacteriol 189: 4305–4309, URL http://dx.doi.org/10.1128/JB.00042-07.
Szurmant, H., Bunn, M. W., Cannistraro, V. J., and Ordal, G. W. (2003) Bacillus subtilis hydrolyzesCheY-P at the location of its action, the flagellar switch. J Biol Chem 278: 48611–48616, URLhttp://dx.doi.org/10.1074/jbc.M306180200.
Szurmant, H., Muff, T. J., and Ordal, G. W. (2004) Bacillus subtilis CheC and FliY are membersof a novel class of CheY-P-hydrolyzing proteins in the chemotactic signal transduction cascade. JBiol Chem 279: 21787–21792, URL http://dx.doi.org/10.1074/jbc.M311497200.
182
Bibliography
Szurmant, H. and Ordal, G. W. (2004) Diversity in chemotaxis mechanisms among the bacteria andarchaea. Microbiol Mol Biol Rev 68: 301–319, URL http://dx.doi.org/10.1128/MMBR.68.2.301-319.2004.
Tarasov, V. Y., Besir, H., Schwaiger, R., Klee, K., Furtwängler, K., Pfeiffer, F., and Oesterhelt, D.(2008) A small protein from the bop-brp intergenic region of Halobacterium salinarum containsa zinc finger motif and regulates bop and crtB1 transcription. Mol Microbiol 67: 772–780, URLhttp://www.ncbi.nlm.nih.gov/pubmed/18179416.
Tatusov, R. L., Fedorova, N. D., Jackson, J. D., Jacobs, A. R., Kiryutin, B., Koonin, E. V., Krylov,D. M., Mazumder, R., Mekhedov, S. L., Nikolskaya, A. N., Rao, B. S., Smirnov, S., Sverdlov,A. V., Vasudevan, S., Wolf, Y. I., Yin, J. J., and Natale, D. A. (2003) The COG database: anupdated version includes eukaryotes. BMC Bioinformatics 4: 41, URL http://dx.doi.org/10.1186/1471-2105-4-41.
Tatusov, R. L., Koonin, E. V., and Lipman, D. J. (1997) A genomic perspective on protein families.Science 278: 631–637, URL http://www.ncbi.nlm.nih.gov/pubmed/9381173.
Tebbe, A., Klein, C., Bisle, B., Siedler, F., Scheffer, B., Garcia-Rizo, C., Wolfertz, J., Hickmann,V., Pfeiffer, F., and Oesterhelt, D. (2005) Analysis of the cytosolic proteome of Halobacteriumsalinarum and its implication for genome annotation. Proteomics 5: 168–179, URL http://dx.doi.org/10.1002/pmic.200400910.
Thar, R. and Kuhl, M. (2003) Bacteria are not too small for spatial sensing of chemical gradients:an experimental evidence. Proc Natl Acad Sci U S A 100: 5748–5753, URL http://dx.doi.org/10.1073/pnas.1030795100.
Thomas, N. A., Bardy, S. L., and Jarrell, K. F. (2001a) The archaeal flagellum: a different kindof prokaryotic motility structure. FEMS Microbiol Rev 25: 147–174, URL http://www.ncbi.nlm.nih.gov/pubmed/11250034.
Thomas, N. A. and Jarrell, K. F. (2001) Characterization of flagellum gene families of methanogenicarchaea and localization of novel flagellum accessory proteins. J Bacteriol 183: 7154–7164, URLhttp://dx.doi.org/10.1128/JB.183.24.7154-7164.2001.
Thomas, N. A., Mueller, S., Klein, A., and Jarrell, K. F. (2002) Mutants in flaI and flaJ of thearchaeon Methanococcus voltae are deficient in flagellum assembly. Mol Microbiol 46: 879–887,URL http://www.ncbi.nlm.nih.gov/pubmed/12410843.
Thomas, N. A., Pawson, C. T., and Jarrell, K. F. (2001b) Insertional inactivation of the flaH genein the archaeon Methanococcus voltae results in non-flagellated cells. Mol Genet Genomics 265:596–603, URL http://www.ncbi.nlm.nih.gov/pubmed/11459179.
Thompson, J. D., Gibson, T. J., Plewniak, F., Jeanmougin, F., and Higgins, D. G. (1997) TheCLUSTAL_X windows interface: flexible strategies for multiple sequence alignment aided byquality analysis tools. Nucleic Acids Res 25: 4876–4882, URL http://www.ncbi.nlm.nih.gov/pubmed/9396791.
Thompson, J. D., Higgins, D. G., and Gibson, T. J. (1994) CLUSTAL W: improving the sensitiv-ity of progressive multiple sequence alignment through sequence weighting, position-specific gappenalties and weight matrix choice. Nucleic Acids Res 22: 4673–4680, URL http://www.ncbi.nlm.nih.gov/pubmed/7984417.
183
Bibliography
Thompson, S. R., Wadhams, G. H., and Armitage, J. P. (2006) The positioning of cytoplasmic proteinclusters in bacteria. Proc Natl Acad Sci U S A 103: 8209–8214, URL http://dx.doi.org/10.1073/pnas.0600919103.
Titz, B., Schlesner, M., and Uetz, P. (2004) What do we learn from high-throughput protein in-teraction data? Expert Rev Proteomics 1: 111–121, URL http://dx.doi.org/10.1586/14789450.1.1.111.
Tomb, J. F., White, O., Kerlavage, A. R., Clayton, R. A., Sutton, G. G., Fleischmann, R. D.,Ketchum, K. A., Klenk, H. P., Gill, S., Dougherty, B. A., Nelson, K., Quackenbush, J., Zhou, L.,Kirkness, E. F., Peterson, S., Loftus, B., Richardson, D., Dodson, R., Khalak, H. G., Glodek, A.,McKenney, K., Fitzegerald, L. M., Lee, N., Adams, M. D., Hickey, E. K., Berg, D. E., Gocayne,J. D., Utterback, T. R., Peterson, J. D., Kelley, J. M., Cotton, M. D., Weidman, J. M., Fujii, C.,Bowman, C., Watthey, L., Wallin, E., Hayes, W. S., Borodovsky, M., Karp, P. D., Smith, H. O.,Fraser, C. M., and Venter, J. C. (1997) The complete genome sequence of the gastric pathogenHelicobacter pylori. Nature 388: 539–547, URL http://dx.doi.org/10.1038/41483.
Tomme, P., Boraston, A., McLean, B., Kormos, J., Creagh, A. L., Sturch, K., Gilkes, N. R., Haynes,C. A., Warren, R. A., and Kilburn, D. G. (1998) Characterization and affinity applications ofcellulose-binding domains. J Chromatogr B Biomed Sci Appl 715: 283–296, URL http://www.ncbi.nlm.nih.gov/pubmed/9792516.
Triezenberg, S. J. (1995) Structure and function of transcriptional activation domains. Curr OpinGenet Dev 5: 190–196, URL http://www.ncbi.nlm.nih.gov/pubmed/7613088.
Uetz, P., Dong, Y.-A., Zeretzke, C., Atzler, C., Baiker, A., Berger, B., Rajagopala, S. V., Roupelieva,M., Rose, D., Fossum, E., and Haas, J. (2006) Herpesviral protein networks and their interac-tion with the human proteome. Science 311: 239–242, URL http://dx.doi.org/10.1126/science.1116804.
Uetz, P., Giot, L., Cagney, G., Mansfield, T. A., Judson, R. S., Knight, J. R., Lockshon, D., Narayan,V., Srinivasan, M., Pochart, P., Qureshi-Emili, A., Li, Y., Godwin, B., Conover, D., Kalbfleisch,T., Vijayadamodar, G., Yang, M., Johnston, M., Fields, S., and Rothberg, J. M. (2000) A compre-hensive analysis of protein-protein interactions in Saccharomyces cerevisiae. Nature 403: 623–627,URL http://dx.doi.org/10.1038/35001009.
Uetz, P. and Vollert, C. S. (2006) Protein-Protein Interactions., chap. 16. Springer, 1548–1552.
Usui, K., Katayama, S., Kanamori-Katayama, M., Ogawa, C., Kai, C., Okada, M., Kawai,J., Arakawa, T., Carninci, P., Itoh, M., Takio, K., Miyano, M., Kidoaki, S., Matsuda, T.,Hayashizaki, Y., and Suzuki, H. (2005) Protein-protein interactions of the hyperthermophilicarchaeon Pyrococcus horikoshii OT3. Genome Biol 6: R98, URL http://dx.doi.org/10.1186/gb-2005-6-12-r98.
Valencia, A. and Pazos, F. (2002) Computational methods for the prediction of protein interac-tions. Curr Opin Struct Biol 12: 368–373, URL http://www.ncbi.nlm.nih.gov/pubmed/12127457.
Vojtek, A. B., Hollenberg, S. M., and Cooper, J. A. (1993) Mammalian Ras interacts directly withthe serine/threonine kinase Raf. Cell 74: 205–214, URL http://www.ncbi.nlm.nih.gov/pubmed/8334704.
184
Bibliography
von Mering, C., Jensen, L. J., Kuhn, M., Chaffron, S., Doerks, T., Krüger, B., Snel, B., and Bork, P.(2007) STRING 7–recent developments in the integration and prediction of protein interactions.Nucleic Acids Res 35: D358–D362, URL http://dx.doi.org/10.1093/nar/gkl825.
von Mering, C., Krause, R., Snel, B., Cornell, M., Oliver, S. G., Fields, S., and Bork, P. (2002)Comparative assessment of large-scale data sets of protein-protein interactions. Nature 417: 399–403, URL http://dx.doi.org/10.1038/nature750.
Wadhams, G. H. and Armitage, J. P. (2004) Making sense of it all: bacterial chemotaxis. Nat RevMol Cell Biol 5: 1024–1037, URL http://dx.doi.org/10.1038/nrm1524.
Wagner, G., Hartmann, R., and Oesterhelt, D. (1978) Potassium uniport and ATP synthesis inHalobacterium halobium. Eur J Biochem 89: 169–179, URL http://www.ncbi.nlm.nih.gov/pubmed/29755.
Wang, H. and Matsumura, P. (1996) Characterization of the CheAS/CheZ complex: a specific inter-action resulting in enhanced dephosphorylating activity on CheY-phosphate. Mol Microbiol 19:695–703, URL http://www.ncbi.nlm.nih.gov/pubmed/8820640.
Weidinger, E. (2007) Herstellung und Charakterisierung von Chemotaxiemutanten von Halobacteriumsalinarum. Diploma thesis, Fachhochschule München.
Welch, M., Chinardet, N., Mourey, L., Birck, C., and Samama, J. P. (1998) Structure of the CheY-binding domain of histidine kinase CheA in complex with CheY. Nat Struct Biol 5: 25–29, URLhttp://www.ncbi.nlm.nih.gov/pubmed/9437425.
Welch, M., Oosawa, K., Aizawa, S., and Eisenbach, M. (1993) Phosphorylation-dependent bindingof a signal molecule to the flagellar switch of bacteria. Proc Natl Acad Sci U S A 90: 8787–8791,URL http://www.ncbi.nlm.nih.gov/pubmed/8415608.
Woese, C. R. and Fox, G. E. (1977) Phylogenetic structure of the prokaryotic domain: the primarykingdoms. Proc Natl Acad Sci U S A 74: 5088–5090, URL http://www.ncbi.nlm.nih.gov/pubmed/270744.
Woese, C. R., Kandler, O., and Wheelis, M. L. (1990) Towards a natural system of organisms:proposal for the domains Archaea, Bacteria, and Eucarya. Proc Natl Acad Sci U S A 87: 4576–4579, URL http://www.ncbi.nlm.nih.gov/pubmed/2112744.
Woese, C. R., Magrum, L. J., and Fox, G. E. (1978) Archaebacteria. J Mol Evol 11: 245–251, URLhttp://www.ncbi.nlm.nih.gov/pubmed/691075.
Wolanin, P. M., Thomason, P. A., and Stock, J. B. (2002) Histidine protein kinases: key signaltransducers outside the animal kingdom. Genome Biol 3: REVIEWS3013, URL http://www.ncbi.nlm.nih.gov/pubmed/12372152.
Wolfe, A. J. and Berg, H. C. (1989) Migration of bacteria in semisolid agar. Proc Natl Acad Sci U SA 86: 6973–6977, URL http://www.ncbi.nlm.nih.gov/pubmed/2674941.
Yamamoto, K., Hirao, K., Oshima, T., Aiba, H., Utsumi, R., and Ishihama, A. (2005) Functionalcharacterization in vitro of all two-component signal transduction systems from Escherichia coli.J Biol Chem 280: 1448–1456, URL http://dx.doi.org/10.1074/jbc.M410104200.
185
Bibliography
Yan, J., Barak, R., Liarzi, O., Shainskaya, A., and Eisenbach, M. (2008) In vivo acetylation ofCheY, a response regulator in chemotaxis of Escherichia coli. J Mol Biol 376: 1260–1271, URLhttp://dx.doi.org/10.1016/j.jmb.2007.12.070.
Yonekura, K., Maki-Yonekura, S., and Namba, K. (2002) Growth mechanism of the bacterial flagellarfilament. Res Microbiol 153: 191–197, URL http://sfx.mpg.de/sfx_local?sid=Entrez:PubMed&id=pmid:12066889.
Zhang, W., Brooun, A., Mueller, M. M., and Alam, M. (1996) The primary structures of the ArchaeonHalobacterium salinarium blue light receptor sensory rhodopsin II and its transducer, a methyl-accepting protein. Proc Natl Acad Sci U S A 93: 8230–8235, URL http://www.ncbi.nlm.nih.gov/pubmed/8710852.
Zhao, R., Collins, E. J., Bourret, R. B., and Silversmith, R. E. (2002) Structure and catalyticmechanism of the E. coli chemotaxis phosphatase CheZ. Nat Struct Biol 9: 570–575, URL http://dx.doi.org/10.1038/nsb816.
186
Appendix
List of abbreviations
3-AT 3-aminotriazoleaa amino acid(s)ACN acetonitrileAD activation domainAde adenineADI arginine deiminaseADP adenosine diphosphateAmp ampicillinAP affinity purificationATP adenosine triphosphatebp base pair(s)BR bacteriorhodopsinCCW counterclockwiseche chemotaxisCFE cell-free extract bufferCW clockwisedATP deoxyadenosine triphosphateDBD DNA-binding domaindCTP deoxycytosine triphosphatedGTP deoxyguanosine triphosphateDHFR dihydrofolate reductaseDIG digoxygeninDMSO dimethylsulfoxidedNTPs mixture dATP, dTTP, dCTP, dGTPDTT dithiothreitoldTTP deoxythymidine triphosphatedUTP deoxyuridine triphosphateEDTA ethylenediaminetetraacetatee. g. for exampleESI electrospray ionisationFA formic acidfla flagella accessoryHAP histidine-aspartate phosphorelayHis histidineHM HalomediumHPK histidine protein kinaseHR halorhodopsinHtr halobacterial transduceri. e. that isIPTG isopropyl-β-D-thiogalactopyranoside
187
Appendix
kDa kilodaltonLB lysogeny broth (also known as Luria broth or Luria-Bertani broth)LC liquid chromatographyLeu leucineM molarMALDI matrix-assisted laser desorption/ionizationMCP methyl-accecpting chemotaxis proteinMS mass spectrometryOD600 optical density at 600 nmPAGE polyacrylamide gel electrophoresisPDB protein data bankPEG polyethylene glycolPi inorganic phosphatePMF proton-motive force or peptide mass fingerprintingPMSF phenylmethanesulphonylfluoridePPI protein-protein interactionRB resuspension bufferrpm revolutions per minuteRR response regulatorRT room temperature (20 - 23 ◦C)SC synthetic complete (yeast medium)SDS sodium dodecyl sulfateS-layer surface layerSM synthetic mediumTCA trichloroacetic acid (for protein precipitation) or tricarboxylic acid (Krebs cycle)TOF time-of-flightTris tris(hydroxymethyl)aminomethaneTrp tryptophanevs. versusv/v volume per volumewt wild typew/v weight per volumeX-gal 5-bromo-4-chloro-3-indolyl-β-D-galacto pyranosideYPD yeast extract, peptone, dextrose (complex medium for yeast)
188
PublicationsSchlesner M., Miller A., Streif S., Staudinger W., Müller J., Scheffer B., Siedler F. and OesterheltD. (2008) Identification of Archaea-specific Chemotaxis Proteins Which Interact with the FlagellarApparatus, submitted
Schlesner M., Miller A., Besir H., Müller J., Scheffer B., Siedler F. and Oesterhelt D. (2008) TheProtein Interaction Network of the Halobacterium salinarum Taxis Signal Transduction System, inpreparation
Aivaliotis M., Oberwinkler T., Klee K., Damsma G., Schlesner M., Siedler F., Pfeiffer F., LottspeichF. and Oesterhelt D. (2008) Arginine Fermentation – a Unique Feature to Gain Energy in an Ex-tremophilic Archaeon, in preparation
Konstantinidis K., Schwarz C., Tebbe A., Schmidt A., Schlesner M., Klein C., Aivaliotis M., ReicheltP., Schwaiger R., Pfeiffer F., Siedler F., Lottspeich F. and Oesterhelt D. (2008) Quantitative analysesof the heat shock response in Halobacterium salinarum and the regulatory effects of a TFB protein,in preparation
Titz B., Schlesner M. and Uetz P. (2004) What do we learn from high-throughput protein interactiondata? Expert Rev Proteomics 1, 111-121
189
DanksagungMein Dank gilt...
Meinem Doktorvater Prof. Dr. Dieter Oesterhelt für die Möglichkeit, meine Doktorarbeit unter seinerBetreuung anfertigen zu können, für die fortwährende Unterstützung, und für das Vertrauen, das ermir entgegengebracht hat. Die große wissenschaftliche Freiheit und die vielen Möglichkeiten, die ichbei meiner Arbeit hier genossen habe und genieße, haben mir wesentlich mehr gebracht, als dieseArbeit widerzuspiegeln vermag.
Prof. Dr. Wolfgang Marwan für die Bereitschaft, das Zweitgutachten für die vorliegende Arbeit zuübernehmen.
Judith Müller, die einen erheblichen Teil der Experimente, die für diese Arbeit notwendig waren, undauch der Experimente, die dann doch nicht nötig waren, durchgeführt hat. Ich danke Judith auchdafür, dass sie mit unerschütterlicher Geduld Gele zerschnitten, Chromatogramme kontrolliert undProben entsalzt hat.
Hüseyin Besir für die vielen Hilfestellungen, Tipps und richtungsweisenden Diskussionen am Anfangmeiner Doktorarbeit, und für das Korrekturlesen, obwohl er Projekt, Abteilung und Institut schonlange verlassen hat.
Arthur Miller, der erst in seiner Diplomarbeit und später als wissenschaftlicher Mitarbeiter wesentlichzum Kapitel „Neue Chemotaxieproteine“ beigetragen hat.
Bea Scheffer für die Durchführung von über tausen MS-Läufen, die Produktion einiger Terabyte anDaten, das Packen ungezählter Vor- und Hauptsäulen und den andauernden Kampf mit LC undQTOF. Michalis Aivaliotis für die Unterstützung bei der Massenspektrometrie, wenn Bea mal nichtda war, und für so einige hilfreiche Diskussionen. Birgit Bisle für die geduldige Hilfestellung beimeinen ersten Gehversuchen in Sachen Massenspektrometrie und Proteomik. Und Frank Siedler fürdie Bereitstellung der Massenspektrometrie-Infrastruktur und die andauernde Unterstützung bei denMessungen.
Friedhelm Pfeiffer für die Starthilfe bei der Programmierung innerhalb des HaloLex-Systems, und fürzahlreiche Diskussionen und Erklärungen.
Valery Tarasov für viele Tipps und Tricks im Umgang mit Halos, und für viele wichtige und wenigerwichtige Diskussionen.
Wilfried Staudinger und Stefan Streif für viele hilfreiche Diskussion über Taxie, Motilität, und dieTücken der Halos.
Yue Noeth-Liu und Mandy Handtke, die im Rahmen ihrer Master- bzw- Diplomarbeiten einige Aspek-te des Interaktionsnetzwerks untersucht haben.
Vielen anderen Mitarbeitern der Abteilung Oesterhelt, die das Arbeiten hier so angenehm gemachthaben. Besonders hervorheben möchte ich Silvia Haslbeck, die uns immer mit sauberem Labormate-rial versorgt, unsere Kolbenberge abtransportiert und literweise Medium bereitgestellt hat, und FrauHaack für die Hilfe in allen möglichen organisatorischen Belangen.
Meinen Eltern für die fortwährende Unterstützung während des Studiums und der Promotion, ohnedie diese Arbeit niemals zustande gekommen wäre. Meinem Vater danke ich außerdem für das Kor-rekturlesen der schriftlichen Arbeit.
Meiner Frau Simone, die mir bei so vielem den Rücken freigehalten hat, Verständnis für so manchenlangen Arbeitstag hatte, und mich nie vergessen lässt, dass es noch wichtigere Dinge gibt als Halo-bakterien, Massenspektrometrie und Proteininteraktionen.
Und natürlich meinem Sohn Lennart für die viele Zeit, in der er mich nicht hat arbeiten lassen.
190
LebenslaufName SchlesnerVorname MatthiasAnschrift Gernstraße 16
82223 Eichenau
Geburtsdatum 8. August 1978Geburtsort KielFamilienstand verheiratet, ein KindNationalität deutsch
Schulbildung 1984 - 1988 Grundschule Groß Vollstedt1988 - 1997 Gymnasium, Max-Planck-Schule in Kiel05/1997 Abitur (Note: 1,2)
Zivildienst 07/1997 - 07/1998 Ergotherapie, Altenzentrum St. Nicolai, Kiel
Studium 10/1998 - 06/2003 Humanbiologie, Philipps-Universität Marburg09/2000 Vordiplom (Note: sehr gut)10/2001 - 09/2002 Hauptfach Infektionsbiologie
Nebenfach Bioinformatik10/2002 - 06/2003 Diplomarbeit
”Erstellung cDNA-gestützter Systeme zur Untersuchungder Pathogenitätsdeterminanten von Influenzaviren”Institut für Virologie, MarburgBetreuer: Prof. Dr. Hans-Dieter Klenk
06/2003 Abschluss der Diplomprüfung (Note 1,0)
Praktikum 07/2001 - 10/2001 Bayer AG, Forschungszentrum Wuppertal„Identifikation und Untersuchung neuer antibakteriellerWirkstoffe“
Promotion 10/2003 - 03/2004 DoktorandArbeitsgruppe Peter UetzInstitut für Toxikologie und GenetikForschungszentrum Karlsruhe„Erstellung einer genomweiten Protein-Protein-Interaktionskarte von Treponema pallidum“
seit 04/2004 DoktorandAbteilung MembranbiochemieMPI für Biochemie, Martinsried„The Halobacterium salinarum Taxis Signal Transducti-on Network: a Protein-Protein Interaction Study“Betreuer: Prof. Dr. Dieter Oesterhelt
Martinsried, 07.10.2008