Embed Size (px)
Citation preview
1
Biorenewables beyond bioenergy -
- creating sustainable value
RWTH Aachen | 18 june 2014
Luuk van der Wielen and Jan van Breugel
Biomass production - for what reason ?
• food & feed
• pulp & paper
• classical construction materials: wood etc
• power & heat
• liquid transport fuels (ethanol, advanced fuels)
• chemicals & polymers
• novel (in)organic) (construction) materials: biofoam,
biocement, biogrout, bioasphalt, others …
Or a mix / portfolio – target :
all biomass-to-value !
Biomass production - for what market ?A. drop-in (fuels, syngas, H2, biogas, bioethene, biosuccinate, bioPET, …)
blend with existing economy (existing industry, infrastructure, capital,
products, buyers, … so ‘hail shale gas’ ?), or
B. substitute (PLA, PEF, biojet fuel…) replace existing products by
biorenewables (similar functionalities, reduced emission - cost, …), or
C. drop-out: (bioconcrete, biosolar, …) “New Bioeconomy” (novel products-
industries, away from vested interests, full benefit of sustainable*
development, rural development-jobs-income, distributed manufacturing,
… but Bio-Bubble – remember “New Economy-2001” ?)
• Can A, B, C can all be realities ?
• What does it require ?
* climate, economic, social
contents
1. Why ? global & regional drivers
2. How ? BBE technology portfolio
3. What ? feedstocks, products, yields – role of
scale and logistics
4. How – again ?
5. Why – again ?
Global drivers for a BBE ?
• more people with more wealth
• less nett GHG emission (global warming)
and/or climate adaptation
• politics (security of oil/gas supply)
• innovation, rural income and economic development
• increasing (and decreasing) prices of resources
• in time*, limited fossil reserves
• add sustainability to food chain
• add value to food chain and prevent hunger
Pick your personal selection !
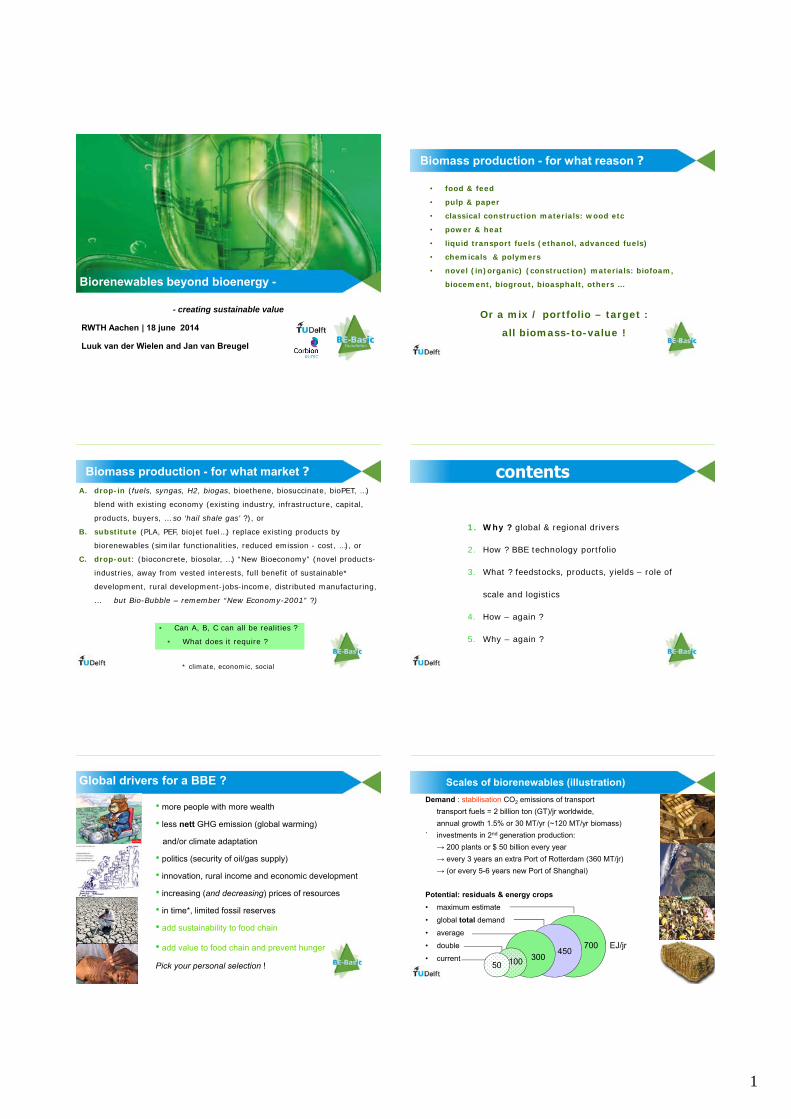
Demand : stabilisation CO2 emissions of transport
transport fuels = 2 billion ton (GT)/jr worldwide,
annual growth 1.5% or 30 MT/yr (~120 MT/yr biomass)
` investments in 2nd generation production:
→ 200 plants or $ 50 billion every year
→ every 3 years an extra Port of Rotterdam (360 MT/jr)
→ (or every 5-6 years new Port of Shanghai)
Potential: residuals & energy crops
• maximum estimate
• global total demand
• average
• double
• current50
450700 EJ/jr
300100
Scales of biorenewables (illustration)
2
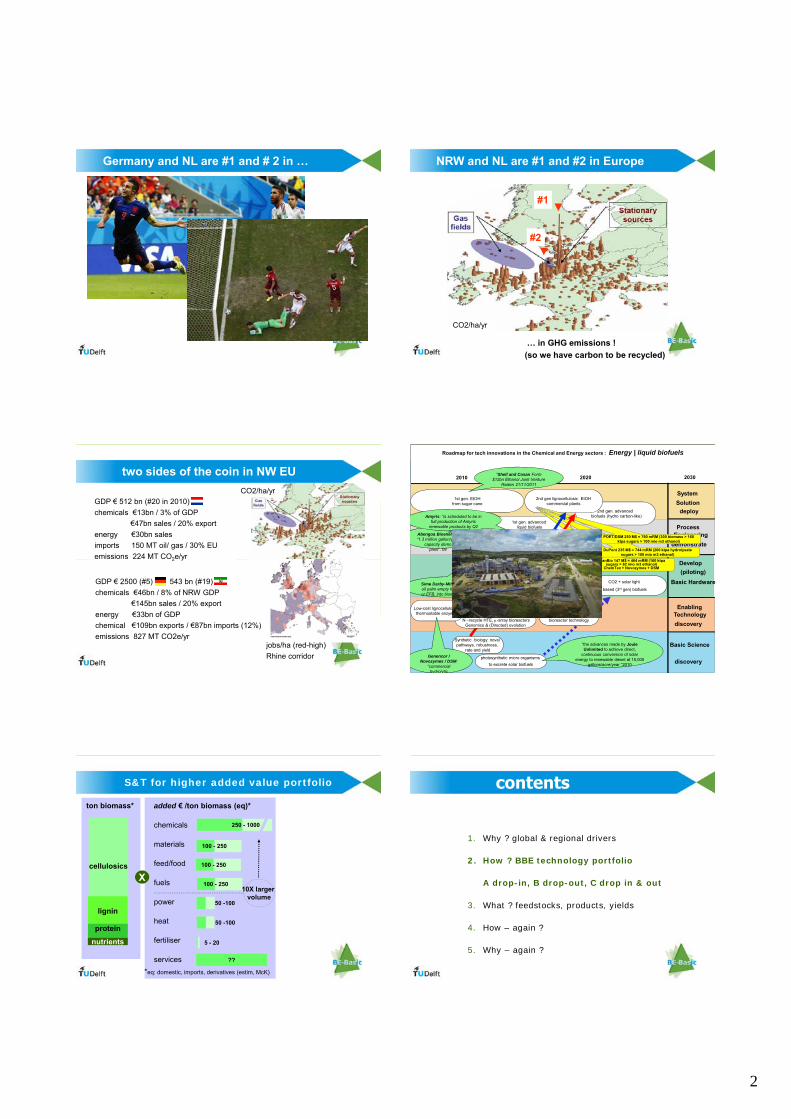
Germany and NL are #1 and # 2 in … NRW and NL are #1 and #2 in Europe
CO2/ha/yr
#1#1
#2#2
… in GHG emissions !
(so we have carbon to be recycled)
two sides of the coin in NW EU
GDP € 512 bn (#20 in 2010)
chemicals €13bn / 3% of GDP
€47bn sales / 20% export
energy €30bn sales
imports 150 MT oil/ gas / 30% EU
emissions 224 MT CO2e/yr
GDP € 2500 (#5) 543 bn (#19)
chemicals €46bn / 8% of NRW GDP
€145bn sales / 20% export
energy €33bn of GDP
chemical €109bn exports / €87bn imports (12%)
emissions 827 MT CO2e/yrjobs/ha (red-high)
Rhine corridor
CO2/ha/yr
2020 2030
2nd gen. advanced biofuels (hydro carbon-like)
Synthetic biology: novel pathways, robustness,
rate and yield
1st gen. EtOHfrom sugar cane
2010
photosynthetic micro organisms
to excrete solar biofuels
Low cost photo bioreactor technology
C5 & C6 cofermentation ; biomassN –recycle HTE, -array bioreactors
Genomics & (Directed) evolution
CO2 + solar light
based (3rd gen) biofuels
Low-cost lignocellulosic pretreatmenttechnology for efficient fail-proof intermediate:
low cost sugar (C5/6) platform
1st gen. advanced liquid biofuels
(hydro carbon-like)
2nd gen lignocellulosic EtOHpilot and demonstration plants
2nd gen lignocellulosic EtOHcommercial plants
System
Process Engineering
Develop
Basic Hardware
Enabling Technology
Basic Science
deploy
discovery
discovery
demonstrate
Solution
(piloting)
Low-cost lignocellulosic, thermostable enzymes
Abengoa Bioenergy: “1.3 million gallon/year
capacity demo plant”.’09
“the advances made by Joule Unlimited to achieve direct,
continuous conversion of solar energy to renewable diesel at 15,000
gallons/acre/year ”2010
“Shell and Cosan Form $12bn Ethanol Joint Venture
Raizen 21/11/2011
Amyris: “is scheduled to be in full production of Amyris
renewable products by Q2 2012.
DSM-TUD-B-Basic: “all you can eat
yeast”.2011
Genencor / Novozymes / DSM:
“commercial hydrolytic
Sime Darby-Mitsui: “convert oil palm empty fruit bunches, or EFB, into bioethanol”.2010
GranBio 147 M$ = 464 mRM (160 ktpasugars > 82 mio m3 ethanol)
ChemTex + Novozymes + DSM
DuPont 235 M$ = 744 mRM (200 ktpa hydrolysate sugars > 100 mio m3 ethanol)
POET/DSM 250 M$ = 790 mRM (300 biomass > 160 ktpa sugars > 100 mio m3 ethanol)
Roadmap for tech innovations in the Chemical and Energy sectors : Energy | liquid biofuels
added € /ton biomass (eq)*
chemicals
materials
feed/food
fuels
power
heat
fertiliser
services
100 - 250
100 - 250
50 -100
100 - 250
250 - 1000
50 -100
5 - 20
??
S&T for higher added value portfolio
cellulosics
lignin
protein
nutrients
X
ton biomass*
*eq: domestic, imports, derivatives (estim, McK)
10X larger volume
contents
1. Why ? global & regional drivers
2. How ? BBE technology portfolio
A drop-in, B drop-out, C drop in & out
3. What ? feedstocks, products, yields
4. How – again ?
5. Why – again ?
3
nutrients
2e generation
agro-emissions(run-offs, N2O)
biobricks
bioplastics
1e generationbiofuels
“CO2”
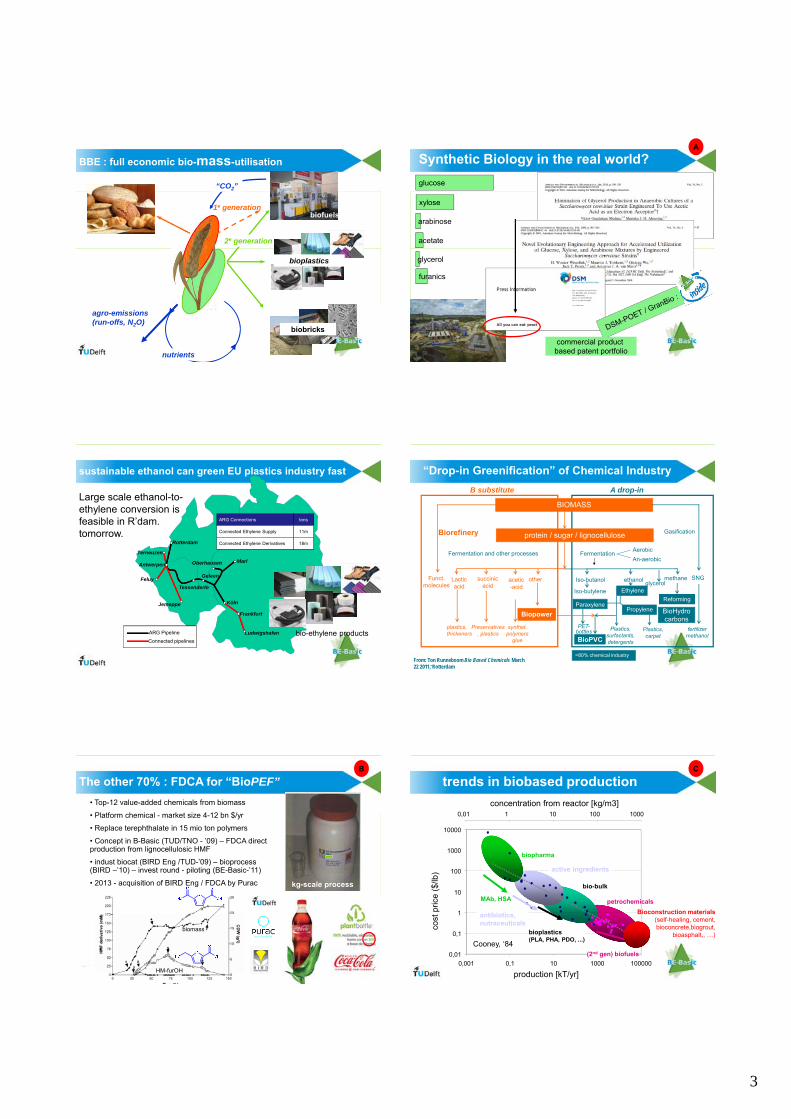
BBE : full economic bio-mass-utilisation Synthetic Biology in the real world?
glucose
xylose
arabinose
acetate
glycerol
furanics
commercial product based patent portfolio
A
Oberhausen
Köln
Rotterdam
Terneuzen
Geleen
Marl
Ludwigshafen
Feluy
Jemeppe
Frankfurt
Antwerpen
Tessenderlo
ARG Connections tons
Connected Ethylene Supply
Connected Ethylene Derivatives
11m
18m
ARG Pipeline
Connected pipelinesbio-ethylene products
Large scale ethanol-to-ethylene conversion is feasible in R’dam.tomorrow.
sustainable ethanol can green EU plastics industry fast “Drop-in Greenification” of Chemical Industry
BIOMASS
protein / sugar / lignocellulose
Iso-butanol ethanol methane SNG
Iso-butylene Ethylene
Gasification
B substitute A drop-in
FermentationAerobic
An-aerobic
othersuccinic acid
acetic-acid
Lactic acid
Funct. molecules
Preservatives, plastics
synthet. polymers
glue
plastics, thickeners
Paraxylene
PET-bottles
Propylene
fertilizer methanol
=80% chemical industry
Plastics, surfactants, detergents
Plastics, carpet
Biorefinery
Reforming
Fermentation and other processes
glycerol
From: Ton Runneboom Bio Based Chemicals March 22 2011, Rotterdam
Biopower
BioPVC
BioHydrocarbons
The other 70% : FDCA for “BioPEF”
biomass
HM-furOH
• Top-12 value-added chemicals from biomass
• Platform chemical - market size 4-12 bn $/yr
• Replace terephthalate in 15 mio ton polymers
• Concept in B-Basic (TUD/TNO - ’09) – FDCA direct production from lignocellulosic HMF
• indust biocat (BIRD Eng /TUD-’09) – bioprocess (BIRD –’10) – invest round - piloting (BE-Basic-’11)
• 2013 - acquisition of BIRD Eng / FDCA by Purac kg-scale process
B
trends in biobased production
production [kT/yr]
concentration from reactor [kg/m3]
0,01
0,1
1
10
100
1000
10000
0,001 0,1 10 1000 100000
petrochemicals
bio-bulk
active ingredients
biopharma
Cooney, ‘84
0,01 1 10 100 1000
MAb, HSA
antibiotics, nutraceuticals
bioplastics(PLA, PHA, PDO, ...)
(2nd gen) biofuels
cost
pric
e ($
/lb)
Bioconstruction materials (self-healing, cement, bioconcrete,biogrout,
bioasphalt,, …)
C
4
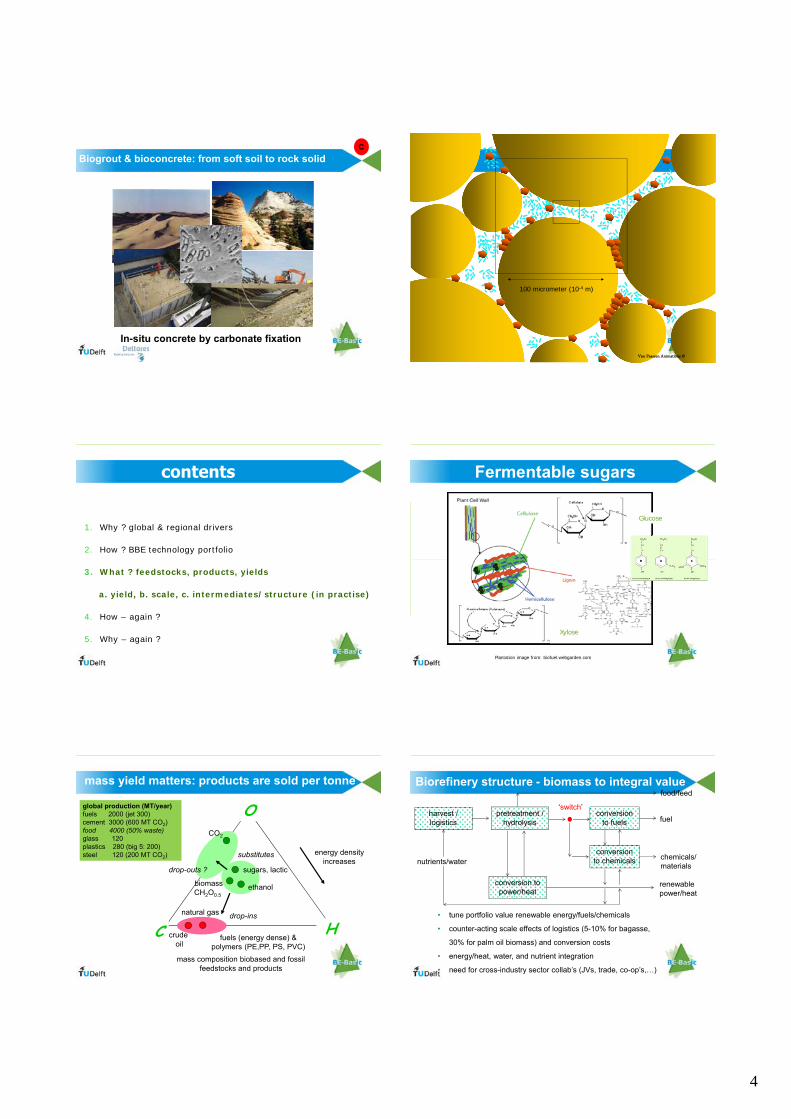
In-situ concrete by carbonate fixation
Biogrout & bioconcrete: from soft soil to rock solidC
100 micrometer (10-4 m)
Van Paassen Animations ©
contents
1. Why ? global & regional drivers
2. How ? BBE technology portfolio
3. What ? feedstocks, products, yields
a. yield, b. scale, c. intermediates/structure (in practise)
4. How – again ?
5. Why – again ?
Fermentable sugars
Xylose
Plantation image from: biofuel.webgarden.com
Glucose
drop-outs ?
mass yield matters: products are sold per tonne
C H
O
substitutes
fuels (energy dense) &polymers (PE,PP, PS, PVC)
natural gas
crude oil
biomass CH2O0.5
ethanol
sugars, lactic
CO2
drop-ins
mass composition biobased and fossil feedstocks and products
energy density increases
global production (MT/year) fuels 2000 (jet 300)cement 3000 (600 MT CO2)food 4000 (50% waste)glass 120plastics 280 (big 5: 200) steel 120 (200 MT CO2)
Biorefinery structure - biomass to integral value
• tune portfolio value renewable energy/fuels/chemicals
• counter-acting scale effects of logistics (5-10% for bagasse,
30% for palm oil biomass) and conversion costs
• energy/heat, water, and nutrient integration
• need for cross-industry sector collab’s (JVs, trade, co-op’s,…)
conversion to fuels fuel
conversion to chemicals
conversion to power/heat
pretreatment / hydrolysis
harvest / logistics
chemicals/materials
renewablepower/heat
nutrients/water
‘switch’
food/feed
5
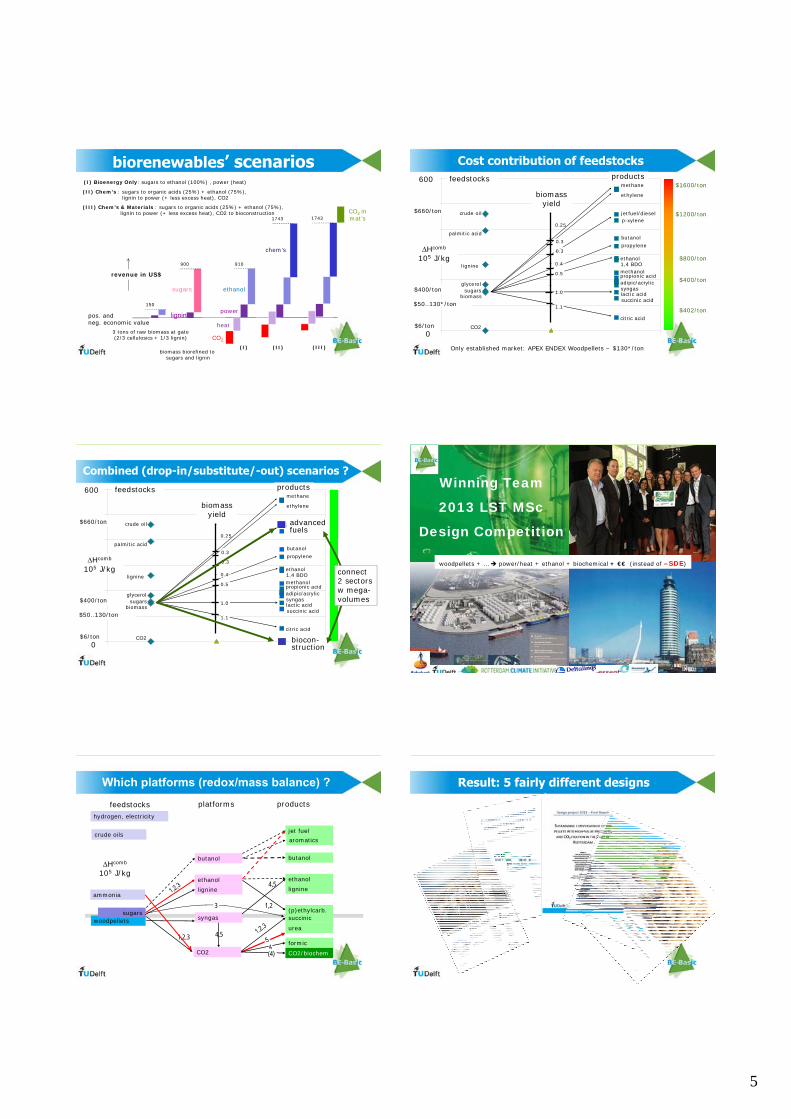
(I) Bioenergy Only: sugars to ethanol (100%) , power (heat)
(II) Chem’s : sugars to organic acids (25%) + ethanol (75%), lignin to power (+ less excess heat), CO2
(III) Chem’s & Materials : sugars to organic acids (25%) + ethanol (75%), lignin to power (+ less excess heat), CO2 to bioconstruction
150
900 910
1743
3 tons of raw biomass at gate(2/3 cellulosics + 1/3 lignin)
biomass biorefined to sugars and lignin
revenue in US$
CO2
heat
1743CO2 in mat’s
(II) (III)(I)
power
ethanolsugars
chem’s
biorenewables’ scenarios
pos. and neg. economic value
lignin
26
palmitic acid
glycerolsugars
methane
butanol
propionic acid
ethanol
succinic acid
citric acid
lactic acid
p-xylenecrude oil
syngas
0.25
adipic/acrylic
ethylene
propylene
jetfuel/diesel
1,4 BDO
0.5
1.0
0.3
1.1
0.4
0.3
CO2
biomass
ligninemethanol
Hcomb
105 J/kg
600
0
biomass yield
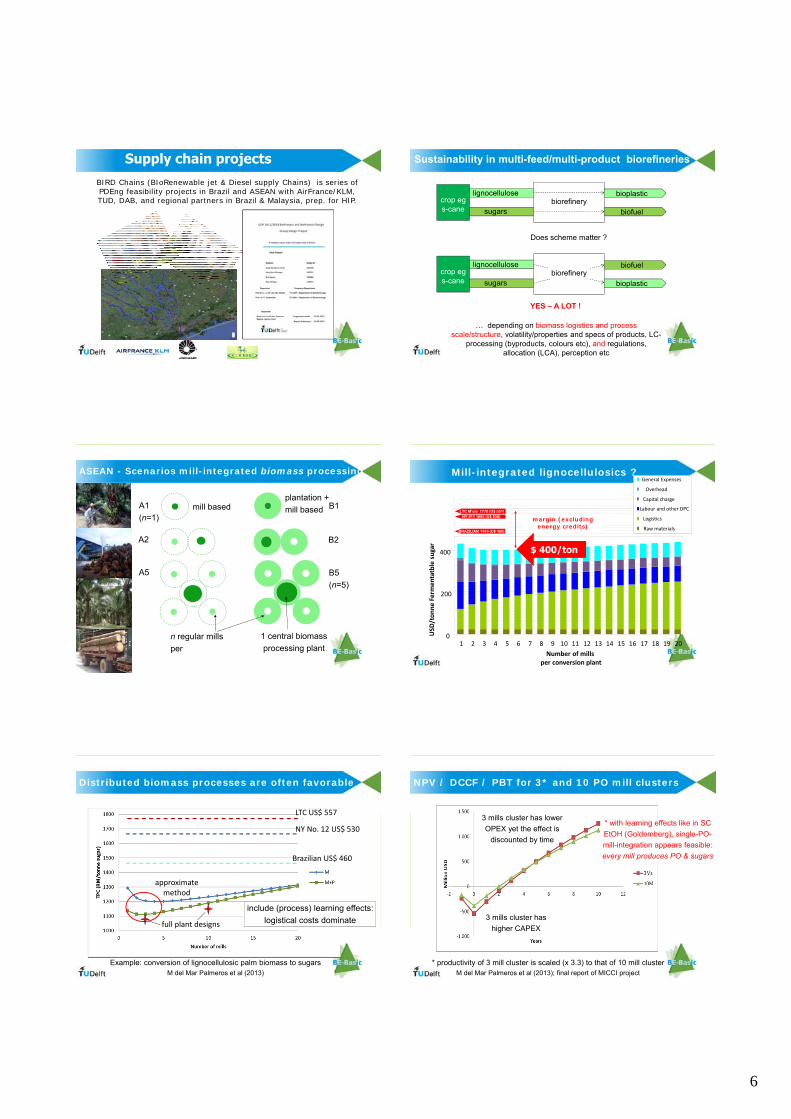
Cost contribution of feedstocks
$400/ton
$50..130*/ton
$660/ton
$6/ton
$1600/ton
$1200/ton
$400/ton
$800/ton
$402/ton
feedstocks products
Only established market: APEX ENDEX Woodpellets ~ $130*/ton
27
palmitic acid
glycerolsugars
methane
butanol
propionic acid
ethanol
succinic acid
citric acid
lactic acid
p-xylenecrude oil
syngas
0.25
adipic/acrylic
ethylene
propylene
jetfuel/diesel
1,4 BDO
0.5
1.0
0.3
1.1
0.4
0.3
CO2
biomass
ligninemethanol
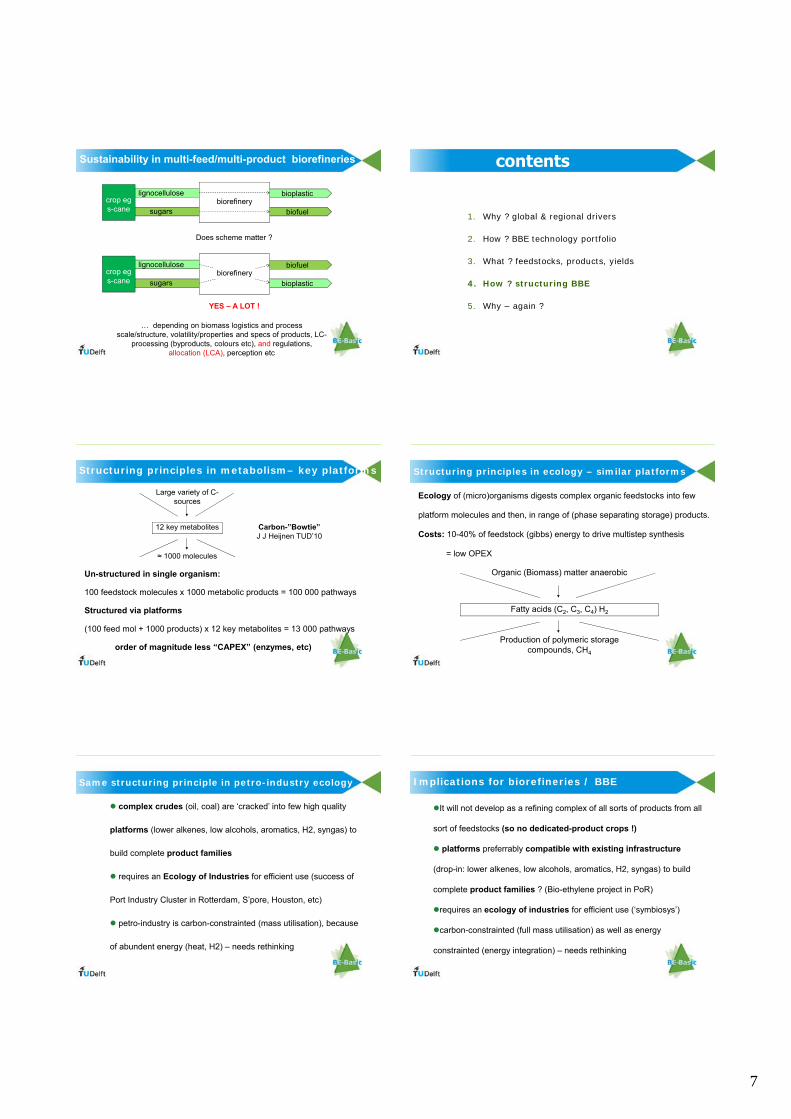
feedstocks
Hcomb
105 J/kg
600
0
biomass yield
Combined (drop-in/substitute/-out) scenarios ?products
$400/ton
$50..130/ton
$660/ton
$6/ton biocon-struction
advanced fuels
connect 2 sectors w mega-volumes
Winning Team
2013 LST MSc
Design Competition
woodpellets + … power/heat + ethanol + biochemical + €€ (instead of –SDE)
Hcomb
105 J/kg
platforms
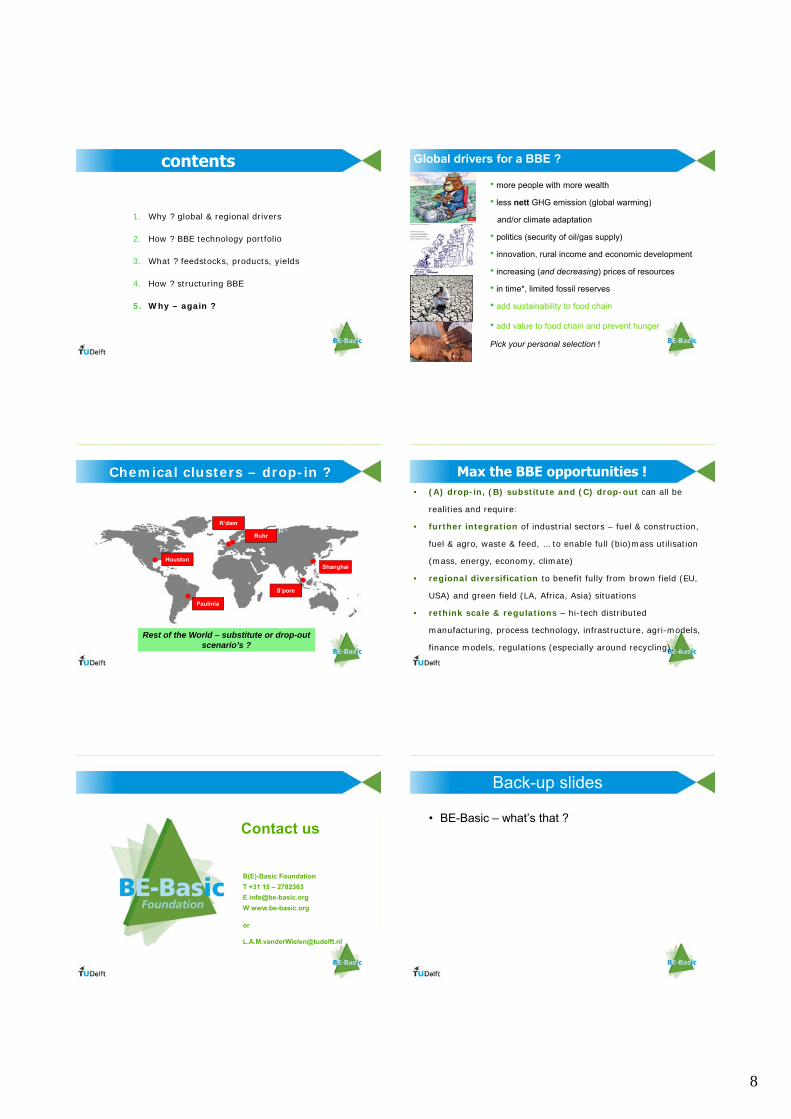
Which platforms (redox/mass balance) ?
feedstocks products
29
ethanol
butanol
lignine
succinic(p)ethylcarb.
ureawoodpellets
formic
crude oils
hydrogen, electricity
ammonia
ethanol
butanol
lignine
sugarssyngas
CO2
jet fuelaromatics
CO2/biochem
1,2
4,5
1,2,3 4,5
(4)
3
Result: 5 fairly different designs
6
BIRD Chains (BIoRenewable jet & Diesel supply Chains) is series of PDEng feasibility projects in Brazil and ASEAN with AirFrance/KLM, TUD, DAB, and regional partners in Brazil & Malaysia, prep. for HIP.
Supply chain projects
sugars
lignocellulose bioplastic
biofuelbiorefinery
sugars
lignocellulose biofuel
bioplasticbiorefinery
Sustainability in multi-feed/multi-product biorefineries
Does scheme matter ?
YES – A LOT !
… depending on biomass logistics and process scale/structure, volatility/properties and specs of products, LC-
processing (byproducts, colours etc), and regulations, allocation (LCA), perception etc
crop egs-cane
crop egs-cane
ASEAN - Scenarios mill-integrated biomass processing
mill basedplantation +
mill based
1 central biomass
processing plant
A1
(n=1)
A2
A5
n regular mills
per
B1
B2
B5
(n=5)
$ 400/ton
0
200
400
1 2 3 4 5 6 7 8 9 10 11 12 13 14 15 16 17 18 19 20
Number of mills per conversion plant
USD
/tonne Ferm
entatble sugar
General Expenses
Overhead
Capital charge
Labour and other DPC
Logistics
Raw materials
Mill-integrated lignocellulosics ?
BRAZILIAN 1465 (U$ 460)
NY #11 1685 (U$ 530) LTC M’sia 1770 (U$ 557)
margin (excluding energy credits)
$ 400/ton
LTC US$ 557
NY No. 12 US$ 530
Brazilian US$ 460
Distributed biomass processes are often favorable
Example: conversion of lignocellulosic palm biomass to sugarsM del Mar Palmeros et al (2013)
full plant designs
approximate method
include (process) learning effects:
logistical costs dominate
NPV / DCCF / PBT for 3* and 10 PO mill clusters
* productivity of 3 mill cluster is scaled (x 3.3) to that of 10 mill clusterM del Mar Palmeros et al (2013); final report of MICCI project
3 mills cluster has
higher CAPEX
3 mills cluster has lower
OPEX yet the effect is
discounted by time
* with learning effects like in SC
EtOH (Goldemberg), single-PO-
mill-integration appears feasible:
every mill produces PO & sugars
7
sugars
lignocellulose bioplastic
biofuelbiorefinery
sugars
lignocellulose biofuel
bioplasticbiorefinery
Sustainability in multi-feed/multi-product biorefineries
Does scheme matter ?
YES – A LOT !
… depending on biomass logistics and process scale/structure, volatility/properties and specs of products, LC-
processing (byproducts, colours etc), and regulations, allocation (LCA), perception etc
crop egs-cane
crop egs-cane
contents
1. Why ? global & regional drivers
2. How ? BBE technology portfolio
3. What ? feedstocks, products, yields
4. How ? structuring BBE
5. Why – again ?
Structuring principles in metabolism– key platforms
Large variety of C-sources
12 key metabolites Carbon-”Bowtie”J J Heijnen TUD’10
≈ 1000 molecules
Un-structured in single organism:
100 feedstock molecules x 1000 metabolic products = 100 000 pathways
Structured via platforms
(100 feed mol + 1000 products) x 12 key metabolites = 13 000 pathways
order of magnitude less “CAPEX” (enzymes, etc)
Organic (Biomass) matter anaerobic
Fatty acids (C2, C3, C4) H2
Production of polymeric storage compounds, CH4
Structuring principles in ecology – similar platforms
Ecology of (micro)organisms digests complex organic feedstocks into few
platform molecules and then, in range of (phase separating storage) products.
Costs: 10-40% of feedstock (gibbs) energy to drive multistep synthesis
= low OPEX
Same structuring principle in petro-industry ecology
complex crudes (oil, coal) are ‘cracked’ into few high quality
platforms (lower alkenes, low alcohols, aromatics, H2, syngas) to
build complete product families
requires an Ecology of Industries for efficient use (success of
Port Industry Cluster in Rotterdam, S’pore, Houston, etc)
petro-industry is carbon-constrainted (mass utilisation), because
of abundent energy (heat, H2) – needs rethinking
Implications for biorefineries / BBE
It will not develop as a refining complex of all sorts of products from all
sort of feedstocks (so no dedicated-product crops !)
platforms preferrably compatible with existing infrastructure
(drop-in: lower alkenes, low alcohols, aromatics, H2, syngas) to build
complete product families ? (Bio-ethylene project in PoR)
requires an ecology of industries for efficient use (‘symbiosys’)
carbon-constrainted (full mass utilisation) as well as energy
constrainted (energy integration) – needs rethinking
8
contents
1. Why ? global & regional drivers
2. How ? BBE technology portfolio
3. What ? feedstocks, products, yields
4. How ? structuring BBE
5. Why – again ?
Global drivers for a BBE ?
• more people with more wealth
• less nett GHG emission (global warming)
and/or climate adaptation
• politics (security of oil/gas supply)
• innovation, rural income and economic development
• increasing (and decreasing) prices of resources
• in time*, limited fossil reserves
• add sustainability to food chain
• add value to food chain and prevent hunger
Pick your personal selection !
Chemical clusters – drop-in ?
S’pore
Shanghai
R’dam
Ruhr
Houston
Paulinia
Rest of the World – substitute or drop-out scenario’s ?
Max the BBE opportunities !• (A) drop-in, (B) substitute and (C) drop-out can all be
realities and require:
• further integration of industrial sectors – fuel & construction,
fuel & agro, waste & feed, … to enable full (bio)mass utilisation
(mass, energy, economy, climate)
• regional diversification to benefit fully from brown field (EU,
USA) and green field (LA, Africa, Asia) situations
• rethink scale & regulations – hi-tech distributed
manufacturing, process technology, infrastructure, agri-models,
finance models, regulations (especially around recycling), ...
B(E)-Basic Foundation
T +31 15 – 2782363
W www.be-basic.org
or
Contact us
Back-up slides
• BE-Basic – what’s that ?