Embed Size (px)
Citation preview
1Was erwarten Kapitalgeber?
Was erwarten Kapitalgeber?
5. Mai, 2017
Prof. Dr. Jörn [email protected]
2Was erwarten Kapitalgeber?
Das Team der Forschungsstelle
Wissenschaftliche Leitung
Mitarbeiter und Geschäftsführung
Prof. Dr. Jörn Block Prof. Dr. Thomas Ellwart
Prof. Dr. Katrin Muehlfeld
René Andres Christian FischGeschäftsführer
Christopher Hansen Christian Masiak Dr. Alexandra MoritzGeschäftsführerin
Prof. Dr. Thorsten Semrau
3Was erwarten Kapitalgeber?
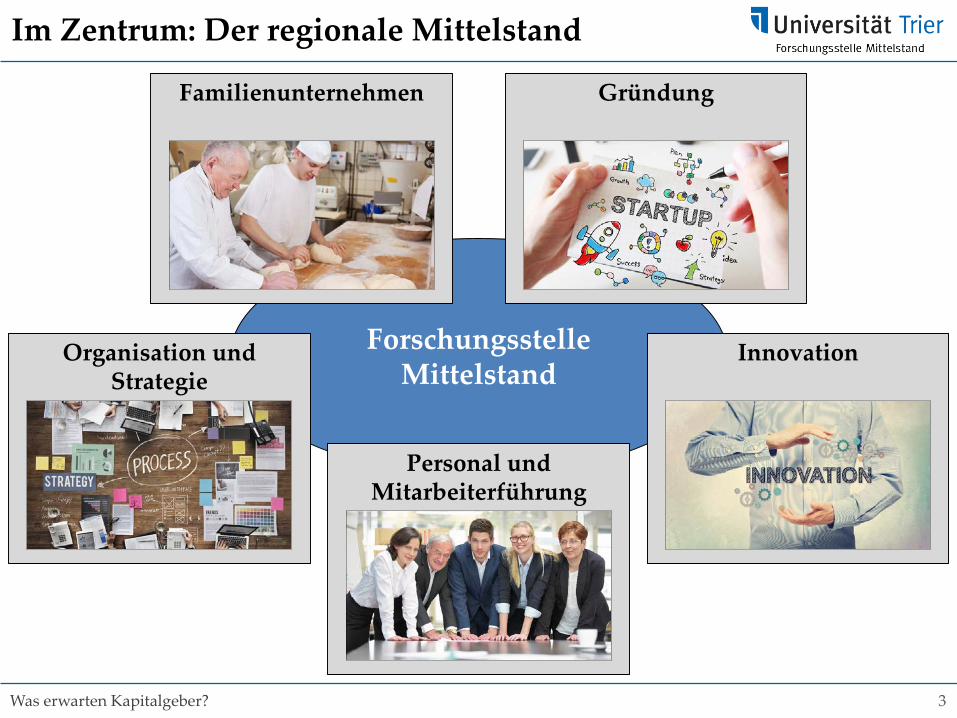
ForschungsstelleMittelstand
Im Zentrum: Der regionale Mittelstand
Personal und Mitarbeiterführung
Organisation und Strategie
Innovation
GründungFamilienunternehmen
4Was erwarten Kapitalgeber?
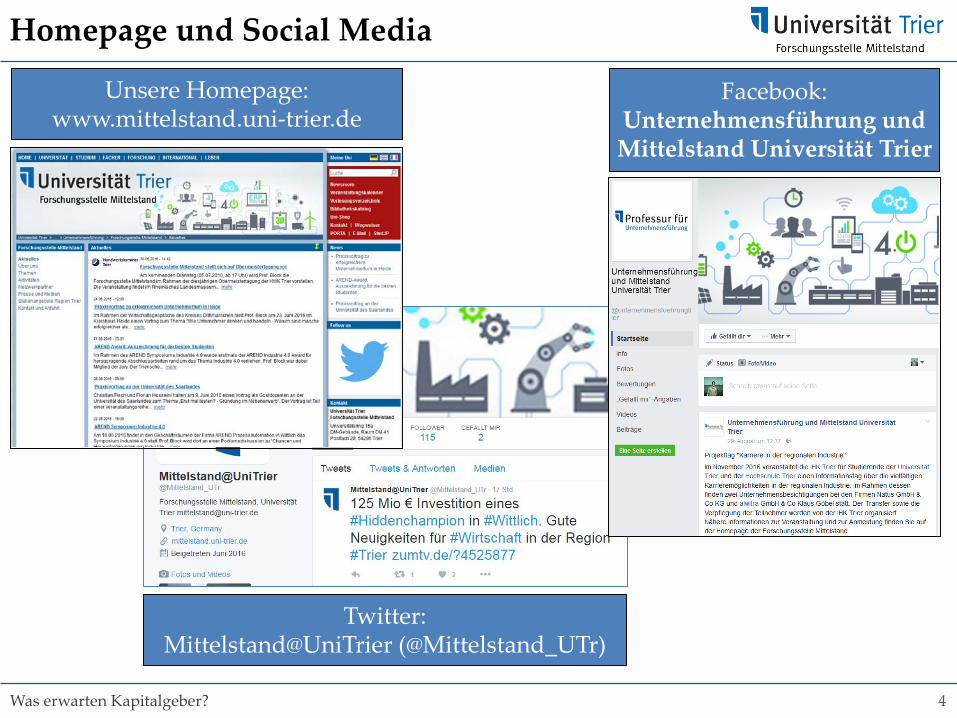
Homepage und Social Media
Unsere Homepage:www.mittelstand.uni-trier.de
Facebook:Unternehmensführung undMittelstand Universität Trier
Twitter:Mittelstand@UniTrier (@Mittelstand_UTr)
5Was erwarten Kapitalgeber?
Förderer und Unterstützer
6Was erwarten Kapitalgeber?
Brauchen Sie überhaupt (externes) Kapital?
7Was erwarten Kapitalgeber?
Was erwarten Kapitalgeber?
Es gibt nicht den Kapitalgeber!
8Was erwarten Kapitalgeber?
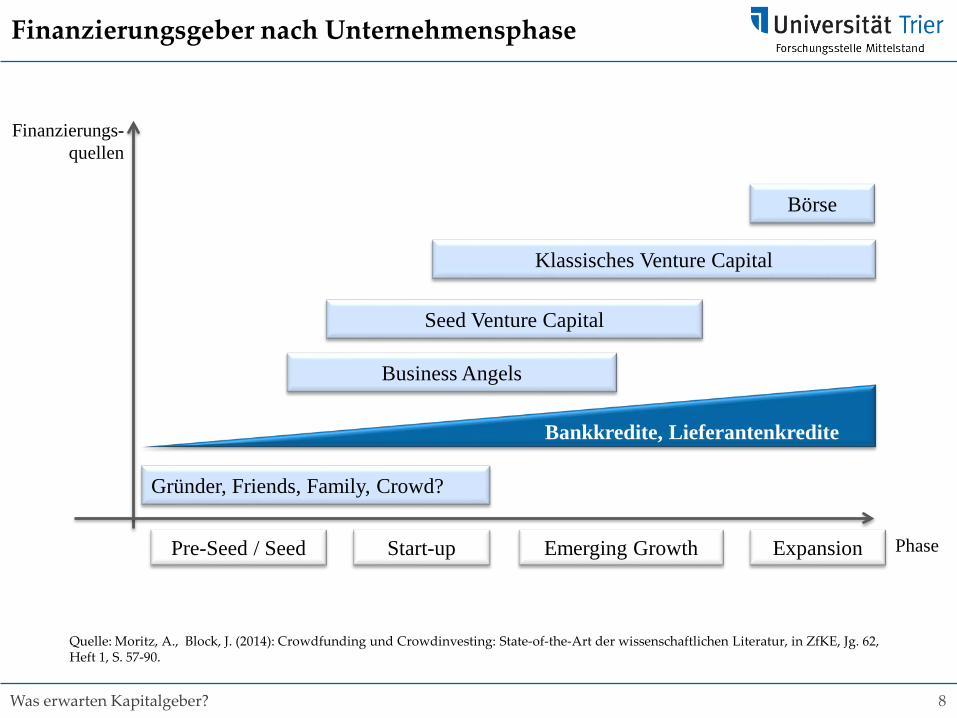
Finanzierungsgeber nach Unternehmensphase
Pre-Seed / Seed Start-up Emerging Growth Expansion Phase
Finanzierungs-quellen
Gründer, Friends, Family, Crowd?
Business Angels
Seed Venture Capital
Bankkredite, Lieferantenkredite
Klassisches Venture Capital
Börse
Quelle: Moritz, A., Block, J. (2014): Crowdfunding und Crowdinvesting: State-of-the-Art der wissenschaftlichen Literatur, in ZfKE, Jg. 62, Heft 1, S. 57-90.
9Was erwarten Kapitalgeber?
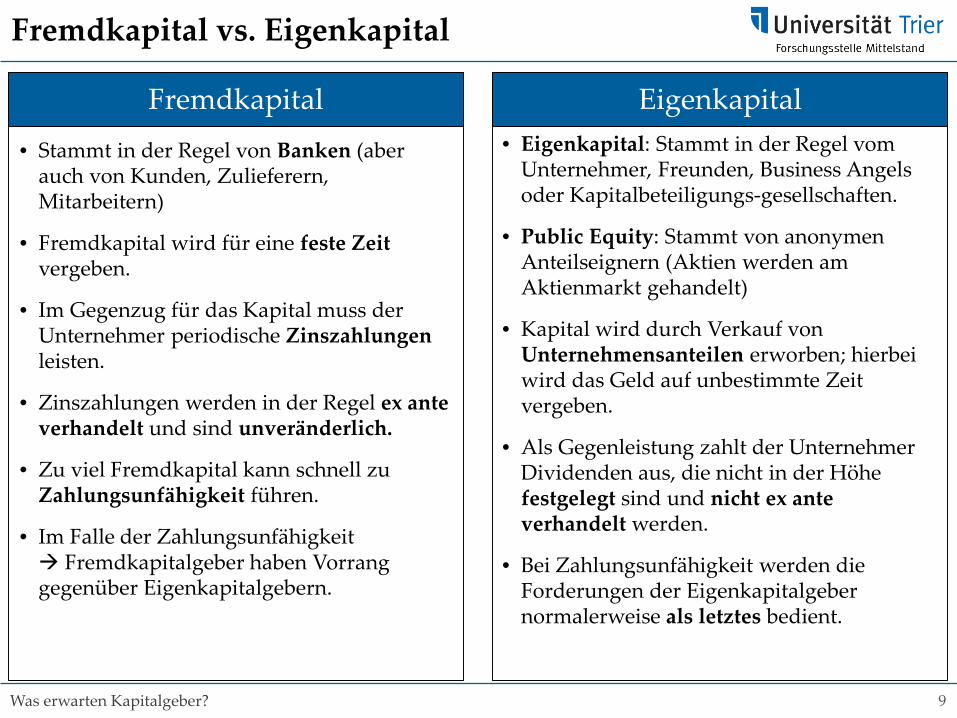
• Stammt in der Regel von Banken (aber auch von Kunden, Zulieferern, Mitarbeitern)
• Fremdkapital wird für eine feste Zeitvergeben.
• Im Gegenzug für das Kapital muss der Unternehmer periodische Zinszahlungenleisten.
• Zinszahlungen werden in der Regel ex ante verhandelt und sind unveränderlich.
• Zu viel Fremdkapital kann schnell zu Zahlungsunfähigkeit führen.
• Im Falle der Zahlungsunfähigkeit Fremdkapitalgeber haben Vorrang gegenüber Eigenkapitalgebern.
Fremdkapital vs. Eigenkapital
• Eigenkapital: Stammt in der Regel vom Unternehmer, Freunden, Business Angels oder Kapitalbeteiligungs-gesellschaften.
• Public Equity: Stammt von anonymen Anteilseignern (Aktien werden am Aktienmarkt gehandelt)
• Kapital wird durch Verkauf von Unternehmensanteilen erworben; hierbei wird das Geld auf unbestimmte Zeit vergeben.
• Als Gegenleistung zahlt der Unternehmer Dividenden aus, die nicht in der Höhe festgelegt sind und nicht ex ante verhandelt werden.
• Bei Zahlungsunfähigkeit werden die Forderungen der Eigenkapitalgeber normalerweise als letztes bedient.
Fremdkapital Eigenkapital
10Was erwarten Kapitalgeber?
Ergebnisse einer empirischen Studie mit Fokus auf Risikokapitalfinanzierung von Wachstumsunternehmen
11Was erwarten Kapitalgeber?
Was ist Venture Capital (VC)?
12Was erwarten Kapitalgeber?
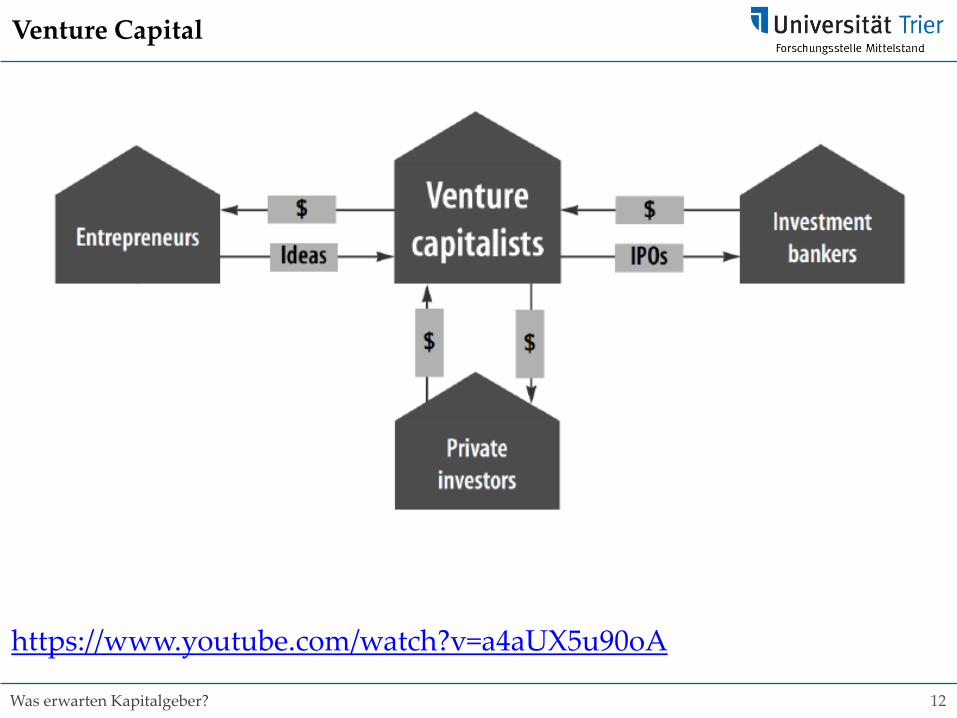
https://www.youtube.com/watch?v=a4aUX5u90oA
Venture Capital
13Was erwarten Kapitalgeber?
Wie überzeuge ich einen VC?

14Was erwarten Kapitalgeber?
15Was erwarten Kapitalgeber?
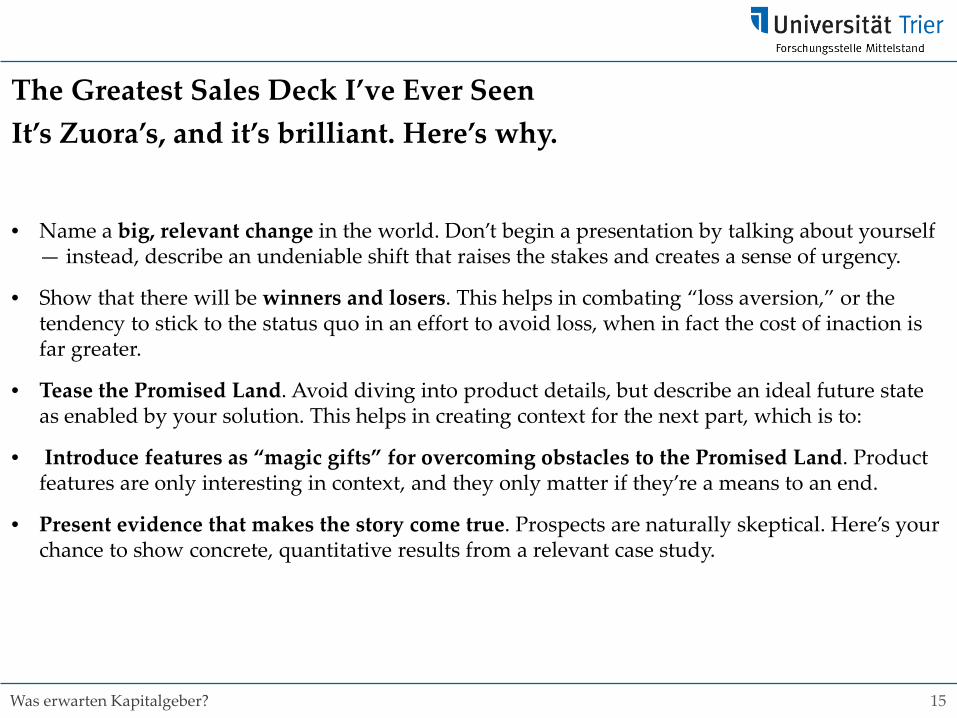
The Greatest Sales Deck I’ve Ever SeenIt’s Zuora’s, and it’s brilliant. Here’s why.
• Name a big, relevant change in the world. Don’t begin a presentation by talking about yourself — instead, describe an undeniable shift that raises the stakes and creates a sense of urgency.
• Show that there will be winners and losers. This helps in combating “loss aversion,” or the tendency to stick to the status quo in an effort to avoid loss, when in fact the cost of inaction is far greater.
• Tease the Promised Land. Avoid diving into product details, but describe an ideal future state as enabled by your solution. This helps in creating context for the next part, which is to:
• Introduce features as “magic gifts” for overcoming obstacles to the Promised Land. Product features are only interesting in context, and they only matter if they’re a means to an end.
• Present evidence that makes the story come true. Prospects are naturally skeptical. Here’s your chance to show concrete, quantitative results from a relevant case study.
16Was erwarten Kapitalgeber?
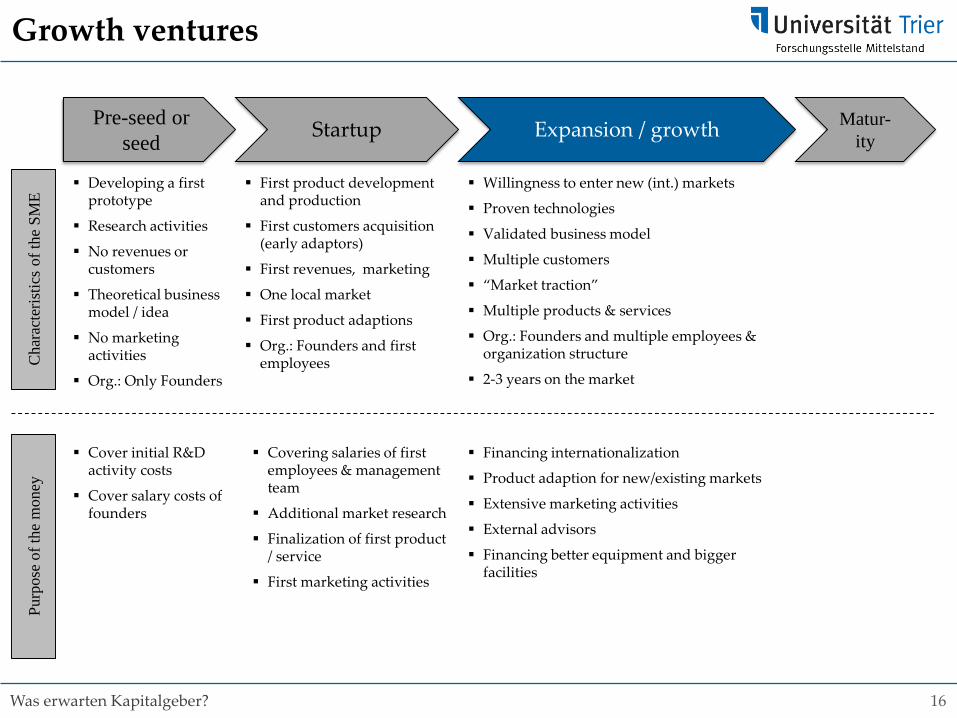
Growth ventures
Developing a first prototype
Research activities
No revenues or customers
Theoretical business model / idea
No marketing activities
Org.: Only Founders
Pre-seed or seed Startup Expansion / growth Matur-
ity
First product development and production
First customers acquisition (early adaptors)
First revenues, marketing
One local market
First product adaptions
Org.: Founders and first employees
Willingness to enter new (int.) markets
Proven technologies
Validated business model
Multiple customers
“Market traction”
Multiple products & services
Org.: Founders and multiple employees & organization structure
2-3 years on the market
Cha
ract
eris
tics
of th
e SM
EPu
rpos
e of
the
mon
ey
Cover initial R&D activity costs
Cover salary costs of founders
Covering salaries of first employees & management team
Additional market research
Finalization of first product / service
First marketing activities
Financing internationalization
Product adaption for new/existing markets
Extensive marketing activities
External advisors
Financing better equipment and bigger facilities
17Was erwarten Kapitalgeber?
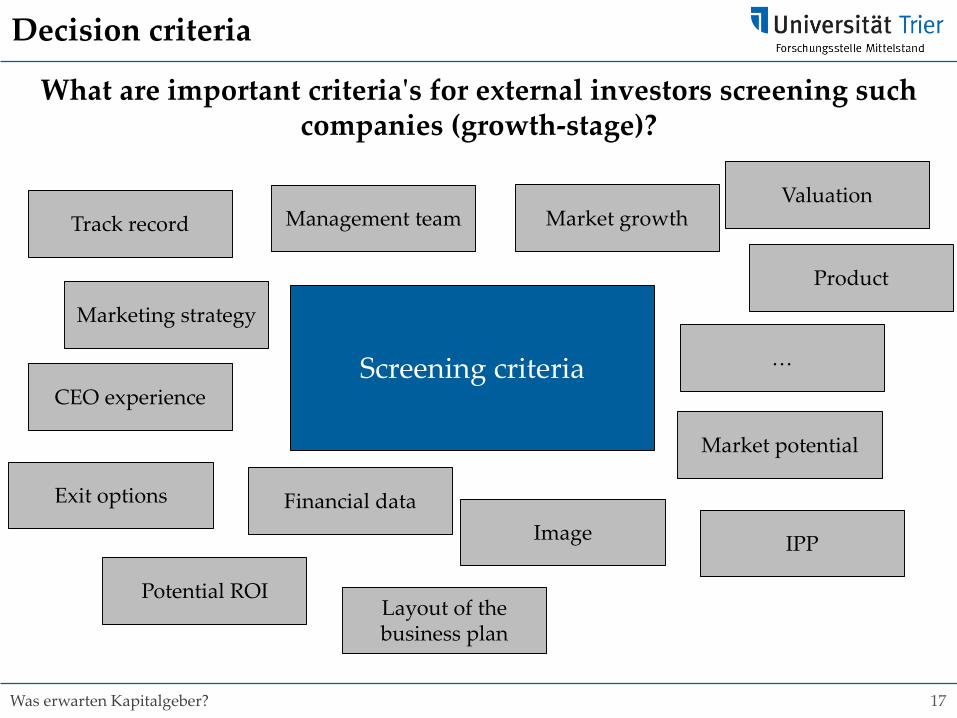
Decision criteria
What are important criteria's for external investors screening such companies (growth-stage)?
Screening criteria
Management team
Product
Market potential
Financial data
Marketing strategy
CEO experience
Exit options
IPP
…
Image
Track record Market growth
Potential ROILayout of the business plan
Valuation
18Was erwarten Kapitalgeber?
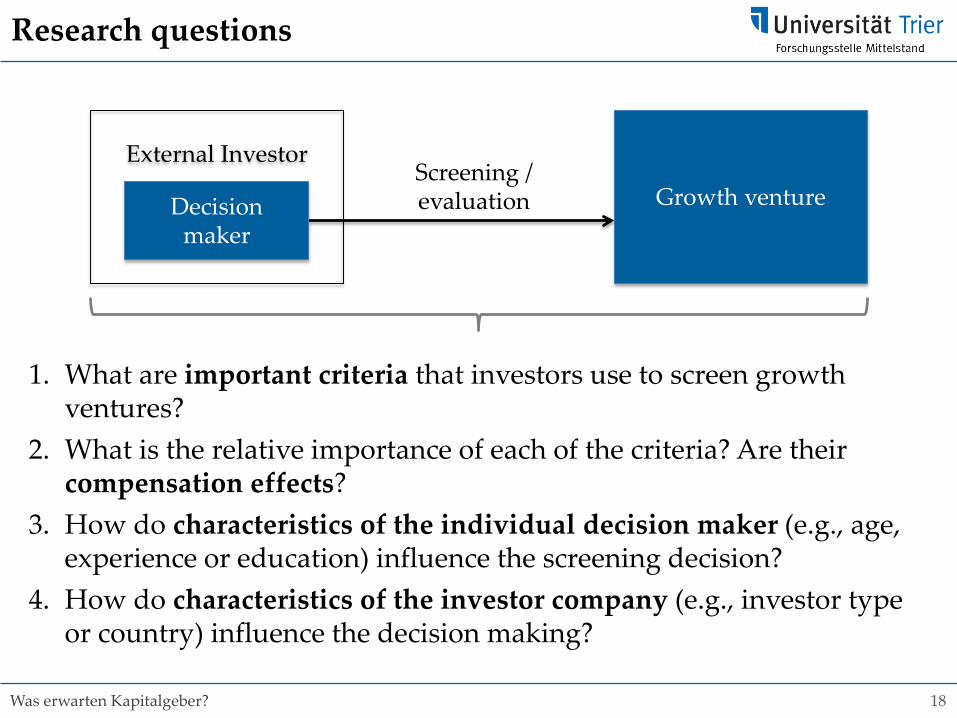
Research questions
1. What are important criteria that investors use to screen growth ventures?
2. What is the relative importance of each of the criteria? Are their compensation effects?
3. How do characteristics of the individual decision maker (e.g., age, experience or education) influence the screening decision?
4. How do characteristics of the investor company (e.g., investor type or country) influence the decision making?
External Investor
Growth ventureDecision maker
Screening / evaluation
19Was erwarten Kapitalgeber?
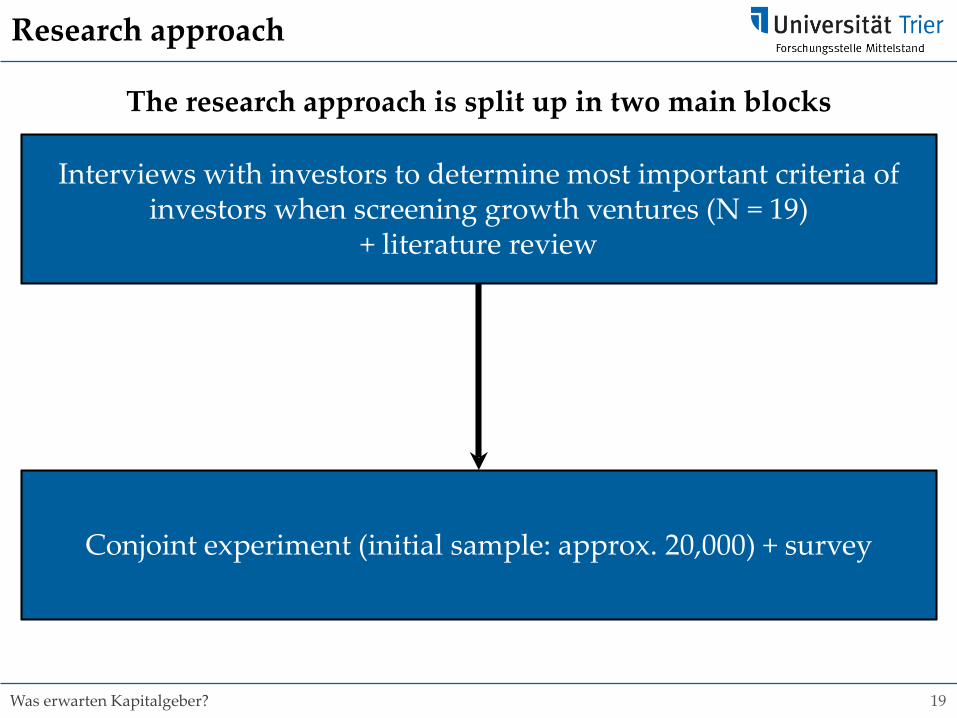
Research approach
The research approach is split up in two main blocks
Interviews with investors to determine most important criteria of investors when screening growth ventures (N = 19)
+ literature review
Conjoint experiment (initial sample: approx. 20,000) + survey
20Was erwarten Kapitalgeber?
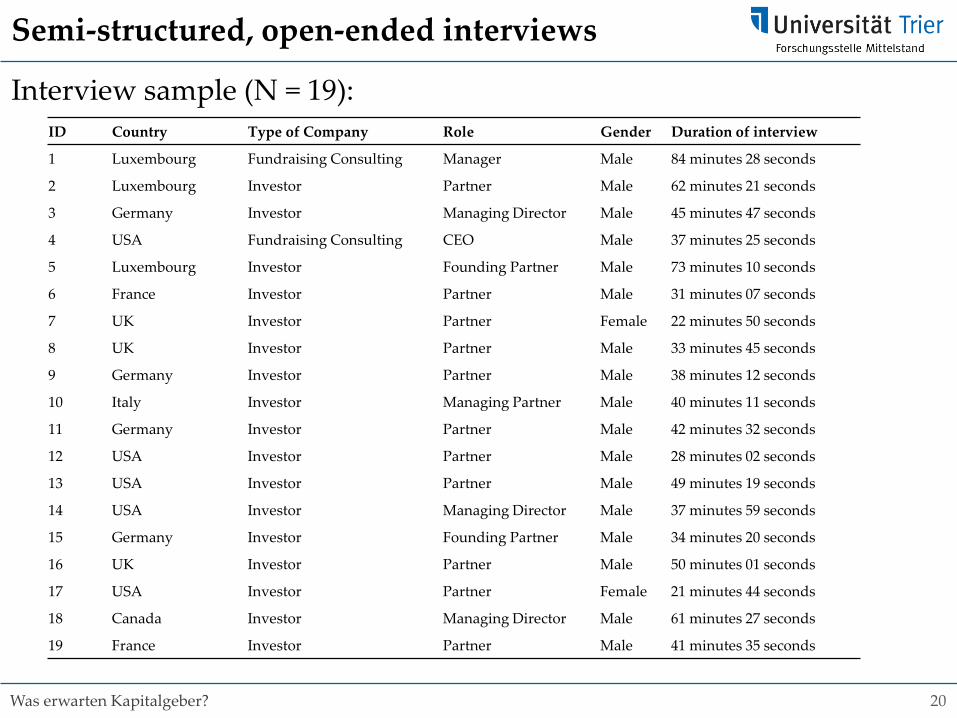
Semi-structured, open-ended interviews
Interview sample (N = 19):ID Country Type of Company Role Gender Duration of interview
1 Luxembourg Fundraising Consulting Manager Male 84 minutes 28 seconds
2 Luxembourg Investor Partner Male 62 minutes 21 seconds
3 Germany Investor Managing Director Male 45 minutes 47 seconds
4 USA Fundraising Consulting CEO Male 37 minutes 25 seconds
5 Luxembourg Investor Founding Partner Male 73 minutes 10 seconds
6 France Investor Partner Male 31 minutes 07 seconds
7 UK Investor Partner Female 22 minutes 50 seconds
8 UK Investor Partner Male 33 minutes 45 seconds
9 Germany Investor Partner Male 38 minutes 12 seconds
10 Italy Investor Managing Partner Male 40 minutes 11 seconds
11 Germany Investor Partner Male 42 minutes 32 seconds
12 USA Investor Partner Male 28 minutes 02 seconds
13 USA Investor Partner Male 49 minutes 19 seconds
14 USA Investor Managing Director Male 37 minutes 59 seconds
15 Germany Investor Founding Partner Male 34 minutes 20 seconds
16 UK Investor Partner Male 50 minutes 01 seconds
17 USA Investor Partner Female 21 minutes 44 seconds
18 Canada Investor Managing Director Male 61 minutes 27 seconds
19 France Investor Partner Male 41 minutes 35 seconds
21Was erwarten Kapitalgeber?
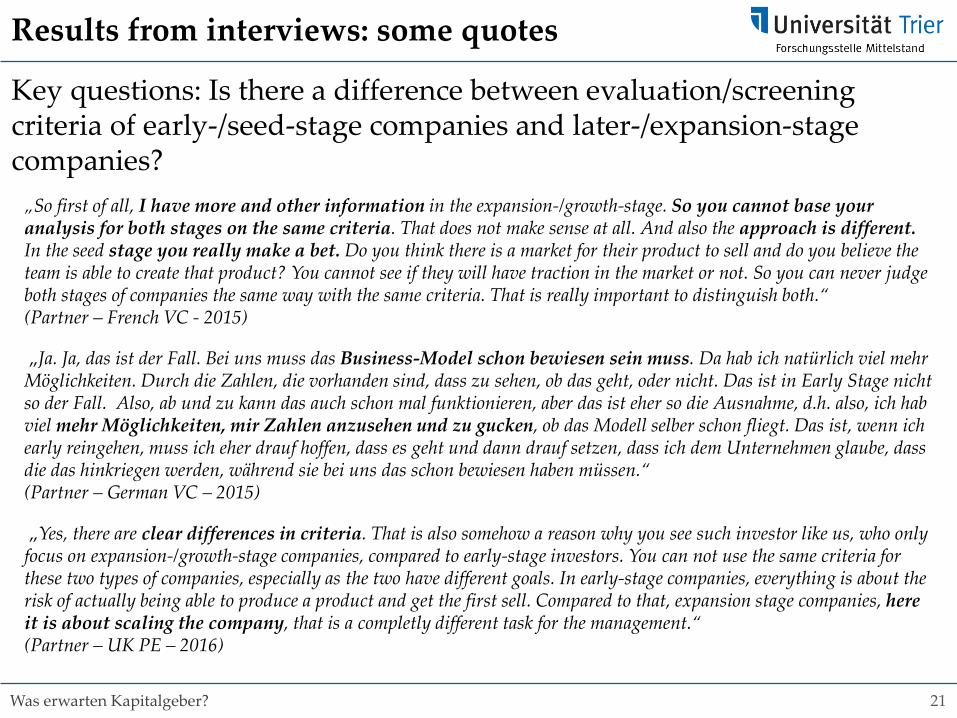
Results from interviews: some quotes
Key questions: Is there a difference between evaluation/screening criteria of early-/seed-stage companies and later-/expansion-stage companies?
„So first of all, I have more and other information in the expansion-/growth-stage. So you cannot base your analysis for both stages on the same criteria. That does not make sense at all. And also the approach is different. In the seed stage you really make a bet. Do you think there is a market for their product to sell and do you believe the team is able to create that product? You cannot see if they will have traction in the market or not. So you can never judge both stages of companies the same way with the same criteria. That is really important to distinguish both.“ (Partner – French VC - 2015)
„Ja. Ja, das ist der Fall. Bei uns muss das Business-Model schon bewiesen sein muss. Da hab ich natürlich viel mehr Möglichkeiten. Durch die Zahlen, die vorhanden sind, dass zu sehen, ob das geht, oder nicht. Das ist in Early Stage nicht so der Fall. Also, ab und zu kann das auch schon mal funktionieren, aber das ist eher so die Ausnahme, d.h. also, ich hab viel mehr Möglichkeiten, mir Zahlen anzusehen und zu gucken, ob das Modell selber schon fliegt. Das ist, wenn ich early reingehen, muss ich eher drauf hoffen, dass es geht und dann drauf setzen, dass ich dem Unternehmen glaube, dass die das hinkriegen werden, während sie bei uns das schon bewiesen haben müssen.“(Partner – German VC – 2015)
„Yes, there are clear differences in criteria. That is also somehow a reason why you see such investor like us, who only focus on expansion-/growth-stage companies, compared to early-stage investors. You can not use the same criteria for these two types of companies, especially as the two have different goals. In early-stage companies, everything is about the risk of actually being able to produce a product and get the first sell. Compared to that, expansion stage companies, here it is about scaling the company, that is a completly different task for the management.“(Partner – UK PE – 2016)
22Was erwarten Kapitalgeber?
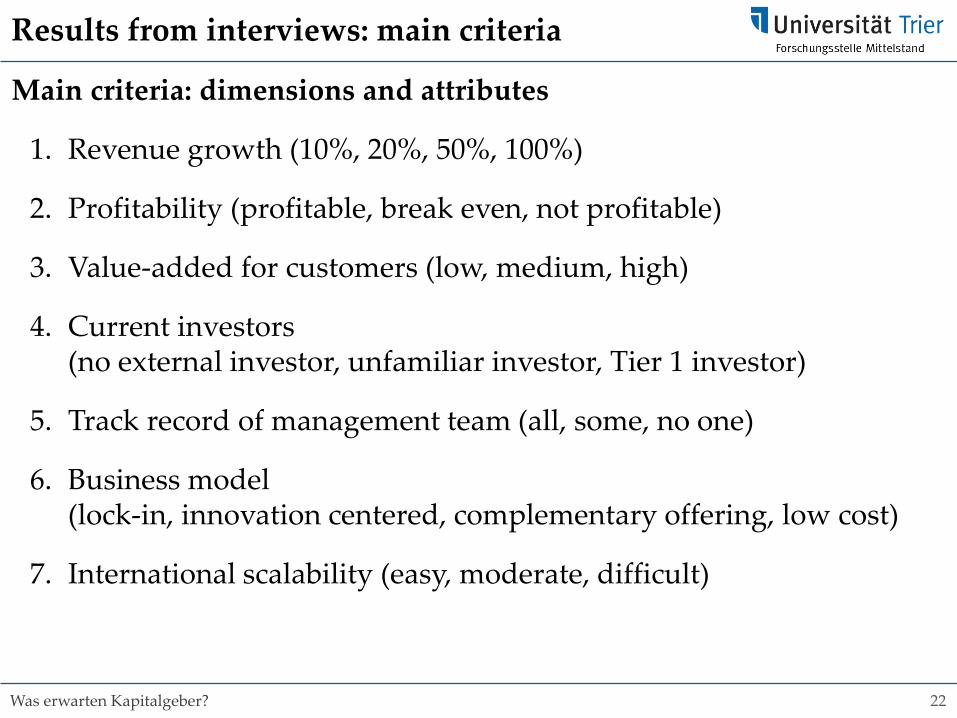
Results from interviews: main criteria
Main criteria: dimensions and attributes
1. Revenue growth (10%, 20%, 50%, 100%)
2. Profitability (profitable, break even, not profitable)
3. Value-added for customers (low, medium, high)
4. Current investors (no external investor, unfamiliar investor, Tier 1 investor)
5. Track record of management team (all, some, no one)
6. Business model (lock-in, innovation centered, complementary offering, low cost)
7. International scalability (easy, moderate, difficult)
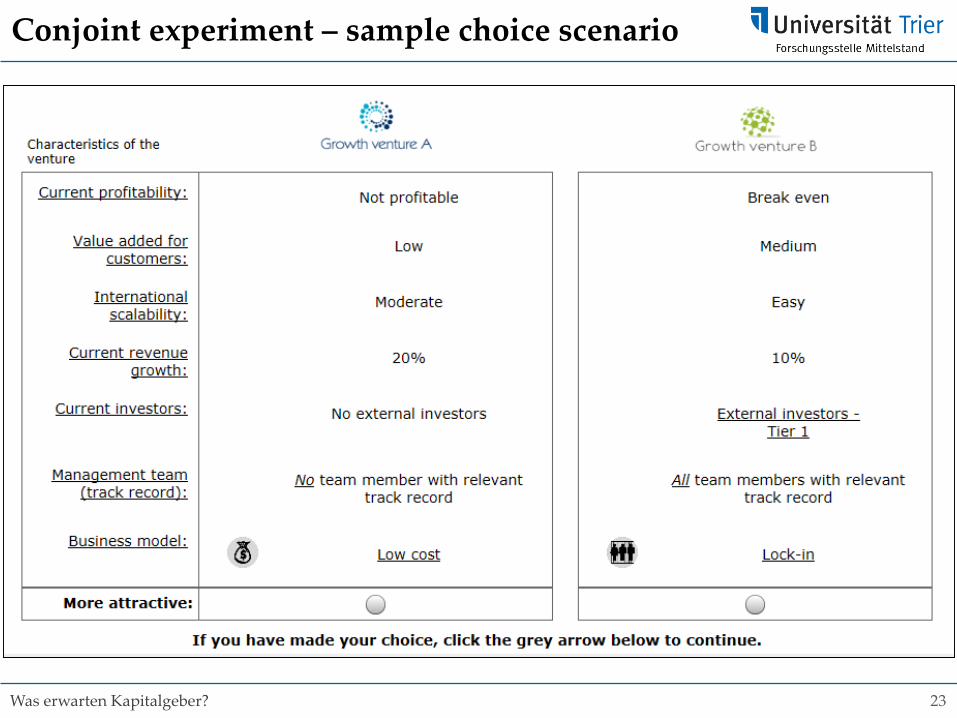
23Was erwarten Kapitalgeber?
Conjoint experiment – sample choice scenario
24Was erwarten Kapitalgeber?
Currently more than 800 participants
25Was erwarten Kapitalgeber?
0
10
20
30
40
50
60
70
1 2 3 4 5 6 7 8 9 10 11 12 13
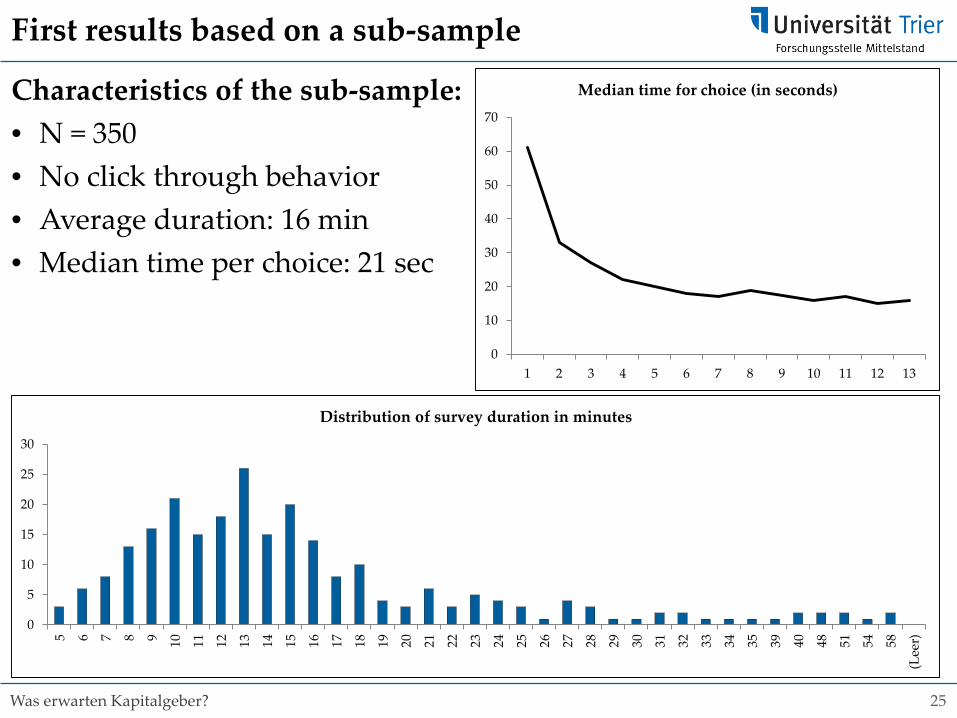
Median time for choice (in seconds)Characteristics of the sub-sample:• N = 350• No click through behavior• Average duration: 16 min• Median time per choice: 21 sec
First results based on a sub-sample
0
5
10
15
20
25
30
5 6 7 8 9 10 11 12 13 14 15 16 17 18 19 20 21 22 23 24 25 26 27 28 29 30 31 32 33 34 35 39 40 48 51 54 58
(Lee
r)
Distribution of survey duration in minutes
26Was erwarten Kapitalgeber?
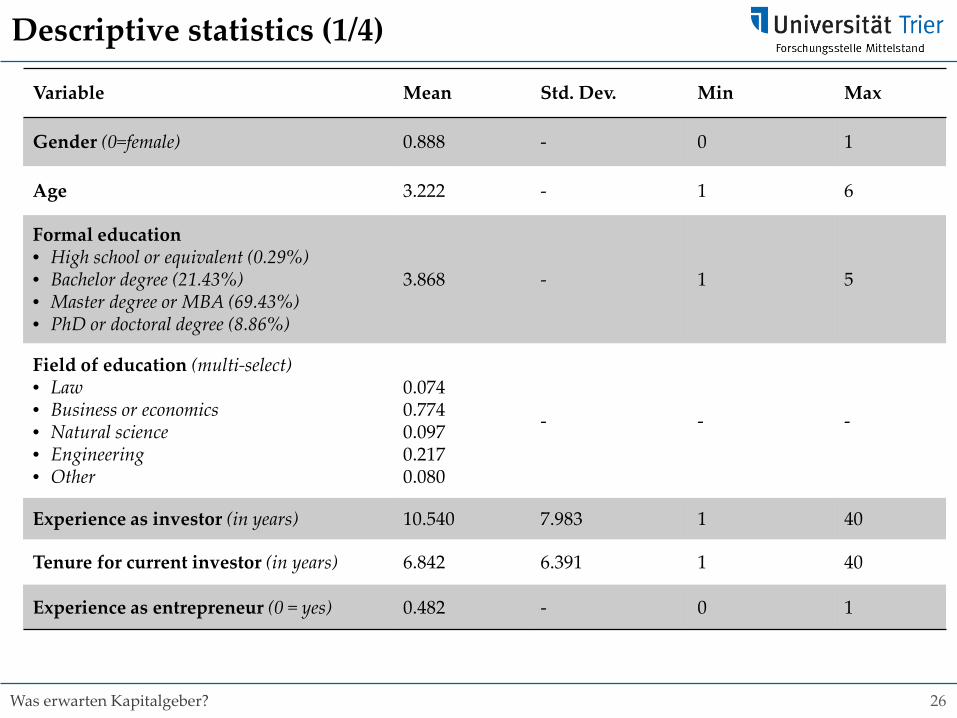
Descriptive statistics (1/4)
Variable Mean Std. Dev. Min Max
Gender (0=female) 0.888 - 0 1
Age 3.222 - 1 6
Formal education• High school or equivalent (0.29%)• Bachelor degree (21.43%)• Master degree or MBA (69.43%)• PhD or doctoral degree (8.86%)
3.868 - 1 5
Field of education (multi-select)• Law• Business or economics• Natural science• Engineering• Other
0.0740.7740.0970.2170.080
- - -
Experience as investor (in years) 10.540 7.983 1 40
Tenure for current investor (in years) 6.842 6.391 1 40
Experience as entrepreneur (0 = yes) 0.482 - 0 1
27Was erwarten Kapitalgeber?
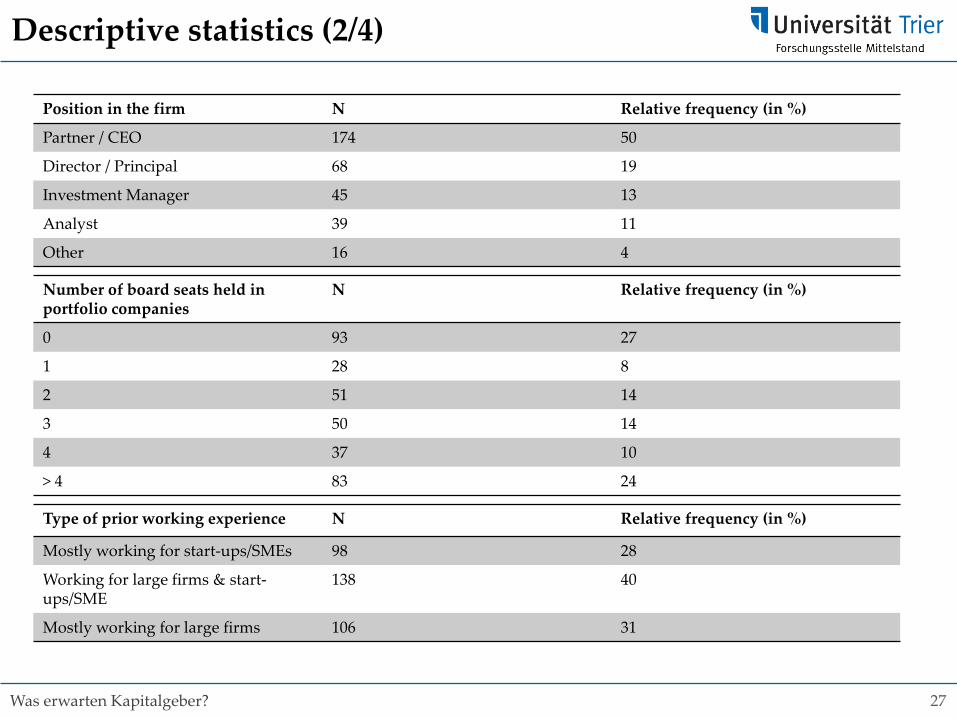
Descriptive statistics (2/4)
Position in the firm N Relative frequency (in %)
Partner / CEO 174 50
Director / Principal 68 19
Investment Manager 45 13
Analyst 39 11
Other 16 4
Number of board seats held in portfolio companies
N Relative frequency (in %)
0 93 27
1 28 8
2 51 14
3 50 14
4 37 10
> 4 83 24
Type of prior working experience N Relative frequency (in %)
Mostly working for start-ups/SMEs 98 28
Working for large firms & start-ups/SME
138 40
Mostly working for large firms 106 31
28Was erwarten Kapitalgeber?
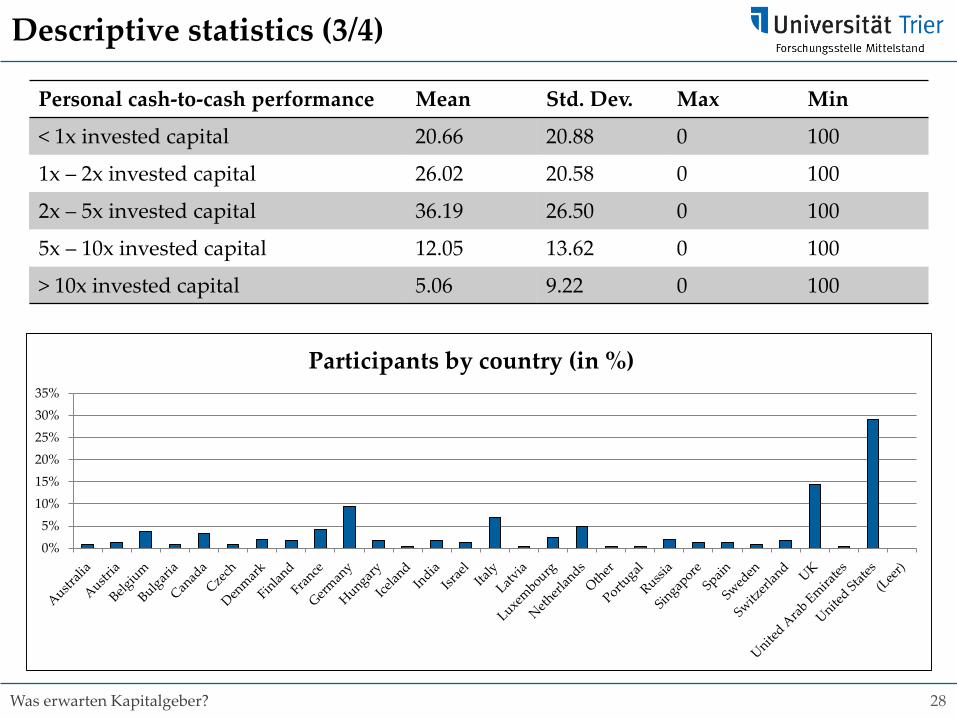
Descriptive statistics (3/4)
Personal cash-to-cash performance Mean Std. Dev. Max Min
< 1x invested capital 20.66 20.88 0 100
1x – 2x invested capital 26.02 20.58 0 100
2x – 5x invested capital 36.19 26.50 0 100
5x – 10x invested capital 12.05 13.62 0 100
> 10x invested capital 5.06 9.22 0 100
0%5%
10%15%20%25%30%35%
Participants by country (in %)
29Was erwarten Kapitalgeber?
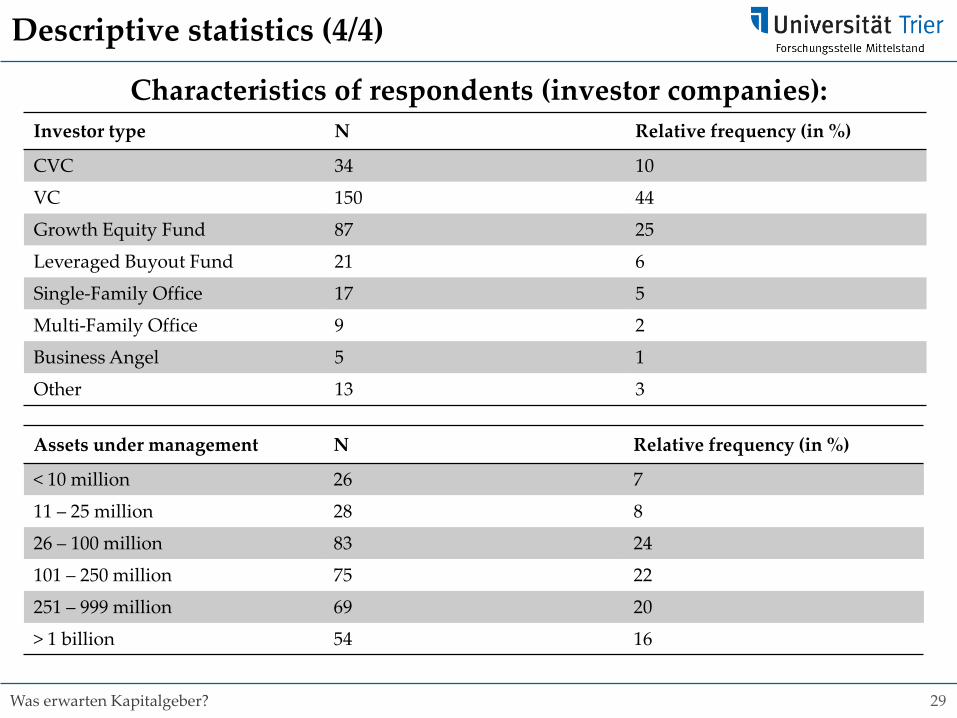
Characteristics of respondents (investor companies):
Descriptive statistics (4/4)
Investor type N Relative frequency (in %)
CVC 34 10
VC 150 44
Growth Equity Fund 87 25
Leveraged Buyout Fund 21 6
Single-Family Office 17 5
Multi-Family Office 9 2
Business Angel 5 1
Other 13 3
Assets under management N Relative frequency (in %)
< 10 million 26 7
11 – 25 million 28 8
26 – 100 million 83 24
101 – 250 million 75 22
251 – 999 million 69 20
> 1 billion 54 16
30Was erwarten Kapitalgeber?
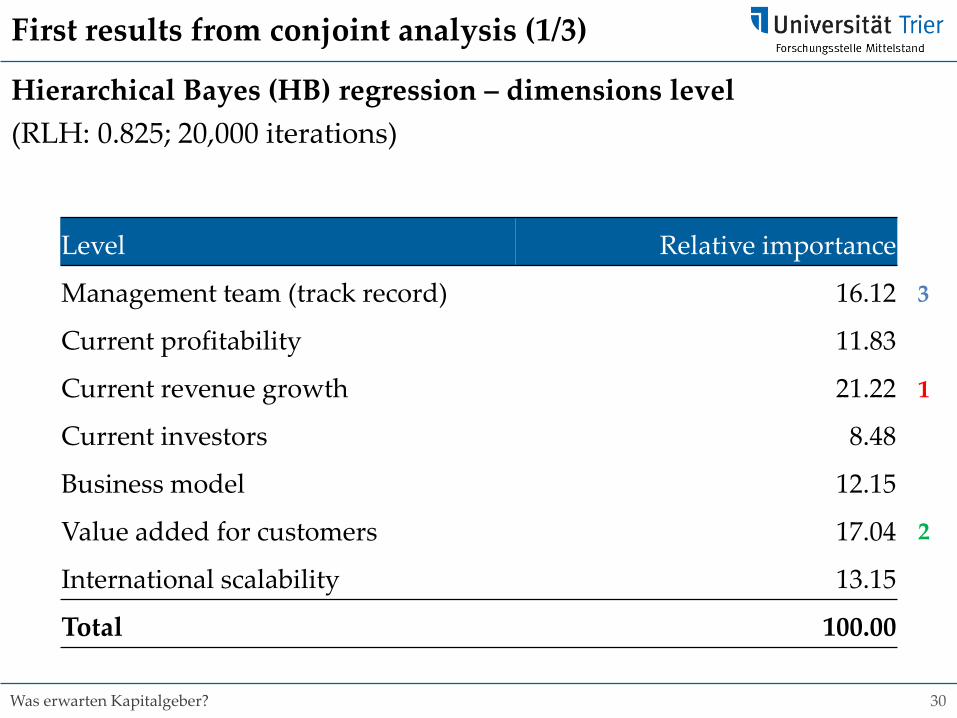
Hierarchical Bayes (HB) regression – dimensions level(RLH: 0.825; 20,000 iterations)
First results from conjoint analysis (1/3)
Level Relative importance
Management team (track record) 16.12
Current profitability 11.83
Current revenue growth 21.22
Current investors 8.48
Business model 12.15
Value added for customers 17.04
International scalability 13.15
Total 100.00
1
2
3
31Was erwarten Kapitalgeber?
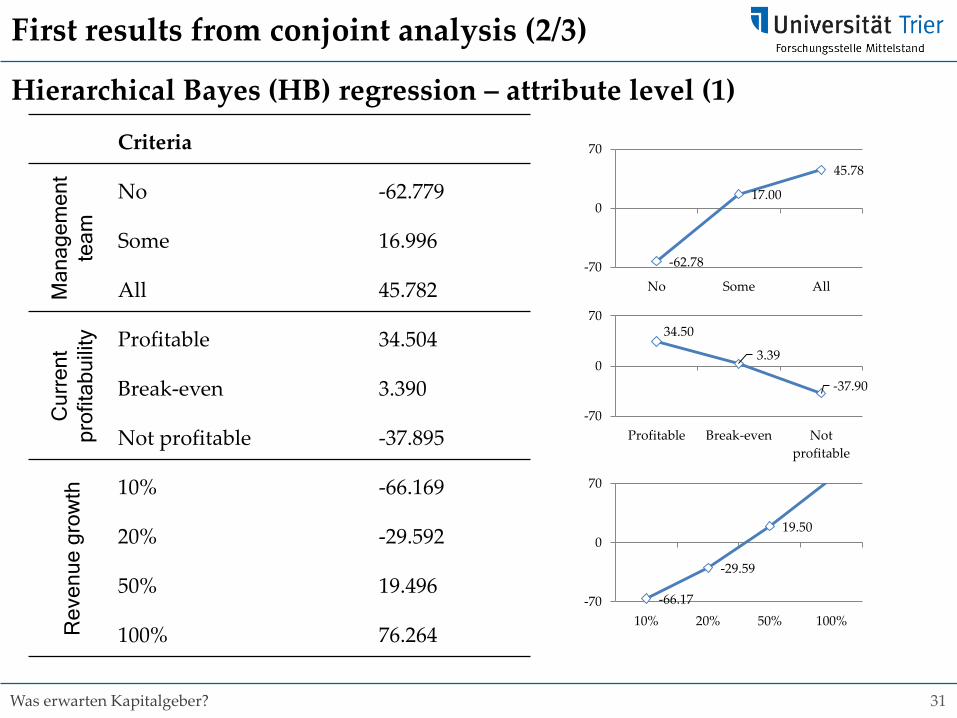
Hierarchical Bayes (HB) regression – attribute level (1)
First results from conjoint analysis (2/3)
Criteria
Man
agem
ent
team
No -62.779
Some 16.996
All 45.782
Cur
rent
prof
itabu
ility Profitable 34.504
Break-even 3.390
Not profitable -37.895
Rev
enue
grow
th 10% -66.169
20% -29.592
50% 19.496
100% 76.264
-62.78
17.00
45.78
-70
0
70
No Some All
34.50
3.39
-37.90
-70
0
70
Profitable Break-even Notprofitable
-66.17
-29.59
19.50
-70
0
70
10% 20% 50% 100%
32Was erwarten Kapitalgeber?
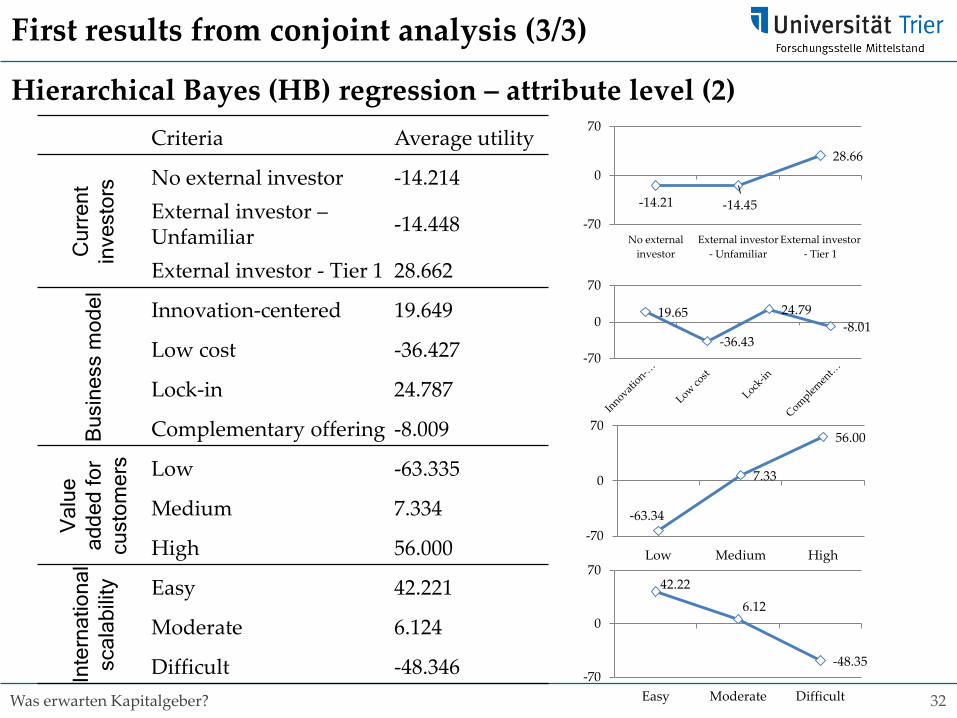
Hierarchical Bayes (HB) regression – attribute level (2)
First results from conjoint analysis (3/3)
Criteria Average utility
Cur
rent
inve
stor
s No external investor -14.214External investor –Unfamiliar -14.448
External investor - Tier 1 28.662
Bus
ines
sm
odel Innovation-centered 19.649
Low cost -36.427
Lock-in 24.787
Complementary offering -8.009
Val
ue
adde
dfo
rcu
stom
ers Low -63.335
Medium 7.334
High 56.000
Inte
rnat
iona
lsc
alab
ility Easy 42.221
Moderate 6.124
Difficult -48.346
-14.21 -14.45
28.66
-70
0
70
No externalinvestor
External investor- Unfamiliar
External investor- Tier 1
19.65
-36.43
24.79-8.01
-70
0
70
-63.34
7.33
56.00
-70
0
70
Low Medium High
42.226.12
-48.35-70
0
70
Easy Moderate Difficult
33Was erwarten Kapitalgeber?
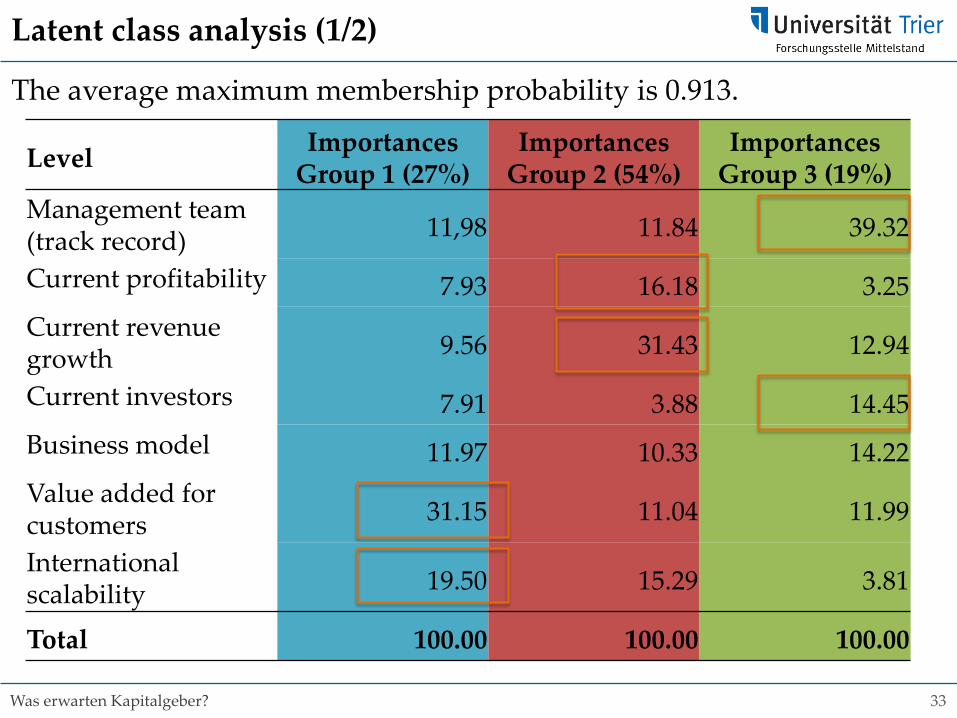
Latent class analysis (1/2)
Level ImportancesGroup 1 (27%)
ImportancesGroup 2 (54%)
ImportancesGroup 3 (19%)
Management team(track record) 11,98 11.84 39.32
Current profitability 7.93 16.18 3.25Current revenuegrowth 9.56 31.43 12.94
Current investors 7.91 3.88 14.45Business model 11.97 10.33 14.22Value added forcustomers 31.15 11.04 11.99
International scalability 19.50 15.29 3.81
Total 100.00 100.00 100.00
The average maximum membership probability is 0.913.
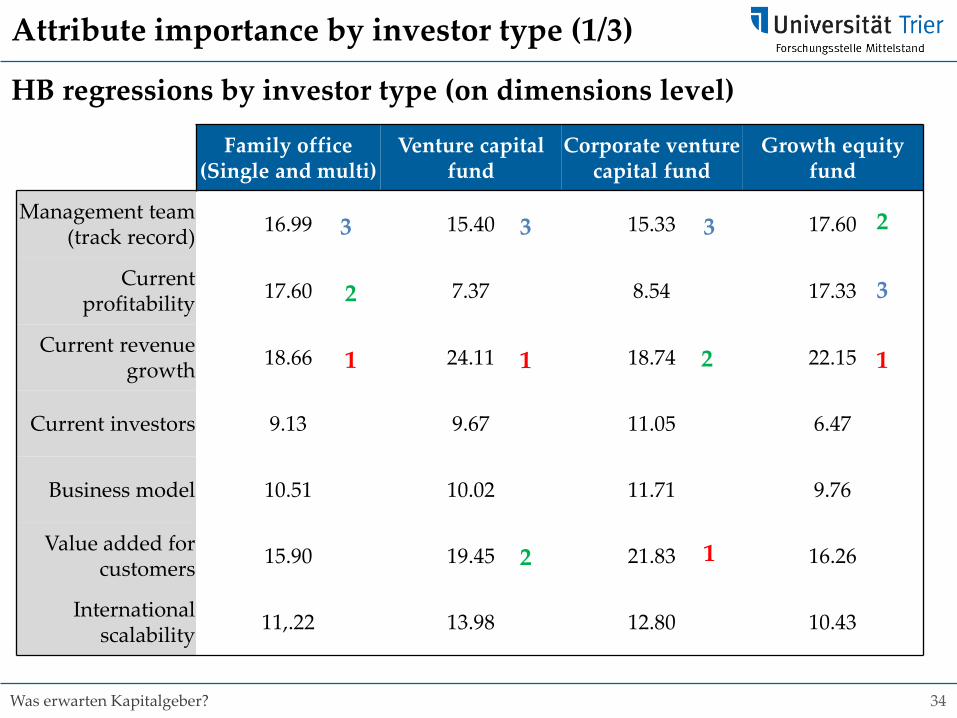
34Was erwarten Kapitalgeber?
HB regressions by investor type (on dimensions level)
Attribute importance by investor type (1/3)
Family office (Single and multi)
Venture capitalfund
Corporate venturecapital fund
Growth equityfund
Management team(track record) 16.99 15.40 15.33 17.60
Currentprofitability 17.60 7.37 8.54 17.33
Current revenuegrowth 18.66 24.11 18.74 22.15
Current investors 9.13 9.67 11.05 6.47
Business model 10.51 10.02 11.71 9.76
Value added forcustomers 15.90 19.45 21.83 16.26
International scalability 11,.22 13.98 12.80 10.43
1 1
1
1
2
2
2
23 3 3
3
35Was erwarten Kapitalgeber?
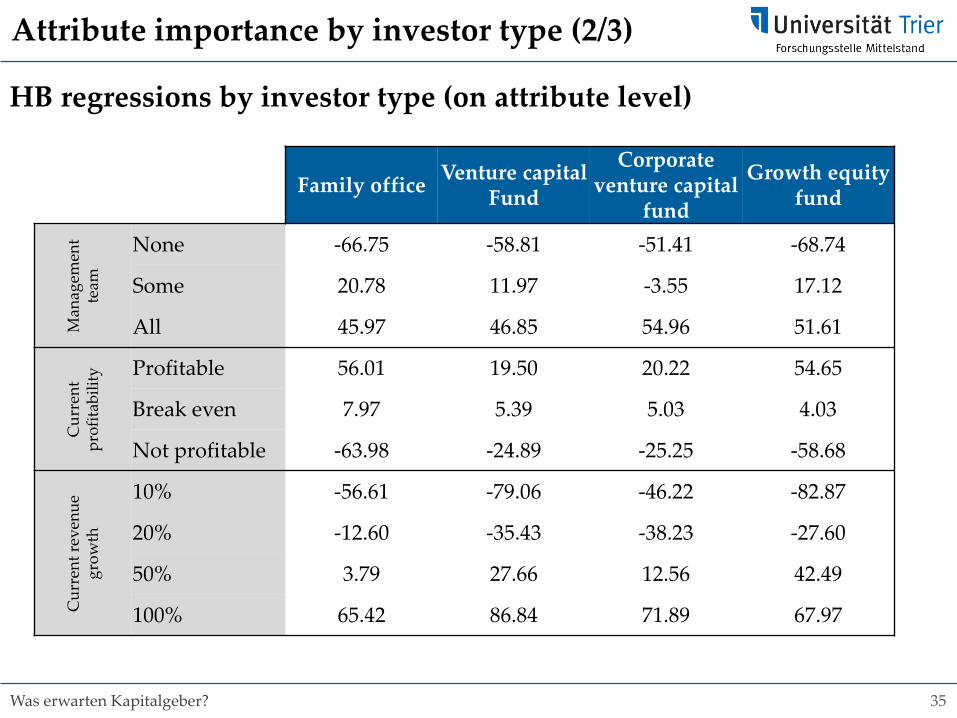
Attribute importance by investor type (2/3)
Family office Venture capitalFund
Corporate venture capital
fund
Growth equityfund
Man
agem
ent
team
None -66.75 -58.81 -51.41 -68.74
Some 20.78 11.97 -3.55 17.12
All 45.97 46.85 54.96 51.61
Cur
rent
prof
itabi
lity Profitable 56.01 19.50 20.22 54.65
Break even 7.97 5.39 5.03 4.03
Not profitable -63.98 -24.89 -25.25 -58.68
Cur
rent
reve
nue
grow
th
10% -56.61 -79.06 -46.22 -82.87
20% -12.60 -35.43 -38.23 -27.60
50% 3.79 27.66 12.56 42.49
100% 65.42 86.84 71.89 67.97
HB regressions by investor type (on attribute level)
36Was erwarten Kapitalgeber?
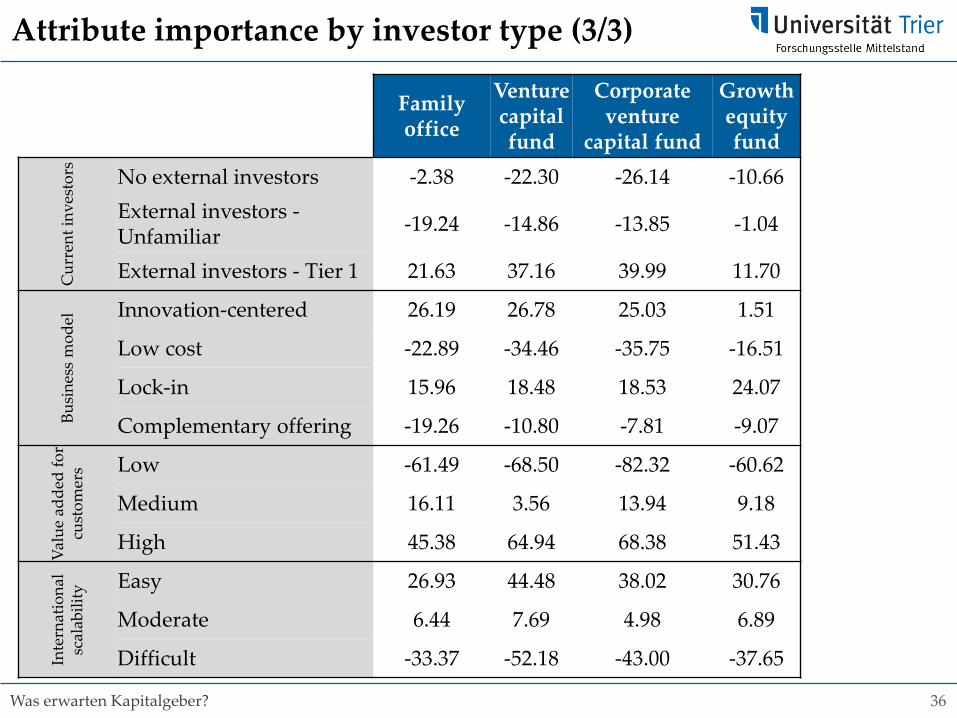
Attribute importance by investor type (3/3)
Family office
Venture capitalfund
Corporate venture
capital fund
Growth equityfund
Cur
rent
inve
stor
s
No external investors -2.38 -22.30 -26.14 -10.66External investors -Unfamiliar -19.24 -14.86 -13.85 -1.04
External investors - Tier 1 21.63 37.16 39.99 11.70
Busi
ness
mod
el Innovation-centered 26.19 26.78 25.03 1.51
Low cost -22.89 -34.46 -35.75 -16.51
Lock-in 15.96 18.48 18.53 24.07
Complementary offering -19.26 -10.80 -7.81 -9.07
Valu
e ad
ded
for
cust
omer
s Low -61.49 -68.50 -82.32 -60.62
Medium 16.11 3.56 13.94 9.18
High 45.38 64.94 68.38 51.43
Inte
rnat
iona
l sc
alab
ility
Easy 26.93 44.48 38.02 30.76
Moderate 6.44 7.69 4.98 6.89
Difficult -33.37 -52.18 -43.00 -37.65