Embed Size (px)
Citation preview
Daten und Fakten zur Internationalität von Studium und Forschung in Deutschland
Facts and Figures on the International Nature of Studies and Research in Germany
Fokus: Akademische Mobilität und Kooperation im Ostseeraum
Focus: Academic mobility and cooperation in the Baltic Sea Area
Wissenschaft weltoffen
Deutscher Akademischer AustauschdienstGerman Academic Exchange Service
Deutsches Zentrum fürHochschul- und WissenschaftsforschungDeutsches Zentrum für
Hochschul- und Wissenschaftsforschung
Alle Abbildungen mit Option zum Daten-Download
2017
Wissenschaft weltoffen2017
Deutscher Akademischer AustauschdienstGerman Academic Exchange Service
Deutsches Zentrum fürHochschul- und Wissenschaftsforschung
Daten und Fakten zur Internationalität von Studium und Forschung in Deutschland
Facts and Figures on the International Nature of Studies and Research in Germany
Fokus: Akademische Mobilität und Kooperation im OstseeraumFocus: Academic Mobility and Cooperation in the Baltic Sea Area
HerausgeberDAAD Deutscher Akademischer AustauschdienstGerman Academic Exchange ServiceKennedyallee 50, D-53175 BonnReferat Forschung und Studien
DZHWDeutsches Zentrum für Hochschul- und Wissenschaftsforschung GmbHLange Laube 12, D-30159 HannoverAbteilung Bildungsverläufe und Beschäftigung
VerlagW. Bertelsmann Verlag GmbH & Co. KG Postfach 10 06 33, D-33506 Bielefeldwbv.de
AutorenDr. Simone Burkhart (DAAD)Nabila Chehab-van den Assem (DAAD)Karin Essig (DAAD) Judith Grützmacher (DZHW)Dr. Ulrich Heublein (DZHW)Lea Jechel (DAAD) Susanne Kammüller (DAAD)Dr. Jan Kercher (DAAD)
DatenaufbereitungAufbau und Auswertung des Web-Informationssystems Wissenschaft weltoffen: Martin Fuchs (DZHW)
Redaktion, Herausgeber und Verlag haben sich bemüht, die in dieser Veröffentlichung enthaltenen Angaben mit größter Sorgfalt zusammenzustellen. Sie können jedoch nicht ausschließen, dass die eine oder andere Informa- tion auf irrtümlichen Angaben beruht oder bei Druckle- gung bereits Änderungen eingetreten sind. Aus diesem Grund kann keine Gewähr und Haftung für die Richtigkeit und Vollständigkeit der Angaben übernommen werden.
Aus Gründen der besseren Lesbarkeit wird im Text durchgehend die männliche Form verwendet.
GesamtherstellungW. Bertelsmann Verlag, Bielefeld 2017
Gestaltunglok.design division, Marion Schnepf, Leopoldshöhe
Englische ÜbersetzungDELTA International CITS GmbH, Bonn
DruckMedia-Print-Group, PaderbornAuflage 2.200
Diese Publikation ist frei verfügbar zum Download unter wbv-open-access.de
Diese Publikation ist unter folgender Creative-Commons-Lizenz veröffentlicht:http://creativecommons.org/licenses/by-sa/3.0/
Für alle in diesem Werk verwendeten Warennamen sowie Firmen- und Markenbezeichnungen können Schutzrechte bestehen, auch wenn diese nicht als solche gekennzeichnet sind. Deren Verwendung in diesem Werk berechtigt nicht zu der Annahme, dass diese frei verfügbar seien.
Printed in Germany
ISBN: 978-3-7639-5875-7DOI: 10.3278/7004002pwBestell-Nr. 7004002p
Bibliografische Information der Deutschen Nati0nalbibliothekDie Deutsche Nationalbibliothek verzeichnet diese Publikation in der Deutschen Nationalbibliografie; detaillierte bibliografische Daten sind im Internet über http://dnb.d-nb.de abrufbar.
Das dieser Publikation zugrunde liegende Projekt sowie die Veröffentlichung wurden aus Zuwendungen des Bundesministeriums für Bildung und Forschung und des Auswärtigen Amtes gefördert.
„Wissenschaft weltoffen“ ist die zentrale Informationsquelle zur internationalen Mobilität von Studierenden und Akademi-kern. Um diesem Anspruch weiterhin gerecht zu werden, wird das Informationsangebot mit jeder Ausgabe weiterentwickelt und verbessert. In diesem Jahr wurden – auf der Grundlage des Fokuskapitels aus dem Vorjahr – insbesondere die Analysen zur Mobilität von Wissenschaftlerinnen und Wissenschaftlern in Deutschland überarbeitet und erweitert. Auch zu Aspekten der internationalen Wissenschaftlermobilität ist erstmals ein eigener Abschnitt aufgenommen. Selbstverständlich finden sich auch in der 17. Auflage von Wissenschaft weltoffen um-fangreiche statistische Kennzahlen zu ausländischen Studie-renden in Deutschland und zu deutschen Studierenden im Aus-land.
Das diesjährige Fokusthema widmet sich der akademischen Mobilität und Kooperation im Ostseeraum. Mit seinen Univer-sitäten und Forschungsinstituten, die häufig sehr gut vernetzt sind, kommt dem innovativen Potenzial dieser Region globale Bedeutung zu. Die sich hier entwickelnde regionale Zusam-menarbeit besitzt Modellcharakter für andere europäische Regionen. Im Jahre 2009 wurde die EU-Ostseestrategie im Rahmen des Konzeptes „Europa der Regionen“ verabschiedet. Sie war die erste von mittlerweile vier Strategien für europäi-sche Makroregionen, deshalb nimmt sie eine Vorreiterrolle für regionale Verbünde in Europa wahr. Auf Initiative des Hambur-ger Senats wurde 2016 das „Baltic Science Network“ (BSN) ins Leben gerufen, mit dem nun auch eine gemeinsame, grenz-überschreitende Wissenschaftspolitik für den Ostseeraum entworfen wird. DAAD und DZHW haben diese aktuelle Ent-wicklung zum Anlass genommen, den Entwicklungsstand des wissenschaftlichen Austausches im Ostseeraum darzustellen und zu analysieren.
Wie immer wird die vorliegende Publikation durch ein umfang-reiches Internetangebot in deutscher und englischer Sprache ergänzt, das unter der Adresse www.wissenschaft-weltoffen.de zur Verfügung steht. Darüber hinaus bietet das DZHW bei Be-darf auch weiter gehende Auswertungen an.
Der Dank des DAAD und des DZHW gilt Frau Marion Schnepf und dem W. Bertelsmann Verlag für die grafische Gestaltung und Umsetzung. Danken möchten wir auch besonders dem Statistischen Bundesamt, den Wissenschaftsorganisationen, den Forschungsinstituten und weiteren Einrichtungen, die In-formationen und Daten bereitgestellt haben, sowie dem Aus-wärtigen Amt und dem Bundesministerium für Bildung und Forschung, aus deren Zuwendungen die Publikation finanziert werden konnte.
Dr. Dorothea Rüland Prof. Dr. Monika Jungbauer-GansGeneralsekretärin des DAAD Wissenschaftliche Geschäfts- führerin des DZHW
“Wissenschaft weltoffen” is the central source of information on the international mobility of students and academics. To maintain this standard, the range of information is enhanced and improved with each issue. Based on last year’s focus chapter, this year most notably the analyses of academic and researcher mobility in Germany have been revised and expanded. A separate section on aspects of international academic and researcher mobility is also included for the first time. The seventeenth issue of “Wissenschaft weltoffen” of course again contains extensive statistical indicators on foreign students in Germany and German students abroad.
This year’s focus topic explores academic mobility and cooperation in the Baltic Sea area. With its universities and research institutes, which are frequently very well networked, the region represents one of Europe’s academic power-houses. The regional cooperation developing here may serve as a model for other European regions. In 2009, the EU’s Baltic Sea Strategy was adopted as part of the “Europe of Regions” concept. It was the first of meanwhile four strategies for European macro-regions and is therefore a pioneer of regional associations in Europe. The Baltic Science Network (BSN) was founded in 2016 on the initiative of the Ham- burg Senate; it is now developing a common, cross-border science policy for the Baltic Sea area. DAAD and DZHW have taken the opportunity of this recent development to present and analyse the current state of academic exchange in the Baltic Sea area.
As always, the present publication is accompanied by a comprehensive website in German and English, which can be found at www.wissenschaft-weltoffen.de. DZHW moreover offers more in-depth analyses on request.
The DAAD and DZHW would like to thank Marion Schnepf and the W. Bertelsman publishing house for the graphic design and implemen- tation of this issue. We are also indebted to the German Federal Statistical Office (Destatis), the research institutes and other institutions that supplied us with information and data, and to the Federal Foreign Office and the Federal Ministry of Education and Research for providing funding for this publication.
Dr. Dorothea RülandSecretary General of the DAAD
Prof. Dr. Monika Jungbauer-GansScientific Director of the DZHW
vorwortpreface
w i sse n sc h a f t w e lto f f e n 20174
Einleitung 8
inhalt
a internationale akademische mobilität und transnationale bildung
Zusammenfassung 16
I. InternationaleStudierendenmobilitätMobilitätsentwicklung und regionale Analyse 18
Mobilitätsströme und -bilanzen 20
Gast- und Herkunftsländer 22
Gastländer und Herkunftsprofile 24
II. Internationale WissenschaftlermobilitätMobilitätsströme und -bilanzen 26
Wichtige Gast- und Herkunftsländer 28
Gastländer und Herkunftsprofile 30
Internationale Doktoranden 32
III. Transnationale BildungTNB-Formen und wichtige Standorte 34
Einschreibungen, Fächer und Abschlüsse 36
Deutschlandbezug der TNB-Projekte 38
b ausländische studierende in deutschland
Zusammenfassung 40
I. Ausländische StudierendeinsgesamtMobilitätsentwicklung 42
Bundesländer und Herkunftsregionen 44
Studienanfänger und Absolventen 46
II. Bildungsausländer:Abschlussbezogene MobilitätMobilitätsentwicklung und Fächergruppen 48
Herkunftsregionen und -länder 50
Abschlussarten und Studienerfolg 52
Abschlussarten und Fächergruppen 54
Studienbewerber 56
Geflüchtete 58
III. Bildungsausländer: Temporärestudienbezogene AufenthalteMobilitätsentwicklung und Fächergruppen 60
Herkunftsregionen und -länder 62
IV. Temporäre studienbezogeneAufenthalte mit ErasmusMobilitätsentwicklung und Herkunftsländer 64
Bundesländer, Fächergruppen und Hochschulen 66
c deutsche studierende im ausland
Zusammenfassung 68
I. Abschlussbezogene MobilitätMobilitätsentwicklung und Gastländer 70
Studienanfänger und Absolventen 72
Fächergruppen und Abschlussarten 74
II. Temporäre studienbezogeneMobilitätMobilitätsentwicklung 76
Stand der Zielerreichung 78
Gastländer und Aufenthaltsdauer 80
Organisation, Förderung und Zufriedenheit 82
Einstellungen und Voraussetzungen 84
Probleme und Hinderungsgründe 86
Soziodemografie mobiler Studierender 88
III. Temporäre studienbezogeneAufenthalte mit ErasmusMobilitätsentwicklung und Gastländer 90
Bundesländer, Hochschulen und Fächergruppen 92
Zusätzlich zu dieser Publikation haben wir für Sie weitere Informationen im Internet aufbereitet, die Sie unter folgender Adresse abrufen können: www.wissenschaft-weltoffen.de.
Dort finden Sie ergänzende Tabellen, Informationen zu weiteren Auswertungsmöglichkeiten sowie ein ausführliches Glossar. Sie finden dort auch ein verlinktes PDF dieser Publikation. Mit einem Klick auf das Symbol können Sie die zu den jeweiligen Abbildungen passenden Datenblätter herunterladen.
Das DZHW hat zusätzlich eine Servicestelle eingerichtet, um Auswertungen aus diesem Datenpool nach individuellen Vorstellungen beratend zu unterstützen und erforderlichenfalls durchzuführen. Dieser Service steht den Hochschulen kostenfrei zur Verfügung.
Anfragen an: [email protected]
in h a lt 5
d ausländische wissen- schaftler in deutschland
Zusammenfassung 94
I. Wissenschaftspersonal an Hochschulen Mobilitätsentwicklung und Herkunft 96
Bundesländer 98
Fächergruppen 100
Promotionen und Habilitationen 102 II. Wissenschaftspersonal an außeruniversitären Einrichtungen
Mobilitätsentwicklung und Herkunft 104
Promoviertes Wissenschaftspersonal 106
Fachgebiete und Altersstruktur 108
III. Gastwissenschaftler
Mobilitätsentwicklung und Fördergruppen 110
Herkunft, Fächergruppen und Aufenthaltsdauer 112
Erasmus-Gastdozenten 114
e deutsche wissenschaftler im ausland
Zusammenfassung 116
I. Wissenschaftler an Hochschulen Mobilitätsentwicklung 118
Doktoranden 120
II. Gastwissenschaftler im Ausland
Mobilitätsentwicklung und Fördergruppen 122
Gastregionen und -länder 124
Fächergruppen und Aufenthaltsdauer 126
Erasmus-Gastdozenten 128
fokus: akademische mobilität und kooperation im ostseeraum
Editorial 130
Zusammenfassung und Interpretation Ansatzpunkte für eine Vertiefung der akademischen Kooperation im Ostseeraum 132
Gastbeitrag Akademische Kooperation in der Makroregion Ostseeraum – Motive und Chancen 134
Ländervergleich und Datenlage Studierende und Wissenschaftler im Ostseeraum 136
Analyse Studierendenmobilität im Ostseeraum 139
Spotlight Doppelabschlussprogramme deutscher Hochschulen mit Hochschulen im Ostseeraum 146
Analyse Wissenschaftlermobilität im Ostseeraum 148
Gastbeitrag Baltic Science Network – Connecting through Science 154
Analyse Ko-Publikationen und Forschungsrahmenprogramme 157
Interview „Hochschulen nutzen Vernetzung im Ostseeraum als strategische Ressource“ 162
Spotlight Leuchtturmprojekte der akademischen Kooperation im Ostseeraum 165
Gastbeitrag Der Ostseeraum als strategischer Fokus der Hochschulinternationalisierung – Die HafenCity Universität Hamburg 168
anhang
Glossar 170 Quellenangaben 171 Important terms from tables and graphs in English 172 Gliederung der Weltregionen 173
w i sse n sc h a f t w e lto f f e n 20176
contents
a international academic mobility and transnational education
Summary 16
I. International student mobilityMobility trends and regional analysis 18
Mobility flows and balances 20
Host countries and countries of origin 22
Host countries and origin profiles 24
II. International mobility of academics and researchersMobility flows and balances 26
Major host countries and countries of origin 28
Host countries and origin profiles 30
International doctoral candidates 32
III. Transnational educationTNE forms and locations 34
Student numbers, subject areas, degree types 36
TNE projects and their connectionto Germany 38
b foreign students in germany
Summary 40
I. Foreign students overallMobility trends 42
Federal states and regions of origin 44
First-year students and graduates 46
II. Bildungsauslaender:Degree-related mobilityMobility trends and subject groups 48
Regions and countries of origin 50
Types of degrees and rates of success 52
Degree types and subject groups 54
Applicants 56
Refugees 58
III. Bildungsauslaender: Temporary study-related visitsMobility trends and subject groups 60
Regions and countries of origin 62
IV. Temporary study-relatederasmus visitsMobility trends and countries of origin 64
Federal states, subject groups and higher education institutions 66
c german students abroad
Summary 68
I. Degree-related mobilityMobility trends and host countries 70
First-year students and graduates 72
Subject groups and types of degree 74
II. Temporary study-related mobilityMobility trends 76
Degree of target achievement 78
Host countries and length of visits 80
Organisation, funding and satisfaction 82
Attitudes and conditions 84
Problems and obstacles 86
Social demographics of mobile students 88
III. Temporary study-relatederasmus visitsMobility trends and host countries 90
Federal states, higher education institutions and subject groups 92
Besides the information contained in this report, further details are also available at: www.wissenschaft-weltoffen.de
The website contains additional tables, information on how the data can be analysed in greater depth and detail, and a comprehensive glossary. There is also a PDF of this publication. By clicking on the symbol , it is possible to download the datasheets to the respective figures.
The DZHW has also set up a service centre to help users produce tailor-made analyses from the current data pool or, if necessary, will also produce these analyses for users. This service is free of charge for higher education institutions.
Please send enquiries to: [email protected]
Introduction 8
co n t e n t s 7
d foreign academics and researchers in germany
Summary 94
I. Academic staff at higher education institutions Mobility trends and origins 96
Federal states 98
Subject groups 100
Doctorates and qualifications to teach at professorial level 102 II. Academic staff at non-university research institutions
Mobility trends and origins 104
Academics and researchers with doctorates 106
Subject areas and age structure 108
III. Guest researchers
Mobility trends and funding groups 110
Region of origin, subject groups and duration of visit 112
Erasmus guest lecturers in Germany 114
e german academics and researchers abroad
Summary 116
I. Academics and researchers at universities Mobility trends 118
Doctoral candidates 120
II. Guest researchers abroad Mobility trends and funding groups 122
Host regions and host countries 124
Subject groups and duration of visit 126
Erasmus guest lecturers 128
focus: academic mobility and cooperation in the baltic sea area
Editorial 130
Summary and interpretationn Approaches to intensifying academic cooperation in the Baltic Sea area 132
Guest contribution Academic cooperation in the Baltic Sea Macro-Region – Motives and opportunities 134
International comparison and available data Students, academics and researchers in the Baltic Sea area 136
Analysis student mobility in the Baltic Sea area 139
Spotlight Double degree programmes of German higher education institutions in cooperation with higher education institutions in the Baltic Sea area 146
Analysis Mobility of academics and researchers in the Baltic Sea area 148
Guest contribution Baltic Science Network – Connecting through Science 154
Analysis Academic cooperation in the Baltic Sea area 157
Interview ”Higher Education Institutions use their Networks in the Baltic Sea area as a strategic resource“ 162
Spotlight Academic cooperation projects in the Baltic Sea area 165
Guest contribution The Baltic Sea Region as a strategic focus of higher education internationalisation – HafenCity University Hamburg 168
appendix
Glossary 170 References 171 Important terms from tables and graphs in English 172 Classification of world regions 173
8
In „Wissenschaft weltoffen“ wird auf verschiedene Datenquel-len zur internationalen Mobilität von Studierenden und Wis-senschaftlern zurückgegriffen. Bei der Interpretation dieser Daten ist zu beachten, dass es sehr unterschiedliche Formen der Studierenden- und Wissenschaftlermobilität gibt, deren datentechnische Erfassung an sehr unterschiedliche Voraus-setzungen gebunden ist. So ist es beispielsweise deutlich einfacher, die Einreisemobilität von Bildungsausländern in Deutschland zu erfassen, als die Ausreisemobilität deutscher Studierender, da bislang nur Erstere in der Hochschulstatistik erhoben wird. Die Erfassung der internationalen Mobilität von Wissenschaftlern fällt im Vergleich dazu noch schwieriger aus, da diese in Deutschland und vielen anderen Ländern nur sehr lückenhaft und in einigen Ländern (wie beispielsweise Frank-reich) überhaupt nicht amtlich erfasst wird. Im Folgenden sollen daher einführend die relevanten Arten der Studierenden- und Wissenschaftlermobilität, die hierfür zur Verfügung stehenden Datenquellen und deren Aussagekraft erläutert werden.
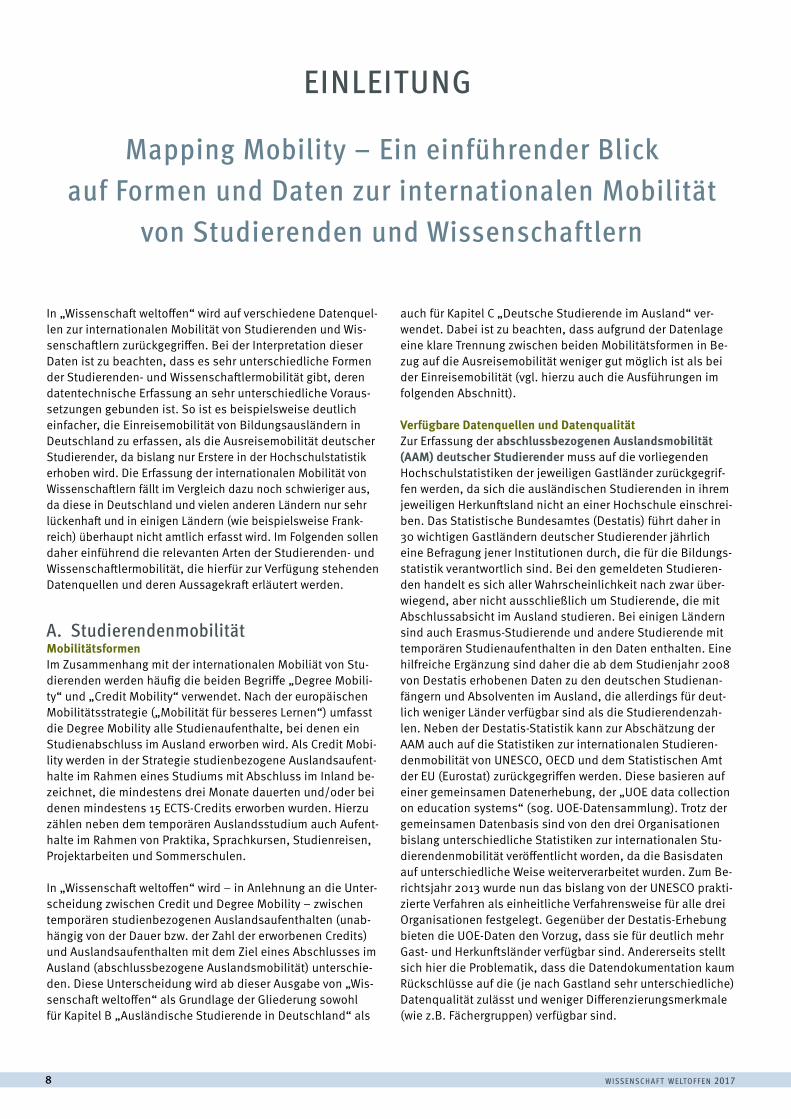
A. StudierendenmobilitätMobilitätsformenIm Zusammenhang mit der internationalen Mobiliät von Stu-dierenden werden häufig die beiden Begriffe „Degree Mobili-ty“ und „Credit Mobility“ verwendet. Nach der europäischen Mobilitätsstrategie („Mobilität für besseres Lernen“) umfasst die Degree Mobility alle Studienaufenthalte, bei denen ein Studienabschluss im Ausland erworben wird. Als Credit Mobi-lity werden in der Strategie studienbezogene Auslandsaufent-halte im Rahmen eines Studiums mit Abschluss im Inland be-zeichnet, die mindestens drei Monate dauerten und/oder bei denen mindestens 15 ECTS-Credits erworben wurden. Hierzu zählen neben dem temporären Auslandsstudium auch Aufent-halte im Rahmen von Praktika, Sprachkursen, Studienreisen, Projektarbeiten und Sommerschulen.
In „Wissenschaft weltoffen“ wird – in Anlehnung an die Unter-scheidung zwischen Credit und Degree Mobility – zwischen temporären studienbezogenen Auslandsaufenthalten (unab-hängig von der Dauer bzw. der Zahl der erworbenen Credits) und Auslandsaufenthalten mit dem Ziel eines Abschlusses im Ausland (abschlussbezogene Auslandsmobilität) unterschie-den. Diese Unterscheidung wird ab dieser Ausgabe von „Wis-senschaft weltoffen“ als Grundlage der Gliederung sowohl für Kapitel B „Ausländische Studierende in Deutschland“ als
auch für Kapitel C „Deutsche Studierende im Ausland“ ver-wendet. Dabei ist zu beachten, dass aufgrund der Datenlage eine klare Trennung zwischen beiden Mobilitätsformen in Be-zug auf die Ausreisemobilität weniger gut möglich ist als bei der Einreisemobilität (vgl. hierzu auch die Ausführungen im folgenden Abschnitt).
Verfügbare Datenquellen und DatenqualitätZur Erfassung der abschlussbezogenen Auslandsmobilität (AAM) deutscher Studierender muss auf die vorliegenden Hochschulstatistiken der jeweiligen Gastländer zurückgegrif-fen werden, da sich die ausländischen Studierenden in ihrem jeweiligen Herkunftsland nicht an einer Hochschule einschrei-ben. Das Statistische Bundesamtes (Destatis) führt daher in 30 wichtigen Gastländern deutscher Studierender jährlich eine Befragung jener Institutionen durch, die für die Bildungs-statistik verantwortlich sind. Bei den gemeldeten Studieren-den handelt es sich aller Wahrscheinlichkeit nach zwar über-wiegend, aber nicht ausschließlich um Studierende, die mit Abschlussabsicht im Ausland studieren. Bei einigen Ländern sind auch Erasmus-Studierende und andere Studierende mit temporären Studienaufenthalten in den Daten enthalten. Eine hilfreiche Ergänzung sind daher die ab dem Studienjahr 2008 von Destatis erhobenen Daten zu den deutschen Studienan-fängern und Absolventen im Ausland, die allerdings für deut-lich weniger Länder verfügbar sind als die Studierendenzah-len. Neben der Destatis-Statistik kann zur Abschätzung der AAM auch auf die Statistiken zur internationalen Studieren-denmobilität von UNESCO, OECD und dem Statistischen Amt der EU (Eurostat) zurückgegriffen werden. Diese basieren auf einer gemeinsamen Datenerhebung, der „UOE data collection on education systems“ (sog. UOE-Datensammlung). Trotz der gemeinsamen Datenbasis sind von den drei Organisationen bislang unterschiedliche Statistiken zur internationalen Stu-dierendenmobilität veröffentlicht worden, da die Basisdaten auf unterschiedliche Weise weiterverarbeitet wurden. Zum Be-richtsjahr 2013 wurde nun das bislang von der UNESCO prakti-zierte Verfahren als einheitliche Verfahrensweise für alle drei Organisationen festgelegt. Gegenüber der Destatis-Erhebung bieten die UOE-Daten den Vorzug, dass sie für deutlich mehr Gast- und Herkunftsländer verfügbar sind. Andererseits stellt sich hier die Problematik, dass die Datendokumentation kaum Rückschlüsse auf die (je nach Gastland sehr unterschiedliche) Datenqualität zulässt und weniger Differenzierungsmerkmale (wie z.B. Fächergruppen) verfügbar sind.
Mapping Mobility – Ein einführender Blick auf Formen und Daten zur internationalen Mobilität
von Studierenden und Wissenschaftlern
w i sse n sc h a f t w e lto f f e n 2017
einleitung
e i n l e i t u n g | i n t ro d u c t i o n 9
Ausländische Studierende in Deutschland werden durch die reguläre Studierendenstatistik des Statistischen Bundesamtes erfasst. Hierbei wird zum einen zwischen Bildungsausländern und Bildungsinländern differenziert. Erstere sind ausländi-sche Studierende, die ihre Hochschulzugangsberechtigung an einer Schule im Ausland erworben haben (hierzu zählen auch deutsche Schulen im Ausland) oder im Ausland erworbene schulische Qualifikationen durch ein deutsches Studienkolleg ergänzt haben. Bildungsinländer sind ausländische Studie-rende, die ihre Hochschulzugangsberechtigung an einer Schu-le in Deutschland erworben oder in Deutschland eine Begab-ten- oder Eignungsprüfung bestanden haben. Darüber hinaus lassen sich innerhalb der Bildungsausländer anhand der De-statis-Daten auch diejenigen Studierenden identifizieren, die einen Studienabschluss in Deutschland anstreben (vgl. hierzu auch vorigen Abschnitt).
Zur Gesamtheit temporärer studienbezogener Auslandsmobi-lität (TSA) deutscher Studierender liegen bislang keine amt-lichen Statistiken vor. Offizielle Daten stehen bisher nur zum Teilbereich der temporären Studien- oder Praktikumsaufent-halte im Rahmen des Erasmus-Programms der EU zur Verfü-gung. Diese Erasmus-Aufenthalte stellen etwa ein Drittel der TSA deutscher Studierender dar. Durch die Einführung des neuen Hochschulstatistikgesetzes werden allerdings in nähe-rer Zukunft (vermutlich bis zum Wintersemester 2018/19) auch amtliche Daten zu den studienbezogenen Aufenthalten außer-halb des Erasmus-Programms vorliegen. Bis dahin muss TSA deutscher Studierender mithilfe von Studierenden- und Absol-ventenbefragungen abgeschätzt werden.
In Bezug auf die Bildungsausländer in Deutschland können die Zahlen zur TSA hingegen der Destatis-Studierendenstatis-tik entnommen werden, die eine Identifikation der Bildungs-ausländer ohne Abschlussabsicht in Deutschland bzw. mit Abschlussabsicht im Ausland ermöglicht (sog. Gaststudieren-de). Darüber hinaus steht auch die Erasmus-Statistik als Da-tenquelle zur Verfügung, wobei zu beachten ist, dass die hier-bei erfassten (eingeschriebenen) Studierenden auch Teil der Destatis-Studierendenstatistik sind. Wichtig ist darüber hin-aus, dass die Erfassung der TSA von Bildungsausländern in Deutschland nur Studiumsaufenthalte an Hochschulen um-fasst. Sonstige studienbezogene Aufenthalte (z.B. Praktika, Sprachkurse, Exkursionen) sind nicht Teil der hier aufbereite-ten Destatis- und Erasmus-Statistik.
BACHELORSTUDIUM MASTERSTUDIUM
Temporäre studienbezogene Auslandsaufenthalte ... im Rahmen des Studiums an einer deutschen Hochschule (z.B. Auslandssemester, Auslandspraktikum, Studienreise) als Brückenmobilität zwischen Bachelor- und Masterstudium (z.B. Auslandspraktikum, Sommerschule, Sprachkurs)
Abschlussbezogene Auslandsmobilität (Studium und Abschluss vollständig im Ausland)
1 Formen studienbezogener Auslandsmobilität im Studienverlauf Types of study-related visits abroad during the course of study
INTRODUCTIONMapping mobility – an introductory look at forms of and data on international student, academic and researcher mobility.
“Wissenschaft weltoffen” uses a range of data sources on international student, academic and researcher mobility. When interpreting these data it must be borne in mind that there are several very different forms of student, academic and researcher mobility, and the collection of data on these is subject to very different conditions. It is for example far easier to analyse incoming Bildungsauslaender mobility into Germany than outgoing mobility of German students, as higher education statistics currently only cover the former. Evaluating the international mobility of academics and researchers is even more difficult, as Germany and many other countries keep only very incomplete official records of such mobility, and some countries (such as France) do not record it at all. The following pages therefore aim to provide an introductory explanation of the relevant types of student, academic and researcher mobility, the available data sources and their informative value.
A. Student mobilityForms of mobilityWhen describing international student mobility, the two terms “degree mobility“ and “credit mobility” are frequently used. According to the European mobility strategy (“Mobility for Better Learning”), degree mobility covers all study visits in the course of which a degree is gained abroad, while credit mobility refers to study-related visits abroad that lasted at least three months and/or in the course of which at least 15 ECTS credits were gained, but which formed part of a study programme leading to a degree in the student’s home country. In addition to temporary study abroad this also includes visits for placements, language courses, study tours, project work and summer schools.
Following the distinction between credit and degree mobility, “Wissen-schaft weltoffen” distinguishes between temporary study-related visits abroad (regardless of duration and number of credit points gained) and stays abroad with the aim of graduating abroad (degree-related international mobility). From this issue of “Wissenschaft weltoffen” onwards, both chapter B “Foreign students in Germany” and chapter C “German students abroad” will be structured on the basis of this distinction. It should be noted that due to the specific data collected it is more difficult to separate clearly between the two forms of mobility among outgoing students than among incoming students (see also the information in the following section).
w i sse n sc h a f t w e lto f f e n 201710
Verwendete DatenquellenDie zentrale Datenbasis für die hier dargestellten Befunde zur abschlussbezogenen Auslandsmobilität deutscher Stu-dierender stellt die Statistik „Deutsche Studierende im Aus-land“ des Statistischen Bundesamtes dar. Ergänzt werden diese für einzelne Gastländer durch Zahlen der UNESCO-Sta-tistik. Zur Beschreibung der temporären studienbezogenen Auslandsaufenthalte werden neben der Erasmus-Statistik v.a. die Ergebnisse der DAAD/DZHW-Mobilitätsstudien verwendet. Hierbei handelt es sich um die bislang einzige regelmäßige Befragung, die sich speziell mit der Auslandsmobilität deut-scher Studierender beschäftigt. Ergänzt werden diese Befun-de um Daten aus anderen Befragungen wie der Sozialerhe-bung des Deutschen Studentenwerks (insbesondere bei der Betrachtung längerfristiger Entwicklungen) und den Absolven-tenstudien von DZHW und INCHER.
Zur Erfassung der ausländischen Studierenden in Deutschland wird insbesondere die Studierendenstatistik des Statistischen Bundesamtes herangezogen und hierbei zwischen Bildungs-ausländern, Bildungsinländern sowie – für Bildungsauslän-der – zwischen Studierenden mit und ohne Abschlussabsicht in Deutschland differenziert. Darüber hinaus werden auch die Daten zu den Erasmus-Teilnehmern aus dem Ausland analy-siert, die temporäre Studiumsaufenthalte an deutschen Hoch-schulen verbringen.
Zur Darstellung der internationalen Studierendenmobilität wird auf die UNESCO-Studierendenstatistik zurückgegriffen.
Urheber Titel der Studie Erhebungsturnus Erfasste Mobilitätsarten Besonderheiten
Deutsche Studierende im Ausland
Statistisches Bundesamt Deutsche Studierende im Ausland Jedes Jahr AAM (in erster Linie) Fächergruppen, Abschlussart, Studienanfänger, Absolventen
DAAD Erasmus-Statistik Jedes Jahr TSA VollerhebungDeutsches Studentenwerk/DZHW Sozialerhebung Alle drei/vier Jahre TSA Erste Erhebung: 1951
DAAD/DZHW Internationale Mobilität im Studium (Mobilitätsstudie) Alle zwei Jahre TSA Umfassendste Daten zu TSA deutscher
StudierenderUniversität Konstanz Studierendensurvey Alle drei Jahre TSA
DZHW Absolventenpanel Jeder vierte Jahrgang TSA Insgesamt drei Befragungswellen nach Abschluss
International Center for Higher Education Research Kassel (INCHER) Kooperationsprojekt Absolventenstudien Jeder Jahrgang TSA
Ausländische Studierende in DeutschlandStatistisches Bundesamt Studierende an Hochschulen Jedes Jahr AAM & TSA VollerhebungStatistisches Bundesamt Prüfungen an Hochschulen Jedes Jahr AAM & TSA VollerhebungDAAD Erasmus-Statistik Jedes Jahr TSA VollerhebungDeutsches Studentenwerk/DZHW Sozialerhebung Alle drei/vier Jahre TSA
Internationale Mobilität von Studierenden
UNESCO UIS.Stat-Datenbank (online) Jedes Jahr AAM (in erster Linie) Umfangreichste Länderdaten, keine Differenzierung nach Abschlussart
OECD Education at a Glance, OECD.Stat-Daten-bank (online) Jedes Jahr AAM (in erster Linie) Nur OECD-Länder, Differenzierung nach
Abschlussart
Eurostat Eurostat-Datenbank (online) Jedes Jahr AAM (in erster Linie) Nur europäische Länder, Differenzierung nach Abschlussart
AAM = abschlussbezogene Auslandsmobilität; TSA = temporäre studienbezogene Auslandsmobilität
2 Wichtige Datenquellen zur Studierendenmobilität Major data sources on student mobility
Available data sources and data qualityDegree-related international mobility (DIM) of German students must be analysed based on the higher education statistics provided by the respective host countries, as these foreign students are not enrolled at a higher education institution in their respective country of origin. The German Federal Statistical Office (Destatis) annually surveys the institutions responsible for education statistics in 30 important host countries of German students. The majority, but not all, of the reported students are most likely studying abroad with the intention to graduate there. For some countries the data also include Erasmus students and other students on temporary study visits. A helpful addition are therefore the data on German first-year students and graduates abroad collected by Destatis from the 2008 academic year onwards, which are however available for significantly fewer countries than the student numbers. In addition to the Destatis statistics, the international student statistics by UNESCO, OECD and the EU statistical office (Eurostat) can also be used to assess degree-related international mobility. These statistics are based on a joint survey, the “UOE data collection on education systems”. Despite the common data basis, the three organisations have previously published different statistics on international student mobility, as they processed the underlying data in different ways. Starting with the reporting year 2013, the procedure previously employed by UNESCO has now been defined as the standard procedure for all three organisations. Compared to the Destatis survey, the UOE data have the advantage that they are available for significantly more host countries and countries of origin. On the other hand, the data documentation allows few conclusions to be drawn regarding the quality of the data (which varies significantly between host countries), and fewer differentiation factors (such as subject groups) are available.
e i n l e i t u n g | i n t ro d u c t i o n 11
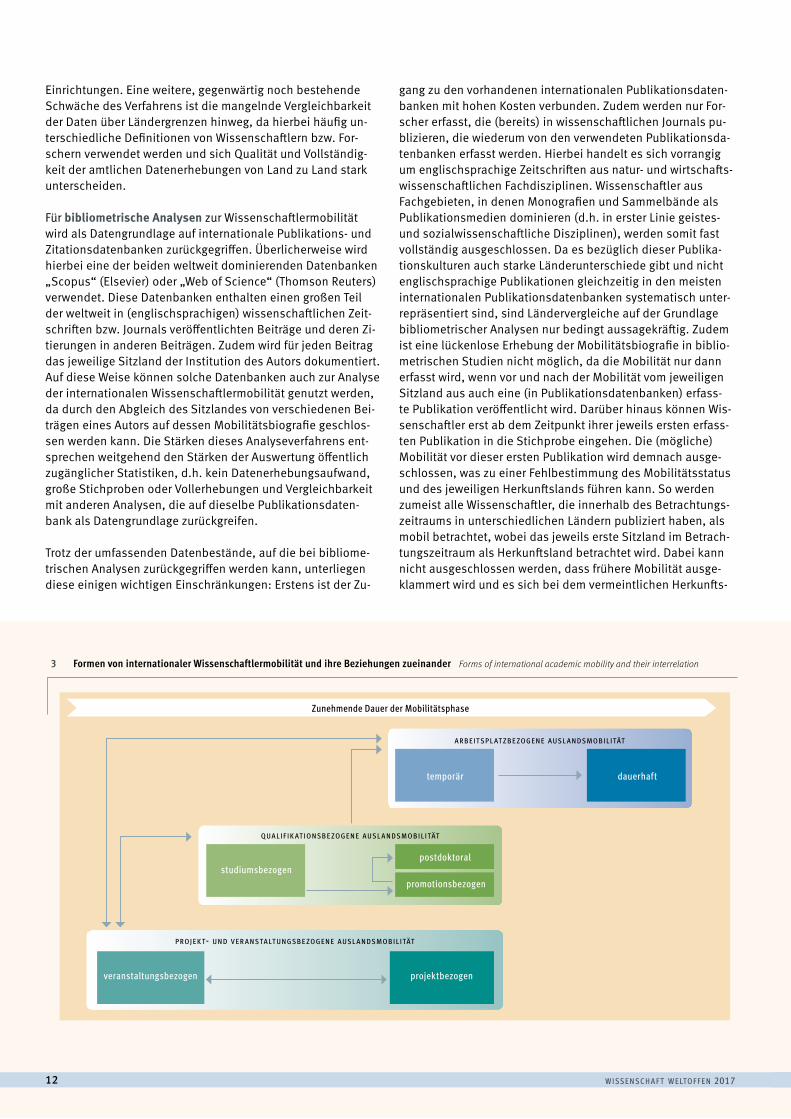
B. WissenschaftlermobilitätMobilitätsformenBasierend auf dem jeweiligen Anlass der Mobilität lassen sich drei grundlegende Typen der Wissenschaftlermobilität unterscheiden, zwischen denen jeweils enge Beziehungen und Überschneidungen bestehen: die projekt- und veran-staltungsbezogene Auslandsmobilität (z.B. Konferenzreisen, Forschungsprojekte im Ausland), die qualifikationsbezoge-ne Auslandsmobilität (z.B. Promotion im Ausland, Postdoc-Projekt im Ausland) und die arbeitsplatzbezogene Auslands-mobilität (temporäre oder dauerhafte Forschungsstellen im Ausland). Viele Fälle von Wissenschaftlermobilität lassen sich dabei – je nach Perspektive – mehreren dieser Typen zuordnen. Beispielsweise handelt es sich bei vielen promo-tionsbezogenen oder postdoktoralen Projekten im Ausland sowohl um projektbezogene als auch um qualifikationsbezo-gene Auslandsmobilität. Neben den Überschneidungen zwi-schen den drei Typen der Wissenschaftlermobilität sind diese auch durch verschiedene Wirkungsbeziehungen verbunden. Dies gilt auch für die konkreten Mobilitätsformen innerhalb der drei Mobilitätstypen. So führt studiumsbezogene Aus-landsmobilität häufig zu promotionsbezogener und diese wiederum zu postdoktoraler Mobilität. Projektbezogene Wis-senschaftlermobilität zieht in vielen Fällen veranstaltungs-bezogene Mobilität nach sich, umgekehrt ergeben sich auf internationalen wissenschaftlichen Konferenzen häufig Kon-takte, die wiederum zu projektbezogener Wissenschaftlermo-bilität führen.
Verfügbare Datenquellen und DatenqualitätDie Forschung zur internationalen Wissenschaftlermobilität stützt sich bislang v.a. auf drei Erhebungsverfahren: die Aus-wertung amtlicher oder sonstiger öffentlich zugänglicher Sta-tistiken, die Auswertung von Publikationsdatenbanken (bib-liometrische Daten) und die Durchführung von Befragungen. Alle drei Verfahren haben Stärken und Schwächen, die sich teilweise spiegelbildlich zueinander verhalten, d.h., die Stär-ke des einen Verfahrens ist die Schwäche des anderen Ver-fahrens und umgekehrt.
Bei der Auswertung öffentlich zugänglicher Statistiken wird keine eigenständige Datenerhebung durchgeführt, sondern es wird auf vorhandene Datenbestände zurückgegriffen. Der Aufwand für die Datenerhebung entfällt also, was als zentra-le Stärke des Verfahrens bezeichnet werden kann. Bei amt-lichen Daten handelt es sich zudem häufig um sehr große Stichproben oder sogar um Vollerhebungen, was ebenfalls zu den Stärken des Verfahrens zählt. Zudem hat die Auswer-tung öffentlich zugänglicher Daten den Vorteil, dass die Be-funde häufig mit anderen Analysen gut vergleichbar sind, die auf dieselbe Datengrundlage zurückgreifen. Die zentrale Einschränkung des Verfahrens ist, dass es auf die in den je-weiligen Datenbanken verfügbaren, zumeist eher deskripti-ven Variablen festgelegt ist und keine zusätzlichen Variablen erhoben werden können, die eine vertiefende Analyse (z.B. von Ursachen und Wirkungen der Wissenschaftlermobilität) ermöglichen. Zudem werden nur diejenigen Wissenschaftler erfasst, die in den amtlichen Statistiken aufgeführt werden, d.h. bislang in erster Linie Wissenschaftler an öffentlichen
Foreign students in Germany are recorded in the regular student statistics compiled by the German Federal Statistical Office (Destatis). These differentiate between Bildungsauslaender and Bildungsinlaender. The former are foreign students who gained their higher education entrance qualification from a school abroad (this also includes German schools abroad) or have attended a German preparatory college to complement a qualification gained at a school abroad. Bildungsin-laender are foreign students who gained their higher education entrance qualification at a school in Germany or have passed a gifted students test or an aptitude test in Germany. The Destatis data moreover make it possible to identify those Bildungsauslaender students who intend to graduate in Germany (see also previous section).
There are currently no official statistics covering temporary study-relat-ed international mobility (TSIM) of German students in its entirety. Official data are only available on the subsection of temporary study or placement visits conducted through the EU’s Erasmus programme. These Erasmus visits represent around two thirds of temporary study-related visits abroad by German students. Thanks to the introduction of the new Higher Education Statistics Act, official data on study-related visits outside the Erasmus programme will be available in the near future (presumably by the 2018/19 winter semester). Until then, the number of temporary study-related visits abroad by German students will have to be estimated through student and graduate surveys.
For Bildungsauslaender in Germany on the other hand the figures on TSIM can be gleaned from the Destatis student statistics, which make it possible to identify Bildungsauslaender not intending to graduate in Germany or intending to graduate abroad (known as visiting students). The Erasmus statistics are available as an additional data source, although it must be borne in mind that the (enrolled) students they cover are also included in the Destatis student statistics. It is moreover important to note that data collected on temporary study-related visits abroad by Bildungsauslaender in Germany only cover study visits to higher education institutions; other study-related visits (e.g. placements, language courses, excursions) are not included in the Destatis and Erasmus statistics analysed here.
Data sourcesThe findings presented here on degree-related international mobility of German students are based mainly on the statistic “German students abroad” from the German Federal Statistical Office (Destatis). For indi- vidual host countries, figures from the UNESCO statistics are used to complement these data. Along with the Erasmus statistics, the results of the DAAD/DZHW mobility surveys are the main source of data on temporary study-related visits abroad. These are currently the only regular surveys that specifically examine the international mobility of German students. Their findings are complemented with data from other surveys, such as the social survey performed by the German National Association for Student Affairs (in particular when examining longer-term trends) and the graduate studies conducted by DZHW and INCHER.
The main source of data on foreign students in Germany are the student statistics of the German Federal Statistical Office (Destatis), which differentiate between Bildungsauslaender, Bildungsinlaender and – for Bildungsauslaender – between students intending to graduate in Germany and those with no such intent. In addition, data on Erasmus participants from abroad who are conducting temporary study visits at German higher education institutions are analysed.
The UNESCO student statistics are used to analyse international student mobility.
w i sse n sc h a f t w e lto f f e n 201712
Einrichtungen. Eine weitere, gegenwärtig noch bestehende Schwäche des Verfahrens ist die mangelnde Vergleichbarkeit der Daten über Ländergrenzen hinweg, da hierbei häufig un-terschiedliche Definitionen von Wissenschaftlern bzw. For-schern verwendet werden und sich Qualität und Vollständig-keit der amtlichen Datenerhebungen von Land zu Land stark unterscheiden.
Für bibliometrische Analysen zur Wissenschaftlermobilität wird als Datengrundlage auf internationale Publikations- und Zitationsdatenbanken zurückgegriffen. Überlicherweise wird hierbei eine der beiden weltweit dominierenden Datenbanken „Scopus“ (Elsevier) oder „Web of Science“ (Thomson Reuters) verwendet. Diese Datenbanken enthalten einen großen Teil der weltweit in (englischsprachigen) wissenschaftlichen Zeit-schriften bzw. Journals veröffentlichten Beiträge und deren Zi-tierungen in anderen Beiträgen. Zudem wird für jeden Beitrag das jeweilige Sitzland der Institution des Autors dokumentiert. Auf diese Weise können solche Datenbanken auch zur Analyse der internationalen Wissenschaftlermobilität genutzt werden, da durch den Abgleich des Sitzlandes von verschiedenen Bei-trägen eines Autors auf dessen Mobilitätsbiografie geschlos-sen werden kann. Die Stärken dieses Analyseverfahrens ent-sprechen weitgehend den Stärken der Auswertung öffentlich zugänglicher Statistiken, d.h. kein Datenerhebungsaufwand, große Stichproben oder Vollerhebungen und Vergleichbarkeit mit anderen Analysen, die auf dieselbe Publikationsdaten-bank als Datengrundlage zurückgreifen.
Trotz der umfassenden Datenbestände, auf die bei bibliome-trischen Analysen zurückgegriffen werden kann, unterliegen diese einigen wichtigen Einschränkungen: Erstens ist der Zu-
gang zu den vorhandenen internationalen Publikationsdaten- banken mit hohen Kosten verbunden. Zudem werden nur For-scher erfasst, die (bereits) in wissenschaftlichen Journals pu-blizieren, die wiederum von den verwendeten Publikationsda-tenbanken erfasst werden. Hierbei handelt es sich vorrangig um englischsprachige Zeitschriften aus natur- und wirtschafts-wissenschaftlichen Fachdisziplinen. Wissenschaftler aus Fachgebieten, in denen Monografien und Sammelbände als Publikationsmedien dominieren (d.h. in erster Linie geistes- und sozialwissenschaftliche Disziplinen), werden somit fast vollständig ausgeschlossen. Da es bezüglich dieser Publika-tionskulturen auch starke Länderunterschiede gibt und nicht englischsprachige Publikationen gleichzeitig in den meisten internationalen Publikationsdatenbanken systematisch unter-repräsentiert sind, sind Ländervergleiche auf der Grundlage bibliometrischer Analysen nur bedingt aussagekräftig. Zudem ist eine lückenlose Erhebung der Mobilitätsbiografie in biblio-metrischen Studien nicht möglich, da die Mobilität nur dann erfasst wird, wenn vor und nach der Mobilität vom jeweiligen Sitzland aus auch eine (in Publikationsdatenbanken) erfass-te Publikation veröffentlicht wird. Darüber hinaus können Wis-senschaftler erst ab dem Zeitpunkt ihrer jeweils ersten erfass-ten Publikation in die Stichprobe eingehen. Die (mögliche) Mobilität vor dieser ersten Publikation wird demnach ausge-schlossen, was zu einer Fehlbestimmung des Mobilitätsstatus und des jeweiligen Herkunftslands führen kann. So werden zumeist alle Wissenschaftler, die innerhalb des Betrachtungs-zeitraums in unterschiedlichen Ländern publiziert haben, als mobil betrachtet, wobei das jeweils erste Sitzland im Betrach-tungszeitraum als Herkunftsland betrachtet wird. Dabei kann nicht ausgeschlossen werden, dass frühere Mobilität ausge-klammert wird und es sich bei dem vermeintlichen Herkunfts-
studiumsbezogen
veranstaltungsbezogen projektbezogen
postdoktoral
temporär dauerhaft
promotionsbezogen
q u a l i f i k at i o n sb e zo g e n e a usl a n dsm o b i l i tät
a r b e i t sp l at z b e zo g e n e a usl a n dsm o b i l i tät
p r o j e k t- u n d v e r a n s ta lt u n g sb e zo g e n e a usl a n dsm o b i l i tät
Zunehmende Dauer der Mobilitätsphase
3 Formen von internationaler Wissenschaftlermobilität und ihre Beziehungen zueinander Forms of international academic mobility and their interrelation
e i n l e i t u n g | i n t ro d u c t i o n 13
land bereits um ein Gastland handelt. Für die Mobilitätsbe-stimmung sind schließlich mindestens zwei Publikationen im Untersuchungszeitraum nötig. Nachwuchswissenschaftler, die im Untersuchungszeitraum noch keine oder erst eine Journal-Publikation vorweisen können, werden demnach aus der Be-trachtung ausgeschlossen.
Befragungen zeichnen sich – im Gegensatz zu den beiden bis-her beschriebenen Verfahren – insbesondere durch die Erhe-bung neuer Daten zur Wissenschaftlermobilität aus. Dies hat den Vorteil, dass vom jeweiligen Studienleiter selbst festge-legt werden kann, wer genau befragt wird und welche Fragen dabei gestellt bzw. welche Merkmale genau erhoben werden. Die zur Verfügung stehende Zahl an Variablen für die Analyse der Wissenschaftlermobilität fällt hier also im Allgemeinen deutlich höher aus als bei der Auswertung von öffentlichen Statistiken und Publikationsdatenbanken, was tiefer gehen-de bzw. erklärende Analysen ermöglicht (z.B. zu Mobilitäts-motiven bzw. -hürden von Wissenschaftlern). Zudem können auch Wissenschaftler in die Analyse mit einbezogen werden, die weder von Publikationsdatenbanken noch von öffentlichen Statistiken erfasst werden (z.B. Forscher in Unternehmen). Bei international angelegten Wissenschaftlerbefragungen kann schließlich eine hohe internationale Vergleichbarkeit der Da-ten aus den unterschiedlichen Ländern sichergestellt werden. Allerdings verursachen Befragungen einen beträchtlichen Er-hebungsaufwand und dadurch auch hohe Kosten. Diese Ein-schränkungen führen dazu, dass regelmäßige Befragungen re-lativ selten stattfinden und deshalb auch nicht als Grundlage für fortlaufende Statistiken zur Wissenschaftlermobilität ge-eignet sind.
Amtliche und sonstige öffentliche Statistiken Bibliometrische Daten Befragungen
Vorteile
• Kein Erhebungsaufwand, d.h. umfassende bzw. sogar Vollerhebung möglich
• Analyse von Entwicklungen im Zeitverlauf möglich
• Keine oder geringe Kosten für Zugang zu Datenbankenoder Registern
• Kein Erhebungsaufwand, d.h. umfassende bzw. sogar Vollerhebung möglich
• Analyse von Entwicklungen im Zeitverlauf möglich
• Genaue Abgrenzung der Zielpopulation möglich
• Vielzahl an möglichen Untersuchungsvariablen
• Stichprobe unabhängig vom Publikationsverhaltenoder Erfassung in öffentlichen Statistiken
• Hohe internationale Vergleichbarkeit realisierbar
Nachteile
• Vorgegebene Stichprobe
• Stichprobe abhängig von Erfassung der Wissenschaft-ler in öffentlichen Statistiken
• Vorgegebene und stark eingeschränkte Zahl anUntersuchungsvariablen
• Internationale Vergleichbarkeit stark eingeschränkt
• Vorgegebene Stichprobe
• Stichprobe abhängig vom Publikationsverhalten der Wissenschaftler
• Vorgegebene und stark eingeschränkte Zahl anUntersuchungsvariablen
• Internationale Vergleichbarkeit stark eingeschränkt
• Hohe Kosten für Zugang zu Publikationsdatenbanken
• Schwieriger Zugang zu Befragten
• Hoher Erhebungsaufwand für Forscher und Befragte
• Erfordert häufig eine Einschränkung der Zahl der Befragten
• Erschwert das Aufzeigen von Entwicklungen imZeitverlauf
4 Vor- und Nachteile von amtlichen Statistiken, bibliometrischen Daten und Befragungen zur Wissenschaftlermobilität
Advantages and disadvantages of official statistics, bibliometric data and surveys on researcher mobility
B. Academic and researcher mobilityForms of mobilityBased on their underlying reason for mobility, three basic types of closely related and often overlapping academic and researcher mobility can be distinguished: project- and event-related international mobility (e.g. conference trips, research projects abroad), qualification-related mobility (e.g. completion of a doctorate or post-doc project abroad) and workplace-related mobility (temporary or permanent research appoint-ments abroad). In many cases, academic mobility can – depending on the perspective considered – be allocated to more than one of these types. Doctorate- or post-doc-related projects abroad are, for instance, often both project- and qualification-related. Apart from overlapping, these three types of academic mobility are also linked through various relationships of cause and effect. This also applies to the actual forms of mobility within the three mobility types. Completion of a first degree abroad, for example, often leads to doctorate-related mobility, which in turn may lead to post-doc mobility. Project-related academic mobility frequently results in event-related mobility, while contacts made at international scientific conferences regularly generate project-related academic mobility.
Available data sources and data qualityResearch on international researcher mobility has to date been based mainly on three survey methods: evaluations of official or other publicly available statistics, analyses of publication databases (bibliometric data), and surveys. All three methods have strengths and weaknesses that are in some cases inverse to each other, i.e. the strength of one method is the weakness of the other and vice versa.
Evaluating publicly available statistics does not involve independent data collection, but rather uses existing datasets. This renders data collection effort unnecessary, which can be seen as a major advantage. Official data moreover frequently involve very large sample sizes or even
w i sse n sc h a f t w e lto f f e n 201714
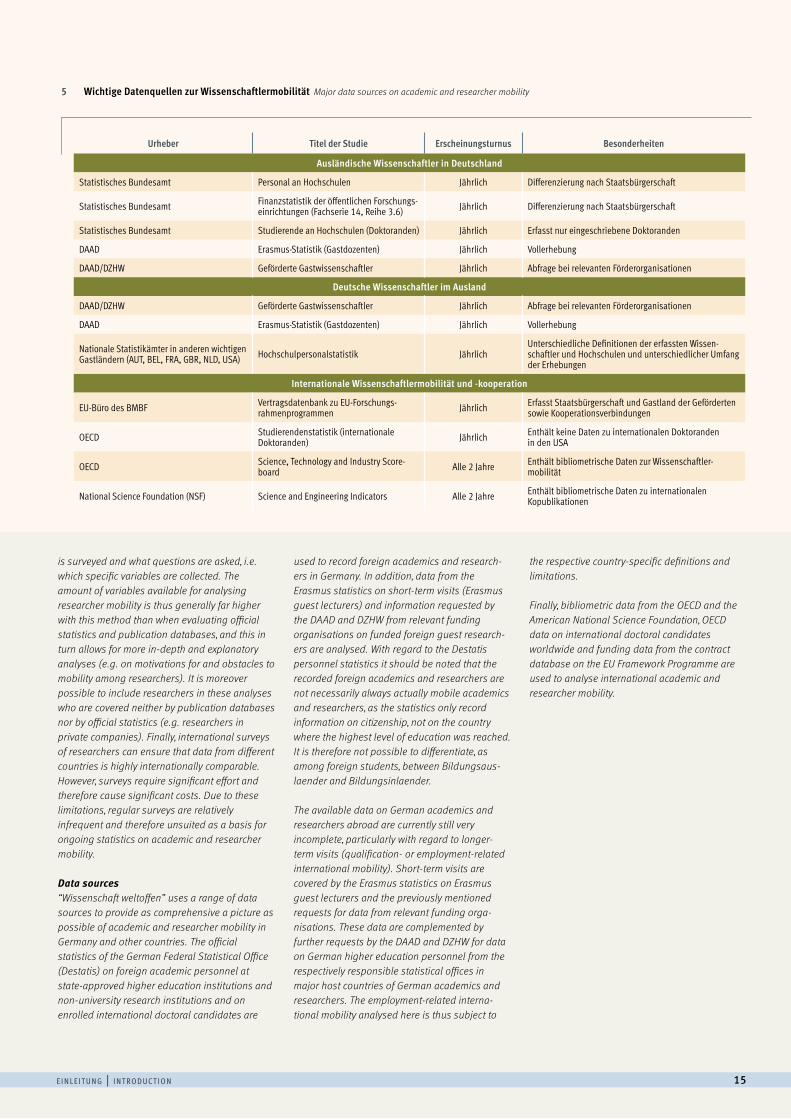
Verwendete DatenquellenIn „Wissenschaft weltoffen“ werden unterschiedliche Daten-quellen genutzt, um ein möglichst umfassendes Bild der Wis-senschaftlermobilität in Deutschland und anderen Ländern erfassen zu können. Für die Erfassung der ausländischen Wis-senschaftler in Deutschland wird auf die amtliche Statistik des Statistischen Bundesamts (Destatis) zum ausländischen Wis-senschaftspersonal an staatlich anerkannten Hochschulen und außeruniversitären Forschungseinrichtungen sowie den eingeschriebenen internationalen Doktoranden zurückgegrif-fen. Ergänzend werden Daten zu kurzfristigeren Gastaufenthal-ten aus der Erasmus-Statistik (Erasmus-Gastdozenten) sowie einer Abfrage von DAAD und DZHW zu geförderten ausländi-schen Gastwissenschaftlern in Deutschland bei relevanten Förderorganisationen analysiert. In Bezug auf die Destatis-Per-sonalstatistik ist hierbei zu berücksichtigen, dass es sich bei den erfassten ausländischen Wissenschaftlern nicht zwangs-läufig in allen Fällen um tatsächlich mobile Wissenschaftler handelt, da hier nur Informationen zur Staatsbürgerschaft er-hoben werden, aber nicht zum Land des höchsten Bildungsab-schlusses. Eine Differenzierung in Bildungsausländer und Bil-dungsinländer, wie bei den ausländischen Studierenden, ist demnach an dieser Stelle nicht möglich.
Die Datenbasis zur Erfassung der deutschen Wissenschaft-ler im Ausland fällt bislang sehr lückenhaft aus, insbesonde-re in Bezug auf längerfristige Aufenthalte (qualifikations- oder arbeitsplatzbezogene Auslandsmobilität). Kurzfristige Gast-aufenthalte werden durch die Erasmus-Statistik zu den Eras-mus-Gastdozenten sowie die bereits erwähnte Abfrage bei relevanten Förderorganisationen erfasst. Ergänzt werden die-se Daten um eine weitere Abfrage vom DAAD und DZHW bei den jeweils zuständigen statistischen Ämtern zum deutschen Hochschulpersonal in wichtigen Gastländern für deutsche Wissenschaftler. Die hierbei erfasste arbeitsplatzbezogene Auslandsmobilität unterliegt demnach jeweils länderspezifi-schen Definitionen und Einschränkungen.
Für die Darstellung der internationalen Wissenschaftlermobi-lität werden schließlich bibliometrische Daten von OECD und der US-amerikanischen National Science Foundation, OECD-Daten zu den internationalen Doktoranden weltweit sowie Förderdaten aus der Vertragsdatenbank zu den Forschungsrah-menprogrammen der EU verwendet.
full population surveys, which is a further strength of this method. Analysing publicly available data also has the advantage that findings can often easily be compared to those of other analyses that are based on the same data. The main constraint of this method is that it is limited to the variables available in the respective databases, which are often rather descriptive, and no additional variables can be collected that would allow a more in-depth analysis (e.g. of causes and effects of researcher mobility). In addition, only those researchers are included who are covered by official statistics, i.e. currently primarily researchers at public institutions. A further disadvantage of this method at present is the lack of international comparability of the data, as different definitions of “academics” and “researchers” are often applied and the quality and completeness of official data collection varies widely between countries.
Bibliometric analyses of academic and researcher mobility are based on international publication and citation databases; usually, one of the world’s two major such databases, “Scopus” (Elsevier) or “Web of Science” (Thomson Reuters), is used. These databases catalogue a large proportion of all articles published in (English-language) academic journals, along with citations of these articles in other publications. The country of location of the author’s institution is also documented for each
item. As a result, these databases can be used to analyse international academic and researcher mobility, as comparing the countries of location for an author’s various contributions permits conclusions regarding his or her mobility biography. The strengths of this method of analysis correspond largely to the strengths of evaluating publicly accessible statistics, i.e. no data collection effort is required, large sample sizes or full population surveys are available, and the results can be compared with other analyses that use the same publication database.
Despite the comprehensive datasets available for bibliometric analyses, such analyses are subject to some significant limitations: Firstly, access to the existing international publication databases is costly. Secondly, only researchers who are (already) publishing in the academic journals covered by the utilised publication databases are included. This applies mainly to English-lan-guage journals in natural and economic science disciplines; researchers in disciplines where monographs and edited volumes dominate (i.e. mainly the Humanities and Social Sciences) are therefore almost entirely excluded. As there are also significant differences between countries regarding these publication cultures, and non-English language publications are moreover systematically underrepresented in most international publication databases, the informative value of international comparisons
based on bibliometric analyses is limited. Bibliometric studies moreover do not allow comprehensive surveys of mobility biographies as mobility is only recorded when researchers actually publish papers (recorded in publication databases) in their respective countries of location both before and after mobility. In addition, academics and researchers can only be included in the sample from the time of their first recorded publication onwards. Any (potential) mobility before this first publication is therefore excluded, which may result in their mobility status and country of origin being determined incorrectly. For example, all researchers who have published in different countries during the reporting period will generally be considered mobile, with the first country of location during the reporting period considered their country of origin. It is therefore possible that earlier mobility is not factored in and a researcher’s apparent country of origin is already a host country. Finally, at least two publications within the survey period are required to determine mobility. Consequently, young researchers who have no or only one journal publication to their name during the survey period are excluded from consideration.
In contrast to the two above-described methods, surveys are characterised in particular by the acquisition of new or primary data on researcher mobility. This has the advantage that survey managers can decide for themselves who exactly
e i n l e i t u n g | i n t ro d u c t i o n 15
Urheber Titel der Studie Erscheinungsturnus Besonderheiten
Ausländische Wissenschaftler in Deutschland
Statistisches Bundesamt Personal an Hochschulen Jährlich Differenzierung nach Staatsbürgerschaft
Statistisches Bundesamt Finanzstatistik der öffentlichen Forschungs-einrichtungen (Fachserie 14, Reihe 3.6) Jährlich Differenzierung nach Staatsbürgerschaft
Statistisches Bundesamt Studierende an Hochschulen (Doktoranden) Jährlich Erfasst nur eingeschriebene Doktoranden
DAAD Erasmus-Statistik (Gastdozenten) Jährlich Vollerhebung
DAAD/DZHW Geförderte Gastwissenschaftler Jährlich Abfrage bei relevanten Förderorganisationen
Deutsche Wissenschaftler im Ausland
DAAD/DZHW Geförderte Gastwissenschaftler Jährlich Abfrage bei relevanten Förderorganisationen
DAAD Erasmus-Statistik (Gastdozenten) Jährlich Vollerhebung
Nationale Statistikämter in anderen wichtigen Gastländern (AUT, BEL, FRA, GBR, NLD, USA) Hochschulpersonalstatistik Jährlich
Unterschiedliche Definitionen der erfassten Wissen-schaftler und Hochschulen und unterschiedlicher Umfang der Erhebungen
Internationale Wissenschaftlermobilität und -kooperation
EU-Büro des BMBF Vertragsdatenbank zu EU-Forschungs- rahmenprogrammen Jährlich Erfasst Staatsbürgerschaft und Gastland der Geförderten
sowie Kooperationsverbindungen
OECD Studierendenstatistik (internationale Doktoranden) Jährlich Enthält keine Daten zu internationalen Doktoranden
in den USA
OECD Science, Technology and Industry Score-board Alle 2 Jahre Enthält bibliometrische Daten zur Wissenschaftler-
mobilität
National Science Foundation (NSF) Science and Engineering Indicators Alle 2 Jahre Enthält bibliometrische Daten zu internationalen Kopublikationen
5 Wichtige Datenquellen zur Wissenschaftlermobilität Major data sources on academic and researcher mobility
is surveyed and what questions are asked, i.e. which specific variables are collected. The amount of variables available for analysing researcher mobility is thus generally far higher with this method than when evaluating official statistics and publication databases, and this in turn allows for more in-depth and explanatory analyses (e.g. on motivations for and obstacles to mobility among researchers). It is moreover possible to include researchers in these analyses who are covered neither by publication databases nor by official statistics (e.g. researchers in private companies). Finally, international surveys of researchers can ensure that data from different countries is highly internationally comparable. However, surveys require significant effort and therefore cause significant costs. Due to these limitations, regular surveys are relatively infrequent and therefore unsuited as a basis for ongoing statistics on academic and researcher mobility.
Data sources“Wissenschaft weltoffen” uses a range of data sources to provide as comprehensive a picture as possible of academic and researcher mobility in Germany and other countries. The official statistics of the German Federal Statistical Office (Destatis) on foreign academic personnel at state-approved higher education institutions and non-university research institutions and on enrolled international doctoral candidates are
used to record foreign academics and research-ers in Germany. In addition, data from the Erasmus statistics on short-term visits (Erasmus guest lecturers) and information requested by the DAAD and DZHW from relevant funding organisations on funded foreign guest research-ers are analysed. With regard to the Destatis personnel statistics it should be noted that the recorded foreign academics and researchers are not necessarily always actually mobile academics and researchers, as the statistics only record information on citizenship, not on the country where the highest level of education was reached. It is therefore not possible to differentiate, as among foreign students, between Bildungsaus-laender and Bildungsinlaender.
The available data on German academics and researchers abroad are currently still very incomplete, particularly with regard to longer-term visits (qualification- or employment-related international mobility). Short-term visits are covered by the Erasmus statistics on Erasmus guest lecturers and the previously mentioned requests for data from relevant funding orga- nisations. These data are complemented by further requests by the DAAD and DZHW for data on German higher education personnel from the respectively responsible statistical offices in major host countries of German academics and researchers. The employment-related interna-tional mobility analysed here is thus subject to
the respective country-specific definitions and limitations.
Finally, bibliometric data from the OECD and the American National Science Foundation, OECD data on international doctoral candidates worldwide and funding data from the contract database on the EU Framework Programme are used to analyse international academic and researcher mobility.
w i sse n sc h a f t w e lto f f e n 201716
internationale akademische mobilitätund transnationale bildung
2014 waren laut UNESCO rund 4,3 Millionen Studierende außerhalb ihres Heimatlandes eingeschrieben. Dies entspricht einem Anstieg von ca. 7,5% im Vergleich zum Vorjahr. Innerhalb der letzten zehn Jahre hat die Zahl der international mobilen Studierenden um 1,6 Millionen zugenommen.
Bei den Gastregionen dominiert nach wie vor Westeuropa (33%), gefolgt von Nordamerika (23%) sowie Asien und Pazifik (19%). Bei den Herkunftsregionen stellt die Region Asien und
Pazifik den größten Anteil der internationalen Studierenden (40%), gefolgt von Westeuropa sowie Nordafrika und Nahost (jeweils 13%).
Die USA sind mit rund 842.000 Studierenden aus dem Aus-land das mit Abstand wichtigste Gastland für internationale Studierende. Es folgen Großbritannien (429.000), Australien (266.000), Frankreich (235.000) und Deutschland (219.000).
Die USA sind nicht nur das wichtigste Gastland international mobiler Wissenschaftler, sondern gleichzeitig auch das wich-tigste Herkunftsland. Im Zeitraum 1996 bis 2013 entfielen rund 30% aller bibliometrisch erfassten Einreisemobilität sowie so-wie 28% aller Ausreisemobilität von Wissenschaftlern auf die USA als Gast- bzw. Herkunftsland.
Mit deutlichem Abstand folgen als Gastländer Großbritannien (10%), Deutschland (7%), China (6%), und Frankreich (6%), bei den Herkunftsländern Großbritannien (12%), Deutschland (8%), Kanada (6%) und Frankreich (5%). China (2%) spielt bei den Herkunftsländern noch eine vergleichsweise geringe Rolle.
Auch für internationale Doktoranden ist die USA das wichtigste Gastland mit 115.000 Nachwuchsforschern im Jahr 2014. Als wichtigstes Herkunftsland dominiert China mit 70.000 inter- nationalen Doktoranden. Prozentual gesehen sind die höchsten Anteile an internationalen Doktoranden in Neuseeland (45%), der Schweiz (53%) und Luxemburg (85%) zu verzeichnen. Betrachtet man den Anteil auslandsmobiler Doktoranden an allen Doktoranden aus den jeweiligen Herkunftsländern, steht ebenfalls Luxemburg an der Spitze (75%), gefolgt von Chile (28%) und Italien (24%).
Deutsche Hochschulen sind mit TNB-Angeboten weltweit auf vier Kontinenten, in 34 Ländern und an über 60 Standorten vertreten, an denen sie insgesamt 274 grundständige und post-graduale Studiengänge anbieten. Insgesamt entwickelt sich der TNB-Bereich seit Jahren sehr dynamisch.
Im Studienjahr 2017 stieg die Zahl der Studierenden insgesamt auf 31.330 Einschreibungen in deutschen TNB-Angeboten. Dabei ist in den letzten beiden Jahren ein durchschnittliches Wachstum der Immatrikulationen von ca. 10% zu verzeichnen.
64% der erfassten TNB-Studierenden entfallen auf die binatio- nale Hochschulen German University in Cairo (GUC), der German Jordanian University (GJU) in Amman, der Vietnamese German University (VGU) in Ho Chi Minh City und der German University of Technology (GUtech) in Maskat, Oman.
In über der Hälfte der erfassten TNB-Studiengänge erwerben die Studierenden mit dem Studienabschluss das Zeugnis einer deutschen Hochschule. 76% der TNB-Studierenden erwerben Sprachkenntnisse in Deutsch als Teil ihres Pflichtcurriculums. Studienbezogene Aufenthalte in Deutschland sind in 42% der erfassten Studiengänge Teil des curricularen Pflichtprogramms.
i n t e r n at i o n a l e s t u d i e r e n d e n m o b i l i tät
i n t e r n at i o n a l e w i s s e n s c h a f t l e r m o b i l i tät
t r a n s n at i o n a l e b i l d u n g

a | i n t e r n at i o n a l e a k a d e m i sc h e m o b i l i tät u n d t r a n sn at i o n a l e b i l d u n g | i n t e r n at i o n a l ac a d e m i c m o b i l i t y a n d t r a n sn at i o n a l e d u c at i o n 17
Ainternational academic mobility and transnational education
t r a n s n at i o n a l e d u c at i o n
i n t e r n at i o n a l s t u d e n t m o b i l i t y
i n t e r n at i o n a l m o b i l i t y o f a c a d e m i c s a n d r e s e a r c h e r s
According to UNESCO, around 4.3 million students were enrolled outside their home countries in 2014. This corresponds to an increase of approx. 7.5% in comparison with the previous year. Over the past ten years, the number of internationally mobile students has grown by 1.6 million.
Western Europe (33%) is still the leading host region, followed by North America (23%) and Asia and Pacific (19%). Among the regions of
origin, the Asia and Pacific region accounts for the largest proportion of international students (40%), followed by Western Europe and North Africa/Middle East (13% each).
With around 842,000 foreign students, the USA is by far the most important host country for international students, followed by the UK (429,000), Australia (266,000), France (235,000) and Germany (219,000).
The USA is not only the most important host country for internationally mobile academics, but is, simultaneously, the most prominent count-ry of origin. Between 1996 and 2013, approx. 30% of all bibliometrically collected data on incoming mobility and 28% of all outgoing mobility of academics was attributable to the USA as a host country or country of origin.
The UK (10%), Germany (7%), China (6%) and France (6%) followed at a significant distance as host countries, while, in the case of the countries of origin, the UK (12%), Germany (8%), Canada (6%) and France (5%) all tailed the USA. With just 2 %, China still plays a com- paratively minor role as far as countries of origin are concerned.
The USA is also the most significant host country for international doctoral candidates, with 115,000 junior researchers in 2014. With 70,000 international doctoral candidates, China dominates as the most important country of origin. In percentage terms, the highest propor-tions of international doctoral candidates pursue their studies in New Zealand (45%), Switzerland (53%) and Luxembourg (85%). An ana-lysis of the proportion of internationally mobile doctoral candidates among all doctoral candidates from the respective countries of origin sees Luxembourg once more leading the group (75%), followed by Chile (28%) and Italy (24%).
As far as TNE offerings are concerned, German universities are represented globally, on four continents, in 34 countries and at over 60 locations, providing a total of 274 undergraduate and postgraduate courses. The field of TNE has witnessed dynamic developments in recent years.
In the academic year 2017, the number of students interested in German TNE offerings increased to 31,330 enrolments. Additionally, an average growth in enrolments of approx. 10% has been observed in the last two years.
64% of the TNE students surveyed are enrolled at the following bi-national universities: the German University in Cairo (GUC), the German Jordanian University (GJU) in Amman, the Vietnamese German University (VGU) in Ho Chi Minh City and the German University of Technology (GUtech) in Muscat, Oman.
On over half the surveyed TNE courses, students are awarded a certifi-cate from a German higher education institution when they graduate. 76% of TNE students gain German language skills as part of their mandatory curriculum. Study-related visits to Germany are part of the mandatory curriculum in 42% of the courses surveyed.
w i sse n sc h a f t w e lto f f e n 201718
a u s l ä n d i s c h e s t u d i e r e n d e | f o r e i g n s t u d e n t si . i n t e r n at i o n a l e s t u d i e r e n d e n m o b i l i tät | i n t e r n at i o n a l s t u d e n t m o b i l i t y
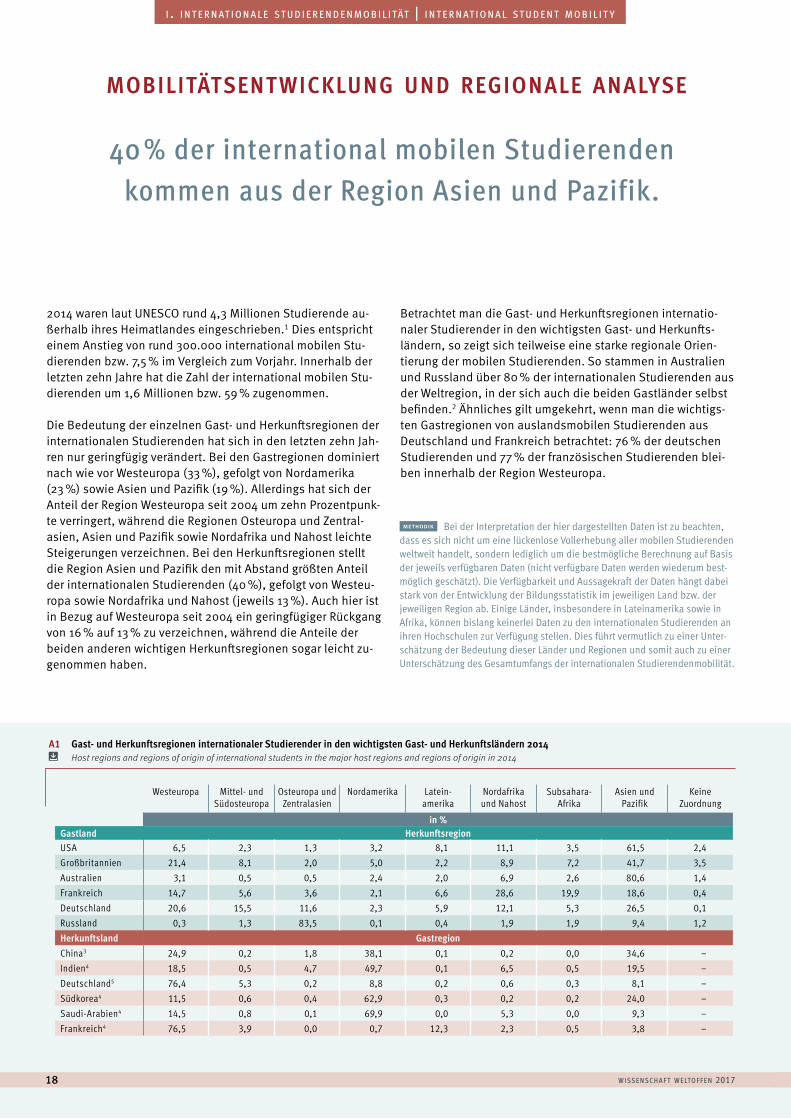
2014 waren laut UNESCO rund 4,3 Millionen Studierende au-ßerhalb ihres Heimatlandes eingeschrieben.1 Dies entspricht einem Anstieg von rund 300.000 international mobilen Stu-dierenden bzw. 7,5 % im Vergleich zum Vorjahr. Innerhalb der letzten zehn Jahre hat die Zahl der international mobilen Stu-dierenden um 1,6 Millionen bzw. 59 % zugenommen.
Die Bedeutung der einzelnen Gast- und Herkunftsregionen der internationalen Studierenden hat sich in den letzten zehn Jah-ren nur geringfügig verändert. Bei den Gastregionen dominiert nach wie vor Westeuropa (33 %), gefolgt von Nordamerika (23 %) sowie Asien und Pazifik (19 %). Allerdings hat sich der Anteil der Region Westeuropa seit 2004 um zehn Prozentpunk-te verringert, während die Regionen Osteuropa und Zentral-asien, Asien und Pazifik sowie Nordafrika und Nahost leichte Steigerungen verzeichnen. Bei den Herkunftsregionen stellt die Region Asien und Pazifik den mit Abstand größten Anteil der internationalen Studierenden (40 %), gefolgt von Westeu-ropa sowie Nordafrika und Nahost (jeweils 13 %). Auch hier ist in Bezug auf Westeuropa seit 2004 ein geringfügiger Rückgang von 16 % auf 13 % zu verzeichnen, während die Anteile der beiden anderen wichtigen Herkunftsregionen sogar leicht zu-genommen haben.
Betrachtet man die Gast- und Herkunftsregionen internatio-naler Studierender in den wichtigsten Gast- und Herkunfts-ländern, so zeigt sich teilweise eine starke regionale Orien-tierung der mobilen Studierenden. So stammen in Australien und Russland über 80 % der internationalen Studierenden aus der Weltregion, in der sich auch die beiden Gastländer selbst befinden.2 Ähnliches gilt umgekehrt, wenn man die wichtigs-ten Gastregionen von auslandsmobilen Studierenden aus Deutschland und Frankreich betrachtet: 76 % der deutschen Studierenden und 77 % der französischen Studierenden blei-ben innerhalb der Region Westeuropa.
40 % der international mobilen Studierenden kommen aus der Region Asien und Pazifik.
mobilitätsent wicklung und regionale analyse
methodik Bei der Interpretation der hier dargestellten Daten ist zu beachten, dass es sich nicht um eine lückenlose Vollerhebung aller mobilen Studierenden weltweit handelt, sondern lediglich um die bestmögliche Berechnung auf Basis der jeweils verfügbaren Daten (nicht verfügbare Daten werden wiederum best-möglich geschätzt). Die Verfügbarkeit und Aussagekraft der Daten hängt dabei stark von der Entwicklung der Bildungsstatistik im jeweiligen Land bzw. der jeweiligen Region ab. Einige Länder, insbesondere in Lateinamerika sowie in Afrika, können bislang keinerlei Daten zu den internationalen Studierenden an ihren Hochschulen zur Verfügung stellen. Dies führt vermutlich zu einer Unter- schätzung der Bedeutung dieser Länder und Regionen und somit auch zu einer Unterschätzung des Gesamtumfangs der internationalen Studierendenmobilität.
A1 Gast- und Herkunftsregionen internationaler Studierender in den wichtigsten Gast- und Herkunftsländern 2014 Host regions and regions of origin of international students in the major host regions and regions of origin in 2014
Westeuropa Mittel- und Südosteuropa
Osteuropa und Zentralasien
Nordamerika Latein- amerika
Nordafrika und Nahost
Subsahara-Afrika
Asien und Pazifik
Keine Zuordnung
in %Gastland HerkunftsregionUSA 6,5 2,3 1,3 3,2 8,1 11,1 3,5 61,5 2,4Großbritannien 21,4 8,1 2,0 5,0 2,2 8,9 7,2 41,7 3,5Australien 3,1 0,5 0,5 2,4 2,0 6,9 2,6 80,6 1,4Frankreich 14,7 5,6 3,6 2,1 6,6 28,6 19,9 18,6 0,4Deutschland 20,6 15,5 11,6 2,3 5,9 12,1 5,3 26,5 0,1Russland 0,3 1,3 83,5 0,1 0,4 1,9 1,9 9,4 1,2Herkunftsland GastregionChina3 24,9 0,2 1,8 38,1 0,1 0,2 0,0 34,6 –Indien4 18,5 0,5 4,7 49,7 0,1 6,5 0,5 19,5 –Deutschland5 76,4 5,3 0,2 8,8 0,2 0,6 0,3 8,1 –Südkorea4 11,5 0,6 0,4 62,9 0,3 0,2 0,2 24,0 –Saudi-Arabien4 14,5 0,8 0,1 69,9 0,0 5,3 0,0 9,3 –Frankreich4 76,5 3,9 0,0 0,7 12,3 2,3 0,5 3,8 –
a | i n t e r n at i o n a l e a k a d e m i sc h e m o b i l i tät u n d t r a n sn at i o n a l e b i l d u n g | i n t e r n at i o n a l ac a d e m i c m o b i l i t y a n d t r a n sn at i o n a l e d u c at i o n 19
0
1
2
3
4
50
20
40
60
80
100
120
0
20
40
60
80
100
120
West-, Nord- und Südeuropa Mittel- und Südosteuropa Osteuropa, Zentralasien und Südkaukasus
Nordamerika Lateinamerika
2004
16241
2553
43
18241
2463
42
1934223
74
38
21
352
22
64
37
20
372
22
75
36
19
372
23
85
33
38
911
746
10
16
39
911
7479
15
40
9
117489
13
40
911
7388
14
40
8
126388
14
40
8
13
63
107
13
2006 2008 2010 2012 2014
2004 2006 2008 2010 2012 2014
2,72,9
3,3
3,74,0
4,3
2,72,9
3,3
3,74,0
4,3
Nahost, Nordafrika Afrika, Subsahara Asien, Pazifik
Angaben in %
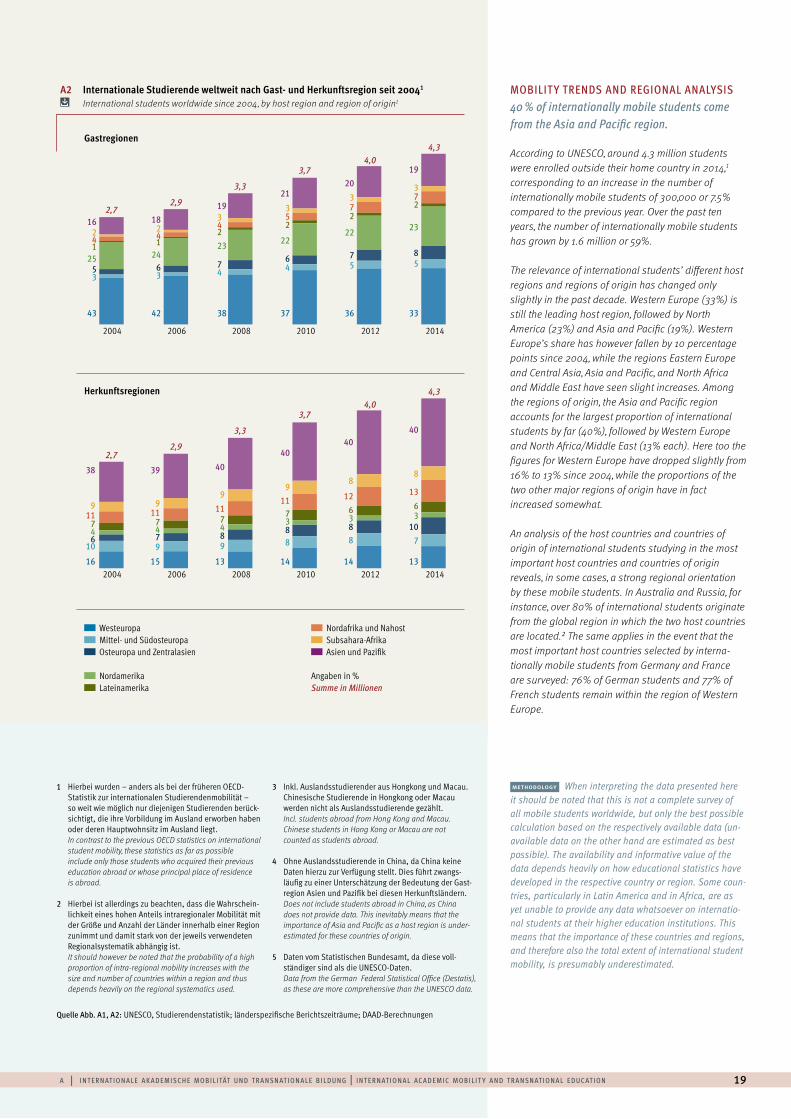
MOBILIT Y TRENDS AND REGIONAL ANALYSIS 40 % of internationally mobile students come from the Asia and Pacific region.
A2 Internationale Studierende weltweit nach Gast- und Herkunftsregion seit 20041 International students worldwide since 2004, by host region and region of origin1
According to UNESCO, around 4.3 million students were enrolled outside their home country in 2014,1 corresponding to an increase in the number of internationally mobile students of 300,000 or 7.5% compared to the previous year. Over the past ten years, the number of internationally mobile students has grown by 1.6 million or 59%.
The relevance of international students’ different host regions and regions of origin has changed only slightly in the past decade. Western Europe (33%) is still the leading host region, followed by North America (23%) and Asia and Pacific (19%). Western Europe’s share has however fallen by 10 percentage points since 2004, while the regions Eastern Europe and Central Asia, Asia and Pacific, and North Africa and Middle East have seen slight increases. Among the regions of origin, the Asia and Pacific region accounts for the largest proportion of international students by far (40%), followed by Western Europe and North Africa/Middle East (13% each). Here too the figures for Western Europe have dropped slightly from 16% to 13% since 2004, while the proportions of the two other major regions of origin have in fact increased somewhat.
An analysis of the host countries and countries of origin of international students studying in the most important host countries and countries of origin reveals, in some cases, a strong regional orientation by these mobile students. In Australia and Russia, for instance, over 80% of international students originate from the global region in which the two host countries are located.2 The same applies in the event that the most important host countries selected by interna-tionally mobile students from Germany and France are surveyed: 76% of German students and 77% of French students remain within the region of Western Europe.
methodology When interpreting the data presented here it should be noted that this is not a complete survey of all mobile students worldwide, but only the best possible calculation based on the respectively available data (un-available data on the other hand are estimated as best possible). The availability and informative value of the data depends heavily on how educational statistics have developed in the respective country or region. Some coun-tries, particularly in Latin America and in Africa, are as yet unable to provide any data whatsoever on internatio-nal students at their higher education institutions. This means that the importance of these countries and regions, and therefore also the total extent of international student mobility, is presumably underestimated.
1 Hierbei wurden – anders als bei der früheren OECD-Statistik zur internationalen Studierendenmobilität – so weit wie möglich nur diejenigen Studierenden berück-sichtigt, die ihre Vorbildung im Ausland erworben haben oder deren Hauptwohnsitz im Ausland liegt. In contrast to the previous OECD statistics on international student mobility, these statistics as far as possible include only those students who acquired their previous education abroad or whose principal place of residence is abroad.
2 Hierbei ist allerdings zu beachten, dass die Wahrschein-lichkeit eines hohen Anteils intraregionaler Mobilität mit der Größe und Anzahl der Länder innerhalb einer Region zunimmt und damit stark von der jeweils verwendeten Regionalsystematik abhängig ist.It should however be noted that the probability of a high proportion of intra-regional mobility increases with the size and number of countries within a region and thus depends heavily on the regional systematics used.
3 Inkl. Auslandsstudierender aus Hongkong und Macau. Chinesische Studierende in Hongkong oder Macau werden nicht als Auslandsstudierende gezählt.Incl. students abroad from Hong Kong and Macau. Chinese students in Hong Kong or Macau are not counted as students abroad.
4 Ohne Auslandsstudierende in China, da China keine Daten hierzu zur Verfügung stellt. Dies führt zwangs-läufig zu einer Unterschätzung der Bedeutung der Gast-region Asien und Pazifik bei diesen Herkunftsländern.Does not include students abroad in China, as China does not provide data. This inevitably means that the importance of Asia and Pacific as a host region is under-estimated for these countries of origin.
5 Daten vom Statistischen Bundesamt, da diese voll-ständiger sind als die UNESCO-Daten.Data from the German Federal Statistical Office (Destatis), as these are more comprehensive than the UNESCO data.
Quelle Abb. A1, A2: UNESCO, Studierendenstatistik; länderspezifische Berichtszeiträume; DAAD-Berechnungen
Westeuropa Mittel- und Südosteuropa Osteuropa und Zentralasien
Nordamerika Lateinamerika
Nordafrika und Nahost Subsahara-Afrika Asien und Pazifik
Angaben in % Summe in Millionen
Gastregionen
Herkunftsregionen
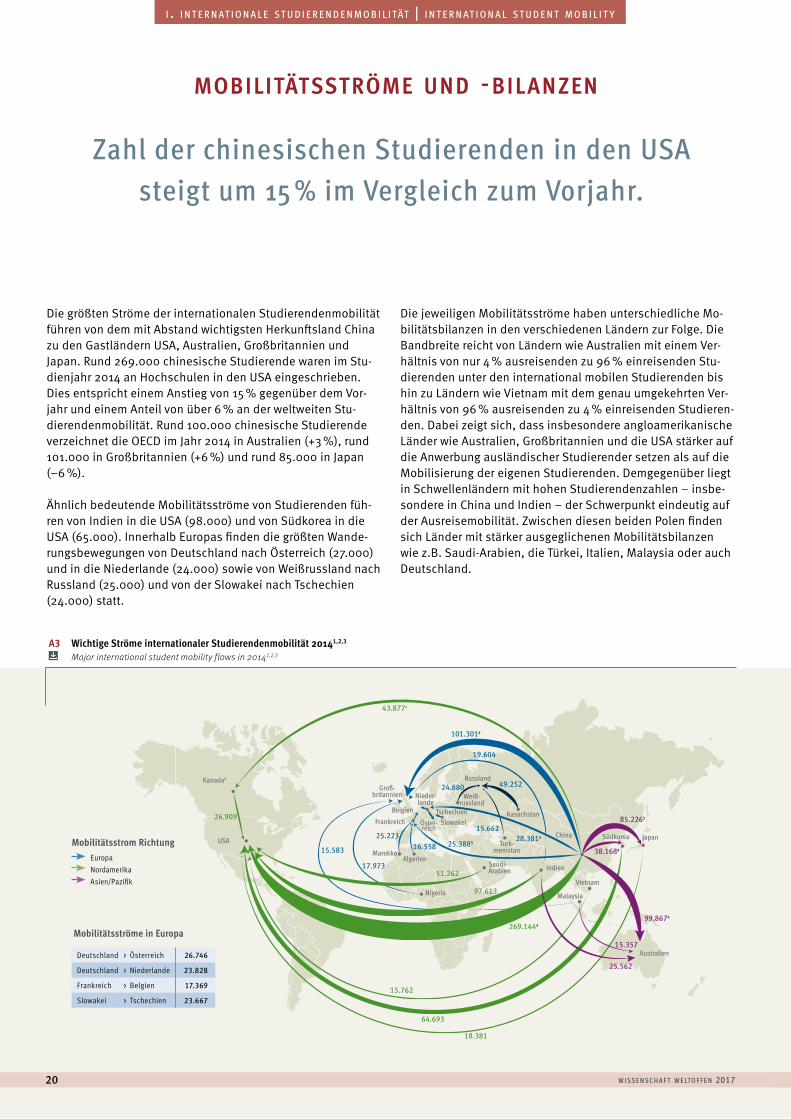
w i sse n sc h a f t w e lto f f e n 201720
a u s l ä n d i s c h e s t u d i e r e n d e | f o r e i g n s t u d e n t si . i n t e r n at i o n a l e s t u d i e r e n d e n m o b i l i tät | i n t e r n at i o n a l s t u d e n t m o b i l i t y
Die größten Ströme der internationalen Studierendenmobilität führen von dem mit Abstand wichtigsten Herkunftsland China zu den Gastländern USA, Australien, Großbritannien und Japan. Rund 269.000 chinesische Studierende waren im Stu- dienjahr 2014 an Hochschulen in den USA eingeschrieben. Dies entspricht einem Anstieg von 15 % gegenüber dem Vor-jahr und einem Anteil von über 6 % an der weltweiten Stu-dierendenmobilität. Rund 100.000 chinesische Studierende verzeichnet die OECD im Jahr 2014 in Australien (+3 %), rund 101.000 in Großbritannien (+6 %) und rund 85.000 in Japan (–6 %).
Ähnlich bedeutende Mobilitätsströme von Studierenden füh-ren von Indien in die USA (98.000) und von Südkorea in die USA (65.000). Innerhalb Europas finden die größten Wande-rungsbewegungen von Deutschland nach Österreich (27.000) und in die Niederlande (24.000) sowie von Weißrussland nach Russland (25.000) und von der Slowakei nach Tschechien (24.000) statt.
Die jeweiligen Mobilitätsströme haben unterschiedliche Mo-bilitätsbilanzen in den verschiedenen Ländern zur Folge. Die Bandbreite reicht von Ländern wie Australien mit einem Ver-hältnis von nur 4 % ausreisenden zu 96 % einreisenden Stu-dierenden unter den international mobilen Studierenden bis hin zu Ländern wie Vietnam mit dem genau umgekehrten Ver-hältnis von 96 % ausreisenden zu 4 % einreisenden Studieren-den. Dabei zeigt sich, dass insbesondere angloamerikanische Länder wie Australien, Großbritannien und die USA stärker auf die Anwerbung ausländischer Studierender setzen als auf die Mobilisierung der eigenen Studierenden. Demgegenüber liegt in Schwellenländern mit hohen Studierendenzahlen – insbe-sondere in China und Indien – der Schwerpunkt eindeutig auf der Ausreisemobilität. Zwischen diesen beiden Polen finden sich Länder mit stärker ausgeglichenen Mobilitätsbilanzen wie z.B. Saudi-Arabien, die Türkei, Italien, Malaysia oder auch Deutschland.
Zahl der chinesischen Studierenden in den USA steigt um 15 % im Vergleich zum Vorjahr.
mobilitätsströme und -bilanzen
USAChina
Australien
Groß-britannien
Nigeria
269.1444
15.762
15.357
25.562
99.8674
85.2265
38.1684
25.223
43.8774
16.558 25.388528.3815
19.604
49.25224.880
15.662
17.973
15.583
101.3014
64.693
18.381
97.613
51.262
26.909
AlgerienMarokko
Saudi-Arabien
Frankreich
Belgien
Malaysia
Vietnam
Indien
JapanSüdkorea
Kasachstan
Turk-menistan
Russland
Öster-reich
SlowakeiTschechien
Nieder-lande
Weiß-russland
Kanada6
Deutschland > Österreich 26.746
Deutschland > Niederlande 23.828
Frankreich > Belgien 17.369
Slowakei > Tschechien 23.667
Mobilitätsströme in Europa
A3 Wichtige Ströme internationaler Studierendenmobilität 20141,2,3 Major international student mobility flows in 20141,2,3
Mobilitätsstrom Richtung EuropaNordamerikaAsien/Pazifik
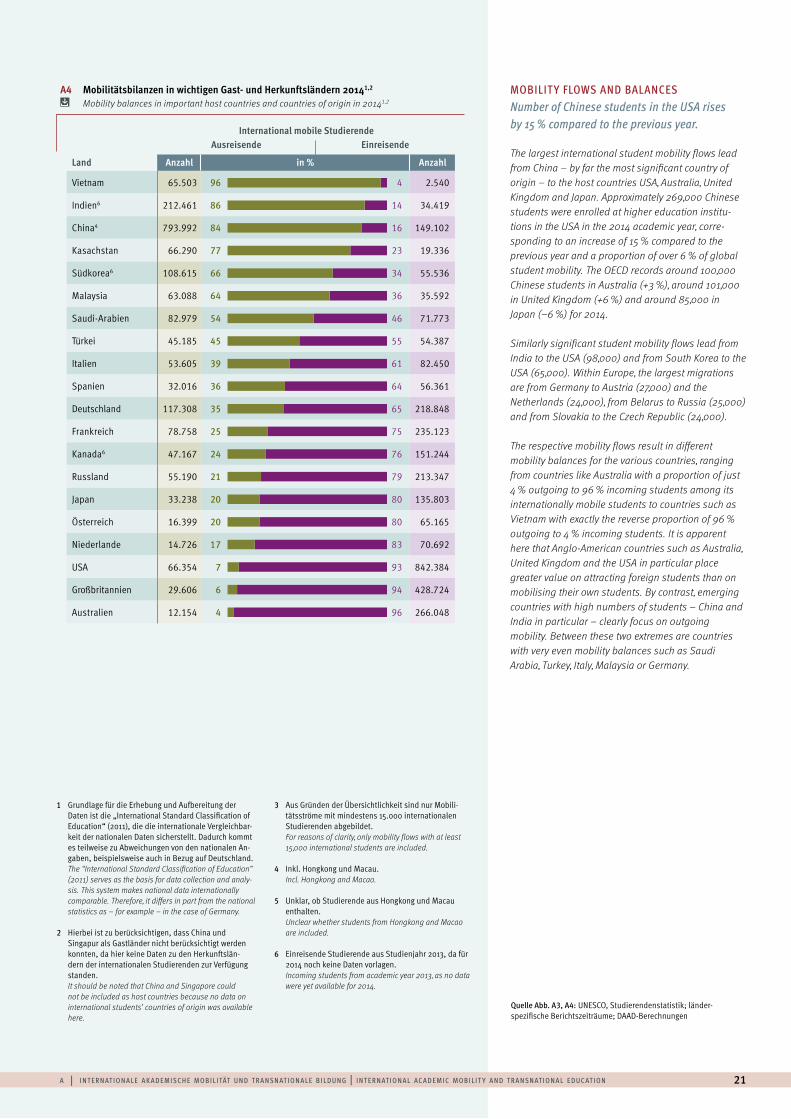
1 Grundlage für die Erhebung und Aufbereitung der Daten ist die „International Standard Classification of Education“ (2011), die die internationale Vergleichbar-keit der nationalen Daten sicherstellt. Dadurch kommt es teilweise zu Abweichungen von den nationalen An-gaben, beispielsweise auch in Bezug auf Deutschland.The “International Standard Classification of Education” (2011) serves as the basis for data collection and analy-sis. This system makes national data internationally comparable. Therefore, it differs in part from the national statistics as – for example – in the case of Germany.
2 Hierbei ist zu berücksichtigen, dass China und Singapur als Gastländer nicht berücksichtigt werden konnten, da hier keine Daten zu den Herkunftslän-dern der internationalen Studierenden zur Verfügung standen.It should be noted that China and Singapore could not be included as host countries because no data on international students’ countries of origin was available here.
3 Aus Gründen der Übersichtlichkeit sind nur Mobili-tätsströme mit mindestens 15.000 internationalen Studierenden abgebildet.For reasons of clarity, only mobility flows with at least 15,000 international students are included.
4 Inkl. Hongkong und Macau.Incl. Hongkong and Macao.
5 Unklar, ob Studierende aus Hongkong und Macau enthalten.Unclear whether students from Hongkong and Macao are included.
6 Einreisende Studierende aus Studienjahr 2013, da für 2014 noch keine Daten vorlagen. Incoming students from academic year 2013, as no data were yet available for 2014.
Quelle Abb. A3, A4: UNESCO, Studierendenstatistik; länder- spezifische Berichtszeiträume; DAAD-Berechnungen
a | i n t e r n at i o n a l e a k a d e m i sc h e m o b i l i tät u n d t r a n sn at i o n a l e b i l d u n g | i n t e r n at i o n a l ac a d e m i c m o b i l i t y a n d t r a n sn at i o n a l e d u c at i o n 21
International mobile StudierendeAusreisende Einreisende
Land Anzahl in % Anzahl
Vietnam 65.503 96 4 2.540
Indien6 212.461 86 14 34.419
China4 793.992 84 16 149.102
Kasachstan 66.290 77 23 19.336
Südkorea6 108.615 66 34 55.536
Malaysia 63.088 64 36 35.592
Saudi-Arabien 82.979 54 46 71.773
Türkei 45.185 45 55 54.387
Italien 53.605 39 61 82.450
Spanien 32.016 36 64 56.361
Deutschland 117.308 35 65 218.848
Frankreich 78.758 25 75 235.123
Kanada6 47.167 24 76 151.244
Russland 55.190 21 79 213.347
Japan 33.238 20 80 135.803
Österreich 16.399 20 80 65.165
Niederlande 14.726 17 83 70.692
USA 66.354 7 93 842.384
Großbritannien 29.606 6 94 428.724
Australien 12.154 4 96 266.048
0 20 40 60 80 100
The largest international student mobility flows lead from China – by far the most significant country of origin – to the host countries USA, Australia, United Kingdom and Japan. Approximately 269,000 Chinese students were enrolled at higher education institu-tions in the USA in the 2014 academic year, corre-sponding to an increase of 15 % compared to the previous year and a proportion of over 6 % of global student mobility. The OECD records around 100,000 Chinese students in Australia (+3 %), around 101,000 in United Kingdom (+6 %) and around 85,000 in Japan (–6 %) for 2014.
Similarly significant student mobility flows lead from India to the USA (98,000) and from South Korea to the USA (65,000). Within Europe, the largest migrations are from Germany to Austria (27,000) and the Netherlands (24,000), from Belarus to Russia (25,000) and from Slovakia to the Czech Republic (24,000).
The respective mobility flows result in different mobility balances for the various countries, ranging from countries like Australia with a proportion of just 4 % outgoing to 96 % incoming students among its internationally mobile students to countries such as Vietnam with exactly the reverse proportion of 96 % outgoing to 4 % incoming students. It is apparent here that Anglo-American countries such as Australia, United Kingdom and the USA in particular place greater value on attracting foreign students than on mobilising their own students. By contrast, emerging countries with high numbers of students – China and India in particular – clearly focus on outgoing mobility. Between these two extremes are countries with very even mobility balances such as Saudi Arabia, Turkey, Italy, Malaysia or Germany.
MOBILIT Y FLOWS AND BALANCES Number of Chinese students in the USA rises by 15 % compared to the previous year.
A4 Mobilitätsbilanzen in wichtigen Gast- und Herkunftsländern 20141,2 Mobility balances in important host countries and countries of origin in 20141,2
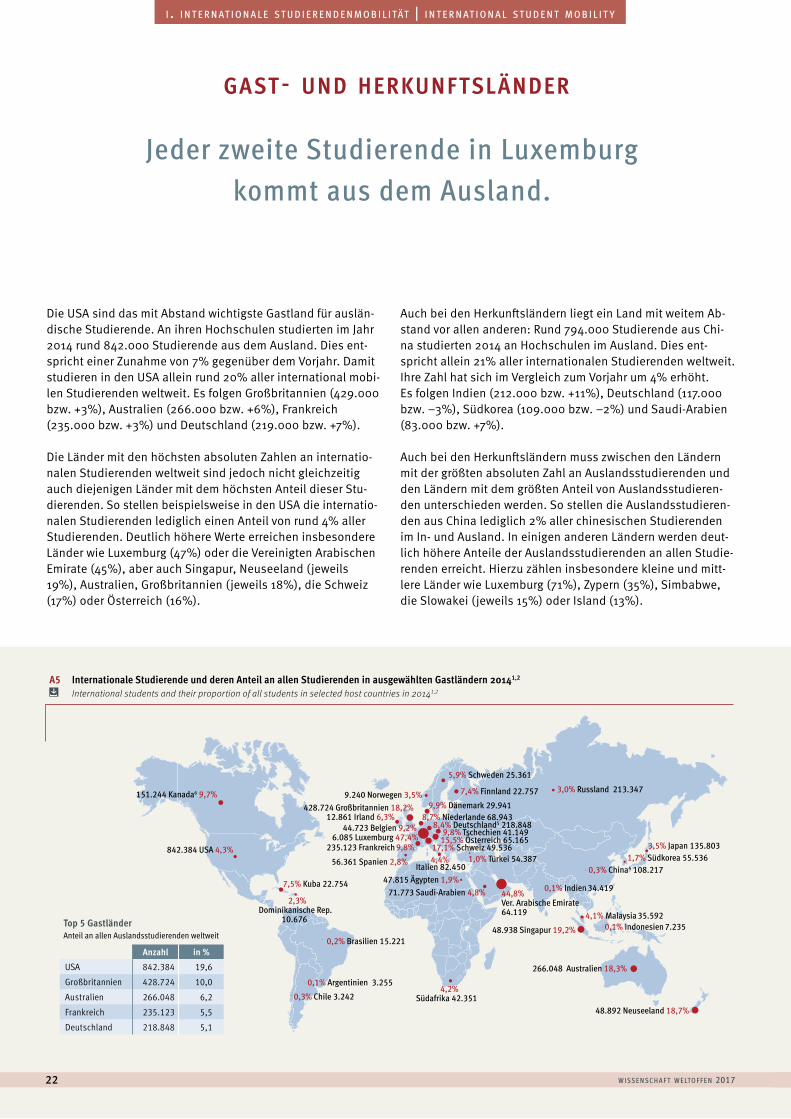
266.048 Australien 18,3%
48.892 Neuseeland 18,7%
3,5% Japan 135.803 1,7% Südkorea 55.536
0,3% China4 108.217
0,1% Indien 34.419
842.384 USA 4,3%
3,0% Russland 213.347
8,4% Deutschland5 218.8489,8% Tschechien 41.149
7,5% Kuba 22.754
8,7% Niederlande 68.9439,9% Dänemark 29.941
15,5% Österreich 65.165
44,8% Ver. Arabische Emirate 64.119
17,1% Schweiz 49.5361,0% Türkei 54.3874,4%
Italien 82.450
4,2%Südafrika 42.351 0,3% Chile 3.242
0,2% Brasilien 15.221
2,3%Dominikanische Rep.
10.676
0,1% Argentinien 3.255
235.123 Frankreich 9,8%
44.723 Belgien 9,2%
12.861 Irland 6,3%
6.085 Luxemburg 47,4%
56.361 Spanien 2,8%
151.244 Kanada6 9,7% 428.724 Großbritannien 18,2%
9.240 Norwegen 3,5%
5,9% Schweden 25.361
7,4% Finnland 22.757
0,1% Indonesien 7.235 4,1% Malaysia 35.592
71.773 Saudi-Arabien 4,8%
48.938 Singapur 19,2%
47.815 Ägypten 1,9%
w i sse n sc h a f t w e lto f f e n 201722
a u s l ä n d i s c h e s t u d i e r e n d e | f o r e i g n s t u d e n t si . i n t e r n at i o n a l e s t u d i e r e n d e n m o b i l i tät | i n t e r n at i o n a l s t u d e n t m o b i l i t y
Die USA sind das mit Abstand wichtigste Gastland für auslän-dische Studierende. An ihren Hochschulen studierten im Jahr 2014 rund 842.000 Studierende aus dem Ausland. Dies ent-spricht einer Zunahme von 7% gegenüber dem Vorjahr. Damit studieren in den USA allein rund 20% aller international mobi-len Studierenden weltweit. Es folgen Großbritannien (429.000 bzw. +3%), Australien (266.000 bzw. +6%), Frankreich (235.000 bzw. +3%) und Deutschland (219.000 bzw. +7%).
Die Länder mit den höchsten absoluten Zahlen an internatio-nalen Studierenden weltweit sind jedoch nicht gleichzeitig auch diejenigen Länder mit dem höchsten Anteil dieser Stu-dierenden. So stellen beispielsweise in den USA die internatio- nalen Studierenden lediglich einen Anteil von rund 4% aller Studierenden. Deutlich höhere Werte erreichen insbesondere Länder wie Luxemburg (47%) oder die Vereinigten Arabischen Emirate (45%), aber auch Singapur, Neuseeland (jeweils 19%), Australien, Großbritannien (jeweils 18%), die Schweiz (17%) oder Österreich (16%).
Auch bei den Herkunftsländern liegt ein Land mit weitem Ab-stand vor allen anderen: Rund 794.000 Studierende aus Chi-na studierten 2014 an Hochschulen im Ausland. Dies ent-spricht allein 21% aller internationalen Studierenden weltweit. Ihre Zahl hat sich im Vergleich zum Vorjahr um 4% erhöht. Es folgen Indien (212.000 bzw. +11%), Deutschland (117.000 bzw. –3%), Südkorea (109.000 bzw. –2%) und Saudi-Arabien (83.000 bzw. +7%).
Auch bei den Herkunftsländern muss zwischen den Ländern mit der größten absoluten Zahl an Auslandsstudierenden und den Ländern mit dem größten Anteil von Auslandsstudieren-den unterschieden werden. So stellen die Auslandsstudieren-den aus China lediglich 2% aller chinesischen Studierenden im In- und Ausland. In einigen anderen Ländern werden deut-lich höhere Anteile der Auslandsstudierenden an allen Studie-renden erreicht. Hierzu zählen insbesondere kleine und mitt-lere Länder wie Luxemburg (71%), Zypern (35%), Simbabwe, die Slowakei (jeweils 15%) oder Island (13%).
Jeder zweite Studierende in Luxemburg kommt aus dem Ausland.
gast- und herkunftsländer
A5 Internationale Studierende und deren Anteil an allen Studierenden in ausgewählten Gastländern 20141,2 International students and their proportion of all students in selected host countries in 20141,2
Top 5 Gastländer Anteil an allen Auslandsstudierenden weltweit
Anzahl in %USA 842.384 19,6
Großbritannien 428.724 10,0
Australien 266.048 6,2
Frankreich 235.123 5,5
Deutschland 218.848 5,1
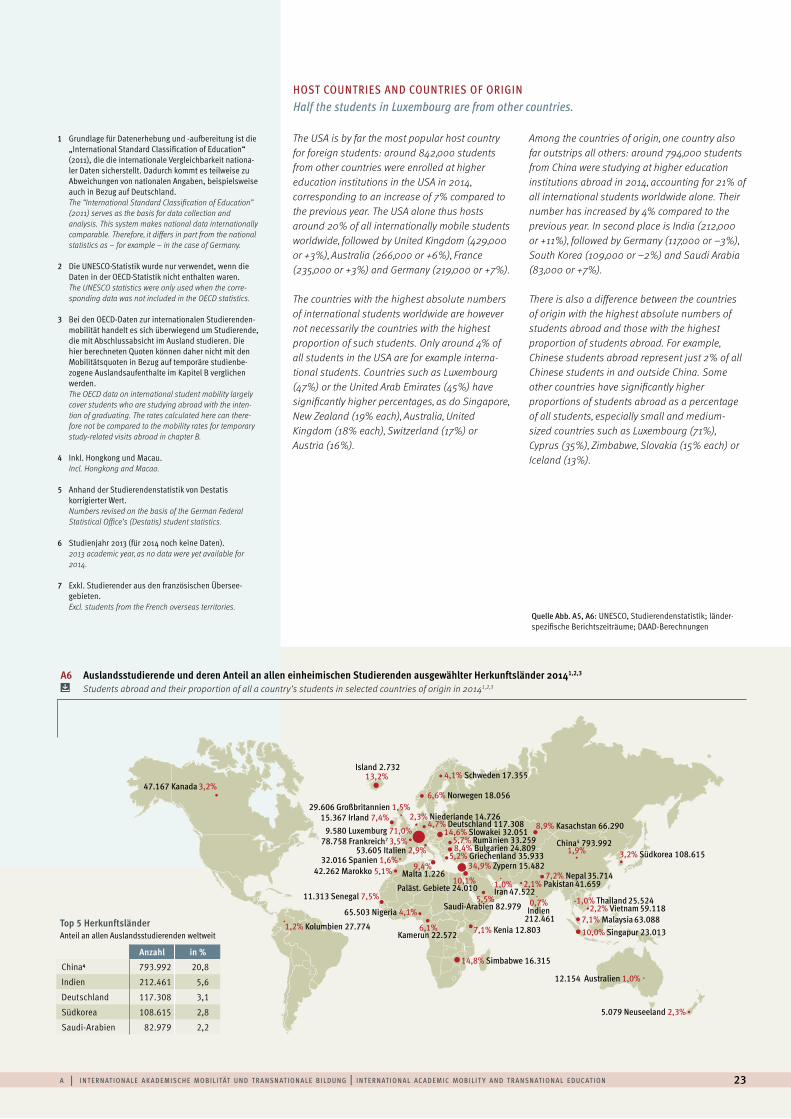
12.154 Australien 1,0%
5.079 Neuseeland 2,3%
3,2% Südkorea 108.615 China4 793.992
1,9%
7,2% Nepal 35.714 2,1% Pakistan 41.6591,0%
Iran 47.5220,7%
Indien 212.461
2,2% Vietnam 59.118 1,0% Thailand 25.524
4,7% Deutschland 117.3082,3% Niederlande 14.726
34,9% Zypern 15.482
10,1% Paläst. Gebiete 24.010
8,4% Bulgarien 24.8095,2% Griechenland 35.933
9,4% Malta 1.226
5,7% Rumänien 33.25914,6% Slowakei 32.051
8,9% Kasachstan 66.290
53.605 Italien 2,9%
1,2% Kolumbien 27.774
78.758 Frankreich7 3,5%
15.367 Irland 7,4%9.580 Luxemburg 71,0%
32.016 Spanien 1,6%
47.167 Kanada 3,2%
29.606 Großbritannien 1,5%
4,1% Schweden 17.355
6,6% Norwegen 18.056
7,1% Malaysia 63.088 10,0% Singapur 23.013
5,5%Saudi-Arabien 82.979
Island 2.73213,2%
14,8% Simbabwe 16.315
7,1% Kenia 12.803 6,1%Kamerun 22.572
42.262 Marokko 5,1%
11.313 Senegal 7,5%
65.503 Nigeria 4,1%
1 Grundlage für Datenerhebung und -aufbereitung ist die „International Standard Classification of Education“ (2011), die die internationale Vergleichbarkeit nationa-ler Daten sicherstellt. Dadurch kommt es teilweise zu Abweichungen von nationalen Angaben, beispielsweise auch in Bezug auf Deutschland.The “International Standard Classification of Education” (2011) serves as the basis for data collection and analysis. This system makes national data internationally comparable. Therefore, it differs in part from the national statistics as – for example – in the case of Germany.
2 Die UNESCO-Statistik wurde nur verwendet, wenn die Daten in der OECD-Statistik nicht enthalten waren.The UNESCO statistics were only used when the corre-sponding data was not included in the OECD statistics.
3 Bei den OECD-Daten zur internationalen Studierenden-mobilität handelt es sich überwiegend um Studierende, die mit Abschlussabsicht im Ausland studieren. Die hier berechneten Quoten können daher nicht mit den Mobilitätsquoten in Bezug auf temporäre studienbe-zogene Auslandsaufenthalte im Kapitel B verglichen werden.The OECD data on international student mobility largely cover students who are studying abroad with the inten-tion of graduating. The rates calculated here can there-fore not be compared to the mobility rates for temporary study-related visits abroad in chapter B.
4 Inkl. Hongkong und Macau.Incl. Hongkong and Macao.
5 Anhand der Studierendenstatistik von Destatis korrigierter Wert.Numbers revised on the basis of the German Federal Statistical Office’s (Destatis) student statistics.
6 Studienjahr 2013 (für 2014 noch keine Daten).2013 academic year, as no data were yet available for 2014.
7 Exkl. Studierender aus den französischen Übersee-gebieten.Excl. students from the French overseas territories.
a | i n t e r n at i o n a l e a k a d e m i sc h e m o b i l i tät u n d t r a n sn at i o n a l e b i l d u n g | i n t e r n at i o n a l ac a d e m i c m o b i l i t y a n d t r a n sn at i o n a l e d u c at i o n 23
A6 Auslandsstudierende und deren Anteil an allen einheimischen Studierenden ausgewählter Herkunftsländer 20141,2,3 Students abroad and their proportion of all a country’s students in selected countries of origin in 20141,2,3
The USA is by far the most popular host country for foreign students: around 842,000 students from other countries were enrolled at higher education institutions in the USA in 2014, corresponding to an increase of 7% compared to the previous year. The USA alone thus hosts around 20% of all internationally mobile students worldwide, followed by United Kingdom (429,000 or +3%), Australia (266,000 or +6%), France (235,000 or +3%) and Germany (219,000 or +7%).
The countries with the highest absolute numbers of international students worldwide are however not necessarily the countries with the highest proportion of such students. Only around 4% of all students in the USA are for example interna-tional students. Countries such as Luxembourg (47%) or the United Arab Emirates (45%) have significantly higher percentages, as do Singapore, New Zealand (19% each), Australia, United Kingdom (18% each), Switzerland (17%) or Austria (16%).
Among the countries of origin, one country also far outstrips all others: around 794,000 students from China were studying at higher education institutions abroad in 2014, accounting for 21% of all international students worldwide alone. Their number has increased by 4% compared to the previous year. In second place is India (212,000 or +11%), followed by Germany (117,000 or –3%), South Korea (109,000 or –2%) and Saudi Arabia (83,000 or +7%).
There is also a difference between the countries of origin with the highest absolute numbers of students abroad and those with the highest proportion of students abroad. For example, Chinese students abroad represent just 2% of all Chinese students in and outside China. Some other countries have significantly higher proportions of students abroad as a percentage of all students, especially small and medium-sized countries such as Luxembourg (71%), Cyprus (35%), Zimbabwe, Slovakia (15% each) or Iceland (13%).
HOST COUNTRIES AND COUNTRIES OF ORIGIN Half the students in Luxembourg are from other countries.
Quelle Abb. A5, A6: UNESCO, Studierendenstatistik; länder-spezifische Berichtszeiträume; DAAD-Berechnungen
Top 5 Herkunftsländer Anteil an allen Auslandsstudierenden weltweit
Anzahl in %China4 793.992 20,8
Indien 212.461 5,6
Deutschland 117.308 3,1
Südkorea 108.615 2,8
Saudi-Arabien 82.979 2,2
w i sse n sc h a f t w e lto f f e n 201724
a u s l ä n d i s c h e s t u d i e r e n d e | f o r e i g n s t u d e n t si . i n t e r n at i o n a l e s t u d i e r e n d e n m o b i l i tät | i n t e r n at i o n a l s t u d e n t m o b i l i t y
In den verschiedenen Herkunftsländern führen historische, sprachliche, geografische, wirtschaftliche und politische Fak-toren zu deutlichen Differenzen bei den bevorzugten Gastlän-dern der auslandsmobilen Studierenden.1 Für Studierende aus China, Indien, Südkorea und Saudi-Arabien stellen die USA jeweils das mit Abstand wichtigste Gastland dar. Besonders deutlich fällt diese Dominanz jedoch für Studierende aus Süd-korea (60%) und Saudi-Arabien (62%) aus.
Die deutschen Studierenden im Ausland verteilen sich demge-genüber relativ ausgeglichen über die fünf wichtigsten Gast-länder Österreich, Niederlande, Großbritannien, Schweiz und USA. Ein ähnlich ausgewogenes Bild zeigt sich bei den be-vorzugten Gastländern der mobilen Studierenden aus Frank-reich. Deutschland und Frankreich sind unter den wichtigsten Herkunftsländern auch die beiden Länder mit den niedrigsten Konzentrationsraten bei den Gastländern: Nur rund 50% der mobilen Studierenden aus Deutschland und Frankreich entfal-len jeweils auf die drei wichtigsten Gastländer. Dieser Anteil fällt für Studierende aus China (59%), Indien (67%) und insbe-sondere Saudi- Arabien und Südkorea (jeweils 79%) deutlich höher aus.
Umgekehrt ergeben sich in den jeweiligen Gastländern be-stimmte Herkunftsprofile innerhalb der Gruppe der internatio-nalen Studierenden. China stellt in fünf der sechs wichtigsten Gastländer weltweit das wichtigste Herkunftsland dar. Beson-ders hohe Anteile haben die chinesischen Studierenden dabei in Australien (38%) und den USA (32%), deutlich geringere da-gegen in Deutschland (13%) und Frankreich (11%). In Russland zeigt sich schließlich ein vollkommen anderes und sehr viel stärker regional dominiertes Herkunftsprofil der internatio- nalen Studierenden. Hier stellen Kasachstan, Weißrussland, Turkmenistan, Usbekistan und Aserbaidschan die fünf wich-tigsten Herkunftsländer dar.
Auch bei den Gastländern zeigen sich schließlich wieder un-terschiedlich starke Konzentrationsraten in Bezug auf die wichtigsten Herkunftsländer. So stellen in den USA und Aus-tralien die drei wichtigsten Herkunftsländer bereits über 50% aller internationalen Studierenden, in Russland liegt dieser Anteil bei 42%, in Großbritannien und Frankreich bei 32% bzw. 29% und in Deutschland bei lediglich 22%.
Rund ein Drittel der internationalen Studierenden in Australien und den USA kommt aus China.
gastländer und herkunftsprofile
Historic, linguistic, geographic, economic and political factors lead to clear differences in the preferred host countries of internationally mobile students from the various countries of origin.1 The USA is by far the most popular host country for students from China, India, South Korea and Saudi Arabia; this preference is however especially pronounced among students from South Korea (60%) and Saudi Arabia (62%).
German students abroad on the other hand are distributed fairly evenly over the five most important host countries Austria, the Netherlands, United Kingdom, Switzerland and the USA. The preferences of mobile students from France are similarly balanced. Among the main countries of
origin, Germany and France are also the countries with the lowest rates of concentration in host countries: only around 50% of mobile students from Germany and France are studying in the three respectively most important host countries. For students from China (59%), India (67%) and especially Saudi Arabia and South Korea (79% each) these proportions are significantly higher.
Conversely, certain origin profiles within the group of international students emerge for the various host countries. China is the most important country of origin for five of the six most important host countries. Chinese students account for especially high proportions of foreign students in Australia (38%) and the USA (32%)
but significantly lower proportions in Germany (13%) and France (11%). Finally, international students in Russia have a completely different and far more regionally dominated origin profile; Kazakhstan, Belarus, Turkmenistan, Uzbekistan and Azerbaijan are the five most important countries of origin here.
The host countries in turn also have different concentration rates with regard to the most important countries of origin. In the USA and Australia, the three main countries of origin already account for over 50% of all international students; this proportion is around 42% in Russia, 32% in United Kingdom, 29% in France and just 22% in Germany.
HOST COUNTRIES AND ORIGIN PROFILES Around one third of international students in Australia and the USA come from China.
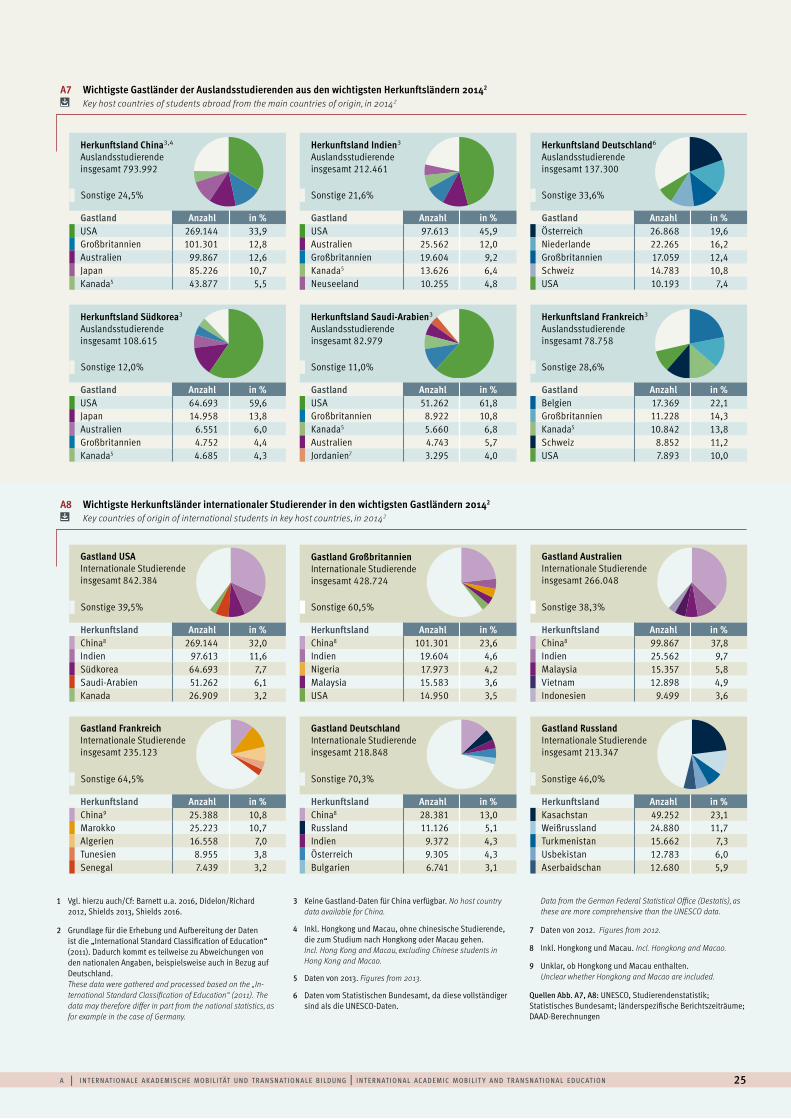
1 Vgl. hierzu auch/Cf: Barnett u.a. 2016, Didelon/Richard 2012, Shields 2013, Shields 2016.
2 Grundlage für die Erhebung und Aufbereitung der Daten ist die „International Standard Classification of Education“ (2011). Dadurch kommt es teilweise zu Abweichungen von den nationalen Angaben, beispielsweise auch in Bezug auf Deutschland.These data were gathered and processed based on the „In-ternational Standard Classification of Education“ (2011). The data may therefore differ in part from the national statistics, as for example in the case of Germany.
3 Keine Gastland-Daten für China verfügbar. No host country data available for China.
4 Inkl. Hongkong und Macau, ohne chinesische Studierende, die zum Studium nach Hongkong oder Macau gehen.Incl. Hong Kong and Macau, excluding Chinese students in Hong Kong and Macao.
5 Daten von 2013. Figures from 2013.
6 Daten vom Statistischen Bundesamt, da diese vollständiger sind als die UNESCO-Daten.
Data from the German Federal Statistical Office (Destatis), as these are more comprehensive than the UNESCO data.
7 Daten von 2012. Figures from 2012.
8 Inkl. Hongkong und Macau. Incl. Hongkong and Macao.
9 Unklar, ob Hongkong und Macau enthalten.Unclear whether Hongkong and Macao are included.
Quellen Abb. A7, A8: UNESCO, Studierendenstatistik; Statistisches Bundesamt; länderspezifische Berichtszeiträume; DAAD-Berechnungen
Herkunftsland China3,4
Auslandsstudierende insgesamt 793.992
Gastland Anzahl in %USA 269.144 33,9Großbritannien 101.301 12,8Australien 99.867 12,6Japan 85.226 10,7Kanada5 43.877 5,5
Gastland USAInternationale Studierende insgesamt 842.384
Herkunftsland Anzahl in %China8 269.144 32,0Indien 97.613 11,6Südkorea 64.693 7,7Saudi-Arabien 51.262 6,1Kanada 26.909 3,2
Herkunftsland Südkorea3
Auslandsstudierende insgesamt 108.615
Gastland Anzahl in %USA 64.693 59,6Japan 14.958 13,8Australien 6.551 6,0Großbritannien 4.752 4,4Kanada5 4.685 4,3
Gastland FrankreichInternationale Studierende insgesamt 235.123
Herkunftsland Anzahl in %China9 25.388 10,8Marokko 25.223 10,7Algerien 16.558 7,0Tunesien 8.955 3,8Senegal 7.439 3,2
Herkunftsland Indien3
Auslandsstudierende insgesamt 212.461
Gastland Anzahl in %USA 97.613 45,9Australien 25.562 12,0Großbritannien 19.604 9,2Kanada5 13.626 6,4Neuseeland 10.255 4,8
Gastland GroßbritannienInternationale Studierendeinsgesamt 428.724
Herkunftsland Anzahl in %China8 101.301 23,6Indien 19.604 4,6Nigeria 17.973 4,2Malaysia 15.583 3,6USA 14.950 3,5
Herkunftsland Saudi-Arabien3
Auslandsstudierende insgesamt 82.979
Gastland Anzahl in %USA 51.262 61,8Großbritannien 8.922 10,8Kanada5 5.660 6,8Australien 4.743 5,7Jordanien7 3.295 4,0
Gastland DeutschlandInternationale Studierendeinsgesamt 218.848
Herkunftsland Anzahl in %China8 28.381 13,0Russland 11.126 5,1Indien 9.372 4,3Österreich 9.305 4,3Bulgarien 6.741 3,1
Herkunftsland Deutschland6
Auslandsstudierende insgesamt 137.300
Gastland Anzahl in %Österreich 26.868 19,6Niederlande 22.265 16,2Großbritannien 17.059 12,4Schweiz 14.783 10,8USA 10.193 7,4
Gastland AustralienInternationale Studierende insgesamt 266.048
Herkunftsland Anzahl in %China8 99.867 37,8Indien 25.562 9,7Malaysia 15.357 5,8Vietnam 12.898 4,9Indonesien 9.499 3,6
Herkunftsland Frankreich3
Auslandsstudierende insgesamt 78.758
Gastland Anzahl in %Belgien 17.369 22,1Großbritannien 11.228 14,3Kanada5 10.842 13,8Schweiz 8.852 11,2USA 7.893 10,0
Gastland RusslandInternationale Studierende insgesamt 213.347
Herkunftsland Anzahl in %Kasachstan 49.252 23,1Weißrussland 24.880 11,7Turkmenistan 15.662 7,3Usbekistan 12.783 6,0Aserbaidschan 12.680 5,9
West-, Nord- und SüdeuropaMittel- und SüdosteuropaOsteuropa, Zentralasien und Südkaukasus
NordamerikaLateinamerika
Nahost, NordafrikaAfrika, Subsahara
Angaben in % Anzahl insgesamt in Mio.
a | i n t e r n at i o n a l e a k a d e m i sc h e m o b i l i tät u n d t r a n sn at i o n a l e b i l d u n g | i n t e r n at i o n a l ac a d e m i c m o b i l i t y a n d t r a n sn at i o n a l e d u c at i o n 25
A7 Wichtigste Gastländer der Auslandsstudierenden aus den wichtigsten Herkunftsländern 20142 Key host countries of students abroad from the main countries of origin, in 20142
A8 Wichtigste Herkunftsländer internationaler Studierender in den wichtigsten Gastländern 20142 Key countries of origin of international students in key host countries, in 20142
Sonstige 24,5%
Sonstige 39,5%
Sonstige 12,0%
Sonstige 64,5%
Sonstige 21,6%
Sonstige 60,5%
Sonstige 11,0%
Sonstige 70,3%
Sonstige 33,6%
Sonstige 38,3%
Sonstige 28,6%
Sonstige 46,0%
West-, Nord- und SüdeuropaMittel- und SüdosteuropaOsteuropa, Zentralasien und Südkaukasus
NordamerikaLateinamerika
Nahost, NordafrikaAfrika, Subsahara
Angaben in % Anzahl insgesamt in Mio.
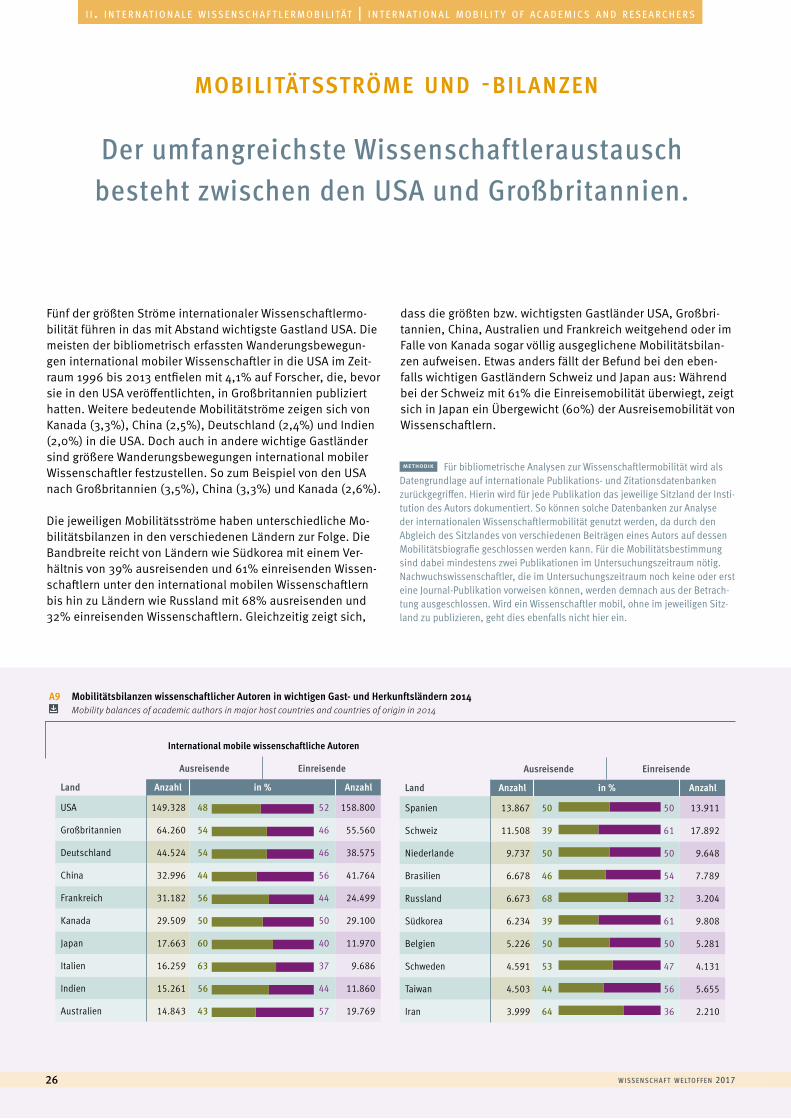
w i sse n sc h a f t w e lto f f e n 201726
a u s l ä n d i s c h e s t u d i e r e n d e | f o r e i g n s t u d e n t si i . i n t e r n at i o n a l e w i s s e n s c h a f t l e r m o b i l i tät | i n t e r n at i o n a l m o b i l i t y o f a c a d e m i c s a n d r e s e a r c h e r s
Fünf der größten Ströme internationaler Wissenschaftlermo-bilität führen in das mit Abstand wichtigste Gastland USA. Die meisten der bibliometrisch erfassten Wanderungsbewegun-gen international mobiler Wissenschaftler in die USA im Zeit-raum 1996 bis 2013 entfielen mit 4,1% auf Forscher, die, bevor sie in den USA veröffentlichten, in Großbritannien publiziert hatten. Weitere bedeutende Mobilitätströme zeigen sich von Kanada (3,3%), China (2,5%), Deutschland (2,4%) und Indien (2,0%) in die USA. Doch auch in andere wichtige Gastländer sind größere Wanderungsbewegungen international mobiler Wissenschaftler festzustellen. So zum Beispiel von den USA nach Großbritannien (3,5%), China (3,3%) und Kanada (2,6%).
Die jeweiligen Mobilitätsströme haben unterschiedliche Mo-bilitätsbilanzen in den verschiedenen Ländern zur Folge. Die Bandbreite reicht von Ländern wie Südkorea mit einem Ver-hältnis von 39% ausreisenden und 61% einreisenden Wissen-schaftlern unter den international mobilen Wissenschaftlern bis hin zu Ländern wie Russland mit 68% ausreisenden und 32% einreisenden Wissenschaftlern. Gleichzeitig zeigt sich,
dass die größten bzw. wichtigsten Gastländer USA, Großbri-tannien, China, Australien und Frankreich weitgehend oder im Falle von Kanada sogar völlig ausgeglichene Mobilitätsbilan-zen aufweisen. Etwas anders fällt der Befund bei den eben-falls wichtigen Gastländern Schweiz und Japan aus: Während bei der Schweiz mit 61% die Einreisemobilität überwiegt, zeigt sich in Japan ein Übergewicht (60%) der Ausreisemobilität von Wissenschaftlern.
Der umfangreichste Wissenschaftleraustausch besteht zwischen den USA und Großbritannien.
mobilitätsströme und -bilanzen
methodik Für bibliometrische Analysen zur Wissenschaftlermobilität wird als Datengrundlage auf internationale Publikations- und Zitationsdatenbanken zurückgegriffen. Hierin wird für jede Publikation das jeweilige Sitzland der Insti-tution des Autors dokumentiert. So können solche Datenbanken zur Analyse der internationalen Wissenschaftlermobilität genutzt werden, da durch den Abgleich des Sitzlandes von verschiedenen Beiträgen eines Autors auf dessen Mobilitätsbiografie geschlossen werden kann. Für die Mobilitätsbestimmung sind dabei mindestens zwei Publikationen im Untersuchungszeitraum nötig. Nachwuchswissenschaftler, die im Untersuchungszeitraum noch keine oder erst eine Journal-Publikation vorweisen können, werden demnach aus der Betrach-tung ausgeschlossen. Wird ein Wissenschaftler mobil, ohne im jeweiligen Sitz-land zu publizieren, geht dies ebenfalls nicht hier ein.
International mobile wissenschaftliche Autoren
Ausreisende Einreisende
Land Anzahl in % Anzahl
USA 149.328 48 52 158.800
Großbritannien 64.260 54 46 55.560
Deutschland 44.524 54 46 38.575
China 32.996 44 56 41.764
Frankreich 31.182 56 44 24.499
Kanada 29.509 50 50 29.100
Japan 17.663 60 40 11.970
Italien 16.259 63 37 9.686
Indien 15.261 56 44 11.860
Australien 14.843 43 57 19.769
Ausreisende Einreisende
Land Anzahl in % Anzahl
Spanien 13.867 50 50 13.911
Schweiz 11.508 39 61 17.892
Niederlande 9.737 50 50 9.648
Brasilien 6.678 46 54 7.789
Russland 6.673 68 32 3.204
Südkorea 6.234 39 61 9.808
Belgien 5.226 50 50 5.281
Schweden 4.591 53 47 4.131
Taiwan 4.503 44 56 5.655
Iran 3.999 64 36 2.210
0 20 40 60 80 100
0 20 40 60 80 100
A9 Mobilitätsbilanzen wissenschaftlicher Autoren in wichtigen Gast- und Herkunftsländern 2014 Mobility balances of academic authors in major host countries and countries of origin in 2014
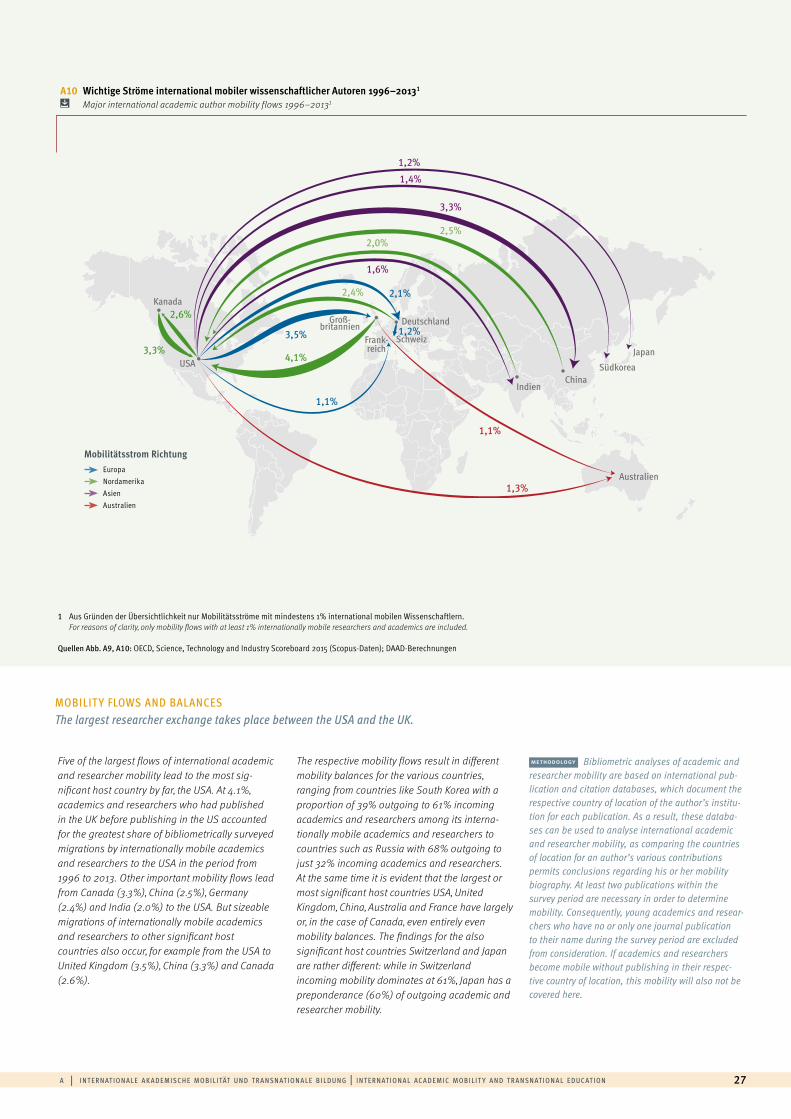
1 Aus Gründen der Übersichtlichkeit nur Mobilitätsströme mit mindestens 1% international mobilen Wissenschaftlern.For reasons of clarity, only mobility flows with at least 1% internationally mobile researchers and academics are included.
Quellen Abb. A9, A10: OECD, Science, Technology and Industry Scoreboard 2015 (Scopus-Daten); DAAD-Berechnungen
a | i n t e r n at i o n a l e a k a d e m i sc h e m o b i l i tät u n d t r a n sn at i o n a l e b i l d u n g | i n t e r n at i o n a l ac a d e m i c m o b i l i t y a n d t r a n sn at i o n a l e d u c at i o n 27
A10 Wichtige Ströme international mobiler wissenschaftlicher Autoren 1996–20131 Major international academic author mobility flows 1996–20131
Five of the largest flows of international academic and researcher mobility lead to the most sig- nificant host country by far, the USA. At 4.1%, academics and researchers who had published in the UK before publishing in the US accounted for the greatest share of bibliometrically surveyed migrations by internationally mobile academics and researchers to the USA in the period from 1996 to 2013. Other important mobility flows lead from Canada (3.3%), China (2.5%), Germany (2.4%) and India (2.0%) to the USA. But sizeable migrations of internationally mobile academics and researchers to other significant host countries also occur, for example from the USA to United Kingdom (3.5%), China (3.3%) and Canada (2.6%).
The respective mobility flows result in different mobility balances for the various countries, ranging from countries like South Korea with a proportion of 39% outgoing to 61% incoming academics and researchers among its interna-tionally mobile academics and researchers to countries such as Russia with 68% outgoing to just 32% incoming academics and researchers. At the same time it is evident that the largest or most significant host countries USA, United Kingdom, China, Australia and France have largely or, in the case of Canada, even entirely even mobility balances. The findings for the also significant host countries Switzerland and Japan are rather different: while in Switzerland incoming mobility dominates at 61%, Japan has a preponderance (60%) of outgoing academic and researcher mobility.
MOBILIT Y FLOWS AND BALANCES The largest researcher exchange takes place between the USA and the UK.
methodology Bibliometric analyses of academic and researcher mobility are based on international pub-lication and citation databases, which document the respective country of location of the author’s institu-tion for each publication. As a result, these databa-ses can be used to analyse international academic and researcher mobility, as comparing the countries of location for an author’s various contributions permits conclusions regarding his or her mobility biography. At least two publications within the survey period are necessary in order to determine mobility. Consequently, young academics and resear-chers who have no or only one journal publication to their name during the survey period are excluded from consideration. If academics and researchers become mobile without publishing in their respec-tive country of location, this mobility will also not be covered here.
USA
China
Australien
Groß-britannien Deutschland
Schweiz3,3%
2,6%
4,1%
3,5%
1,1%
1,3%
1,2%
1,4%
3,3%
2,5%2,0%
2,4%
1,6%
2,1%
1,2%
1,1%
Frank-reich
Indien
Japan
Südkorea
Kanada
Mobilitätsstrom Richtung EuropaNordamerikaAsienAustralien
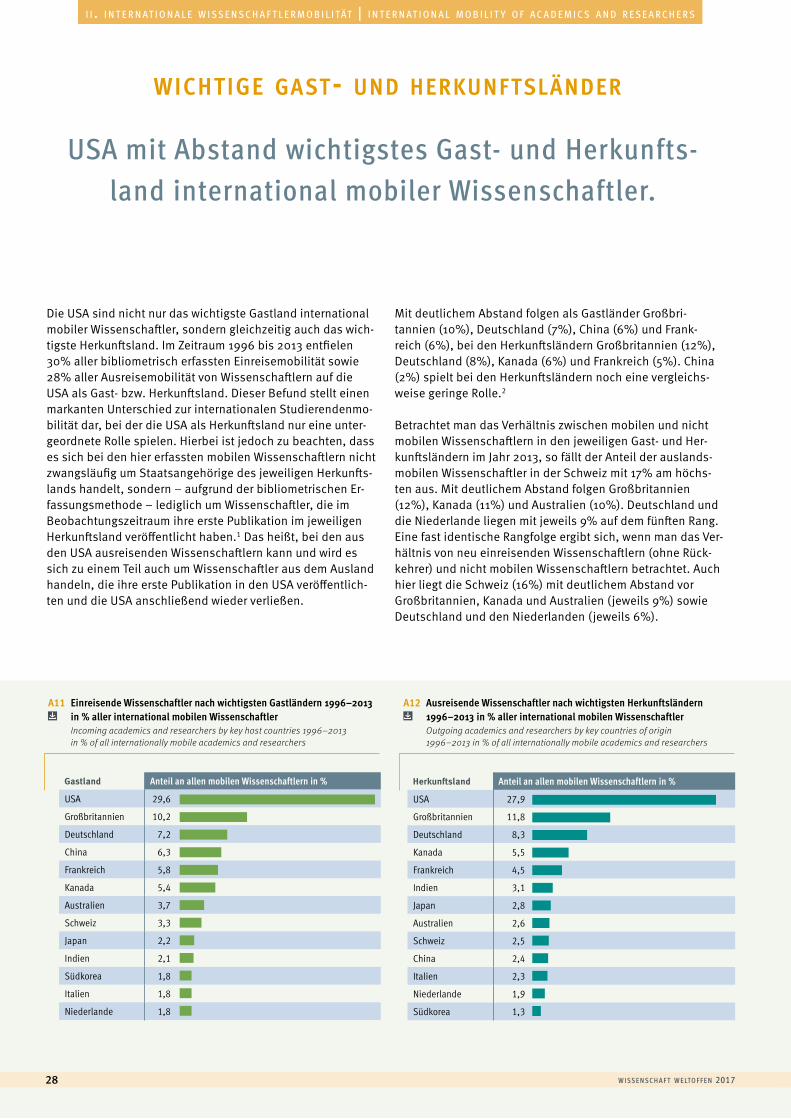
Gastland Anteil an allen mobilen Wissenschaftlern in %
USA 29,6
Großbritannien 10,2
Deutschland 7,2
China 6,3
Frankreich 5,8
Kanada 5,4
Australien 3,7
Schweiz 3,3
Japan 2,2
Indien 2,1
Südkorea 1,8
Italien 1,8
Niederlande 1,8
0 5 10 15 20 25 30
Herkunftsland Anteil an allen mobilen Wissenschaftlern in %
USA 27,9
Großbritannien 11,8
Deutschland 8,3
Kanada 5,5
Frankreich 4,5
Indien 3,1
Japan 2,8
Australien 2,6
Schweiz 2,5
China 2,4
Italien 2,3
Niederlande 1,9
Südkorea 1,3
0 5 10 15 20 25 30
A11 Einreisende Wissenschaftler nach wichtigsten Gastländern 1996–2013 in % aller international mobilen Wissenschaftler Incoming academics and researchers by key host countries 1996–2013 in % of all internationally mobile academics and researchers
A12 Ausreisende Wissenschaftler nach wichtigsten Herkunftsländern 1996–2013 in % aller international mobilen Wissenschaftler Outgoing academics and researchers by key countries of origin 1996–2013 in % of all internationally mobile academics and researchers
w i sse n sc h a f t w e lto f f e n 201728
a u s l ä n d i s c h e s t u d i e r e n d e | f o r e i g n s t u d e n t si i . i n t e r n at i o n a l e w i s s e n s c h a f t l e r m o b i l i tät | i n t e r n at i o n a l m o b i l i t y o f a c a d e m i c s a n d r e s e a r c h e r s
USA mit Abstand wichtigstes Gast- und Herkunfts-land international mobiler Wissenschaftler.
Die USA sind nicht nur das wichtigste Gastland international mobiler Wissenschaftler, sondern gleichzeitig auch das wich-tigste Herkunftsland. Im Zeitraum 1996 bis 2013 entfielen 30% aller bibliometrisch erfassten Einreisemobilität sowie 28% aller Ausreisemobilität von Wissenschaftlern auf die USA als Gast- bzw. Herkunftsland. Dieser Befund stellt einen markanten Unterschied zur internationalen Studierendenmo-bilität dar, bei der die USA als Herkunftsland nur eine unter-geordnete Rolle spielen. Hierbei ist jedoch zu beachten, dass es sich bei den hier erfassten mobilen Wissenschaftlern nicht zwangsläufig um Staatsangehörige des jeweiligen Herkunfts-lands handelt, sondern – aufgrund der bibliometrischen Er-fassungsmethode – lediglich um Wissenschaftler, die im Beobachtungszeitraum ihre erste Publikation im jeweiligen Herkunftsland veröffentlicht haben.1 Das heißt, bei den aus den USA ausreisenden Wissenschaftlern kann und wird es sich zu einem Teil auch um Wissenschaftler aus dem Ausland handeln, die ihre erste Publikation in den USA veröffentlich-ten und die USA anschließend wieder verließen.
Mit deutlichem Abstand folgen als Gastländer Großbri-tannien (10%), Deutschland (7%), China (6%) und Frank-reich (6%), bei den Herkunftsländern Großbritannien (12%), Deutschland (8%), Kanada (6%) und Frankreich (5%). China (2%) spielt bei den Herkunftsländern noch eine vergleichs-weise geringe Rolle.2
Betrachtet man das Verhältnis zwischen mobilen und nicht mobilen Wissenschaftlern in den jeweiligen Gast- und Her-kunftsländern im Jahr 2013, so fällt der Anteil der auslands-mobilen Wissenschaftler in der Schweiz mit 17% am höchs-ten aus. Mit deutlichem Abstand folgen Großbritannien (12%), Kanada (11%) und Australien (10%). Deutschland und die Niederlande liegen mit jeweils 9% auf dem fünften Rang. Eine fast identische Rangfolge ergibt sich, wenn man das Ver-hältnis von neu einreisenden Wissenschaftlern (ohne Rück-kehrer) und nicht mobilen Wissenschaftlern betrachtet. Auch hier liegt die Schweiz (16%) mit deutlichem Abstand vor Großbritannien, Kanada und Australien (jeweils 9%) sowie Deutschland und den Niederlanden (jeweils 6%).
wichtige gast- und herkunftsländer
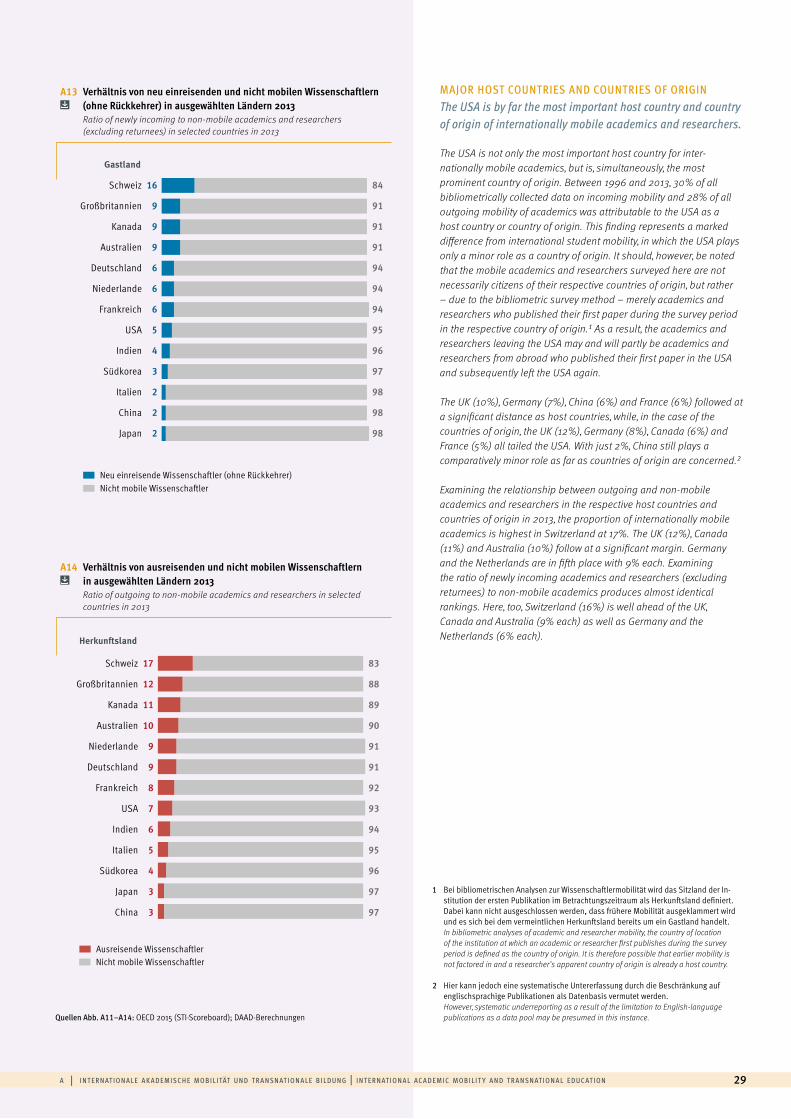
Schweiz
Großbritannien
Kanada
Australien
Niederlande
Deutschland
Frankreich
USA
Indien
Italien
Südkorea
Japan
China
17
12
11
10
9
9
8
7
6
5
4
3
3
83
88
89
90
91
91
92
93
94
95
96
97
97
0,00000016,66666733,33333350,00000066,66666783,333333100,000000
Ausreisende WissenschaftlerNicht mobile Wissenschaftler
Schweiz
Großbritannien
Kanada
Australien
Deutschland
Niederlande
Frankreich
USA
Indien
Südkorea
Italien
China
Japan
16
9
9
9
6
6
6
5
4
3
2
2
2
84
91
91
91
94
94
94
95
96
97
98
98
98
0,00000016,66666733,33333350,00000066,66666783,333333100,000000
Neu einreisende Wissenschaftler (ohne Rückkehrer)Nicht mobile Wissenschaftler
A13 Verhältnis von neu einreisenden und nicht mobilen Wissenschaftlern (ohne Rückkehrer) in ausgewählten Ländern 2013 Ratio of newly incoming to non-mobile academics and researchers (excluding returnees) in selected countries in 2013
A14 Verhältnis von ausreisenden und nicht mobilen Wissenschaftlern in ausgewählten Ländern 2013 Ratio of outgoing to non-mobile academics and researchers in selected countries in 2013
1 Bei bibliometrischen Analysen zur Wissenschaftlermobilität wird das Sitzland der In-stitution der ersten Publikation im Betrachtungszeitraum als Herkunftsland definiert. Dabei kann nicht ausgeschlossen werden, dass frühere Mobilität ausgeklammert wird und es sich bei dem vermeintlichen Herkunftsland bereits um ein Gastland handelt.In bibliometric analyses of academic and researcher mobility, the country of location of the institution at which an academic or researcher first publishes during the survey period is defined as the country of origin. It is therefore possible that earlier mobility is not factored in and a researcher’s apparent country of origin is already a host country.
2 Hier kann jedoch eine systematische Untererfassung durch die Beschränkung auf englischsprachige Publikationen als Datenbasis vermutet werden.However, systematic underreporting as a result of the limitation to English-language publications as a data pool may be presumed in this instance.Quellen Abb. A11–A14: OECD 2015 (STI-Scoreboard); DAAD-Berechnungen
Gastland
Herkunftsland
a | i n t e r n at i o n a l e a k a d e m i sc h e m o b i l i tät u n d t r a n sn at i o n a l e b i l d u n g | i n t e r n at i o n a l ac a d e m i c m o b i l i t y a n d t r a n sn at i o n a l e d u c at i o n 29
The USA is not only the most important host country for inter- nationally mobile academics, but is, simultaneously, the most prominent country of origin. Between 1996 and 2013, 30% of all bibliometrically collected data on incoming mobility and 28% of all outgoing mobility of academics was attributable to the USA as a host country or country of origin. This finding represents a marked difference from international student mobility, in which the USA plays only a minor role as a country of origin. It should, however, be noted that the mobile academics and researchers surveyed here are not necessarily citizens of their respective countries of origin, but rather – due to the bibliometric survey method – merely academics and researchers who published their first paper during the survey period in the respective country of origin.1 As a result, the academics and researchers leaving the USA may and will partly be academics and researchers from abroad who published their first paper in the USA and subsequently left the USA again.
The UK (10%), Germany (7%), China (6%) and France (6%) followed at a significant distance as host countries, while, in the case of the countries of origin, the UK (12%), Germany (8%), Canada (6%) and France (5%) all tailed the USA. With just 2%, China still plays a comparatively minor role as far as countries of origin are concerned.2
Examining the relationship between outgoing and non-mobile academics and researchers in the respective host countries and countries of origin in 2013, the proportion of internationally mobile academics is highest in Switzerland at 17%. The UK (12%), Canada (11%) and Australia (10%) follow at a significant margin. Germany and the Netherlands are in fifth place with 9% each. Examining the ratio of newly incoming academics and researchers (excluding returnees) to non-mobile academics produces almost identical rankings. Here, too, Switzerland (16%) is well ahead of the UK, Canada and Australia (9% each) as well as Germany and the Netherlands (6% each).
MAJOR HOST COUNTRIES AND COUNTRIES OF ORIGIN The USA is by far the most important host country and country of origin of internationally mobile academics and researchers.
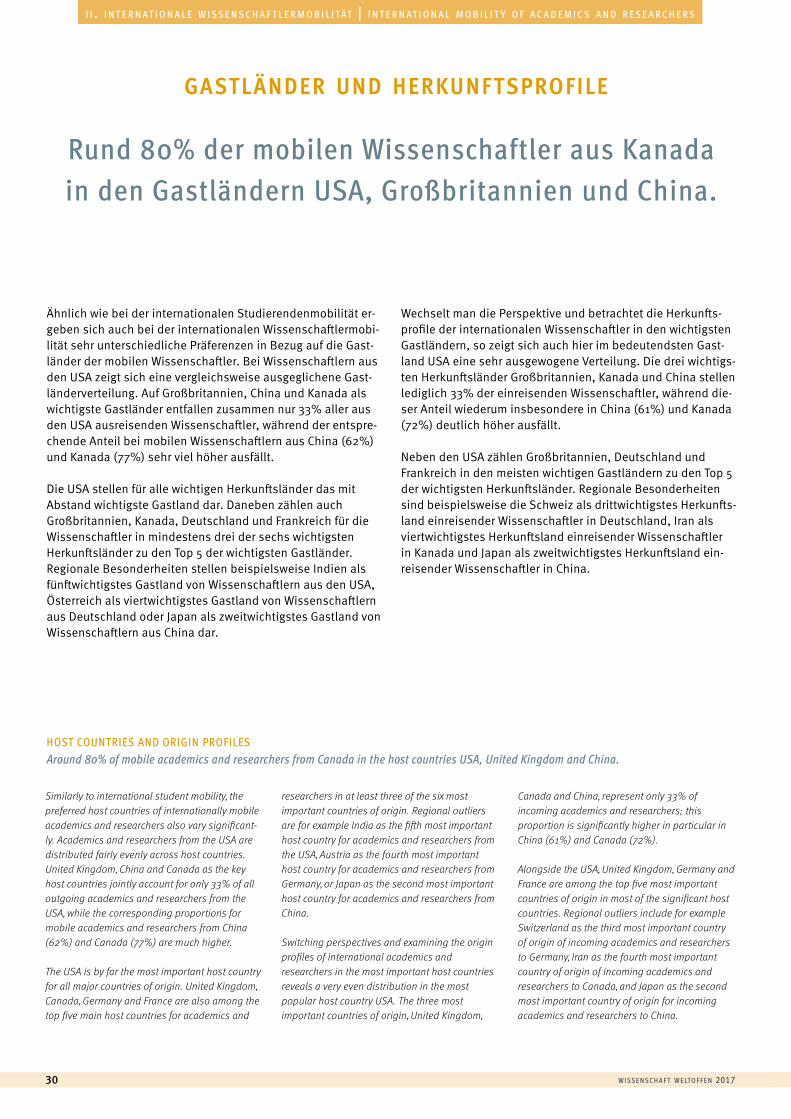
w i sse n sc h a f t w e lto f f e n 201730
a u s l ä n d i s c h e s t u d i e r e n d e | f o r e i g n s t u d e n t si i . i n t e r n at i o n a l e w i s s e n s c h a f t l e r m o b i l i tät | i n t e r n at i o n a l m o b i l i t y o f a c a d e m i c s a n d r e s e a r c h e r s
Ähnlich wie bei der internationalen Studierendenmobilität er-geben sich auch bei der internationalen Wissenschaftlermobi-lität sehr unterschiedliche Präferenzen in Bezug auf die Gast-länder der mobilen Wissenschaftler. Bei Wissenschaftlern aus den USA zeigt sich eine vergleichsweise ausgeglichene Gast-länderverteilung. Auf Großbritannien, China und Kanada als wichtigste Gastländer entfallen zusammen nur 33% aller aus den USA ausreisenden Wissenschaftler, während der entspre-chende Anteil bei mobilen Wissenschaftlern aus China (62%) und Kanada (77%) sehr viel höher ausfällt.
Die USA stellen für alle wichtigen Herkunftsländer das mit Abstand wichtigste Gastland dar. Daneben zählen auch Großbritannien, Kanada, Deutschland und Frankreich für die Wissenschaftler in mindestens drei der sechs wichtigsten Herkunftsländer zu den Top 5 der wichtigsten Gastländer. Regionale Besonderheiten stellen beispielsweise Indien als fünftwichtigstes Gastland von Wissenschaftlern aus den USA, Österreich als viertwichtigstes Gastland von Wissenschaftlern aus Deutschland oder Japan als zweitwichtigstes Gastland von Wissenschaftlern aus China dar.
Wechselt man die Perspektive und betrachtet die Herkunfts-profile der internationalen Wissenschaftler in den wichtigsten Gastländern, so zeigt sich auch hier im bedeutendsten Gast-land USA eine sehr ausgewogene Verteilung. Die drei wichtigs-ten Herkunftsländer Großbritannien, Kanada und China stellen lediglich 33% der einreisenden Wissenschaftler, während die-ser Anteil wiederum insbesondere in China (61%) und Kanada (72%) deutlich höher ausfällt.
Neben den USA zählen Großbritannien, Deutschland und Frankreich in den meisten wichtigen Gastländern zu den Top 5 der wichtigsten Herkunftsländer. Regionale Besonderheiten sind beispielsweise die Schweiz als drittwichtigstes Herkunfts- land einreisender Wissenschaftler in Deutschland, Iran als viertwichtigstes Herkunftsland einreisender Wissenschaftler in Kanada und Japan als zweitwichtigstes Herkunftsland ein-reisender Wissenschaftler in China.
Rund 80% der mobilen Wissenschaftler aus Kanada in den Gastländern USA, Großbritannien und China.
gastländer und herkunftsprofile
Similarly to international student mobility, the preferred host countries of internationally mobile academics and researchers also vary significant-ly. Academics and researchers from the USA are distributed fairly evenly across host countries. United Kingdom, China and Canada as the key host countries jointly account for only 33% of all outgoing academics and researchers from the USA, while the corresponding proportions for mobile academics and researchers from China (62%) and Canada (77%) are much higher.
The USA is by far the most important host country for all major countries of origin. United Kingdom, Canada, Germany and France are also among the top five main host countries for academics and
researchers in at least three of the six most important countries of origin. Regional outliers are for example India as the fifth most important host country for academics and researchers from the USA, Austria as the fourth most important host country for academics and researchers from Germany, or Japan as the second most important host country for academics and researchers from China.
Switching perspectives and examining the origin profiles of international academics and researchers in the most important host countries reveals a very even distribution in the most popular host country USA. The three most important countries of origin, United Kingdom,
Canada and China, represent only 33% of incoming academics and researchers; this proportion is significantly higher in particular in China (61%) and Canada (72%).
Alongside the USA, United Kingdom, Germany and France are among the top five most important countries of origin in most of the significant host countries. Regional outliers include for example Switzerland as the third most important country of origin of incoming academics and researchers to Germany, Iran as the fourth most important country of origin of incoming academics and researchers to Canada, and Japan as the second most important country of origin for incoming academics and researchers to China.
HOST COUNTRIES AND ORIGIN PROFILES Around 80% of mobile academics and researchers from Canada in the host countries USA, United Kingdom and China.
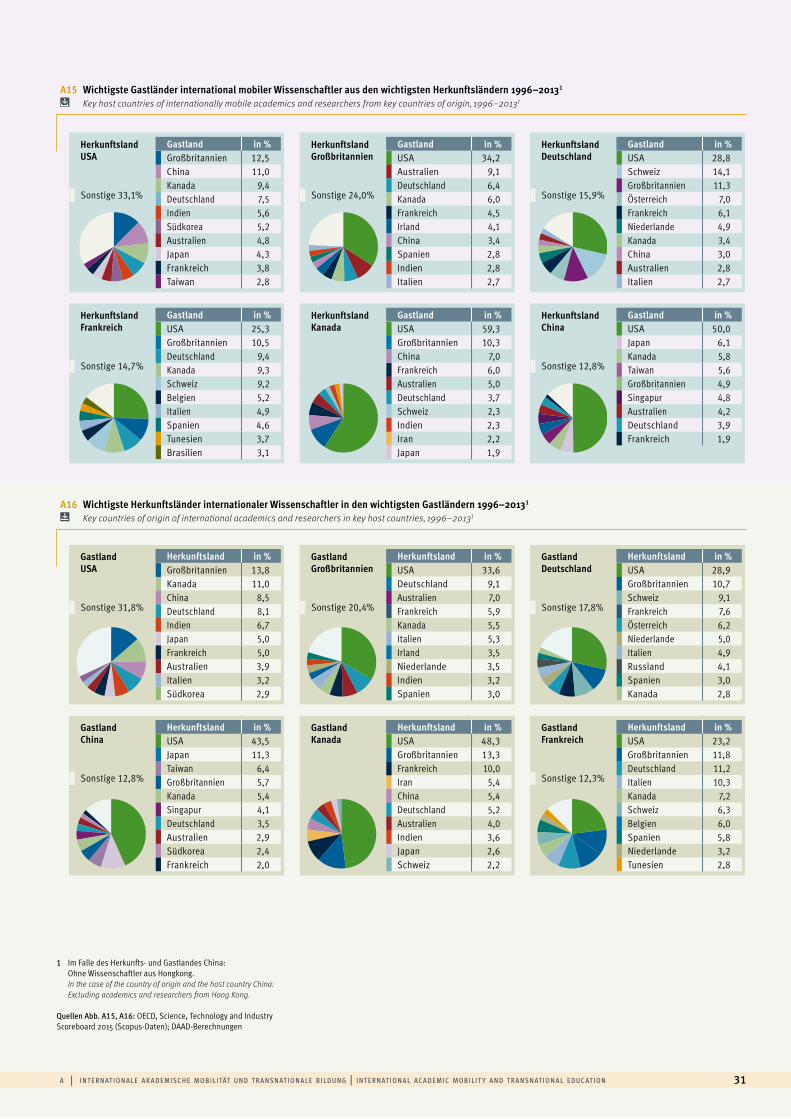
Gastland USA
Herkunftsland in %Großbritannien 13,8Kanada 11,0China 8,5Deutschland 8,1Indien 6,7Japan 5,0Frankreich 5,0Australien 3,9Italien 3,2Südkorea 2,9
Sonstige 31,8%
Gastland China
Herkunftsland in %USA 43,5Japan 11,3Taiwan 6,4Großbritannien 5,7Kanada 5,4Singapur 4,1Deutschland 3,5Australien 2,9Südkorea 2,4Frankreich 2,0
Sonstige 12,8%
Gastland Großbritannien
Herkunftsland in %USA 33,6Deutschland 9,1Australien 7,0Frankreich 5,9Kanada 5,5Italien 5,3Irland 3,5Niederlande 3,5Indien 3,2Spanien 3,0
Sonstige 20,4%
Gastland Kanada
Herkunftsland in %USA 48,3Großbritannien 13,3Frankreich 10,0Iran 5,4China 5,4Deutschland 5,2Australien 4,0Indien 3,6Japan 2,6Schweiz 2,2
Gastland Deutschland
Herkunftsland in %USA 28,9Großbritannien 10,7Schweiz 9,1Frankreich 7,6Österreich 6,2Niederlande 5,0Italien 4,9Russland 4,1Spanien 3,0Kanada 2,8
Sonstige 17,8%
Gastland Frankreich
Herkunftsland in %USA 23,2Großbritannien 11,8Deutschland 11,2Italien 10,3Kanada 7,2Schweiz 6,3Belgien 6,0Spanien 5,8Niederlande 3,2Tunesien 2,8
Sonstige 12,3%
1 Im Falle des Herkunfts- und Gastlandes China: Ohne Wissenschaftler aus Hongkong.In the case of the country of origin and the host country China: Excluding academics and researchers from Hong Kong.
Quellen Abb. A15, A16: OECD, Science, Technology and Industry Scoreboard 2015 (Scopus-Daten); DAAD-Berechnungen
West-, Nord- und SüdeuropaMittel- und SüdosteuropaOsteuropa, Zentralasien und Südkaukasus
NordamerikaLateinamerika
Nahost, NordafrikaAfrika, Subsahara
Angaben in % Anzahl insgesamt in Mio.
Herkunftsland USA
Gastland in %Großbritannien 12,5China 11,0Kanada 9,4Deutschland 7,5Indien 5,6Südkorea 5,2Australien 4,8Japan 4,3Frankreich 3,8Taiwan 2,8
Sonstige 33,1%
Herkunftsland Frankreich
Gastland in %USA 25,3Großbritannien 10,5Deutschland 9,4Kanada 9,3Schweiz 9,2Belgien 5,2Italien 4,9Spanien 4,6Tunesien 3,7Brasilien 3,1
Sonstige 14,7%
Herkunftsland Großbritannien
Gastland in %USA 34,2Australien 9,1Deutschland 6,4Kanada 6,0Frankreich 4,5Irland 4,1China 3,4Spanien 2,8Indien 2,8Italien 2,7
Sonstige 24,0%
Herkunftsland Kanada
Gastland in %USA 59,3Großbritannien 10,3China 7,0Frankreich 6,0Australien 5,0Deutschland 3,7Schweiz 2,3Indien 2,3Iran 2,2Japan 1,9
Herkunftsland Deutschland
Gastland in %USA 28,8Schweiz 14,1Großbritannien 11,3Österreich 7,0Frankreich 6,1Niederlande 4,9Kanada 3,4China 3,0Australien 2,8Italien 2,7
Sonstige 15,9%
Herkunftsland China
Gastland in %USA 50,0Japan 6,1Kanada 5,8Taiwan 5,6Großbritannien 4,9Singapur 4,8Australien 4,2Deutschland 3,9Frankreich 1,9
Sonstige 12,8%
West-, Nord- und SüdeuropaMittel- und SüdosteuropaOsteuropa, Zentralasien und Südkaukasus
NordamerikaLateinamerika
Nahost, NordafrikaAfrika, Subsahara
Angaben in % Anzahl insgesamt in Mio.
a | i n t e r n at i o n a l e a k a d e m i sc h e m o b i l i tät u n d t r a n sn at i o n a l e b i l d u n g | i n t e r n at i o n a l ac a d e m i c m o b i l i t y a n d t r a n sn at i o n a l e d u c at i o n 31
A15 Wichtigste Gastländer international mobiler Wissenschaftler aus den wichtigsten Herkunftsländern 1996–20131 Key host countries of internationally mobile academics and researchers from key countries of origin, 1996–20131
A16 Wichtigste Herkunftsländer internationaler Wissenschaftler in den wichtigsten Gastländern 1996–20131 Key countries of origin of international academics and researchers in key host countries, 1996–20131
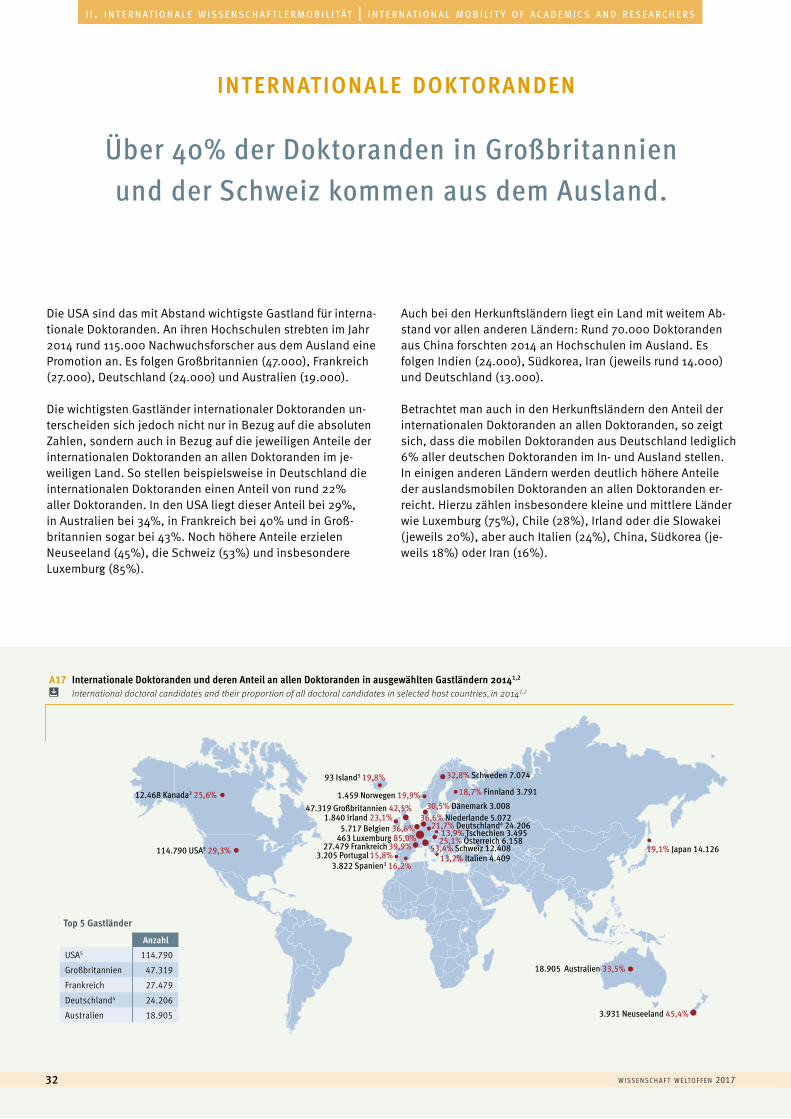
w i sse n sc h a f t w e lto f f e n 201732
a u s l ä n d i s c h e s t u d i e r e n d e | f o r e i g n s t u d e n t si i . i n t e r n at i o n a l e w i s s e n s c h a f t l e r m o b i l i tät | i n t e r n at i o n a l m o b i l i t y o f a c a d e m i c s a n d r e s e a r c h e r s
A17 Internationale Doktoranden und deren Anteil an allen Doktoranden in ausgewählten Gastländern 20141,2 International doctoral candidates and their proportion of all doctoral candidates in selected host countries, in 20141,2
Die USA sind das mit Abstand wichtigste Gastland für interna-tionale Doktoranden. An ihren Hochschulen strebten im Jahr 2014 rund 115.000 Nachwuchsforscher aus dem Ausland eine Promotion an. Es folgen Großbritannien (47.000), Frankreich (27.000), Deutschland (24.000) und Australien (19.000).
Die wichtigsten Gastländer internationaler Doktoranden un-terscheiden sich jedoch nicht nur in Bezug auf die absoluten Zahlen, sondern auch in Bezug auf die jeweiligen Anteile der internationalen Doktoranden an allen Doktoranden im je- weiligen Land. So stellen beispielsweise in Deutschland die internationalen Doktoranden einen Anteil von rund 22% aller Doktoranden. In den USA liegt dieser Anteil bei 29%, in Australien bei 34%, in Frankreich bei 40% und in Groß- britannien sogar bei 43%. Noch höhere Anteile erzielen Neuseeland (45%), die Schweiz (53%) und insbesondere Luxemburg (85%).
Auch bei den Herkunftsländern liegt ein Land mit weitem Ab-stand vor allen anderen Ländern: Rund 70.000 Doktoranden aus China forschten 2014 an Hochschulen im Ausland. Es folgen Indien (24.000), Südkorea, Iran (jeweils rund 14.000) und Deutschland (13.000).
Betrachtet man auch in den Herkunftsländern den Anteil der internationalen Doktoranden an allen Doktoranden, so zeigt sich, dass die mobilen Doktoranden aus Deutschland lediglich 6% aller deutschen Doktoranden im In- und Ausland stellen. In einigen anderen Ländern werden deutlich höhere Anteile der auslandsmobilen Doktoranden an allen Doktoranden er-reicht. Hierzu zählen insbesondere kleine und mittlere Länder wie Luxemburg (75%), Chile (28%), Irland oder die Slowakei (jeweils 20%), aber auch Italien (24%), China, Südkorea (je-weils 18%) oder Iran (16%).
Über 40% der Doktoranden in Großbritannien und der Schweiz kommen aus dem Ausland.
internationale doktoranden
18.905 Australien 33,5%
3.931 Neuseeland 45,4%
19,1% Japan 14.126114.790 USA5 29,3%
21,7% Deutschland4 24.20613,9% Tschechien 3.495
36,6% Niederlande 5.07230,5% Dänemark 3.008
25,1% Österreich 6.15853,4% Schweiz 12.408
13,2% Italien 4.40927.479 Frankreich 39,9%
3.205 Portugal 15,8%
5.717 Belgien 36,6%
1.840 Irland 23,1%
463 Luxemburg 85,0%
3.822 Spanien3 16,2%
12.468 Kanada3 25,6% 47.319 Großbritannien 42,5%
1.459 Norwegen 19,9%
93 Island3 19,8% 32,8% Schweden 7.074
18,7% Finnland 3.791
PolenBrasilienMexiko2ChinaChileRusslandIsraelTürkeiLettlandEstlandSüdkoreaSlowenienUngarnSlowakeiItalienTschechienPortugalSpanien2FinnlandJapanIsland2NorwegenDeutschland3IrlandÖsterreichKanada2USA4DänemarkSchwedenAustralienNiederlandeBelgienFrankreichGroßbritannienNeuseelandSchweizLuxemburg
Top 5 Gastländer
AnzahlUSA5 114.790
Großbritannien 47.319
Frankreich 27.479
Deutschland4 24.206
Australien 18.905
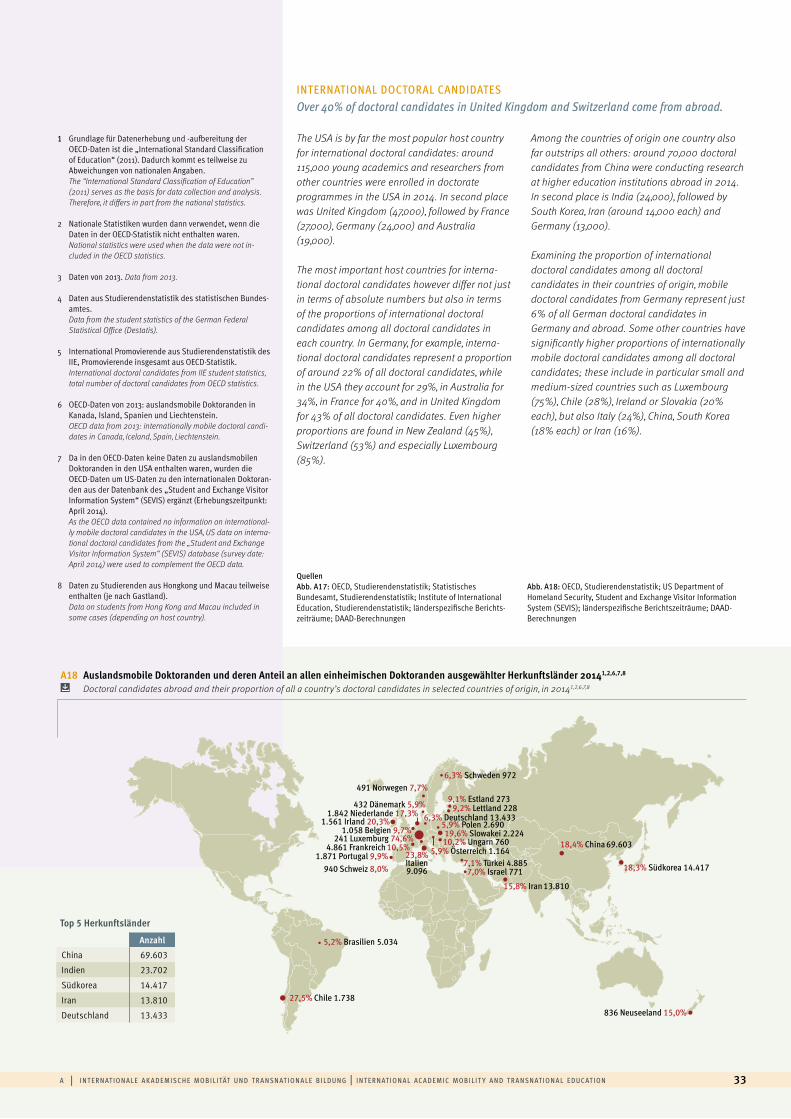
a | i n t e r n at i o n a l e a k a d e m i sc h e m o b i l i tät u n d t r a n sn at i o n a l e b i l d u n g | i n t e r n at i o n a l ac a d e m i c m o b i l i t y a n d t r a n sn at i o n a l e d u c at i o n 33
1 Grundlage für Datenerhebung und -aufbereitung der OECD-Daten ist die „International Standard Classification of Education“ (2011). Dadurch kommt es teilweise zu Abweichungen von nationalen Angaben.The “International Standard Classification of Education” (2011) serves as the basis for data collection and analysis. Therefore, it differs in part from the national statistics.
2 Nationale Statistiken wurden dann verwendet, wenn die Daten in der OECD-Statistik nicht enthalten waren.National statistics were used when the data were not in-cluded in the OECD statistics.
3 Daten von 2013. Data from 2013.
4 Daten aus Studierendenstatistik des statistischen Bundes-amtes.Data from the student statistics of the German Federal Statistical Office (Destatis).
5 International Promovierende aus Studierendenstatistik des IIE, Promovierende insgesamt aus OECD-Statistik.International doctoral candidates from IIE student statistics, total number of doctoral candidates from OECD statistics.
6 OECD-Daten von 2013: auslandsmobile Doktoranden in Kanada, Island, Spanien und Liechtenstein.OECD data from 2013: internationally mobile doctoral candi-dates in Canada, Iceland, Spain, Liechtenstein.
7 Da in den OECD-Daten keine Daten zu auslandsmobilen Doktoranden in den USA enthalten waren, wurden die OECD-Daten um US-Daten zu den internationalen Doktoran-den aus der Datenbank des „Student and Exchange Visitor Information System“ (SEVIS) ergänzt (Erhebungszeitpunkt: April 2014).As the OECD data contained no information on international-ly mobile doctoral candidates in the USA, US data on interna-tional doctoral candidates from the „Student and Exchange Visitor Information System“ (SEVIS) database (survey date: April 2014) were used to complement the OECD data.
8 Daten zu Studierenden aus Hongkong und Macau teilweise enthalten (je nach Gastland).Data on students from Hong Kong and Macau included in some cases (depending on host country).
A18 Auslandsmobile Doktoranden und deren Anteil an allen einheimischen Doktoranden ausgewählter Herkunftsländer 20141,2,6,7,8 Doctoral candidates abroad and their proportion of all a country’s doctoral candidates in selected countries of origin, in 20141,2,6,7,8
The USA is by far the most popular host country for international doctoral candidates: around 115,000 young academics and researchers from other countries were enrolled in doctorate programmes in the USA in 2014. In second place was United Kingdom (47,000), followed by France (27,000), Germany (24,000) and Australia (19,000).
The most important host countries for interna-tional doctoral candidates however differ not just in terms of absolute numbers but also in terms of the proportions of international doctoral candidates among all doctoral candidates in each country. In Germany, for example, interna-tional doctoral candidates represent a proportion of around 22% of all doctoral candidates, while in the USA they account for 29%, in Australia for 34%, in France for 40%, and in United Kingdom for 43% of all doctoral candidates. Even higher proportions are found in New Zealand (45%), Switzerland (53%) and especially Luxembourg (85%).
Among the countries of origin one country also far outstrips all others: around 70,000 doctoral candidates from China were conducting research at higher education institutions abroad in 2014. In second place is India (24,000), followed by South Korea, Iran (around 14,000 each) and Germany (13,000).
Examining the proportion of international doctoral candidates among all doctoral candidates in their countries of origin, mobile doctoral candidates from Germany represent just 6% of all German doctoral candidates in Germany and abroad. Some other countries have significantly higher proportions of internationally mobile doctoral candidates among all doctoral candidates; these include in particular small and medium-sized countries such as Luxembourg (75%), Chile (28%), Ireland or Slovakia (20% each), but also Italy (24%), China, South Korea (18% each) or Iran (16%).
INTERNATIONAL DOCTORAL CANDIDATES Over 40% of doctoral candidates in United Kingdom and Switzerland come from abroad.
QuellenAbb. A17: OECD, Studierendenstatistik; Statistisches Bundesamt, Studierendenstatistik; Institute of International Education, Studierendenstatistik; länderspezifische Berichts-zeiträume; DAAD-Berechnungen
Abb. A18: OECD, Studierendenstatistik; US Department of Homeland Security, Student and Exchange Visitor Information System (SEVIS); länderspezifische Berichtszeiträume; DAAD-Berechnungen
836 Neuseeland 15,0%
18,3% Südkorea 14.417
18,4% China 69.603
15,8% Iran 13.810
6,3% Deutschland 13.4335,9% Polen 2.690
9,2% Lettland 2289,1% Estland 273
19,6% Slowakei 2.22410,2% Ungarn 760
5,9% Österreich 1.164
7,0% Israel 7717,1% Türkei 4.885
23,8%Italien9.096
27,5% Chile 1.738
5,2% Brasilien 5.034
4.861 Frankreich 10,5%
1.561 Irland 20,3%
432 Dänemark 5,9% 1.842 Niederlande 17,3%
491 Norwegen 7,7%
241 Luxemburg 74,6%
1.058 Belgien 9,7%
1.871 Portugal 9,9%
940 Schweiz 8,0%
6,3% Schweden 972
USAFinnlandÖsterreichRusslandTschechienJapanGroßbritannienBrasilienDänemarkPolenÖsterreichSchwedenDeutschlandIsraelTürkeiNorwegenSchweizEstlandLettlandSlowenienBelgienPortugalUngarnFrankreichNeuseelandIranNiederlandeSüdkoreaChinaSlowakeiIrlandItalienChileLuxemburg
Top 5 Herkunftsländer
AnzahlChina 69.603
Indien 23.702
Südkorea 14.417
Iran 13.810
Deutschland 13.433
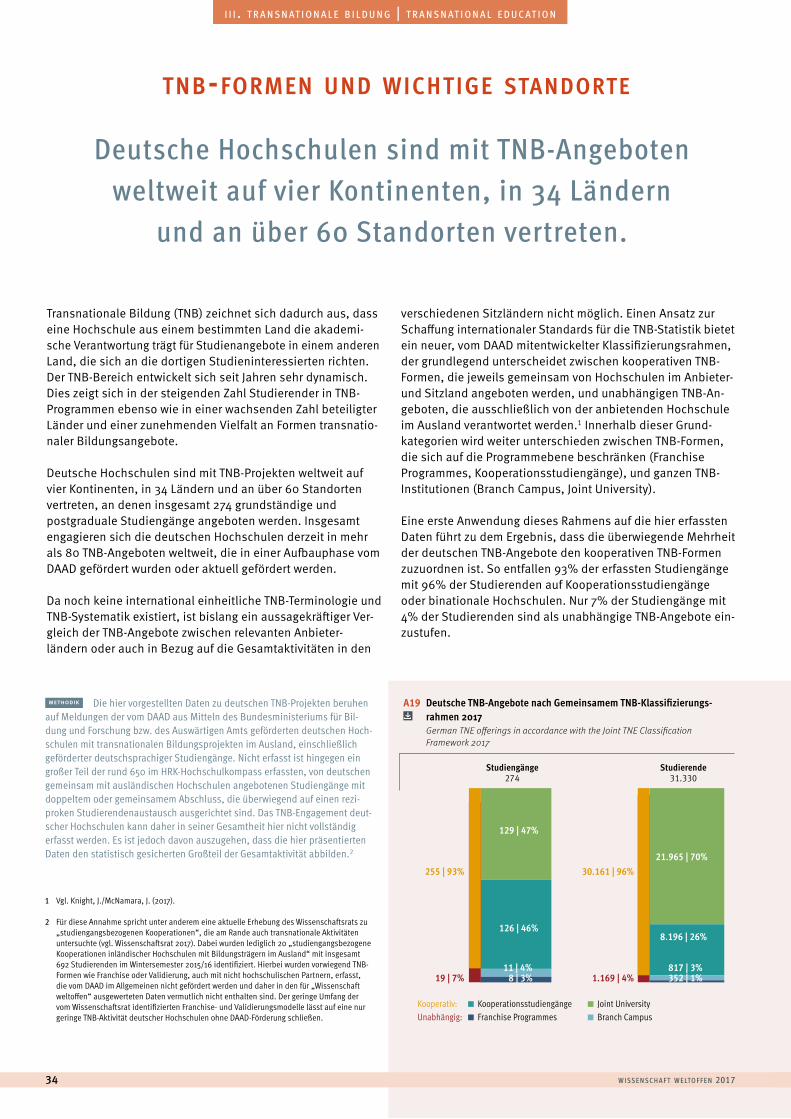
1 Vgl. Knight, J./McNamara, J. (2017).
2 Für diese Annahme spricht unter anderem eine aktuelle Erhebung des Wissenschaftsrats zu „studiengangsbezogenen Kooperationen“, die am Rande auch transnationale Aktivitäten untersuchte (vgl. Wissenschaftsrat 2017). Dabei wurden lediglich 20 „studiengangsbezogene Kooperationen inländischer Hochschulen mit Bildungsträgern im Ausland“ mit insgesamt 692 Studierenden im Wintersemester 2015/16 identifiziert. Hierbei wurden vorwiegend TNB-Formen wie Franchise oder Validierung, auch mit nicht hochschulischen Partnern, erfasst, die vom DAAD im Allgemeinen nicht gefördert werden und daher in den für „Wissenschaft weltoffen“ ausgewerteten Daten vermutlich nicht enthalten sind. Der geringe Umfang der vom Wissenschaftsrat identifizierten Franchise- und Validierungsmodelle lässt auf eine nur geringe TNB-Aktivität deutscher Hochschulen ohne DAAD-Förderung schließen.
A19 Deutsche TNB-Angebote nach Gemeinsamem TNB-Klassifizierungs- rahmen 2017
German TNE offerings in accordance with the Joint TNE Classification Framework 2017
Kooperativ: Kooperationsstudiengänge Joint UniversityUnabhängig: Franchise Programmes Branch Campus
0
20
40
60
80
100
0
20
40
60
80
100Studiengänge
274Studierende
31.330
126 | 46%8.196 | 26%
11 | 4% 817 | 3%8 | 3% 352 | 1%
129 | 47%
21.965 | 70%30.161 | 96%255 | 93%
1.169 | 4%19 | 7%
w i sse n sc h a f t w e lto f f e n 201734
a u s l ä n d i s c h e s t u d i e r e n d e | f o r e i g n s t u d e n t si i i . t r a n s n at i o n a l e b i l d u n g | t r a n s n at i o n a l e d u c at i o n
Deutsche Hochschulen sind mit TNB-Angeboten weltweit auf vier Kontinenten, in 34 Ländern
und an über 60 Standorten vertreten.
Transnationale Bildung (TNB) zeichnet sich dadurch aus, dass eine Hochschule aus einem bestimmten Land die akademi-sche Verantwortung trägt für Studienangebote in einem anderen Land, die sich an die dortigen Studieninteressierten richten. Der TNB-Bereich entwickelt sich seit Jahren sehr dynamisch. Dies zeigt sich in der steigenden Zahl Studierender in TNB-Programmen ebenso wie in einer wachsenden Zahl beteiligter Länder und einer zunehmenden Vielfalt an Formen transnatio-naler Bildungsangebote.
Deutsche Hochschulen sind mit TNB-Projekten weltweit auf vier Kontinenten, in 34 Ländern und an über 60 Standorten vertreten, an denen insgesamt 274 grundständige und postgraduale Studiengänge angeboten werden. Insgesamt engagieren sich die deutschen Hochschulen derzeit in mehr als 80 TNB-Angeboten weltweit, die in einer Aufbauphase vom DAAD gefördert wurden oder aktuell gefördert werden.
Da noch keine international einheitliche TNB-Terminologie und TNB-Systematik existiert, ist bislang ein aussagekräftiger Ver-gleich der TNB-Angebote zwischen relevanten Anbieter- ländern oder auch in Bezug auf die Gesamtaktivitäten in den
verschiedenen Sitzländern nicht möglich. Einen Ansatz zur Schaffung internationaler Standards für die TNB-Statistik bietet ein neuer, vom DAAD mitentwickelter Klassifizierungsrahmen, der grundlegend unterscheidet zwischen kooperativen TNB-Formen, die jeweils gemeinsam von Hochschulen im Anbieter- und Sitzland angeboten werden, und unabhängigen TNB-An-geboten, die ausschließlich von der anbietenden Hochschule im Ausland verantwortet werden.1 Innerhalb dieser Grund- kategorien wird weiter unterschieden zwischen TNB-Formen, die sich auf die Programmebene beschränken (Franchise Programmes, Kooperationsstudiengänge), und ganzen TNB- Institutionen (Branch Campus, Joint University).
Eine erste Anwendung dieses Rahmens auf die hier erfassten Daten führt zu dem Ergebnis, dass die überwiegende Mehrheit der deutschen TNB-Angebote den kooperativen TNB-Formen zuzuordnen ist. So entfallen 93% der erfassten Studiengänge mit 96% der Studierenden auf Kooperationsstudiengänge oder binationale Hochschulen. Nur 7% der Studiengänge mit 4% der Studierenden sind als unabhängige TNB-Angebote ein-zustufen.
tnb-formen und wichtige standorte
methodik Die hier vorgestellten Daten zu deutschen TNB-Projekten beruhen auf Meldungen der vom DAAD aus Mitteln des Bundesministeriums für Bil-dung und Forschung bzw. des Auswärtigen Amts geförderten deutschen Hoch-schulen mit transnationalen Bildungsprojekten im Ausland, einschließlich geförderter deutschsprachiger Studiengänge. Nicht erfasst ist hingegen ein großer Teil der rund 650 im HRK-Hochschulkompass erfassten, von deutschen gemeinsam mit ausländischen Hochschulen angebotenen Studiengänge mit doppeltem oder gemeinsamem Abschluss, die überwiegend auf einen rezi-proken Studierendenaustausch ausgerichtet sind. Das TNB-Engagement deut-scher Hochschulen kann daher in seiner Gesamtheit hier nicht vollständig erfasst werden. Es ist jedoch davon auszugehen, dass die hier präsentierten Daten den statistisch gesicherten Großteil der Gesamtaktivität abbilden.2
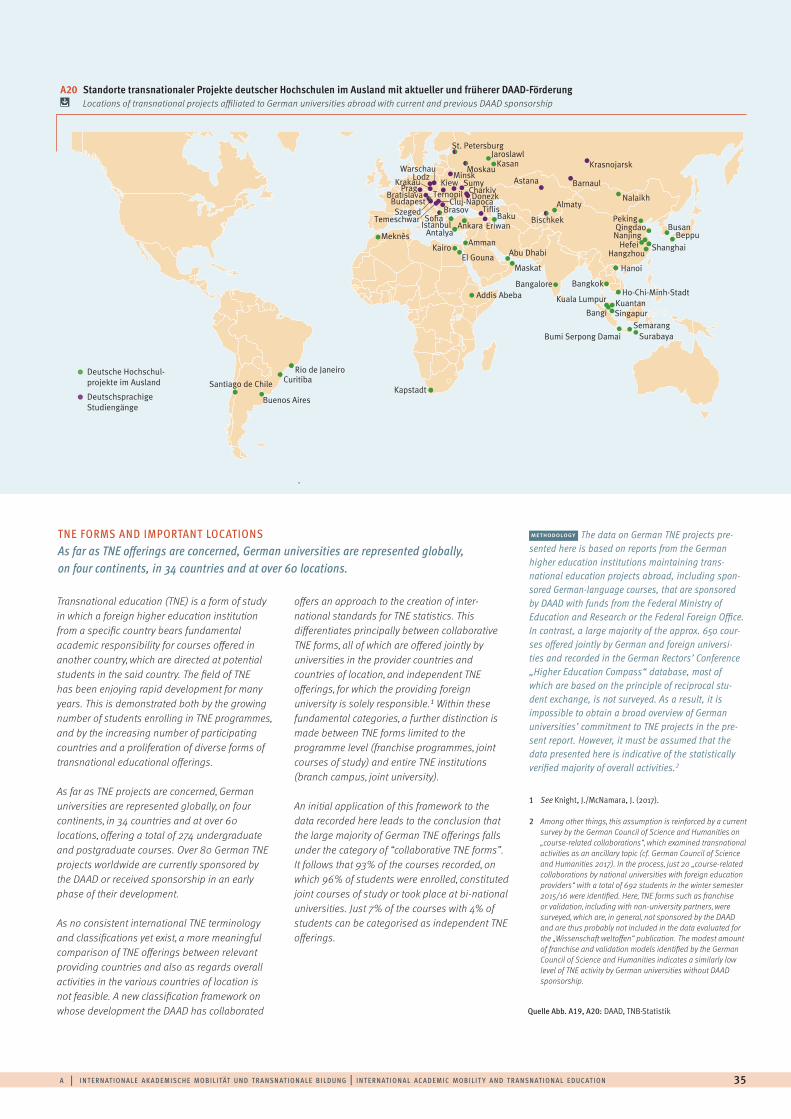
1 See Knight, J./McNamara, J. (2017).
2 Among other things, this assumption is reinforced by a current survey by the German Council of Science and Humanities on „course-related collaborations“, which examined transnational activities as an ancillary topic (cf. German Council of Science and Humanities 2017). In the process, just 20 „course-related collaborations by national universities with foreign education providers“ with a total of 692 students in the winter semester 2015/16 were identified. Here, TNE forms such as franchise or validation, including with non-university partners, were surveyed, which are, in general, not sponsored by the DAAD and are thus probably not included in the data evaluated for the „Wissenschaft weltoffen“ publication. The modest amount of franchise and validation models identified by the German Council of Science and Humanities indicates a similarly low level of TNE activity by German universities without DAAD sponsorship.
a | i n t e r n at i o n a l e a k a d e m i sc h e m o b i l i tät u n d t r a n sn at i o n a l e b i l d u n g | i n t e r n at i o n a l ac a d e m i c m o b i l i t y a n d t r a n sn at i o n a l e d u c at i o n 35
Minsk
Bischkek
WarschauLodz
Bratislava
Temeschwar
KrakauTernopil
Cluj-NapocaBrasov
MoskauKasan
Barnaul
Krasnojarsk
PragDonezk
CharkivKiew
Budapest
Rio de JaneiroCuritiba
Buenos Aires
JaroslawlSt. Petersburg
Sofia
Sumy
Szeged
IstanbulAntalya
Amman
Ankara EriwanBaku
Tiflis
MaskatEl Gouna
Kapstadt
Almaty
Bangalore
SurabayaSemarang
Bumi Serpong Damai
Bangkok
Beppu
Abu Dhabi
BusanQingdaoPeking
Nalaikh
ShanghaiMeknès
HefeiNanjing
Hangzhou
Kuala Lumpur
Bangi SingapurKuantan
Ho-Chi-Minh-StadtAddis Abeba
Hanoi
Kairo
Santiago de Chile
Astana
-
DeutscheHochschul- projekteimAusland
Deutschsprachige Studiengänge
A20 Standorte transnationaler Projekte deutscher Hochschulen im Ausland mit aktueller und früherer DAAD-Förderung Locations of transnational projects affiliated to German universities abroad with current and previous DAAD sponsorship
Transnational education (TNE) is a form of study in which a foreign higher education institution from a specific country bears fundamental academic responsibility for courses offered in another country, which are directed at potential students in the said country. The field of TNE has been enjoying rapid development for many years. This is demonstrated both by the growing number of students enrolling in TNE programmes, and by the increasing number of participating countries and a proliferation of diverse forms of transnational educational offerings.
As far as TNE projects are concerned, German universities are represented globally, on four continents, in 34 countries and at over 60 locations, offering a total of 274 undergraduate and postgraduate courses. Over 80 German TNE projects worldwide are currently sponsored by the DAAD or received sponsorship in an early phase of their development.
As no consistent international TNE terminology and classifications yet exist, a more meaningful comparison of TNE offerings between relevant providing countries and also as regards overall activities in the various countries of location is not feasible. A new classification framework on whose development the DAAD has collaborated
offers an approach to the creation of inter-national standards for TNE statistics. This differentiates principally between collaborative TNE forms, all of which are offered jointly by universities in the provider countries and countries of location, and independent TNE offerings, for which the providing foreign university is solely responsible.1 Within these fundamental categories, a further distinction is made between TNE forms limited to the programme level (franchise programmes, joint courses of study) and entire TNE institutions (branch campus, joint university).
An initial application of this framework to the data recorded here leads to the conclusion that the large majority of German TNE offerings falls under the category of “collaborative TNE forms”. It follows that 93% of the courses recorded, on which 96% of students were enrolled, constituted joint courses of study or took place at bi-national universities. Just 7% of the courses with 4% of students can be categorised as independent TNE offerings.
TNE FORMS AND IMPORTANT LOCATIONS As far as TNE offerings are concerned, German universities are represented globally, on four continents, in 34 countries and at over 60 locations.
methodology The data on German TNE projects pre-sented here is based on reports from the German higher education institutions maintaining trans- national education projects abroad, including spon-sored German-language courses, that are sponsored by DAAD with funds from the Federal Ministry of Education and Research or the Federal Foreign Office. In contrast, a large majority of the approx. 650 cour-ses offered jointly by German and foreign universi-ties and recorded in the German Rectors’ Conference „Higher Education Compass“ database, most of which are based on the principle of reciprocal stu-dent exchange, is not surveyed. As a result, it is impossible to obtain a broad overview of German universities’ commitment to TNE projects in the pre-sent report. However, it must be assumed that the data presented here is indicative of the statistically verified majority of overall activities.2
Quelle Abb. A19, A20: DAAD, TNB-Statistik
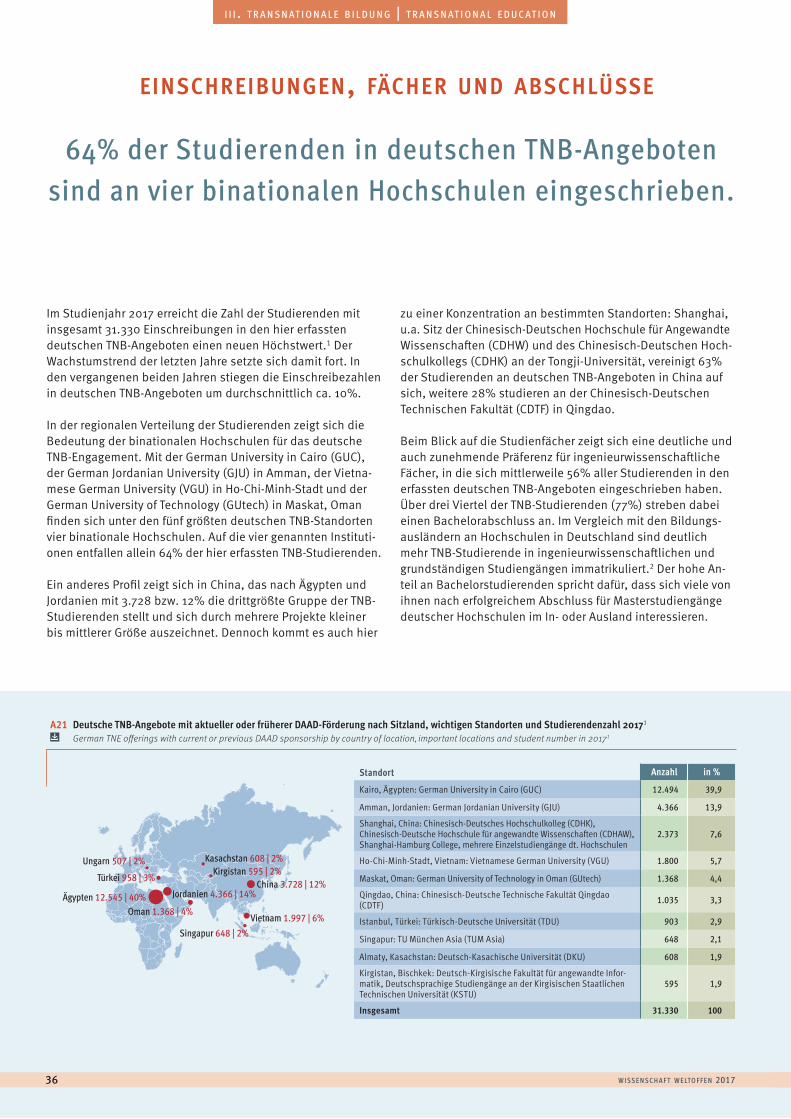
w i sse n sc h a f t w e lto f f e n 201736
a u s l ä n d i s c h e s t u d i e r e n d e | f o r e i g n s t u d e n t si i i . t r a n s n at i o n a l e b i l d u n g | t r a n s n at i o n a l e d u c at i o n
64% der Studierenden in deutschen TNB-Angeboten sind an vier binationalen Hochschulen eingeschrieben.
Im Studienjahr 2017 erreicht die Zahl der Studierenden mit insgesamt 31.330 Einschreibungen in den hier erfassten deutschen TNB-Angeboten einen neuen Höchstwert.1 Der Wachstumstrend der letzten Jahre setzte sich damit fort. In den vergangenen beiden Jahren stiegen die Einschreibezahlen in deutschen TNB-Angeboten um durchschnittlich ca. 10%.
In der regionalen Verteilung der Studierenden zeigt sich die Bedeutung der binationalen Hochschulen für das deutsche TNB-Engagement. Mit der German University in Cairo (GUC), der German Jordanian University (GJU) in Amman, der Vietna-mese German University (VGU) in Ho-Chi-Minh-Stadt und der German University of Technology (GUtech) in Maskat, Oman finden sich unter den fünf größten deutschen TNB-Standorten vier binationale Hochschulen. Auf die vier genannten Instituti-onen entfallen allein 64% der hier erfassten TNB-Studierenden.
Ein anderes Profil zeigt sich in China, das nach Ägypten und Jordanien mit 3.728 bzw. 12% die drittgrößte Gruppe der TNB-Studierenden stellt und sich durch mehrere Projekte kleiner bis mittlerer Größe auszeichnet. Dennoch kommt es auch hier
zu einer Konzentration an bestimmten Standorten: Shanghai, u.a. Sitz der Chinesisch-Deutschen Hochschule für Angewandte Wissenschaften (CDHW) und des Chinesisch-Deutschen Hoch-schulkollegs (CDHK) an der Tongji-Universität, vereinigt 63% der Studierenden an deutschen TNB-Angeboten in China auf sich, weitere 28% studieren an der Chinesisch-Deutschen Technischen Fakultät (CDTF) in Qingdao.
Beim Blick auf die Studienfächer zeigt sich eine deutliche und auch zunehmende Präferenz für ingenieurwissenschaftliche Fächer, in die sich mittlerweile 56% aller Studierenden in den erfassten deutschen TNB-Angeboten eingeschrieben haben. Über drei Viertel der TNB-Studierenden (77%) streben dabei einen Bachelorabschluss an. Im Vergleich mit den Bildungs-ausländern an Hochschulen in Deutschland sind deutlich mehr TNB-Studierende in ingenieurwissenschaftlichen und grundständigen Studiengängen immatrikuliert.2 Der hohe An-teil an Bachelorstudierenden spricht dafür, dass sich viele von ihnen nach erfolgreichem Abschluss für Masterstudiengänge deutscher Hochschulen im In- oder Ausland interessieren.
einschreibungen, fächer und abschlüsse
A21 Deutsche TNB-Angebote mit aktueller oder früherer DAAD-Förderung nach Sitzland, wichtigen Standorten und Studierendenzahl 20171 German TNE offerings with current or previous DAAD sponsorship by country of location, important locations and student number in 20171
Standort Anzahl in %
Kairo, Ägypten: German University in Cairo (GUC) 12.494 39,9
Amman, Jordanien: German Jordanian University (GJU) 4.366 13,9
Shanghai, China: Chinesisch-Deutsches Hochschulkolleg (CDHK), Chinesisch-Deutsche Hochschule für angewandte Wissenschaften (CDHAW), Shanghai-Hamburg College, mehrere Einzelstudiengänge dt. Hochschulen
2.373 7,6
Ho-Chi-Minh-Stadt, Vietnam: Vietnamese German University (VGU) 1.800 5,7
Maskat, Oman: German University of Technology in Oman (GUtech) 1.368 4,4
Qingdao, China: Chinesisch-Deutsche Technische Fakultät Qingdao (CDTF) 1.035 3,3
Istanbul, Türkei: Türkisch-Deutsche Universität (TDU) 903 2,9
Singapur: TU München Asia (TUM Asia) 648 2,1
Almaty, Kasachstan: Deutsch-Kasachische Universität (DKU) 608 1,9
Kirgistan, Bischkek: Deutsch-Kirgisische Fakultät für angewandte Infor-matik, Deutschsprachige Studiengänge an der Kirgisischen Staatlichen Technischen Universität (KSTU)
595 1,9
Insgesamt 31.330 100
Jordanien 4.366 | 14%
Kasachstan 608 | 2%Kirgistan 595 | 2%
Oman 1.368 | 4%
China 3.728 | 12%
Vietnam 1.997 | 6%
Singapur 648 | 2%
Ägypten 12.545 | 40%
Ungarn 507 | 2%
Türkei 958 | 3%
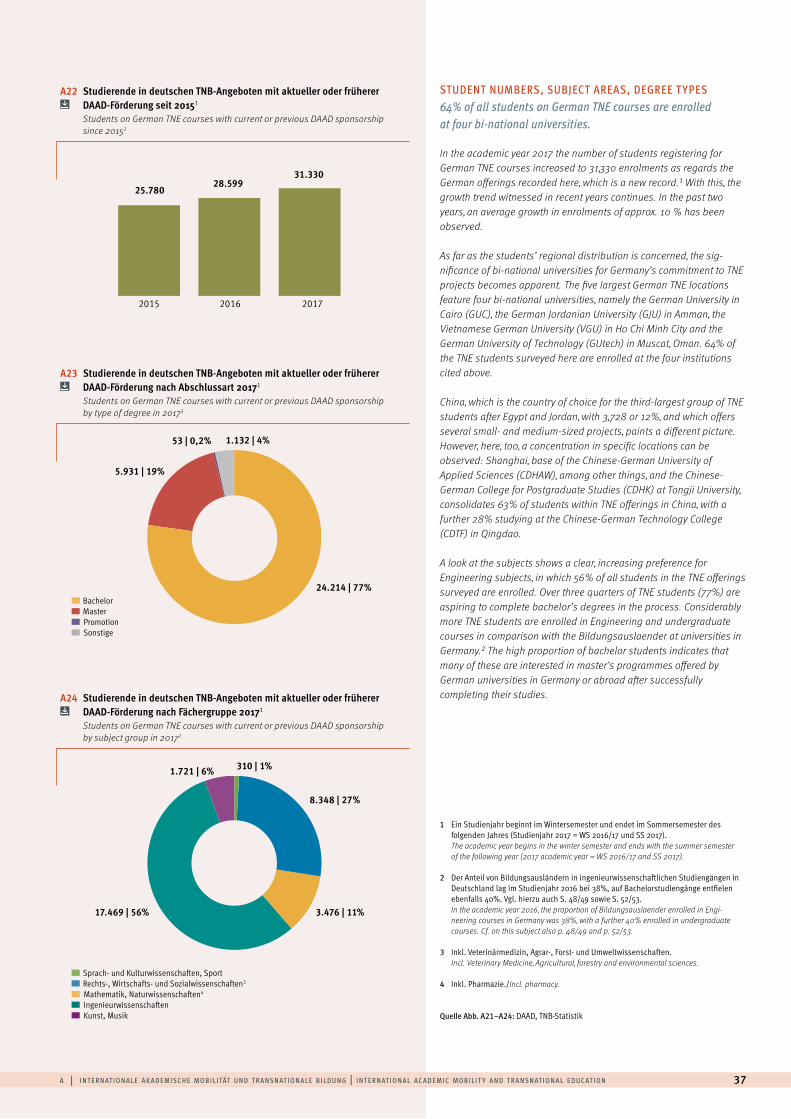
A22 Studierende in deutschen TNB-Angeboten mit aktueller oder früherer DAAD-Förderung seit 20151 Students on German TNE courses with current or previous DAAD sponsorship since 20151
A24 Studierende in deutschen TNB-Angeboten mit aktueller oder früherer DAAD-Förderung nach Fächergruppe 20171 Students on German TNE courses with current or previous DAAD sponsorship by subject group in 20171
2015 2016 2017
8.348 | 27%
3.476 | 11%17.469 | 56%
1.721 | 6% 310 | 1%
Sprach- und Kulturwissenschaften, Sport Rechts-, Wirtschafts- und Sozialwissenschaften3
Mathematik, Naturwissenschaften4
Ingenieurwissenschaften Kunst, Musik
25.78028.599
31.330
1 Ein Studienjahr beginnt im Wintersemester und endet im Sommersemester des folgenden Jahres (Studienjahr 2017 = WS 2016/17 und SS 2017). The academic year begins in the winter semester and ends with the summer semester of the following year (2017 academic year = WS 2016/17 and SS 2017).
2 Der Anteil von Bildungsausländern in ingenieurwissenschaftlichen Studiengängen in Deutschland lag im Studienjahr 2016 bei 38%, auf Bachelorstudiengänge entfielen ebenfalls 40%. Vgl. hierzu auch S. 48/49 sowie S. 52/53.In the academic year 2016, the proportion of Bildungsauslaender enrolled in Engi-neering courses in Germany was 38%, with a further 40% enrolled in undergraduate courses. Cf. on this subject also p. 48/49 and p. 52/53.
3 Inkl. Veterinärmedizin, Agrar-, Forst- und Umweltwissenschaften.Incl. Veterinary Medicine, Agricultural, forestry and environmental sciences.
4 Inkl. Pharmazie./Incl. pharmacy.
Quelle Abb. A21–A24: DAAD, TNB-Statistik
a | i n t e r n at i o n a l e a k a d e m i sc h e m o b i l i tät u n d t r a n sn at i o n a l e b i l d u n g | i n t e r n at i o n a l ac a d e m i c m o b i l i t y a n d t r a n sn at i o n a l e d u c at i o n 37
In the academic year 2017 the number of students registering for German TNE courses increased to 31,330 enrolments as regards the German offerings recorded here, which is a new record.1 With this, the growth trend witnessed in recent years continues. In the past two years, an average growth in enrolments of approx. 10 % has been observed.
As far as the students’ regional distribution is concerned, the sig- nificance of bi-national universities for Germany’s commitment to TNE projects becomes apparent. The five largest German TNE locations feature four bi-national universities, namely the German University in Cairo (GUC), the German Jordanian University (GJU) in Amman, the Vietnamese German University (VGU) in Ho Chi Minh City and the German University of Technology (GUtech) in Muscat, Oman. 64% of the TNE students surveyed here are enrolled at the four institutions cited above.
China, which is the country of choice for the third-largest group of TNE students after Egypt and Jordan, with 3, 728 or 12%, and which offers several small- and medium-sized projects, paints a different picture. However, here, too, a concentration in specific locations can be observed: Shanghai, base of the Chinese-German University of Applied Sciences (CDHAW), among other things, and the Chinese-German College for Postgraduate Studies (CDHK) at Tongji University, consolidates 63% of students within TNE offerings in China, with a further 28% studying at the Chinese-German Technology College (CDTF) in Qingdao.
A look at the subjects shows a clear, increasing preference for Engineering subjects, in which 56% of all students in the TNE offerings surveyed are enrolled. Over three quarters of TNE students (77%) are aspiring to complete bachelor’s degrees in the process. Considerably more TNE students are enrolled in Engineering and undergraduate courses in comparison with the Bildungsauslaender at universities in Germany.2 The high proportion of bachelor students indicates that many of these are interested in master’s programmes offered by German universities in Germany or abroad after successfully completing their studies.
STUDENT NUMBERS, SUBJECT AREAS, DEGREE T YPES 64% of all students on German TNE courses are enrolled at four bi-national universities.
A23 Studierende in deutschen TNB-Angeboten mit aktueller oder früherer DAAD-Förderung nach Abschlussart 20171 Students on German TNE courses with current or previous DAAD sponsorship by type of degree in 20171
24.214 | 77%
5.931 | 19%
53 | 0,2% 1.132 | 4%
Bachelor Master Promotion Sonstige
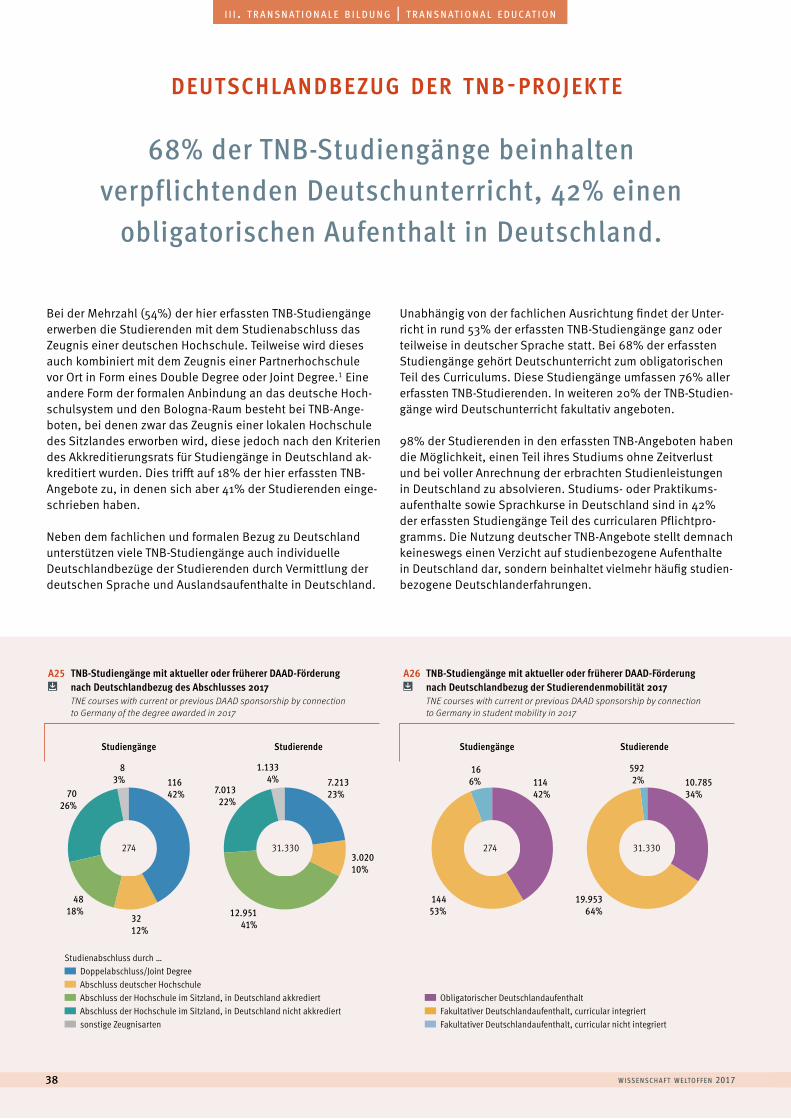
A25 TNB-Studiengänge mit aktueller oder früherer DAAD-Förderung nach Deutschlandbezug des Abschlusses 2017
TNE courses with current or previous DAAD sponsorship by connection to Germany of the degree awarded in 2017
A26 TNB-Studiengänge mit aktueller oder früherer DAAD-Förderung nach Deutschlandbezug der Studierendenmobilität 2017
TNE courses with current or previous DAAD sponsorship by connection to Germany in student mobility in 2017
Studiengänge StudiengängeStudierende Studierende
274 27431.330 31.330
7.21323%
11442%
10.78534%
11642%
3.02010%
3212%
4818%
14453%
19.95364%
166%
5922%
7026%
83%
12.95141%
7.01322%
1.1334%
Studienabschluss durch … Doppelabschluss/Joint Degree Abschluss deutscher Hochschule Abschluss der Hochschule im Sitzland, in Deutschland akkrediert Abschluss der Hochschule im Sitzland, in Deutschland nicht akkrediert sonstige Zeugnisarten
Obligatorischer Deutschlandaufenthalt Fakultativer Deutschlandaufenthalt, curricular integriert Fakultativer Deutschlandaufenthalt, curricular nicht integriert
w i sse n sc h a f t w e lto f f e n 201738
a u s l ä n d i s c h e s t u d i e r e n d e | f o r e i g n s t u d e n t si i i . t r a n s n at i o n a l e b i l d u n g | t r a n s n at i o n a l e d u c at i o n
Bei der Mehrzahl (54%) der hier erfassten TNB-Studiengänge erwerben die Studierenden mit dem Studienabschluss das Zeugnis einer deutschen Hochschule. Teilweise wird dieses auch kombiniert mit dem Zeugnis einer Partnerhochschule vor Ort in Form eines Double Degree oder Joint Degree.1 Eine andere Form der formalen Anbindung an das deutsche Hoch-schulsystem und den Bologna-Raum besteht bei TNB-Ange-boten, bei denen zwar das Zeugnis einer lokalen Hochschule des Sitzlandes erworben wird, diese jedoch nach den Kriterien des Akkreditierungsrats für Studiengänge in Deutschland ak-kreditiert wurden. Dies trifft auf 18% der hier erfassten TNB-Angebote zu, in denen sich aber 41% der Studierenden einge-schrieben haben.
Neben dem fachlichen und formalen Bezug zu Deutschland unterstützen viele TNB-Studiengänge auch individuelle Deutschlandbezüge der Studierenden durch Vermittlung der deutschen Sprache und Auslandsaufenthalte in Deutschland.
Unabhängig von der fachlichen Ausrichtung findet der Unter-richt in rund 53% der erfassten TNB-Studiengänge ganz oder teilweise in deutscher Sprache statt. Bei 68% der erfassten Studiengänge gehört Deutschunterricht zum obligatorischen Teil des Curriculums. Diese Studiengänge umfassen 76% aller erfassten TNB-Studierenden. In weiteren 20% der TNB-Studien- gänge wird Deutschunterricht fakultativ angeboten.
98% der Studierenden in den erfassten TNB-Angeboten haben die Möglichkeit, einen Teil ihres Studiums ohne Zeitverlust und bei voller Anrechnung der erbrachten Studienleistungen in Deutschland zu absolvieren. Studiums- oder Praktikums-aufenthalte sowie Sprachkurse in Deutschland sind in 42% der erfassten Studiengänge Teil des curricularen Pflichtpro-gramms. Die Nutzung deutscher TNB-Angebote stellt demnach keineswegs einen Verzicht auf studienbezogene Aufenthalte in Deutschland dar, sondern beinhaltet vielmehr häufig studien- bezogene Deutschlanderfahrungen.
68% der TNB-Studiengänge beinhalten verpflichtenden Deutschunterricht, 42% einen
obligatorischen Aufenthalt in Deutschland.
deutschlandbezug der tnb-projekte
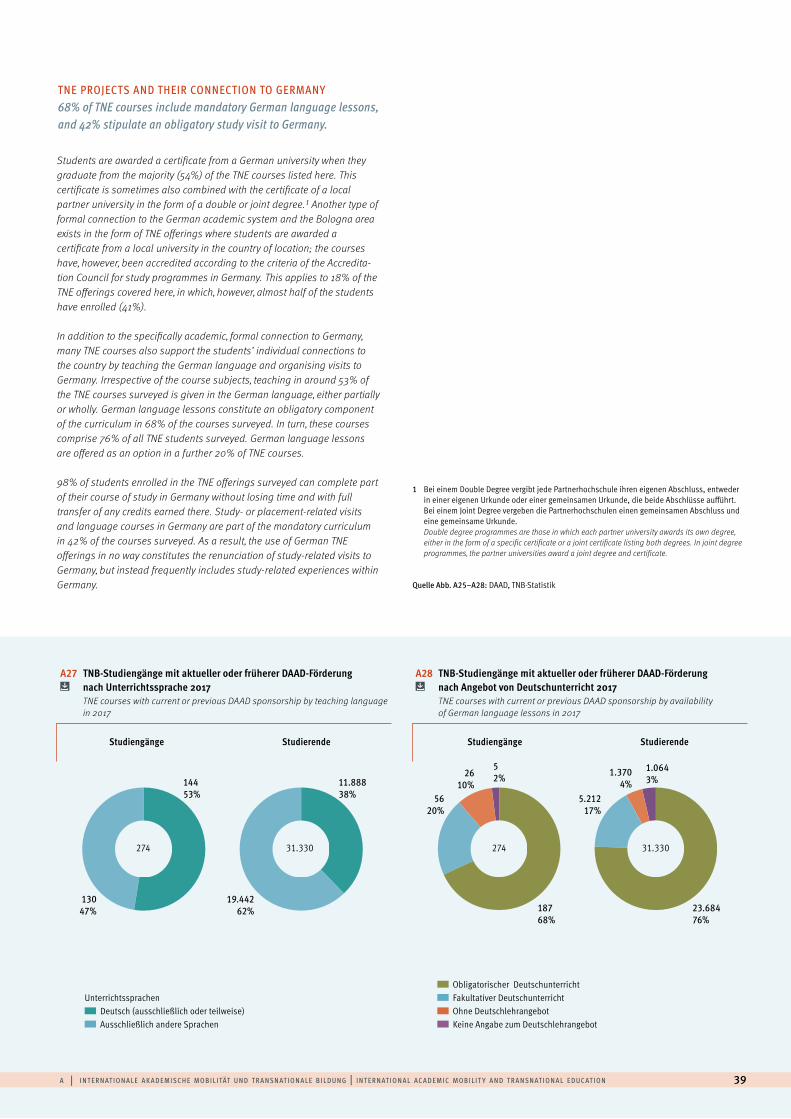
A27 TNB-Studiengänge mit aktueller oder früherer DAAD-Förderung nach Unterrichtssprache 2017 TNE courses with current or previous DAAD sponsorship by teaching language in 2017
A28 TNB-Studiengänge mit aktueller oder früherer DAAD-Förderung nach Angebot von Deutschunterricht 2017 TNE courses with current or previous DAAD sponsorship by availability of German language lessons in 2017
Studiengänge StudiengängeStudierende Studierende
274 27431.330 31.330
144 53%
11.88838%
18768%
52%
23.68476%
1.0643%
13047%
19.44262%
5620%
2610%
5.21217%
1.3704%
Obligatorischer Deutschunterricht Fakultativer Deutschunterricht Ohne Deutschlehrangebot Keine Angabe zum Deutschlehrangebot
Unterrichtssprachen Deutsch (ausschließlich oder teilweise) Ausschließlich andere Sprachen
1 Bei einem Double Degree vergibt jede Partnerhochschule ihren eigenen Abschluss, entweder in einer eigenen Urkunde oder einer gemeinsamen Urkunde, die beide Abschlüsse aufführt. Bei einem Joint Degree vergeben die Partnerhochschulen einen gemeinsamen Abschluss und eine gemeinsame Urkunde. Double degree programmes are those in which each partner university awards its own degree, either in the form of a specific certificate or a joint certificate listing both degrees. In joint degree programmes, the partner universities award a joint degree and certificate.
Quelle Abb. A25–A28: DAAD, TNB-Statistik
a | i n t e r n at i o n a l e a k a d e m i sc h e m o b i l i tät u n d t r a n sn at i o n a l e b i l d u n g | i n t e r n at i o n a l ac a d e m i c m o b i l i t y a n d t r a n sn at i o n a l e d u c at i o n 39
Students are awarded a certificate from a German university when they graduate from the majority (54%) of the TNE courses listed here. This certificate is sometimes also combined with the certificate of a local partner university in the form of a double or joint degree.1 Another type of formal connection to the German academic system and the Bologna area exists in the form of TNE offerings where students are awarded a certificate from a local university in the country of location; the courses have, however, been accredited according to the criteria of the Accredita-tion Council for study programmes in Germany. This applies to 18% of the TNE offerings covered here, in which, however, almost half of the students have enrolled (41%).
In addition to the specifically academic, formal connection to Germany, many TNE courses also support the students’ individual connections to the country by teaching the German language and organising visits to Germany. Irrespective of the course subjects, teaching in around 53% of the TNE courses surveyed is given in the German language, either partially or wholly. German language lessons constitute an obligatory component of the curriculum in 68% of the courses surveyed. In turn, these courses comprise 76% of all TNE students surveyed. German language lessons are offered as an option in a further 20% of TNE courses.
98% of students enrolled in the TNE offerings surveyed can complete part of their course of study in Germany without losing time and with full transfer of any credits earned there. Study- or placement-related visits and language courses in Germany are part of the mandatory curriculum in 42% of the courses surveyed. As a result, the use of German TNE offerings in no way constitutes the renunciation of study-related visits to Germany, but instead frequently includes study-related experiences within Germany.
TNE PROJECTS AND THEIR CONNECTION TO GERMANY 68% of TNE courses include mandatory German language lessons, and 42% stipulate an obligatory study visit to Germany.
w i sse n sc h a f t w e lto f f e n 201740
Im Jahr 2016 haben sich rund 340.000 ausländische Studie-rende an deutschen Hochschulen eingeschrieben. Im Vergleich zum Vorjahr hat sich ihre Zahl um 6% bzw. rund 19.000 Studie-rende erhöht. Dabei stieg die Zahl der Bildungsausländer stärker (+7%) als die der Bildungsinländer (+4%). Durch den Anstieg hat sich der Anteil der ausländischen Studierenden an allen Studierenden auf 12,3% erhöht. Dabei verzeichnen die Hochschulen in Berlin den höchsten Anteil von Bildungsaus-ländern an allen Studierenden (15%), gefolgt von den sächsi-schen und brandenburgischen Hochschulen.
Die größte Gruppe der Bildungsausländer stammt aus der Region Asien und Pazifik (28%), gefolgt von Westeuropa (20%) und Mittel- und Südosteuropa (14%).
Die Zahl ausländischer Studienanfänger erhöhte sich 2015 gegenüber dem Vorjahr um 6% auf rund 115.000. Dies ist allein auf die Bildungsausländer zurückzuführen (+7%). Die Zahl der Bildungsinländer stagniert seit 2013 bei rund 16.400.
Die Zahl ausländischer Absolventen hat sich gegenüber 2010 um mehr als 10.000 auf rund 46.000 erhöht. Der Anteil der Bil-dungsausländer unter allen Absolventen im Prüfungsjahr 2015 beträgt 8%, der Anteil der Bildungsinländer beläuft sich auf 2%.
89% der Bildungsausländer planen einen Abschluss in Deutschland. Ihre Zahl ist in den letzten fünf Jahren um rund ein Drittel gestiegen, seit 2015 um 7%. Ingenieurwissenschaften sind die am häufigsten studierte Fächergruppe (38%), die seit 2010 auch den stärksten Zuwachs erlebt hat (+67%). Mit deut- lichem Abstand folgen die Wirtschaftswissenschaften (26%).
Mit 29% kommt die größte Gruppe der Bildungsausländer mit Abschlussabsicht aus der Region Asien und Pazifik. Dahinter folgen Westeuropa (18%), Nordafrika und Nahost (14%) sowie Mittel- und Südosteuropa (14%). China ist erneut mit Abstand das wichtigste Herkunftsland, gefolgt von Indien und Russland.
Während an Fachhochschulen 66% der Bildungsausländer mit Abschlussabsicht den Bachelor anstreben, sind es an Universi-täten nur 31%. Hier wollen 42% einen Masterabschluss ablegen.
Die Studienabbruchrate unter den Bildungsausländer-Studien-anfängern der Jahrgänge 2010 und 2011 im Bachelorstudium
beträgt wie schon für die beiden Jahrgänge zuvor 41%. Zu einer deutlichen Erhöhung ist es unter den Masterstudierenden gekommen. Für den Jahrgang 2012 beträgt die Quote 28%.
Studienbewerber der uni-assist-Mitgliedshochschulen kommen am häufigsten aus China, Indien und Syrien. Die Weiterleitungs-quoten der Bewerbungen nach formaler Prüfung schwanken je nach Herkunftsland zwischen 40% und 80%. Im Durchschnitt können zwei Drittel der Bewerbungen an die Hochschulen wei-tergeleitet werden. Ähnlich starke Differenzen sind hinsichtlich der Deutschkenntnisse der Bewerber festzustellen.
75% der rund 6.600 Geflüchteten, die am Integra-Programm teilnehmen, kommen aus Syrien. Fast 30% interessieren sich für ein Studium in der Fächergruppe Medizin und Gesundheits-wissenschaften, 25% für Mathematik, Informatik und Natur-wissenschaften und weitere 24% für Ingenieurwissenschaften.
2015 sind knapp 29.000 Bildungsausländer temporär, d.h. ohne Abschlussabsicht, an deutschen Hochschulen immatri-kuliert. Die Zahl ist gegenüber dem Vorjahr um 2% angestiegen (FH +6%, Uni +1%). 84% der ausländischen Gaststudierenden studieren dabei im ersten Hochschulsemester.
Die Hälfte aller an FHs eingeschriebenen Gaststudierenden stu-diert Wirtschafts- (50%), ein weiteres Drittel in Ingenieurwis-senschaften (35%). An Unis studieren 34% in Geistes-, 17% in Ingenieur- und 13% in Rechts- und Sozialwissenschaften.
Mehr als ein Drittel der Gaststudierenden stammt aus Westeu-ropa (37%), ein Fünftel aus der Region Asien und Pazifik (20%). An der Spitze steht Italien, gefolgt von Spanien und China.
Rund 33.000 Erasmus-Teilnehmer hielten sich 2015 in Deutsch-land auf, 6% mehr als im Jahr zuvor. Der Zuwachs geht vor allem auf die gestiegene Zahl der Praktikanten zurück (+19%). Frank-reich, Spanien und Italien sind die wichtigsten Herkunftslän-der, sie stellen allein 39% aller Erasmus-Studierenden an deut-schen Hochschulen.
Ausländische Studierende an deutschen Hochschulen teilen sich in Bildungsausländer (Studierende ausländischer Staatsbürger-schaft, die ihre Hochschulzugangsberechtigung im Ausland er-worben haben) und Bildungsinländer (Studierende ausländischer Staatsbürgerschaft, die ihre Hochschulzugangsberechtigung in
Deutschland erworben haben). Ein Teil der Bildungsausländer ver-folgt dabei keine Abschlussabsicht, sondern ist nur temporär an deutschen Hochschulen eingeschrieben. Die überwiegende Mehr-zahl der Bildungsausländer strebt allerdings einen deutschen Hochschulabschluss an.
a u s l ä n d i s c h e s t u d i e r e n d e i n s g e s a m t
b i l d u n g s a u s l ä n d e r : a b s c h l u s s b e z o g e n e m o b i l i tät
b i l d u n g s a u s l ä n d e r : t e m p o r ä r e s t u d i e n b e z o g e n e a u f e n t h a lt e u n d e r a s m u s - t e i l n e h m e r
ausländische studierendein deutschland
a | a u sl ä n d i sc h e st u d i e r e n d e i n d e ut sc h l a n d | f o r e i g n st u d e n t s i n g e rm a n y 41
b i l d u n g s a u s l a e n d e r : d e g r e e - r e l at e d m o b i l i t y
b i l d u n g s a u s l a e n d e r : t e m p o r a r y s t u d y - r e l at e d v i s i t s a n d e r a s m u s pa r t i c i pa n t s
Bforeign students in germany
f o r e i g n s t u d e n t s o v e r a l l
Foreign students at German higher education institutions are divided into Bildungsauslaender (students with foreign nationality who gained their higher education entrance qualification abroad) and Bildungsinlaender (students with foreign nationality who gained their higher education
entrance qualification in Germany). Some Bildungsauslaender do not intend to graduate, and are only enrolled temporarily at German higher education institutions; the vast majority of Bildungsauslaender however intend to graduate in Germany.
Around 340,000 foreign students enrolled at German higher education institutions in 2016. Compared to the previous year, their number in-creased by 6% or about 19,000 students, with the number of Bildungs-auslaender rising more steeply (+7%) than that of Bildungsinlaender (+4%). This increased the proportion of foreign students among all students to 12.3%. The higher education institutions in Berlin had the highest proportion of Bildungsauslaender among all students (15%), followed by the higher education institutions in Saxony and Branden-burg.
The largest group of Bildungsauslaender came from the Asia and Pacific region (28%), followed by Western Europe (20%) and Central and South Eastern Europe (14%). The number of foreign first-year students increased by 6% compared to the previous year, to 115,000 in 2015. This growth is due solely to the Bildungsauslaender (+7%). The number of Bildungsinlaender has remained almost unchanged, stagnating at around 16,400 since 2013.The number of foreign graduates increased by more than 10,000 compared to 2010, to around 46,000 graduates. The proportion of Bildungsauslaender among all graduates was 8% in the 2015 gradu-ation year; the proportion of Bildungsinlaender came to 2%.
89% of Bildungsauslaender intend to graduate in Germany. Their num-ber has increased by around a third over the past five years, by 7% since 2015 alone. Engineering is the most popular subject group (38%), and has also seen the highest increase since 2010 (+67%). Economics is a distant second (26%). At 29%, the largest group of Bildungsauslaender intending to graduate came from the Asia and Pacific region, followed at a significant distance by Western Europe (18%), North Africa and Middle East (14%), and Cen-tral and South Eastern Europe (14%). China is again by far the most im-portant country of origin, followed by India and Russia.While at universities of applied sciences 66% of Bildungsauslaender intending to graduate are aiming for a bachelor’s degree, this is true of only 31% at universities; in contrast, 42% of Bildungsauslaender at universities are studying for a master’s degree. The drop-out rate among Bildungsauslaender first-year students who enrolled in bachelor’s programmes in 2010 or 2011 remains at 41%, the
same as for students who enrolled in the two previous years. Among Bildungsauslaender studying towards master’s degrees, drop-out rates have increased significantly; the drop-out rate for the 2012 student cohort was 28%. Prospective students at the uni-assist member higher education institu-tions most frequently came from China, India and Syria. The forwarding rates for applications following formal assessment vary widely, from 40% to 80% depending on country of origin. On average, two thirds of applications can be forwarded to the respective higher education institutions. Similarly large differences can be observed regarding applicants’ German language skills.Three quarters of the around 6,600 refugees participating in the Integra-programme were from Syria. Almost 30% were interested in a degree programme in the subject group Medicine and Health Sciences, 25% in Science, and a further 24% in Engineering.
Just under 29,000 Bildungsauslaender were enrolled temporarily, i.e. without intending to graduate, at German higher education institutions in 2015. Their number has increased by 2% compared to the previous year (universities of applied sciences +6%, universities +1%). At 84%, the vast majority are in their first academic semester. Half of all visiting students at universities of applied sciences was enrolled in Economics degree programmes (50%) and a further third in Engineering (35%). At universities, 34% were studying in the Humanities, 17% in Engineering and 13% in Law and Social Sciences.
More than a third of visiting students came from Western Europe (37%), while a fifth was from the Asia and Pacific region (20%). The leading country of origin was Italy, followed by Spain and China. Around 33,000 Erasmus participants spent time in Germany in 2015, 6% more than in the previous year. This increase is due mainly to the greater number of persons who completed a placement in Germany (+19%). France, Spain and Italy are the main countries of origin; they alone account for 39% of all Erasmus students at German higher edu-cation institutions.
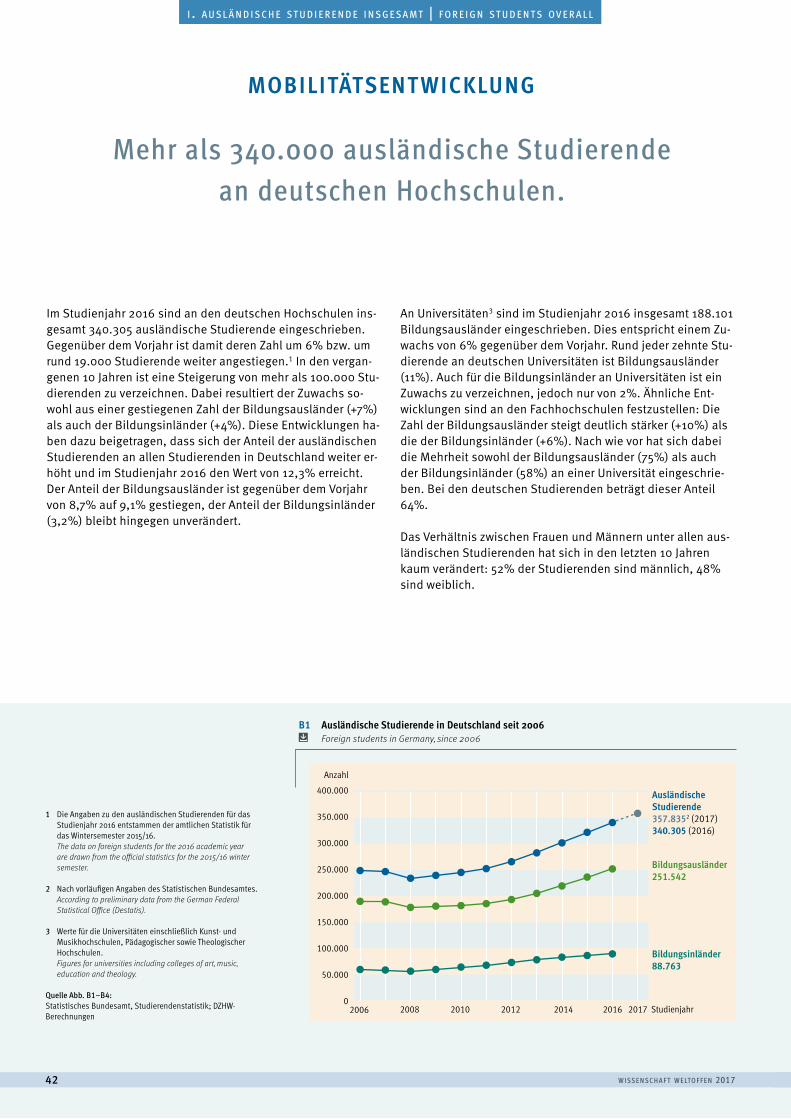
w i sse n sc h a f t w e lto f f e n 201742
a u s l ä n d i s c h e s t u d i e r e n d e | f o r e i g n s t u d e n t si . a u s l ä n d i s c h e s t u d i e r e n d e i n s g e s a m t | f o r e i g n s t u d e n t s o v e r a l l
Mehr als 340.000 ausländische Studierende an deutschen Hochschulen.
Im Studienjahr 2016 sind an den deutschen Hochschulen ins-gesamt 340.305 ausländische Studierende eingeschrieben. Gegenüber dem Vorjahr ist damit deren Zahl um 6% bzw. um rund 19.000 Studierende weiter angestiegen.1 In den vergan-genen 10 Jahren ist eine Steigerung von mehr als 100.000 Stu-dierenden zu verzeichnen. Dabei resultiert der Zuwachs so-wohl aus einer gestiegenen Zahl der Bildungsausländer (+7%) als auch der Bildungsinländer (+4%). Diese Entwicklungen ha-ben dazu beigetragen, dass sich der Anteil der ausländischen Studierenden an allen Studierenden in Deutschland weiter er-höht und im Studienjahr 2016 den Wert von 12,3% erreicht. Der Anteil der Bildungsausländer ist gegenüber dem Vorjahr von 8,7% auf 9,1% gestiegen, der Anteil der Bildungsinländer (3,2%) bleibt hingegen unverändert.
An Universitäten3 sind im Studienjahr 2016 insgesamt 188.101 Bildungsausländer eingeschrieben. Dies entspricht einem Zu-wachs von 6% gegenüber dem Vorjahr. Rund jeder zehnte Stu-dierende an deutschen Universitäten ist Bildungsausländer (11%). Auch für die Bildungsinländer an Universitäten ist ein Zuwachs zu verzeichnen, jedoch nur von 2%. Ähnliche Ent-wicklungen sind an den Fachhochschulen festzustellen: Die Zahl der Bildungsausländer steigt deutlich stärker (+10%) als die der Bildungsinländer (+6%). Nach wie vor hat sich dabei die Mehrheit sowohl der Bildungsausländer (75%) als auch der Bildungsinländer (58%) an einer Universität eingeschrie-ben. Bei den deutschen Studierenden beträgt dieser Anteil 64%.
Das Verhältnis zwischen Frauen und Männern unter allen aus-ländischen Studierenden hat sich in den letzten 10 Jahren kaum verändert: 52% der Studierenden sind männlich, 48% sind weiblich.
mobilitätsent wicklung
1 Die Angaben zu den ausländischen Studierenden für das Studienjahr 2016 entstammen der amtlichen Statistik für das Wintersemester 2015/16. The data on foreign students for the 2016 academic year are drawn from the official statistics for the 2015/16 winter semester.
2 Nach vorläufigen Angaben des Statistischen Bundesamtes.According to preliminary data from the German Federal Statistical Office (Destatis).
3 Werte für die Universitäten einschließlich Kunst- und Musikhochschulen, Pädagogischer sowie Theologischer Hochschulen. Figures for universities including colleges of art, music, education and theology.
Quelle Abb. B1–B4:Statistisches Bundesamt, Studierendenstatistik; DZHW-Berechnungen
400.000
Anzahl
350.000
300.000
200.000
250.000
150.000
100.000
50.000
0Studienjahr2008 2010 2012 2014 201720162006
Bildungsinländer88.763
Bildungsausländer251.542
Ausländische Studierende357.8352 (2017)340.305 (2016)
0
50000
100000
150000
200000
250000
300000
350000
400000
B1 Ausländische Studierende in Deutschland seit 2006 Foreign students in Germany, since 2006
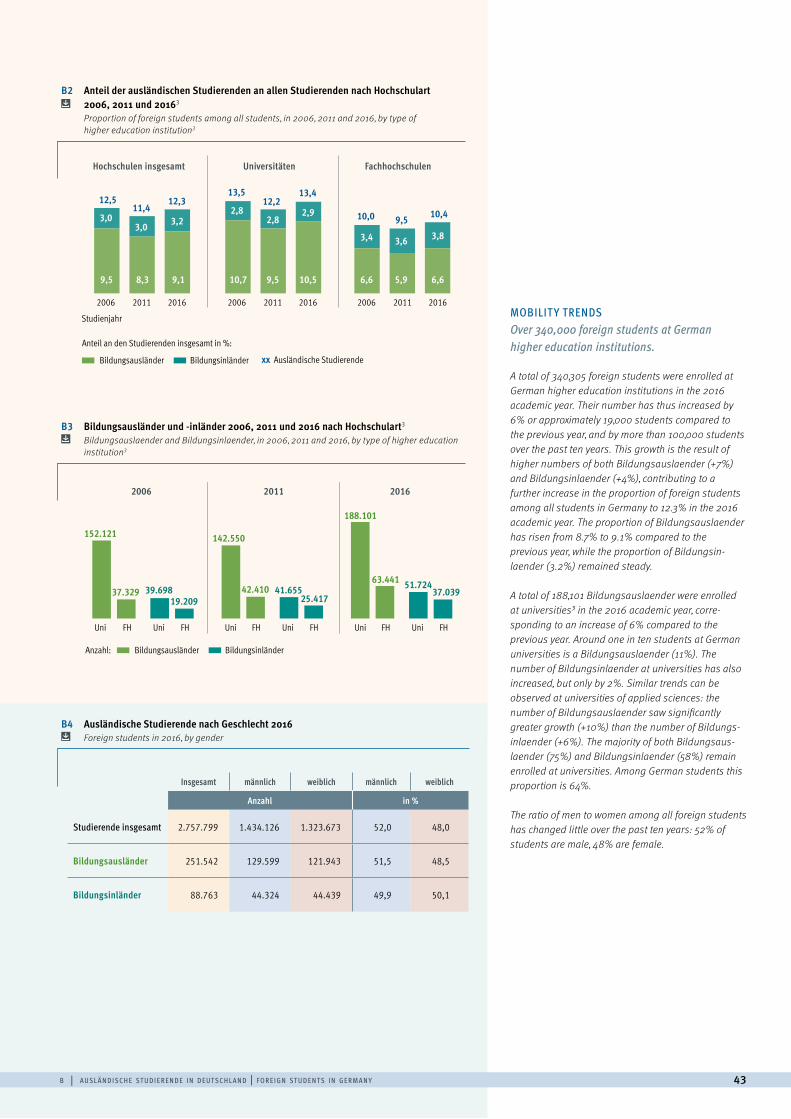
b | a u sl ä n d i sc h e st u d i e r e n d e i n d e ut sc h l a n d | f o r e i g n st u d e n t s i n g e rm a n y 43
MOBILIT Y TRENDS Over 340,000 foreign students at German higher education institutions.
A total of 340,305 foreign students were enrolled at German higher education institutions in the 2016 academic year. Their number has thus increased by 6% or approximately 19,000 students compared to the previous year, and by more than 100,000 students over the past ten years. This growth is the result of higher numbers of both Bildungsauslaender (+7%) and Bildungsinlaender (+4%), contributing to a further increase in the proportion of foreign students among all students in Germany to 12.3% in the 2016 academic year. The proportion of Bildungsauslaender has risen from 8.7% to 9.1% compared to the previous year, while the proportion of Bildungsin-laender (3.2%) remained steady.
A total of 188,101 Bildungsauslaender were enrolled at universities3 in the 2016 academic year, corre-sponding to an increase of 6% compared to the previous year. Around one in ten students at German universities is a Bildungsauslaender (11%). The number of Bildungsinlaender at universities has also increased, but only by 2%. Similar trends can be observed at universities of applied sciences: the number of Bildungsauslaender saw significantly greater growth (+10%) than the number of Bildungs-inlaender (+6%). The majority of both Bildungsaus-laender (75%) and Bildungsinlaender (58%) remain enrolled at universities. Among German students this proportion is 64%.
The ratio of men to women among all foreign students has changed little over the past ten years: 52% of students are male, 48% are female.
B2 Anteil der ausländischen Studierenden an allen Studierenden nach Hochschulart 2006, 2011 und 20163
Proportion of foreign students among all students, in 2006, 2011 and 2016, by type of higher education institution3
B3 Bildungsausländer und -inländer 2006, 2011 und 2016 nach Hochschulart3 Bildungsauslaender and Bildungsinlaender, in 2006, 2011 and 2016, by type of higher education
institution3
B4 Ausländische Studierende nach Geschlecht 2016 Foreign students in 2016, by gender
2006 2011 2016 2006 2011 2016 2006 2011 2016
Studienjahr
Hochschulen insgesamt Universitäten Fachhochschulen
0
3
6
9
12
15
12,511,4
12,313,4
3,03,0 3,2
2,82,8
2,9
3,4 3,6 3,8
9,5 8,3 9,1 10,7 9,5 10,5 6,6 5,9 6,6
12,213,5
10,0 9,5 10,4
Anteil an den Studierenden insgesamt in %: xx Ausländische StudierendeBildungsausländer Bildungsinländer
Bildungsausländer BildungsinländerAnzahl:
Uni FH Uni FH Uni FH Uni FH Uni FH Uni FH
2006 2011 2016
0
50000
100000
150000
200000152.121 142.550
37.329 42.410
188.101
63.441 51.72437.03939.698 41.655
19.209 25.417
Insgesamt männlich weiblich männlich weiblich
Anzahl in %
Studierende insgesamt 2.757.799 1.434.126 1.323.673 52,0 48,0
Bildungsausländer 251.542 129.599 121.943 51,5 48,5
Bildungsinländer 88.763 44.324 44.439 49,9 50,1
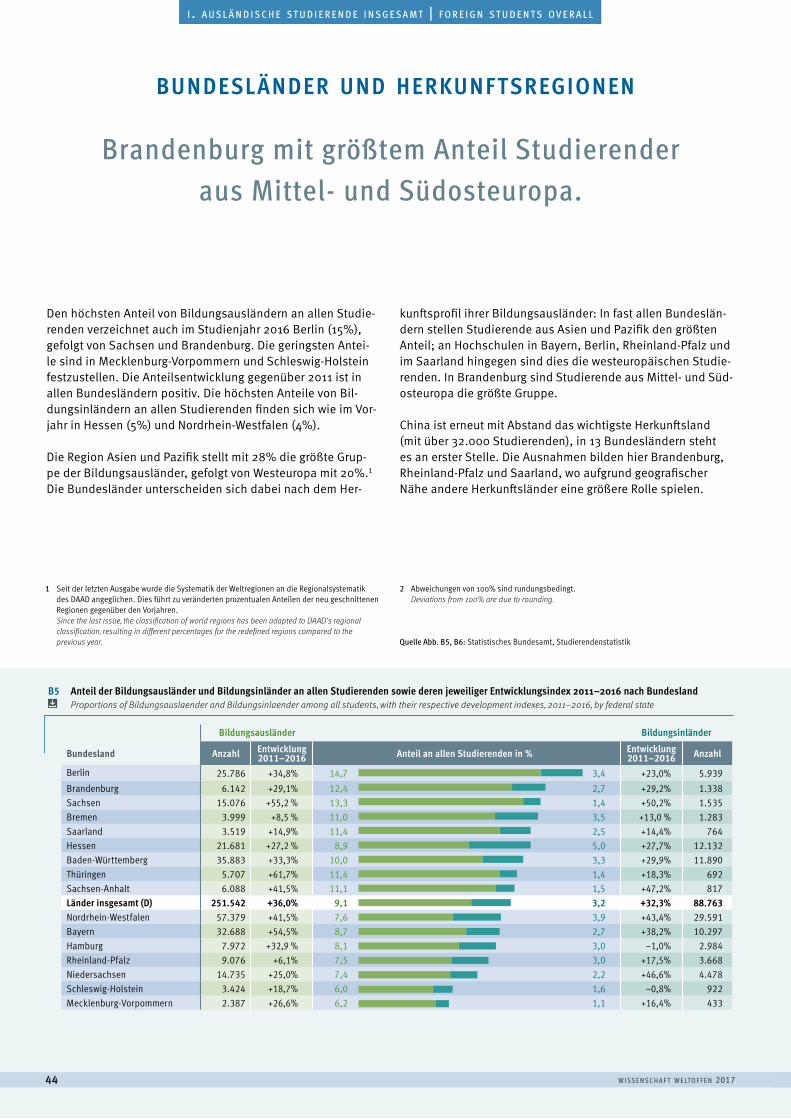
w i sse n sc h a f t w e lto f f e n 201744
a u s l ä n d i s c h e s t u d i e r e n d e | f o r e i g n s t u d e n t si . a u s l ä n d i s c h e s t u d i e r e n d e i n s g e s a m t | f o r e i g n s t u d e n t s o v e r a l l
B5 Anteil der Bildungsausländer und Bildungsinländer an allen Studierenden sowie deren jeweiliger Entwicklungsindex 2011–2016 nach Bundesland Proportions of Bildungsauslaender and Bildungsinlaender among all students, with their respective development indexes, 2011–2016, by federal state
Bildungsausländer Bildungsinländer
Bundesland Anzahl Entwicklung 2011–2016 Anteil an allen Studierenden in % Entwicklung
2011–2016 Anzahl
Berlin 25.786 +34,8% 14,7 3,4 +23,0% 5.939Brandenburg 6.142 +29,1% 12,4 2,7 +29,2% 1.338Sachsen 15.076 +55,2 % 13,3 1,4 +50,2% 1.535Bremen 3.999 +8,5 % 11,0 3,5 +13,0 % 1.283Saarland 3.519 +14,9% 11,4 2,5 +14,4% 764Hessen 21.681 +27,2 % 8,9 5,0 +27,7% 12.132Baden-Württemberg 35.883 +33,3% 10,0 3,3 +29,9% 11.890Thüringen 5.707 +61,7% 11,4 1,4 +18,3% 692Sachsen-Anhalt 6.088 +41,5% 11,1 1,5 +47,2% 817Länder insgesamt (D) 251.542 +36,0% 9,1 3,2 +32,3% 88.763Nordrhein-Westfalen 57.379 +41,5% 7,6 3,9 +43,4% 29.591Bayern 32.688 +54,5% 8,7 2,7 +38,2% 10.297Hamburg 7.972 +32,9 % 8,1 3,0 –1,0% 2.984Rheinland-Pfalz 9.076 +6,1% 7,5 3,0 +17,5% 3.668Niedersachsen 14.735 +25,0% 7,4 2,2 +46,6% 4.478Schleswig-Holstein 3.424 +18,7% 6,0 1,6 –0,8% 922Mecklenburg-Vorpommern 2.387 +26,6% 6,2 1,1 +16,4% 433
0 5 10 15 20
Brandenburg mit größtem Anteil Studierender aus Mittel- und Südosteuropa.
Den höchsten Anteil von Bildungsausländern an allen Studie-renden verzeichnet auch im Studienjahr 2016 Berlin (15%), gefolgt von Sachsen und Brandenburg. Die geringsten Antei-le sind in Mecklenburg-Vorpommern und Schleswig-Holstein festzustellen. Die Anteilsentwicklung gegenüber 2011 ist in allen Bundesländern positiv. Die höchsten Anteile von Bil-dungsinländern an allen Studierenden finden sich wie im Vor-jahr in Hessen (5%) und Nordrhein-Westfalen (4%).
Die Region Asien und Pazifik stellt mit 28% die größte Grup-pe der Bildungsausländer, gefolgt von Westeuropa mit 20%.1 Die Bundesländer unterscheiden sich dabei nach dem Her-
kunftsprofil ihrer Bildungsausländer: In fast allen Bundeslän-dern stellen Studierende aus Asien und Pazifik den größten Anteil; an Hochschulen in Bayern, Berlin, Rheinland-Pfalz und im Saarland hingegen sind dies die westeuropäischen Studie-renden. In Brandenburg sind Studierende aus Mittel- und Süd-osteuropa die größte Gruppe.
China ist erneut mit Abstand das wichtigste Herkunftsland (mit über 32.000 Studierenden), in 13 Bundesländern steht es an erster Stelle. Die Ausnahmen bilden hier Brandenburg, Rheinland-Pfalz und Saarland, wo aufgrund geografischer Nähe andere Herkunftsländer eine größere Rolle spielen.
bundesländer und herkunftsregionen
1 Seit der letzten Ausgabe wurde die Systematik der Weltregionen an die Regionalsystematik des DAAD angeglichen. Dies führt zu veränderten prozentualen Anteilen der neu geschnittenen Regionen gegenüber den Vorjahren.Since the last issue, the classification of world regions has been adapted to DAAD‘s regional classification, resulting in different percentages for the redefined regions compared to the previous year.
2 Abweichungen von 100% sind rundungsbedingt. Deviations from 100% are due to rounding.
Quelle Abb. B5, B6: Statistisches Bundesamt, Studierendenstatistik
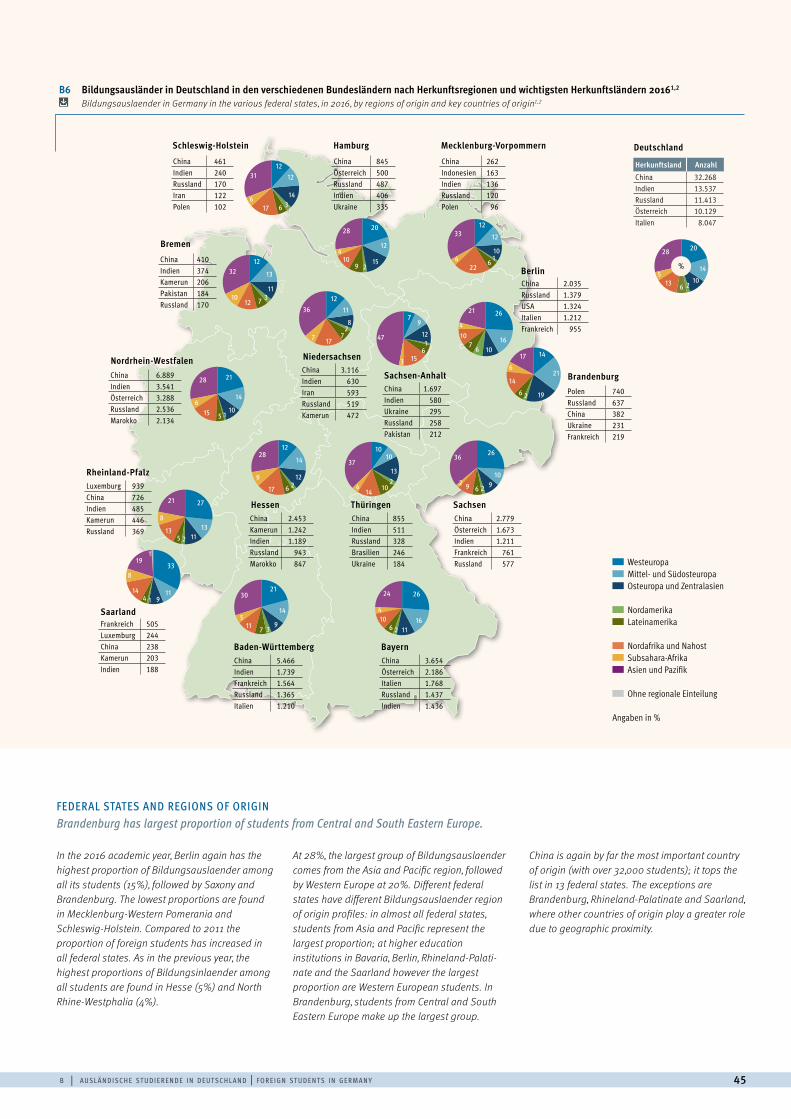
b | a u sl ä n d i sc h e st u d i e r e n d e i n d e ut sc h l a n d | f o r e i g n st u d e n t s i n g e rm a n y 45
FEDERAL STATES AND REGIONS OF ORIGIN Brandenburg has largest proportion of students from Central and South Eastern Europe.
In the 2016 academic year, Berlin again has the highest proportion of Bildungsauslaender among all its students (15%), followed by Saxony and Brandenburg. The lowest proportions are found in Mecklenburg-Western Pomerania and Schleswig-Holstein. Compared to 2011 the proportion of foreign students has increased in all federal states. As in the previous year, the highest proportions of Bildungsinlaender among all students are found in Hesse (5%) and North Rhine-Westphalia (4%).
At 28%, the largest group of Bildungsauslaender comes from the Asia and Pacific region, followed by Western Europe at 20%. Different federal states have different Bildungsauslaender region of origin profiles: in almost all federal states, students from Asia and Pacific represent the largest proportion; at higher education institutions in Bavaria, Berlin, Rhineland-Palati-nate and the Saarland however the largest proportion are Western European students. In Brandenburg, students from Central and South Eastern Europe make up the largest group.
China is again by far the most important country of origin (with over 32,000 students); it tops the list in 13 federal states. The exceptions are Brandenburg, Rhineland-Palatinate and Saarland, where other countries of origin play a greater role due to geographic proximity.
B6 Bildungsausländer in Deutschland in den verschiedenen Bundesländern nach Herkunftsregionen und wichtigsten Herkunftsländern 20161,2 Bildungsauslaender in Germany in the various federal states, in 2016, by regions of origin and key countries of origin1,2
Westeuropa Mittel- und Südosteuropa Osteuropa und Zentralasien
Nordamerika Lateinamerika
Nordafrika und Nahost Subsahara-Afrika Asien und Pazifik
Ohne regionale Einteilung
Angaben in %
Niedersachsen
Sachsen-Anhalt
Mecklenburg-VorpommernHamburgSchleswig-Holstein
Bremen
Nordrhein-Westfalen
Hessen Thüringen
Rheinland-Pfalz
Saarland
Baden-Württemberg Bayern
Sachsen
Berlin
Brandenburg
12
14
27
13
21
13
11
19
11
3
2
2
7
6
5
12
14
13
20
12
1529
104
28
12
12
143617
6
31
10
32
12
11
82
7177
36
12
12
101
622
4
33
26
16106
7104
21
6
17
79
121
6153
47
21
14
101515
6
28
12
14
122617
9
2810
10
132
1014
4
3726
1092692
36
8
21
33
11914
14
8
191
21
14
93711
5
30 26
161126
104
24
Deutschland
20
14
102613
5
28
Herkunftsland AnzahlChina 32.268Indien 13.537Russland 11.413Österreich 10.129Italien 8.047
Polen 740Russland 637China 382Ukraine 231Frankreich 219
China 2.035Russland 1.379USA 1.324Italien 1.212Frankreich 955
China 3.654Österreich 2.186Italien 1.768Russland 1.437Indien 1.436
China 5.466Indien 1.739Frankreich 1.564Russland 1.365Italien 1.210
Frankreich 505Luxemburg 244China 238Kamerun 203Indien 188
Luxemburg 939China 726Indien 485Kamerun 446Russland 369
China 2.453Kamerun 1.242Indien 1.189Russland 943Marokko 847
China 855Indien 511Russland 328Brasilien 246Ukraine 184
China 2.779Österreich 1.673Indien 1.211Frankreich 761Russland 577
China 461Indien 240Russland 170Iran 122Polen 102
China 410Indien 374Kamerun 206Pakistan 184Russland 170
China 6.889Indien 3.541Österreich 3.288Russland 2.536Marokko 2.134
China 3.116Indien 630Iran 593Russland 519Kamerun 472
China 1.697Indien 580Ukraine 295Russland 258Pakistan 212
China 845Österreich 500Russland 487Indien 406Ukraine 335
China 262Indonesien 163Indien 136Russland 120Polen 96
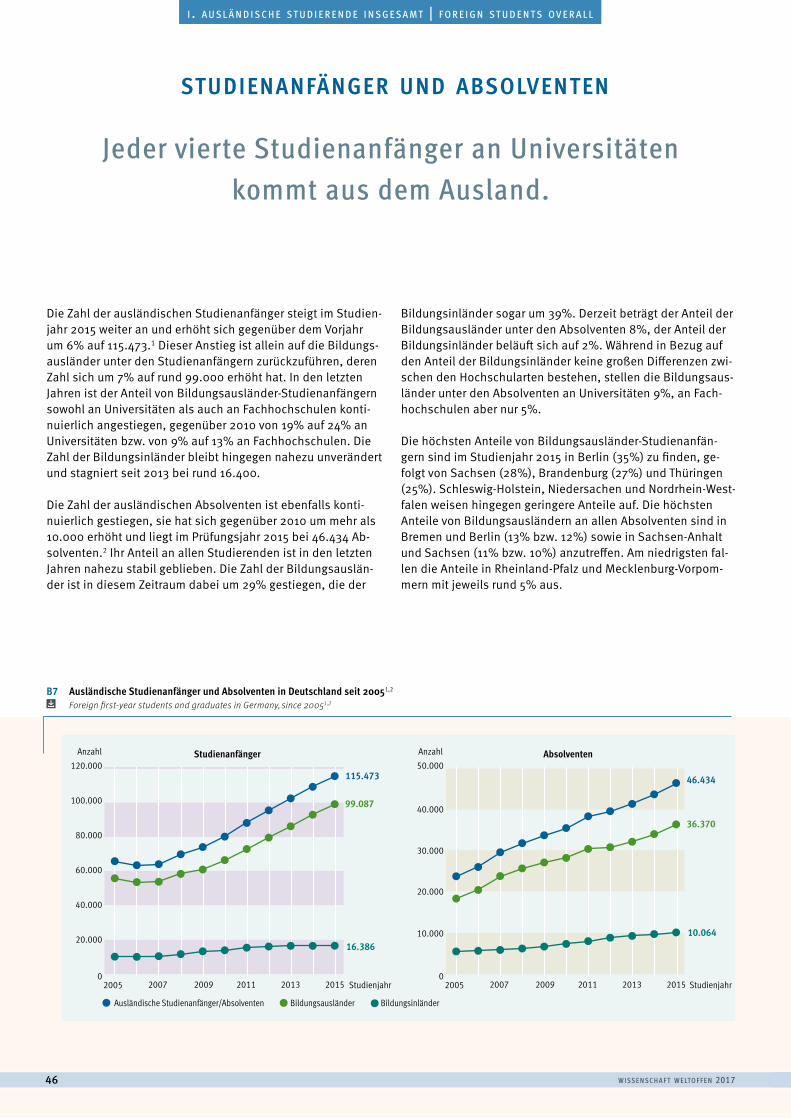
w i sse n sc h a f t w e lto f f e n 201746
a u s l ä n d i s c h e s t u d i e r e n d e | f o r e i g n s t u d e n t si . a u s l ä n d i s c h e s t u d i e r e n d e i n s g e s a m t | f o r e i g n s t u d e n t s o v e r a l l
Die Zahl der ausländischen Studienanfänger steigt im Studien- jahr 2015 weiter an und erhöht sich gegenüber dem Vorjahr um 6% auf 115.473.1 Dieser Anstieg ist allein auf die Bildungs-ausländer unter den Studienanfängern zurückzuführen, deren Zahl sich um 7% auf rund 99.000 erhöht hat. In den letzten Jahren ist der Anteil von Bildungsausländer-Studienanfängern sowohl an Universitäten als auch an Fachhochschulen konti-nuierlich angestiegen, gegenüber 2010 von 19% auf 24% an Universitäten bzw. von 9% auf 13% an Fachhochschulen. Die Zahl der Bildungsinländer bleibt hingegen nahezu unverändert und stagniert seit 2013 bei rund 16.400.
Die Zahl der ausländischen Absolventen ist ebenfalls konti-nuierlich gestiegen, sie hat sich gegenüber 2010 um mehr als 10.000 erhöht und liegt im Prüfungsjahr 2015 bei 46.434 Ab-solventen.2 Ihr Anteil an allen Studierenden ist in den letzten Jahren nahezu stabil geblieben. Die Zahl der Bildungsauslän-der ist in diesem Zeitraum dabei um 29% gestiegen, die der
Bildungsinländer sogar um 39%. Derzeit beträgt der Anteil der Bildungsausländer unter den Absolventen 8%, der Anteil der Bildungsinländer beläuft sich auf 2%. Während in Bezug auf den Anteil der Bildungsinländer keine großen Differenzen zwi-schen den Hochschularten bestehen, stellen die Bildungsaus-länder unter den Absolventen an Universitäten 9%, an Fach-hochschulen aber nur 5%.
Die höchsten Anteile von Bildungsausländer-Studienanfän-gern sind im Studienjahr 2015 in Berlin (35%) zu finden, ge-folgt von Sachsen (28%), Brandenburg (27%) und Thüringen (25%). Schleswig-Holstein, Niedersachen und Nordrhein-West-falen weisen hingegen geringere Anteile auf. Die höchsten Anteile von Bildungsausländern an allen Absolventen sind in Bremen und Berlin (13% bzw. 12%) sowie in Sachsen-Anhalt und Sachsen (11% bzw. 10%) anzutreffen. Am niedrigsten fal-len die Anteile in Rheinland-Pfalz und Mecklenburg-Vorpom-mern mit jeweils rund 5% aus.
Jeder vierte Studienanfänger an Universitäten kommt aus dem Ausland.
studienanfänger und absolventen
B7 Ausländische Studienanfänger und Absolventen in Deutschland seit 20051,2 Foreign first-year students and graduates in Germany, since 20051,2
120.000Anzahl Anzahl
100.000
60.000
80.000
40.000
20.000
0Studienjahr Studienjahr2007 2009 2011 2013 20152005
16.386
Studienanfänger Absolventen
99.087
115.47350.000
40.000
20.000
30.000
10.000
02007 2009 2011 2013 20152005
10.064
36.370
46.434
Ausländische Studienanfänger/Absolventen Bildungsausländer Bildungsinländer
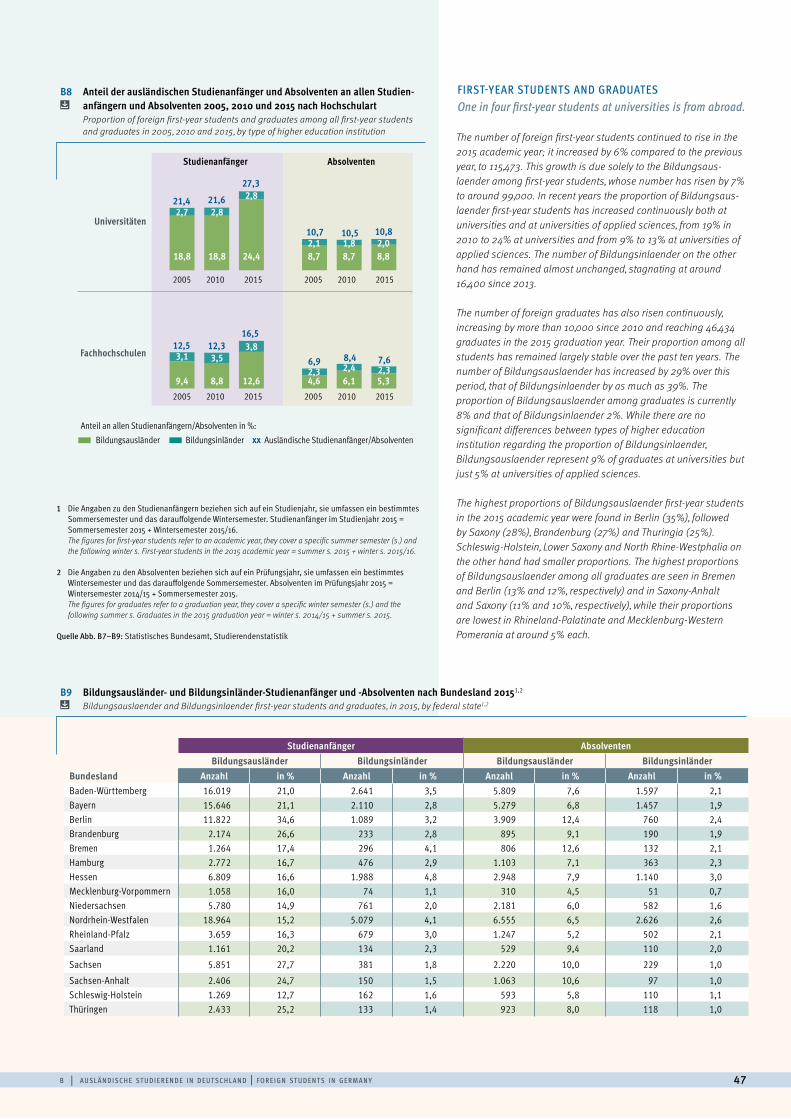
b | a u sl ä n d i sc h e st u d i e r e n d e i n d e ut sc h l a n d | f o r e i g n st u d e n t s i n g e rm a n y 47
FIRST-YEAR STUDENTS AND GRADUATES One in four first-year students at universities is from abroad.
The number of foreign first-year students continued to rise in the 2015 academic year; it increased by 6% compared to the previous year, to 115,473. This growth is due solely to the Bildungsaus-laender among first-year students, whose number has risen by 7% to around 99,000. In recent years the proportion of Bildungsaus-laender first-year students has increased continuously both at universities and at universities of applied sciences, from 19% in 2010 to 24% at universities and from 9% to 13% at universities of applied sciences. The number of Bildungsinlaender on the other hand has remained almost unchanged, stagnating at around 16,400 since 2013.
The number of foreign graduates has also risen continuously, increasing by more than 10,000 since 2010 and reaching 46,434 graduates in the 2015 graduation year. Their proportion among all students has remained largely stable over the past ten years. The number of Bildungsauslaender has increased by 29% over this period, that of Bildungsinlaender by as much as 39%. The proportion of Bildungsauslaender among graduates is currently 8% and that of Bildungsinlaender 2%. While there are no significant differences between types of higher education institution regarding the proportion of Bildungsinlaender, Bildungsauslaender represent 9% of graduates at universities but just 5% at universities of applied sciences.
The highest proportions of Bildungsauslaender first-year students in the 2015 academic year were found in Berlin (35%), followed by Saxony (28%), Brandenburg (27%) and Thuringia (25%). Schleswig-Holstein, Lower Saxony and North Rhine-Westphalia on the other hand had smaller proportions. The highest proportions of Bildungsauslaender among all graduates are seen in Bremen and Berlin (13% and 12%, respectively) and in Saxony-Anhalt and Saxony (11% and 10%, respectively), while their proportions are lowest in Rhineland-Palatinate and Mecklenburg-Western Pomerania at around 5% each.
1 Die Angaben zu den Studienanfängern beziehen sich auf ein Studienjahr, sie umfassen ein bestimmtes Sommersemester und das darauffolgende Wintersemester. Studienanfänger im Studienjahr 2015 = Sommersemester 2015 + Wintersemester 2015/16.The figures for first-year students refer to an academic year, they cover a specific summer semester (s.) and the following winter s. First-year students in the 2015 academic year = summer s. 2015 + winter s. 2015/16.
2 Die Angaben zu den Absolventen beziehen sich auf ein Prüfungsjahr, sie umfassen ein bestimmtes Wintersemester und das darauffolgende Sommersemester. Absolventen im Prüfungsjahr 2015 = Wintersemester 2014/15 + Sommersemester 2015.The figures for graduates refer to a graduation year, they cover a specific winter semester (s.) and the following summer s. Graduates in the 2015 graduation year = winter s. 2014/15 + summer s. 2015.
Quelle Abb. B7–B9: Statistisches Bundesamt, Studierendenstatistik
B8 Anteil der ausländischen Studienanfänger und Absolventen an allen Studien- anfängern und Absolventen 2005, 2010 und 2015 nach Hochschulart
Proportion of foreign first-year students and graduates among all first-year students and graduates in 2005, 2010 and 2015, by type of higher education institution
B9 Bildungsausländer- und Bildungsinländer-Studienanfänger und -Absolventen nach Bundesland 20151,2 Bildungsauslaender and Bildungsinlaender first-year students and graduates, in 2015, by federal state1,2
Studienanfänger AbsolventenBildungsausländer Bildungsinländer Bildungsausländer Bildungsinländer
Bundesland Anzahl in % Anzahl in % Anzahl in % Anzahl in %Baden-Württemberg 16.019 21,0 2.641 3,5 5.809 7,6 1.597 2,1Bayern 15.646 21,1 2.110 2,8 5.279 6,8 1.457 1,9Berlin 11.822 34,6 1.089 3,2 3.909 12,4 760 2,4Brandenburg 2.174 26,6 233 2,8 895 9,1 190 1,9Bremen 1.264 17,4 296 4,1 806 12,6 132 2,1Hamburg 2.772 16,7 476 2,9 1.103 7,1 363 2,3Hessen 6.809 16,6 1.988 4,8 2.948 7,9 1.140 3,0Mecklenburg-Vorpommern 1.058 16,0 74 1,1 310 4,5 51 0,7Niedersachsen 5.780 14,9 761 2,0 2.181 6,0 582 1,6Nordrhein-Westfalen 18.964 15,2 5.079 4,1 6.555 6,5 2.626 2,6Rheinland-Pfalz 3.659 16,3 679 3,0 1.247 5,2 502 2,1Saarland 1.161 20,2 134 2,3 529 9,4 110 2,0
Sachsen 5.851 27,7 381 1,8 2.220 10,0 229 1,0
Sachsen-Anhalt 2.406 24,7 150 1,5 1.063 10,6 97 1,0Schleswig-Holstein 1.269 12,7 162 1,6 593 5,8 110 1,1Thüringen 2.433 25,2 133 1,4 923 8,0 118 1,0
2005 2010 2015 2005 2010 2015
2005 2010 2015 2005 2010 2015
Studienanfänger
Universitäten
Fachhochschulen
Absolventen
21,4
27,3
21,6
10,7 10,810,5
12,516,5
12,36,9 7,68,4
18,8 18,8 24,4
2,7 2,8
2,8
8,7 8,7 8,82,1 1,8 2,0
9,4 8,8 12,6
3,1 3,53,8
4,6 6,1 5,32,3 2,4 2,3
Anteil an allen Studienanfängern/Absolventen in %: xx Ausländische Studienanfänger/Absolventen
Bildungsausländer Bildungsinländer
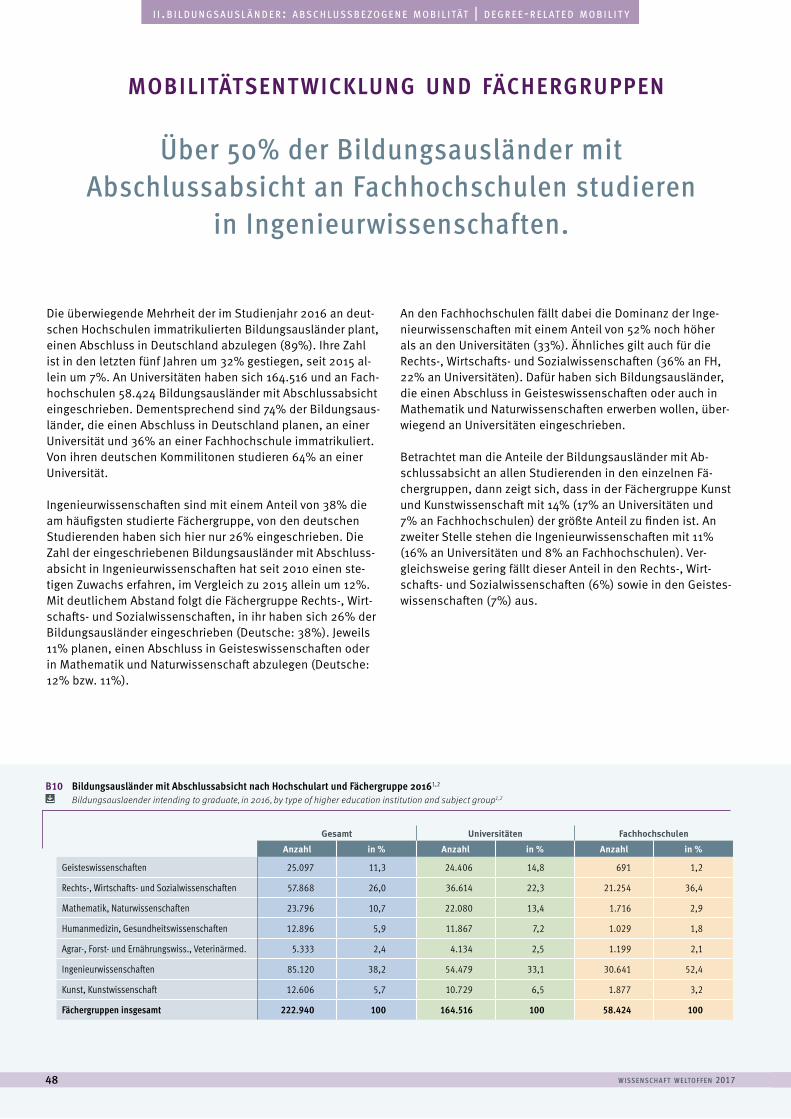
w i sse n sc h a f t w e lto f f e n 201748
a u s l ä n d i s c h e s t u d i e r e n d e | f o r e i g n s t u d e n t si i . b i l d u n g s a u s l ä n d e r : a b s c h l u s s b e z o g e n e m o b i l i tät | d e g r e e - r e l at e d m o b i l i t y
Über 50% der Bildungsausländer mit Abschlussabsicht an Fachhochschulen studieren
in Ingenieurwissenschaften.
Die überwiegende Mehrheit der im Studienjahr 2016 an deut-schen Hochschulen immatrikulierten Bildungsausländer plant, einen Abschluss in Deutschland abzulegen (89%). Ihre Zahl ist in den letzten fünf Jahren um 32% gestiegen, seit 2015 al-lein um 7%. An Universitäten haben sich 164.516 und an Fach-hochschulen 58.424 Bildungsausländer mit Abschlussabsicht eingeschrieben. Dementsprechend sind 74% der Bildungsaus-länder, die einen Abschluss in Deutschland planen, an einer Universität und 36% an einer Fachhochschule immatrikuliert. Von ihren deutschen Kommilitonen studieren 64% an einer Universität.
Ingenieurwissenschaften sind mit einem Anteil von 38% die am häufigsten studierte Fächergruppe, von den deutschen Studierenden haben sich hier nur 26% eingeschrieben. Die Zahl der eingeschriebenen Bildungsausländer mit Abschluss-absicht in Ingenieurwissenschaften hat seit 2010 einen ste-tigen Zuwachs erfahren, im Vergleich zu 2015 allein um 12%. Mit deutlichem Abstand folgt die Fächergruppe Rechts-, Wirt-schafts- und Sozialwissenschaften, in ihr haben sich 26% der Bildungsausländer eingeschrieben (Deutsche: 38%). Jeweils 11% planen, einen Abschluss in Geisteswissenschaften oder in Mathematik und Naturwissenschaft abzulegen (Deutsche: 12% bzw. 11%).
An den Fachhochschulen fällt dabei die Dominanz der Inge-nieurwissenschaften mit einem Anteil von 52% noch höher als an den Universitäten (33%). Ähnliches gilt auch für die Rechts-, Wirtschafts- und Sozialwissenschaften (36% an FH, 22% an Universitäten). Dafür haben sich Bildungsausländer, die einen Abschluss in Geisteswissenschaften oder auch in Mathematik und Naturwissenschaften erwerben wollen, über-wiegend an Universitäten eingeschrieben.
Betrachtet man die Anteile der Bildungsausländer mit Ab-schlussabsicht an allen Studierenden in den einzelnen Fä-chergruppen, dann zeigt sich, dass in der Fächergruppe Kunst und Kunstwissenschaft mit 14% (17% an Universitäten und 7% an Fachhochschulen) der größte Anteil zu finden ist. An zweiter Stelle stehen die Ingenieurwissenschaften mit 11% (16% an Universitäten und 8% an Fachhochschulen). Ver-gleichsweise gering fällt dieser Anteil in den Rechts-, Wirt-schafts- und Sozialwissenschaften (6%) sowie in den Geistes-wissenschaften (7%) aus.
mobilitätsent wicklung und fächergruppen
B10 Bildungsausländer mit Abschlussabsicht nach Hochschulart und Fächergruppe 20161,2 Bildungsauslaender intending to graduate, in 2016, by type of higher education institution and subject group1,2
Gesamt Universitäten Fachhochschulen
Anzahl in % Anzahl in % Anzahl in %
Geisteswissenschaften 25.097 11,3 24.406 14,8 691 1,2
Rechts-, Wirtschafts- und Sozialwissenschaften 57.868 26,0 36.614 22,3 21.254 36,4
Mathematik, Naturwissenschaften 23.796 10,7 22.080 13,4 1.716 2,9
Humanmedizin, Gesundheitswissenschaften 12.896 5,9 11.867 7,2 1.029 1,8
Agrar-, Forst- und Ernährungswiss., Veterinärmed. 5.333 2,4 4.134 2,5 1.199 2,1
Ingenieurwissenschaften 85.120 38,2 54.479 33,1 30.641 52,4
Kunst, Kunstwissenschaft 12.606 5,7 10.729 6,5 1.877 3,2
Fächergruppen insgesamt 222.940 100 164.516 100 58.424 100
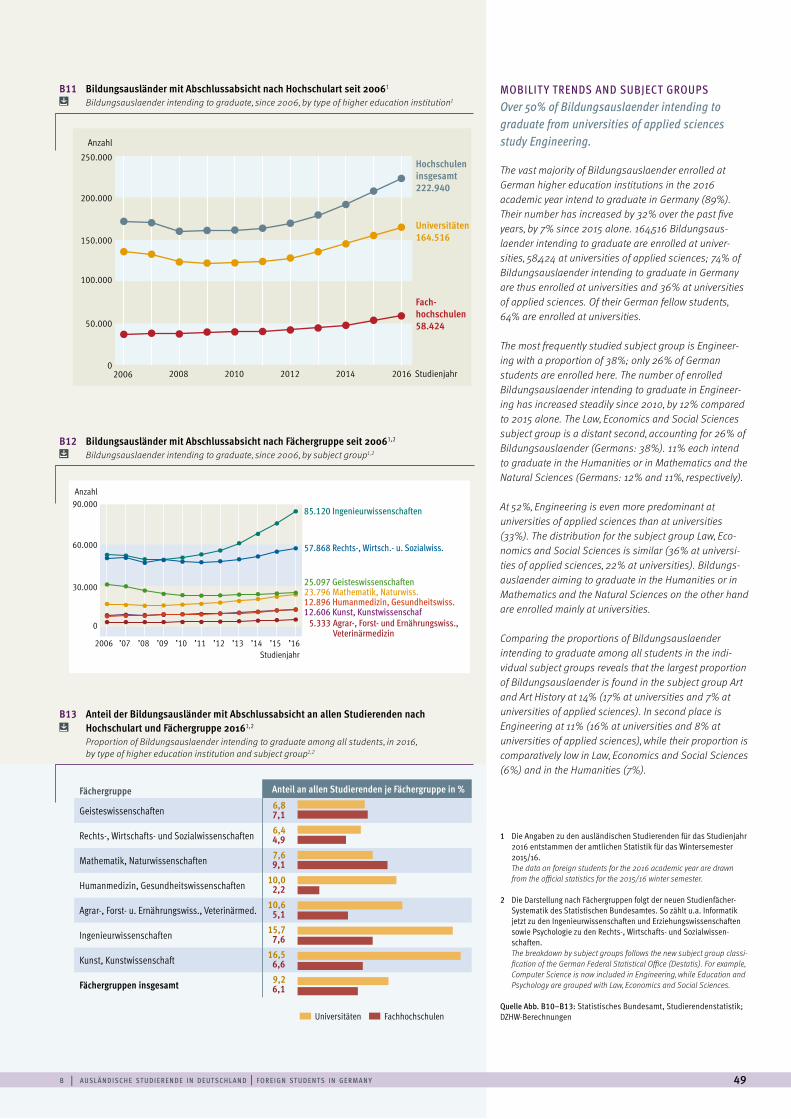
b | a u sl ä n d i sc h e st u d i e r e n d e i n d e ut sc h l a n d | f o r e i g n st u d e n t s i n g e rm a n y 49
B13 Anteil der Bildungsausländer mit Abschlussabsicht an allen Studierenden nach Hochschulart und Fächergruppe 20161,2
Proportion of Bildungsauslaender intending to graduate among all students, in 2016, by type of higher education institution and subject group1,2
MOBILIT Y TRENDS AND SUBJECT GROUPS Over 50% of Bildungsauslaender intending to graduate from universities of applied sciences study Engineering.
The vast majority of Bildungsauslaender enrolled at German higher education institutions in the 2016 academic year intend to graduate in Germany (89%). Their number has increased by 32% over the past five years, by 7% since 2015 alone. 164,516 Bildungsaus-laender intending to graduate are enrolled at univer- sities, 58,424 at universities of applied sciences; 74% of Bildungsauslaender intending to graduate in Germany are thus enrolled at universities and 36% at universities of applied sciences. Of their German fellow students, 64% are enrolled at universities.
The most frequently studied subject group is Engineer-ing with a proportion of 38%; only 26% of German students are enrolled here. The number of enrolled Bildungsauslaender intending to graduate in Engineer-ing has increased steadily since 2010, by 12% compared to 2015 alone. The Law, Economics and Social Sciences subject group is a distant second, accounting for 26% of Bildungsauslaender (Germans: 38%). 11% each intend to graduate in the Humanities or in Mathematics and the Natural Sciences (Germans: 12% and 11%, respectively).
At 52%, Engineering is even more predominant at universities of applied sciences than at universities (33%). The distribution for the subject group Law, Eco- nomics and Social Sciences is similar (36% at universi-ties of applied sciences, 22% at universities). Bildungs- auslaender aiming to graduate in the Humanities or in Mathematics and the Natural Sciences on the other hand are enrolled mainly at universities.
Comparing the proportions of Bildungsauslaender intending to graduate among all students in the indi- vidual subject groups reveals that the largest proportion of Bildungsauslaender is found in the subject group Art and Art History at 14% (17% at universities and 7% at universities of applied sciences). In second place is Engineering at 11% (16% at universities and 8% at universities of applied sciences), while their proportion is comparatively low in Law, Economics and Social Sciences (6%) and in the Humanities (7%).
1 Die Angaben zu den ausländischen Studierenden für das Studienjahr 2016 entstammen der amtlichen Statistik für das Wintersemester 2015/16.The data on foreign students for the 2016 academic year are drawn from the official statistics for the 2015/16 winter semester.
2 Die Darstellung nach Fächergruppen folgt der neuen Studienfächer- Systematik des Statistischen Bundesamtes. So zählt u.a. Informatik jetzt zu den Ingenieurwissenschaften und Erziehungswissenschaften sowie Psychologie zu den Rechts-, Wirtschafts- und Sozialwissen-schaften. The breakdown by subject groups follows the new subject group classi-fication of the German Federal Statistical Office (Destatis). For example, Computer Science is now included in Engineering, while Education and Psychology are grouped with Law, Economics and Social Sciences.
Quelle Abb. B10–B13: Statistisches Bundesamt, Studierendenstatistik; DZHW-Berechnungen
B11 Bildungsausländer mit Abschlussabsicht nach Hochschulart seit 20061 Bildungsauslaender intending to graduate, since 2006, by type of higher education institution1
B12 Bildungsausländer mit Abschlussabsicht nach Fächergruppe seit 20061,2 Bildungsauslaender intending to graduate, since 2006, by subject group1,2
25.097 Geisteswissenschaften
85.120 Ingenieurwissenschaften
57.868 Rechts-, Wirtsch.- u. Sozialwiss.
23.796 Mathematik, Naturwiss.12.896 Humanmedizin, Gesundheitswiss.12.606 Kunst, Kunstwissenschaf 5.333 Agrar-, Forst- und Ernährungswiss., Veterinärmedizin
90.000Anzahl
60.000
30.000
0
2006 ’07 ’08 ’09 ’10 ’14 ’15 ’16’13’12’11Studienjahr
200.000
250.000
Anzahl
150.000
100.000
50.000
0Studienjahr2008 2010 2012 2014 20162006
Fach-hochschulen58.424
Universitäten164.516
Hochschulen insgesamt222.940
0
50000
100000
150000
200000
250000
Fächergruppe Anteil an allen Studierenden je Fächergruppe in %
Geisteswissenschaften 7,1
Rechts-, Wirtschafts- und Sozialwissenschaften 4,9
Mathematik, Naturwissenschaften 9,1
Humanmedizin, Gesundheitswissenschaften 2,2
Agrar-, Forst- u. Ernährungswiss., Veterinärmed. 5,1
Ingenieurwissenschaften 7,6
Kunst, Kunstwissenschaft 6,6
Fächergruppen insgesamt 6,1
6,8
6,4
7,6
10,0
10,6
15,7
16,5
9,2
Universitäten Fachhochschulen0 5 10 15 20
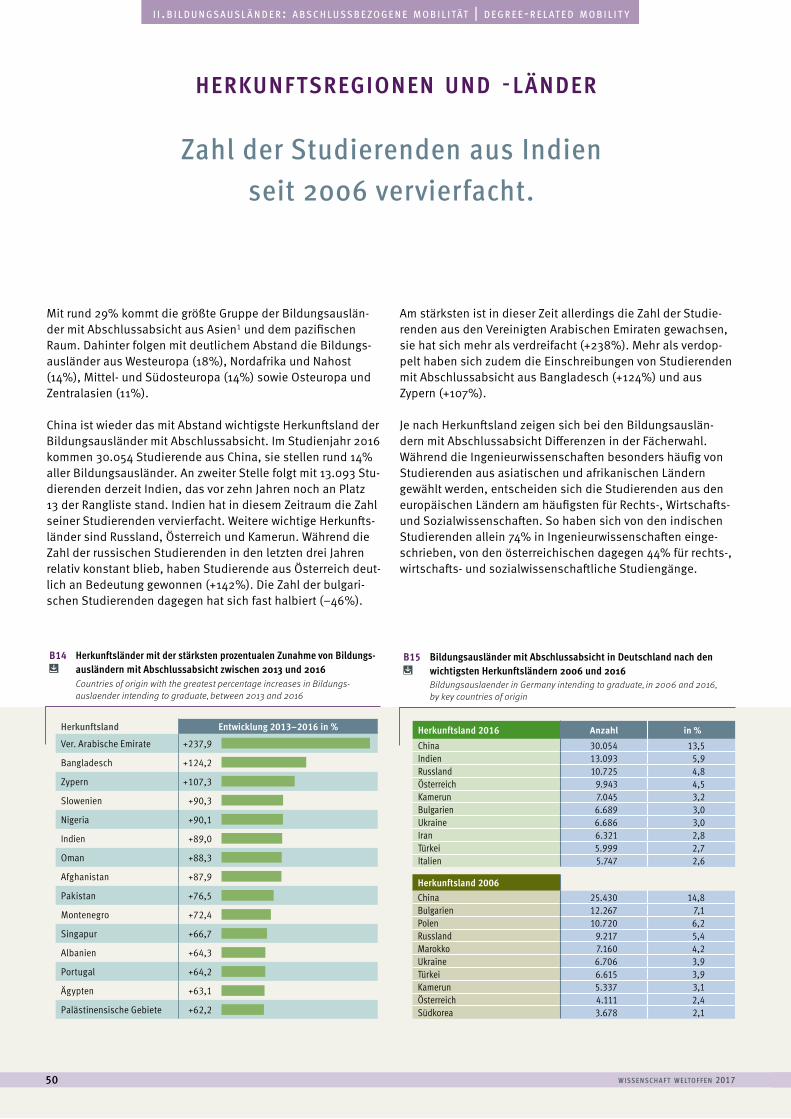
w i sse n sc h a f t w e lto f f e n 201750
a u s l ä n d i s c h e s t u d i e r e n d e | f o r e i g n s t u d e n t si i . b i l d u n g s a u s l ä n d e r : a b s c h l u s s b e z o g e n e m o b i l i tät | d e g r e e - r e l at e d m o b i l i t y
Zahl der Studierenden aus Indien seit 2006 vervierfacht.
Mit rund 29% kommt die größte Gruppe der Bildungsauslän-der mit Abschlussabsicht aus Asien1 und dem pazifischen Raum. Dahinter folgen mit deutlichem Abstand die Bildungs-ausländer aus Westeuropa (18%), Nordafrika und Nahost (14%), Mittel- und Südosteuropa (14%) sowie Osteuropa und Zentralasien (11%).
China ist wieder das mit Abstand wichtigste Herkunftsland der Bildungsausländer mit Abschlussabsicht. Im Studienjahr 2016 kommen 30.054 Studierende aus China, sie stellen rund 14% aller Bildungsausländer. An zweiter Stelle folgt mit 13.093 Stu-dierenden derzeit Indien, das vor zehn Jahren noch an Platz 13 der Rangliste stand. Indien hat in diesem Zeitraum die Zahl seiner Studierenden vervierfacht. Weitere wichtige Herkunfts-länder sind Russland, Österreich und Kamerun. Während die Zahl der russischen Studierenden in den letzten drei Jahren relativ konstant blieb, haben Studierende aus Österreich deut-lich an Bedeutung gewonnen (+142%). Die Zahl der bulgari-schen Studierenden dagegen hat sich fast halbiert (–46%).
Am stärksten ist in dieser Zeit allerdings die Zahl der Studie-renden aus den Vereinigten Arabischen Emiraten gewachsen, sie hat sich mehr als verdreifacht (+238%). Mehr als verdop-pelt haben sich zudem die Einschreibungen von Studierenden mit Abschlussabsicht aus Bangladesch (+124%) und aus Zypern (+107%).
Je nach Herkunftsland zeigen sich bei den Bildungsauslän-dern mit Abschlussabsicht Differenzen in der Fächerwahl. Während die Ingenieurwissenschaften besonders häufig von Studierenden aus asiatischen und afrikanischen Ländern gewählt werden, entscheiden sich die Studierenden aus den europäischen Ländern am häufigsten für Rechts-, Wirtschafts- und Sozialwissenschaften. So haben sich von den indischen Studierenden allein 74% in Ingenieurwissenschaften einge-schrieben, von den österreichischen dagegen 44% für rechts-, wirtschafts- und sozialwissenschaftliche Studiengänge.
herkunftsregionen und -länder
Herkunftsland Entwicklung 2013–2016 in %
Ver. Arabische Emirate +237,9
Bangladesch +124,2
Zypern +107,3
Slowenien +90,3
Nigeria +90,1
Indien +89,0
Oman +88,3
Afghanistan +87,9
Pakistan +76,5
Montenegro +72,4
Singapur +66,7
Albanien +64,3
Portugal +64,2
Ägypten +63,1
Palästinensische Gebiete +62,2
0 50 100 150 200 250
Herkunftsland 2006China 25.430 14,8Bulgarien 12.267 7,1Polen 10.720 6,2Russland 9.217 5,4Marokko 7.160 4,2Ukraine 6.706 3,9Türkei 6.615 3,9Kamerun 5.337 3,1Österreich 4.111 2,4Südkorea 3.678 2,1
Herkunftsland 2016 Anzahl in %
China 30.054 13,5Indien 13.093 5,9Russland 10.725 4,8Österreich 9.943 4,5Kamerun 7.045 3,2Bulgarien 6.689 3,0Ukraine 6.686 3,0Iran 6.321 2,8Türkei 5.999 2,7Italien 5.747 2,6
B14 Herkunftsländer mit der stärksten prozentualen Zunahme von Bildungs- ausländern mit Abschlussabsicht zwischen 2013 und 2016
Countries of origin with the greatest percentage increases in Bildungs- auslaender intending to graduate, between 2013 and 2016
B15 Bildungsausländer mit Abschlussabsicht in Deutschland nach den wichtigsten Herkunftsländern 2006 und 2016
Bildungsauslaender in Germany intending to graduate, in 2006 and 2016, by key countries of origin
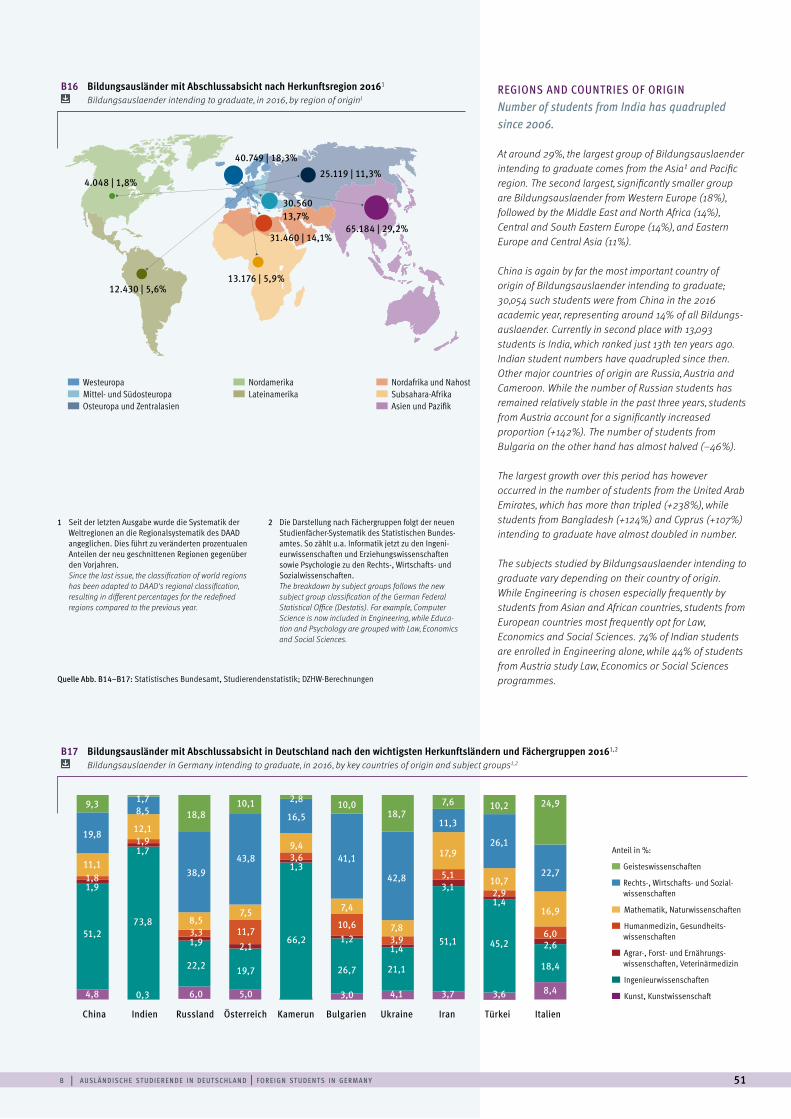
b | a u sl ä n d i sc h e st u d i e r e n d e i n d e ut sc h l a n d | f o r e i g n st u d e n t s i n g e rm a n y 51
REGIONS AND COUNTRIES OF ORIGIN Number of students from India has quadrupled since 2006.
At around 29%, the largest group of Bildungsauslaender intending to graduate comes from the Asia1 and Pacific region. The second largest, significantly smaller group are Bildungsauslaender from Western Europe (18%), followed by the Middle East and North Africa (14%), Central and South Eastern Europe (14%), and Eastern Europe and Central Asia (11%).
China is again by far the most important country of origin of Bildungsauslaender intending to graduate; 30,054 such students were from China in the 2016 academic year, representing around 14% of all Bildungs-auslaender. Currently in second place with 13,093 students is India, which ranked just 13th ten years ago. Indian student numbers have quadrupled since then. Other major countries of origin are Russia, Austria and Cameroon. While the number of Russian students has remained relatively stable in the past three years, students from Austria account for a significantly increased proportion (+142%). The number of students from Bulgaria on the other hand has almost halved (–46%).
The largest growth over this period has however occurred in the number of students from the United Arab Emirates, which has more than tripled (+238%), while students from Bangladesh (+124%) and Cyprus (+107%) intending to graduate have almost doubled in number.
The subjects studied by Bildungsauslaender intending to graduate vary depending on their country of origin. While Engineering is chosen especially frequently by students from Asian and African countries, students from European countries most frequently opt for Law, Economics and Social Sciences. 74% of Indian students are enrolled in Engineering alone, while 44% of students from Austria study Law, Economics or Social Sciences programmes.
1 Seit der letzten Ausgabe wurde die Systematik der Weltregionen an die Regionalsystematik des DAAD angeglichen. Dies führt zu veränderten prozentualen Anteilen der neu geschnittenen Regionen gegenüber den Vorjahren. Since the last issue, the classification of world regions has been adapted to DAAD‘s regional classification, resulting in different percentages for the redefined regions compared to the previous year.
2 Die Darstellung nach Fächergruppen folgt der neuen Studienfächer-Systematik des Statistischen Bundes-amtes. So zählt u.a. Informatik jetzt zu den Ingeni-eurwissenschaften und Erziehungswissenschaften sowie Psychologie zu den Rechts-, Wirtschafts- und Sozialwissenschaften. The breakdown by subject groups follows the new subject group classification of the German Federal Statistical Office (Destatis). For example, Computer Science is now included in Engineering, while Educa-tion and Psychology are grouped with Law, Economics and Social Sciences.
B17 Bildungsausländer mit Abschlussabsicht in Deutschland nach den wichtigsten Herkunftsländern und Fächergruppen 20161,2 Bildungsauslaender in Germany intending to graduate, in 2016, by key countries of origin and subject groups1,2
Ohne regionale EinteilungAsien, Pazi�kAfrika SubsaharaNahost, NordafrikaLateinamerikaNordamerikaOsteuropa, Zentralasien und SüdkaukasusMittel- und SüdosteuropaWest-, Nord- und Südeuropa
40.749 | 18,3%
4.048 | 1,8%
12.430 | 5,6%13.176 | 5,9%
China Indien Russland Österreich Kamerun Bulgarien Ukraine Iran Türkei Italien
31.460 | 14,1%
30.56013,7%
25.119 | 11,3%
65.184 | 29,2%
Westeuropa Mittel- und Südosteuropa Osteuropa und Zentralasien
Nordamerika Lateinamerika
Nordafrika und Nahost Subsahara-Afrika Asien und Pazifik
B16 Bildungsausländer mit Abschlussabsicht nach Herkunftsregion 20161 Bildungsauslaender intending to graduate, in 2016, by region of origin1
Quelle Abb. B14–B17: Statistisches Bundesamt, Studierendenstatistik; DZHW-Berechnungen
Anteil in %:
Geisteswissenschaften
Rechts-, Wirtschafts- und Sozial- wissenschaften
Mathematik, Naturwissenschaften
Humanmedizin, Gesundheits- wissenschaften
Agrar-, Forst- und Ernährungs- wissenschaften, Veterinärmedizin
Ingenieurwissenschaften
Kunst, Kunstwissenschaft
1,7
18,810,19,3 2,8 10,0
18,77,6 10,2 24,9
8,5
38,943,8
19,8
16,5
41,1
42,8
11,3
26,1
22,7
12,1
8,57,5
11,1
9,4
7,4
7,8
17,9
10,7
16,9
1,9
3,3 11,7
1,8
3,6
10,6
3,9
5,1
2,9
6,0
1,7
1,9 2,1
1,9
1,3
1,21,4
3,1
1,4
2,6
73,8
22,2 19,7
51,266,2
26,7 21,1
51,1 45,2
18,4
0,3 6,0 5,04,8 3,0 4,1 3,7 3,6 8,4
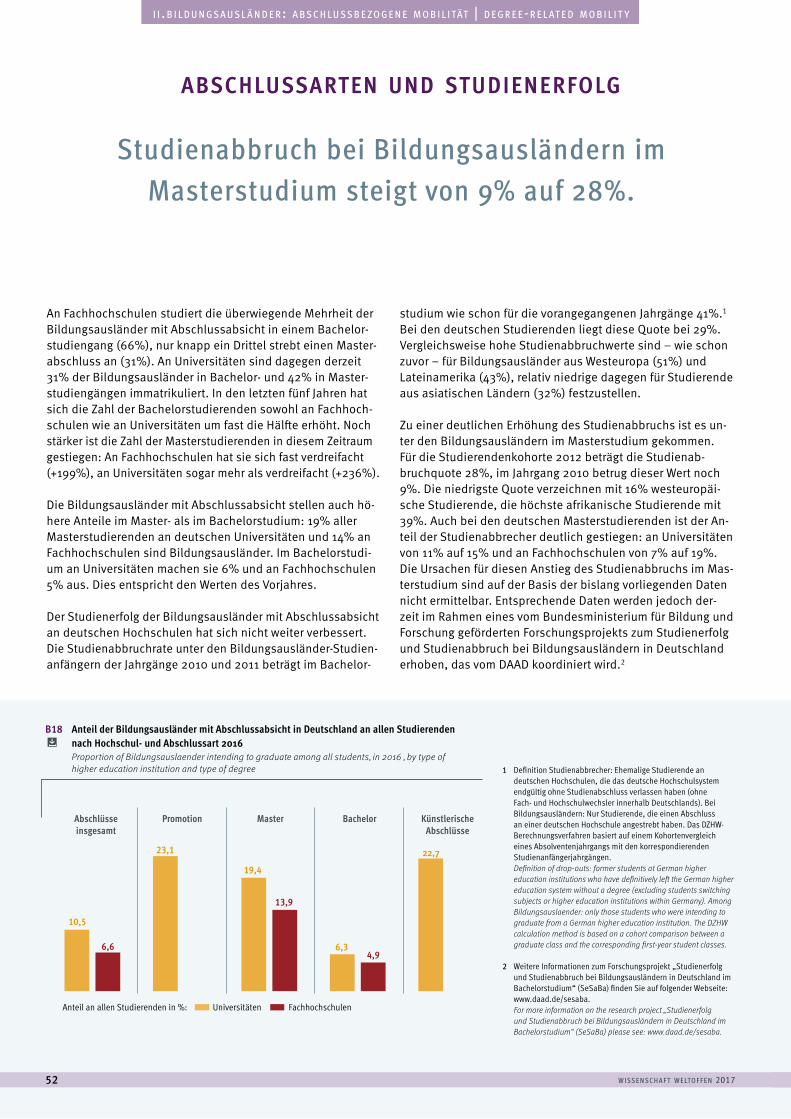
w i sse n sc h a f t w e lto f f e n 201752
a u s l ä n d i s c h e s t u d i e r e n d e | f o r e i g n s t u d e n t si i . b i l d u n g s a u s l ä n d e r : a b s c h l u s s b e z o g e n e m o b i l i tät | d e g r e e - r e l at e d m o b i l i t y
Studienabbruch bei Bildungsausländern im Masterstudium steigt von 9% auf 28%.
An Fachhochschulen studiert die überwiegende Mehrheit der Bildungsausländer mit Abschlussabsicht in einem Bachelor-studiengang (66%), nur knapp ein Drittel strebt einen Master-abschluss an (31%). An Universitäten sind dagegen derzeit 31% der Bildungsausländer in Bachelor- und 42% in Master-studiengängen immatrikuliert. In den letzten fünf Jahren hat sich die Zahl der Bachelorstudierenden sowohl an Fachhoch-schulen wie an Universitäten um fast die Hälfte erhöht. Noch stärker ist die Zahl der Masterstudierenden in diesem Zeitraum gestiegen: An Fachhochschulen hat sie sich fast verdreifacht (+199%), an Universitäten sogar mehr als verdreifacht (+236%).
Die Bildungsausländer mit Abschlussabsicht stellen auch hö-here Anteile im Master- als im Bachelorstudium: 19% aller Masterstudierenden an deutschen Universitäten und 14% an Fachhochschulen sind Bildungsausländer. Im Bachelorstudi-um an Universitäten machen sie 6% und an Fachhochschulen 5% aus. Dies entspricht den Werten des Vorjahres.
Der Studienerfolg der Bildungsausländer mit Abschlussabsicht an deutschen Hochschulen hat sich nicht weiter verbessert. Die Studienabbruchrate unter den Bildungsausländer-Studien- anfängern der Jahrgänge 2010 und 2011 beträgt im Bachelor-
studium wie schon für die vorangegangenen Jahrgänge 41%.1 Bei den deutschen Studierenden liegt diese Quote bei 29%. Vergleichsweise hohe Studienabbruchwerte sind – wie schon zuvor – für Bildungsausländer aus Westeuropa (51%) und Lateinamerika (43%), relativ niedrige dagegen für Studierende aus asiatischen Ländern (32%) festzustellen.
Zu einer deutlichen Erhöhung des Studienabbruchs ist es un-ter den Bildungsausländern im Masterstudium gekommen. Für die Studierendenkohorte 2012 beträgt die Studienab-bruchquote 28%, im Jahrgang 2010 betrug dieser Wert noch 9%. Die niedrigste Quote verzeichnen mit 16% westeuropäi-sche Studierende, die höchste afrikanische Studierende mit 39%. Auch bei den deutschen Masterstudierenden ist der An-teil der Studienabbrecher deutlich gestiegen: an Universitäten von 11% auf 15% und an Fachhochschulen von 7% auf 19%. Die Ursachen für diesen Anstieg des Studienabbruchs im Mas-terstudium sind auf der Basis der bislang vorliegenden Daten nicht ermittelbar. Entsprechende Daten werden jedoch der-zeit im Rahmen eines vom Bundesministerium für Bildung und Forschung geförderten Forschungsprojekts zum Studienerfolg und Studienabbruch bei Bildungsausländern in Deutschland erhoben, das vom DAAD koordiniert wird.2
abschlussarten und studienerfolg
1 Definition Studienabbrecher: Ehemalige Studierende an deutschen Hochschulen, die das deutsche Hochschulsystem endgültig ohne Studienabschluss verlassen haben (ohne Fach- und Hochschulwechsler innerhalb Deutschlands). Bei Bildungsausländern: Nur Studierende, die einen Abschluss an einer deutschen Hochschule angestrebt haben. Das DZHW-Berechnungsverfahren basiert auf einem Kohortenvergleich eines Absolventenjahrgangs mit den korrespondierenden Studienanfängerjahrgängen. Definition of drop-outs: former students at German higher education institutions who have definitively left the German higher education system without a degree (excluding students switching subjects or higher education institutions within Germany). Among Bildungsauslaender: only those students who were intending to graduate from a German higher education institution. The DZHW calculation method is based on a cohort comparison between a graduate class and the corresponding first-year student classes.
2 Weitere Informationen zum Forschungsprojekt „Studienerfolg und Studienabbruch bei Bildungsausländern in Deutschland im Bachelorstudium“ (SeSaBa) finden Sie auf folgender Webseite: www.daad.de/sesaba.For more information on the research project „Studienerfolg und Studienabbruch bei Bildungsausländern in Deutschland im Bachelorstudium“ (SeSaBa) please see: www.daad.de/sesaba.
B18 Anteil der Bildungsausländer mit Abschlussabsicht in Deutschland an allen Studierenden nach Hochschul- und Abschlussart 2016 Proportion of Bildungsauslaender intending to graduate among all students, in 2016 , by type of higher education institution and type of degree
0,00000
4,16667
8,33334
12,50001
16,66668
20,83335
Abschlüsseinsgesamt
Promotion Master Bachelor KünstlerischeAbschlüsse
10,5
6,6
23,1
19,4
13,9
6,34,9
22,7
Universitäten FachhochschulenAnteil an allen Studierenden in %:
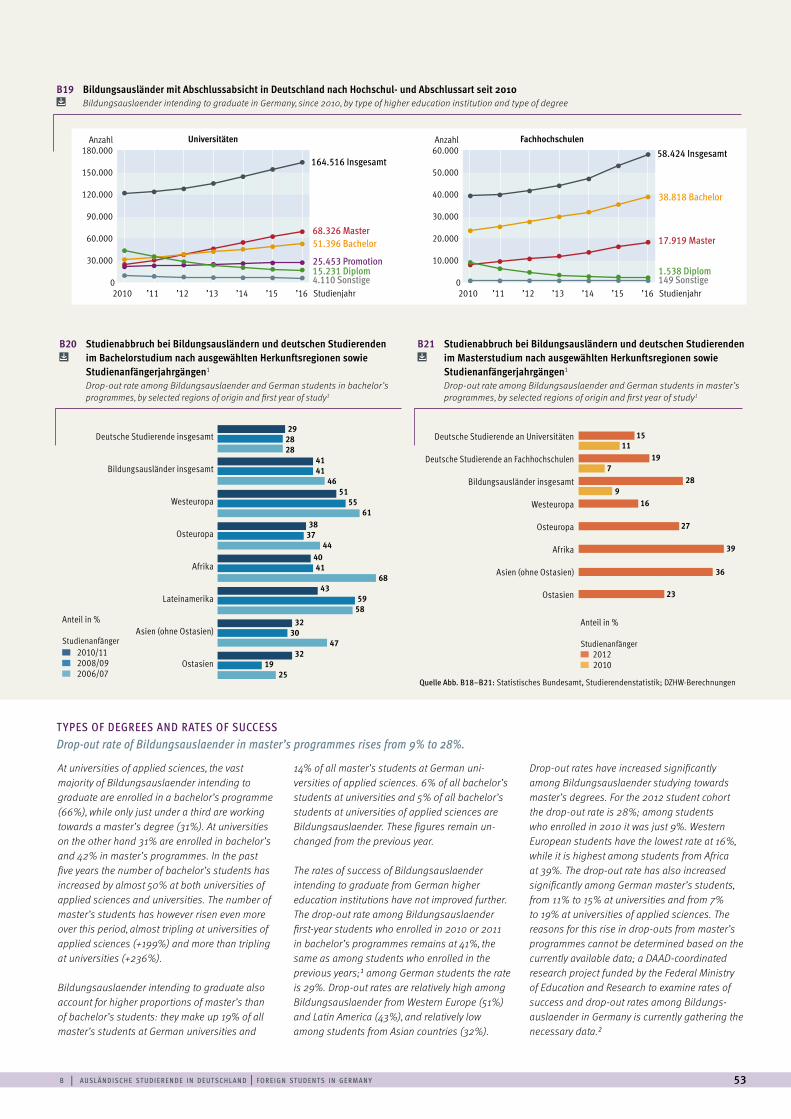
b | a u sl ä n d i sc h e st u d i e r e n d e i n d e ut sc h l a n d | f o r e i g n st u d e n t s i n g e rm a n y 53
T YPES OF DEGREES AND RATES OF SUCCESS Drop-out rate of Bildungsauslaender in master’s programmes rises from 9% to 28%.
At universities of applied sciences, the vast majority of Bildungsauslaender intending to graduate are enrolled in a bachelor’s programme (66%), while only just under a third are working towards a master’s degree (31%). At universities on the other hand 31% are enrolled in bachelor’s and 42% in master’s programmes. In the past five years the number of bachelor’s students has increased by almost 50% at both universities of applied sciences and universities. The number of master’s students has however risen even more over this period, almost tripling at universities of applied sciences (+199%) and more than tripling at universities (+236%).
Bildungsauslaender intending to graduate also account for higher proportions of master’s than of bachelor’s students: they make up 19% of all master’s students at German universities and
14% of all master’s students at German uni- versities of applied sciences. 6% of all bachelor’s students at universities and 5% of all bachelor’s students at universities of applied sciences are Bildungsauslaender. These figures remain un- changed from the previous year.
The rates of success of Bildungsauslaender intending to graduate from German higher education institutions have not improved further. The drop-out rate among Bildungsauslaender first-year students who enrolled in 2010 or 2011 in bachelor’s programmes remains at 41%, the same as among students who enrolled in the previous years;1 among German students the rate is 29%. Drop-out rates are relatively high among Bildungsauslaender from Western Europe (51%) and Latin America (43%), and relatively low among students from Asian countries (32%).
Drop-out rates have increased significantly among Bildungsauslaender studying towards master’s degrees. For the 2012 student cohort the drop-out rate is 28%; among students who enrolled in 2010 it was just 9%. Western European students have the lowest rate at 16%, while it is highest among students from Africa at 39%. The drop-out rate has also increased significantly among German master’s students, from 11% to 15% at universities and from 7% to 19% at universities of applied sciences. The reasons for this rise in drop-outs from master’s programmes cannot be determined based on the currently available data; a DAAD-coordinated research project funded by the Federal Ministry of Education and Research to examine rates of success and drop-out rates among Bildungs- auslaender in Germany is currently gathering the necessary data.2
B19 Bildungsausländer mit Abschlussabsicht in Deutschland nach Hochschul- und Abschlussart seit 2010 Bildungsauslaender intending to graduate in Germany, since 2010, by type of higher education institution and type of degree
B20 Studienabbruch bei Bildungsausländern und deutschen Studierenden im Bachelorstudium nach ausgewählten Herkunftsregionen sowie
Studienanfängerjahrgängen1 Drop-out rate among Bildungsauslaender and German students in bachelor’s
programmes, by selected regions of origin and first year of study1
B21 Studienabbruch bei Bildungsausländern und deutschen Studierenden im Masterstudium nach ausgewählten Herkunftsregionen sowie
Studienanfängerjahrgängen1 Drop-out rate among Bildungsauslaender and German students in master’s programmes, by selected regions of origin and first year of study1
Deutsche Studierende insgesamt
Bildungsausländer insgesamt
Westeuropa
Osteuropa
Afrika
Lateinamerika
Asien (ohne Ostasien)
Ostasien
Deutsche Studierende an Universitäten
Deutsche Studierende an Fachhochschulen
Bildungsausländer insgesamt
Westeuropa
Osteuropa
Afrika
Asien (ohne Ostasien)
Ostasien
2010 Studienjahr
Universitäten
’11 ’14 ’16’15’13’12
51.396 Bachelor 68.326 Master
4.110 Sonstige 15.231 Diplom 25.453 Promotion
164.516 Insgesamt
180.000
150.000
120.000
90.000
60.000
30.000
02010 Studienjahr
Fachhochschulen
’11 ’14 ’16’15’13’12
38.818 Bachelor
17.919 Master
149 Sonstige 1.538 Diplom
58.424 Insgesamt
60.000Anzahl Anzahl
50.000
40.000
30.000
20.000
10.000
0
Quelle Abb. B18–B21: Statistisches Bundesamt, Studierendenstatistik; DZHW-Berechnungen
292828
4141
4651
5561
3837
444041
6843
5958
3230
4732
1925
0 5 10 15 20 25 30 35 40
1511
197
289
16
27
39
23
36
2010/11 2008/09 2006/07
Anteil in %
Studienanfänger
Anteil in %
Studienanfänger 2012 2010
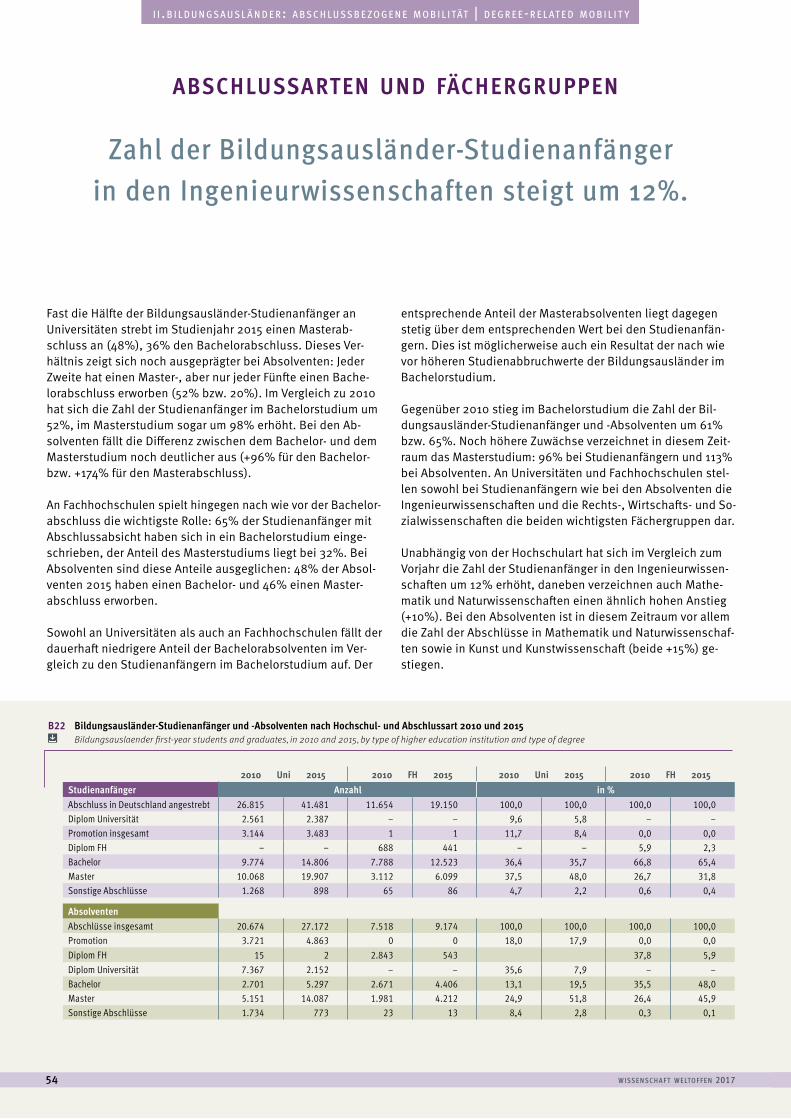
w i sse n sc h a f t w e lto f f e n 201754
a u s l ä n d i s c h e s t u d i e r e n d e | f o r e i g n s t u d e n t si i . b i l d u n g s a u s l ä n d e r : a b s c h l u s s b e z o g e n e m o b i l i tät | d e g r e e - r e l at e d m o b i l i t y
Zahl der Bildungsausländer-Studienanfänger in den Ingenieurwissenschaften steigt um 12%.
Fast die Hälfte der Bildungsausländer-Studienanfänger an Universitäten strebt im Studienjahr 2015 einen Masterab-schluss an (48%), 36% den Bachelorabschluss. Dieses Ver-hältnis zeigt sich noch ausgeprägter bei Absolventen: Jeder Zweite hat einen Master-, aber nur jeder Fünfte einen Bache-lorabschluss erworben (52% bzw. 20%). Im Vergleich zu 2010 hat sich die Zahl der Studienanfänger im Bachelorstudium um 52%, im Masterstudium sogar um 98% erhöht. Bei den Ab-solventen fällt die Differenz zwischen dem Bachelor- und dem Masterstudium noch deutlicher aus (+96% für den Bachelor- bzw. +174% für den Masterabschluss).
An Fachhochschulen spielt hingegen nach wie vor der Bachelor- abschluss die wichtigste Rolle: 65% der Studienanfänger mit Abschlussabsicht haben sich in ein Bachelorstudium einge-schrieben, der Anteil des Masterstudiums liegt bei 32%. Bei Absolventen sind diese Anteile ausgeglichen: 48% der Absol-venten 2015 haben einen Bachelor- und 46% einen Master- abschluss erworben.
Sowohl an Universitäten als auch an Fachhochschulen fällt der dauerhaft niedrigere Anteil der Bachelorabsolventen im Ver-gleich zu den Studienanfängern im Bachelorstudium auf. Der
entsprechende Anteil der Masterabsolventen liegt dagegen stetig über dem entsprechenden Wert bei den Studienanfän-gern. Dies ist möglicherweise auch ein Resultat der nach wie vor höheren Studienabbruchwerte der Bildungsausländer im Bachelorstudium.
Gegenüber 2010 stieg im Bachelorstudium die Zahl der Bil-dungsausländer-Studienanfänger und -Absolventen um 61% bzw. 65%. Noch höhere Zuwächse verzeichnet in diesem Zeit-raum das Masterstudium: 96% bei Studienanfängern und 113% bei Absolventen. An Universitäten und Fachhochschulen stel-len sowohl bei Studienanfängern wie bei den Absolventen die Ingenieurwissenschaften und die Rechts-, Wirtschafts- und So-zialwissenschaften die beiden wichtigsten Fächergruppen dar.
Unabhängig von der Hochschulart hat sich im Vergleich zum Vorjahr die Zahl der Studienanfänger in den Ingenieurwissen-schaften um 12% erhöht, daneben verzeichnen auch Mathe-matik und Naturwissenschaften einen ähnlich hohen Anstieg (+10%). Bei den Absolventen ist in diesem Zeitraum vor allem die Zahl der Abschlüsse in Mathematik und Naturwissenschaf-ten sowie in Kunst und Kunstwissenschaft (beide +15%) ge-stiegen.
abschlussarten und fächergruppen
B22 Bildungsausländer-Studienanfänger und -Absolventen nach Hochschul- und Abschlussart 2010 und 2015 Bildungsauslaender first-year students and graduates, in 2010 and 2015, by type of higher education institution and type of degree
2010 Uni 2015 2010 FH 2015 2010 Uni 2015 2010 FH 2015Studienanfänger Anzahl in %Abschluss in Deutschland angestrebt 26.815 41.481 11.654 19.150 100,0 100,0 100,0 100,0Diplom Universität 2.561 2.387 – – 9,6 5,8 – –Promotion insgesamt 3.144 3.483 1 1 11,7 8,4 0,0 0,0Diplom FH – – 688 441 – – 5,9 2,3Bachelor 9.774 14.806 7.788 12.523 36,4 35,7 66,8 65,4Master 10.068 19.907 3.112 6.099 37,5 48,0 26,7 31,8Sonstige Abschlüsse 1.268 898 65 86 4,7 2,2 0,6 0,4
AbsolventenAbschlüsse insgesamt 20.674 27.172 7.518 9.174 100,0 100,0 100,0 100,0Promotion 3.721 4.863 0 0 18,0 17,9 0,0 0,0Diplom FH 15 2 2.843 543 37,8 5,9Diplom Universität 7.367 2.152 – – 35,6 7,9 – –Bachelor 2.701 5.297 2.671 4.406 13,1 19,5 35,5 48,0Master 5.151 14.087 1.981 4.212 24,9 51,8 26,4 45,9Sonstige Abschlüsse 1.734 773 23 13 8,4 2,8 0,3 0,1
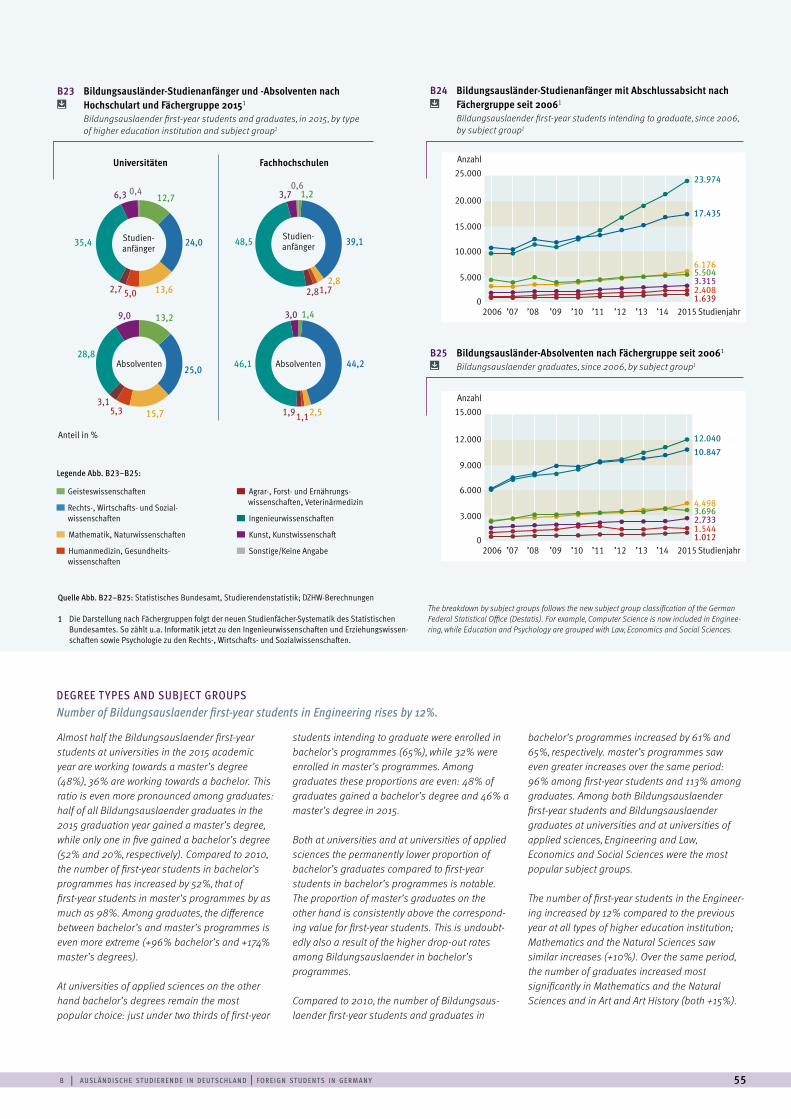
b | a u sl ä n d i sc h e st u d i e r e n d e i n d e ut sc h l a n d | f o r e i g n st u d e n t s i n g e rm a n y 55
DEGREE T YPES AND SUBJECT GROUPS Number of Bildungsauslaender first-year students in Engineering rises by 12%.
Almost half the Bildungsauslaender first-year students at universities in the 2015 academic year are working towards a master’s degree (48%), 36% are working towards a bachelor. This ratio is even more pronounced among graduates: half of all Bildungsauslaender graduates in the 2015 graduation year gained a master’s degree, while only one in five gained a bachelor’s degree (52% and 20%, respectively). Compared to 2010, the number of first-year students in bachelor’s programmes has increased by 52%, that of first-year students in master’s programmes by as much as 98%. Among graduates, the difference between bachelor’s and master’s programmes is even more extreme (+96% bachelor’s and +174% master’s degrees).
At universities of applied sciences on the other hand bachelor’s degrees remain the most popular choice: just under two thirds of first-year
students intending to graduate were enrolled in bachelor’s programmes (65%), while 32% were enrolled in master’s programmes. Among graduates these proportions are even: 48% of graduates gained a bachelor’s degree and 46% a master’s degree in 2015.
Both at universities and at universities of applied sciences the permanently lower proportion of bachelor’s graduates compared to first-year students in bachelor’s programmes is notable. The proportion of master’s graduates on the other hand is consistently above the correspond-ing value for first-year students. This is undoubt-edly also a result of the higher drop-out rates among Bildungsauslaender in bachelor’s programmes.
Compared to 2010, the number of Bildungsaus-laender first-year students and graduates in
bachelor’s programmes increased by 61% and 65%, respectively. master’s programmes saw even greater increases over the same period: 96% among first-year students and 113% among graduates. Among both Bildungsauslaender first-year students and Bildungsauslaender graduates at universities and at universities of applied sciences, Engineering and Law, Economics and Social Sciences were the most popular subject groups.
The number of first-year students in the Engineer-ing increased by 12% compared to the previous year at all types of higher education institution; Mathematics and the Natural Sciences saw similar increases (+10%). Over the same period, the number of graduates increased most significantly in Mathematics and the Natural Sciences and in Art and Art History (both +15%).
Quelle Abb. B22–B25: Statistisches Bundesamt, Studierendenstatistik; DZHW-Berechnungen
1 Die Darstellung nach Fächergruppen folgt der neuen Studienfächer-Systematik des Statistischen Bundesamtes. So zählt u.a. Informatik jetzt zu den Ingenieurwissenschaften und Erziehungswissen-schaften sowie Psychologie zu den Rechts-, Wirtschafts- und Sozialwissenschaften.
The breakdown by subject groups follows the new subject group classification of the German Federal Statistical Office (Destatis). For example, Computer Science is now included in Enginee-ring, while Education and Psychology are grouped with Law, Economics and Social Sciences.
B24 Bildungsausländer-Studienanfänger mit Abschlussabsicht nach Fächergruppe seit 20061
Bildungsauslaender first-year students intending to graduate, since 2006, by subject group1
B25 Bildungsausländer-Absolventen nach Fächergruppe seit 20061 Bildungsauslaender graduates, since 2006, by subject group1
B23 Bildungsausländer-Studienanfänger und -Absolventen nach Hochschulart und Fächergruppe 20151
Bildungsauslaender first-year students and graduates, in 2015, by type of higher education institution and subject group1
5.504
23.974
17.435
6.176
2.408 3.315
1.639
25.000Anzahl
20.000
15.000
10.000
5.000
02006 2015’07 ’09 ’11’10 ’12 ’14’13’08 Studienjahr
3.696
12.04010.847
4.498
1.5442.733
1.012
15.000Anzahl
12.000
9.000
6.000
3.000
02006 2015’07 ’09 ’11’10 ’12 ’14’13’08 Studienjahr
Universitäten
12,7 1,2
1,413,2
24,0 39,1
44,225,0
13,62,8
2,515,7
5,0 1,7
1,15,3
2,7 2,8
1,93,1
35,4 48,5
46,128,8
6,3 0,4 0,63,7
3,09,0
Fachhochschulen
Studien-anfänger
Absolventen
Anteil in %
Absolventen
Studien-anfänger
Geisteswissenschaften
Rechts-, Wirtschafts- und Sozial- wissenschaften
Mathematik, Naturwissenschaften
Humanmedizin, Gesundheits- wissenschaften
Agrar-, Forst- und Ernährungs- wissenschaften, Veterinärmedizin
Ingenieurwissenschaften
Kunst, Kunstwissenschaft
Sonstige/Keine Angabe
Legende Abb. B23–B25:
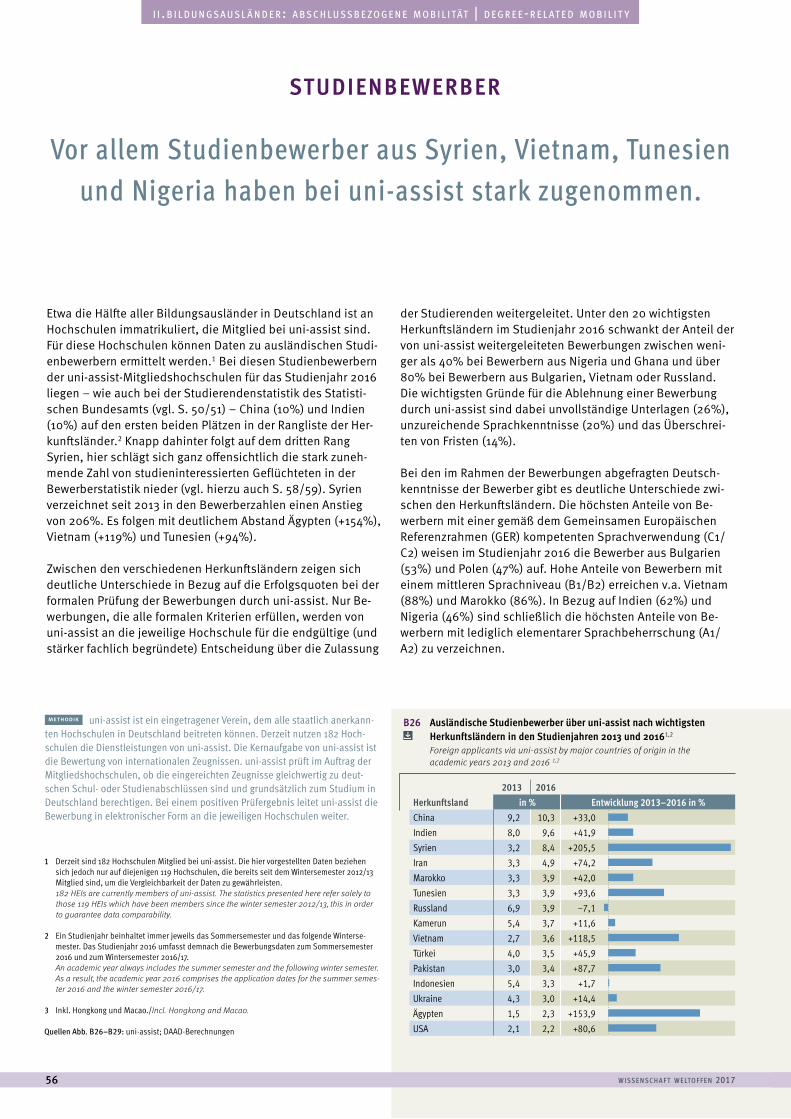
w i sse n sc h a f t w e lto f f e n 201756
a u s l ä n d i s c h e s t u d i e r e n d e | f o r e i g n s t u d e n t si i . b i l d u n g s a u s l ä n d e r : a b s c h l u s s b e z o g e n e m o b i l i tät | d e g r e e - r e l at e d m o b i l i t y
Etwa die Hälfte aller Bildungsausländer in Deutschland ist an Hochschulen immatrikuliert, die Mitglied bei uni-assist sind. Für diese Hochschulen können Daten zu ausländischen Studi-enbewerbern ermittelt werden.1 Bei diesen Studienbewerbern der uni-assist-Mitgliedshochschulen für das Studienjahr 2016 liegen – wie auch bei der Studierendenstatistik des Statisti-schen Bundesamts (vgl. S. 50/51) – China (10%) und Indien (10%) auf den ersten beiden Plätzen in der Rangliste der Her-kunftsländer.2 Knapp dahinter folgt auf dem dritten Rang Syrien, hier schlägt sich ganz offensichtlich die stark zuneh-mende Zahl von studieninteressierten Geflüchteten in der Bewerberstatistik nieder (vgl. hierzu auch S. 58/59). Syrien verzeichnet seit 2013 in den Bewerberzahlen einen Anstieg von 206%. Es folgen mit deutlichem Abstand Ägypten (+154%), Vietnam (+119%) und Tunesien (+94%).
Zwischen den verschiedenen Herkunftsländern zeigen sich deutliche Unterschiede in Bezug auf die Erfolgsquoten bei der formalen Prüfung der Bewerbungen durch uni-assist. Nur Be-werbungen, die alle formalen Kriterien erfüllen, werden von uni-assist an die jeweilige Hochschule für die endgültige (und stärker fachlich begründete) Entscheidung über die Zulassung
der Studierenden weitergeleitet. Unter den 20 wichtigsten Herkunftsländern im Studienjahr 2016 schwankt der Anteil der von uni-assist weitergeleiteten Bewerbungen zwischen weni-ger als 40% bei Bewerbern aus Nigeria und Ghana und über 80% bei Bewerbern aus Bulgarien, Vietnam oder Russland. Die wichtigsten Gründe für die Ablehnung einer Bewerbung durch uni-assist sind dabei unvollständige Unterlagen (26%), unzureichende Sprachkenntnisse (20%) und das Überschrei-ten von Fristen (14%).
Bei den im Rahmen der Bewerbungen abgefragten Deutsch-kenntnisse der Bewerber gibt es deutliche Unterschiede zwi-schen den Herkunftsländern. Die höchsten Anteile von Be-werbern mit einer gemäß dem Gemeinsamen Europäischen Referenzrahmen (GER) kompetenten Sprachverwendung (C1/C2) weisen im Studienjahr 2016 die Bewerber aus Bulgarien (53%) und Polen (47%) auf. Hohe Anteile von Bewerbern mit einem mittleren Sprachniveau (B1/B2) erreichen v.a. Vietnam (88%) und Marokko (86%). In Bezug auf Indien (62%) und Nigeria (46%) sind schließlich die höchsten Anteile von Be-werbern mit lediglich elementarer Sprachbeherrschung (A1/A2) zu verzeichnen.
Vor allem Studienbewerber aus Syrien, Vietnam, Tunesien und Nigeria haben bei uni-assist stark zugenommen.
studienbewerber
methodik uni-assist ist ein eingetragener Verein, dem alle staatlich anerkann-ten Hochschulen in Deutschland beitreten können. Derzeit nutzen 182 Hoch-schulen die Dienstleistungen von uni-assist. Die Kernaufgabe von uni-assist ist die Bewertung von internationalen Zeugnissen. uni-assist prüft im Auftrag der Mitgliedshochschulen, ob die eingereichten Zeugnisse gleichwertig zu deut-schen Schul- oder Studienabschlüssen sind und grundsätzlich zum Studium in Deutschland berechtigen. Bei einem positiven Prüfergebnis leitet uni-assist die Bewerbung in elektronischer Form an die jeweiligen Hochschulen weiter.
1 Derzeit sind 182 Hochschulen Mitglied bei uni-assist. Die hier vorgestellten Daten beziehen sich jedoch nur auf diejenigen 119 Hochschulen, die bereits seit dem Wintersemester 2012/13 Mitglied sind, um die Vergleichbarkeit der Daten zu gewährleisten.
182 HEIs are currently members of uni-assist. The statistics presented here refer solely to those 119 HEIs which have been members since the winter semester 2012/13, this in order to guarantee data comparability.
2 Ein Studienjahr beinhaltet immer jeweils das Sommersemester und das folgende Winterse-mester. Das Studienjahr 2016 umfasst demnach die Bewerbungsdaten zum Sommersemester 2016 und zum Wintersemester 2016/17.
An academic year always includes the summer semester and the following winter semester. As a result, the academic year 2016 comprises the application dates for the summer semes-ter 2016 and the winter semester 2016/17.
3 Inkl. Hongkong und Macao./Incl. Hongkong and Macao.
Quellen Abb. B26–B29: uni-assist; DAAD-Berechnungen
B26 Ausländische Studienbewerber über uni-assist nach wichtigsten Herkunftsländern in den Studienjahren 2013 und 20161,2
Foreign applicants via uni-assist by major countries of origin in the academic years 2013 and 2016 1,2
2013 2016Herkunftsland in % Entwicklung 2013–2016 in %China 9,2 10,3 +33,0Indien 8,0 9,6 +41,9Syrien 3,2 8,4 +205,5Iran 3,3 4,9 +74,2Marokko 3,3 3,9 +42,0Tunesien 3,3 3,9 +93,6Russland 6,9 3,9 –7,1Kamerun 5,4 3,7 +11,6Vietnam 2,7 3,6 +118,5Türkei 4,0 3,5 +45,9Pakistan 3,0 3,4 +87,7Indonesien 5,4 3,3 +1,7Ukraine 4,3 3,0 +14,4Ägypten 1,5 2,3 +153,9USA 2,1 2,2 +80,6
0 50 100 150 200 250
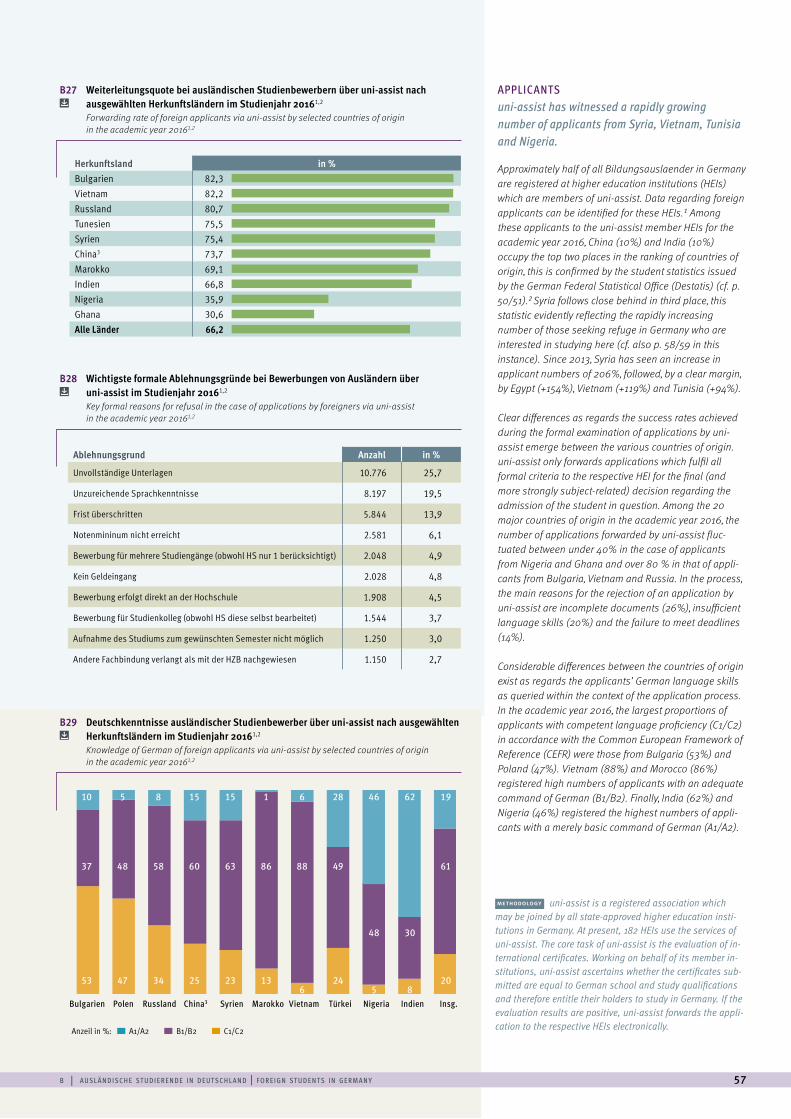
b | a u sl ä n d i sc h e st u d i e r e n d e i n d e ut sc h l a n d | f o r e i g n st u d e n t s i n g e rm a n y 57
APPLICANTS uni-assist has witnessed a rapidly growing number of applicants from Syria, Vietnam, Tunisia and Nigeria.
Approximately half of all Bildungsauslaender in Germany are registered at higher education institutions (HEIs) which are members of uni-assist. Data regarding foreign applicants can be identified for these HEIs.1 Among these applicants to the uni-assist member HEIs for the academic year 2016, China (10%) and India (10%) occupy the top two places in the ranking of countries of origin, this is confirmed by the student statistics issued by the German Federal Statistical Office (Destatis) (cf. p. 50/51).2 Syria follows close behind in third place, this statistic evidently reflecting the rapidly increasing number of those seeking refuge in Germany who are interested in studying here (cf. also p. 58/59 in this instance). Since 2013, Syria has seen an increase in applicant numbers of 206%, followed, by a clear margin, by Egypt (+154%), Vietnam (+119%) and Tunisia (+94%).
Clear differences as regards the success rates achieved during the formal examination of applications by uni- assist emerge between the various countries of origin. uni-assist only forwards applications which fulfil all formal criteria to the respective HEI for the final (and more strongly subject-related) decision regarding the admission of the student in question. Among the 20 major countries of origin in the academic year 2016, the number of applications forwarded by uni-assist fluc- tuated between under 40% in the case of applicants from Nigeria and Ghana and over 80 % in that of appli- cants from Bulgaria, Vietnam and Russia. In the process, the main reasons for the rejection of an application by uni-assist are incomplete documents (26%), insufficient language skills (20%) and the failure to meet deadlines (14%).
Considerable differences between the countries of origin exist as regards the applicants’ German language skills as queried within the context of the application process. In the academic year 2016, the largest proportions of applicants with competent language proficiency (C1/C2) in accordance with the Common European Framework of Reference (CEFR) were those from Bulgaria (53%) and Poland (47%). Vietnam (88%) and Morocco (86%) registered high numbers of applicants with an adequate command of German (B1/B2). Finally, India (62%) and Nigeria (46%) registered the highest numbers of appli- cants with a merely basic command of German (A1/A2).
methodology uni-assist is a registered association which may be joined by all state-approved higher education insti-tutions in Germany. At present, 182 HEIs use the services of uni-assist. The core task of uni-assist is the evaluation of in-ternational certificates. Working on behalf of its member in-stitutions, uni-assist ascertains whether the certificates sub-mitted are equal to German school and study qualifications and therefore entitle their holders to study in Germany. If the evaluation results are positive, uni-assist forwards the appli-cation to the respective HEIs electronically. Anzeil in %: A1/A2 B1/B2 C1/C2
B27 Weiterleitungsquote bei ausländischen Studienbewerbern über uni-assist nach ausgewählten Herkunftsländern im Studienjahr 20161,2
Forwarding rate of foreign applicants via uni-assist by selected countries of origin in the academic year 20161,2
B28 Wichtigste formale Ablehnungsgründe bei Bewerbungen von Ausländern über uni-assist im Studienjahr 20161,2
Key formal reasons for refusal in the case of applications by foreigners via uni-assist in the academic year 20161,2
B29 Deutschkenntnisse ausländischer Studienbewerber über uni-assist nach ausgewählten Herkunftsländern im Studienjahr 20161,2
Knowledge of German of foreign applicants via uni-assist by selected countries of origin in the academic year 20161,2
Herkunftsland in %Bulgarien 82,3Vietnam 82,2Russland 80,7Tunesien 75,5Syrien 75,4China3 73,7Marokko 69,1Indien 66,8Nigeria 35,9Ghana 30,6Alle Länder 66,2
Ablehnungsgrund Anzahl in %
Unvollständige Unterlagen 10.776 25,7
Unzureichende Sprachkenntnisse 8.197 19,5
Frist überschritten 5.844 13,9
Notenmininum nicht erreicht 2.581 6,1
Bewerbung für mehrere Studiengänge (obwohl HS nur 1 berücksichtigt) 2.048 4,9
Kein Geldeingang 2.028 4,8
Bewerbung erfolgt direkt an der Hochschule 1.908 4,5
Bewerbung für Studienkolleg (obwohl HS diese selbst bearbeitet) 1.544 3,7
Aufnahme des Studiums zum gewünschten Semester nicht möglich 1.250 3,0
Andere Fachbindung verlangt als mit der HZB nachgewiesen 1.150 2,7
0 20 40 60 80 100
53 47 34 25 23 136
245 8
20
37 48 58 60 63 86 88 49
48 30
61
10 5 8 15 15 1 6 28 46 62 19
Bulgarien Polen Russland China3 Syrien Marokko Vietnam Türkei Nigeria Indien Insg.
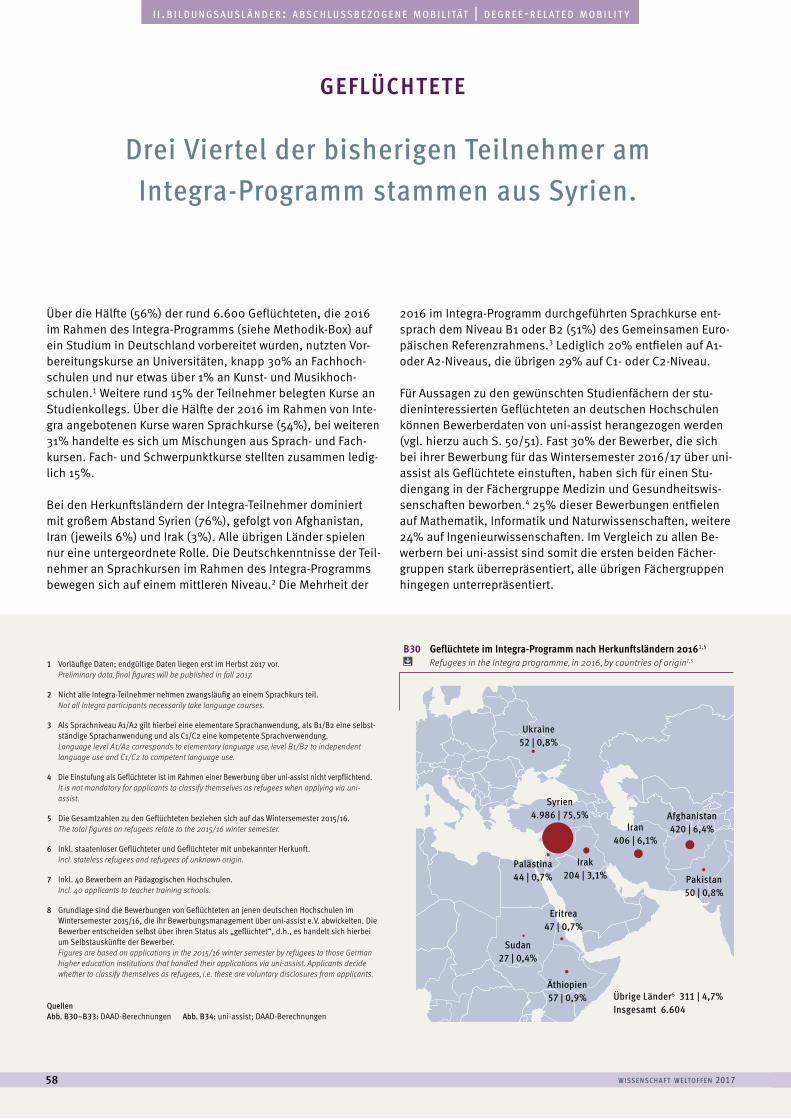
w i sse n sc h a f t w e lto f f e n 201758
a u s l ä n d i s c h e s t u d i e r e n d e | f o r e i g n s t u d e n t si i . b i l d u n g s a u s l ä n d e r : a b s c h l u s s b e z o g e n e m o b i l i tät | d e g r e e - r e l at e d m o b i l i t y
Über die Hälfte (56%) der rund 6.600 Geflüchteten, die 2016 im Rahmen des Integra-Programms (siehe Methodik-Box) auf ein Studium in Deutschland vorbereitet wurden, nutzten Vor-bereitungskurse an Universitäten, knapp 30% an Fachhoch-schulen und nur etwas über 1% an Kunst- und Musikhoch-schulen.1 Weitere rund 15% der Teilnehmer belegten Kurse an Studienkollegs. Über die Hälfte der 2016 im Rahmen von Inte-gra angebotenen Kurse waren Sprachkurse (54%), bei weiteren 31% handelte es sich um Mischungen aus Sprach- und Fach-kursen. Fach- und Schwerpunktkurse stellten zusammen ledig-lich 15%.
Bei den Herkunftsländern der Integra-Teilnehmer dominiert mit großem Abstand Syrien (76%), gefolgt von Afghanistan, Iran (jeweils 6%) und Irak (3%). Alle übrigen Länder spielen nur eine untergeordnete Rolle. Die Deutschkenntnisse der Teil-nehmer an Sprachkursen im Rahmen des Integra-Programms bewegen sich auf einem mittleren Niveau.2 Die Mehrheit der
2016 im Integra-Programm durchgeführten Sprachkurse ent-sprach dem Niveau B1 oder B2 (51%) des Gemeinsamen Euro-päischen Referenzrahmens.3 Lediglich 20% entfielen auf A1- oder A2-Niveaus, die übrigen 29% auf C1- oder C2-Niveau.
Für Aussagen zu den gewünschten Studienfächern der stu-dieninteressierten Geflüchteten an deutschen Hochschulen können Bewerberdaten von uni-assist herangezogen werden (vgl. hierzu auch S. 50/51). Fast 30% der Bewerber, die sich bei ihrer Bewerbung für das Wintersemester 2016/17 über uni-assist als Geflüchtete einstuften, haben sich für einen Stu-diengang in der Fächergruppe Medizin und Gesundheitswis-senschaften beworben.4 25% dieser Bewerbungen entfielen auf Mathematik, Informatik und Naturwissenschaften, weitere 24% auf Ingenieurwissenschaften. Im Vergleich zu allen Be-werbern bei uni-assist sind somit die ersten beiden Fächer-gruppen stark überrepräsentiert, alle übrigen Fächergruppen hingegen unterrepräsentiert.
Drei Viertel der bisherigen Teilnehmer am Integra-Programm stammen aus Syrien.
geflüchtete
1 Vorläufige Daten; endgültige Daten liegen erst im Herbst 2017 vor.Preliminary data, final figures will be published in fall 2017.
2 Nicht alle Integra-Teilnehmer nehmen zwangsläufig an einem Sprachkurs teil.Not all Integra participants necessarily take language courses.
3 Als Sprachniveau A1/A2 gilt hierbei eine elementare Sprachanwendung, als B1/B2 eine selbst-ständige Sprachanwendung und als C1/C2 eine kompetente Sprachverwendung.Language level A1/A2 corresponds to elementary language use, level B1/B2 to independent language use and C1/C2 to competent language use.
4 Die Einstufung als Geflüchteter ist im Rahmen einer Bewerbung über uni-assist nicht verpflichtend.It is not mandatory for applicants to classify themselves as refugees when applying via uni-assist.
5 Die Gesamtzahlen zu den Geflüchteten beziehen sich auf das Wintersemester 2015/16.The total figures on refugees relate to the 2015/16 winter semester.
6 Inkl. staatenloser Geflüchteter und Geflüchteter mit unbekannter Herkunft.Incl. stateless refugees and refugees of unknown origin.
7 Inkl. 40 Bewerbern an Pädagogischen Hochschulen.Incl. 40 applicants to teacher training schools.
8 Grundlage sind die Bewerbungen von Geflüchteten an jenen deutschen Hochschulen im Wintersemester 2015/16, die ihr Bewerbungsmanagement über uni-assist e.V. abwickelten. Die Bewerber entscheiden selbst über ihren Status als „geflüchtet“, d.h., es handelt sich hierbei um Selbstauskünfte der Bewerber.Figures are based on applications in the 2015/16 winter semester by refugees to those German higher education institutions that handled their applications via uni-assist. Applicants decide whether to classify themselves as refugees, i.e. these are voluntary disclosures from applicants.
Quellen Abb. B30–B33: DAAD-Berechnungen Abb. B34: uni-assist; DAAD-Berechnungen
B30 Geflüchtete im Integra-Programm nach Herkunftsländern 20161,5 Refugees in the Integra programme, in 2016, by countries of origin1,5
Syrien4.986 | 75,5%
Iran406 | 6,1%
Afghanistan420 | 6,4%
Ukraine52 | 0,8%
Palästina44 | 0,7%
Irak204 | 3,1%
Eritrea47 | 0,7%
Pakistan50 | 0,8%
Äthiopien57 | 0,9% Übrige Länder6 311 | 4,7%
Insgesamt 6.604
Sudan27 | 0,4%
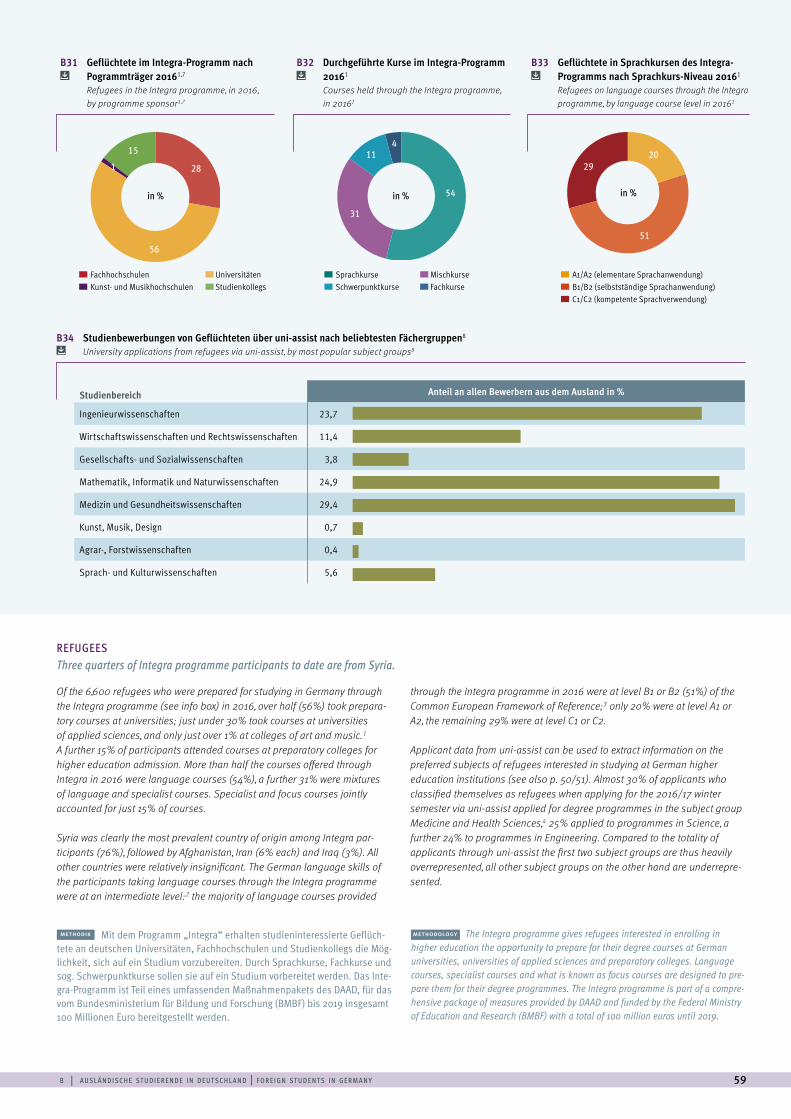
b | a u sl ä n d i sc h e st u d i e r e n d e i n d e ut sc h l a n d | f o r e i g n st u d e n t s i n g e rm a n y 59
methodik Mit dem Programm „Integra“ erhalten studieninteressierte Geflüch-tete an deutschen Universitäten, Fachhochschulen und Studienkollegs die Mög-lichkeit, sich auf ein Studium vorzubereiten. Durch Sprachkurse, Fachkurse und sog. Schwerpunktkurse sollen sie auf ein Studium vorbereitet werden. Das Inte-gra-Programm ist Teil eines umfassenden Maßnahmenpakets des DAAD, für das vom Bundesministerium für Bildung und Forschung (BMBF) bis 2019 insgesamt 100 Millionen Euro bereitgestellt werden.
REFUGEESThree quarters of Integra programme participants to date are from Syria.
Of the 6,600 refugees who were prepared for studying in Germany through the Integra programme (see info box) in 2016, over half (56%) took prepara- tory courses at universities; just under 30% took courses at universities of applied sciences, and only just over 1% at colleges of art and music.1 A further 15% of participants attended courses at preparatory colleges for higher education admission. More than half the courses offered through Integra in 2016 were language courses (54%), a further 31% were mixtures of language and specialist courses. Specialist and focus courses jointly accounted for just 15% of courses.
Syria was clearly the most prevalent country of origin among Integra par- ticipants (76%), followed by Afghanistan, Iran (6% each) and Iraq (3%). All other countries were relatively insignificant. The German language skills of the participants taking language courses through the Integra programme were at an intermediate level:2 the majority of language courses provided
through the Integra programme in 2016 were at level B1 or B2 (51%) of the Common European Framework of Reference;3 only 20% were at level A1 or A2, the remaining 29% were at level C1 or C2.
Applicant data from uni-assist can be used to extract information on the preferred subjects of refugees interested in studying at German higher education institutions (see also p. 50/51). Almost 30% of applicants who classified themselves as refugees when applying for the 2016/17 winter semester via uni-assist applied for degree programmes in the subject group Medicine and Health Sciences,4 25% applied to programmes in Science, a further 24% to programmes in Engineering. Compared to the totality of applicants through uni-assist the first two subject groups are thus heavily overrepresented, all other subject groups on the other hand are underrepre-sented.
methodology The Integra programme gives refugees interested in enrolling in higher education the opportunity to prepare for their degree courses at German universities, universities of applied sciences and preparatory colleges. Language courses, specialist courses and what is known as focus courses are designed to pre-pare them for their degree programmes. The Integra programme is part of a compre-hensive package of measures provided by DAAD and funded by the Federal Ministry of Education and Research (BMBF) with a total of 100 million euros until 2019.
B31 Geflüchtete im Integra-Programm nach Pogrammträger 20161,7
Refugees in the Integra programme, in 2016, by programme sponsor1,7
B32 Durchgeführte Kurse im Integra-Programm 20161
Courses held through the Integra programme, in 20161
B33 Geflüchtete in Sprachkursen des Integra- Programms nach Sprachkurs-Niveau 20161
Refugees on language courses through the Integra programme, by language course level in 20161
B34 Studienbewerbungen von Geflüchteten über uni-assist nach beliebtesten Fächergruppen8 University applications from refugees via uni-assist, by most popular subject groups8
411
29
31
51
54
28
15
1
56
20
Sprachkurse Mischkurse Schwerpunktkurse Fachkurse
Fachhochschulen Universitäten Kunst- und Musikhochschulen Studienkollegs
A1/A2 (elementare Sprachanwendung) B1/B2 (selbstständige Sprachanwendung) C1/C2 (kompetente Sprachverwendung)
Studienbereich Anteil an allen Bewerbern aus dem Ausland in %
Ingenieurwissenschaften 23,7
Wirtschaftswissenschaften und Rechtswissenschaften 11,4
Gesellschafts- und Sozialwissenschaften 3,8
Mathematik, Informatik und Naturwissenschaften 24,9
Medizin und Gesundheitswissenschaften 29,4
Kunst, Musik, Design 0,7
Agrar-, Forstwissenschaften 0,4
Sprach- und Kulturwissenschaften 5,6
0 5 10 15 20 25 30
in %in % in %
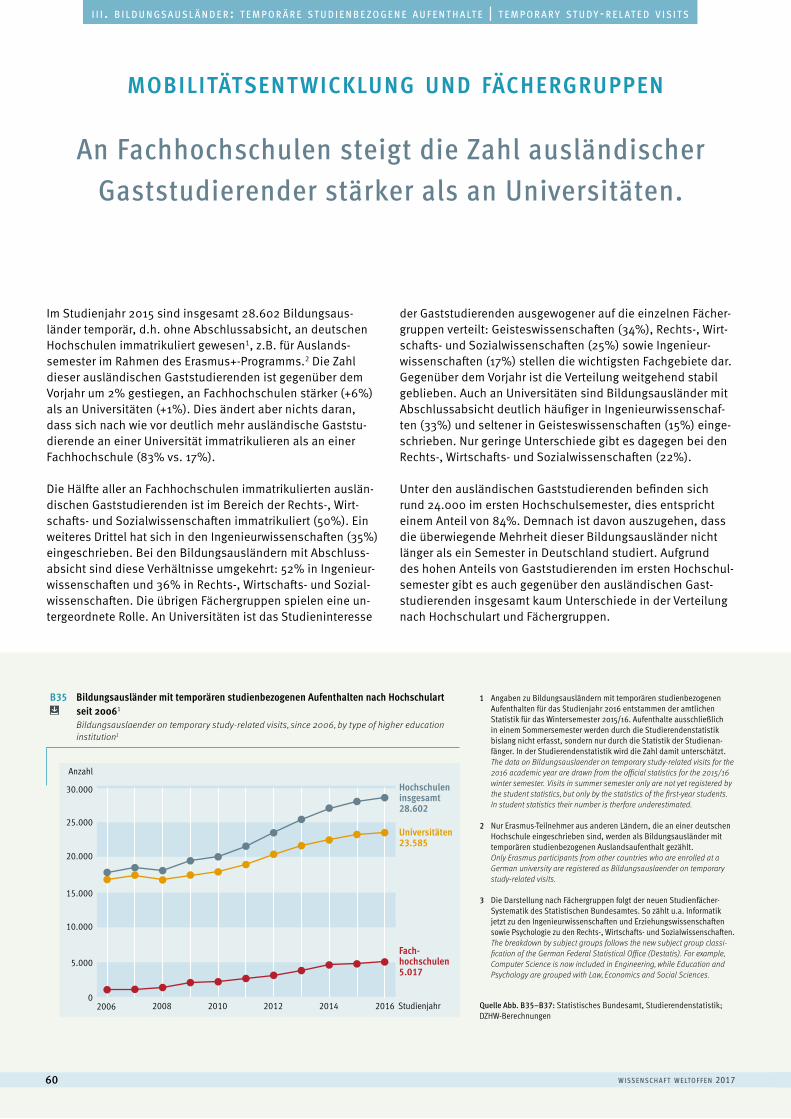
w i sse n sc h a f t w e lto f f e n 201760
a u s l ä n d i s c h e s t u d i e r e n d e | f o r e i g n s t u d e n t si i i . b i l d u n g s a u s l ä n d e r : t e m p o r ä r e s t u d i e n b e z o g e n e a u f e n t h a lt e | t e m p o r a r y s t u d y - r e l at e d v i s i t s
An Fachhochschulen steigt die Zahl ausländischer Gaststudierender stärker als an Universitäten.
Im Studienjahr 2015 sind insgesamt 28.602 Bildungsaus-länder temporär, d.h. ohne Abschlussabsicht, an deutschen Hochschulen immatrikuliert gewesen1, z.B. für Auslands- semester im Rahmen des Erasmus+-Programms.2 Die Zahl dieser ausländischen Gaststudierenden ist gegenüber dem Vorjahr um 2% gestiegen, an Fachhochschulen stärker (+6%) als an Universitäten (+1%). Dies ändert aber nichts daran, dass sich nach wie vor deutlich mehr ausländische Gaststu-dierende an einer Universität immatrikulieren als an einer Fachhochschule (83% vs. 17%).
Die Hälfte aller an Fachhochschulen immatrikulierten auslän-dischen Gaststudierenden ist im Bereich der Rechts-, Wirt-schafts- und Sozialwissenschaften immatrikuliert (50%). Ein weiteres Drittel hat sich in den Ingenieurwissenschaften (35%) eingeschrieben. Bei den Bildungsausländern mit Abschluss-absicht sind diese Verhältnisse umgekehrt: 52% in Ingenieur- wissenschaften und 36% in Rechts-, Wirtschafts- und Sozial-wissenschaften. Die übrigen Fächergruppen spielen eine un-tergeordnete Rolle. An Universitäten ist das Studieninteresse
der Gaststudierenden ausgewogener auf die einzelnen Fächer- gruppen verteilt: Geisteswissenschaften (34%), Rechts-, Wirt-schafts- und Sozialwissenschaften (25%) sowie Ingenieur- wissenschaften (17%) stellen die wichtigsten Fachgebiete dar. Gegenüber dem Vorjahr ist die Verteilung weitgehend stabil geblieben. Auch an Universitäten sind Bildungsausländer mit Abschlussabsicht deutlich häufiger in Ingenieurwissenschaf-ten (33%) und seltener in Geisteswissenschaften (15%) einge-schrieben. Nur geringe Unterschiede gibt es dagegen bei den Rechts-, Wirtschafts- und Sozialwissenschaften (22%).
Unter den ausländischen Gaststudierenden befinden sich rund 24.000 im ersten Hochschulsemester, dies entspricht einem Anteil von 84%. Demnach ist davon auszugehen, dass die überwiegende Mehrheit dieser Bildungsausländer nicht länger als ein Semester in Deutschland studiert. Aufgrund des hohen Anteils von Gaststudierenden im ersten Hochschul-semester gibt es auch gegenüber den ausländischen Gast-studierenden insgesamt kaum Unterschiede in der Verteilung nach Hochschulart und Fächergruppen.
mobilitätsent wicklung und fächergruppen
1 Angaben zu Bildungsausländern mit temporären studienbezogenen Aufenthalten für das Studienjahr 2016 entstammen der amtlichen Statistik für das Wintersemester 2015/16. Aufenthalte ausschließlich in einem Sommersemester werden durch die Studierendenstatistik bislang nicht erfasst, sondern nur durch die Statistik der Studienan-fänger. In der Studierendenstatistik wird die Zahl damit unterschätzt. The data on Bildungsauslaender on temporary study-related visits for the 2016 academic year are drawn from the official statistics for the 2015/16 winter semester. Visits in summer semester only are not yet registered by the student statistics, but only by the statistics of the first-year students. In student statistics their number is therfore underestimated.
2 Nur Erasmus-Teilnehmer aus anderen Ländern, die an einer deutschen Hochschule eingeschrieben sind, werden als Bildungsausländer mit temporären studienbezogenen Auslandsaufenthalt gezählt. Only Erasmus participants from other countries who are enrolled at a German university are registered as Bildungsauslaender on temporary study-related visits.
3 Die Darstellung nach Fächergruppen folgt der neuen Studienfächer- Systematik des Statistischen Bundesamtes. So zählt u.a. Informatik jetzt zu den Ingenieurwissenschaften und Erziehungswissenschaften sowie Psychologie zu den Rechts-, Wirtschafts- und Sozialwissenschaften. The breakdown by subject groups follows the new subject group classi-fication of the German Federal Statistical Office (Destatis). For example, Computer Science is now included in Engineering, while Education and Psychology are grouped with Law, Economics and Social Sciences.
Quelle Abb. B35–B37: Statistisches Bundesamt, Studierendenstatistik; DZHW-Berechnungen
B35 Bildungsausländer mit temporären studienbezogenen Aufenthalten nach Hochschulart seit 20061
Bildungsauslaender on temporary study-related visits, since 2006, by type of higher education institution1
25.000
30.000
Anzahl
20.000
10.000
15.000
5.000
0Studienjahr2008 2010 2012 2014 20162006
Fach-hochschulen5.017
Universitäten23.585
Hochschulen insgesamt28.602
0
5000
10000
15000
20000
25000
30000
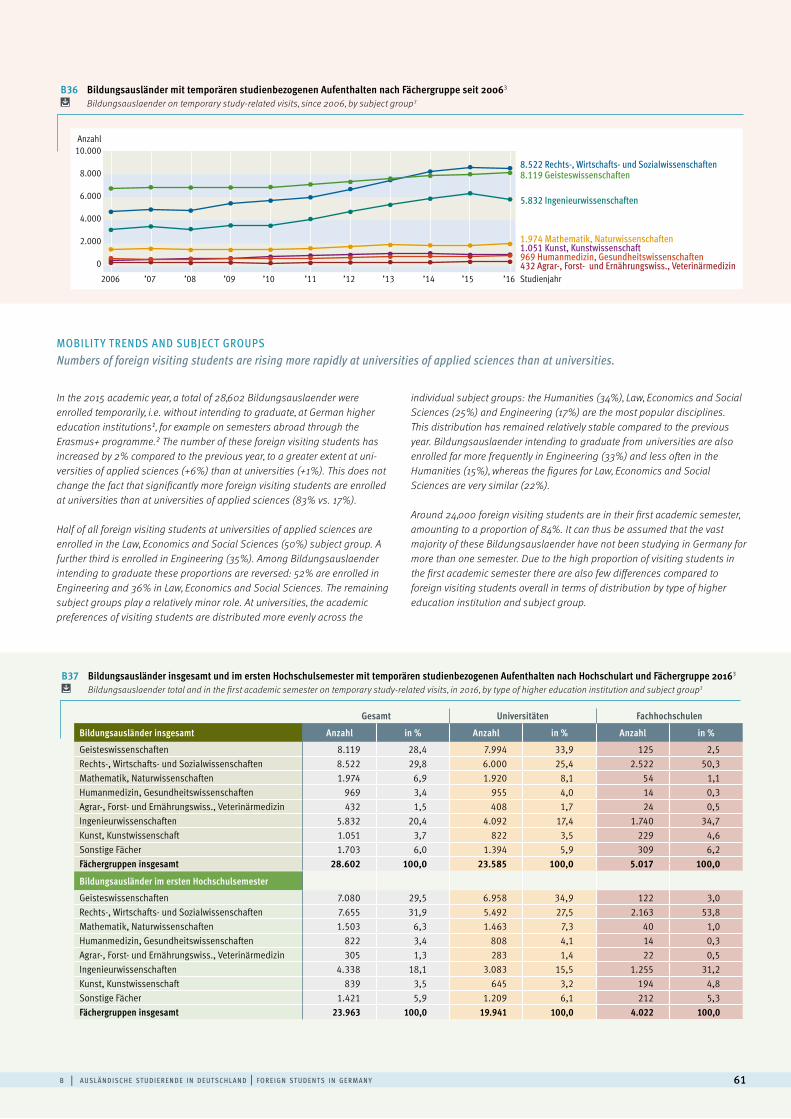
b | a u sl ä n d i sc h e st u d i e r e n d e i n d e ut sc h l a n d | f o r e i g n st u d e n t s i n g e rm a n y 61
B36 Bildungsausländer mit temporären studienbezogenen Aufenthalten nach Fächergruppe seit 20063 Bildungsauslaender on temporary study-related visits, since 2006, by subject group3
8.119 Geisteswissenschaften
5.832 Ingenieurwissenschaften
8.522 Rechts-, Wirtschafts- und Sozialwissenschaften
1.974 Mathematik, Naturwissenschaften
969 Humanmedizin, Gesundheitswissenschaften1.051 Kunst, Kunstwissenschaft
432 Agrar-, Forst- und Ernährungswiss., Veterinärmedizin
10.000Anzahl
8.000
4.000
6.000
2.000
0
2006 ’07 ’08 ’09 ’10 ’14 ’15 ’16’13’12’11 Studienjahr
MOBILIT Y TRENDS AND SUBJECT GROUPS Numbers of foreign visiting students are rising more rapidly at universities of applied sciences than at universities.
In the 2015 academic year, a total of 28,602 Bildungsauslaender were enrolled temporarily, i.e. without intending to graduate, at German higher education institutions1, for example on semesters abroad through the Erasmus+ programme.2 The number of these foreign visiting students has increased by 2% compared to the previous year, to a greater extent at uni- versities of applied sciences (+6%) than at universities (+1%). This does not change the fact that significantly more foreign visiting students are enrolled at universities than at universities of applied sciences (83% vs. 17%).
Half of all foreign visiting students at universities of applied sciences are enrolled in the Law, Economics and Social Sciences (50%) subject group. A further third is enrolled in Engineering (35%). Among Bildungsauslaender intending to graduate these proportions are reversed: 52% are enrolled in Engineering and 36% in Law, Economics and Social Sciences. The remaining subject groups play a relatively minor role. At universities, the academic preferences of visiting students are distributed more evenly across the
individual subject groups: the Humanities (34%), Law, Economics and Social Sciences (25%) and Engineering (17%) are the most popular disciplines. This distribution has remained relatively stable compared to the previous year. Bildungsauslaender intending to graduate from universities are also enrolled far more frequently in Engineering (33%) and less often in the Humanities (15%), whereas the figures for Law, Economics and Social Sciences are very similar (22%).
Around 24,000 foreign visiting students are in their first academic semester, amounting to a proportion of 84%. It can thus be assumed that the vast majority of these Bildungsauslaender have not been studying in Germany for more than one semester. Due to the high proportion of visiting students in the first academic semester there are also few differences compared to foreign visiting students overall in terms of distribution by type of higher education institution and subject group.
B37 Bildungsausländer insgesamt und im ersten Hochschulsemester mit temporären studienbezogenen Aufenthalten nach Hochschulart und Fächergruppe 20163 Bildungsauslaender total and in the first academic semester on temporary study-related visits, in 2016, by type of higher education institution and subject group3
Gesamt Universitäten Fachhochschulen
Bildungsausländer insgesamt Anzahl in % Anzahl in % Anzahl in %
Geisteswissenschaften 8.119 28,4 7.994 33,9 125 2,5Rechts-, Wirtschafts- und Sozialwissenschaften 8.522 29,8 6.000 25,4 2.522 50,3Mathematik, Naturwissenschaften 1.974 6,9 1.920 8,1 54 1,1Humanmedizin, Gesundheitswissenschaften 969 3,4 955 4,0 14 0,3Agrar-, Forst- und Ernährungswiss., Veterinärmedizin 432 1,5 408 1,7 24 0,5Ingenieurwissenschaften 5.832 20,4 4.092 17,4 1.740 34,7Kunst, Kunstwissenschaft 1.051 3,7 822 3,5 229 4,6Sonstige Fächer 1.703 6,0 1.394 5,9 309 6,2Fächergruppen insgesamt 28.602 100,0 23.585 100,0 5.017 100,0.
Bildungsausländer im ersten Hochschulsemester
Geisteswissenschaften 7.080 29,5 6.958 34,9 122 3,0Rechts-, Wirtschafts- und Sozialwissenschaften 7.655 31,9 5.492 27,5 2.163 53,8Mathematik, Naturwissenschaften 1.503 6,3 1.463 7,3 40 1,0Humanmedizin, Gesundheitswissenschaften 822 3,4 808 4,1 14 0,3Agrar-, Forst- und Ernährungswiss., Veterinärmedizin 305 1,3 283 1,4 22 0,5Ingenieurwissenschaften 4.338 18,1 3.083 15,5 1.255 31,2Kunst, Kunstwissenschaft 839 3,5 645 3,2 194 4,8Sonstige Fächer 1.421 5,9 1.209 6,1 212 5,3Fächergruppen insgesamt 23.963 100,0 19.941 100,0 4.022 100,0
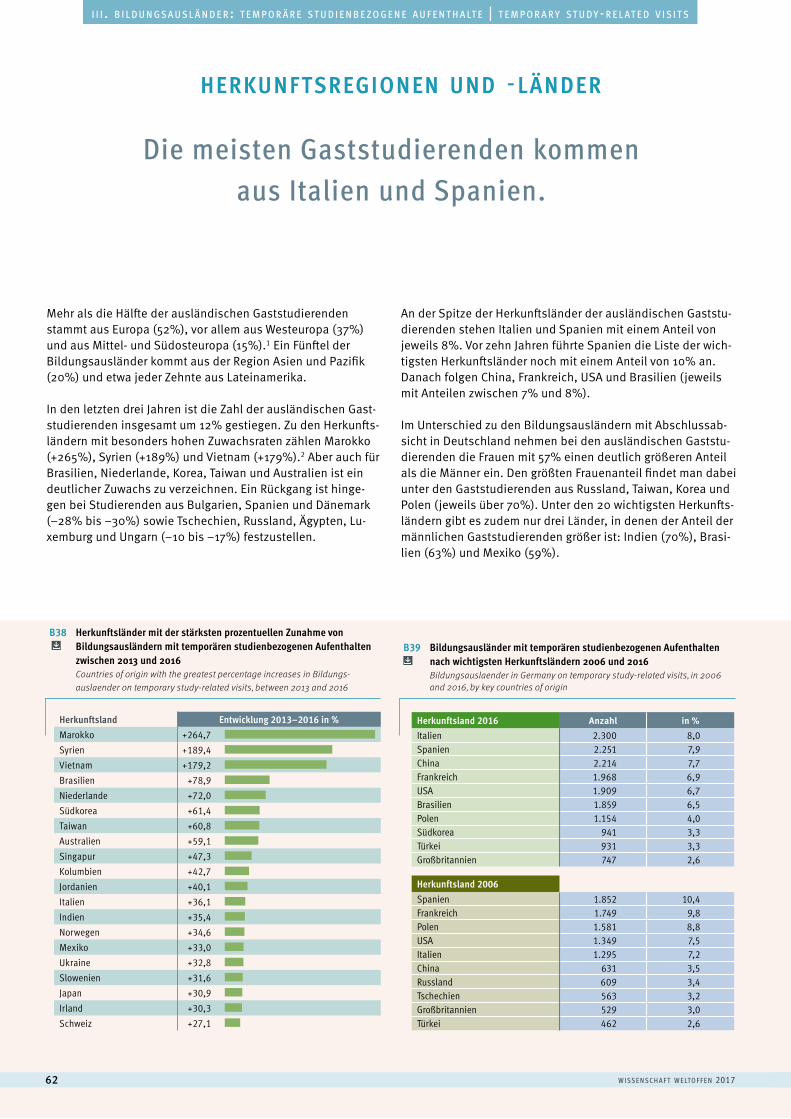
w i sse n sc h a f t w e lto f f e n 201762
a u s l ä n d i s c h e s t u d i e r e n d e | f o r e i g n s t u d e n t si i i . b i l d u n g s a u s l ä n d e r : t e m p o r ä r e s t u d i e n b e z o g e n e a u f e n t h a lt e | t e m p o r a r y s t u d y - r e l at e d v i s i t s
Die meisten Gaststudierenden kommen aus Italien und Spanien.
Mehr als die Hälfte der ausländischen Gaststudierenden stammt aus Europa (52%), vor allem aus Westeuropa (37%) und aus Mittel- und Südosteuropa (15%).1 Ein Fünftel der Bildungsausländer kommt aus der Region Asien und Pazifik (20%) und etwa jeder Zehnte aus Lateinamerika.
In den letzten drei Jahren ist die Zahl der ausländischen Gast-studierenden insgesamt um 12% gestiegen. Zu den Herkunfts-ländern mit besonders hohen Zuwachsraten zählen Marokko (+265%), Syrien (+189%) und Vietnam (+179%).2 Aber auch für Brasilien, Niederlande, Korea, Taiwan und Australien ist ein deutlicher Zuwachs zu verzeichnen. Ein Rückgang ist hinge-gen bei Studierenden aus Bulgarien, Spanien und Dänemark (–28% bis –30%) sowie Tschechien, Russland, Ägypten, Lu-xemburg und Ungarn (–10 bis –17%) festzustellen.
An der Spitze der Herkunftsländer der ausländischen Gaststu-dierenden stehen Italien und Spanien mit einem Anteil von jeweils 8%. Vor zehn Jahren führte Spanien die Liste der wich-tigsten Herkunftsländer noch mit einem Anteil von 10% an. Danach folgen China, Frankreich, USA und Brasilien (jeweils mit Anteilen zwischen 7% und 8%).
Im Unterschied zu den Bildungsausländern mit Abschlussab-sicht in Deutschland nehmen bei den ausländischen Gaststu-dierenden die Frauen mit 57% einen deutlich größeren Anteil als die Männer ein. Den größten Frauenanteil findet man dabei unter den Gaststudierenden aus Russland, Taiwan, Korea und Polen (jeweils über 70%). Unter den 20 wichtigsten Herkunfts-ländern gibt es zudem nur drei Länder, in denen der Anteil der männlichen Gaststudierenden größer ist: Indien (70%), Brasi-lien (63%) und Mexiko (59%).
herkunftsregionen und -länder
B38 Herkunftsländer mit der stärksten prozentuellen Zunahme von Bildungsausländern mit temporären studienbezogenen Aufenthaltenzwischen 2013 und 2016 Countries of origin with the greatest percentage increases in Bildungs-
auslaender on temporary study-related visits, between 2013 and 2016
B39 Bildungsausländer mit temporären studienbezogenen Aufenthalten nach wichtigsten Herkunftsländern 2006 und 2016 Bildungsauslaender in Germany on temporary study-related visits, in 2006and 2016, by key countries of origin
Herkunftsland 2006Spanien 1.852 10,4Frankreich 1.749 9,8Polen 1.581 8,8USA 1.349 7,5Italien 1.295 7,2China 631 3,5Russland 609 3,4Tschechien 563 3,2Großbritannien 529 3,0Türkei 462 2,6
Herkunftsland 2016 Anzahl in %
Italien 2.300 8,0Spanien 2.251 7,9China 2.214 7,7Frankreich 1.968 6,9USA 1.909 6,7Brasilien 1.859 6,5Polen 1.154 4,0Südkorea 941 3,3Türkei 931 3,3Großbritannien 747 2,6
Herkunftsland Entwicklung 2013–2016 in %Marokko +264,7
Syrien +189,4
Vietnam +179,2
Brasilien +78,9
Niederlande +72,0
Südkorea +61,4
Taiwan +60,8
Australien +59,1
Singapur +47,3
Kolumbien +42,7
Jordanien +40,1
Italien +36,1
Indien +35,4
Norwegen +34,6
Mexiko +33,0
Ukraine +32,8
Slowenien +31,6
Japan +30,9
Irland +30,3
Schweiz +27,1
0 50 100 150 200 250 300
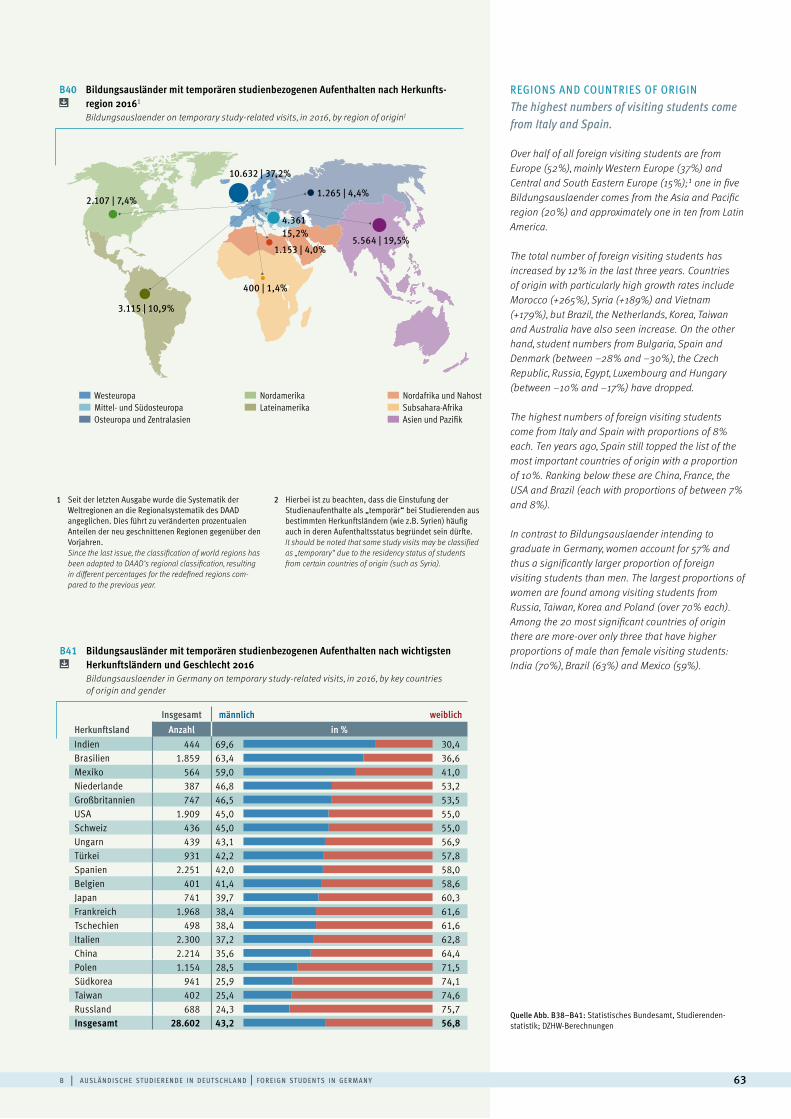
b | a u sl ä n d i sc h e st u d i e r e n d e i n d e ut sc h l a n d | f o r e i g n st u d e n t s i n g e rm a n y 63
REGIONS AND COUNTRIES OF ORIGIN The highest numbers of visiting students come from Italy and Spain.
Over half of all foreign visiting students are from Europe (52%), mainly Western Europe (37%) and Central and South Eastern Europe (15%);1 one in five Bildungsauslaender comes from the Asia and Pacific region (20%) and approximately one in ten from Latin America.
The total number of foreign visiting students has increased by 12% in the last three years. Countries of origin with particularly high growth rates include Morocco (+265%), Syria (+189%) and Vietnam (+179%), but Brazil, the Netherlands, Korea, Taiwan and Australia have also seen increase. On the other hand, student numbers from Bulgaria, Spain and Denmark (between –28% and –30%), the Czech Republic, Russia, Egypt, Luxembourg and Hungary (between –10% and –17%) have dropped.
The highest numbers of foreign visiting students come from Italy and Spain with proportions of 8% each. Ten years ago, Spain still topped the list of the most important countries of origin with a proportion of 10%. Ranking below these are China, France, the USA and Brazil (each with proportions of between 7% and 8%).
In contrast to Bildungsauslaender intending to graduate in Germany, women account for 57% and thus a significantly larger proportion of foreign visiting students than men. The largest proportions of women are found among visiting students from Russia, Taiwan, Korea and Poland (over 70% each). Among the 20 most significant countries of origin there are more-over only three that have higher proportions of male than female visiting students: India (70%), Brazil (63%) and Mexico (59%).
1 Seit der letzten Ausgabe wurde die Systematik der Weltregionen an die Regionalsystematik des DAAD angeglichen. Dies führt zu veränderten prozentualen Anteilen der neu geschnittenen Regionen gegenüber den Vorjahren.Since the last issue, the classification of world regions has been adapted to DAAD‘s regional classification, resulting in different percentages for the redefined regions com-pared to the previous year.
2 Hierbei ist zu beachten, dass die Einstufung der Studienaufenthalte als „temporär“ bei Studierenden aus bestimmten Herkunftsländern (wie z.B. Syrien) häufig auch in deren Aufenthaltsstatus begründet sein dürfte.It should be noted that some study visits may be classified as „temporary“ due to the residency status of students from certain countries of origin (such as Syria).
B41 Bildungsausländer mit temporären studienbezogenen Aufenthalten nach wichtigsten Herkunftsländern und Geschlecht 2016 Bildungsauslaender in Germany on temporary study-related visits, in 2016, by key countries of origin and gender
Insgesamt männlich weiblichHerkunftsland Anzahl in %Indien 444 69,6 30,4Brasilien 1.859 63,4 36,6Mexiko 564 59,0 41,0Niederlande 387 46,8 53,2Großbritannien 747 46,5 53,5USA 1.909 45,0 55,0Schweiz 436 45,0 55,0Ungarn 439 43,1 56,9Türkei 931 42,2 57,8Spanien 2.251 42,0 58,0Belgien 401 41,4 58,6Japan 741 39,7 60,3Frankreich 1.968 38,4 61,6Tschechien 498 38,4 61,6Italien 2.300 37,2 62,8China 2.214 35,6 64,4Polen 1.154 28,5 71,5Südkorea 941 25,9 74,1Taiwan 402 25,4 74,6Russland 688 24,3 75,7Insgesamt 28.602 43,2 56,8
0 20 40 60 80 100
B40 Bildungsausländer mit temporären studienbezogenen Aufenthalten nach Herkunfts- region 20161
Bildungsauslaender on temporary study-related visits, in 2016, by region of origin1
Ohne regionale EinteilungAsien, Pazi�kAfrika SubsaharaNahost, NordafrikaLateinamerikaNordamerikaOsteuropa, Zentralasien und SüdkaukasusMittel- und SüdosteuropaWest-, Nord- und Südeuropa
10.632 | 37,2%
2.107 | 7,4%
3.115 | 10,9%
400 | 1,4%
1.153 | 4,0%
4.36115,2%
1.265 | 4,4%
5.564 | 19,5%
Westeuropa Mittel- und Südosteuropa Osteuropa und Zentralasien
Nordamerika Lateinamerika
Nordafrika und Nahost Subsahara-Afrika Asien und Pazifik
Quelle Abb. B38–B41: Statistisches Bundesamt, Studierenden-statistik; DZHW-Berechnungen
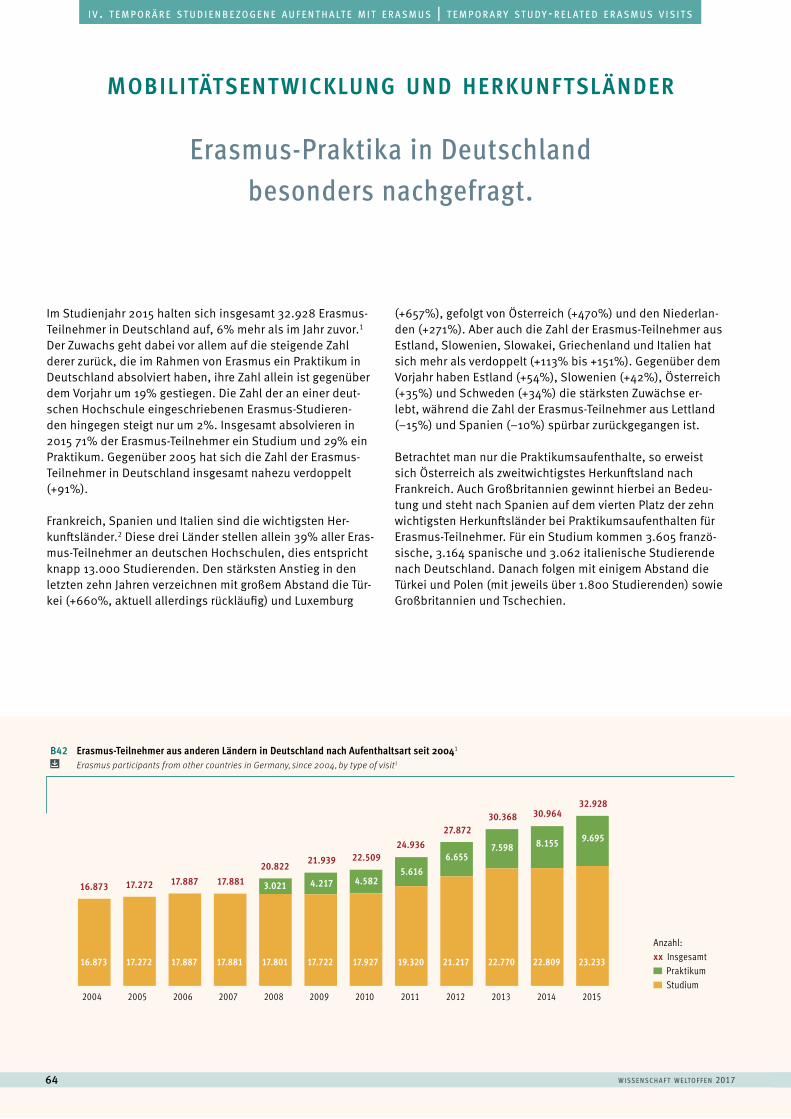
w i sse n sc h a f t w e lto f f e n 201764
a u s l ä n d i s c h e s t u d i e r e n d e | f o r e i g n s t u d e n t si v . t e m p o r ä r e s t u d i e n b e z o g e n e a u f e n t h a lt e m i t e r a s m u s | t e m p o r a r y s t u d y - r e l at e d e r a s m u s v i s i t s
Im Studienjahr 2015 halten sich insgesamt 32.928 Erasmus-Teilnehmer in Deutschland auf, 6% mehr als im Jahr zuvor.1 Der Zuwachs geht dabei vor allem auf die steigende Zahl derer zurück, die im Rahmen von Erasmus ein Praktikum in Deutschland absolviert haben, ihre Zahl allein ist gegenüber dem Vorjahr um 19% gestiegen. Die Zahl der an einer deut-schen Hochschule eingeschriebenen Erasmus-Studieren-den hingegen steigt nur um 2%. Insgesamt absolvieren in 2015 71% der Erasmus-Teilnehmer ein Studium und 29% ein Praktikum. Gegenüber 2005 hat sich die Zahl der Erasmus-Teilnehmer in Deutschland insgesamt nahezu verdoppelt (+91%).
Frankreich, Spanien und Italien sind die wichtigsten Her-kunftsländer.2 Diese drei Länder stellen allein 39% aller Eras-mus-Teilnehmer an deutschen Hochschulen, dies entspricht knapp 13.000 Studierenden. Den stärksten Anstieg in den letzten zehn Jahren verzeichnen mit großem Abstand die Tür-kei (+660%, aktuell allerdings rückläufig) und Luxemburg
(+657%), gefolgt von Österreich (+470%) und den Niederlan-den (+271%). Aber auch die Zahl der Erasmus-Teilnehmer aus Estland, Slowenien, Slowakei, Griechenland und Italien hat sich mehr als verdoppelt (+113% bis +151%). Gegenüber dem Vorjahr haben Estland (+54%), Slowenien (+42%), Österreich (+35%) und Schweden (+34%) die stärksten Zuwächse er-lebt, während die Zahl der Erasmus-Teilnehmer aus Lettland (–15%) und Spanien (–10%) spürbar zurückgegangen ist.
Betrachtet man nur die Praktikumsaufenthalte, so erweist sich Österreich als zweitwichtigstes Herkunftsland nach Frankreich. Auch Großbritannien gewinnt hierbei an Bedeu-tung und steht nach Spanien auf dem vierten Platz der zehn wichtigsten Herkunftsländer bei Praktikumsaufenthalten für Erasmus-Teilnehmer. Für ein Studium kommen 3.605 franzö-sische, 3.164 spanische und 3.062 italienische Studierende nach Deutschland. Danach folgen mit einigem Abstand die Türkei und Polen (mit jeweils über 1.800 Studierenden) sowie Großbritannien und Tschechien.
Erasmus-Praktika in Deutschland besonders nachgefragt.
mobilitätsent wicklung und herkunftsländer
0
10000
20000
30000
40000
0
2
4
6
8
10
Anzahl: xx Insgesamt
Praktikum Studium
9.6958.1557.5986.655
5.6164.5824.2173.021
20.82217.88117.88717.27216.873
21.939 22.50924.936
27.87230.368 30.964
32.928
2004 2005 2006 2007 2008 2009 2010 2011 2012 2013 2014 2015
16.873 17.272 17.887 17.881 17.801 17.722 17.927 19.320 21.217 22.770 22.809 23.233
B42 Erasmus-Teilnehmer aus anderen Ländern in Deutschland nach Aufenthaltsart seit 20041
Erasmus participants from other countries in Germany, since 2004, by type of visit1
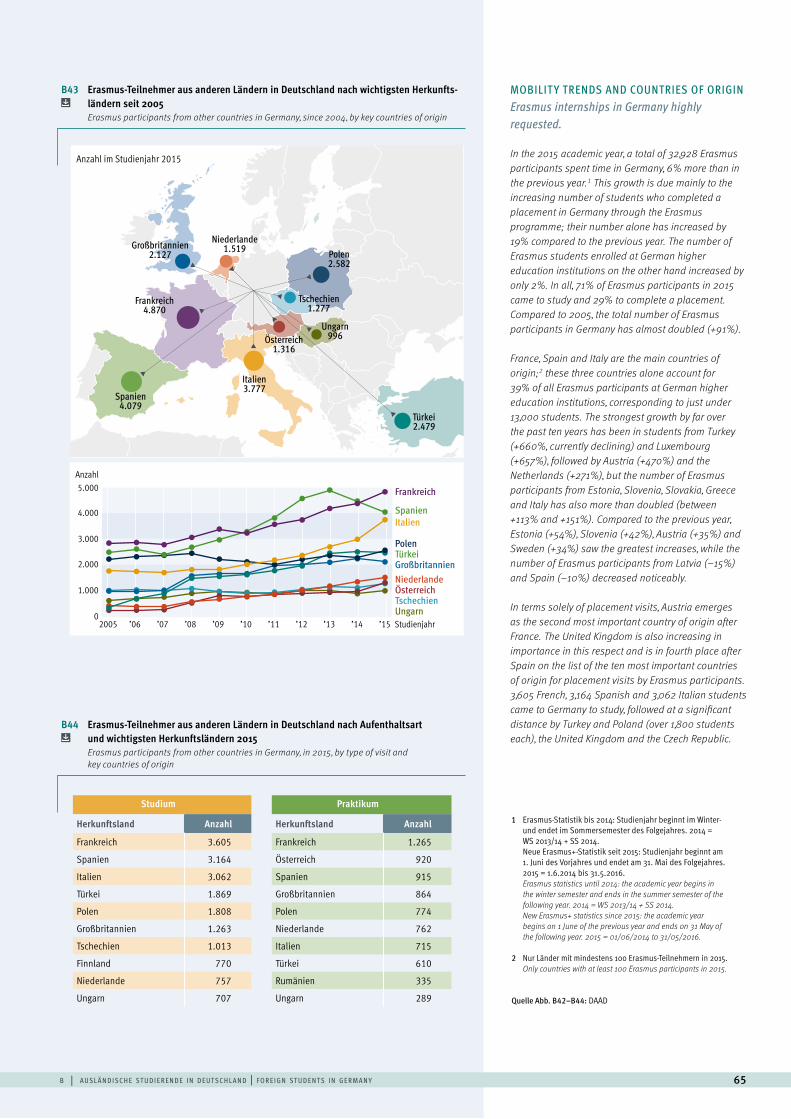
b | a u sl ä n d i sc h e st u d i e r e n d e i n d e ut sc h l a n d | f o r e i g n st u d e n t s i n g e rm a n y 65
MOBILIT Y TRENDS AND COUNTRIES OF ORIGIN Erasmus internships in Germany highly requested.
In the 2015 academic year, a total of 32,928 Erasmus participants spent time in Germany, 6% more than in the previous year.1 This growth is due mainly to the increasing number of students who completed a placement in Germany through the Erasmus programme; their number alone has increased by 19% compared to the previous year. The number of Erasmus students enrolled at German higher education institutions on the other hand increased by only 2%. In all, 71% of Erasmus participants in 2015 came to study and 29% to complete a placement. Compared to 2005, the total number of Erasmus participants in Germany has almost doubled (+91%).
France, Spain and Italy are the main countries of origin;2 these three countries alone account for 39% of all Erasmus participants at German higher education institutions, corresponding to just under 13,000 students. The strongest growth by far over the past ten years has been in students from Turkey (+660%, currently declining) and Luxembourg (+657%), followed by Austria (+470%) and the Netherlands (+271%), but the number of Erasmus participants from Estonia, Slovenia, Slovakia, Greece and Italy has also more than doubled (between +113% and +151%). Compared to the previous year, Estonia (+54%), Slovenia (+42%), Austria (+35%) and Sweden (+34%) saw the greatest increases, while the number of Erasmus participants from Latvia (–15%) and Spain (–10%) decreased noticeably.
In terms solely of placement visits, Austria emerges as the second most important country of origin after France. The United Kingdom is also increasing in importance in this respect and is in fourth place after Spain on the list of the ten most important countries of origin for placement visits by Erasmus participants. 3,605 French, 3,164 Spanish and 3,062 Italian students came to Germany to study, followed at a significant distance by Turkey and Poland (over 1,800 students each), the United Kingdom and the Czech Republic.
Großbritannien2.127
Frankreich4.870
Italien3.777
Polen2.582
Ungarn996
Tschechien1.277
Österreich1.316
Niederlande1.519
Türkei2.479
Spanien4.079
Studienjahr’062005 ’07 ’08 ’09 ’12 ’13 ’15’14’11’10
3.000
4.000
5.000Anzahl
1.000
2.000
0
Frankreich
SpanienItalien
PolenTürkeiGroßbritannienNiederlandeÖsterreichTschechienUngarn
Anzahl im Studienjahr 2015
B43 Erasmus-Teilnehmer aus anderen Ländern in Deutschland nach wichtigsten Herkunfts- ländern seit 2005
Erasmus participants from other countries in Germany, since 2004, by key countries of origin
B44 Erasmus-Teilnehmer aus anderen Ländern in Deutschland nach Aufenthaltsart und wichtigsten Herkunftsländern 2015
Erasmus participants from other countries in Germany, in 2015, by type of visit and key countries of origin
Studium
Herkunftsland Anzahl
Frankreich 3.605
Spanien 3.164
Italien 3.062
Türkei 1.869
Polen 1.808
Großbritannien 1.263
Tschechien 1.013
Finnland 770
Niederlande 757
Ungarn 707
Praktikum
Herkunftsland Anzahl
Frankreich 1.265
Österreich 920
Spanien 915
Großbritannien 864
Polen 774
Niederlande 762
Italien 715
Türkei 610
Rumänien 335
Ungarn 289
1 Erasmus-Statistik bis 2014: Studienjahr beginnt im Winter- und endet im Sommersemester des Folgejahres. 2014 = WS 2013/14 + SS 2014.
Neue Erasmus+-Statistik seit 2015: Studienjahr beginnt am 1. Juni des Vorjahres und endet am 31. Mai des Folgejahres. 2015 = 1.6.2014 bis 31.5.2016.Erasmus statistics until 2014: the academic year begins in the winter semester and ends in the summer semester of the following year. 2014 = WS 2013/14 + SS 2014.New Erasmus+ statistics since 2015: the academic year begins on 1 June of the previous year and ends on 31 May of the following year. 2015 = 01/06/2014 to 31/05/2016.
2 Nur Länder mit mindestens 100 Erasmus-Teilnehmern in 2015.Only countries with at least 100 Erasmus participants in 2015.
Quelle Abb. B42–B44: DAAD
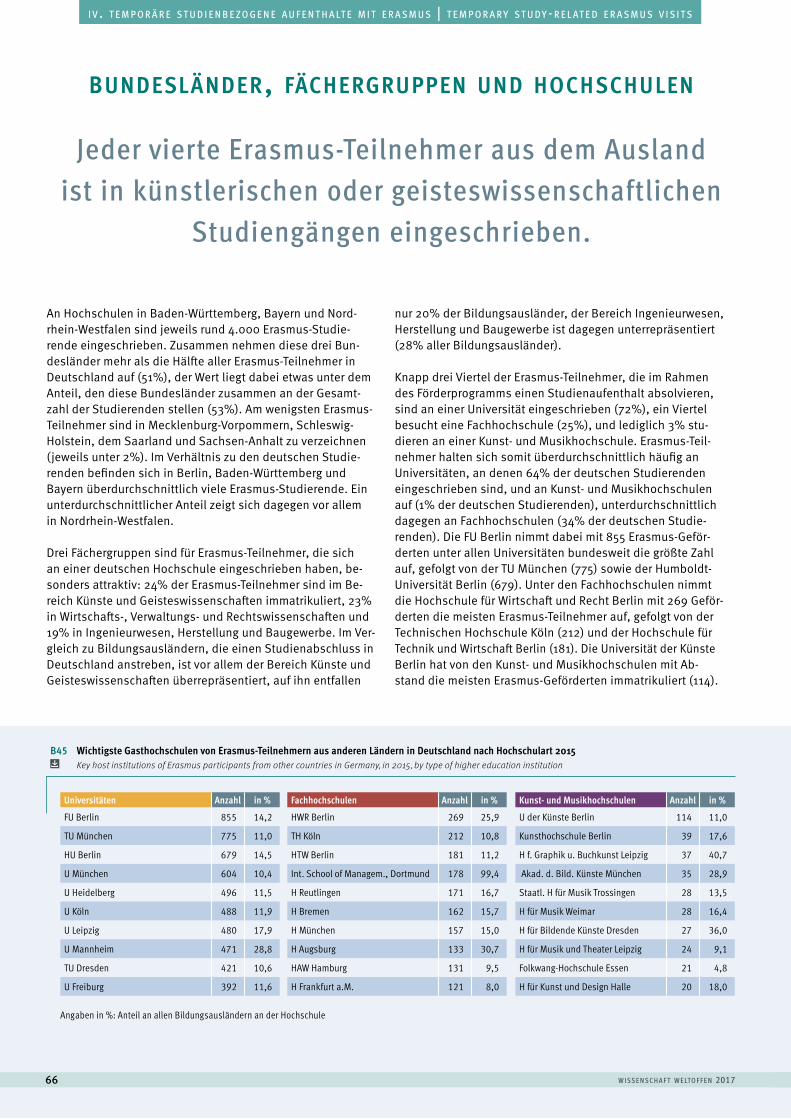
w i sse n sc h a f t w e lto f f e n 201766
a u s l ä n d i s c h e s t u d i e r e n d e | f o r e i g n s t u d e n t si v . t e m p o r ä r e s t u d i e n b e z o g e n e a u f e n t h a lt e m i t e r a s m u s | t e m p o r a r y s t u d y - r e l at e d e r a s m u s v i s i t s
An Hochschulen in Baden-Württemberg, Bayern und Nord-rhein-Westfalen sind jeweils rund 4.000 Erasmus-Studie-rende eingeschrieben. Zusammen nehmen diese drei Bun-desländer mehr als die Hälfte aller Erasmus-Teilnehmer in Deutschland auf (51%), der Wert liegt dabei etwas unter dem Anteil, den diese Bundesländer zusammen an der Gesamt-zahl der Studierenden stellen (53%). Am wenigsten Erasmus-Teilnehmer sind in Mecklenburg-Vorpommern, Schleswig-Holstein, dem Saarland und Sachsen-Anhalt zu verzeichnen (jeweils unter 2%). Im Verhältnis zu den deutschen Studie-renden befinden sich in Berlin, Baden-Württemberg und Bayern überdurchschnittlich viele Erasmus-Studierende. Ein unterdurchschnittlicher Anteil zeigt sich dagegen vor allem in Nordrhein-Westfalen.
Drei Fächergruppen sind für Erasmus-Teilnehmer, die sich an einer deutschen Hochschule eingeschrieben haben, be-sonders attraktiv: 24% der Erasmus-Teilnehmer sind im Be-reich Künste und Geisteswissenschaften immatrikuliert, 23% in Wirtschafts-, Verwaltungs- und Rechtswissenschaften und 19% in Ingenieurwesen, Herstellung und Baugewerbe. Im Ver-gleich zu Bildungsausländern, die einen Studienabschluss in Deutschland anstreben, ist vor allem der Bereich Künste und Geisteswissenschaften überrepräsentiert, auf ihn entfallen
nur 20% der Bildungsausländer, der Bereich Ingenieurwesen, Herstellung und Baugewerbe ist dagegen unterrepräsentiert (28% aller Bildungsausländer).
Knapp drei Viertel der Erasmus-Teilnehmer, die im Rahmen des Förderprogramms einen Studienaufenthalt absolvieren, sind an einer Universität eingeschrieben (72%), ein Viertel besucht eine Fachhochschule (25%), und lediglich 3% stu-dieren an einer Kunst- und Musikhochschule. Erasmus-Teil-nehmer halten sich somit überdurchschnittlich häufig an Universitäten, an denen 64% der deutschen Studierenden eingeschrieben sind, und an Kunst- und Musikhochschulen auf (1% der deutschen Studierenden), unterdurchschnittlich dagegen an Fachhochschulen (34% der deutschen Studie-renden). Die FU Berlin nimmt dabei mit 855 Erasmus-Geför-derten unter allen Universitäten bundesweit die größte Zahl auf, gefolgt von der TU München (775) sowie der Humboldt-Universität Berlin (679). Unter den Fachhochschulen nimmt die Hochschule für Wirtschaft und Recht Berlin mit 269 Geför-derten die meisten Erasmus-Teilnehmer auf, gefolgt von der Technischen Hochschule Köln (212) und der Hochschule für Technik und Wirtschaft Berlin (181). Die Universität der Künste Berlin hat von den Kunst- und Musikhochschulen mit Ab-stand die meisten Erasmus-Geförderten immatrikuliert (114).
Jeder vierte Erasmus-Teilnehmer aus dem Ausland ist in künstlerischen oder geisteswissenschaftlichen
Studiengängen eingeschrieben.
bundesländer, fächergruppen und hochschulen
Universitäten Anzahl in %
FU Berlin 855 14,2
TU München 775 11,0
HU Berlin 679 14,5
U München 604 10,4
U Heidelberg 496 11,5
U Köln 488 11,9
U Leipzig 480 17,9
U Mannheim 471 28,8
TU Dresden 421 10,6
U Freiburg 392 11,6
Fachhochschulen Anzahl in %
HWR Berlin 269 25,9
TH Köln 212 10,8
HTW Berlin 181 11,2
Int. School of Managem., Dortmund 178 99,4
H Reutlingen 171 16,7
H Bremen 162 15,7
H München 157 15,0
H Augsburg 133 30,7
HAW Hamburg 131 9,5
H Frankfurt a.M. 121 8,0
Kunst- und Musikhochschulen Anzahl in %
U der Künste Berlin 114 11,0
Kunsthochschule Berlin 39 17,6
H f. Graphik u. Buchkunst Leipzig 37 40,7
Akad. d. Bild. Künste München 35 28,9
Staatl. H für Musik Trossingen 28 13,5
H für Musik Weimar 28 16,4
H für Bildende Künste Dresden 27 36,0
H für Musik und Theater Leipzig 24 9,1
Folkwang-Hochschule Essen 21 4,8
H für Kunst und Design Halle 20 18,0
B45 Wichtigste Gasthochschulen von Erasmus-Teilnehmern aus anderen Ländern in Deutschland nach Hochschulart 2015 Key host institutions of Erasmus participants from other countries in Germany, in 2015, by type of higher education institution
Angaben in %: Anteil an allen Bildungsausländern an der Hochschule
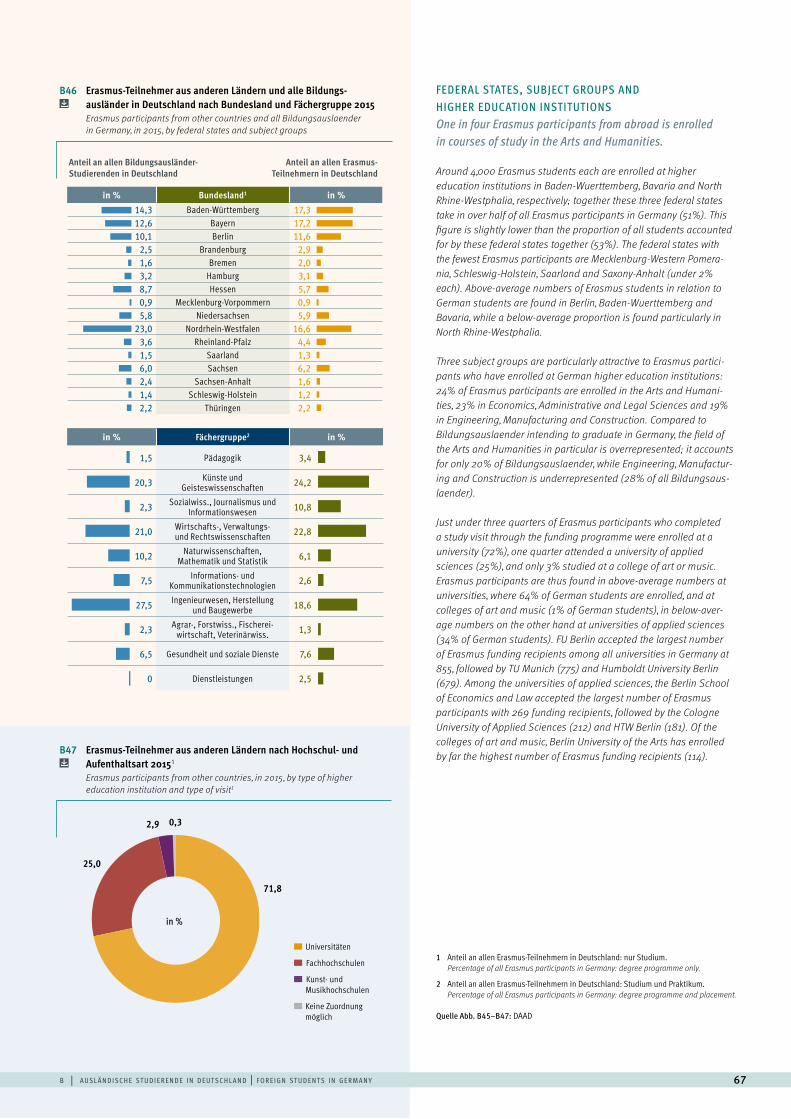
b | a u sl ä n d i sc h e st u d i e r e n d e i n d e ut sc h l a n d | f o r e i g n st u d e n t s i n g e rm a n y 67
B47 Erasmus-Teilnehmer aus anderen Ländern nach Hochschul- und Aufenthaltsart 20151
Erasmus participants from other countries, in 2015, by type of higher education institution and type of visit1
FEDERAL STATES, SUBJECT GROUPS AND HIGHER EDUCATION INSTITUTIONS One in four Erasmus participants from abroad is enrolled in courses of study in the Arts and Humanities.
Around 4,000 Erasmus students each are enrolled at higher education institutions in Baden-Wuerttemberg, Bavaria and North Rhine-Westphalia, respectively; together these three federal states take in over half of all Erasmus participants in Germany (51%). This figure is slightly lower than the proportion of all students accounted for by these federal states together (53%). The federal states with the fewest Erasmus participants are Mecklenburg-Western Pomera-nia, Schleswig-Holstein, Saarland and Saxony-Anhalt (under 2% each). Above-average numbers of Erasmus students in relation to German students are found in Berlin, Baden-Wuerttemberg and Bavaria, while a below-average proportion is found particularly in North Rhine-Westphalia.
Three subject groups are particularly attractive to Erasmus partici- pants who have enrolled at German higher education institutions: 24% of Erasmus participants are enrolled in the Arts and Humani-ties, 23% in Economics, Administrative and Legal Sciences and 19% in Engineering, Manufacturing and Construction. Compared to Bildungsauslaender intending to graduate in Germany, the field of the Arts and Humanities in particular is overrepresented; it accounts for only 20% of Bildungsauslaender, while Engineering, Manufactur-ing and Construction is underrepresented (28% of all Bildungsaus-laender).
Just under three quarters of Erasmus participants who completed a study visit through the funding programme were enrolled at a university (72%), one quarter attended a university of applied sciences (25%), and only 3% studied at a college of art or music. Erasmus participants are thus found in above-average numbers at universities, where 64% of German students are enrolled, and at colleges of art and music (1% of German students), in below-aver-age numbers on the other hand at universities of applied sciences (34% of German students). FU Berlin accepted the largest number of Erasmus funding recipients among all universities in Germany at 855, followed by TU Munich (775) and Humboldt University Berlin (679). Among the universities of applied sciences, the Berlin School of Economics and Law accepted the largest number of Erasmus participants with 269 funding recipients, followed by the Cologne University of Applied Sciences (212) and HTW Berlin (181). Of the colleges of art and music, Berlin University of the Arts has enrolled by far the highest number of Erasmus funding recipients (114).
in % Fächergruppe2 in %
1,5 Pädagogik 3,4
20,3 Künste und Geisteswissenschaften 24,2
2,3 Sozialwiss., Journalismus und Informationswesen 10,8
21,0 Wirtschafts-, Verwaltungs- und Rechtswissenschaften 22,8
10,2 Naturwissenschaften, Mathematik und Statistik 6,1
7,5 Informations- und Kommunikationstechnologien 2,6
27,5 Ingenieurwesen, Herstellung und Baugewerbe 18,6
2,3 Agrar-, Forstwiss., Fischerei-wirtschaft, Veterinärwiss. 1,3
6,5 Gesundheit und soziale Dienste 7,6
0 Dienstleistungen 2,5
in % Bundesland1 in %14,3 Baden-Württemberg 17,312,6 Bayern 17,210,1 Berlin 11,6
2,5 Brandenburg 2,91,6 Bremen 2,03,2 Hamburg 3,18,7 Hessen 5,70,9 Mecklenburg-Vorpommern 0,95,8 Niedersachsen 5,9
23,0 Nordrhein-Westfalen 16,63,6 Rheinland-Pfalz 4,41,5 Saarland 1,36,0 Sachsen 6,22,4 Sachsen-Anhalt 1,61,4 Schleswig-Holstein 1,22,2 Thüringen 2,2
030
0 30
030
0 30
050
0 50
050
0 50
B46 Erasmus-Teilnehmer aus anderen Ländern und alle Bildungs- ausländer in Deutschland nach Bundesland und Fächergruppe 2015
Erasmus participants from other countries and all Bildungsauslaender in Germany, in 2015, by federal states and subject groups
Anteil an allen Bildungsausländer-Studierenden in Deutschland
Anteil an allen Erasmus-Teilnehmern in Deutschland
1 Anteil an allen Erasmus-Teilnehmern in Deutschland: nur Studium.Percentage of all Erasmus participants in Germany: degree programme only.
2 Anteil an allen Erasmus-Teilnehmern in Deutschland: Studium und Praktikum.Percentage of all Erasmus participants in Germany: degree programme and placement.
Quelle Abb. B45–B47: DAAD
Universitäten
Fachhochschulen
Kunst- und Musikhochschulen
Keine Zuordnung möglich
71,8
0,3
25,0
2,9
in %
w i sse n sc h a f t w e lto f f e n 201768
In „Wissenschaft weltoffen“ wird zwischen den beiden Mobili-tätsarten abschlussbezogene Auslandsmobilität (z.B. komplettes Bachelor- oder Masterstudium im Ausland) und temporäre stu-dienbezogene Auslandsaufenthalte (z.B. Auslandssemester oder -praktikum) getrennt (vgl. hierzu auch das einleitende Kapitel
„Mapping Mobility“). Letztere umfassen dabei aber nicht nur die sog. „Credit Mobility“ im Sinn der europäischen Mobilitätsstra-tegie, sondern auch studienbezogene Aufenthalte, die kürzer als drei Monate dauern oder bei denen weniger als 15 ECTS-Punkte er-worben werden.
Bei der Entwicklung der abschlussbezogenen Auslandsmobilität im Jahr 2014 ist nach einem statistisch bedingten Rückgang im Vorjahr wieder eine Zunahme festzustellen: Die Zahl der im Aus-land eingeschriebenen Deutschen stieg von 134.800 in 2013 auf 137.300 in 2014 bzw. um 2%. Wie im Vorjahr stellen deutsche Studierende im Ausland 5,8% aller deutschen Studierenden.
Die vier beliebtesten Gastländer sind nach wie vor Österreich, die Niederlande, Großbritannien und die Schweiz. Während die Zahl deutscher Studierender in den Niederlanden (–4%) und der Schweiz (–0,5%) etwas zurückgegangen ist, lässt sich ins-
besondere in Großbritannien (+9%) eine deutliche Zunahme beobachten. Am stärksten abgenommen haben die Zahlen der deutschen Studierenden in Australien (–12%), Island (–9%), Neuseeland und den Vereinigten Arabischen Emiraten (je –7%).
Der größte Teil deutscher Studierender, die einen Abschluss im Ausland anstreben, ist in den Wirtschafts- und Sozialwis-senschaften eingeschrieben (jeweils 20%). Dahinter folgen Sprach- und Kulturwissenschaften (13%), Mathematik und Na-turwissenschaften (11%), Humanmedizin und Gesundheitswis-senschaften (9%) sowie Ingenieurwissenschaften (9%).
a b s c h l u s s b e z o g e n e a u s l a n d s m o b i l i tät
Laut der DAAD/DZHW-Mobilitätsstudie 2017 ist der Anteil der Studierenden, die im Laufe ihres Studiums einen Auslandsauf-enthalt absolvieren, seit 2015 von 37% auf 38% gestiegen. Im Gegensatz dazu konstatiert die 21. Sozialerhebung zwischen 2012 und 2016 einen Rückgang der Mobilitätsquote von 30% auf 28%. Die deutlichen Abweichungen zwischen den Befun-den sind durch unterschiedliche Erhebungsmethodiken der beiden Untersuchungen zu erklären. Unabhängig davon ist nach wie vor eine deutliche Mobilitätssteigerung nötig, um das 50%-Ziel von Bund, Ländern und DAAD zu erreichen.
Auslandsmobile Studierende interessieren sich vor allem für studienbezogene Aufenthalte in westeuropäischen Ländern (58%). Hier stehen Großbritannien, Frankreich und Spanien an der Spitze. Mit deutlichem Abstand folgen die Region Asien und Pazifik (15%) mit dem Gastland China (4%) sowie Nordamerika (14%) mit den USA (12%) als dominierendem Gastland.
Über 90% der befragten auslandsmobilen Studierenden sind zufrieden mit ihren studienbezogenen Auslandsaufenthalten. Zwischen den Organisationsformen der Auslandsaufenthalte zeigen sich hierbei praktisch keine Unterschiede.
t e m p o r ä r e s t u d i e n b e z o g e n e a u s l a n d s m o b i l i tät
Seit 1999 hat sich die Zahl der jährlichen Erasmus-Aufenthal-te von Studierenden deutscher Hochschulen von 14.693 auf 39.719 im Erasmusjahr 2015 mehr als verdoppelt. 80% der Erasmus-Aufenthalte sind Studiumsaufenthalte, 20% Prakti-kumsaufenthalte.
Wie schon in den Vorjahren war Spanien bei den Erasmus-Teil-nehmern aus Deutschland auch im Erasmusjahr 2015 wieder am beliebtesten, gefolgt von Frankreich, Großbritannien und Schweden.
Die durchschnittliche Dauer der Erasmus-Studiumsaufent- halte ist im Erasmusjahr 2015 im Vergleich zum Vorjahr von 5,5 auf 5,3 Monate weiter gesunken. Auch bei den Praktikumsauf-enthalten ist erstmals seit 2008 ein deutlicher Rückgang auf 4,2 Monate zu verzeichnen.
t e m p o r ä r e s t u d i e n b e z o g e n e a u s l a n d s a u f e n t h a lt e m i t e r a s m u s
deutsche studierendeim ausland
c | d e ut sc h e st u d i e r e n d e i m a u sl a n d | g e rm a n st u d e n t s a b roa d 69
Following a drop in the previous year due to a change in statistical methods, degree-related international mobility increased again in 2014: the number of Germans enrolled abroad increased from 134,800 in 2013 to 137,300 in 2014, constituting a rise of 2%. As in the previous year, German students abroad accounted for 5.8% of all German students.Austria, the Netherlands, the UK and Switzerland remain the four most popular host countries. While the number of German students fell slightly in the Netherlands (–4%) and Switzerland (–0.5%), it grew
significantly in the UK (+9%). Finally, the countries in which the numbers of German students dropped most noticeably were Australia (–12%), Iceland (–9%), New Zealand and the United Arab Emirates (–7% each).The majority of German students aiming to graduate abroad are enrolled in the economic and Social Sciences (20% each), followed by Language and Cultural Studies (13%), Mathematics and Natural Sciences (11%), Medicine and Health Sciences (9%), and Engineering (9%).
According to the 2017 DAAD/DZHW mobility survey, the proportion of students who complete a visit abroad during their studies has increased from 37% in 2015 to 38%. By contrast, the 21st social survey confirmed a decline in the mobility rate from 30% to 28%. The clear deviations in the findings can be explained by differing methodologies employed by the two investigations. Irrespective of this, a significant increase in mo-bility is still required if the goal of 50% set by the Federal Government, the federal states and DAAD is to be achieved.
Internationally mobile students are mainly interested in study-related visits to Western European countries (58%). The UK, France and Spain top the list of most popular countries. Trailing behind somewhat are the Asia and Pacific region (15%), with host country China (4%) leading the pack, and North America (14%), with the USA (12%) as the strongest host country.Over 90% of the students surveyed are satisfied with their study-related visits abroad. Virtually no differences can be ascertained between the various organisational forms taken by said visits.
Since 1999, the number of Erasmus visits conducted annually by students from German higher education institutions has more than doubled, from initially 14,693 to 39,719 in the 2015 Erasmus year. 80% of Erasmus visits are for study purposes, and 20% for placement purposes.As in previous years, the most popular destination for Erasmus partici-pants from Germany in the 2015 Erasmus year was once again Spain, fol-lowed by France, the United Kingdom and Sweden.
The average duration of Erasmus study visits fell further in the 2015 Eras-mus year compared to the previous year, from 5.5 to 5.3 months. For the first time since 2008, the average duration of placement visits has also dropped significantly, to 4.2 months.
d e g r e e - r e l at e d i n t e r n at i o n a l m o b i l i t y
t e m p o r a r y s t u d y - r e l at e d m o b i l i t y
t e m p o r a r y s t u d y - r e l at e d m o b i l i t y
“Wissenschaft weltoffen” differentiates between the two types of mobility „degree-related international mobility“ (e.g. a full bachelor’s or master’s programme) and „temporary study-related mobility“ (e.g. a semester or placement abroad). The latter however comprise not only credit mobility
as outlined in the European mobility strategy, but also study-related visits that are shorter than three months or during which fewer than 15 ECTS points are earned.
Cgerman students abroad
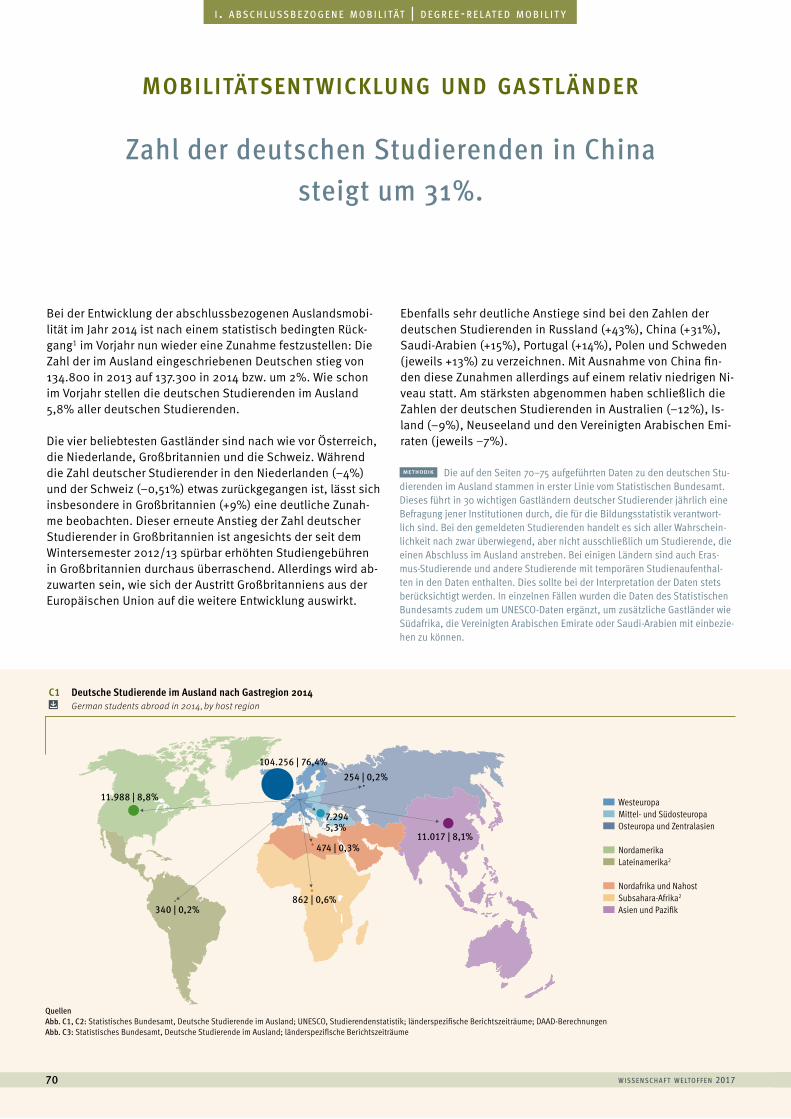
C1 Deutsche Studierende im Ausland nach Gastregion 2014 German students abroad in 2014, by host region
w i sse n sc h a f t w e lto f f e n 201770
a u s l ä n d i s c h e s t u d i e r e n d e | f o r e i g n s t u d e n t si . a b s c h l u s s b e z o g e n e m o b i l i tät | d e g r e e - r e l at e d m o b i l i t y
Zahl der deutschen Studierenden in China steigt um 31%.
Bei der Entwicklung der abschlussbezogenen Auslandsmobi-lität im Jahr 2014 ist nach einem statistisch bedingten Rück-gang1 im Vorjahr nun wieder eine Zunahme festzustellen: Die Zahl der im Ausland eingeschriebenen Deutschen stieg von 134.800 in 2013 auf 137.300 in 2014 bzw. um 2%. Wie schon im Vorjahr stellen die deutschen Studierenden im Ausland 5,8% aller deutschen Studierenden.
Die vier beliebtesten Gastländer sind nach wie vor Österreich, die Niederlande, Großbritannien und die Schweiz. Während die Zahl deutscher Studierender in den Niederlanden (–4%) und der Schweiz (–0,51%) etwas zurückgegangen ist, lässt sich insbesondere in Großbritannien (+9%) eine deutliche Zunah-me beobachten. Dieser erneute Anstieg der Zahl deutscher Studierender in Großbritannien ist angesichts der seit dem Wintersemester 2012/13 spürbar erhöhten Studiengebühren in Großbritannien durchaus überraschend. Allerdings wird ab-zuwarten sein, wie sich der Austritt Großbritanniens aus der Europäischen Union auf die weitere Entwicklung auswirkt.
Ebenfalls sehr deutliche Anstiege sind bei den Zahlen der deutschen Studierenden in Russland (+43%), China (+31%), Saudi-Arabien (+15%), Portugal (+14%), Polen und Schweden (jeweils +13%) zu verzeichnen. Mit Ausnahme von China fin-den diese Zunahmen allerdings auf einem relativ niedrigen Ni-veau statt. Am stärksten abgenommen haben schließlich die Zahlen der deutschen Studierenden in Australien (–12%), Is-land (–9%), Neuseeland und den Vereinigten Arabischen Emi-raten (jeweils –7%).
mobilitätsent wicklung und gastländer
methodik Die auf den Seiten 70–75 aufgeführten Daten zu den deutschen Stu-dierenden im Ausland stammen in erster Linie vom Statistischen Bundesamt. Dieses führt in 30 wichtigen Gastländern deutscher Studierender jährlich eine Befragung jener Institutionen durch, die für die Bildungsstatistik verantwort-lich sind. Bei den gemeldeten Studierenden handelt es sich aller Wahrschein-lichkeit nach zwar überwiegend, aber nicht ausschließlich um Studierende, die einen Abschluss im Ausland anstreben. Bei einigen Ländern sind auch Eras-mus-Studierende und andere Studierende mit temporären Studienaufenthal-ten in den Daten enthalten. Dies sollte bei der Interpretation der Daten stets berücksichtigt werden. In einzelnen Fällen wurden die Daten des Statistischen Bundesamts zudem um UNESCO-Daten ergänzt, um zusätzliche Gastländer wie Südafrika, die Vereinigten Arabischen Emirate oder Saudi-Arabien mit einbezie-hen zu können.
Afrika Subsahara
Nahost, Nordafrika
Asien, Pazi�k
Lateinamerika
NordamerikaOsteuropa, Zentralasien und Südkaukasus
Mittel- und Südosteuropa
West-, Nord- und Südeuropa
104.256 | 76,4%
11.988 | 8,8%
340 | 0,2%862 | 0,6%
474 | 0,3%
7.2945,3%
254 | 0,2%
11.017 | 8,1%
Westeuropa Mittel- und Südosteuropa Osteuropa und Zentralasien
Nordamerika Lateinamerika2
Nordafrika und Nahost Subsahara-Afrika2 Asien und Pazifik
Quellen Abb. C1, C2: Statistisches Bundesamt, Deutsche Studierende im Ausland; UNESCO, Studierendenstatistik; länderspezifische Berichtszeiträume; DAAD-BerechnungenAbb. C3: Statistisches Bundesamt, Deutsche Studierende im Ausland; länderspezifische Berichtszeiträume
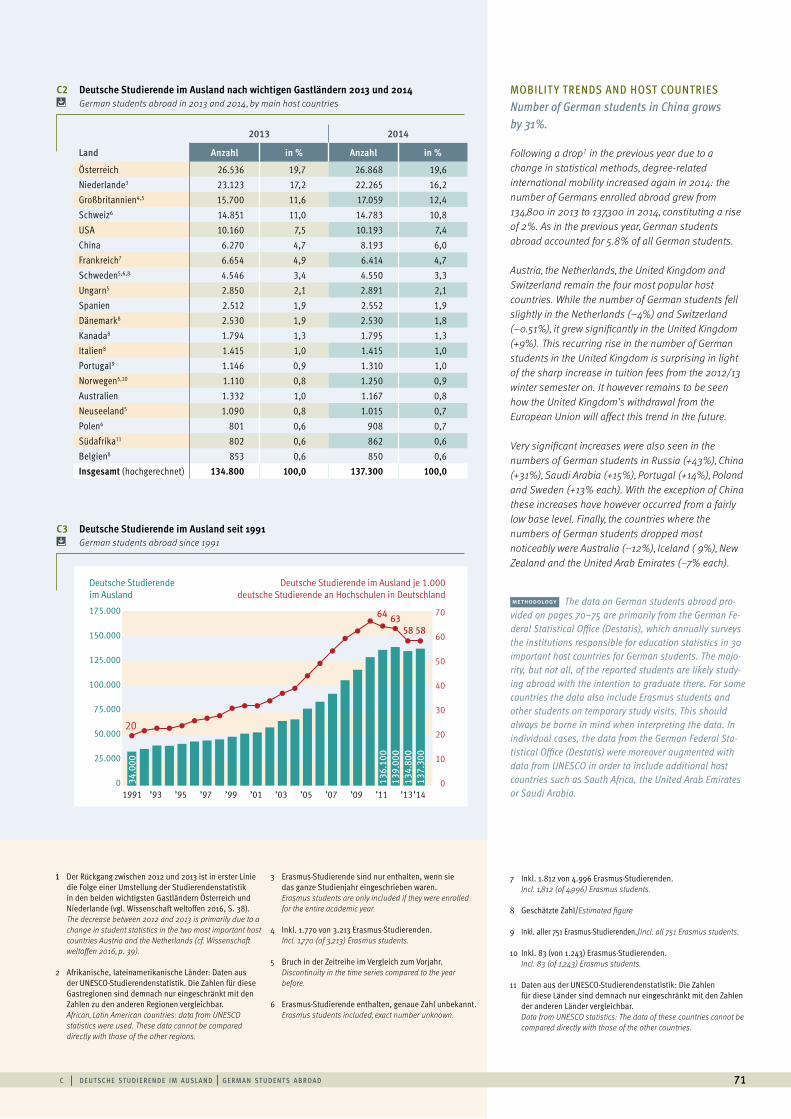
c | d e ut sc h e st u d i e r e n d e i m a u sl a n d | g e rm a n st u d e n t s a b roa d 71
2013 2014
Land Anzahl in % Anzahl in %
Österreich 26.536 19,7 26.868 19,6Niederlande3 23.123 17,2 22.265 16,2Großbritannien4,5 15.700 11,6 17.059 12,4Schweiz6 14.851 11,0 14.783 10,8USA 10.160 7,5 10.193 7,4China 6.270 4,7 8.193 6,0Frankreich7 6.654 4,9 6.414 4,7Schweden5,6,8 4.546 3,4 4.550 3,3Ungarn5 2.850 2,1 2.891 2,1Spanien 2.512 1,9 2.552 1,9Dänemark8 2.530 1,9 2.530 1,8Kanada8 1.794 1,3 1.795 1,3Italien8 1.415 1,0 1.415 1,0Portugal9 1.146 0,9 1.310 1,0Norwegen5,10 1.110 0,8 1.250 0,9Australien 1.332 1,0 1.167 0,8Neuseeland5 1.090 0,8 1.015 0,7Polen6 801 0,6 908 0,7Südafrika11 802 0,6 862 0,6Belgien8 853 0,6 850 0,6Insgesamt (hochgerechnet) 134.800 100,0 137.300 100,0
Niederlande 11.896Vereinigtes Königreich 11.600Österreich 10.174Vereinigte Staaten 8.829Schweiz 7.839Frankreich 6.867Schweden 2.880 sAustralien 2.764
1991
20
6364
5858
’93 ’95 ’97 ’99 ’03 ’05 ’07 ’09 ’11 ’14’13’01
175.000
150.000
125.000
100.000
75.000
50.000
25.000
0
70
60
50
40
30
20
10
0
Deutsche Studierende im Ausland
Deutsche Studierende im Ausland je 1.000deutsche Studierende an Hochschulen in Deutschland
02000400060008000
1000012000
0
25000
50000
75000
100000
125000
150000
175000
200000
34.0
00
136.
100
139.
000
134.
800
137.
300
0
10
20
30
40
50
60
70
80
MOBILIT Y TRENDS AND HOST COUNTRIES Number of German students in China grows by 31%.
Following a drop1 in the previous year due to a change in statistical methods, degree-related international mobility increased again in 2014: the number of Germans enrolled abroad grew from 134,800 in 2013 to 137,300 in 2014, constituting a rise of 2%. As in the previous year, German students abroad accounted for 5.8% of all German students.
Austria, the Netherlands, the United Kingdom and Switzerland remain the four most popular host countries. While the number of German students fell slightly in the Netherlands (–4%) and Switzerland (–0.51%), it grew significantly in the United Kingdom (+9%). This recurring rise in the number of German students in the United Kingdom is surprising in light of the sharp increase in tuition fees from the 2012/13 winter semester on. It however remains to be seen how the United Kingdom’s withdrawal from the European Union will affect this trend in the future.
Very significant increases were also seen in the numbers of German students in Russia (+43%), China (+31%), Saudi Arabia (+15%), Portugal (+14%), Poland and Sweden (+13% each). With the exception of China these increases have however occurred from a fairly low base level. Finally, the countries where the numbers of German students dropped most noticeably were Australia (–12%), Iceland ( 9%), New Zealand and the United Arab Emirates (–7% each).
methodology The data on German students abroad pro-vided on pages 70–75 are primarily from the German Fe-deral Statistical Office (Destatis), which annually surveys the institutions responsible for education statistics in 30 important host countries for German students. The majo-rity, but not all, of the reported students are likely study-ing abroad with the intention to graduate there. For some countries the data also include Erasmus students and other students on temporary study visits. This should always be borne in mind when interpreting the data. In individual cases, the data from the German Federal Sta-tistical Office (Destatis) were moreover augmented with data from UNESCO in order to include additional host countries such as South Africa, the United Arab Emirates or Saudi Arabia.
C2 Deutsche Studierende im Ausland nach wichtigen Gastländern 2013 und 2014 German students abroad in 2013 and 2014, by main host countries
C3 Deutsche Studierende im Ausland seit 1991 German students abroad since 1991
1 Der Rückgang zwischen 2012 und 2013 ist in erster Linie die Folge einer Umstellung der Studierendenstatistik in den beiden wichtigsten Gastländern Österreich und Niederlande (vgl. Wissenschaft weltoffen 2016, S. 38).The decrease between 2012 and 2013 is primarily due to a change in student statistics in the two most important host countries Austria and the Netherlands (cf. Wissenschaft weltoffen 2016, p. 39).
2 Afrikanische, lateinamerikanische Länder: Daten aus der UNESCO-Studierendenstatistik. Die Zahlen für diese Gastregionen sind demnach nur eingeschränkt mit den Zahlen zu den anderen Regionen vergleichbar.African, Latin American countries: data from UNESCO statistics were used. These data cannot be compared directly with those of the other regions.
3 Erasmus-Studierende sind nur enthalten, wenn sie das ganze Studienjahr eingeschrieben waren.Erasmus students are only included if they were enrolled for the entire academic year.
4 Inkl. 1.770 von 3.213 Erasmus-Studierenden. Incl. 1,770 (of 3,213) Erasmus students.
5 Bruch in der Zeitreihe im Vergleich zum Vorjahr.Discontinuity in the time series compared to the year before.
6 Erasmus-Studierende enthalten, genaue Zahl unbekannt. Erasmus students included, exact number unknown.
7 Inkl. 1.812 von 4.996 Erasmus-Studierenden. Incl. 1,812 (of 4,996) Erasmus students.
8 Geschätzte Zahl/Estimated figure
9 Inkl. aller 751 Erasmus-Studierenden./Incl. all 751 Erasmus students.
10 Inkl. 83 (von 1.243) Erasmus-Studierenden. Incl. 83 (of 1,243) Erasmus students.
11 Daten aus der UNESCO-Studierendenstatistik: Die Zahlen für diese Länder sind demnach nur eingeschränkt mit den Zahlen der anderen Länder vergleichbar.Data from UNESCO statistics: The data of these countries cannot be compared directly with those of the other countries.
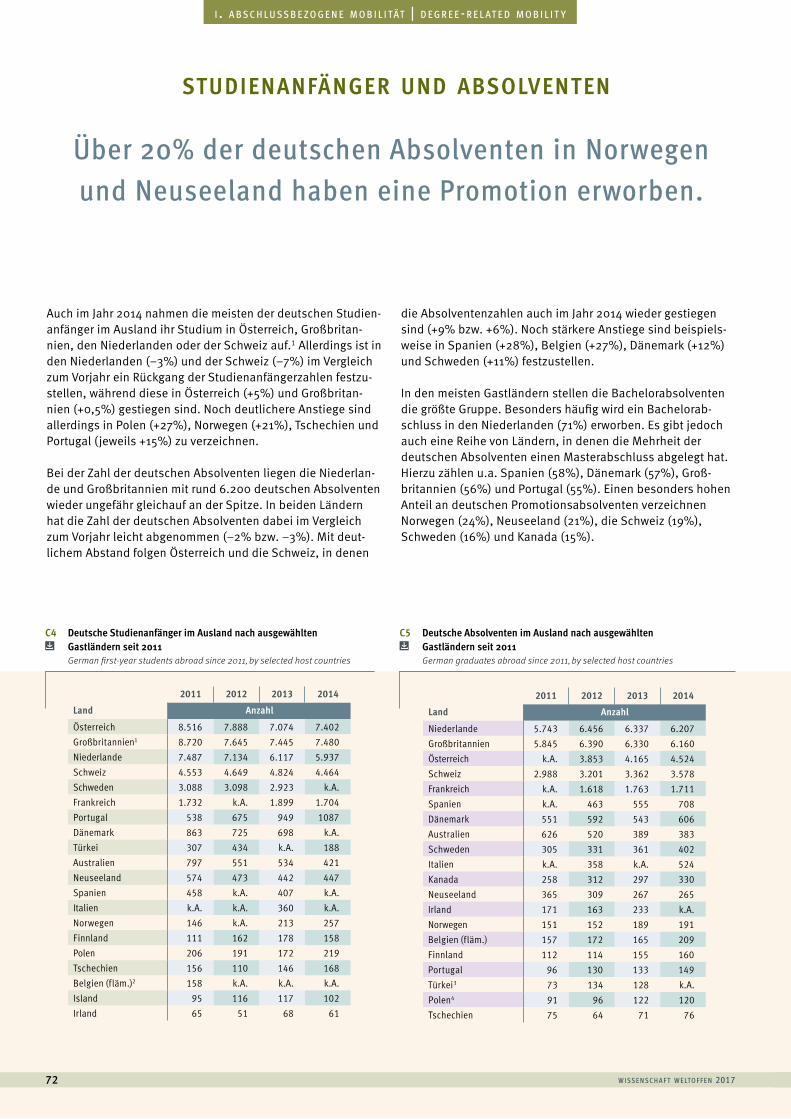
w i sse n sc h a f t w e lto f f e n 201772
a u s l ä n d i s c h e s t u d i e r e n d e | f o r e i g n s t u d e n t si . a b s c h l u s s b e z o g e n e m o b i l i tät | d e g r e e - r e l at e d m o b i l i t y
Auch im Jahr 2014 nahmen die meisten der deutschen Studien-anfänger im Ausland ihr Studium in Österreich, Großbritan- nien, den Niederlanden oder der Schweiz auf.1 Allerdings ist in den Niederlanden (–3%) und der Schweiz (–7%) im Vergleich zum Vorjahr ein Rückgang der Studienanfängerzahlen festzu-stellen, während diese in Österreich (+5%) und Großbritan- nien (+0,5%) gestiegen sind. Noch deutlichere Anstiege sind allerdings in Polen (+27%), Norwegen (+21%), Tschechien und Portugal (jeweils +15%) zu verzeichnen.
Bei der Zahl der deutschen Absolventen liegen die Niederlan-de und Großbritannien mit rund 6.200 deutschen Absolventen wieder ungefähr gleichauf an der Spitze. In beiden Ländern hat die Zahl der deutschen Absolventen dabei im Vergleich zum Vorjahr leicht abgenommen (–2% bzw. –3%). Mit deut-lichem Abstand folgen Österreich und die Schweiz, in denen
die Absolventenzahlen auch im Jahr 2014 wieder gestiegen sind (+9% bzw. +6%). Noch stärkere Anstiege sind beispiels-weise in Spanien (+28%), Belgien (+27%), Dänemark (+12%) und Schweden (+11%) festzustellen.
In den meisten Gastländern stellen die Bachelorabsolventen die größte Gruppe. Besonders häufig wird ein Bachelorab-schluss in den Niederlanden (71%) erworben. Es gibt jedoch auch eine Reihe von Ländern, in denen die Mehrheit der deutschen Absolventen einen Masterabschluss abgelegt hat. Hierzu zählen u.a. Spanien (58%), Dänemark (57%), Groß- britannien (56%) und Portugal (55%). Einen besonders hohen Anteil an deutschen Promotionsabsolventen verzeichnen Norwegen (24%), Neuseeland (21%), die Schweiz (19%), Schweden (16%) und Kanada (15%).
Über 20% der deutschen Absolventen in Norwegen und Neuseeland haben eine Promotion erworben.
studienanfänger und absolventen
2011 2012 2013 2014
Land Anzahl
Österreich 8.516 7.888 7.074 7.402Großbritannien1 8.720 7.645 7.445 7.480Niederlande 7.487 7.134 6.117 5.937Schweiz 4.553 4.649 4.824 4.464Schweden 3.088 3.098 2.923 k.A.Frankreich 1.732 k.A. 1.899 1.704Portugal 538 675 949 1087Dänemark 863 725 698 k.A.Türkei 307 434 k.A. 188Australien 797 551 534 421Neuseeland 574 473 442 447Spanien 458 k.A. 407 k.A.Italien k.A. k.A. 360 k.A.Norwegen 146 k.A. 213 257Finnland 111 162 178 158Polen 206 191 172 219Tschechien 156 110 146 168Belgien (fläm.)2 158 k.A. k.A. k.A.Island 95 116 117 102Irland 65 51 68 61
2011 2012 2013 2014
Land Anzahl
Niederlande 5.743 6.456 6.337 6.207Großbritannien 5.845 6.390 6.330 6.160Österreich k.A. 3.853 4.165 4.524Schweiz 2.988 3.201 3.362 3.578Frankreich k.A. 1.618 1.763 1.711Spanien k.A. 463 555 708Dänemark 551 592 543 606Australien 626 520 389 383Schweden 305 331 361 402Italien k.A. 358 k.A. 524Kanada 258 312 297 330Neuseeland 365 309 267 265Irland 171 163 233 k.A.Norwegen 151 152 189 191Belgien (fläm.) 157 172 165 209Finnland 112 114 155 160Portugal 96 130 133 149Türkei3 73 134 128 k.A.Polen4 91 96 122 120Tschechien 75 64 71 76
C4 Deutsche Studienanfänger im Ausland nach ausgewählten Gastländern seit 2011
German first-year students abroad since 2011, by selected host countries
C5 Deutsche Absolventen im Ausland nach ausgewählten Gastländern seit 2011
German graduates abroad since 2011, by selected host countries
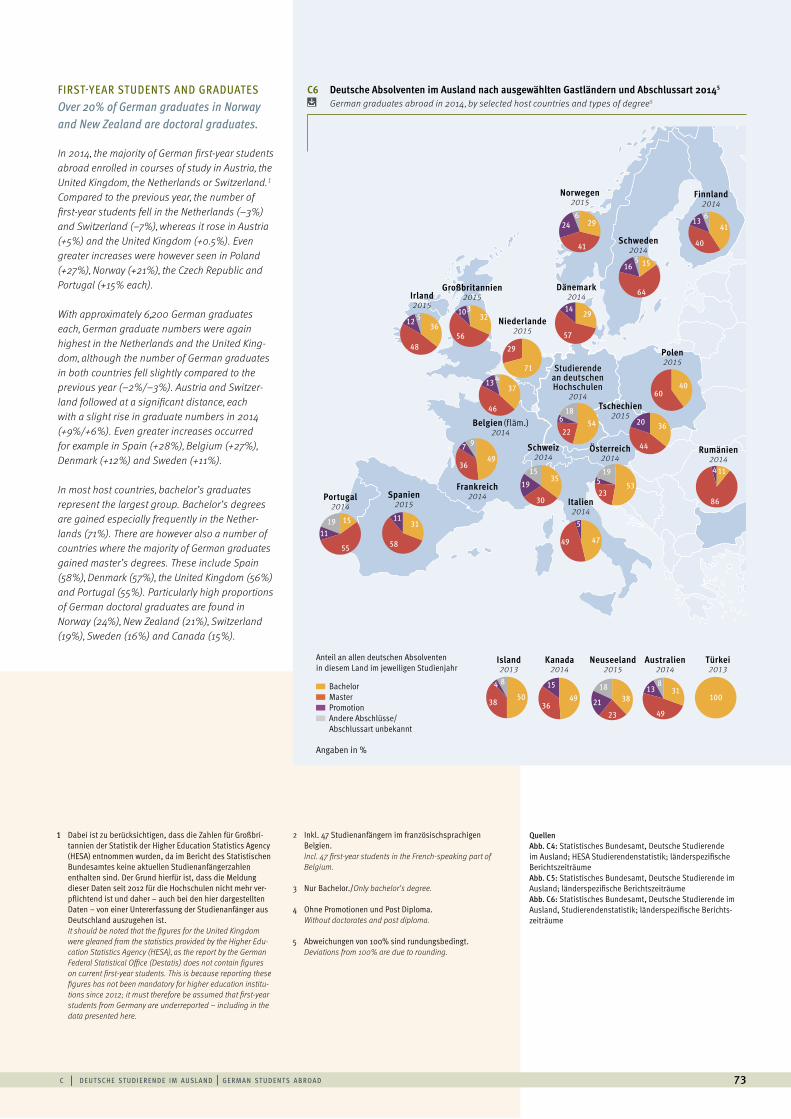
c | d e ut sc h e st u d i e r e n d e i m a u sl a n d | g e rm a n st u d e n t s a b roa d 73
In 2014, the majority of German first-year students abroad enrolled in courses of study in Austria, the United Kingdom, the Netherlands or Switzerland.1 Compared to the previous year, the number of first-year students fell in the Netherlands (–3%) and Switzerland (–7%), whereas it rose in Austria (+5%) and the United Kingdom (+0.5%). Even greater increases were however seen in Poland (+27%), Norway (+21%), the Czech Republic and Portugal (+15% each).
With approximately 6,200 German graduates each, German graduate numbers were again highest in the Netherlands and the United King- dom, although the number of German graduates in both countries fell slightly compared to the previous year (–2%/–3%). Austria and Switzer-land followed at a significant distance, each with a slight rise in graduate numbers in 2014 (+9%/+6%). Even greater increases occurred for example in Spain (+28%), Belgium (+27%), Denmark (+12%) and Sweden (+11%).
In most host countries, bachelor’s graduates represent the largest group. Bachelor’s degrees are gained especially frequently in the Nether-lands (71%). There are however also a number of countries where the majority of German graduates gained master’s degrees. These include Spain (58%), Denmark (57%), the United Kingdom (56%) and Portugal (55%). Particularly high proportions of German doctoral graduates are found in Norway (24%), New Zealand (21%), Switzerland (19%), Sweden (16%) and Canada (15%).
-
- Bachelor Master Promotion Andere Abschlüsse/ Abschlussart unbekannt
Angaben in %
Anteil an allen deutschen Absolventen in diesem Land im jeweiligen Studienjahr
19
Australien2014
31
49
138
Türkei2013
100
Neuseeland2015
38
23
21
18
Großbritannien 2015
Schweiz2014
Frankreich2014
Belgien (fläm.)2014
Niederlande2015
Dänemark 2014
Norwegen 2015
Schweden 2014
Österreich2014
Tschechien2015
Rumänien2014
Polen2015
Italien2014
Spanien2015
Portugal2014
Finnland2014
Irland 2015
Studierende an deutschen Hochschulen
2014
49
5
47
3115 11
115855
4936
7 9
35
4060
36
44
20
30
19
15
41
40
136
53
11
2386
5419
71
46
13 437
29
512
48
3629
29
64
516 15
41
246
57
1432
56
103
5422
618
Kanada2014
4936
15
Island2013
5038
4
FIRST-YEAR STUDENTS AND GRADUATES Over 20% of German graduates in Norway and New Zealand are doctoral graduates.
C6 Deutsche Absolventen im Ausland nach ausgewählten Gastländern und Abschlussart 20145 German graduates abroad in 2014, by selected host countries and types of degree5
1 Dabei ist zu berücksichtigen, dass die Zahlen für Großbri-tannien der Statistik der Higher Education Statistics Agency (HESA) entnommen wurden, da im Bericht des Statistischen Bundesamtes keine aktuellen Studienanfängerzahlen enthalten sind. Der Grund hierfür ist, dass die Meldung dieser Daten seit 2012 für die Hochschulen nicht mehr ver-pflichtend ist und daher – auch bei den hier dargestellten Daten – von einer Untererfassung der Studienanfänger aus Deutschland auszugehen ist.It should be noted that the figures for the United Kingdom were gleaned from the statistics provided by the Higher Edu-cation Statistics Agency (HESA), as the report by the German Federal Statistical Office (Destatis) does not contain figures on current first-year students. This is because reporting these figures has not been mandatory for higher education institu-tions since 2012; it must therefore be assumed that first-year students from Germany are underreported – including in the data presented here.
2 Inkl. 47 Studienanfängern im französischsprachigen Belgien.Incl. 47 first-year students in the French-speaking part of Belgium.
3 Nur Bachelor./Only bachelor’s degree.
4 Ohne Promotionen und Post Diploma. Without doctorates and post diploma.
5 Abweichungen von 100% sind rundungsbedingt.Deviations from 100% are due to rounding.
QuellenAbb. C4: Statistisches Bundesamt, Deutsche Studierende im Ausland; HESA Studierendenstatistik; länderspezifische BerichtszeiträumeAbb. C5: Statistisches Bundesamt, Deutsche Studierende im Ausland; länderspezifische BerichtszeiträumeAbb. C6: Statistisches Bundesamt, Deutsche Studierende im Ausland, Studierendenstatistik; länderspezifische Berichts-zeiträume
8
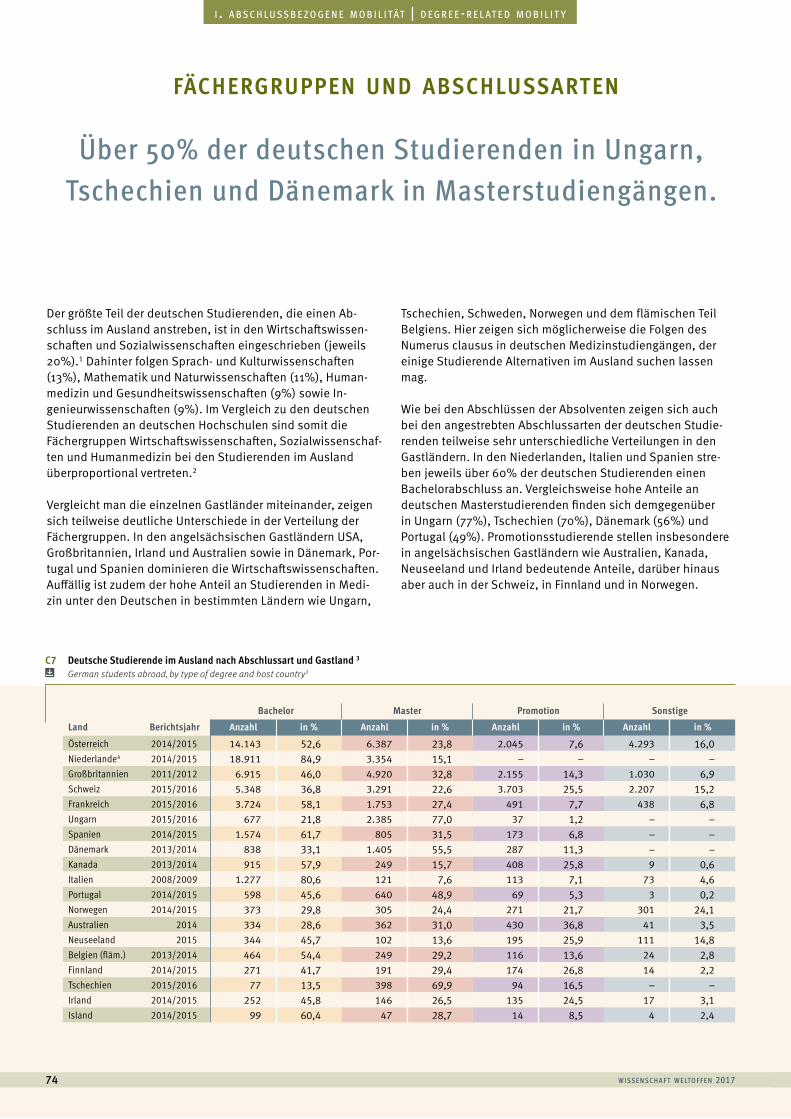
w i sse n sc h a f t w e lto f f e n 201774
a u s l ä n d i s c h e s t u d i e r e n d e | f o r e i g n s t u d e n t si . a b s c h l u s s b e z o g e n e m o b i l i tät | d e g r e e - r e l at e d m o b i l i t y
Der größte Teil der deutschen Studierenden, die einen Ab-schluss im Ausland anstreben, ist in den Wirtschaftswissen-schaften und Sozialwissenschaften eingeschrieben (jeweils 20%).1 Dahinter folgen Sprach- und Kulturwissenschaften (13%), Mathematik und Naturwissenschaften (11%), Human-medizin und Gesundheitswissenschaften (9%) sowie In- genieurwissenschaften (9%). Im Vergleich zu den deutschen Studierenden an deutschen Hochschulen sind somit die Fächergruppen Wirtschaftswissenschaften, Sozialwissenschaf-ten und Humanmedizin bei den Studierenden im Ausland überproportional vertreten.2
Vergleicht man die einzelnen Gastländer miteinander, zeigen sich teilweise deutliche Unterschiede in der Verteilung der Fächergruppen. In den angelsächsischen Gastländern USA, Großbritannien, Irland und Australien sowie in Dänemark, Por-tugal und Spanien dominieren die Wirtschaftswissenschaften. Auffällig ist zudem der hohe Anteil an Studierenden in Medi-zin unter den Deutschen in bestimmten Ländern wie Ungarn,
Tschechien, Schweden, Norwegen und dem flämischen Teil Belgiens. Hier zeigen sich möglicherweise die Folgen des Numerus clausus in deutschen Medizinstudiengängen, der einige Studierende Alternativen im Ausland suchen lassen mag.
Wie bei den Abschlüssen der Absolventen zeigen sich auch bei den angestrebten Abschlussarten der deutschen Studie-renden teilweise sehr unterschiedliche Verteilungen in den Gastländern. In den Niederlanden, Italien und Spanien stre-ben jeweils über 60% der deutschen Studierenden einen Bachelorabschluss an. Vergleichsweise hohe Anteile an deutschen Masterstudierenden finden sich demgegenüber in Ungarn (77%), Tschechien (70%), Dänemark (56%) und Portugal (49%). Promotionsstudierende stellen insbesondere in angelsächsischen Gastländern wie Australien, Kanada, Neuseeland und Irland bedeutende Anteile, darüber hinaus aber auch in der Schweiz, in Finnland und in Norwegen.
Über 50% der deutschen Studierenden in Ungarn, Tschechien und Dänemark in Masterstudiengängen.
fächergruppen und abschlussarten
Bachelor Master Promotion Sonstige
Land Berichtsjahr Anzahl in % Anzahl in % Anzahl in % Anzahl in %
Österreich 2014/2015 14.143 52,6 6.387 23,8 2.045 7,6 4.293 16,0Niederlande4 2014/2015 18.911 84,9 3.354 15,1 – – – –Großbritannien 2011/2012 6.915 46,0 4.920 32,8 2.155 14,3 1.030 6,9Schweiz 2015/2016 5.348 36,8 3.291 22,6 3.703 25,5 2.207 15,2Frankreich 2015/2016 3.724 58,1 1.753 27,4 491 7,7 438 6,8Ungarn 2015/2016 677 21,8 2.385 77,0 37 1,2 – –Spanien 2014/2015 1.574 61,7 805 31,5 173 6,8 – –Dänemark 2013/2014 838 33,1 1.405 55,5 287 11,3 – –Kanada 2013/2014 915 57,9 249 15,7 408 25,8 9 0,6Italien 2008/2009 1.277 80,6 121 7,6 113 7,1 73 4,6Portugal 2014/2015 598 45,6 640 48,9 69 5,3 3 0,2Norwegen 2014/2015 373 29,8 305 24,4 271 21,7 301 24,1Australien 2014 334 28,6 362 31,0 430 36,8 41 3,5Neuseeland 2015 344 45,7 102 13,6 195 25,9 111 14,8Belgien (fläm.) 2013/2014 464 54,4 249 29,2 116 13,6 24 2,8Finnland 2014/2015 271 41,7 191 29,4 174 26,8 14 2,2
Tschechien 2015/2016 77 13,5 398 69,9 94 16,5 – –Irland 2014/2015 252 45,8 146 26,5 135 24,5 17 3,1Island 2014/2015 99 60,4 47 28,7 14 8,5 4 2,4
C7 Deutsche Studierende im Ausland nach Abschlussart und Gastland 3 German students abroad, by type of degree and host country3
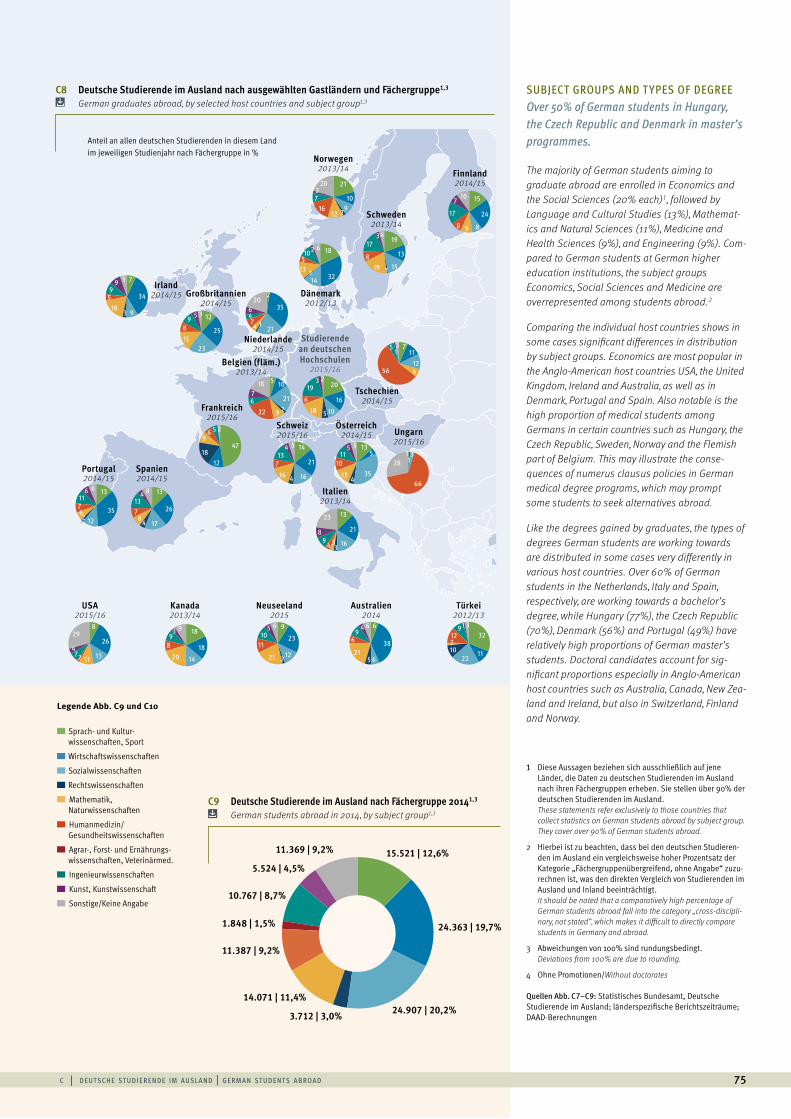
c | d e ut sc h e st u d i e r e n d e i m a u sl a n d | g e rm a n st u d e n t s a b roa d 75
Großbritannien 2014/15
Schweiz2015/16
Frankreich2015/16
Belgien (fläm.)2013/14
Niederlande2014/15
Dänemark2012/13
Norwegen 2013/14
Schweden 2013/14
Österreich2014/15 Ungarn
2015/16
Tschechien2014/15
Italien2013/14
Spanien2014/15
Portugal2014/15
Irland 2014/15
Studierende an deutschen Hochschulen
2015/16
Anteil an allen deutschen Studierenden in diesem Land im jeweiligen Studienjahr nach Fächergruppe in %
135
3513
1011
5 5
711
12656
513
113
66
28
47
1218
96 5 2
13
26
1748
713
413
35122
6711
6
USA2015/16
8
26
1311274
29
Türkei2012/13
9
23
12221
1110
5
Kanada2013/14
18
18
1420
89
3 9
12
25
23158
9 5
7
34
9318
59
9
14
21
16416713
4
5 10
212922
67
20
16
10
2
5186
193
13
21
16334
98
2
35
2114
746
18
3214
135102 6
19
13
15198
173 4
21
109
1216
72
20
410
Australien2014
6
38
6521
69
4 6
Neuseeland2015
32
1122
10212
91
23
6
511
2
18
Finnland2014/15
15
24
898
17
710
Legende Abb. C9 und C10
Sprach- und Kultur- wissenschaften, Sport
Wirtschaftswissenschaften
Sozialwissenschaften
Rechtswissenschaften
Mathematik, Naturwissenschaften
Humanmedizin/ Gesundheitswissenschaften
Agrar-, Forst- und Ernährungs- wissenschaften, Veterinärmed.
Ingenieurwissenschaften
Kunst, Kunstwissenschaft
Sonstige/Keine Angabe
SUBJECT GROUPS AND T YPES OF DEGREE Over 50% of German students in Hungary, the Czech Republic and Denmark in master’s programmes.
The majority of German students aiming to graduate abroad are enrolled in Economics and the Social Sciences (20% each)1, followed by Language and Cultural Studies (13%), Mathemat-ics and Natural Sciences (11%), Medicine and Health Sciences (9%), and Engineering (9%). Com-pared to German students at German higher education institutions, the subject groups Economics, Social Sciences and Medicine are overrepresented among students abroad.2
Comparing the individual host countries shows in some cases significant differences in distribution by subject groups. Economics are most popular in the Anglo-American host countries USA, the United Kingdom, Ireland and Australia, as well as in Denmark, Portugal and Spain. Also notable is the high proportion of medical students among Germans in certain countries such as Hungary, the Czech Republic, Sweden, Norway and the Flemish part of Belgium. This may illustrate the conse-quences of numerus clausus policies in German medical degree programs, which may prompt some students to seek alternatives abroad.
Like the degrees gained by graduates, the types of degrees German students are working towards are distributed in some cases very differently in various host countries. Over 60% of German students in the Netherlands, Italy and Spain, respectively, are working towards a bachelor’s degree, while Hungary (77%), the Czech Republic (70%), Denmark (56%) and Portugal (49%) have relatively high proportions of German master’s students. Doctoral candidates account for sig- nificant proportions especially in Anglo-American host countries such as Australia, Canada, New Zea-land and Ireland, but also in Switzerland, Finland and Norway.
C8 Deutsche Studierende im Ausland nach ausgewählten Gastländern und Fächergruppe1,3 German graduates abroad, by selected host countries and subject group1,3
1 Diese Aussagen beziehen sich ausschließlich auf jene Länder, die Daten zu deutschen Studierenden im Ausland nach ihren Fächergruppen erheben. Sie stellen über 90% der deutschen Studierenden im Ausland.These statements refer exclusively to those countries that collect statistics on German students abroad by subject group. They cover over 90% of German students abroad.
2 Hierbei ist zu beachten, dass bei den deutschen Studieren-den im Ausland ein vergleichsweise hoher Prozentsatz der Kategorie „Fächergruppenübergreifend, ohne Angabe“ zuzu-rechnen ist, was den direkten Vergleich von Studierenden im Ausland und Inland beeinträchtigt.It should be noted that a comparatively high percentage of German students abroad fall into the category „cross-discipli-nary, not stated“, which makes it difficult to directly compare students in Germany and abroad.
3 Abweichungen von 100% sind rundungsbedingt.Deviations from 100% are due to rounding.
4 Ohne Promotionen/Without doctorates
Quellen Abb. C7–C9: Statistisches Bundesamt, Deutsche Studierende im Ausland; länderspezifische Berichtszeiträume; DAAD-Berechnungen
C9 Deutsche Studierende im Ausland nach Fächergruppe 20141,3 German students abroad in 2014, by subject group1,3
24.363 | 19,7%
24.907 | 20,2%
15.521 | 12,6%11.369 | 9,2%
5.524 | 4,5%
10.767 | 8,7%
1.848 | 1,5%
11.387 | 9,2%
14.071 | 11,4%
3.712 | 3,0%
20
3
5
8
36
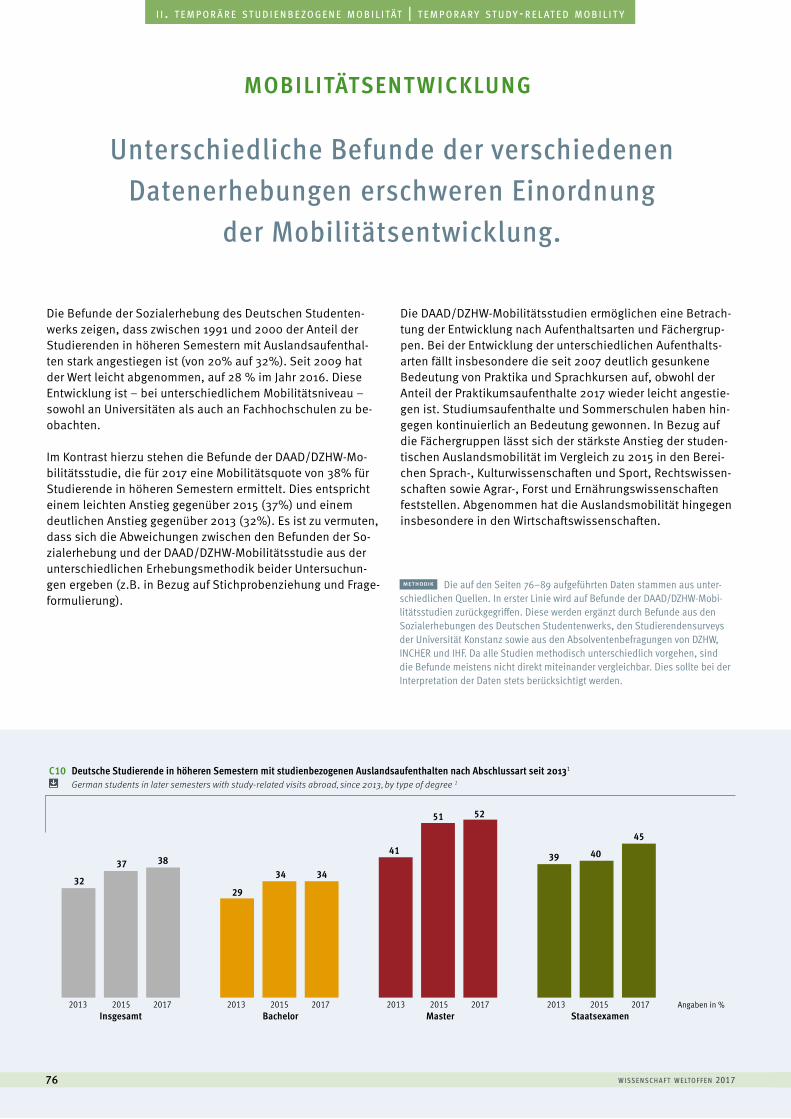
w i sse n sc h a f t w e lto f f e n 201776
a u s l ä n d i s c h e s t u d i e r e n d e | f o r e i g n s t u d e n t si i . t e m p o r ä r e s t u d i e n b e z o g e n e m o b i l i tät | t e m p o r a r y s t u d y - r e l at e d m o b i l i t y
Unterschiedliche Befunde der verschiedenen Datenerhebungen erschweren Einordnung
der Mobilitätsentwicklung.
Die Befunde der Sozialerhebung des Deutschen Studenten-werks zeigen, dass zwischen 1991 und 2000 der Anteil der Studierenden in höheren Semestern mit Auslandsaufenthal-ten stark angestiegen ist (von 20% auf 32%). Seit 2009 hat der Wert leicht abgenommen, auf 28 % im Jahr 2016. Diese Entwicklung ist – bei unterschiedlichem Mobilitätsniveau – sowohl an Universitäten als auch an Fachhochschulen zu be-obachten.
Im Kontrast hierzu stehen die Befunde der DAAD/DZHW-Mo-bilitätsstudie, die für 2017 eine Mobilitätsquote von 38% für Studierende in höheren Semestern ermittelt. Dies entspricht einem leichten Anstieg gegenüber 2015 (37%) und einem deutlichen Anstieg gegenüber 2013 (32%). Es ist zu vermuten, dass sich die Abweichungen zwischen den Befunden der So-zialerhebung und der DAAD/DZHW-Mobilitätsstudie aus der unterschiedlichen Erhebungsmethodik beider Untersuchun-gen ergeben (z.B. in Bezug auf Stichprobenziehung und Frage-formulierung).
Die DAAD/DZHW-Mobilitätsstudien ermöglichen eine Betrach-tung der Entwicklung nach Aufenthaltsarten und Fächergrup-pen. Bei der Entwicklung der unterschiedlichen Aufenthalts-arten fällt insbesondere die seit 2007 deutlich gesunkene Bedeutung von Praktika und Sprachkursen auf, obwohl der Anteil der Praktikumsaufenthalte 2017 wieder leicht angestie-gen ist. Studiumsaufenthalte und Sommerschulen haben hin-gegen kontinuierlich an Bedeutung gewonnen. In Bezug auf die Fächergruppen lässt sich der stärkste Anstieg der studen-tischen Auslandsmobilität im Vergleich zu 2015 in den Berei-chen Sprach-, Kulturwissenschaften und Sport, Rechtswissen-schaften sowie Agrar-, Forst und Ernährungswissenschaften feststellen. Abgenommen hat die Auslandsmobilität hingegen insbesondere in den Wirtschaftswissenschaften.
mobilitätsent wicklung
methodik Die auf den Seiten 76–89 aufgeführten Daten stammen aus unter-schiedlichen Quellen. In erster Linie wird auf Befunde der DAAD/DZHW-Mobi- litätsstudien zurückgegriffen. Diese werden ergänzt durch Befunde aus den Sozialerhebungen des Deutschen Studentenwerks, den Studierendensurveys der Universität Konstanz sowie aus den Absolventenbefragungen von DZHW, INCHER und IHF. Da alle Studien methodisch unterschiedlich vorgehen, sind die Befunde meistens nicht direkt miteinander vergleichbar. Dies sollte bei der Interpretation der Daten stets berücksichtigt werden.
StaatsexamenInsgesamt MasterBachelor2013 2015 2017 2013 2015 2017 2013 2015 2017 2013 2015 2017
32
37 38
29
34 34
41
51 52
39 40
45
C10 Deutsche Studierende in höheren Semestern mit studienbezogenen Auslandsaufenthalten nach Abschlussart seit 20131 German students in later semesters with study-related visits abroad, since 2013, by type of degree 1
Angaben in %
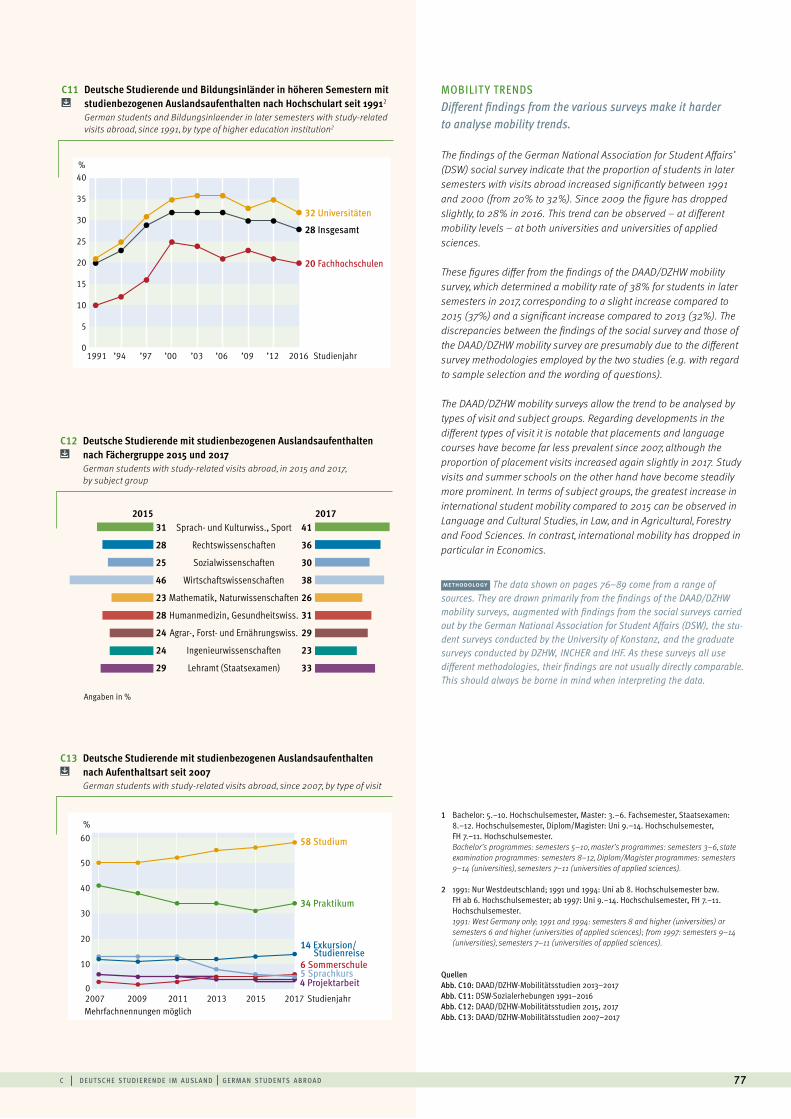
c | d e ut sc h e st u d i e r e n d e i m a u sl a n d | g e rm a n st u d e n t s a b roa d 77
StudienjahrMehrfachnennungen möglich
58 Studium
6 Sommerschule
34 Praktikum
5 Sprachkurs
14 Exkursion/ Studienreise
4 Projektarbeit
36.28832.88026.0528.6073.143
22.9868.460
30
60%
50
40
0
20
10
05000
1000015000200002500030000350004000045000
2007 2009 2011 2013 20172015
40
35
30
25
20
15
10
5
0
%
1991
20 Fachhochschulen
28 Insgesamt
32 Universitäten
’94 ’97 ’00 ’03 ’06 ’09 ’12 2016 Studienjahr
20172015Sprach- und Kulturwiss., Sport
Rechtswissenschaften
Sozialwissenschaften
Wirtschaftswissenschaften
Mathematik, Naturwissenschaften
Humanmedizin, Gesundheitswiss.
Agrar-, Forst- und Ernährungswiss.
Ingenieurwissenschaften
Lehramt (Staatsexamen)
41
36
30
38
26
31
29
23
33
31
28
25
46
23
28
24
24
29
C11 Deutsche Studierende und Bildungsinländer in höheren Semestern mit studienbezogenen Auslandsaufenthalten nach Hochschulart seit 19912
German students and Bildungsinlaender in later semesters with study-related visits abroad, since 1991, by type of higher education institution2
C12 Deutsche Studierende mit studienbezogenen Auslandsaufenthalten nach Fächergruppe 2015 und 2017 German students with study-related visits abroad, in 2015 and 2017, by subject group
C13 Deutsche Studierende mit studienbezogenen Auslandsaufenthalten nach Aufenthaltsart seit 2007 German students with study-related visits abroad, since 2007, by type of visit
1 Bachelor: 5.–10. Hochschulsemester, Master: 3.–6. Fachsemester, Staatsexamen: 8.–12. Hochschulsemester, Diplom/Magister: Uni 9.–14. Hochschulsemester, FH 7.–11. Hochschulsemester. Bachelor’s programmes: semesters 5–10, master’s programmes: semesters 3–6, state examination programmes: semesters 8–12, Diplom/Magister programmes: semesters 9–14 (universities), semesters 7–11 (universities of applied sciences).
2 1991: Nur Westdeutschland; 1991 und 1994: Uni ab 8. Hochschulsemester bzw. FH ab 6. Hochschulsemester; ab 1997: Uni 9.–14. Hochschulsemester, FH 7.–11. Hochschulsemester.1991: West Germany only; 1991 and 1994: semesters 8 and higher (universities) or semesters 6 and higher (universities of applied sciences); from 1997: semesters 9–14 (universities), semesters 7–11 (universities of applied sciences).
Quellen Abb. C10: DAAD/DZHW-Mobilitätsstudien 2013–2017Abb. C11: DSW-Sozialerhebungen 1991–2016Abb. C12: DAAD/DZHW-Mobilitätsstudien 2015, 2017Abb. C13: DAAD/DZHW-Mobilitätsstudien 2007–2017
MOBILIT Y TRENDS Different findings from the various surveys make it harder to analyse mobility trends.
methodology The data shown on pages 76–89 come from a range of sources. They are drawn primarily from the findings of the DAAD/DZHW mobility surveys, augmented with findings from the social surveys carried out by the German National Association for Student Affairs (DSW), the stu-dent surveys conducted by the University of Konstanz, and the graduate surveys conducted by DZHW, INCHER and IHF. As these surveys all use different methodologies, their findings are not usually directly comparable. This should always be borne in mind when interpreting the data.
The findings of the German National Association for Student Affairs’ (DSW) social survey indicate that the proportion of students in later semesters with visits abroad increased significantly between 1991 and 2000 (from 20% to 32%). Since 2009 the figure has dropped slightly, to 28% in 2016. This trend can be observed – at different mobility levels – at both universities and universities of applied sciences.
These figures differ from the findings of the DAAD/DZHW mobility survey, which determined a mobility rate of 38% for students in later semesters in 2017, corresponding to a slight increase compared to 2015 (37%) and a significant increase compared to 2013 (32%). The discrepancies between the findings of the social survey and those of the DAAD/DZHW mobility survey are presumably due to the different survey methodologies employed by the two studies (e.g. with regard to sample selection and the wording of questions).
The DAAD/DZHW mobility surveys allow the trend to be analysed by types of visit and subject groups. Regarding developments in the different types of visit it is notable that placements and language courses have become far less prevalent since 2007, although the proportion of placement visits increased again slightly in 2017. Study visits and summer schools on the other hand have become steadily more prominent. In terms of subject groups, the greatest increase in international student mobility compared to 2015 can be observed in Language and Cultural Studies, in Law, and in Agricultural, Forestry and Food Sciences. In contrast, international mobility has dropped in particular in Economics.
Angaben in %
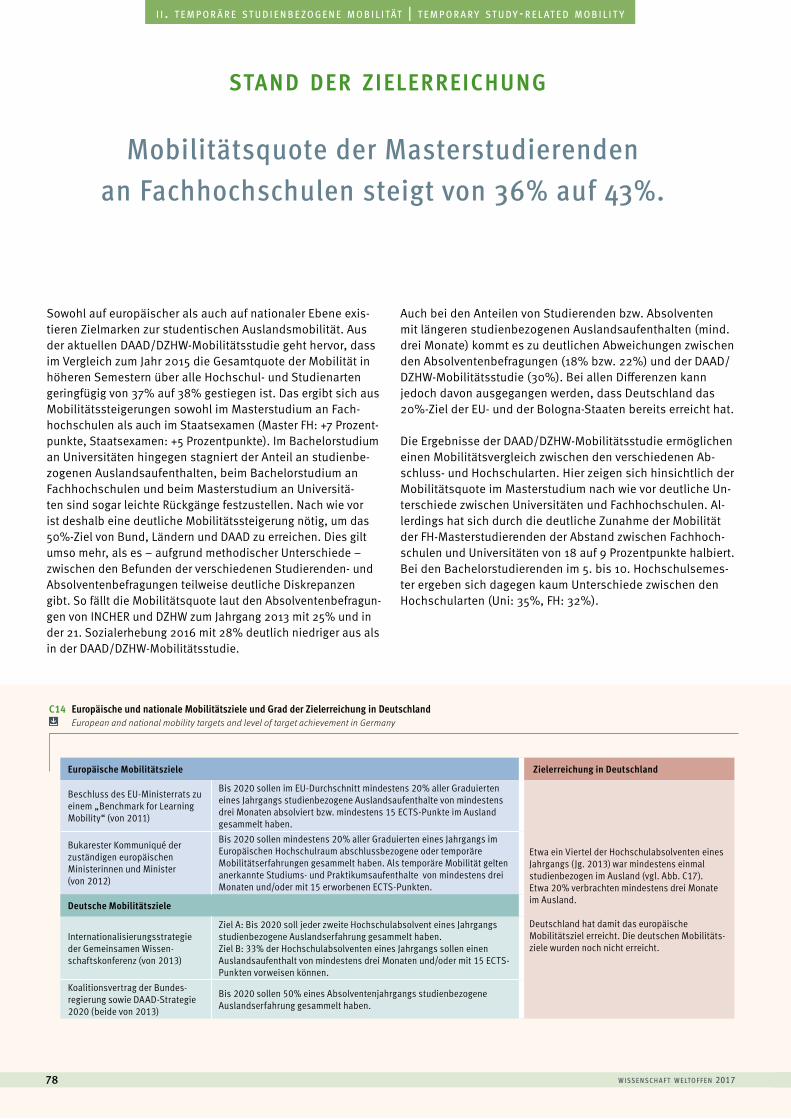
w i sse n sc h a f t w e lto f f e n 201778
a u s l ä n d i s c h e s t u d i e r e n d e | f o r e i g n s t u d e n t si i . t e m p o r ä r e s t u d i e n b e z o g e n e m o b i l i tät | t e m p o r a r y s t u d y - r e l at e d m o b i l i t y
Mobilitätsquote der Masterstudierenden an Fachhochschulen steigt von 36% auf 43%.
Sowohl auf europäischer als auch auf nationaler Ebene exis-tieren Zielmarken zur studentischen Auslandsmobilität. Aus der aktuellen DAAD/DZHW-Mobilitätsstudie geht hervor, dass im Vergleich zum Jahr 2015 die Gesamtquote der Mobilität in höheren Semestern über alle Hochschul- und Studienarten geringfügig von 37% auf 38% gestiegen ist. Das ergibt sich aus Mobilitätssteigerungen sowohl im Masterstudium an Fach-hochschulen als auch im Staatsexamen (Master FH: +7 Prozent- punkte, Staatsexamen: +5 Prozentpunkte). Im Bachelorstudium an Universitäten hingegen stagniert der Anteil an studienbe-zogenen Auslandsaufenthalten, beim Bachelorstudium an Fachhochschulen und beim Masterstudium an Universitä-ten sind sogar leichte Rückgänge festzustellen. Nach wie vor ist deshalb eine deutliche Mobilitätssteigerung nötig, um das 50%-Ziel von Bund, Ländern und DAAD zu erreichen. Dies gilt umso mehr, als es – aufgrund methodischer Unterschiede – zwischen den Befunden der verschiedenen Studierenden- und Absolventenbefragungen teilweise deutliche Diskrepanzen gibt. So fällt die Mobilitätsquote laut den Absolventenbefragun-gen von INCHER und DZHW zum Jahrgang 2013 mit 25% und in der 21. Sozialerhebung 2016 mit 28% deutlich niedriger aus als in der DAAD/DZHW-Mobilitätsstudie.
Auch bei den Anteilen von Studierenden bzw. Absolventen mit längeren studienbezogenen Auslandsaufenthalten (mind. drei Monate) kommt es zu deutlichen Abweichungen zwischen den Absolventenbefragungen (18% bzw. 22%) und der DAAD/DZHW-Mobilitätsstudie (30%). Bei allen Differenzen kann jedoch davon ausgegangen werden, dass Deutschland das 20%-Ziel der EU- und der Bologna-Staaten bereits erreicht hat.
Die Ergebnisse der DAAD/DZHW-Mobilitätsstudie ermöglichen einen Mobilitätsvergleich zwischen den verschiedenen Ab-schluss- und Hochschularten. Hier zeigen sich hinsichtlich der Mobilitätsquote im Masterstudium nach wie vor deutliche Un-terschiede zwischen Universitäten und Fachhochschulen. Al-lerdings hat sich durch die deutliche Zunahme der Mobilität der FH-Masterstudierenden der Abstand zwischen Fachhoch-schulen und Universitäten von 18 auf 9 Prozentpunkte halbiert. Bei den Bachelorstudierenden im 5. bis 10. Hochschulsemes-ter ergeben sich dagegen kaum Unterschiede zwischen den Hochschularten (Uni: 35%, FH: 32%).
stand der zielerreichung
Europäische Mobilitätsziele Zielerreichung in Deutschland
Beschluss des EU-Ministerrats zu einem „Benchmark for Learning Mobility“ (von 2011)
Bis 2020 sollen im EU-Durchschnitt mindestens 20% aller Graduierten eines Jahrgangs studienbezogene Auslandsaufenthalte von mindestens drei Monaten absolviert bzw. mindestens 15 ECTS-Punkte im Ausland gesammelt haben.
Etwa ein Viertel der Hochschulabsolventen eines Jahrgangs (Jg. 2013) war mindestens einmal studienbezogen im Ausland (vgl. Abb. C17). Etwa 20% verbrachten mindestens drei Monate im Ausland.
Deutschland hat damit das europäische Mobilitätsziel erreicht. Die deutschen Mobilitäts-ziele wurden noch nicht erreicht.
Bukarester Kommuniqué der zuständigen europäischen Ministerinnen und Minister (von 2012)
Bis 2020 sollen mindestens 20% aller Graduierten eines Jahrgangs im Europäischen Hochschulraum abschlussbezogene oder temporäre Mobilitätserfahrungen gesammelt haben. Als temporäre Mobilität gelten anerkannte Studiums- und Praktikumsaufenthalte von mindestens drei Monaten und/oder mit 15 erworbenen ECTS-Punkten.
Deutsche Mobilitätsziele
Internationalisierungsstrategie der Gemeinsamen Wissen- schaftskonferenz (von 2013)
Ziel A: Bis 2020 soll jeder zweite Hochschulabsolvent eines Jahrgangs studienbezogene Auslandserfahrung gesammelt haben.Ziel B: 33% der Hochschulabsolventen eines Jahrgangs sollen einen Auslandsaufenthalt von mindestens drei Monaten und/oder mit 15 ECTS- Punkten vorweisen können.
Koalitionsvertrag der Bundes-regierung sowie DAAD-Strategie 2020 (beide von 2013)
Bis 2020 sollen 50% eines Absolventenjahrgangs studienbezogene Auslandserfahrung gesammelt haben.
C14 Europäische und nationale Mobilitätsziele und Grad der Zielerreichung in Deutschland European and national mobility targets and level of target achievement in Germany
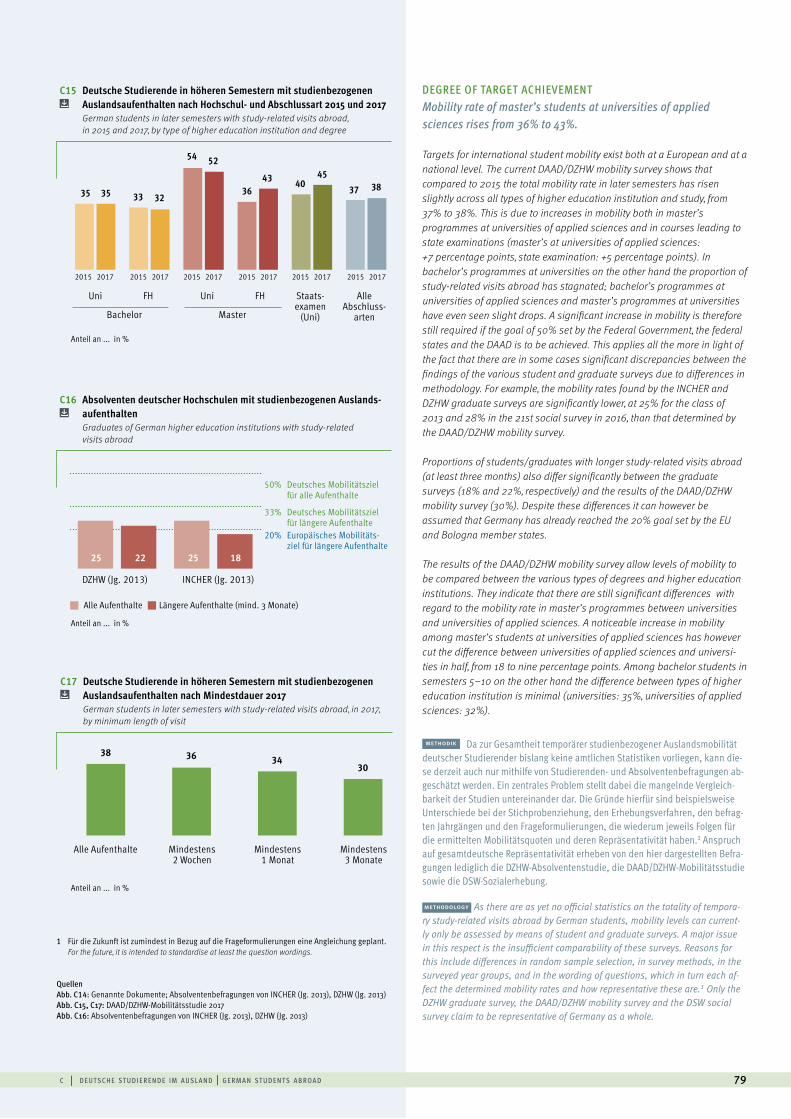
c | d e ut sc h e st u d i e r e n d e i m a u sl a n d | g e rm a n st u d e n t s a b roa d 79
C15 Deutsche Studierende in höheren Semestern mit studienbezogenen Auslandsaufenthalten nach Hochschul- und Abschlussart 2015 und 2017 German students in later semesters with study-related visits abroad, in 2015 and 2017, by type of higher education institution and degree
methodik Da zur Gesamtheit temporärer studienbezogener Auslandsmobilität deutscher Studierender bislang keine amtlichen Statistiken vorliegen, kann die-se derzeit auch nur mithilfe von Studierenden- und Absolventenbefragungen ab-geschätzt werden. Ein zentrales Problem stellt dabei die mangelnde Vergleich-barkeit der Studien untereinander dar. Die Gründe hierfür sind beispielsweise Unterschiede bei der Stichprobenziehung, den Erhebungsverfahren, den befrag-ten Jahrgängen und den Frageformulierungen, die wiederum jeweils Folgen für die ermittelten Mobilitätsquoten und deren Repräsentativität haben.1 Anspruch auf gesamtdeutsche Repräsentativität erheben von den hier dargestellten Befra-gungen lediglich die DZHW-Absolventenstudie, die DAAD/DZHW-Mobilitätsstudie sowie die DSW-Sozialerhebung.
35 35 33 32
54 52
3643 40
4537 38
Uni
Bachelor
Uni
Master
FH FH Staats-examen
(Uni)
Alle Abschluss-
arten
C17 Deutsche Studierende in höheren Semestern mit studienbezogenen Auslandsaufenthalten nach Mindestdauer 2017 German students in later semesters with study-related visits abroad, in 2017, by minimum length of visit
C16 Absolventen deutscher Hochschulen mit studienbezogenen Auslands- aufenthalten
Graduates of German higher education institutions with study-related visits abroad
DZHW (Jg. 2013) INCHER (Jg. 2013)
25 22 25 18
33% Deutsches Mobilitätsziel für längere Aufenthalte
50% Deutsches Mobilitätsziel für alle Aufenthalte
20% Europäisches Mobilitäts- ziel für längere Aufenthalte
Alle Aufenthalte Längere Aufenthalte (mind. 3 Monate)
Alle Aufenthalte Mindestens 2 Wochen
Mindestens 1 Monat
Mindestens 3 Monate
38 36 3430
2015 2017 2015 2017 2015 2017 2015 20172015 2017 2015 2017
1 Für die Zukunft ist zumindest in Bezug auf die Frageformulierungen eine Angleichung geplant.For the future, it is intended to standardise at least the question wordings.
Quellen Abb. C14: Genannte Dokumente; Absolventenbefragungen von INCHER (Jg. 2013), DZHW (Jg. 2013)Abb. C15, C17: DAAD/DZHW-Mobilitätsstudie 2017Abb. C16: Absolventenbefragungen von INCHER (Jg. 2013), DZHW (Jg. 2013)
DEGREE OF TARGET ACHIEVEMENT Mobility rate of master’s students at universities of applied sciences rises from 36% to 43%.
methodology As there are as yet no official statistics on the totality of tempora-ry study-related visits abroad by German students, mobility levels can current-ly only be assessed by means of student and graduate surveys. A major issue in this respect is the insufficient comparability of these surveys. Reasons for this include differences in random sample selection, in survey methods, in the surveyed year groups, and in the wording of questions, which in turn each af-fect the determined mobility rates and how representative these are.1 Only the DZHW graduate survey, the DAAD/DZHW mobility survey and the DSW social survey claim to be representative of Germany as a whole.
Targets for international student mobility exist both at a European and at a national level. The current DAAD/DZHW mobility survey shows that compared to 2015 the total mobility rate in later semesters has risen slightly across all types of higher education institution and study, from 37% to 38%. This is due to increases in mobility both in master’s programmes at universities of applied sciences and in courses leading to state examinations (master’s at universities of applied sciences: +7 percentage points, state examination: +5 percentage points). In bachelor’s programmes at universities on the other hand the proportion of study-related visits abroad has stagnated; bachelor’s programmes at universities of applied sciences and master’s programmes at universities have even seen slight drops. A significant increase in mobility is therefore still required if the goal of 50% set by the Federal Government, the federal states and the DAAD is to be achieved. This applies all the more in light of the fact that there are in some cases significant discrepancies between the findings of the various student and graduate surveys due to differences in methodology. For example, the mobility rates found by the INCHER and DZHW graduate surveys are significantly lower, at 25% for the class of 2013 and 28% in the 21st social survey in 2016, than that determined by the DAAD/DZHW mobility survey.
Proportions of students/graduates with longer study-related visits abroad (at least three months) also differ significantly between the graduate surveys (18% and 22%, respectively) and the results of the DAAD/DZHW mobility survey (30%). Despite these differences it can however be assumed that Germany has already reached the 20% goal set by the EU and Bologna member states.
The results of the DAAD/DZHW mobility survey allow levels of mobility to be compared between the various types of degrees and higher education institutions. They indicate that there are still significant differences with regard to the mobility rate in master’s programmes between universities and universities of applied sciences. A noticeable increase in mobility among master’s students at universities of applied sciences has however cut the difference between universities of applied sciences and universi-ties in half, from 18 to nine percentage points. Among bachelor students in semesters 5–10 on the other hand the difference between types of higher education institution is minimal (universities: 35%, universities of applied sciences: 32%).
Anteil an ... in %
Anteil an ... in %
Anteil an ... in %
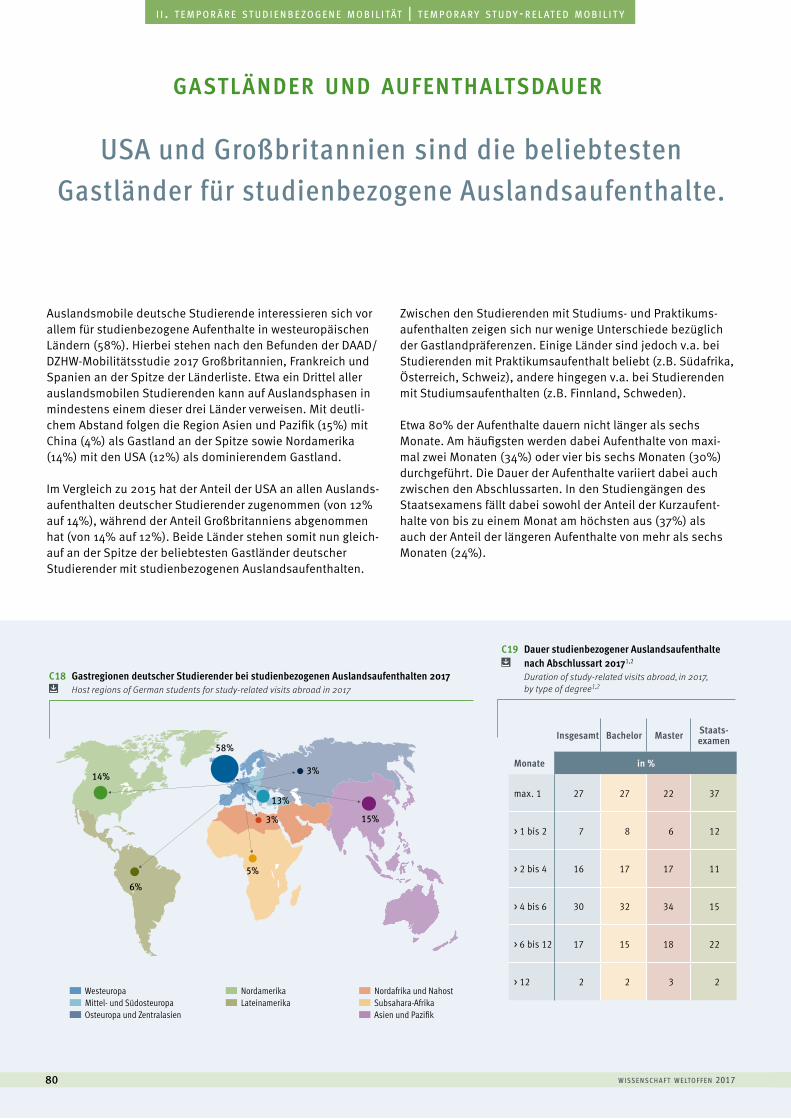
C18 Gastregionen deutscher Studierender bei studienbezogenen Auslandsaufenthalten 2017 Host regions of German students for study-related visits abroad in 2017
Ohne regionale EinteilungAsien, Pazi�kAfrika SubsaharaNahost, NordafrikaLateinamerikaNordamerikaOsteuropa, Zentralasien und SüdkaukasusMittel- und SüdosteuropaWest-, Nord- und Südeuropa
58%
14%
6%
5%
3%
13%
3%
15%
Westeuropa Mittel- und Südosteuropa Osteuropa und Zentralasien
Nordamerika Lateinamerika
Nordafrika und Nahost Subsahara-Afrika Asien und Pazifik
w i sse n sc h a f t w e lto f f e n 201780
a u s l ä n d i s c h e s t u d i e r e n d e | f o r e i g n s t u d e n t si i . t e m p o r ä r e s t u d i e n b e z o g e n e m o b i l i tät | t e m p o r a r y s t u d y - r e l at e d m o b i l i t y
USA und Großbritannien sind die beliebtesten Gastländer für studienbezogene Auslandsaufenthalte.
Auslandsmobile deutsche Studierende interessieren sich vor allem für studienbezogene Aufenthalte in westeuropäischen Ländern (58%). Hierbei stehen nach den Befunden der DAAD/DZHW-Mobilitätsstudie 2017 Großbritannien, Frankreich und Spanien an der Spitze der Länderliste. Etwa ein Drittel aller auslandsmobilen Studierenden kann auf Auslandsphasen in mindestens einem dieser drei Länder verweisen. Mit deutli-chem Abstand folgen die Region Asien und Pazifik (15%) mit China (4%) als Gastland an der Spitze sowie Nordamerika (14%) mit den USA (12%) als dominierendem Gastland.
Im Vergleich zu 2015 hat der Anteil der USA an allen Auslands-aufenthalten deutscher Studierender zugenommen (von 12% auf 14%), während der Anteil Großbritanniens abgenommen hat (von 14% auf 12%). Beide Länder stehen somit nun gleich-auf an der Spitze der beliebtesten Gastländer deutscher Studierender mit studienbezogenen Auslandsaufenthalten.
Zwischen den Studierenden mit Studiums- und Praktikums-aufenthalten zeigen sich nur wenige Unterschiede bezüglich der Gastlandpräferenzen. Einige Länder sind jedoch v.a. bei Studierenden mit Praktikumsaufenthalt beliebt (z.B. Südafrika, Österreich, Schweiz), andere hingegen v.a. bei Studierenden mit Studiumsaufenthalten (z.B. Finnland, Schweden).
Etwa 80% der Aufenthalte dauern nicht länger als sechs Monate. Am häufigsten werden dabei Aufenthalte von maxi-mal zwei Monaten (34%) oder vier bis sechs Monaten (30%) durchgeführt. Die Dauer der Aufenthalte variiert dabei auch zwischen den Abschlussarten. In den Studiengängen des Staatsexamens fällt dabei sowohl der Anteil der Kurzaufent-halte von bis zu einem Monat am höchsten aus (37%) als auch der Anteil der längeren Aufenthalte von mehr als sechs Monaten (24%).
gastländer und aufenthaltsdauer
Insgesamt Bachelor Master Staats-examen
Monate in %
max. 1 27 27 22 37
> 1 bis 2 7 8 6 12
> 2 bis 4 16 17 17 11
> 4 bis 6 30 32 34 15
> 6 bis 12 17 15 18 22
> 12 2 2 3 2
C19 Dauer studienbezogener Auslandsaufenthaltenach Abschlussart 20171,2 Duration of study-related visits abroad, in 2017, by type of degree1,2
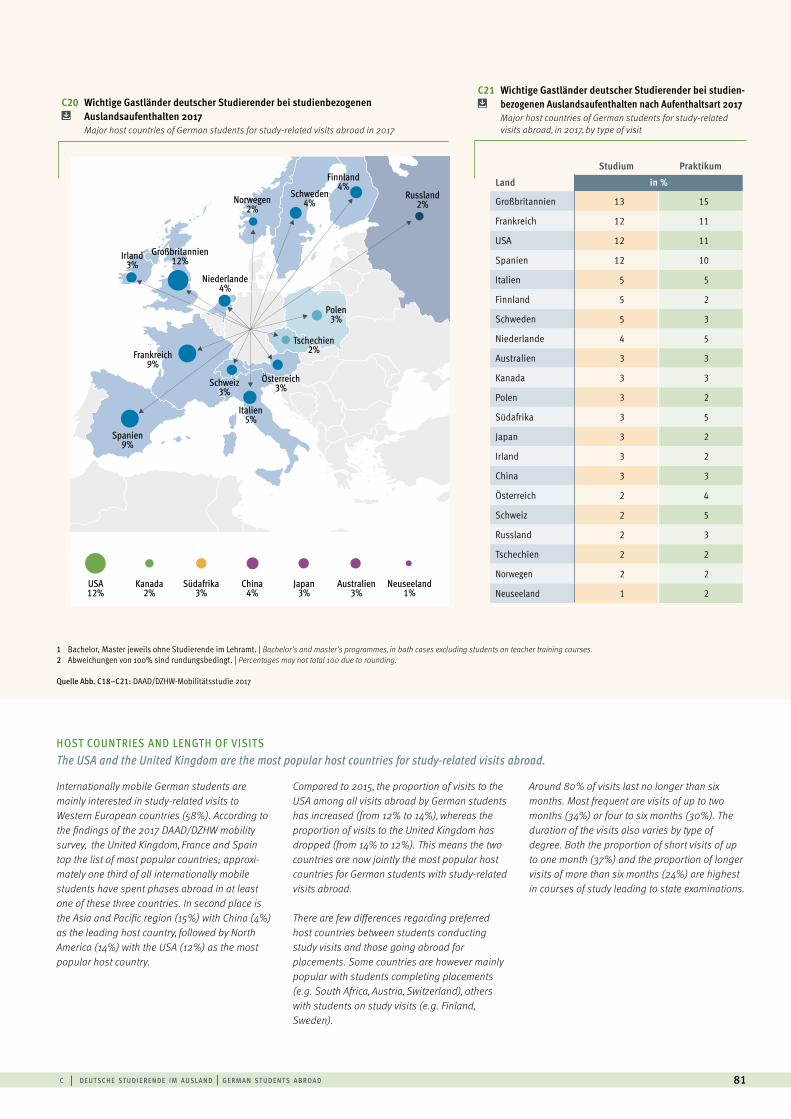
C21 Wichtige Gastländer deutscher Studierender bei studien- bezogenen Auslandsaufenthalten nach Aufenthaltsart 2017
Major host countries of German students for study-related visits abroad, in 2017, by type of visit
c | d e ut sc h e st u d i e r e n d e i m a u sl a n d | g e rm a n st u d e n t s a b roa d 81
C20 Wichtige Gastländer deutscher Studierender bei studienbezogenen Auslandsaufenthalten 2017 Major host countries of German students for study-related visits abroad in 2017
Großbritannien12%Irland
3%
Frankreich9%
Italien5%
Polen3%
Tschechien2%
Österreich3%Schweiz
3%
Niederlande4%
Norwegen2%
Schweden4%
Finnland4%
Russland2%
Spanien9%
Neuseeland Norwegen Tschechien Russland Kanada Irland Japan Südafrika Polen Schweiz Österreich AustralienChina Schweden Finnland Niederlande ItalienSpanienFrankreichUSAGroßbritannien
USA12%
Kanada2%
China4%
Australien3%
Neuseeland1%
Japan3%
Südafrika3%
Studium Praktikum
Land in %
Großbritannien 13 15
Frankreich 12 11
USA 12 11
Spanien 12 10
Italien 5 5
Finnland 5 2
Schweden 5 3
Niederlande 4 5
Australien 3 3
Kanada 3 3
Polen 3 2
Südafrika 3 5
Japan 3 2
Irland 3 2
China 3 3
Österreich 2 4
Schweiz 2 5
Russland 2 3
Tschechien 2 2
Norwegen 2 2
Neuseeland 1 2
Internationally mobile German students are mainly interested in study-related visits to Western European countries (58%). According to the findings of the 2017 DAAD/DZHW mobility survey, the United Kingdom, France and Spain top the list of most popular countries; approxi-mately one third of all internationally mobile students have spent phases abroad in at least one of these three countries. In second place is the Asia and Pacific region (15%) with China (4%) as the leading host country, followed by North America (14%) with the USA (12%) as the most popular host country.
Compared to 2015, the proportion of visits to the USA among all visits abroad by German students has increased (from 12% to 14%), whereas the proportion of visits to the United Kingdom has dropped (from 14% to 12%). This means the two countries are now jointly the most popular host countries for German students with study-related visits abroad.
There are few differences regarding preferred host countries between students conducting study visits and those going abroad for placements. Some countries are however mainly popular with students completing placements (e.g. South Africa, Austria, Switzerland), others with students on study visits (e.g. Finland, Sweden).
Around 80% of visits last no longer than six months. Most frequent are visits of up to two months (34%) or four to six months (30%). The duration of the visits also varies by type of degree. Both the proportion of short visits of up to one month (37%) and the proportion of longer visits of more than six months (24%) are highest in courses of study leading to state examinations.
HOST COUNTRIES AND LENGTH OF VISITS The USA and the United Kingdom are the most popular host countries for study-related visits abroad.
1 Bachelor, Master jeweils ohne Studierende im Lehramt. | Bachelor’s and master’s programmes, in both cases excluding students on teacher training courses. 2 Abweichungen von 100% sind rundungsbedingt. | Percentages may not total 100 due to rounding.
Quelle Abb. C18–C21: DAAD/DZHW-Mobilitätsstudie 2017
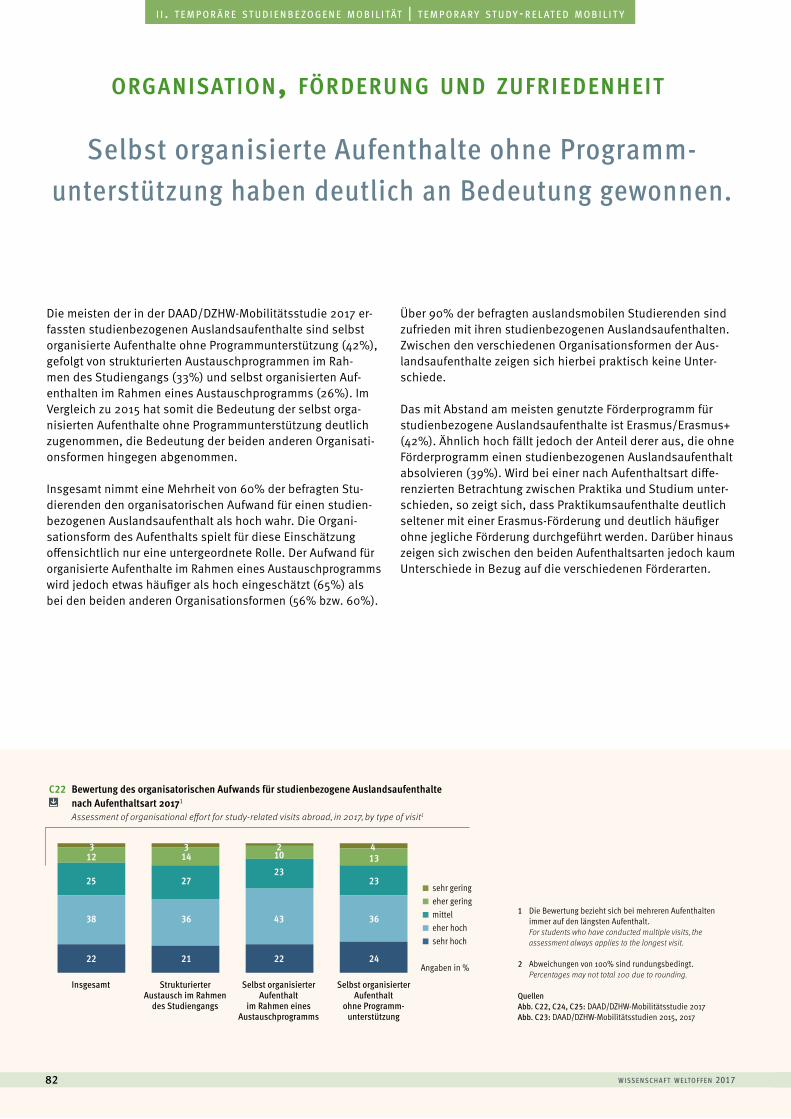
C22 Bewertung des organisatorischen Aufwands für studienbezogene Auslandsaufenthalte nach Aufenthaltsart 20171 Assessment of organisational effort for study-related visits abroad, in 2017, by type of visit1
w i sse n sc h a f t w e lto f f e n 201782
a u s l ä n d i s c h e s t u d i e r e n d e | f o r e i g n s t u d e n t si i . t e m p o r ä r e s t u d i e n b e z o g e n e m o b i l i tät | t e m p o r a r y s t u d y - r e l at e d m o b i l i t y
Selbst organisierte Aufenthalte ohne Programm- unterstützung haben deutlich an Bedeutung gewonnen.
Die meisten der in der DAAD/DZHW-Mobilitätsstudie 2017 er-fassten studienbezogenen Auslandsaufenthalte sind selbst organisierte Aufenthalte ohne Programmunterstützung (42%), gefolgt von strukturierten Austauschprogrammen im Rah-men des Studiengangs (33%) und selbst organisierten Auf-enthalten im Rahmen eines Austauschprogramms (26%). Im Vergleich zu 2015 hat somit die Bedeutung der selbst orga-nisierten Aufenthalte ohne Programmunterstützung deutlich zugenommen, die Bedeutung der beiden anderen Organisati-onsformen hingegen abgenommen.
Insgesamt nimmt eine Mehrheit von 60% der befragten Stu- dierenden den organisatorischen Aufwand für einen studien- bezogenen Auslandsaufenthalt als hoch wahr. Die Organi-sationsform des Aufenthalts spielt für diese Einschätzung offensichtlich nur eine untergeordnete Rolle. Der Aufwand für organisierte Aufenthalte im Rahmen eines Austauschprogramms wird jedoch etwas häufiger als hoch eingeschätzt (65%) als bei den beiden anderen Organisationsformen (56% bzw. 60%).
Über 90% der befragten auslandsmobilen Studierenden sind zufrieden mit ihren studienbezogenen Auslandsaufenthalten. Zwischen den verschiedenen Organisationsformen der Aus-landsaufenthalte zeigen sich hierbei praktisch keine Unter-schiede.
Das mit Abstand am meisten genutzte Förderprogramm für studienbezogene Auslandsaufenthalte ist Erasmus/Erasmus+ (42%). Ähnlich hoch fällt jedoch der Anteil derer aus, die ohne Förderprogramm einen studienbezogenen Auslandsaufenthalt absolvieren (39%). Wird bei einer nach Aufenthaltsart diffe-renzierten Betrachtung zwischen Praktika und Studium unter-schieden, so zeigt sich, dass Praktikumsaufenthalte deutlich seltener mit einer Erasmus-Förderung und deutlich häufiger ohne jegliche Förderung durchgeführt werden. Darüber hinaus zeigen sich zwischen den beiden Aufenthaltsarten jedoch kaum Unterschiede in Bezug auf die verschiedenen Förderarten.
organisation, förderung und zufriedenheit
sehr gering eher gering mittel eher hoch sehr hoch
Angaben in %0
20
40
60
80
100
24
23
36
13
21
27
36
143
22
23
43
102
22
25
38
123 4
Strukturierter Austausch im Rahmen
des Studiengangs
Selbst organisierter Aufenthalt
im Rahmen eines Austauschprogramms
Selbst organisierter Aufenthalt
ohne Programm-unterstützung
Insgesamt
1 Die Bewertung bezieht sich bei mehreren Aufenthalten immer auf den längsten Aufenthalt.For students who have conducted multiple visits, the assessment always applies to the longest visit.
2 Abweichungen von 100% sind rundungsbedingt. Percentages may not total 100 due to rounding.
QuellenAbb. C22, C24, C25: DAAD/DZHW-Mobilitätsstudie 2017Abb. C23: DAAD/DZHW-Mobilitätsstudien 2015, 2017
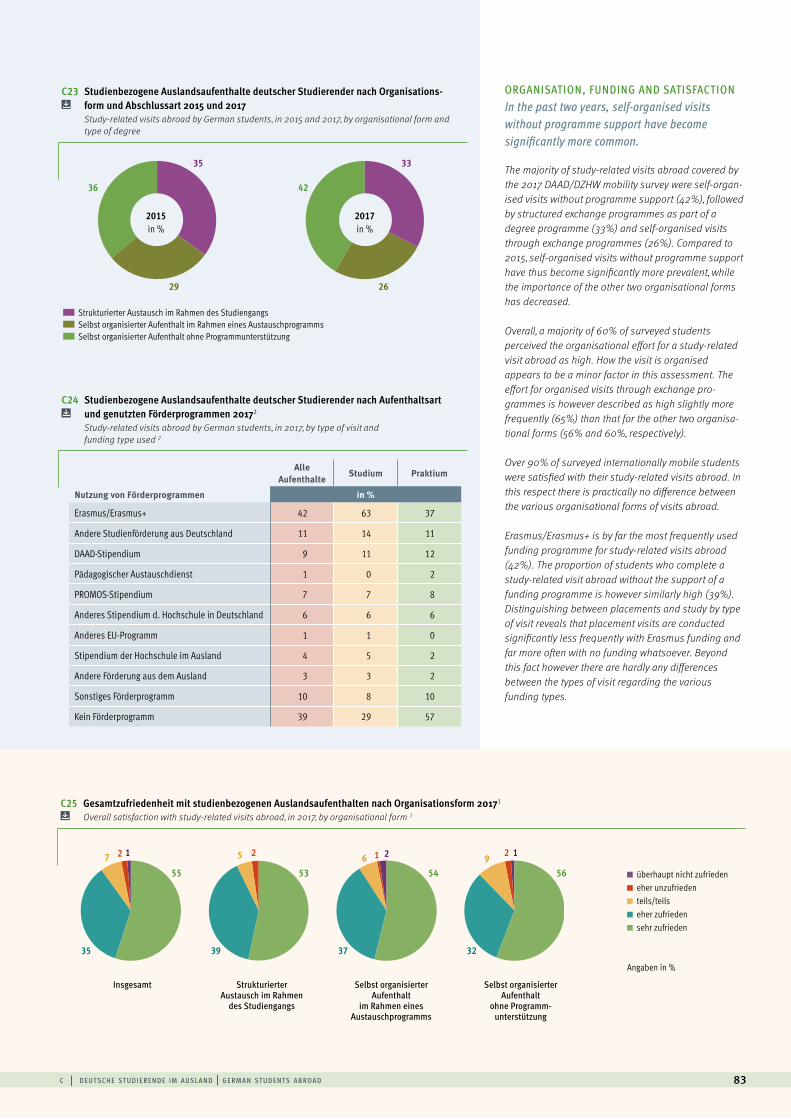
c | d e ut sc h e st u d i e r e n d e i m a u sl a n d | g e rm a n st u d e n t s a b roa d 83
C23 Studienbezogene Auslandsaufenthalte deutscher Studierender nach Organisations- form und Abschlussart 2015 und 2017
Study-related visits abroad by German students, in 2015 and 2017, by organisational form and type of degree
überhaupt nicht zufrieden eher unzufrieden teils/teils eher zufrieden sehr zufrieden
Angaben in %
Strukturierter Austausch im Rahmen
des Studiengangs
Selbst organisierter Aufenthalt
im Rahmen eines Austauschprogramms
Selbst organisierter Aufenthalt
ohne Programm-unterstützung
Insgesamt
4236
29 26
Strukturierter Austausch im Rahmen des Studiengangs Selbst organisierter Aufenthalt im Rahmen eines Austauschprogramms Selbst organisierter Aufenthalt ohne Programmunterstützung
2017in %
2015in %
3335
ORGANISATION, FUNDING AND SATISFACTION In the past two years, self-organised visits without programme support have become significantly more common.
The majority of study-related visits abroad covered by the 2017 DAAD/DZHW mobility survey were self-organ-ised visits without programme support (42%), followed by structured exchange programmes as part of a degree programme (33%) and self-organised visits through exchange programmes (26%). Compared to 2015, self-organised visits without programme support have thus become significantly more prevalent, while the importance of the other two organisational forms has decreased.
Overall, a majority of 60% of surveyed students perceived the organisational effort for a study-related visit abroad as high. How the visit is organised appears to be a minor factor in this assessment. The effort for organised visits through exchange pro-grammes is however described as high slightly more frequently (65%) than that for the other two organisa-tional forms (56% and 60%, respectively).
Over 90% of surveyed internationally mobile students were satisfied with their study-related visits abroad. In this respect there is practically no difference between the various organisational forms of visits abroad.
Erasmus/Erasmus+ is by far the most frequently used funding programme for study-related visits abroad (42%). The proportion of students who complete a study-related visit abroad without the support of a funding programme is however similarly high (39%). Distinguishing between placements and study by type of visit reveals that placement visits are conducted significantly less frequently with Erasmus funding and far more often with no funding whatsoever. Beyond this fact however there are hardly any differences between the types of visit regarding the various funding types.
Alle Aufenthalte
Studium Praktium
Nutzung von Förderprogrammen in %
Erasmus/Erasmus+ 42 63 37
Andere Studienförderung aus Deutschland 11 14 11
DAAD-Stipendium 9 11 12
Pädagogischer Austauschdienst 1 0 2
PROMOS-Stipendium 7 7 8
Anderes Stipendium d. Hochschule in Deutschland 6 6 6
Anderes EU-Programm 1 1 0
Stipendium der Hochschule im Ausland 4 5 2
Andere Förderung aus dem Ausland 3 3 2
Sonstiges Förderprogramm 10 8 10
Kein Förderprogramm 39 29 57
C24 Studienbezogene Auslandsaufenthalte deutscher Studierender nach Aufenthaltsart und genutzten Förderprogrammen 20172 Study-related visits abroad by German students, in 2017, by type of visit and funding type used 2
C25 Gesamtzufriedenheit mit studienbezogenen Auslandsaufenthalten nach Organisationsform 20171 Overall satisfaction with study-related visits abroad, in 2017, by organisational form 1
54
37
55
35
56
32
9657 2 2 1 2 121
53
39
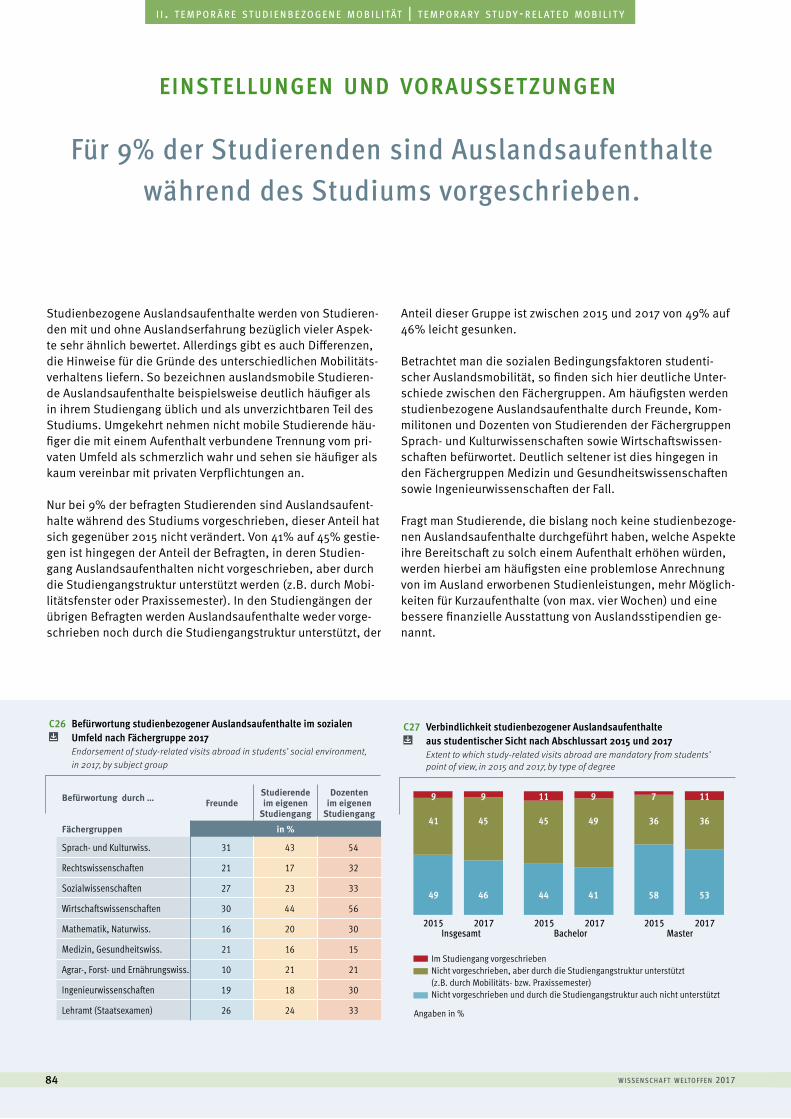
w i sse n sc h a f t w e lto f f e n 201784
a u s l ä n d i s c h e s t u d i e r e n d e | f o r e i g n s t u d e n t si i . t e m p o r ä r e s t u d i e n b e z o g e n e m o b i l i tät | t e m p o r a r y s t u d y - r e l at e d m o b i l i t y
Für 9% der Studierenden sind Auslandsaufenthalte während des Studiums vorgeschrieben.
Studienbezogene Auslandsaufenthalte werden von Studieren-den mit und ohne Auslandserfahrung bezüglich vieler Aspek-te sehr ähnlich bewertet. Allerdings gibt es auch Differenzen, die Hinweise für die Gründe des unterschiedlichen Mobilitäts-verhaltens liefern. So bezeichnen auslandsmobile Studieren-de Auslandsaufenthalte beispielsweise deutlich häufiger als in ihrem Studiengang üblich und als unverzichtbaren Teil des Studiums. Umgekehrt nehmen nicht mobile Studierende häu-figer die mit einem Aufenthalt verbundene Trennung vom pri-vaten Umfeld als schmerzlich wahr und sehen sie häufiger als kaum vereinbar mit privaten Verpflichtungen an.
Nur bei 9% der befragten Studierenden sind Auslandsaufent-halte während des Studiums vorgeschrieben, dieser Anteil hat sich gegenüber 2015 nicht verändert. Von 41% auf 45% gestie-gen ist hingegen der Anteil der Befragten, in deren Studien-gang Auslandsaufenthalten nicht vorgeschrieben, aber durch die Studiengangstruktur unterstützt werden (z.B. durch Mobi-litätsfenster oder Praxissemester). In den Studiengängen der übrigen Befragten werden Auslandsaufenthalte weder vorge-schrieben noch durch die Studiengangstruktur unterstützt, der
Anteil dieser Gruppe ist zwischen 2015 und 2017 von 49% auf 46% leicht gesunken.
Betrachtet man die sozialen Bedingungsfaktoren studenti-scher Auslandsmobilität, so finden sich hier deutliche Unter-schiede zwischen den Fächergruppen. Am häufigsten werden studienbezogene Auslandsaufenthalte durch Freunde, Kom-militonen und Dozenten von Studierenden der Fächergruppen Sprach- und Kulturwissenschaften sowie Wirtschaftswissen-schaften befürwortet. Deutlich seltener ist dies hingegen in den Fächergruppen Medizin und Gesundheitswissenschaften sowie Ingenieurwissenschaften der Fall.
Fragt man Studierende, die bislang noch keine studienbezoge-nen Auslandsaufenthalte durchgeführt haben, welche Aspekte ihre Bereitschaft zu solch einem Aufenthalt erhöhen würden, werden hierbei am häufigsten eine problemlose Anrechnung von im Ausland erworbenen Studienleistungen, mehr Möglich-keiten für Kurzaufenthalte (von max. vier Wochen) und eine bessere finanzielle Ausstattung von Auslandsstipendien ge-nannt.
einstellungen und voraussetzungen
Befürwortung durch … FreundeStudierende im eigenen
Studiengang
Dozenten im eigenen
Studiengang
Fächergruppen in %
Sprach- und Kulturwiss. 31 43 54
Rechtswissenschaften 21 17 32
Sozialwissenschaften 27 23 33
Wirtschaftswissenschaften 30 44 56
Mathematik, Naturwiss. 16 20 30
Medizin, Gesundheitswiss. 21 16 15
Agrar-, Forst- und Ernährungswiss. 10 21 21
Ingenieurwissenschaften 19 18 30
Lehramt (Staatsexamen) 26 24 33
C26 Befürwortung studienbezogener Auslandsaufenthalte im sozialen Umfeld nach Fächergruppe 2017 Endorsement of study-related visits abroad in students’ social environment, in 2017, by subject group
C27 Verbindlichkeit studienbezogener Auslandsaufenthalte aus studentischer Sicht nach Abschlussart 2015 und 2017 Extent to which study-related visits abroad are mandatory from students’ point of view, in 2015 and 2017, by type of degree
0
20
40
60
80
100
120Insgesamt
2015 2015 20152017 2017 2017Bachelor Master
49
41
9
44
45
11
58
36
7
46
45
9
41
49
9
53
36
11
Im Studiengang vorgeschriebenNicht vorgeschrieben, aber durch die Studiengangstruktur unterstützt (z.B. durch Mobilitäts- bzw. Praxissemester)Nicht vorgeschrieben und durch die Studiengangstruktur auch nicht unterstützt
Angaben in %
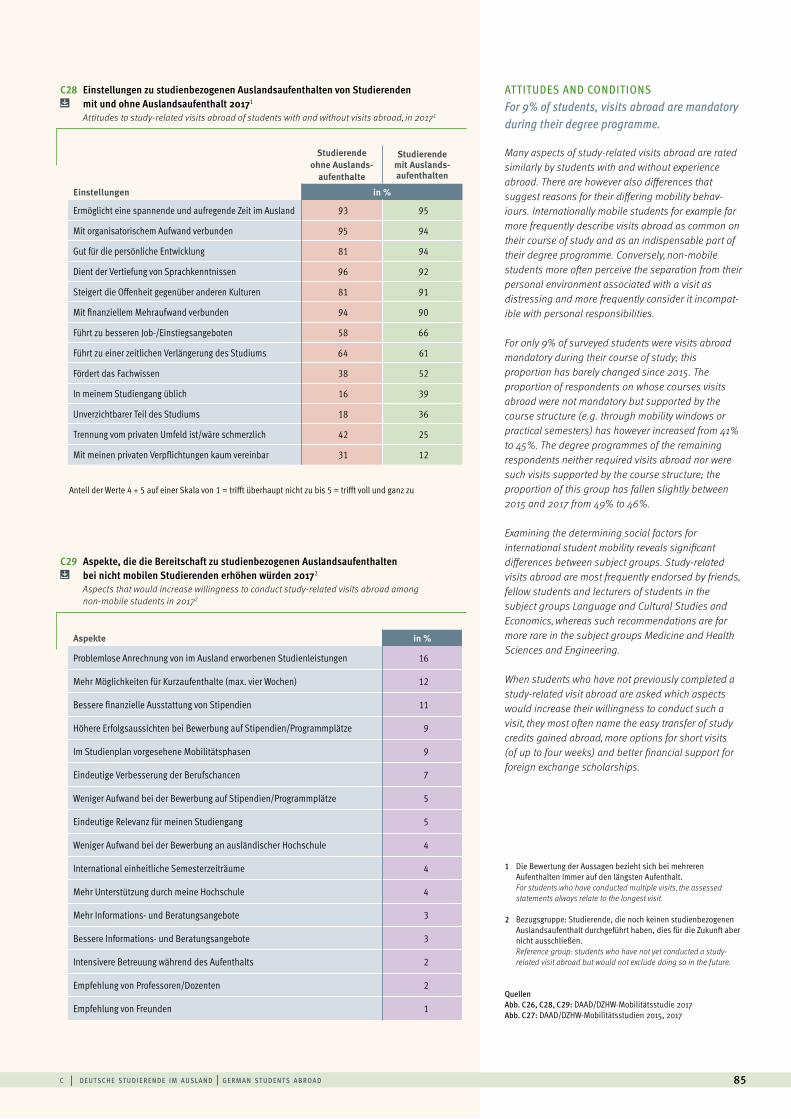
c | d e ut sc h e st u d i e r e n d e i m a u sl a n d | g e rm a n st u d e n t s a b roa d 85
Studierende ohne Auslands-
aufenthalte
Studierende mit Auslands-aufenthalten
Einstellungen in %
Ermöglicht eine spannende und aufregende Zeit im Ausland 93 95
Mit organisatorischem Aufwand verbunden 95 94
Gut für die persönliche Entwicklung 81 94
Dient der Vertiefung von Sprachkenntnissen 96 92
Steigert die Offenheit gegenüber anderen Kulturen 81 91
Mit finanziellem Mehraufwand verbunden 94 90
Führt zu besseren Job-/Einstiegsangeboten 58 66
Führt zu einer zeitlichen Verlängerung des Studiums 64 61
Fördert das Fachwissen 38 52
In meinem Studiengang üblich 16 39
Unverzichtbarer Teil des Studiums 18 36
Trennung vom privaten Umfeld ist/wäre schmerzlich 42 25
Mit meinen privaten Verpflichtungen kaum vereinbar 31 12
Aspekte in %
Problemlose Anrechnung von im Ausland erworbenen Studienleistungen 16
Mehr Möglichkeiten für Kurzaufenthalte (max. vier Wochen) 12
Bessere finanzielle Ausstattung von Stipendien 11
Höhere Erfolgsaussichten bei Bewerbung auf Stipendien/Programmplätze 9
Im Studienplan vorgesehene Mobilitätsphasen 9
Eindeutige Verbesserung der Berufschancen 7
Weniger Aufwand bei der Bewerbung auf Stipendien/Programmplätze 5
Eindeutige Relevanz für meinen Studiengang 5
Weniger Aufwand bei der Bewerbung an ausländischer Hochschule 4
International einheitliche Semesterzeiträume 4
Mehr Unterstützung durch meine Hochschule 4
Mehr Informations- und Beratungsangebote 3
Bessere Informations- und Beratungsangebote 3
Intensivere Betreuung während des Aufenthalts 2
Empfehlung von Professoren/Dozenten 2
Empfehlung von Freunden 1
C28 Einstellungen zu studienbezogenen Auslandsaufenthalten von Studierenden mit und ohne Auslandsaufenthalt 20171
Attitudes to study-related visits abroad of students with and without visits abroad, in 20171
C29 Aspekte, die die Bereitschaft zu studienbezogenen Auslandsaufenthalten bei nicht mobilen Studierenden erhöhen würden 20172
Aspects that would increase willingness to conduct study-related visits abroad among non-mobile students in 20172
Anteil der Werte 4 + 5 auf einer Skala von 1 = trifft überhaupt nicht zu bis 5 = trifft voll und ganz zu
1 Die Bewertung der Aussagen bezieht sich bei mehreren Aufenthalten immer auf den längsten Aufenthalt.
For students who have conducted multiple visits, the assessed statements always relate to the longest visit.
2 Bezugsgruppe: Studierende, die noch keinen studienbezogenen Auslandsaufenthalt durchgeführt haben, dies für die Zukunft aber nicht ausschließen.
Reference group: students who have not yet conducted a study-related visit abroad but would not exclude doing so in the future.
Quellen Abb. C26, C28, C29: DAAD/DZHW-Mobilitätsstudie 2017Abb. C27: DAAD/DZHW-Mobilitätsstudien 2015, 2017
ATTITUDES AND CONDITIONS For 9% of students, visits abroad are mandatory during their degree programme.
Many aspects of study-related visits abroad are rated similarly by students with and without experience abroad. There are however also differences that suggest reasons for their differing mobility behav-iours. Internationally mobile students for example far more frequently describe visits abroad as common on their course of study and as an indispensable part of their degree programme. Conversely, non-mobile students more often perceive the separation from their personal environment associated with a visit as distressing and more frequently consider it incompat-ible with personal responsibilities.
For only 9% of surveyed students were visits abroad mandatory during their course of study; this proportion has barely changed since 2015. The proportion of respondents on whose courses visits abroad were not mandatory but supported by the course structure (e.g. through mobility windows or practical semesters) has however increased from 41% to 45%. The degree programmes of the remaining respondents neither required visits abroad nor were such visits supported by the course structure; the proportion of this group has fallen slightly between 2015 and 2017 from 49% to 46%.
Examining the determining social factors for international student mobility reveals significant differences between subject groups. Study-related visits abroad are most frequently endorsed by friends, fellow students and lecturers of students in the subject groups Language and Cultural Studies and Economics, whereas such recommendations are far more rare in the subject groups Medicine and Health Sciences and Engineering.
When students who have not previously completed a study-related visit abroad are asked which aspects would increase their willingness to conduct such a visit, they most often name the easy transfer of study credits gained abroad, more options for short visits (of up to four weeks) and better financial support for foreign exchange scholarships.
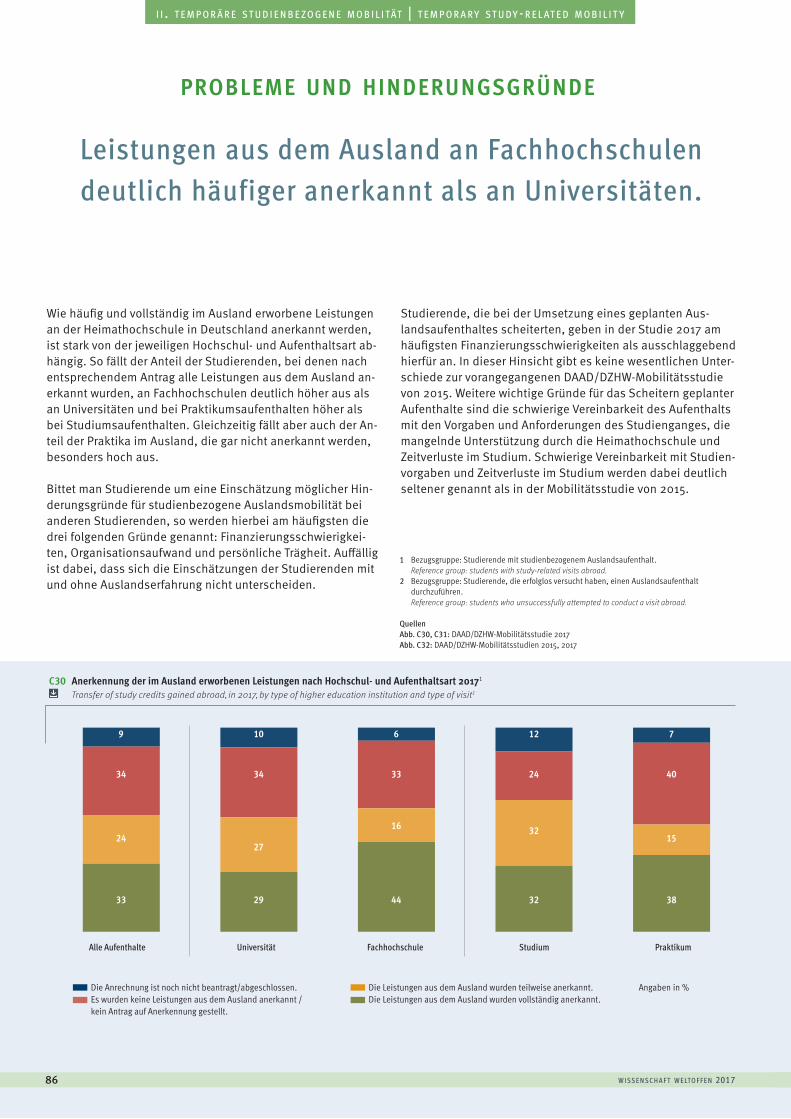
C30 Anerkennung der im Ausland erworbenen Leistungen nach Hochschul- und Aufenthaltsart 20171 Transfer of study credits gained abroad, in 2017, by type of higher education institution and type of visit1
w i sse n sc h a f t w e lto f f e n 201786
a u s l ä n d i s c h e s t u d i e r e n d e | f o r e i g n s t u d e n t si i . t e m p o r ä r e s t u d i e n b e z o g e n e m o b i l i tät | t e m p o r a r y s t u d y - r e l at e d m o b i l i t y
Leistungen aus dem Ausland an Fachhochschulen deutlich häufiger anerkannt als an Universitäten.
Wie häufig und vollständig im Ausland erworbene Leistungen an der Heimathochschule in Deutschland anerkannt werden, ist stark von der jeweiligen Hochschul- und Aufenthaltsart ab-hängig. So fällt der Anteil der Studierenden, bei denen nach entsprechendem Antrag alle Leistungen aus dem Ausland an-erkannt wurden, an Fachhochschulen deutlich höher aus als an Universitäten und bei Praktikumsaufenthalten höher als bei Studiumsaufenthalten. Gleichzeitig fällt aber auch der An-teil der Praktika im Ausland, die gar nicht anerkannt werden, besonders hoch aus.
Bittet man Studierende um eine Einschätzung möglicher Hin-derungsgründe für studienbezogene Auslandsmobilität bei anderen Studierenden, so werden hierbei am häufigsten die drei folgenden Gründe genannt: Finanzierungsschwierigkei-ten, Organisationsaufwand und persönliche Trägheit. Auffällig ist dabei, dass sich die Einschätzungen der Studierenden mit und ohne Auslandserfahrung nicht unterscheiden.
Studierende, die bei der Umsetzung eines geplanten Aus-landsaufenthaltes scheiterten, geben in der Studie 2017 am häufigsten Finanzierungsschwierigkeiten als ausschlaggebend hierfür an. In dieser Hinsicht gibt es keine wesentlichen Unter-schiede zur vorangegangenen DAAD/DZHW-Mobilitätsstudie von 2015. Weitere wichtige Gründe für das Scheitern geplanter Aufenthalte sind die schwierige Vereinbarkeit des Aufenthalts mit den Vorgaben und Anforderungen des Studienganges, die mangelnde Unterstützung durch die Heimathochschule und Zeitverluste im Studium. Schwierige Vereinbarkeit mit Studien-vorgaben und Zeitverluste im Studium werden dabei deutlich seltener genannt als in der Mobilitätsstudie von 2015.
probleme und hinderungsgründe
Alle Aufenthalte Universität Fachhochschule Studium Praktikum
Die Anrechnung ist noch nicht beantragt/abgeschlossen.Es wurden keine Leistungen aus dem Ausland anerkannt / kein Antrag auf Anerkennung gestellt.
Die Leistungen aus dem Ausland wurden teilweise anerkannt.Die Leistungen aus dem Ausland wurden vollständig anerkannt.
Angaben in %
33
34
9
24
44
33
6
16
29
34
10
27
32
24
12
32
38
40
7
15
1 Bezugsgruppe: Studierende mit studienbezogenem Auslandsaufenthalt. Reference group: students with study-related visits abroad.2 Bezugsgruppe: Studierende, die erfolglos versucht haben, einen Auslandsaufenthalt durchzuführen. Reference group: students who unsuccessfully attempted to conduct a visit abroad.
QuellenAbb. C30, C31: DAAD/DZHW-Mobilitätsstudie 2017Abb. C32: DAAD/DZHW-Mobilitätsstudien 2015, 2017
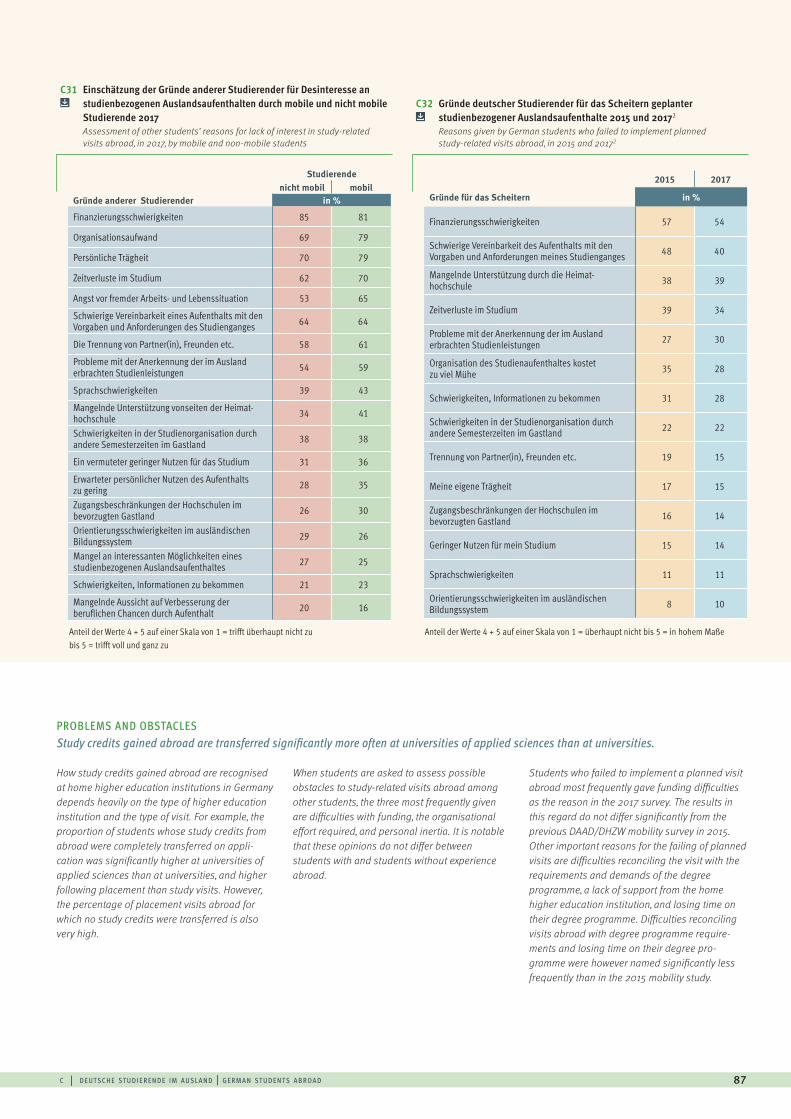
PROBLEMS AND OBSTACLES Study credits gained abroad are transferred significantly more often at universities of applied sciences than at universities.
c | d e ut sc h e st u d i e r e n d e i m a u sl a n d | g e rm a n st u d e n t s a b roa d 87
How study credits gained abroad are recognised at home higher education institutions in Germany depends heavily on the type of higher education institution and the type of visit. For example, the proportion of students whose study credits from abroad were completely transferred on appli-cation was significantly higher at universities of applied sciences than at universities, and higher following placement than study visits. However, the percentage of placement visits abroad for which no study credits were transferred is also very high.
When students are asked to assess possible obstacles to study-related visits abroad among other students, the three most frequently given are difficulties with funding, the organisational effort required, and personal inertia. It is notable that these opinions do not differ between students with and students without experience abroad.
Students who failed to implement a planned visit abroad most frequently gave funding difficulties as the reason in the 2017 survey. The results in this regard do not differ significantly from the previous DAAD/DHZW mobility survey in 2015. Other important reasons for the failing of planned visits are difficulties reconciling the visit with the requirements and demands of the degree programme, a lack of support from the home higher education institution, and losing time on their degree programme. Difficulties reconciling visits abroad with degree programme require-ments and losing time on their degree pro-gramme were however named significantly less frequently than in the 2015 mobility study.
Studierende
nicht mobil mobilGründe anderer Studierender in %
Finanzierungsschwierigkeiten 85 81
Organisationsaufwand 69 79
Persönliche Trägheit 70 79
Zeitverluste im Studium 62 70
Angst vor fremder Arbeits- und Lebenssituation 53 65
Schwierige Vereinbarkeit eines Aufenthalts mit den Vorgaben und Anforderungen des Studienganges 64 64
Die Trennung von Partner(in), Freunden etc. 58 61
Probleme mit der Anerkennung der im Ausland erbrachten Studienleistungen 54 59
Sprachschwierigkeiten 39 43
Mangelnde Unterstützung vonseiten der Heimat-hochschule 34 41
Schwierigkeiten in der Studienorganisation durch andere Semesterzeiten im Gastland 38 38
Ein vermuteter geringer Nutzen für das Studium 31 36
Erwarteter persönlicher Nutzen des Aufenthalts zu gering 28 35
Zugangsbeschränkungen der Hochschulen im bevorzugten Gastland 26 30
Orientierungsschwierigkeiten im ausländischen Bildungssystem 29 26
Mangel an interessanten Möglichkeiten eines studienbezogenen Auslandsaufenthaltes 27 25
Schwierigkeiten, Informationen zu bekommen 21 23
Mangelnde Aussicht auf Verbesserung der beruflichen Chancen durch Aufenthalt 20 16
2015 2017
Gründe für das Scheitern in %
Finanzierungsschwierigkeiten 57 54
Schwierige Vereinbarkeit des Aufenthalts mit den Vorgaben und Anforderungen meines Studienganges 48 40
Mangelnde Unterstützung durch die Heimat- hochschule 38 39
Zeitverluste im Studium 39 34
Probleme mit der Anerkennung der im Ausland erbrachten Studienleistungen 27 30
Organisation des Studienaufenthaltes kostet zu viel Mühe 35 28
Schwierigkeiten, Informationen zu bekommen 31 28
Schwierigkeiten in der Studienorganisation durch andere Semesterzeiten im Gastland 22 22
Trennung von Partner(in), Freunden etc. 19 15
Meine eigene Trägheit 17 15
Zugangsbeschränkungen der Hochschulen im bevorzugten Gastland 16 14
Geringer Nutzen für mein Studium 15 14
Sprachschwierigkeiten 11 11
Orientierungsschwierigkeiten im ausländischen Bildungssystem 8 10
C31 Einschätzung der Gründe anderer Studierender für Desinteresse an studienbezogenen Auslandsaufenthalten durch mobile und nicht mobile
Studierende 2017 Assessment of other students’ reasons for lack of interest in study-related visits abroad, in 2017, by mobile and non-mobile students
C32 Gründe deutscher Studierender für das Scheitern geplanter studienbezogener Auslandsaufenthalte 2015 und 20172
Reasons given by German students who failed to implement planned study-related visits abroad, in 2015 and 20172
Anteil der Werte 4 + 5 auf einer Skala von 1 = trifft überhaupt nicht zu bis 5 = trifft voll und ganz zu
Anteil der Werte 4 + 5 auf einer Skala von 1 = überhaupt nicht bis 5 = in hohem Maße
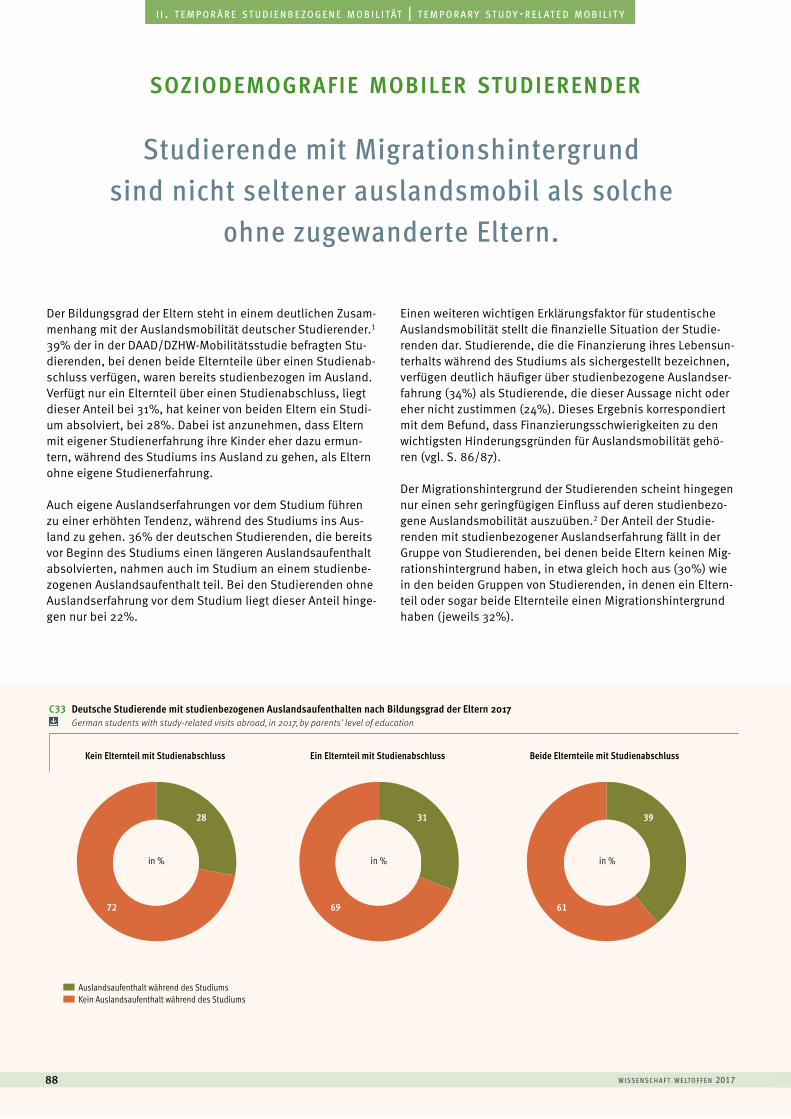
C33 Deutsche Studierende mit studienbezogenen Auslandsaufenthalten nach Bildungsgrad der Eltern 2017 German students with study-related visits abroad, in 2017, by parents’ level of education
w i sse n sc h a f t w e lto f f e n 201788
a u s l ä n d i s c h e s t u d i e r e n d e | f o r e i g n s t u d e n t si i . t e m p o r ä r e s t u d i e n b e z o g e n e m o b i l i tät | t e m p o r a r y s t u d y - r e l at e d m o b i l i t y
Der Bildungsgrad der Eltern steht in einem deutlichen Zusam-menhang mit der Auslandsmobilität deutscher Studierender.1 39% der in der DAAD/DZHW-Mobilitätsstudie befragten Stu-dierenden, bei denen beide Elternteile über einen Studienab-schluss verfügen, waren bereits studienbezogen im Ausland. Verfügt nur ein Elternteil über einen Studienabschluss, liegt dieser Anteil bei 31%, hat keiner von beiden Eltern ein Studi-um absolviert, bei 28%. Dabei ist anzunehmen, dass Eltern mit eigener Studienerfahrung ihre Kinder eher dazu ermun-tern, während des Studiums ins Ausland zu gehen, als Eltern ohne eigene Studienerfahrung.
Auch eigene Auslandserfahrungen vor dem Studium führen zu einer erhöhten Tendenz, während des Studiums ins Aus-land zu gehen. 36% der deutschen Studierenden, die bereits vor Beginn des Studiums einen längeren Auslandsaufenthalt absolvierten, nahmen auch im Studium an einem studienbe-zogenen Auslandsaufenthalt teil. Bei den Studierenden ohne Auslandserfahrung vor dem Studium liegt dieser Anteil hinge-gen nur bei 22%.
Einen weiteren wichtigen Erklärungsfaktor für studentische Auslandsmobilität stellt die finanzielle Situation der Studie-renden dar. Studierende, die die Finanzierung ihres Lebensun-terhalts während des Studiums als sichergestellt bezeichnen, verfügen deutlich häufiger über studienbezogene Auslandser-fahrung (34%) als Studierende, die dieser Aussage nicht oder eher nicht zustimmen (24%). Dieses Ergebnis korrespondiert mit dem Befund, dass Finanzierungsschwierigkeiten zu den wichtigsten Hinderungsgründen für Auslandsmobilität gehö-ren (vgl. S. 86/87).
Der Migrationshintergrund der Studierenden scheint hingegen nur einen sehr geringfügigen Einfluss auf deren studienbezo-gene Auslandsmobilität auszuüben.2 Der Anteil der Studie-renden mit studienbezogener Auslandserfahrung fällt in der Gruppe von Studierenden, bei denen beide Eltern keinen Mig-rationshintergrund haben, in etwa gleich hoch aus (30%) wie in den beiden Gruppen von Studierenden, in denen ein Eltern-teil oder sogar beide Elternteile einen Migrationshintergrund haben (jeweils 32%).
Studierende mit Migrationshintergrund sind nicht seltener auslandsmobil als solche
ohne zugewanderte Eltern.
soziodemografie mobiler studierender
28
72
31
69
39
61
Auslandsaufenthalt während des Studiums Kein Auslandsaufenthalt während des Studiums
Kein Elternteil mit Studienabschluss Ein Elternteil mit Studienabschluss Beide Elternteile mit Studienabschluss
in % in % in %
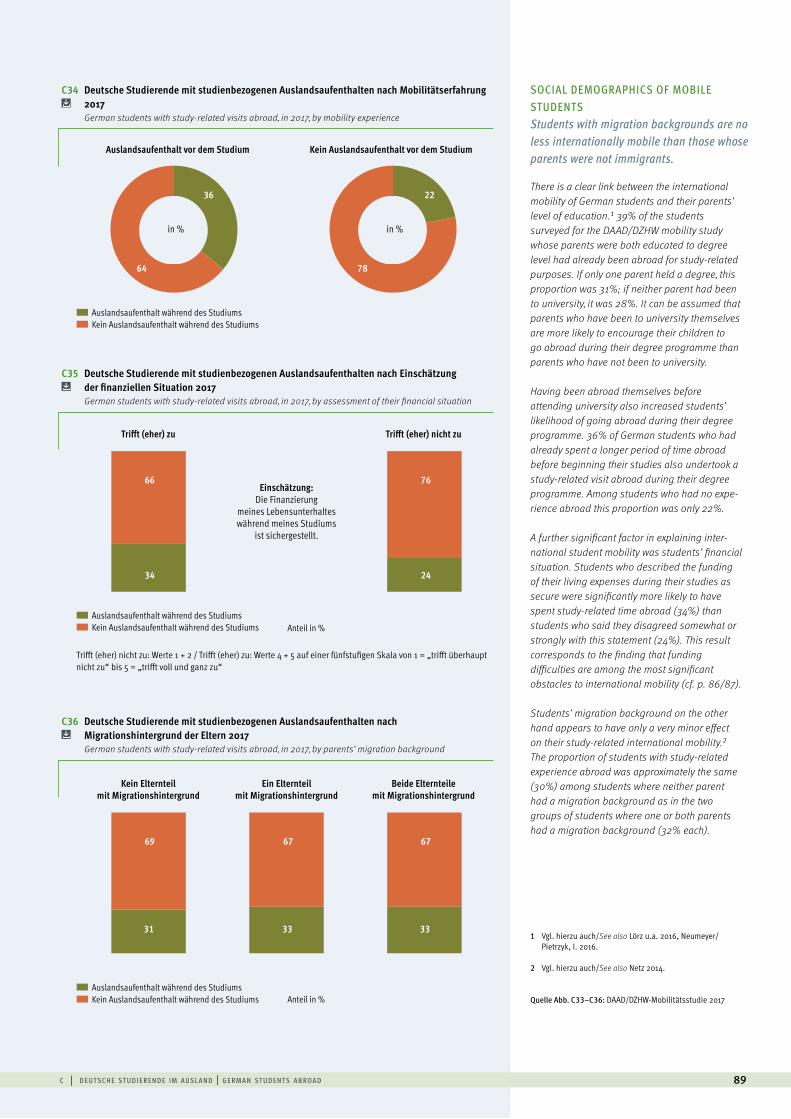
c | d e ut sc h e st u d i e r e n d e i m a u sl a n d | g e rm a n st u d e n t s a b roa d 89
SOCIAL DEMOGRAPHICS OF MOBILE STUDENTS Students with migration backgrounds are no less internationally mobile than those whose parents were not immigrants.
There is a clear link between the international mobility of German students and their parents’ level of education.1 39% of the students surveyed for the DAAD/DZHW mobility study whose parents were both educated to degree level had already been abroad for study-related purposes. If only one parent held a degree, this proportion was 31%; if neither parent had been to university, it was 28%. It can be assumed that parents who have been to university themselves are more likely to encourage their children to go abroad during their degree programme than parents who have not been to university.
Having been abroad themselves before attending university also increased students’ likelihood of going abroad during their degree programme. 36% of German students who had already spent a longer period of time abroad before beginning their studies also undertook a study-related visit abroad during their degree programme. Among students who had no expe- rience abroad this proportion was only 22%.
A further significant factor in explaining inter- national student mobility was students’ financial situation. Students who described the funding of their living expenses during their studies as secure were significantly more likely to have spent study-related time abroad (34%) than students who said they disagreed somewhat or strongly with this statement (24%). This result corresponds to the finding that funding difficulties are among the most significant obstacles to international mobility (cf. p. 86/87).
Students’ migration background on the other hand appears to have only a very minor effect on their study-related international mobility.2
The proportion of students with study-related experience abroad was approximately the same (30%) among students where neither parent had a migration background as in the two groups of students where one or both parents had a migration background (32% each).
1 Vgl. hierzu auch/See also Lörz u.a. 2016, Neumeyer/ Pietrzyk, I. 2016.
2 Vgl. hierzu auch/See also Netz 2014.
Quelle Abb. C33–C36: DAAD/DZHW-Mobilitätsstudie 2017
C34 Deutsche Studierende mit studienbezogenen Auslandsaufenthalten nach Mobilitätserfahrung 2017 German students with study-related visits abroad, in 2017, by mobility experience
C35 Deutsche Studierende mit studienbezogenen Auslandsaufenthalten nach Einschätzung der finanziellen Situation 2017 German students with study-related visits abroad, in 2017, by assessment of their financial situation
C36 Deutsche Studierende mit studienbezogenen Auslandsaufenthalten nach Migrationshintergrund der Eltern 2017 German students with study-related visits abroad, in 2017, by parents’ migration background
Trifft (eher) nicht zu: Werte 1 + 2 / Trifft (eher) zu: Werte 4 + 5 auf einer fünfstufigen Skala von 1 = „trifft überhaupt nicht zu“ bis 5 = „trifft voll und ganz zu“
36
64
22
78
Auslandsaufenthalt während des Studiums Kein Auslandsaufenthalt während des Studiums Anteil in %
Anteil in % Auslandsaufenthalt während des Studiums Kein Auslandsaufenthalt während des Studiums
Auslandsaufenthalt während des Studiums Kein Auslandsaufenthalt während des Studiums
Auslandsaufenthalt vor dem Studium Kein Auslandsaufenthalt vor dem Studium
Kein Elternteil mit Migrationshintergrund
Trifft (eher) zu
Ein Elternteil mit Migrationshintergrund
Einschätzung: Die Finanzierung
meines Lebensunterhaltes während meines Studiums
ist sichergestellt.
Beide Elternteilemit Migrationshintergrund
Trifft (eher) nicht zu
in % in %
0
20
40
60
80
100
0
20
40
60
80
100
69
66
34
31
67
33
67
76
24
33
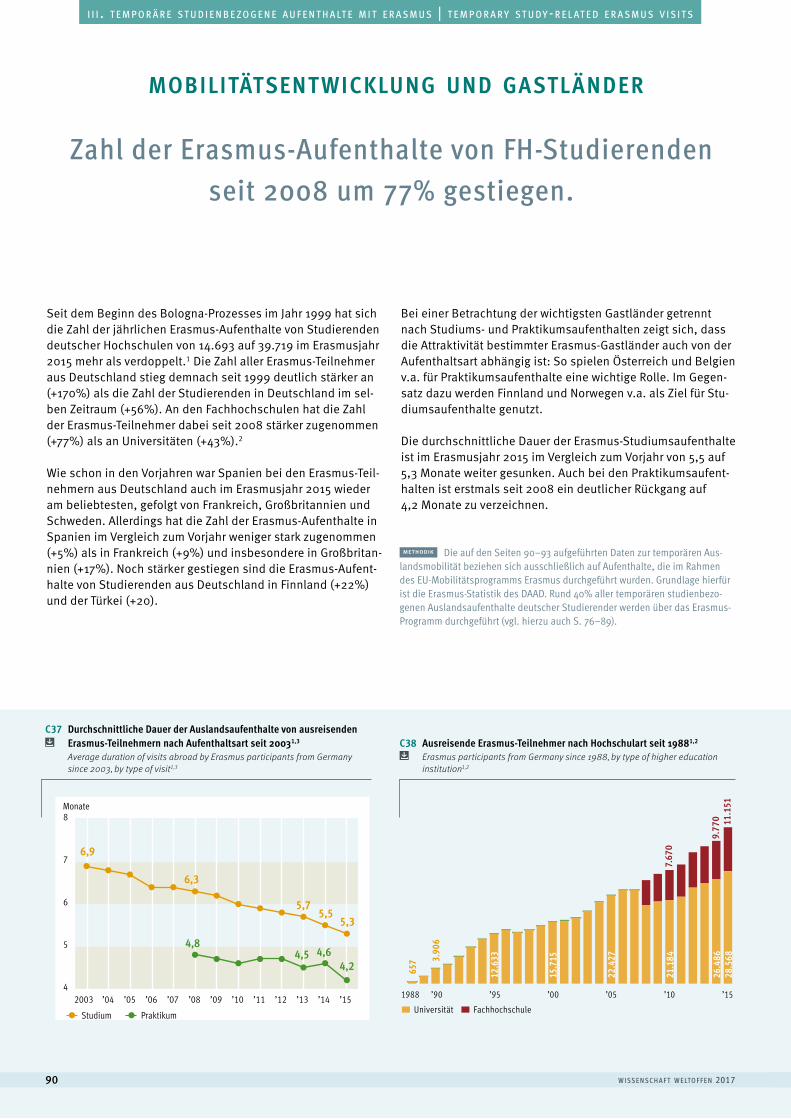
w i sse n sc h a f t w e lto f f e n 201790
a u s l ä n d i s c h e s t u d i e r e n d e | f o r e i g n s t u d e n t si i i . t e m p o r ä r e s t u d i e n b e z o g e n e a u f e n t h a lt e m i t e r a s m u s | t e m p o r a r y s t u d y - r e l at e d e r a s m u s v i s i t s
Zahl der Erasmus-Aufenthalte von FH-Studierenden seit 2008 um 77% gestiegen.
Seit dem Beginn des Bologna-Prozesses im Jahr 1999 hat sich die Zahl der jährlichen Erasmus-Aufenthalte von Studierenden deutscher Hochschulen von 14.693 auf 39.719 im Erasmusjahr 2015 mehr als verdoppelt.1 Die Zahl aller Erasmus-Teilnehmer aus Deutschland stieg demnach seit 1999 deutlich stärker an (+170%) als die Zahl der Studierenden in Deutschland im sel-ben Zeitraum (+56%). An den Fachhochschulen hat die Zahl der Erasmus-Teilnehmer dabei seit 2008 stärker zugenommen (+77%) als an Universitäten (+43%).2
Wie schon in den Vorjahren war Spanien bei den Erasmus-Teil-nehmern aus Deutschland auch im Erasmusjahr 2015 wieder am beliebtesten, gefolgt von Frankreich, Großbritannien und Schweden. Allerdings hat die Zahl der Erasmus-Aufenthalte in Spanien im Vergleich zum Vorjahr weniger stark zugenommen (+5%) als in Frankreich (+9%) und insbesondere in Großbritan-nien (+17%). Noch stärker gestiegen sind die Erasmus-Aufent-halte von Studierenden aus Deutschland in Finnland (+22%) und der Türkei (+20).
Bei einer Betrachtung der wichtigsten Gastländer getrennt nach Studiums- und Praktikumsaufenthalten zeigt sich, dass die Attraktivität bestimmter Erasmus-Gastländer auch von der Aufenthaltsart abhängig ist: So spielen Österreich und Belgien v.a. für Praktikumsaufenthalte eine wichtige Rolle. Im Gegen-satz dazu werden Finnland und Norwegen v.a. als Ziel für Stu-diumsaufenthalte genutzt.
Die durchschnittliche Dauer der Erasmus-Studiumsaufenthalte ist im Erasmusjahr 2015 im Vergleich zum Vorjahr von 5,5 auf 5,3 Monate weiter gesunken. Auch bei den Praktikumsaufent-halten ist erstmals seit 2008 ein deutlicher Rückgang auf 4,2 Monate zu verzeichnen.
mobilitätsent wicklung und gastländer
methodik Die auf den Seiten 90–93 aufgeführten Daten zur temporären Aus-landsmobilität beziehen sich ausschließlich auf Aufenthalte, die im Rahmen des EU-Mobilitätsprogramms Erasmus durchgeführt wurden. Grundlage hierfür ist die Erasmus-Statistik des DAAD. Rund 40% aller temporären studienbezo-genen Auslandsaufenthalte deutscher Studierender werden über das Erasmus-Programm durchgeführt (vgl. hierzu auch S. 76–89).
0
10000
20000
30000
40000
0
2
4
6
8
10
657
3.90
6
12.6
33
15.7
15
22.4
27
21.1
84
26.4
8628
.568
9.77
0 11.1
51
8
7
6
5
4
Monate
2003 ’04 ’05 ’06 ’07 ’08 ’09 ’10 ’11 ’12 ’15’14’13
4,84,5 4,6
4,2
5,75,5
5,3
6,3
6,9
Studium Praktikum
7.67
0
1988 ’90 ’00 ’10’95 ’05 ’15
C37 Durchschnittliche Dauer der Auslandsaufenthalte von ausreisenden Erasmus-Teilnehmern nach Aufenthaltsart seit 20031,3 Average duration of visits abroad by Erasmus participants from Germany since 2003, by type of visit
C38 Ausreisende Erasmus-Teilnehmer nach Hochschulart seit 19881,2
Erasmus participants from Germany since 1988, by type of higher education institution
Universität Fachhochschule
1,3 1,2
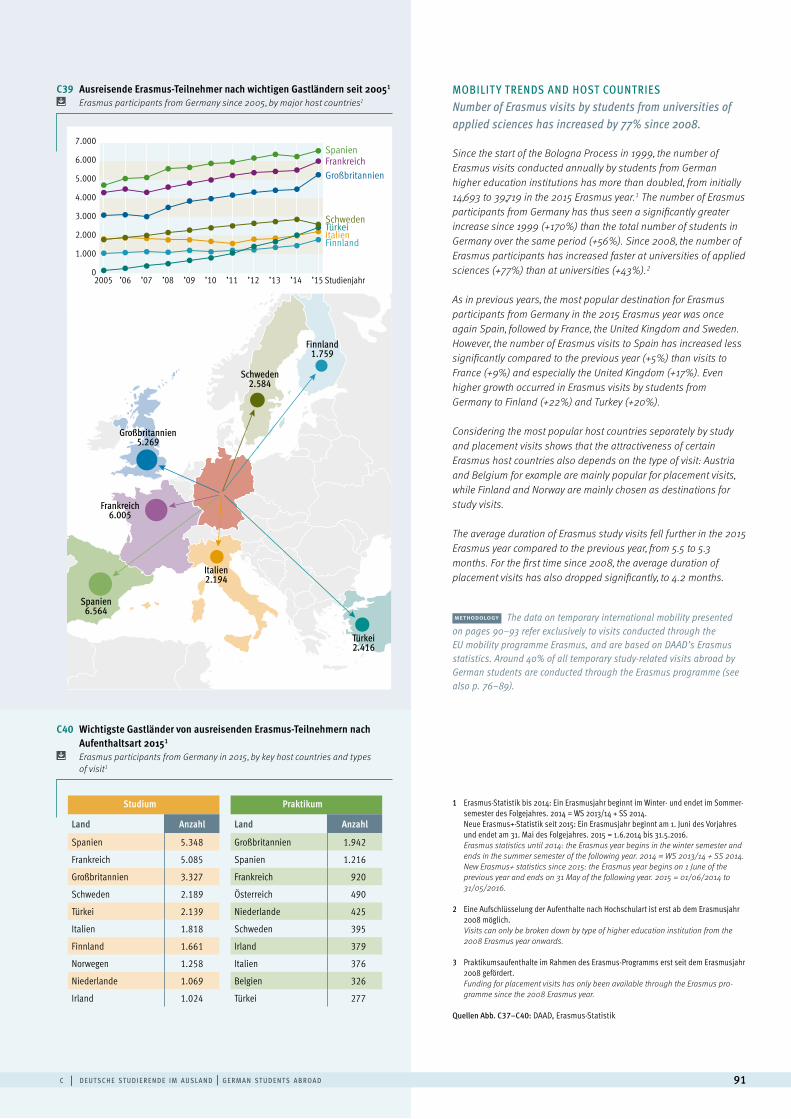
c | d e ut sc h e st u d i e r e n d e i m a u sl a n d | g e rm a n st u d e n t s a b roa d 91
Since the start of the Bologna Process in 1999, the number of Erasmus visits conducted annually by students from German higher education institutions has more than doubled, from initially 14,693 to 39,719 in the 2015 Erasmus year.1 The number of Erasmus participants from Germany has thus seen a significantly greater increase since 1999 (+170%) than the total number of students in Germany over the same period (+56%). Since 2008, the number of Erasmus participants has increased faster at universities of applied sciences (+77%) than at universities (+43%).2
As in previous years, the most popular destination for Erasmus participants from Germany in the 2015 Erasmus year was once again Spain, followed by France, the United Kingdom and Sweden. However, the number of Erasmus visits to Spain has increased less significantly compared to the previous year (+5%) than visits to France (+9%) and especially the United Kingdom (+17%). Even higher growth occurred in Erasmus visits by students from Germany to Finland (+22%) and Turkey (+20%).
Considering the most popular host countries separately by study and placement visits shows that the attractiveness of certain Erasmus host countries also depends on the type of visit: Austria and Belgium for example are mainly popular for placement visits, while Finland and Norway are mainly chosen as destinations for study visits.
The average duration of Erasmus study visits fell further in the 2015 Erasmus year compared to the previous year, from 5.5 to 5.3 months. For the first time since 2008, the average duration of placement visits has also dropped significantly, to 4.2 months.
methodology The data on temporary international mobility presented on pages 90–93 refer exclusively to visits conducted through the EU mobility programme Erasmus, and are based on DAAD’s Erasmus statistics. Around 40% of all temporary study-related visits abroad by German students are conducted through the Erasmus programme (see also p. 76–89).
Großbritannien5.269
Frankreich6.005
Italien2.194
Türkei2.416
Schweden2.584
Finnland1.759
Spanien6.564
Studienjahr’062005 ’07 ’08 ’09 ’12 ’13 ’15’14’11’10
7.000
6.000
3.000
4.000
5.000
1.000
2.000
0
Spanien Frankreich Großbritannien
Italien
Schweden
Finnland
Türkei
Studium
Land Anzahl
Spanien 5.348
Frankreich 5.085
Großbritannien 3.327
Schweden 2.189
Türkei 2.139
Italien 1.818
Finnland 1.661
Norwegen 1.258
Niederlande 1.069
Irland 1.024
Praktikum
Land Anzahl
Großbritannien 1.942
Spanien 1.216
Frankreich 920
Österreich 490
Niederlande 425
Schweden 395
Irland 379
Italien 376
Belgien 326
Türkei 277
MOBILIT Y TRENDS AND HOST COUNTRIES Number of Erasmus visits by students from universities of applied sciences has increased by 77% since 2008.
C40 Wichtigste Gastländer von ausreisenden Erasmus-Teilnehmern nach Aufenthaltsart 20151
Erasmus participants from Germany in 2015, by key host countries and types of visit1
C39 Ausreisende Erasmus-Teilnehmer nach wichtigen Gastländern seit 20051 Erasmus participants from Germany since 2005, by major host countries1
1 Erasmus-Statistik bis 2014: Ein Erasmusjahr beginnt im Winter- und endet im Sommer-semester des Folgejahres. 2014 = WS 2013/14 + SS 2014. Neue Erasmus+-Statistik seit 2015: Ein Erasmusjahr beginnt am 1. Juni des Vorjahres und endet am 31. Mai des Folgejahres. 2015 = 1.6.2014 bis 31.5.2016.Erasmus statistics until 2014: the Erasmus year begins in the winter semester and ends in the summer semester of the following year. 2014 = WS 2013/14 + SS 2014.New Erasmus+ statistics since 2015: the Erasmus year begins on 1 June of the previous year and ends on 31 May of the following year. 2015 = 01/06/2014 to 31/05/2016.
2 Eine Aufschlüsselung der Aufenthalte nach Hochschulart ist erst ab dem Erasmusjahr 2008 möglich. Visits can only be broken down by type of higher education institution from the 2008 Erasmus year onwards.
3 Praktikumsaufenthalte im Rahmen des Erasmus-Programms erst seit dem Erasmusjahr 2008 gefördert.Funding for placement visits has only been available through the Erasmus pro-gramme since the 2008 Erasmus year.
Quellen Abb. C37–C40: DAAD, Erasmus-Statistik
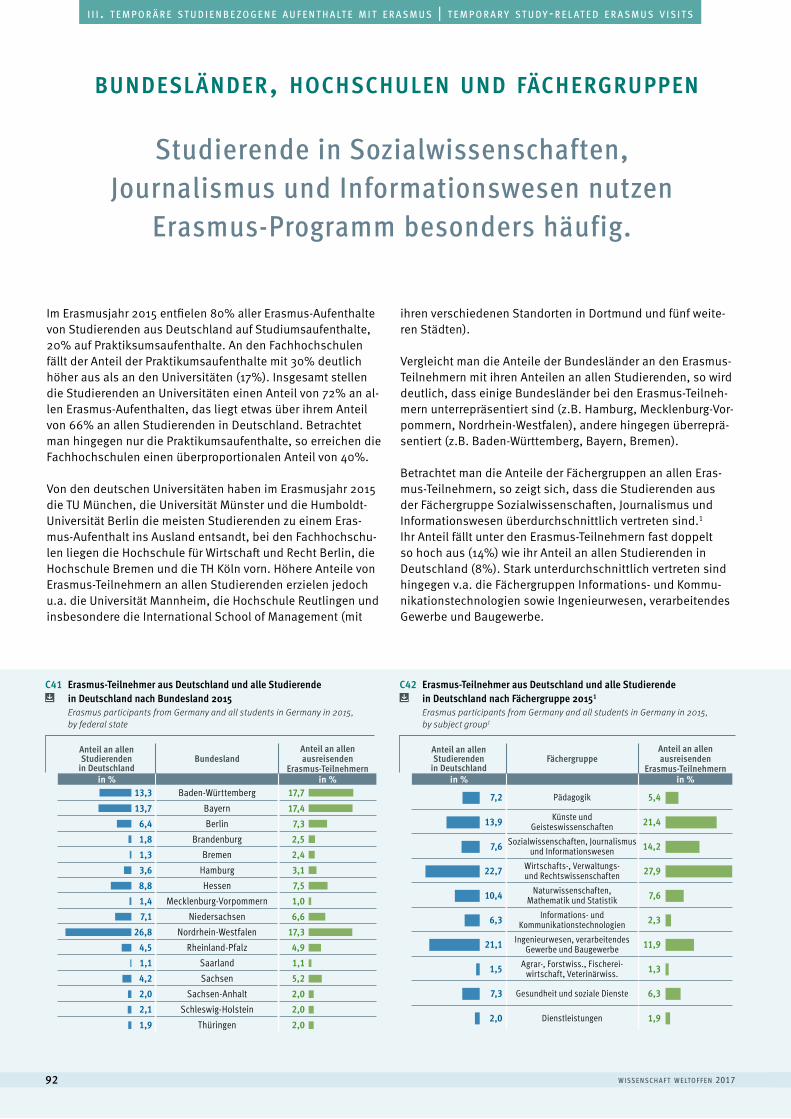
w i sse n sc h a f t w e lto f f e n 201792
a u s l ä n d i s c h e s t u d i e r e n d e | f o r e i g n s t u d e n t si i i . t e m p o r ä r e s t u d i e n b e z o g e n e a u f e n t h a lt e m i t e r a s m u s | t e m p o r a r y s t u d y - r e l at e d e r a s m u s v i s i t s
Im Erasmusjahr 2015 entfielen 80% aller Erasmus-Aufenthalte von Studierenden aus Deutschland auf Studiumsaufenthalte, 20% auf Praktiksumsaufenthalte. An den Fachhochschulen fällt der Anteil der Praktikumsaufenthalte mit 30% deutlich höher aus als an den Universitäten (17%). Insgesamt stellen die Studierenden an Universitäten einen Anteil von 72% an al-len Erasmus-Aufenthalten, das liegt etwas über ihrem Anteil von 66% an allen Studierenden in Deutschland. Betrachtet man hingegen nur die Praktikumsaufenthalte, so erreichen die Fachhochschulen einen überproportionalen Anteil von 40%.
Von den deutschen Universitäten haben im Erasmusjahr 2015 die TU München, die Universität Münster und die Humboldt-Universität Berlin die meisten Studierenden zu einem Eras-mus-Aufenthalt ins Ausland entsandt, bei den Fachhochschu-len liegen die Hochschule für Wirtschaft und Recht Berlin, die Hochschule Bremen und die TH Köln vorn. Höhere Anteile von Erasmus-Teilnehmern an allen Studierenden erzielen jedoch u.a. die Universität Mannheim, die Hochschule Reutlingen undinsbesondere die International School of Management (mit
ihren verschiedenen Standorten in Dortmund und fünf weite-ren Städten).
Vergleicht man die Anteile der Bundesländer an den Erasmus-Teilnehmern mit ihren Anteilen an allen Studierenden, so wird deutlich, dass einige Bundesländer bei den Erasmus-Teilneh-mern unterrepräsentiert sind (z.B. Hamburg, Mecklenburg-Vor-pommern, Nordrhein-Westfalen), andere hingegen überreprä-sentiert (z.B. Baden-Württemberg, Bayern, Bremen).
Betrachtet man die Anteile der Fächergruppen an allen Eras-mus-Teilnehmern, so zeigt sich, dass die Studierenden aus der Fächergruppe Sozialwissenschaften, Journalismus und Informationswesen überdurchschnittlich vertreten sind.1 Ihr Anteil fällt unter den Erasmus-Teilnehmern fast doppelt so hoch aus (14%) wie ihr Anteil an allen Studierenden in Deutschland (8%). Stark unterdurchschnittlich vertreten sind hingegen v.a. die Fächergruppen Informations- und Kommu-nikationstechnologien sowie Ingenieurwesen, verarbeitendes Gewerbe und Baugewerbe.
Studierende in Sozialwissenschaften, Journalismus und Informationswesen nutzen
Erasmus-Programm besonders häufig.
bundesländer, hochschulen und fächergruppen
Anteil an allen Studierenden
in Deutschland Bundesland
Anteil an allenausreisenden
Erasmus-Teilnehmern in % in %
13,3 Baden-Württemberg 17,713,7 Bayern 17,4
6,4 Berlin 7,31,8 Brandenburg 2,51,3 Bremen 2,43,6 Hamburg 3,18,8 Hessen 7,51,4 Mecklenburg-Vorpommern 1,07,1 Niedersachsen 6,6
26,8 Nordrhein-Westfalen 17,34,5 Rheinland-Pfalz 4,91,1 Saarland 1,14,2 Sachsen 5,22,0 Sachsen-Anhalt 2,02,1 Schleswig-Holstein 2,01,9 Thüringen 2,0
Anteil an allen Studierenden
in Deutschland Fächergruppe
Anteil an allenausreisenden
Erasmus-Teilnehmern in % in %
7,2 Pädagogik 5,4
13,9 Künste und Geisteswissenschaften 21,4
7,6 Sozialwissenschaften, Journalismus und Informationswesen 14,2
22,7 Wirtschafts-, Verwaltungs- und Rechtswissenschaften 27,9
10,4 Naturwissenschaften, Mathematik und Statistik 7,6
6,3 Informations- und Kommunikationstechnologien 2,3
21,1 Ingenieurwesen, verarbeitendes Gewerbe und Baugewerbe 11,9
1,5 Agrar-, Forstwiss., Fischerei-wirtschaft, Veterinärwiss. 1,3
7,3 Gesundheit und soziale Dienste 6,3
2,0 Dienstleistungen 1,9
030
0 30
030
0 30
C41 Erasmus-Teilnehmer aus Deutschland und alle Studierende in Deutschland nach Bundesland 2015 Erasmus participants from Germany and all students in Germany in 2015, by federal state
C42 Erasmus-Teilnehmer aus Deutschland und alle Studierende in Deutschland nach Fächergruppe 20151 Erasmus participants from Germany and all students in Germany in 2015, by subject group1
050
0 50
050
0 50
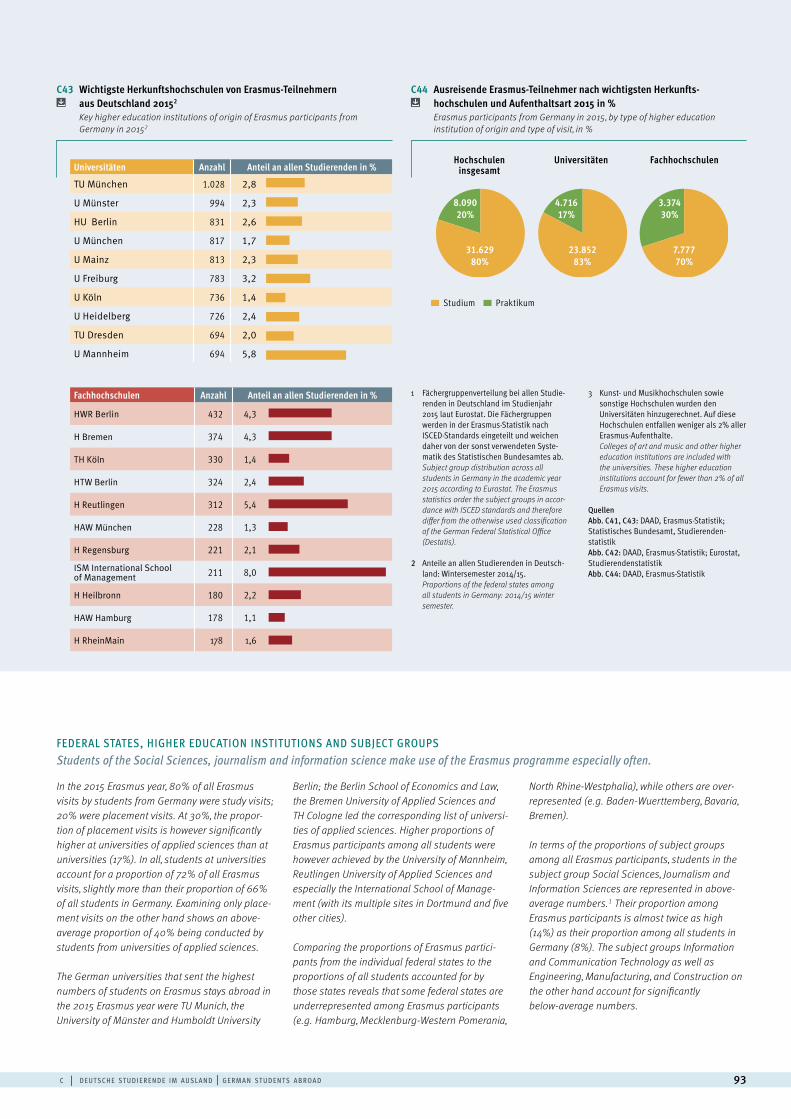
c | d e ut sc h e st u d i e r e n d e i m a u sl a n d | g e rm a n st u d e n t s a b roa d 93
C44 Ausreisende Erasmus-Teilnehmer nach wichtigsten Herkunfts- hochschulen und Aufenthaltsart 2015 in %
Erasmus participants from Germany in 2015, by type of higher education institution of origin and type of visit, in %
Universitäten Anzahl Anteil an allen Studierenden in %
TU München 1.028 2,8
U Münster 994 2,3
HU Berlin 831 2,6
U München 817 1,7
U Mainz 813 2,3
U Freiburg 783 3,2
U Köln 736 1,4
U Heidelberg 726 2,4
TU Dresden 694 2,0
U Mannheim 694 5,8
Fachhochschulen Anzahl Anteil an allen Studierenden in %
HWR Berlin 432 4,3
HBremen 374 4,3
THKöln 330 1,4
HTWBerlin 324 2,4
HReutlingen 312 5,4
HAWMünchen 228 1,3
HRegensburg 221 2,1
ISMInternationalSchoolofManagement 211 8,0
HHeilbronn 180 2,2
HAWHamburg 178 1,1
HRheinMain 178 1,6
Studium Praktikum
Hochschulen insgesamt
Universitäten Fachhochschulen
8.09020%
4.71617%
3.37430%
31.62980%
23.85283%
7.77770%
0,0000001,6666673,3333335,0000006,6666678,33333310,000000
0,0000001,6666673,3333335,0000006,6666678,333333
C43 Wichtigste Herkunftshochschulen von Erasmus-Teilnehmern aus Deutschland 20152 Key higher education institutions of origin of Erasmus participants from Germany in 20152
In the 2015 Erasmus year, 80% of all Erasmus visits by students from Germany were study visits; 20% were placement visits. At 30%, the propor- tion of placement visits is however significantly higher at universities of applied sciences than at universities (17%). In all, students at universities account for a proportion of 72% of all Erasmus visits, slightly more than their proportion of 66% of all students in Germany. Examining only place- ment visits on the other hand shows an above- average proportion of 40% being conducted by students from universities of applied sciences.
The German universities that sent the highest numbers of students on Erasmus stays abroad in the 2015 Erasmus year were TU Munich, the University of Münster and Humboldt University
Berlin; the Berlin School of Economics and Law, the Bremen University of Applied Sciences and TH Cologne led the corresponding list of universi- ties of applied sciences. Higher proportions of Erasmus participants among all students were however achieved by the University of Mannheim, Reutlingen University of Applied Sciences and especially the International School of Manage-ment (with its multiple sites in Dortmund and five other cities).
Comparing the proportions of Erasmus partici- pants from the individual federal states to the proportions of all students accounted for by those states reveals that some federal states are underrepresented among Erasmus participants (e.g. Hamburg, Mecklenburg-Western Pomerania,
North Rhine-Westphalia), while others are over- represented (e.g. Baden-Wuerttemberg, Bavaria, Bremen).
In terms of the proportions of subject groups among all Erasmus participants, students in the subject group Social Sciences, Journalism and Information Sciences are represented in above- average numbers.1 Their proportion among Erasmus participants is almost twice as high (14%) as their proportion among all students in Germany (8%). The subject groups Information and Communication Technology as well as Engineering, Manufacturing, and Construction on the other hand account for significantly below-average numbers.
FEDERAL STATES, HIGHER EDUCATION INSTITUTIONS AND SUBJECT GROUPS Students of the Social Sciences, journalism and information science make use of the Erasmus programme especially often.
1 Fächergruppenverteilung bei allen Studie-renden in Deutschland im Studienjahr 2015 laut Eurostat. Die Fächergruppen werden in der Erasmus-Statistik nach ISCED-Standards eingeteilt und weichen daher von der sonst verwendeten Syste-matik des Statistischen Bundesamtes ab.Subject group distribution across all students in Germany in the academic year 2015 according to Eurostat. The Erasmus statistics order the subject groups in accor-dance with ISCED standards and therefore differ from the otherwise used classification of the German Federal Statistical Office (Destatis).
2 Anteile an allen Studierenden in Deutsch-land: Wintersemester 2014/15.Proportions of the federal states among all students in Germany: 2014/15 winter semester.
3 Kunst- und Musikhochschulen sowie sonstige Hochschulen wurden den Universitäten hinzugerechnet. Auf diese Hochschulen entfallen weniger als 2% aller Erasmus-Aufenthalte.Colleges of art and music and other higher education institutions are included with the universities. These higher education institutions account for fewer than 2% of all Erasmus visits.
QuellenAbb. C41, C43: DAAD, Erasmus-Statistik; Statistisches Bundesamt, Studierenden- statistikAbb. C42: DAAD, Erasmus-Statistik; Eurostat, StudierendenstatistikAbb. C44: DAAD, Erasmus-Statistik
w i sse n sc h a f t w e lto f f e n 201794
2015 sind 43.129 ausländische Wissenschaftler an deutschen Hochschulen angestellt, unter ihnen rund 3.100 Professoren. Die Zahl des ausländischen Wissenschaftspersonals ist in den letzten zehn Jahren um 74% gestiegen, bei den ausländischen Professoren um 49%.
37% der ausländischen Wissenschaftler kommen aus Westeu-ropa, 17% aus der Region Asien und Pazifik sowie 15% aus Mit-tel- und Südosteuropa. Die wichtigsten Herkunftsländer sind Italien, China, Österreich, die USA und Russland. Von den aus-ländischen Professoren stammen 67% aus Westeuropa.
Ausländische Wissenschaftler stellen 11% des gesamten Wis-senschaftspersonals. Besonders hohe Anteile sind im Saarland (17%) und in Berlin (13%) zu verzeichnen. Ausländische Pro-fessoren haben einen Anteil von 7% an allen Professoren.
Überdurchschnittlich hohe Anteile ausländischer Wissen-schaftler lassen sich an Universitäten in Mathematik und
Natur- (17%) sowie Ingenieurwissenschaften (16%) feststellen, an Fachhochschulen in Geisteswissenschaften (23%).
2015 haben 4.887 Bildungsausländer an deutschen Hochschu-len eine Promotion erworben. Ihr Anteil an allen Promovier-ten beträgt 17%. Ihre Zahl ist seit 2011 um 31% gestiegen. Die meisten der ausländischen Promovierten kommen aus der Re-gion Asien und Pazifik (31%) und aus Westeuropa (17%). Das wichtigste Herkunftsland ist China, gefolgt von Indien und Iran. Der größte Anteil hat in Mathematik und Naturwissenschaften (35%) sowie in Ingenieurwissenschaften (22%) promoviert.
Insgesamt 159 ausländische Wissenschaftler haben 2015 an deutschen Hochschulen eine Habilitation abgeschlossen. Sie stellen einen Anteil von 10%. Mehrheitlich stammen sie aus Westeuropa (53%). Die wichtigsten Fächergruppen sind Humanmedizin und Gesundheitswissenschaften (35%) sowie Mathematik und Naturwissenschaften (33%).
2014 sind 8.932 ausländische Wissenschaftler an den Einrich-tungen der Max-Planck-Gesellschaft, der Helmholtz-Gemein-schaft, der Leibniz-Gemeinschaft und der Fraunhofer-Gesell-schaft angestellt. Seit 2008 ist ihre Zahl um 59% gestiegen. Rund die Hälfte arbeitet bei der Helmholtz-Gemeinschaft (48%) und ein Viertel bei der Max-Planck-Gesellschaft (26%). Sie stellen insgesamt 20% aller Wissenschaftler an diesen vier größten außeruniversitären Forschungseinrichtungen.
64% des ausländischen Wissenschaftspersonals an den außer-
universitären Forschungseinrichtungen stammen aus Europa, überwiegend aus EU-Staaten, 24% aus Asien.
Die Mehrheit der angestellten ausländischen Wissenschaft-ler ist promoviert (52%). Einen überdurchschnittlichen Anteil ausländischer Promovierter weist die Max-Planck-Gesellschaft (65%) auf. Insgesamt kommt jeder vierte angestellte promo-vierte Wissenschaftler aus dem Ausland.
Bei drei Viertel des ausländischen Wissenschaftspersonals handelt es sich um Naturwissenschaftler.
2015 wurde der Aufenthalt von 35.636 ausländischen Gastwissen-schaftlern in Deutschland gefördert. Die wichtigsten Förderorga-nisationen sind DAAD, DFG und Alexander von Humboldt-Stiftung. Mit ihrer Unterstützung sind 95% der geförderten Aufenthalte realisiert worden. Der DAAD hat 58% aller Aufenthalte gefördert.
Die meisten ausländischen Gastwissenschaftler kommen aus der Region Asien und Pazifik sowie aus Westeuropa (je 18%). Je 13% stammen aus Mittel- und Südosteuropa sowie Osteuropa und Zentralasien. Die wichtigsten Herkunftsländer sind Russ-land (6%), gefolgt von China, den USA, Indien und Italien.
Der größte Anteil ausländischer Gastwissenschaftler ist mit 38% in Mathematik und Naturwissenschaften tätig. 18% sind Geisteswissenschaftler, 15% im Bereich Rechts-, Wirtschafts-
und Sozialwissenschaften und 14% in den Ingenieurwissen-schaften tätig. DFG und Alexander von Humboldt-Stiftung för-dern häufig im Bereich Mathematik und Naturwissenschaften, kleinere deutsche Forschungsorganisationen häufiger Geistes- sowie Rechts-, Wirtschafts- und Sozialwissenschaftler.
Ein Drittel der ausländischen Gastwissenschaftler hält sich we-niger als einen Monat in Deutschland auf. Länger als ein Jahr bleiben nur 6% der Gastwissenschaftler.
2015 haben sich insgesamt 2.814 Erasmus-Gastdozenten in Deutschland aufgehalten. Fast ein Drittel von ihnen stammt aus Ost-, 28% aus West- und 16% aus Südeuropa. Bei den Her-kunftsländern stehen Polen, Spanien und Großbritannien an der Spitze.
Ausländische Wissenschaftler arbeiten in Deutschland fest an-gestellt an Hochschulen und außeruniversitären Forschungsein-richtungen. Darüber hinaus halten sich auch ausländische Gast-
wissenschaftler mit Förderung unterschiedlicher Einrichtungen zu temporären Forschungs- und Lehraufenthalten in Deutschland auf.
a u s l ä n d i s c h e s w i s s e n s c h a f t s p e r s o n a l a n d e u t s c h e n h o c h s c h u l e n
a u s l ä n d i s c h e s w i s s e n s c h a f t s p e r s o n a l a n a u s s e r u n i v e r s i tä r e n f o r s c h u n g s e i n r i c h t u n g e n
a u s l ä n d i s c h e g a s t w i s s e n s c h a f t l e r i n d e u t s c h l a n d
ausländische wissenschaftlerin deutschland
a | a u sl ä n d i sc h e w i sse n sc h a f t l e r i n d e ut sc h l a n d | f o r e i g n ac a d e m i cs a n d r ese a rc h e rs i n g e rm a n y 95
Dforeign academics and researchers in germany
f o r e i g n a c a d e m i c s ta f f at g e r m a n h i g h e r e d u c at i o n i n s t i t u t i o n s
In Germany, foreign academics and researchers are employed at high-er education institutions and non-university research institutions. For-
eign guest researchers also come to Germany for temporary research and teaching visits with funding from various organisations.
43,129 foreign academics and researchers were employed at German higher education institutions in 2015, among them 3,100 professors. The number of foreign academic staff has increased by 74% over the past ten years, the number of foreign professors by 49%.37% of foreign academics and researchers came from Western Euro-pe, 17% from the Asia and Pacific region and 15% from Central and South Eastern Europe. The most frequent countries of origin were Italy, China, Austria, the USA and Russia. 67% of foreign professors were from Western Europe.Foreign academics and researchers represented 11% of all academic staff. Their proportions were especially high at higher education institu-tions in Saarland (17%) and Berlin (13%). Foreign professors accounted for 7% of all professors.At universities, above-average proportions of foreign academics and re-searchers were found in Mathematics and the Natural Sciences (17%) and in Engineering (16%), while universities of applied sciences had above-
average proportions in the Humanities (23%). A total of 4,887 Bildungsauslaender gained doctorates at German higher education institutions in 2015, accounting for 17% of all successful doc-toral candidates. The number of Bildungsauslaender with completed doctoral studies has increased by 31% since 2011. The majority of suc-cessful foreign doctoral candidates were from the Asia and Pacific regi-on (31%) and from Western Europe (17%). The most important country of origin was China, followed by India and Iran. The largest proportion of these Bildungsauslaender completed their doctoral studies in Mathe-matics and Natural Sciences (35%) and in Engineering (22%).A total of 159 foreign academics and researchers gained a qualification to teach at professorial level at German higher education institutions in 2015, accounting for 10%. The majority of foreign holders of qualifi-cations to teach at professorial level came from Western Europe (53%). The most popular subject groups were Medicine and Health Sciences (35%) and Mathematics and Natural Sciences (33%).
f o r e i g n a c a d e m i c s ta f f at n o n - u n i v e r s i t y r e s e a r c h i n s t i t u t i o n s
In 2014, 8,932 foreign academics and researchers were employed at the institutes of the Max Planck Society, the Helmholtz Association, the Leibniz Association and Fraunhofer. Their number has increased by 59% since 2008. They accounted for a total of 20% of all academics and re-searchers at these four largest non-university research institutions. Around half of all employed foreign academics and researchers worked at the Helmholtz Association (48%) and a quarter at the Max Planck So-ciety (26%).
64% of foreign academic staff at non-university research institutions came from Europe, mainly from EU member states; 24% were from Asia.The majority of employed foreign academics and researchers held doc-torates (52%). The Max Planck Society had an above-average proportion of doctorate holders (65%). Overall, one in four employed academics and researchers with doctorates at non-university research institutions came from abroad.Three quarters of foreign academic staff were natural scientists.
f o r e i g n g u e s t r e s e a r c h e r s i n g e r m a n y
Funding was provided by German and non-German organisations for vi-sits by 35,636 foreign guest researchers in 2015. The main funding or-ganisations were the DAAD, DFG and the Alexander von Humboldt Foun-dation; together, they supported a total of 95% of all funded visits. The DAAD funded 58% of all visits. The majority of foreign guest researchers came from the Asia and Paci-fic region and from Western Europe; these groups each accounted for 18%. 13% came from Central and South Eastern Europe and 13% from Eastern Europe and Central Asia. The major countries of origin were Russia, which alone accounted for 6% of all guest researchers in 2015, followed by China, the USA, India and Italy.At 38%, the highest proportion of foreign guest researchers in Germany worked in Mathematics and the Natural Sciences. 18% were Humanities
scholars, 15% worked in Law, Economics and Social Sciences, and 14% in Engineering. Academics and researchers who received funding from DFG or the Alexander von Humboldt Foundation often worked in Mathe-matics and the Natural Sciences, while the smaller German research or-ganisations more frequently supported researchers in the Humanities, Law, Economics and Social Sciences.A third of foreign guest researchers stayed in Germany for less than a month, a tenth for one to six months and a fifth for seven to twelve months. Just 6% of guest researchers stayed longer than a year. In 2015, a total of 2,814 Erasmus guest lecturers visited Germany. Al-most a third of them came from Eastern Europe, 28% from Western Eu-rope and 16% from Southern Europe. Poland, Spain and the United Kingdom were their main countries of origin.
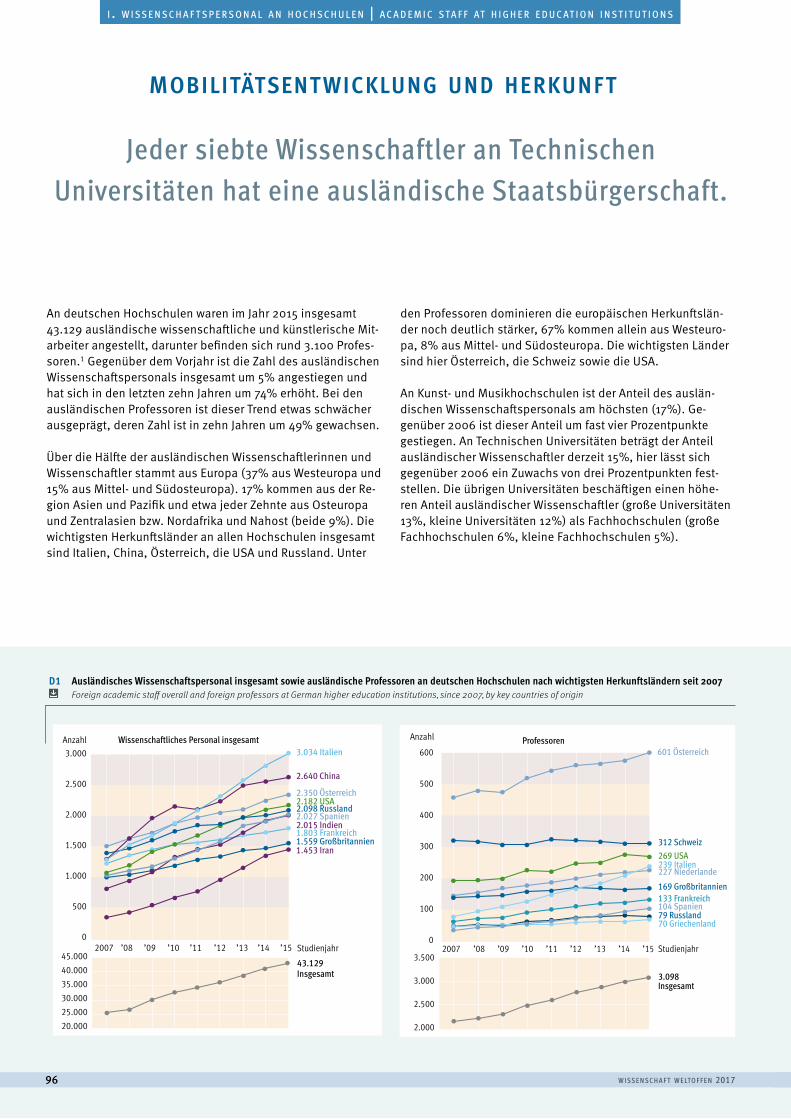
w i sse n sc h a f t w e lto f f e n 201796
a u s l ä n d i s c h e s t u d i e r e n d e | f o r e i g n s t u d e n t si . w i s s e n s c h a f t s p e r s o n a l a n h o c h s c h u l e n | a c a d e m i c s ta f f at h i g h e r e d u c at i o n i n s t i t u t i o n s
Jeder siebte Wissenschaftler an Technischen Universitäten hat eine ausländische Staatsbürgerschaft.
An deutschen Hochschulen waren im Jahr 2015 insgesamt 43.129 ausländische wissenschaftliche und künstlerische Mit-arbeiter angestellt, darunter befinden sich rund 3.100 Profes-soren.1 Gegenüber dem Vorjahr ist die Zahl des ausländischen Wissenschaftspersonals insgesamt um 5% angestiegen und hat sich in den letzten zehn Jahren um 74% erhöht. Bei den ausländischen Professoren ist dieser Trend etwas schwächer ausgeprägt, deren Zahl ist in zehn Jahren um 49% gewachsen.
Über die Hälfte der ausländischen Wissenschaftlerinnen und Wissenschaftler stammt aus Europa (37% aus Westeuropa und 15% aus Mittel- und Südosteuropa). 17% kommen aus der Re-gion Asien und Pazifik und etwa jeder Zehnte aus Osteuropa und Zentralasien bzw. Nordafrika und Nahost (beide 9%). Die wichtigsten Herkunftsländer an allen Hochschulen insgesamt sind Italien, China, Österreich, die USA und Russland. Unter
den Professoren dominieren die europäischen Herkunftslän-der noch deutlich stärker, 67% kommen allein aus Westeuro-pa, 8% aus Mittel- und Südosteuropa. Die wichtigsten Länder sind hier Österreich, die Schweiz sowie die USA.
An Kunst- und Musikhochschulen ist der Anteil des auslän-dischen Wissenschaftspersonals am höchsten (17%). Ge-genüber 2006 ist dieser Anteil um fast vier Prozentpunkte gestiegen. An Technischen Universitäten beträgt der Anteil ausländischer Wissenschaftler derzeit 15%, hier lässt sich gegenüber 2006 ein Zuwachs von drei Prozentpunkten fest-stellen. Die übrigen Universitäten beschäftigen einen höhe-ren Anteil ausländischer Wissenschaftler (große Universitäten 13%, kleine Universitäten 12%) als Fachhochschulen (große Fachhochschulen 6%, kleine Fachhochschulen 5%).
mobilitätsent wicklung und herkunft
D1 Ausländisches Wissenschaftspersonal insgesamt sowie ausländische Professoren an deutschen Hochschulen nach wichtigsten Herkunftsländern seit 2007 Foreign academic staff overall and foreign professors at German higher education institutions, since 2007, by key countries of origin
2007 Studienjahr’08 ’13 ’14 ’15’11 ’12’09 ’10
3.000
2.500
2.000
1.500
1.000
500
0
Anzahl
43.129Insgesamt
2.182 USA
1.803 Frankreich
2.027 Spanien2.015 Indien
1.559 Großbritannien1.453 Iran
2.350 Österreich
3.034 Italien Wissenschaftliches Personal insgesamt
2.098 Russland
2.640 China
20000
25000
30000
35000
40000
4500045.00040.00035.00030.00025.00020.000
2007 ’08 ’13 ’14 Studienjahr’15’11 ’12’09 ’10
600
500
400
300
200
100
0
3.500
3.000
2.500
2.000
3.098Insgesamt
269 USA
133 Frankreich
70 Griechenland
104 Spanien
169 Großbritannien
601 Österreich
239 Italien
79 Russland
227 Niederlande
312 Schweiz
Anzahl Professoren
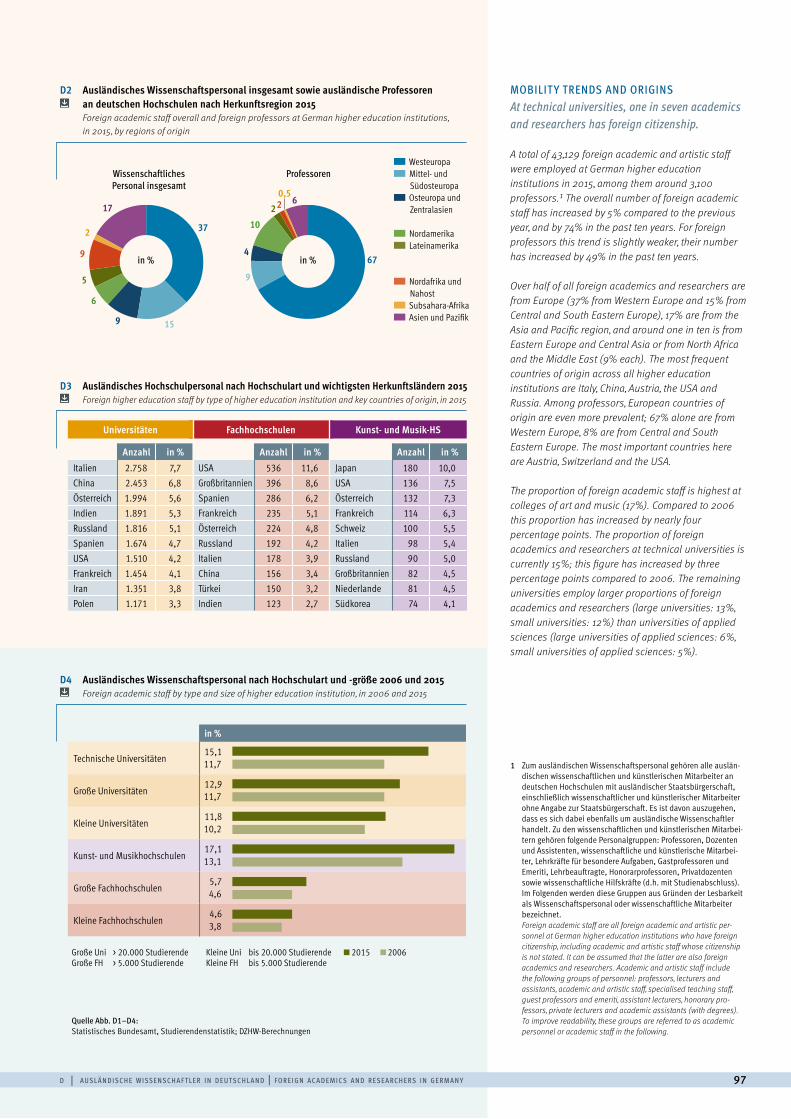
d | a u sl ä n d i sc h e w i sse n sc h a f t l e r i n d e ut sc h l a n d | f o r e i g n ac a d e m i cs a n d r ese a rc h e rs i n g e rm a n y 97
MOBILIT Y TRENDS AND ORIGINS At technical universities, one in seven academics and researchers has foreign citizenship.
A total of 43,129 foreign academic and artistic staff were employed at German higher education institutions in 2015, among them around 3,100 professors.1 The overall number of foreign academic staff has increased by 5% compared to the previous year, and by 74% in the past ten years. For foreign professors this trend is slightly weaker, their number has increased by 49% in the past ten years.
Over half of all foreign academics and researchers are from Europe (37% from Western Europe and 15% from Central and South Eastern Europe), 17% are from the Asia and Pacific region, and around one in ten is from Eastern Europe and Central Asia or from North Africa and the Middle East (9% each). The most frequent countries of origin across all higher education institutions are Italy, China, Austria, the USA and Russia. Among professors, European countries of origin are even more prevalent; 67% alone are from Western Europe, 8% are from Central and South Eastern Europe. The most important countries here are Austria, Switzerland and the USA.
The proportion of foreign academic staff is highest at colleges of art and music (17%). Compared to 2006 this proportion has increased by nearly four percentage points. The proportion of foreign academics and researchers at technical universities is currently 15%; this figure has increased by three percentage points compared to 2006. The remaining universities employ larger proportions of foreign academics and researchers (large universities: 13%, small universities: 12%) than universities of applied sciences (large universities of applied sciences: 6%, small universities of applied sciences: 5%).
Wissenschaftliches Personal insgesamt
Professoren
9
15
4
9
10
6
2
5
0,5
2
617 2
9
D4 Ausländisches Wissenschaftspersonal nach Hochschulart und -größe 2006 und 2015 Foreign academic staff by type and size of higher education institution, in 2006 and 2015
D2 Ausländisches Wissenschaftspersonal insgesamt sowie ausländische Professoren an deutschen Hochschulen nach Herkunftsregion 2015
Foreign academic staff overall and foreign professors at German higher education institutions, in 2015, by regions of origin
in %
Technische Universitäten15,1
Große Universitäten12,9
Kleine Universitäten11,8
Kunst- und Musikhochschulen17,1
Große Fachhochschulen5,7
Kleine Fachhochschulen4,6
0 5 10 15 20
2015 2006Große Uni > 20.000 Studierende Kleine Uni bis 20.000 Studierende Große FH > 5.000 Studierende Kleine FH bis 5.000 Studierende
1 Zum ausländischen Wissenschaftspersonal gehören alle auslän-dischen wissenschaftlichen und künstlerischen Mitarbeiter an deutschen Hochschulen mit ausländischer Staatsbürgerschaft, einschließlich wissenschaftlicher und künstlerischer Mitarbeiter ohne Angabe zur Staatsbürgerschaft. Es ist davon auszugehen, dass es sich dabei ebenfalls um ausländische Wissenschaftler handelt. Zu den wissenschaftlichen und künstlerischen Mitarbei-tern gehören folgende Personalgruppen: Professoren, Dozenten und Assistenten, wissenschaftliche und künstlerische Mitarbei-ter, Lehrkräfte für besondere Aufgaben, Gastprofessoren und Emeriti, Lehrbeauftragte, Honorarprofessoren, Privatdozenten sowie wissenschaftliche Hilfskräfte (d.h. mit Studienabschluss). Im Folgenden werden diese Gruppen aus Gründen der Lesbarkeit als Wissenschaftspersonal oder wissenschaftliche Mitarbeiter bezeichnet. Foreign academic staff are all foreign academic and artistic per-sonnel at German higher education institutions who have foreign citizenship, including academic and artistic staff whose citizenship is not stated. It can be assumed that the latter are also foreign academics and researchers. Academic and artistic staff include the following groups of personnel: professors, lecturers and assistants, academic and artistic staff, specialised teaching staff, guest professors and emeriti, assistant lecturers, honorary pro-fessors, private lecturers and academic assistants (with degrees). To improve readability, these groups are referred to as academic personnel or academic staff in the following.
Quelle Abb. D1–D4:Statistisches Bundesamt, Studierendenstatistik; DZHW-Berechnungen
Westeuropa Mittel- und
Südosteuropa Osteuropa und
Zentralasien
Nordamerika Lateinamerika
Nordafrika und Nahost
Subsahara-Afrika Asien und Pazifik
in %in % 67
37
D3 Ausländisches Hochschulpersonal nach Hochschulart und wichtigsten Herkunftsländern 2015 Foreign higher education staff by type of higher education institution and key countries of origin, in 2015
Anzahl in %Italien 2.758 7,7China 2.453 6,8Österreich 1.994 5,6Indien 1.891 5,3Russland 1.816 5,1Spanien 1.674 4,7USA 1.510 4,2Frankreich 1.454 4,1Iran 1.351 3,8Polen 1.171 3,3
Anzahl in %USA 536 11,6Großbritannien 396 8,6Spanien 286 6,2Frankreich 235 5,1Österreich 224 4,8Russland 192 4,2Italien 178 3,9China 156 3,4Türkei 150 3,2Indien 123 2,7
Anzahl in %Japan 180 10,0USA 136 7,5Österreich 132 7,3Frankreich 114 6,3Schweiz 100 5,5Italien 98 5,4Russland 90 5,0Großbritannien 82 4,5Niederlande 81 4,5Südkorea 74 4,1
FachhochschulenUniversitäten Kunst- und Musik-HS
11,7
11,7
10,2
13,1
4,6
3,8
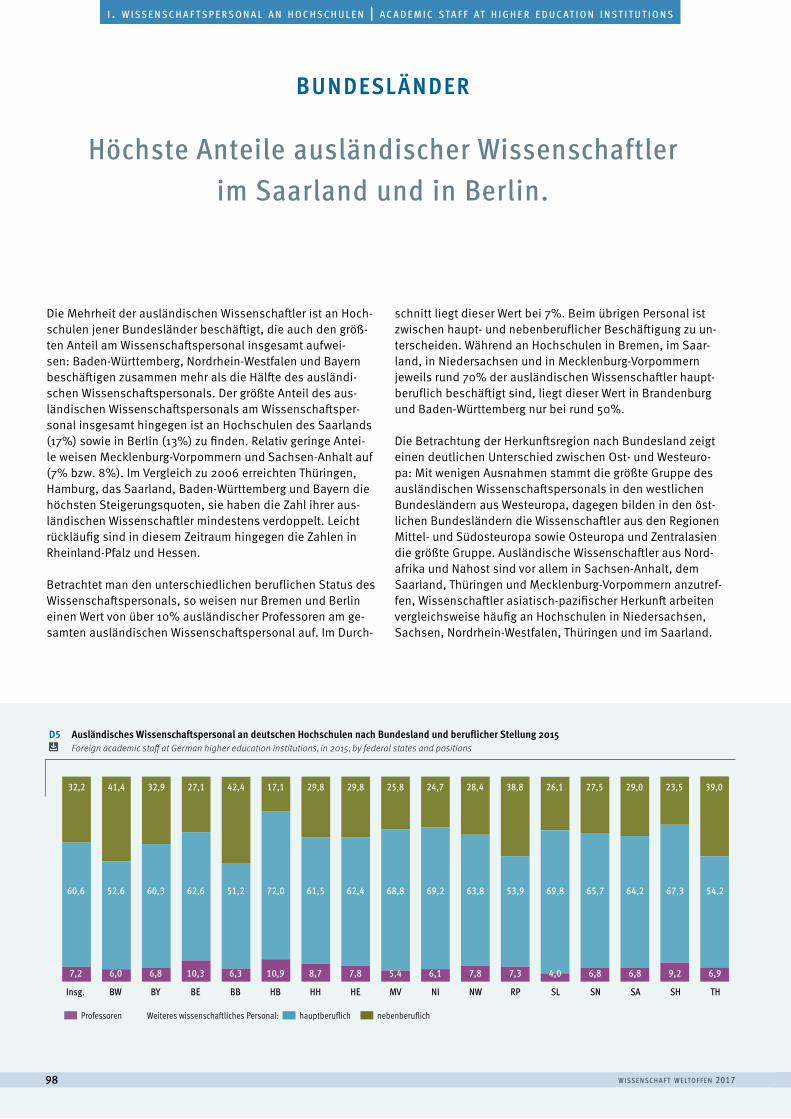
w i sse n sc h a f t w e lto f f e n 201798
a u s l ä n d i s c h e s t u d i e r e n d e | f o r e i g n s t u d e n t si . w i s s e n s c h a f t s p e r s o n a l a n h o c h s c h u l e n | a c a d e m i c s ta f f at h i g h e r e d u c at i o n i n s t i t u t i o n s
D5 Ausländisches Wissenschaftspersonal an deutschen Hochschulen nach Bundesland und beruflicher Stellung 2015 Foreign academic staff at German higher education institutions, in 2015, by federal states and positions
Höchste Anteile ausländischer Wissenschaftler im Saarland und in Berlin.
Die Mehrheit der ausländischen Wissenschaftler ist an Hoch-schulen jener Bundesländer beschäftigt, die auch den größ-ten Anteil am Wissenschaftspersonal insgesamt aufwei-sen: Baden-Württemberg, Nordrhein-Westfalen und Bayern beschäftigen zusammen mehr als die Hälfte des ausländi-schen Wissenschaftspersonals. Der größte Anteil des aus-ländischen Wissenschaftspersonals am Wissenschaftsper-sonal insgesamt hingegen ist an Hochschulen des Saarlands (17%) sowie in Berlin (13%) zu finden. Relativ geringe Antei-le weisen Mecklenburg-Vorpommern und Sachsen-Anhalt auf (7% bzw. 8%). Im Vergleich zu 2006 erreichten Thüringen, Hamburg, das Saarland, Baden-Württemberg und Bayern die höchsten Steigerungsquoten, sie haben die Zahl ihrer aus-ländischen Wissenschaftler mindestens verdoppelt. Leicht rückläufig sind in diesem Zeitraum hingegen die Zahlen in Rheinland-Pfalz und Hessen.
Betrachtet man den unterschiedlichen beruflichen Status des Wissenschaftspersonals, so weisen nur Bremen und Berlin einen Wert von über 10% ausländischer Professoren am ge-samten ausländischen Wissenschaftspersonal auf. Im Durch-
schnitt liegt dieser Wert bei 7%. Beim übrigen Personal ist zwischen haupt- und nebenberuflicher Beschäftigung zu un-terscheiden. Während an Hochschulen in Bremen, im Saar-land, in Niedersachsen und in Mecklenburg-Vorpommern jeweils rund 70% der ausländischen Wissenschaftler haupt-beruflich beschäftigt sind, liegt dieser Wert in Brandenburg und Baden-Württemberg nur bei rund 50%.
Die Betrachtung der Herkunftsregion nach Bundesland zeigt einen deutlichen Unterschied zwischen Ost- und Westeuro-pa: Mit wenigen Ausnahmen stammt die größte Gruppe des ausländischen Wissenschaftspersonals in den westlichen Bundesländern aus Westeuropa, dagegen bilden in den öst-lichen Bundesländern die Wissenschaftler aus den Regionen Mittel- und Südosteuropa sowie Osteuropa und Zentralasien die größte Gruppe. Ausländische Wissenschaftler aus Nord-afrika und Nahost sind vor allem in Sachsen-Anhalt, dem Saarland, Thüringen und Mecklenburg-Vorpommern anzutref-fen, Wissenschaftler asiatisch-pazifischer Herkunft arbeiten vergleichsweise häufig an Hochschulen in Niedersachsen, Sachsen, Nordrhein-Westfalen, Thüringen und im Saarland.
bundesländer
0
24
48
72
96
120
BWInsg. BY HB MV RP SABB HE NW SN THBE HH NI SL SH
60,6 52,6 60,3 62,6 51,2 72,0 61,5 62,4 68,8 69,2 63,8 53,9 69,8 65,7 64,2 67,3 54,2
7,2 6,0 6,8 10,3 6,3 10,9 8,7 7,8 5,4 6,1 7,8 7,3 4,0 6,8 6,8 9,2 6,9
32,2 41,4 32,9 27,1 42,4 17,1 29,8 29,8 25,8 24,7 28,4 38,8 26,1 27,5 29,0 23,5 39,0
Professoren Weiteres wissenschaftliches Personal: hauptberuflich nebenberuflich
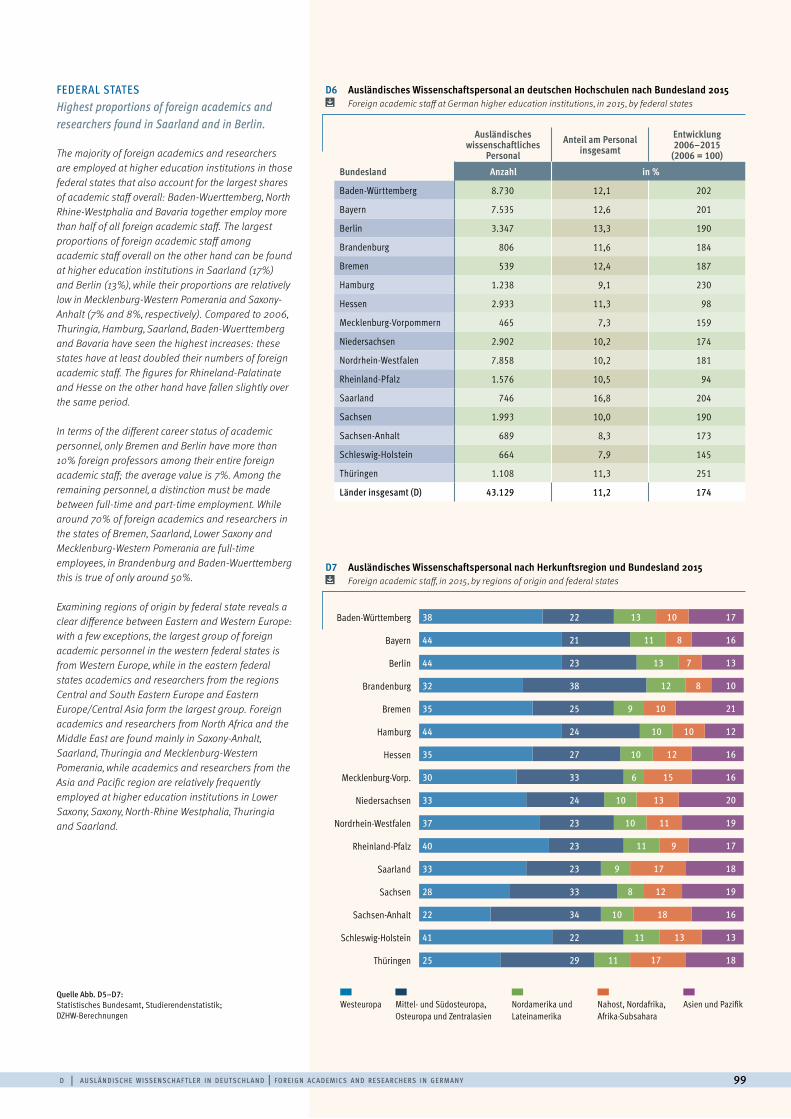
d | a u sl ä n d i sc h e w i sse n sc h a f t l e r i n d e ut sc h l a n d | f o r e i g n ac a d e m i cs a n d r ese a rc h e rs i n g e rm a n y 99
FEDERAL STATES Highest proportions of foreign academics and researchers found in Saarland and in Berlin.
The majority of foreign academics and researchers are employed at higher education institutions in those federal states that also account for the largest shares of academic staff overall: Baden-Wuerttemberg, North Rhine-Westphalia and Bavaria together employ more than half of all foreign academic staff. The largest proportions of foreign academic staff among academic staff overall on the other hand can be found at higher education institutions in Saarland (17%) and Berlin (13%), while their proportions are relatively low in Mecklenburg-Western Pomerania and Saxony- Anhalt (7% and 8%, respectively). Compared to 2006, Thuringia, Hamburg, Saarland, Baden-Wuerttemberg and Bavaria have seen the highest increases: these states have at least doubled their numbers of foreign academic staff. The figures for Rhineland-Palatinate and Hesse on the other hand have fallen slightly over the same period.
In terms of the different career status of academic personnel, only Bremen and Berlin have more than 10% foreign professors among their entire foreign academic staff; the average value is 7%. Among the remaining personnel, a distinction must be made between full-time and part-time employment. While around 70% of foreign academics and researchers in the states of Bremen, Saarland, Lower Saxony and Mecklenburg-Western Pomerania are full-time employees, in Brandenburg and Baden-Wuerttemberg this is true of only around 50%.
Examining regions of origin by federal state reveals a clear difference between Eastern and Western Europe: with a few exceptions, the largest group of foreign academic personnel in the western federal states is from Western Europe, while in the eastern federal states academics and researchers from the regions Central and South Eastern Europe and Eastern Europe/Central Asia form the largest group. Foreign academics and researchers from North Africa and the Middle East are found mainly in Saxony-Anhalt, Saarland, Thuringia and Mecklenburg-Western Pomerania, while academics and researchers from the Asia and Pacific region are relatively frequently employed at higher education institutions in Lower Saxony, Saxony, North-Rhine Westphalia, Thuringia and Saarland.
Ausländisches wissenschaftliches
PersonalAnteil am Personal
insgesamtEntwicklung 2006–2015
(2006 = 100)
Bundesland Anzahl in %
Baden-Württemberg 8.730 12,1 202
Bayern 7.535 12,6 201
Berlin 3.347 13,3 190
Brandenburg 806 11,6 184
Bremen 539 12,4 187
Hamburg 1.238 9,1 230
Hessen 2.933 11,3 98
Mecklenburg-Vorpommern 465 7,3 159
Niedersachsen 2.902 10,2 174
Nordrhein-Westfalen 7.858 10,2 181
Rheinland-Pfalz 1.576 10,5 94
Saarland 746 16,8 204
Sachsen 1.993 10,0 190
Sachsen-Anhalt 689 8,3 173
Schleswig-Holstein 664 7,9 145
Thüringen 1.108 11,3 251
Länder insgesamt (D) 43.129 11,2 174
D6 Ausländisches Wissenschaftspersonal an deutschen Hochschulen nach Bundesland 2015 Foreign academic staff at German higher education institutions, in 2015, by federal states
D7 Ausländisches Wissenschaftspersonal nach Herkunftsregion und Bundesland 2015 Foreign academic staff, in 2015, by regions of origin and federal states
Baden-Württemberg
Bayern
Berlin
Brandenburg
Bremen
Hamburg
Hessen
Mecklenburg-Vorp.
Niedersachsen
Nordrhein-Westfalen
Rheinland-Pfalz
Saarland
Sachsen
Sachsen-Anhalt
Schleswig-Holstein
Thüringen
0,0000 16,6667 33,3334 50,0001 66,6668 83,3335
38
44
44
32
35
44
35
30
33
37
40
33
28
22
41
25
22
21
23
38
25
24
27
33
24
23
23
23
33
34
22
29
13
11
13
12
9
10
10
6
10
10
11
9
8
10
11
11
10
8
7
8
10
10
12
15
13
11
9
17
12
18
13
17
16
13
10
21
12
16
16
20
19
17
18
19
16
13
1817
Quelle Abb. D5–D7:Statistisches Bundesamt, Studierendenstatistik; DZHW-Berechnungen
Westeuropa Nordamerika und Lateinamerika
Nahost, Nordafrika, Afrika-Subsahara
Asien und PazifikMittel- und Südosteuropa, Osteuropa und Zentralasien
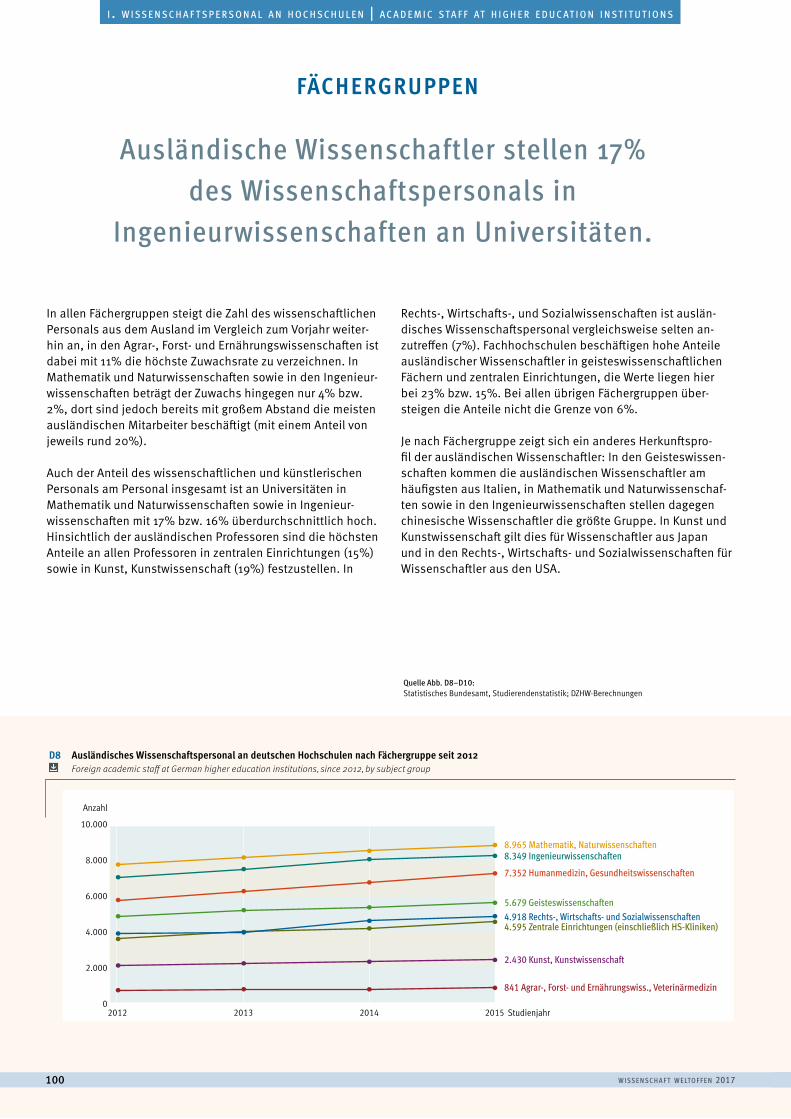
2012 2013 2014 2015 Studienjahr
10.000
8.000
6.000
4.000
2.000
0
Anzahl
5.679 Geisteswissenschaften
8.349 Ingenieurwissenschaften
4.918 Rechts-, Wirtschafts- und Sozialwissenschaften
8.965 Mathematik, Naturwissenschaften
7.352 Humanmedizin, Gesundheitswissenschaften
2.430 Kunst, Kunstwissenschaft
4.595 Zentrale Einrichtungen (einschließlich HS-Kliniken)
841 Agrar-, Forst- und Ernährungswiss., Veterinärmedizin
w i sse n sc h a f t w e lto f f e n 2017100
a u s l ä n d i s c h e s t u d i e r e n d e | f o r e i g n s t u d e n t si . w i s s e n s c h a f t s p e r s o n a l a n h o c h s c h u l e n | a c a d e m i c s ta f f at h i g h e r e d u c at i o n i n s t i t u t i o n s
Ausländische Wissenschaftler stellen 17% des Wissenschaftspersonals in
Ingenieurwissenschaften an Universitäten.
In allen Fächergruppen steigt die Zahl des wissenschaftlichen Personals aus dem Ausland im Vergleich zum Vorjahr weiter-hin an, in den Agrar-, Forst- und Ernährungswissenschaften ist dabei mit 11% die höchste Zuwachsrate zu verzeichnen. In Mathematik und Naturwissenschaften sowie in den Ingenieur-wissenschaften beträgt der Zuwachs hingegen nur 4% bzw. 2%, dort sind jedoch bereits mit großem Abstand die meisten ausländischen Mitarbeiter beschäftigt (mit einem Anteil von jeweils rund 20%).
Auch der Anteil des wissenschaftlichen und künstlerischen Personals am Personal insgesamt ist an Universitäten in Mathematik und Naturwissenschaften sowie in Ingenieur- wissenschaften mit 17% bzw. 16% überdurchschnittlich hoch. Hinsichtlich der ausländischen Professoren sind die höchsten Anteile an allen Professoren in zentralen Einrichtungen (15%) sowie in Kunst, Kunstwissenschaft (19%) festzustellen. In
Rechts-, Wirtschafts-, und Sozialwissenschaften ist auslän- disches Wissenschaftspersonal vergleichsweise selten an- zutreffen (7%). Fachhochschulen beschäftigen hohe Anteile ausländischer Wissenschaftler in geisteswissenschaftlichen Fächern und zentralen Einrichtungen, die Werte liegen hier bei 23% bzw. 15%. Bei allen übrigen Fächergruppen über- steigen die Anteile nicht die Grenze von 6%.
Je nach Fächergruppe zeigt sich ein anderes Herkunftspro-fil der ausländischen Wissenschaftler: In den Geisteswissen-schaften kommen die ausländischen Wissenschaftler am häufigsten aus Italien, in Mathematik und Naturwissenschaf-ten sowie in den Ingenieurwissenschaften stellen dagegen chinesische Wissenschaftler die größte Gruppe. In Kunst und Kunstwissenschaft gilt dies für Wissenschaftler aus Japan und in den Rechts-, Wirtschafts- und Sozialwissenschaften für Wissenschaftler aus den USA.
fächergruppen
Quelle Abb. D8–D10:Statistisches Bundesamt, Studierendenstatistik; DZHW-Berechnungen
D8 Ausländisches Wissenschaftspersonal an deutschen Hochschulen nach Fächergruppe seit 2012 Foreign academic staff at German higher education institutions, since 2012, by subject group
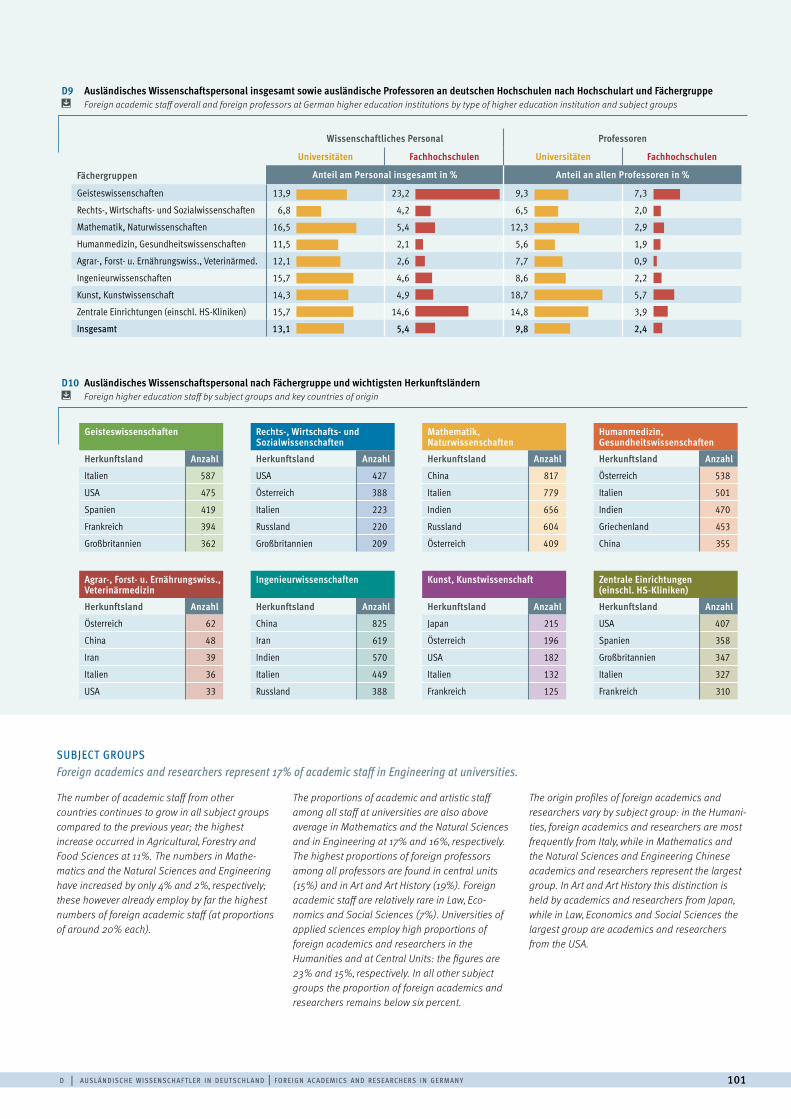
Wissenschaftliches Personal Professoren
Universitäten Fachhochschulen Universitäten Fachhochschulen
Fächergruppen Anteil am Personal insgesamt in % Anteil an allen Professoren in %
Geisteswissenschaften 13,9 23,2 9,3 7,3
Rechts-, Wirtschafts- und Sozialwissenschaften 6,8 4,2 6,5 2,0
Mathematik, Naturwissenschaften 16,5 5,4 12,3 2,9
Humanmedizin, Gesundheitswissenschaften 11,5 2,1 5,6 1,9
Agrar-, Forst- u. Ernährungswiss., Veterinärmed. 12,1 2,6 7,7 0,9
Ingenieurwissenschaften 15,7 4,6 8,6 2,2
Kunst, Kunstwissenschaft 14,3 4,9 18,7 5,7
Zentrale Einrichtungen (einschl. HS-Kliniken) 15,7 14,6 14,8 3,9
Insgesamt 13,1 5,4 9,8 2,4
0,000 3,125 6,250 9,375 12,50015,62518,75021,87525,000 0,000 3,125 6,250 9,375 12,50015,62518,75021,87525,000 0,000 3,125 6,250 9,375 12,50015,62518,75021,87525,000 0,000 3,125 6,250 9,375 12,50015,62518,75021,87525,000
d | a u sl ä n d i sc h e w i sse n sc h a f t l e r i n d e ut sc h l a n d | f o r e i g n ac a d e m i cs a n d r ese a rc h e rs i n g e rm a n y 101
SUBJECT GROUPS Foreign academics and researchers represent 17% of academic staff in Engineering at universities.
The number of academic staff from other countries continues to grow in all subject groups compared to the previous year; the highest increase occurred in Agricultural, Forestry and Food Sciences at 11%. The numbers in Mathe-matics and the Natural Sciences and Engineering have increased by only 4% and 2%, respectively; these however already employ by far the highest numbers of foreign academic staff (at proportions of around 20% each).
The proportions of academic and artistic staff among all staff at universities are also above average in Mathematics and the Natural Sciences and in Engineering at 17% and 16%, respectively. The highest proportions of foreign professors among all professors are found in central units (15%) and in Art and Art History (19%). Foreign academic staff are relatively rare in Law, Eco- nomics and Social Sciences (7%). Universities of applied sciences employ high proportions of foreign academics and researchers in the Humanities and at Central Units: the figures are 23% and 15%, respectively. In all other subject groups the proportion of foreign academics and researchers remains below six percent.
The origin profiles of foreign academics and researchers vary by subject group: in the Humani-ties, foreign academics and researchers are most frequently from Italy, while in Mathematics and the Natural Sciences and Engineering Chinese academics and researchers represent the largest group. In Art and Art History this distinction is held by academics and researchers from Japan, while in Law, Economics and Social Sciences the largest group are academics and researchers from the USA.
D9 Ausländisches Wissenschaftspersonal insgesamt sowie ausländische Professoren an deutschen Hochschulen nach Hochschulart und Fächergruppe Foreign academic staff overall and foreign professors at German higher education institutions by type of higher education institution and subject groups
D10 Ausländisches Wissenschaftspersonal nach Fächergruppe und wichtigsten Herkunftsländern Foreign higher education staff by subject groups and key countries of origin
Rechts-, Wirtschafts- und Sozialwissenschaften
Herkunftsland Anzahl
USA 427
Österreich 388
Italien 223
Russland 220
Großbritannien 209
Ingenieurwissenschaften
Herkunftsland Anzahl
China 825
Iran 619
Indien 570
Italien 449
Russland 388
Humanmedizin, Gesundheitswissenschaften
Herkunftsland Anzahl
Österreich 538
Italien 501
Indien 470
Griechenland 453
China 355
Zentrale Einrichtungen (einschl. HS-Kliniken)
Herkunftsland Anzahl
USA 407
Spanien 358
Großbritannien 347
Italien 327
Frankreich 310
Geisteswissenschaften
Herkunftsland Anzahl
Italien 587
USA 475
Spanien 419
Frankreich 394
Großbritannien 362
Agrar-, Forst- u. Ernährungswiss., Veterinärmedizin
Herkunftsland Anzahl
Österreich 62
China 48
Iran 39
Italien 36
USA 33
Mathematik, Naturwissenschaften
Herkunftsland Anzahl
China 817
Italien 779
Indien 656
Russland 604
Österreich 409
Kunst, Kunstwissenschaft
Herkunftsland Anzahl
Japan 215
Österreich 196
USA 182
Italien 132
Frankreich 125
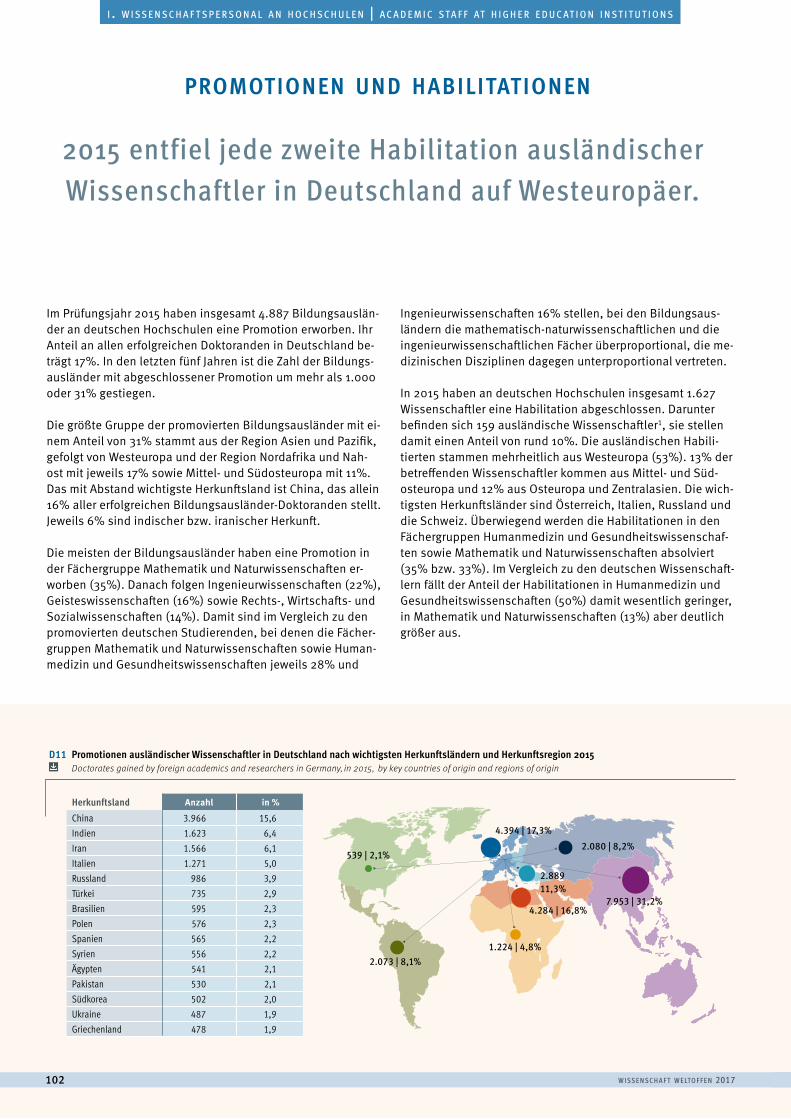
w i sse n sc h a f t w e lto f f e n 2017102
a u s l ä n d i s c h e s t u d i e r e n d e | f o r e i g n s t u d e n t si . w i s s e n s c h a f t s p e r s o n a l a n h o c h s c h u l e n | a c a d e m i c s ta f f at h i g h e r e d u c at i o n i n s t i t u t i o n s
2015 entfiel jede zweite Habilitation ausländischer Wissenschaftler in Deutschland auf Westeuropäer.
Im Prüfungsjahr 2015 haben insgesamt 4.887 Bildungsauslän-der an deutschen Hochschulen eine Promotion erworben. Ihr Anteil an allen erfolgreichen Doktoranden in Deutschland be-trägt 17%. In den letzten fünf Jahren ist die Zahl der Bildungs-ausländer mit abgeschlossener Promotion um mehr als 1.000 oder 31% gestiegen.
Die größte Gruppe der promovierten Bildungsausländer mit ei-nem Anteil von 31% stammt aus der Region Asien und Pazifik, gefolgt von Westeuropa und der Region Nordafrika und Nah-ost mit jeweils 17% sowie Mittel- und Südosteuropa mit 11%. Das mit Abstand wichtigste Herkunftsland ist China, das allein 16% aller erfolgreichen Bildungsausländer-Doktoranden stellt. Jeweils 6% sind indischer bzw. iranischer Herkunft.
Die meisten der Bildungsausländer haben eine Promotion in der Fächergruppe Mathematik und Naturwissenschaften er-worben (35%). Danach folgen Ingenieurwissenschaften (22%), Geisteswissenschaften (16%) sowie Rechts-, Wirtschafts- und Sozialwissenschaften (14%). Damit sind im Vergleich zu den promovierten deutschen Studierenden, bei denen die Fächer-gruppen Mathematik und Naturwissenschaften sowie Human-medizin und Gesundheitswissenschaften jeweils 28% und
Ingenieurwissenschaften 16% stellen, bei den Bildungsaus-ländern die mathematisch-naturwissenschaftlichen und die ingenieurwissenschaftlichen Fächer überproportional, die me-dizinischen Disziplinen dagegen unterproportional vertreten.
In 2015 haben an deutschen Hochschulen insgesamt 1.627 Wissenschaftler eine Habilitation abgeschlossen. Darunter befinden sich 159 ausländische Wissenschaftler1, sie stellen damit einen Anteil von rund 10%. Die ausländischen Habili-tierten stammen mehrheitlich aus Westeuropa (53%). 13% der betreffenden Wissenschaftler kommen aus Mittel- und Süd-osteuropa und 12% aus Osteuropa und Zentralasien. Die wich-tigsten Herkunftsländer sind Österreich, Italien, Russland und die Schweiz. Überwiegend werden die Habilitationen in den Fächergruppen Humanmedizin und Gesundheitswissenschaf-ten sowie Mathematik und Naturwissenschaften absolviert (35% bzw. 33%). Im Vergleich zu den deutschen Wissenschaft-lern fällt der Anteil der Habilitationen in Humanmedizin und Gesundheitswissenschaften (50%) damit wesentlich geringer, in Mathematik und Naturwissenschaften (13%) aber deutlich größer aus.
promotionen und habilitationen
Ohne regionale EinteilungAsien, Pazi�kAfrika SubsaharaNahost, NordafrikaLateinamerikaNordamerikaOsteuropa, Zentralasien und SüdkaukasusMittel- und SüdosteuropaWest-, Nord- und Südeuropa
4.394 | 17,3%
539 | 2,1%
2.073 | 8,1%1.224 | 4,8%
4.284 | 16,8%
2.88911,3%
2.080 | 8,2%
7.953 | 31,2%
D11 Promotionen ausländischer Wissenschaftler in Deutschland nach wichtigsten Herkunftsländern und Herkunftsregion 2015 Doctorates gained by foreign academics and researchers in Germany, in 2015, by key countries of origin and regions of origin
Herkunftsland Anzahl in %
China 3.966 15,6Indien 1.623 6,4Iran 1.566 6,1Italien 1.271 5,0Russland 986 3,9Türkei 735 2,9Brasilien 595 2,3Polen 576 2,3Spanien 565 2,2Syrien 556 2,2Ägypten 541 2,1Pakistan 530 2,1Südkorea 502 2,0Ukraine 487 1,9Griechenland 478 1,9
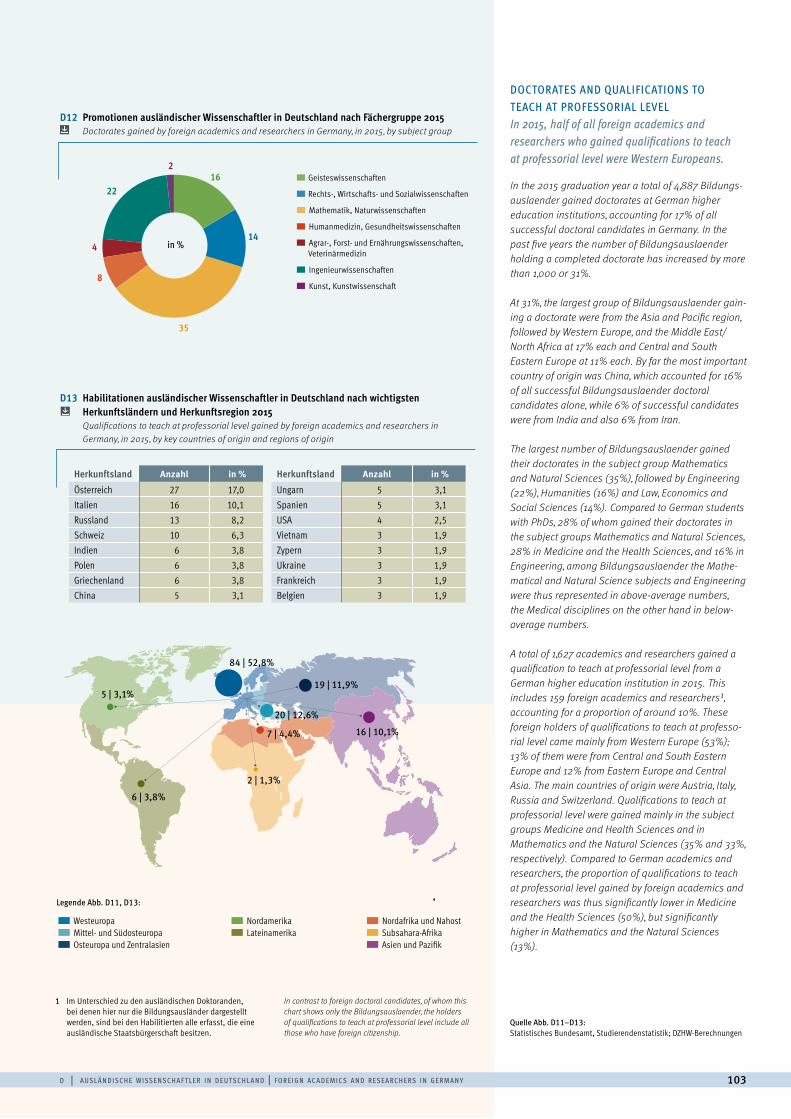
d | a u sl ä n d i sc h e w i sse n sc h a f t l e r i n d e ut sc h l a n d | f o r e i g n ac a d e m i cs a n d r ese a rc h e rs i n g e rm a n y 103
DOCTORATES AND QUALIFICATIONS TO TEACH AT PROFESSORIAL LEVEL In 2015, half of all foreign academics and researchers who gained qualifications to teach at professorial level were Western Europeans.
In the 2015 graduation year a total of 4,887 Bildungs-auslaender gained doctorates at German higher education institutions, accounting for 17% of all successful doctoral candidates in Germany. In the past five years the number of Bildungsauslaender holding a completed doctorate has increased by more than 1,000 or 31%.
At 31%, the largest group of Bildungsauslaender gain-ing a doctorate were from the Asia and Pacific region, followed by Western Europe, and the Middle East/North Africa at 17% each and Central and South Eastern Europe at 11% each. By far the most important country of origin was China, which accounted for 16% of all successful Bildungsauslaender doctoral candidates alone, while 6% of successful candidates were from India and also 6% from Iran.
The largest number of Bildungsauslaender gained their doctorates in the subject group Mathematics and Natural Sciences (35%), followed by Engineering (22%), Humanities (16%) and Law, Economics and Social Sciences (14%). Compared to German students with PhDs, 28% of whom gained their doctorates in the subject groups Mathematics and Natural Sciences, 28% in Medicine and the Health Sciences, and 16% in Engineering, among Bildungsauslaender the Mathe- matical and Natural Science subjects and Engineering were thus represented in above-average numbers, the Medical disciplines on the other hand in below- average numbers.
A total of 1,627 academics and researchers gained a qualification to teach at professorial level from a German higher education institution in 2015. This includes 159 foreign academics and researchers1, accounting for a proportion of around 10%. These foreign holders of qualifications to teach at professo-rial level came mainly from Western Europe (53%); 13% of them were from Central and South Eastern Europe and 12% from Eastern Europe and Central Asia. The main countries of origin were Austria, Italy, Russia and Switzerland. Qualifications to teach at professorial level were gained mainly in the subject groups Medicine and Health Sciences and in Mathematics and the Natural Sciences (35% and 33%, respectively). Compared to German academics and researchers, the proportion of qualifications to teach at professorial level gained by foreign academics and researchers was thus significantly lower in Medicine and the Health Sciences (50%), but significantly higher in Mathematics and the Natural Sciences (13%).
Westeuropa Mittel- und Südosteuropa Osteuropa und Zentralasien
Nordamerika Lateinamerika
Nordafrika und Nahost Subsahara-Afrika Asien und Pazifik
Ohne regionale EinteilungAsien, Pazi�kAfrika SubsaharaNahost, NordafrikaLateinamerikaNordamerikaOsteuropa, Zentralasien und SüdkaukasusMittel- und SüdosteuropaWest-, Nord- und Südeuropa
84 | 52,8%
5 | 3,1%
6 | 3,8%
2 | 1,3%
7 | 4,4%
20 | 12,6%
19 | 11,9%
16 | 10,1%
Legende Abb. D11, D13:
1 Im Unterschied zu den ausländischen Doktoranden, bei denen hier nur die Bildungsausländer dargestellt werden, sind bei den Habilitierten alle erfasst, die eine ausländische Staatsbürgerschaft besitzen.
In contrast to foreign doctoral candidates, of whom this chart shows only the Bildungsauslaender, the holders of qualifications to teach at professorial level include all those who have foreign citizenship.
Quelle Abb. D11–D13:Statistisches Bundesamt, Studierendenstatistik; DZHW-Berechnungen
Herkunftsland Anzahl in %
Österreich 27 17,0Italien 16 10,1Russland 13 8,2Schweiz 10 6,3Indien 6 3,8Polen 6 3,8Griechenland 6 3,8China 5 3,1
Herkunftsland Anzahl in %
Ungarn 5 3,1Spanien 5 3,1USA 4 2,5Vietnam 3 1,9Zypern 3 1,9Ukraine 3 1,9Frankreich 3 1,9Belgien 3 1,9
D12 Promotionen ausländischer Wissenschaftler in Deutschland nach Fächergruppe 2015 Doctorates gained by foreign academics and researchers in Germany, in 2015, by subject group
D13 Habilitationen ausländischer Wissenschaftler in Deutschland nach wichtigsten Herkunftsländern und Herkunftsregion 2015 Qualifications to teach at professorial level gained by foreign academics and researchers in Germany, in 2015, by key countries of origin and regions of origin
Geisteswissenschaften
Rechts-, Wirtschafts- und Sozialwissenschaften
Mathematik, Naturwissenschaften
Humanmedizin, Gesundheitswissenschaften
Agrar-, Forst- und Ernährungswissenschaften, Veterinärmedizin
Ingenieurwissenschaften
Kunst, Kunstwissenschaft
in %
16
14
35
8
4
22
2
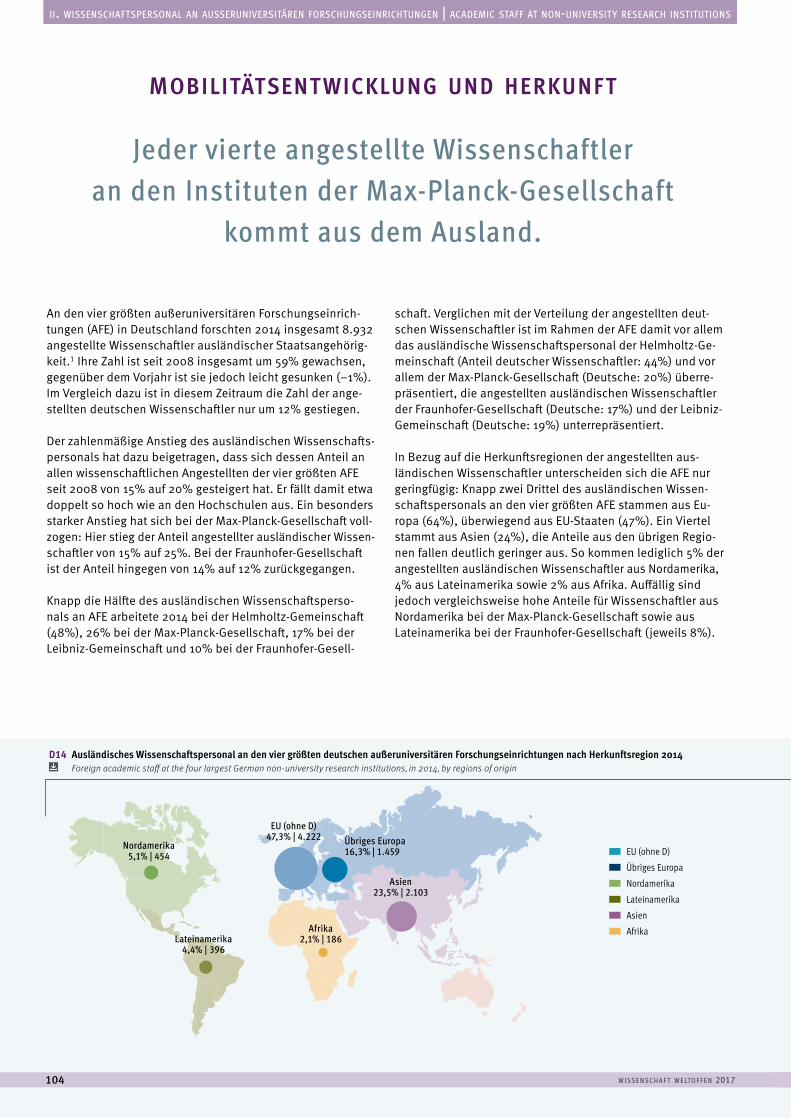
w i sse n sc h a f t w e lto f f e n 2017104
a u s l ä n d i s c h e s t u d i e r e n d e | f o r e i g n s t u d e n t sii. wissenschaftspersonal an ausseruniversitären forschungseinrichtungen | academic staff at non-university research institutions
D14 Ausländisches Wissenschaftspersonal an den vier größten deutschen außeruniversitären Forschungseinrichtungen nach Herkunftsregion 2014 Foreign academic staff at the four largest German non-university research institutions, in 2014, by regions of origin
Jeder vierte angestellte Wissenschaftler an den Instituten der Max-Planck-Gesellschaft
kommt aus dem Ausland.
An den vier größten außeruniversitären Forschungseinrich-tungen (AFE) in Deutschland forschten 2014 insgesamt 8.932 angestellte Wissenschaftler ausländischer Staatsangehörig-keit.1 Ihre Zahl ist seit 2008 insgesamt um 59% gewachsen, gegenüber dem Vorjahr ist sie jedoch leicht gesunken (–1%). Im Vergleich dazu ist in diesem Zeitraum die Zahl der ange-stellten deutschen Wissenschaftler nur um 12% gestiegen.
Der zahlenmäßige Anstieg des ausländischen Wissenschafts-personals hat dazu beigetragen, dass sich dessen Anteil an allen wissenschaftlichen Angestellten der vier größten AFE seit 2008 von 15% auf 20% gesteigert hat. Er fällt damit etwa doppelt so hoch wie an den Hochschulen aus. Ein besonders starker Anstieg hat sich bei der Max-Planck-Gesellschaft voll- zogen: Hier stieg der Anteil angestellter ausländischer Wissen- schaftler von 15% auf 25%. Bei der Fraunhofer-Gesellschaft ist der Anteil hingegen von 14% auf 12% zurückgegangen.
Knapp die Hälfte des ausländischen Wissenschaftsperso-nals an AFE arbeitete 2014 bei der Helmholtz-Gemeinschaft (48%), 26% bei der Max-Planck-Gesellschaft, 17% bei der Leibniz-Gemeinschaft und 10% bei der Fraunhofer-Gesell-
schaft. Verglichen mit der Verteilung der angestellten deut-schen Wissenschaftler ist im Rahmen der AFE damit vor allem das ausländische Wissenschaftspersonal der Helmholtz-Ge-meinschaft (Anteil deutscher Wissenschaftler: 44%) und vor allem der Max-Planck-Gesellschaft (Deutsche: 20%) überre-präsentiert, die angestellten ausländischen Wissenschaftler der Fraunhofer-Gesellschaft (Deutsche: 17%) und der Leibniz-Gemeinschaft (Deutsche: 19%) unterrepräsentiert.
In Bezug auf die Herkunftsregionen der angestellten aus-ländischen Wissenschaftler unterscheiden sich die AFE nur geringfügig: Knapp zwei Drittel des ausländischen Wissen-schaftspersonals an den vier größten AFE stammen aus Eu-ropa (64%), überwiegend aus EU-Staaten (47%). Ein Viertel stammt aus Asien (24%), die Anteile aus den übrigen Regio-nen fallen deutlich geringer aus. So kommen lediglich 5% der angestellten ausländischen Wissenschaftler aus Nordamerika, 4% aus Lateinamerika sowie 2% aus Afrika. Auffällig sind jedoch vergleichsweise hohe Anteile für Wissenschaftler aus Nordamerika bei der Max-Planck-Gesellschaft sowie aus Lateinamerika bei der Fraunhofer-Gesellschaft (jeweils 8%).
mobilitätsent wicklung und herkunft
Lateinamerika4,4% | 396
Nordamerika5,1% | 454
EU (ohne D)47,3% | 4.222 Übriges Europa
16,3% | 1.459
Asien23,5% | 2.103
Afrika2,1% | 186
EU (ohne D)
Übriges Europa
Nordamerika
Lateinamerika
Asien
Afrika
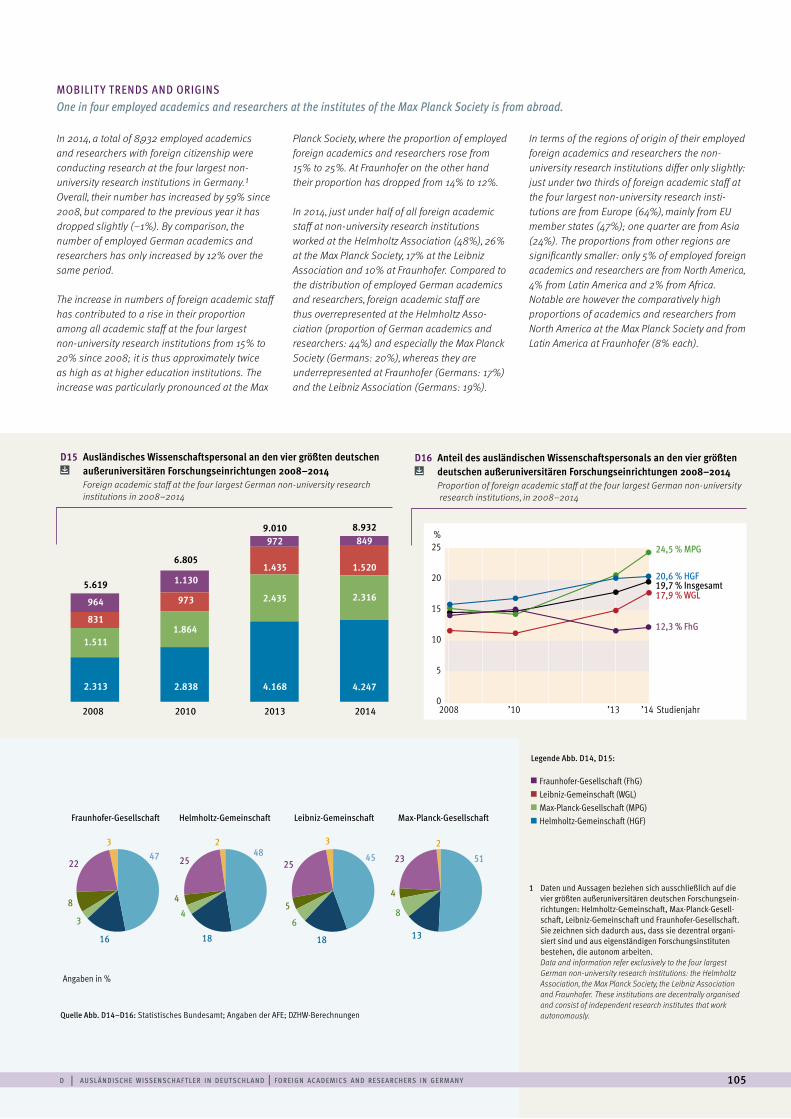
d | a u sl ä n d i sc h e w i sse n sc h a f t l e r i n d e ut sc h l a n d | f o r e i g n ac a d e m i cs a n d r ese a rc h e rs i n g e rm a n y 105
D15 Ausländisches Wissenschaftspersonal an den vier größten deutschen außeruniversitären Forschungseinrichtungen 2008–2014
Foreign academic staff at the four largest German non-university research institutions in 2008–2014
MOBILIT Y TRENDS AND ORIGINSOne in four employed academics and researchers at the institutes of the Max Planck Society is from abroad.
In 2014, a total of 8,932 employed academics and researchers with foreign citizenship were conducting research at the four largest non-university research institutions in Germany.1 Overall, their number has increased by 59% since 2008, but compared to the previous year it has dropped slightly (–1%). By comparison, the number of employed German academics and researchers has only increased by 12% over the same period.
The increase in numbers of foreign academic staff has contributed to a rise in their proportion among all academic staff at the four largest non-university research institutions from 15% to 20% since 2008; it is thus approximately twice as high as at higher education institutions. The increase was particularly pronounced at the Max
Planck Society, where the proportion of employed foreign academics and researchers rose from 15% to 25%. At Fraunhofer on the other hand their proportion has dropped from 14% to 12%.
In 2014, just under half of all foreign academic staff at non-university research institutions worked at the Helmholtz Association (48%), 26% at the Max Planck Society, 17% at the Leibniz Association and 10% at Fraunhofer. Compared to the distribution of employed German academics and researchers, foreign academic staff are thus overrepresented at the Helmholtz Asso- ciation (proportion of German academics and researchers: 44%) and especially the Max Planck Society (Germans: 20%), whereas they are underrepresented at Fraunhofer (Germans: 17%) and the Leibniz Association (Germans: 19%).
In terms of the regions of origin of their employed foreign academics and researchers the non-university research institutions differ only slightly: just under two thirds of foreign academic staff at the four largest non-university research insti- tutions are from Europe (64%), mainly from EU member states (47%); one quarter are from Asia (24%). The proportions from other regions are significantly smaller: only 5% of employed foreign academics and researchers are from North America, 4% from Latin America and 2% from Africa. Notable are however the comparatively high proportions of academics and researchers from North America at the Max Planck Society and from Latin America at Fraunhofer (8% each).
0
2000
4000
6000
8000
10000
Fraunhofer-Gesellschaft (FhG)Leibniz-Gemeinschaft (WGL)Max-Planck-Gesellschaft (MPG)Helmholtz-Gemeinschaft (HGF)
2.313
1.511
831
964
5.619
2.838 4.168
1.864
2.435973
972
1.1301.435
6.805
9.010
4.247
2.316
1.520
8498.932
2008 2010 20142013
Niederlande 11.896Vereinigtes Königreich 11.600Österreich 10.174Vereinigte Staaten 8.829Schweiz 7.839Frankreich 6.867Schweden 2.880 sAustralien 2.764
2008 ’10 ’13 ’14 Studienjahr
25
20
15
10
5
0
%
020004000600080001000012000
17,9 % WGL19,7 % Insgesamt20,6 % HGF
12,3 % FhG
24,5 % MPG
0
5
10
15
20
25
51454847
16 18 18 13
3 2 3 2
23252522
8 45
4
34
68
Fraunhofer-Gesellschaft Helmholtz-Gemeinschaft Leibniz-Gemeinschaft Max-Planck-Gesellschaft
1 Daten und Aussagen beziehen sich ausschließlich auf die vier größten außeruniversitären deutschen Forschungsein-richtungen: Helmholtz-Gemeinschaft, Max-Planck-Gesell-schaft, Leibniz-Gemeinschaft und Fraunhofer-Gesellschaft. Sie zeichnen sich dadurch aus, dass sie dezentral organi-siert sind und aus eigenständigen Forschungsinstituten bestehen, die autonom arbeiten.Data and information refer exclusively to the four largest German non-university research institutions: the Helmholtz Association, the Max Planck Society, the Leibniz Association and Fraunhofer. These institutions are decentrally organised and consist of independent research institutes that work autonomously. Quelle Abb. D14–D16: Statistisches Bundesamt; Angaben der AFE; DZHW-Berechnungen
D16 Anteil des ausländischen Wissenschaftspersonals an den vier größten deutschen außeruniversitären Forschungseinrichtungen 2008–2014
Proportion of foreign academic staff at the four largest German non-university research institutions, in 2008–2014
Legende Abb. D14, D15:
Angaben in %
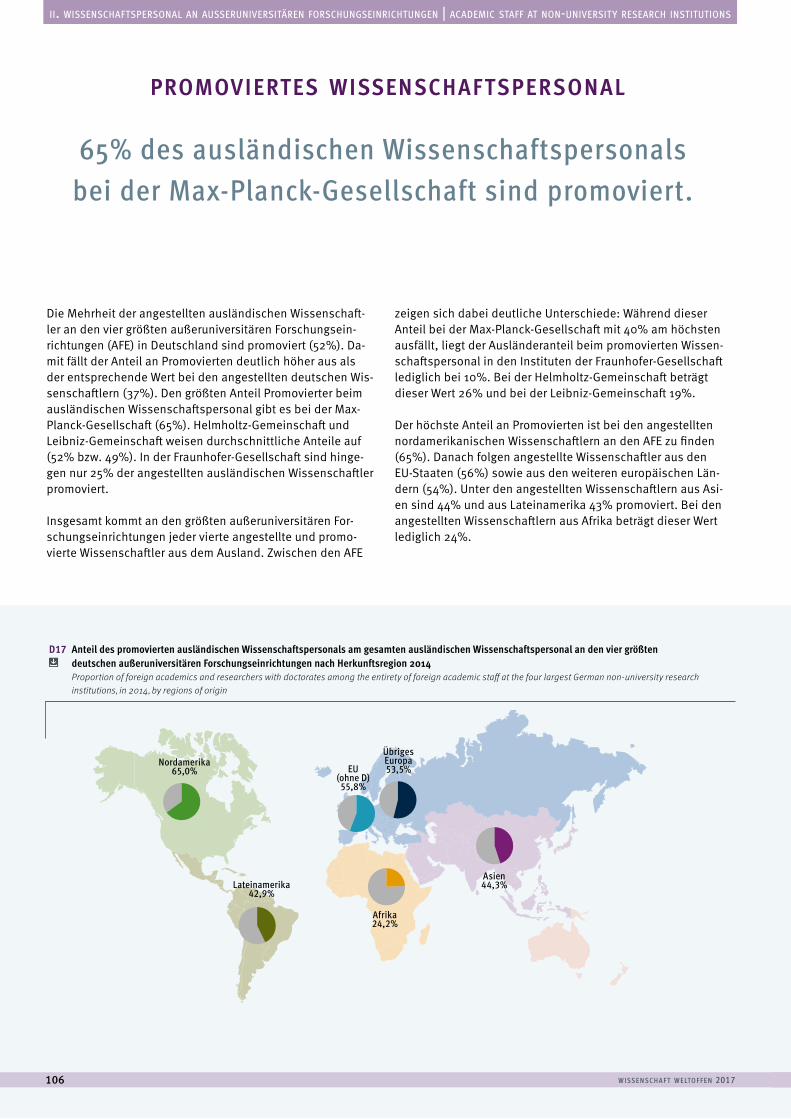
w i sse n sc h a f t w e lto f f e n 2017106
a u s l ä n d i s c h e s t u d i e r e n d e | f o r e i g n s t u d e n t sii. wissenschaftspersonal an ausseruniversitären forschungseinrichtungen | academic staff at non-university research institutions
Die Mehrheit der angestellten ausländischen Wissenschaft-ler an den vier größten außeruniversitären Forschungsein-richtungen (AFE) in Deutschland sind promoviert (52%). Da-mit fällt der Anteil an Promovierten deutlich höher aus als der entsprechende Wert bei den angestellten deutschen Wis-senschaftlern (37%). Den größten Anteil Promovierter beim ausländischen Wissenschaftspersonal gibt es bei der Max-Planck-Gesellschaft (65%). Helmholtz-Gemeinschaft und Leibniz-Gemeinschaft weisen durchschnittliche Anteile auf (52% bzw. 49%). In der Fraunhofer-Gesellschaft sind hinge-gen nur 25% der angestellten ausländischen Wissenschaftler promoviert.
Insgesamt kommt an den größten außeruniversitären For-schungseinrichtungen jeder vierte angestellte und promo-vierte Wissenschaftler aus dem Ausland. Zwischen den AFE
zeigen sich dabei deutliche Unterschiede: Während dieser Anteil bei der Max-Planck-Gesellschaft mit 40% am höchsten ausfällt, liegt der Ausländeranteil beim promovierten Wissen-schaftspersonal in den Instituten der Fraunhofer-Gesellschaft lediglich bei 10%. Bei der Helmholtz-Gemeinschaft beträgt dieser Wert 26% und bei der Leibniz-Gemeinschaft 19%.
Der höchste Anteil an Promovierten ist bei den angestellten nordamerikanischen Wissenschaftlern an den AFE zu finden (65%). Danach folgen angestellte Wissenschaftler aus den EU-Staaten (56%) sowie aus den weiteren europäischen Län-dern (54%). Unter den angestellten Wissenschaftlern aus Asi-en sind 44% und aus Lateinamerika 43% promoviert. Bei den angestellten Wissenschaftlern aus Afrika beträgt dieser Wert lediglich 24%.
65% des ausländischen Wissenschaftspersonals bei der Max-Planck-Gesellschaft sind promoviert.
promoviertes wissenschaftspersonal
Lateinamerika42,9%
Nordamerika65,0% EU
(ohne D)55,8%
Übriges Europa53,5%
Asien44,3%
Afrika24,2%
D17 Anteil des promovierten ausländischen Wissenschaftspersonals am gesamten ausländischen Wissenschaftspersonal an den vier größten deutschen außeruniversitären Forschungseinrichtungen nach Herkunftsregion 2014
Proportion of foreign academics and researchers with doctorates among the entirety of foreign academic staff at the four largest German non-university research institutions, in 2014, by regions of origin
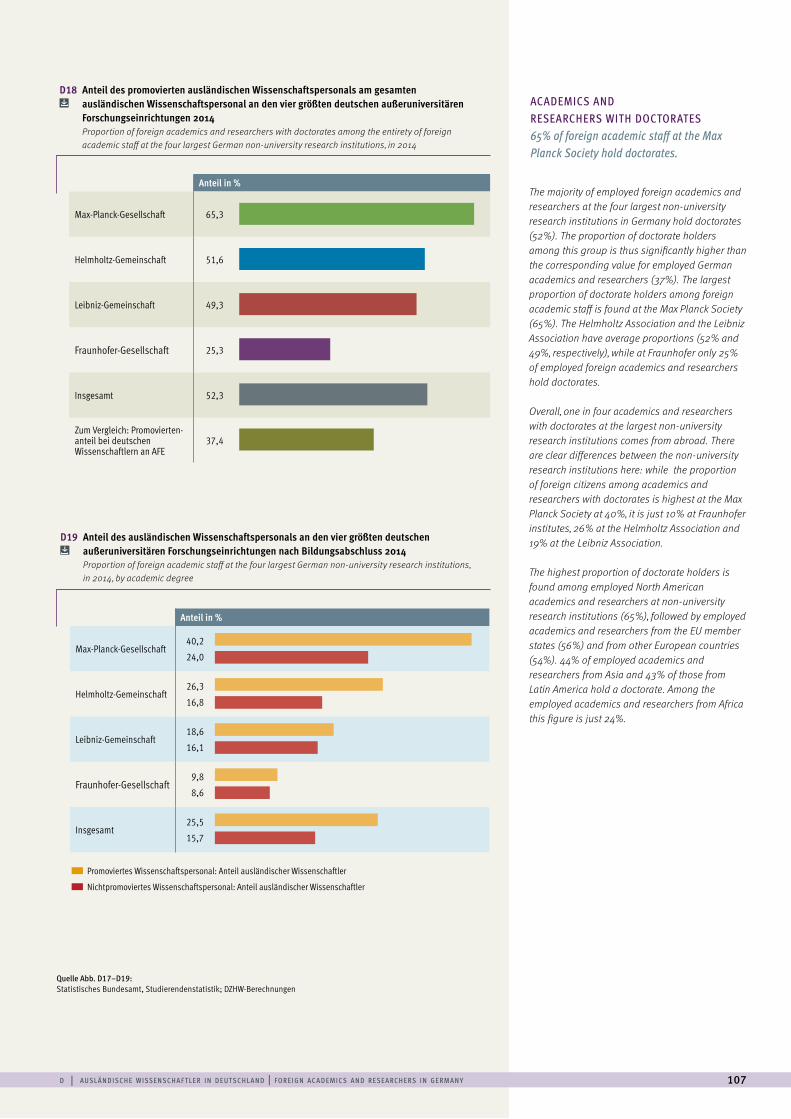
d | a u sl ä n d i sc h e w i sse n sc h a f t l e r i n d e ut sc h l a n d | f o r e i g n ac a d e m i cs a n d r ese a rc h e rs i n g e rm a n y 107
ACADEMICS ANDRESEARCHERS WITH DOCTORATES65% of foreign academic staff at the Max Planck Society hold doctorates.
The majority of employed foreign academics and researchers at the four largest non-university research institutions in Germany hold doctorates (52%). The proportion of doctorate holders among this group is thus significantly higher than the corresponding value for employed German academics and researchers (37%). The largest proportion of doctorate holders among foreign academic staff is found at the Max Planck Society (65%). The Helmholtz Association and the Leibniz Association have average proportions (52% and 49%, respectively), while at Fraunhofer only 25% of employed foreign academics and researchers hold doctorates.
Overall, one in four academics and researchers with doctorates at the largest non-university research institutions comes from abroad. There are clear differences between the non-university research institutions here: while the proportion of foreign citizens among academics and researchers with doctorates is highest at the Max Planck Society at 40%, it is just 10% at Fraunhofer institutes, 26% at the Helmholtz Association and 19% at the Leibniz Association.
The highest proportion of doctorate holders is found among employed North American academics and researchers at non-university research institutions (65%), followed by employed academics and researchers from the EU member states (56%) and from other European countries (54%). 44% of employed academics and researchers from Asia and 43% of those from Latin America hold a doctorate. Among the employed academics and researchers from Africa this figure is just 24%.
Anteil in %
Max-Planck-Gesellschaft 65,3
Helmholtz-Gemeinschaft 51,6
Leibniz-Gemeinschaft 49,3
Fraunhofer-Gesellschaft 25,3
Insgesamt 52,3
Zum Vergleich: Promovierten-anteil bei deutschen Wissenschaftlern an AFE
37,4
Quelle Abb. D17–D19:Statistisches Bundesamt, Studierendenstatistik; DZHW-Berechnungen
D18 Anteil des promovierten ausländischen Wissenschaftspersonals am gesamten ausländischen Wissenschaftspersonal an den vier größten deutschen außeruniversitären
Forschungseinrichtungen 2014 Proportion of foreign academics and researchers with doctorates among the entirety of foreign academic staff at the four largest German non-university research institutions, in 2014
Anteil in %
Max-Planck-Gesellschaft40,2
24,0
Helmholtz-Gemeinschaft26,3
16,8
Leibniz-Gemeinschaft18,6
16,1
Fraunhofer-Gesellschaft9,8
8,6
Insgesamt25,5
15,7
0 10 20 30 40 50
D19 Anteil des ausländischen Wissenschaftspersonals an den vier größten deutschen außeruniversitären Forschungseinrichtungen nach Bildungsabschluss 2014
Proportion of foreign academic staff at the four largest German non-university research institutions, in 2014, by academic degree
Promoviertes Wissenschaftspersonal: Anteil ausländischer Wissenschaftler
Nichtpromoviertes Wissenschaftspersonal: Anteil ausländischer Wissenschaftler
0,0 12,5 25,0 37,5 50,0 62,5 75,0 87,5 100,0
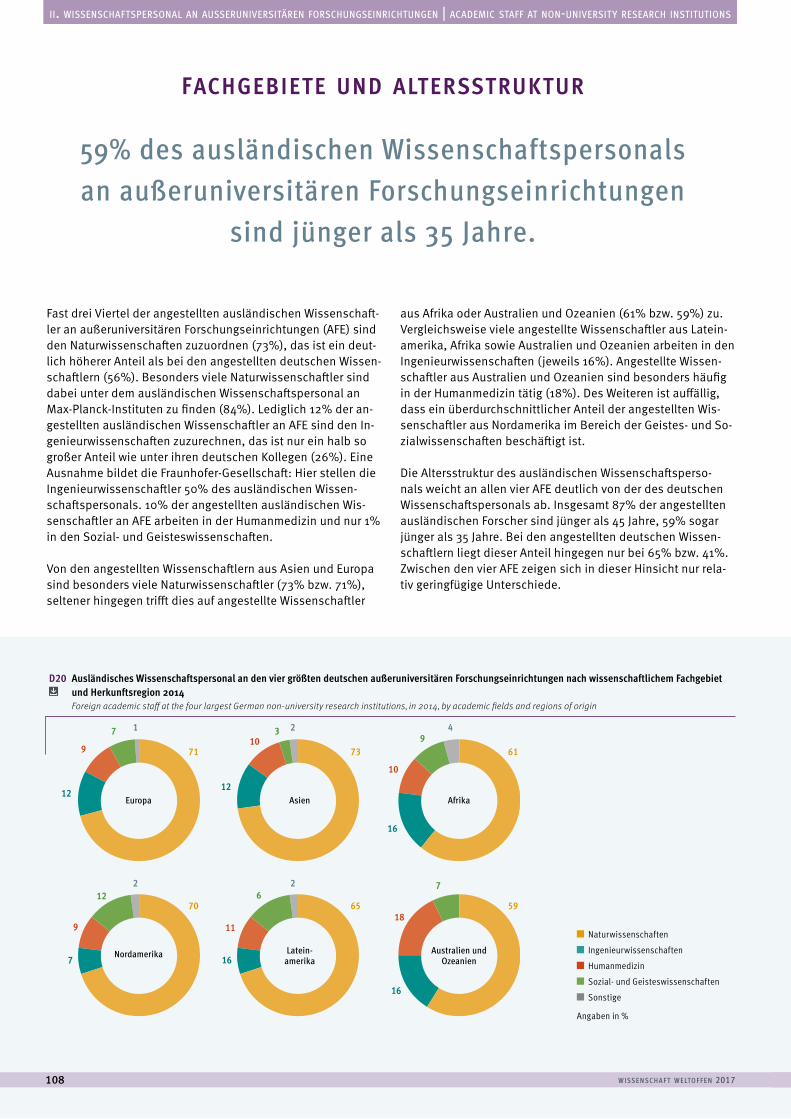
w i sse n sc h a f t w e lto f f e n 2017108
a u s l ä n d i s c h e s t u d i e r e n d e | f o r e i g n s t u d e n t sii. wissenschaftspersonal an ausseruniversitären forschungseinrichtungen | academic staff at non-university research institutions
59% des ausländischen Wissenschaftspersonals an außeruniversitären Forschungseinrichtungen
sind jünger als 35 Jahre.
Fast drei Viertel der angestellten ausländischen Wissenschaft-ler an außeruniversitären Forschungseinrichtungen (AFE) sind den Naturwissenschaften zuzuordnen (73%), das ist ein deut-lich höherer Anteil als bei den angestellten deutschen Wissen-schaftlern (56%). Besonders viele Naturwissenschaftler sind dabei unter dem ausländischen Wissenschaftspersonal an Max-Planck-Instituten zu finden (84%). Lediglich 12% der an-gestellten ausländischen Wissenschaftler an AFE sind den In-genieurwissenschaften zuzurechnen, das ist nur ein halb so großer Anteil wie unter ihren deutschen Kollegen (26%). Eine Ausnahme bildet die Fraunhofer-Gesellschaft: Hier stellen die Ingenieurwissenschaftler 50% des ausländischen Wissen-schaftspersonals. 10% der angestellten ausländischen Wis-senschaftler an AFE arbeiten in der Humanmedizin und nur 1% in den Sozial- und Geisteswissenschaften.
Von den angestellten Wissenschaftlern aus Asien und Europa sind besonders viele Naturwissenschaftler (73% bzw. 71%), seltener hingegen trifft dies auf angestellte Wissenschaftler
aus Afrika oder Australien und Ozeanien (61% bzw. 59%) zu. Vergleichsweise viele angestellte Wissenschaftler aus Latein-amerika, Afrika sowie Australien und Ozeanien arbeiten in den Ingenieurwissenschaften (jeweils 16%). Angestellte Wissen-schaftler aus Australien und Ozeanien sind besonders häufig in der Humanmedizin tätig (18%). Des Weiteren ist auffällig, dass ein überdurchschnittlicher Anteil der angestellten Wis-senschaftler aus Nordamerika im Bereich der Geistes- und So-zialwissenschaften beschäftigt ist.
Die Altersstruktur des ausländischen Wissenschaftsperso-nals weicht an allen vier AFE deutlich von der des deutschen Wissenschaftspersonals ab. Insgesamt 87% der angestellten ausländischen Forscher sind jünger als 45 Jahre, 59% sogar jünger als 35 Jahre. Bei den angestellten deutschen Wissen-schaftlern liegt dieser Anteil hingegen nur bei 65% bzw. 41%. Zwischen den vier AFE zeigen sich in dieser Hinsicht nur rela-tiv geringfügige Unterschiede.
fachgebiete und altersstruktur
D20 Ausländisches Wissenschaftspersonal an den vier größten deutschen außeruniversitären Forschungseinrichtungen nach wissenschaftlichem Fachgebiet und Herkunftsregion 2014
Foreign academic staff at the four largest German non-university research institutions, in 2014, by academic fields and regions of origin
12
7
12
16
16
16
7
12
3
6
9
7
1
2
2
2
4
9
9
10
11
10
18
71
70
73
65
61
59
Europa
Nordamerika
Asien
Latein-amerika
Afrika
Australien und Ozeanien
Naturwissenschaften
Ingenieurwissenschaften
Humanmedizin
Sozial- und Geisteswissenschaften
Sonstige
Angaben in %
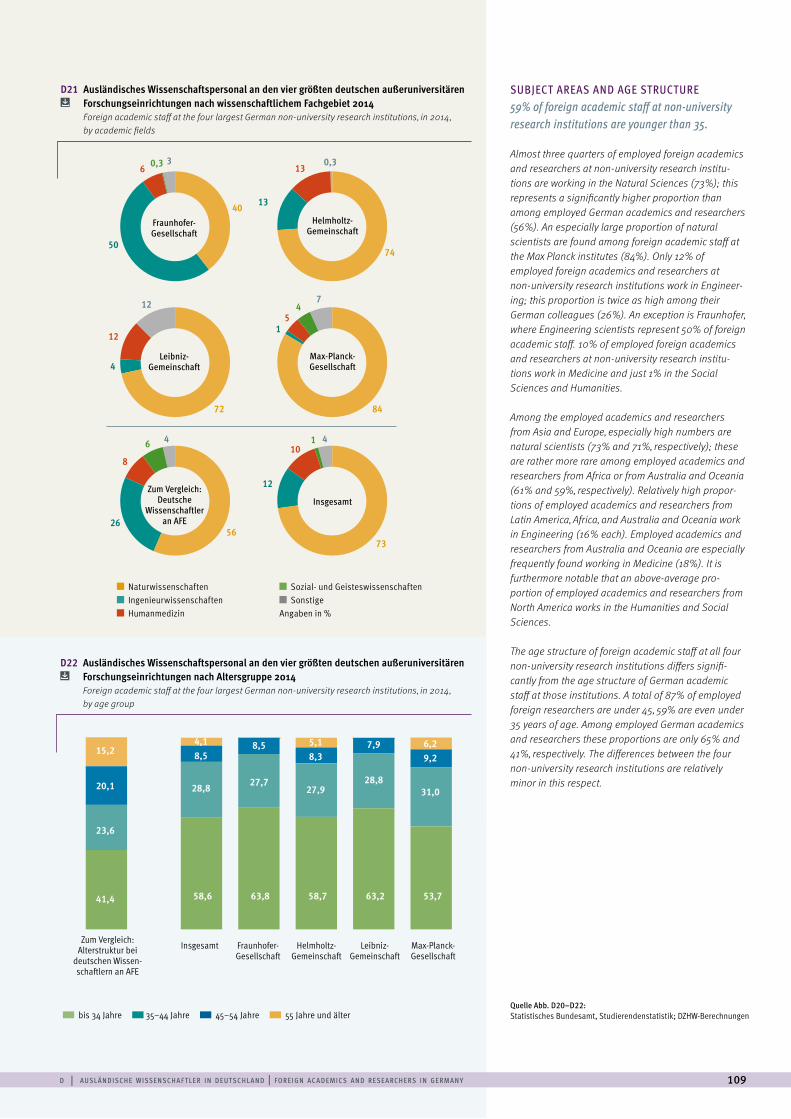
d | a u sl ä n d i sc h e w i sse n sc h a f t l e r i n d e ut sc h l a n d | f o r e i g n ac a d e m i cs a n d r ese a rc h e rs i n g e rm a n y 109
D21 Ausländisches Wissenschaftspersonal an den vier größten deutschen außeruniversitären Forschungseinrichtungen nach wissenschaftlichem Fachgebiet 2014
Foreign academic staff at the four largest German non-university research institutions, in 2014, by academic fields
D22 Ausländisches Wissenschaftspersonal an den vier größten deutschen außeruniversitären Forschungseinrichtungen nach Altersgruppe 2014
Foreign academic staff at the four largest German non-university research institutions, in 2014, by age group
SUBJECT AREAS AND AGE STRUCTURE59% of foreign academic staff at non-university research institutions are younger than 35.
Almost three quarters of employed foreign academics and researchers at non-university research institu-tions are working in the Natural Sciences (73%); this represents a significantly higher proportion than among employed German academics and researchers (56%). An especially large proportion of natural scientists are found among foreign academic staff at the Max Planck institutes (84%). Only 12% of employed foreign academics and researchers at non-university research institutions work in Engineer-ing; this proportion is twice as high among their German colleagues (26%). An exception is Fraunhofer, where Engineering scientists represent 50% of foreign academic staff. 10% of employed foreign academics and researchers at non-university research institu-tions work in Medicine and just 1% in the Social Sciences and Humanities.
Among the employed academics and researchers from Asia and Europe, especially high numbers are natural scientists (73% and 71%, respectively); these are rather more rare among employed academics and researchers from Africa or from Australia and Oceania (61% and 59%, respectively). Relatively high propor- tions of employed academics and researchers from Latin America, Africa, and Australia and Oceania work in Engineering (16% each). Employed academics and researchers from Australia and Oceania are especially frequently found working in Medicine (18%). It is furthermore notable that an above-average pro- portion of employed academics and researchers from North America works in the Humanities and Social Sciences.
The age structure of foreign academic staff at all four non-university research institutions differs signifi-cantly from the age structure of German academic staff at those institutions. A total of 87% of employed foreign researchers are under 45, 59% are even under 35 years of age. Among employed German academics and researchers these proportions are only 65% and 41%, respectively. The differences between the four non-university research institutions are relatively minor in this respect.
bis 34 Jahre 35–44 Jahre 45–54 Jahre 55 Jahre und älter
Insgesamt Fraunhofer-Gesellschaft
Helmholtz-Gemeinschaft
Leibniz-Gemeinschaft
Max-Planck-Gesellschaft
Zum Vergleich: Alterstruktur bei
deutschen Wissen- schaftlern an AFE
58,6 63,8 58,7 63,2 53,7
15,24,1 5,1 6,28,5 7,9
20,1
8,5 8,3 9,2
23,6
41,4
28,8 27,9 31,027,7 28,8
40
6
4
50
26
12
1
13
8
6
0,3 3
12 7
44
0,3
4
1
13
5
12
10
72
56
74
84
73
Naturwissenschaften Ingenieurwissenschaften Humanmedizin
Sozial- und Geisteswissenschaften Sonstige
Angaben in %
Leibniz-Gemeinschaft
Fraunhofer-Gesellschaft
Zum Vergleich: Deutsche
Wissenschaftler an AFE
Helmholtz-Gemeinschaft
Max-Planck-Gesellschaft
Insgesamt
Quelle Abb. D20–D22:Statistisches Bundesamt, Studierendenstatistik; DZHW-Berechnungen
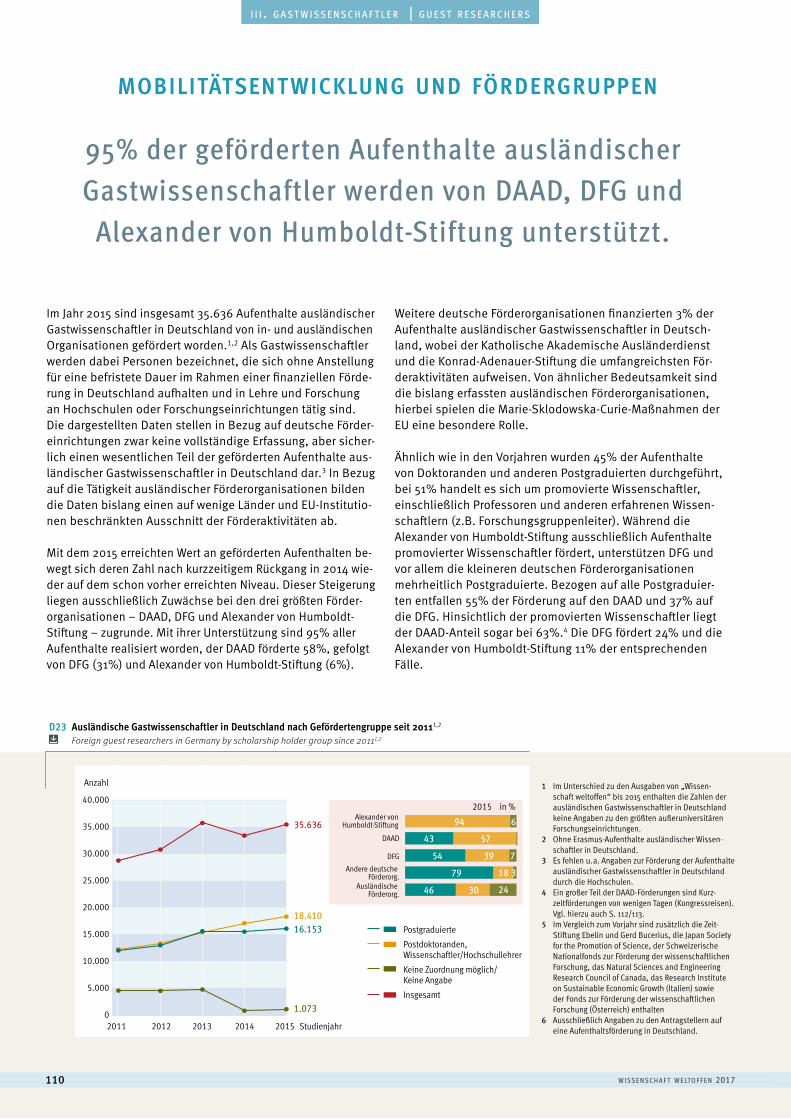
w i sse n sc h a f t w e lto f f e n 2017110
a u s l ä n d i s c h e s t u d i e r e n d e | f o r e i g n s t u d e n t si i i . g a s t w i s s e n s c h a f t l e r | g u e s t r e s e a r c h e r s
95% der geförderten Aufenthalte ausländischer Gastwissenschaftler werden von DAAD, DFG und
Alexander von Humboldt-Stiftung unterstützt.
Im Jahr 2015 sind insgesamt 35.636 Aufenthalte ausländischer Gastwissenschaftler in Deutschland von in- und ausländischen Organisationen gefördert worden.1,2 Als Gastwissenschaftler werden dabei Personen bezeichnet, die sich ohne Anstellung für eine befristete Dauer im Rahmen einer finanziellen Förde-rung in Deutschland aufhalten und in Lehre und Forschung an Hochschulen oder Forschungseinrichtungen tätig sind. Die dargestellten Daten stellen in Bezug auf deutsche Förder-einrichtungen zwar keine vollständige Erfassung, aber sicher-lich einen wesentlichen Teil der geförderten Aufenthalte aus-ländischer Gastwissenschaftler in Deutschland dar.3 In Bezug auf die Tätigkeit ausländischer Förderorganisationen bilden die Daten bislang einen auf wenige Länder und EU-Institutio-nen beschränkten Ausschnitt der Förderaktivitäten ab.
Mit dem 2015 erreichten Wert an geförderten Aufenthalten be-wegt sich deren Zahl nach kurzzeitigem Rückgang in 2014 wie-der auf dem schon vorher erreichten Niveau. Dieser Steigerung liegen ausschließlich Zuwächse bei den drei größten Förder-organisationen – DAAD, DFG und Alexander von Humboldt- Stiftung – zugrunde. Mit ihrer Unterstützung sind 95% aller Aufenthalte realisiert worden, der DAAD förderte 58%, gefolgt von DFG (31%) und Alexander von Humboldt-Stiftung (6%).
Weitere deutsche Förderorganisationen finanzierten 3% der Aufenthalte ausländischer Gastwissenschaftler in Deutsch-land, wobei der Katholische Akademische Ausländerdienst und die Konrad-Adenauer-Stiftung die umfangreichsten För-deraktivitäten aufweisen. Von ähnlicher Bedeutsamkeit sind die bislang erfassten ausländischen Förderorganisationen, hierbei spielen die Marie-Sklodowska-Curie-Maßnahmen der EU eine besondere Rolle.
Ähnlich wie in den Vorjahren wurden 45% der Aufenthalte von Doktoranden und anderen Postgraduierten durchgeführt, bei 51% handelt es sich um promovierte Wissenschaftler, einschließlich Professoren und anderen erfahrenen Wissen-schaftlern (z.B. Forschungsgruppenleiter). Während die Alexander von Humboldt-Stiftung ausschließlich Aufenthalte promovierter Wissenschaftler fördert, unterstützen DFG und vor allem die kleineren deutschen Förderorganisationen mehrheitlich Postgraduierte. Bezogen auf alle Postgraduier-ten entfallen 55% der Förderung auf den DAAD und 37% auf die DFG. Hinsichtlich der promovierten Wissenschaftler liegt der DAAD-Anteil sogar bei 63%.4 Die DFG fördert 24% und die Alexander von Humboldt-Stiftung 11% der entsprechenden Fälle.
mobilitätsent wicklung und fördergruppen
2011 2012 2013 2014 2015
DAAD
Alexander vonHumboldt-Stiftung
DFG
Andere deutsche Förderorg.
Ausländische Förderorg.
Studienjahr
Postgraduierte
Postdoktoranden, Wissenschaftler/Hochschullehrer
Keine Zuordnung möglich/Keine Angabe
Insgesamt
40.000
35.000
30.000
25.000
20.000
15.000
10.000
5.000
0
Anzahl
2015 in %
18.41016.153
1.073
35.636
0
20
40
60
80
10
0
94
57
39
18
30
6
7
3
24
43
54
79
46
D23 Ausländische Gastwissenschaftler in Deutschland nach Gefördertengruppe seit 20111,2 Foreign guest researchers in Germany by scholarship holder group since 20111,2
1 Im Unterschied zu den Ausgaben von „Wissen-schaft weltoffen“ bis 2015 enthalten die Zahlen der ausländischen Gastwissenschaftler in Deutschland keine Angaben zu den größten außeruniversitären Forschungseinrichtungen.
2 Ohne Erasmus-Aufenthalte ausländischer Wissen-schaftler in Deutschland.
3 Es fehlen u. a. Angaben zur Förderung der Aufenthalte ausländischer Gastwissenschaftler in Deutschland durch die Hochschulen.
4 Ein großer Teil der DAAD-Förderungen sind Kurz- zeitförderungen von wenigen Tagen (Kongressreisen). Vgl. hierzu auch S. 112/113.
5 Im Vergleich zum Vorjahr sind zusätzlich die Zeit-Stiftung Ebelin und Gerd Bucerius, die Japan Society for the Promotion of Science, der Schweizerische Nationalfonds zur Förderung der wissenschaftlichen Forschung, das Natural Sciences and Engineering Research Council of Canada, das Research Institute on Sustainable Economic Growth (Italien) sowie der Fonds zur Förderung der wissenschaftlichen Forschung (Österreich) enthalten
6 Ausschließlich Angaben zu den Antragstellern auf eine Aufenthaltsförderung in Deutschland.
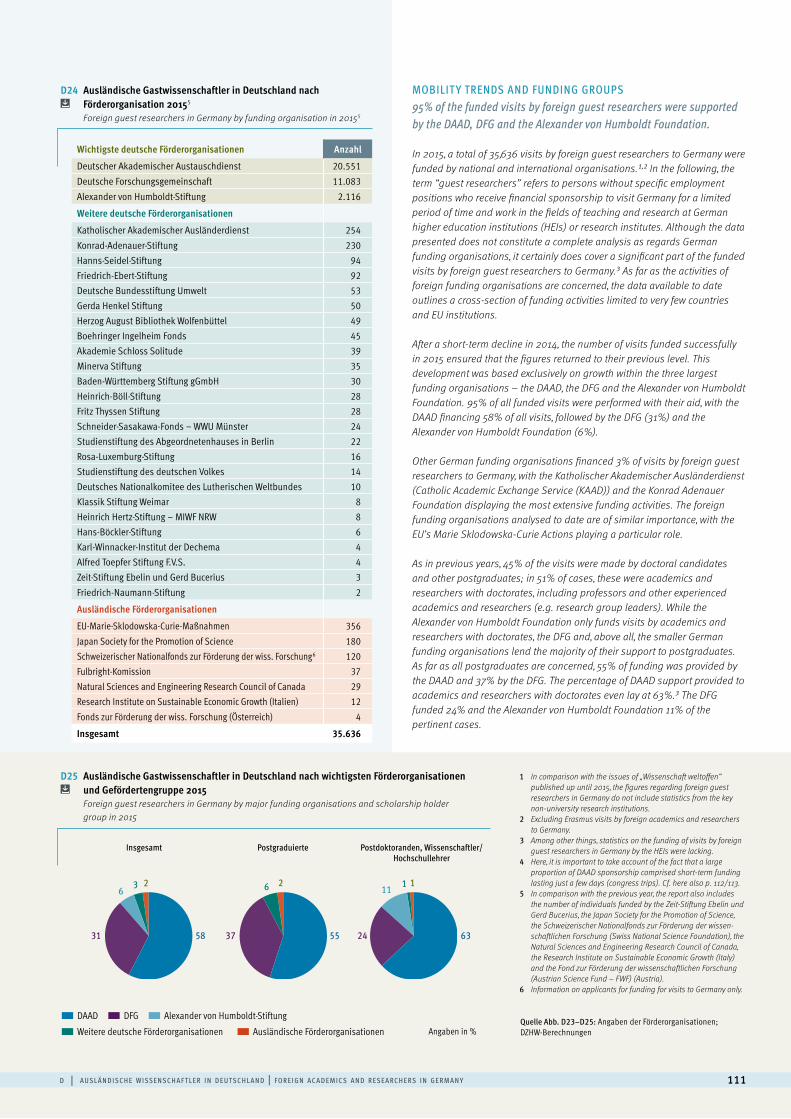
d | a u sl ä n d i sc h e w i sse n sc h a f t l e r i n d e ut sc h l a n d | f o r e i g n ac a d e m i cs a n d r ese a rc h e rs i n g e rm a n y 111
D25 Ausländische Gastwissenschaftler in Deutschland nach wichtigsten Förderorganisationen und Gefördertengruppe 2015
Foreign guest researchers in Germany by major funding organisations and scholarship holder group in 2015
MOBILIT Y TRENDS AND FUNDING GROUPS95% of the funded visits by foreign guest researchers were supported by the DAAD, DFG and the Alexander von Humboldt Foundation.
58 55 63243731
63 6 12 2 1
11
Insgesamt Postgraduierte Postdoktoranden, Wissenschaftler/Hochschullehrer
Quelle Abb. D23–D25: Angaben der Förderorganisationen; DZHW-BerechnungenAngaben in %
DAAD DFG Alexander von Humboldt-Stiftung
Weitere deutsche Förderorganisationen Ausländische Förderorganisationen
Wichtigste deutsche Förderorganisationen Anzahl
Deutscher Akademischer Austauschdienst 20.551
Deutsche Forschungsgemeinschaft 11.083
Alexander von Humboldt-Stiftung 2.116
Weitere deutsche Förderorganisationen
Katholischer Akademischer Ausländerdienst 254
Konrad-Adenauer-Stiftung 230Hanns-Seidel-Stiftung 94Friedrich-Ebert-Stiftung 92Deutsche Bundesstiftung Umwelt 53Gerda Henkel Stiftung 50Herzog August Bibliothek Wolfenbüttel 49Boehringer Ingelheim Fonds 45Akademie Schloss Solitude 39Minerva Stiftung 35Baden-Württemberg Stiftung gGmbH 30Heinrich-Böll-Stiftung 28Fritz Thyssen Stiftung 28Schneider-Sasakawa-Fonds – WWU Münster 24Studienstiftung des Abgeordnetenhauses in Berlin 22Rosa-Luxemburg-Stiftung 16Studienstiftung des deutschen Volkes 14Deutsches Nationalkomitee des Lutherischen Weltbundes 10Klassik Stiftung Weimar 8Heinrich Hertz-Stiftung – MIWF NRW 8Hans-Böckler-Stiftung 6Karl-Winnacker-Institut der Dechema 4Alfred Toepfer Stiftung F.V.S. 4Zeit-Stiftung Ebelin und Gerd Bucerius 3
Friedrich-Naumann-Stiftung 2
Ausländische Förderorganisationen
EU-Marie-Sklodowska-Curie-Maßnahmen 356
Japan Society for the Promotion of Science 180Schweizerischer Nationalfonds zur Förderung der wiss. Forschung 6 120Fulbright-Komission 37Natural Sciences and Engineering Research Council of Canada 29Research Institute on Sustainable Economic Growth (Italien) 12
Fonds zur Förderung der wiss. Forschung (Österreich) 4
Insgesamt 35.636
1 In comparison with the issues of „Wissenschaft weltoffen“ published up until 2015, the figures regarding foreign guest researchers in Germany do not include statistics from the key non-university research institutions.
2 Excluding Erasmus visits by foreign academics and researchers to Germany.
3 Among other things, statistics on the funding of visits by foreign guest researchers in Germany by the HEIs were lacking.
4 Here, it is important to take account of the fact that a large proportion of DAAD sponsorship comprised short-term funding lasting just a few days (congress trips). Cf. here also p. 112/113.
5 In comparison with the previous year, the report also includes the number of individuals funded by the Zeit-Stiftung Ebelin und Gerd Bucerius, the Japan Society for the Promotion of Science, the Schweizerischer Nationalfonds zur Förderung der wissen-schaftlichen Forschung (Swiss National Science Foundation), the Natural Sciences and Engineering Research Council of Canada, the Research Institute on Sustainable Economic Growth (Italy) and the Fond zur Förderung der wissenschaftlichen Forschung (Austrian Science Fund – FWF) (Austria).
6 Information on applicants for funding for visits to Germany only.
D24 Ausländische Gastwissenschaftler in Deutschland nach Förderorganisation 20155
Foreign guest researchers in Germany by funding organisation in 20155
In 2015, a total of 35,636 visits by foreign guest researchers to Germany were funded by national and international organisations.1,2 In the following, the term “guest researchers” refers to persons without specific employment positions who receive financial sponsorship to visit Germany for a limited period of time and work in the fields of teaching and research at German higher education institutions (HEIs) or research institutes. Although the data presented does not constitute a complete analysis as regards German funding organisations, it certainly does cover a significant part of the funded visits by foreign guest researchers to Germany.3 As far as the activities of foreign funding organisations are concerned, the data available to date outlines a cross-section of funding activities limited to very few countries and EU institutions.
After a short-term decline in 2014, the number of visits funded successfully in 2015 ensured that the figures returned to their previous level. This development was based exclusively on growth within the three largest funding organisations – the DAAD, the DFG and the Alexander von Humboldt Foundation. 95% of all funded visits were performed with their aid, with the DAAD financing 58% of all visits, followed by the DFG (31%) and the Alexander von Humboldt Foundation (6%).
Other German funding organisations financed 3% of visits by foreign guest researchers to Germany, with the Katholischer Akademischer Ausländerdienst (Catholic Academic Exchange Service (KAAD)) and the Konrad Adenauer Foundation displaying the most extensive funding activities. The foreign funding organisations analysed to date are of similar importance, with the EU’s Marie Sklodowska-Curie Actions playing a particular role.
As in previous years, 45% of the visits were made by doctoral candidates and other postgraduates; in 51% of cases, these were academics and researchers with doctorates, including professors and other experienced academics and researchers (e.g. research group leaders). While the Alexander von Humboldt Foundation only funds visits by academics and researchers with doctorates, the DFG and, above all, the smaller German funding organisations lend the majority of their support to postgraduates. As far as all postgraduates are concerned, 55% of funding was provided by the DAAD and 37% by the DFG. The percentage of DAAD support provided to academics and researchers with doctorates even lay at 63%.3 The DFG funded 24% and the Alexander von Humboldt Foundation 11% of the pertinent cases.
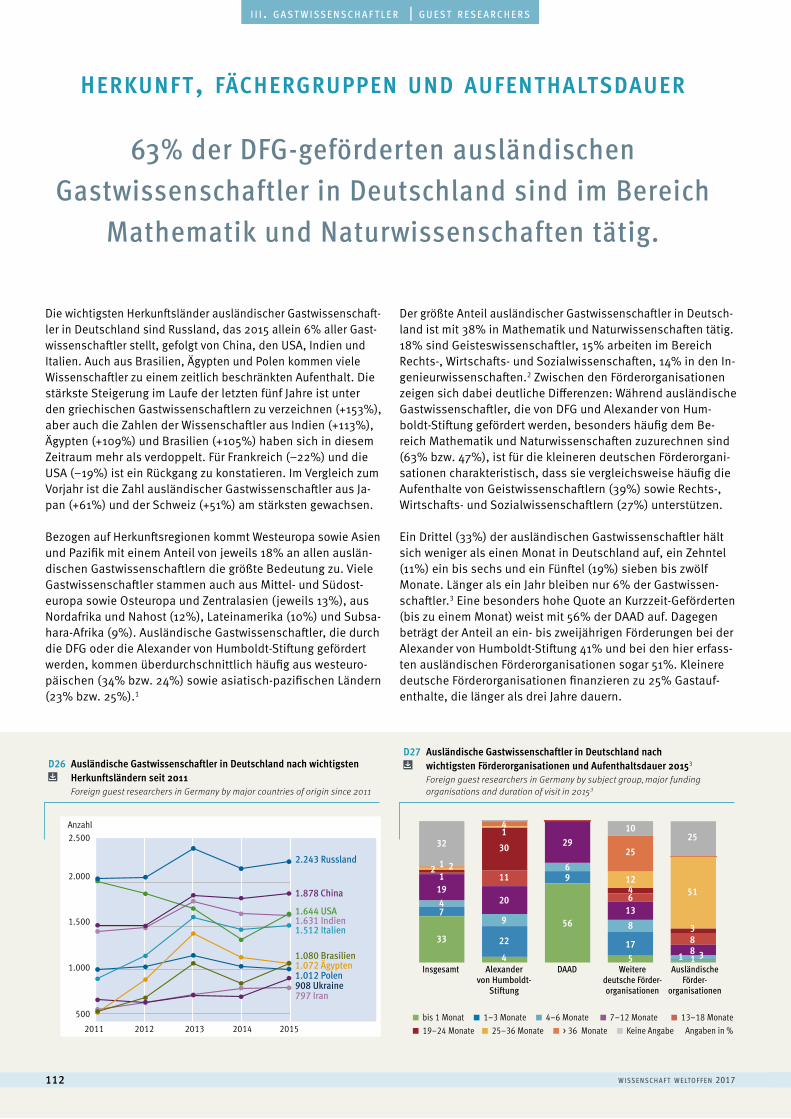
w i sse n sc h a f t w e lto f f e n 2017112
a u s l ä n d i s c h e s t u d i e r e n d e | f o r e i g n s t u d e n t si i i . g a s t w i s s e n s c h a f t l e r | g u e s t r e s e a r c h e r s
D26 Ausländische Gastwissenschaftler in Deutschland nach wichtigsten Herkunftsländern seit 2011
Foreign guest researchers in Germany by major countries of origin since 2011
D27 Ausländische Gastwissenschaftler in Deutschland nach wichtigsten Förderorganisationen und Aufenthaltsdauer 20153
Foreign guest researchers in Germany by subject group, major funding organisations and duration of visit in 20153
63% der DFG-geförderten ausländischen Gastwissenschaftler in Deutschland sind im Bereich
Mathematik und Naturwissenschaften tätig.
Die wichtigsten Herkunftsländer ausländischer Gastwissenschaft-ler in Deutschland sind Russland, das 2015 allein 6% aller Gast-wissenschaftler stellt, gefolgt von China, den USA, Indien und Italien. Auch aus Brasilien, Ägypten und Polen kommen viele Wissenschaftler zu einem zeitlich beschränkten Aufenthalt. Die stärkste Steigerung im Laufe der letzten fünf Jahre ist unter den griechischen Gastwissenschaftlern zu verzeichnen (+153%), aber auch die Zahlen der Wissenschaftler aus Indien (+113%), Ägypten (+109%) und Brasilien (+105%) haben sich in diesem Zeitraum mehr als verdoppelt. Für Frankreich (–22%) und die USA (–19%) ist ein Rückgang zu konstatieren. Im Vergleich zum Vorjahr ist die Zahl ausländischer Gastwissenschaftler aus Ja-pan (+61%) und der Schweiz (+51%) am stärksten gewachsen.
Bezogen auf Herkunftsregionen kommt Westeuropa sowie Asien und Pazifik mit einem Anteil von jeweils 18% an allen auslän-dischen Gastwissenschaftlern die größte Bedeutung zu. Viele Gastwissenschaftler stammen auch aus Mittel- und Südost-europa sowie Osteuropa und Zentralasien (jeweils 13%), aus Nordafrika und Nahost (12%), Lateinamerika (10%) und Subsa-hara-Afrika (9%). Ausländische Gastwissenschaftler, die durch die DFG oder die Alexander von Humboldt-Stiftung gefördert werden, kommen überdurchschnittlich häufig aus westeuro-päischen (34% bzw. 24%) sowie asiatisch-pazifischen Ländern (23% bzw. 25%).1
Der größte Anteil ausländischer Gastwissenschaftler in Deutsch-land ist mit 38% in Mathematik und Naturwissenschaften tätig. 18% sind Geisteswissenschaftler, 15% arbeiten im Bereich Rechts-, Wirtschafts- und Sozialwissenschaften, 14% in den In-genieurwissenschaften.2 Zwischen den Förderorganisationen zeigen sich dabei deutliche Differenzen: Während ausländische Gastwissenschaftler, die von DFG und Alexander von Hum-boldt-Stiftung gefördert werden, besonders häufig dem Be-reich Mathematik und Naturwissenschaften zuzurechnen sind (63% bzw. 47%), ist für die kleineren deutschen Förderorgani-sationen charakteristisch, dass sie vergleichsweise häufig die Aufenthalte von Geistwissenschaftlern (39%) sowie Rechts-, Wirtschafts- und Sozialwissenschaftlern (27%) unterstützen.
Ein Drittel (33%) der ausländischen Gastwissenschaftler hält sich weniger als einen Monat in Deutschland auf, ein Zehntel (11%) ein bis sechs und ein Fünftel (19%) sieben bis zwölf Monate. Länger als ein Jahr bleiben nur 6% der Gastwissen-schaftler.3 Eine besonders hohe Quote an Kurzzeit-Geförderten (bis zu einem Monat) weist mit 56% der DAAD auf. Dagegen beträgt der Anteil an ein- bis zweijährigen Förderungen bei der Alexander von Humboldt-Stiftung 41% und bei den hier erfass-ten ausländischen Förderorganisationen sogar 51%. Kleinere deutsche Förderorganisationen finanzieren zu 25% Gastauf-enthalte, die länger als drei Jahre dauern.
herkunft, fächergruppen und aufenthaltsdauer
2011 2012 2014 20152013
1.878 China
1.631 Indien
2.243 Russland
1.512 Italien
1.072 Ägypten
1.644 USA
1.012 Polen908 Ukraine797 Iran
1.080 Brasilien
500
1.000
1.500
2.000
2.500Anzahl
bis 1 Monat 1–3 Monate 4–6 Monate 7–12 Monate 13–18 Monate 19–24 Monate 25–36 Monate > 36 Monate Keine Angabe Angaben in %
0
20
40
60
80
100
120
32
4
22
9
20
11
301
11
4
2910
25
51
3
388
25
1246
138
175
69
56
19
33
7
11 22
4
DAADInsgesamt Weitere deutsche Förder- organisationen
Ausländische Förder-
organisationen
Alexander von Humboldt-
Stiftung
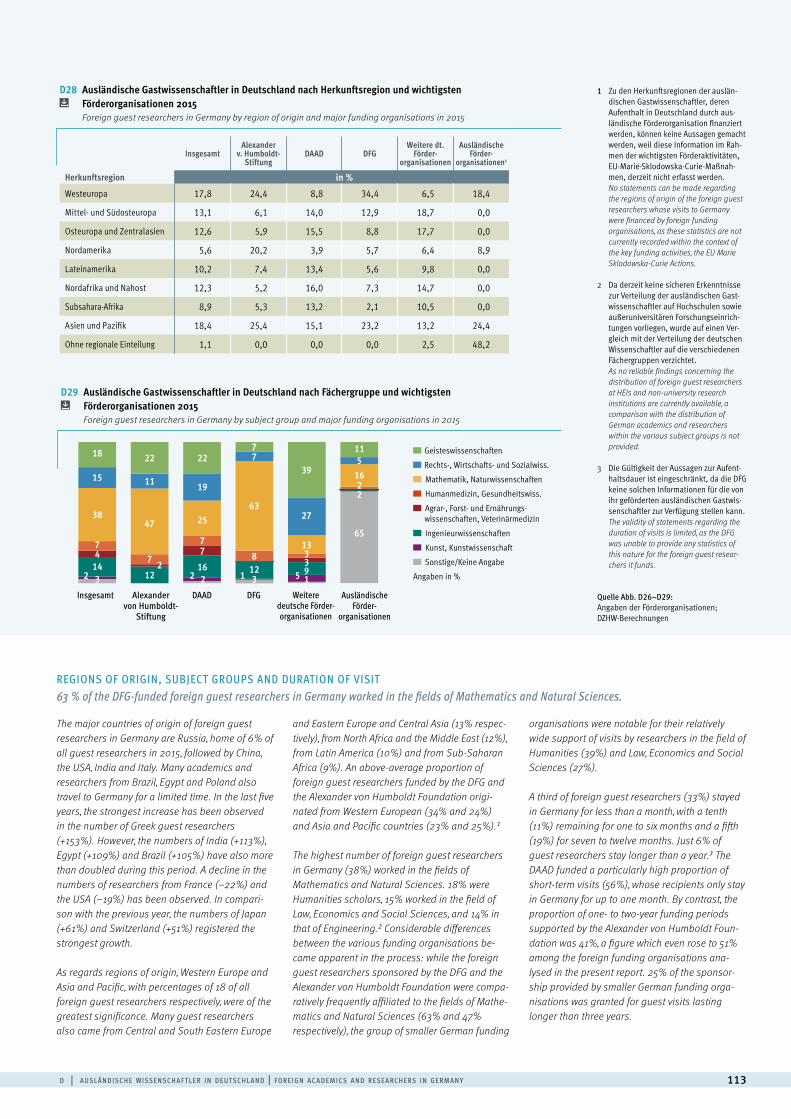
d | a u sl ä n d i sc h e w i sse n sc h a f t l e r i n d e ut sc h l a n d | f o r e i g n ac a d e m i cs a n d r ese a rc h e rs i n g e rm a n y 113
REGIONS OF ORIGIN, SUBJECT GROUPS AND DURATION OF VISIT63 % of the DFG-funded foreign guest researchers in Germany worked in the fields of Mathematics and Natural Sciences.
The major countries of origin of foreign guest researchers in Germany are Russia, home of 6% of all guest researchers in 2015, followed by China, the USA, India and Italy. Many academics and researchers from Brazil, Egypt and Poland also travel to Germany for a limited time. In the last five years, the strongest increase has been observed in the number of Greek guest researchers (+153%). However, the numbers of India (+113%), Egypt (+109%) and Brazil (+105%) have also more than doubled during this period. A decline in the numbers of researchers from France (–22%) and the USA (–19%) has been observed. In compari-son with the previous year, the numbers of Japan (+61%) and Switzerland (+51%) registered the strongest growth.
As regards regions of origin, Western Europe and Asia and Pacific, with percentages of 18 of all foreign guest researchers respectively, were of the greatest significance. Many guest researchers also came from Central and South Eastern Europe
and Eastern Europe and Central Asia (13% respec- tively), from North Africa and the Middle East (12%), from Latin America (10%) and from Sub-Saharan Africa (9%). An above-average proportion of foreign guest researchers funded by the DFG and the Alexander von Humboldt Foundation origi- nated from Western European (34% and 24%) and Asia and Pacific countries (23% and 25%).1
The highest number of foreign guest researchers in Germany (38%) worked in the fields of Mathematics and Natural Sciences. 18% were Humanities scholars, 15% worked in the field of Law, Economics and Social Sciences, and 14% in that of Engineering.2 Considerable differences between the various funding organisations be- came apparent in the process: while the foreign guest researchers sponsored by the DFG and the Alexander von Humboldt Foundation were compa- ratively frequently affiliated to the fields of Mathe- matics and Natural Sciences (63% and 47% respectively), the group of smaller German funding
organisations were notable for their relatively wide support of visits by researchers in the field of Humanities (39%) and Law, Economics and Social Sciences (27%).
A third of foreign guest researchers (33%) stayed in Germany for less than a month, with a tenth (11%) remaining for one to six months and a fifth (19%) for seven to twelve months. Just 6% of guest researchers stay longer than a year.3 The DAAD funded a particularly high proportion of short-term visits (56%), whose recipients only stay in Germany for up to one month. By contrast, the proportion of one- to two-year funding periods supported by the Alexander von Humboldt Foun- dation was 41%, a figure which even rose to 51% among the foreign funding organisations ana- lysed in the present report. 25% of the sponsor-ship provided by smaller German funding orga- nisations was granted for guest visits lasting longer than three years.
InsgesamtAlexander
v. Humboldt-Stiftung
DAAD DFGWeitere dt.
Förder-organisationen
AusländischeFörder-
organisationen1
Herkunftsregion in %Westeuropa 17,8 24,4 8,8 34,4 6,5 18,4
Mittel- und Südosteuropa 13,1 6,1 14,0 12,9 18,7 0,0
Osteuropa und Zentralasien 12,6 5,9 15,5 8,8 17,7 0,0
Nordamerika 5,6 20,2 3,9 5,7 6,4 8,9
Lateinamerika 10,2 7,4 13,4 5,6 9,8 0,0
Nordafrika und Nahost 12,3 5,2 16,0 7,3 14,7 0,0
Subsahara-Afrika 8,9 5,3 13,2 2,1 10,5 0,0
Asien und Pazifik 18,4 25,4 15,1 23,2 13,2 24,4
Ohne regionale Einteilung 1,1 0,0 0,0 0,0 2,5 48,2
D28 Ausländische Gastwissenschaftler in Deutschland nach Herkunftsregion und wichtigsten Förderorganisationen 2015
Foreign guest researchers in Germany by region of origin and major funding organisations in 2015
0
20
40
60
80
100
120 DAAD DFGInsgesamt Weitere deutsche Förder- organisationen
Ausländische Förder-
organisationen
Alexander von Humboldt-
Stiftung
Geisteswissenschaften
Rechts-, Wirtschafts- und Sozialwiss.
Mathematik, Naturwissenschaften
Humanmedizin, Gesundheitswiss.
Agrar-, Forst- und Ernährungs- wissenschaften, Veterinärmedizin
Ingenieurwissenschaften
Kunst, Kunstwissenschaft
Sonstige/Keine Angabe
Angaben in %
D29 Ausländische Gastwissenschaftler in Deutschland nach Fächergruppe und wichtigsten Förderorganisationen 2015
Foreign guest researchers in Germany by subject group and major funding organisations in 2015
1 Zu den Herkunftsregionen der auslän- dischen Gastwissenschaftler, deren Aufenthalt in Deutschland durch aus-ländische Förderorganisation finanziert werden, können keine Aussagen gemacht werden, weil diese Information im Rah-men der wichtigsten Förderaktivitäten, EU-Marie-Sklodowska-Curie-Maßnah-men, derzeit nicht erfasst werden.No statements can be made regarding the regions of origin of the foreign guest researchers whose visits to Germany were financed by foreign funding organisations, as these statistics are not currently recorded within the context of the key funding activities, the EU Marie Sklodowska-Curie Actions.
2 Da derzeit keine sicheren Erkenntnisse zur Verteilung der ausländischen Gast-wissenschaftler auf Hochschulen sowie außeruniversitären Forschungseinrich-tungen vorliegen, wurde auf einen Ver-gleich mit der Verteilung der deutschen Wissenschaftler auf die verschiedenen Fächergruppen verzichtet.As no reliable findings concerning the distribution of foreign guest researchers at HEIs and non-university research institutions are currently available, a comparison with the distribution of German academics and researchers within the various subject groups is not provided.
3 Die Gültigkeit der Aussagen zur Aufent-haltsdauer ist eingeschränkt, da die DFG keine solchen Informationen für die von ihr geförderten ausländischen Gastwis-senschaftler zur Verfügung stellen kann.The validity of statements regarding the duration of visits is limited, as the DFG was unable to provide any statistics of this nature for the foreign guest resear-chers it funds.
Quelle Abb. D26–D29: Angaben der Förderorganisationen; DZHW-Berechnungen
18 22 2277
63
39
115
16
65
22
27
133395
8123
19
25
77
16
11
47
7 212
15
38
74
1432 12 2 1
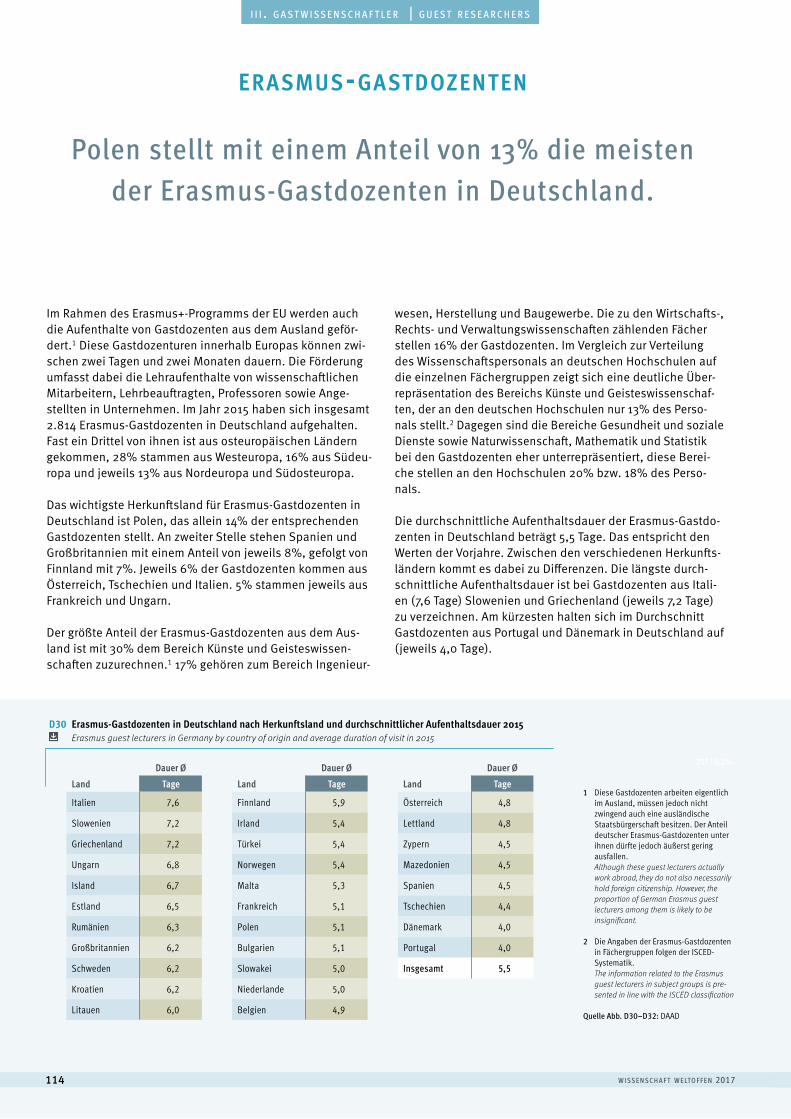
w i sse n sc h a f t w e lto f f e n 2017114
a u s l ä n d i s c h e s t u d i e r e n d e | f o r e i g n s t u d e n t si i i . g a s t w i s s e n s c h a f t l e r | g u e s t r e s e a r c h e r s
Polen stellt mit einem Anteil von 13% die meisten der Erasmus-Gastdozenten in Deutschland.
Im Rahmen des Erasmus+-Programms der EU werden auch die Aufenthalte von Gastdozenten aus dem Ausland geför-dert.1 Diese Gastdozenturen innerhalb Europas können zwi-schen zwei Tagen und zwei Monaten dauern. Die Förderung umfasst dabei die Lehraufenthalte von wissenschaftlichen Mitarbeitern, Lehrbeauftragten, Professoren sowie Ange-stellten in Unternehmen. Im Jahr 2015 haben sich insgesamt 2.814 Erasmus-Gastdozenten in Deutschland aufgehalten. Fast ein Drittel von ihnen ist aus osteuropäischen Ländern gekommen, 28% stammen aus Westeuropa, 16% aus Südeu-ropa und jeweils 13% aus Nordeuropa und Südosteuropa.
Das wichtigste Herkunftsland für Erasmus-Gastdozenten in Deutschland ist Polen, das allein 14% der entsprechenden Gastdozenten stellt. An zweiter Stelle stehen Spanien und Großbritannien mit einem Anteil von jeweils 8%, gefolgt von Finnland mit 7%. Jeweils 6% der Gastdozenten kommen aus Österreich, Tschechien und Italien. 5% stammen jeweils aus Frankreich und Ungarn.
Der größte Anteil der Erasmus-Gastdozenten aus dem Aus-land ist mit 30% dem Bereich Künste und Geisteswissen-schaften zuzurechnen.1 17% gehören zum Bereich Ingenieur-
wesen, Herstellung und Baugewerbe. Die zu den Wirtschafts-, Rechts- und Verwaltungswissenschaften zählenden Fächer stellen 16% der Gastdozenten. Im Vergleich zur Verteilung des Wissenschaftspersonals an deutschen Hochschulen auf die einzelnen Fächergruppen zeigt sich eine deutliche Über-repräsentation des Bereichs Künste und Geisteswissenschaf-ten, der an den deutschen Hochschulen nur 13% des Perso-nals stellt.2 Dagegen sind die Bereiche Gesundheit und soziale Dienste sowie Naturwissenschaft, Mathematik und Statistik bei den Gastdozenten eher unterrepräsentiert, diese Berei-che stellen an den Hochschulen 20% bzw. 18% des Perso-nals.
Die durchschnittliche Aufenthaltsdauer der Erasmus-Gastdo-zenten in Deutschland beträgt 5,5 Tage. Das entspricht den Werten der Vorjahre. Zwischen den verschiedenen Herkunfts-ländern kommt es dabei zu Differenzen. Die längste durch-schnittliche Aufenthaltsdauer ist bei Gastdozenten aus Itali-en (7,6 Tage) Slowenien und Griechenland (jeweils 7,2 Tage) zu verzeichnen. Am kürzesten halten sich im Durchschnitt Gastdozenten aus Portugal und Dänemark in Deutschland auf (jeweils 4,0 Tage).
erasmus-gastdozenten
Dauer Ø
Land Tage
Italien 7,6
Slowenien 7,2
Griechenland 7,2
Ungarn 6,8
Island 6,7
Estland 6,5
Rumänien 6,3
Großbritannien 6,2
Schweden 6,2
Kroatien 6,2
Litauen 6,0
Dauer Ø
Land Tage
Finnland 5,9
Irland 5,4
Türkei 5,4
Norwegen 5,4
Malta 5,3
Frankreich 5,1
Polen 5,1
Bulgarien 5,1
Slowakei 5,0
Niederlande 5,0
Belgien 4,9
Dauer Ø
Land Tage
Österreich 4,8
Lettland 4,8
Zypern 4,5
Mazedonien 4,5
Spanien 4,5
Tschechien 4,4
Dänemark 4,0
Portugal 4,0
Insgesamt 5,5
257 | 9,2%
D30 Erasmus-Gastdozenten in Deutschland nach Herkunftsland und durchschnittlicher Aufenthaltsdauer 2015 Erasmus guest lecturers in Germany by country of origin and average duration of visit in 2015
1 Diese Gastdozenten arbeiten eigentlich im Ausland, müssen jedoch nicht zwingend auch eine ausländische Staatsbürgerschaft besitzen. Der Anteil deutscher Erasmus-Gastdozenten unter ihnen dürfte jedoch äußerst gering ausfallen.Although these guest lecturers actually work abroad, they do not also necessarily hold foreign citizenship. However, the proportion of German Erasmus guest lecturers among them is likely to be insignificant.
2 Die Angaben der Erasmus-Gastdozenten in Fächergruppen folgen der ISCED-Systematik.The information related to the Erasmus guest lecturers in subject groups is pre-sented in line with the ISCED classification
Quelle Abb. D30–D32: DAAD
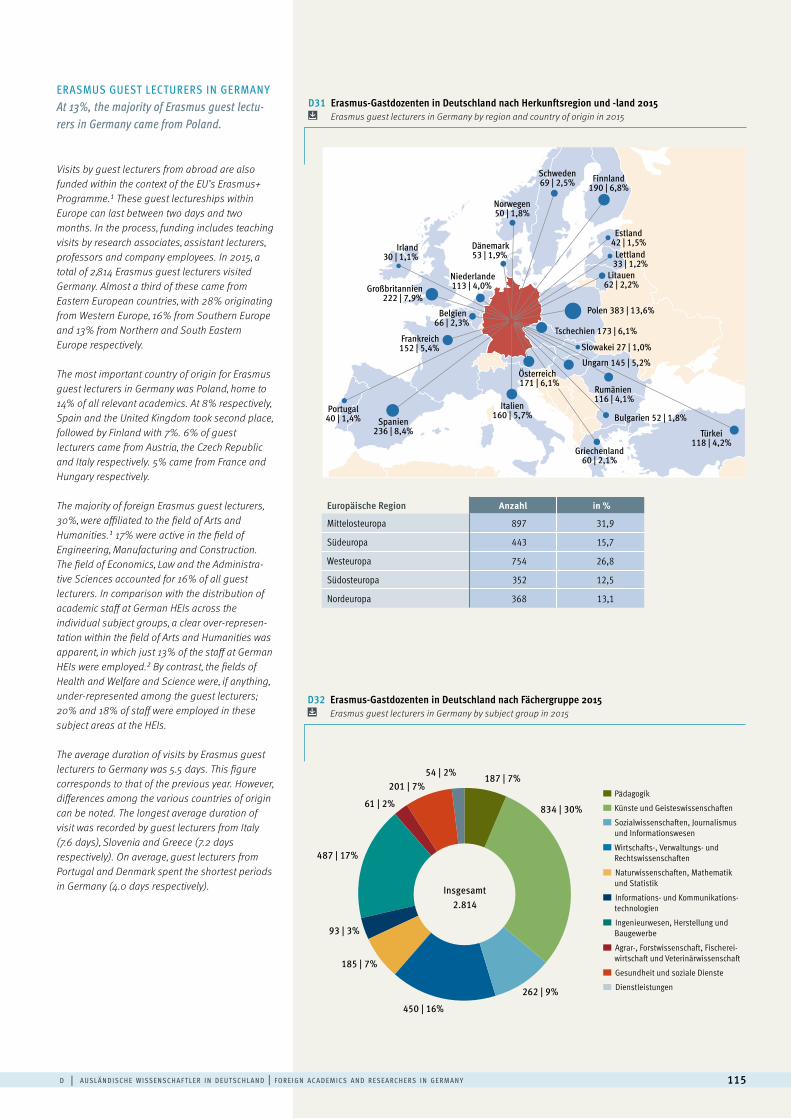
d | a u sl ä n d i sc h e w i sse n sc h a f t l e r i n d e ut sc h l a n d | f o r e i g n ac a d e m i cs a n d r ese a rc h e rs i n g e rm a n y 115
ERASMUS GUEST LECTURERS IN GERMANYAt 13%, the majority of Erasmus guest lectu-rers in Germany came from Poland.
Visits by guest lecturers from abroad are also funded within the context of the EU’s Erasmus+ Programme.1 These guest lectureships within Europe can last between two days and two months. In the process, funding includes teaching visits by research associates, assistant lecturers, professors and company employees. In 2015, a total of 2,814 Erasmus guest lecturers visited Germany. Almost a third of these came from Eastern European countries, with 28% originating from Western Europe, 16% from Southern Europe and 13% from Northern and South Eastern Europe respectively.
The most important country of origin for Erasmus guest lecturers in Germany was Poland, home to 14% of all relevant academics. At 8% respectively, Spain and the United Kingdom took second place, followed by Finland with 7%. 6% of guest lecturers came from Austria, the Czech Republic and Italy respectively. 5% came from France and Hungary respectively.
The majority of foreign Erasmus guest lecturers, 30%, were affiliated to the field of Arts and Humanities.1 17% were active in the field of Engineering, Manufacturing and Construction. The field of Economics, Law and the Administra-tive Sciences accounted for 16% of all guest lecturers. In comparison with the distribution of academic staff at German HEIs across the individual subject groups, a clear over-represen-tation within the field of Arts and Humanities was apparent, in which just 13% of the staff at German HEIs were employed.2 By contrast, the fields of Health and Welfare and Science were, if anything, under-represented among the guest lecturers; 20% and 18% of staff were employed in these subject areas at the HEIs.
The average duration of visits by Erasmus guest lecturers to Germany was 5.5 days. This figure corresponds to that of the previous year. However, differences among the various countries of origin can be noted. The longest average duration of visit was recorded by guest lecturers from Italy (7.6 days), Slovenia and Greece (7.2 days respectively). On average, guest lecturers from Portugal and Denmark spent the shortest periods in Germany (4.0 days respectively).
Niederlande113 | 4,0%
Dänemark53 | 1,9%
Belgien66 | 2,3%
Schweden69 | 2,5%
Norwegen50 | 1,8%
Finnland190 | 6,8%
Litauen62 | 2,2%
Estland42 | 1,5%
Lettland33 | 1,2%
Großbritannien222 | 7,9%
Irland30 | 1,1%
Frankreich152 | 5,4%
Spanien236 | 8,4%
Portugal40 | 1,4%
Italien160 | 5,7%
Türkei118 | 4,2%
Griechenland60 | 2,1%
Rumänien 116 | 4,1%
Bulgarien 52 | 1,8%
Tschechien 173 | 6,1%
Slowakei 27 | 1,0%
Polen 383 | 13,6%
Ungarn 145 | 5,2%Österreich 171 | 6,1%
D31 Erasmus-Gastdozenten in Deutschland nach Herkunftsregion und -land 2015 Erasmus guest lecturers in Germany by region and country of origin in 2015
187 | 7%
D32 Erasmus-Gastdozenten in Deutschland nach Fächergruppe 2015 Erasmus guest lecturers in Germany by subject group in 2015
Pädagogik
Künste und Geisteswissenschaften
Sozialwissenschaften, Journalismus und Informationswesen
Wirtschafts-, Verwaltungs- und Rechtswissenschaften
Naturwissenschaften, Mathematik und Statistik
Informations- und Kommunikations- technologien
Ingenieurwesen, Herstellung und Baugewerbe
Agrar-, Forstwissenschaft, Fischerei- wirtschaft und Veterinärwissenschaft
Gesundheit und soziale Dienste
Dienstleistungen
Insgesamt2.814
834 | 30%
262 | 9%
450 | 16%
201 | 7%
61 | 2%
487 | 17%
93 | 3%
185 | 7%
54 | 2%
Europäische Region Anzahl in %
Mittelosteuropa 897 31,9
Südeuropa 443 15,7
Westeuropa 754 26,8
Südosteuropa 352 12,5
Nordeuropa 368 13,1
w i sse n sc h a f t w e lto f f e n 2017116
deutsche wissenschaftler im ausland
Nach den verfügbaren Daten arbeiten die meisten deutschen Wissenschaftler an Universitäten in der Schweiz, gefolgt von Universitäten in Großbritannien und Österreich. Diese Rangfol-ge gilt auch für die Zahl der deutschen Professoren im Ausland. Gemessen am Anteil der deutschen an allen ausländischen Wissenschaftlern lässt sich allerdings der größte Anteil deut-scher Wissenschaftler in Österreich (45%), der Schweiz (32%) und den Niederlanden (16%) feststellen. Die deutschen Profes-soren stellen dabei an allen ausländischen Professoren in Ös-terreich einen Anteil von 72%.
Im Jahr 2014 befinden sich insgesamt 14.059 deutsche Dokto-randen im Ausland. Die wichtigsten Gastländer sind dabei die Schweiz, auf die 26% aller erfassten deutschen Doktoran-den im Ausland entfallen, sowie Großbritannien (17%) und Österreich (15%). Damit hat sich in diesen drei Ländern allein deutlich über die Hälfte (58%) aller deutschen Doktoranden im Ausland aufgehalten. Eine starke Zunahme der deutschen Doktoranden ist zwischen 2009 und 2014 aber vor allem in Dä-nemark, im flämischen Teil von Belgien, in Norwegen und in Schweden festzustellen.
Im Jahr 2015 sind 16.006 Aufenthalte deutscher Gastwissen-schaftler in Deutschland von in- und ausländischen Organi-sationen gefördert worden. 76% von ihnen wurden durch den DAAD, 13% durch die DFG und 9% durch weitere deutsche För-derorganisationen unterstützt. Der Anteil der erfassten Förde-rungen durch ausländische Organisationen liegt bei 2%. Der größte Teil der Aufenthalte wurde von promovierten Wissen-schaftlern, einschließlich Professoren und anderer erfahrener Wissenschaftler (54%), durchgeführt, bei 33% handelt es sich um Doktoranden und andere Postgraduierte.
Die USA sind mit Abstand das wichtigste Gastland für deut-sche Gastwissenschaftler im Ausland. Allein 16% aller Aus-landsaufenthalte wurden dort absolviert. Weitere wichtige Gastländer sind China, Großbritannien und Russland. Bei den Gastregionen kommt Westeuropa und Nordamerika mit Antei-len von 22% bzw. 19% an allen deutschen Gastwissenschaft-lern die größte Bedeutung zu. Vergleichsweise viele Gastwis-senschaftler sind zum Auslandsaufenthalt auch in der Region Asien und Pazifik (15%) sowie in Mittel- und Südosteuropa (11%). Die Postgraduierten unter den deutschen Gastwissen-schaftlern absolvieren dabei besonders häufig Auslandsauf-enthalte in Westeuropa (33%) und Nordamerika (25%). Bei den Postdoktoranden ergibt sich dagegen eine gleichmäßigere re-gionale Verteilung. Für sie ist neben Westeuropa (18%) und Nordamerika (15%) unter anderem auch die Region Asien und Pazifik (18%) wichtig.
26% der deutschen Gastwissenschaftler im Ausland sind in den Geisteswissenschaften, 23% in den Naturwissenschaften, 19% im Bereich Rechts-, Wirtschafts- und Sozialwissenschaften und 10% in den Ingenieurwissenschaften tätig.
Über die Hälfte (57%) der deutschen Gastwissenschaftler hält sich weniger als einen Monat im Ausland auf, ein Zehn-tel (10%) ein bis sechs Monate und ein Siebtel (15%) sieben bis zwölf Monate. Länger als ein Jahr bleiben nur 4% der deut-schen Gastwissenschaftler im Ausland.
2015 haben sich insgesamt 3.192 Erasmus-Gastdozenten aus Deutschland im Ausland aufgehalten, das sind 8% mehr als im Jahr zuvor. Die wichtigste Gastregion stellt Westeuropa dar, in ihr wurden 28% aller Aufenthalte absolviert. An zweiter Stelle steht Mittelosteuropa (24%), gefolgt von Südeuropa (22%). Die wichtigsten Gastländer sind Frankreich, Spanien und Po-len. Der größte Anteil der Erasmus-Gastdozenten ist mit 34% dem Bereich Geisteswissenschaften und Künste zuzurechnen, 17% gehören zum Bereich Wirtschafts-, Rechts- und Verwal-tungswissenschaften. Die durchschnittliche Aufenthaltsdauer der Erasmus-Gastdozenten aus Deutschland beträgt 5,3 Tage.
Deutsche Wissenschaftler arbeiten in anderen Ländern zum einen fest angestellt an Hochschulen und Forschungseinrichtungen. Zum anderen absolvieren aber auch viele deutsche Gastwissenschaftler
mit Förderung unterschiedlicher Einrichtungen einen temporären Forschungs- und Lehraufenthalt im Ausland.
w i s s e n s c h a f t l e r a n u n i v e r s i tät e n i m a u s l a n d
g a s t w i s s e n s c h a f t l e r i m a u s l a n d
e | d e ut sc h e w i sse n sc h a f t l e r i m a u sl a n d | g e rm a n ac a d e m i cs a n d r ese a rc h e rs a b roa d 117
Egerman academics and researchers abroad
a c a d e m i c s a n d r e s e a r c h e r s at u n i v e r s i t i e s a b r o a d
German academics and researchers in other countries on the one hand work in permanent roles at higher education institutions and research institutes. But many German guest researchers also conduct temporary
research and teaching visits abroad with funding from a range of organi-sations.
According to the available data, the largest number of German academ-ics and researchers work at universities in Switzerland, followed by uni-versities in the United Kingdom and Austria. These are – in the same or-der – also the countries with the largest numbers of German professors abroad. Measured against the proportion of German academics and researchers among all foreign academics and researchers however the largest proportions of German academics and researchers are found in Austria (45%), Switzerland (32%) and the Netherlands (16%). German professors account for 72% of all foreign professors in Austria.
There were a total of 14,059 German doctoral candidates abroad in 2014. Their most important host countries were Switzerland, with 26% of all German doctoral candidates abroad, the United Kingdom (17%) and Austria (15%). These three countries alone thus hosted well over half (58%) of all German doctoral candidates abroad; however, German doctoral candidate numbers particularly in Denmark, in the Flemish part of Belgium, in Norway and in Sweden saw significant increases between 2009 and 2014.
g u e s t r e s e a r c h e r s a b r o a d
In 2015, national and international organisations funded a total of 16,006 visits by German guest lecturers to other countries. 76% of these visits were sponsored by the DAAD, 13% by DFG and 9% by other German funding organisations. The proportion of recorded grants from foreign organisations was 2%. The majority of these visits were conduc-ted by academics and researchers with doctorates, including professors and other experienced academics and researchers (54%), while 33% were conducted by doctoral candidates and other postgraduates.
The USA was by far the most important host country for German guest researchers abroad. 16% of visits abroad were made there alone. Other important host countries included China, the United Kingdom and Rus-sia. The most popular host regions were Western Europe and North America with proportions of 22% and 19%, respectively, of all German guest researchers. Comparatively large numbers of guest researchers also visited the Asia and Pacific region (15%) and Central and South Eastern Europe (11%). The postgraduates among the German guest researchers particularly frequently made visits abroad to Western Europe (33%) and North America (25%). By contrast, post-docs' visits abroad were distributed more evenly across the regions: in addition to Western Europe (18%) and North America (15%), they frequently travelled to the Asia and Pacific region (18%).
26% of German guest researchers abroad worked in the Humanities, 23% in the Natural Sciences, 19% in Law, Economics and the Social Sciences, and 10% in Engineering.
Over half of German guest researchers (57%) stayed abroad for less than a month, with a tenth (10%) remaining for one to six months and a seventh (15%) for seven to twelve months. Only 4% of guest researchers stayed abroad for longer than a year.
In 2015, a total of 3,192 Erasmus guest lecturers from Germany conduc-ted visits abroad; this represents an increase of 8% over the previous year. The most important host region was Western Europe, which was the destination for 28% of all visits. In second place was Central and Eastern Europe (24%), followed by Southern Europe (22%). The main host countries were France, Spain and Poland. At 34%, the largest pro-portion of Erasmus guest lecturers worked in the Humanities and Arts, while Economics, Law and the Administrative Sciences accounted for 17%. The average duration of visits by Erasmus guest lecturers from Germany was 5.3 days.
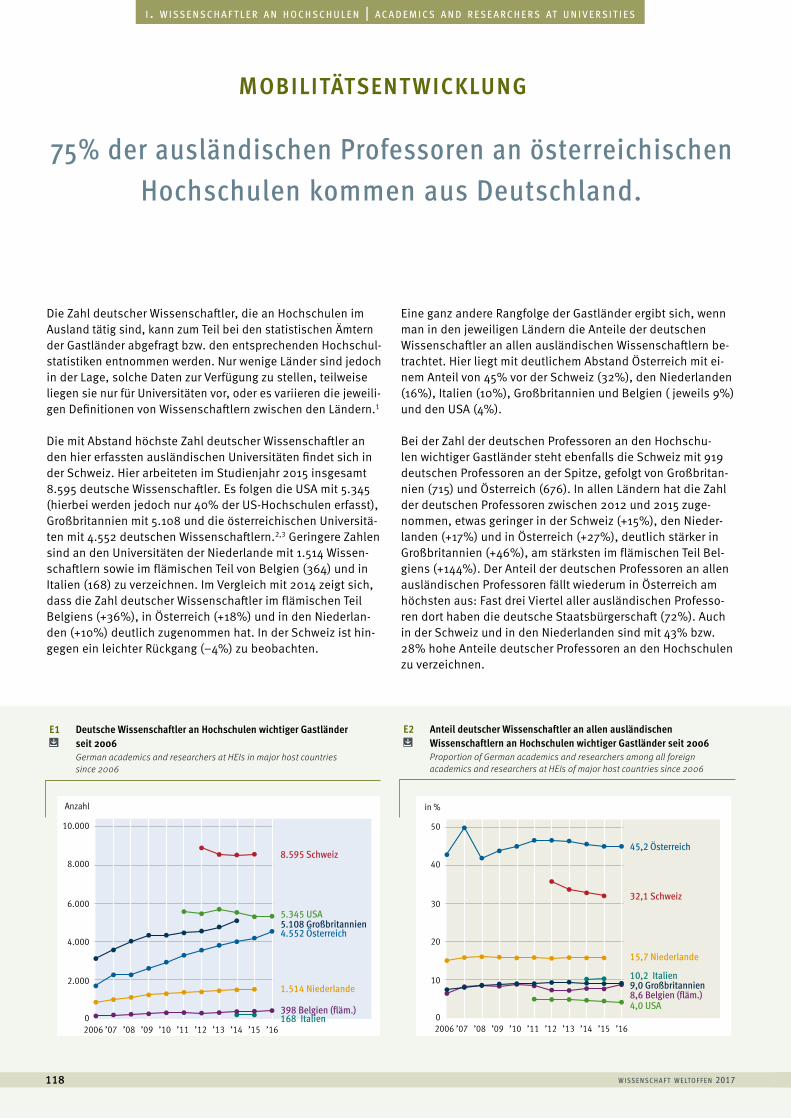
E1 Deutsche Wissenschaftler an Hochschulen wichtiger Gastländer seit 2006
German academics and researchers at HEIs in major host countries since 2006
E2 Anteil deutscher Wissenschaftler an allen ausländischen Wissenschaftlern an Hochschulen wichtiger Gastländer seit 2006
Proportion of German academics and researchers among all foreign academics and researchers at HEIs of major host countries since 2006
w i sse n sc h a f t w e lto f f e n 2017118
a u s l ä n d i s c h e s t u d i e r e n d e | f o r e i g n s t u d e n t si . w i s s e n s c h a f t l e r a n h o c h s c h u l e n | a c a d e m i c s a n d r e s e a r c h e r s at u n i v e r s i t i e s
75% der ausländischen Professoren an österreichischen Hochschulen kommen aus Deutschland.
Die Zahl deutscher Wissenschaftler, die an Hochschulen im Ausland tätig sind, kann zum Teil bei den statistischen Ämtern der Gastländer abgefragt bzw. den entsprechenden Hochschul- statistiken entnommen werden. Nur wenige Länder sind jedoch in der Lage, solche Daten zur Verfügung zu stellen, teilweise liegen sie nur für Universitäten vor, oder es variieren die jeweili-gen Definitionen von Wissenschaftlern zwischen den Ländern.1
Die mit Abstand höchste Zahl deutscher Wissenschaftler an den hier erfassten ausländischen Universitäten findet sich in der Schweiz. Hier arbeiteten im Studienjahr 2015 insgesamt 8.595 deutsche Wissenschaftler. Es folgen die USA mit 5.345 (hierbei werden jedoch nur 40% der US-Hochschulen erfasst), Großbritannien mit 5.108 und die österreichischen Universitä-ten mit 4.552 deutschen Wissenschaftlern.2,3 Geringere Zahlen sind an den Universitäten der Niederlande mit 1.514 Wissen-schaftlern sowie im flämischen Teil von Belgien (364) und in Italien (168) zu verzeichnen. Im Vergleich mit 2014 zeigt sich, dass die Zahl deutscher Wissenschaftler im flämischen Teil Belgiens (+36%), in Österreich (+18%) und in den Niederlan-den (+10%) deutlich zugenommen hat. In der Schweiz ist hin-gegen ein leichter Rückgang (–4%) zu beobachten.
Eine ganz andere Rangfolge der Gastländer ergibt sich, wenn man in den jeweiligen Ländern die Anteile der deutschen Wissenschaftler an allen ausländischen Wissenschaftlern be-trachtet. Hier liegt mit deutlichem Abstand Österreich mit ei-nem Anteil von 45% vor der Schweiz (32%), den Niederlanden (16%), Italien (10%), Großbritannien und Belgien ( jeweils 9%) und den USA (4%).
Bei der Zahl der deutschen Professoren an den Hochschu-len wichtiger Gastländer steht ebenfalls die Schweiz mit 919 deutschen Professoren an der Spitze, gefolgt von Großbritan-nien (715) und Österreich (676). In allen Ländern hat die Zahl der deutschen Professoren zwischen 2012 und 2015 zuge-nommen, etwas geringer in der Schweiz (+15%), den Nieder-landen (+17%) und in Österreich (+27%), deutlich stärker in Großbritannien (+46%), am stärksten im flämischen Teil Bel-giens (+144%). Der Anteil der deutschen Professoren an allen ausländischen Professoren fällt wiederum in Österreich am höchsten aus: Fast drei Viertel aller ausländischen Professo-ren dort haben die deutsche Staatsbürgerschaft (72%). Auch in der Schweiz und in den Niederlanden sind mit 43% bzw. 28% hohe Anteile deutscher Professoren an den Hochschulen zu verzeichnen.
mobilitätsent wicklung
2006 ’07 ’08 ’09 ’10 ’11 ’12 ’13 ’14 ’16’150
2.000
4.000
6.000
8.000
10.000
Anzahl
8.595 Schweiz
5.108 Großbritannien4.552 Österreich
5.345 USA
398 Belgien (fläm.)168 Italien
1.514 Niederlande
2006 ’07 ’08 ’09 ’10 ’11 ’12 ’13 ’14 ’16’150
10
20
30
40
50
in %
32,1 Schweiz
9,0 Großbritannien
45,2 Österreich
4,0 USA8,6 Belgien (fläm.)
10,2 Italien
15,7 Niederlande
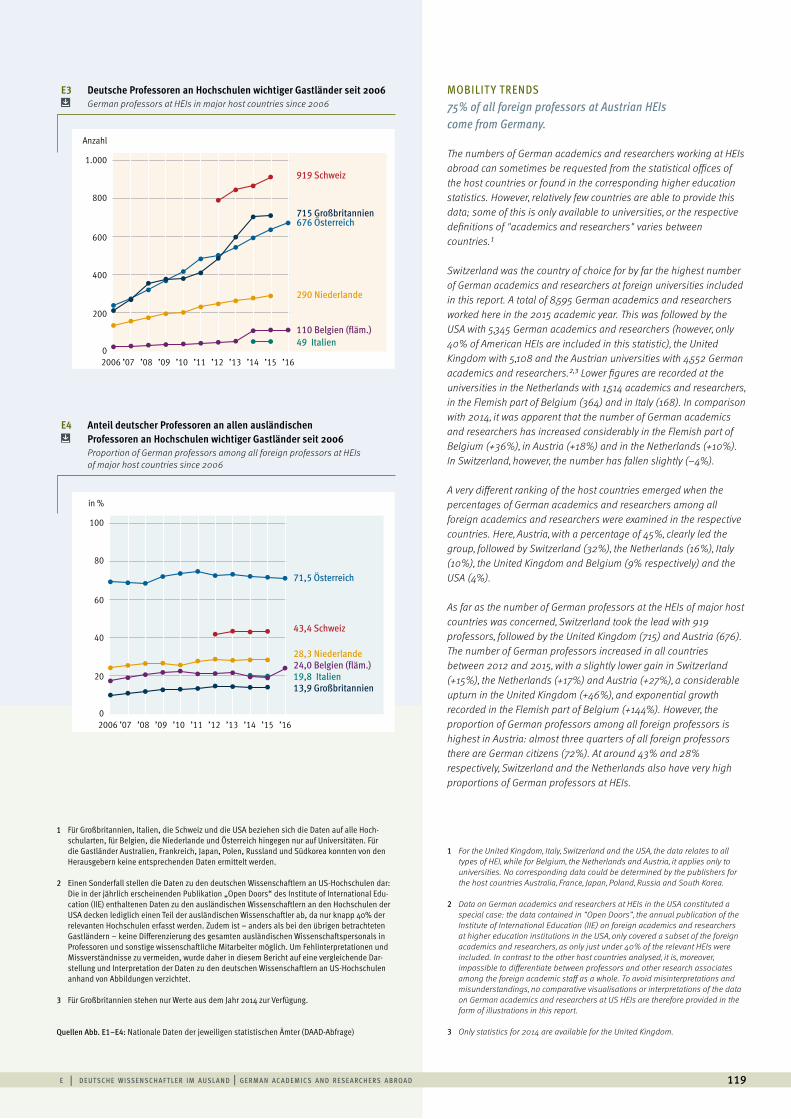
E3 Deutsche Professoren an Hochschulen wichtiger Gastländer seit 2006 German professors at HEIs in major host countries since 2006
E4 Anteil deutscher Professoren an allen ausländischen Professoren an Hochschulen wichtiger Gastländer seit 2006
Proportion of German professors among all foreign professors at HEIs of major host countries since 2006
e | d e ut sc h e w i sse n sc h a f t l e r i m a u sl a n d | g e rm a n ac a d e m i cs a n d r ese a rc h e rs a b roa d 119
2006 ’07 ’08 ’09 ’10 ’11 ’12 ’13 ’14 ’16’150
200
400
600
800
1.000
Anzahl
919 Schweiz
715 Großbritannien676 Österreich
110 Belgien (fläm.)49 Italien
290 Niederlande
2006 ’07 ’08 ’09 ’10 ’11 ’12 ’13 ’14 ’16’150
20
40
60
80
100
in %
43,4 Schweiz
13,9 Großbritannien
71,5 Österreich
24,0 Belgien (fläm.)19,8 Italien
28,3 Niederlande
1 Für Großbritannien, Italien, die Schweiz und die USA beziehen sich die Daten auf alle Hoch-schularten, für Belgien, die Niederlande und Österreich hingegen nur auf Universitäten. Für die Gastländer Australien, Frankreich, Japan, Polen, Russland und Südkorea konnten von den Herausgebern keine entsprechenden Daten ermittelt werden.
2 Einen Sonderfall stellen die Daten zu den deutschen Wissenschaftlern an US-Hochschulen dar: Die in der jährlich erscheinenden Publikation „Open Doors“ des Institute of International Edu-cation (IIE) enthaltenen Daten zu den ausländischen Wissenschaftlern an den Hochschulen der USA decken lediglich einen Teil der ausländischen Wissenschaftler ab, da nur knapp 40% der relevanten Hochschulen erfasst werden. Zudem ist – anders als bei den übrigen betrachteten Gastländern – keine Differenzierung des gesamten ausländischen Wissenschaftspersonals in Professoren und sonstige wissenschaftliche Mitarbeiter möglich. Um Fehlinterpretationen und Missverständnisse zu vermeiden, wurde daher in diesem Bericht auf eine vergleichende Dar-stellung und Interpretation der Daten zu den deutschen Wissenschaftlern an US-Hochschulen anhand von Abbildungen verzichtet.
3 Für Großbritannien stehen nur Werte aus dem Jahr 2014 zur Verfügung.
Quellen Abb. E1–E4: Nationale Daten der jeweiligen statistischen Ämter (DAAD-Abfrage)
1 For the United Kingdom, Italy, Switzerland and the USA, the data relates to all types of HEI, while for Belgium, the Netherlands and Austria, it applies only to universities. No corresponding data could be determined by the publishers for the host countries Australia, France, Japan, Poland, Russia and South Korea.
2 Data on German academics and researchers at HEIs in the USA constituted a special case: the data contained in “Open Doors”, the annual publication of the Institute of International Education (IIE) on foreign academics and researchers at higher education institutions in the USA, only covered a subset of the foreign academics and researchers, as only just under 40% of the relevant HEIs were included. In contrast to the other host countries analysed, it is, moreover, impossible to differentiate between professors and other research associates among the foreign academic staff as a whole. To avoid misinterpretations and misunderstandings, no comparative visualisations or interpretations of the data on German academics and researchers at US HEIs are therefore provided in the form of illustrations in this report.
3 Only statistics for 2014 are available for the United Kingdom.
MOBILIT Y TRENDS 75% of all foreign professors at Austrian HEIs come from Germany.
The numbers of German academics and researchers working at HEIs abroad can sometimes be requested from the statistical offices of the host countries or found in the corresponding higher education statistics. However, relatively few countries are able to provide this data; some of this is only available to universities, or the respective definitions of "academics and researchers" varies between countries.1
Switzerland was the country of choice for by far the highest number of German academics and researchers at foreign universities included in this report. A total of 8,595 German academics and researchers worked here in the 2015 academic year. This was followed by the USA with 5,345 German academics and researchers (however, only 40% of American HEIs are included in this statistic), the United Kingdom with 5,108 and the Austrian universities with 4,552 German academics and researchers.2,3 Lower figures are recorded at the universities in the Netherlands with 1,514 academics and researchers, in the Flemish part of Belgium (364) and in Italy (168). In comparison with 2014, it was apparent that the number of German academics and researchers has increased considerably in the Flemish part of Belgium (+36%), in Austria (+18%) and in the Netherlands (+10%). In Switzerland, however, the number has fallen slightly (–4%).
A very different ranking of the host countries emerged when the percentages of German academics and researchers among all foreign academics and researchers were examined in the respective countries. Here, Austria, with a percentage of 45%, clearly led the group, followed by Switzerland (32%), the Netherlands (16%), Italy (10%), the United Kingdom and Belgium (9% respectively) and the USA (4%).
As far as the number of German professors at the HEIs of major host countries was concerned, Switzerland took the lead with 919 professors, followed by the United Kingdom (715) and Austria (676). The number of German professors increased in all countries between 2012 and 2015, with a slightly lower gain in Switzerland (+15%), the Netherlands (+17%) and Austria (+27%), a considerable upturn in the United Kingdom (+46%), and exponential growth recorded in the Flemish part of Belgium (+144%). However, the proportion of German professors among all foreign professors is highest in Austria: almost three quarters of all foreign professors there are German citizens (72%). At around 43% and 28% respectively, Switzerland and the Netherlands also have very high proportions of German professors at HEIs.
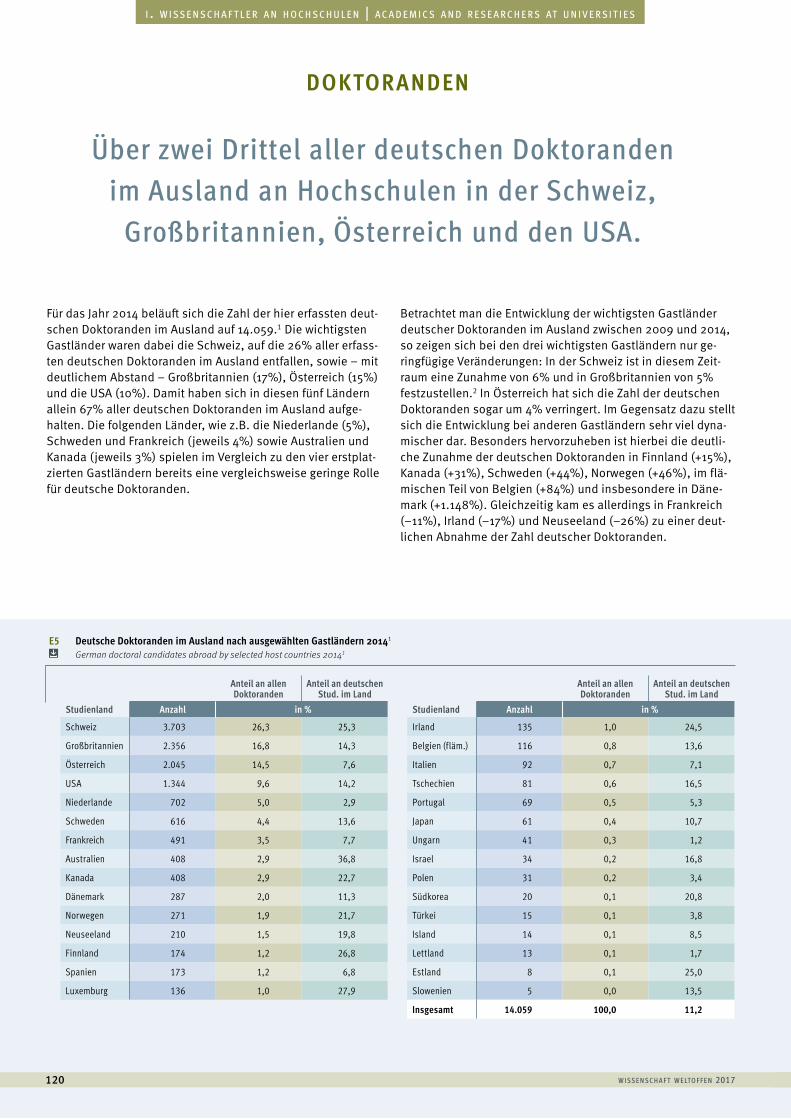
E5 Deutsche Doktoranden im Ausland nach ausgewählten Gastländern 20141
German doctoral candidates abroad by selected host countries 20141
w i sse n sc h a f t w e lto f f e n 2017120
a u s l ä n d i s c h e s t u d i e r e n d e | f o r e i g n s t u d e n t si . w i s s e n s c h a f t l e r a n h o c h s c h u l e n | a c a d e m i c s a n d r e s e a r c h e r s at u n i v e r s i t i e s
Über zwei Drittel aller deutschen Doktoranden im Ausland an Hochschulen in der Schweiz,
Großbritannien, Österreich und den USA.
Für das Jahr 2014 beläuft sich die Zahl der hier erfassten deut-schen Doktoranden im Ausland auf 14.059.1 Die wichtigsten Gastländer waren dabei die Schweiz, auf die 26% aller erfass-ten deutschen Doktoranden im Ausland entfallen, sowie – mit deutlichem Abstand – Großbritannien (17%), Österreich (15%) und die USA (10%). Damit haben sich in diesen fünf Ländern allein 67% aller deutschen Doktoranden im Ausland aufge-halten. Die folgenden Länder, wie z.B. die Niederlande (5%), Schweden und Frankreich (jeweils 4%) sowie Australien und Kanada (jeweils 3%) spielen im Vergleich zu den vier erstplat-zierten Gastländern bereits eine vergleichsweise geringe Rolle für deutsche Doktoranden.
Betrachtet man die Entwicklung der wichtigsten Gastländer deutscher Doktoranden im Ausland zwischen 2009 und 2014, so zeigen sich bei den drei wichtigsten Gastländern nur ge-ringfügige Veränderungen: In der Schweiz ist in diesem Zeit-raum eine Zunahme von 6% und in Großbritannien von 5% festzustellen.2 In Österreich hat sich die Zahl der deutschen Doktoranden sogar um 4% verringert. Im Gegensatz dazu stellt sich die Entwicklung bei anderen Gastländern sehr viel dyna-mischer dar. Besonders hervorzuheben ist hierbei die deutli-che Zunahme der deutschen Doktoranden in Finnland (+15%), Kanada (+31%), Schweden (+44%), Norwegen (+46%), im flä-mischen Teil von Belgien (+84%) und insbesondere in Däne-mark (+1.148%). Gleichzeitig kam es allerdings in Frankreich (–11%), Irland (–17%) und Neuseeland (–26%) zu einer deut-lichen Abnahme der Zahl deutscher Doktoranden.
doktoranden
Anteil an allen Doktoranden
Anteil an deutschen Stud. im Land
Studienland Anzahl in %
Schweiz 3.703 26,3 25,3
Großbritannien 2.356 16,8 14,3
Österreich 2.045 14,5 7,6
USA 1.344 9,6 14,2
Niederlande 702 5,0 2,9
Schweden 616 4,4 13,6
Frankreich 491 3,5 7,7
Australien 408 2,9 36,8
Kanada 408 2,9 22,7
Dänemark 287 2,0 11,3
Norwegen 271 1,9 21,7
Neuseeland 210 1,5 19,8
Finnland 174 1,2 26,8
Spanien 173 1,2 6,8
Luxemburg 136 1,0 27,9
Anteil an allen Doktoranden
Anteil an deutschen Stud. im Land
Studienland Anzahl in %
Irland 135 1,0 24,5
Belgien (fläm.) 116 0,8 13,6
Italien 92 0,7 7,1
Tschechien 81 0,6 16,5
Portugal 69 0,5 5,3
Japan 61 0,4 10,7
Ungarn 41 0,3 1,2
Israel 34 0,2 16,8
Polen 31 0,2 3,4
Südkorea 20 0,1 20,8
Türkei 15 0,1 3,8
Island 14 0,1 8,5
Lettland 13 0,1 1,7
Estland 8 0,1 25,0
Slowenien 5 0,0 13,5
Insgesamt 14.059 100,0 11,2
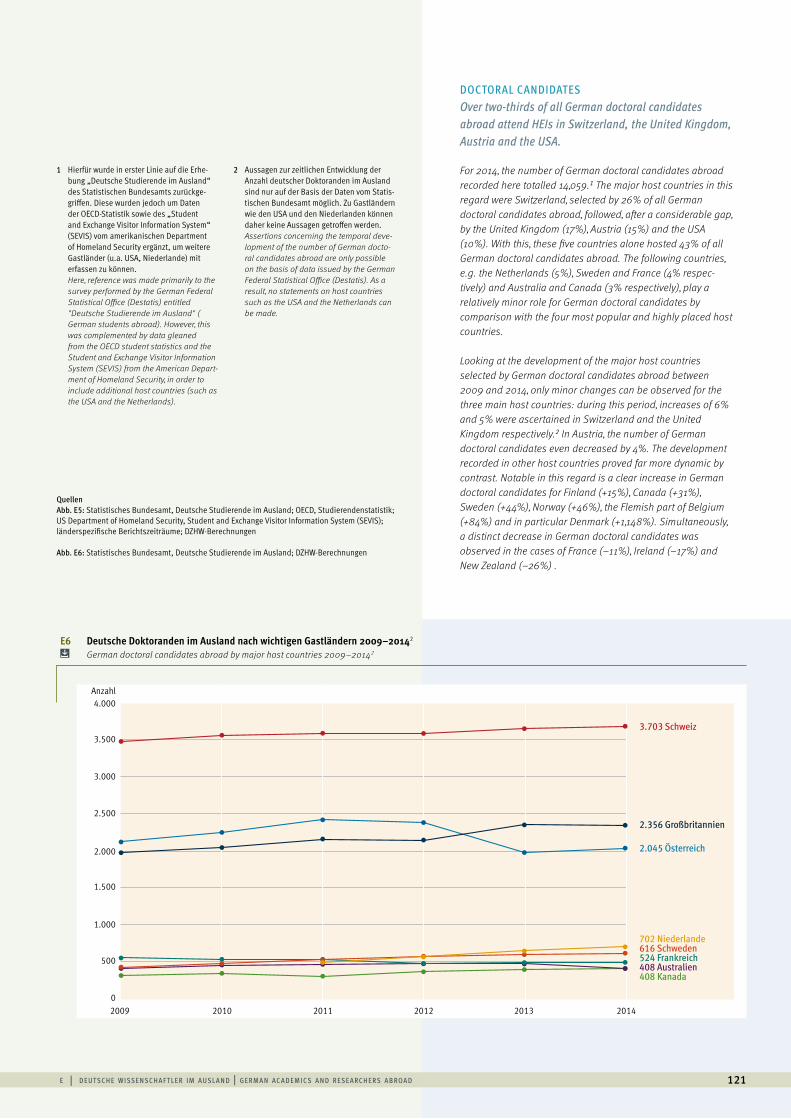
E6 Deutsche Doktoranden im Ausland nach wichtigen Gastländern 2009–20142
German doctoral candidates abroad by major host countries 2009–20142
e | d e ut sc h e w i sse n sc h a f t l e r i m a u sl a n d | g e rm a n ac a d e m i cs a n d r ese a rc h e rs a b roa d 121
1 Hierfür wurde in erster Linie auf die Erhe-bung „Deutsche Studierende im Ausland“ des Statistischen Bundesamts zurückge-griffen. Diese wurden jedoch um Daten der OECD-Statistik sowie des „Student and Exchange Visitor Information System“ (SEVIS) vom amerikanischen Department of Homeland Security ergänzt, um weitere Gastländer (u.a. USA, Niederlande) mit erfassen zu können.
Here, reference was made primarily to the survey performed by the German Federal Statistical Office (Destatis) entitled "Deutsche Studierende im Ausland" ( German students abroad). However, this was complemented by data gleaned from the OECD student statistics and the Student and Exchange Visitor Information System (SEVIS) from the American Depart-ment of Homeland Security, in order to include additional host countries (such as the USA and the Netherlands).
2 Aussagen zur zeitlichen Entwicklung der Anzahl deutscher Doktoranden im Ausland sind nur auf der Basis der Daten vom Statis-tischen Bundesamt möglich. Zu Gastländern wie den USA und den Niederlanden können daher keine Aussagen getroffen werden.
Assertions concerning the temporal deve-lopment of the number of German docto-ral candidates abroad are only possible on the basis of data issued by the German Federal Statistical Office (Destatis). As a result, no statements on host countries such as the USA and the Netherlands can be made.
2009 2010 2011 20142012 2013
3.703 Schweiz
2.356 Großbritannien
2.045 Österreich
702 Niederlande616 Schweden524 Frankreich408 Australien408 Kanada
0
500
1.000
1.500
2.000
2.500
3.000
3.500
4.000Anzahl
DOCTORAL CANDIDATES Over two-thirds of all German doctoral candidates abroad attend HEIs in Switzerland, the United Kingdom, Austria and the USA.
For 2014, the number of German doctoral candidates abroad recorded here totalled 14,059.1 The major host countries in this regard were Switzerland, selected by 26% of all German doctoral candidates abroad, followed, after a considerable gap, by the United Kingdom (17%), Austria (15%) and the USA (10%). With this, these five countries alone hosted 43% of all German doctoral candidates abroad. The following countries, e.g. the Netherlands (5%), Sweden and France (4% respec-tively) and Australia and Canada (3% respectively), play a relatively minor role for German doctoral candidates by comparison with the four most popular and highly placed host countries.
Looking at the development of the major host countries selected by German doctoral candidates abroad between 2009 and 2014, only minor changes can be observed for the three main host countries: during this period, increases of 6% and 5% were ascertained in Switzerland and the United Kingdom respectively.2 In Austria, the number of German doctoral candidates even decreased by 4%. The development recorded in other host countries proved far more dynamic by contrast. Notable in this regard is a clear increase in German doctoral candidates for Finland (+15%), Canada (+31%), Sweden (+44%), Norway (+46%), the Flemish part of Belgium (+84%) and in particular Denmark (+1,148%). Simultaneously, a distinct decrease in German doctoral candidates was observed in the cases of France (–11%), Ireland (–17%) and New Zealand (–26%) .
Quellen Abb. E5: Statistisches Bundesamt, Deutsche Studierende im Ausland; OECD, Studierendenstatistik; US Department of Homeland Security, Student and Exchange Visitor Information System (SEVIS); länderspezifische Berichtszeiträume; DZHW-Berechnungen
Abb. E6: Statistisches Bundesamt, Deutsche Studierende im Ausland; DZHW-Berechnungen
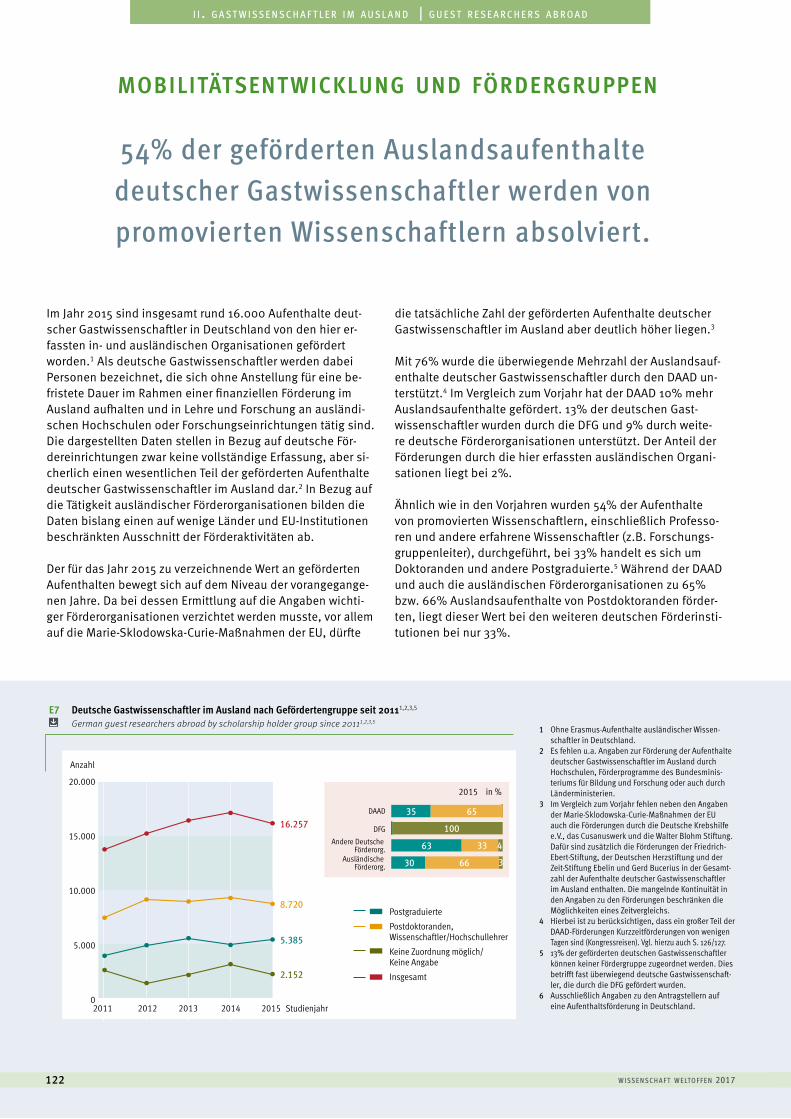
w i sse n sc h a f t w e lto f f e n 2017122
a u s l ä n d i s c h e s t u d i e r e n d e | f o r e i g n s t u d e n t si i . g a s t w i s s e n s c h a f t l e r i m a u s l a n d | g u e s t r e s e a r c h e r s a b r o a d
54% der geförderten Auslandsaufenthalte deutscher Gastwissenschaftler werden von promovierten Wissenschaftlern absolviert.
Im Jahr 2015 sind insgesamt rund 16.000 Aufenthalte deut-scher Gastwissenschaftler in Deutschland von den hier er-fassten in- und ausländischen Organisationen gefördert worden.1 Als deutsche Gastwissenschaftler werden dabei Personen bezeichnet, die sich ohne Anstellung für eine be-fristete Dauer im Rahmen einer finanziellen Förderung im Ausland aufhalten und in Lehre und Forschung an ausländi-schen Hochschulen oder Forschungseinrichtungen tätig sind. Die dargestellten Daten stellen in Bezug auf deutsche För-dereinrichtungen zwar keine vollständige Erfassung, aber si-cherlich einen wesentlichen Teil der geförderten Aufenthalte deutscher Gastwissenschaftler im Ausland dar.2 In Bezug auf die Tätigkeit ausländischer Förderorganisationen bilden die Daten bislang einen auf wenige Länder und EU-Institutionen beschränkten Ausschnitt der Förderaktivitäten ab.
Der für das Jahr 2015 zu verzeichnende Wert an geförderten Aufenthalten bewegt sich auf dem Niveau der vorangegange-nen Jahre. Da bei dessen Ermittlung auf die Angaben wichti-ger Förderorganisationen verzichtet werden musste, vor allem auf die Marie-Sklodowska-Curie-Maßnahmen der EU, dürfte
die tatsächliche Zahl der geförderten Aufenthalte deutscher Gastwissenschaftler im Ausland aber deutlich höher liegen.3
Mit 76% wurde die überwiegende Mehrzahl der Auslandsauf-enthalte deutscher Gastwissenschaftler durch den DAAD un-terstützt.4 Im Vergleich zum Vorjahr hat der DAAD 10% mehr Auslandsaufenthalte gefördert. 13% der deutschen Gast-wissenschaftler wurden durch die DFG und 9% durch weite-re deutsche Förderorganisationen unterstützt. Der Anteil der Förderungen durch die hier erfassten ausländischen Organi-sationen liegt bei 2%.
Ähnlich wie in den Vorjahren wurden 54% der Aufenthalte von promovierten Wissenschaftlern, einschließlich Professo-ren und andere erfahrene Wissenschaftler (z.B. Forschungs-gruppenleiter), durchgeführt, bei 33% handelt es sich um Doktoranden und andere Postgraduierte.5 Während der DAAD und auch die ausländischen Förderorganisationen zu 65% bzw. 66% Auslandsaufenthalte von Postdoktoranden förder-ten, liegt dieser Wert bei den weiteren deutschen Förderinsti-tutionen bei nur 33%.
mobilitätsent wicklung und fördergruppen
2011 2012 2013 2014 2015
DAAD
DFG
Andere Deutsche Förderorg.
Ausländische Förderorg.
Studienjahr
Postgraduierte
Postdoktoranden, Wissenschaftler/Hochschullehrer
Keine Zuordnung möglich/Keine Angabe
Insgesamt
20.000
15.000
10.000
5.000
0
Anzahl
2015 in %
8.720
5.385
2.152
16.257
0
20
40
60
80
10
0
65
33
66
4
3
35
100
63
30
E7 Deutsche Gastwissenschaftler im Ausland nach Gefördertengruppe seit 20111,2,3,5 German guest researchers abroad by scholarship holder group since 20111,2,3,5
1 Ohne Erasmus-Aufenthalte ausländischer Wissen-schaftler in Deutschland.
2 Es fehlen u.a. Angaben zur Förderung der Aufenthalte deutscher Gastwissenschaftler im Ausland durch Hochschulen, Förderprogramme des Bundesminis-teriums für Bildung und Forschung oder auch durch Länderministerien.
3 Im Vergleich zum Vorjahr fehlen neben den Angaben der Marie-Sklodowska-Curie-Maßnahmen der EU auch die Förderungen durch die Deutsche Krebshilfe e.V., das Cusanuswerk und die Walter Blohm Stiftung. Dafür sind zusätzlich die Förderungen der Friedrich-Ebert-Stiftung, der Deutschen Herzstiftung und der Zeit-Stiftung Ebelin und Gerd Bucerius in der Gesamt-zahl der Aufenthalte deutscher Gastwissenschaftler im Ausland enthalten. Die mangelnde Kontinuität in den Angaben zu den Förderungen beschränken die Möglichkeiten eines Zeitvergleichs.
4 Hierbei ist zu berücksichtigen, dass ein großer Teil der DAAD-Förderungen Kurzzeitförderungen von wenigen Tagen sind (Kongressreisen). Vgl. hierzu auch S. 126/127.
5 13% der geförderten deutschen Gastwissenschaftler können keiner Fördergruppe zugeordnet werden. Dies betrifft fast überwiegend deutsche Gastwissenschaft-ler, die durch die DFG gefördert wurden.
6 Ausschließlich Angaben zu den Antragstellern auf eine Aufenthaltsförderung in Deutschland.
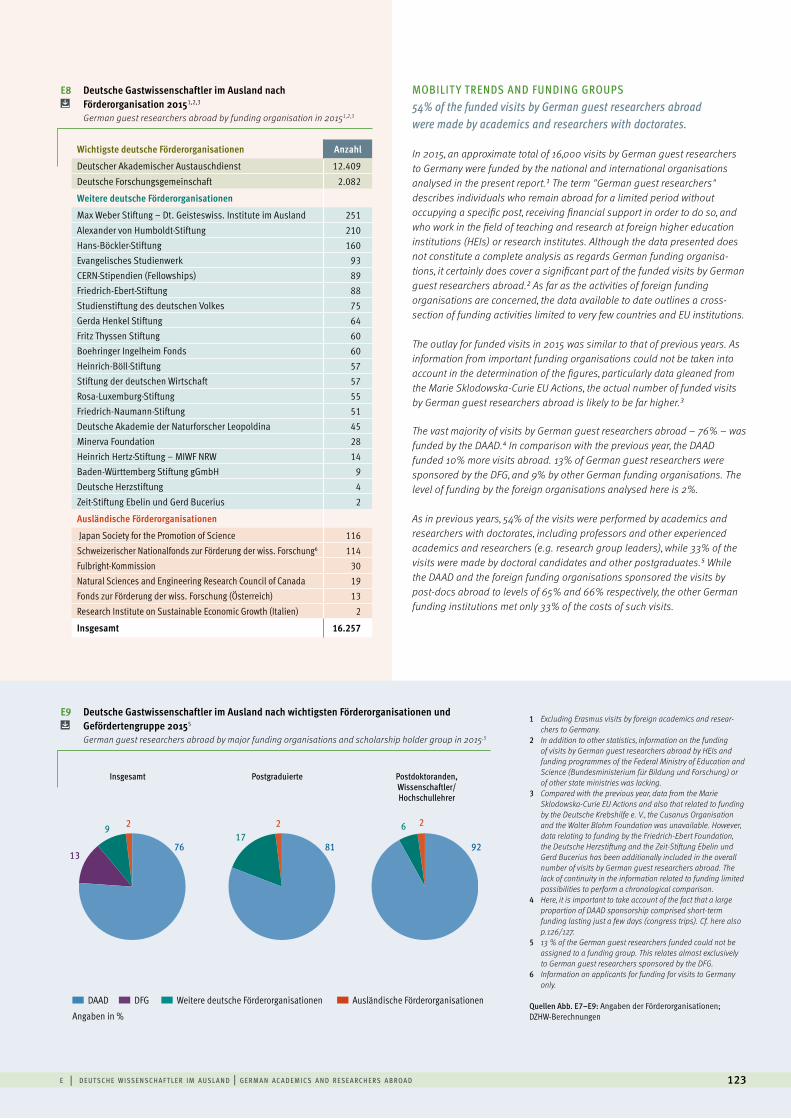
e | d e ut sc h e w i sse n sc h a f t l e r i m a u sl a n d | g e rm a n ac a d e m i cs a n d r ese a rc h e rs a b roa d 123
E9 Deutsche Gastwissenschaftler im Ausland nach wichtigsten Förderorganisationen und Gefördertengruppe 20155
German guest researchers abroad by major funding organisations and scholarship holder group in 2015,5
MOBILIT Y TRENDS AND FUNDING GROUPS54% of the funded visits by German guest researchers abroad were made by academics and researchers with doctorates.
76
29 217
1381 92
26
Insgesamt Postgraduierte Postdoktoranden, Wissenschaftler/Hochschullehrer
DAAD DFG Weitere deutsche Förderorganisationen Ausländische Förderorganisationen
Angaben in %
Wichtigste deutsche Förderorganisationen Anzahl
Deutscher Akademischer Austauschdienst 12.409
Deutsche Forschungsgemeinschaft 2.082
Weitere deutsche Förderorganisationen
Max Weber Stiftung – Dt. Geisteswiss. Institute im Ausland 251
Alexander von Humboldt-Stiftung 210Hans-Böckler-Stiftung 160Evangelisches Studienwerk 93CERN-Stipendien (Fellowships) 89Friedrich-Ebert-Stiftung 88Studienstiftung des deutschen Volkes 75Gerda Henkel Stiftung 64Fritz Thyssen Stiftung 60Boehringer Ingelheim Fonds 60Heinrich-Böll-Stiftung 57Stiftung der deutschen Wirtschaft 57Rosa-Luxemburg-Stiftung 55Friedrich-Naumann-Stiftung 51Deutsche Akademie der Naturforscher Leopoldina 45Minerva Foundation 28Heinrich Hertz-Stiftung – MIWF NRW 14Baden-Württemberg Stiftung gGmbH 9Deutsche Herzstiftung 4
Zeit-Stiftung Ebelin und Gerd Bucerius 2
Ausländische Förderorganisationen
Japan Society for the Promotion of Science 116
Schweizerischer Nationalfonds zur Förderung der wiss. Forschung6 114Fulbright-Kommission 30Natural Sciences and Engineering Research Council of Canada 19Fonds zur Förderung der wiss. Forschung (Österreich) 13
Research Institute on Sustainable Economic Growth (Italien) 2
Insgesamt 16.257
1 Excluding Erasmus visits by foreign academics and resear-chers to Germany.
2 In addition to other statistics, information on the funding of visits by German guest researchers abroad by HEIs and funding programmes of the Federal Ministry of Education and Science (Bundesministerium für Bildung und Forschung) or of other state ministries was lacking.
3 Compared with the previous year, data from the Marie Sklodowska-Curie EU Actions and also that related to funding by the Deutsche Krebshilfe e. V., the Cusanus Organisation and the Walter Blohm Foundation was unavailable. However, data relating to funding by the Friedrich-Ebert Foundation, the Deutsche Herzstiftung and the Zeit-Stiftung Ebelin und Gerd Bucerius has been additionally included in the overall number of visits by German guest researchers abroad. The lack of continuity in the information related to funding limited possibilities to perform a chronological comparison.
4 Here, it is important to take account of the fact that a large proportion of DAAD sponsorship comprised short-term funding lasting just a few days (congress trips). Cf. here also p.126/127.
5 13 % of the German guest researchers funded could not be assigned to a funding group. This relates almost exclusively to German guest researchers sponsored by the DFG.
6 Information on applicants for funding for visits to Germany only.
Quellen Abb. E7–E9: Angaben der Förderorganisationen; DZHW-Berechnungen
E8 Deutsche Gastwissenschaftler im Ausland nach Förderorganisation 20151,2,3
German guest researchers abroad by funding organisation in 20151,2,3
In 2015, an approximate total of 16,000 visits by German guest researchers to Germany were funded by the national and international organisations analysed in the present report.1 The term "German guest researchers" describes individuals who remain abroad for a limited period without occupying a specific post, receiving financial support in order to do so, and who work in the field of teaching and research at foreign higher education institutions (HEIs) or research institutes. Although the data presented does not constitute a complete analysis as regards German funding organisa-tions, it certainly does cover a significant part of the funded visits by German guest researchers abroad.2 As far as the activities of foreign funding organisations are concerned, the data available to date outlines a cross-section of funding activities limited to very few countries and EU institutions.
The outlay for funded visits in 2015 was similar to that of previous years. As information from important funding organisations could not be taken into account in the determination of the figures, particularly data gleaned from the Marie Sklodowska-Curie EU Actions, the actual number of funded visits by German guest researchers abroad is likely to be far higher.3
The vast majority of visits by German guest researchers abroad – 76% – was funded by the DAAD.4 In comparison with the previous year, the DAAD funded 10% more visits abroad. 13% of German guest researchers were sponsored by the DFG, and 9% by other German funding organisations. The level of funding by the foreign organisations analysed here is 2%.
As in previous years, 54% of the visits were performed by academics and researchers with doctorates, including professors and other experienced academics and researchers (e.g. research group leaders), while 33% of the visits were made by doctoral candidates and other postgraduates.5 While the DAAD and the foreign funding organisations sponsored the visits by post-docs abroad to levels of 65% and 66% respectively, the other German funding institutions met only 33% of the costs of such visits.
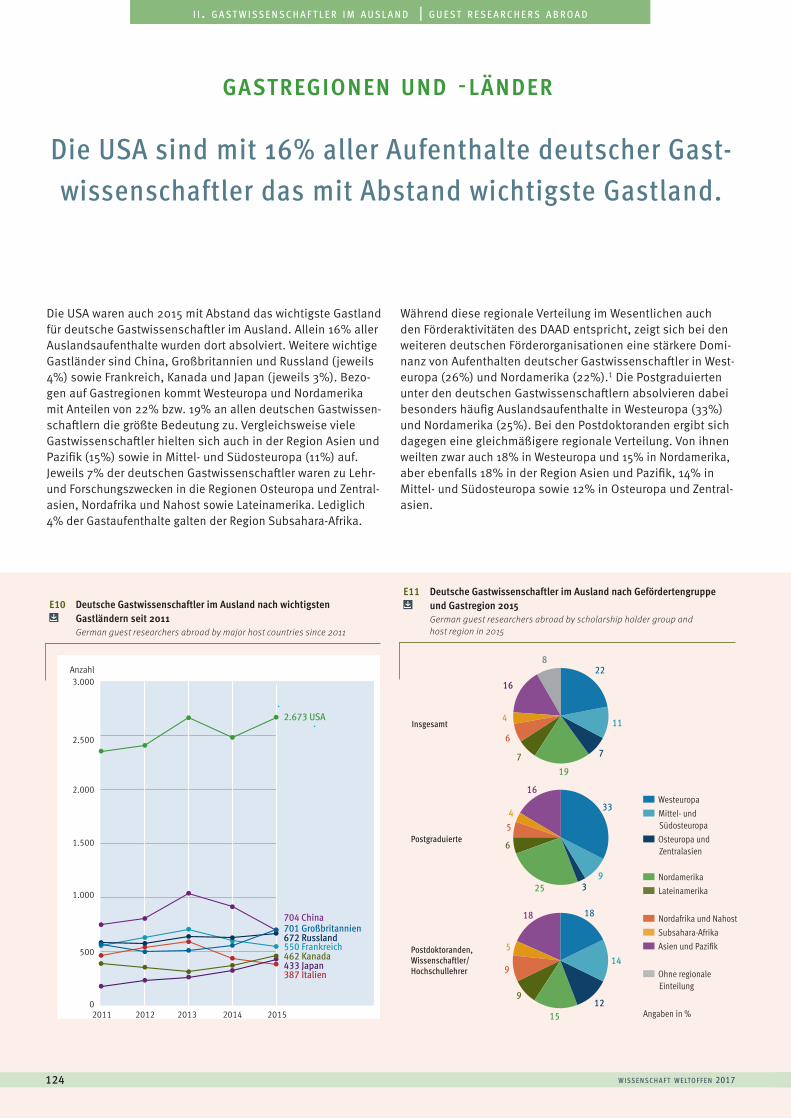
E10 Deutsche Gastwissenschaftler im Ausland nach wichtigsten Gastländern seit 2011
German guest researchers abroad by major host countries since 2011
E11 Deutsche Gastwissenschaftler im Ausland nach Gefördertengruppe und Gastregion 2015
German guest researchers abroad by scholarship holder group and host region in 2015
2011 2012 2013 2014 20150
1.000
500
1.500
2.000
2.500
3.000Anzahl
2.673 USA
704 China701 Großbritannien672 Russland550 Frankreich462 Kanada433 Japan387 Italien
Westeuropa Mittel- und
Südosteuropa Osteuropa und
Zentralasien
Nordamerika Lateinamerika
Nordafrika und Nahost Subsahara-Afrika Asien und Pazifik
Ohne regionale Einteilung
Angaben in %
w i sse n sc h a f t w e lto f f e n 2017124
a u s l ä n d i s c h e s t u d i e r e n d e | f o r e i g n s t u d e n t si i . g a s t w i s s e n s c h a f t l e r i m a u s l a n d | g u e s t r e s e a r c h e r s a b r o a d
Die USA sind mit 16% aller Aufenthalte deutscher Gast-wissenschaftler das mit Abstand wichtigste Gastland.
Die USA waren auch 2015 mit Abstand das wichtigste Gastland für deutsche Gastwissenschaftler im Ausland. Allein 16% aller Auslandsaufenthalte wurden dort absolviert. Weitere wichtige Gastländer sind China, Großbritannien und Russland (jeweils 4%) sowie Frankreich, Kanada und Japan (jeweils 3%). Bezo-gen auf Gastregionen kommt Westeuropa und Nordamerika mit Anteilen von 22% bzw. 19% an allen deutschen Gastwissen- schaftlern die größte Bedeutung zu. Vergleichsweise viele Gastwissenschaftler hielten sich auch in der Region Asien und Pazifik (15%) sowie in Mittel- und Südosteuropa (11%) auf. Jeweils 7% der deutschen Gastwissenschaftler waren zu Lehr- und Forschungszwecken in die Regionen Osteuropa und Zentral- asien, Nordafrika und Nahost sowie Lateinamerika. Lediglich 4% der Gastaufenthalte galten der Region Subsahara-Afrika.
Während diese regionale Verteilung im Wesentlichen auch den Förderaktivitäten des DAAD entspricht, zeigt sich bei den weiteren deutschen Förderorganisationen eine stärkere Domi-nanz von Aufenthalten deutscher Gastwissenschaftler in West-europa (26%) und Nordamerika (22%).1 Die Postgraduierten unter den deutschen Gastwissenschaftlern absolvieren dabei besonders häufig Auslandsaufenthalte in Westeuropa (33%) und Nordamerika (25%). Bei den Postdoktoranden ergibt sich dagegen eine gleichmäßigere regionale Verteilung. Von ihnen weilten zwar auch 18% in Westeuropa und 15% in Nordamerika, aber ebenfalls 18% in der Region Asien und Pazifik, 14% in Mittel- und Südosteuropa sowie 12% in Osteuropa und Zentral- asien.
gastregionen und -länder
Insgesamt
Postgraduierte
Postdoktoranden, Wissenschaftler/Hochschullehrer
22
33
18
11
9
14
7
3
12
19
25
15
7
6
9
6
5
9
4
4
5
16
16
18
8
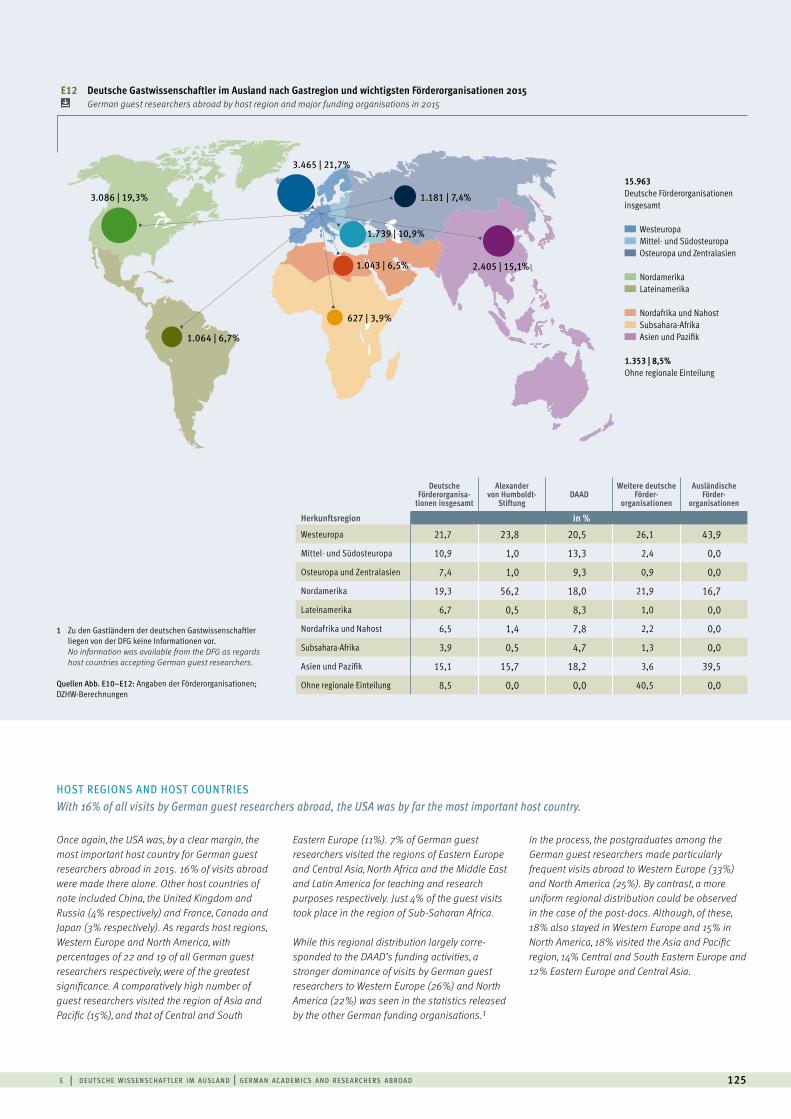
Deutsche Förderorganisa-
tionen insgesamt
Alexander von Humboldt-
StiftungDAAD
Weitere deutsche Förder-
organisationen
AusländischeFörder-
organisationen
Herkunftsregion in %Westeuropa 21,7 23,8 20,5 26,1 43,9
Mittel- und Südosteuropa 10,9 1,0 13,3 2,4 0,0
Osteuropa und Zentralasien 7,4 1,0 9,3 0,9 0,0
Nordamerika 19,3 56,2 18,0 21,9 16,7
Lateinamerika 6,7 0,5 8,3 1,0 0,0
Nordafrika und Nahost 6,5 1,4 7,8 2,2 0,0
Subsahara-Afrika 3,9 0,5 4,7 1,3 0,0
Asien und Pazifik 15,1 15,7 18,2 3,6 39,5
Ohne regionale Einteilung 8,5 0,0 0,0 40,5 0,0
Ohne regionale EinteilungAsien, Pazi�kAfrika SubsaharaNahost, NordafrikaLateinamerikaNordamerikaOsteuropa, Zentralasien und SüdkaukasusMittel- und SüdosteuropaWest-, Nord- und Südeuropa
3.465 | 21,7%
3.086 | 19,3%
1.064 | 6,7%
627 | 3,9%
1.043 | 6,5%
1.739 | 10,9%
1.181 | 7,4%
2.405 | 15,1%
15.963 Deutsche Förderorganisationen insgesamt
Westeuropa Mittel- und Südosteuropa Osteuropa und Zentralasien
Nordamerika Lateinamerika
Nordafrika und Nahost Subsahara-Afrika Asien und Pazifik
1.353 | 8,5% Ohne regionale Einteilung
HOST REGIONS AND HOST COUNTRIESWith 16% of all visits by German guest researchers abroad, the USA was by far the most important host country.
Once again, the USA was, by a clear margin, the most important host country for German guest researchers abroad in 2015. 16% of visits abroad were made there alone. Other host countries of note included China, the United Kingdom and Russia (4% respectively) and France, Canada and Japan (3% respectively). As regards host regions, Western Europe and North America, with percentages of 22 and 19 of all German guest researchers respectively, were of the greatest significance. A comparatively high number of guest researchers visited the region of Asia and Pacific (15%), and that of Central and South
Eastern Europe (11%). 7% of German guest researchers visited the regions of Eastern Europe and Central Asia, North Africa and the Middle East and Latin America for teaching and research purposes respectively. Just 4% of the guest visits took place in the region of Sub-Saharan Africa.
While this regional distribution largely corre-sponded to the DAAD’s funding activities, a stronger dominance of visits by German guest researchers to Western Europe (26%) and North America (22%) was seen in the statistics released by the other German funding organisations.1
In the process, the postgraduates among the German guest researchers made particularly frequent visits abroad to Western Europe (33%) and North America (25%). By contrast, a more uniform regional distribution could be observed in the case of the post-docs. Although, of these, 18% also stayed in Western Europe and 15% in North America, 18% visited the Asia and Pacific region, 14% Central and South Eastern Europe and 12% Eastern Europe and Central Asia.
e | d e ut sc h e w i sse n sc h a f t l e r i m a u sl a n d | g e rm a n ac a d e m i cs a n d r ese a rc h e rs a b roa d 125
1 Zu den Gastländern der deutschen Gastwissenschaftler liegen von der DFG keine Informationen vor.
No information was available from the DFG as regards host countries accepting German guest researchers.
Quellen Abb. E10–E12: Angaben der Förderorganisationen; DZHW-Berechnungen
E12 Deutsche Gastwissenschaftler im Ausland nach Gastregion und wichtigsten Förderorganisationen 2015 German guest researchers abroad by host region and major funding organisations in 2015
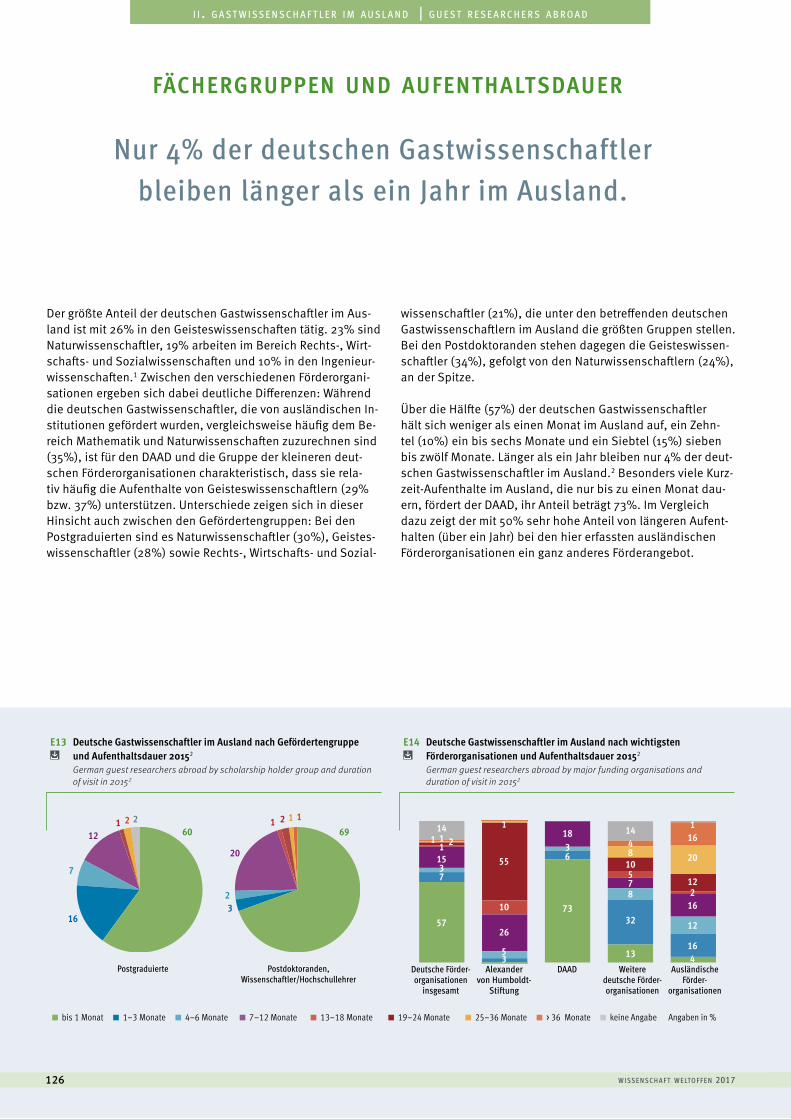
w i sse n sc h a f t w e lto f f e n 2017126
a u s l ä n d i s c h e s t u d i e r e n d e | f o r e i g n s t u d e n t si i . g a s t w i s s e n s c h a f t l e r i m a u s l a n d | g u e s t r e s e a r c h e r s a b r o a d
Nur 4% der deutschen Gastwissenschaftler bleiben länger als ein Jahr im Ausland.
Der größte Anteil der deutschen Gastwissenschaftler im Aus-land ist mit 26% in den Geisteswissenschaften tätig. 23% sind Naturwissenschaftler, 19% arbeiten im Bereich Rechts-, Wirt-schafts- und Sozialwissenschaften und 10% in den Ingenieur-wissenschaften.1 Zwischen den verschiedenen Förderorgani-sationen ergeben sich dabei deutliche Differenzen: Während die deutschen Gastwissenschaftler, die von ausländischen In-stitutionen gefördert wurden, vergleichsweise häufig dem Be-reich Mathematik und Naturwissenschaften zuzurechnen sind (35%), ist für den DAAD und die Gruppe der kleineren deut-schen Förderorganisationen charakteristisch, dass sie rela-tiv häufig die Aufenthalte von Geisteswissenschaftlern (29% bzw. 37%) unterstützen. Unterschiede zeigen sich in dieser Hinsicht auch zwischen den Gefördertengruppen: Bei den Postgraduierten sind es Naturwissenschaftler (30%), Geistes-wissenschaftler (28%) sowie Rechts-, Wirtschafts- und Sozial-
wissenschaftler (21%), die unter den betreffenden deutschen Gastwissenschaftlern im Ausland die größten Gruppen stellen. Bei den Postdoktoranden stehen dagegen die Geisteswissen-schaftler (34%), gefolgt von den Naturwissenschaftlern (24%), an der Spitze.
Über die Hälfte (57%) der deutschen Gastwissenschaftler hält sich weniger als einen Monat im Ausland auf, ein Zehn-tel (10%) ein bis sechs Monate und ein Siebtel (15%) sieben bis zwölf Monate. Länger als ein Jahr bleiben nur 4% der deut-schen Gastwissenschaftler im Ausland.2 Besonders viele Kurz-zeit-Aufenthalte im Ausland, die nur bis zu einen Monat dau-ern, fördert der DAAD, ihr Anteil beträgt 73%. Im Vergleich dazu zeigt der mit 50% sehr hohe Anteil von längeren Aufent-halten (über ein Jahr) bei den hier erfassten ausländischen Förderorganisationen ein ganz anderes Förderangebot.
fächergruppen und aufenthaltsdauer
E14 Deutsche Gastwissenschaftler im Ausland nach wichtigsten Förderorganisationen und Aufenthaltsdauer 20152
German guest researchers abroad by major funding organisations and duration of visit in 20152
E13 Deutsche Gastwissenschaftler im Ausland nach Gefördertengruppe und Aufenthaltsdauer 20152
German guest researchers abroad by scholarship holder group and duration of visit in 20152
bis 1 Monat 1–3 Monate 4–6 Monate 7–12 Monate 13–18 Monate 19–24 Monate 25–36 Monate > 36 Monate keine Angabe Angaben in %
0
20
40
60
80
100
120
14
35
26
10
55
118
13
116
20
12
12
2
4
16
16
32
875
1084
14
36
73
15
57
6960
163
2
7
12
20
1
7
11 21
3
DAADDeutsche Förder- organisationen
insgesamt
Weitere deutsche Förder- organisationen
Ausländische Förder-
organisationen
Alexander von Humboldt-
Stiftung
Postgraduierte Postdoktoranden, Wissenschaftler/Hochschullehrer
1 2 1 12 2
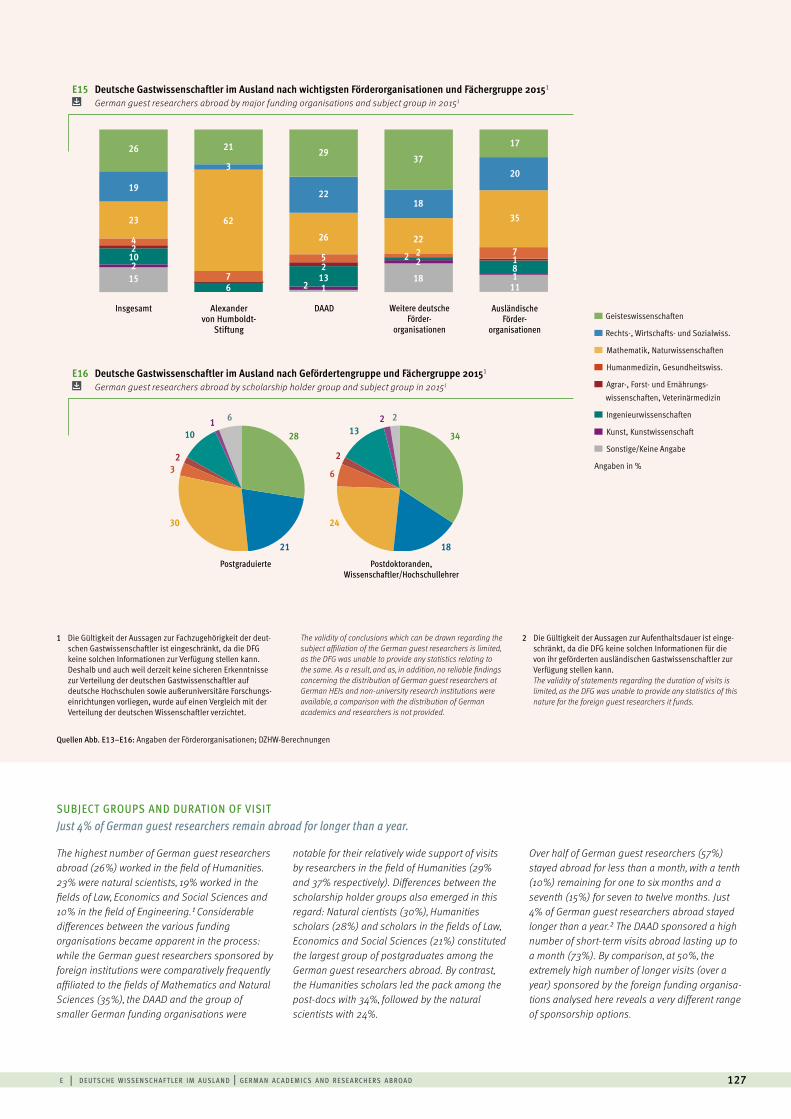
SUBJECT GROUPS AND DURATION OF VISITJust 4% of German guest researchers remain abroad for longer than a year.
The highest number of German guest researchers abroad (26%) worked in the field of Humanities. 23% were natural scientists, 19% worked in the fields of Law, Economics and Social Sciences and 10% in the field of Engineering.1 Considerable differences between the various funding organisations became apparent in the process: while the German guest researchers sponsored by foreign institutions were comparatively frequently affiliated to the fields of Mathematics and Natural Sciences (35%), the DAAD and the group of smaller German funding organisations were
notable for their relatively wide support of visits by researchers in the field of Humanities (29% and 37% respectively). Differences between the scholarship holder groups also emerged in this regard: Natural cientists (30%), Humanities scholars (28%) and scholars in the fields of Law, Economics and Social Sciences (21%) constituted the largest group of postgraduates among the German guest researchers abroad. By contrast, the Humanities scholars led the pack among the post-docs with 34%, followed by the natural scientists with 24%.
Over half of German guest researchers (57%) stayed abroad for less than a month, with a tenth (10%) remaining for one to six months and a seventh (15%) for seven to twelve months. Just 4% of German guest researchers abroad stayed longer than a year.2 The DAAD sponsored a high number of short-term visits abroad lasting up to a month (73%). By comparison, at 50%, the extremely high number of longer visits (over a year) sponsored by the foreign funding organisa-tions analysed here reveals a very different range of sponsorship options.
E16 Deutsche Gastwissenschaftler im Ausland nach Gefördertengruppe und Fächergruppe 20151 German guest researchers abroad by scholarship holder group and subject group in 20151
e | d e ut sc h e w i sse n sc h a f t l e r i m a u sl a n d | g e rm a n ac a d e m i cs a n d r ese a rc h e rs a b roa d 127
0
20
40
60
80
100
120 DAADInsgesamt Weitere deutsche Förder-
organisationen
Ausländische Förder-
organisationen
Alexander von Humboldt-
Stiftung Geisteswissenschaften
Rechts-, Wirtschafts- und Sozialwiss.
Mathematik, Naturwissenschaften
Humanmedizin, Gesundheitswiss.
Agrar-, Forst- und Ernährungs-
wissenschaften, Veterinärmedizin
Ingenieurwissenschaften
Kunst, Kunstwissenschaft
Sonstige/Keine Angabe
Angaben in %
E15 Deutsche Gastwissenschaftler im Ausland nach wichtigsten Förderorganisationen und Fächergruppe 20151 German guest researchers abroad by major funding organisations and subject group in 20151
26
19
23
42
102
15
21
3
62
76
29
22
26
52
113
2
37
18
2222 2
18
17
20
35
7181
11
34
18
24
28
21
30
3 6
2 2
10 131 26 2
Postgraduierte Postdoktoranden, Wissenschaftler/Hochschullehrer
1 Die Gültigkeit der Aussagen zur Fachzugehörigkeit der deut-schen Gastwissenschaftler ist eingeschränkt, da die DFG keine solchen Informationen zur Verfügung stellen kann. Deshalb und auch weil derzeit keine sicheren Erkenntnisse zur Verteilung der deutschen Gastwissenschaftler auf deutsche Hochschulen sowie außeruniversitäre Forschungs-einrichtungen vorliegen, wurde auf einen Vergleich mit der Verteilung der deutschen Wissenschaftler verzichtet.
The validity of conclusions which can be drawn regarding the subject affiliation of the German guest researchers is limited, as the DFG was unable to provide any statistics relating to the same. As a result, and as, in addition, no reliable findings concerning the distribution of German guest researchers at German HEIs and non-university research institutions were available, a comparison with the distribution of German academics and researchers is not provided.
2 Die Gültigkeit der Aussagen zur Aufenthaltsdauer ist einge-schränkt, da die DFG keine solchen Informationen für die von ihr geförderten ausländischen Gastwissenschaftler zur Verfügung stellen kann.The validity of statements regarding the duration of visits is limited, as the DFG was unable to provide any statistics of this nature for the foreign guest researchers it funds.
Quellen Abb. E13–E16: Angaben der Förderorganisationen; DZHW-Berechnungen
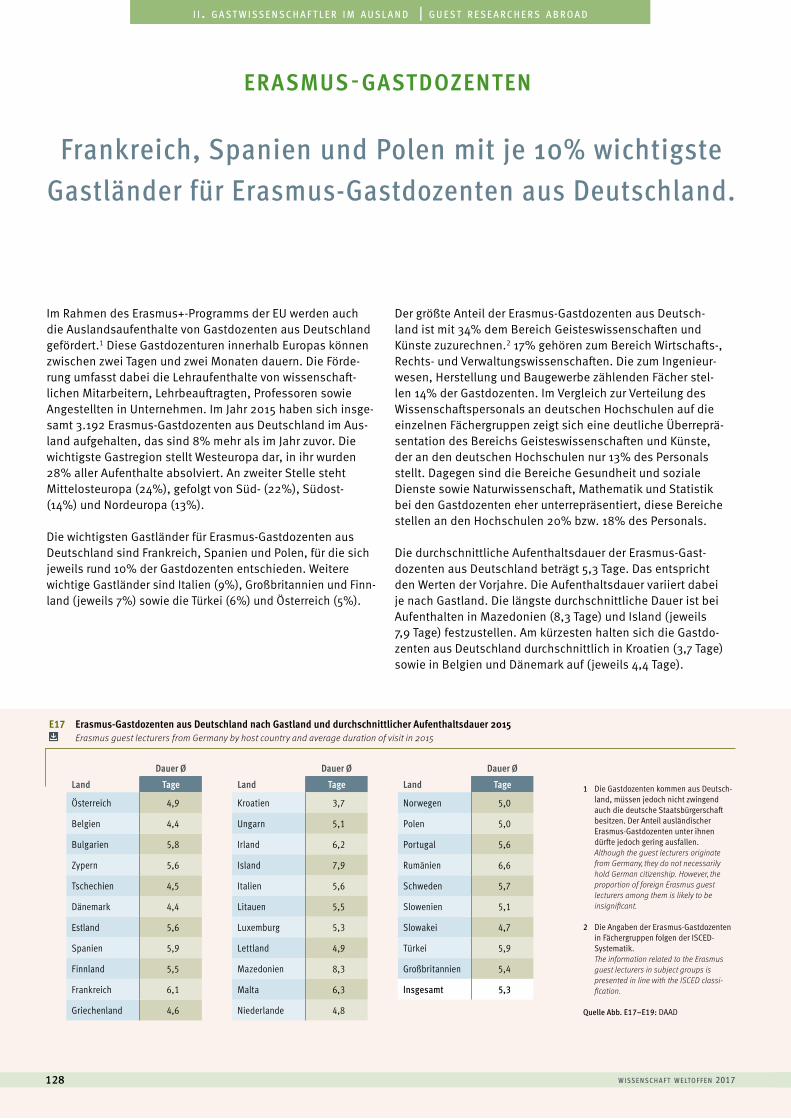
Dauer Ø
Land Tage
Österreich 4,9
Belgien 4,4
Bulgarien 5,8
Zypern 5,6
Tschechien 4,5
Dänemark 4,4
Estland 5,6
Spanien 5,9
Finnland 5,5
Frankreich 6,1
Griechenland 4,6
Dauer Ø
Land Tage
Kroatien 3,7
Ungarn 5,1
Irland 6,2
Island 7,9
Italien 5,6
Litauen 5,5
Luxemburg 5,3
Lettland 4,9
Mazedonien 8,3
Malta 6,3
Niederlande 4,8
Dauer Ø
Land Tage
Norwegen 5,0
Polen 5,0
Portugal 5,6
Rumänien 6,6
Schweden 5,7
Slowenien 5,1
Slowakei 4,7
Türkei 5,9
Großbritannien 5,4
Insgesamt 5,3
E17 Erasmus-Gastdozenten aus Deutschland nach Gastland und durchschnittlicher Aufenthaltsdauer 2015 Erasmus guest lecturers from Germany by host country and average duration of visit in 2015
1 Die Gastdozenten kommen aus Deutsch-land, müssen jedoch nicht zwingend auch die deutsche Staatsbürgerschaft besitzen. Der Anteil ausländischer Erasmus-Gastdozenten unter ihnen dürfte jedoch gering ausfallen.Although the guest lecturers originate from Germany, they do not necessarily hold German citizenship. However, the proportion of foreign Erasmus guest lecturers among them is likely to be insignificant.
2 Die Angaben der Erasmus-Gastdozenten in Fächergruppen folgen der ISCED-Systematik.The information related to the Erasmusguest lecturers in subject groups is presented in line with the ISCED classi-fication.
Quelle Abb. E17–E19: DAAD
w i sse n sc h a f t w e lto f f e n 2017128
a u s l ä n d i s c h e s t u d i e r e n d e | f o r e i g n s t u d e n t si i . g a s t w i s s e n s c h a f t l e r i m a u s l a n d | g u e s t r e s e a r c h e r s a b r o a d
Frankreich, Spanien und Polen mit je 10% wichtigste Gastländer für Erasmus-Gastdozenten aus Deutschland.
Im Rahmen des Erasmus+-Programms der EU werden auch die Auslandsaufenthalte von Gastdozenten aus Deutschland gefördert.1 Diese Gastdozenturen innerhalb Europas können zwischen zwei Tagen und zwei Monaten dauern. Die Förde-rung umfasst dabei die Lehraufenthalte von wissenschaft-lichen Mitarbeitern, Lehrbeauftragten, Professoren sowie Angestellten in Unternehmen. Im Jahr 2015 haben sich insge-samt 3.192 Erasmus-Gastdozenten aus Deutschland im Aus-land aufgehalten, das sind 8% mehr als im Jahr zuvor. Die wichtigste Gastregion stellt Westeuropa dar, in ihr wurden 28% aller Aufenthalte absolviert. An zweiter Stelle steht Mittelosteuropa (24%), gefolgt von Süd- (22%), Südost- (14%) und Nordeuropa (13%).
Die wichtigsten Gastländer für Erasmus-Gastdozenten aus Deutschland sind Frankreich, Spanien und Polen, für die sich jeweils rund 10% der Gastdozenten entschieden. Weitere wichtige Gastländer sind Italien (9%), Großbritannien und Finn-land (jeweils 7%) sowie die Türkei (6%) und Österreich (5%).
Der größte Anteil der Erasmus-Gastdozenten aus Deutsch-land ist mit 34% dem Bereich Geisteswissenschaften und Künste zuzurechnen.2 17% gehören zum Bereich Wirtschafts-, Rechts- und Verwaltungswissenschaften. Die zum Ingenieur-wesen, Herstellung und Baugewerbe zählenden Fächer stel-len 14% der Gastdozenten. Im Vergleich zur Verteilung des Wissenschaftspersonals an deutschen Hochschulen auf die einzelnen Fächergruppen zeigt sich eine deutliche Überreprä-sentation des Bereichs Geisteswissenschaften und Künste, der an den deutschen Hochschulen nur 13% des Personals stellt. Dagegen sind die Bereiche Gesundheit und soziale Dienste sowie Naturwissenschaft, Mathematik und Statistik bei den Gastdozenten eher unterrepräsentiert, diese Bereiche stellen an den Hochschulen 20% bzw. 18% des Personals.
Die durchschnittliche Aufenthaltsdauer der Erasmus-Gast-dozenten aus Deutschland beträgt 5,3 Tage. Das entspricht den Werten der Vorjahre. Die Aufenthaltsdauer variiert dabei je nach Gastland. Die längste durchschnittliche Dauer ist bei Aufenthalten in Mazedonien (8,3 Tage) und Island (jeweils 7,9 Tage) festzustellen. Am kürzesten halten sich die Gastdo- zenten aus Deutschland durchschnittlich in Kroatien (3,7 Tage) sowie in Belgien und Dänemark auf (jeweils 4,4 Tage).
erasmus-gastdozenten
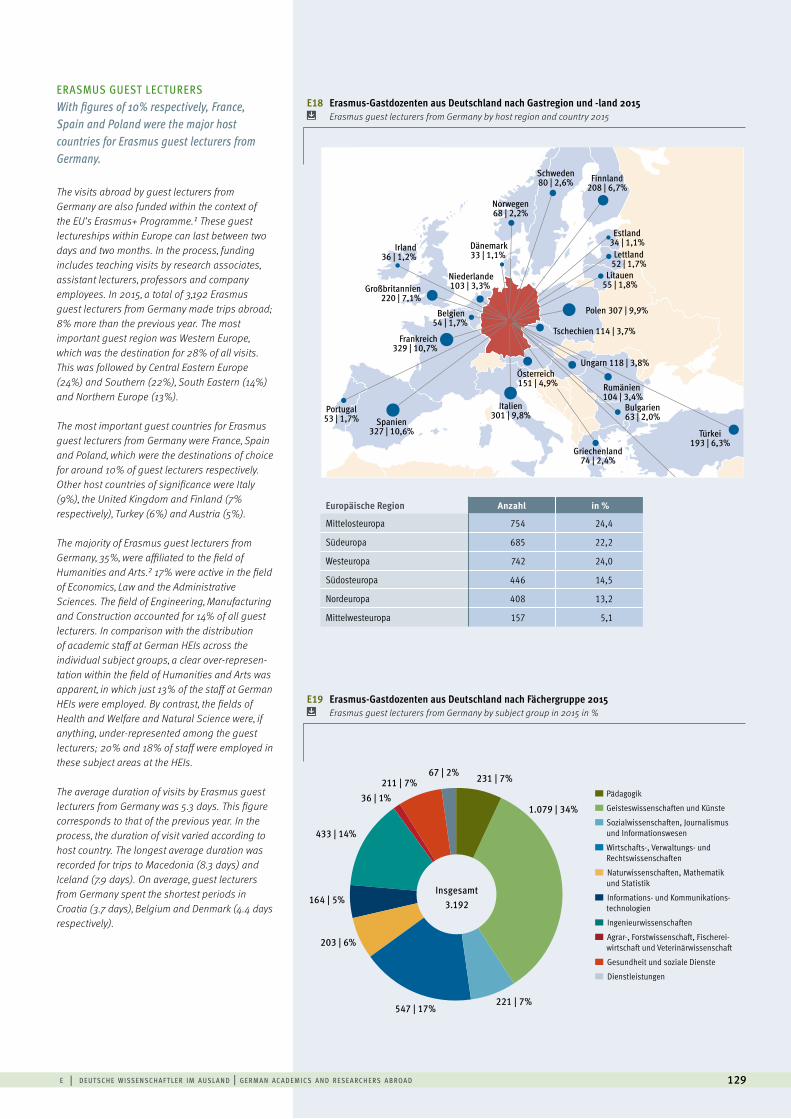
ERASMUS GUEST LECTURERSWith figures of 10% respectively, France, Spain and Poland were the major host countries for Erasmus guest lecturers from Germany.
The visits abroad by guest lecturers from Germany are also funded within the context of the EU’s Erasmus+ Programme.1 These guest lectureships within Europe can last between two days and two months. In the process, funding includes teaching visits by research associates, assistant lecturers, professors and company employees. In 2015, a total of 3,192 Erasmus guest lecturers from Germany made trips abroad; 8% more than the previous year. The most important guest region was Western Europe, which was the destination for 28% of all visits. This was followed by Central Eastern Europe (24%) and Southern (22%), South Eastern (14%) and Northern Europe (13%).
The most important guest countries for Erasmus guest lecturers from Germany were France, Spain and Poland, which were the destinations of choice for around 10% of guest lecturers respectively. Other host countries of significance were Italy (9%), the United Kingdom and Finland (7% respectively), Turkey (6%) and Austria (5%).
The majority of Erasmus guest lecturers from Germany, 35%, were affiliated to the field of Humanities and Arts.2 17% were active in the field of Economics, Law and the Administrative Sciences. The field of Engineering, Manufacturing and Construction accounted for 14% of all guest lecturers. In comparison with the distribution of academic staff at German HEIs across the individual subject groups, a clear over-represen-tation within the field of Humanities and Arts was apparent, in which just 13% of the staff at German HEIs were employed. By contrast, the fields of Health and Welfare and Natural Science were, if anything, under-represented among the guest lecturers; 20% and 18% of staff were employed in these subject areas at the HEIs.
The average duration of visits by Erasmus guest lecturers from Germany was 5.3 days. This figure corresponds to that of the previous year. In the process, the duration of visit varied according to host country. The longest average duration was recorded for trips to Macedonia (8.3 days) and Iceland (7.9 days). On average, guest lecturers from Germany spent the shortest periods in Croatia (3.7 days), Belgium and Denmark (4.4 days respectively).
e | d e ut sc h e w i sse n sc h a f t l e r i m a u sl a n d | g e rm a n ac a d e m i cs a n d r ese a rc h e rs a b roa d 129
231 | 7% Pädagogik
Geisteswissenschaften und Künste
Sozialwissenschaften, Journalismus und Informationswesen
Wirtschafts-, Verwaltungs- und Rechtswissenschaften
Naturwissenschaften, Mathematik und Statistik
Informations- und Kommunikations- technologien
Ingenieurwissenschaften
Agrar-, Forstwissenschaft, Fischerei- wirtschaft und Veterinärwissenschaft
Gesundheit und soziale Dienste
Dienstleistungen
Insgesamt3.192
1.079 | 34%
221 | 7%547 | 17%
211 | 7%
36 | 1%
433 | 14%
164 | 5%
203 | 6%
67 | 2%
Niederlande103 | 3,3%
Dänemark33 | 1,1%
Belgien54 | 1,7%
Schweden80 | 2,6%
Norwegen68 | 2,2%
Finnland208 | 6,7%
Litauen55 | 1,8%
Estland34 | 1,1%
Lettland52 | 1,7%
Großbritannien220 | 7,1%
Irland36 | 1,2%
Frankreich329 | 10,7%
Spanien327 | 10,6%
Portugal53 | 1,7%
Italien301 | 9,8%
Türkei193 | 6,3%
Griechenland74 | 2,4%
Zypern9 | 0,3%
Rumänien 104 | 3,4%
Bulgarien63 | 2,0%
Tschechien 114 | 3,7%
Polen 307 | 9,9%
Ungarn 118 | 3,8%Österreich 151 | 4,9%
E18 Erasmus-Gastdozenten aus Deutschland nach Gastregion und -land 2015 Erasmus guest lecturers from Germany by host region and country 2015
E19 Erasmus-Gastdozenten aus Deutschland nach Fächergruppe 2015 Erasmus guest lecturers from Germany by subject group in 2015 in %
Europäische Region Anzahl in %
Mittelosteuropa 754 24,4
Südeuropa 685 22,2
Westeuropa 742 24,0
Südosteuropa 446 14,5
Nordeuropa 408 13,2
Mittelwesteuropa 157 5,1
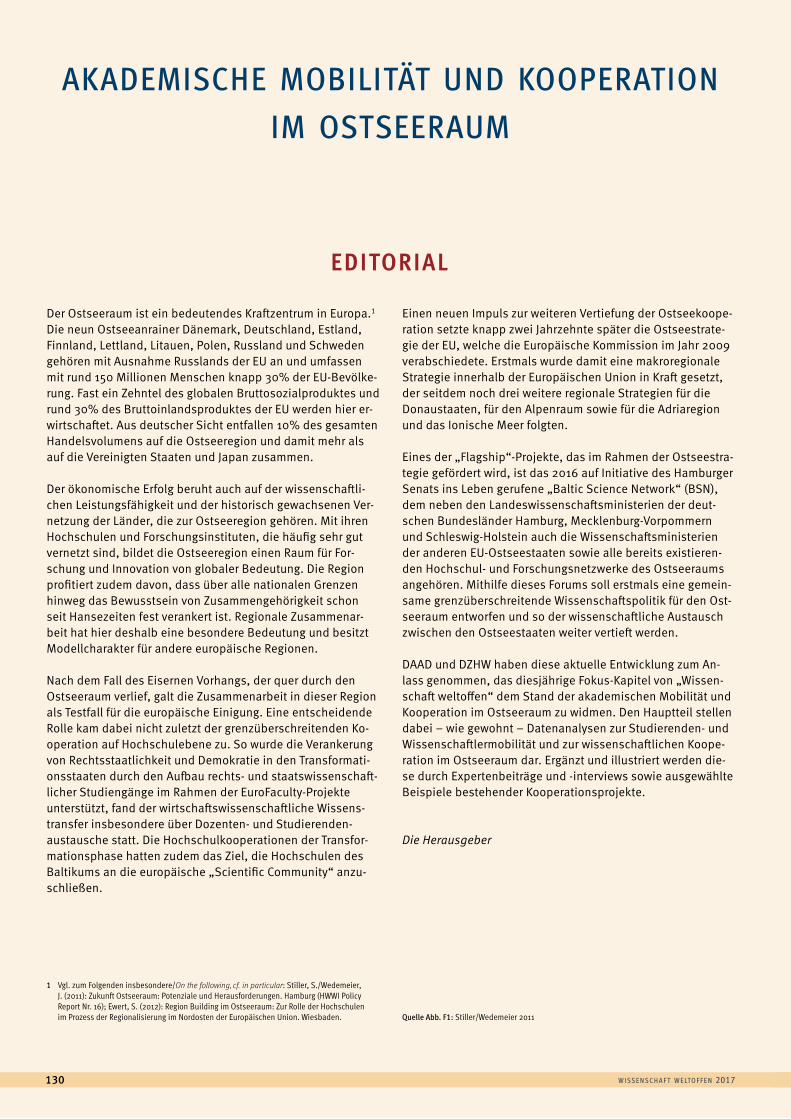
w i sse n sc h a f t w e lto f f e n 2017130
Der Ostseeraum ist ein bedeutendes Kraftzentrum in Europa.1 Die neun Ostseeanrainer Dänemark, Deutschland, Estland, Finnland, Lettland, Litauen, Polen, Russland und Schweden gehören mit Ausnahme Russlands der EU an und umfassen mit rund 150 Millionen Menschen knapp 30% der EU-Bevölke-rung. Fast ein Zehntel des globalen Bruttosozialproduktes und rund 30% des Bruttoinlandsproduktes der EU werden hier er-wirtschaftet. Aus deutscher Sicht entfallen 10% des gesamten Handelsvolumens auf die Ostseeregion und damit mehr als auf die Vereinigten Staaten und Japan zusammen.
Der ökonomische Erfolg beruht auch auf der wissenschaftli-chen Leistungsfähigkeit und der historisch gewachsenen Ver-netzung der Länder, die zur Ostseeregion gehören. Mit ihren Hochschulen und Forschungsinstituten, die häufig sehr gut vernetzt sind, bildet die Ostseeregion einen Raum für For-schung und Innovation von globaler Bedeutung. Die Region profitiert zudem davon, dass über alle nationalen Grenzen hinweg das Bewusstsein von Zusammengehörigkeit schon seit Hansezeiten fest verankert ist. Regionale Zusammenar-beit hat hier deshalb eine besondere Bedeutung und besitzt Modellcharakter für andere europäische Regionen.
Nach dem Fall des Eisernen Vorhangs, der quer durch den Ostseeraum verlief, galt die Zusammenarbeit in dieser Region als Testfall für die europäische Einigung. Eine entscheidende Rolle kam dabei nicht zuletzt der grenzüberschreitenden Ko-operation auf Hochschulebene zu. So wurde die Verankerung von Rechtsstaatlichkeit und Demokratie in den Transformati-onsstaaten durch den Aufbau rechts- und staatswissenschaft-licher Studiengänge im Rahmen der EuroFaculty-Projekte unterstützt, fand der wirtschaftswissenschaftliche Wissens-transfer insbesondere über Dozenten- und Studierenden-austausche statt. Die Hochschulkooperationen der Transfor-mationsphase hatten zudem das Ziel, die Hochschulen des Baltikums an die europäische „Scientific Community“ anzu-schließen.
Einen neuen Impuls zur weiteren Vertiefung der Ostseekoope-ration setzte knapp zwei Jahrzehnte später die Ostseestrate-gie der EU, welche die Europäische Kommission im Jahr 2009 verabschiedete. Erstmals wurde damit eine makroregionale Strategie innerhalb der Europäischen Union in Kraft gesetzt, der seitdem noch drei weitere regionale Strategien für die Donaustaaten, für den Alpenraum sowie für die Adriaregion und das Ionische Meer folgten.
Eines der „Flagship“-Projekte, das im Rahmen der Ostseestra-tegie gefördert wird, ist das 2016 auf Initiative des Hamburger Senats ins Leben gerufene „Baltic Science Network“ (BSN), dem neben den Landeswissenschaftsministerien der deut-schen Bundesländer Hamburg, Mecklenburg-Vorpommern und Schleswig-Holstein auch die Wissenschaftsministerien der anderen EU-Ostseestaaten sowie alle bereits existieren-den Hochschul- und Forschungsnetzwerke des Ostseeraums angehören. Mithilfe dieses Forums soll erstmals eine gemein-same grenzüberschreitende Wissenschaftspolitik für den Ost-seeraum entworfen und so der wissenschaftliche Austausch zwischen den Ostseestaaten weiter vertieft werden.
DAAD und DZHW haben diese aktuelle Entwicklung zum An-lass genommen, das diesjährige Fokus-Kapitel von „Wissen-schaft weltoffen“ dem Stand der akademischen Mobilität und Kooperation im Ostseeraum zu widmen. Den Hauptteil stellen dabei – wie gewohnt – Datenanalysen zur Studierenden- und Wissenschaftlermobilität und zur wissenschaftlichen Koope-ration im Ostseeraum dar. Ergänzt und illustriert werden die-se durch Expertenbeiträge und -interviews sowie ausgewählte Beispiele bestehender Kooperationsprojekte.
Die Herausgeber
1 Vgl. zum Folgenden insbesondere/On the following, cf. in particular: Stiller, S./Wedemeier, J. (2011): Zukunft Ostseeraum: Potenziale und Herausforderungen. Hamburg (HWWI Policy Report Nr. 16); Ewert, S. (2012): Region Building im Ostseeraum: Zur Rolle der Hochschulen im Prozess der Regionalisierung im Nordosten der Europäischen Union. Wiesbaden. Quelle Abb. F1: Stiller/Wedemeier 2011
editorial
akademische mobilität und kooperation im ostseeraum
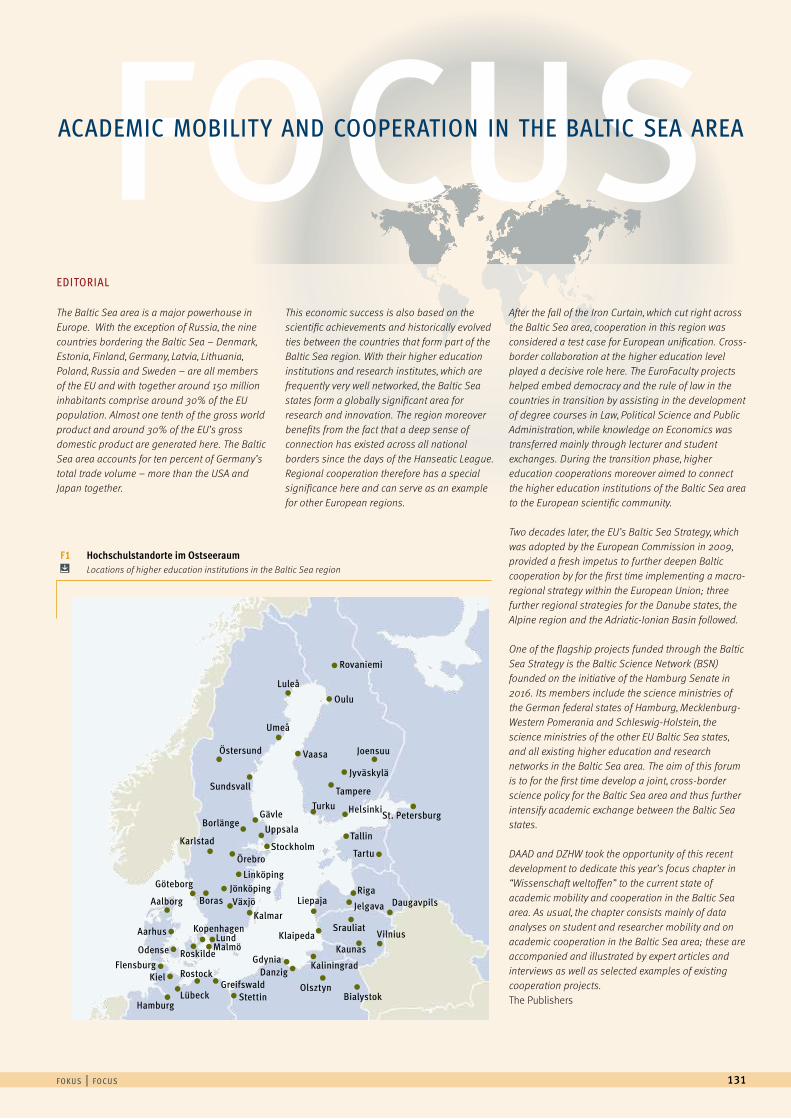
f o k u s | f o c u s 131
FOCUSacademic mobility and cooperation in the baltic sea area
The Baltic Sea area is a major powerhouse in Europe. With the exception of Russia, the nine countries bordering the Baltic Sea – Denmark, Estonia, Finland, Germany, Latvia, Lithuania, Poland, Russia and Sweden – are all members of the EU and with together around 150 million inhabitants comprise around 30% of the EU population. Almost one tenth of the gross world product and around 30% of the EU’s gross domestic product are generated here. The Baltic Sea area accounts for ten percent of Germany’s total trade volume – more than the USA and Japan together.
This economic success is also based on the scientific achievements and historically evolved ties between the countries that form part of the Baltic Sea region. With their higher education institutions and research institutes, which are frequently very well networked, the Baltic Sea states form a globally significant area for research and innovation. The region moreover benefits from the fact that a deep sense of connection has existed across all national borders since the days of the Hanseatic League. Regional cooperation therefore has a special significance here and can serve as an example for other European regions.
After the fall of the Iron Curtain, which cut right across the Baltic Sea area, cooperation in this region was considered a test case for European unification. Cross-border collaboration at the higher education level played a decisive role here. The EuroFaculty projects helped embed democracy and the rule of law in the countries in transition by assisting in the development of degree courses in Law, Political Science and Public Administration, while knowledge on Economics was transferred mainly through lecturer and student exchanges. During the transition phase, higher education cooperations moreover aimed to connect the higher education institutions of the Baltic Sea area to the European scientific community.
Two decades later, the EU’s Baltic Sea Strategy, which was adopted by the European Commission in 2009, provided a fresh impetus to further deepen Baltic cooperation by for the first time implementing a macro- regional strategy within the European Union; three further regional strategies for the Danube states, the Alpine region and the Adriatic-Ionian Basin followed.
One of the flagship projects funded through the Baltic Sea Strategy is the Baltic Science Network (BSN) founded on the initiative of the Hamburg Senate in 2016. Its members include the science ministries of the German federal states of Hamburg, Mecklenburg-Western Pomerania and Schleswig-Holstein, the science ministries of the other EU Baltic Sea states, and all existing higher education and research networks in the Baltic Sea area. The aim of this forum is to for the first time develop a joint, cross-border science policy for the Baltic Sea area and thus further intensify academic exchange between the Baltic Sea states.
DAAD and DZHW took the opportunity of this recent development to dedicate this year’s focus chapter in “Wissenschaft weltoffen” to the current state of academic mobility and cooperation in the Baltic Sea area. As usual, the chapter consists mainly of data analyses on student and researcher mobility and on academic cooperation in the Baltic Sea area; these are accompanied and illustrated by expert articles and interviews as well as selected examples of existing cooperation projects.The Publishers
EDITORIAL
F1 Hochschulstandorte im Ostseeraum Locations of higher education institutions in the Baltic Sea region
Rovaniemi
Oulu
JoensuuVaasa
TampereTurku
Riga
Srauliat
Kaunas
KaliningradDanzig
StettinLübeck
KielFlensburg
Hamburg
GreifswaldRostock
Aalborg
Göteborg
Boras
Borlänge
Karlstad
Aarhus
Odense MalmöLund
Roskilde
KalmarVäxjö
JönköpingLinköping
Stockholm
Uppsala
Gävle
Örebro
Kopenhagen
OlsztynBialystok
Gdynia
VilniusKlaipeda
JelgavaLiepaja Daugavpils
Jyväskylä
HelsinkiSt. Petersburg
Tallin
Tartu
Östersund
Sundsvall
Lulea
Umea
w i sse n sc h a f t w e lto f f e n 2017132
a u s l ä n d i s c h e s t u d i e r e n d e | f o r e i g n s t u d e n t sf o k u s : a k a d e m i s c h e m o b i l i tät u n d k o o p e r at i o n i m o s t s e e r a u m
Im Ostseeraum bestehen vielfältige kooperative Strukturen, von gemeinsamen länderübergreifenden Studiengängen bis hin zu politischen Plattformen, die für die Entwicklung der akademischen Kooperation ein wichtiges Potenzial darstellen. Allerdings ist dieses Potenzial an bestehenden institutio- nalisierten Netzwerken noch lange nicht ausgeschöpft. Das belegen die differierenden Tendenzen in der Entwicklung der wissenschaftlichen Zusammenarbeit zwischen den ver-schiedenen Staaten der Ostseeregion.
Entwicklung der akademischen Mobilität im OsteseeraumSeit 2003 hat die Einreise von Studierenden aus anderen Län-dern in den Ostseeraum deutlich stärker zugenommen als die studentische Mobilität zwischen den europäischen Staaten bzw. den Erasmus-Ländern. Der Ostseeraum hat demnach in diesem Zeitraum als Gastregion für Studierende aus anderen europäischen Regionen spürbar an Attraktivität gewonnen. Die abschlussbezogene Studierendenmobilität innerhalb des Ost-seeraums stieg allerdings im gleichen Zeitraum sehr viel weni- ger. Demnach hat seit 2003 für Studierende aus Ostseestaaten der Ostseeraum selbst tendenziell an Attraktivität gegenüber anderen Destinationen verloren. Für Erasmus-Gastdozenten gilt dies sogar in einem noch umfassenderen Sinn: Für sie hat die relative Bedeutung des Ostseeraums als Zielregion insgesamt abgenommen, unabhängig davon, ob sie aus Ostseeanrainer-staaten oder aus anderen europäischen Ländern einreisen. Um dieser Entwicklung entgegenzuwirken, sollten die Erasmus-Ko-operationen zwischen den Ostseestaaten gezielt gestärkt und gefördert, mögliche Hürden für den Gastdozenten-Austausch im Ostseeraum identifiziert und beseitigt werden.
Bedeutung des Ostseeraums für den akademischen AustauschEine detailliertere Analyse der Studierenden- und Wissen-schaftlermobilität zeigt, dass es auch in Bezug auf die Betei- ligung der Ostseestaaten an der intraregionalen Mobilität deutliche Unterschiede gibt. Deutschland dominiert den Studierenden- und Wissenschaftleraustausch im Ostseeraum sowohl als Herkunfts- als auch als Gastland. Diese Dominanz
fällt bei der Studierendenmobilität noch deutlicher aus als bei der Wissenschaftlermobilität. Bei den östlichen Staaten Russland, Polen, Estland, Lettland und Litauen zeigt sich ein Übergewicht der Ausreisemobilität in den Ostseeraum hinein, während die Einreisemobilität aus den anderen Ostseestaa-ten in diese Länder eine deutlich geringere Rolle spielt. Quasi spiegelbildlich stellt sich die Situation in den drei nordischen Ländern Dänemark, Schweden und Finnland dar: Hier liegt der Schwerpunkt auf der Einreisemobilität, sowohl aus den öst- lichen Staaten wie auch aus Deutschland. Die Ausreise-mobi-lität in andere Ostseestaaten hingegen fällt demgegenüber ge-ring aus. Diese unterschiedlichen Mobilitätsprofile der Ostsee-staaten stellen für die Zukunft des akademischen Austauschs innerhalb des Ostseeraums eine weitere wichtige Herausforde-rung dar. Ein mögliches Ziel weiterer Förderaktivitäten könnte deshalb ein gezielter Ausgleich des bestehenden Ungleichge-wichtes bei der „Brain Circulation“ im Ostseeraum sein.
Forschungskooperation im Ostseeraum Die wissenschaftliche Kooperation zwischen den Ostseestaa-ten ist ebenfalls kein „Selbstläufer“. So hat der Anteil der Ko-Publikationen von Autoren aus Ostseestaaten mit russischer Beteiligung seit 1999 stark abgenommen, was insbesondere auf die gesunkene Anzahl deutsch-russischer Ko-Publikatio-nen zurückzuführen ist. Bei einer Betrachtung der Koopera-tionsverbindungen im Rahmen der beiden letzten EU-For-schungsrahmenprogramme deutet sich zudem insgesamt eine abnehmende Beteiligung des Ostseeraums an. Offensichtlich benötigt eine weitere Vertiefung dieser Kooperation gezielte Anreize und weitergehende institutionelle Unterstützung. Dabei sollten, im Sinne einer nachhaltigen „Bottom-up“-Stra-tegie, insbesondere die gemeinsamen Interessen der Ost-seepartner, z.B. beim Schutz des Ökosystems Ostsee oder in Bezug auf die gemeinsame Kultur und Geschichte des Ostsee-raums, im Vordergrund stehen. Hochschulen wie die HafenCity Universität in Hamburg haben dieses Möglichkeiten bereits er-kannt und in ihre Internationalisierungsstrategien aufgenom-men. Weitere Hochschulen in Deutschland und den anderen Ostseeländern sollten diesem Beispiel folgen. Erfahrungsaus-tausch, aber auch entsprechende Förderprogramme könnten dazu beitragen. Eine besondere Bedeutung dürfte hierbei aus deutscher Sicht die stärkere Einbindung Polens und Russlands als akademische Kooperationspartner haben.
Ansatzpunkte für eine Vertiefungder akademischen Kooperation im Ostseeraum
zusammenfassung und interpretation
f o k u s | f o c u s 133
f o c u s : a c a d e m i c m o b i l i t y a n d co o p e r at i o n i n t h e b a lt i c s e a a r e a
Erweiterung der makroregionalen FörderungDie bisherige Entwicklung der akademischen Kooperation im Ostseeraum hat zu einem wichtigen Netzwerk kooperativer Strukturen geführt. Das sollte allerdings nicht darüber hinweg-täuschen, dass auch die bestehenden Förderprogramme und Formen der Zusammenarbeit der Weiterentwicklung bedür-fen. Bislang existieren nur wenige Fördermaßnahmen, die sich auf den Ostseeraum als Makroregion im Sinne der EU-Strate-gie beziehen. Aufgrund der Fragmentierung sind die bisheri-gen Maßnahmen zur Förderung der akademischen Kooperation vielfach nicht auf ein „makro-regionales Denken“ der relevan-
ten Akteure ausgerichtet. Beispiele wie das BONUS-Programm zeigen jedoch das große Potenzial solcher makroregionalen Förderansätze. Mit dem neu gegründeten „Baltic Science Net-work“ existiert nun eine Plattform, die der bisherigen Frag-mentierung der Förderstrukturen entgegenwirkt und makro-regionale Kooperationsstrategien unterstützt, z.B. durch eine gezielte Fokussierung auf bestimmte gemeinsame Interessen und Stärken sowie die Erhöhung der Transparenz bei den vor-handenen Förderinstrumenten.
From joint transnational courses of study to political platforms, there are a wide range of cooperative structures in the Baltic Sea area that offer significant potential for the development of academic cooperation. This potential of existing institutionalised networks has however not yet been fully utilised, as the differing tendencies in the development of academic cooperation between the various states of the Baltic Sea region show.
Development of academic mobility in the Baltic Sea areaSince 2003, the number of incoming students from other countries to the Baltic Sea area has seen a significantly greater increase than student mobility between European states/the Erasmus countries. The Baltic Sea area has therefore become noticeably more attractive as a host region for students from other European regions over this period. Degree-related student mobility within the Baltic Sea area has however increased far less over the same period of time. This would indicate that the Baltic Sea area itself has tended to become less attractive to students from the Baltic Sea states since 2003 than other destinations. The same is true of Erasmus guest lecturers in an even more comprehensive sense: for them, the relative significance of the Baltic Sea area as a destination region has decreased overall, regardless of whether they come from states bordering the Baltic Sea or from other European countries. In order to counteract this trend, Erasmus cooperations between the Baltic Sea states should be strengthened and supported in a targeted manner. Possible obstacles to guest lecturer exchange in the Baltic Sea area must be identified and removed.
Significance of the Baltic Sea area for academic exchange A detailed analysis of student, academic and researcher mobility shows that there are also clear differences regarding the participation of the Baltic Sea states in intraregional mobility. Germany dominates student and researcher exchange in the Baltic Sea area both as a country of origin and as a host country. This dominance is even more pronounced in student mobility than in academic and researcher mobility. The eastern states of Russia, Poland, Estonia, Latvia and Lithuania see a preponderance of outgoing mobility into the Baltic Sea area, while incoming mobility from the other Baltic Sea states is significantly less prominent. The situation in the three Nordic countries Denmark, Sweden and Finland is virtually the opposite: here, incoming mobility, both from the eastern states and from Germany, is more prevalent, while outgoing mobility to other Baltic Sea states is relatively low. These different mobility profiles of the Baltic Sea states present a further major challenge for the future of academic exchange within the Baltic Sea area. A possible goal of further funding activities could therefore be to specifically address the existing imbalance in “brain circulation” in the Baltic Sea area.
Research cooperations in the Baltic Sea areaThe academic cooperation between the Baltic Sea states does not arise automatically either. The proportion of co-publications by authors from the Baltic Sea states with Russian participa-tion has dropped significantly since 1999, due mainly to the reduced number of German- Russian co-publications. Examining the coope- rative ties within the last two EU Framework Programmes moreover indicates declining participation of the Baltic Sea area overall. Intensifying these cooperations further will evidently require targeted incentives and more extensive institutional support. In order to establish a long-term, bottom-up strategy, such incentives and support should be focused on the
common interests of the Baltic Sea partners, for example in protecting the Baltic Sea ecosystem or relating to the shared culture and history of the Baltic Sea area. Higher education institutions such as HafenCity University in Hamburg have already identified these possibilities and included them in their internationalisation strategies. Further higher education institutions in Germany and the other Baltic Sea states should follow this example. Measures that could facilitate this include exchanges of experience, but also corresponding funding programmes. From a German point of view, integrating Poland and Russia more strongly as academic cooperation partners will be especially important.
Expanding macro-regional fundingThe development of academic cooperation in the Baltic Sea area to date has given rise to an important network of cooperative structures; that its potential is not currently fully utilised should not distract from the fact that funding pro-grammes and forms of cooperation also need to be developed further. There are currently only a small number of funding measures that relate to the Baltic Sea area as a macro-region in the sense of the EU strategy. Due to their fragmenta-tion, the existing measures to promote academic cooperation are frequently not aimed at encouraging “macro-regional thinking” among the relevant stakeholders. Examples such as the BONUS programme however highlight the significant potential of such macro-regional funding approaches. In the form of the newly founded Baltic Science Network there now exists a platform that counteracts the previous fragmentation in funding structures and supports macro-regional cooperation strategies, e.g. by focusing specifically on particular shared interests and strengths and increasing transpar-ency in the existing funding instruments.
SUMMARY AND INTERPRETATION Approaches to intensifying academic cooperation in the Baltic Sea area
w i sse n sc h a f t w e lto f f e n 2017134
a u s l ä n d i s c h e s t u d i e r e n d e | f o r e i g n s t u d e n t sf o k u s : a k a d e m i s c h e m o b i l i tät u n d k o o p e r at i o n i m o s t s e e r a u m
Mit der Verabschiedung der Strategie für den Ostseeraum im Jahre 2009 hat die Europäische Union (EU) erstmals den Ver-such unternommen, einen natur- und kulturraumbezogenen Mechanismus für transnationale Kooperation und Koordination zu schaffen. Diesem liegt die Überlegung zugrunde, dass – gerade auch angesichts der mannigfaltigen Krisen, denen sich die EU nunmehr bereits seit Jahren gegenübersieht – in sol-chen kulturgeografischen Räumen ein besonders hohes Maß an Identifikationspotenzial in der Bevölkerung vorhanden ist. Der Ostseestrategie, die mittlerweile um Strategien für den Donau- und den Alpenraum sowie das Adriatisch-Ionische Be-cken ergänzt worden ist, kommt dabei europaweit ein Modell- und Vorbildcharakter zu. Als einer zentralen gemeinsamen Herausforderung stehen die Ostseeanrainer, darunter auch Deutschland, etwa vor der Notwendigkeit, die Verschmutzung der Ostsee zu reduzieren und den Ausbau der Verkehrswege zu forcieren. Dabei besteht die zentrale Aufgabe der Strategie darin, eine Vielzahl von Akteuren, wie Städte, Regionen, Mit-glieds- und Partnerstaaten, an einen Tisch zu bringen. Es geht dabei vor allem um gesamteuropäische Ziele (z.B. im Rahmen der EU-Beschäftigungs- und Wachstumsstrategie Europa 2020) in einem territorial bestimmten Handlungsrahmen oberhalb des „Nationalstaates“. Viele der dabei geschaffenen Koordi-nierungsmechanismen sind bewusst nicht hierarchisch struk-turiert, um den Akteuren auf souveränitätsschonende Weise den Einstieg bzw. die Teilnahme zu erleichtern und Arbeitsfelder und -weisen pragmatisch und bedarfsorientiert zu entwickeln.
Gleichzeitig bildet die über Jahrzehnte eingeübte nordische sowie die Ostseekooperation, bei der sich auch Deutschland frühzeitig engagiert hat, bereits ein vielschichtiges Substrat, auf dem die grenzüberschreitende Zusammenarbeit gedeihen kann. Dabei kann der Ostseeraum auf eine entwickelte Hoch-schulzusammenarbeit zurückblicken, die in den 1990er-Jahren begann und dem Ziel verpflichtet war – etwa im Rahmen der Euro-Fakultät (in Vilnius, Riga, Tartu, Kaliningrad und Pskov) –, die Transformationsländer Mittel- und Osteuropas bei ihrer wirtschaftlichen Entwicklung und auf ihrem Weg in die EU zu unterstützen. Daneben entwickelte sich die Zusammenarbeit in Lehre und Forschung im Rahmen transnationaler Netzwer-ke, die den gesamten Ostseeraum umfassen. Dies gilt etwa für das Baltic University Programme, einem Netzwerk von 225 Universitäten und Instituten in der Ostseeregion (darunter
z.B. die Hochschulen Hamburg und Zittau/Görlitz), das bereits seit 1991 besteht, oder das transnationale Forschungspro-gramm BONUS, an dem sich seit seiner Etablierung 2003 auch viele deutsche Wissenschaftlern beteiligt haben.
Auf dieser bereits etablierten Kooperation baut die EU-Stra-tegie auf. Heute geht es neben der Konsolidierung der EU als transnationalem Akteurs- und Gestaltungsrahmen im Ostsee-raum auch darum, die Einbindung Russlands – trotz Ukraine-Krise und bilateralen Sanktionsregimen zwischen Russland und der EU – in die Ostseezusammenarbeit weiterhin sicher-zustellen. Dabei wächst der akademischen Mobilität im Be-reich der Hochschulzusammenarbeit eine besondere Rolle zu. Der Ostseeraum ist aufgrund seiner relativen natur- und kul-turräumlichen Homogenität dafür geradezu prädestiniert. Der makroregionale Bezugsrahmen kann einen besonderen Stel-lenwert einnehmen, wenn es den entsprechenden Akteuren gelingt, einerseits ein Bindeglied bei der Vernetzung der glo-balen bzw. europäischen mit der lokalen Ebene zu bilden und andererseits die Vorteile makroregionalen Handelns klar auf-zuzeigen. Dies kann sowohl im Wettbewerb der besten Ideen und Praktiken etwa bei der Integration von Flüchtlingen oder der Eingliederung von Schulabbrechern in den Arbeitsmarkt als auch in der transnationalen Zusammenführung und Bün-delung entsprechender Vorhaben bestehen. So bemüht sich seit 2012 das Flagship-Projekt School to Work darum, Maß-nahmen zu entwickeln, um die Schulabbrecherquote in den Ländern des Ostseeraumes zu verringern. Seit 2016 wiederum besteht im Rahmen des EU-Förderprogramms Interreg mit dem Baltic Science Network ein Netzwerk zwischen den Wissen-schaftsministerien der Ostseeanrainer, welches u.a. das Ziel verfolgt, die wissenschaftspolitischen und transnatio-nalen Forschungs- und Bildungsziele der beteiligten Staaten aufein-ander abzustimmen und gemeinsame Forschungsziele gegen-über der EU voranzutreiben. Da die meisten der EU-Mitglied-staaten aus dem Ostseeraum zu klein sind, um ihre Absichten und Ziele individuell auf EU-Ebene verfolgen zu können, bie-tet die makroregionale Strategie einen geeigneten Rahmen für die Koordination der Zusammenarbeit im Bereich Bildung und Forschung im Ostseeraum.
Akademische Kooperation in der Makroregion Ostseeraum – Motive und Chancen
gastbeitrag
f o k u s | f o c u s 135
f o c u s : a c a d e m i c m o b i l i t y a n d co o p e r at i o n i n t h e b a lt i c s e a a r e a
The adoption of its strategy for the Baltic Sea region in 2009 was the first time the European Union (EU) attempted to create a mechanism relating to a specific natural and cultural area in order to facilitate transnational cooperation and coordination. This attempt was based on the consideration that – particularly also in light of the many crises that the EU has now been facing for years – an especially high level of identifica-tion potential exists within the population of such cultural and geographic areas. The Baltic Sea Strategy, which has meanwhile been joined by strategies for the Danube and the Alpine regions and the Adriatic-Ionian Initiative, is considered pioneering and exemplary within Europe. As a central common challenge, the states bordering the Baltic Sea – Germany among them – are faced with the need to reduce pollution in the Baltic Sea and drive the expansion of transporta-tion routes. The strategy’s main aim is to bring a large number of stakeholders such as cities, regions, member and partner states to the same table; its focus is mainly on pan-European goals (e.g. as part of the EU’s job and growth strategy Europe 2020) within a territorially determined frame of action above that of the ’nation state’. Many of the coordination mechanisms thereby created are intentionally not hierarchically structured in order to make it easier for stake- holders to join and participate in a manner that does not impinge on their sovereignty, and to develop working areas and methods pragmati-cally and oriented to demand.
At the same time, Nordic cooperation, which has been practised over decades, and Baltic cooperation, in which Germany became involved early on, already form a multi-layered substrate on which cross-border cooperation can thrive. The Baltic Sea area has a history of well developed higher education cooperation that began in the 1990s and was dedicated to supporting the central and eastern European countries in transition in their economic development and on their way into the EU – for example through the Euro Faculty (in Vilnius, Riga, Tartu, Kaliningrad und Pskov). In addition, cooperation in teaching and research developed through transnational networks that cover the entire Baltic region, such as the Baltic University Programme, a network of 225 universities and institutes in the Baltic region (including for example the universities of applied sciences Hamburg and Zittau/Görlitz) that has existed since 1991, or the transnational research programme BONUS, in which many German academics have participated since its establish-ment in 2003.
The EU strategy builds on this previously established cooperation. In addition to consoli-dating the EU as a transnational stakeholder forum and policy-making framework in the Baltic region it also – despite the Ukraine crisis and bilateral sanction regimes between Russia and the EU – aims to continue to integrate Russia into Baltic cooperation. Academic mobility plays an especially important role in higher education cooperation; its relative natural and cultural homogeneity make the Baltic Sea area particu-larly well suited for this. The macro-regional frame of reference can take on special signifi-cance if the corresponding stakeholders succeed on the one hand in forming a link in the network between the global/EU and the local level and on the other hand in clearly highlighting the advantages of macro-regional action. This may consist both in competing for the best ideas and practices, for example when integrating refugees or bringing school drop-outs into the labour market, and in transnationally merging and bundling corresponding projects. The flagship project School to Work for example has been developing measures to reduce school drop-out rates in the Baltic countries since 2012. A network between the science ministries of the Baltic states, which aims among other things to coordinate the science policies and transnational research and education goals of the participating states and advance joint research goals within the EU, has been founded in 2016 in the form of the Baltic Science Network within the EU funding programme Interreg. As the majority of EU member states from the Baltic region are too small to individually pursue their intentions and goals at the EU level, the macro-regional strategy offers a suitable framework for coordinating collaboration in education and research in the Baltic Sea area.
authors Prof. Dr Kristine Kern works at the Leibniz Institute for Research on Society and Space (IRS) and is also an associate professor at Åbo Akademi University in Finland. Her research focus includes transnational city networks, European regional seas (especially the Baltic) and the macro-regional strategies of the EU.
Dr Stefan Gänzle is an associate professor in the Department of Political Science and Management at Agder University in Norway. His research focus lies in integration and governance research, in particular relating to the EU.
Stefan Gänzle and Kristine Kern recently jointly edited and published „A ‚Macro-regional’ Europe in the Making – Theoretical Approaches and Empirical Evidence“, which among other things examines the EU’s four macro-regional strategies from various angles.
autoren Prof. Dr. Kristine Kern ist am Leibniz-Institut für Raumbezogene Sozialforschung (IRS) beschäftigt und zudem Associate Professor an der Åbo Aka- demi University in Finnland. Zu ihren Forschungsschwerpunkten zählen u.a. transnationale Städtenetzwerke, europäische Regionalmeere (insbesondere die Ostsee) und die makroregionalen Strategien der EU.
Dr. Stefan Gänzle ist Associate Professor am Department of Political Science and Management der Universität Agder in Norwegen. Seine For-schungsschwerpunkte liegen in der Integrations- und Governance-Forschung, v.a. mit Bezug zur EU.
In gemeinsamer Herausgeberschaft veröffentlichten Stefan Gänzle und Kristine Kern vor Kurzem den Sammelband „A ’Macro-regional’ Europe in the Making – Theoretical Approaches and Empirical Evidence“, in dem u.a. die vier makroregionalen Strategien der EU aus unterschiedlichen Blick- winkeln beleuchtet werden.
GUEST CONTRIBUTION Academic cooperation in the Baltic Sea macro-region – Motives and opportunities
w i sse n sc h a f t w e lto f f e n 2017136
a u s l ä n d i s c h e s t u d i e r e n d e | f o r e i g n s t u d e n t sf o k u s : a k a d e m i s c h e m o b i l i tät u n d k o o p e r at i o n i m o s t s e e r a u m
Studierende und Wissenschaftler im Ostseeraum
ländervergleich und datenlage
Merkmale der Wissenschafts- und Hochschulsysteme im OstseeraumEine Analyse der akademischen Mobilität und Kooperation im Ostseeraum un-terliegt unterschiedlichen Herausforderungen. Das zeigt schon der Blick auf die für Bildung und Forschung relevanten Indikatoren (wie z.B. die Anzahl von Stu-dierenden und Forschern) sowie die finanziellen Mittel, die für Hochschulbildung und Forschung jeweils zur Verfügung stehen.
Betrachtet man die Gesamtzahl der Hochschulen, so teilen sich die hier unter-suchten Ostseestaaten in drei Gruppen auf: Russland liegt mit über 800 Hoch-schulen weit vor allen anderen Ostseestaaten, gefolgt von Deutschland und Po-len mit jeweils rund 400 Hochschulen. In allen anderen Ländern liegt die Zahl der Hochschulen nur zwischen zehn und 40. Eine ähnliche Gruppierung ergibt sich bei der Gesamtzahl der eingeschriebenen Studierenden: Auch hier liegt Russland mit gut sieben Millionen vor Deutschland und Polen mit zwei bis drei Millionen Studierenden. In den übrigen Ostseestaaten sind nur rund 60.000 bis 400.000 Studierende an den Hochschulen eingeschrieben. In Bezug auf die Anzahl der Forscher liegen Deutschland und Russland mit jeweils über 350.000 deutlich vor allen anderen Ostseestaaten, gefolgt von Dänemark, Finnland, Schweden und Polen mit 40.000 bis 80.000 Forschern sowie Estland, Lettland und Litauen mit jeweils weniger als 10.000 Forschern.
Eine andere Gruppierung ergibt sich, wenn die Bruttoinlandsaufwendungen für Forschung und Entwicklung pro Kopf zugrunde gelegt werden. Hier liegen Däne-mark, Finnland, Deutschland und Schweden mit jeweils 1.300 bis 1.400 US-Dol-lar pro Kopf mit deutlichem Abstand vor allen anderen Ostseestaaten, bei denen die entsprechenden Aufwendungen nur zwischen 160 und 400 US-Dollar liegen. Ein ähnliches Bild zeigt sich bei den öffentlichen Ausgaben pro Studierendem. An der Spitze stehen hier Finnland und Schweden mit etwas über 20.000 US-Dol-lar, gefolgt von Dänemark und Deutschland mit 14.000 bis 15.000 US-Dollar. Die übrigen Länder liegen zwischen 4.000 und 10.000 US-Dollar, wobei für Russland entsprechende Daten fehlen.
Anbindung und Identifikation mit dem OstseeraumEin weiterer wichtiger Unterschied zwischen den verschiedenen Ostseestaaten ist deren unterschiedlich stark ausgeprägte Ostseeanbindung. Während nur ein vergleichsweise geringer Teil des Territoriums insbesondere von Russland, aber auch von Deutschland und Polen an die Ostsee angrenzen, trifft dies in den übri-gen Ostseestaaten auf weitaus größere Abschnitte ihrer Landesgrenze zu. Damit einher gehen auch unterschiedlich große Bevölkerungsanteile, die in den jewei-ligen Ländern in direkter Küstennähe leben. Es kann somit davon ausgegangen
Features of academic and higher education systems in the Baltic Sea areaAn analysis of academic mobility and cooperation in the Baltic Sea area is subject to a range of challenges, as will be immediately apparent from a glance at the indicators relevant to education and research (such as the number of students and researchers) and the financial means that are available for higher edu- cation and research in each country.
Examining the number higher education institutions (HEI) reveals that the analysed Baltic states fall into three groups: Russia is far ahead with over 800 HEI, followed by Germany and Poland with about 400 HEI each. In all other countries, there are only between ten and 40 HEI. A similar grouping can be observed if the number of enrolled students is examined: Again, Russia is far ahead with about seven million students, followed by Germany and Poland with two to three million. In all other Baltic Sea states, there are only between 60,000 and 400,000 enrolled students. In terms of researcher numbers, Germany and Russia are far ahead of all other Baltic Sea states with over 350,000 researchers each, followed by Denmark, Finland, Sweden and Poland with between 40,000 and 80,000 researchers and Estonia, Latvia and Lithuania with less than 10,000 researchers each.
Different groupings result based on per-capita gross domestic expenditure on research and development. With between 1,300 and 1,400 USD per capita, Denmark, Finland, Germany and Sweden are clearly ahead of all other Baltic Sea states, which only spend between 160 and 400 USD per capita. A similar picture emerges regarding public spending per student, where Finland and Sweden are in the lead with slightly over 20,000 USD, followed by Denmark and Germany with between 14,000 and 15,000 USD. The other countries spend between 4,000 and 10,000 USD per student; corresponding data for Russia are unavailable.
INTERNATIONAL COMPARISON AND AVAILABLE DATA Students, academics and researchers in the Baltic Sea area
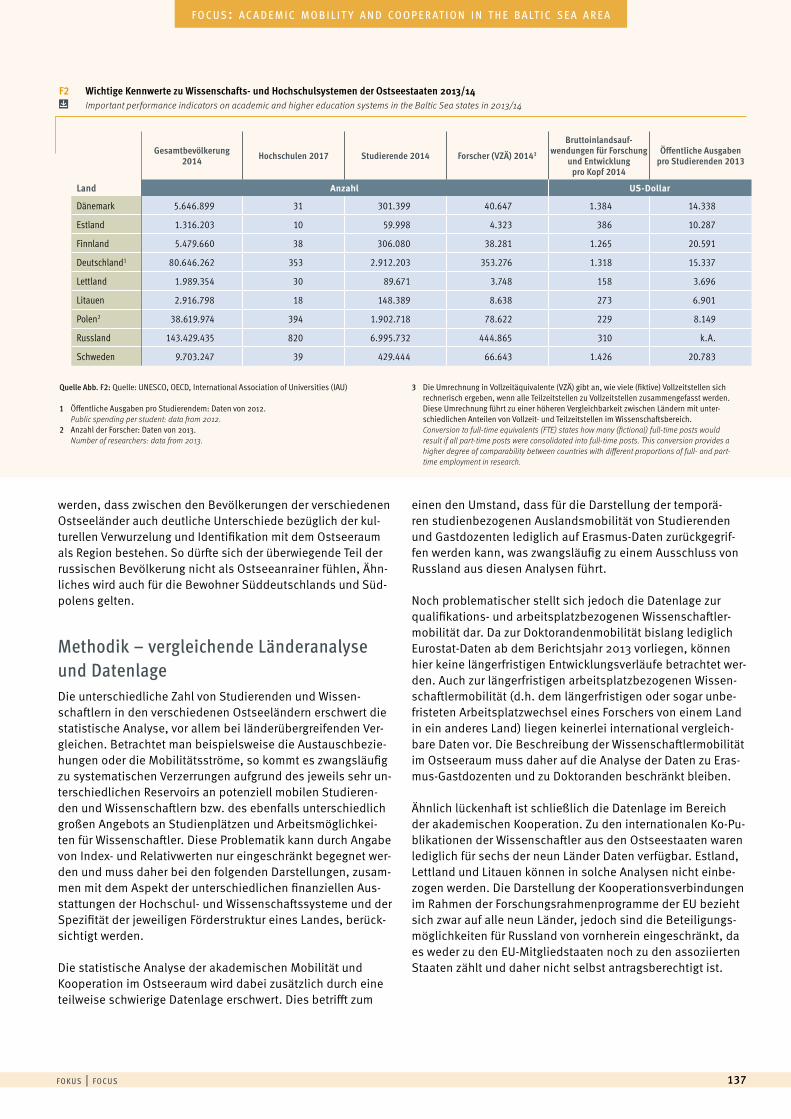
f o k u s | f o c u s 137
f o c u s : a c a d e m i c m o b i l i t y a n d co o p e r at i o n i n t h e b a lt i c s e a a r e a
werden, dass zwischen den Bevölkerungen der verschiedenen Ostseeländer auch deutliche Unterschiede bezüglich der kul-turellen Verwurzelung und Identifikation mit dem Ostseeraum als Region bestehen. So dürfte sich der überwiegende Teil der russischen Bevölkerung nicht als Ostseeanrainer fühlen, Ähn-liches wird auch für die Bewohner Süddeutschlands und Süd-polens gelten.
Methodik – vergleichende Länderanalyse und DatenlageDie unterschiedliche Zahl von Studierenden und Wissen-schaftlern in den verschiedenen Ostseeländern erschwert die statistische Analyse, vor allem bei länderübergreifenden Ver-gleichen. Betrachtet man beispielsweise die Austauschbezie-hungen oder die Mobilitätsströme, so kommt es zwangsläufig zu systematischen Verzerrungen aufgrund des jeweils sehr un-terschiedlichen Reservoirs an potenziell mobilen Studieren-den und Wissenschaftlern bzw. des ebenfalls unterschiedlich großen Angebots an Studienplätzen und Arbeitsmöglichkei-ten für Wissenschaftler. Diese Problematik kann durch Angabe von Index- und Relativwerten nur eingeschränkt begegnet wer-den und muss daher bei den folgenden Darstellungen, zusam-men mit dem Aspekt der unterschiedlichen finanziellen Aus-stattungen der Hochschul- und Wissenschaftssysteme und der Spezifität der jeweiligen Förderstruktur eines Landes, berück-sichtigt werden.
Die statistische Analyse der akademischen Mobilität und Kooperation im Ostseeraum wird dabei zusätzlich durch eine teilweise schwierige Datenlage erschwert. Dies betrifft zum
einen den Umstand, dass für die Darstellung der temporä-ren studienbezogenen Auslandsmobilität von Studierenden und Gastdozenten lediglich auf Erasmus-Daten zurückgegrif-fen werden kann, was zwangsläufig zu einem Ausschluss von Russland aus diesen Analysen führt.
Noch problematischer stellt sich jedoch die Datenlage zur qualifikations- und arbeitsplatzbezogenen Wissenschaftler-mobilität dar. Da zur Doktorandenmobilität bislang lediglich Eurostat-Daten ab dem Berichtsjahr 2013 vorliegen, können hier keine längerfristigen Entwicklungsverläufe betrachtet wer-den. Auch zur längerfristigen arbeitsplatzbezogenen Wissen-schaftlermobilität (d.h. dem längerfristigen oder sogar unbe-fristeten Arbeitsplatzwechsel eines Forschers von einem Land in ein anderes Land) liegen keinerlei international vergleich-bare Daten vor. Die Beschreibung der Wissenschaftlermobilität im Ostseeraum muss daher auf die Analyse der Daten zu Eras-mus-Gastdozenten und zu Doktoranden beschränkt bleiben.
Ähnlich lückenhaft ist schließlich die Datenlage im Bereich der akademischen Kooperation. Zu den internationalen Ko-Pu-blikationen der Wissenschaftler aus den Ostseestaaten waren lediglich für sechs der neun Länder Daten verfügbar. Estland, Lettland und Litauen können in solche Analysen nicht einbe-zogen werden. Die Darstellung der Kooperationsverbindungen im Rahmen der Forschungsrahmenprogramme der EU bezieht sich zwar auf alle neun Länder, jedoch sind die Beteiligungs-möglichkeiten für Russland von vornherein eingeschränkt, da es weder zu den EU-Mitgliedstaaten noch zu den assoziierten Staaten zählt und daher nicht selbst antragsberechtigt ist.
F2 Wichtige Kennwerte zu Wissenschafts- und Hochschulsystemen der Ostseestaaten 2013/14 Important performance indicators on academic and higher education systems in the Baltic Sea states in 2013/14
Gesamtbevölkerung 2014 Hochschulen 2017 Studierende 2014 Forscher (VZÄ) 20143
Bruttoinlandsauf- wendungen für Forschung
und Entwicklung pro Kopf 2014
Öffentliche Ausgaben pro Studierenden 2013
Land Anzahl US-Dollar
Dänemark 5.646.899 31 301.399 40.647 1.384 14.338
Estland 1.316.203 10 59.998 4.323 386 10.287
Finnland 5.479.660 38 306.080 38.281 1.265 20.591
Deutschland1 80.646.262 353 2.912.203 353.276 1.318 15.337
Lettland 1.989.354 30 89.671 3.748 158 3.696
Litauen 2.916.798 18 148.389 8.638 273 6.901
Polen2 38.619.974 394 1.902.718 78.622 229 8.149
Russland 143.429.435 820 6.995.732 444.865 310 k.A.
Schweden 9.703.247 39 429.444 66.643 1.426 20.783
Quelle Abb. F2: Quelle: UNESCO, OECD, International Association of Universities (IAU)
1 Öffentliche Ausgaben pro Studierendem: Daten von 2012. Public spending per student: data from 2012. 2 Anzahl der Forscher: Daten von 2013. Number of researchers: data from 2013.
3 Die Umrechnung in Vollzeitäquivalente (VZÄ) gibt an, wie viele (fiktive) Vollzeitstellen sich rechnerisch ergeben, wenn alle Teilzeitstellen zu Vollzeitstellen zusammengefasst werden. Diese Umrechnung führt zu einer höheren Vergleichbarkeit zwischen Ländern mit unter-schiedlichen Anteilen von Vollzeit- und Teilzeitstellen im Wissenschaftsbereich. Conversion to full-time equivalents (FTE) states how many (fictional) full-time posts would result if all part-time posts were consolidated into full-time posts. This conversion provides a higher degree of comparability between countries with different proportions of full- and part-time employment in research.
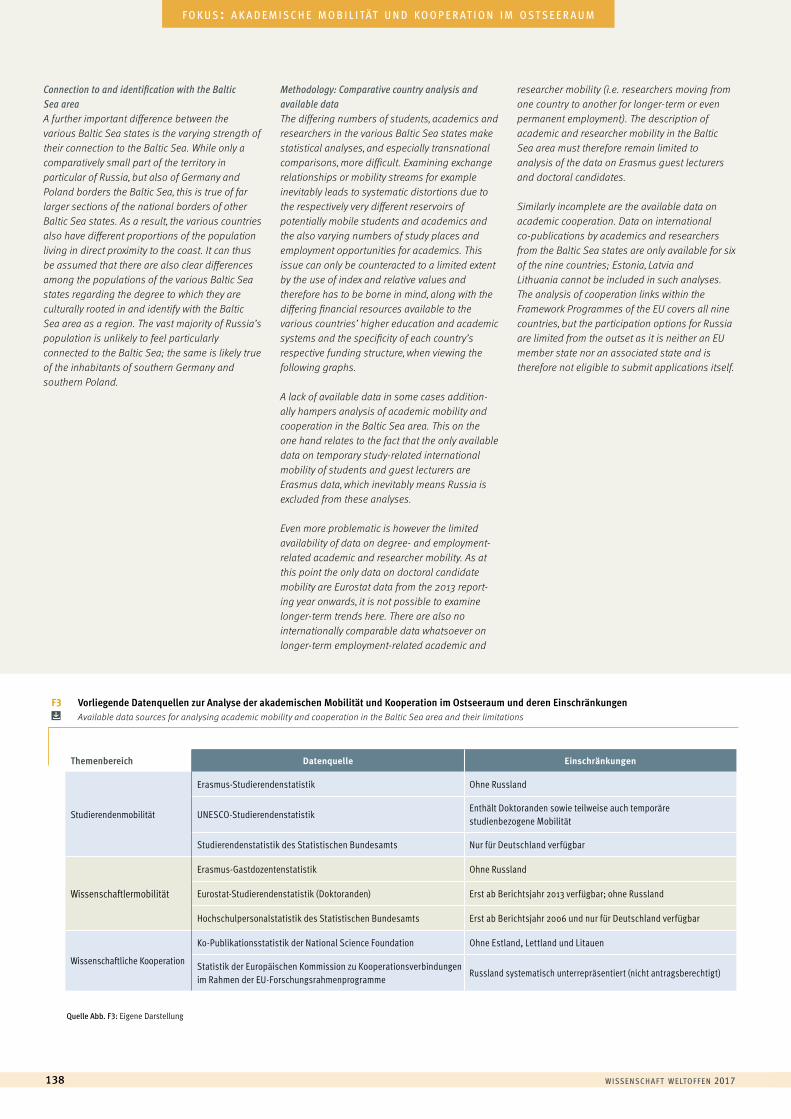
Quelle Abb. F3: Eigene Darstellung
w i sse n sc h a f t w e lto f f e n 2017138
a u s l ä n d i s c h e s t u d i e r e n d e | f o r e i g n s t u d e n t sf o k u s : a k a d e m i s c h e m o b i l i tät u n d k o o p e r at i o n i m o s t s e e r a u m
Connection to and identification with the Baltic Sea areaA further important difference between the various Baltic Sea states is the varying strength of their connection to the Baltic Sea. While only a comparatively small part of the territory in particular of Russia, but also of Germany and Poland borders the Baltic Sea, this is true of far larger sections of the national borders of other Baltic Sea states. As a result, the various countries also have different proportions of the population living in direct proximity to the coast. It can thus be assumed that there are also clear differences among the populations of the various Baltic Sea states regarding the degree to which they are culturally rooted in and identify with the Baltic Sea area as a region. The vast majority of Russia’s population is unlikely to feel particularly connected to the Baltic Sea; the same is likely true of the inhabitants of southern Germany and southern Poland.
Methodology: Comparative country analysis and available dataThe differing numbers of students, academics and researchers in the various Baltic Sea states make statistical analyses, and especially transnational comparisons, more difficult. Examining exchange relationships or mobility streams for example inevitably leads to systematic distortions due to the respectively very different reservoirs of potentially mobile students and academics and the also varying numbers of study places and employment opportunities for academics. This issue can only be counteracted to a limited extent by the use of index and relative values and therefore has to be borne in mind, along with the differing financial resources available to the various countries’ higher education and academic systems and the specificity of each country’s respective funding structure, when viewing the following graphs.
A lack of available data in some cases addition-ally hampers analysis of academic mobility and cooperation in the Baltic Sea area. This on the one hand relates to the fact that the only available data on temporary study-related international mobility of students and guest lecturers are Erasmus data, which inevitably means Russia is excluded from these analyses.
Even more problematic is however the limited availability of data on degree- and employment-related academic and researcher mobility. As at this point the only data on doctoral candidate mobility are Eurostat data from the 2013 report- ing year onwards, it is not possible to examine longer-term trends here. There are also no internationally comparable data whatsoever on longer-term employment-related academic and
researcher mobility (i.e. researchers moving from one country to another for longer-term or even permanent employment). The description of academic and researcher mobility in the Baltic Sea area must therefore remain limited to analysis of the data on Erasmus guest lecturers and doctoral candidates.
Similarly incomplete are the available data on academic cooperation. Data on international co-publications by academics and researchers from the Baltic Sea states are only available for six of the nine countries; Estonia, Latvia and Lithuania cannot be included in such analyses. The analysis of cooperation links within the Framework Programmes of the EU covers all nine countries, but the participation options for Russia are limited from the outset as it is neither an EU member state nor an associated state and is therefore not eligible to submit applications itself.
F3 Vorliegende Datenquellen zur Analyse der akademischen Mobilität und Kooperation im Ostseeraum und deren Einschränkungen Available data sources for analysing academic mobility and cooperation in the Baltic Sea area and their limitations
Themenbereich Datenquelle Einschränkungen
Studierendenmobilität
Erasmus-Studierendenstatistik Ohne Russland
UNESCO-StudierendenstatistikEnthält Doktoranden sowie teilweise auch temporäre studienbezogene Mobilität
Studierendenstatistik des Statistischen Bundesamts Nur für Deutschland verfügbar
Wissenschaftlermobilität
Erasmus-Gastdozentenstatistik Ohne Russland
Eurostat-Studierendenstatistik (Doktoranden) Erst ab Berichtsjahr 2013 verfügbar; ohne Russland
Hochschulpersonalstatistik des Statistischen Bundesamts Erst ab Berichtsjahr 2006 und nur für Deutschland verfügbar
Wissenschaftliche Kooperation
Ko-Publikationsstatistik der National Science Foundation Ohne Estland, Lettland und Litauen
Statistik der Europäischen Kommission zu Kooperationsverbindungen im Rahmen der EU-Forschungsrahmenprogramme
Russland systematisch unterrepräsentiert (nicht antragsberechtigt)
methodology Methodology: A distinction is made bet-ween four groups of mobile students as far as the ob-servation of mobility development in the Baltic Sea area since 2003 is concerned:1. Students who are mobile within the Baltic Sea area
(i.e. between the various Baltic Sea states);2. Students entering a Baltic Sea country, from other
Erasmus or European countries;3. Students leaving a Baltic Sea country for other
Erasmus or European countries;4. Total of all students moving between European or
Erasmus countries.
Index-linked time series were calculated on the basis of the absolute student numbers in order to be able to compare the mobility development within these stu-dent groups despite the varying baseline values. Here, the respective baseline values from 2003 were equated to the index value of 100. This facilitates a direct com-parison of percentage-based increases or declines in all three student groups in the monitoring period.
Development of student mobility in the Baltic Sea area
f o k u s | f o c u s 139
f o c u s : a c a d e m i c m o b i l i t y a n d co o p e r at i o n i n t h e b a lt i c s e a a r e a
Datenlage und -interpretation
Für die Analyse der Studierendenmo- bilität im Ostseeraum wurden die fol-genden Datenquellen herangezogen:• Erasmus-Statistik: erfasst den Groß-
teil temporärer studienbezogener Stu-dierendenmobilität im Ostseeraum;1
• UNESCO-Statistik: erfasst in erster Linie die abschlussbezogene Studie-rendenmobilität in den anderen Ost-seestaaten.2
Temporäre wie abschlussbezogene Mo-bilität werden dabei von unterschied-lichen Bedingungen beeinflusst. Hierzu zählen z.B. bestehende Partnerschaften der Heimathochschule mit ausländi-schen Hochschulen, vorhandene Aus-tauschplätze oder die Verfügbarkeit von Fördermitteln zur Studienfinanzierung bzw. deren Übertragbarkeit ins Aus-
land. Darüber hinaus spielen studen-tische Motivlagen, insbesondere die wahrgenommene Attraktivität der Gast-länder, für die jeweilige Form der Stu-dierendenmobilität eine wichtige Rolle. Bei temporären studienbezogenen Aus-landsaufenthalten werden die Anrech-nungsmöglichkeiten von im Ausland erbrachten Leistungen oder auch die kulturelle Attraktivität des jeweiligen Gastlands beachtet. Bei der abschluss-bezogenen Auslandsmobilität stehen stärker karrierebezogene Motive im Vor-dergrund, wie die Qualität der Bildungs-abschlüsse und die damit bestehenden Beschäftigungsaussichten. Viel stärker als bei der temporären spielen bei der abschlussbezogenen Studierenden- mobilität auch Unterschiede zwischen den Gast- und Herkunftsländern bezüg-lich der wirtschaftlichen Lage und der Arbeitsmarktsituation eine Rolle.
Entwicklung der Studierendenmobilität im Ostseeraum
analyse
methodik Bei der Betrachtung der Mobilitäts- entwicklung im Ostseeraum wird zwischen vier Gruppen unterschieden:1. Studierende, die innerhalb des Ostseeraums
mobil sind (d.h. zwischen den verschiedenen Ostseestaaten);
2. Studierende, die aus anderen Erasmus-Staaten bzw. europäischen Staaten in einen Ostseestaat einreisen;
3. Studierende, die aus einem Ostseestaat in an-dere Erasmus-Staaten bzw. europäische Staaten ausreisen;
4. Gesamtheit aller zwischen europäischen bzw. Erasmus-Staaten mobilen Studierenden.
Um die Mobilitätsentwicklung dieser Gruppen trotz unterschiedlicher Ausgangswerte miteinander vergleichen zu können, wurden auf Grundlage der absoluten Studierendenzahlen indexbezogene Zeit-reihen (2003 = 100) berechnet.
1 Ohne Erasmus-Praktikumsaufenthalte.Without Erasmus placement-related visits.
2 Enthält in geringem Umfang Daten zu mobilen Doktoran-den und Studierenden mit temporären studienbezogenen Auslandsaufenthalten. Also contains data on mobile doctoral candidates and, in part, on students pursuing temporary study-related visits abroad.
ANALYSIS Student mobility in the Baltic Sea areaAvailable data and its interpretation The following data sources were consulted when drawing up the analysis of student mobility in the Baltic Sea area:• Erasmus statistics: records data on a large
majority of temporary study-related student mobility in the Baltic Sea area;1
• UNESCO statistics: primarily records data on degree-related student mobility in the other Baltic Sea countries..2
In the process, temporary and degree-related mobility are influenced by a range of factors. These include, for instance, existing partnerships between home and foreign universities, the number of available exchange places or the availability of funding for study financing, or its transferability abroad. Furthermore, student motives, particularly the perceived attractiveness of the host countries, play an important role in the respective forms of student mobility. While the
opportunity to accumulate credits relating to courses attended abroad, or the cultural attrac- tiveness of the respective host country are taken account of in the case of temporary study-related visits abroad, degree-related international mobility focuses more strongly on career-oriented motives, including the quality of the educational qualifications and the associated employment prospects. Differences between host countries and countries of origin as regards the economic and labour market situations play a more signi- ficant role in degree-related student mobility than is the case with temporary student mobility.
Studierendenmobilität im Ostseeraum
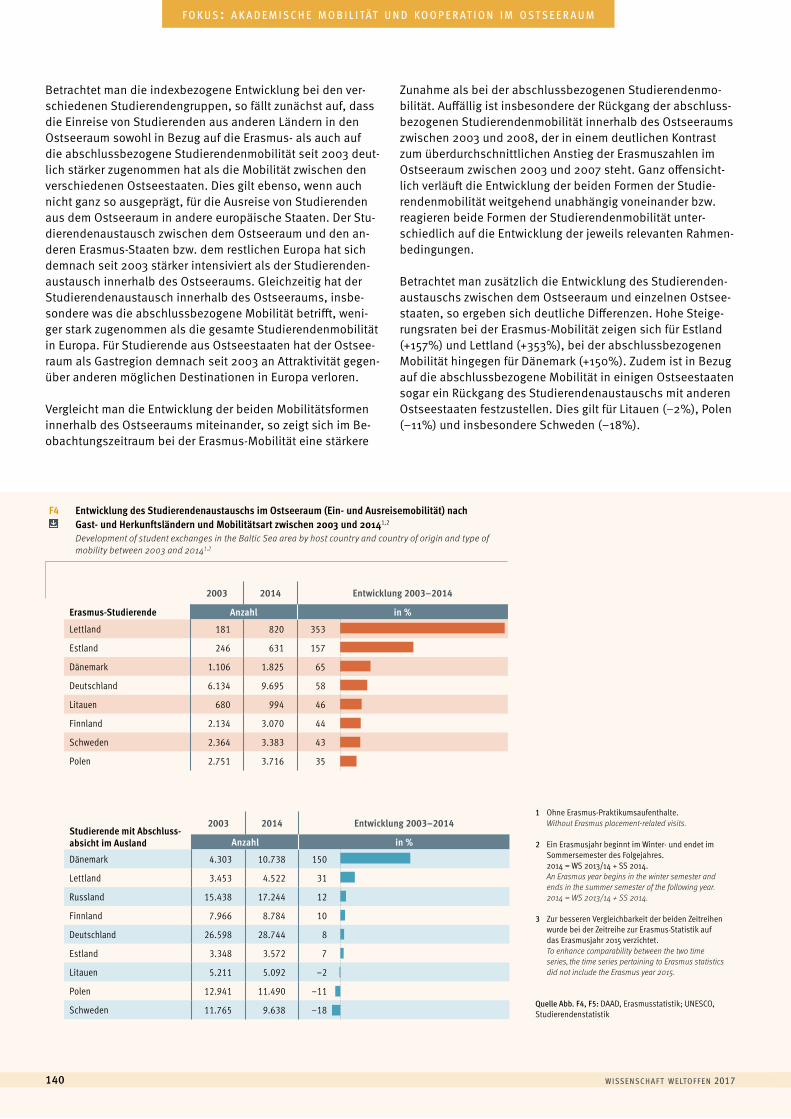
Quelle Abb. F4, F5: DAAD, Erasmusstatistik; UNESCO, Studierendenstatistik
w i sse n sc h a f t w e lto f f e n 2017140
a u s l ä n d i s c h e s t u d i e r e n d e | f o r e i g n s t u d e n t sf o k u s : a k a d e m i s c h e m o b i l i tät u n d k o o p e r at i o n i m o s t s e e r a u m
Betrachtet man die indexbezogene Entwicklung bei den ver-schiedenen Studierendengruppen, so fällt zunächst auf, dass die Einreise von Studierenden aus anderen Ländern in den Ostseeraum sowohl in Bezug auf die Erasmus- als auch auf die abschlussbezogene Studierendenmobilität seit 2003 deut-lich stärker zugenommen hat als die Mobilität zwischen den verschiedenen Ostseestaaten. Dies gilt ebenso, wenn auch nicht ganz so ausgeprägt, für die Ausreise von Studierenden aus dem Ostseeraum in andere europäische Staaten. Der Stu-dierendenaustausch zwischen dem Ostseeraum und den an-deren Erasmus-Staaten bzw. dem restlichen Europa hat sich demnach seit 2003 stärker intensiviert als der Studierenden-austausch innerhalb des Ostseeraums. Gleichzeitig hat der Studierendenaustausch innerhalb des Ostseeraums, insbe-sondere was die abschlussbezogene Mobilität betrifft, weni-ger stark zugenommen als die gesamte Studierendenmobilität in Europa. Für Studierende aus Ostseestaaten hat der Ostsee-raum als Gastregion demnach seit 2003 an Attraktivität gegen-über anderen möglichen Destinationen in Europa verloren.
Vergleicht man die Entwicklung der beiden Mobilitätsformen innerhalb des Ostseeraums miteinander, so zeigt sich im Be-obachtungszeitraum bei der Erasmus-Mobilität eine stärkere
Zunahme als bei der abschlussbezogenen Studierendenmo-bilität. Auffällig ist insbesondere der Rückgang der abschluss-bezogenen Studierendenmobilität innerhalb des Ostseeraums zwischen 2003 und 2008, der in einem deutlichen Kontrast zum überdurchschnittlichen Anstieg der Erasmuszahlen im Ostseeraum zwischen 2003 und 2007 steht. Ganz offensicht-lich verläuft die Entwicklung der beiden Formen der Studie-rendenmobilität weitgehend unabhängig voneinander bzw. reagieren beide Formen der Studierendenmobilität unter-schiedlich auf die Entwicklung der jeweils relevanten Rahmen-bedingungen.
Betrachtet man zusätzlich die Entwicklung des Studierenden-austauschs zwischen dem Ostseeraum und einzelnen Ostsee-staaten, so ergeben sich deutliche Differenzen. Hohe Steige-rungsraten bei der Erasmus-Mobilität zeigen sich für Estland (+157%) und Lettland (+353%), bei der abschlussbezogenen Mobilität hingegen für Dänemark (+150%). Zudem ist in Bezug auf die abschlussbezogene Mobilität in einigen Ostseestaaten sogar ein Rückgang des Studierendenaustauschs mit anderen Ostseestaaten festzustellen. Dies gilt für Litauen (–2%), Polen (–11%) und insbesondere Schweden (–18%).
F4 Entwicklung des Studierendenaustauschs im Ostseeraum (Ein- und Ausreisemobilität) nach Gast- und Herkunftsländern und Mobilitätsart zwischen 2003 und 20141,2
Development of student exchanges in the Baltic Sea area by host country and country of origin and type of mobility between 2003 and 20141,2
2003 2014 Entwicklung 2003–2014
Erasmus-Studierende Anzahl in %
Lettland 181 820 353
Estland 246 631 157
Dänemark 1.106 1.825 65
Deutschland 6.134 9.695 58
Litauen 680 994 46
Finnland 2.134 3.070 44
Schweden 2.364 3.383 43
Polen 2.751 3.716 35
Studierende mit Abschluss- absicht im Ausland
2003 2014 Entwicklung 2003–2014
Anzahl in %
Dänemark 4.303 10.738 150
Lettland 3.453 4.522 31
Russland 15.438 17.244 12
Finnland 7.966 8.784 10
Deutschland 26.598 28.744 8
Estland 3.348 3.572 7
Litauen 5.211 5.092 –2
Polen 12.941 11.490 –11
Schweden 11.765 9.638 –18
1 Ohne Erasmus-Praktikumsaufenthalte.Without Erasmus placement-related visits.
2 Ein Erasmusjahr beginnt im Winter- und endet im Sommersemester des Folgejahres. 2014 = WS 2013/14 + SS 2014.An Erasmus year begins in the winter semester and ends in the summer semester of the following year. 2014 = WS 2013/14 + SS 2014.
3 Zur besseren Vergleichbarkeit der beiden Zeitreihen wurde bei der Zeitreihe zur Erasmus-Statistik auf das Erasmusjahr 2015 verzichtet.To enhance comparability between the two time series, the time series pertaining to Erasmus statistics did not include the Erasmus year 2015.
-20 14 48 82 116 150
-20 14 48 82 116 150
-20 14 48 82 116 150
-20 14 48 82 116 150
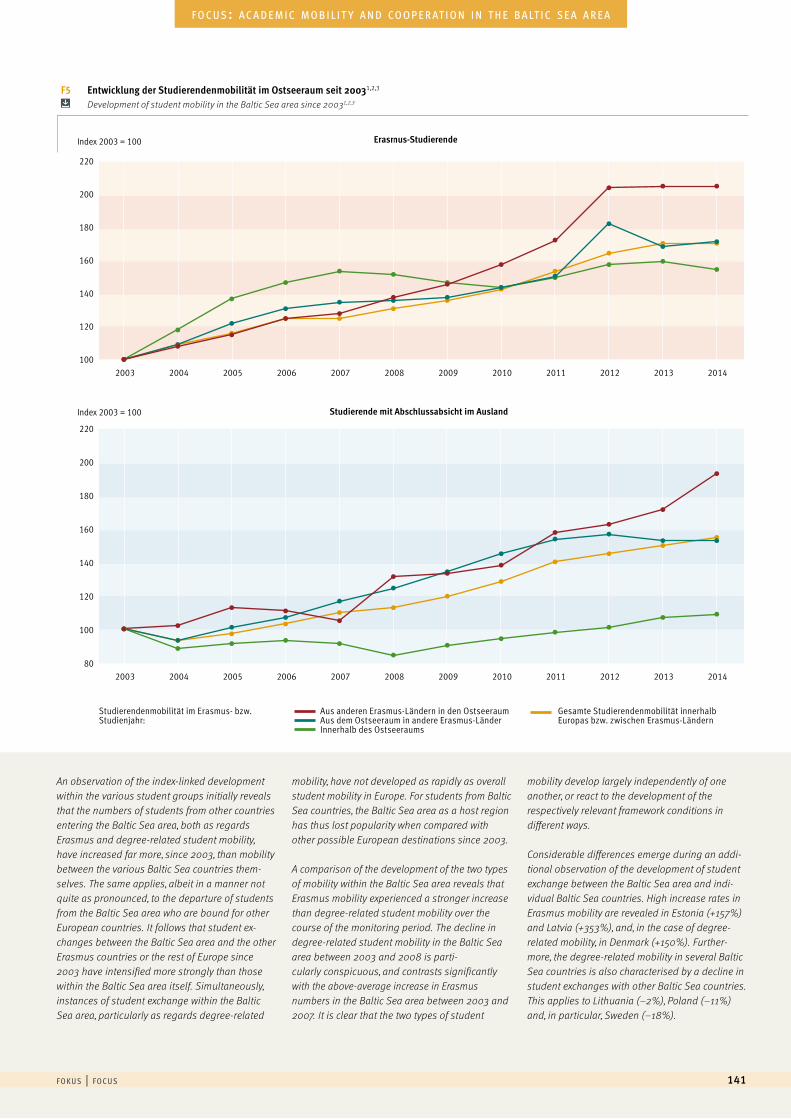
f o k u s | f o c u s 141
f o c u s : a c a d e m i c m o b i l i t y a n d co o p e r at i o n i n t h e b a lt i c s e a a r e a
F5 Entwicklung der Studierendenmobilität im Ostseeraum seit 20031,2,3 Development of student mobility in the Baltic Sea area since 20031,2,3
An observation of the index-linked development within the various student groups initially reveals that the numbers of students from other countries entering the Baltic Sea area, both as regards Erasmus and degree-related student mobility, have increased far more, since 2003, than mobility between the various Baltic Sea countries them- selves. The same applies, albeit in a manner not quite as pronounced, to the departure of students from the Baltic Sea area who are bound for other European countries. It follows that student ex- changes between the Baltic Sea area and the other Erasmus countries or the rest of Europe since 2003 have intensified more strongly than those within the Baltic Sea area itself. Simultaneously, instances of student exchange within the Baltic Sea area, particularly as regards degree-related
mobility, have not developed as rapidly as overall student mobility in Europe. For students from Baltic Sea countries, the Baltic Sea area as a host region has thus lost popularity when compared with other possible European destinations since 2003.
A comparison of the development of the two types of mobility within the Baltic Sea area reveals that Erasmus mobility experienced a stronger increase than degree-related student mobility over the course of the monitoring period. The decline in degree-related student mobility in the Baltic Sea area between 2003 and 2008 is parti- cularly conspicuous, and contrasts significantly with the above-average increase in Erasmus numbers in the Baltic Sea area between 2003 and 2007. It is clear that the two types of student
mobility develop largely independently of one another, or react to the development of the respectively relevant framework conditions in different ways.
Considerable differences emerge during an addi- tional observation of the development of student exchange between the Baltic Sea area and indi- vidual Baltic Sea countries. High increase rates in Erasmus mobility are revealed in Estonia (+157%) and Latvia (+353%), and, in the case of degree-related mobility, in Denmark (+150%). Further-more, the degree-related mobility in several Baltic Sea countries is also characterised by a decline in student exchanges with other Baltic Sea countries. This applies to Lithuania (–2%), Poland (–11%) and, in particular, Sweden (–18%).
Erasmus-Studierende
220
Index 2003 = 100
200
180
160
140
120
100
Studierende mit Abschlussabsicht im Ausland
220
Index 2003 = 100
200
180
160
140
120
80
100
2003 2004 2005 2006 2007 2008 2009 2010 2011 2012 2013 2014
2003 2004 2005 2006 2007 2008 2009 2010 2011 2012 2013 2014
Studierendenmobilität im Erasmus- bzw. Studienjahr:
Aus anderen Erasmus-Ländern in den OstseeraumAus dem Ostseeraum in andere Erasmus-LänderInnerhalb des Ostseeraums
Gesamte Studierendenmobilität innerhalb Europas bzw. zwischen Erasmus-Ländern
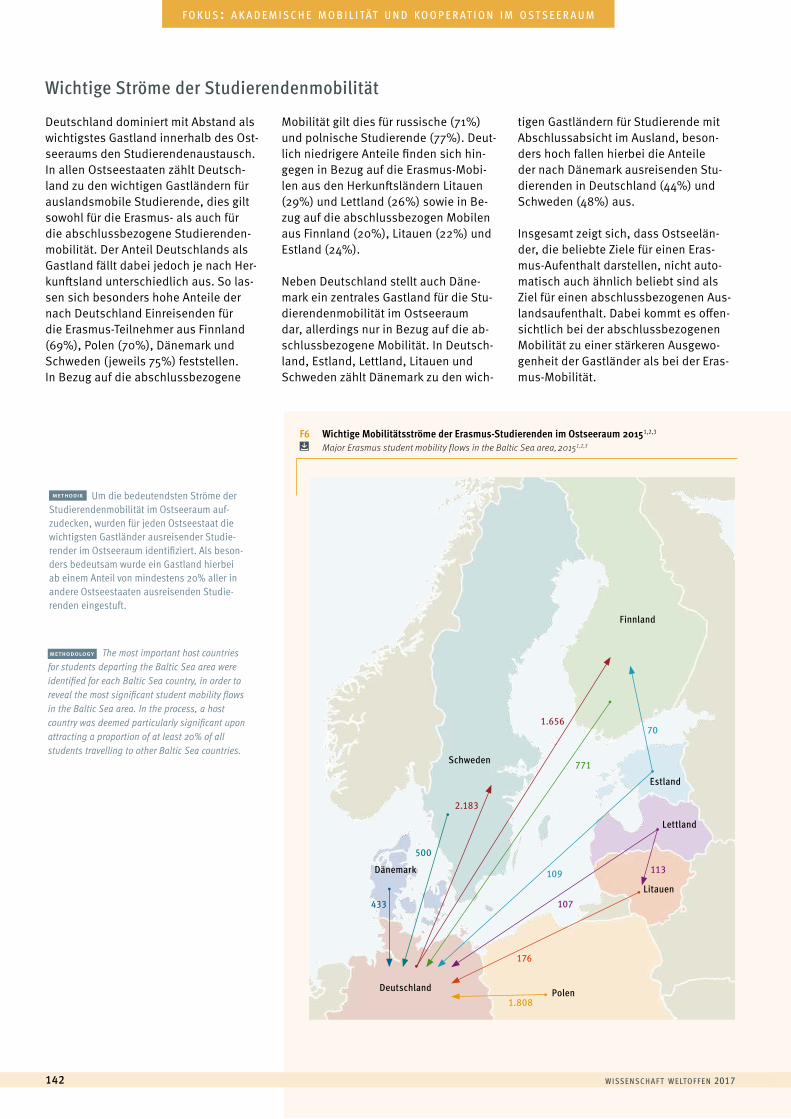
w i sse n sc h a f t w e lto f f e n 2017142
a u s l ä n d i s c h e s t u d i e r e n d e | f o r e i g n s t u d e n t sf o k u s : a k a d e m i s c h e m o b i l i tät u n d k o o p e r at i o n i m o s t s e e r a u m
Deutschland dominiert mit Abstand als wichtigstes Gastland innerhalb des Ost-seeraums den Studierendenaustausch. In allen Ostseestaaten zählt Deutsch-land zu den wichtigen Gastländern für auslandsmobile Studierende, dies gilt sowohl für die Erasmus- als auch für die abschlussbezogene Studierenden-mobilität. Der Anteil Deutschlands als Gastland fällt dabei jedoch je nach Her-kunftsland unterschiedlich aus. So las-sen sich besonders hohe Anteile der nach Deutschland Einreisenden für die Erasmus-Teilnehmer aus Finnland (69%), Polen (70%), Dänemark und Schweden (jeweils 75%) feststellen. In Bezug auf die abschlussbezogene
Mobilität gilt dies für russische (71%) und polnische Studierende (77%). Deut-lich niedrigere Anteile finden sich hin-gegen in Bezug auf die Erasmus-Mobi-len aus den Herkunftsländern Litauen (29%) und Lettland (26%) sowie in Be-zug auf die abschlussbezogen Mobilen aus Finnland (20%), Litauen (22%) und Estland (24%).
Neben Deutschland stellt auch Däne-mark ein zentrales Gastland für die Stu-dierendenmobilität im Ostseeraum dar, allerdings nur in Bezug auf die ab-schlussbezogene Mobilität. In Deutsch-land, Estland, Lettland, Litauen und Schweden zählt Dänemark zu den wich-
tigen Gastländern für Studierende mit Abschlussabsicht im Ausland, beson-ders hoch fallen hierbei die Anteile der nach Dänemark ausreisenden Stu-dierenden in Deutschland (44%) und Schweden (48%) aus.
Insgesamt zeigt sich, dass Ostseelän-der, die beliebte Ziele für einen Eras-mus-Aufenthalt darstellen, nicht auto-matisch auch ähnlich beliebt sind als Ziel für einen abschlussbezogenen Aus-landsaufenthalt. Dabei kommt es offen-sichtlich bei der abschlussbezogenen Mobilität zu einer stärkeren Ausgewo-genheit der Gastländer als bei der Eras-mus-Mobilität.
methodik Um die bedeutendsten Ströme der Studierendenmobilität im Ostseeraum auf-zudecken, wurden für jeden Ostseestaat die wichtigsten Gastländer ausreisender Studie-render im Ostseeraum identifiziert. Als beson-ders bedeutsam wurde ein Gastland hierbei ab einem Anteil von mindestens 20% aller in andere Ostseestaaten ausreisenden Studie-renden eingestuft.
Wichtige Ströme der Studierendenmobilität
methodology The most important host countries for students departing the Baltic Sea area were identified for each Baltic Sea country, in order to reveal the most significant student mobility flows in the Baltic Sea area. In the process, a host country was deemed particularly significant upon attracting a proportion of at least 20% of all students travelling to other Baltic Sea countries.
F6 Wichtige Mobilitätsströme der Erasmus-Studierenden im Ostseeraum 20151,2,3 Major Erasmus student mobility flows in the Baltic Sea area, 20151,2,3
Dänemark
Schweden
Finnland
Polen
Estland
Lettland
Litauen
Deutschland
433
500
2.183
1.656
771
70
109
107
176
1.808
113
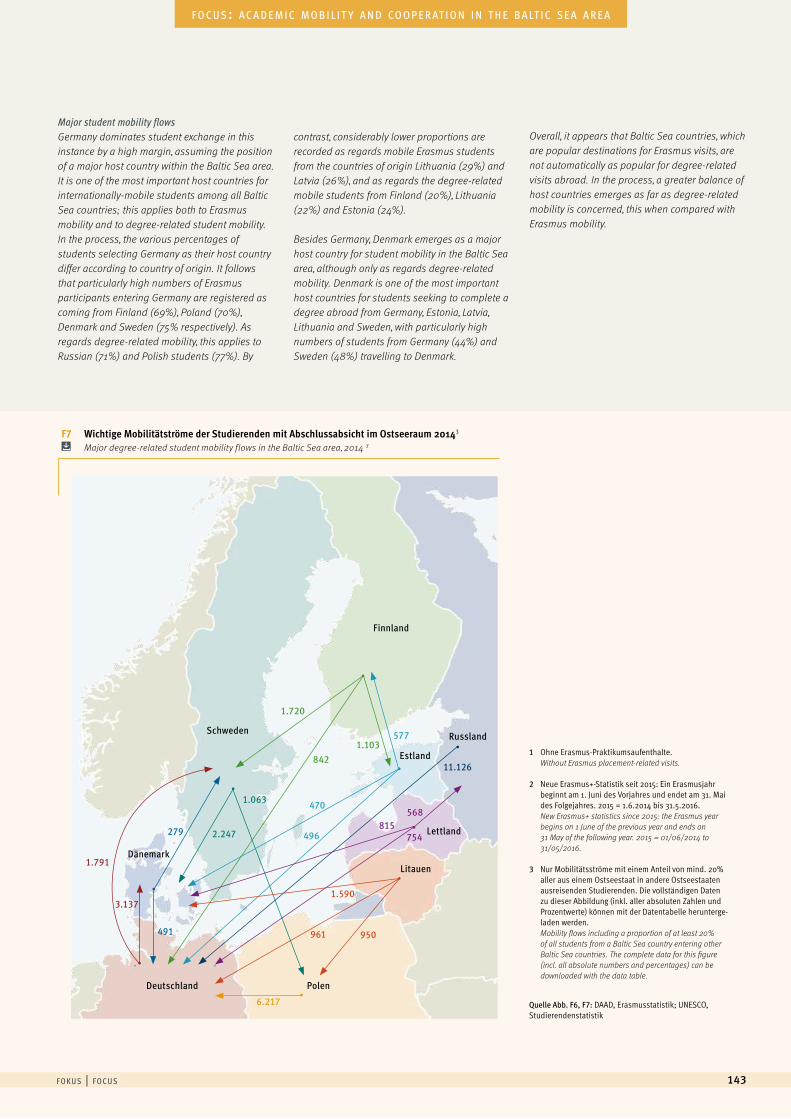
f o k u s | f o c u s 143
f o c u s : a c a d e m i c m o b i l i t y a n d co o p e r at i o n i n t h e b a lt i c s e a a r e a
Quelle Abb. F6, F7: DAAD, Erasmusstatistik; UNESCO, Studierendenstatistik
1 Ohne Erasmus-Praktikumsaufenthalte.Without Erasmus placement-related visits.
2 Neue Erasmus+-Statistik seit 2015: Ein Erasmusjahr beginnt am 1. Juni des Vorjahres und endet am 31. Mai des Folgejahres. 2015 = 1.6.2014 bis 31.5.2016.New Erasmus+ statistics since 2015: the Erasmus year begins on 1 June of the previous year and ends on 31 May of the following year. 2015 = 01/06/2014 to 31/05/2016.
3 Nur Mobilitätsströme mit einem Anteil von mind. 20% aller aus einem Ostseestaat in andere Ostseestaaten ausreisenden Studierenden. Die vollständigen Daten zu dieser Abbildung (inkl. aller absoluten Zahlen und Prozentwerte) können mit der Datentabelle herunterge-laden werden.Mobility flows including a proportion of at least 20% of all students from a Baltic Sea country entering other Baltic Sea countries. The complete data for this figure (incl. all absolute numbers and percentages) can be downloaded with the data table.
Major student mobility flowsGermany dominates student exchange in this instance by a high margin, assuming the position of a major host country within the Baltic Sea area. It is one of the most important host countries for internationally-mobile students among all Baltic Sea countries; this applies both to Erasmus mobility and to degree-related student mobility. In the process, the various percentages of students selecting Germany as their host country differ according to country of origin. It follows that particularly high numbers of Erasmus participants entering Germany are registered as coming from Finland (69%), Poland (70%), Denmark and Sweden (75% respectively). As regards degree-related mobility, this applies to Russian (71%) and Polish students (77%). By
contrast, considerably lower proportions are recorded as regards mobile Erasmus students from the countries of origin Lithuania (29%) and Latvia (26%), and as regards the degree-related mobile students from Finland (20%), Lithuania (22%) and Estonia (24%).
Besides Germany, Denmark emerges as a major host country for student mobility in the Baltic Sea area, although only as regards degree-related mobility. Denmark is one of the most important host countries for students seeking to complete a degree abroad from Germany, Estonia, Latvia, Lithuania and Sweden, with particularly high numbers of students from Germany (44%) and Sweden (48%) travelling to Denmark.
Overall, it appears that Baltic Sea countries, which are popular destinations for Erasmus visits, are not automatically as popular for degree-related visits abroad. In the process, a greater balance of host countries emerges as far as degree-related mobility is concerned, this when compared with Erasmus mobility.
F7 Wichtige Mobilitätströme der Studierenden mit Abschlussabsicht im Ostseeraum 20143 Major degree-related student mobility flows in the Baltic Sea area, 2014 3
Dänemark
Schweden
Finnland
Polen
Estland
Russland
Lettland
Litauen
Deutschland
815568
470
496
5771.103
1.720
842
950961
1.590
1.063
2.247279
491
6.217
11.126
3.137
1.791
754
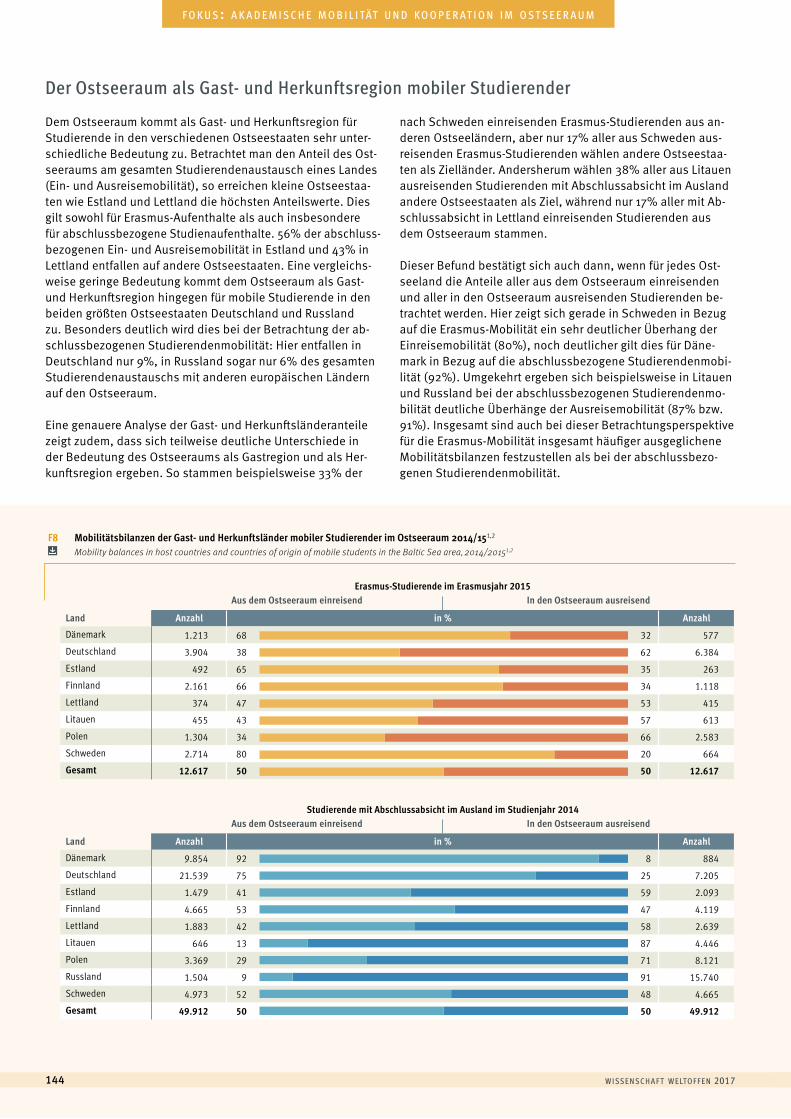
w i sse n sc h a f t w e lto f f e n 2017144
a u s l ä n d i s c h e s t u d i e r e n d e | f o r e i g n s t u d e n t sf o k u s : a k a d e m i s c h e m o b i l i tät u n d k o o p e r at i o n i m o s t s e e r a u m
Dem Ostseeraum kommt als Gast- und Herkunftsregion für Studierende in den verschiedenen Ostseestaaten sehr unter-schiedliche Bedeutung zu. Betrachtet man den Anteil des Ost-seeraums am gesamten Studierendenaustausch eines Landes (Ein- und Ausreisemobilität), so erreichen kleine Ostseestaa-ten wie Estland und Lettland die höchsten Anteilswerte. Dies gilt sowohl für Erasmus-Aufenthalte als auch insbesondere für abschlussbezogene Studienaufenthalte. 56% der abschluss- bezogenen Ein- und Ausreisemobilität in Estland und 43% in Lettland entfallen auf andere Ostseestaaten. Eine vergleichs-weise geringe Bedeutung kommt dem Ostseeraum als Gast- und Herkunftsregion hingegen für mobile Studierende in den beiden größten Ostseestaaten Deutschland und Russland zu. Besonders deutlich wird dies bei der Betrachtung der ab-schlussbezogenen Studierendenmobilität: Hier entfallen in Deutschland nur 9%, in Russland sogar nur 6% des gesamten Studierendenaustauschs mit anderen europäischen Ländern auf den Ostseeraum.
Eine genauere Analyse der Gast- und Herkunftsländeranteile zeigt zudem, dass sich teilweise deutliche Unterschiede in der Bedeutung des Ostseeraums als Gastregion und als Her-kunftsregion ergeben. So stammen beispielsweise 33% der
nach Schweden einreisenden Erasmus-Studierenden aus an-deren Ostseeländern, aber nur 17% aller aus Schweden aus-reisenden Erasmus-Studierenden wählen andere Ostseestaa-ten als Zielländer. Andersherum wählen 38% aller aus Litauen ausreisenden Studierenden mit Abschlussabsicht im Ausland andere Ostseestaaten als Ziel, während nur 17% aller mit Ab-schlussabsicht in Lettland einreisenden Studierenden aus dem Ostseeraum stammen.
Dieser Befund bestätigt sich auch dann, wenn für jedes Ost-seeland die Anteile aller aus dem Ostseeraum einreisenden und aller in den Ostseeraum ausreisenden Studierenden be-trachtet werden. Hier zeigt sich gerade in Schweden in Bezug auf die Erasmus-Mobilität ein sehr deutlicher Überhang der Einreisemobilität (80%), noch deutlicher gilt dies für Däne-mark in Bezug auf die abschlussbezogene Studierendenmobi-lität (92%). Umgekehrt ergeben sich beispielsweise in Litauen und Russland bei der abschlussbezogenen Studierendenmo-bilität deutliche Überhänge der Ausreisemobilität (87% bzw. 91%). Insgesamt sind auch bei dieser Betrachtungsperspektive für die Erasmus-Mobilität insgesamt häufiger ausgeglichene Mobilitätsbilanzen festzustellen als bei der abschlussbezo- genen Studierendenmobilität.
Der Ostseeraum als Gast- und Herkunftsregion mobiler Studierender
Erasmus-Studierende im Erasmusjahr 2015Aus dem Ostseeraum einreisend In den Ostseeraum ausreisend
Land Anzahl in % Anzahl
Dänemark 1.213 68 32 577
Deutschland 3.904 38 62 6.384
Estland 492 65 35 263
Finnland 2.161 66 34 1.118
Lettland 374 47 53 415
Litauen 455 43 57 613
Polen 1.304 34 66 2.583
Schweden 2.714 80 20 664
Gesamt 12.617 50 50 12.617
Studierende mit Abschlussabsicht im Ausland im Studienjahr 2014Aus dem Ostseeraum einreisend In den Ostseeraum ausreisend
Land Anzahl in % Anzahl
Dänemark 9.854 92 8 884
Deutschland 21.539 75 25 7.205
Estland 1.479 41 59 2.093
Finnland 4.665 53 47 4.119
Lettland 1.883 42 58 2.639
Litauen 646 13 87 4.446
Polen 3.369 29 71 8.121
Russland 1.504 9 91 15.740
Schweden 4.973 52 48 4.665
Gesamt 49.912 50 50 49.912
0 20 40 60 80 100
0 20 40 60 80 100
F8 Mobilitätsbilanzen der Gast- und Herkunftsländer mobiler Studierender im Ostseeraum 2014/151,2 Mobility balances in host countries and countries of origin of mobile students in the Baltic Sea area, 2014/20151,2
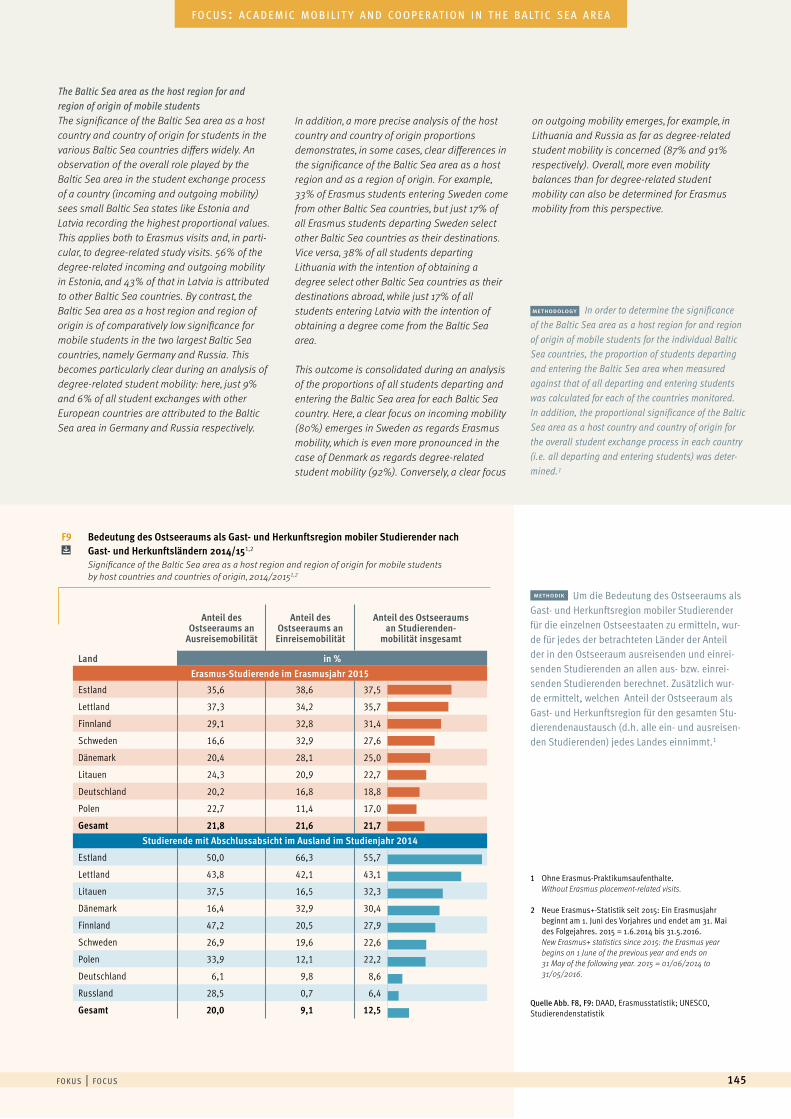
f o k u s | f o c u s 145
f o c u s : a c a d e m i c m o b i l i t y a n d co o p e r at i o n i n t h e b a lt i c s e a a r e a
Quelle Abb. F8, F9: DAAD, Erasmusstatistik; UNESCO, Studierendenstatistik
1 Ohne Erasmus-Praktikumsaufenthalte.Without Erasmus placement-related visits.
2 Neue Erasmus+-Statistik seit 2015: Ein Erasmusjahr beginnt am 1. Juni des Vorjahres und endet am 31. Mai des Folgejahres. 2015 = 1.6.2014 bis 31.5.2016.New Erasmus+ statistics since 2015: the Erasmus year begins on 1 June of the previous year and ends on 31 May of the following year. 2015 = 01/06/2014 to 31/05/2016.
methodik Um die Bedeutung des Ostseeraums als Gast- und Herkunftsregion mobiler Studierender für die einzelnen Ostseestaaten zu ermitteln, wur-de für jedes der betrachteten Länder der Anteil der in den Ostseeraum ausreisenden und einrei-senden Studierenden an allen aus- bzw. einrei-senden Studierenden berechnet. Zusätzlich wur-de ermittelt, welchen Anteil der Ostseeraum als Gast- und Herkunftsregion für den gesamten Stu-dierendenaustausch (d.h. alle ein- und ausreisen-den Studierenden) jedes Landes einnimmt.1
The Baltic Sea area as the host region for and region of origin of mobile students The significance of the Baltic Sea area as a host country and country of origin for students in the various Baltic Sea countries differs widely. An observation of the overall role played by the Baltic Sea area in the student exchange process of a country (incoming and outgoing mobility) sees small Baltic Sea states like Estonia and Latvia recording the highest proportional values. This applies both to Erasmus visits and, in parti- cular, to degree-related study visits. 56% of the degree-related incoming and outgoing mobility in Estonia, and 43% of that in Latvia is attributed to other Baltic Sea countries. By contrast, the Baltic Sea area as a host region and region of origin is of comparatively low significance for mobile students in the two largest Baltic Sea countries, namely Germany and Russia. This becomes particularly clear during an analysis of degree-related student mobility: here, just 9% and 6% of all student exchanges with other European countries are attributed to the Baltic Sea area in Germany and Russia respectively.
In addition, a more precise analysis of the host country and country of origin proportions demonstrates, in some cases, clear differences in the significance of the Baltic Sea area as a host region and as a region of origin. For example, 33% of Erasmus students entering Sweden come from other Baltic Sea countries, but just 17% of all Erasmus students departing Sweden select other Baltic Sea countries as their destinations. Vice versa, 38% of all students departing Lithuania with the intention of obtaining a degree select other Baltic Sea countries as their destinations abroad, while just 17% of all students entering Latvia with the intention of obtaining a degree come from the Baltic Sea area.
This outcome is consolidated during an analysis of the proportions of all students departing and entering the Baltic Sea area for each Baltic Sea country. Here, a clear focus on incoming mobility (80%) emerges in Sweden as regards Erasmus mobility, which is even more pronounced in the case of Denmark as regards degree-related student mobility (92%). Conversely, a clear focus
on outgoing mobility emerges, for example, in Lithuania and Russia as far as degree-related student mobility is concerned (87% and 91% respectively). Overall, more even mobility balances than for degree-related student mobility can also be determined for Erasmus mobility from this perspective.
methodology In order to determine the significance of the Baltic Sea area as a host region for and region of origin of mobile students for the individual Baltic Sea countries, the proportion of students departing and entering the Baltic Sea area when measured against that of all departing and entering students was calculated for each of the countries monitored. In addition, the proportional significance of the Baltic Sea area as a host country and country of origin for the overall student exchange process in each country (i.e. all departing and entering students) was deter-mined.1
Land
Anteil des Ostseeraums an
Ausreisemobilität
Anteil des Ostseeraums an Einreisemobilität
Anteil des Ostseeraums an Studierenden-
mobilität insgesamt
in %Erasmus-Studierende im Erasmusjahr 2015
Estland 35,6 38,6 37,5
Lettland 37,3 34,2 35,7
Finnland 29,1 32,8 31,4
Schweden 16,6 32,9 27,6
Dänemark 20,4 28,1 25,0
Litauen 24,3 20,9 22,7
Deutschland 20,2 16,8 18,8
Polen 22,7 11,4 17,0
Gesamt 21,8 21,6 21,7Studierende mit Abschlussabsicht im Ausland im Studienjahr 2014
Estland 50,0 66,3 55,7
Lettland 43,8 42,1 43,1
Litauen 37,5 16,5 32,3
Dänemark 16,4 32,9 30,4
Finnland 47,2 20,5 27,9
Schweden 26,9 19,6 22,6
Polen 33,9 12,1 22,2
Deutschland 6,1 9,8 8,6
Russland 28,5 0,7 6,4
Gesamt 20,0 9,1 12,5
-20 14 48 82 116 150
-20 14 48 82 116 150
-20 14 48 82 116 150
-20 14 48 82 116 150
F9 Bedeutung des Ostseeraums als Gast- und Herkunftsregion mobiler Studierender nach Gast- und Herkunftsländern 2014/151,2
Significance of the Baltic Sea area as a host region and region of origin for mobile students by host countries and countries of origin, 2014/20151,2
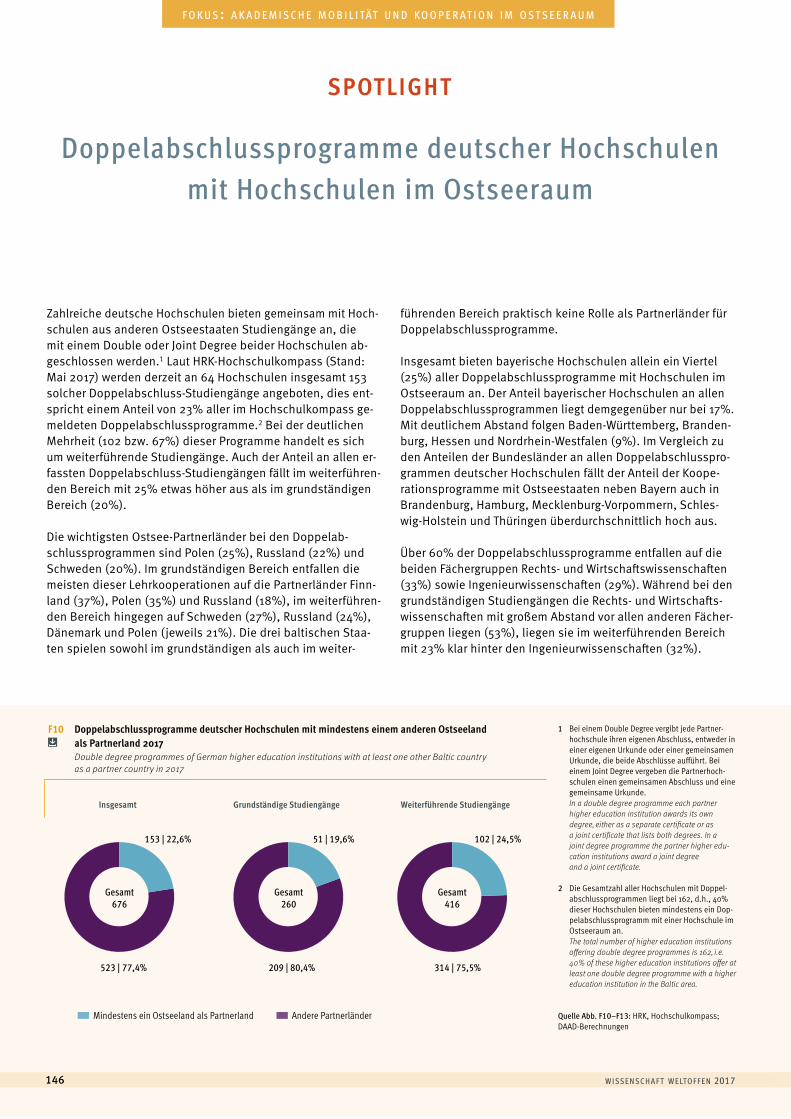
w i sse n sc h a f t w e lto f f e n 2017146
a u s l ä n d i s c h e s t u d i e r e n d e | f o r e i g n s t u d e n t sf o k u s : a k a d e m i s c h e m o b i l i tät u n d k o o p e r at i o n i m o s t s e e r a u m
Doppelabschlussprogramme deutscher Hochschulen mit Hochschulen im Ostseeraum
spotlight
Zahlreiche deutsche Hochschulen bieten gemeinsam mit Hoch- schulen aus anderen Ostseestaaten Studiengänge an, die mit einem Double oder Joint Degree beider Hochschulen ab-geschlossen werden.1 Laut HRK-Hochschulkompass (Stand: Mai 2017) werden derzeit an 64 Hochschulen insgesamt 153 solcher Doppelabschluss-Studiengänge angeboten, dies ent-spricht einem Anteil von 23% aller im Hochschulkompass ge-meldeten Doppelabschlussprogramme.2 Bei der deutlichen Mehrheit (102 bzw. 67%) dieser Programme handelt es sich um weiterführende Studiengänge. Auch der Anteil an allen er-fassten Doppelabschluss-Studiengängen fällt im weiterführen-den Bereich mit 25% etwas höher aus als im grundständigen Bereich (20%).
Die wichtigsten Ostsee-Partnerländer bei den Doppelab-schlussprogrammen sind Polen (25%), Russland (22%) und Schweden (20%). Im grundständigen Bereich entfallen die meisten dieser Lehrkooperationen auf die Partnerländer Finn-land (37%), Polen (35%) und Russland (18%), im weiterführen-den Bereich hingegen auf Schweden (27%), Russland (24%), Dänemark und Polen (jeweils 21%). Die drei baltischen Staa-ten spielen sowohl im grundständigen als auch im weiter-
führenden Bereich praktisch keine Rolle als Partnerländer für Doppelabschlussprogramme.
Insgesamt bieten bayerische Hochschulen allein ein Viertel (25%) aller Doppelabschlussprogramme mit Hochschulen im Ostseeraum an. Der Anteil bayerischer Hochschulen an allen Doppelabschlussprogrammen liegt demgegenüber nur bei 17%. Mit deutlichem Abstand folgen Baden-Württemberg, Branden-burg, Hessen und Nordrhein-Westfalen (9%). Im Vergleich zu den Anteilen der Bundesländer an allen Doppelabschlusspro-grammen deutscher Hochschulen fällt der Anteil der Koope-rationsprogramme mit Ostseestaaten neben Bayern auch in Brandenburg, Hamburg, Mecklenburg-Vorpommern, Schles-wig-Holstein und Thüringen überdurchschnittlich hoch aus.
Über 60% der Doppelabschlussprogramme entfallen auf die beiden Fächergruppen Rechts- und Wirtschaftswissenschaften (33%) sowie Ingenieurwissenschaften (29%). Während bei den grundständigen Studiengängen die Rechts- und Wirtschafts-wissenschaften mit großem Abstand vor allen anderen Fächer-gruppen liegen (53%), liegen sie im weiterführenden Bereich mit 23% klar hinter den Ingenieurwissenschaften (32%).
F10 Doppelabschlussprogramme deutscher Hochschulen mit mindestens einem anderen Ostseeland als Partnerland 2017
Double degree programmes of German higher education institutions with at least one other Baltic country as a partner country in 2017
Mindestens ein Ostseeland als Partnerland Andere Partnerländer
Insgesamt Grundständige Studiengänge Weiterführende Studiengänge
153 | 22,6%
523 | 77,4%
51 | 19,6%
209 | 80,4%
102 | 24,5%
314 | 75,5%
Gesamt676
Gesamt260
Gesamt416
1 Bei einem Double Degree vergibt jede Partner- hochschule ihren eigenen Abschluss, entweder in einer eigenen Urkunde oder einer gemeinsamen Urkunde, die beide Abschlüsse aufführt. Bei einem Joint Degree vergeben die Partnerhoch-schulen einen gemeinsamen Abschluss und eine gemeinsame Urkunde.In a double degree programme each partner higher education institution awards its own degree, either as a separate certificate or as a joint certificate that lists both degrees. In a joint degree programme the partner higher edu-cation institutions award a joint degree and a joint certificate.
2 Die Gesamtzahl aller Hochschulen mit Doppel-abschlussprogrammen liegt bei 162, d.h., 40% dieser Hochschulen bieten mindestens ein Dop-pelabschlussprogramm mit einer Hochschule im Ostseeraum an.The total number of higher education institutions offering double degree programmes is 162, i.e. 40% of these higher education institutions offer at least one double degree programme with a higher education institution in the Baltic area.
Quelle Abb. F10–F13: HRK, Hochschulkompass; DAAD-Berechnungen
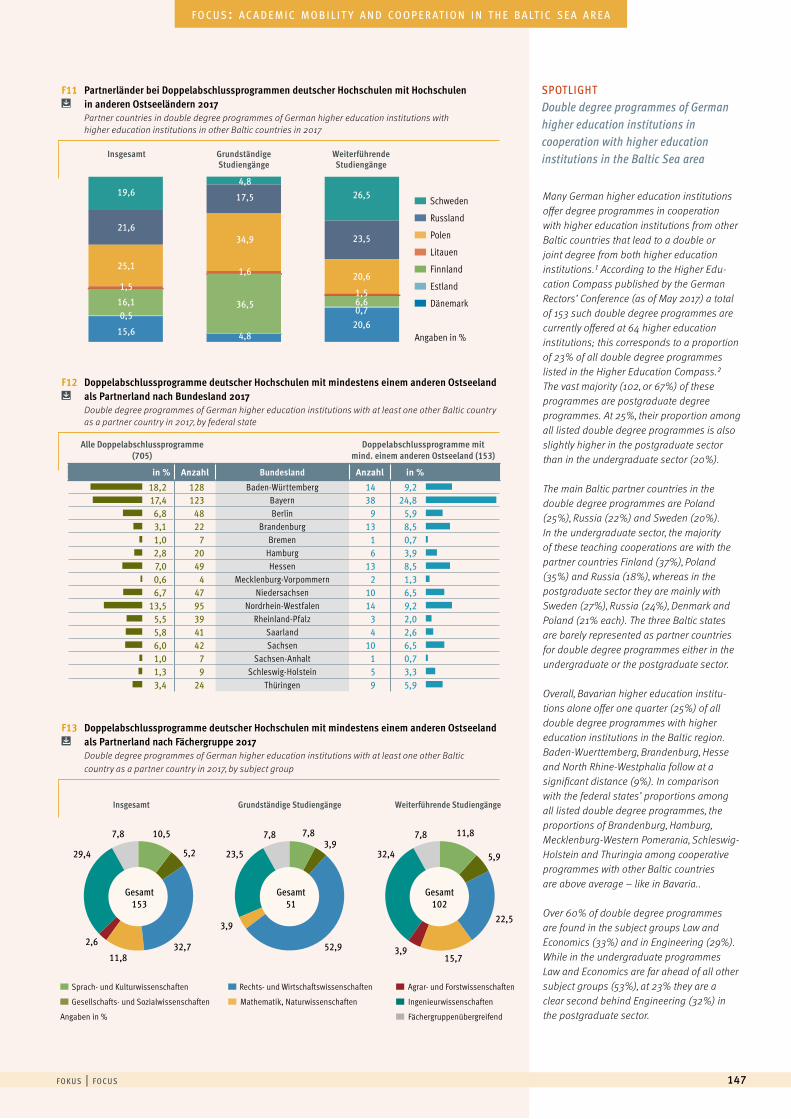
f o k u s | f o c u s 147
f o c u s : a c a d e m i c m o b i l i t y a n d co o p e r at i o n i n t h e b a lt i c s e a a r e a
Many German higher education institutions offer degree programmes in cooperation with higher education institutions from other Baltic countries that lead to a double or joint degree from both higher education institutions.1 According to the Higher Edu- cation Compass published by the German Rectors’ Conference (as of May 2017) a total of 153 such double degree programmes are currently offered at 64 higher education institutions; this corresponds to a proportion of 23% of all double degree programmes listed in the Higher Education Compass.2 The vast majority (102, or 67%) of these programmes are postgraduate degree programmes. At 25%, their proportion among all listed double degree programmes is also slightly higher in the postgraduate sector than in the undergraduate sector (20%).
The main Baltic partner countries in the double degree programmes are Poland (25%), Russia (22%) and Sweden (20%). In the undergraduate sector, the majority of these teaching cooperations are with the partner countries Finland (37%), Poland (35%) and Russia (18%), whereas in the postgraduate sector they are mainly with Sweden (27%), Russia (24%), Denmark and Poland (21% each). The three Baltic states are barely represented as partner countries for double degree programmes either in the undergraduate or the postgraduate sector.
Overall, Bavarian higher education institu-tions alone offer one quarter (25%) of all double degree programmes with higher education institutions in the Baltic region. Baden-Wuerttemberg, Brandenburg, Hesse and North Rhine-Westphalia follow at a significant distance (9%). In comparison with the federal states’ proportions among all listed double degree programmes, the proportions of Brandenburg, Hamburg, Mecklenburg-Western Pomerania, Schleswig-Holstein and Thuringia among cooperative programmes with other Baltic countries are above average – like in Bavaria..
Over 60% of double degree programmes are found in the subject groups Law and Economics (33%) and in Engineering (29%). While in the undergraduate programmes Law and Economics are far ahead of all other subject groups (53%), at 23% they are a clear second behind Engineering (32%) in the postgraduate sector.
SPOTLIGHTDouble degree programmes of German higher education institutions in cooperation with higher educationinstitutions in the Baltic Sea area
Insgesamt Grundständige Studiengänge Weiterführende Studiengänge
10,5 7,8 11,8
5,23,9
5,9
32,7 52,9
22,5
15,73,9
3,9
11,8
2,6
29,4 23,5 32,4
7,8 7,8 7,8
Gesamt153
Gesamt51
Gesamt102
030
0 30
Doppelabschlussprogramme mit mind. einem anderen Ostseeland (153)
Sprach- und Kulturwissenschaften
Gesellschafts- und Sozialwissenschaften
Angaben in %
Rechts- und Wirtschaftswissenschaften
Mathematik, Naturwissenschaften
Agrar- und Forstwissenschaften
Ingenieurwissenschaften
Fächergruppenübergreifend
F13 Doppelabschlussprogramme deutscher Hochschulen mit mindestens einem anderen Ostseeland als Partnerland nach Fächergruppe 2017
Double degree programmes of German higher education institutions with at least one other Baltic country as a partner country in 2017, by subject group
F12 Doppelabschlussprogramme deutscher Hochschulen mit mindestens einem anderen Ostseeland als Partnerland nach Bundesland 2017
Double degree programmes of German higher education institutions with at least one other Baltic country as a partner country in 2017, by federal state
19,6 17,5
4,826,5
23,5
20,6
1,56,60,7
20,6
21,6
25,1
1,5
16,10,5
15,6
Schweden
Russland
Polen
Litauen
Finnland
Estland
Dänemark
Angaben in %
F11 Partnerländer bei Doppelabschlussprogrammen deutscher Hochschulen mit Hochschulen in anderen Ostseeländern 2017
Partner countries in double degree programmes of German higher education institutions with higher education institutions in other Baltic countries in 2017
Insgesamt Grundständige Studiengänge
Weiterführende Studiengänge
34,9
1,6
36,5
4,8
in % Anzahl Bundesland Anzahl in %
18,2 128 Baden-Württemberg 14 9,217,4 123 Bayern 38 24,86,8 48 Berlin 9 5,93,1 22 Brandenburg 13 8,51,0 7 Bremen 1 0,72,8 20 Hamburg 6 3,97,0 49 Hessen 13 8,50,6 4 Mecklenburg-Vorpommern 2 1,36,7 47 Niedersachsen 10 6,5
13,5 95 Nordrhein-Westfalen 14 9,25,5 39 Rheinland-Pfalz 3 2,05,8 41 Saarland 4 2,66,0 42 Sachsen 10 6,51,0 7 Sachsen-Anhalt 1 0,71,3 9 Schleswig-Holstein 5 3,33,4 24 Thüringen 9 5,9
030
0 30
Alle Doppelabschlussprogramme(705)
w i sse n sc h a f t w e lto f f e n 2017148
a u s l ä n d i s c h e s t u d i e r e n d e | f o r e i g n s t u d e n t sf o k u s : a k a d e m i s c h e m o b i l i tät u n d k o o p e r at i o n i m o s t s e e r a u m
Datenlage und -interpretation
Für die Analyse der Wissenschaftlermo-bilität im Ostseeraum wurden folgende Datenquellen herangezogen:• Erasmus-Statistik:
erfasst einen Teil der kurzfristigen Gastaufenthalte von Hochschulwissen-schaftlern im Ostseeraum (Erasmus-Gastdozenturen);
• Eurostat-Studierendenstatistik: erfasst die abschlussbezogene Doktorandenmobilität im Ostseeraum (ohne Russland).1
Beide Datenquellen bilden nur kleine und sehr spezifische Teilausschnitte der gesamten Wissenschaftlermobilität im Ostseeraum ab. Andere wichtige Formen der Wissenschaftlermobilität, wie z.B. längerfristige Forschungsaufenthalte oder auch eine langfristige Tätigkeit als angestellter Wissenschaftler an einer ausländischen Hochschule, werden für die Mehrzahl der hier betrachteten Län-der nicht in einer vergleichbaren Form erfasst.
Für die Interpretation der Daten ist zu berücksichtigen, dass bei der Wissen-schaftlermobilität im Gegensatz zur Studierendenmobilität sowohl für kurz- als auch für langfristige Auslandsauf-enthalte in erster Linie projekt- und karrierebezogene Motive im Vorder-grund stehen. Für diese Motive spielen länderspezifische Differenzen wie z.B. wirtschaftliche Lage, Arbeitsmarktsitua-tion, aber auch Zugang zu Forschungs-geldern, Forschungsinfrastruktur und Netzwerken eine wichtige Rolle.
methodik Für eine Analyse der Entwicklung der Wissenschaftlermobilität im Ostseeraum steht als Datenquelle lediglich die Statistik zu den Erasmus-Gastdozenturen zur Verfügung. Wie bei der Analyse der Studierendenmobilität wird auch hier zwischen (1) der Dozentenmobilität innerhalb des Ostsee-raums (d.h. zwischen den verschiedenen Ostsee-staaten),
(2) der Dozentenmobilität aus anderen Erasmus-Ländern in den Ostseeraum hinein, (3) der Dozentenmobilität aus dem Ostseeraum hinaus in andere Erasmus-Länder und (4) der gesamten Erasmus-Dozentenmobilität unter-schieden. Die Entwicklung der entsprechenden Daten wird zur besseren Vergleichbarkeit index- bezogen ausgewiesen (2003 = 100).
Anders als bei der Erasmus-Studierendenmobilität weist die Entwicklung der Erasmus- Gastdozenturen zwischen 2003 und 2014 bei allen drei betrachteten Dozentengrup-pen sehr ähnliche Verläufe auf. Generell lässt sich ein stetiger Anstieg der Mobili-tätszahlen feststellen. Wie schon bei der Erasmus-Studierendenstatistik hat die Entwicklung der Dozentenmobilität innerhalb des Ostseeraums im Vergleich zur Dozentenmobilität zwischen Ostseeraum und übrigen Erasmus-Ländern weniger stark zugenommen. Während die Erasmus-Dozentenmobilität zwischen den Ostsee-ländern im Betrachtungszeitraum um 104% zunahm, stieg die Zahl der aus anderen Erasmus-Ländern in den Ostseeraum einreisenden Dozenten um 113% und die Zahl der aus dem Ostseeraum in andere Erasmus-Länder ausreisenden Dozenten sogar um 133%. Der gesamte Erasmus-Dozentenaustausch nahm im selben Zeitraum um 125% zu. Der Dozentenaustausch zwischen dem Ostseeraum und den anderen Eras-mus-Staaten hat sich demnach seit 2003 stärker intensiviert als der Dozentenaus-tausch innerhalb des Ostseeraums. Doch anders als bei der Studierendenmobilität nahm die Dozentenmobilität aus dem Ostseeraum hinaus dabei stärker zu als die Dozentenmobilität in den Ostseeraum hinein. Das bedeutet, dass sich die Attraktivi-tät des Ostseeraums als Destination sowohl für Erasmus-Gastdozenten aus Ostsee-staaten als auch für Erasmus-Gastdozenten aus anderen Ländern im Vergleich zur Attraktivität anderer Erasmus-Länder im Beobachtungszeitraum unterdurchschnitt-lich entwickelt hat.
Bei einer länderspezifischen Betrachtung der Entwicklung des Gastdozentenaus-tauschs innerhalb des Ostseeraums zeigt sich, dass sich die Wachstumsraten zwi-schen den verschiedenen Ostseestaaten wiederum deutlich unterscheiden. Ähnlich wie bei der Studierendenmobilität weisen Estland (+266%) und insbesondere Lett-land (+624%) die höchsten Steigerungsraten auf. Auch in Litauen (+204%) und Polen (+151%) hat sich der Dozentenaustausch mit dem übrigen Ostseeraum zwischen 2003 und 2014 stark überdurchschnittlich entwickelt, während die Entwicklung in allen übrigen Ländern unterdurchschnittlich ausfällt. Derzeit zeigt sich ein starkes Ost-West-Gefälle zwischen den Ostseestaaten, das sicherlich auch durch einen „Aufholbedarf“ der östlichen Länder nach deren Aufnahme ins Erasmus-Programm zu erklären ist: Polen nimmt erst seit dem Erasmusjahr 1999 am Erasmus-Programm teil, Estland, Lettland und Litauen erst seit dem Jahr 2000.
Entwicklung der Wissenschaftlermobilität im Ostseeraum
analyse
Wissenschaftlermobilität im Ostseeraum
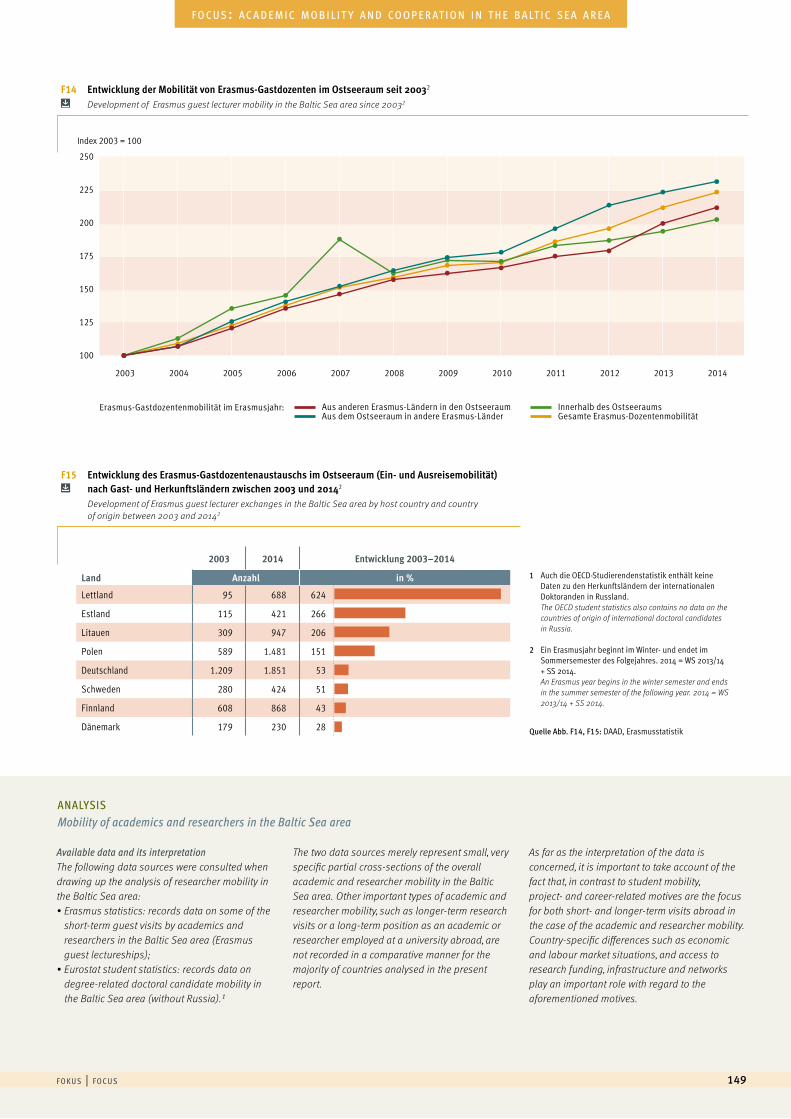
f o k u s | f o c u s 149
f o c u s : a c a d e m i c m o b i l i t y a n d co o p e r at i o n i n t h e b a lt i c s e a a r e a
F14 Entwicklung der Mobilität von Erasmus-Gastdozenten im Ostseeraum seit 20032 Development of Erasmus guest lecturer mobility in the Baltic Sea area since 20032
250
Index 2003 = 100
225
200
175
150
125
100
2003 2004 2005 2006 2007 2008 2009 2010 2011 2012 2013 2014
Erasmus-Gastdozentenmobilität im Erasmusjahr:
F15 Entwicklung des Erasmus-Gastdozentenaustauschs im Ostseeraum (Ein- und Ausreisemobilität) nach Gast- und Herkunftsländern zwischen 2003 und 20142
Development of Erasmus guest lecturer exchanges in the Baltic Sea area by host country and country of origin between 2003 and 20142
2003 2014 Entwicklung 2003–2014
Land Anzahl in %
Lettland 95 688 624
Estland 115 421 266
Litauen 309 947 206
Polen 589 1.481 151
Deutschland 1.209 1.851 53
Schweden 280 424 51
Finnland 608 868 43
Dänemark 179 230 280 100 200 300 400 500 600 700 800
Quelle Abb. F14, F15: DAAD, Erasmusstatistik
1 Auch die OECD-Studierendenstatistik enthält keine Daten zu den Herkunftsländern der internationalen Doktoranden in Russland. The OECD student statistics also contains no data on the countries of origin of international doctoral candidates in Russia.
2 Ein Erasmusjahr beginnt im Winter- und endet im Sommersemester des Folgejahres. 2014 = WS 2013/14 + SS 2014.An Erasmus year begins in the winter semester and ends in the summer semester of the following year. 2014 = WS 2013/14 + SS 2014.
ANALYSIS Mobility of academics and researchers in the Baltic Sea area
Available data and its interpretation The following data sources were consulted when drawing up the analysis of researcher mobility in the Baltic Sea area:• Erasmus statistics: records data on some of the
short-term guest visits by academics and researchers in the Baltic Sea area (Erasmus guest lectureships);
• Eurostat student statistics: records data on degree-related doctoral candidate mobility in the Baltic Sea area (without Russia).1
The two data sources merely represent small, very specific partial cross-sections of the overall academic and researcher mobility in the Baltic Sea area. Other important types of academic and researcher mobility, such as longer-term research visits or a long-term position as an academic or researcher employed at a university abroad, are not recorded in a comparative manner for the majority of countries analysed in the present report.
As far as the interpretation of the data is concerned, it is important to take account of the fact that, in contrast to student mobility, project- and career-related motives are the focus for both short- and longer-term visits abroad in the case of the academic and researcher mobility. Country-specific differences such as economic and labour market situations, and access to research funding, infrastructure and networks play an important role with regard to the aforementioned motives.
Aus anderen Erasmus-Ländern in den OstseeraumAus dem Ostseeraum in andere Erasmus-Länder
Innerhalb des OstseeraumsGesamte Erasmus-Dozentenmobilität
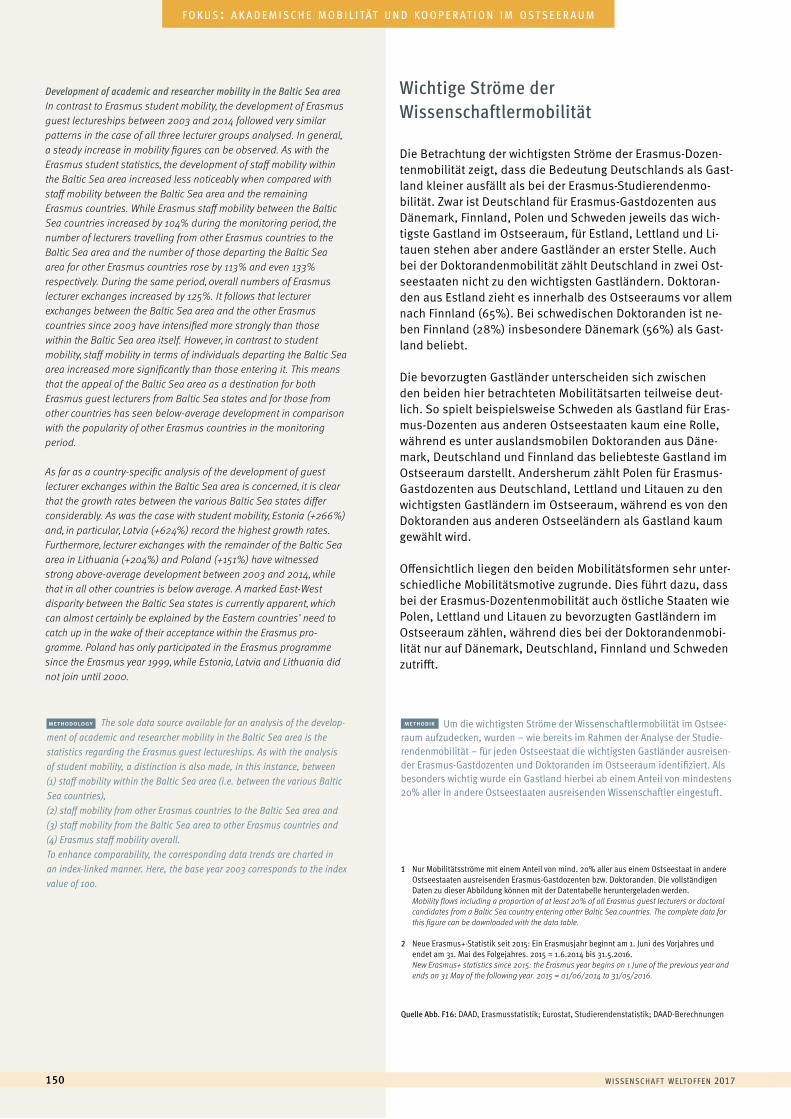
w i sse n sc h a f t w e lto f f e n 2017150
a u s l ä n d i s c h e s t u d i e r e n d e | f o r e i g n s t u d e n t sf o k u s : a k a d e m i s c h e m o b i l i tät u n d k o o p e r at i o n i m o s t s e e r a u m
Die Betrachtung der wichtigsten Ströme der Erasmus-Dozen-tenmobilität zeigt, dass die Bedeutung Deutschlands als Gast-land kleiner ausfällt als bei der Erasmus-Studierendenmo-bilität. Zwar ist Deutschland für Erasmus-Gastdozenten aus Dänemark, Finnland, Polen und Schweden jeweils das wich-tigste Gastland im Ostseeraum, für Estland, Lettland und Li-tauen stehen aber andere Gastländer an erster Stelle. Auch bei der Doktorandenmobilität zählt Deutschland in zwei Ost-seestaaten nicht zu den wichtigsten Gastländern. Doktoran-den aus Estland zieht es innerhalb des Ostseeraums vor allem nach Finnland (65%). Bei schwedischen Doktoranden ist ne-ben Finnland (28%) insbesondere Dänemark (56%) als Gast-land beliebt.
Die bevorzugten Gastländer unterscheiden sich zwischen den beiden hier betrachteten Mobilitätsarten teilweise deut-lich. So spielt beispielsweise Schweden als Gastland für Eras-mus-Dozenten aus anderen Ostseestaaten kaum eine Rolle, während es unter auslandsmobilen Doktoranden aus Däne-mark, Deutschland und Finnland das beliebteste Gastland im Ostseeraum darstellt. Andersherum zählt Polen für Erasmus-Gastdozenten aus Deutschland, Lettland und Litauen zu den wichtigsten Gastländern im Ostseeraum, während es von den Doktoranden aus anderen Ostseeländern als Gastland kaum gewählt wird.
Offensichtlich liegen den beiden Mobilitätsformen sehr unter-schiedliche Mobilitätsmotive zugrunde. Dies führt dazu, dass bei der Erasmus-Dozentenmobilität auch östliche Staaten wie Polen, Lettland und Litauen zu bevorzugten Gastländern im Ostseeraum zählen, während dies bei der Doktorandenmobi-lität nur auf Dänemark, Deutschland, Finnland und Schweden zutrifft.
Wichtige Ströme der Wissenschaftlermobilität
methodik Um die wichtigsten Ströme der Wissenschaftlermobilität im Ostsee-raum aufzudecken, wurden – wie bereits im Rahmen der Analyse der Studie-rendenmobilität – für jeden Ostseestaat die wichtigsten Gastländer ausreisen-der Erasmus-Gastdozenten und Doktoranden im Ostseeraum identifiziert. Als besonders wichtig wurde ein Gastland hierbei ab einem Anteil von mindestens 20% aller in andere Ostseestaaten ausreisenden Wissenschaftler eingestuft.
Quelle Abb. F16: DAAD, Erasmusstatistik; Eurostat, Studierendenstatistik; DAAD-Berechnungen
1 Nur Mobilitätsströme mit einem Anteil von mind. 20% aller aus einem Ostseestaat in andere Ostseestaaten ausreisenden Erasmus-Gastdozenten bzw. Doktoranden. Die vollständigen Daten zu dieser Abbildung können mit der Datentabelle heruntergeladen werden.Mobility flows including a proportion of at least 20% of all Erasmus guest lecturers or doctoral candidates from a Baltic Sea country entering other Baltic Sea countries. The complete data for this figure can be downloaded with the data table.
2 Neue Erasmus+-Statistik seit 2015: Ein Erasmusjahr beginnt am 1. Juni des Vorjahres und endet am 31. Mai des Folgejahres. 2015 = 1.6.2014 bis 31.5.2016.New Erasmus+ statistics since 2015: the Erasmus year begins on 1 June of the previous year and ends on 31 May of the following year. 2015 = 01/06/2014 to 31/05/2016.
Development of academic and researcher mobility in the Baltic Sea area In contrast to Erasmus student mobility, the development of Erasmus guest lectureships between 2003 and 2014 followed very similar patterns in the case of all three lecturer groups analysed. In general, a steady increase in mobility figures can be observed. As with the Erasmus student statistics, the development of staff mobility within the Baltic Sea area increased less noticeably when compared with staff mobility between the Baltic Sea area and the remaining Erasmus countries. While Erasmus staff mobility between the Baltic Sea countries increased by 104% during the monitoring period, the number of lecturers travelling from other Erasmus countries to the Baltic Sea area and the number of those departing the Baltic Sea area for other Erasmus countries rose by 113% and even 133% respectively. During the same period, overall numbers of Erasmus lecturer exchanges increased by 125%. It follows that lecturer exchanges between the Baltic Sea area and the other Erasmus countries since 2003 have intensified more strongly than those within the Baltic Sea area itself. However, in contrast to student mobility, staff mobility in terms of individuals departing the Baltic Sea area increased more significantly than those entering it. This means that the appeal of the Baltic Sea area as a destination for both Erasmus guest lecturers from Baltic Sea states and for those from other countries has seen below-average development in comparison with the popularity of other Erasmus countries in the monitoring period.
As far as a country-specific analysis of the development of guest lecturer exchanges within the Baltic Sea area is concerned, it is clear that the growth rates between the various Baltic Sea states differ considerably. As was the case with student mobility, Estonia (+266%) and, in particular, Latvia (+624%) record the highest growth rates. Furthermore, lecturer exchanges with the remainder of the Baltic Sea area in Lithuania (+204%) and Poland (+151%) have witnessed strong above-average development between 2003 and 2014, while that in all other countries is below average. A marked East-West disparity between the Baltic Sea states is currently apparent, which can almost certainly be explained by the Eastern countries’ need to catch up in the wake of their acceptance within the Erasmus pro-gramme. Poland has only participated in the Erasmus programme since the Erasmus year 1999, while Estonia, Latvia and Lithuania did not join until 2000.
methodology The sole data source available for an analysis of the develop-ment of academic and researcher mobility in the Baltic Sea area is the statistics regarding the Erasmus guest lectureships. As with the analysis of student mobility, a distinction is also made, in this instance, between (1) staff mobility within the Baltic Sea area (i.e. between the various Baltic Sea countries), (2) staff mobility from other Erasmus countries to the Baltic Sea area and (3) staff mobility from the Baltic Sea area to other Erasmus countries and (4) Erasmus staff mobility overall. To enhance comparability, the corresponding data trends are charted in an index-linked manner. Here, the base year 2003 corresponds to the index value of 100.
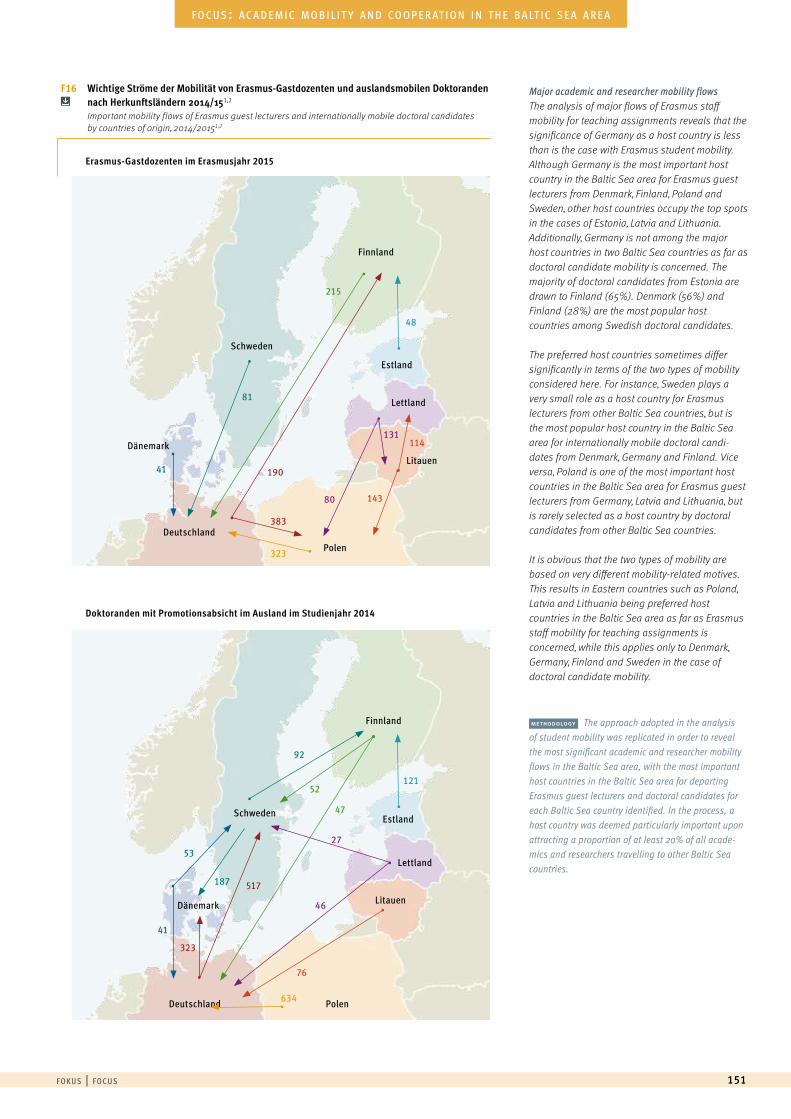
Major academic and researcher mobility flows The analysis of major flows of Erasmus staff mobility for teaching assignments reveals that the significance of Germany as a host country is less than is the case with Erasmus student mobility. Although Germany is the most important host country in the Baltic Sea area for Erasmus guest lecturers from Denmark, Finland, Poland and Sweden, other host countries occupy the top spots in the cases of Estonia, Latvia and Lithuania. Additionally, Germany is not among the major host countries in two Baltic Sea countries as far as doctoral candidate mobility is concerned. The majority of doctoral candidates from Estonia are drawn to Finland (65%). Denmark (56%) and Finland (28%) are the most popular host countries among Swedish doctoral candidates.
The preferred host countries sometimes differ significantly in terms of the two types of mobility considered here. For instance, Sweden plays a very small role as a host country for Erasmus lecturers from other Baltic Sea countries, but is the most popular host country in the Baltic Sea area for internationally mobile doctoral candi-dates from Denmark, Germany and Finland. Vice versa, Poland is one of the most important host countries in the Baltic Sea area for Erasmus guest lecturers from Germany, Latvia and Lithuania, but is rarely selected as a host country by doctoral candidates from other Baltic Sea countries.
It is obvious that the two types of mobility are based on very different mobility-related motives. This results in Eastern countries such as Poland, Latvia and Lithuania being preferred host countries in the Baltic Sea area as far as Erasmus staff mobility for teaching assignments is concerned, while this applies only to Denmark, Germany, Finland and Sweden in the case of doctoral candidate mobility.
f o k u s | f o c u s 151
f o c u s : a c a d e m i c m o b i l i t y a n d co o p e r at i o n i n t h e b a lt i c s e a a r e a
F16 Wichtige Ströme der Mobilität von Erasmus-Gastdozenten und auslandsmobilen Doktoranden nach Herkunftsländern 2014/151,2
Important mobility flows of Erasmus guest lecturers and internationally mobile doctoral candidates by countries of origin, 2014/20151,2
methodology The approach adopted in the analysis of student mobility was replicated in order to reveal the most significant academic and researcher mobility flows in the Baltic Sea area, with the most important host countries in the Baltic Sea area for departing Erasmus guest lecturers and doctoral candidates for each Baltic Sea country identified. In the process, a host country was deemed particularly important upon attracting a proportion of at least 20% of all acade-mics and researchers travelling to other Baltic Sea countries.
Dänemark
Dänemark
Schweden
Schweden
Finnland
Finnland
Erasmus-Gastdozenten im Erasmusjahr 2015
Doktoranden mit Promotionsabsicht im Ausland im Studienjahr 2014
Polen
Polen
Estland
Estland
Lettland
Lettland
Litauen
Litauen
Deutschland
Deutschland
190
517
323
383
323
634
41
41
187
92
53
81
215
47
52
48
121
80
27
46
131114
143
76
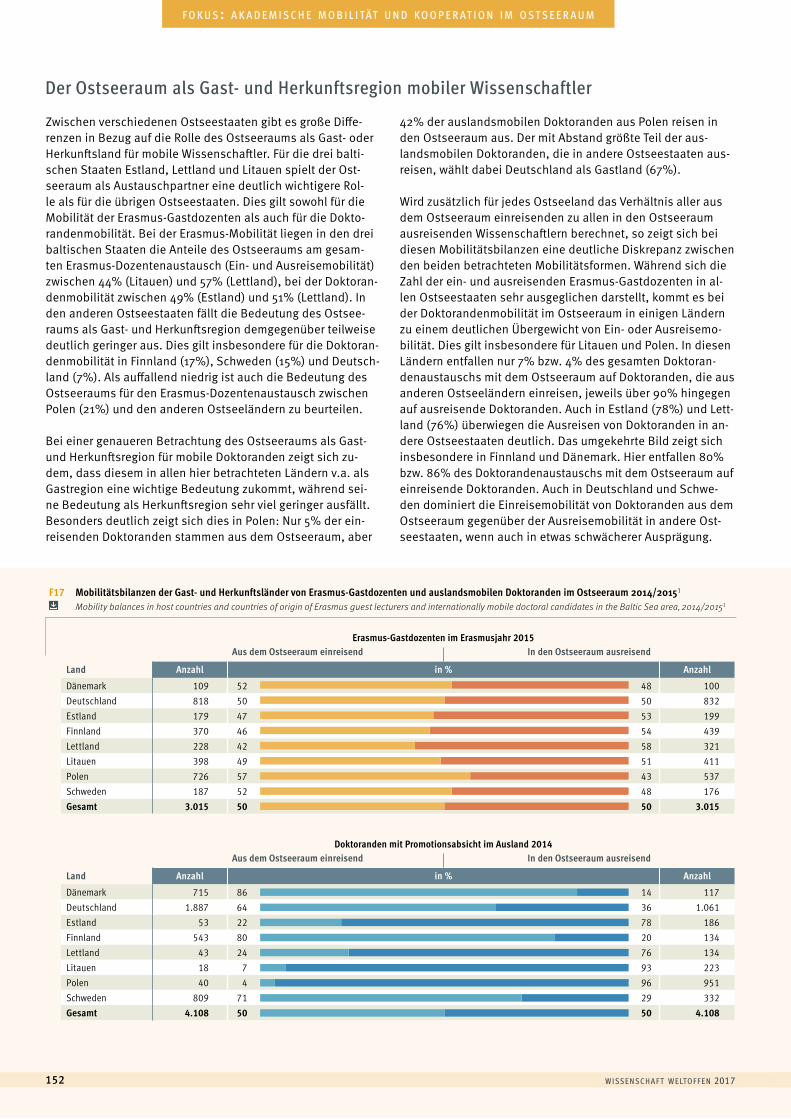
w i sse n sc h a f t w e lto f f e n 2017152
a u s l ä n d i s c h e s t u d i e r e n d e | f o r e i g n s t u d e n t sf o k u s : a k a d e m i s c h e m o b i l i tät u n d k o o p e r at i o n i m o s t s e e r a u m
Zwischen verschiedenen Ostseestaaten gibt es große Diffe-renzen in Bezug auf die Rolle des Ostseeraums als Gast- oder Herkunftsland für mobile Wissenschaftler. Für die drei balti-schen Staaten Estland, Lettland und Litauen spielt der Ost-seeraum als Austauschpartner eine deutlich wichtigere Rol-le als für die übrigen Ostseestaaten. Dies gilt sowohl für die Mobilität der Erasmus-Gastdozenten als auch für die Dokto-randenmobilität. Bei der Erasmus-Mobilität liegen in den drei baltischen Staaten die Anteile des Ostseeraums am gesam-ten Erasmus-Dozentenaustausch (Ein- und Ausreisemobilität) zwischen 44% (Litauen) und 57% (Lettland), bei der Doktoran-denmobilität zwischen 49% (Estland) und 51% (Lettland). In den anderen Ostseestaaten fällt die Bedeutung des Ostsee-raums als Gast- und Herkunftsregion demgegenüber teilweise deutlich geringer aus. Dies gilt insbesondere für die Doktoran-denmobilität in Finnland (17%), Schweden (15%) und Deutsch-land (7%). Als auffallend niedrig ist auch die Bedeutung des Ostseeraums für den Erasmus-Dozentenaustausch zwischen Polen (21%) und den anderen Ostseeländern zu beurteilen.
Bei einer genaueren Betrachtung des Ostseeraums als Gast- und Herkunftsregion für mobile Doktoranden zeigt sich zu-dem, dass diesem in allen hier betrachteten Ländern v.a. als Gastregion eine wichtige Bedeutung zukommt, während sei-ne Bedeutung als Herkunftsregion sehr viel geringer ausfällt. Besonders deutlich zeigt sich dies in Polen: Nur 5% der ein-reisenden Doktoranden stammen aus dem Ostseeraum, aber
42% der auslandsmobilen Doktoranden aus Polen reisen in den Ostseeraum aus. Der mit Abstand größte Teil der aus-landsmobilen Doktoranden, die in andere Ostseestaaten aus-reisen, wählt dabei Deutschland als Gastland (67%).
Wird zusätzlich für jedes Ostseeland das Verhältnis aller aus dem Ostseeraum einreisenden zu allen in den Ostseeraum ausreisenden Wissenschaftlern berechnet, so zeigt sich bei diesen Mobilitätsbilanzen eine deutliche Diskrepanz zwischen den beiden betrachteten Mobilitätsformen. Während sich die Zahl der ein- und ausreisenden Erasmus-Gastdozenten in al-len Ostseestaaten sehr ausgeglichen darstellt, kommt es bei der Doktorandenmobilität im Ostseeraum in einigen Ländern zu einem deutlichen Übergewicht von Ein- oder Ausreisemo-bilität. Dies gilt insbesondere für Litauen und Polen. In diesen Ländern entfallen nur 7% bzw. 4% des gesamten Doktoran-denaustauschs mit dem Ostseeraum auf Doktoranden, die aus anderen Ostseeländern einreisen, jeweils über 90% hingegen auf ausreisende Doktoranden. Auch in Estland (78%) und Lett- land (76%) überwiegen die Ausreisen von Doktoranden in an- dere Ostseestaaten deutlich. Das umgekehrte Bild zeigt sich insbesondere in Finnland und Dänemark. Hier entfallen 80% bzw. 86% des Doktorandenaustauschs mit dem Ostseeraum auf einreisende Doktoranden. Auch in Deutschland und Schwe-den dominiert die Einreisemobilität von Doktoranden aus dem Ostseeraum gegenüber der Ausreisemobilität in andere Ost-seestaaten, wenn auch in etwas schwächerer Ausprägung.
Der Ostseeraum als Gast- und Herkunftsregion mobiler Wissenschaftler
Erasmus-Gastdozenten im Erasmusjahr 2015Aus dem Ostseeraum einreisend In den Ostseeraum ausreisend
Land Anzahl in % Anzahl
Dänemark 109 52 48 100Deutschland 818 50 50 832Estland 179 47 53 199Finnland 370 46 54 439Lettland 228 42 58 321Litauen 398 49 51 411Polen 726 57 43 537Schweden 187 52 48 176Gesamt 3.015 50 50 3.015
Doktoranden mit Promotionsabsicht im Ausland 2014Aus dem Ostseeraum einreisend In den Ostseeraum ausreisend
Land Anzahl in % Anzahl
Dänemark 715 86 14 117Deutschland 1.887 64 36 1.061Estland 53 22 78 186Finnland 543 80 20 134Lettland 43 24 76 134Litauen 18 7 93 223Polen 40 4 96 951Schweden 809 71 29 332Gesamt 4.108 50 50 4.108
0 20 40 60 80 100
0 20 40 60 80 100
F17 Mobilitätsbilanzen der Gast- und Herkunftsländer von Erasmus-Gastdozenten und auslandsmobilen Doktoranden im Ostseeraum 2014/20151 Mobility balances in host countries and countries of origin of Erasmus guest lecturers and internationally mobile doctoral candidates in the Baltic Sea area, 2014/20151
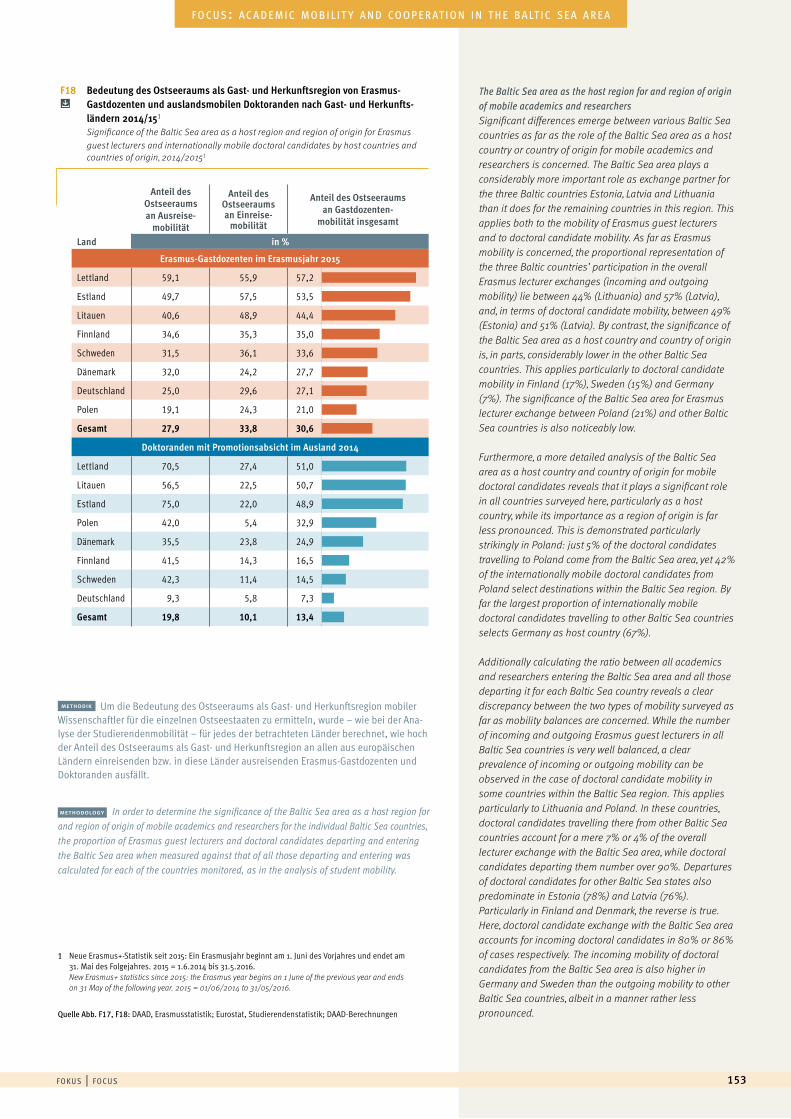
f o k u s | f o c u s 153
f o c u s : a c a d e m i c m o b i l i t y a n d co o p e r at i o n i n t h e b a lt i c s e a a r e a
methodik Um die Bedeutung des Ostseeraums als Gast- und Herkunftsregion mobiler Wissenschaftler für die einzelnen Ostseestaaten zu ermitteln, wurde – wie bei der Ana-lyse der Studierendenmobilität – für jedes der betrachteten Länder berechnet, wie hoch der Anteil des Ostseeraums als Gast- und Herkunftsregion an allen aus europäischen Ländern einreisenden bzw. in diese Länder ausreisenden Erasmus-Gastdozenten und Doktoranden ausfällt.
Land
Anteil des Ostseeraums an Ausreise-
mobilität
Anteil des Ostseeraums an Einreise-
mobilität
Anteil des Ostseeraums an Gastdozenten-
mobilität insgesamt
in %
Erasmus-Gastdozenten im Erasmusjahr 2015
Lettland 59,1 55,9 57,2
Estland 49,7 57,5 53,5
Litauen 40,6 48,9 44,4
Finnland 34,6 35,3 35,0
Schweden 31,5 36,1 33,6
Dänemark 32,0 24,2 27,7
Deutschland 25,0 29,6 27,1
Polen 19,1 24,3 21,0
Gesamt 27,9 33,8 30,6-20 14 48 82 116 150
-20 14 48 82 116 150
Doktoranden mit Promotionsabsicht im Ausland 2014
Lettland 70,5 27,4 51,0
Litauen 56,5 22,5 50,7
Estland 75,0 22,0 48,9
Polen 42,0 5,4 32,9
Dänemark 35,5 23,8 24,9
Finnland 41,5 14,3 16,5
Schweden 42,3 11,4 14,5
Deutschland 9,3 5,8 7,3
Gesamt 19,8 10,1 13,4
-20 14 48 82 116 150
-20 14 48 82 116 150
F18 Bedeutung des Ostseeraums als Gast- und Herkunftsregion von Erasmus- Gastdozenten und auslandsmobilen Doktoranden nach Gast- und Herkunfts- ländern 2014/151
Significance of the Baltic Sea area as a host region and region of origin for Erasmus guest lecturers and internationally mobile doctoral candidates by host countries and countries of origin, 2014/20151
1 Neue Erasmus+-Statistik seit 2015: Ein Erasmusjahr beginnt am 1. Juni des Vorjahres und endet am 31. Mai des Folgejahres. 2015 = 1.6.2014 bis 31.5.2016.New Erasmus+ statistics since 2015: the Erasmus year begins on 1 June of the previous year and ends on 31 May of the following year. 2015 = 01/06/2014 to 31/05/2016.
Quelle Abb. F17, F18: DAAD, Erasmusstatistik; Eurostat, Studierendenstatistik; DAAD-Berechnungen
The Baltic Sea area as the host region for and region of origin of mobile academics and researchers Significant differences emerge between various Baltic Sea countries as far as the role of the Baltic Sea area as a host country or country of origin for mobile academics and researchers is concerned. The Baltic Sea area plays a considerably more important role as exchange partner for the three Baltic countries Estonia, Latvia and Lithuania than it does for the remaining countries in this region. This applies both to the mobility of Erasmus guest lecturers and to doctoral candidate mobility. As far as Erasmus mobility is concerned, the proportional representation of the three Baltic countries’ participation in the overall Erasmus lecturer exchanges (incoming and outgoing mobility) lie between 44% (Lithuania) and 57% (Latvia), and, in terms of doctoral candidate mobility, between 49% (Estonia) and 51% (Latvia). By contrast, the significance of the Baltic Sea area as a host country and country of origin is, in parts, considerably lower in the other Baltic Sea countries. This applies particularly to doctoral candidate mobility in Finland (17%), Sweden (15%) and Germany (7%). The significance of the Baltic Sea area for Erasmus lecturer exchange between Poland (21%) and other Baltic Sea countries is also noticeably low.
Furthermore, a more detailed analysis of the Baltic Sea area as a host country and country of origin for mobile doctoral candidates reveals that it plays a significant role in all countries surveyed here, particularly as a host country, while its importance as a region of origin is far less pronounced. This is demonstrated particularly strikingly in Poland: just 5% of the doctoral candidates travelling to Poland come from the Baltic Sea area, yet 42% of the internationally mobile doctoral candidates from Poland select destinations within the Baltic Sea region. By far the largest proportion of internationally mobile doctoral candidates travelling to other Baltic Sea countries selects Germany as host country (67%).
Additionally calculating the ratio between all academics and researchers entering the Baltic Sea area and all those departing it for each Baltic Sea country reveals a clear discrepancy between the two types of mobility surveyed as far as mobility balances are concerned. While the number of incoming and outgoing Erasmus guest lecturers in all Baltic Sea countries is very well balanced, a clear prevalence of incoming or outgoing mobility can be observed in the case of doctoral candidate mobility in some countries within the Baltic Sea region. This applies particularly to Lithuania and Poland. In these countries, doctoral candidates travelling there from other Baltic Sea countries account for a mere 7% or 4% of the overall lecturer exchange with the Baltic Sea area, while doctoral candidates departing them number over 90%. Departures of doctoral candidates for other Baltic Sea states also predominate in Estonia (78%) and Latvia (76%). Particularly in Finland and Denmark, the reverse is true. Here, doctoral candidate exchange with the Baltic Sea area accounts for incoming doctoral candidates in 80% or 86% of cases respectively. The incoming mobility of doctoral candidates from the Baltic Sea area is also higher in Germany and Sweden than the outgoing mobility to other Baltic Sea countries, albeit in a manner rather less pronounced.
methodology In order to determine the significance of the Baltic Sea area as a host region for and region of origin of mobile academics and researchers for the individual Baltic Sea countries, the proportion of Erasmus guest lecturers and doctoral candidates departing and entering the Baltic Sea area when measured against that of all those departing and entering was calculated for each of the countries monitored, as in the analysis of student mobility.
w i sse n sc h a f t w e lto f f e n 2017154
a u s l ä n d i s c h e s t u d i e r e n d e | f o r e i g n s t u d e n t sf o k u s : a k a d e m i s c h e m o b i l i tät u n d k o o p e r at i o n i m o s t s e e r a u m
Der Ostseeraum ist eine der wettbewerbsfähigsten und in-novativsten Wissenschaftsregionen der Welt mit einer über-durchschnittlich hohen Dichte an erstklassigen Hochschulen und Forschungseinrichtungen in enger räumlicher Nähe zu Deutschland. Diesen geografischen Vorteil gilt es in intensivere Wissenschaftsbeziehungen umzumünzen. Zweifellos sollten Wissenschaftskooperationen in erster Linie inhaltlich und nicht geografisch determiniert sein, andererseits sind viele wissenschaftliche Durchbrüche im persönlichen Gespräch bei einer guten Tasse Kaffee entstanden. Der Ostseeraum bietet die Möglichkeit, mit relativ überschaubarem zeitlichen und finanziellen Aufwand eine Vielzahl solcher „Cup of Coffee Meetings“ zwischen Wissenschaftlern der Region zu generieren.
Aufgabe der Politik ist es, hierfür die richtigen Rahmenbedin-gungen zu schaffen. Der Hamburger Senat hat daher im Jahr 2014 die „Ostsee-Strategie für den Wissenschaftsstandort Hamburg“ verabschiedet. Einerseits unterstützt der Senat die Hamburger Hochschulen bei der Anbahnung neuer Wissen- schaftsbeziehungen mit Partnern aus dem Ostseeraum durch eine eigene „Seed Money Facility Ostsee“ im Rahmen der Lan-desforschungsförderung. Auf der anderen Seite ist 2016 unter der Federführung der Hamburger Behörde für Wissenschaft, Forschung und Gleichstellung das „Baltic Science Network“ (BSN) als erstes transnationales Forum für Wissenschafts-politik im Ostseeraum etabliert worden, um auch auf politi-scher Ebene die Rahmenbedingungen für eine intensivere For-schungs- und Hochschulzusammenarbeit im Ostseeraum zu optimieren und die Interessen des Ostseeraums in Brüssel deutlicher zu artikulieren.
Obwohl der Ostseeraum sehr gut vernetzt ist, fehlte eine sol-che Netzwerkstruktur im Bereich der Wissenschaft bisher. Tra-ditionell wird Wissenschaftspolitik auf regionaler, nationaler oder europäischer Ebene betrieben. Ein grenzüberschreiten-des Denken im Rahmen von Makroregionen ist neu. Diese Lü-cke schließt das BSN. Dabei bietet die Makroregion Ostsee für alle Akteure im Bereich Wissenschaft eine große Chance. Für die nordischen Länder könnte sie eine neue, erweiterte Perspektive der nordischen Zusammenarbeit darstellen. Für die kleineren Länder des Ostseeraums bietet sie die Möglich-keit, ihre Stimme deutlicher zu artikulieren als im Konzert der EU-28. Auch die Einbindung Russlands ist in diesem Konzept – jenseits aller Verwerfungen auf politscher Ebene – möglich und eine Chance. In Deutschland und Polen haben traditionell die nördlichen Regionen beider Länder eine hohe Affinität zum Ostseeraum. Aber die Mitgliedstaaten des Ostseeraums sind auch wichtige Verbündete Deutschlands bei der Ausgestaltung beispielsweise des 9. EU-Forschungsrahmenprogramms.
Bei der Zusammensetzung des Partnerkonsortiums mussten die regionalen Besonderheiten der verschiedenen Wissen-schaftssysteme (föderaler vs. nationaler Aufbau, Länder mit teilweise politikgestaltenden Mittlerorganisationen; Länder sehr unterschiedlicher Größe etc.) und die transnationalen Akteure berücksichtigt werden. Von großem Vorteil ist hierbei
autor Klaus von Lepel ist leitender Regierungsdirek-tor in der Hamburger Behörde für Wissenschaft, Forschung und Gleichstellung (BWFG) und Programmdirektor des Baltic Science Networks.
author Klaus von Lepel is a senior official at the Hamburg Ministry of Science, Research and Equalities (Behör-de für Wissenschaft, Forschung und Gleichstellung, BWFG) and programme director of the Baltic Science Network.
Baltic Science Network – Connecting through Science
gastbeitrag
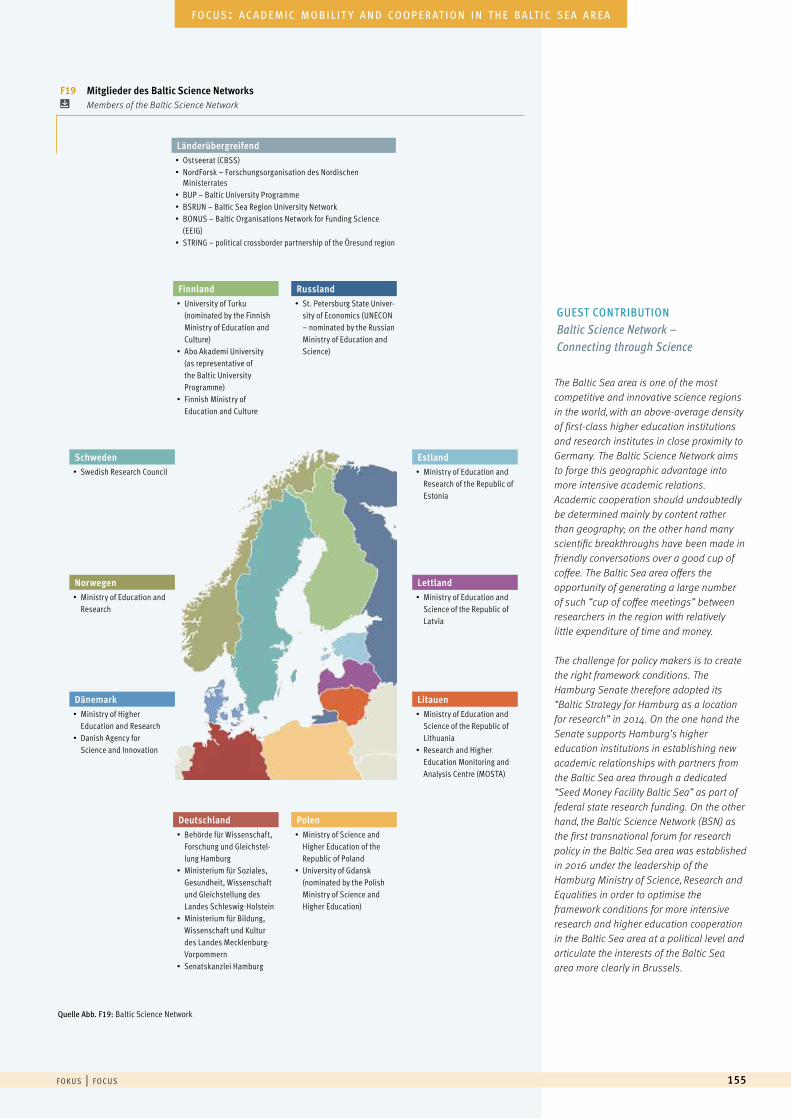
The Baltic Sea area is one of the most competitive and innovative science regions in the world, with an above-average density of first-class higher education institutions and research institutes in close proximity to Germany. The Baltic Science Network aims to forge this geographic advantage into more intensive academic relations. Academic cooperation should undoubtedly be determined mainly by content rather than geography; on the other hand many scientific breakthroughs have been made in friendly conversations over a good cup of coffee. The Baltic Sea area offers the opportunity of generating a large number of such “cup of coffee meetings” between researchers in the region with relatively little expenditure of time and money.
The challenge for policy makers is to create the right framework conditions. The Hamburg Senate therefore adopted its “Baltic Strategy for Hamburg as a location for research” in 2014. On the one hand the Senate supports Hamburg’s higher education institutions in establishing new academic relationships with partners from the Baltic Sea area through a dedicated “Seed Money Facility Baltic Sea” as part of federal state research funding. On the other hand, the Baltic Science Network (BSN) as the first transnational forum for research policy in the Baltic Sea area was established in 2016 under the leadership of the Hamburg Ministry of Science, Research and Equalities in order to optimise the framework conditions for more intensive research and higher education cooperation in the Baltic Sea area at a political level and articulate the interests of the Baltic Sea area more clearly in Brussels.
GUEST CONTRIBUTIONBaltic Science Network – Connecting through Science
f o k u s | f o c u s 155
f o c u s : a c a d e m i c m o b i l i t y a n d co o p e r at i o n i n t h e b a lt i c s e a a r e a
F19 Mitglieder des Baltic Science Networks Members of the Baltic Science Network
Deutschland• Behörde für Wissenschaft,
Forschung und Gleichstel-lung Hamburg
• Ministerium für Soziales, Gesundheit, Wissenschaft und Gleichstellung des Landes Schleswig-Holstein
• Ministerium für Bildung, Wissenschaft und Kultur des Landes Mecklenburg-Vorpommern
• Senatskanzlei Hamburg
Estland• Ministry of Education and
Research of the Republic of Estonia
Lettland• Ministry of Education and
Science of the Republic of Latvia
Litauen• Ministry of Education and
Science of the Republic of Lithuania
• Research and Higher Education Monitoring and Analysis Centre (MOSTA)
Polen• Ministry of Science and
Higher Education of the Republic of Poland
• University of Gdansk (nominated by the Polish Ministry of Science and Higher Education)
Dänemark• Ministry of Higher
Education and Research• Danish Agency for
Science and Innovation
Schweden• Swedish Research Council
Finnland• University of Turku
(nominated by the Finnish Ministry of Education and Culture)
• Abo Akademi University (as representative of the Baltic University Programme)
• Finnish Ministry of Education and Culture
Norwegen• Ministry of Education and
Research
Russland• St. Petersburg State Univer-
sity of Economics (UNECON – nominated by the Russian Ministry of Education and Science)
Länderübergreifend• Ostseerat (CBSS)• NordForsk – Forschungsorganisation des Nordischen Ministerrates • BUP – Baltic University Programme • BSRUN – Baltic Sea Region University Network • BONUS – Baltic Organisations Network for Funding Science
(EEIG) • STRING – political crossborder partnership of the Öresund region
Quelle Abb. F19: Baltic Science Network
Although the Baltic Sea area is very well networked, no academic network structure of this kind had previously existed. Science policy is generally made at regional, national or European level; cross-border thinking at the macro-regional level is new. The BSN closes this gap. The Baltic macro-region offers a great opportunity for all stakeholders in the field of science: for the Nordic countries it could represent new, expanded prospects for Nordic cooperation, while for the smaller countries of the Baltic Sea area it offers the opportunity to make their voice heard more clearly than within the concert of the EU-28. Integrating Russia – despite all disagreements on the political level – is also a possibility and an opportunity offered by this concept. In Germany and Poland, the northern regions of both countries traditionally have a high affinity to the Baltic Sea area. The member states of the Baltic Sea area are however also important allies for Germany in shaping for example the 9th EU Framework Programme.
The regional particularities of the various academic systems (federal vs. national structures; countries with non-governmental organisations that in some cases shape policy; countries of very different sizes; etc.) and the transnational stakeholders had to be considered when assembling the partner consortium. Very advantageous in this respect is the non-hierarchical flexibility of the macro-regional concept. Today, almost all science policy-relevant organisations from all ten states bordering the Baltic Sea, including Russia, are members of the Baltic Science Network. This includes ten regional or national science ministries, a major national research funding organisation, a science policy think tank, and the Baltic Council and the Nordic Council of Ministers as international stakehold-ers. The perspective of higher education institutions is represented in the BSN through the two existing university networks Baltic University Programme and Baltic Sea Region University Network, along with three universities explicitly nominated by their national governments. The EU perspective of the BSN is reflected in its membership in BONUS, the EU’s only macro-regional research funding programme, and its co-optation of the responsible policy area coordinator of the EU Baltic Strategy.
The BSN is intensively involved in the international cooperation structures of the Baltic region. It is a flagship project for the EU Baltic Strategy and one of the two pillars of the Research and Innovation Agenda of the Baltic Council. It also receives start-up funding of approximately 3 million euros from the EU funding programme Interreg.
Following an intensive brainstorming phase at the outset as to how a macro-regional research perspective for the Baltic region could be shaped and of what it could consist, the work of the BSN today focuses on the five topics of research and innovation excellence, academic and researcher mobility, widening participation in the EU research funding programmes, best practice learning and joint articulation of the science policy interests of the Baltic macro-region. Within three years, new innovative concepts, tools and strategies for more intensive transna-tional science cooperation are to be developed on these topics. The aim is to establish a common science policy for the Baltic Sea area in selected fields.
w i sse n sc h a f t w e lto f f e n 2017156
a u s l ä n d i s c h e s t u d i e r e n d e | f o r e i g n s t u d e n t sf o k u s : a k a d e m i s c h e m o b i l i tät u n d k o o p e r at i o n i m o s t s e e r a u m
die nicht hierarchische Flexibilität des makroregionalen Kon-zepts. Heute gehören dem Baltic Science Network fast alle wis-senschaftspolitisch relevanten Organisationen aus allen zehn Ostseeanrainerstaaten inklusive Russland an. Darunter sind 10 regionale oder nationale Wissenschaftsministerien, eine große nationale Forschungsförderorganisation, ein wissen-schaftspolitischer Think Tank sowie der Ostseerat und der Nor-dische Ministerrat als internationale Akteure. Die Perspektive der Hochschulen wird im BSN durch die beiden existierenden Hochschulnetzwerke Baltic University Programme und Baltic Sea Region University Network und drei von ihren nationalen Regierungen explizit nominierten Universitäten vertreten. Die EU-Perspektive des BSN spiegelt sich in der Mitgliedschaft in BONUS, dem einzigen makroregionalen Forschungsförderpro-gramm der EU, und Kooptation des zuständigen Policy-Area- Koordinators der EU-Ostseestrategie.
Das BSN ist intensiv in die internationalen Kooperationsstruk-turen des Ostseeraumes eingebunden. Es ist ein „Flagship Project“ der EU-Ostseestrategie und einer der beiden Eckp- feiler der „Innovations- und Wissenschaftsagenda“ des Ost-seerates. Es erhält zudem eine Anschubfinanzierung von ca. 3 Millionen Euro aus dem EU-Förderprogramm Interreg.
Nach einer intensiven Brainstorming-Phase am Anfang, wie und was eine makroregionale Wissenschaftsperspektive für den Ostseeraum sein könnte, fokussiert sich die inhaltliche Arbeit des BSN heute auf die fünf Themenfelder Forschungs- und Innovationsexzellenz, Wissenschaftlermobilität, Widening Participation an den EU-Forschungsprogrammen, Best Practice Learning und gemeinsame Artikulation wissenschaftspoliti-scher Interessen der Makroregion Ostsee. Innerhalb von drei Jahren sollen hierzu neue innovative Konzepte, Instrumen-te und Strategien für eine intensivere transnationale Wissen-schaftskooperation entwickelt werden. Ziel ist es, in ausge-suchten Bereichen eine gemeinsame Wissenschaftspolitik für den Ostseeraum zu entwickeln.
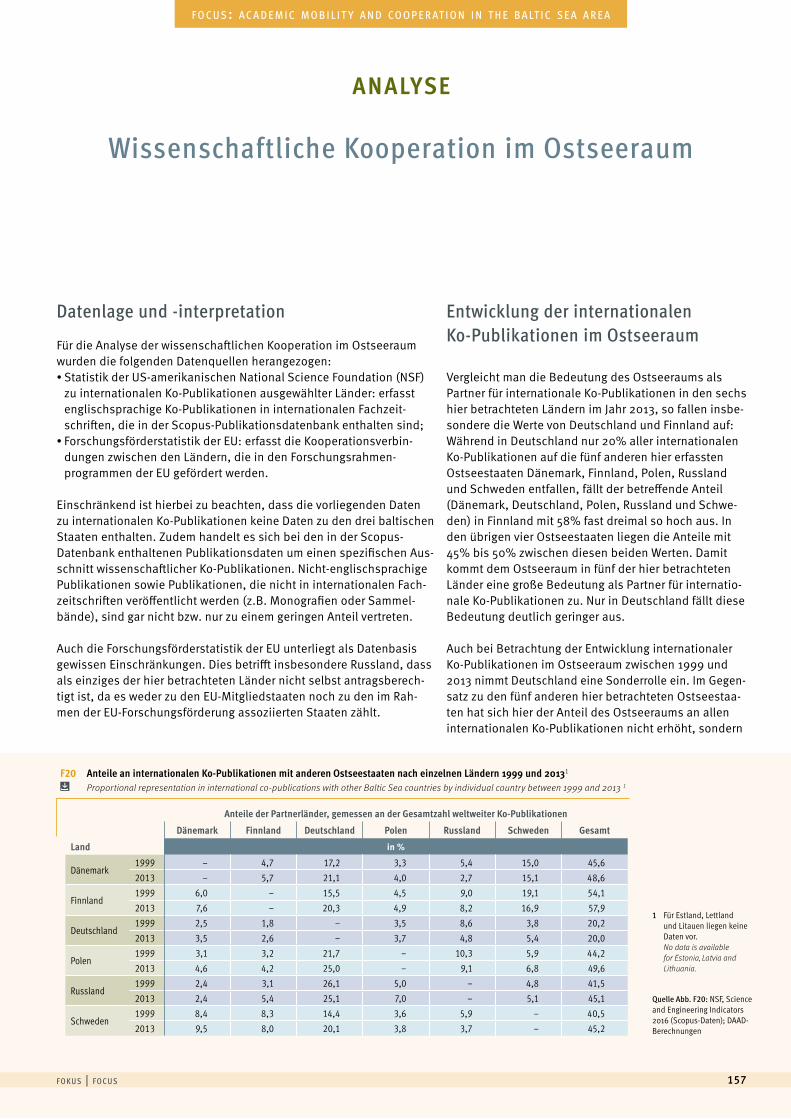
f o k u s | f o c u s 157
f o c u s : a c a d e m i c m o b i l i t y a n d co o p e r at i o n i n t h e b a lt i c s e a a r e a
Datenlage und -interpretation
Für die Analyse der wissenschaftlichen Kooperation im Ostseeraum wurden die folgenden Datenquellen herangezogen:• Statistik der US-amerikanischen National Science Foundation (NSF)
zu internationalen Ko-Publikationen ausgewählter Länder: erfasst englischsprachige Ko-Publikationen in internationalen Fachzeit-schriften, die in der Scopus-Publikationsdatenbank enthalten sind;
• Forschungsförderstatistik der EU: erfasst die Kooperationsverbin- dungen zwischen den Ländern, die in den Forschungsrahmen- programmen der EU gefördert werden.
Einschränkend ist hierbei zu beachten, dass die vorliegenden Daten zu internationalen Ko-Publikationen keine Daten zu den drei baltischen Staaten enthalten. Zudem handelt es sich bei den in der Scopus- Datenbank enthaltenen Publikationsdaten um einen spezifischen Aus-schnitt wissenschaftlicher Ko-Publikationen. Nicht-englischsprachige Publikationen sowie Publikationen, die nicht in internationalen Fach-zeitschriften veröffentlicht werden (z.B. Monografien oder Sammel-bände), sind gar nicht bzw. nur zu einem geringen Anteil vertreten.
Auch die Forschungsförderstatistik der EU unterliegt als Datenbasis gewissen Einschränkungen. Dies betrifft insbesondere Russland, dass als einziges der hier betrachteten Länder nicht selbst antragsberech-tigt ist, da es weder zu den EU-Mitgliedstaaten noch zu den im Rah-men der EU-Forschungsförderung assoziierten Staaten zählt.
Vergleicht man die Bedeutung des Ostseeraums als Partner für internationale Ko-Publikationen in den sechs hier betrachteten Ländern im Jahr 2013, so fallen insbe-sondere die Werte von Deutschland und Finnland auf: Während in Deutschland nur 20% aller internationalen Ko-Publikationen auf die fünf anderen hier erfassten Ostseestaaten Dänemark, Finnland, Polen, Russland und Schweden entfallen, fällt der betreffende Anteil (Dänemark, Deutschland, Polen, Russland und Schwe-den) in Finnland mit 58% fast dreimal so hoch aus. In den übrigen vier Ostseestaaten liegen die Anteile mit 45% bis 50% zwischen diesen beiden Werten. Damit kommt dem Ostseeraum in fünf der hier betrachteten Länder eine große Bedeutung als Partner für internatio-nale Ko-Publikationen zu. Nur in Deutschland fällt diese Bedeutung deutlich geringer aus.
Auch bei Betrachtung der Entwicklung internationaler Ko-Publikationen im Ostseeraum zwischen 1999 und 2013 nimmt Deutschland eine Sonderrolle ein. Im Gegen- satz zu den fünf anderen hier betrachteten Ostseestaa-ten hat sich hier der Anteil des Ostseeraums an allen internationalen Ko-Publikationen nicht erhöht, sondern
Entwicklung der internationalen Ko-Publikationen im Ostseeraum
analyse
Wissenschaftliche Kooperation im Ostseeraum
F20 Anteile an internationalen Ko-Publikationen mit anderen Ostseestaaten nach einzelnen Ländern 1999 und 20131
Proportional representation in international co-publications with other Baltic Sea countries by individual country between 1999 and 2013 1
1 Für Estland, Lettland und Litauen liegen keine Daten vor.No data is available for Estonia, Latvia and Lithuania.
Quelle Abb. F20: NSF, Science and Engineering Indicators 2016 (Scopus-Daten); DAAD-Berechnungen
Anteile der Partnerländer, gemessen an der Gesamtzahl weltweiter Ko-Publikationen
Dänemark Finnland Deutschland Polen Russland Schweden Gesamt
Land in %
Dänemark1999 – 4,7 17,2 3,3 5,4 15,0 45,62013 – 5,7 21,1 4,0 2,7 15,1 48,6
Finnland1999 6,0 – 15,5 4,5 9,0 19,1 54,12013 7,6 – 20,3 4,9 8,2 16,9 57,9
Deutschland1999 2,5 1,8 – 3,5 8,6 3,8 20,22013 3,5 2,6 – 3,7 4,8 5,4 20,0
Polen1999 3,1 3,2 21,7 – 10,3 5,9 44,22013 4,6 4,2 25,0 – 9,1 6,8 49,6
Russland1999 2,4 3,1 26,1 5,0 – 4,8 41,52013 2,4 5,4 25,1 7,0 – 5,1 45,1
Schweden1999 8,4 8,3 14,4 3,6 5,9 – 40,52013 9,5 8,0 20,1 3,8 3,7 – 45,2
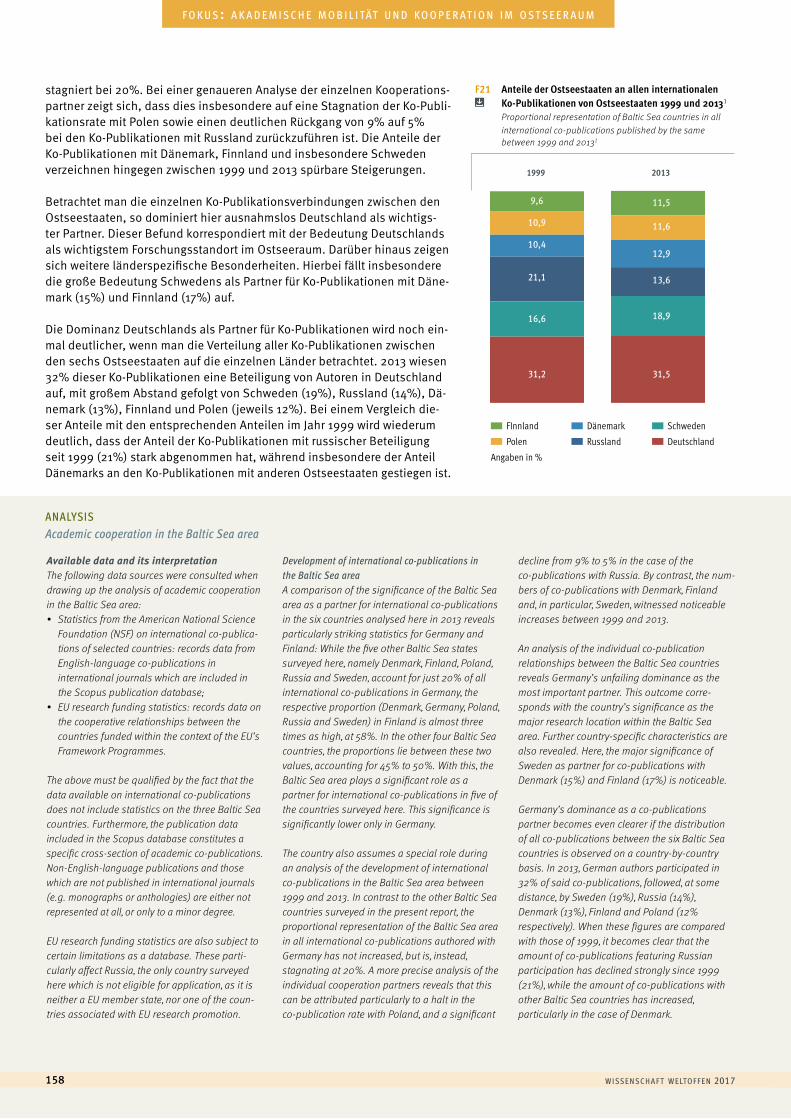
Available data and its interpretation The following data sources were consulted when drawing up the analysis of academic cooperation in the Baltic Sea area:• Statistics from the American National Science
Foundation (NSF) on international co-publica-tions of selected countries: records data from English-language co-publications in international journals which are included in the Scopus publication database;
• EU research funding statistics: records data on the cooperative relationships between the countries funded within the context of the EU’s Framework Programmes.
The above must be qualified by the fact that the data available on international co-publications does not include statistics on the three Baltic Sea countries. Furthermore, the publication data included in the Scopus database constitutes a specific cross-section of academic co-publications. Non-English-language publications and those which are not published in international journals (e.g. monographs or anthologies) are either not represented at all, or only to a minor degree.
EU research funding statistics are also subject to certain limitations as a database. These parti- cularly affect Russia, the only country surveyed here which is not eligible for application, as it is neither a EU member state, nor one of the coun- tries associated with EU research promotion.
Development of international co-publications in the Baltic Sea areaA comparison of the significance of the Baltic Sea area as a partner for international co-publications in the six countries analysed here in 2013 reveals particularly striking statistics for Germany and Finland: While the five other Baltic Sea states surveyed here, namely Denmark, Finland, Poland, Russia and Sweden, account for just 20% of all international co-publications in Germany, the respective proportion (Denmark, Germany, Poland, Russia and Sweden) in Finland is almost three times as high, at 58%. In the other four Baltic Sea countries, the proportions lie between these two values, accounting for 45% to 50%. With this, the Baltic Sea area plays a significant role as a partner for international co-publications in five of the countries surveyed here. This significance is significantly lower only in Germany.
The country also assumes a special role during an analysis of the development of international co-publications in the Baltic Sea area between 1999 and 2013. In contrast to the other Baltic Sea countries surveyed in the present report, the proportional representation of the Baltic Sea area in all international co-publications authored with Germany has not increased, but is, instead, stagnating at 20%. A more precise analysis of the individual cooperation partners reveals that this can be attributed particularly to a halt in the co-publication rate with Poland, and a significant
decline from 9% to 5% in the case of the co-publications with Russia. By contrast, the num-bers of co-publications with Denmark, Finland and, in particular, Sweden, witnessed noticeable increases between 1999 and 2013.
An analysis of the individual co-publication relationships between the Baltic Sea countries reveals Germany’s unfailing dominance as the most important partner. This outcome corre-sponds with the country’s significance as the major research location within the Baltic Sea area. Further country-specific characteristics are also revealed. Here, the major significance of Sweden as partner for co-publications with Denmark (15%) and Finland (17%) is noticeable.
Germany’s dominance as a co-publications partner becomes even clearer if the distribution of all co-publications between the six Baltic Sea countries is observed on a country-by-country basis. In 2013, German authors participated in 32% of said co-publications, followed, at some distance, by Sweden (19%), Russia (14%), Denmark (13%), Finland and Poland (12% respectively). When these figures are compared with those of 1999, it becomes clear that the amount of co-publications featuring Russian participation has declined strongly since 1999 (21%), while the amount of co-publications with other Baltic Sea countries has increased, particularly in the case of Denmark.
ANALYSISAcademic cooperation in the Baltic Sea area
w i sse n sc h a f t w e lto f f e n 2017158
a u s l ä n d i s c h e s t u d i e r e n d e | f o r e i g n s t u d e n t sf o k u s : a k a d e m i s c h e m o b i l i tät u n d k o o p e r at i o n i m o s t s e e r a u m
stagniert bei 20%. Bei einer genaueren Analyse der einzelnen Kooperations-partner zeigt sich, dass dies insbesondere auf eine Stagnation der Ko-Publi- kationsrate mit Polen sowie einen deutlichen Rückgang von 9% auf 5% bei den Ko-Publikationen mit Russland zurückzuführen ist. Die Anteile der Ko-Publikationen mit Dänemark, Finnland und insbesondere Schweden verzeichnen hingegen zwischen 1999 und 2013 spürbare Steigerungen.
Betrachtet man die einzelnen Ko-Publikationsverbindungen zwischen den Ostseestaaten, so dominiert hier ausnahmslos Deutschland als wichtigs-ter Partner. Dieser Befund korrespondiert mit der Bedeutung Deutschlands als wichtigstem Forschungsstandort im Ostseeraum. Darüber hinaus zeigen sich weitere länderspezifische Besonderheiten. Hierbei fällt insbesondere die große Bedeutung Schwedens als Partner für Ko-Publikationen mit Däne-mark (15%) und Finnland (17%) auf.
Die Dominanz Deutschlands als Partner für Ko-Publikationen wird noch ein-mal deutlicher, wenn man die Verteilung aller Ko-Publikationen zwischen den sechs Ostseestaaten auf die einzelnen Länder betrachtet. 2013 wiesen 32% dieser Ko-Publikationen eine Beteiligung von Autoren in Deutschland auf, mit großem Abstand gefolgt von Schweden (19%), Russland (14%), Dä-nemark (13%), Finnland und Polen (jeweils 12%). Bei einem Vergleich die-ser Anteile mit den entsprechenden Anteilen im Jahr 1999 wird wiederum deutlich, dass der Anteil der Ko-Publikationen mit russischer Beteiligung seit 1999 (21%) stark abgenommen hat, während insbesondere der Anteil Dänemarks an den Ko-Publikationen mit anderen Ostseestaaten gestiegen ist.
F21 Anteile der Ostseestaaten an allen internationalen Ko-Publikationen von Ostseestaaten 1999 und 20131
Proportional representation of Baltic Sea countries in all international co-publications published by the same between 1999 and 20131
9,6 11,5
10,9 11,6
10,412,9
21,1 13,6
16,6 18,9
31,2 31,5
FInnland
Polen
Angaben in %
Dänemark
Russland
Schweden
Deutschland
1999 2013
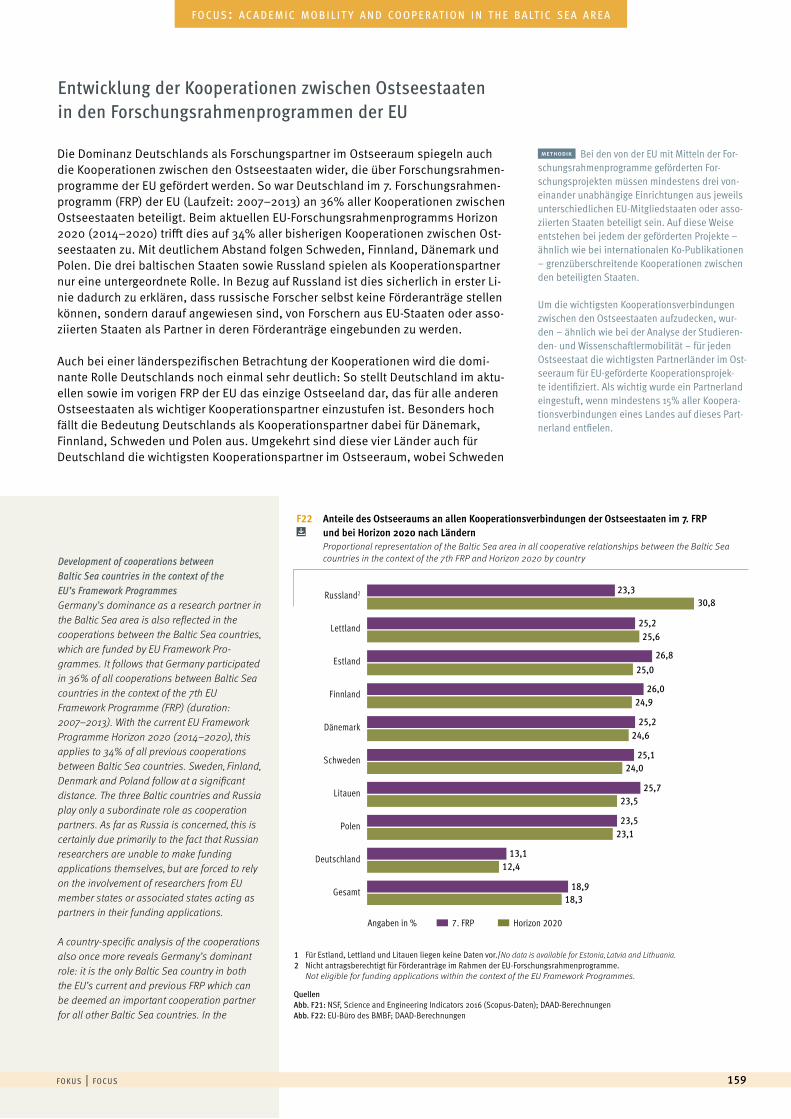
Development of cooperations between Baltic Sea countries in the context of the EU’s Framework ProgrammesGermany’s dominance as a research partner in the Baltic Sea area is also reflected in the cooperations between the Baltic Sea countries, which are funded by EU Framework Pro-grammes. It follows that Germany participated in 36% of all cooperations between Baltic Sea countries in the context of the 7th EU Framework Programme (FRP) (duration: 2007–2013). With the current EU Framework Programme Horizon 2020 (2014–2020), this applies to 34% of all previous cooperations between Baltic Sea countries. Sweden, Finland, Denmark and Poland follow at a significant distance. The three Baltic countries and Russia play only a subordinate role as cooperation partners. As far as Russia is concerned, this is certainly due primarily to the fact that Russian researchers are unable to make funding applications themselves, but are forced to rely on the involvement of researchers from EU member states or associated states acting as partners in their funding applications.
A country-specific analysis of the cooperations also once more reveals Germany’s dominant role: it is the only Baltic Sea country in both the EU’s current and previous FRP which can be deemed an important cooperation partner for all other Baltic Sea countries. In the
f o k u s | f o c u s 159
f o c u s : a c a d e m i c m o b i l i t y a n d co o p e r at i o n i n t h e b a lt i c s e a a r e a
Die Dominanz Deutschlands als Forschungspartner im Ostseeraum spiegeln auch die Kooperationen zwischen den Ostseestaaten wider, die über Forschungsrahmen-programme der EU gefördert werden. So war Deutschland im 7. Forschungsrahmen-programm (FRP) der EU (Laufzeit: 2007–2013) an 36% aller Kooperationen zwischen Ostseestaaten beteiligt. Beim aktuellen EU-Forschungsrahmenprogramms Horizon 2020 (2014–2020) trifft dies auf 34% aller bisherigen Kooperationen zwischen Ost-seestaaten zu. Mit deutlichem Abstand folgen Schweden, Finnland, Dänemark und Polen. Die drei baltischen Staaten sowie Russland spielen als Kooperationspartner nur eine untergeordnete Rolle. In Bezug auf Russland ist dies sicherlich in erster Li-nie dadurch zu erklären, dass russische Forscher selbst keine Förderanträge stellen können, sondern darauf angewiesen sind, von Forschern aus EU-Staaten oder asso-ziierten Staaten als Partner in deren Förderanträge eingebunden zu werden.
Auch bei einer länderspezifischen Betrachtung der Kooperationen wird die domi-nante Rolle Deutschlands noch einmal sehr deutlich: So stellt Deutschland im aktu-ellen sowie im vorigen FRP der EU das einzige Ostseeland dar, das für alle anderen Ostseestaaten als wichtiger Kooperationspartner einzustufen ist. Besonders hoch fällt die Bedeutung Deutschlands als Kooperationspartner dabei für Dänemark, Finnland, Schweden und Polen aus. Umgekehrt sind diese vier Länder auch für Deutschland die wichtigsten Kooperationspartner im Ostseeraum, wobei Schweden
methodik Bei den von der EU mit Mitteln der For- schungsrahmenprogramme geförderten For-schungsprojekten müssen mindestens drei von-einander unabhängige Einrichtungen aus jeweils unterschiedlichen EU-Mitgliedstaaten oder asso-ziierten Staaten beteiligt sein. Auf diese Weise entstehen bei jedem der geförderten Projekte – ähnlich wie bei internationalen Ko-Publikationen – grenzüberschreitende Kooperationen zwischen den beteiligten Staaten.
Um die wichtigsten Kooperationsverbindungen zwischen den Ostseestaaten aufzudecken, wur-den – ähnlich wie bei der Analyse der Studieren-den- und Wissenschaftlermobilität – für jeden Ostseestaat die wichtigsten Partnerländer im Ost-seeraum für EU-geförderte Kooperationsprojek-te identifiziert. Als wichtig wurde ein Partnerland eingestuft, wenn mindestens 15% aller Koopera-tionsverbindungen eines Landes auf dieses Part-nerland entfielen.
Entwicklung der Kooperationen zwischen Ostseestaatenin den Forschungsrahmenprogrammen der EU
1 Für Estland, Lettland und Litauen liegen keine Daten vor./No data is available for Estonia, Latvia and Lithuania.2 Nicht antragsberechtigt für Förderanträge im Rahmen der EU-Forschungsrahmenprogramme. Not eligible for funding applications within the context of the EU Framework Programmes.
QuellenAbb. F21: NSF, Science and Engineering Indicators 2016 (Scopus-Daten); DAAD-BerechnungenAbb. F22: EU-Büro des BMBF; DAAD-Berechnungen
F22 Anteile des Ostseeraums an allen Kooperationsverbindungen der Ostseestaaten im 7. FRP und bei Horizon 2020 nach Ländern
Proportional representation of the Baltic Sea area in all cooperative relationships between the Baltic Sea countries in the context of the 7th FRP and Horizon 2020 by country
Russland2
Lettland
Estland
Finnland
Dänemark
Schweden
Litauen
Polen
Deutschland
Gesamt
23,330,8
25,225,6
26,825,0
26,024,9
25,224,6
25,124,0
25,723,5
23,523,1
13,112,4
18,918,3
Angaben in % 7. FRP Horizon 2020
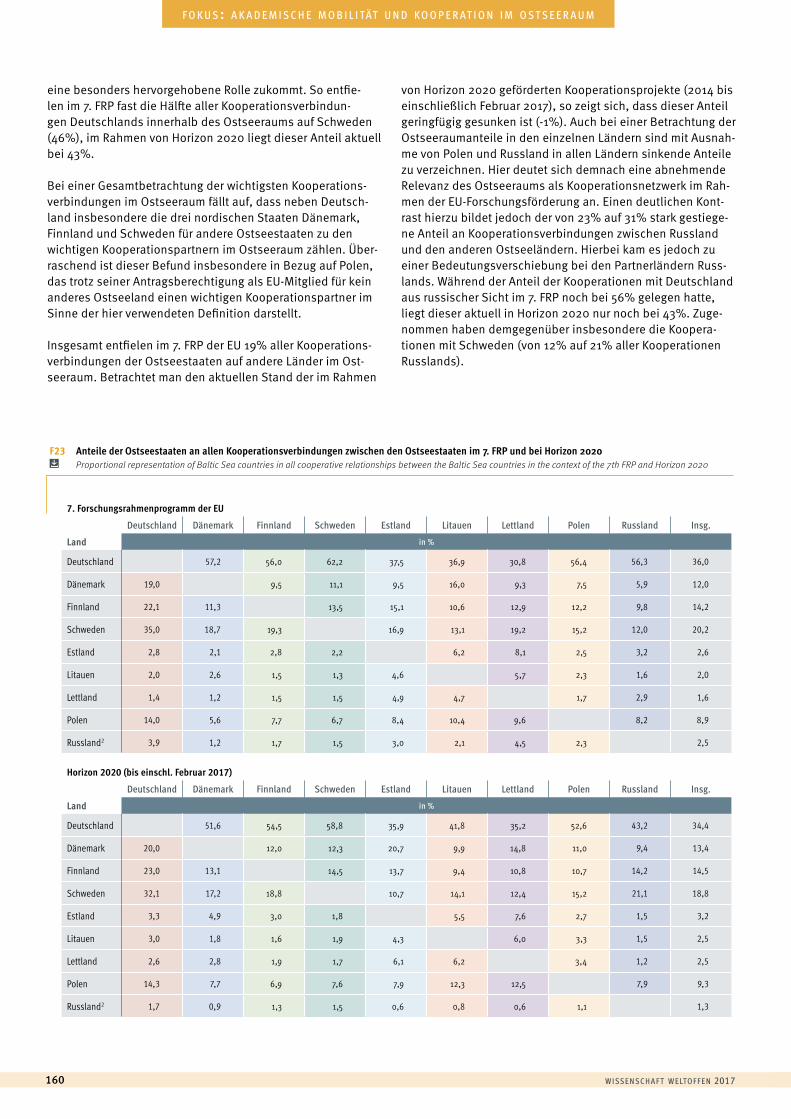
w i sse n sc h a f t w e lto f f e n 2017160
a u s l ä n d i s c h e s t u d i e r e n d e | f o r e i g n s t u d e n t sf o k u s : a k a d e m i s c h e m o b i l i tät u n d k o o p e r at i o n i m o s t s e e r a u m
eine besonders hervorgehobene Rolle zukommt. So entfie-len im 7. FRP fast die Hälfte aller Kooperationsverbindun-gen Deutschlands innerhalb des Ostseeraums auf Schweden (46%), im Rahmen von Horizon 2020 liegt dieser Anteil aktuell bei 43%.
Bei einer Gesamtbetrachtung der wichtigsten Kooperations-verbindungen im Ostseeraum fällt auf, dass neben Deutsch-land insbesondere die drei nordischen Staaten Dänemark, Finnland und Schweden für andere Ostseestaaten zu den wichtigen Kooperationspartnern im Ostseeraum zählen. Über-raschend ist dieser Befund insbesondere in Bezug auf Polen, das trotz seiner Antragsberechtigung als EU-Mitglied für kein anderes Ostseeland einen wichtigen Kooperationspartner im Sinne der hier verwendeten Definition darstellt.
Insgesamt entfielen im 7. FRP der EU 19% aller Kooperations-verbindungen der Ostseestaaten auf andere Länder im Ost-seeraum. Betrachtet man den aktuellen Stand der im Rahmen
von Horizon 2020 geförderten Kooperationsprojekte (2014 bis einschließlich Februar 2017), so zeigt sich, dass dieser Anteil geringfügig gesunken ist (-1%). Auch bei einer Betrachtung der Ostseeraumanteile in den einzelnen Ländern sind mit Ausnah-me von Polen und Russland in allen Ländern sinkende Anteile zu verzeichnen. Hier deutet sich demnach eine abnehmende Relevanz des Ostseeraums als Kooperationsnetzwerk im Rah-men der EU-Forschungsförderung an. Einen deutlichen Kont-rast hierzu bildet jedoch der von 23% auf 31% stark gestiege-ne Anteil an Kooperationsverbindungen zwischen Russland und den anderen Ostseeländern. Hierbei kam es jedoch zu einer Bedeutungsverschiebung bei den Partnerländern Russ-lands. Während der Anteil der Kooperationen mit Deutschland aus russischer Sicht im 7. FRP noch bei 56% gelegen hatte, liegt dieser aktuell in Horizon 2020 nur noch bei 43%. Zuge-nommen haben demgegenüber insbesondere die Koopera-tionen mit Schweden (von 12% auf 21% aller Kooperationen Russlands).
F23 Anteile der Ostseestaaten an allen Kooperationsverbindungen zwischen den Ostseestaaten im 7. FRP und bei Horizon 2020 Proportional representation of Baltic Sea countries in all cooperative relationships between the Baltic Sea countries in the context of the 7th FRP and Horizon 2020
7. Forschungsrahmenprogramm der EU
Deutschland Dänemark Finnland Schweden Estland Litauen Lettland Polen Russland Insg.
Land in %
Deutschland 57,2 56,0 62,2 37,5 36,9 30,8 56,4 56,3 36,0
Dänemark 19,0 9,5 11,1 9,5 16,0 9,3 7,5 5,9 12,0
Finnland 22,1 11,3 13,5 15,1 10,6 12,9 12,2 9,8 14,2
Schweden 35,0 18,7 19,3 16,9 13,1 19,2 15,2 12,0 20,2
Estland 2,8 2,1 2,8 2,2 6,2 8,1 2,5 3,2 2,6
Litauen 2,0 2,6 1,5 1,3 4,6 5,7 2,3 1,6 2,0
Lettland 1,4 1,2 1,5 1,5 4,9 4,7 1,7 2,9 1,6
Polen 14,0 5,6 7,7 6,7 8,4 10,4 9,6 8,2 8,9
Russland2 3,9 1,2 1,7 1,5 3,0 2,1 4,5 2,3 2,5
Horizon 2020 (bis einschl. Februar 2017)
Deutschland Dänemark Finnland Schweden Estland Litauen Lettland Polen Russland Insg.
Land in %
Deutschland 51,6 54,5 58,8 35,9 41,8 35,2 52,6 43,2 34,4
Dänemark 20,0 12,0 12,3 20,7 9,9 14,8 11,0 9,4 13,4
Finnland 23,0 13,1 14,5 13,7 9,4 10,8 10,7 14,2 14,5
Schweden 32,1 17,2 18,8 10,7 14,1 12,4 15,2 21,1 18,8
Estland 3,3 4,9 3,0 1,8 5,5 7,6 2,7 1,5 3,2
Litauen 3,0 1,8 1,6 1,9 4,3 6,0 3,3 1,5 2,5
Lettland 2,6 2,8 1,9 1,7 6,1 6,2 3,4 1,2 2,5
Polen 14,3 7,7 6,9 7,6 7,9 12,3 12,5 7,9 9,3
Russland2 1,7 0,9 1,3 1,5 0,6 0,8 0,6 1,1 1,3
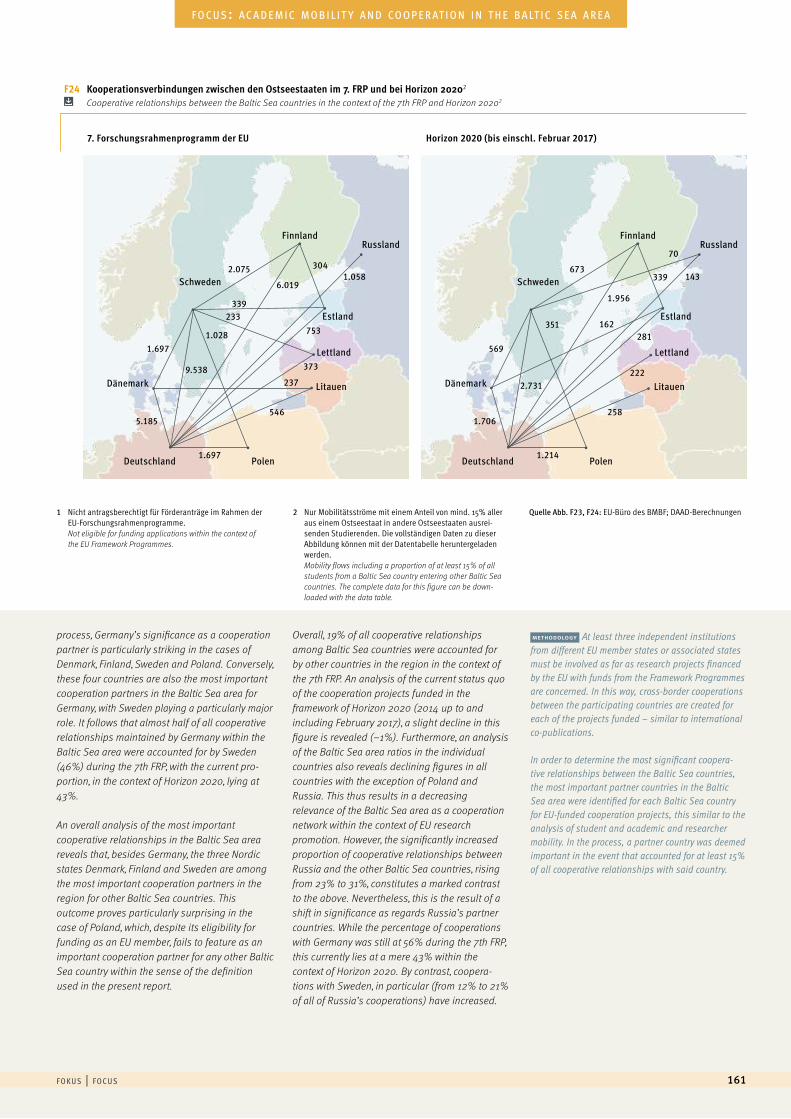
process, Germany’s significance as a cooperation partner is particularly striking in the cases of Denmark, Finland, Sweden and Poland. Conversely, these four countries are also the most important cooperation partners in the Baltic Sea area for Germany, with Sweden playing a particularly major role. It follows that almost half of all cooperative relationships maintained by Germany within the Baltic Sea area were accounted for by Sweden (46%) during the 7th FRP, with the current pro- portion, in the context of Horizon 2020, lying at 43%.
An overall analysis of the most important cooperative relationships in the Baltic Sea area reveals that, besides Germany, the three Nordic states Denmark, Finland and Sweden are among the most important cooperation partners in the region for other Baltic Sea countries. This outcome proves particularly surprising in the case of Poland, which, despite its eligibility for funding as an EU member, fails to feature as an important cooperation partner for any other Baltic Sea country within the sense of the definition used in the present report.
Overall, 19% of all cooperative relationships among Baltic Sea countries were accounted for by other countries in the region in the context of the 7th FRP. An analysis of the current status quo of the cooperation projects funded in the framework of Horizon 2020 (2014 up to and including February 2017), a slight decline in this figure is revealed (–1%). Furthermore, an analysis of the Baltic Sea area ratios in the individual countries also reveals declining figures in all countries with the exception of Poland and Russia. This thus results in a decreasing relevance of the Baltic Sea area as a cooperation network within the context of EU research promotion. However, the significantly increased proportion of cooperative relationships between Russia and the other Baltic Sea countries, rising from 23% to 31%, constitutes a marked contrast to the above. Nevertheless, this is the result of a shift in significance as regards Russia’s partner countries. While the percentage of cooperations with Germany was still at 56% during the 7th FRP, this currently lies at a mere 43% within the context of Horizon 2020. By contrast, coopera-tions with Sweden, in particular (from 12% to 21% of all of Russia’s cooperations) have increased.
methodology At least three independent institutions from different EU member states or associated states must be involved as far as research projects financed by the EU with funds from the Framework Programmes are concerned. In this way, cross-border cooperations between the participating countries are created for each of the projects funded – similar to international co-publications.
In order to determine the most significant coopera-tive relationships between the Baltic Sea countries, the most important partner countries in the Baltic Sea area were identified for each Baltic Sea country for EU-funded cooperation projects, this similar to the analysis of student and academic and researcher mobility. In the process, a partner country was deemed important in the event that accounted for at least 15% of all cooperative relationships with said country.
f o k u s | f o c u s 161
f o c u s : a c a d e m i c m o b i l i t y a n d co o p e r at i o n i n t h e b a lt i c s e a a r e a
F24 Kooperationsverbindungen zwischen den Ostseestaaten im 7. FRP und bei Horizon 20202 Cooperative relationships between the Baltic Sea countries in the context of the 7th FRP and Horizon 20202
1 Nicht antragsberechtigt für Förderanträge im Rahmen der EU-Forschungsrahmenprogramme.Not eligible for funding applications within the context of the EU Framework Programmes.
2 Nur Mobilitätsströme mit einem Anteil von mind. 15% aller aus einem Ostseestaat in andere Ostseestaaten ausrei-senden Studierenden. Die vollständigen Daten zu dieser Abbildung können mit der Datentabelle heruntergeladen werden.Mobility flows including a proportion of at least 15% of all students from a Baltic Sea country entering other Baltic Sea countries. The complete data for this figure can be down-loaded with the data table.
Quelle Abb. F23, F24: EU-Büro des BMBF; DAAD-Berechnungen
7. Forschungsrahmenprogramm der EU Horizon 2020 (bis einschl. Februar 2017)
Dänemark Dänemark
Schweden Schweden
Finnland Finnland
Polen Polen
Estland Estland
Russland Russland
Lettland Lettland
Litauen Litauen
Deutschland Deutschland
1.697 569
2.731
2.075 67330470
1.058 143
753281
373222
237
546 258
6.0191.956
9.538
1621.028
351
339
339
233
1.697 1.214
5.185 1.706
w i sse n sc h a f t w e lto f f e n 2017162
a u s l ä n d i s c h e s t u d i e r e n d e | f o r e i g n s t u d e n t sf o k u s : a k a d e m i s c h e m o b i l i tät u n d k o o p e r at i o n i m o s t s e e r a u m
Warum ist der Ostseeraum aus Ihrer Sicht ein besonders interessantes Beispiel für das von Ihnen untersuchte „Region Building“?Neben den vielfältigen Aspekten regionaler Kontakte, Koope-rationen und Konflikte aus historischer Perspektive gab es im Ostseeraum seit den späten 1960er-Jahren das Wissen und das Bewusstsein eines grenzüberschreitenden, aber regional klar abgrenzbaren Problems: Man erkannte die Bedrohung des ausgesprochen fragilen Ökosystems Ostsee. Die Reduzie-rung des Eintrags von Nährstoffen und toxischen Substanzen konnte nur mit einer regional abgestimmten Politik erreicht werden, die in den 1970er-Jahren dann auch blockübergrei-fend mit der Helsinki-Kommission institutionalisiert wurde. Von diesem Nukleus ausgehend, erschien die Region nach dem Fall des Eisernen Vorhangs in den 1990er-Jahren als ein „Labor“ der europäischen Einigung. Mittlerweile sind jedoch auch hier verstärkte nationalistische Tendenzen zu erkennen, die zeigen, dass sich so ein Regionalisierungsprozess nicht automatisch weiterentwickelt. Erkennbar sind diese Tenden-zen vor allem an dem wachsenden Erfolg nationalkonservati-ver und rechtspopulistischer Parteien, der in fast allen Ostsee-anrainerstaaten zu beobachten ist. Sehr deutlich gegen eine engere Zusammenarbeit im Ostseeraum gerichtet ist dann natürlich vor allem die Politik der Länder, in denen solche Par-teien in Regierungsverantwortung sind.
Welche Rolle spielten und spielen die Hochschulen bei der Regionenbildung im Ostseeraum?Die Hochschulen sind zum einen Orte, an denen das Wissen, z.B. zum Ökosystem Ostsee, zu seiner Gefährdung und zu möglichen Gegenmaßnahmen generiert und verbreitet wird. Zum anderen gab und gibt es eine Reihe von Hochschulko-operatio-nen, die den Transformationsprozess der östlichen Anrainerstaaten begleiten und sich darüber hinaus weiteren Feldern der Zusammenarbeit – etwa im Bereich der Agrarwis-senschaft – widmen. Zudem wirkte von Anfang an eine Reihe von Wissenschaftlern aktiv am Region-Building-Prozess mit, indem sie genau diesen auf die wissenschaftliche Agenda setzten.
autor Dr. Stefan Ewert arbeitet als wissen-schaftlicher Mitarbeiter am Institut für Politik- und Kommunikationswissen-schaft der Universität Greifswald. Seine Promotion verfasste er zum Thema „Region Building im Ostseeraum? Zur Rolle der Hochschulen im Prozess der Regionalisierung im Nordosten der Europäischen Union“. Hierin unter-sucht er mit Blick auf den Region- Building-Ansatz und einem selbst ent-wickelten Index die Ostseeraumvernet-zung der Hochschulen in Mecklenburg-Vorpommern, Estland, Lettland und Litauen.
„Hochschulen nutzen Vernetzung im Ostseeraum als strategische Ressource“
interview
author Dr Stefan Ewert is a research associate at the Department of Politics and Communica-tion Studies at the University of Greifswald. His doctoral thesis, „Region building in the Baltic Sea area? On the role of higher edu-cation institutions in the regionalisation process in the north-east of the European Union“, examines networking between higher education institutions in Mecklen-burg-Western Pomerania, Estonia, Latvia and Lithuania by means of what is known as the region-building approach and a self-developed index.
Why do you consider the Baltic Sea area an especially interesting example of the “region building” you have examined?In addition to the multifaceted aspects of regional contacts, cooperations and conflicts from a historical point of view, since the late 1960s there has existed an understanding and awareness in the Baltic Sea area of a cross-border, but regionally clearly delimitable problem: it was recognised that the extremely fragile ecosystem of the Baltic Sea was endangered. Its contamination with nutrients and toxic substances could only be reduced through a regionally coordi-nated policy, which was indeed institutionalised across block lines with the Helsinki Commission in the 1970s. Based on this nucleus, after the fall of the Iron Curtain in the 1990s the region appeared to be a “laboratory” of European unification. However, increased nationalistic tendencies have now emerged here too, demonstrating that such an internationalisa-tion process does not progress automatically. These tendencies are apparent mainly in the growing success of nationalist conservative and right-wing populist parties which can be observed in almost all states bordering the Baltic Sea. The policies of those countries where such parties are in government are then of course very clearly opposed to closer collaboration in the Baltic region.
What role do higher education institutions play, and what role have they played in the past, in region building in the Baltic Sea area?On the one hand, higher education institutions are places where knowledge on the Baltic Sea ecosystem, on its endangerment and on possible countermeas-ures is generated and disseminated. On the other hand there are and have been in the past a whole range of higher education cooperations accompany-ing the transformation process of the eastern Baltic states and additionally working in other fields of cooperation – for example in Agriculture. Moreover, a number of academics have been actively involved in the region-building process from the start by putting this very process on the scientific agenda.
What were and are the main drivers of region building, in your opinion, and which research disciplines play a part here?In my opinion, the main drivers are on the one hand shared historic experiences and on the other hand current regional challenges such as the protection of the Baltic Sea ecosystem outlined above. These in turn often stretch across disciplines, as e.g. issues of
f o k u s | f o c u s 163
f o c u s : a c a d e m i c m o b i l i t y a n d co o p e r at i o n i n t h e b a lt i c s e a a r e a
Was waren und sind aus Ihrer Sicht die wichtigsten Treiber der Regionen- bildung und welche Forschungsdisziplinen spielen hierbei eine Rolle?Meines Erachtens sind zum einen die gemeinsamen historischen Erfahrungen und zum anderen die aktuellen regionalen Herausforderungen wie insbe- sondere der oben skizzierte Schutz des Ökosystems Ostsee die wichtigsten Treiber. Das wiederum erfolgt vielfach fächerübergreifend, da ja z.B. Fragen der Fragilität und des Schutzes der Ostsee auch viele wissenschaftliche Disziplinen berühren. Eine Lehr- und Forschungskooperation, die als Beispiel zu nennen ist und verschiedene Forschungsdisziplinen umschließt, wäre etwa das Graduiertenkolleg „Baltic Borderlands“ mit den beteiligten Universi-täten Lund, Tartu und Greifswald. Die Auswirkungen von Grenzen und Grenz-veränderungen in der Region werden hierbei aus historischer, linguistischer, ökonomischer, sozialpsychologischer, kultur- und politikwissenschaftlicher Perspektive untersucht.
Wurde die Hochschulkooperation im Ostseeraum eher „von unten“, also durch die Hochschulen selbst, oder eher „von oben“, also durch die Politik, angestoßen?Die meisten Projekte entstanden „bottom-up“. Beobachtbar ist zudem, dass Projekte, die z.B. zur Begleitung des Transformationsprozesses der rechts- und staatswissenschaftlichen Studiengänge im Baltikum und in Russland von oben angestoßen wurden, spätestens nach Auslaufen der Finanzierung nicht weitergeführt wurden. Von vielen regional vernetzten Wissenschaftlern wird daher der Eindruck geteilt, dass Kooperationen, die von den Hochschulen selber ausgehen, sich zum Teil nachhaltiger gestalten als von der Politik ini- tiierte Kooperationen.
Warum entscheiden sich bestimmte Hochschulen für eine starke regionale Kooperation und andere eher nicht?Zum einen spielt natürlich eine gewissermaßen strategische Überlegung mit Blick auf günstige Kooperationskonstellationen für Antragstellungen eine Rolle. Erkennbar ist jedoch auch, dass die Entscheidung der Hochschulleitung zur Teilnahme an regionalen Hochschulinitiativen wie dem „Baltic University Programme“ deutlich korreliert mit der regionalen Vernetzung der Hochschule in der Lehre (z.B. über Austauschprogramme) und der Forschung (z.B. über gemeinsame Publikationen). Manche Hochschulen nutzen ihre Vernetzung im Ostseeraum auch als strategische Ressource für weitere internationale Kooperationen. Eine Reihe von Hochschulen der Region ist z.B. im Netzwerk „ScanBalt“ organisiert, welches zum Ziel hat, die Sichtbarkeit dieser regio- nalen Kooperationen im Bereich Life Sciences/Bioökonomie weltweit zu er-höhen und Verbundprojekte in Wissenschaft und Wirtschaft zu koordinieren.
Gab oder gibt es bestimmte „Leuchtturmprojekte“, die als besonders wichtige Beispiele der Hochschulkooperation im Ostseeraum angeführt werden können?Ein Leuchtturm ist sicherlich das Baltic University Programme, in welchem mehr als 200 Universitäten der Region mitwirken. Ein Schwerpunkt ist hier die gemeinsame Curriculumentwicklung, z.B. zum Gewässerschutz und zu Fragen der regionalen Stabilität. Sowohl beim „Baltic University Programme“ als auch beim ähnlich gelagerten „Baltic Sea Region University Network“ handelt es sich mit Blick auf die Mitgliederzahlen um die größten hochschu-lischen Netzwerke der Region.
INTERVIEW „Higher education institutions use their networks in the Baltic Sea area as a strategic resource“
fragility and the protection of the Baltic Sea also touch on many scientific disciplines. A teaching and research cooperation that may serve as an example and involves multiple research disciplines would be the graduate college “Baltic Borderlands” in which the universities of Lund, Tartu and Greifswald are involved. It examines the effects of borders and border changes in the region from a historical, linguistic, economic, social psychology, cultural and political science perspective.
Was higher education cooperation in the Baltic Sea area initiated “bottom up”, i.e. by the higher education institutions themselves, or rather “top down”, i.e. by policy makers?Most of these projects began “bottom up”. It can moreover be observed that projects that were initiated “top down”, e.g. to accompany the transformation process of Law and Political Science degree programmes in the Baltic area and in Russia, were discontinued once funding ran out, if not before. Many regionally networked academics therefore share the impression that coopera-tions that are initiated by the higher education institutions themselves often develop more sustainably than those initiated by policy makers.
Why do some higher education institutions choose to cooperate heavily within the region while others do not?On the one hand, certain strategic considerations with regard to advantageous cooperation constellations for applications are of course a factor. It is however also evident that university managers’ decisions to participate in regional higher education initiatives such as the Baltic University Programme correlate significantly with the extent to which their higher education institutions are regionally networked in teaching (e.g. via exchange programmes) and research (e.g. via joint publications). Some higher education institutions also use their networks in the Baltic Sea area as a strategic resource for further international cooperation. A number of higher education institutions in the region are for example organised in the ScanBalt network, which aims to raise the profile of these regional cooperations in the life sciences/bioeconomics sector worldwide and coordinate joint projects in science and industry.
Are there or have there been certain “flagship projects” that could be considered especially important examples of higher education cooperation in the Baltic area?One flagship project is surely the Baltic University Programme, which involves more than 200 universities from the region. It focuses on joint curriculum development e.g. on water pollution prevention and on issues of regional stability. In terms of membership numbers, the Baltic University Programme and the similar Baltic Sea region University Network are the largest higher education networks in the region.
What, in your opinion, are the most important outcomes of increased higher education cooperation in the Baltic Sea area, and what are their effects beyond the higher education institutions?On the one hand, future decision-makers in regional and national administration are trained at universities, on the other hand universities of course also generate the knowledge that is needed for regional cooperation. With regard to historical awareness there were for example cooperation projects that developed e-learning modules on the history of the Baltic Sea for school pupils in the region. Knowledge on protecting the ecosystem, but also historical awareness of the region’s shared history and of historic lines of conflict thus have an impact from within the higher education institutions out into the region.
What opportunities and potential do you see for the future of higher education coopera-tion in the Baltic Sea area, and how do you believe they could best be accessed?An interesting question is surely to what extent the Baltic Sea area can be positioned as a joint higher education area in global competition. Initiatives aimed especially at teaching cooperations – so mainly at establishing double and joint degree programmes – are coming particularly from the smaller or less populated countries in the north and east of the region. I believe that a core focus arising from regional particularities and specific problems will be very important for such cooperations to attract attention and be effective in the long term.
w i sse n sc h a f t w e lto f f e n 2017164
a u s l ä n d i s c h e s t u d i e r e n d e | f o r e i g n s t u d e n t sf o k u s : a k a d e m i s c h e m o b i l i tät u n d k o o p e r at i o n i m o s t s e e r a u m
Welches sind aus Ihrer Sicht die wichtigsten Erträge einer verstärkten Hochschulkooperation im Ostseeraum und wie wirken diese auch über die Hochschulen hinaus?Zum einen werden die zukünftigen Ent-scheidungsträger in den regionalen und nationalen Verwaltungen an den Uni-versitäten ausgebildet, zum anderen wird hier natürlich auch das Wissen ge-neriert, welches für die regionale Zu-sammenarbeit wichtig ist. Mit Blick auf das historische Bewusstsein gab es beispielsweise Kooperationsprojekte, die E-Learning-Module zur Geschichte der Ostsee für Schülerinnen und Schü-ler in der Region entwickelten. Das Wis-sen zum Ökosystemschutz, aber auch das historische Bewusstsein über die gemeinsame Geschichte und histori-sche Konfliktlinien wirken somit aus den Hochschulen heraus in die Region hinein.
Welche Chancen und Potenziale sehen Sie für die Zukunft der Hochschul- kooperation im Ostseeraum und wie ließen sich diese aus Ihrer Sicht am besten erschließen?Eine spannende Frage ist sicherlich, in-wieweit es gelingen kann, den Ostsee-raum als gemeinsamen Hochschulraum im weltweiten Wettbewerb zu positio-nieren. Gerade aus den kleineren bzw. dünn besiedelten Anrainerstaaten im Norden und Osten der Region kommen hierzu Initiativen, die insbesondere auf Lehrkooperationen – also v.a. Double und Joint Degree Programme – abzie-len. Ein inhaltlicher Kern, der sich auf regionale Besonderheiten bzw. spezifi-sche Problemlagen ergibt, scheint mir dabei sehr wichtig, um langfristig wahr-genommen zu werden und Wirkung zu erzielen.
f o k u s | f o c u s 165
f o c u s : a c a d e m i c m o b i l i t y a n d co o p e r at i o n i n t h e b a lt i c s e a a r e a
Leuchtturmprojekte der akademischen Kooperation im Ostseeraum
spotlight
Baltic University Programme
Das Baltic University Programme (BUP) umfasst ein Netzwerk von 225 Universitäten und Hochschuleinrichtungen aus allen neun Ostseeländern sowie Norwegen, Weißrussland, Ukrai-ne, Slowakei und Tschechien und wird von der schwedischen Universität in Uppsala koordiniert. Themenschwerpunkte in-nerhalb des Programms sind Nachhaltigkeit, Demokratie und Umweltschutz in der Ostseeregion. In Deutschland befinden sich nationale BUP-Zentren an den Fachhochschulen (HAW) Hamburg und Zittau/Görlitz. Ziel ist es, Bachelor- und Mas-terprogramme hochschulübergreifend zu gestalten sowie ge-meinsame Forschungsprojekte zu fördern. Aktuell nehmen rund 10.000 Studierende am Baltic University Programme teil. Finanziert wird BUP u.a. durch die schwedische Regierung, EU-Förderprogramme und durch die Mitgliedsuniversitäten des Netzwerks.
Baltic Sea Region University Network
Das Baltic Sea Region University Network (BSRUN) wurde im Jahr 2000 durch 16 Hochschulen gegründet und hat mittler-weile 26 Mitglieder in Estland, Finnland, Lettland, Litauen, Polen, Russland, Weißrussland und Deutschland (Hochschu-le für Wirtschaft und Recht in Berlin). Durch das Netzwerk soll der Wissens- und Erfahrungsaustausch zwischen den einzel-nen Institutionen gefördert werden. Der Schwerpunkt dieses Austauschs liegt hierbei im Gegensatz zum Baltic University Programme nicht im Bereich Lehre und Forschung, sondern in den Bereichen Governance, Management und Verwaltung, wozu auch der Bereich Internationalisierung zählt. Ein weite-res wichtiges Ziel des Netzwerks ist die Unterstützung der akademischen Kooperation zwischen der EU, Russland, Weiß-russland und der Ukraine.
Baltic University Programme
The Baltic University Programme (BUP) comprises a network of 225 universities and higher education facilities from all nine Baltic countries as well as Norway, Belarus, Ukraine, Slovakia and the Czech Republic, and is coordinated by the University of Uppsala in Sweden. The programme focuses on sustainability, democracy and environmental protection in the Baltic region. In Germany there are national BUP centres at the universities of applied sciences of Hamburg and Zittau/Görlitz. The BUP aims to develop bachelor’s and master’s programmes across higher education institutions and fund joint research projects. Around 10,000 students are currently participating in the Baltic University Programme. The BUP is funded by the Swedish government, EU funding programmes and the network’s member universities, among others.
Baltic Sea Region University Network
The Baltic Sea Region University Network (BSRUN) was founded in 2000 by 16 higher education institutions; today it has 26 members in Estonia, Finland, Latvia, Lithuania, Poland, Russia, Belarus and Germany (Berlin School of Economics and Law). The network is intended to promote the exchange of knowledge and experience between the individual institutions. In contrast to the Baltic University Programme, this exchange focuses not on teaching and research but on governance, management and administration, which also includes internationalisation. A further important goal of the network is to support academic cooperation between the EU, Russia, Belarus and Ukraine.
Academic cooperation projects in the Baltic Sea area
Centre for Baltic and East European Studies
The Centre for Baltic and East European Studies (CBEES) is a research centre focusing on cross-disciplinary studies on the Baltic Sea area and Eastern Europe. The research network was founded in 2005 on the initiative of Södertörn University in Sweden and now includes 18 international cooperation partners. German members are the Herder Institute in Marburg, Humboldt University Berlin and its Department of Northern European Studies, and the University of Greifswald. In addition to providing funding through the research network, it offers researchers the opportunity to complete a doctorate in the “Doctoral level education at the Baltic and East European Graduate School” (BEEGS) programme.
BONUS-Programme
The BONUS transnational research and development programme bundles and funds cross-national European research activities in the Baltic region. The aim of the BONUS programme is to facilitate positive ecological and economic development in the Baltic region through sustainable use of resources and goods. Participating in BONUS are the Baltic states of Denmark, Germany, Estonia, Latvia, Lithuania, Poland, Finland and Sweden; Russia is involved on the basis of bilateral agreements. The member states want to jointly define long-term strategic priorities for marine research and technology development in the maritime sector in Europe and conduct targeted measures to emphasise common key areas of further scientific and technological development. The programme’s overall budget for the years 2013 to 2018 is 100 million euros, around half of which is contributed by the EU and the other half by national funding organisations.
w i sse n sc h a f t w e lto f f e n 2017166
a u s l ä n d i s c h e s t u d i e r e n d e | f o r e i g n s t u d e n t sf o k u s : a k a d e m i s c h e m o b i l i tät u n d k o o p e r at i o n i m o s t s e e r a u m
Centre for Baltic and East European Studies
Das „Centre for Baltic and East European Studies“ (CBEES) ist ein Forschungszentrum, in dessen Fokus disziplinübergreifen-de Studien zur Ostseeregion und Osteuropa stehen. Auf Ini- tiative der schwedischen Södertörn University wurde 2005 ein Forschungsnetzwerk gegründet, dem mittlerweile 18 in-ternationale Kooperationspartner angehören. Mitglieder von deutscher Seite sind das Herder-Institut in Marburg, die Hum-boldt-Universität Berlin und deren Nordeuropa-Institut sowie die Universität Greifswald. Neben der Förderung durch das Forschungsnetzwerk besteht für Forscher die Möglichkeit, im Rahmen der „Doctoral level education at the Baltic and East European Graduate School” (BEEGS) zu promovieren.
BONUS-Programm
Im Rahmen des transnationalen Forschungs- und Entwick-lungsprogramms BONUS werden zwischenstaatliche europäi- sche Forschungsaktivitäten im Ostseeraum gebündelt und gefördert. Ziel des BONUS-Programms ist eine positive öko-logische und wirtschaftliche Entwicklung der Ostseeregion, indem Ressourcen und Güter nachhaltig genutzt werden. An BONUS beteiligen sich die Ostseestaaten Dänemark, Deutsch-land, Estland, Lettland, Litauen, Polen, Finnland und Schwe-den. Russland nimmt auf Grundlage von bilateralen Abkom-men teil. Die Mitgliedsländer wollen gemeinsam langfristige strategische Prioritäten für die Meeresforschung und Techno-logieentwicklung im maritimen Bereich in Europa festlegen und durch gezielte Maßnahmen gemeinsame Schwerpunkte in der weiteren wissenschaftlich-technischen Entwicklung set-zen. Das Gesamtbudget für die Jahre 2013 bis 2018 beträgt 100 Millionen Euro, etwa die Hälfte dieser Mittel werden von der EU beigesteuert, die andere Hälfte von nationalen Förder-gremien.
CBEESCENTRE FOR BALTIC AND EAST EUROPEAN STUDIES
Nordic Water Network
The Nordic Water Network is designed to advance international research projects that work to find solutions for managing the effects of climate change and for improving water and sewage infrastructures. In addition, the network facilitates new approaches in joint teaching offering students interdisciplinary training on the subject of water. A further core area of the network lies in accrediting junior researchers. The network is jointly managed by the Department of Fluid System Dynamics at TU Berlin and the Water and Wastewater Engineering Group at NTNU Trondheim. Further partners are Aalborg University in Denmark and the Krakow University of Technology in Poland. The network will receive around 700,000 euros in funding from DAAD between 2015 and 2018.
BalticTRAM/ScienceLink
Lead by DESY in the Helmholtz Association, 14 project partners and five other organisations from all Baltic EU countries are cooperating within the BalticTRAM (Transnational Research Access in the Macroregion) project. BalticTRAM is developing national nodes – mainly at universities – in Sweden, Germany and Poland which as a network offer measuring and other services for industrial customers locally and in international exchange. The project is one of the activities of the ScienceLink network, a cooperation of leading universities, research centres and regional development partners in the Baltic region that aims to transfer academic findings more quickly into innovations. It is funded by the EU Baltic programme Interreg with around three million euros.
f o k u s | f o c u s 167
f o c u s : a c a d e m i c m o b i l i t y a n d co o p e r at i o n i n t h e b a lt i c s e a a r e a
Nordic Water Network
Mit dem „Nordic Water Network“ sollen internationale For-schungsprojekte vorangebracht werden, die an Lösungen zur Bewältigung der Folgen des Klimawandels und zur Verbesse-rung der Wasser- und Abwasserinfrastrukturen arbeiten. Dar-über hinaus ermöglicht das Netzwerk neue Ansätze in der ge-meinsamen Lehre, die eine interdisziplinäre Qualifizierung der Studierenden im Themenbereich Wasser anbietet. Ein weite-rer Kernbereich des Netzwerkes liegt in der Akkreditierung von Nachwuchswissenschaftlerinnen und -wissenschaftlern. Die gemeinsame Leitung des Netzwerks liegt beim Fachgebiet Flu-idsystemdynamik der TU Berlin und dem Fachgebiet für Was-ser und Abwasser der NTNU Trondheim. Als weitere Partner sind die Universität Aalborg in Dänemark und die Technische Universität Krakau in Polen beteiligt. Das Netzwerk wird von 2015 bis 2018 mit rund 700.000 Euro vom DAAD gefördert.
BalticTRAM/ScienceLink
Unter der Leitung des Deutschen Elektronen-Synchrotrons (DESY) in der Helmholtz-Gemeinschaft kooperieren 14 Projekt-partner und fünf weitere Organisationen aus dem EU-Ostsee-raum innerhalb des Projektes BalticTRAM (Transnational Re-search Access in the Macroregion). In dessen Rahmen werden in Schweden, Deutschland und Polen nationale Knotenpunk-te, insbesondere an Universitäten, aufgebaut, die als Netz-werk lokal und im internationalen Austausch Messungen und Service für Industriekunden anbieten. Das Projekt gehört zu den Aktivitäten des ScienceLink-Netzwerkes, einer Kooperation führender Universitäten, Forschungszentren und regionaler Entwicklungspartner in der Ostseeregion mit dem Ziel, wissen-schaftliche Erkenntnisse schneller in Innovationen zu über-führen. Es wird vom EU-Ostseeprogramm Interreg mit rund drei Millionen Euro gefördert.
Gute Erreichbarkeit, niedrige Sprachbarrieren und schnelle so-wie unkomplizierte Reisen und Begegnungsmöglichkeiten sind eher die praktischen Aspekte, die die HafenCity Universität Hamburg (HCU) darin bestärkt haben, 2013 in ihre Internatio-nalisierungsstrategie neben fachlichen und exzellenzorientier-ten Entwicklungsachsen auch einen regionalen Schwerpunkt in der Ostseeregion zu setzen.
Ausschlaggebend für die Etablierung strategischer Partner-schaften mit Universitäten aus anderen Ostseestaaten war jedoch die Attraktivität dieser Wissenschaftsregion, in der exzellente Universitäten überproportional vertreten sind. Da-bei steht für die HCU als kleine, thematisch fokussierte Uni-versität für Baukunst und Metropolenentwicklung das fachli-che Interesse im Vordergrund: So stehen die (Hafen-)Städte der Ostseeanrainer vor denselben stadtplanerischen, städte-baulichen und architektonischen Herausforderungen wie die Metropolregion Hamburg: stetiger Bevölkerungszuwachs, der ganz neue Anforderungen an Wohnungsbau, Erholung und Mobilität mit sich bringt, demografischer Wandel, Transfor-mation von Hafengebieten, neue Formen von Partizipation bei Realisierung von städtischen Großprojekten. Diese themati-schen Überschneidungen bieten ein großes Spektrum an ge-meinsamen Forschungsthemen, die gefundenen Erkenntnisse und Lösungen sind weitgehend transferierbar. Davon profitiert auch die Wirtschaftsregion. Hinzu kommt eine kulturelle Ver-bundenheit der Ostseeanrainer untereinander, die geprägt ist durch eine – in Teilen – gemeinsame Geschichte. Durch ihre Seefahrertradition stand die gesamte Region in engen Kultur- und Handelsbeziehungen, die Austausch und Kooperation be-günstigt haben.
Es kooperieren jedoch nicht Institutionen miteinander, son-dern Menschen. Um die Kooperationen mit den wissenschaft-lichen Institutionen in den Metropolregionen der Schwer-punktländer nachhaltig aufzubauen und zu fördern, wurde daher an der HCU die Position – oder besser die Aufgabe – der „Liaison-Professur“ geschaffen. Dabei handelt es sich um Professorinnen und Professoren der HCU, die mit einer die-ser Partneruniversitäten im engen kontinuierlichen Austausch stehen und als zentrale Ansprechpartner für alle Kontakte der Partneruniversität fungieren.
Zusätzlich wurde als eine jährliche Begegnungsplattform eine Sommerakademie ins Leben gerufen, in der seit 2015 jedes Jahr ca. 70 Nachwuchswissenschaftler der Partneruniversitä-ten in Hamburg an der HCU zusammenkommen und in inter-kulturellen und interdisziplinären Teams zu städtischen Ent-wicklungsthemen forschen. Die Baltic International Summer School (B.I.S.S.) ist inzwischen ein wesentlicher Baustein in der strategischen Vernetzung der HCU mit den Partneruniver-sitäten in der Ostseeregion. So entstehen jedes Jahr aus den Begegnungen weitere bi- oder multilaterale Forschungs- und Lehrkooperationen oder die Teilnahme an Berufungsverfahren.
Die erste Summer School (2015) wurde aus den Mitteln der Landesforschungsförderung gefördert. Heute ist die Sommer-akademie ein fester Baustein im EU-Projekt „BeInterBaltic“, das interdisziplinäre Lehrmethoden erforscht und im Rahmen der Erasmus+-Linie zu strategischen Partnerschaften gefördert wird. Aus dem Netzwerk dieses Projekts ist eine Community aus Nachwuchswissenschaftlern entstanden, die sich bereits in der Vorbereitung eines Horizon-2020-Projektes befindet und auch schon in weiteren Forschungsprojekten zusammen aktiv ist.
Bereits heute merken wir die positiven Aspekte, die aus der strategischen Vernetzung erwachsen: So ist die HCU inzwi-schen eine gefragte Partnerin für politische und wissenschaft-liche Akteure im Ostseeraum – sei es als Projektpartner in Lehr- und Forschungskooperationen, als Veranstaltungsort wie bei der Creative with Aarhus Exhibition 2015, in der das dä-nische Kronprinzenpaar die junge Universität in der HafenCi-ty besuchte, oder als Gastgeber der Fehmarnbelt Days 2016 mit über 700 Besuchern aus Politik, Wirtschaft und Zivilgesell-schaft der Region.
w i sse n sc h a f t w e lto f f e n 2017168
a u s l ä n d i s c h e s t u d i e r e n d e | f o r e i g n s t u d e n t sf o k u s : a k a d e m i s c h e m o b i l i tät u n d k o o p e r at i o n i m o s t s e e r a u m
Der Ostseeraum als strategischer Fokus der Hochschulinternationalisierung –
die HafenCity Universität Hamburg
gastbeitrag
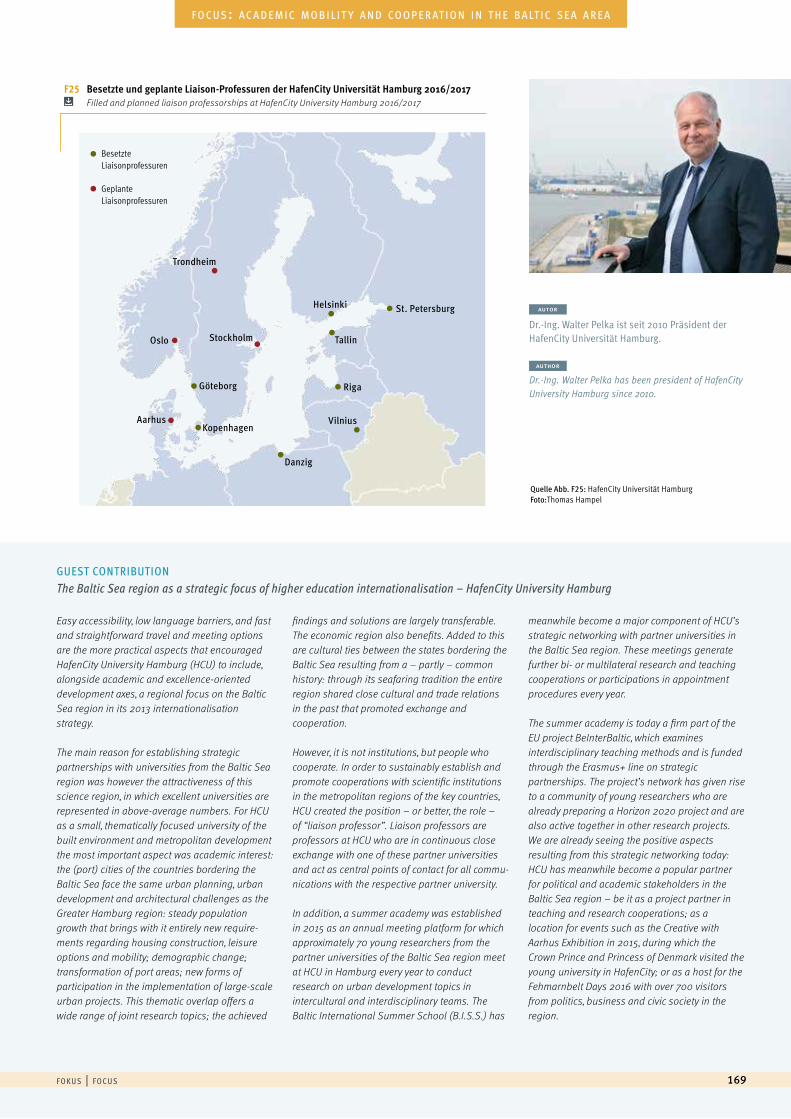
f o k u s | f o c u s 169
f o c u s : a c a d e m i c m o b i l i t y a n d co o p e r at i o n i n t h e b a lt i c s e a a r e a
autor Dr.-Ing. Walter Pelka ist seit 2010 Präsident der HafenCity Universität Hamburg.
author Dr.-Ing. Walter Pelka has been president of HafenCity University Hamburg since 2010.
F25 Besetzte und geplante Liaison-Professuren der HafenCity Universität Hamburg 2016/2017 Filled and planned liaison professorships at HafenCity University Hamburg 2016/2017
Easy accessibility, low language barriers, and fast and straightforward travel and meeting options are the more practical aspects that encouraged HafenCity University Hamburg (HCU) to include, alongside academic and excellence-oriented development axes, a regional focus on the Baltic Sea region in its 2013 internationalisation strategy.
The main reason for establishing strategic partnerships with universities from the Baltic Sea region was however the attractiveness of this science region, in which excellent universities are represented in above-average numbers. For HCU as a small, thematically focused university of the built environment and metropolitan development the most important aspect was academic interest: the (port) cities of the countries bordering the Baltic Sea face the same urban planning, urban development and architectural challenges as the Greater Hamburg region: steady population growth that brings with it entirely new require-ments regarding housing construction, leisure options and mobility; demographic change; transformation of port areas; new forms of participation in the implementation of large-scale urban projects. This thematic overlap offers a wide range of joint research topics; the achieved
findings and solutions are largely transferable. The economic region also benefits. Added to this are cultural ties between the states bordering the Baltic Sea resulting from a – partly – common history: through its seafaring tradition the entire region shared close cultural and trade relations in the past that promoted exchange and cooperation.
However, it is not institutions, but people who cooperate. In order to sustainably establish and promote cooperations with scientific institutions in the metropolitan regions of the key countries, HCU created the position – or better, the role – of “liaison professor”. Liaison professors are professors at HCU who are in continuous close exchange with one of these partner universities and act as central points of contact for all commu- nications with the respective partner university.
In addition, a summer academy was established in 2015 as an annual meeting platform for which approximately 70 young researchers from the partner universities of the Baltic Sea region meet at HCU in Hamburg every year to conduct research on urban development topics in intercultural and interdisciplinary teams. The Baltic International Summer School (B.I.S.S.) has
meanwhile become a major component of HCU’s strategic networking with partner universities in the Baltic Sea region. These meetings generate further bi- or multilateral research and teaching cooperations or participations in appointment procedures every year.
The summer academy is today a firm part of the EU project BeInterBaltic, which examines interdisciplinary teaching methods and is funded through the Erasmus+ line on strategic partnerships. The project’s network has given rise to a community of young researchers who are already preparing a Horizon 2020 project and are also active together in other research projects. We are already seeing the positive aspects resulting from this strategic networking today: HCU has meanwhile become a popular partner for political and academic stakeholders in the Baltic Sea region – be it as a project partner in teaching and research cooperations; as a location for events such as the Creative with Aarhus Exhibition in 2015, during which the Crown Prince and Princess of Denmark visited the young university in HafenCity; or as a host for the Fehmarnbelt Days 2016 with over 700 visitors from politics, business and civic society in the region.
GUEST CONTRIBUTIONThe Baltic Sea region as a strategic focus of higher education internationalisation – HafenCity University Hamburg
Trondheim
Oslo
Helsinki
Stockholm
Göteborg
Kopenhagen
Danzig
Vilnius
Riga
Tallin
St. Petersburg
Aarhus
Besetzte Liaisonprofessuren
Geplante Liaisonprofessuren
Quelle Abb. F25: HafenCity Universität HamburgFoto:Thomas Hampel
Ausländische StudierendeAlle Studierenden mit ausländischer Staatsangehörigkeit inkl. staatenloser Studierender und Studierender mit dop-pelter Staatsbürgerschaft, d.h. sowohl Bildungsausländer als auch Bildungsinländer.
BildungsausländerStudierende mit ausländischer Staatsangehörigkeit (oder Staatenlose), die ihre Hochschulzugangsberechtigung an einer ausländischen Schule erworben haben.
BildungsinländerStudierende mit ausländischer Staatsangehörigkeit (oder Staatenlose), die ihre Hochschulzugangsberechtigung an einer deutschen Schule erworben haben.
BrückenmobilitätStudienbezogene Auslandsaufenthalte zwischen dem Abschluss eines inländischen Bachelorstudiums und der Aufnahme eines Masterstudiums.
Credit MobilityStudienbezogene Auslandsaufenthalte im Rahmen eines Inlandsstudiums, die mindestens drei Monate dauern und/oder bei denen mindestens 15 ECTS-Punkte erworben wer-den (vgl. Mobilitätsstrategie der Bologna-Staaten von 2012).
Degree Mobility/Abschlussbezogene AuslandsmobilitätStudium an einer ausländischen Hochschule mit der Absicht, dort auch einen Studienabschluss zu erwerben.
GefördertengruppenZu den Gefördertengruppen zählen hier:
Postgraduierte | Personen mit einem Hochschulabschluss, die gefördert werden, um als Ausländer in Deutschland oder als Deutscher im Ausland an einer Dissertation zu ar-beiten, sowie Personen, die nach Abschluss ihres Studi-ums auch ohne Promotionsabsichten ein Mobilitätsstipen-dium erhalten.
Postdoktoranden (Postdocs) | Personen mit abgeschlos-sener Promotion, deren Aufenthalt in Deutschland bzw. im Ausland gefördert wird, damit sie sich durch Forschung weiterqualifizieren. Dazu gehören auch Hochschullehrer sowie erfahrene wissenschaftliche Mitarbeiter von Hoch-schulen und Forschungsinstituten.
Internationale Studierende/International mobile StudierendeStudierende, die für ihr Studium international mobil wer-den, d.h. nationale Grenzen überschreiten, um von ihrem Herkunftsland in ihr Gastland zu gelangen.
PrüfungsjahrEin Prüfungsjahr umfasst die Absolventen eines Winter- semesters und des nachfolgenden Sommersemesters. Die Zahl der „Absolventen 2014“ ist die Summe der Zahl der Absolventen des Wintersemesters 2013/14 und des Sommersemesters 2014.
StudienanfängerAusländische Studienanfänger in Deutschland sind Stu-dierende an einer deutschen Hochschule im 1. Hochschul-semester (Studienanfänger im 1. Hochschulsemester) oder im 1. Fachsemester (Studienanfänger im 1. Fachsemester). Als deutsche Studienanfänger im Ausland werden in den meisten Ländern Studierende gezählt, die zum Erhebungs-zeitpunkt zum ersten Mal in der Studierendenstatistik er-scheinen – unabhängig davon, in welchem Semester sie eingeschrieben sind. Es handelt sich dabei also teilweise auch um Studierende in höheren Semestern. StudienartenZu den Studienarten zählen:
Erststudium | Studium, das zu einem ersten Hochschulab-schluss führt.
Promotionsstudium | Studium mit dem Abschlussziel Promotion nach einem abgeschlossenen Erststudium.
Weiterführendes Studium | Studium nach Abschluss eines Erststudiums; zu einem weiterführenden Studium gehören Zweitstudium, Aufbaustudium, Ergänzungs-, Erweiterungs- und Zusatzstudium, Kontakt-/Weiterbildungsstudium, nicht konsekutives und konsekutives Masterstudium.
StudienjahrHier verwendet als Bezugsgröße für die Bestimmung der Anzahl von Studierenden bzw. Studienanfängern. Bei Stu-dierenden gilt die Zahl der Studierenden eines Winterse-mesters als Jahreszahl. In „Wissenschaft weltoffen“ sind die Studierenden des Wintersemesters 2014/15 als die Studierenden des Studienjahres 2015 definiert. Für die Studienanfänger ist festgelegt, dass die Summe der An-zahl der Studienanfänger eines Sommersemesters und des nachfolgenden Wintersemesters die Jahreszahl ist. Die Studienanfänger des Studienjahres 2014 sind die Studien-anfänger des Sommersemesters 2014 und des Winterse-mesters 2014/15.
Studierende in höheren SemesternJe nach Befragungsstudie existieren unterschiedliche Definitionen. In der DSW-Sozialerhebung werden alle Uni-Studierenden im 9. bis 14. Hochschulsemester und alle FH-Studierenden im 7. bis 11. Hochschulsemester als Studierende im höheren Semester betrachtet. In der DAAD/DZHW-Mobilitätsstudie gelten hingegen abschluss-spezifische Semestergrenzen: Bachelor: 5.–10. HochschulsemesterMaster: 3.–6. FachsemesterStaatsexamen: 8.–12. HochschulsemesterDiplom/Magister: 9.–14. Hochschulsemester (Uni) 7.–11. Hochschulsemester (FH).
Temporäre studienbezogene AuslandsaufenthalteStudienbezogene Auslandsaufenthalte im Rahmen eines Inlandsstudiums; im Unterschied zur Credit Mobility um- fassen sie alle Auslandsaufenthalte, auch jene, die kürzer als drei Monate dauern oder bei denen weniger als 15 bzw. überhaupt keine ECTS-Punkte erworben werden.
Transnationale Bildungsprojekte (TNB)Transnationale Bildungsprojekte sind Studienangebote, für die eine Hochschule aus dem Ausland die wesentliche akademische Verantwortung trägt. Darunter werden hier nur TNB-Studiengänge, TNB-Fakultäten, Branch Campuses – d.h. Ausgründungen bzw. Filialen von Universitäten im Ausland – und binationale Hochschulen verstanden, d.h. keine Doppelabschlussprogramme oder Fernlehrangebote.
Wissenschaftler/ForscherUnter Wissenschaftlern bzw. Forschern werden im Rahmen von „Wissenschaft weltoffen“ Personen verstanden, die sich beruflich mit der Konzipierung und Veröffentlichung neuer Erkenntnisse befassen und im Rahmen ihrer öffent-lich finanzierten oder geförderten Forschung Konzepte, Theorien, Modelle, Instrumente, EDV-Programme oder Methoden entwickeln oder verbessern.
Wissenschaftliches und künstlerisches HochschulpersonalDas wissenschaftliche und künstlerische Hochschulper-sonal umfasst laut Hochschulstatistik Professoren (ein-schließlich Gast-, Honorar- und außerplanmäßiger Profes-soren), Dozenten und Assistenten, wissenschaftliche und künstlerische Mitarbeiter, Lehrkräfte für besondere Auf-gaben, Emeriti, Lehrbeauftragte, Privatdozenten, wissen-schaftliche und studentische Hilfskräfte sowie Tutoren.
Academic and artistic staff at a higher education institutionAcademic and artistic university staff as reported in the higher education statistics includes professors (incl. visit-ing, honorary and extraordinary professors), lecturers and teaching assistants, research assistants and art assistants, specialised teaching staff, emeriti, contract teachers, pri-vate lecturers, student research assistants and tutors.
Academic yearUsed here as a reference parameter to determine the num-ber of students or first-year students. In the case of stu-dents, the annual figure is equal to the number of students in the winter semester. In “Wissenschaft weltoffen”, the students of the winter semester 2013/14 are defined as the students of the 2014 academic year. Concerning the ERAS-MUS statistics, an academic year starts in the winter se-mester and ends in the summer semester of the following year. The 2014 academic year, for example, includes the winter semester 2013/14 and the summer semester 2014.
Academics and researchersIn “Wissenschaft weltoffen”, academics and researchers are understood to be professionals engaged in the con-ception and publication of new knowledge, who conduct publicly funded or supported research and improve or de-velop concepts, theories, models, techniques, instrumen-tation, software or operational methods.
BildungsauslaenderStudents who are foreign nationals (or stateless students) and who have obtained their higher education entrance qualification at a foreign school.
BildungsinlaenderStudents who are foreign nationals (or stateless students) and who have obtained their higher education entrance qualification at a German school.
Bridge MobilityStudy-related visits abroad between completing a bachelor’s course in Germany and commencing a master’s course.
Credit MobilityStudy-related visits abroad as part of a course at a Ger-man higher education institution, which last at least three months and/or during which at least 15 ECTS credits are gained (c.f. Mobility strategy 2020 for the European Higher Education Area, 2012).
Degree Mobility/Degree-related international mobilityStudy at a foreign higher education institution, with the intention of gaining a degree there.
First-year studentsForeign first-year students in Germany are, as a rule, stu-dents in their first semester of studies at a German high-er education institution. In most other countries, German first-year students abroad are those students who, during the course of the reporting period, enter any programme in the given country for the first time, irrespective of whether the students enter the programme at the beginning or at an advanced stage of the programme. Thus, there are also students in later semesters among this group of students.
Foreign studentsAll students who are foreign nationals (incl. stateless stu-dents and students with dual citizenship), i.e.both Bil-dungsauslaender and Bildungsinlaender.
w i sse n sc h a f t w e lto f f e n 2017170
g l o s s a r g l o s s a r y
anhang | appendix
Funded groups“Wissenschaft weltoffen” differentiates between the following funded groups:
Postgraduates | Holders of a master’s or equivalent academ-ic degree who receive funding either as foreigners in Germa-ny or as Germans abroad to enable them to work on a doctoral dissertation or thesis, and individuals who, after completing their studies, receive a research grant.
Postdocs | Holders of a doctorate who receive funding for vis-its to Germany or abroad in order to conduct research and gain further qualifications. Lecturers and experienced aca-demic staff at higher education and research institutions are also included here.
Graduation yearA graduation year includes the graduates of a winter semester and of the following summer semester. The number of “2014 graduates” is the sum total of the number of graduates of the winter semester 2013/14 and of the summer semester 2014.
International students / Internationally mobile studentsStudents who are getting internationally mobile for their stu-dies, i.e. who cross national borders from their country of ori-gin to their host country.
Students in later semesters The definitions vary, depending on the survey. In the DSW Social Survey, all university students in the 9th to 14th semes-ter of higher education and all FH students in the 7th to 11th semester of higher education are regarded as students in later semesters. In the DAAD/DZHW Mobility Study, on the other hand, the number of semesters depends on specific degrees: Bachelor: 5th–10th semester of higher education, Master: 3rd–6th specialist semester, state examination: 8th–12th semester of higher education, Diploma/Magister: 9th–14th semester (U), 7th–11th semester (UAS).
Temporary/intermittent study-related visits abroadStudy-related visits abroad as part of a course at a German higher education institution; unlike with Credit Mobility, they encompass all visits abroad, including those lasting less than three months, or where fewer than 15 ECTS credits are gained, or none at all.
Transnational Education Projects (TNE)Transnational Education projects are study programmes for which a foreign higher education institution bears the main academic responsibility. The definition used here includes only TNE study programmes, branch campuses and binational higher education institutions. It explicitly excludes double de-gree programmes and distance learning programmes.
Types of studyThe different types of study are as follows:
First-degree course | Studies that culminate in the award of a first academic degree.
(Post)graduate studies | Studies undertaken after the comple-tion of a first degree. (Post)graduate studies include second degree courses, postgraduate courses, extension and comple-mentary studies, refresher courses and continuing training.
Doctoral studies | Studies undertaken after the completion of a first degree and with the aim of obtaining a doctorate.
Barnett,G.A.u.a.(2016):Theflowofinternationalstudentsfromamacroperspective:anetworkanalysis.In:Compare46(4):533–559
Bonny,C./Kosmützky,A.(2015):InternationaleMobilitätvonNachwuchswissenschaftlerinnenundNachwuchswissenschaftlerninDeutschland.INCHERWorkingPaper4,Kassel
Børing,P.u.a.(2015):Internationalmobility:FindingsfromasurveyofresearchersintheEUIn:ScienceandPublicPolicy42:811–826
BritishCouncil(2015):Theshapeofinternationaleducationto2025
Choudaha,R.(2017):Threewavesofinternationalstudentmobility(1999–2020).In:StudiesinHigherEducation42:825–832
Conchi,S./Michels,C.(2014):Scientificmobility–AnanalysisofGermany,Austria,FranceandGreatBritain.FraunhoferISIDiscussionPapersInnovationSystemsandPolicyAnalysis,No.41,Karlsruhe
DAAD/IW(2016):HochschulabsolventenmitAus-landserfahrungenaufdemdeutschenArbeitsmarkt.Bonn/Köln
Didelon,C./Richard,Y.(2012):TheEuropeanUnionintheflowsofinternationalstudents:attractivenessandinconsistency.In:InternationalReviewofSociology22(2):229–244
Esser,M.u.a.(2014):ErgebnisberichtzurEvaluierungdesProgrammsSTIBETIundSTIBETIIIMatchingFunds.StudieimAuftragdesDAAD.Bonn
Ewert,S.(2012):RegionBuildingimOstseeraum:ZurRollederHochschulenimProzessderRegio-nalisierungimNordostenderEuropäischenUnion.Wiesbaden
Finger,C./Netz,N.(2016):NeueUngleichheitenimdeutschenHochschulsystem?InternationaleStudierendenmobilitätzwischen1991und2012.Berlin
Gänzle,S./Kern,K.(2016):A‘Macro-regional’EuropeintheMaking:TheoreticalApproachesandEmpiri-calEvidence.Houndmills,Basingstoke,Hampshire
Geuna,A.(Hg.)(2015):GlobalMobilityofResearchScientists:TheEconomicsofwhogoeswhereandwhy.SanDiego
Grabheretal.(2014):StudentmobilityintheEHEA:Underrepresentationinstudentcreditmobilityandimbalancesindegreemobility.Projektbericht,InstitutfürHöhereStudien(IHS),Wien
Gruber,S.u.a.(2016):PerformanceandStructuresoftheGermanScienceSystem2015.Berlin
Hanganu,E./Heß,B.(2014):Beschäftigungauslän-discherAbsolventendeutscherHochschulen.ErgebnissederBAMF-Absolventenstudie2013.Nürnberg
Hanganu,E.(2015):Bleibequotenvoninternatio-nalenStudierendenimZielstaaten-Vergleich.Nürnberg
Kritz,M.M.(2016):WhyDoCountriesDifferinTheirRatesofOutboundStudentMobility?In:JournalofStudiesinInternationalEducation20(2):99–117
Knight,J./McNamara,J.(2017):Transnationaleduca-tion:aclassificationframeworkanddatacollectionguidelines.London
Lindberg,E.u.a.(2014):Braindrainorbraincircula-tion?Careerpathsofinternationalstudents.Zürich
Lörz,M.u.a.(2016):Whydostudentsfromunderpri-vilegedfamilieslessoftenintendtostudyabroad?In:HigherEducation,72(2):153–174
Netz,N.(2014):DerZugangzustudienbezogenenAuslandsaufenthaltenausSichtvonHochschul-politikundHochschulforschung:EineBestands-aufnahme.Banscherus,U.u.a.(Hg.):ÜbergängeimSpannungsfeldvonExpansionundExklusion.EineAnalysederSchnittstellenimdeutschenHoch-schulsystem.Bielefeld
Netz,N./Jaksztat,S.(2016):ExplainingScientists’PlansforInternationalMobilityfromaLifeCoursePerspective.In:ResearchinHigherEducation(firstonline):1–23
Netz,N./Schirmer,H.(2017):InternationaleMobi-litätvonwissenschaftlichemNachwuchs.StudienimRahmendesBundesberichtsWissenschaftlicherNachwuchs(BuWiN)2017.Hannover
Neumeyer,S./Pietrzyk,I.(2016):HatdieBildungsher-kunfteinenEinflussaufdieDauerunddieArtderAuslandsmobilitätundfallsja,warum?In:BeiträgezurHochschulforschung,38(3):108–127
OECD(2016):EducationataGlance2016:OECDIndicators.Paris
OECD(2015):OECDScience,TechnologyandIndustryScoreboard2015:Innovationforgrowthandsociety.Paris
Schumacher,T.(2016):InternationalMobilityofResearchersintheBalticSeaRegion.Kiel
Shields,R.(2013):GlobalizationandInternationalStudentMobility:ANetworkAnalysis.In:ComparativeEducationReview57(4):609–636
Shields,R.(2016):Reconsideringregionalisationinglobalhighereducation:studentmobilityspacesoftheEuropeanHigherEducationArea.In:Compare,46(1):5–23
Stiller,S./Wedemeier,J.(2011):ZukunftOstseeraum:PotenzialeundHerausforderungen.HWWIPolicyReportNr.16.Hamburg
Wegner,A.(2016):InternationaleNachwuchswissen-schaftlerinDeutschland:Motivation-Integration-Förderung–ErgebnisseeinerbundesweitenStudie.Bielefeld
Wissenschaftsrat(2017):BestandsaufnahmeundEmpfehlungenzustudiengangsbezogenenKooperationen:Franchise-,Validierungs-undAnrechnungsmodelle.Berlin
Woisch,A./Willige,J.(2015):InternationaleMobilitätimStudium2015:ErgebnissederfünftenBefragungdeutscherStudierenderzurstudien-bezogenenAuslandsmobilität.Hannover
Unterwww.wissenschaft-weltoffen.de/links findenSieeinenAnhangmitAngabenzurDatenlageundzurValiditätderverwendetenDatensowieeineLinklisterelevanterQuellen.
a n h a n g | a p p e n d i x 171
q u e l l e n a n g a b e n | r e f e r e n c e s
Studierende StudentsAusländische Studierende foreign/non-citizen studentsAusreisende Studierende outgoing studentsBildungsausländer Bildungsauslaender (non-resident students)Bildungsinländer BildungsinlaenderDeutsche Studierende German studentsEinreisende Studierende incoming studentsInternationale Studierende international students Keine Angabe n.s. (not specified)
Fächergrupıpen Subject groupsAgrar-, Forst- und Ernährungs- Agricultural, Forestry, Nutritional wissenschaften Sciences
Geisteswissenschaften HumanitiesHumanmedizin, Gesundheits- Human Medicine, Healthcare Science wissenschaften
Ingenieurwissenschaften EngineeringKunst/Kunstwissenschaft Art/Art HistoryMathematik, Naturwissenschaften Mathematics, Natural SciencesRechts-, Wirtschafts- und Sozial- Law, Economics/Business wissenschaften Administration, Social Sciences
Sport SportSprach- und Kulturwissenschaften Languages, Cultural StudiesVeterinärmedizin Veterinary Medicine
Studienbereiche Fields of studyAgrarwissenschaften, Lebensmittel- und Agricultural Sciences, Food and Getränketechnik Beverage Technology
Anglistik, Amerikanistik English Studies, American StudiesArchitektur, Innenarchitektur Architecture, Interior DesignBauingenieurwesen Civil EngineeringElektrotechnik Electrical EngineeringErziehungswissenschaft EducationGermanistik (Deutsch, germanische German Studies (German, Germanic Sprachen) languages)
Geschichte HistoryGestaltung DesignHumanmedizin Human MedicineInformatik Computer ScienceIngenieurwesen allgemein Engineering Maschinenbau, Verfahrenstechnik Mechanical/Process EngineeringMathematik MathematicsMusik, Musikwissenschaft Music, MusicologyPolitikwissenschaft Political SciencesRechtswissenschaft LawSozialwesen Social Work and Social EducationsWirtschaftsingenieurwesen Industrial Engineering Wirtschaftswissenschaften Economics, Business Administration
Deutschland GermanyBaden-Württemberg Baden-WuerttembergBayern BavariaBerlin BerlinBrandenburg BrandenburgBremen BremenHamburg HamburgHessen HesseMecklenburg-Vorpommern Mecklenburg-Western PomeraniaNiedersachsen Lower SaxonyNordrhein-Westfalen North Rhine-WestphaliaRheinland-Pfalz Rhineland-PalatinateSaarland SaarlandSachsen SaxonySachsen-Anhalt Saxony-AnhaltSchleswig-Holstein Schleswig-HolsteinThüringen ThuringiaLänder insgesamt Total
Regionen RegionsAfrika AfricaAmerika AmericaAsien AsiaAustralien und Ozeanien Australia and OceaniaEuropa EuropeLateinamerika Latin America Mittel- und Südosteuropa Central and South Eastern EuropeNordafrika und Nahost Middle East and North AfricaNordamerika North AmericaOstafrika East AfricaOstasien East AsiaOsteuropa Eastern EuropePazifik PacificSubsahara-Afrika Sub-Saharan Africa Südasien South Asia Südostasien South East AsiaVorderasien (Mittlerer Osten) Middle EastWestafrika West AfricaWesteuropa Western EuropeZentralafrika Central AfricaZentralasien Central AsiaGastland host countryGastregionen host regionsHerkunftsland country of originHerkunftsregionen regions of origin
Abschlussart Type of degreeAbschlüsse degreesAbschlüsse insgesamt total (of all degrees)Bachelor/Master bachelor’s degree/master’s degreeDiplom/Magister German “Diplom”/“Magister”Kein Abschluss angestrebt not studying for a degreePromotion Doctorate/PhDSonstige Abschlüsse other degrees
Studienart Type of studyErststudium first degree coursePromotionsstudium Doctoral studiesWeiterführendes Studium (Post)graduate studies
Personal StaffHauptberuflich full-timeNebenberuflich part-timePostdoktoranden post-docsPostgraduierte postgraduatesProfessoren professorsStudierende insgesamt total (of all students)
Hochschulen und außerhochschulische Higher education institutions and Einrichtungen institutions outside the higher
education sector
Alexander v. Humboldt-Stiftung Alexander v. Humboldt Foundation (AvH)Fachhochschulen (FH) universities of applied sciences (UAS)Förderorganisationen funding organisations Fraunhofer-Gesellschaft Fraunhofer-Gesellschaft (FhG) Helmholtz-Gesellschaft Helmholtz Association (HGF)Hochschulen insgesamt total (of all higher education
institutions)
Kunst- und Musikhochschulen Colleges of Art and MusicLeibniz-Gemeinschaft Leibniz Association (WGL)Marie-Skłodowska-Curie-Maßnahmen Marie Skłodowska-Curie Actions Max-Planck-Gesellschaft Max Planck Society (MPG)Universitäten (Uni, U) universities (U)Zentrale Einrichtungen insgesamt total of central institutions (mit Hochschulkliniken) (incl. higher education hospitals)
w i sse n sc h a f t w e lto f f e n 2017172
i m p o r ta n t t e r m s f r o m ta b l e s a n d g r a p h s i n e n g l i s h
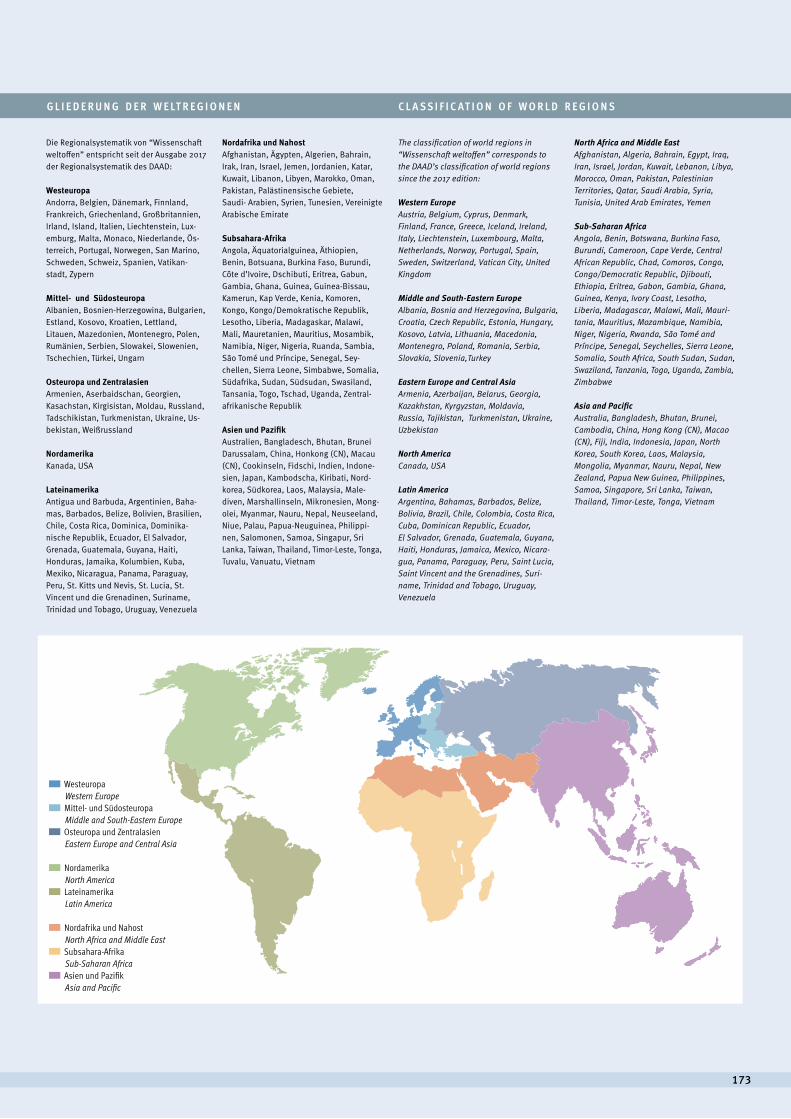
g l i e d e r u n g d e r w e lt r e g i o n e n c l a s s i f i c at i o n o f w o r l d r e g i o n s
173Ohne regionale EinteilungAsien, Pazi�kAfrika SubsaharaNahost, NordafrikaLateinamerikaNordamerikaOsteuropa, Zentralasien und SüdkaukasusMittel- und SüdosteuropaWest-, Nord- und Südeuropa
Die Regionalsystematik von “Wissenschaft weltoffen” entspricht seit der Ausgabe 2017 der Regionalsystematik des DAAD:
Westeuropa Andorra, Belgien, Dänemark, Finnland, Frankreich, Griechenland, Großbritannien, Irland, Island, Italien, Liechtenstein, Lux-emburg, Malta, Monaco, Niederlande, Ös-terreich, Portugal, Norwegen, San Marino, Schweden, Schweiz, Spanien, Vatikan-stadt, Zypern
Mittel- und SüdosteuropaAlbanien, Bosnien-Herzegowina, Bulgarien, Estland, Kosovo, Kroatien, Lettland, Litauen, Mazedonien, Montenegro, Polen, Rumänien, Serbien, Slowakei, Slowenien, Tschechien, Türkei, Ungarn
Osteuropa und Zentralasien Armenien, Aserbaidschan, Georgien, Kasachstan, Kirgisistan, Moldau, Russland, Tadschikistan, Turkmenistan, Ukraine, Us-bekistan, Weißrussland
Nordamerika Kanada, USA
Lateinamerika Antigua und Barbuda, Argentinien, Baha-mas, Barbados, Belize, Bolivien, Brasilien, Chile, Costa Rica, Dominica, Dominika- nische Republik, Ecuador, El Salvador, Grenada, Guatemala, Guyana, Haiti, Honduras, Jamaika, Kolumbien, Kuba, Mexiko, Nicaragua, Panama, Paraguay, Peru, St. Kitts und Nevis, St. Lucia, St. Vincent und die Grenadinen, Suriname, Trinidad und Tobago, Uruguay, Venezuela
Nordafrika und Nahost Afghanistan, Ägypten, Algerien, Bahrain, Irak, Iran, Israel, Jemen, Jordanien, Katar, Kuwait, Libanon, Libyen, Marokko, Oman, Pakistan, Palästinensische Gebiete, Saudi- Arabien, Syrien, Tunesien, Vereinigte Arabische Emirate
Subsahara-Afrika Angola, Äquatorialguinea, Äthiopien, Benin, Botsuana, Burkina Faso, Burundi, Côte d’Ivoire, Dschibuti, Eritrea, Gabun, Gambia, Ghana, Guinea, Guinea-Bissau, Kamerun, Kap Verde, Kenia, Komoren, Kongo, Kongo/Demokratische Republik, Lesotho, Liberia, Madagaskar, Malawi, Mali, Mauretanien, Mauritius, Mosambik, Namibia, Niger, Nigeria, Ruanda, Sambia, São Tomé und Príncipe, Senegal, Sey- chellen, Sierra Leone, Simbabwe, Somalia, Südafrika, Sudan, Südsudan, Swasiland, Tansania, Togo, Tschad, Uganda, Zentral- afrikanische Republik
Asien und Pazifik Australien, Bangladesch, Bhutan, Brunei Darussalam, China, Honkong (CN), Macau (CN), Cookinseln, Fidschi, Indien, Indone-sien, Japan, Kambodscha, Kiribati, Nord-korea, Südkorea, Laos, Malaysia, Male- diven, Marshallinseln, Mikronesien, Mong-olei, Myanmar, Nauru, Nepal, Neuseeland, Niue, Palau, Papua-Neuguinea, Philippi-nen, Salomonen, Samoa, Singapur, Sri Lanka, Taiwan, Thailand, Timor-Leste, Tonga, Tuvalu, Vanuatu, Vietnam
The classification of world regions in “Wissenschaft weltoffen” corresponds to the DAAD’s classification of world regions since the 2017 edition:
Western Europe Austria, Belgium, Cyprus, Denmark, Finland, France, Greece, Iceland, Ireland, Italy, Liechtenstein, Luxembourg, Malta, Netherlands, Norway, Portugal, Spain, Sweden, Switzerland, Vatican City, United Kingdom
Middle and South-Eastern Europe Albania, Bosnia and Herzegovina, Bulgaria, Croatia, Czech Republic, Estonia, Hungary, Kosovo, Latvia, Lithuania, Macedonia, Montenegro, Poland, Romania, Serbia, Slovakia, Slovenia,Turkey
Eastern Europe and Central Asia Armenia, Azerbaijan, Belarus, Georgia, Kazakhstan, Kyrgyzstan, Moldavia, Russia, Tajikistan, Turkmenistan, Ukraine, Uzbekistan
North America Canada, USA
Latin America Argentina, Bahamas, Barbados, Belize, Bolivia, Brazil, Chile, Colombia, Costa Rica, Cuba, Dominican Republic, Ecuador, El Salvador, Grenada, Guatemala, Guyana, Haiti, Honduras, Jamaica, Mexico, Nicara-gua, Panama, Paraguay, Peru, Saint Lucia, Saint Vincent and the Grenadines, Suri-name, Trinidad and Tobago, Uruguay, Venezuela
North Africa and Middle East Afghanistan, Algeria, Bahrain, Egypt, Iraq, Iran, Israel, Jordan, Kuwait, Lebanon, Libya, Morocco, Oman, Pakistan, Palestinian Territories, Qatar, Saudi Arabia, Syria, Tunisia, United Arab Emirates, Yemen
Sub-Saharan Africa Angola, Benin, Botswana, Burkina Faso, Burundi, Cameroon, Cape Verde, Central African Republic, Chad, Comoros, Congo, Congo/Democratic Republic, Djibouti, Ethiopia, Eritrea, Gabon, Gambia, Ghana, Guinea, Kenya, Ivory Coast, Lesotho, Liberia, Madagascar, Malawi, Mali, Mauri-tania, Mauritius, Mozambique, Namibia, Niger, Nigeria, Rwanda, São Tomé and Príncipe, Senegal, Seychelles, Sierra Leone, Somalia, South Africa, South Sudan, Sudan, Swaziland, Tanzania, Togo, Uganda, Zambia, Zimbabwe
Asia and Pacific Australia, Bangladesh, Bhutan, Brunei, Cambodia, China, Hong Kong (CN), Macao (CN), Fiji, India, Indonesia, Japan, North Korea, South Korea, Laos, Malaysia, Mongolia, Myanmar, Nauru, Nepal, New Zealand, Papua New Guinea, Philippines, Samoa, Singapore, Sri Lanka, Taiwan, Thailand, Timor-Leste, Tonga, Vietnam
Westeuropa Western Europe
Mittel- und Südosteuropa Middle and South-Eastern Europe
Osteuropa und Zentralasien Eastern Europe and Central Asia
Nordamerika North America
Lateinamerika Latin America
Nordafrika und Nahost North Africa and Middle East
Subsahara-Afrika Sub-Saharan Africa
Asien und Pazifik Asia and Pacific
wbv.de
Wis
sens
chaf
t w
elto
ffen
201
7
Der Deutsche Akademische Austauschdienst (DAAD) ist die Organi- sation der deutschen Hochschulen und ihrer Studierenden zur Inter- nationalisierung des Wissenschaftssystems. Er schafft Zugänge zu den besten Studien- und Forschungsmöglichkeiten für Studierende, Forschende und Lehrende durch die Vergabe von Stipendien.
Der DAAD fördert transnationale Kooperationen und Partnerschaften zwischen Hochschulen und ist die Nationale Agentur für die euro- päische Hochschulzusammenarbeit. Der DAAD unterhält dafür ein Netzwerk mit 71 Außenstellen und Informationszentren und rund 500 Lektorate weltweit sowie die internationale DAAD-Akademie (iDA).
2016 hat der DAAD über 130.000 Deutsche und Ausländer rund um den Globus gefördert. Der DAAD wird überwiegend aus Mitteln des Auswärtigen Amts, des Bundesministeriums für Bildung und For-schung, des Bundesministeriums für wirtschaftliche Zusammenarbeit und Entwicklung und der Europäischen Union finanziert.
The German Academic Exchange Service (DAAD) is the organisation of the German higher education institutions and their students devoted to internationalising the academic and scientific research system. Through its scholarship programme, the DAAD enables students, researchers and instructors to take advantage of the best study and research opportunities available.
The DAAD promotes transnational cooperation and partnerships between higher education institutions and is the German National Agency for European higher education cooperation. The DAAD main- tains a network of 71 regional offices and information centres and around 500 lectureships around the world as well as the international DAAD Academy (iDA).
In 2016 the DAAD supported more than 130,000 Germans and foreig-ners all round the world. The DAAD is principally funded by the Federal Foreign Office, the Federal Ministry of Education and Research (BMBF), the Federal Ministry for Economic Cooperation and Development (BMZ) and the European Union.
www.daad.de
Das Deutsche Zentrum für Hochschul- und Wissenschaftsforschung (DZHW GmbH) mit Sitz in Hannover betreibt anwendungsorientierte empirische Forschung im Bereich des Hochschul- und Wissenschafts-systems. Die Forschung des DZHW ist theoriegeleitet und praxis- bezogen. Sie ist meist als langfristige Beobachtung angelegt, teils auch in international vergleichender Perspektive.
Das DZHW versteht sich als Teil der wissenschaftlichen Gemeinschaft und als Dienstleister für Hochschulen und Politik. Eine besondere Stärke der Untersuchungen des DZHW liegt in der Langzeitbeobach-tung von Entwicklungen im Hochschulbereich. Profilbildend sind die deutschlandweiten, regelmäßigen Befragungen von Studienberech-tigten, Studienanfänger(inne)n, Studierenden und Absolvent(inn)en.
Das DZHW war bis zu seiner Ausgründung im September 2013 über 40 Jahre Teil der Hochschul-Informations-System GmbH (HIS). Es ist eine öffentlich geförderte Einrichtung. Gesellschafter sind der Bund und die Länder.
The German Centre for Higher Education Research and Science Studies (DZHW GmbH) has its headquarters in Hanover. It carries out application-oriented research in the higher education field. The DZHW’s research is based on theory and related to practice, usually in the form of long-term observations and sometimes also including an international comparative perspective.
The DZHW considers itself to be part of the scientific community as well as a service partner both of higher education institutions and of educational policy. One of the particular strengths of the DZHW’s research lies in the long-term observation of trends in the higher education sector. The regular nationwide surveys of German young people qualified to study in higher education institutions, first-year students, students and graduates form a major part of the DZHW’s profile.
After being part of the Higher Education Information System (HIS GmbH) for over 40 years, the DZHW was founded as a spin-off in September 2013. It is a publicly funded institution, funded by German federal and state governments.
www.dzhw.eu
W. Bertelsmann Verlag
Daten und Fakten zur Internationalität von Studium und Forschung in Deutschland
Facts and Figures on the International Nature of Studies and Research in Germany
Fokus: Akademische Mobilität und Kooperation im Ostseeraum
Focus: Academic mobility and cooperation in the Baltic Sea Area
Wissenschaft weltoffen
Deutscher Akademischer AustauschdienstGerman Academic Exchange Service
Deutsches Zentrum fürHochschul- und WissenschaftsforschungDeutsches Zentrum für
Hochschul- und Wissenschaftsforschung
Alle Abbildungen mit Option zum Daten-Download
2017
I SBN 978-3-7639-5875-7