Lehrstuhl fürIndustrie, Energie und Umwelt
Universität WienFakultät für WirtschaftswissenschaftenLehrstuhl für Industrie, Energie und UmweltBrünner Straße 72, 1210 Wien
IEUInternational Industrial Management I
Location Decisions I| Introduction | Examples | Check List |
| Steiner-Weber Model|
| Florian Pützl © 2009 | International Industrial Management I, WS 2009 Page 2
IEU International Industrial Management ILehrstuhl f. Industrie, Energie und Umwelt | Mag. Florian Pützl |
Overview | Location Decisions
Choice of locations IntroductionA class of locational choice problemsFactors for locationsMethods
Check listsBenefit analysis (simple, additive)Location break-even analysisTransportation methodSteiner-Weber ModelLocation-alloction Model of Cooper and extensionsHotelling Model
Choice of locations with the firmThe basic problemCRAFTLayouts
| Florian Pützl © 2009 | International Industrial Management I, WS 2009 Page 3
IEU International Industrial Management ILehrstuhl f. Industrie, Energie und Umwelt | Mag. Florian Pützl |
Location Decisions - Objective
Choose the location that maximizes
the firm’s benefit
There are only three important things concerning locations:1) Location, 2) Location, 3) Location.
| Florian Pützl © 2009 | International Industrial Management I, WS 2009 Page 4
IEU International Industrial Management ILehrstuhl f. Industrie, Energie und Umwelt | Mag. Florian Pützl |
Location Decisions
Importance: Location decisions do not only result in real estate and investment costs but influence in particular fixed and variable costs.
Transportation costs
rentals
Wages
Taxes, etc.
Links to the environment (universities, clusters, etc.)
| Florian Pützl © 2009 | International Industrial Management I, WS 2009 Page 5
IEU International Industrial Management ILehrstuhl f. Industrie, Energie und Umwelt | Mag. Florian Pützl |
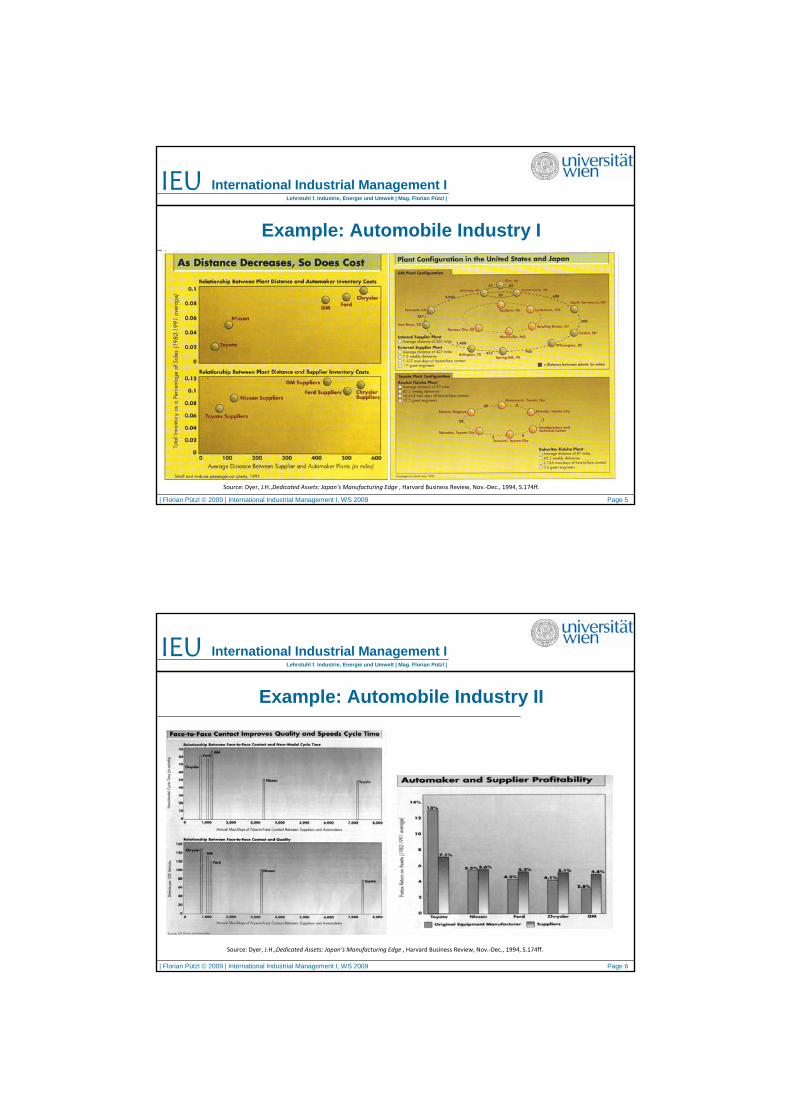
Example: Automobile Industry I
Source: Dyer, J.H.,Dedicated Assets: Japan‘s Manufacturing Edge , Harvard Business Review, Nov.‐Dec., 1994, S.174ff.
| Florian Pützl © 2009 | International Industrial Management I, WS 2009 Page 6
IEU International Industrial Management ILehrstuhl f. Industrie, Energie und Umwelt | Mag. Florian Pützl |
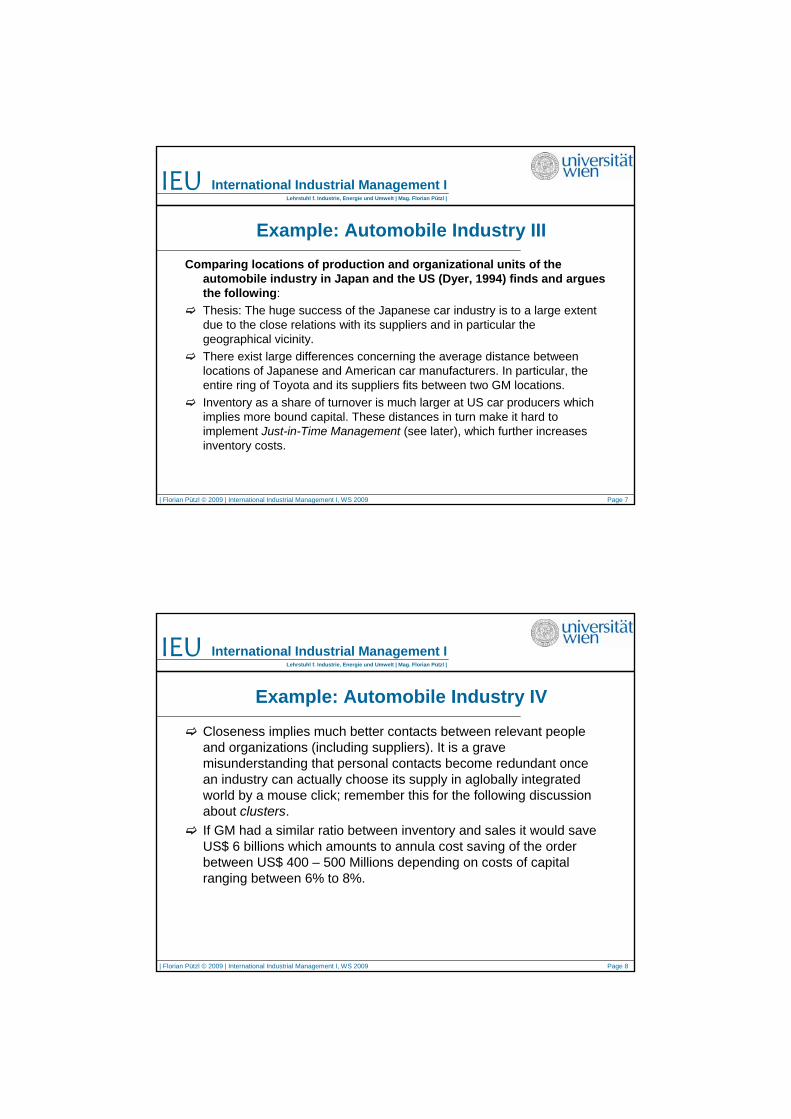
Example: Automobile Industry II
Source: Dyer, J.H.,Dedicated Assets: Japan‘s Manufacturing Edge , Harvard Business Review, Nov.‐Dec., 1994, S.174ff.
| Florian Pützl © 2009 | International Industrial Management I, WS 2009 Page 7
IEU International Industrial Management ILehrstuhl f. Industrie, Energie und Umwelt | Mag. Florian Pützl |
Example: Automobile Industry IIIComparing locations of production and organizational units of the
automobile industry in Japan and the US (Dyer, 1994) finds and argues the following:Thesis: The huge success of the Japanese car industry is to a large extent due to the close relations with its suppliers and in particular the geographical vicinity.There exist large differences concerning the average distance between locations of Japanese and American car manufacturers. In particular, the entire ring of Toyota and its suppliers fits between two GM locations. Inventory as a share of turnover is much larger at US car producers which implies more bound capital. These distances in turn make it hard to implement Just-in-Time Management (see later), which further increases inventory costs.
| Florian Pützl © 2009 | International Industrial Management I, WS 2009 Page 8
IEU International Industrial Management ILehrstuhl f. Industrie, Energie und Umwelt | Mag. Florian Pützl |
Example: Automobile Industry IV
Closeness implies much better contacts between relevant people and organizations (including suppliers). It is a grave misunderstanding that personal contacts become redundant once an industry can actually choose its supply in aglobally integrated world by a mouse click; remember this for the following discussion about clusters. If GM had a similar ratio between inventory and sales it would save US$ 6 billions which amounts to annula cost saving of the order between US$ 400 – 500 Millions depending on costs of capital ranging between 6% to 8%.
| Florian Pützl © 2009 | International Industrial Management I, WS 2009 Page 9
IEU International Industrial Management ILehrstuhl f. Industrie, Energie und Umwelt | Mag. Florian Pützl |
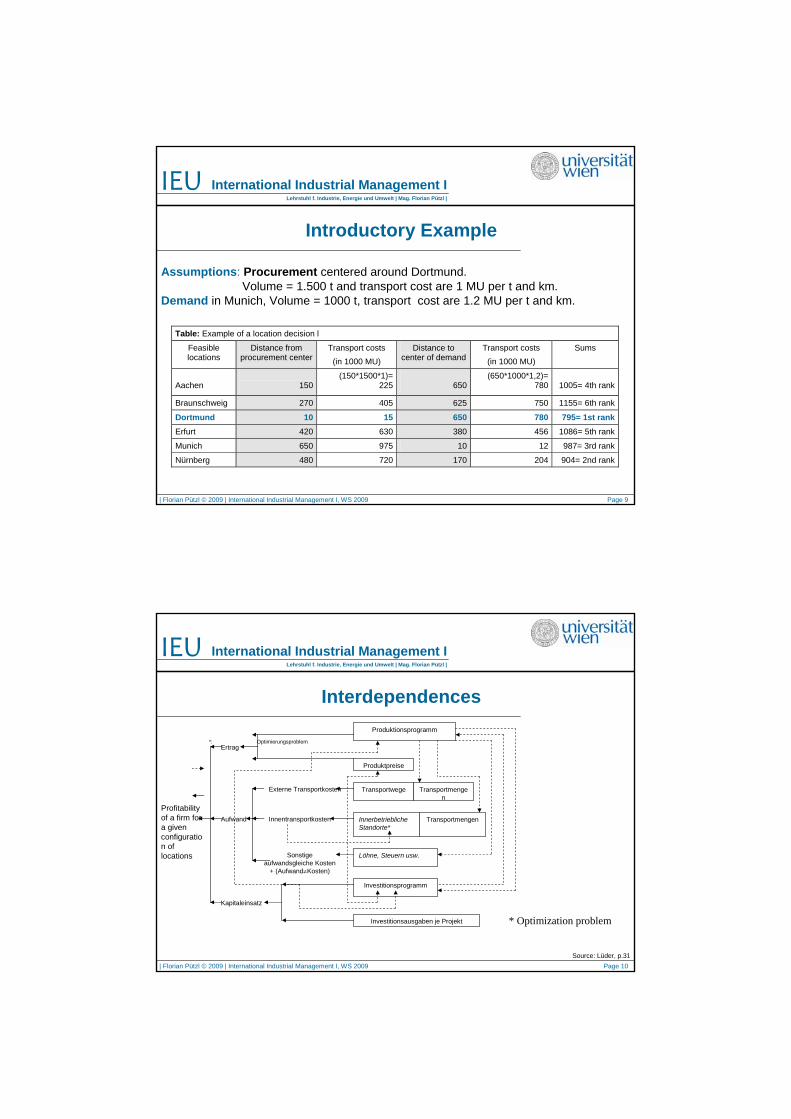
Introductory Example
Table: Example of a location decision l
Feasible locations
Distance from procurement center
Transport costs (in 1000 MU)
Distance to center of demand
Transport costs (in 1000 MU)
Sums
Aachen
150
(150*1500*1)=225 650
(650*1000*1,2)= 780
1005= 4th rank
Braunschweig 270 405 625 750 1155= 6th rank
Dortmund 10 15 650 780 795= 1st rank Erfurt 420 630 380 456 1086= 5th rank
Munich 650 975 10 12 987= 3rd rank
Nürnberg 480 720 170 204 904= 2nd rank
Assumptions: Procurement centered around Dortmund. Volume = 1.500 t and transport cost are 1 MU per t and km.
Demand in Munich, Volume = 1000 t, transport cost are 1.2 MU per t and km.
| Florian Pützl © 2009 | International Industrial Management I, WS 2009 Page 10
IEU International Industrial Management ILehrstuhl f. Industrie, Energie und Umwelt | Mag. Florian Pützl |
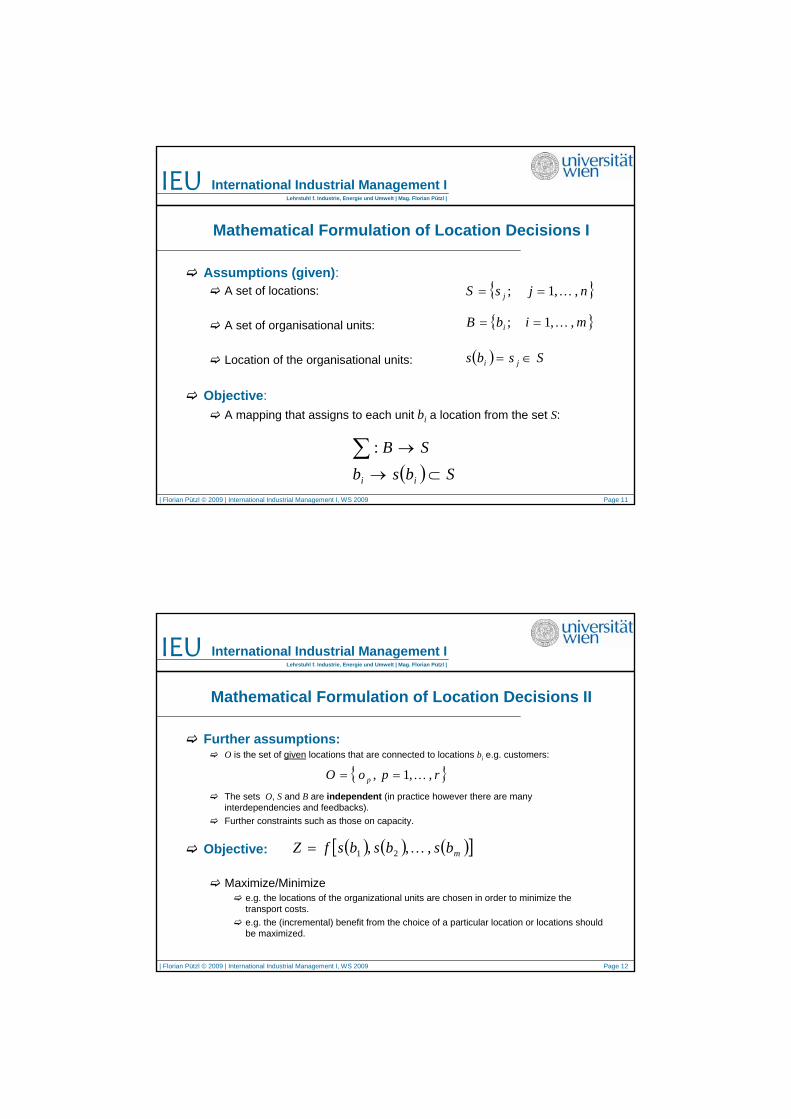
InterdependencesProduktionsprogramm
Produktpreise
Transportwege Transportmengen
TransportmengenInnerbetriebliche Standorte*
Löhne, Steuern usw.
Investitionsprogramm
Investitionsausgaben je Projekt
Innentransportkosten
Kapitaleinsatz
Sonstige aufwandsgleiche Kosten
+ (Aufwand≠Kosten)
Externe Transportkosten
Aufwand
Ertrag
Profitabilityof a firm fora givenconfiguration of locations
*: Optimierungsproblem
* Optimization problem
Source: Lüder, p.31
| Florian Pützl © 2009 | International Industrial Management I, WS 2009 Page 11
IEU International Industrial Management ILehrstuhl f. Industrie, Energie und Umwelt | Mag. Florian Pützl |
Assumptions (given):A set of locations:
A set of organisational units:
Location of the organisational units:
Objective:A mapping that assigns to each unit bi a location from the set S:
Mathematical Formulation of Location Decisions I
{ }njsS j ,,1; K==
{ }mibB i ,,1; K==
( ) Ssbs ji ∈=
( ) SbsbSB
ii ⊂→
→∑ :
| Florian Pützl © 2009 | International Industrial Management I, WS 2009 Page 12
IEU International Industrial Management ILehrstuhl f. Industrie, Energie und Umwelt | Mag. Florian Pützl |
Mathematical Formulation of Location Decisions II
Further assumptions:O is the set of given locations that are connected to locations bi e.g. customers:
The sets O, S and B are independent (in practice however there are many interdependencies and feedbacks).Further constraints such as those on capacity.
Objective:
Maximize/Minimizee.g. the locations of the organizational units are chosen in order to minimize the transport costs.e.g. the (incremental) benefit from the choice of a particular location or locations should be maximized.
{ }rpoO p ,,1, K==
( ) ( ) ( )[ ]mbsbsbsfZ ,,, 21 K=
| Florian Pützl © 2009 | International Industrial Management I, WS 2009 Page 13
IEU International Industrial Management ILehrstuhl f. Industrie, Energie und Umwelt | Mag. Florian Pützl |
Examples of Constraints
Organizational units that must be close to the marketPublic
Police, ambulance, fire brigadepost
Retail and ServicesFast food, gas stations, super marketsPharmacies, shopping malls.
ServicesM.D., lawyers, barbersBanks (?), mechanics, hotels
| Florian Pützl © 2009 | International Industrial Management I, WS 2009 Page 14
IEU International Industrial Management ILehrstuhl f. Industrie, Energie und Umwelt | Mag. Florian Pützl |
Evaluation of Locations
Methods
Check lists
(Cost-) Benefit analysis
Location Break-Even Analysis
Transportation Method
Steiner-Weber Model
Location-Alloction Model von Cooper
Hotelling
| Florian Pützl © 2009 | International Industrial Management I, WS 2009 Page 15
IEU International Industrial Management ILehrstuhl f. Industrie, Energie und Umwelt | Mag. Florian Pützl |
Factors Crucial for Locations
Market size
Expected profits
Openess of markets
Stability
bureaucracy
Labour (quality and work ethics)
Infrastructure
Technological know how
Labor costs
Resources, primary inputs
Availability of qualified labor
Reserach institutes
Quality of life
Venture-Capital
Costs
Technology
IT-Infrastructure
Bureaucracy
Suppliers & partners
Subsidies
Arthur Anderson Deloitte Touche
| Florian Pützl © 2009 | International Industrial Management I, WS 2009 Page 16
IEU International Industrial Management ILehrstuhl f. Industrie, Energie und Umwelt | Mag. Florian Pützl |
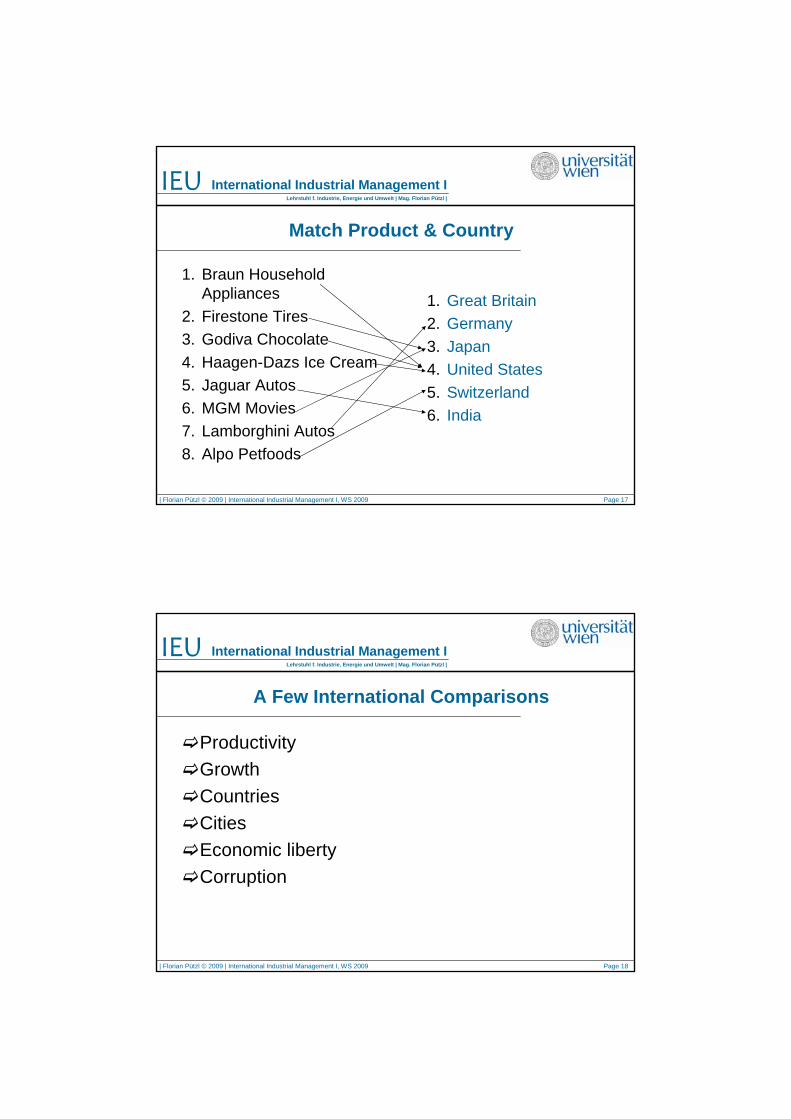
Match Product & Country
1. Braun Household Appliances
2. Firestone Tires3. Godiva Chocolate4. Haagen-Dazs Ice Cream5. Jaguar Autos6. MGM Movies7. Lamborghini Autos8. Alpo Petfoods
1. Great Britain2. Germany3. Japan4. United States5. Switzerland6. India7. Italy8. Denmark
| Florian Pützl © 2009 | International Industrial Management I, WS 2009 Page 17
IEU International Industrial Management ILehrstuhl f. Industrie, Energie und Umwelt | Mag. Florian Pützl |
Match Product & Country
1. Braun Household Appliances
2. Firestone Tires3. Godiva Chocolate4. Haagen-Dazs Ice Cream5. Jaguar Autos6. MGM Movies7. Lamborghini Autos8. Alpo Petfoods
1. Great Britain2. Germany3. Japan4. United States5. Switzerland6. India
| Florian Pützl © 2009 | International Industrial Management I, WS 2009 Page 18
IEU International Industrial Management ILehrstuhl f. Industrie, Energie und Umwelt | Mag. Florian Pützl |
A Few International Comparisons
ProductivityGrowthCountriesCitiesEconomic libertyCorruption
| Florian Pützl © 2009 | International Industrial Management I, WS 2009 Page 19
IEU International Industrial Management ILehrstuhl f. Industrie, Energie und Umwelt | Mag. Florian Pützl |
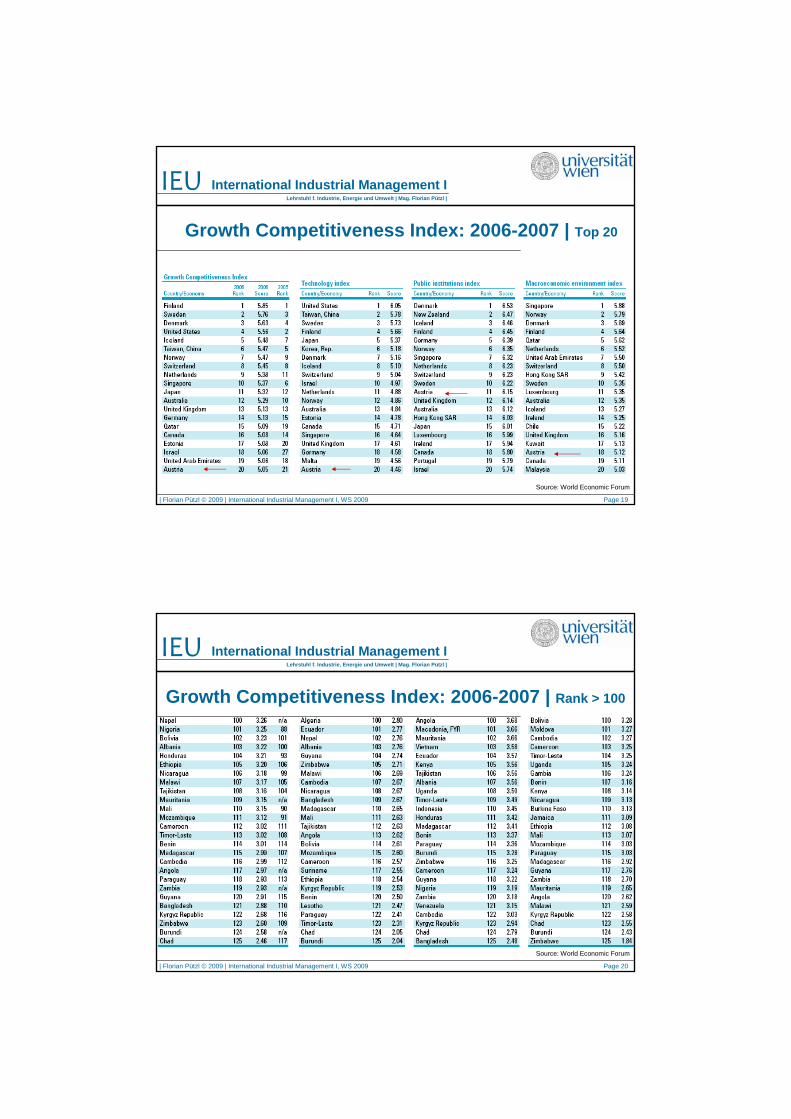
Growth Competitiveness Index: 2006-2007 | Top 20
Source: World Economic Forum
| Florian Pützl © 2009 | International Industrial Management I, WS 2009 Page 20
IEU International Industrial Management ILehrstuhl f. Industrie, Energie und Umwelt | Mag. Florian Pützl |
Growth Competitiveness Index – 2006-2007, Rank >100
Source: World Economic Forum
Growth Competitiveness Index: 2006-2007 | Rank > 100
| Florian Pützl © 2009 | International Industrial Management I, WS 2009 Page 21
IEU International Industrial Management ILehrstuhl f. Industrie, Energie und Umwelt | Mag. Florian Pützl |
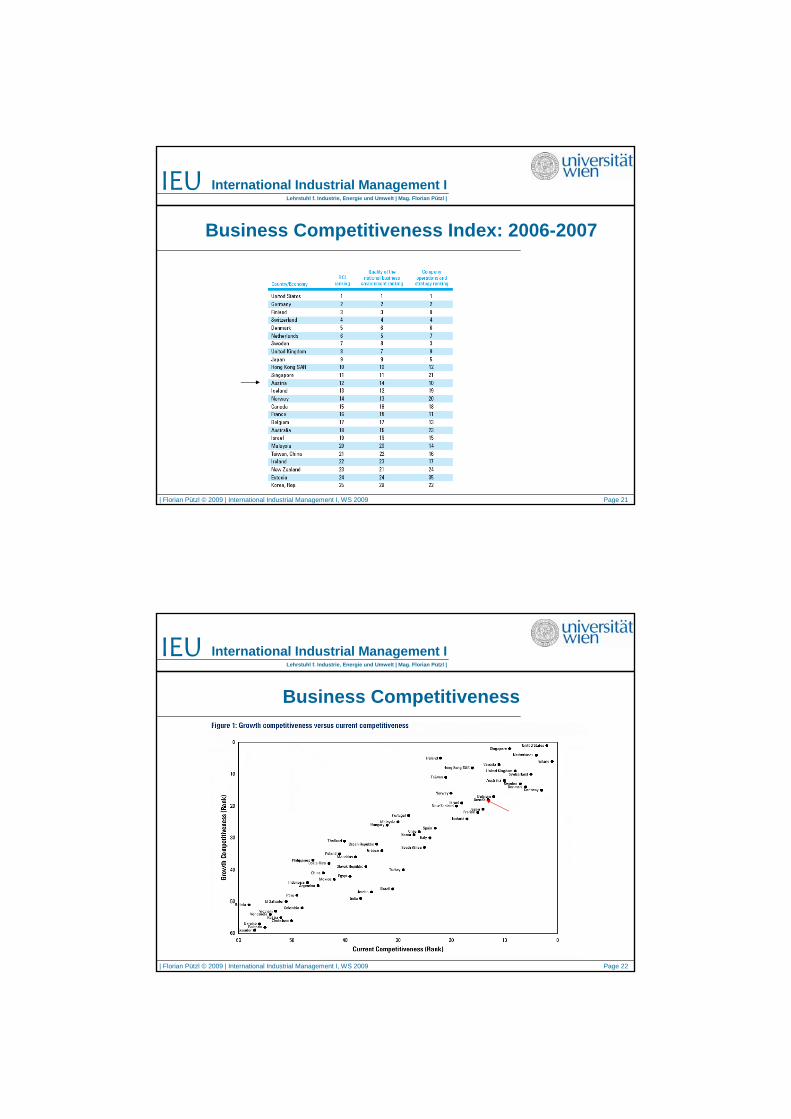
Business Competitiveness Index: 2006-2007
| Florian Pützl © 2009 | International Industrial Management I, WS 2009 Page 22
IEU International Industrial Management ILehrstuhl f. Industrie, Energie und Umwelt | Mag. Florian Pützl |
Business Competitiveness
| Florian Pützl © 2009 | International Industrial Management I, WS 2009 Page 23
IEU International Industrial Management ILehrstuhl f. Industrie, Energie und Umwelt | Mag. Florian Pützl |
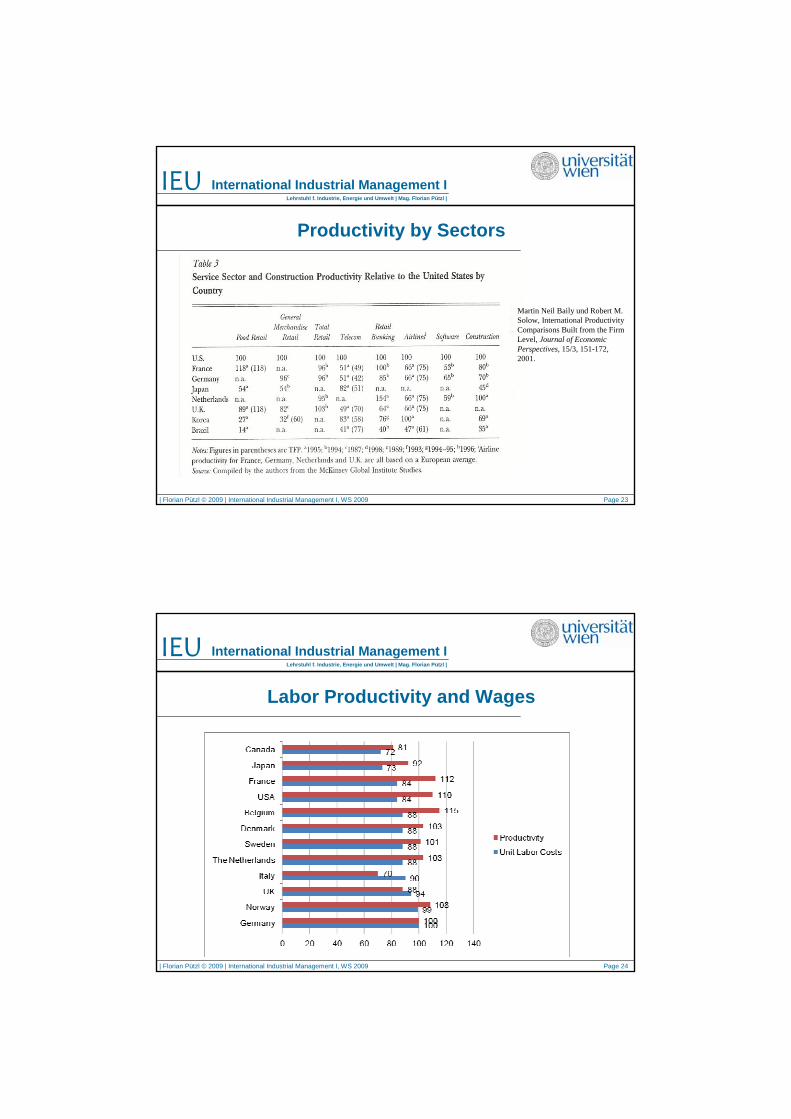
Productivity by Sectors
Martin Neil Baily und Robert M. Solow, International Productivity Comparisons Built from the Firm Level, Journal of Economic Perspectives, 15/3, 151-172, 2001.
| Florian Pützl © 2009 | International Industrial Management I, WS 2009 Page 24
IEU International Industrial Management ILehrstuhl f. Industrie, Energie und Umwelt | Mag. Florian Pützl |
Labor Productivity and Wages
| Florian Pützl © 2009 | International Industrial Management I, WS 2009 Page 25
IEU International Industrial Management ILehrstuhl f. Industrie, Energie und Umwelt | Mag. Florian Pützl |
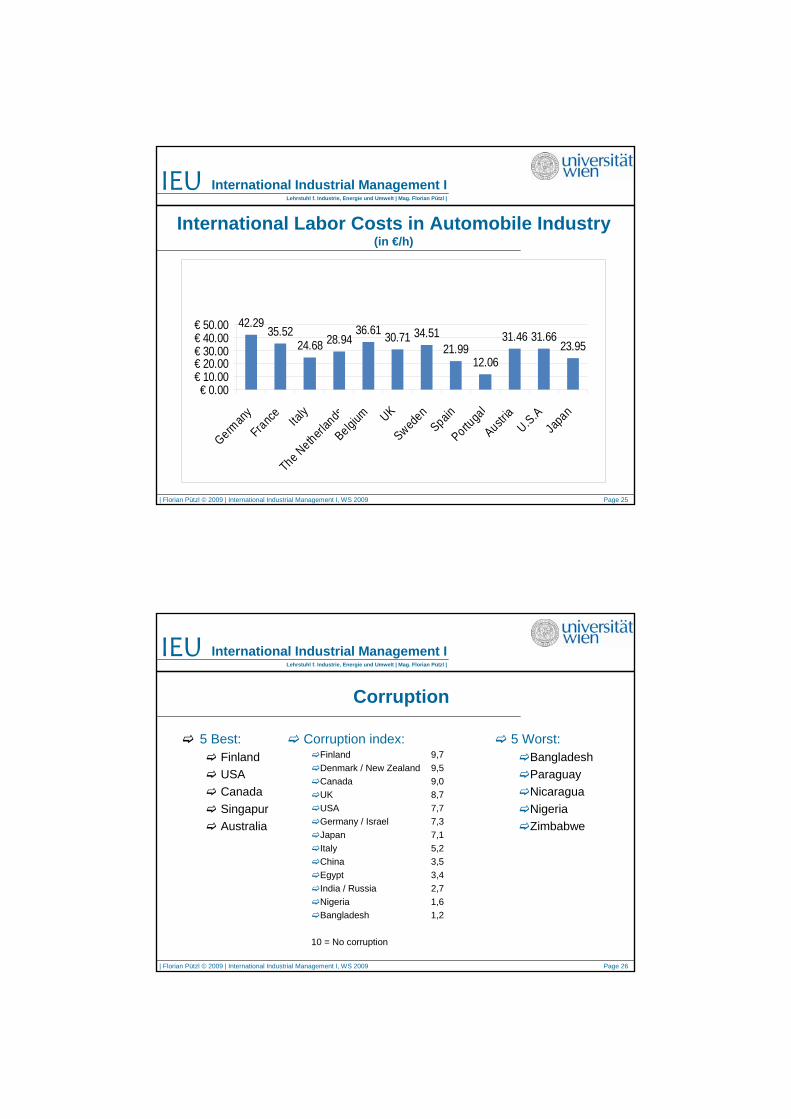
International Labor Costs in Automobile Industry (in €/h)
42.2935.52
24.68 28.9436.61 30.71 34.51
21.9912.06
31.46 31.6623.95
€ 0.00€ 10.00€ 20.00€ 30.00€ 40.00€ 50.00
German
y
France Italy
The Netherl
ands
Belgium UK
Sweden
Spain
Portuga
l
Austria
U.S.AJa
pan
| Florian Pützl © 2009 | International Industrial Management I, WS 2009 Page 26
IEU International Industrial Management ILehrstuhl f. Industrie, Energie und Umwelt | Mag. Florian Pützl |
Corruption
5 Best:FinlandUSACanadaSingapurAustralia
5 Worst:BangladeshParaguayNicaraguaNigeriaZimbabwe
Corruption index:Finland 9,7Denmark / New Zealand 9,5Canada 9,0UK 8,7USA 7,7Germany / Israel 7,3Japan 7,1Italy 5,2China 3,5Egypt 3,4India / Russia 2,7Nigeria 1,6Bangladesh 1,2
10 = No corruption
| Florian Pützl © 2009 | International Industrial Management I, WS 2009 Page 27
IEU International Industrial Management ILehrstuhl f. Industrie, Energie und Umwelt | Mag. Florian Pützl |
Economic Freedom I
| Florian Pützl © 2009 | International Industrial Management I, WS 2009 Page 28
IEU International Industrial Management ILehrstuhl f. Industrie, Energie und Umwelt | Mag. Florian Pützl |
Economic Freedom II
| Florian Pützl © 2009 | International Industrial Management I, WS 2009 Page 29
IEU International Industrial Management ILehrstuhl f. Industrie, Energie und Umwelt | Mag. Florian Pützl |
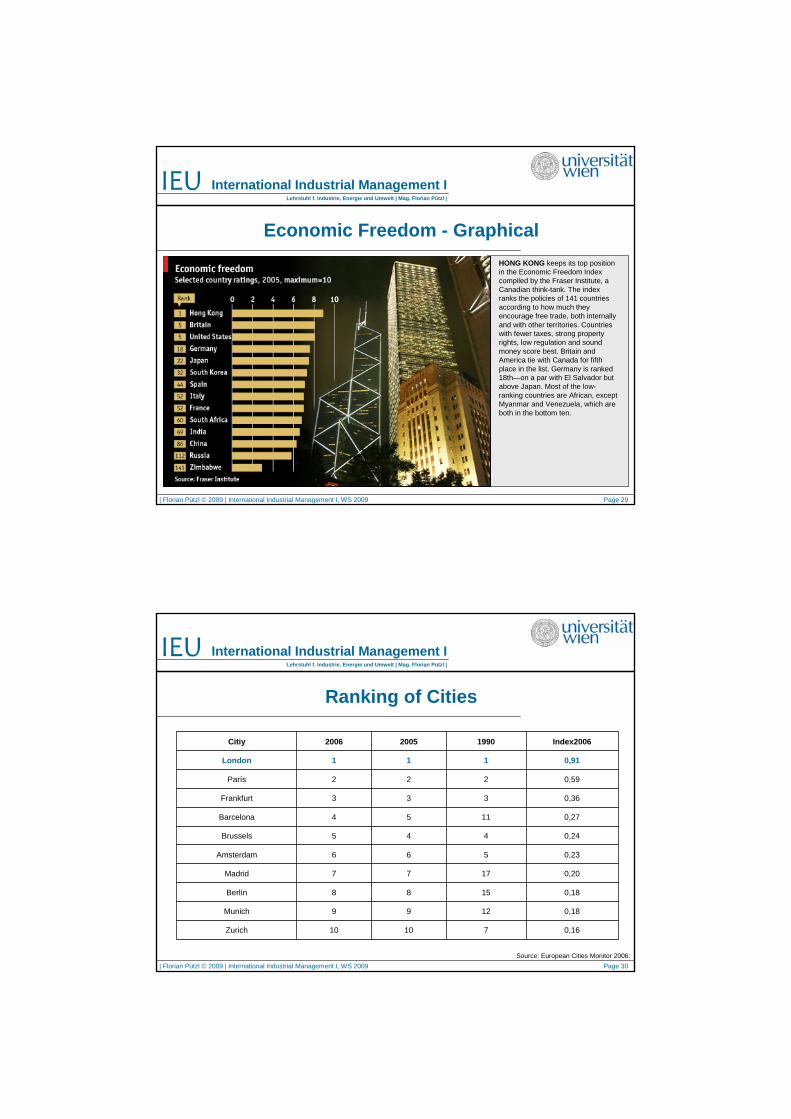
Economic Freedom - GraphicalHONG KONG keeps its top position in the Economic Freedom Index compiled by the Fraser Institute, a Canadian think-tank. The index ranks the policies of 141 countries according to how much they encourage free trade, both internally and with other territories. Countries with fewer taxes, strong property rights, low regulation and sound money score best. Britain and America tie with Canada for fifth place in the list. Germany is ranked 18th—on a par with El Salvador but above Japan. Most of the low-ranking countries are African, except Myanmar and Venezuela, which are both in the bottom ten.
| Florian Pützl © 2009 | International Industrial Management I, WS 2009 Page 30
IEU International Industrial Management ILehrstuhl f. Industrie, Energie und Umwelt | Mag. Florian Pützl |
Ranking of Cities
Source: European Cities Monitor 2006:
0,1671010Zurich
0,181299Munich
0,181588Berlín
0,201777Madrid
0,23566Amsterdam
0,24445Brussels
0,271154Barcelona
0,36333Frankfurt
0,59222París
0,91111London
Index2006199020052006Citiy
| Florian Pützl © 2009 | International Industrial Management I, WS 2009 Page 31
IEU International Industrial Management ILehrstuhl f. Industrie, Energie und Umwelt | Mag. Florian Pützl |
Another Ranking of Cities
London and Paris maintain their position as Europe's two top cities to locate a business
Warsaw can expect the biggest influx of international companies over the next fiveyears.
Barcelona is also the city perceived as doingthe most in Europe to improve itself as a business location, followed by Prague and Madrid
| Florian Pützl © 2009 | International Industrial Management I, WS 2009 Page 32
IEU International Industrial Management ILehrstuhl f. Industrie, Energie und Umwelt | Mag. Florian Pützl |
Hardship Rating
| Florian Pützl © 2009 | International Industrial Management I, WS 2009 Page 33
IEU International Industrial Management ILehrstuhl f. Industrie, Energie und Umwelt | Mag. Florian Pützl |
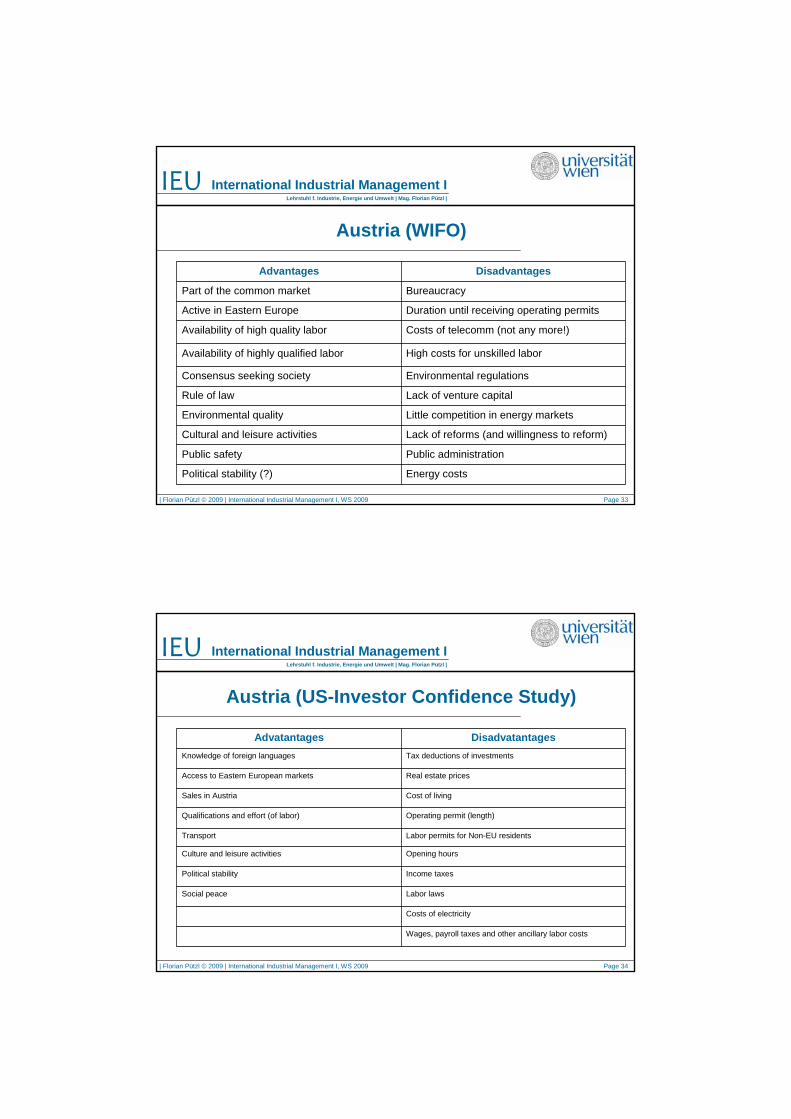
Austria (WIFO)
Energy costsPolitical stability (?)
Public administration Public safety
Lack of reforms (and willingness to reform)Cultural and leisure activities
Little competition in energy marketsEnvironmental quality
Lack of venture capitalRule of law
Environmental regulationsConsensus seeking society
High costs for unskilled laborAvailability of highly qualified labor
Costs of telecomm (not any more!)Availability of high quality labor
Duration until receiving operating permitsActive in Eastern Europe
BureaucracyPart of the common market
DisadvantagesAdvantages
| Florian Pützl © 2009 | International Industrial Management I, WS 2009 Page 34
IEU International Industrial Management ILehrstuhl f. Industrie, Energie und Umwelt | Mag. Florian Pützl |
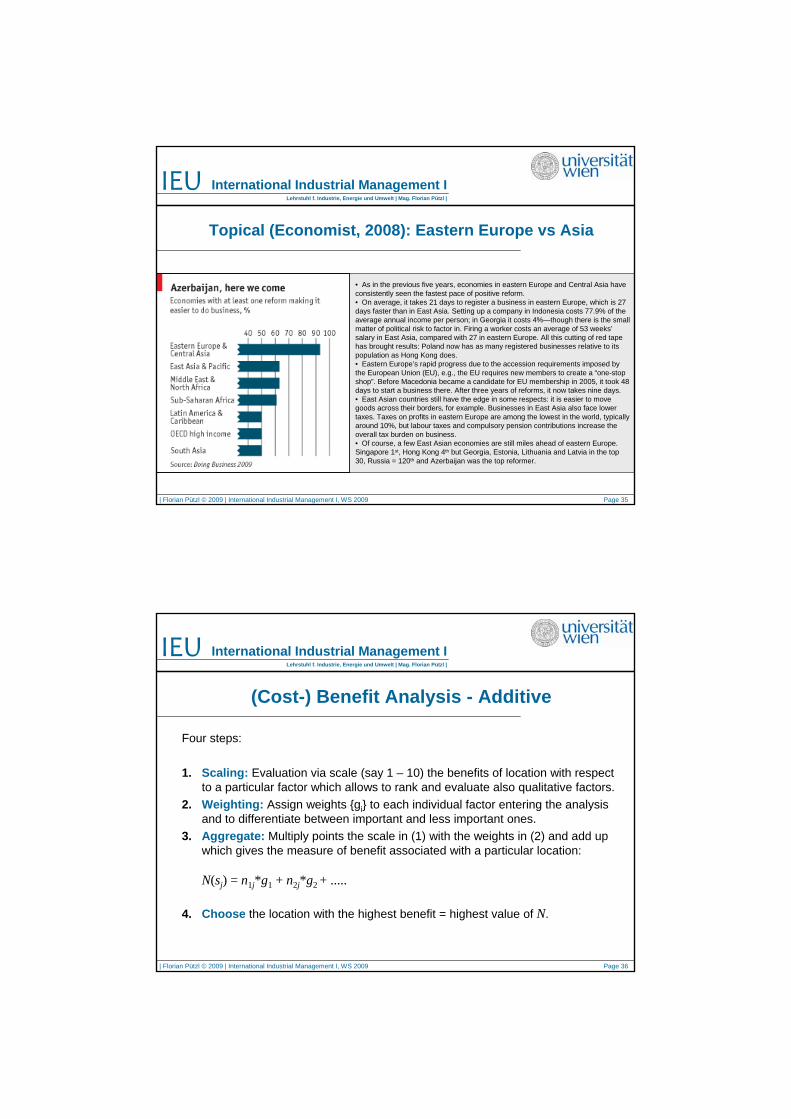
Austria (US-Investor Confidence Study)
Wages, payroll taxes and other ancillary labor costs
Costs of electricity
Labor lawsSocial peace
Income taxesPolitical stability
Opening hours Culture and leisure activities
Labor permits for Non-EU residentsTransport
Operating permit (length)Qualifications and effort (of labor)
Cost of livingSales in Austria
Real estate pricesAccess to Eastern European markets
Tax deductions of investmentsKnowledge of foreign languages
DisadvatantagesAdvatantages
| Florian Pützl © 2009 | International Industrial Management I, WS 2009 Page 35
IEU International Industrial Management ILehrstuhl f. Industrie, Energie und Umwelt | Mag. Florian Pützl |
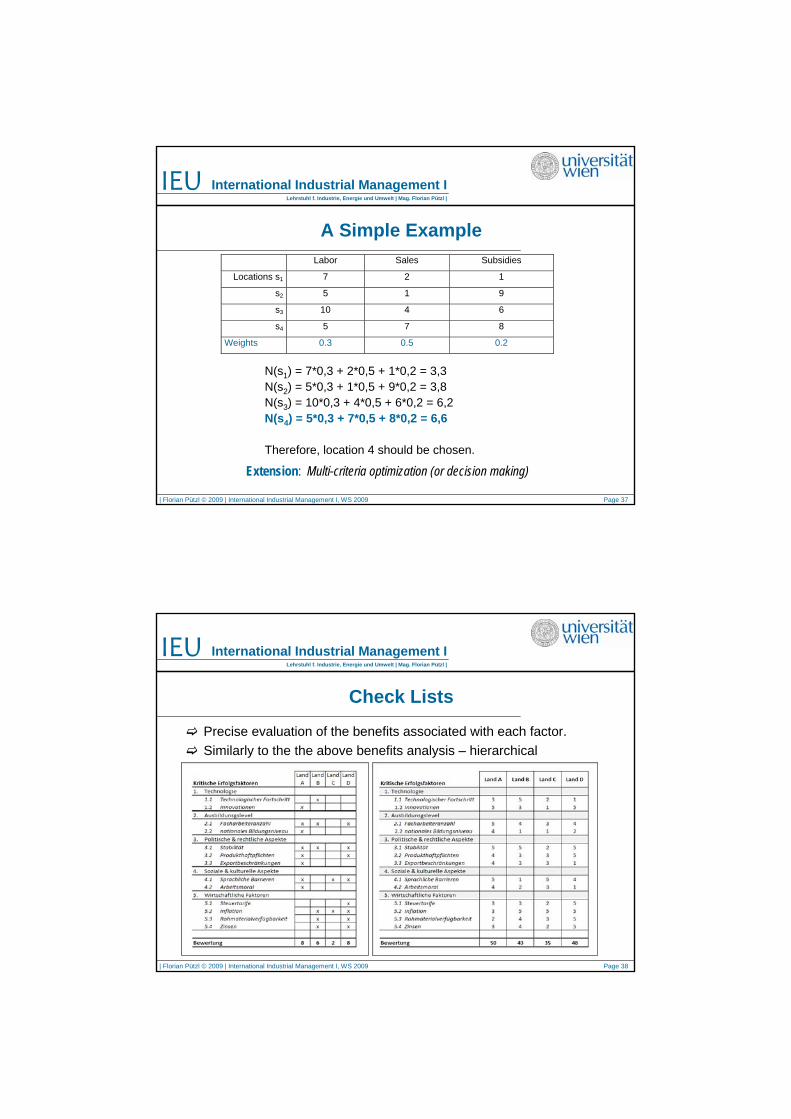
Topical (Economist, 2008): Eastern Europe vs Asia
• As in the previous five years, economies in eastern Europe and Central Asia have consistently seen the fastest pace of positive reform.• On average, it takes 21 days to register a business in eastern Europe, which is 27 days faster than in East Asia. Setting up a company in Indonesia costs 77.9% of the average annual income per person; in Georgia it costs 4%—though there is the small matter of political risk to factor in. Firing a worker costs an average of 53 weeks’salary in East Asia, compared with 27 in eastern Europe. All this cutting of red tape has brought results: Poland now has as many registered businesses relative to its population as Hong Kong does.• Eastern Europe’s rapid progress due to the accession requirements imposed by the European Union (EU), e.g., the EU requires new members to create a “one-stop shop”. Before Macedonia became a candidate for EU membership in 2005, it took 48 days to start a business there. After three years of reforms, it now takes nine days.• East Asian countries still have the edge in some respects: it is easier to move goods across their borders, for example. Businesses in East Asia also face lower taxes. Taxes on profits in eastern Europe are among the lowest in the world, typically around 10%, but labour taxes and compulsory pension contributions increase the overall tax burden on business.• Of course, a few East Asian economies are still miles ahead of eastern Europe. Singapore 1st, Hong Kong 4th but Georgia, Estonia, Lithuania and Latvia in the top 30, Russia = 120th and Azerbaijan was the top reformer.
| Florian Pützl © 2009 | International Industrial Management I, WS 2009 Page 36
IEU International Industrial Management ILehrstuhl f. Industrie, Energie und Umwelt | Mag. Florian Pützl |
(Cost-) Benefit Analysis - Additive
Four steps:
1. Scaling: Evaluation via scale (say 1 – 10) the benefits of location with respect to a particular factor which allows to rank and evaluate also qualitative factors.
2. Weighting: Assign weights {gi} to each individual factor entering the analysis and to differentiate between important and less important ones.
3. Aggregate: Multiply points the scale in (1) with the weights in (2) and add up which gives the measure of benefit associated with a particular location:
N(sj) = n1j*g1 + n2j*g2 + .....
4. Choose the location with the highest benefit = highest value of N.
| Florian Pützl © 2009 | International Industrial Management I, WS 2009 Page 37
IEU International Industrial Management ILehrstuhl f. Industrie, Energie und Umwelt | Mag. Florian Pützl |
A Simple Example Labor Sales Subsidies
Locations s1 7 2 1
s2 5 1 9
s3 10 4 6
s4 5 7 8
Weights 0.3 0.5 0.2
N(s1) = 7*0,3 + 2*0,5 + 1*0,2 = 3,3N(s2) = 5*0,3 + 1*0,5 + 9*0,2 = 3,8N(s3) = 10*0,3 + 4*0,5 + 6*0,2 = 6,2N(s4) = 5*0,3 + 7*0,5 + 8*0,2 = 6,6
Therefore, location 4 should be chosen.
Extension: Multi-criteria optimization (or decision making)
| Florian Pützl © 2009 | International Industrial Management I, WS 2009 Page 38
IEU International Industrial Management ILehrstuhl f. Industrie, Energie und Umwelt | Mag. Florian Pützl |
Check Lists
Precise evaluation of the benefits associated with each factor.Similarly to the the above benefits analysis – hierarchical
| Florian Pützl © 2009 | International Industrial Management I, WS 2009 Page 39
IEU International Industrial Management ILehrstuhl f. Industrie, Energie und Umwelt | Mag. Florian Pützl |
Benefit Analysis
Weights allow to mitigate for outliersRanking without weights:C – B – A - DRanking with weights:A – C – D – B
| Florian Pützl © 2009 | International Industrial Management I, WS 2009 Page 40
IEU International Industrial Management ILehrstuhl f. Industrie, Energie und Umwelt | Mag. Florian Pützl |
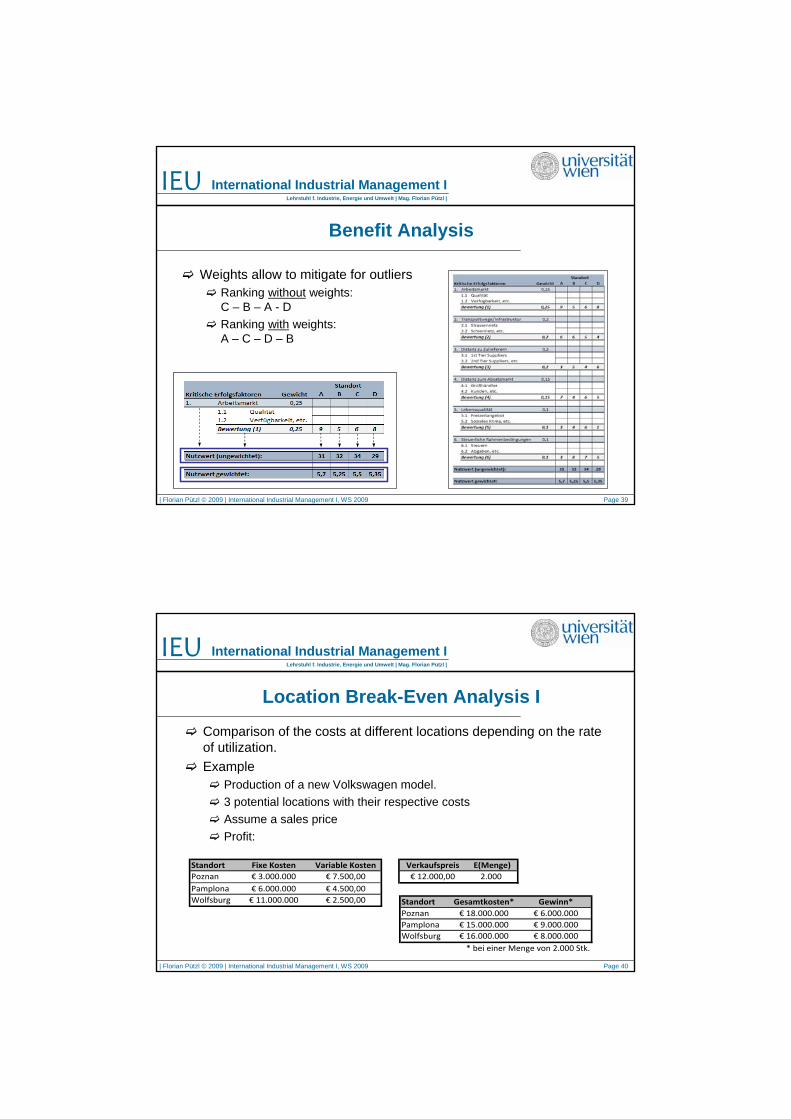
Location Break-Even Analysis I
Comparison of the costs at different locations depending on the rate of utilization.Example
Production of a new Volkswagen model.3 potential locations with their respective costsAssume a sales priceProfit:
Standort Fixe Kosten Variable Kosten Verkaufspreis E(Menge)Poznan € 3.000.000 € 7.500,00 € 12.000,00 2.000Pamplona € 6.000.000 € 4.500,00Wolfsburg € 11.000.000 € 2.500,00 Standort Gesamtkosten* Gewinn*
Poznan € 18.000.000 € 6.000.000Pamplona € 15.000.000 € 9.000.000Wolfsburg € 16.000.000 € 8.000.000
* bei einer Menge von 2.000 Stk.
| Florian Pützl © 2009 | International Industrial Management I, WS 2009 Page 41
IEU International Industrial Management ILehrstuhl f. Industrie, Energie und Umwelt | Mag. Florian Pützl |
Location Break-Even Analysis II
1. Given a fixed quantity of 2000 pieces Pamplona yields the highest profits.
2. Since the assumption of 2000 pieces depends on a marketing studyit is unreliable. Therefore, the management wants to know whether Pamplona remains the most profitable with less or higher production.
Location Break-Even AnalysisThis procedure calculates the intersections of the cost curves associated with the different locations depending on the rate ofproduction.
This yields capacity bounds where which location is efficient as well as the minimal costs over all locations contingent on production.
| Florian Pützl © 2009 | International Industrial Management I, WS 2009 Page 42
IEU International Industrial Management ILehrstuhl f. Industrie, Energie und Umwelt | Mag. Florian Pützl |
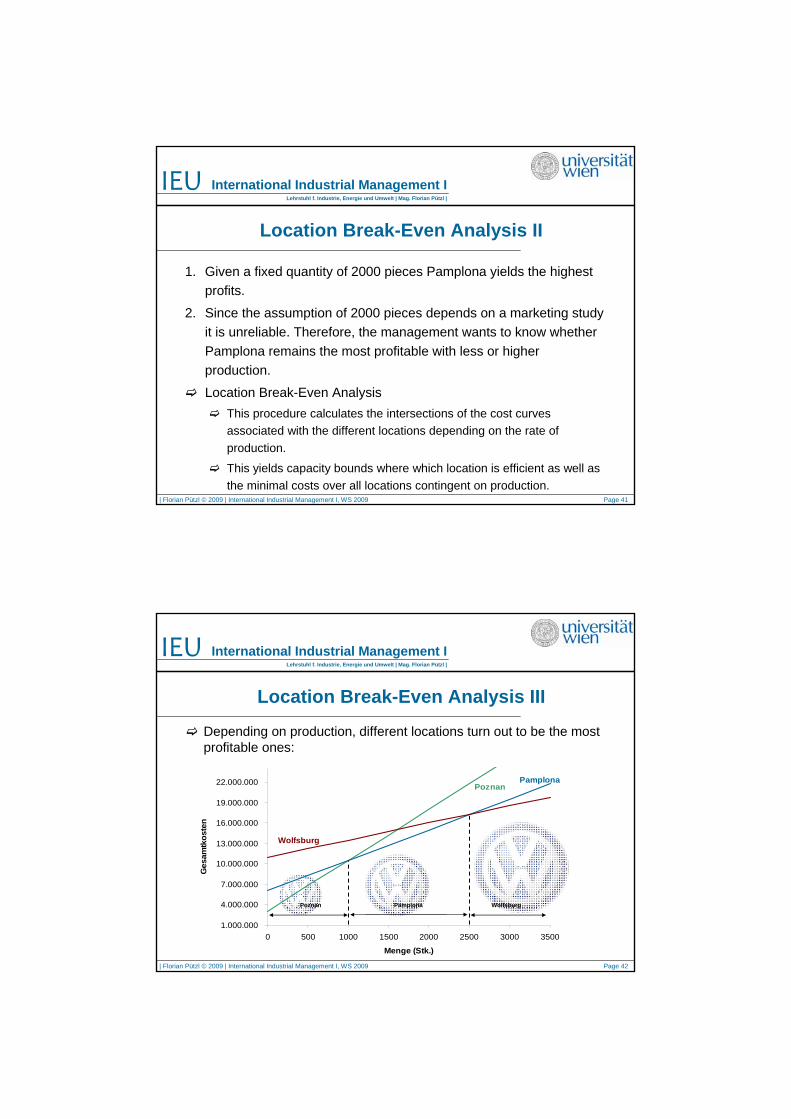
Location Break-Even Analysis III
PoznanPamplona
Wolfsburg
1.000.000
4.000.000
7.000.000
10.000.000
13.000.000
16.000.000
19.000.000
22.000.000
0 500 1000 1500 2000 2500 3000 3500
Menge (Stk.)
Ges
amtk
oste
n
Poznan Pamplona Wolfsburg
Depending on production, different locations turn out to be the mostprofitable ones:
| Florian Pützl © 2009 | International Industrial Management I, WS 2009 Page 43
IEU International Industrial Management ILehrstuhl f. Industrie, Energie und Umwelt | Mag. Florian Pützl |
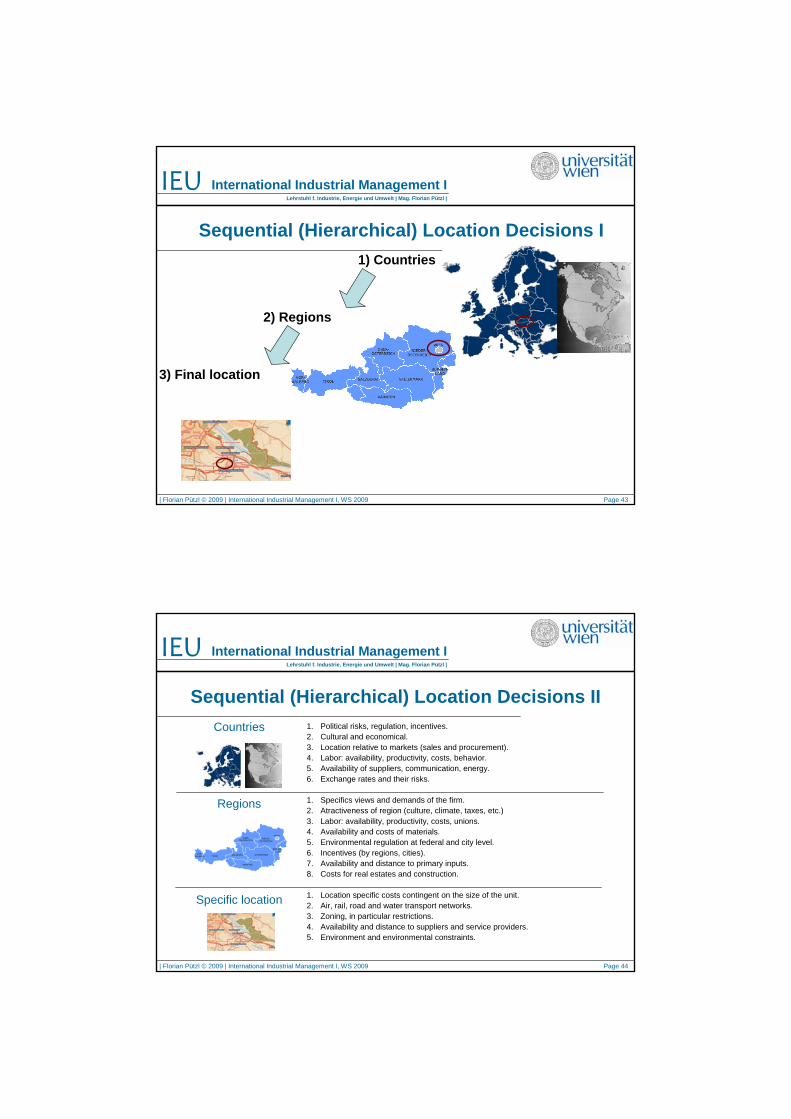
1) Countries
2) Regions
3) Final location
Sequential (Hierarchical) Location Decisions I
| Florian Pützl © 2009 | International Industrial Management I, WS 2009 Page 44
IEU International Industrial Management ILehrstuhl f. Industrie, Energie und Umwelt | Mag. Florian Pützl |
Countries
Regions
Specific location
1. Political risks, regulation, incentives.2. Cultural and economical.3. Location relative to markets (sales and procurement).4. Labor: availability, productivity, costs, behavior.5. Availability of suppliers, communication, energy.6. Exchange rates and their risks.
1. Specifics views and demands of the firm.2. Atractiveness of region (culture, climate, taxes, etc.)3. Labor: availability, productivity, costs, unions.4. Availability and costs of materials.5. Environmental regulation at federal and city level.6. Incentives (by regions, cities).7. Availability and distance to primary inputs.8. Costs for real estates and construction.
1. Location specific costs contingent on the size of the unit.2. Air, rail, road and water transport networks.3. Zoning, in particular restrictions.4. Availability and distance to suppliers and service providers.5. Environment and environmental constraints.
Sequential (Hierarchical) Location Decisions II
| Florian Pützl © 2009 | International Industrial Management I, WS 2009 Page 45
IEU International Industrial Management ILehrstuhl f. Industrie, Energie und Umwelt | Mag. Florian Pützl |
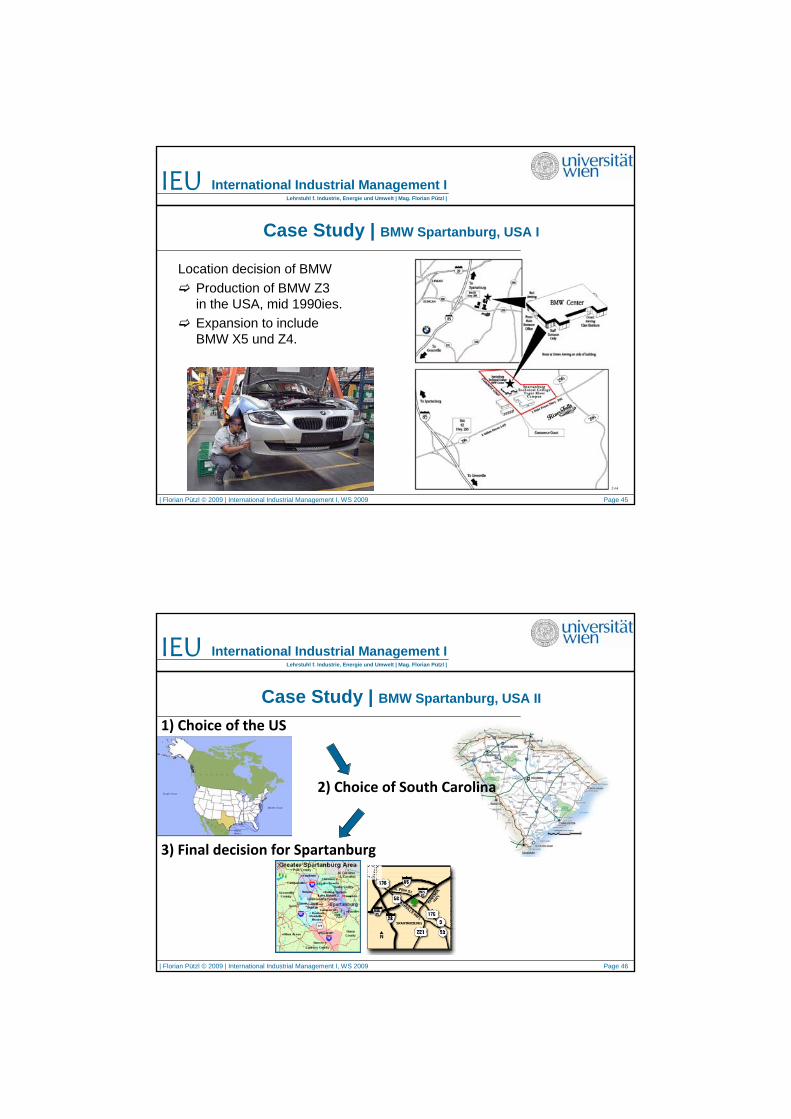
Case Study | BMW Spartanburg, USA I
Location decision of BMWProduction of BMW Z3 in the USA, mid 1990ies.Expansion to includeBMW X5 und Z4.
| Florian Pützl © 2009 | International Industrial Management I, WS 2009 Page 46
IEU International Industrial Management ILehrstuhl f. Industrie, Energie und Umwelt | Mag. Florian Pützl |
Case Study | BMW Spartanburg, USA II
3) Final decision for Spartanburg
2) Choice of South Carolina
1) Choice of the US
| Florian Pützl © 2009 | International Industrial Management I, WS 2009 Page 47
IEU International Industrial Management ILehrstuhl f. Industrie, Energie und Umwelt | Mag. Florian Pützl |
Case Study | BMW Spartanburg, USA III
Factors decisive for choosing USA
Market:Market size: USA is the world‘s largest market for luxury carsGrowing versus declining markets: US growing market due to baby boomers.
Labor:Lower labor and production costs: (US: US$ 17/h, DEU: US$ 27/h)High labor productivity(Holidays: US 11, Germany: 31)
Additionally:Low transport costs (US$ 2.500,- less per vehicle)New facilities improve productivity and thus lower the costs per car (around US$ 2.000-3.000.-)Insurance (‚hedging‘) against high Dollar-Euro exchange rates.
| Florian Pützl © 2009 | International Industrial Management I, WS 2009 Page 48
IEU International Industrial Management ILehrstuhl f. Industrie, Energie und Umwelt | Mag. Florian Pützl |
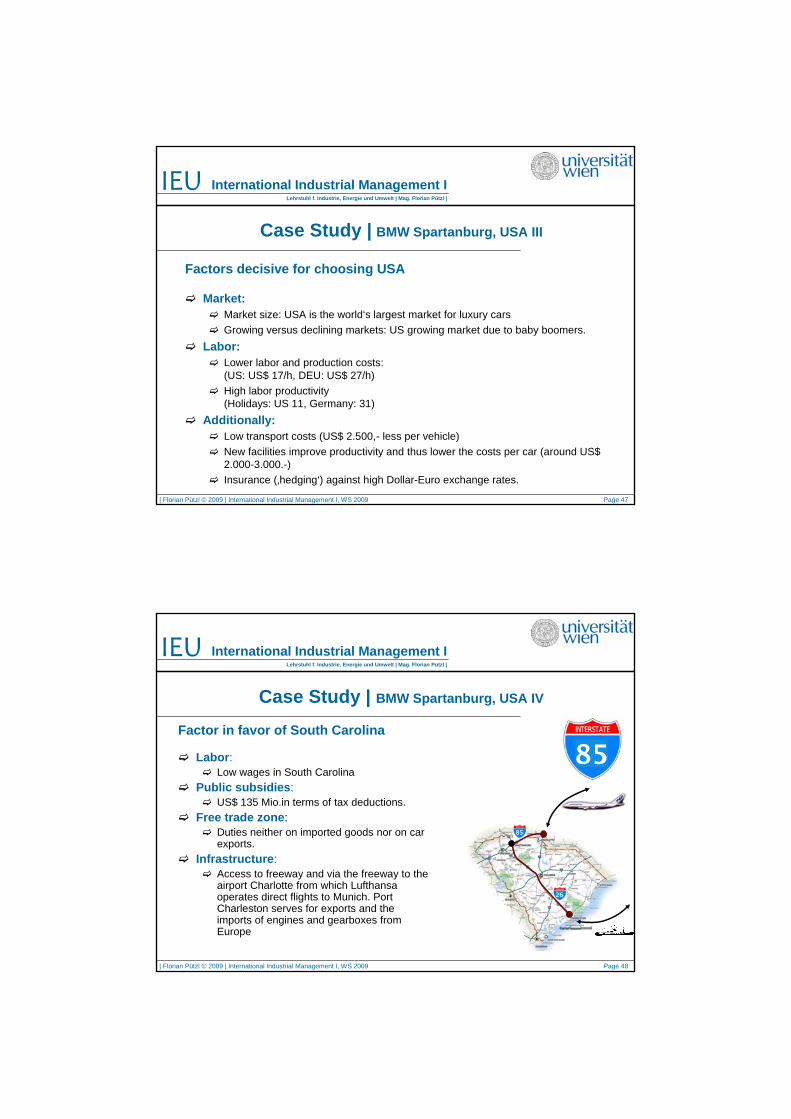
Case Study | BMW Spartanburg, USA IV
Factor in favor of South Carolina
Labor:Low wages in South Carolina
Public subsidies:US$ 135 Mio.in terms of tax deductions.
Free trade zone:Duties neither on imported goods nor on carexports.
Infrastructure:Access to freeway and via the freeway to theairport Charlotte from which Lufthansa operates direct flights to Munich. Port Charleston serves for exports and theimports of engines and gearboxes fromEurope
8585
2626
85
| Florian Pützl © 2009 | International Industrial Management I, WS 2009 Page 49
IEU International Industrial Management ILehrstuhl f. Industrie, Energie und Umwelt | Mag. Florian Pützl |
Labor Productivity
Keyword: level of labor costs
Cheaper employees => higher profit?
However, cheap labor is NOT everything – countries with cheap labor are often characterized by low labor productity that can erode partially or totally the advantage in terms of labor cost. Compare: Gregory Clark, Farewell to Alms, textile production in England and colonial India.
‚Skills‘ of workers, good infrastructure, and technology are often more important to many industries than plain labor costs.
| Florian Pützl © 2009 | International Industrial Management I, WS 2009 Page 50
IEU International Industrial Management ILehrstuhl f. Industrie, Energie und Umwelt | Mag. Florian Pützl |
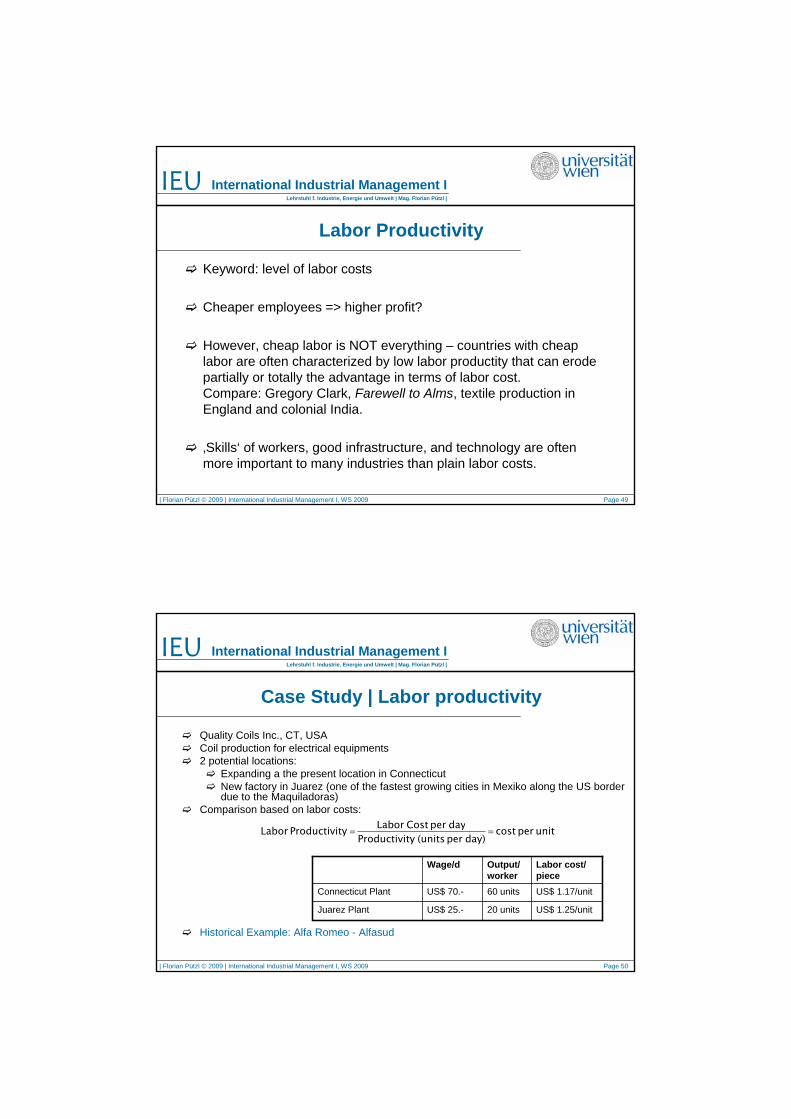
Case Study | Labor productivity
Quality Coils Inc., CT, USA Coil production for electrical equipments 2 potential locations:
Expanding a the present location in Connecticut New factory in Juarez (one of the fastest growing cities in Mexiko along the US border due to the Maquiladoras)
Comparison based on labor costs:
Historical Example: Alfa Romeo - Alfasud
US$ 1.25/unit20 unitsUS$ 25.-Juarez Plant
US$ 1.17/unit60 unitsUS$ 70.-Connecticut Plant
Labor cost/piece
Output/worker
Wage/d
unit per costday) per (units tyProductivi
dayperCostLabortyProductivi Labor ==
| Florian Pützl © 2009 | International Industrial Management I, WS 2009 Page 51
IEU International Industrial Management ILehrstuhl f. Industrie, Energie und Umwelt | Mag. Florian Pützl |
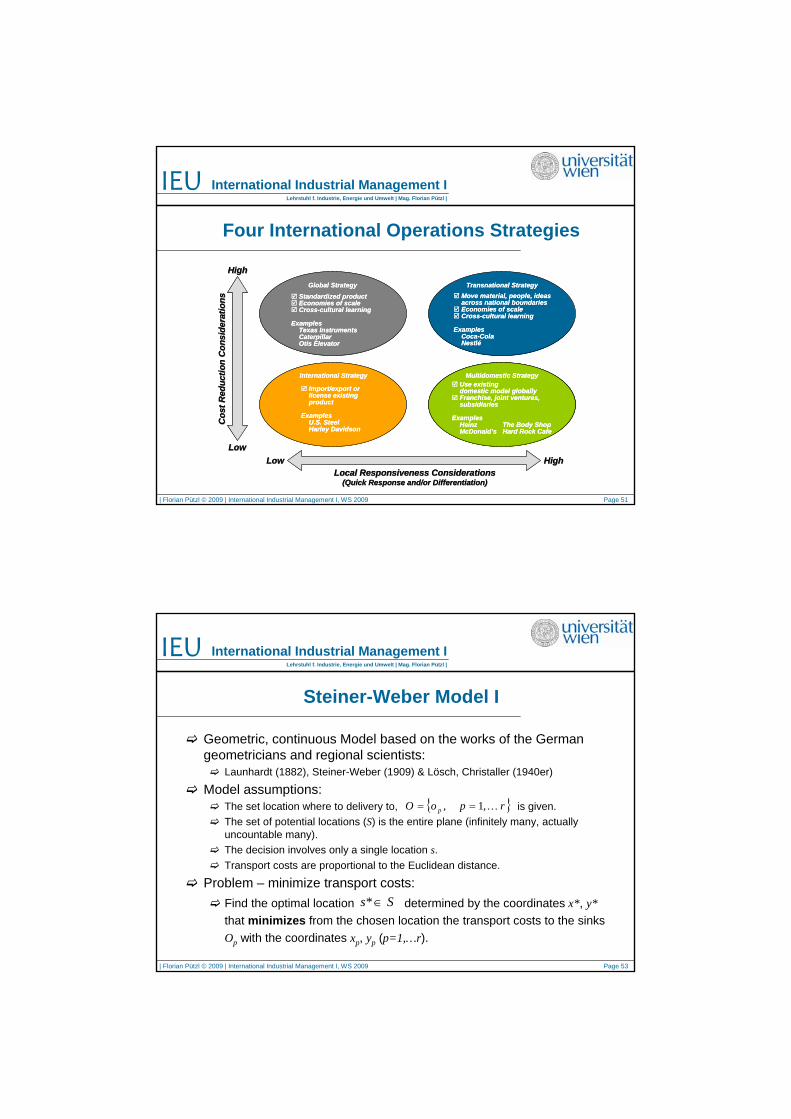
Four International Operations StrategiesC
ost R
educ
tion
Con
side
ratio
nsC
ost R
educ
tion
Con
side
ratio
ns
HighHigh
LowLowHighHighLowLow
Local Responsiveness ConsiderationsLocal Responsiveness Considerations(Quick Response and/or Differentiation)(Quick Response and/or Differentiation)
Cos
t Red
uctio
n C
onsi
dera
tions
Cos
t Red
uctio
n C
onsi
dera
tions
HighHigh
LowLowHighHighLowLow
Local Responsiveness ConsiderationsLocal Responsiveness Considerations(Quick Response and/or Differentiation)(Quick Response and/or Differentiation)
Standardized productEconomies of scaleCross-cultural learning
ExamplesTexas InstrumentsCaterpillarOtis Elevator
Global Strategy Transnational StrategyMove material, people, ideas across national boundariesEconomies of scaleCross-cultural learning
ExamplesCoca-ColaNestlé
International Strategy
Import/export or license existing product
ExamplesU.S. SteelHarley Davidson
Multidomestic StrategyUse existing domestic model globallyFranchise, joint ventures, subsidiaries
ExamplesHeinz The Body ShopMcDonald’s Hard Rock Cafe
Standardized productEconomies of scaleCross-cultural learning
ExamplesTexas InstrumentsCaterpillarOtis Elevator
Global StrategyStandardized productEconomies of scaleCross-cultural learning
ExamplesTexas InstrumentsCaterpillarOtis Elevator
Global Strategy Transnational StrategyMove material, people, ideas across national boundariesEconomies of scaleCross-cultural learning
ExamplesCoca-ColaNestlé
Transnational StrategyMove material, people, ideas across national boundariesEconomies of scaleCross-cultural learning
ExamplesCoca-ColaNestlé
International Strategy
Import/export or license existing product
ExamplesU.S. SteelHarley Davidson
International Strategy
Import/export or license existing product
ExamplesU.S. SteelHarley Davidson
Multidomestic StrategyUse existing domestic model globallyFranchise, joint ventures, subsidiaries
ExamplesHeinz The Body ShopMcDonald’s Hard Rock Cafe
Multidomestic StrategyUse existing domestic model globallyFranchise, joint ventures, subsidiaries
ExamplesHeinz The Body ShopMcDonald’s Hard Rock Cafe
Multidomestic StrategyUse existing domestic model globallyFranchise, joint ventures, subsidiaries
ExamplesHeinz The Body ShopMcDonald’s Hard Rock Cafe
| Florian Pützl © 2009 | International Industrial Management I, WS 2009 Page 53
IEU International Industrial Management ILehrstuhl f. Industrie, Energie und Umwelt | Mag. Florian Pützl |
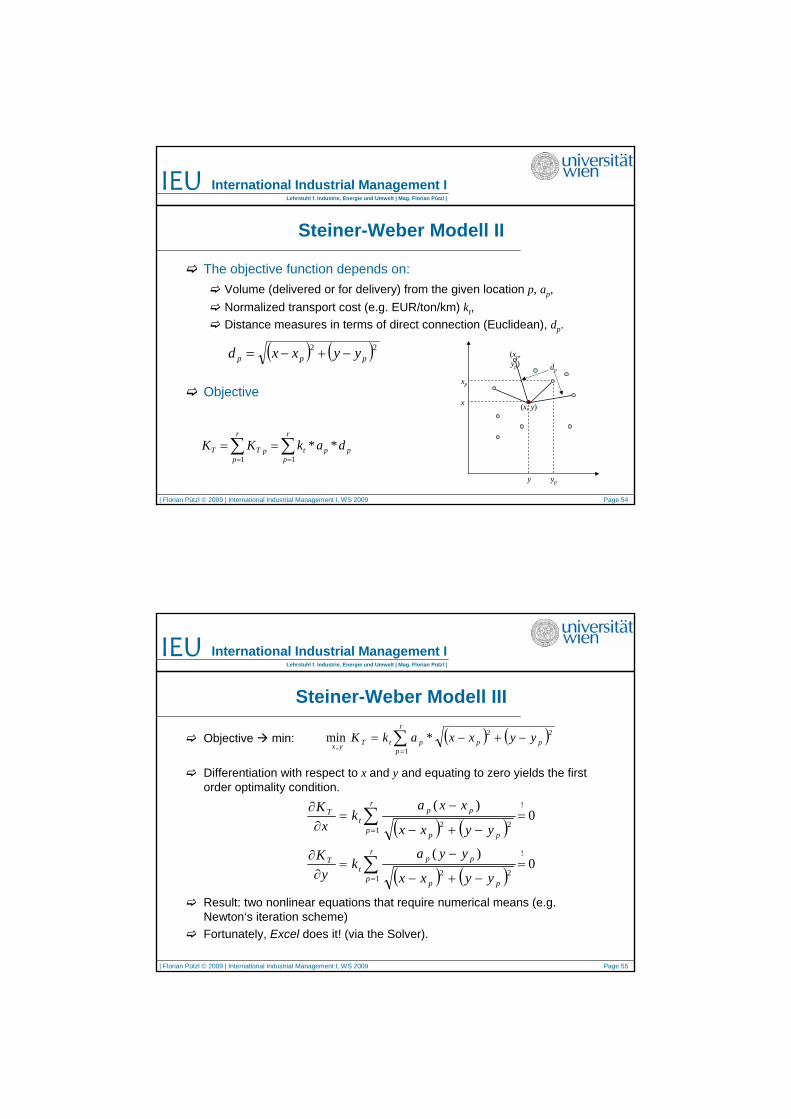
Steiner-Weber Model I
Geometric, continuous Model based on the works of the German geometricians and regional scientists:
Launhardt (1882), Steiner-Weber (1909) & Lösch, Christaller (1940er)
Model assumptions:The set location where to delivery to, is given.The set of potential locations (S) is the entire plane (infinitely many, actually uncountable many).The decision involves only a single location s.Transport costs are proportional to the Euclidean distance.
Problem – minimize transport costs:Find the optimal location determined by the coordinates x*, y*that minimizes from the chosen location the transport costs to the sinks Op with the coordinates xp, yp (p=1,…r).
{ }rpoO p K,1, ==
Ss ∈*
| Florian Pützl © 2009 | International Industrial Management I, WS 2009 Page 54
IEU International Industrial Management ILehrstuhl f. Industrie, Energie und Umwelt | Mag. Florian Pützl |
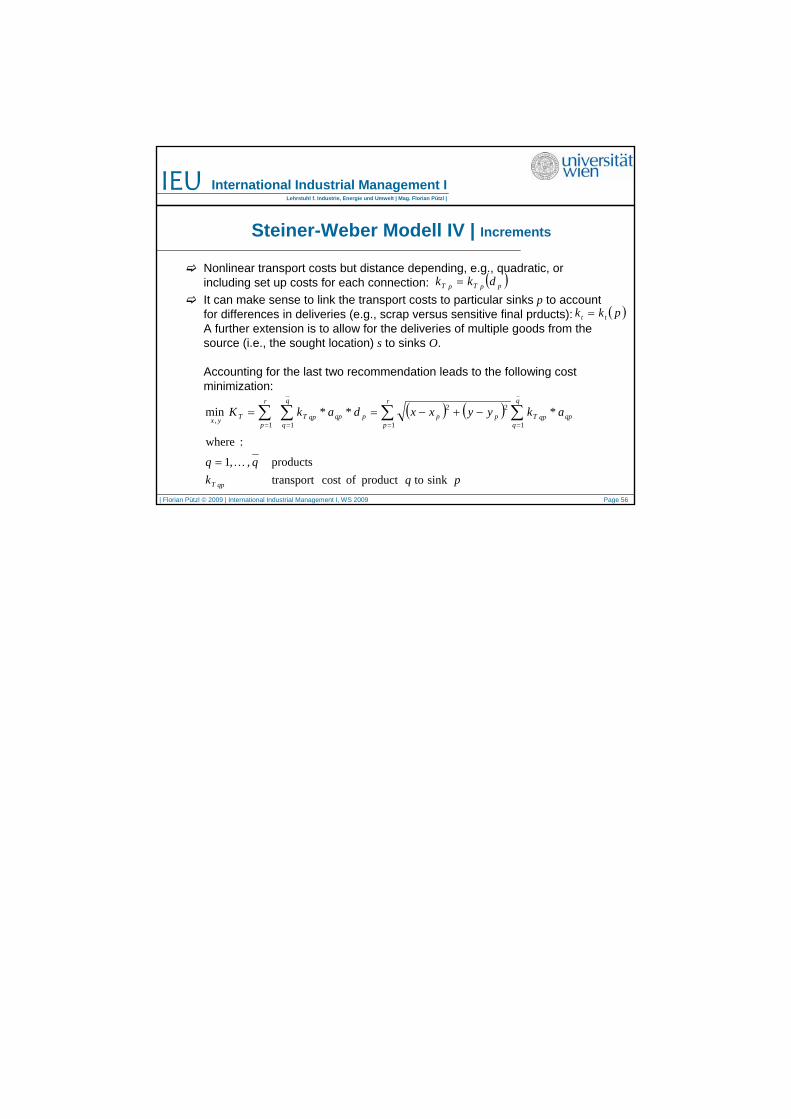
Steiner-Weber Modell II
The objective function depends on:Volume (delivered or for delivery) from the given location p, ap,Normalized transport cost (e.g. EUR/ton/km) kt,Distance measures in terms of direct connection (Euclidean), dp.
Objective
∑∑==
==r
pppt
r
ppTT dakKK
11**
( ) ( )22ppp yyxxd −+−=
dp
xp
x
ypy
(xp, yp)
(x, y)
| Florian Pützl © 2009 | International Industrial Management I, WS 2009 Page 55
IEU International Industrial Management ILehrstuhl f. Industrie, Energie und Umwelt | Mag. Florian Pützl |
Steiner-Weber Modell III
Objective min:
Differentiation with respect to x and y and equating to zero yields the first order optimality condition.
Result: two nonlinear equations that require numerical means (e.g. Newton‘s iteration scheme)Fortunately, Excel does it! (via the Solver).
( ) ( )∑=
−+−=r
pppptTyx
yyxxakK1
22
,*min
( ) ( )
( ) ( )∑
∑
=
=
=−+−
−=
∂∂
=−+−
−=
∂∂
r
p pp
ppt
T
r
p pp
ppt
T
yyxx
yyak
yK
yyxx
xxak
xK
1
!
22
1
!
22
0)(
0)(
| Florian Pützl © 2009 | International Industrial Management I, WS 2009 Page 56
IEU International Industrial Management ILehrstuhl f. Industrie, Energie und Umwelt | Mag. Florian Pützl |
Steiner-Weber Modell IV | Increments
Nonlinear transport costs but distance depending, e.g., quadratic, or including set up costs for each connection: It can make sense to link the transport costs to particular sinks p to account for differences in deliveries (e.g., scrap versus sensitive final prducts):A further extension is to allow for the deliveries of multiple goods from the source (i.e., the sought location) s to sinks O.
Accounting for the last two recommendation leads to the following cost minimization:
pqkqq
qpT sink toproduct ofcost transport products,,1
:where
K=
( ) ( ) ∑∑ ∑∑== ==
−+−==q
qqpqpT
q
q
r
ppppqpqpT
r
pTyx
akyyxxdakK11 1
22
1,***min
( )ppTpT dkk =
( )pkk tt =
Recommended