The role of CCR10 in cutaneous carcinogenesis
Inaugural-Dissertation
zur Erlangung des Doktorgrades der Mathematisch-Naturwissenschaftlichen Fakultät
der Heinrich-Heine-Universität Düsseldorf
vorgelegt von
Stephanie Müller aus Essen
Düsseldorf, August 2019
II
aus der Klinik für Dermatologie, Forschungslabor für Dermato-Immunologie und Onkologie Medizinische Fakultät der Heinrich-Heine-Universität Düsseldorf Gedruckt mit der Genehmigung der Mathematisch-Naturwissenschaftlichen Fakultät der Heinrich-Heine-Universität Düsseldorf Berichterstatter:
1. Univ.-Prof. Dr. med. Bernhard Homey 2. Univ.-Prof. Dr. rer. nat. Johannes Hegemann Tag der mündlichen Prüfung: 26.06.2020

III
MMeinen Eltern in Liebe und großer Dankbarkeit
gewidmet
Table of contents
IV
Table of contents
Abbreviations ............................................................................................................. VI
Summary .................................................................................................................... 1
Zusammenfassung ..................................................................................................... 2
1 Introduction .............................................................................................................. 3
1.1 The natural function of the skin ..................................................................... 3
1.2 The structure of the skin ................................................................................ 4
1.2.1 Epidermis ................................................................................................ 4
1.2.2 Dermis .................................................................................................... 7
1.2.3 Subcutis .................................................................................................. 8
1.2.4 Mouse skin .............................................................................................. 9
1.3 Cutaneous squamous cell carcinoma (SCC) ............................................... 10
1.4 Chemokines and chemokine receptors ....................................................... 12
1.4.1 The Chemokine receptor CCR10 .......................................................... 15
1.4.2 The chemokine CCL27 ......................................................................... 17
1.5 Chemokines and chemokine receptors in cancer ........................................ 18
1.6 The DMBA/TPA two-stage carcinogenesis model ....................................... 21
1.7 The UVB-irradiation model of cutaneous carcinogenesis ............................ 24
1.8 Aims ............................................................................................................ 26
2 Material and Methods ........................................................................................ 28
2.1 Mice ............................................................................................................. 28
2.2 Buffers and solutions ................................................................................... 28
2.2.1 Reagents............................................................................................... 28
2.2.2 DNA Ladder .......................................................................................... 29
2.2.3 Kits ........................................................................................................ 30
2.2.4 Instruments ........................................................................................... 30
2.3 Methods ....................................................................................................... 31
2.3.1 DMBA/TPA two-stage skin carcinogenesis model. ............................... 31
2.3.2 Detailed listing of animal numbers used in DMBA/TPA experiments .... 32
2.3.3 Minimal Erythema Dose ........................................................................ 36
2.3.4 UVB-irradiation of mice ......................................................................... 37
2.3.5 Detailed listing of animal numbers used in UVB experiments ............... 38
2.3.6 Measurement of epidermal thickness ................................................... 41
Table of contents
V
2.3.7 Total DNA Isolation of murine tail tips ................................................... 43
2.3.8 Polymerase chain reaction (PCR) ......................................................... 44
2.3.9 Agarose gel electrophoresis.................................................................. 46
2.3.10 Statistical analysis ............................................................................. 47
3 Results .............................................................................................................. 48
3.1 Analysis of the role of CCR10 in cutaneous carcinogenesis in two model
systems ................................................................................................................. 48
3.2 Tumor progression in Ccr10-deficient mice is significantly reduced compared
to WT controls after DMBA/TPA treatment ........................................................... 48
3.3 Absence of CCR10 signaling decreases cutaneous carcinogenesis in an
‘inflammation’-dependent (DMBA/TPA) tumor model............................................ 50
3.4 Ccr10-deficiency induces different tumor morphologies compared to WT
controls ................................................................................................................. 52
3.5 Ccr10-deficient mice do not exhibit reduced nuchal fold thickness to
DMBA/TPA administration .................................................................................... 55
3.6 Chronic UVB-irradiation causes a decreased overall survival in Ccr10-
deficient mice ........................................................................................................ 58
3.7 UVB-irradiation increases tumor burden in the absence of CCR10 signaling
60
3.8 Loss of Ccr10 results in morphologically different tumors compared to WT
mice in a photocarcinogenesis model ................................................................... 61
3.9 Decreased epidermal thickness in Ccr10-deficient mice is associated with an
increased tumor burden ........................................................................................ 64
4 Discussion ......................................................................................................... 67
5 References ........................................................................................................ 86
6 List of figures ................................................................................................... 103
7 List of tables .................................................................................................... 104
8 Vita .................................................................................................................. 105
9 Publications ..................................................................................................... 106
9.1 Scientific articles ........................................................................................ 106
9.2 Poster ........................................................................................................ 106
10 Acknowledgements ....................................................................................... 107
11 Declaration .................................................................................................... 108
List of tables
VI
Abbreviations
A AIDS acquired immune deficiency syndrome
Arnt aryl hydrocarbon receptor nuclear translocator
ASC antibody secreting cell
B Balb/c Bagg albino c
BCC basal cell carcinoma
B cell B lymphocyte
bp base pair
BSA bovine serum albumin
C C cysteine
°C degree Celsius
CAF cancer-associated fibroblast
CCL CC-motif chemokine ligand
CCR CC-motif chemokine receptor
Ccr10-/- Ccr10-deficient
CD cluster of differentiation
CE cornified envelope
CI confidence interval
CLA cutaneous lymphocyte-associated antigen
CLL chronic lymphocytic leukemia
cm centimeter
cm² square centimeter
CO2 carbon dioxide
CTACK cutaneous T cell-attracting chemokine
CTL cytotoxic T lymphocyte
CX26 connexin 26
CXCL CXC-motif chemokine ligand
CXCR CXC-motif chemokine receptor
List of tables
VII
CX3CL CX3CL-motif chemokine ligand
CX3CR CX3CR-motif chemokine receptor
D Δ delta
d-x day x
Da Dalton
DC dendritic cell
DEPC diethylpyrocarbonate
Dept. Department
dH2O distilled water
DLN draining lymph node
DMBA 7,12-Dimethylbenz(a)anthracene
DNA deoxyribonucleic acid
DNFB 2,4-Dinitro-1-fluorbenzol
dNTP deoxyribonucleotide triphosphate
DSO Düsseldorf School of Oncology
E ECM extracellular matrix
EDC epidermal differentiation complex
EDTA Ethylenediaminetetraacetic acid
e.g. for exsample
EGF epidermal growth factor
EGFP enhanced green fluorescent protein
EGFR epidermal growth factor receptor
EGFRΔep EGFR deletion in the epidermis
EGFRI epidermal growth factor receptor inhibitor
ELR glutamic acid-leucine-arginine
EPI envoplakin, periplakin, and involucrin
Erk extracellular-signal regulated kinase
ESDR European Society for Dermatology Research
et al. et alii, and others
List of tables
VIII
F fg femtogram
FGF fibroblast growth factor
Fig. Figure
FoxP3 Forkhead-Box-Protein P3
G g gram
γδTCR gamma delta t cell receptor
GGT γ-glutamyl transpeptidase
Glu-Leu-Arg glutamic acid-leucine-arginine
GPCR G protein-coupled receptor
G-protein guanine nucleotide-binding-proteins
H h hour
HCL hydrogen chloride
H&E hematoxylin and eosin
HEV high endothelial venules
HIV human immunodeficiency virus
H2O hydrogen oxide, water
HPV human papillomasvirus
HRAS Harvey rat sarcoma viral oncogene
HYA hyaluronan
I Ig immunoglobulin
IL interleukin
ILC innate lymphoid cell
INF-γ interferon gamma
INFγR interferon gamma receptor
K K keratin
List of tables
IX
kDa kilodalton
kg kilogram
KO knockout
L L ligand
LC Langerhans cell
LE lupus erythematosus
M μ micro
M molar
m² square meter
MAPK mitogen-activated protein kinases
max maximum
mCCL27 mouse CC-motif chemokine ligand 27
MED minimal erythema dose
μg microgram
mg milligram
MgCl2 magnesium chloride
min minute/ minimum
mJ millijoule
μl microliter
ml milliliter
μm micrometer
mm millimeter
mm³ cubic millimeter
mM millimolar
mRNA messenger RNA
MSC mesenchymal stem cell
mW milliwatt
N n number
List of tables
X
NaCl sodium chloride
NK natural killer
nm nanometer
NMSC nonmelanoma skin cancer
n.s. not significant
NSCLC non-small cell lung cancer
O O.C.T. optimal cutting temperature
OTR organ transplant recipient
P % percentage
P probability
PAS Per-Arnt-Sim
PCR Polymerase chain reaction
pDC plasmacytoid dendritic cell
PDGF platelet-derived growth factor
pErk phosphor-Erk
PGE2 prostaglandin E2
pH potential hydrogenii
pmol picomole
R R receptor
Rag2 recombination activating gene 2 protein
RAGE receptor for advanced glycation endproducts
Ras rat sarcoma
RNA ribonucleic acid
ROS reactive oxygen species
rpm revolutions per minute
RT room temperature
List of tables
XI
S SCC squamous cell carcinoma
SD standard deviation
sec second
SEM standard error of the mean
shRNA small hairpin RNA
STAT signal transducer and activator of transcription
T Tab. table
TAE Tris-acetate-EDTA
TAM tumor-associated macrophage
TAN tumor-associated neutrophil
Taq Thermus aquaticus
T cell T lymphocyte
Teff effector T cell
TGF transforming growth factor
Th T helper cell
TNF-α tumor necrosis factor-α
TPA 12-0-Tetradecanoylphorbol-13-acetate
Treg regulatory T cell
U U unit
UCA urocanic acid
USA United States of America
UV ultraviolet
V V volt
VEGF vascular endothelial growth factor
VEGFA vascular endothelial growth factor A
Vol. volume
List of tables
XII
W WT wildtype
X XCL XC-motif chemokine ligand
XCR XC-motif chemokine receptor
Z ZETT Zentrale Einrichtung für Tierforschung und
Tierschutzaufgaben
Summary
1
Summary The activation of the EGFR/Ras signaling pathway plays an important role in
cutaneous carcinogenesis. In particular, it regulates the expression of several
chemokines, which in turn modulate the tumor micromilieu. Chemokines and their
receptors are interesting pharmacological targets.
In this work the role of CCR10 signaling was investigated by taking advantage of an
inflammation-driven cutaneous carcinogenesis 7,12-Dimethylbenz(a)anthracene/12-
0-Tetradecanoylphorbol-13-acetate (DMBA/TPA) model compared to an
immunomodulation-associated UVB-induced skin carcinogenesis model. Ccr10-
deficient mice in a DMBA/TPA carcinogenesis model show a significantly lower
number of tumors and the tumor growth is inhibited. Hence, the tumor-free survival of
Ccr10-deficient mice in the inflammation-driven DMBA/TPA skin carcinogenesis
model is significantly increased. Skin thickness measurements as a marker for
cutaneous inflammation show no significant differences in Ccr10-deficient versus
wildtype mice.
In contrast to the inflammation-driven DMBA/TPA model, Ccr10-deficiency resulted in
an increased tumor growth, accompanied with decreased overall survival, in an
immunomodulation-associated UVB-induced skin carcinogenesis model. In further
analyses, Ccr10-deficient mice showed a reduced UVB-induced epidermal thickening
(acanthosis) when compared to wildtype mice.
Taken together, results of the present study demonstrate a context-dependent role of
CCR10 in cutaneous carcinogenesis. Further analyses have to unravel the
underlying mechanisms of CCR10. Finally, findings of the present study suggest that
potential pharmacological targets should be evaluated in different tumor models and
context-dependent indications could be relevant.
Zusammenfassung
2
Zusammenfassung Für die Entstehung von Plattenepithelkarzinomen der Haut ist die Aktivierung des
EGFR/Ras Signaltransduktionswegs von großer Bedeutung, unter anderem werden
dadurch zahlreiche Chemokine reguliert, die das Tumormikromilieu modulieren.
Chemokine und ihre Rezeptoren stellen interessante pharmakologische Ziele dar.
In dieser Arbeit wurde die Rolle des Chemokinrezeptors CCR10 auf die spontane,
kutane Karzinogenese in zwei in vivo-Mausmodellen untersucht. In einem
entzündungsgetriebenen 7,12-Dimethylbenzo(a)anthracen/12-0-Tetradecanoylphor-
bol-13-acetat (DMBA/TPA)-Modell zeigen die Ccr10-defizienten Mäuse im Vergleich
zu Wildtyptieren eine signifikant reduzierte Tumoranzahl und eine signifikant
reduzierte Tumorgröße. Dies resultiert in einer signifikant erhöhten tumorfreien
Überlebensrate der Ccr10-defizienten Mäuse im DMBA/TPA-Modell. In der
Hautdickenmessung, als Maß für die lokale Entzündungsreaktion in der Haut, zeigen
Ccr10-defiziente im Vergleich zu Wildtyptieren keinen Unterschied.
Im Gegensatz zum entzündungsgetriebenen DMBA/TPA-Modell zeigten die Ccr10-
defizienten Mäuse in einem immunmodulationsgetriebenen UVB-induzierten kutanen
Kanzerogenesemodell ein erhöhtes Tumorwachstum, begleitet von einer signifikant
niedrigeren Gesamtüberlebensrate. In weiteren Untersuchungen zeigte sich in
Ccr10-defizienten im Vergleich zu Wildtyptieren eine geringere Zunahme der
Epidermisdicke (Akanthose) unter chronischer UVB-Bestrahlung.
Zusammenfassend unterstreichen die Ergebnisse der vorliegenden Arbeit eine
kontextabhängige Rolle von CCR10 in der kutanen Kanzerogenese. Weiterführende
Untersuchungen müssen nun die zugrundeliegenden CCR10-vermittelten
Mechanismen aufklären. Abschließend weisen die Daten der Arbeit daraufhin, dass
potentielle pharmakologische Ziele in unterschiedlichen Tumormodellen getestet
werden sollten und kontextabhängige Indikatoren relevant sein können.
1. Introduction
3
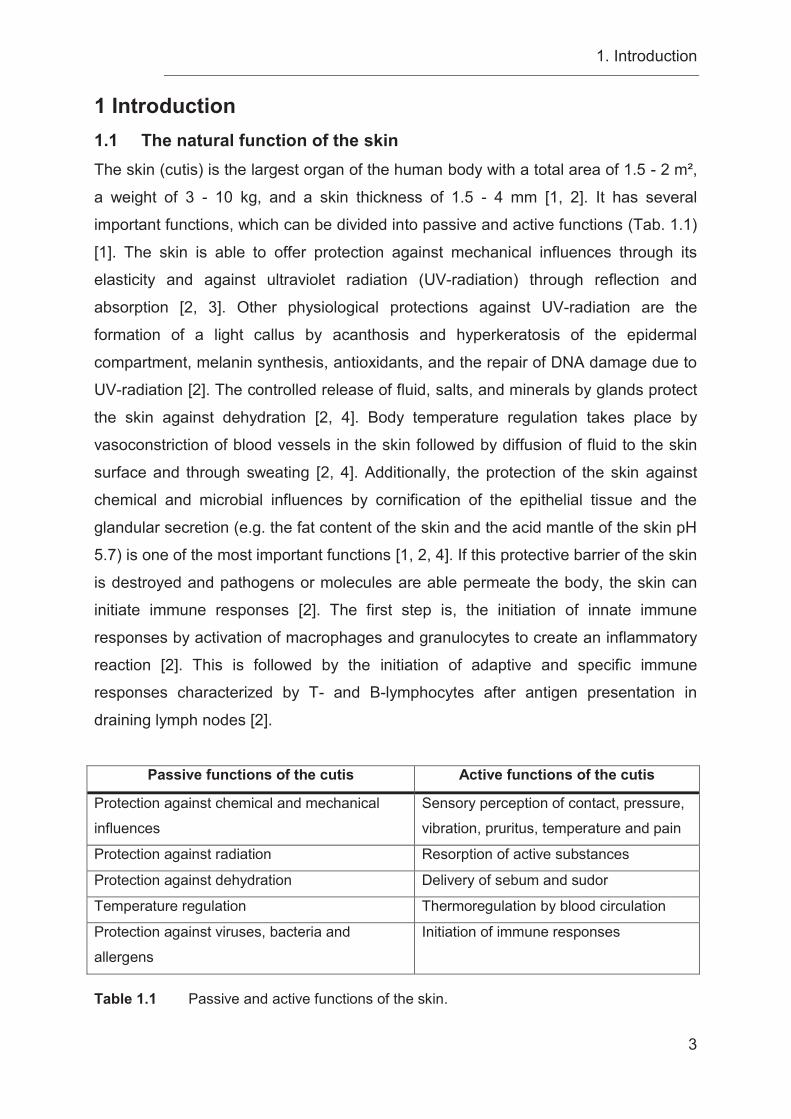
1 Introduction 1.1 The natural function of the skin The skin (cutis) is the largest organ of the human body with a total area of 1.5 - 2 m²,
a weight of 3 - 10 kg, and a skin thickness of 1.5 - 4 mm [1, 2]. It has several
important functions, which can be divided into passive and active functions (Tab. 1.1)
[1]. The skin is able to offer protection against mechanical influences through its
elasticity and against ultraviolet radiation (UV-radiation) through reflection and
absorption [2, 3]. Other physiological protections against UV-radiation are the
formation of a light callus by acanthosis and hyperkeratosis of the epidermal
compartment, melanin synthesis, antioxidants, and the repair of DNA damage due to
UV-radiation [2]. The controlled release of fluid, salts, and minerals by glands protect
the skin against dehydration [2, 4]. Body temperature regulation takes place by
vasoconstriction of blood vessels in the skin followed by diffusion of fluid to the skin
surface and through sweating [2, 4]. Additionally, the protection of the skin against
chemical and microbial influences by cornification of the epithelial tissue and the
glandular secretion (e.g. the fat content of the skin and the acid mantle of the skin pH
5.7) is one of the most important functions [1, 2, 4]. If this protective barrier of the skin
is destroyed and pathogens or molecules are able permeate the body, the skin can
initiate immune responses [2]. The first step is, the initiation of innate immune
responses by activation of macrophages and granulocytes to create an inflammatory
reaction [2]. This is followed by the initiation of adaptive and specific immune
responses characterized by T- and B-lymphocytes after antigen presentation in
draining lymph nodes [2].
Passive functions of the cutis Active functions of the cutis
Protection against chemical and mechanical
influences
Sensory perception of contact, pressure,
vibration, pruritus, temperature and pain
Protection against radiation Resorption of active substances
Protection against dehydration Delivery of sebum and sudor
Temperature regulation Thermoregulation by blood circulation
Protection against viruses, bacteria and
allergens
Initiation of immune responses
Table 1.1 Passive and active functions of the skin.
1. Introduction
4
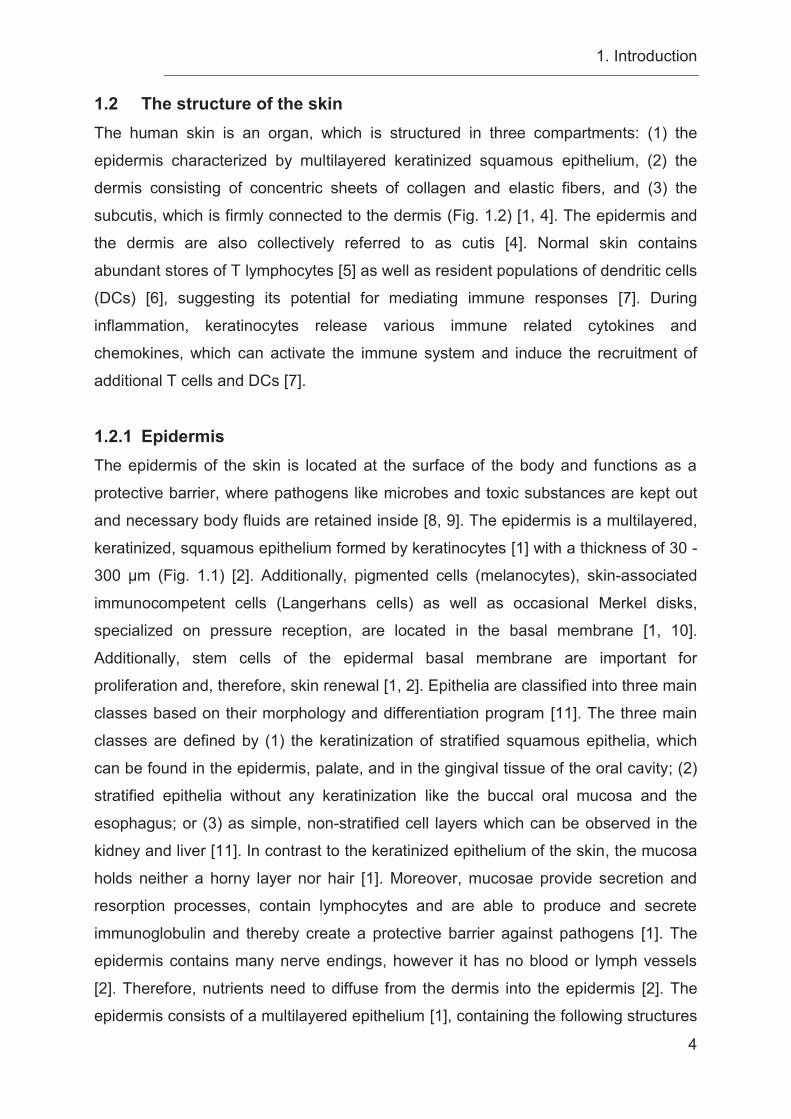
1.2 The structure of the skin The human skin is an organ, which is structured in three compartments: (1) the
epidermis characterized by multilayered keratinized squamous epithelium, (2) the
dermis consisting of concentric sheets of collagen and elastic fibers, and (3) the
subcutis, which is firmly connected to the dermis (Fig. 1.2) [1, 4]. The epidermis and
the dermis are also collectively referred to as cutis [4]. Normal skin contains
abundant stores of T lymphocytes [5] as well as resident populations of dendritic cells
(DCs) [6], suggesting its potential for mediating immune responses [7]. During
inflammation, keratinocytes release various immune related cytokines and
chemokines, which can activate the immune system and induce the recruitment of
additional T cells and DCs [7].
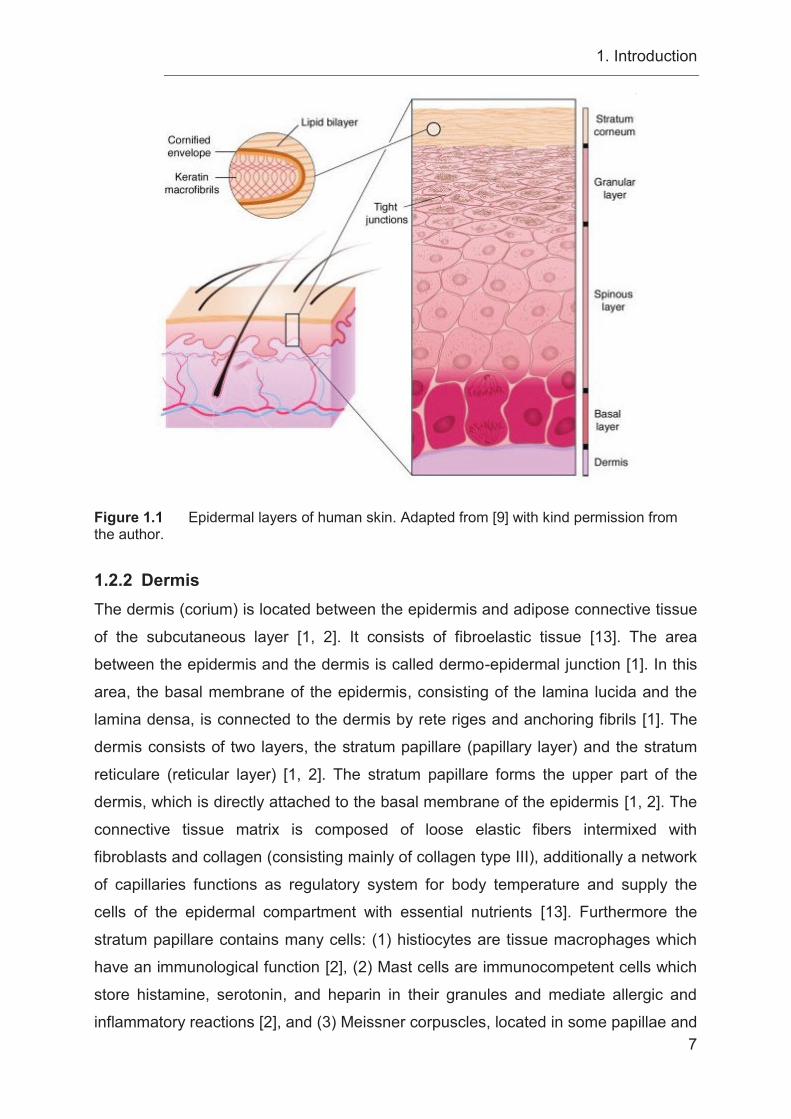
1.2.1 Epidermis The epidermis of the skin is located at the surface of the body and functions as a
protective barrier, where pathogens like microbes and toxic substances are kept out
and necessary body fluids are retained inside [8, 9]. The epidermis is a multilayered,
keratinized, squamous epithelium formed by keratinocytes [1] with a thickness of 30 -
300 μm (Fig. 1.1) [2]. Additionally, pigmented cells (melanocytes), skin-associated
immunocompetent cells (Langerhans cells) as well as occasional Merkel disks,
specialized on pressure reception, are located in the basal membrane [1, 10].
Additionally, stem cells of the epidermal basal membrane are important for
proliferation and, therefore, skin renewal [1, 2]. Epithelia are classified into three main
classes based on their morphology and differentiation program [11]. The three main
classes are defined by (1) the keratinization of stratified squamous epithelia, which
can be found in the epidermis, palate, and in the gingival tissue of the oral cavity; (2)
stratified epithelia without any keratinization like the buccal oral mucosa and the
esophagus; or (3) as simple, non-stratified cell layers which can be observed in the
kidney and liver [11]. In contrast to the keratinized epithelium of the skin, the mucosa
holds neither a horny layer nor hair [1]. Moreover, mucosae provide secretion and
resorption processes, contain lymphocytes and are able to produce and secrete
immunoglobulin and thereby create a protective barrier against pathogens [1]. The
epidermis contains many nerve endings, however it has no blood or lymph vessels
[2]. Therefore, nutrients need to diffuse from the dermis into the epidermis [2]. The
epidermis consists of a multilayered epithelium [1], containing the following structures
1. Introduction
5
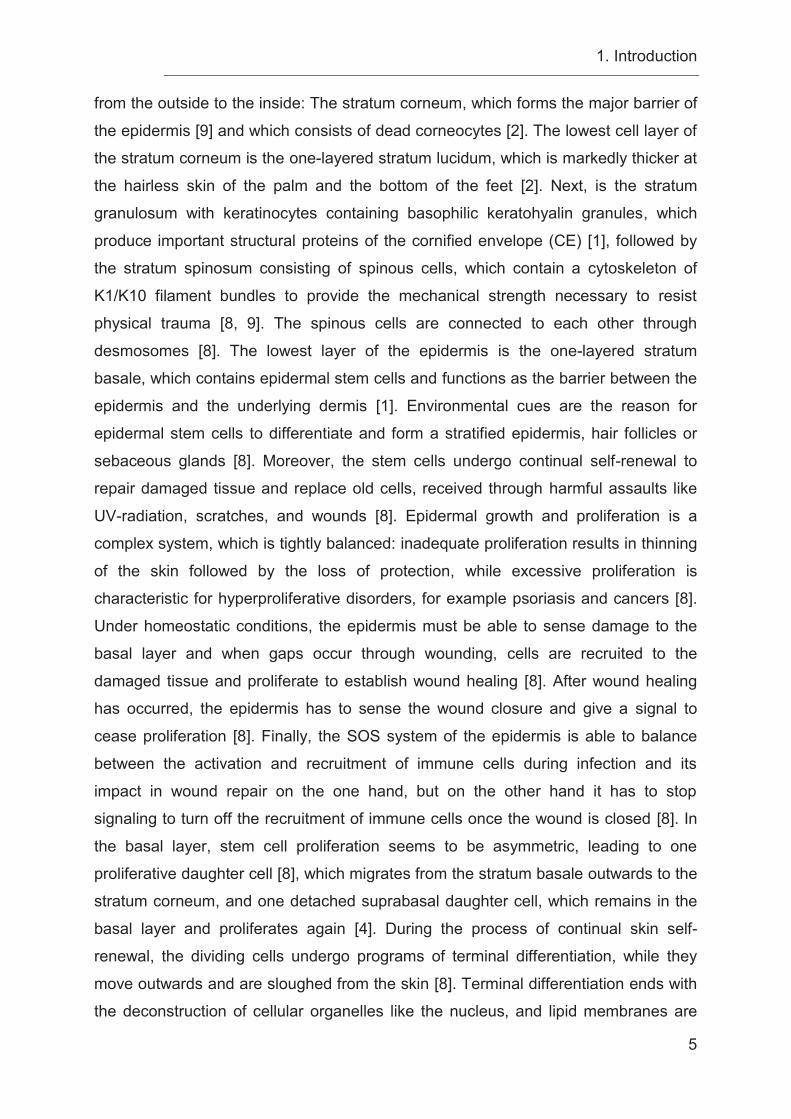
from the outside to the inside: The stratum corneum, which forms the major barrier of
the epidermis [9] and which consists of dead corneocytes [2]. The lowest cell layer of
the stratum corneum is the one-layered stratum lucidum, which is markedly thicker at
the hairless skin of the palm and the bottom of the feet [2]. Next, is the stratum
granulosum with keratinocytes containing basophilic keratohyalin granules, which
produce important structural proteins of the cornified envelope (CE) [1], followed by
the stratum spinosum consisting of spinous cells, which contain a cytoskeleton of
K1/K10 filament bundles to provide the mechanical strength necessary to resist
physical trauma [8, 9]. The spinous cells are connected to each other through
desmosomes [8]. The lowest layer of the epidermis is the one-layered stratum
basale, which contains epidermal stem cells and functions as the barrier between the
epidermis and the underlying dermis [1]. Environmental cues are the reason for
epidermal stem cells to differentiate and form a stratified epidermis, hair follicles or
sebaceous glands [8]. Moreover, the stem cells undergo continual self-renewal to
repair damaged tissue and replace old cells, received through harmful assaults like
UV-radiation, scratches, and wounds [8]. Epidermal growth and proliferation is a
complex system, which is tightly balanced: inadequate proliferation results in thinning
of the skin followed by the loss of protection, while excessive proliferation is
characteristic for hyperproliferative disorders, for example psoriasis and cancers [8].
Under homeostatic conditions, the epidermis must be able to sense damage to the
basal layer and when gaps occur through wounding, cells are recruited to the
damaged tissue and proliferate to establish wound healing [8]. After wound healing
has occurred, the epidermis has to sense the wound closure and give a signal to
cease proliferation [8]. Finally, the SOS system of the epidermis is able to balance
between the activation and recruitment of immune cells during infection and its
impact in wound repair on the one hand, but on the other hand it has to stop
signaling to turn off the recruitment of immune cells once the wound is closed [8]. In
the basal layer, stem cell proliferation seems to be asymmetric, leading to one
proliferative daughter cell [8], which migrates from the stratum basale outwards to the
stratum corneum, and one detached suprabasal daughter cell, which remains in the
basal layer and proliferates again [4]. During the process of continual skin self-
renewal, the dividing cells undergo programs of terminal differentiation, while they
move outwards and are sloughed from the skin [8]. Terminal differentiation ends with
the deconstruction of cellular organelles like the nucleus, and lipid membranes are
1. Introduction
6
packaged in lamellar granules to transport them to the cornified envelope [8]. During
terminal differentiation, when cells migrate from the basal layer towards the skin
surface, they change their expression pattern from the expression of keratins K14
and K5 to K1 and K10 [8, 12]. In humans, the epidermal self-renewal takes place
every 4 weeks [1, 8]. A key to basal cell proliferation is the basal membrane, located
between the epidermis and the dermis, which contains extracellular matrix (ECM)
proteins and growth factors [8]. Basal cells adhere to one another through
desmosomes and adherens junctions [8]. Adherens junctions act as sensors for
basal cell density, which is important for mediating cell migration and proliferation and
the recruitment of immune cells in the case of low basal cell density, e.g. in a wound
[8]. After wound closure and the re-establishment of optimal junction formation, cell
migration is stopped and proliferation returns to homeostatic levels [8]. Melanocytes
migrate originally from the neural crest to the basal membrane of the epidermis and
the hair follicle [2]. These cells form dendrites and contain melanosomes in which
they synthesize and store melanin [2]. Melanocytes deliver their synthesized melanin
to neighboring keratinocytes [2]. They can be activated through various factors but
the most important inductor is radiation from the sun [1]. Especially UVB-irradiation
leads to increased pigmentation, damaged DNA, and induction of DNA repair
mechanisms [1]. While the number of melanocytes is always the same regardless of
skin type [1], pigmentation of the skin is determined by their ability to produce
melanin [1]. Merkel disks also originally migrate from the neural crest to the basal
membrane and contain neurosecretory granules [1, 2]. They are attached to
neighboring keratinocytes via desmosomes [1] and mediate tactile sensation [2].
Langerhans cells (LCs) are immunocompetent cells of the epidermis [1]. They are
important for antigen presentation and the activation of T cells [1]. They are
characterized by Birbeck granules and express CD1a on their cell surface [2]. There
are also a few T cells in the epidermis, but they are predominately located in the
stratum papillare of the dermis and interact with LCs [2].
1. Introduction
7
Figure 1.1 Epidermal layers of human skin. Adapted from [9] with kind permission from the author.
1.2.2 Dermis The dermis (corium) is located between the epidermis and adipose connective tissue
of the subcutaneous layer [1, 2]. It consists of fibroelastic tissue [13]. The area
between the epidermis and the dermis is called dermo-epidermal junction [1]. In this
area, the basal membrane of the epidermis, consisting of the lamina lucida and the
lamina densa, is connected to the dermis by rete riges and anchoring fibrils [1]. The
dermis consists of two layers, the stratum papillare (papillary layer) and the stratum
reticulare (reticular layer) [1, 2]. The stratum papillare forms the upper part of the
dermis, which is directly attached to the basal membrane of the epidermis [1, 2]. The
connective tissue matrix is composed of loose elastic fibers intermixed with
fibroblasts and collagen (consisting mainly of collagen type III), additionally a network
of capillaries functions as regulatory system for body temperature and supply the
cells of the epidermal compartment with essential nutrients [13]. Furthermore the
stratum papillare contains many cells: (1) histiocytes are tissue macrophages which
have an immunological function [2], (2) Mast cells are immunocompetent cells which
store histamine, serotonin, and heparin in their granules and mediate allergic and
inflammatory reactions [2], and (3) Meissner corpuscles, located in some papillae and
1. Introduction
8
especially numerous in the lips, external genitalia, and nipples, which contain
mechanoreceptors mediating tactile stimuli of slight deformations of the epidermal
compartment [13]. The stratum reticulare is located under the stratum papillare and is
a mixture of dense connective tissue, mainly type I collagen fibers bundles with
elastic fibers and fibroblasts [1, 13]. Whereas there are many cells in the stratum
papillare, the stratum reticulare contains fewer cells, mainly a few melanocytes and
T-lymphocytes [2]. Additionally, hair follicles, sebaceous glands, and sweat glands
are located in this layer [1]. The mechanoreceptors of Pacinian corpuscles are
located in deeper parts of the dermis close to the subcutis and signal to pressure
stimuli [13]. The ECM of the connective tissue is established by fibroblasts [1]. It
consists of collagen fibers, reticulin fibers, and elastic fibers [1, 2]. Collagen fibers are
important for the mechanical stability of the dermis [2] and elastic fibers are important
for the elasticity of the dermis [1]. Hyaluronan (HYA), a straight chain of
glycosaminoglycan polymer is a component of the ECM [14] in loose connective
tissues [15]. Bindings of HYA with proteoglycans stabilize the structure of the ECM
and interactions of both kinds with cell surfaces modify cell behavior [15]. Because of
its osmotic activity, HYA has an important impact on the distribution of water in tissue
and plays a major role in water homeostasis [15, 16]. An important property of
hyaluronan in its hydrated state is its visco-elasticity [15]. Moreover, hyaluronan is
located in small volumes of liquid in the serous cavities and in regions of tissue
movement between muscle bodies and skin [15, 16]. The enrichment of HYA in the
ECM is closely related to embryonic development, some forms of tissue injury,
immune reactions, inflammation, and cancer development [15, 16]. The reduction of
elastic fibers during aging causes the age-related atony of the skin [2].
1.2.3 Subcutis The subcutis, also called hypodermis, is the deepest layer of the skin and is mainly
composed of large pads of adipose tissue [13]. It is located beneath the stratum
reticulare of the dermis and serves as thermal insulation, storage of energy, and
mechanical protection [1, 13]. It is only loosely attached to the deep fascia or
periosteum and therefore it gives the skin its ability to slide over them [13]. Adipose
tissue cannot be found in the subcutis of the eyelids, clitoris, or penis [13]. Situated
between the hypodermis and the cutis is a broad capillary network [4, 13] to supply
1. Introduction
9
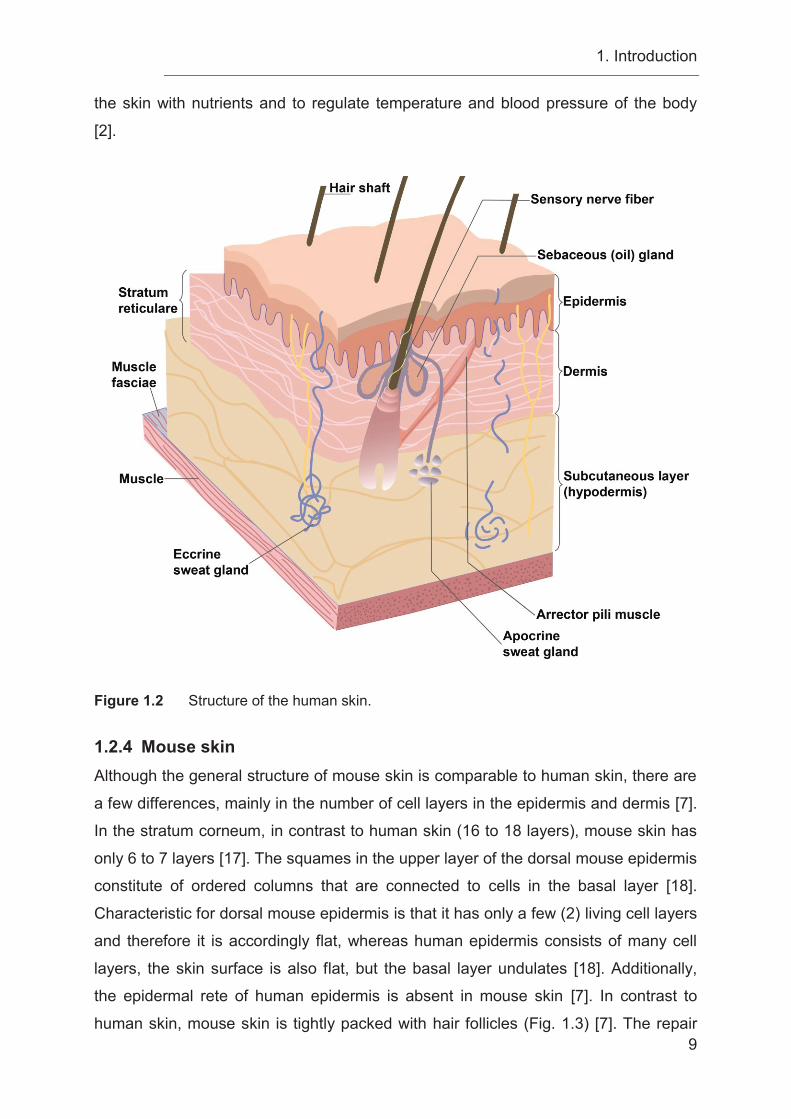
the skin with nutrients and to regulate temperature and blood pressure of the body
[2].
Figure 1.2 Structure of the human skin.
1.2.4 Mouse skin Although the general structure of mouse skin is comparable to human skin, there are
a few differences, mainly in the number of cell layers in the epidermis and dermis [7].
In the stratum corneum, in contrast to human skin (16 to 18 layers), mouse skin has
only 6 to 7 layers [17]. The squames in the upper layer of the dorsal mouse epidermis
constitute of ordered columns that are connected to cells in the basal layer [18].
Characteristic for dorsal mouse epidermis is that it has only a few (2) living cell layers
and therefore it is accordingly flat, whereas human epidermis consists of many cell
layers, the skin surface is also flat, but the basal layer undulates [18]. Additionally,
the epidermal rete of human epidermis is absent in mouse skin [7]. In contrast to
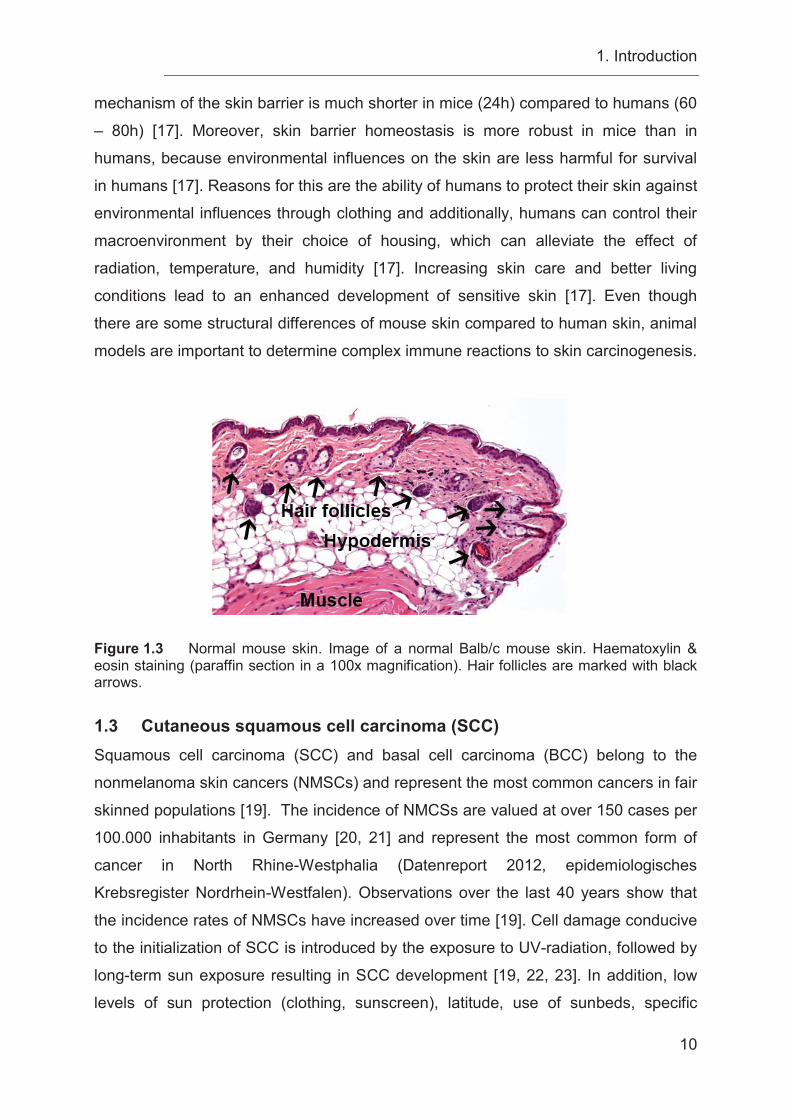
human skin, mouse skin is tightly packed with hair follicles (Fig. 1.3) [7]. The repair
1. Introduction
10
mechanism of the skin barrier is much shorter in mice (24h) compared to humans (60
– 80h) [17]. Moreover, skin barrier homeostasis is more robust in mice than in
humans, because environmental influences on the skin are less harmful for survival
in humans [17]. Reasons for this are the ability of humans to protect their skin against
environmental influences through clothing and additionally, humans can control their
macroenvironment by their choice of housing, which can alleviate the effect of
radiation, temperature, and humidity [17]. Increasing skin care and better living
conditions lead to an enhanced development of sensitive skin [17]. Even though
there are some structural differences of mouse skin compared to human skin, animal
models are important to determine complex immune reactions to skin carcinogenesis.
Figure 1.3 Normal mouse skin. Image of a normal Balb/c mouse skin. Haematoxylin & eosin staining (paraffin section in a 100x magnification). Hair follicles are marked with black arrows.
1.3 Cutaneous squamous cell carcinoma (SCC) Squamous cell carcinoma (SCC) and basal cell carcinoma (BCC) belong to the
nonmelanoma skin cancers (NMSCs) and represent the most common cancers in fair
skinned populations [19]. The incidence of NMCSs are valued at over 150 cases per
100.000 inhabitants in Germany [20, 21] and represent the most common form of
cancer in North Rhine-Westphalia (Datenreport 2012, epidemiologisches
Krebsregister Nordrhein-Westfalen). Observations over the last 40 years show that
the incidence rates of NMSCs have increased over time [19]. Cell damage conducive
to the initialization of SCC is introduced by the exposure to UV-radiation, followed by
long-term sun exposure resulting in SCC development [19, 22, 23]. In addition, low
levels of sun protection (clothing, sunscreen), latitude, use of sunbeds, specific
1. Introduction
11
carcinogens (e.g. arsenic, tobacco), chronic wounds, and inflammatory skin diseases
(e.g. ulcers, burns, scars, lichenoid diseases, and bullous skin disease) or
immunosuppression (e.g. human immunodeficiency depending on viral infections or
organ transplantation) increase the risk of NMSC and especially of SCCs
development [19, 24-27]. Furthermore, fair skin types with reduced tanning ability
have an increased risk to develop skin cancer [28, 29]. Interestingly, the highest
incidence rates of skin cancer is found in Australia [30]. This effect is caused by (1)
depletion of the ozone layer with the most impact at the polar regions, which is
responsible for an increase in UVB-radiation [30], and (2) an unnatural migration of
fair skin people to subtropical regions [30]. UV-radiation is directly associated with the
climate [30, 31]. Populations living in middle latitudes, like Australia, tend to spend
more time outside with inappropriate clothes due to the pleasant temperature
followed by increased UV-exposure [30, 31]. People living in climate zones with
temperatures under 18°C or over 27°C have a different behavior of clothing, spend
more time inside or seek shade [30, 31]. This effect can be observed for example in
the incidence rates of NMSC development between Australia and Scotland with a
difference of 10-fold according to their latitude [19, 29, 32]. Additionally, the incidence
rates for developing a NMSC are significantly higher in men than in women and
increase with age, which might be a result of traditional role differences whereby men
spend much more time outside either by choosing outdoor professions or hobby
activities and use less sunscreen than women, leading to higher UV-radiation of the
skin and NMSC development [19, 33]. 20% of NMSCs are represented by SCC [34],
the second most common tumor in the Caucasian population in which 5% of cancer
patients are observed with metastatic formations [26, 35]. The risk of SCC metastasis
formation significantly increases in tumors with a thickness larger than 2.0 mm [22].
In tumors with a thickness over 6.0 mm the risk for metastasis formation is high and
local relapse is a common occurrence [22]. The beginning of SCC development is
characterized by the disorganization of the epidermal compartment and
morphological changes of cells [26]. In the development of human cutaneous SCC,
alterations in the following genes are known: ras, c-jun, c-fos, c-myc gene mutations
[36], and, especially, a mutation of the p53 tumor suppressor gene is observed in 40
– 50% of patients [34, 37, 38]. All the genes mentioned above are key players in the
regulation of important cell signaling pathways, controlling cell proliferation,
differentiation, survival or apoptosis and are found to be mutated in response to
1. Introduction
12
chronic UVB-irradiation, the major risk factor for SCC development [36]. Moreover,
solid organ transplant patients, who are immune-compromised due to
immunosuppressive regimens against rejection reactions, have a 65-fold to 250-fold
higher risk to develop SCC and metastasis [22, 39-41]. Lymphatic cellular infiltrates
with SCCs have been associated with smaller tumors, whereas lack of inflammation
was detected in invasive and aggressive tumors as mentioned in cases of chronic
lymphocytic leukemia (CLL) [42]. Pivarcsi et al. showed that NMSCs inhibit T cell-
mediated antitumor immune responses through activation of the EGFR-Ras-MAPK-
signaling pathway, leading to downregulation of CCL27 mRNA and protein
expression [43]. Furthermore, they reported that blocking of CCL27 function results in
decreased leukocyte migration into the tumor environment and significantly increase
tumor growth [43]. Other groups associated chronic skin inflammation with the
development of SCCs and tumor progression [44]. Based on this understanding that
the host immunity regulates tumor growth and progression in SCC, it is important to
understand the mechanism of tumor-associated immune regulation [45].
1.4 Chemokines and chemokine receptors Chemokines are a group of small, secreted molecules (8-14 kDa) that regulate, along
with adhesion molecules, cell trafficking of specific leukocyte subpopulations to sites
of tissue damage, through interactions with a subset of seven-transmembrane, G
protein-coupled receptors (GPCRs) [46-48]. They are abundantly produced by cells
that express them and mainly act on neutrophils, monocytes, lymphocytes, and
eosinophils and play fundamental roles in host defense mechanisms, development,
homeostasis, and in functions of the immune system [47, 48]. Chemokines are often
highly expressed and build concentration gradients, along which specific responding
cell populations migrate [48]. However, chemokines and their receptors are also
important in lymphoid organ development, lymphoid trafficking, wound healing,
Th1/Th2 development and responses, angiogenesis, and disease processes,
including inflammation, autoimmune disease, infectious disease (such as HIV/AIDS
and HPV) and cancer (in regulating tumor growth and metastasis formation) [46, 48].
The human chemokine superfamily includes at least 50 chemokines [49] and is
classified into four subclasses of chemokines, due to the location of their first N-
terminal cysteine residues, which are CC, CXC, XC and CX3C, where the X in the
classification name denotes the position and number of other amino acid residues in
1. Introduction
13
relation to the cysteines [50]. The nomenclature of chemokines uses the subclass
name, followed by an R for receptor or an L for ligand and then a number specific to
a single chemokine [47]. The two major chemokine subfamilies (CC and CXC) are
composed of several family members, whereas the other two chemokine classes
contain only two family members in the case of the XC family and only one in the
case of the CX3C family, where CX3CL1 is the only known family member (Fig. 1.4)
[47, 50, 51]. Moreover, the chemokine genes are located in distinct chromosomal
sites, which assemble into two large gene clusters, one for CXC chemokines, which
is located at chromosome 4q13.3 in humans, and another for CC chemokines
clustered in the human chromosome 17q12 [50]. The majority of these chemokines
are characterized as inflammatory, due to their important roles during inflammatory
processes, where they recruit leukocytes to sites of tissue damage [50]. An
explanation for the redundancy of the ligands to receptor pairings could be that,
during inflammation, multiple chemokines might be needed to induce a robust
inflammatory response [48]. Furthermore, chemokines are differentially expressed
based on the site of tissue origin and are able to orchestrate the recruitment of
leukocytes to the specific tissues, thereby allowing for a customization of
inflammatory responses [48]. In contrast, non-cluster or mini-cluster chemokines,
whose genes are located separately in unique chromosomal locations are conserved
between species and many of them exhibit highly restricted ligand-receptor
relationships [48, 50]. These homeostatic chemokines are constitutively expressed
and their expression is restricted to specific cells or organs, so that each human
chemokine of this type has a clearly identifiable mouse counterpart, as in the case of
CCL27 [48, 50]. Homeostatic chemokines recruit subsets of lymphocytes or dendritic
cells to specific healthy tissues, where they act as surveillance as part of the acquired
immunity, while inflammatory chemokines are expressed after activation and mainly
attract macrophages or neutrophils [50]. Additionally, homeostatic chemokines recruit
leukocytes under steady state conditions, whereas inflammatory chemokines are
produced at sites of infection and disease and are able to react to stimuli with the
recruitment of effector cells [52]. Homeostatic chemokines are known to play major
roles in organogenesis of immune specific organs such as lymph nodes [50]. Other
important examples for homeostatic chemokines are CXCL12 and CCL21. CXCL12
is the only ligand for CXCR4 [53-55]. This ligand-receptor pair is crucial for
organogenesis, homing and repopulation of human stem cells into the bone marrow
1. Introduction
14
[54, 56-58]. This is exemplified in mice, where Ccxr4- and Ccxl12-deficiency is lethal
and results in abortion due to defects in organs such as the heart, brain or bone
marrow during organogenesis [48]. CXCL12 also has a pivotal role in homing of
immune cells to the skin due to its ubiquitous tissue expression and that its only
receptor is expressed on all circulating leukocytes [52]. The chemokines CCL19 and
CCL21 are both binding to chemokine receptor CCR7 and play an important role for
the recruitment of lymphocytes and dendritic cells into secondary lymphoid organs,
where CCL19 and CCL21 are expressed [50, 54]. Moreover, both are expressed in T
cell zones of secondary lymphatic tissues, whereas only CCL21 is expressed by high
endothelial venules (HEV) and on afferent lymphatic vessels [50]. In contrast, only
CCL19 is able to desensitize and internalize CCR7 [50]. Therefore, CCR7 expressing
lymphocytes and dendritic cells are recruited into lymph nodes by a gradient of
CCL21 and T cell zones via HEVs and afferent lymphatics [50]. CCL19 has to
override CCL21-mediated cell recruitment, followed by CCR7 downregulation to
guide B and follicular helper T cells into B cell zones via CXCL13/CXCR5 signaling
[50, 59]. The effects of chemokines are mediated through GPCRs and, they are
grouped in to their respective chemokine subfamilies [50]. Just like the chemokines
themselves, chemokine receptors also tend to be present in gene clusters [50]. The
largest chemokine receptor cluster is found on human chromosome 3 [50].
Chemokine receptors of inflammatory chemokines tend to be promiscuous, meaning
that one chemokine can interact with several receptors, while a single chemokine
receptor can mediate signals for more than one chemokine [47, 50]. 18 chemokine
receptors have been found in humans and mice [50]. Additionally, 5 atypical
chemokine receptors were discovered [50]. The interaction of chemokine receptors
and adhesion molecules enable a distinct tissue recruitment and provide ‘distinct
address codes’ deciding which leukocytes subsets remain in circulation, are recruited
to secondary lymphoid organs or to peripheral tissues [52]. Taken together,
chemokines are mediators to control immune and inflammatory responses and as a
consequence have a strong therapeutic potential, mainly in cancer [46, 47]. To date,
there are two main therapeutic areas of application for chemokine receptor inhibition,
(1) targeting of CCR5 to reduce HIV infection and (2) targeting of CXCR4 to release
bone marrow stem cells into the bloodstream for harvesting cells for bone marrow
transplants [55].
1. Introduction
15
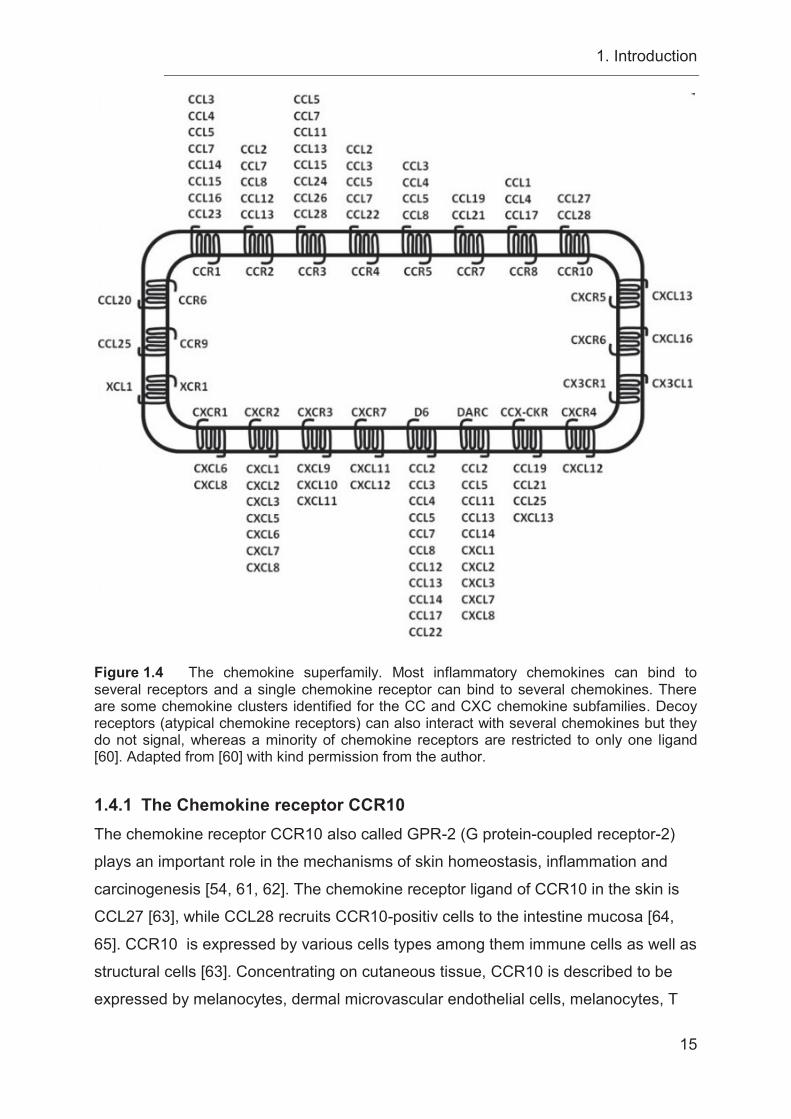
Figure 1.4 The chemokine superfamily. Most inflammatory chemokines can bind to several receptors and a single chemokine receptor can bind to several chemokines. There are some chemokine clusters identified for the CC and CXC chemokine subfamilies. Decoy receptors (atypical chemokine receptors) can also interact with several chemokines but they do not signal, whereas a minority of chemokine receptors are restricted to only one ligand [60]. Adapted from [60] with kind permission from the author. 1.4.1 The Chemokine receptor CCR10 The chemokine receptor CCR10 also called GPR-2 (G protein-coupled receptor-2)
plays an important role in the mechanisms of skin homeostasis, inflammation and
carcinogenesis [54, 61, 62]. The chemokine receptor ligand of CCR10 in the skin is
CCL27 [63], while CCL28 recruits CCR10-positiv cells to the intestine mucosa [64,
65]. CCR10 is expressed by various cells types among them immune cells as well as
structural cells [63]. Concentrating on cutaneous tissue, CCR10 is described to be
expressed by melanocytes, dermal microvascular endothelial cells, melanocytes, T
1. Introduction
16
cells and Langerhans cells [61]. The recruitment of skin-homing CCR10+ CLA+
memory T cells are connected to homeostatic and inflammatory conditions [66, 67]
(Figure 4.1 A). Cutaneous inflammatory diseases like psoriasis, atopic dermatitis and
allergic-contact dermatitis are linked to CCR10+ lymphocyte recruitment [67].
Inflamed skin samples of patients suffering from psoriasis or verrucae vulgaris show
migration of CCR6+ CCR10+ plasmacytoid dendritic cells (pDC) [68]. The authors
suggest that activated pDCs migrate from the blood into lymphoid tissue by
expressing CCR7 [68]. Afterwards the pDCs change their receptor expression profile
by acquiring CCR6 and CCR10 expression through IL-3 stimulation released from
local T cells, which allows the pDCs to migrate into inflamed epithelial sites of the
skin or the mucosa where they release IFN-α [68]. In addition, another subset of
CCR6+ CCR4+ CCR10+ CD4+ T cells are recruited to the skin in homeostasis [69, 70].
These T cell subsets secrete IL-22 but not IL-17 or IFN-γ and are characterized as
Th22 cells [69, 70]. Another immune cell population expressing CCR10 are the innate
lymphoid cells (ILCs) [71]. In skin-draining lymph nodes ILCs are programmed for the
expression of CCR10 by T cells and B cells [71]. The expression of CCR10 on ILCs
allows them to migrate into the skin, where they are responsible for maintaining
homeostatic levels of Treg cells and effector T cells [71]. In turn T cells are important
for the maintenance of CCR10+ ILCs in the skin, suggesting a crosstalk between
these two different cell types [71] (Figure 4.1 A). By Using a Ccr10-deficient/ EGFP-
knock-in mouse model Fu et al. showed that CCR10 is required for CD8+ T cell
migration into the skin and that the loss of CCR10 results in an altered CD4+ T cell
homeostasis including Treg cells and Teff cells [72]. These results suggest a role for
CCR10 in balancing Treg and Teff (Th17 cells) immune homeostasis [72, 73]. The
same mouse model showed that CCR10 is also required for the migration of γδT
cells into the epidermal regions of the skin and the maintenance of their dendritic
shape [72, 73]. Ccr10-deficency resulted in impaired skin homing and an altered
morphology of γδT cells [72]. Ccr10-deficient/ EGFP-knock-in mice are also reported
to acquire an increased immune response to 2,4-Dinitro-1-flourbenzol (DNFB)
challenging [73]. In contrast, the reaction to topical TPA treatment was comparable in
Ccr10-deficent mice and control mice [73]. After infection with Leishmania major
Ccr10-deficent mice react with an enhanced Th17 response accompanied by
increased secretion of TNF-α and IL-1β which resulted in more efficient pathogen
clearance compared to control mice indicating an important role for CCR10 in
1. Introduction
17
balancing Treg and Th17 immune responses for skin homeostasis and inflammation
[73]. Analyzing the expression pattern of CCR10 in T cells of mice and human by
flow cytometric analysis, resulted in comparable CCR10 expression pattern which
leads to the expectation that CCR10 has a similar function in mice and human [73].
The Ccr10-deficient mice used in this study are describes first by Morteau et al. [74].
This Ccr10-deficient mice strain had an insertion of a EGFP/NeoR cassette within the
start codon of Ccr10 [74]. Morteau et al. reported an impact for CCR10 in lymphocyte
recruitment of IgA-ASCs to mucosal tissue via the CCR10-CCL28 axis [74]. A
recently published paper analyzes the role of CCR10 on structural cells [75, 76].
Human dermal fibroblasts and primary dermal microvascular endothelial cells
express both CCR10 on their cell surface [75]. Both cell types promoted wound repair
by migration via a CCL27-CCR10 axis [75]. In the case of cancer progression,
CCR10 expressed on lymphatic endothelial cells promotes lymphatic vessel
development via CCL27/CCL28-CCR10 interactions during tumor lymphangiogenesis
[76]. Another paper reported increased CCR10 mRNA expression in malignant
melanoma cells showing an impact of CCR10 in support of skin metastasis
development through its ligand CCL27 [54].
1.4.2 The chemokine CCL27 Homeostatic chemokines are constitutively expressed and regulate tissue-specific
leukocyte migration [77]. The homeostatic chemokine CCL27 also called CTACK
(cutaneous T cell-attracting chemokine) is specifically expressed by human
epidermal keratinocytes in the skin [67, 78]. CCL27 is expressed in large amounts in
basal cells of the epidermis [67]. During the process of epidermal cell differentiation
from the basal layer to the skin surface, the expression levels of CCL27 decrease
[67]. CCL27 binds to its receptor CCR10 and recruits CLA+ skin-homing memory T
cells predominantly to the epidermis [61, 78] (Figure 4.1 A). During cutaneous
inflammation the proinflammatory cytokines TNF-α and IL-1β can induce an
increased expression of CCL27, accompanied by an upregulation of the vascular
ligand E-selectin [78]. The TNF-α/-IL-1β-induced CCL27 expression can be partially
inhibited by IL-10 treatment [61]. In inflammatory skin diseases, like psoriasis,
allergic-contact dermatitis, and atopic dermatitis, the inflammatory infiltrate is
dominated by lymphocytes [67]. Interestingly, these inflammatory skin diseases also
show an increased expression of CCL27 and CCR10 [67]. In a lymphocyte-driven in
1. Introduction
18
vivo mouse model induced by epicutaneous ovalbumin exposure, mice showed an
upregulation of CCL27 in inflamed skin [67]. When mice were treated with
neutralizing antibodies against CCL27, histological analysis indicated a suppression
of inflammation-induced skin thickening, and a substantially decreased leukocyte
recruitment into the skin [67]. In previous experiments, Pivarcsi et al. could show the
progressive loss of CCL27 expression during cutaneous carcinogenesis (actinic
keratosis, basal cell carcinoma, squamous cell carcinoma) by activation of the
EGFR/Ras signaling pathway [43]. The epidermal growth factor receptor (EGFR)
induces Ras signaling, which is activated in a variety of tumors [43, 79]. In cell culture
experiments, it was observed that oncogenic Ras down-regulates CCL27 but
increases CXCL8 expression in keratinocytes [43]. Immunohistochemical analysis of
skin tumor samples showed a significantly increased phosphor-Erk1/2 (p-Erk1/2)
expression, suggesting a role for MAPK pathway activation in skin tumors [43].
Furthermore, in the case of an enhanced response rate to an epidermal growth factor
receptor inhibitor (EGFRI) treatment such as Erlotinib®, tumor patients are observed
with inflammatory skin lesions (rash) [43, 80, 81]. These patients also presented with
an up-regulated CCL27 expression in lesional skin and, additionally, an increased
inflammatory infiltrate with clustering macrophages, intraepidermal LCs, and CD4+
and CD8+ T cells [43, 81]. Mutant mice, which bore a specific EGFR deletion in the
epidermis (EGFRΔep), developed a severe skin inflammation three weeks after birth,
characterized by an increased amount of DCs, granulocytes, monocytes,
degranulated mast cells, and T cells [81]. In accordance to these results, other
studies were able to show in an in vivo tumor mouse model of injected murine
B16/F10 tumor cells into the dermis and additional treatment with CCL27-neutralizing
antibody that tumor growth is significantly enhanced by inhibition of leukocyte
recruitment (CD4 and CD8) to sites of tumor formation [43].
1.5 Chemokines and chemokine receptors in cancer Chemokines have diversified roles in malignancies: some chemokines have a role in
combatting tumor development by their activation and recruitment of immune
responses or by impairment of angiogenesis, whereas other chemokines promote
tumor development and growth, followed by induction of angiogenesis and the
metastatic spread [82, 83].
1. Introduction
19
The prominent role of chemokines in metastasis has been a focus of research in the
last years [84]. Chemokine receptors expressed by tumor cells are implicated to be
responsible for specific metastasis into target organs, e.g. CXCR4 into the liver, lung
and bone marrow, and CCR7 into lymph nodes [54]. Tumors consist of a variety of
different cells (malignant cells, resident fibroblasts, endothelia cells, pericytes, and
leukocytes), the interaction of these cells with each other constitute the tumor
microenvironment [85, 86]. Inflammation is one of the hallmarks of cancer [85]. The
tumor stroma and tumor-associated inflammatory processes play a leading role in
tumor development, growth, and progression [86]. During carcinogenesis,
chemokines are produced by cancer cells as well as by different cells of the tumor
microenvironment, such as cancer-associated fibroblasts (CAFs), mesenchymal stem
cells (MSCs), endothelial cells, tumor-associated macrophages (TAMs), and tumor-
associated neutrophils (TANs) [83]. Tumor cells themselves and the cells of the
tumor microenvironment influence each other through stimuli, which promote tumor
growth and metastasis [83]. Chemokines are key players, not only in the recruitment
of cancer cells to distinct metastatic organs, but they also guide a variety of different
cells to sites of tumor development for the establishment of a favorable tumor
microenvironment [83]. Chemokines expressed by tumor-infiltrating cells can
influence tumor growth, cell survival, senescence, angiogenesis, and metastasis [83].
The upregulation of chemokines and chemokine receptors on cancer epithelia cells
can induce the release of cytokines, which create a strong inflammatory response by
recruiting immune cells, like macrophages, neutrophils, and lymphocytes, to establish
an anti-tumor or a tumor-promoting environment [83]. Infiltrating leukocytes,
endothelial cells, and CAFs are carrying chemokines receptors, such as CXCR1, 2
and CCR2, 4, 5 and 6 [83]. In turn, these cells, after recruitment to sites of tumor
development, express chemokines, which have an impact on tumor growth,
angiogenesis, metastasis, as well as the continued development of the tumor
microenvironment [83]. Indeed, epithelial tumors are often enriched with many
immune cells [82]. In contrast, effector cells have the potential to recognize tumor
cells and eliminate them and therefore they are very important for a possible rejection
of tumor cells [87]. For example, the infiltration of CD4+ and CD8+ T cells and natural
killer (NK) cells, recruited after detection by these effector cells through specific
chemokine expression, is correlated with the protection against tumor growth [87-89].
The expression of CCL2 within the tumor micromilieu is restricted to epithelial areas
1. Introduction
20
and was found to be correlated with the amount of infiltrating lymphocytes and
macrophages [90]. CCL5 recruits CD8+ T-lymphocyte into the tumor micromilieu [90].
To avoid this fate, some tumors developed the ability to evade immunosurveillance
by suppressing immune responses [87]. Additionally, tumors hijack the direct growth
stimulatory activity of some chemokines by changing their chemokine receptor profile
to include receptors for these stimulatory chemokines [82, 91]. Another leading role
of chemokines is the induction of angiogenesis to ensure the nourishment of the
tumor in case of tumor growth [82, 91]. Therefore, it is important to balance the
inflammatory responses [92].
Chemokines can affect angiogenesis by releasing promoting or inhibitory stimuli [93,
94]. Two sets of angiogenesis-modulating chemokines have been discovered. They
are distinguished by either containing or missing a so-called ELR motif in their amino
acid sequence. ELR motif-containing chemokines that contain the three amino acid
(Glu-Leu-Arg) motif are angiogenic and enhance tumor growth by induction of
angiogenesis, while chemokines that do not contain the ELR motif are interferon γ
(IFN-γ)-inducible and inhibit angiogenesis [82, 93, 94]. The ELR-positive chemokine
CXCL8 is correlated with angiogenesis in ovarian carcinoma, while ELR-positive
CXCL5 is an important regulator of angiogenesis in non-small cell lung cancer
(NSCLC) [93, 95]. In contrast, ELR motif-negative chemokines like CXCL9 and
CXCL10 are associated with spontaneous regression due to decreased angiogenesis
in human lymphoma and human NSCLC xenograft mouse models [93, 94].
Therefore, the balance between angiogenic and angiostatic chemokines in the tumor
micromilieu decides the strength and occurrence of angiogenesis initiation and
defines the metastatic potential of a tumor [82].
In most cases, the main problem for cancer patients is not the primary tumor, but the
metastatic spread of cancer cells to distant organs, which is often the cause of
treatment failure [96]. At the beginning of the last century, scientist discovered that
secondary tumors developed from tumor cells migrated from the original tumor into
other organ systems by lymphatic and blood vessels [96]. 15 years ago, Müller et al.
reported that tumor cell migration and metastatic spread are comparable to the
migration of leukocytes, which is mediated by chemokines and their receptors as
mentioned before [54]. The authors demonstrated that tumor cells also express a
distinct and non-random pattern of chemokine receptors [54]. After analyzing human
malignant breast tumors and metastases, they showed that CXCR4 and CCR7
1. Introduction
21
signaling pathways are regulators for actin polymerization and pseudopodia
formation and induce the response of tumor cells to chemotactic signals which leads
to metastasis development [54]. Additionally, they observed that distinct organs are
the main locations of breast cancer metastasis (bone-marrow, lung, liver, and lymph
node) and these organs express the ligands for chemokine receptors expressed by
breast cancer cells (CXCL12 and CCL21) [54]. In in vivo experiments, they
demonstrated that inhibition of CXCL12/CXCR4 signaling resulted in a significant
inhibition of lymph node and lung metastasis development [54]. Another example is
CCR10, which is expressed on normal melanocytes and malignant melanoma cells
[54, 55, 61]. The skin-specific expression of its ligand CCL27 might explain the high
incidence of melanoma skin metastases [54, 55]. Interestingly, if a shift in the
receptor expression of melanoma cells from CCR10 to CCR9 occurs, melanoma
metastasis formation is redirected to the small intestine, where the ligand of CCR9,
CCL25, is expressed [55, 97]. Therefore, chemokines and their receptors play a dual
role by not only mediating leukocyte trafficking and organogenesis, but by also
guiding tumor cells to their metastatic destination [54].
1.6 The DMBA/TPA two-stage carcinogenesis model The DMBA/TPA two-stage carcinogenesis model is well established [98]. It is based
on an initiation-promotion protocol [99]. In the initiation stage, the induction of skin
carcinogenesis by topical application of the carcinogen 7,12-
dimethylbenz(a)anthracene (DMBA) causes an activated Hras gene mutation at
codon 61, which leads to an irreversible change of some epidermal cells [99-101].
Activation of Hras signaling leads to altered gene expression in cells through
increased gene expression of ras-inducible genes [102-104]. This is followed by the
promotion stage, in which repetitive topical applications of the tumor promoting agent
12-O-tetradecanoylphorbol-13-acetate (TPA) is carried out to induce cutaneous
inflammation and epidermal hyperplasia in the treated area by induction of the EGFR
[99, 105]. The combination of the promotion and the induction of epidermal cell
proliferation induced by TPA gives initiated cells the possibility of selective clonal
expansion into papillomas and some papillomas progress irreversibly to carcinomas
[99, 100, 104]. Signaling through the EGFR is an essential component of skin tumor
promotion during chemically induced mouse skin carcinogenesis [106]. The
expression of EGFR ligands, such as the growth factors TGF-α and EGF, have been
1. Introduction
22
identified to be overexpressed during two-stage carcinogenesis and to activate the
EGFR [104, 106]. Additionally, there are also other factors which have an altered
expression pattern during chemically induced skin carcinogenesis. The growth
inhibitor TGF-β and keratin 1 (K1) are suppressed, while the cell cycle protein cyclin
D1, α6β4 integrin, keratin 13 (K13), γ-glutamyl transpeptidase (GGT) and the gap-
junctional protein connexin 26 (Cx26) are overexpressed [103, 104, 107, 108]. Hras
mutations appear to be an initiation-dependent event in mouse skin by DMBA, while
in contrast, v-fos has been implicated in later stages [104]. Immune responses play
an important role during tumor promotion and rejection [109, 110]. As mentioned
before, the topical application of TPA onto the skin induces an inflammatory response
in the skin [98, 99, 111], therefore in the following paragraph the role of immune
responses after DMBA/TPA treatment will be elucidated. The importance of immune
responses for the control of tumor incidence and progression is a key mechanism
which is reduced in immunosuppressive conditions such as in case of organ
transplantations, autoimmune disease and atopic dermatitis [112]. All these diseases
are treated with immune suppressive drugs which increase the risk of tumor
development as a recent study of skin carcinogenesis in Swiss albino mice showed
[112]. In this study, DMBA/TPA-induced skin carcinogenesis was enhanced by
additional topical treatment with immunosuppressant tacrolimus accompanied by
reduced levels of CD4+/CD8+ T cells [112]. The tumor-promoting effect of tacrolimus
was also previously shown by Niwa et al. [113]. The role of T cell mediated immune
response during skin carcinogenesis induction was also shown in another study of
DMBA/TPA-induced carcinogenesis [114]. Here, EPI-deficient mice are observed
with significantly reduced tumor development [114]. EPI-deficient mice have defects
in the epidermal barrier accompanied by an enhanced inflammatory response which
presented with an altered immune response leading to reduced γδTCR+ CD3+ cells
and a prominent dermal infiltrate of CD4+ T cells [114]. Additionally, these mice
showed an increased recruitment of dermal mast cells and eosinophils which are also
presented together with CD4+ T cells in acute atopic dermatitis [114]. In contrast to
the two studies above, DMBA/TPA carcinogenesis in FVB/N-Cd4-deficient mice
exhibit significantly reduced tumor multiplicity compared to wildtype littermates [115].
In accordance with that observation, Cxcr3-deficient mice are found with reduced
tumor development accompanied with a general increase of the inflammatory
infiltrate but markedly decreased epidermal proliferation whereas the infiltration of
1. Introduction
23
CD4+ and CD8+ T cells was significantly reduced after DMBA/TPA treatment [116].
Schioppa et al. found out that Tnf-deficient mice are resistant to DMBA/TPA induced
papilloma development which was associated with a decrease of tumor-promoting
IL10-producing B cells and an increased recruitment of IFN-γ-producing CD8+ T cells
[117]. When DMBA/TPA-treated Tnf-deficient mice were transferred with B cells from
DMBA/TPA treated wildtype mice the effect was an enhanced infiltrate of F4/80+
macrophages, but a decreased amount of CD8+ T cells, accompanied by significantly
increased papilloma development compared to Tnf-deficient mice [117]. They also
reported that C57BL/6 Rag2-deficient mice are resistant to DMBA/TPA-induced
papilloma development indicating a role for B and T cells for skin tumor development
[117]. Furthermore B cell-deficient Jh mice showed reduced tumor development
[117]. Surprisingly, INFγR-deficient mice are also resistant to papilloma development
after DMBA/TPA treatment [118]. The analysis of the immune infiltrate of these mice
exhibited a decreased amount of CD11b+ and Gr1+ cells, but predominantly, the
number of IL-17+ CD4+ T cells was reduced in INFγR-deficient mice compared to the
wildtype mice [118]. The same level could be observed for the amount of Th17 cells
in INFγR-deficient mice compared to the wildtype controls [118]. A study by Yusuf et
al. impressively showed that Cd8-deficient mice developed only a reduced contact
hypersensitivity to DMBA treatment whereas Cd4-deficient mice showed a strong
reaction to DMBA-induced contact hypersensitivity [119]. When these mice were
treated with DMBA/TPA, Cd8-deficient mice developed significantly more tumors
compared to wildtype controls whereas Cd4-deficient mice presented with a
decreased number of tumors compared to wildtype mice [119]. These results suggest
an anti-tumor role for CD8+ effector T cells compared to CD4+ T cells which seem to
have an inhibitory effect and promote tumor development [119]. A further
characterization of the distinct T cell subpopulations from tumor-bearing mice
demonstrated that CD4+ T cells mainly produced IL-4, IL-10 and Il-17 in contrast
CD8+ T cells produced IFN-γ [119]. As all the studies above show, the inflammatory
infiltrate of DMBA/TPA-induced carcinogenesis is complex and not easy to
understand. Complex processes orchestrate the immune infiltrate, which can have
pro-tumor or anti-tumor effects. Inflammation is a hallmark of cancer [85] and the
obvious conclusion would be that a reduction of the inflammatory infiltrate would
reduce tumor development, but this reduction is a double-edged sword and
depending on the mechanism of immune inhibition, might lead to a tumor-favorable
1. Introduction
24
modulation of the inflammatory infiltrate. Studies above showed also a decrease in
tumor development, if the immune response of the inflammatory infiltrate is altered
from Th2 to Th1. Inflammation is a multifactorial process, therefore it is important to
consider that not only a reduction of the inflammatory response can be beneficial, but
also an alteration of the inflammatory infiltrate to a Th1 response.
1.7 The UVB-irradiation model of cutaneous carcinogenesis It is well known that UV-irradiation impairs the immune system and is responsible for
tumor progression and cutaneous carcinogenesis [120]. Chronic UV exposure leads
to inflammation of the irradiated skin, oxidative stress, DNA damage, and impairment
of immune responses [121]. These events play an important role during skin
carcinogenesis [121]. In 1977, Fortner and Kripke could show in in vivo-
transplantation studies that UV-induced tumors grow progressively when
transplanted onto UV-irradiated mice, whereas all were rejected in control mice, who
had never been exposed to UVB [120]. They also suggested a reduction of cytotoxic
lymphocytes, which is responsible for the progressive growth of tumors in UVB-
irradiated mice [120]. Previous studies suggested the importance of a change in a
subpopulation of T cells and an increased induction of CD4+ regulatory T cells
(Tregs) and inhibition of CD8+ effector T cells [122, 123]. Another group could show
in a UVB-induced murine tumor model that a markedly increased recruitment of CD8+
T cell into the tumor microenvironment correlate with significantly decreased skin
carcinogenesis and spontaneous rejection of developed tumors [124]. In contrast,
inhibition of CD8-signaling was followed by tumor development and strong tumor
growth [124]. To validate the impact of CD4+ and CD8+ T cells in UVB-induced skin
carcinogenesis, a study by Nasti et al. took advantage of Cd8-deficient and Cd4-
deficient mouse strains [125]. Cd4-deficient mice show reduced skin carcinogenesis
compared to wildtype mice, while Cd8-deficient mice presented with increased tumor
induction and progression [125]. Additionally, they reported a higher secretion of
TGF-β and a higher expression of CD25 and FoxP3 in Tregs of Cd8-deficient mice
compared to the wildtype control [125]. The results of this study suggest that CD8+
and CD4+ T cells seem to have opposing roles during skin carcinogenesis. While
CD4+ T cells have a pro-tumor effect by producing IL-4, IL-10, and IL-17, CD8+ T
cells reduce tumor development through the release of INF-γ [125]. In their work,
Wang et al. showed that a significant increase of CD1+ DCs, which are antigen-
1. Introduction
25
presenting cells important for the activation of the T cell immune response and a
significant increase of CD4+ and CD8+ T cells markedly decrease skin carcinogenesis
of UVB-induced SCCs [126]. This was accompanied by a strong enhancement of
TNF-α expression [126]. Meanwhile, Hatton et al. reported a significantly increased
recruitment of CD4+ T cells into the epidermal compartment after UVB-irradiation,
whereas they detected no change in the amount of CD8+ T cells [127]. Interestingly,
an inhibition of CD4-signaling resulted in a significant enhancement of CD8+ T cells in
the epidermal compartment, while inhibition of CD8-signaling had no effect on the
amount of CD4+ T cells in the epidermis after UVB-exposure [127]. Furthermore, an
inhibition of CD4-signaling was followed by a significantly increased recruitment of
neutrophils into the irradiated skin, which led to increased tumor induction compared
to mice injected with the isotype control [127]. The amount of neutrophils did not alter
after the impairment of CD8-signaling [127]. Taken together, this study indicated a
complete novel role for CD4+ T cells in maintaining skin homeostasis, where an
inhibition of CD4-signaling would lead to increased tumor development by shaping
the immune response after UVB-irradiation to an increased inflammatory response
characterized by significantly enhanced recruitment of CD8+ T cells and neutrophils
[127]. The studies of Nasti et al. and Hatton et al. have contrary results, which might
be due to experimental differences. While Nasti et al. used Cd4-deficient and Cd8-
deficient mice on a C3H/HeN background, Hatton et al. used Skh-1 hairless mice and
used antibodies against CD4+ and CD8+ cells to induce a CD4- and CD8-depletion.
Furthermore, Nasti et al. irradiated the mice for 40 weeks with 200 mJ/cm², whereas
Hatton et al. irradiated the mice only for 25 weeks with 224 mJ/cm². Moreover, Hatton
et al. did not examine the impact of CD8-depletion during skin carcinogenesis and
the CD4-depletion was first induced after 11 weeks of UVB-irradiation. In addition, for
CD4-depletion, mice had to be injected with the antibody or the control two times a
week every third week, which might cause also differences in inflammatory
responses.
UV-radiation is capable of isomerizing trans-urocanic acid (UCA) to cis-UCA [123].
Cis-UCA impairs the function of keratinocytes, LCs, fibroblasts, T lymphocytes, NK
cells, and macrophages [123]. In addition, mast cells seem to play a role in UVB-
induced immunosuppression related to BCC development, too [128]. The effect of
UVB-induced immunomodulation is manifested by damage to skin-specific antigen
presenting cells, like LCs in the epidermis and DCs and macrophages in the dermis,
1. Introduction
26
whose antigen presenting function is impaired by cis-UCA [123, 129], which is
accompanied by the induction of immunomodulatory cytokines, for example TNF-α
and IL-10 [123]. These cytokines, together with IL-1, IL-6, IL-8 and PGE2, are
responsible for the establishment of an inflammatory response by releasing
chemotatic signals to immune competent cells, such as neutrophils and
macrophages in the skin [123, 130, 131]. IL-10 seems to be a major player in UVB-
induced immunomodulation [123]. There are also other factors with important roles in
cutaneous carcinogenesis. UVB light (280-320 nm) is absorbed by chromophores of
the skin, producing “signature” mutations in DNA, which induce the development of
cutaneous carcinogenesis [132]. How does radiation cause mutations in skin cells?
UVB-radiation causes an increased reactive oxygen species (ROS) production [123,
133]. ROS production induces the migration of LCs from the epidermal compartment
into the draining lymph node (DLN) after UVB-irradiation [123, 134]. Additionally,
oxygen radicals are responsible for base substitutions and alter single pyrimidines
[135]. Interestingly, such mutations have also been found in the p53 tumor
suppressor gene in UV-induced SCC [135, 136]. The mutation of the p53 tumor
suppressor gene seems to be an early event from sun exposure, primarily in
childhood, followed by other events: development of dysplasia, actinic keratosis, or
carcinoma in situ with a possible end result of SCC [136, 137]. SCCs arise from
mutated epithelial keratinocytes in the upper layers of the epidermal compartment,
are characterized by increased cornification and the development of horn beads, and
have a risk to metastasize [135, 138].
1.8 Aims During carcinogenesis, the activation of the EGFR/Ras signaling pathway on
transformed cells is important for modulating tumor immune escape and tumor
progression [43, 139]. In particular, the expression of the chemokine CCL27 is
regulated by the EGFR/Ras signaling pathway [43]. The chemokine CCL27 and its
receptor CCR10 play an important role during the maintenance of cutaneous
homeostasis and inflammation [63, 67, 87]. This study investigates the role of CCR10
in cutaneous carcinogenesis in two distinct skin tumor models.
The focus of this study involves the role of CCL27/CCR10 signaling during
cutaneous carcinogenesis. In a previous study, it was discovered that loss of
1. Introduction
27
CCL27 expression during cutaneous carcinogenesis leads to tumor immune
escape [43]. This mechanism will be further elucidated in the present study by
taking advantage of a Ccr10-deficient mouse strain and two distinct murine
cutaneous carcinogenesis models, using either chemicals (DMBA/TPA) or
UVB-radiation. The aim of the present study is to address the following
questions:
Does the loss of Ccr10 in the skin during skin carcinogenesis result in increased tumor growth and progression?
Which tumor phenotypes develop in the different models and does Ccr10-deficiency influence the ratio of developing tumor types?
Does Ccr10-deficiency have an impact on alterations of skin morphology?
Does a difference in the mechanism of carcinogenesis induction lead to different roles of CCL27/CCR10 signaling?
2. Material and Methods
28
2 Material and Methods 2.1 Mice The study involved two different models of carcinogenesis induction. In each
experiment, female Balb/c wildtype (WT) and Balb/c-Ccr10-deficient mice at the age
of 12-16 weeks were used. WT mice were purchased from Janvier Labs (France,
Europe). Ccr10-deficient mice were originally provided by Craig Gerard and were a
kind gift from Dr. M. Steinhoff (Dept. of Dermatology, University Hospital Münster,
Münster, Germany). All mice received food and water ad libitum and were housed on
a 12-hour light/dark cycle within an air-conditioned facility at the Zentrale Einrichtung
für Tierforschung und Tierschutzaufgaben (ZETT) of the Heinrich-Heine-University
Düsseldorf (Düsseldorf, Germany). All animal experiments were performed according
to the guidelines of the Animal Care and Use Committee of the Heinrich-Heine-
University and Bezirksregierung Düsseldorf, animal license number 84-02.04.2011.
Genotypes of all mice were validated by PCR.
2.2 Buffers and solutions Distilled water (dH2O) was used for the production of all solutions.
EDTA (Ethylenediaminetetraacetic acid) 0.5 M EDTA adjust to pH 8.0
Oligonucleotide primer 10 pmol/μl dH2O
TAE (Tris-acetate-EDTA) buffer, 50x 2.0 M Tris acetate
0.05 M EDTA
ad 1000 ml ddH2O adjust to pH 8.3
2.2.1 Reagents Acetone Merk (Darmstadt, Germany)
Agarose Low EEO Sigma-Aldrich (St. Louis, USA)
Bovine Serum Albumin (BSA) Sigma-Aldrich (St. Louis, USA)
DEPC water Carl Roth (Karlsruhe, Germany)
7,12-Dimethylbenz[a]anthracene Sigma-Aldrich (St. Louis, USA)
dNTP mix [10 mM] Bioline USA Inc. (Taunton, USA)
4% formalin Sigma-Aldrich (St. Louis, USA)
2. Material and Methods
29
Hematoxylin Sigma-Aldrich (St. Louis, USA)
MgCl2 Qiagen (Hilden, Germany)
Orange DNA Loading Dye (6x) Thermo Fisher Scientific (Waltham,
USA)
Phorbol 12-myristate 13-acetate [10 mg] Sigma-Aldrich (St. Louis, USA)
PCR buffer without MgCl2 Qiagen (Hilden, Germany)
RedSafe TM iNtRON Biotechnology (Korea)
RNAlater Qiagen (Hilden, Germany)
Tissue-Tek®-O.C.T. Sakura (Zoeterwoude, Netherlands)
Veet Enthaarungscreme — Sensible Haut Veet (Reckitt Benckiser, Slough, UK)
Xylene Merk (Darmstadt, Germany)
2.2.2 DNA Ladder For genotyping PCRs the Thermo Scientific O’GeneRuler 100 bp DNA Ladder was
used (Thermo Fisher Scientific, Waltham, USA).
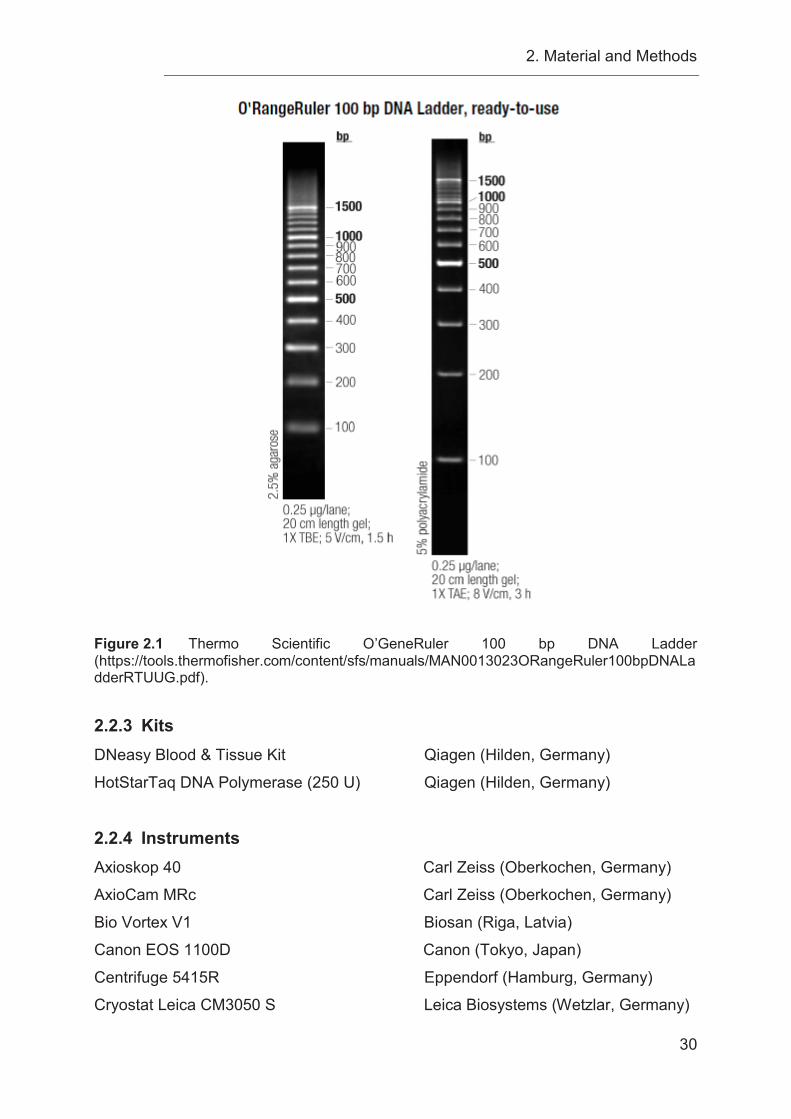
2. Material and Methods
30
Figure 2.1 Thermo Scientific O’GeneRuler 100 bp DNA Ladder (https://tools.thermofisher.com/content/sfs/manuals/MAN0013023ORangeRuler100bpDNALadderRTUUG.pdf). 2.2.3 Kits DNeasy Blood & Tissue Kit Qiagen (Hilden, Germany)
HotStarTaq DNA Polymerase (250 U) Qiagen (Hilden, Germany)
2.2.4 Instruments Axioskop 40 Carl Zeiss (Oberkochen, Germany)
AxioCam MRc Carl Zeiss (Oberkochen, Germany)
Bio Vortex V1 Biosan (Riga, Latvia)
Canon EOS 1100D Canon (Tokyo, Japan)
Centrifuge 5415R Eppendorf (Hamburg, Germany)
Cryostat Leica CM3050 S Leica Biosystems (Wetzlar, Germany)
2. Material and Methods
31
Irradiation chamber Saalmann GmbH (Herford, Germany)
Isis GT420 Aesculap Suhl GmbH (Suhl, Germany)
Oditest 00T6 Kroeplin GmbH (Schlüchtern,
Germany)
peqSTAR 96x Thermocycler Gradient PEQLAB Biotechnologie GmbH
(Erlangen, Germany)
Caliper Fine Science Tools (Heidelberg,
Germany)
Thermomixer 5437 Eppendorf (Hamburg, Germany)
UV-meter Waldmann (Villingen-Schwenningen,
Germany)
2.3 Methods 2.3.1 DMBA/TPA two-stage skin carcinogenesis model. Groups of 10 WT and 10 Ccr10-deficient mice were included for an early time point,
ending the experiment after 12 weeks of DMBA/TPA treatment. Additionally, 40 WT
mice and 40 Ccr10-deficient mice were included in the experiment for a late time
point, ending the experiment after 40 weeks of DMBA/TPA treatment. The dorsal
area of the mice was shaved with an electric razor (Isis GT420, Aesculap Suhl
GmbH, Suhl, Germany) in conjunction with topical hair removal cream for sensitive
skin (Veet, Slough, UK) 3 days prior to administration of the initiating agent DMBA
(Sigma-Aldrich, St. Louis, USA). Mice received a single application of 25 μg DMBA
dissolved in 200 μl acetone. One week after DMBA application, the promoting agent
TPA (5 μg/ 200 μl) (Sigma-Aldrich, St. Louis, USA) was administered once a week for
either 12 or 40 weeks. The shaving of mice was repeated every other week with an
electric razor and mice were additionally treated with hair removal cream for sensitive
skin (Veet, Slough, UK) every five weeks. The mice were observed daily and pictures
of the mice were taken weekly (Canon EOS 1100D, Tokyo, Japan). Additionally,
emerging tumors were counted weekly. At the end of the experiment, either after 12
or 40 weeks or due to a tumor diameter over 1 cm per tumor, mice were
photographed (Canon EOS 1100D, Tokyo, Japan) and afterwards sacrificed by CO2
exposure. After measuring the nuchal fold thickness with dial caliper gage (Oditest
00T6, Kroeplin GmbH, Schlüchtern, Germany), tumors were excised and measured
manually with a caliper (Fine Science Tools, Heidelberg, Germany) and weighed.
2. Material and Methods
32
Nuchal fold thickness was measured as a marker for inflammation-induced skin
thickening. A larger thickness denotes a stronger induction of an inflammatory
response. Additionally, the tumor volume was calculated by measuring the three-
dimensional size (height, length and width). Developed tumors showed a hemi-
ellipsoid shape and ellipsoid tumor volume was calculated by:
Vol.= 6 × ( ℎ) × ( ℎ) × (ℎ ℎ )
The spleen and the lymph nodes (inguinal, axillary and mandibular) were collected,
and a 5 mm skin biopsy of the back and the abdominal region was also collected by
using a skin biopsy punch (pfm medical ag, Cologne, Germany).
2.3.2 Detailed listing of animal numbers used in DMBA/TPA experiments For the early time point (12 weeks) of DMBA/TPA treatment, 10 WT mice and 10
Ccr10-deficient mice were used in the experiment. In the WT group, one mouse was
excluded from the experiment, due to a premature death, independent of tumor size
or cancer development. As this death might be unconnected to the treatment, it was
decided to exclude the mouse from this analysis. Therefore, only 9 WT mice reached
the end of experiment after 12 weeks of DMBA/TPA treatment. In contrast, all Ccr10-
deficient mice survived until the end of DMBA/TPA treatment after 12 weeks.
Group Start of
experiment [n] Death due to other causes [n]
Death due to tumor size [n]
End of experiment [n]
WT 10 1 0 9 Ccr10-/- 10 0 0 10
Table 2.1 Number of total mice used for the 12-week early time point analysis after DMBA/TPA treatment.
For analysis of early morphological changes of the skin, changes in the epidermal
thickness were analyzed after 12 weeks of DMBA/TPA treatment. In this experiment
mice were only included, if they survived the end of experiment (n = 9 WT and n = 10
Ccr10-deficient mice).
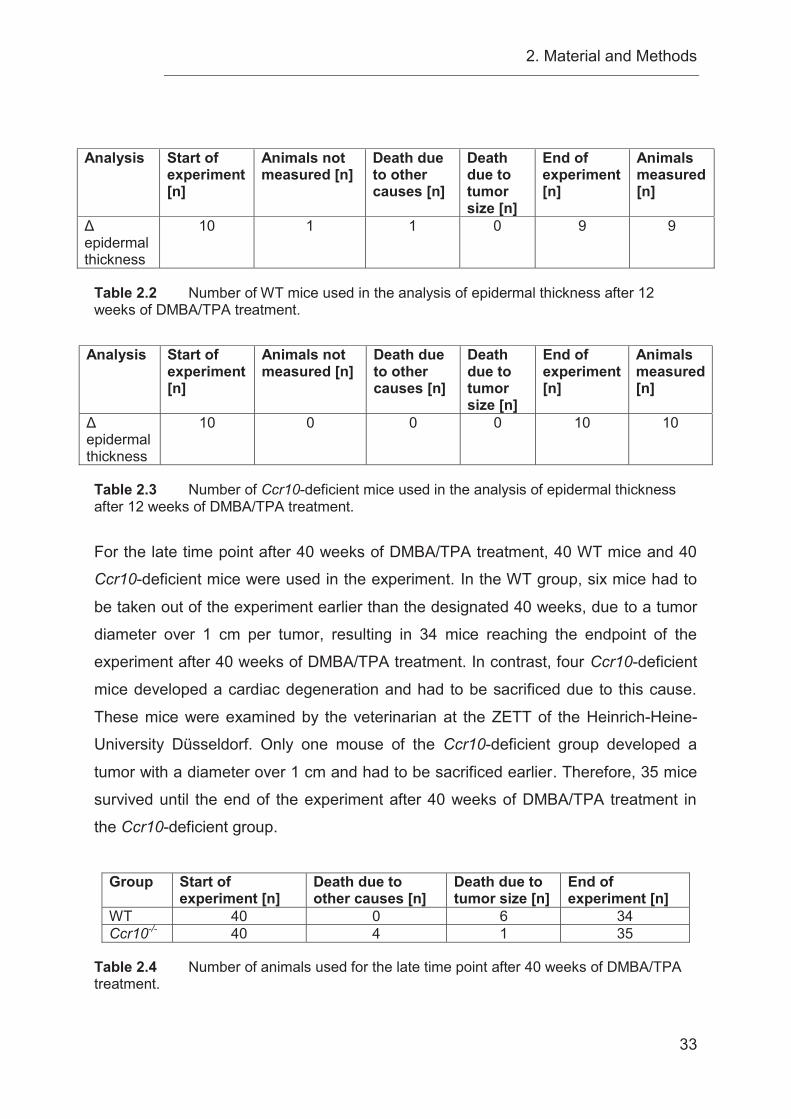
2. Material and Methods
33
Analysis Start of
experiment [n]
Animals not measured [n]
Death due to other causes [n]
Death due to tumor size [n]
End of experiment [n]
Animals measured [n]
Δ epidermal thickness
10 1 1 0 9 9
Table 2.2 Number of WT mice used in the analysis of epidermal thickness after 12 weeks of DMBA/TPA treatment.
Analysis Start of experiment [n]
Animals not measured [n]
Death due to other causes [n]
Death due to tumor size [n]
End of experiment [n]
Animals measured [n]
Δ epidermal thickness
10 0 0 0 10 10
Table 2.3 Number of Ccr10-deficient mice used in the analysis of epidermal thickness after 12 weeks of DMBA/TPA treatment.
For the late time point after 40 weeks of DMBA/TPA treatment, 40 WT mice and 40
Ccr10-deficient mice were used in the experiment. In the WT group, six mice had to
be taken out of the experiment earlier than the designated 40 weeks, due to a tumor
diameter over 1 cm per tumor, resulting in 34 mice reaching the endpoint of the
experiment after 40 weeks of DMBA/TPA treatment. In contrast, four Ccr10-deficient
mice developed a cardiac degeneration and had to be sacrificed due to this cause.
These mice were examined by the veterinarian at the ZETT of the Heinrich-Heine-
University Düsseldorf. Only one mouse of the Ccr10-deficient group developed a
tumor with a diameter over 1 cm and had to be sacrificed earlier. Therefore, 35 mice
survived until the end of the experiment after 40 weeks of DMBA/TPA treatment in
the Ccr10-deficient group.
Group Start of
experiment [n] Death due to other causes [n]
Death due to tumor size [n]
End of experiment [n]
WT 40 0 6 34 Ccr10-/- 40 4 1 35
Table 2.4 Number of animals used for the late time point after 40 weeks of DMBA/TPA treatment.
2. Material and Methods
34
All mice sacrificed due to a tumor diameter over 1 cm and all mice surviving to the
end of the experiment after 40 weeks of DMBA/TPA treatment were included into the
analysis of the tumor burden (WT mice n = 40 and Ccr10-deficient mice n = 36). 40
WT mice and all 40 Ccr10-deficient mice were included into the evaluation of overall
survival and tumor-free survival. Four mice in the Ccr10-deficient group died due to
cardiac degeneration and were censored in the two survival statistics. Censored
animals (Ccr10-deficient mice n = 4) are shown by a vertical line in the figures (Fig.
3.1 C and D). All mice sacrificed due to their tumor size and all mice surviving to the
end of the experiment after 40 weeks of DMBA/TPA treatment were included (WT
mice n = 40 and Ccr10-deficient mice n = 36) in the analysis of tumors per mouse
and tumor size per mouse. All mice, which survived the end of experiment or were
sacrificed due to their tumor size, except one individual, where the tumor weight was
not measured, were included in the analysis of tumor weights. Therefore 39 WT mice
and 36 Ccr10-deficient mice were included in this analysis. For the evaluation of
tumor size distribution, only those mice were included in the analysis, which
developed tumor. This included mice sacrificed based on their tumor size (n = 6 WT
and n = 1 Ccr10-deficient mice) and those developing tumors smaller than 1 cm till
the endpoint of the experiment after 40 weeks (WT mice n = 28 and Ccr10-deficient
mice n = 21). Excluded were mice that died due to causes other than tumor size
(Ccr10-deficient mice n = 4). Therefore, 34 WT mice and 22 Ccr10-deficient mice
were analyzed in the tumor size distribution, altogether. The huge difference between
the numbers of tumors, which developed in both groups, was the reason for the
evaluation of the data as a percentage. For an investigation of tumor morphology,
only mice with intermediate and large tumors (> 50 mm³) were included in the
analysis (WT mice n = 9 and Ccr10-deficient mice n = 3). Mice with smaller tumors
than > 50 mm³, mice without tumors or mice, which died due to cardiac degeneration,
were excluded from the evaluation. In this analysis, data were also shown as a
percentage due to the difference in the tumor number. For the measurement of the
nuchal fold thickness, all mice surviving to the end of the experiment and all mice
sacrificed sooner due to tumor size greater than 1 cm were included in the analysis
(WT mice n = 40 and Ccr10-deficient mice n = 36). Moreover, the nuchal fold
thickness in control mice (WT mice n = 4 and Ccr10-deficient mice n = 4), was
measured. Finally, changes in epidermal thickness were measured in eight randomly
picked mice from each group (WT mice n = 8 and Ccr10-deficient mice n = 8) out of
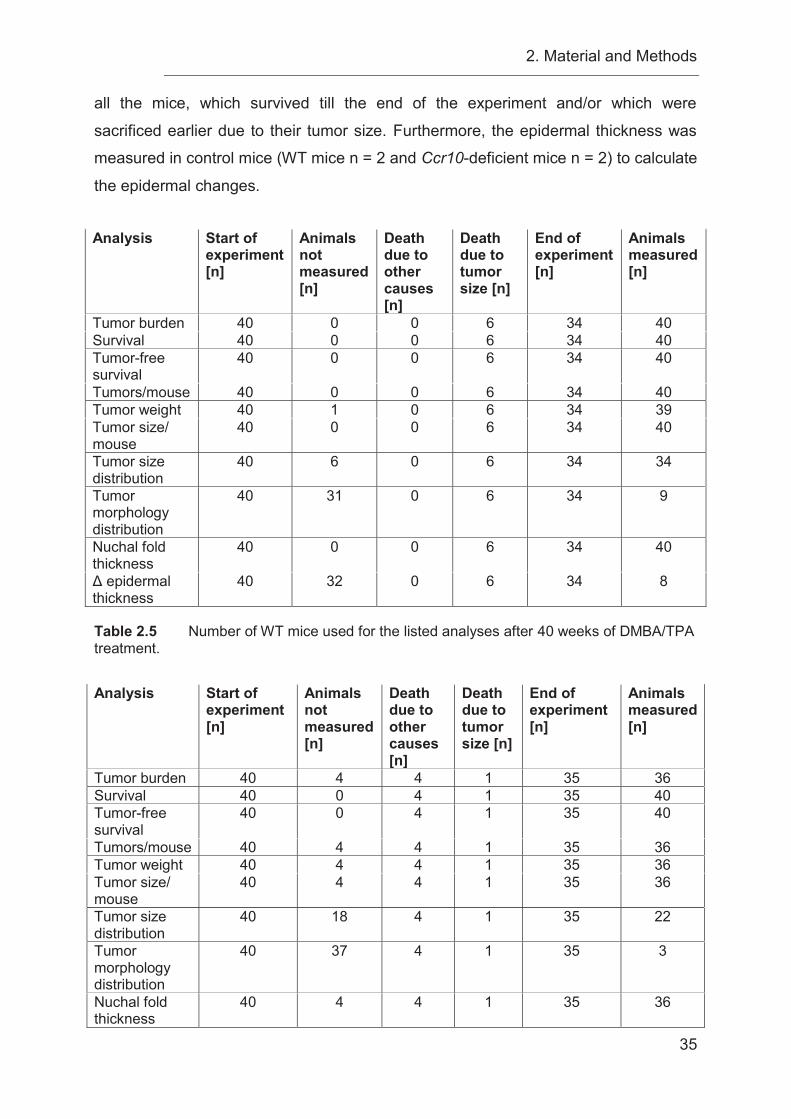
2. Material and Methods
35
all the mice, which survived till the end of the experiment and/or which were
sacrificed earlier due to their tumor size. Furthermore, the epidermal thickness was
measured in control mice (WT mice n = 2 and Ccr10-deficient mice n = 2) to calculate
the epidermal changes. Analysis Start of
experiment [n]
Animals not measured [n]
Death due to other causes [n]
Death due to tumor size [n]
End of experiment [n]
Animals measured [n]
Tumor burden 40 0 0 6 34 40 Survival 40 0 0 6 34 40 Tumor-free survival
40 0 0 6 34 40
Tumors/mouse 40 0 0 6 34 40 Tumor weight 40 1 0 6 34 39 Tumor size/ mouse
40 0 0 6 34 40
Tumor size distribution
40 6 0 6 34 34
Tumor morphology distribution
40 31 0 6 34 9
Nuchal fold thickness
40 0 0 6 34 40
Δ epidermal thickness
40 32 0 6 34 8
Table 2.5 Number of WT mice used for the listed analyses after 40 weeks of DMBA/TPA treatment. Analysis Start of
experiment [n]
Animals not measured [n]
Death due to other causes [n]
Death due to tumor size [n]
End of experiment [n]
Animals measured [n]
Tumor burden 40 4 4 1 35 36 Survival 40 0 4 1 35 40 Tumor-free survival
40 0 4 1 35 40
Tumors/mouse 40 4 4 1 35 36 Tumor weight 40 4 4 1 35 36 Tumor size/ mouse
40 4 4 1 35 36
Tumor size distribution
40 18 4 1 35 22
Tumor morphology distribution
40 37 4 1 35 3
Nuchal fold thickness
40 4 4 1 35 36
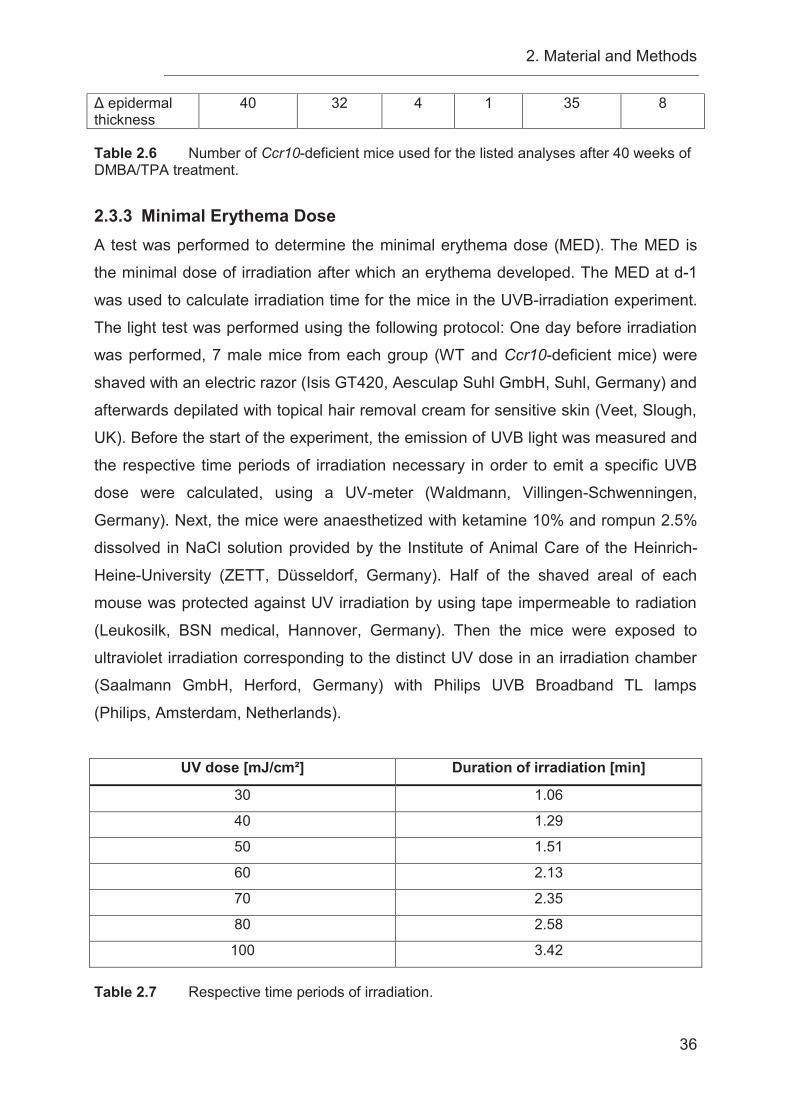
2. Material and Methods
36
Δ epidermal thickness
40 32 4 1 35 8
Table 2.6 Number of Ccr10-deficient mice used for the listed analyses after 40 weeks of DMBA/TPA treatment.
2.3.3 Minimal Erythema Dose A test was performed to determine the minimal erythema dose (MED). The MED is
the minimal dose of irradiation after which an erythema developed. The MED at d-1
was used to calculate irradiation time for the mice in the UVB-irradiation experiment.
The light test was performed using the following protocol: One day before irradiation
was performed, 7 male mice from each group (WT and Ccr10-deficient mice) were
shaved with an electric razor (Isis GT420, Aesculap Suhl GmbH, Suhl, Germany) and
afterwards depilated with topical hair removal cream for sensitive skin (Veet, Slough,
UK). Before the start of the experiment, the emission of UVB light was measured and
the respective time periods of irradiation necessary in order to emit a specific UVB
dose were calculated, using a UV-meter (Waldmann, Villingen-Schwenningen,
Germany). Next, the mice were anaesthetized with ketamine 10% and rompun 2.5%
dissolved in NaCl solution provided by the Institute of Animal Care of the Heinrich-
Heine-University (ZETT, Düsseldorf, Germany). Half of the shaved areal of each
mouse was protected against UV irradiation by using tape impermeable to radiation
(Leukosilk, BSN medical, Hannover, Germany). Then the mice were exposed to
ultraviolet irradiation corresponding to the distinct UV dose in an irradiation chamber
(Saalmann GmbH, Herford, Germany) with Philips UVB Broadband TL lamps
(Philips, Amsterdam, Netherlands).
UV dose [mJ/cm²] Duration of irradiation [min]
30 1.06
40 1.29
50 1.51
60 2.13
70 2.35
80 2.58
100 3.42
Table 2.7 Respective time periods of irradiation.
2. Material and Methods
37
Right after irradiation and before the mice recovered from anesthesia, the tape was
removed. The UV exposed area of the back of the mice was compared to the
protected area of the back 24h after irradiation to determine the MED.
2.3.4 UVB-irradiation of mice
Groups of 10 WT and 10 Ccr10-deficient mice were included for an early time point,
ending the experiment after 12 weeks of UVB-irradiation. Additionally, 40 WT mice
and 40 Ccr10-deficient mice were included in the experiment for a late time point,
ending the UVB-irradiation after 60 weeks. The dorsal area of the mice was trimmed
at the start of the experiment and every second week with an electric razor (Isis
GT420, Aesculap Suhl GmbH, Suhl, Germany) and every fifth week in conjunction
with topical hair removal cream for sensitive skin (Veet, Slough, UK) to make sure
that the tissue would not be damaged. Mice were irradiated with 50 mJ/cm² UVB
(1.25 MED) three times a week on non-consecutive days for 12 or 60 weeks. Mice
were irradiated as described in chapter 2.3.3. Philips UVB Broadband TL lamps
(Philips, Amsterdam, Netherlands) emit in a range from 290-320 nm and peak at 302
nm according to manufacturers’ specifications (http://www.lighting.philips.com/main/
prof/lamps/special-lamps/medical-lamps/medical-therapy-uvb-broad-band/uvb-
broadband-tl). To ensure the emitted dose of dorsal UVB-irradiation, the emission
was measured and calculated as follows every time before exposure of the mice
using a UV-meter (Waldmann, Villingen-Schwenningen, Germany):
Energy ² = ² ( )
² ² = ( )60 =
For the late time point after 60 weeks UVB-irradiation, the mice were observed for
another 10 weeks without irradiation. The mice were observed daily and pictures of
the mice were taken weekly (Canon EOS 1100 D, Tokyo, Japan). Additionally,
developing tumors were counted and measured on a weekly basis. Furthermore,
lesions with a minimum diameter of 1 mm were measured by using a caliper (Fine
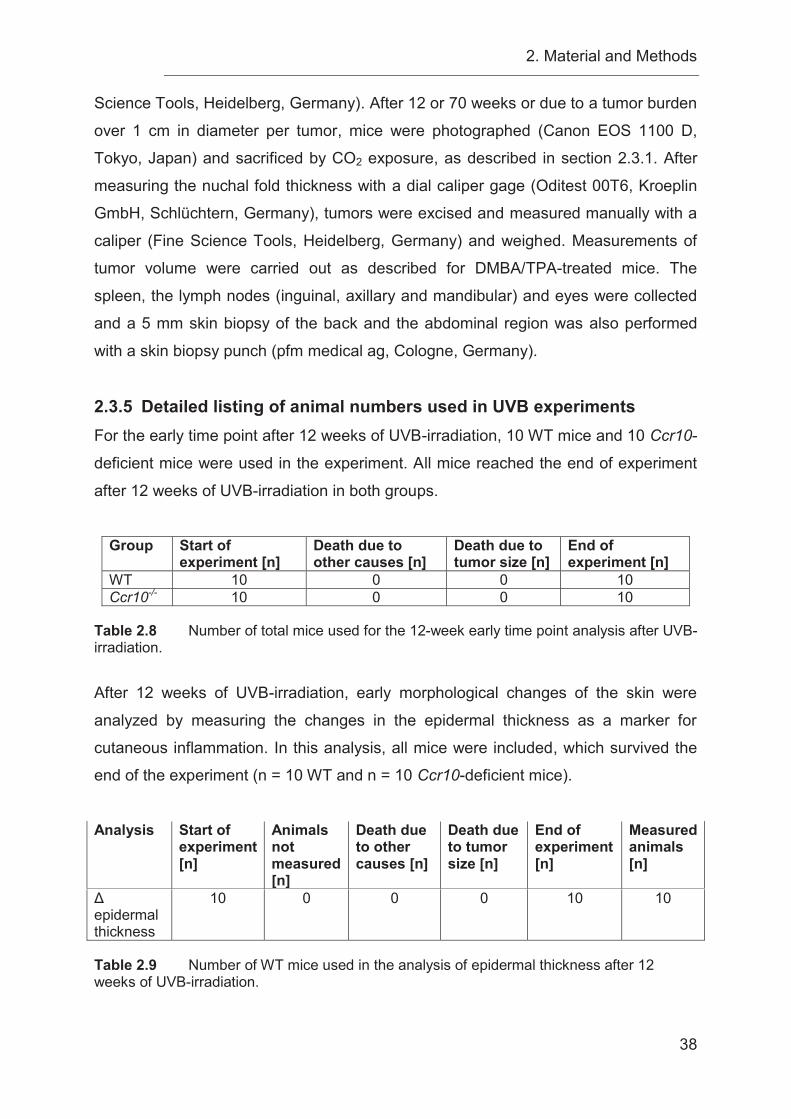
2. Material and Methods
38
Science Tools, Heidelberg, Germany). After 12 or 70 weeks or due to a tumor burden
over 1 cm in diameter per tumor, mice were photographed (Canon EOS 1100 D,
Tokyo, Japan) and sacrificed by CO2 exposure, as described in section 2.3.1. After
measuring the nuchal fold thickness with a dial caliper gage (Oditest 00T6, Kroeplin
GmbH, Schlüchtern, Germany), tumors were excised and measured manually with a
caliper (Fine Science Tools, Heidelberg, Germany) and weighed. Measurements of
tumor volume were carried out as described for DMBA/TPA-treated mice. The
spleen, the lymph nodes (inguinal, axillary and mandibular) and eyes were collected
and a 5 mm skin biopsy of the back and the abdominal region was also performed
with a skin biopsy punch (pfm medical ag, Cologne, Germany).
2.3.5 Detailed listing of animal numbers used in UVB experiments For the early time point after 12 weeks of UVB-irradiation, 10 WT mice and 10 Ccr10-
deficient mice were used in the experiment. All mice reached the end of experiment
after 12 weeks of UVB-irradiation in both groups.
Group Start of
experiment [n] Death due to other causes [n]
Death due to tumor size [n]
End of experiment [n]
WT 10 0 0 10 Ccr10-/- 10 0 0 10
Table 2.8 Number of total mice used for the 12-week early time point analysis after UVB-irradiation.
After 12 weeks of UVB-irradiation, early morphological changes of the skin were
analyzed by measuring the changes in the epidermal thickness as a marker for
cutaneous inflammation. In this analysis, all mice were included, which survived the
end of the experiment (n = 10 WT and n = 10 Ccr10-deficient mice).
Analysis Start of
experiment [n]
Animals not measured [n]
Death due to other causes [n]
Death due to tumor size [n]
End of experiment [n]
Measured animals [n]
Δ epidermal thickness
10 0 0 0 10 10
Table 2.9 Number of WT mice used in the analysis of epidermal thickness after 12 weeks of UVB-irradiation.
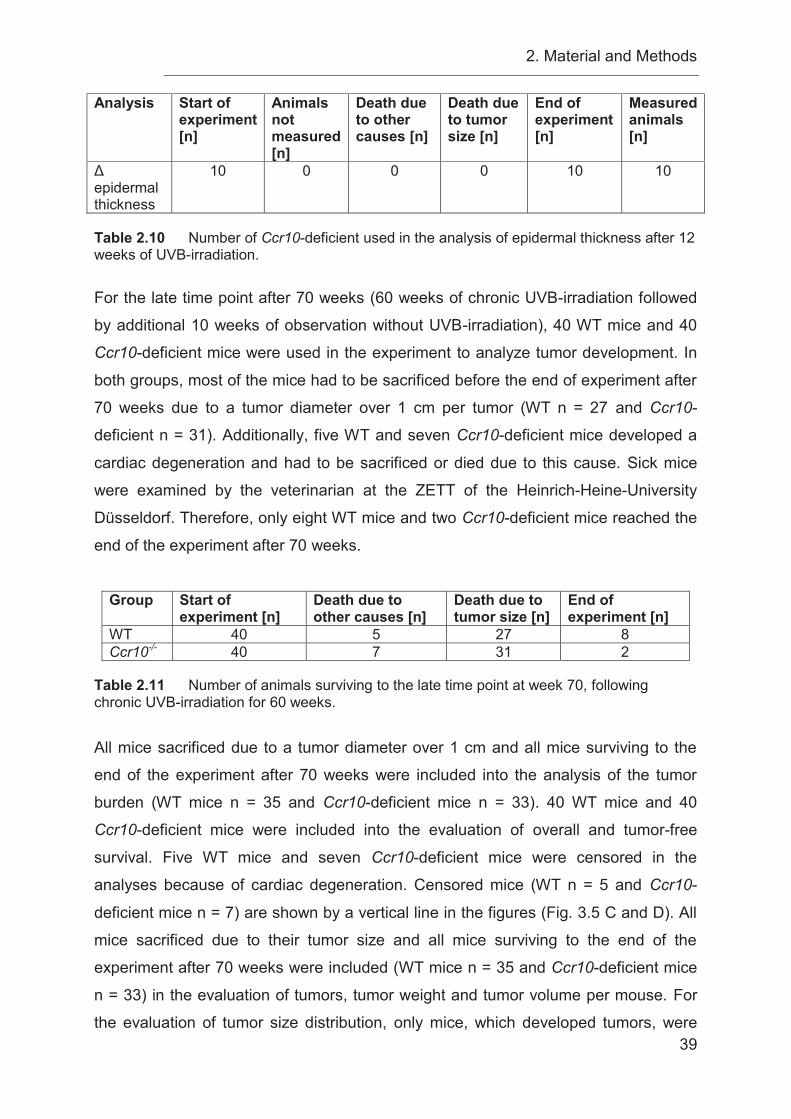
2. Material and Methods
39
Analysis Start of experiment [n]
Animals not measured [n]
Death due to other causes [n]
Death due to tumor size [n]
End of experiment [n]
Measured animals [n]
Δ epidermal thickness
10 0 0 0 10 10
Table 2.10 Number of Ccr10-deficient used in the analysis of epidermal thickness after 12 weeks of UVB-irradiation.
For the late time point after 70 weeks (60 weeks of chronic UVB-irradiation followed
by additional 10 weeks of observation without UVB-irradiation), 40 WT mice and 40
Ccr10-deficient mice were used in the experiment to analyze tumor development. In
both groups, most of the mice had to be sacrificed before the end of experiment after
70 weeks due to a tumor diameter over 1 cm per tumor (WT n = 27 and Ccr10-
deficient n = 31). Additionally, five WT and seven Ccr10-deficient mice developed a
cardiac degeneration and had to be sacrificed or died due to this cause. Sick mice
were examined by the veterinarian at the ZETT of the Heinrich-Heine-University
Düsseldorf. Therefore, only eight WT mice and two Ccr10-deficient mice reached the
end of the experiment after 70 weeks.
Group Start of
experiment [n] Death due to other causes [n]
Death due to tumor size [n]
End of experiment [n]
WT 40 5 27 8 Ccr10-/- 40 7 31 2
Table 2.11 Number of animals surviving to the late time point at week 70, following chronic UVB-irradiation for 60 weeks. All mice sacrificed due to a tumor diameter over 1 cm and all mice surviving to the
end of the experiment after 70 weeks were included into the analysis of the tumor
burden (WT mice n = 35 and Ccr10-deficient mice n = 33). 40 WT mice and 40
Ccr10-deficient mice were included into the evaluation of overall and tumor-free
survival. Five WT mice and seven Ccr10-deficient mice were censored in the
analyses because of cardiac degeneration. Censored mice (WT n = 5 and Ccr10-
deficient mice n = 7) are shown by a vertical line in the figures (Fig. 3.5 C and D). All
mice sacrificed due to their tumor size and all mice surviving to the end of the
experiment after 70 weeks were included (WT mice n = 35 and Ccr10-deficient mice
n = 33) in the evaluation of tumors, tumor weight and tumor volume per mouse. For
the evaluation of tumor size distribution, only mice, which developed tumors, were
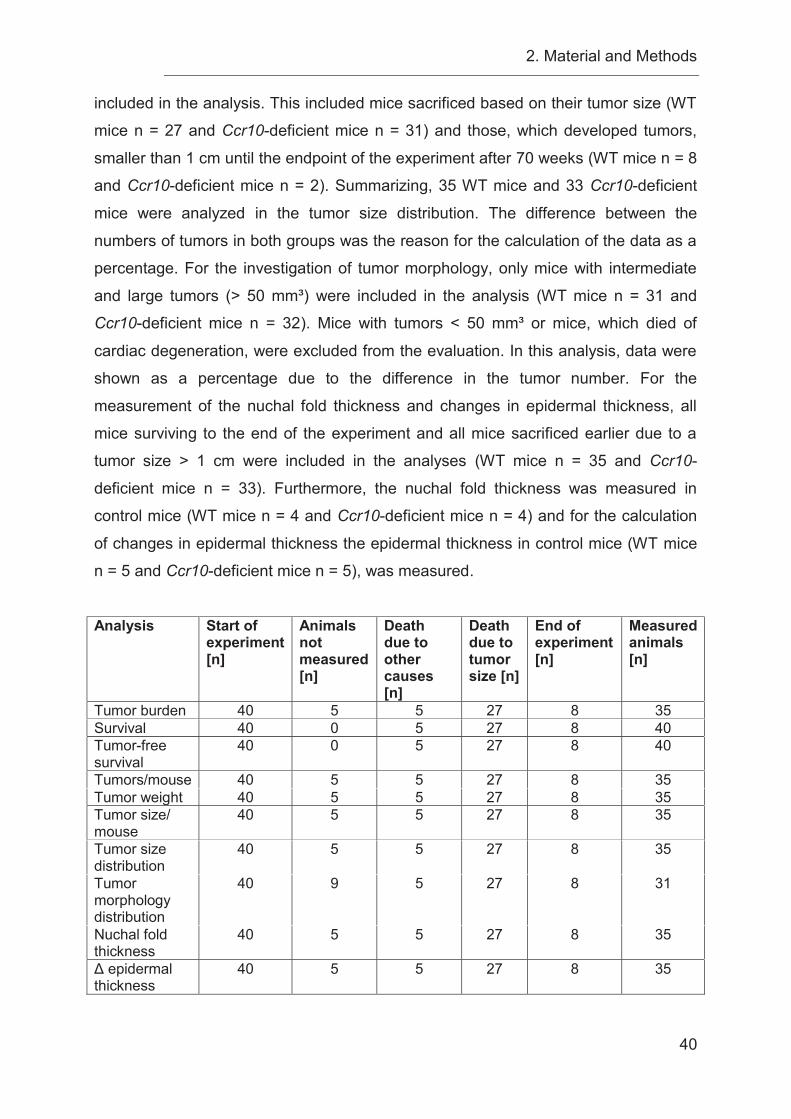
2. Material and Methods
40
included in the analysis. This included mice sacrificed based on their tumor size (WT
mice n = 27 and Ccr10-deficient mice n = 31) and those, which developed tumors,
smaller than 1 cm until the endpoint of the experiment after 70 weeks (WT mice n = 8
and Ccr10-deficient mice n = 2). Summarizing, 35 WT mice and 33 Ccr10-deficient
mice were analyzed in the tumor size distribution. The difference between the
numbers of tumors in both groups was the reason for the calculation of the data as a
percentage. For the investigation of tumor morphology, only mice with intermediate
and large tumors (> 50 mm³) were included in the analysis (WT mice n = 31 and
Ccr10-deficient mice n = 32). Mice with tumors < 50 mm³ or mice, which died of
cardiac degeneration, were excluded from the evaluation. In this analysis, data were
shown as a percentage due to the difference in the tumor number. For the
measurement of the nuchal fold thickness and changes in epidermal thickness, all
mice surviving to the end of the experiment and all mice sacrificed earlier due to a
tumor size > 1 cm were included in the analyses (WT mice n = 35 and Ccr10-
deficient mice n = 33). Furthermore, the nuchal fold thickness was measured in
control mice (WT mice n = 4 and Ccr10-deficient mice n = 4) and for the calculation
of changes in epidermal thickness the epidermal thickness in control mice (WT mice
n = 5 and Ccr10-deficient mice n = 5), was measured.
Analysis Start of
experiment [n]
Animals not measured [n]
Death due to other causes [n]
Death due to tumor size [n]
End of experiment [n]
Measured animals [n]
Tumor burden 40 5 5 27 8 35 Survival 40 0 5 27 8 40 Tumor-free survival
40 0 5 27 8 40
Tumors/mouse 40 5 5 27 8 35 Tumor weight 40 5 5 27 8 35 Tumor size/ mouse
40 5 5 27 8 35
Tumor size distribution
40 5 5 27 8 35
Tumor morphology distribution
40 9 5 27 8 31
Nuchal fold thickness
40 5 5 27 8 35
Δ epidermal thickness
40 5 5 27 8 35
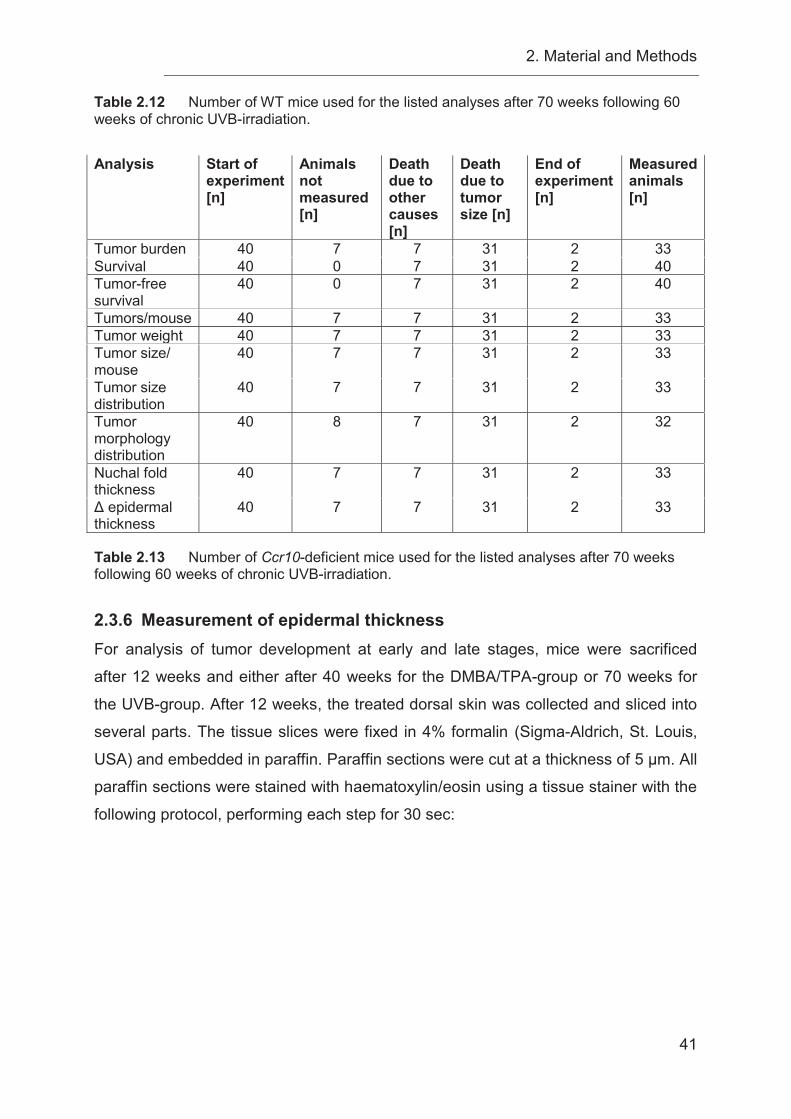
2. Material and Methods
41
Table 2.12 Number of WT mice used for the listed analyses after 70 weeks following 60 weeks of chronic UVB-irradiation. Analysis Start of
experiment [n]
Animals not measured [n]
Death due to other causes [n]
Death due to tumor size [n]
End of experiment [n]
Measured animals [n]
Tumor burden 40 7 7 31 2 33 Survival 40 0 7 31 2 40 Tumor-free survival
40 0 7 31 2 40
Tumors/mouse 40 7 7 31 2 33 Tumor weight 40 7 7 31 2 33 Tumor size/ mouse
40 7 7 31 2 33
Tumor size distribution
40 7 7 31 2 33
Tumor morphology distribution
40 8 7 31 2 32
Nuchal fold thickness
40 7 7 31 2 33
Δ epidermal thickness
40 7 7 31 2 33
Table 2.13 Number of Ccr10-deficient mice used for the listed analyses after 70 weeks following 60 weeks of chronic UVB-irradiation.
2.3.6 Measurement of epidermal thickness For analysis of tumor development at early and late stages, mice were sacrificed
after 12 weeks and either after 40 weeks for the DMBA/TPA-group or 70 weeks for
the UVB-group. After 12 weeks, the treated dorsal skin was collected and sliced into
several parts. The tissue slices were fixed in 4% formalin (Sigma-Aldrich, St. Louis,
USA) and embedded in paraffin. Paraffin sections were cut at a thickness of 5 μm. All
paraffin sections were stained with haematoxylin/eosin using a tissue stainer with the
following protocol, performing each step for 30 sec:
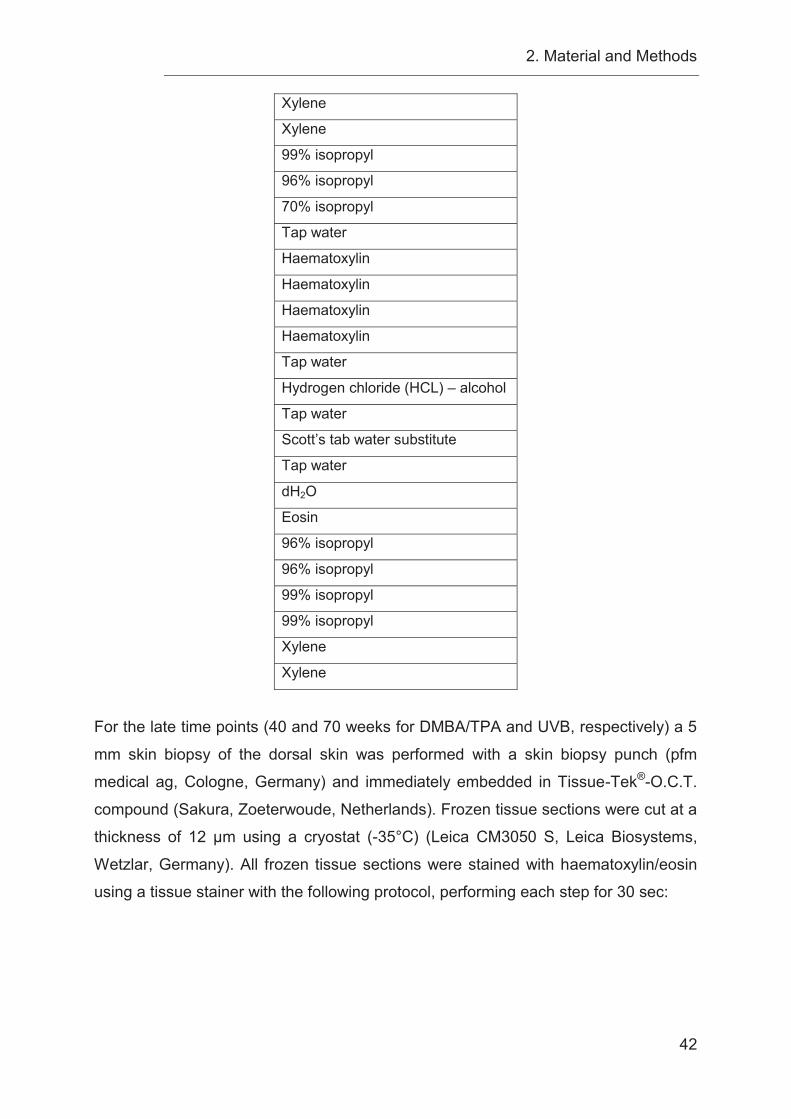
2. Material and Methods
42
Xylene
Xylene
99% isopropyl
96% isopropyl
70% isopropyl
Tap water
Haematoxylin
Haematoxylin
Haematoxylin
Haematoxylin
Tap water
Hydrogen chloride (HCL) – alcohol
Tap water
Scott’s tab water substitute
Tap water
dH2O
Eosin
96% isopropyl
96% isopropyl
99% isopropyl
99% isopropyl
Xylene
Xylene
For the late time points (40 and 70 weeks for DMBA/TPA and UVB, respectively) a 5
mm skin biopsy of the dorsal skin was performed with a skin biopsy punch (pfm
medical ag, Cologne, Germany) and immediately embedded in Tissue-Tek®-O.C.T.
compound (Sakura, Zoeterwoude, Netherlands). Frozen tissue sections were cut at a
thickness of 12 μm using a cryostat (-35°C) (Leica CM3050 S, Leica Biosystems,
Wetzlar, Germany). All frozen tissue sections were stained with haematoxylin/eosin
using a tissue stainer with the following protocol, performing each step for 30 sec:
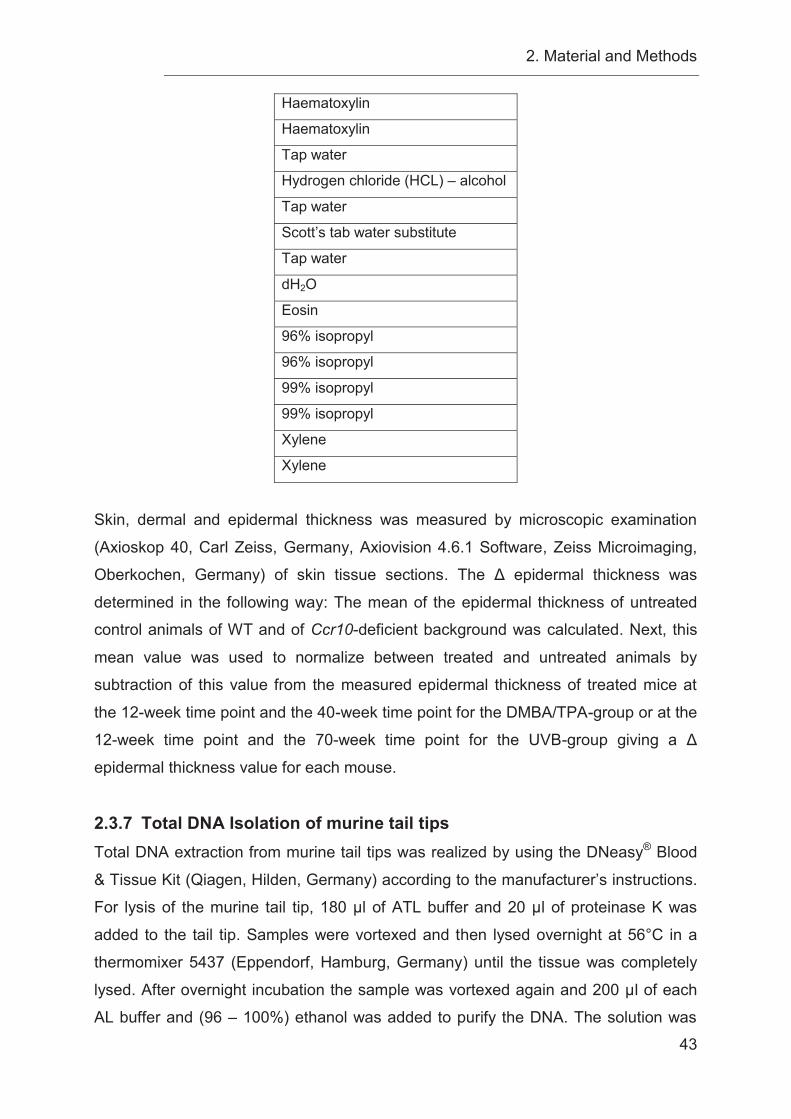
2. Material and Methods
43
Haematoxylin
Haematoxylin
Tap water
Hydrogen chloride (HCL) – alcohol
Tap water
Scott’s tab water substitute
Tap water
dH2O
Eosin
96% isopropyl
96% isopropyl
99% isopropyl
99% isopropyl
Xylene
Xylene
Skin, dermal and epidermal thickness was measured by microscopic examination
(Axioskop 40, Carl Zeiss, Germany, Axiovision 4.6.1 Software, Zeiss Microimaging,
Oberkochen, Germany) of skin tissue sections. The Δ epidermal thickness was
determined in the following way: The mean of the epidermal thickness of untreated
control animals of WT and of Ccr10-deficient background was calculated. Next, this
mean value was used to normalize between treated and untreated animals by
subtraction of this value from the measured epidermal thickness of treated mice at
the 12-week time point and the 40-week time point for the DMBA/TPA-group or at the
12-week time point and the 70-week time point for the UVB-group giving a Δ
epidermal thickness value for each mouse.
2.3.7 Total DNA Isolation of murine tail tips Total DNA extraction from murine tail tips was realized by using the DNeasy® Blood
& Tissue Kit (Qiagen, Hilden, Germany) according to the manufacturer’s instructions.
For lysis of the murine tail tip, 180 μl of ATL buffer and 20 μl of proteinase K was
added to the tail tip. Samples were vortexed and then lysed overnight at 56°C in a
thermomixer 5437 (Eppendorf, Hamburg, Germany) until the tissue was completely
lysed. After overnight incubation the sample was vortexed again and 200 μl of each
AL buffer and (96 – 100%) ethanol was added to purify the DNA. The solution was
2. Material and Methods
44
again mixed by vortexing. The mixture was transferred into a DNeasy Mini spin
column and subsequently centrifuged (8000 rpm for 1 min at RT) (Centrifuge 5415R,
Eppendorf, Hamburg, Germany). During centrifugation, DNA of the mouse-tail tip
bound to the DNeasy membrane. Contaminants were removed by washing the
membrane with 500 μl AW1 buffer and a centrifugation step (8000 rpm for 1 min at
RT) (Centrifuge 5415R, Eppendorf, Hamburg, Germany). Subsequently, a washing
step was performed with 500 μl AW2 buffer and centrifugation (14,000 rpm for 3 min
at RT) (Centrifuge 5415R, Eppendorf, Hamburg, Germany), followed by an additional
dry centrifugation step (14,000 rpm for 1 min at RT) (Centrifuge 5415R, Eppendorf,
Hamburg, Germany) to remove residual ethanol. The DNeasy Mini spin column was
placed into a new 1.5 ml tube and the bound DNA was eluted with 200 μl AE buffer
directly loaded on the column membrane. After incubation for 1 min a final
centrifugation step was performed to elute the DNA from the membrane (8000 rpm
for 1 min at RT) (Centrifuge 5415R, Eppendorf, Hamburg, Germany).
2.3.8 Polymerase chain reaction (PCR) PCR was performed to enzymatically amplify specific DNA sequences using two
oligonucleotide primers for verification of the genotype of mice used in the
experiment. First, the DNA was initially denatured. Then a three step procedure was
performed (denaturation, annealing of primers and extension), which characterizes
the principle of PCR method. During the denaturation step genomic DNA was heated
up to 95°C, which separated the DNA double-strands from each other. This was
followed by an annealing step to anneal primers to the complementary single-
stranded DNA at a reduced temperature, according to nucleotide composition of the
primers. In the last step, extension was performed and temperature was set to
optimal working conditions for the Taq polymerase (72°C) to synthesize the DNA.
Cycles were repeated 28 times to allow exponential amplification of a specific DNA
sequence. Finally, a last extension step was performed. The PCR program, which
was used, is listed in the following table:
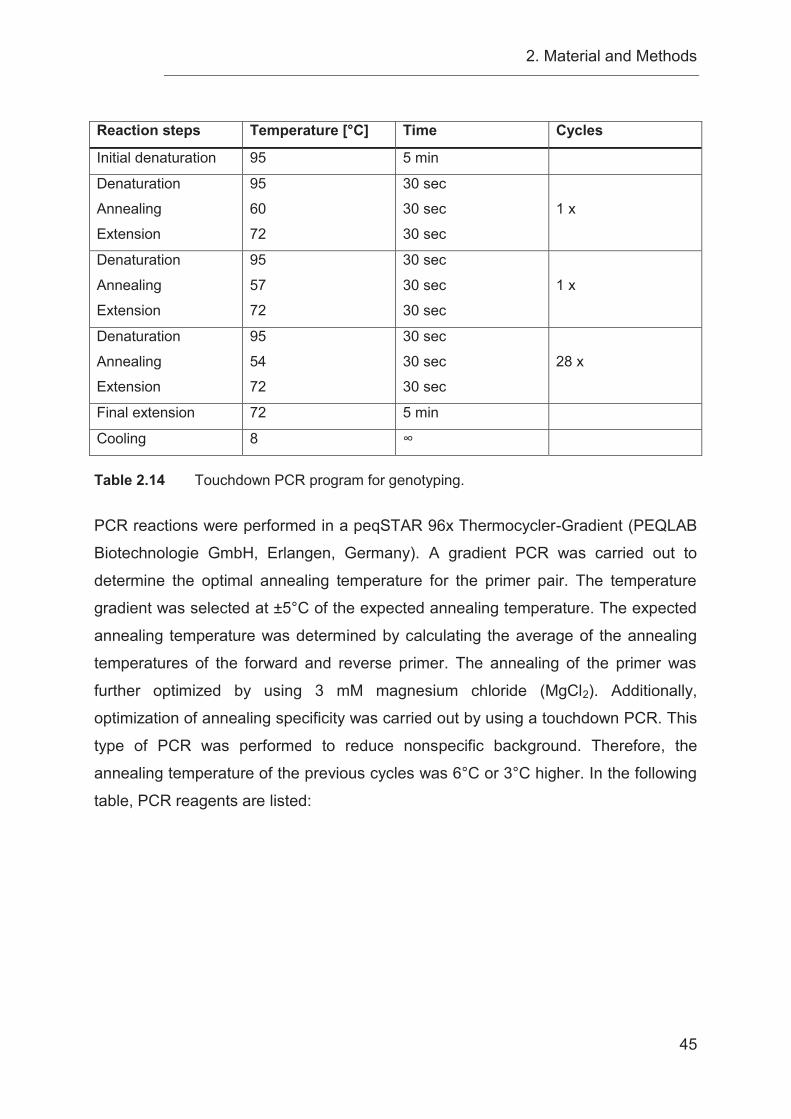
2. Material and Methods
45
Reaction steps Temperature [°C] Time Cycles
Initial denaturation 95 5 min
Denaturation
Annealing
Extension
95
60
72
30 sec
30 sec
30 sec
1 x
Denaturation
Annealing
Extension
95
57
72
30 sec
30 sec
30 sec
1 x
Denaturation
Annealing
Extension
95
54
72
30 sec
30 sec
30 sec
28 x
Final extension 72 5 min
Cooling 8 ∞
Table 2.14 Touchdown PCR program for genotyping. PCR reactions were performed in a peqSTAR 96x Thermocycler-Gradient (PEQLAB
Biotechnologie GmbH, Erlangen, Germany). A gradient PCR was carried out to
determine the optimal annealing temperature for the primer pair. The temperature
gradient was selected at ±5°C of the expected annealing temperature. The expected
annealing temperature was determined by calculating the average of the annealing
temperatures of the forward and reverse primer. The annealing of the primer was
further optimized by using 3 mM magnesium chloride (MgCl2). Additionally,
optimization of annealing specificity was carried out by using a touchdown PCR. This
type of PCR was performed to reduce nonspecific background. Therefore, the
annealing temperature of the previous cycles was 6°C or 3°C higher. In the following
table, PCR reagents are listed:
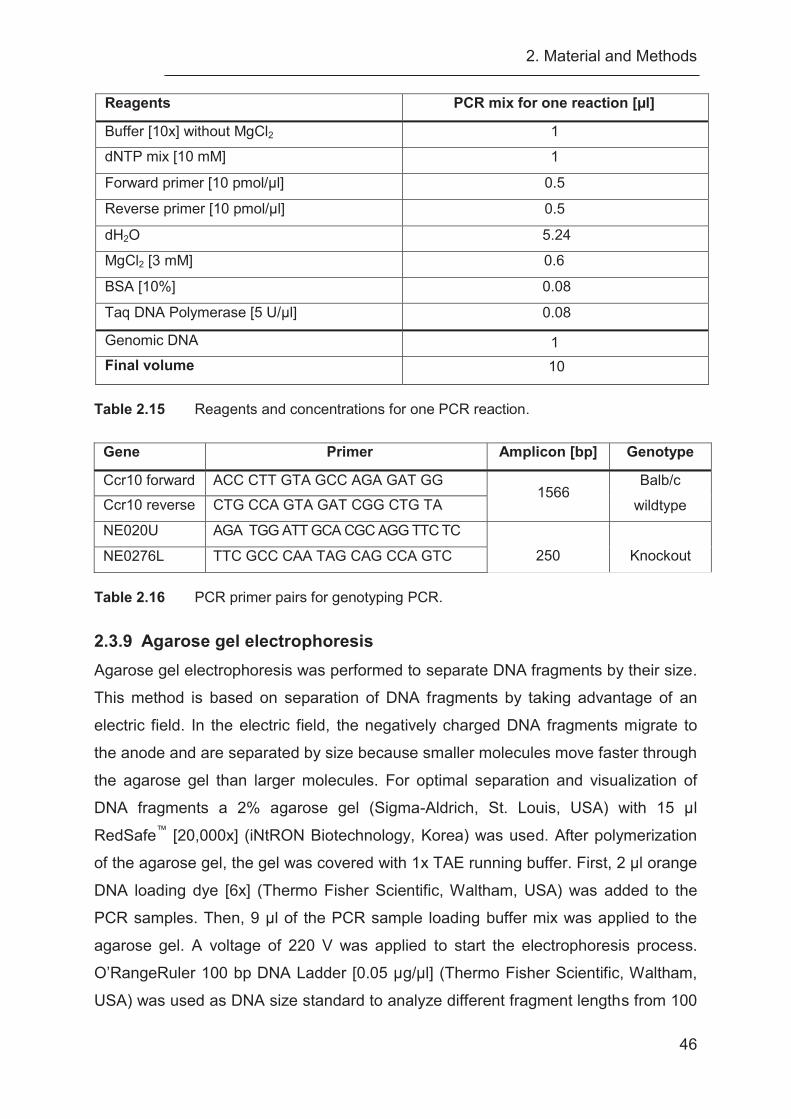
2. Material and Methods
46
Reagents PCR mix for one reaction [μl]
Buffer [10x] without MgCl2 1
dNTP mix [10 mM] 1
Forward primer [10 pmol/μl] 0.5
Reverse primer [10 pmol/μl] 0.5
dH2O 5.24
MgCl2 [3 mM] 0.6
BSA [10%] 0.08
Taq DNA Polymerase [5 U/μl] 0.08
Genomic DNA 1 Final volume 10
Table 2.15 Reagents and concentrations for one PCR reaction.
Gene Primer Amplicon [bp] Genotype
Ccr10 forward ACC CTT GTA GCC AGA GAT GG 1566
Balb/c
wildtype Ccr10 reverse CTG CCA GTA GAT CGG CTG TA
NE020U AGA TGG ATT GCA CGC AGG TTC TC
250
Knockout NE0276L TTC GCC CAA TAG CAG CCA GTC
Table 2.16 PCR primer pairs for genotyping PCR.
2.3.9 Agarose gel electrophoresis Agarose gel electrophoresis was performed to separate DNA fragments by their size.
This method is based on separation of DNA fragments by taking advantage of an
electric field. In the electric field, the negatively charged DNA fragments migrate to
the anode and are separated by size because smaller molecules move faster through
the agarose gel than larger molecules. For optimal separation and visualization of
DNA fragments a 2% agarose gel (Sigma-Aldrich, St. Louis, USA) with 15 μl
RedSafe™ [20,000x] (iNtRON Biotechnology, Korea) was used. After polymerization
of the agarose gel, the gel was covered with 1x TAE running buffer. First, 2 μl orange
DNA loading dye [6x] (Thermo Fisher Scientific, Waltham, USA) was added to the
PCR samples. Then, 9 μl of the PCR sample loading buffer mix was applied to the
agarose gel. A voltage of 220 V was applied to start the electrophoresis process.
O’RangeRuler 100 bp DNA Ladder [0.05 μg/μl] (Thermo Fisher Scientific, Waltham,
USA) was used as DNA size standard to analyze different fragment lengths from 100
2. Material and Methods
47
— 1500 bp. During separation of DNA fragments, RedSafe™ binds to the DNA and
emits a green fluorescence at 537 nm by irradiation with UV light for visualization of
DNA fragments. Sizes of the DNA fragments were then determined by comparison to
the DNA size standard.
2.3.10 Statistical analysis Statistical analyses were carried out using the nonparametric Mann-Whitney U test.
Kaplan-Meier curves were used for the demonstration of follow-up data and survival
analyses. For the analyses of Kaplan-Meier curves the log-rank test was used.
Experimental endpoints were set after 12 and 40 weeks in the DMBA/TPA-model and
after 12 and 70 weeks in the UVB-model, in addition a tumor diameter over 1 cm was
a termination criterion of the experiment. Fisher's exact test was used for the
evaluation of tumor morphologies and tumor sizes. Significations of P-values were
set as following: *, P < 0.05; **, P < 0.01; ***, P ˂ 0.001.
3. Results
48
3 Results 3.1 Analysis of the role of CCR10 in cutaneous carcinogenesis in two model systems The impact of CCR10 on cutaneous carcinogenesis was examined. Recent findings,
by Pivarcsi et al. indicated that the activation of the EGFR/Ras signaling pathway
resulted in the progressive loss of the skin-specific chemokine CCL27 during
cutaneous carcinogenesis [43]. Furthermore, loss of CCL27 correlated with
significantly better tumor growth and inhibition of a robust immune response against
the tumor [43]. Therefore, the aim of the present study was to further elucidate the
impact of CCL27-CCR10 interactions on carcinogenesis in vivo by taking advantage
of a Ccr10-deficient mouse strain. Two distinct models of carcinogenesis induction
were analyzed, one depending on a background of chronic inflammation
(DMBA/TPA-model) and the other depending on the inhibition of the immune system
(UVB-model). Given previous findings it was expected that more carcinogenesis
would occur in the Ccr10-negative background due to a deficiency of the mice in their
tumor immune surveillance system.
3.2 Tumor progression in Ccr10-deficient mice is significantly reduced compared to WT controls after DMBA/TPA treatment DMBA/TPA treatment causes activated Hras mutations followed by EGFR activation
leading to inflammation and epidermal hyperplasia [99, 101, 105]. After tumor
induction by DMBA/TPA, macroscopic analysis upon tumor harvest showed that
Balb/c WT mice had markedly more and bigger flank and back tumors, while Ccr10-
deficient mice had less and smaller tumors (Fig. 3.1 A). In mice initiated with DMBA
(stage I) and promoted with TPA for 40 weeks (stage II), first lesions occur between
the 9th and 15th week. In both groups the number of tumors per mouse increased
with time. The WT group demonstrated an increased tumor burden of 0.5 tumors per
mouse after 20 weeks up to 2.9 tumors per mouse after 40 weeks of treatment,
compared to the Ccr10-deficient group, where the average number of tumors was 0.1
tumors per mouse after 20 weeks and 1.4 tumors per mouse after 40 weeks of
treatment. After 25 weeks of DMBA/TPA treatment the tumor burden markedly
increased in both groups. The final tumor yield after 40 weeks in the Ccr10-deficient
group was significantly lower with a reduction of 52% compared to the WT. These
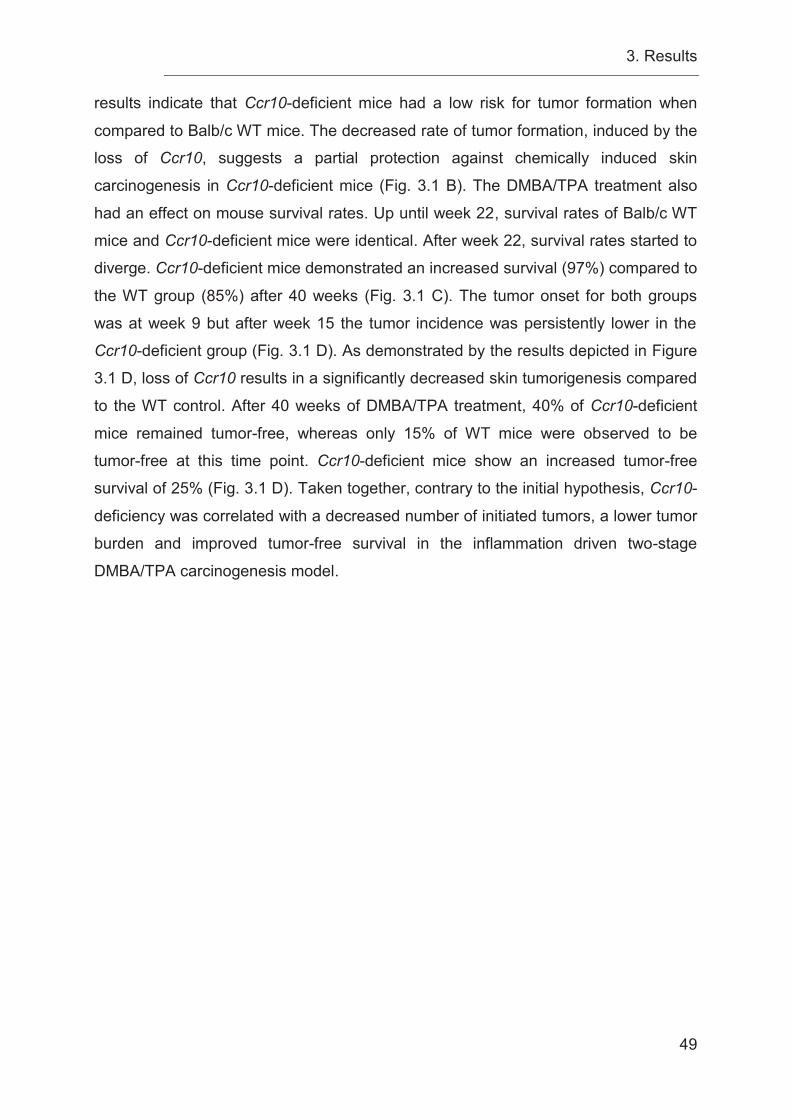
3. Results
49
results indicate that Ccr10-deficient mice had a low risk for tumor formation when
compared to Balb/c WT mice. The decreased rate of tumor formation, induced by the
loss of Ccr10, suggests a partial protection against chemically induced skin
carcinogenesis in Ccr10-deficient mice (Fig. 3.1 B). The DMBA/TPA treatment also
had an effect on mouse survival rates. Up until week 22, survival rates of Balb/c WT
mice and Ccr10-deficient mice were identical. After week 22, survival rates started to
diverge. Ccr10-deficient mice demonstrated an increased survival (97%) compared to
the WT group (85%) after 40 weeks (Fig. 3.1 C). The tumor onset for both groups
was at week 9 but after week 15 the tumor incidence was persistently lower in the
Ccr10-deficient group (Fig. 3.1 D). As demonstrated by the results depicted in Figure
3.1 D, loss of Ccr10 results in a significantly decreased skin tumorigenesis compared
to the WT control. After 40 weeks of DMBA/TPA treatment, 40% of Ccr10-deficient
mice remained tumor-free, whereas only 15% of WT mice were observed to be
tumor-free at this time point. Ccr10-deficient mice show an increased tumor-free
survival of 25% (Fig. 3.1 D). Taken together, contrary to the initial hypothesis, Ccr10-
deficiency was correlated with a decreased number of initiated tumors, a lower tumor
burden and improved tumor-free survival in the inflammation driven two-stage
DMBA/TPA carcinogenesis model.
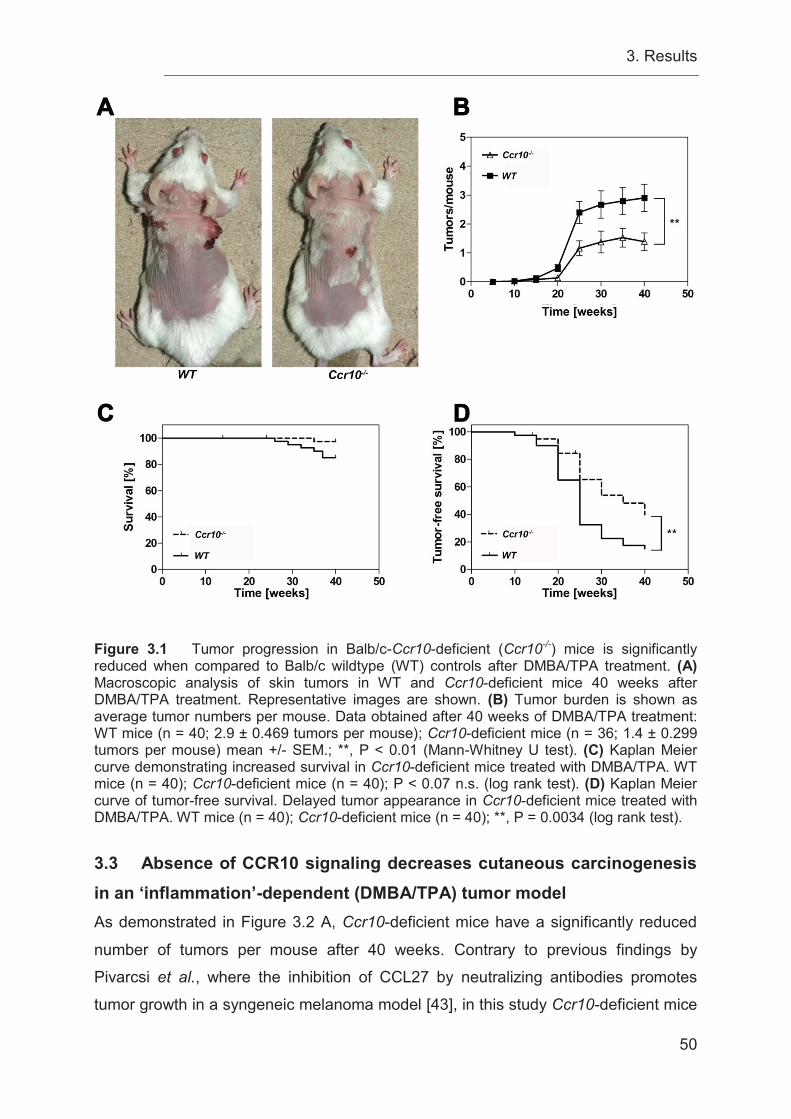
3. Results
50
Figure 3.1 Tumor progression in Balb/c-Ccr10-deficient (Ccr10-/-) mice is significantly reduced when compared to Balb/c wildtype (WT) controls after DMBA/TPA treatment. (A) Macroscopic analysis of skin tumors in WT and Ccr10-deficient mice 40 weeks after DMBA/TPA treatment. Representative images are shown. (B) Tumor burden is shown as average tumor numbers per mouse. Data obtained after 40 weeks of DMBA/TPA treatment: WT mice (n = 40; 2.9 ± 0.469 tumors per mouse); Ccr10-deficient mice (n = 36; 1.4 ± 0.299 tumors per mouse) mean +/- SEM.; **, P < 0.01 (Mann-Whitney U test). (C) Kaplan Meier curve demonstrating increased survival in Ccr10-deficient mice treated with DMBA/TPA. WT mice (n = 40); Ccr10-deficient mice (n = 40); P < 0.07 n.s. (log rank test). (D) Kaplan Meier curve of tumor-free survival. Delayed tumor appearance in Ccr10-deficient mice treated with DMBA/TPA. WT mice (n = 40); Ccr10-deficient mice (n = 40); **, P = 0.0034 (log rank test).
3.3 Absence of CCR10 signaling decreases cutaneous carcinogenesis in an ‘inflammation’-dependent (DMBA/TPA) tumor model As demonstrated in Figure 3.2 A, Ccr10-deficient mice have a significantly reduced
number of tumors per mouse after 40 weeks. Contrary to previous findings by
Pivarcsi et al., where the inhibition of CCL27 by neutralizing antibodies promotes
tumor growth in a syngeneic melanoma model [43], in this study Ccr10-deficient mice
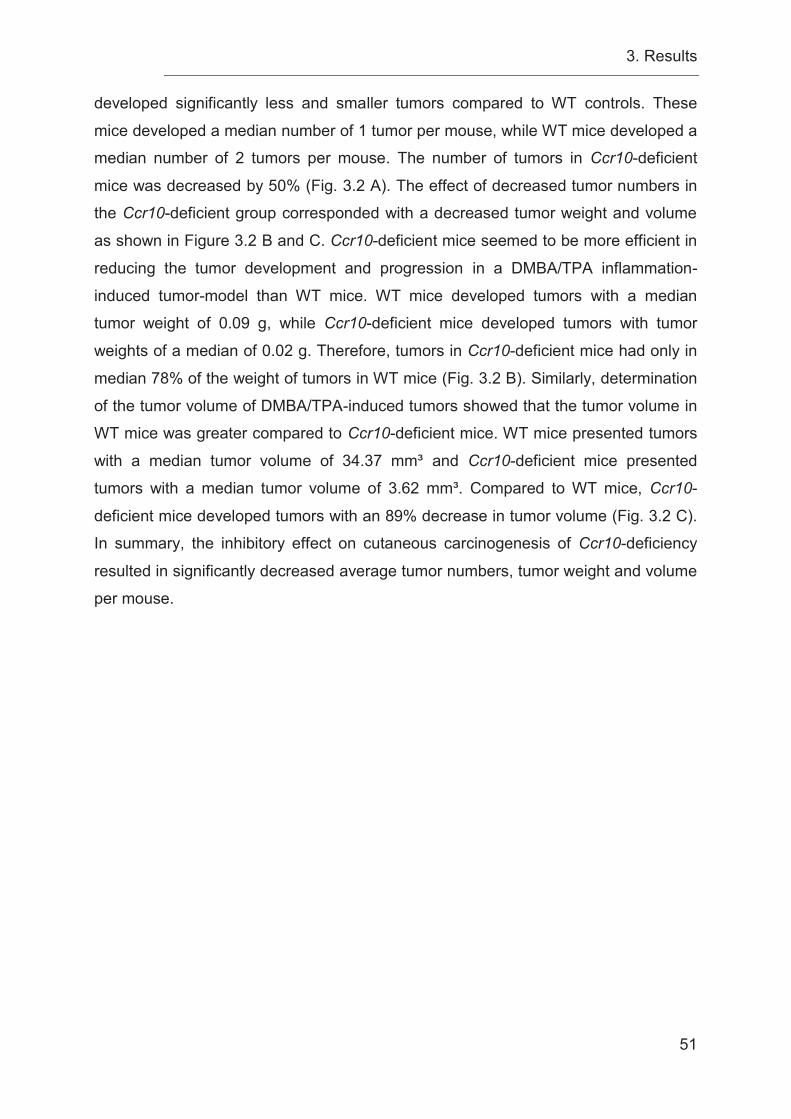
3. Results
51
developed significantly less and smaller tumors compared to WT controls. These
mice developed a median number of 1 tumor per mouse, while WT mice developed a
median number of 2 tumors per mouse. The number of tumors in Ccr10-deficient
mice was decreased by 50% (Fig. 3.2 A). The effect of decreased tumor numbers in
the Ccr10-deficient group corresponded with a decreased tumor weight and volume
as shown in Figure 3.2 B and C. Ccr10-deficient mice seemed to be more efficient in
reducing the tumor development and progression in a DMBA/TPA inflammation-
induced tumor-model than WT mice. WT mice developed tumors with a median
tumor weight of 0.09 g, while Ccr10-deficient mice developed tumors with tumor
weights of a median of 0.02 g. Therefore, tumors in Ccr10-deficient mice had only in
median 78% of the weight of tumors in WT mice (Fig. 3.2 B). Similarly, determination
of the tumor volume of DMBA/TPA-induced tumors showed that the tumor volume in
WT mice was greater compared to Ccr10-deficient mice. WT mice presented tumors
with a median tumor volume of 34.37 mm³ and Ccr10-deficient mice presented
tumors with a median tumor volume of 3.62 mm³. Compared to WT mice, Ccr10-
deficient mice developed tumors with an 89% decrease in tumor volume (Fig. 3.2 C).
In summary, the inhibitory effect on cutaneous carcinogenesis of Ccr10-deficiency
resulted in significantly decreased average tumor numbers, tumor weight and volume
per mouse.
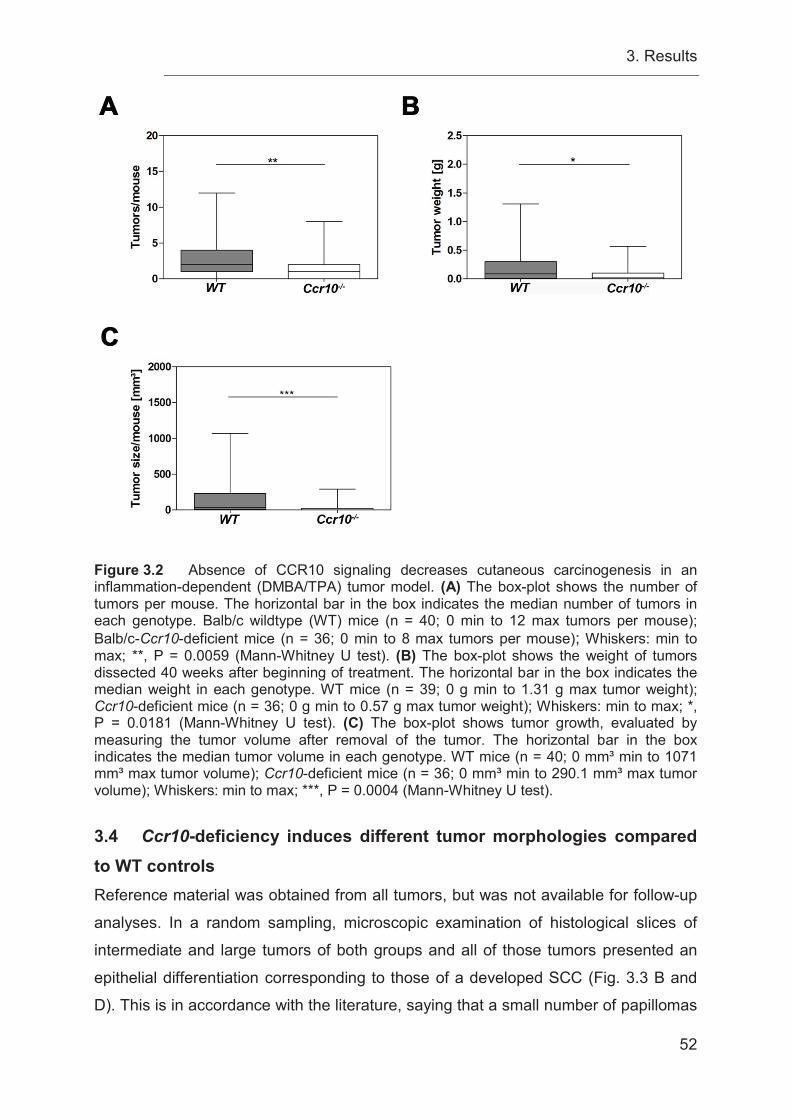
3. Results
52
Figure 3.2 Absence of CCR10 signaling decreases cutaneous carcinogenesis in an inflammation-dependent (DMBA/TPA) tumor model. (A) The box-plot shows the number of tumors per mouse. The horizontal bar in the box indicates the median number of tumors in each genotype. Balb/c wildtype (WT) mice (n = 40; 0 min to 12 max tumors per mouse); Balb/c-Ccr10-deficient mice (n = 36; 0 min to 8 max tumors per mouse); Whiskers: min to max; **, P = 0.0059 (Mann-Whitney U test). (B) The box-plot shows the weight of tumors dissected 40 weeks after beginning of treatment. The horizontal bar in the box indicates the median weight in each genotype. WT mice (n = 39; 0 g min to 1.31 g max tumor weight); Ccr10-deficient mice (n = 36; 0 g min to 0.57 g max tumor weight); Whiskers: min to max; *, P = 0.0181 (Mann-Whitney U test). (C) The box-plot shows tumor growth, evaluated by measuring the tumor volume after removal of the tumor. The horizontal bar in the box indicates the median tumor volume in each genotype. WT mice (n = 40; 0 mm³ min to 1071 mm³ max tumor volume); Ccr10-deficient mice (n = 36; 0 mm³ min to 290.1 mm³ max tumor volume); Whiskers: min to max; ***, P = 0.0004 (Mann-Whitney U test).
3.4 Ccr10-deficiency induces different tumor morphologies compared to WT controls Reference material was obtained from all tumors, but was not available for follow-up
analyses. In a random sampling, microscopic examination of histological slices of
intermediate and large tumors of both groups and all of those tumors presented an
epithelial differentiation corresponding to those of a developed SCC (Fig. 3.3 B and
D). This is in accordance with the literature, saying that a small number of papillomas
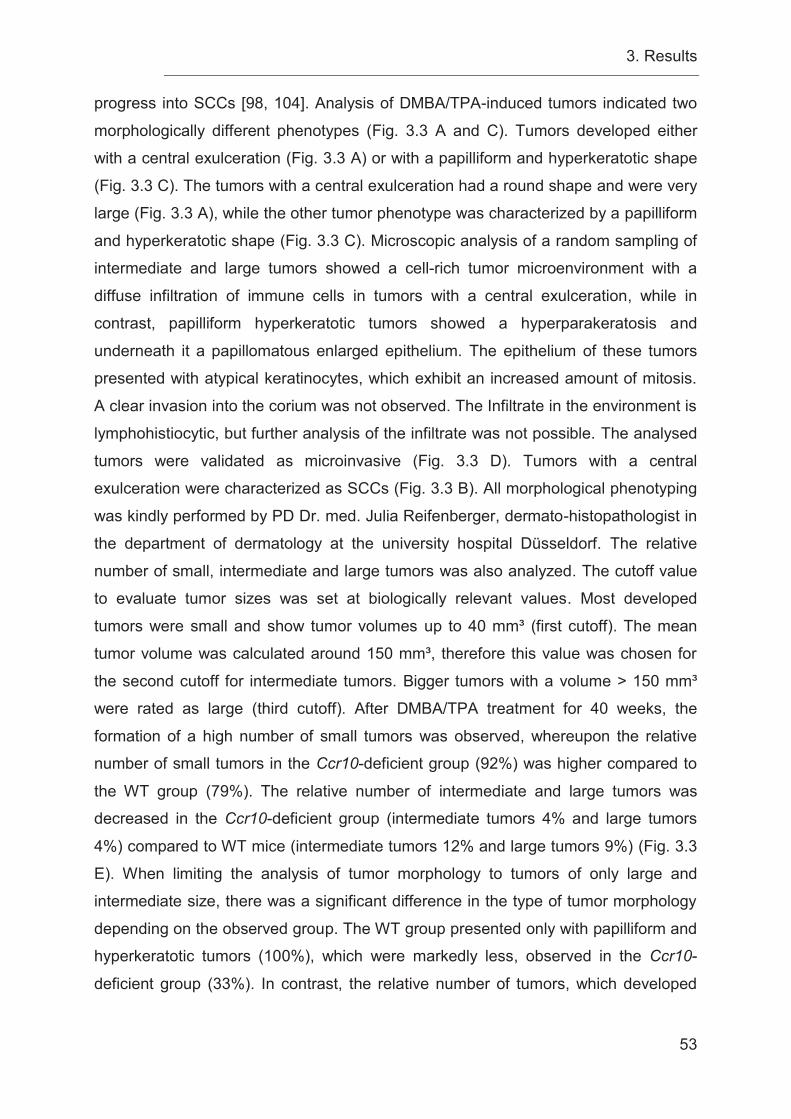
3. Results
53
progress into SCCs [98, 104]. Analysis of DMBA/TPA-induced tumors indicated two
morphologically different phenotypes (Fig. 3.3 A and C). Tumors developed either
with a central exulceration (Fig. 3.3 A) or with a papilliform and hyperkeratotic shape
(Fig. 3.3 C). The tumors with a central exulceration had a round shape and were very
large (Fig. 3.3 A), while the other tumor phenotype was characterized by a papilliform
and hyperkeratotic shape (Fig. 3.3 C). Microscopic analysis of a random sampling of
intermediate and large tumors showed a cell-rich tumor microenvironment with a
diffuse infiltration of immune cells in tumors with a central exulceration, while in
contrast, papilliform hyperkeratotic tumors showed a hyperparakeratosis and
underneath it a papillomatous enlarged epithelium. The epithelium of these tumors
presented with atypical keratinocytes, which exhibit an increased amount of mitosis.
A clear invasion into the corium was not observed. The Infiltrate in the environment is
lymphohistiocytic, but further analysis of the infiltrate was not possible. The analysed
tumors were validated as microinvasive (Fig. 3.3 D). Tumors with a central
exulceration were characterized as SCCs (Fig. 3.3 B). All morphological phenotyping
was kindly performed by PD Dr. med. Julia Reifenberger, dermato-histopathologist in
the department of dermatology at the university hospital Düsseldorf. The relative
number of small, intermediate and large tumors was also analyzed. The cutoff value
to evaluate tumor sizes was set at biologically relevant values. Most developed
tumors were small and show tumor volumes up to 40 mm³ (first cutoff). The mean
tumor volume was calculated around 150 mm³, therefore this value was chosen for
the second cutoff for intermediate tumors. Bigger tumors with a volume > 150 mm³
were rated as large (third cutoff). After DMBA/TPA treatment for 40 weeks, the
formation of a high number of small tumors was observed, whereupon the relative
number of small tumors in the Ccr10-deficient group (92%) was higher compared to
the WT group (79%). The relative number of intermediate and large tumors was
decreased in the Ccr10-deficient group (intermediate tumors 4% and large tumors
4%) compared to WT mice (intermediate tumors 12% and large tumors 9%) (Fig. 3.3
E). When limiting the analysis of tumor morphology to tumors of only large and
intermediate size, there was a significant difference in the type of tumor morphology
depending on the observed group. The WT group presented only with papilliform and
hyperkeratotic tumors (100%), which were markedly less, observed in the Ccr10-
deficient group (33%). In contrast, the relative number of tumors, which developed
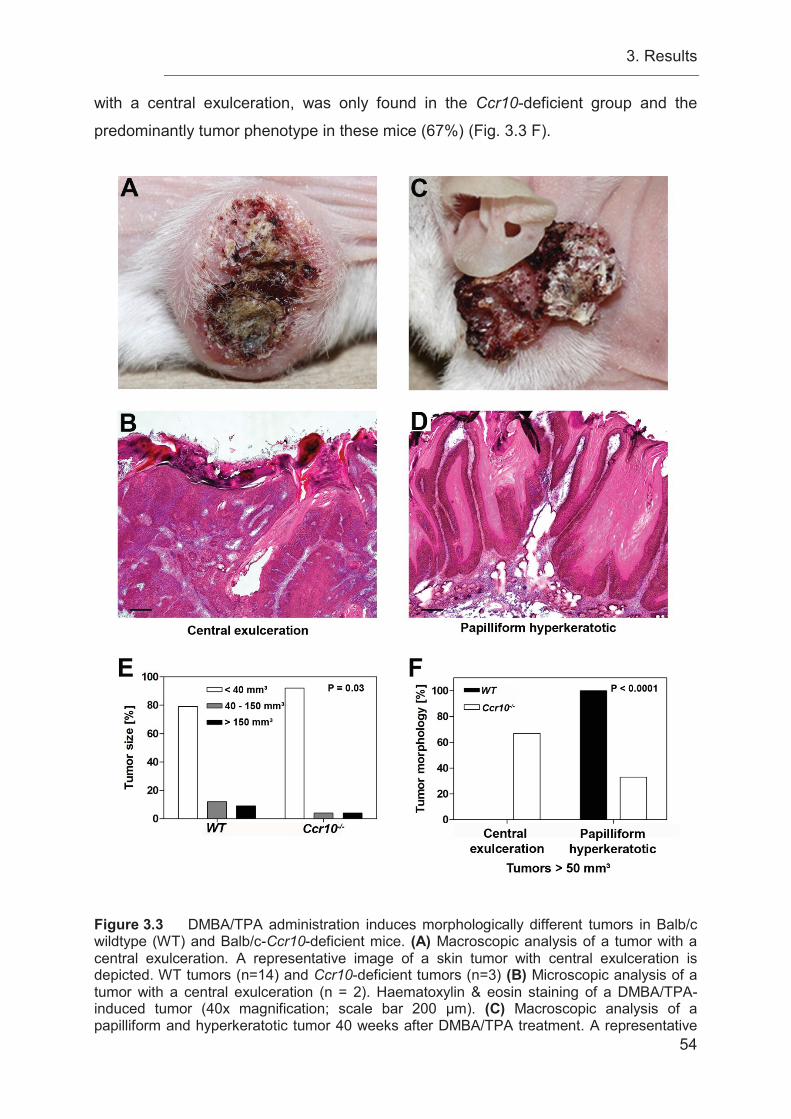
3. Results
54
with a central exulceration, was only found in the Ccr10-deficient group and the
predominantly tumor phenotype in these mice (67%) (Fig. 3.3 F).
Figure 3.3 DMBA/TPA administration induces morphologically different tumors in Balb/c wildtype (WT) and Balb/c-Ccr10-deficient mice. (A) Macroscopic analysis of a tumor with a central exulceration. A representative image of a skin tumor with central exulceration is depicted. WT tumors (n=14) and Ccr10-deficient tumors (n=3) (B) Microscopic analysis of a tumor with a central exulceration (n = 2). Haematoxylin & eosin staining of a DMBA/TPA-induced tumor (40x magnification; scale bar 200 μm). (C) Macroscopic analysis of a papilliform and hyperkeratotic tumor 40 weeks after DMBA/TPA treatment. A representative
3. Results
55
image of a papilliform and hyperkeratotic skin tumor is shown. (D) Microscopic analysis of a papilliform and hyperkeratotic tumor (n = 2). Haematoxylin & eosin staining of a DMBA/TPA-induced papilliform and hyperkeratotic skin tumor (40x magnification; scale bar 200 μm). (E) Tumor size distribution in percentage terms showing the relative number of small (< 40 mm³), intermediate (40-150 mm³) and large tumors (> 150 mm³) determined for each genotype (all measured as tumor volume). WT mice (n = 34); Ccr10-deficient mice (n = 22); WT tumors (n = 116); Ccr10-deficient tumors (n = 50); *, P = 0.03 (Fisher’s exact test). (F) Tumor morphology distribution in percentage, showing the tumor morphology of the relative number of tumors (> 50 mm³) determined for each genotype. All tumors presented with either a central exulceration or a papilliform and hyperkeratotic morphology. WT mice (n = 9); Ccr10-deficient mice (n = 3); WT tumors (n = 14); Ccr10-deficient tumors (n = 3); ***, P < 0.0001 (Fisher’s exact test).
3.5 Ccr10-deficient mice do not exhibit reduced nuchal fold thickness to DMBA/TPA administration To determine a potential underlying mechanism for the inhibition of tumor
development in Ccr10-deficient mice after DMBA/TPA administration, the
inflammatory response of the mice was analyzed. Previous studies showed that
CCL27-CCR10 interaction is important in the development of cutaneous inflammation
in a murine atopy-like skin inflammation model [67]. In particular, the recruitment of T
cells into the skin was impaired and resulted in decreased skin thickness and
decreased acanthosis [67]. Moreover, Pivarcsi et al. have shown that administration
of a neutralizing antibody against murine CCL27 leads to significantly decreased
recruitment of CD4 and CD8 lymphocytes, decreased IFN-ɣ release, and increased
tumor growth in a murine melanoma model in vivo [43]. Therefore, it was ascertained
whether the loss of Ccr10 would alter the inflammation-induced thickening of the skin.
Figure 3.4 A shows a markedly increased skin thickness of the epidermal and dermal
compartment accompanied by an increased immune response in the WT and Ccr10-
deficient group after DMBA/TPA treatment compared to control mice. Surprisingly,
there was not a difference in DMBA/TPA-induced skin thickening between the WT
and the Ccr10-deficient mice (Fig. 3.4 A). Nuchal fold thickness was measured as a
marker for inflammation-induced skin thickening. A larger thickness denotes a
stronger induction of an inflammatory response. Additionally, the treatment with
DMBA/TPA resulted in a significant increase in nuchal fold thickness in both Ccr10-
deficient and WT mice after 40 weeks. In WT control mice, which were never treated
with DMBA/TPA, the mean of the measured nuchal fold thickness was 0.745 mm and
was markedly increased in WT mice treated with DMBA/TPA for 40 weeks with a
mean nuchal fold thickness of 0.978 mm. The nuchal fold thickness in WT mice was
increased by 31% as a result of DMBA/TPA treatment for 40 weeks (Fig. 3.4 B).
3. Results
56
Similarly, in Ccr10-deficient control mice the mean nuchal fold thickness was
measured at 0.770 mm and was significantly increased in DMBA/TPA-treated mice,
which presented with a mean nuchal fold thickness of 0.959 mm. In Ccr10-deficient
mice the nuchal fold thickness was increased by 25%, following 40 weeks of
DMBA/TPA treatment (Fig. 3.4 B). No significant difference between Ccr10-deficient
mice and WT mice was observed. Furthermore, changes in epidermal thickness were
measured after 12 and 40 weeks of DMBA/TPA treatment. An increase of acanthosis
was seen after 12 weeks of DMBA/TPA treatment in both WT and Ccr10-deficient
mice (Fig. 3.4 C). WT mice presented with an enhanced mean epidermal thickness of
12.15 μm compared to Ccr10-deficient mice, in which the epidermal thickness
increased to a mean of 20.59 after 12 weeks of DMBA/TPA treatment. Determination
of epidermal thickness changes after 40 weeks of DMBA/TPA treatment exhibit only
a mean increase of 5.41 μm in the WT group and a mean increase of 9.43 μm in the
Ccr10-deficient group compared to control mice. No significant difference between
Ccr10-deficient and WT mice was observed at week 12 or at week 40 of DMBA/TPA
treatment.
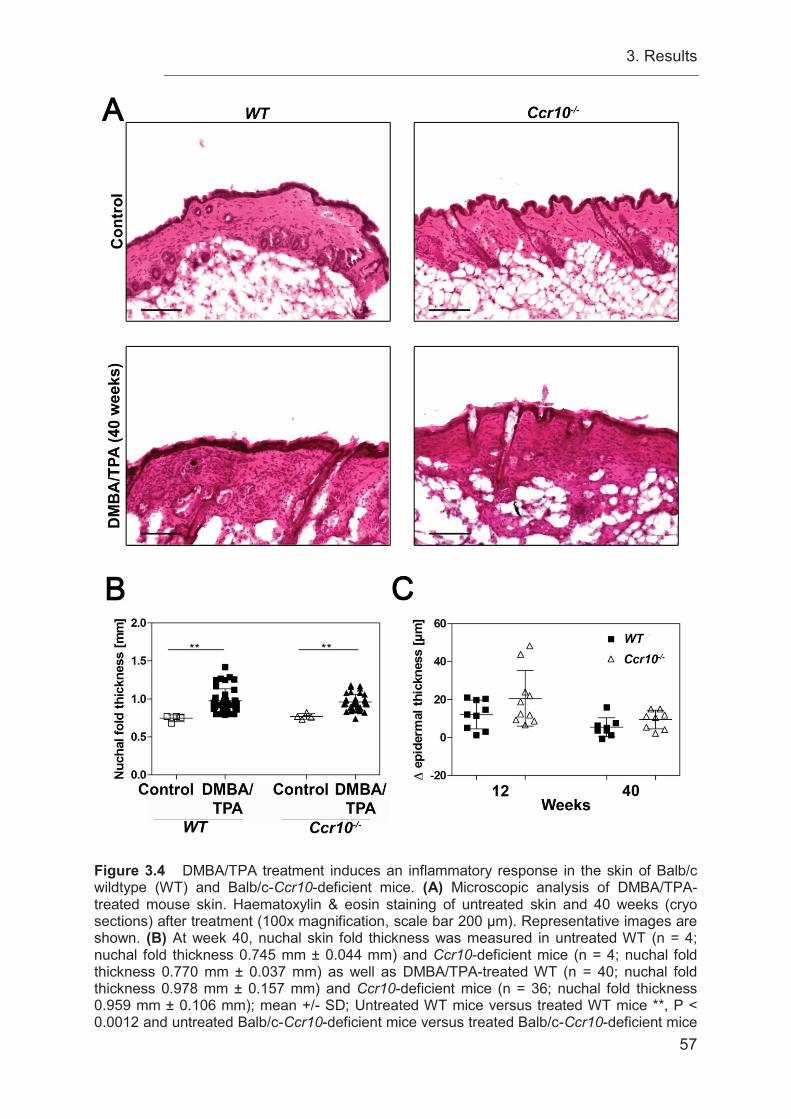
3. Results
57
Figure 3.4 DMBA/TPA treatment induces an inflammatory response in the skin of Balb/c wildtype (WT) and Balb/c-Ccr10-deficient mice. (A) Microscopic analysis of DMBA/TPA-treated mouse skin. Haematoxylin & eosin staining of untreated skin and 40 weeks (cryo sections) after treatment (100x magnification, scale bar 200 μm). Representative images are shown. (B) At week 40, nuchal skin fold thickness was measured in untreated WT (n = 4; nuchal fold thickness 0.745 mm ± 0.044 mm) and Ccr10-deficient mice (n = 4; nuchal fold thickness 0.770 mm ± 0.037 mm) as well as DMBA/TPA-treated WT (n = 40; nuchal fold thickness 0.978 mm ± 0.157 mm) and Ccr10-deficient mice (n = 36; nuchal fold thickness 0.959 mm ± 0.106 mm); mean +/- SD; Untreated WT mice versus treated WT mice **, P < 0.0012 and untreated Balb/c-Ccr10-deficient mice versus treated Balb/c-Ccr10-deficient mice
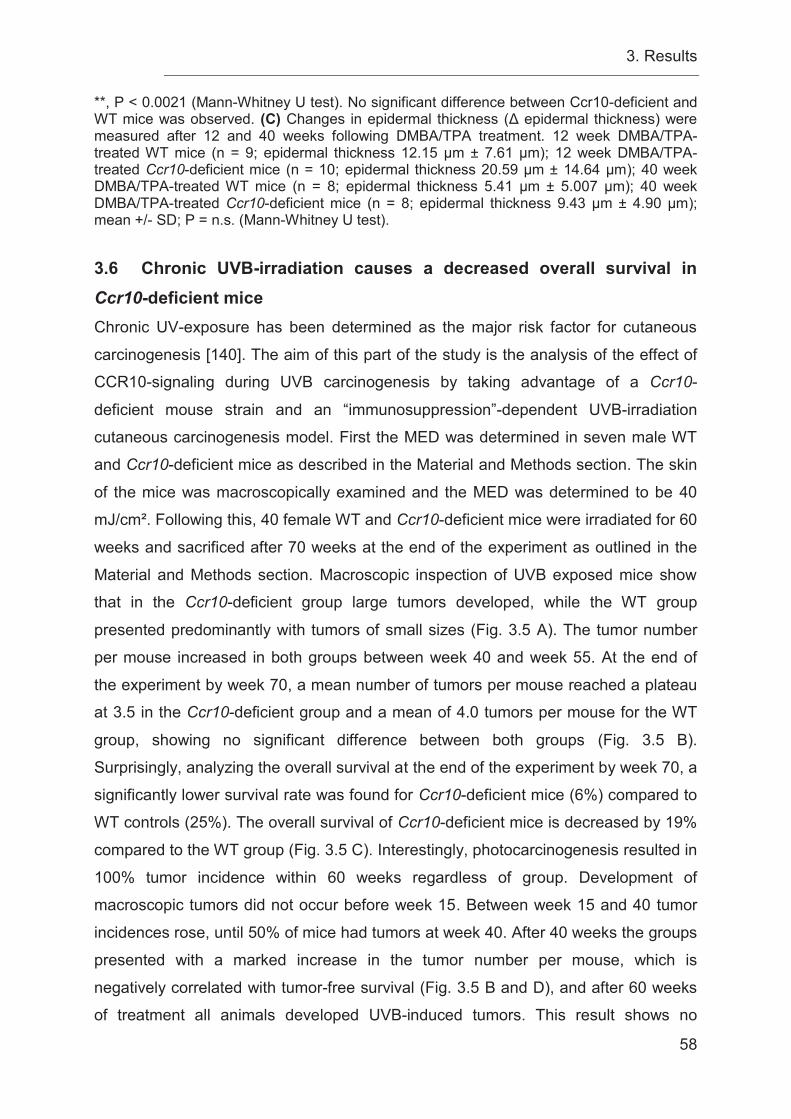
3. Results
58
**, P < 0.0021 (Mann-Whitney U test). No significant difference between Ccr10-deficient and WT mice was observed. (C) Changes in epidermal thickness (Δ epidermal thickness) were measured after 12 and 40 weeks following DMBA/TPA treatment. 12 week DMBA/TPA-treated WT mice (n = 9; epidermal thickness 12.15 μm ± 7.61 μm); 12 week DMBA/TPA-treated Ccr10-deficient mice (n = 10; epidermal thickness 20.59 μm ± 14.64 μm); 40 week DMBA/TPA-treated WT mice (n = 8; epidermal thickness 5.41 μm ± 5.007 μm); 40 week DMBA/TPA-treated Ccr10-deficient mice (n = 8; epidermal thickness 9.43 μm ± 4.90 μm); mean +/- SD; P = n.s. (Mann-Whitney U test). 3.6 Chronic UVB-irradiation causes a decreased overall survival in Ccr10-deficient mice Chronic UV-exposure has been determined as the major risk factor for cutaneous
carcinogenesis [140]. The aim of this part of the study is the analysis of the effect of
CCR10-signaling during UVB carcinogenesis by taking advantage of a Ccr10-
deficient mouse strain and an “immunosuppression”-dependent UVB-irradiation
cutaneous carcinogenesis model. First the MED was determined in seven male WT
and Ccr10-deficient mice as described in the Material and Methods section. The skin
of the mice was macroscopically examined and the MED was determined to be 40
mJ/cm². Following this, 40 female WT and Ccr10-deficient mice were irradiated for 60
weeks and sacrificed after 70 weeks at the end of the experiment as outlined in the
Material and Methods section. Macroscopic inspection of UVB exposed mice show
that in the Ccr10-deficient group large tumors developed, while the WT group
presented predominantly with tumors of small sizes (Fig. 3.5 A). The tumor number
per mouse increased in both groups between week 40 and week 55. At the end of
the experiment by week 70, a mean number of tumors per mouse reached a plateau
at 3.5 in the Ccr10-deficient group and a mean of 4.0 tumors per mouse for the WT
group, showing no significant difference between both groups (Fig. 3.5 B).
Surprisingly, analyzing the overall survival at the end of the experiment by week 70, a
significantly lower survival rate was found for Ccr10-deficient mice (6%) compared to
WT controls (25%). The overall survival of Ccr10-deficient mice is decreased by 19%
compared to the WT group (Fig. 3.5 C). Interestingly, photocarcinogenesis resulted in
100% tumor incidence within 60 weeks regardless of group. Development of
macroscopic tumors did not occur before week 15. Between week 15 and 40 tumor
incidences rose, until 50% of mice had tumors at week 40. After 40 weeks the groups
presented with a marked increase in the tumor number per mouse, which is
negatively correlated with tumor-free survival (Fig. 3.5 B and D), and after 60 weeks
of treatment all animals developed UVB-induced tumors. This result shows no
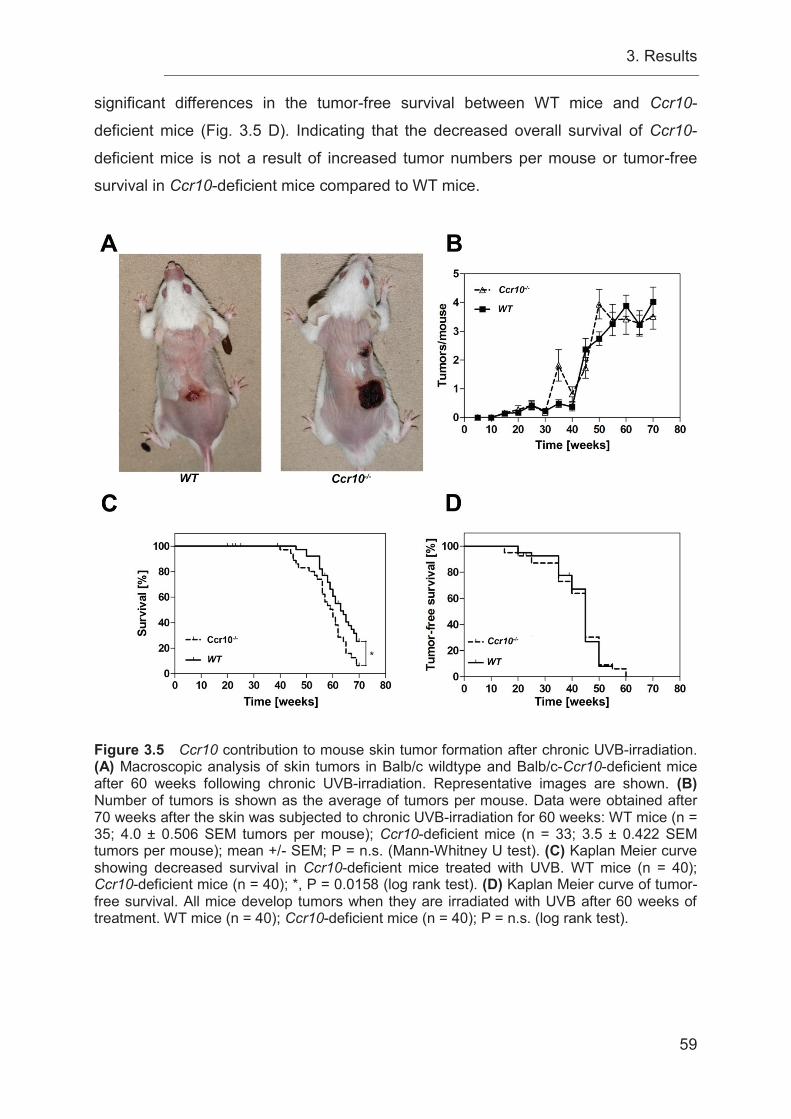
3. Results
59
significant differences in the tumor-free survival between WT mice and Ccr10-
deficient mice (Fig. 3.5 D). Indicating that the decreased overall survival of Ccr10-
deficient mice is not a result of increased tumor numbers per mouse or tumor-free
survival in Ccr10-deficient mice compared to WT mice.
Figure 3.5 Ccr10 contribution to mouse skin tumor formation after chronic UVB-irradiation. (A) Macroscopic analysis of skin tumors in Balb/c wildtype and Balb/c-Ccr10-deficient mice after 60 weeks following chronic UVB-irradiation. Representative images are shown. (B) Number of tumors is shown as the average of tumors per mouse. Data were obtained after 70 weeks after the skin was subjected to chronic UVB-irradiation for 60 weeks: WT mice (n = 35; 4.0 ± 0.506 SEM tumors per mouse); Ccr10-deficient mice (n = 33; 3.5 ± 0.422 SEM tumors per mouse); mean +/- SEM; P = n.s. (Mann-Whitney U test). (C) Kaplan Meier curve showing decreased survival in Ccr10-deficient mice treated with UVB. WT mice (n = 40); Ccr10-deficient mice (n = 40); *, P = 0.0158 (log rank test). (D) Kaplan Meier curve of tumor-free survival. All mice develop tumors when they are irradiated with UVB after 60 weeks of treatment. WT mice (n = 40); Ccr10-deficient mice (n = 40); P = n.s. (log rank test).
3. Results
60
3.7 UVB-irradiation increases tumor burden in the absence of CCR10 signaling
To determine the reason for the significantly decreased overall survival of Ccr10-
deficient mice, tumor numbers, weight and volume were analyzed. Interestingly,
significantly enhanced tumor size and volume after chronic UVB-exposure in the
Ccr10-deficient group was observed (Fig. 3.6 A-C). WT mice presented with a
median tumor number of 3 tumors per mouse, similarly Ccr10-deficient mice
developed a median tumor number of 3 tumors per mouse (Fig. 3.6 A). After 70
weeks, a significantly enhanced median tumor weight of 0.48 g in the Ccr10-deficient
group compared to a median tumor weight of 0.35 g in the WT group was observed.
This is a significant increase in tumor weight by 37% in Ccr10-deficient mice
compared to WT mice (Fig. 3.6 B). Furthermore, determination of tumor volume per
mouse showed a median tumor volume of 234 mm³ in the WT group, while Ccr10-
deficient mice were found with a significantly increased tumor volume presenting with
a median of 367.3 mm³. The median tumor volume per mouse was increased by 57%
in the knock-out group compared to the WT group as shown in Figure 3.6 C.
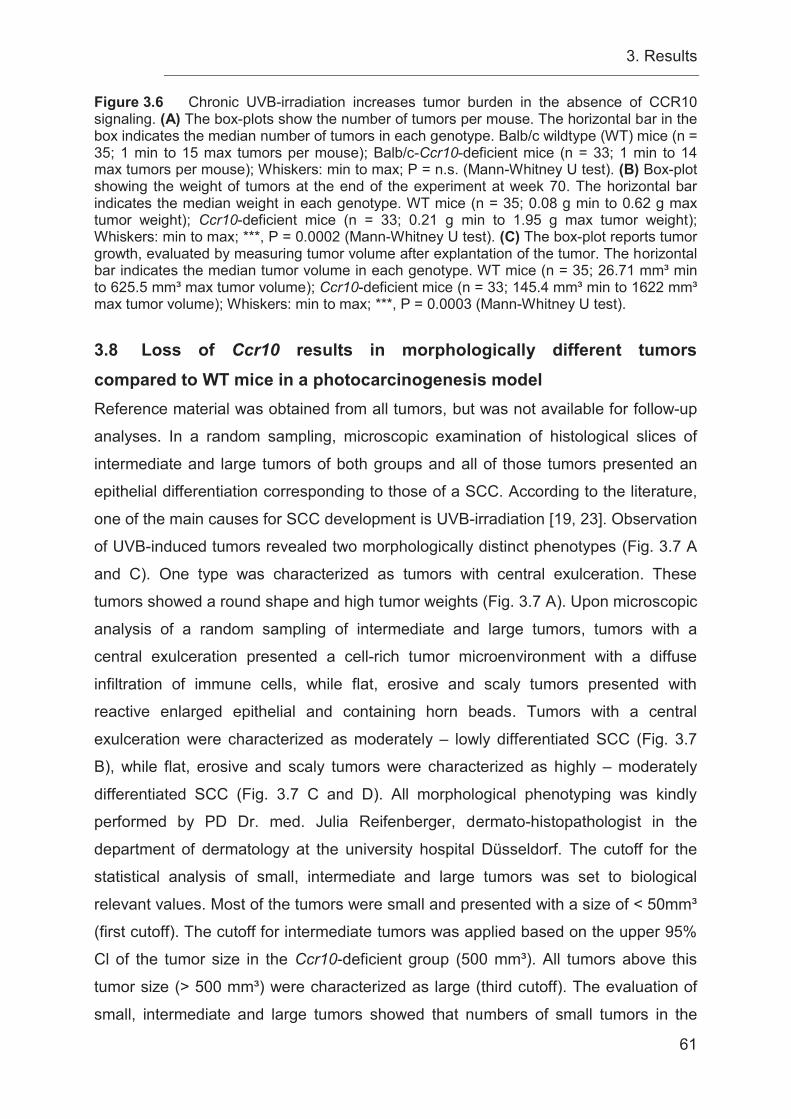
3. Results
61
Figure 3.6 Chronic UVB-irradiation increases tumor burden in the absence of CCR10 signaling. (A) The box-plots show the number of tumors per mouse. The horizontal bar in the box indicates the median number of tumors in each genotype. Balb/c wildtype (WT) mice (n = 35; 1 min to 15 max tumors per mouse); Balb/c-Ccr10-deficient mice (n = 33; 1 min to 14 max tumors per mouse); Whiskers: min to max; P = n.s. (Mann-Whitney U test). (B) Box-plot showing the weight of tumors at the end of the experiment at week 70. The horizontal bar indicates the median weight in each genotype. WT mice (n = 35; 0.08 g min to 0.62 g max tumor weight); Ccr10-deficient mice (n = 33; 0.21 g min to 1.95 g max tumor weight); Whiskers: min to max; ***, P = 0.0002 (Mann-Whitney U test). (C) The box-plot reports tumor growth, evaluated by measuring tumor volume after explantation of the tumor. The horizontal bar indicates the median tumor volume in each genotype. WT mice (n = 35; 26.71 mm³ min to 625.5 mm³ max tumor volume); Ccr10-deficient mice (n = 33; 145.4 mm³ min to 1622 mm³ max tumor volume); Whiskers: min to max; ***, P = 0.0003 (Mann-Whitney U test).
3.8 Loss of Ccr10 results in morphologically different tumors compared to WT mice in a photocarcinogenesis model Reference material was obtained from all tumors, but was not available for follow-up
analyses. In a random sampling, microscopic examination of histological slices of
intermediate and large tumors of both groups and all of those tumors presented an
epithelial differentiation corresponding to those of a SCC. According to the literature,
one of the main causes for SCC development is UVB-irradiation [19, 23]. Observation
of UVB-induced tumors revealed two morphologically distinct phenotypes (Fig. 3.7 A
and C). One type was characterized as tumors with central exulceration. These
tumors showed a round shape and high tumor weights (Fig. 3.7 A). Upon microscopic
analysis of a random sampling of intermediate and large tumors, tumors with a
central exulceration presented a cell-rich tumor microenvironment with a diffuse
infiltration of immune cells, while flat, erosive and scaly tumors presented with
reactive enlarged epithelial and containing horn beads. Tumors with a central
exulceration were characterized as moderately – lowly differentiated SCC (Fig. 3.7
B), while flat, erosive and scaly tumors were characterized as highly – moderately
differentiated SCC (Fig. 3.7 C and D). All morphological phenotyping was kindly
performed by PD Dr. med. Julia Reifenberger, dermato-histopathologist in the
department of dermatology at the university hospital Düsseldorf. The cutoff for the
statistical analysis of small, intermediate and large tumors was set to biological
relevant values. Most of the tumors were small and presented with a size of < 50mm³
(first cutoff). The cutoff for intermediate tumors was applied based on the upper 95%
Cl of the tumor size in the Ccr10-deficient group (500 mm³). All tumors above this
tumor size (> 500 mm³) were characterized as large (third cutoff). The evaluation of
small, intermediate and large tumors showed that numbers of small tumors in the
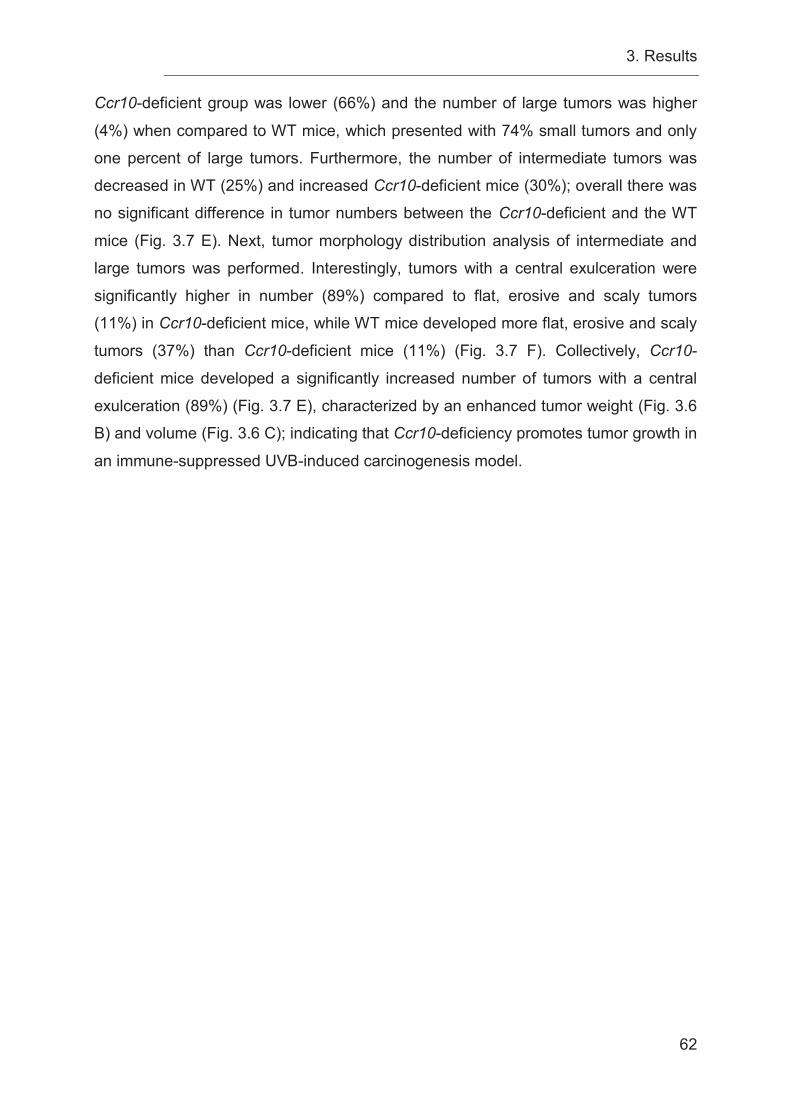
3. Results
62
Ccr10-deficient group was lower (66%) and the number of large tumors was higher
(4%) when compared to WT mice, which presented with 74% small tumors and only
one percent of large tumors. Furthermore, the number of intermediate tumors was
decreased in WT (25%) and increased Ccr10-deficient mice (30%); overall there was
no significant difference in tumor numbers between the Ccr10-deficient and the WT
mice (Fig. 3.7 E). Next, tumor morphology distribution analysis of intermediate and
large tumors was performed. Interestingly, tumors with a central exulceration were
significantly higher in number (89%) compared to flat, erosive and scaly tumors
(11%) in Ccr10-deficient mice, while WT mice developed more flat, erosive and scaly
tumors (37%) than Ccr10-deficient mice (11%) (Fig. 3.7 F). Collectively, Ccr10-
deficient mice developed a significantly increased number of tumors with a central
exulceration (89%) (Fig. 3.7 E), characterized by an enhanced tumor weight (Fig. 3.6
B) and volume (Fig. 3.6 C); indicating that Ccr10-deficiency promotes tumor growth in
an immune-suppressed UVB-induced carcinogenesis model.
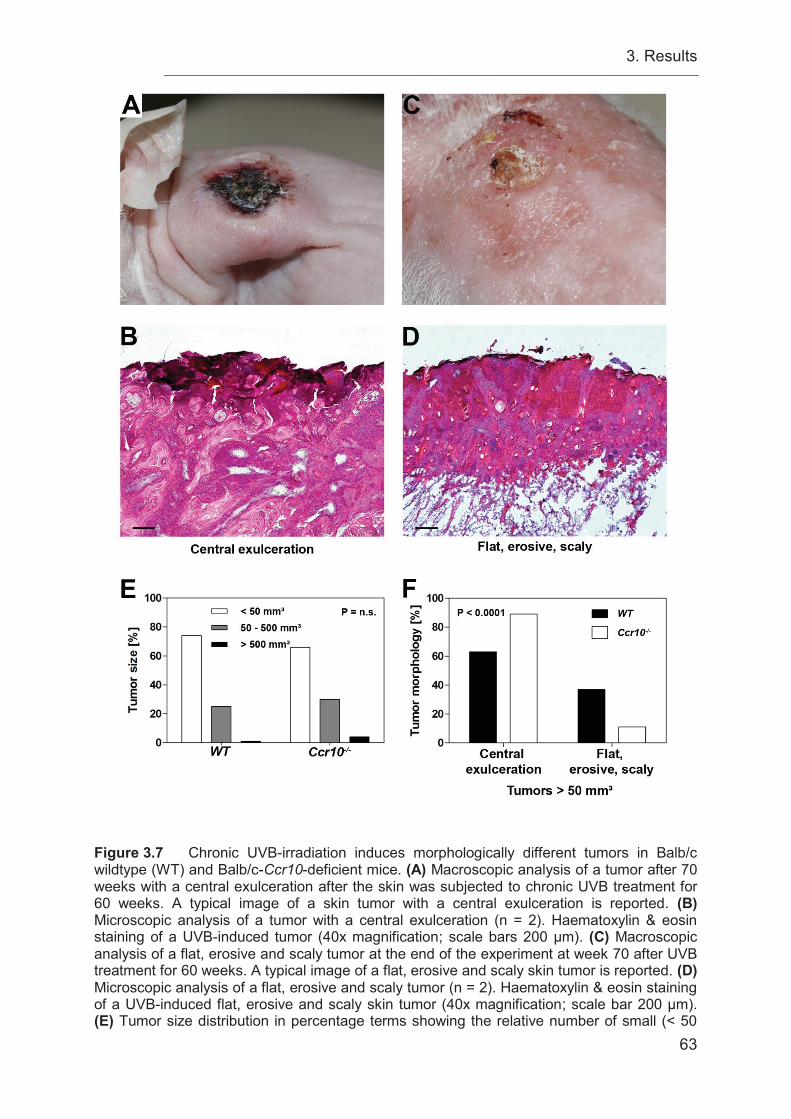
3. Results
63
Figure 3.7 Chronic UVB-irradiation induces morphologically different tumors in Balb/c wildtype (WT) and Balb/c-Ccr10-deficient mice. (A) Macroscopic analysis of a tumor after 70 weeks with a central exulceration after the skin was subjected to chronic UVB treatment for 60 weeks. A typical image of a skin tumor with a central exulceration is reported. (B) Microscopic analysis of a tumor with a central exulceration (n = 2). Haematoxylin & eosin staining of a UVB-induced tumor (40x magnification; scale bars 200 μm). (C) Macroscopic analysis of a flat, erosive and scaly tumor at the end of the experiment at week 70 after UVB treatment for 60 weeks. A typical image of a flat, erosive and scaly skin tumor is reported. (D) Microscopic analysis of a flat, erosive and scaly tumor (n = 2). Haematoxylin & eosin staining of a UVB-induced flat, erosive and scaly skin tumor (40x magnification; scale bar 200 μm). (E) Tumor size distribution in percentage terms showing the relative number of small (< 50
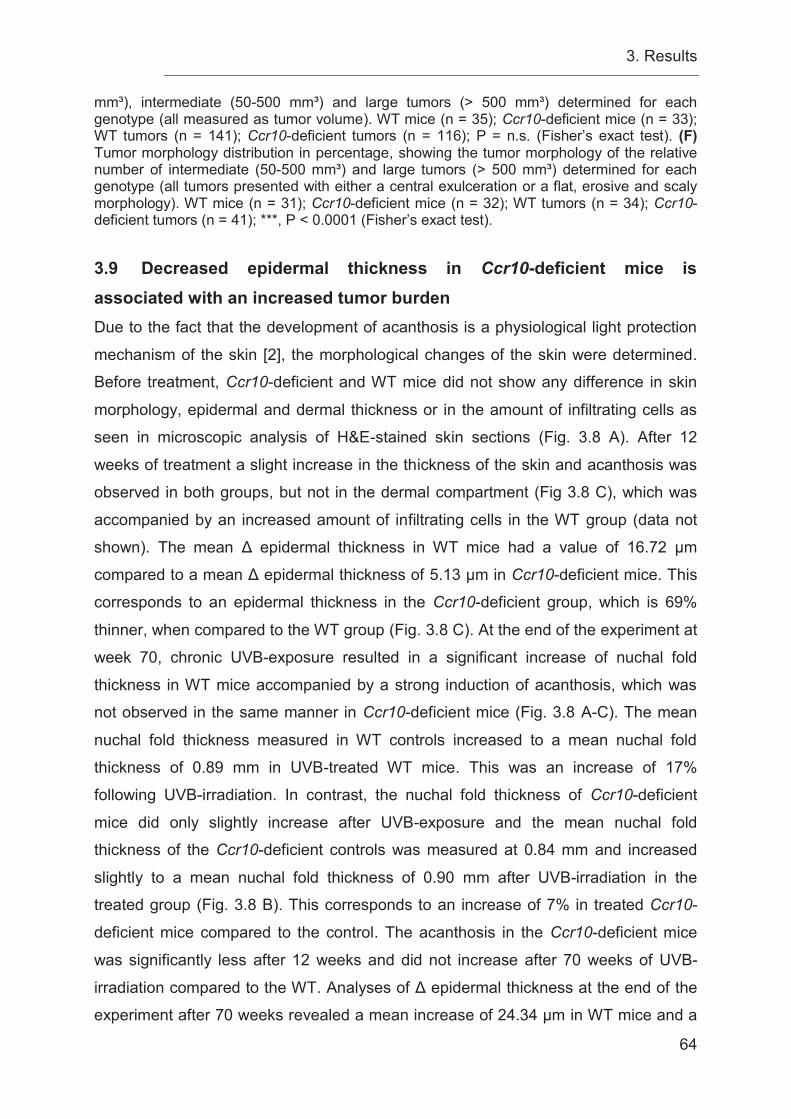
3. Results
64
mm³), intermediate (50-500 mm³) and large tumors (> 500 mm³) determined for each genotype (all measured as tumor volume). WT mice (n = 35); Ccr10-deficient mice (n = 33); WT tumors (n = 141); Ccr10-deficient tumors (n = 116); P = n.s. (Fisher’s exact test). (F) Tumor morphology distribution in percentage, showing the tumor morphology of the relative number of intermediate (50-500 mm³) and large tumors (> 500 mm³) determined for each genotype (all tumors presented with either a central exulceration or a flat, erosive and scaly morphology). WT mice (n = 31); Ccr10-deficient mice (n = 32); WT tumors (n = 34); Ccr10-deficient tumors (n = 41); ***, P < 0.0001 (Fisher’s exact test). 3.9 Decreased epidermal thickness in Ccr10-deficient mice is associated with an increased tumor burden Due to the fact that the development of acanthosis is a physiological light protection
mechanism of the skin [2], the morphological changes of the skin were determined.
Before treatment, Ccr10-deficient and WT mice did not show any difference in skin
morphology, epidermal and dermal thickness or in the amount of infiltrating cells as
seen in microscopic analysis of H&E-stained skin sections (Fig. 3.8 A). After 12
weeks of treatment a slight increase in the thickness of the skin and acanthosis was
observed in both groups, but not in the dermal compartment (Fig 3.8 C), which was
accompanied by an increased amount of infiltrating cells in the WT group (data not
shown). The mean Δ epidermal thickness in WT mice had a value of 16.72 μm
compared to a mean Δ epidermal thickness of 5.13 μm in Ccr10-deficient mice. This
corresponds to an epidermal thickness in the Ccr10-deficient group, which is 69%
thinner, when compared to the WT group (Fig. 3.8 C). At the end of the experiment at
week 70, chronic UVB-exposure resulted in a significant increase of nuchal fold
thickness in WT mice accompanied by a strong induction of acanthosis, which was
not observed in the same manner in Ccr10-deficient mice (Fig. 3.8 A-C). The mean
nuchal fold thickness measured in WT controls increased to a mean nuchal fold
thickness of 0.89 mm in UVB-treated WT mice. This was an increase of 17%
following UVB-irradiation. In contrast, the nuchal fold thickness of Ccr10-deficient
mice did only slightly increase after UVB-exposure and the mean nuchal fold
thickness of the Ccr10-deficient controls was measured at 0.84 mm and increased
slightly to a mean nuchal fold thickness of 0.90 mm after UVB-irradiation in the
treated group (Fig. 3.8 B). This corresponds to an increase of 7% in treated Ccr10-
deficient mice compared to the control. The acanthosis in the Ccr10-deficient mice
was significantly less after 12 weeks and did not increase after 70 weeks of UVB-
irradiation compared to the WT. Analyses of Δ epidermal thickness at the end of the
experiment after 70 weeks revealed a mean increase of 24.34 μm in WT mice and a
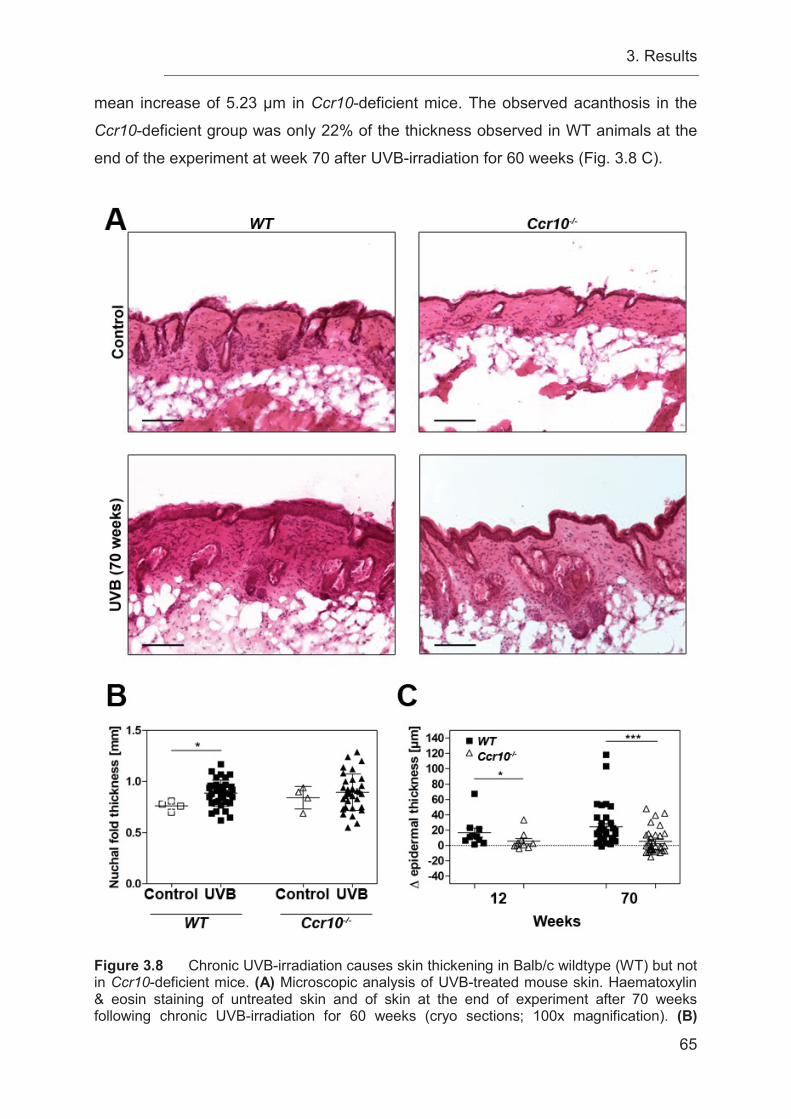
3. Results
65
mean increase of 5.23 μm in Ccr10-deficient mice. The observed acanthosis in the
Ccr10-deficient group was only 22% of the thickness observed in WT animals at the
end of the experiment at week 70 after UVB-irradiation for 60 weeks (Fig. 3.8 C).
Figure 3.8 Chronic UVB-irradiation causes skin thickening in Balb/c wildtype (WT) but not in Ccr10-deficient mice. (A) Microscopic analysis of UVB-treated mouse skin. Haematoxylin & eosin staining of untreated skin and of skin at the end of experiment after 70 weeks following chronic UVB-irradiation for 60 weeks (cryo sections; 100x magnification). (B)

3. Results
66
Nuchal fold thickness was measured at the end of the experiment at week 70 following chronic UVB-irradiation for 60 weeks in untreated WT mice (n = 4; 0.76 mm ± 0.04646 mm nuchal fold thickness); Ccr10-deficient mice (n = 4; 0.84 mm ± 0.1097 mm nuchal fold thickness); 60 week chronically UVB-irradiated WT mice (n = 35; 0.89 mm ± 0.1286 mm nuchal fold thickness); 60 week chronically UVB-irradiated Ccr10-deficient mice (n = 33; 0.90 mm ± 0.1787 mm nuchal fold thickness); mean +/- SD; *, P = 0.0371 (Mann-Whitney U test). (C) Changes in epidermal thickness (Δ epidermal thickness) were measured after 12 and 70 weeks following chronic UVB-irradiation for 60 weeks. 12 week UVB-irradiated WT mice (n = 10; 16.72 μm ± 19.13 μm Δ epidermal thickness); 12 week UVB-irradiated Ccr10-deficient mice (n = 10; 5.13 μm ± 10.99 μm Δ epidermal thickness); *, P = 0.0312. 70 week UVB-irradiated WT mice (n = 35; 24.34 μm ± 26.55 μm Δ epidermal thickness); 70 week UVB-irradiated Ccr10-deficient mice (n = 33; 5.23 μm ± 16.12 μm Δ epidermal thickness); mean +/- SD; *, P = 0.0312; ***, P < 0.0001 (Mann-Whitney U test).
4. Discussion
67
4 DiscussionThe aim of this work was to elucidate the role of CCL27/CCR10 interactions in skin
carcinogenesis by taking advantage of two different murine in vivo-models of
cutaneous carcinogenesis.
The findings of the present study show that the role of CCR10 signaling during
cutaneous carcinogenesis is context dependent. In the inflammation-driven
DMBA/TPA skin carcinogenesis model, CCR10 promotes tumor development and
progression, while under conditions of immune suppression, generated using chronic
UVB-irradiation, CCR10 signaling is beneficial via the reduction of tumor growth
accompanied by an increased overall survival (Figure 4.1 B+C).
There are at least two different avenues leading to cutaneous carcinogenesis. First,
chronic inflammation supports squamous cell carcinoma development in patients
suffering from chronic wounds, like non-healing post-burn scar ulcers [141],
epidermolysis bullosa [142] and non-healing vascular, diabetic, and pressure ulcers
[143], in which only a part of the ulcer transforms into a malignant state and the
remaining part is characterized by non-healing inflamed tissue [142]. Another
example of chronic inflammation turning into cutaneous carcinogenesis is seen in
patients suffering from lichen ruber planus [144, 145], characterized by a markedly
increased chemokine-driven inflammatory infiltrate [146].
In contrast to inflammation-induced carcinogenesis, the primary cause for the
formation of non-melanoma skin cancer is an UV- or drug-induced
immunosuppression [19, 26, 27]. An important effect of UV-induced carcinogenesis is
the UV-dependent local and systemic suppression of immune surveillance [147].
Solar keratosis and cutaneous SCCs develop in skin areas of chronic UV-irradiation
[148, 149]. The solar keratosis is a precancerous lesion of the skin, which develops
into an invasive SCC in 5-10% of patients [149]. The tumor incidence of SCCs of the
skin in immune-suppressed solid organ transplant recipients (OTRs) is much higher
compared to the general population [149, 150]. 30% of OTRs suffering from solar
keratosis develop an invasive SCC [149]. The risk for OTRs to develop a solar
keratosis is increased by 250-fold and additionally, they have a 100-fold increased
risk for developing an invasive SCC [149]. Interestingly, tumor development in OTRs
depends on the duration and the dose-intensity of immunosuppressive therapy [147].
Patients infected with human immunodeficiency virus (HIV) can develop aggressively
4. Discussion
68
growing SCC much earlier in their life (on average at the age of 44 years) [151]. This
contrasts with the incidence in a HIV-negative population, which according to a
Belgium study published in 2016 that showed incidence rates for the development of
SCC increasing with age with an average age for the development of SCCs at 76
years including men and women [152]. Tumors in HIV-infected patients have a high
potential for local recurrence and metastatic spread [151]. HIV suppresses the host
immunity by elimination of CD4+ T cells, which in turn is responsible for the enhanced
development of cutaneous tumors [147].
Chronic lymphocytic leukemia (CLL) is a malignancy characterized by immune
defects and the development of aggressive skin cancers in patients suffering from the
disease is increased [147]. Patients, which are immuno-compromised due to HIV
infection, solid organ transplantation or CLL, have an increased risk to develop anal
SCC [153].
Experimentally, these different avenues of cutaneous carcinogenesis can be
mimicked in the murine DMBA/TPA- or in the chronic UVB-model. The DMBA/TPA-
model is based on the initiation-promotion protocol, characterized by one initiating
topical application of DMBA causing an activated Hras gene mutation followed by the
promotion stage, in which TPA induces a chronic inflammation in the skin [99].
Therefore, this model is mimicking the diseases and chronic wounds in which chronic
inflammation leads to cutaneous carcinogenesis. Liu et al. reported recently that
DMBA/TPA-induced carcinogenesis induction and promotion was significantly
reduced by an additional treatment of the dorsal murine skin with the
immunosuppressant methanol in a dose-dependent manner [154]. Furthermore,
another study using (+)-catechin emulsified gel showed that a reduction of the
inflammatory response decreased tumor development [155].
In contrast, DMBA/TPA tumor development was increased by treatment of the skin
with the immunosuppressant tacrolimus [112]. This effect is accompanied by reduced
levels of CD4+/CD8+ T cells in lymph nodes [112]. Other studies, concentrating on the
type of the induced inflammatory response, demonstrated that a modulation of the
inflammatory infiltrate to a Th1 response, including recruitment of INF-γ-producing
CD8+ T cells, reduces DMBA/TPA-induced skin carcinogenesis [117, 119]. These
studies show that inflammation or a distinct type of inflammatory response is crucial
for DMBA/TPA-induced cutaneous carcinogenesis. In contrast to the DMBA/TPA
4. Discussion
69
inflammation-driven skin carcinogenesis model, UVB-irradiation is associated with
immune suppression and therefore is responsible for tumor progression and
cutaneous carcinogenesis [120]. Fortner and Kripke showed that UV-induced tumors
grow progressively in UV-irradiated mice, whereas they regressed in mice never
exposed to UVB light [120]. They suggested that a reduction of cytotoxic lymphocytes
is responsible for this kind of tumor growth behavior due to UVB-irradiation [120].
Other studies suggested an important change of T cell subpopulations after
irradiation to a Th2-dependent immune response, characterized by increased
recruitment of CD4+ Tregs and macrophages, and a suppression of CD8+ effector T
cells [122, 123]. Further studies validated the role for CD8+ T cells in the reduction of
cutaneous carcinogenesis [124, 125]. Especially, the study of Nasti et al. showed the
opposing effects of different T cell subsets and their role during cutaneous
carcinogenesis, where CD8+ T cells are important for a reduction of carcinogenesis,
while CD4+ T cells promote tumor development and progression [125]. Tumors
arising due to immune suppression are highly immunogenic, because they developed
under conditions, where they never needed to evade the effects of the immune
system on tumor promotion or reduction.
Previous findings on the role of CCL27/CCR10 signaling in cutaneous biology
demonstrated that CCL27 is specifically expressed in the skin and recruits CLA+ skin
homing T cells to sites of chemokine expression [61, 67, 78] (Figure 4.1 A). In vivo
models of atopy-like dermatitis demonstrated an increased expression of CCL27 in
the skin accompanied by a markedly increased inflammatory response dominated by
lymphocytes, while inhibition of CCL27/CCR10 signaling suppressed cutaneous
inflammation and inflammation-induced skin thickening [67]. Pivarcsi et al. observed
a progressive loss of CCL27 expression during cutaneous carcinogenesis in tumor
cells, caused by an activation of the EGFR signaling pathway [43]. Furthermore, in an
in vivo tumor mouse model anti-CCL27 antibodies promote tumor growth by
decreasing the recruitment of CD4+ and CD8+ T cells [43].
In contrast, patients treated with EGFRIs presented with an up-regulation of CCL27
expression and an increased inflammatory response in the skin, characterized by
clustering macrophages, intraepidermal LCs, CD4+ and CD8+ T cells, thereby
indicating a strong correlation between CCL27 expression and the EGFR signaling
pathway [81]. In addition, these results show the importance of CCL27/CCR10
4. Discussion
70
interactions for the development of a robust immune response in the skin. Therefore,
it was expected that an increased cutaneous carcinogenesis would be observed in
this work’s experiments due to Ccr10-deficiency supporting tumor immune escape in
both models of cutaneous carcinogenesis induction.
In the UVB model, the results supported our prediction that loss of CCL27/CCR10
interactions supports tumor growth. Findings of the present study show an increased
tumor growth in Ccr10-deficient mice in the “immunosuppression”-dependent chronic
UVB-model of cutaneous carcinogenesis (Figure 4.1 C). Although both groups of
mice developed the same amount of tumors at the end of the experiment and the
loss of Ccr10 does not have a strong impact on tumor induction, because tumor
multiplicity and the percentage of tumor-free survival were not different in both groups
at the end of the experiment, survival was severely impacted by loss of
CCL27/CCR10 signaling. In particular, shorter survival was associated with the loss
of Ccr10, indicating an effect of CCL27/CCR10 signaling for a better disease
outcome and reduced tumor progression in the UVB-model.
A significantly increased tumor growth was found in Ccr10-deficient mice, though
tumor numbers per mouse were equal in both groups. This implies that CCR10 has
no effect on tumor induction, but may play an important role in tumor suppression in
an immune-impaired carcinogenesis model, suggesting that CCR10 might be
beneficial in reducing tumor growth in higher staged patients. These findings are in
line with observations of Pivarcsi et al. showing that anti-CCL27 treatment increases
tumor growth in a CCR10-negative melanoma model [43]. Pivarcsi et al. used an
“immunogenic” CCR10-negative melanoma cell line (B16F10) to study the role of
CCL27/CCR10 interactions in cutaneous immune surveillance [43]. Neutralization of
CCL27/CCR10 signaling markedly decreased the recruitment of INF-γ-expressing T
cells into the tumor microenvironment [43]. Furthermore, tumor progression was
associated with an upregulation of matrix metalloproteinase and cyclooxygenase 2
expression [43]. This is in accordance with other studies, which showed an important
role for CCL27/CCR10 interactions for the recruitment of T cells into the skin during
immune surveillance [61, 78]. An inhibition of these interactions in vivo by a mCCL27
antibody leads to markedly reduced recruitment of lymphocytes, but not eosinophils,
4. Discussion
71
into the skin accompanied by a significantly reduced skin thickness under
inflammatory conditions [67].
A recent study by Fu et al. showed the importance of CCL27/CCR10 interactions for
the recruitment of CD8+ resident T cells under homeostatic conditions [72]. Moreover,
they reported a function for CD8+ resident T cells in the regulation of CD4+ T cell
homeostasis [72]. Another group showed in their work that CCL27/CCR10
interactions are important for the recruitment of CCR10+ innate lymphoid cells (ILCs)
into the skin, where they are responsible for the maintenance of skin-resident T cells
[71] (Figure 4.1 A).
For the present study these results indicate that in contrast to WT mice, Ccr10-
deficient mice lacking CCL27/CCR10 interactions are impaired in their immune
surveillance, which might be the cause for unrestricted tumor growth and decreased
survival in the case of a suppressed immune system. In the work of Pivarcsi et al., it
was shown that during cutaneous carcinogenesis the EGFR/Ras signaling pathway is
activated in vivo [43]. In vitro experiments elucidated that CCL27 mRNA and protein
expression is negatively correlated with the level of Ras activity [43]. Furthermore,
the EGFR is essential for tissue homeostasis and promotes tumor development [81].
EGFR signaling pathway activation in keratinocytes is important for the skin
inflammatory response, host barrier function and immune surveillance [81], but high
activation of EGFR signaling can result in tumor development and progression [156].
One of the effects of an overabundance of EGFR/Ras signaling is that the expression
of CCL27 is inhibited [43]. This was associated with tumors of epithelial origin [43].
An overexpression of EGFR/Ras signaling followed by CCL27 inhibition during skin
carcinogenesis leads to tumor immune escape as well as tumor growth and
progression [43] (Figure 4.1 C). Cancer patients treated with EGFR inhibitors present
with increased expression of CCL27 followed by a strong inflammatory response in
the skin, which correlates with the patient’s treatment response [81]. In addition, mice
deficient in epidermal EGFR are found with a comparable skin phenotype, which is
characterized by a strong chemokine-driven inflammatory response in the skin [81].
In this study, the loss of CCL27 will arise gradually over time due to increasing levels
of activation of the EGFR/Ras signaling pathway during carcinogenesis. Therefore, in
Ccr10-deficient mice, where no CCL27/CCR10 signaling is possible, enhanced tumor
growth and progression will be observed compared to wildtype mice due to reduced
immune surveillance. Under UVB-treatment wildtype mice, which bear a functional
4. Discussion
72
immune system with reduced but still functional CCL27/CCR10 signaling, would be
able to recognize and eliminate transformed cells and as a consequence present with
reduced tumor growth and progression compared to Ccr10-deficient mice (Figure 4.1
C).
It has been shown that after UVB-induced tissue damage, CCL27 is highly expressed
in the basal epidermis followed by a strong release of CCL27 into the papillary dermis
of patients with dermatitis solaris and UV-induced cutaneous lupus erythematosus
(LE), suggesting an increased recruitment of CCR10+ skin-homing leukocytes into
the UV-irradiated skin [157]. Meanwhile, patients with advanced or chronic UV-
induced cutaneous LE are found with reduced CCL27 expression [157].
Interestingly, in this study, CCR10 has no impact on tumor induction in an immune-
suppressed environment, but it has an important role in the reduction tumor
progression of established tumors. Consequent on the studies mentioned above the
recruitment of CD8+ T cells should be inhibited in Ccr10-deficient mice. Especially,
the study of Nasti et al. showed that these cells are very important for the reduction of
tumor progression [125].
Norris et al. demonstrated in their work that patients suffering from xeroderma
pigmentosum have an increased risk of tumor induction by an impaired immune
surveillance of NK cells [158]. In an in vivo model analyzing the role of NK cells after
UVB-irradiation, mice-lacking NK cells develop more tumors then mice with a high
amount of NK cells [159]. These two studies are implicating a role for NK cells in
reducing UV-induced tumor induction [158, 159]. PCR analysis by Gao et al. shows
that NK cells markedly express Ccr10 [160]. They were the first group, who suggests
NK cell recruitment by CCL27/CCR10 interaction [160]. A recent study reported that
drugs against multiple sclerosis (glatiramer acetate, dimethyl fumarate, and
monomethyl fumarate) increase CCR10 cell surface expression on NK cells [161]. In
addition, the study shows that these drugs increase tumor cell destruction by NK cells
[161]. In the current study, NK cells might be unaffected by CCL27/CCR10 signaling
and as a result; this may lead to the same numbers of tumors in both groups.
Additionally, chronic UVB-irradiation reduces Ccl27 and INF-γ expression in the skin,
resulting in decreased recruitment of Th and CTL protective immune cells into the
tumor microenvironment and an increased recruitment of immune-suppressive Treg
cells, which, together with enhanced vascular endothelial growth factor (VEGF)
expression, leads to increased angiogenesis and promotion of tumor growth [162].
4. Discussion
73
Not all cells are transformed and the healthy neighboring cells still have the ability to
express reduced levels of CCL27. This could lead to Balb/c wildtype mice having the
ability to moderately recruit anti-tumor immune cells via a low CCL27 expression,
whereas Ccr10-deficient mice lack this ability. This might explain the reduced tumor
growth in Balb/c wildtype mice, while enhanced Treg infiltration due to UVB-
irradiation without cells able to respond to a baseline CCL27 expression might cause
a further suppression of beneficial immune responses in Ccr10-deficient mice (Figure
4.1 A).
The tumor growth analysis showed that Ccr10-deficient mice developed a higher
percentage of intermediate and large tumors, when compared to wildtype mice, even
though the result was not significant. After analyzing the tumor morphology of
intermediate and large tumors of Ccr10-deficient mice these showed mostly a central
exulceration, indicating an increased proliferative capacity of tumor cells. In contrast,
Balb/c wildtype mice developed significantly more flat, erosive and scaly tumors,
demonstrating that CCL27/CCR10 interaction protected against UVB-induced tumor
growth, while the absence of CCL27/CCR10 interaction leads to the development of
large tumors with a central exulceration.
CCL27 is predominantly produced by keratinocytes in the basal layer of the
epidermal compartment and is displayed on the outer membrane of dermal
endothelia cells [67]. In addition, the production of vitamin D3 in the skin is strongly
induced by UVB-irradiation [163]. The study by Schlumpf et al. showed that in the
presence of vitamin D3, T cells were activated and expressed CCR10, which recruits
T cells into the epidermis, where CCL27 is expressed [163]. In contrast to normal
skin, the skin of patients with cutaneous lupus erythematosus (LE) showed an
increased expression of CCL27 in the basal layer of the epidermal compartment
establishing a chemokine gradient into the papillary dermis, resulting in the activation
and migration of T cells and INF-α-producing pDCs as an early response due to
UVB-irradiation [157]. CCL27 expression is markedly reduced in advanced or chronic
discoid LE suggesting that increased CCL27 expression due to UVB-irradiation is an
early response which decreases during disease progression and continuing UVB-
irradiation [157]. Moreover, UVB-irradiation decreases Th17 immune responses
when applied three times weekly for eight weeks [164].
4. Discussion
74
For the present study, this indicates that UVB-irradiation might markedly reduce the
expression of CCL27 over time, but may increase vitamin D3 production in the skin of
the mice leading to a higher number of CCR10+ immune cells in Balb/c wildtype.
Therefore, Balb/c wildtype mice expressing Ccr10 might have an increased ability to
recruit CCR10+-expressing T cells and pDCs to the skin during the start of the
experiment compared to Ccr10-deficient mice which are lacking this ability.
Consequently, this might lead to the elimination of transformed cells and result in
reduced tumor growth and increased survival of Balb/c wildtype mice (Figure 4.1 C).
Speculating from the study of Xia et al., Ccr10-deficient mice, in contrast to Balb/c
wildtype mice, might exhibit a shifted immune response towards Th17 cells and may
have the ability to clear out transformed cells at the start of the experiment, but due to
long-term treatment and no Ccr10 expression, these mice might be impaired in the
process of tumor cell clearance, thereby resulting in markedly increased tumor
progression and decreased survival [73].
The last part of the present study focused on the analysis of morphologically changes
of the skin due to UVB-irradiation. Interestingly, the nuchal fold thickness of Balb/c
wildtype mice is significantly increased, while Ccr10-deficient mice show only a slight
thickening of the skin. Further analysis uncovered that Ccr10-deficient mice are
impaired in developing acanthosis, compared to Balb/c wildtype mice (Figure 4.1 C).
The development of acanthosis is a physiological protection mechanism of the skin
against UV-irradiation [2]. An impairment of this protection mechanism suggests a
higher sensitivity to UVB-induced tumor progression of Ccr10-deficient mice.
Recently, Hessner et al. showed that S100A10 calcium-binding proteins are able to
bind directly to CCR10 [165]. S100A10 interacts with annexin A2, forming a
heterotetrameric complex [165]. This complex binds via S100A10 directly to the C-
terminal tail of CCR10 located within the 326 to 339 amino acid residues [165].
CCR10 occurs as a dimer and builds a heterotetrameric complex with two annexin
A2 molecules [166]. S100A10 is permanently activated and loses its ability to bind
calcium, which is very unique among this protein family [166]. Together with
S100A10, S100A8 and S100A9 are localized in a gene cluster on the human
chromosome 1q21 [167, 168]. The S100 gene cluster consists of three subgroups
[168]. The first subgroup containing the genes S100A2 and S100A6, the second
subgroup containing the genes A100A8, S100A9 and S100A12 and the third
4. Discussion
75
subgroup consists of the genes S100A10 and S100A11 [168]. The latter gene cluster
is also called the epidermal differentiation complex (EDC) [169]. Corresponding to the
S100 gene cluster on the human chromosome 1q21 the genes S100A10, S100A8
and S100A9 are syntenically clustered on mouse chromosome 3 [170]. A recently
published paper dealing with the expression of S100 genes in correlation with
melanoma showed a strong expression of S100A10, S100A8 and S100A9 genes in
primary melanoma but more interestingly, the paper showed a strong positive
correlation of these genes with each other by using correlation analysis [171]. γδT
cells migrate according to their CCR10 expression into the epidermal compartment
[72]. In the human tumor micromilieu of a neuroblastoma cell line γδT cells secrete
growth factors like EGF and PDGF [172]. In astrocytes, EGF is responsible for the
induction of FGF-2 protein and mRNA [173]. It has also been shown that an EGF
family member regulates FGF-2 expression in pulmonary fibrobasts [174]. In turn,
FGF-2 is able to induce the expression of S100A8 mRNA in a 3T3 fibroblast cell line
[175]. In combinational treatment with heparin the effect increased by two-fold [175].
S100A9 forms a heterodimer with S100A8 called calprotectin [176]. Lee et. al.
reported that S100A9 and S100A8 can function as homo- or heterodimers [177]. In
2008, a study demonstrated that advanced glycation end-products (RAGE) function
as a ligand of calprotectin [178]. In this study, Rage-deficient mice treated with
DMBA/TPA had impaired development of epidermal hyperplasia [178], reminiscent of
the phenotype shown by UVB-treated Ccr10-deficient mice in the current study.
Additionally, hyperproliferation of the epidermal compartment in psoriasis was
associated with a marked upregulation of S100A8 and S100A9 [179]. A strong
expression of CCL27 and CCR10 in psoriatic skin was also published [67]. An
important observation in UV-irradiated skin and UV-induced SCCs is the highly
increased expression of S100A9 calcium-binding proteins, which are barely
detectable in normal skin, but present with increased expression in psoriasis [180,
181]. The expression of S100A9 calcium-binding proteins is increased in the
epidermis under UV-induced and inflammatory conditions and was observed to
recruit various immune cells to sites of tissue damage [177, 180, 181]. Several
studies linked epidermal hyperproliferation to S100A8/S100A9 overexpression [179,
181-183]. The mechanism to achieve a hyperproliferative state of the epidermal
compartment seems to be very complex. Iotzova-Weiss et al. published recently a
study in which they indicate that S100A8/S100A9 signaling mediates the
4. Discussion
76
development of acanthosis via Rage [183]. Interestingly, they speculated that in
OTRs this mechanism might contribute to increased SCC formation [183]. In turn,
S100A8/S100A9 mediated cell proliferation seems to depend on cytokine induction
[182]. S100A8/S100A9 complex and/or S100A8 and S100A9 themselves function as
a chemoattractant for the recruitment of immune cells [177]. Recruited immune cells
may crosstalk with keratinocytes resulting in the production of cytokines which leads
to a positive feedback loop and enhanced secretion of S100A8 and S100A9 and, in
addition, to keratinocyte hyperproliferation [177, 182]. This suggests a high impact of
S100A9 calcium-binding proteins in mediating and reacting to keratinocyte
hyperproliferation [181] and a thickening of the skin.
When epidermal thickening was analyzed in the current study, it was observed that it
developed over time in Balb/c wildtype mice. There was no difference in epidermal
thickening between wildtype and Ccr10-deficient mice in the beginning of the
experiment and therefore may not have had an impact on tumor induction. Instead a
correlation between acanthosis and tumor progression was observed, as Ccr10-
deficient mice showed increased tumor growth followed by decreased survival, while
lacking the increased thickness of the epidermis observed in wildtype mice (Figure
4.1 C).
There is evidence that Ccr10-deficient mice have an inhibition of epidermal
hyperproliferation. The reason for this could be a lack of CCR10+ γδT cell recruitment
via CCL27 and the missing induction of S100A8. The effect of this impairment might
become more crucial during tumor progression, because the development of
acanthosis increases over time.
The proinflammatory activities of S100A8/S100A9 calcium-binding proteins in
combination with CCR10 in Balb/c wildtype mice might be important for the
hyperproliferation of keratinocytes, promoting the development of acanthosis, which
protects against UVB-irradiation, resulting in reduced tumor growth in Balb/c wildtype
mice.
In contrast, Ccr10-deficient mice might have an impaired epidermal hyperproliferation
due to the lack of CCR10+ γδT cell recruitment via CCL27 and the missing induction
of S100A8, which would explain the inhibition of acanthosis leading to inadequate
protection against UVB-irradiation and the insufficient protection against UV-induced
carcinogenesis. A possible connection of CCR10+ γδT cell recruitment and S100A8
4. Discussion
77
induction has not been demonstrated to date and further analysis is needed to
validate this hypothesis. A recently published paper examining chemokine ligand-
receptor interactions in cutaneous wound healing offers another possible explanation
for acanthosis development [75]. The authors were able to show that CCL27
expression in concert with CCR10-expressing wound-infiltrating fibroblasts and
endothelial cells increase wound repair [75]. It might be possible that in the UVB-
model due to UVB-induced tissue damage CCL27/CCR10 interactions lead to the
recruitment of structural cells to increase tissue repair. Bünemann et al. also suggest
a role for infiltrating CD3+ CCR10+ lymphocytes, which by promote endothelial cell
proliferation and recruitment [75]. The reported mechanisms for cutaneous wound
healing could be responsible for the development of acanthosis in wildtype mice in
the UVB-model, while Ccr10-deficent mice lacking these mechanisms due to the loss
of CCR10 might be impaired in acanthosis development.
In contrast to the findings in an “immunosuppression”-dependent UVB-model, the
present study demonstrates that the formation of tumors was decreased in Ccr10-
deficient mice in an “inflammation”-dependent DMBA/TPA-model of cutaneous
carcinogenesis (Figure 4.1 B). Findings by Murakami et al. using CCR10-expressing
melanoma cells demonstrate that direct stimulation of CCR10 on melanoma cells via
its ligand promotes melanoma cell survival [184]. This resistance to Fas-mediated
apoptosis in the presence of CCL27/CCR10 signaling [184], might also play a role
under circumstances of the present study. Not all cells are affected by DMBA/TPA
treatment, which results in Ras activation and loss of CCL27 expression, therefore
some keratinocytes might still express CCL27, and thereby recruit CCR10+ T cells
into the skin of WT mice, which might have an effect of resistance to Fas-mediated
apoptosis. It is reported that EGF-induced EGFR activation leads to Akt activation
which inhibits Fas-mediated apoptosis [185]. Murakami et al. observed that CCR10-
B16 melanoma cells show a strong enrichment of Akt phosphorylation after
CCL27/CCR10 interaction [184]. In addition, they showed that without CCL27/CCR10
interactions, INF-γ is able to increase Fas expression, which mediates apoptosis in
B16 cells [184]. If this would be the case in the present study speculating from the
work of Murakami et al. that for Akt mediated Fas-inhibition, CCR10 is required.
Kaplan-Meier survival analysis showed that the loss of Ccr10 has a tendency to
increase the survival of mice by reducing tumor development. Additionally, results of
4. Discussion
78
the present study showed that tumor-free survival was significantly increased in
Ccr10-deficient mice, indicating an important role for CCR10 during tumor induction
in an inflammation-dependent carcinogenesis model. This was in accordance with a
study by Kai et al. which investigated CCL27 and CCR10 expression in cutaneous
SCC and reported that CCL27/CCR10 signaling seems to be favorable for tumor cell
survival and proliferation [186]. The discrepancy of this observation with the results
by Pivarcsi et al. might be due to a different patient cohort [43, 186]. The group of
Martinez-Rodriguez et. al. observed that a high CCL27 expression in patients
suffering from cutaneous malignant melanoma was correlated with increased survival
[187]. In the study of Martinez-Rodriguez et al. the immunological environment in skin
is completely different from the present study. Patients suffering from the malignant
melanoma subtype which showed CCL27 expression in this study develop in body
areas with chronic UV-exposure and do not present with chronic-inflammation in the
skin [187], whereas in the present study carcinogenesis is based on chronic-
inflammation in the skin. This might be the reason that the present study showed
contrary results when analyzing overall-survival. Interestingly, DMBA/TPA-treated
Cd4-deficient mice developed significantly less tumors and the tumor incidence was
also significantly reduced compared to DMBA/TPA-treated WT mice [119]. Indicating
for the present study that Cd4-deficient and Ccr10-deficient mice were observed with
the same reaction to DMBA/TPA-induced cutaneous carcinogenesis. Suggesting that
CD4+ T cells play a main role in CCL27/CCR10 signaling for the promotion of
DMBA/TPA-induced cutaneous carcinogenesis.
When analyzing mice for tumor numbers, Ccr10-deficient mice developed
significantly less tumors per mouse compared to the wildtype mice. Moreover, tumor
growth (weight and volume) was significantly reduced in Ccr10-deficient mice (Figure
4.1 B). In contrast, earlier studies showed that CCL27/CCR10 interactions reduce
tumor growth and are beneficial for tumor survival [43, 188]. In these studies, tumor
cells were injected into the flank of the mice and the injected tumor cells were
generated from different tumor entities (melanoma and ovarian cancer). Further
experiments with an ex vivo transfection of a murine CCL27 expressing vector into
CT26 colon carcinoma cells and B16BL6 melanoma cells showed only a slight
reduction of tumor growth in CT26 colon carcinoma [189] and no effect in B16BL6
melanoma. Additionally, the works of Okada et al. and Pivarcsi et al. showed a
4. Discussion
79
reduced tumor growth due to CCL27/CCR10 signaling in melanoma in vivo [43, 190].
Moreover, other experiments with intratumoral injection of a CCL27 expressing vector
in vivo indicate no impact of CCL27/CCR10 interactions for tumor growth inhibition in
OV-HM murine ovarian carcinoma and Meth-A murine fibrosarcoma [160, 191]. Only
a combined intratumoral injection of Il12 and CCL27 (in a ratio 1:1 or 9:1 but not 1:9
for OV-HM tumors) was able to significantly reduce tumor growth in OV-HM and
Meth-A [160, 191]. These results indicate that CCL27/CCR10 signaling in vivo alone
is not sufficient for an effect, e.g. other factors, besides CCL27 signaling, must be
present to achieve tumor growth reduction. In all of these cases above, large
numbers of already malignant tumor cells were introduced into non-inflammed,
homeostatic skin, whereas the model used in this work, establishes first a chronic
inflammation and only during the process of inflammation malignant transformation
does occur. This fundamental difference might be the root cause for the diverging
observations. Other important aspects are the influence of the carcinogenic induction
and the state of the immune system. Similar to the observations in the present study,
it was reported that CCL27/CCR10 signaling resulted in tumor progression via the
inhibition of Fas-triggered apoptosis, while inhibition of CCL27 signaling utilizing
neutralizing antibodies markedly decreased tumor growth in murine melanoma cells
transduced with Ccr10 [184]. Huang et al. connected significantly increased tumor
growth of colorectal cancer with IL-22 expression [192]. Furthermore, they identified
an increased migration of Th22 cells within the tumor microenvironment expressing
higher levels of CCL27 [192]. In addition, IL-22 is responsible for anti-apoptotic
effects via STAT3 signaling [192]. This indicates that, as a result of chronic
inflammation, CCL27/CCR10 interactions might lead to enhanced tumor growth by
avoiding apoptosis via an accumulation of Th22 CCR4+CCR6+CCR10+ cells
producing IL-22 in the tumor micromilieu in Balb/c wildtype mice (Figure 4.1 B). In
contrast, the loss of Ccr10 might enable tumor cell elimination by apoptosis which
causes reduced tumor progression in Ccr10-deficient mice (Figure 4.1 B).
Macroscopic evaluation of intermediate and large tumors, which developed in this
study, by a dermato-histopathologist characterized the tumors as squamous cell
carcinoma. Reference material was obtained from all developed tumors but is not
available for further histopathological analyses. Histopathological analysis of a
random sampling of developed tumors confirmed the macroscopic evaluation and
4. Discussion
80
showed an epithelial differentiation in the notion of a developed SCC. The
observation of developed lesions and tumors was in accordance with the literature,
which largely reports that, following DMBA/TPA treatment, squamous papillomas
predominantly develop and in the course of tumor progression a small number of
papillomas progress into SCCs [98, 103, 193]. The development of BCC could be
excluded because only mice with an aberrant hedgehog signaling develop BCCs
[194, 195]. When analyzing the tumor morphology of DMBA/TPA-treated mice,
Ccr10-deficient mice showed reduced tumor formation and growth, as demonstrated
by a percentage analysis which compared tumor size per group of deficient and
wildtype mice. A CCR10-positive immune system seems to be an important factor in
tumor growth, which is absent in Ccr10-deficient mice (Figure 4.1 B). The
investigation of intermediate and large tumors showed an impairment in the ability to
develop hyperkeratotic tumors in Ccr10-deficient mice. Robinson et al. suggest that
S100A10, annexin I, and S100A11 function as “envelope organizer proteins” [196].
Interestingly, Arnt-deficient mice present with problems in epidermal barrier function
resulting in a short lifespan [197]. The Aryl hydrocarbon Receptor Nuclear
Translocator (Arnt) belongs to the Per-Arnt-Sim (PAS) protein family, which plays a
role in several biological functions like the maintenance of epidermal barrier function
[197, 198]. The Arnt-deficient mice develop parakeratosis with a strong cornification
of keratinocytes and additionally, showed a thick corny layer and tightly packed
corneocytes [197]. A microarray analysis of Arnt-deficient epidermis showed
significantly increased expression of genes linked to the EDC, among them S100A10
[197]. Geng et al. confirmed an important role for these genes in the development of
the cornified envelope at late epidermal differentiation [197]. The main role for
S100A10 together with annexin A II seems to be the regulation of several proteins by
affecting their cell surface expression [199]. A recent study showed that S100A10 is
able to bind to CCR10 which results in a decreased CCR10 cell surface presentation
[165]. An altered expression of S100A10 was previously found in SCCs [200-202]. Ito
et al. demonstrated an important role for S100A10 in papillary carcinoma [201]. They
suggest that the S100A10 and annexin II complex promotes tumor initiation and/or
tumor progression [201]. Interestingly, a recent study found that oncogenic Ras
positively regulates the expression of S100A10 [203]. It is known that DMBA-
treatment causes an activated Hras gene mutation [99-101]. This suggests that
4. Discussion
81
DMBA-induced Hras activation, as present in this study’s experiment, might lead to
S100A10 overexpression.
SCCs are also associated with keratin 6 and 16 expression [180, 204, 205]. IL-22 is
able to induce the expression of keratin 6 and 16, which is usually associated with
the wound healing process of the epidermis, but also shows an increased expression
in the epidermal compartment of patients suffering from systemic sclerosis [150].
Experimentally, the DMBA/TPA-model is mimicking the chronic inflammation-induced
development of squamous cell carcinoma in patients suffering e.g. from chronic
wounds. Kai et al. reported that an overexpression of CCR10 and CCL27 in
advanced SCC is predominantly related to hyperkeratotic lesions of altered
keratinocytes [186]. Speculating from the studies above, morphological changes in
tumor development of Ccr10-deficient mice, as observed in the recent study, may be
a consequence of an impaired S100A10/CCR10 interaction, which might have an
important role for papillary hyperkeratotic tumor development.
Finally, when analyzing the morphologic changes of the DMBA/TPA-treated skin,
surprisingly, Ccr10-deficient and Balb/c wildtype mice demonstrated similar
inflammation-induced thickening of the nuchal fold and the epidermal compartment.
This result indicates that CCR10 is not solely responsible for the proliferative
response to DMBA/TPA treatment. In a chronic atopic dermatitis mouse model the
inhibition of CCL27/CCR10 interactions leads to markedly reduced ovalbumin-
induced skin inflammation characterized by reduced inflammation-induced skin and
epidermal thickening, accompanied by decreased recruitment of lymphocytes to sites
of inflammation [67]. Winkler et al. observed in their study that chemokine receptor
Cxcr3-deficiency leads to decreased epidermal proliferation in response to
DMBA/TPA treatment and associated that with significant decreased recruitment of
CD4+ and CD8+ T cells [116]. They suggest that CD4+ and CD8+ T cells were
responsible for the induction of DMBA/TPA-induced epidermal proliferation [116].
Additionally, Ccr10-deficient mice had significantly reduced tumor development und
progression, leading to increased tumor-free survival, which seems not to be
dependent on differences of skin morphology changes during inflammation in the
Ccr10-deficient mice, as was expected at the start of the experiment. Therefore, the
crucial advantage of Ccr10-deficient mice in inhibiting skin carcinogenesis might be
based on changes of the immune response type. It is well known that CCR10 is
4. Discussion
82
important in recruitment of CD4+ and CD8+ T cells into the skin during homeostatic
and inflammatory conditions [66, 73]. CCL27 expression vector injection into OV-HM
tumors increased predominantly the recruitment of CD4+ T cells, while only small
numbers of CD8+ T cells were recruited. In contrast in Meth-A tumors, CCL27 vector
injection had the opposite effect [191]. In these tumors, the recruitment of CD8+ T
cells was favored through CCL27/CCR10 signaling instead of the CD4+ T cell subset
[191]. This suggests a tumor specific effect for CCL27/CCR10-mediated T cell subset
recruitment [191]. In accordance with the recent study, Cd4-deficent mice showed
increased tumor-free survival and developed significantly less tumors compared to
WT mice [119]. This is evidence for an important role of CD4+ T cells in CCR10-
mediated tumor promotion. A recent report by Xia et al. suggests that CCR10 has a
leading role in balancing the recruitment and function of resident Treg and effector T
cells (Th17 cells), which in turn are responsible for skin homeostasis [73]. The study
shows that Th17 effector T cells cause prolonged immune reactions, while regulatory
T cells have the important role to counterbalance Th17 overactive immune responses
by suppressing the function of Th17 cells in heterozygous Ccr10 knockout mice [73].
Ccr10-deficient mice are impaired in T cell memory responses and have less
regulatory T cells in their skin, which leads to overactive immune responses
compared to heterozygous Ccr10 knockout mice [73]. This indicates a role for
CCR10 in regulating Treg and effector T cell responses under homeostatic conditions
[73]. Furthermore, Cc10-deficiency has much more impact on the CD8+ T cell subset
than on CD4+ cells [73]. These results were supported by another study from Fu et al.
which reports that CD8+ T cells are required for the maintenance and the survival of
Treg in the skin under homeostatic conditions [72]. Interestingly, CCR10+ innate
lymphoid cells (ILC) are important for the maintenance of Treg in the skin and in turn
a balanced recruitment and function of Treg and effector T cells is important for the
recruitment of CCR10+ ILCs to the skin [71] (Figure 4.1 A). It could be speculated that
due to these dysregulations in Ccr10-deficient mice and the DMBA/TPA treatment,
transformed cells can be cleared more effectively due to immune response shifts
from Treg to Th17 cells. In Balb/c wildtype mice, the immune response may be
shifted towards Treg to turn down an overactive immune response due to the
immune suppressive effect of Treg cells (Figure 4.1 B). Facciabene et al. reported
that a CCR10-related migration of Treg cells into sites of tumor formation promotes
immunotolerance and angiogenesis of the tumor, through impairment of effector T
4. Discussion
83
cell function and secretion of vascular endothelial growth factor A (VEGFA), which
increases tumor angiogenesis, and is related to tumor growth in vivo [206]. This
might be the cause of the enhanced tumor induction and growth in Balb/c wildtype
mice, which might be orchestrated by a larger population of Treg cells. Interestingly,
INF-γ-producing Th17 cells are also negatively regulated by CCR10-expressing Th22
cells, which play an essential role in psoriasis and atopic dermatitis [69, 150, 207].
Therefore, in addition to the possible larger population of Treg cells, Th22 cells might
play an important role in creating a tumor-promoting environment, which might be
responsible for tumor formation and progression in wildtype mice. Importantly, the
DMBA/TPA treatment will also induce the expression of other chemokines, e.g.
Ccl20, which will also be responsible for creating a tumor-promoting
microenvironment. Duhen et al. reported that the induction of Th22 cells is mediated
by plasmacytoid dendritic cells (pDCs) [69]. pDCs express CCR6 and CCR10
chemokine receptors, which promote pDC recruitment to sites of inflamed epithelia
[68]. It is also known that pDCs migrate to imiquimod-treated skin tumors in mice,
which possibly promotes local inflammation [68]. In conclusion, there is evidence that
the loss of CCR10 signaling may shift the immune response to INF-γ-expressing
Th17/Th1 cells, resulting in robust tumor immune response and clearance of
transformed cells (Figure 4.1 B). This leads to significantly reduced tumor formation
and progression, resulting in significantly enhanced tumor-free survival (Figure 4.1
B). Whereas in Balb/c wildtype mice, due to DMBA/TPA treatment, an inflammatory,
tumor promoting environment is established, which may shift the immune response
towards an increased recruitment of Treg-, Th22-cells and pDCs. As a result, this
may leads to significantly increased tumor formation and progression with markedly
reduced tumor-free survival (Figure 4.1 B).
Taken together, the two different carcinogenesis models show opposing effects of
Ccr10-deficiency. In the DMBA/TPA-model, which depends on local skin
inflammation, the results suggest that the loss of CCR10 signaling modulates the
inflammatory response towards tumor cell clearance, resulting in lower tumor
formation and progression, while the inflammation-independent UVB carcinogenesis
model showed a disadvantage of Ccr10-deficiency, resulting in increased tumor
growth and decreased survival. This could be the result of an impaired acanthosis
development in combination with increased tumor immune escape in Ccr10-deficient
4. Discussion
84
mice (Figure 4.1 C). The mechanism of carcinogenesis induction appears to be
instrumental in deciding the effect of CCR10 on carcinogenesis. It is well known that
inflammation is a hallmark of cancer, and CCR10-neutralization might offer an
advantage to patients due to an abrogation of an orchestrated immune response,
which favors tumor growth. However, considering the usual mechanism of SCC
induction in a real patient’s scenario, which depends on UVB-exposure of the skin,
CCL27 expression, and therefore induction of the anti-tumor response observed in
the UVB-mouse-model, might be a more worthwhile therapeutic strategy to follow.
One important insight of this study is that the effect of CCR10 depends on the
mechanism of carcinogenesis induction. Further analysis will elucidate the alterations
in the immune response and the expression of genes important for the observed
morphological changes. In conclusion, CCR10 plays an important role in skin
carcinogenesis, but its impact depends on the individual circumstances. Therefore, it
might be a dangerous therapeutic strategy to either completely inhibit or induce a
strong expression of CCL27. A robust therapeutic strategy should take the context of
skin carcinogenesis formation into account. Based on the recent study, inhibition of
CCL27 in chronic inflammation and in contrast, an enhancement of CCL27
expression in an immune suppressive context might be worthwhile avenues for a
supportive therapy. Further studies elucidating the role of this interesting chemokine
receptor in carcinogenesis seem to be worthwhile.
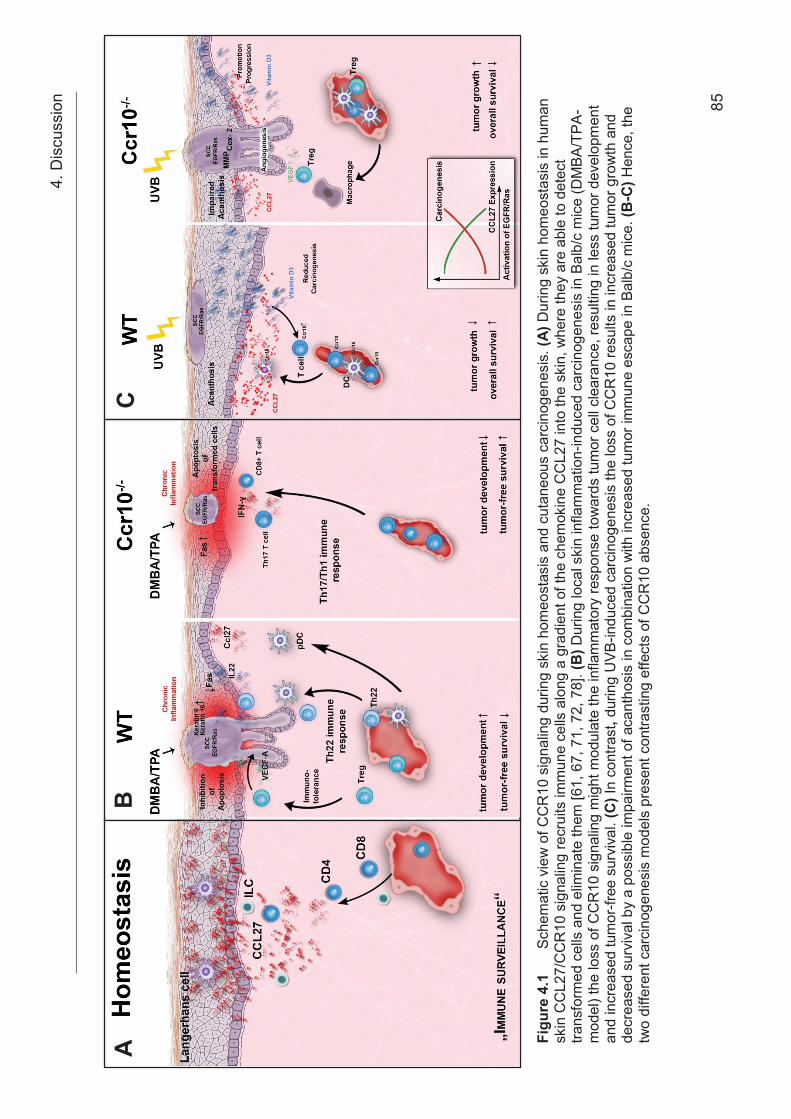
4. D
iscu
ssio
n 85
Figu
re 4
.1
Sche
mat
ic v
iew
of C
CR
10 s
igna
ling
durin
g sk
in h
omeo
stas
is a
nd c
utan
eous
car
cino
gene
sis.
(A) D
urin
g sk
in h
omeo
stas
is in
hum
an
skin
CC
L27/
CC
R10
sig
nalin
g re
crui
ts im
mun
e ce
lls a
long
a g
radi
ent o
f the
che
mok
ine
CC
L27
into
the
skin
, whe
re th
ey a
re a
ble
to d
etec
t tra
nsfo
rmed
cel
ls a
nd e
limin
ate
them
[61,
67,
71,
72,
78]
. (B
) Dur
ing
loca
l ski
n in
flam
mat
ion-
indu
ced
carc
inog
enes
is in
Bal
b/c
mic
e (D
MBA
/TPA
-m
odel
) the
loss
of C
CR
10 s
igna
ling
mig
ht m
odul
ate
the
infla
mm
ator
y re
spon
se to
war
ds tu
mor
cel
l cle
aran
ce, r
esul
ting
in le
ss tu
mor
dev
elop
men
t an
d in
crea
sed
tum
or-fr
ee s
urvi
val.
(C) I
n co
ntra
st, d
urin
g U
VB-in
duce
d ca
rcin
ogen
esis
the
loss
of C
CR
10 re
sults
in in
crea
sed
tum
or g
row
th a
nd
decr
ease
d su
rviv
al b
y a
poss
ible
impa
irmen
t of a
cant
hosi
s in
com
bina
tion
with
incr
ease
d tu
mor
imm
une
esca
pe in
Bal
b/c
mic
e. (B
-C) H
ence
, the
tw
o di
ffere
nt c
arci
noge
nesi
s m
odel
s pr
esen
t con
trast
ing
effe
cts
of C
CR
10 a
bsen
ce.
A
B
C
5. References
86
5 References
1. Sterry, W., Kurzlehrbuch Dermatologie. 2011.
2. Terhorst, D., Basics Dermatologie. 4th ed. 2015, Munich, Germany: Urban &
Fischer/ Elsevier GmbH.
3. Holick, M.F., Sunlight and vitamin D for bone health and prevention of
autoimmune diseases, cancers, and cardiovascular disease. Am J Clin Nutr,
2004. 80(6 Suppl): p. 1678S-88S.
4. Faller, A., Der Körper des Menschen. 13th ed. 1999, Stuttgart, Germany:
Thieme.
5. Liu, Y.J., Dendritic cell subsets and lineages, and their functions in innate and
adaptive immunity. Cell, 2001. 106(3): p. 259-62.
6. Boyman, O., et al., Activation of dendritic antigen-presenting cells expressing
common heat shock protein receptor CD91 during induction of psoriasis. Br J
Dermatol, 2005. 152(6): p. 1211-8.
7. Lowes, M.A., A.M. Bowcock, and J.G. Krueger, Pathogenesis and therapy of
psoriasis. Nature, 2007. 445(7130): p. 866-73.
8. Fuchs, E., Scratching the surface of skin development. Nature, 2007.
445(7130): p. 834-42.
9. Segre, J.A., Epidermal barrier formation and recovery in skin disorders. J Clin
Invest, 2006. 116(5): p. 1150-8.
10. Oaklander, A.L. and S.M. Siegel, Cutaneous innervation: form and function. J
Am Acad Dermatol, 2005. 53(6): p. 1027-37.
11. Presland, R.B. and B.A. Dale, Epithelial structural proteins of the skin and oral
cavity: function in health and disease. Crit Rev Oral Biol Med, 2000. 11(4): p.
383-408.
12. Fuchs, E. and H. Green, Changes in keratin gene expression during terminal
differentiation of the keratinocyte. Cell, 1980. 19(4): p. 1033-42.
13. Arda, O., N. Goksugur, and Y. Tuzun, Basic histological structure and
functions of facial skin. Clin Dermatol, 2014. 32(1): p. 3-13.
14. Stern, R., A.A. Asari, and K.N. Sugahara, Hyaluronan fragments: an
information-rich system. Eur J Cell Biol, 2006. 85(8): p. 699-715.
15. Fraser, J.R., T.C. Laurent, and U.B. Laurent, Hyaluronan: its nature,
distribution, functions and turnover. J Intern Med, 1997. 242(1): p. 27-33.
5. References
87
16. Laurent, T.C. and J.R. Fraser, Hyaluronan. FASEB J, 1992. 6(7): p. 2397-404.
17. Menon, G.K., New insights into skin structure: scratching the surface. Adv
Drug Deliv Rev, 2002. 54 Suppl 1: p. S3-17.
18. Janes, S.M., S. Lowell, and C. Hutter, Epidermal stem cells. J Pathol, 2002.
197(4): p. 479-91.
19. Xiang, F., et al., Incidence of nonmelanoma skin cancer in relation to ambient
UV radiation in white populations, 1978-2012: empirical relationships. JAMA
Dermatol, 2014. 150(10): p. 1063-71.
20. Kraywinkel, K., U. Wolf, and A. Katalinic Hautkrebs – Epidemiologie und
Früherkennung. 2012.
21. Nordrhein-Westfalen, E.-N.-E.K., Jahresbericht 2014 mit Datenreport 2012.
2014.
22. Brantsch, K.D., et al., Analysis of risk factors determining prognosis of
cutaneous squamous-cell carcinoma: a prospective study. Lancet Oncol,
2008. 9(8): p. 713-20.
23. Strickland, P.T., et al., Quantitative carcinogenesis in man: solar ultraviolet B
dose dependence of skin cancer in Maryland watermen. J Natl Cancer Inst,
1989. 81(24): p. 1910-3.
24. Albert, M.R. and M.A. Weinstock, Keratinocyte carcinoma. CA Cancer J Clin,
2003. 53(5): p. 292-302.
25. Markey, A.C., Etiology and pathogenesis of squamous cell carcinoma. Clin
Dermatol, 1995. 13(6): p. 537-43.
26. Breuninger, H., et al., Brief S2k guidelines--Cutaneous squamous cell
carcinoma. J Dtsch Dermatol Ges, 2013. 11 Suppl 3: p. 37-45, 39-47.
27. Silverberg, M.J., et al., HIV infection status, immunodeficiency, and the
incidence of non-melanoma skin cancer. J Natl Cancer Inst, 2013. 105(5): p.
350-60.
28. Armstrong, B.K. and A. Kricker, The epidemiology of UV induced skin cancer.
J Photochem Photobiol B, 2001. 63(1-3): p. 8-18.
29. Staples, M.P., et al., Non-melanoma skin cancer in Australia: the 2002
national survey and trends since 1985. Med J Aust, 2006. 184(1): p. 6-10.
30. Fabbrocini, G., et al., Epidemiology of skin cancer: role of some environmental
factors. Cancers (Basel), 2010. 2(4): p. 1980-9.
5. References
88
31. Lucas, R.M., et al., The consequences for human health of stratospheric
ozone depletion in association with other environmental factors. Photochem
Photobiol Sci, 2015. 14(1): p. 53-87.
32. Brewster, D.H., et al., Recent trends in incidence of nonmelanoma skin
cancers in the East of Scotland, 1992-2003. Br J Dermatol, 2007. 156(6): p.
1295-300.
33. Green, A., et al., Skin cancer in a subtropical Australian population: incidence
and lack of association with occupation. The Nambour Study Group. Am J
Epidemiol, 1996. 144(11): p. 1034-40.
34. Owens, D.M., p53, chemokines, and squamous cell carcinoma. J Clin Invest,
2007. 117(7): p. 1752-5.
35. Weinberg, A.S., C.A. Ogle, and E.K. Shim, Metastatic cutaneous squamous
cell carcinoma: an update. Dermatol Surg, 2007. 33(8): p. 885-99.
36. Sato, H., et al., Gene expression in skin tumors induced in hairless mice by
chronic exposure to ultraviolet B irradiation. Photochem Photobiol, 1997.
65(5): p. 908-14.
37. Bolshakov, S., et al., p53 mutations in human aggressive and nonaggressive
basal and squamous cell carcinomas. Clin Cancer Res, 2003. 9(1): p. 228-34.
38. Melnikova, V.O., et al., Mutant p53 is constitutively phosphorylated at Serine
15 in UV-induced mouse skin tumors: involvement of ERK1/2 MAP kinase.
Oncogene, 2003. 22(38): p. 5958-66.
39. Lindelof, B., et al., Incidence of skin cancer in 5356 patients following organ
transplantation. Br J Dermatol, 2000. 143(3): p. 513-9.
40. Carucci, J.A., Cutaneous oncology in organ transplant recipients: meeting the
challenge of squamous cell carcinoma. J Invest Dermatol, 2004. 123(5): p.
809-16.
41. Cooper, J.Z. and M.D. Brown, Special concern about squamous cell
carcinoma of the scalp in organ transplant recipients. Arch Dermatol, 2006.
142(6): p. 755-8.
42. Smoller, B.R. and R.A. Warnke, Cutaneous infiltrate of chronic lymphocytic
leukemia and relationship to primary cutaneous epithelial neoplasms. J Cutan
Pathol, 1998. 25(3): p. 160-4.
43. Pivarcsi, A., et al., Tumor immune escape by the loss of homeostatic
chemokine expression. Proc Natl Acad Sci U S A, 2007. 104(48): p. 19055-60.
5. References
89
44. Mueller, M.M., Inflammation in epithelial skin tumours: old stories and new
ideas. Eur J Cancer, 2006. 42(6): p. 735-44.
45. Pettersen, J.S., et al., Tumor-associated macrophages in the cutaneous SCC
microenvironment are heterogeneously activated. J Invest Dermatol, 2011.
131(6): p. 1322-30.
46. Rossi, D. and A. Zlotnik, The biology of chemokines and their receptors. Annu
Rev Immunol, 2000. 18: p. 217-42.
47. Zlotnik, A. and O. Yoshie, Chemokines: a new classification system and their
role in immunity. Immunity, 2000. 12(2): p. 121-7.
48. Zlotnik, A., O. Yoshie, and H. Nomiyama, The chemokine and chemokine
receptor superfamilies and their molecular evolution. Genome Biol, 2006.
7(12): p. 243.
49. Karin, N. and G. Wildbaum, The Role of Chemokines in Shaping the Balance
Between CD4(+) T Cell Subsets and Its Therapeutic Implications in
Autoimmune and Cancer Diseases. Front Immunol, 2015. 6: p. 609.
50. Zlotnik, A. and O. Yoshie, The chemokine superfamily revisited. Immunity,
2012. 36(5): p. 705-16.
51. Homey, B. and A. Zlotnik, Chemokines in allergy. Curr Opin Immunol, 1999.
11(6): p. 626-34.
52. McCully, M.L. and B. Moser, The human cutaneous chemokine system. Front
Immunol, 2011. 2: p. 33.
53. Ma, Q., et al., Impaired B-lymphopoiesis, myelopoiesis, and derailed
cerebellar neuron migration in CXCR4- and SDF-1-deficient mice. Proc Natl
Acad Sci U S A, 1998. 95(16): p. 9448-53.
54. Muller, A., et al., Involvement of chemokine receptors in breast cancer
metastasis. Nature, 2001. 410(6824): p. 50-6.
55. Bachelerie, F., et al., International Union of Basic and Clinical Pharmacology.
[corrected]. LXXXIX. Update on the extended family of chemokine receptors
and introducing a new nomenclature for atypical chemokine receptors.
Pharmacol Rev, 2014. 66(1): p. 1-79.
56. Tachibana, K., et al., The chemokine receptor CXCR4 is essential for
vascularization of the gastrointestinal tract. Nature, 1998. 393(6685): p. 591-4.
5. References
90
57. Peled, A., et al., Dependence of human stem cell engraftment and
repopulation of NOD/SCID mice on CXCR4. Science, 1999. 283(5403): p.
845-8.
58. Nagasawa, T., et al., Defects of B-cell lymphopoiesis and bone-marrow
myelopoiesis in mice lacking the CXC chemokine PBSF/SDF-1. Nature, 1996.
382(6592): p. 635-8.
59. Haynes, N.M., et al., Role of CXCR5 and CCR7 in follicular Th cell positioning
and appearance of a programmed cell death gene-1high germinal center-
associated subpopulation. J Immunol, 2007. 179(8): p. 5099-108.
60. Su, Y. and A. Richmond, Chemokine Regulation of Neutrophil Infiltration of
Skin Wounds. Adv Wound Care (New Rochelle), 2015. 4(11): p. 631-640.
61. Homey, B., et al., Cutting edge: the orphan chemokine receptor G protein-
coupled receptor-2 (GPR-2, CCR10) binds the skin-associated chemokine
CCL27 (CTACK/ALP/ILC). J Immunol, 2000. 164(7): p. 3465-70.
62. Marchese A., D.j.M., Nguyen T., Heiber M., Cheng R., Heng H.H., Tsui L.C.,
Shi X., George S.R., and O'Dowd B.F., Cloning of humn genes encoding noval
G protein-coupled receptors. Genomics, 1994: p. 609-618.
63. Homey, B., A. Muller, and A. Zlotnik, Chemokines: agents for the
immunotherapy of cancer? Nat Rev Immunol, 2002. 2(3): p. 175-84.
64. Kunkel, E.J., et al., CCR10 expression is a common feature of circulating and
mucosal epithelial tissue IgA Ab-secreting cells. J Clin Invest, 2003. 111(7): p.
1001-10.
65. Wang, W., et al., Identification of a novel chemokine (CCL28), which binds
CCR10 (GPR2). J Biol Chem, 2000. 275(29): p. 22313-23.
66. Hudak, S., et al., Immune surveillance and effector functions of CCR10(+) skin
homing T cells. J Immunol, 2002. 169(3): p. 1189-96.
67. Homey, B., et al., CCL27-CCR10 interactions regulate T cell-mediated skin
inflammation. Nat Med, 2002. 8(2): p. 157-65.
68. Sisirak, V., et al., CCR6/CCR10-mediated plasmacytoid dendritic cell
recruitment to inflamed epithelia after instruction in lymphoid tissues. Blood,
2011. 118(19): p. 5130-40.
69. Duhen, T., et al., Production of interleukin 22 but not interleukin 17 by a subset
of human skin-homing memory T cells. Nat Immunol, 2009. 10(8): p. 857-63.
5. References
91
70. Trifari, S., et al., Identification of a human helper T cell population that has
abundant production of interleukin 22 and is distinct from T(H)-17, T(H)1 and
T(H)2 cells. Nat Immunol, 2009. 10(8): p. 864-71.
71. Yang, J., et al., Selective programming of CCR10(+) innate lymphoid cells in
skin-draining lymph nodes for cutaneous homeostatic regulation. Nat Immunol,
2016. 17(1): p. 48-56.
72. Fu, Y., J. Yang, and N. Xiong, Cutting Edge: Skin CCR10+ CD8+ T Cells
Support Resident Regulatory T Cells through the B7.2/Receptor Axis To
Regulate Local Immune Homeostasis and Response. J Immunol, 2016.
196(12): p. 4859-64.
73. Xia, M., et al., CCR10 regulates balanced maintenance and function of
resident regulatory and effector T cells to promote immune homeostasis in the
skin. J Allergy Clin Immunol, 2014. 134(3): p. 634-644 e10.
74. Morteau, O., et al., An indispensable role for the chemokine receptor CCR10
in IgA antibody-secreting cell accumulation. J Immunol, 2008. 181(9): p. 6309-
15.
75. Bunemann, E., et al., Chemokine ligand-receptor interactions critically regulate
cutaneous wound healing. Eur J Med Res, 2018. 23(1): p. 4.
76. Karnezis, T., et al., CCL27/CCL28-CCR10 Chemokine Signaling Mediates
Migration of Lymphatic Endothelial Cells. Cancer Res, 2019. 79(7): p. 1558-
1572.
77. Graham, G.J., D6 and the atypical chemokine receptor family: novel regulators
of immune and inflammatory processes. Eur J Immunol, 2009. 39(2): p. 342-
51.
78. Morales, J., et al., CTACK, a skin-associated chemokine that preferentially
attracts skin-homing memory T cells. Proc Natl Acad Sci U S A, 1999. 96(25):
p. 14470-5.
79. Baselga, J., Why the epidermal growth factor receptor? The rationale for
cancer therapy. Oncologist, 2002. 7 Suppl 4: p. 2-8.
80. Eilers, R.E., Jr., et al., Dermatologic infections in cancer patients treated with
epidermal growth factor receptor inhibitor therapy. J Natl Cancer Inst, 2010.
102(1): p. 47-53.
81. Lichtenberger, B.M., et al., Epidermal EGFR controls cutaneous host defense
and prevents inflammation. Sci Transl Med, 2013. 5(199): p. 199ra111.
5. References
92
82. Wang, J.M., et al., Chemokines and their role in tumor growth and metastasis.
J Immunol Methods, 1998. 220(1-2): p. 1-17.
83. Lazennec, G. and A. Richmond, Chemokines and chemokine receptors: new
insights into cancer-related inflammation. Trends Mol Med, 2010. 16(3): p.
133-44.
84. Hanahan, D. and R.A. Weinberg, The hallmarks of cancer. Cell, 2000. 100(1):
p. 57-70.
85. Hanahan, D. and R.A. Weinberg, Hallmarks of cancer: the next generation.
Cell, 2011. 144(5): p. 646-74.
86. Pietras, K. and A. Ostman, Hallmarks of cancer: interactions with the tumor
stroma. Exp Cell Res, 2010. 316(8): p. 1324-31.
87. Emtage, P.C., et al., Adenoviral vectors expressing lymphotactin and
interleukin 2 or lymphotactin and interleukin 12 synergize to facilitate tumor
regression in murine breast cancer models. Hum Gene Ther, 1999. 10(5): p.
697-709.
88. Vicari, A.P., et al., Antitumor effects of the mouse chemokine 6Ckine/SLC
through angiostatic and immunological mechanisms. J Immunol, 2000. 165(4):
p. 1992-2000.
89. Braun, S.E., et al., The CC chemokine CK beta-11/MIP-3 beta/ELC/Exodus 3
mediates tumor rejection of murine breast cancer cells through NK cells. J
Immunol, 2000. 164(8): p. 4025-31.
90. Balkwill, F., Cancer and the chemokine network. Nat Rev Cancer, 2004. 4(7):
p. 540-50.
91. Arenberg, D.A., et al., The role of CXC chemokines in the regulation of
angiogenesis in non-small cell lung cancer. J Leukoc Biol, 1997. 62(5): p. 554-
62.
92. Coussens, L.M. and Z. Werb, Inflammation and cancer. Nature, 2002.
420(6917): p. 860-7.
93. Strieter, R.M., Chemokines: not just leukocyte chemoattractants in the
promotion of cancer. Nat Immunol, 2001. 2(4): p. 285-6.
94. Belperio, J.A., et al., CXC chemokines in angiogenesis. J Leukoc Biol, 2000.
68(1): p. 1-8.
5. References
93
95. Arenberg, D.A., et al., Epithelial-neutrophil activating peptide (ENA-78) is an
important angiogenic factor in non-small cell lung cancer. J Clin Invest, 1998.
102(3): p. 465-72.
96. Liotta, L.A., An attractive force in metastasis. Nature, 2001. 410(6824): p. 24-
5.
97. Amersi, F.F., et al., Activation of CCR9/CCL25 in cutaneous melanoma
mediates preferential metastasis to the small intestine. Clin Cancer Res, 2008.
14(3): p. 638-45.
98. DiGiovanni, J., Multistage carcinogenesis in mouse skin. Pharmacol Ther,
1992. 54(1): p. 63-128.
99. Slaga, T.J., Overview of tumor promotion in animals. Environ Health Perspect,
1983. 50: p. 3-14.
100. Hennings, H., et al., Malignant conversion and metastasis of mouse skin
tumors: a comparison of SENCAR and CD-1 mice. Environ Health Perspect,
1986. 68: p. 69-74.
101. Bizub, D., A.W. Wood, and A.M. Skalka, Mutagenesis of the Ha-ras oncogene
in mouse skin tumors induced by polycyclic aromatic hydrocarbons. Proc Natl
Acad Sci U S A, 1986. 83(16): p. 6048-52.
102. Roop, D.R., et al., An activated Harvey ras oncogene produces benign
tumours on mouse epidermal tissue. Nature, 1986. 323(6091): p. 822-4.
103. Yuspa, S.H., The pathogenesis of squamous cell cancer: lessons learned from
studies of skin carcinogenesis--thirty-third G. H. A. Clowes Memorial Award
Lecture. Cancer Res, 1994. 54(5): p. 1178-89.
104. Rundhaug, J.E., et al., Changes in protein expression during multistage
mouse skin carcinogenesis. Mol Carcinog, 1997. 20(1): p. 125-36.
105. Xian, W., et al., Activation of the epidermal growth factor receptor by skin
tumor promoters and in skin tumors from SENCAR mice. Cell Growth Differ,
1995. 6(11): p. 1447-55.
106. Kiguchi, K., et al., Altered expression of epidermal growth factor receptor
ligands in tumor promoter-treated mouse epidermis and in primary mouse skin
tumors induced by an initiation-promotion protocol. Mol Carcinog, 1998. 22(2):
p. 73-83.
107. Glick, A.B., et al., Targeted deletion of the TGF-beta 1 gene causes rapid
progression to squamous cell carcinoma. Genes Dev, 1994. 8(20): p. 2429-40.
5. References
94
108. Van Waes, C., et al., The A9 antigen associated with aggressive human
squamous carcinoma is structurally and functionally similar to the newly
defined integrin alpha 6 beta 4. Cancer Res, 1991. 51(9): p. 2395-402.
109. Allen, M. and J. Louise Jones, Jekyll and Hyde: the role of the
microenvironment on the progression of cancer. J Pathol, 2011. 223(2): p.
162-76.
110. Whiteside, T.L., The tumor microenvironment and its role in promoting tumor
growth. Oncogene, 2008. 27(45): p. 5904-12.
111. Lewis, J.G. and D.O. Adams, Inflammation, oxidative DNA damage, and
carcinogenesis. Environ Health Perspect, 1987. 76: p. 19-27.
112. Rahman, S., et al., Nordihydroguiaretic acid attenuates skin tumorigenesis in
Swiss albino mice with the condition of topical co-administration of an
immunosuppressant. Chem Biol Interact, 2015. 233: p. 106-14.
113. Niwa, Y., T. Terashima, and H. Sumi, Topical application of the
immunosuppressant tacrolimus accelerates carcinogenesis in mouse skin. Br
J Dermatol, 2003. 149(5): p. 960-7.
114. Cipolat, S., et al., Epidermal barrier defects link atopic dermatitis with altered
skin cancer susceptibility. Elife, 2014. 3: p. e01888.
115. Benavides, F., et al., Protective role of cathepsin L in mouse skin
carcinogenesis. Mol Carcinog, 2012. 51(4): p. 352-61.
116. Winkler, A.E., et al., CXCR3 enhances a T-cell-dependent epidermal
proliferative response and promotes skin tumorigenesis. Cancer Res, 2011.
71(17): p. 5707-16.
117. Schioppa, T., et al., B regulatory cells and the tumor-promoting actions of
TNF-alpha during squamous carcinogenesis. Proc Natl Acad Sci U S A, 2011.
108(26): p. 10662-7.
118. Xiao, M., et al., IFNgamma promotes papilloma development by up-regulating
Th17-associated inflammation. Cancer Res, 2009. 69(5): p. 2010-7.
119. Yusuf, N., et al., Antagonistic roles of CD4+ and CD8+ T-cells in 7,12-
dimethylbenz(a)anthracene cutaneous carcinogenesis. Cancer Res, 2008.
68(10): p. 3924-30.
120. Fortner, G.W. and M.L. Kripke, In vitro reactivity of splenic lymphocytes from
normal and UV-irradiated mice against syngeneic UV-induced tumors. J
Immunol, 1977. 118(4): p. 1483-7.
5. References
95
121. Katiyar, S.K., Dietary proanthocyanidins inhibit UV radiation-induced skin
tumor development through functional activation of the immune system. Mol
Nutr Food Res, 2016. 60(6): p. 1374-82.
122. Spellman, C.W. and R.A. Daynes, Immunoregulation by ultraviolet light-III.
Enhancement of suppressor cell activity in older animals. Exp Gerontol, 1978.
13(3-4): p. 141-6.
123. Schade, N., C. Esser, and J. Krutmann, Ultraviolet B radiation-induced
immunosuppression: molecular mechanisms and cellular alterations.
Photochem Photobiol Sci, 2005. 4(9): p. 699-708.
124. Loeser, S., et al., Spontaneous tumor rejection by cbl-b-deficient CD8+ T cells.
J Exp Med, 2007. 204(4): p. 879-91.
125. Nasti, T.H., et al., Differential roles of T-cell subsets in regulation of ultraviolet
radiation induced cutaneous photocarcinogenesis. Photochem Photobiol,
2011. 87(2): p. 387-98.
126. Wang, H., et al., Therapeutic and immune effects of 5-aminolevulinic acid
photodynamic therapy on UVB-induced squamous cell carcinomas in hairless
mice. Exp Dermatol, 2013. 22(5): p. 362-3.
127. Hatton, J.L., et al., Depletion of CD4+ cells exacerbates the cutaneous
response to acute and chronic UVB exposure. J Invest Dermatol, 2007.
127(6): p. 1507-15.
128. Hart, P.H., M.A. Grimbaldeston, and J.J. Finlay-Jones, Sunlight,
immunosuppression and skin cancer: role of histamine and mast cells. Clin
Exp Pharmacol Physiol, 2001. 28(1-2): p. 1-8.
129. Kripke, M.L., et al., Pyrimidine dimers in DNA initiate systemic
immunosuppression in UV-irradiated mice. Proc Natl Acad Sci U S A, 1992.
89(16): p. 7516-20.
130. Ullrich, S.E. and D.A. Schmitt, The role of cytokines in UV-induced systemic
immune suppression. J Dermatol Sci, 2000. 23 Suppl 1: p. S10-2.
131. Ullrich, S.E., The role of epidermal cytokines in the generation of cutaneous
immune reactions and ultraviolet radiation-induced immune suppression.
Photochem Photobiol, 1995. 62(3): p. 389-401.
132. Kanjilal, S., et al., High frequency of p53 mutations in ultraviolet radiation-
induced murine skin tumors: evidence for strand bias and tumor heterogeneity.
Cancer Res, 1993. 53(13): p. 2961-4.
5. References
96
133. Masaki, H., T. Atsumi, and H. Sakurai, Detection of hydrogen peroxide and
hydroxyl radicals in murine skin fibroblasts under UVB irradiation. Biochem
Biophys Res Commun, 1995. 206(2): p. 474-9.
134. Moodycliffe, A.M., I. Kimber, and M. Norval, The effect of ultraviolet B
irradiation and urocanic acid isomers on dendritic cell migration. Immunology,
1992. 77(3): p. 394-9.
135. Ziegler, A., et al., Mutation hotspots due to sunlight in the p53 gene of
nonmelanoma skin cancers. Proc Natl Acad Sci U S A, 1993. 90(9): p. 4216-
20.
136. Brash, D.E., et al., A role for sunlight in skin cancer: UV-induced p53
mutations in squamous cell carcinoma. Proc Natl Acad Sci U S A, 1991.
88(22): p. 10124-8.
137. English, D.R., et al., Case-control study of sun exposure and squamous cell
carcinoma of the skin. Int J Cancer, 1998. 77(3): p. 347-53.
138. Green, A., et al., Daily sunscreen application and betacarotene
supplementation in prevention of basal-cell and squamous-cell carcinomas of
the skin: a randomised controlled trial. Lancet, 1999. 354(9180): p. 723-9.
139. Downward, J., Targeting RAS signalling pathways in cancer therapy. Nat Rev
Cancer, 2003. 3(1): p. 11-22.
140. Kraywinkel, K.W., U; Katalinic, A, Hautkrebs - Epidemiologie und
Früherkennung. 2012.
141. Das, K.K., et al., Incidences of malignancy in chronic burn scar ulcers:
experience from Bangladesh. Burns, 2015. 41(6): p. 1315-21.
142. Mallipeddi, R., Epidermolysis bullosa and cancer. Clin Exp Dermatol, 2002.
27(8): p. 616-23.
143. Onesti, M.G., et al., Ten years of experience in chronic ulcers and malignant
transformation. Int Wound J, 2015. 12(4): p. 447-50.
144. Taghavi Zenouz, A., et al., Squamous cell carcinoma arising from an oral
lichenoid lesion: a case report. J Dent Res Dent Clin Dent Prospects, 2012.
6(1): p. 29-32.
145. Tong, L.X., et al., Widely metastatic squamous cell carcinoma originating from
malignant transformation of hypertrophic lichen planus in a 24-year-old
woman: case report and review of the literature. Pediatr Dermatol, 2015.
32(3): p. e98-101.
5. References
97
146. Meller, S., M. Gilliet, and B. Homey, Chemokines in the pathogenesis of
lichenoid tissue reactions. J Invest Dermatol, 2009. 129(2): p. 315-9.
147. Connolly, K., et al., Papillomavirus-associated squamous skin cancers
following transplant immunosuppression: one Notch closer to control. Cancer
Treat Rev, 2014. 40(2): p. 205-14.
148. Harvey, I., et al., Non-melanoma skin cancer and solar keratoses II analytical
results of the South Wales Skin Cancer Study. Br J Cancer, 1996. 74(8): p.
1308-12.
149. Majores, M. and E. Bierhoff, [Actinic keratosis, Bowen's disease,
keratoacanthoma and squamous cell carcinoma of the skin]. Pathologe, 2015.
36(1): p. 16-29.
150. Fujita, H., The role of IL-22 and Th22 cells in human skin diseases. J Dermatol
Sci, 2013. 72(1): p. 3-8.
151. Nguyen, P., et al., Aggressive squamous cell carcinomas in persons infected
with the human immunodeficiency virus. Arch Dermatol, 2002. 138(6): p. 758-
63.
152. Callens, J., et al., Epidemiology of basal and squamous cell carcinoma in
Belgium: the need for a uniform and compulsory registration. J Eur Acad
Dermatol Venereol, 2016. 30(11): p. 1912-1918.
153. Sunesen, K.G., et al., Immunosuppressive disorders and risk of anal
squamous cell carcinoma: a nationwide cohort study in Denmark, 1978-2005.
Int J Cancer, 2010. 127(3): p. 675-84.
154. Liu, Z., et al., Chemopreventive efficacy of menthol on carcinogen-induced
cutaneous carcinoma through inhibition of inflammation and oxidative stress in
mice. Food Chem Toxicol, 2015. 82: p. 12-8.
155. Monga, J., et al., Topical (+)-catechin emulsified gel prevents DMBA/TPA-
induced squamous cell carcinoma of the skin by modulating antioxidants and
inflammatory biomarkers in BALB/c mice. Food Funct, 2014. 5(12): p. 3197-
207.
156. Sibilia, M., et al., The epidermal growth factor receptor: from development to
tumorigenesis. Differentiation, 2007. 75(9): p. 770-87.
157. Meller, S., et al., Ultraviolet radiation-induced injury, chemokines, and
leukocyte recruitment: An amplification cycle triggering cutaneous lupus
erythematosus. Arthritis Rheum, 2005. 52(5): p. 1504-16.
5. References
98
158. Norris, P.G., et al., Immune function, mutant frequency, and cancer risk in the
DNA repair defective genodermatoses xeroderma pigmentosum, Cockayne's
syndrome, and trichothiodystrophy. J Invest Dermatol, 1990. 94(1): p. 94-100.
159. Ishigaki, Y., et al., A comparison of UVB-carcinogenesis between nude mice
and nude beige mice. J Radiat Res, 1998. 39(2): p. 119-27.
160. Gao, J.Q., et al., NK cells are migrated and indispensable in the anti-tumor
activity induced by CCL27 gene therapy. Cancer Immunol Immunother, 2009.
58(2): p. 291-9.
161. Maghazachi, A.A., K.L. Sand, and Z. Al-Jaderi, Glatiramer Acetate, Dimethyl
Fumarate, and Monomethyl Fumarate Upregulate the Expression of CCR10
on the Surface of Natural Killer Cells and Enhance Their Chemotaxis and
Cytotoxicity. Front Immunol, 2016. 7: p. 437.
162. Dhabhar, F.S., et al., High-anxious individuals show increased chronic stress
burden, decreased protective immunity, and increased cancer progression in a
mouse model of squamous cell carcinoma. PLoS One, 2012. 7(4): p. e33069.
163. Schlumpf, M., et al., Fundamental questions to sun protection: A continuous
education symposium on vitamin D, immune system and sun protection at the
University of Zurich. Dermatoendocrinol, 2010. 2(1): p. 19-25.
164. Eysteinsdottir, J.H., et al., The role of Th17/Tc17 peripheral blood T cells in
psoriasis and their positive therapeutic response. Scand J Immunol, 2013.
78(6): p. 529-37.
165. Hessner, F., et al., CC chemokine receptor 10 cell surface presentation in
melanocytes is regulated by the novel interaction partner S100A10. Sci Rep,
2016. 6: p. 22649.
166. Ozorowski, G., S. Milton, and H. Luecke, Structure of a C-terminal AHNAK
peptide in a 1:2:2 complex with S100A10 and an acetylated N-terminal peptide
of annexin A2. Acta Crystallogr D Biol Crystallogr, 2013. 69(Pt 1): p. 92-104.
167. Schafer, B.W., et al., Isolation of a YAC clone covering a cluster of nine S100
genes on human chromosome 1q21: rationale for a new nomenclature of the
S100 calcium-binding protein family. Genomics, 1995. 25(3): p. 638-43.
168. Wicki, R., et al., Characterization of the human S100A12 (calgranulin C, p6,
CAAF1, CGRP) gene, a new member of the S100 gene cluster on
chromosome 1q21. Cell Calcium, 1996. 20(6): p. 459-64.
5. References
99
169. Mischke, D., et al., Genes encoding structural proteins of epidermal
cornification and S100 calcium-binding proteins form a gene complex
("epidermal differentiation complex") on human chromosome 1q21. J Invest
Dermatol, 1996. 106(5): p. 989-92.
170. Moseley W.S., S.M.F., Definitio of mouse chromosome 1 and 3 gene linkage
groups that are conserved on human chromosome 1: evidence that a
conserved linkage group spans the centromere of human chroosome 1.
Genomics, 1989: p. 899-905.
171. Xiong, T.F., F.Q. Pan, and D. Li, Expression and clinical significance of S100
family genes in patients with melanoma. Melanoma Res, 2019. 29(1): p. 23-
29.
172. Schilbach, K., et al., Immune response of human propagated gammadelta-T-
cells to neuroblastoma recommend the Vdelta1+ subset for gammadelta-T-
cell-based immunotherapy. J Immunother, 2008. 31(9): p. 896-905.
173. Moffett, J., et al., Transcriptional regulation of fibroblast growth factor-2
expression in human astrocytes: implications for cell plasticity. Mol Biol Cell,
1998. 9(8): p. 2269-85.
174. Liu, J., et al., Heparin-binding EGF-like growth factor regulates elastin and
FGF-2 expression in pulmonary fibroblasts. Am J Physiol Lung Cell Mol
Physiol, 2003. 285(5): p. L1106-15.
175. Rahimi, F., et al., FGF-2, IL-1beta and TGF-beta regulate fibroblast expression
of S100A8. FEBS J, 2005. 272(11): p. 2811-27.
176. Brophy, M.B., et al., Contributions of the S100A9 C-terminal tail to high-affinity
Mn(II) chelation by the host-defense protein human calprotectin. J Am Chem
Soc, 2013. 135(47): p. 17804-17.
177. Lee, Y., et al., S100A8 and S100A9 are messengers in the crosstalk between
epidermis and dermis modulating a psoriatic milieu in human skin. Biochem
Biophys Res Commun, 2012. 423(4): p. 647-53.
178. Gebhardt, C., et al., RAGE signaling sustains inflammation and promotes
tumor development. J Exp Med, 2008. 205(2): p. 275-85.
179. Benoit, S., et al., Elevated serum levels of calcium-binding S100 proteins A8
and A9 reflect disease activity and abnormal differentiation of keratinocytes in
psoriasis. Br J Dermatol, 2006. 155(1): p. 62-6.
5. References
100
180. Rundhaug, J.E., et al., SAGE profiling of UV-induced mouse skin squamous
cell carcinomas, comparison with acute UV irradiation effects. Mol Carcinog,
2005. 42(1): p. 40-52.
181. Broome, A.M., D. Ryan, and R.L. Eckert, S100 protein subcellular localization
during epidermal differentiation and psoriasis. J Histochem Cytochem, 2003.
51(5): p. 675-85.
182. Nukui, T., et al., S100A8/A9, a key mediator for positive feedback growth
stimulation of normal human keratinocytes. J Cell Biochem, 2008. 104(2): p.
453-64.
183. Iotzova-Weiss, G., et al., S100A8/A9 stimulates keratinocyte proliferation in
the development of squamous cell carcinoma of the skin via the receptor for
advanced glycation-end products. PLoS One, 2015. 10(3): p. e0120971.
184. Murakami, T., et al., Immune evasion by murine melanoma mediated through
CC chemokine receptor-10. J Exp Med, 2003. 198(9): p. 1337-47.
185. Gibson, S., et al., Epidermal growth factor protects epithelial cells against Fas-
induced apoptosis. Requirement for Akt activation. J Biol Chem, 1999.
274(25): p. 17612-8.
186. Kai, H., et al., CCR10 and CCL27 are overexpressed in cutaneous squamous
cell carcinoma. Pathol Res Pract, 2011. 207(1): p. 43-8.
187. Martinez-Rodriguez, M., A.K. Thompson, and C. Monteagudo, High CCL27
immunoreactivity in 'supratumoral' epidermis correlates with better prognosis
in patients with cutaneous malignant melanoma. J Clin Pathol, 2016.
188. Gao, J.Q., et al., Antitumor effect by interleukin-11 receptor alpha-locus
chemokine/CCL27, introduced into tumor cells through a recombinant
adenovirus vector. Cancer Res, 2003. 63(15): p. 4420-5.
189. Okada, N., et al., Anti-tumor activity of chemokine is affected by both kinds of
tumors and the activation state of the host's immune system: implications for
chemokine-based cancer immunotherapy. Biochem Biophys Res Commun,
2004. 317(1): p. 68-76.
190. Okada, N., et al., Tumor suppressive efficacy through augmentation of tumor-
infiltrating immune cells by intratumoral injection of chemokine-expressing
adenoviral vector. Cancer Gene Ther, 2006. 13(4): p. 393-405.
191. Gao, J.Q., et al., Cotransduction of CCL27 gene can improve the efficacy and
safety of IL-12 gene therapy for cancer. Gene Ther, 2007. 14(6): p. 491-502.
5. References
101
192. Huang, Y.H., et al., Th22 cell accumulation is associated with colorectal
cancer development. World J Gastroenterol, 2015. 21(14): p. 4216-24.
193. Rundhaug, J.E., et al., Opposite effect of stable transfection of bioactive
transforming growth factor-beta 1 (TGF beta 1) versus exogenous TGF beta 1
treatment on expression of 92-kDa type IV collagenase in mouse skin
squamous cell carcinoma CH72 cells. Mol Carcinog, 1997. 19(2): p. 122-36.
194. Uhmann, A., et al., DMBA/TPA treatment is necessary for BCC formation from
patched deficient epidermal cells in Ptch(flox/flox)CD4Cre(+/-) mice. J Invest
Dermatol, 2014. 134(10): p. 2620-9.
195. Brennan-Crispi, D.M., et al., Crosstalk between Desmoglein 2 and Patched 1
accelerates chemical-induced skin tumorigenesis. Oncotarget, 2015. 6(11): p.
8593-605.
196. Robinson, N.A., et al., S100A11, S100A10, annexin I, desmosomal proteins,
small proline-rich proteins, plasminogen activator inhibitor-2, and involucrin are
components of the cornified envelope of cultured human epidermal
keratinocytes. J Biol Chem, 1997. 272(18): p. 12035-46.
197. Geng, S., et al., Targeted ablation of Arnt in mouse epidermis results in
profound defects in desquamation and epidermal barrier function. J Cell Sci,
2006. 119(Pt 23): p. 4901-12.
198. Reyes, H., S. Reisz-Porszasz, and O. Hankinson, Identification of the Ah
receptor nuclear translocator protein (Arnt) as a component of the DNA
binding form of the Ah receptor. Science, 1992. 256(5060): p. 1193-5.
199. Rescher, U. and V. Gerke, S100A10/p11: family, friends and functions.
Pflugers Arch, 2008. 455(4): p. 575-82.
200. Domoto, T., et al., Evaluation of S100A10, annexin II and B-FABP expression
as markers for renal cell carcinoma. Cancer Sci, 2007. 98(1): p. 77-82.
201. Ito, Y., et al., S100A10 expression in thyroid neoplasms originating from the
follicular epithelium: contribution to the aggressive characteristic of anaplastic
carcinoma. Anticancer Res, 2007. 27(4C): p. 2679-83.
202. Li, J., et al., S100A expression in normal corneal-limbal epithelial cells and
ocular surface squamous cell carcinoma tissue. Mol Vis, 2011. 17: p. 2263-71.
203. Madureira, P.A., et al., Cell surface protease activation during RAS
transformation: Critical role of the plasminogen receptor, S100A10.
Oncotarget, 2016.
5. References
102
204. Kopan, R. and E. Fuchs, The use of retinoic acid to probe the relation between
hyperproliferation-associated keratins and cell proliferation in normal and
malignant epidermal cells. J Cell Biol, 1989. 109(1): p. 295-307.
205. Stoler, A., et al., Use of monospecific antisera and cRNA probes to localize the
major changes in keratin expression during normal and abnormal epidermal
differentiation. J Cell Biol, 1988. 107(2): p. 427-46.
206. Facciabene, A., et al., Tumour hypoxia promotes tolerance and angiogenesis
via CCL28 and T(reg) cells. Nature, 2011. 475(7355): p. 226-30.
207. Karakawa, M., et al., CCL27 is downregulated by interferon gamma via
epidermal growth factor receptor in normal human epidermal keratinocytes. J
Cell Physiol, 2014. 229(12): p. 1935-45.
6. List of figures
103
6 List of figures
Figure 1.1 Epidermal layers of human skin 7
Figure 1.2 Structure of the human skin 9
Figure 1.3 Normal mouse skin 10
Figure 1.4 The chemokine superfamily 15
Figure 2.1 Thermo Scientific O’GeneRuler 100 bp DNA Ladder 30
Figure 3.1 Tumor progression in Balb/c-Ccr10-deficient (Ccr10-/-) mice is
significantly reduced when compared to Balb/c wildtype (WT)
controls after DMBA/TPA treatment 50
Figure 3.2 Absence of CCR10 signaling decreases cutaneous carcinogenesis
in an inflammation-dependent (DMBA/TPA) tumor model 52
Figure 3.3 DMBA/TPA administration induces morphologically different
tumors in Balb/c wildtype (WT) and Balb/c-Ccr10-deficient mice 54
Figure 3.4 DMBA/TPA administration induces an inflammatory response in
the skin of Balb/c wildtype (WT) and Balb/c-Ccr10-deficient mice 57
Figure 3.5 Ccr10 contribution to mouse skin tumor formation after chronic
UVB-irradiation 59
Figure 3.6 Chronic UVB-irradiation increases tumor burden in the absence
of CCR10 signaling 60
Figure 3.7 Chronic UVB-irradiation induces morphologically different tumors
in Balb/c wildtype (WT) and Balb/c-Ccr10-deficient mice 63
Figure 3.8 Chronic UVB-irradiation causes a skin thickening in Balb/c
wildtype mice (WT) but not in Ccr10-deficient mice 65
Figure 4.1 Schematic view of CCR10 signaling during skin homeostasis and
cutaneous carcinogenesis 85
7. List of tables
104
7 List of tables
Table 1.1 Passive and active functions of the skin 3
Table 2.1 Number of total mice used for the 12-week early time point
analysis after DMBA/TPA treatment 32
Table 2.2 Number of WT mice used in the analysis of epidermal thickness
after 12 weeks of DMBA/TPA treatment 33
Table 2.3 Number of Ccr10-deficient mice used in the analysis of
epidermal thickness after 12 weeks of DMBA/TPA treatment 33
Table 2.4 Number of animals used for the late time point after 40 weeks of
DMBA/TPA treatment 33
Table 2.5 Number of WT mice used for the listed analyses after 40 weeks
of DMBA/TPA treatment 35
Table 2.6 Number of Ccr10-deficient mice used for the listed analyses
after 40 weeks of DMBA/TPA treatment 36
Table 2.7 Respective time periods of irradiation 36
Table 2.8 Number of total mice used for the 12-week early time point
analysis after UVB-irradiation 38
Table 2.9 Number of WT mice used in the analysis of epidermal thickness
after 12 weeks of UVB-irradiation 38
Table 2.10 Number of Ccr10-deficient mice used in the analysis of
epidermal thickness after 12 weeks of UVB-irradiation 39
Table 2.11 Number of animals surviving to the late time point at week 70,
following chronic UVB-irradiation for 60 weeks 39
Table 2.12 Number of WT mice used for the listed analyses after 70 weeks
following 60 weeks of chronic UVB-irradiation 41
Table 2.13 Number of Ccr10-deficient mice used for the listed analyses
after 70 weeks following 60 weeks of chronic UVB-irradiation 41
Table 2.14 Touchdown PCR program for genotyping 45
Table 2.15 Reagents and concentrations for one PCR reaction 46
Table 2.16 PCR primer pairs for genotyping PCR 46
8. Vita
105
8 Vita Personal Information Name Stephanie Müller
Date of birth 09/16/1983
Place of birth Essen, Germany
Education 2018- Teacher, Gesamtschule Xanten-Sonsbeck, comprehensive
school, Xanten, Germany
2016-2018 Teacher training, Gesamtschule Xanten-Sonsbeck,
comprehensive school, Xanten, Germany
2014-2016 Doctoral student, Heinrich-Heine University Düsseldorf,
Düsseldorf, Germany
2011-2014 Doctoral Scholar, Department of Dermatology, University
Hospital Düsseldorf, Düsseldorf, Germany
2010-2011 Doctoral Scholar, Clinic of Gastroenterology and Hepatology,
Essen University Hospital, Essen, Germany
2003-2009 Diploma in Biology (Human Genetics, Faculty of Medicine)
Ruhr University Bochum, Bochum, Germany
2000-2003 Grashof Gymnasium, Academic High School, Essen, Germany
1994-2000 Albert-Einstein-Realschule, Middle School, Essen, Germany
Research Activities
2008-2009 Diploma, Thesis Research on “Genetische Variabilität der
angeborenen Immunabwehr und ihre Bedeutung in der
Pathogenese der ANCA-assoziierten Vaskulitidenˮ
Ruhr University Bochum, Bochum, Germany
9. Publications
106
9 Publications 9.1 Scientific articles January 2010 Stefan Wieczorek, Julia U. Holle, Stephanie Müller,
Harald Fricke, Wolfgang L. Gross, Jörg T. Epplen, “A
functionally relevant IRF5 haplotype is associated with
reduced risk to Wegener’s granulomatosis.” J Mol Med
2010
May 2014 CA. Husmann, JU. Holle, F. Moosig, S. Mueller, B. Wilde,
JW. Cohen Tervaert, L. Harper, G. Assmann, WL. Gross,
JT. Epplen, S. Wieczorek, “Genetics of toll like receptor 9
in ANCA associated vasculitides.ˮ Ann Rheum Dis. 2014
9.2 Poster March 2014 Stephanie Müller, Andreas Hippe, Juliane Noffke,
Andreas Kislat, Erich Bünemann and Bernhard Homey
“Skin carcinogenesis is reduced in immune deprived
Ccr10-deficient miceˮ
Düsseldorf School of Oncology ‘DSO-Retreatʼ, Düsseldorf,
Germany
September 2014 Stephanie Müller, Andreas Hippe, Juliane Noffke,
Andreas Kislat, Erich Bünemann and Bernhard Homey
“Skin carcinogenesis is modulated in immune deprived
Ccr10-deficient miceˮ
European Society for Dermatological Research ‘The
ESDR 2014ʼ, Copenhagen, Denmark

10. Acknowledgements
107
10 Acknowledgements An important chapter of my life is drawing to an end and a new chapter begins,
therefore I would like to thank everyone, who accompanied and supported me, thank
you so much!
First of all, I would like to express my sincere gratitude to my supervisor Prof. Dr.
Bernhard Homey for giving me the opportunity to write my dissertation at the
department of dermatology and for providing this deeply interesting research subject.
I appreciate his scientific guidance, the helpful suggestions and the interesting
discussions. I would particularly like to thank Prof. Dr. Johannes Hegemann for co-
advising this work.
Additionally, I would like to offer special thanks to Dr. Andreas Hippe for the
cooperation and supervision of my thesis. Finishing this dissertation would not have
been possible without his patient guidance, advice and interesting discussions.
I want to thank all members of the laboratory for their competent and friendly help
during my thesis. At this point, I would like to thank everybody for the pleasant
working atmosphere and the valuable conversations.
I owe the most to my parents and my partner, Brian, who always encouraged and
constantly supported me. You were always there for me whenever I needed you.
Thank you for your loving support.
Finally, I would like to express my warm thanks to my dear friend Leonie. Now, it has
been 15 years since we met each other and you still stand by my side by giving good
advice and continuous encouragement. Thank you!
Last but not least, I want to thank Juliane Noffke, Heike Friedrich, Flora Smit, Kristin
Plesser, Andreas Kislat and Holger Schrumpf. Thank you for our time together, for all
the helpful discussions and the friendship that has developed. Unbelievable that you
made me go running. Without you it would not have been the same.
11. Declaration
108
11 Declaration
I declare that this thesis was composed by myself and that I exclusively used the
indicated literature and resources. The thoughts taken directly or indirectly from
external sources are properly marked as such.
Ich versichere an Eides Statt, dass die Dissertation von mir selbständig und ohne
unzulässige fremde Hilfe unter Beachtung der „Grundsätze zur Sicherung guter
wissenschaftlicher Praxis an der Heinrich-Heine-Universität Düsseldorf“ erstellt
worden ist.
Recommended