Western Mediterranean shelf foraminifera: Recent distribution, Holocene sea-level
reconstructions, and paleoceanographic implications
Dissertation
Zur Erlangung des Doktorgrades der Naturwissenschaften im Department
Geowissenschaften der Universität Hamburg
vorgelegt von
Yvonne Milker aus
Leipzig
Hamburg
(2010)
Als Dissertation angenommen vom Department Geowissenschaften der Universität Hamburg
auf Grund der Gutachten von Prof. Dr. G. Schmiedl
und Prof. Dr. C. Betzler
Hamburg, den 07.07.2010
Prof. Dr. Jürgen Oßenbrügge
Leiter des Departments für Geowissenschaften
Danksagung
Zum Entstehen und Gelingen dieser Arbeit hat eine Reihe von Personen beigetragen, denen ich an dieser Stelle meinen Dank ausdrücken möchte.
Allen voran möchte ich mich bei meinem Doktorvater Prof. Dr. Gerhard Schmiedl für die Vergabe des Dissertationsthemas, für die ausgezeichnete fachliche Betreuung, die konstruktiven Diskussionen und Anregungen im Verlaufe der Arbeit sowie für die Verbesserungen der englischen Sprache herzlich bedanken. Weiterhin danke ich herzlich Prof. Dr. Christian Betzler für dessen fachliche Betreuung und die vielen anregenden Diskussionen im Verlaufe der Arbeit.
Dipl. Geol. Miriam Römer und Dipl. Geol. David Jaramillo-Vogel danke ich herzlich für die Bereitstellung der Daten aus ihren Diplomarbeiten und für die vielfältigen Diskussionen. Für seinen Einsatz bei der Aufbereitung des Probenmaterials danke ich Dipl. Geol. Robert Welti. Unserer studentischen Hilfskraft cand. Dipl. Geol. Marc Theodor gilt besonderer Dank für seine Labortätigkeiten und die vorbereitende Arbeiten mit dem Probenmaterial sowie für die vielfältigen Diskussionen und das Aushalten meiner Monologe, die der Reflektion der eigenen Arbeit dienten.
Für die vielfältigen konstruktiven Diskussionen und Anregungen bedanke ich mich bei Dr. Sebastian Lindhorst und Dipl. Geol. Jörn Fürstenau, Prof. Dr. Michal Kucera und Dr. Michael Siccha sowie Prof. Dr. Klaus Reicherter und Prof. Dr. emer. Klaus Bandel.
Dr. Nils Andersen (Leibniz Labor für Altersbestimmung und Isotopenforschung, Universität Kiel) ist für die Durchführung der Isotopenmessung und Prof. Dr. Pieter Grootes (Leibniz Labor für Altersbestimmung und Isotopenforschung, Universität Kiel) für die Durchführungen der Alterdatierungen gedankt.
Weiterhin danke ich der Promotionsförderungsstelle der Universität Hamburg, die es durch meine Anstellung möglich machte diese Arbeit durchführen zu können. Der Deutschen Forschungsgemeinschaft (DFG) ist für die finanzielle Unterstützung im Rahmen des Projektes CARBMED zu danken.
Bei meinen Eltern bedanke ich mich herzlich für die finanzielle Unterstützung während dieser Arbeit und den Rückhalt, den sie mir geben konnten. Meinem Freund Thomas danke ich vor allem für seine emotionale Unterstützung, die es möglich machte, immer wieder neu Kraft zu schöpfen und auch für seine Hilfe bei der Verbesserung des Englischen.
3

Summary
Modern and fossil benthic shelf foraminifera from three western Mediterranean cool-water
carbonate regions (Alboran Platform, Oran Bight and the Mallorca Shelf) have been analyzed
for the development of quantitative sea-level estimates and the reconstruction of changes in
shelf water oceanography. The live (Rose Bengal stained) assemblages exhibit variable
standing stocks and low diversity, probably reflecting seasonal population dynamics during the
sampling period in late summer 2006. The dominance of “high food”-taxa in the live faunas of
Oran Bight suggests the impact of an anthropogenic eutrophication on the near-coastal
benthic ecosystems of this region. In contrast, the dead benthic foraminiferal assemblages are
characterized by a higher diversity. In all study areas, a distinct faunal change between
approximately 80 - 94 m water depth has been observed. On the shelf off Southwest Mallorca,
this faunal shift coincides with the lower distribution limit of living rhodoliths, providing coarse-
grained substrates that are dominated by attached epifauna. The species assemblages of the
shallower sites (down to ~90 m water depth) are dominated by epifaunal species in all study
areas. In contrast, the species assemblages of the deeper stations show regional differences,
depending on the grain-size of the substrate and related accumulation of organic material.
Fine-grained substrates, providing niches for infaunal species, are restricted to low-energy
environments on the deeper Mallorca shelf. These observations demonstrate that the
availability of food on the sea floor and the creation of infaunal niches in cool water carbonate
shelf environments are mainly controlled by the substrate type and do not reflect differences in
surface water production.
For relative sea-level reconstructions, transfer functions based on the Recent benthic
foraminiferal assemblages and on Plankton/ Benthos ratios (P/B) were developed and then
applied to fossil foraminiferal assemblages and P/B ratios. The transfer functions are based on
regression methods such as Weighted Averaging (WA), Partial Least Squares (PLS), and WA-
PLS, and further, the Modern Analoque Technique (MAT). The best predictive potential was
given for the WA-PLS method, reflecting a high potential for quantitative sea-level
reconstructions with an accuracy of +/- 10 m within a total sea-level rise of ~45 and ~47 m for
the Alboran Platform and the southwest shelf off Mallorca, respectively. The more classical
approach, based on Plankton/Benthos (P/B) transfer functions, resulted in less consistent
reconstructions with higher errors. On the Alboran Platform and the Mallorca Shelf, the relative
sea-level estimates correspond to the global and the Mediterranean sea-level developments
during the Holocene. On the Mallorca shelf, the relative sea-level signal interferes with
temporal substrate changes, resulting in minor inconsistencies during the middle Holocene
period. In the Oran Bight, the estimated sea-level rise appears to be overestimated, when
5
Summary
6
compared to the global and Mediterranean sea-level histories in the middle and late Holocene.
While major vertical tectonic movements in this area can be excluded, the overestimation may
be attributed to a problematic age model and to redeposition processes resulting in enhanced
relocation of benthic foraminifera.
The paleoclimatic evolution of the southwestern shelf off Mallorca during the Holocene has
been reconstructed from stable oxygen and carbon isotope records in various benthic and
planktonic foraminiferal tests and by micro- and macrofossil observations in a sediment core.
The earliest Holocene is characterized by a higher seasonality as reflected by stable oxygen
signals in the planktonic foraminifera Globigerinoides ruber (white) and Globigerina bulloides.
The early and middle Holocene period (between 9.6 and 5.5 kyr BP) is characterized by
particularly low seasonal contrasts and by the establishment of humid conditions on Mallorca
Island. This resulted in a freshening of the surface mixed layer, enhanced nutrient fluxes from
the island and a related eutrophication of the near-coastal marine ecosystems. This
hydrological change is reflected by drops in the stable carbon isotope values of G. ruber
(white) and the endobenthic Bulimina aculeata as well as in the appearances of the gastropod
Turritella communis and the endobenthic foraminifer Rectuvigerina phlegeri. This humid period
is nearly contemporaneous to the sapropel S1 formation in the eastern Mediterranean Sea.
This demonstrates for the first time that the early Holocene warm and humid phase in the
Mediterranean Sea has also affected the near-coastal ecosystems in the western part.
The detailed systematic documentation of benthic foraminiferal taxa from shallow-water
carbonate environments of the western Mediterranean Sea provides a solid taxonomic base
for further ecological and paleoenvironmental applications and adds significantly to already
existing systematic descriptions from other areas of the Mediterranean Sea.
Kurzfassung
Im Rahmen der vorliegenden Arbeit wurden rezente und holozäne benthische Foraminiferen
aus drei Karbonatschelfgebieten im westlichen Mittelmeer (Alboran-Plattform, Bucht von Oran
und der Schelf von Mallorca) auf ihre Zusammensetzung, ihre Abhängigkeit von
Umweltbedingungen sowie auf ihr zeitliches Auftreten hin untersucht. Wesentliches Ziel der
Arbeit ist die Entwicklung von Transferfunktionen für quantitative Meeresspiegel-
Rekonstruktionen und die Dokumentation von regionalen Auswirkungen der holozänen
Klimadynamik auf flachmarine Ökosysteme im westlichen Mittelmeer.
Die Lebendgemeinschaftten zeichnen sich durch eine relativ geringe Diversität und
schwankende Siedlungsdichten aus, was auf eine saisonal bedingte Populationsdynamik
hinweist. In der Bucht von Oran werden die Lebendgemeinschaften von infaunalen
Foraminiferen dominiert, was auf eine anthropogen verursachte Eutrophierung dieser Region
in jüngster Vergangenheit zurückgeführt wird. Im Unterschied zu den Biozönosen sind die
Thanatozönosen deutlich höher divers. Die flacheren Stationen (bis etwa 90 m Wassertiefe)
im Untersuchungsgebiet werden von epifaunal lebenden Foraminiferen dominiert und weisen
im Hinblick auf ihre Artenzusammensetzung Ähnlichkeiten untereinander auf. Im Gegensatz
dazu zeigen die Totgemeinschaften der tieferen Stationen (~90 m - 235 m) deutlichere
regionale Unterschiede, die in einem engen Zusammenhang mit dem vorhandenen
Substrattyp und der damit verbundenen Akkumulation organischen Materials stehen. Dieser
signifikante Faunenwechsel wurde in allen Untersuchungsgebieten beobachtet und fällt auf
dem Schelf von Mallorca mit der Wassertiefe zusammen, in der noch lebende Rotalgen
angetroffen werden. Die flacheren Stationen auf dem Schelf zeichnen sich durch das
Vorhandensein grobkörnigen Substrats aus, auf dem epifaunal lebende Foraminiferen
festgeheftet leben können, während die tieferen Stationen durch das Vorhandenensein
feinkörnigen Substrats gekennzeichnet sind, welches einerseits Nischen für infaunal lebende
Arten bereitstellt und anderseits auf geringe Bodenströmungen hindeutet. Diese
Beobachtungen zeigen, dass die Verfügbarkeit von Nahrung und Nischen für infaunal lebende
Foraminiferen eng mit dem wassertiefenabhängigen Substrat-Typ verknüpft ist, während die
Oberflächenwasserproduktion die Zusammensetzung der Thanatozönosen nur wenig zu
beeinflussen scheint.
Die rezenten benthischen Totgemeinschaften, die in den Untersuchungsgebieten auskartiert
wurden, bilden die Grundlage für die Rekonstruktion der spätglazialen und Holozänen
Meeresspiegelentwicklung. Mittels verschiedener Regressionsmethoden („Weighted
Averaging“ WA, „Partial Least Squares“ PLS und WA-PLS) sowie der „Modern Analog
Technique“ (MAT) wurden Transferfunktionen entwickelt, die auf die fossilen Thanatozönosen
7
Kurzfassung
in drei Sedimentkernen aus den Untersuchungsgebieten angewandt wurden. Darüber hinaus
wurden verschiedene Transferfunktionen aus rezenten Plankton/Benthos-Verhältnissen (P/B)
abgeleitet und auf fossile P/B-Verhältnisse angewandt. Die WA-PLS-Methode weist in allen
Untersuchungsgebieten das größte Vorhersagepotential auf. Es wurden Genauigkeiten von
+/- 10 m bei einem Gesamtmeerespiegelanstieg von ~45 m für die Alboran Platform und ~50
m für den südwestlichen Schelf von Mallorca erreicht, was das Potential benthischer
Schelfforaminiferen für quantitative Meeresspiegel-Rekonstruktionen verdeutlicht. Die
Rekonstruktionen, die auf den verschiedenen P/B-Transferfunktionen beruhen, zeigten
hingegen größere Ungenauigkeiten. Auf der Alboran-Plattform und dem Schelf von Mallorca
stimmt die rekonstruierte Meeresspiegelentwicklung im Wesentlichen mit dem globalen Trend
und der mediterranen Meeresspiegelentwicklung während des Holozäns überein. Allerdings
zeigen die mittels multivariaten statistischen Methoden analysierten Arten-Umwelt-
Zusammenhänge auf dem Schelf von Mallorca einen signifikanten Einfluss von
Substratänderungen auf die Meeresspiegel-Rekonstruktionen im mittleren Holozän, was in
einer geringen Überschätzung der Paläowassertiefen in diesem Zeitabschnitt führte. In der
Bucht von Oran hingegen wurde ein Meeresspiegelanstieg für das mittlere und späte Holozän
rekonstruiert, der deutlich über dem globalen und denen der anderen Arbeitsgebiete liegt.
Eine Beeinflussung durch tektonische Hebungsprozesse kann bei der zugrundeliegenen
Genauigkeit ausgeschlossen werden. Vielmehr erscheint es wahrscheinlich, dass
Umlagerungen von Foraminiferengehäusen und/ oder ein problematisches Altersmodell zu
diesen Resultaten führten.
Zur Rekonstruktion der paläoökologischen and paläoozeanographischen Entwicklung des
Schelfs von Mallorca wurden stabile Sauerstoff- und Kohlenstoffisotopensignale in
benthischen und planktischen Foraminiferengehäusen gemessen und interpretiert. Die
stabilen Sauerstoffisotopensignale in den planktischen Foraminiferen Globigerina bulloides
und Globigerinoides ruber (weiß) belegen, dass das früheste Holozän durch eine höhere
Saisonalität gekennzeichnet war. Im frühen und mittleren Holozän, zwischen etwa 9,5 und 5,5
ka vor heute, hingegen sanken die saisonalen Unterschiede und es stellten sich humide
Bedingungen auf der Insel von Mallorca ein. Dies führte zu einer erhöhten Frischwasser- und
damit Nährstoffzufuhr auf dem südwestlichen Schelf von Mallorca, was sich in den stabilen
Kohlenstoffsignalen in G. ruber (weiß) und über erhöhte Nahrungsflüsse auch in der
benthischen Foraminifere Bulimina aculeata widerspiegelt. Darüber hinaus weisen das
gehäufte Auftreten des benthischen Gastropoden Turritella communis und der infaunalen
benthischen Foraminifere Rectuvigerina phlegeri ebenfalls auf eine Eutrophierung der
mallorcinischen Küstenregion in dieser Zeit hin. Das Auftreten humider Bedingungen auf der
Insel von Mallorca fällt zeitlich annähernd mit der Bildungsphase des Sapropels S1 im
östlichen Mittelmeer zusammen. Dies zeigt, dass die frühholozäne Feuchtphase im Mittelmeer
8
Kurzfassung
9
nicht nur das östliche Mittelmeer sondern auch die Küstenregionen im westlichen Mittelmeer
beeinflusst hat.
Die systematische Untersuchung der rezenten und fossilen Benthosforaminiferen im
Untersuchungsgebiet in Hinblick auf ihre taxonomische Zuordnung erfolgte mit dem Ziel, eine
systematische Beschreibung dieser Foraminiferen zu erstellen. Hierdurch wurden bereits
vorhandene taxonomische Arbeiten für das Mittelmeer deutlich erweitert.

Table of contents
1 Introduction…………………………………………………………………………………... 15
1.1 Aims of the study…………………………………………………………………………….… 17
1.2 Outline of thesis…………………………………………………………………………......… 17
2 Study area…………………………………………………………………………………….. 19
2.1 Geographical and geological settings……………………………………………………….. 19
2.2 Climate, hydrography and productivity……………………………………………………… 20
3 Distribution of Recent benthic foraminifera in neritic carbonate
environments of the western Mediterranean Sea………………………………………….. 25
Abstract……………………………………………………………………………………………… 25
3.1 Introduction……………………………………………………………………………………... 26
3.2 Study area……………………………………………………………………………………… 27
3.3 Materials and methods………………………………………………………………………... 28
3.4 Results………………………………………………………………………………………….. 31
3.4.1 Surface sediment composition and grain-size…………………………………………………… 31
3.4.2 Distribution of living (Rose Bengal stained) benthic foraminifera……………………………… 31
3.4.3 Distribution of dead benthic foraminifera………………………………………………………… 33
3.4.4 Relationship between foraminifera and environmental parameters………………………….. 35
3.5 Discussion……………………………………………………………………………………… 38
3.5.1 Diversity of benthic foraminifera in shelf carbonate environments……………………………. 38 3.5.2 Impact of substrate, hydrodynamic energy at the benthic boundary layer, and food
availability…………………………………………………………………………………………….......... 39
3.5.2.1 Benthic foraminiferal assemblages from shallow water sites………………………………………… 40
3.5.2.1 Benthic foraminiferal assemblages from deeper sites……………………………………………….... 41
3.5.3 Potential anthropogenic impacts………………………………………………………………….. 42
3.6 Conclusions…………………………………………………………………………………….. 43
11
Table of contents
4 Holocene sea-level change in the western Mediterranean Sea:
Quantitative reconstructions based on foraminiferal transfer functions……………… 45
Abstract……………………………………………………………………………………………… 45
4.1 Introduction…………………………………………………………………………………….. 46
4.1.1 Quantitative sea-level reconstructions based on foraminifera………………………………… 47
4.2 Study area……………………………………………………………………………………… 48
4.2.1 Tectonic setting and sedimentation processes………………………………………………….. 48
4.2.2 Oceanographic settings……………………………………………………………………………. 49
4.3 Materials and methods………………………………………………………………………... 50
4.3.1 Samples, sample preparation and statistical methods…………………………………………. 50
4.3.2 Age model…………………………………………………………………………………………… 51
4.3.3 Methods for quantitative sea-level reconstructions…………………………………………….. 53
4.3.3.1 Transfer functions based on Plankton/ Benthos ratios………………………………………………… 53 4.3.3.2 Weighted Averaging, Partial Least Squares, Weighted Averaging - Partial Least Squares
and Modern Analog Technique…………………………………………………………………………………….53
4.4 Results………………………………………………………………………………………….. 54
4.4.1 Recent and Holocene Plankton/ Benthos ratios………………………………………………… 54
4.4.2 Holocene benthic foraminiferal assemblages…………………………………………………… 56
4.4.3 Results of the quantitative sea-level reconstructions……………………………………….….. 57
4.4.3.1 Transfer functions based on Plankton/ Benthos ratios………………………………………………… 57
4.4.3.2 Transfer functions based onWA, PLS, WA-PLS and MAT……………………………………………. 60
4.5 Discussion……………………………………………………………………………………… 63 4.5.1 Comparison and significance of the different transfer functions for quantitative
sea-level reconstruction…………………………………………………………………………………... 63 4.5.2 Global versus regional sea-level evolution of the western Mediterranean Sea during the
late glacial and Holocene…………………………………………………………………………………. 64 4.5.3 Shelf ecosystem processes and the significance of quantitative sea-level reconstructions
for the late glacial and Holocene western Mediterranean Sea………………………………………. 66
4.6 Conclusions…………………………………………………………………………………….. 68
5 Impact of an early Holocene humid phase on shelf environments off
Southwest Mallorca, western Mediterranean Sea.............................................................71
Abstract................................................................................................................................. 71
5.1 Introduction..................................................................................................................... 72
5.2 Regional settings............................................................................................................. 73
12
Table of contents
13
5.2 Materials and methods.................................................................................................... 75
5.3 Results............................................................................................................................ 76
5.4 Discussion....................................................................................................................... 78
5.4.1 Regional climate trends and seasonality............................................................................... 78
5.4.2 Regional hydrology, organic matter fluxes and benthic shelf ecosystem dynamics.............. 81
5.5 Conclusions..................................................................................................................... 84
6 Taxonomy of modern benthic shelf foraminifera in the western
Mediterranean Sea………………………………………………………………………………... 85
Abstract……………………………………………………………………………………………... 85
6.1 Introduction…………………………………………………………………………………….. 86
6.2 Materials and methods……………………………………………………………………….. 87
6.3 Systematic benthic foraminiferal descriptions……………………………………………… 88
7 Conclusions and outlook………………………………………………………...............147
7.1 Conclusions……………………………………………………………………………...........147
7.2 Outlook…………………………………………………………………………………………148
8 References………………………………………………………………............................151
Appendix
Enclosure 1 CD-ROM (census counts; Tables A.17-A.21)

1 Introduction
Foraminifera occur in high numerical densities in marine environments and provide an
excellent tool for paleoceanographic reconstructions, relative sea-level estimates, and
biodiversity studies. The Mediterranean Sea is one of the primary regions for the investigation
of foraminiferal ecology and paleoecology because of its strong spatial and temporal variability
of environmental conditions and high foraminiferal diversity. In this context, the comprehensive
taxonomic overviews by d’Orbigny (1839), Parker (1958), Todd (1958), Hofker (1960), and
more recently, by Cimerman and Langer (1991), Sgarrella and Moncharmont Zei (1993) and
Rasmussen (2005) established a solid basis for further applications. Various ecological
studies revealed significant spatial contrasts in the species composition. These studies
showed that the diversity and microhabitat structure of Mediterranean benthic foraminiferal
faunas, like in other oceans, depend on food and oxygen availability (Jorissen et al., 1995; De
Rijk et al., 2000).
The distribution of shelf faunas is additionally influenced by gradients in light, temperature,
salinity, the type of substrate, as well as velocity and turbulence of surface water currents
(Jorissen, 1987; Cimerman & Langer, 1991; Sgarrella & Moncharmont Zei, 1993; Culver et al.,
1996; Langer et al., 1998; Pawlowski et al., 2001; Saraswati, 2002; Schönfeld, 2002;
Saraswati et al., 2003; Sen Gupta, 2003; Mendes et al., 2004; Lee, 2006 and Mojtahid et al.,
2009). Shelf benthic foraminifera display a stenobathyal distribution, which is determined by
oceanographic, trophic and sedimentological conditions. First data on the bathymetric
zonation of Mediterranean benthic shallow water to deep sea foraminifera was reported by
Bandy & Cherici (1966) and Cita & Zocchi (1978). More recent publications have shown that
deposit feeding foraminifera decrease in number with increasing distance from the coast and
increasing water depth as a response to a decreasing flux of organic matter (De Stigter et al.,
1998). De Rijk et al. (1999, 2000) have illustrated that W-E shifts in the bathymetric zonation
of shallow to deep benthic foraminiferal faunas in the Mediterranean Sea are basically
determined by food availability.
The accurate knowledge of relative sea-level changes plays a fundamental role in the
reconstruction of global circulation patterns, ice sheet dynamics, regional tectonic movements
and validation of model results of future sea-level trends. The relative sea-level of the
Mediterranean Sea during the late glacial and the Holocene follows that of the global sea-level
development, but it is further influenced by neotectonic movements and hydro-isostatic effects
(Kayan, 1988; Alessio et al., 1994; Antonioli et al., 1999; Lambeck & Bard, 2000; Antonioli et
al., 2001; Morhange et al., 2001; Sivan et al., 2001; Antonioli et al., 2002; Goy et al., 2003;
Lambeck et al., 2004; Pirazolli, 2005; Vouvalidis et al., 2005; Berne et al., 2007 and Stocchi &
15
Introduction
Spada, 2007). In this context, bathymetric information is provided by both benthic and
planktonic foraminifera. An older and relatively simple method for quantitative sea-level
estimates is the use of transfer functions based on the ratio of planktonic to benthic
foraminifera (e.g. Van der Zwaan et al. 1990; De Rijk et al., 1999 and Van Hinsbergen et al.
2005). In addition, various regression methods (e.g. Weighted Averaging, Partial Least
Squares or Weighted Averaging-Partial Least Squares) have been applied on marsh
foraminifera for an accurate quantification of low-amplitude sea-level changes (e.g. Horton et
al. 1999; Gehrels 2000; Sabean, 2004; Horton & Edwards 2006; Boomer & Horton, 2006;
Leorri et al. 2008; Nelson et al., 2008 and Hawkes et al., in press). To date, these
sophisticated regression methods have never been applied to shelf sediment successions
over the full range of glacio-eustatic sea-level changes.
Sediments from the Mediterranean Sea provide excellent climate archives. The ocean basin
is situated between a humid and temperate climate regime in its northern part, and an arid
climate regime in its southern part. Its oceanography and ecosystems respond sensitively to
climatic changes. Marine sediments have been intensively studied with focus on the Neogene
paleoclimatic history (e.g. Thunell et al., 1984; Rohling and de Rijk, 1999; Ariztegui et al.,
2000; Cacho et al., 2000; Emeis et al., 2000; Cacho et al., 2001; Sbaffi et al., 2001; Cacho et
al., 2002; Sbaffi et al., 2004; Jimenez-Espejo et al., 2007 and Kuhnt et al., 2008). The eastern
Mediterranean Sea is characterized by cyclical depositions of sapropels, documenting the
impact of insolation-driven hydrological changes (e.g. Rossignol-Strick et al., 1982; Rohling
and Hilgen, 1991; Cramp and O’Sullivan, 1999). In the western Mediterranean Sea, sapropel-
equivalent depositions have only rarely been found, implying a generally better ventilation of
deep sea basins (Comas et al., 1996; Capotondi and Vigliotti, 1999). The drastic climatic and
circulation changes are documented in the faunal and geochemical composition of
foraminifera. The stable isotope signatures of planktonic foraminifera has been interpreted in
terms of changes in temperature and freshwater discharge (e.g. Vergnaud Grazzini, 1977;
Thunell et al., 1984; Vergnaud Grazzini et al., 1986; Rohling et al., 2002; Casford et al., 2003
and Rohling et al., 2004). In combination with independent proxies, this allowed the
quantification of past sea surface temperatures and salinities (Thunell, 1979; Hayes et al.,
1999; Emeis et al., 2000; Kucera et al., 2005 and Melki et al., 2009). In contrast, benthic
foraminiferal stable isotope signals provide information on deep-water ventilation and organic
matter fluxes (Vergnaud Grazzini et al., 1986; Vergnaud Grazzini & Pierre 1991, 1992;
Schilman et al., 2001 and Kuhnt et al., 2008).
16
Chapter 1
17
1.1 Aims of the study
Major target of this study is the reconstruction of the late glacial and Holocene sea-level
history based on benthic and planktonic foraminifera from the western Mediterranean Sea. In
a first step, the biodiversity, distribution and ecology of Recent benthic foraminifera has been
studied in order to provide data on foraminiferal assemblages in neritic carbonate
environments and their relation to specific environmental conditions. In a second step, this
knowledge is used for the development of transfer functions for quantitative sea-level
reconstructions. These major aims are complemented by the reconstruction of the
paleoclimatic and paleooceanographic history of the southwestern shelf off Mallorca during the
Holocene, based on planktonic and benthic stable oxygen and carbon isotope records. In
order to realize the aims of this study, a comprehensive taxonomic framework is established
for the benthic foraminiferal faunas. This can provide important insights into the biodiversity of
shelf foraminifera in cool water carbonate environments.
1.2 Outline of thesis
This thesis is subdivided into 7 chapters. Chapter 1 contains an introduction and chapter 2
gives an overview on the present geographical and geological settings as well as on the
climatic and oceanographic conditions in the Mediterranean Sea. Chapter 3 concentrates on
the distribution of Recent benthic shelf foraminifera in three selected areas of the western
Mediterranean Sea and their relation to the environment. The results of this chapter provide
the base for chapter 4, where quantitative sea-level reconstructions for late glacial and
Holocene successions are presented. These reconstructions are based on the development
and application of various transfer functions using benthic foraminifera and Plankton/Benthos
ratios. Chapter 5 focuses on the reconstruction of paleo-environmental changes on the
southwestern shelf off Mallorca during the Holocene, recorded in the stable carbon and
oxygen isotope signals of benthic and planktonic foraminifera and in faunal changes. Chapter
6 contains a systematic description of the benthic shelf foraminifera investigated in this study
and chapter 7 presents the conclusions of the study and an outlook.
The basis of chapters 3 and 4 are provided by a publication in Marine Micropaleontology in
2009 and a publication submitted in Quarternary Science Reviews, respectively. Chapters 5
and 6 are based on manuscript drafts, prepared for publication in international journals.

2 Study area
2.1 Geographical and geological settings
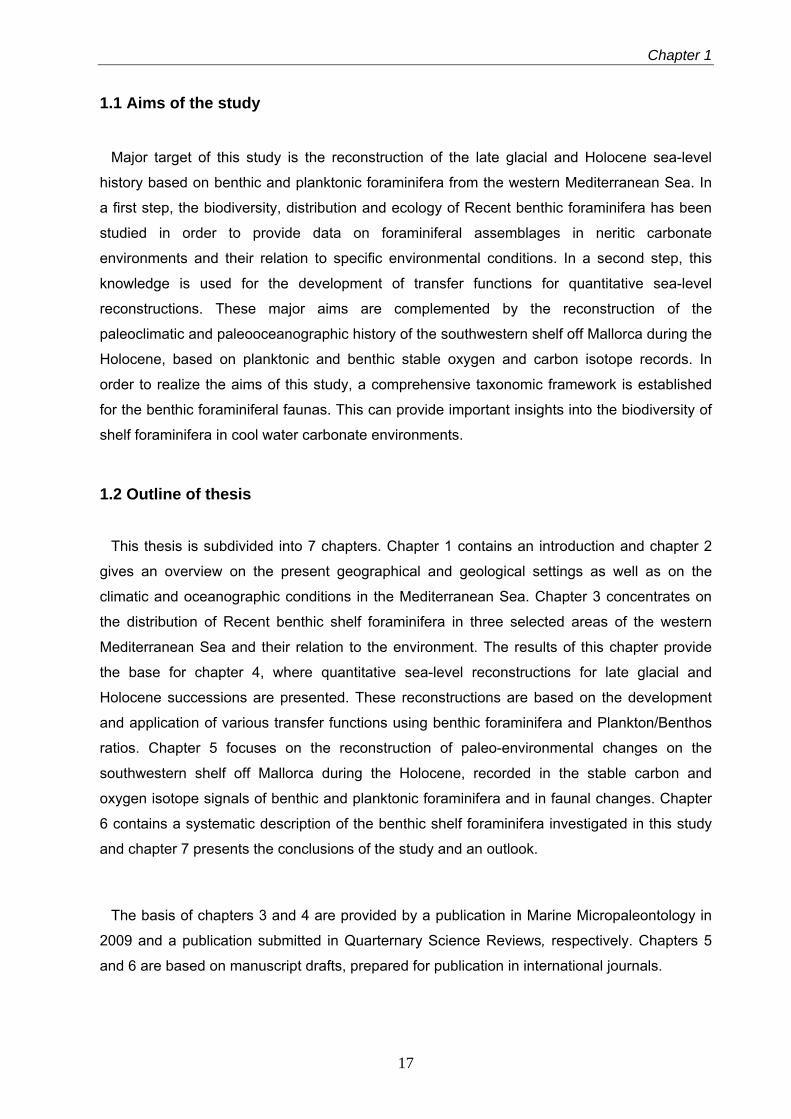
The semi-enclosed Mediterranean Sea that represents a relict basin of the Tethys Ocean, is
situated between the European and the African continent (Fig. 2.1). It covers an area of 2.5
million km2 with an EW extent of 3700 km and an NS extent of 1600 km (Lionello et al., 2004).
The average water depth is 1500 m and the maximum water depth of 5150 m is reached in the
Ionian Sea (Lionello et al., 2004). The Mediterranean Sea is divided into two nearly equal
sized basins - the western Mediterranean Basin and the eastern Mediterranean Basin -
connected through the Strait of Sicily with approximately 330 m water depth (Wüst, 1960;
Robinson et al., 2001). Via the Strait of Gibraltar (~345 m depth) it is connected with the North
Atlantic Ocean and through the Marmara Sea with the Black Sea. The eastern Mediterranean
Sea comprises the Levantine and Ionian Basins and the Adriatic and Aegean Seas (Fig. 2.1).
The western Mediterranean Basin is subdivided into the Alboran Basin in its western part, the
Provencal and Algerian Basins in its middle part and the Tyrrhenian Basin in its eastern part
(Fig. 2.1).
Fig. 2.1. Simplified map of the Mediterranean Sea with location of the study area in the western Mediterranean Sea.
The opening of the western Mediterranean Sea mainly took place from the late Oligocene
onwards (Gueguen et al., 1998; Comas et al., 1999). The present western Mediterranean sub-
basins become progressively younger eastwards. They were formed by late orogenic
extension, resulting from the collision of Eurasian and African plates from the Cretaceous to
the Paleogene, which is related to the spreading of the Atlantic Ocean ridge (Gueguen et al.,
19
Study area
1998; Comas et al., 1999). The opening of the Alboran, Provencal and Valencia basins dates
back to the Oligocene and the early Miocene, whereas the Algerian and Tyrrhenian basins
were formed from the Late Miocene to the Plio-Pleistocene (Dewey et al., 1989; Sanz De
Galdeano, 1990; Doglioni et al., 1997; Gueguen et al., 1998) (Fig. 2.2). These basins acted as
parts of a back arc-basin, related to the eastward roll back of the Apennines-Maghrebides
subduction zone (Doglioni et al., 1997; Gueguen et al., 1998) (Fig. 2.2).
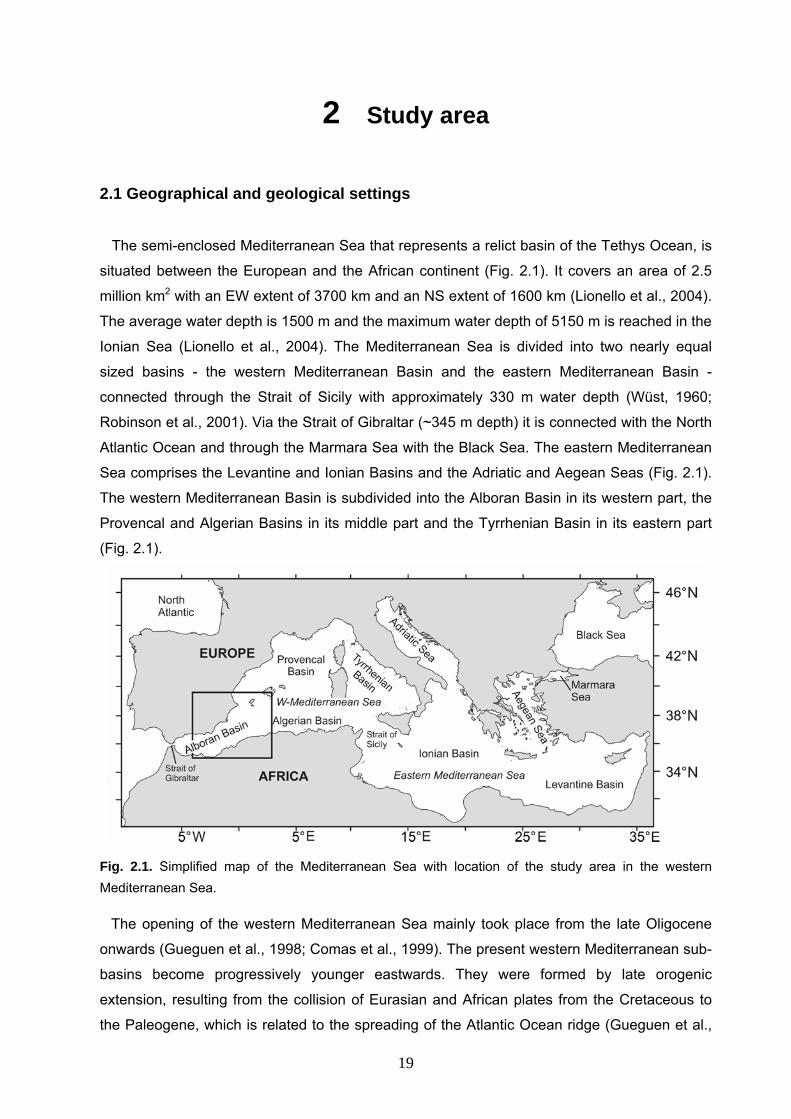
Recently, the Alboran region and Algerian coast are influenced by tectonic movements.
Along the Alboran Ridge, uplifting processes and active subsidence occur coevally (Comas et
al, 1999; Martinez-Garcia et al., submitted). Otherwise, no distinct subsidence or uplift since
the Miocene is recorded for the southwestern Mallorca Island (Pomar, 1991). Recent
seismicity in the western Mediterranean is almost entirely restricted to the western Alboran
Sea and the North Algerian coast, where earthquakes are relatively frequent (e.g. Piromallo &
Morelli, 2003; Giresse et al., 2009). The Oran region is characterized by relatively high
seismicity and the occurrence of earthquakes (Bouhadad, 2001), whereas the Mallorca region
shows only low seismic activity (Silva et al., 2001).
Fig. 2.2. Present tectonic situation in the western Mediterranean Sea redrawn after Gueguen et al. (1998) showing the positions of the Apennines Front and the Betic and Alpine Fronts.
2.2 Climate, hydrography and productivity
The Mediterranean Sea is situated in the transition zone between two major climate regions:
a humid and temperate climate in the north and an arid climate in the south. Following an
20
Chapter 2
updated Köppen & Geiger climate classification published in Peel et al. (2007), most of the
northern, north-eastern and the south-western coastal regions are characterized by a
temperate climate with dry and hot or warm summers with or without a dry season, while the
south-eastern Mediterranean coastal regions are influenced by a warm desert climate.
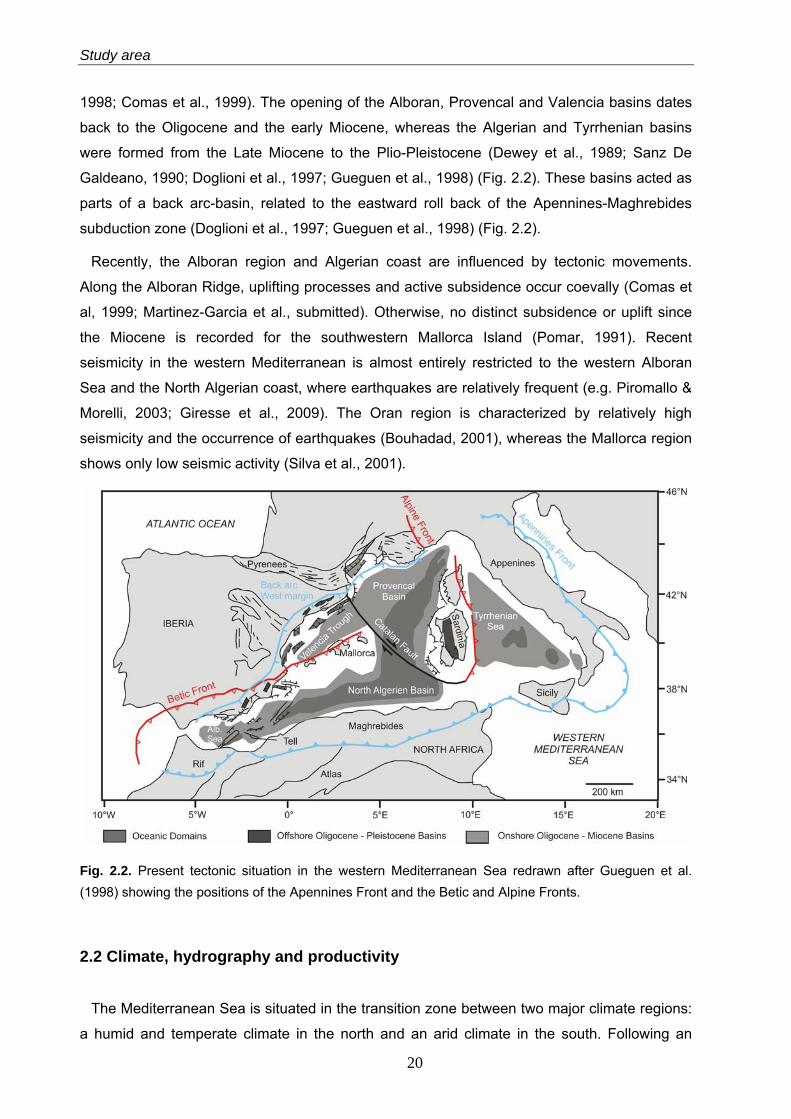
The seasonal climate variability is generally linked to the North Atlantic Oscillation (NAO)
during the winter season and to the position of the inner-tropical convergence zone (ITCZ) in
the summer months. During the summer season, when the ITCZ and the Azores High shift
towards higher latitudes, the Mediterranean region is under direct influence of the Hadley
circulation - driven by deep convection in the ITCZ - and a stable high-pressure system is
established across the Mediterranean resulting in hot and dry summers (Cramp & O’Sullivan,
1999; Traub et al. 2003) (Fig. 2.3). In the Mediterranean Sea, warm and dry winters are
related to a positive NAO pattern, whereas cold and wet winters occur during a negative NAO
pattern (Luterbacher et al., 2006). In contrast, during the winter season the eastern
Mediterranean might be more affected by the North Sea Caspian Pattern (NCP) that is formed
in the mid Troposphere due to geopotential height differences between the North Sea and the
Caspian Sea (Gündüz & Özsoy, 2005).
Fig. 2.3. Surface pressure (high pressure H, low pressure L), wind and precipitation in the Mediterranean region and in North Africa during January and July. The figure has been adapted from Cramp & O’Sullivan (1999).
The Mediterranean Sea is characterized by four main water masses. The surface water
mass up to 75 - 150 m depth mainly consists of inflowing Atlantic Water (AW) (Wüst, 1961;
Rixen et al., 2005) (Fig. 2.4). The intermediate water mass between ~150m - 600 m water
depth consists of the Levantine Intermediate Water (LIW) which is formed in the eastern part
of the Mediterranean (Wüst, 1961; Robinson et al., 2001). The basins below 600 m water
depth are filled by deep water masses. The Western Mediterranean Deep Water (WMDW) is
21
Study area
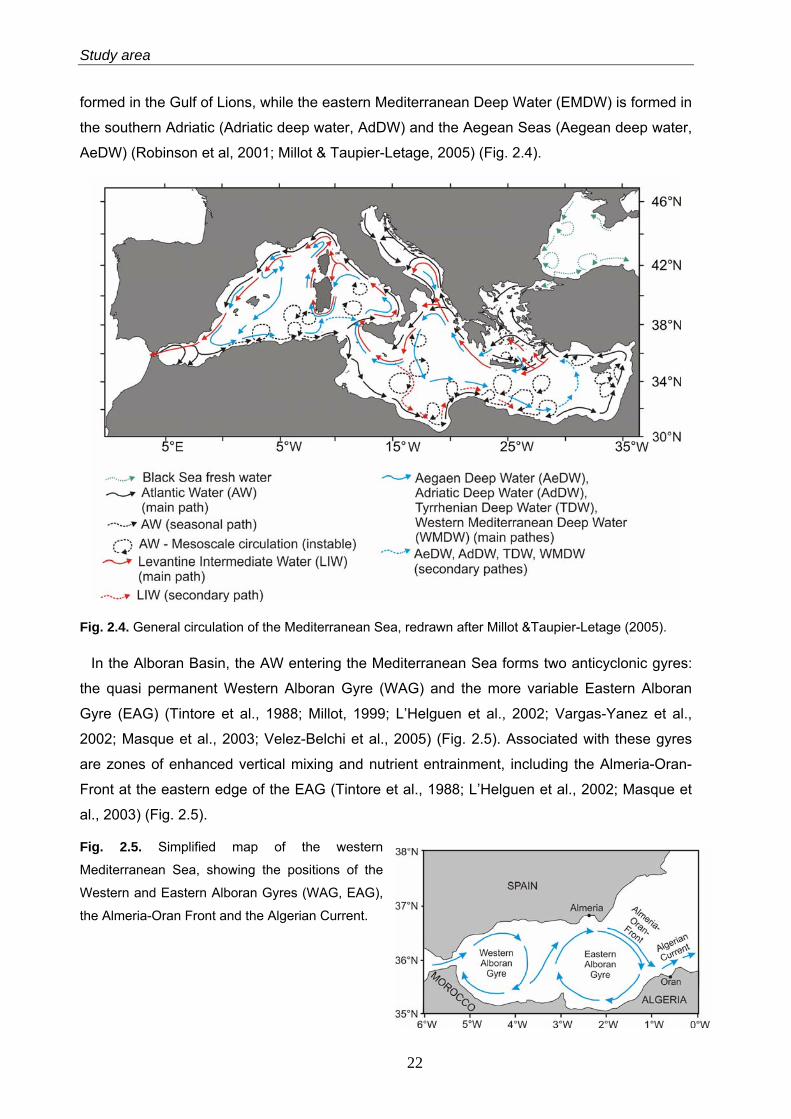
formed in the Gulf of Lions, while the eastern Mediterranean Deep Water (EMDW) is formed in
the southern Adriatic (Adriatic deep water, AdDW) and the Aegean Seas (Aegean deep water,
AeDW) (Robinson et al, 2001; Millot & Taupier-Letage, 2005) (Fig. 2.4).
Fig. 2.4. General circulation of the Mediterranean Sea, redrawn after Millot &Taupier-Letage (2005).
In the Alboran Basin, the AW entering the Mediterranean Sea forms two anticyclonic gyres:
the quasi permanent Western Alboran Gyre (WAG) and the more variable Eastern Alboran
Gyre (EAG) (Tintore et al., 1988; Millot, 1999; L’Helguen et al., 2002; Vargas-Yanez et al.,
2002; Masque et al., 2003; Velez-Belchi et al., 2005) (Fig. 2.5). Associated with these gyres
are zones of enhanced vertical mixing and nutrient entrainment, including the Almeria-Oran-
Front at the eastern edge of the EAG (Tintore et al., 1988; L’Helguen et al., 2002; Masque et
al., 2003) (Fig. 2.5).
Fig. 2.5. Simplified map of the western
Mediterranean Sea, showing the positions of the
Western and Eastern Alboran Gyres (WAG, EAG),
the Almeria-Oran Front and the Algerian Current.
22
Chapter 2
The recent anti-estuarine circulation in the Mediterranean Sea is forced by its negative water
balance, e.g. increasing evaporation rates towards the eastern basins (Bethoux, 1980; Millot &
Taupier-Letage, 2005). The AW (mean annual salinity of 36 - 37‰) that flows from the
western Mediterranean through the Strait of Gibraltar into the eastern Mediterranean,
gradually increasing in salinity to around 39‰ (Bethoux, 1980; Malanotte-Rizzoli, 1988; Millot
& Taupier-Letage, 2005) (Fig. 2.4). In the winter months, vertical convection occurs in the
eastern Mediterranean due to cooling of the saline AW, resulting in the formation of LIW (e.g.
Millot & Taupier-Letage, 2005). The LIW flows back to the western Mediterranean, and as
Mediterranean Intermediate Water (MIW) it enters the North Atlantic Ocean (Fig. 2.4). This
water mass has a salinity of ~38 - 38.5‰ (Bethoux, 1980; Millot & Taupier-Letage, 2005).
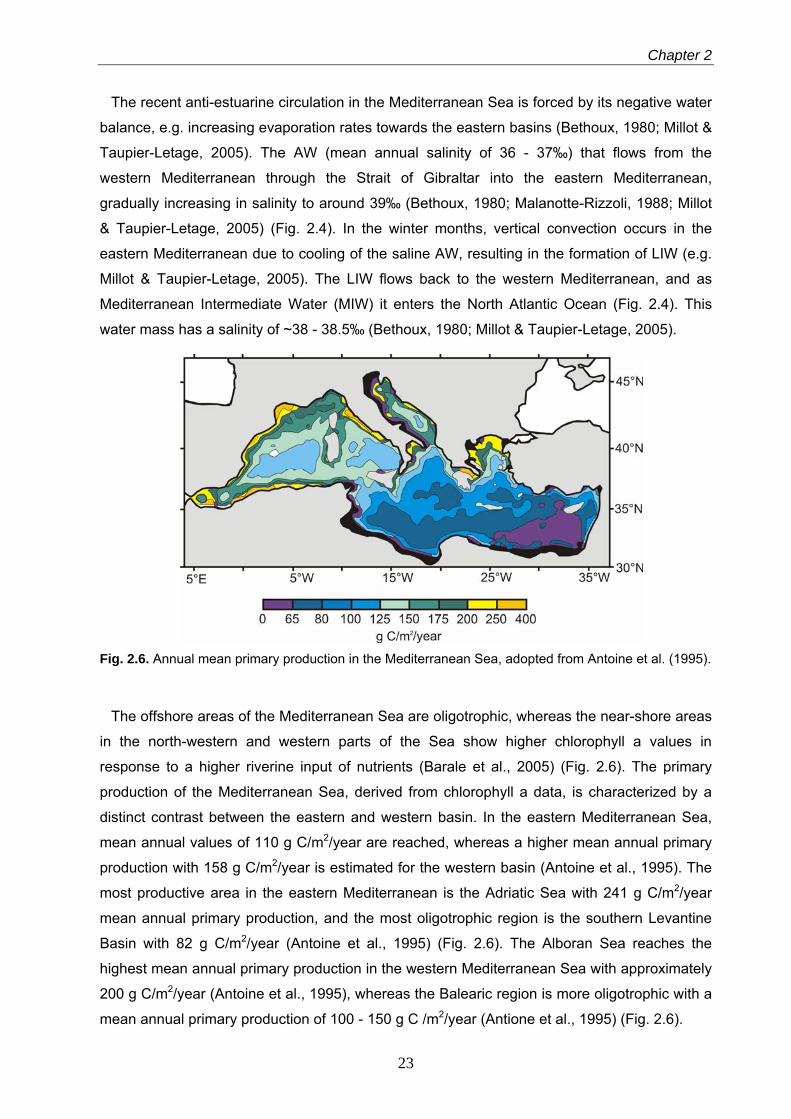
Fig. 2.6. Annual mean primary production in the Mediterranean Sea, adopted from Antoine et al. (1995).
The offshore areas of the Mediterranean Sea are oligotrophic, whereas the near-shore areas
in the north-western and western parts of the Sea show higher chlorophyll a values in
response to a higher riverine input of nutrients (Barale et al., 2005) (Fig. 2.6). The primary
production of the Mediterranean Sea, derived from chlorophyll a data, is characterized by a
distinct contrast between the eastern and western basin. In the eastern Mediterranean Sea,
mean annual values of 110 g C/m2/year are reached, whereas a higher mean annual primary
production with 158 g C/m2/year is estimated for the western basin (Antoine et al., 1995). The
most productive area in the eastern Mediterranean is the Adriatic Sea with 241 g C/m2/year
mean annual primary production, and the most oligotrophic region is the southern Levantine
Basin with 82 g C/m2/year (Antoine et al., 1995) (Fig. 2.6). The Alboran Sea reaches the
highest mean annual primary production in the western Mediterranean Sea with approximately
200 g C/m2/year (Antoine et al., 1995), whereas the Balearic region is more oligotrophic with a
mean annual primary production of 100 - 150 g C /m2/year (Antione et al., 1995) (Fig. 2.6).
23

3 Distribution of Recent benthic foraminifera in
neritic carbonate environments of the western Mediterranean Sea
Abstract
The distribution of Recent shallow-water benthic foraminifera in surface sediment samples
from cool-water carbonate environments of the Oran Bight, Alboran Platform and Mallorca
Shelf in the western Mediterranean Sea was studied. Multivariate statistical analyses resulted
in the identification of species assemblages, representing different environmental settings. In
all three regions the assemblages show a distinct bathymetric zonation that is mainly
attributed to the distribution of rhodoliths and related substrates, but also to water turbulence
and the availability of food at the sea floor. The live assemblages (Rose Bengal stained
individuals) are characterized by rather low diversity and low standing stocks, likely reflecting
seasonal population dynamics. In the Oran Bight, elevated standing stocks of “high food”-taxa
suggest the impact of anthropogenic eutrophication on the near-coastal benthic ecosystems of
this area. The diversity of the dead assemblages is higher than in siliclastic shelf ecosystems
of the Mediterranean Sea but lower when compared to carbonate environments of the
Levantine Sea. This regional difference is mainly attributed to lower sea surface temperatures
and the lack of Lessepsian invaders in the western Mediterranean Sea. In all study areas, a
distinct faunal change occurs between approximately 80 - 90 m water depth. This change
coincides with the lower distribution limit of living rhodoliths at the shelf of Mallorca, providing
coarse-grained substrates that are dominated by attached taxa. Below this depth interval, the
fauna shows regional differences depending on the grain-size and related accumulation of
organic material. Fine-grained substrates with infaunal niches are restricted to low-energy
environments on the deeper shelf southwest off Mallorca.
This chapter is based on: Milker Y., Schmiedl, G., Betzler, C., Römer, M., David Jaramillo-Vogel, D.,
Siccha, M., 2009. Distribution of Recent benthic foraminifera in shelf carbonate environments of the
western Mediterranean Sea. Marine Micropaleontology 73, 207-255
25
Recent benthic foraminifera in the Western Mediterranean Sea
3.1 Introduction
Benthic foraminifera are widely used in ecological and paleoceanographic studies of various
marine environments. In deep-sea benthic ecosystems, diversity, species composition and
microhabitat preferences of benthic foraminifera basically reflect food and oxygen availability
on the sea floor and in the upper surface sediment (e.g., Corliss, 1985; Jorissen et al., 1995;
Van der Zwaan et al., 1999; De Rijk et al., 2000). Similar adaptations are observed in shelf
ecosystems with fine-grained substrates (Jorissen et al., 1992; Mojtahid et al., 2009).
However, shallow water (littoral and neritic) habitats can be additionally influenced by
gradients in light, temperature, salinity, substrate, as well as velocity and turbulence of surface
waters currents (Culver et al., 1996; Sen Gupta, 2003). These faunas commonly exhibit high
foraminiferal numbers, variable diversity and a dominance of epifaunal and shallow infaunal
taxa (e.g. Semeniuk, 2000; Murray, 2006). Particularly, many shallow-water taxa depend on
the hydrodynamic energy at the benthic boundary layer and the corresponding substrate on
the sea floor. The response of these taxa to oceanographic, trophic and sedimentological
parameters is reflected by a stenobathyal distribution pattern.
In the Mediterranean Sea, the distribution of shelf foraminifera is documented in various
regional studies (e.g., Jorissen, 1987; Cimerman & Langer, 1991; Sgarrella & Moncharmont
Zei, 1993; Mojtahid et al., 2009). These studies revealed significant spatial contrasts in the
composition of shelf faunas. In fine-grained sediments of the Adriatic Sea and the Gulf of
Lions, the faunas show a distinct microhabitat zonation, depending on food availability and
oxygen penetration into the sediment (Barmawidjaja et al., 1992; Jorissen et al. 1992;
Schmiedl et al., 2000). In other regions, a strong correlation is observed between the diversity
and abundance of symbiont-bearing shallow water foraminifera and water column illumination
(Langer et al., 1998). In addition, near-coastal marine ecosystems can be affected by
anthropogenic impacts. In this context, Frontalini & Coccioni (2008) and Romano et al. (2008)
describe the influence of heavy metal pollution on shallow-water foraminifera on the Adriatic
Sea coast and the coastal area of Bagnoli (Naples, Italy). The faunas of these areas contained
a higher incidence of test deformations and a higher abundance of pollutant-tolerant species.
Recently, the eastern Mediterranean shallow-water ecosystems have been invaded by various
taxa from the Red Sea through the Suez Channel (Langer & Hottinger, 2000; Hyams et al.,
2002; Hyams-Kaphzan et al., 2008). The number of the so-called Lessepsian invaders is still
under debate, since data on the biogeography, diversity and ecology of autochthonous
shallow-water faunas from various carbonate environments of the Mediterranean Sea are
limited.
In this chapter, the diversity, species distribution and ecology of shelf benthic foraminifera in
various cool-water carbonate environments of the western Mediterranean Sea is discussed. A
26
Chapter 3
variety of multivariate analyses (Principal Component Analysis, Detrended Correspondence
Analysis, and Redundancy Analysis) was applied in order to identify various assemblages and
their links to different environmental parameters. In ecological studies, multivariate statistical
methods are widely used to characterize community structures and to quantify the relationship
between communities and environmental parameters (for summary see Ramette, 2007).
Among the different methods, Principal Component Analysis and Cluster Analysis are
commonly used in foraminiferal research to quantify the community structure of foraminiferal
faunas (e.g. Schmiedl et al., 1997; Schönfeld, 2002; Mendes et al., 2004; Kuhnt et al., 2007).
With other multivariate analyses such as Redundancy Analysis or Canonical Correspondence
Analysis, faunal data can be directly related to environmental data allowing a more
comprehensive analysis of foraminiferal ecology.
To date relatively little is known about the foraminiferal assemblages living in cool-water
carbonate environments (Murray, 2006). Therefore, the study is designed to add new
information on the diversity, distribution patterns and ecology of the Recent western
Mediterranean cool-water carbonate taxa. The established relations between benthic
foraminiferal faunas and environmental parameters can provide a basis for reconstructions of
past environmental changes, including quantitative sea-level reconstructions (chapter 4).
3.2 Study area
The Mediterranean Sea is a semi-enclosed basin between Europe in the north and Africa in
the south and can be divided into two nearly equal-sized basins (western Mediterranean and
eastern Mediterranean basins) connected by the Strait of Sicily (Robinson et al., 2001) (Fig.
2.1).
The Mediterranean Sea is characterized by four main water masses. The surface waters
consist of inflowing Atlantic Water (AW) (e.g. Robinson et al., 2001; Masque et al., 2003;
Rixen et al., 2005). At intermediate depths, the Levantine Intermediate Water is present, which
is formed in the eastern Mediterranean Sea (Robinson et al., 2001; Rixen et al., 2005). Below
600 m water depth, the basins are bathed by Western Mediterranean Deep Water formed in
the Gulf of Lions, and by Eastern Mediterranean Deep Water formed in the Adriatic and
Aegean seas (Robinson et al., 2001; Rixen et al., 2005) (Fig. 2.4).
In the Alboran Basin, the AW forms two anticyclonic gyres: the Western Alboran Gyre (WAG)
and the Eastern Alboran Gyre (EAG) (Fig. 2.5). Surface water velocities on the Alboran
Platform are relatively high, e.g. WAG velocities in October 1996 ranged between 124 and 140
cm/s (Velez-Belchi et al., 2005). In contrast, surface water velocities south-west off Mallorca
are generally lower, ranging between < 15cm/s and a maximum of 50 cm/s during storm
events (Werner et al., 1993). Associated with the Alboran gyres are zones of enhanced
27
Recent benthic foraminifera in the Western Mediterranean Sea
vertical mixing and nutrient entrainment, including the Almeria-Oran-Front (Fig. 2.5). This front
is marked by higher levels of primary production when compared to other open-ocean areas of
the western Mediterranean Sea (L’Helguen et al., 2002; Masque et al., 2003; Velez-Belchi et
al., 2005). In the Alboran basin, the annual primary production ranges between 150 and >250
g C per m2 and year, whereas the Balearic region, with estimated annual values of 100 to 150
g C /m2, has a more oligotrophic character than the Alboran region (Antoine et al., 1995) (Fig.
2.6).
In the western Mediterranean Sea cool-water carbonates form in areas protected from major
siliciclastic input. A first comprehensive report of such carbonates was a significant part of the
seminal work of Pérès and Picard (1964). Later publications corroborated and expanded these
facies concepts (for example Blanc, 1972; Caulet, 1972; Fornos and Ahr, 1997; Ros et al.,
1984; Carannante et al., 1988; Fornos and Ahr, 2006). The shallow subtidal facies zone (inner
ramp) is dominated by Posidonia meadows with bioclastic sand patches down to 40 m of
water depth. The middle ramp facies are dominated by coarse sediments with branching and
foliose red algae, neighbouring rhodoliths may coalesce and generate a rigid coralline algal
framework (corraligène de plateau) (Basso, 1997). At water depths below 90 m, muddy sands
with a mixed biotic content occur.
3.3 Materials and methods
For the present study, 47 surface sediment samples were collected during Meteor cruise
69/1 in August 2006 from the Alboran Platform (14 samples), the Oran Bight (19 samples) and
south-western off Mallorca (14 samples) using a grab or box corer (Fig. 3.1, Table A.1). The
application of a multicorer for sampling of the sediment-water interface was not possible
because of the generally coarse-grained sediments. Samples 341, 342 and 343 from the
Alboran Platform were taken from the top of sediment cores drilled with a vibrocorer. The
sampling depth ranges between 20 m to 235 m. After retrieval, the upper 1 to 2 cm of surface
sediment was preserved in a Rose Bengal solution (1.0 - 1.5 g Rose Bengal per litre 96%-
ethanol) to separate living (Rose Bengal stained) from unstained individuals except for core-
top samples 341, 342 and 343. All samples were wet-sieved over a 63 µm sieve and the
sample volumes were calculated. The fraction > 63 µm was dried at 40°C.
For determination of the grain-size distribution, samples were wet sieved and the weight
percentages of the > 1000 µm, 1000 - 500 µm, 500 - 200 µm, 200 - 100 µm, 100 - 63 µm and
< 63 µm fraction were calculated (Table A.5). Sea surface temperature and salinity data were
measured during Meteor cruise 69/1 (Table A.5). As a proxy for regional primary productivity
values, annual averages for chlorophyll a concentration in surface waters were extracted from
the NASA SeaWiFS database (Feldmann and McClain, 2006) (Table A.5).
28
Chapter 3
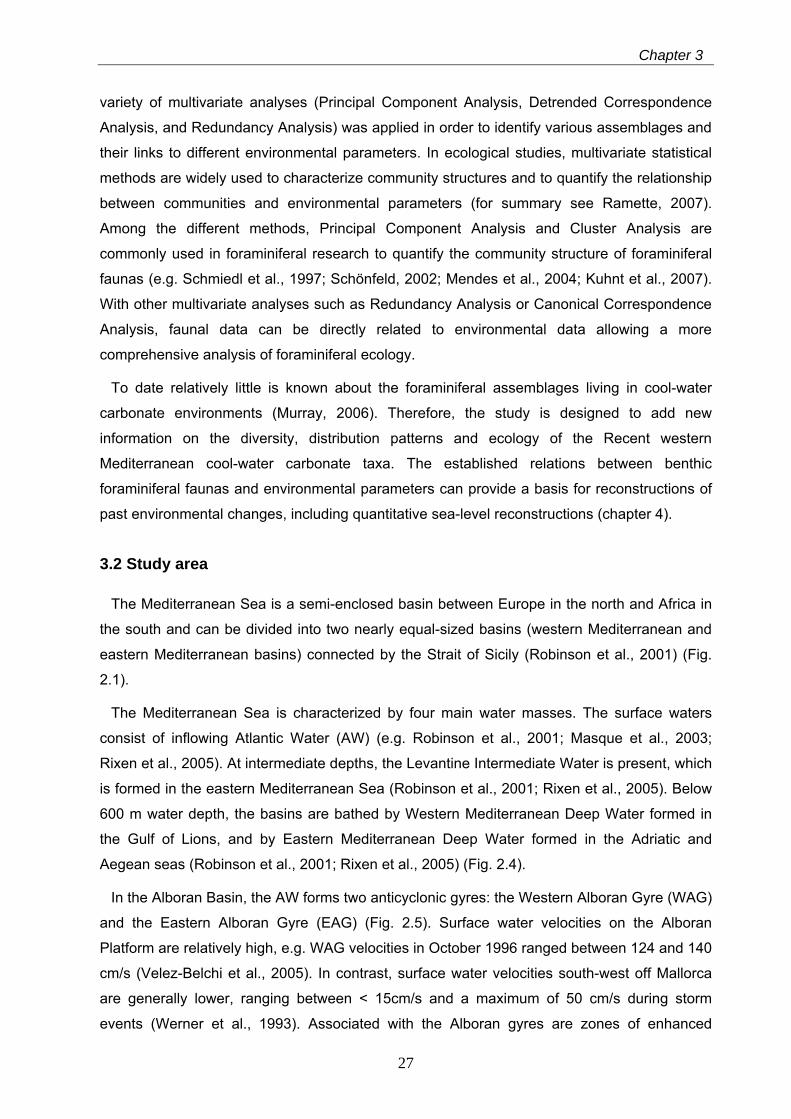
Fig. 3.1. Bathymetric survey of the western Mediterranean Sea (A) and three detailed bathymetric maps
showing the studied areas Alboran Platform (B), Oran Bight (C) and Mallorca Shelf (D) (see also Table
A.1) Throughout this chapter and in the following chapter figures, sample numbers are given without the
suffix for better readability.
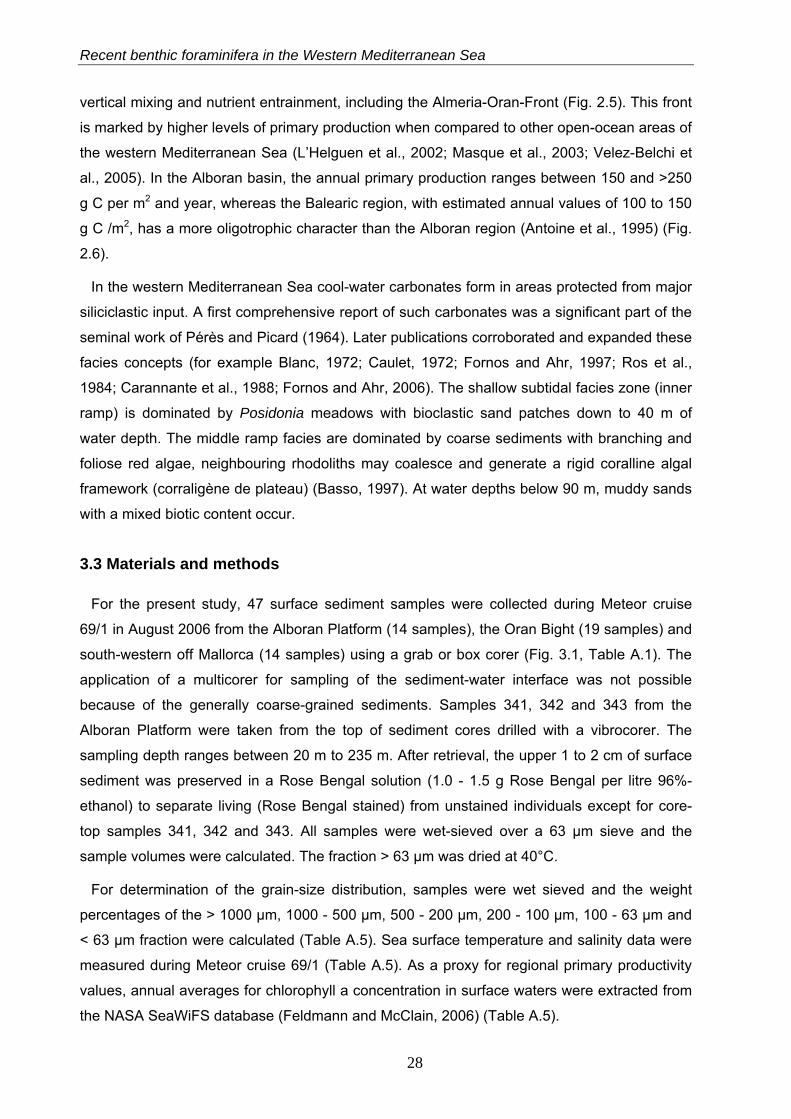
To count the foraminifera, all samples were split into two equal aliquots in order to generate
sub-samples with 300 to a maximum of 1000 individuals (Fig. 3.2). The sub-samples were dry-
sieved over a 125 µm - sieve. From the > 125 µm fraction, all stained and non-stained benthic
foraminifera, and all planktonic foraminifera were picked and counted (electronic Tables A.17
and A.18). Only monothalamous tests with a clear pink staining and multichambered tests with
more than one completely pink-stained chamber were considered as “living”. For an accurate
identification of living miliolids and agglutinated specimens, tests were moistened with water.
The identification of the benthic foraminiferal taxa was mainly based on the publications of
Cimerman & Langer (1991), Sgarrella & Moncharmont Zei (1993), Jones (1994) and
Rasmussen (2005) (see chapter 7). Test fragments and tests with yellowish-brown
appearance were considered as re-deposited and counted separately. In addition to the
standing stocks, the benthic foraminiferal number for empty tests (BFN) and number of taxa,
the dominance D and the Shannon diversity H were calculated as defined by Hammer et al.
(2008), applying the equations D =Σ (ni/n)2 and H= -Σ ni/n * ln (ni/n), with ni = number of
individuals of taxon i, and n = total number of individuals. Diversity values were computed with
the PAST (PAlaeontological STatistics) software (Hammer et al., 2001, Hammer et al., 2008).
29
Recent benthic foraminifera in the Western Mediterranean Sea
Fig. 3.2. Number of dead taxa versus number of counted dead individuals in the surface samples. It is shown that most of the taxa (74%) are captured within a total of 300 counted individuals.
Principle component analysis (PCA) was carried out to reduce the redundancy in the data
set and to extract the most important foraminiferal assemblages. In PCA, the number of
variables of the data matrix is reduced by extraction of uncorrelated axes, the principle
components (PCs). When applied to a species matrix in Q-Mode, the correlation of a taxon to
a principle component is given by its score value and the value of a principal component on a
sample by its loading. For each new axis (or principle component), the explained proportion of
the total variance of the data matrix can be calculated. One limitation of PCA in ecological
studies is the assumption that taxa are linearly correlated with each other and the axes. For
further details on methodological aspects of PCA see Leyer & Wesche (2007) and Ramette
(2007). In the present study, only benthic foraminiferal taxa with a relative abundance of ≥ 1 %
in at least three samples were selected and PCA was carried out with the software package
Systat 12 in Q-mode for each area separately. PC loadings > 0.5 were defined as significant,
following the suggestions of Malmgren & Haq (1982) and Backhaus et al. (2006).
A Detrended Correspondence Analysis (DCA) was performed to test whether species exhibit
a unimodal or linear response to an environmental gradient (Leps & Smilauer, 2005; Leyer &
Wesche, 2007). Redundancy Analyses (RDA) were carried out to quantify the relationship
between the distribution of benthic foraminifera and ecological parameters such as water
depth, grain-sizes, surface water chlorophyll a, surface water temperature and salinity, using
the software package Canoco, version 4.5 (Ter Braak & Smilauer, 2002; Leps & Smilauer,
2005). RDA is based on a linear species-environment relationship, where the axes are linear
combinations of the environmental variables (Leyer & Wesche, 2007). Both DCA and RDA
were carried out on all samples except for sample 362 that contained only few foraminiferal
tests. Species with values exceeding 1% in at least three samples were selected for analyses.
For DCA, detrending by segments was chosen and species were centred. For RDA, species
were square root transformed and environmental parameters were standardized. Partial RDAs
30
Chapter 3
were used to calculate the explained variance in the foraminiferal data for each variable.
Additionally, nominal variables (transformed into binary “dummy variables”) for the three areas
were created for RDA analysis to explore potential local effects of environmental parameters.
For both analyses, Monte Carlo permutation tests (full model, 5000 permutations) were
performed with the software package Canoco (version 4.5) to test the significance of the
environmental parameters.
3.4 Results
3.4.1 Surface sediment composition and grain-size
The surface sediments from the Alboran Platform consist of coarse-grained carbonates with
an admixture of volcanoclastic debris. The fractions 125 µm - 2 mm and > 2 mm mainly
consist of red algae, often in form of rhodoliths, gastropods, bivalves, fragments of
echinoderms, foraminifera and various other biogenic components. Surface sediments of the
Oran Bight resemble those from the Alboran Platform and are coarse-grained carbonates,
mainly containing rhodoliths, gastropods and bivalves in the coarse fraction. The two
shallowest samples (20 m and 40 m water depth) from Oran Bight are siliciclastic sands. In all
other samples, siliciclastic rock fragments and mineral grains are rare. The surface sediments
of the deeper stations south-western off Mallorca are fine-grained and carbonate-rich with few
sea grass fragments. In contrast, samples from the shallower sites consist of coarse-grained
carbonate and show a composition similar to those from the Alboran Platform and Oran Bight.
3.4.2 Distribution of living (Rose Bengal stained) benthic foraminifera
In all three areas, the total number of living benthic foraminifera, with a maximum of 535
individuals per 10 cm3 sediment, is very low compared to the number of empty tests, with a
maximum of 99,000 individuals per 10 cm3 sediment. The highest standing stocks were
observed on the Mallorca Shelf, with 33 - 535 living individuals per 10 cm3 sediment. In the
Oran Bight, 11 - 298, and on the Alboran Platform only 5 - 52 living individuals per 10 cm3
were found (Fig. 3.3). Generally, similar species dominate the biocoenosis and the
thanatocoenosis at each site, suggesting an autochthonous occurrence for most tests.
The diversity of the live fauna from the Alboran Platform shows a total of only 19 taxa, with 1
- 7 different taxa per sample (Fig. 3.3). The most abundant species are Cassidulina crassa,
Spirillina vivipara, Textularia pseudorugosa, Brizalina difformis and Brizalina striatula. Due to
their generally low densities, no significant spatial or bathymetric trends can be extracted from
the census data.
31
Recent benthic foraminifera in the Western Mediterranean Sea
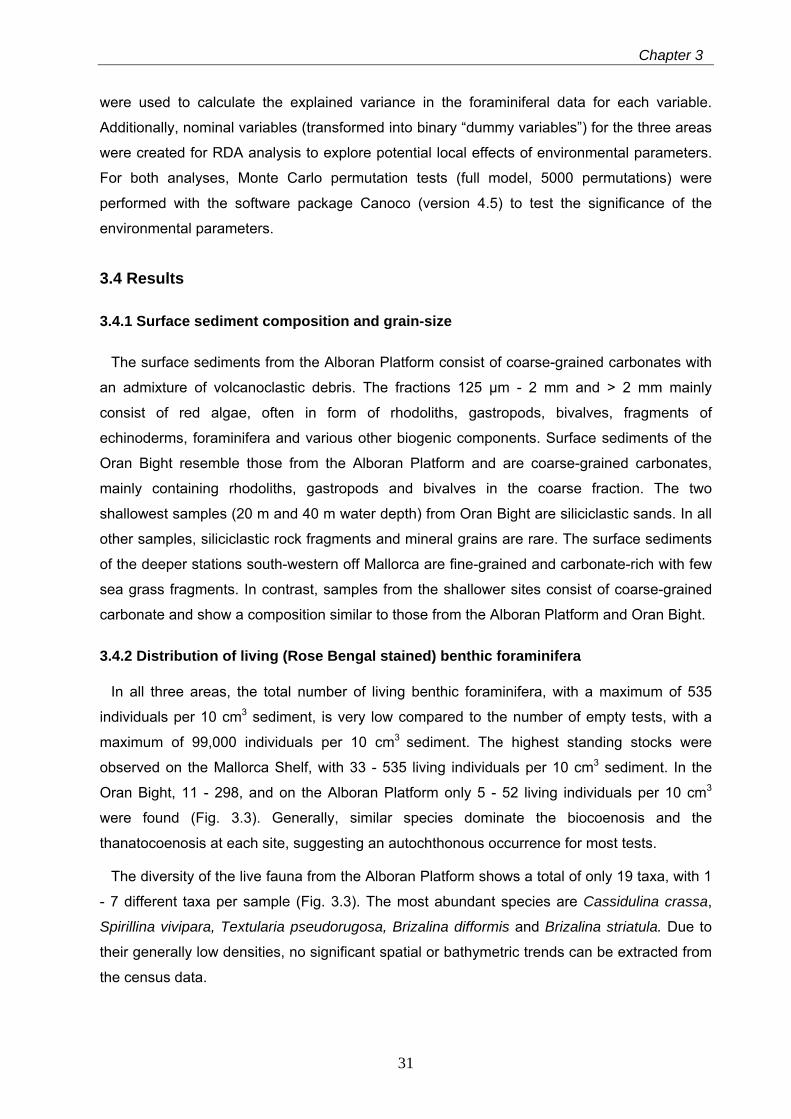
Fig. 3.3. Standing stocks (per 10cm3 sediment) in the first centimetre of the sediment, number of individual taxa, Dominance (D) of taxa and Shannon diversity (H) for the studied areas versus water depths.
The diversity of the live fauna from the Oran Bight is higher when compared to the Alboran
Platform and shows a total of 76 taxa, with 3 to 17 taxa per sample (Fig. 3.3). The biocoenosis
is dominated by hyaline foraminifera with Cancris auriculus as the most abundant species.
Brizalina difformis, Bulimina elongata, Rectuvigerina phlegeri, Globocassidulina oblonga and
Uvigerina peregrina appear in different numbers in all samples from Oran Bight, except the
shallowest sample 362 at 20 m. In addition, various typical shelf taxa (e.g., Discorbinella
bertheloti, Nonion fabum, Stomatorbina concentrica and Cibicides spp.) occur in moderate
numbers. Arenaceous and miliolid taxa are found in low numbers, except the more common
Reophax scorpiurus and Cibrostomoides jeffreysii.
The live fauna from the Mallorca Shelf exhibits the highest diversities of the three study
areas with a total of 83 different taxa (and 5 to 21 different taxa per sample) (Fig. 3.3). The
species composition is markedly different when compared to those of the Alboran Platform
and Oran Bight. The coarser-grained samples from shallower water depths (40 m - 94 m)
mainly consist of various miliolids, Neoconorbina terquemi, Textularia pala, Tritaxis challengeri
and Asterigerinata mamilla s.l. (with a sparse content of Asterigerinata mariae and
Asterigerinata adriatica). The finer-grained samples from deeper sites (94 m - 235 m) are
characterized by elevated numbers of Cassidulina laevigata s.l., Hyalinea balthica, Textularia
calva, Textularia gramen, Cassidulina crassa and Melonis affinis, and low numbers of some
other arenaceous and miliolid taxa.
The dominance D and the Shannon diversity H show a wide range, with values between
0.09 and 0.78 and 0.56 - 2.59, respectively. Exceptions are the samples 327 and 330 from
Alboran Platform, where D=1 and H=0, due to the fact that only one taxon were found alive in
each sample (Fig. 3.3).
32
Chapter 3
3.4.3 Distribution of dead benthic foraminifera
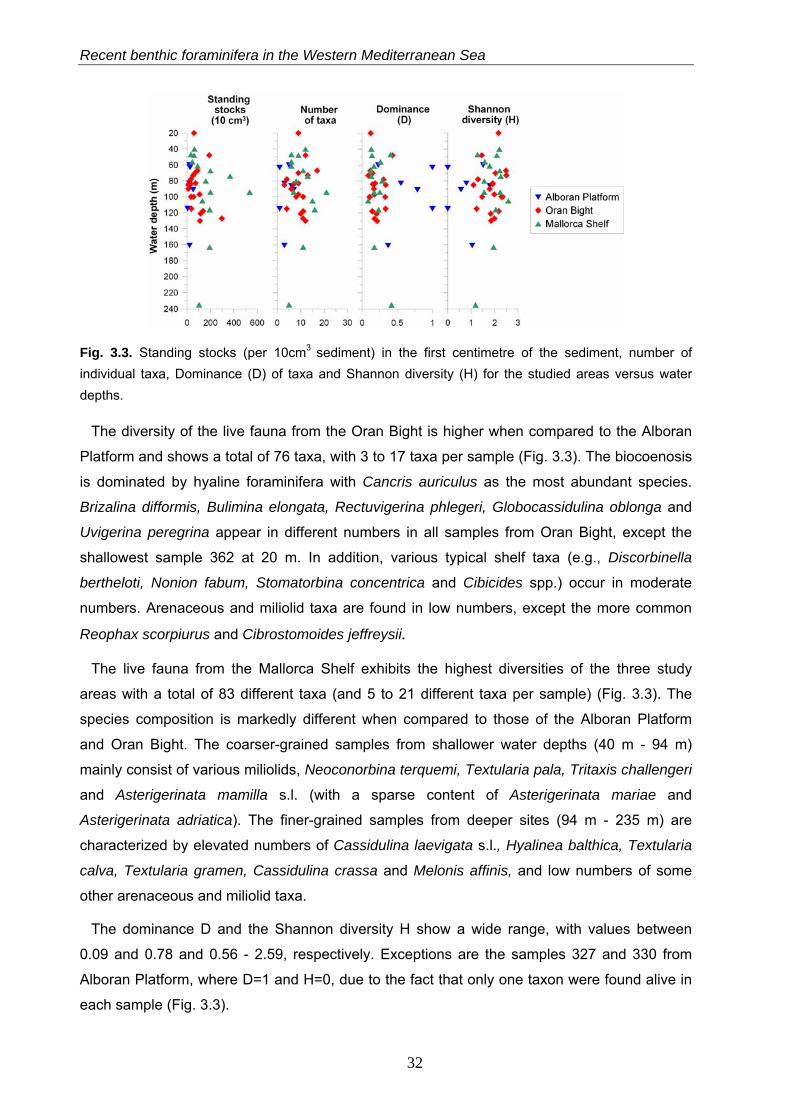
The total benthic foraminiferal number (BFN) is highly variable, ranging between 382 and
98,987 individuals per 10 cm3 sediment on the Alboran Platform, between 320 and 59,505
individuals per 10 cm3 in the Oran Bight and between 1827 and 98,525 ind. per 10 cm3 on the
Mallorca Shelf (Fig. 3.4).
The Oran Bight samples contain a particularly high number of redeposited benthic
foraminiferal tests with a maximum estimate of 84% in the shallowest site 362 from 20 m water
depth. The number of taxa ranges between 57 and 88 on the Alboran Platform, between 16
and 112 in the Oran Bight and between 67 and 99 on the Mallorca Shelf (Fig. 3.4). The
dominance D and the Shannon diversity H are quite similar in the different regions. D values
range from 0.03 to 0.09 and H values from 3.1 to 3.9. Relatively high dominance and low
diversity is restricted to the shallowest site 362 (20 m water depth) in the Oran Bight, with D =
0.13 and H = 2.35 (Fig. 3.4).
Fig. 3.4. Number of empty benthic foraminifera (BFN) per 10cm3 sediment, number of individual taxa, Dominance (D) of taxa and Shannon diversity (H) for the studied areas versus water depth.
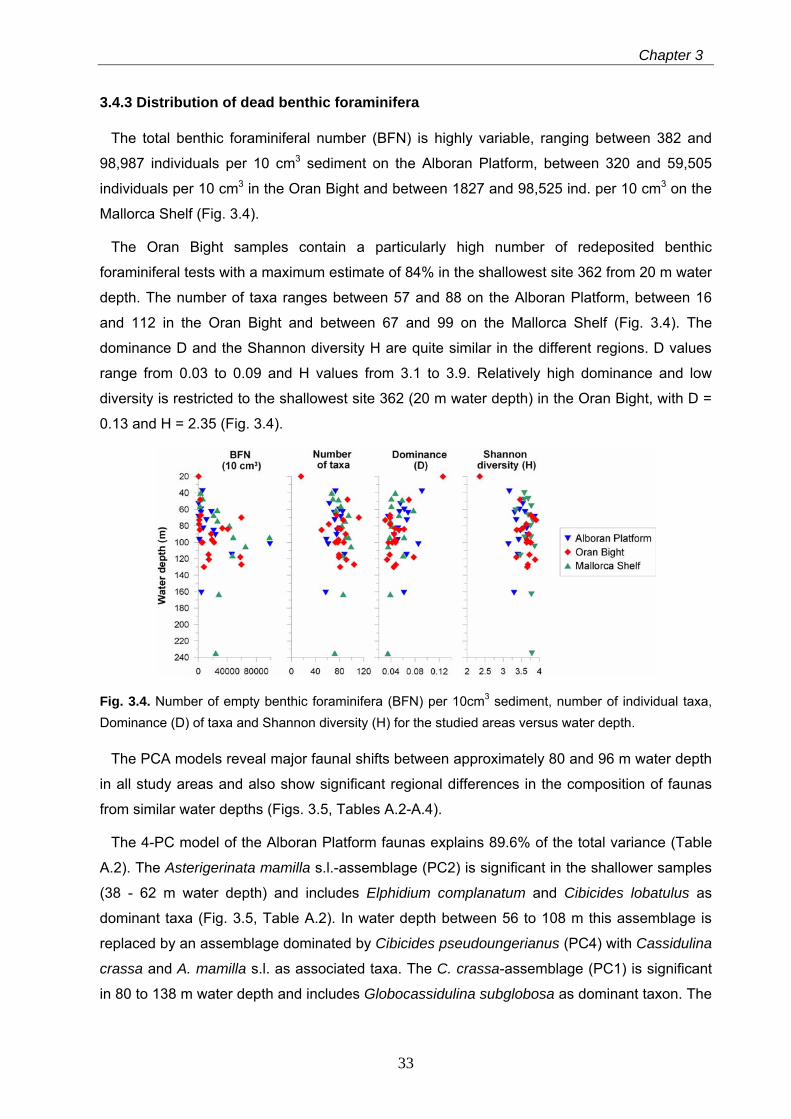
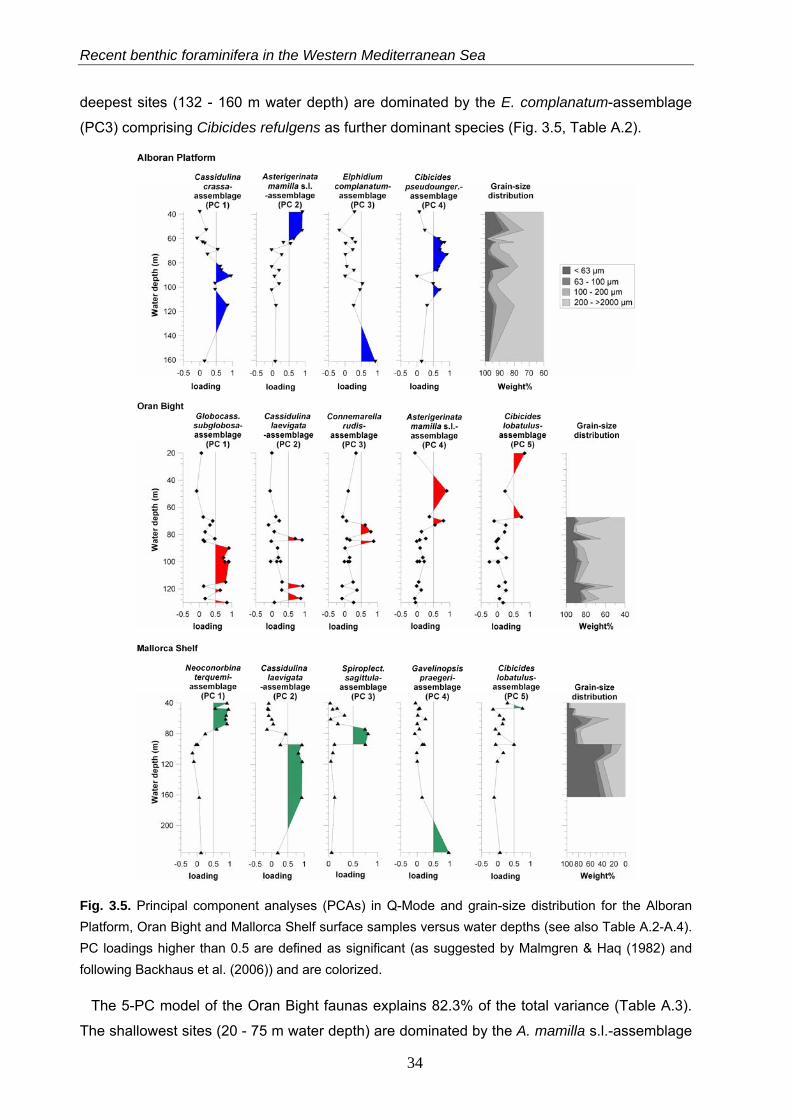
The PCA models reveal major faunal shifts between approximately 80 and 96 m water depth
in all study areas and also show significant regional differences in the composition of faunas
from similar water depths (Figs. 3.5, Tables A.2-A.4).
The 4-PC model of the Alboran Platform faunas explains 89.6% of the total variance (Table
A.2). The Asterigerinata mamilla s.l.-assemblage (PC2) is significant in the shallower samples
(38 - 62 m water depth) and includes Elphidium complanatum and Cibicides lobatulus as
dominant taxa (Fig. 3.5, Table A.2). In water depth between 56 to 108 m this assemblage is
replaced by an assemblage dominated by Cibicides pseudoungerianus (PC4) with Cassidulina
crassa and A. mamilla s.l. as associated taxa. The C. crassa-assemblage (PC1) is significant
in 80 to 138 m water depth and includes Globocassidulina subglobosa as dominant taxon. The
33
Recent benthic foraminifera in the Western Mediterranean Sea
deepest sites (132 - 160 m water depth) are dominated by the E. complanatum-assemblage
(PC3) comprising Cibicides refulgens as further dominant species (Fig. 3.5, Table A.2).
Fig. 3.5. Principal component analyses (PCAs) in Q-Mode and grain-size distribution for the Alboran Platform, Oran Bight and Mallorca Shelf surface samples versus water depths (see also Table A.2-A.4). PC loadings higher than 0.5 are defined as significant (as suggested by Malmgren & Haq (1982) and following Backhaus et al. (2006)) and are colorized.
The 5-PC model of the Oran Bight faunas explains 82.3% of the total variance (Table A.3).
The shallowest sites (20 - 75 m water depth) are dominated by the A. mamilla s.l.-assemblage
34
Chapter 3
(PC4) with Rosalina macropora as dominant taxon, and the C. lobatulus-assemblage (PC5),
including Neoconorbina terquemi as dominant taxon (Fig. 3.5, Table A.3). In the water depth
interval from 72 to 88 m a Gaudryina rudis-assemblage (PC3) with C. lobatulus as associated
taxon is significant. In contrast, the deeper sites (80 - 130 m water depth) are characterized by
the G. subglobosa-assemblage (PC1, with C. crassa as dominant taxon) and the Cassidulina
laevigata s.l.-assemblage (PC2, including Globocassidulina oblonga as associated taxon) (Fig.
3.5, Table A.3).
The 5-PC model of the Mallorca Shelf faunas explains 90.5% of the total variance (Table
A.4). The shallowest sites (40 - 75 m water depth) are characterized by significant loadings of
the Cibicides lobatulus-assemblage (PC5, 40 - 48 m water depth) and the N. terquemi-
assemblage (PC1, 40 - 76 m water depth) comprising A. mamilla s.l. as further dominant taxon
(Fig. 3.5, Table A.4). A Spiroplectinella sagittula s.l-assemblage (PC3) dominates between 72
and 95 m water depth. Dominant taxa of this assemblage include A. mamilla s.l. and C.
lobatulus. Significant loadings of the C. laevigata s.l.-assemblage (PC2) are restricted to the
deeper sites, below approximately 96 m and down to ~210 m water depth. This assemblage
contains Bulimina elongata as further dominant taxon. The deepest site is characterized by a
Gavelinopsis praegeri-assemblage (PC4) with G. subglobosa and C. crassa as associated
taxa (Fig. 3.5, Table A.4).
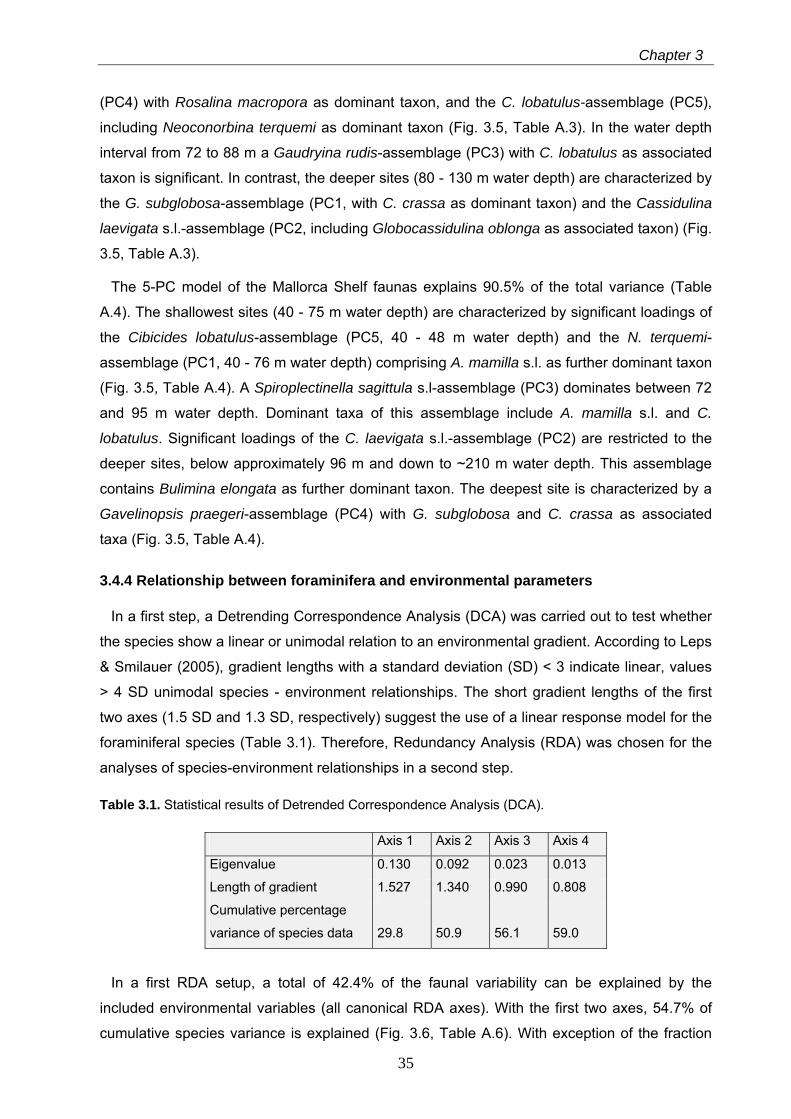
3.4.4 Relationship between foraminifera and environmental parameters
In a first step, a Detrending Correspondence Analysis (DCA) was carried out to test whether
the species show a linear or unimodal relation to an environmental gradient. According to Leps
& Smilauer (2005), gradient lengths with a standard deviation (SD) < 3 indicate linear, values
> 4 SD unimodal species - environment relationships. The short gradient lengths of the first
two axes (1.5 SD and 1.3 SD, respectively) suggest the use of a linear response model for the
foraminiferal species (Table 3.1). Therefore, Redundancy Analysis (RDA) was chosen for the
analyses of species-environment relationships in a second step.
Table 3.1. Statistical results of Detrended Correspondence Analysis (DCA).
Axis 1 Axis 2 Axis 3 Axis 4
Eigenvalue 0.130 0.092 0.023 0.013
Length of gradient 1.527 1.340 0.990 0.808
Cumulative percentage
variance of species data 29.8 50.9 56.1 59.0
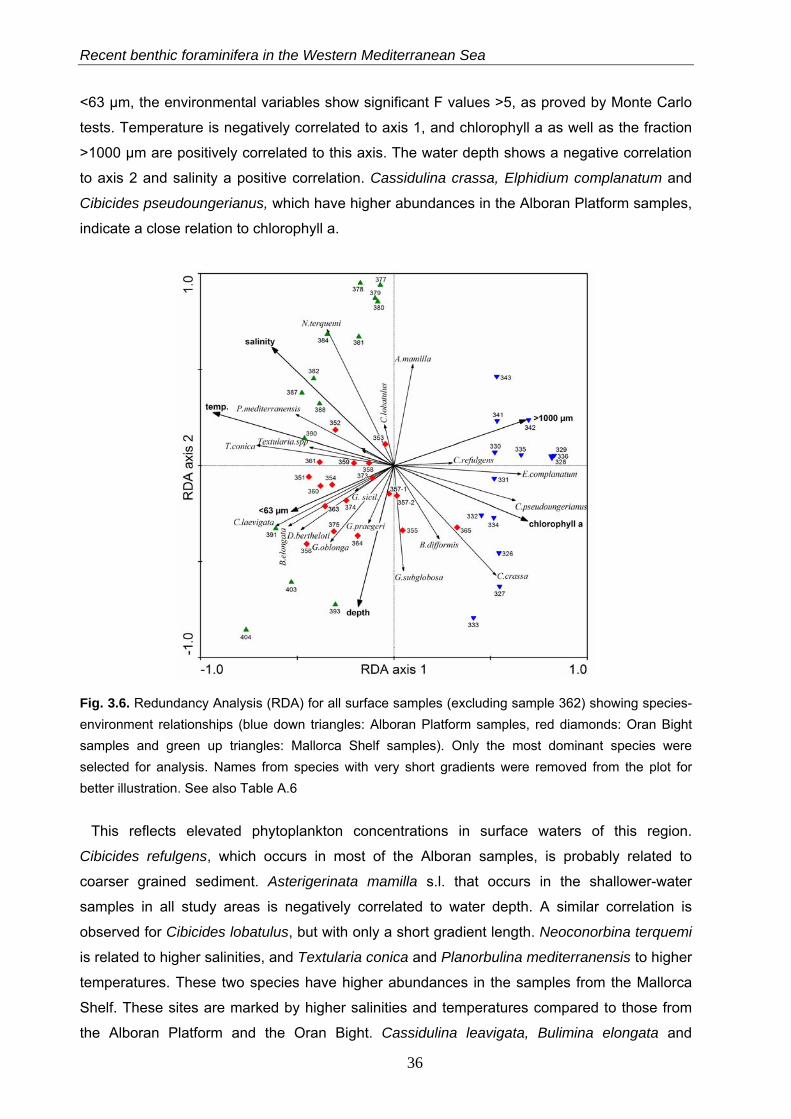
In a first RDA setup, a total of 42.4% of the faunal variability can be explained by the
included environmental variables (all canonical RDA axes). With the first two axes, 54.7% of
cumulative species variance is explained (Fig. 3.6, Table A.6). With exception of the fraction
35
Recent benthic foraminifera in the Western Mediterranean Sea
<63 µm, the environmental variables show significant F values >5, as proved by Monte Carlo
tests. Temperature is negatively correlated to axis 1, and chlorophyll a as well as the fraction
>1000 µm are positively correlated to this axis. The water depth shows a negative correlation
to axis 2 and salinity a positive correlation. Cassidulina crassa, Elphidium complanatum and
Cibicides pseudoungerianus, which have higher abundances in the Alboran Platform samples,
indicate a close relation to chlorophyll a.
Fig. 3.6. Redundancy Analysis (RDA) for all surface samples (excluding sample 362) showing species-environment relationships (blue down triangles: Alboran Platform samples, red diamonds: Oran Bight samples and green up triangles: Mallorca Shelf samples). Only the most dominant species were selected for analysis. Names from species with very short gradients were removed from the plot for better illustration. See also Table A.6
This reflects elevated phytoplankton concentrations in surface waters of this region.
Cibicides refulgens, which occurs in most of the Alboran samples, is probably related to
coarser grained sediment. Asterigerinata mamilla s.l. that occurs in the shallower-water
samples in all study areas is negatively correlated to water depth. A similar correlation is
observed for Cibicides lobatulus, but with only a short gradient length. Neoconorbina terquemi
is related to higher salinities, and Textularia conica and Planorbulina mediterranensis to higher
temperatures. These two species have higher abundances in the samples from the Mallorca
Shelf. These sites are marked by higher salinities and temperatures compared to those from
the Alboran Platform and the Oran Bight. Cassidulina leavigata, Bulimina elongata and
36
Chapter 3
Discorbinella bertheloti, which occur in the deeper samples from the Mallorca Shelf, exhibit a
close relation to the <63 µm fraction. Globocassidulina subglobosa and Gavelinopsis praegeri,
which have higher values in the Oran Bight samples, show a positive correlation with water
depth. Globocassidulina oblonga, which occurs in all sampling areas, shows positive
correlations with water depth and the content of <63 µm material (Fig. 3.6, Table A.6).
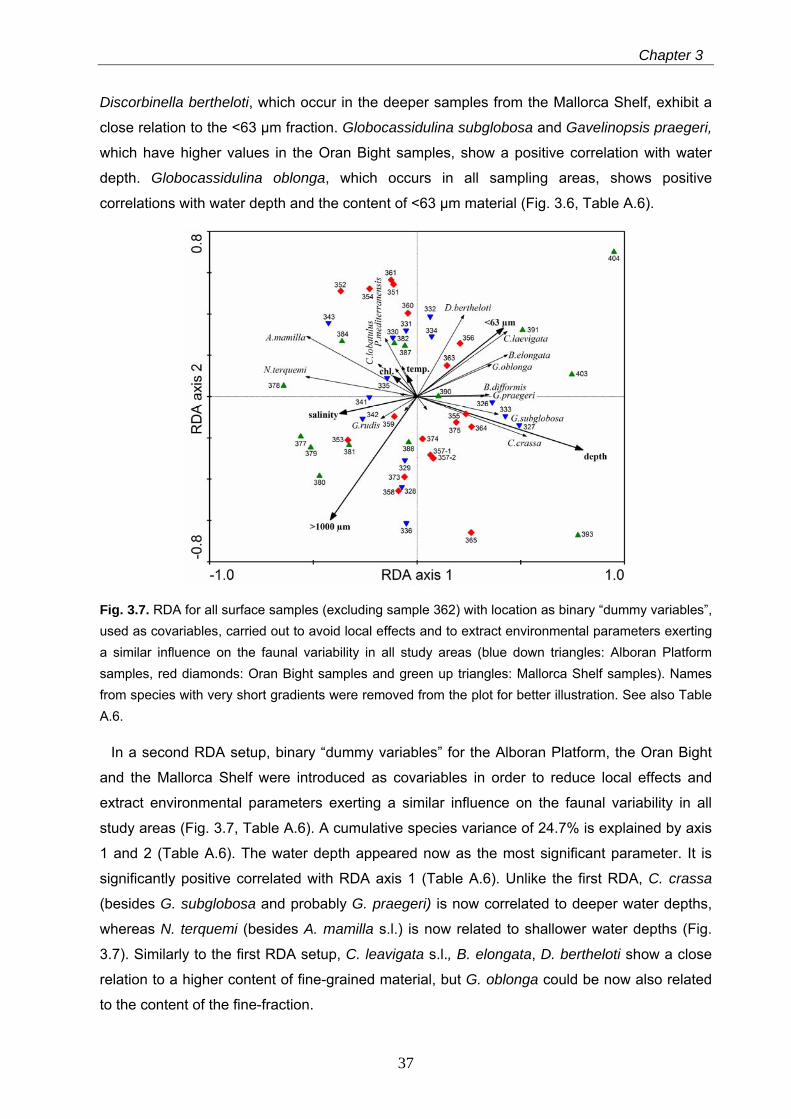
Fig. 3.7. RDA for all surface samples (excluding sample 362) with location as binary “dummy variables”, used as covariables, carried out to avoid local effects and to extract environmental parameters exerting a similar influence on the faunal variability in all study areas (blue down triangles: Alboran Platform samples, red diamonds: Oran Bight samples and green up triangles: Mallorca Shelf samples). Names from species with very short gradients were removed from the plot for better illustration. See also Table A.6.
In a second RDA setup, binary “dummy variables” for the Alboran Platform, the Oran Bight
and the Mallorca Shelf were introduced as covariables in order to reduce local effects and
extract environmental parameters exerting a similar influence on the faunal variability in all
study areas (Fig. 3.7, Table A.6). A cumulative species variance of 24.7% is explained by axis
1 and 2 (Table A.6). The water depth appeared now as the most significant parameter. It is
significantly positive correlated with RDA axis 1 (Table A.6). Unlike the first RDA, C. crassa
(besides G. subglobosa and probably G. praegeri) is now correlated to deeper water depths,
whereas N. terquemi (besides A. mamilla s.l.) is now related to shallower water depths (Fig.
3.7). Similarly to the first RDA setup, C. leavigata s.l., B. elongata, D. bertheloti show a close
relation to a higher content of fine-grained material, but G. oblonga could be now also related
to the content of the fine-fraction.
37
Recent benthic foraminifera in the Western Mediterranean Sea
3.5 Discussion
3.5.1 Diversity of benthic foraminifera in shelf carbonate environments
The standing stocks and diversities of the living fauna are quite variable and exhibit distinct
contrasts within and between the study areas (Fig. 3.3). A patchy distribution of benthic
foraminifera is common to most shelf ecosystems and attributed to highly variable
environmental conditions (summary in Murray, 2006). In our study areas, standing stocks and
live diversities display generally lower values when compared to faunas from siliciclastic shelf
environments of the western Mediterranean Sea, e.g. from the Rhone prodelta (Mojtahid et al.,
2009) and from the southern Tuscany continental shelf off the Ombrone river (Frezza &
Carboni, 2009). In these siliciclastic environments, high fluxes of marine and terrestrial organic
matter and fine-grained substrates generate a variety of infaunal niches that are obviously less
developed in the coarser-grained carbonate environments. The relatively low diversities of the
living fauna may also reflect seasonal population dynamics that are well documented from
various shelf and deep sea ecosystems (Silva et al., 1995; Ohga and Kitazato, 1997;
Duijnstee et al., 2004; Duchemin et al., 2007). These studies indicate an immediate or slightly
lagged response of the faunas to changes in trophic conditions. In the western Mediterranean
Sea, major phytoplankton blooms are restricted to February and March (Barale et al., 2005),
while at the time of sampling in August 2006, phytodetritus fluxes are at a minimum. The
oligotrophic summer situation likely supported only low numbers of living specimens. In
addition, disturbance of the surface layer and partly loss of the living fauna during the
sampling process cannot be excluded. However, such an artefact appears unlikely, since only
visually intact sediment surfaces were considered for faunal analysis.
In contrast to the living faunas, the diversities of the dead faunas are similar or even higher
when compared to those from siliciclastic shelf environments of the Mediterranean and other
oceans (Levy et al., 1993; Scott et al., 2003; Murray; 2006, Frezza & Carboni, 2009; own
unpublished data) (Fig. 3.4). Carbonate environments of the western Mediterranean Sea
obviously provide a variety of (epifaunal) niches fostering the long-term development of
complex benthic foraminiferal faunas. However, the mapped diversities are slightly lower than
in mixed siliciclastic-carbonate ecosystems of the southeastern Levantine shelf (Hyams-
Kaphzan et al., 2008). The faunas from the latter region contain various symbiont-bearing
taxa, that are typical for subtropical and tropical shallow-water environments (for example the
genera Amphistegina, Heterostegina, Peneroplis). In addition, the southeastern Levantine
shelf is inhabited by a number of so-called Lessepsian invaders from the Red Sea (Hyams-
Kaphzan et al., 2008). Living specimens of the Lessepsian invader Amphistegina lobifera are
also reported from hard substrates in shallow water (0 to 3 m water depth) of the Maltese
38
Chapter 3
Islands (Yokes et al., 2007). So far, none of the Lessepsian invaders have been documented
in our study area except of Cibicides cf. C. majori that resembles a taxon common both on the
Israeli shelf and the Gulf of Aqaba (Hottinger et al., 1993; Hyams-Kaphzan et al., 2008). In our
study area, symbiont-bearing subtropical taxa are absent, except for a few living and dead
specimens of Peneroplis pertusus and some soritids found in the Oran Bight at 20 m water
depth (site 362). P. pertusus was described as an epiphytic species from 0 to 20 m water
depth from the Adriatic and Tyrrhenian seas (Cimerman & Langer, 1991; Langer et al., 1998).
The near-absence of symbiont-bearing taxa may have several reasons. In our study, all but
sample 362 were recovered from water depths below 38 m, excluding the upper part of the
photic zone, where the majority of Mediterranean larger foraminifera commonly lives on phytal
substrates (Cimerman & Langer, 1991; Langer et al., 1998; Hyams-Kaphzan et al., 2008). In
addition, most of larger benthic foraminifera exhibit a close affinity to warm-water temperatures
with rather low seasonal variability (e.g., Hohenegger et al., 1999). In our study areas, winter
sea-surface temperatures can be as low as 13°C and mean annual values are approximately
3 to 5°C lower than in the southeastern Levantine Sea (MEDATLAS data).
3.5.2 Impact of substrate, hydrodynamic energy at the benthic boundary layer, and food availability
3.5.2.1 Benthic foraminiferal assemblages from shallow-water sites
In all study areas, the benthic foraminiferal assemblages exhibit a marked faunal shift that is
centred around 80 m on the Alboran Platform and in the Oran Bight, and around 94 m water
depth on the Mallorca Shelf (Fig. 3.5). The faunas of the shallow circalittoral, between
approximately 40 and 80 m, are dominated by trochospiral species, including Asterigerinata
mamilla s.l., Cibicides lobatulus, Cibicides pseudoungerianus, and Neoconorbina terquemi as
the most dominant taxa. These and most of the associated species are common
Mediterranean shelf taxa (Jorissen, 1987; Cimerman and Langer, 1991; Sgarrella &
Moncharmont Zei, 1993). They are epifaunal suspension feeders and are permanently or
temporarily attached to coarse substrates, such as bioclastic sands and gravel (Sturrock and
Murray, 1981; Coppa & Di Tuoro, 1995; summary in Murray, 2006). The general adaptation of
these taxa to shallow water depths and coarse-grained substrate is confirmed by the results of
the RDA analyses and by the grain-size distribution of the samples (Fig. 3.5 and 3.7).
On the Mallorca Shelf, the lower limit of the distribution of the shallow-water assemblages
(C. lobatulus-, N. terquemi- and Spiroplectinella sagittula s.l.-assemblage) is associated with a
change in grain-size composition of the substrate (Fig. 3.5). In water shallower than 94 m
water depths, surface sediments are dominated by sand and gravel, while mud plays only a
subordinate role. The observed shift in grain-size on the Mallorca Shelf coincides more or less
with the lower limit of rhodolith growths, marking the depth of the lower photic zone (Pedley
39
Recent benthic foraminifera in the Western Mediterranean Sea
and Carannante, 2006; own observations). No distinct bathymetric shift in substrate is present
on the Alboran Platform and in the Oran Bight, whereas no rhodoliths were found deeper than
91 m on the Alboran Platform. In both areas a faunal shift has also been observed at ~80 m
water depth (Fig. 3.5). The shallower sites are characterized by assemblages dominated by
the A. mamilla s.l., C. pseudoungerianus, Gaudryina rudis and C. lobatulus, whereas in the
deeper sites the assemblages are dominated by Cassidulina crassa, Globocassidulina
subglobosa and Cassidulina laevigata s.l.. In the western Mediterranean Sea, the 1% light
penetration depth is located at 70 - 80 m, while in the eastern Mediterranean Sea it is in 110 m
water depth (Moutin & Rainbault, 2002).
It appears likely that the associated taphonomic production of coarse carbonate particles
and living sciaphile algae provide suitable substrates for the observed epifaunal taxa. In shelf
environments, habitat exposure to water turbulence may exert an important influence on
winnowing and lateral transport of sediment and food particles. In the western Mediterranean
Sea, the storm wave base is located between 30 and 60 m (Pedley and Carannante, 2006).
Our own bathymetric surveys of the study areas revealed abrasion platforms at around 35 - 40
m water depths, marking the location of the average storm wave base (Betzler et al, in press).
According to this finding, and the persistence of sandy substrates on the Alboran Platform and
in the Oran Bight below this depth limit, wave turbulence cannot account for the observed
faunal shifts at ~80 m. Instead, the impact of near-bottom currents and local sea floor
topography may play a more important role for the deeper circalittoral environments. To date,
no Posidonia meadows and associated epiphytic taxa were encountered at the studied sites.
These ecosystems are restricted to the infralittoral zone (lower depth limit around 30 - 40 m)
where photophile algae are associated with a variety of epiphytic benthic foraminifera
(Jorissen, 1987; Langer et al., 1998).
3.5.2.2 Benthic foraminiferal assemblages from deeper sites
Below approximately 80 - 94 m water depths, the most characteristic taxa of the benthic
foraminiferal assemblages belong to the family of Cassidulinidae, including Cassidulina crassa
and Globocassidulina subglobosa on the Alboran Platform, G. subglobosa, C. crassa
Cassidulina laevigata s.l., and Globocassidulina oblonga in the Oran Bight, and C. laevigata
s.l. on the Mallorca Shelf. According to the results of RDA analyses, the species C. crassa and
G. subglobosa are clearly related to water depth, while C. laevigata s.l. and probably G.
oblonga are closely related to fine-grained substrates (Fig. 3.7).
The epifaunal to shallow infaunal species G. oblonga and G. subglobosa are commonly
associated with elevated bottom water currents, vegetation cover, sandy substrates, and
oligotrophic to mesotrophic conditions (Jorissen, 1987; Schmiedl et al., 1997; Martins et al.,
40
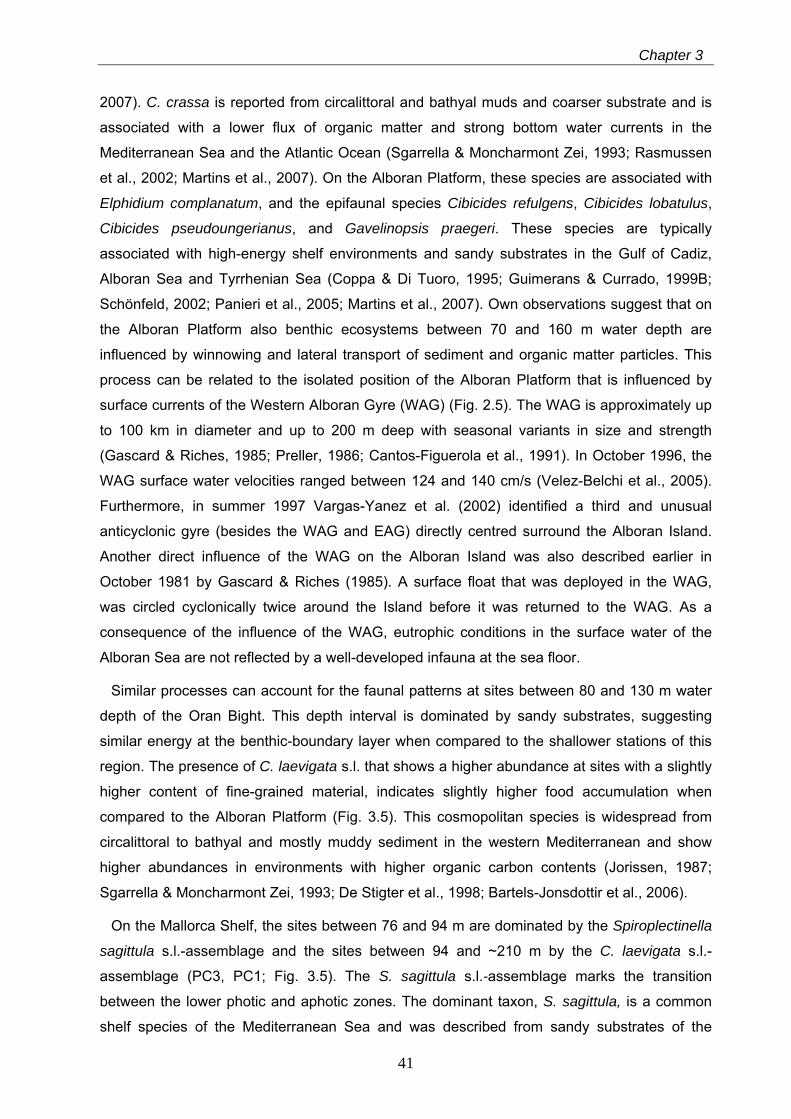
Chapter 3
2007). C. crassa is reported from circalittoral and bathyal muds and coarser substrate and is
associated with a lower flux of organic matter and strong bottom water currents in the
Mediterranean Sea and the Atlantic Ocean (Sgarrella & Moncharmont Zei, 1993; Rasmussen
et al., 2002; Martins et al., 2007). On the Alboran Platform, these species are associated with
Elphidium complanatum, and the epifaunal species Cibicides refulgens, Cibicides lobatulus,
Cibicides pseudoungerianus, and Gavelinopsis praegeri. These species are typically
associated with high-energy shelf environments and sandy substrates in the Gulf of Cadiz,
Alboran Sea and Tyrrhenian Sea (Coppa & Di Tuoro, 1995; Guimerans & Currado, 1999B;
Schönfeld, 2002; Panieri et al., 2005; Martins et al., 2007). Own observations suggest that on
the Alboran Platform also benthic ecosystems between 70 and 160 m water depth are
influenced by winnowing and lateral transport of sediment and organic matter particles. This
process can be related to the isolated position of the Alboran Platform that is influenced by
surface currents of the Western Alboran Gyre (WAG) (Fig. 2.5). The WAG is approximately up
to 100 km in diameter and up to 200 m deep with seasonal variants in size and strength
(Gascard & Riches, 1985; Preller, 1986; Cantos-Figuerola et al., 1991). In October 1996, the
WAG surface water velocities ranged between 124 and 140 cm/s (Velez-Belchi et al., 2005).
Furthermore, in summer 1997 Vargas-Yanez et al. (2002) identified a third and unusual
anticyclonic gyre (besides the WAG and EAG) directly centred surround the Alboran Island.
Another direct influence of the WAG on the Alboran Island was also described earlier in
October 1981 by Gascard & Riches (1985). A surface float that was deployed in the WAG,
was circled cyclonically twice around the Island before it was returned to the WAG. As a
consequence of the influence of the WAG, eutrophic conditions in the surface water of the
Alboran Sea are not reflected by a well-developed infauna at the sea floor.
Similar processes can account for the faunal patterns at sites between 80 and 130 m water
depth of the Oran Bight. This depth interval is dominated by sandy substrates, suggesting
similar energy at the benthic-boundary layer when compared to the shallower stations of this
region. The presence of C. laevigata s.l. that shows a higher abundance at sites with a slightly
higher content of fine-grained material, indicates slightly higher food accumulation when
compared to the Alboran Platform (Fig. 3.5). This cosmopolitan species is widespread from
circalittoral to bathyal and mostly muddy sediment in the western Mediterranean and show
higher abundances in environments with higher organic carbon contents (Jorissen, 1987;
Sgarrella & Moncharmont Zei, 1993; De Stigter et al., 1998; Bartels-Jonsdottir et al., 2006).
On the Mallorca Shelf, the sites between 76 and 94 m are dominated by the Spiroplectinella
sagittula s.l.-assemblage and the sites between 94 and ~210 m by the C. laevigata s.l.-
assemblage (PC3, PC1; Fig. 3.5). The S. sagittula s.l.-assemblage marks the transition
between the lower photic and aphotic zones. The dominant taxon, S. sagittula, is a common
shelf species of the Mediterranean Sea and was described from sandy substrates of the
41
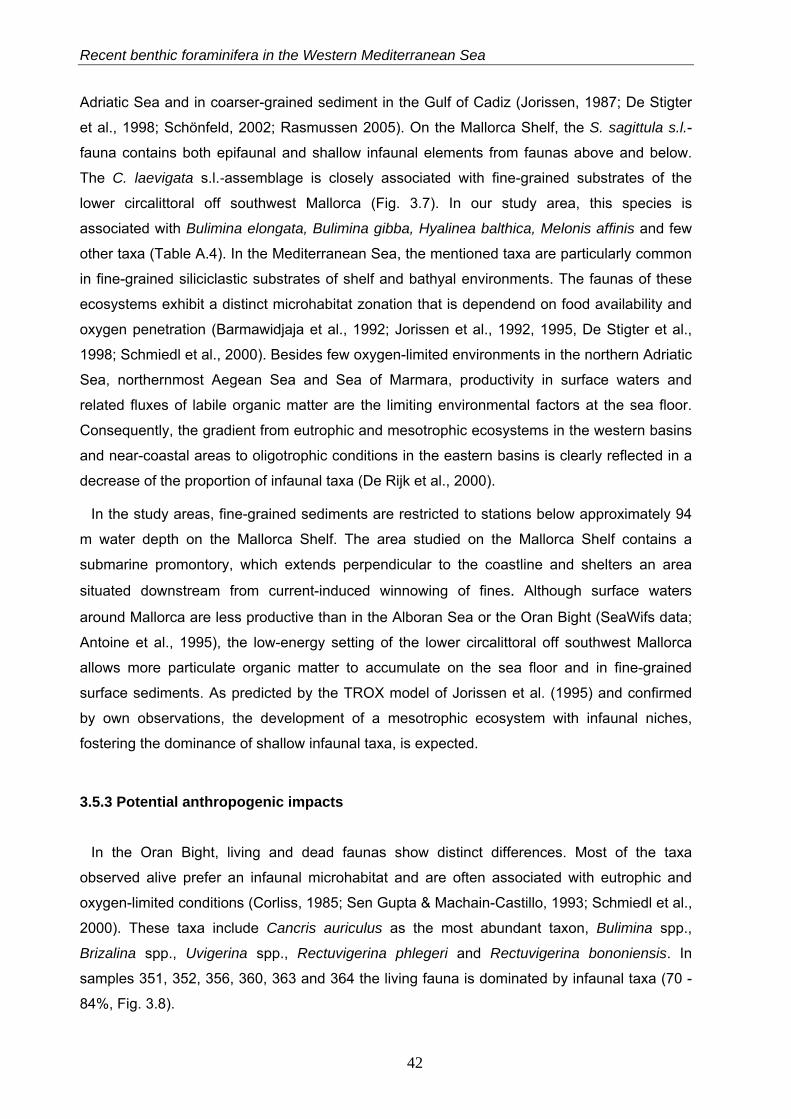
Recent benthic foraminifera in the Western Mediterranean Sea
Adriatic Sea and in coarser-grained sediment in the Gulf of Cadiz (Jorissen, 1987; De Stigter
et al., 1998; Schönfeld, 2002; Rasmussen 2005). On the Mallorca Shelf, the S. sagittula s.l.-
fauna contains both epifaunal and shallow infaunal elements from faunas above and below.
The C. laevigata s.l.-assemblage is closely associated with fine-grained substrates of the
lower circalittoral off southwest Mallorca (Fig. 3.7). In our study area, this species is
associated with Bulimina elongata, Bulimina gibba, Hyalinea balthica, Melonis affinis and few
other taxa (Table A.4). In the Mediterranean Sea, the mentioned taxa are particularly common
in fine-grained siliciclastic substrates of shelf and bathyal environments. The faunas of these
ecosystems exhibit a distinct microhabitat zonation that is dependend on food availability and
oxygen penetration (Barmawidjaja et al., 1992; Jorissen et al., 1992, 1995, De Stigter et al.,
1998; Schmiedl et al., 2000). Besides few oxygen-limited environments in the northern Adriatic
Sea, northernmost Aegean Sea and Sea of Marmara, productivity in surface waters and
related fluxes of labile organic matter are the limiting environmental factors at the sea floor.
Consequently, the gradient from eutrophic and mesotrophic ecosystems in the western basins
and near-coastal areas to oligotrophic conditions in the eastern basins is clearly reflected in a
decrease of the proportion of infaunal taxa (De Rijk et al., 2000).
In the study areas, fine-grained sediments are restricted to stations below approximately 94
m water depth on the Mallorca Shelf. The area studied on the Mallorca Shelf contains a
submarine promontory, which extends perpendicular to the coastline and shelters an area
situated downstream from current-induced winnowing of fines. Although surface waters
around Mallorca are less productive than in the Alboran Sea or the Oran Bight (SeaWifs data;
Antoine et al., 1995), the low-energy setting of the lower circalittoral off southwest Mallorca
allows more particulate organic matter to accumulate on the sea floor and in fine-grained
surface sediments. As predicted by the TROX model of Jorissen et al. (1995) and confirmed
by own observations, the development of a mesotrophic ecosystem with infaunal niches,
fostering the dominance of shallow infaunal taxa, is expected.
3.5.3 Potential anthropogenic impacts
In the Oran Bight, living and dead faunas show distinct differences. Most of the taxa
observed alive prefer an infaunal microhabitat and are often associated with eutrophic and
oxygen-limited conditions (Corliss, 1985; Sen Gupta & Machain-Castillo, 1993; Schmiedl et al.,
2000). These taxa include Cancris auriculus as the most abundant taxon, Bulimina spp.,
Brizalina spp., Uvigerina spp., Rectuvigerina phlegeri and Rectuvigerina bononiensis. In
samples 351, 352, 356, 360, 363 and 364 the living fauna is dominated by infaunal taxa (70 -
84%, Fig. 3.8).
42
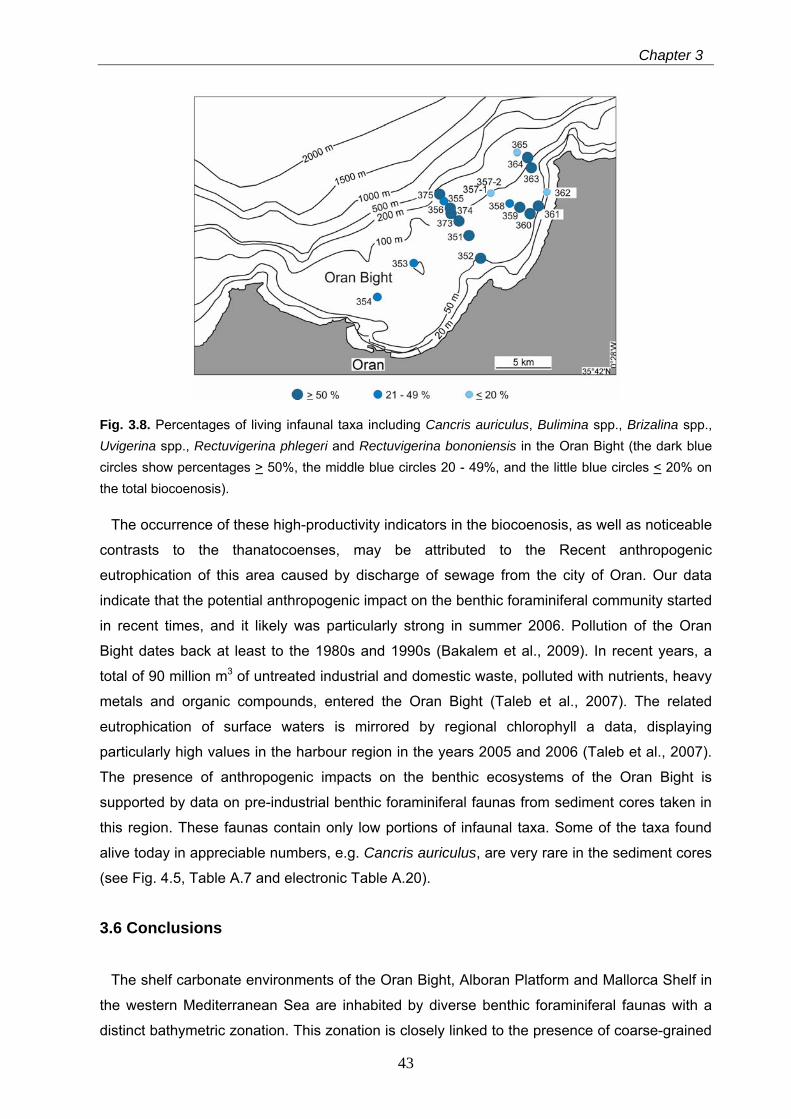
Chapter 3
Fig. 3.8. Percentages of living infaunal taxa including Cancris auriculus, Bulimina spp., Brizalina spp., Uvigerina spp., Rectuvigerina phlegeri and Rectuvigerina bononiensis in the Oran Bight (the dark blue circles show percentages > 50%, the middle blue circles 20 - 49%, and the little blue circles < 20% on the total biocoenosis).
The occurrence of these high-productivity indicators in the biocoenosis, as well as noticeable
contrasts to the thanatocoenses, may be attributed to the Recent anthropogenic
eutrophication of this area caused by discharge of sewage from the city of Oran. Our data
indicate that the potential anthropogenic impact on the benthic foraminiferal community started
in recent times, and it likely was particularly strong in summer 2006. Pollution of the Oran
Bight dates back at least to the 1980s and 1990s (Bakalem et al., 2009). In recent years, a
total of 90 million m3 of untreated industrial and domestic waste, polluted with nutrients, heavy
metals and organic compounds, entered the Oran Bight (Taleb et al., 2007). The related
eutrophication of surface waters is mirrored by regional chlorophyll a data, displaying
particularly high values in the harbour region in the years 2005 and 2006 (Taleb et al., 2007).
The presence of anthropogenic impacts on the benthic ecosystems of the Oran Bight is
supported by data on pre-industrial benthic foraminiferal faunas from sediment cores taken in
this region. These faunas contain only low portions of infaunal taxa. Some of the taxa found
alive today in appreciable numbers, e.g. Cancris auriculus, are very rare in the sediment cores
(see Fig. 4.5, Table A.7 and electronic Table A.20).
3.6 Conclusions
The shelf carbonate environments of the Oran Bight, Alboran Platform and Mallorca Shelf in
the western Mediterranean Sea are inhabited by diverse benthic foraminiferal faunas with a
distinct bathymetric zonation. This zonation is closely linked to the presence of coarse-grained
43
Recent benthic foraminifera in the Western Mediterranean Sea
44
substrates, mainly containing rhodoliths, and is likely controlled by light penetration and the
hydrodynamic energy at the benthic boundary layer.
The benthic foraminiferal biocoenoses are characterized by relatively low diversity and a
wide range of standing stocks, reflecting population dynamics and variable environmental
conditions in august 2006. The live assemblages of most sites in the Oran Bight are
dominated by taxa typical for eutrophic conditions, such as Cancris auriculus, Rectuvigerina
spp., bolivinids and buliminids. These species are generally rare in pre-industrial faunas from
sediment cores of this region, suggesting a Recent anthropogenic impact on primary
production and organic matter fluxes of coastal ecosystems in the vicinity of the city of Oran.
The diversities of the benthic foraminiferal thanatocoenoses exceed those of other
Mediterranean siliciclastic shelf environments but are lower when compared to carbonate
environments of the Levantine Sea. The latter difference can be mainly attributed to lower sea
surface temperatures with higher seasonal contrasts in the western Mediterranean Sea.
In all three areas, a distinct faunal change occurs between approximately 80 to 94 m water
depth. The upper part of the circalittoral, between approximately 40 and 80 m, is dominated by
epifaunal species, such as Asterigerinata mamilla, Neoconorbina terquemi, Cibicides spp.,
Rosalina macropora and Elphidium spp.. These taxa are permanently or temporarily attached
to carbonate fragments that are derived from rhodoliths. The lower bathymetric range of this
fauna coincides with the lower distribution limit of living rhodoliths, tracing the boundary of the
photic zone.
The faunas of the deeper circalittoral (below approximately 80 m water depth (Alboran
Platform and Oran Bight) and 94 m water depth (Mallorca Shelf)) exhibit clear regional
contrasts, depending on the energy at the benthic boundary layer and related grain-size of the
substrate. High abundance of infaunal taxa, including Cassidulina laevigata and Bulimina
elongata, are restricted to fine-grained sediments that have been deposited under a low-
energy regime on the southwestern Mallorca Shelf. These results demonstrate that in shelf
environments, the availability of food at the sea floor and the creation of infaunal niches are
mainly controlled by the substrate type and do not reflect regional gradients in surface water
production.
4 Holocene sea-level change in the western
Mediterranean Sea: Quantitative reconstructions based on foraminiferal transfer functions
Abstract
Here, results from late glacial and Holocene relative sea-level estimates in warm-temperate
shelf carbonate environments of the western Mediterranean Sea are presented. The
quantitative approach is based on the evaluation of foraminiferal data with various regression
methods, including Weighted Averaging (WA), Partial Least Squares (PLS), and a
combination of both (WA-PLS). Further, the Modern Analog Technique (MAT) and an
independent method based on Plankton/Benthos (P/B) ratios have been applied. The transfer
functions were developed on the basis of Recent benthic foraminiferal assemblages in surface
samples, and were then applied to sediment cores from the Alboran Platform, the Oran Bight
and the Mallorca Shelf. The best predictive models were derived from the WA-PLS approach.
The reconstructed relative sea-level histories in the study areas generally match the global
record. Inconsistencies are attributed to the interference of the sea-level signal with
redeposition processes and other environmental parameters such as substrate and food
availability. Paleobathymetric estimates based on P/B ratios reflect the general sea-level
development in the study areas, but exhibit a higher inaccuracy when compared to the
regression methods that provides a powerful tool for sea-level reconstructions in shelf areas.
This chapter based on: Milker, Y., Schmiedl, G., Betzler, C., submitted. Holocene sea-level
change in the Western Mediterranean Sea: Quantitative reconstructions based on
foraminiferal transfer functions. Quarternary Science Reviews.
45
Holocene sea-level changes in the Western Mediterranean Sea
4.1 Introduction
Sea-level changes are mainly related to eustatic and tectonic factors and have a strong
impact on sedimentation processes at continental margins and in epicontinental seas.
Accurate sea-level estimates are relevant for a wide range of scientific questions, such as
documentation of the ice sheet history, modeling of global circulation patterns and
reconstruction of spatial and temporal variations of crustal movements. Global sea-level was
approximately 120 to 130 m lower than today at the time of maximum continental glaciation
during the last glacial maximum, e.g. around 22 kyr B.P. (Fairbanks, 1989). The deglaciation
occurred between approximately 21 and 5 kyr B.P. and was associated with a dramatic sea-
level rise, comprising two major melt-water pulses around 14 and 11 kyr B.P. and a slowing-
down of sea-level rise during the Younger Dryas period and in the middle Holocene (Bard et
al., 1996, 2010). In the Mediterranean Sea, sea-level changes generally follow the global
development, but are also influenced by hydro-isostatic effects and neotectonic movements
(Lambeck and Bard, 2000; Morhange and Pirazolli, 2005; Stocchi and Spada, 2007). In
contrast to northern European shelf areas and coastlines, Holocene glacio-isostatic effects
can be neglected for the Mediterranean Sea (Pirazolli, 2005). Various aspects and regional
expressions of the Mediterranean sea-level change are documented by geomorphologic,
geophysical and archaeological observations (Kayan, 1988; Morhange et al., 2001; Sivan et
al., 2001; Goy et al., 2003; Vouvalidis et al., 2005 and Berne et al., 2007), overgrowth rates of
speleothems (e.g., Alessio et al., 1994; Antonioli et al., 1999, 2001, 2002), and are simulated
by numerical models (Lambeck and Bard, 2000; Lambeck et al., 2004, Pirazolli, 2005 and
Stocchi and Spada, 2007).
Shelf ecosystems are particularly susceptible to relative sea-level changes, as documented
by benthic foraminifera preserved in sediment successions. Shallow-water benthic
foraminifera depend on various factors, such as food-availability, substrate-type, bottom
current velocity, temperature, salinity, vegetation, light penetration, and the presence of
endosymbionts in more tropical and oligotrophic settings (Jorissen, 1987; Langer et al., 1998;
Pawlowski et al., 2001; Saraswati, 2002; Schönfeld, 2002; Saraswati et al., 2003; Mendes et
al., 2004; Lee, 2006; Milker et al., 2009). In addition, the benthic foraminiferal communities in
marginal marine environments, such as the Mediterranean Sea, are strongly influenced by
food quality, e.g. the input, distribution and degradation of marine and terrestrial organic
matter (Hyams-Kaphzan et al., 2008; Mojtahid et al. 2009). As a consequence, the specific
environmental setting of the Mediterranean Sea is reflected by a distinct bathymetric zonation
of the various shallow and deep-sea benthic foraminiferal taxa (Bandy and Chierici, 1966; Cita
and Zocchi, 1978; Milker et al., 2009). This zonation exihibits general contrasts between the
western and eastern basins of the Mediterranean Sea, reflecting a W-E decrease of surface
46
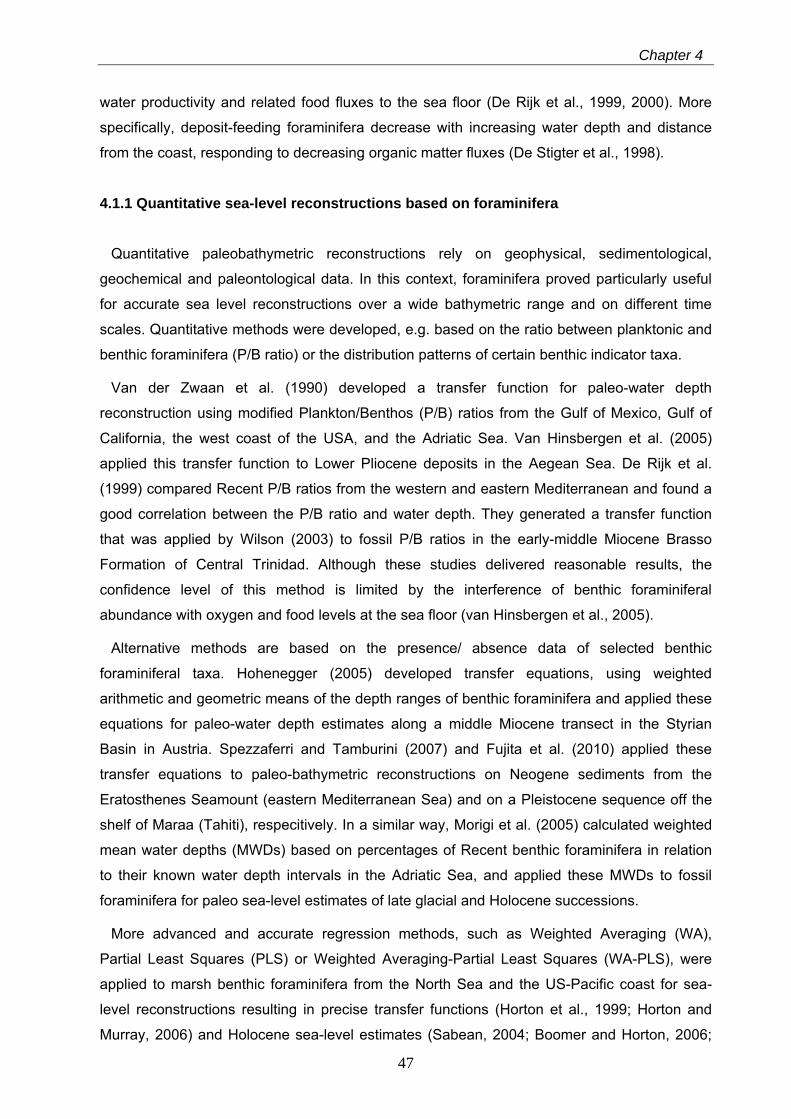
Chapter 4
water productivity and related food fluxes to the sea floor (De Rijk et al., 1999, 2000). More
specifically, deposit-feeding foraminifera decrease with increasing water depth and distance
from the coast, responding to decreasing organic matter fluxes (De Stigter et al., 1998).
4.1.1 Quantitative sea-level reconstructions based on foraminifera
Quantitative paleobathymetric reconstructions rely on geophysical, sedimentological,
geochemical and paleontological data. In this context, foraminifera proved particularly useful
for accurate sea level reconstructions over a wide bathymetric range and on different time
scales. Quantitative methods were developed, e.g. based on the ratio between planktonic and
benthic foraminifera (P/B ratio) or the distribution patterns of certain benthic indicator taxa.
Van der Zwaan et al. (1990) developed a transfer function for paleo-water depth
reconstruction using modified Plankton/Benthos (P/B) ratios from the Gulf of Mexico, Gulf of
California, the west coast of the USA, and the Adriatic Sea. Van Hinsbergen et al. (2005)
applied this transfer function to Lower Pliocene deposits in the Aegean Sea. De Rijk et al.
(1999) compared Recent P/B ratios from the western and eastern Mediterranean and found a
good correlation between the P/B ratio and water depth. They generated a transfer function
that was applied by Wilson (2003) to fossil P/B ratios in the early-middle Miocene Brasso
Formation of Central Trinidad. Although these studies delivered reasonable results, the
confidence level of this method is limited by the interference of benthic foraminiferal
abundance with oxygen and food levels at the sea floor (van Hinsbergen et al., 2005).
Alternative methods are based on the presence/ absence data of selected benthic
foraminiferal taxa. Hohenegger (2005) developed transfer equations, using weighted
arithmetic and geometric means of the depth ranges of benthic foraminifera and applied these
equations for paleo-water depth estimates along a middle Miocene transect in the Styrian
Basin in Austria. Spezzaferri and Tamburini (2007) and Fujita et al. (2010) applied these
transfer equations to paleo-bathymetric reconstructions on Neogene sediments from the
Eratosthenes Seamount (eastern Mediterranean Sea) and on a Pleistocene sequence off the
shelf of Maraa (Tahiti), respecitively. In a similar way, Morigi et al. (2005) calculated weighted
mean water depths (MWDs) based on percentages of Recent benthic foraminifera in relation
to their known water depth intervals in the Adriatic Sea, and applied these MWDs to fossil
foraminifera for paleo sea-level estimates of late glacial and Holocene successions.
More advanced and accurate regression methods, such as Weighted Averaging (WA),
Partial Least Squares (PLS) or Weighted Averaging-Partial Least Squares (WA-PLS), were
applied to marsh benthic foraminifera from the North Sea and the US-Pacific coast for sea-
level reconstructions resulting in precise transfer functions (Horton et al., 1999; Horton and
Murray, 2006) and Holocene sea-level estimates (Sabean, 2004; Boomer and Horton, 2006;
47
Holocene sea-level changes in the Western Mediterranean Sea
Horton and Edwards, 2006; Nelson et al., 2008; Hawkes et al., in press). Similar applications
provided precise sea-level transfer functions for intertidal environments of the Atlantic coast of
Maine and the Bay of Biscay for the latest Holocene (Gehrels, 2000; Leorri et al., 2008).
Finally, the Modern Analogue Technique (MAT) approach was applied by Hayward (2004) in
order to generate consistent paleobathymetric estimates for Miocene benthic foraminiferal
assemblages from offshore Taranaki, New Zealand.
Here, different quantitative sea-level reconstructions for the latest glacial and Holocene
based on Recent and fossil benthic foraminiferal assemblages of shelf carbonate
environments from three regions with different environmental settings in the western
Mediterranean Sea (Alboran Platform, Oran Bight and Mallorca Shelf) are presented.
Quantitative data were generated, using regression methods (WA, WA-PLS and PLS) and
MAT, as well as P/B ratios. The relative sea-level estimates have been compared with the
global deglacial sea-level history, and with several regional sea-level reconstructions from the
Mediterranean Sea. Major target of this study is to test the potential, applicability, and
limitation of the regression methods and P/B ratios for sea-level estimates in shelf
environments of the Mediterranean Sea. In contrast to previous applications of regression
methods on marsh environments, the covering of a much higher water depth range is intended
here.
4.2 Study area
4.2.1 Tectonic setting and sedimentation processes
The study area is located in the western Mediterranean basin (Fig. 4.1), which consists of
the Alboran-, Valencia-, Provencal-, Algeria- and Tyrrhenian sub basins that were formed
mainly during the Oligocene and Miocene by late orogenic extension as a result of the collision
of Eurasian and African plates (Comas et al., 1999) (Fig. 2.2). Recent seismicity and tectonic
movements in the western Mediterranean are concentrated in the western Alboran Sea and in
the North Algerian coastal region, where earthquakes are relatively frequent (Piromallo and
Morelli, 2003; Giresse et al., 2009). The Oran region is characterized by relatively high
seismicity and the occurrence of earthquakes (Bouhadad, 2001), while the more offshore
areas are nearly aseismic with exception of the Yusuf Fault (Domzig et al., 2006). Estimated
uplift rates in the Oran Bight amount to 0.186 (+/- 0.023) mm/yr (Bouhadad, 2001). Recent
uplifting and active subsidence occur coevally along the Alboran Ridge (Comas et al., 1999;
Martinez-Garcia et al., submitted). Present seismic activity in the Mallorca region is low (Silva
et al., 2001), and earthquakes with a magnitude higher than 4 and epicenters shallower than
48
Chapter 4
30 km were not observed since 1973 (Tinti et al., 2005). No distinct vertical movements since
the Miocene are documented for the southern part of the Mallorca Island (Pomar, 1991).
The specific tectonic, morphological and oceanographic settings influence the Recent
sedimentation processes in the different areas. The Alboran Ridge forms a steep-flanked and
rugged plateau around the small Alboran Island. The southern shelf of Mallorca, as part of the
low energy and temperate Balearic carbonate platform, as well as the Algerian shelf off Oran
are distally-steepened ramps (Fornos and Ahr, 2006; Betzler et al, in press). The shallow
subtidal zones (uppermost 40 m water depth) of the western Mediterranean Sea are
dominated by Posidonia meadows with bioclastic sand patches, whereas red algae and
coarse-grained carbonate particles (rhodoliths, gastropods, bivalves and various other
biogenic components) prevail between around 40 to 90 m water depths. Outer ramp
sediments - deeper than approximately 90 m - consist of muddy sands with mixed biotic
content (Betzler et al., in press). Siliciclastic components are rare in all of these cool-water
carbonate environments, with exception of a quartz sand nearshore prism at the Algerian
coast.
4.2.2 Oceanographic settings
The surface water mass of the western Mediterranean Sea mainly consists of inflowing
Atlantic Water (AW). Subsurface water masses include the Levantine Intermediate Water,
formed in the eastern part of the Mediterranean Sea, and the Western Mediterranean Deep
Water (Robinson et al., 2001; Masque et al., 2003; Rixen et al., 2005) (Fig. 2.4). The AW
enters the Alboran Basin as the westernmost part of the Mediterranean Sea and forms two
anticyclonic gyres, the Western Alboran Gyre (WAG) and the Eastern Alboran Gyre (EAG),
separated by the Alboran Ridge (Fig. 2.5). These gyres and the Almeria-Oran-Front that
corresponds to the eastern edge of the EAG are zones of high primary production (Arnone,
1994; L’Helguen et al., 2002; Masque et al., 2003; Velez-Belchi et al., 2005). The Alboran
Platform is directly influenced by the up to 100 km wide, and up to 200 m deep and seasonally
variable WAG (Gascard and Riches, 1985; Preller, 1986; Cantos-Figuerola et al., 1991). The
WAG surface water velocities measured in October 1996 ranged from 124 to 140 cm/s (Velez-
Belchi et al., 2005). Geostrophic currents with velocities of ~20 cm/s at water depths of 0 to
200 m are postulated for the shelf south-west of Mallorca by model results of Werner et al.
(1993). The Oran Bight is influenced by the variable Algerian Current flowing along the
Algerian coast (Fig. 2.5). This current supplies the coastal regions with elevated nutrient loads
and is characterized by higher chlorophyll a values when compared to the more oligotrophic
Algerian Basin (Millot et al., 1990; Arnone, 1994). As a consequence of this oceanographic
49
Holocene sea-level changes in the Western Mediterranean Sea
setting, the Alboran Basin and the Oran Bight have higher annual primary production rates
when compared to the more oligotrophic Balearic region (Antoine et al., 1995).
4.3 Materials and methods
4.3.1 Samples, sample preparation and statistical methods
Three sediment-cores were recovered with a vibro-corer during Meteor cruise 69/1 in August
2006. The cores were taken on the Alboran Platform (core 342-1) at 64 m water, in the Oran
Bight (core 367-1) at 63 m water depth, and on the Mallorca Shelf (core 401-1) at 74 m water
depth (Table 4.1, Fig. 4.1).
Fig. 4.1. Map of the western Mediterranean Sea showing the locations of cores 342-1 from the Alboran Platform, 367-1 from the Oran Bight, and 401-1 from the Mallorca Shelf (see also Table 4.1).
Core 342-1 consists of mostly bioturbated and cross-bedded carbonate-volcanoclastic mixed
sediment in its lower part, and it contains calcarenites and calcirudites with bioclasts, bryozoa
and rhodoliths in the upper part. In the lower part of core 367-1, the contact between the
marlstone and sandstone basement and the overlying postglacial sediments were drilled
Sediments consist of calcirudite and calcarenites with rhodoliths, lithoclasts encrusted by
coralline crusts, bivalves and gastropods. The lower part of core 401-1 consists of calcirudite
with warty, small and loose branching rhodoliths. The middle part contains an interval rich in
the gastropod Turritella communis embedded in a fine- to middle-grained calcarenite, and the
upper part is composed of fine-grained calcarenites with debris and shells of bivalves,
50
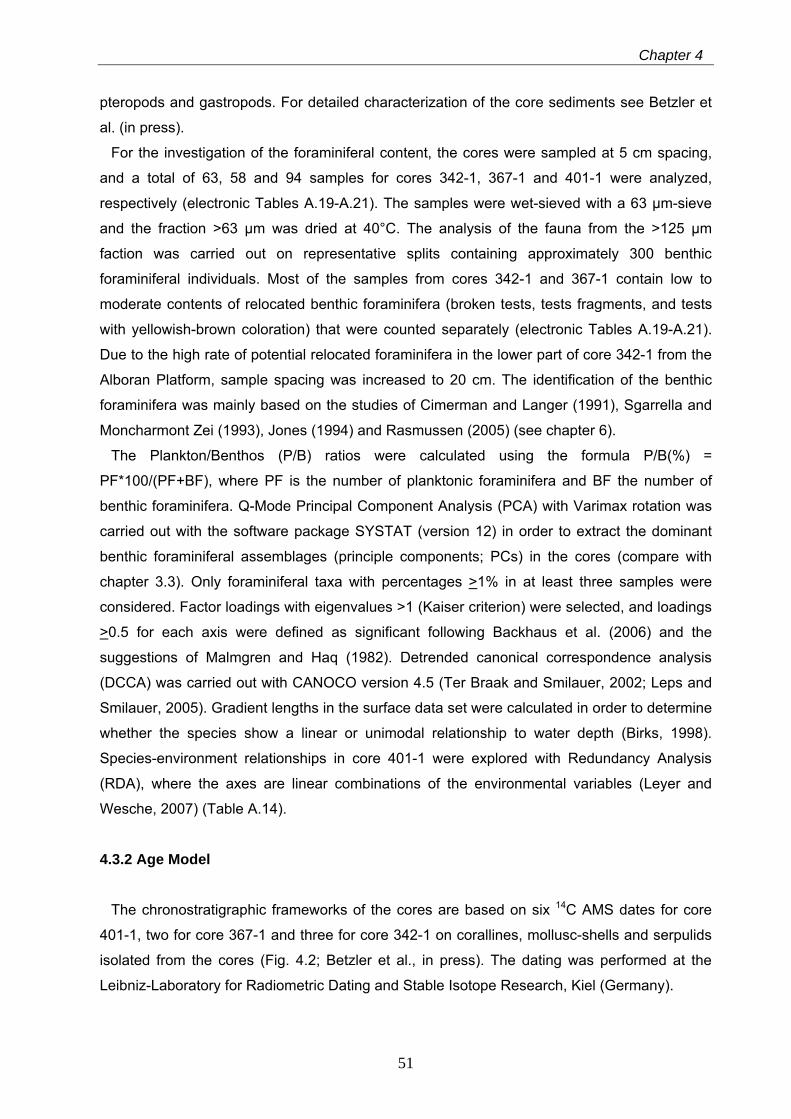
Chapter 4
pteropods and gastropods. For detailed characterization of the core sediments see Betzler et
al. (in press).
For the investigation of the foraminiferal content, the cores were sampled at 5 cm spacing,
and a total of 63, 58 and 94 samples for cores 342-1, 367-1 and 401-1 were analyzed,
respectively (electronic Tables A.19-A.21). The samples were wet-sieved with a 63 µm-sieve
and the fraction >63 µm was dried at 40°C. The analysis of the fauna from the >125 µm
faction was carried out on representative splits containing approximately 300 benthic
foraminiferal individuals. Most of the samples from cores 342-1 and 367-1 contain low to
moderate contents of relocated benthic foraminifera (broken tests, tests fragments, and tests
with yellowish-brown coloration) that were counted separately (electronic Tables A.19-A.21).
Due to the high rate of potential relocated foraminifera in the lower part of core 342-1 from the
Alboran Platform, sample spacing was increased to 20 cm. The identification of the benthic
foraminifera was mainly based on the studies of Cimerman and Langer (1991), Sgarrella and
Moncharmont Zei (1993), Jones (1994) and Rasmussen (2005) (see chapter 6).
The Plankton/Benthos (P/B) ratios were calculated using the formula P/B(%) =
PF*100/(PF+BF), where PF is the number of planktonic foraminifera and BF the number of
benthic foraminifera. Q-Mode Principal Component Analysis (PCA) with Varimax rotation was
carried out with the software package SYSTAT (version 12) in order to extract the dominant
benthic foraminiferal assemblages (principle components; PCs) in the cores (compare with
chapter 3.3). Only foraminiferal taxa with percentages >1% in at least three samples were
considered. Factor loadings with eigenvalues >1 (Kaiser criterion) were selected, and loadings
>0.5 for each axis were defined as significant following Backhaus et al. (2006) and the
suggestions of Malmgren and Haq (1982). Detrended canonical correspondence analysis
(DCCA) was carried out with CANOCO version 4.5 (Ter Braak and Smilauer, 2002; Leps and
Smilauer, 2005). Gradient lengths in the surface data set were calculated in order to determine
whether the species show a linear or unimodal relationship to water depth (Birks, 1998).
Species-environment relationships in core 401-1 were explored with Redundancy Analysis
(RDA), where the axes are linear combinations of the environmental variables (Leyer and
Wesche, 2007) (Table A.14).
4.3.2 Age Model
The chronostratigraphic frameworks of the cores are based on six 14C AMS dates for core
401-1, two for core 367-1 and three for core 342-1 on corallines, mollusc-shells and serpulids
isolated from the cores (Fig. 4.2; Betzler et al., in press). The dating was performed at the
Leibniz-Laboratory for Radiometric Dating and Stable Isotope Research, Kiel (Germany).
51
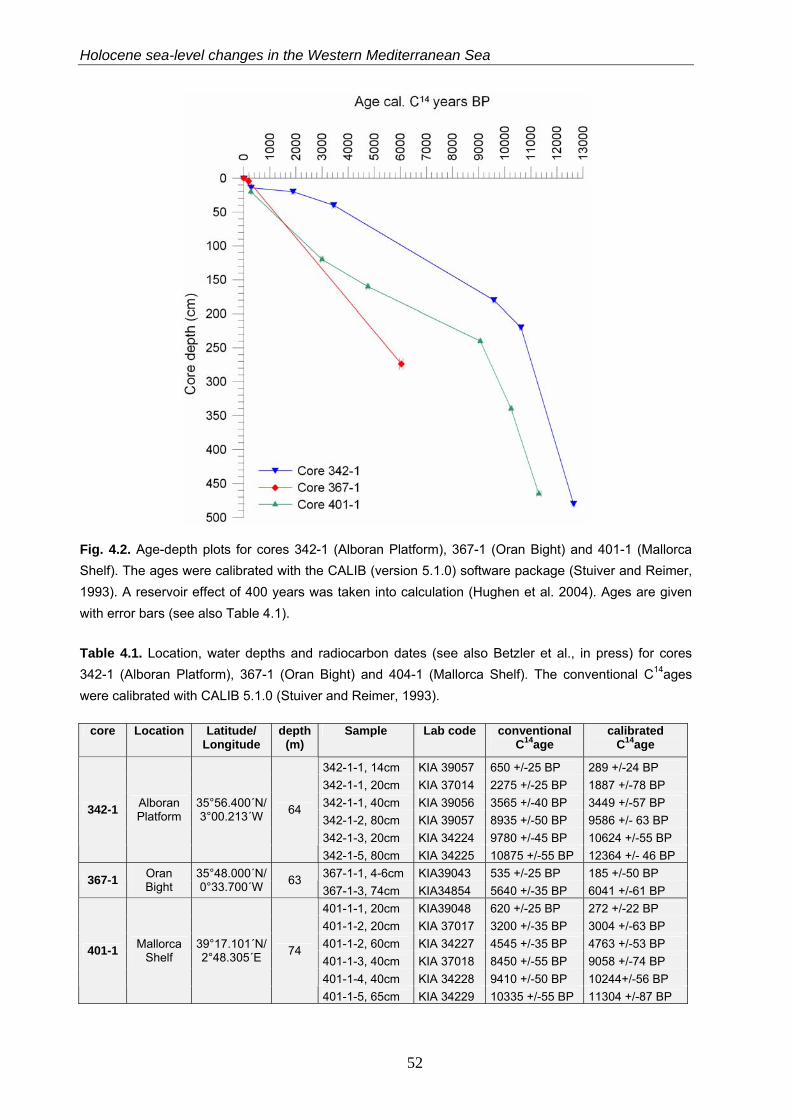
Holocene sea-level changes in the Western Mediterranean Sea
Fig. 4.2. Age-depth plots for cores 342-1 (Alboran Platform), 367-1 (Oran Bight) and 401-1 (Mallorca Shelf). The ages were calibrated with the CALIB (version 5.1.0) software package (Stuiver and Reimer, 1993). A reservoir effect of 400 years was taken into calculation (Hughen et al. 2004). Ages are given with error bars (see also Table 4.1).
Table 4.1. Location, water depths and radiocarbon dates (see also Betzler et al., in press) for cores 342-1 (Alboran Platform), 367-1 (Oran Bight) and 404-1 (Mallorca Shelf). The conventional C14ages were calibrated with CALIB 5.1.0 (Stuiver and Reimer, 1993).
core Location Latitude/ Longitude
depth (m)
Sample Lab code conventional C14age
calibrated C14age
342-1-1, 14cm KIA 39057 650 +/-25 BP 289 +/-24 BP 342-1-1, 20cm KIA 37014 2275 +/-25 BP 1887 +/-78 BP 342-1-1, 40cm KIA 39056 3565 +/-40 BP 3449 +/-57 BP 342-1-2, 80cm KIA 39057 8935 +/-50 BP 9586 +/- 63 BP 342-1-3, 20cm KIA 34224 9780 +/-45 BP 10624 +/-55 BP
342-1 Alboran Platform
35°56.400´N/ 3°00.213´W 64
342-1-5, 80cm KIA 34225 10875 +/-55 BP 12364 +/- 46 BP 367-1-1, 4-6cm KIA39043 535 +/-25 BP 185 +/-50 BP 367-1 Oran
Bight 35°48.000´N/ 0°33.700´W 63
367-1-3, 74cm KIA34854 5640 +/-35 BP 6041 +/-61 BP 401-1-1, 20cm KIA39048 620 +/-25 BP 272 +/-22 BP 401-1-2, 20cm KIA 37017 3200 +/-35 BP 3004 +/-63 BP 401-1-2, 60cm KIA 34227 4545 +/-35 BP 4763 +/-53 BP 401-1-3, 40cm KIA 37018 8450 +/-55 BP 9058 +/-74 BP 401-1-4, 40cm KIA 34228 9410 +/-50 BP 10244+/-56 BP
401-1 Mallorca Shelf
39°17.101´N/ 2°48.305´E 74
401-1-5, 65cm KIA 34229 10335 +/-55 BP 11304 +/-87 BP
52
Chapter 4
The conventional radiocarbon dates were calibrated with the CALIB (version 5.1.0) software
package (Stuiver and Reimer, 1993), considering a reservoir effect of 400 years (Hughen et
al., 2004) (Fig. 4.2, Table 4.1). In the upper parts of the cores, sedimentation rates range
between 12 cm/kyrs (core 342-1) and 46 cm/kyrs (core 367-1). In the lower parts of cores 342-
1 and 401-1, sedimentation rates are 120 cm/kyrs and 84 - 118 cm/kyrs, respectively.
Accordingly, temporal resolution of this study ranges between 42 and 417 years.
4.3.3 Methods for quantitative sea-level reconstructions
4.3.3.1 Transfer functions based on Plankton/ Benthos ratios
A widely applied method for paleo-water depth reconstructions is adopted from an organic
matter flux equation that was transformed into an exponential transfer function for paleo-water
depth estimates: D = exp(3.58718+(0.03534*%Pmod)), where D is the water depth and Pmod is the
modified P/B ratio (Van der Zwaan et al., 1990). Pmod was calculated excluding infaunal living
benthic foraminifera (stress markers), such as the genera Bulimina, Bolivina, Uvigerina,
Globobulimina and Fursenkoina that do not directly depend on the accumulation of fresh
organic matter following van der Zwaan et al. (1990). We have created new transfer functions
based on both counted and modified P/B ratios from surface samples. Surface samples 326-1
and 334-1 from the Alboran Platform and 391-1 from the Mallorca Shelf revealed very low P/B
ratios compared to the given water depth and were excluded from the model. The different
transfer functions were applied on the sediment core samples.
4.3.3.2 Weighted Averaging, Partial Least Squares, Weighted Averaging - Partial Least
Squares and Modern Analog Technique
The rationale behind the Weighted Averaging (WA) regression method is that a species
commonly shows a unimodal distribution along an environmental gradient (Ter Braak et al.,
1993). Applying this concept, mean values are calculated by weighted averaging for each
species along a known environmental gradient in the training data set (surface samples). This
step is followed by the estimation of the environmental parameter in the fossil data set (core
samples) based on the calculated weighted averages (Birks et al., 1990; Ter Braak and
Juggins, 1993). Partial Least Squares (PLS) is a method that can be used both for univariate
and multivariate regression (Garthwaite, 1994). New components from independent predictors
and dependent environmental variable(s) are created by maximizing the covariance between
these variables (Birks, 1998; Rosipal and Krämer, 2006). In the combined approach of WA
and PLS (WA-PLS), the first component is a weighted average for the environmental variable
and is similar to the WA method, the further components are weighted averages for the
53
Holocene sea-level changes in the Western Mediterranean Sea
residuals of the environmental variable (Ter Braak and Juggins, 1993). The advantage of this
method is that it can improve predictions because it considers the influence of additional
environmental variables (Horton and Edwards, 2006). The Modern Analog Technique (MAT)
searches in a training data-set for the nearest modern analogues for a fossil assemblage by
calculating dissimilarity coefficients (Birks, 1998). The given environmental parameters in the
best modern analogues are then applied to the environmental estimates in a fossil sample by
(weighted) averaging of these parameters (Malmgren and Nordlund 1997).
Prior to the development of transfer functions with the above described methods, both
training and fossil data sets were reduced to benthic foraminifera with abundances of >1% in
more than one sample. A total of 46 surface samples with 87 species were used for the
calculations. Surface sample 362-1 from the Oran Bight was excluded from the training data
sets due to its low number of benthic foraminifera. Species counts were transformed into
percentages for MAT, and were square-root transformed for WA, WA-PLS and PLS. All
calculations were carried out with the C2-Software (Juggins, 2003). Cross-validations for WA,
WA-PLS and PLS, and bootstrapping for MAT were selected to calculate the square root error
of prediction (RMSEP) in the training data-sets (Overpeck et al., 1985; Ter Braak and Juggins,
1993). Three deeper sites (393-1 from 235 m, 391-1 from 163 m and 333-1 from 161 m) were
excluded step by step, because the estimated water depths recalculated in the full training
data set revealed an underestimation of 12 - 36% for these samples. The number of
components for WA-PLS and PLS was selected according to the lowest RMSEP values if the
reduction in prediction error exceeds 5% for this component compared to the next lower
component (Ter Braak and Juggins, 1993). For WA, an inverse approach was chosen
because of better performance (Birks, 1998).
4.4 Results
4.4.1 Recent and Holocene Plankton/ Benthos ratios
The Recent P/B ratios in the Alboran Platform surface samples range from 63% at 163 m to
26% at 38 m water depth (Fig. 4.3). In the Oran Bight samples, P/B ratios range from 58% at
85 m to 9% at 20 m water depth (Fig. 4.3). On the Mallorca Shelf, the P/B ratios range from
44% at 235 m to 8% at 40 m water depth (Fig. 4.3). On the Mallorca Shelf, P/B ratios
continuously increase with increasing water depth, whereas on the Alboran Platform and in the
Oran Bight no such trend is observed (Fig. 4.3).
54
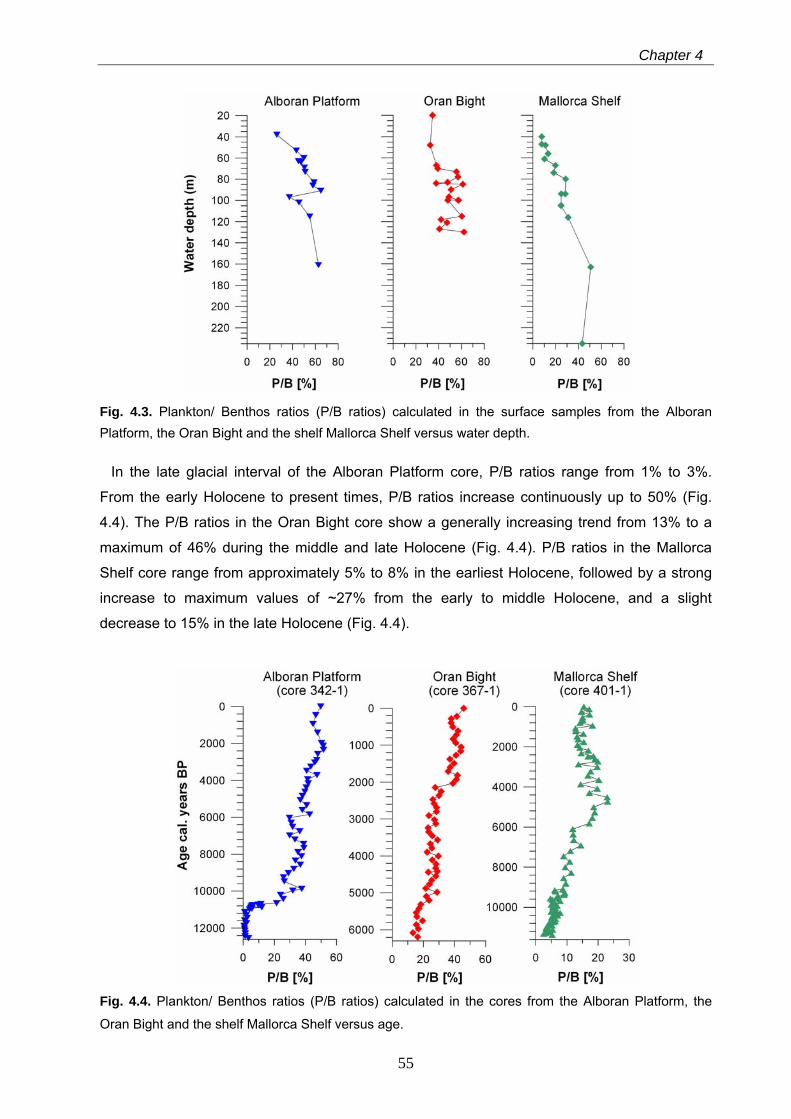
Chapter 4
Fig. 4.3. Plankton/ Benthos ratios (P/B ratios) calculated in the surface samples from the Alboran Platform, the Oran Bight and the shelf Mallorca Shelf versus water depth.
In the late glacial interval of the Alboran Platform core, P/B ratios range from 1% to 3%.
From the early Holocene to present times, P/B ratios increase continuously up to 50% (Fig.
4.4). The P/B ratios in the Oran Bight core show a generally increasing trend from 13% to a
maximum of 46% during the middle and late Holocene (Fig. 4.4). P/B ratios in the Mallorca
Shelf core range from approximately 5% to 8% in the earliest Holocene, followed by a strong
increase to maximum values of ~27% from the early to middle Holocene, and a slight
decrease to 15% in the late Holocene (Fig. 4.4).
Fig. 4.4. Plankton/ Benthos ratios (P/B ratios) calculated in the cores from the Alboran Platform, the
Oran Bight and the shelf Mallorca Shelf versus age.
55
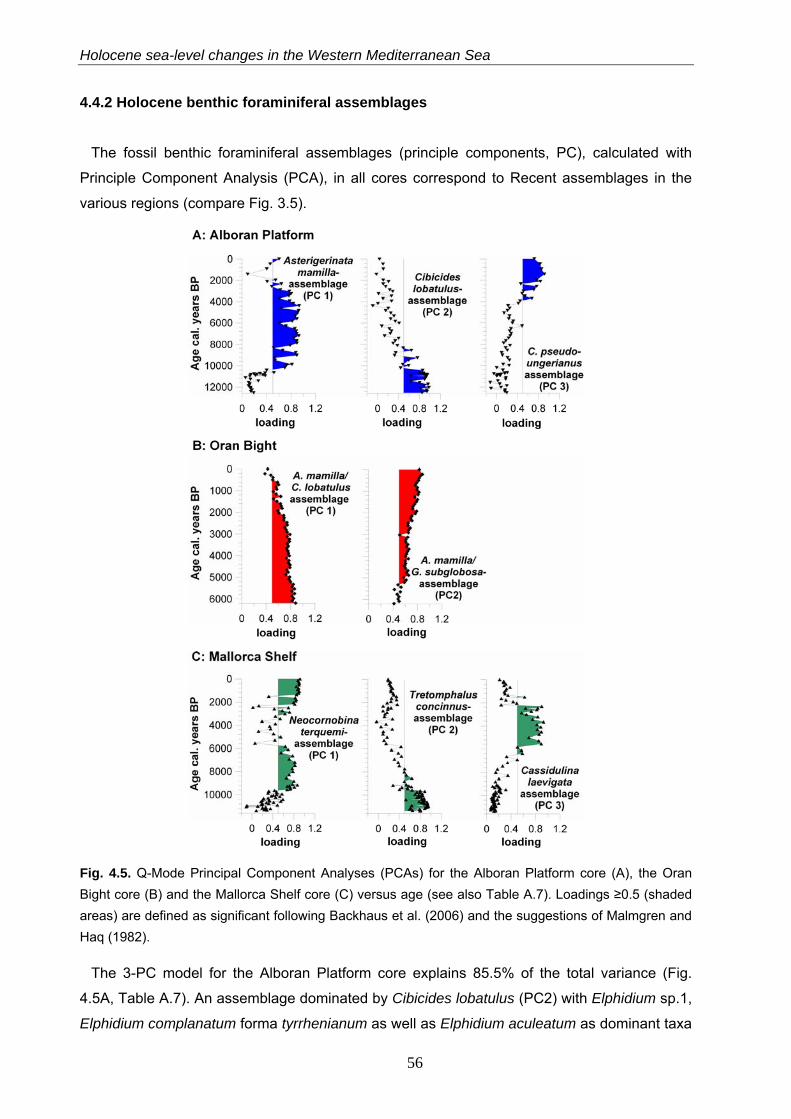
Holocene sea-level changes in the Western Mediterranean Sea
4.4.2 Holocene benthic foraminiferal assemblages
The fossil benthic foraminiferal assemblages (principle components, PC), calculated with
Principle Component Analysis (PCA), in all cores correspond to Recent assemblages in the
various regions (compare Fig. 3.5).
Fig. 4.5. Q-Mode Principal Component Analyses (PCAs) for the Alboran Platform core (A), the Oran Bight core (B) and the Mallorca Shelf core (C) versus age (see also Table A.7). Loadings ≥0.5 (shaded areas) are defined as significant following Backhaus et al. (2006) and the suggestions of Malmgren and Haq (1982).
The 3-PC model for the Alboran Platform core explains 85.5% of the total variance (Fig.
4.5A, Table A.7). An assemblage dominated by Cibicides lobatulus (PC2) with Elphidium sp.1,
Elphidium complanatum forma tyrrhenianum as well as Elphidium aculeatum as dominant taxa
56
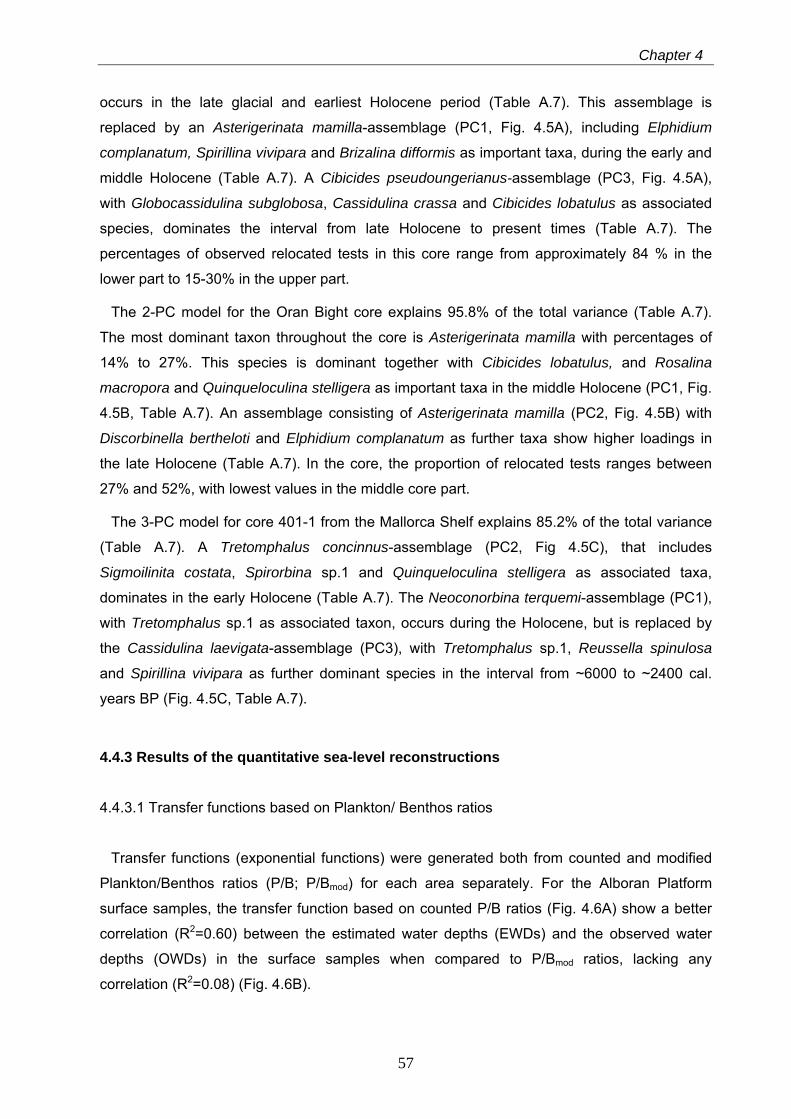
Chapter 4
occurs in the late glacial and earliest Holocene period (Table A.7). This assemblage is
replaced by an Asterigerinata mamilla-assemblage (PC1, Fig. 4.5A), including Elphidium
complanatum, Spirillina vivipara and Brizalina difformis as important taxa, during the early and
middle Holocene (Table A.7). A Cibicides pseudoungerianus-assemblage (PC3, Fig. 4.5A),
with Globocassidulina subglobosa, Cassidulina crassa and Cibicides lobatulus as associated
species, dominates the interval from late Holocene to present times (Table A.7). The
percentages of observed relocated tests in this core range from approximately 84 % in the
lower part to 15-30% in the upper part.
The 2-PC model for the Oran Bight core explains 95.8% of the total variance (Table A.7).
The most dominant taxon throughout the core is Asterigerinata mamilla with percentages of
14% to 27%. This species is dominant together with Cibicides lobatulus, and Rosalina
macropora and Quinqueloculina stelligera as important taxa in the middle Holocene (PC1, Fig.
4.5B, Table A.7). An assemblage consisting of Asterigerinata mamilla (PC2, Fig. 4.5B) with
Discorbinella bertheloti and Elphidium complanatum as further taxa show higher loadings in
the late Holocene (Table A.7). In the core, the proportion of relocated tests ranges between
27% and 52%, with lowest values in the middle core part.
The 3-PC model for core 401-1 from the Mallorca Shelf explains 85.2% of the total variance
(Table A.7). A Tretomphalus concinnus-assemblage (PC2, Fig 4.5C), that includes
Sigmoilinita costata, Spirorbina sp.1 and Quinqueloculina stelligera as associated taxa,
dominates in the early Holocene (Table A.7). The Neoconorbina terquemi-assemblage (PC1),
with Tretomphalus sp.1 as associated taxon, occurs during the Holocene, but is replaced by
the Cassidulina laevigata-assemblage (PC3), with Tretomphalus sp.1, Reussella spinulosa
and Spirillina vivipara as further dominant species in the interval from ~6000 to ~2400 cal.
years BP (Fig. 4.5C, Table A.7).
4.4.3 Results of the quantitative sea-level reconstructions
4.4.3.1 Transfer functions based on Plankton/ Benthos ratios
Transfer functions (exponential functions) were generated both from counted and modified
Plankton/Benthos ratios (P/B; P/Bmod) for each area separately. For the Alboran Platform
surface samples, the transfer function based on counted P/B ratios (Fig. 4.6A) show a better
correlation (R2=0.60) between the estimated water depths (EWDs) and the observed water
depths (OWDs) in the surface samples when compared to P/Bmod ratios, lacking any
correlation (R2=0.08) (Fig. 4.6B).
57
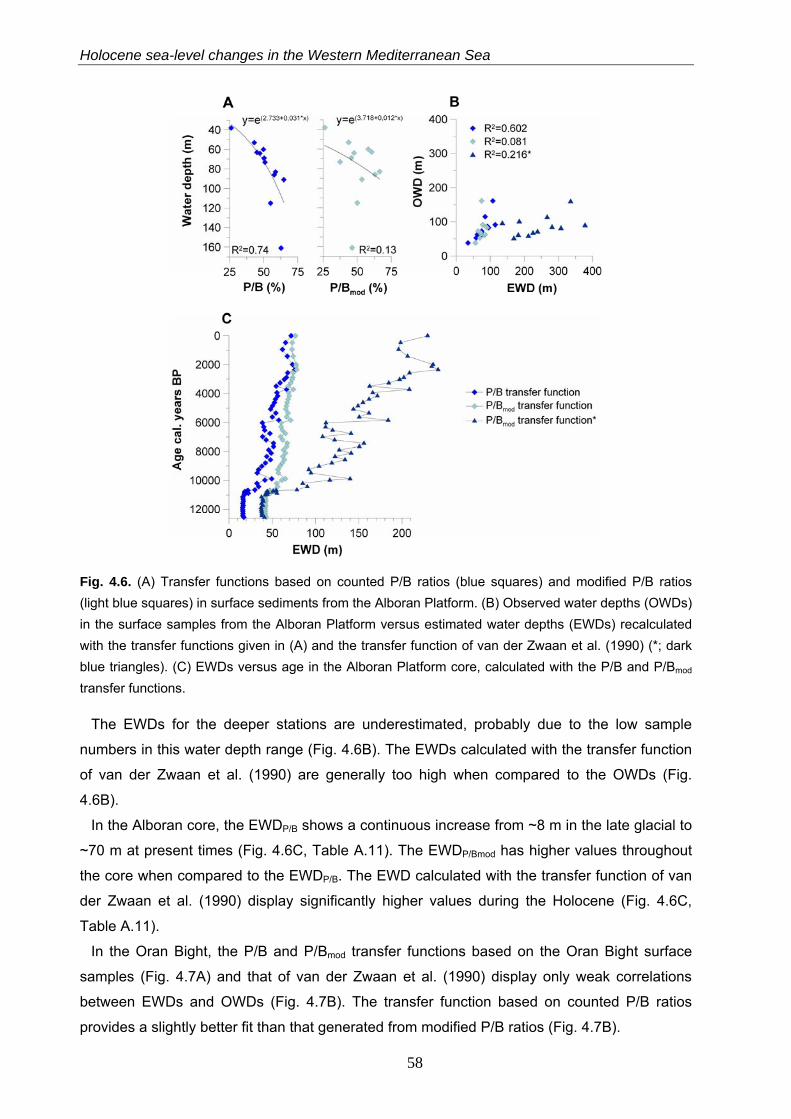
Holocene sea-level changes in the Western Mediterranean Sea
Fig. 4.6. (A) Transfer functions based on counted P/B ratios (blue squares) and modified P/B ratios (light blue squares) in surface sediments from the Alboran Platform. (B) Observed water depths (OWDs) in the surface samples from the Alboran Platform versus estimated water depths (EWDs) recalculated with the transfer functions given in (A) and the transfer function of van der Zwaan et al. (1990) (*; dark blue triangles). (C) EWDs versus age in the Alboran Platform core, calculated with the P/B and P/Bmod transfer functions.
The EWDs for the deeper stations are underestimated, probably due to the low sample
numbers in this water depth range (Fig. 4.6B). The EWDs calculated with the transfer function
of van der Zwaan et al. (1990) are generally too high when compared to the OWDs (Fig.
4.6B).
In the Alboran core, the EWDP/B shows a continuous increase from ~8 m in the late glacial to
~70 m at present times (Fig. 4.6C, Table A.11). The EWDP/Bmod has higher values throughout
the core when compared to the EWDP/B. The EWD calculated with the transfer function of van
der Zwaan et al. (1990) display significantly higher values during the Holocene (Fig. 4.6C,
Table A.11).
In the Oran Bight, the P/B and P/Bmod transfer functions based on the Oran Bight surface
samples (Fig. 4.7A) and that of van der Zwaan et al. (1990) display only weak correlations
between EWDs and OWDs (Fig. 4.7B). The transfer function based on counted P/B ratios
provides a slightly better fit than that generated from modified P/B ratios (Fig. 4.7B).
58
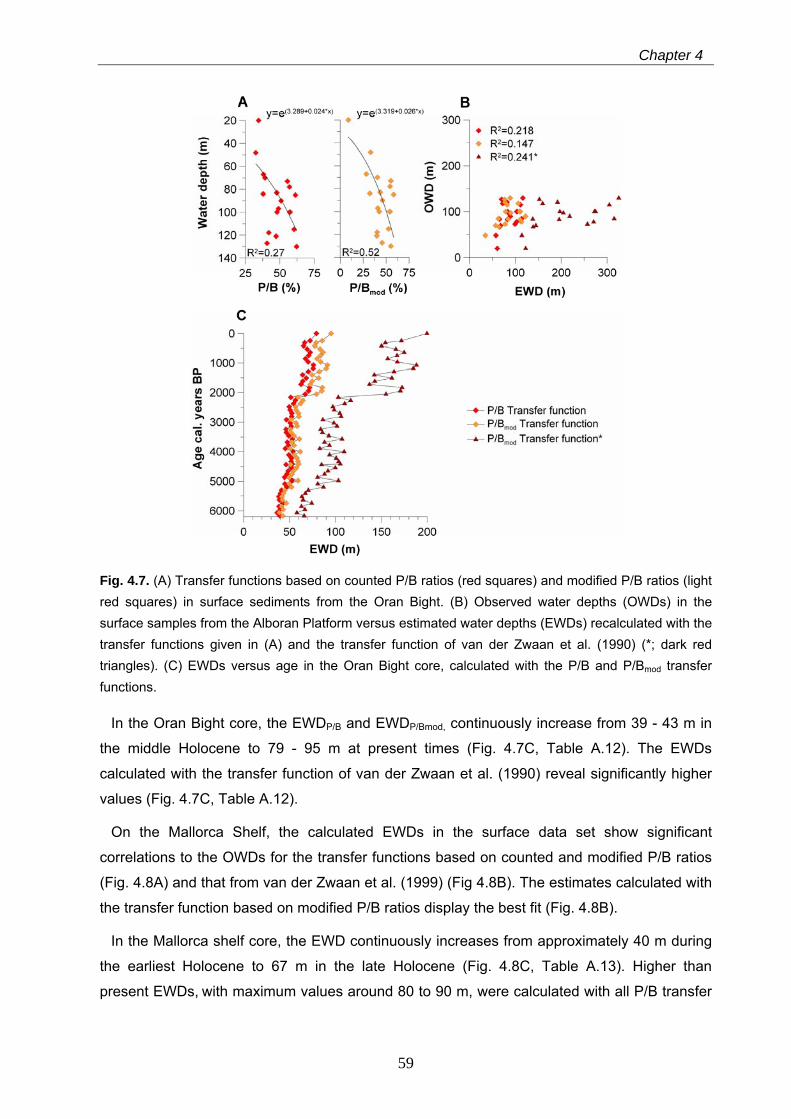
Chapter 4
Fig. 4.7. (A) Transfer functions based on counted P/B ratios (red squares) and modified P/B ratios (light red squares) in surface sediments from the Oran Bight. (B) Observed water depths (OWDs) in the surface samples from the Alboran Platform versus estimated water depths (EWDs) recalculated with the transfer functions given in (A) and the transfer function of van der Zwaan et al. (1990) (*; dark red triangles). (C) EWDs versus age in the Oran Bight core, calculated with the P/B and P/Bmod transfer functions.
In the Oran Bight core, the EWDP/B and EWDP/Bmod, continuously increase from 39 - 43 m in
the middle Holocene to 79 - 95 m at present times (Fig. 4.7C, Table A.12). The EWDs
calculated with the transfer function of van der Zwaan et al. (1990) reveal significantly higher
values (Fig. 4.7C, Table A.12).
On the Mallorca Shelf, the calculated EWDs in the surface data set show significant
correlations to the OWDs for the transfer functions based on counted and modified P/B ratios
(Fig. 4.8A) and that from van der Zwaan et al. (1999) (Fig 4.8B). The estimates calculated with
the transfer function based on modified P/B ratios display the best fit (Fig. 4.8B).
In the Mallorca shelf core, the EWD continuously increases from approximately 40 m during
the earliest Holocene to 67 m in the late Holocene (Fig. 4.8C, Table A.13). Higher than
present EWDs, with maximum values around 80 to 90 m, were calculated with all P/B transfer
59
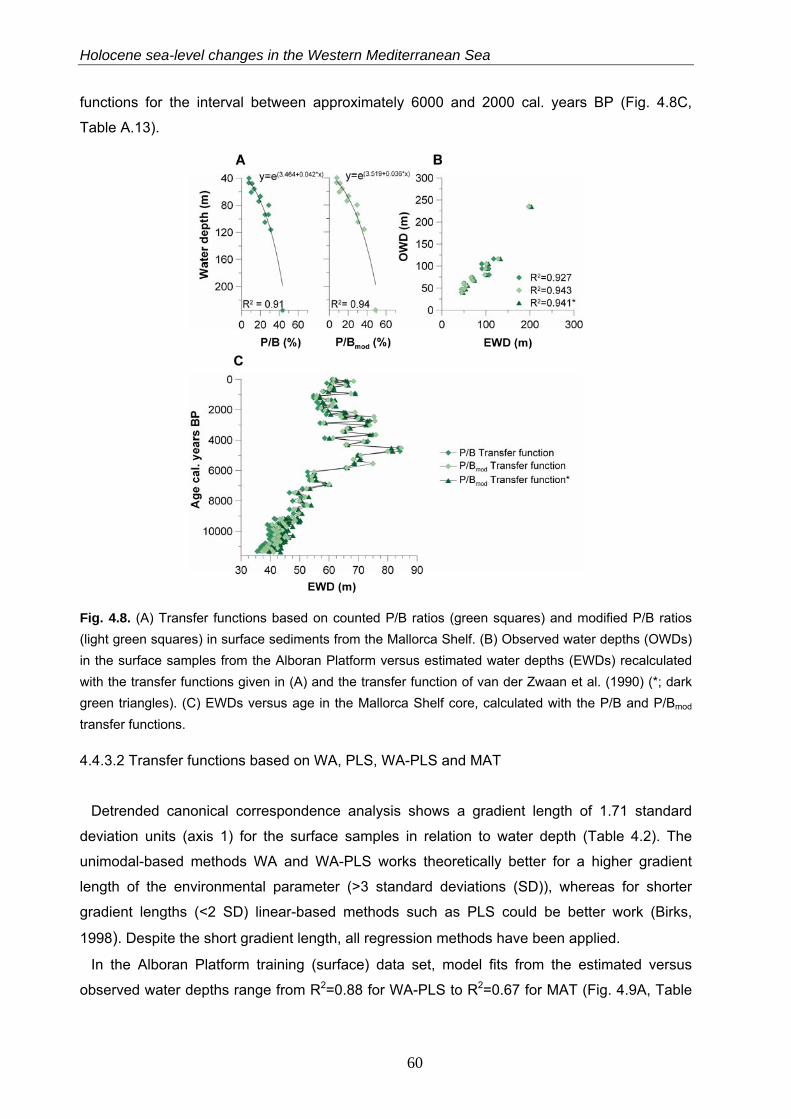
Holocene sea-level changes in the Western Mediterranean Sea
functions for the interval between approximately 6000 and 2000 cal. years BP (Fig. 4.8C,
Table A.13).
Fig. 4.8. (A) Transfer functions based on counted P/B ratios (green squares) and modified P/B ratios (light green squares) in surface sediments from the Mallorca Shelf. (B) Observed water depths (OWDs) in the surface samples from the Alboran Platform versus estimated water depths (EWDs) recalculated with the transfer functions given in (A) and the transfer function of van der Zwaan et al. (1990) (*; dark green triangles). (C) EWDs versus age in the Mallorca Shelf core, calculated with the P/B and P/Bmod transfer functions.
4.4.3.2 Transfer functions based on WA, PLS, WA-PLS and MAT
Detrended canonical correspondence analysis shows a gradient length of 1.71 standard
deviation units (axis 1) for the surface samples in relation to water depth (Table 4.2). The
unimodal-based methods WA and WA-PLS works theoretically better for a higher gradient
length of the environmental parameter (>3 standard deviations (SD)), whereas for shorter
gradient lengths (<2 SD) linear-based methods such as PLS could be better work (Birks,
1998). Despite the short gradient length, all regression methods have been applied.
In the Alboran Platform training (surface) data set, model fits from the estimated versus
observed water depths range from R2=0.88 for WA-PLS to R2=0.67 for MAT (Fig. 4.9A, Table
60
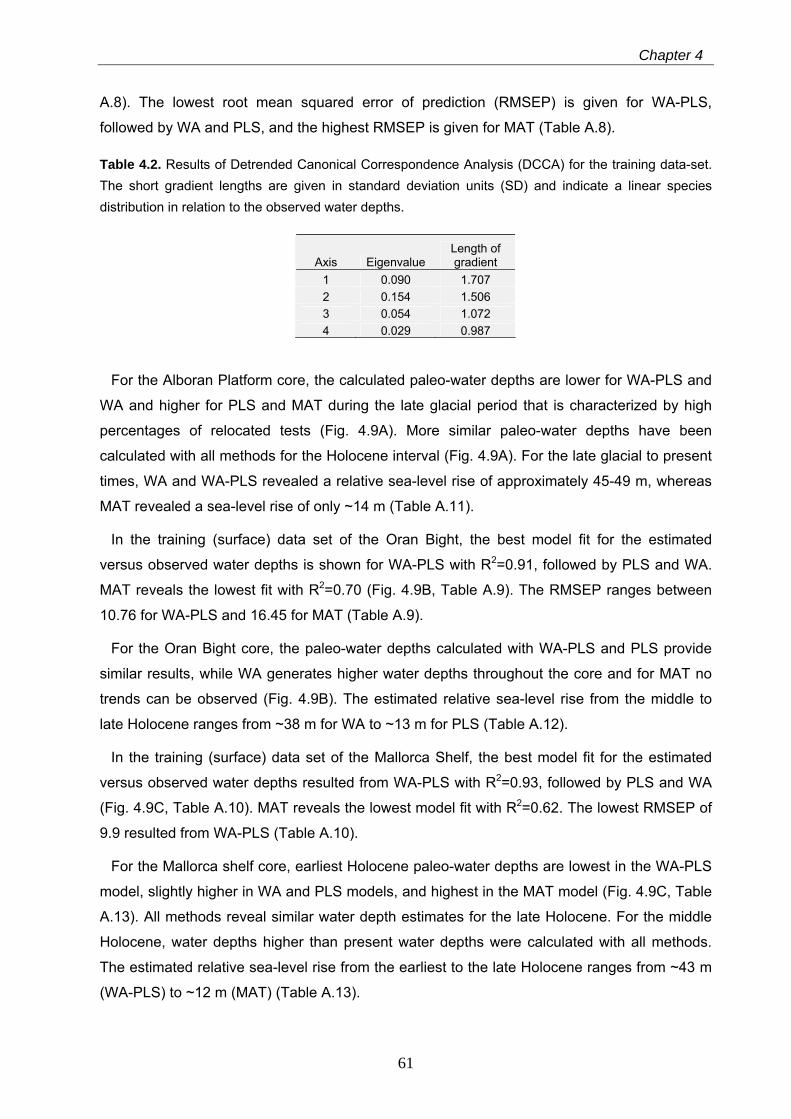
Chapter 4
A.8). The lowest root mean squared error of prediction (RMSEP) is given for WA-PLS,
followed by WA and PLS, and the highest RMSEP is given for MAT (Table A.8).
Table 4.2. Results of Detrended Canonical Correspondence Analysis (DCCA) for the training data-set. The short gradient lengths are given in standard deviation units (SD) and indicate a linear species distribution in relation to the observed water depths.
Axis Eigenvalue Length of gradient
1 0.090 1.707 2 0.154 1.506 3 0.054 1.072 4 0.029 0.987
For the Alboran Platform core, the calculated paleo-water depths are lower for WA-PLS and
WA and higher for PLS and MAT during the late glacial period that is characterized by high
percentages of relocated tests (Fig. 4.9A). More similar paleo-water depths have been
calculated with all methods for the Holocene interval (Fig. 4.9A). For the late glacial to present
times, WA and WA-PLS revealed a relative sea-level rise of approximately 45-49 m, whereas
MAT revealed a sea-level rise of only ~14 m (Table A.11).
In the training (surface) data set of the Oran Bight, the best model fit for the estimated
versus observed water depths is shown for WA-PLS with R2=0.91, followed by PLS and WA.
MAT reveals the lowest fit with R2=0.70 (Fig. 4.9B, Table A.9). The RMSEP ranges between
10.76 for WA-PLS and 16.45 for MAT (Table A.9).
For the Oran Bight core, the paleo-water depths calculated with WA-PLS and PLS provide
similar results, while WA generates higher water depths throughout the core and for MAT no
trends can be observed (Fig. 4.9B). The estimated relative sea-level rise from the middle to
late Holocene ranges from ~38 m for WA to ~13 m for PLS (Table A.12).
In the training (surface) data set of the Mallorca Shelf, the best model fit for the estimated
versus observed water depths resulted from WA-PLS with R2=0.93, followed by PLS and WA
(Fig. 4.9C, Table A.10). MAT reveals the lowest model fit with R2=0.62. The lowest RMSEP of
9.9 resulted from WA-PLS (Table A.10).
For the Mallorca shelf core, earliest Holocene paleo-water depths are lowest in the WA-PLS
model, slightly higher in WA and PLS models, and highest in the MAT model (Fig. 4.9C, Table
A.13). All methods reveal similar water depth estimates for the late Holocene. For the middle
Holocene, water depths higher than present water depths were calculated with all methods.
The estimated relative sea-level rise from the earliest to the late Holocene ranges from ~43 m
(WA-PLS) to ~12 m (MAT) (Table A.13).
61
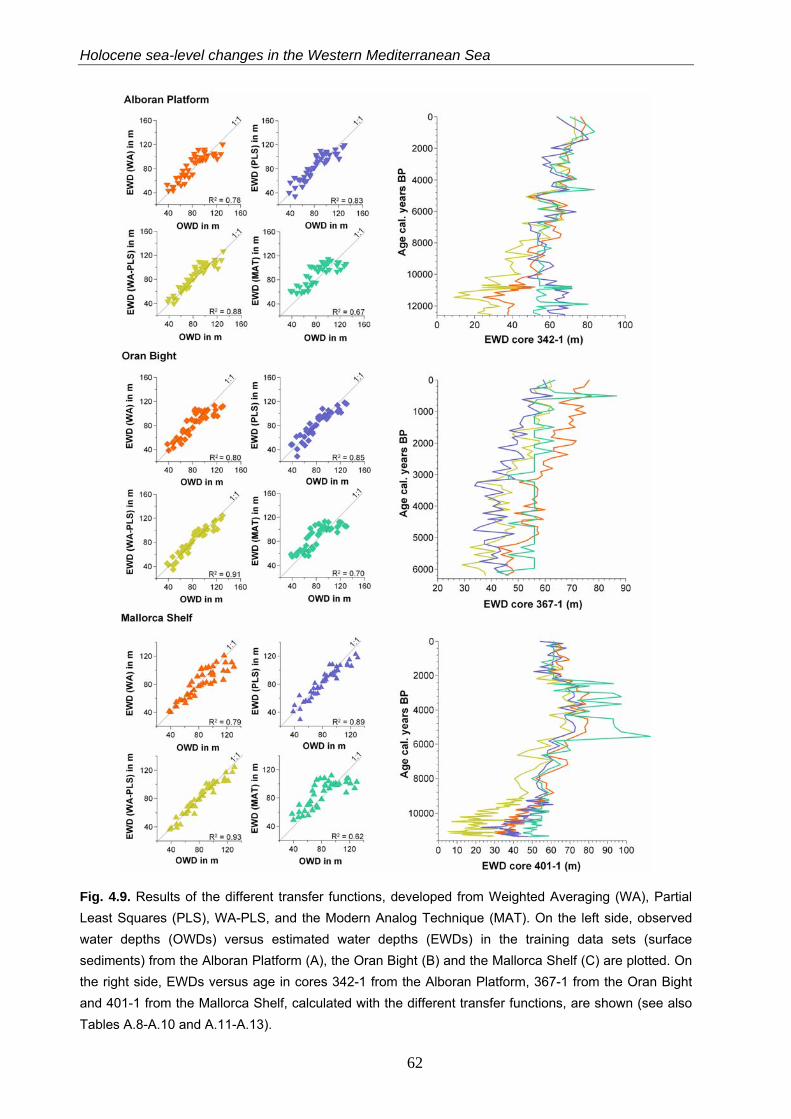
Holocene sea-level changes in the Western Mediterranean Sea
Fig. 4.9. Results of the different transfer functions, developed from Weighted Averaging (WA), Partial Least Squares (PLS), WA-PLS, and the Modern Analog Technique (MAT). On the left side, observed water depths (OWDs) versus estimated water depths (EWDs) in the training data sets (surface sediments) from the Alboran Platform (A), the Oran Bight (B) and the Mallorca Shelf (C) are plotted. On the right side, EWDs versus age in cores 342-1 from the Alboran Platform, 367-1 from the Oran Bight and 401-1 from the Mallorca Shelf, calculated with the different transfer functions, are shown (see also Tables A.8-A.10 and A.11-A.13).
62
Chapter 4
4.5 Discussion
4.5.1 Comparison and significance of the different transfer functions for quantitative sea-level reconstruction
The results illustrate the advantages and disadvantages of the different methods applied.
Among the developed transfer functions, WA-PLS resulted in the best prediction potential (Fig.
4.9A-C). This method revealed lowest root mean squared error of prediction (RMSEP) and the
best correlations (cross-validated R2jack and R2) for all study areas (Tables A.8-A.10). One
general problem is the edge effect for models based on weighted averaging (WA, WA-PLS)
resulting in underestimation of the high end and overestimation of the low end of an
environmental gradient (Birks, 1998). Accordingly, the estimated water depths in the training
data sets for the deeper stations are underestimated for WA and WA-PLS, but also for PLS
and MAT, when compared to the observed water depths (Fig. 4.9A-C). A further problem is
that WA ignores influencing environmental parameters other than the parameter of interest
(Birks, 1998). This problem is solved in WA-PLS that is able to “identify” the influence of
additional environmental parameters (Birks, 1998; Horton & Edwards, 2006). In this method,
regression coefficients can be optimized, assuming that the influencing parameters are the
same in the fossil and training data sets (Ter Braak and Juggins, 1993; Birks, 1998; Horton
and Edwards, 2006). Based on this advantage, Ter Braak and Juggins (1993) and Ter Braak
et al. (1993) preferred WA-PLS in their applications when compared to WA and PLS. In
addition, WA-PLS performs well under no-analogue conditions, if the dominant species in a
fossil data set also occur in the training data set, allowing estimation of their optima (Birks,
1998). The distribution of Recent shelf benthic foraminifera in the study areas is not only
controlled by water depth, but is also influenced by other factors, such as substrate and food
availability (see also 3.5). Similar effects can be expected for late glacial and Holocene
faunas. These observations and methodological advantages explain the best performance of
WA-PLS in our application.
The advantage of MAT is that it can handle with non-linear relationships between species
and environmental parameters. However, extremes in the environmental parameters are only
poorly performed, since this method is based on an interpolative technique (Kucera et al.,
2005). The poor statistical performance of MAT, especially in the training data sets from the
Alboran Platform and Oran Bight likely results from the no-analogue problem (Tables A.8 and
A.9). This is because samples from shallower sites are under-represented in the training data
set. Accordingly, the distance to the closest modern analogue increases in the down-core
samples in all areas.
63
Holocene sea-level changes in the Western Mediterranean Sea
The applied P/B transfer functions displayed variable performance in the different regions,
suggesting that the applicability of this method for accurate quantitative sea-level
reconstructions is limited by local environmental conditions, such as exposure to the open
ocean (shelf morphology), surface currents and trophic conditions. The P/B transfer functions
that are based on the counted P/B ratios in the training data set from the Alboran Platform
worked better when compared to that of van der Zwaan et al. (1990), while on the Mallorca
shelf all transfer functions provide similar results. P/B transfer functions should therefore be
validated by local training data sets.
4.5.2 Global versus regional sea-level evolution of the western Mediterranean Sea during the late glacial and Holocene
On the Alboran Platform and the Mallorca Shelf, the estimated relative sea-level rises
calculated with WA-PLS (ERSLWA-PLS), generally match the global sea-level development of
the past 12,000 years (Bard et al., 1996; Fairbanks et al., 1989) but also resemble regional
sea-level reconstructions for the Mediterranean Sea (Allesio et al., 1994; Lambeck and Bard,
2000; Antonioli et al., 2001; Sivan et al., 2001) (Fig. 4.10A). Our sea-level reconstructions
exhibit a higher variability when compared to the available sea-level curves (Fig. 4.10A). This
may be explained by the confidence levels of our transfer function, resulting in uncertainties of
approximately +/-10 m within a total sea-level rise of ~45 and ~50 m for the Alboran Platform
and the southwest shelf off Mallorca, respectively. These uncertainties prevent the detection of
potential neotectonic movements on the Alboran Platform (Comas et al., 1999; Silva et al.,
2001; Martinez-Garcia et al., submitted). In addition, the higher variability in the calculated
ERSLWA-PLS values for the late glacial intervals and early Holocene on the Alboran Platform
and on the Mallorca shelf are likely biased by redeposition processes resulting in relocation of
foraminiferal tests. According to the reconstructions of Lambeck and Bard (2000) for the
Mediterranean region, sea-level would have risen from approximately 5 to 25 m during the
latest glacial and earliest Holocene period on the Alboran Platform and from approximately 14
to 30 m during the earliest Holocene period on the Mallorca Shelf, respectively. In both areas,
the modern storm wave base is located at ~40 m (Betzler et al., in press), suggesting a strong
influence of wave activity on sediment redeposition during this time interval. This agrees well
with the high sedimentation rates in both areas during this time interval (Fig. 4.2).
In the Oran Bight, contrasting results are achieved with application of the different transfer
functions. ERSLWA-PLS and ERSLP/B records revealed a sea-level rise of approximately 30 m
and 36 m, respectively, during the past 6000 cal. years BP (Figs. 4.10A, 4.10B). These
estimates are significantly higher when compared to the published global and regional sea-
64
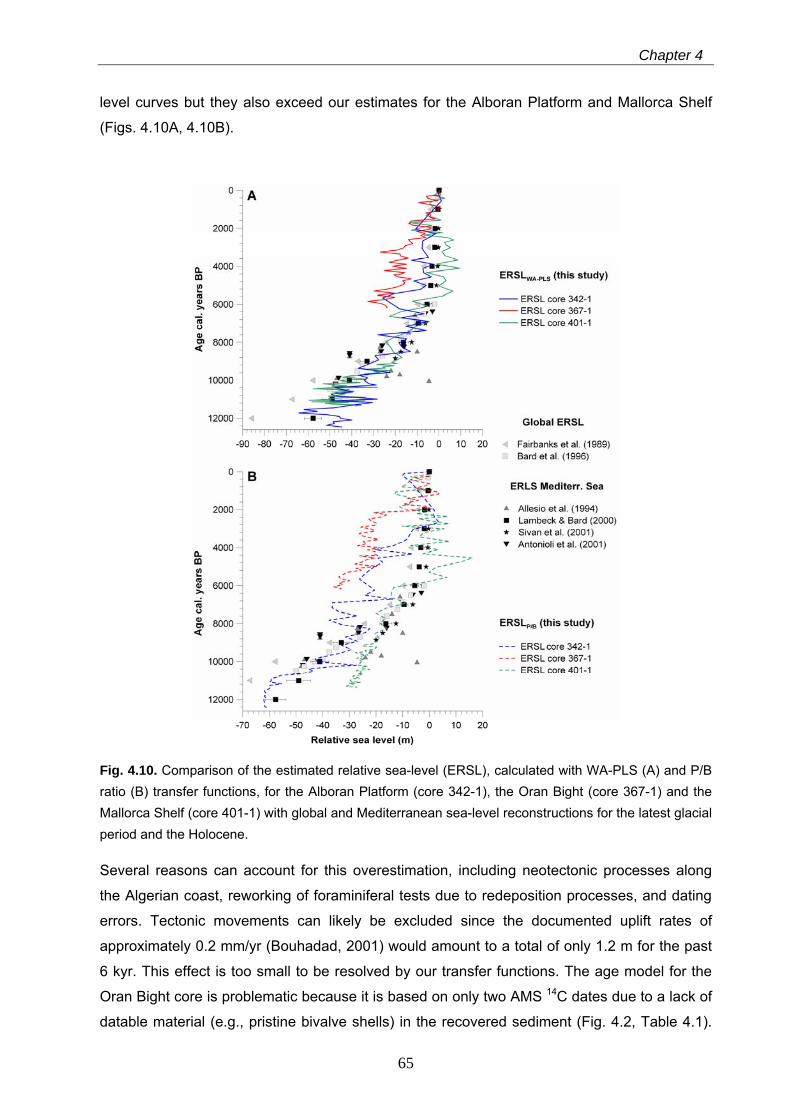
Chapter 4
level curves but they also exceed our estimates for the Alboran Platform and Mallorca Shelf
(Figs. 4.10A, 4.10B).
Fig. 4.10. Comparison of the estimated relative sea-level (ERSL), calculated with WA-PLS (A) and P/B ratio (B) transfer functions, for the Alboran Platform (core 342-1), the Oran Bight (core 367-1) and the Mallorca Shelf (core 401-1) with global and Mediterranean sea-level reconstructions for the latest glacial period and the Holocene.
Several reasons can account for this overestimation, including neotectonic processes along
the Algerian coast, reworking of foraminiferal tests due to redeposition processes, and dating
errors. Tectonic movements can likely be excluded since the documented uplift rates of
approximately 0.2 mm/yr (Bouhadad, 2001) would amount to a total of only 1.2 m for the past
6 kyr. This effect is too small to be resolved by our transfer functions. The age model for the
Oran Bight core is problematic because it is based on only two AMS 14C dates due to a lack of
datable material (e.g., pristine bivalve shells) in the recovered sediment (Fig. 4.2, Table 4.1).
65
Holocene sea-level changes in the Western Mediterranean Sea
The lower 14C date was derived from material directly overlaying the basement identified in the
lowest core part and gives an age of ~6000 years BP. However, a sedimentation gap of
several thousand years above the basement is also conceivable. According to Betzler et al. (in
press), the modern wave base is located at 35 m water depth in the Oran Bight, which could
have resulted in permanent and local sediment erosion at site 367-1. This interpretation is
supported by echosounder profiles (see Betzler et al., in press), showing a thinned sediment
cover at site 367-1 in close proximity to an area with thicker sediment cover, probably
containing the redeposited material permanently eroded from site 367-1. If the estimated
relative sea-level reconstruction with the WA-PLS method is correct, sediment accumulation
started after a sea-level in the range of 30 m had been reached and the sea-level signal could
be a local one in the Oran Bight. Otherwise, significant reworking and redeposition of
foraminiferal tests observed in the core would have also disturbed the sea-level signal
between approximately 6 and 2 kyr BP.
4.5.3 Shelf ecosystem processes and the significance of quantitative sea-level reconstructions for the late glacial and Holocene western Mediterranean Sea
The transfer functions based on the different P/B ratios revealed consistent results only for
the Mallorca Shelf (Fig. 4.8) that is presently characterized by low bottom water currents and
is covered by relatively fine-grained sediments. On the Alboran Platform, the counted P/B
ratios performed better than the modified P/B ratios (Fig. 4.6), while in the Oran Bight, all P/B
ratio transfer functions show little applicability for bathymetric estimates (Fig. 4.7). The ratio of
planktonic to benthic foraminifera depends on various environmental factors that are
correlated with water depth, such as temperature, salinity, dissolved oxygen and nutrient level
(Van der Zwaan et al., 1990; Sen Gupta, 2003; van Hinsbergen et al., 2005). Another
important factor is the surrounding marine setting. P/B ratios appear to be higher on shelf
areas with more open marine conditions when compared to shelf areas of enclosed marine
basins (Sen Gupta, 2003). The Alboran Platform and the Oran Bight are exposed to open
marine conditions due to narrow shelf areas associated with the particular morphologies of the
Alboran Ridge and of the Algerian continental margin. In addition, surface water ecosystems
of both areas contain relatively high nutrient levels (Arnone, 1994). These factors result in
higher Recent P/B ratios when compared to values from surface sediments of the more
oligotrophic and relatively broad southwest shelf off Mallorca at similar water depths. On the
other hand, high-energy environments are stressful for benthic foraminiferal communities,
particularly for infaunal species that depend on microhabitats in fine-grained sediments
(Murray, 2006). Low population densities of (infaunal) benthic foraminifera are typical for high-
energy ecosystems, such as the Alboran Platform and the Oran Bight (see chapter 3.5). In
66
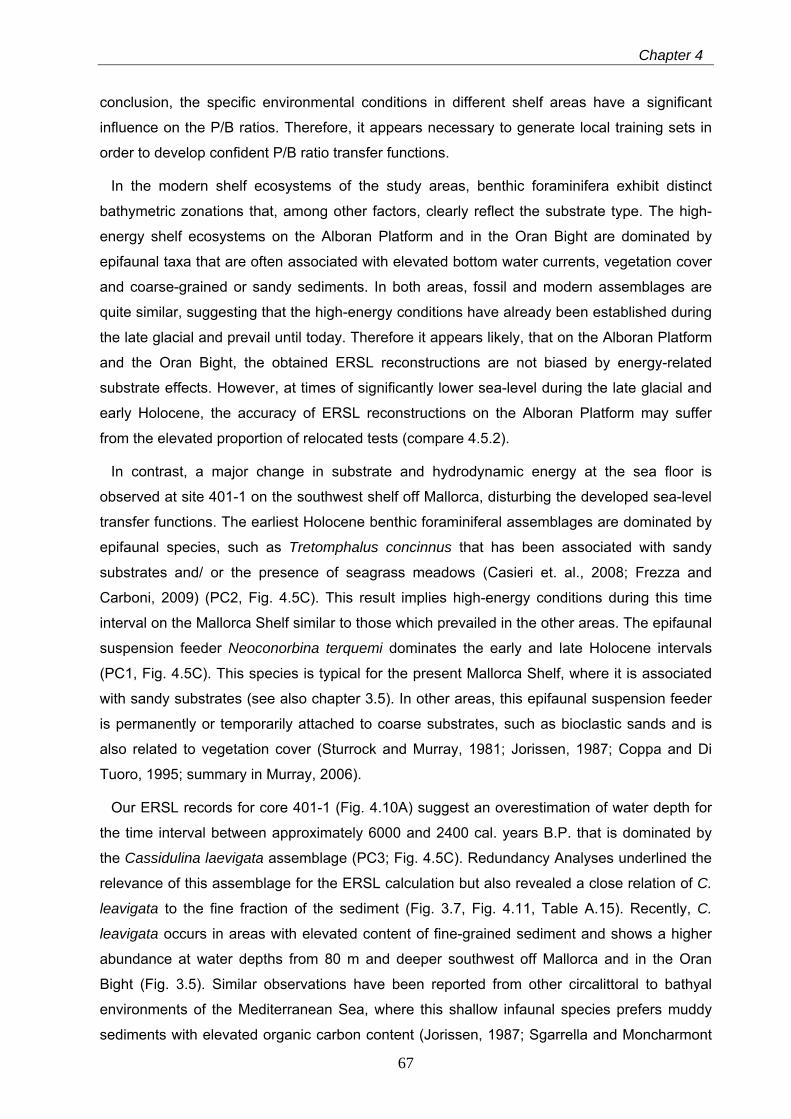
Chapter 4
conclusion, the specific environmental conditions in different shelf areas have a significant
influence on the P/B ratios. Therefore, it appears necessary to generate local training sets in
order to develop confident P/B ratio transfer functions.
In the modern shelf ecosystems of the study areas, benthic foraminifera exhibit distinct
bathymetric zonations that, among other factors, clearly reflect the substrate type. The high-
energy shelf ecosystems on the Alboran Platform and in the Oran Bight are dominated by
epifaunal taxa that are often associated with elevated bottom water currents, vegetation cover
and coarse-grained or sandy sediments. In both areas, fossil and modern assemblages are
quite similar, suggesting that the high-energy conditions have already been established during
the late glacial and prevail until today. Therefore it appears likely, that on the Alboran Platform
and the Oran Bight, the obtained ERSL reconstructions are not biased by energy-related
substrate effects. However, at times of significantly lower sea-level during the late glacial and
early Holocene, the accuracy of ERSL reconstructions on the Alboran Platform may suffer
from the elevated proportion of relocated tests (compare 4.5.2).
In contrast, a major change in substrate and hydrodynamic energy at the sea floor is
observed at site 401-1 on the southwest shelf off Mallorca, disturbing the developed sea-level
transfer functions. The earliest Holocene benthic foraminiferal assemblages are dominated by
epifaunal species, such as Tretomphalus concinnus that has been associated with sandy
substrates and/ or the presence of seagrass meadows (Casieri et. al., 2008; Frezza and
Carboni, 2009) (PC2, Fig. 4.5C). This result implies high-energy conditions during this time
interval on the Mallorca Shelf similar to those which prevailed in the other areas. The epifaunal
suspension feeder Neoconorbina terquemi dominates the early and late Holocene intervals
(PC1, Fig. 4.5C). This species is typical for the present Mallorca Shelf, where it is associated
with sandy substrates (see also chapter 3.5). In other areas, this epifaunal suspension feeder
is permanently or temporarily attached to coarse substrates, such as bioclastic sands and is
also related to vegetation cover (Sturrock and Murray, 1981; Jorissen, 1987; Coppa and Di
Tuoro, 1995; summary in Murray, 2006).
Our ERSL records for core 401-1 (Fig. 4.10A) suggest an overestimation of water depth for
the time interval between approximately 6000 and 2400 cal. years B.P. that is dominated by
the Cassidulina laevigata assemblage (PC3; Fig. 4.5C). Redundancy Analyses underlined the
relevance of this assemblage for the ERSL calculation but also revealed a close relation of C.
leavigata to the fine fraction of the sediment (Fig. 3.7, Fig. 4.11, Table A.15). Recently, C.
leavigata occurs in areas with elevated content of fine-grained sediment and shows a higher
abundance at water depths from 80 m and deeper southwest off Mallorca and in the Oran
Bight (Fig. 3.5). Similar observations have been reported from other circalittoral to bathyal
environments of the Mediterranean Sea, where this shallow infaunal species prefers muddy
sediments with elevated organic carbon content (Jorissen, 1987; Sgarrella and Moncharmont
67
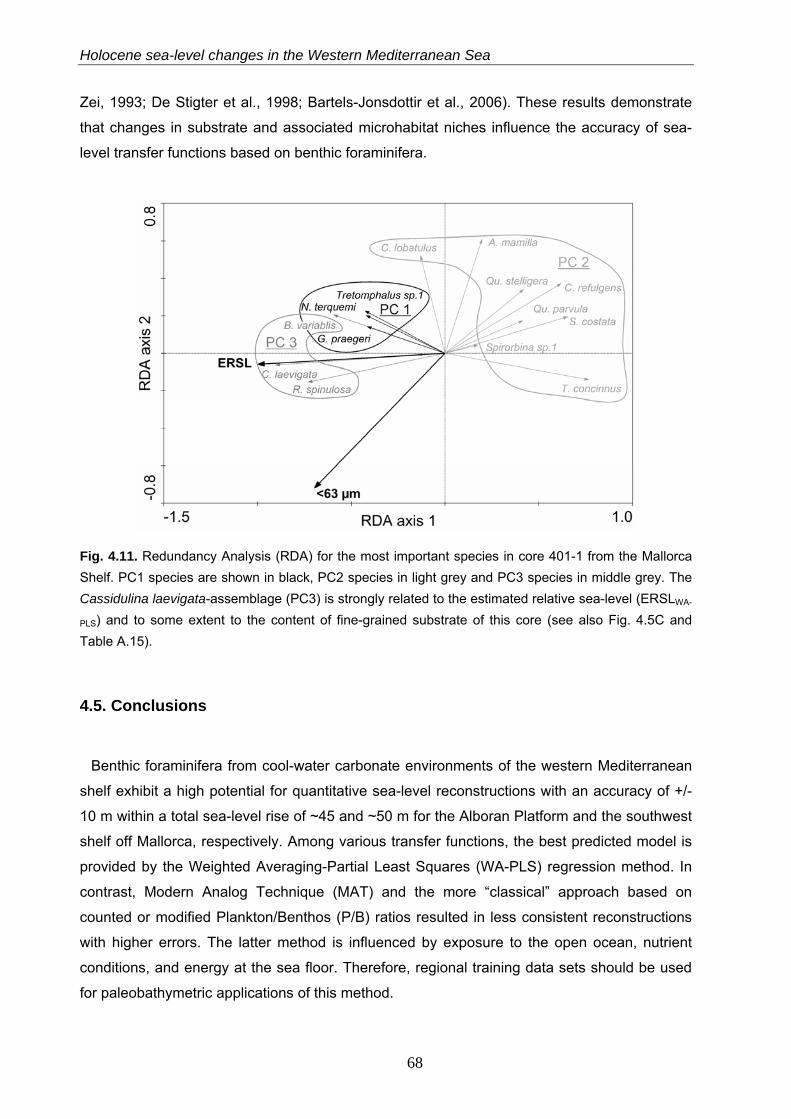
Holocene sea-level changes in the Western Mediterranean Sea
Zei, 1993; De Stigter et al., 1998; Bartels-Jonsdottir et al., 2006). These results demonstrate
that changes in substrate and associated microhabitat niches influence the accuracy of sea-
level transfer functions based on benthic foraminifera.
Fig. 4.11. Redundancy Analysis (RDA) for the most important species in core 401-1 from the Mallorca Shelf. PC1 species are shown in black, PC2 species in light grey and PC3 species in middle grey. The Cassidulina laevigata-assemblage (PC3) is strongly related to the estimated relative sea-level (ERSLWA-
PLS) and to some extent to the content of fine-grained substrate of this core (see also Fig. 4.5C and Table A.15).
4.5. Conclusions
Benthic foraminifera from cool-water carbonate environments of the western Mediterranean
shelf exhibit a high potential for quantitative sea-level reconstructions with an accuracy of +/-
10 m within a total sea-level rise of ~45 and ~50 m for the Alboran Platform and the southwest
shelf off Mallorca, respectively. Among various transfer functions, the best predicted model is
provided by the Weighted Averaging-Partial Least Squares (WA-PLS) regression method. In
contrast, Modern Analog Technique (MAT) and the more “classical” approach based on
counted or modified Plankton/Benthos (P/B) ratios resulted in less consistent reconstructions
with higher errors. The latter method is influenced by exposure to the open ocean, nutrient
conditions, and energy at the sea floor. Therefore, regional training data sets should be used
for paleobathymetric applications of this method.
68
Chapter 4
69
The paleobathymetric trends for the Alboran Platform and the Mallorca Shelf regions reflect
the global and Mediterranean sea-level histories during the Holocene. In contrast, the
calculated middle to late Holocene sea-level rise in the Oran Bight appears to be
overestimated when compared to the global signal. Major tectonic vertical movements can be
excluded for this region, and thus cannot account for the observed inconsistencies. Instead,
the results may be attributed to redeposition processes with enhanced relocation of benthic
foraminifera and/ or a problematic age model. On the Mallorca shelf, the sea-level signal
interferes with temporal changes in substrate and microhabitat niches, resulting in minor
inconsistencies during the middle Holocene period.

5 Impact of an early Holocene humid phase on
shelf environments off Southwest Mallorca, western Mediterranean Sea
Abstract
Stable oxygen and carbon isotope records of different planktonic and benthic foraminifera from
a shelf sediment core off southwest Mallorca document major climatic, hydrological and
trophic changes during the Holocene. A change in sediment facies between approximately 9.6
and 5.5 kyr BP is attributed to humid conditions on Mallorca Island. This humid interval is
nearly contemporaneous to the formation of sapropel S1 in the eastern Mediterranean Sea
and resulted in a freshening of the surface mixed layer, enhanced nutrient input from land and
related eutrophication of near-coastal marine ecosystems off SW Mallorca. These results
demonstrate that the early Holocene warm and humid phase also affected surface water
hydrography, organic carbon cycling and marine ecosystems in the western Mediterranean
Sea. Comparison with records from more open-ocean settings of different areas in the western
Mediterranean Sea suggests that the climate impacts were likely restricted to near-coastal
systems.
This chapter is based on: Milker, Y., Schmiedl, G., Betzler, C., Andersen, N., Theodor, M., in
prep. Impact of an early Holocene humid phase on shelf environments off Southwest Mallorca,
western Mediterranean Sea.
71
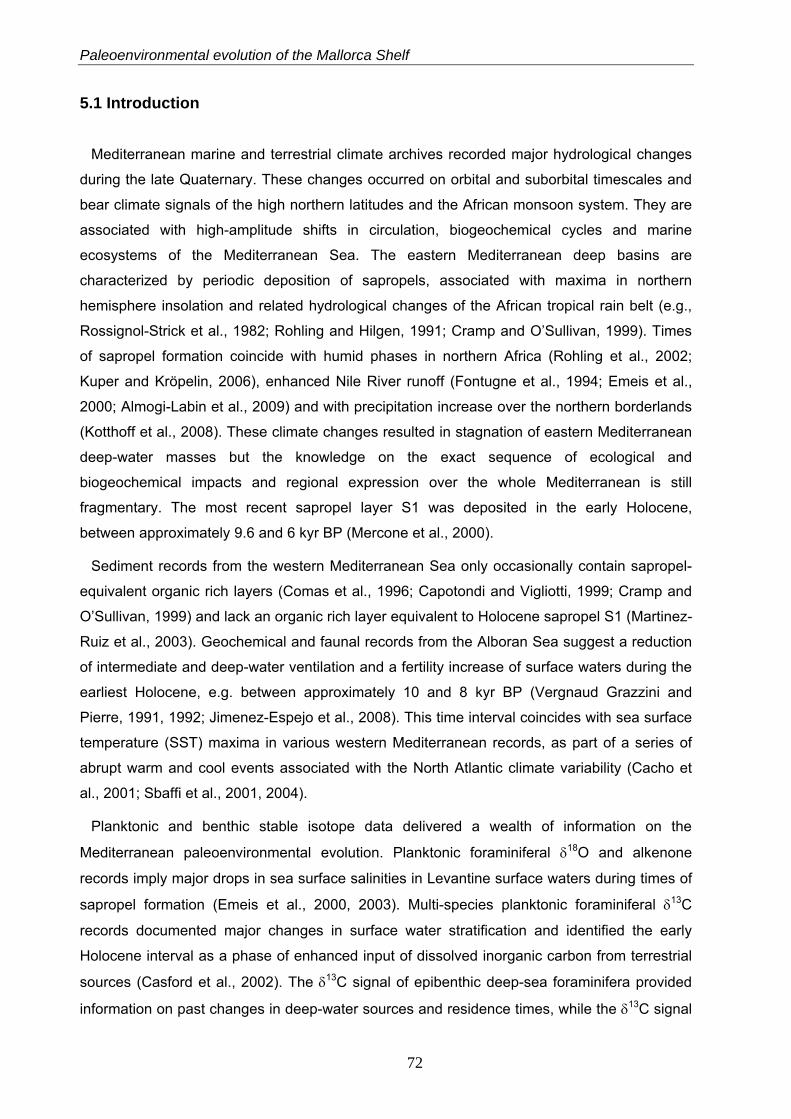
Paleoenvironmental evolution of the Mallorca Shelf
5.1 Introduction
Mediterranean marine and terrestrial climate archives recorded major hydrological changes
during the late Quaternary. These changes occurred on orbital and suborbital timescales and
bear climate signals of the high northern latitudes and the African monsoon system. They are
associated with high-amplitude shifts in circulation, biogeochemical cycles and marine
ecosystems of the Mediterranean Sea. The eastern Mediterranean deep basins are
characterized by periodic deposition of sapropels, associated with maxima in northern
hemisphere insolation and related hydrological changes of the African tropical rain belt (e.g.,
Rossignol-Strick et al., 1982; Rohling and Hilgen, 1991; Cramp and O’Sullivan, 1999). Times
of sapropel formation coincide with humid phases in northern Africa (Rohling et al., 2002;
Kuper and Kröpelin, 2006), enhanced Nile River runoff (Fontugne et al., 1994; Emeis et al.,
2000; Almogi-Labin et al., 2009) and with precipitation increase over the northern borderlands
(Kotthoff et al., 2008). These climate changes resulted in stagnation of eastern Mediterranean
deep-water masses but the knowledge on the exact sequence of ecological and
biogeochemical impacts and regional expression over the whole Mediterranean is still
fragmentary. The most recent sapropel layer S1 was deposited in the early Holocene,
between approximately 9.6 and 6 kyr BP (Mercone et al., 2000).
Sediment records from the western Mediterranean Sea only occasionally contain sapropel-
equivalent organic rich layers (Comas et al., 1996; Capotondi and Vigliotti, 1999; Cramp and
O’Sullivan, 1999) and lack an organic rich layer equivalent to Holocene sapropel S1 (Martinez-
Ruiz et al., 2003). Geochemical and faunal records from the Alboran Sea suggest a reduction
of intermediate and deep-water ventilation and a fertility increase of surface waters during the
earliest Holocene, e.g. between approximately 10 and 8 kyr BP (Vergnaud Grazzini and
Pierre, 1991, 1992; Jimenez-Espejo et al., 2008). This time interval coincides with sea surface
temperature (SST) maxima in various western Mediterranean records, as part of a series of
abrupt warm and cool events associated with the North Atlantic climate variability (Cacho et
al., 2001; Sbaffi et al., 2001, 2004).
Planktonic and benthic stable isotope data delivered a wealth of information on the
Mediterranean paleoenvironmental evolution. Planktonic foraminiferal δ18O and alkenone
records imply major drops in sea surface salinities in Levantine surface waters during times of
sapropel formation (Emeis et al., 2000, 2003). Multi-species planktonic foraminiferal δ13C
records documented major changes in surface water stratification and identified the early
Holocene interval as a phase of enhanced input of dissolved inorganic carbon from terrestrial
sources (Casford et al., 2002). The δ13C signal of epibenthic deep-sea foraminifera provided
information on past changes in deep-water sources and residence times, while the δ13C signal
72
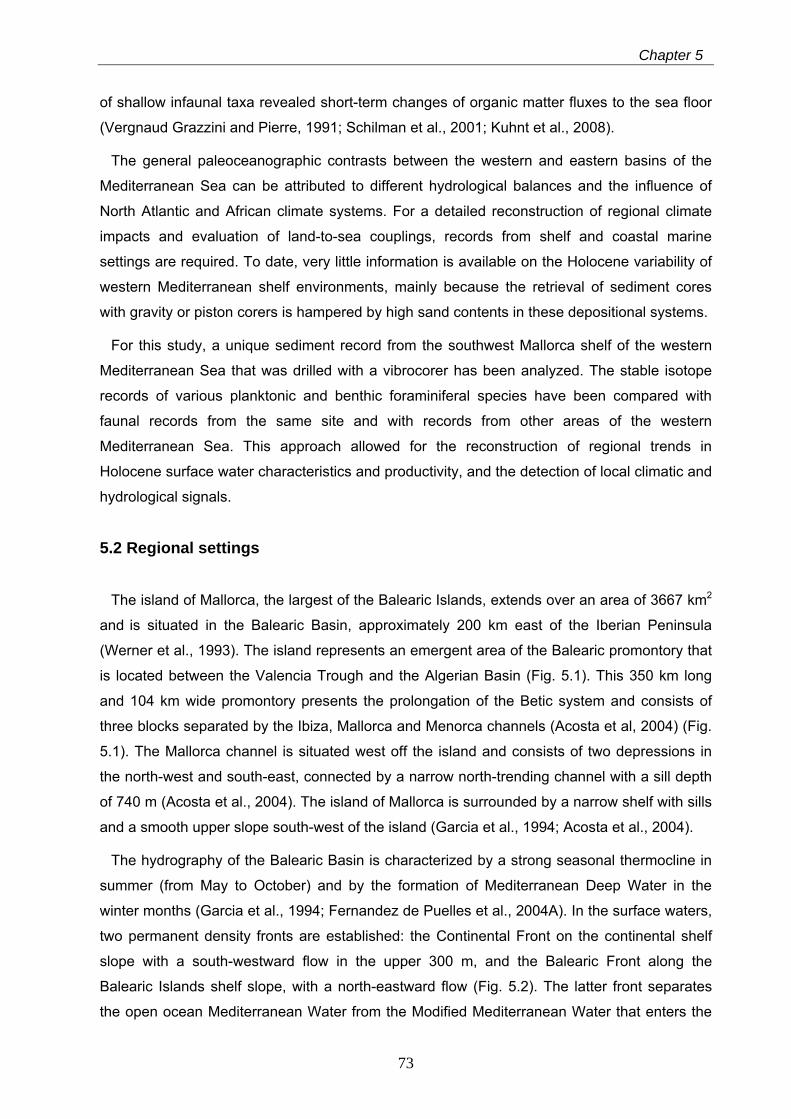
Chapter 5
of shallow infaunal taxa revealed short-term changes of organic matter fluxes to the sea floor
(Vergnaud Grazzini and Pierre, 1991; Schilman et al., 2001; Kuhnt et al., 2008).
The general paleoceanographic contrasts between the western and eastern basins of the
Mediterranean Sea can be attributed to different hydrological balances and the influence of
North Atlantic and African climate systems. For a detailed reconstruction of regional climate
impacts and evaluation of land-to-sea couplings, records from shelf and coastal marine
settings are required. To date, very little information is available on the Holocene variability of
western Mediterranean shelf environments, mainly because the retrieval of sediment cores
with gravity or piston corers is hampered by high sand contents in these depositional systems.
For this study, a unique sediment record from the southwest Mallorca shelf of the western
Mediterranean Sea that was drilled with a vibrocorer has been analyzed. The stable isotope
records of various planktonic and benthic foraminiferal species have been compared with
faunal records from the same site and with records from other areas of the western
Mediterranean Sea. This approach allowed for the reconstruction of regional trends in
Holocene surface water characteristics and productivity, and the detection of local climatic and
hydrological signals.
5.2 Regional settings
The island of Mallorca, the largest of the Balearic Islands, extends over an area of 3667 km2
and is situated in the Balearic Basin, approximately 200 km east of the Iberian Peninsula
(Werner et al., 1993). The island represents an emergent area of the Balearic promontory that
is located between the Valencia Trough and the Algerian Basin (Fig. 5.1). This 350 km long
and 104 km wide promontory presents the prolongation of the Betic system and consists of
three blocks separated by the Ibiza, Mallorca and Menorca channels (Acosta et al, 2004) (Fig.
5.1). The Mallorca channel is situated west off the island and consists of two depressions in
the north-west and south-east, connected by a narrow north-trending channel with a sill depth
of 740 m (Acosta et al., 2004). The island of Mallorca is surrounded by a narrow shelf with sills
and a smooth upper slope south-west of the island (Garcia et al., 1994; Acosta et al., 2004).
The hydrography of the Balearic Basin is characterized by a strong seasonal thermocline in
summer (from May to October) and by the formation of Mediterranean Deep Water in the
winter months (Garcia et al., 1994; Fernandez de Puelles et al., 2004A). In the surface waters,
two permanent density fronts are established: the Continental Front on the continental shelf
slope with a south-westward flow in the upper 300 m, and the Balearic Front along the
Balearic Islands shelf slope, with a north-eastward flow (Fig. 5.2). The latter front separates
the open ocean Mediterranean Water from the Modified Mediterranean Water that enters the
73
Paleoenvironmental evolution of the Mallorca Shelf
Balearic Basin through the Ibiza channel (Garcia et al., 1994). The southwest shelf of Mallorca
is characterized by geostrophic currents that follow the topographic features and reach
velocities of approximately 20 cm/s (Werner et al., 1993).
Fig. 5.1. Bathymetric map of the western Mediterranean Sea showing the location of core 401-1 on the south-western shelf off Mallorca.
The salinities of the shelf off Mallorca show no annual seasonality but an interannual
monthly variability (Fernandez de Puelles et al., 2004A). They range from 37.3 to 37.5‰ at 10
m water depth (Brasseur et al., 1996). Sea surface salinities measured in the working area
during Meteor-Cruise 69/1 in august 2006 were in the same range (37.3-37.4‰; Table A.5).
Mean sea surface temperatures on the shelf show an annual seasonality and range from 21.5
- 27.4°C in summer and 13.4 - 14.3°C in winter (Fernandez de Puelles et al., 2004A). Sea
surface temperatures measured during Meteor-cruise in august 2008 were in the range of 25.4
to 26.3°C (Table A.5).
Recently, the Balearic region has an oligotrophic character with estimated an annual primary
production of 100 to 150 g C/m2/year (Antoine et al., 1995). The Mallorca Channel is
characterized by very low chlorophyll a values in the surface waters, with a deep chlorophyll a
maximum between 50 m and 75 m (Fernandez de Puelles et al., 2004B). Elevated chlorophyll
a concentrations are restricted to the coastal areas and the frontal systems (Fernandez de
Puelles et al., 2004B).
74
Chapter 5
Fig. 5.2. Circulation of the Modified Atlantic Water (MAW) and the Winter Intermediate Water (WIW) in the western Mediterranean Sea adapted from Millot (1999) and Pinot et al. (2002). For the Balearic region, the Northern and the Balearic Currents are indicated.
5.3 Materials and Methods
The 470 cm long sediment core 401-1 was recovered by means of a vibrocorer on the south-
western shelf of Mallorca at 74 m water depth, at 39°17.10’ N and 2°48.31’ E, during Meteor
cruise 69/1 (Fig. 5.1). The lower part of the core consists of calcirudites containing rhodoliths,
shells and debris of molluscs. The middle part is characterized by fine to middle calcarenites
with a high content of shells of the benthic gastropod Turritella communis. The upper part is
composed of fine to middle calcarenites with debris and shells of molluscs (Betzler et al., in
press).
For the stable oxygen and carbon isotope measurements, benthic and planktonic
foraminifera were picked from the fraction >125 µm of 94 core samples (Table A.16).
Approximately 30 tests of the planktonic species Globigerina bulloides and Globigerinoides
ruber (white) and approximately 10 tests of the benthic species Bulimina aculeata, Cibicides
lobatulus and Rectuvigerina phlegeri were picked. The latter species was only picked in the
core interval from 176.5 cm and 301.5 cm because of its low abundance or absence in the
other core sections. For the isotopic analyses, only the compact type of G. ruber (G. ruber
gomitulus) was selected because this phenotype shows different δ13C and δ18O values when
compared to the larger specimens of G. ruber (G. ruber ruber) (Emiliani, 1971; Weiner, 1975).
All specimens were cleaned with ethanol in an ultrasonic bath. The isotopic composition was
measured with a Finnigan MAT 251 mass spectrometer at the Leibniz-Laboratory for
Radiometric Dating and Isotope Research, Kiel (Germany). The data are given in δ-notation,
standardized to the Vienna Pee Dee Belemnite (VPBD). The external precision ranges from
75
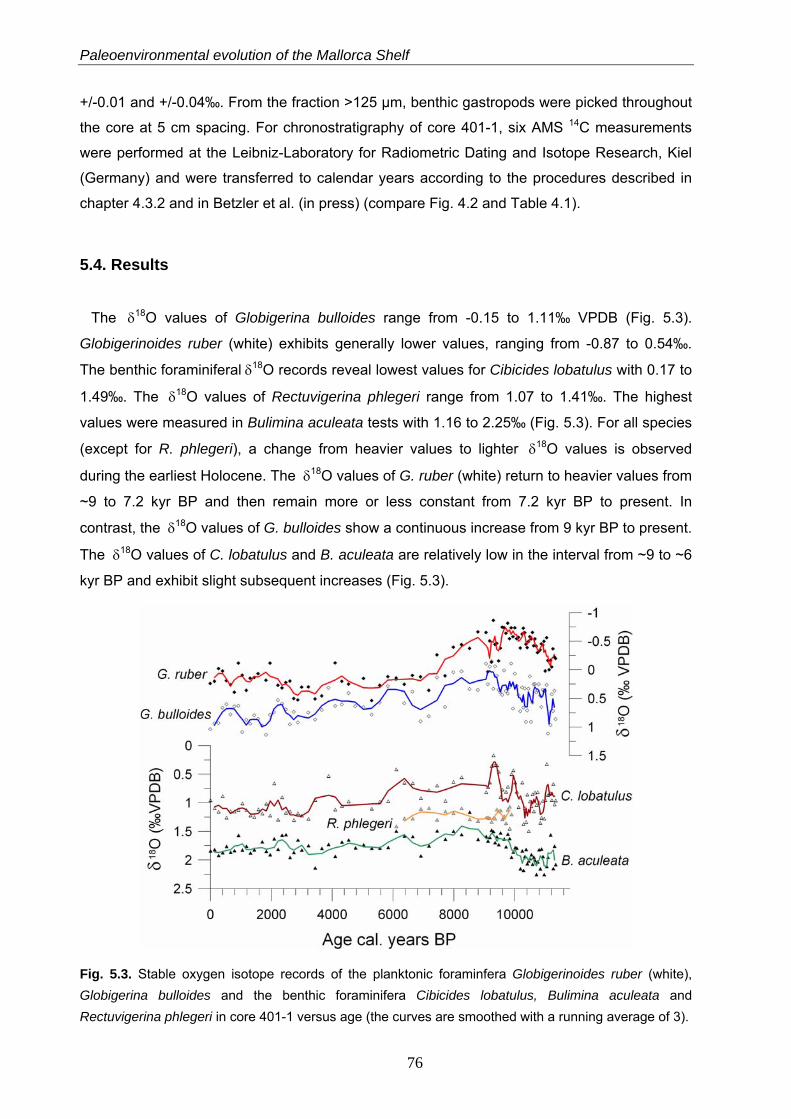
Paleoenvironmental evolution of the Mallorca Shelf
+/-0.01 and +/-0.04‰. From the fraction >125 µm, benthic gastropods were picked throughout
the core at 5 cm spacing. For chronostratigraphy of core 401-1, six AMS 14C measurements
were performed at the Leibniz-Laboratory for Radiometric Dating and Isotope Research, Kiel
(Germany) and were transferred to calendar years according to the procedures described in
chapter 4.3.2 and in Betzler et al. (in press) (compare Fig. 4.2 and Table 4.1).
5.4. Results
The δ18O values of Globigerina bulloides range from -0.15 to 1.11‰ VPDB (Fig. 5.3).
Globigerinoides ruber (white) exhibits generally lower values, ranging from -0.87 to 0.54‰.
The benthic foraminiferal δ18O records reveal lowest values for Cibicides lobatulus with 0.17 to
1.49‰. The δ18O values of Rectuvigerina phlegeri range from 1.07 to 1.41‰. The highest
values were measured in Bulimina aculeata tests with 1.16 to 2.25‰ (Fig. 5.3). For all species
(except for R. phlegeri), a change from heavier values to lighter δ18O values is observed
during the earliest Holocene. The δ18O values of G. ruber (white) return to heavier values from
~9 to 7.2 kyr BP and then remain more or less constant from 7.2 kyr BP to present. In
contrast, the δ18O values of G. bulloides show a continuous increase from 9 kyr BP to present.
The δ18O values of C. lobatulus and B. aculeata are relatively low in the interval from ~9 to ~6
kyr BP and exhibit slight subsequent increases (Fig. 5.3).
Fig. 5.3. Stable oxygen isotope records of the planktonic foraminfera Globigerinoides ruber (white), Globigerina bulloides and the benthic foraminifera Cibicides lobatulus, Bulimina aculeata and Rectuvigerina phlegeri in core 401-1 versus age (the curves are smoothed with a running average of 3).
76
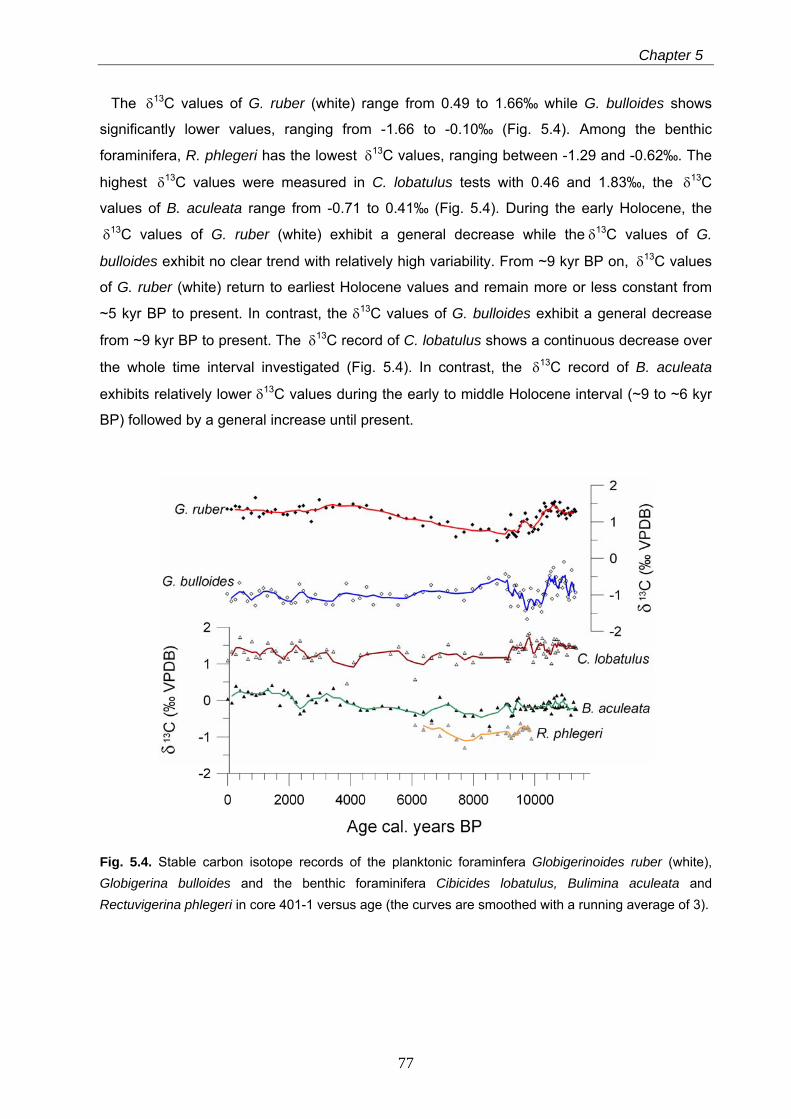
Chapter 5
The δ13C values of G. ruber (white) range from 0.49 to 1.66‰ while G. bulloides shows
significantly lower values, ranging from -1.66 to -0.10‰ (Fig. 5.4). Among the benthic
foraminifera, R. phlegeri has the lowest δ13C values, ranging between -1.29 and -0.62‰. The
highest δ13C values were measured in C. lobatulus tests with 0.46 and 1.83‰, the δ13C
values of B. aculeata range from -0.71 to 0.41‰ (Fig. 5.4). During the early Holocene, the
δ13C values of G. ruber (white) exhibit a general decrease while the δ13C values of G.
bulloides exhibit no clear trend with relatively high variability. From ~9 kyr BP on, δ13C values
of G. ruber (white) return to earliest Holocene values and remain more or less constant from
~5 kyr BP to present. In contrast, the δ13C values of G. bulloides exhibit a general decrease
from ~9 kyr BP to present. The δ13C record of C. lobatulus shows a continuous decrease over
the whole time interval investigated (Fig. 5.4). In contrast, the δ13C record of B. aculeata
exhibits relatively lower δ13C values during the early to middle Holocene interval (~9 to ~6 kyr
BP) followed by a general increase until present.
Fig. 5.4. Stable carbon isotope records of the planktonic foraminfera Globigerinoides ruber (white), Globigerina bulloides and the benthic foraminifera Cibicides lobatulus, Bulimina aculeata and Rectuvigerina phlegeri in core 401-1 versus age (the curves are smoothed with a running average of 3).
77
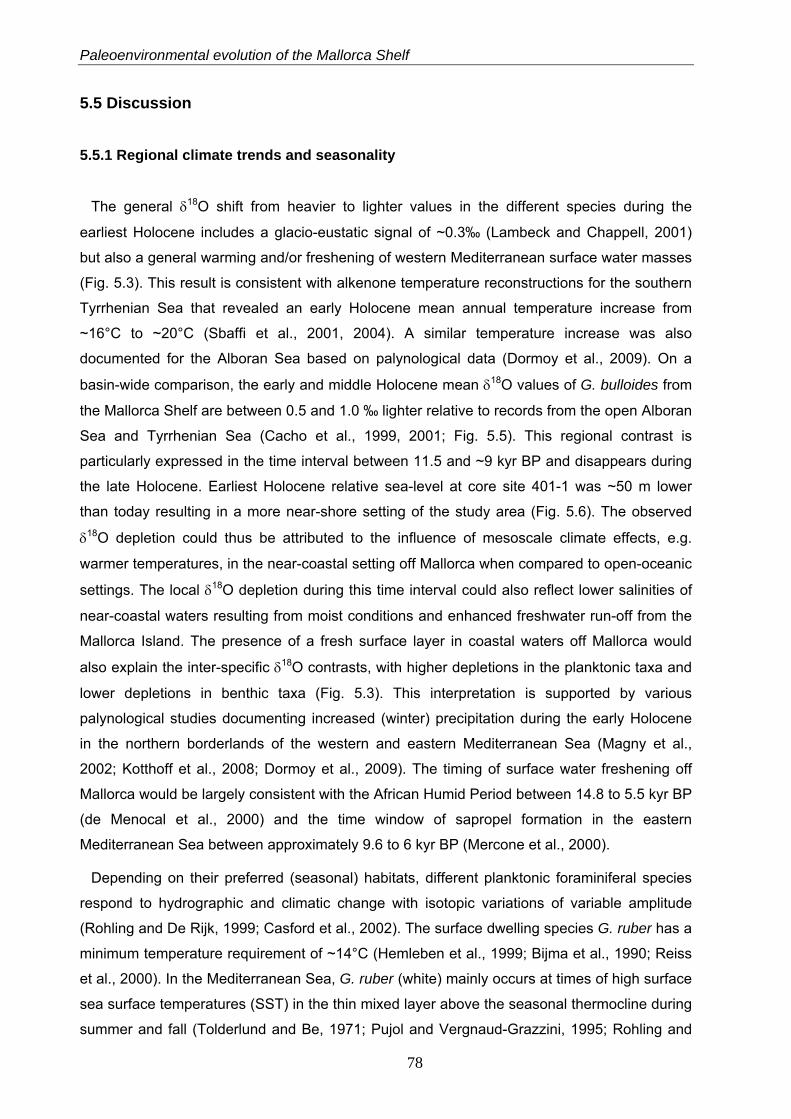
Paleoenvironmental evolution of the Mallorca Shelf
5.5 Discussion
5.5.1 Regional climate trends and seasonality
The general δ18O shift from heavier to lighter values in the different species during the
earliest Holocene includes a glacio-eustatic signal of ~0.3‰ (Lambeck and Chappell, 2001)
but also a general warming and/or freshening of western Mediterranean surface water masses
(Fig. 5.3). This result is consistent with alkenone temperature reconstructions for the southern
Tyrrhenian Sea that revealed an early Holocene mean annual temperature increase from
~16°C to ~20°C (Sbaffi et al., 2001, 2004). A similar temperature increase was also
documented for the Alboran Sea based on palynological data (Dormoy et al., 2009). On a
basin-wide comparison, the early and middle Holocene mean δ18O values of G. bulloides from
the Mallorca Shelf are between 0.5 and 1.0 ‰ lighter relative to records from the open Alboran
Sea and Tyrrhenian Sea (Cacho et al., 1999, 2001; Fig. 5.5). This regional contrast is
particularly expressed in the time interval between 11.5 and ~9 kyr BP and disappears during
the late Holocene. Earliest Holocene relative sea-level at core site 401-1 was ~50 m lower
than today resulting in a more near-shore setting of the study area (Fig. 5.6). The observed
δ18O depletion could thus be attributed to the influence of mesoscale climate effects, e.g.
warmer temperatures, in the near-coastal setting off Mallorca when compared to open-oceanic
settings. The local δ18O depletion during this time interval could also reflect lower salinities of
near-coastal waters resulting from moist conditions and enhanced freshwater run-off from the
Mallorca Island. The presence of a fresh surface layer in coastal waters off Mallorca would
also explain the inter-specific δ18O contrasts, with higher depletions in the planktonic taxa and
lower depletions in benthic taxa (Fig. 5.3). This interpretation is supported by various
palynological studies documenting increased (winter) precipitation during the early Holocene
in the northern borderlands of the western and eastern Mediterranean Sea (Magny et al.,
2002; Kotthoff et al., 2008; Dormoy et al., 2009). The timing of surface water freshening off
Mallorca would be largely consistent with the African Humid Period between 14.8 to 5.5 kyr BP
(de Menocal et al., 2000) and the time window of sapropel formation in the eastern
Mediterranean Sea between approximately 9.6 to 6 kyr BP (Mercone et al., 2000).
Depending on their preferred (seasonal) habitats, different planktonic foraminiferal species
respond to hydrographic and climatic change with isotopic variations of variable amplitude
(Rohling and De Rijk, 1999; Casford et al., 2002). The surface dwelling species G. ruber has a
minimum temperature requirement of ~14°C (Hemleben et al., 1999; Bijma et al., 1990; Reiss
et al., 2000). In the Mediterranean Sea, G. ruber (white) mainly occurs at times of high surface
sea surface temperatures (SST) in the thin mixed layer above the seasonal thermocline during
summer and fall (Tolderlund and Be, 1971; Pujol and Vergnaud-Grazzini, 1995; Rohling and
78
Chapter 5
De Rijk, 1999; Rohling et al., 2004; Capotondi et al., 2006). In contrast, G. bulloides inhabits a
greater depth range and appears in the mixed layer during the colder transitional periods,
mainly from late winter to spring (Tolderlund and Be, 1971; Pujol and Vergnaud-Grazzini,
1995). During this transitional period, G. bulloides depends on the wind-induced entrainment
of nutrients from subsurface waters (Schiebel et al., 2001; Rohling et al., 2004). The Δδ18O
signal between G. bulloides and G. ruber can thus be interpreted as a proxy for the seasonal
contrasts in sea surface temperature and salinity (SST, SSS) (Fig. 5.6). Accordingly,
seasonality of shelf waters off SW Mallorca was highest during the earliest Holocene and
dropped significantly around 9.5 kyr BP, coinciding with the onset of sapropel deposition in the
eastern Mediterranean Sea. In the Tyrrhenian Sea, strong seasonal contrasts with efficient
vertical mixing in winter and stratified water column in summer has been reported by Carboni
et al. (2005) for the interval between 10.9 to 8.3 kyr BP. This result is in accordance with
paleolimnological records around the Mediterranean Sea and shows that the earliest Holocene
climate was characterized by colder winters and warmer summers than today (Watts et al.,
1996; Magny et al., 2002).
Fig. 5.5. Comparison of the stable δ18O record of Globigerina bulloides in core 401-1 from the shelf off Mallorca (blue line) with deep water isotope records of this species (symbols) from the Alboran and Tyrrhenian Seas (*1 Cacho et al., 1999; *2 Cacho et al., 2001).
79
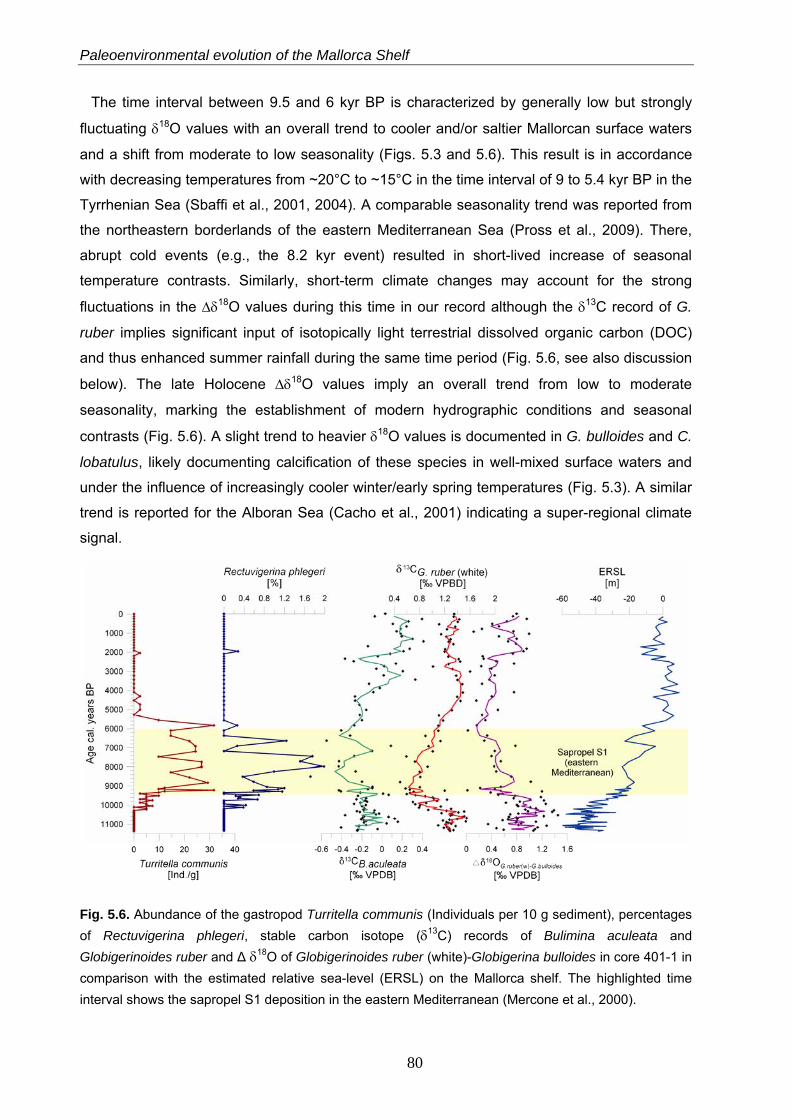
Paleoenvironmental evolution of the Mallorca Shelf
The time interval between 9.5 and 6 kyr BP is characterized by generally low but strongly
fluctuating δ18O values with an overall trend to cooler and/or saltier Mallorcan surface waters
and a shift from moderate to low seasonality (Figs. 5.3 and 5.6). This result is in accordance
with decreasing temperatures from ~20°C to ~15°C in the time interval of 9 to 5.4 kyr BP in the
Tyrrhenian Sea (Sbaffi et al., 2001, 2004). A comparable seasonality trend was reported from
the northeastern borderlands of the eastern Mediterranean Sea (Pross et al., 2009). There,
abrupt cold events (e.g., the 8.2 kyr event) resulted in short-lived increase of seasonal
temperature contrasts. Similarly, short-term climate changes may account for the strong
fluctuations in the Δδ18O values during this time in our record although the δ13C record of G.
ruber implies significant input of isotopically light terrestrial dissolved organic carbon (DOC)
and thus enhanced summer rainfall during the same time period (Fig. 5.6, see also discussion
below). The late Holocene Δδ18O values imply an overall trend from low to moderate
seasonality, marking the establishment of modern hydrographic conditions and seasonal
contrasts (Fig. 5.6). A slight trend to heavier δ18O values is documented in G. bulloides and C.
lobatulus, likely documenting calcification of these species in well-mixed surface waters and
under the influence of increasingly cooler winter/early spring temperatures (Fig. 5.3). A similar
trend is reported for the Alboran Sea (Cacho et al., 2001) indicating a super-regional climate
signal.
Fig. 5.6. Abundance of the gastropod Turritella communis (Individuals per 10 g sediment), percentages of Rectuvigerina phlegeri, stable carbon isotope (δ13C) records of Bulimina aculeata and Globigerinoides ruber and Δ δ18O of Globigerinoides ruber (white)-Globigerina bulloides in core 401-1 in comparison with the estimated relative sea-level (ERSL) on the Mallorca shelf. The highlighted time interval shows the sapropel S1 deposition in the eastern Mediterranean (Mercone et al., 2000).
80
Chapter 5
5.5.2 Regional hydrology, organic matter fluxes and benthic shelf ecosystem dynamics
The interval between approximately 10.5 and 5 kyr BP is marked by low δ13C values of G.
ruber (white) that are depleted by up to 1 % around 9 kyr BP relative to the earliest Holocene
and late Holocene values (Figs. 5.4 and 5.6). The δ13C record of G. bulloides exhibits only a
short-lived depletion between ~10.5 and 9.5 kyr BP while the δ13C record of the epibenthic C.
lobatulus lacks a comparable signal (Fig. 5.4). These δ13C signatures suggest that the
environmental signal is mainly restricted to the summer season and localized in the thin mixed
surface layer. In the eastern Mediterranean Sea, similar δ13C drops of G. ruber have been
reported for the time interval of sapropel S1 formation and have been related to input of
isotopically light carbon of terrestrial sources (Casford et al., 2002). Similarly, the δ13C signal of
G. ruber from the Mallorca shelf likely indicates the increased input of terrestrial DOC with
enhanced freshwater runoff. This documents the establishment of humid conditions and
related summer rainfall on Mallorca Island. The local expression of this early to middle
Holocene runoff signal is validated by lighter δ13C values of G. ruber when compared to open-
ocean records from the Alboran Sea (Pujol and Vergnaud Grazzini, 1989). Although this
interpretation appears reasonable, the planktonic foraminiferal signals may also interfere with
the 12C removal in surface waters through the process of phytoplankton production (Pujol and
Vergnaud Grazzini, 1989; Ortiz et al., 1996).
The early to middle Holocene climatic and hydrological changes had a strong impact on
shelf sedimentation processes and benthic ecosystem dynamics. The time interval between
approximately 9.6 and 5.5 kyr BP is characterized by a unique sediment facies consisting of
fine to middle calcarenites with a high content of shells of the benthic gastropod Turritella
communis and the appearance of the infaunal benthic foraminifer Rectuvigerina phlegeri (Fig.
5.6). This facies is documented in several sediment cores from the south-western shelf of
Mallorca (Betzler et al., in press). The infaunal suspension feeder Turritella communis is
characteristic for muddy substrates and soft bottoms in various Atlanto-Mediterranean
shallow- to mid-shelf environments and favors ecosystems with a high content of suspended
organic matter (Fretter and Graham, 1981; Allmon, 1988, 1992; Koulouri et al., 2006). In the
western Mediterranean Sea, it also occurs in sandy substrates with carbonate detritus
together with green algae and calcareous red algae (Simboura and Zenetos, 2002; Massuti
and Renoues, 2005; Poirier et al., 2009). In the Bay of Banyuls (south-western France) it is
very abundant and co-occurs with Rectuvigerina phlegeri in pelitic substrates around 30-40 m
water depth, representing a mesotrophic setting (unpublished data of G. Schmiedl). To date,
this facies has not been documented on the modern shelf off SW Mallorca (Betzler et al., in
press; own observations).
81
Paleoenvironmental evolution of the Mallorca Shelf
The presence of this facies correlates with the drop in δ13C of G. ruber during the early and
middle Holocene, documenting a rise in freshwater runoff and associated nutrient input from
land (Fig. 5.6). This nutrient supply finally resulted in higher organic matter fluxes and food
availability at the sea floor, where it is reflected by the presence of T. communis and the
increase in abundance of the benthic foraminifer Rectuvigerina phlegeri (Fig. 5.6). R. phlegeri
occupies a shallow to intermediate infaunal microhabitat and occurs in muddy shelf
environments with relatively high organic matter content (Guimerans and Currado, 1999A;
Bartels-Jonsdottir et al., 2006). In the western Mediterranean Sea, R. phlegeri is particularly
abundant in ecosystems influenced by river plumes where it feeds from fresh organic matter
(Frezza and Carboni, 2009; Mojtahid et al., 2009). A relatively deep infaunal habitat of R.
phlegeri at site 401-1 is confirmed by its low δ13C values relative to B. aculeata and C.
lobatulus, reflecting a strong pore water influence (Fig. 5.4).
The early Holocene eutrophication is corroborated by a decrease in the δ13C values of B.
aculeata (Figs. 5.4 and 5.6). Bulimina aculeata is abundant in shelf and bathyal environments
where it responds to seasonal phytodetritus pulses and occupies a predominantly shallow
infaunal microhabitat in organic-rich muddy sediments with a shallow oxygen penetration
(Rathburn and Corliss, 1994; Mendes et al., 2004; Murgese and de Deckker, 2007). Its δ13C
signal depends on the organic carbon fluxes and site-specific δ13C of pore water dissolved
inorganic carbon (Mackensen et al., 2000). Accordingly, the δ13C signal of B. aculeata reflects
the remineralisation rate of organic matter in the uppermost surface sediment that is correlated
to organic matter flux rates (McCorkle et al., 1985, 1990; Holsten et al., 2004; Schmiedl et al.,
2004). The high fluctuations of the various trophic signals imply high-amplitude short-term
changes in freshwater runoff and nutrient fluxes during the early to middle Holocene period.
The inferred environmental shifts are likely linked to abrupt climate change although the
limited temporal resolution of our record for this interval does not allow for a more
comprehensive evaluation.
The humid phase on Mallorca Island between 9.6 and 5.5 kyr BP is nearly synchronous to
sapropel S1 formation in the eastern Mediterranean Sea that is dated to approximately 9.6 to
6 kyr B.P. (Mercone et al., 2000; Fig. 5.6). The eastern Mediterranean climate during S1
formation was characterized by generally warmer and wetter conditions in both southern and
northern Mediterranean borderlands when compared to present conditions (Rossignol-Strick,
1999; Bar-Matthews et al., 2000; Kotthoff et al., 2008; Dormoy et al., 2009). More specifically,
the high abundance of deciduous tree pollen in sediment archives has been related to high
annual precipitation rates and absence of summer drought (Rossignol-Strick, 1995, 1999).
Increased Mediterranean rainfalls co-occur with an intensification of the African monsoon
system and northward shift of the African tropical rain belt (Rossignol-Strick, 1983; de Menocal
82
Chapter 5
et al. 2000) and likely resulted from the formation and eastward movement of more summer
depressions in the western Mediterranean (Rohling and Hilgen, 1991; Rossignol-Strick, 1999).
This early Holocene humid period is associated with low δ18O and δ13C values of G. ruber
(white) in eastern Mediterranean sediment cores documenting enhanced freshwater input
(Rossignol-Strick et al., 1982; Emeis et al., 2000; Rohling et al, 2002; Capotondi et al, 2006).
Pollen records from the western Mediterranean region also document a more humid and
warmer climate during the time interval of S1 formation (Ariztegui et al., 2000; Drescher-
Schneider et al., 2007; Ninyerola et al., 2007). Specifically, moist conditions during the early
Holocene (8 - 5 kyr BP) have also been documented for the Balearic islands, based on higher
abundances of Quercus, Buxus and other mesophilous taxa in lagoonal and marshland
sediments (Yll et al. 1997). However, the impact of early Holocene warm and humid conditions
on marine environments is less well constrained in temperature and salinity proxies (Emeis et
al., 2000; Cacho et al., 2001; Melki et al., 2009). Evidence for enhanced freshwater runoff and
enhanced stratification during this time period (e.g., 8.3 to 5.2 kyr BP) is restricted to the
Tyrrhenian Sea (Ariztegui et al., 2000; Carboni et al., 2005). In addition, deep-sea records
from the Algerian and Balearic basins did not show any comparable productivity increase for
this time interval (Weldeab et al., 2003; Jimenez-Espejo et al., 2007). In the Alboran Basin,
however, Vergnaud Grazzini and Pierre (1992) found higher percentages of U. peregrina with
depleted δ13C values in the interval between 9 and 6 kyr BP implying a regional productivity
increase. This increase is linked to the history of the gyre and frontal system of the Alboran
Sea and therefore is likely influenced by early Holocene sea-level rise and the hydrography of
Atlantic surface waters.
The rather abrupt drops in the abundance of T. communis and R. phlegeri imply a rapid
termination of meso- to oligotrophic conditions on the southwest shelf off Mallorca around 5.5
kyr BP (Fig. 5.6) coinciding with the abrupt termination of the African Humid Period (de
Menocal et al., 2000). In both regions, these signals may reflect rapid ecosystem shifts rather
than rapid climate changes. This interpretation is corroborated by a gradual increase of δ13C
values of B. acuelata and planktonic foraminiferal δ18O and δ13C values suggesting a gradual
hydrological change (Figs. 5.3, 5.4 and 5.6). This result is confirmed by a gradual decrease in
total biomass, Buxus and Corylus, and a dominance of Olea heralding the modern xeric
conditions and an increasing anthropogenic influence (Yll et al., 1997; Ninyerola et al., 2007;
Perez-Obiol, 2007). Generally, the late Holocene Mediterranean climate is characterized by
drier summers and more humid winters, similar to present conditions (Watts et al., 1996;
Dormoy et al., 2009). During the past 5 kyr, annual sea surface temperatures in the southern
Tyrrhenian Sea decreased from ~17°C to ~15°C (Sbaffi et al., 2001).
83
Paleoenvironmental evolution of the Mallorca Shelf
84
5.6 Conclusions
The stable isotope records of two surface-dwelling planktonic and three benthic foraminiferal
species, together with micro- and macrofaunal data from a shelf sediment core off southwest
Mallorca (western Mediterranean Sea) provide insights into the hydrographic evolution and
ecosystem dynamics of this region during the Holocene.
The establishment of humid conditions with enhanced summer rainfalls on Mallorca Island
during the early and middle Holocene (e.g. between 9.6 and 5.5 kyr BP) resulted in increased
freshwater runoff, input of terrestrial dissolved organic matter and nutrients into the coastal
marine system. In the upper surface layer, these hydrological changes are documented by
decreased δ18O and δ13C values of Globigerinoides ruber (white). On the sea floor, elevated
organic matter fluxes resulted in a lowering of δ13C values of Bulimina aculeata, and the
appearance of the suspension feeding gastropod Turritella communis and the infaunal benthic
foraminifer Rectuvigerina phlegeri.
Differences in the δ18O signals of Globigerina bulloides (representing the late winter/spring
situation) and Globigerinoides ruber (representing the late summer situation) reveal higher
seasonality during the earliest Holocene and an abrupt drop of seasonal contrasts with onset
of the humid phase around 9.6 kyr.
The timing of the Mallorca humid interval is nearly synchronous to the formation of sapropel
S1 (9.6-6.0 kyr BP) in the eastern Mediterranean Sea, corroborating previous evidence from
pollen records. For the first time, a major impact of this humid period on western
Mediterranean marine ecosystems is documented here. Comparisons with open-ocean
records from the Alboran, Balearic and Tyrrhenian basins illustrate that the marine response to
enhanced precipitation in the western Mediterranean during the early Holocene is probably
confined to near-coastal settings.
6 Taxonomy of modern benthic shelf foraminifera
in the western Mediterranean Sea
Abstract
A total of 280 modern benthic foraminifera from carbonate shelf environments of three areas in the western Mediterranean Sea (Alboran Platform, Oran Bight and the south-western shelf off Mallorca) have been studied and are systematically listed here. The systematic description provides a list of synonyms, short remarks about morphological features of various taxa and some annotations about taxa with problematic generic status. 111 taxa are illustrated by SEM photographs.
This chapter is based on: Milker, Y. and Schmiedl, G., in prep. Taxonomy of modern benthic shelf
foraminifera in the western Mediterranean Sea.
85
Taxonomy of modern benthic foraminifera in the Mediterranean Sea
6.1 Introduction
Foraminifera are a widely distributed and diverse order of protists in marine environments.
They play an important role in ecological and paleo-ecological studies due to their high
numerical density in marine sediments and the excellent preservation potential of their shells.
Benthic foraminifera show a great diversity with more than 10,000 modern taxa while
planktonic foraminifera are less diverse with 40-50 modern species. The oldest benthic
foraminifera were found in Cambrian deposits, and the oldest planktonic species occur in the
Jurassic (Sen Gupta, 2003).
An accurate knowledge of the taxonomy of foraminifera provides the basis for any
applications in paleoenvironmental or biostratigraphic studies of these protozoa. In the early
18th century, Scheuchzer was the first who identified foraminifera as animals, and he assigned
them to the gastropoda (Nuglisch, 1985). Lamarck established independent foraminiferal
orders such as Discorbis, Rotalia, Lenticulina and Nummulites in 1801 and 1804 (Nuglisch,
1985). D’Orbigny, who played an important role in foraminiferal research, categorized
foraminifera as their own order inside the cephalopoda in 1826, and Dujardin assigned them to
the protozoa in 1841 (Nuglisch, 1985). Since the first investigations, more systematic studies
were carried out by Reuss, Ehrenberg and later by Thalman. An important monograph about
modern foraminifera based on the material collected during the Challenger expedition (1872 -
1876) was published by Brady in 1884 and later republished in revised forms by Barker (1960)
and Jones (1994). In the early 20th century, Cushman was one of the leading researchers of
foraminiferal taxonomy (e.g., Cushman, 1910, 1911, 1914, 1915, 1917, 1918, 1920, 1929,
1930, 1931). The last magnum opus on foraminifera dates back to 1988, when Loeblich and
Tappan published a comprehensive work about the taxonomy of foraminifera with a
description of 878 genera.
The Mediterranean Sea represents a classical region for investigations in foraminiferal
taxonomy. D’Orbigny described numerous current taxa from the Mediterranean region in 1826
(Cimerman and Langer, 1991). Further, scientists such as Parker (1958) and Todd (1958)
investigated deep sea benthic and planktonic foraminifera from the eastern and western
Mediterranean Sea, collected during the Swedish Deep Sea Expedition (1946 - 1948) and the
Atlantic cruise 151 (1948). Hofker (1960) investigated in the taxonomy of shallow water
benthic foraminifera from the Gulf of Naples.
More recent comprehensive and systematic descriptions were provided by Cimerman and
Langer (1991) for the Adriatic and Tyrrhenian Seas, by Sgarrella and Moncharmont Zei (1993)
for the Gulf of Naples, and by Rasmussen (2005) for the southern Aegean Sea. Beside these
works, there are many additional publications about foraminiferal taxonomy from the
86
Chapter 6
Mediterranean Sea (e.g. Jorissen, 1987; Alberola et al 1987, 1991; Mendes et al., 2004;
Frezza & Carboni, 2009), and the Sea of Marmara (e.g. Kaminski et al., 2002; Chendes et al,
2004; Avsar et al., 2006, 2009).
6.2 Materials and methods
This chapter provides a taxonomic summary for a total of 280 Recent, Holocene and late glacial benthic shelf foraminifera from the western Mediterranean Sea, ranging from 20 m to 235 m water depth. A total of 98 living (Rose Bengal stained) species have been identified in the surface samples (electronic Table A.17). In addition, a total of 163, 175 and 173 Recent species, represented by empty tests, have been identified on the Alboran Platform, the Oran Bight and the Mallorca Shelf, respectively (compare Fig. 3.1 and electronic Table A.18). In the sediment-cores 342-1 (Alboran Platform), 367-1 (Oran Bight) and 401-1 (Mallorca Shelf) a total of 172, 178 and 194 late glacial and Holocene species have been identified (compare Fig. 4.1; electronic Tables A.19-A.21). Rare species or species with problematic systematic position have been summarized in higher taxonomic units (genera, families).
The classification of Loeblich and Tappan (1988) provides the basis for the generic classification of this study. Identification on the species level is primarily based on the publications of Cimerman & Langer (1991), Sgarrella & Moncharmont Zei (1993) and Rasmussen (2005). Furthermore, other publications about the Mediterranean Sea were studied (e.g., Hofker, 1950; Parker, 1958; Jorissen, 1987; Alberola et al., 1987, 1991, Mendes et al., 2004; Frezza and Carboni, 2009). Valuable information was also provided by comprehensive taxonomic studies from other areas, such as the Atlantic Ocean (Jones, 2004) or the Red Sea (Hottinger et al., 1993).
In the systematic description, species within the same genus are listed in alphabetical order. The given references include publications that have an extensive list of synonyms, useful illustrations and taxa descriptions. The given remarks contain short morphological descriptions of those species, for which the classification was restricted to family or genus level, and for which no illustrations in the literature were available. Furthermore, annotations on controversial species classifications are given. SEM photographs of 111 taxa, performed with a Zeiss LEO 1455VP, are appended to this chapter.
87
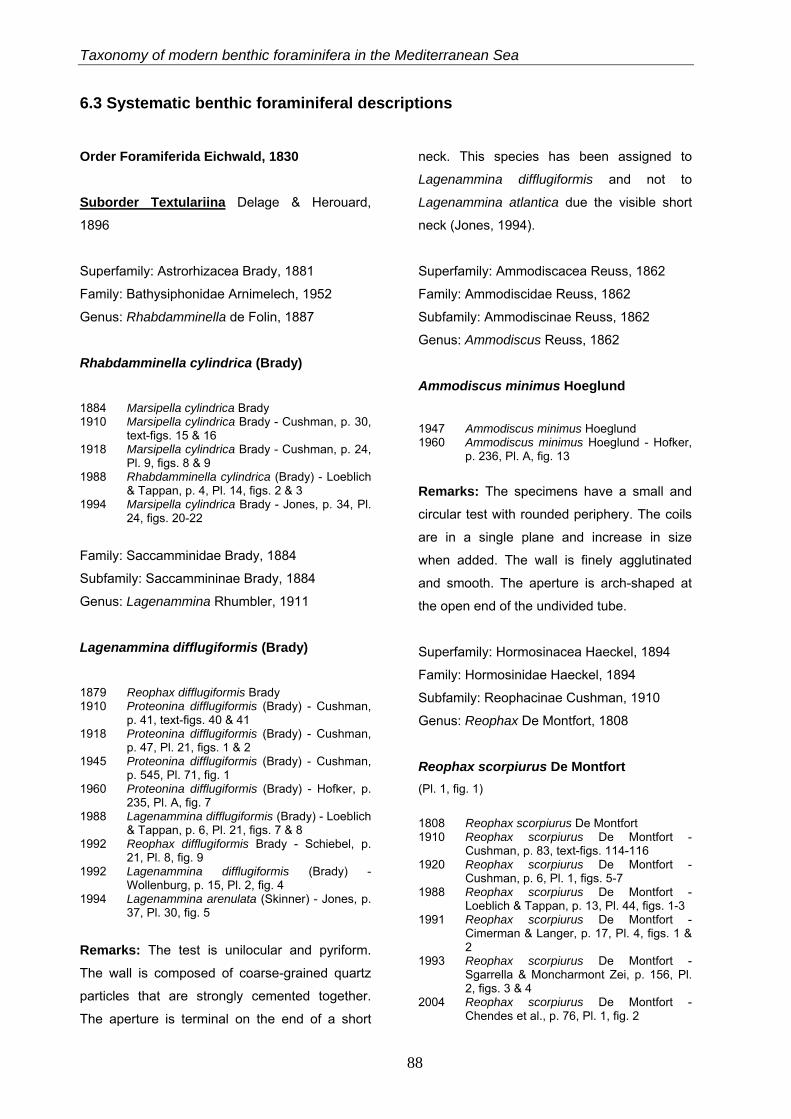
Taxonomy of modern benthic foraminifera in the Mediterranean Sea
88
6.3 Systematic benthic foraminiferal descriptions Order Foramiferida Eichwald, 1830 Suborder Textulariina Delage & Herouard,
1896
Superfamily: Astrorhizacea Brady, 1881
Family: Bathysiphonidae Arnimelech, 1952
Genus: Rhabdamminella de Folin, 1887
Rhabdamminella cylindrica (Brady) 1884 Marsipella cylindrica Brady 1910 Marsipella cylindrica Brady - Cushman, p. 30,
text-figs. 15 & 16 1918 Marsipella cylindrica Brady - Cushman, p. 24,
Pl. 9, figs. 8 & 9 1988 Rhabdamminella cylindrica (Brady) - Loeblich
& Tappan, p. 4, Pl. 14, figs. 2 & 3 1994 Marsipella cylindrica Brady - Jones, p. 34, Pl.
24, figs. 20-22
Family: Saccamminidae Brady, 1884
Subfamily: Saccammininae Brady, 1884
Genus: Lagenammina Rhumbler, 1911
Lagenammina difflugiformis (Brady) 1879 Reophax difflugiformis Brady 1910 Proteonina difflugiformis (Brady) - Cushman,
p. 41, text-figs. 40 & 41 1918 Proteonina difflugiformis (Brady) - Cushman,
p. 47, Pl. 21, figs. 1 & 2 1945 Proteonina difflugiformis (Brady) - Cushman,
p. 545, Pl. 71, fig. 1 1960 Proteonina difflugiformis (Brady) - Hofker, p.
235, Pl. A, fig. 7 1988 Lagenammina difflugiformis (Brady) - Loeblich
& Tappan, p. 6, Pl. 21, figs. 7 & 8 1992 Reophax difflugiformis Brady - Schiebel, p.
21, Pl. 8, fig. 9 1992 Lagenammina difflugiformis (Brady) -
Wollenburg, p. 15, Pl. 2, fig. 4 1994 Lagenammina arenulata (Skinner) - Jones, p.
37, Pl. 30, fig. 5
Remarks: The test is unilocular and pyriform.
The wall is composed of coarse-grained quartz
particles that are strongly cemented together.
The aperture is terminal on the end of a short
neck. This species has been assigned to
Lagenammina difflugiformis and not to
Lagenammina atlantica due the visible short
neck (Jones, 1994).
Superfamily: Ammodiscacea Reuss, 1862
Family: Ammodiscidae Reuss, 1862
Subfamily: Ammodiscinae Reuss, 1862
Genus: Ammodiscus Reuss, 1862
Ammodiscus minimus Hoeglund
1947 Ammodiscus minimus Hoeglund 1960 Ammodiscus minimus Hoeglund - Hofker,
p. 236, Pl. A, fig. 13
Remarks: The specimens have a small and
circular test with rounded periphery. The coils
are in a single plane and increase in size
when added. The wall is finely agglutinated
and smooth. The aperture is arch-shaped at
the open end of the undivided tube.
Superfamily: Hormosinacea Haeckel, 1894
Family: Hormosinidae Haeckel, 1894
Subfamily: Reophacinae Cushman, 1910
Genus: Reophax De Montfort, 1808
Reophax scorpiurus De Montfort (Pl. 1, fig. 1)
1808 Reophax scorpiurus De Montfort 1910 Reophax scorpiurus De Montfort -
Cushman, p. 83, text-figs. 114-116 1920 Reophax scorpiurus De Montfort -
Cushman, p. 6, Pl. 1, figs. 5-7 1988 Reophax scorpiurus De Montfort -
Loeblich & Tappan, p. 13, Pl. 44, figs. 1-3 1991 Reophax scorpiurus De Montfort -
Cimerman & Langer, p. 17, Pl. 4, figs. 1 & 2
1993 Reophax scorpiurus De Montfort - Sgarrella & Moncharmont Zei, p. 156, Pl. 2, figs. 3 & 4
2004 Reophax scorpiurus De Montfort - Chendes et al., p. 76, Pl. 1, fig. 2
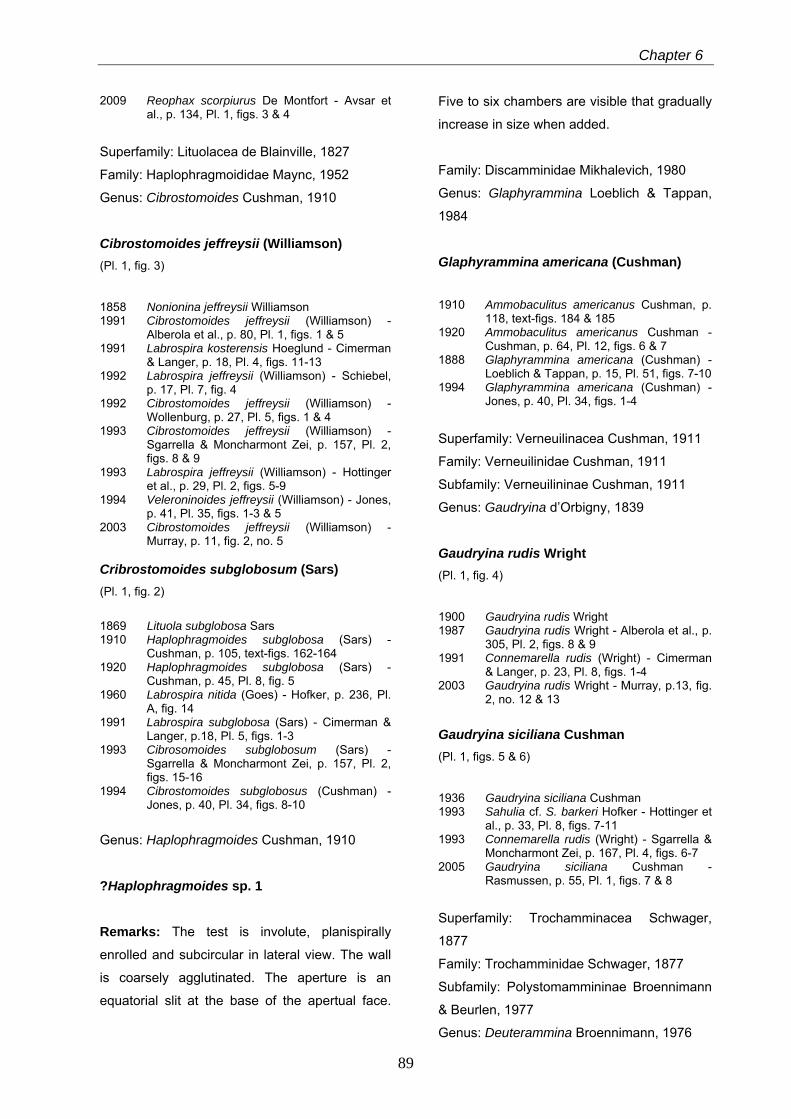
Chapter 6
2009 Reophax scorpiurus De Montfort - Avsar et al., p. 134, Pl. 1, figs. 3 & 4
Superfamily: Lituolacea de Blainville, 1827
Family: Haplophragmoididae Maync, 1952
Genus: Cibrostomoides Cushman, 1910
Cibrostomoides jeffreysii (Williamson) (Pl. 1, fig. 3)
1858 Nonionina jeffreysii Williamson 1991 Cibrostomoides jeffreysii (Williamson) -
Alberola et al., p. 80, Pl. 1, figs. 1 & 5 1991 Labrospira kosterensis Hoeglund - Cimerman
& Langer, p. 18, Pl. 4, figs. 11-13 1992 Labrospira jeffreysii (Williamson) - Schiebel,
p. 17, Pl. 7, fig. 4 1992 Cibrostomoides jeffreysii (Williamson) -
Wollenburg, p. 27, Pl. 5, figs. 1 & 4 1993 Cibrostomoides jeffreysii (Williamson) -
Sgarrella & Moncharmont Zei, p. 157, Pl. 2, figs. 8 & 9
1993 Labrospira jeffreysii (Williamson) - Hottinger et al., p. 29, Pl. 2, figs. 5-9
1994 Veleroninoides jeffreysii (Williamson) - Jones, p. 41, Pl. 35, figs. 1-3 & 5
2003 Cibrostomoides jeffreysii (Williamson) - Murray, p. 11, fig. 2, no. 5
Cribrostomoides subglobosum (Sars) (Pl. 1, fig. 2)
1869 Lituola subglobosa Sars 1910 Haplophragmoides subglobosa (Sars) -
Cushman, p. 105, text-figs. 162-164 1920 Haplophragmoides subglobosa (Sars) -
Cushman, p. 45, Pl. 8, fig. 5 1960 Labrospira nitida (Goes) - Hofker, p. 236, Pl.
A, fig. 14 1991 Labrospira subglobosa (Sars) - Cimerman &
Langer, p.18, Pl. 5, figs. 1-3 1993 Cibrosomoides subglobosum (Sars) -
Sgarrella & Moncharmont Zei, p. 157, Pl. 2, figs. 15-16
1994 Cibrostomoides subglobosus (Cushman) - Jones, p. 40, Pl. 34, figs. 8-10
Genus: Haplophragmoides Cushman, 1910
?Haplophragmoides sp. 1
Remarks: The test is involute, planispirally
enrolled and subcircular in lateral view. The wall
is coarsely agglutinated. The aperture is an
equatorial slit at the base of the apertual face.
Five to six chambers are visible that gradually
increase in size when added.
Family: Discamminidae Mikhalevich, 1980
Genus: Glaphyrammina Loeblich & Tappan,
1984
Glaphyrammina americana (Cushman)
1910 Ammobaculitus americanus Cushman, p. 118, text-figs. 184 & 185
1920 Ammobaculitus americanus Cushman - Cushman, p. 64, Pl. 12, figs. 6 & 7
1888 Glaphyrammina americana (Cushman) - Loeblich & Tappan, p. 15, Pl. 51, figs. 7-10
1994 Glaphyrammina americana (Cushman) - Jones, p. 40, Pl. 34, figs. 1-4
Superfamily: Verneuilinacea Cushman, 1911
Family: Verneuilinidae Cushman, 1911
Subfamily: Verneuilininae Cushman, 1911
Genus: Gaudryina d’Orbigny, 1839
Gaudryina rudis Wright (Pl. 1, fig. 4)
1900 Gaudryina rudis Wright 1987 Gaudryina rudis Wright - Alberola et al., p.
305, Pl. 2, figs. 8 & 9 1991 Connemarella rudis (Wright) - Cimerman
& Langer, p. 23, Pl. 8, figs. 1-4 2003 Gaudryina rudis Wright - Murray, p.13, fig.
2, no. 12 & 13
Gaudryina siciliana Cushman (Pl. 1, figs. 5 & 6)
1936 Gaudryina siciliana Cushman 1993 Sahulia cf. S. barkeri Hofker - Hottinger et
al., p. 33, Pl. 8, figs. 7-11 1993 Connemarella rudis (Wright) - Sgarrella &
Moncharmont Zei, p. 167, Pl. 4, figs. 6-7 2005 Gaudryina siciliana Cushman -
Rasmussen, p. 55, Pl. 1, figs. 7 & 8
Superfamily: Trochamminacea Schwager,
1877
Family: Trochamminidae Schwager, 1877
Subfamily: Polystomammininae Broennimann
& Beurlen, 1977
Genus: Deuterammina Broennimann, 1976
89
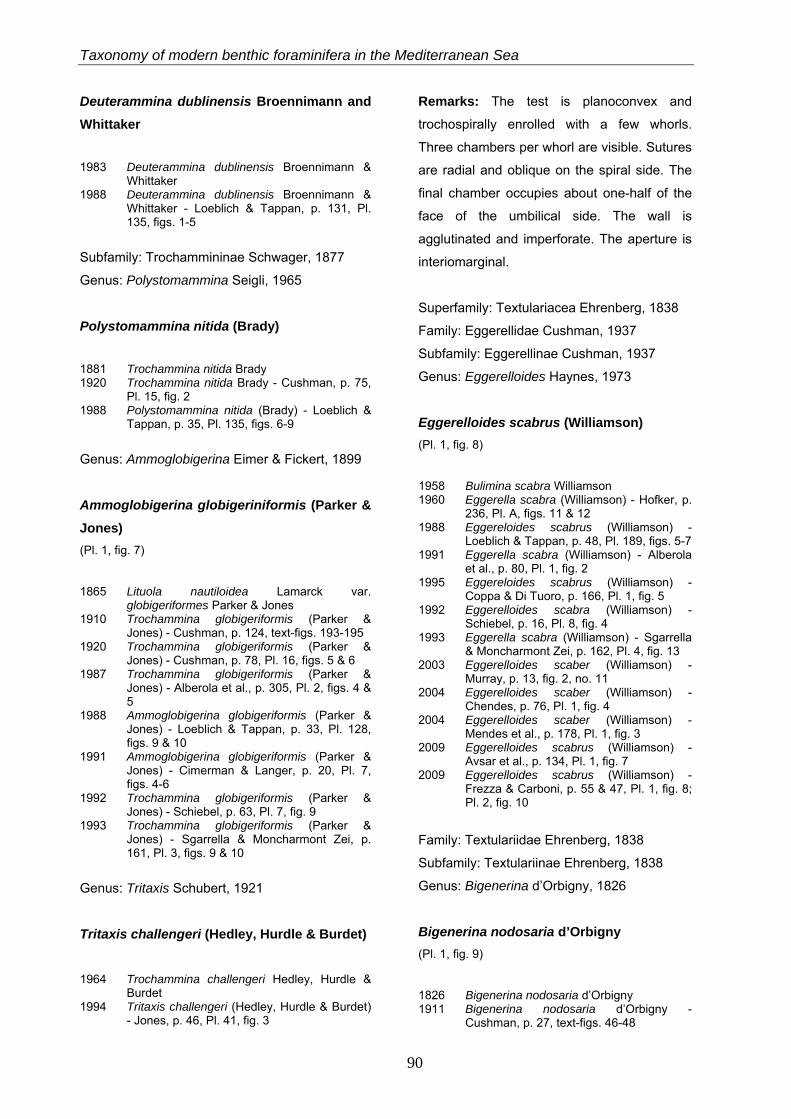
Taxonomy of modern benthic foraminifera in the Mediterranean Sea
Deuterammina dublinensis Broennimann and Whittaker
1983 Deuterammina dublinensis Broennimann & Whittaker
1988 Deuterammina dublinensis Broennimann & Whittaker - Loeblich & Tappan, p. 131, Pl. 135, figs. 1-5
Subfamily: Trochammininae Schwager, 1877
Genus: Polystomammina Seigli, 1965
Polystomammina nitida (Brady)
1881 Trochammina nitida Brady 1920 Trochammina nitida Brady - Cushman, p. 75,
Pl. 15, fig. 2 1988 Polystomammina nitida (Brady) - Loeblich &
Tappan, p. 35, Pl. 135, figs. 6-9
Genus: Ammoglobigerina Eimer & Fickert, 1899
Ammoglobigerina globigeriniformis (Parker & Jones) (Pl. 1, fig. 7)
1865 Lituola nautiloidea Lamarck var. globigeriformes Parker & Jones
1910 Trochammina globigeriformis (Parker & Jones) - Cushman, p. 124, text-figs. 193-195
1920 Trochammina globigeriformis (Parker & Jones) - Cushman, p. 78, Pl. 16, figs. 5 & 6
1987 Trochammina globigeriformis (Parker & Jones) - Alberola et al., p. 305, Pl. 2, figs. 4 & 5
1988 Ammoglobigerina globigeriformis (Parker & Jones) - Loeblich & Tappan, p. 33, Pl. 128, figs. 9 & 10
1991 Ammoglobigerina globigeriformis (Parker & Jones) - Cimerman & Langer, p. 20, Pl. 7, figs. 4-6
1992 Trochammina globigeriformis (Parker & Jones) - Schiebel, p. 63, Pl. 7, fig. 9
1993 Trochammina globigeriformis (Parker & Jones) - Sgarrella & Moncharmont Zei, p. 161, Pl. 3, figs. 9 & 10
Genus: Tritaxis Schubert, 1921
Tritaxis challengeri (Hedley, Hurdle & Burdet) 1964 Trochammina challengeri Hedley, Hurdle &
Burdet 1994 Tritaxis challengeri (Hedley, Hurdle & Burdet)
- Jones, p. 46, Pl. 41, fig. 3
Remarks: The test is planoconvex and
trochospirally enrolled with a few whorls.
Three chambers per whorl are visible. Sutures
are radial and oblique on the spiral side. The
final chamber occupies about one-half of the
face of the umbilical side. The wall is
agglutinated and imperforate. The aperture is
interiomarginal.
Superfamily: Textulariacea Ehrenberg, 1838
Family: Eggerellidae Cushman, 1937
Subfamily: Eggerellinae Cushman, 1937
Genus: Eggerelloides Haynes, 1973
Eggerelloides scabrus (Williamson) (Pl. 1, fig. 8)
1958 Bulimina scabra Williamson 1960 Eggerella scabra (Williamson) - Hofker, p.
236, Pl. A, figs. 11 & 12 1988 Eggereloides scabrus (Williamson) -
Loeblich & Tappan, p. 48, Pl. 189, figs. 5-7 1991 Eggerella scabra (Williamson) - Alberola
et al., p. 80, Pl. 1, fig. 2 1995 Eggereloides scabrus (Williamson) -
Coppa & Di Tuoro, p. 166, Pl. 1, fig. 5 1992 Eggerelloides scabra (Williamson) -
Schiebel, p. 16, Pl. 8, fig. 4 1993 Eggerella scabra (Williamson) - Sgarrella
& Moncharmont Zei, p. 162, Pl. 4, fig. 13 2003 Eggerelloides scaber (Williamson) -
Murray, p. 13, fig. 2, no. 11 2004 Eggerelloides scaber (Williamson) -
Chendes, p. 76, Pl. 1, fig. 4 2004 Eggerelloides scaber (Williamson) -
Mendes et al., p. 178, Pl. 1, fig. 3 2009 Eggerelloides scabrus (Williamson) -
Avsar et al., p. 134, Pl. 1, fig. 7 2009 Eggerelloides scabrus (Williamson) -
Frezza & Carboni, p. 55 & 47, Pl. 1, fig. 8; Pl. 2, fig. 10
Family: Textulariidae Ehrenberg, 1838
Subfamily: Textulariinae Ehrenberg, 1838
Genus: Bigenerina d’Orbigny, 1826
Bigenerina nodosaria d’Orbigny (Pl. 1, fig. 9)
1826 Bigenerina nodosaria d’Orbigny 1911 Bigenerina nodosaria d’Orbigny -
Cushman, p. 27, text-figs. 46-48
90
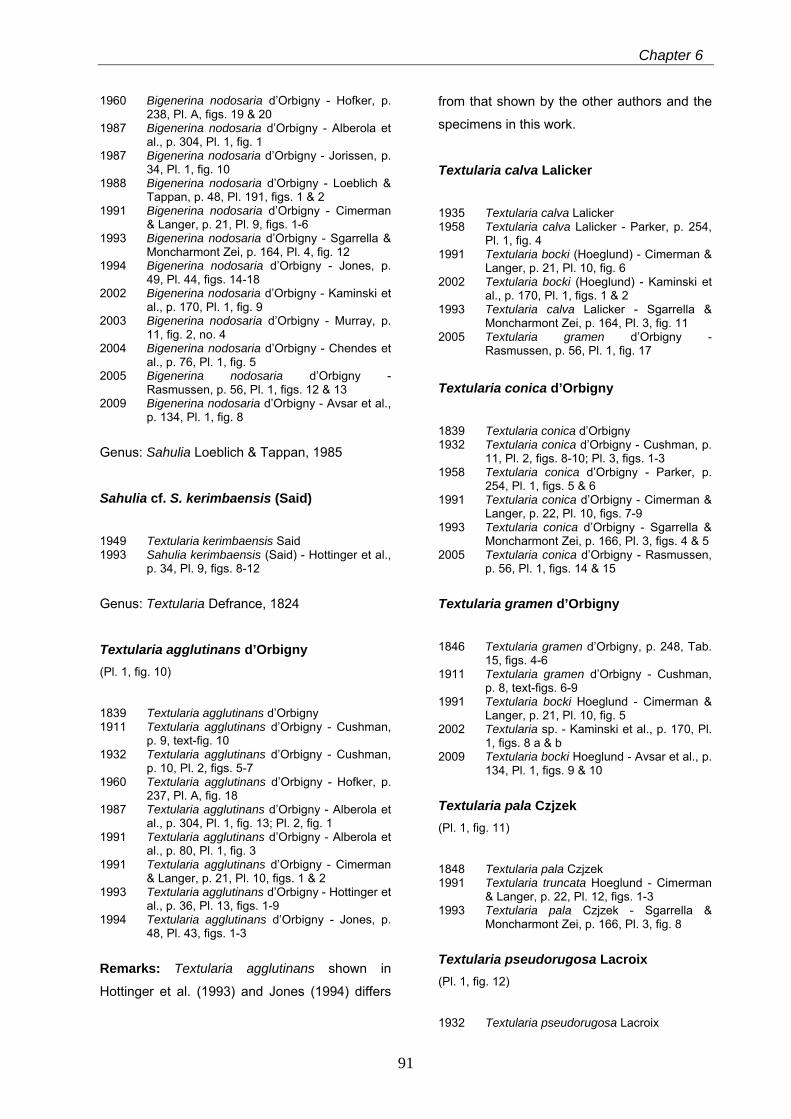
Chapter 6
1960 Bigenerina nodosaria d’Orbigny - Hofker, p. 238, Pl. A, figs. 19 & 20
1987 Bigenerina nodosaria d’Orbigny - Alberola et al., p. 304, Pl. 1, fig. 1
1987 Bigenerina nodosaria d’Orbigny - Jorissen, p. 34, Pl. 1, fig. 10
1988 Bigenerina nodosaria d’Orbigny - Loeblich & Tappan, p. 48, Pl. 191, figs. 1 & 2
1991 Bigenerina nodosaria d’Orbigny - Cimerman & Langer, p. 21, Pl. 9, figs. 1-6
1993 Bigenerina nodosaria d’Orbigny - Sgarrella & Moncharmont Zei, p. 164, Pl. 4, fig. 12
1994 Bigenerina nodosaria d’Orbigny - Jones, p. 49, Pl. 44, figs. 14-18
2002 Bigenerina nodosaria d’Orbigny - Kaminski et al., p. 170, Pl. 1, fig. 9
2003 Bigenerina nodosaria d’Orbigny - Murray, p. 11, fig. 2, no. 4
2004 Bigenerina nodosaria d’Orbigny - Chendes et al., p. 76, Pl. 1, fig. 5
2005 Bigenerina nodosaria d’Orbigny - Rasmussen, p. 56, Pl. 1, figs. 12 & 13
2009 Bigenerina nodosaria d’Orbigny - Avsar et al., p. 134, Pl. 1, fig. 8
Genus: Sahulia Loeblich & Tappan, 1985
Sahulia cf. S. kerimbaensis (Said)
1949 Textularia kerimbaensis Said 1993 Sahulia kerimbaensis (Said) - Hottinger et al.,
p. 34, Pl. 9, figs. 8-12
Genus: Textularia Defrance, 1824
Textularia agglutinans d’Orbigny (Pl. 1, fig. 10)
1839 Textularia agglutinans d’Orbigny 1911 Textularia agglutinans d’Orbigny - Cushman,
p. 9, text-fig. 10 1932 Textularia agglutinans d’Orbigny - Cushman,
p. 10, Pl. 2, figs. 5-7 1960 Textularia agglutinans d’Orbigny - Hofker, p.
237, Pl. A, fig. 18 1987 Textularia agglutinans d’Orbigny - Alberola et
al., p. 304, Pl. 1, fig. 13; Pl. 2, fig. 1 1991 Textularia agglutinans d’Orbigny - Alberola et
al., p. 80, Pl. 1, fig. 3 1991 Textularia agglutinans d’Orbigny - Cimerman
& Langer, p. 21, Pl. 10, figs. 1 & 2 1993 Textularia agglutinans d’Orbigny - Hottinger et
al., p. 36, Pl. 13, figs. 1-9 1994 Textularia agglutinans d’Orbigny - Jones, p.
48, Pl. 43, figs. 1-3
Remarks: Textularia agglutinans shown in
Hottinger et al. (1993) and Jones (1994) differs
from that shown by the other authors and the
specimens in this work.
Textularia calva Lalicker
1935 Textularia calva Lalicker 1958 Textularia calva Lalicker - Parker, p. 254,
Pl. 1, fig. 4 1991 Textularia bocki (Hoeglund) - Cimerman &
Langer, p. 21, Pl. 10, fig. 6 2002 Textularia bocki (Hoeglund) - Kaminski et
al., p. 170, Pl. 1, figs. 1 & 2 1993 Textularia calva Lalicker - Sgarrella &
Moncharmont Zei, p. 164, Pl. 3, fig. 11 2005 Textularia gramen d’Orbigny -
Rasmussen, p. 56, Pl. 1, fig. 17 Textularia conica d’Orbigny
1839 Textularia conica d’Orbigny 1932 Textularia conica d’Orbigny - Cushman, p.
11, Pl. 2, figs. 8-10; Pl. 3, figs. 1-3 1958 Textularia conica d’Orbigny - Parker, p.
254, Pl. 1, figs. 5 & 6 1991 Textularia conica d’Orbigny - Cimerman &
Langer, p. 22, Pl. 10, figs. 7-9 1993 Textularia conica d’Orbigny - Sgarrella &
Moncharmont Zei, p. 166, Pl. 3, figs. 4 & 5 2005 Textularia conica d’Orbigny - Rasmussen,
p. 56, Pl. 1, figs. 14 & 15
Textularia gramen d’Orbigny
1846 Textularia gramen d’Orbigny, p. 248, Tab. 15, figs. 4-6
1911 Textularia gramen d’Orbigny - Cushman, p. 8, text-figs. 6-9
1991 Textularia bocki Hoeglund - Cimerman & Langer, p. 21, Pl. 10, fig. 5
2002 Textularia sp. - Kaminski et al., p. 170, Pl. 1, figs. 8 a & b
2009 Textularia bocki Hoeglund - Avsar et al., p. 134, Pl. 1, figs. 9 & 10
Textularia pala Czjzek (Pl. 1, fig. 11)
1848 Textularia pala Czjzek 1991 Textularia truncata Hoeglund - Cimerman
& Langer, p. 22, Pl. 12, figs. 1-3 1993 Textularia pala Czjzek - Sgarrella &
Moncharmont Zei, p. 166, Pl. 3, fig. 8
Textularia pseudorugosa Lacroix (Pl. 1, fig. 12)
1932 Textularia pseudorugosa Lacroix
91
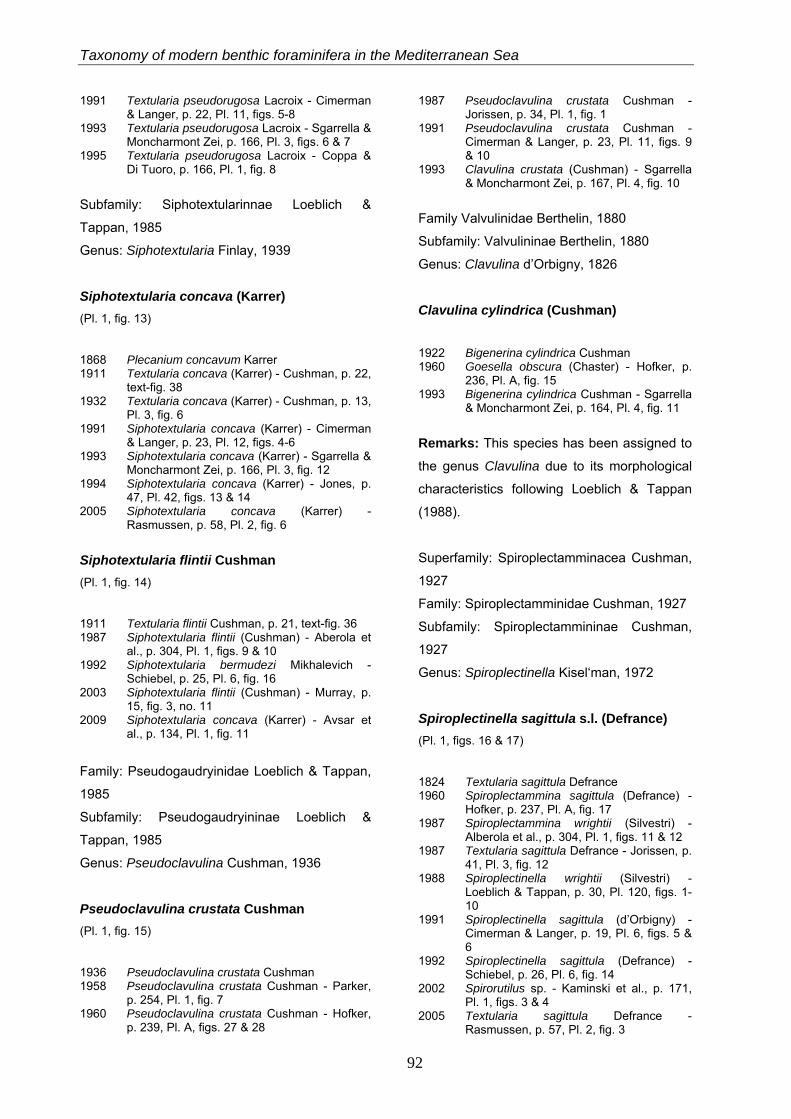
Taxonomy of modern benthic foraminifera in the Mediterranean Sea
1991 Textularia pseudorugosa Lacroix - Cimerman & Langer, p. 22, Pl. 11, figs. 5-8
1993 Textularia pseudorugosa Lacroix - Sgarrella & Moncharmont Zei, p. 166, Pl. 3, figs. 6 & 7
1995 Textularia pseudorugosa Lacroix - Coppa & Di Tuoro, p. 166, Pl. 1, fig. 8
Subfamily: Siphotextularinnae Loeblich &
Tappan, 1985
Genus: Siphotextularia Finlay, 1939
Siphotextularia concava (Karrer) (Pl. 1, fig. 13)
1868 Plecanium concavum Karrer 1911 Textularia concava (Karrer) - Cushman, p. 22,
text-fig. 38 1932 Textularia concava (Karrer) - Cushman, p. 13,
Pl. 3, fig. 6 1991 Siphotextularia concava (Karrer) - Cimerman
& Langer, p. 23, Pl. 12, figs. 4-6 1993 Siphotextularia concava (Karrer) - Sgarrella &
Moncharmont Zei, p. 166, Pl. 3, fig. 12 1994 Siphotextularia concava (Karrer) - Jones, p.
47, Pl. 42, figs. 13 & 14 2005 Siphotextularia concava (Karrer) -
Rasmussen, p. 58, Pl. 2, fig. 6
Siphotextularia flintii Cushman (Pl. 1, fig. 14)
1911 Textularia flintii Cushman, p. 21, text-fig. 36 1987 Siphotextularia flintii (Cushman) - Aberola et
al., p. 304, Pl. 1, figs. 9 & 10 1992 Siphotextularia bermudezi Mikhalevich -
Schiebel, p. 25, Pl. 6, fig. 16 2003 Siphotextularia flintii (Cushman) - Murray, p.
15, fig. 3, no. 11 2009 Siphotextularia concava (Karrer) - Avsar et
al., p. 134, Pl. 1, fig. 11
Family: Pseudogaudryinidae Loeblich & Tappan,
1985
Subfamily: Pseudogaudryininae Loeblich &
Tappan, 1985
Genus: Pseudoclavulina Cushman, 1936
Pseudoclavulina crustata Cushman (Pl. 1, fig. 15)
1936 Pseudoclavulina crustata Cushman 1958 Pseudoclavulina crustata Cushman - Parker,
p. 254, Pl. 1, fig. 7 1960 Pseudoclavulina crustata Cushman - Hofker,
p. 239, Pl. A, figs. 27 & 28
1987 Pseudoclavulina crustata Cushman - Jorissen, p. 34, Pl. 1, fig. 1
1991 Pseudoclavulina crustata Cushman - Cimerman & Langer, p. 23, Pl. 11, figs. 9 & 10
1993 Clavulina crustata (Cushman) - Sgarrella & Moncharmont Zei, p. 167, Pl. 4, fig. 10
Family Valvulinidae Berthelin, 1880
Subfamily: Valvulininae Berthelin, 1880
Genus: Clavulina d’Orbigny, 1826
Clavulina cylindrica (Cushman)
1922 Bigenerina cylindrica Cushman 1960 Goesella obscura (Chaster) - Hofker, p.
236, Pl. A, fig. 15 1993 Bigenerina cylindrica Cushman - Sgarrella
& Moncharmont Zei, p. 164, Pl. 4, fig. 11
Remarks: This species has been assigned to
the genus Clavulina due to its morphological
characteristics following Loeblich & Tappan
(1988).
Superfamily: Spiroplectamminacea Cushman,
1927
Family: Spiroplectamminidae Cushman, 1927
Subfamily: Spiroplectammininae Cushman,
1927
Genus: Spiroplectinella Kisel‘man, 1972
Spiroplectinella sagittula s.l. (Defrance) (Pl. 1, figs. 16 & 17)
1824 Textularia sagittula Defrance 1960 Spiroplectammina sagittula (Defrance) -
Hofker, p. 237, Pl. A, fig. 17 1987 Spiroplectammina wrightii (Silvestri) -
Alberola et al., p. 304, Pl. 1, figs. 11 & 12 1987 Textularia sagittula Defrance - Jorissen, p.
41, Pl. 3, fig. 12 1988 Spiroplectinella wrightii (Silvestri) -
Loeblich & Tappan, p. 30, Pl. 120, figs. 1-10
1991 Spiroplectinella sagittula (d’Orbigny) - Cimerman & Langer, p. 19, Pl. 6, figs. 5 & 6
1992 Spiroplectinella sagittula (Defrance) - Schiebel, p. 26, Pl. 6, fig. 14
2002 Spirorutilus sp. - Kaminski et al., p. 171, Pl. 1, figs. 3 & 4
2005 Textularia sagittula Defrance - Rasmussen, p. 57, Pl. 2, fig. 3
92
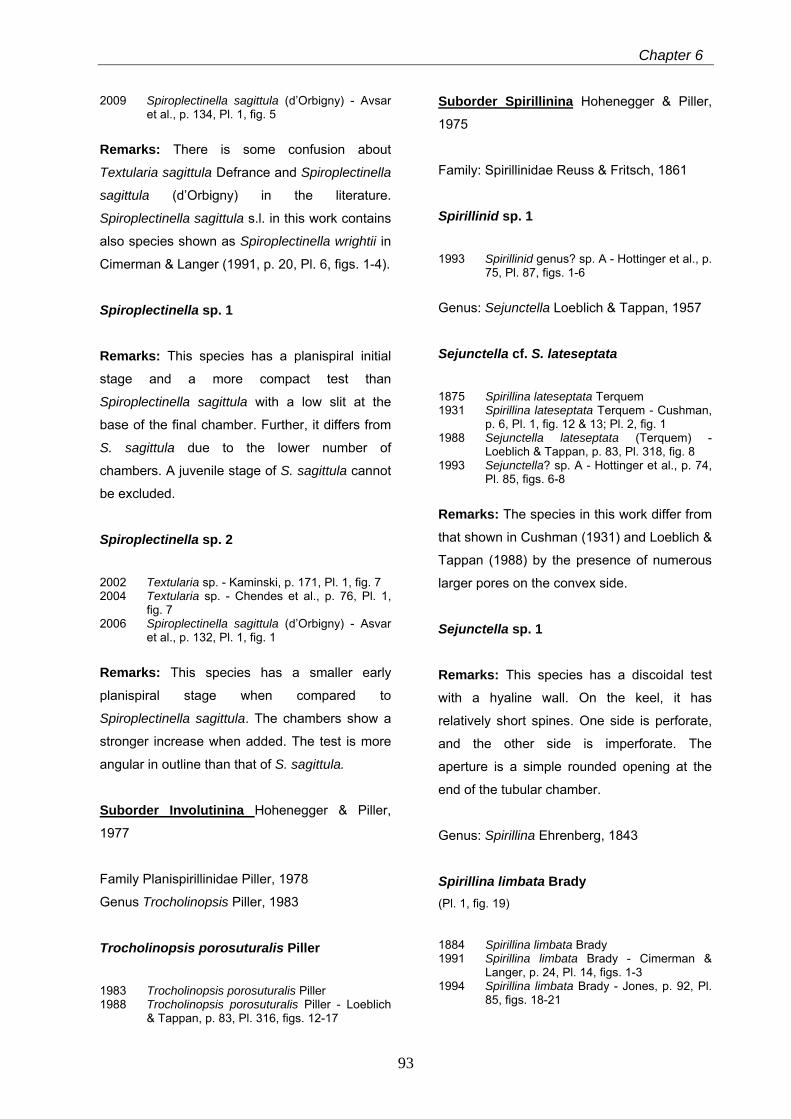
Chapter 6
2009 Spiroplectinella sagittula (d’Orbigny) - Avsar et al., p. 134, Pl. 1, fig. 5
Remarks: There is some confusion about
Textularia sagittula Defrance and Spiroplectinella
sagittula (d’Orbigny) in the literature.
Spiroplectinella sagittula s.l. in this work contains
also species shown as Spiroplectinella wrightii in
Cimerman & Langer (1991, p. 20, Pl. 6, figs. 1-4).
Spiroplectinella sp. 1
Remarks: This species has a planispiral initial
stage and a more compact test than
Spiroplectinella sagittula with a low slit at the
base of the final chamber. Further, it differs from
S. sagittula due to the lower number of
chambers. A juvenile stage of S. sagittula cannot
be excluded.
Spiroplectinella sp. 2
2002 Textularia sp. - Kaminski, p. 171, Pl. 1, fig. 7 2004 Textularia sp. - Chendes et al., p. 76, Pl. 1,
fig. 7 2006 Spiroplectinella sagittula (d’Orbigny) - Asvar
et al., p. 132, Pl. 1, fig. 1
Remarks: This species has a smaller early
planispiral stage when compared to
Spiroplectinella sagittula. The chambers show a
stronger increase when added. The test is more
angular in outline than that of S. sagittula.
Suborder Involutinina Hohenegger & Piller,
1977
Family Planispirillinidae Piller, 1978
Genus Trocholinopsis Piller, 1983
Trocholinopsis porosuturalis Piller
1983 Trocholinopsis porosuturalis Piller 1988 Trocholinopsis porosuturalis Piller - Loeblich
& Tappan, p. 83, Pl. 316, figs. 12-17
Suborder Spirillinina Hohenegger & Piller,
1975
Family: Spirillinidae Reuss & Fritsch, 1861
Spirillinid sp. 1
1993 Spirillinid genus? sp. A - Hottinger et al., p. 75, Pl. 87, figs. 1-6
Genus: Sejunctella Loeblich & Tappan, 1957
Sejunctella cf. S. lateseptata
1875 Spirillina lateseptata Terquem 1931 Spirillina lateseptata Terquem - Cushman,
p. 6, Pl. 1, fig. 12 & 13; Pl. 2, fig. 1 1988 Sejunctella lateseptata (Terquem) -
Loeblich & Tappan, p. 83, Pl. 318, fig. 8 1993 Sejunctella? sp. A - Hottinger et al., p. 74,
Pl. 85, figs. 6-8
Remarks: The species in this work differ from
that shown in Cushman (1931) and Loeblich &
Tappan (1988) by the presence of numerous
larger pores on the convex side.
Sejunctella sp. 1
Remarks: This species has a discoidal test
with a hyaline wall. On the keel, it has
relatively short spines. One side is perforate,
and the other side is imperforate. The
aperture is a simple rounded opening at the
end of the tubular chamber.
Genus: Spirillina Ehrenberg, 1843
Spirillina limbata Brady (Pl. 1, fig. 19)
1884 Spirillina limbata Brady 1991 Spirillina limbata Brady - Cimerman &
Langer, p. 24, Pl. 14, figs. 1-3 1994 Spirillina limbata Brady - Jones, p. 92, Pl.
85, figs. 18-21
93
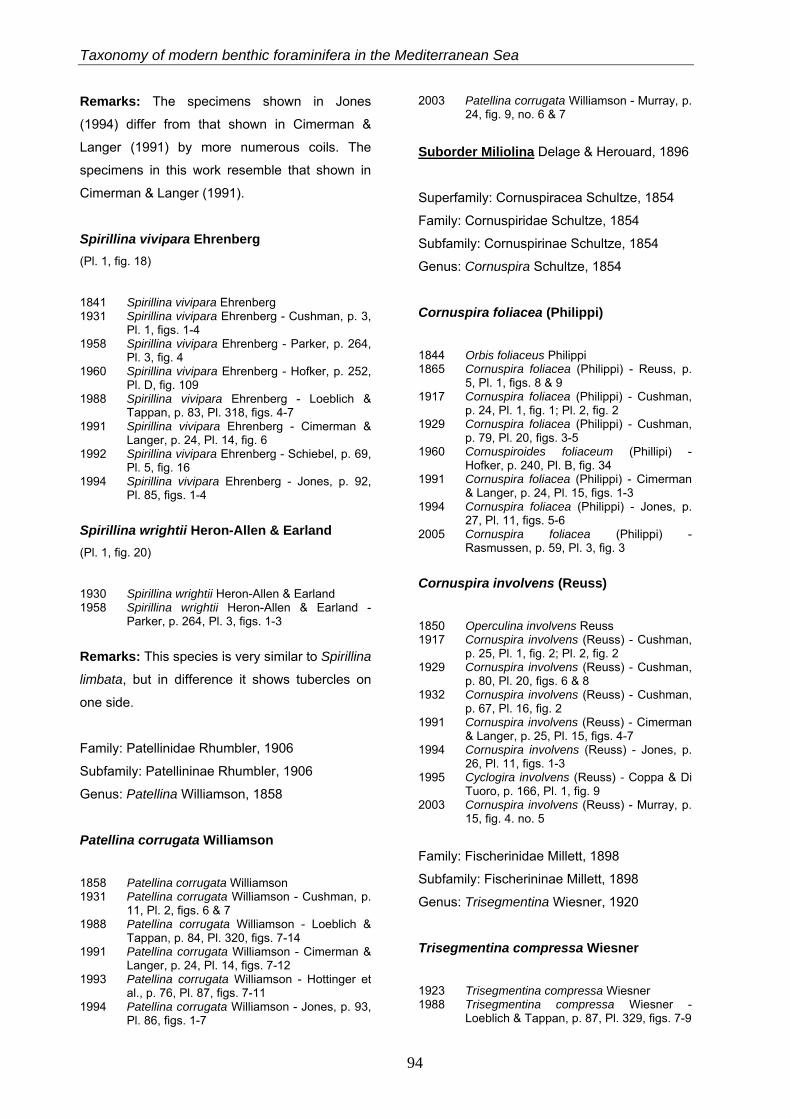
Taxonomy of modern benthic foraminifera in the Mediterranean Sea
Remarks: The specimens shown in Jones
(1994) differ from that shown in Cimerman &
Langer (1991) by more numerous coils. The
specimens in this work resemble that shown in
Cimerman & Langer (1991).
Spirillina vivipara Ehrenberg (Pl. 1, fig. 18)
1841 Spirillina vivipara Ehrenberg 1931 Spirillina vivipara Ehrenberg - Cushman, p. 3,
Pl. 1, figs. 1-4 1958 Spirillina vivipara Ehrenberg - Parker, p. 264,
Pl. 3, fig. 4 1960 Spirillina vivipara Ehrenberg - Hofker, p. 252,
Pl. D, fig. 109 1988 Spirillina vivipara Ehrenberg - Loeblich &
Tappan, p. 83, Pl. 318, figs. 4-7 1991 Spirillina vivipara Ehrenberg - Cimerman &
Langer, p. 24, Pl. 14, fig. 6 1992 Spirillina vivipara Ehrenberg - Schiebel, p. 69,
Pl. 5, fig. 16 1994 Spirillina vivipara Ehrenberg - Jones, p. 92,
Pl. 85, figs. 1-4
Spirillina wrightii Heron-Allen & Earland (Pl. 1, fig. 20)
1930 Spirillina wrightii Heron-Allen & Earland 1958 Spirillina wrightii Heron-Allen & Earland -
Parker, p. 264, Pl. 3, figs. 1-3
Remarks: This species is very similar to Spirillina
limbata, but in difference it shows tubercles on
one side.
Family: Patellinidae Rhumbler, 1906
Subfamily: Patellininae Rhumbler, 1906
Genus: Patellina Williamson, 1858
Patellina corrugata Williamson
1858 Patellina corrugata Williamson 1931 Patellina corrugata Williamson - Cushman, p.
11, Pl. 2, figs. 6 & 7 1988 Patellina corrugata Williamson - Loeblich &
Tappan, p. 84, Pl. 320, figs. 7-14 1991 Patellina corrugata Williamson - Cimerman &
Langer, p. 24, Pl. 14, figs. 7-12 1993 Patellina corrugata Williamson - Hottinger et
al., p. 76, Pl. 87, figs. 7-11 1994 Patellina corrugata Williamson - Jones, p. 93,
Pl. 86, figs. 1-7
2003 Patellina corrugata Williamson - Murray, p. 24, fig. 9, no. 6 & 7
Suborder Miliolina Delage & Herouard, 1896
Superfamily: Cornuspiracea Schultze, 1854
Family: Cornuspiridae Schultze, 1854
Subfamily: Cornuspirinae Schultze, 1854
Genus: Cornuspira Schultze, 1854
Cornuspira foliacea (Philippi)
1844 Orbis foliaceus Philippi 1865 Cornuspira foliacea (Philippi) - Reuss, p.
5, Pl. 1, figs. 8 & 9 1917 Cornuspira foliacea (Philippi) - Cushman,
p. 24, Pl. 1, fig. 1; Pl. 2, fig. 2 1929 Cornuspira foliacea (Philippi) - Cushman,
p. 79, Pl. 20, figs. 3-5 1960 Cornuspiroides foliaceum (Phillipi) -
Hofker, p. 240, Pl. B, fig. 34 1991 Cornuspira foliacea (Philippi) - Cimerman
& Langer, p. 24, Pl. 15, figs. 1-3 1994 Cornuspira foliacea (Philippi) - Jones, p.
27, Pl. 11, figs. 5-6 2005 Cornuspira foliacea (Philippi) -
Rasmussen, p. 59, Pl. 3, fig. 3
Cornuspira involvens (Reuss)
1850 Operculina involvens Reuss 1917 Cornuspira involvens (Reuss) - Cushman,
p. 25, Pl. 1, fig. 2; Pl. 2, fig. 2 1929 Cornuspira involvens (Reuss) - Cushman,
p. 80, Pl. 20, figs. 6 & 8 1932 Cornuspira involvens (Reuss) - Cushman,
p. 67, Pl. 16, fig. 2 1991 Cornuspira involvens (Reuss) - Cimerman
& Langer, p. 25, Pl. 15, figs. 4-7 1994 Cornuspira involvens (Reuss) - Jones, p.
26, Pl. 11, figs. 1-3 1995 Cyclogira involvens (Reuss) - Coppa & Di
Tuoro, p. 166, Pl. 1, fig. 9 2003 Cornuspira involvens (Reuss) - Murray, p.
15, fig. 4. no. 5
Family: Fischerinidae Millett, 1898
Subfamily: Fischerininae Millett, 1898
Genus: Trisegmentina Wiesner, 1920
Trisegmentina compressa Wiesner
1923 Trisegmentina compressa Wiesner 1988 Trisegmentina compressa Wiesner -
Loeblich & Tappan, p. 87, Pl. 329, figs. 7-9
94
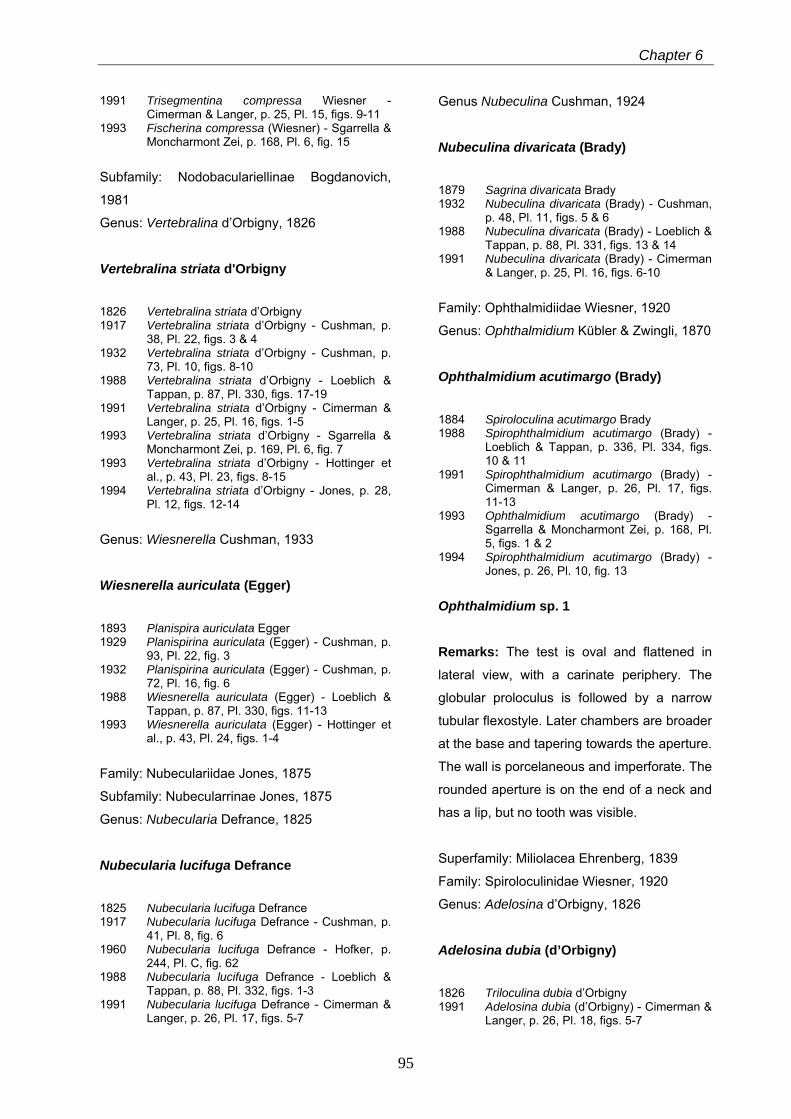
Chapter 6
1991 Trisegmentina compressa Wiesner - Cimerman & Langer, p. 25, Pl. 15, figs. 9-11
1993 Fischerina compressa (Wiesner) - Sgarrella & Moncharmont Zei, p. 168, Pl. 6, fig. 15
Subfamily: Nodobaculariellinae Bogdanovich,
1981
Genus: Vertebralina d’Orbigny, 1826
Vertebralina striata d'Orbigny
1826 Vertebralina striata d’Orbigny 1917 Vertebralina striata d’Orbigny - Cushman, p.
38, Pl. 22, figs. 3 & 4 1932 Vertebralina striata d’Orbigny - Cushman, p.
73, Pl. 10, figs. 8-10 1988 Vertebralina striata d’Orbigny - Loeblich &
Tappan, p. 87, Pl. 330, figs. 17-19 1991 Vertebralina striata d’Orbigny - Cimerman &
Langer, p. 25, Pl. 16, figs. 1-5 1993 Vertebralina striata d’Orbigny - Sgarrella &
Moncharmont Zei, p. 169, Pl. 6, fig. 7 1993 Vertebralina striata d’Orbigny - Hottinger et
al., p. 43, Pl. 23, figs. 8-15 1994 Vertebralina striata d’Orbigny - Jones, p. 28,
Pl. 12, figs. 12-14
Genus: Wiesnerella Cushman, 1933
Wiesnerella auriculata (Egger)
1893 Planispira auriculata Egger 1929 Planispirina auriculata (Egger) - Cushman, p.
93, Pl. 22, fig. 3 1932 Planispirina auriculata (Egger) - Cushman, p.
72, Pl. 16, fig. 6 1988 Wiesnerella auriculata (Egger) - Loeblich &
Tappan, p. 87, Pl. 330, figs. 11-13 1993 Wiesnerella auriculata (Egger) - Hottinger et
al., p. 43, Pl. 24, figs. 1-4
Family: Nubeculariidae Jones, 1875
Subfamily: Nubecularrinae Jones, 1875
Genus: Nubecularia Defrance, 1825
Nubecularia lucifuga Defrance
1825 Nubecularia lucifuga Defrance 1917 Nubecularia lucifuga Defrance - Cushman, p.
41, Pl. 8, fig. 6 1960 Nubecularia lucifuga Defrance - Hofker, p.
244, Pl. C, fig. 62 1988 Nubecularia lucifuga Defrance - Loeblich &
Tappan, p. 88, Pl. 332, figs. 1-3 1991 Nubecularia lucifuga Defrance - Cimerman &
Langer, p. 26, Pl. 17, figs. 5-7
Genus Nubeculina Cushman, 1924
Nubeculina divaricata (Brady)
1879 Sagrina divaricata Brady 1932 Nubeculina divaricata (Brady) - Cushman,
p. 48, Pl. 11, figs. 5 & 6 1988 Nubeculina divaricata (Brady) - Loeblich &
Tappan, p. 88, Pl. 331, figs. 13 & 14 1991 Nubeculina divaricata (Brady) - Cimerman
& Langer, p. 25, Pl. 16, figs. 6-10
Family: Ophthalmidiidae Wiesner, 1920
Genus: Ophthalmidium Kübler & Zwingli, 1870
Ophthalmidium acutimargo (Brady)
1884 Spiroloculina acutimargo Brady 1988 Spirophthalmidium acutimargo (Brady) -
Loeblich & Tappan, p. 336, Pl. 334, figs. 10 & 11
1991 Spirophthalmidium acutimargo (Brady) - Cimerman & Langer, p. 26, Pl. 17, figs. 11-13
1993 Ophthalmidium acutimargo (Brady) - Sgarrella & Moncharmont Zei, p. 168, Pl. 5, figs. 1 & 2
1994 Spirophthalmidium acutimargo (Brady) - Jones, p. 26, Pl. 10, fig. 13
Ophthalmidium sp. 1
Remarks: The test is oval and flattened in
lateral view, with a carinate periphery. The
globular proloculus is followed by a narrow
tubular flexostyle. Later chambers are broader
at the base and tapering towards the aperture.
The wall is porcelaneous and imperforate. The
rounded aperture is on the end of a neck and
has a lip, but no tooth was visible.
Superfamily: Miliolacea Ehrenberg, 1839
Family: Spiroloculinidae Wiesner, 1920
Genus: Adelosina d’Orbigny, 1826
Adelosina dubia (d’Orbigny) 1826 Triloculina dubia d’Orbigny 1991 Adelosina dubia (d’Orbigny) - Cimerman &
Langer, p. 26, Pl. 18, figs. 5-7
95
Taxonomy of modern benthic foraminifera in the Mediterranean Sea
Adelosina intricata (Terquem)
1878 Quinqueloculina intricata Terquem 1991 Adelosina intricata (Terquem) - Cimerman &
Langer, p. 27, Pl. 18, figs. 9-10 1993 Adelosina intricata (Terquem) - Sgarrella &
Moncharmont Zei, p. 178, Pl. 8, figs. 4 & 5 1994 Adelosina intricata (Terquem) - Jones, p. 22,
Pl. 6, figs. 11 & 12
Adelosina italica (Terquem)
1878 Quinqueloculina italica Terquem 1993 Adelosina italica (Terquem) - Sgarrella &
Moncharmont Zei, p. 179, Pl. 7, figs. 13 & 14
Adelosina laevigata d’Orbigny
1825 Adelosina laevigata d’Orbigny 1846 Adelosina laevigata d’Orbigny - D’Orbigny, p.
302, Tab. 20, figs. 22-24 1988 Adelosina laevigata d’Orbigny - Loeblich &
Tappan, p. 90, Pl. 337, figs. 5-12
Adelosina longirostra (d’Orbigny)
1826 Quinqueloculina longirostra d’Orbigny 1846 Quinqueloculina longirostra d’Orbigny -
D’Orbigny, p. 291, Tab. 18, figs. 25-27 2005 Adelosina longirostra (d’Orbigny) -
Rasmussen, p. 60, Pl. 3, figs. 7 & 8
Adelosina mediterranensis (Le Calvez & Le Calvez) (Pl. 2, fig. 2)
1958 Quinqueloculina mediterranensis Le Calvez & Le Calvez
1987 Quinqueloculina mediterranensis Le Calvez & Le Calvez - Alberola et al., p. 306, Pl. 3, fig. 8
1991 Adelosina mediterranensis (Le Calvez & Le Calvez) - Cimerman & Langer, p. 28, Pl. 19, figs. 1-16
1993 Adelosina mediterranensis (Le Calvez & Le Calvez) - Sgarrella & Moncharmont Zei, p. 179, Pl. 7, figs. 9-11
2005 Adelosina mediterranensis (Le Calvez & Le Calvez) - Rasmussen, p. 60, Pl. 3, fig. 6
2009 Adelosina mediterranensis (Le Calvez & Le Calvez) - Avsar et al., p. 134, Pl. 1, fig. 14
Adelosina sp.1 (Pl. 2, fig. 1)
1991 Adelosina sp. 1 - Cimerman & Langer, p. 28, Pl. 21, fig. 1 (juvenile specimen)
1994 Miliolid juvenaria - Jones, p. 19, Pl. 3, fig. 11
Remarks: This species is a juvenile Adelosina
form with a megalospheric proloculus followed
by a embracing and planispirally enrolled
second chamber provided with a neck. No
further determination is possible.
Genus: Spiroloculina d’Orbigny, 1826
Spiroloculina dilatata d’Orbigny
1846 Spiroloculina dilatata d’Orbigny, p. 271, Pl. 16, figs. 16-18
1991 Spiroloculina dilatata d’Orbigny - Cimerman & Langer, p. 30, Pl. 22, figs. 5-8
Spiroloculina excavata d’Orbigny (Pl. 2, fig. 3)
1846 Spiroloculina excavata d’Orbigny, p. 271, Tab. 16, figs. 19-21
1960 Spiroloculina excavata d’Orbigny - Hofker, p. 239, Pl. A, fig. 30
1987 Spiroloculina excavata d’Orbigny - Alberola et al., p. 306, Pl. 2, fig. 11
1991 Spiroloculina excavata d’Orbigny - Cimerman & Langer, p. 30, Pl. 23, figs.1-3
1993 Spiroloculina excavata d’Orbigny - Sgarrella & Moncharmont Zei, p. 169, Pl. 5, fig. 6
2002 Spiroloculina excavata d’Orbigny - Kaminski et al., p. 170, Pl. 1, fig. 11
2003 Spiroloculina excavata d’Orbigny - Murray, p. 17, fig. 4, no. 13 & 14
2004 Spiroloculina excavata d’Orbigny - Chendes et al., p. 76, Pl. 1, fig. 9
2005 Spiroloculina excavata d’Orbigny - Rasmussen, p. 61, Pl. 3, fig. 11
2006 Spiroloculina excavata d’Orbigny - Avsar et al., p. 132, Pl. 1, fig. 3
2009 Spiroloculina excavata d’Orbigny - Avsar et al., p. 134, Pl. 1, fig. 16
Spiroloculina cf. S. rostrata Reuss
1850 Spiroloculina rostrata Reuss 1993 cf. Spiroloculina rostrata Reuss - Sgarrella
& Moncharmont Zei, p. 169, Pl. 5, fig. 5
Remarks: The specimens in this work differ
from that shown in Sgarrella & Moncharmont
Zei (1993) due to their shorter necks. The
aperture is nearly rounded with a rim and
provided with a short tooth.
96
Chapter 6
Spiroloculina tenuiseptata Brady (Pl. 2, fig. 4)
1884 Spiroloculina tenuiseptata Brady 1958 Spiroloculina canaliculata d’Orbigny - Parker,
p. 257, Pl. 1, figs. 26-28 1960 Spiroloculina canaliculata d’Orbigny - Hofker,
p. 240, Pl. A, fig. 32 1987 Spiroloculina canaliculata d’Orbigny - Alberola
et al., p. 306, Pl. 2, fig. 16 1991 Spiroloculina tenuiseptata Brady - Cimerman
& Langer, p. 31, Pl. 24, figs. 6-9 1993 Spiroloculina tenuiseptata Brady - Sgarrella &
Moncharmont Zei, p. 169, Pl. 5, fig. 7 1994 Spiroloculina tenuiseptata Brady - Jones, p.
26, Pl. 10, figs. 5 & 6 2002 Spiroloculina tenuiseptata Brady - Kaminski et
al., p. 170, Pl. 1, fig. 10 2005 Spiroloculina tenuiseptata Brady -
Rasmussen, p. 61, Pl. 3, fig. 12
Spiroloculina sp. 1
Remarks: The test is ovate in lateral view. The
proloculus is followed by a second chamber of
one whorl in length. The periphery margin is
broad. The wall is porcelaneous and imperforate.
The aperture, at the open end, is relatively broad
and oval. This species is likely a juvenile stage of
Spiroloculina excavata.
Spiroloculina sp. 2
Remarks: The test is fusiform in side view,
biconcave in end view, and evolute. The wall is
porcelaneous and imperforate with a slightly
rough test surface. The aperture is rounded with
a rim and provided with a short bifite tooth.
Spiroloculina sp. 3
Remarks: The test is fusiform in outline,
biconcave in end view, and evolute. The wall is
porcelaneous and imperforate with a slightly
rough test surface. The aperture is rounded with
a small rim and, provided with a relatively short
bifite tooth.
Family: Hauerinidae Schwager, 1876
Miliolid sp. 1 (Pl. 2, fig. 5)
Remarks: The test of these small specimens
is nearly rounded and partly ornamented with
longitudinal striae. The periphery margin is
carinate in lateral view. Three chambers are
visible from one side, and two from the other
side. The wall is porcelaneous and
imperforate. The terminal aperture is oval and
bordered by a rim, provided with a short
simple tooth. These specimens have been
assigned to the Hauerinidae and not to the
Miliolidae, due to the absence of pseudopores
defined by Loeblich and Tappan (1988) for the
latter family.
Miliolid sp. 2 (Pl. 2, fig. 6)
Remarks: The test of these small specimens
is oval, with a rounded periphery margin in
lateral view. Three chambers are visible on
both sides. The wall is porcelaneous and
imperforate. The terminal aperture is oval. The
tooth is long, but mostly broken. These
specimens have been assigned to the
Hauerinidae and not to the Miliolidae, due to
the absence of pseudopores defined by
Loeblich and Tappan (1988) for the latter
family.
Subfamily: Siphonapertinae Saidova, 1975
Genus: Siphonaperta Vella, 1957
Siphonaperta agglutinans (d’Orbigny) (Pl. 2, fig. 7)
1839 Quinqueloculina agglutinans d’Orbigny 1929 Quinqueloculina agglutinans d’Orbigny -
Cushman, p. 22, Pl. 1, fig. 1
97
Taxonomy of modern benthic foraminifera in the Mediterranean Sea
1991 Siphonaperta agglutinans (d’Orbigny) - Cimerman & Langer, p. 31, Pl. 25, figs. 1-3
1993 Siphonaperta agglutinans (d’Orbigny) - Hottinger et al., p. 62, Pl. 61, figs. 10 & 11; Pl. 62, figs. 1-3
Siphonaperta aspera (d’Orbigny)
1826 Quinqueloculina aspera d’Orbigny 1987 Quinqueloculina aspera d’Orbigny - Jorissen,
p. 40, Pl. 3, fig. 2 1991 Siphonaperta aspera (d’Orbigny) - Cimerman
& Langer, p. 31, Pl. 25, figs. 4-6 1993 Siphonaperta aspera (d’Orbigny) - Sgarrella &
Moncharmont Zei, p. 185, Pl. 6, fig. 12 1995 Siphonaperta aspera dilatata Le Calvez & Le
Calvez - Coppa & Di Tuoro, p. 166, Pl. 1, fig. 7
2005 Siphonaperta aspera (d’Orbigny) - Rasmussen, p. 61, Pl. 4, fig. 1
2009 Siphonaperta aspera (d’Orbigny) - Frezza & Carboni, p. 55, Pl. 1, fig. 21
Siphonaperta dilatata (Le Calvez & Le Calvez)
1958 Quinqueloculina aspera d’Orbigny var. dilatata Le Calvez & Le Calvez
1991 Siphonaperta dilatata (Le Calvez & Le Calvez) - Cimerman & Langer, p. 31, Pl. 26, figs. 1-3
Siphonaperta horrida (Cushman)
1947 Quinqueloculina horrida Cushman 1993 Siphonaperta horrida (Cushman) - Hottinger
et al., p. 63, Pl. 63, figs. 7-12
Siphonaperta irregularis (d’Orbigny)
1826 Quinqueloculina irregularis d’Orbigny 1991 Siphonaperta irregularis (d’Orbigny) -
Cimerman & Langer, p. 32, Pl. 26, figs. 4-6
Siphonaperta sp. 1
1991 Siphonaperta sp. 2 - Cimerman & Langer, p. 32, Pl. 26, figs. 7-9
Siphonaperta sp. 2
Remarks: The test is subelliptical in lateral and
peripheral view. The chamber arrangement is
quinqueloculine. The wall is imperforate and has
an agglutinated outer coating. The aperture is
terminal and rounded at the end of a short neck.
The tooth is simple and narrow. This species
looks close to Siphonaperta sp.1, but it is
generally smaller.
Subfamily: Hauerininae Schwager, 1876
Genus: Cycloforina Luczkowksa, 1972
Cycloforina contorta (d’Orbigny) (Pl. 2, fig. 8)
1846 Quinqueloculina contorta d’Orbigny, p. 298, Tab. 20, figs. 4-6
1929 Quinqueloculina contorta d’Orbigny - Cushman, p. 29, Pl. 3, fig. 6
1988 Cycloforina contorta (d’Orbigny) - Loeblich & Tappan, p. 91, Pl. 342, figs. 4-9
1991 Cycloforina contorta (d’Orbigny) - Cimerman & Langer, p. 32, Pl. 27, figs. 7-11
1993 Quinqueloculina contorta d’Orbigny - Sgarrella & Moncharmont Zei, p. 170, Pl. 6, figs. 5 & 6
Cycloforina tenuicollis (Wiesner)
1923 Miliolina tenuicollis Wiesner 1991 Cycloforina tenuicollis (Wiesner) -
Cimerman & Langer, p. 33, Pl. 28, figs. 5-6
1993 Quinqueloculina tenuicollis (Wiesner) - Sgarrella & Moncharmont Zei, p. 175, Pl. 6, figs. 10 & 11
2009 Cycloforina tenuicollis (Wiesner) - Avsar et al., p. 134, Pl. 1, fig. 18
Cycloforina villafranca Le Calvez & Le Calvez
1958 Quinqueloculina villafranca Le Calvez & Le Calvez
1991 Cycloforina villafranca (Le Calvez & Le Calvez) - Cimerman & Langer, p. 33, Pl. 28, figs. 7-9
1993 Quinqueloculina villafranca Le Calvez & Le Calvez - Sgarrella & Moncharmont Zei, p. 176, Pl. 7, figs. 3 & 4
2005 Cycloforina villafranca (Le Calvez & Le Calvez) - Rasmussen, p. 62, Pl. 4, fig. 3
2009 Cycloforina villafranca (Le Calvez & Le Calvez) - Avsar et al., p. 134, Pl. 1, fig. 19
?Cycloforina sp. 1
Remarks: The test is elongate. The chambers
are arranged in a quinqueloculine manner and
98
Chapter 6
are one-half coil in length. Four chambers are
visible from one side and three chambers from
the other side. The wall is porcelaneous and
imperforate with weak and minute longitudinal
anastoming microstriae. The aperture is ovate at
the end of the final chamber and provided with a
peristomal rim and a relatively long slender tooth
with a short bifite termination.
Genus: Lachlanella Vella, 1957
Lachlanella bicornis (Walker and Jacob) emend. Haynes
1973 Quinqueloculina bicornis (Walker and Jacob) emend. Haynes
1987 Quinqueloculina bicornis Walker & Jacob - Alberola et al., p. 305, Pl. 2, figs. 10 & 14
1991 Lachlanella bicornis ((Walker and Jacob) emend. Haynes) - Cimerman & Langer, p. 34, Pl. 29, figs. 1-3
1994 Adelosina bicornis ((Walker & Jacob) emend. Haynes) - Jones, p. 22, Pl. 6, fig. 9
2006 Quinqueloculina bicornis Walker & Jacob - Avsar et al., p. 132, Pl. 1, fig. 5
Lachlanella bradyana Cushman
1917 Quinqueloculina bradyana Cushman 1929 Quinqueloculina bradyana Cushman -
Cushman, p. 23, Pl. 1, fig. 3 1994 Quinqueloculina bradyana Cushman - Jones,
p. 22, Pl. 6, figs. 6 & 7 1995 Quinqueloculina bradyana Cushman - Coppa
& Di Tuoro, p. 166, Pl. 1, fig. 12
Lachlanella undulata (d’Orbigny) (Pl. 2, fig. 9)
1826 Quinqueloculina undulata d’Orbigny 1991 Lachlanella undulata (d’Orbigny) - Cimerman
& Langer, p. 34, Pl. 30, figs. 3-6 1993 Quinqueloculina undulata d’Orbigny -
Sgarrella & Moncharmont Zei, p. 175, Pl. 7, fig. 6
2005 Lachlanella undulata (d’Orbigny) - Rasmussen, p. 62, Pl. 4, fig. 4
Lachlanella variolata (d’Orbigny) 1826 Quinqueloculina variolata d’Orbigny 1929 Triloculina carinata d’Orbigny - Cushman, p.
65, Pl. 17, fig. 5
1991 Lachlanella variolata (d’Orbigny) - Cimerman & Langer, p. 35, Pl. 31, figs. 1-12
1993 Quinqueloculina variolata d’Orbigny - Sgarrella & Moncharmont Zei, p. 175, Pl. 8, fig.1
Lachlanella sp. 1
Remarks: The test is elongate-ovate, with a
quinqueloculine chamber arrangement. The
wall is porcelaneous and imperforate. The test
surface is ornamented by numerous striae.
The large aperture consists of two nearly
parallel sides and an everted rim provided
with a long, slender tooth with short bifite
termination.
Genus: Quinqueloculina d’Orbigny, 1826
Quinqueloculina cf. Q. annectens (Schlum-berger)
1893 Massilina annectens Schlumberger 1960 Quinqueloculina annectens (Schlum-
berger) - Hofker, p. 241, Pl. B, fig. 38 1991 Quinqueloculina annectens (Schlum-
berger) - Cimerman & Langer, p. 35, Pl. 32, figs. 1 & 2
Remarks: These large specimens are oval in
outline. The periphery is broadly rounded.
Four chambers are visible from the exterior.
On the wall few dark sand grains are visible.
The aperture is oval with a bifite tooth. In
contrast to the specimen shown in Hofker
(1960) and Cimerman & Langer (1991), the
specimens in this work have a lower width to
length ratio.
Quinqueloculina auberiana d’Orbigny
1826 Quinqueloculina auberiana d’Orbigny 1917 Quinqueloculina auberiana d’Orbigny -
Cushman, p. 46, Pl. 12, fig. 1 1991 Quinqueloculina auberiana d’Orbigny -
Cimerman & Langer, p. 36, Pl. 32, figs. 8 & 9
99
Taxonomy of modern benthic foraminifera in the Mediterranean Sea
Quinqueloculina berthelotiana d’Orbigny
1839 Quinqueloculina berthelotiana d’Orbigny 1987 Quinqueloculina berthelotiana d’Orbigny -
Alberola et al., p. 305, Pl. 3, fig. 2 1991 Quinqueloculina berthelotiana d’Orbigny -
Cimerman & Langer, p. 36, Pl. 32, figs. 5-7 1993 Quinqueloculina berthelotiana d’Orbigny -
Sgarrella & Moncharmont Zei, p. 170, Pl. 6, figs. 1 & 2
2005 Quinqueloculina berthelotiana d’Orbigny - Rasmussen, p. 62, Pl. 4, fig. 5
2006 Quinqueloculina berthelotiana d’Orbigny - Avsar et al., p. 132, Pl. 1, fig. 6
Quinqueloculina disparilis d’Orbigny
1826 Quinqueloculina disparilis d’Orbigny 1929 Quinqueloculina disparilis d’Orbigny -
Cushman, p. 32, Pl. 5, fig. 4 1991 Quinqueloculina disparilis d’Orbigny -
Cimerman & Langer, p. 36, Pl. 33, figs. 1 & 2 1993 Quinqueloculina disparilis d’Orbigny -
Sgarrella & Moncharmont Zei, p. 170, Pl. 8, fig. 2
1995 Quinqueloculina disparilis d’Orbigny - Coppa & Di Tuoro, p. 168, Pl. 2, fig. 2
Quinqueloculina lata Terquem
1876 Quinqueloculina lata Terquem 1993 Quinqueloculina lata Terquem - Sgarrella &
Moncharmont Zei, p. 172, Pl. 5, fig. 15 2003 Quinqueloculina lata Terquem - Murray, p. 17,
fig. 4, no. 9 & 10
Quinqueloculina laevigata d’Orbigny
1839 Quinqueloculina laevigata d’Orbigny 1929 Quinqueloculina laevigata d’Orbigny -
Cushman, p. 30, Pl. 4, fig. 3 1965 Quinqueloculina laevigata d’Orbigny -
Phleger, p. 53, Pl. 1, fig. 23 1991 Quinqueloculina laevigata d’Orbigny -
Cimerman & Langer, p. 37, Pl. 33, figs. 8-11
Quinqueloculina limbata d’Orbigny
1826 Quinqueloculina limbata d’Orbigny 1991 Quinqueloculina limbata d’Orbigny -
Cimerman & Langer, p. 37, Pl. 34, figs. 1-5
Quinqueloculina neapolitana Sgarrella & Moncharmont Zei
1993 Quinqueloculina neapolitana n.sp. - Sgarrella & Moncharmont Zei, p. 173, Pl. 5, figs. 10-12
Quinqueloculina padana Perconi (Pl. 2, fig. 10)
1954 Quinqueloculina padana Perconig 1987 Quinqueloculina badenensis d’Orbigny -
Jorissen, p. 43, Pl. 4, fig. 10 1993 Quinqueloculina padana Perconig -
Sgarrella & Moncharmont Zei, p. 172, Pl. 7, fig. 1
2005 Quinqueloculina padana Perconig - Rasmussen, p. 63, Pl. 4, figs. 8 & 9
2009 Quinqueloculina padana Perconig - Frezza & Carboni, p. 55, Pl. 1, fig. 9
Quinqueloculina parvula Schlumberger (Pl. 2, fig. 11)
1894 Quinqueloculina parvula Schlumberger 1991 Quinqueloculina parvula Schlumberger -
Cimerman & Langer, p. 37, Pl. 34, figs. 6-8
1993 Quinqueloculina parvula Schlumberger - Sgarrella & Moncharmont Zei, p. 174, Pl. 5, fig. 16
Quinqueloculina pseudobuchiana Lucz-kowksa
1974 Quinqueloculina pseudobuchiana Lucz-kowska
1991 Quinqueloculina pseudobuchiana Lucz-kowska - Cimerman & Langer, p. 38, Pl. 35, figs. 1-4
Quinqueloculina seminula (Linné) (Pl. 2, fig. 12)
1758 Serpula seminula Linné 1917 Quinqueloculina seminulum (Linné) -
Cushman, p. 44, pl. 11, fig. 2 1929 Quinqueloculina seminulum (Linné) -
Cushman, p. 24, Pl. 2, figs. 1 & 2 1960 Quinqueloculina seminulum (Linné) -
Hofker, p. 241, Pl. B, fig. 41 1988 Quinqueloculina seminula (Linné) -
Loeblich & Tappan, p. 92, Pl. 344, figs. 8-13
1991 Quinqueloculina seminula (Linné) - Cimerman & Langer, p. 38, Pl. 34, fig. 9-12
1992 Quinqueloculina seminula (Linné) -Schiebel, p. 64, Pl. 5, fig. 3
1992 Quinqueloculina seminula (Linné) - Wollenburg, p. 40, Pl. 10, fig. 8
1994 Quinqueloculina seminulum (Linné) - Jones, p. 21, Pl. 5, fig. 6
2006 Quinqueloculina seminula (Linné) - Avsar et al., p. 132, Pl. 1, fig. 7
2009 Quinqueloculina seminula (Linné) - Frezza & Carboni, p. 55, Pl. 1, figs. 10 & 11
100
Chapter 6
Quinqueloculina stalkeri Loeblich & Tappan
1953 Quinqueloculina stalkeri Loeblich & Tappan 1991 Quinqueloculina stalkeri Loeblich & Tappan -
Sgarrella & Moncharmont Zei, p. 174, Pl. 5, figs. 13 & 14
2005 Quinqueloculina stalkeri Loeblich & Tappan - Rasmussen, p. 63, Pl. 4, figs. 10 & 11
Quinqueloculina stelligera Schlumberger (Pl. 2, fig. 13)
1893 Quinqueloculina stelligera Schlumberger 1929 Quinqueloculina stelligera Schlumberger -
Cushman, p. 28, Pl. 3, figs. 3 & 4 1991 Quinqueloculina stelligera Schlumberger -
Cimerman & Langer, p. 38, Pl. 34, fig. 13-15 1993 Quinqueloculina stelligera Schlumberger -
Sgarrella & Moncharmont Zei, p. 175, Pl. 6, figs. 13 & 14
Quinqueloculina viennensis Le Calvez & Le Calvez (Pl. 2, fig. 14)
1958 Quinqueloculina viennensis Le Calvez & Le Calvez
1993 Quinqueloculina viennensis Le Calvez & Le Calvez - Sgarrella & Moncharmont Zei, p. 176, Pl. 7, fig. 8
2005 Quinqueloculina viennensis Le Calvez & Le Calvez - Rasmussen, p. 64, Pl. 4, fig. 13
Quinqueloculina sp. 1
Remarks: The test of these small specimens is
lenticular in outline, with a quinqueloculine
chamber arrangement. The length-width ratio is
nearly one. Five chambers are visible from the
exterior. The wall is porcelaneous and
imperforate with a smooth surface. The oval
aperture is terminal, provided with a short bifite
tooth.
Subfamily: Miliolinellinae Vella, 1957
Genus: Affinetrina Luczkowska, 1972
Affinetrina sp. 1
Remarks: The test is ovate in outline and in
section. The chamber arrangement is
triloculine and three chambers are visible. The
wall is porcelaneous and imperforate. The
aperture is a long slit with a long, slender
tooth. The test surface is smooth with
elongated microstriae.
Affinetrina sp.2
Remarks: The test is ovate in outline and in
section. The chamber arrangement is
triloculine and three chambers are visible. The
wall is porcelanous and imperforate. The test
surface is smooth. The aperture is a long slit
with a long, slender tooth.
Genus: Biloculinella Wiesner, 1931
Biloculinella globula (Bornemann) (Pl. 2, fig. 15)
1855 Biloculina globulus Bornemann 1917 Biloculina globulus Bornemann -
Cushman, p. 78, Pl. 31, fig. 2 1932 Pyrgo globula (Bornemann) - Cushman, p.
65, Pl. 15, figs. 6-8 1991 Biloculinella globula (Bornemann) -
Cimerman & Langer, p. 40, Pl. 36, figs. 1 & 2
2003 Biloculinella globula (Bornemann) - Kaminski et al., p. 172, Pl. 2, fig. 1
2005 Biloculinella globula (Bornemann) - Rasmussen, p. 64, Pl. 4, fig. 14
Biloculinella inflata (Wright)
1902 Biloculina inflata - Wright 1988 Biloculinella inflata Wright - Sgarrella &
Moncharmont Zei, p. 188, Pl. 10, fig. 12
Biloculinella labiata (Schlumberger)
1891 Biloculina labiata Schlumberger 1958 Biloculinella labiata (Schlumberger) -
Parker, p. 255, Pl. 1, figs. 10 &11 1988 Biloculinella labiata (Schlumberger) -
Loeblich & Tappan, p. 93, Pl. 348, figs. 1-4 1991 Biloculinella labiata (Schlumberger) -
Cimerman & Langer, p. 40, Pl. 36, fig. 12
101
Taxonomy of modern benthic foraminifera in the Mediterranean Sea
2009 Biloculinella labiata (Schlumberger) - Avsar et al., p. 134, Pl. 1, fig. 20
?Biloculinella sp. 1
Remarks: The test is ovate in outline and
narrow. In section, the test is ovate and the
periphery is rounded. The wall is porcelaneous
and imperforate. The apertural flap is terminal,
but smaller when compared to other Biloculinella
species.
Genus: Miliolinella Wiesner, 1931
Miliolinella dilatata (d’Orbigny)
1839 Quinqueloculina dilatata d’Orbigny 1991 Miliolinella dilatata (d’Orbigny) - Cimerman &
Langer, p. 41, Pl. 37, figs. 9-11
Miliolinella elongata Kruit
1955 Miliolinella circularis (Bornemann) var. elongata Kruit
1991 Miliolinella elongata Kruit - Cimerman & Langer, p. 41, Pl. 37, fig. 8
1993 Miliolinella circularis elongata Kruit - Sgarrella & Moncharmont Zei, p. 187, Pl. 10, fig. 5
2009 Miliolinella elongata Kruit - Avsar et al., p. 134, Pl. 1, fig. 21
Miliolinella cf. M. hybrida (Terquem)
1878 Quinqueloculina hybrida Terquem 1993 Miliolinella cf. M. hybrida (Terquem) -
Hottinger et al., p. 52, Pl. 39, figs. 1-6
Remarks: The test is porcelaneous, oval to
subcircular in section. The test surface is smooth.
The chambers are strongly inflated and often
distorted. Sutures are distinct and depressed.
The aperture is terminal, arch-shaped or
triangular, mostly rounded, but also irregular. The
specimens in this work have no thick rim that
bordered the aperture and no basal flap
(probably broken?) as described in Hottinger et
al. (1993).
Miliolinella labiosa (d’Orbigny)
1839 Triloculina labiosa d’Orbigny 1839 Triloculina labiosa d’Orbigny - Cushman,
p. 53, Pl. 11, fig. 12 1960 Miliolinella labiosa (d’Orbigny) - Hofker, p.
243, Pl. B, fig. 54 1991 Miliolinella labiosa (d’Orbigny) - Cimerman
& Langer, p. 41, Pl. 38, figs. 1-3
Miliolinella semicostata (Wiesner) (Pl. 2, fig. 16)
1923 Miliolina semicostata Wiesner 1991 Miliolinella semicostata (Wiesner) -
Cimerman & Langer, p. 42, Pl. 38, figs. 10-15
1993 Miliolinella semicostata (Wiesner) - Sgarrella & Moncharmont Zei, p. 187, Pl. 10, fig. 7
Miliolinella subrotunda (Montagu) (Pl. 2, fig. 17)
1803 Vermiculum subrotundum Montagu 1929 ?Quinqueloculina subrotunda (Montagu) -
Cushman, p. 25, Pl. 2, fig. 4 1988 Miliolinella subrotunda (Montagu) -
Loeblich & Tappan, p. 93, Pl. 350, figs. 1-12
1991 Miliolinella subrotunda (Montagu) - Cimerman & Langer, p. 42, Pl. 38, figs. 4-9
1992 Miliolinella subrotunda (Montagu) - Schiebel, p. 28, Pl. 5, fig. 1
1994 Miliolinella subrotunda (Montagu) - Jones, p. 20, Pl. 4, fig. 3
2003 Miliolinella subrotunda (Monatgu) - Murray, p. 15, fig. 4, no. 6
2005 Miliolinella subrotunda (Montagu) - Rasmussen, p. 64, Pl. 4, fig. 15
2009 Miliolinella subrotunda (Montagu) - Avsar et al., p. 134, Pl. 1, figs. 22 & 23
Miliolinella webbiana (d’Orbigny) (Pl. 2, fig. 18)
1839 Triloculina webbiana d’Orbigny 1987 Miliolinella webbiana (d’Orbigny) -
Alberola et al., p. 306, Pl. 2, fig. 12 1991 Miliolinella webbiana (d’Orbigny) -
Cimerman & Langer, p. 42, Pl. 39, figs. 1-3
1993 Miliolinella webbiana (d’Orbigny) - Sgarrella & Moncharmont Zei, p. 187, Pl. 10, fig. 6
102
Chapter 6
Miliolinella sp. 1
1991 c.f. Miliolinella sp. 2 - Cimerman & Langer, p. 42, Pl. 39, figs. 6 & 7
Remarks: The test is porcelaneous, with a
smooth surface, and ovate in lateral view. The
periphery margin is broadly rounded. The
chambers are initially arranged in a
quinqueloculine pattern but later nearly
planispirally. They are inflated and increasing
when added. Three chambers are visible from
the exterior. The terminal aperture is provided
with an apertual flap.
Genus: Pseudotriloculina Cherif, 1970
Pseudotriloculina laevigata (d’Orbigny)
1826 Triloculina leavigata d’Orbigny 1991 Pseudotriloculina laevigata (d’Orbigny) -
Cimerman & Langer, p. 43, Pl. 39, figs. 8-12
Pseudotriloculina planciana (d’Orbigny)
1839 Triloculina planciana d’Orbigny 1929 Triloculina planciana d’Orbigny - Cushman, p.
62, Pl. 15, fig. 6
Pseudotriloculina sp. 1 Remarks: The test of these small specimens is
ovate in outline with a broadly rounded periphery.
Three chambers are visible from the exterior. The
wall is porcelaneous and imperforate with a
smooth surface. The large aperture, at the end of
the final chamber, is subrounded and provided by
a long bifite? tooth.
Genus: Ptychomiliola Eimer & Fickert, 1899
?Ptychomiliola separans (Brady)
1881 Miliolina separans Brady 1988 c.f. Ptychomiliola separans (Brady) - Loeblich
& Tappan, p. 94, Pl. 353, figs. 10 & 11
1994 c.f. Ptychomiliola separans (Brady) - Jones, p. 23, Pl. 7, figs. 1-4
Remarks: The specimens were mostly
broken, and the apertural tooth was not
visible. Therefore, the correct identification is
questionable.
Genus: Pyrgoella Cushman & White, 1936
Pyrgoella sphaera (d’Orbigny)
1839 Biloculina sphaera d’Orbigny, p. 66, Pl. 8, figs. 13-16
1960 Planispirina sphaera (d’Orbigny) - Hofker, p. 244, Pl. B, fig. 59
1958 Pyrgoella sphaera (d’Orbigny) - Parker, p. 256, Pl. 1, fig. 14
1958 Pyrgoella sphaera (d’Orbigny) - Todd, p. 188, Pl. 1, fig. 4
1988 Pyrgoella sphaera (d’Orbigny) - Loeblich & Tappan, p. 94, Pl. 351, figs. 1-4
1992 Pyrgoella sphaera (d’Orbigny) - Wollenburg, p. 41, Pl. 11, fig. 2
1991 Pyrgoella sphaera (d’Orbigny) - Cimerman & Langer, p. 45, Pl. 41, figs. 1 & 2
1994 Pyrgoella sphaera (d’Orbigny) - Jones, p. 18, Pl. 2, fig. 4
Genus: Pyrgo Defrance, 1824
Pyrgo anomala (Schlumberger) (Pl. 3, fig. 1)
1891 Biloculina anomala Schlumberger 1917 Biloculina anomala Schlumberger -
Cushman, p. 79, Pl. 32, fig. 1 1958 Pyrgo anomala (Schlumberger) - Parker,
p. 255, Pl. 1, figs. 22 & 23 1960 Pyrgo fischeri (Schlumberger) - Hofker, p.
243, Pl. B, fig. 56 1991 Pyrgo anomala (Schlumberger) -
Cimerman & Langer, p. 44, Pl. 41, figs. 3-5
1993 Pyrgo anomala (Schlumberger) - Sgarrella & Moncharmont Zei, p. 180, Pl. 9, fig. 3
Pyrgo depressa (d’Orbigny)
1826 Biloculina depressa d’Orbigny 1929 Pyrgo depressa (d’Orbigny) - Cushman, p.
71, Pl. 19, figs. 4 & 5 1960 Pyrgo depressa (d’Orbigny) - Hofker, p.
243, Pl. B, fig. 53 1990 Pyrgo depressa (d’Orbigny) - Hasegawa
et al., p. 475, Pl. 2, fig. 1
103
Taxonomy of modern benthic foraminifera in the Mediterranean Sea
1994 Pyrgo depressa (d’Orbigny) - Jones, p. 19, Pl. 3, figs. 1 & 2
2003 Biloculinella depressa (d’Orbigny) - Murray, p. 15, fig. 4, no. 2 & 3
2005 Pyrgo depressa (d’Orbigny) - Rasmussen, p. 65, Pl. 4, fig. 17
Pyrgo elongata (d’Orbigny)
1826 Biloculina elongata d’Orbigny 1917 Biloculina elongata d’Orbigny - Cushman, p.
78, Pl. 31, fig. 1 1929 Pyrgo elongata (d’Orbigny) - Cushman, p. 70,
Pl. 19, figs. 2 & 3 1960 Pyrgo elongata (d’Orbigny) - Hofker, p. 244,
Pl. B, fig. 58 1991 Pyrgo elongata (d’Orbigny) - Cimerman &
Langer, p. 44, Pl. 41, figs. 6-8 1993 Pyrgo elongata (d’Orbigny) - Sgarrella &
Moncharmont Zei, p. 182, Pl. 9, fig. 1 1994 Pyrgo elongata (d’Orbigny) - Jones, p. 18, Pl.
2, fig. 9
Remarks: The specimen shown in Sgarrella &
Moncharmont Zei (1993) differs from that shown
by the other authors, and from that in this work,
by its not so elongate test.
Pyrgo oblonga (d’Orbigny)
1839 Biloculina oblonga d’Orbigny 1988 Pyrgo oblonga (d’Orbigny) - Loeblich &
Tappan, p. 94, Pl. 351, figs. 11-13 2003 Pyrgo oblonga (d’Orbigny) - Hottinger et al.,
p. 57, Pl. 50, figs. 1-6 Pyrgo sp. 1
2006 Pyrgo elongata (d’Orbigny) - Avsar et al., p. 132, Pl. 1, fig. 13
Remarks: The specimen shown in Avsar et al.
(2006) differs from Pyrgo elongata shown in
Cimerman & Langer (1991) and Sgarrella &
Moncharmont Zei (1993). The specimens in this
work and that in Avsar et al. (2006) are broader
than P. elongata in outline, and contain a
rectangle-like attachment at the base of the test.
Genus: Triloculina d’Orbigny, 1826
?Triloculina eburnea d’Orbigny
1839 Triloculina eburnea d’Orbigny 1993 “Quinqueloculina” eburnea (d’Orbigny) -
Hottinger et al., p. 59, Pl. 53, figs. 9-11; Pl. 54, figs. 1-5
Remarks: The generic position of this species
is questionable due to the chamber
arrangement, the absence of an everted lip
and a bifite tooth termination (see also
Hottinger et al., 2003).
Triloculina oblonga (Montagu)
1803 Vermiculum oblongum Montagu 1917 Triloculina oblonga (Montagu) - Cushman,
p. 69, Pl. 26, fig. 3 1929 Triloculina oblonga (Montagu) - Cushman,
p. 57, Pl. 13, fig. 4 1991 Pseudotriloculina oblonga (Montagu) -
Cimerman & Langer, p. 43, Pl. 40, figs. 1-4
2005 Triloculina oblonga (Montagu) - Rasmussen, p. 67, Pl. 5, fig. 4
2009 Pseudotriloculina oblonga (Montagu) - Avsar et al., p. 134, Pl. 1, fig. 24
Triloculina plicata Terquem (Pl. 2, fig. 19)
1878 Triloculina plicata Terquem 1991 Triloculina plicata Terquem - Cimerman &
Langer, p. 46, Pl. 43, figs. 8-10 2005 Triloculina plicata Terquem - Rasmussen,
p. 67, Pl. 5, fig. 5
Triloculina tricarinata d'Orbigny (Pl. 2, fig. 20)
1826 Triloculina tricarinata d’Orbigny 1917 Triloculina tricarinata d’Orbigny -
Cushman, p. 66, Pl. 25, fig. 2 1929 Triloculina tricarinata d’Orbigny -
Cushman, p. 56, Pl. 13, fig. 3 1932 Triloculina tricarinata d’Orbigny -
Cushman, p. 59, Pl. 13, fig. 3 1960 Triloculina tricarinata d’Orbigny - Hofker,
p. 242, Pl. B, fig. 47 1990 Triloculina tricarinata d’Orbigny -
Hasegawa et al., p. 475, Pl. 2, figs. 10 & 11
1991 Triloculina tricarinata d’Orbigny - Cimerman & Langer, p. 46, Pl. 44, figs. 3 & 4
1993 Triloculina tricarinata d’Orbigny - Hottinger et al., p. 64-65, Pl. 68, figs. 7-12
1993 Triloculina tricarinata d’Orbigny - Sgarrella & Moncharmont Zei, p. 187, Pl. 9, figs. 14 & 15
104
Chapter 6
1994 Triloculina tricarinata d’Orbigny - Jones, p. 20, Pl. 3, fig. 17
2004 Triloculina tricarinata d’Orbigny - Chendes et al., p. 76, Pl. 1, fig. 11
2005 Triloculina tricarinata d’Orbigny - Rasmussen, p. 67, Pl. 5, fig. 6
Triloculina sp. 1 Remarks: The test is ovate in outline and
subtriangular in section. The chambers are one-
half coil in length. The chamber arrangement is
triloculine in the adult stage. Three chambers are
visible from the exterior. The wall is porcelaneous
and imperforate. The subrounded aperture, at the
end of the last chamber, is surrounded by a thick
peristomal rim and provided with a short bifite
tooth.
Subfamily: Sigmoilinitinae Luczkowska, 1974
Genus: Pseudoschlumbergerina Cherif, 1970
Pseudoschlumbergerina ovata (Side-bottom)
1904 Sigmoilina ovata Sidebottom 1988 Pseudoschlumbergerina ovata (Side-bottom)
- Loeblich & Tappan, p. 95, Pl. 355, figs. 7-10 1993 Pseudoschlumbergerina ovata (Side-bottom)
- Hottinger et al., p. 55, Pl. 46, figs. 1-6
Genus: Sigmoilina Schlumberger, 1887
Sigmoilina distorta Phleger & Parker
1951 Sigmoilina distorta Phleger & Parker 1958 Sigmoilina distorta Phleger & Parker - Parker,
p. 256, Pl. 1, fig. 25 1993 Sigmoilina distorta Phleger & Parker -
Sgarrella & Moncharmont Zei, p. 185, Pl. 9, fig. 5
Sigmoilina sigmoidea (Brady)
1884 Planispirina sigmoidea Brady 1917 Sigmoilina sigmoidea (Brady) - Cushman, p.
61, Pl. 24, figs. 2 & 3 1929 Sigmoilina sigmoidea (Brady) - Cushman, p.
50, Pl. 11, figs. 5 & 6 1988 Sigmoilina sigmoidea (Brady) - Loeblich &
Tappan, p. 95, Pl. 356, figs. 21-23 1992 Sigmoilina sigmoidea (Brady) - Wollenburg, p.
43, Pl. 11, fig. 9
1993 Sigmoilina sigmoidea (Brady) - Sgarrella & Moncharmont Zei, p. 184, Pl. 9, fig. 13
1994 Sigmoilina sigmoidea (Brady) - Jones, p. 18, Pl. 2, figs. 1-3
Remarks: The specimen shown in Loeblich &
Tappan (1988) has a short simple tooth and
not a flap-like tooth as shown by the other
authors and also observed in this work.
Genus: Sigmoilinita Seiglie, 1965
Sigmoilinita costata (Schlumberger) (Pl. 3, fig. 2)
1893 Sigmoilina costata Schlumberger 1987 Sigmoilina costata Schlumberger -
Alberola et al., p. 306, Pl. 2, fig. 15 1991 Sigmoilinita costata (Schlumberger) -
Cimerman & Langer, p. 47, Pl. 45, figs. 1-6
1993 Sigmoilina costata Schlumberger - Sgarrella & Moncharmont Zei, p. 184, Pl. 9, figs. 6-8
2009 Sigmoilinita costata (Schlumberger) - Avsar et al., p. 134, Pl. 1, fig. 27
Sigmoilinita cf. S. tricosta (Cushman & Todd)
1944 Spiroloculina tricosta Cushman & Todd 1993 c.f. Sigmoilina tricosta (Cushman & Todd)
- Sgarrella & Moncharmont Zei, p. 185, Pl. 5, figs. 8 & 9
Remarks: The test is fusiform in lateral view
and flattened in peripheral view. The
chambers are one-half coil in length. Early
chambers are arranged in sigmoid pattern and
later nearly planispirally. The wall is
porcelaneous and imperforate. The surface is
ornamented by longitudinal costae. The
aperture at the end of the final chamber is
small and ovate to rounded. A tooth was not
visible.
105
Taxonomy of modern benthic foraminifera in the Mediterranean Sea
Genus: Subedentostomina McCulloch, 1981
Subedentostomina sp. 1
Remarks: The test is elongate-oval with flattened
sites. The chambers are one-half coil in length,
added in various planes and are various in
numbers. The chambers are mostly broader at
the base and narrowing towards the aperture and
overlapping more strongly on one side than on
the other side. The wall is imperforate and
calcareous. The toothless aperture is terminal at
the end of the last chamber and provided by a
narrow slit bordered by a lip.
Subfamily: Sigmoilopsinae Vella, 1957
Genus: Sigmoilopsis Finlay, 1947
Sigmoilopsis minuta (Collins)
1958 Massilina minuta Collins 1993 Sigmoilopsis minuta (Collins) - Hottinger et
al., p. 62, Pl. 61, figs. 4-9
Sigmoilopsis schlumbergeri (Silvestri) (Pl. 3, fig. 3)
1904 Sigmoilina schlumbergeri Silvestri 1929 Sigmoilina schlumbergeri Silvestri - Cushman,
p. 49, Pl. 11, figs. 1-3 1960 Sigmoilina schlumbergeri Silvestri - Hofker, p.
244, Pl. C, fig. 61 1987 Sigmoilopsis schlumbergeri (Silvestri) -
Jorissen, p. 43, Pl. 4, fig. 9 1988 Sigmoilopsis schlumbergeri (Silvestri) -
Loeblich & Tappan, p. 95, Pl. 356, figs. 8-13 1993 Sigmoilopsis schlumbergeri (Silvestri) -
Sgarrella & Moncharmont Zei, p. 185, Pl. 9, fig. 4
1994 Sigmoilopsis schlumbergeri (Silvestri) - Jones, p. 23, Pl. 8, figs. 1-4
2004 Sigmoilopsis schlumbergeri (Silvestri) - Chendes et al., p. 76, Pl. 1, fig. 12
2005 Sigmoilopsis schlumbergeri (Silvestri) - Rasmussen, p. 68, Pl. 5, fig. 8
2009 Sigmoilopsis schlumbergeri (Silvestri) - Avsar et al., p. 134, Pl. 1, fig. 28
2009 Sigmoilopsis schlumbergeri (Silvestri) - Frezza & Carboni, p. 57, Pl. 2, fig. 21
Subfamily: Tubinellinae Rhumbler, 1906
Genus: Articulina d'Orbigny, 1826
Articulina mucronata (d’Orbigny)
1839 Vertebralina mucronata d’Orbigny 1993 Articulina mucronata (d’Orbigny) -
Sgarrella & Moncharmont Zei, p. 190, Pl. 10, fig. 11
Superfamily: Soritacea Ehrenberg, 1839
Family: Peneroplidae Schultze, 1854
Genus: Peneroplis De Montfort, 1808
Peneroplis pertusus (Forskal) (Pl. 3, fig. 4)
1775 Nautilus pertusus Forskal 1917 Peneroplis pertusus (Forskal) - Cushman,
p. 86, Pl. 37, figs. 1, 2 & 6 1930 Peneroplis pertusus (Forskal) - Cushman,
p. 35, Pl. 12, figs. 3-6 1991 Peneroplis pertusus (Forskal) - Cimerman
& Langer, p. 49, Pl. 49, figs. 1-7 1993 Peneroplis pertusus (Forskal) - Sgarrella &
Moncharmont Zei, p. 190, Pl. 10, fig. 13 1994 Peneroplis pertusus (Forskal) - Jones, p.
29, Pl. 13, figs. 16 & 17, 23
Family: Soritidae Ehrenberg, 1839
Subfamily: Archaiasinae Cushman, 1927
Genus: Parasorites Seiglie & Rivera, 1977
Parasorites marginales (Lamarck)
1816 Orbulites marginales Lamarck 1994 Parasorites marginales (Lamarck) - Jones,
p. 30, Pl. 15, figs. 1-3 & 5
Suborder Lagenina Delage & Herouard,
1896
Superfamily: Nodosariacea Ehrenberg, 1838
Family: Nodosariidae Ehrenberg, 1838
Genus: Dentalina Risso, 1826
Dentalina guttifera d’Orbigny
1846 Dentalina guttifera d’Orbigny, p. 49, Tab. 2, figs. 11 & 13
1993 Dentalina guttifera d’Orbigny - Sgarrella & Moncharmont Zei, p. 192, Pl. 11, fig. 7
2005 Dentalina pyrula (d’Orbigny) - Rasmussen, p. 69, Pl. 5, fig. 13
106
Chapter 6
Subfamily: Nodosariinae Ehrenberg, 1838
Genus: Laevidentalina Loeblich & Tappan, 1986
Laevidentalina sp. 1
Remarks: The test is elongate and arcuate. The
chambers are uniserially arranged. Sutures are
oblique. The wall is calcareous and hyaline with a
smooth and unornamented surface. The aperture
is terminal and consists of a serial of radial slits
Genus: Pyramidulina Fornasini, 1894
Pyramidulina catesbyi (d’Orbigny)
1839 Nodosaria catesbyi d’Orbigny 1993 Pyramidulina catesbyi (d’Orbigny) - Hottinger
et al., p. 76, Pl. 88, figs. 1-19
Remarks: The specimens in this work have two
uniserial chambers, where the first is globular
and larger than the second chamber that is more
pyriform. In difference to the specimens shown in
Hottinger et al. (1993), the specimens have more
distinct striae.
Family: Vaginulinidae Reuss, 1860
Subfamily: Lenticulininae Chapman, Parr &
Collins, 1934
Genus: Lenticulina Lamarck, 1804
Lenticulina calcar (Linné) (Pl. 3, fig. 5)
1758 Nautilus calcar Linné 1846 Robulina calcar d’Orbigny - D’Orbigny, p. 99,
Tab. 4, figs. 18-20 1933 Robulina calcar (Linné) - Cushman, p. 7, Pl.
2, fig. 3 1991 Lenticulina calcar (Linné) - Cimerman &
Langer, p. 51, Pl. 53, figs. 1-4 1993 Lenticulina calcar (Linné) - Sgarrella &
Moncharmont Zei, p. 194, Pl. 12, fig. 11 1994 Lenticulina calcar (Linné) - Jones, 1994, p.
81, Pl. 70, figs. 9-12 2005 Lenticulina calcar (Linné) - Rasmussen, p. 69,
Pl. 6, fig. 5
Lenticulina orbicularis (d’Orbigny) (Pl. 3, fig. 6)
1826 Robulina orbicularis d’Orbigny 1991 Lenticulina orbicularis (d’Orbigny) -
Cimerman & Langer, p. 51, Pl. 53, fig. 12 1993 Lenticulina orbicularis (d’Orbigny) -
Sgarrella & Moncharmont Zei, p. 194, Pl. 12, fig. 8
1994 Lenticulina orbicularis (d’Orbigny) - Jones, p. 81, Pl. 69, fig. 17
2005 Lenticulina orbicularis (d’Orbigny) - Rasmussen, p. 70, Pl. 6, fig. 8
Genus: Neolenticulina McCulloch, 1977
Neolenticulina peregrina (Schwager)
1866 Cristellaria peregrina Schwager 1960 Lenticulina peregrina (Schwager) - Hofker,
p. 245, Pl. C, fig. 71 1988 Neolenticulina peregrina (Schwager) -
Loeblich & Tappan, p. 115, Pl. 447, figs. 9-12 & 16
1993 Neolenticulina peregrina (Schwager) - Sgarrella & Moncharmont Zei, p. 195, Pl. 12, fig. 4
1994 Neolenticulina variablis (Reuss) - Jones, p. 80, Pl. 68, figs. 11-16
2005 Lenticulina peregrina (Schwager) - Rasmussen, p. 70, Pl. 6, fig. 9
Subfamily: Marginulininae Wedekind, 1937
Genus: Amphicoryna Schlumberger, 1881
Amphicoryna scalaris (Batsch) (Pl. 3, figs. 7 & 8)
1791 Nautilus (Ortoceras) scalaris Batsch 1958 Lagenonodosaria scalaris (Batsch) -
Parker, p. 258, Pl. 1, figs. 32 & 33 1960 Nodogenerina scalaris (Batsch) - Hofker,
p. 244, Pl. C, figs. 63-65 1988 Amphicoryna scalaris (Batsch) - Loeblich
& Tappan, p. 116, Pl. 450, figs. 11-14 1991 Amphicoryna scalaris (Batsch) -
Cimerman & Langer, p. 52, Pl. 54, figs. 1-9
1993 Amphicoryna scalaris (Batsch) - Sgarrella & Moncharmont Zei, p. 191, Pl. 11, figs. 2-3
1994 Amphicoryna scalaris (Batsch) - Jones, p. 75, Pl. 63, figs. 28-31; Pl. 65, figs. 7-9
2003 Amphicoryna scalaris (Batsch) - Murray, p. 17, fig. 5, no. 1
2004 Amphicoryna scalaris (Batsch) - Chendes et al., p. 76, Pl. 1, fig. 14
2009 Amphicoryna scalaris (Batsch) - Frezza & Carboni, p. 57, Pl. 2, figs. 19 & 20
107
Taxonomy of modern benthic foraminifera in the Mediterranean Sea
Genus: Marginulina d’Orbigny, 1826
Marginulina costata (Batsch)
1791 Nautilus costatus Batsch 1993 Marginulina costata (Batsch) - Sgarrella &
Moncharmont Zei, p. 195, Pl. 12, fig. 5 1994 Marginulina costata (Batsch) - Jones, p. 77,
Pl. 65, fig. 13 2005 Marginulina costata (Batsch) - Rasmussen, p.
71, Pl. 6, fig. 17
Genus: Hemirobulina Stache, 1864
Hemirobulina sp. 1
Remarks: The test is elongate and circular in
section. The chambers are added in a slightly
curve at the base and later become rectilinear.
Sutures are oblique and depressed. The wall is
calcareous and hyaline, with a smooth surface.
The aperture is terminal at the dorsal angle.
Subfamily: Vaginulininae Reuss, 1860
Genus: Vaginulina d’Orbigny, 1826
Vaginulina cf. V. americana Cushman
1923 Vaginulina americana Cushman 1994 c.f. Vaginulina americana Cushman - Jones,
p. 79, Pl. 67, figs. 10-12
Remarks: The species in this work shows, in
difference to that shown in Jones (1994), only a
few striae on the test.
Family: Lagenidae Reuss, 1862
Genus: Hyalinonetrion Patterson & Richardson,
1987
Hyalinonetrion gracillimum (Sequenza)
1862 Amphorina gracillima Sequenza 1988 Hyalinonetrion sahulense (Patterson &
Richardson) - Loeblich & Tappan, p. 117, Pl. 455, figs. 6 & 7
1991 Hyalinonetrion gracillimum (Sequenza) - Cimerman & Langer, p. 52, Pl. 55, figs. 1 & 2
1994 Procerolagena gracillima (Sequenza) - Jones, p. 62, Pl. 56, figs. 19-22 & 24-29
1993 Hyalinonetrion gracillis (Costa) - Hottinger et al., p. 78, Pl. 90, figs. 7 & 8
2005 Lagena gracillima (Sequenza) - Rasmussen, p. 72, Pl. 7, figs. 4 & 5
2009 Hyalinonetrion gracillimum (Sequenza) - Avsar et al., p. 134, Pl. 2, fig. 1
Genus: Lagena Walker & Jacob, 1798
Lagena doveyensis Haynes
1973 Lagena doveyensis Haynes 1991 Lagena doveyensis Haynes - Cimerman &
Langer, p. 53, Pl. 55, figs. 3-5 2009 Lagena doveyensis Haynes - Avsar et al.,
p. 134, Pl. 2, fig. 2
Lagena striata (d’Orbigny)
1839 Oolina striata d’Orbigny 1933 Lagena striata (d’Orbigny) - Cushman, p.
32, Pl. 8, figs. 11 & 13 1991 Lagena striata (d’Orbigny) - Cimerman &
Langer, p. 53, Pl. 55, figs. 6-7 1992 Lagena striata (d’Orbigny) - Wollenburg, p.
46, Pl. 12, fig. 3 1993 Lagena striata (d’Orbigny) - Sgarrella &
Moncharmont Zei, p. 198, Pl. 12, figs. 2-3 1994 Lagena striata (d’Orbigny) - Jones, p. 64,
Pl. 57, figs. 22 & 24 2005 Lagena striata (d’Orbigny) - Rasmussen,
p. 73, Pl. 7, fig. 8 2005 Lagena striata (d’Orbigny) - Avsar et al., p.
134, Pl. 2, figs. 3 & 4
Lagena strumosa Reuss
1858 Lagena striata (d’Orbigny) var. strumosa Reuss
1833 Lagena striata (d’Orbigny) var. strumosa Reuss - Cushman, p. 32, Pl. 8, figs. 11 & 13
1993 Lagena strumosa Reuss - Hottinger et al., p. 79, Pl. 90, figs. 18-25
2002 Amphycorina proxima (Silvestri) - Kaminski et al., p. 173, Pl. 2, fig. 5
Family: Polymorphinidae d’Orbigny, 1839
Subfamily: Polymorphininae d'Orbigny, 1839
Genus: Globulina d’Orbigny, 1839
Globulina gibba (d’Orbigny)
1826 Polymorphina (Globuline) gibba d’Orbigny 1960 Globulina gibba (d’Orbigny) - Hofker, p.
247, Pl. C, figs. 79 & 81
108
Chapter 6
1993 Globulina gibba (d’Orbigny) - Hottinger et al., p. 79, Pl. 91, figs. 6-12
2005 Globulina gibba (d’Orbigny) - Rasmussen, p. 74, Pl. 7, figs. 11 & 12
Remarks: Under the name Globulina gibba only
the fistulose form of this species has been
counted.
Globulina myristiformis (Williamson)
1858 Polymorphina myristiformis Williamson 1991 Globulina myristiformes (Williamson) -
Cimerman & Langer, p. 53, Pl. 56, figs. 13 & 14
1994 Globulina myristiformes (Williamson) - Jones, p. 85, Pl. 73, figs. 9 & 10
Family: Ellipsolagenidae Silvestri, 1923
Subfamily: Oolinininae Loeblich & Tappan, 1961
Genus: Lagnea Popescu, 1983
Lagnea sp. 1
Remarks: The test is unilocular, flask-shaped
and compressed. The periphery is broadly
carinate, with plate-like struts forming polygonal
and tubular structures extending completely
around the periphery. The wall is calcareous and
hyaline, with a smooth test surface. The aperture
is rounded and terminal at the end of the neck,
and bordered by a thickened rim.
Genus: Oolina d’Orbigny, 1839
Oolina acuticosta (Reuss)
1862 Lagena acuticosta Reuss 1933 Lagena acuticosta Reuss - Cushman, p. 34,
Pl. 8, figs. 9, 10 & 12 1983 Oolina acuticosta (Reuss) - Boltovskoy, p.
301, Pl. 1, figs. 8 & 9 1993 Oolina acuticosta (Reuss) - Sgarrella &
Moncharmont Zei, p. 199, Pl. 12, fig. 12 1994 Oolina sp. nov. - Jones, p. 65, Pl. 57, fig. 31 2006 Oolina acuticosta (Reuss) - Avsar et al., p.
133, Pl. 1, fig. 17
Oolina foveolata (Sequenza)
1862 Orbulina foveolata Sequenza 1993 Oolina foveolata (Sequenza) - Sgarrella &
Moncharmont Zei, p. 199, Pl. 12, fig. 14
Oolina hexagona (Williamson) (Pl. 3, fig. 9)
1848 Entesolenia squamosa (Montagu) var. hexagona Williamson
1988 Favulina hexagona (Williamson) - Loeblich & Tappan, p. 120, Pl. 463, figs. 1 & 2
1991 Favulina hexagona (Williamson) - Cimerman & Langer, p. 55, Pl. 58, figs. 8 & 9
1992 Favulina hexagona (Williamson) - Wollenburg, p. 46, Pl. 12, fig. 9
1993 Oolina hexagona (Williamson) - Sgarrella & Moncharmont Zei, p. 199, Pl. 12, fig. 15
1994 Oolina hexagona (Williamson) - Jones, p. 66, Pl. 58, fig. 33
2004 Favulina hexagona (Williamson) - Chendes et al., p. 76, Pl. 1, fig. 16
2005 Oolina hexagona (Williamson) - Rasmussen, p. 76, Pl. 8, fig. 10
Subfamily: Ellipsolageninae Silvestri, 1923
Genus: Fissurina Reuss, 1850
Fissurina castanea (Flint)
1899 Lagena castanea Flint 1993 Fissurina castanea (Flint) - Sgarrella &
Moncharmont Zei, p. 201, Pl. 13, fig. 10
Fissurina crebra (Matthes)
1939 Lagena crebra Matthes 1983 Fissurina crebra (Matthes) - Boltovskoy, p.
301, Pl. 1, figs. 1 & 2
Fissurina fasciata (Egger)
1857 Oolina fasciata Egger 1983 Fissurina fasciata (Egger) - Boltovskoy, p.
301, Pl. 2, figs. 6 & 7 1993 Fissurina orbignyana Sequenza -
Sgarrella & Moncharmont Zei, p. 204, Pl. 13, figs. 2 & 3
Fissurina lacunata (Burrows & Holland)
1895 Lagena orbignyana Sequenza var. lacunata Burrows & Holland
109
Taxonomy of modern benthic foraminifera in the Mediterranean Sea
1933 Lagena orbignyana Sequenza var. lacunata Burrows & Holland - Cushman, p. 27, Pl. 7, figs. 1-5 & 8
1994 Fissurina castanea (Burrows & Holland) - Jones, p. 69, Pl. 60, figs. 1 & 2
2005 Fissurina orbignyana Sequenza var. lacunata (Burrows & Holland) - Rasmussen, p. 77, Pl. 9, fig. 4
Fissurina orbignyana Sequenza
1862 Fissurina orbignyana Sequenza 1933 Lagena orbignyana (Sequenza) - Cushman,
p. 26, Pl. 6, figs, 7, 8 & 11 1991 Palliolatella orbignyana (Sequenza) -
Cimerman & Langer, p. 56, Pl. 59, figs. 5-7 1994 Fissurina cucculata (Silvestri) - Jones, p. 68,
Pl. 59, fig. 18 2003 Fissurina orbignyana Sequenza - Murray, p.
17, fig. 5, no. 5 & 6 2005 Fissurina orbignyana Sequenza -
Rasmussen, p. 77, Pl. 9, figs. 2 & 3
Fissurina submarginata Boomgaart
1949 Fissurina submarginata Boomgaart 1994 Fissurina submarginata Boomgaart - Jones,
p. 68, Pl. 59, figs. 21 & 22
Subfamily: Parafissurininae Jones, 1984
Genus: Parafissurina Parr, 1947
Parafissurina lateralis carinata (Buchner)
1940 Lagena lateralis Cushman var. carinata Buchner
1983 Parafissurina lateralis carinata (Buchner) - Boltovskoy, p. 303, Pl. 1, fig. 28
1993 Parafissurina lateralis (Cushman) - Sgarrella & Moncharmont Zei, p. 205, Pl. 13, fig. 11
Superfamily: Ceratobuliminacea Cushman, 1927
Family: Ceratobuliminidae Cushman, 1927
Subfamily: Ceratobulimininae Cushman, 1927
Genus: Lamarckina Berthelin, 1881
Lamarckina scabra (Brady)
1884 Pulvinulina oblonga (Williamson) var. scabra Brady
1931 Lamarckina scabra (Brady) - Cushman, p. 35, Pl. 7, fig. 6
1993 Lamarckina scabra (Brady) - Sgarrella & Moncharmont Zei, p. 242, Pl. 26, figs. 3 & 4
Family: Epistominidea Wedekind, 1937
Subfamily: Epistomininae Wedekind, 1937
Genus: Hoeglundina Brotzen, 1948
Hoeglundina elegans (d’Orbigny)
1826 Rotalia elegans d’Orbigny 1931 Epistomina elegans (d’Orbigny) -
Cushman, p. 65, Pl. 13, fig. 6 1979 Hoeglundina elegans (d’Orbigny) - Corliss,
p. 12, Pl. 5, figs. 11-13 1991 Hoeglundina elegans (d’Orbigny) -
Cimerman & Langer, p. 56, Pl. 59, figs. 10-12
1992 Hoeglundina elegans (d’Orbigny) - Schiebel, p. 49, Pl. 5, fig. 8
1993 Hoeglundina elegans (d’Orbigny) - Sgarrella & Moncharmont Zei, p. 242, Pl. 26, figs. 7 & 8
1994 Hoeglundina elegans (d’Orbigny) - Jones, p. 104, Pl. 105, figs. 3-6
2005 Hoeglundina elegans (d’Orbigny) - Rasmussen, p. 78, Pl. 9, fig. 11
Superfamily: Robertinacea Reuss, 1850
Family: Robertinidae Reuss, 1850
Subfamily: Alliatininae Mc Gowran, 1966
Genus: Robertina d’Orbigny, 1846
Robertina translucens Cushman & Parker 1936 Robertina translucens Cushman & Parker 1958 Robertina translucens Cushman & Parker
- Parker, p. 263, Pl. 2, fig. 34 1993 Robertina translucens Cushman & Parker
- Sgarrella & Moncharmont Zei, p. 244, Pl. 26, fig. 13
2004 Robertina translucens Cushman & Parker - Chendes et al., p. 76, Pl. 1, fig. 17
2005 Robertina translucens Cushman & Parker - Rasmussen, p. 79, Pl. 9, fig. 12
Suborder Rotaliina Delage & Hertouard,
1896
Superfamily: Bolivinacea Glaessner, 1937
Family: Bolivinidae Glassner, 1937
Genus: Bolivina d’Orbigny, 1839
Bolivina cistina Cushman
1936 Bolivina cistina Cushman
110
Chapter 6
1990 Bolivina cistina (Cushman) - Hasegawa et al., p. 476, Pl. 3, figs. 1 & 2
1991 Abditodentrix rhomboidales (Millett) - Cimerman & Langer, p. 60, Pl. 61, figs. 4-6
Bolivina plicatella Cushman
1930 Bolivina plicatella Cushman 1990 Bolivina plicatella Cushman - Hasegawa et
al., p. 476, Pl. 3, figs. 3 & 4 1993 Bolivina plicatella plicatella Cushman -
Mehrnusch, p. 11, figs. 22-27
Bolivina pseudoplicata Heron-Allen & Earland (Pl. 3, fig. 10)
1858 Bolivina pseudoplicata Heron-Allen & Earland 1958 Bolivina pseudoplicata Heron-Allen & Earland
- Parker, p. 261, Pl. 2, fig. 8 1960 Bolivina pseudoplicata Heron-Allen & Earland
- Hofker, p. 251, Pl. D, fig. 108 1990 Bolivina pseudoplicata Heron-Allen & Earland
- Hasegawa, p. 476, Pl. 3, figs. 5 & 6 1991 Bolivina pseudoplicata Heron-Allen & Earland
- Cimerman & Langer, p. 58, Pl. 61, figs. 1 & 2
1993 Bolivina pseudoplicata Heron-Allen & Earland - Sgarrella & Moncharmont Zei, p. 208, Pl. 14, figs. 9 & 10
2003 Bolivina pseudoplicata Heron-Allen & Earland - Murray, p. 19, fig. 5, no. 17
2005 Bolivina pseudoplicata Heron-Allen & Earland - Rasmussen, p. 80, Pl. 9, figs. 16 & 17
Bolivina subspinescens Cushman
1922 Bolivina subspinescens Cushman 1990 Bolivina subspinescens Cushman -
Hasegawa et al., p. 476, Pl. 3, fig. 10 1992 Bolivina subspinescens Cushman - Schiebel,
p. 34, Pl. 1, fig. 5 1993 Bolivina subspinescens Cushman - Sgarrella
& Moncharmont Zei, p. 210, Pl. 14, figs. 12 & 13
2005 Sagrina subspinescens (Cushman) - Rasmussen, p. 85, Pl. 11, fig. 2
2008 Bolivina subspinescens Cushman - Leiter, p. 24, Pl. 3, fig. 4
Bolivina variablis (Williamson) (Pl. 3, fig. 11)
1858 Textularia variablis Williamson 1965 Bolivina variablis (Williamson) - Phleger, p.
51, Pl. 1, fig. 8 1991 Bolivina variablis (Williamson) - Cimerman &
Langer, p. 59, Pl. 61, figs. 7 & 8 1992 Bolivina variablis (Williamson) - Schiebel, p.
32, Pl. 1, fig. 6a 1993 Bolivina variablis (Williamson) - Hottinger et
al., p. 91, Pl. 110, figs. 1-4; Pl. 111, figs. 1 & 2
Bolivina sp. 1
Remarks: The test is elongate and triangular
in outline. The periphery is rounded. The
chambers are broad, low and biserially
arranged. The test surface is ornamented with
flat rips and ridges. It is less densely perforate
on the older chambers, and more densely
perforate on the last chamber. The wall is
calcareous and hyaline. The aperture is a
narrow loop at the base of the apertural face.
Genus: Brizalina Costa, 1856
Brizalina difformis (Williamson) (Pl. 3, fig. 12)
1858 Textularia variablis var. difformis Williamson
1958 Bolivina difformis (Williamson) - Parker, p. 260, Pl. 2, fig. 9
1991 Brizalina difformis (Williamson) - Cimerman & Langer, p. 59, Pl. 61, figs. 9-11
2003 Brizalina difformis (Williamson) - Murray, p. 19, fig. 6, no. 2
Brizalina dilatata (Reuss)
1850 Bolivina dilatata Reuss 1911 Bolivina dilatata Reuss - Cushman, p. 33,
text-fig. 54 1991 Brizalina dilatata (Reuss) - Cimerman &
Langer, p. 59, Pl. 62, fig. 2 1992 Bolivina dilatata Reuss - Schiebel, p. 31,
Pl. 1, fig. 4a 2002 Brizalina dilatata (Reuss) - Kaminski, p.
173, Pl. 2, fig. 13 2004 Bolivina dilatata Reuss - Mendes et al., p.
180, Pl. 2, fig. 1 2008 Bolivina dilatata Reuss - Leiter, p. 22, Pl.
3, fig. 6
Brizalina spathulata (Williamson) (Pl. 3, fig. 14)
1858 Textularia variablis var. spathulata Williamson
1987 Bolivina spathulata (Williamson) - Jorissen, p. 34, Pl. 1, fig. 5
1991 Brizalina spathulata (Williamson) - Cimerman & Langer, p. 60, Pl. 62, figs. 3-5
111
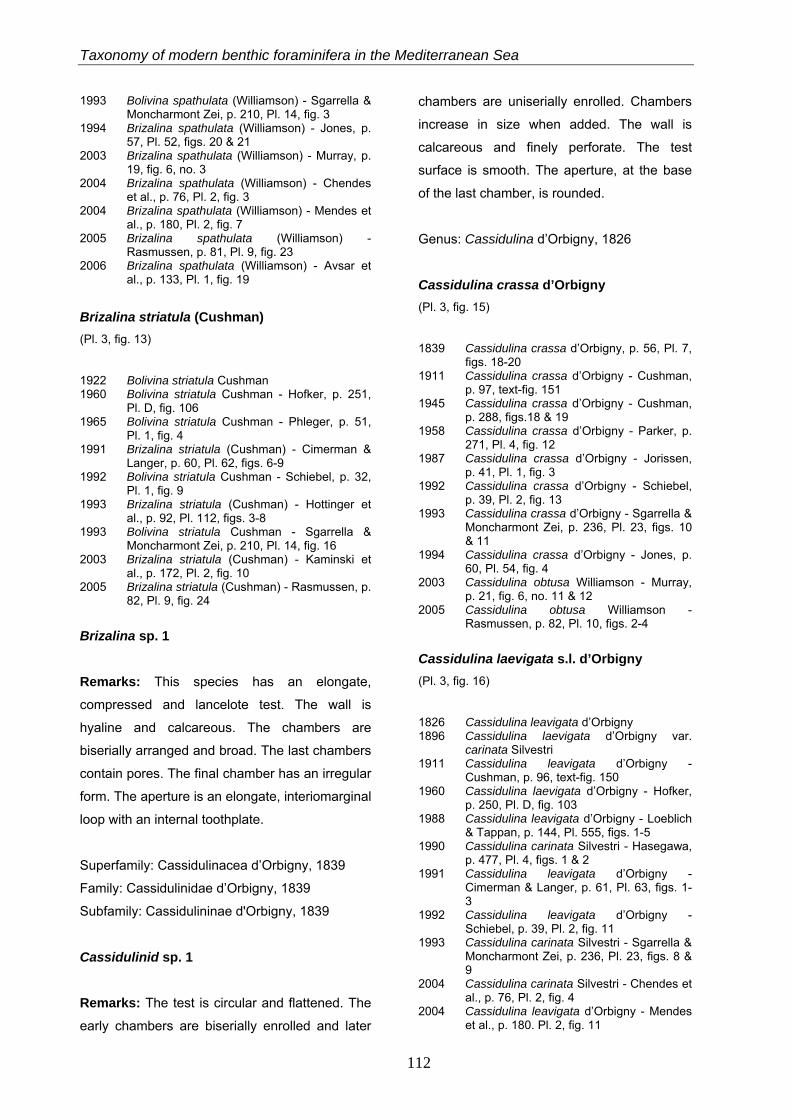
Taxonomy of modern benthic foraminifera in the Mediterranean Sea
1993 Bolivina spathulata (Williamson) - Sgarrella & Moncharmont Zei, p. 210, Pl. 14, fig. 3
1994 Brizalina spathulata (Williamson) - Jones, p. 57, Pl. 52, figs. 20 & 21
2003 Brizalina spathulata (Williamson) - Murray, p. 19, fig. 6, no. 3
2004 Brizalina spathulata (Williamson) - Chendes et al., p. 76, Pl. 2, fig. 3
2004 Brizalina spathulata (Williamson) - Mendes et al., p. 180, Pl. 2, fig. 7
2005 Brizalina spathulata (Williamson) - Rasmussen, p. 81, Pl. 9, fig. 23
2006 Brizalina spathulata (Williamson) - Avsar et al., p. 133, Pl. 1, fig. 19
Brizalina striatula (Cushman) (Pl. 3, fig. 13)
1922 Bolivina striatula Cushman 1960 Bolivina striatula Cushman - Hofker, p. 251,
Pl. D, fig. 106 1965 Bolivina striatula Cushman - Phleger, p. 51,
Pl. 1, fig. 4 1991 Brizalina striatula (Cushman) - Cimerman &
Langer, p. 60, Pl. 62, figs. 6-9 1992 Bolivina striatula Cushman - Schiebel, p. 32,
Pl. 1, fig. 9 1993 Brizalina striatula (Cushman) - Hottinger et
al., p. 92, Pl. 112, figs. 3-8 1993 Bolivina striatula Cushman - Sgarrella &
Moncharmont Zei, p. 210, Pl. 14, fig. 16 2003 Brizalina striatula (Cushman) - Kaminski et
al., p. 172, Pl. 2, fig. 10 2005 Brizalina striatula (Cushman) - Rasmussen, p.
82, Pl. 9, fig. 24
Brizalina sp. 1
Remarks: This species has an elongate,
compressed and lancelote test. The wall is
hyaline and calcareous. The chambers are
biserially arranged and broad. The last chambers
contain pores. The final chamber has an irregular
form. The aperture is an elongate, interiomarginal
loop with an internal toothplate. Superfamily: Cassidulinacea d’Orbigny, 1839
Family: Cassidulinidae d’Orbigny, 1839
Subfamily: Cassidulininae d'Orbigny, 1839
Cassidulinid sp. 1 Remarks: The test is circular and flattened. The
early chambers are biserially enrolled and later
chambers are uniserially enrolled. Chambers
increase in size when added. The wall is
calcareous and finely perforate. The test
surface is smooth. The aperture, at the base
of the last chamber, is rounded.
Genus: Cassidulina d’Orbigny, 1826
Cassidulina crassa d’Orbigny (Pl. 3, fig. 15)
1839 Cassidulina crassa d’Orbigny, p. 56, Pl. 7, figs. 18-20
1911 Cassidulina crassa d’Orbigny - Cushman, p. 97, text-fig. 151
1945 Cassidulina crassa d’Orbigny - Cushman, p. 288, figs.18 & 19
1958 Cassidulina crassa d’Orbigny - Parker, p. 271, Pl. 4, fig. 12
1987 Cassidulina crassa d’Orbigny - Jorissen, p. 41, Pl. 1, fig. 3
1992 Cassidulina crassa d’Orbigny - Schiebel, p. 39, Pl. 2, fig. 13
1993 Cassidulina crassa d’Orbigny - Sgarrella & Moncharmont Zei, p. 236, Pl. 23, figs. 10 & 11
1994 Cassidulina crassa d’Orbigny - Jones, p. 60, Pl. 54, fig. 4
2003 Cassidulina obtusa Williamson - Murray, p. 21, fig. 6, no. 11 & 12
2005 Cassidulina obtusa Williamson - Rasmussen, p. 82, Pl. 10, figs. 2-4
Cassidulina laevigata s.l. d’Orbigny (Pl. 3, fig. 16)
1826 Cassidulina leavigata d’Orbigny 1896 Cassidulina laevigata d’Orbigny var.
carinata Silvestri 1911 Cassidulina leavigata d’Orbigny -
Cushman, p. 96, text-fig. 150 1960 Cassidulina laevigata d’Orbigny - Hofker,
p. 250, Pl. D, fig. 103 1988 Cassidulina leavigata d’Orbigny - Loeblich
& Tappan, p. 144, Pl. 555, figs. 1-5 1990 Cassidulina carinata Silvestri - Hasegawa,
p. 477, Pl. 4, figs. 1 & 2 1991 Cassidulina leavigata d’Orbigny -
Cimerman & Langer, p. 61, Pl. 63, figs. 1-3
1992 Cassidulina leavigata d’Orbigny - Schiebel, p. 39, Pl. 2, fig. 11
1993 Cassidulina carinata Silvestri - Sgarrella & Moncharmont Zei, p. 236, Pl. 23, figs. 8 & 9
2004 Cassidulina carinata Silvestri - Chendes et al., p. 76, Pl. 2, fig. 4
2004 Cassidulina leavigata d’Orbigny - Mendes et al., p. 180. Pl. 2, fig. 11
112
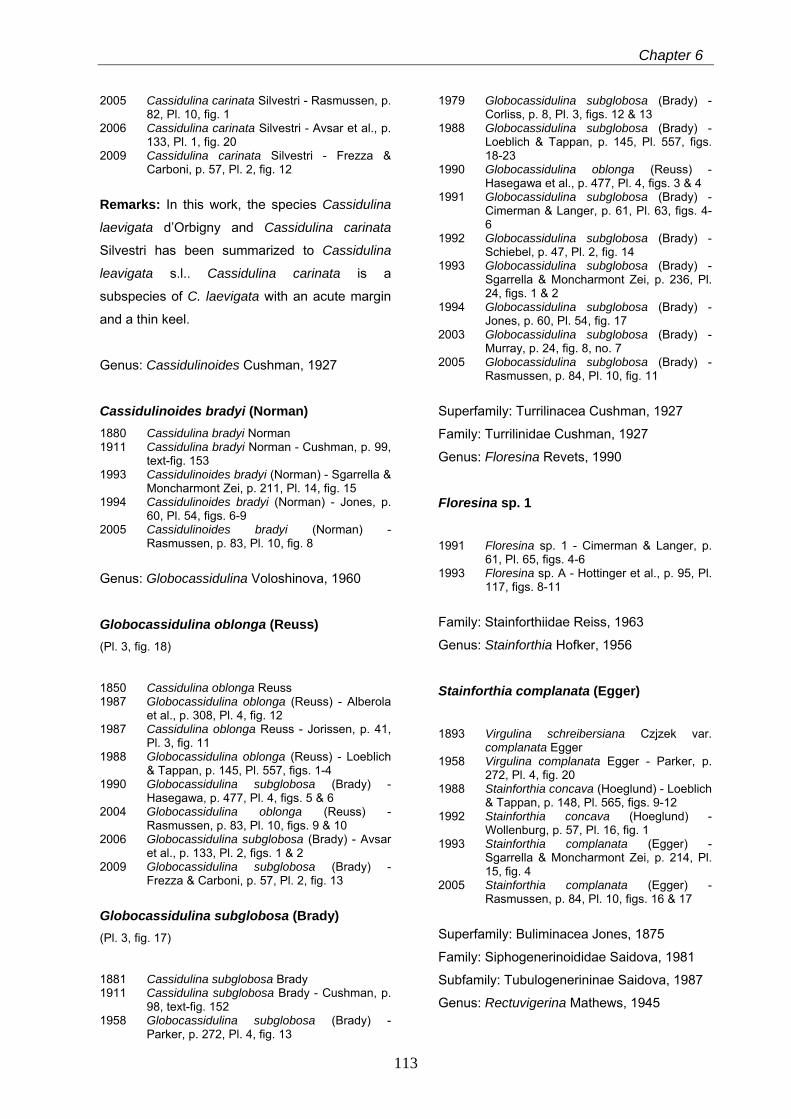
Chapter 6
2005 Cassidulina carinata Silvestri - Rasmussen, p. 82, Pl. 10, fig. 1
2006 Cassidulina carinata Silvestri - Avsar et al., p. 133, Pl. 1, fig. 20
2009 Cassidulina carinata Silvestri - Frezza & Carboni, p. 57, Pl. 2, fig. 12
Remarks: In this work, the species Cassidulina
laevigata d’Orbigny and Cassidulina carinata
Silvestri has been summarized to Cassidulina
leavigata s.l.. Cassidulina carinata is a
subspecies of C. laevigata with an acute margin
and a thin keel.
Genus: Cassidulinoides Cushman, 1927
Cassidulinoides bradyi (Norman) 1880 Cassidulina bradyi Norman 1911 Cassidulina bradyi Norman - Cushman, p. 99,
text-fig. 153 1993 Cassidulinoides bradyi (Norman) - Sgarrella &
Moncharmont Zei, p. 211, Pl. 14, fig. 15 1994 Cassidulinoides bradyi (Norman) - Jones, p.
60, Pl. 54, figs. 6-9 2005 Cassidulinoides bradyi (Norman) -
Rasmussen, p. 83, Pl. 10, fig. 8
Genus: Globocassidulina Voloshinova, 1960
Globocassidulina oblonga (Reuss) (Pl. 3, fig. 18)
1850 Cassidulina oblonga Reuss 1987 Globocassidulina oblonga (Reuss) - Alberola
et al., p. 308, Pl. 4, fig. 12 1987 Cassidulina oblonga Reuss - Jorissen, p. 41,
Pl. 3, fig. 11 1988 Globocassidulina oblonga (Reuss) - Loeblich
& Tappan, p. 145, Pl. 557, figs. 1-4 1990 Globocassidulina subglobosa (Brady) -
Hasegawa, p. 477, Pl. 4, figs. 5 & 6 2004 Globocassidulina oblonga (Reuss) -
Rasmussen, p. 83, Pl. 10, figs. 9 & 10 2006 Globocassidulina subglobosa (Brady) - Avsar
et al., p. 133, Pl. 2, figs. 1 & 2 2009 Globocassidulina subglobosa (Brady) -
Frezza & Carboni, p. 57, Pl. 2, fig. 13
Globocassidulina subglobosa (Brady) (Pl. 3, fig. 17)
1881 Cassidulina subglobosa Brady 1911 Cassidulina subglobosa Brady - Cushman, p.
98, text-fig. 152 1958 Globocassidulina subglobosa (Brady) -
Parker, p. 272, Pl. 4, fig. 13
1979 Globocassidulina subglobosa (Brady) - Corliss, p. 8, Pl. 3, figs. 12 & 13
1988 Globocassidulina subglobosa (Brady) - Loeblich & Tappan, p. 145, Pl. 557, figs. 18-23
1990 Globocassidulina oblonga (Reuss) - Hasegawa et al., p. 477, Pl. 4, figs. 3 & 4
1991 Globocassidulina subglobosa (Brady) - Cimerman & Langer, p. 61, Pl. 63, figs. 4-6
1992 Globocassidulina subglobosa (Brady) - Schiebel, p. 47, Pl. 2, fig. 14
1993 Globocassidulina subglobosa (Brady) - Sgarrella & Moncharmont Zei, p. 236, Pl. 24, figs. 1 & 2
1994 Globocassidulina subglobosa (Brady) - Jones, p. 60, Pl. 54, fig. 17
2003 Globocassidulina subglobosa (Brady) - Murray, p. 24, fig. 8, no. 7
2005 Globocassidulina subglobosa (Brady) - Rasmussen, p. 84, Pl. 10, fig. 11
Superfamily: Turrilinacea Cushman, 1927
Family: Turrilinidae Cushman, 1927
Genus: Floresina Revets, 1990
Floresina sp. 1
1991 Floresina sp. 1 - Cimerman & Langer, p. 61, Pl. 65, figs. 4-6
1993 Floresina sp. A - Hottinger et al., p. 95, Pl. 117, figs. 8-11
Family: Stainforthiidae Reiss, 1963
Genus: Stainforthia Hofker, 1956
Stainforthia complanata (Egger)
1893 Virgulina schreibersiana Czjzek var. complanata Egger
1958 Virgulina complanata Egger - Parker, p. 272, Pl. 4, fig. 20
1988 Stainforthia concava (Hoeglund) - Loeblich & Tappan, p. 148, Pl. 565, figs. 9-12
1992 Stainforthia concava (Hoeglund) - Wollenburg, p. 57, Pl. 16, fig. 1
1993 Stainforthia complanata (Egger) - Sgarrella & Moncharmont Zei, p. 214, Pl. 15, fig. 4
2005 Stainforthia complanata (Egger) - Rasmussen, p. 84, Pl. 10, figs. 16 & 17
Superfamily: Buliminacea Jones, 1875
Family: Siphogenerinoididae Saidova, 1981
Subfamily: Tubulogenerininae Saidova, 1987
Genus: Rectuvigerina Mathews, 1945
113
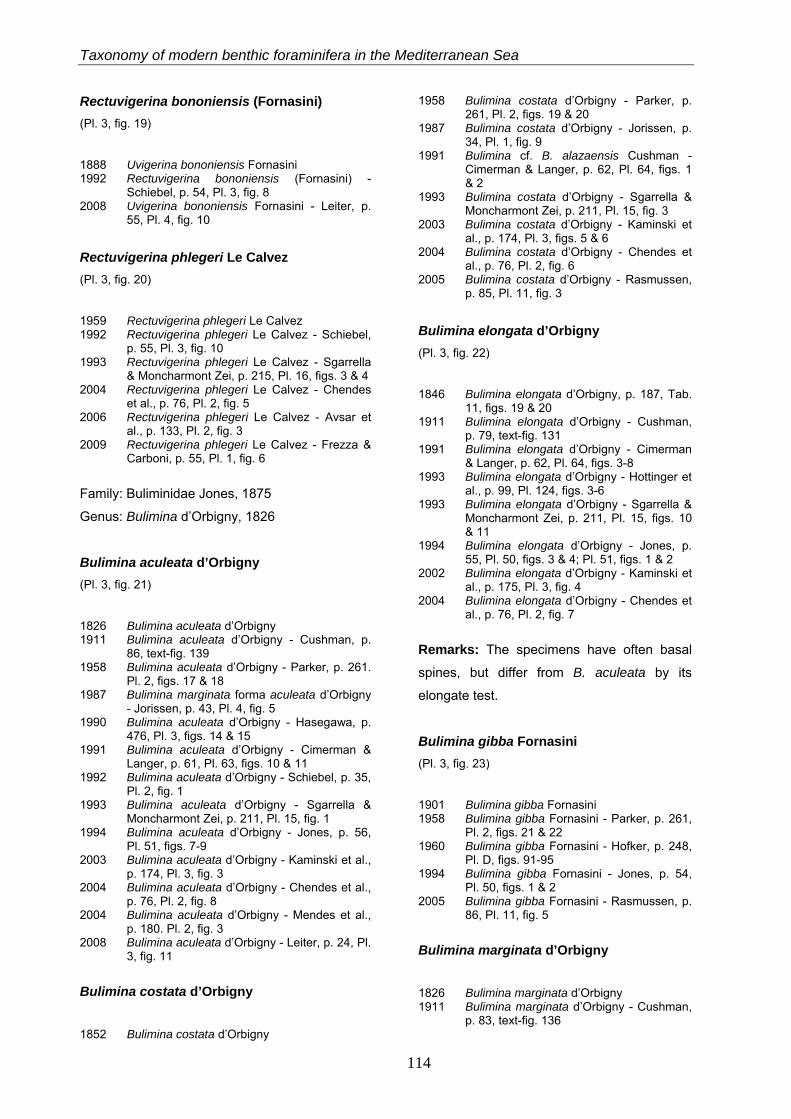
Taxonomy of modern benthic foraminifera in the Mediterranean Sea
Rectuvigerina bononiensis (Fornasini) (Pl. 3, fig. 19)
1888 Uvigerina bononiensis Fornasini 1992 Rectuvigerina bononiensis (Fornasini) -
Schiebel, p. 54, Pl. 3, fig. 8 2008 Uvigerina bononiensis Fornasini - Leiter, p.
55, Pl. 4, fig. 10 Rectuvigerina phlegeri Le Calvez (Pl. 3, fig. 20)
1959 Rectuvigerina phlegeri Le Calvez 1992 Rectuvigerina phlegeri Le Calvez - Schiebel,
p. 55, Pl. 3, fig. 10 1993 Rectuvigerina phlegeri Le Calvez - Sgarrella
& Moncharmont Zei, p. 215, Pl. 16, figs. 3 & 4 2004 Rectuvigerina phlegeri Le Calvez - Chendes
et al., p. 76, Pl. 2, fig. 5 2006 Rectuvigerina phlegeri Le Calvez - Avsar et
al., p. 133, Pl. 2, fig. 3 2009 Rectuvigerina phlegeri Le Calvez - Frezza &
Carboni, p. 55, Pl. 1, fig. 6
Family: Buliminidae Jones, 1875
Genus: Bulimina d’Orbigny, 1826
Bulimina aculeata d’Orbigny (Pl. 3, fig. 21)
1826 Bulimina aculeata d’Orbigny 1911 Bulimina aculeata d’Orbigny - Cushman, p.
86, text-fig. 139 1958 Bulimina aculeata d’Orbigny - Parker, p. 261.
Pl. 2, figs. 17 & 18 1987 Bulimina marginata forma aculeata d’Orbigny
- Jorissen, p. 43, Pl. 4, fig. 5 1990 Bulimina aculeata d’Orbigny - Hasegawa, p.
476, Pl. 3, figs. 14 & 15 1991 Bulimina aculeata d’Orbigny - Cimerman &
Langer, p. 61, Pl. 63, figs. 10 & 11 1992 Bulimina aculeata d’Orbigny - Schiebel, p. 35,
Pl. 2, fig. 1 1993 Bulimina aculeata d’Orbigny - Sgarrella &
Moncharmont Zei, p. 211, Pl. 15, fig. 1 1994 Bulimina aculeata d’Orbigny - Jones, p. 56,
Pl. 51, figs. 7-9 2003 Bulimina aculeata d’Orbigny - Kaminski et al.,
p. 174, Pl. 3, fig. 3 2004 Bulimina aculeata d’Orbigny - Chendes et al.,
p. 76, Pl. 2, fig. 8 2004 Bulimina aculeata d’Orbigny - Mendes et al.,
p. 180. Pl. 2, fig. 3 2008 Bulimina aculeata d’Orbigny - Leiter, p. 24, Pl.
3, fig. 11
Bulimina costata d’Orbigny
1852 Bulimina costata d’Orbigny
1958 Bulimina costata d’Orbigny - Parker, p. 261, Pl. 2, figs. 19 & 20
1987 Bulimina costata d’Orbigny - Jorissen, p. 34, Pl. 1, fig. 9
1991 Bulimina cf. B. alazaensis Cushman - Cimerman & Langer, p. 62, Pl. 64, figs. 1 & 2
1993 Bulimina costata d’Orbigny - Sgarrella & Moncharmont Zei, p. 211, Pl. 15, fig. 3
2003 Bulimina costata d’Orbigny - Kaminski et al., p. 174, Pl. 3, figs. 5 & 6
2004 Bulimina costata d’Orbigny - Chendes et al., p. 76, Pl. 2, fig. 6
2005 Bulimina costata d’Orbigny - Rasmussen, p. 85, Pl. 11, fig. 3
Bulimina elongata d’Orbigny (Pl. 3, fig. 22)
1846 Bulimina elongata d’Orbigny, p. 187, Tab. 11, figs. 19 & 20
1911 Bulimina elongata d’Orbigny - Cushman, p. 79, text-fig. 131
1991 Bulimina elongata d’Orbigny - Cimerman & Langer, p. 62, Pl. 64, figs. 3-8
1993 Bulimina elongata d’Orbigny - Hottinger et al., p. 99, Pl. 124, figs. 3-6
1993 Bulimina elongata d’Orbigny - Sgarrella & Moncharmont Zei, p. 211, Pl. 15, figs. 10 & 11
1994 Bulimina elongata d’Orbigny - Jones, p. 55, Pl. 50, figs. 3 & 4; Pl. 51, figs. 1 & 2
2002 Bulimina elongata d’Orbigny - Kaminski et al., p. 175, Pl. 3, fig. 4
2004 Bulimina elongata d’Orbigny - Chendes et al., p. 76, Pl. 2, fig. 7
Remarks: The specimens have often basal
spines, but differ from B. aculeata by its
elongate test.
Bulimina gibba Fornasini (Pl. 3, fig. 23)
1901 Bulimina gibba Fornasini 1958 Bulimina gibba Fornasini - Parker, p. 261,
Pl. 2, figs. 21 & 22 1960 Bulimina gibba Fornasini - Hofker, p. 248,
Pl. D, figs. 91-95 1994 Bulimina gibba Fornasini - Jones, p. 54,
Pl. 50, figs. 1 & 2 2005 Bulimina gibba Fornasini - Rasmussen, p.
86, Pl. 11, fig. 5
Bulimina marginata d’Orbigny
1826 Bulimina marginata d’Orbigny 1911 Bulimina marginata d’Orbigny - Cushman,
p. 83, text-fig. 136
114
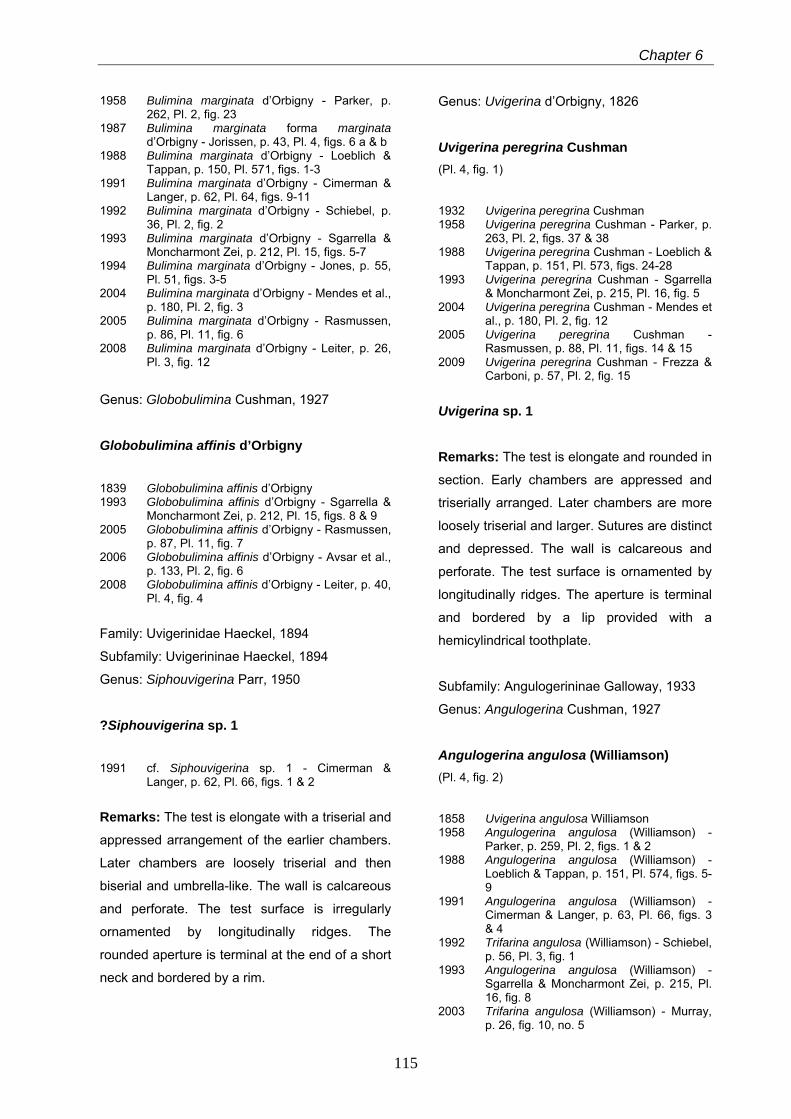
Chapter 6
1958 Bulimina marginata d’Orbigny - Parker, p. 262, Pl. 2, fig. 23
1987 Bulimina marginata forma marginata d’Orbigny - Jorissen, p. 43, Pl. 4, figs. 6 a & b
1988 Bulimina marginata d’Orbigny - Loeblich & Tappan, p. 150, Pl. 571, figs. 1-3
1991 Bulimina marginata d’Orbigny - Cimerman & Langer, p. 62, Pl. 64, figs. 9-11
1992 Bulimina marginata d’Orbigny - Schiebel, p. 36, Pl. 2, fig. 2
1993 Bulimina marginata d’Orbigny - Sgarrella & Moncharmont Zei, p. 212, Pl. 15, figs. 5-7
1994 Bulimina marginata d’Orbigny - Jones, p. 55, Pl. 51, figs. 3-5
2004 Bulimina marginata d’Orbigny - Mendes et al., p. 180, Pl. 2, fig. 3
2005 Bulimina marginata d’Orbigny - Rasmussen, p. 86, Pl. 11, fig. 6
2008 Bulimina marginata d’Orbigny - Leiter, p. 26, Pl. 3, fig. 12
Genus: Globobulimina Cushman, 1927
Globobulimina affinis d’Orbigny
1839 Globobulimina affinis d’Orbigny 1993 Globobulimina affinis d’Orbigny - Sgarrella &
Moncharmont Zei, p. 212, Pl. 15, figs. 8 & 9 2005 Globobulimina affinis d’Orbigny - Rasmussen,
p. 87, Pl. 11, fig. 7 2006 Globobulimina affinis d’Orbigny - Avsar et al.,
p. 133, Pl. 2, fig. 6 2008 Globobulimina affinis d’Orbigny - Leiter, p. 40,
Pl. 4, fig. 4
Family: Uvigerinidae Haeckel, 1894
Subfamily: Uvigerininae Haeckel, 1894
Genus: Siphouvigerina Parr, 1950
?Siphouvigerina sp. 1
1991 cf. Siphouvigerina sp. 1 - Cimerman & Langer, p. 62, Pl. 66, figs. 1 & 2
Remarks: The test is elongate with a triserial and
appressed arrangement of the earlier chambers.
Later chambers are loosely triserial and then
biserial and umbrella-like. The wall is calcareous
and perforate. The test surface is irregularly
ornamented by longitudinally ridges. The
rounded aperture is terminal at the end of a short
neck and bordered by a rim.
Genus: Uvigerina d’Orbigny, 1826
Uvigerina peregrina Cushman (Pl. 4, fig. 1)
1932 Uvigerina peregrina Cushman 1958 Uvigerina peregrina Cushman - Parker, p.
263, Pl. 2, figs. 37 & 38 1988 Uvigerina peregrina Cushman - Loeblich &
Tappan, p. 151, Pl. 573, figs. 24-28 1993 Uvigerina peregrina Cushman - Sgarrella
& Moncharmont Zei, p. 215, Pl. 16, fig. 5 2004 Uvigerina peregrina Cushman - Mendes et
al., p. 180, Pl. 2, fig. 12 2005 Uvigerina peregrina Cushman -
Rasmussen, p. 88, Pl. 11, figs. 14 & 15 2009 Uvigerina peregrina Cushman - Frezza &
Carboni, p. 57, Pl. 2, fig. 15
Uvigerina sp. 1
Remarks: The test is elongate and rounded in
section. Early chambers are appressed and
triserially arranged. Later chambers are more
loosely triserial and larger. Sutures are distinct
and depressed. The wall is calcareous and
perforate. The test surface is ornamented by
longitudinally ridges. The aperture is terminal
and bordered by a lip provided with a
hemicylindrical toothplate.
Subfamily: Angulogerininae Galloway, 1933
Genus: Angulogerina Cushman, 1927
Angulogerina angulosa (Williamson) (Pl. 4, fig. 2)
1858 Uvigerina angulosa Williamson 1958 Angulogerina angulosa (Williamson) -
Parker, p. 259, Pl. 2, figs. 1 & 2 1988 Angulogerina angulosa (Williamson) -
Loeblich & Tappan, p. 151, Pl. 574, figs. 5-9
1991 Angulogerina angulosa (Williamson) - Cimerman & Langer, p. 63, Pl. 66, figs. 3 & 4
1992 Trifarina angulosa (Williamson) - Schiebel, p. 56, Pl. 3, fig. 1
1993 Angulogerina angulosa (Williamson) - Sgarrella & Moncharmont Zei, p. 215, Pl. 16, fig. 8
2003 Trifarina angulosa (Williamson) - Murray, p. 26, fig. 10, no. 5
115
Taxonomy of modern benthic foraminifera in the Mediterranean Sea
2005 Trifarina angulosa (Williamson) - Rasmussen, p. 89, Pl. 12, fig. 1
Genus: Trifarina Cushman 1923
Trifarina fornasinii (Selli)
1948 Angulogerina fornasinii Selli 1992 Trifarina fornasinii (Selli) - Schiebel, p. 56, Pl.
3, fig. 2 2005 Trifarina fornasinii (Selli) - Rasmussen, p. 89,
Pl. 12, fig. 3
Family: Reussellidae Cushman, 1933
Genus: Reussella Galloway, 1933
Reussella spinulosa (Reuss) (Pl. 4, fig. 3)
1850 Verneuilina spinulosa Reuss 1911 Verneuilina spinulosa Reuss - Cushman, p.
55, text-fig. 88 1987 Reussella spinulosa (Reuss) - Alberola et al.,
p. 322, Pl. 4, fig. 14 1987 Reussella spinulosa (Reuss) - Jorissen, p. 41,
Pl. 3, fig. 7 1988 Reussella spinulosa (Reuss) - Loeblich &
Tappan, p. 152, Pl. 575, figs. 9-12 1991 Reussella spinulosa (Reuss) - Cimerman &
Langer, p. 63, Pl. 66, figs. 5-8 1993 Reussella spinulosa (Reuss) - Sgarrella &
Moncharmont Zei, p. 214, Pl. 15, fig. 14 2005 Reussella spinulosa (Reuss) - Rasmussen, p.
90, Pl. 12, fig. 4 2006 Reussella spinulosa (Reuss) - Avsar et al., p.
133, Pl. 2, fig. 7 2009 Reussella spinulosa (Reuss) - Avsar et al., p.
134, Pl. 2, fig. 9
Superfamily: Fursenkoinacea Loeblich & Tappan,
1961
Family: Fursenkoinidae Loeblich & Tappan, 1961
Genus: Fursenkoina Loeblich & Tappan, 1961
Fursenkoina acuta (d’Orbigny)
1846 Polymorphina acuta d’Orbigny 1991 Fursenkoina acuta (d’Orbigny) - Cimerman &
Langer, p. 64, Pl. 67, figs. 1 & 2 1993 Fursenkoina acuta (d’Orbigny) - Sgarrella &
Moncharmont Zei, p. 235, Pl. 23, fig. 7 2002 Fursenkoina acuta (d’Orbigny) - Kaminski et
al., p. 174, Pl. 3, figs. 11 & 12 2005 Fursenkoina acuta (d’Orbigny) - Rasmussen,
p. 90, Pl. 12, fig. 8
2006 Fursenkoina acuta (d’Orbigny) - Avsar et al., p. 133, Pl. 2, fig. 8
2009 Fursenkoina acuta (d’Orbigny) - Avsar et al., p. 135, Pl. 2, fig. 10
Genus: Sigmavirgulina Loeblich & Tappan,
1957
Sigmavirgulina tortuosa (Brady)
1881 Bolivina tortuosa Brady 1988 Sigmavirgulina tortuosa (Brady) - Loeblich
& Tappan, p. 153, Pl. 579, figs. 1-5 1994 Sigmavirgulina tortuosa (Brady) - Jones,
p. 58, Pl. 52, figs. 31-34
Sigmavirgulina sp. 1 1990 Sigmavirgulina sp. 1 - Cimerman &
Langer, p. 64, Pl. 67, figs. 3-7
Remarks: The test is flatter than the typical
flaring test of Sigmavirgulina species, and
biserial. The early chambers show a sigmoidal
alignment and the later chambers increase in
breadth and are arranged in a single plane.
The periphery is carinate. The wall is
calcareous and later chambers are coarsely
perforate. The aperture is elongate and oval at
the inner margin of the final chamber, and
surrounded by a small lip.
Superfamily: Discorbacea Ehrenberg, 1838
Family: Bagginidae Cushman, 1927
Subfamily: Baggininae Cushman, 1927
Genus: Cancris De Montfort, 1808
Cancris auriculus (Fichtel & Moll) (Pl. 4, figs. 4 & 5)
1798 Nautilus auricula Fichtel & Moll 1931 Cancris auricula (Fichtel & Moll) -
Cushman, p. 72, Pl. 15, fig. 1 1988 Cancris auriculus (Fichtel & Moll) -
Loeblich & Tappan, p. 157, Pl. 591, figs. 1-3
1993 Cancris auriculus (Fichtel & Moll) - Hottinger et al., p. 106, Pl. 136, figs. 6-14
1994 Cancris auriculus (Fichtel & Moll) - Jones, p. 105, Pl. 106, fig. 4
116
Chapter 6
2005 Cancris auricula (Fichtel & Moll) - Rasmussen, p. 91, Pl. 12, figs. 14 & 15
Genus: Valvulineria Cushman, 1926
Valvulineria bradyana (Fornasini) (Pl. 4, figs. 6 & 7)
1900 Discorbina bradyana Fornasini 1958 Valvulineria complanata (d’Orbigny) - Parker,
p. 268, Pl. 3, figs. 42-44 1987 Valvulineria bradyana (Fornasini) - Jorissen,
p. 43, Pl. 4, figs. 2 a & b 1991 Valvulineria bradyana (Fornasini) - Cimerman
& Langer, p. 64, Pl. 67, figs. 8-10 1993 Valvulineria bradyana (Fornasini) - Sgarrella
& Moncharmont Zei, p. 220, Pl. 18, figs. 1 & 2 1995 Valvulineria bradyana (Fornasini) - Coppa &
Di Tuoro, p. 170, Pl. 3, figs. 3 & 6 2004 Valvulineria bradyana (Fornasini) - Chendes
et al., p. 76, Pl. 2, fig. 12 2005 Valvulineria complanata (d’Orbigny) -
Rasmussen, p. 91, Pl. 12, figs. 16 & 17 2006 Valvulineria complanata (d’Orbigny) - Avsar et
al., p. 133, Pl. 2, figs. 9 & 10 2009 Valvulineria bradyana (Fornasini) - Avsar et
al., p. 135, Pl. 2, figs. 11 & 12 2009 Valvulineria bradyana (Fornasini) - Frezza &
Carboni, p. 55, Pl. 1, figs. 1 & 2
Valvulineria minuta Parker
1954 Valvulineria minuta Parker 1993 Valvulineria minuta Parker - Sgarella &
Moncharmont Zei, p. 220, Pl. 18, figs. 3 & 4
Valvulineria sp. 1
Remarks: The test is rounded in outline and
trochospirally enrolled. Two and a half whorls are
visible. The chambers are inflated and gradually
increase when added. Six chambers are visible
in the final whorl. The periphery is rounded. The
spiral side is flattened. On the umbilical side, the
umbilicus is depressed. Sutures are curved,
radial and depressed. The wall is calcareous,
more finely perforate than Valvulineria bradyana,
and hyaline with a smooth surface. The aperture
is an interiomarginal arch on the base of the last
chamber with a flap that partly covers the
umbilicus.
Family: Eponididae Hofker, 1951
Subfamily: Eponidinae Hofker, 1951
Genus: Eponides De Montfort, 1808
Eponides concameratus (Williamson) (Pl. 4, figs. 8 & 9)
1858 Rotalina concamerata Williamson 1931 Eponides repanda var. concamerata
(Williamson) - Cushman, p. 51, Pl. 11, fig. 4
1988 Eponides repandus (Fichtel & Moll) - Loeblich & Tappan, p. 158, Pl. 594, figs. 1-3
1991 Eponides concameratus (Williamson) - Cimerman & Langer, p. 64, Pl. 67, figs. 11-14
1993 Eponides repandus (Fichtel & Moll) - Hottinger et al., p. 106, Pl. 137, figs. 1-10
1993 Eponides repandus var. concamerata (Williamson) - Sgarrella & Moncharmont Zei, 232, Pl. 22, figs. 4 & 5
1995 Eponides repandus (Fichtel & Moll) - Coppa & Di Tuoro, p. 172, Pl. 4, figs. 8 & 10
2005 Eponides repandus (Fichtel & Moll) - Rasmussen, p. 92, Pl. 13, figs. 1 & 2
Eponides sp. 1
1991 cf. Eponides sp. 1 - Cimerman & Langer, p. 64, Pl. 68, figs. 1 & 2
Remarks: The test is trochospiral and
planoconvex. The spiral side is evolute. The
umbilical side is convex and involute. Sutures
are backwards curved, depressed on umbilical
side, and thickened on the spiral side. The
aperture is an interiomarginal, extraumbilical
large arched slit. This species differs from
Eponides repandus by the larger and curved
apertural opening. The specimens in this
study are generally larger and more oval in
outside than E. repandus.
Family: Mississippinidae Saidova, 1981
Subfamily: Stomatorbininae Saidova, 1981
Genus: Stomatorbina Doreen, 1948
117
Taxonomy of modern benthic foraminifera in the Mediterranean Sea
Stomatorbina concentrica (Parker & Jones) (Pl. 4, figs. 10 & 11)
1846 Pulvinulina concentrica Parker & Jones 1931 Eponides concentrica (Parker & Jones) -
Cushman, p. 43, Pl. 9, figs. 4 & 5 1991 Stomatorbina concentrica (Parker & Jones) -
Cimerman & Langer, p. 65, Pl. 68, figs. 7-9 1993 Stomatorbina concentrica (Parker & Jones) -
Sgarrella & Moncharmont Zei, p. 232, Pl. 26, figs. 9 & 10
2005 Stomatorbina concentrica (Parker & Jones) - Rasmussen, p. 92, Pl. 13, figs. 3 & 4
Stomatorbina sp. 1
Remarks: The test is flat, subelliptical in outline,
very low trochospiral, evolute on the spiral side,
and involute on the umbilical side. Six chambers
are visible in the last whorl that increase in size.
Sutures are narrower and not very elevated when
compared to Stomatorbina described by Loeblich
& Tappan (1988), but curved, oblique, depressed
and nearly radiate on the umbilical side. The
periphery is rounded. The wall is calcareous and
finely perforate with a smooth surface. The
aperture is an interio-marginal slit, partly covered
by a triangular umbilical flap.
Family Discorbidae Ehrenberg, 1838
Genus: Discorbis Lamarck, 1804
Discorbis williamsoni Chapman & Parr (Pl. 4, figs. 12 & 13)
1932 Discorbis williamsoni Chapman & Parr 2003 Discorbinoides milletti (Wright) - Murray, p.
21, fig. 7, no. 3 & 4 2005 Discorbis williamsoni Chapman & Parr -
Rasmussen, p. 93, Pl. 13, figs. 7 & 8
Family: Rosalinidae Reiss, 1963
Genus: Gavelinopsis Hofker, 1951
Gavelinopsis praegeri (Heron Allen & Earland) (Pl. 4, figs. 14 & 15)
1913 Discorbina praegeri Heron Allen & Earland 1931 ?Discorbis praegeri (Heron-Allen &
Earland) - Cushman, p. 30, Pl. 6, fig. 4 1958 Gavelinopsis praegeri (Heron Allen &
Earland) - Parker, p. 264, Pl. 3, figs. 24 & 25
1960 Gavelinopsis praegeri (Heron Allen & Earland) - Hofker, p. 252, Pl. D, fig. 114
1987 Gavelinopsis praegeri (Heron Allen & Earland) - Jorissen, p. 41, Pl. 3, fig. 13
1988 Gavelinopsis praegeri (Heron Allen & Earland) - Loeblich & Tappan, p. 161, Pl. 608, figs. 6-12
1991 Gavelinopsis praegeri (Heron Allen & Earland) - Cimerman & Langer, p. 66, Pl. 70, figs. 3 & 4
1992 Gavelinopsis praegeri (Heron Allen & Earland) - Schiebel, p. 46, Pl. 4, fig. 6
1993 Gavelinopsis praegeri (Heron Allen & Earland) - Sgarrella & Moncharmont Zei, p. 218, Pl. 17, figs. 1 & 2
2003 Gavelinopsis praegeri (Heron Allen & Earland) - Murray, p. 24, fig. 8, no. 5 & 6
Genus: Neoconorbina Hofker, 1951
Neoconorbina terquemi (Rzehak) (Pl. 4, figs. 16 & 17)
1888 Discorbina terquemi Rzehak 1958 Neoconorbina terquemi (Rzehak) - Parker,
p. 267, Pl. 3, figs. 26 & 27 1960 Neoconorbina neapolitana Hofker -
Hofker, p. 252, Pl. D, fig. 115 1987 Neoconorbina terquemi (Rzehak) -
Alberola, p. 308, Pl. 4, fig. 9 1987 Neoconorbina terquemi (Rzehak) -
Jorissen, p. 40, Pl. 3, figs. 3 & 4 1988 Neoconorbina terquemi (Rzehak) -
Loeblich & Tappan, p. 161, Pl. 609, figs. 8-10
1991 Neoconorbina terquemi (Rzehak) - Cimerman & Langer, p. 66, Pl. 70, figs. 5-7
1993 Neoconorbina terquemi (Rzehak) - Sgarrella & Moncharmont Zei, p. 218, Pl. 17, fig. 3
1994 Neoconorbina terquemi (Rzehak) - Jones, p. 94, Pl. 88, figs. 5-8
2005 Neoconorbina terquemi (Rzehak) - Rasmussen, p. 93, Pl. 13, figs. 11 & 12
2006 Neoconorbina terquemi (Rzehak) - Avsar et al., p. 133, Pl. 2, fig. 16
Genus: Planodiscorbis Bermudez, 1952
Planodiscorbis rarescens (Brady)
1884 Discorbis rarescens Brady 1915 Discorbis rarescens Brady - Cushman, p.
20, Pl. 7, fig. 4
118
Chapter 6
1958 Planodiscorbis rarescens (Brady) - Todd, p. 196, Pl. 1, fig. 17
Genus: Rosalina d’Orbigny, 1826
Rosalina anomala Terquem (Pl. 4, figs. 18 & 19)
1875 Rosalina anomala Terquem 2003 Rosalina anomala Terquem - Murray, p. 26,
fig. 9, no. 9 & 10 2006 Rosalina anomala Terquem - Wisshak &
Rueggenberg, p. 4, fig. 3, figs. J & K
Rosalina bradyi Cushman (Pl. 4, figs. 20 & 21)
1915 Rosalina bradyi Cushman 1987 Rosalina bradyi Cushman - Jorissen, p. 41,
Pl. 3, figs. 6 a & b 1991 Rosalina bradyi Cushman - Cimerman &
Langer, p. 66, Pl. 71, figs. 1-5 1993 Rosalina bradyi Cushman - Hottinger et al., p.
110, Pl. 142, fig. 12; Pl. 143, figs. 1-6 1994 Rosalina bradyi Cushman - Jones, p. 93, Pl.
86, fig. 8 1995 Rosalina globularis d’Orbigny - Coppa & Di
Tuoro, p. 170, Pl. 3, figs. 8 & 9 Rosalina globularis d’Orbigny
1926 Rosalina globularis d’Orbigny 1988 Rosalina globularis d’Orbigny - Loeblich &
Tappan, p. 161, Pl. 610, figs. 1-5; Pl. 611, figs. 1-3
1993 Rosalina globularis d’Orbigny - Sgarrella & Moncharmont Zei, p. 219, Pl. 17, figs. 7 & 8
2005 Rosalina globularis d’Orbigny - Rasmussen, p. 94, Pl. 14, fig. 1
Rosalina macropora (Hofker) (Pl. 5, figs. 1 & 2)
1951 Discopulvinulina macropora Hofker 1960 Discopulvinulina macropora Hofker - Hofker,
p. 253, Pl. D, fig. 122 1991 Rosalina macropora (Hofker) - Cimerman &
Langer, p. 67, Pl. 71, figs. 6 & 7 1993 Rosalina bradyi (Cushman) - Sgarrella &
Moncharmont Zei, p. 218, Pl. 17, figs. 4 & 5 1995 Rosalina bradyi (Cushman) - Coppa & Di
Tuoro, p. 168, Pl. 2, figs. 12 & 13 2004 Mississipina concentrica (Parker & Jones) -
Mendes et al., p. 178, Pl. 1, fig. 4 2005 Rosalina macropora (Hofker) - Rasmussen, p.
95, Pl. 14, figs. 3 & 4
Rosalina obtusa d’Orbigny
1846 Rosalina obtusa d’Orbigny, p. 179, Tab. 11, figs. 4-6
1958 Rosalina obtusa d’Orbigny - Parker, p. 268, Pl. 3, figs. 33, 34 & 39
1993 Rosalina obtusa d’Orbigny - Sgarrella & Moncharmont Zei, p. 219, Pl. 17, figs. 9 & 10
1995 Rosalina obtusa d’Orbigny - Coppa & Di Tuoro, p. 170, Pl. 3, figs. 1 & 2
2006 Rosalina bradyi Cushman - Avsar et al., p. 133, Pl. 2, figs. 13 & 14
Rosalina sp. 1
1993 cf. Rosalina sp. A - Hottinger et al., p. 112, Pl. 145, figs. 1-4
Remarks: The test is large, trochospiral and
flat. The spiral side is slightly convex and
evolute, the umbilical side is involute. The test
shape is often irregular. Six to seven
chambers are visible in the adult coil, rapidly
increasing in size when added. Sutures are
thickened, curved on the spiral side,
depressed and curved on the umbilical side.
The test is coarsely perforated on the spiral
side, but shows no perforation on the umbilical
side.
Genus: Spirorbina Sellier de Civrieux, 1977
?Spirorbina sp. 1
Remarks: The test is low trochospiral and
planoconvex. The spiral side is weakly convex
and evolute with one and a half whorls of
broad and low semilunate chambers. Six to
seven chambers are visible in the final whorl.
Sutures are backcurved, oblique, flush and
obscure on both sides, but the first, second or
three first sutures can be depressed on the
spiral side. The umbilical side is flat and
partially involute with large pustules in the
umbilical region. The periphery is subacut.
The wall is calcareous and finely perforate on
119
Taxonomy of modern benthic foraminifera in the Mediterranean Sea
the spiral side. The umbilical side is not perforate
or has a few large pores parallel to the sutures.
The aperture is a low slit extending from near the
periphery along the umbilical chamber margin to
the preceding suture for much of the final whorl.
Genus: Tretomphalus Moebius, 1880
Tretomphalus concinnus (Brady) (Pl. 5, fig. 3)
1884 Discorbina concinna Brady 1915 Discorbis concinna (Brady) - Cushman, p. 16,
Pl. 5, fig. 3 1988 Tretomphalus concinnus (Brady) - Loeblich &
Tappan, p. 162, Pl. 613, figs. 1-6 1991 Tretomphalus bulloides (d’Orbigny) -
Cimerman & Langer, p. 67, Pl. 72, figs. 3-5 1993 Tretomphalus concinnus (Brady) - Sgarrella &
Moncharmont Zei, p. 219, Pl. 17, figs. 11 & 12 1994 Tretomphalus concinnus (Brady) - Jones, p.
96, Pl. 90, fig. 7
Tretomphalus sp. 1 (Pl. 5, fig. 4)
Remarks: The test is trochospiral and
planoconvex. Chambers rapidly increase when
added and are slightly inflated. Five chambers
are visible in the adult coil. On the spiral side,
sutures are strongly backcurved, depressed and
oblique. On the umbilical side, chambers are
triangular and overlapping. The final chamber
occupies about one third of the circumference.
The chamber interior is simple and undivided.
The periphery is subacut. The wall is calcareous
and smooth. The spiral side is non-perforate or
with a perforation of only one chamber. The
umbilical side is densely and coarsely perforate.
The aperture is a low interiomarginal arch with a
bordering lip near the periphery on the umbilical
side.
Family: Sphaeroidinidae Cushman, 1927
Genus: Sphaeroidina d’Orbigny, 1826
Sphaeroidina bulloides d’Orbigny
1832 Sphaeroidina bulloides d’Orbigny 1914 Sphaeroidina bulloides d’Orbigny -
Cushman, p. 18, Pl. 12, figs. 1 a & b 1960 Sphaeroidina bulloides d’Orbigny - Hofker,
p. 251, Pl. D, fig. 107 1988 Sphaeroidina bulloides d’Orbigny -
Loeblich & Tappan, p. 162, Pl. 617, figs. 1-6
1990 Sphaeroidina bulloides d’Orbigny - Hasegawa et al., p. 477, Pl. 4, figs. 10 & 11
1994 Sphaeroidina bulloides d’Orbigny - Jones, p. 91, Pl. 84, figs. 1 & 2
2005 Sphaeroidina bulloides d’Orbigny - Rasmussen, p. 95, Pl. 14, fig. 11
Superfamily: Glabratellacea Loeblich &
Tappan, 1964
Family: Glabratellidae Loeblich & Tappan,
1964
Genus: Conorbella Hofker, 1951
Conorbella imperiatoria (d’Orbigny)
1846 Rosalina imperiatoria d’Orbigny, p. 176, Tab. 10, figs. 16-18
1991 Conorbella imperiatoria (d’Orbigny) - Cimerman & Langer, p. 68, Pl. 72, figs. 9-11
1993 Schackoinella imperiatoria (d’Orbigny) - Sgarrella & Moncharmont Zei, p. 222, Pl. 18, figs. 5 & 6
Conorbella pulvinata (Brady) (Pl. 5, figs. 5 & 6)
1884 Discorbina pulvinata Brady 1915 Discorbina pulvinata Brady - Cushman, p.
19, Pl. 7, fig. 2 1988 Conorbella pulvinata (Brady) - Loeblich &
Tappan, p. 163, Pl. 618, figs. 4-6 1991 Conorbella pulvinata (Brady) - Cimerman
& Langer, p. 68, Pl. 73, figs. 4-7 1994 Glabratella pulvinata (Brady) - Jones, p.
94, Pl. 88, fig. 10 2005 Glabratella pulvinata (Brady) -
Rasmussen, p. 96, Pl. 14, figs. 12 & 13
Genus: Glabratella Doreen, 1948
Glabratella erecta (Sidebottom)
1908 Discorbina erecta Sidebottom
120
Chapter 6
1991 Conorbella erecta (Sidebottom) - Cimerman & Langer, p. 68, Pl. 72, figs. 6-8
1993 Glabratella erecta (Sidebottom) - Sgarrella & Moncharmont Zei, p. 220, Pl. 18, figs. 7 & 8
Glabratella hexacamerata Seigle & Bermudez (Pl. 5, figs. 7 & 8)
1965 Glabratella hexacamerata Seigle & Bermudez 1993 Glabratella hexacamerata Seigle & Bermudez
- Sgarrella & Moncharmont Zei, p. 222, Pl. 18, figs. 9 & 10
Glabratella patelliformis (Brady)
1884 Discorbis patelliformis Brady 1915 Discorbis patelliformis Brady - Cushman, p.
17, Pl. 5, fig. 5 1994 Glabratella patelliformes (Brady) - Jones, p.
94, Pl. 88, figs. 3 a-c 1991 Glabratella patelliformis (Brady) - Cimerman,
p. 68, Pl. 73, figs. 1-3
Genus: Planoglabratella Seiglie & Bermudez,
1965
Planoglabratella opercularis (d’Orbigny) (Pl. 5, figs. 9 & 10)
1939 Rosalina opercularis d’Orbigny 1915 Discorbis opercularis (d’Orbigny) - Cushman,
p. 18, Pl. 11, fig. 3 1988 Planoglabratella opercularis (d’Orbigny) -
Loeblich & Tappan, p. 164, Pl. 621, figs. 21-23
1994 Planoglabratella opercularis (d’Orbigny) - Sgarrella & Moncharmont Zei, p. 222, Pl. 19, figs. 4 & 5
2009 Planoglabratella opercularis (d’Orbigny) - Avsar et al. p. 135, Pl. 2, figs. 15 & 16
Planoglabratella sp. 1
Remarks: The test is planoconvex and
trochospiral, with a subconical spiral side and a
flat umbilical side. On the spiral side, rapidly
enlarging whorls are visible. The up to ten
chambers are low, broad and strongly curved on
both sides. The periphery is subangular with
short spines. The wall is calcareous and
perforate. On the umbilical side, there are fine
radial striae with pustules in the center. The
aperture is an interiomarginal slit near the
periphery margin of the last chamber.
Planoglabratella sp. 2
Remarks: The test is planoconvex and
trochospiral, with a subconical spiral side and
a flat umbilical side. More than eight
backcurved chambers are visible. Sutures are
relatively broad, backcurved on the spiral and
umbilical side. The wall is calcareous and
densely perforate with a smooth surface on
the spiral side. The umbilical side provides
radial microstriae and a pustulose region in its
center. The aperture is a low interiomarginal
slit near the peripheral margin of the final
chamber.
Family: Heronalleniidae Loeblich & Tappan,
1986
Genus: Heronallenia Chapman & Parr, 1931
Heronallenia lingulata (Burrows & Holland) 1895 Discorbina lingulata Burrows & Holland 1994 Heronallenia lingulata (Burrows & Holland)
- Jones, p. 96, Pl. 91, fig. 3 1991 Heronallenia sp.1 - Cimerman & Langer,
p. 69, Pl. 73, figs. 9-10 2005 Heronallenia lingulata (Burrows & Holland)
- Rasmussen, p. 96, Pl. 14, figs. 16 & 17
Superfamily: Siphoninacea Cushman, 1927
Family: Siphoninidae Cushman, 1927
Subfamily: Siphonininae Cushman, 1927
Genus: Siphonina Reuss, 1850
Siphonina reticulata (Czjzek)
1848 Rotalina reticulata Czjzek 1931 Siphonina reticulata (Czjzek) - Cushman,
p. 68, Pl. 14, fig. 1 1958 Siphonina reticulata (Czjzek) - Parker, p.
273, Pl. 4, fig. 25 1988 Siphonina reticulata (Czjzek) - Loeblich &
Tappan, p. 164, Pl. 624, figs. 4-6 1990 Siphonina reticulata (Czjzek) - Hasegawa
et al., p. 477, Pl. 4, figs. 12-14
121
Taxonomy of modern benthic foraminifera in the Mediterranean Sea
1991 Siphonina reticulata (Czjzek) - Cimerman & Langer, p. 69, Pl. 73, figs. 11-13
1993 Siphonina reticulata (Czjzek) - Sgarrella & Moncharmont Zei, p. 222, Pl. 19, figs. 7 & 8
2004 Siphonina reticulata (Czjzek) - Chendes et al., p. 76, Pl. 2, fig. 13
2005 Siphonina reticulata (Czjzek) - Rasmussen, p. 97, Pl. 14, fig. 18
2009 Siphonina reticulata (Czjzek) - Avsar et al., p. 135, Pl. 2, figs. 17 & 18
Genus: Siphoninella Cushman, 1927
Siphoninella soluta (Brady) 1884 Truncatulina soluta Brady 1988 Siphoninella soluta (Brady) - Loeblich &
Tappan, p. 164, Pl. 624, figs. 7-9 1994 Siphoninella soluta (Brady) - Jones, p. 100,
Pl. 96, fig. 4
Superfamily: Discorbinellacea Sigal, 1952
Family: Discorbinellidae Sigal, 1952
Subfamily: Discorbinellinae Sigal, 1952
Genus: Discorbinella Cushman & Martin, 1935
Discorbinella bertheloti (d’Orbigny) (Pl. 5, figs. 11 & 12)
1839 Rosalina bertheloti d’Orbigny 1931 Discorbis bertheloti (d’Orbigny) - Cushman, p.
16, Pl. 2, fig. 2 1988 Discorbinella bertheloti (d’Orbigny) - Loeblich
& Tappan, p. 166, Pl. 630, figs. 4-6 1993 Discorbinella bertheloti (d’Orbigny) - Hottinger
et al., p. 114, Pl. 150, figs. 1-4 1993 Discorbinella bertheloti (d’Orbigny) - Sgarrella
& Moncharmont Zei, p. 216, Pl. 16, figs. 11 & 12
2004 Discorbinella bertheloti (d’Orbigny) - Chendes et al., p. 76, Pl. 3, fig. 3
2005 Discorbinella bertheloti (d’Orbigny) - Rasmussen, p. 98, Pl. 14, figs. 25 & 26
2006 Discorbinella bertheloti (d’Orbigny) - Avsar et al., p. 133, Pl. 2, fig. 15
2009 Discorbinella bertheloti (d’Orbigny) - Avsar et al., p. 135, Pl. 2, figs. 19 & 20
Superfamily: Planorbulinacea Schwager, 1877
Family: Planulinidae Bermudez, 1952 Genus: Hyalinea Hofker, 1951
Hyalinea balthica (Schroeter) (Pl. 5, fig. 13)
1783 Nautilus balthicus Schroeter
1931 Anomalina balthica (Schroeter) - Cushman, p. 108, Pl. 19, fig. 3
1958 Hyalinea balthica (Schroeter) - Parker, p. 275, Pl. 4, fig. 39
1960 Hofkerinella baltica (Schroeter) - Hofker, p. 255, Pl. E, fig. 137
1988 Hyalinea balthica (Schroeter) - Loeblich & Tappan, p. 167, Pl. 632, figs. 5-8
1993 Hyalinea balthica (Schroeter) - Sgarrella & Moncharmont Zei, p. 234, Pl. 22, fig. 12
1994 Hyalinea balthica (Schroeter) - Jones, p. 110, Pl. 112, figs. 1-2
2002 Hyalinea balthica (Schroeter) - Kaminski et al., p. 174, Pl. 3, fig. 13
2003 Hyalinea balthica (Schroeter) - Murray, p. 24, fig. 8, no. 8-10
2005 Hyalinea balthica (Schroeter) - Rasmussen, p. 98, Pl. 14, figs. 27 & 28
2006 Hyalinea balthica (Schroeter) - Avsar et al., p. 133, Pl. 2, fig. 17
2009 Hyalinea balthica (Schroeter) - Frezza & Carboni, p. 57, Pl. 2, fig. 18
Genus: Planulina d’Orbigny, 1826
Planulina ariminensis d’Orbigny
1826 Planulina ariminensis d’Orbigny 1988 Planulina ariminensis d’Orbigny - Loeblich
& Tappan, p. 167, Pl. 633, figs. 1-4 1990 Planulina ariminensis d’Orbigny -
Hasegawa et al., p. 477, Pl. 4, figs. 15 & 16
1993 Planulina ariminensis d’Orbigny - Sgarrella & Moncharmont Zei, p. 234, Pl. 22, fig. 9
Family: Cibicididae Cushman, 1927
Subfamily: Cibicidinae Cushman, 1927
Genus: Cibicides De Montfort, 1808
Cibicides lobatulus s.l. (Walker & Jacob) (Pl. 5, figs. 14 & 15)
1798 Nautilus lobatulus Walker & Jacob 1846 Truncatulina lobatula d’Orbigny -
D’Orbigny, p. 168, Tab. 9, figs. 18-23 1931 Cibicides lobatula (Walker & Jacob) -
Cushman, p. 118, Pl. 21, fig. 3 1945 Cibicides lobatulus (Walker & Jacob) -
Cushman, p. 288, fig. 21 1979 Cibicidoides lobatulus (Walker & Jacob) -
Corliss, p. 10, Pl. 3, figs. 7-9 1987 Cibicides lobatulus (Walker & Jacob) -
Alberola et al., p. 308, Pl. 4, fig. 11 1988 Lobatula lobatula (Walker & Jacob) -
Loeblich & Tappan, p. 168, Pl. 637, figs. 10-13
1991 Lobatula lobatula (Walker & Jacob) - Cimerman & Langer, p. 71, Pl. 75, figs. 1-4
122
Chapter 6
1992 Lobatula lobatulus (Walker & Jacob) - Wollenburg, p. 63, Pl. 19, fig. 3
1993 Lobatula lobatulus (Walker & Jacob) - Hottinger et al., p. 118, Pl. 154, figs. 5-11
1993 Cibicides pseudolobatulus (Perelis & Reiss) - Hottinger et al., p. 116, Pl. 152, figs. 7-11
1993 Cibicides lobatulus (Walker & Jacob) - Sgarrella & Moncharmont Zei, p. 234, Pl. 22, figs. 10 & 11
1994 Cibicides lobatulus (Walker & Jacob) - Jones, p. 97, Pl. 92, fig. 10; Pl. 93, figs. 1 & 4-5
1995 Cibicides lobatulus (Walker & Jacob) - Coppa & Di Tuoro, p. 170, Pl. 3, figs. 7 & 10
2003 Cibicides lobatulus (Walker & Jacob) - Murray, p. 21, fig. 6, no. 13-15
2005 Cibicides lobatulus (Walker & Jacob) - Rasmussen, p. 99, Pl. 15, figs. 4-6
2006 Lobatula lobatula (Walker & Jacob) - Avsar et al., p. 133, Pl. 3, figs. 1 & 2
2009 Lobatula lobatula (Walker & Jacob) - Frezza & Carboni, p. 55, Pl. 1, figs. 18-20
Remarks: In this work, Cibicides lobatulus s.l.
contains the species Cibicides pseudo-lobatulus
that is characterized by a lower pore density on
the umbilical side, and Cibicides lobatulus s.s.
that is coarsely and uniformly perforate on both
sides.
Cibicides cf. C. mayori (Cushman)
1924 Truncatulina mayori Cushman 1993 ?Cibicides mayori (Cushman) - Hottinger et
al., p. 116, Pl. 152, figs. 1-6
Remarks: The test is lamellar, trochospiral and
mostly plano-convex. The peripheral margin is
acute with thin fringe-like carina. Six to seven
chambers are visible in the adult stage.
Chambers are partly irregularly formed. Sutures
are backcurved on both sides, limbate on the
spiral side and depressed on the umbilical side.
The calcareous test is densely perforated on the
spiral side. The perforation on the umbilical side
is restricted to the last chambers. On the
umbilical side, a small imperforate, umbilical
knob is sometimes present. The aperture is
interiomarginal.
Cibicides pseudoungerianus (Cushman) (Pl. 5, figs. 16 & 17)
1922 Truncatulina pseudoungerianus Cushman 1931 Cibicides pseudoungeriana (Cushman) -
Cushman, p. 123, Pl. 22, figs. 3-7 1991 Cibicidoides pseudoungerianus
(Cushman) - Cimerman & Langer, p. 69, Pl. 74, figs. 2 & 3
2005 Cibicides ungerianus (Cushman) - Rasmussen, p. 100, Pl. 15, figs. 12 & 13
2008 Cibicidoides pseudoungerianus (Cushman) - Leiter, p. 33, Pl. 1, fig. 9
Cibicides refulgens De Montfort (Pl. 5, figs. 18 & 19)
1808 Cibicides refulgens De Montfort 1931 Cibicides refulgens De Montfort -
Cushman, p. 116, Pl. 21, fig. 2 1988 Cibicides refulgens De Montfort - Loeblich
& Tappan, p. 167, Pl. 634, figs. 1-3 1991 Cibicides refulgens De Montfort -
Cimerman & Langer, p. 70, Pl. 75, figs. 5-9
2003 Cibicides refulgens De Montfort - Murray, p. 21, fig 7, no. 1 & 2
2004 Cibicides refulgens De Montfort - Chendes et al., p. 76, Pl. 3, fig. 2
2005 Cibicides refulgens De Montfort - Rasmussen, p. 100, Pl. 15, figs. 7 & 8
Cibicides sp. 1
Remarks: The test is trochospiral,
planoconvex and ovate to subcircular in
outline. The spiral side is evolute and flat for
the first chambers, but slightly convex for the
last chambers. The spiral side is coarsely and
densely perforated. Sutures are backcurved
and thickened on the spiral side. The umbilical
side is convex, involute and finely perforate
with a knob-like feature in the umbilical region.
Sutures are depressed on the umbilical side.
The apertural face is angular, and the
periphery is subcarinate. Eight chambers that
increase in size when added, are visible in the
final whorl. The wall is calcareous. The
aperture is a low interiomarginal opening.
Family: Planorbulinidae Schwager, 1877
Subfamily: Planorbulininae Schwager, 1877
Genus: Planorbulina d’Orbigny, 1826
123
Taxonomy of modern benthic foraminifera in the Mediterranean Sea
Planorbulina mediterranensis d'Orbigny (Pl. 5, fig. 20)
1825 Planorbulina mediterranensis d'Orbigny 1846 Planorbulina mediterranensis d'Orbigny -
D’Orbigny, p. 166, Tab. 9, figs. 15-17 1931 Planorbulina mediterranensis d'Orbigny -
Cushman, p. 129, Pl. 24, figs. 5-8 1958 Planorbulina mediterranensis d'Orbigny -
Parker, p. 276, Pl. 4, fig. 44 1960 Planorbulina mediterranensis d'Orbigny -
Hofker, p. 254, Pl. E, figs. 128 & 129 1988 Planorbulina mediterranensis d'Orbigny -
Loeblich & Tappan, p. 170, Pl. 645, figs. 1-4 1991 Planorbulina mediterranensis d'Orbigny -
Cimerman & Langer, p. 71, Pl. 78, figs. 1-8 1993 Planorbulina mediterranensis d'Orbigny -
Sgarrella & Moncharmont Zei, p. 235, Pl. 23, fig. 4
1995 Planorbulina mediterranensis d'Orbigny - Coppa & Di Tuoro, p. 168, Pl. 2, figs. 8 & 11
2004 Planorbulina mediterranensis d'Orbigny - Chendes et al., p. 76, Pl. 3, fig. 5
2004 Planorbulina mediterranensis d'Orbigny - Mendes et al., p. 178, Pl. 1, fig. 5
2005 Planorbulina mediterranensis d'Orbigny - Rasmussen, p. 100, Pl. 15, fig. 14
2006 Planorbulina mediterranensis d'Orbigny - Avsar et al., p. 133, Pl. 3, fig. 3
2009 Planorbulina mediterranensis d'Orbigny - Avsar et al., p. 135, Pl. 3, figs. 2 & 3
Planorbulina variablis (d’Orbigny)
1839 Truncatulina variablis d’Orbigny 1988 Planorbulina variablis (d’Orbigny) - Loeblich &
Tappan, p. 170, Pl. 645, figs. 5 & 6 1991 Cibicidella variablis (d’Orbigny) - Cimerman &
Langer, p. 72, Pl. 77, figs. 1-10 1993 Cibicidella variablis (d’Orbigny) - Sgarrella &
Moncharmont Zei, p. 234, Pl. 23, figs. 2 & 3
Family: Cymbaloporidae Cushman, 1927
Subfamily: Cymbaloporinae Cushman, 1927
Genus: Cymbaloporetta Cushman, 1928
Cymbaloporetta bulloides (d’Orbigny)
1839 Rosalina bulloides d’Orbigny 1988 Cymbaloporetta bulloides (d’Orbigny) -
Loeblich & Tappan, p. 170, Pl. 649, figs. 11-15
1991 Cymbaloporetta sp.1 - Cimerman & Langer, p. 72, Pl. 80, figs. 1-5
Superfamily: Acervulinacea Schultze, 1854
Family: Acervulinidae Schultze, 1854 Genus: Acervulina Schultze, 1854
Acervulina inhaerens Schultze
1854 Acervulina inhaerens Schultze 1988 Acervulina inhaerens Schultze - Loeblich
& Tappan, p. 597, Pl. 659, figs. 1-6
Genus: Sphaerogypsina Galloway, 1933
Sphaerogypsina globula (Reuss)
1848 Ceriopora globula Reuss 1988 Sphaerogypsina globula (Reuss) -
Loeblich & Tappan, p. 173, Pl. 662, figs. 4-6
1991 Sphaerogypsina globula (Reuss) - Cimerman & Langer, p. 72, Pl. 80, figs. 6-9
1993 Sphaerogypsina globula (Reuss) - Sgarrella & Moncharmont Zei, p. 235, Pl. 23, fig. 6
1993 Sphaerogypsina globula (Reuss) - Hottinger et al., p. 128, Pl. 173, figs. 1-10
Family: Homotrematidae Cushman, 1927
Genus: Miniacina Galloway, 1933
Miniacina miniacea (Pallas)
1766 Millepora miniacea Pallas 1988 Miniacina miniacea (Pallas) - Loeblich &
Tappan, p. 173, Pl. 663, figs. 4-6; Pl. 664, figs. 1-5
1991 Miniacina miniacea (Pallas) - Cimerman & Langer, p. 73, Pl. 81, figs. 1-6
1993 Miniacina miniacea (Pallas) - Hottinger et al., p. 122, Pl. 175, figs. 9 & 10; Pl. 176, figs. 1-6; Pl. 177, figs. 1-7
1993 Miniacina miniacea (Pallas) - Sgarrella & Moncharmont Zei, p. 235, Pl. 23, fig. 5
1994 Miniacina miniacea (Pallas) - Jones, p. 101, Pl. 100, figs. 5-9; Pl. 101, fig. 1
Superfamily: Asterigerinacea d’Orbigny, 1839
Family: Asterigerinatidae Reiss, 1963
Genus: Asterigerinata Bermudez, 1949
Asterigerinata adriatica Haake (Pl. 6, fig. 1 & 2)
1977 Asterigerinata adriatica Haake 1991 Asterigerinata sp.1 - Cimerman & Langer,
p. 73, Pl. 82, figs. 5 & 6 1993 Asterigerinata adriatica Haake - Sgarrella
& Moncharmont Zei, p. 224, Pl. 19, figs. 11 & 12
124
Chapter 6
2004 Asterigerinata adriatica Haake - Chendes et al., p. 76, Pl. 3, fig. 6
2006 Asterigerinata adriatica Haake - Avsar et al., p. 133, Pl. 3, fig. 4
Asterigerinata mamilla (Williamson) (Pl. 6, figs. 3 & 4)
1858 Rotalina mamilla Williamson 1931 Discorbis mamilla (Williamson) - Cushman, p.
23, Pl. 5, fig. 1 1958 Asterigerinata mamilla (Williamson) - Parker,
p. 264, Pl. 3, figs. 5 & 6 1960 Asterigerinata mamilla (Williamson) - Hofker,
p. 252, Pl. D, fig. 111 1987 Asterigerinata mamilla (Williamson) - Alberola
et al., p. 322, Pl. 4, fig. 10 1987 Asterigerinata mamilla (Williamson) -
Jorissen, p. 41, Pl. 3, fig. 1 1991 Asterigerinata mamilla (Williamson) -
Cimerman & Langer, p. 73, Pl. 83, figs. 1-4 1993 Asterigerinata mamilla (Williamson) -
Sgarrella & Moncharmont Zei, p. 224, Pl. 19, figs. 9 & 10
1995 Asterigerinata mamilla (Williamson) - Coppa & Di Tuoro, p. 170, Pl. 3, figs. 11 & 12
2004 Asterigerinata mamilla (Williamson) - Mendes et al., p. 178, Pl. 1, fig. 2
2005 Asterigerinata mamilla (Williamson) - Rasmussen, p. 101, Pl. 15, figs. 17 & 18
2006 Asterigerinata mamilla (Williamson) - Avsar et al., p. 133, Pl. 3, figs. 5-7
2009 Asterigerinata mamilla (Williamson) - Avsar et al., p. 135, Pl. 3, figs. 5 & 6
Asterigerinata mariae Sgarrella (Pl. 6, figs. 5 & 6)
1990 Asterigerinata mariae Sgarrella 1993 Asterigerinata mariae Sgarrella - Sgarrella &
Moncharmont Zei, p. 224, Pl. 20, fig. 1
Superfamily: Nonionacea Schultze, 1854
Family: Nonionidae Schultze, 1854
Subfamily: Nonioninae Schultze, 1854
Genus: Haynesina Banner & Calver, 1978
Haynesina depressula (Walker & Jacob) (Pl. 6, fig. 7)
1798 Nautilus depressula Walker & Jacob 1914 Nonionina depressula (Walker & Jacob) -
Cushman, p. 23, Pl. 17, figs. 3 a & b 1987 Nonion depressulum (Walker & Jacob) -
Jorissen, p. 39, Pl. 2, figs. 7 a & b 1991 Haynesina depressula (Walker & Jacob) -
Cimerman & Langer, p. 81, Pl. 83, figs. 1-4
1993 Nonion depressulum (Walker & Jacob) - Sgarrella & Moncharmont Zei, p. 238, Pl. 24, figs. 3 & 4
2004 Haynesina depressula (Walker & Jacob) - Chendes et al., p. 76, Pl. 3, fig. 7
2005 Haynesina depressula (Walker & Jacob) - Rasmussen, p. 102, Pl. 16, fig. 3
2009 Nonion depressulum (Walker & Jacob) - Avsar et al., p. 135, Pl. 3, figs. 7 & 8
Haynesina sp. 1
Remarks: The test is planispirally enrolled,
biumbilicate and circular with involute coiling.
The umbilical region is depressed and
completely filled with tubercles. Sutures are
backcurved. The periphery is rounded. Seven
to eight slightly inflated chambers are visible
on the final whorl, extending near the
periphery. The chambers slightly increase
when added. The wall is calcareous, finely
and densely perforate, with a smooth surface.
The interlocular spaces are ornamented with
minute pseudospines. The aperture is a low
interiomarginal arch at the base of the
apertural face, extending nearly to the
umbilicus and is covered by granules.
Haynesina sp. 2 (Pl. 6, fig. 8)
1958 Nonion sp. B - Parker, p. 259, Pl. 1, figs. 40 & 41
Remarks: The test is planispiral, circular in
outline and compressed. Up to twelve
chambers are visible in the final whorl. The
umbilicus is partly filled with pustules. The
incised sutures are backcurved, and also filled
with pustules. The periphery is subrounded.
The wall is calcareous and smooth, except the
umbilical region and the sutures, and finely
perforate. The aperture is an interiomarginal
slit covered by pustules.
The species in this work has similarities to
Haynesina sp. shown and described in
125
Taxonomy of modern benthic foraminifera in the Mediterranean Sea
Rasmussen (2005; p. 102, Pl. 16, fig. 4), but has
more chambers.
Genus: Nonion De Montfort, 1808
Nonion fabum (Fichtel & Moll) (Pl. 6, fig. 19)
1798 Nautilus faba Fichtel & Moll 1988 Nonion fabum (Fichtel & Moll) - Loeblich &
Tappan, p. 179, Pl. 690, figs. 1-7 1994 Nonion fabum (Fichtel & Moll) - Jones, p. 108,
Pl. 109, figs. 12 & 13 2004 Nonion fabum (Fichtel & Moll) - Mendes et al.,
p. 178. Pl. 1, fig. 10 2005 Nonion fabum (Fichtel & Moll) - Rasmussen,
p. 102, Pl. 16, fig. 5 2008 Nonion asterizans (Fichtel & Moll) - Leiter, p.
46, Pl. 2, fig. 5
Genus: Nonionella Cushman, 1926
Nonionella turgida (Williamson) (Pl. 6, figs. 10 & 11)
1858 Rotalina turgida Williamson 1930 Nonionella turgida (Williamson) - Cushman, p.
15, Pl. 6, figs. 1 & 4 1960 Nonionella turgida (Williamson) - Hofker, p.
258, Pl. F, figs. 181 & 182 1987 Nonionella turgida (Williamson) - Jorissen, p.
47, Pl. 4, figs. 11-13 1993 Nonionella turgida (Williamson) - Sgarrella &
Moncharmont Zei, p. 240, Pl. 24, fig. 5 1993 Nonionella turgida (Williamson) - Cimerman &
Langer, p. 74, Pl. 84, figs. 6-8 2003 Nonionella turgida (Williamson) - Murray, p.
24, fig. 9, no. 5 2005 Nonionella turgida (Williamson) - Rasmussen,
p. 103, Pl. 16, figs. 11 & 12 2006 Nonionella turgida (Williamson) - Avsar et al.,
p. 133. Pl. 3, fig. 8 2009 Nonionella turgida (Williamson) - Frezza &
Carboni, p. 57, Pl. 2, figs. 7 & 8
Nonionella sp. 1 (Pl. 6, fig. 12)
1914 Nonionina turgida (Williamson) - Cushman, p. 29, Pl. 15, figs. 3 a & b
1930 Nonionella turgida (Williamson) - Cushman, p. 15, Pl. 6, figs. 2 & 3
1994 Nonionella turgida (Williamson) - Jones, p. 108, Pl. 109, fig. 17
2003 Nonionella turgida (Williamson) - Murray, p. 24, fig. 9, no. 4
Remarks: In our opinion, this species differs
from N. turgida by its equilateral face view.
However, specimens that look close to our
specimens have been grouped to Nonionella
turgida by Brady (see Cushman, 1930) and
also by the authors listed above.
Subfamily: Astrononioninae Saidova, 1981
Genus: Astrononion Cushman & Edwards,
1937
Astrononion stelligerum (d’Orbigny) (Pl. 6, fig. 13)
1839 Nonionina stelligera d’Orbigny 1930 Nonion stelligerum (d’Orbigny) -
Cushman, p. 7, Pl. 2, figs. 8-12; Pl. 3, figs. 1-3
1958 Astrononion stelligerum (d’Orbigny) - Parker, p. 258, Pl. 1, figs. 34 & 35
1988 Astrononion stelligerum (d’Orbigny) - Loeblich & Tappan, p. 180, Pl. 694, figs. 1 & 2; figs. 20 & 21
1990 Astrononion stelligerum (d’Orbigny) - Sprovieri & Hasegawa, p. 457, Pl. 3, figs. 1 & 2
1991 Astrononion stelligerum (d’Orbigny) - Cimerman & Langer, p. 74, Pl. 84, figs. 13-15
1993 Astrononion stelligerum (d’Orbigny) - Sgarrella & Moncharmont Zei, p. 238, Pl. 24, fig. 10
1994 Astrononion stelligerum (d’Orbigny) - Jones, p. 107, Pl. 109, figs. 3 & 4
2006 Astrononion stelligerum (d’Orbigny) - Avsar et al., p. 133, Pl. 3, figs. 9 & 10
2009 Astrononion stelligerum (d’Orbigny) - Avsar et al., p. 135, Pl. 3, fig. 9
Subfamily: Pulleniinae Schwager, 1877
Genus: Melonis De Montfort, 1808
Melonis barleeanum (Williamson) (Pl. 6, figs. 14 & 15)
1858 Nonionina barleeana Williamson 1930 Nonion barleeanum (Williamson) -
Cushman, p. 11, Pl. 4, fig. 5 1958 Nonion barleeanum (Williamson) - Parker,
p. 258, Pl. 1, figs. 36 & 37 1958 Nonion barleeanum (Williamson) - Todd,
p. 190, Pl. 1, fig. 7 1979 Melonis barleeanum (Williamson) -
Corliss, p. 10, Pl. 5, figs. 7 & 8
126
Chapter 6
1987 Nonion barleeanum (Williamson) - Jorissen, p. 43, Pl. 4, fig. 8
1988 Melonis barleeanum (Williamson) - Loeblich & Tappan, p. 180, Pl. 696, figs. 5 & 6
1990 Melonis barleeanum (Williamson) - Sprovieri & Hasegawa, p. 457, Pl. 3, figs. 7 & 8
1993 Melonis barleeanum (Williamson) - Sgarrella & Moncharmont Zei, p. 242, Pl. 26, figs. 1 & 2
2003 Melonis barleeanum (Williamson) - Sen Gupta, p. 191, text-fig. 11.5, no. 6
2004 Melonis barleeanum (Williamson) - Chendes et al., p. 76, Pl. 4, fig. 1
Melonis affinis (Reuss) (Pl. 6, figs. 16 & 17)
1851 Nonionina affinis Reuss 1978 Nonion affine (Reuss) - Boltovskoy, p. 162,
Pl. 5, figs. 1 & 2 1990 Melonis affinis (Reuss) - Sprovieri &
Hasegawa, p. 457, Pl. 34, figs. 11 & 12 1994 Melonis affinis (Reuss) - Jones, p. 107, Pl.
109, figs. 8 & 9 2009 Melonis pompilioides (Fichtel & Moll) - Avsar
et al., p. 135, Pl. 3, figs. 10 & 11
Genus: Pullenia Parker & Jones, 1862
Pullenia quadriloba (Reuss)
1867 Pullenia compressiuscula Reuss var. quadriloba Reuss
1978 Pullenia quadriloba (Reuss) - Boltovskoy, p. 166, Pl. 6, fig. 20
1990 Pullenia quadriloba (Reuss) - Sprovieri & Hasegawa, p. 457, Pl. 3, figs. 19 & 20
Superfamily: Chilostomellacea Brady, 1881
Family: Alabaminidae Hofker, 1951
Genus: Svratkina Pokorny, 1956
Svratkina sp. 1
Remarks: The test is trochospiral and biconvex.
The spiral side is evolute and rather flattened. Six
crescentic chambers are visible in the final whorl
of the spiral side. Sutures are oblique and
curved. The umbilical side is involute and convex
with radial sutures. The periphery is rounded.
The wall is calcareous, and coarsely perforate on
the spiral side and near the periphery of the
umbilical side. The aperture is an elongate,
oblique opening in a slight depression, extending
from near the umbilicus to the face of the last
chamber.
Family: Gavelinellidae Hofker, 1956
Subfamily: Gavelinellinae Hofker, 1956
Genus: Discanomalina Asano, 1951
Discanomalina semipunctata (Bailey)
1851 Rotalina semipunctata Bailey 1978 Discanomalina semipunctata (Bailey) -
Medioli & Scott, p. 296, Pl. 1, figs. 13-16 1988 Discanomalina semipunctata (Bailey) -
Loeblich & Tappan, p. 185, Pl. 718, figs. 1-9
Genus: Gyroidina d’Orbigny, 1826
Gyroidina neosoldanii Brotzen (Pl. 6, figs. 20 & 21)
1936 Gyroidina neosoldanii Brotzen 1993 Gyroidina neosoldanii Brotzen - Sgarrella
& Moncharmont Zei, p. 241, Pl. 25, figs. 5 & 6
Gyroidina umbonata (Silvestri) (Pl. 6, figs. 18 & 19)
1898 Rotalia soldanii d’Orbigny var. umbonata Silvestri
1958 Gyroidinia umbonata (Silvestri) - Parker, p. 266, Pl. 3, figs. 19 & 20
1958 Gyroidinia umbonata (Silvestri) - Todd, p. 197, Pl. 1, fig. 18
1992 Gyroidinia umbonata (Silvestri) - Schiebel, p. 48, Pl. 4, fig. 8
1993 Gyroidinia umbonata (Silvestri) - Sgarrella & Moncharmont Zei, p. 241, Pl. 25, figs. 1 & 2
2005 Gyroidinoides umbonata (Silvestri) - Rasmussen, p. 106, Pl. 17, figs. 9-11
Family: Trichohyalidae Saidova, 1981
Genus: Buccella Andersen, 1952
Buccella granulata (Di Napoli Alliata) (Pl. 7, figs. 1 & 2)
1952 Eponidus frigidus granulatus Di Napoli
Alliata 1987 Buccella granulata (Di Napoli Alliata) -
Alberola et al., p. 308, Pl. 4, fig. 15
127
Taxonomy of modern benthic foraminifera in the Mediterranean Sea
1987 Buccella granulata (Di Napoli Alliata) - Jorissen, p. 41, Pl. 3, fig. 5
1993 Buccella granulata (Di Napoli Alliata) - Sgarrella & Moncharmont Zei, 1993, p. 216, Pl. 16, figs. 6 & 7
1995 Buccella granulata (Di Napoli Alliata) - Coppa & Di Tuoro, p. 168, Pl. 2, figs. 7 & 14
2005 Buccella granulata (Di Napoli Alliata) - Rasmussen, p. 107, Pl. 18, figs. 1-3
Superfamily: Rotaliacea Ehrenberg, 1839
Family: Rotaliidae Ehrenberg, 1839
Subfamily: Rotaliinae Ehrenberg, 1839
Genus: Ammonia Bruennich, 1772
Ammonia beccarii (Linné) (Pl. 7, figs. 5 & 6)
1767 Nautilus beccarii Linné 1931 Rotalia beccarii (Linné) - Cushman, p. 58, Pl.
12, figs. 1-7; Pl. 13, figs. 1 & 2 1960 Streblus beccarii (Linné) - Hofker, p. 255, Pl.
E, fig. 134 2009 Ammonia beccarii (Linné) - Frezza & Carboni,
p. 55, Pl. 1, figs. 5 & 12
Ammonia parkinsonia (d’Orbigny) (Pl. 7, figs. 3 & 4)
1839 Rosalina parkinsonia d’Orbigny 1960 Streblus parkinsonianus (d’Orbigny) - Hofker,
p. 254, Pl. E. fig. 132 1990 Ammonia parkinsonia (d’Orbigny) - Cimerman
& Langer, p. 76, Pl. 87, figs. 7-9 1993 Ammonia parkinsonia (d’Orbigny) - Sgarrella
& Moncharmont Zei, p. 228, Pl. 20, figs. 3 & 4 2004 Ammonia parkinsonia (d’Orbigny) - Chendes
et al., p. 76, Pl. 4, fig. 4 2005 Ammonia parkinsonia (d’Orbigny) -
Rasmussen, p. 107, Pl. 18, figs. 5-8 2006 Ammonia parkinsonia (d’Orbigny) - Avsar et
al., p. 133, Pl. 3, figs. 15 & 16
Family: Elphidiidae Galloway, 1933
Subfamily: Elphidiinae Galloway, 1933
Genus: Elphidium De Montfort, 1808
Elphidium aculeatum (d’Orbigny) (Pl. 7, fig. 7)
1846 Polystomella aculeata d’Orbigny, p. 131, Tab. 6, figs. 27 & 28
1991 Elphidium aculeatum (d’Orbigny) - Cimerman & Langer, p. 77, Pl. 89, figs. 1-4
1994 Elphidium aculeatum (d’Orbigny) - Jones, p. 109, Pl. 110, fig. 10
2005 Elphidium aculeatum (d’Orbigny) - Rasmussen, p. 108, Pl. 18, fig. 12
Elphidium advenum (Cushman) (Pl. 7, fig. 8)
1922 Polystomella advena Cushman 1933 Elphidium advenum (Cushman) -
Cushman, p. 50, Pl. 12, figs. 1-3 1958 Elphidium advena (Cushman) - Parker, p.
269, Pl. 4, figs. 3 & 4 1993 Elphidium advenum (Cushman) -
Hottinger et al., p. 146, Pl. 207, figs. 1-7 1993 Elphidium punctatum (Terquem) -
Sgarrella & Moncharmont Zei, p. 230, Pl. 21, figs. 3 & 4
1995 Elphidium punctatum (Terquem) - Coppa & Di Tuoro, p. 172, Pl. 4, fig. 11
2005 Elphidium advenum (Cushman) - Rasmussen, p. 108, Pl. 18, figs. 13-15
Elphidium complanatum (d’Orbigny) (Pl. 7, figs. 9 & 10)
1839 Polystomella complanata d’Orbigny 1958 Elphidium complanatum (d’Orbigny) -
Parker, p. 270, Pl. 4, fig. 5 1933 Elphidium jenseni (Cushman) - Cushman,
p. 48, Pl. 11, figs. 6 & 7 1991 Elphidium jenseni (Cushman) - Cimerman
& Langer, p. 78, Pl. 92, figs. 1-3 1993 Elphidium jenseni (Cushman) - Hottinger
et al., p. 148, Pl. 211, figs. 8-14 1993 Elphidium complanatum (d’Orbigny) -
Sgarrella & Moncharmont Zei, p. 228, Pl. 20, figs. 9 & 10
2005 Elphidium complanatum (d’Orbigny) - Rasmussen, p. 109, Pl. 19, fig. 2
2006 Elphidium complanatum (d’Orbigny) - Avsar et al., p. 134, Pl. 3, fig. 19
Elphidium complanatum var. tyrrhenianum Accordi (Pl. 7, fig. 13)
1951 Elphidium complanatum (d’Orbigny) var. tyrrhenianum Accordi
2005 Elphidium complanatum (d’Orbigny) var. tyrrhenianum Accordi - Rasmussen, p. 109, Pl. 19, fig. 3
Elphidium crispum (Linné) (Pl. 7, fig. 11 & 12)
1758 Nautilus crispum Linné 1846 Polystomella crispa Lamarck - D’Orbigny,
p. 125, Tab. 6, figs. 9-14 1914 Polystomella crispa (Linné) - Cushman, p.
32, Pl. 18, figs. 1 a & b
128
Chapter 6
1933 Elphidium crispum (Linné) - Cushman, p. 47, Pl. 11, fig. 4
1960 Elphidium crispum (Linné) - Hofker, p. 258, Pl. F, fig. 184
1987 Elphidium crispum (Linné) - Alberola et al., p. 322, Pl. 4, fig. 2
1987 Elphidium crispum forma crispum (Linné) - Jorissen, p. 41, Pl. 3, fig. 8
1988 Elphidium crispum (Linné) - Loeblich & Tappan, p. 199, Pl. 786, figs. 8 & 9; Pl. 787, figs. 1-5
1991 Elphidium crispum (Linné) - Cimerman & Langer, p. 77, Pl. 90, figs. 1-6
1993 Elphidium crispum (Linné) - Sgarrella & Moncharmont Zei, p. 228, Pl. 20, fig. 11
2005 Elphidium crispum (Linné) - Rasmussen, p. 109, Pl. 19, fig. 4
2006 Elphidium crispum (Linné) - Avsar et al., p. 134, Pl. 3, fig. 20
2009 Elphidium crispum (Linné) - Avsar et al., p. 135, Pl. 3, figs. 19 & 20
2009 Elphidium crispum (Linné) - Frezza & Carboni, p. 55, Pl. 1, fig. 16
Elphidium granosum (d’Orbigny) (Pl. 7, fig. 14)
1826 Nonionina granosa d’Orbigny 1958 Elphidium granosum (d’Orbigny) - Parker, p.
270, Pl. 4, figs. 10 & 11 1987 Elphidium granosum forma granosum
(d’Orbigny) - Jorissen, p. 39, Pl. 2, figs. 1 & 2 1993 Elphidium granosum (d’Orbigny) - Sgarrella &
Moncharmont Zei, p. 229, Pl. 21, figs. 1 & 2 1995 Cibroelphidium granosum (d’Orbigny) -
Coppa & Di Tuoro, p. 172, Pl. 4, fig. 2 2004 Porosononion granosum (d’Orbigny) -
Chendes et al., p. 76, Pl. 4, fig. 7 2005 Elphidium granosum (d’Orbigny) -
Rasmussen, p. 110, Pl. 19, fig. 8 2009 Porosononion subgranosum (Egger) - Avsar
et al., p. 135, Pl. 3, fig. 17 & 18 2009 Elphidium granosum (d’Orbigny) - Frezza &
Carboni, p. 57, Pl. 2, fig. 5
Elphidium incertum (Williamson) (Pl. 7, fig. 15)
1858 Polystomella incertum Williamson 1930 Elphidium incertum (Williamson) - Cushman,
p. 18, Pl. 7, figs. 4-9 1993 Elphidium incertum (Williamson) - Sgarrella &
Moncharmont Zei, p. 229, Pl. 21, fig. 5 2005 Elphidium excavatum (Terquem) -
Rasmussen, p. 110, Pl. 19, figs. 6 & 7
Elphidium macellum (Fichtel & Moll) (Pl. 7, fig. 16)
1798 Nautilus macellus Fichtel & Moll 1914 Elphidium macellum (Fichtel & Moll) -
Cushman, p. 33, Pl. 18, figs. 3a & b
1987 Elphidium crispum forma macellum (Fichtel & Moll) - Jorissen, p. 41, Pl. 3, figs. 9 a & b
1988 Elphidium macellum (Fichtel & Moll) - Loeblich & Tappan, p. 199, Pl. 789, figs. 1-5
1993 Elphidium macellum (Fichtel & Moll) - Sgarrella & Moncharmont Zei, p. 229, Pl. 20, fig. 12
2002 Elphidium macellum (Fichtel & Moll) - Kaminski, p. 179, Pl. 5, fig. 11
2004 Elphidium macellum (Fichtel & Moll)- Jones, p. 109, Pl. 110, figs. 8 & 11
2005 Elphidium macellum (Fichtel & Moll) - Rasmussen, p. 110, Pl. 19, fig. 10
Elphidium margaritaceum (Cushman)
1930 Elphidium advenum var. margaritaceum Cushman
1991 Elphidium margaritaceum (Cushman) - Cimerman & Langer, p. 79, Pl. 92, figs. 4-6
1993 Elphidium pulvereum Todd - Sgarrella & Moncharmont Zei, p. 230, Pl. 21, fig. 6
2005 Elphidium margaritaceum (Cushman) - Rasmussen, p. 111, Pl. 19, figs. 13 & 14
Elphidium translucens Natland (Pl. 7, fig. 17)
1938 Elphidium translucens Natland 1991 Elphidium translucens Natland -
Cimerman & Langer, p. 79, Pl. 92, figs. 7-11
2002 Elphidium translucens Natland - Kaminski et al., p. 176, Pl. 5, fig. 12
2009 Elphidium translucens Natland - Frezza & Carboni, p. 55, Pl. 1, fig. 15
Elphidium sp. 1 (pl. 7, fig. 18)
1991 Elphidium sp. 4 - Cimerman & Langer, p. 80, Pl. 91, figs. 5 & 6
Remarks: The test is planispiral, involute and
lamellar. It is subcircular in lateral view, and
broadly lenticular in profile view. The
peripheral margin is acute and carinate. The
at least 18 chambers in the adult coil are
narrow and gradually increase when added.
Sutures are arranged as rips and curved
backwards. They are connected by at least 14
ponticuli (in the adult chambers) providing
129
Taxonomy of modern benthic foraminifera in the Mediterranean Sea
130
slightly elongated fossettes. The wall is
calcareous, finely and densely perforate.
Parrellina verriculata (Brady) (Pl. 7, figs. 19 & 20)
1881 Polystomella verriculata Brady 1958 Parrellina verriculata (Brady) - Parker, p. 271,
Pl. 4, fig. 7 1993 Parrellina verriculata (Brady) - Sgarrella &
Moncharmont Zei, p. 232, Pl. 21, fig. 7

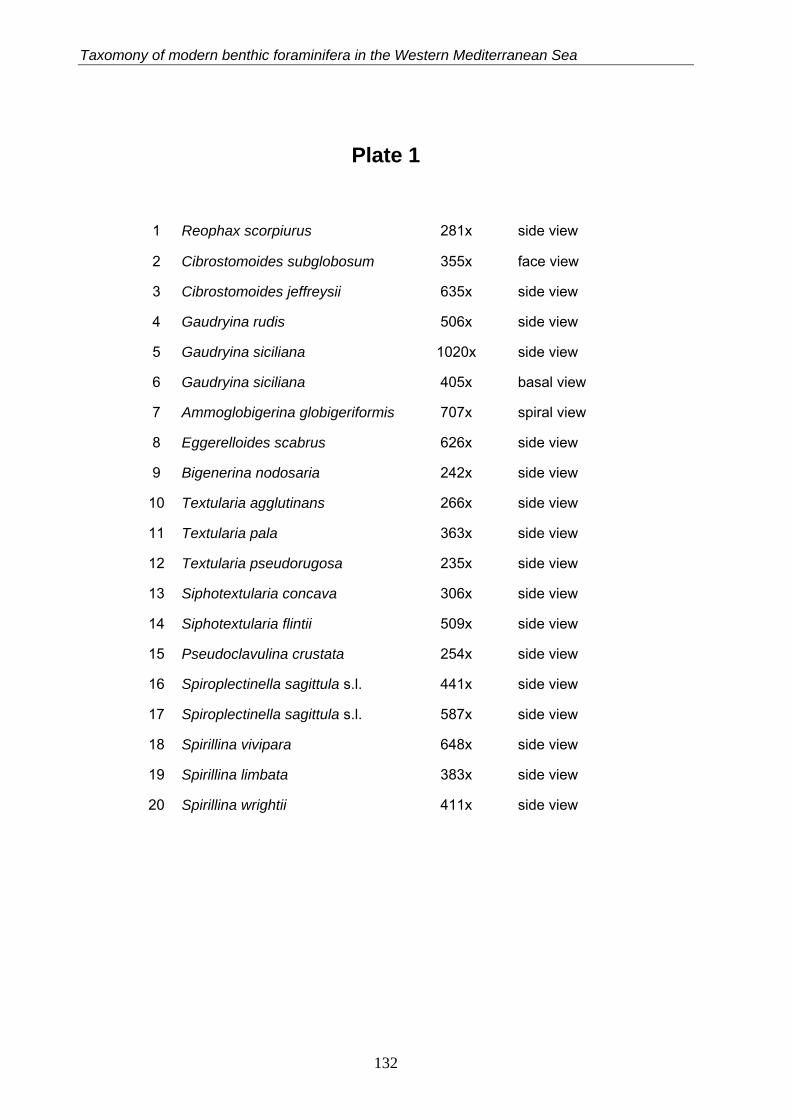
Taxomony of modern benthic foraminifera in the Western Mediterranean Sea
Plate 1
1 Reophax scorpiurus 281x side view
2 Cibrostomoides subglobosum 355x face view
3 Cibrostomoides jeffreysii 635x side view
4 Gaudryina rudis 506x side view
5 Gaudryina siciliana 1020x side view
6 Gaudryina siciliana 405x basal view
7 Ammoglobigerina globigeriformis 707x spiral view
8 Eggerelloides scabrus 626x side view
9 Bigenerina nodosaria 242x side view
10 Textularia agglutinans 266x side view
11 Textularia pala 363x side view
12 Textularia pseudorugosa 235x side view
13 Siphotextularia concava 306x side view
14 Siphotextularia flintii 509x side view
15 Pseudoclavulina crustata 254x side view
16 Spiroplectinella sagittula s.l. 441x side view
17 Spiroplectinella sagittula s.l. 587x side view
18 Spirillina vivipara 648x side view
19 Spirillina limbata 383x side view
20 Spirillina wrightii 411x side view
132
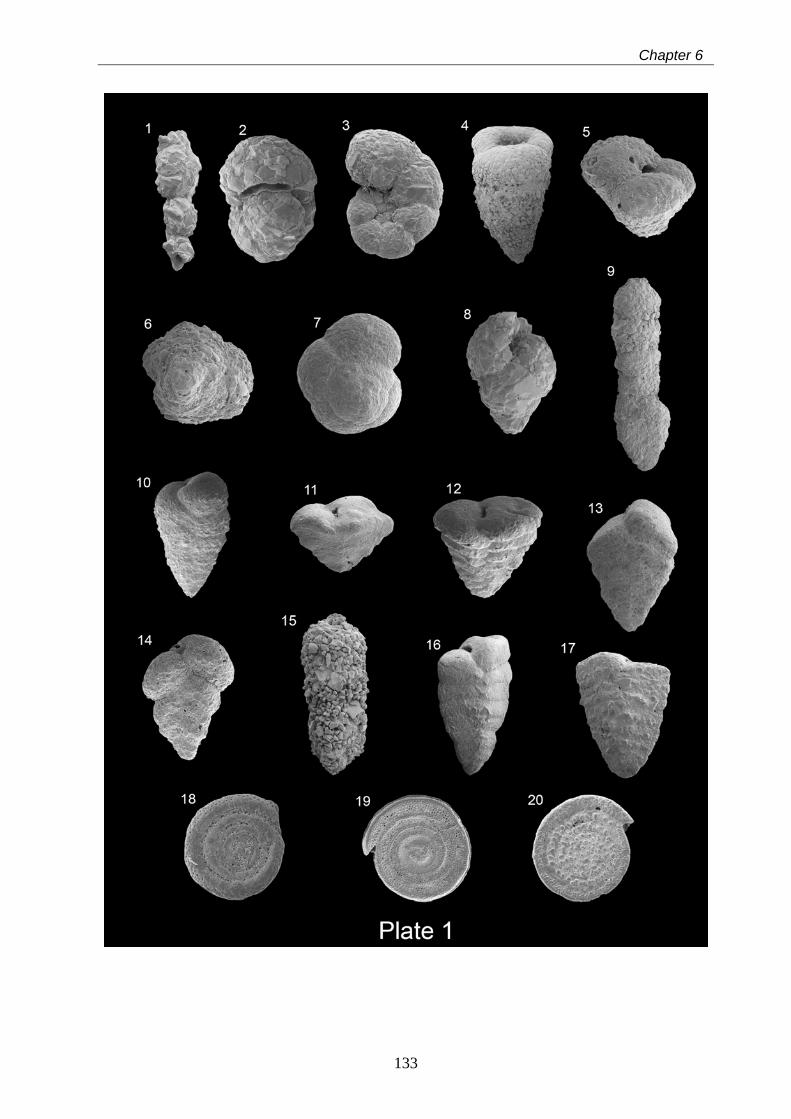
Chapter 6
133
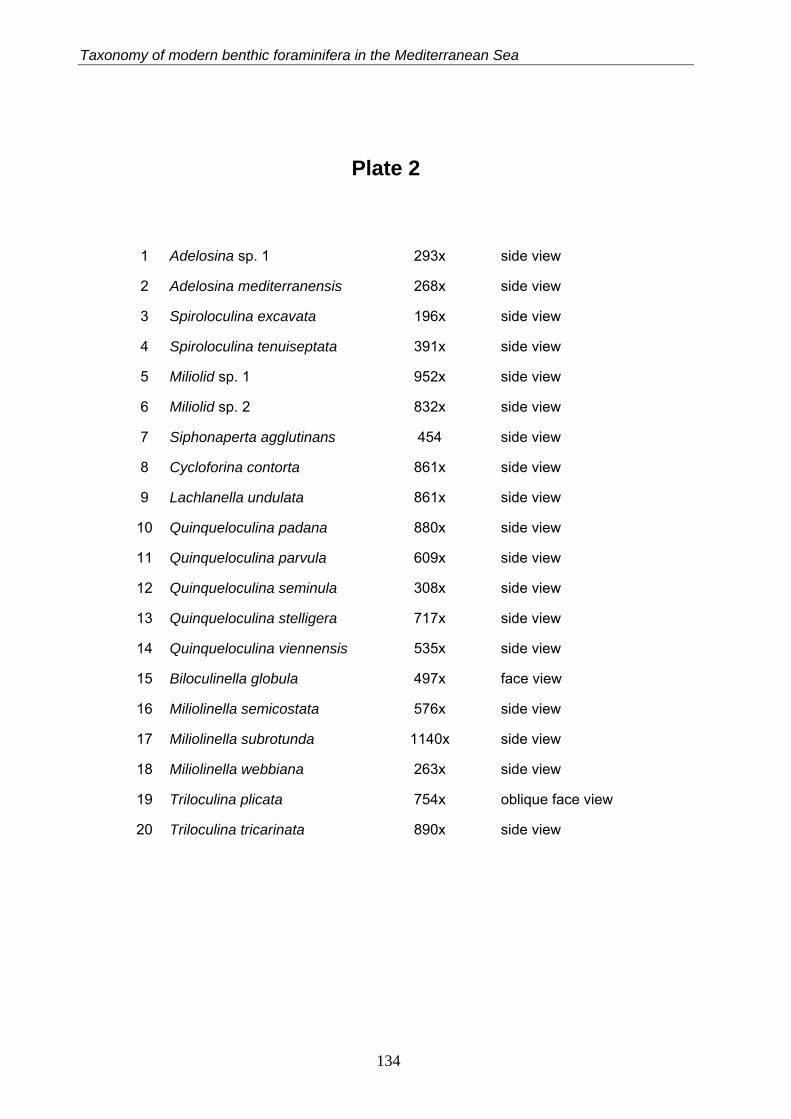
Taxonomy of modern benthic foraminifera in the Mediterranean Sea
Plate 2
1 Adelosina sp. 1 293x side view
2 Adelosina mediterranensis 268x side view
3 Spiroloculina excavata 196x side view
4 Spiroloculina tenuiseptata 391x side view
5 Miliolid sp. 1 952x side view
6 Miliolid sp. 2 832x side view
7 Siphonaperta agglutinans 454 side view
8 Cycloforina contorta 861x side view
9 Lachlanella undulata 861x side view
10 Quinqueloculina padana 880x side view
11 Quinqueloculina parvula 609x side view
12 Quinqueloculina seminula 308x side view
13 Quinqueloculina stelligera 717x side view
14 Quinqueloculina viennensis 535x side view
15 Biloculinella globula 497x face view
16 Miliolinella semicostata 576x side view
17 Miliolinella subrotunda 1140x side view
18 Miliolinella webbiana 263x side view
19 Triloculina plicata 754x oblique face view
20 Triloculina tricarinata 890x side view
134
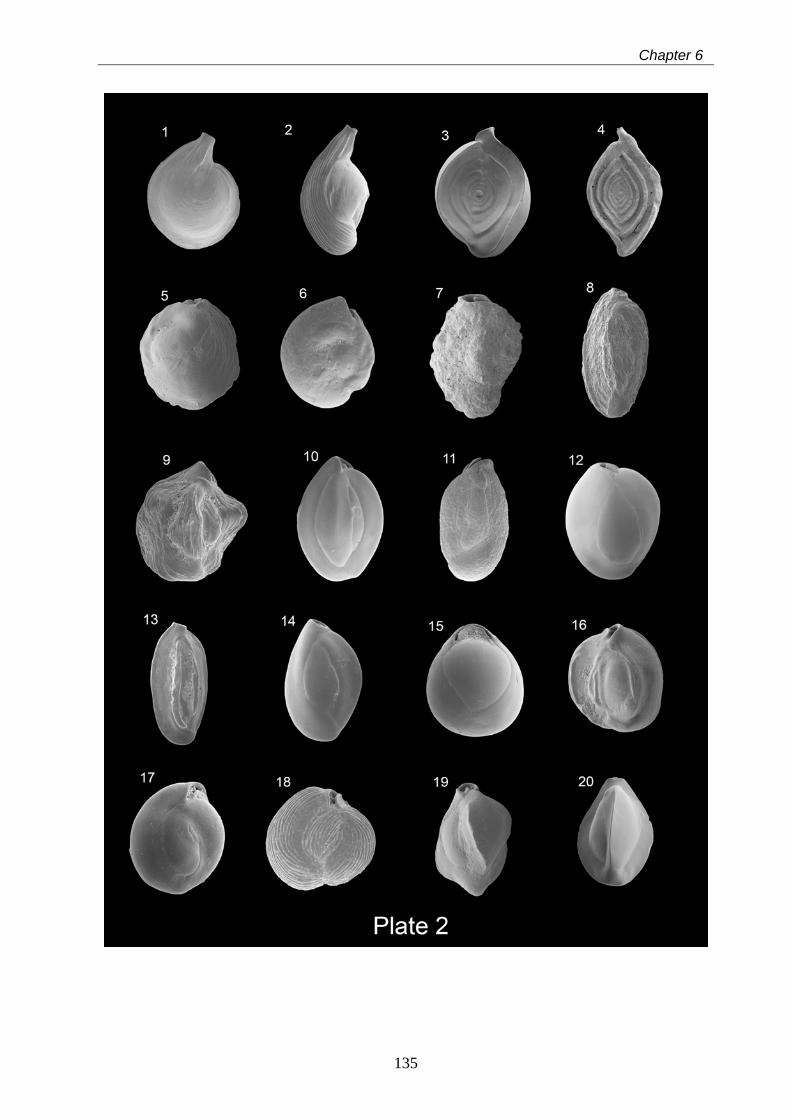
Chapter 6
135
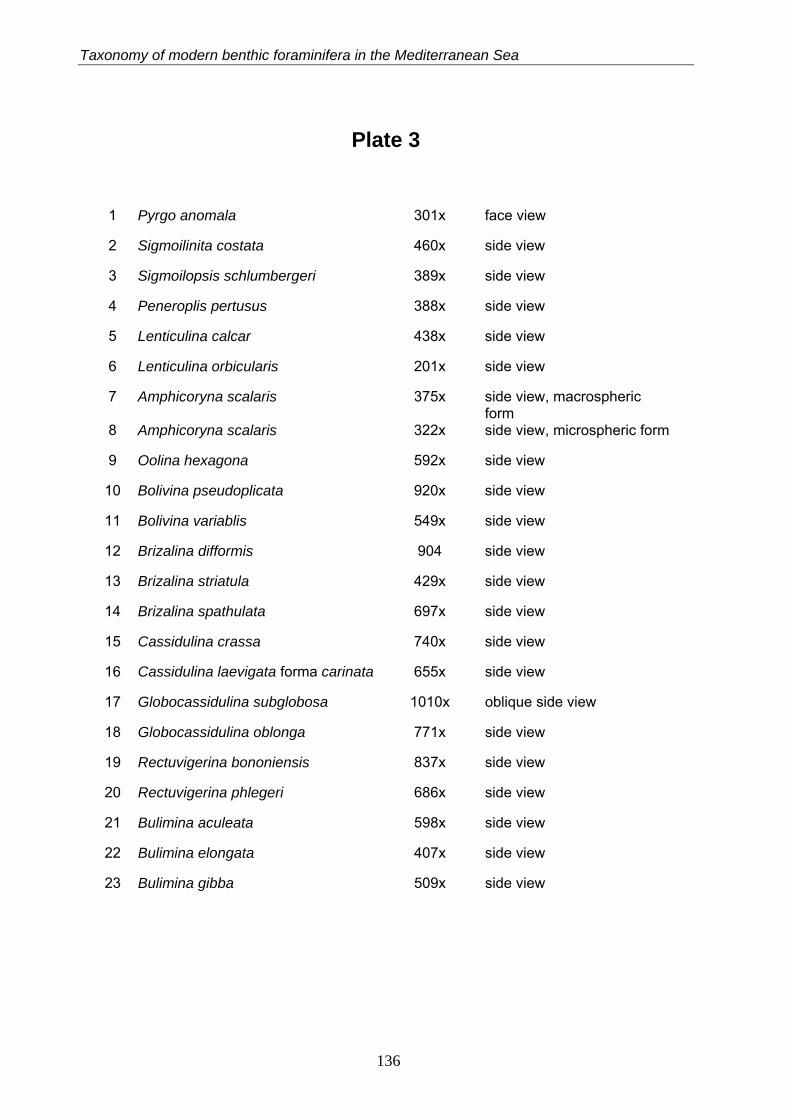
Taxonomy of modern benthic foraminifera in the Mediterranean Sea
Plate 3
1 Pyrgo anomala 301x face view
2 Sigmoilinita costata 460x side view
3 Sigmoilopsis schlumbergeri 389x side view
4 Peneroplis pertusus 388x side view
5 Lenticulina calcar 438x side view
6 Lenticulina orbicularis 201x side view
7 Amphicoryna scalaris 375x side view, macrospheric form
8 Amphicoryna scalaris 322x side view, microspheric form
9 Oolina hexagona 592x side view
10 Bolivina pseudoplicata 920x side view
11 Bolivina variablis 549x side view
12 Brizalina difformis 904 side view
13 Brizalina striatula 429x side view
14 Brizalina spathulata 697x side view
15 Cassidulina crassa 740x side view
16 Cassidulina laevigata forma carinata 655x side view
17 Globocassidulina subglobosa 1010x oblique side view
18 Globocassidulina oblonga 771x side view
19 Rectuvigerina bononiensis 837x side view
20 Rectuvigerina phlegeri 686x side view
21 Bulimina aculeata 598x side view
22 Bulimina elongata 407x side view
23 Bulimina gibba 509x side view
136
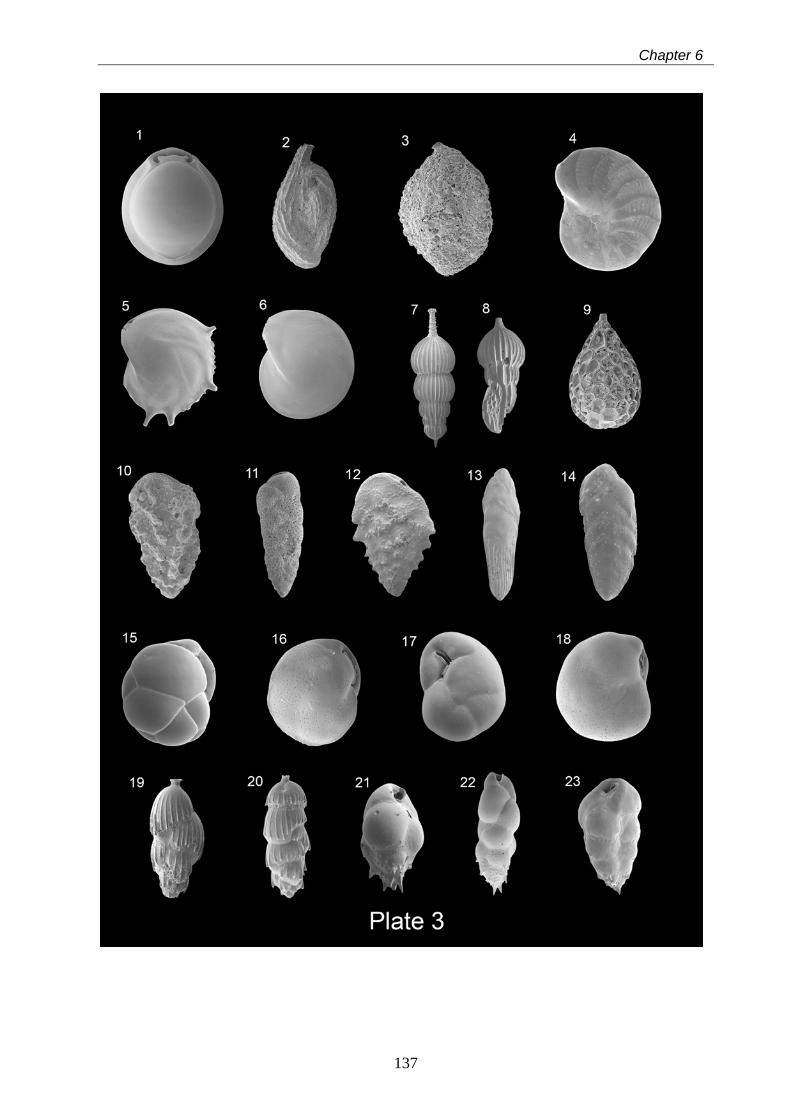
Chapter 6
137
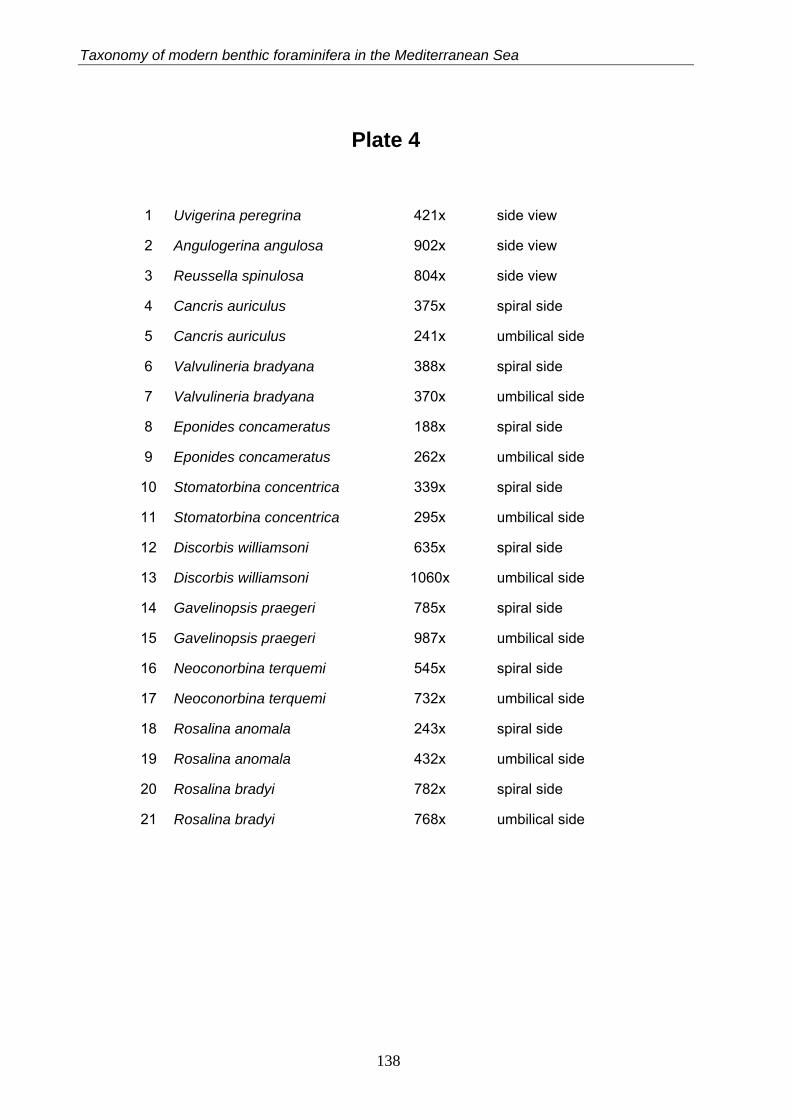
Taxonomy of modern benthic foraminifera in the Mediterranean Sea
Plate 4
1 Uvigerina peregrina 421x side view
2 Angulogerina angulosa 902x side view
3 Reussella spinulosa 804x side view
4 Cancris auriculus 375x spiral side
5 Cancris auriculus 241x umbilical side
6 Valvulineria bradyana 388x spiral side
7 Valvulineria bradyana 370x umbilical side
8 Eponides concameratus 188x spiral side
9 Eponides concameratus 262x umbilical side
10 Stomatorbina concentrica 339x spiral side
11 Stomatorbina concentrica 295x umbilical side
12 Discorbis williamsoni 635x spiral side
13 Discorbis williamsoni 1060x umbilical side
14 Gavelinopsis praegeri 785x spiral side
15 Gavelinopsis praegeri 987x umbilical side
16 Neoconorbina terquemi 545x spiral side
17 Neoconorbina terquemi 732x umbilical side
18 Rosalina anomala 243x spiral side
19 Rosalina anomala 432x umbilical side
20 Rosalina bradyi 782x spiral side
21 Rosalina bradyi 768x umbilical side
138
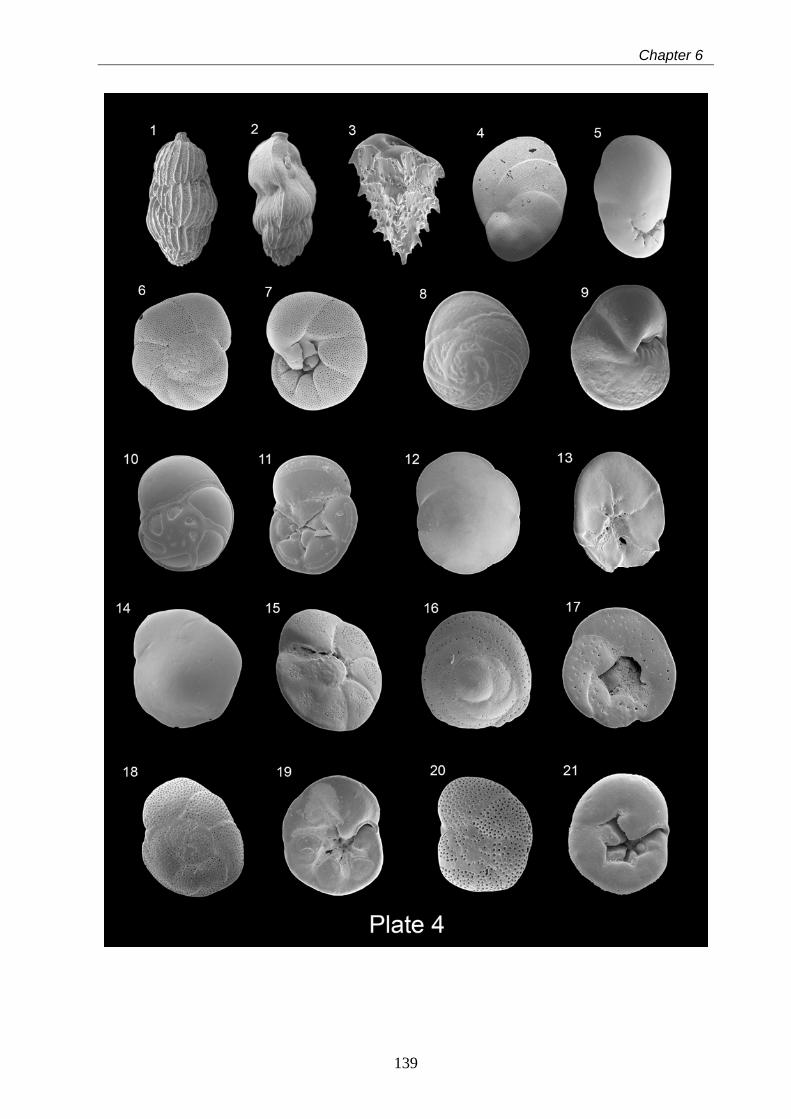
Chapter 6
139
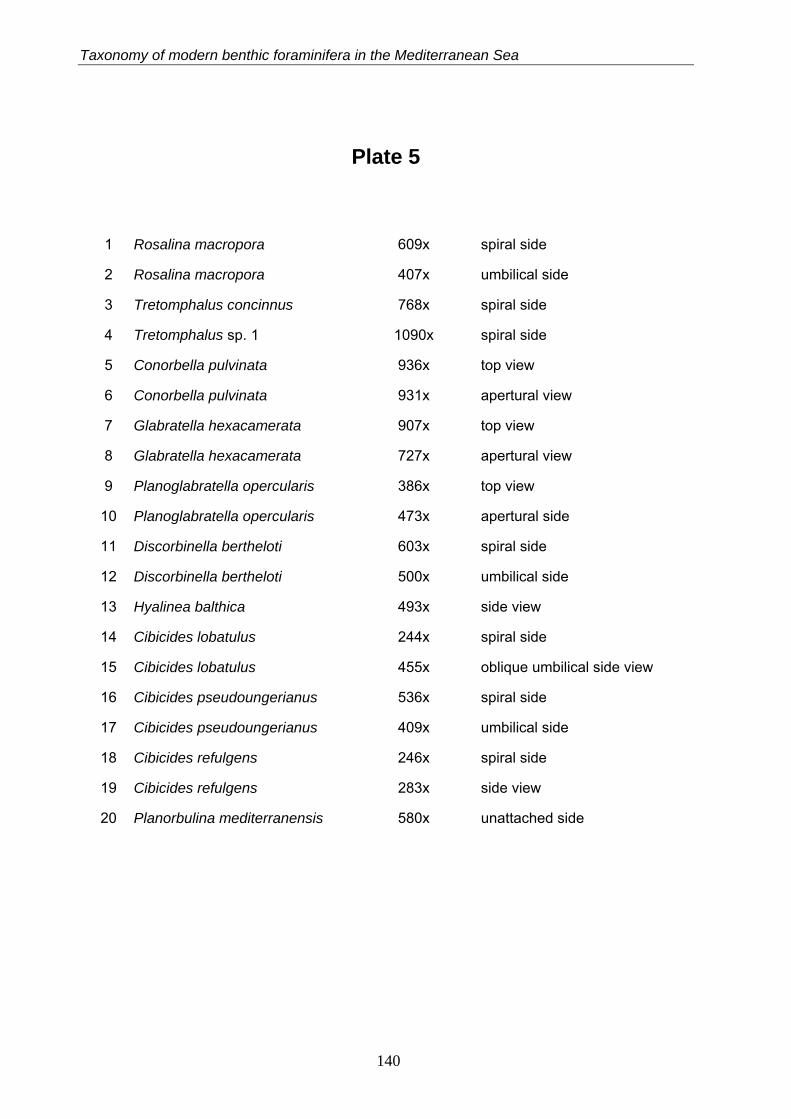
Taxonomy of modern benthic foraminifera in the Mediterranean Sea
Plate 5
1 Rosalina macropora 609x spiral side
2 Rosalina macropora 407x umbilical side
3 Tretomphalus concinnus 768x spiral side
4 Tretomphalus sp. 1 1090x spiral side
5 Conorbella pulvinata 936x top view
6 Conorbella pulvinata 931x apertural view
7 Glabratella hexacamerata 907x top view
8 Glabratella hexacamerata 727x apertural view
9 Planoglabratella opercularis 386x top view
10 Planoglabratella opercularis 473x apertural side
11 Discorbinella bertheloti 603x spiral side
12 Discorbinella bertheloti 500x umbilical side
13 Hyalinea balthica 493x side view
14 Cibicides lobatulus 244x spiral side
15 Cibicides lobatulus 455x oblique umbilical side view
16 Cibicides pseudoungerianus 536x spiral side
17 Cibicides pseudoungerianus 409x umbilical side
18 Cibicides refulgens 246x spiral side
19 Cibicides refulgens 283x side view
20 Planorbulina mediterranensis 580x unattached side
140
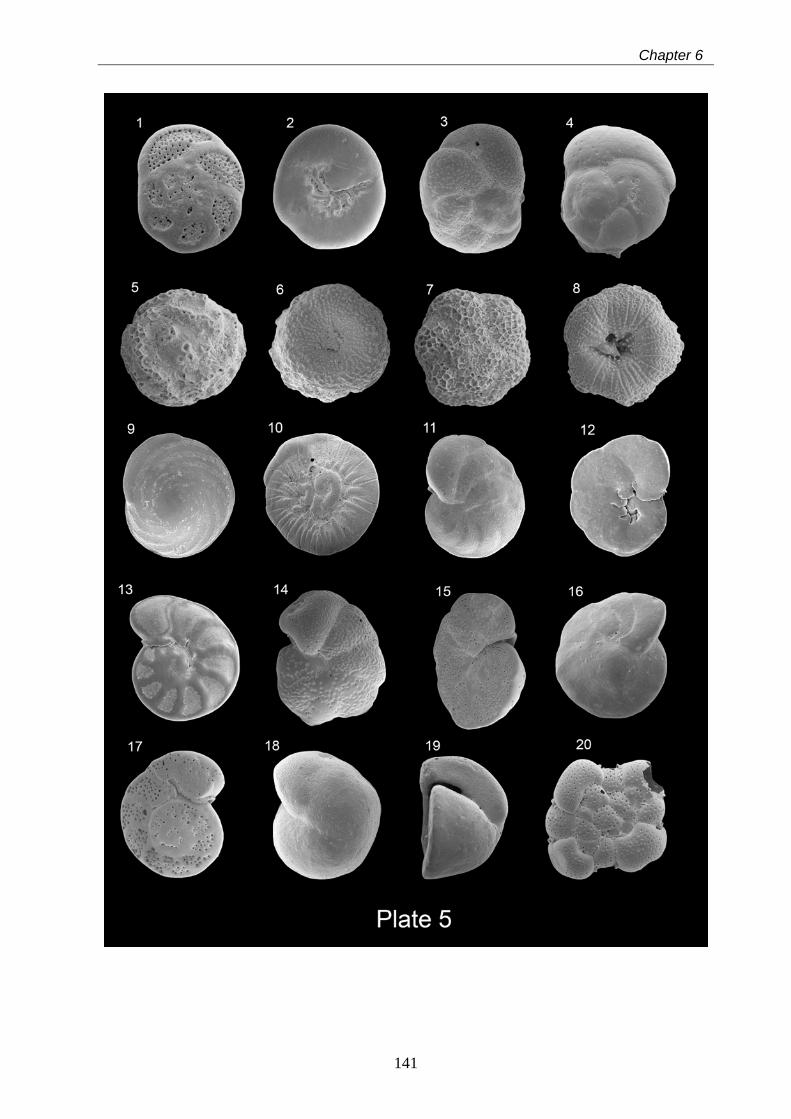
Chapter 6
141
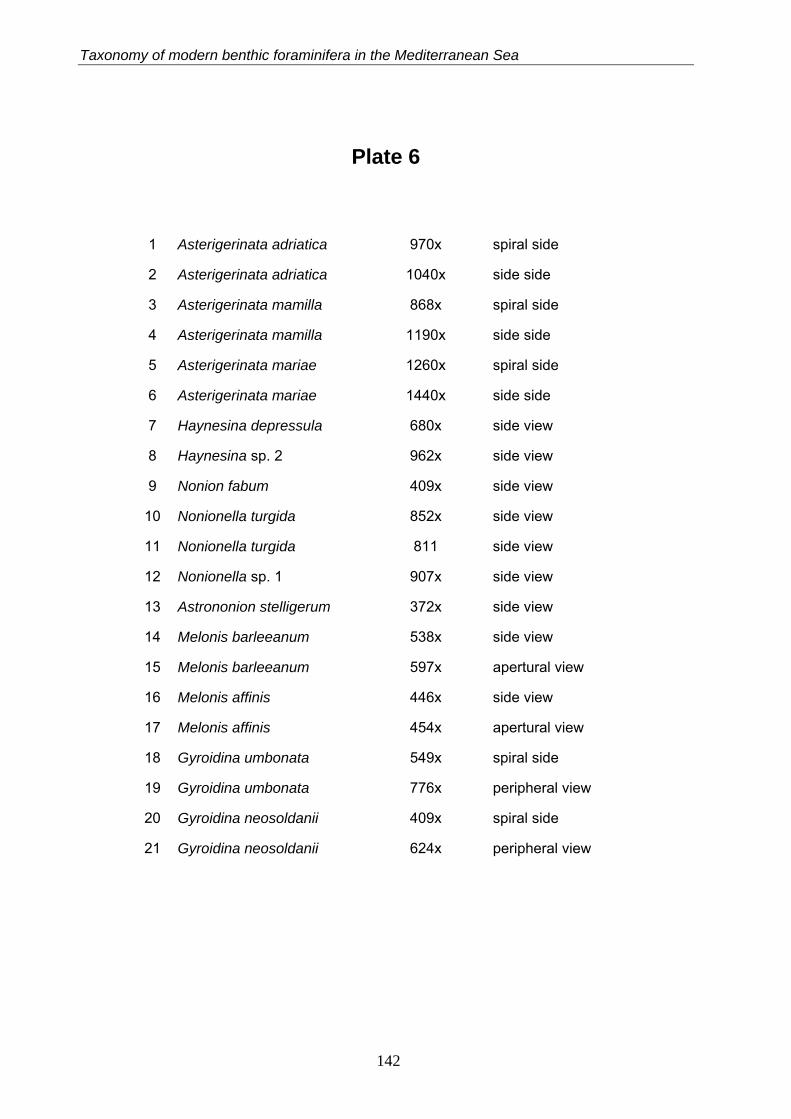
Taxonomy of modern benthic foraminifera in the Mediterranean Sea
Plate 6
1 Asterigerinata adriatica 970x spiral side
2 Asterigerinata adriatica 1040x side side
3 Asterigerinata mamilla 868x spiral side
4 Asterigerinata mamilla 1190x side side
5 Asterigerinata mariae 1260x spiral side
6 Asterigerinata mariae 1440x side side
7 Haynesina depressula 680x side view
8 Haynesina sp. 2 962x side view
9 Nonion fabum 409x side view
10 Nonionella turgida 852x side view
11 Nonionella turgida 811 side view
12 Nonionella sp. 1 907x side view
13 Astrononion stelligerum 372x side view
14 Melonis barleeanum 538x side view
15 Melonis barleeanum 597x apertural view
16 Melonis affinis 446x side view
17 Melonis affinis 454x apertural view
18 Gyroidina umbonata 549x spiral side
19 Gyroidina umbonata 776x peripheral view
20 Gyroidina neosoldanii 409x spiral side
21 Gyroidina neosoldanii 624x peripheral view
142
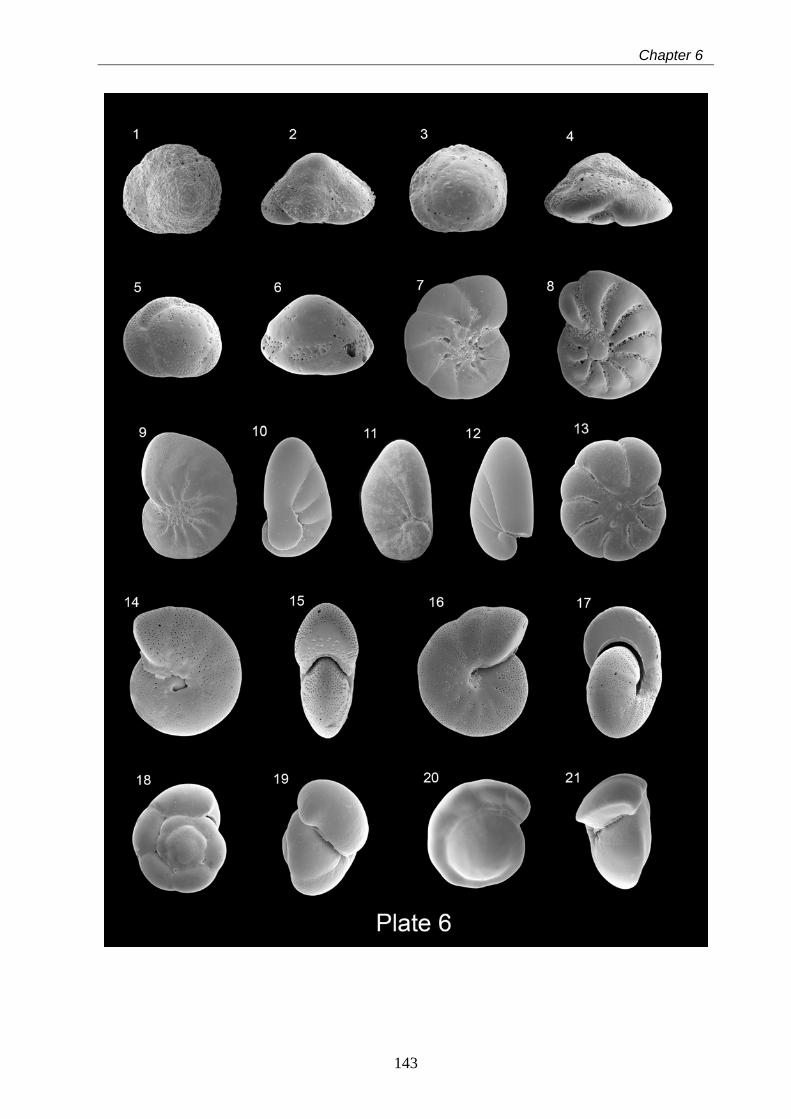
Chapter 6
143
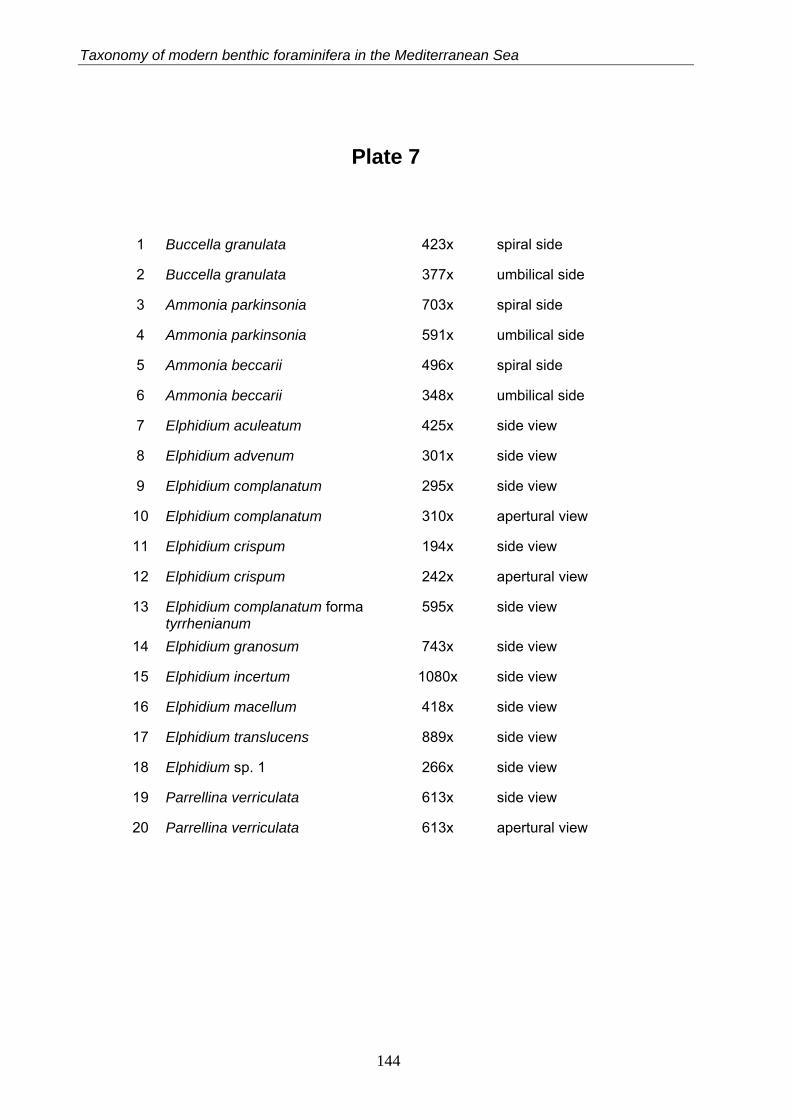
Taxonomy of modern benthic foraminifera in the Mediterranean Sea
Plate 7
1 Buccella granulata 423x spiral side
2 Buccella granulata 377x umbilical side
3 Ammonia parkinsonia 703x spiral side
4 Ammonia parkinsonia 591x umbilical side
5 Ammonia beccarii 496x spiral side
6 Ammonia beccarii 348x umbilical side
7 Elphidium aculeatum 425x side view
8 Elphidium advenum 301x side view
9 Elphidium complanatum 295x side view
10 Elphidium complanatum 310x apertural view
11 Elphidium crispum 194x side view
12 Elphidium crispum 242x apertural view
13 Elphidium complanatum forma tyrrhenianum
595x side view
14 Elphidium granosum 743x side view
15 Elphidium incertum 1080x side view
16 Elphidium macellum 418x side view
17 Elphidium translucens 889x side view
18 Elphidium sp. 1 266x side view
19 Parrellina verriculata 613x side view
20 Parrellina verriculata 613x apertural view
144
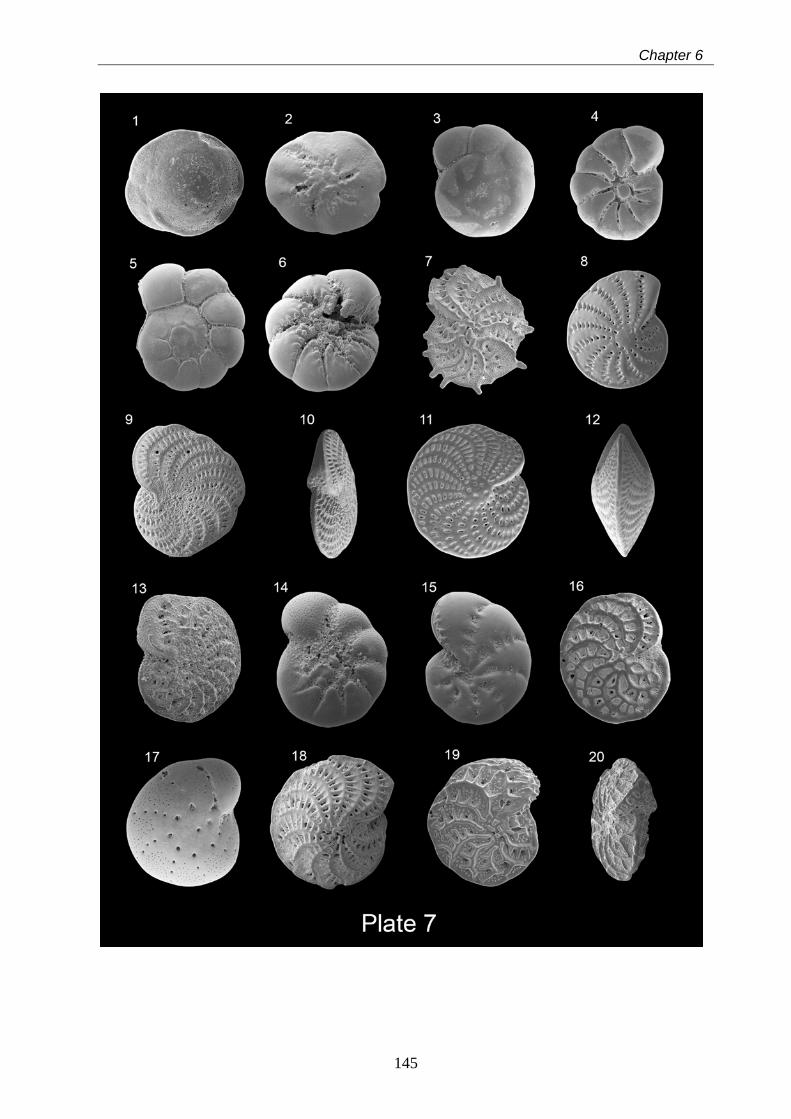
Chapter 6
145

7 Conclusions and outlook
7.1 Conclusions
The aims of this thesis were (1) the analyses of Recent live and dead benthic shelf foraminiferal
assemblages and the species-environment relationships in the western Mediterranean Sea, (2)
the reconstruction of the relative sea-level development in the study areas during the latest glacial
and Holocene, (3) the evaluation of climatic impacts on Mallorcan shelf ecosystems during the
Holocene, and (4) a systematic description of the benthic shelf foraminifera investigated during
this work.
The cool-water carbonate areas in the western Mediterranean Sea are characterized by diverse
benthic foraminiferal faunas. The Recent thanatocoenoses from the shallower sites, (40 - ~80 m
water depth) consist of assemblages dominated by epifaunal species such as Asterigerinata
mamilla, Neoconorbina terquemi, Rosalina macropora and various Cibicides and Elphidium taxa.
These species are permanently or temporarily attached to carbonate fragments derived from
rhodoliths. A distinct faunal change between approximately 80 to 94 m water depth has been
observed in all areas. On the Mallorca Shelf, the lower bathymetric limit of the shallower water
assemblages coincides with the lower distribution limit of living rhodoliths, tracing the boundary of
the photic zone. The assemblages from the deeper stations are characterized by higher regional
contrasts, which can be related to different environmental conditions such as different substrate-
type and a variable energy at the benthic boundary layer. Shallow infaunal species such as
Cassidulina laevigata s.l. and Bulimina elongata occur in higher numbers in fine-grained
substrates in the deeper stations on the shelf off Southwest Mallorca reflecting low energy
conditions at the sea floor. These observations show that the distinct bathymetric zonation of the
benthic faunas, the availability of food on the sea floor and the creation of infaunal niches are
mainly controlled by the presence of different substrate-types and do not reflect regional contrasts
in surface water production. In contrast, the biocoenoses in the studied areas are characterized
by a low diversity and a wide range of standing stocks reflecting variable environmental
conditions and a lower population dynamic in late summer 2006. In the Oran Bight, most of the
biocenoses are clearly dominated by infaunal living taxa typical for areas with enhanced food
fluxes such as Cancris auriculus, Rectuvigerina spp., bolivinids and buliminids suggesting a
recent anthropogenic-induced eutrophication of the coastal region near the city of Oran. This
interpretation is supported by very rare abundances of these species in middle and late Holocene
assemblages analyzed in a sediment core from this region.
The shelf benthic foraminiferal assemblages from cool-water carbonate environments of the
western Mediterranean Sea provide a high potential for quantitative sea-level reconstructions.
147
Conclusions and outlook
The best predictive potential is given from the Weighted Averaging-Partial Least Squares (WA-
PLS) regression method resulting in an accuracy of +/- 10 m within a total sea-level rise of ~45
and ~47 m for the Alboran Platform and the shelf off Southwest Mallorca, respectively. However,
transfer functions based on the Modern Analog Technique (MAT) and on Plankton/Benthos (P/B)
ratios resulted in less consistent reconstructions with higher errors. The relative sea-level
estimates with WA-PLS for the Alboran Platform and the Mallorca Shelf generally reflect the
global and regional sea-level histories during the Holocene. Redeposition processes of
foraminiferal tests can be attributed to the observed inaccuracies in the estimates in both areas.
Further, the sea-level signal interferes with temporal changes in substrate on the Mallorca shelf,
resulting in minor inconsistencies during the middle Holocene. In contrast, an estimated relative
sea-level rise of 30 m in the Oran Bight exceeds the global sea-level rise and the rise calculated
for the Alboran Platform and the Mallorca Shelf during the middle and late Holocene. While major
neotectonic movements can be excluded for this region, this overestimation may be attributed to
redeposition processes with enhanced relocation of benthic foraminiferal tests disturbing the sea-
level signal and to a problematic age model.
Stable isotope records of planktonic and benthic foraminiferal tests provide information about
the hydrological evolution and carbon cycling in marine ecosystems. Differences in the stable
oxygen isotope signals of the planktonic foraminifera Globigerina bulloides, representing the late
winter/spring situation, and Globigerinoides ruber, representing the late summer situation, reflect
a higher seasonality on the shelf off Southwest Mallorca during the earliest Holocene and an
abrupt decrease of seasonal contrasts with onset of the humid phase around 9.6 kyr. Humid
conditions prevailed during the early and middle Holocene (e.g., between 9.6 and 5.5 kyr BP) and
were characterized by enhanced summer rainfalls on the Mallorca Island leading to enhanced
freshwater discharge and input of terrestrial disolved organic matter and nutrients to the coastal
marine environments. This is documented by decreased δ18O and δ13C values of the planktonic
foraminifer Globigerinoides ruber (white) in the upper surface layer, a lowering of δ13C values of
Bulimina aculeata and increased abundances of the gastropod Turritella communis and the
infaunal benthic foraminifer Rectuvigerina phlegeri. This humid phase on the Mallorca Shelf was
established nearly at the same time as sapropel S1 was formed in the eastern Mediterranean
Sea at around 9.6 to 6.0 kyr. For the first time, the impact of this humid phase on western
Mediterranean shelf ecosystems is documented.
7.2 Outlook
- The present study provides new information on shallow water benthic foraminifera from
cool-water carbonate environments of the western Mediterranean Sea and their relation to
different environmental settings. The more comprehensive evaluation of the distribution patterns
148
Chapter 7
149
and ecological preferences of western Mediterranean shelf faunas would require a dense network
of samples over a wide bathymteric range. For further investigations, main focus should be laid
on the inclusion of further environmental parameters influencing the benthic foraminiferal
assemblages such as bottom water temperatures, salinities and current velocities, organic carbon
contents and other geochemical and sedimentological parameters. This would allow a more
precise interpretation of species-environment relationships.
- The predictability and accuracy of the transfer functions applied for sea-level
reconstruction could be improved by the creation of larger calibration data-sets, which goes hand
in hand with the suggestions in the first paragraph. Furthermore, innovative methods such as
Artificial Neural Networks (ANN) could be applied for relative sea-level estimates. Various
potential future applications of these transfer functions are conceivable: (1) Quantification of
Neogene vertical tectonic movements in coastal areas, e.g. in the eastern Mediterranean Sea, (2)
Identification and provenance analysis of tsunami deposits in risk assessment studies of
earthquake impacts in tectonically active areas, and (3) refining of the quantification of low-
amplitude late Holocene sea-level changes on the basis of intertidal microfossil assemblages.
- The present study provides only local information on the Holocene palaeoecological and
paleoceanographic development on the south-western Mallorca Shelf. Comparable geochemical
and micropaleontological records should be generated for other shelf areas in the western and
eastern Mediterranean Sea and compared with information from the coastal and terrestrial
environments, such as pollen data from lagoonal or lacustrine environments, speleothem data
etc. This would enable a more integrative and super-regional approach in the reconstruction of
climate impacts on Mediterranean shelf ecosystems and the characterization of land-to-sea
couplings in a marginal ocean system.
- The compilation of a comprehensive, well-illustrated and open-access benthic
foraminiferal online catalogue for various applications would be very desirable. The catalogue
should contain revised descriptions on the generic and species levels. This target could be
realized by a close collaboration of experts for foraminiferal taxonomy.

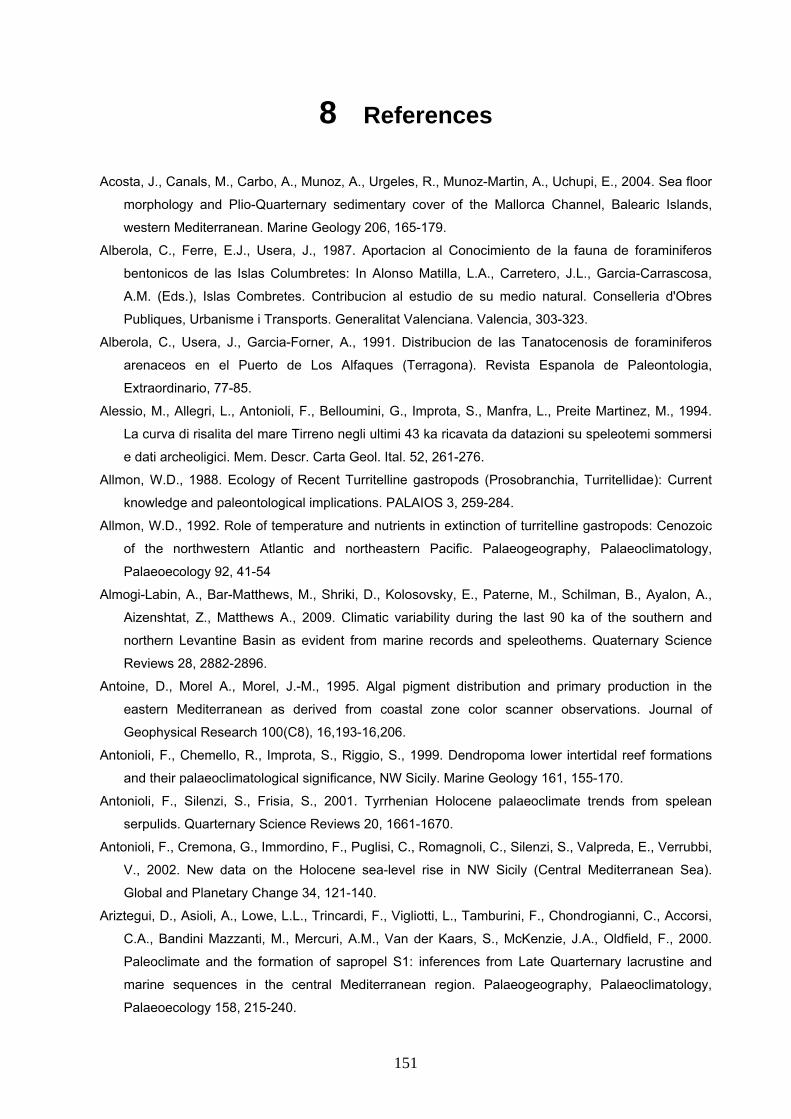
8 References Acosta, J., Canals, M., Carbo, A., Munoz, A., Urgeles, R., Munoz-Martin, A., Uchupi, E., 2004. Sea floor
morphology and Plio-Quarternary sedimentary cover of the Mallorca Channel, Balearic Islands,
western Mediterranean. Marine Geology 206, 165-179.
Alberola, C., Ferre, E.J., Usera, J., 1987. Aportacion al Conocimiento de la fauna de foraminiferos
bentonicos de las Islas Columbretes: In Alonso Matilla, L.A., Carretero, J.L., Garcia-Carrascosa,
A.M. (Eds.), Islas Combretes. Contribucion al estudio de su medio natural. Conselleria d'Obres
Publiques, Urbanisme i Transports. Generalitat Valenciana. Valencia, 303-323.
Alberola, C., Usera, J., Garcia-Forner, A., 1991. Distribucion de las Tanatocenosis de foraminiferos
arenaceos en el Puerto de Los Alfaques (Terragona). Revista Espanola de Paleontologia,
Extraordinario, 77-85.
Alessio, M., Allegri, L., Antonioli, F., Belloumini, G., Improta, S., Manfra, L., Preite Martinez, M., 1994.
La curva di risalita del mare Tirreno negli ultimi 43 ka ricavata da datazioni su speleotemi sommersi
e dati archeoligici. Mem. Descr. Carta Geol. Ital. 52, 261-276.
Allmon, W.D., 1988. Ecology of Recent Turritelline gastropods (Prosobranchia, Turritellidae): Current
knowledge and paleontological implications. PALAIOS 3, 259-284.
Allmon, W.D., 1992. Role of temperature and nutrients in extinction of turritelline gastropods: Cenozoic
of the northwestern Atlantic and northeastern Pacific. Palaeogeography, Palaeoclimatology,
Palaeoecology 92, 41-54
Almogi-Labin, A., Bar-Matthews, M., Shriki, D., Kolosovsky, E., Paterne, M., Schilman, B., Ayalon, A.,
Aizenshtat, Z., Matthews A., 2009. Climatic variability during the last 90 ka of the southern and
northern Levantine Basin as evident from marine records and speleothems. Quaternary Science
Reviews 28, 2882-2896.
Antoine, D., Morel A., Morel, J.-M., 1995. Algal pigment distribution and primary production in the
eastern Mediterranean as derived from coastal zone color scanner observations. Journal of
Geophysical Research 100(C8), 16,193-16,206.
Antonioli, F., Chemello, R., Improta, S., Riggio, S., 1999. Dendropoma lower intertidal reef formations
and their palaeoclimatological significance, NW Sicily. Marine Geology 161, 155-170.
Antonioli, F., Silenzi, S., Frisia, S., 2001. Tyrrhenian Holocene palaeoclimate trends from spelean
serpulids. Quarternary Science Reviews 20, 1661-1670.
Antonioli, F., Cremona, G., Immordino, F., Puglisi, C., Romagnoli, C., Silenzi, S., Valpreda, E., Verrubbi,
V., 2002. New data on the Holocene sea-level rise in NW Sicily (Central Mediterranean Sea).
Global and Planetary Change 34, 121-140.
Ariztegui, D., Asioli, A., Lowe, L.L., Trincardi, F., Vigliotti, L., Tamburini, F., Chondrogianni, C., Accorsi,
C.A., Bandini Mazzanti, M., Mercuri, A.M., Van der Kaars, S., McKenzie, J.A., Oldfield, F., 2000.
Paleoclimate and the formation of sapropel S1: inferences from Late Quarternary lacrustine and
marine sequences in the central Mediterranean region. Palaeogeography, Palaeoclimatology,
Palaeoecology 158, 215-240.
151
References
Arnone, R., 1994. The temporal and spatial variability of chlorophyll in the Western Mediterranean. In:
La Violette P.E. (Ed.), Seasonal and Interannual Variability of the Western Mediterranean Sea.
Coastal and Estuarine Studies, Vol. 46, AGU, Washington D.C., pp. 195-225.
Avsar, N., Aksu, A., Dincer, F., 2006. Benthic foraminiferal assemblage of Erdek Bay (SW Marmara
Sea). Yerbilimleri 27(3), 125-141.
Avsar, N., Meric, E., Cevik, M.G., Dincer, F., 2009. Recent benthic foraminiferal assemblages on the
continental shelf off the Büyük Menderes river delta (W Turkey). Yerbilimleri 30(2), 127-144.
Backhaus, K., Erichson, B., Plinke, W., Weiber, R., 2006. Multivariate Analysemethoden. Springer,
Berlin, Heidelberg, New York
Bakalem, A., Ruellet, T., Dauvin, J.C., 2009. Benthic indices and ecological quality of shallow Algeria
fine sand community. Ecological Indicators 9, 395-408.
Bandy, O.L., Chierici, M.A., 1966. Depth-temperature evaluation of selected California and
Mediterranean bathyal foraminifera. Marine Geology 4, 259-271.
Bar-Matthews, M., Aylon, A., Kaufman, A., 2000. Timing and hydrological conditions of sapropel events
in the Eastern Mediterranean, as evident from speleothemes, Soreq cave, Israel. Chemical Geology
169, 145-146.
Barale, V., Weber, B., Melin, F., Jaquet, J.M., 2005. Recurrent and anomalous algal blooms in the
Mediterranean Sea as seen by seaWiFS (1998-2003), 8th Conference on Remote Sensing for
Marine and Costal Environments Halifax, Nova Scotia.
Bard, E., Hamelin, B., Arnold, M., Montaggioni, L., Cabioch, G., Faure, G., Rougerie, F., 1996. Deglacial
sea-level record from Tahiti corals and the timing of global meltwater discharge. Nature 382, 241-
244.
Bard, E., Hamelin, B., Delanghe-Sabatier, D., 2010. Deglacial meltwater pulse 1B and Younger Dryas
sea levels revisited with boreholes at Tahiti. Science 327, 1235-1237.
Barker, R.W., 1960. Taxonomic notes on the species figured by H.B. Brady in his report on the
foraminifera dredged by H.M.S. Challenger during the years 1873-1876. Soc. Econ. Paleontol.
Mineral. Spec. Publ. 9, 238 pp
Barmawidjaja, D.M., Jorissen, F.J., Puskaric, S., Van der Zwaan, G.J., 1992. Microhabitat selection by
benthic foraminifera in the northern Adriatic Sea. Journal of Foraminiferal Research 22, 297-317.
Bartels-Jonsdottir, H.B., Knudsen, K.L., Abrantes, F., Lebreiro, S., Eriksson, J., 2006. Climate variability
during the last 2000 years in the Tagus Prodelta, western Iberian Margin: Benthic foraminifera and
stable isotopes. Marine Micropaleontology 59, 83-103.
Basso, D., 1997. Deep rhodolith distribution in the Pontian Islands, Italy: a model for the paleoecology of
a temperate sea. Palaeogeography, Palaeoclimatology, Palaeoecology 137, 173-187.
Berne, S., Jouet, G., Bassetti, M.A., Dennielou, B., Taviani, M., 2007. Late Glacial to Preboreal sea-
level rise recorded by the Rhone deltaic system (NW Mediterranean). Marine Geology 245, 65-88.
Bethoux, J.-P., 1980. Mean water fluxes across sections in the Mediterranean Sea, evaluated on the
basis of water and salt budgets and of observed salinities. Oceanologica Acta 3(1), 79-88.
Betzler, C., Braga, J.C., Jaramillo-Vogel, D., Römer, M., Hübscher, C., Schmiedl, G., Lindhorst, S., in
press. Late Pleistocene and Holocene cool-water carbonates in the Western Mediterranean Sea.
Sedimentology.
152
References
Bijma, J., Faber Jr., W.W., Hemleben, C., 1990. Temperature and salinity limits for growths and survival
of some planktonic foraminifers in laboratory cultures. J. Foraminiferal Res. 20, 95-116.
Birks, H.J.B., 1998. Numerical tools in palaeolimnology - Progress, potentialities, and problems. Journal
of Paleolimnology 20, 307-332.
Birks, H.J.B., Line, J.M., Juggins, S., Stevenson, A.C., Ter Braak, C.J.F., 1990. Diatoms and pH
reconstruction. Phil. Trans. R. Soc. Lond. B 327, 263-278.
Blanc, J.J., 1972. Observation sur la sédimentation bioclastique en quelques points de la marge
continentale de la Méditerranée. In: Stanley D.J. (Ed.), The Mediterranean Sea. A natural
sedimentation laboratory. Dowden, Hutchinson and Ross, Inc., pp. 225-240.
Boltovskoy, E., 1978. Late Cenozoic benthonic foraminifera of the Ninetyeast Ridge (Indian Ocean).
Marine Geology 26, 139-175.
Boltovskoy, E., Guissani de Kahn, G., 1983. Evaluation of benthic monothalamous foraminifers as guide
fossils in Cenozoic deep-sea deposits of the south Atlantic. Micropaleontology 29(3), 298-308.
Boomer, I., Horton, B.P., 2006. Holocene relative sea-level movements along the North Norfolk Coast,
UK. Palaeogeography, Palaeoclimatology, Palaeoecology 230, 32-51.
Bouhadad, Y., 2001. The Murdjadjo, Western Algeria, fault-related fold: Implications for seismic hazard.
Journal of Seismology 5, 541-558.
Brasseur, P., Beckers, J. M., Brankart, J. M., Schoenauen, R.,1996. Seasonal temperature and salinity
fields in the Mediterranean Sea: Climatological analyses of a historical data set. Deep-Sea
Research I 43(2), 159-192.
Cacho, I., Grimalt, J.O., Pelejero, C., Canals, M., Sierro, F.J., Flores, J.A., Shackleton, N.J., 1999.
Dansgaard-Oeschger and Heinrich event imprints in the Alboran Sea paleotemperatures.
Paleoceanography 14(6), 698-705.
Cacho, I., Grimalt, J.O., Francisco, J., Sierro, J., Shackleton, N., Canals, M., 2000. Evidence for
enhanced Mediterranean thermohaline circulation during rapid climatic coolings. Earth and
Planetary Science Letters 183, 417-429.
Cacho, I., Grimalt, J.O., Canals, M., Sbaffi, L., Shackleton, N.J., Schönfeld, J., Zahn, R., 2001.
Variability of the western Mediterranean Sea surface temperature during the last 25,000 years and
its connection with the Northern Hemisphere climatic changes. Paleoceanography 16, 40-52.
Cacho, I., Grimalt, J.O., Canals, M., 2002. Response of the Western Mediterranean Sea to rapid
climatic variability during the last 50,000 years: a molecular biomarker approach. Journal of Marine
Systems 33-34, 253-272.
Cantos-Figuerola, A., Parrilla, G., Werner, F.E., 1991. Modelling of the surface flow in the Alboran Sea:
review of sensitivity studies of reduced gravity flows. Fisica de la Tierra 3, 307-330.
Capotondi, L., Vigliotti, L., 1999. Magnetic and microfaunal characterization of Late Quarternary
sediments from the Western Mediterranean: Inferences about sapropel formation and
paleoceanographic implications. In: Zahn, R. Comas, M.C., Klaus, A. (Eds.), Proceedings of the
Ocean Drilling Program, Scientific Results, pp. 505-518.
Capotondi, L., Speranza Principato, M., Morigi, C., Sangiorgi, F., Maffioli, P., Giunta, S., Negri, A.,
Corselli, C., 2006. Foraminiferal variations and stratigraphic implications to the deposition of
153
References
sapropel S5 in the eastern Mediterranean. Palaeogeography, Palaeoclimatology, Palaeoecology
235, 48-65.
Carannante, G., Esteban, M., Milliman, J.D., Simone, L., 1988. Carbonate lithofacies as paleolatitude
indicators: problems and limitations. Sedimentary Geology 60, 333-346.
Carboni, M.G., Bergamin, L., Di Bella, L., Landini, B., Manfra, L., Vesica, P., 2005. Late Quarternary
paleoclimatic and paleoenvironmental changes in the Tyrrhenian Sea. Quarternary Science
Reviews 24, 2069-2082.
Casford, J.S.L., Rohling, E.J., Abu-Zied, R.H., Cooke, S., Fontanier, C., Leng, M.J., Lykousis, V., 2002.
Circulation changes and nutrient concentrations in the late Quarternary Aegean Sea: A nonsteady
state concept for sapropel formation. Paleoceanography 17(2), 14-1 - 14-11.
Casford, J.S.L., Rohling, E.J., Abu-Zied, R.H., Fontanier, C., Jorissen, F.J., Leng, M.J., Schmiedl, G.,
Thomson, J., 2003. A dynamic concept for eastern Mediterranean circulation and oxygenation
during sapropel formation. Palaeogeography, Palaeoclimatology, Palaeoecology 190, 103-119.
Casieri, S., Frezza, V., Mancini, S., Carboni, M.G., 2008. Epiphytic foraminifera on leaves and rhizomes
of Posidonia oceanica from Ischia Island (Tyrrhenian Sea, Italy). Geophysical Research Abstracts
10, 2 p.
Caulet, J.P., 1972. Recent biogenic calcareous sedimentation on the Algerian continental shelf. In:
Stanley D.J. (Ed.), The Mediterranean Sea. A natural sedimentation laboratory. Dowden,
Hutchinson and Ross, Inc., pp. 261-277.
Chendes, C., Kaminiski, M.A., Filipescu, S., Aksu, A.E., Yasar, D., 2004. The response of modern
benthic foraminiferal assemblages to water-mass properties along the southern shelf of Marmara
Sea. Acta Palaeontologica Romaniae 4, 69-80.
Cimerman, F., Langer M.R., 1991. Mediterranean foraminifera. Slovenska Akad. Znanosti in Umetnosti.
Opera. Academia Sciertiarum et Artium, Slovenca, Cl. 4, Hist. Nat. 30, Ljubljana
Cita, M. B., Zocchi, M., 1978. Distribution patterns of benthic foraminifera on the floor of the
Mediterranean Sea. Oceanologica Acta 1(4), 445-462.
Comas, M.C., Zahn, R., Klaus, A., et al., 1996. Proceedings of the Ocean Drilling Program, Initial
Results 161, pp. 5-18, College Station, Texas (ODP)
Comas, M.C., Platt, J.P., Soto, J.I., Watts, A.B., 1999. The origin and tectonic history of the Alboran
Basin: insights from Leg 161 results. In: Zahn, R., Comas, M.C., Klaus, A. (Eds.), Proceedings of
the Ocean Drilling Program, Scientific Results 161, 555-580.
Coppa, M.G., Di Tuoro, A., 1995. Preliminary data on the Holocene foraminifera of the Cilento
continental shelf (Tyrrhenian Sea). Revista Espanola de Paleontologia 10(2), 161-174.
Corliss, B.H., 1979. Recent deep-sea benthonic foraminifera from the southeast Indian Ocean.
Micropaleontology 25(1), 1-19.
Corliss, B.H., 1985. Microhabitats of benthic foraminifera within deep-sea sediments. Nature 314, 435-
438.
Cramp, A., O’Sullivan, G., 1999. Neogene sapropels in the Mediterranean: a review. Marine Geology
153, 11-28.
Culver, S.J., Woo, H.J., Oertel, G.F., Buzas, M.A., 1996. Foraminifera of coastal depositional
environments, Virginia, U.S.A., distribution and taphonomy. Palaios 11, 459-486.
154
References
Cushman, J.A., 1910. A monograph of the foraminifera of the North Pacific Ocean, Part 1: Astrorhizidae
and Lituolidae. Smithonian Institution, United States National Museum, Bulletin 71, Government
Print Service, Washington.
Cushman, J.A., 1911. A monograph of the foraminifera of the North Pacific Ocean, Part 2: Textularidae.
Smithonian Institution, United States National Museum, Bulletin 71, Government Print Service,
Washington.
Cushman, J.A., 1914. A monograph of the foraminifera on the north Pacific ocean, Part 4:
Chilostomellidae, Globigerinidae, Nummulitidae. Smithonian Institution, United States National
Museum, Bulletin 71, Government Print Service, Washington.
Cushman, J.A., 1915. A monograph of the foraminifera of the North Pacific Ocean, Part 5: Rotaliidae.
Smithonian Institution, United States National Museum, Bulletin 71, Government Print Service,
Washington.
Cushman, J.A., 1917. A monograph of the foraminifera of the North Pacific Ocean, Part 6: Miliolidae.
Smithonian Institution, United States National Museum, Bulletin 71, Government Print Service,
Washington.
Cushman, J.A., 1918. The foraminifera of the Atlantic Ocean, Part 1: Astrorhizidae. Smithonian
Institution, United States National Museum, Bulletin 104, Government Print Service, Washington.
Cushman, J.A., 1920. The foraminifera of the Atlantic Ocean, Part 2: Lituolidae. Smithonian Institution,
United States National Museum, Bulletin 104, Government Print Service, Washington.
Cushman, J.A., 1929. The foraminifera of the Atlantic Ocean, Part 6: Miliolidae, Ophthalmidiidae,
Fischerinidae. Smithonian Institution, United States National Museum, Bulletin 104, Government
Print Service, Washington.
Cushman, J.A., 1930. The foraminifera of the Atlantic Ocean, Part 7: Nonionidae, Camerinidae,
Peneroplidae and Alveolinellidae. Smithonian Institution, United States National Museum, Bulletin
104, Government Print Service, Washington.
Cushman, J.A., 1931. The foraminifera of the Atlantic Ocean, Part 8: Rotaliidae, Amphisteginidae,
Calcarinidae, Cymbalporettidae, Globorotallidae, Anomalinidae, Planorbulinidae, Pupertiidae and
Homotremidae. Smithonian Institution, United States National Museum, Bulletin 104, Government
Print Service, Washington.
Cushman, J.A., 1945. Foraminifera of the United States Antarctic Service Expedition 1939-1941,
Proceedings of the American Philosophical Society, Reports on Scientific Results of the Antarctic
Service Expedition, 1939-1941. American Philosophical Society, pp. 285-288.
DeMenocal, P., Ortiz, J., Guilderson, T., Adkins, J., Sarnthein, M., Baker, L., Yarusinsky, M., 2000.
Abrupt onset and termination of the African Humid Period: rapid climate responses to gradual
insolation forcing. Quarternary Science Reviews 19, 347-361.
De Rijk, S., Troelstra, S.R., Rohling, E.J., 1999. Benthic foraminiferal distribution in the Mediterranean
Sea. Journal of Foraminiferal Research 29(2), 93-103.
De Rijk, S., Jorissen, F.J., Rohling, E.J., Troelstra, S.R., 2000. Organic flux control on bathymetric
zonation of Mediterranean benthic foraminifera. Marine Micropaleontology 40, 151-166.
155
References
De Stigter, H.C., Jorissen, F.J., Van der Zwaan, G.J., 1998. Bathymetric distribution and microhabitat
partitioning of live (Rose Bengal stained) benthic foraminifera along a shelf to bathyal transect in the
southern Adriatic Sea. Journal of Foraminiferal Research 28 (1), 40-65.
Dewey, J.F., Helman, M.L., Turco, E., Hutton, D.H.W., Knott, S.D., 1989. Kinematics of the western
Mediterranean. In: Coward, M.P., Dietrich, D., Park, R.G. (Eds.), Alpine Tectonics. Geological
Society Special Publication, pp. 265-283.
Doglioni, C., Gueguen, E., Sabat, F., Fernandez, M., 1997. The Western Mediterranean extensional
basins and the Alpine. Terra Nova 9, 109-112.
Domzig, A., Yelles, K., Le Roy, C., Deverchere, J., Bouillin, J.-P., Bracene, R., Mercier de Lepinay, B.,
Le Roy, P., Calais, E., Kherroubi, A., Gaullier, V., Savoye, B., Pauc, H., 2006. Searching for the
Africa-Eurasia Miocene boundary offshore western Algeria (MARADJA 03 cruise). C.R. Geoscience
338, 80-91.
Dormoy, I., Peyron, O., Comboourieu-Neboutb, N., Goring, S., Kotthoff, U., Magny, M., Pross, J., 2009.
Terrestrial climate variablility and seasonality changes in the Mediterranean region between 15,000
and 4000 years BP deduced from marine pollen records. Clim. Past Discuss. 5, 735-770.
Drescher-Schneider, R., de Beaulieu, J.-L., Magny, M., Walter-Simonnet, A.-V., Bossuet, G., Millet, L.,
Brugiapaglia, E., Drescher, A., 2007. Vegetation history, climate and human impact over the last
15,000 years at Lago dell´Accesa (Tuscany, central Italy). Veget Hist Archaeobot 16, 279-299.
Duchemin, G., Fontanier, C., Jorissen, F.J., Barras, C., Griveaud, C., 2007. Living small-sized (63-150
µm) foraminifera from mid-shelf to mid-slope environments in the Bay of Biscay. Journal of
Foraminiferal Research 37, 12-32.
Duijnstee, I., de Lugt, I., Vonk Noordegraaf, H., Van der Zwaan, B., 2004. Temporal variability of
foraminiferal densities in the northern Adriatic Sea. Marine Micropaleontology 50, 125-148.
Emeis, K.-C., Struck, U., Schulz, H.-M., Rosenberg, R., Bernasconi, S., Erlenkeuser, H., Sakamoto, T.,
Martinez-Ruiz, F., 2000. Temperature and salinity variations of Mediterranean Sea surface waters
over the last 16,000 years from records of planktonic stable oxygen isotopes and alkenone
unsaturation ratios. Palaeogeography, Palaeoclimatology, Palaeoecology 158, 259-280.
Emeis, K.-C., Schulz, H., Struck, U., Rossignol-Strick, M., Erlenkeuser, H., Howell, M.W., Kroon, D.,
Mackensen, A., Ishizuka, S., Oba, T., Sakamoto, T., Koizumi I., 2003. Eastern Mediterranean
surface water temperatures and δ18O composition during deposition of sapropels in the late
Quaternary. Paleoceanography 18, doi: 10.1029/2000PA000617.
Emiliani, C., 1971. Isotopic paleotemperatures and shell morphology of Globigerinoides rubra in the
type section for the Pliocene-Pleistocene boundary. Micropaleontology 17, 233-238.
Fairbanks, R.G., 1989. A 17,000-year glacio-eustatic sea level record: influence of glacial melting rates
on the Younger Dryas event and deep-ocean circulation. Nature 342, 637-642.
Feldman, G.C., McClain, C.R., 2006. Ocean Color Web, SeaWiFS/Chlorophyll a concentration,
07/2002-06/2006. NASA Goddard Space Flight Center, Washington, USA.,
http://oceancolor.gsfc.nasa.gov/
Fernandez de Puelles, M. L., Valencia, J., Vicente, L., 2004A. Zooplankton variability and climatic
anomalies from 1994 to 2001 in the Balearic Sea (Western Mediterranean. Journal of Marine
Science 61, 492-500.
156
References
Fernandez de Puelles, M.L., Valencia, J., Jansa, J., Morillas, A., 2004B. Hydrographical characteristics
and zooplankton distribution in the Mallorca channel (Western Mediterranean): spring 2001. ICES
Journal of Marine Science 61, 654-666. Fontugne, M., Arnold, M., Labeyrie, L., Paterne, M., Calvert, S., Duplessy, J.C., 1994.
Paleoenvironment, sapropel chronology, and Nile river discharge during the last 20,000 years as
indicated by deep-sea sediment records in the eastern Mediterranean. Radiocarbon 34, 75-88.
Fornos, J.J., Ahr, W.M., 1997. Temperate carbonates on a modern, low-energy, isolated ramp: The
Balearic Platform, Spain. Journal of Sedimentary Research 67, 364-373.
Fornos, J.J., Ahr, W.M., 2006. Present-day temperate carbonate sedimentation on the Balearic
platform, western Mediterranean: compositional and textural variation along a low-energy isolated
ramp. In: Pedley H.M., Carannante, G. (Eds.), Cool-water carbonates: depositional systems and
palaeoenvironmental controls. London, pp. 71 - 84.
Fretter, V., Graham A., 1981. The prosobranch molluscs of Britain and Denmark, Part 6, Cerithiacea,
Strombacea, Hipponicacea, Calyptraeacea, Lamellariacea, Cypracea, Naticacea, Tonnacea,
Heteropoda. J. Mollus. Stud. 47, 286-293.
Frezza, V., Carboni, M.G., 2009. Distribution of recent foraminiferal assemblages near the Ombrone
River mouth (Northern Tyrrhenian Sea, Italy). Revue de micropaleontologie 52, 43-66.
Frontalini, F., Coccioni, R., 2008. Benthic foraminifera for heavy metal pollution monitoring: A case
study from the central Adriatic Sea coast of Italy. Estuarine, Costal and Shelf Science 76(2), 404-
417.
Fujita, K., Omori, A., Yokoyama, Y., Sakai, S., Iryu, Y., 2010. Sea-level rise during Termination II
inferred from large benthic foraminifers: IODP expedition 310, Tahiti sea level. Marine Geology 271,
149-155.
Garcia, E., Tintore, J., Pinot, J.M., Font, J., Manriquez, M., 1994. Surface circulation and dynamics of
the Balearic Sea. In: P.E. LaViolette (Ed.), Seasonal and Interannual Variability of the Western
Mediterranean Sea, Coastal and Estuarine Studies, Vol. 46. American Geophysical Union,
Washington D.C., pp. 73-91.
Garthwaite, P.H., 1994. An interpretation of Partial Least Squares. Journal of the American Statistical
Association 89(425), 122-127.
Gascard, J. C., Riches, C., 1985. Water masses and circulation in the Western Alboran Sea and in the
Straits of Gibraltar. Progress in Oceanography 15, 157-216.
Gehrels, W.A., 2000. Using foraminiferal transfer functions to produce high-resolution sea-level records
from salt-marsh deposits, Maine, USA. The Holocene 10(3), 367-376.
Giresse, P., Pauc, H., Deverchere, J., and the Maradja Shipboard Scientific Party, 2009. Sedimentary
processes and origin of sediment gravity-flow deposits on the western Algerian margin during late
Pleistocene and Holocene. Marine and Petroleum Geology 26, 695-710.
Goy, J. L., Zazo, C., Dabrio, C.J., 2003. A beach-ridge progradation complex reflecting periodical sea-
level and climate variability during the Holocene. Geomorphology 50, 251-268.
Gueguen, E., Doglioni, C., Fernandez, M., 1998. On the post-25 Ma geodynamic evolution of the
western Mediterranean. Tectonophysics 298, 259-269.
157
References
Guimerans, P. V., Currado J.L.C., 1999A. The recent uvigerinids (benthic foraminifera) in the
northeastern Gulf of Cadiz. Bol.Inst.Esp.Oceanogr. 15, 191-202.
Guimerans, P.V., Currado, J.L.C., 1999B. Distribution of Planorbulinacea (benthic foraminifera)
assemblages in surface sediments on the northern margin of the Gulf of Cadiz. Bol. Inst. Esp.
Oceanogr. 15(1-4), 181-190.
Gündüz, M., Öszoy, E., 2005. Effects of the North Sea Caspian pattern on surface fluxes of Euro-Asian-
Mediterranean Seas. Geophysical Research Letters 32, 4 pp.
Hammer, O., Harper, D.A.T., Ryan, P.D., 2001. PAST: Palaeontological statistics package for education
and data analysis. Paleaeontologia Electronica 4(1), 9 pp.
Hammer, O., Harper, D.A.T., Ryan, P.D., 2008. PAST PAlaeontological STatistics, ver. 1.81., Software
Documentation.
Hasegawa, S., Sprovieri, R., Poluzzi, A., 1990. Quantitative analysis of benthic foraminiferal
assemblages from Plio-Pleistocene sequences in the Tyrrhenian Sea, ODP LEG 107. In: Kastens,
K.A., Mascle, J. et al. (Eds.), Proceedings of the Ocean Drilling Program, Scientific Results, pp.
461-478.
Hawkes, A.D., Horton, B.P., Nelson, A.R., Hill, D.F., in press. The application of intertidal foraminifera to
reconstruct coastal subsidence during the giant Cascadia earthquake of AD 1700 in Oregon, USA.
Quarternary International.
Hayes, A., Rohling, E.J., De Rijk, S., Kroon, D., Zachariasse, W.J., 1999. Mediterranean planktonic
foraminiferal faunas during the last glacial cycle. Marine Geology 153, 239-252.
Hayward, B. W., 2004. Foraminifera-based estimates of paleobathymetry using Modern Analoque
Technique, and the subsidence history of the early Miocene Waitemata Basin. New Zealand
Journal of Geology & Geophysics 47, 749-767.
Hemleben, C., Spindler, M., Anderson, O.R., 1999. Modern Planktonic Foraminifera. Springer-Verlag,
New York.
Hofker, J., 1960. Foraminiferen aus dem Golf von Neapel. Paläont. Z. 34(3/4), 233-262.
Hohenegger, J., 2005. Estimation of environmental paleogradient values based on presence/absence
data: a case study using benthic foraminifera for paleodepth estimation. Palaeogeography,
Palaeoclimatology, Palaeoecology 217, 115-130.
Hohenegger, J., Yordanova, E., Nakano, Y., Tatzreiter, F., 1999. Habitats of larger foraminifera on the
upper reef slope of Sesoko Island, Okinawa, Japan. Marine Micropaleontology 36, 109-168.
Holsten, J., Stott, L., Berelson, W., 2004. Reconstructing benthic carbon oxidation rates using δ13C of
benthic foraminifera, Marine Micropaleontology 53, 117-132.
Horton, B.J., Edwards R.J., 2006. Quantifying Holocene sea-level change using intertidal foraminifera:
Lessons from the British Isles. Cushman Foundation for Foraminiferal Research Special Publication
No. 40, 1-97.
Horton, B.J., Murray, J.W., 2006. Patterns in cumulative increase in live and dead species from
foraminiferal time series of Cowpen Marsh, Tees Estuary, UK: Implications for sea-level studies.
Marine Micropaleontology 58, 287-315.
Horton, B.P., Edwards, R.J., Lloyd, J.M., 1999. A foraminiferal-based transfer function: Implications for
sea-level studies. Journal of Foraminiferal Research 29(2), 117-129.
158
References
Hottinger, L., Halicz, E., Reiss, Z., 1993. Recent foraminiferida from the Gulf of Aqaba, Red Sea.
Slovenska Akademija Znanosti in Umetnosti, Ljubljana.
Hughen, K.A., Baillie, M.G.L., Bard, E., Bayliss, A., Beck, J.W., Bertrand, C.J.H., Blackwell, P.G., Buck,
C.E., Burr, G.S., Cutler, K.B., Damon, P.E., Edwards, R.L., Fairbanks, R.G., Friedrich, M.,
Guilderson, T.P., Kromer, B., McCormac, F.G., Manning, S.W., Bronk Ramsey, C., Reimer, P.J.,
Reimer, R.W., Remmele, S., Southon, J.R., Stuiver, M., Talamo, S., Taylor, F.W., van der Plicht, J.,
Weyhenmeyer, C.E., 2004. Marine04 Marine radiocarbon age calibration, 26 - 0 ka BP.
Radiocarbon 46, 1059-1086.
Hyams, O., Almogi-Labin, A., Benjamini, C., 2002. Larger foraminifera of the southeastern
Mediterranean shallow continental shelf off Israel. Israel Journal of Earth Science 51, 169-179.
Hyams-Kaphzan, O., Almogi-Labin, A., Sivan, D., Benjamini, C., 2008. Benthic foraminifera assemblage
change along the southeastern Mediterranean inner shelf due to fall-off of Nile-derived siliciclastics.
N. Jb. Geol. Paläont. Abh. 248(3), 315-344.
Jimenez-Espejo, F.J., Martinez-Ruiz, F., Sakamoto, T., Iijima, K., Gallego-Torres, D., Harada, N., 2007.
Paleoenvironmental changes in the western Mediterranean since the last glacial maximum: High
resolution multiproxy record from the Algero-Balearic basin. Palaeogeography, Palaeoclimatology,
Palaeoecology 246, 292-306.
Jimenez-Espejo, F.J., Martinez-Ruiz, F., Rogerson, M., González-Donoso, J.M., Romero, O.E., Linares,
D., Sakamoto, T., Gallego-Torres, D., Rueda Ruiz, J.L., Ortega-Huertas, M., Perez Claros, J.A.,
2008. Detrital input, productivity fluctuations, and water mass circulation in the westernmost
Mediterranean Sea since the Last Glacial Maximum. Geochemistry, Geophysics, Geosystems 9,
Q11U02, doi:10.1029/2008GC002096.
Jones, R.W., 1994. The Challenger Foraminifera, 1st Edition, Oxford University Press Inc., New York.
Jorissen, F.J., 1987. The distribution of benthic foraminifera in the Adriatic Sea. Marine
Micropaleontology 12, 21-48.
Jorissen, F.J., Barmawidjaja, D.M., Puskaric, S., Van der Zwaan, G.J., 1992. Vertical distribution of
benthic foraminifera in the northern Adriatic Sea: the relation with the organic flux. Marine
Micropaleontology 19, 131-146.
Jorissen, F.J., de Stigter, H.C., Widmark, J.G.V., 1995. A conceptual model explaining benthic
foraminiferal microhabitats. Marine Micropaleontology 26, 3-15.
Juggins, S., 2003. Software for ecological and palaeoecological data analysis and visualisation. Tutorial
version 1.3, 1-24.
Kaminski, M.A., Aksu, A., Box, M., Hiscott, R.N., Filipescu, S., Al-Salameen, M., 2002. Late Glacial to
Holocene benthic foraminifera in the Marmara Sea: implications for Black Sea - Mediterranean Sea
connections following the last deglaciation. Marine Geology 190, 162-202.
Kayan, I., 1988. Late Holocene sea-level changes on the western Anatolian coast. Palaeogeography,
Palaeoclimatology, Palaeoecology 68, 205-218.
Kotthoff, U., Pross, J., Müller, U.C., Peyron, O., Schmiedl, G., Schulz, H., Bordon A., 2008. Climate
dynamics in the borderlands of the Aegean Sea during deposition of Sapropel S1 deduced from a
marine pollen record. Quaternary Science Reviews 27, 832–845.
159
References
Koulouri, P., Dounas, C., Arvanitidis, C., Koutsoubas, D., Eleftheriou, A., 2006. Molluscan diversity
along a Mediterranean soft bottom sublittoral ecotone. Scientia Marina 70, 573-583.
Kucera, M., Weinelt, M., Kiefer, T., Pflaumann, U., Hayes, A., Weinelt, M., Chen, M.-T., Mix, A.C.,
Barrows, T.T., Cortijo, E., Duprat, J., Juggins, S., Waelbroeck, C., 2005. Reconstruction of sea-
surface temperatures from assemblages of planktonic foraminifera: multi-technique approach based
on geographically constrained calibration data sets and its application to glacial Atlantic and Pacific
Oceans. Quarternary Science Reviews 24(7-9), 951-998.
Kuhnt, T., Schmiedl, G., Ehrmann, W., Hamann, Y., Hemleben, C., 2007. Deep-sea ecosystem
variability of the Aegean Sea during the past 22 kyr as revealed by benthic foraminifera. Marine
Micropaleontology 64(3-4), 141-162.
Kuhnt, T., Schmiedl, G., Ehrmann, W., Hamann, Y., Andersen, N., 2008. Stable isotopic composition of
Holocene benthic foraminifers from the Eastern Mediterranean Sea: past changes in productivity
and deep water oxygenation. Palaeogeography, Palaeoclimatology, Palaeoecology 268, 106-115.
Kuper, R., Kröpelin S., 2006. Climate-controlled Holocene occupation in the Sahara: Motor of Africa’s
evolution. Science 313, 803-807.
Lambeck, K., Bard, E., 2000. Sea-level change along the French Mediterranean coast for the past
30,000 years. Earth and Planetary Science Letters 175, 203-222.
Lambeck, K., Chappell, J., 2001. Sea-level change through the last glacial cycle. Science 292, 679-686.
Lambeck, K., Antonioli, F., Purcell, A., Silenzi, S., 2004. Sea-level change along the Italian coast for the
past 10,000 yr. Quarternary Science Reviews 23, 1567-1598.
Langer, M.R., Hottinger, L., 2000. Biogeography of selected "larger" foraminifera. Micropaleontology 46,
105-126.
Langer, M.R., Frick, H., Silk, M.T., 1998. Photophile and sciaphil foraminiferal assemblages from marine
plant communities of Lavezzi Islands (Corsica, Mediterranean Sea). Revue Paleobiol. Geneve
17(2), 525-530.
Lee, J. J., 2006. Algal symbiosis in larger foraminifera. Symbiosis 42, 63-75.
Leiter, C., 2008. Benthos-Foraminiferen in Extremhabitaten: Auswertung von METEOR-Expeditionen
vor Namibia, Ph.D. Thesis, Ludwig-Maximilians-Universität, München, 151 pp.
Leorri, E., Horton, B.P., Cearreta, A., 2008. Development of foraminifera-based transfer function in the
Basque marshes, N. Spain: Implications for sea-level studies in the Bay of Biscay. Marine Geology
251, 60-74.
Leps, J., Smilauer, P., 2005. Multivariate analysis of ecological data using CANOCO. Cambridge
University Press, Cambridge.
Levy, A., Mathieu, R., Poignant, A., Rosset-Moulinier, M., Ubaldo, M. de L., Ambroise, D., 1993. Recent
foraminifera from the continental margin of Portugal. Micropaleontology 39, 75-87.
Leyer, I., Wesche, K., 2007. Multivariate Statistik in der Ökologie. Springer, Berlin Heidelberg.
L’Helguen, S., Le Corre, P., Madec, C., Morin, P., 2002. New and regenerated production in the
Almeria-Oran front area, eastern Alboran Sea. Deep-Sea Research I 49, 83-99.
Lionello, P., Malanotte-Rizzoli, P., Boscolo, R., Luterbacher, J., 2004. The Mediterranean climate: basic
issues and perspectives. In: White Paper on Mediterranean climate variability and predictability,
Technical Report, 5-17
160
References
Loeblich, A.R., Tappan, H., 1988. Foraminiferal genera and their classification. Van Nostrand Reinhold
Company, New York.
Luterbacher, J., Xoplaki, E., Casty, C., Wanner, H., Pauling, A., Küttel, M., Rutishauser, T., Brönnimann,
S., Fischer, E., Fleitmann, D., González-Rouco, F.J., García-Herrera, R., Barriendos, M., Rodrigo,
F., Gonzalez-Hidalgo, J.C., Saz, M.A., Gimeno, L., Ribera, P., Brunet, M., Paeth, H., Rimbu, N.,
Felis, T., Jacobeit, J., Dünkeloh, A., Zorita, E., Guiot, J., Türkes, M., Alcoforado, M.J., Trigo, R.,
Wheeler, D., Tett, S., Mann, M.E., Touchan, R., Shindell, D.T., Silenzi, S., Montagna, P., Camuffo,
D., Mariotti, A., Nanni, T., Brunetti, M., Maugeri, M., Zerefos, C., De Zolt, S., Lionello, P., 2006.
Mediterranean climate variability over the last centuries: a review. In: Lionello, P., Malanotte-Rizzoli,
P., Boscolo, R. (Eds.), Mediterranean Climate variability 4. Elsevier, Amsterdam, pp. 438.
Mackensen, A., Schumacher, S., Radke, J., Schmidt, D.N., 2000. Mircrohabitat preferences and stable
carbon isotopes of endobenthic foraminifera: clue to quantitative reconstruction of oceanic new
production? Marine Micropaleontology 40, 233-258.
Magny, M., Miramont, C., Sivan, O., 2002. Assessment of the impact of climate and anthropogenic
factors on Holocene Mediterranean vegetation in Europe on the basis of palaeohydrological
records. Palaeogeography, Palaeoclimatology, Palaeoecology 186, 47-59.
Malanotte-Rizzoli, P., Hecht, A., 1988. Large-scale properties of the Eastern Mediterranean: a review.
Oceanologica Acta 11(4), 323-335.
Malmgren, B.A., Haq, B.U., 1982. Assessment of quantitative techniques in paleobiogeography. Marine
Micropaleontology 7, 213-230.
Malmgren, B.A., Nordlund, U., 1997. Application of artificial neural networks to paleoceanographic data.
Palaeogeography, Palaeoclimatology, Palaeoecology 136, 359-373.
Martinez-Garcia, P., Soto, J.I., Comas, M., submitted. Recent structures in the Alboran Ridge and Yusuf
fault-zones: interpretation from swath-bathymetry and sub-bottom profiling. Geo-Marine Letters.
Martinez-Ruiz, F., Paytan, A., Kastner, M., Gonzalez-Donoso, J.M., Linares, D., Bernasconi, S.M.,
Jimenez-Espejo, F.J., 2003. A comparative study of the geochemical and mineralogical
characteristics of the S1 sapropel in the western and eastern Mediterranean. Palaeogeography,
Palaeoclimatology, Palaeoecology 190, 23-37.
Martins, V., Dubert, J., Jouanneau, J.-M., Weber, O., Ferreira da Silva, E., Patinha, C., Alveirinho Dias,
J.M., Rocha, F., 2007. A multiproxy approach of the Holocene evolution of shelf-slope circulation on
the NW Iberian Continental Shelf. Marine Geology 239, 1-18.
Masque, P., Fabres, J., Canals, M., Sanchez-Cabeza, J.A., Sanchez-Vidal, A., Cacho, I., Calafat, A.M.,
Bruach, J.M., 2003. Accumulation rates of major constituents of hemipelagic sediments in the deep
Alboran Sea: a centennial perspective of sedimentary dynamics. Marine Geology 193, 207-253.
Massuti, E., Renones, O., 2005. Demersal resource assemblages in the trawl fishing grounds off the
Balearic Islands (western Mediterranean) Scientia Marina 69(1), 167-181.
McCorkle, D.C., Emerson, S.R., Quay, P.D., 1985. Stable carbon isotopes in marine porewaters. Earth
and Planetary Science Letters 74, 13-26.
McCorkle, D.C., Keigwin, L.D., Corliss, B.H., Emerson, S.R., 1990. The influence of microhabitats on
the carbon isotopic composition of deep-sea benthic foraminifera. Paleoceanography 5, 161-185.
161
References
Medioli, F.S., Scott, D.B., 1978. Emendation of the genus Discanomalina Asano and its implications on
the taxonomy of some of the attached foraminiferal forms. Micropaleontology 24(3), 291-302.
Mehrnusch, M., 1993. Morhpologische und strukturelle Merkmale einiger Bolivinen (Foraminiferida).
Diskussion des taxonomischen Status von Afrobulimina, Brizalina, Bolivina and verwandten Taxa.
Paläont. Z. 67(1/2), 3-19.
Melki, T., Kallel, N., Jorissen, F.J., Guichard, F., Dennielou, B., Berne, S., Labeyrie, L., Fontugne, M.,
2009. Abrupt climate change, sea surface salinity and paleoproductivity in the western
Mediterranean Sea (Gulf of Lion) during the last 28 kyr. Palaeogeography, Palaeoclimatology,
Palaeoecology 279, 96-113.
Mendes, I., Gonzalez, R., Dias, J.M.A., Lobo, F., Martins, V., 2004. Factors influencing Recent benthic
foraminifera distribution on the Guandiana shelf (Southwestern Iberia). Marine Micropaleontology
51, 171-192.
Mercone, D., Thomson, J., Croudace, I.W., Siani, G., Paterne, M., Troelstra S., 2000. Duration of S1,
the most recent sapropel in the eastern Mediterranean Sea, as indicated by accelerator mass
spectrometry radiocarbon and geochemical evidence. Paleoceanography 15, 336-347.
Milker, Y., Schmiedl, G., Betzler, C., Römer, M., Jaramillo-Vogel, D., Siccha, M., 2009. Distribution of
Recent benthic foraminifera in neritic carbonate environments of the Western Mediterranean Sea.
Marine Micropaleontology 70, 207-225
Milker, Y., Schmiedl, G., Betzler C., submitted. Holocene sea-level change in the Western
Mediterranean Sea: Quantitative reconstructions based on foraminiferal transfer functions.
Quaternary Science Reviews.
Millot, C., 1999. Circulation in the Western Mediterranean Sea. Journal of Marine Systems 20, 423-442.
Millot, C., Taupier-Letage, I., 2005. Circulation in the Mediterranean Sea. In: Saliot. A. (Ed.), The
Handbook of Environmental Chemistry. Springer Verlag, Heidelberg, pp. 29-66.
Millot, C., Taupier-Letage, I., Benzohra, M., 1990. The Algerian eddies. Earth-Science Reviews 27, 203-
219.
Mojtahid, M., Jorissen, F., Lansard, B., Fontanier, C., Bombled, B., Rabouille, C., 2009. Spatial
distribution of live benthic foraminifera in the Rhone prodelta: Faunal response to a continental-
marine organic matter gradient. Marine Micropaleontology 70, 177-200.
Morhange, C., Pirazzoli, P.A., 2005. Mid-Holocene emergence of southern Tunisian coasts. Marine
Geology 220, 205-213.
Morhange, C., Laborel, J., Hesnard, A., 2001. Changes of relative sea-level during the past 5000 years
in the ancient harbour of Marseilles, Southern France. Palaeogeography, Palaeoclimatology,
Palaeoecology 166, 319-329.
Morigi, C., Jorissen, F.J., Fraticelli, S., Horton, B.P., Principi, M., Sabbatini, A., Capotondi, L., Curzi,
P.V., Negri, A., 2005. Benthic foraminiferal evidence for the formation of the Holocene mud-belt and
bathymetrical evolution in the central Adriatic Sea. Marine Micropaleontology 57, 25-49.
Moutin, T., Raimbault, P., 2002. Primary production, carbon export and nutrients availability in western
and eastern Mediterranean Sea in early summer 1996 (MINOS cruise). Journal of Marine Systems
33-34, 273-288.
162
References
Murgese, D.S., de Deckker, P., 2007. The Late Quarternary evolution of water masses in the eastern
Indian Ocean between Australia and Indonesia, based on benthic foraminifera faunal and carbon
isotopes analyses. Palaeogeography, Palaeoclimatology, Palaeoecology 247, 382-401.
Murray, J.W., 2003. An illustrated guide to the benthic foraminifera of the Hebridean shelf, west of
Scotland, with notes on their mode of life. Paleaeontologia Electronica 5(1), 31 pp.
Murray, J.W., 2006. Ecology and Applications of Benthic Foraminifera. Cambridge University Press,
Cambridge.
Nelson, A.R., Sawai, Y., Jennings, A.E., Bradley, L.-A., Gerson, L., Sherrod, B.L., Sabean, J., Horton,
B.P., 2008. Great-earthquake paleogeodesy and tsunamies of the past 2000 years at Alsea Bay,
central Oregon coast, USA. Quarternary Science Reviews 27, 747-768.
Niniyerola, M., Saez, L., Perez-Obiol, R., 2007. Relating postglacial relict plants and Holocene
vegetation dynamics in the Balearic Islands trough field surveys, pollen analysis and GIS modeling.
Plant Biosystems 141(3), 292-304.
Nuglisch, K., 1985. Foraminiferen - marine Mikroorganismen. A. Ziemsen Verlag, Lutherstadt
Wittemberg.
Ohga, T., Kitazato, H., 1997. Seasonal changes in bathyal foraminiferal populations in response to the
flux of organic matter (Sagami Bay Japan). Terra Nova 9, 33-37.
Orbigny, A. d’, 1839. Foraminiferes. Voyage dans I'Amerique Meridonale 5(5), Paris and Strasbourg.
Orbigny, A. d’, 1846. Foraminiferes Fossiles Du Bassin Tertiaire De Vienne (Autriche). Gide et Comp,
Libraires-Editeurs, Paris.
Ortiz, J.D., Mix, A.C., Rugh, W., Watkins, J.M., Collier, R.W., 1996. Deep-dwelling planktonic
foraminifera in the northeastern Pacific Ocean reveal environmental control of oxygen and carbon
isotopic disequilibria. Geochimica et Cosmochimica Acta 60(22), 4509-4523.
Overpeck, J.T., Webb III. T., Prentice, I.C., 1985. Quantitative interpretation of fossil pollen spectra:
Dissimilarity coefficients and the method of Modern Analogs. Quarternary Research 23, 87-108.
Panieri, G., Gamberi, F., Marani, M., Barbieri, R., 2005. Benthic foraminifera from a recent, shallow-
water hydrothermal environment in the Aeolian Arc (Tyrrhenian Sea). Marine Geology 218, 207-
229.
Parker, F.L., 1958. Eastern Mediterranean Foraminifera. Reports of the Swedish Deep-Sea Expedition,
Sediment Cores from the Mediterranean Sea and the Red Sea 8(4), 217-285.
Pawlowski, J., Holzmann, M., Fahrni, J.F., Hallock, P., 2001. Molecular identification of algal
endosymbionts in large Miliolid foraminifera: 1. Chlorophytes. Journal of Eukaryotic Microbiology
48(3), 362-367.
Pedley H.M., Carannante, G. (Eds.), 2006. Cool-Water Carbonates. Depositional Systems and
Palaeoenvironmental Controls. Geological Society Special Publication, 255, London.
Peel, M.C., Finlayson, B.L., McMahon, T.A., 2007. Updated world map of the Köppen-Geiger climate
classification. Hydrol. Earth Syst. Sci. 11, 1633-1644.
Pérès, J.M., Picard, J., 1964. Nouveau manuel de bionomie bentique de la Mer Mediterranée. Rec.
Trav. St. Mar. Endoume 31, 1-137.
Perez-Obiol, R., 2007. Palynological evidence for climatic change along the eastern Iberian Peninsula
and Balearic Islands. Contributions to Science 3(3), 415-419.
163
References
Phleger, F.B., 1965. Living benthic foraminifera from coastal marsh, southwestern Florida. Bol. Soc.
Geol. Mexicana 28(1), 45-60.
Pinot, J.-M., Lopez-Jurado, J.L., Riera, M., 2002. The CANALES experiment (1996-1998). Interannual,
seasonal, and mesoscale variablitiy of the circulation in the Balearic channels. Progress in
Oceanography 55, 335-370.
Pirazolli, P.A., 2005. A review of possible eustatic, isostatic and tectonic contributions in eight late-
Holocene relative sea-level histories from the Mediterranean area. Quarternary Science Reviews
24, 1989-2001.
Piromallo, C., Morelli, A., 2003. P wave tomography of the mantle under the Alpine-Mediterranean area.
Journal of Geophysical Research 108(B2), 1-23.
Poirier, C., Sauriau, P.-G., Chaumillon, E., Allard J., 2009. Can molluscan assemblages give insights
into Holocene environmental changes other than sea level rise? A case study from a macrotidal bay
(Marennes-Oleron, France). Palaeogeography, Palaeoclimatology, Palaeoecology 280, 105-118.
Pomar, L., 1991. Reef geometries, erosion surfaces and high-frequency sea-level changes, upper
Miocene reef complex, Mallorca, Spain. Sedimentology 38, 243-269.
Preller, R., 1986. A numerical model study of the Alboran Sea gyre. Progress in Oceanography 16, 113-
146.
Pross, J., Kotthoff, U., Müller, U.C., Peyron, O., Dormoy, I., Schmiedl, G., Kalaitzidis, S., Smith, A.M.,
2009. Massive perturbation in terrestrial ecosystems of the Eastern Mediterranean region
associated with the 8.2 kyr B.P. climatic event. Geology 37, 887-890.
Pujol, C., Vergnaud Grazzini C., 1989. Palaeoceanography of the last deglaciation in the Alboran Sea
(Western Mediterranean). Stable isotopes and planktonic foraminiferal records. Marine
Micropaleontology 15, 153-179.
Pujol, A., Vergnaud-Grazzini C., 1995. Distribution patterns of live planktic foraminifera as related to
regional hydrography and productive systems of the Mediterranean Sea. Marine Micropaleontology
25, 187-217.
Ramette, A., 2007. Multivariate analyses in microbial ecology. FEMS Microbiol. Ecol. 62, 142-160.
Rasmussen, T.L., 2005. Systematic paleontology and ecology of benthic foraminifera from the Plio-
Pleistocene Kallithea Bay section, Rhodes, Greece. Cushman Foundation Special Publication 39,
53-157.
Rasmussen, T.L., Bäckström, D., Heinemeier, J., Klitgaard-Kristensen, D., Knutz, P.C., Kuijpers, A.,
Lassen, S., Thomsen, E., Troelstra, S.R., van Weering, T.C.E., 2002. The Faroer-Shetland
Gateway: Late Quarternary water mass exchange between the Nordic Seas and the northeastern
Atlantic. Marine Geology 188, 165-192.
Rathburn, A. E., Corliss B.H., 1994. The ecology of living (stained) deep-sea benthic foraminifera from
the Sulu Sea. Paleoceanography 9, 87-150.
Reiss, Z., Halicz, E., Boaz, L., 2000. Late-Holocene foraminifera from the SE Levantine Basin. Isr. J.
Earth Sci. 48, 1-27.
Reuss, A.E., 1865. Die Foraminiferen, Anthozoen und Bryozoen des deutschen Septarientons - Ein
Beitrag zur Fauna der mitteloligozänen Tertiärschichten. Denkschr. Akad. Wiss. 25, 117-214.
164
References
Rixen, M., Beckers, J.-M., Levitus, S., Antonov, J., Boyer, T., Maillard, C., Fichaut, M., Balopoulos, E.,
Iona, S., Dooley, H., Garcia, M.-J., Manca, B., Giorgetti, A., Manzella, G., Mikhailov, N., Pinardi, N.,
Zavatarelli, M., and the Medar Consortium, 2005. The Western Mediterranean Deep Water: A proxy
for climate change. Geophysical Research Letters 32(12), 1-9.
Robinson, A.R., Leslie, W.G., Theocharis, A., Lascaratos, A., 2001. Mediterranean Sea circulation.
Encyclopedia of Ocean Science 3, 1689-1705.
Rohling, E.J., Hilgen, F.J., 1991. The eastern Mediterranean climate at times of sapropel formation: a
review. Geologie en Mijnbouw 70, 253-264.
Rohling, E.J., De Rijk, S., 1999. Holocene climate optimum and Last Glacial Maximum in the
Mediterranean: the marine oxygen isotope record. Marine Geology 153, 57-75.
Rohling, E.J., Cane, T.R., Cooke, S., Sprovieri, M., Bouloubassi, I., Emeis, K.-C., Schiebel, R., Kroon,
D., Jorissen, F.J., Lorre, A., Kemp, A.E.S., 2002. African monsoon variability during the previous
interglacial maximum. Earth and Planetary Science Letters 202, 61-75.
Rohling, E.J., Sprovieri, M., Cane, T., Casford, J.S.L., Cooke, S., Bouloubassi, I., Emeis, K.C., Schiebel,
R., Rogerson, M., Hayes, A., Jorissen, F.J., Kroon, D., 2004. Reconstructing past planktic
foraminiferal habitats using stable isotope data: a case history for Mediterranean sapropel S5.
Marine Micropaleontology 50, 89-123.
Ros, J.D., Romero, J., Ballesteros, E., Gili, J.M., 1984. Diving in blue water. The benthos. In: Margalef
R. (Ed.), Western Mediterranean, Pergamon Press, Oxford, pp. 233-295.
Rosipal, R., Krämer, N., 2006. Overview and recent advances in Partial Least Squares. Subspace,
Latent Structure and Feature Selection, Lecture notes in computer science. Springer, Heidelberg-
Berlin, pp. 34-51.
Rossignol-Strick, M., 1983. African monsoons, an immediate response to orbital insolation. Nature 304,
46-49.
Rossignol-Strick, M., 1995. Sea-land correlation of pollen records in the Eastern Mediterranean for the
glacial-interglacial transition: biostratigraphy versus radiometric time-scale. Quarternary Science
Reviews 14, 893-915.
Rossignol-Strick, M., 1999. The Holocene climate optimum and pollen records of sapropel 1 in the
eastern Mediterranean, 9000-6000 BP. Quarternary Science Reviews 18, 515-530.
Rossignol-Strick, M., Nesteroff, Olive, P., Vergnaud-Grazzini, C., 1982. After the deluge: Mediterranean
stagnation and sapropel formation. Nature 295, 105-110.
Romano, E., Bergamin, L., Finoia, M.G., Carboni, M.G., Ausili, A., Gabellini, M., 2008. Industrial
pollution at Bagnoli (Naples, Italy): Benthic foraminifera as a tool in integrated programs of
environmental characterisation. Marine Pollution Bulletin 56, 439-457.
Sabean, J.A.R., 2004. Application of foraminifera to detecting land level change associated with great
earthquakes along the west coast of North America, Master Thesis, Simon Fraser University,
Burnaby, British Columbia, 85 pp.
Sanz de Galdeano, C., 1990. Geologic evolution of the Betic Cordilleras in the Western Mediterranean,
Miocene to the present. Tectonophysics 172, 107-119.
Saraswati, P.K., 2002. Growth and habitat of some recent miliolid foraminifera: Palaeoecological
implications. Current Science 82(1), 81-84.
165
References
Saraswati, P.K., Shimoike, K., Iwao, K., Mitra, A., 2003. Distribution of larger foraminifera in the reef
sediments of Akajima, Okinawa, Japan. Journal Geological Society of India 61, 16-21.
Sbaffi, L., Wezel, F.C., Kallel, N., Paterne, M., Cacho, I., Ziveri, P., Shackleton, N., 2001. Response of
the pelagic environment to palaeoclimatic changes in the central Mediterranean Sea during the late
Quarternary. Marine Geology 178, 39-62.
Sbaffi, L., Wezel, F.C., Curzi, G., Zoppi, U., 2004. Millenial- to centennial-scale palaeoclimatic variations
during Termination I and Holocene in the central Mediterranean Sea. Global and Planetary Change
40, 201-217.
Schiebel, R., 1992. Rezente benthische Foraminiferen in Sedimenten des Schelfes und oberen
Kontinentalhanges im Golf von Guinea (Westafrika). Berichte-Reports, Geol. Paläont. Inst.
Universität Kiel 51, 1-126.
Schiebel, R., Waniek, J., Bork, M., Hemleben, C., 2001. Planktic foraminiferal porduction stimulated by
chlorophyll redistribution and entrainment of nutrients. Deep-Sea Research I 48, 721-740.
Schilman, B., Almogi-Labin, A., Bar-Matthews, M., Labeyrie, L., Paterne, M., Luz, B., 2001. Long- and
short-term carbon fluctuations in the Eastern Mediterranean during the late Holocene. Geology 29,
1099-1102.
Schönfeld, J., 2002. Recent benthic foraminiferal assemblages in deep high-energy environments from
Gulf of Cadiz (Spain). Marine Micropaleontology 44, 141-162.
Schmiedl, G., Mackensen, A., Müller, P.J., 1997. Recent benthic foraminifera from the eastern South
Atlantic Ocean: Dependence on food supply and water masses. Marine Micropaleontology 32, 249-
287.
Schmiedl, G., de Bovée, F., Buscail, R., Charrière, B., Hemleben, C., Medernach, L., Picon, P., 2000.
Trophic control of benthic foraminiferal abundance and microhabitat in the bathyal Gulf of Lions,
western Mediterranean Sea. Marine Micropaleontology 40, 167-188.
Schmiedl, G., Pfeilstricker, M., Hemleben, C., Mackensen, A., 2004. Environmental and biological
effects on the stable isotope composition of recent deep-sea benthic foraminifera from the western
Mediterranean Sea. Marine Micropaleontology 51, 129-152.
Scott, G.A., Scourse, J.D., Austin, W.E.N., 2003. The distribution of benthic foraminifera in the Celtic
Sea: the significance of seasonal stratification. Journal of Foraminiferal Research 33, 32-61.
Semeniuk, T.A., 2000. Spatial variability in epiphytic foraminifera from micro- to regional scale. Journal
of Foraminiferal Research 30, 99-109.
Sen Gupta, B.K. (Ed.), 2003. Modern Foraminifera. Kluwer Academic Publishers, Dordrecht.
Sen Gupta, B.K., Machain-Castillo, M.L., 1993. Benthic foraminifera on oxygen-poor habitats. Marine
Micropaleontology 20, 183-201.
Sgarrella, F., Moncharmont Zei, M., 1993. Benthic foraminifera in the Gulf of Naples (Italy): systematics
and autoecology. Bollettino della Societa Paleontologica Italiana 32(2), 145-264.
Silva, K.A., Corliss, B.H., Rathburn, A.E., Thunell, R.C., 1995. Seasonality of living benthic foraminifera
from the San Pedro Basin, California Borderland. Journal of Foraminiferal Research 26, 71-93.
Silva, P.G., Gonzalez Hernandez, F.M., Goy, J.L., Zazo, C., Carrasco, P., 2001. Paleo and historical
seismicitiy in Mallorca (Baleares, Spain) - a preliminary approach. Acta Geologica Hispanica 36(3-
4), 245-266.
166
References
Simboura, N., Zenetos, A., 2002. Benthic indicators to use in Ecological Quality classification of
Mediterranean soft bottom marine ecosystems, including a new Biotic Index. Mediterranean Marine
Science 3(2), 77-111.
Sivan, D., Wdowinski, S., Lambeck, K., Galili, E., Raban, A., 2001. Holocene sea-level changes along
the Mediterranean coast of Israel, based on archaeological observations and numerical model.
Palaeogeography, Palaeoclimatology, Palaeoecology 167, 101-117.
Spezzaferri, S., Tamburini, F., 2007. Paleodepth variations on the Eratosthenes Seamount (Eastern
Mediterranean): sea-level changes or subsidence? eEarth Discussions 2, 115-132.
Sprovieri, R., Hasegawa, S., 1990. Plio-Pleistocene benthic foraminifer stratigraphic distribution in the
deep-sea record of the Tyrrhenian Sea (OPD Leg 107), In: Kastens, K.A., Mascle, J. (Eds.),
Proceedings of the Ocean Drilling Program, Scientific Results 107, 429-459.
Stocchi, P., Spada, G., 2007. Glacio- and hydro-isostasy in the Mediterranean Sea: Clark´s zones and
role of remote ice sheets. Annals of Geophysics 50, 741-761.
Stuiver, M., Reimer, P. J., 1993. Extended 14C database and revised CALIB radiocarbon calibration
program. Radiocarbon 35, 215-230.
Sturrock, S., Murray, J.W., 1981. Comparison of low energy and high energy marine middle shelf
foraminiferal faunas: Celtic Sea and western English Channel. In: Neale, J.W., Brasier, M.D. (Eds.),
Microfossils from Recent and fossil shelf seas. Ellis Horwood, Chichester, pp. 251-260.
Taleb, Z.M., Benghali, S., Kaddour, A., Boutiba, Z., 2007. Monitoring the biological effects of pollution
on the Algerian west coast using mussels Mytilus galloprovincialis. Oceanologia 49(4), 543-564.
Ter Braak, C.J.F., Juggins, S., 1993. Weighted averaging partial least squares regression (WA-PLS): an
improved method for reconstructing environmental variables from species assemblages.
Hydrobiologia 269/270, 485-502.
Ter Braak, C.J.F., Looman, C.W.N., 1986. Weighted averaging, logistic regression and the Gaussian
response model. Vegetatio 65, 3-11.
Ter Braak, C.J.F., Smilauer, P., 2002. CANOCO Reference manual and CanoDraw for Windows User´s
guide (version 4.5). Microcomputer power Ithaka, NY, USA.
Ter Braak, C.J.F., Juggins, S., Birks, H.J.B., Van der Voet, H., 1993. Weighted averaging least squares
regression (WA-PLS): definition and comparison with other methods for species-environment
calibration. In: Patil, G.P. Rao, C.R. (Eds.), Multivariate environmental statistics. Elsevier Science
Publishers B.V. (North Holland), Amsterdam, pp. 525-560.
Thunell, R.C., 1979. Pliocene-Pleistocene paleotemperature and paleosalinity history of the
Mediterranean Sea: Results from DSDP sites 125 and 132. Marine Micropalaeontology 4, 173-187.
Thunell, R., Williams, D.F., Belyea, P.R., 1984. Anoxic events in the Mediterranean Sea in relation to
the evolution of late Neogene climates. Marine Geology 59, 105-134.
Tinti, S., Armigliato, A., Pagnoni, G., Zaniboni, F., 2005. Scenarios of giant tsunamis of tectonic origin in
the Mediterranean. ISET Journal of Earthquake Technology 42(4), 171-188.
Tintore, J., La Violette, P.E., Blade, I., Cruzado, A., 1988. A study of an intense density from in the
Eastern Alboran Sea: the Almeria-Oran Front. Journal of Physical Oceanography 18, 1384-1397.
167
References
Todd, R., 1958. Foraminifera from the Western Mediterranean deep-sea cores. Reports of the Swedish
Deep-Sea Expedition, Sediment Cores from the Mediterranean Sea and the Red Sea 8(3), 167-
215.
Tolderlund, D.S., Be, A.W.H., 1971. Seasonal distribution of planktonic foraminifera in the western North
Atlantic, Micropaleontology 17, 297-329.
Traub, M., Fischer, H., de Reus, M., Kormann, R., Heland, J., Ziereis, H., Schlager, H., Holzinger, R.,
Williams, J., Warneke, C., de Gouw, J., Lelieveld, J., 2003. Chemical characteristics assigned to
trajectory clusters during the MINOS campaign. Atmos. Chem. Phys. Discuss. 3, 107-134.
Van der Zwaan, G.J., Jorissen, F.J., de Stigter, H.C., 1990. The depth dependency of planktonic/benthic
foraminiferal ratios: Constraints and applications. Marine Geology 95, 1-16.
Van der Zwaan, G.J., Duijnstee, I.A.P., den Dulk, M., Ernst, S.R., Jannink, N.T., Kouwenhoven, T.J.,
1999. Benthic foraminifers: proxies or problems? A review of paleoecological concepts. Earth-
Science Reviews 46, 213-236.
Van Hinsbergen, D.J.J., Kouwenhoven, T.J., Van der Zwaan, G.J., 2005. Paleobathymetry in the
backstripping procedure: Correction for oxygenation effects on depth estimates. Palaeogeography,
Palaeoclimatology, Palaeoecology 221, 245-265.
Vargas-Yanez, M., Plaza, F., Garcia-Lafuente, J., Sarhan, T., Vargas, J.M., Velez-Belchi, P., 2002.
About the seasonal variability of the Alboran Sea circulation. Journal of Marine Systems 35, 229-
248.
Velez-Belchi, P., Vargas-Yanez, M., Tintore, J., 2005. Observation of a western Alboran gyre migration
event. Progress in Oceanography 66, 190-210.
Vergnaud Grazzini, C., Pierre, C., 1991. High fertility in the Alboran Sea since the Last Glacial
Maximum. Paleoceanography 6, 519-536.
Vergnaud Grazzini, C., Pierre, C., 1992. The carbon isotope distribution in the deep ∑CO2 and benthic
foraminifers of the Alboran Basin, western Mediterranean: Implications for variations in primary
production levels since the last deglaciation. Marine Micropaleontology 19, 147-161.
Vergnaud Grazzini, C., Ryan, W.B.F., Cita, M.B., 1977. Stable isotopic fractionation, climate change
and episodic stagnation in the Eastern Mediterranean during the late Quarternary. Marine
Micropaleontology 2, 353-370.
Vergnaud Grazzini, C., Devaux, M., Znaidi, J., 1986. Stable isotope "anomalies" in the Mediterranean
Pleistocene records. Marine Micropaleontology 10, 35-69.
Vouvalidis, K.G., Syrides, G.E., Albanakis, K.S., 2005. Holocene morphology of the Thessaloniki Bay:
impact of sea level rise. In: Fouache, E., Pavlopoulos, K. (Eds.), Sea Level Changes in Eastern
Mediterranean during Holocene - Indicators and Human Impacts -. Gebrueder Bornträger, Berlin
Stuttgart, pp. 147-158.
Watts, W.A., Allen, J.R.M., Huntley, B., Fritz, S.C., 1996. Vegetation history and climate if the last
15,000 years at Laghi di Monticchio, southern Italy. Quarternary Science Reviews 15, 113-132.
Weiner, S., 1975. The carbon isotopic composition of the Eastern Mediterranean planktonic foraminifera
Orbulina universa and the phenotypes of Globigerinoides ruber. Palaeogeography,
Palaeoclimatology, Palaeoecology 17, 149-156.
168
References
169
Weldeab, S., Siebel, W., Wehausen, R., Emeis, K.-C., Schmiedl, G., Hemleben, C., 2003. Late
Pleistocene sedimentation in the Western Mediterranean Sea: implications for productivity changes
and climatic conditions in the catchment areas. Palaeogeography, Palaeoclimatology,
Palaeoecology 190, 121-137.
Werner, F.E., Vuidez, A., Tintore, J., 1993. An explanatory numerical study of the currents off the
southern coast of Mallorca including the Cabrera Island complex. Journal of Marine Systems 4, 45-
66.
Wilson, B., 2003. Foraminifera and paleodepths in a section of the early to middle Miocene Brasso
Formation, central Trinidad. Carribean Journal of Science 39(2), 209-214.
Wisshak, M., Rueggeberg, A., 2006. Colonisation and bioerosion of experimental substrates by benthic
foraminiferans from euphotic to aphotic depths (Kosterfjord, SW Sweden). Facies 52, 1-17.
Wollenburg, J., 1992. Zur Taxonomie von rezenten benthischen Foraminiferen aus dem Nansen
Becken, Arktischer Ozean. Berichte zur Polarforschung 112, 137 p.
Wüst, G., 1960. Die Tiefenzirkulation des Mittelländischen Meeres. Deutsche Hydrographische
Zeitschrift 13, 105-131.
Wüst, G., 1961. On the vertical circulation of the Mediterranean Sea. Journal of Geophysical Research
66(20), 3261-3271.
Yll, E.-I., Perez-Obiol, R., Pantaleon-Cano, J., Roure. J.M., 1997. Palynological evidence for climatic
change and human activity during the Holocene on Minorca (Balearic Islands). Quarternary
Research 48, 339-347.
Yokes, M.B., Meric, E., Avsar, N., 2007. On the presence of alien foraminifera Amphistegina lobifera
Larsen on the coasts of the Maltese Islands. Aquatic Invasions 2(4), 439-441.

Appendix
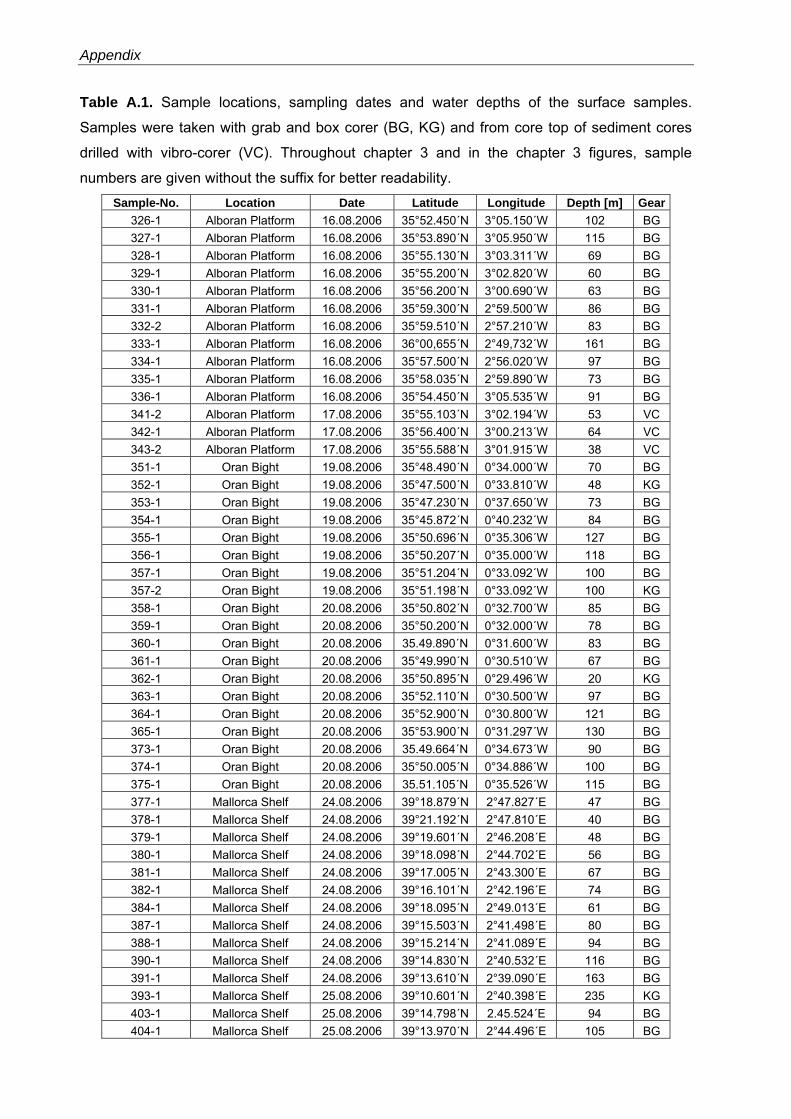
Appendix
Table A.1. Sample locations, sampling dates and water depths of the surface samples.
Samples were taken with grab and box corer (BG, KG) and from core top of sediment cores
drilled with vibro-corer (VC). Throughout chapter 3 and in the chapter 3 figures, sample
numbers are given without the suffix for better readability. Sample-No. Location Date Latitude Longitude Depth [m] Gear
326-1 Alboran Platform 16.08.2006 35°52.450´N 3°05.150´W 102 BG 327-1 Alboran Platform 16.08.2006 35°53.890´N 3°05.950´W 115 BG 328-1 Alboran Platform 16.08.2006 35°55.130´N 3°03.311´W 69 BG 329-1 Alboran Platform 16.08.2006 35°55.200´N 3°02.820´W 60 BG 330-1 Alboran Platform 16.08.2006 35°56.200´N 3°00.690´W 63 BG 331-1 Alboran Platform 16.08.2006 35°59.300´N 2°59.500´W 86 BG 332-2 Alboran Platform 16.08.2006 35°59.510´N 2°57.210´W 83 BG 333-1 Alboran Platform 16.08.2006 36°00,655´N 2°49,732´W 161 BG 334-1 Alboran Platform 16.08.2006 35°57.500´N 2°56.020´W 97 BG 335-1 Alboran Platform 16.08.2006 35°58.035´N 2°59.890´W 73 BG 336-1 Alboran Platform 16.08.2006 35°54.450´N 3°05.535´W 91 BG 341-2 Alboran Platform 17.08.2006 35°55.103´N 3°02.194´W 53 VC 342-1 Alboran Platform 17.08.2006 35°56.400´N 3°00.213´W 64 VC 343-2 Alboran Platform 17.08.2006 35°55.588´N 3°01.915´W 38 VC 351-1 Oran Bight 19.08.2006 35°48.490´N 0°34.000´W 70 BG 352-1 Oran Bight 19.08.2006 35°47.500´N 0°33.810´W 48 KG 353-1 Oran Bight 19.08.2006 35°47.230´N 0°37.650´W 73 BG 354-1 Oran Bight 19.08.2006 35°45.872´N 0°40.232´W 84 BG 355-1 Oran Bight 19.08.2006 35°50.696´N 0°35.306´W 127 BG 356-1 Oran Bight 19.08.2006 35°50.207´N 0°35.000´W 118 BG 357-1 Oran Bight 19.08.2006 35°51.204´N 0°33.092´W 100 BG 357-2 Oran Bight 19.08.2006 35°51.198´N 0°33.092´W 100 KG 358-1 Oran Bight 20.08.2006 35°50.802´N 0°32.700´W 85 BG 359-1 Oran Bight 20.08.2006 35°50.200´N 0°32.000´W 78 BG 360-1 Oran Bight 20.08.2006 35.49.890´N 0°31.600´W 83 BG 361-1 Oran Bight 20.08.2006 35°49.990´N 0°30.510´W 67 BG 362-1 Oran Bight 20.08.2006 35°50.895´N 0°29.496´W 20 KG 363-1 Oran Bight 20.08.2006 35°52.110´N 0°30.500´W 97 BG 364-1 Oran Bight 20.08.2006 35°52.900´N 0°30.800´W 121 BG 365-1 Oran Bight 20.08.2006 35°53.900´N 0°31.297´W 130 BG 373-1 Oran Bight 20.08.2006 35.49.664´N 0°34.673´W 90 BG 374-1 Oran Bight 20.08.2006 35°50.005´N 0°34.886´W 100 BG 375-1 Oran Bight 20.08.2006 35.51.105´N 0°35.526´W 115 BG 377-1 Mallorca Shelf 24.08.2006 39°18.879´N 2°47.827´E 47 BG 378-1 Mallorca Shelf 24.08.2006 39°21.192´N 2°47.810´E 40 BG 379-1 Mallorca Shelf 24.08.2006 39°19.601´N 2°46.208´E 48 BG 380-1 Mallorca Shelf 24.08.2006 39°18.098´N 2°44.702´E 56 BG 381-1 Mallorca Shelf 24.08.2006 39°17.005´N 2°43.300´E 67 BG 382-1 Mallorca Shelf 24.08.2006 39°16.101´N 2°42.196´E 74 BG 384-1 Mallorca Shelf 24.08.2006 39°18.095´N 2°49.013´E 61 BG 387-1 Mallorca Shelf 24.08.2006 39°15.503´N 2°41.498´E 80 BG 388-1 Mallorca Shelf 24.08.2006 39°15.214´N 2°41.089´E 94 BG 390-1 Mallorca Shelf 24.08.2006 39°14.830´N 2°40.532´E 116 BG 391-1 Mallorca Shelf 24.08.2006 39°13.610´N 2°39.090´E 163 BG 393-1 Mallorca Shelf 25.08.2006 39°10.601´N 2°40.398´E 235 KG 403-1 Mallorca Shelf 25.08.2006 39°14.798´N 2.45.524´E 94 BG 404-1 Mallorca Shelf 25.08.2006 39°13.970´N 2°44.496´E 105 BG
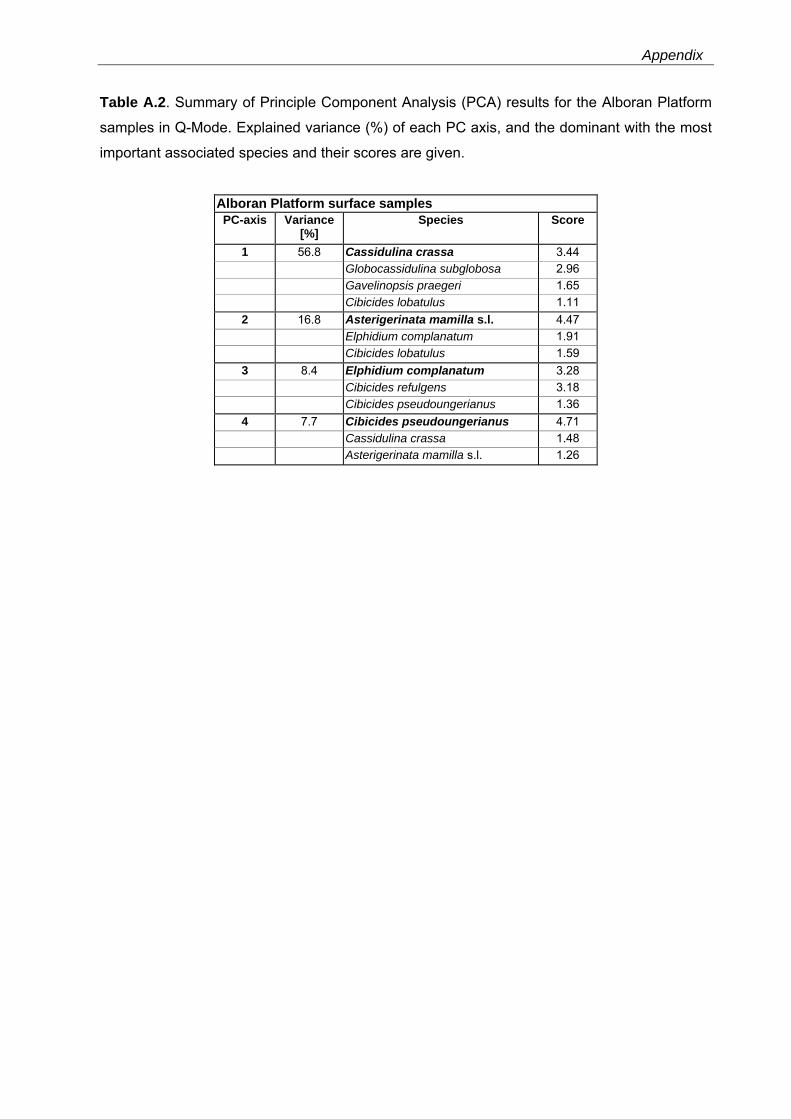
Appendix
Table A.2. Summary of Principle Component Analysis (PCA) results for the Alboran Platform
samples in Q-Mode. Explained variance (%) of each PC axis, and the dominant with the most
important associated species and their scores are given.
Alboran Platform surface samples PC-axis Variance
[%] Species Score
1 56.8 Cassidulina crassa 3.44 Globocassidulina subglobosa 2.96 Gavelinopsis praegeri 1.65 Cibicides lobatulus 1.11
2 16.8 Asterigerinata mamilla s.l. 4.47 Elphidium complanatum 1.91 Cibicides lobatulus 1.59
3 8.4 Elphidium complanatum 3.28 Cibicides refulgens 3.18 Cibicides pseudoungerianus 1.36
4 7.7 Cibicides pseudoungerianus 4.71 Cassidulina crassa 1.48 Asterigerinata mamilla s.l. 1.26
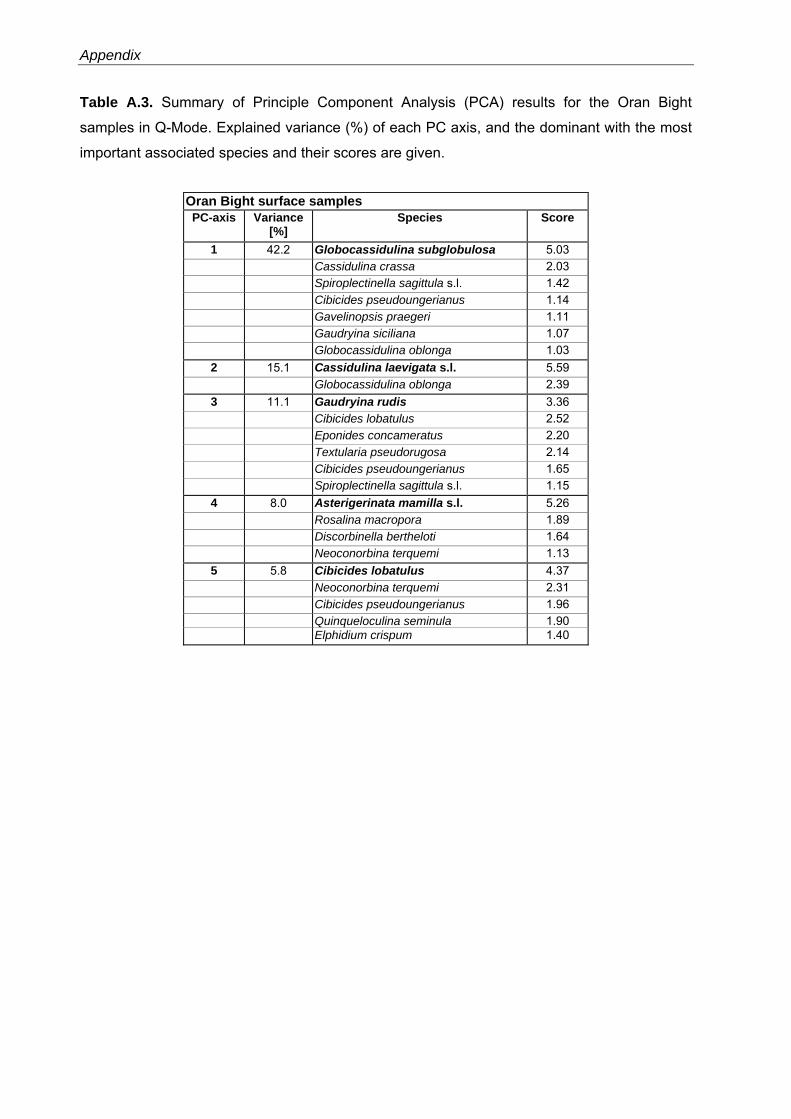
Appendix
Table A.3. Summary of Principle Component Analysis (PCA) results for the Oran Bight
samples in Q-Mode. Explained variance (%) of each PC axis, and the dominant with the most
important associated species and their scores are given.
Oran Bight surface samples PC-axis Variance
[%] Species Score
1 42.2 Globocassidulina subglobulosa 5.03 Cassidulina crassa 2.03 Spiroplectinella sagittula s.l. 1.42 Cibicides pseudoungerianus 1.14 Gavelinopsis praegeri 1.11 Gaudryina siciliana 1.07 Globocassidulina oblonga 1.03
2 15.1 Cassidulina laevigata s.l. 5.59 Globocassidulina oblonga 2.39
3 11.1 Gaudryina rudis 3.36 Cibicides lobatulus 2.52 Eponides concameratus 2.20 Textularia pseudorugosa 2.14 Cibicides pseudoungerianus 1.65 Spiroplectinella sagittula s.l. 1.15
4 8.0 Asterigerinata mamilla s.l. 5.26 Rosalina macropora 1.89 Discorbinella bertheloti 1.64 Neoconorbina terquemi 1.13
5 5.8 Cibicides lobatulus 4.37 Neoconorbina terquemi 2.31 Cibicides pseudoungerianus 1.96 Quinqueloculina seminula 1.90 Elphidium crispum 1.40
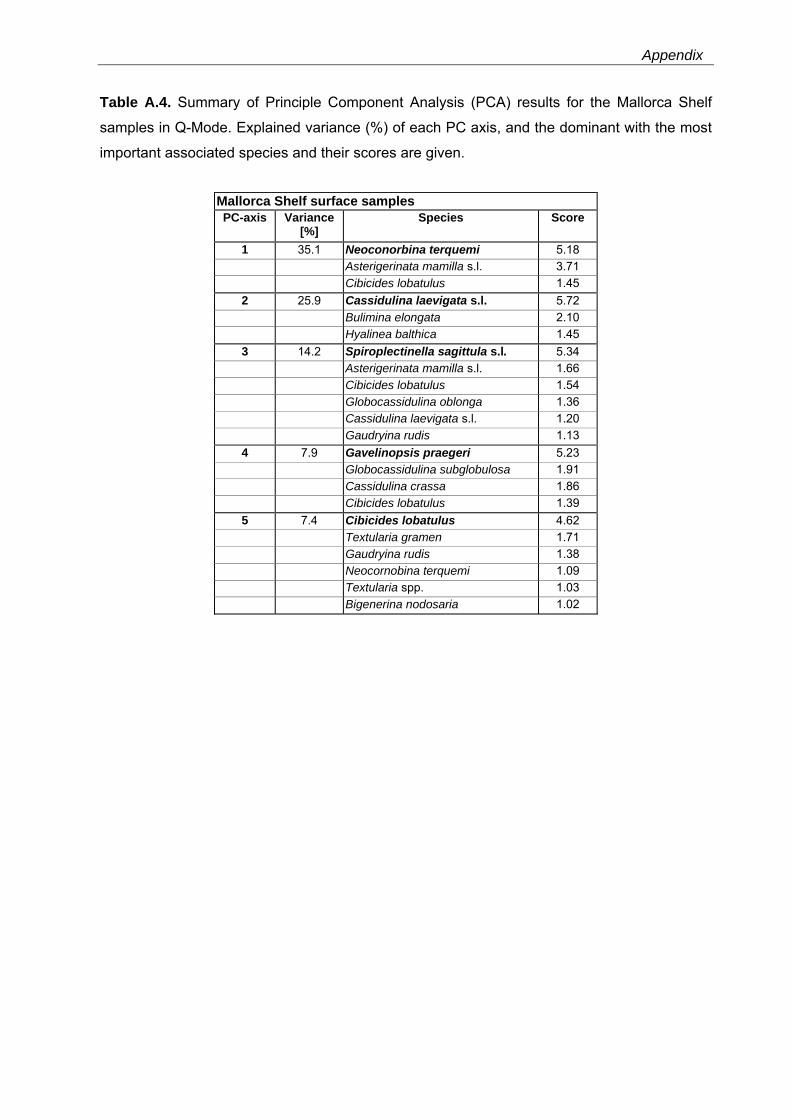
Appendix
Table A.4. Summary of Principle Component Analysis (PCA) results for the Mallorca Shelf
samples in Q-Mode. Explained variance (%) of each PC axis, and the dominant with the most
important associated species and their scores are given.
Mallorca Shelf surface samples PC-axis Variance
[%] Species Score
1 35.1 Neoconorbina terquemi 5.18 Asterigerinata mamilla s.l. 3.71 Cibicides lobatulus 1.45
2 25.9 Cassidulina laevigata s.l. 5.72 Bulimina elongata 2.10 Hyalinea balthica 1.45
3 14.2 Spiroplectinella sagittula s.l. 5.34 Asterigerinata mamilla s.l. 1.66 Cibicides lobatulus 1.54 Globocassidulina oblonga 1.36 Cassidulina laevigata s.l. 1.20 Gaudryina rudis 1.13
4 7.9 Gavelinopsis praegeri 5.23 Globocassidulina subglobulosa 1.91 Cassidulina crassa 1.86 Cibicides lobatulus 1.39
5 7.4 Cibicides lobatulus 4.62 Textularia gramen 1.71 Gaudryina rudis 1.38 Neocornobina terquemi 1.09 Textularia spp. 1.03 Bigenerina nodosaria 1.02
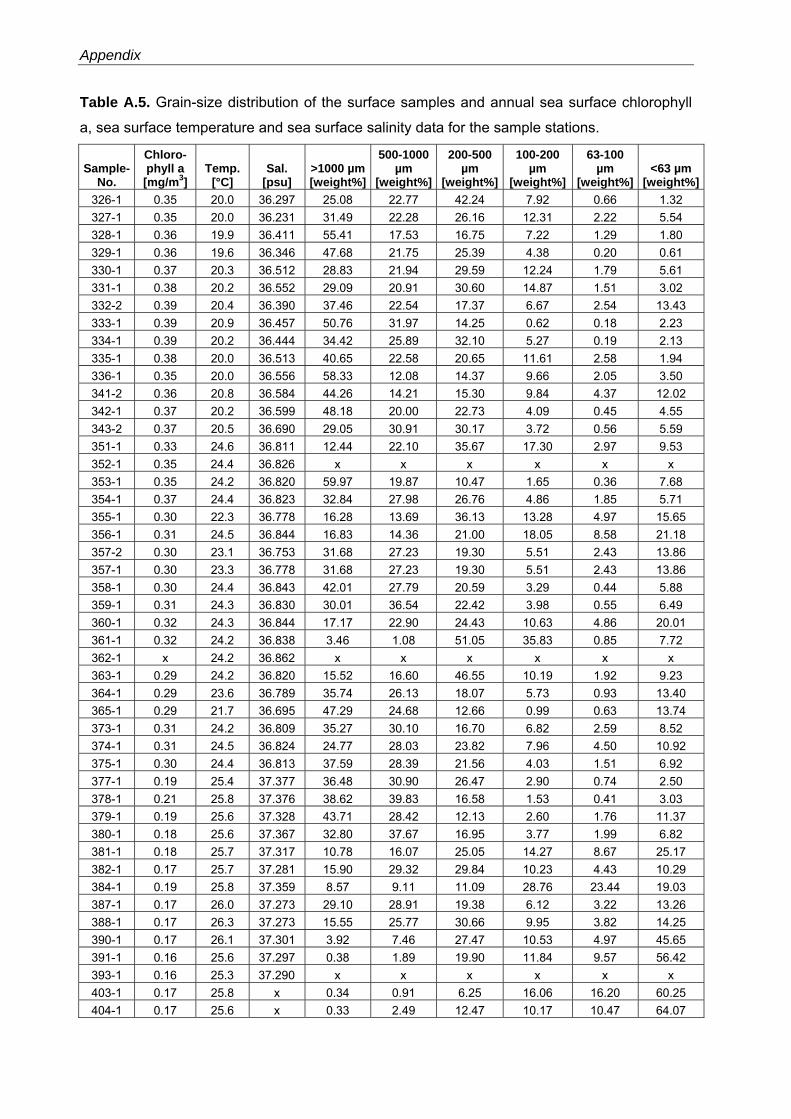
Appendix
Table A.5. Grain-size distribution of the surface samples and annual sea surface chlorophyll
a, sea surface temperature and sea surface salinity data for the sample stations.
Sample-No.
Chloro-phyll a [mg/m3]
Temp. [°C]
Sal. [psu]
>1000 µm [weight%]
500-1000 µm
[weight%]
200-500 µm
[weight%]
100-200 µm
[weight%]
63-100 µm
[weight%] <63 µm
[weight%]326-1 0.35 20.0 36.297 25.08 22.77 42.24 7.92 0.66 1.32 327-1 0.35 20.0 36.231 31.49 22.28 26.16 12.31 2.22 5.54 328-1 0.36 19.9 36.411 55.41 17.53 16.75 7.22 1.29 1.80 329-1 0.36 19.6 36.346 47.68 21.75 25.39 4.38 0.20 0.61 330-1 0.37 20.3 36.512 28.83 21.94 29.59 12.24 1.79 5.61 331-1 0.38 20.2 36.552 29.09 20.91 30.60 14.87 1.51 3.02 332-2 0.39 20.4 36.390 37.46 22.54 17.37 6.67 2.54 13.43 333-1 0.39 20.9 36.457 50.76 31.97 14.25 0.62 0.18 2.23 334-1 0.39 20.2 36.444 34.42 25.89 32.10 5.27 0.19 2.13 335-1 0.38 20.0 36.513 40.65 22.58 20.65 11.61 2.58 1.94 336-1 0.35 20.0 36.556 58.33 12.08 14.37 9.66 2.05 3.50 341-2 0.36 20.8 36.584 44.26 14.21 15.30 9.84 4.37 12.02 342-1 0.37 20.2 36.599 48.18 20.00 22.73 4.09 0.45 4.55 343-2 0.37 20.5 36.690 29.05 30.91 30.17 3.72 0.56 5.59 351-1 0.33 24.6 36.811 12.44 22.10 35.67 17.30 2.97 9.53 352-1 0.35 24.4 36.826 x x x x x x 353-1 0.35 24.2 36.820 59.97 19.87 10.47 1.65 0.36 7.68 354-1 0.37 24.4 36.823 32.84 27.98 26.76 4.86 1.85 5.71 355-1 0.30 22.3 36.778 16.28 13.69 36.13 13.28 4.97 15.65 356-1 0.31 24.5 36.844 16.83 14.36 21.00 18.05 8.58 21.18 357-2 0.30 23.1 36.753 31.68 27.23 19.30 5.51 2.43 13.86 357-1 0.30 23.3 36.778 31.68 27.23 19.30 5.51 2.43 13.86 358-1 0.30 24.4 36.843 42.01 27.79 20.59 3.29 0.44 5.88 359-1 0.31 24.3 36.830 30.01 36.54 22.42 3.98 0.55 6.49 360-1 0.32 24.3 36.844 17.17 22.90 24.43 10.63 4.86 20.01 361-1 0.32 24.2 36.838 3.46 1.08 51.05 35.83 0.85 7.72 362-1 x 24.2 36.862 x x x x x x 363-1 0.29 24.2 36.820 15.52 16.60 46.55 10.19 1.92 9.23 364-1 0.29 23.6 36.789 35.74 26.13 18.07 5.73 0.93 13.40 365-1 0.29 21.7 36.695 47.29 24.68 12.66 0.99 0.63 13.74 373-1 0.31 24.2 36.809 35.27 30.10 16.70 6.82 2.59 8.52 374-1 0.31 24.5 36.824 24.77 28.03 23.82 7.96 4.50 10.92 375-1 0.30 24.4 36.813 37.59 28.39 21.56 4.03 1.51 6.92 377-1 0.19 25.4 37.377 36.48 30.90 26.47 2.90 0.74 2.50 378-1 0.21 25.8 37.376 38.62 39.83 16.58 1.53 0.41 3.03 379-1 0.19 25.6 37.328 43.71 28.42 12.13 2.60 1.76 11.37 380-1 0.18 25.6 37.367 32.80 37.67 16.95 3.77 1.99 6.82 381-1 0.18 25.7 37.317 10.78 16.07 25.05 14.27 8.67 25.17 382-1 0.17 25.7 37.281 15.90 29.32 29.84 10.23 4.43 10.29 384-1 0.19 25.8 37.359 8.57 9.11 11.09 28.76 23.44 19.03 387-1 0.17 26.0 37.273 29.10 28.91 19.38 6.12 3.22 13.26 388-1 0.17 26.3 37.273 15.55 25.77 30.66 9.95 3.82 14.25 390-1 0.17 26.1 37.301 3.92 7.46 27.47 10.53 4.97 45.65 391-1 0.16 25.6 37.297 0.38 1.89 19.90 11.84 9.57 56.42 393-1 0.16 25.3 37.290 x x x x x x 403-1 0.17 25.8 x 0.34 0.91 6.25 16.06 16.20 60.25 404-1 0.17 25.6 x 0.33 2.49 12.47 10.17 10.47 64.07
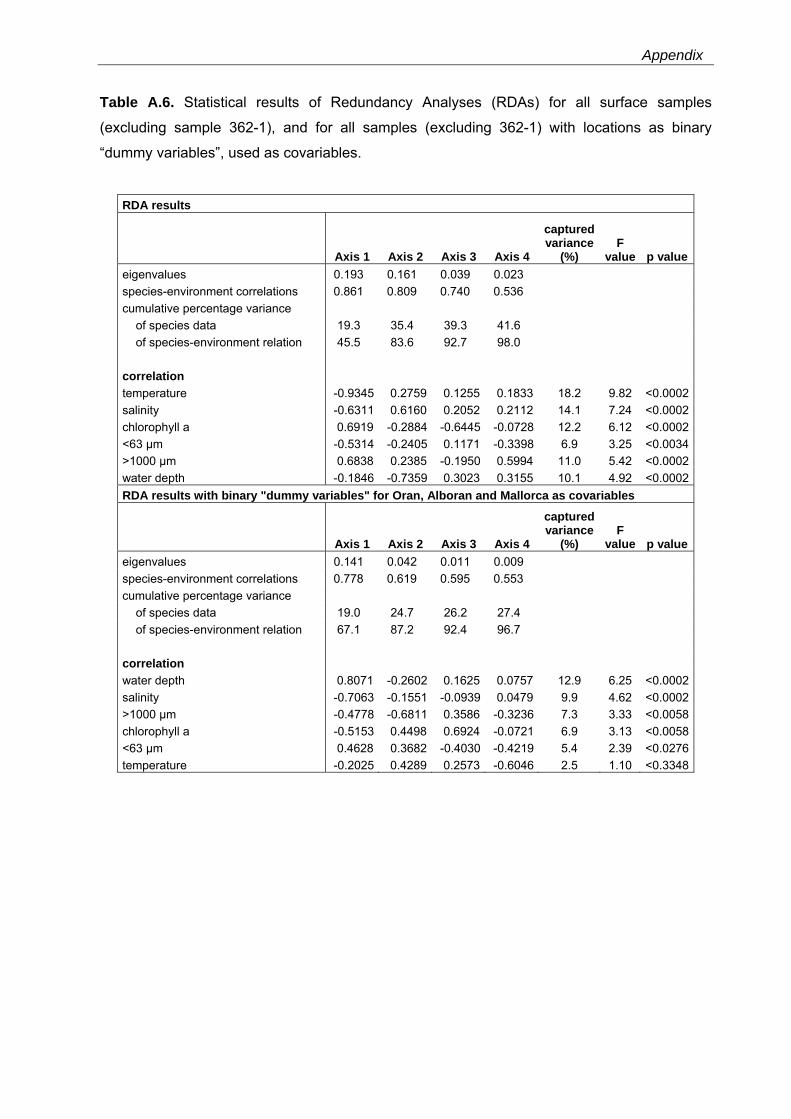
Appendix
Table A.6. Statistical results of Redundancy Analyses (RDAs) for all surface samples
(excluding sample 362-1), and for all samples (excluding 362-1) with locations as binary
“dummy variables”, used as covariables.
RDA results
Axis 1 Axis 2 Axis 3 Axis 4
captured variance
(%) F
value p valueeigenvalues 0.193 0.161 0.039 0.023 species-environment correlations 0.861 0.809 0.740 0.536 cumulative percentage variance of species data 19.3 35.4 39.3 41.6 of species-environment relation 45.5 83.6 92.7 98.0 correlation temperature -0.9345 0.2759 0.1255 0.1833 18.2 9.82 <0.0002salinity -0.6311 0.6160 0.2052 0.2112 14.1 7.24 <0.0002chlorophyll a 0.6919 -0.2884 -0.6445 -0.0728 12.2 6.12 <0.0002<63 µm -0.5314 -0.2405 0.1171 -0.3398 6.9 3.25 <0.0034>1000 µm 0.6838 0.2385 -0.1950 0.5994 11.0 5.42 <0.0002water depth -0.1846 -0.7359 0.3023 0.3155 10.1 4.92 <0.0002RDA results with binary "dummy variables" for Oran, Alboran and Mallorca as covariables
Axis 1 Axis 2 Axis 3 Axis 4
captured variance
(%) F
value p valueeigenvalues 0.141 0.042 0.011 0.009 species-environment correlations 0.778 0.619 0.595 0.553 cumulative percentage variance of species data 19.0 24.7 26.2 27.4 of species-environment relation 67.1 87.2 92.4 96.7 correlation water depth 0.8071 -0.2602 0.1625 0.0757 12.9 6.25 <0.0002salinity -0.7063 -0.1551 -0.0939 0.0479 9.9 4.62 <0.0002>1000 µm -0.4778 -0.6811 0.3586 -0.3236 7.3 3.33 <0.0058chlorophyll a -0.5153 0.4498 0.6924 -0.0721 6.9 3.13 <0.0058<63 µm 0.4628 0.3682 -0.4030 -0.4219 5.4 2.39 <0.0276temperature -0.2025 0.4289 0.2573 -0.6046 2.5 1.10 <0.3348
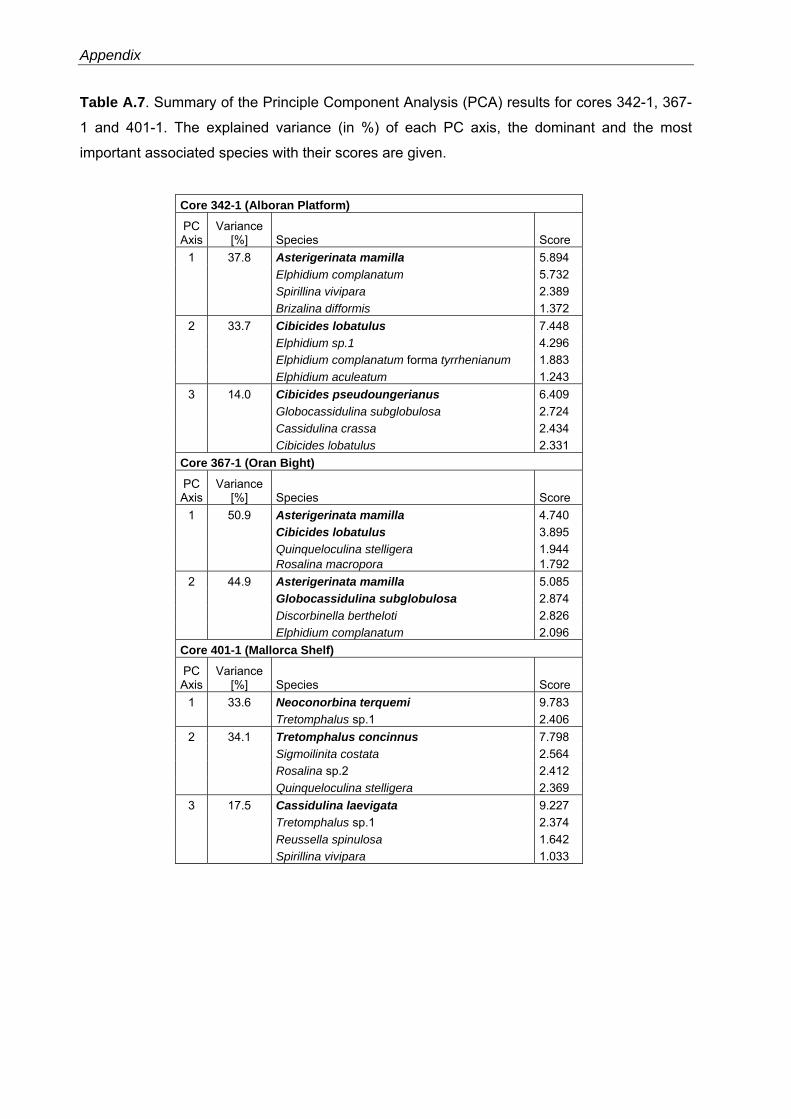
Appendix
Table A.7. Summary of the Principle Component Analysis (PCA) results for cores 342-1, 367-
1 and 401-1. The explained variance (in %) of each PC axis, the dominant and the most
important associated species with their scores are given.
Core 342-1 (Alboran Platform)
PC Axis
Variance [%] Species Score
1 37.8 Asterigerinata mamilla 5.894 Elphidium complanatum 5.732 Spirillina vivipara 2.389 Brizalina difformis 1.372
2 33.7 Cibicides lobatulus 7.448 Elphidium sp.1 4.296 Elphidium complanatum forma tyrrhenianum 1.883 Elphidium aculeatum 1.243
3 14.0 Cibicides pseudoungerianus 6.409 Globocassidulina subglobulosa 2.724 Cassidulina crassa 2.434 Cibicides lobatulus 2.331
Core 367-1 (Oran Bight)
PC Axis
Variance [%] Species Score
1 50.9 Asterigerinata mamilla 4.740 Cibicides lobatulus 3.895 Quinqueloculina stelligera 1.944 Rosalina macropora 1.792
2 44.9 Asterigerinata mamilla 5.085 Globocassidulina subglobulosa 2.874 Discorbinella bertheloti 2.826 Elphidium complanatum 2.096
Core 401-1 (Mallorca Shelf)
PC Axis
Variance [%] Species Score
1 33.6 Neoconorbina terquemi 9.783 Tretomphalus sp.1 2.406
2 34.1 Tretomphalus concinnus 7.798 Sigmoilinita costata 2.564 Rosalina sp.2 2.412 Quinqueloculina stelligera 2.369
3 17.5 Cassidulina laevigata 9.227 Tretomphalus sp.1 2.374 Reussella spinulosa 1.642
Spirillina vivipara 1.033
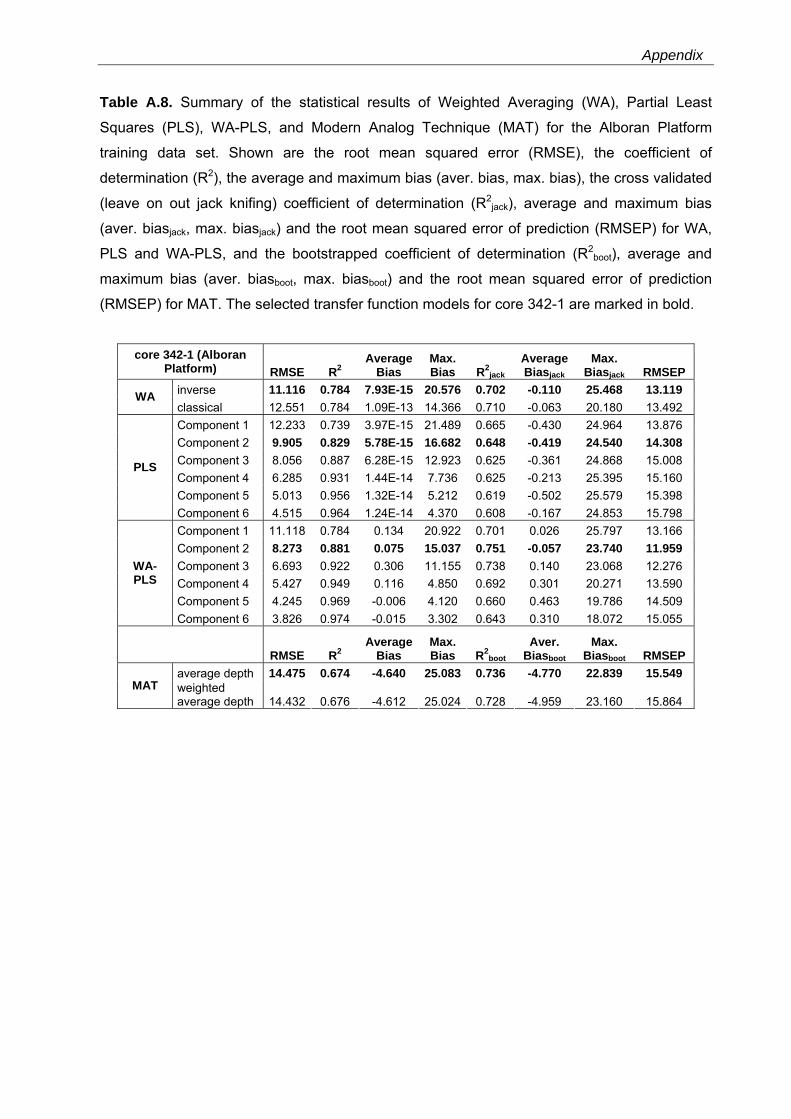
Appendix
Table A.8. Summary of the statistical results of Weighted Averaging (WA), Partial Least
Squares (PLS), WA-PLS, and Modern Analog Technique (MAT) for the Alboran Platform
training data set. Shown are the root mean squared error (RMSE), the coefficient of
determination (R2), the average and maximum bias (aver. bias, max. bias), the cross validated
(leave on out jack knifing) coefficient of determination (R2jack), average and maximum bias
(aver. biasjack, max. biasjack) and the root mean squared error of prediction (RMSEP) for WA,
PLS and WA-PLS, and the bootstrapped coefficient of determination (R2boot), average and
maximum bias (aver. biasboot, max. biasboot) and the root mean squared error of prediction
(RMSEP) for MAT. The selected transfer function models for core 342-1 are marked in bold.
core 342-1 (Alboran Platform) RMSE R2
Average Bias
Max. Bias R2
jack Average Biasjack
Max. Biasjack RMSEP
inverse 11.116 0.784 7.93E-15 20.576 0.702 -0.110 25.468 13.119 WA classical 12.551 0.784 1.09E-13 14.366 0.710 -0.063 20.180 13.492 Component 1 12.233 0.739 3.97E-15 21.489 0.665 -0.430 24.964 13.876 Component 2 9.905 0.829 5.78E-15 16.682 0.648 -0.419 24.540 14.308 Component 3 8.056 0.887 6.28E-15 12.923 0.625 -0.361 24.868 15.008 Component 4 6.285 0.931 1.44E-14 7.736 0.625 -0.213 25.395 15.160 Component 5 5.013 0.956 1.32E-14 5.212 0.619 -0.502 25.579 15.398
PLS
Component 6 4.515 0.964 1.24E-14 4.370 0.608 -0.167 24.853 15.798 Component 1 11.118 0.784 0.134 20.922 0.701 0.026 25.797 13.166 Component 2 8.273 0.881 0.075 15.037 0.751 -0.057 23.740 11.959 Component 3 6.693 0.922 0.306 11.155 0.738 0.140 23.068 12.276 Component 4 5.427 0.949 0.116 4.850 0.692 0.301 20.271 13.590 Component 5 4.245 0.969 -0.006 4.120 0.660 0.463 19.786 14.509
WA-PLS
Component 6 3.826 0.974 -0.015 3.302 0.643 0.310 18.072 15.055
RMSE R2
Average Bias
Max. Bias R2
boot Aver.
Biasboot Max.
Biasboot RMSEP average depth 14.475 0.674 -4.640 25.083 0.736 -4.770 22.839 15.549
MAT weighted average depth 14.432 0.676 -4.612 25.024 0.728 -4.959 23.160 15.864
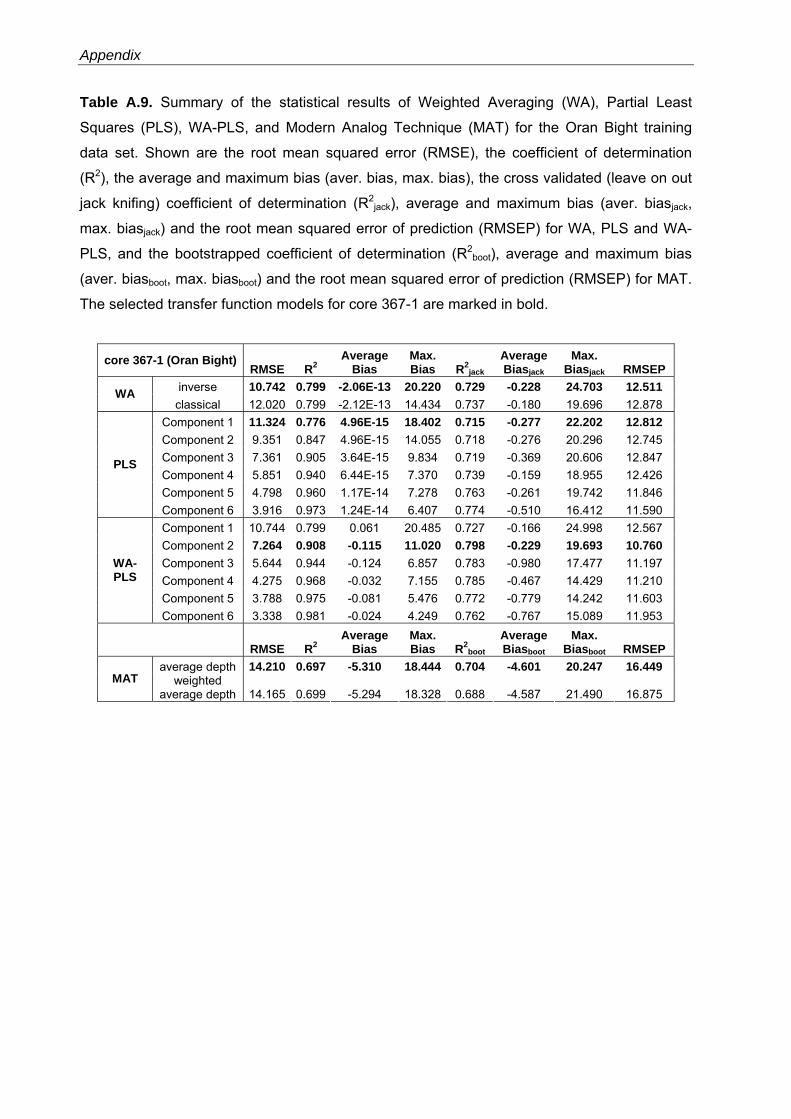
Appendix
Table A.9. Summary of the statistical results of Weighted Averaging (WA), Partial Least
Squares (PLS), WA-PLS, and Modern Analog Technique (MAT) for the Oran Bight training
data set. Shown are the root mean squared error (RMSE), the coefficient of determination
(R2), the average and maximum bias (aver. bias, max. bias), the cross validated (leave on out
jack knifing) coefficient of determination (R2jack), average and maximum bias (aver. biasjack,
max. biasjack) and the root mean squared error of prediction (RMSEP) for WA, PLS and WA-
PLS, and the bootstrapped coefficient of determination (R2boot), average and maximum bias
(aver. biasboot, max. biasboot) and the root mean squared error of prediction (RMSEP) for MAT.
The selected transfer function models for core 367-1 are marked in bold.
core 367-1 (Oran Bight)RMSE R2
Average Bias
Max. Bias R2
jack Average Biasjack
Max. Biasjack RMSEP
inverse 10.742 0.799 -2.06E-13 20.220 0.729 -0.228 24.703 12.511 WA classical 12.020 0.799 -2.12E-13 14.434 0.737 -0.180 19.696 12.878
Component 1 11.324 0.776 4.96E-15 18.402 0.715 -0.277 22.202 12.812 Component 2 9.351 0.847 4.96E-15 14.055 0.718 -0.276 20.296 12.745 Component 3 7.361 0.905 3.64E-15 9.834 0.719 -0.369 20.606 12.847 Component 4 5.851 0.940 6.44E-15 7.370 0.739 -0.159 18.955 12.426 Component 5 4.798 0.960 1.17E-14 7.278 0.763 -0.261 19.742 11.846
PLS
Component 6 3.916 0.973 1.24E-14 6.407 0.774 -0.510 16.412 11.590 Component 1 10.744 0.799 0.061 20.485 0.727 -0.166 24.998 12.567 Component 2 7.264 0.908 -0.115 11.020 0.798 -0.229 19.693 10.760 Component 3 5.644 0.944 -0.124 6.857 0.783 -0.980 17.477 11.197 Component 4 4.275 0.968 -0.032 7.155 0.785 -0.467 14.429 11.210 Component 5 3.788 0.975 -0.081 5.476 0.772 -0.779 14.242 11.603
WA-PLS
Component 6 3.338 0.981 -0.024 4.249 0.762 -0.767 15.089 11.953
RMSE R2
Average Bias
Max. Bias R2
boot AverageBiasboot
Max. Biasboot RMSEP
average depth 14.210 0.697 -5.310 18.444 0.704 -4.601 20.247 16.449 MAT weighted
average depth 14.165 0.699 -5.294 18.328 0.688 -4.587 21.490 16.875
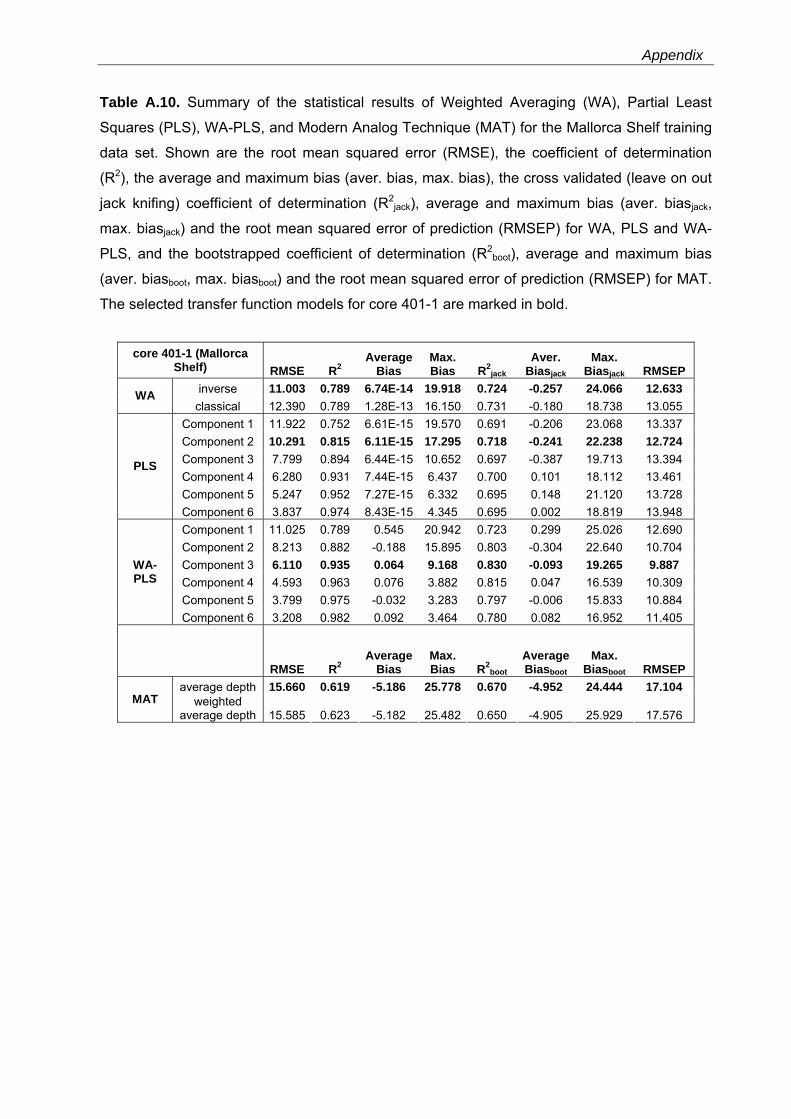
Appendix
Table A.10. Summary of the statistical results of Weighted Averaging (WA), Partial Least
Squares (PLS), WA-PLS, and Modern Analog Technique (MAT) for the Mallorca Shelf training
data set. Shown are the root mean squared error (RMSE), the coefficient of determination
(R2), the average and maximum bias (aver. bias, max. bias), the cross validated (leave on out
jack knifing) coefficient of determination (R2jack), average and maximum bias (aver. biasjack,
max. biasjack) and the root mean squared error of prediction (RMSEP) for WA, PLS and WA-
PLS, and the bootstrapped coefficient of determination (R2boot), average and maximum bias
(aver. biasboot, max. biasboot) and the root mean squared error of prediction (RMSEP) for MAT.
The selected transfer function models for core 401-1 are marked in bold.
core 401-1 (Mallorca
Shelf) RMSE R2 Average
Bias Max. Bias R2
jack Aver.
Biasjack Max.
Biasjack RMSEP inverse 11.003 0.789 6.74E-14 19.918 0.724 -0.257 24.066 12.633 WA
classical 12.390 0.789 1.28E-13 16.150 0.731 -0.180 18.738 13.055 Component 1 11.922 0.752 6.61E-15 19.570 0.691 -0.206 23.068 13.337 Component 2 10.291 0.815 6.11E-15 17.295 0.718 -0.241 22.238 12.724 Component 3 7.799 0.894 6.44E-15 10.652 0.697 -0.387 19.713 13.394 Component 4 6.280 0.931 7.44E-15 6.437 0.700 0.101 18.112 13.461 Component 5 5.247 0.952 7.27E-15 6.332 0.695 0.148 21.120 13.728
PLS
Component 6 3.837 0.974 8.43E-15 4.345 0.695 0.002 18.819 13.948 Component 1 11.025 0.789 0.545 20.942 0.723 0.299 25.026 12.690 Component 2 8.213 0.882 -0.188 15.895 0.803 -0.304 22.640 10.704 Component 3 6.110 0.935 0.064 9.168 0.830 -0.093 19.265 9.887 Component 4 4.593 0.963 0.076 3.882 0.815 0.047 16.539 10.309 Component 5 3.799 0.975 -0.032 3.283 0.797 -0.006 15.833 10.884
WA-PLS
Component 6 3.208 0.982 0.092 3.464 0.780 0.082 16.952 11.405
RMSE R2
Average Bias
Max. Bias R2
boot AverageBiasboot
Max. Biasboot RMSEP
average depth 15.660 0.619 -5.186 25.778 0.670 -4.952 24.444 17.104 MAT weighted
average depth 15.585 0.623 -5.182 25.482 0.650 -4.905 25.929 17.576
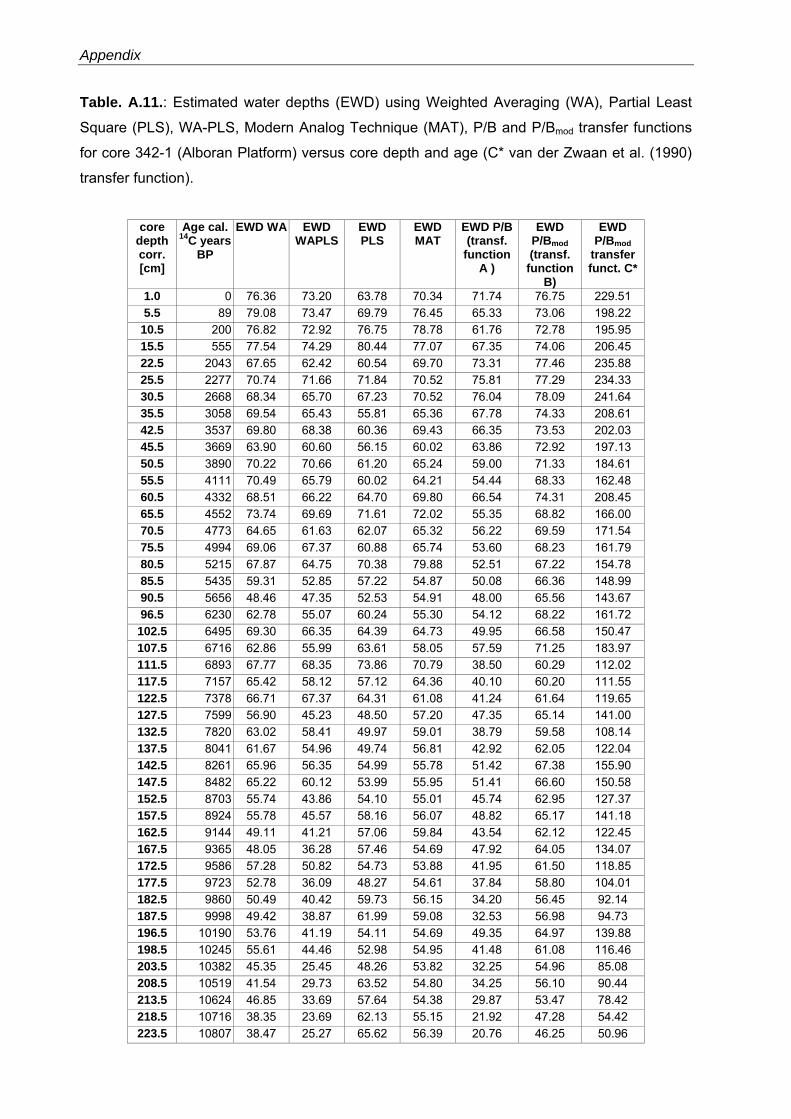
Appendix
Table. A.11.: Estimated water depths (EWD) using Weighted Averaging (WA), Partial Least
Square (PLS), WA-PLS, Modern Analog Technique (MAT), P/B and P/Bmod transfer functions
for core 342-1 (Alboran Platform) versus core depth and age (C* van der Zwaan et al. (1990)
transfer function).
core
depth corr. [cm]
Age cal. 14C years
BP
EWD WA EWD WAPLS
EWD PLS
EWD MAT
EWD P/B (transf.
function A )
EWD P/Bmod (transf.
function B)
EWD P/Bmod
transfer funct. C*
1.0 0 76.36 73.20 63.78 70.34 71.74 76.75 229.51 5.5 89 79.08 73.47 69.79 76.45 65.33 73.06 198.22
10.5 200 76.82 72.92 76.75 78.78 61.76 72.78 195.95 15.5 555 77.54 74.29 80.44 77.07 67.35 74.06 206.45 22.5 2043 67.65 62.42 60.54 69.70 73.31 77.46 235.88 25.5 2277 70.74 71.66 71.84 70.52 75.81 77.29 234.33 30.5 2668 68.34 65.70 67.23 70.52 76.04 78.09 241.64 35.5 3058 69.54 65.43 55.81 65.36 67.78 74.33 208.61 42.5 3537 69.80 68.38 60.36 69.43 66.35 73.53 202.03 45.5 3669 63.90 60.60 56.15 60.02 63.86 72.92 197.13 50.5 3890 70.22 70.66 61.20 65.24 59.00 71.33 184.61 55.5 4111 70.49 65.79 60.02 64.21 54.44 68.33 162.48 60.5 4332 68.51 66.22 64.70 69.80 66.54 74.31 208.45 65.5 4552 73.74 69.69 71.61 72.02 55.35 68.82 166.00 70.5 4773 64.65 61.63 62.07 65.32 56.22 69.59 171.54 75.5 4994 69.06 67.37 60.88 65.74 53.60 68.23 161.79 80.5 5215 67.87 64.75 70.38 79.88 52.51 67.22 154.78 85.5 5435 59.31 52.85 57.22 54.87 50.08 66.36 148.99 90.5 5656 48.46 47.35 52.53 54.91 48.00 65.56 143.67 96.5 6230 62.78 55.07 60.24 55.30 54.12 68.22 161.72 102.5 6495 69.30 66.35 64.39 64.73 49.95 66.58 150.47 107.5 6716 62.86 55.99 63.61 58.05 57.59 71.25 183.97 111.5 6893 67.77 68.35 73.86 70.79 38.50 60.29 112.02 117.5 7157 65.42 58.12 57.12 64.36 40.10 60.20 111.55 122.5 7378 66.71 67.37 64.31 61.08 41.24 61.64 119.65 127.5 7599 56.90 45.23 48.50 57.20 47.35 65.14 141.00 132.5 7820 63.02 58.41 49.97 59.01 38.79 59.58 108.14 137.5 8041 61.67 54.96 49.74 56.81 42.92 62.05 122.04 142.5 8261 65.96 56.35 54.99 55.78 51.42 67.38 155.90 147.5 8482 65.22 60.12 53.99 55.95 51.41 66.60 150.58 152.5 8703 55.74 43.86 54.10 55.01 45.74 62.95 127.37 157.5 8924 55.78 45.57 58.16 56.07 48.82 65.17 141.18 162.5 9144 49.11 41.21 57.06 59.84 43.54 62.12 122.45 167.5 9365 48.05 36.28 57.46 54.69 47.92 64.05 134.07 172.5 9586 57.28 50.82 54.73 53.88 41.95 61.50 118.85 177.5 9723 52.78 36.09 48.27 54.61 37.84 58.80 104.01 182.5 9860 50.49 40.42 59.73 56.15 34.20 56.45 92.14 187.5 9998 49.42 38.87 61.99 59.08 32.53 56.98 94.73 196.5 10190 53.76 41.19 54.11 54.69 49.35 64.97 139.88 198.5 10245 55.61 44.46 52.98 54.95 41.48 61.08 116.46 203.5 10382 45.35 25.45 48.26 53.82 32.25 54.96 85.08 208.5 10519 41.54 29.73 63.52 54.80 34.25 56.10 90.44 213.5 10624 46.85 33.69 57.64 54.38 29.87 53.47 78.42 218.5 10716 38.35 23.69 62.13 55.15 21.92 47.28 54.42 223.5 10807 38.47 25.27 65.62 56.39 20.76 46.25 50.96
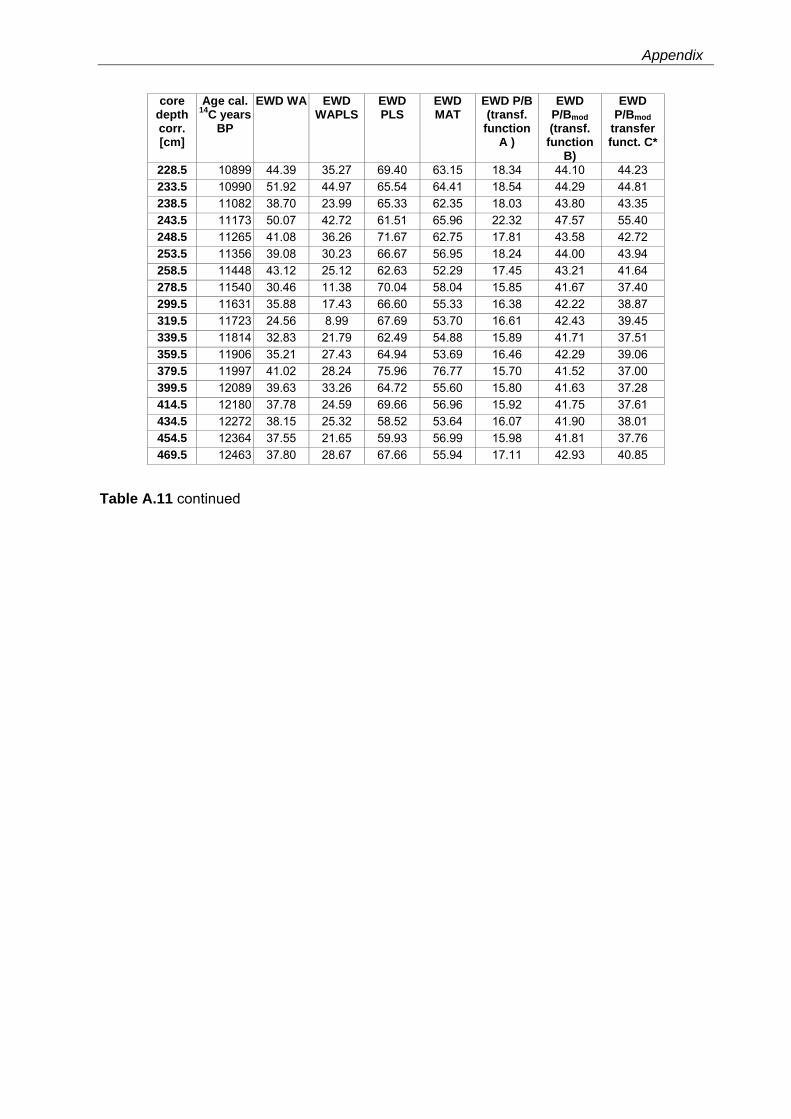
Appendix
core depth corr. [cm]
Age cal. 14C years
BP
EWD WA EWD WAPLS
EWD PLS
EWD MAT
EWD P/B (transf.
function A )
EWD P/Bmod (transf.
function B)
EWD P/Bmod
transfer funct. C*
228.5 10899 44.39 35.27 69.40 63.15 18.34 44.10 44.23 233.5 10990 51.92 44.97 65.54 64.41 18.54 44.29 44.81 238.5 11082 38.70 23.99 65.33 62.35 18.03 43.80 43.35 243.5 11173 50.07 42.72 61.51 65.96 22.32 47.57 55.40 248.5 11265 41.08 36.26 71.67 62.75 17.81 43.58 42.72 253.5 11356 39.08 30.23 66.67 56.95 18.24 44.00 43.94 258.5 11448 43.12 25.12 62.63 52.29 17.45 43.21 41.64 278.5 11540 30.46 11.38 70.04 58.04 15.85 41.67 37.40 299.5 11631 35.88 17.43 66.60 55.33 16.38 42.22 38.87 319.5 11723 24.56 8.99 67.69 53.70 16.61 42.43 39.45 339.5 11814 32.83 21.79 62.49 54.88 15.89 41.71 37.51 359.5 11906 35.21 27.43 64.94 53.69 16.46 42.29 39.06 379.5 11997 41.02 28.24 75.96 76.77 15.70 41.52 37.00 399.5 12089 39.63 33.26 64.72 55.60 15.80 41.63 37.28 414.5 12180 37.78 24.59 69.66 56.96 15.92 41.75 37.61 434.5 12272 38.15 25.32 58.52 53.64 16.07 41.90 38.01 454.5 12364 37.55 21.65 59.93 56.99 15.98 41.81 37.76 469.5 12463 37.80 28.67 67.66 55.94 17.11 42.93 40.85
Table A.11 continued
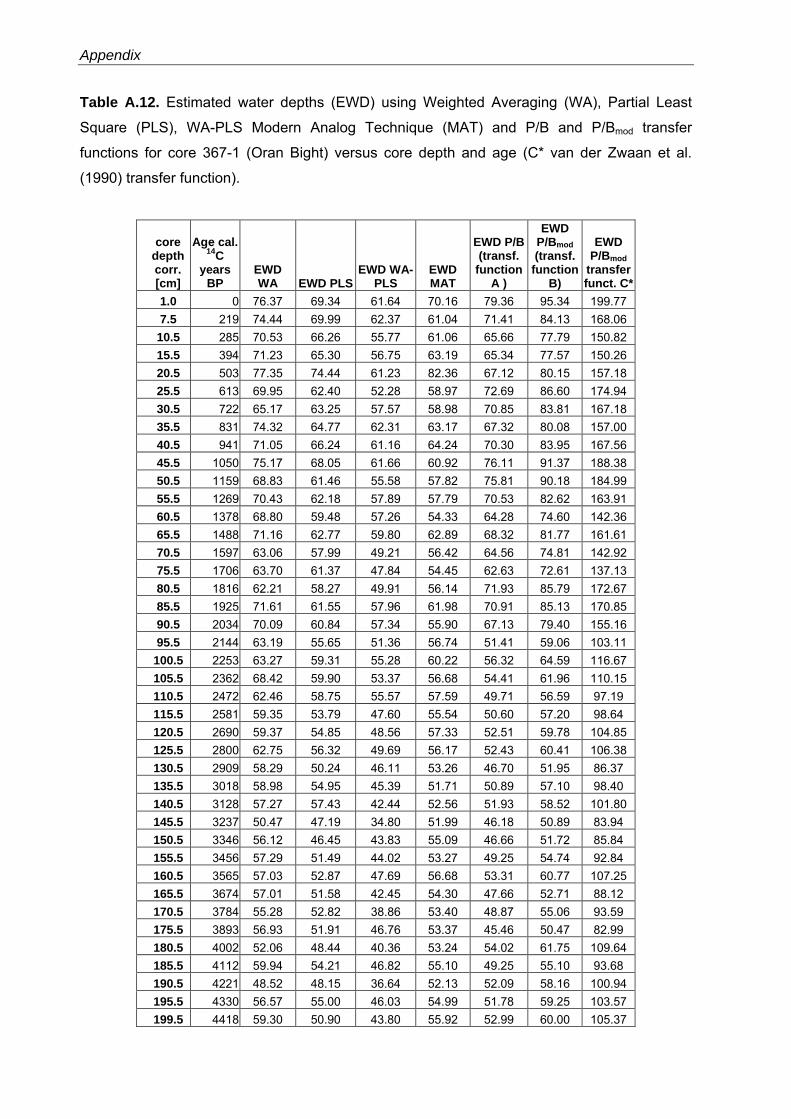
Appendix
Table A.12. Estimated water depths (EWD) using Weighted Averaging (WA), Partial Least
Square (PLS), WA-PLS Modern Analog Technique (MAT) and P/B and P/Bmod transfer
functions for core 367-1 (Oran Bight) versus core depth and age (C* van der Zwaan et al.
(1990) transfer function).
core depth corr. [cm]
Age cal. 14C
years BP
EWD WA EWD PLS
EWD WA-PLS
EWD MAT
EWD P/B (transf.
function A )
EWD P/Bmod (transf.
function B)
EWD P/Bmod
transfer funct. C*
1.0 0 76.37 69.34 61.64 70.16 79.36 95.34 199.77 7.5 219 74.44 69.99 62.37 61.04 71.41 84.13 168.06 10.5 285 70.53 66.26 55.77 61.06 65.66 77.79 150.82 15.5 394 71.23 65.30 56.75 63.19 65.34 77.57 150.26 20.5 503 77.35 74.44 61.23 82.36 67.12 80.15 157.18 25.5 613 69.95 62.40 52.28 58.97 72.69 86.60 174.94 30.5 722 65.17 63.25 57.57 58.98 70.85 83.81 167.18 35.5 831 74.32 64.77 62.31 63.17 67.32 80.08 157.00 40.5 941 71.05 66.24 61.16 64.24 70.30 83.95 167.56 45.5 1050 75.17 68.05 61.66 60.92 76.11 91.37 188.38 50.5 1159 68.83 61.46 55.58 57.82 75.81 90.18 184.99 55.5 1269 70.43 62.18 57.89 57.79 70.53 82.62 163.91 60.5 1378 68.80 59.48 57.26 54.33 64.28 74.60 142.36 65.5 1488 71.16 62.77 59.80 62.89 68.32 81.77 161.61 70.5 1597 63.06 57.99 49.21 56.42 64.56 74.81 142.92 75.5 1706 63.70 61.37 47.84 54.45 62.63 72.61 137.13 80.5 1816 62.21 58.27 49.91 56.14 71.93 85.79 172.67 85.5 1925 71.61 61.55 57.96 61.98 70.91 85.13 170.85 90.5 2034 70.09 60.84 57.34 55.90 67.13 79.40 155.16 95.5 2144 63.19 55.65 51.36 56.74 51.41 59.06 103.11
100.5 2253 63.27 59.31 55.28 60.22 56.32 64.59 116.67 105.5 2362 68.42 59.90 53.37 56.68 54.41 61.96 110.15 110.5 2472 62.46 58.75 55.57 57.59 49.71 56.59 97.19 115.5 2581 59.35 53.79 47.60 55.54 50.60 57.20 98.64 120.5 2690 59.37 54.85 48.56 57.33 52.51 59.78 104.85 125.5 2800 62.75 56.32 49.69 56.17 52.43 60.41 106.38 130.5 2909 58.29 50.24 46.11 53.26 46.70 51.95 86.37 135.5 3018 58.98 54.95 45.39 51.71 50.89 57.10 98.40 140.5 3128 57.27 57.43 42.44 52.56 51.93 58.52 101.80 145.5 3237 50.47 47.19 34.80 51.99 46.18 50.89 83.94 150.5 3346 56.12 46.45 43.83 55.09 46.66 51.72 85.84 155.5 3456 57.29 51.49 44.02 53.27 49.25 54.74 92.84 160.5 3565 57.03 52.87 47.69 56.68 53.31 60.77 107.25 165.5 3674 57.01 51.58 42.45 54.30 47.66 52.71 88.12 170.5 3784 55.28 52.82 38.86 53.40 48.87 55.06 93.59 175.5 3893 56.93 51.91 46.76 53.37 45.46 50.47 82.99 180.5 4002 52.06 48.44 40.36 53.24 54.02 61.75 109.64 185.5 4112 59.94 54.21 46.82 55.10 49.25 55.10 93.68 190.5 4221 48.52 48.15 36.64 52.13 52.09 58.16 100.94 195.5 4330 56.57 55.00 46.03 54.99 51.78 59.25 103.57 199.5 4418 59.30 50.90 43.80 55.92 52.99 60.00 105.37
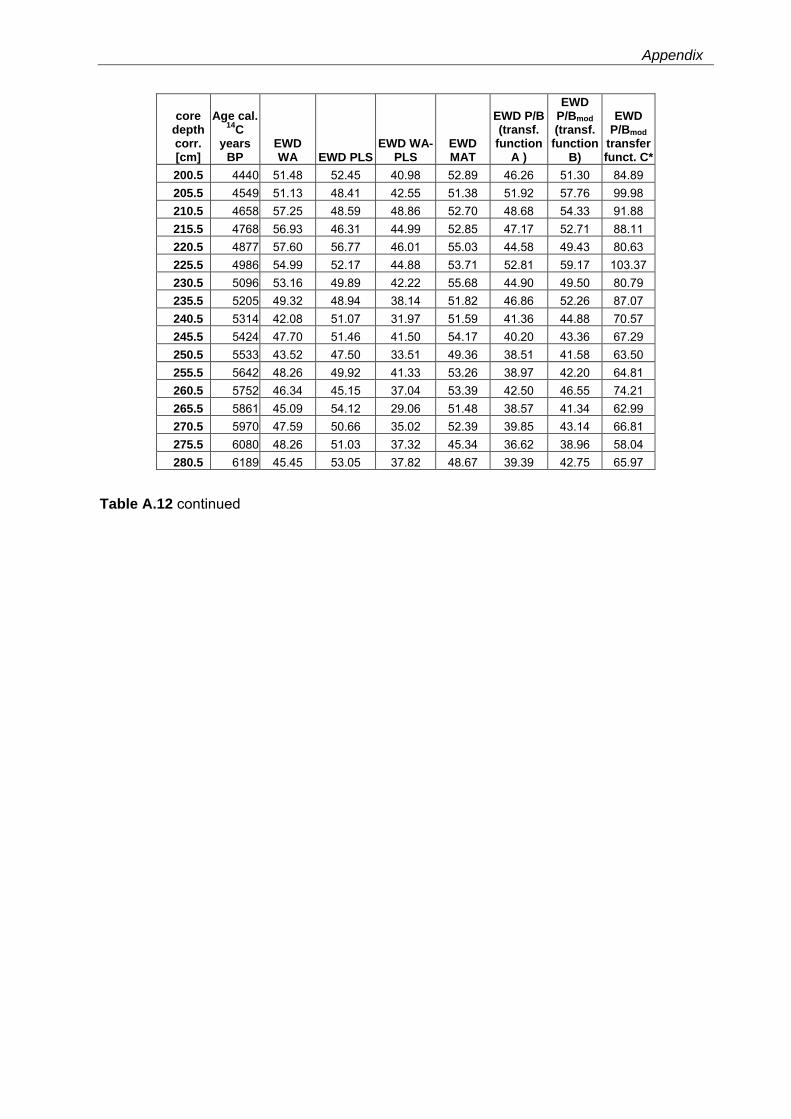
Appendix
core depth corr. [cm]
Age cal. 14C
years BP
EWD WA EWD PLS
EWD WA-PLS
EWD MAT
EWD P/B (transf.
function A )
EWD P/Bmod (transf.
function B)
EWD P/Bmod
transfer funct. C*
200.5 4440 51.48 52.45 40.98 52.89 46.26 51.30 84.89 205.5 4549 51.13 48.41 42.55 51.38 51.92 57.76 99.98 210.5 4658 57.25 48.59 48.86 52.70 48.68 54.33 91.88 215.5 4768 56.93 46.31 44.99 52.85 47.17 52.71 88.11 220.5 4877 57.60 56.77 46.01 55.03 44.58 49.43 80.63 225.5 4986 54.99 52.17 44.88 53.71 52.81 59.17 103.37 230.5 5096 53.16 49.89 42.22 55.68 44.90 49.50 80.79 235.5 5205 49.32 48.94 38.14 51.82 46.86 52.26 87.07 240.5 5314 42.08 51.07 31.97 51.59 41.36 44.88 70.57 245.5 5424 47.70 51.46 41.50 54.17 40.20 43.36 67.29 250.5 5533 43.52 47.50 33.51 49.36 38.51 41.58 63.50 255.5 5642 48.26 49.92 41.33 53.26 38.97 42.20 64.81 260.5 5752 46.34 45.15 37.04 53.39 42.50 46.55 74.21 265.5 5861 45.09 54.12 29.06 51.48 38.57 41.34 62.99 270.5 5970 47.59 50.66 35.02 52.39 39.85 43.14 66.81 275.5 6080 48.26 51.03 37.32 45.34 36.62 38.96 58.04 280.5 6189 45.45 53.05 37.82 48.67 39.39 42.75 65.97
Table A.12 continued
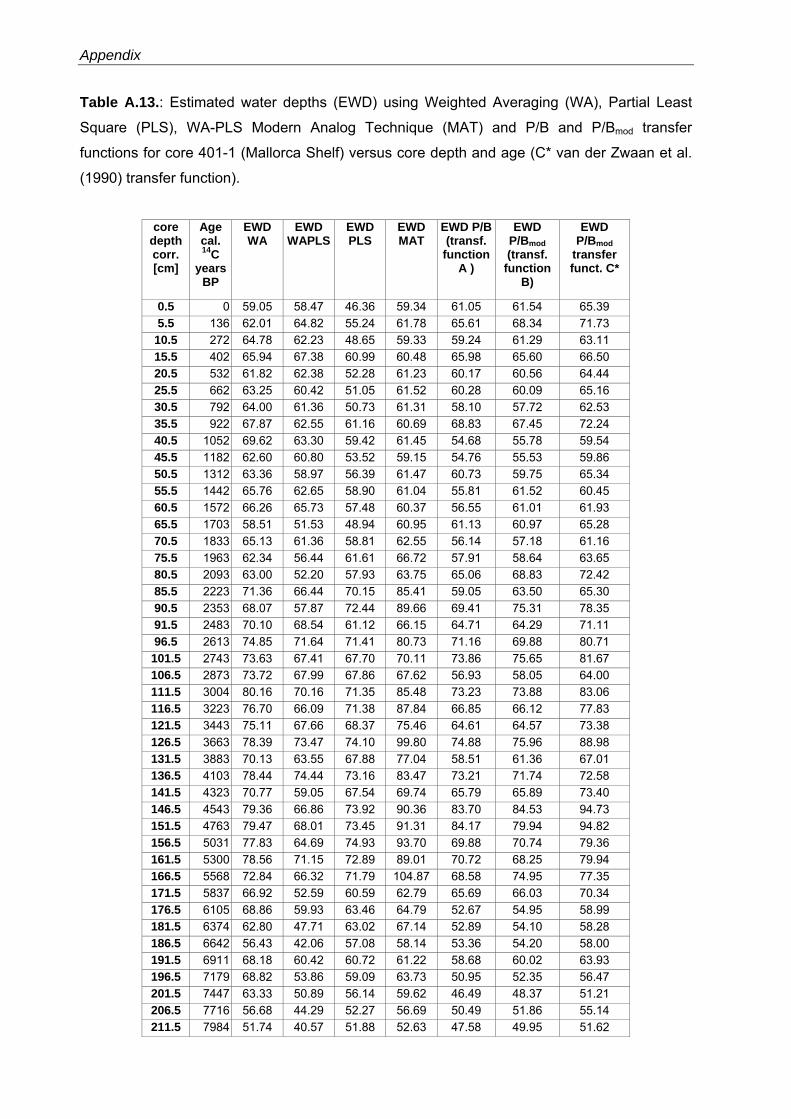
Appendix
Table A.13.: Estimated water depths (EWD) using Weighted Averaging (WA), Partial Least
Square (PLS), WA-PLS Modern Analog Technique (MAT) and P/B and P/Bmod transfer
functions for core 401-1 (Mallorca Shelf) versus core depth and age (C* van der Zwaan et al.
(1990) transfer function).
core
depth corr. [cm]
Age cal. 14C
years BP
EWD WA
EWD WAPLS
EWD PLS
EWD MAT
EWD P/B (transf.
function A )
EWD P/Bmod (transf.
function B)
EWD P/Bmod
transfer funct. C*
0.5 0 59.05 58.47 46.36 59.34 61.05 61.54 65.39 5.5 136 62.01 64.82 55.24 61.78 65.61 68.34 71.73
10.5 272 64.78 62.23 48.65 59.33 59.24 61.29 63.11 15.5 402 65.94 67.38 60.99 60.48 65.98 65.60 66.50 20.5 532 61.82 62.38 52.28 61.23 60.17 60.56 64.44 25.5 662 63.25 60.42 51.05 61.52 60.28 60.09 65.16 30.5 792 64.00 61.36 50.73 61.31 58.10 57.72 62.53 35.5 922 67.87 62.55 61.16 60.69 68.83 67.45 72.24 40.5 1052 69.62 63.30 59.42 61.45 54.68 55.78 59.54 45.5 1182 62.60 60.80 53.52 59.15 54.76 55.53 59.86 50.5 1312 63.36 58.97 56.39 61.47 60.73 59.75 65.34 55.5 1442 65.76 62.65 58.90 61.04 55.81 61.52 60.45 60.5 1572 66.26 65.73 57.48 60.37 56.55 61.01 61.93 65.5 1703 58.51 51.53 48.94 60.95 61.13 60.97 65.28 70.5 1833 65.13 61.36 58.81 62.55 56.14 57.18 61.16 75.5 1963 62.34 56.44 61.61 66.72 57.91 58.64 63.65 80.5 2093 63.00 52.20 57.93 63.75 65.06 68.83 72.42 85.5 2223 71.36 66.44 70.15 85.41 59.05 63.50 65.30 90.5 2353 68.07 57.87 72.44 89.66 69.41 75.31 78.35 91.5 2483 70.10 68.54 61.12 66.15 64.71 64.29 71.11 96.5 2613 74.85 71.64 71.41 80.73 71.16 69.88 80.71 101.5 2743 73.63 67.41 67.70 70.11 73.86 75.65 81.67 106.5 2873 73.72 67.99 67.86 67.62 56.93 58.05 64.00 111.5 3004 80.16 70.16 71.35 85.48 73.23 73.88 83.06 116.5 3223 76.70 66.09 71.38 87.84 66.85 66.12 77.83 121.5 3443 75.11 67.66 68.37 75.46 64.61 64.57 73.38 126.5 3663 78.39 73.47 74.10 99.80 74.88 75.96 88.98 131.5 3883 70.13 63.55 67.88 77.04 58.51 61.36 67.01 136.5 4103 78.44 74.44 73.16 83.47 73.21 71.74 72.58 141.5 4323 70.77 59.05 67.54 69.74 65.79 65.89 73.40 146.5 4543 79.36 66.86 73.92 90.36 83.70 84.53 94.73 151.5 4763 79.47 68.01 73.45 91.31 84.17 79.94 94.82 156.5 5031 77.83 64.69 74.93 93.70 69.88 70.74 79.36 161.5 5300 78.56 71.15 72.89 89.01 70.72 68.25 79.94 166.5 5568 72.84 66.32 71.79 104.87 68.58 74.95 77.35 171.5 5837 66.92 52.59 60.59 62.79 65.69 66.03 70.34 176.5 6105 68.86 59.93 63.46 64.79 52.67 54.95 58.99 181.5 6374 62.80 47.71 63.02 67.14 52.89 54.10 58.28 186.5 6642 56.43 42.06 57.08 58.14 53.36 54.20 58.00 191.5 6911 68.18 60.42 60.72 61.22 58.68 60.02 63.93 196.5 7179 68.82 53.86 59.09 63.73 50.95 52.35 56.47 201.5 7447 63.33 50.89 56.14 59.62 46.49 48.37 51.21 206.5 7716 56.68 44.29 52.27 56.69 50.49 51.86 55.14 211.5 7984 51.74 40.57 51.88 52.63 47.58 49.95 51.62
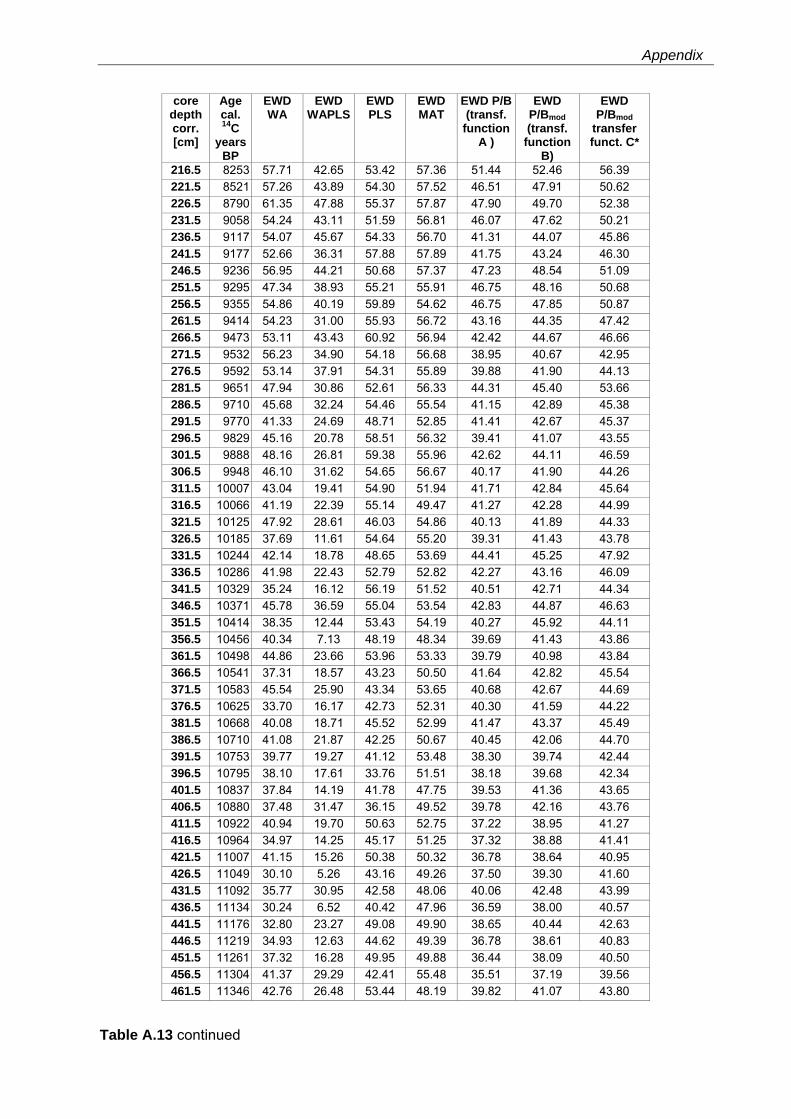
Appendix
core depth corr. [cm]
Age cal. 14C
years BP
EWD WA
EWD WAPLS
EWD PLS
EWD MAT
EWD P/B (transf.
function A )
EWD P/Bmod (transf.
function B)
EWD P/Bmod
transfer funct. C*
216.5 8253 57.71 42.65 53.42 57.36 51.44 52.46 56.39 221.5 8521 57.26 43.89 54.30 57.52 46.51 47.91 50.62 226.5 8790 61.35 47.88 55.37 57.87 47.90 49.70 52.38 231.5 9058 54.24 43.11 51.59 56.81 46.07 47.62 50.21 236.5 9117 54.07 45.67 54.33 56.70 41.31 44.07 45.86 241.5 9177 52.66 36.31 57.88 57.89 41.75 43.24 46.30 246.5 9236 56.95 44.21 50.68 57.37 47.23 48.54 51.09 251.5 9295 47.34 38.93 55.21 55.91 46.75 48.16 50.68 256.5 9355 54.86 40.19 59.89 54.62 46.75 47.85 50.87 261.5 9414 54.23 31.00 55.93 56.72 43.16 44.35 47.42 266.5 9473 53.11 43.43 60.92 56.94 42.42 44.67 46.66 271.5 9532 56.23 34.90 54.18 56.68 38.95 40.67 42.95 276.5 9592 53.14 37.91 54.31 55.89 39.88 41.90 44.13 281.5 9651 47.94 30.86 52.61 56.33 44.31 45.40 53.66 286.5 9710 45.68 32.24 54.46 55.54 41.15 42.89 45.38 291.5 9770 41.33 24.69 48.71 52.85 41.41 42.67 45.37 296.5 9829 45.16 20.78 58.51 56.32 39.41 41.07 43.55 301.5 9888 48.16 26.81 59.38 55.96 42.62 44.11 46.59 306.5 9948 46.10 31.62 54.65 56.67 40.17 41.90 44.26 311.5 10007 43.04 19.41 54.90 51.94 41.71 42.84 45.64 316.5 10066 41.19 22.39 55.14 49.47 41.27 42.28 44.99 321.5 10125 47.92 28.61 46.03 54.86 40.13 41.89 44.33 326.5 10185 37.69 11.61 54.64 55.20 39.31 41.43 43.78 331.5 10244 42.14 18.78 48.65 53.69 44.41 45.25 47.92 336.5 10286 41.98 22.43 52.79 52.82 42.27 43.16 46.09 341.5 10329 35.24 16.12 56.19 51.52 40.51 42.71 44.34 346.5 10371 45.78 36.59 55.04 53.54 42.83 44.87 46.63 351.5 10414 38.35 12.44 53.43 54.19 40.27 45.92 44.11 356.5 10456 40.34 7.13 48.19 48.34 39.69 41.43 43.86 361.5 10498 44.86 23.66 53.96 53.33 39.79 40.98 43.84 366.5 10541 37.31 18.57 43.23 50.50 41.64 42.82 45.54 371.5 10583 45.54 25.90 43.34 53.65 40.68 42.67 44.69 376.5 10625 33.70 16.17 42.73 52.31 40.30 41.59 44.22 381.5 10668 40.08 18.71 45.52 52.99 41.47 43.37 45.49 386.5 10710 41.08 21.87 42.25 50.67 40.45 42.06 44.70 391.5 10753 39.77 19.27 41.12 53.48 38.30 39.74 42.44 396.5 10795 38.10 17.61 33.76 51.51 38.18 39.68 42.34 401.5 10837 37.84 14.19 41.78 47.75 39.53 41.36 43.65 406.5 10880 37.48 31.47 36.15 49.52 39.78 42.16 43.76 411.5 10922 40.94 19.70 50.63 52.75 37.22 38.95 41.27 416.5 10964 34.97 14.25 45.17 51.25 37.32 38.88 41.41 421.5 11007 41.15 15.26 50.38 50.32 36.78 38.64 40.95 426.5 11049 30.10 5.26 43.16 49.26 37.50 39.30 41.60 431.5 11092 35.77 30.95 42.58 48.06 40.06 42.48 43.99 436.5 11134 30.24 6.52 40.42 47.96 36.59 38.00 40.57 441.5 11176 32.80 23.27 49.08 49.90 38.65 40.44 42.63 446.5 11219 34.93 12.63 44.62 49.39 36.78 38.61 40.83 451.5 11261 37.32 16.28 49.95 49.88 36.44 38.09 40.50 456.5 11304 41.37 29.29 42.41 55.48 35.51 37.19 39.56 461.5 11346 42.76 26.48 53.44 48.19 39.82 41.07 43.80
Table A.13 continued
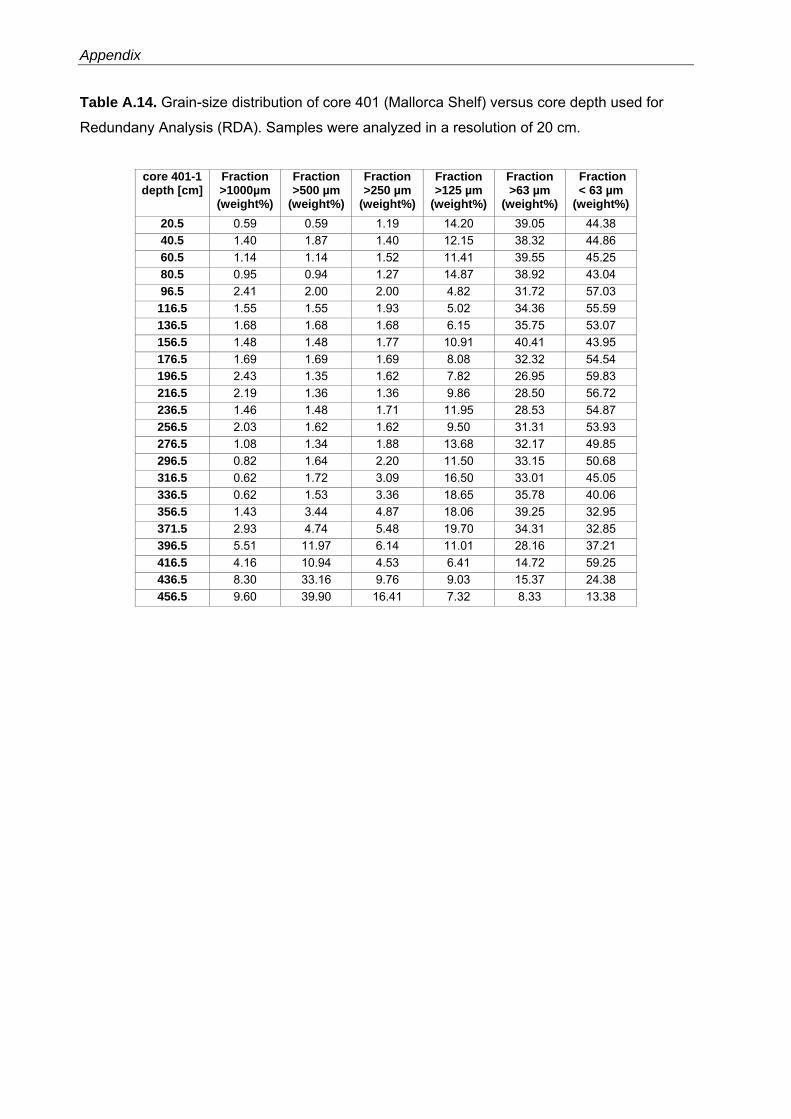
Appendix
Table A.14. Grain-size distribution of core 401 (Mallorca Shelf) versus core depth used for
Redundany Analysis (RDA). Samples were analyzed in a resolution of 20 cm.
core 401-1 depth [cm]
Fraction >1000µm (weight%)
Fraction >500 µm
(weight%)
Fraction >250 µm
(weight%)
Fraction >125 µm
(weight%)
Fraction >63 µm
(weight%)
Fraction < 63 µm
(weight%) 20.5 0.59 0.59 1.19 14.20 39.05 44.38 40.5 1.40 1.87 1.40 12.15 38.32 44.86 60.5 1.14 1.14 1.52 11.41 39.55 45.25 80.5 0.95 0.94 1.27 14.87 38.92 43.04 96.5 2.41 2.00 2.00 4.82 31.72 57.03 116.5 1.55 1.55 1.93 5.02 34.36 55.59 136.5 1.68 1.68 1.68 6.15 35.75 53.07 156.5 1.48 1.48 1.77 10.91 40.41 43.95 176.5 1.69 1.69 1.69 8.08 32.32 54.54 196.5 2.43 1.35 1.62 7.82 26.95 59.83 216.5 2.19 1.36 1.36 9.86 28.50 56.72 236.5 1.46 1.48 1.71 11.95 28.53 54.87 256.5 2.03 1.62 1.62 9.50 31.31 53.93 276.5 1.08 1.34 1.88 13.68 32.17 49.85 296.5 0.82 1.64 2.20 11.50 33.15 50.68 316.5 0.62 1.72 3.09 16.50 33.01 45.05 336.5 0.62 1.53 3.36 18.65 35.78 40.06 356.5 1.43 3.44 4.87 18.06 39.25 32.95 371.5 2.93 4.74 5.48 19.70 34.31 32.85 396.5 5.51 11.97 6.14 11.01 28.16 37.21 416.5 4.16 10.94 4.53 6.41 14.72 59.25 436.5 8.30 33.16 9.76 9.03 15.37 24.38 456.5 9.60 39.90 16.41 7.32 8.33 13.38
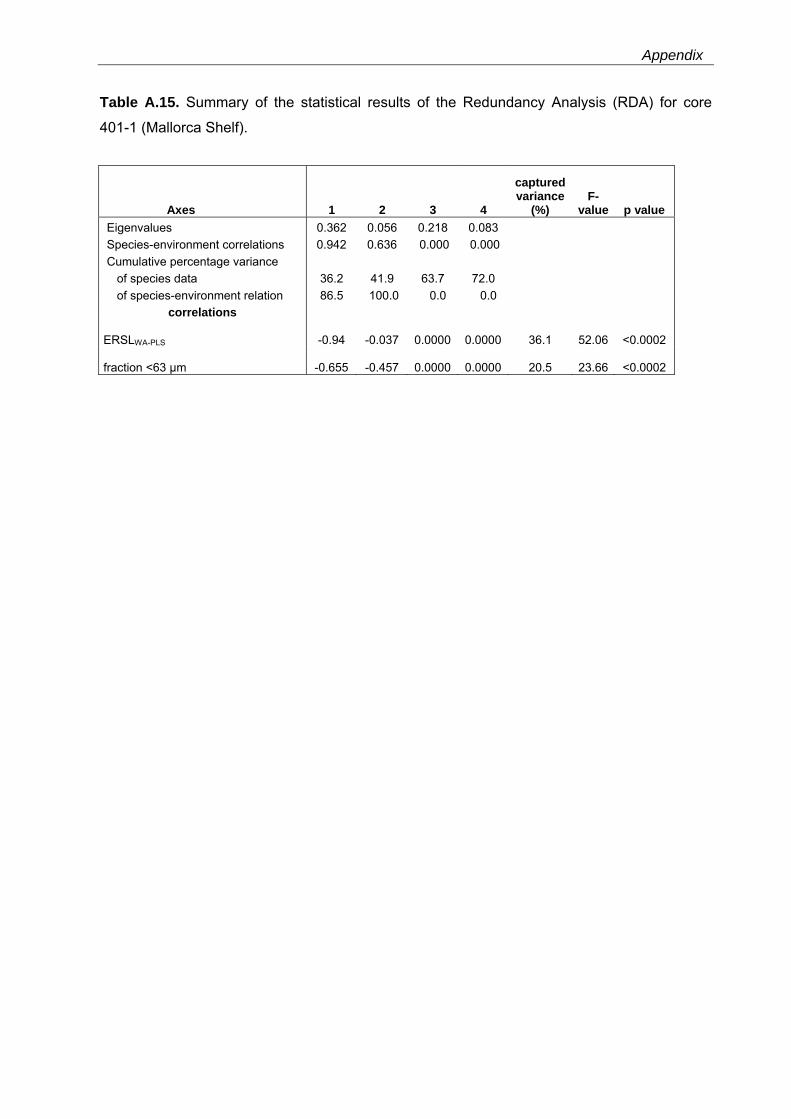
Appendix
Table A.15. Summary of the statistical results of the Redundancy Analysis (RDA) for core
401-1 (Mallorca Shelf).
Axes 1 2 3 4
captured variance
(%) F-
value p value Eigenvalues 0.362 0.056 0.218 0.083 Species-environment correlations 0.942 0.636 0.000 0.000 Cumulative percentage variance of species data 36.2 41.9 63.7 72.0 of species-environment relation 86.5 100.0 0.0 0.0
correlations
ERSLWA-PLS -0.94 -0.037
0.0000
0.0000 36.1 52.06 <0.0002
fraction <63 µm -0.655 -0.457
0.0000
0.0000 20.5 23.66 <0.0002
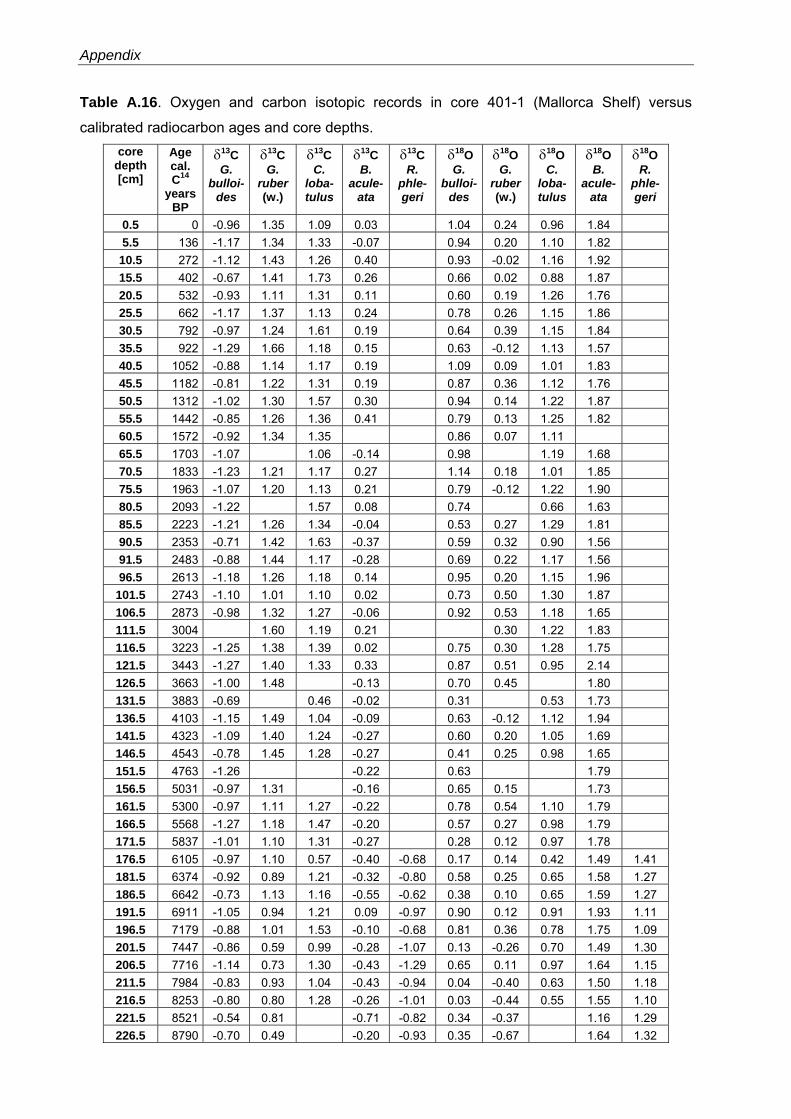
Appendix
Table A.16. Oxygen and carbon isotopic records in core 401-1 (Mallorca Shelf) versus
calibrated radiocarbon ages and core depths. core
depth [cm]
Age cal. C14
years BP
δ13C G.
bulloi-des
δ13C G.
ruber (w.)
δ13C C.
loba-tulus
δ13C B.
acule-ata
δ13C R.
phle-geri
δ18O G.
bulloi-des
δ18O G.
ruber (w.)
δ18O C.
loba-tulus
δ18O B.
acule-ata
δ18O R.
phle-geri
0.5 0 -0.96 1.35 1.09 0.03 1.04 0.24 0.96 1.84 5.5 136 -1.17 1.34 1.33 -0.07 0.94 0.20 1.10 1.82 10.5 272 -1.12 1.43 1.26 0.40 0.93 -0.02 1.16 1.92 15.5 402 -0.67 1.41 1.73 0.26 0.66 0.02 0.88 1.87 20.5 532 -0.93 1.11 1.31 0.11 0.60 0.19 1.26 1.76 25.5 662 -1.17 1.37 1.13 0.24 0.78 0.26 1.15 1.86 30.5 792 -0.97 1.24 1.61 0.19 0.64 0.39 1.15 1.84 35.5 922 -1.29 1.66 1.18 0.15 0.63 -0.12 1.13 1.57 40.5 1052 -0.88 1.14 1.17 0.19 1.09 0.09 1.01 1.83 45.5 1182 -0.81 1.22 1.31 0.19 0.87 0.36 1.12 1.76 50.5 1312 -1.02 1.30 1.57 0.30 0.94 0.14 1.22 1.87 55.5 1442 -0.85 1.26 1.36 0.41 0.79 0.13 1.25 1.82 60.5 1572 -0.92 1.34 1.35 0.86 0.07 1.11 65.5 1703 -1.07 1.06 -0.14 0.98 1.19 1.68 70.5 1833 -1.23 1.21 1.17 0.27 1.14 0.18 1.01 1.85 75.5 1963 -1.07 1.20 1.13 0.21 0.79 -0.12 1.22 1.90 80.5 2093 -1.22 1.57 0.08 0.74 0.66 1.63 85.5 2223 -1.21 1.26 1.34 -0.04 0.53 0.27 1.29 1.81 90.5 2353 -0.71 1.42 1.63 -0.37 0.59 0.32 0.90 1.56 91.5 2483 -0.88 1.44 1.17 -0.28 0.69 0.22 1.17 1.56 96.5 2613 -1.18 1.26 1.18 0.14 0.95 0.20 1.15 1.96
101.5 2743 -1.10 1.01 1.10 0.02 0.73 0.50 1.30 1.87 106.5 2873 -0.98 1.32 1.27 -0.06 0.92 0.53 1.18 1.65 111.5 3004 1.60 1.19 0.21 0.30 1.22 1.83 116.5 3223 -1.25 1.38 1.39 0.02 0.75 0.30 1.28 1.75 121.5 3443 -1.27 1.40 1.33 0.33 0.87 0.51 0.95 2.14 126.5 3663 -1.00 1.48 -0.13 0.70 0.45 1.80 131.5 3883 -0.69 0.46 -0.02 0.31 0.53 1.73 136.5 4103 -1.15 1.49 1.04 -0.09 0.63 -0.12 1.12 1.94 141.5 4323 -1.09 1.40 1.24 -0.27 0.60 0.20 1.05 1.69 146.5 4543 -0.78 1.45 1.28 -0.27 0.41 0.25 0.98 1.65 151.5 4763 -1.26 -0.22 0.63 1.79 156.5 5031 -0.97 1.31 -0.16 0.65 0.15 1.73 161.5 5300 -0.97 1.11 1.27 -0.22 0.78 0.54 1.10 1.79 166.5 5568 -1.27 1.18 1.47 -0.20 0.57 0.27 0.98 1.79 171.5 5837 -1.01 1.10 1.31 -0.27 0.28 0.12 0.97 1.78 176.5 6105 -0.97 1.10 0.57 -0.40 -0.68 0.17 0.14 0.42 1.49 1.41 181.5 6374 -0.92 0.89 1.21 -0.32 -0.80 0.58 0.25 0.65 1.58 1.27 186.5 6642 -0.73 1.13 1.16 -0.55 -0.62 0.38 0.10 0.65 1.59 1.27 191.5 6911 -1.05 0.94 1.21 0.09 -0.97 0.90 0.12 0.91 1.93 1.11 196.5 7179 -0.88 1.01 1.53 -0.10 -0.68 0.81 0.36 0.78 1.75 1.09 201.5 7447 -0.86 0.59 0.99 -0.28 -1.07 0.13 -0.26 0.70 1.49 1.30 206.5 7716 -1.14 0.73 1.30 -0.43 -1.29 0.65 0.11 0.97 1.64 1.15 211.5 7984 -0.83 0.93 1.04 -0.43 -0.94 0.04 -0.40 0.63 1.50 1.18 216.5 8253 -0.80 0.80 1.28 -0.26 -1.01 0.03 -0.44 0.55 1.55 1.10 221.5 8521 -0.54 0.81 -0.71 -0.82 0.34 -0.37 1.16 1.29 226.5 8790 -0.70 0.49 -0.20 -0.93 0.35 -0.67 1.64 1.32
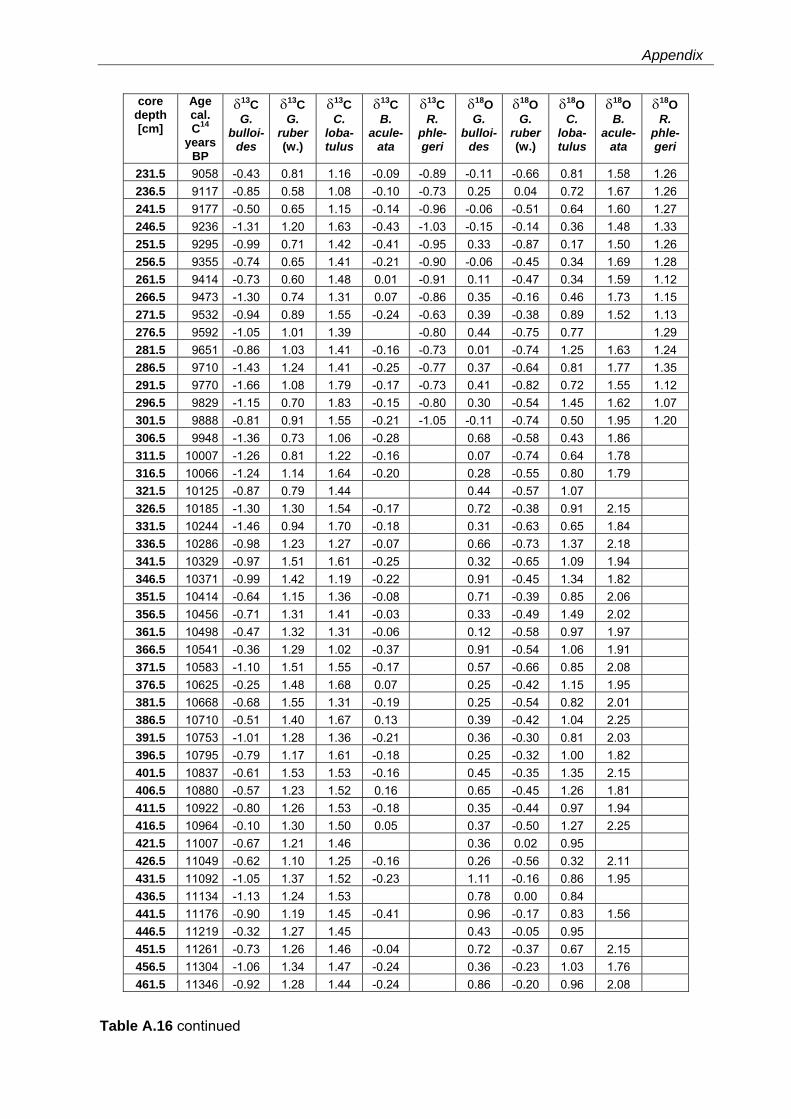
Appendix
core depth [cm]
Age cal. C14
years BP
δ13C G.
bulloi-des
δ13C G.
ruber (w.)
δ13C C.
loba-tulus
δ13C B.
acule-ata
δ13C R.
phle-geri
δ18O G.
bulloi-des
δ18O G.
ruber (w.)
δ18O C.
loba-tulus
δ18O B.
acule-ata
δ18O R.
phle-geri
231.5 9058 -0.43 0.81 1.16 -0.09 -0.89 -0.11 -0.66 0.81 1.58 1.26 236.5 9117 -0.85 0.58 1.08 -0.10 -0.73 0.25 0.04 0.72 1.67 1.26 241.5 9177 -0.50 0.65 1.15 -0.14 -0.96 -0.06 -0.51 0.64 1.60 1.27 246.5 9236 -1.31 1.20 1.63 -0.43 -1.03 -0.15 -0.14 0.36 1.48 1.33 251.5 9295 -0.99 0.71 1.42 -0.41 -0.95 0.33 -0.87 0.17 1.50 1.26 256.5 9355 -0.74 0.65 1.41 -0.21 -0.90 -0.06 -0.45 0.34 1.69 1.28 261.5 9414 -0.73 0.60 1.48 0.01 -0.91 0.11 -0.47 0.34 1.59 1.12 266.5 9473 -1.30 0.74 1.31 0.07 -0.86 0.35 -0.16 0.46 1.73 1.15 271.5 9532 -0.94 0.89 1.55 -0.24 -0.63 0.39 -0.38 0.89 1.52 1.13 276.5 9592 -1.05 1.01 1.39 -0.80 0.44 -0.75 0.77 1.29 281.5 9651 -0.86 1.03 1.41 -0.16 -0.73 0.01 -0.74 1.25 1.63 1.24 286.5 9710 -1.43 1.24 1.41 -0.25 -0.77 0.37 -0.64 0.81 1.77 1.35 291.5 9770 -1.66 1.08 1.79 -0.17 -0.73 0.41 -0.82 0.72 1.55 1.12 296.5 9829 -1.15 0.70 1.83 -0.15 -0.80 0.30 -0.54 1.45 1.62 1.07 301.5 9888 -0.81 0.91 1.55 -0.21 -1.05 -0.11 -0.74 0.50 1.95 1.20 306.5 9948 -1.36 0.73 1.06 -0.28 0.68 -0.58 0.43 1.86 311.5 10007 -1.26 0.81 1.22 -0.16 0.07 -0.74 0.64 1.78 316.5 10066 -1.24 1.14 1.64 -0.20 0.28 -0.55 0.80 1.79 321.5 10125 -0.87 0.79 1.44 0.44 -0.57 1.07 326.5 10185 -1.30 1.30 1.54 -0.17 0.72 -0.38 0.91 2.15 331.5 10244 -1.46 0.94 1.70 -0.18 0.31 -0.63 0.65 1.84 336.5 10286 -0.98 1.23 1.27 -0.07 0.66 -0.73 1.37 2.18 341.5 10329 -0.97 1.51 1.61 -0.25 0.32 -0.65 1.09 1.94 346.5 10371 -0.99 1.42 1.19 -0.22 0.91 -0.45 1.34 1.82 351.5 10414 -0.64 1.15 1.36 -0.08 0.71 -0.39 0.85 2.06 356.5 10456 -0.71 1.31 1.41 -0.03 0.33 -0.49 1.49 2.02 361.5 10498 -0.47 1.32 1.31 -0.06 0.12 -0.58 0.97 1.97 366.5 10541 -0.36 1.29 1.02 -0.37 0.91 -0.54 1.06 1.91 371.5 10583 -1.10 1.51 1.55 -0.17 0.57 -0.66 0.85 2.08 376.5 10625 -0.25 1.48 1.68 0.07 0.25 -0.42 1.15 1.95 381.5 10668 -0.68 1.55 1.31 -0.19 0.25 -0.54 0.82 2.01 386.5 10710 -0.51 1.40 1.67 0.13 0.39 -0.42 1.04 2.25 391.5 10753 -1.01 1.28 1.36 -0.21 0.36 -0.30 0.81 2.03 396.5 10795 -0.79 1.17 1.61 -0.18 0.25 -0.32 1.00 1.82 401.5 10837 -0.61 1.53 1.53 -0.16 0.45 -0.35 1.35 2.15 406.5 10880 -0.57 1.23 1.52 0.16 0.65 -0.45 1.26 1.81 411.5 10922 -0.80 1.26 1.53 -0.18 0.35 -0.44 0.97 1.94 416.5 10964 -0.10 1.30 1.50 0.05 0.37 -0.50 1.27 2.25 421.5 11007 -0.67 1.21 1.46 0.36 0.02 0.95 426.5 11049 -0.62 1.10 1.25 -0.16 0.26 -0.56 0.32 2.11 431.5 11092 -1.05 1.37 1.52 -0.23 1.11 -0.16 0.86 1.95 436.5 11134 -1.13 1.24 1.53 0.78 0.00 0.84 441.5 11176 -0.90 1.19 1.45 -0.41 0.96 -0.17 0.83 1.56 446.5 11219 -0.32 1.27 1.45 0.43 -0.05 0.95 451.5 11261 -0.73 1.26 1.46 -0.04 0.72 -0.37 0.67 2.15 456.5 11304 -1.06 1.34 1.47 -0.24 0.36 -0.23 1.03 1.76 461.5 11346 -0.92 1.28 1.44 -0.24 0.86 -0.20 0.96 2.08
Table A.16 continued
Appendix
The enclosure (CD-ROM) contains the following Tables:
Electronic Table A.17. Census counts live (Rose Bengal stained) benthic foraminifera in the
surface samples from the Alboran Platform, Oran Bight, and the Mallorca Shelf with sample
splits and sample volumens.
Electronic Table A.18. Census counts dead benthic foraminifera, sum benthic and planktonic
foraminifera, sum redeposited foraminifera in the surface samples from the Alboran Platform,
Oran Bight, and the Mallorca Shelf with sample splits and sample weights.
Electronic Table A.19. Census counts dead benthic foraminifera, sum benthic and planktonic
foraminifera, sum redeposited foraminifera in sediment-core 342-1 from the Alboran Platform
with sample splits and sample weights.
Electronic Table A.20. Census counts dead benthic foraminifera, sum benthic and planktonic
foraminifera, sum redeposited foraminifera in sediment-core 367-1 from the Oran Bight with
sample splits and sample weights.
Electronic Table A.21. Census counts dead benthic foraminifera, sum benthic and planktonic
foraminifera in sediment-core 401-1 from the Mallorca Shelf with sample splits and sample
weights.
Recommended