Embed Size (px)
Citation preview
±270 VDC Aircraft Harness Structural Analysis - a Simulation Based Approach Holger Sparr1, Alexander Hausdorf1, Peter Jeske1, Nachiket Kale2, Ralph Schacht1, Matthias Ziegenhorn1, Oliver Zysk2 1Brandenburgische Technische Universität Cottbus–Senftenberg, Großenhainer Str. 57, 01968 Senftenberg, Germany 2QualityPark Aviation Center GmbH, Schellerdamm 22, 21079 Hamburg, Germany * Corresponding Author: [email protected], +49 (0) 3573 85 516
Abstract
This research focuses on the structural analysis of aircraft electrical harnesses for the ± 270 VDC network. A combined experimental and simulation-based approach is used, where numerical models for the harnesses are developed and experimental data are acquired for basic test cases (steady load, pendulum test, etc.) as well as for different vibration load cases. Validation of the numerical models is done using the preliminary experimental data, resulting in a mature refined model in order to simulate complex scenarios. The goal of the project is thus to develop a suite of tools that allows detailed structural analysis of the aircraft harnesses, both stand alone as well as in combination with other systems.
1 Introduction
In recent years, due to the evolution of alternative power sources like fuel cells generating DC power, as well as due to the increasing push towards creating a “more electric” aircraft, ± 270 VDC electrical devices and networks have emerged in aircrafts. For instance, the Boeing 787 Dreamliner has produced almost twice as much electrical energy as its predecessors, owing to its no-bleed electrical architecture [1]. The adjustable speed motors that are essential for the no-bleed architecture operate on ± 270 VDC. It has also been proposed that using either a HVDC grid of ± 270 VDC or a hybrid grid involving ± 270 VDC will lead to substantial weight optimization of the aircraft [2]. This motivates the analysis of the electrical harnesses involved in carrying the HVDC power, from an aerospace application point of view.
The aim of this project is to analyse the effect of vibration loads on electrical harnesses conducting ± 270 HVDC power inside an aircraft. In particular, the vibration loads generated by the wind milling imbalance condition of the aircraft (free uncontrolled and unbalanced movement of the fan blades due to failure of engine and blade-off condition) was used as the target test case. The harnesses themselves have structural complexity, due to their multi-strand conductors and insulating layers.
Experimental as well as numerical analyses were performed to evaluate the effect from structural, thermal and electrical perspectives. The experimental data accumulated and subsequent validation performed of the numerical models enabled the preliminary development of a computational system that can be used to predict the behaviour of the harnesses under more complex real-life conditions without having to perform expensive experimentation.
2 Experimental Investigations
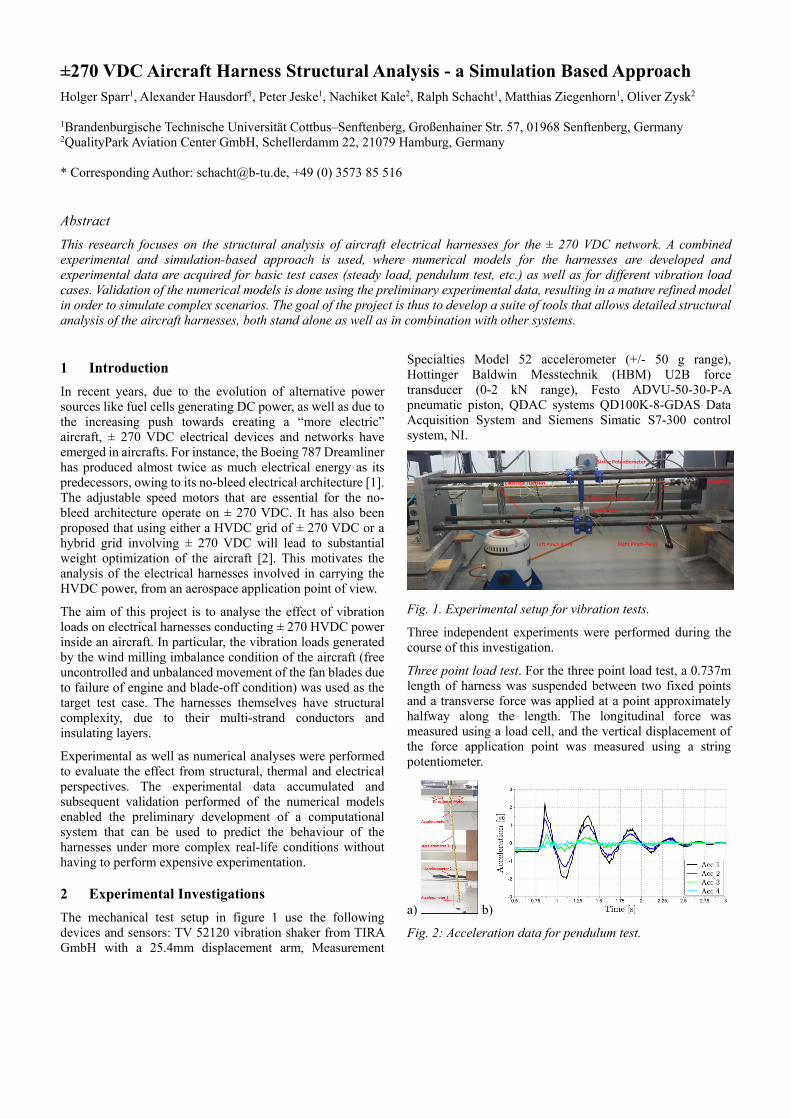
The mechanical test setup in figure 1 use the following devices and sensors: TV 52120 vibration shaker from TIRA GmbH with a 25.4mm displacement arm, Measurement
Specialties Model 52 accelerometer (+/- 50 g range), Hottinger Baldwin Messtechnik (HBM) U2B force transducer (0-2 kN range), Festo ADVU-50-30-P-A pneumatic piston, QDAC systems QD100K-8-GDAS Data Acquisition System and Siemens Simatic S7-300 control system, NI.
Fig. 1. Experimental setup for vibration tests.
Three independent experiments were performed during the course of this investigation.
Three point load test. For the three point load test, a 0.737m length of harness was suspended between two fixed points and a transverse force was applied at a point approximately halfway along the length. The longitudinal force was measured using a load cell, and the vertical displacement of the force application point was measured using a string potentiometer.
a) b)
Fig. 2: Acceleration data for pendulum test.
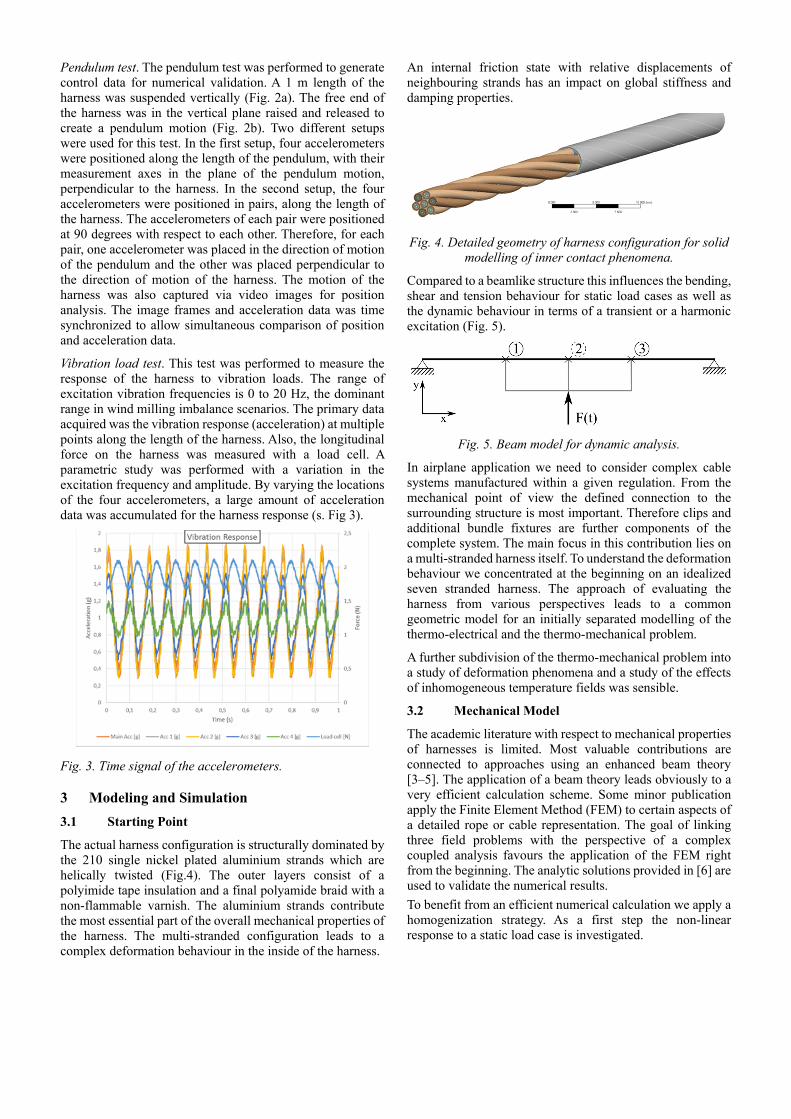
Pendulum test. The pendulum test was performed to generate control data for numerical validation. A 1 m length of the harness was suspended vertically (Fig. 2a). The free end of the harness was in the vertical plane raised and released to create a pendulum motion (Fig. 2b). Two different setups were used for this test. In the first setup, four accelerometers were positioned along the length of the pendulum, with their measurement axes in the plane of the pendulum motion, perpendicular to the harness. In the second setup, the four accelerometers were positioned in pairs, along the length of the harness. The accelerometers of each pair were positioned at 90 degrees with respect to each other. Therefore, for each pair, one accelerometer was placed in the direction of motion of the pendulum and the other was placed perpendicular to the direction of motion of the harness. The motion of the harness was also captured via video images for position analysis. The image frames and acceleration data was time synchronized to allow simultaneous comparison of position and acceleration data.
Vibration load test. This test was performed to measure the response of the harness to vibration loads. The range of excitation vibration frequencies is 0 to 20 Hz, the dominant range in wind milling imbalance scenarios. The primary data acquired was the vibration response (acceleration) at multiple points along the length of the harness. Also, the longitudinal force on the harness was measured with a load cell. A parametric study was performed with a variation in the excitation frequency and amplitude. By varying the locations of the four accelerometers, a large amount of acceleration data was accumulated for the harness response (s. Fig 3).
Fig. 3. Time signal of the accelerometers.
3 Modeling and Simulation
3.1 Starting Point
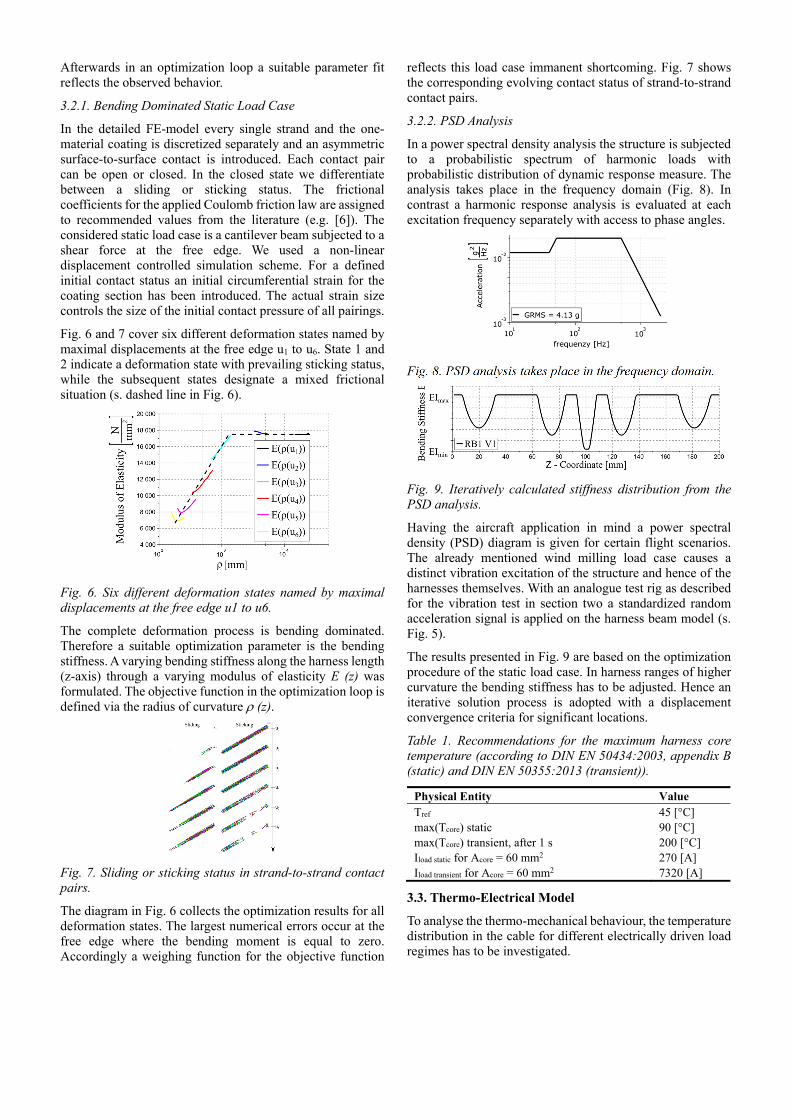
The actual harness configuration is structurally dominated by the 210 single nickel plated aluminium strands which are helically twisted (Fig.4). The outer layers consist of a polyimide tape insulation and a final polyamide braid with a non-flammable varnish. The aluminium strands contribute the most essential part of the overall mechanical properties of the harness. The multi-stranded configuration leads to a complex deformation behaviour in the inside of the harness.
An internal friction state with relative displacements of neighbouring strands has an impact on global stiffness and damping properties.
Fig. 4. Detailed geometry of harness configuration for solid modelling of inner contact phenomena.
Compared to a beamlike structure this influences the bending, shear and tension behaviour for static load cases as well as the dynamic behaviour in terms of a transient or a harmonic excitation (Fig. 5).
Fig. 5. Beam model for dynamic analysis.
In airplane application we need to consider complex cable systems manufactured within a given regulation. From the mechanical point of view the defined connection to the surrounding structure is most important. Therefore clips and additional bundle fixtures are further components of the complete system. The main focus in this contribution lies on a multi-stranded harness itself. To understand the deformation behaviour we concentrated at the beginning on an idealized seven stranded harness. The approach of evaluating the harness from various perspectives leads to a common geometric model for an initially separated modelling of the thermo-electrical and the thermo-mechanical problem.
A further subdivision of the thermo-mechanical problem into a study of deformation phenomena and a study of the effects of inhomogeneous temperature fields was sensible.
3.2 Mechanical Model
The academic literature with respect to mechanical properties of harnesses is limited. Most valuable contributions are connected to approaches using an enhanced beam theory [3–5]. The application of a beam theory leads obviously to a very efficient calculation scheme. Some minor publication apply the Finite Element Method (FEM) to certain aspects of a detailed rope or cable representation. The goal of linking three field problems with the perspective of a complex coupled analysis favours the application of the FEM right from the beginning. The analytic solutions provided in [6] are used to validate the numerical results.
To benefit from an efficient numerical calculation we apply a homogenization strategy. As a first step the non-linear response to a static load case is investigated.
Afterwards in an optimization loop a suitable parameter fit reflects the observed behavior.
3.2.1. Bending Dominated Static Load Case
In the detailed FE-model every single strand and the one-material coating is discretized separately and an asymmetric surface-to-surface contact is introduced. Each contact pair can be open or closed. In the closed state we differentiate between a sliding or sticking status. The frictional coefficients for the applied Coulomb friction law are assigned to recommended values from the literature (e.g. [6]). The considered static load case is a cantilever beam subjected to a shear force at the free edge. We used a non-linear displacement controlled simulation scheme. For a defined initial contact status an initial circumferential strain for the coating section has been introduced. The actual strain size controls the size of the initial contact pressure of all pairings.
Fig. 6 and 7 cover six different deformation states named by maximal displacements at the free edge u1 to u6. State 1 and 2 indicate a deformation state with prevailing sticking status, while the subsequent states designate a mixed frictional situation (s. dashed line in Fig. 6).
Fig. 6. Six different deformation states named by maximal displacements at the free edge u1 to u6.
The complete deformation process is bending dominated. Therefore a suitable optimization parameter is the bending stiffness. A varying bending stiffness along the harness length (z-axis) through a varying modulus of elasticity E (z) was formulated. The objective function in the optimization loop is defined via the radius of curvature (z).
Fig. 7. Sliding or sticking status in strand-to-strand contact pairs.
The diagram in Fig. 6 collects the optimization results for all deformation states. The largest numerical errors occur at the free edge where the bending moment is equal to zero. Accordingly a weighing function for the objective function
reflects this load case immanent shortcoming. Fig. 7 shows the corresponding evolving contact status of strand-to-strand contact pairs.
3.2.2. PSD Analysis
In a power spectral density analysis the structure is subjected to a probabilistic spectrum of harmonic loads with probabilistic distribution of dynamic response measure. The analysis takes place in the frequency domain (Fig. 8). In contrast a harmonic response analysis is evaluated at each excitation frequency separately with access to phase angles.
Fig. 8. PSD analysis takes place in the frequency domain.
Fig. 9. Iteratively calculated stiffness distribution from the PSD analysis.
Having the aircraft application in mind a power spectral density (PSD) diagram is given for certain flight scenarios. The already mentioned wind milling load case causes a distinct vibration excitation of the structure and hence of the harnesses themselves. With an analogue test rig as described for the vibration test in section two a standardized random acceleration signal is applied on the harness beam model (s. Fig. 5).
The results presented in Fig. 9 are based on the optimization procedure of the static load case. In harness ranges of higher curvature the bending stiffness has to be adjusted. Hence an iterative solution process is adopted with a displacement convergence criteria for significant locations.
Table 1. Recommendations for the maximum harness core temperature (according to DIN EN 50434:2003, appendix B (static) and DIN EN 50355:2013 (transient)).
Physical Entity Value Tref 45 [°C] max(Tcore) static 90 [°C] max(Tcore) transient, after 1 s 200 [°C] Iload static for Acore = 60 mm2 270 [A] Iload transient for Acore = 60 mm2 7320 [A]
3.3. Thermo-Electrical Model
To analyse the thermo-mechanical behaviour, the temperature distribution in the cable for different electrically driven load regimes has to be investigated.
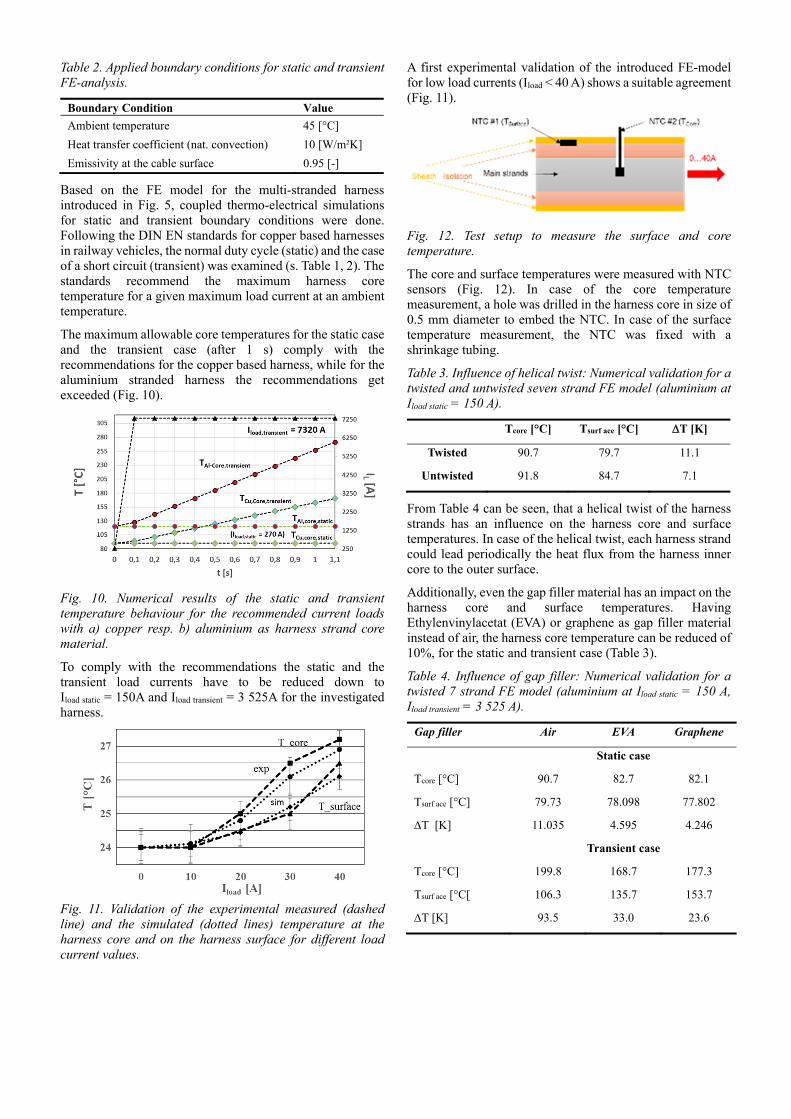
Table 2. Applied boundary conditions for static and transient FE-analysis.
Boundary Condition Value
Ambient temperature 45 [°C]
Heat transfer coefficient (nat. convection) 10 [W/m²K]
Emissivity at the cable surface 0.95 [-]
Based on the FE model for the multi-stranded harness introduced in Fig. 5, coupled thermo-electrical simulations for static and transient boundary conditions were done. Following the DIN EN standards for copper based harnesses in railway vehicles, the normal duty cycle (static) and the case of a short circuit (transient) was examined (s. Table 1, 2). The standards recommend the maximum harness core temperature for a given maximum load current at an ambient temperature.
The maximum allowable core temperatures for the static case and the transient case (after 1 s) comply with the recommendations for the copper based harness, while for the aluminium stranded harness the recommendations get exceeded (Fig. 10).
Fig. 10. Numerical results of the static and transient temperature behaviour for the recommended current loads with a) copper resp. b) aluminium as harness strand core material.
To comply with the recommendations the static and the transient load currents have to be reduced down to Iload static = 150A and Iload transient = 3 525A for the investigated harness.
Fig. 11. Validation of the experimental measured (dashed line) and the simulated (dotted lines) temperature at the harness core and on the harness surface for different load current values.
A first experimental validation of the introduced FE-model for low load currents (Iload < 40 A) shows a suitable agreement (Fig. 11).
Fig. 12. Test setup to measure the surface and core temperature.
The core and surface temperatures were measured with NTC sensors (Fig. 12). In case of the core temperature measurement, a hole was drilled in the harness core in size of 0.5 mm diameter to embed the NTC. In case of the surface temperature measurement, the NTC was fixed with a shrinkage tubing.
Table 3. Influence of helical twist: Numerical validation for a twisted and untwisted seven strand FE model (aluminium at Iload static = 150 A).
Tcore [°C] Tsurf ace [°C] T [K]
Twisted 90.7 79.7 11.1
Untwisted 91.8 84.7 7.1
From Table 4 can be seen, that a helical twist of the harness strands has an influence on the harness core and surface temperatures. In case of the helical twist, each harness strand could lead periodically the heat flux from the harness inner core to the outer surface.
Additionally, even the gap filler material has an impact on the harness core and surface temperatures. Having Ethylenvinylacetat (EVA) or graphene as gap filler material instead of air, the harness core temperature can be reduced of 10%, for the static and transient case (Table 3).
Table 4. Influence of gap filler: Numerical validation for a twisted 7 strand FE model (aluminium at Iload static = 150 A, Iload transient = 3 525 A).
Gap filler Air EVA Graphene
Static case
Tcore [°C] 90.7 82.7 82.1
Tsurf ace [°C] 79.73 78.098 77.802
T [K] 11.035 4.595 4.246
Transient case
Tcore [°C] 199.8 168.7 177.3
Tsurf ace [°C[ 106.3 135.7 153.7
T [K] 93.5 33.0 23.6
3.4. Thermo-Mechanical Model
The calculated temperature field of a static or transient thermo-electrical analysis can be transferred to a corresponding mechanical analysis motivated by temperature dependent stiffness properties and more decisively the influence of the inner contact status.
In a first attempt a localized heat flux impulse is used for a clamped-clamped seven-strand harness configuration followed by a transient mechanical analysis. The impulse location is the harness centre in the axial directions.
To increase the rotational asymmetry due to twisted strands the heat flux impulse is positioned in the outer strand layer. In terms of geometric linearity a simple buckling analysis on a pre-stressed system can be appended.
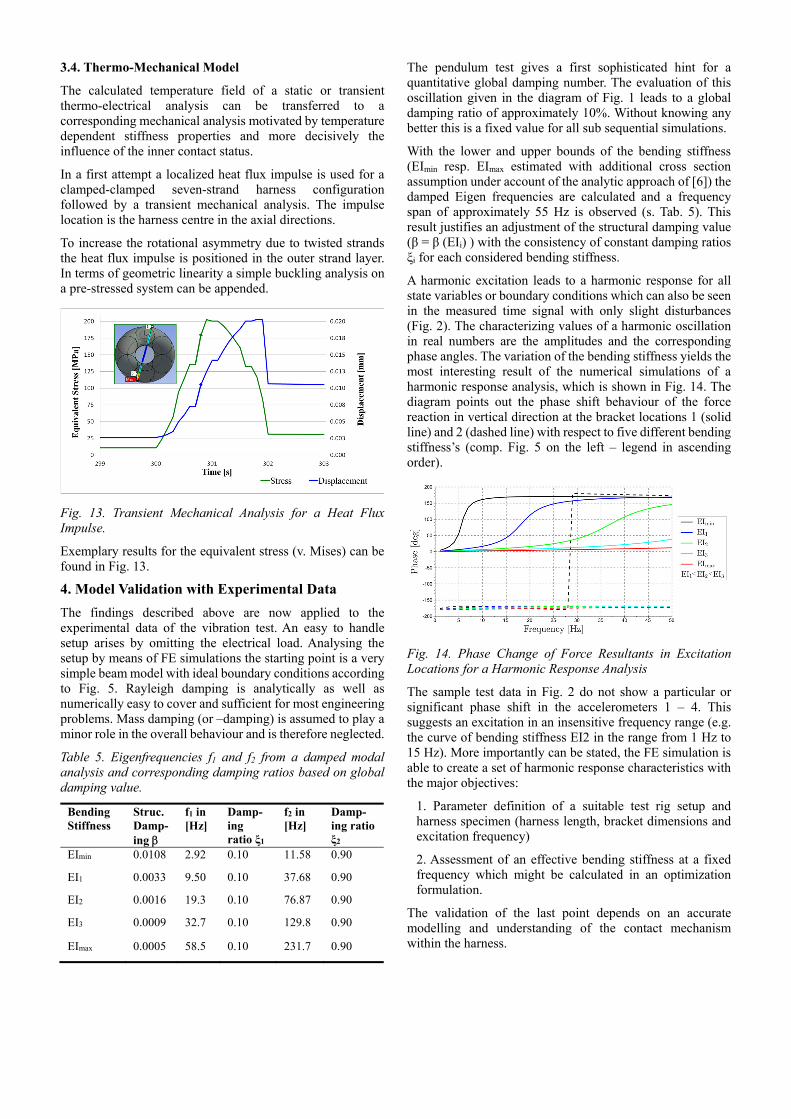
Fig. 13. Transient Mechanical Analysis for a Heat Flux Impulse.
Exemplary results for the equivalent stress (v. Mises) can be found in Fig. 13.
4. Model Validation with Experimental Data
The findings described above are now applied to the experimental data of the vibration test. An easy to handle setup arises by omitting the electrical load. Analysing the setup by means of FE simulations the starting point is a very simple beam model with ideal boundary conditions according to Fig. 5. Rayleigh damping is analytically as well as numerically easy to cover and sufficient for most engineering problems. Mass damping (or –damping) is assumed to play a minor role in the overall behaviour and is therefore neglected.
Table 5. Eigenfrequencies f1 and f2 from a damped modal analysis and corresponding damping ratios based on global damping value.
Bending Stiffness
Struc. Damp-ing
f1 in [Hz]
Damp-ing ratio ξ1
f2 in [Hz]
Damp-ing ratio ξ2
EImin 0.0108 2.92 0.10 11.58 0.90
EI1 0.0033 9.50 0.10 37.68 0.90
EI2 0.0016 19.3 0.10 76.87 0.90
EI3 0.0009 32.7 0.10 129.8 0.90
EImax 0.0005 58.5 0.10 231.7 0.90
The pendulum test gives a first sophisticated hint for a quantitative global damping number. The evaluation of this oscillation given in the diagram of Fig. 1 leads to a global damping ratio of approximately 10%. Without knowing any better this is a fixed value for all sub sequential simulations.
With the lower and upper bounds of the bending stiffness (EImin resp. EImax estimated with additional cross section assumption under account of the analytic approach of [6]) the damped Eigen frequencies are calculated and a frequency span of approximately 55 Hz is observed (s. Tab. 5). This result justifies an adjustment of the structural damping value (β = β (EIi) ) with the consistency of constant damping ratios ξi for each considered bending stiffness.
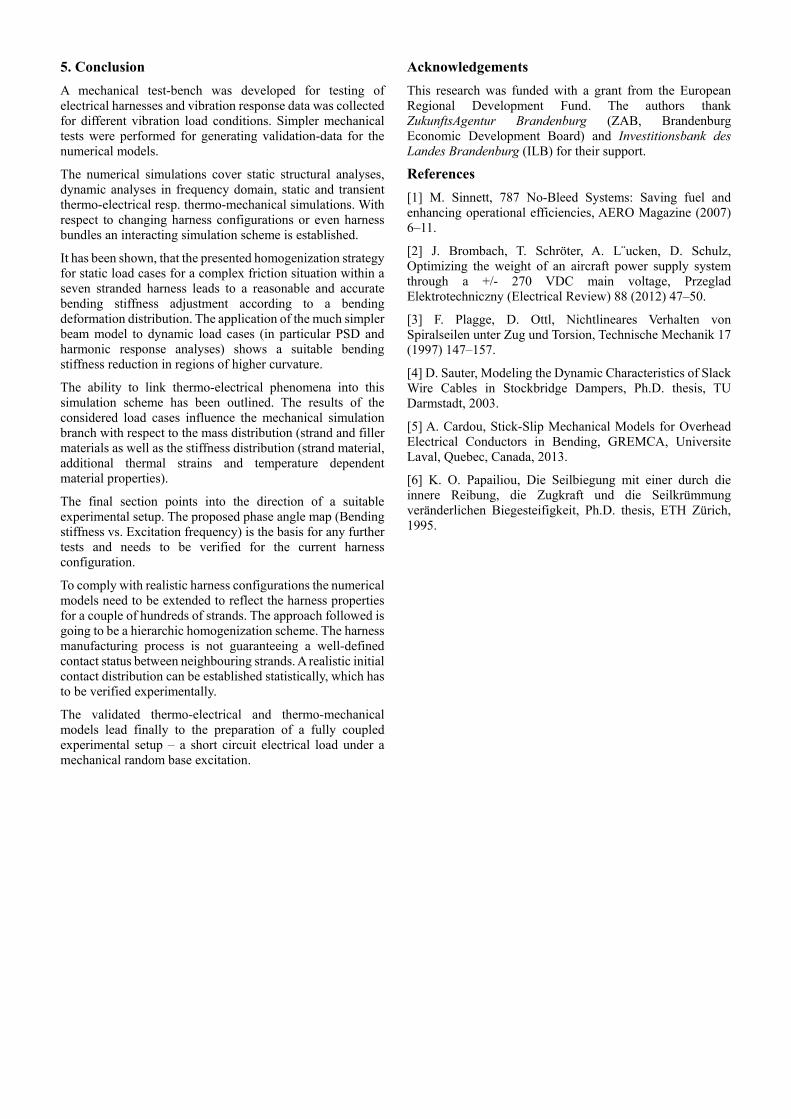
A harmonic excitation leads to a harmonic response for all state variables or boundary conditions which can also be seen in the measured time signal with only slight disturbances (Fig. 2). The characterizing values of a harmonic oscillation in real numbers are the amplitudes and the corresponding phase angles. The variation of the bending stiffness yields the most interesting result of the numerical simulations of a harmonic response analysis, which is shown in Fig. 14. The diagram points out the phase shift behaviour of the force reaction in vertical direction at the bracket locations 1 (solid line) and 2 (dashed line) with respect to five different bending stiffness’s (comp. Fig. 5 on the left – legend in ascending order).
Fig. 14. Phase Change of Force Resultants in Excitation Locations for a Harmonic Response Analysis
The sample test data in Fig. 2 do not show a particular or significant phase shift in the accelerometers 1 – 4. This suggests an excitation in an insensitive frequency range (e.g. the curve of bending stiffness EI2 in the range from 1 Hz to 15 Hz). More importantly can be stated, the FE simulation is able to create a set of harmonic response characteristics with the major objectives:
1. Parameter definition of a suitable test rig setup and harness specimen (harness length, bracket dimensions and excitation frequency)
2. Assessment of an effective bending stiffness at a fixed frequency which might be calculated in an optimization formulation.
The validation of the last point depends on an accurate modelling and understanding of the contact mechanism within the harness.
5. Conclusion
A mechanical test-bench was developed for testing of electrical harnesses and vibration response data was collected for different vibration load conditions. Simpler mechanical tests were performed for generating validation-data for the numerical models.
The numerical simulations cover static structural analyses, dynamic analyses in frequency domain, static and transient thermo-electrical resp. thermo-mechanical simulations. With respect to changing harness configurations or even harness bundles an interacting simulation scheme is established.
It has been shown, that the presented homogenization strategy for static load cases for a complex friction situation within a seven stranded harness leads to a reasonable and accurate bending stiffness adjustment according to a bending deformation distribution. The application of the much simpler beam model to dynamic load cases (in particular PSD and harmonic response analyses) shows a suitable bending stiffness reduction in regions of higher curvature.
The ability to link thermo-electrical phenomena into this simulation scheme has been outlined. The results of the considered load cases influence the mechanical simulation branch with respect to the mass distribution (strand and filler materials as well as the stiffness distribution (strand material, additional thermal strains and temperature dependent material properties).
The final section points into the direction of a suitable experimental setup. The proposed phase angle map (Bending stiffness vs. Excitation frequency) is the basis for any further tests and needs to be verified for the current harness configuration.
To comply with realistic harness configurations the numerical models need to be extended to reflect the harness properties for a couple of hundreds of strands. The approach followed is going to be a hierarchic homogenization scheme. The harness manufacturing process is not guaranteeing a well-defined contact status between neighbouring strands. A realistic initial contact distribution can be established statistically, which has to be verified experimentally.
The validated thermo-electrical and thermo-mechanical models lead finally to the preparation of a fully coupled experimental setup – a short circuit electrical load under a mechanical random base excitation.
Acknowledgements
This research was funded with a grant from the European Regional Development Fund. The authors thank ZukunftsAgentur Brandenburg (ZAB, Brandenburg Economic Development Board) and Investitionsbank des Landes Brandenburg (ILB) for their support.
References
[1] M. Sinnett, 787 No-Bleed Systems: Saving fuel and enhancing operational efficiencies, AERO Magazine (2007) 6–11.
[2] J. Brombach, T. Schröter, A. L¨ucken, D. Schulz, Optimizing the weight of an aircraft power supply system through a +/- 270 VDC main voltage, Przeglad Elektrotechniczny (Electrical Review) 88 (2012) 47–50.
[3] F. Plagge, D. Ottl, Nichtlineares Verhalten von Spiralseilen unter Zug und Torsion, Technische Mechanik 17 (1997) 147–157.
[4] D. Sauter, Modeling the Dynamic Characteristics of Slack Wire Cables in Stockbridge Dampers, Ph.D. thesis, TU Darmstadt, 2003.
[5] A. Cardou, Stick-Slip Mechanical Models for Overhead Electrical Conductors in Bending, GREMCA, Universite Laval, Quebec, Canada, 2013.
[6] K. O. Papailiou, Die Seilbiegung mit einer durch die innere Reibung, die Zugkraft und die Seilkrümmung veränderlichen Biegesteifigkeit, Ph.D. thesis, ETH Zürich, 1995.